Embed Size (px)
Citation preview
7/23/2019 Paper EWEA 2013 Devriendt Christof v2
http://slidepdf.com/reader/full/paper-ewea-2013-devriendt-christof-v2 1/10
MONITORING OF RESONANT FREQUENCIES ANDDAMPING VALUES OF AN OFFSHORE WIND TURBINE
ON A MONOPILE FOUNDATION
Christof DevriendtOWI-Lab / Vrije
Universiteit Brussel
Pieter Jan JordaensOWI-Lab / Sirris
pieterjan.jordaens@sir
ris.be
Yves Van IngelgemOWI-Lab / Vrije
Universiteit Brussel
Gert De SitterOWI-Lab /Vrije
Universiteit Brussel
Patrick GuillaumeVrije Universiteit
Brussel
1. Abstract
This paper shows the first results of a longtermmonitoring campaign on an offshore wind turbine inthe Belgian North Sea. It focuses on the continuousmonitoring of the resonant frequencies and
damping values of the dominant fundamentalmodes of the support structure. These parametersallow to better understand the dynamics of offshorewind turbines and are crucial in the fatigueassessment during the design phase. They canalso help to minimize O&M costs and to extend thelifetime of offshore wind turbines structures duringtheir operation. To do accurate continuousmonitoring of these parameters state-of-the-artoperational modal analysis techniques have beenautomated and their reliability improved, so that nohuman-interaction is required and the system cantrack small changes in the dynamic behaviour ofthe offshore wind turbine.
Keywords: Vibrations, Offshore, Measurement &monitoring, Foundations, Structural design
2. Introduction
2.1. Relevance
To increase the power generation and limit theweight, offshore wind turbines are becomingstructurally more flexible, thus an accurateprediction of their dynamic behavior is mandatory.On the other hand, inspection and maintenance foroffshore installations are much more cumbersomeand expensive than for onshore turbines. Thus, aremote monitoring application with the ability topredict structural changes can help to reduce O&Mcosts and extend the lifetime of these structures.
Many large scale offshore wind farm projects usemonopile foundations to obtain a cost effectivedesign. During the design of these monopilestructures fatigue due to combined wind and waveloading is one of the most important problems totake into account. Coincidence of structuralresonances with those dynamic wind and waveforces can lead to large amplitude stresses andsubsequent accelerated fatigue.
Damping ratios are crucial for lifetime predictionsas the amplitude of vibrations at resonance areinversely proportional to these ratios. The overalldamping ratios of an offshore wind turbine consistof a combination of aerodynamic damping,damping due to vortex shedding, damping due toconstructive devices, such as a tuned massdamper, and additional offshore damping thatconsists of damping from wave creation due tostructural vibration, viscous damping due tohydrodynamic drag, material damping of steel andsoil damping due to inner soil friction [1,2]. Realdamping ratios are very difficult to predict bynumerical tools and therefore measurements onexisting offshore wind turbines are crucial to verifythe existing design assumptions [3].
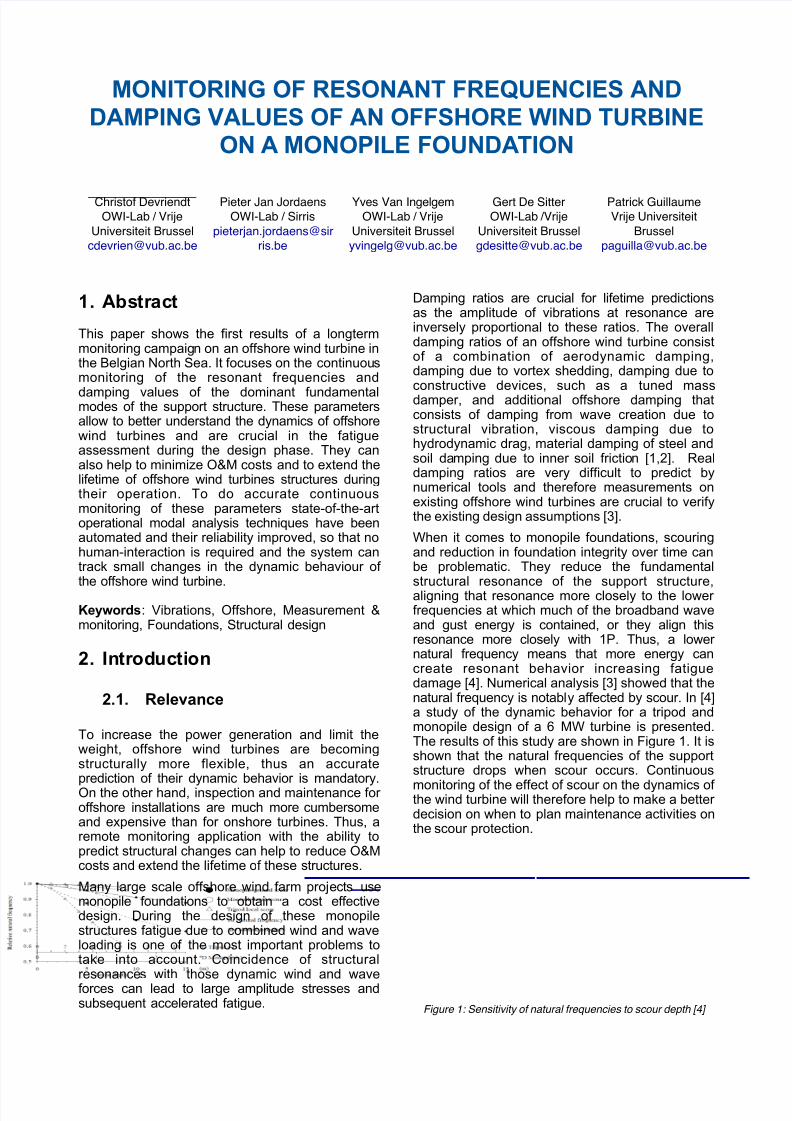
When it comes to monopile foundations, scouringand reduction in foundation integrity over time canbe problematic. They reduce the fundamentalstructural resonance of the support structure,aligning that resonance more closely to the lowerfrequencies at which much of the broadband waveand gust energy is contained, or they align thisresonance more closely with 1P. Thus, a lowernatural frequency means that more energy cancreate resonant behavior increasing fatiguedamage [4]. Numerical analysis [3] showed that thenatural frequency is notably affected by scour. In [4]a study of the dynamic behavior for a tripod andmonopile design of a 6 MW turbine is presented.The results of this study are shown in Figure 1. It isshown that the natural frequencies of the supportstructure drops when scour occurs. Continuous
monitoring of the effect of scour on the dynamics ofthe wind turbine will therefore help to make a betterdecision on when to plan maintenance activities onthe scour protection.
Figure 1: Sensitivity of natural frequencies to scour depth [4]
7/23/2019 Paper EWEA 2013 Devriendt Christof v2
http://slidepdf.com/reader/full/paper-ewea-2013-devriendt-christof-v2 2/10
State-of-the-art operational modal analysistechniques can provide accurate estimates ofnatural frequencies and damping ratios ofstructures in operating conditions. However existingtechniques require a lot of human-interaction andas such they cannot easily be applied forcontinuous monitoring purposes. Therefore thedevelopment and validation of tools for the
automatic and continuous identification of theseparameters is fundamental, as the success ofsubsequent analyses depends on the accuracy ofthese identified parameters. Furthermore, it isessential that these routines are sufficiently robustto run on an online basis, in order to provide inalmost real-time parameters that characterize thewind turbine’s condition.
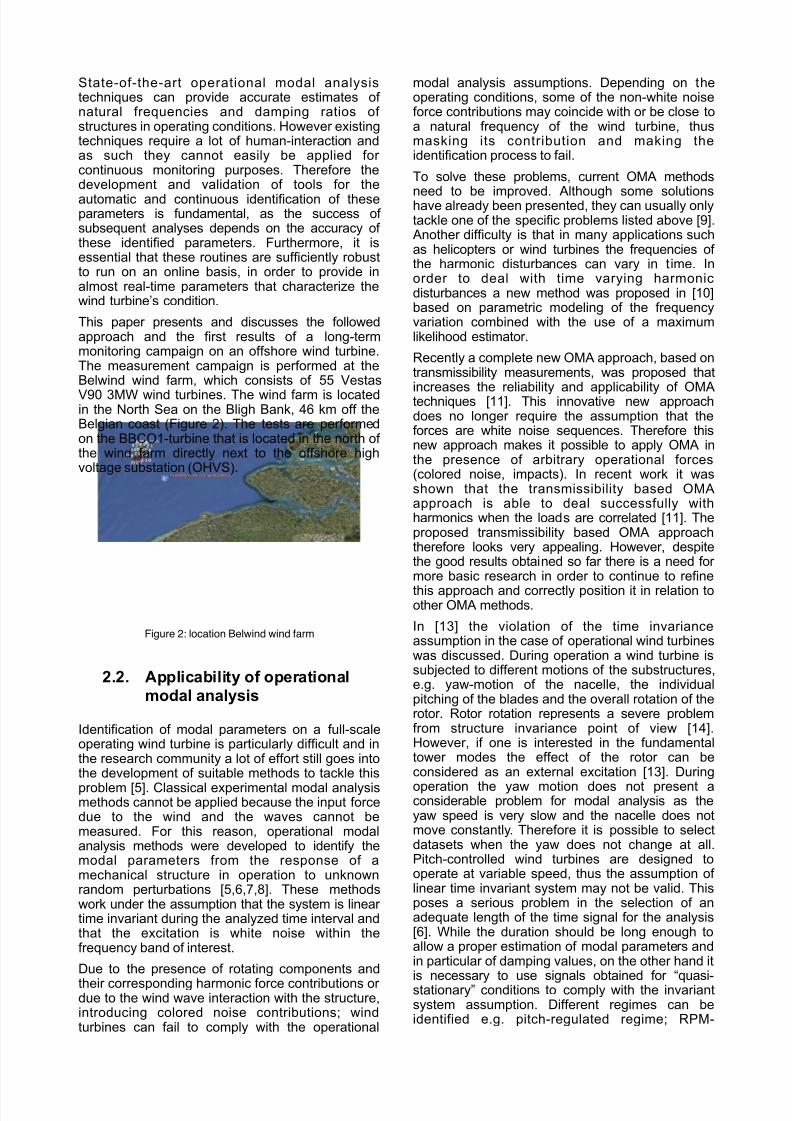
This paper presents and discusses the followedapproach and the first results of a long-termmonitoring campaign on an offshore wind turbine.The measurement campaign is performed at theBelwind wind farm, which consists of 55 Vestas
V90 3MW wind turbines. The wind farm is locatedin the North Sea on the Bligh Bank, 46 km off theBelgian coast (Figure 2). The tests are performedon the BBCO1-turbine that is located in the north ofthe wind farm directly next to the offshore highvoltage substation (OHVS).
Figure 2: location Belwind wind farm
2.2. Applicability of operationalmodal analysis
Identification of modal parameters on a full-scaleoperating wind turbine is particularly difficult and inthe research community a lot of effort still goes intothe development of suitable methods to tackle this
problem [5]. Classical experimental modal analysismethods cannot be applied because the input forcedue to the wind and the waves cannot bemeasured. For this reason, operational modalanalysis methods were developed to identify themodal parameters from the response of amechanical structure in operation to unknownrandom perturbations [5,6,7,8]. These methodswork under the assumption that the system is lineartime invariant during the analyzed time interval andthat the excitation is white noise within thefrequency band of interest.
Due to the presence of rotating components and
their corresponding harmonic force contributions ordue to the wind wave interaction with the structure,introducing colored noise contributions; windturbines can fail to comply with the operational
modal analysis assumptions. Depending on theoperating conditions, some of the non-white noiseforce contributions may coincide with or be close toa natural frequency of the wind turbine, thusmasking its contribution and making theidentification process to fail.
To solve these problems, current OMA methods
need to be improved. Although some solutionshave already been presented, they can usually onlytackle one of the specific problems listed above [9]. Another difficulty is that in many applications suchas helicopters or wind turbines the frequencies ofthe harmonic disturbances can vary in time. Inorder to deal with time varying harmonicdisturbances a new method was proposed in [10]based on parametric modeling of the frequencyvariation combined with the use of a maximumlikelihood estimator.
Recently a complete new OMA approach, based ontransmissibility measurements, was proposed that
increases the reliability and applicability of OMAtechniques [11]. This innovative new approachdoes no longer require the assumption that theforces are white noise sequences. Therefore thisnew approach makes it possible to apply OMA inthe presence of arbitrary operational forces(colored noise, impacts). In recent work it wasshown that the transmissibility based OMAapproach is able to deal successfully withharmonics when the loads are correlated [11]. Theproposed transmissibility based OMA approachtherefore looks very appealing. However, despitethe good results obtained so far there is a need formore basic research in order to continue to refine
this approach and correctly position it in relation toother OMA methods.
In [13] the violation of the time invarianceassumption in the case of operational wind turbineswas discussed. During operation a wind turbine issubjected to different motions of the substructures,e.g. yaw-motion of the nacelle, the individualpitching of the blades and the overall rotation of therotor. Rotor rotation represents a severe problemfrom structure invariance point of view [14].However, if one is interested in the fundamentaltower modes the effect of the rotor can beconsidered as an external excitation [13]. During
operation the yaw motion does not present aconsiderable problem for modal analysis as theyaw speed is very slow and the nacelle does notmove constantly. Therefore it is possible to selectdatasets when the yaw does not change at all.Pitch-controlled wind turbines are designed tooperate at variable speed, thus the assumption oflinear time invariant system may not be valid. Thisposes a serious problem in the selection of anadequate length of the time signal for the analysis[6]. While the duration should be long enough toallow a proper estimation of modal parameters andin particular of damping values, on the other hand it
is necessary to use signals obtained for “quasi-stationary” conditions to comply with the invariantsystem assumption. Different regimes can beidentified e.g. pitch-regulated regime; RPM-
7/23/2019 Paper EWEA 2013 Devriendt Christof v2
http://slidepdf.com/reader/full/paper-ewea-2013-devriendt-christof-v2 3/10
regulated regime and parked conditions. Obviouslyin parked conditions the system is time invariantand OMA assumptions are fulfilled. Also in theRPM-regulated regime OMA is possible as thepitch is set to minimum and does not change a lot.
3. Offshore Measurements
Within the OWI-project (www.owi-lab.be) twomeasurement campaigns have been performed.The first short measurement campaign focussed onperforming an overspeed test with the aim ofobtaining a first estimate of the damping value ofthe fundamental for-aft vibration mode of the windturbine. The results of this measurement campaignhave been presented by the authors at EWEA 2012[27]. During the second long term measurementcampaign we are continuously monitoring thevibration levels and the evolution of the frequenciesand damping of the fundamental modes of the
tower and foundation.
3.1. The wind turbine
The tested wind turbine is a Vestas V90 placed ona monopile foundation structure with a diameter of5m and a wall-thickness of 7cm. The hub-height ofthe wind turbine is on average 72m above sea-level. The transition piece is 25m high. Theinterface level between the transition piece and thewind turbine tower is at 17m above sea level. Theactual water depth at the location of BBCO1 is22.9m and the monopile has a penetration depth of
20.6m. The soil is considered stiff and mainlyconsists of sand. A picture illustrating thefoundation geometry and the wind turbine is shownin Figure 3.
Figure 3: Schematic picture instrumented wind turbine (left)
3.2. The monitoring system
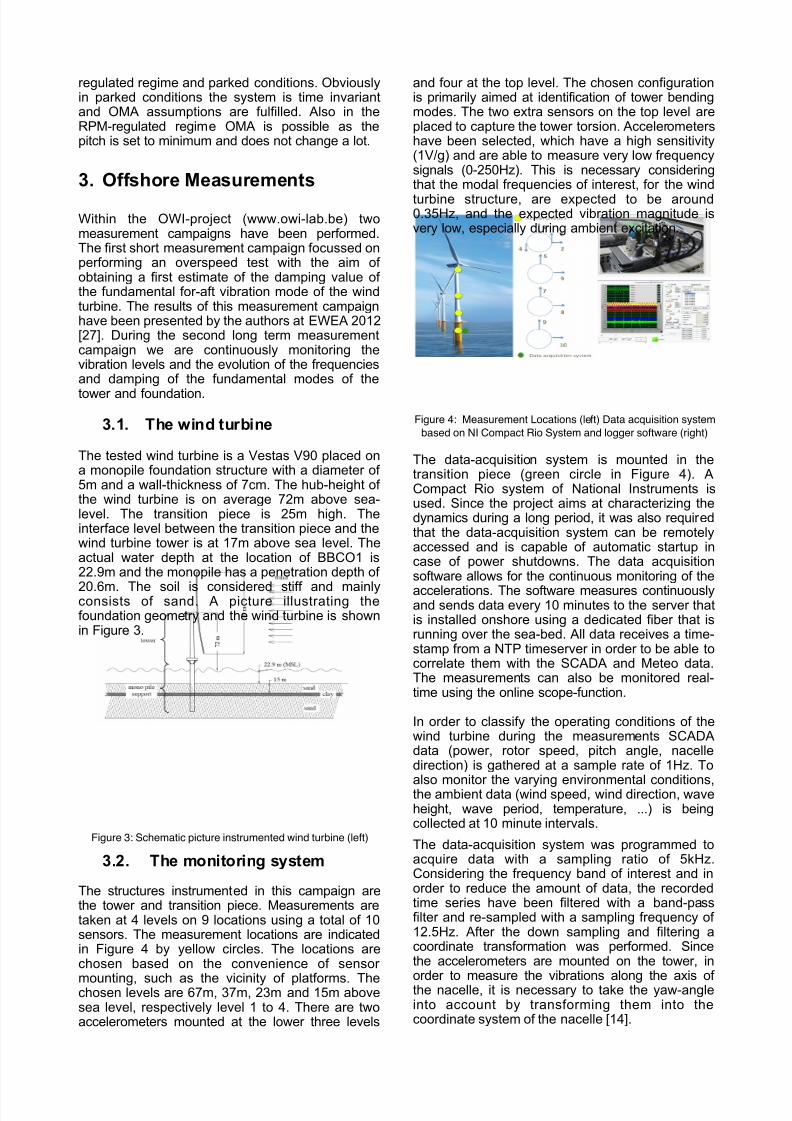
The structures instrumented in this campaign arethe tower and transition piece. Measurements aretaken at 4 levels on 9 locations using a total of 10sensors. The measurement locations are indicatedin Figure 4 by yellow circles. The locations arechosen based on the convenience of sensor
mounting, such as the vicinity of platforms. Thechosen levels are 67m, 37m, 23m and 15m abovesea level, respectively level 1 to 4. There are twoaccelerometers mounted at the lower three levels
and four at the top level. The chosen configurationis primarily aimed at identification of tower bendingmodes. The two extra sensors on the top level areplaced to capture the tower torsion. Accelerometershave been selected, which have a high sensitivity(1V/g) and are able to measure very low frequencysignals (0-250Hz). This is necessary consideringthat the modal frequencies of interest, for the wind
turbine structure, are expected to be around0.35Hz, and the expected vibration magnitude isvery low, especially during ambient excitation.
Figure 4: Measurement Locations (left) Data acquisition system
based on NI Compact Rio System and logger software (right)
The data-acquisition system is mounted in thetransition piece (green circle in Figure 4). ACompact Rio system of National Instruments isused. Since the project aims at characterizing thedynamics during a long period, it was also requiredthat the data-acquisition system can be remotelyaccessed and is capable of automatic startup incase of power shutdowns. The data acquisitionsoftware allows for the continuous monitoring of the
accelerations. The software measures continuouslyand sends data every 10 minutes to the server thatis installed onshore using a dedicated fiber that isrunning over the sea-bed. All data receives a time-stamp from a NTP timeserver in order to be able tocorrelate them with the SCADA and Meteo data.The measurements can also be monitored real-time using the online scope-function.
In order to classify the operating conditions of thewind turbine during the measurements SCADAdata (power, rotor speed, pitch angle, nacelledirection) is gathered at a sample rate of 1Hz. To
also monitor the varying environmental conditions,the ambient data (wind speed, wind direction, waveheight, wave period, temperature, ...) is beingcollected at 10 minute intervals.
The data-acquisition system was programmed toacquire data with a sampling ratio of 5kHz.Considering the frequency band of interest and inorder to reduce the amount of data, the recordedtime series have been filtered with a band-passfilter and re-sampled with a sampling frequency of12.5Hz. After the down sampling and filtering acoordinate transformation was performed. Sincethe accelerometers are mounted on the tower, in
order to measure the vibrations along the axis ofthe nacelle, it is necessary to take the yaw-angleinto account by transforming them into thecoordinate system of the nacelle [14].
7/23/2019 Paper EWEA 2013 Devriendt Christof v2
http://slidepdf.com/reader/full/paper-ewea-2013-devriendt-christof-v2 4/10
4. Continuous DynamicMonitoring
During the long-term measurement campaign ouraim is to continuously monitor the vibration levelsand the evolution of the frequencies and dampingvalues of some of the fundamental modes of the
tower and foundation.
In order to perform continuous dynamic monitoringthe following steps have been followed:
- Creation of a database with the originalvibration data sampled at a high frequency,the ambient data and the SCADA data withcorresponding time-stamps.
- Pre-processing the vibration-data toeliminate the offset, reduce the samplingfrequency and to transform them into thenacelle coordinate system
- Calculate statistical vibration parameterse.g. min, max, standard deviations andrms-values
- Estimation of modal parameters in anautomated way: resonant frequencies,damping values, mode shapes
- Creation of a database with processedresults
- Reporting by displaying the results
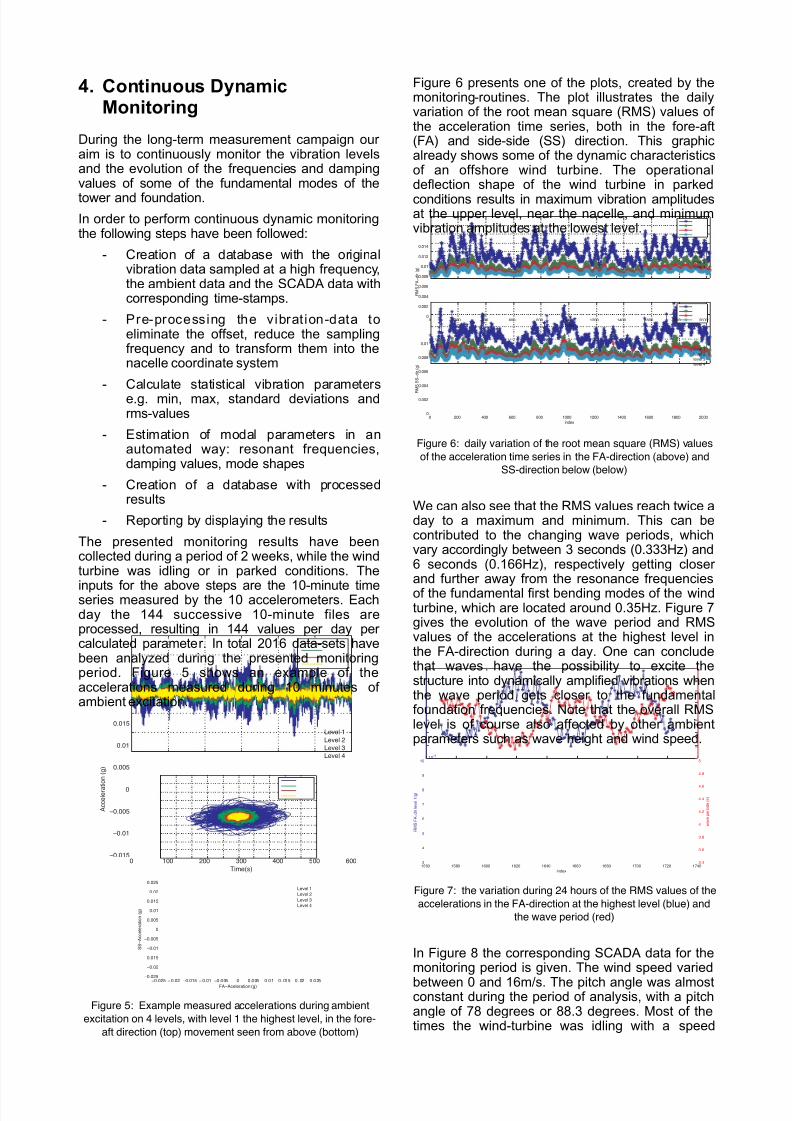
The presented monitoring results have beencollected during a period of 2 weeks, while the windturbine was idling or in parked conditions. The
inputs for the above steps are the 10-minute timeseries measured by the 10 accelerometers. Eachday the 144 successive 10-minute files areprocessed, resulting in 144 values per day percalculated parameter. In total 2016 data-sets havebeen analyzed during the presented monitoringperiod. Figure 5 shows an example of theaccelerations measured during 10 minutes ofambient excitation.
! "!! #!! $!! %!! &!! '!!−!(!"&
−!(!"
−!(!!&
!
!(!!&
!(!"
!(!"&
)*+,-./
0 1 1 , 2 , 3 4 5 * 6 7 - 9 /
:,;,2 "
:,;,2 #
:,;,2 $
:,;,2 %
−
!"!#$ −
!"!# −
!"!%$ −
!"!% −
! "!!$ ! ! "!!$ ! "!% ! "!%$ ! "!# ! "!#$
−!"!#$
−!"!#
−!"!%$
−!"!%
−!"!!$
!
!"!!$
!"!%
!"!%$
!"!#
!"!#$
&'−'()*)+,-./0 234
5 5 −
' ( ( ) * ) + , - . / 0
2 3 4
6)7)* %
6)7)* #
6)7)* 8
6)7)* 9
Figure 5: Example measured accelerations during ambient
excitation on 4 levels, with level 1 the highest level, in the fore-
aft direction (top) movement seen from above (bottom)
Figure 6 presents one of the plots, created by themonitoring-routines. The plot illustrates the dailyvariation of the root mean square (RMS) values ofthe acceleration time series, both in the fore-aft(FA) and side-side (SS) direction. This graphicalready shows some of the dynamic characteristicsof an offshore wind turbine. The operationaldeflection shape of the wind turbine in parked
conditions results in maximum vibration amplitudesat the upper level, near the nacelle, and minimumvibration amplitudes at the lowest level.
! "!! #!! $!! %!! &!!! &"!! &#!! &$!! &%!! "!!!!
!'!!"
!'!!#
!'!!$
!'!!%
!'!&
!'!&"
!'!&#
( ) * , - −
. / 0 1 2 3
/4.56
! "!! #!! $!! %!! &!!! &"!! &#!! &$!! &%!! "!!!!
!'!!"
!'!!#
!'!!$
!'!!%
!'!&
(
) * * * −
. / 0 1 2 3
/4.56
75857 &
75857 "
75857 9
75857 #
75857 &
75857 "
75857 9
75857 #
Figure 6: daily variation of the root mean square (RMS) values
of the acceleration time series in the FA-direction (above) and
SS-direction below (below)
We can also see that the RMS values reach twice aday to a maximum and minimum. This can becontributed to the changing wave periods, whichvary accordingly between 3 seconds (0.333Hz) and6 seconds (0.166Hz), respectively getting closerand further away from the resonance frequencies
of the fundamental first bending modes of the windturbine, which are located around 0.35Hz. Figure 7gives the evolution of the wave period and RMSvalues of the accelerations at the highest level inthe FA-direction during a day. One can concludethat waves have the possibility to excite thestructure into dynamically amplified vibrations whenthe wave period gets closer to the fundamentalfoundation frequencies. Note that the overall RMSlevel is of course also affected by other ambientparameters such as wave height and wind speed.
!"#$ !"%$ !#$$ !#&$ !#'$ !##$ !#%$ !($$ !(&$ !('$)
'
"
#
(
%
*
!$+ !$
−)
-./0+
1 2 3 4 5 −
/ - 6 7 0 8 0 7 ! 9 : ;
< = 8 0 > 0 6 - ? / 0 9 @ ;
)A'
)A#
)A%
'
'A&
'A'
'A#
'A%
"
Figure 7: the variation during 24 hours of the RMS values of the
accelerations in the FA-direction at the highest level (blue) and
the wave period (red)
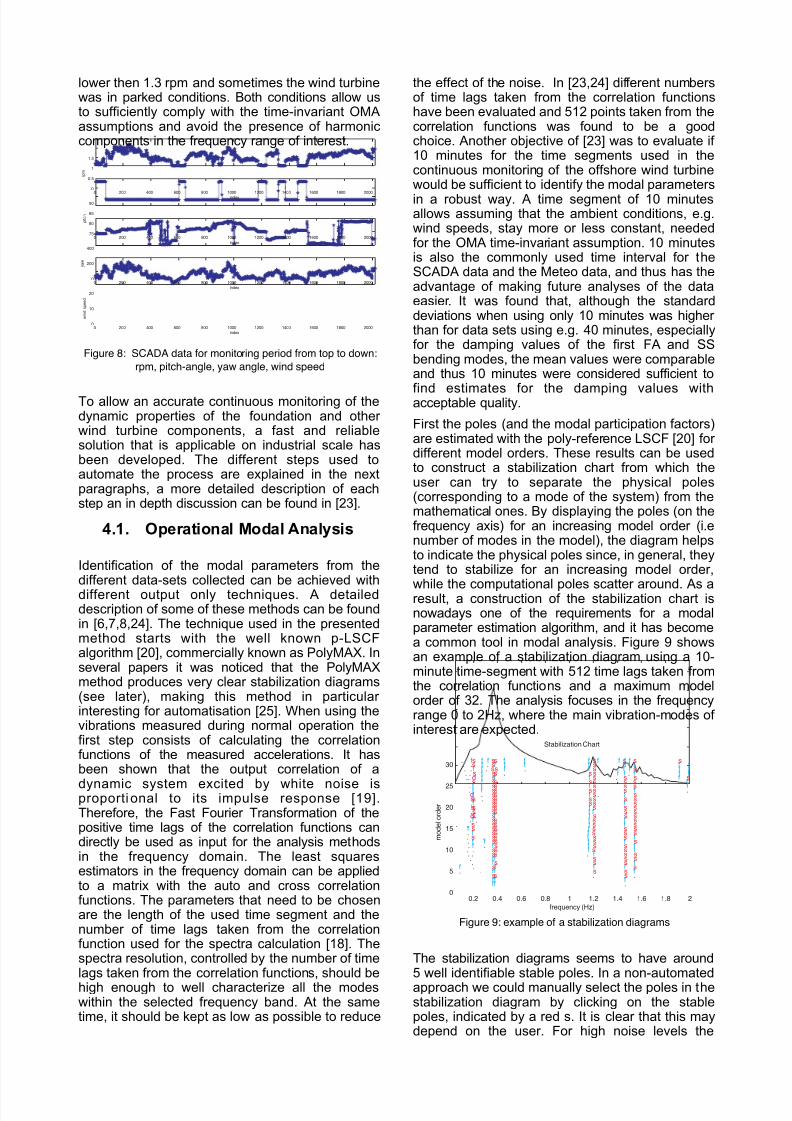
In Figure 8 the corresponding SCADA data for themonitoring period is given. The wind speed varied
between 0 and 16m/s. The pitch angle was almostconstant during the period of analysis, with a pitchangle of 78 degrees or 88.3 degrees. Most of thetimes the wind-turbine was idling with a speed
7/23/2019 Paper EWEA 2013 Devriendt Christof v2
http://slidepdf.com/reader/full/paper-ewea-2013-devriendt-christof-v2 5/10
lower then 1.3 rpm and sometimes the wind turbinewas in parked conditions. Both conditions allow usto sufficiently comply with the time-invariant OMAassumptions and avoid the presence of harmoniccomponents in the frequency range of interest.
0 200 400 600 800 1000 1200 1400 1600 1800 20000
0.5
1
1.5
r p m
index
0 200 400 600 800 1000 1200 1400 1600 1800 200075
80
85
90
p i t c h
index
0 200 400 600 800 1000 1200 1400 1600 1800 20000
200
400
y a w
index
0 200 400 600 800 1000 1200 1400 1600 1800 20000
10
20
w i n d s p e e d
index
Figure 8: SCADA data for monitoring period from top to down:
rpm, pitch-angle, yaw angle, wind speed
To allow an accurate continuous monitoring of thedynamic properties of the foundation and otherwind turbine components, a fast and reliablesolution that is applicable on industrial scale hasbeen developed. The different steps used toautomate the process are explained in the nextparagraphs, a more detailed description of eachstep an in depth discussion can be found in [23].
4.1. Operational Modal Analysis
Identification of the modal parameters from thedifferent data-sets collected can be achieved withdifferent output only techniques. A detaileddescription of some of these methods can be foundin [6,7,8,24]. The technique used in the presentedmethod starts with the well known p-LSCFalgorithm [20], commercially known as PolyMAX. Inseveral papers it was noticed that the PolyMAXmethod produces very clear stabilization diagrams(see later), making this method in particularinteresting for automatisation [25]. When using thevibrations measured during normal operation thefirst step consists of calculating the correlationfunctions of the measured accelerations. It hasbeen shown that the output correlation of a
dynamic system excited by white noise isproporti onal to its impulse response [19].Therefore, the Fast Fourier Transformation of thepositive time lags of the correlation functions candirectly be used as input for the analysis methodsin the frequency domain. The least squaresestimators in the frequency domain can be appliedto a matrix with the auto and cross correlationfunctions. The parameters that need to be chosenare the length of the used time segment and thenumber of time lags taken from the correlationfunction used for the spectra calculation [18]. Thespectra resolution, controlled by the number of timelags taken from the correlation functions, should behigh enough to well characterize all the modeswithin the selected frequency band. At the sametime, it should be kept as low as possible to reduce
the effect of the noise. In [23,24] different numbersof time lags taken from the correlation functionshave been evaluated and 512 points taken from thecorrelation functions was found to be a goodchoice. Another objective of [23] was to evaluate if10 minutes for the time segments used in thecontinuous monitoring of the offshore wind turbinewould be sufficient to identify the modal parameters
in a robust way. A time segment of 10 minutesallows assuming that the ambient conditions, e.g.wind speeds, stay more or less constant, neededfor the OMA time-invariant assumption. 10 minutesis also the commonly used time interval for theSCADA data and the Meteo data, and thus has theadvantage of making future analyses of the dataeasier. It was found that, although the standarddeviations when using only 10 minutes was higherthan for data sets using e.g. 40 minutes, especiallyfor the damping values of the first FA and SSbending modes, the mean values were comparableand thus 10 minutes were considered sufficient to
find estimates for the damping values withacceptable quality.
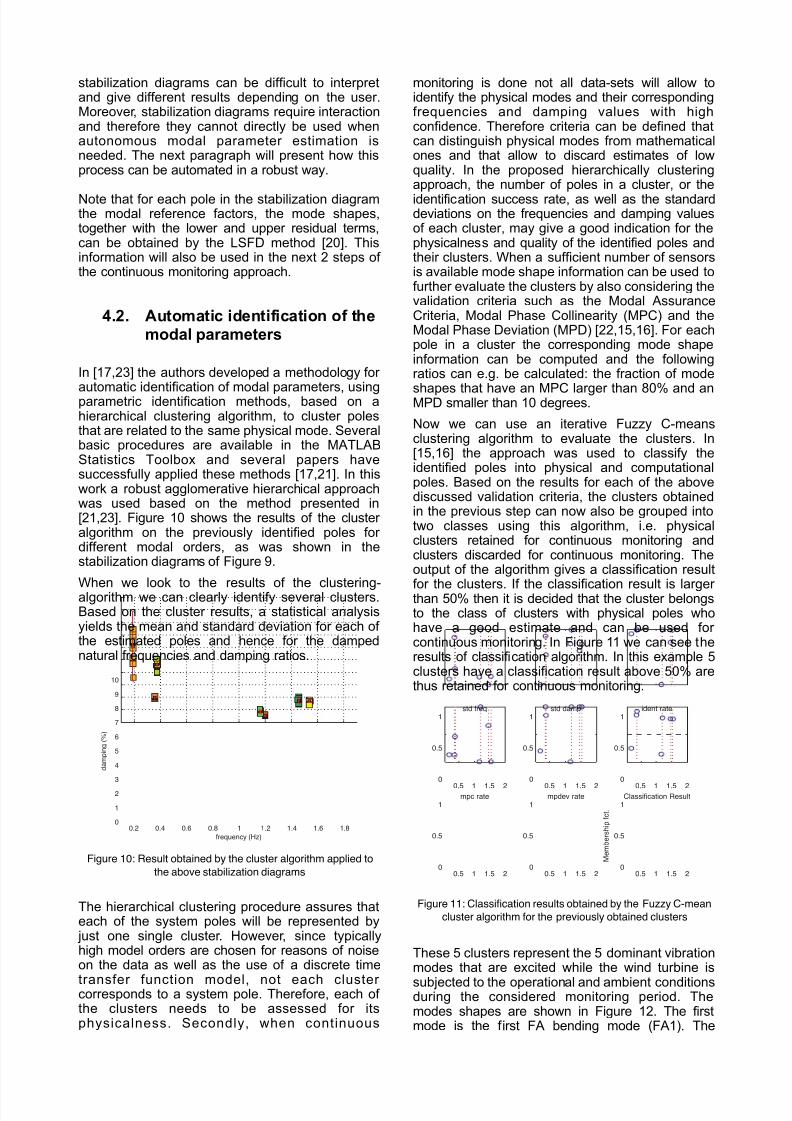
First the poles (and the modal participation factors)are estimated with the poly-reference LSCF [20] fordifferent model orders. These results can be usedto construct a stabilization chart from which theuser can try to separate the physical poles(corresponding to a mode of the system) from themathematical ones. By displaying the poles (on thefrequency axis) for an increasing model order (i.enumber of modes in the model), the diagram helpsto indicate the physical poles since, in general, theytend to stabilize for an increasing model order,
while the computational poles scatter around. As aresult, a construction of the stabilization chart isnowadays one of the requirements for a modalparameter estimation algorithm, and it has becomea common tool in modal analysis. Figure 9 showsan example of a stabilization diagram using a 10-minute time-segment with 512 time lags taken fromthe correlation functions and a maximum modelorder of 32. The analysis focuses in the frequencyrange 0 to 2Hz, where the main vibration-modes ofinterest are expected.
0.2 0.4 0.6 0.8 1 1.2 1.4 1.6 1.8 20
5
10
15
20
25
30
.ff fff
. .sss s fs. . ff f sff . sf s fs. fs
sss. ff . f ss. . ss f s fs. . ss
fssf. f . fs sfsf. f f ss
f s fs. s . ss ssf s. f ss ssf sf s ss sff s. . s ss
f s sf. f . ss sssfds. sf ssf f.s. ss
f s ssss. ss sfss.f ss
ss . ss ss ss sf.sfdf . ss
.fsss. f f ss fsssf. f f ss f.ss .ss. s f ss sfss.sf.. d f sf ffff .fss. . s .f ss ffsf fsf.. .f ff . ss ffffff..sff. .s ff . sf
ssfsfffsff. fs ff f ss
Stabilization Chart
frequency (Hz)
m o d e l o r d e r
Figure 9: example of a stabilization diagrams
The stabilization diagrams seems to have around5 well identifiable stable poles. In a non-automatedapproach we could manually select the poles in thestabilization diagram by clicking on the stablepoles, indicated by a red s. It is clear that this maydepend on the user. For high noise levels the
7/23/2019 Paper EWEA 2013 Devriendt Christof v2
http://slidepdf.com/reader/full/paper-ewea-2013-devriendt-christof-v2 6/10
stabilization diagrams can be difficult to interpretand give different results depending on the user.Moreover, stabilization diagrams require interactionand therefore they cannot directly be used whenautonomous modal parameter estimation isneeded. The next paragraph will present how thisprocess can be automated in a robust way.
Note that for each pole in the stabilization diagramthe modal reference factors, the mode shapes,together with the lower and upper residual terms,can be obtained by the LSFD method [20]. Thisinformation will also be used in the next 2 steps ofthe continuous monitoring approach.
4.2. Automatic identification of themodal parameters
In [17,23] the authors developed a methodology for
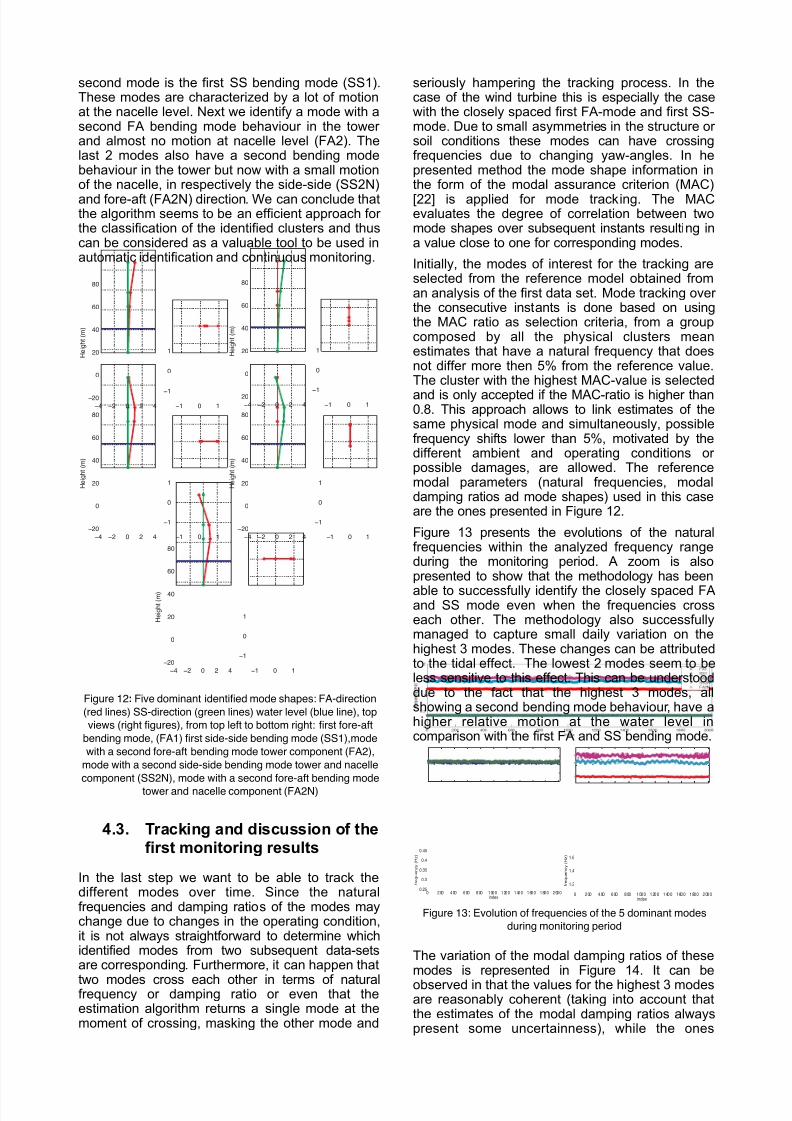
automatic identification of modal parameters, usingparametric identification methods, based on ahierarchical clustering algorithm, to cluster polesthat are related to the same physical mode. Severalbasic procedures are available in the MATLABStatistics Toolbox and several papers havesuccessfully applied these methods [17,21]. In thiswork a robust agglomerative hierarchical approachwas used based on the method presented in[21,23]. Figure 10 shows the results of the clusteralgorithm on the previously identified poles fordifferent modal orders, as was shown in thestabilization diagrams of Figure 9.
When we look to the results of the clustering-algorithm we can clearly identify several clusters.Based on the cluster results, a statistical analysisyields the mean and standard deviation for each ofthe estimated poles and hence for the dampednatural frequencies and damping ratios.
0.2 0.4 0.6 0.8 1 1.2 1.4 1.6 1.80
1
2
3
4
5
6
7
8
9
10
d a m p i n g ( % )
frequency (Hz)
Figure 10: Result obtained by the cluster algorithm applied to
the above stabilization diagrams
The hierarchical clustering procedure assures thateach of the system poles will be represented by just one single cluster. However, since typicallyhigh model orders are chosen for reasons of noiseon the data as well as the use of a discrete time
transfer function model, not each clustercorresponds to a system pole. Therefore, each ofthe clusters needs to be assessed for itsphysicalness. Secondly, when continuous
monitoring is done not all data-sets will allow toidentify the physical modes and their correspondingfrequencies and damping values with highconfidence. Therefore criteria can be defined thatcan distinguish physical modes from mathematicalones and that allow to discard estimates of lowquality. In the proposed hierarchically clusteringapproach, the number of poles in a cluster, or the
identification success rate, as well as the standarddeviations on the frequencies and damping valuesof each cluster, may give a good indication for thephysicalness and quality of the identified poles andtheir clusters. When a sufficient number of sensorsis available mode shape information can be used tofurther evaluate the clusters by also considering thevalidation criteria such as the Modal AssuranceCriteria, Modal Phase Collinearity (MPC) and theModal Phase Deviation (MPD) [22,15,16]. For eachpole in a cluster the corresponding mode shapeinformation can be computed and the followingratios can e.g. be calculated: the fraction of mode
shapes that have an MPC larger than 80% and anMPD smaller than 10 degrees.
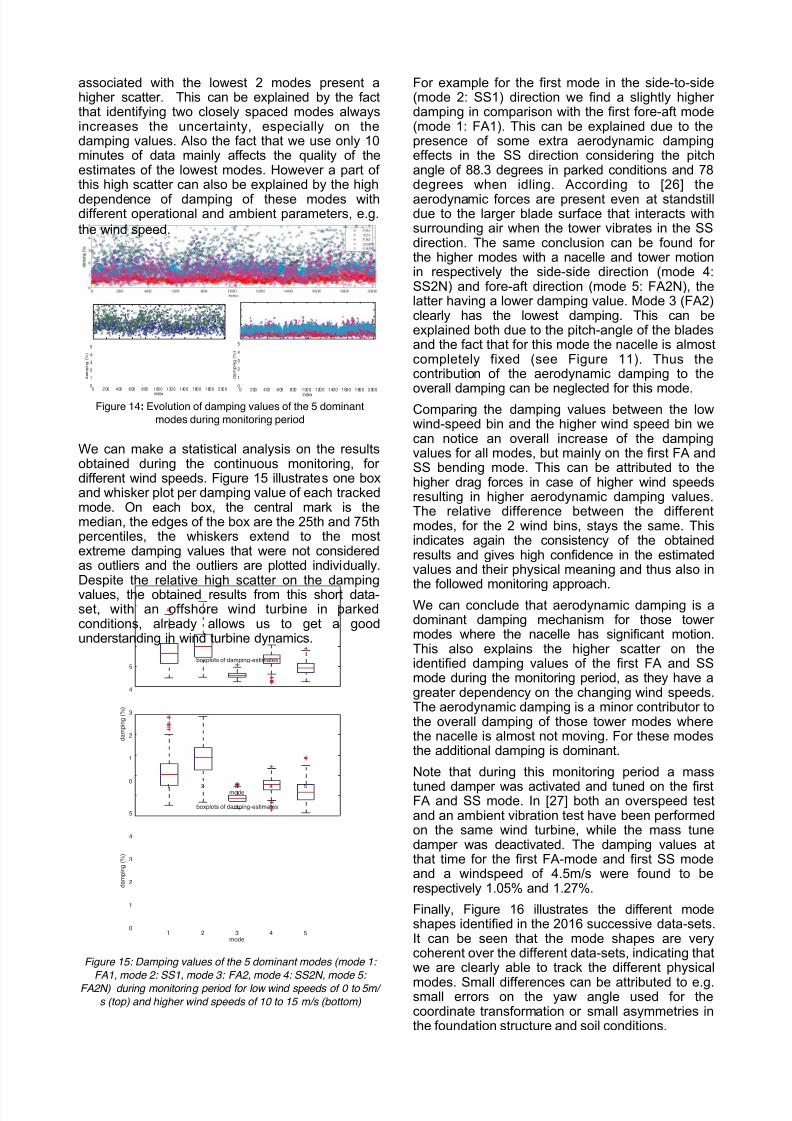
Now we can use an iterative Fuzzy C-meansclustering algorithm to evaluate the clusters. In[15,16] the approach was used to classify theidentified poles into physical and computationalpoles. Based on the results for each of the abovediscussed validation criteria, the clusters obtainedin the previous step can now also be grouped intotwo classes using this algorithm, i.e. physicalclusters retained for continuous monitoring andclusters discarded for continuous monitoring. Theoutput of the algorithm gives a classification result
for the clusters. If the classification result is largerthan 50% then it is decided that the cluster belongsto the class of clusters with physical poles whohave a good estimate and can be used forcontinuous monitoring. In Figure 11 we can see theresults of classification algorithm. In this example 5clusters have a classification result above 50% arethus retained for continuous monitoring.
0.5 1 1.5 2
0
0.5
1std freq
0.5 1 1.5 2
0
0.5
1std damp
0.5 1 1.5 2
0
0.5
1ident rate
0.5 1 1.5 20
0.5
1mpc rate
0.5 1 1.5 20
0.5
1mpdev rate
0.5 1 1.5 20
0.5
1
M e m b e r s h i p f c t .
Classification Result
Figure 11: Classification results obtained by the Fuzzy C-mean
cluster algorithm for the previously obtained clusters
These 5 clusters represent the 5 dominant vibrationmodes that are excited while the wind turbine is
subjected to the operational and ambient conditionsduring the considered monitoring period. Themodes shapes are shown in Figure 12. The firstmode is the first FA bending mode (FA1). The
7/23/2019 Paper EWEA 2013 Devriendt Christof v2
http://slidepdf.com/reader/full/paper-ewea-2013-devriendt-christof-v2 7/10
second mode is the first SS bending mode (SS1).These modes are characterized by a lot of motionat the nacelle level. Next we identify a mode with asecond FA bending mode behaviour in the towerand almost no motion at nacelle level (FA2). Thelast 2 modes also have a second bending modebehaviour in the tower but now with a small motionof the nacelle, in respectively the side-side (SS2N)
and fore-aft (FA2N) direction. We can conclude thatthe algorithm seems to be an efficient approach forthe classification of the identified clusters and thuscan be considered as a valuable tool to be used inautomatic identification and continuous monitoring.
−! −" # " !
−"#
#
"#
!#
$#
%#
& ' ( ) * + - . /
−0 # 0
−0
#
0
−! −" # " !
−"#
#
"#
!#
$#
%#
& ' ( ) * + - . /
−0 # 0
−0
#
0
−! −" # " !
−"#
#
"#
!#
$#
%#
& ' ( ) * + - . /
−0 # 0
−0
#
0
−! −" # " !
−"#
#
"#
!#
$#
%#
& ' ( ) * + - . /
−0 # 0
−0
#
0
−! −" # " !
−"#
#
"#
!#
$#
%#
& ' ( ) * + - . /
−0 # 0
−0
#
0
Figure 12: Five dominant identified mode shapes: FA-direction
(red lines) SS-direction (green lines) water level (blue line), top
views (right figures), from top left to bottom right: first fore-aft
bending mode, (FA1) first side-side bending mode (SS1),mode
with a second fore-aft bending mode tower component (FA2),
mode with a second side-side bending mode tower and nacelle
component (SS2N), mode with a second fore-aft bending mode
tower and nacelle component (FA2N)
4.3. Tracking and discussion of thefirst monitoring results
In the last step we want to be able to track thedifferent modes over time. Since the naturalfrequencies and damping ratios of the modes maychange due to changes in the operating condition,it is not always straightforward to determine whichidentified modes from two subsequent data-setsare corresponding. Furthermore, it can happen that
two modes cross each other in terms of naturalfrequency or damping ratio or even that theestimation algorithm returns a single mode at themoment of crossing, masking the other mode and
seriously hampering the tracking process. In thecase of the wind turbine this is especially the casewith the closely spaced first FA-mode and first SS-mode. Due to small asymmetries in the structure orsoil conditions these modes can have crossingfrequencies due to changing yaw-angles. In hepresented method the mode shape information inthe form of the modal assurance criterion (MAC)
[22] is applied for mode tracking. The MACevaluates the degree of correlation between twomode shapes over subsequent instants resulting ina value close to one for corresponding modes.
Initially, the modes of interest for the tracking areselected from the reference model obtained froman analysis of the first data set. Mode tracking overthe consecutive instants is done based on usingthe MAC ratio as selection criteria, from a groupcomposed by all the physical clusters meanestimates that have a natural frequency that doesnot differ more then 5% from the reference value.The cluster with the highest MAC-value is selected
and is only accepted if the MAC-ratio is higher than0.8. This approach allows to link estimates of thesame physical mode and simultaneously, possiblefrequency shifts lower than 5%, motivated by thedifferent ambient and operating conditions orpossible damages, are allowed. The referencemodal parameters (natural frequencies, modaldamping ratios ad mode shapes) used in this caseare the ones presented in Figure 12.
Figure 13 presents the evolutions of the naturalfrequencies within the analyzed frequency rangeduring the monitoring period. A zoom is alsopresented to show that the methodology has been
able to successfully identify the closely spaced FAand SS mode even when the frequencies crosseach other. The methodology also successfullymanaged to capture small daily variation on thehighest 3 modes. These changes can be attributedto the tidal effect. The lowest 2 modes seem to beless sensitive to this effect. This can be understooddue to the fact that the highest 3 modes, allshowing a second bending mode behaviour, have ahigher relative motion at the water level incomparison with the first FA and SS bending mode.
0 2 00 4 00 6 00 8 00 1 00 0 1 20 0 1 40 0 1 60 0 1 80 0 2 00 00.25
0.3
0.35
0.4
0.45
f r e q u e n c y ( H z )
index
0 200 400 600 800 1000 1200 1400 1600 1800 2000
1.2
1.4
1.6
f r e q u e n c y ( H z )
index
Figure 13: Evolution of frequencies of the 5 dominant modes
during monitoring period
The variation of the modal damping ratios of thesemodes is represented in Figure 14. It can be
observed in that the values for the highest 3 modesare reasonably coherent (taking into account thatthe estimates of the modal damping ratios alwayspresent some uncertainness), while the ones
7/23/2019 Paper EWEA 2013 Devriendt Christof v2
http://slidepdf.com/reader/full/paper-ewea-2013-devriendt-christof-v2 8/10
associated with the lowest 2 modes present ahigher scatter. This can be explained by the factthat identifying two closely spaced modes alwaysincreases the uncertainty, especially on thedamping values. Also the fact that we use only 10minutes of data mainly affects the quality of theestimates of the lowest modes. However a part ofthis high scatter can also be explained by the high
dependence of damping of these modes withdifferent operational and ambient parameters, e.g.
the wind speed.
0 2 00 4 00 6 00 8 00 1 00 0 1 20 0 1 40 0 1 60 0 1 80 0 2 00 00
1
2
3
4
5
d a m p i n g ( % )
index
0 200 400 600 800 1000 1200 1400 1600 1800 2000
0
1
2
3
4
5
d a m p i n g ( % )
index
Figure 14: Evolution of damping values of the 5 dominant
modes during monitoring period
We can make a statistical analysis on the resultsobtained during the continuous monitoring, fordifferent wind speeds. Figure 15 illustrates one boxand whisker plot per damping value of each trackedmode. On each box, the central mark is themedian, the edges of the box are the 25th and 75thpercentiles, the whiskers extend to the mostextreme damping values that were not consideredas outliers and the outliers are plotted individually.Despite the relative high scatter on the dampingvalues, the obtained results from this short data-set, with an offshore wind turbine in parkedconditions, already allows us to get a goodunderstanding in wind turbine dynamics.
0
1
2
3
4
5
1 2 3 4 5mode
boxplots of damping-estimates
d a m p i n g ( % )
0
1
2
3
4
5
1 2 3 4 5mode
boxplots of damping-estimates
d a m p i n g ( % )
Figure 15: Damping values of the 5 dominant modes (mode 1:
FA1, mode 2: SS1, mode 3: FA2, mode 4: SS2N, mode 5:
FA2N) during monitoring period for low wind speeds of 0 to 5m/
s (top) and higher wind speeds of 10 to 15 m/s (bottom)
For example for the first mode in the side-to-side(mode 2: SS1) direction we find a slightly higherdamping in comparison with the first fore-aft mode(mode 1: FA1). This can be explained due to thepresence of some extra aerodynamic dampingeffects in the SS direction considering the pitchangle of 88.3 degrees in parked conditions and 78degrees when idling. According to [26] the
aerodynamic forces are present even at standstilldue to the larger blade surface that interacts withsurrounding air when the tower vibrates in the SSdirection. The same conclusion can be found forthe higher modes with a nacelle and tower motionin respectively the side-side direction (mode 4:SS2N) and fore-aft direction (mode 5: FA2N), thelatter having a lower damping value. Mode 3 (FA2)clearly has the lowest damping. This can beexplained both due to the pitch-angle of the bladesand the fact that for this mode the nacelle is almostcompletely fixed (see Figure 11). Thus thecontribution of the aerodynamic damping to the
overall damping can be neglected for this mode.Comparing the damping values between the lowwind-speed bin and the higher wind speed bin wecan notice an overall increase of the dampingvalues for all modes, but mainly on the first FA andSS bending mode. This can be attributed to thehigher drag forces in case of higher wind speedsresulting in higher aerodynamic damping values.The relative difference between the differentmodes, for the 2 wind bins, stays the same. Thisindicates again the consistency of the obtainedresults and gives high confidence in the estimatedvalues and their physical meaning and thus also in
the followed monitoring approach.We can conclude that aerodynamic damping is adominant damping mechanism for those towermodes where the nacelle has significant motion.This also explains the higher scatter on theidentified damping values of the first FA and SSmode during the monitoring period, as they have agreater dependency on the changing wind speeds.The aerodynamic damping is a minor contributor tothe overall damping of those tower modes wherethe nacelle is almost not moving. For these modesthe additional damping is dominant.
Note that during this monitoring period a mass
tuned damper was activated and tuned on the firstFA and SS mode. In [27] both an overspeed testand an ambient vibration test have been performedon the same wind turbine, while the mass tunedamper was deactivated. The damping values atthat time for the first FA-mode and first SS modeand a windspeed of 4.5m/s were found to berespectively 1.05% and 1.27%.
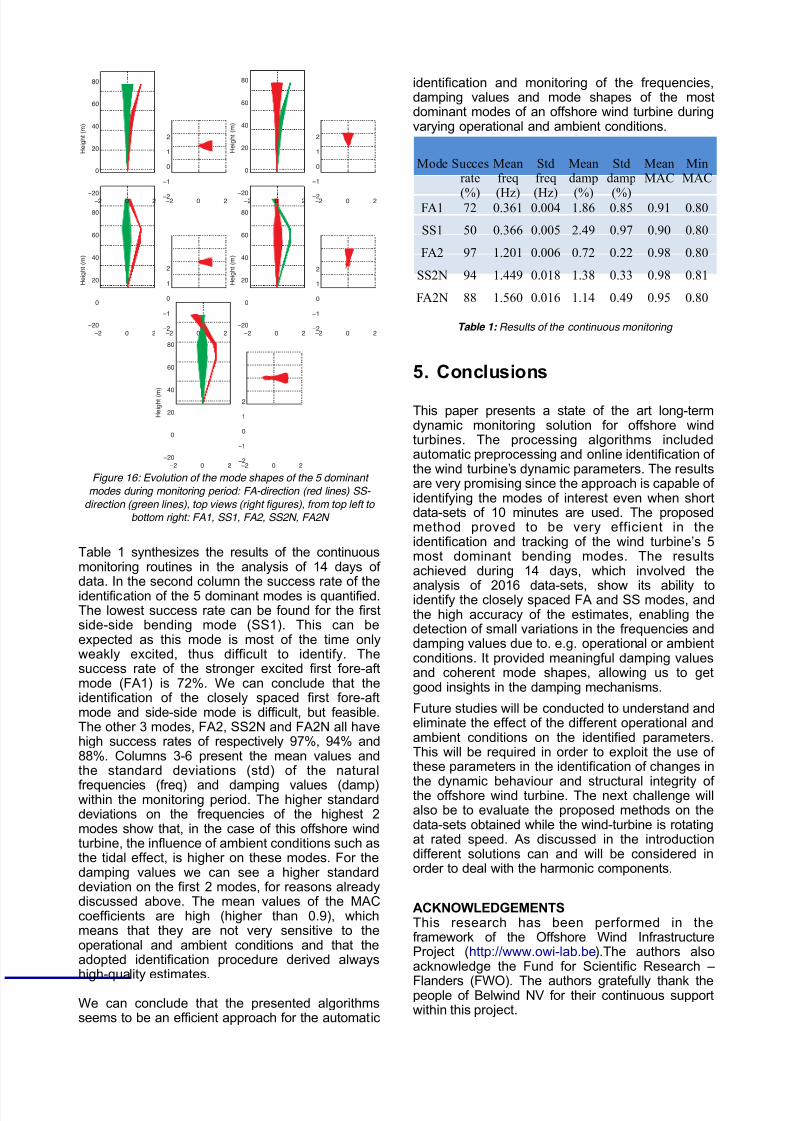
Finally, Figure 16 illustrates the different modeshapes identified in the 2016 successive data-sets.It can be seen that the mode shapes are verycoherent over the different data-sets, indicating thatwe are clearly able to track the different physical
modes. Small differences can be attributed to e.g.small errors on the yaw angle used for thecoordinate transformation or small asymmetries inthe foundation structure and soil conditions.
7/23/2019 Paper EWEA 2013 Devriendt Christof v2
http://slidepdf.com/reader/full/paper-ewea-2013-devriendt-christof-v2 9/10
−! " !
−!"
"
!"
#"
$"
%"
& ' ( ) * + - . /
−! " !−!
−0
"
0
!
−! " !
−!"
"
!"
#"
$"
%"
& ' ( ) * + - . /
−! " !−!
−0
"
0
!
−! " !
−!"
"
!"
#"
$"
%"
& ' ( ) * + - . /
−! " !−!
−0
"
0
!
−! " !
−!"
"
!"
#"
$"
%"
& ' ( ) * + - . /
−! " !−!
−0
"
0
!
−! " !
−!"
"
!"
#"
$"
%"
& ' ( ) * + - .
/
−! " !−!
−0
"
0
!
Figure 16: Evolution of the mode shapes of the 5 dominant
modes during monitoring period: FA-direction (red lines) SS-
direction (green lines), top views (right figures), from top left to
bottom right: FA1, SS1, FA2, SS2N, FA2N
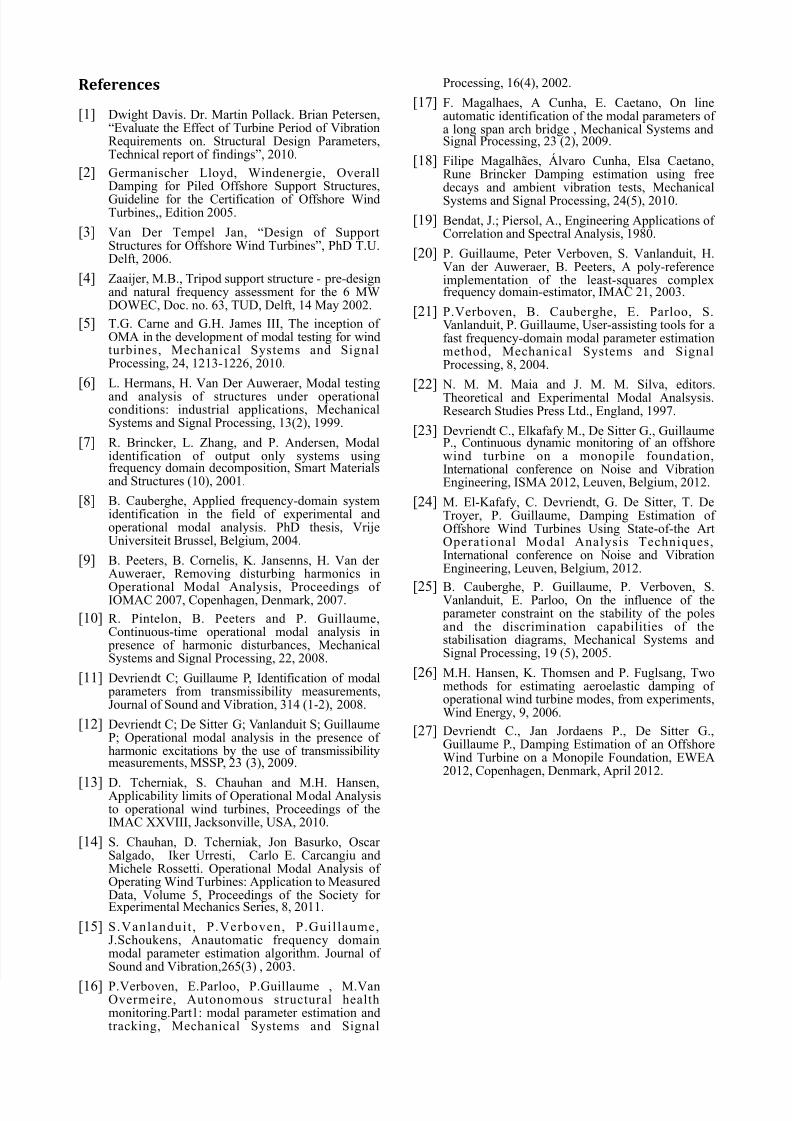
Table 1 synthesizes the results of the continuousmonitoring routines in the analysis of 14 days ofdata. In the second column the success rate of theidentification of the 5 dominant modes is quantified.The lowest success rate can be found for the firstside-side bending mode (SS1). This can beexpected as this mode is most of the time onlyweakly excited, thus difficult to identify. Thesuccess rate of the stronger excited first fore-aftmode (FA1) is 72%. We can conclude that theidentification of the closely spaced first fore-aftmode and side-side mode is difficult, but feasible.The other 3 modes, FA2, SS2N and FA2N all havehigh success rates of respectively 97%, 94% and88%. Columns 3-6 present the mean values andthe standard deviations (std) of the natural
frequencies (freq) and damping values (damp)within the monitoring period. The higher standarddeviations on the frequencies of the highest 2modes show that, in the case of this offshore windturbine, the influence of ambient conditions such asthe tidal effect, is higher on these modes. For thedamping values we can see a higher standarddeviation on the first 2 modes, for reasons alreadydiscussed above. The mean values of the MACcoefficients are high (higher than 0.9), whichmeans that they are not very sensitive to theoperational and ambient conditions and that theadopted identification procedure derived alwayshigh-quality estimates.
We can conclude that the presented algorithmsseems to be an efficient approach for the automatic
identification and monitoring of the frequencies,damping values and mode shapes of the mostdominant modes of an offshore wind turbine duringvarying operational and ambient conditions.
Mode Succesrate
(%)
Meanfreq
(Hz)
Stdfreq
(Hz)
Meandamp
(%)
Stddamp
(%)
MeanMAC
MinMAC
FA1 72 0.361 0.004 1.86 0.85 0.91 0.80
SS1 50 0.366 0.005 2.49 0.97 0.90 0.80
FA2 97 1.201 0.006 0.72 0.22 0.98 0.80
SS2N 94 1.449 0.018 1.38 0.33 0.98 0.81
FA2N 88 1.560 0.016 1.14 0.49 0.95 0.80
Table 1: Results of the continuous monitoring
5. Conclusions
This paper presents a state of the art long-termdynamic monitoring solution for offshore windturbines. The processing algorithms includedautomatic preprocessing and online identification ofthe wind turbine’s dynamic parameters. The resultsare very promising since the approach is capable ofidentifying the modes of interest even when shortdata-sets of 10 minutes are used. The proposedmethod proved to be very efficient in theidentification and tracking of the wind turbine’s 5most dominant bending modes. The resultsachieved during 14 days, which involved the
analysis of 2016 data-sets, show its ability toidentify the closely spaced FA and SS modes, andthe high accuracy of the estimates, enabling thedetection of small variations in the frequencies anddamping values due to. e.g. operational or ambientconditions. It provided meaningful damping valuesand coherent mode shapes, allowing us to getgood insights in the damping mechanisms.
Future studies will be conducted to understand andeliminate the effect of the different operational andambient conditions on the identified parameters.This will be required in order to exploit the use ofthese parameters in the identification of changes in
the dynamic behaviour and structural integrity ofthe offshore wind turbine. The next challenge willalso be to evaluate the proposed methods on thedata-sets obtained while the wind-turbine is rotatingat rated speed. As discussed in the introductiondifferent solutions can and will be considered inorder to deal with the harmonic components.
ACKNOWLEDGEMENTSThis research has been performed in theframework of the Offshore Wind InfrastructureProject (http://www.owi-lab.be).The authors alsoacknowledge the Fund for Scientific Research –
Flanders (FWO). The authors gratefully thank thepeople of Belwind NV for their continuous supportwithin this project.
7/23/2019 Paper EWEA 2013 Devriendt Christof v2
http://slidepdf.com/reader/full/paper-ewea-2013-devriendt-christof-v2 10/10
!"#"$"%&"'
[1] Dwight Davis. Dr. Martin Pollack. Brian Petersen,“Evaluate the Effect of Turbine Period of VibrationRequirements on. Structural Design Parameters,Technical report of findings”, 2010.
[2] Germanischer Lloyd, Windenergie, OverallDamping for Piled Offshore Support Structures,Guideline for the Certification of Offshore WindTurbines,, Edition 2005.
[3] Van Der Tempel Jan, “Design of SupportStructures for Offshore Wind Turbines”, PhD T.U.Delft, 2006.
[4] Zaaijer, M.B., Tripod support structure - pre-designand natural frequency assessment for the 6 MWDOWEC, Doc. no. 63, TUD, Delft, 14 May 2002.
[5] T.G. Carne and G.H. James III, The inception ofOMA in the development of modal testing for windturbines, Mechanical Systems and SignalProcessing, 24, 1213-1226, 2010.
[6] L. Hermans, H. Van Der Auweraer, Modal testingand analysis of structures under operationalconditions: industrial applications, MechanicalSystems and Signal Processing, 13(2), 1999.
[7] R. Brincker, L. Zhang, and P. Andersen, Modalidentification of output only systems usingfrequency domain decomposition, Smart Materialsand Structures (10), 2001.
[8] B. Cauberghe, Applied frequency-domain systemidentification in the field of experimental andoperational modal analysis. PhD thesis, VrijeUniversiteit Brussel, Belgium, 2004.
[9] B. Peeters, B. Cornelis, K. Jansenns, H. Van derAuweraer, Removing disturbing harmonics in
Operational Modal Analysis, Proceedings ofIOMAC 2007, Copenhagen, Denmark, 2007.
[10] R. Pintelon, B. Peeters and P. Guillaume,Continuous-time operational modal analysis in
presence of harmonic disturbances, MechanicalSystems and Signal Processing, 22, 2008.
[11] Devriendt C; Guillaume P, Identification of modal parameters from transmissibility measurements,Journal of Sound and Vibration, 314 (1-2), 2008.
[12] Devriendt C; De Sitter G; Vanlanduit S; GuillaumeP; Operational modal analysis in the presence ofharmonic excitations by the use of transmissibilitymeasurements, MSSP, 23 (3), 2009.
[13] D. Tcherniak, S. Chauhan and M.H. Hansen,Applicability limits of Operational Modal Analysisto operational wind turbines, Proceedings of theIMAC XXVIII, Jacksonville, USA, 2010.
[14] S. Chauhan, D. Tcherniak, Jon Basurko, OscarSalgado, Iker Urresti, Carlo E. Carcangiu andMichele Rossetti. Operational Modal Analysis ofOperating Wind Turbines: Application to MeasuredData, Volume 5, Proceedings of the Society forExperimental Mechanics Series, 8, 2011.
[15] S.Vanlanduit , P.Verboven, P.Guillaume,J.Schoukens, Anautomatic frequency domainmodal parameter estimation algorithm. Journal ofSound and Vibration,265(3) , 2003.
[16] P.Verboven, E.Parloo, P.Guillaume , M.VanOvermeire, Autonomous structural healthmonitoring.Part1: modal parameter estimation andtracking, Mechanical Systems and Signal
Processing, 16(4), 2002.
[17] F. Magalhaes, A Cunha, E. Caetano, On lineautomatic identification of the modal parameters ofa long span arch bridge , Mechanical Systems andSignal Processing, 23 (2), 2009.
[18] Filipe Magalhães, Álvaro Cunha, Elsa Caetano,Rune Brincker Damping estimation using freedecays and ambient vibration tests, MechanicalSystems and Signal Processing, 24(5), 2010.
[19] Bendat, J.; Piersol, A., Engineering Applications ofCorrelation and Spectral Analysis, 1980.
[20] P. Guillaume, Peter Verboven, S. Vanlanduit, H.Van der Auweraer, B. Peeters, A poly-referenceimplementation of the least-squares complexfrequency domain-estimator, IMAC 21, 2003.
[21] P.Verboven, B. Cauberghe, E. Parloo, S.Vanlanduit, P. Guillaume, User-assisting tools for afast frequency-domain modal parameter estimationmethod, Mechanical Systems and SignalProcessing, 8, 2004.
[22] N. M. M. Maia and J. M. M. Silva, editors.Theoretical and Experimental Modal Analsysis.Research Studies Press Ltd., England, 1997.
[23] Devriendt C., Elkafafy M., De Sitter G., GuillaumeP., Continuous dynamic monitoring of an offshorewind turbine on a monopile foundation,International conference on Noise and VibrationEngineering, ISMA 2012, Leuven, Belgium, 2012.
[24] M. El-Kafafy, C. Devriendt, G. De Sitter, T. DeTroyer, P. Guillaume, Damping Estimation ofOffshore Wind Turbines Using State-of-the ArtOperational Modal Analysis Techniques,International conference on Noise and VibrationEngineering, Leuven, Belgium, 2012.
[25] B. Cauberghe, P. Guillaume, P. Verboven, S.Vanlanduit, E. Parloo, On the influence of the parameter constraint on the stability of the polesand the discrimination capabilities of thestabilisation diagrams, Mechanical Systems andSignal Processing, 19 (5), 2005.
[26] M.H. Hansen, K. Thomsen and P. Fuglsang, Twomethods for estimating aeroelastic damping ofoperational wind turbine modes, from experiments,Wind Energy, 9, 2006.
[27] Devriendt C., Jan Jordaens P., De Sitter G.,Guillaume P., Damping Estimation of an OffshoreWind Turbine on a Monopile Foundation, EWEA2012, Copenhagen, Denmark, April 2012.