Embed Size (px)
Citation preview

Plénière 2 : Les politiques scolaires au service des mixités à l’école : quelles expériences
dans les pays de l’OCDE ?

Admissions policies to secondary schools in England: Facilitating mixed intakes
Anne West

Historical context Market-oriented reforms Admissions Banding Random allocation Prioritising disadvantaged pupils Examples of policies at school level
3
Outline

Historical context
From 1944 secondary school system academically selective – grammar, technical and secondary modern schools
From 1965 – move towards comprehensive system (one school type for all)
1972 – Inner London Education Authority introduced area-wide banding to try and ensure comprehensive intakes
Involved pupils being placed in ability bands on the basis of test scores
Places were then offered to pupils from each of the ability bands in each school
1988 – Education Reform Act abolished ILEA: banding continued in some inner London authorities
4

Market reforms
Conservative government: 1980 Education Act and 1988 Education Reform resulted in introduction of market principles into school-based education
Some schools with more autonomy changed admissions policies to maximise their league table position (e.g. selecting some pupils because of ‘aptitude’ in a subject)
Labour government: concerns led to tightening up school admissions (1998 School Standards and Framework Act) and attempts to make the process clearer and fairer
School admissions code introduced in 1999 – guidance regarding school admissions – along with schools adjudicator
5

Admissions to schools
Parents express a minimum of three ‘choices’
(preferences) for publicly-funded secondary schools
Allocation to schools is undertaken by either the local authority or the individual school
The decision to admit a pupil is based on published admissions criteria taking into account parents’ preferences
Admissions policies can also include banding and random allocation
6

Main admissions criteria (2012)
Admissions criteria/policies % of secondary schools (N=2837)
Child in care of the local authority 100
Child has sibling at the school 97
Distance between child’s home and school 93
Child has special educational needs 68
Child lives in school’s catchment area 64
Child has medical/social needs 55
Religion/religious denomination 16
Partial selection by ability/aptitude in subject 6
School uses banding 4
School uses random allocation across zone/area 2
7

Pupil ability banding
Pupil ability banding is a permitted form of selection used by some admission authorities to ensure that the intake for a school includes a proportionate spread of children of different abilities. Banding can be used to produce an intake that is representative of:
a) the full range of ability of applicants for the school(s); b) the range of ability of children in the local area; or c) the
national ability range. Admission authorities’ entry requirements for banding
must be fair, clear and objective… The admission authority must publish the admission
requirements and the process for such banding …(DfE, 2014)
8
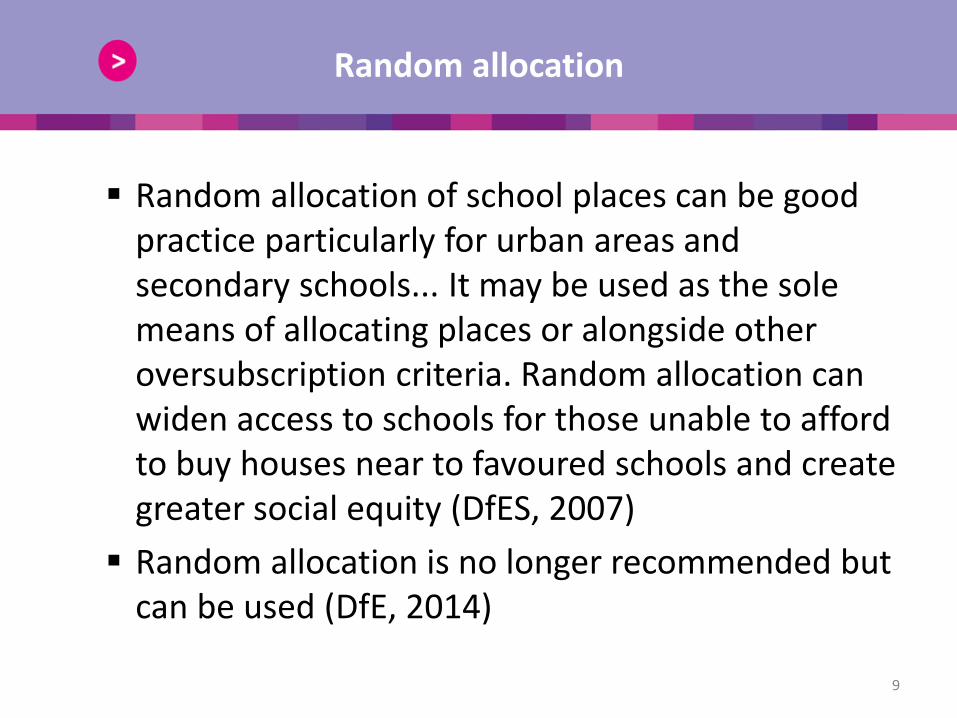
Random allocation
Random allocation of school places can be good practice particularly for urban areas and secondary schools... It may be used as the sole means of allocating places or alongside other oversubscription criteria. Random allocation can widen access to schools for those unable to afford to buy houses near to favoured schools and create greater social equity (DfES, 2007)
Random allocation is no longer recommended but can be used (DfE, 2014)
9
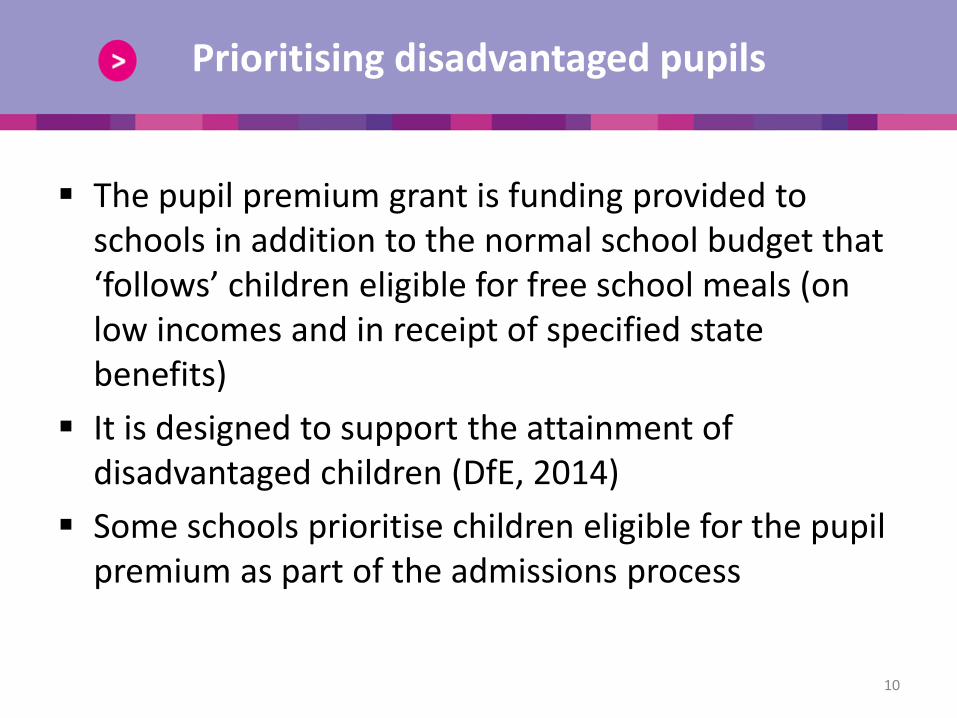
Prioritising disadvantaged pupils
The pupil premium grant is funding provided to schools in addition to the normal school budget that ‘follows’ children eligible for free school meals (on low incomes and in receipt of specified state benefits)
It is designed to support the attainment of disadvantaged children (DfE, 2014)
Some schools prioritise children eligible for the pupil premium as part of the admissions process
10

School using banding
• The school has adopted the local authority’s policy of banding. The available 240 places are divided equally across the four bands of ability
• Children with statement of special educational needs naming school (place will be provided in appropriate band)
• 12 places (3 in each band) allocated to children with aptitude in music
• Children looked after by local authority • Children with strong social/medical need • Children living nearest the school who are eldest in child in family
(25% of each band) • Children whose older brother or sister attend the school • Children who live nearest the school as measured by the shortest
walking route
11

Academy using random allocation
Pupils with a statement of special educational needs… Criteria will be applied in the following order. 1 Looked After Children. 2 Admission of pupils whose siblings attend the Academy in
Year 7–10 and who will continue to do so on the date of admission.
3 Remaining places in each ability band will be allocated by drawing lots in geographical zones. Zone A will be a zone up to a 2 mile radius from the fixed point shown on display at the Academy and on the website…Zone B will be a zone over 2 miles’ radius from the point on the map
(90% of places will be allocated to Zone A and 10% to Zone B)
12

Academy: banding, random
1 Children in public care will be offered a place
2 Children with a statement of special educational needs…governors may grant a place to a child with a very exceptional medical or social need on the recommendation of an independent professional
3 Children whose siblings at the time of application [in specific year groups] at the Academy
4 65% of the remaining places will then be offered to: (i) an inner catchment area which will include all addresses in post code zone [postcode x]. If there is oversubscription, the Academy will offer places using fair banding and random selection to ensure all abilities are represented…. (ii) The remaining 35% of places will be offered to an outer catchment area which will include all addresses in the post code zones [postcodes y, z]. If there is oversubscription, the Academy will offer places using fair banding
13

Assurer à tous un véritable choix et favoriser la mixité sociale : le difficile défi de la politique de régulation du
choix scolaire en Belgique francophone Christian Maroy
Université de Montréal & Louvain

Traits structurels du système scolaire en Belgique (1831-1997)
• Double liberté de l’enseignement : offre et demande
• un « Système scolaire » – fragmenté en différents « réseaux » scolaires (Etat
faible) – Décentralisé : forte autonomie des Pouvoirs
organisateurs : personnel, programme, pédagogie, gestion
– Soumis de plus en plus à une régulation par la compétition et le « marché » au fur et à mesure de la « sécularisation » et de l’individualisation de la société


Politique scolaire depuis les années 90 (décret « missions » 1997 …)
• Politique orientée vers le renforcement de la régulation de « l’offre scolaire » (construction du système et de son « pilotage ») – Diffusion de « standards » (curriculum par compétence) et
de règles transversales – renforcement de l’administration « centrale » et de lieux
de concertation/pilotage « inter-réseaux » (développement de l’évaluation externe)
– Encadrement des PO/établissements scolaires
• Faible régulation de la « demande » : – Liberté de choix des parents non remise en question – Régulation timide des conditions d’inscription et
d’exclusion des écoles
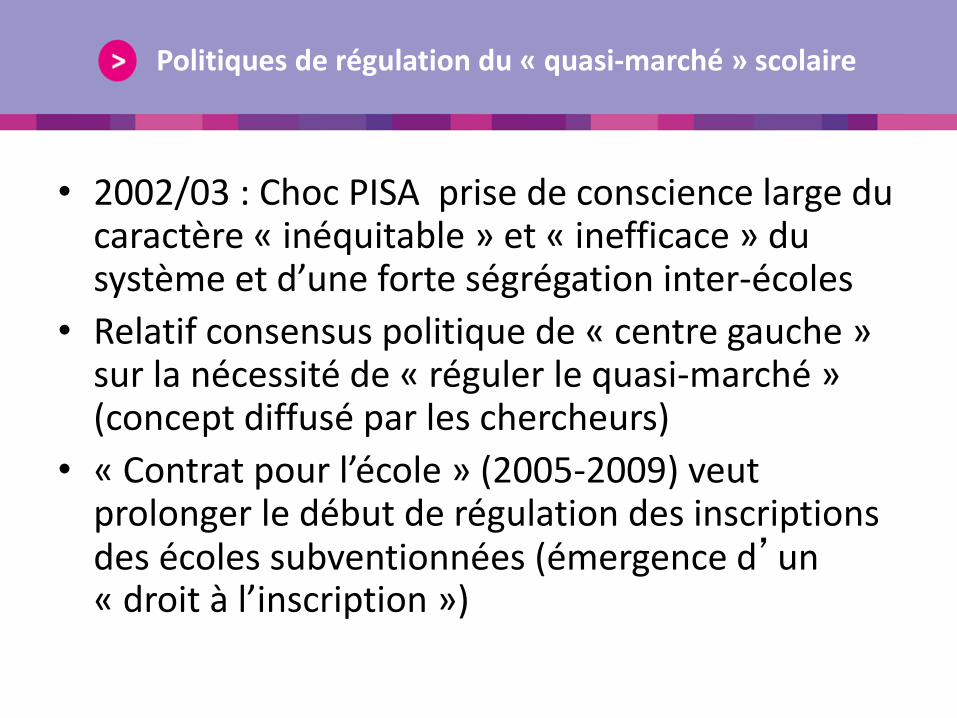
Politiques de régulation du « quasi-marché » scolaire
• 2002/03 : Choc PISA prise de conscience large du caractère « inéquitable » et « inefficace » du système et d’une forte ségrégation inter-écoles
• Relatif consensus politique de « centre gauche » sur la nécessité de « réguler le quasi-marché » (concept diffusé par les chercheurs)
• « Contrat pour l’école » (2005-2009) veut prolonger le début de régulation des inscriptions des écoles subventionnées (émergence d’un « droit à l’inscription »)
Décrets « inscription » (8 mars 2007)
• Règlementation de l’inscription au début du secondaire seulement
• Mise en place d’une date d’inscription obligatoire (novembre)
• « premier arrivé, premier servi » ; registre d’inscriptions dans les écoles
• Pas d’affichage d’une visée de mixité ; visée de donner à tous les mêmes possibilités de choix
• Résultat : – forte couverture médiatique des « files d’attente » devant les
écoles (de 3 à 17 % selon les sources) – émergence de « nouvelles » associations de parents (ELEVeS),
pétitions, recours juridiques, débat médiat. – retrait du décret et remplacement de la ministre

Décret « mixité » (18 juillet 2008)
• Visée essentielle : assurer une égalité d’exercice de la liberté de choix (mais « éviter les files » ) et favoriser la « mixité sociale »
• Deux phases d’inscription : élèves « prioritaires » (fratrie, écoles adossées…) et « non prioritaires »
• Si demande supérieure à l’offre, après avoir satisfait aux priorités : tirage au sort des « reçus » (procédure très complexe avec visée de garantir une proportion de 15 % d’élèves issus d’écoles défavorisées, définies selon l’indice ISE = indice socio-économique, basé sur les caractéristiques socio-économiques moyennes des quartiers d’habitation des élèves )
• Effets : médiatisation, manifestations, « bulle des inscriptions » , partis désavouent le gouvernement (élections en juin 2009), retrait du décret

Nouveau décret Inscriptions (18 mars 2010)
• Objectifs du décret
– « organiser le processus d’inscription de façon pragmatique et transparente »
– « assurer à toutes les familles une égalité d’accès à tous les établissements, et une égalité de traitement dans le processus d’inscription »,
– soutenir la « mixité sociale, culturelle et académique » pour améliorer les performances de chaque élève et lutter contre l’échec scolaire

Procédures d’inscription (simplifiée)
• Formulaire unique d’inscription (FUI) déposé dans l’ école « de premier choix » par les parents (avec expression de 9 préférences hiérarchisées ) (3 semaines ; fin février –début mars)
• A la fin de la période d’inscription, si la demande dans un établissement < ou = 102% des places disponibles, l’établissement est dit « incomplet » et attribue les places aux parents demandeurs (= place assurée)
• Si demande > 102% des places déclarées = écoles « complètes » • les établissements « complets » octroient 80% de leurs places disponibles en
fonction d’un « classement des élèves » combinant des « priorités » et le « calcul d’un indice composite » lié aux choix de l’élève
– 1) attribution de 20, 4% des places aux élèves issus d’écoles défavorisées (= écoles primaires scolarisant 40% d’élèves les plus défavorisés = (élèves ISEF) ) ; classement de ces élèves selon l’indice composite
– 2) attribution des places successivement à 6 types d’ élèves «prioritaires »: 1) fratrie, 2& 3) élèves en « situation précaire » ou à « besoins spécifiques » 4 ) élèves visant un internat 5) enfants du personnel 6) élèves venant d’une « école primaire adossée » ou en « partenariat pédagogique » ; (chaque catégorie est classée selon l’indice composite)
– 3) attribution jusqu’à concurrence des 80 % des places déclarées, des autres places aux autres demandes d’élèves (en fonction de leur indice composite)

Procédures d’inscription (2)
• Critères de calcul de l’indice composite : rang de l’école dans les préférences des parents ; distance domicile/école primaire ; distance domicile/école sec visée ; distance école primaire fréquentée/secondaire visée ; écoles en immersion linguistique ; offre scolaire dans la commune ; partenariat pédagogique
• Pour les élèves qui n’ont pas de place « assurée » (début mai), Les élèves sont en liste d’attente ou en ordre utile (selon les établissements « complets » visés ) et les parents sont informés par la CIRI (Commission inter- réseau) ;
• Celle-ci va attribuer progressivement les 22% des places des écoles complètes et places disponibles dans les écoles incomplètes. En fonction de l’évolution des choix et désistements des parents/ d’ouverture de nouvelles places et en fonction du classement des élèves (indice composite et priorités), l’administration (en relation avec les parents) ajuste offre et demande sur base d’un logiciel d’optimisation (jusqu’au 31 aout).
• Possibilité des parents de « réinscription » dans une autre école tierce (hors préférences) et de « recours » à la CIRI (à partir de mai)

Mise en œuvre de la politique
• Le décret « inscriptions » (2010) a été mis en application pour la rentrée 2010/11
• Sa mise en œuvre et ses effets ont été interrogés
– du point de vue de son efficacité (source : rapports d’ évaluation faits par la Commission de pilotage, (COPI, 2013 & 2014)
– Du point de vue de sa légitimité et acceptabilité sociale (de façon récurrente depuis le premier décret inscriptions, dans les débats publics)
Evaluation par la Commission de pilotage (COPI)
Le rapport Copi s’efforce de rendre compte de
–De l’effectivité du caractère pragmatique et transparent de la procédure (pour résoudre les tensions entre offre et demande)
–De l’effectivité de l’égalité d’accès aux établissements et de l’égalité de traitement permis par la procédure d’inscription
–Effets sur la mixité sociale des écoles (et par delà sur la réussite – redoublement/changements d’école)

Efficacité/effectivité du décret selon la COPI
• Une effectivité de l’égalité (formelle) d’accès à tous les établissements, mais des possibilités de filtrage des inscriptions toujours existantes
• Une amélioration de l’égalité de traitement permise par une procédure d’inscription transparente et centralisée
• Peu d’effet pervers de la procédure sur l’exacerbation des tensions offre/demande ; mais celles-ci sont grandes et exogènes dans certaines zones (en particulier Bruxelles)

Efficacité/effectivité du décret selon la COPI
• Conclusions « partielles » sur l’objectif de lutte contre l’échec scolaire et l’amélioration des performances par le soutien à la « mixité sociale, culturelle et académique »
– taux de réussite/taux de redoublement ont peu varié suite au décret
– Usage varié – parfois insuffisant- des moyens financiers pour venir en aide aux élèves en difficulté (dans les écoles « complètes » ) et efficacité « à améliorer » (constat fait sur base d’un échantillon d’écoles visitées par l’inspection)
– effet très limité du décret sur la réduction de la mixité sociale

Source : Rapport de la Commission de pilotage relatif au Décret inscriptions, 2014

Acceptabilité et légitimité
• Les décrets inscriptions successifs ont fait l’objet depuis le début de controverses vives, tant dans l’espace médiatique que politique (Delvaux & Maroy, 2009) ;
• ces controverses ne sont pas éteintes aujourd’hui et le décret est encore remis en cause de façon variable par certains partis d’opposition et associations de parents : – Au niveau de ses principes: compatibilité liberté/égalité ; visée d’égalité des
acquis/égalité des chances méritocratique
– Surtout dans son instrumentation: effets pervers de sa procédure (composition de l’indice composite, fiabilité de l’indice ISE)
– de son inefficacité relative et de sa non-pertinence par rapport aux problèmes de pénuries de « places » (à Bruxelles)

Conclusion
• Le « décret inscriptions » ne me semble pas encore complètement institutionnalisé, en raison de la conjugaison de ces problèmes de légitimité et d’efficacité
• L’efficacité décevante du point de vue de la mixité et de la réussite pourrait être liée à plusieurs facteurs – Peu d’emprise sur les « ressorts et logiques de choix des familles elles-mêmes »
(leurs représentations des écoles, leur croyances sur la « bonne école ») ; – sous-mobilisation du dispositif de choix par les familles défavorisées en raison
de sa complexité technique et des difficultés d’accès à l’information pertinente – Pas de refus d’ouverture des écoles « complètes » aux élèves « en difficulté »,
mais peu de changement dans les logiques pédagogiques et sociales des écoles, diverses et orientées d’abord vers le public élève dominant et les attentes parentales
• L’acceptabilité différenciée renvoie à des intérêts en tension, mais aussi à des pratiques et croyances fortement institutionnalisées (peu d’évidence du « système scolaire » et d’un « bien commun » à ce niveau ; primat du « local » ; peu d’évidence encore de « l’égalité des acquis ») : c’est difficile à changer à CT et par des outils techniques seulement

Education Policies to Promote Diversity at School: The Experience of the United
States Richard D. Kahlenberg

History of Racial Segregation and Racial Desegregation through compulsory busing
The New Integration by Socioeconomic Status and Public School Choice (Magnets/Charters) Socioeconomic vs. Racial Integration Choice vs. Compulsion Examples of School Districts Student Outcomes under Socioeconomic
Integration Politics of Socioeconomic Integration
33
Overview

1870s-1954 De Jure Racial Segregation/Jim Crow Laws. Plessy v. Ferguson “separate but equal.”
1954 – Brown v. Board of Education – separate is inherently unequal
1954-1969 – Massive resistance
1969 – Compulsory busing to desegregate by race.
34
U.S.A. History of Racial Segregation/Desegregation
1974 – Milliken v. Bradley. Wealthy suburban areas exempt from urban desegregation. White flight to suburbs possible. Urban racial integration often involved low-income
black and white students. 1990s – Supreme Court made it easier to end
desegregation efforts and be declared “unitary.” 2007- Parents Involved in Community Schools v.
Seattle – Supreme Court struck down voluntary efforts to integrate using race.
35
The Demise of Compulsory Racial Desegregation

Emphasize socioeconomic status rather than race.
Emphasize public school choice (magnet schools, charter schools, etc.) to achieve integrated schooling.
36
The New Integration

Legal Concerns with Race do not apply to
Socioeconomic Status. Social science research suggests socioeconomic status
of peers matters more than race in boosting academic achievement.
Racial diversity is important for promoting social cohesion, but socioeconomic integration will produce considerable racial integration.
37
Trend: Socioeconomic Status over Race in Integration Plans

Research: Academic benefits of integration not from
proximity to whiteness but middle-class environment Racial Desegregation in Charlotte vs. Boston
(1970s) Roosevelt Perry Elementary in Louisville.
Socioeconomic integration produces significant racial diversity in a manner that’s perfectly legal
Among 4th graders nationally, 24% whites eligible free and reduced lunch; 70% African Americans; 73% Latinos 38
Evidence on Socioeconomic Integration vis a vis race

Magnet Schools and Charter Schools Poll parents now using private school and living in suburbs,
as well as parents of city students to see what themes or pedagogical approaches are popular.
Build partnerships between particular magnet schools and well-regarded institutions (universities, museums, military facilities, sports teams, private sector institutions)
Universal Choice with fairness guidelines to ensure economic integration Franchise popular and over-chosen schools.
Inter-District School Choice (suburbs and cities) in Boston, Hartford, Milwaukee, St. Louis etc.
39
Integration through Choice
80 U.S. Districts, educating 4 million students, using
socioeconomic status as a factor in student assignment. Examples:
Cambridge, MA. All schools should fall within + or – 10 percentage points of district average for free and reduced price lunch (40%).
Chicago, IL. 85% low-income so begin by integrating a subset of magnet and selective schools, with the goal of integrating more as middle-class return.
40
Examples of Socioeconomic Integration

Montgomery County, MD “inclusionary zoning”
housing policies.
New York State – “turn around” failing schools by creating magnet themes that attract middle class students.
41
Examples (cont.)

RAND researcher Heather Schwartz tests the effectiveness to two strategies: extra resources (class size reduction, professional development, extended learning time) in high poverty “red zone” schools ($2,000 more/pupil) vs. “inclusionary housing” policy that allows low-income students to attend low poverty “green zone” schools with fewer resources.
Examined 858 children randomly assigned to public housing
units scattered throughout Montgomery County and enrolled in Montgomery County public elementary schools 2001-2007.
42
Montgomery County, MD Inclusionary Housing

43
Public Housing Students in Green Zone Schools Outperformed Those in Red Zone Schools
Source: Heather Schwartz, “Housing Policy Is School Policy.” in The Future of School Integration (New
York: The Century Foundation, 2012), p. 45, Figure 2.6.

Low-income public housing students in low poverty schools performed at .4 of a standard deviation better in math than low-income public housing students in higher poverty schools with more resources
Low-income students in green zone schools cut their large initial math gap with middle-class students in half. The reading gap was cut by one-third
Most of the effect (2/3) was due to attending low-poverty schools, and some (1/3) due to living in low-poverty neighborhoods
44
Montgomery County MD

45
Cambridge, Massachusetts, and Boston—Four-Year Cohort Graduation Rates, 2014
85,4 82,5 87.0
91,2
75,5 74,9 69,2
90.9
65,3 65,8 59,8
72,3
0
10
20
30
40
50
60
70
80
90
100
Low-income Black Hispanic White
Perc
en
t
Cambridge Massachusetts Boston
Source: Massachusetts Department of Elementary and Secondary Education, Cohort 2014 Four-Year Graduation
Rates—State Results.

National Assessment of Educational Progress 2011, Fourth Grade Math Results
46
Poverty Concentrations and Achievement
241 244
240
237234
232
224
223
258
265
258 256252
251
246
238
210
220
230
240
250
260
270
0% 1-5% 6-10% 11-25% 26-34% 35-50% 51-75% 76-99% 100%
Av
era
ge
NA
EP
ma
th s
co
re
Percentage of students in school eligible for free or reduced price lunch
Students Eligible for Free or Reduced Price Lunch Students Not Eligible
Source: U.S. Department of Education, Institute of Education Sciences, National Center for Education Statistics, National
Assessments of Educational Progress (NAEP), 2011 Math Assessment, Grade 4.
47
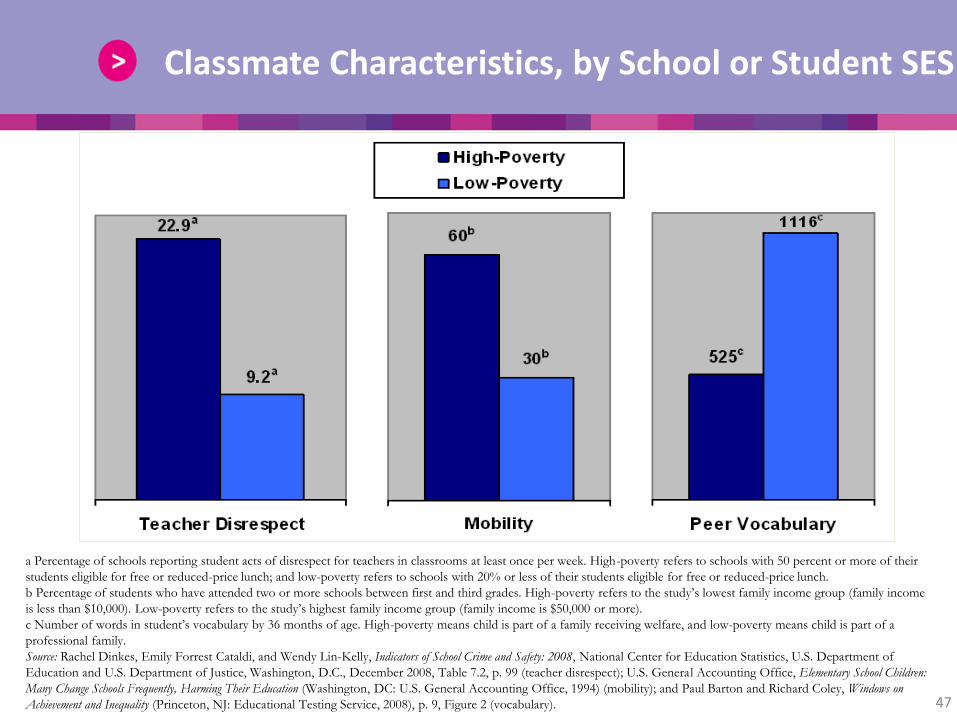
Classmate Characteristics, by School or Student SES
a Percentage of schools reporting student acts of disrespect for teachers in classrooms at least once per week. High-poverty refers to schools with 50 percent or more of their
students eligible for free or reduced-price lunch; and low-poverty refers to schools with 20% or less of their students eligible for free or reduced-price lunch.
b Percentage of students who have attended two or more schools between first and third grades. High-poverty refers to the study’s lowest family income group (family income
is less than $10,000). Low-poverty refers to the study’s highest family income group (family income is $50,000 or more).
c Number of words in student’s vocabulary by 36 months of age. High-poverty means child is part of a family receiving welfare, and low-poverty means child is part of a
professional family.
Source: Rachel Dinkes, Emily Forrest Cataldi, and Wendy Lin-Kelly, Indicators of School Crime and Safety: 2008, National Center for Education Statistics, U.S. Department of
Education and U.S. Department of Justice, Washington, D.C., December 2008, Table 7.2, p. 99 (teacher disrespect); U.S. General Accounting Office, Elementary School Children:
Many Change Schools Frequently, Harming Their Education (Washington, DC: U.S. General Accounting Office, 1994) (mobility); and Paul Barton and Richard Coley, Windows on
Achievement and Inequality (Princeton, NJ: Educational Testing Service, 2008), p. 9, Figure 2 (vocabulary).
48
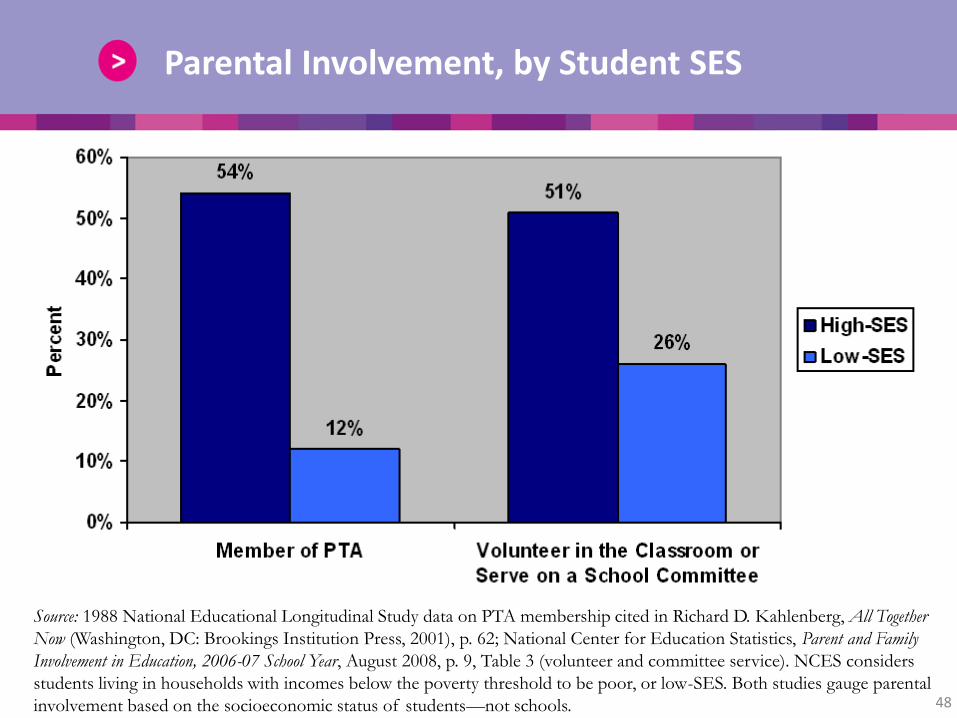
Parental Involvement, by Student SES
Source: 1988 National Educational Longitudinal Study data on PTA membership cited in Richard D. Kahlenberg, All Together
Now (Washington, DC: Brookings Institution Press, 2001), p. 62; National Center for Education Statistics, Parent and Family
Involvement in Education, 2006-07 School Year, August 2008, p. 9, Table 3 (volunteer and committee service). NCES considers
students living in households with incomes below the poverty threshold to be poor, or low-SES. Both studies gauge parental
involvement based on the socioeconomic status of students—not schools.

49
Teaching Quality, by School SES
Source: U.S. Department of Education, The Condition of Education 2008 (Washington, D.C.: Government Printing Office,
2008), p. 51; Richard M. Ingersoll, cited in “Parsing the Achievement Gap,” Educational Testing Service, 2003, p. 11;
Linda Darling-Hammond, “Doing What Matters Most: Investing in Quality Teaching,” National Commission on
Teaching and America’s Future, 1997, pp. 25–27.

Stephen Colbert on Wake County School Integration
50
Politics of Integration
http://www.huffingtonpost.com/2011/01/19/stephen-colbert-wake-county-schools_n_811048.html
http://www.colbertnation.com/the-colbert-report-videos/371414/january-18-2011/the-word---disintegration

Teachers Unions (La Crosse, Louisville)
Civil Rights Groups
Faith Groups
Business Groups (St. Louis, Wake County)
51
Building Political Support with Key Constituencies

Richard D. Kahlenberg, All Together Now: Creating Middle Class Schools through Public School Choice (Brookings Press, 2001; paperback, 2003).
The Future of School Integration: Socioeconomic Diversity as an Education Reform Strategy, ed. by Richard D. Kahlenberg (Century Foundation, 2012).
Richard D. Kahlenberg and Halley Potter, A Smarter Charter: Finding What Works for Charter Schools and Public Education (Teachers College Press, 2014).
52
For More Information

Richard D. Kahlenberg
Senior Fellow
The Century Foundation
1333 H Street, N.W. 10th Floor
Washington, D.C. 20005
www.tcf.org 53
Contact Information

Dutch decentralized approach in favour of diversity in schools
Manon Persoon
Policy officer Ministry of Education, Culture and Science Primary education (age 4-12)

1.Motives for diversity in schools
2.Facts and figures
3.Dutch policy in favour of diversity in schools
4.Pilot study to stimulate mixed schools
5.Focus on educational disadvantages
55
Presentation

The main objectives are:
1. To enhance pupils’ knowledge and skills.
2. To teach pupils to be members of society.
But there is no scientific and political consensus about these goals.
The policy for mixed schools is highly influenced by the prevailing political stance.
56
What are the motives for diversity in schools?
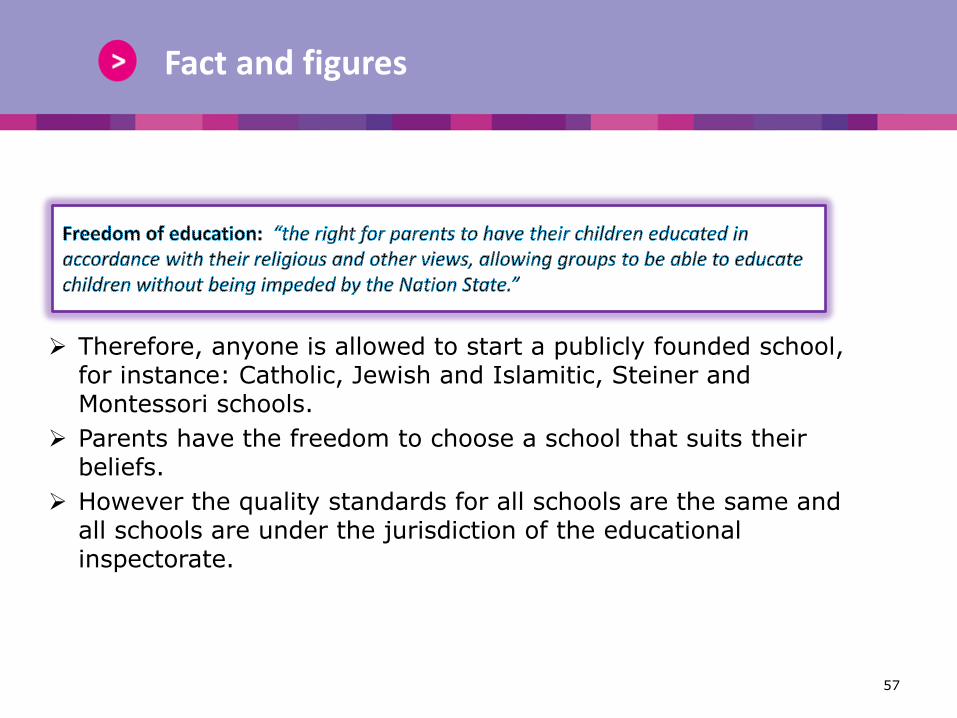
Therefore, anyone is allowed to start a publicly founded school, for instance: Catholic, Jewish and Islamitic, Steiner and Montessori schools.
Parents have the freedom to choose a school that suits their beliefs.
However the quality standards for all schools are the same and all schools are under the jurisdiction of the educational inspectorate.
57
Fact and figures

• 3.5 million immigrants (17 million inhabitants):
20% of the population
12% is non-Western
• Non-Western persons with a
migrant background mainly live
in and around:
Rotterdam (37%),
Amsterdam (35%),
The Hague (35%).
• Countries of birth: Morocco,
Dutch Antilles, Suriname, Turkey.
58
Fact and figures of the Dutch situation
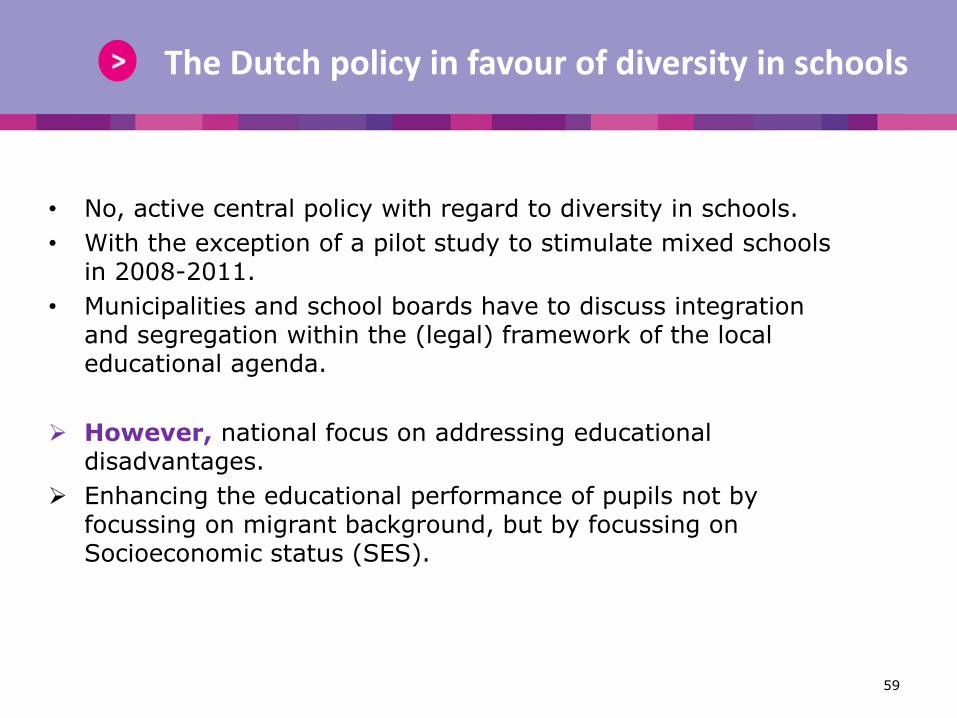
• No, active central policy with regard to diversity in schools.
• With the exception of a pilot study to stimulate mixed schools in 2008-2011.
• Municipalities and school boards have to discuss integration and segregation within the (legal) framework of the local educational agenda.
However, national focus on addressing educational disadvantages.
Enhancing the educational performance of pupils not by focussing on migrant background, but by focussing on Socioeconomic status (SES).
59
The Dutch policy in favour of diversity in schools

• Which (policy)instruments can be used to address these issues?
I. Controlled choice
II. Information provision to parents
III.Parental initiatives
IV. Interaction between pupils from schools of different mixture (“friendshipschools”)
60
Pilot study to stimulate mixed schools

Experiences:
• Two-thirds of the pilot cities could not establish an agreement whit their schools about controlled choice.
• Just one pilot used background or SES as criteria.
Results:
Transparency and equal chances for parents.
More children go to school in their own neighborhood.
However, no prove that a central registration system enhances integration. Parents with different background have different preferences.
61
I. Controlled choice

Experiences:
• Mainly highly educated parents attended these tours.
• Partipation is in some neighborhoods an issue.
Results:
Limited effect on integration, however:
Schooltours are an opportunity for schools to promote themselves.
Schooltours bring parents together.
62
II. Information provision to parents

Experiences:
• Success depends on: the enthusiasm of the parents, the involvement of the school, the quality of the school, the support of the local government and the mixed background of the parents of the neighborhood.
Results:
Parental involvement helps to enhance mixed schools on a small scale.
63
III. Parental initiatives
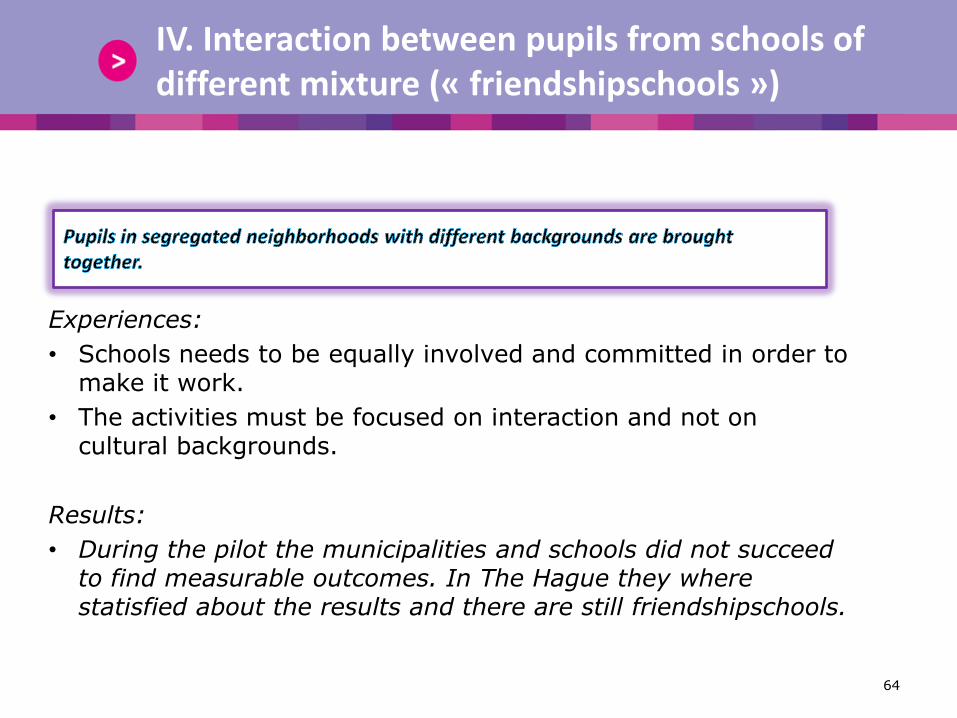
Experiences:
• Schools needs to be equally involved and committed in order to make it work.
• The activities must be focused on interaction and not on cultural backgrounds.
Results:
• During the pilot the municipalities and schools did not succeed to find measurable outcomes. In The Hague they where statisfied about the results and there are still friendshipschools.
64
IV. Interaction between pupils from schools of different mixture (« friendshipschools »)

• The options and willingness of municipalities to actively tackle segregation are limited.
• The effectiviness of the instruments depends on the local situation.
Neighborhood population,
The neighborhood.
• Based on the results some municipalities continued the pilots on a small scale.
• The main focus of the policy
of the Dutch (local) government is
addressing educational disadvantages.
65
Conclusion of the pilot

By:
I. A system of additional financial support II. Early Childhood Education and Care (age 2,5-4)
• Every school with pupils with educational disadvantages receives extra
resources, based on SES. • The result can be that a school with almost a total of 100% pupils with
educational disadvantages receives double amount of funding. • Early childhood education contributes to reducing the (language)
disadvantage of pupils at a young age.
66
Adressing educational disadvantages

67
PISA, 2012

Thank for your attention!
68

Diversity, segregation and school choice in Sweden
Nihad Bunar Professor
Department of Child and Youth Studies, Stockholm University, Sweden [email protected]

Sweden – diversity and education
• Sweden has become an ethnically diverse society due to immigration and globalization (16% foreign born).
• 20% of all students in elementary schools and 20% of children in preschools have another mother tongue than Swedish.
• 146 languages are spoken in Swedish schools.
70

Major challenges
• Housing segregation
• Achievement gap
• Newly arrived refugee and asylum-seeking students
• General lack of knowledge among teachers about how to work with language development
• Relations with parents
• Selective use of school choice policy 71

Major policy initiatives
• Additional resources allocated to schools according to social and ethnic composition of their students.
• More education and training for teachers.
• All students, irrespective of their migration status, are entitled to education.
• Various and pretty affluent integration and urban development projects set up over the last decade in the most deprived areas.
• Mother tongue teaching, instruction in students’ native language and Swedish as a second language as a part of school curriculum.
• Cooperation with universities and university student unions in order to provide students in immigrant dominated schools with additional assistance (home-work, language learning, positive role-models).
• Extra teaching hours in Swedish as a second language and summer schools.
72
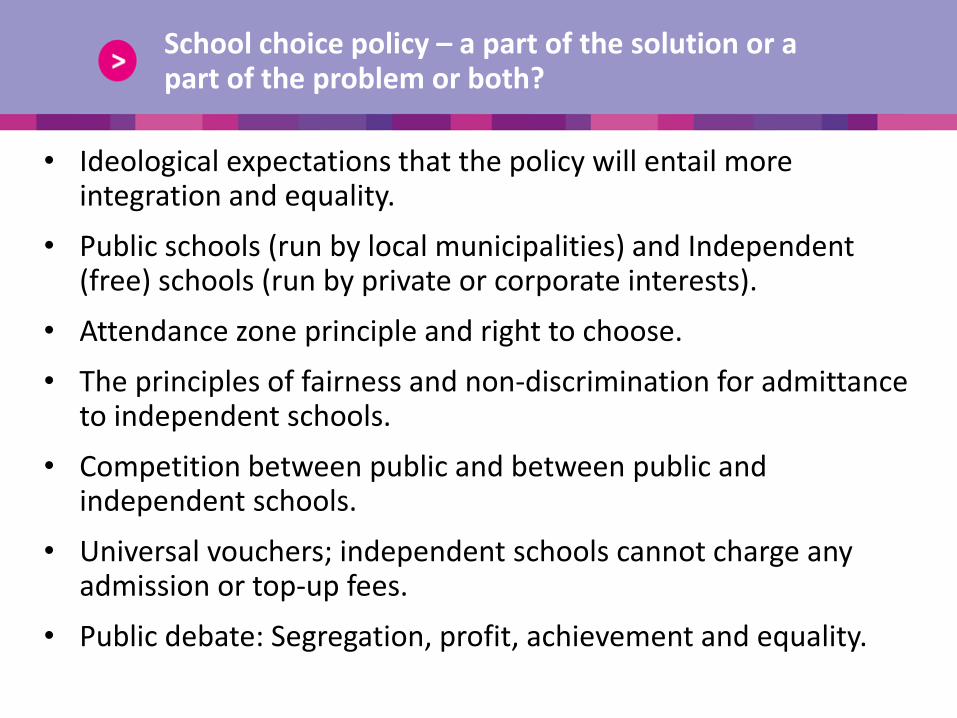
School choice policy – a part of the solution or a part of the problem or both?
• Ideological expectations that the policy will entail more integration and equality.
• Public schools (run by local municipalities) and Independent (free) schools (run by private or corporate interests).
• Attendance zone principle and right to choose.
• The principles of fairness and non-discrimination for admittance to independent schools.
• Competition between public and between public and independent schools.
• Universal vouchers; independent schools cannot charge any admission or top-up fees.
• Public debate: Segregation, profit, achievement and equality.

School choice policy and its outcomes
• Social and ethnic diversity
• Segregation
• The overall contribution of independent schools to better performances and lower costs?
• The legitimacy of independent schools
• Reversing to catchment area only-policy?

Conclusion – In order to achieve and support diversity at schools we need to work with following areas
• All schools involved – not just schools in urban suburbs
• Integration – creating meeting places
• Inclusion in school’s social and pedagogical arenas
• De-stigmatization of certain neighborhoods, schools, ethnic and religious groups
• Pedagogical efforts to promote acquisition of knowledge and language and to increase achievement among the most disadvantaged students
• School choice policy should be reformed in order to minimize its negative effects and maximize its positive outcomes
75

76
Discussion avec le public


![Malnutrition among Children under 5 Does Not Correlate ...The impact of malnutrition usually falls mainly on children under five years of age [3]. Contributing to more than half of](https://img.pdfslide.fr/doc/110x75/5e7dac5e6de8da02de5acf65/malnutrition-among-children-under-5-does-not-correlate-the-impact-of-malnutrition.jpg)