Embed Size (px)
Citation preview
Reacutepublique Algeacuterienne Deacutemocratique et Populaire
وزارة التعليم العالي و البحث العلمي
Ministegravere de lrsquoenseignement supeacuterieur et de la recherche scientifique
Universiteacute Mohamed Khider
Biskra
جامعة محمد خيضر بسكرة
Faculteacute des Sciences Exactes et
des Sciences de la Nature et de
la Vie
كلية العلوم الدقيقة و علوم الطبيعة و
الحياة
Deacutepartement Sciences de la
matiegravere
علوم المادة قسم
Reacutef helliphelliphelliphelliphelliphellip المرجع
Thegravese preacutesenteacutee en vue de lrsquoobtention
du diplocircme de
Doctorat en Chimie
Speacutecialiteacute (Option) Chimie Moleacuteculaire
Quantification caracteacuterisation et proprieacuteteacutes
antioxydantes des polypheacutenols dans la pomme de
terre de la reacutegion drsquoEl Oued
Preacutesenteacutee par Khaoula BEN HAOUA
Soutenue publiquement le
Devant le jury composeacute de
Mr D BARKAT Professeur Universiteacute de Biskra Preacutesident
Mr M OUMARI Professeur Universiteacute de Biskra Examinateur
MmeC BOUBEKRI Maicirctre de confeacuterences A Universiteacute de El Oued Examinatrice
Mr T LANEZ Professeur Universiteacute de El Oued Rapporteur
Mr S BELAIDI Professeur Universiteacute de Biskra Co-rapporteur
I
Acknowledgments
First of all I am grateful to God for the blessing he has bestowed on to complete this
work
Foremost I would like to express my sincere gratitude to my supervisors without whom
this valuable piece of research would never have been completed Prof LANEZ Touhami as a
Director of the thesis for the continuous support to my study and research for his patience
motivation enthusiasm and immense knowledge His guidance helped me during my
research and the writing of this thesis Prof BELAIDI Salah Eddine not only for his
involvement as my Co-Director in the thesis but also for the rigor and the confidence that he
put in me His constant availability and the kindness that he has demonstrated in my regard
and his support during the years of my research
My cordial thanks go also to my thesis jury
Prof BARKAT Djamel Professor and Head of the Department of Industrial Chemistry
Faculty of Sciences and Technology at the University Mohamed Khider Biskra for my honor
to accept to be the president of the jury of my thesis despite their many occupations and
responsibilities
Prof OMARI Mahmoud Professor at the Department of Chemistry Faculty of exact
sciences and sciences of nature and of Life the University Mohamed Khider Biskra of the
same honor to have accepted to judge as an examinator my piece of research
Dr BOUBEKRI Cherifa Teacher at the Department of Industrial Chemistry Faculty of
Sciences and Technology at the University Hamma Lakhder ElOued for the honor of
accepting to participate in the jury of this argument
for their valuable comments and encouragements but also for the questions which
incented me to widen my research from various perspectives
I would like to thank Dr LAOUINI Salah Eddine for the valuable scientific help and all
the advice that he was able to provide me Also all the labmates for their support to my work
to get better quality of results In particular I am grateful to Dr Hammami Hadia and Dr
Henni Meriem for enlightening the first glance of my research
Last but not least I must express my profound gratitude to my teacher Amiri Athmane
as a second reader of this thesis and I am gratefully indebted to him for his very valuable
comments
II
Abstract
Our work focuses on the study of the phytochemistry and antioxidant activities of four
different varieties of Solanum tuberosum L (red and yellow) these varieties are grown in
different area of El-Oued region To extract the bioactive compound we study the effect of
two different commonly applied extraction techniques Soxhlet extraction (SE) and
ultrasonic-assisted extraction combine with maceration (UAE-M) with two ratios of ethanol
as solvent (100 ethanol - 7030 ethanolwater) The use of UAE-M proved to be faster and
more efficient process when compared to Soxhlet extraction with 100 ethanol The
phytochemical screening has highlighted the presence of alkaloids coumarins flavonoids
phytosterols The qualitative analysis of Solanum tuberosum L for the whole root by high-
performance liquid chromatography has revealed the presence of gallic acid ascorbic acid
vanillin and chlorogenic acid in the majority of the tested extracts The methods used to
quantify the phytochemical compounds are Folin-Ciocalteu assay for polyphenols and
tricholorur aluminum assay for the flavonoids The measurement of antioxidant capacities is
determined by two techniques spectrophotometry using DPPH FRAP and voltammetric
using superoxide anion radical (Obull2
minus) The correlation between the antioxidant activity and the
content of phenolic and flavonoids compounds has also been investigated the results of the
analysis show a positive correlation between them All results of this work have statistical
significance and enabled us to assert that the extracts of Kondor variety are studied have a
very high antioxidant property and reveal that their wealth in phytochemical content
Generally extracts of the whole root of Kondor variety was more active and show that the
antioxidant activity in is higher than interest than the flesh of sample
Keywords antioxidant capacity El-Oued potatoes flavonoids polyphenols Cyclic
voltammetry
III
الملخص
و نظرا لهذه الاهمية أوجبت دراستها تحليليا للتعرف تعتبر البطاطس مخزون غذائي شائع على سطح الارض
و لهذا تعرضنا في هذا العمل الى استخلاص عصارة اربعة انواع منها الشائعة الاستعمال في على محتوياتها الغذائية
منطقة الوادي جنوب شرق الجزائر
الأولى حوض المواج الفوق صوتية مرفقة بالنقع و اد ذات الفعالية الحيوية استعملنا طريقتينللاستخلاص المو
و الثاني مزيج من الكحول الايثيلي مع الماء 011و ذلك باستعمال مذيبين الاول كحول ايثيلي الثانية طريقة سوكسلي
ر فعالية من حيث استخلاص المواد الفعالة من الطريقة ان استعمال الطريقة الولى اثبت أنها أسرع و أكث( 01-01)بنسبة
كمذيب 011الثانية و ذلك باستخدام الكحول ايثيلي بنسبة
و عند استعمال تقنية الكومارين والفيتوستيرول الفلافانويدات و قد افضى التحليل الى اظهار المواد التالية
الفانيلين حمض الاسكوربيك حمض الغاليك التعرف على العناصر التاليةالكروماتوعرافيا السائلة ذات الجودة العالية تم
و حمض الكرونولوجيك في اغلب الانواع
كيميائيةولكهرالتقنية و ا (FRAP DPPH)الطيفية أثبتت دراسة الفعالية المضادة للاكسدة المقاسة بتقنيتين
( دة سة تمتلك فعالية مضارولمدت البطاطس امستخلصان لعمل بأا اذهلنا نتائج ت كدأكما للمستخلصات الاربعة (
من جهة أخرى درنة كوندور أكثر من باقي الدرنات تليها بارتينا ثم سبونتا و أخيرا كيرودا عالية في نتكوة اذ جيدة للأكسد
دة لمضاالفعالية العلاقة بين ا يضا بتقييمأكما قمنا توصلنا الى أن درنة البطاطس كاملة أغنى بمضادات الأكسدة من لبها
الفلافانويداتت و لبوليفينولااكمية و لفعالية ةاللأكسد
ةللأكسددة لمضاالفعالية ا ميائيةكيولكهرالتقنية ا حوض المواج الفوق صوتية الفلافانويدات البطاطس الكلمات الدالة
Table of content
V
AcknowledgmenthelliphelliphelliphelliphelliphelliphelliphelliphelliphelliphelliphelliphelliphelliphelliphelliphelliphelliphelliphelliphelliphelliphelliphelliphelliphelliphelliphelliphellipI
Abstract helliphelliphelliphelliphelliphelliphelliphelliphelliphelliphelliphelliphelliphelliphelliphelliphelliphelliphelliphelliphelliphelliphelliphelliphelliphelliphelliphelliphelliphelliphelliphellipII
Table of contenthelliphelliphelliphelliphelliphelliphelliphelliphelliphelliphelliphelliphelliphelliphelliphelliphelliphelliphelliphelliphelliphelliphelliphelliphelliphelliphelliphelliphellipIV
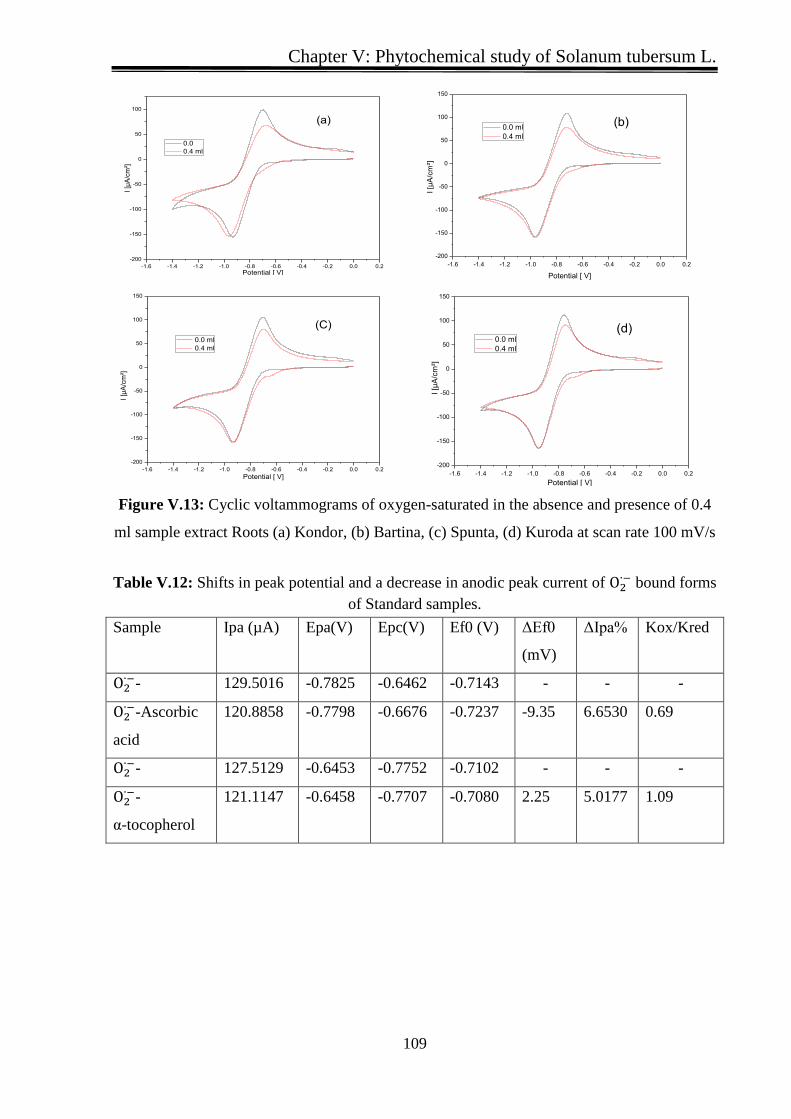
List of FigureshelliphelliphelliphelliphelliphelliphelliphelliphelliphelliphelliphelliphelliphelliphelliphelliphelliphelliphelliphelliphelliphelliphelliphelliphelliphelliphelliphelliphellipXIII
List of TableshelliphelliphelliphelliphelliphelliphelliphelliphelliphelliphelliphelliphelliphelliphelliphelliphelliphelliphelliphelliphelliphelliphelliphelliphelliphelliphelliphelliphelliphellipXVII
List of AbbreviationshelliphelliphelliphelliphelliphelliphelliphelliphelliphelliphelliphelliphelliphelliphelliphelliphelliphelliphelliphelliphelliphelliphelliphelliphelliphelliphellipXX
Bibliographic Part
General introduction 1
References 3
Chapter I Free radical
I) Free radical 5
I1) Generality 5
I2) Sources of Free Radicals 5
I21) Endogenous source 5
I22) Exogenous source 6
I3) Major types of free radicals 7
I31) Reactive Oxygen Species (ROS) 7
I311) Superoxide oxygen ( one electron) 7
I312) Hydrogen Peroxide (H2O2) 7
I313) Hydroxyl Radical (bullOH) 7
I32) Reactive Nitrogen Spices (RNS) 8
I321) Nitric oxide (NObull) 8
I322) Peroxynitrite Anion and Nitrogen dioxide 8
I4) Free radicals reaction 8
I5) Oxidative Stress 9
I6) The Bodyrsquos Antioxidant Defense 9
Table of content
VI
I7) Classification of antioxidants 10
I71)Enzymatic (Endogenous) 10
I72) Non-Enzymatic (Exogenous) 10
I721) Ascorbic acid 10
I722) α-tocopherol 11
I723) Carotenoids 11
I724) Phenolic Compounds 12
I7242) Flavonoids 13
I7243) Tannins 15
I725) Minerals 16
I7252) Iron 16
I8) Synthetic antioxidants 16
I9) Antioxidant mechanism 17
I91) Preventive antioxidants 18
I92) Chain-breaking antioxidants 18
I10) Antioxidants benefits 19
References 20
Chapter II Potato Generality
II) Potato (Solanum tuberosum L) 26
II1) Generality 26
II2) Origin and history 26
II2) Scientific classification 27
II3) Botanic description 28
II31)The above ground portion 28
Table of content
VII
II311) Flowers 28
II312) Leaflets 29
II313) Stem 29
II314) Fruits 29
II32) The below-ground portion 30
II321) Tubers 30
II322) Roots 30
II4) Varieties 30
II41) Russet (a) 31
II42) Yellow (b) 31
II43) White (c) 32
II44) Red (d) 32
II45) Fingerling (e) 32
II46) Purple and Blue (f) 33
II47) PetitesOther (g) 33
II5) Tuber Composition 33
II6) Cultivation 37
II7) Production 38
II8) Non-Food Uses of Potato 38
II9) Potatoes information 39
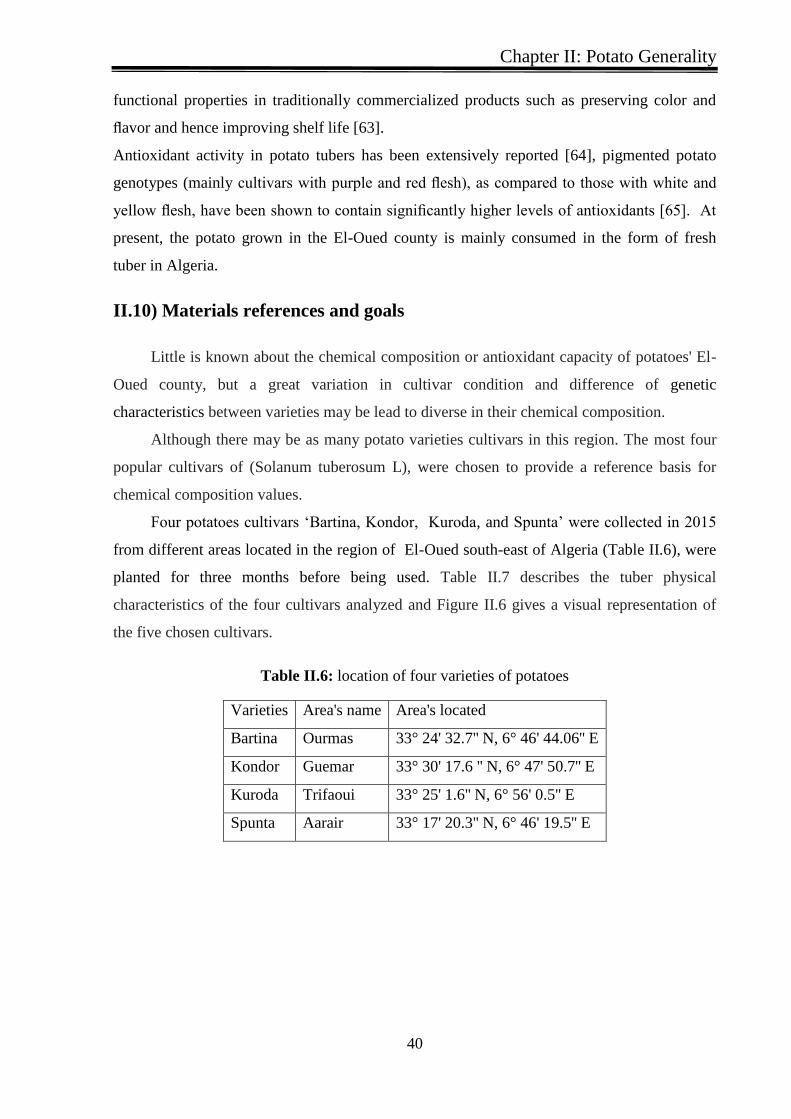
II10) Materials references and goals 40
References 43
Chapter III Methods
III1) Introduction 49
Table of content
VIII
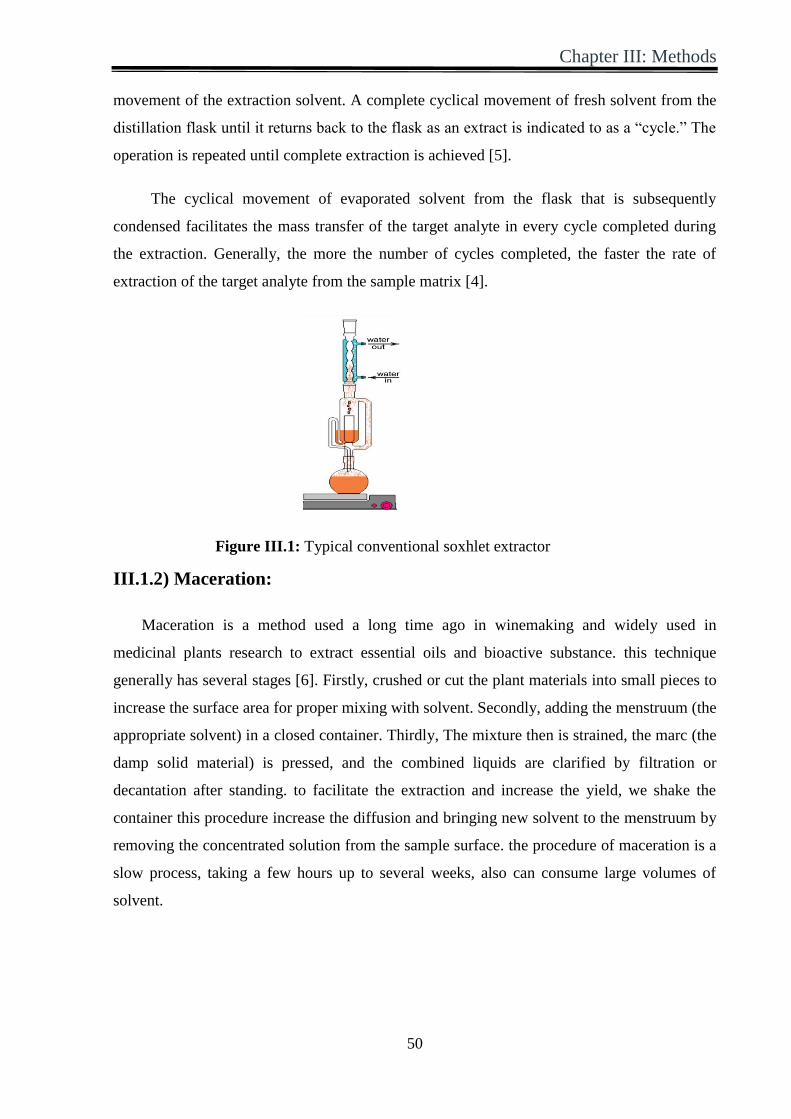
III1) Methods 49
III11) Soxhlet 49
III12) Maceration 50
III13) Ultrasound-assisted extraction 51
III14) Several variables effect on extraction system 51
III141) Solvent 51
III142) Solvent-to-feed-ratio 52
III143) Temperature 52
III144) Time 53
III145) Particle size 53
III2) Estimation of the water weight percentage in potato roots 53
III3) Phytochemical investigation 54
III31) Screening chemistry 54
III311) Detection of flavonoids 54
III312) Detection of phytosterols 55
III313) Detection of tannins 55
III314) Detection of carbohydrates 55
III315) Detection of alkaloids 55
III315) Detection of coumarins 55
III32) Total flavonoids content (TFC) 56
III33) Total phenolics content (TPC) 56
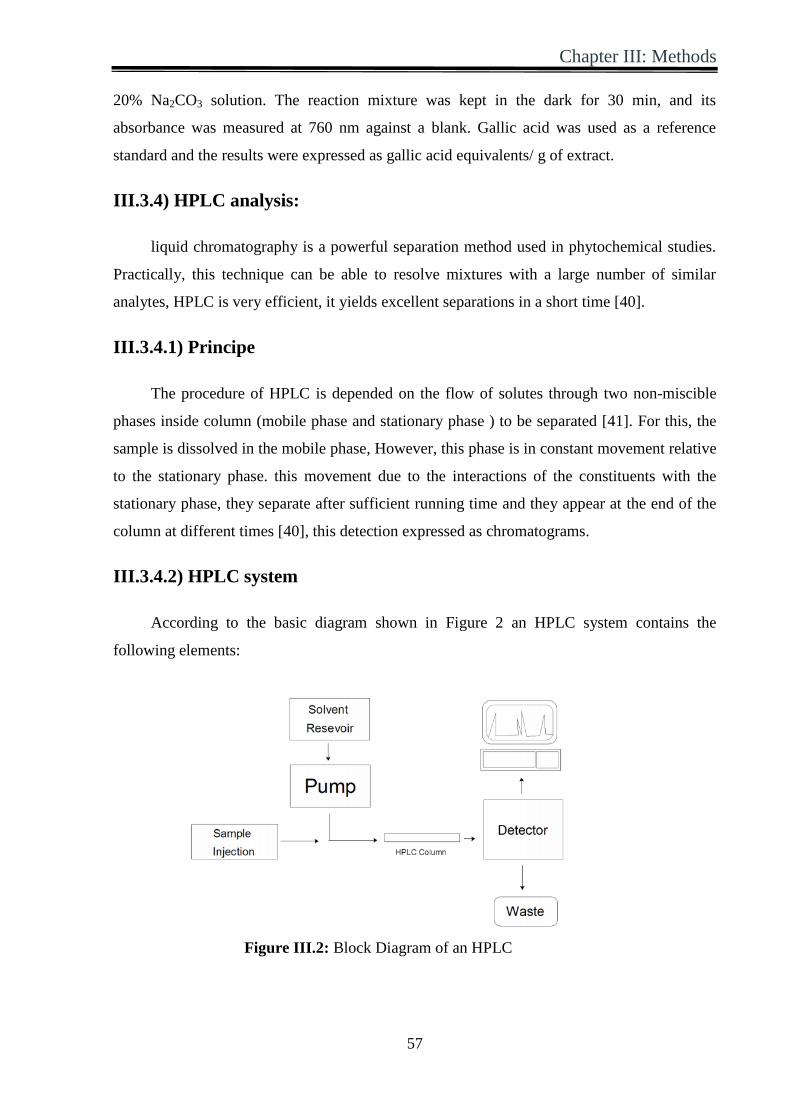
III34) HPLC analysis 57
III341) Principe 57
III342) HPLC system 57
Table of content
IX
III343) Protocol 59
III4) Antioxidant activity 59
III41) Spectrophotometers assay 60
III411) DPPH assay 60
III412) Evaluation of total antioxidant capacity (TAC) by Phosphomolybdenum method 61
III413) Ferric-reducing antioxidant power (FRAP) assay 61
III414) Beta-carotene bleaching 62
III42) Electrochemical techniques 63
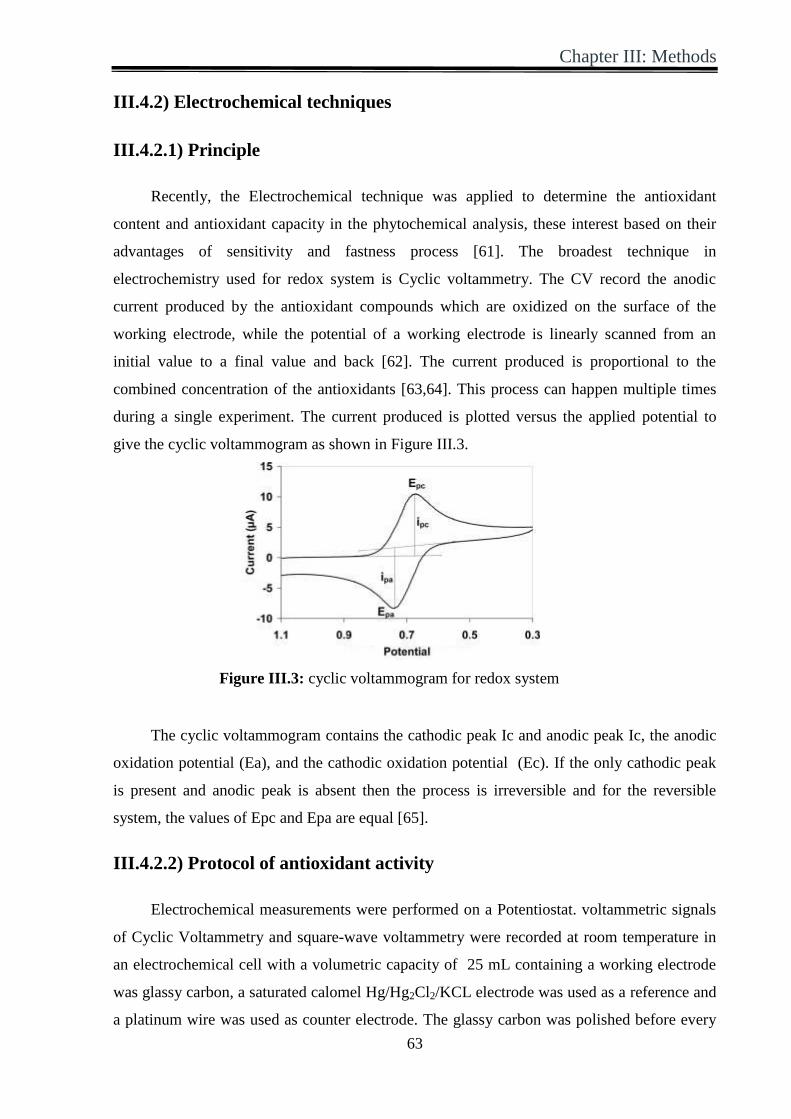
III421) Principle 63
III422) Protocol of antioxidant activity 63
III422) Protocol for scavenging activity of superoxide anion Obull2
minus radicals 64
III5) Calibration curve 64
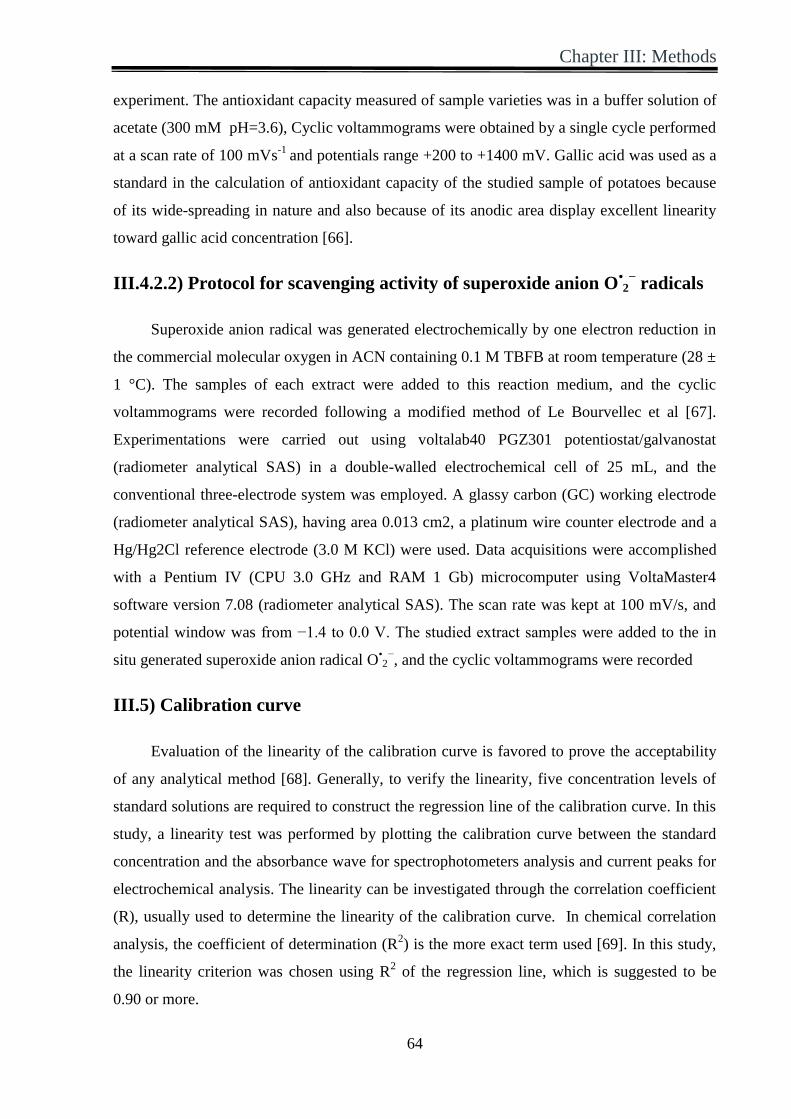
III51) Totale phenolic content 65
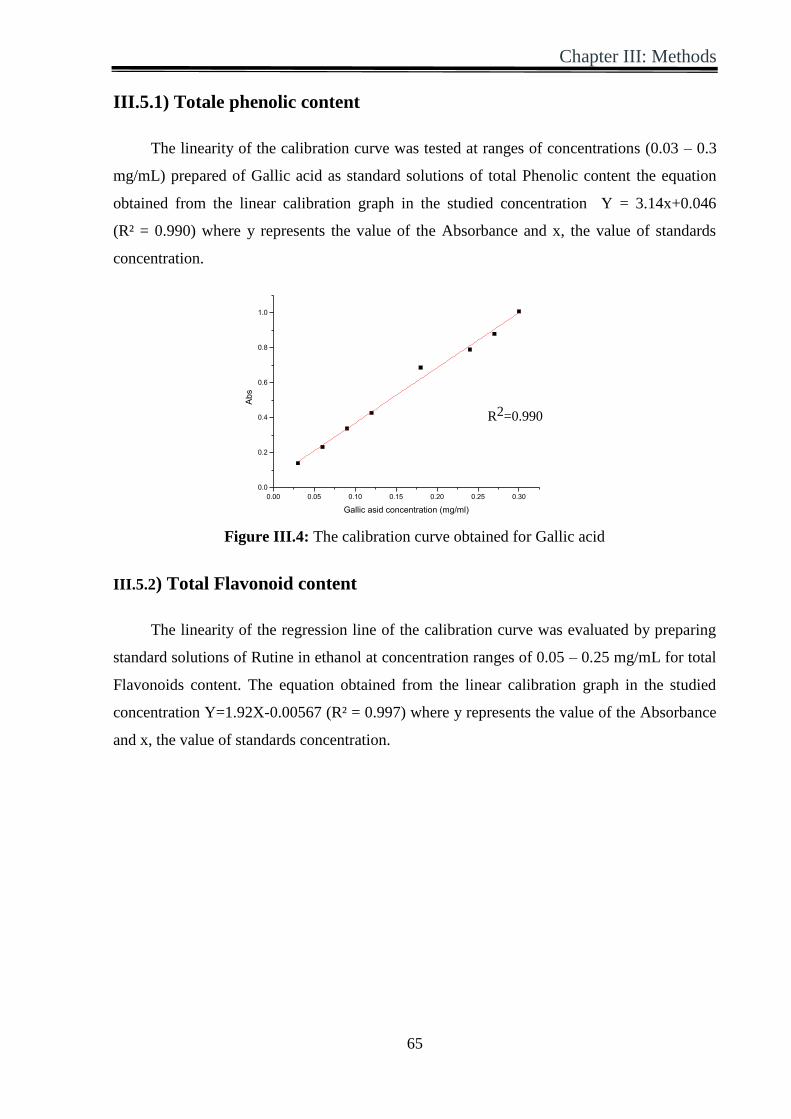
III52) Total Flavonoid content 65
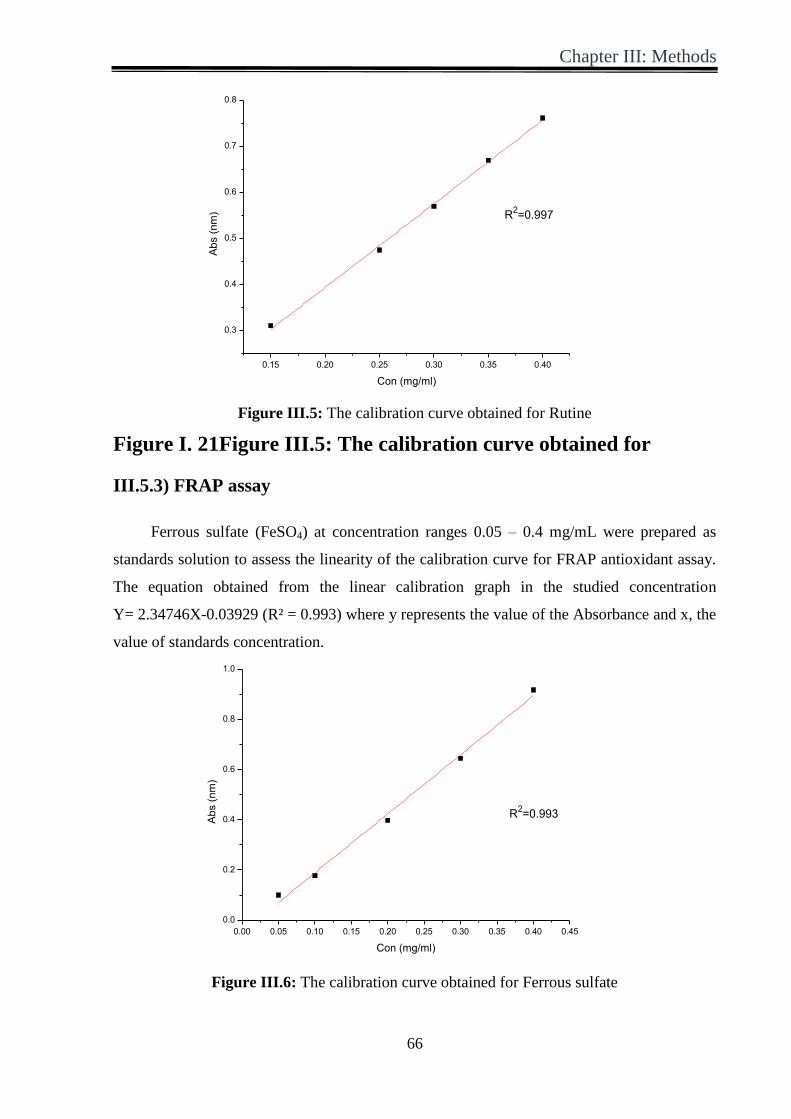
III53) FRAP assay 66
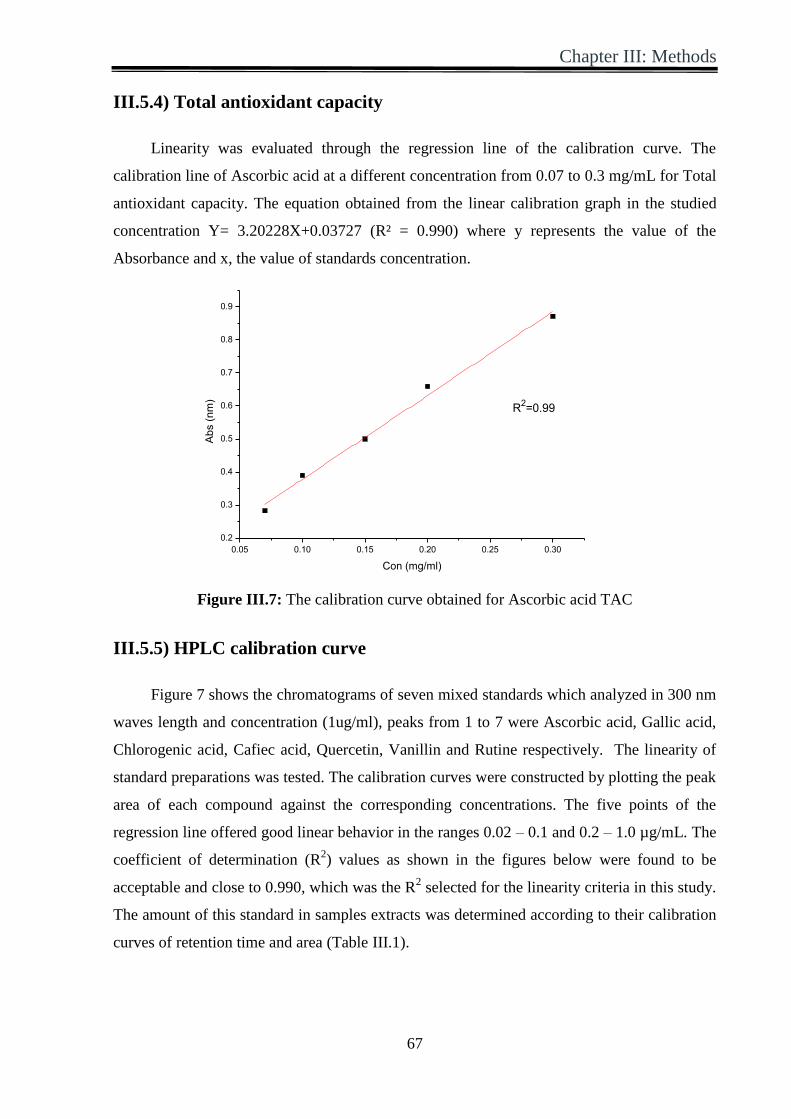
III54) Total antioxidant capacity 67
III55) HPLC calibration curve 67
III6) Determination of IC50 value 69
III7) Statistic analysis 69
III71) Linear regression analysis 69
III72) Main effect plot and interaction plot 70
III73) p-values and R-squared values 70
References 71
Table of content
X
Chapter IV Comparative study of extraction methods
IV1) Introduction 79
IV2) Aim 79
IV32) Preparation of samples 79
IV33) Ultrasonic extraction 79
IV34) Soxhlet extraction 80
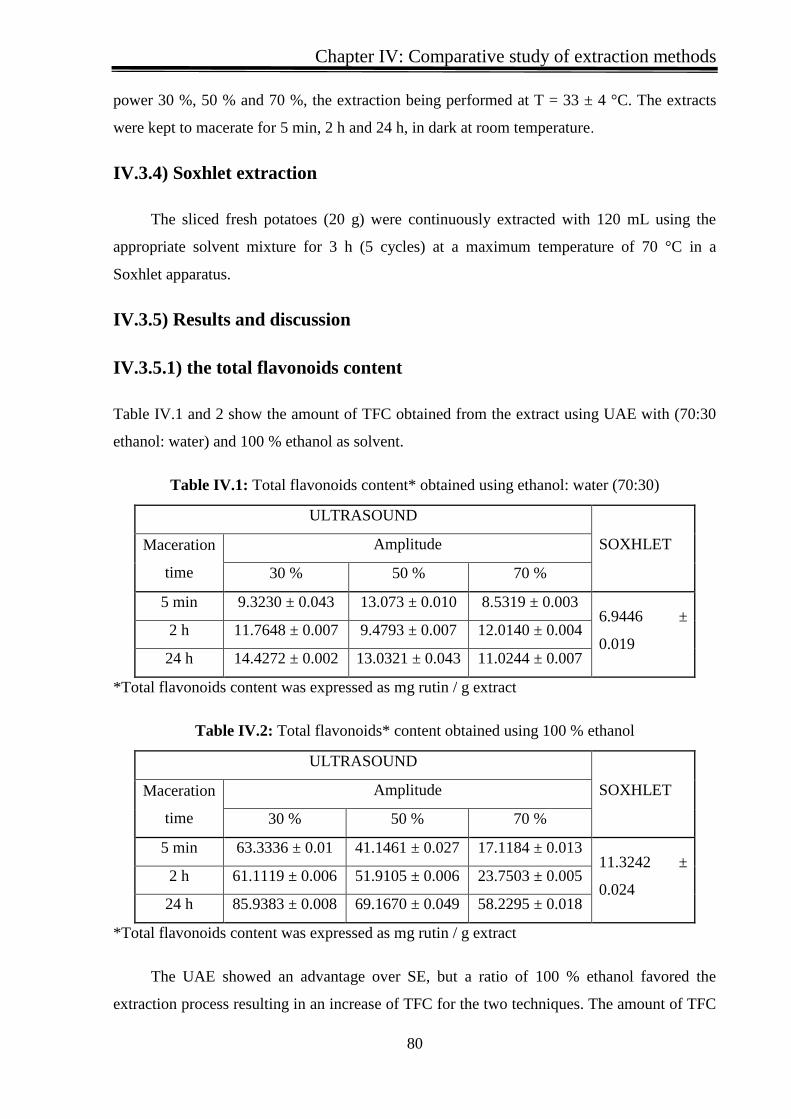
IV35) Results and discussion 80
IV351) the total flavonoids content 80
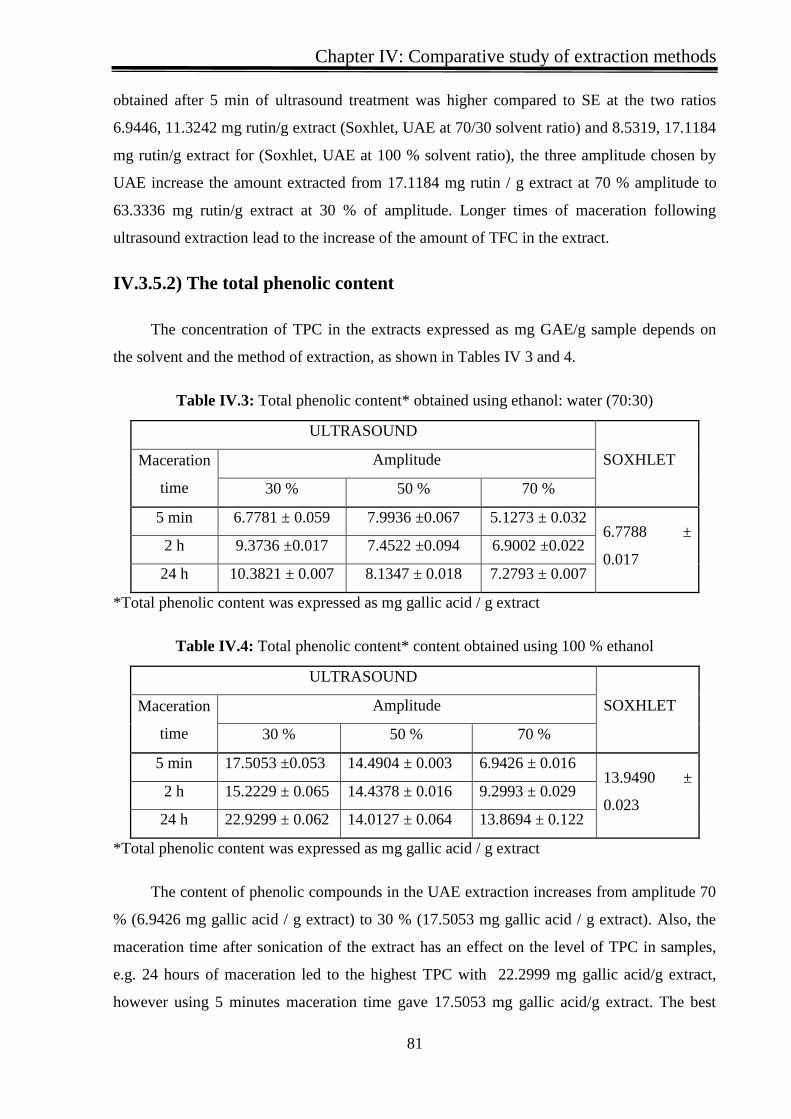
IV352) The total phenolic content 81
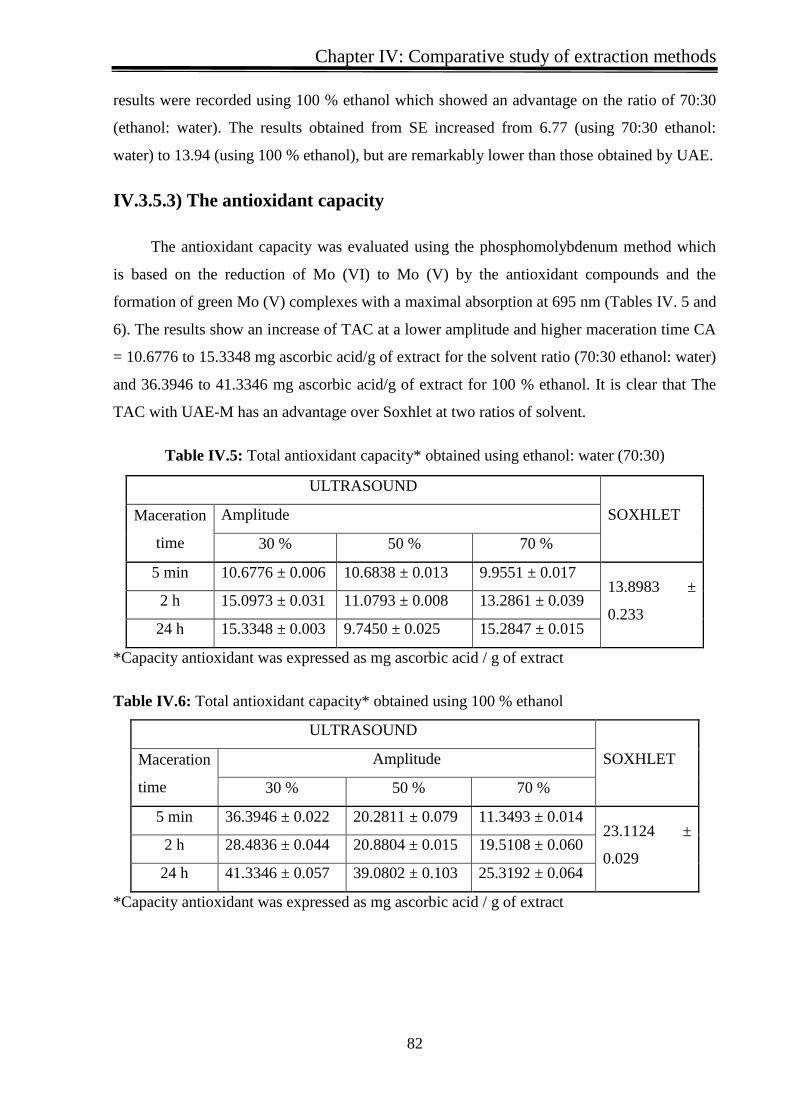
IV353) The antioxidant capacity 82
IV354) Statistic analysis 83
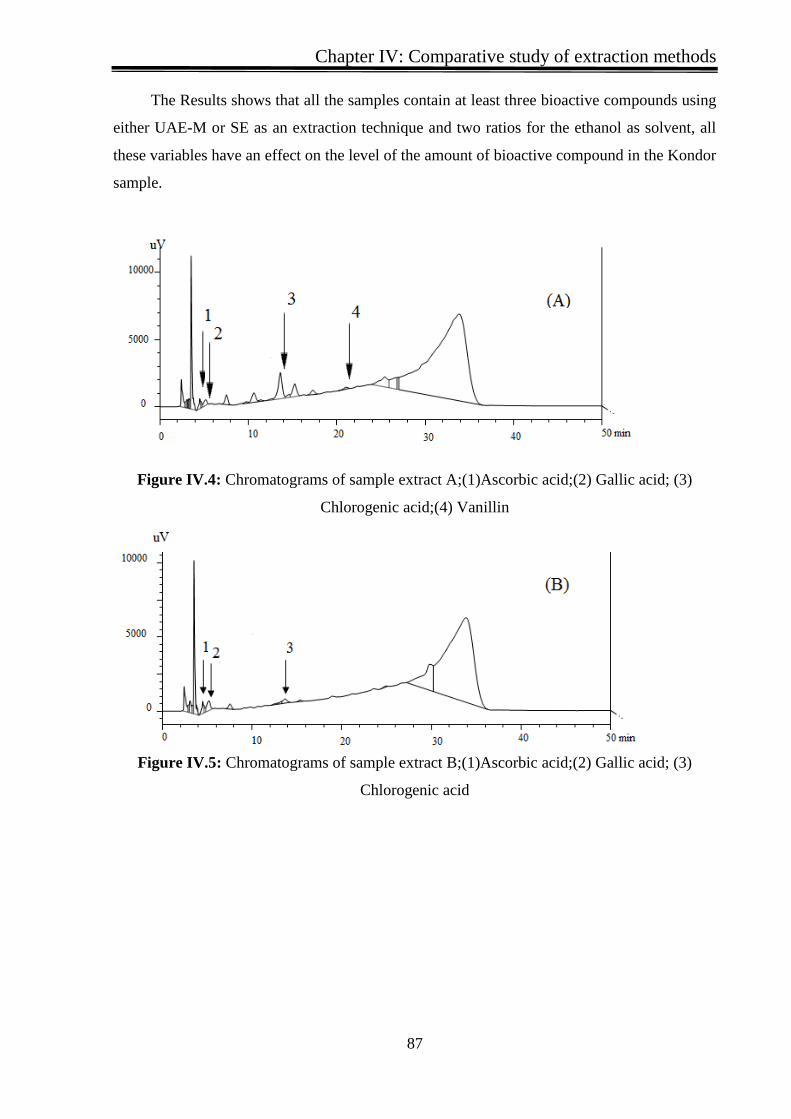
IV354) HPLC analysis 86
IV4) Discussion 89
Chapter V
Phytochemical study of Solanum tubersum L
V1) Introduction 91
V2) Experiment One 91
V21) Aim 91
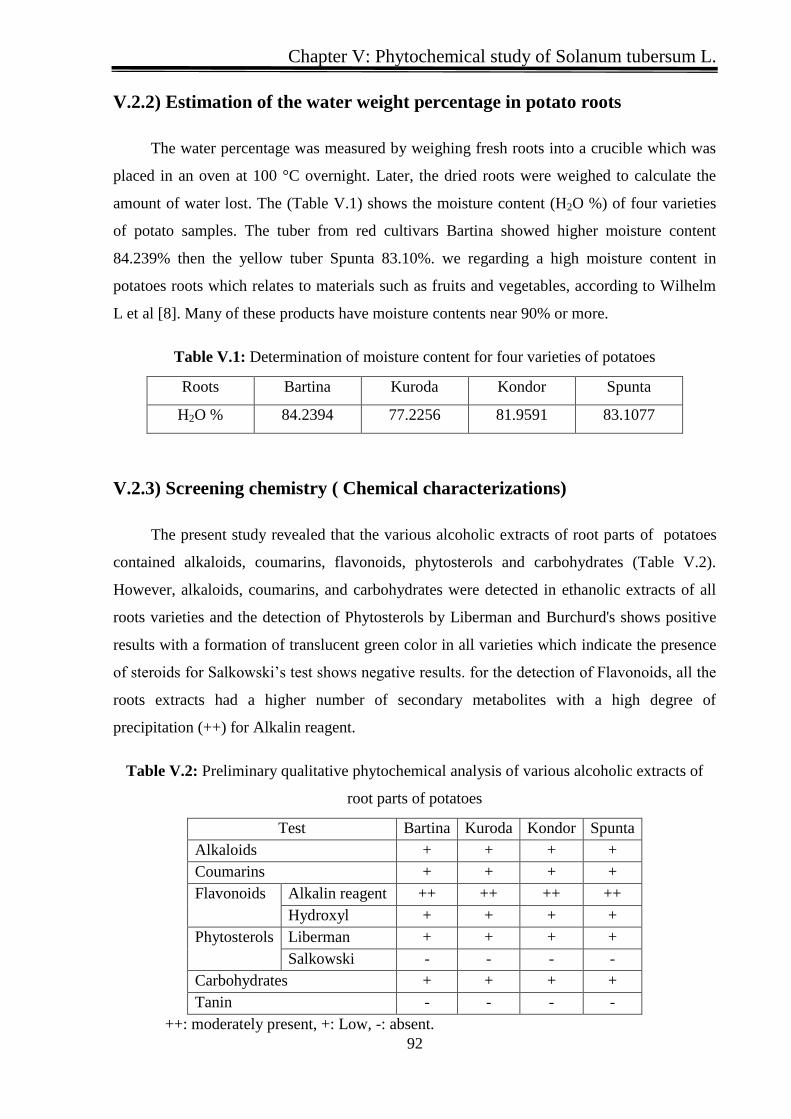
V22) Estimation of the water weight percentage in potato roots 92
V23) Screening chemistry ( Chemical characterizations) 92
V24) Phytochemical contents 93
V25) HPLC analysis 93
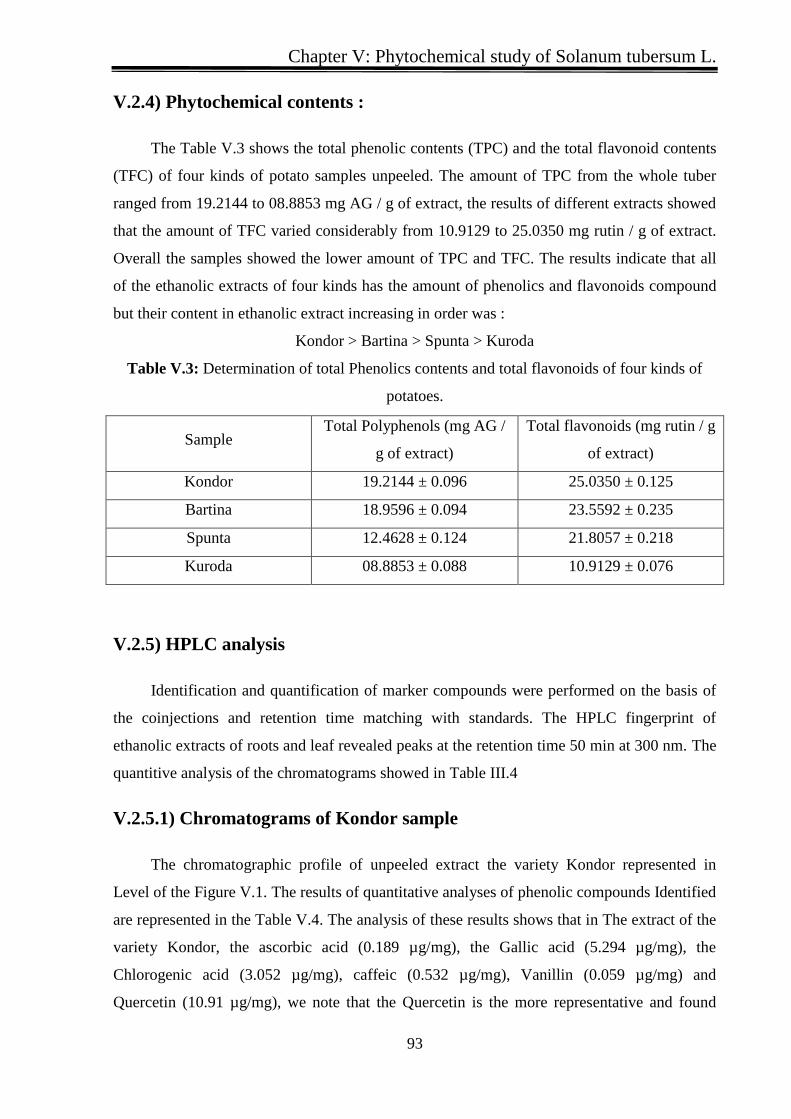
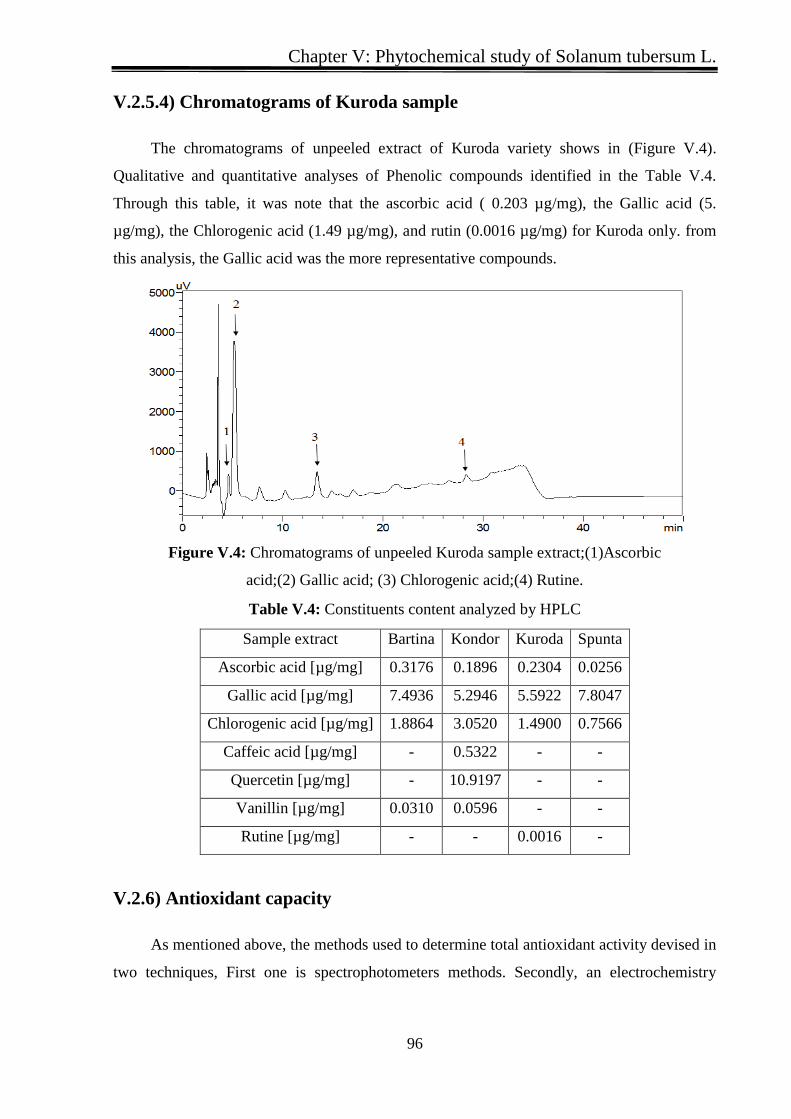
V251) Chromatograms of Kondor sample 93
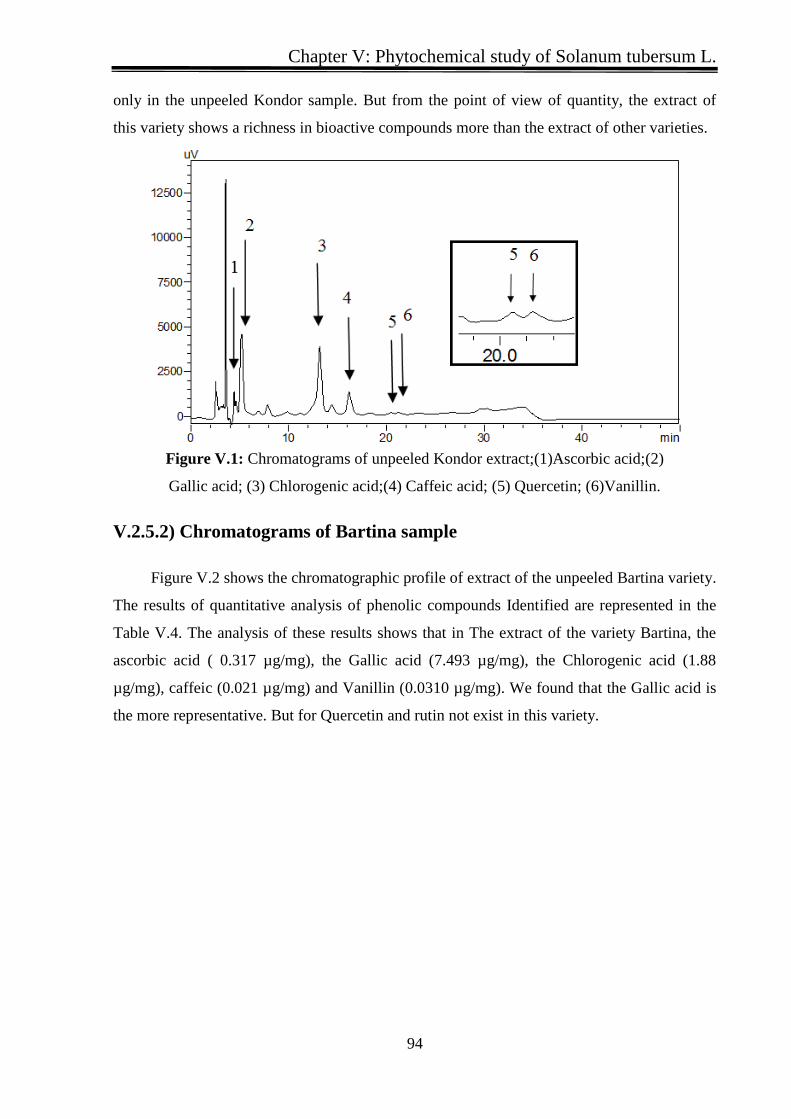
V252) Chromatograms of Bartina sample 94
Table of content
XI
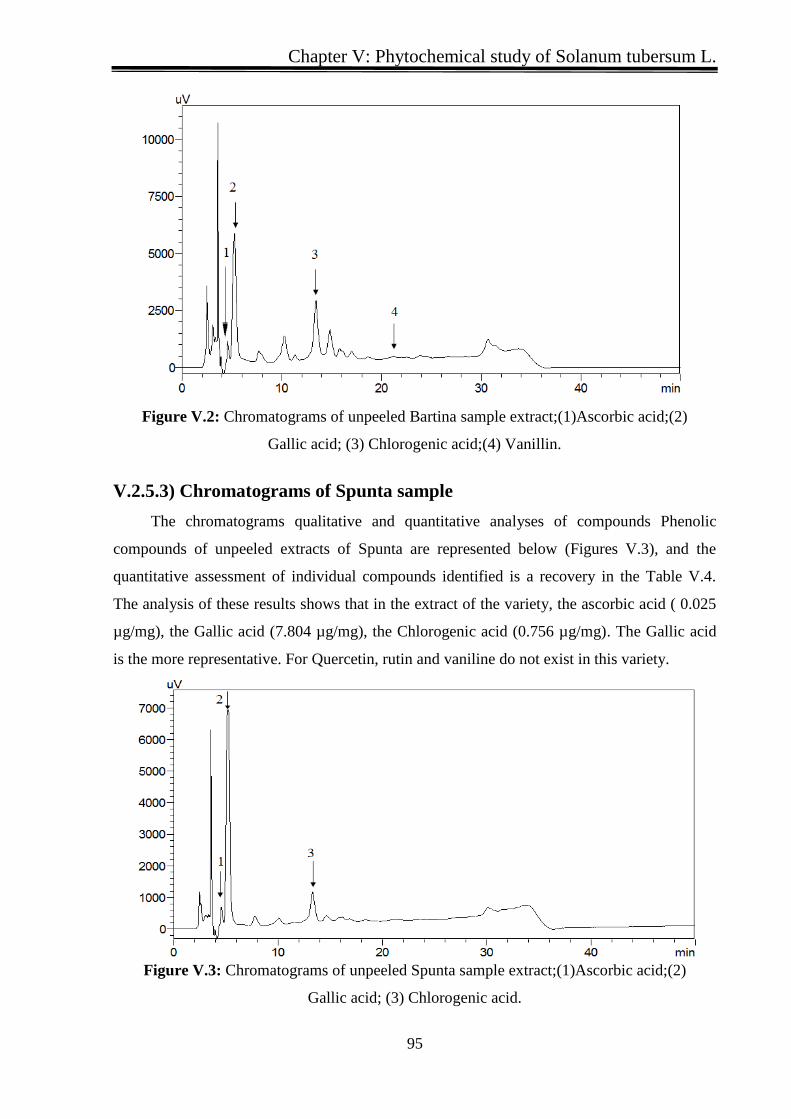
V253) Chromatograms of Spunta sample 95
V254) Chromatograms of Kuroda sample 96
V26) Antioxidant capacity 96
V261) Spectrophotometers 97
V2611) FRAP assay 97
V2612) DPPH 97
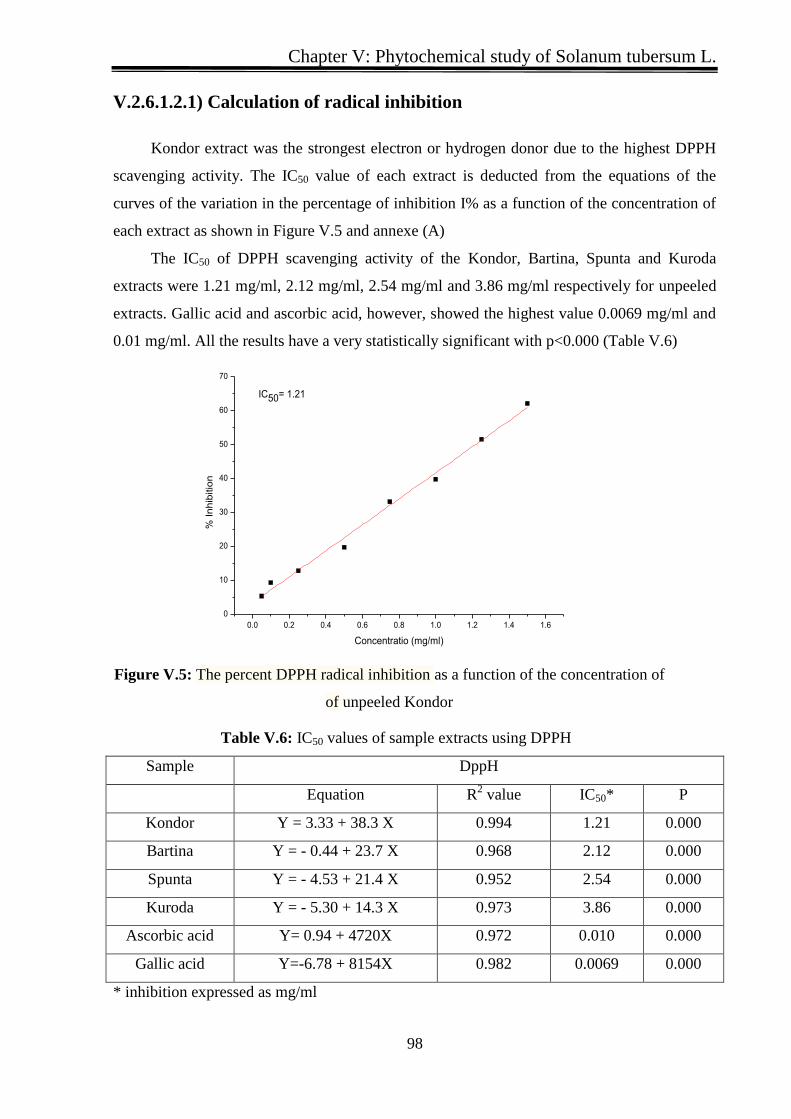
V26121) Calculation of radical inhibition 98
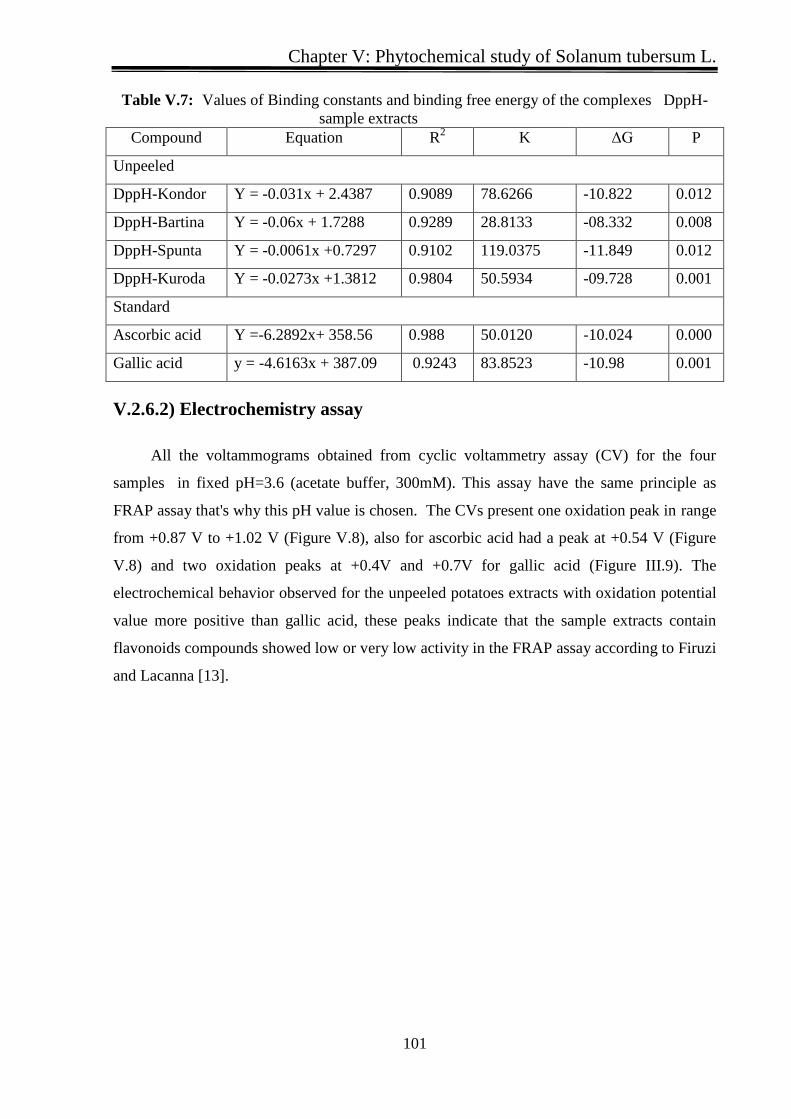
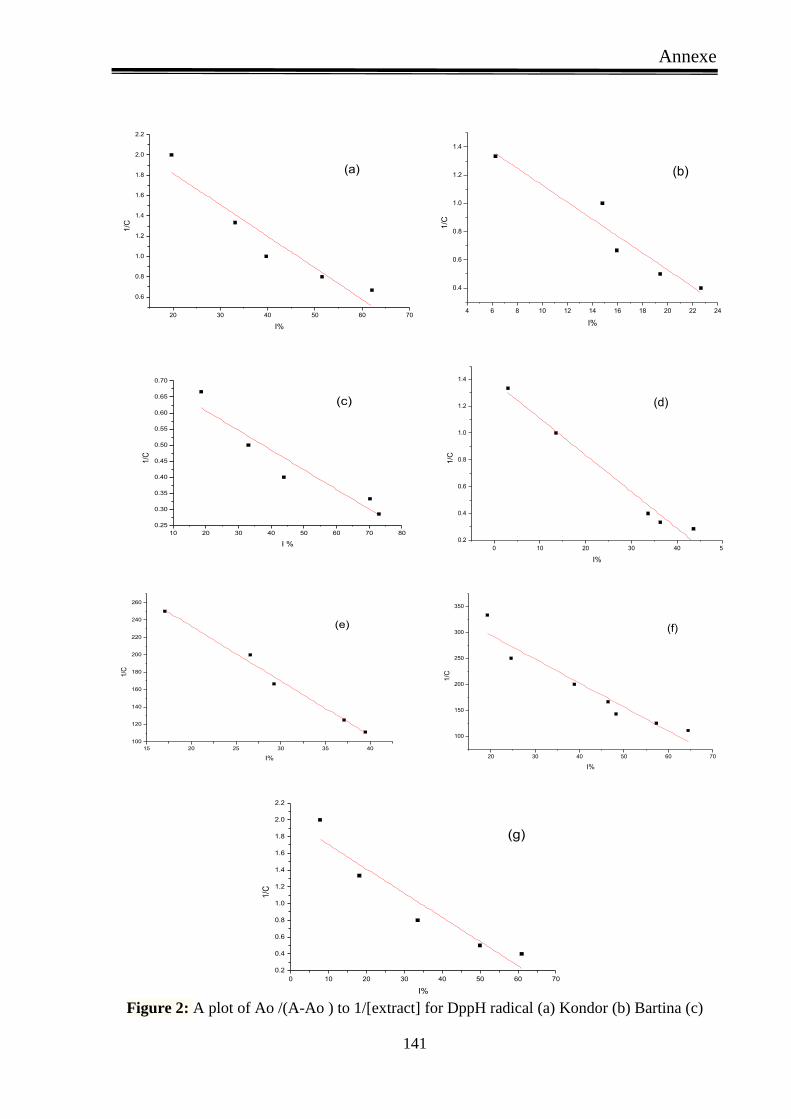
V26122) Calculation of the binding constant 99
V262) Electrochemistry assay 101
V2621) Electrochemistry behavior 103
V2622) Electrochemistry assay radical scavenging activity 104
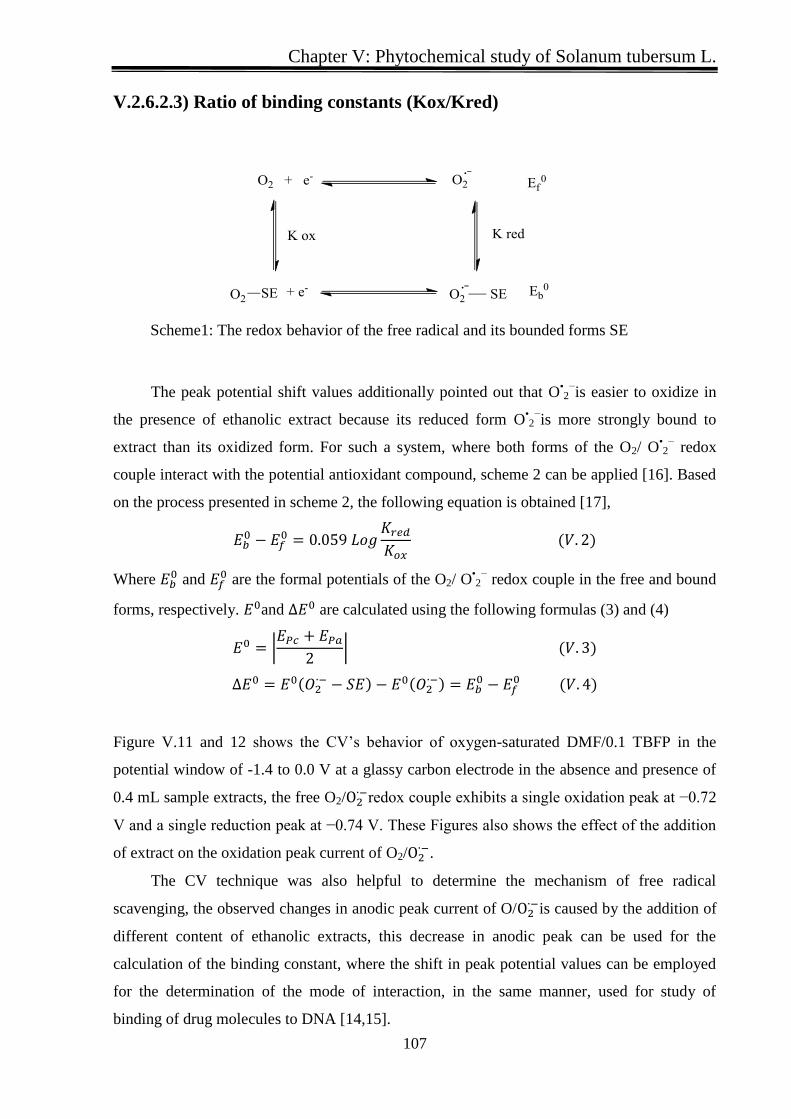
V2623) Ratio of binding constants (KoxKred) 107
V2624) Thermodynamic properties 110
V2625) Diffusion coefficients 111
V27) Discussion 114
V3) Experiment Two Kondor tuber analysis 115
V31) Aim 115
V32) Phytochemical contents 115
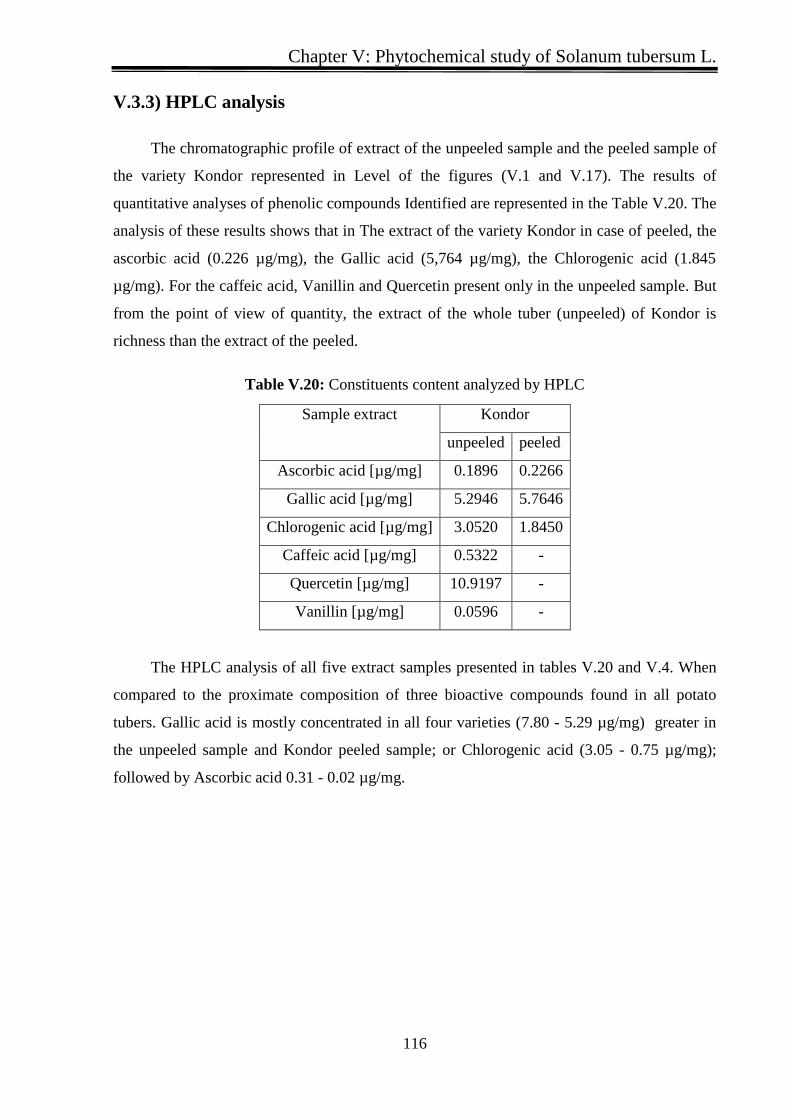
V33) HPLC analysis 116
V34) Spectrophotometers assays 117
V341) FRAP assay 117
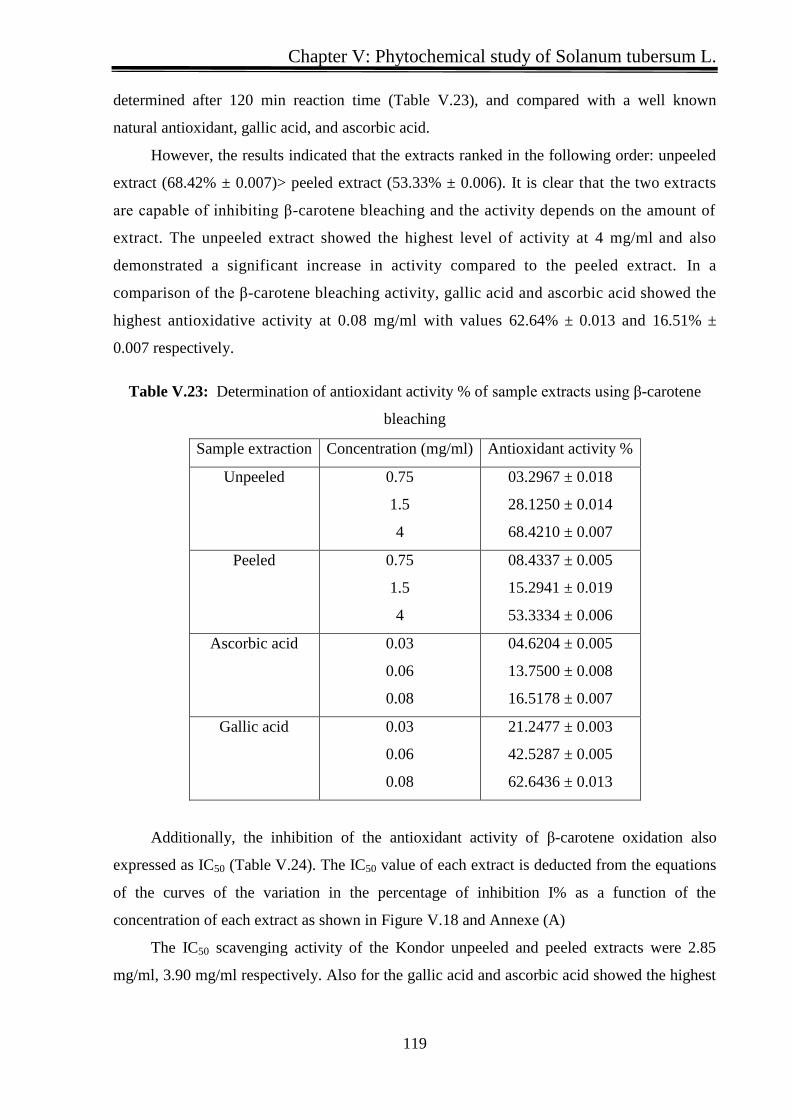
V342) Total antioxidant capacity 118
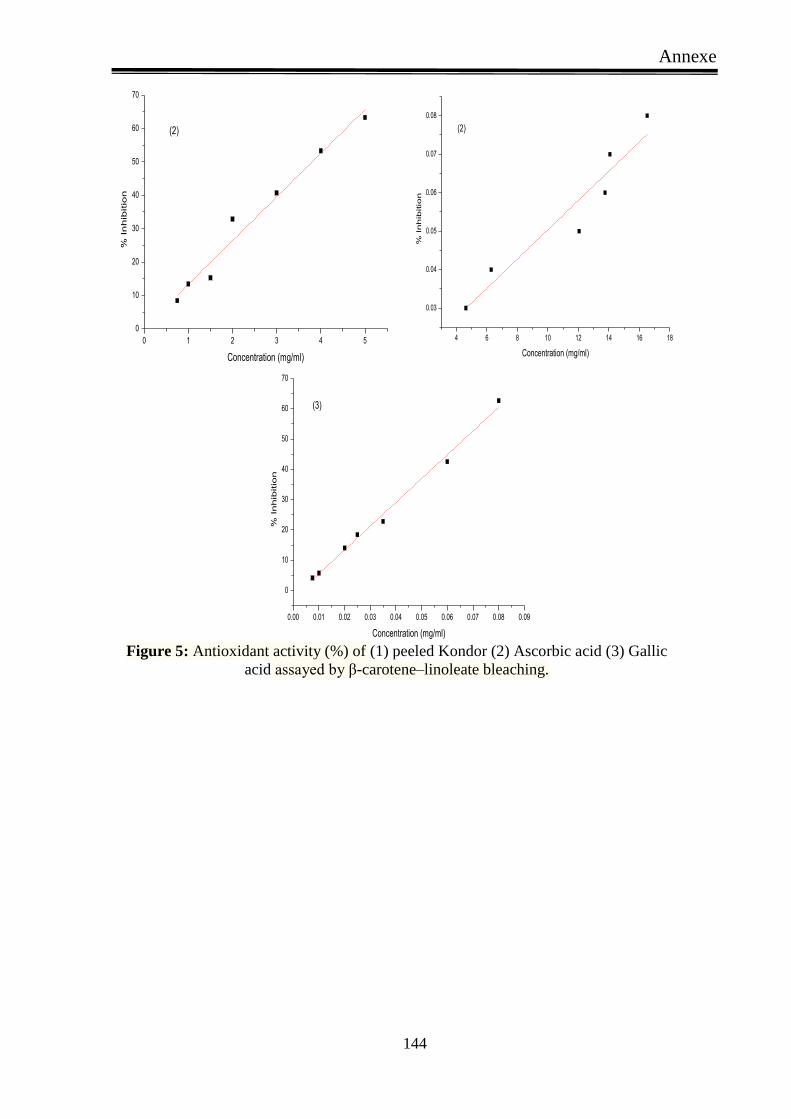
V343) β-carotene bleaching assay 118
V343) DPPH 120
Table of content
XII
V3431) Calculation of radical inhibition 120
V3432) Calculation of the binding constant 121
V35) Electrochemistry assay 122
V352) Electrochemistry assay radical scavenging activity 123
V3521) Ratio of binding constants (KoxKred) 124
V3522)Thermodynamic properties 125
V36) Discussion 126
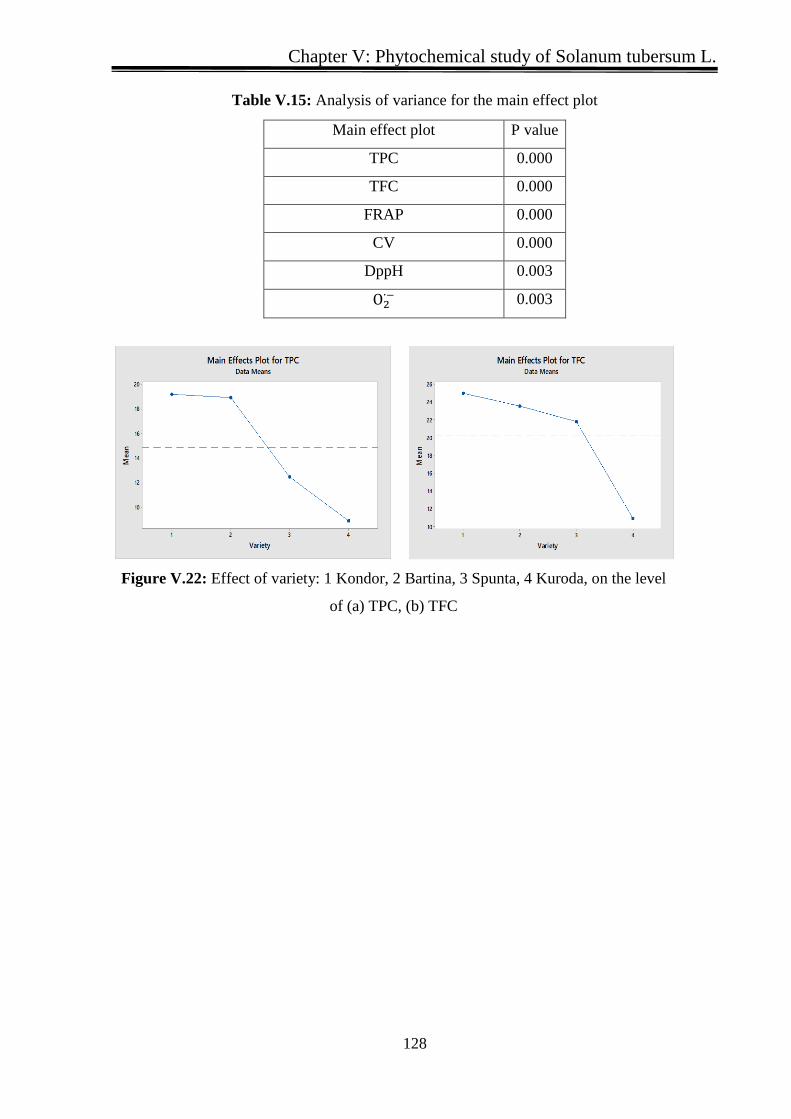
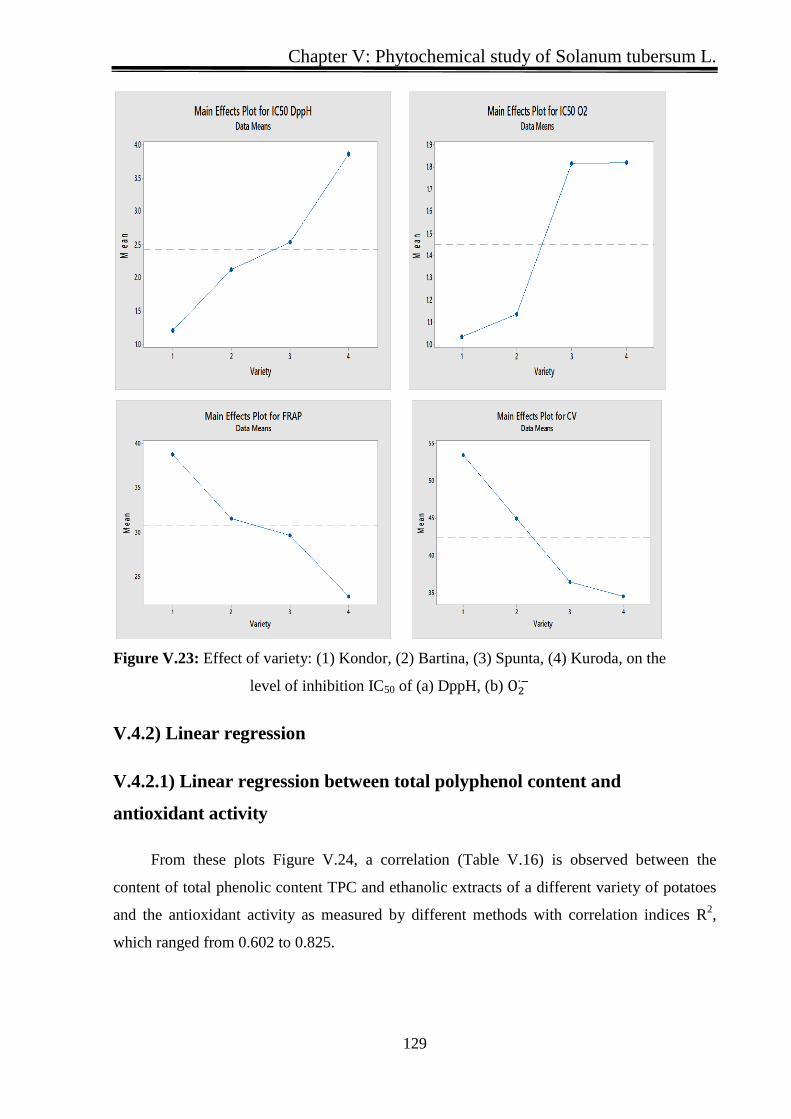
V4) Statistic analysis 127
V41) Main effect plot 127
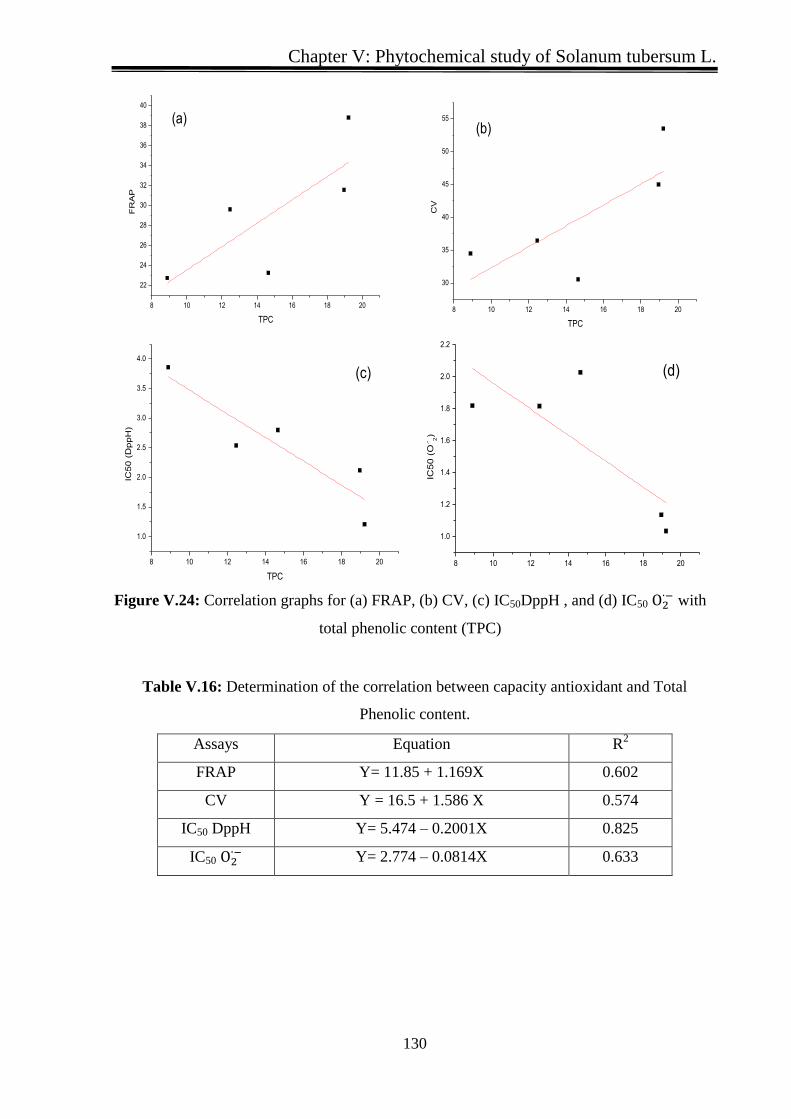
V42) Linear regression 129
V421) Linear regression between total polyphenol content and antioxidant activity 129
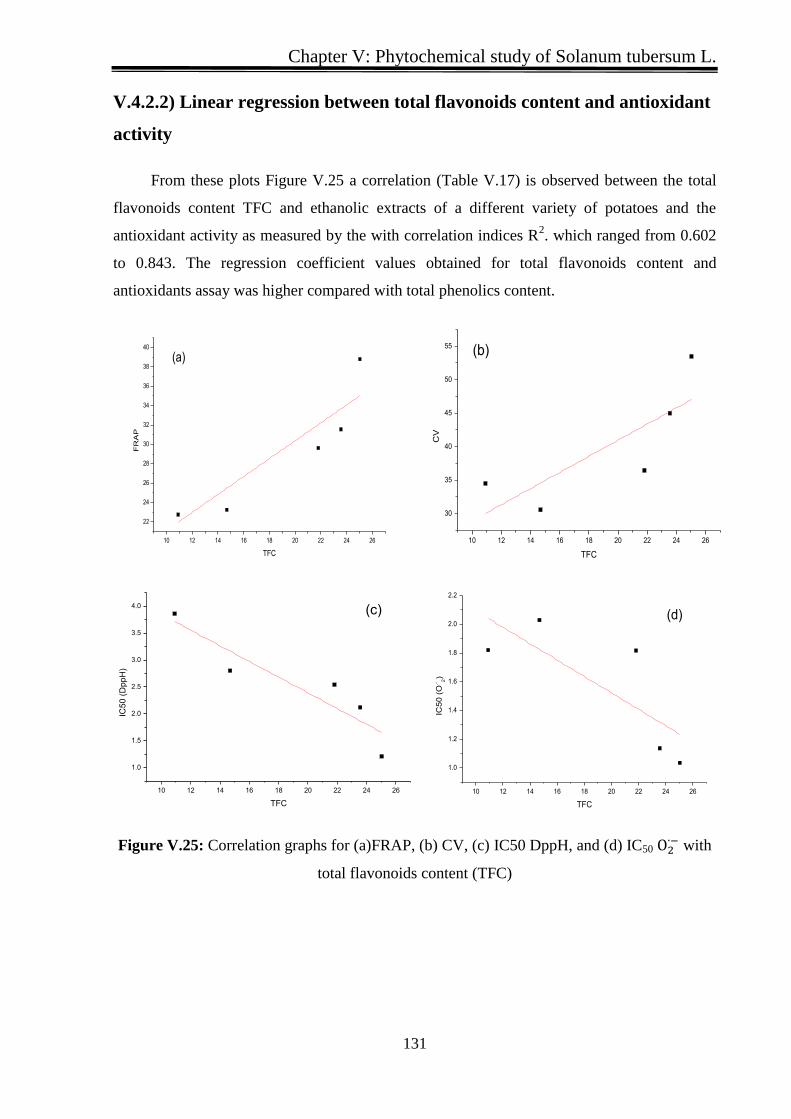
V422) Linear regression between total flavonoids content and antioxidant activity 131
V423) Linear regression between different methods antioxidant activity 133
References 134
General conclusion 136
Annexes
List of Figures
XIII
List of Figures
Figure I 1Mitochondrial ROS production 5
Figure I 2Ascorbic acid 10
Figure I 3α-tocopherol 11
Figure I 4β-carotene 12
Figure I 5phenolic acid derivatives of (a) benzoic and (b) cinnamic acids 13
Figure I 6flavonoids structure 14
Figure I 7Chemical structures of (a)casuarictin and (b) proanthocyanidins 15
Figure I 8Chemical structure of synthetic food antioxidants 17
Figure I 9A selection of potato cultivars 26
Figure I 10The potato plant 28
Figure I 11Different potato variety 31
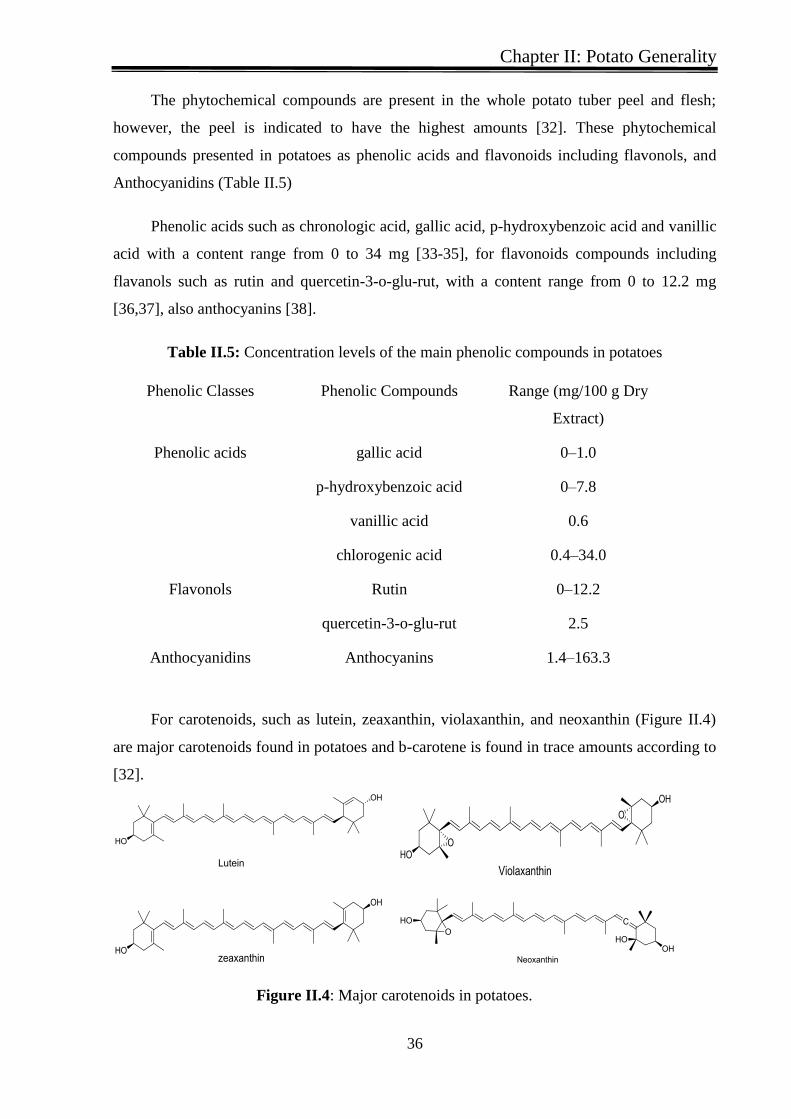
Figure I 12Major carotenoids in potatoes 36
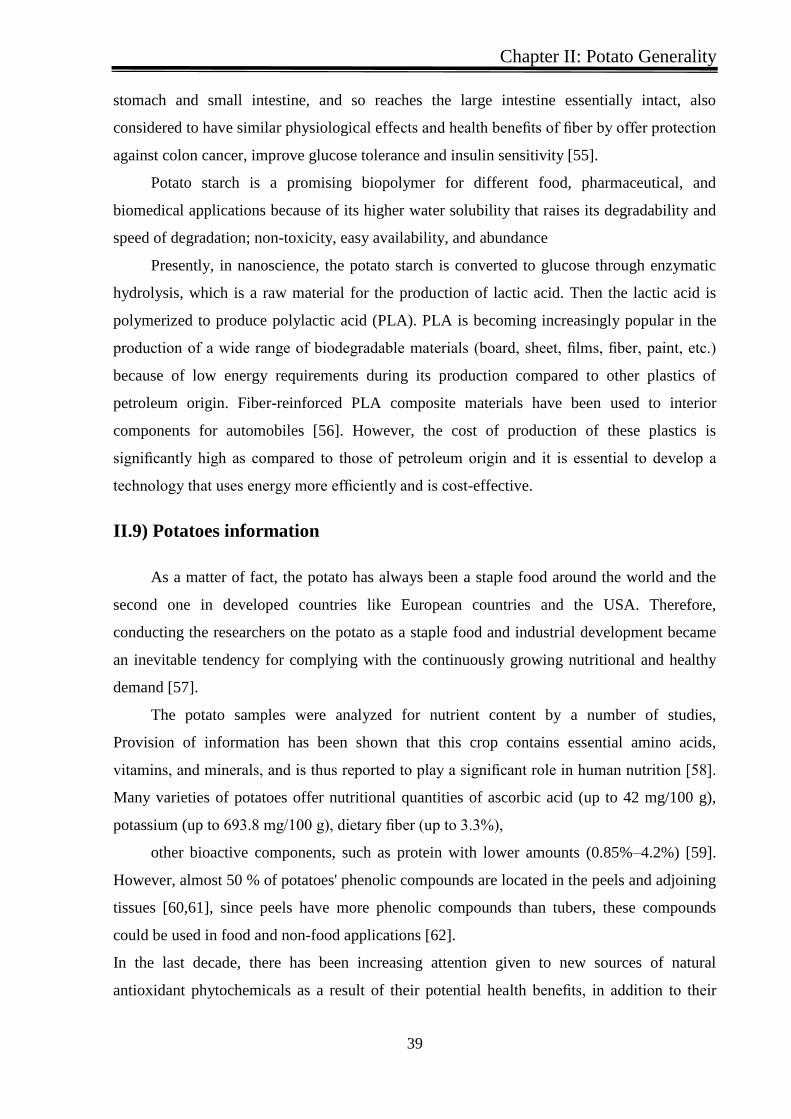
Figure I 13Top five potato-producing countries in 2014 (FAO 2016 ) 38
Figure I 01 The visual appearance of the four potato tuber varieties analyzed in this thesis 41
Figure I 15Typical conventional soxhlet extractor 50
Figure III 1Typical conventional soxhlet extractor 50
Figure III2Block Diagram of an HPLC 57
Figure III3 Cyclic voltammogram for redox system 63
Figure III4 The calibration curve obtained for Gallic acid 65
Figure III5 The calibration curve obtained for Rutine 66
Figure III6The calibration curve obtained for Ascorbic acid TAC 67
Figure III7Chromatograms of standard phenolic compounds1ascorbic acid 2gallic acid 3
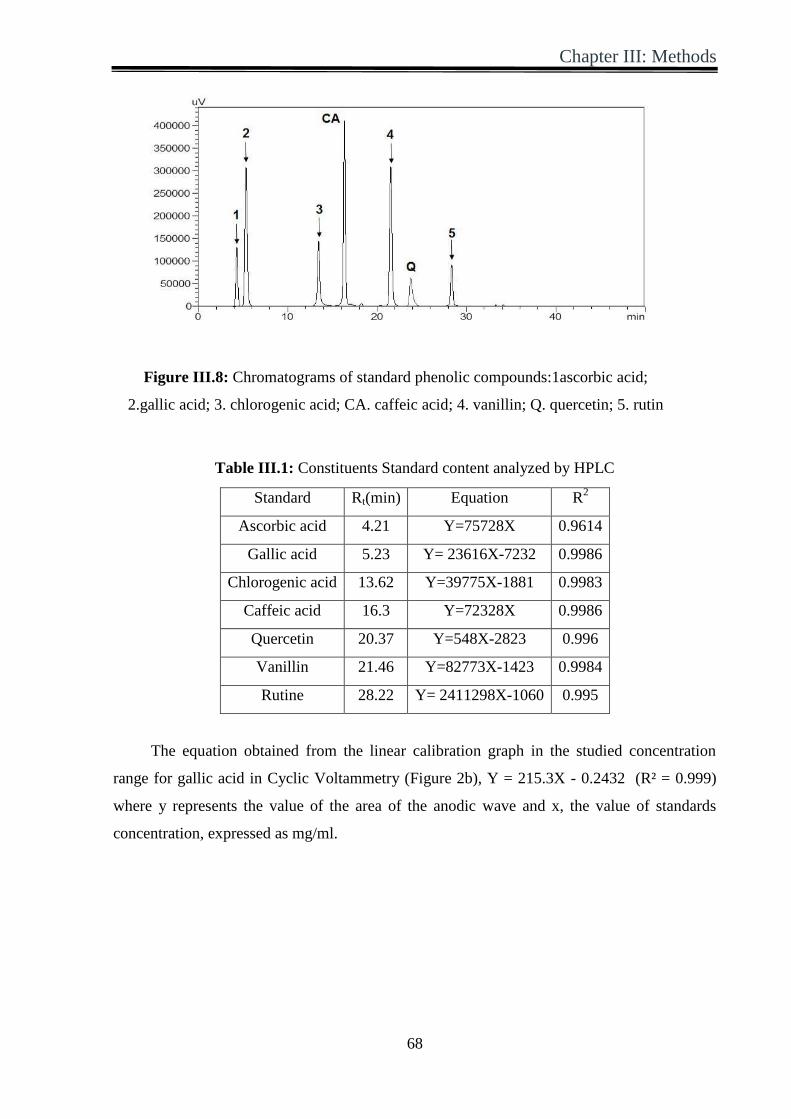
chlorogenic acid CA caffeic acid 4 vanillin Q quercetin 5 rutin 68
Figure III8Voltammograms obtained for gallic acid (a) and (b) The calibration curve
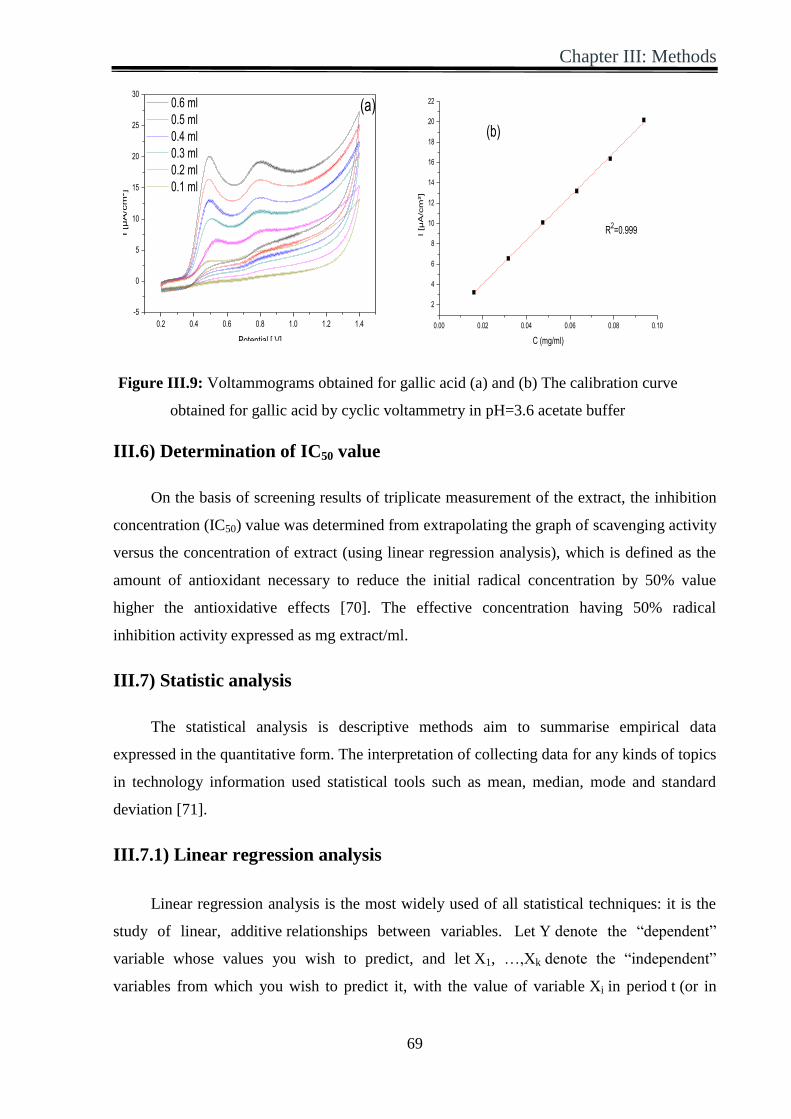
obtained for gallic acid by cyclic voltammetry in pH=36 acetate buffer 69
List of Figures
XIV
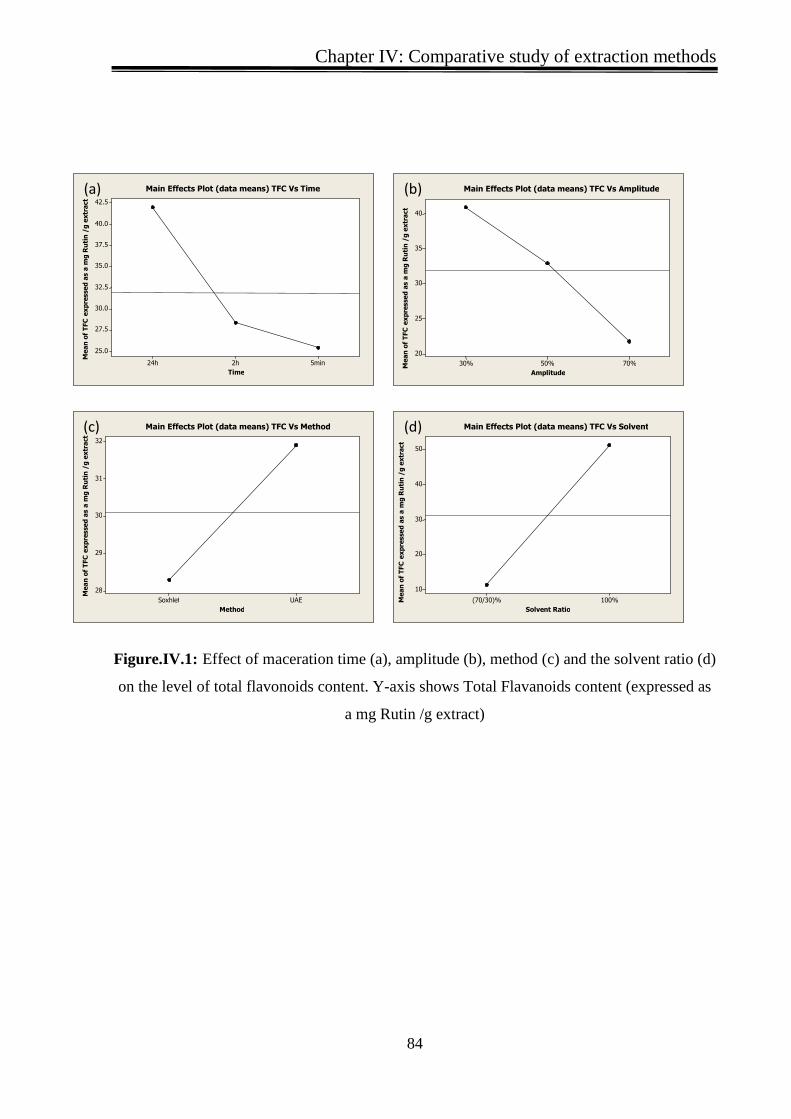
Figure IV1 Effect of maceration time (a) amplitude (b) method (c) and the solvent ratio (d)
on the level of total flavonoids content Y-axis shows Total Flavanoids content (expressed as
a mg Rutin g extract) 84
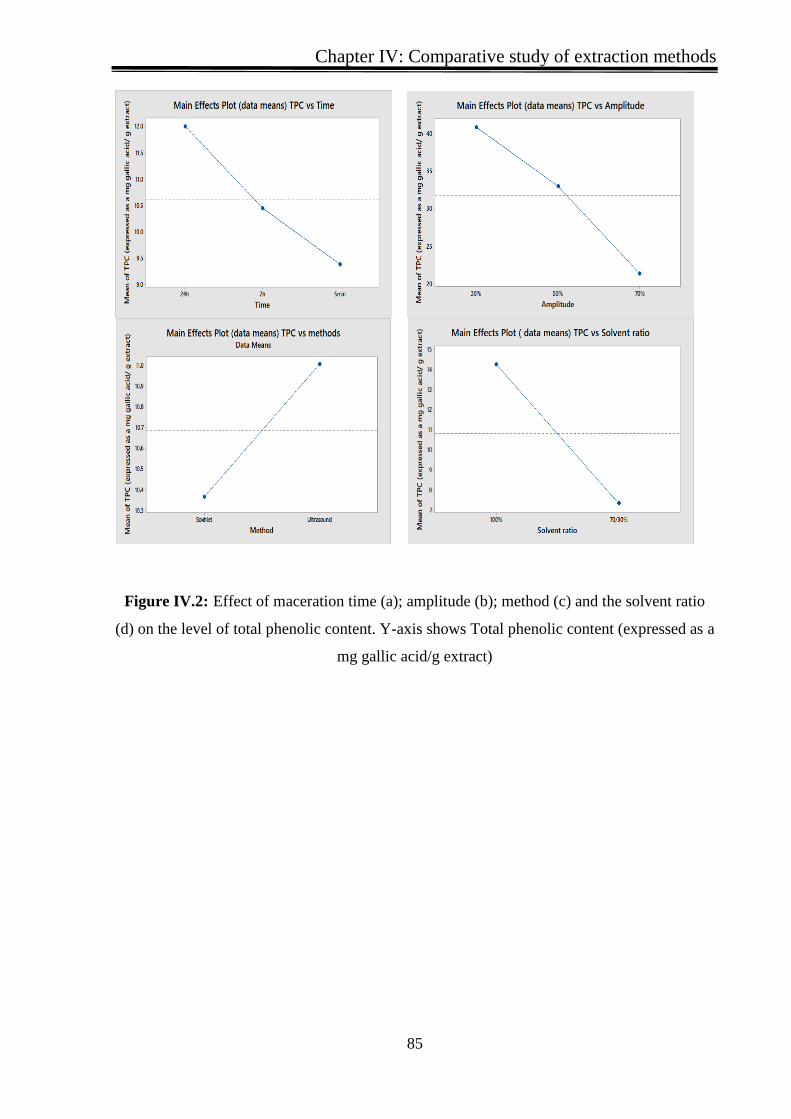
Figure IV2 Effect of maceration time (a) amplitude (b) method (c) and the solvent ratio (d)
on the level of total phenolic content Y-axis shows Total phenolic content (expressed as a mg
gallic acidg extract) 85
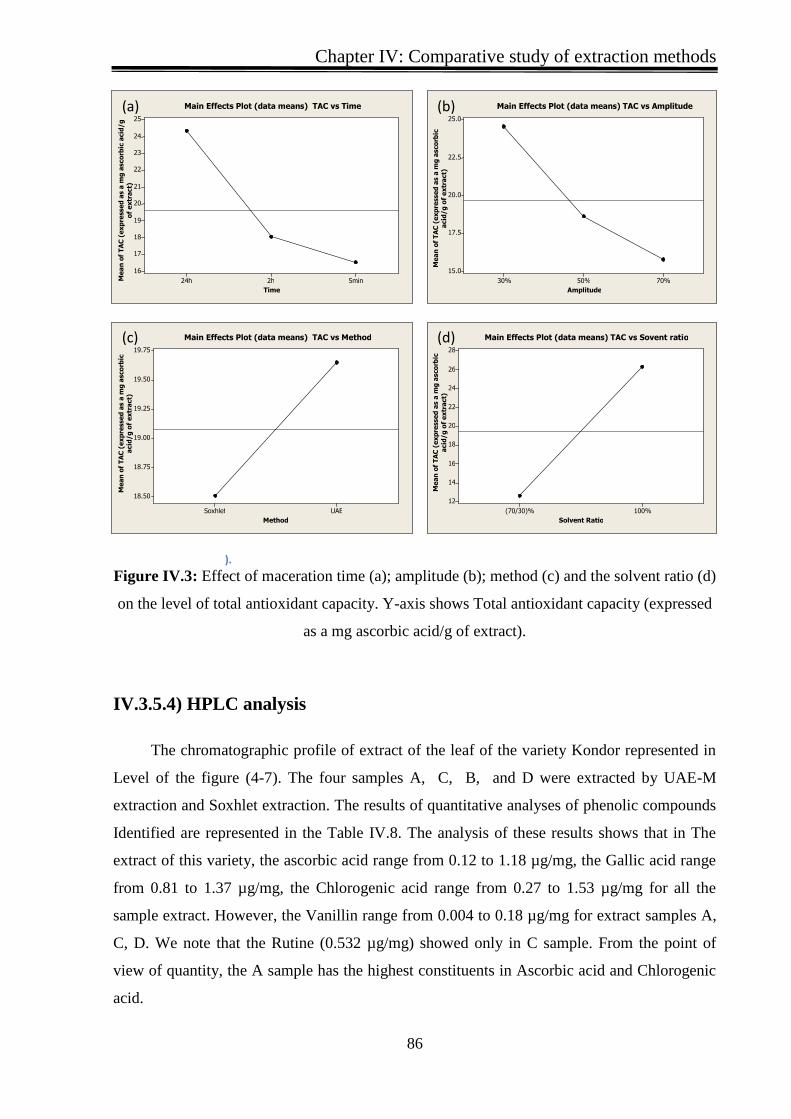
Figure IV3 Effect of maceration time (a) amplitude (b) method (c) and the solvent ratio (d)
on the level of total antioxidant capacity Y-axis shows Total antioxidant capacity (expressed
as a mg ascorbic acidg of extract) 86
Figure IV4 Chromatograms of sample extract A(1)Ascorbic acid(2) Gallic acid (3)
Chlorogenic acid(4) Vanillin 87
Figure IV5Chromatograms of sample extract B(1)Ascorbic acid(2) Gallic acid (3)
Chlorogenic acid 70
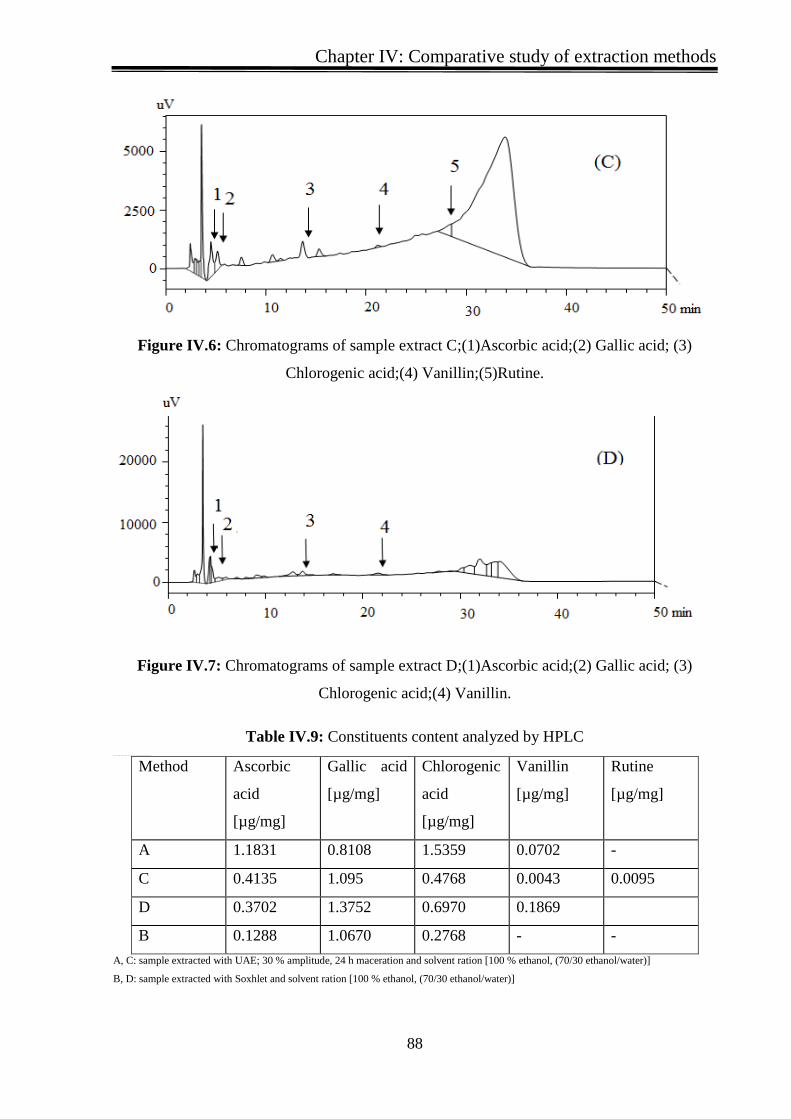
Figure IV6Chromatograms of sample extract C(1)Ascorbic acid(2) Gallic acid (3)
Chlorogenic acid(4) Vanillin(5)Rutine 88
Figure IV7Chromatograms of sample extract D(1)Ascorbic acid(2) Gallic acid (3)
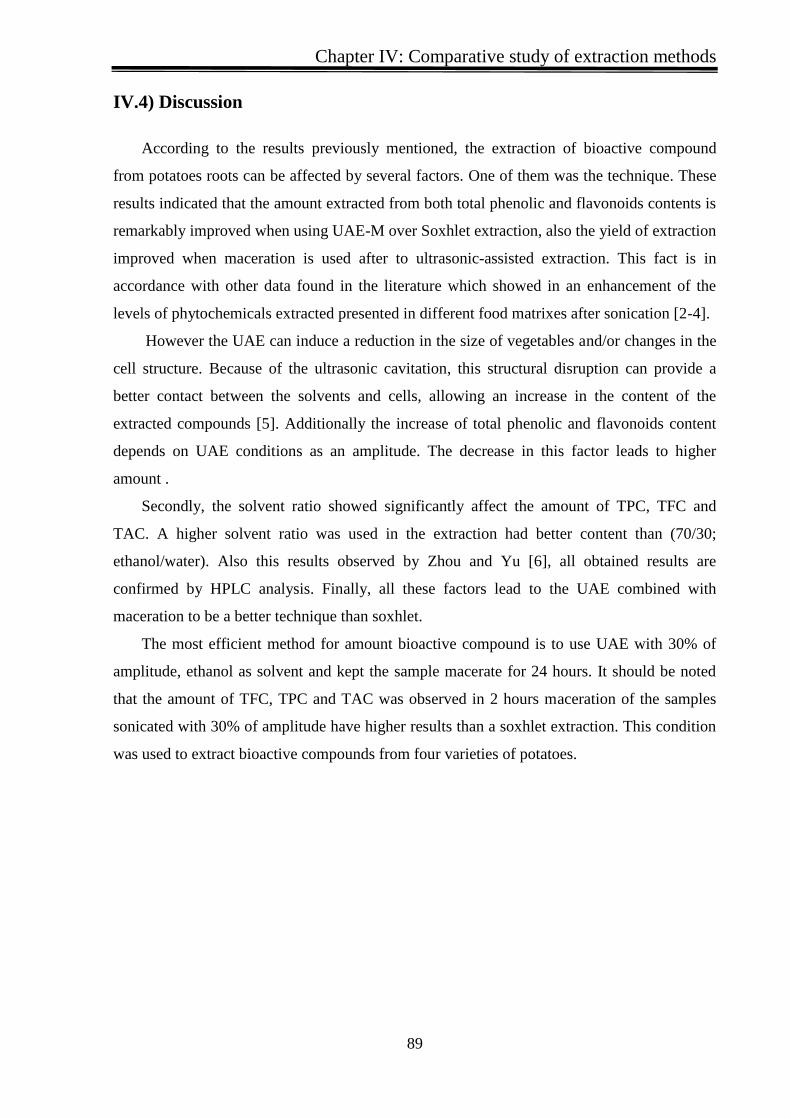
Chlorogenic acid(4) Vanillin 88
Figure V1Chromatograms of unpeeled Kondor extract(1)Ascorbic acid(2) Gallic acid (3)
Chlorogenic acid(4) Caffeic acid (5) Quercetin (6)Vanillin 94
Figure V2Chromatograms of unpeeled Bartina sample extract(1)Ascorbic acid(2) Gallic
acid (3) Chlorogenic acid(4) Vanillin 95
Figure V3Chromatograms of unpeeled Spunta sample extract(1)Ascorbic acid(2) Gallic
acid (3) Chlorogenic acid 95
Figure V4Chromatograms of unpeeled Kuroda sample extract(1)Ascorbic acid(2) Gallic
acid (3) Chlorogenic acid(4) Rutine 96
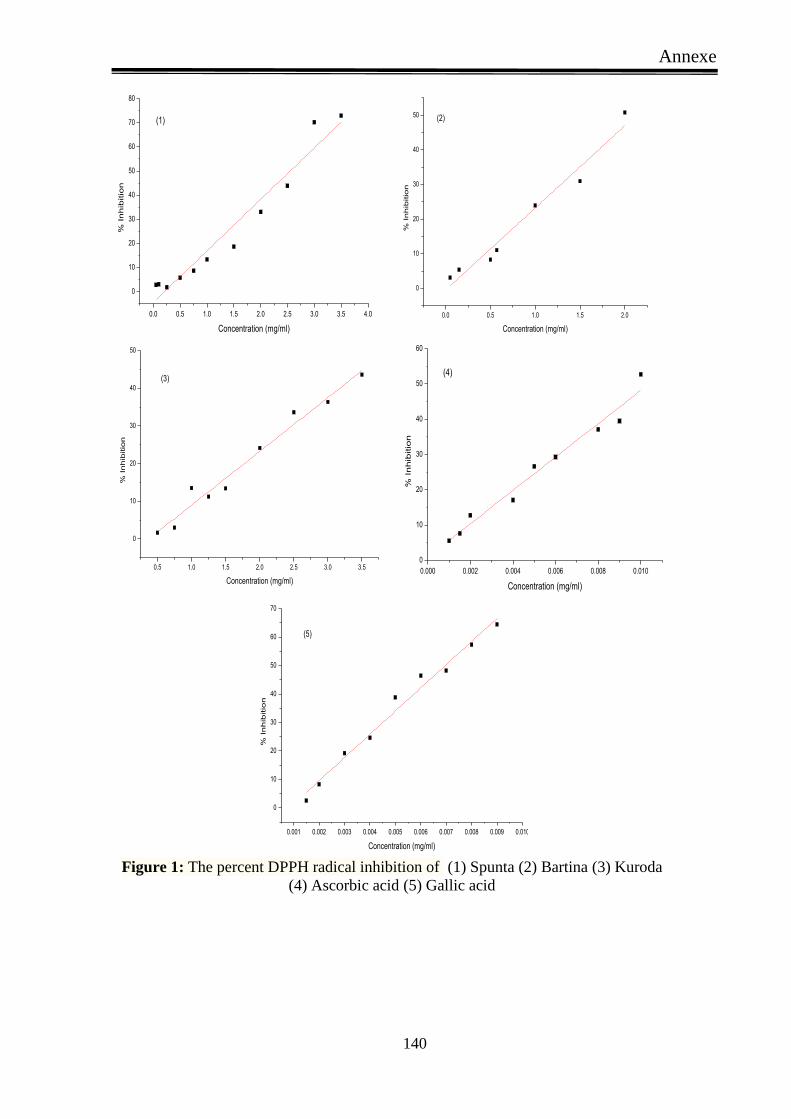
Figure V5The percent DPPH radical inhibition as a function of the concentration of of
unpeeled Kondor 98
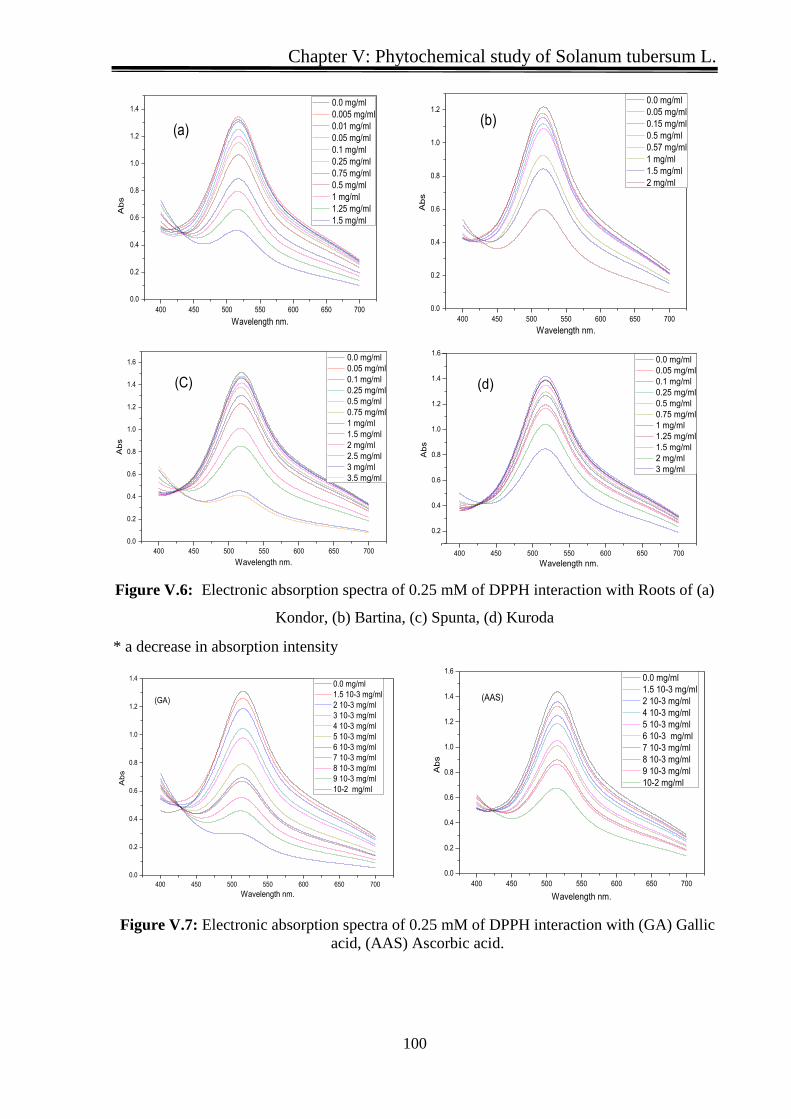
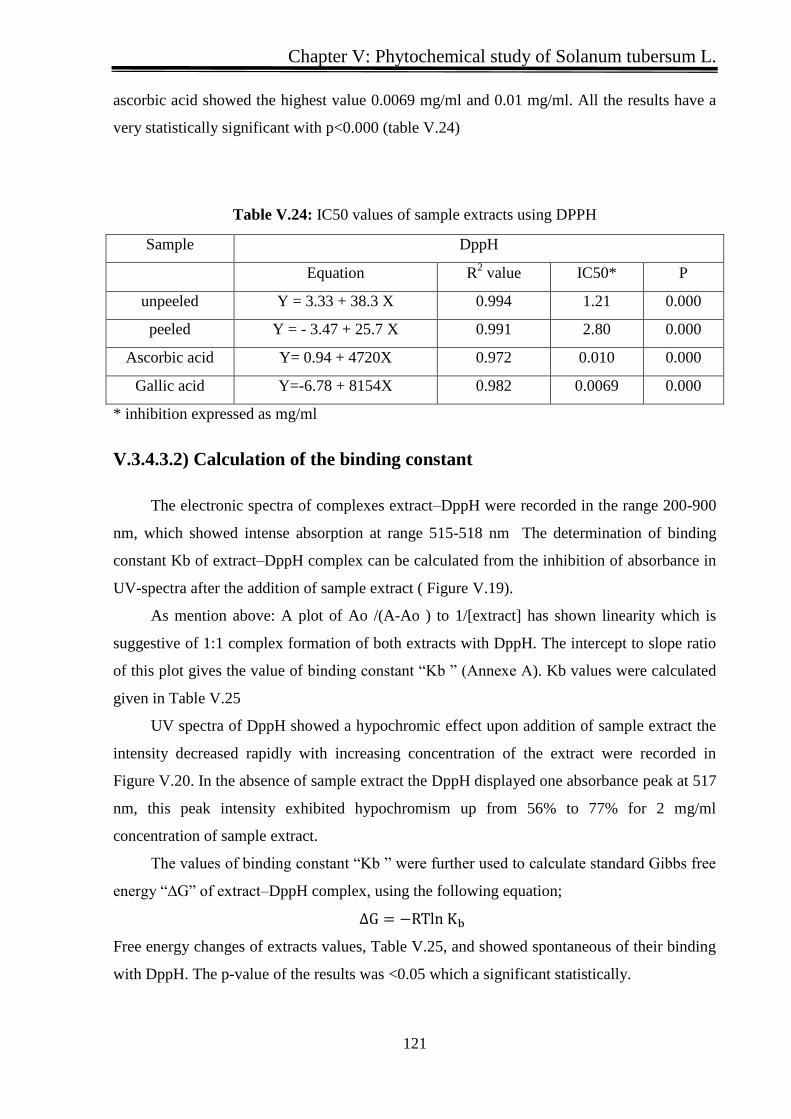
Figure V6Electronic absorption spectra of 025 mM of DPPH interaction with Roots of (a)
Kondor (b) Bartina (c) Spunta (d) Kuroda 100
Figure V7 Electronic absorption spectra of 025 mM of DPPH interaction with (GA) Gallic
acid (AAS) Ascorbic acid 100
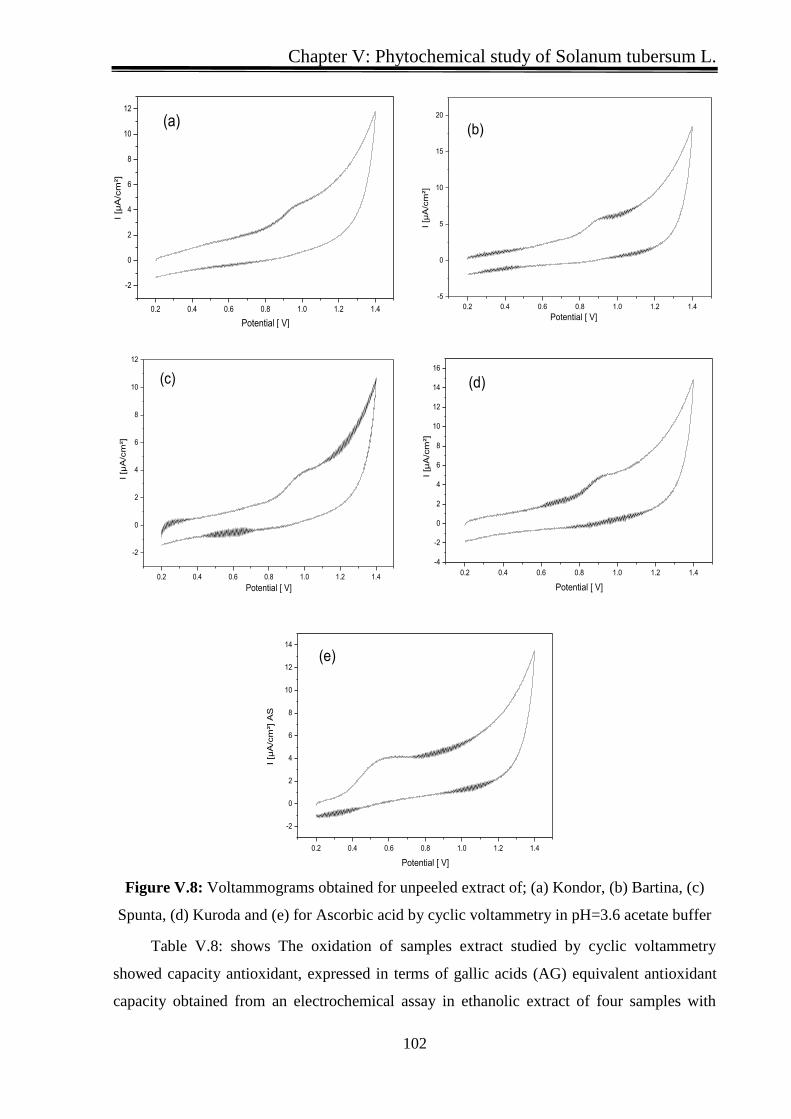
Figure V8 Voltammograms obtained for unpeeled extract of (a) Kondor (b) Bartina (c)
Spunta (d) Kuroda and (e) for Ascorbic acid by cyclic voltammetry in pH=36 acetate buffer
102
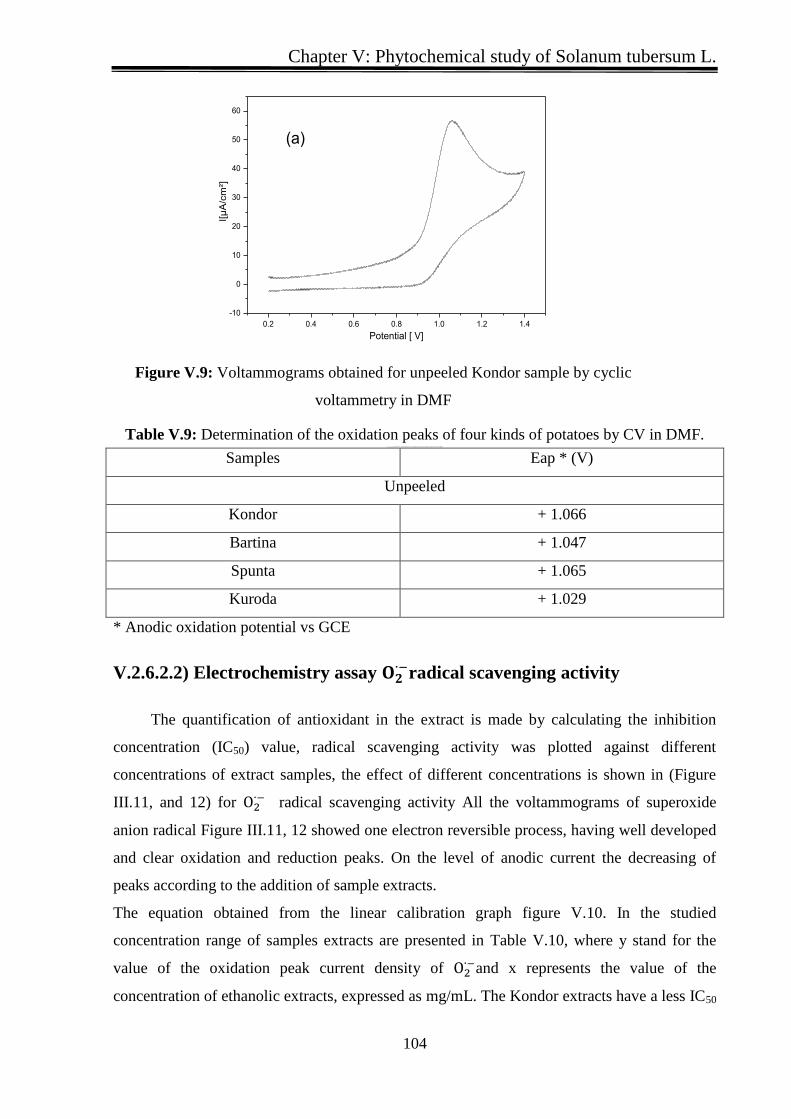
Figure V9 Voltammograms obtained for unpeeled Kondor sample by cyclic voltammetry in
DMF 104
List of Figures
XV
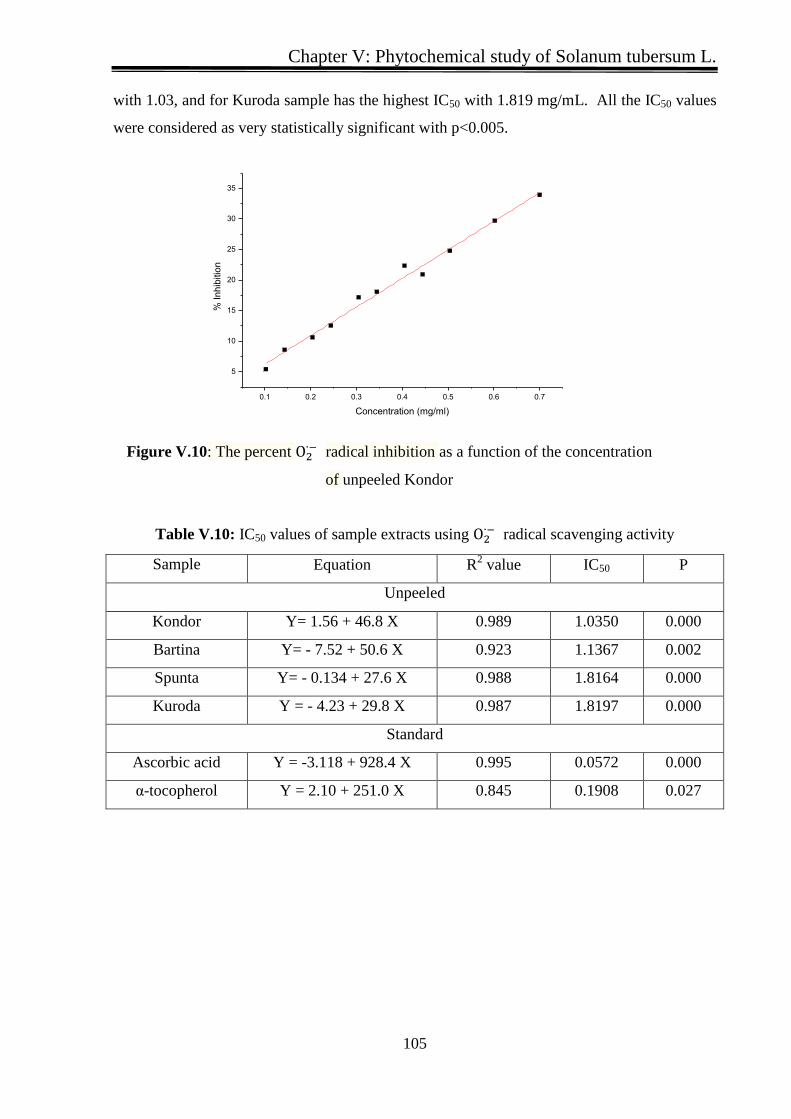
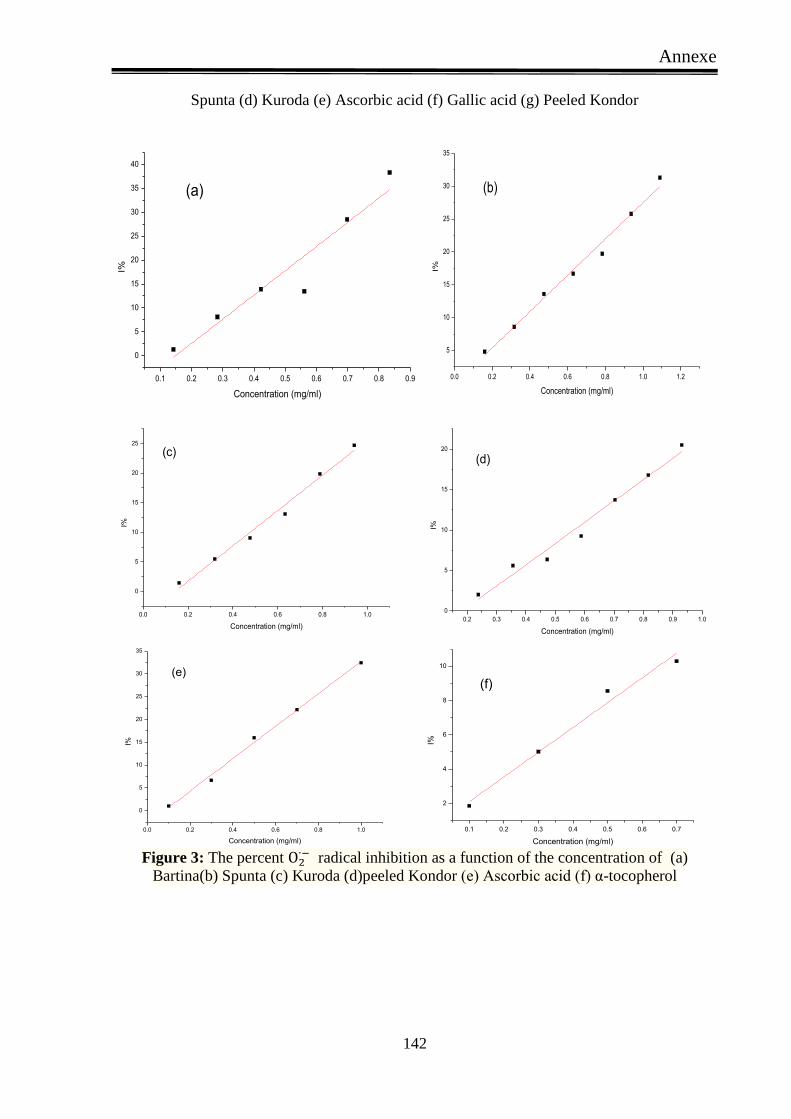
Figure V10 The percent O_2^(∙-) radical inhibition as a function of the concentration of
unpeeled Kondor 105
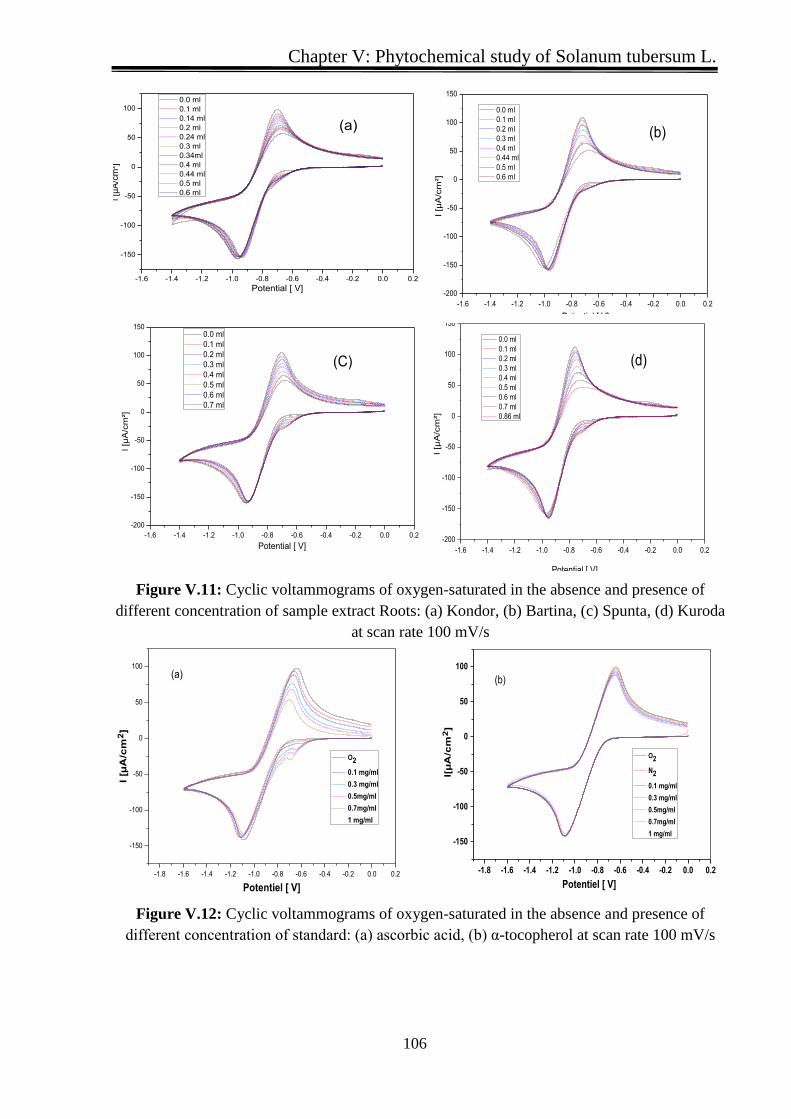
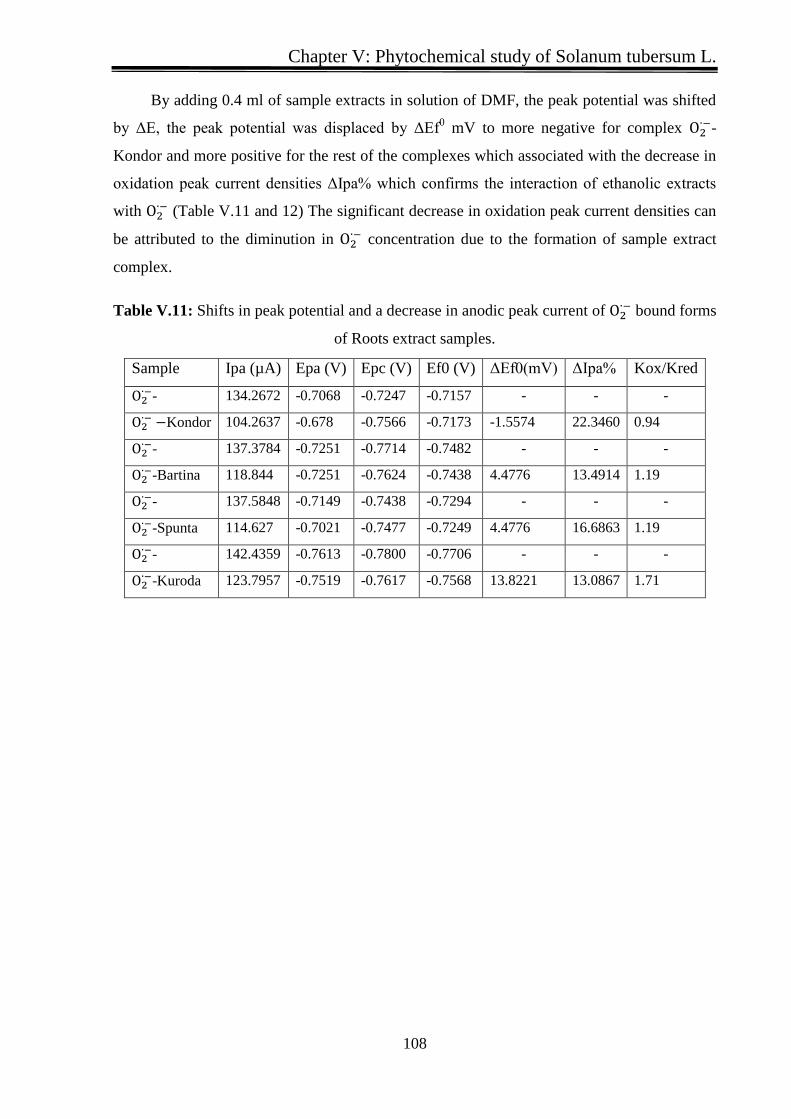
Figure V11 Cyclic voltammograms of oxygen-saturated in the absence and presence of
different concentration of sample extract Roots (a) Kondor (b) Bartina (c) Spunta (d)
Kuroda at scan rate 100 mVs 106
Figure V12Cyclic voltammograms of oxygen-saturated in the absence and presence of
different concentration of standard (a) ascorbic acid (b) α-tocopherol at scan rate 100 mVs
106
Figure V13Voltammograms of oxygen-saturated in the absence and presence of 04 ml
sample extract Roots (a) Kondor (b) Bartina (c) Spunta (d) Kuroda at scan rate 100 mVs
109
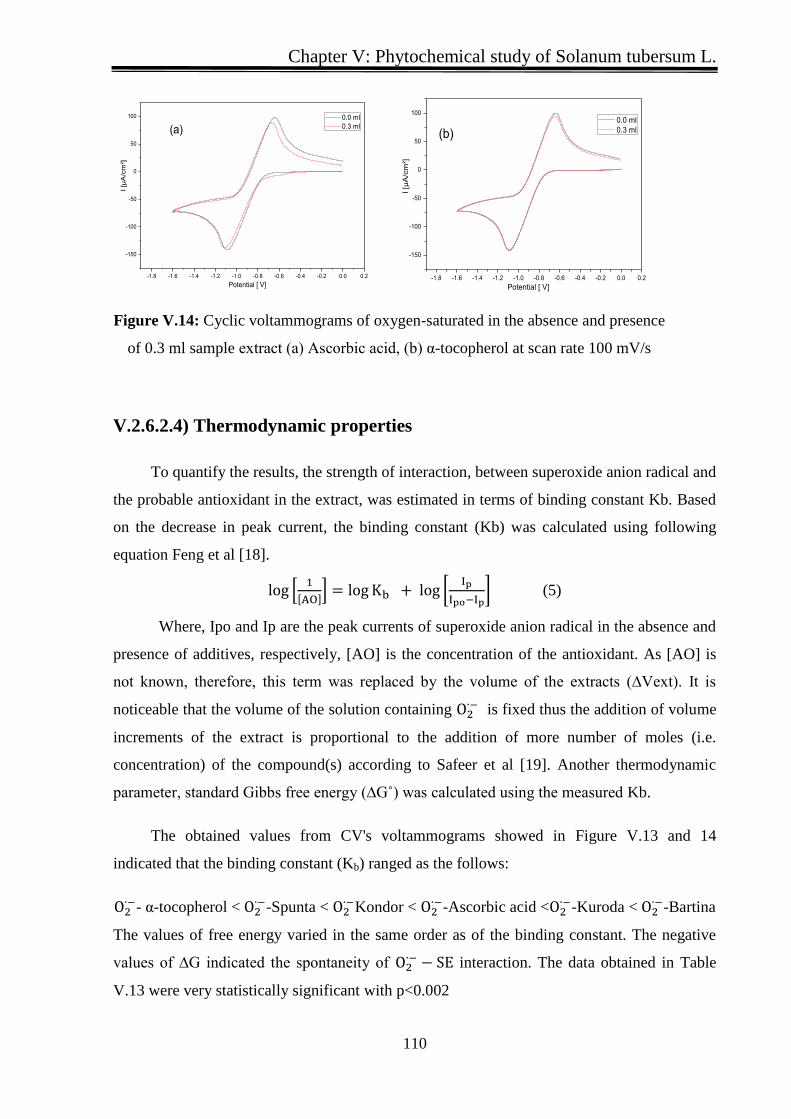
Figure V14Cyclic voltammograms of oxygen-saturated in the absence and presence of 03
ml sample extract (a) Ascorbic acid (b) α-tocopherol at scan rate 100 mVs 110
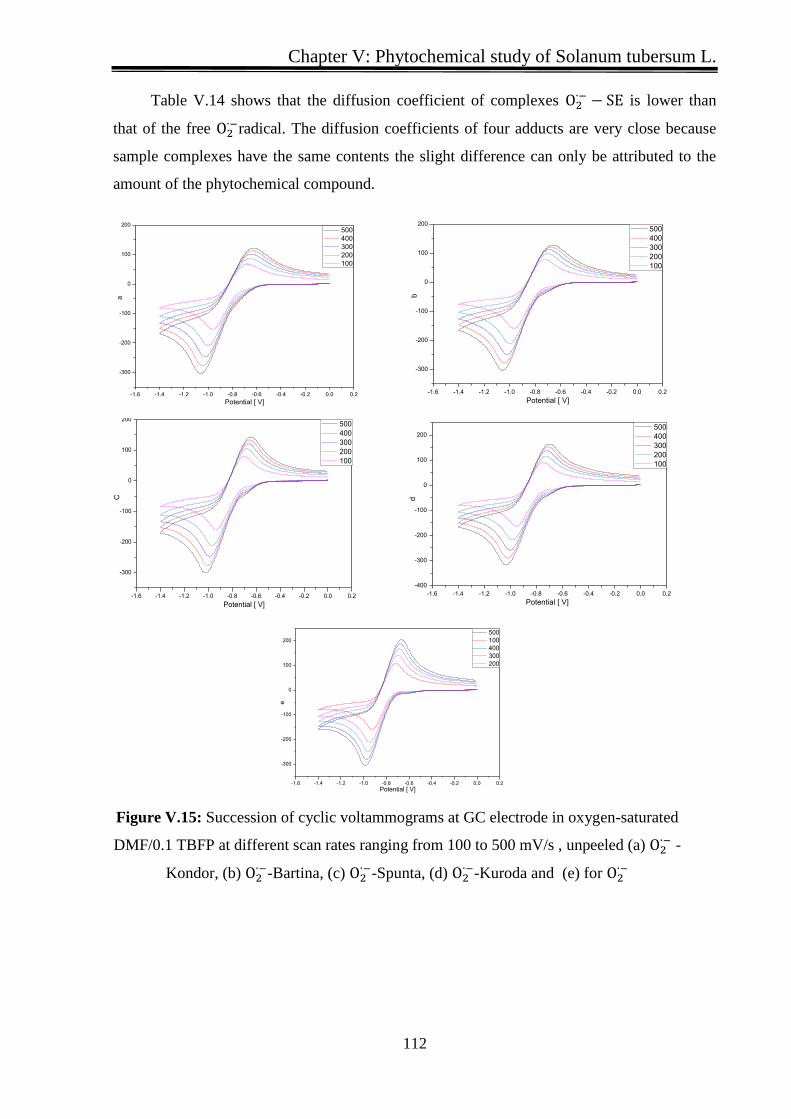
Figure V15 Succession of cyclic voltammograms at GC electrode in oxygen-saturated
DMF01 TBFP at different scan rates ranging from 100 to 500 mVs unpeeled (a) O_2^(∙-) -
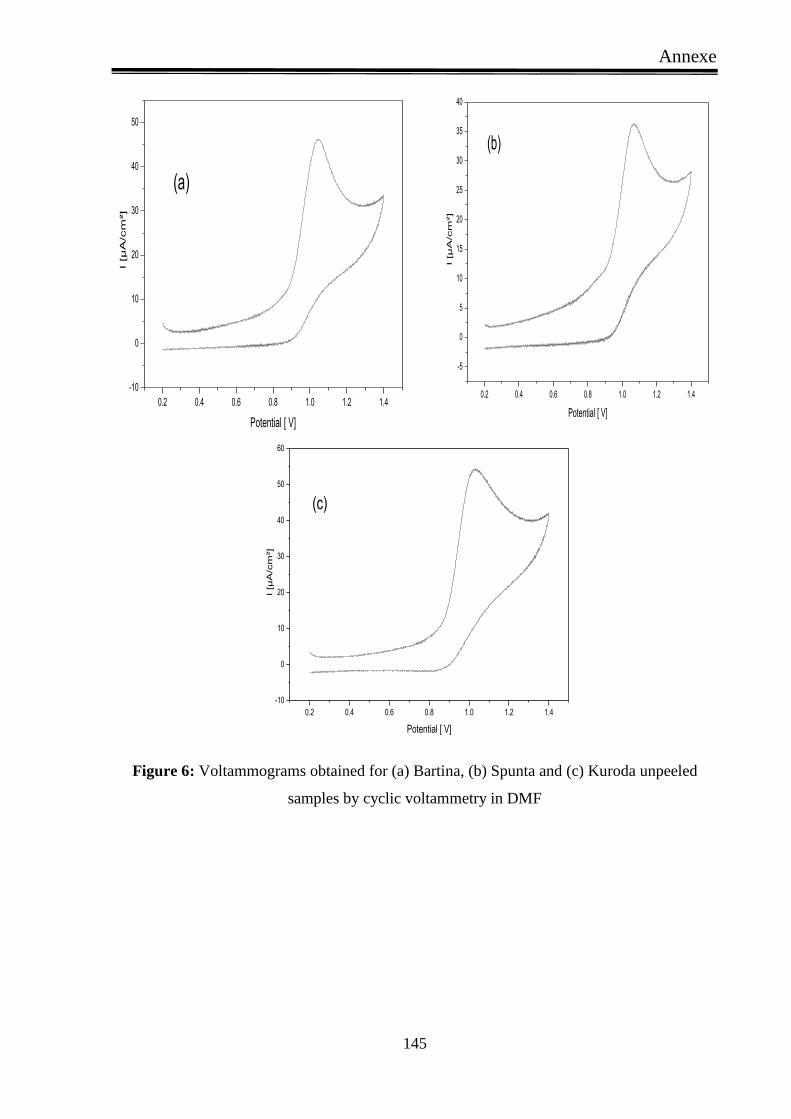
Kondor (b) O_2^(∙-)-Bartina (c) O_2^(∙-)-Spunta (d) O_2^(∙-)-Kuroda and (e) for 112
Figure V16 ipa versus V12 plots of oxygen-saturated DMF A in absence of 04 ml of
unpeeled extract 113
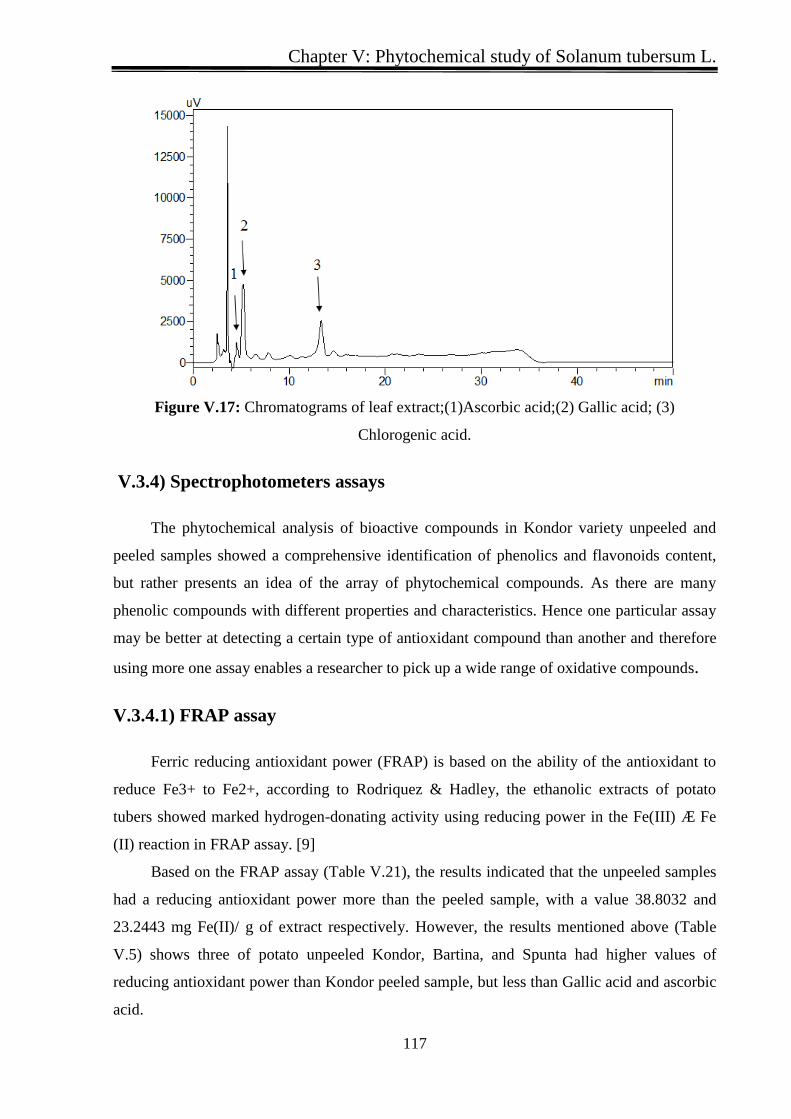
Figure V17Chromatograms of leaf extract(1)Ascorbic acid(2) Gallic acid (3) Chlorogenic
acid 116
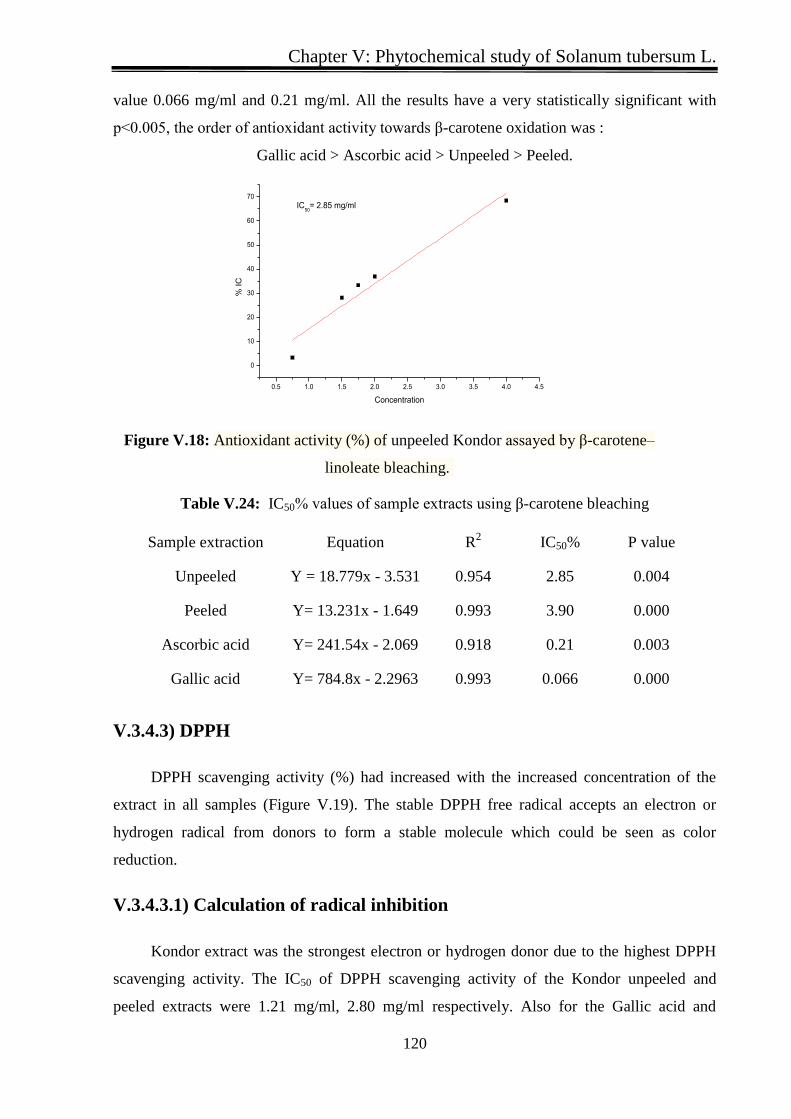
Figure V18Antioxidant activity () of unpeeled Kondor assayed by β-carotenendashlinoleate
bleaching 120
Figure V19Electronic absorption spectra of 025 mM of DPPH interaction with of (a) Root
and (b) Flesh 122
Figure V20Cyclic voltammograms of oxygen-saturated in the absence and presence of
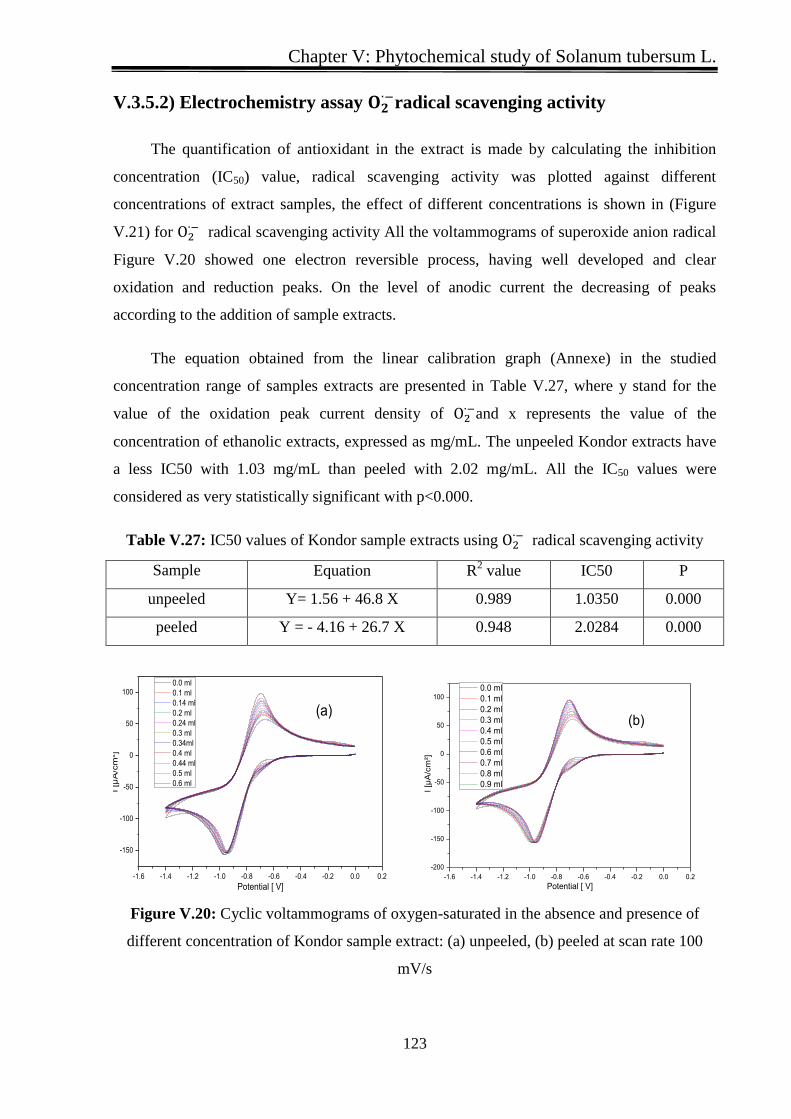
different concentration of Kondor sample extract (a) unpeeled (b) peeled at scan rate 100
mVs 123
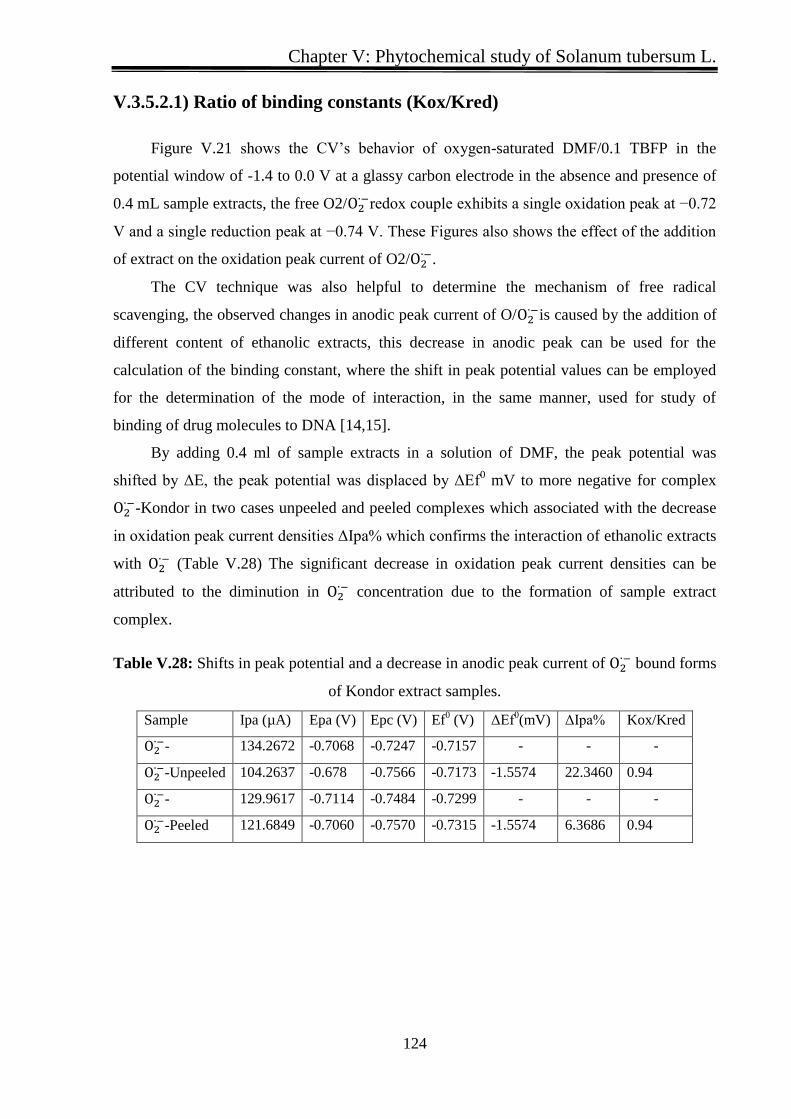
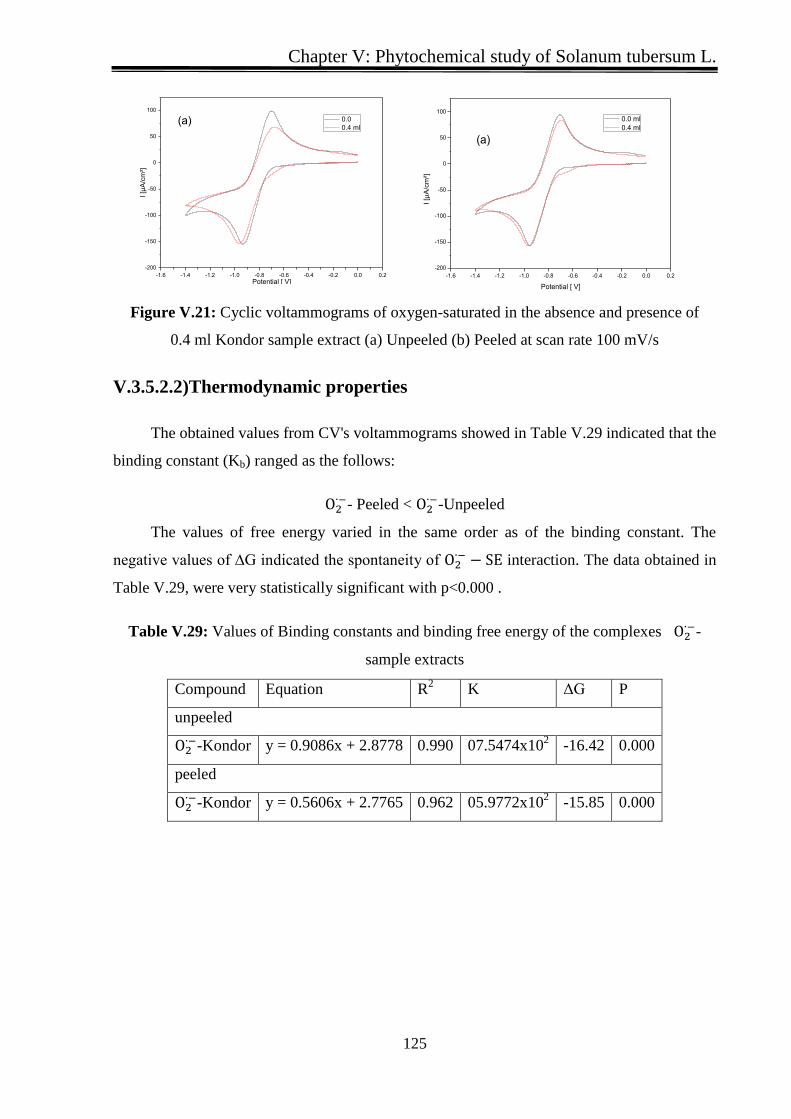
Figure V21Cyclic voltammograms of oxygen-saturated in the absence and presence of 04
ml Kondor sample extract (a) Unpeeled (b) Peeled at scan rate 100 mVs 125
Figure V22Effect of variety 1 Kondor 2 Bartina 3 Spunta 4 Kuroda on the level of (a)
TPC (b) TFC 127
Figure V23Effect of variety (1) Kondor (2) Bartina (3) Spunta (4) Kuroda on the level of
inhibition IC50 of (a) DppH (b) O_2^(∙-) 128
Figure V24Correlation graphs for (a) FRAP (b) CV (c) IC50DppH and (d) IC50 O_2^(∙-)
with total phenolic content (TPC) 129
List of Figures
XVI
Figure V25Correlation graphs for (a)FRAP (b) CV (c) IC50 DppH and (d) IC50 O_2^(∙-)
with total flavonoids content (TFC) 130
Figure V26Correlation graphs for (a) FRAP and CV (b) IC50 between DppH and O_2^(∙-)
132
List of Tables
XVII
List of Tables
Table I1 Endogenous Sources of Free Radicals 6
Table II1 Significant happenings in the history of the potato 27
Table II2 Proximate composition of edible portion of potatoes 34
Table II3 Selected nutrients and vitamins in flesh and peel of raw potatoes (based on 100 g
wet basis) 34
Table II4 Nutrition information of potato (dry weight) 35
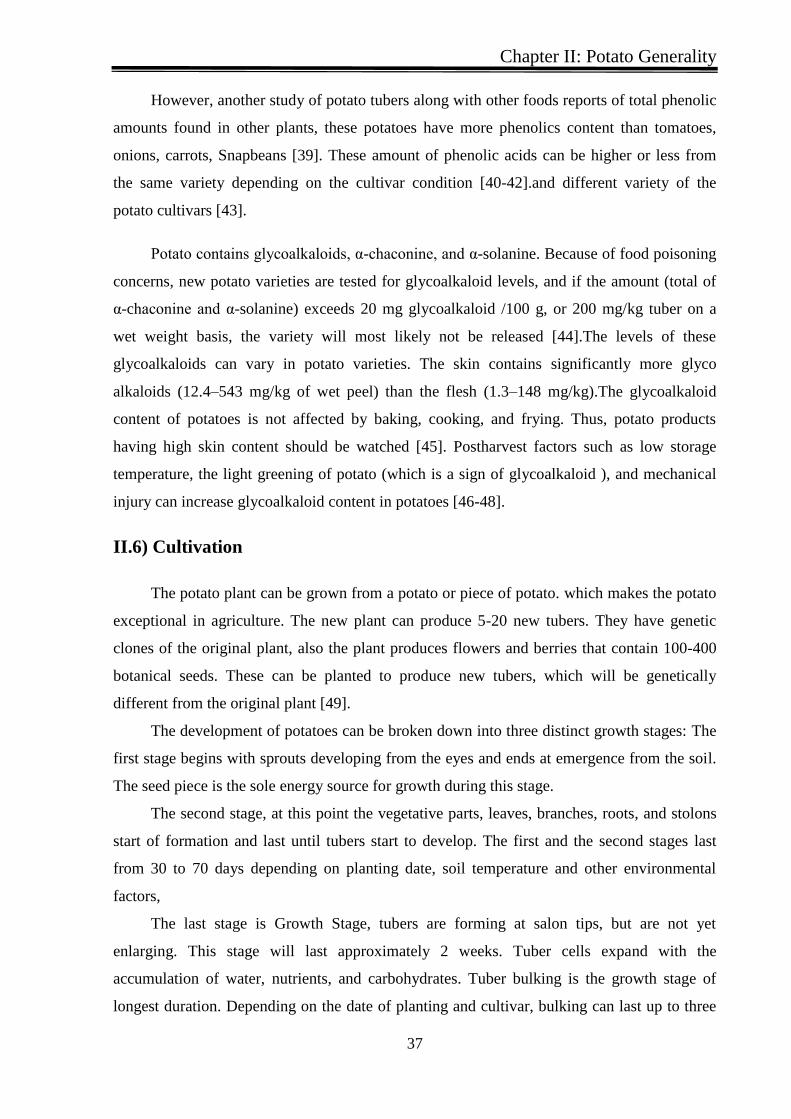
Table II5 Concentration levels of the main phenolic compounds in potatoes 36
Table II6 location of four varieties of potatoes 40
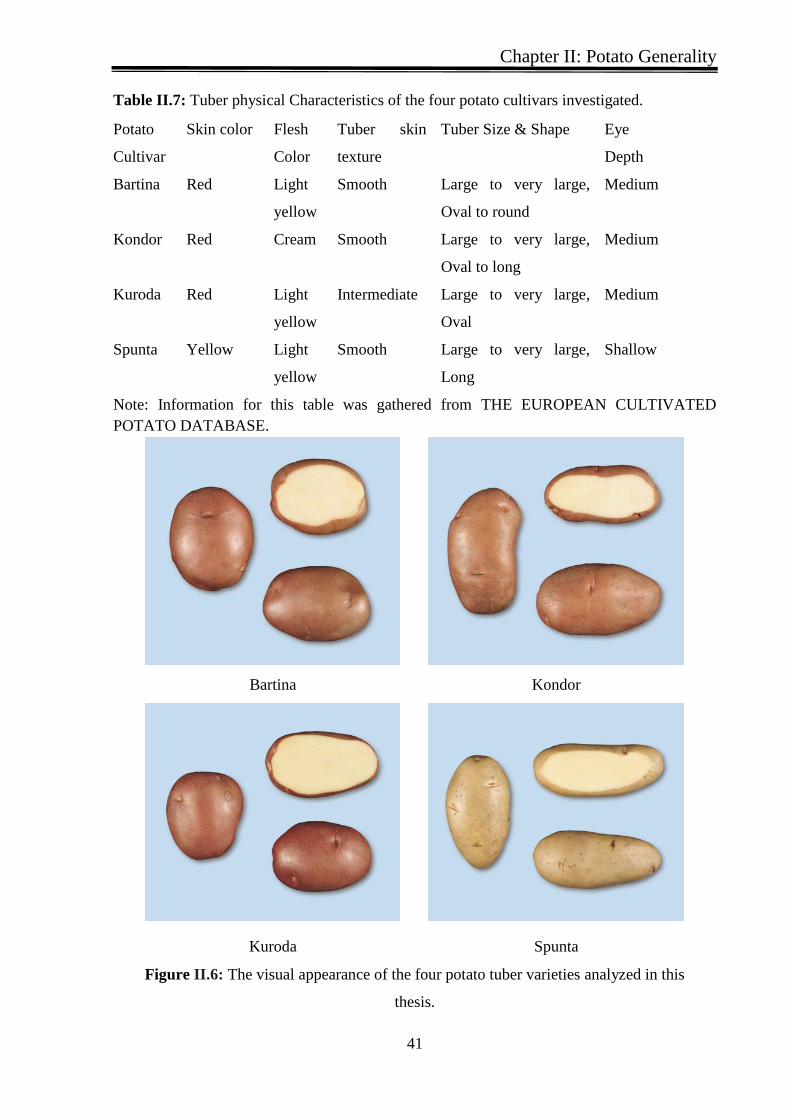
Table II7 Tuber physical Characteristics of the four potato cultivars investigated 41
Table III1 Constituents Standard content analyzed by HPLC 68
Table IV1 Total flavonoids content obtained using ethanol water (7030) 80
Table IV2 Total flavonoids content obtained using 100 ethanol 80
Table IV3 Total phenolic content obtained using ethanol water (7030) 81
Table IV4 Total phenolic content content obtained using 100 ethanol 81
Table IV5 Total antioxidant capacity obtained using ethanol water (7030) 82
Table IV6 Total antioxidant capacity obtained using 100 ethanol 82
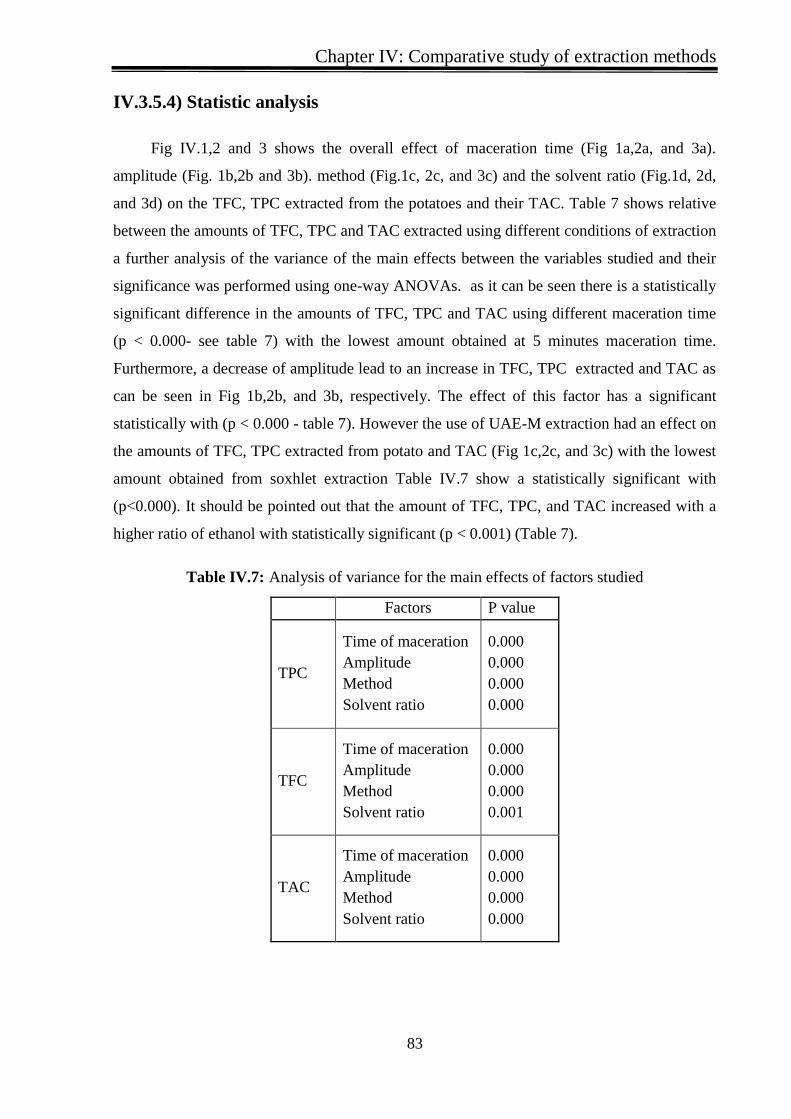
Table IV7 Analysis of variance for the main effects of factors studied 83
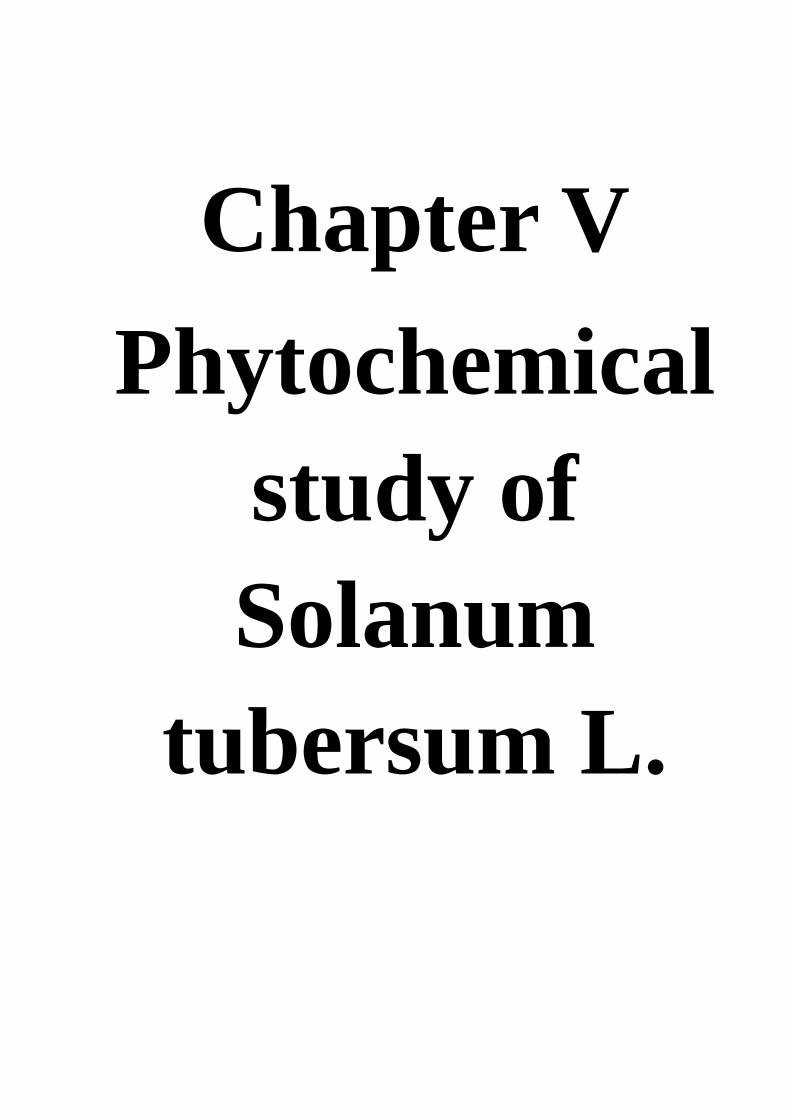
Table IV9 Constituents content analyzed by HPLC88
Table V1 Determination of moisture content for four varieties of potatoes 92
Table V2 Preliminary qualitative phytochemical analysis of various alcoholic extracts of
root parts of potatoes 92
Table V3 Determination of total Phenolics contents and total flavonoids of four kinds of
potatoes 93
Table V4 Constituents content analyzed by HPLC 96
Table V5 Determination of reducing the antioxidant power of four kinds of potatoes 97
List of Tables
XVIII
Table V6 IC50 values of sample extracts using DPPH 98
Table V7 Values of Binding constants and binding free energy of the complexes DppH-
sample extracts 101
Table V9 Determination of the oxidation peaks of four kinds of potatoes by CV in DMF 104
Table V10 IC50 values of sample extracts using O_2^(∙-) radical scavenging activity 105
1Table V11 Shifts in peak potential and a decrease in anodic peak current of O_2^(∙-) bound
forms of Roots extract samples 108
Table V12 Shifts in peak potential and a decrease in anodic peak current of O_2^(∙-) bound
forms of Flesh extract samples 109
Table V13 Values of Binding constants and binding free energy of the complexes O_2^(∙-)-
sample extracts 111
Table V14 Diffusion coefficient values 113
Table V19 Determination of total Phenolics contents and total flavonoids of the whole root
and the flesh 115
Table V20 Constituents content analyzed by HPLC 116
Table V21 Determination of reducing the antioxidant power of four kinds of potatoes 118
Table V22 Determination of the Total antioxidant capacity of Kondor 118
Table V23 Determination of antioxidant activity of sample extracts using β-carotene
bleaching 119
Table V24 IC50 values of sample extracts using β-carotene bleaching 120
Table V24 IC50 values of sample extracts using DPPH 121
Table V25 Values of Binding constants and binding free energy of the complexes DppH-
sample extracts 122
Table V26 Determination of the Antioxidant capacity of Kondor variety by CV 122
Table V27 IC50 values of Kondor sample extracts using O_2^(∙-) radical scavenging
activity 123
Table V28 Shifts in peak potential and a decrease in anodic peak current of O_2^(∙-) bound
forms of Kondor extract samples 124
Table V29 Values of Binding constants and binding free energy of the complexes O_2^(∙-)-
sample extracts 125
List of Tables
XIX
Table V15 Analysis of variance for the main effect plot 128
Table V16 Determination of the correlation between capacity antioxidant and Total Phenolic
content 130
Table V17 Determination of the correlation between capacity antioxidant and Total
Flavanoids content 132
Table V18 The R2 values between antioxidant activities and phytochemical content 132
List of Tables
XX
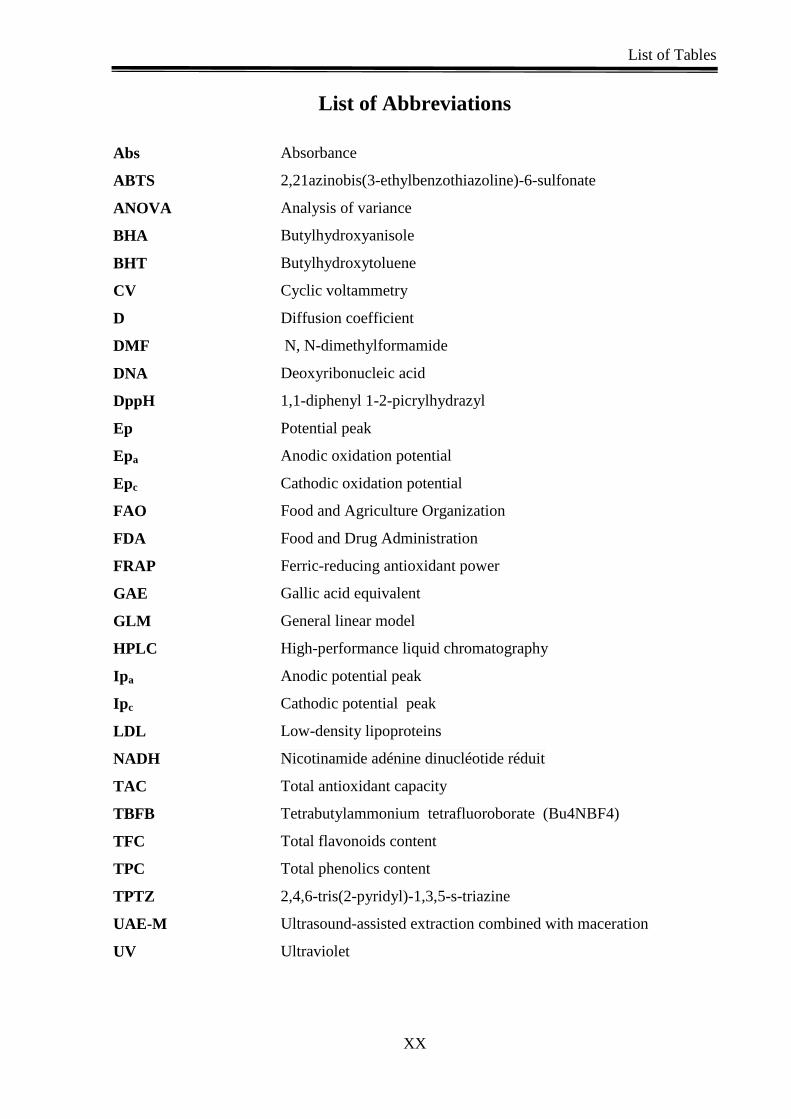
List of Abbreviations
Abs Absorbance
ABTS 221azinobis(3-ethylbenzothiazoline)-6-sulfonate
ANOVA Analysis of variance
BHA Butylhydroxyanisole
BHT Butylhydroxytoluene
CV Cyclic voltammetry
D Diffusion coefficient
DMF N N-dimethylformamide
DNA Deoxyribonucleic acid
DppH 11-diphenyl 1-2-picrylhydrazyl
Ep Potential peak
Epa Anodic oxidation potential
Epc Cathodic oxidation potential
FAO Food and Agriculture Organization
FDA Food and Drug Administration
FRAP Ferric-reducing antioxidant power
GAE Gallic acid equivalent
GLM General linear model
HPLC High-performance liquid chromatography
Ipa Anodic potential peak
Ipc Cathodic potential peak
LDL Low-density lipoproteins
NADH Nicotinamide adeacutenine dinucleacuteotide reacuteduit
TAC Total antioxidant capacity
TBFB Tetrabutylammonium tetrafluoroborate (Bu4NBF4)
TFC Total flavonoids content
TPC Total phenolics content
TPTZ 246-tris(2-pyridyl)-135-s-triazine
UAE-M Ultrasound-assisted extraction combined with maceration
UV Ultraviolet
General introduction
1
General introduction
Because of todays chase for healthy products the production and purification of
vegetable extracts is an area of interests to the industry and academia Recently researchers
have shown a proof for the role of antioxidants of plant origin on scavenging of free-radical
this property could have great importance as therapeutic agents in several diseases caused due
to oxidative stress such as heart diseases and cancers[1] However plant constituents and
phytochemical compounds were to be found effective as radical scavengers and inhibitors of
lipid peroxidation
The cellular functions and normal respiration produce a free radical Under normal
physiological conditions approximately 2 of oxygen used up by the human body during
respiration is transformed into superoxide anion free radical with a negative charge (Obull2
minus) [2]
which considered as one of a large group of reactive oxygen species (ROS) and reactive
nitrogen species (RNS) This oxygen environment is unfriendly to the living organisms To
survive this organism produces a water- and lipid-soluble antioxidants that can neutralize
these highly reactive free radicals [3] If the bodys antioxidant mechanism does not operate
optimally excess free radicals can damage various bimolecular including lipids proteins
carbohydrates and nucleic acids
A variety of antioxidants is found in dietary sources like fruits and vegetables which
were known as a phytochemicals compounds These plant constituents are classified as
primary or secondary components depending on their role in plant metabolism Primary
constituents include the common sugars amino acids proteins purines and pyrimidines of
nucleic acids chlorophylls etc Secondary constituents are the remaining plant chemicals such
as alkaloids (derived from amino acids) terpenes (a group of lipids) and phenolics (derived
from carbohydrates) [4]
They are present in all parts of higher plants (roots stems leaves flowers pollen fruit
seeds and wood) and are involved in many physiological processes such as cell growth
rhizogenesis germination of the seeds or fruit maturation The most represented are the
anthocyanins flavonoids and tannins [5]
That is why we are interested to make a phytochemical and quantification study of the
plant Solanum tuberosum L (potato) which is considered as an important source of
polyphenolic and flavonoid compounds most recent studies focused on the evaluation of its
antioxidant activities and its phenolic and flavonoid contents [6] Until now no studies related
General introduction
2
to the antioxidant activity of the potato in the region of El Oued (south-east of Algeria) have
been conducted According to the national statistics the production of potato is growing very
fast in this area which may lead her to become the first producer in Algeria and that since
2011
Our study has been divided into two parts the first one contains Bibliographic research
presented in three chapters the first one is a generality and description of the potato plant the
second is devoted to a free radical the Polyphenols and the antioxidant activity and the last
one describes the equipment and methods used in this work
The second one is the experimental part which contains two chapters the fouth chapter
discuss the results of different methods used by focuses on
the solid-liquid extraction by Ultrasound-assisted maceration and soxhlet techniques
determination of the total polyphenols flavonoids by colorimetric methods and liquid
chromatography of high performance (HPLC)
The fifth chapter presents the results obtained and their discussions in two experiments
the first one is Study of the antioxidant activity of extracts from four different varieties by
spectrophotometry Methods ferric reducing antioxidant power (FRAP) assay and the
inhibition of the free radical (DPPHbull ) Electrochemical methods (cyclic voltammetry (CV) )
to evaluate the antioxidant capacity and the inhibition of superoxide anion (Obull2
minus) Finally the
experiment two present more phytochemical analysis for the richness variety
We will complete this piece of research with a general conclusion giving a summary of
the main results obtained during this work as well as the perspectives which will be the
objectives of the future work
General introduction
3
References
[1] Mahantesh SP Gangawane AK PATIL CS free radicals antioxidants diseases and
phytomedicines in human health future prospects World Research Journal of Medicinal amp
Aromatic Plant 2012 (1) pp-06-10
[2] Kunwar A Priyadarsini KI Free radicals oxidative stress and importance of antioxidants
in human health J Med Allied Sci 2011153-60
[3] Davies KJ Oxidative stress the paradox of aerobic life Biochem Soc Symp 199561131
[4] Krishnaiah D Sarbatly R Bono A (2007) Phytochemical antioxidants for health and
medicine A move towards nature Biotechnol Mol Biol Rev 1 97-104
[5] BoizotN Charpentier JP (2006) A rapid method for the evaluation of the content of
phenolic compounds of the organs of a forest tree Methods and tools for observation and
assessment of forestiens environments grassland and aquatic INRA 79-82
[6] Deuszliger H Guignard C Hoffmann L Evers D Polyphenol and glycoalkaloid
contents in potato cultivars grown in Luxembourg Food Chemistry 2012 135 (4) 2814-
2824
Chapter I
Free radical
Chapter I Free radical
5
I) Free radical
I1) Generality
A free radical is an atom or molecular species capable of liberated in existence that hold
at least one or more unpaired electrons in the outermost shell configuration [1] Free radicals
are highly reactive short-lived species generated by a variety of biological mechanisms
including inflammation [2] or as a side effect of the reactions occurring during normal
oxidative metabolism [3] During their short lifespan they readily interact with
macromolecules including lipids proteins and nucleic acids damaging their structures and
often modifying their functionality the most common free radicals are Superoxide anion
radical Hydroxyl radical Hydroperoxyl radical Nitric oxide and Lipid radical [4]
I2) Sources of Free Radicals
In general free radicals can be produced from either endogenous sources or exogenous
sources They are continuously forming in cells and environment [5]
I21) Endogenous source
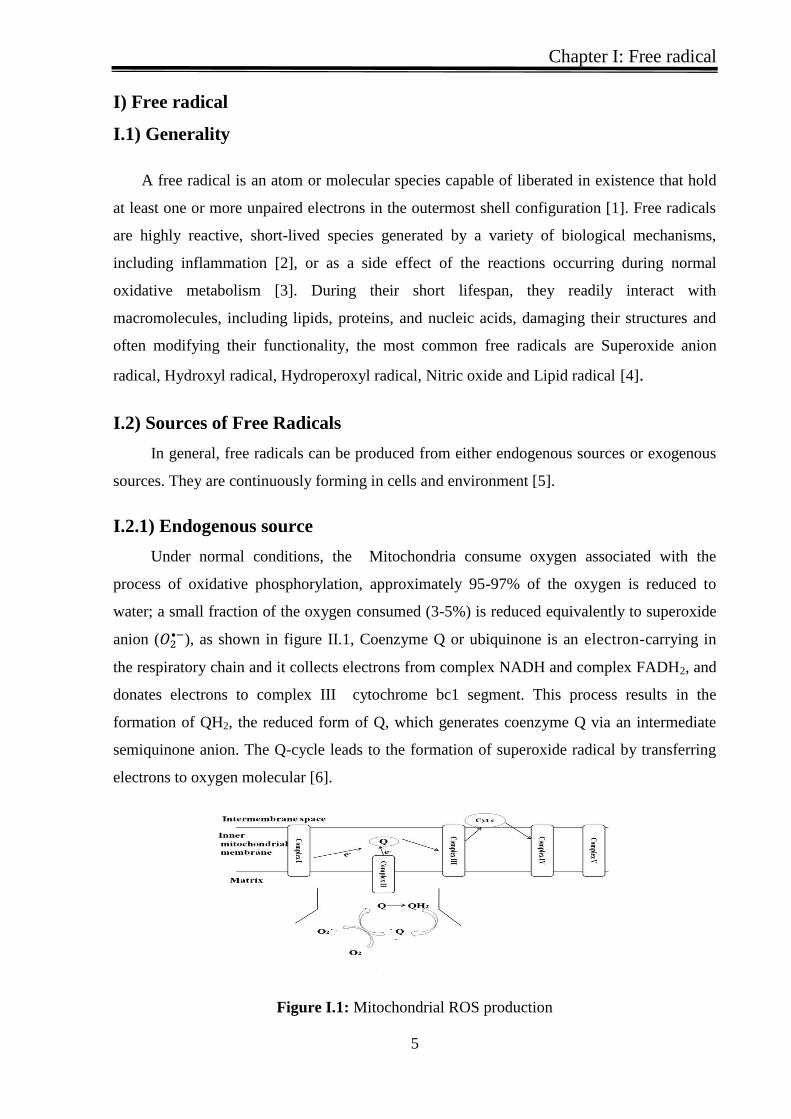
Under normal conditions the Mitochondria consume oxygen associated with the
process of oxidative phosphorylation approximately 95-97 of the oxygen is reduced to
water a small fraction of the oxygen consumed (3-5) is reduced equivalently to superoxide
anion ( ) as shown in figure II1 Coenzyme Q or ubiquinone is an electron-carrying in
the respiratory chain and it collects electrons from complex NADH and complex FADH2 and
donates electrons to complex III cytochrome bc1 segment This process results in the
formation of QH2 the reduced form of Q which generates coenzyme Q via an intermediate
semiquinone anion The Q-cycle leads to the formation of superoxide radical by transferring
electrons to oxygen molecular [6]
Figure I 1Mit ochondrial ROS producti on
Figure I1 Mitochondrial ROS production
ROS production
Chapter I Free radical
6
The most common endogenous sources of free radicals are summarized in table I1[4]
Table I1 Endogenous Sources of Free Radicals Table ITable I 1 Endogenous Sources of Free Radicals
Physiological
Process
Comment
Infection May produce free radicals because the immune system may try to
neutralize invading microorganisms with a burst of free radicals
Enzymatic
reaction
Many enzymatic reactions involving xanthine oxidase lipoxygenase
aldehyde oxidase etc can generate free radicals
Metal Ions Metal ions such as copper ion and ferrous ion which are essential for the
body can react with hydrogen peroxide to produce free radicals
I22) Exogenous source
Exposure to Solar radiations UV radiations X-rays gamma rays and microwave
radiations has a capacity to generate reactive chemical species including free radicals in
cells [784] Table I2 summarizes most exogenous sources [910]
Table I2 Exogenous Sources of Free Radicals
External
sources
Comments
Air pollution Exposure to particulate matters in polluted air can produce significant
oxidative stress increasing the risk of asthma cardiovascular diseases
chronic pulmonary obstructive disease (COPD) and lung cancer
Tobacco
smoking
Oxidants present in tobacco smoked can damage lungs causing COPD and
even raising the risk of lung cancer
Some
medications
Medications such as bleomycin adriamycin and sulfasalazine may produce
oxidative stress
Chapter I Free radical
7
I3) Major types of free radicals
I31) Reactive Oxygen Species (ROS)
Reactive oxygen species (ROS) is a term used for different reactive molecules derived
from molecular oxygen They are devised in radical derivatives such as superoxide hydroxyl
radical nitric oxide and non-radical derivatives of high reactivity as singlet oxygen hydrogen
peroxide peroxynitrite hypochlorite [11]
I311) Superoxide oxygen ( one electron)
is produced in vivo in a variety of ways the major source being the electron chain in
mitochondria [1213] is not highly reactive with biological substrates in an aqueous
environment Once formed quickly undergoes dismutation to generate H2O2 This
reaction is accelerated by the antioxidative enzyme the SOD [1415] In addition to SOD
several other enzymes that generate H2O2 also exist in human tissues
I312) Hydrogen Peroxide (H2O2)
Hydrogen peroxide (H2O2) itself is not especially toxic unless it is present in high
concentrations within cells H2O2 readily diffuses through cellular membranes and can
thereby reach sites distant from where it was generated Also in the presence of transition
metals mainly Fe2+
but also Cu1+
H2O2 is reduced to the hydroxyl radical (OHdeg) via either the
HaberndashWeiss or Fenton reactions [16-18] In most cells H2O2 is converted to innocuous
products by the actions of two important antioxidant enzymes that is catalase and selenium-
dependent glutathione peroxidase (GPx) GPx utilizes H2O2 hydroperoxides as substrates
during the conversion of reduced glutathione (GSH) to its sulfide (GSSG) [19]
I313) Hydroxyl Radical (bullOH)
The hydroxyl radical (bullOH) is a high reactive radical under normal physiological
conditions the generating of hydroxyl radicals can be produced with the combination of both
H2O2 and O2bullminus
in presence of certain metals [20 ] According to the Haber-Weiss reaction of
bullOH it consists of the following two reactions
In the first reaction
(1)
In the second reaction
(2)
Chapter I Free radical
8
I32) Reactive Nitrogen Spices (RNS)
Reactive nitrogen species (RNS) is a term used for different reactive molecules nitric
and in particular nitric oxide radical considered as major components of oxidative burst and
redox state regulation [21] This spices is also devised into radical spices such as Nitric Oxide
(NObull) Nitrogen dioxide (NO2
bull) and non-radical spices Peroxynitrite (ONOO
-) and Alkyl
peroxynitrites (ROONO)[22]
I321) Nitric oxide (NObull)
Nitric oxide (NObull) contains an unpaired electron thus it is a paramagnetic molecule and
a free radical The convert of L-arginine to L-citrulline with nitric oxide synthases (NOSs)
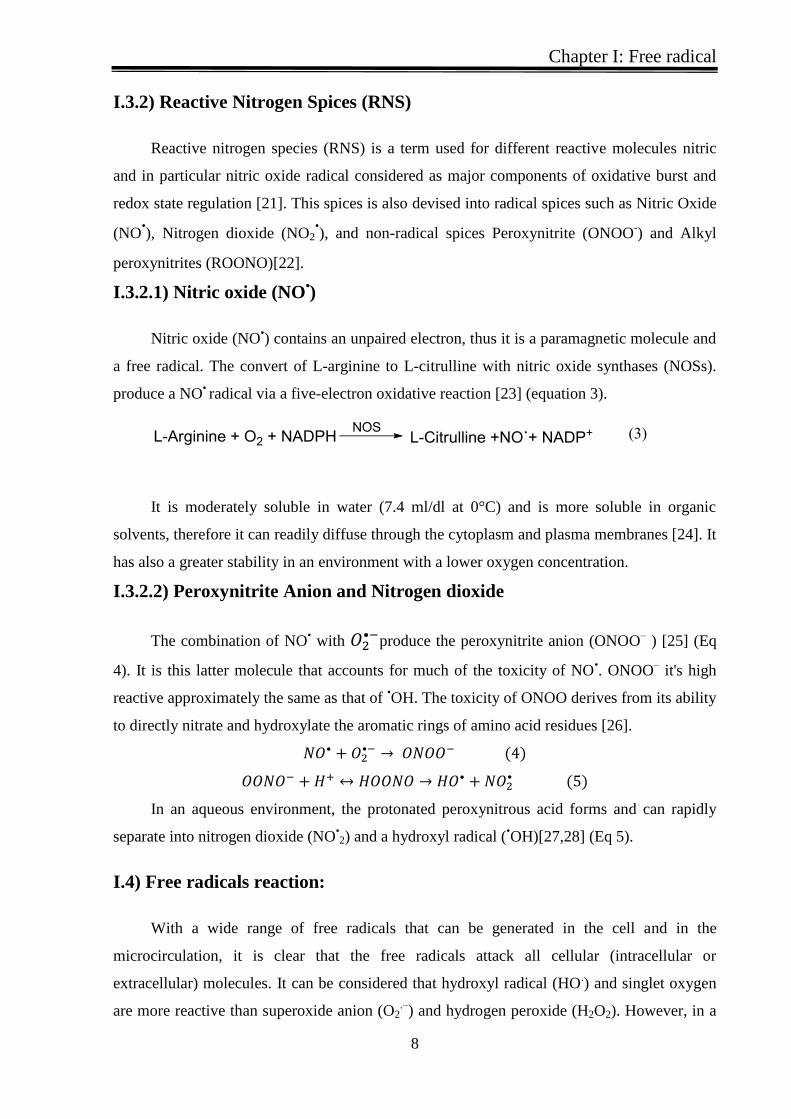
produce a NObull radical via a five-electron oxidative reaction [23] (equation 3)
It is moderately soluble in water (74 mldl at 0degC) and is more soluble in organic
solvents therefore it can readily diffuse through the cytoplasm and plasma membranes [24] It
has also a greater stability in an environment with a lower oxygen concentration
I322) Peroxynitrite Anion and Nitrogen dioxide
The combination of NObull with
produce the peroxynitrite anion (ONOOndash ) [25] (Eq
4) It is this latter molecule that accounts for much of the toxicity of NObull ONOO
ndash its high
reactive approximately the same as that of bullOH The toxicity of ONOO derives from its ability
to directly nitrate and hydroxylate the aromatic rings of amino acid residues [26]
In an aqueous environment the protonated peroxynitrous acid forms and can rapidly
separate into nitrogen dioxide (NObull2) and a hydroxyl radical (
bullOH)[2728] (Eq 5)
I4) Free radicals reaction
With a wide range of free radicals that can be generated in the cell and in the
microcirculation it is clear that the free radicals attack all cellular (intracellular or
extracellular) molecules It can be considered that hydroxyl radical (HO) and singlet oxygen
are more reactive than superoxide anion (O2ndash
) and hydrogen peroxide (H2O2) However in a
Chapter I Free radical
9
suitable biological setting the two last species may display considerable chemical reactivity
leading to damage of various biomolecules [29]
Generally this damage results from the involvement of free radical in chain reactions a
series of reactions lead to regenerate a radical that can begin a new cycle of reactions [30]
Free radical reactions take three distinct identifiable steps
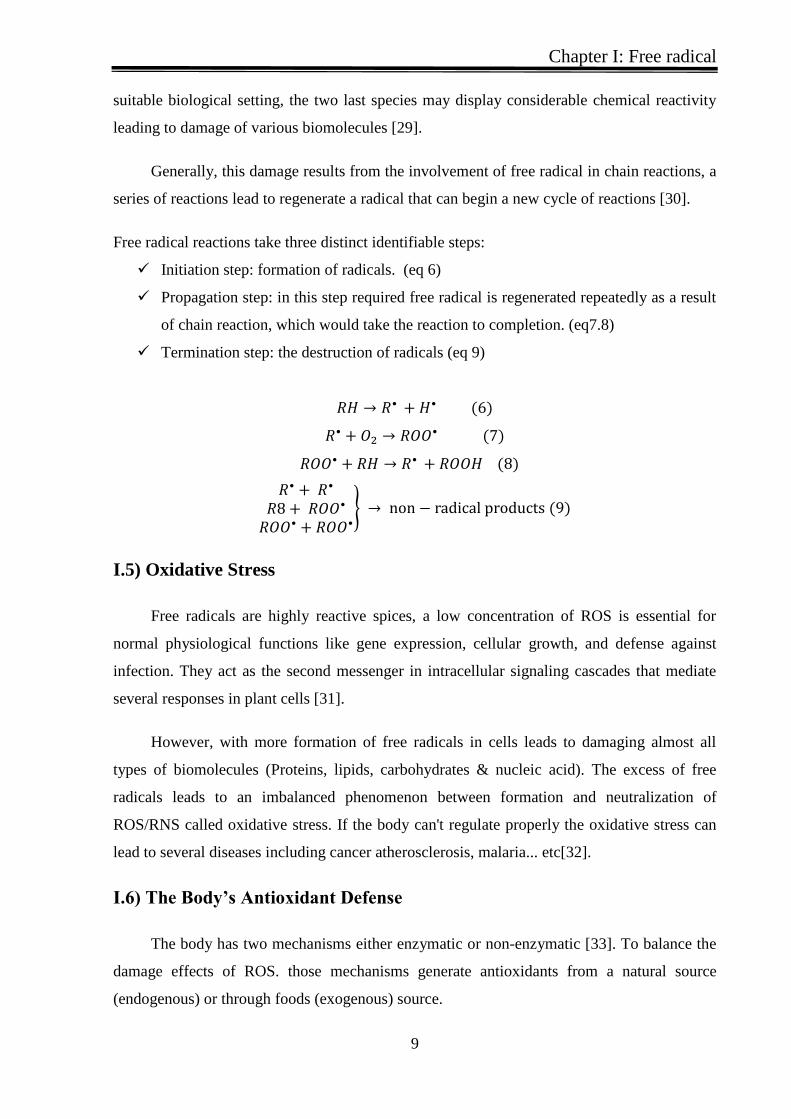
Initiation step formation of radicals (eq 6)
Propagation step in this step required free radical is regenerated repeatedly as a result
of chain reaction which would take the reaction to completion (eq78)
Termination step the destruction of radicals (eq 9)
I5) Oxidative Stress
Free radicals are highly reactive spices a low concentration of ROS is essential for
normal physiological functions like gene expression cellular growth and defense against
infection They act as the second messenger in intracellular signaling cascades that mediate
several responses in plant cells [31]
However with more formation of free radicals in cells leads to damaging almost all
types of biomolecules (Proteins lipids carbohydrates amp nucleic acid) The excess of free
radicals leads to an imbalanced phenomenon between formation and neutralization of
ROSRNS called oxidative stress If the body cant regulate properly the oxidative stress can
lead to several diseases including cancer atherosclerosis malaria etc[32]
I6) The Bodyrsquos Antioxidant Defense
The body has two mechanisms either enzymatic or non-enzymatic [33] To balance the
damage effects of ROS those mechanisms generate antioxidants from a natural source
(endogenous) or through foods (exogenous) source
Chapter I Free radical
10
The excess of free radicals is neutralized by antioxidants to protect the cells against their
toxic effects and to contribute to disease prevention [34]
An antioxidant is any substance that when present at low concentrations compared
with that of an oxidizable substrate significantly delays or inhibits oxidation of that substrate
[35] In another term the antioxidant is any substance that delays prevents or removes
oxidative damage to a target molecule [36]
I7) Classification of antioxidants
I71)Enzymatic (Endogenous)
The body depends on diverse endogenous defense mechanisms to protect the cells
against free radical damage The antioxidant enzymes are
a) Superoxide dismutases SOD is an antioxidant enzyme which scavenges superoxide anion
into oxygen and hydrogen peroxide [37]
b) catalase (CAT) cytoplasmic enzyme which converts the hydrogen peroxide (H2O2) into
H2O and O2 by disproportionation[38]
c) Glutathione Peroxidase enzyme occurs in the mitochondria during the reaction hydrogen
peroxide (H2O2) is reduced to water and glutathione (GSH) is oxidized to glutathione
disulfide (GSSG)[39]
I72) Non-Enzymatic (Exogenous)
I721) Ascorbic acid
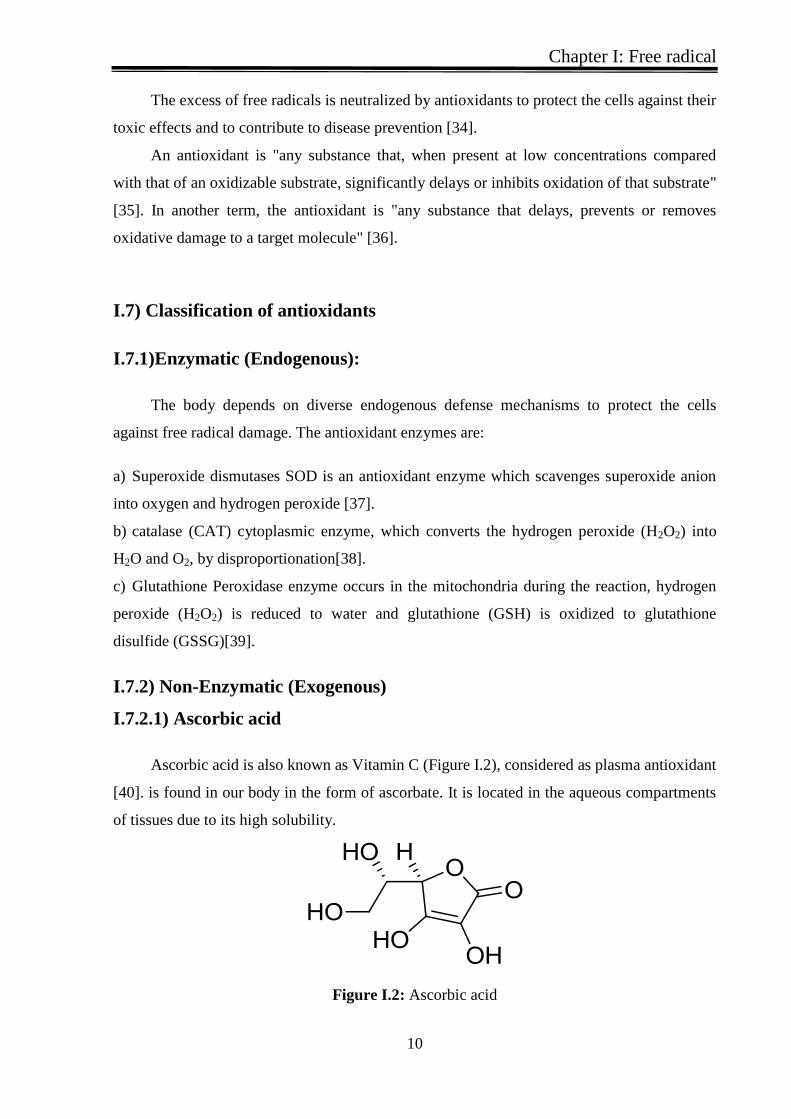
Ascorbic acid is also known as Vitamin C (Figure I2) considered as plasma antioxidant
[40] is found in our body in the form of ascorbate It is located in the aqueous compartments
of tissues due to its high solubility
Figure I2 Ascorbic acid
Figure I 2Ascorbic acid
Chapter I Free radical
11
Ascorbate is a primary antioxidant in that it directly neutralizes radical species acts as a
reducing agent and reducing transition metals (Fe+3
and Cu+2
) present in active sites of
enzymes or in free form in the body Can be oxidized by free radical also can be a good
reducing agent which arrives or is in tissue in an aqueous medium and in the reaction with
free radicals form a radical (semi- dehydroascorbate) which is little reactive The ascorbate
can act as an antioxidant against lipid peroxidation plays a major role in preventing
cardiovascular disease and in conjunction with the alpha-tocopherol [38]
I722) α-tocopherol
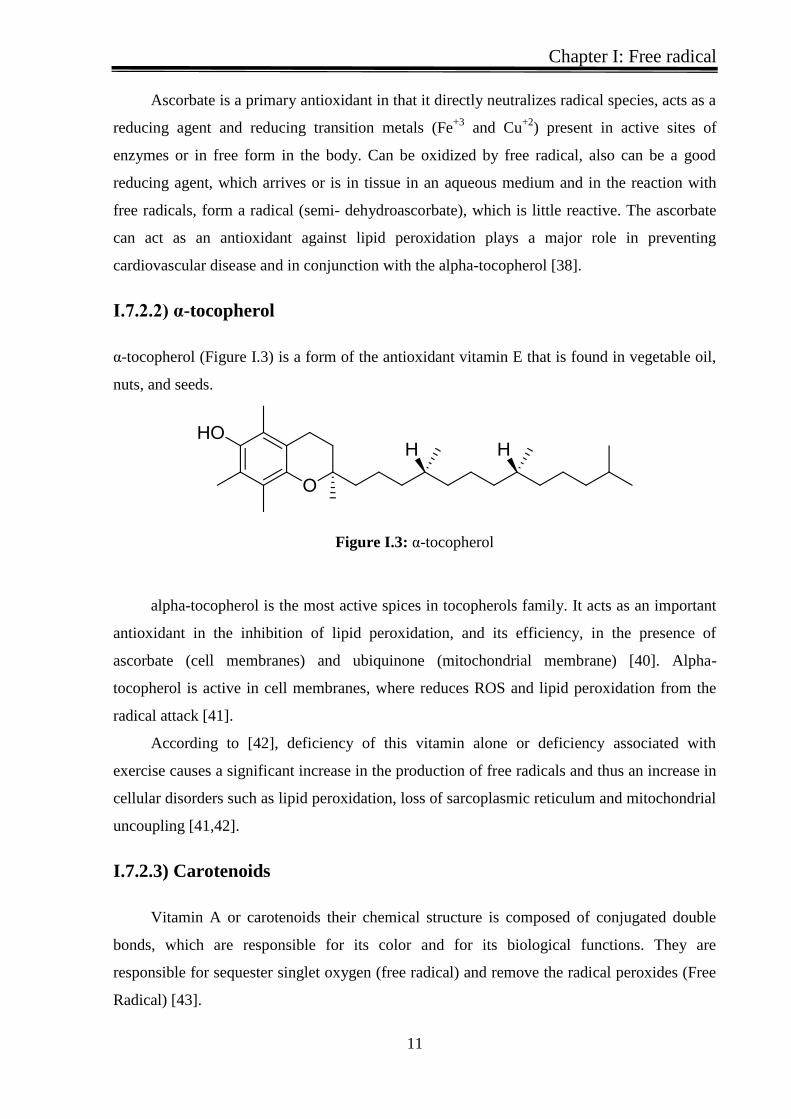
α-tocopherol (Figure I3) is a form of the antioxidant vitamin E that is found in vegetable oil
nuts and seeds
Figure I3 α-tocopherol Figure I 3α-tocopherol
alpha-tocopherol is the most active spices in tocopherols family It acts as an important
antioxidant in the inhibition of lipid peroxidation and its efficiency in the presence of
ascorbate (cell membranes) and ubiquinone (mitochondrial membrane) [40] Alpha-
tocopherol is active in cell membranes where reduces ROS and lipid peroxidation from the
radical attack [41]
According to [42] deficiency of this vitamin alone or deficiency associated with
exercise causes a significant increase in the production of free radicals and thus an increase in
cellular disorders such as lipid peroxidation loss of sarcoplasmic reticulum and mitochondrial
uncoupling [4142]
I723) Carotenoids
Vitamin A or carotenoids their chemical structure is composed of conjugated double
bonds which are responsible for its color and for its biological functions They are
responsible for sequester singlet oxygen (free radical) and remove the radical peroxides (Free
Radical) [43]
Chapter I Free radical
12
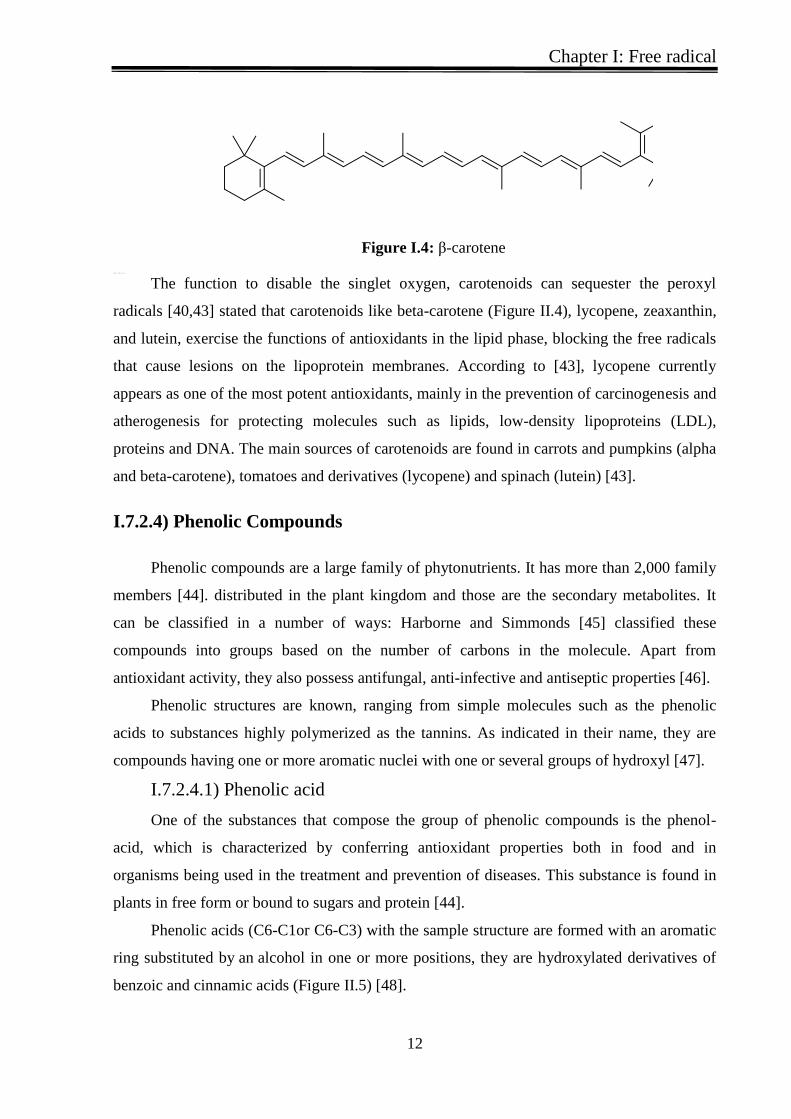
Figure I4 β-carotene
Figure I 4β-carotene
The function to disable the singlet oxygen carotenoids can sequester the peroxyl
radicals [4043] stated that carotenoids like beta-carotene (Figure II4) lycopene zeaxanthin
and lutein exercise the functions of antioxidants in the lipid phase blocking the free radicals
that cause lesions on the lipoprotein membranes According to [43] lycopene currently
appears as one of the most potent antioxidants mainly in the prevention of carcinogenesis and
atherogenesis for protecting molecules such as lipids low-density lipoproteins (LDL)
proteins and DNA The main sources of carotenoids are found in carrots and pumpkins (alpha
and beta-carotene) tomatoes and derivatives (lycopene) and spinach (lutein) [43]
I724) Phenolic Compounds
Phenolic compounds are a large family of phytonutrients It has more than 2000 family
members [44] distributed in the plant kingdom and those are the secondary metabolites It
can be classified in a number of ways Harborne and Simmonds [45] classified these
compounds into groups based on the number of carbons in the molecule Apart from
antioxidant activity they also possess antifungal anti-infective and antiseptic properties [46]
Phenolic structures are known ranging from simple molecules such as the phenolic
acids to substances highly polymerized as the tannins As indicated in their name they are
compounds having one or more aromatic nuclei with one or several groups of hydroxyl [47]
I7241) Phenolic acid
One of the substances that compose the group of phenolic compounds is the phenol-
acid which is characterized by conferring antioxidant properties both in food and in
organisms being used in the treatment and prevention of diseases This substance is found in
plants in free form or bound to sugars and protein [44]
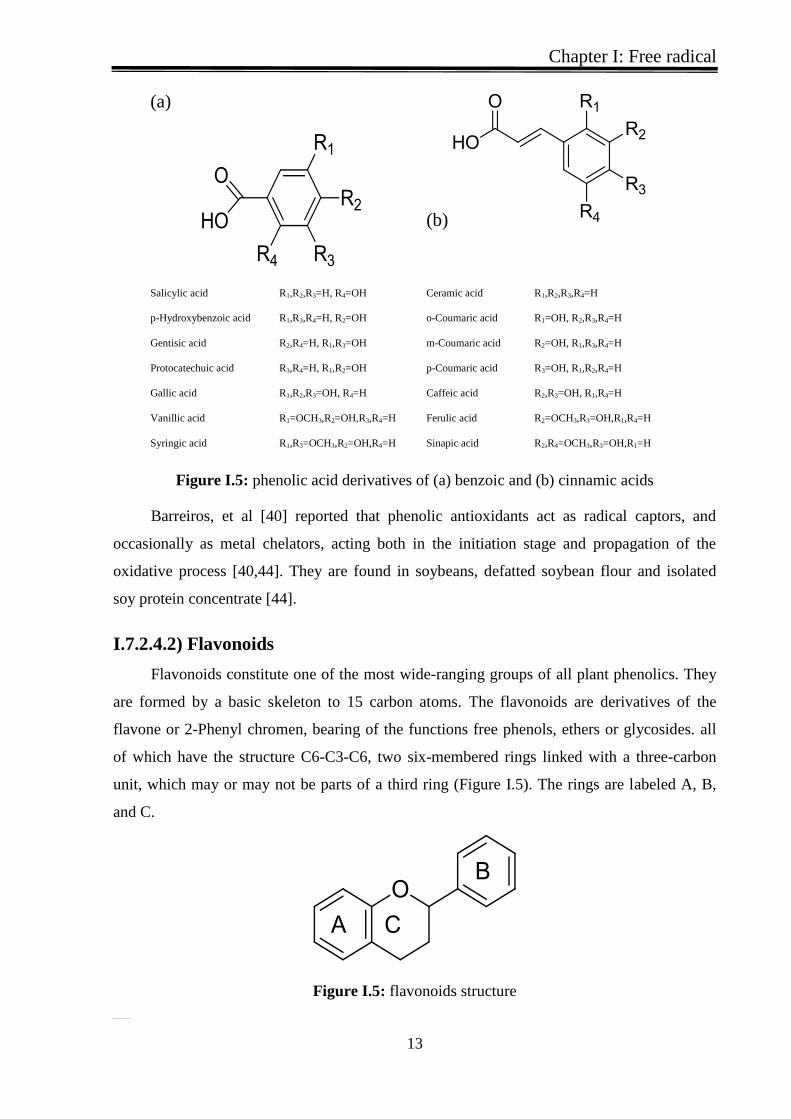
Phenolic acids (C6-C1or C6-C3) with the sample structure are formed with an aromatic
ring substituted by an alcohol in one or more positions they are hydroxylated derivatives of
benzoic and cinnamic acids (Figure II5) [48]
Chapter I Free radical
13
(a)
(b)
Salicylic acid R1R2R3=H R4=OH Ceramic acid R1R2R3R4=H
p-Hydroxybenzoic acid R1R3R4=H R2=OH o-Coumaric acid R1=OH R2R3R4=H
Gentisic acid R2R4=H R1R3=OH m-Coumaric acid R2=OH R1R3R4=H
Protocatechuic acid R3R4=H R1R2=OH p-Coumaric acid R3=OH R1R2R4=H
Gallic acid R1R2R3=OH R4=H Caffeic acid R2R3=OH R1R4=H
Vanillic acid R1=OCH3R2=OHR3R4=H Ferulic acid R2=OCH3R3=OHR1R4=H
Syringic acid R1R3=OCH3R2=OHR4=H Sinapic acid R2R4=OCH3R3=OHR1=H
Figure I5 phenolic acid derivatives of (a) benzoic and (b) cinnamic acids
Figure I 5phenolic acid derivatives of (a) benzoic and (b) cinnamic acids
Barreiros et al [40] reported that phenolic antioxidants act as radical captors and
occasionally as metal chelators acting both in the initiation stage and propagation of the
oxidative process [4044] They are found in soybeans defatted soybean flour and isolated
soy protein concentrate [44]
I7242) Flavonoids
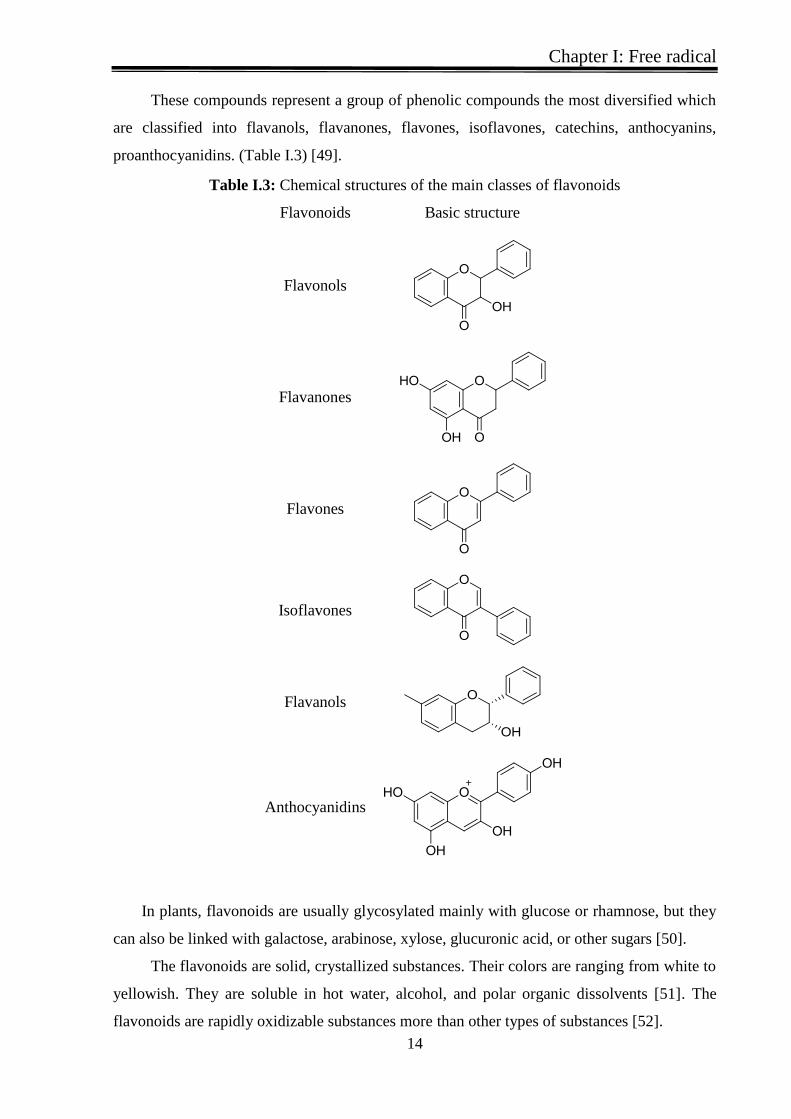
Flavonoids constitute one of the most wide-ranging groups of all plant phenolics They
are formed by a basic skeleton to 15 carbon atoms The flavonoids are derivatives of the
flavone or 2-Phenyl chromen bearing of the functions free phenols ethers or glycosides all
of which have the structure C6-C3-C6 two six-membered rings linked with a three-carbon
unit which may or may not be parts of a third ring (Figure I5) The rings are labeled A B
and C
Figure I5 flavonoids structure
Figure I 6flavonoids structure
Chapter I Free radical
14
These compounds represent a group of phenolic compounds the most diversified which
are classified into flavanols flavanones flavones isoflavones catechins anthocyanins
proanthocyanidins (Table I3) [49]
Table I3 Chemical structures of the main classes of flavonoids
Flavonoids Basic structure
Flavonols
Flavanones
Flavones
Isoflavones
Flavanols
Anthocyanidins
In plants flavonoids are usually glycosylated mainly with glucose or rhamnose but they
can also be linked with galactose arabinose xylose glucuronic acid or other sugars [50]
The flavonoids are solid crystallized substances Their colors are ranging from white to
yellowish They are soluble in hot water alcohol and polar organic dissolvents [51] The
flavonoids are rapidly oxidizable substances more than other types of substances [52]
Chapter I Free radical
15
However the capacity of the flavonoids decreases with the substitution of hydroxyl
groups for sugars being the glycosides less antioxidants than their corresponding aglycons [53]
I7243) Tannins
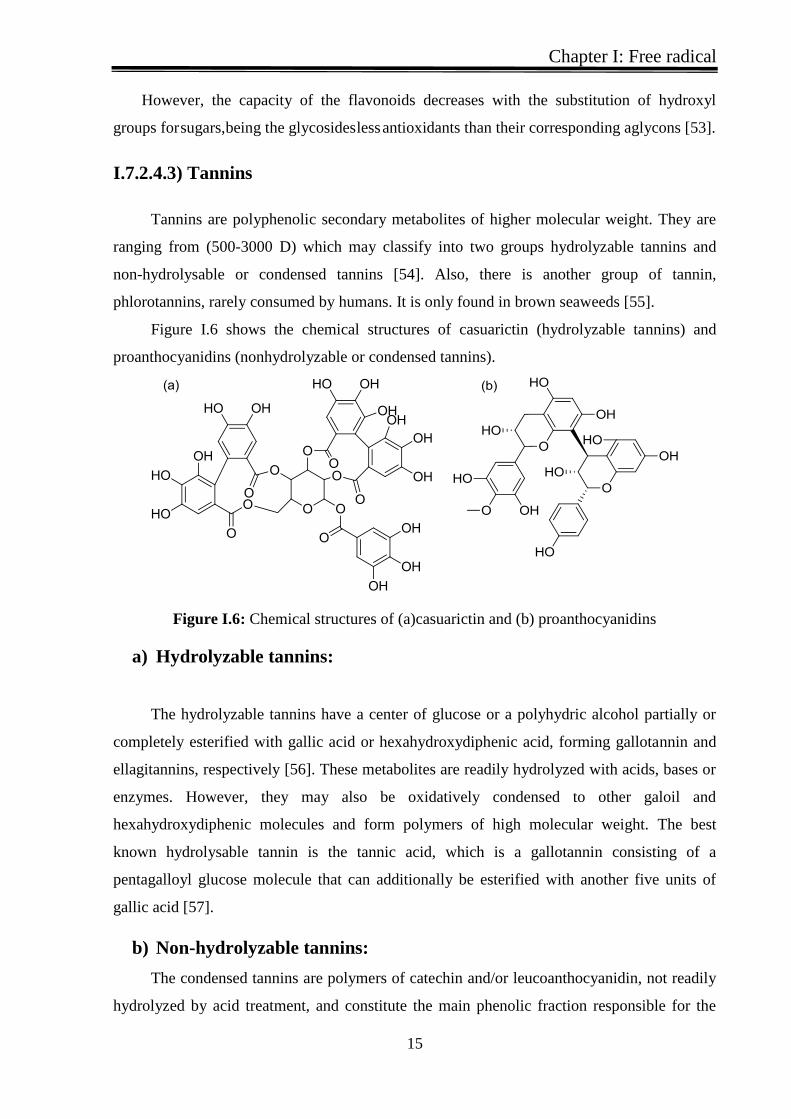
Tannins are polyphenolic secondary metabolites of higher molecular weight They are
ranging from (500-3000 D) which may classify into two groups hydrolyzable tannins and
non-hydrolysable or condensed tannins [54] Also there is another group of tannin
phlorotannins rarely consumed by humans It is only found in brown seaweeds [55]
Figure I6 shows the chemical structures of casuarictin (hydrolyzable tannins) and
proanthocyanidins (nonhydrolyzable or condensed tannins)
Figure I6 Chemical structures of (a)casuarictin and (b) proanthocyanidins
Figure I 7C he mical struct ures of (a)casuarictin and (b) proanthocyanidins
a) Hydrolyzable tannins
The hydrolyzable tannins have a center of glucose or a polyhydric alcohol partially or
completely esterified with gallic acid or hexahydroxydiphenic acid forming gallotannin and
ellagitannins respectively [56] These metabolites are readily hydrolyzed with acids bases or
enzymes However they may also be oxidatively condensed to other galoil and
hexahydroxydiphenic molecules and form polymers of high molecular weight The best
known hydrolysable tannin is the tannic acid which is a gallotannin consisting of a
pentagalloyl glucose molecule that can additionally be esterified with another five units of
gallic acid [57]
b) Non-hydrolyzable tannins
The condensed tannins are polymers of catechin andor leucoanthocyanidin not readily
hydrolyzed by acid treatment and constitute the main phenolic fraction responsible for the
Chapter I Free radical
16
characteristics of the astringency of the vegetables Although the term condensed tannins are
still widely used the chemically more descriptive term proanthocyanidins has gained more
acceptance These substances are polymeric flavonoids that form the anthocyanidins
pigments The proanthocyanidins most widely studied are based on flavan-3-ols (-)-
epicatechin and (+)-catechin [58]
I725) Minerals
Other potent antioxidants include minerals such as copper manganese selenium zinc
and iron These minerals exercise their antioxidant function in diverse processes and
metabolic steps in the organism
I7251) Copper
Copper has a role as an antioxidant protecting the cells from the toxic effects of free
radicals and it helps to fix calcium and phosphorous also participates in functions with
antioxidant features of the enzyme family denominated Superoxide dismutase (SOD) which
is responsible for eliminating the superoxide anion [59]
I7252) Iron
Iron forms part of the organismrsquos antioxidant system because it contributes to
eliminating the peroxide groups However its capacity to change valence with ease (2+3+)
renders that it can also intervene depending on the environment in the formation of Free
radicals [60]
I8) Synthetic antioxidants
In the food industry naturally occurring antioxidants impart a certain level of protection
against oxidation However during the food processing or storage the natural antioxidants are
often lost which necessitate the addition of exogenous antioxidants Most of the synthetic
antioxidants whose skeletons are often derived from natural antioxidants are of phenolic type [61]
The differences in their chemical structures reflect their antioxidant activities which also
influence their physical properties such as volatility solubility and thermal stability The
commercially available synthetic antioxidants are butylated hydroxyl toluene (BHT) 2-ferf-
butylhydroquinone (M3HQ) 2-ferpound-butyl-4-hydroxyanisole (BHA) and esters of gallic acid
eg propyl gallate Most of the synthetic phenolic antioxidants used in processed foods are
Chapter I Free radical
17
regulated by the FDA Antioxidants must fulfill the following conditions they must not be
toxic and highly active at low concentrations at the level of 002 of fat or oil content of the
food [62]
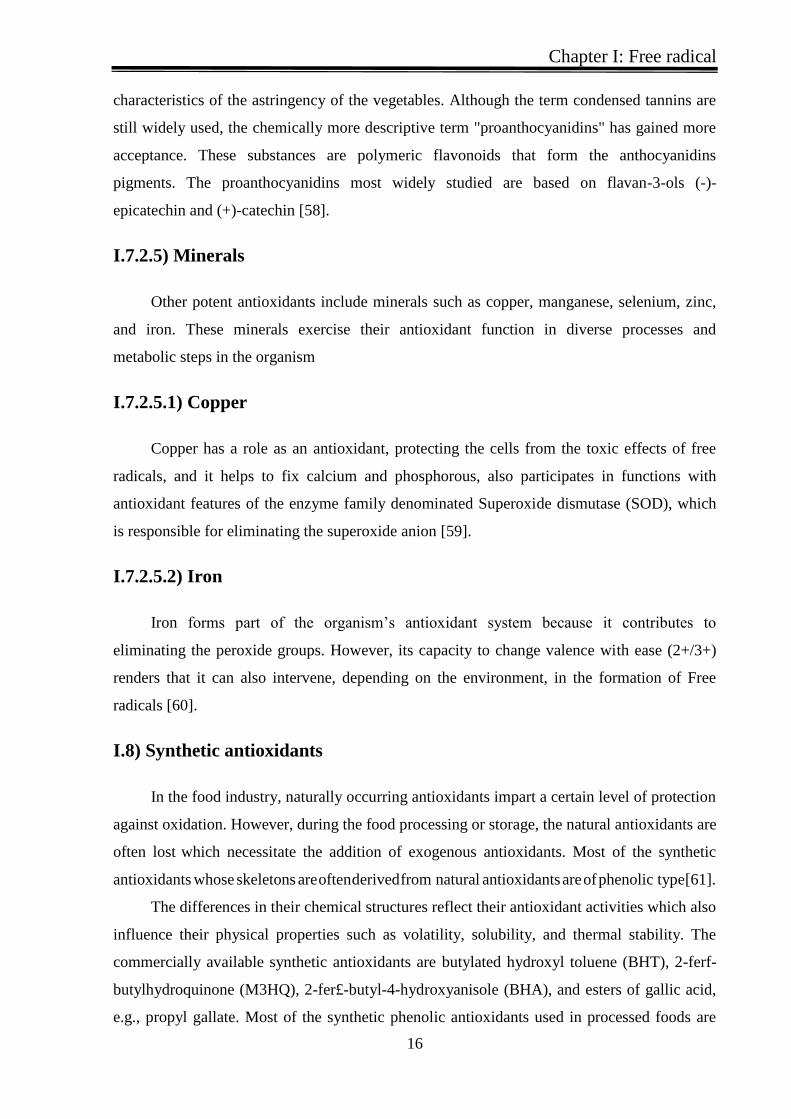
Figure I7 Chemical structure of synthetic food antioxidants Figure I 8C he mical struct ure of synt hetic food antiox idants
Figure I7 shows an example of these substances These sterically hindered phenols are
very effective antioxidants and react with free radicals The phenoxy radicals are stabilized by
delocalizing unpaired electrons in the aromatic ring
I9) Antioxidant mechanism
Antioxidants counteract oxidation in two different ways by protecting target lipids from
oxidation initiators or by stalling the propagation phase In the first case the so-called
preventive antioxidants hinder ROS formation or scavenge species responsible for oxidation
initiation (O2 1O2 etc) In the second case the so-called chain-breaking antioxidants
intercept radical oxidation propagators (LOO) or indirectly participate in stopping radical
chain propagation The mechanisms of action are sequentially reviewed here but it should be
kept in mind that antioxidants often act via mixed mechanisms that combine different types of
antioxidation [63]
Chapter I Free radical
18
I91) Preventive antioxidants
There are many different preventive antioxidation pathways because of the diverse
range of available oxidation initiators
Transient metal chelators
Chelators of transition metals such as copper and iron can prevent oxidation by forming
complexes or coordination compounds with the metals These are proteins such as transferrin
ferritin and lactalbumin that sequester iron or ceruloplasmin and albumin that sequester
copper However this type of antioxidation depends directly on the oxidizable target being
protected The mechanism of action is minor for lipid peroxidation inhibition as compared to
the anti-radical activity via ROS scavenging [64] but paramount in the inhibition of DNA
strand breakage [65]
Singlet oxygen quenchers
Carotenoids are the most efficient molecules for 1O2 quenching Hundreds of carotenoids
compounds occur naturally in the environment most of which have 40 carbon atoms They
can be pure hydrocarbons carotenes (lycopene b-carotene etc) or include an oxygenated
functional group [36] carotenoids as many antioxidants have antioxidant activity through
several different but highly complementary mechanisms chain breaking anti-oxidants and 1O2
quenchers This latter mechanism of action occurs through deactivation of 1O2 into
3O2 (eq
10) [66]
1O2 + β-carotene rarr
3O2 + β-carotene
(10)
ROS detoxification
ROS detoxification is a crucial oxidation prevention pathway mainly mediated by
endogenous enzymatic antioxidant systems First superoxide dismutase (SOD) a
metalloenzyme that is omnipresent in eukaryotic organisms catalyzes superoxide anion
dismutation into hydrogen peroxide and oxygen (eq 11)
I92) Chain-breaking antioxidants
In lipid peroxidation chain-breaking antioxidants usually lose a hydrogen radical to
LOO (eq12) thus halting radical oxidation propagation This primarily involves mono-or
poly-hydroxylated phenol compounds (tocopherols flavonoids phenolic acidsetc) with
different substituents on one or several aromatic rings
Chapter I Free radical
19
Chain-Breaking antioxidants induce a lag phase during which the substrate is not
substantially oxidized This phase continues until the antioxidant is completely consumed
Once the antioxidant has disappeared the peroxidation rate rises sharply until it reaches the
same rate as during uninhibited oxidation Conversely retarder antioxidants reduce the
peroxidation rate without inducing a distinct lag phase [63]
I10) Antioxidants benefits
The human body naturally produces reactive oxygen or nitrogen species which are
known as free radicals The overproduction of these compounds leads to oxidative damage to
large biomolecules such as lipids DNA and proteins This damage is responsible for Chronic
diseases like cardiovascular diseases diabetes and cancers However it has been
demonstrated that phytochemical compounds play a significant role in the protective effect
against the development of these chronic diseases In order to benefit the body the
phytochemical compounds neutralize and remove the free radicals [67]
The phytochemical compounds as Antioxidant exist widely in fruits vegetables cereal
grains and medicinal plants [68] Besides wild fruits and fruits wastes (peel and seed) also
contain high contents of antioxidant phytochemicals This antioxidant distributed in a wide
range in nature and classified in groups such as phenolics flavonoids and carotenoidsetc
The polyphenols have a beneficial effect on the plasma Some studies found that
consuming 10 servings of fruit and vegetables each day for 15 days increase their antioxidant
capacity [69] In addition the binding of polyphenols with red blood cells also leads to
improving the total oxidant-scavenging capacities of human blood [70] this role of
polyphenols has an effect on blood pressure which could also protect the cardiovascular
system
Furthermore anthocyanins and flavonoids were also proved to have protective actions
against several cardiovascular risk factors [71] Several other phytochemicals compounds
such as caffeic acid and chlorogenic acid possess potent anti-obesity activity
Antioxidant phytochemicals could possess protective actions against many other
chronic diseases besides the diseases mentioned above Recent studies have suggested that the
appropriate lifestyle modifications could prevent more than two-thirds of human cancers and
the diet contributes to about 35 of human cancer mortality [72] Therefore phytochemicals
compounds as an antioxidant can be good candidates for the prevention and treatment of
human body diseases
Chapter I Free radical
20
References
[1] Halliwell B Gutteridge JMC (1989) Free Radical Biology and Medicine Oxford UK
Oxford University Press
[2] Hussain SP Hofseth LJ and Harris CC (2003) Radical causes of cancer Nature
Reviews Cancer 3 276ndash285
[3] Poulsen HE Jensen BR Weimann A Jensen SA Sorensen M et al (2000)
Antioxidants DNA damage and gene expression Free Radical Research 33 Suppl S33ndash39
[4] A Dasgupta K Klein 2014 Antioxidants in Food Vitamins and Supplements Prevention
and Treatment of Disease Elsevier Inc London UK p 02
[5] SPMahantesh AK Gangawane CS Patil 2012 Free Radicals antioxidants diseases
and phytomedicines in human health future prospects World Research Journal of Medicinal
amp Aromatic Plants 06-10
[6] Finkel T Holbrook NJ Oxidants oxidative stress and the biology of aging Nature
2000408239ndash47
[7] K Jung M Seifert Th Herrling J Fuchs 2008 UV-generated free radicals (FR) in skin
Their prevention by sunscreens and their induction by self-tanning agents Spectrochimica
Acta Part A 69 1423ndash1428
[8] Aroun A Zhong JL Tyrrell RM OrsquoPourzand C Iron oxidative stress and the example of
solar ultraviolet A radiation Photochem Photobiol Sci 201211118
[9] Langrish JP Li X Wang S Lee MM et al Reducing personal exposure to particulate air
pollution improves cardiovascular health in patients with coronary heart disease Environ
Health Perspect 2012120367-72
[10] Centers for Disease Control and Prevention Annual smoking-attributable mortality
years of potential life lost and economic costsmdash the United States 1995-1999 MMWR
200251 (14)300-3
[11] V Rani U C Singh Yadav 2015 Free Radicals in Human Health and Disease
Springer New Delhi India 17 4173
[12] Nohl H Hegner D Do mitochondria produce oxygen free radicals in vivo Eur J
Biochem 197882563ndash7
[13] Sohal RS Mitochondria generate superoxide anion radicals and hydrogen peroxide
FASEB J 1997111269ndash70
[14] Fridovich I Superoxide dismutases An adaptation to a paramagnetic gas J Biol Chem
19892647761ndash4
Chapter I Free radical
21
[15] Touati D The molecular genetics of superoxide dismutase in E coli An approach to
understanding the biological role and regulation of SOD in relation to other elements of the
defense system against oxygen toxicity Free Radic Biol Med 198981ndash9
[16] Imlay JA Chin SM Linn S Toxic DNA damage by hydrogen peroxide through the
Fenton reaction in vivo and in vitro Science 19882401302ndash9
[17] Halliwell B Gutteridge JM Role of free radicals and catalytic metal ions in human
disease an overview Methods Enzymol 19901861ndash85
[18] Yamazaki I Piette LH EPR spin trapping study on the oxidizing species formed in the
reaction of the ferrous ion with hydrogen peroxide J Am Chem Soc 19911137588ndash93
[19] Jain A Martensson J Stole E et al Glutathione deficiency leads to mitochondrial
damage in brain Proc Natl Acad Sci USA 1991881913ndash7
[20] McCord JM (1988) Iron free radicals and oxidative injury Semin Hematol 355ndash12
[21] N Pauly C Pucciariello K Mandon G Innocenti A Jamet E Baudouin D
Heacuterouart P Frendo A Puppo 2006 Reactive oxygen and nitrogen species and glutathione
key players in the legume-Rhizobium symbiosis Journal of Experimental Botany Vol 57
No 8 pp 1769ndash1776
[22] Palmer RM Rees DD Ashton DS et al (1980) L-arginine is the physiological precursor
for the formation of nitric oxide in endothelium-dependent relaxation Biochem Biophys Res
Commun 153(3)1251ndash1256
[23] Ghafourifar P Cadenas E (2005) Mitochondrial nitric oxide synthase Trends Pharmacol
Sci 26 190ndash195
[24] Chiueth CC (1999) Neuroprotective properties of nitric oxide Ann NY Acad Sci 890
301ndash311
[25] Radi R Beckman JS Bush KM et al Peroxynitrite oxidation of sulfhydryls The
cytotoxic potential of superoxide and nitric oxide J Biol Chem 19912664244ndash50
[26] Beckman JS Ischiropoulos H Zhu L et al Kinetics of superoxide dismutase- and iron-
catalyzed nitration of phenolics by peroxynitrite Arch Biochem Biophys 1992298438ndash55
[27] Francis SH Busch JL Corbin JD Sibley D cGMP-dependent protein kinases and cGMP
phosphodiesterases in nitric oxide and cGMP action Pharmacol Rev 201062525ndash63
[28] McDonald LJ Murad F Nitric oxide and cGMP signaling Adv Pharmacol
199534263ndash75
[29] SSen R Chakraborty C Sridhar Y S R Reddy Biplab De 2010 free radicals
antioxidants diseases and phytomedicines current status and future prospect International
Journal of Pharmaceutical Sciences Review and Research 3 (1)91-100
Chapter I Free radical
22
[30] Manavalan K Ramasamy C Physical Pharmaceutics ed 2 Vignesh Publishers
Chennai 2001
[31] P Sharma A Bhushan Jha R Shanker Dubey M Pessarakli 2012 Reactive Oxygen
Species Oxidative Damage and Antioxidative Defense Mechanism in Plants under Stressful
Conditions Journal of Botany 26
[32] A Shinde J Ganu P Naik 2012 Effect of Free Radicals amp Antioxidants on Oxidative
Stress A Review Journal of Dental amp Allied Sciences 1(2)63-66
[33] B Halliwell Antioxidants in human health and disease Ann Rev Nutr 16 (1996) 33ndash50
[34] Pham-Huy L A He H Pham-Huy C Free radicals Antioxidants in Disease and Health
International Journal of Biomedical Science 2008 4(2) 89-96
[35] Halliwell B and Gutteridge JMC The Definition and Measurement of Antioxidants
in Biological Systems Free Radical Biology and Medicinal 18 125-126 (1995)
[36] Halliwell B Biochemistry of Oxidative Stress Bioche- chemical Society Transactions
35 1147-1150 (2007)
[37] Zelko I Mariani T Folz R (2002) Superoxide dismutase multigene family a
comparison of the CuZn-SOD (SOD1) MnSOD (SOD2) and EC-SOD (SOD3) gene
structures evolution and expression Free Radic Biol Med 33 (3) 337-49
[38] TG Cavalli MG Santos2015 The Role of Nutrition in Fighting Free Radicals Journal
of Nutrition and Health Sciences
[39] S U Rakesh P R Patil S R Mane 2010 Use of Natural Antioxidants to Scavenge
Free Radicals A Major Cause of Diseases International Journal of PharmTech Research
2(2)1074-1081
[40] Barreiros Andre LBS Juceni PD (2006) Estresse oxidativo relaccedilatildeo entre geraccedilatildeo de
espeacutecies reativas e defesa do organismo Quiacutem Nova 29 113-23
[41] Zacks MA Wen JJ Vyatkina G Bhatia V Garg N (2005) An overview of chagasic
cardiomyopathy the pathogenic importance of oxidative stress An Acad Bras Cienc 77 695-
715
[42] JI LL (2000) Antioxidants and Oxidative Stress in Exercise Society for Experimental
Biology and Medicine 222 283-91
[43] Esh Shami NJI Machado Moreira EA (2004) Licopeno como agente antioxidante Rev
Nutr 17 227-36
[44] King A Young G Characteristics and occurance of phenolic phytochemicals J Amer
Diet Assoc 1999 99 213-18
Chapter I Free radical
23
[45] Harborne J B and Simmonds N W 1964 Biochemistry of Phenolic Compounds
Academic Press London pp 101
[46] Tabak M Armon R Neeman I Cinnamon extracts inhibitory effect on Helicobacter
pylory J Ethnopharmacol 1999 67 269-77
[47] J Dai RJ Mumper (2010) Plant Phenolics Extraction Analysis and Their Antioxidant
and Anticancer Properties Molecules 15(10)7313-52
[48] Shahidi F and Naczk M (1995) Food Phenolics Sources Chemistry Effects
Applications Technomic Publishing Company Inc Lancaster USA
[49] Sailaja Rao P S Kalva A Yerramilli S Mamidi 2011 Free Radicals and Tissue
Damage Role of Antioxidants Free Radicals and Antioxidants (1) 4 2-7
[50] Vallejo F Tomaacutes-Barberaacuten FA and Ferreres F (2004) Characterisation of flavonols
in broccoli (Brassica oleracea L var italica) by liquid chromatography-UV diode-array
detection-electrospray ionisation mass spectrometry Journal of Chromatography A 1054(1ndash
2) 181ndash193
[51] JA Morales-Gonzaacutelez 2013 oxidative stress and chronic degenerative diesease-a role
for antioxidants InTech Rijeka Croatia
[52] Pratt D E amp Hudson B J F (1990) Natural antioxidant no exploited commercially
In Hudson BJF (ed) Food antioxidants London Elsevier Applied sciences 171-180
[53] Rice-Evans C Miller N J amp Paganga G (1996) Structure-antioxidant activity
relationships of flavonoids and phenolic acids Free Radical Biology and Medicine 20(7)
[54] Chung K T Wong T Y Wei C I Huang Y W amp Lin Y (1998) Tannins and
human health a review Critical Reviews in Food Science and Nutrition 38(6) 421-464
[55] Ragan M A amp Glombitza K (1986) Phlorotannin Brown algal polyphenols Progress
in Physiological Research 4 177-241
[56] Okuda T Yoshida T amp Hatano T (1995) Hidrolyzable tannins and related
polyphenols Fortschritte der Chemie organischer Naturstoffe 66 1-117
[57] Bravo L (1998) Polyphenols chemistry dietary sources metabolism and nutritional
significance Nutrition Reviews 56(11) 317-333
[58] Stafford H A (1983) Enzymic regulation of procyanidin bisynthesis lack of a flav-3-
en-3-ol intermediate Phytochemistry 22 2643-2646
[59] Vilaplana M Antioxidantes presentes en los alimentos O F F A R M Aacutembito
Farmaceacuteutico Bioquimica 2007 Vol 26 Nuacutem 10 Noviembre
Chapter I Free radical
24
[60] Garciacutea-Aacutelvarez JL Saacutenchez-Tovar T y Garciacutea-Vigil JL Uso de antioxidantes para
prevenir enfermedad cardiovascular Metaanaacutelisis de ensayos cliacutenicos Rev Med Inst Mex
Seguro Soc 2009 47 (1) 7-16
[61] F Shahidi PK Wanasundara Critic Rev Food Sei Nutr Vol 32 p 671992
[62] WJ Bauer R Badoud J Loumlliger A Etournaud (2010) Science et Technologie des
aliments Principes de Chimie des constituents et de Technologie des proceacutedeacutes 1egravere eacutedition
Presses polytechniques et Universitaires romandes Lausanne p212
[63] M Laguerre J Lecomte P Villeneuve Evaluation of the ability of antioxidants to
counteract lipid oxidation Existing methods new trends and challenges Progress in Lipid
Research 46 (2007) 244ndash282
[64] Van Acker SABE van Balen GP van den Berg DJ Bast A van der Vijgh WJF
Influence of iron chelation on the antioxidant activity of flavonoids Biochem Pharmacol
199856935ndash43
[65] Sestili P Guidarelli A Dacha M Cantoni O Quercetin prevents DNA single-strand
breakage and cytotoxicity caused by tert-butylhydroperoxide free radical scavenging versus
iron chelating mechanism Free Radic Biol Med 199825196ndash200
[66] Krinsky NI The antioxidant and biological properties of the carotenoids Ann NY Acad
Sci 1998854443ndash7
[67] Kruk J Association between vegetable fruit and carbohydrate intake and breast cancer
risk in relation to physical activity Asian Pac J Cancer Prev 2014 15 4429ndash4436
[68] Deng GF Xu XR Guo YJ Xia EQ Li S Wu S Chen F Ling WH Li
HB Determination of antioxidant property and their lipophilic and hydrophilic phenolic
contents in cereal grains J Funct Food 2012 4 906ndash914
[69] Mazza G Kay CD Cottrell T Holub BJ Absorption of anthocyanins from
blueberries and serum antioxidant status in human subjects J Agric Food Chem 2002 50
7731ndash7737
[70] Koren E Kohen R Ginsburg I Polyphenols enhance total oxidant-scavenging
capacities of human blood by binding to red blood cells Exper Biol Med 2010 235 689ndash
699
[71] Kruger MJ Davies N Myburgh KH Lecour S Proanthocyanidins anthocyanins
and cardiovascular diseases Food Res Int 2014 59 41ndash52
[72] Sak K Site-Specific anticancer effects of dietary flavonoid quercetin Nutr Cancer
2014 66 177ndash193
Chapter II
Potato
Generality
Chapter II Potato Generality
26
II) Potato (Solanum tuberosum L)
II1) Generality
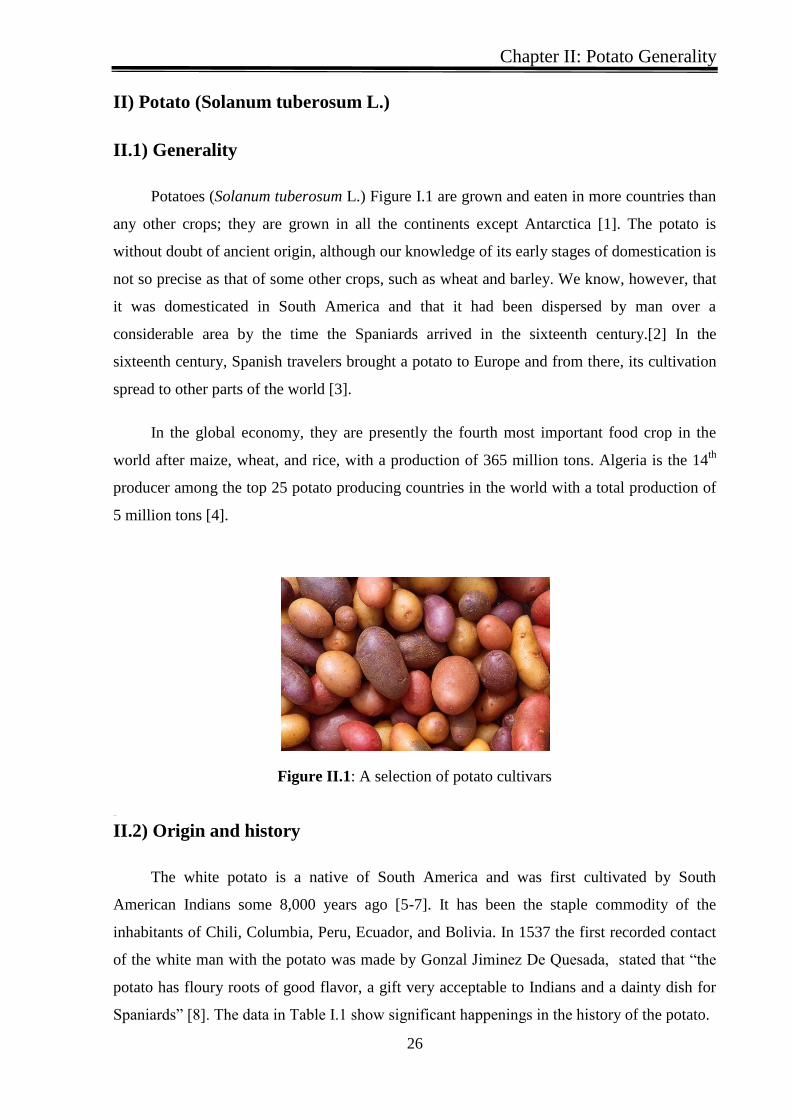
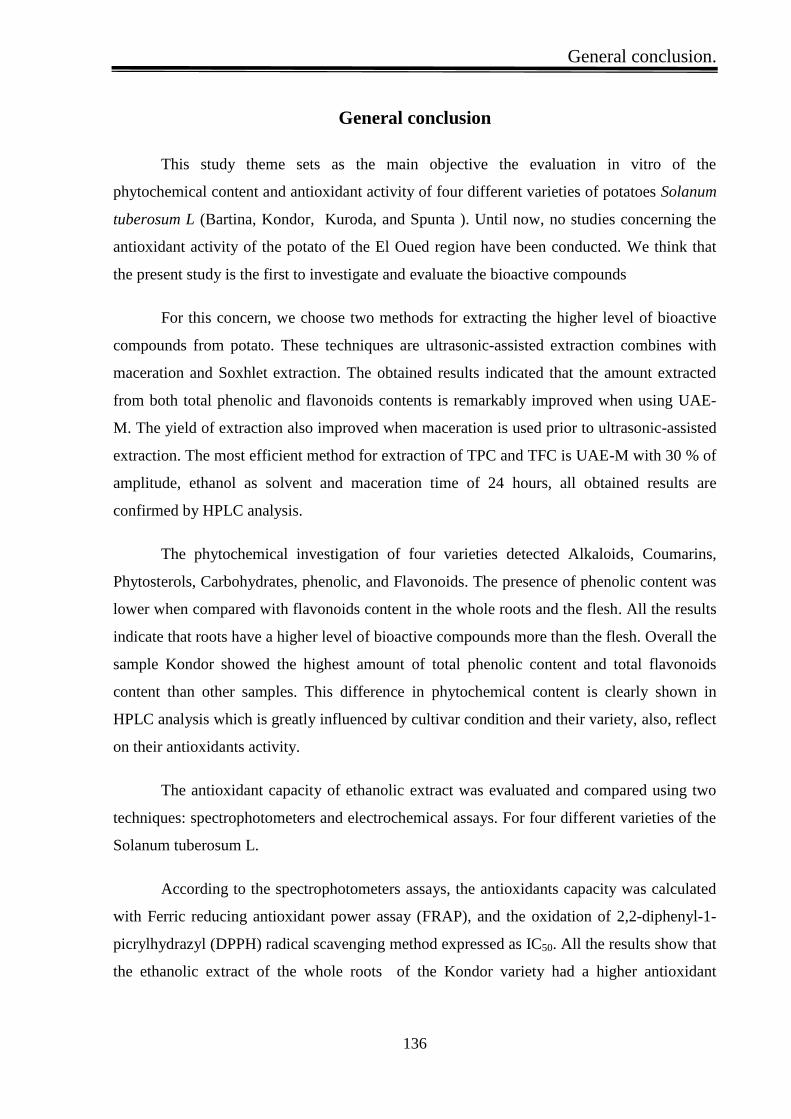
Potatoes (Solanum tuberosum L) Figure I1 are grown and eaten in more countries than
any other crops they are grown in all the continents except Antarctica [1] The potato is
without doubt of ancient origin although our knowledge of its early stages of domestication is
not so precise as that of some other crops such as wheat and barley We know however that
it was domesticated in South America and that it had been dispersed by man over a
considerable area by the time the Spaniards arrived in the sixteenth century[2] In the
sixteenth century Spanish travelers brought a potato to Europe and from there its cultivation
spread to other parts of the world [3]
In the global economy they are presently the fourth most important food crop in the
world after maize wheat and rice with a production of 365 million tons Algeria is the 14th
producer among the top 25 potato producing countries in the world with a total production of
5 million tons [4]
Figure II1 A selection of potato cultivars
Figure I 9A selection of potato cultivars
II2) Origin and history
The white potato is a native of South America and was first cultivated by South
American Indians some 8000 years ago [5-7] It has been the staple commodity of the
inhabitants of Chili Columbia Peru Ecuador and Bolivia In 1537 the first recorded contact
of the white man with the potato was made by Gonzal Jiminez De Quesada stated that ldquothe
potato has floury roots of good flavor a gift very acceptable to Indians and a dainty dish for
Spaniardsrdquo [8] The data in Table I1 show significant happenings in the history of the potato
Chapter II Potato Generality
27
The original name of potato tuber came from the latina word batata (name of sweet potato)
because the European couldnt adopt the word papa (name from the Inca empire ) whose name
came with the Spaniards one of many Latin names such as amka (in Bolivia ) and poni (in
Chile) [2]
Table II1 Significant happenings in the history of the potato
Table IITable II1 Significant happenings in t he history of the potato
Dates(Year) Activities
1536 Potatoes were first encountered by Spanish Conquistadors in The
Andes
1586 Sir Walter Raleigh brought potatoes to England
1620 Bauhia named potato Solanium Tuberosum
1662 Royal Society recommended the plantation of potatoes to prevent
famine
1731 Miller mentioned two varieties of sorts the red and the white
1814 The National Society of Agriculture of France gathered and displayed a
collection of 115 to 120 varieties of potatoes
After Solanum tuberosums introduction to Algeria in the mid-1800s potatoes were
grown mainly for export to French markets By national independence from France in 1962
farmers were harvesting on average 250 000 tonnes a year with about one third marked for
export[9]
II2) Scientific classification
Plant classification is the placing of known plants into groups or categories then
grouping successive categories into a hierarchy The act of classification can be defined as
lsquothe grouping of individuals so that all the individuals in one group have certain features or
properties in commonrsquo According to the rules of taxonomy potatoes are classified as
Order Solanales
Family Solanaceae
Subfamily Solanoideae
Genus Solanum L
Species Solanum tuberosum L
Chapter II Potato Generality
28
Potato is part of a group of plant family Solanaceae The Solanaceae includes 95 genera
with Solanum from which the family gets its name being the largest and most economically
significant In addition to potato the Solanaceae includes other significant crop plants
including tomato (Solanum lycopersicum) eggplant (Solanum melongena)[10] The genus
Solanum ranks among the five largest of plant genera estimated at 1000 to1700 species
[1112]
II3) Botanic description
The potato is a plant whose growth dies down annually but whose roots or other
underground parts survive The figure I2 shows potato plant is devised into an above-ground
portion which contains flowers leaves fruits and stems and a below-ground portion contains
tubers and roots
Figure II2 The potato plant
Figure I 10The potato plant
II31)The above ground portion
II311) Flowers
Potato flowers obtain all four essential parts of flower calyx corolla male and female
elements (flowers are bisexual) The corolla consists of five petals These are also joined at
their base and form a short tube and flat five-lobe surface Each lobe ends a triangular point
The form of the corolla is generally round Some primitive cultivars have pentagonal or star-
like corollas The corolla color may be either white light blue blue red and purple with
different tones and intensities[13]
Chapter II Potato Generality
29
II312) Leaflets
The potato leaflets are attached along a common axis there is a terminal leaflet and
therefore an odd number of leaflets Three to four pairs of leaflets are generally present The
leaflets are borne on petiolules they are ovate (ie they have a tapering point) Secondary
leaflets fill the spaces between the primary leaflets and serve to increase the amount of light
intercepted [14]
The most important role of the leaves is photosynthesis by absorbing sunlight which
may make the leaves the most active organs of the potato plant The plant has a rosette or
semi-rosette habit because of the arrangement of the most of the leaves at or near the base of
short stems and is near the soil surface
According to one variety the leaf may be long or short also its colors may be light
dark or grey-green [15]
II313) Stem
Stem color is generally green or mottled green (Figure I2) occasionally it may be red-
brown or purple Main stems show partial apical dominance plays a major role in
determining tuber yield This is achieved through interstem competition whereby stems
compete for water nutrients and light The intensity of competition controls the number of
tubers formed per stem and then goes on to influence the size distribution of the tuber crop [14]
II314) Fruits
Some potato cultivars will produce small green tomato-like fruits in addition to tubers
These fruits typically contain 25 to 200 seeds each When mature such fruits can be
harvested and their seeds extracted When stored in a dry cool place these seeds can maintain
viability for ten years or more [13]
Chapter II Potato Generality
30
II32) The below-ground portion
II321) Tubers
A tuber is a botanical name for the swollen end of a fleshy underground stem (a stolon)
which arises from a below ground axil at the base of the stem Not all stolons will form
tubers Stolon tips not covered by soil develop into vertical stems with normal foliage Tuber
formation is basically the result of translocation and storage of excess food and is dependent
upon several genetic and environmental factors [13]
The shape of tuber can range from very long fingerling types to round All tubers even
round ones have two ends the heel or stem end where the tuber is attached to the stolon
and the apical rose or seed end The eyes are located on the axils of scalelike leaves or
eyebrows Morphologically the eyes correspond to the nodes of stems Each eye contains
several buds [14]
II322) Roots
A much branched fibrous root system is formed either by the seedling tap root or by
adventitious roots in tuber-grown plants In early stages of growth the root system is
restricted to surface soil the roots turning downward after extending for some distance
horizontally this leaves the area of subsoil directly below a plant almost free of its own roots
[16]
II4) Varieties
The cultivation of potato around the world for years under different climate conditions
[17] has effects on shape size color flavor and nutritional content of potato Actually there
are more than 4000 distinct varieties worldwide but only about 100 are suitable for
commercial use and are consistently available in consumer markets [18]
Potato varieties can be classified and grouped according to size shape color texture
taste and cooking characteristics Potatoes are also classified on the basis of their skin color
(Red yellow and white) texture (smooth slightly netted) tuber shape (round and oval to
round) and flesh color (cream and light yellow)
According to [18] the potato varieties classified according to one of seven subcategories
(Figure II3) Russet yellow white red fingerling purple and blue and petitesother
Chapter II Potato Generality
31
(a) (b)
(c)
(d)
(e)
(f)
(g)
Figure II3 Different potato variety
Figure I 11Different potato variety
II41) Russet (a)
These bulky oval potatoes are characterized by netted brown skin and white flesh In
general Russet-type varieties exhibit high starch content containing between 60 and 70 of
starch Russets also contain low moisture levels [19]
Common Russet varieties are Russet Burbank Kennebec Russet Norkotah Canela
Russet Ranger Russet [20]
II42) Yellow (b)
The yellow potato category is gaining popularity for its diversity Yellow potatoes vary
in size from 1 oz to larger sizes comparable to a Russet The category gets its name from the
yellow interior flesh though the exterior skin is typically light brown to a yellow-golden
Chapter II Potato Generality
32
color The interior of a common yellow variety will be smooth and creamy Moderate levels
of starch and sugar make many yellows a popular choice for a variety of uses
Common yellow varieties are Yukon Gold Satina and Dutch Baby [20]
II43) White (c)
Whites are typically small-medium size and many varieties are oval or oblong in shape
The interior flesh is white and the delicate exterior skin can range from nearly colorless to
shades of tan Common white varieties frequently have a slightly creamy dense texture and
average starch levels and low-sugar content [18]
Common white varieties are Atlantic Snowden Dakota Pearl Superior Kennebec
Shepody Cal White Reba and Pike [20]
II44) Red (d)
The skin of red potatoes tends to be thin and the tubers are often smaller and rounder
than other varieties The interior flesh is commonly cream or white in color and is firm Also
in many red varieties known with her higher levels of sugar and lower starch levels
Common red varieties are Sangre Norland Dakota Rose Chieftain Red La Soda Red
Pontiac Cherry Red and Modoc [20]
II45) Fingerling (e)
Fingerling varieties are named for their comparatively slender and long appearance
Average fingerlings are approximately 10 cm in length although sizes vary greatly by the
variety and desired end use The term ldquofingerlingrdquo characterizes potatoes of a particular shape
and size rather than a specific subset of varieties Thus there is more diversity in color
texture flavor nutrition starch and sugar content within this category of potatoes compared
to others (eg Russet white etc) External fingerling colors range from browntan red
orange yellow white and even purple Interior colors are often cream or white [19]
Common fingerling varieties are Russian Banana French Rose Finn Apple and Purple
Peruvian [21]
Chapter II Potato Generality
33
II46) Purple and Blue (f)
These colorful potatoes are eye-catching and come in a range of hues of blue purple
and even red The skin and the flesh of these varieties tend to be highly pigmented and
contain relatively high levels of antioxidants Category members tend to be small to medium
size and may range in shape from round to oblong and even fingerling size
Common purple and blue varieties are Purple Majesty Purple Peruvian All Blue Mountain
Rose Adirondack Blue Congo Blue and True Blue [2021]
II47) PetitesOther (g)
The category of ldquoPetitesrdquo refers to smaller versions of full-sized potatoes The unifying
characteristic is the C-size class distinction which is no larger than 38 cm in diameter
roughly marble or pearl-sized Category members range significantly in terms of starch and
sugar content flavor color and texture Attractive medleys of yellow red and purple or blue
flesh are increasingly available in US grocery stores [18]
Common petite varieties are smaller sizes of most potato varieties Dutch Babies and
RosaraKlondike Rose
II5) Tuber Composition
The composition of a potato tuber is dependent on a number of factors although the
innate genetic characteristics associated with each cultivar are thought to be among the most
significant [22] Other factors are known to influence potato chemical composition include the
geographic growing location soil type and climate [23] agronomic factors such as fertilizer
or pesticide use [24] the impact of potato pests or diseases [25] and age or maturity at harvest
[24] In addition processing or preparation techniques [26] can affect the actual quantity of
the nutrient that is present at the time the potato is eaten Finally at the time of consumption
factors such as the bioavailability of the nutrient or other foods eaten in conjunction with the
potato can influence how well the nutrient is able to be utilized for nutritional or health
benefits
The nutritional content of potato tuber is important for human health Table II2 shows
the nutritional content of a whole potato tuber 100 g mass provides
Chapter II Potato Generality
34
Table II2 Proximate composition of edible portion of potatoes Table IIITable II2 Prox imate composition of edible portion of potatoes
Component Value100g
Water 7858
Total carbohydrate (by difference) 1807
Starch 1586
Dietary fibre 130
Sugars 061
Protein 214
Total lipids 008
Ash 113
About 80 water (Table II2) A major portion of potato solids is starch followed by
protein and fiber Table I3 gives the proximate composition of an edible portion of a typical
potato tuber Approximately 6 of a potato tuber consists of peel having slightly higher
amounts of ash crude fiber protein riboflavin and folic acid than the flesh
Table II3 Selected nutrients and vitamins in flesh and peel of raw potatoes (based on 100 g
wet basis)
Table IVTable II3 Selected nutrients and v itamins in flesh and peel of raw potatoes (base d on 100 g wet bas is)
Component Potato flesh Potato peel
Dry matter () 216 170
Ash () 086 167
Crude fiber () 037 183
Protein () 181 267
Ascorbicacid(mg) 144 118
Thiamine (mg) 010 003
Riboflavin (mg) 0036 0058
Niacin (mg) 157 105
Folic acid (mg) 128 173
Vitamin B6 (mg) 022 021
Chapter II Potato Generality
35
Although potato contains most of the minerals (Table II4) iron zinc calcium
magnesium selenium manganese of nutritional significance in relatively small amounts it is
considered a valuable source of potassium (5635 mg100 g of edible portion) in our diet
However Potato varieties differ in their mineral compositions [27]
Table II4 Nutrition information of potato (dry weight)
Table VTable II 4 Nutrition information of potato ( dry weight)
Ingredient name Content a (mg100 g)
Energy (kJ100 g) 1492 plusmn 000
Vitamin B1 (thiamine) 076 plusmn 000
Vitamin B2 (riboflavin) 040 plusmn 001
Vitamin B3 (niacin) 904 plusmn 002
Vitamin C 287 plusmn 020
Na 274 plusmn 015
Mg 762 plusmn 003
K 5635 plusmn 000
P 3019 plusmn 000
Ca 140 plusmn 000
Fe 432 plusmn 000
Cu 376 plusmn 000
Zn 103 plusmn 007
Mn 484 plusmn 000
Se (μg100 g) 387 plusmn 130
a Potato cultivar Shepody
Also contain phytochemicals compounds besides a combination of vitamins and
minerals [28] Potato is considered as an important source of phenolic compounds diverse in
groups of tens of thousands of different compounds some of which are effective against
malady or have other health-promoting qualities containing effects on longevity mental
acuity cardiovascular disease and eye health [29-31]
Chapter II Potato Generality
36
The phytochemical compounds are present in the whole potato tuber peel and flesh
however the peel is indicated to have the highest amounts [32] These phytochemical
compounds presented in potatoes as phenolic acids and flavonoids including flavonols and
Anthocyanidins (Table II5)
Phenolic acids such as chronologic acid gallic acid p-hydroxybenzoic acid and vanillic
acid with a content range from 0 to 34 mg [33-35] for flavonoids compounds including
flavanols such as rutin and quercetin-3-o-glu-rut with a content range from 0 to 122 mg
[3637] also anthocyanins [38]
Table II5 Concentration levels of the main phenolic compounds in potatoes
Table VITable II5 Concentration levels of the main phe nolic compounds in potatoes
Phenolic Classes Phenolic Compounds Range (mg100 g Dry
Extract)
Phenolic acids gallic acid 0ndash10
p-hydroxybenzoic acid 0ndash78
vanillic acid 06
chlorogenic acid 04ndash340
Flavonols Rutin 0ndash122
quercetin-3-o-glu-rut 25
Anthocyanidins Anthocyanins 14ndash1633
For carotenoids such as lutein zeaxanthin violaxanthin and neoxanthin (Figure II4)
are major carotenoids found in potatoes and b-carotene is found in trace amounts according to
[32]
Figure II4 Major carotenoids in potatoes
Figure I 12Major caroteno ids in potatoes
Chapter II Potato Generality
37
However another study of potato tubers along with other foods reports of total phenolic
amounts found in other plants these potatoes have more phenolics content than tomatoes
onions carrots Snapbeans [39] These amount of phenolic acids can be higher or less from
the same variety depending on the cultivar condition [40-42]and different variety of the
potato cultivars [43]
Potato contains glycoalkaloids α-chaconine and α-solanine Because of food poisoning
concerns new potato varieties are tested for glycoalkaloid levels and if the amount (total of
α-chaconine and α-solanine) exceeds 20 mg glycoalkaloid 100 g or 200 mgkg tuber on a
wet weight basis the variety will most likely not be released [44]The levels of these
glycoalkaloids can vary in potato varieties The skin contains significantly more glyco
alkaloids (124ndash543 mgkg of wet peel) than the flesh (13ndash148 mgkg)The glycoalkaloid
content of potatoes is not affected by baking cooking and frying Thus potato products
having high skin content should be watched [45] Postharvest factors such as low storage
temperature the light greening of potato (which is a sign of glycoalkaloid ) and mechanical
injury can increase glycoalkaloid content in potatoes [46-48]
II6) Cultivation
The potato plant can be grown from a potato or piece of potato which makes the potato
exceptional in agriculture The new plant can produce 5-20 new tubers They have genetic
clones of the original plant also the plant produces flowers and berries that contain 100-400
botanical seeds These can be planted to produce new tubers which will be genetically
different from the original plant [49]
The development of potatoes can be broken down into three distinct growth stages The
first stage begins with sprouts developing from the eyes and ends at emergence from the soil
The seed piece is the sole energy source for growth during this stage
The second stage at this point the vegetative parts leaves branches roots and stolons
start of formation and last until tubers start to develop The first and the second stages last
from 30 to 70 days depending on planting date soil temperature and other environmental
factors
The last stage is Growth Stage tubers are forming at salon tips but are not yet
enlarging This stage will last approximately 2 weeks Tuber cells expand with the
accumulation of water nutrients and carbohydrates Tuber bulking is the growth stage of
longest duration Depending on the date of planting and cultivar bulking can last up to three
Chapter II Potato Generality
38
months Vines turn yellow and lose leaves photosynthesis gradually decreases tuber growth
rate slows and the vines die [50]
II7) Production
Since 1960s the production of potato has rapid growth in 2005 the combination of
potato production in Africa Asia and South America exceeds that of Europe and the USA
[5152] with 200 million cropping area globally about the half is concentrated in Asia which
include China India and Russia the first three producing countries (Figure I5) with 961 46
and 32 million tonnes respectively [53]
Algeria is the 14th
producer among the top 25 potato producing countries in the world
and the first in Africa with a total production of 5 million tons [4] The potato is grown over
an area of over 160 000 ha and can be planted and harvested somewhere in Algeria in
virtually any month of the year Recently the county of El Oued southeast Algeria become the
first producer in the country with 11 million tons which represent 35 of the national
production [54]
Figure II5 Top five potato-producing countries in 2014 (FAO 2016 ) Figure I 13Top five potato- producing countries in 2014 (FA O 2016 )
II8) Non-Food Uses of Potato
From the economic side the potato is considered as the most widely grown tuber crop
in the world which used for human consumption as the main purpose In addition to its use in
the industrial field like potato starch alcohol etc
In the nutritional side the potatoes are known for their carbohydrate content the
predominant form of this carbohydrate content is starch A small but significant portion of the
starch in potatoes called lsquoresistant starchrsquo which resist the digestion by enzymes in the
Chapter II Potato Generality
39
stomach and small intestine and so reaches the large intestine essentially intact also
considered to have similar physiological effects and health benefits of fiber by offer protection
against colon cancer improve glucose tolerance and insulin sensitivity [55]
Potato starch is a promising biopolymer for different food pharmaceutical and
biomedical applications because of its higher water solubility that raises its degradability and
speed of degradation non-toxicity easy availability and abundance
Presently in nanoscience the potato starch is converted to glucose through enzymatic
hydrolysis which is a raw material for the production of lactic acid Then the lactic acid is
polymerized to produce polylactic acid (PLA) PLA is becoming increasingly popular in the
production of a wide range of biodegradable materials (board sheet films fiber paint etc)
because of low energy requirements during its production compared to other plastics of
petroleum origin Fiber-reinforced PLA composite materials have been used to interior
components for automobiles [56] However the cost of production of these plastics is
significantly high as compared to those of petroleum origin and it is essential to develop a
technology that uses energy more efficiently and is cost-effective
II9) Potatoes information
As a matter of fact the potato has always been a staple food around the world and the
second one in developed countries like European countries and the USA Therefore
conducting the researchers on the potato as a staple food and industrial development became
an inevitable tendency for complying with the continuously growing nutritional and healthy
demand [57]
The potato samples were analyzed for nutrient content by a number of studies
Provision of information has been shown that this crop contains essential amino acids
vitamins and minerals and is thus reported to play a significant role in human nutrition [58]
Many varieties of potatoes offer nutritional quantities of ascorbic acid (up to 42 mg100 g)
potassium (up to 6938 mg100 g) dietary fiber (up to 33)
other bioactive components such as protein with lower amounts (085ndash42) [59]
However almost 50 of potatoes phenolic compounds are located in the peels and adjoining
tissues [6061] since peels have more phenolic compounds than tubers these compounds
could be used in food and non-food applications [62]
In the last decade there has been increasing attention given to new sources of natural
antioxidant phytochemicals as a result of their potential health benefits in addition to their
Chapter II Potato Generality
40
functional properties in traditionally commercialized products such as preserving color and
flavor and hence improving shelf life [63]
Antioxidant activity in potato tubers has been extensively reported [64] pigmented potato
genotypes (mainly cultivars with purple and red flesh) as compared to those with white and
yellow flesh have been shown to contain significantly higher levels of antioxidants [65] At
present the potato grown in the El-Oued county is mainly consumed in the form of fresh
tuber in Algeria
II10) Materials references and goals
Little is known about the chemical composition or antioxidant capacity of potatoes El-
Oued county but a great variation in cultivar condition and difference of genetic
characteristics between varieties may be lead to diverse in their chemical composition
Although there may be as many potato varieties cultivars in this region The most four
popular cultivars of (Solanum tuberosum L) were chosen to provide a reference basis for
chemical composition values
Four potatoes cultivars lsquoBartina Kondor Kuroda and Spuntarsquo were collected in 2015
from different areas located in the region of El-Oued south-east of Algeria (Table II6) were
planted for three months before being used Table II7 describes the tuber physical
characteristics of the four cultivars analyzed and Figure II6 gives a visual representation of
the five chosen cultivars
Table II6 location of four varieties of potatoes Table VIITable II6 location of four varieties of potatoes
Varieties Areas name Areas located
Bartina Ourmas 33deg 24 327 N 6deg 46 4406 E
Kondor Guemar 33deg 30 176 N 6deg 47 507 E
Kuroda Trifaoui 33deg 25 16 N 6deg 56 05 E
Spunta Aarair 33deg 17 203 N 6deg 46 195 E
Chapter II Potato Generality
41
Table II7 Tuber physical Characteristics of the four potato cultivars investigated Table VIIITable II7 Tuber phys ical Characteristics of the four potato c ultivars investigated
Potato
Cultivar
Skin color Flesh
Color
Tuber skin
texture
Tuber Size amp Shape Eye
Depth
Bartina Red Light
yellow
Smooth Large to very large
Oval to round
Medium
Kondor Red Cream Smooth Large to very large
Oval to long
Medium
Kuroda Red Light
yellow
Intermediate Large to very large
Oval
Medium
Spunta Yellow Light
yellow
Smooth Large to very large
Long
Shallow
Note Information for this table was gathered from THE EUROPEAN CULTIVATED
POTATO DATABASE
Bartina Kondor
Kuroda Spunta
Figure II6 The visual appearance of the four potato tuber varieties analyzed in this
thesis
Figure I 41 The visual appearance of the four potato tuber varieties analyzed in t his t hesis
Chapter II Potato Generality
42
The overall goals of this thesis are threefold
1) To choose an extraction technique and a ratio of solvent which gives high yield
extraction of bioactive compounds from one cultivated potato variety
The literature research shows that the use of proper methods has an influence on the level of
phytochemical compounds extracted from plant sample Also the extraction process is
affected by several factors as solvent type contact time and others These will be discussed in
chapter IV by focusses on the level of total phenolic and flavonoids content extracted which
leads to conclude the best technique
2) To investigate and quantification the chemical composition and antioxidant activity of
the whole roots of four different variety of potatoes which are present the most
popular cultivated in the region of El-Oued (Bartina Kondor Kuroda Spunta)
However there are large differences in quantity of phytochemical compounds between
potatoes cultivars Thus chapter V will aim to quantify the total phenolics and total
flavonoids content this investigation will complete with HPLC analysis
The antioxidant activity of four samples measured by two techniques the first one is
spectrophotometer assay and the second one is electrochemical (cyclic voltammetry) assay
Also we will emphasize on comparing the results obtained by linear regression analysis
3) To incorporate the characteristics of the bioactive compounds and antioxidant
activities found in one variety which shows the highest level in phytochemical
compounds thus we will measure the potential antioxidant activity with other
spectrophotometers assays
As discussed in the first experiment (chapter V) The Kondor variety shows the highest
phytochemical compounds we will undertake in order to assess the potential acceptability of
peeled and unpeeled Kondor variety and compare the results in the second experiment in
chapter V
Chapter II Potato Generality
43
References
[1] J J Burke Growing the Potato Crop Vita Equity House Upper Ormond Quay Dublin
7 Ireland p16
[2] PM Harris History of the potato Charpmen amp Hall 1992 p 01
[3] R Navarre M J Pavek 2014 The Potato Botany Production and Uses CAB
International Washington USA p1
[4] httpwwwfaoorgstatisticsfr FAOSTAT 2012 and FAOSTAT 2013 accessed
February 09 2017
[5] Bukasov SM (1978) Systematics of the potato Systematics Breeding and Seed
Production of Potatoes Bulletin of Applied Botany Genetics and Breeding Leningrad
USSR pp 1ndash42
[6] Hawkes JG (1990) The Potato Evolution Biodiversity and Genetic Resources
Smithsonian Institution Press Washington DC USA
[7] Ochoa CM (1990) The Potatoes of South America Bolivia Cambridge Univ Press
Cambridge UK
[8] W A Gould 1999 POTATO PRODUCTION PROCESSING amp TECHNOL CTI
PUBLICATIONS USA p01
[9] httpwwwfaoorgpotato-2008enworldafrica international year of potato accessed
October 10 2017
[10] JM Bradeen Ch Kole Genetics Genomics and Breeding of Crop Plant Science
Publishers USA 2011 p06
[11] DrsquoArcy WG (1991) The Solanaceae since 1976 with a review of its biogeography In
JG Hawkes RN Lester M Nee N Estrada (eds) Solanaceae III Taxonomy Chemistry
Evolution Royal Botanical Gardens Kew UK pp 75ndash137
[12] Mabberley DJ (1997) The Plant Book 2nd edn Cambridge Univ Press Cambridge UK
[13] H D Jong J B Sieczka W D Jong 2011 The Complete Book of Potatoes Timber
Press Portland London p17
[14] Rousselle P Robert Y et Crosnier JC 1996 La pomme de terre INRA Pp 50
[15] (Canadian Food Inspection Agency) Plant Morphology (httpwwwinspectiongcca
accessed 16 November 2017)
[16] D Soltner 1979 Les grandes production veacutegeacutetales phytotechnie speacuteciale Collection
Sciences Et Techniques Agricoles PARIS 10eacutemeacute Edition P 427
Chapter II Potato Generality
44
[17] CIP (International Potato Center) (2012a) Potato Facts and Figures
(httpcipotatoorgpotatofacts accessed 15 December 2012)
[18] USPB (United States Potato Board) (2011a) Potato Types Guide
(httpwwwciaprochefcompotatoespdf PotatoTypespdf accessed 15 December 2012)
[19] R Navarre M J Pavek 2014 The Potato Botany Production and Uses CAB
International Boston USA p 43
[20] (USDA National Agricultural Statistics Service) (2013) Crop
Production(httpwwwnassusdagovPublicationsTodays_Reportsreportscrop1212pdf
accessed 15 May 2013)
[21] WSU (Washington State University Extension) (2012) Potato Varieties A
Comprehensive List (httppotatoes wsueduvarietiesvars-allhtm accessed 15 December
2012)
[22] Tahvonen R Hietanen RM Sihvonen J and Salminen E (2006) Influence of
different processing methods on the glycaemic index of potato (Nicola) Journal of Food
Composition and Analysis 19(4) 372-378
[23] Knuthsen P Jensen U Schmidt B and Larsen I K (2009) Glycoalkaloids in
potatoes Content of glycoalkaloids in potatoes for consumption Journal of Food
Composition and Analysis 22(6) 577-581
[24] Lombardo S Pandino G and Mauromicale G (2012) Nutritional and sensory
characteristics of ldquoearlyrdquo potato cultivars under organic and conventional cultivation systems
Food Chemistry 133(4) 1249-1254
[25] Lambert DH Powelson ML and Stevenson WR (2005) Nutritional interactions
influencing diseases of potato American Journal of Potato Research 82(4) 309-319
[26] Decker EA and Ferruzzi MG (2013) Innovations in food chemistry and processing to
enhance the nutrient profile of the white potato in all forms Advances in Nutrition An
International Review Journal 4(3) 345S-350S
[27] Casanas R Gonzalez M Rodriguez E Marrero A Diaz C 2002 Chemometric studies of
chemical compounds influence cultivars of potatoes from Tenerife J Agric Food Chem
502076ndash2082
[28] T Mu H Sun X Liu Potato Staple Food Processing Technology Springer Briefs in
Food Health and Nutrition 2017 Singapore 53 50-125
[29] Manach C Scalbert A Morand C Remesy C amp Jimenez L (2004) Polyphenols
food sources and bioavailability Am J Clin Nutr 79 727ndash747
Chapter II Potato Generality
45
[30] Parr AJampBolwell GP (2000) Phenols in the plant and in manThe potential for
possible nutritional enhancement of the diet by modifying the phenols content or profile
Journal of the Science of Food and Agriculture 80 985ndash1012
[31] Scalbert A Manach C Morand C Remesy C amp Jimenez L (2005) Dietary
polyphenols and the prevention of diseases Crit Rev Food Sci Nutr 45 287ndash306
[32] Ezekiel R Singh N Sharma S Kaur A Beneficial phytochemicals in potatomdashA
review Food Res Int 2013 50 487ndash496
[33] Maumlder J Rawel H Kroh L Composition of phenolic compounds and glycoalkaloids
α-solanine and α-chaconine during commercial potato processing J Agric Food Chem 2009
57 6292ndash6297
[34] Mattila P Hellstroumlm J Phenolic acids in potatoes vegetables and some of their
products J Food Comp Anal 2007 20 152ndash160
[35] Im H Suh B Lee S Kozukue N Ohnisi-Kameyama M Levin C Friedman M
Analysis of phenolic compounds by high-performance liquid chromatography and liquid
chromatographymass spectrometry in potato plant flowers leaves stems and tubers and in
home-processed potatoes J Agric Food Chem 2008 56 3341ndash3349
[36] Deuszliger H Guignard C Hoffmann L Evers D Polyphenol and glycoalkaloid
contents in potato cultivars grown in Luxembourg Food Chem 2012 135 2814ndash2824
[37] Shakya R Navarre D Rapid screening of ascorbic acid glycoalkaloids and phenolics
in potato using high-performance liquid chromatography J Agric Food Chem 2006 54
5253ndash5260
[38] Andre C Oufir M Guignard C Hoffmann L Hausman J Evers D Larondelle
Y Antioxidant profiling of native andean potato tubers (Solanum tuberosum L) reveals
cultivars with high levels of β-carotene α-tocopherol chlorogenic acid and petanin J Agric
Food Chem 2007 55 10839ndash10849
[39] Wu X Beecher GR Hoden J M Haytowitz D B Gebhardt SE Prior R L 2004
Lipophilic and hydrophilic antioxidant capacities of common foods in the United States J
Agric Food Chem 52 4026ndash4037
[40] Lombardo S Pandino G Mauromicale G 2012 Nutritional and sensory
characteristics of ldquoearlyrdquo potato cultivars under organic and conventional cultivation systems
Food Chemistry 133 (4) 1249ndash1254
[41] Hamouz K Lachman J Pazderů K Hejtmaacutenkovaacute K Cimr J Musilovaacute J Pivec
V Orsaacutek M Svobodovaacute A 2013 Effect of cultivar location and method of cultivation on
Chapter II Potato Generality
46
the content of chlorogenic acid in potatoes with different flesh colour Plant Soil and
Environment 59 (10) 465ndash471
[42] Brazinskiene V Asakaviciute R Miezeliene A Alencikiene G Ivanauskas L
Jakstas V Viskelis P Razukas A 2014 Effect of farming systems on the yield quality
parameters and sensory properties of conventionally and organically grown potato (Solanum
tuberosum L) tubers Food Chemistry 145 903ndash909
[43] Kanatt S Chander R Radhakrishna P Sharma A Potato peel extract natural
antioxidant for retarding lipid peroxidation in radiation processed lamb meat J Agric Food
Chem 2005 53 1499ndash1504
[44] Bushway RJ Bureay JL McGann DF 1983 Alph-chaconine and Alpha-Solanine
content of potato peels and potato peel products J Food Sci 4684ndash86
[45] Friedman M Roitman JN Kozukue N 2003 Glycoalkaloid and calysteigine contents
of eight potato cultivars J Agric Food Chem 512964ndash2973
[46] Fitzpatrick TJ McDermott JA Osman SF 1978 Evaluation of injured potato samples
for total glycoalkaloid content J Food Sci 431617ndash1618
[47] Wu MT Salunkhe DK 1978 After-effect of submersion in water on greening and
glycoalkaloid formation of potato tubers J Food Sci 431330ndash1331
[48] Griffith DW Bain H Dale MFB 1998 Effect of storage temperature on potato
(Solanum tuberosum L) tuber glycoalkaloid content and subsequent accumulation of
glycoalkaloids and chlorophyll in response to light exposure J Agric Food Chem 465262ndash
5268
[49] International Potato Center Potato facts and figures httpcipotatoorgpotatofacts
Accessed July 21 2016
[50] S C Yadav 2008 POTATO Production Processing and Marketing BIOTECH BOOKS
Delhi India p 16
[51] Birch PRJ Bryan G Fenton B Gilroy EM Hein I Jones JT Prashar H
Taylor MA Torrance L Toth IK 2012 Crops that feed the world 8 potato are the
trends of increased global production sustainable Food Security 4 (4) 477ndash508
[52] Food and Agriculture Organization of the United Nations (FAO) 2008 International
Year of the Potato The Global Potato Economy FAO Rome Italy
[53] J Singh L Kaur 2016 Advances in Potato Chemistry and Technology Second Edition
Elsevier Inc London United Kingdom p 12
Chapter II Potato Generality
47
[54] A Ould Rebai T Hartani M N Chabaca M Kuper Une innovation 2017
increacutementielle la conception et la diffusion drsquoun pivot drsquoirrigation artisanal dans le Souf
(Sahara algeacuterien) Cah Agric 26 35005
[55] Hylla S Gostner A Dusel G Anger H Bartram H P Christl S U Kasper H amp
Scheppach W (1998) Effects of resistant starch on the colon in healthy volunteers possible
implications for cancer preventionAmer J Clin Nutr 67 136ndash142
[56] Kawamoto H (2007) Trends in research and development of plastics of plant origin-
from the perspective of nanocomposite polylactic acid for automobile use Science and
Technology Trends 22 62ndash75
[57] Z Hong XU Fen W Yul H Hong-hai1 D Xiao-feng Progress of potato staple food
research and industry development in China Journal of Integrative Agriculture 2017 16(12)
2924ndash2932
[58] Deuszliger H Guignard C Hoffmann L Evers D Polyphenol and glycoalkaloid
contents in potato cultivars grown in Luxembourg Food Chem 2012 135 2814ndash2824
[59] BurlingameB MouilleacuteB CharrondiegravereR Nutrients bioactivenon-nutrients and anti-
nutrients in potatoes J Food Comp Anal 2009 22 494ndash502
[60] Albishi T John J Al-Khalifa A Shahidi F Phenolic content and antioxidant
activities of selected potato varieties and their processing by-products J Funct Foods 2013
5 590ndash600
[61] Al-Weshahy A Venket Rao A Isolation and characterization of functional components
from peel samples of six potatoes varieties growing in Ontario Food Res Int 2009 42
1062ndash1066
[62] H Akyol Y Riciputi E Capanoglu M Fiorenza Caboni V Verardo Phenolic
Compounds in the Potato and Its Byproducts An Overview Int J Mol Sci 2016 17 835
[63] OrsquoShea N Arendt E Gallagher E Dietary fibre and phytochemical characteristics of
fruit and vegetable by-products and their recent applications as novel ingredients in food
products Innov FoodSci Emerg 2012 16 1ndash10
[64] Madiwale G Reddivari L Stone M Holm D Vanamala J Combined effects of
storage and processing on the bioactive compounds and pro-apoptotic properties of color-
fleshed potatoes in human colon cancer cells J Agric Food Chem 2012 60 11088ndash11096
[65] Kuumllen O Stushnoff C Holm D Effect of cold storage on total phenolics content
antioxidant activity and vitamin c level of selected potato clones J Sci Food Agric 2013 93
2437ndash2444
Chapter III
Methods
Chapter III Methods
49
III1) Introduction
For most analytical protocols the procedure for the effective extraction of the specific
compounds from the bulk matrix is one of the most important processes in the analytical
mechanism [1] The composition and nature (simple andor complex) of the phytochemical
compounds to be extracted determine the condition of the extraction process
The extraction process is affected by the chemical structure of the phytochemical
compounds (simple or complex compounds) the extraction technique employed by solvents
solid-phase extraction and supercritical extraction the conditions of storage time and
temperature and the presence of the substance [2] the polymerization of the phytochemical
content is ranged from simple to high polymerized substance Some plants contain different
phenolic acids phenylpropanoids anthocyanins and tannins which can interact with other
plant components such as primary metabolism substances (protein and carbohydrates) these
compounds might be insoluble That is why it is difficult to develop a process capable of
recovering all the phytochemical substances contain in a plant matrix [3] which makes the
choice of the condition extraction solvent and technique an important factor
III1) Methods
III11) Soxhlet
Soxhlet extraction is a common example of an exhaustive solid-liquid extraction
technique and its principle of operations depend on the transfer of the target compound from
the plant (solid) to appropriate organic solvent(s) by ensuring that the extraction solvent
(liquid) maintains continuous contact with the sample at the time of the heat-aided extraction
process[4]
Figure III1 shows the traditional Soxhlet extraction apparatus generally contain a
distillation flask the sample holder (thimble) siphon and condenser In practice a
preweighed and sufficiently dried solid sample is loaded on filter paper and placed inside the
thimble Solvent vapors generated from the heated flask containing the extraction solvent(s)
pass through the thimble and become liquefied in the condenser
The extraction process begins the moment the liquefied solvent maintains contact with
the sample in the thimble The level of the condensed solvent therefore continues to upgrade
until it reaches the overflow level At this point an instant siphon effect rapidly makes the
extract (solute + solvent) to fall back into the distillation flask
Within the flask only the fresh solvent evaporates resulting in a continuous cyclical
Chapter III Methods
50
movement of the extraction solvent A complete cyclical movement of fresh solvent from the
distillation flask until it returns back to the flask as an extract is indicated to as a ldquocyclerdquo The
operation is repeated until complete extraction is achieved [5]
The cyclical movement of evaporated solvent from the flask that is subsequently
condensed facilitates the mass transfer of the target analyte in every cycle completed during
the extraction Generally the more the number of cycles completed the faster the rate of
extraction of the target analyte from the sample matrix [4]
Figure III1 Typical conventional soxhlet extractor Figure I 15Typical conventiona l soxhlet extractor
Figure I 16Typical conventiona l soxhlet extractor
III12) Maceration
Maceration is a method used a long time ago in winemaking and widely used in
medicinal plants research to extract essential oils and bioactive substance this technique
generally has several stages [6] Firstly crushed or cut the plant materials into small pieces to
increase the surface area for proper mixing with solvent Secondly adding the menstruum (the
appropriate solvent) in a closed container Thirdly The mixture then is strained the marc (the
damp solid material) is pressed and the combined liquids are clarified by filtration or
decantation after standing to facilitate the extraction and increase the yield we shake the
container this procedure increase the diffusion and bringing new solvent to the menstruum by
removing the concentrated solution from the sample surface the procedure of maceration is a
slow process taking a few hours up to several weeks also can consume large volumes of
solvent
Chapter III Methods
51
III13) Ultrasound-assisted extraction
Most applications of ultrasound-assisted leaching contain systems using the bath or
ultrasonic probe This kind of equipment has been used for leaching organic and inorganic
compounds with frequencies more than 20 kHz [7] The plant materials placed in a flask
which fixed an ultrasonic bath the mechanical stress produced by ultrasonic on the cells
through the production of cavitations in the sample made the cellular breakdown this damage
increases the solubilization of metabolites in the solvent and develops extraction yields [8]
The condition of sonication frequency time and temperature effect on the level of the
extraction
III14) Several variables effect on extraction system
In general terms the extraction productivity of a target compound is usually a function of
several process variables The most important factors concerning the extraction of phenolic
compounds natural products are the solvent type temperature contact time solvent-to-solid
ratio particle size and among others
The positive or negative effect of each variable on the mass transfer phenomenon which
governs the extraction process is specific to different varieties of the vegetable matrix and is
not always obvious the extraction of soluble phenolic compounds can be performed by
promoting their dispersion from plant tissue using a solvent
Each vegetable material possesses unique properties that might interfere with the
phenolic compounds extraction so it is important to develop optimal extraction technique for
their quantification and identification [9]
III141) Solvent
Solvent composition is always an important variable to be considered when dealing
with the extraction process
This variable should always be optimized in order to produce good extraction yields in
an economically advantageous process Many solvents can be used to extract phenolic
compounds from plant matrices ethanol isopropanol water and their combination these
substances are classified with the GRAS status and for that reason water isopropanol and
ethanol are suitable for the recovery of nutraceuticals [1]
Ethanol is reported to be appropriate solvent to recovery the phenolic compounds and
for that reason it is usually used for the obtaining of this group of compounds especially
Chapter III Methods
52
when it comes to the production of nutraceuticals which is related to its GRAS classification
[1] Ethanol water and their mixtures are the preferable solvent systems currently used for
natural product production
In that context infusions (immersion in hot water) continue to be an interesting way to
produce extracts with high contents of antioxidant compounds further the use of ethanol
should also be considered [10]
III142) Solvent-to-feed-ratio
According to mass transfer principles the driving force during mass transfer is the
concentration gradient between the solid and the bulk of the liquid which is increased when
the ration solvent to solid creased
Therefore according to mass transfer principles independent of the extraction solvent
used the higher the solvent-to-solid ratio the higher the total amount of solids obtained [11]
However from economic side the effect of consumption of the solvent on the extraction
process cost this variable should be carefully analyzed and optimized
There for several studies have reported that the effect of the solvent-to-feed (SF) ratio
variation from 61 to 181 was evaluated in terms of recovery of the antioxidant agents from
several plants [12] The effect of the solvent-to-solid ratio on the recovery of phenolic
compounds from different plant matrices was well studied by several authors [13-15]
III143) Temperature
Many phytochemicals are heat stable and extraction at high temperature has no adverse
effects however there are some phytochemicals which are heat labile In general a higher
extraction temperature causes an increase in the rate of diffusion of the soluble plant
phytochemicals into the extraction solvent An increase in temperature can cause an augment
in the content of some phytochemicals which is possibly due to an increase in the solubility
of many of these bioactive compounds [16-17]
Overall some phytochemicals such as anthocyanins the heat had an effect on
anthocyanins degradation [18-19] therefore high temperatures for long extraction times
would not be suitable for extraction of plants containing these compounds However for
phenolic compounds attention should be paid to their stability during the process phenolic
Chapter III Methods
53
compounds when kept above certain temperatures for certain periods of time can suffer
thermal degradation (oxidation) and activity loss [20]
In this study the temperature was ranged from 33degC in UAE extraction which reached
by the extraction performed by UAE [21] to 70 degC ( Ethanol boiling point) for Soxhlet
extraction
III144) Time
The time necessary for the extraction of phytochemicals compounds from plant tissue
will vary depending on the plant species to be extracted [10] According to Durling et all The
concentration of the target compounds in the extract obtained after a 6-h extraction time was
20 higher than that observed for the sample related to the extraction period of 1 h [12]
Increased contact time between solvents like ethanol and solid matrices might lead to a
progressive release of solute from the solid matrix to solvent [22]
Generally the extraction time using for UAE process ranged from 10ndash60 min and for
Soxhlet extraction ranged from 6ndash24 h [23-25]
III145) Particle size
The variation of in particle size of the sample has a strong influence on The quantity of
polyphenol recovery from plant materials
Mass transfer can be improved by the use of smaller particles to improve the penetration
of solvent in the solid matrix [10] The bigger the particle size of the material the longer the
path that the solvent has to travel which increase the time for maximum phytochemical
content to be extracted [26]
Also the damage of the plant cells caused by the crushing or milling the plant material
lead to increased extraction of phytochemical compounds
III2) Estimation of the water weight percentage in potato roots
No agricultural product in its natural state is completely dry Some water is always
present The percent moisture is an expression used for the description of the quantity of
water in plant material and for this purpose we usually use two methods
Chapter III Methods
54
These methods are the wet basis and dry basis In addition the content may be
expressed as a percent or as a decimal ratio [27] In our work we will use one form (percent)
in analyzing moisture in potatoes roots calculating by the following equation
where
is the moisture content of the sample (mm)
is the sample weight before drying g
is the sample weight after drying g
Two or three parallel measurement has to prepare The final sample moisture content
will be the mean of the two or three parallel measurements
III3) Phytochemical investigation
Analyses of plant materials based on two methods non-chromatographic
spectrophotometric methods or chromatographic methods Spectrophotometric methods are
based on the ability of the phytochemicals that absorb light in the ultraviolet (UV) or visible
range of the spectrum (eg total flavonoids content) or the ability to form such chromophores
after reacting with certain reagents such as total phenolic content and this quantification
depending on Beer-Lambert law This approach does not require separation of individual
compounds in the extract and often quantification is done as the total amount of similar
compounds in the extract
The advantages of the non-chromatographic spectrophotometric methods are simple
fast and of low cost but these methods lack the specificity for individual compounds and the
results are less precise [28]
III31) Screening chemistry
Phytochemical analysis was determined for all the extracts using the standard methods
III311) Detection of flavonoids
The detection of flavonoids done by Alkaline Reagent Test Extracts were treated with
few drops of sodium hydroxide solution Formation of intense yellow color which becomes
colorless on the addition of dilute acid indicates the presence of flavonoids[2930]
Chapter III Methods
55
III312) Detection of phytosterols
a) Liberman and Burchurds The test was done after the extraction and reflux of the plant
material 2 ml extract taken in a test tube 2 ml Chloroform 2 ml Acetic Anhydride and 2 ml
concentrate Sulphuric acid was added to it translucent green color shows the presence of
steroids and formation of deep red color indicates the presence of triterpenoids [3132]
b) Salkowskirsquos test Dissolve the extract in chloroform with few drops of concentrated
Sulfuric acid shake well and allow to stand for some time red color appears in the lower
layer indicates the presence of sterols and formation of yellow colored lower layer indicating
the presence of triterpenoids [32]
III313) Detection of tannins
About 05 g of the extract was boiled in 10 ml of water in a test tube and then filtered A
few drops of 01 ferric chloride was added and observed for brownish green or a blue-black
coloration [33]
III314) Detection of carbohydrates
Fehlingrsquos Test Filtrates were hydrolyzed with diluted HCl neutralized with alkali and
heated with Fehlingrsquos A amp B solutions Formation of red precipitate indicates the presence of
reducing sugars[3034]
III315) Detection of alkaloids
a) Mayerrsquos Test Filtrates were treated with Mayerrsquos reagent (Potassium Mercuric Iodide)
Formation of a yellow colored precipitate indicates the presence of alkaloids[32]
b) Wagnerrsquos Test Filtrates were treated with Wagnerrsquos reagent (Iodine in Potassium Iodide)
Formation of brownreddish precipitate indicates the presence of alkaloids[32]
III315) Detection of coumarins
3 ml of 10 NaOH was added to 2 ml of aqueous extract formation of yellow color
indicates the presence of coumarins [3135]
Chapter III Methods
56
III32) Total flavonoids content (TFC)
a) Principle
The estimation of the total flavonoids content generally used by aluminum chloride
method This method is based on flavonoids capability of forming a stable complex with Al
ions in a solution
The color of the complex depends on the ratio of the Al ions to the flavonoid molecules
and the hydroxylation pattern of the latter For this reason the spectrophotometric readings
used in this method can vary from 367 to 510 nm in different experimental procedures[36]
b)Protocol
Total flavonoids content was determined as described previously by ZOU et AL (2004) [37]
A mixture of 1 ml of extract 2 ml of nanopure water and 015 ml of 5 NaNO2 was prepared
and allowed to react for 6 min Then 015 ml of 10 AlCl3 solution was added and mixed
thoroughly After 6 min 2 ml of 4 NaOH solution was added and allowed to stand for
another 15 min The absorbance of the mixture was measured at 510 nm versus prepared
blank Rutin was used as a standard compound for the quantification of flavonoids content
Results were expressed in mg of rutin equivalents g of extract
III33) Total phenolics content (TPC)
a)Principle
The Folin-Ciocalteu (FC) assay is the most widely used method for the estimation of
total phenolic content (TPC) in extracts fruits vegetables grains and other foods The FC
reagent consists of an oxidizing mixture of phosphotungstic acid and phosphomolybdic acid
which when reduced produce a mixture of blue molybdenum and tungsten oxides (λ max
765 nm) Technically all compounds that can be oxidized by the FC reagent will be measured
[38]
b)Protocol
Total phenolics content was determined with the Folin-Ciocalteu reagent according to a
method described by Singelton-Ross (1956)[39] Briefly 100 microl of the appropriately diluted
extract was added to 05 ml of freshly diluted 10-fold Folin-Ciocalteu reagent Then 2 ml of
Chapter III Methods
57
20 Na2CO3 solution The reaction mixture was kept in the dark for 30 min and its
absorbance was measured at 760 nm against a blank Gallic acid was used as a reference
standard and the results were expressed as gallic acid equivalents g of extract
III34) HPLC analysis
liquid chromatography is a powerful separation method used in phytochemical studies
Practically this technique can be able to resolve mixtures with a large number of similar
analytes HPLC is very efficient it yields excellent separations in a short time [40]
III341) Principe
The procedure of HPLC is depended on the flow of solutes through two non-miscible
phases inside column (mobile phase and stationary phase ) to be separated [41] For this the
sample is dissolved in the mobile phase However this phase is in constant movement relative
to the stationary phase this movement due to the interactions of the constituents with the
stationary phase they separate after sufficient running time and they appear at the end of the
column at different times [40] this detection expressed as chromatograms
III342) HPLC system
According to the basic diagram shown in Figure 2 an HPLC system contains the
following elements
Figure III2 Block Diagram of an HPLC
Figure I 17Bloc k Diagram of an HPLC
Chapter III Methods
58
a) Solvents
Requirements for the solvents used in HPLC are filtering and degassing Filtering the
solvents will get rid of particulates that might contaminate the sample and can block the flow
through the HPLC column Particulates that are large enough can cause permanent damage to
the column Degassing helps to remove dissolved gases that are in the solvent This is
accomplished by pulling a vacuum on the solvent container while vibrating or sonicating
Both the particulates and the dissolved gas bubbles can also cause the efficiency of the
separation to go down Dissolved gas bubbles reduce separation efficiency by causing band
broadening and interfering with some detection systems [42]
b) Pumps
Pumps These are devices that deliver the mobile solvent at a controlled flow rate to the
separation system The pumping system needs to be of a high enough quality that it can
consistently produce a high-pressure [43] High-pressure gradients that are reached by these
pumps provide more accurately different gradients maintained by microprocessor control In
the gradients up to four solvents are presented in a constant relationship
c) Injection systems
Injector this device allows the addition of the liquid sample to the mobile phase Sample
injection systems which work automatically are preferred for prominent precision in sample
introduction [44]
d) Column
In the analytical model stainless steel columns generally have an internal diameter of
46mm The length is 5 10 15 or 25cm The filling (silica grafted silica or polymeric
particles) has a particle size of 3 5 or 10 um The internal diameter of a column is usually 4
or 46 mm If pure substances must be collected at the end of the chromatogram large
diameter columns will be required [45]
e) Detectors
An ideal detector of any type is sensitive to low concentrations of every analyte provides a
linear response and does not expand the eluted peaks according to the characteristic of the
molecules investigated various detectors are used such as its absorption in UV range or its
fluorescence This is the most frequent method used and its application allows for over 70
of detections [45]
Chapter III Methods
59
III343) Protocol
The phenolic compounds were analyzed by HPLC A LC-18 column (150 mm x 46
mm id x 5 mm) maintained at 30 degC was employed Elution was performed at a flow rate of
1 mLbullmin-1 using a mobile phase composed of wateracetic acid (982 vv) (solvent A) and
acetonitrile (solvent B) in gradient elution mode The elution gradient was 0 - 5 min 5 B
10 min 10 B 11 min 20 B 20 min 20 B 30 min 40 B 40 min 50 B 50 min 80
B
Chromatograms were acquired at 300 nm Phenolic compound standards ascorbic acid
gallic acid chlorogenic acid vanillin rutin were dissolved in extraction solvents and used for
identification of phenolic acids presents in different sample extracts Peak identification in
HPLC analysis was achieved by comparison of retention time and UV spectra of reference
standards
Quantification of individual phenolic compounds in the extracts was done using the
peak area of reference compounds and reported as microgmg of extract
III4) Antioxidant activity
According to its definition an antioxidant should have a significantly lower
concentration than the substrate in the antioxidant activity test Depending on the type of
reactive oxygen species (ROS) and target substrate a certain antioxidant may play a
completely different action or have a completely different roleperformance In line with this
some studies support the use of a selection of methods to measure the antioxidant activity [46-
47] The choice of substrate is very important in an antioxidant activity test Depending on the
type of substrate and its amountconcentration different results will be achieved
In our study the methods used to determine total antioxidant activity devised in two
techniques First one is spectrophotometers methods such as 11-diphenyl-2-picrylhydrazyl
(DPPH) assay and ferric ion reducing antioxidant parameter (FRAP) assay Secondly an
electrochemistry technique in this process we used cyclic voltammetry methods to determine
the antioxidant activity
Chapter III Methods
60
III41) Spectrophotometers assay
The Spectrophotometry is a quantitative analytical method that involves measuring the
absorbance or optical density of a given chemical substance in solution More this species is
concentrated plus it absorbs light within the limits of proportionality laid down by the law of
Beer-Lambert The optical density of the solutions is determined by a spectrophotometer
previously calibrated to the absorption wavelength of the chemical species to be studied
when intensity light I0 passes through a solution part of it is absorbed by the solute (s)
Therefore the intensity I of the transmitted light is less than I0 [48]
The absorbance of the solution is a positive value and defined as follows
Or When
III411) DPPH assay
a) Principle
The 11-diphenyl 1-2-picrylhydrazyl ( DPPHbull) - which is also known as αα-diphenyl-
β- picrylhydrazyl 22-diphenyl -1- picrylhydrazyl or 2 2-Diphenyl -1-(246-Trinitrophenyl
hydroxyl) assay originally described by Boils (1958) was designed to take advantage of a
common electron spin resonance reagent a stable free radical with an odd unpaired valence
electron to study antioxidant activity With its odd electron DPPHbull
can be stabilized by
accepting an electron or hydrogen radical from an antioxidant molecule such as a gallic acid
as a reducing agent DPPHbull
is known for its deep violet color and the strong absorbance at
517nm when dissolved in ethanol at concentrations between 1mM and 225microM [49-51] this
absorbance is decreased with the decolorization of DPPHbull which accompanies the pairing of
the lone electron
b) Protocol
The scavenging activity by the DPPH (22-diphenyl-1-picrylhydrazyl) radical scavenging
method according to Ohinishi and others [52] with some modifications a 1 ml of diluted
extract and 1 ml of DPPH (025 mM) were mixed and after 30 min the absorbance was
measured at 517 nm The scavenging activity was measured as the decrease in absorbance of
the samples versus DPPH standard solution Results were expressed as radical scavenging
activity percentage () of the DPPH according to the formula
Chapter III Methods
61
Where
A0 absorbance of the control
As absorbance of the sample
III412) Evaluation of total antioxidant capacity (TAC) by
Phosphomolybdenum method
a) Principle
The total antioxidant capacity of the ethanol extract was evaluated by the
phosphomolybdenum method according to the procedure described by Prieto et al [53]
The assay is based on the reduction of Mo (VI) to Mo (V) by the extract and
subsequent formation of green phosphateMo (V) complex at acid ρH
c) Protocol
The antioxidant activity of different samples was evaluated by the phosphomolybdenum
method of Prieto et al [53] An aliquot of 100 microl of the sample was combined with 1ml of
reagent solution (06 M sulfuric acid 28 mM sodium phosphate and 4 mM ammonium
molybdate) The tubes were capped and incubated in water bath at 95 degC for 90 min After the
samples were cooled to room temperature the absorbance was measured at 695 nm The
antioxidant capacity was expressed as equivalent to ascorbic acid ( mg ascorbic acid g of
extract)
III413) Ferric-reducing antioxidant power (FRAP) assay
a) Principle
The FRAP assay is based on the single electron transfer by an antioxidant to reduce the ferric
to ferrous ion when the ferric- tripyridyltriazine (Fe3+
-TPTZ) complex is reduced to the
ferrous counterpart the complex absorbs at 593 nm with an intense blue color [55]
b) Protocol
The FRAP assay was performed based on the procedure described by Benzie and Strain
[54] 100 microl of the diluted sample was added to 300 microl water then 3 ml of the FRAP reagent
and the reaction was monitored after 30 min in the dark at 593 nm The results were expressed
as mg Fe(II) g of extract
Chapter III Methods
62
III414) Beta-carotene bleaching
a) Principe
This method first developed by Marco [55] and modified by Miller [56]
This technique is sensitive and mainly based on the principle oxidation of linoleic acid
which is an unsaturated fatty acid by Reactive Oxygen Species (ROS) produced by
oxygenated water This complex formed will oxidate the b-carotene this oxidation will lead
to discoloration The retarding of this oxidation correlate with the addition of an antioxidation
compounds [57]
The degradation of b-carotene by linolic acid catalyzed with heat 50 degC in the aqueous
phase the activity is measured at 470 nm [58]
b) Protocol
Two milliliters of a solution of β-carotene in chloroform (2mg10ml) was pipetted into a
flask containing 40mg of linoleic acid and 400 mg of Tween 80The chloroform was removed
by rotary vacuum evaporator at 45 for 4min and 100 ml of distilled water was added
slowly to the semisolid residue with vigorous agitation to form an emulsion A 48ml aliquot
of the emulsion was added to a tube containing 02ml of the antioxidant solution the
absorbance was measured at 470 nm immediately against a blank consisting of the emulsion
without β-carotene [59] The tubes were placed in a water bath at 50 and the absorbance
measurements were conducted again at 15 min intervals up to 120minAll determinations
were carried out in triplicate [60] The antioxidant activity (AA) of the extracts was evaluated
in terms of bleaching of β-carotene using the following formula
where
is the absorbance of values measured at zero time of the incubation for the test sample
is the absorbance of values measured at zero time of the incubation for test control
is the absorbances measured in the test sample
is the absorbances measured in the test control
After incubation for 120 min the total antioxidant activity of acid ascorbic and Gallic acid
was also measured by inhibition of β-carotene bleaching method for comparison
Chapter III Methods
63
III42) Electrochemical techniques
III421) Principle
Recently the Electrochemical technique was applied to determine the antioxidant
content and antioxidant capacity in the phytochemical analysis these interest based on their
advantages of sensitivity and fastness process [61] The broadest technique in
electrochemistry used for redox system is Cyclic voltammetry The CV record the anodic
current produced by the antioxidant compounds which are oxidized on the surface of the
working electrode while the potential of a working electrode is linearly scanned from an
initial value to a final value and back [62] The current produced is proportional to the
combined concentration of the antioxidants [6364] This process can happen multiple times
during a single experiment The current produced is plotted versus the applied potential to
give the cyclic voltammogram as shown in Figure III3
Figure III3 cyclic voltammogram for redox system
Figure I 18
Figure I 19cyclic voltammogram for redox system
The cyclic voltammogram contains the cathodic peak Ic and anodic peak Ic the anodic
oxidation potential (Ea) and the cathodic oxidation potential (Ec) If the only cathodic peak
is present and anodic peak is absent then the process is irreversible and for the reversible
system the values of Epc and Epa are equal [65]
III422) Protocol of antioxidant activity
Electrochemical measurements were performed on a Potentiostat voltammetric signals
of Cyclic Voltammetry and square-wave voltammetry were recorded at room temperature in
an electrochemical cell with a volumetric capacity of 25 mL containing a working electrode
was glassy carbon a saturated calomel HgHg2Cl2KCL electrode was used as a reference and
a platinum wire was used as counter electrode The glassy carbon was polished before every
Chapter III Methods
64
experiment The antioxidant capacity measured of sample varieties was in a buffer solution of
acetate (300 mM pH=36) Cyclic voltammograms were obtained by a single cycle performed
at a scan rate of 100 mVs-1
and potentials range +200 to +1400 mV Gallic acid was used as a
standard in the calculation of antioxidant capacity of the studied sample of potatoes because
of its wide-spreading in nature and also because of its anodic area display excellent linearity
toward gallic acid concentration [66]
III422) Protocol for scavenging activity of superoxide anion Obull2
minus radicals
Superoxide anion radical was generated electrochemically by one electron reduction in
the commercial molecular oxygen in ACN containing 01 M TBFB at room temperature (28 plusmn
1 degC) The samples of each extract were added to this reaction medium and the cyclic
voltammograms were recorded following a modified method of Le Bourvellec et al [67]
Experimentations were carried out using voltalab40 PGZ301 potentiostatgalvanostat
(radiometer analytical SAS) in a double-walled electrochemical cell of 25 mL and the
conventional three-electrode system was employed A glassy carbon (GC) working electrode
(radiometer analytical SAS) having area 0013 cm2 a platinum wire counter electrode and a
HgHg2Cl reference electrode (30 M KCl) were used Data acquisitions were accomplished
with a Pentium IV (CPU 30 GHz and RAM 1 Gb) microcomputer using VoltaMaster4
software version 708 (radiometer analytical SAS) The scan rate was kept at 100 mVs and
potential window was from minus14 to 00 V The studied extract samples were added to the in
situ generated superoxide anion radical Obull2
minus and the cyclic voltammograms were recorded
III5) Calibration curve
Evaluation of the linearity of the calibration curve is favored to prove the acceptability
of any analytical method [68] Generally to verify the linearity five concentration levels of
standard solutions are required to construct the regression line of the calibration curve In this
study a linearity test was performed by plotting the calibration curve between the standard
concentration and the absorbance wave for spectrophotometers analysis and current peaks for
electrochemical analysis The linearity can be investigated through the correlation coefficient
(R) usually used to determine the linearity of the calibration curve In chemical correlation
analysis the coefficient of determination (R2) is the more exact term used [69] In this study
the linearity criterion was chosen using R2 of the regression line which is suggested to be
090 or more
Chapter III Methods
65
III51) Totale phenolic content
The linearity of the calibration curve was tested at ranges of concentrations (003 ndash 03
mgmL) prepared of Gallic acid as standard solutions of total Phenolic content the equation
obtained from the linear calibration graph in the studied concentration Y = 314x+0046
(Rsup2 = 0990) where y represents the value of the Absorbance and x the value of standards
concentration
000 005 010 015 020 025 030
00
02
04
06
08
10
Ab
s
Gallic asid concentration (mgml)
R2=0990
Figure III4 The calibration curve obtained for Gallic acid Figure I 02 Figure III4 The calibration curve obtained for Gallic acid
III52) Total Flavonoid content
The linearity of the regression line of the calibration curve was evaluated by preparing
standard solutions of Rutine in ethanol at concentration ranges of 005 ndash 025 mgmL for total
Flavonoids content The equation obtained from the linear calibration graph in the studied
concentration Y=192X-000567 (Rsup2 = 0997) where y represents the value of the Absorbance
and x the value of standards concentration
Chapter III Methods
66
015 020 025 030 035 040
03
04
05
06
07
08
Ab
s (
nm
)
Con (mgml)
R2=0997
Figure III5 The calibration curve obtained for Rutine
Figure I 21Figure III5 The calibration curve obtained for R utine
III53) FRAP assay
Ferrous sulfate (FeSO4) at concentration ranges 005 ndash 04 mgmL were prepared as
standards solution to assess the linearity of the calibration curve for FRAP antioxidant assay
The equation obtained from the linear calibration graph in the studied concentration
Y= 234746X-003929 (Rsup2 = 0993) where y represents the value of the Absorbance and x the
value of standards concentration
000 005 010 015 020 025 030 035 040 045
00
02
04
06
08
10
Ab
s (
nm
)
Con (mgml)
R2=0993
Figure III6 The calibration curve obtained for Ferrous sulfate
Chapter III Methods
67
III54) Total antioxidant capacity
Linearity was evaluated through the regression line of the calibration curve The
calibration line of Ascorbic acid at a different concentration from 007 to 03 mgmL for Total
antioxidant capacity The equation obtained from the linear calibration graph in the studied
concentration Y= 320228X+003727 (Rsup2 = 0990) where y represents the value of the
Absorbance and x the value of standards concentration
005 010 015 020 025 030
02
03
04
05
06
07
08
09
Ab
s (
nm
)
Con (mgml)
R2=099
Figure III7 The calibration curve obtained for Ascorbic acid TAC Figure I 22T he cali bration curve obtaine d for Ascor bic a cid TA C
III55) HPLC calibration curve
Figure 7 shows the chromatograms of seven mixed standards which analyzed in 300 nm
waves length and concentration (1ugml) peaks from 1 to 7 were Ascorbic acid Gallic acid
Chlorogenic acid Cafiec acid Quercetin Vanillin and Rutine respectively The linearity of
standard preparations was tested The calibration curves were constructed by plotting the peak
area of each compound against the corresponding concentrations The five points of the
regression line offered good linear behavior in the ranges 002 ndash 01 and 02 ndash 10 microgmL The
coefficient of determination (R2) values as shown in the figures below were found to be
acceptable and close to 0990 which was the R2 selected for the linearity criteria in this study
The amount of this standard in samples extracts was determined according to their calibration
curves of retention time and area (Table III1)
Chapter III Methods
68
Figure III8 Chromatograms of standard phenolic compounds1ascorbic acid
2gallic acid 3 chlorogenic acid CA caffeic acid 4 vanillin Q quercetin 5 rutin
Figure I 23hr omatograms of sta ndar d phenolic compounds1ascor bic a cid 2galli c aci d 3 chl oroge nic a cid CA caffeic aci d 4 va nillin Q querceti n 5 r utin
Table III1 Constituents Standard content analyzed by HPLC Table IXTable III1 Constit uents Standard content analyzed by HP LC
Standard Rt(min) Equation R2
Ascorbic acid 421 Y=75728X 09614
Gallic acid 523 Y= 23616X-7232 09986
Chlorogenic acid 1362 Y=39775X-1881 09983
Caffeic acid 163 Y=72328X 09986
Quercetin 2037 Y=548X-2823 0996
Vanillin 2146 Y=82773X-1423 09984
Rutine 2822 Y= 2411298X-1060 0995
The equation obtained from the linear calibration graph in the studied concentration
range for gallic acid in Cyclic Voltammetry (Figure 2b) Y = 2153X - 02432 (Rsup2 = 0999)
where y represents the value of the area of the anodic wave and x the value of standards
concentration expressed as mgml
Chapter III Methods
69
Figure III9 Voltammograms obtained for gallic acid (a) and (b) The calibration curve
obtained for gallic acid by cyclic voltammetry in pH=36 acetate buffer
Figure I 24Voltammograms obtai ned for galli c aci d (a) and (b) The calibrati on curve obtai ned for galli c aci d by cy clic v oltammetry in pH =36 a cetate buffer
III6) Determination of IC50 value
On the basis of screening results of triplicate measurement of the extract the inhibition
concentration (IC50) value was determined from extrapolating the graph of scavenging activity
versus the concentration of extract (using linear regression analysis) which is defined as the
amount of antioxidant necessary to reduce the initial radical concentration by 50 value
higher the antioxidative effects [70] The effective concentration having 50 radical
inhibition activity expressed as mg extractml
III7) Statistic analysis
The statistical analysis is descriptive methods aim to summarise empirical data
expressed in the quantitative form The interpretation of collecting data for any kinds of topics
in technology information used statistical tools such as mean median mode and standard
deviation [71]
III71) Linear regression analysis
Linear regression analysis is the most widely used of all statistical techniques it is the
study of linear additive relationships between variables Let Y denote the ldquodependentrdquo
variable whose values you wish to predict and let X1 hellipXk denote the ldquoindependentrdquo
variables from which you wish to predict it with the value of variable Xi in period t (or in
02 04 06 08 10 12 14
-5
0
5
10
15
20
25
30
I [micro
Ac
msup2]
Potential [ V]
06 ml
05 ml
04 ml
03 ml
02 ml
01 ml
(a)
000 002 004 006 008 010
2
4
6
8
10
12
14
16
18
20
22
I [micro
Ac
msup2]
C (mgml)
(b)
R2=0999
Chapter III Methods
70
row t of the data set) denoted by Xit Then the equation for computing the predicted value
of Yt is
This formula has the property that the prediction for Y is a straight-line function of each
of the X variables holding the others fixed and the contributions of different X variables to
the predictions are additive [72]
III72) Main effect plot and interaction plot
For two-way data an interaction plot shows the mean value of the response variable for
each combination of the independent variables This type of plot gives us some understanding
of the effect of the main factors and their interaction When main effects or interaction effects
are statistically significant post-hoc testing can be conducted to determine which groups
differ significantly from other groups[73]
III73) p-values and R-squared values
p-values and R-squared values measure different things The p-value indicates if there is
a significant relationship described by the model and the R-squared measures the degree to
which the data is explained by the model It is therefore possible to get a significant p-value
with a low R-squared value This often happens when there is a lot of variability in the
dependent variable but there are enough data points for a significant relationship to be
indicated [74]
In this study all the experiments data were performed in triplicate and the results were
expressed as mean plusmn SD (standard deviation) calculated by Excel 2007 These means were
compared using analysis of variance (ANOVA) using the Minitab version 17 (SAS) and
Linear regression the data obtained were considered statistically significant at p lt 005 and
very statistically significant at p lt 0005
Chapter III Methods
71
References
[1] Santana CM Ferrera ZS Padroacuten MET and Rodriacuteguez JJS (2009) Methodologies
for the Extraction of Phenolic Compounds from Environmental Samples New Approaches
Molecules 14 298-320
[2] Naczk M and F Shahidi 2006 Phenolics in cereals fruits and vegetables Occurrence
extraction and analysis Journal of Pharmaceutical and Biomedical Analysis 411523ndash1542
[3] Jin Dai Russell J Mumper Plant Phenolics Extraction Analysis and Their Antioxidant
and Anticancer Properties Molecules 2010 15 7313-7352
[4] MD Luque de Castro F Priego-Capote Soxhlet extraction Past and present panacea
Journal of Chromatography A 1217 (2010) 2383ndash2389
[5] MD Luque de Castro LE GarcotildeAcirca-Ayuso Soxhlet extraction of solid materials an
outdated technique with a promising innovative future Analytica Chimica Acta 369 (1998) 1-
10
[6] J Azmir ISM Zaidul MM Rahman KM Sharif A Mohamed F Sahena MHA
Jahurul K Ghafoor NAN Norulaini AKM Omar 2013 Techniques for extraction of
bioactive compounds from plant materials A review Journal of Food Engineering 117 426ndash
436
[7] Handa SS Khanuja SPS Longo G Rakesh DD(2008) Extraction Technologies for
Medicinal and Aromatic Plants (1stedn) no 66 Italy United Nations Industrial
Development Organization and the International Centre for Science and High Technology
[8] Dhanani T Shah S Gajbhiye NA Kumar S (2013) Effect of extraction methods on yield
phytochemical constituents and antioxidant activity of Withaniasomnifera Arab J Chem
[9] Chirinos R H Rogez D Camposa et al 2007 Optimization of extraction conditions of
antioxidant phenolic compounds from mashua (Tropaeolum tuberosum Ruız amp Pavon) tubers
Separation and Purification Technology 55217ndash225
[10] M Angela A Meireles Extracting bioactive compounds for Food products Theory and
Applications 2009 CRC Press New York USA P 190
[11] Spigno G L Tramelli and D M De Faveri 2007 Effects of extraction time
Chapter III Methods
72
temperature and solvent on concentration and antioxidant activity of grape marc phenolics
Journal of Food Engineering 81200ndash208
[12] Durling N E O J Catchpole J B Grey et al 2007 Extraction of phenolics and
essential oil from dried sage (Salvia officinalis) using ethanol-water mixtures Food
Chemistry 1011417ndash1424
[13] Herodez SS M Hadolin M Skerget et al 2003 Solvent extraction study of
antioxidants from Balm (Melissa officinalis L) leaves Food Chemistry 80275ndash 282
[14] Pinelo M P Del Fabbro L Marzocco et al 2005 Optimization of continuous phenol
extraction from Vitis vinifera byproducts Food Chemistry 92109ndash117
[15] Cacace J E and G Mazza 2003 Optimization of extraction of anthocyanins from
black currants with aqueous ethanol Journal of Food Science 68240ndash248
[16] Lim YY and Murtijaya J (2007) Antioxidant properties of Phyllanthus amarus
extracts as affected by different drying methods LWT ndash Food Science and Technology
40(9) 1664ndash1669
[17] Marete E Jacquier JC and Orsquo Riordan D (2009) Effects of extraction temperature on
the phenolic and parthenolide contents and colour of aqueous feverfew (Tanacetum
parthenium) extracts Food Chemistry 117 226ndash231
[18] Harbourne N Jacquier JC Morgan D and Lyng J (2008) Determination of the
degradation kinetics of anthocyanins in a model juice system using isothermal and non-
isothermal methods Food Chemistry 111 204ndash208
[19] Patras A Brunton N OrsquoDonnell C and Tiwari B (2010) Effect of thermal
processing on anthocyanin stability in foods mechanisms and kinetics of degradation Trends
in Food Science and Technology 21 3ndash11
[20] Lafka T-I V Sinanoglou and E S Lazos 2007 On the extraction and antioxidant
activity of phenolic compounds from winery wastes Food Chemistry 104 (3) 1206ndash1214
[21] Mane S Bremner DH Tziboula-Clarke A Lemos MA Effect of ultrasound on the
extraction of total anthocyanins from Purple Majesty potato Ultrasonics Sonochemistry
2015 27 509-514
Chapter III Methods
73
[22] Pinelo M M A Arnous and A S Meyer 2006 Upgrading of grape skins
Significance of plant cell-wall structural components and extraction techniques for phenol
release Trends in Food Science and Technology 17579ndash590
[23] Bendicho C De La Calle I Pena F Costas M Cabaleiro N Lavilla I Ultrasound-
assisted pretreatment of solid samples in the context of green analytical chemistry TrAC
Trends Anal Chem 2012 31 50ndash60
[24] Armenta S Garrigues S De Guardia M The role of green extraction techniques in
Green Analyticla Chemistry Trends Anal Chem 2015 71 2ndash8
[25] Chemat F Khan MK Applications of ultrasound in food technology Processing
preservation and extraction Ultrason Sonochem 2011 18 813ndash835
[26] Shi J Nawaz H Pohorly J Mittal G Kakuda Y and Jiang Y (2005) Extraction of
polyphenols from plant material for functional foods - Engineering and Technology Food
Reviews International 21 139ndash166
[27] LR Wilhelm DA Suter GH Brusewitz 2004 Food amp Process Engineering
Technology St Joseph Michigan USA p 259-284
[28] BK Tiwari NP Brunton CS Brennan 2013 Handbook of Plant Food
Phytochemicals Sources Stability and Extraction John Wiley amp Sons Ltd Oxford UK p
439
[29] Roopashree TS Dang R Rani SRH Narendra C Antibacterial activity of anti-psoriatic
herbs Cassia tora Momordica charantia and Calendula officinalis International Journal of
Applied Research in Natural Products 2008 1(3) 20-28
[30] Audu SA Mohammed I Kaita HA Phytochemical screening of the leaves of Lophira
lanceolata (Ochanaceae) Life Science Journal 2007 4(4) 75-79
[31] NSAVITHRAMMA MLIMGA RAO AND DSUHRULATHA Screening of
medicinal plants for secondary metabolites Journal of Scientific Research 2011 Vol8 PP
580-581
[32] PARCHANA TSAMATHA BMAHITHA NRAMASWAMY Preliminary
phytochemical screening from leaf and seed extracts of Senna alata LRoxb-an
Chapter III Methods
74
Ethnomedicinal plant Journal of pharmaceutical and biological research 2012 Vol3 PP
8285
[33] Paris R Moyse H Preacutecis de matiegravere meacutedicinale 1969 Paris Masson
[34] Obasi NL Egbuonu ACC Ukoha PO Ejikeme PM Comparative phytochemical and
antimicrobial screening of some solvent extracts of Samanea saman pods African journal of
pure and applied chemistry 2010 4(9) 206-212
[35] Rizk AM 1982 Fitoterapia 52 35-42
[36] BK Tiwari N P Brunton C S Brennan Handbook of Plant Food Phytochemicals
Sources Stability and Extraction 2013 John Wiley amp Sons Ltd Sussex UK P440
[37] Zou Y L Y Wei D 2004 Antioxidant activity of a flavonoid-rich extract of
Hypericum perforatum L in vitro J Agric Food Chem 52 5032-5039
[38] Escarpa A and Gonzalez MC (2001) Approach to the content of total extractable
phenolic compounds from different food samples by comparison of chromatographic and
spectrophotometric methods Anal Chim Acta 427 119ndash127
[39] Singleton V L and Rossi J A 1956 Colorimetry of total phenolics with
phosphomolybdic-phosphotungstic acid reagents American Journal of Enology and
Viticulture 16 144ndash158
[40] VR Meyer 2010 Practical High-Performance Liquid Chromatography Fifth edition
John Wiley amp Sons Ltd United Kingdom p 5
[41] JL Anderson ABerthod VPEsteacutevez A M Stalcup2015 Analytical Separation
Science First Edition Blackwell Verlag Gmb H Berlin Germany p24
[42] Skoog Douglas Holler James Nieman Timothy Principles of Instrumental Analysis
5th ed BrooksCole US 1998 p 728
[43] McMaster Marvin C HPLC A Practical Userrsquos Guide 2nd Ed Wiley New Jersey
USA 2007 p 7
Chapter III Methods
75
[44] S S Handa S P Singh Khanuja G Longo D D Rakesh 2008 Extraction
Technologies for Medicinal and Aromatic Plants international center for science and high
technology Trieste Italy
[45] R Kellner J M Mermet M Otto H M Widmer 1998 Analytical Chemistry
Weinheim Wiley VCH Germany
[46] Yuan YV Bone DE and Carrington MF (2005a) Antioxidant activity of dulse
(Palmaria palmata) extract evaluated in vitro Food Chemistry 91(3) 485-494
[47] Yuan YV Carrington MF and Walsh NA (2005b) Extracts from dulse (Palmaria
palmata) are effective antioxidants and inhibitors of cell proliferation in vitro Food and
Chemical Toxicology 43(7) 1073-1081
[48] T Owen 2000 Fundamentals of modern UV-visible spectroscopy Agilent
Technologies Germany p 16
[49] Blois MS (1958) Antioxidant determinations by the use of a stable free radical Nature
181(4617) 1199-1200
[50] Yen G-C and Chen H-Y (1995) Antioxidant activity of various tea extracts in relation
to their antimutagenicity Journal of Agricultural and Food Chemistry 43 27-32
[51] Sharma OP and Bhat TK (2009) DPPH antioxidant assay revisited Food Chemistry
113 1202-1205
[52] Ohinishi M Morishita H Iwahashi H Shizuo T Yoshiaki S Kimura Mand Kido
R (1994) Inhibitory effects of chlorogenic acids on linoleic acid peroxidation and haemolysis
Phytochemistry 36 579ndash583
[53] Prieto P Pineda M Aguilar MM 1999 Spectrophotometric quantitation of
antioxidant capacity through the formation of phosphoolybdenum complex specific
application to the determination of vitamin E Anal Biochem 269 337-341
[54] Benzie I F F ampStrain J J (1996) The ferric reducing ability of plasma (FRAP) as a
measure of antioxidant power The FRAP assay Analytical Biochemistry 239 70-76
[55] GL Marco A rapid method for evaluation of antioxidants J Am Oil Chem Soc 1968 45
594-8
Chapter III Methods
76
[56] HE Miller A simplified method for the evaluation of antioxidants J Am Oil Chem Soc
1971 4891
[57]Koleva II van Beek TA Linssen JPH de Groot A Evstatieva LN Screening of plant
extracts for antioxidant activity a comparative study on three testing methods Phytochem
Anal 2001 138-17
[58] MLaguerre J Lecompte P Villeneuve Evaluation of the ability of antioxidants to
counteract lipid oxidation Existing methods new trends and challenges Progress in Lipid
Research 2007 46244-282
[59] Tag MS Miller EF Pratt DE 1984 Chia seeds as a source of natural lipid
antioxidants J Am Oil Chem Soc 61 928-931
[60] Md Nur Alam N J Bristi Md Rafiquzzaman Review on in vivo and in vitro methods
evaluation of antioxidant activity Saudi Pharmaceutical Journal (2013) 21 143ndash152
[61] A M Pisoschi C Cimpeanu G Predoi 2015 Electrochemical Methods for Total
Antioxidant Capacity and its Main Contributors Determination A review Open Chem 13
824ndash856
[62] D Hynek L Krejcova J Sochor N Cernei J Kynicky V Adam L Trnkova J
Hubalek R Vrba and R Kizek Int J Electrochem Sci 7 (2012) 1802
[63] P A Kilmartin H L Zou and A L Waterhouse Am J Enol Vitic 53 (2002) 294
[64] A Mittal F Goke R Flint B P T Loveday N Thompson B Delahunt P A
Kilmartin G J S Cooper J MacDonald A Hickey J A Windsor and A R J Phillips
Shock 33 (2010) 460
[65] Chevion S Roberts MA Chevion M(2000) The use of cyclic voltammetry for the
evaluation of antioxidant capacity Free Radic Biol Med 28 860-870
[66] Rebiai A Lanez T Belfar ML In vitro Evaluation of Antioxidant Capacity of Algerian
Propolis by Spectrophotometrical and Electrochemical Assays Int J Pharm 2011 7 113-118
[67] C Le Bourvellec D Hauchard A Darchen JL Burgot ML Abasq Talanta (2008)
doi101016jtalanta200801007
Chapter III Methods
77
[68] GREEN J M (1996) A practical guide to analytical method validation Analytical
Chemistry 68 A305-A309
[69] EXNER O amp ZVARA K (1999) Coefficient of determination in some atypical
situations Use in chemical correlation analysis Journal of Physical Organic Chemistry 12
151-156
[70] Chew AL Jessica JJA Sasidharan S 2012 Antioxidant and antibacterial activity of
different parts of Leucas aspera Asian Pac J trop Biomed 2176-180
[71]GBohm G Zech 2010 Introduction to Statistics and Data Analysis for Physicists
Elektronen-Synchrotron Hamburg Germany p 02
[72]X Yan XG Su 2009 Linear Regression Analysis Theory and Computing World
Scientific Publishing Co Singapore p 04
[73] SS Mangiafico 2016 Summary and Analysis of Extension Program Evaluation in R
Rutgers Cooperative Extension New Brunswick NJ p 325
[74] SS Mangiafico 2016 Summary and Analysis of Extension Program Evaluation in R
Rutgers Cooperative Extension New Brunswick NJ p 336
Chapter IV
Comparative
study of
extraction
methods
Chapter IV Comparative study of extraction methods
79
IV1) Introduction
Sample preparation is a critical step of a successful analytical method Again due to the
large variations in sample matrices for example plant materials food formulations
biological fluid and tissue samples the diverse chemical structures and physicochemical
properties of the phytochemicals it is unrealistic to develop any definitive procedure or
protocol for all types of sample matrices However there are important common precautions
that must be taken for better preparing samples for the subsequent analyses The overall
purposes of sample preparation are to concentrate or dilute the samples so the analytes can be
detected and quantified within the detection limit and linear range to rid any interference that
might affect the detection of the compounds of interest Therefore techniques adopted to
sample preparation must follow these two principles [1] The aim of extraction is to maximize
the yield of compounds of interest while minimizing the time and solvent
IV2) Aim
To decrease the yield of phytochemical compound extract from potato sample We
elected to compare traditional extraction techniques as Soxhlet extraction maceration
extraction and modern extraction techniques as Ultrasound-assisted extraction this three
techniques used to extract the bioactive compound from red potatoes cultivars Kondor In this
chapter we looked for technique with less time and solvent which gives a higher yield
IV32) Preparation of samples
Immediately after receiving all samples of raw potatoes were peeled using a kitchen
knife and prepared by simply cutting into 5 mm thick slices 20 g of the slices of freshly
peeled potatoes was extracted using 120 mL extraction solution (16 S-f-ratio)which is
consisted of a mixture of ethanol and water at a ratio of (7030 vv) Subsequently all the
samples taken after the treatment were filtered before analysis for removal of potato particles
then the filtrate was concentrated under reduced pressure at 60 degC by rotary evaporator and
stored in a refrigerator
IV33) Ultrasonic extraction
In this study the ultrasound-assisted extraction procedure was used for the extraction
thus samples were further submitted to ultrasonication in bath (40 kHz) at three levels of
Chapter IV Comparative study of extraction methods
80
power 30 50 and 70 the extraction being performed at T = 33 plusmn 4 degC The extracts
were kept to macerate for 5 min 2 h and 24 h in dark at room temperature
IV34) Soxhlet extraction
The sliced fresh potatoes (20 g) were continuously extracted with 120 mL using the
appropriate solvent mixture for 3 h (5 cycles) at a maximum temperature of 70 degC in a
Soxhlet apparatus
IV35) Results and discussion
IV351) the total flavonoids content
Table IV1 and 2 show the amount of TFC obtained from the extract using UAE with (7030
ethanol water) and 100 ethanol as solvent
Table IV1 Total flavonoids content obtained using ethanol water (7030) Table XTable IV1 Total flavonoids content obta ine d using ethanol water (7030)
ULTRASOUND
SOXHLET Maceration
time
Amplitude
30 50 70
5 min 93230 plusmn 0043 13073 plusmn 0010 85319 plusmn 0003 69446 plusmn
0019 2 h 117648 plusmn 0007 94793 plusmn 0007 120140 plusmn 0004
24 h 144272 plusmn 0002 130321 plusmn 0043 110244 plusmn 0007
Total flavonoids content was expressed as mg rutin g extract
Table IV2 Total flavonoids content obtained using 100 ethanol Table XITable IV 2 Tota l flavonoids content obtained using 100 ethano l
ULTRASOUND
SOXHLET Maceration
time
Amplitude
30 50 70
5 min 633336 plusmn 001 411461 plusmn 0027 171184 plusmn 0013 113242 plusmn
0024 2 h 611119 plusmn 0006 519105 plusmn 0006 237503 plusmn 0005
24 h 859383 plusmn 0008 691670 plusmn 0049 582295 plusmn 0018
Total flavonoids content was expressed as mg rutin g extract
The UAE showed an advantage over SE but a ratio of 100 ethanol favored the
extraction process resulting in an increase of TFC for the two techniques The amount of TFC
Chapter IV Comparative study of extraction methods
81
obtained after 5 min of ultrasound treatment was higher compared to SE at the two ratios
69446 113242 mg ruting extract (Soxhlet UAE at 7030 solvent ratio) and 85319 171184
mg ruting extract for (Soxhlet UAE at 100 solvent ratio) the three amplitude chosen by
UAE increase the amount extracted from 171184 mg rutin g extract at 70 amplitude to
633336 mg ruting extract at 30 of amplitude Longer times of maceration following
ultrasound extraction lead to the increase of the amount of TFC in the extract
IV352) The total phenolic content
The concentration of TPC in the extracts expressed as mg GAEg sample depends on
the solvent and the method of extraction as shown in Tables IV 3 and 4
Table IV3 Total phenolic content obtained using ethanol water (7030) Table XIITable IV3 Total phenolic content obta ine d using ethanol water (7030)
ULTRASOUND
SOXHLET Maceration
time
Amplitude
30 50 70
5 min 67781 plusmn 0059 79936 plusmn0067 51273 plusmn 0032 67788 plusmn
0017 2 h 93736 plusmn0017 74522 plusmn0094 69002 plusmn0022
24 h 103821 plusmn 0007 81347 plusmn 0018 72793 plusmn 0007
Total phenolic content was expressed as mg gallic acid g extract
Table IV4 Total phenolic content content obtained using 100 ethanol Table XIIITable IV4 Total phe nolic content conte nt obtained us ing 100 ethanol
ULTRASOUND
SOXHLET Maceration
time
Amplitude
30 50 70
5 min 175053 plusmn0053 144904 plusmn 0003 69426 plusmn 0016 139490 plusmn
0023 2 h 152229 plusmn 0065 144378 plusmn 0016 92993 plusmn 0029
24 h 229299 plusmn 0062 140127 plusmn 0064 138694 plusmn 0122
Total phenolic content was expressed as mg gallic acid g extract
The content of phenolic compounds in the UAE extraction increases from amplitude 70
(69426 mg gallic acid g extract) to 30 (175053 mg gallic acid g extract) Also the
maceration time after sonication of the extract has an effect on the level of TPC in samples
eg 24 hours of maceration led to the highest TPC with 222999 mg gallic acidg extract
however using 5 minutes maceration time gave 175053 mg gallic acidg extract The best
Chapter IV Comparative study of extraction methods
82
results were recorded using 100 ethanol which showed an advantage on the ratio of 7030
(ethanol water) The results obtained from SE increased from 677 (using 7030 ethanol
water) to 1394 (using 100 ethanol) but are remarkably lower than those obtained by UAE
IV353) The antioxidant capacity
The antioxidant capacity was evaluated using the phosphomolybdenum method which
is based on the reduction of Mo (VI) to Mo (V) by the antioxidant compounds and the
formation of green Mo (V) complexes with a maximal absorption at 695 nm (Tables IV 5 and
6) The results show an increase of TAC at a lower amplitude and higher maceration time CA
= 106776 to 153348 mg ascorbic acidg of extract for the solvent ratio (7030 ethanol water)
and 363946 to 413346 mg ascorbic acidg of extract for 100 ethanol It is clear that The
TAC with UAE-M has an advantage over Soxhlet at two ratios of solvent
Table IV5 Total antioxidant capacity obtained using ethanol water (7030) Table XIVTable IV 5 Tota l ant ioxidant capacity obtained us ing ethanol water (7030)
ULTRASOUND
SOXHLET Maceration
time
Amplitude
30 50 70
5 min 106776 plusmn 0006 106838 plusmn 0013 99551 plusmn 0017 138983 plusmn
0233 2 h 150973 plusmn 0031 110793 plusmn 0008 132861 plusmn 0039
24 h 153348 plusmn 0003 97450 plusmn 0025 152847 plusmn 0015
Capacity antioxidant was expressed as mg ascorbic acid g of extract
Table IV6 Total antioxidant capacity obtained using 100 ethanolTable XVTable IV6 To tal antiox idant capacity obtained u sing 100 ethanol
ULTRASOUND
SOXHLET Maceration
time
Amplitude
30 50 70
5 min 363946 plusmn 0022 202811 plusmn 0079 113493 plusmn 0014 231124 plusmn
0029 2 h 284836 plusmn 0044 208804 plusmn 0015 195108 plusmn 0060
24 h 413346 plusmn 0057 390802 plusmn 0103 253192 plusmn 0064
Capacity antioxidant was expressed as mg ascorbic acid g of extract
Chapter IV Comparative study of extraction methods
83
IV354) Statistic analysis
Fig IV12 and 3 shows the overall effect of maceration time (Fig 1a2a and 3a)
amplitude (Fig 1b2b and 3b) method (Fig1c 2c and 3c) and the solvent ratio (Fig1d 2d
and 3d) on the TFC TPC extracted from the potatoes and their TAC Table 7 shows relative
between the amounts of TFC TPC and TAC extracted using different conditions of extraction
a further analysis of the variance of the main effects between the variables studied and their
significance was performed using one-way ANOVAs as it can be seen there is a statistically
significant difference in the amounts of TFC TPC and TAC using different maceration time
(p lt 0000- see table 7) with the lowest amount obtained at 5 minutes maceration time
Furthermore a decrease of amplitude lead to an increase in TFC TPC extracted and TAC as
can be seen in Fig 1b2b and 3b respectively The effect of this factor has a significant
statistically with (p lt 0000 - table 7) However the use of UAE-M extraction had an effect on
the amounts of TFC TPC extracted from potato and TAC (Fig 1c2c and 3c) with the lowest
amount obtained from soxhlet extraction Table IV7 show a statistically significant with
(plt0000) It should be pointed out that the amount of TFC TPC and TAC increased with a
higher ratio of ethanol with statistically significant (p lt 0001) (Table 7)
Table IV7 Analysis of variance for the main effects of factors studied Table XV ITable IV 7 Ana lysis of variance for the ma in effects of factors studie d
Factors P value
TPC
Time of maceration
Amplitude
Method
Solvent ratio
0000
0000
0000
0000
TFC
Time of maceration
Amplitude
Method
Solvent ratio
0000
0000
0000
0001
TAC
Time of maceration
Amplitude
Method
Solvent ratio
0000
0000
0000
0000
Chapter IV Comparative study of extraction methods
84
Figure I 25 Effect of macerati on time (a) amplitude (b) method (c) and the solve nt ratio (d) on t he level of total flavonoids content Y-axi s shows T otal Flavanoids content (expre sse d as a mg Rutin g extract)
FigureIV1 Effect of maceration time (a) amplitude (b) method (c) and the solvent ratio (d)
on the level of total flavonoids content Y-axis shows Total Flavanoids content (expressed as
a mg Rutin g extract)
(d)
Solvent Ratio 100 (7030)
50
40
30
20
10
Main Effects Plot (data means) TFC Vs Solvent
Me
an
of
TFC e
xp
resse
d a
s a
mg
Ru
tin
g
ex
tra
ct
(c)
Method UAE Soxhlet
32
31
30
29
28
Main Effects Plot (data means) TFC Vs Method
(b)
Amplitude 70 50 30
40
35
30
25
20
Main Effects Plot (data means) TFC Vs Amplitude
Me
an
of
TFC e
xp
resse
d a
s a
mg
Ru
tin
g
ex
tra
ct
(a)
Time 5min 2h 24h
425
400
375
350
325
300
275
250
Main Effects Plot (data means) TFC Vs Time
Me
an
of
TFC e
xp
resse
d a
s a
mg
Ru
tin
g
ex
tra
ct
Me
an
of
TFC e
xp
resse
d a
s a
mg
Ru
tin
g
ex
tra
ct
Chapter IV Comparative study of extraction methods
85
Figure I 26 Effect of macerati on time (a) amplitude (b) method (c) and t he solvent ratio (d) on the leve l of total phenolic content Y-axis shows T otal phenolic content (expre ssed a s a mg gallic acidg extract)
Figure IV2 Effect of maceration time (a) amplitude (b) method (c) and the solvent ratio
(d) on the level of total phenolic content Y-axis shows Total phenolic content (expressed as a
mg gallic acidg extract)
Chapter IV Comparative study of extraction methods
86
Figure I 27Effect of macerati on time (a) amplitude (b) method (c) and the solvent rati o (d) on the l evel of total anti oxida nt ca pacity Y-axis shows T otal anti oxida nt capacity (expressed a s a mg ascorbi c aci dg of extract)
Figure IV3 Effect of maceration time (a) amplitude (b) method (c) and the solvent ratio (d)
on the level of total antioxidant capacity Y-axis shows Total antioxidant capacity (expressed
as a mg ascorbic acidg of extract)
IV354) HPLC analysis
The chromatographic profile of extract of the leaf of the variety Kondor represented in
Level of the figure (4-7) The four samples A C B and D were extracted by UAE-M
extraction and Soxhlet extraction The results of quantitative analyses of phenolic compounds
Identified are represented in the Table IV8 The analysis of these results shows that in The
extract of this variety the ascorbic acid range from 012 to 118 microgmg the Gallic acid range
from 081 to 137 microgmg the Chlorogenic acid range from 027 to 153 microgmg for all the
sample extract However the Vanillin range from 0004 to 018 microgmg for extract samples A
C D We note that the Rutine (0532 microgmg) showed only in C sample From the point of
view of quantity the A sample has the highest constituents in Ascorbic acid and Chlorogenic
acid
(d)
Solvent Ratio
Me
an
of
TA
C (
ex
pre
sse
d a
s a
mg
asco
rbic
acid
g
of
ex
tra
ct)
100 (7030)
28 26 24 22 20 18 16 14 12
Main Effects Plot (data means) TAC vs Sovent ratio (c)
Method
Me
an
of
TA
C (
ex
pre
sse
d a
s a
mg
asco
rbic
a
cid
g
of
ex
tra
ct)
UAE Soxhlet
1975
1950
1925
1900
1875
1850
Main Effects Plot (data means) TAC vs Method
(b)
Amplitude
Me
an
of
TA
C (
ex
pre
sse
d a
s a
mg
asco
rbic
a
cid
g
of
ex
tra
ct)
70 50 30
250
225
200
175
150
Main Effects Plot (data means) TAC vs Amplitude (a)
Time
Me
an
of
TA
C (
ex
pre
sse
d a
s a
mg
asco
rbic
acid
g
of
ex
tra
ct)
5min 2h 24h
25 24 23 22 21 20 19 18 17 16
Main Effects Plot (data means) TAC vs Time
Chapter IV Comparative study of extraction methods
87
The Results shows that all the samples contain at least three bioactive compounds using
either UAE-M or SE as an extraction technique and two ratios for the ethanol as solvent all
these variables have an effect on the level of the amount of bioactive compound in the Kondor
sample
Figure I 28 Chr omatograms of sample extract A(1)Ascorbi c aci d(2) Galli c aci d (3) Chlor oge nic a cid(4) Vanilli n
Figure IV4 Chromatograms of sample extract A(1)Ascorbic acid(2) Gallic acid (3)
Chlorogenic acid(4) Vanillin
Figure I 29Chromat ograms of sampl e extract B(1)Ascor bic a cid(2) Gallic a cid (3) Chl orog eni c aci d
Figure IV5 Chromatograms of sample extract B(1)Ascorbic acid(2) Gallic acid (3)
Chlorogenic acid
Chapter IV Comparative study of extraction methods
88
Figure I 30Chromatograms of sample extra ct C(1)Ascorbi c aci d(2) Gallic a cid (3) Chlor ogeni c aci d(4) Vanilli n(5)Rutine
Figure IV6 Chromatograms of sample extract C(1)Ascorbic acid(2) Gallic acid (3)
Chlorogenic acid(4) Vanillin(5)Rutine
Figure I 31Chromat ograms of sampl e extract D(1)Ascorbi c aci d(2) Galli c aci d (3) Chl oroge nic a cid(4) Vanilli n
Figure IV7 Chromatograms of sample extract D(1)Ascorbic acid(2) Gallic acid (3)
Chlorogenic acid(4) Vanillin
Table IV9 Constituents content analyzed by HPLC 24)جدول رقم ) 1Table IV9 Constitue nts content ana lyze d by HP LC
Method Ascorbic
acid
[microgmg]
Gallic acid
[microgmg]
Chlorogenic
acid
[microgmg]
Vanillin
[microgmg]
Rutine
[microgmg]
A 11831 08108 15359 00702 -
C 04135 1095 04768 00043 00095
D 03702 13752 06970 01869
B 01288 10670 02768 - -
A C sample extracted with UAE 30 amplitude 24 h maceration and solvent ration [100 ethanol (7030 ethanolwater)]
B D sample extracted with Soxhlet and solvent ration [100 ethanol (7030 ethanolwater)]
Chapter IV Comparative study of extraction methods
89
IV4) Discussion
According to the results previously mentioned the extraction of bioactive compound
from potatoes roots can be affected by several factors One of them was the technique These
results indicated that the amount extracted from both total phenolic and flavonoids contents is
remarkably improved when using UAE-M over Soxhlet extraction also the yield of extraction
improved when maceration is used after to ultrasonic-assisted extraction This fact is in
accordance with other data found in the literature which showed in an enhancement of the
levels of phytochemicals extracted presented in different food matrixes after sonication [2-4]
However the UAE can induce a reduction in the size of vegetables andor changes in the
cell structure Because of the ultrasonic cavitation this structural disruption can provide a
better contact between the solvents and cells allowing an increase in the content of the
extracted compounds [5] Additionally the increase of total phenolic and flavonoids content
depends on UAE conditions as an amplitude The decrease in this factor leads to higher
amount
Secondly the solvent ratio showed significantly affect the amount of TPC TFC and
TAC A higher solvent ratio was used in the extraction had better content than (7030
ethanolwater) Also this results observed by Zhou and Yu [6] all obtained results are
confirmed by HPLC analysis Finally all these factors lead to the UAE combined with
maceration to be a better technique than soxhlet
The most efficient method for amount bioactive compound is to use UAE with 30 of
amplitude ethanol as solvent and kept the sample macerate for 24 hours It should be noted
that the amount of TFC TPC and TAC was observed in 2 hours maceration of the samples
sonicated with 30 of amplitude have higher results than a soxhlet extraction This condition
was used to extract bioactive compounds from four varieties of potatoes
Chapter V
Phytochemical
study of
Solanum
tubersum L
Chapter V Phytochemical study of Solanum tubersum L
91
V1) Introduction
Potatoes can be a good source of phenolic and flavonoid compounds in the diet despite
its moderate levels compared to other plant sources However as mention above The
composition of a potato tuber depends on a number of factors although the innate genetic
characteristics associated with each cultivar are thought to be among the most significant
Other factors known to influence potato chemical composition include the geographic
growing location soil type and climate [7] Thus the nutrient screening of a range of different
cultivars can help classify the potato variety by their phytochemicals compounds
The proximate analysis estimates the moistures phenolic flavonoids and other
phytochemical compounds and antioxidant activity in vegetable or fruits is the method used to
assist in determining potential end use and tuber quality of potato variety Experiment one of
this chapter will discuss the proximate analysis results of four potato tubers in order to qualify
the major phytochemicals content of the tubers and to identify the most richness potato
variety in phytochemicals compounds
The phytochemicals value of the richness tuber will then be further quantified in
Experiment two by assessing the quantity of phytochemical content and their antioxidant
activity in the flesh and the whole tuber
V2) Experiment One
V21) Aim
This experiment aimed to examine the presence and quantity of the certain
phytochemical component in order to gauge health-promoting in four most popular variety of
potatoes cultivated in El-Oued county lsquoBartina Kondor Kuroda and Spuntarsquo This was
achieved by performing analyses to estimate and identify certain phenolic flavonoid content
by spectrophotometers assays and HPLC analysis Also we will take into our consideration
the estimation of moisturewater the presence of phytochemicals compounds by standard
methods The antioxidant activity measured by two techniques spectrophotometer assays and
electrochemical assays All these analysis results will discuss the proximate analysis results of
four different variety of potato cultivars
Chapter V Phytochemical study of Solanum tubersum L
92
V22) Estimation of the water weight percentage in potato roots
The water percentage was measured by weighing fresh roots into a crucible which was
placed in an oven at 100 degC overnight Later the dried roots were weighed to calculate the
amount of water lost The (Table V1) shows the moisture content (H2O ) of four varieties
of potato samples The tuber from red cultivars Bartina showed higher moisture content
84239 then the yellow tuber Spunta 8310 we regarding a high moisture content in
potatoes roots which relates to materials such as fruits and vegetables according to Wilhelm
L et al [8] Many of these products have moisture contents near 90 or more
Table V1 Determination of moisture content for four varieties of potatoes 24)جدول رقم ) 2Table V1 Determination of moist ure content for four varieties of potatoes
Roots Bartina Kuroda Kondor Spunta
H2O 842394 772256 819591 831077
V23) Screening chemistry ( Chemical characterizations)
The present study revealed that the various alcoholic extracts of root parts of potatoes
contained alkaloids coumarins flavonoids phytosterols and carbohydrates (Table V2)
However alkaloids coumarins and carbohydrates were detected in ethanolic extracts of all
roots varieties and the detection of Phytosterols by Liberman and Burchurds shows positive
results with a formation of translucent green color in all varieties which indicate the presence
of steroids for Salkowskirsquos test shows negative results for the detection of Flavonoids all the
roots extracts had a higher number of secondary metabolites with a high degree of
precipitation (++) for Alkalin reagent
Table V2 Preliminary qualitative phytochemical analysis of various alcoholic extracts of
root parts of potatoes 24)جدول رقم ) 3Table V2 Preliminary qualitative phytoche mica l analys is of various alcoholic extracts of root parts of potatoes
Test Bartina Kuroda Kondor Spunta
Alkaloids + + + +
Coumarins + + + +
Flavonoids Alkalin reagent ++ ++ ++ ++
Hydroxyl + + + +
Phytosterols Liberman + + + +
Salkowski - - - -
Carbohydrates + + + +
Tanin - - - -
++ moderately present + Low - absent
Chapter V Phytochemical study of Solanum tubersum L
93
V24) Phytochemical contents
The Table V3 shows the total phenolic contents (TPC) and the total flavonoid contents
(TFC) of four kinds of potato samples unpeeled The amount of TPC from the whole tuber
ranged from 192144 to 088853 mg AG g of extract the results of different extracts showed
that the amount of TFC varied considerably from 109129 to 250350 mg rutin g of extract
Overall the samples showed the lower amount of TPC and TFC The results indicate that all
of the ethanolic extracts of four kinds has the amount of phenolics and flavonoids compound
but their content in ethanolic extract increasing in order was
Kondor gt Bartina gt Spunta gt Kuroda
Table V3 Determination of total Phenolics contents and total flavonoids of four kinds of
potatoes 24)جدول رقم ) 4Table V3 Determination of total P henolics contents and total flavonoids of four kinds of potatoes
Sample Total Polyphenols (mg AG
g of extract)
Total flavonoids (mg rutin g
of extract)
Kondor 192144 plusmn 0096 250350 plusmn 0125
Bartina 189596 plusmn 0094 235592 plusmn 0235
Spunta 124628 plusmn 0124 218057 plusmn 0218
Kuroda 088853 plusmn 0088 109129 plusmn 0076
V25) HPLC analysis
Identification and quantification of marker compounds were performed on the basis of
the coinjections and retention time matching with standards The HPLC fingerprint of
ethanolic extracts of roots and leaf revealed peaks at the retention time 50 min at 300 nm The
quantitive analysis of the chromatograms showed in Table III4
V251) Chromatograms of Kondor sample
The chromatographic profile of unpeeled extract the variety Kondor represented in
Level of the Figure V1 The results of quantitative analyses of phenolic compounds Identified
are represented in the Table V4 The analysis of these results shows that in The extract of the
variety Kondor the ascorbic acid (0189 microgmg) the Gallic acid (5294 microgmg) the
Chlorogenic acid (3052 microgmg) caffeic (0532 microgmg) Vanillin (0059 microgmg) and
Quercetin (1091 microgmg) we note that the Quercetin is the more representative and found
Chapter V Phytochemical study of Solanum tubersum L
94
only in the unpeeled Kondor sample But from the point of view of quantity the extract of
this variety shows a richness in bioactive compounds more than the extract of other varieties
Figure I 32Chromat ograms of unpeel ed Kondor extract(1)Ascorbi c aci d(2) Gallic a cid (3) Chlor ogeni c aci d(4) Caffeic acid (5) Quercet in (6)Vanilli n
Figure V1 Chromatograms of unpeeled Kondor extract(1)Ascorbic acid(2)
Gallic acid (3) Chlorogenic acid(4) Caffeic acid (5) Quercetin (6)Vanillin
V252) Chromatograms of Bartina sample
Figure V2 shows the chromatographic profile of extract of the unpeeled Bartina variety
The results of quantitative analysis of phenolic compounds Identified are represented in the
Table V4 The analysis of these results shows that in The extract of the variety Bartina the
ascorbic acid ( 0317 microgmg) the Gallic acid (7493 microgmg) the Chlorogenic acid (188
microgmg) caffeic (0021 microgmg) and Vanillin (00310 microgmg) We found that the Gallic acid is
the more representative But for Quercetin and rutin not exist in this variety
Chapter V Phytochemical study of Solanum tubersum L
95
Figure V2 Chromatograms of unpeeled Bartina sample extract(1)Ascorbic acid(2)
Gallic acid (3) Chlorogenic acid(4) Vanillin Figure I 33Chromatograms of unpeele d Barti na sample extract(1)Ascorbic a cid(2) Galli c aci d (3) Chl oroge nic a cid(4) Vanilli n
V253) Chromatograms of Spunta sample
The chromatograms qualitative and quantitative analyses of compounds Phenolic
compounds of unpeeled extracts of Spunta are represented below (Figures V3) and the
quantitative assessment of individual compounds identified is a recovery in the Table V4
The analysis of these results shows that in the extract of the variety the ascorbic acid ( 0025
microgmg) the Gallic acid (7804 microgmg) the Chlorogenic acid (0756 microgmg) The Gallic acid
is the more representative For Quercetin rutin and vaniline do not exist in this variety
Figure I 34Chromat ograms of unpeel ed Spunta sample extra ct(1)Ascorbic a cid(2) Gallic a cid (3) Chlorog eni c aci d
Figure V3 Chromatograms of unpeeled Spunta sample extract(1)Ascorbic acid(2)
Gallic acid (3) Chlorogenic acid
Chapter V Phytochemical study of Solanum tubersum L
96
V254) Chromatograms of Kuroda sample
The chromatograms of unpeeled extract of Kuroda variety shows in (Figure V4)
Qualitative and quantitative analyses of Phenolic compounds identified in the Table V4
Through this table it was note that the ascorbic acid ( 0203 microgmg) the Gallic acid (5
microgmg) the Chlorogenic acid (149 microgmg) and rutin (00016 microgmg) for Kuroda only from
this analysis the Gallic acid was the more representative compounds
Figure V4 Chromatograms of unpeeled Kuroda sample extract(1)Ascorbic
acid(2) Gallic acid (3) Chlorogenic acid(4) Rutine Figure I 35Chromat ograms of unpeel ed Kuroda sam ple extract(1)Ascor bic a cid(2) Galli c aci d (3) Chl oroge nic a cid(4) Rutine
Table V4 Constituents content analyzed by HPLC 24)جدول رقم ) 5Table V4 Constituents content analyze d by HP LC
Sample extract Bartina Kondor Kuroda Spunta
Ascorbic acid [microgmg] 03176 01896 02304 00256
Gallic acid [microgmg] 74936 52946 55922 78047
Chlorogenic acid [microgmg] 18864 30520 14900 07566
Caffeic acid [microgmg] - 05322 - -
Quercetin [microgmg] - 109197 - -
Vanillin [microgmg] 00310 00596 - -
Rutine [microgmg] - - 00016 -
V26) Antioxidant capacity
As mentioned above the methods used to determine total antioxidant activity devised in
two techniques First one is spectrophotometers methods Secondly an electrochemistry
Chapter V Phytochemical study of Solanum tubersum L
97
technique in this process we used cyclic voltammetry methods to determine the antioxidant
activity
V261) Spectrophotometers
V2611) FRAP assay
Ferric reducing antioxidant power (FRAP) is based on the ability of the antioxidant to
reduce Fe3+ to Fe2+ according to Rodriquez amp Hadley the ethanolic extracts of potato
tubers showed marked hydrogen-donating activity using reducing power in the Fe(III) AElig Fe
(II) reaction in FRAP assay [9]
Based on the FRAP assay (Table V5) the results indicated that the whole root
(unpeeled) samples had a reducing antioxidant power However the results indicated that
Kondor extract had the highest level of reducing power with value of 388032 mg Fe(II) g of
extract this activity may due to the contents of flavonoids The Kuroda extract indicates the
lowest reducing antioxidant power with a value of 227442 mg Fe(II) g of extract All the
extract samples showed reducing antioxidant power but less than ascorbic acid
Table V5 Determination of reducing the antioxidant power of four kinds of potatoes 24)جدول رقم ) 6Table V5 Determination of reducing the antiox idant power of four kinds of potatoes
Sample FRAP (mg Fe(II) g of extract)
Kondor 388032 plusmn 0043
Bartina 315543 plusmn 0010
Spunta 296169 plusmn 0007
Kuroda 227442 plusmn 0005
Ascorbic acid 2512985 plusmn 0020
Gallic acid 77782511 plusmn 0388
V2612) DPPH
DPPH scavenging activity () had increased with the increased concentration of the
extract in all samples (Figure V 5 6 and 7) The stable DPPH free radical accepts an electron
or hydrogen radical from donors to form a stable molecule which could be seen as color
reduction
Chapter V Phytochemical study of Solanum tubersum L
98
V26121) Calculation of radical inhibition
Kondor extract was the strongest electron or hydrogen donor due to the highest DPPH
scavenging activity The IC50 value of each extract is deducted from the equations of the
curves of the variation in the percentage of inhibition I as a function of the concentration of
each extract as shown in Figure V5 and annexe (A)
The IC50 of DPPH scavenging activity of the Kondor Bartina Spunta and Kuroda
extracts were 121 mgml 212 mgml 254 mgml and 386 mgml respectively for unpeeled
extracts Gallic acid and ascorbic acid however showed the highest value 00069 mgml and
001 mgml All the results have a very statistically significant with plt0000 (Table V6)
00 02 04 06 08 10 12 14 16
0
10
20
30
40
50
60
70
In
hib
itio
n
Concentratio (mgml)
IC50= 121
Figure V5 The percent DPPH radical inhibition as a function of the concentration of
of unpeeled Kondor
Figure I 36T he per ce nt DPPH radi cal inhibiti on a s a functi on of the concentrati on of of unpeele d Kondor
Table V6 IC50 values of sample extracts using DPPH 10)جدول رقم ) 7Table V6 IC50 values of sample extracts us ing DPPH
Sample DppH
Equation R2 value IC50 P
Kondor Y = 333 + 383 X 0994 121 0000
Bartina Y = - 044 + 237 X 0968 212 0000
Spunta Y = - 453 + 214 X 0952 254 0000
Kuroda Y = - 530 + 143 X 0973 386 0000
Ascorbic acid Y= 094 + 4720X 0972 0010 0000
Gallic acid Y=-678 + 8154X 0982 00069 0000
inhibition expressed as mgml
Chapter V Phytochemical study of Solanum tubersum L
99
V26122) Calculation of the binding constant
The electronic spectra of complexes extractndashDppH were recorded in the range 200-900
nm which showed intense absorption at range 515-518 nm The determination of binding
constant Kb of extractndashDppH complex can be calculated from the inhibition of absorbance in
UV-spectra after the addition of unpeeled sample extract ( Figure V6 and 7) Benesi-
Hildebrand equation is used to evaluate binding constants spectrophotometrically [10-12]
Where
Ao and A are the absorbances of free and bound extract
εG and εH-G are their molar extinction coefficients respectively (H and G correspond
to host and guest)
A plot of Ao (A-Ao ) to 1[extract] has shown linearity which is suggestive of 11
complex formation of both extracts with DppH The intercept to slope ratio of this plot gives
the value of binding constant ldquoKb rdquo (Annexe) Kb values were calculated given in Table V7
UV spectra of DppH showed a hypochromic effect upon addition of sample extract the
intensity decreased rapidly with increasing concentration of the extract were recorded in
Figure III5 6 In the absence of sample extract the DppH displayed one absorbance peak at
517 nm this peak intensity exhibited hypochromism up from 56 to 77 for 2 mgml
concentration of sample extract
The values of binding constant ldquoKb rdquo were further used to calculate standard Gibbs free
energy ldquo∆Grdquo of extractndashDppH complex using the following equation
Free energy changes of extracts values Table V7 and showed spontaneous of their binding
with DppH The p-value of the results was lt005 which a significant statistically
HYPOCHROMIC EFFECT decrease in the intensity of a spectral band due to substituents or interactions with the
molecular environment Source PAC 1996 68 2223 (Glossary of terms used in photochemistry (IUPAC Recommendations 1996)) on page 2247
Chapter V Phytochemical study of Solanum tubersum L
100
400 450 500 550 600 650 700
00
02
04
06
08
10
12
14
Abs
Wavelength nm
00 mgml
0005 mgml
001 mgml
005 mgml
01 mgml
025 mgml
075 mgml
05 mgml
1 mgml
125 mgml
15 mgml
(a)
400 450 500 550 600 650 700
00
02
04
06
08
10
12
Abs
Wavelength nm
00 mgml
005 mgml
015 mgml
05 mgml
057 mgml
1 mgml
15 mgml
2 mgml
(b)
400 450 500 550 600 650 700
00
02
04
06
08
10
12
14
16
Ab
s
Wavelength nm
00 mgml
005 mgml
01 mgml
025 mgml
05 mgml
075 mgml
1 mgml
15 mgml
2 mgml
25 mgml
3 mgml
35 mgml
(C)
400 450 500 550 600 650 700
02
04
06
08
10
12
14
16
Ab
s
Wavelength nm
00 mgml
005 mgml
01 mgml
025 mgml
05 mgml
075 mgml
1 mgml
125 mgml
15 mgml
2 mgml
3 mgml
(d)
Figure V6 Electronic absorption spectra of 025 mM of DPPH interaction with Roots of (a)
Kondor (b) Bartina (c) Spunta (d) Kuroda Figure I 37Electr oni c absorpti on spe ctra of 025 mM of DPPH intera ction with Roots of (a) Kondor (b) Bartina (c) Spunta (d) Kuroda
a decrease in absorption intensity
400 450 500 550 600 650 700
00
02
04
06
08
10
12
14
Ab
s
Wavelength nm
00 mgml
15 10-3 mgml
2 10-3 mgml
3 10-3 mgml
4 10-3 mgml
5 10-3 mgml
6 10-3 mgml
7 10-3 mgml
8 10-3 mgml
9 10-3 mgml
10-2 mgml
(GA)
400 450 500 550 600 650 700
00
02
04
06
08
10
12
14
16
Abs
Wavelength nm
00 mgml
15 10-3 mgml
2 10-3 mgml
4 10-3 mgml
5 10-3 mgml
6 10-3 mgml
7 10-3 mgml
8 10-3 mgml
9 10-3 mgml
10-2 mgml
(AAS)
Figure V7 Electronic absorption spectra of 025 mM of DPPH interaction with (GA) Gallic
acid (AAS) Ascorbic acid Figure I 38 Ele ctronic a bsorption spectra of 025 mM of D PPH i nteracti on wit h (GA) Gallic a cid (AAS) Ascorbi c aci d
Chapter V Phytochemical study of Solanum tubersum L
101
Table V7 Values of Binding constants and binding free energy of the complexes DppH-
sample extracts رقم 10)جدول ) 8Table V7 Values of Bind ing cons tants and b inding free energy of the complexes DppH- sample extracts
Compound Equation R2 K ΔG P
Unpeeled
DppH-Kondor Y = -0031x + 24387 09089 786266 -10822 0012
DppH-Bartina Y = -006x + 17288 09289 288133 -08332 0008
DppH-Spunta Y = -00061x +07297 09102 1190375 -11849 0012
DppH-Kuroda Y = -00273x +13812 09804 505934 -09728 0001
Standard
Ascorbic acid Y =-62892x+ 35856 0988 500120 -10024 0000
Gallic acid y = -46163x + 38709 09243 838523 -1098 0001
V262) Electrochemistry assay
All the voltammograms obtained from cyclic voltammetry assay (CV) for the four
samples in fixed pH=36 (acetate buffer 300mM) This assay have the same principle as
FRAP assay thats why this pH value is chosen The CVs present one oxidation peak in range
from +087 V to +102 V (Figure V8) also for ascorbic acid had a peak at +054 V (Figure
V8) and two oxidation peaks at +04V and +07V for gallic acid (Figure III9) The
electrochemical behavior observed for the unpeeled potatoes extracts with oxidation potential
value more positive than gallic acid these peaks indicate that the sample extracts contain
flavonoids compounds showed low or very low activity in the FRAP assay according to Firuzi
and Lacanna [13]
Chapter V Phytochemical study of Solanum tubersum L
102
02 04 06 08 10 12 14
-2
0
2
4
6
8
10
12I
[microA
cm
sup2]
Potential [ V]
(a)
02 04 06 08 10 12 14
-5
0
5
10
15
20
I [micro
Ac
msup2]
Potential [ V]
(b)
02 04 06 08 10 12 14
-2
0
2
4
6
8
10
12
I [micro
Ac
msup2]
Potential [ V]
(c)
02 04 06 08 10 12 14
-4
-2
0
2
4
6
8
10
12
14
16
I [micro
Ac
msup2]
Potential [ V]
(d)
02 04 06 08 10 12 14
-2
0
2
4
6
8
10
12
14
I [micro
Ac
msup2]
AS
Potential [ V]
(e)
Figure V8 Voltammograms obtained for unpeeled extract of (a) Kondor (b) Bartina (c)
Spunta (d) Kuroda and (e) for Ascorbic acid by cyclic voltammetry in pH=36 acetate buffer Figure I 39V oltammograms obtaine d for unpeel ed extra ct of (a) Kondor (b) Bartina (c) Spunta (d) Kuroda and (e) for Ascorbic a cid by cycli c voltammetry in pH=36 a cetate buffer
Table V8 shows The oxidation of samples extract studied by cyclic voltammetry
showed capacity antioxidant expressed in terms of gallic acids (AG) equivalent antioxidant
capacity obtained from an electrochemical assay in ethanolic extract of four samples with
Chapter V Phytochemical study of Solanum tubersum L
103
values ranged from 534813 mg EAGg extract to 345025 mg EAGg extract On the other
hand ascorbic acid showed a higher capacity antioxidant with 6374624 mg EAGg extract
This capacity related to the potential peaks which determined the antioxidant power of sample
extracts according to Firuzi and Lacanna [13] the flavonoids which have potential peaks at
range from +044 to +071 V this groups were active antioxidants in the FRAP assays
Table V8 Determination of the Antioxidant capacity of four kinds of potatoes by CV
Sample Antioxidant capacity CVa Eap
b (V)
Unpeeled
Kondor 534813 plusmn 0254 +088
Bartina 449876 plusmn 0325 +089
Spunta 364515 plusmn 0481 +095
Kuroda 345025 plusmn 0341 +090
Ascorbic acid 6374624 plusmn 0117 +054
a capacity antioxidant expressed as milligrams of gallic acid equivalent per gram of extract
b Anodic oxidation potential vs GCE
V2621) Electrochemistry behavior
Figure V9 shows cyclic voltammograms for unpeeled Kondor extracts in DMF01
TBFP solvent the observed behavior of the extract of all samples the whole roots at potential
range (+200V to +1400V) present one oxidation peak recorded between + 1029V to
+1066V (Table V9 Fig V9) The cyclic voltammograms of all samples extracts depends on
the chemical structures the observed electrochemical behavior of all samples extracts showed
similarly in both solvent cell aqueous buffer acetate PH 36 03 mM (Figure V 8 Table V
8) and organic solvent (DMF) with a shifts to positive potential side up from 1210 to 2113
in case of unpeeled extracts of Spunta and Kondor sample respectively in DMF solution It is
worth noting that all cyclic appearance under the same patterns indicating the producibility of
the resistant of the solution the phenomena
Chapter V Phytochemical study of Solanum tubersum L
104
02 04 06 08 10 12 14
-10
0
10
20
30
40
50
60
I[micro
Ac
msup2]
Potential [ V]
(a)
Figure V9 Voltammograms obtained for unpeeled Kondor sample by cyclic
voltammetry in DMF
Figure I 40Voltamm ograms obta ine d for unpeel ed Kondor sample by cycli c voltammetry in D MF
Table V9 Determination of the oxidation peaks of four kinds of potatoes by CV in DMF 10)جدول رقم ) 9Table V9 Determination of the ox idation peaks of four kinds of potatoes by CV in D MF
Samples Eap (V)
Unpeeled
Kondor + 1066
Bartina + 1047
Spunta + 1065
Kuroda + 1029
Anodic oxidation potential vs GCE
V2622) Electrochemistry assay radical scavenging activity
The quantification of antioxidant in the extract is made by calculating the inhibition
concentration (IC50) value radical scavenging activity was plotted against different
concentrations of extract samples the effect of different concentrations is shown in (Figure
III11 and 12) for radical scavenging activity All the voltammograms of superoxide
anion radical Figure III11 12 showed one electron reversible process having well developed
and clear oxidation and reduction peaks On the level of anodic current the decreasing of
peaks according to the addition of sample extracts
The equation obtained from the linear calibration graph figure V10 In the studied
concentration range of samples extracts are presented in Table V10 where y stand for the
value of the oxidation peak current density of and x represents the value of the
concentration of ethanolic extracts expressed as mgmL The Kondor extracts have a less IC50
Chapter V Phytochemical study of Solanum tubersum L
105
with 103 and for Kuroda sample has the highest IC50 with 1819 mgmL All the IC50 values
were considered as very statistically significant with plt0005
01 02 03 04 05 06 07
5
10
15
20
25
30
35
In
hib
itio
n
Concentration (mgml)
Figure V10 The percent radical inhibition as a function of the concentration
of unpeeled Kondor
Figure I 41T he per ce nt O_2 ^(∙-) radica l inhi bition as a functi on of the conce ntration of unpeel ed Kondor
Table V10 IC50 values of sample extracts using radical scavenging activity
24)جدول رقم ) 10Table V10 IC50 values of sample extracts using O_2^(∙-) radica l scaveng ing activity
Sample Equation R2 value IC50 P
Unpeeled
Kondor Y= 156 + 468 X 0989 10350 0000
Bartina Y= - 752 + 506 X 0923 11367 0002
Spunta Y= - 0134 + 276 X 0988 18164 0000
Kuroda Y = - 423 + 298 X 0987 18197 0000
Standard
Ascorbic acid Y = -3118 + 9284 X 0995 00572 0000
α-tocopherol Y = 210 + 2510 X 0845 01908 0027
Chapter V Phytochemical study of Solanum tubersum L
106
-16 -14 -12 -10 -08 -06 -04 -02 00 02
-150
-100
-50
0
50
100
I [micro
Ac
msup2]
Potential [ V]
00 ml
01 ml
014 ml
02 ml
024 ml
03 ml
034ml
04 ml
044 ml
05 ml
06 ml
(a)
-16 -14 -12 -10 -08 -06 -04 -02 00 02
-200
-150
-100
-50
0
50
100
150
I [micro
Ac
msup2]
Potential [ V]
00 ml
01 ml
02 ml
03 ml
04 ml
044 ml
05 ml
06 ml
(b)
-16 -14 -12 -10 -08 -06 -04 -02 00 02
-200
-150
-100
-50
0
50
100
150
I [micro
Ac
msup2]
Potential [ V]
00 ml
01 ml
02 ml
03 ml
04 ml
05 ml
06 ml
07 ml
(C)
-16 -14 -12 -10 -08 -06 -04 -02 00 02
-200
-150
-100
-50
0
50
100
150
Potential [ V]
I [micro
Ac
msup2]
00 ml
01 ml
02 ml
03 ml
04 ml
05 ml
06 ml
07 ml
086 ml
(d)
Figure V11 Cyclic voltammograms of oxygen-saturated in the absence and presence of
different concentration of sample extract Roots (a) Kondor (b) Bartina (c) Spunta (d) Kuroda
at scan rate 100 mVs
-18 -16 -14 -12 -10 -08 -06 -04 -02 00 02
-150
-100
-50
0
50
100
O2
01 mgml
03 mgml
05mgml
07mgml
1 mgml
I [micro
Ac
m2]
Potentiel [ V]
(a)
-18 -16 -14 -12 -10 -08 -06 -04 -02 00 02
-150
-100
-50
0
50
100
O2
N2
01 mgml
03 mgml
05mgml
07mgml
1 mgml
I[micro
Ac
m2]
Potentiel [ V]
(b)
Figure V12 Cyclic voltammograms of oxygen-saturated in the absence and presence of
different concentration of standard (a) ascorbic acid (b) α-tocopherol at scan rate 100 mVs
Chapter V Phytochemical study of Solanum tubersum L
107
V2623) Ratio of binding constants (KoxKred)
Scheme1 The redox behavior of the free radical and its bounded forms SE
The peak potential shift values additionally pointed out that Obull2
minusis easier to oxidize in
the presence of ethanolic extract because its reduced form Obull2
minusis more strongly bound to
extract than its oxidized form For such a system where both forms of the O2 Obull2minus redox
couple interact with the potential antioxidant compound scheme 2 can be applied [16] Based
on the process presented in scheme 2 the following equation is obtained [17]
Where and
are the formal potentials of the O2 Obull2
minus redox couple in the free and bound
forms respectively and are calculated using the following formulas (3) and (4)
Figure V11 and 12 shows the CVrsquos behavior of oxygen-saturated DMF01 TBFP in the
potential window of -14 to 00 V at a glassy carbon electrode in the absence and presence of
04 mL sample extracts the free O2 redox couple exhibits a single oxidation peak at minus072
V and a single reduction peak at minus074 V These Figures also shows the effect of the addition
of extract on the oxidation peak current of O2
The CV technique was also helpful to determine the mechanism of free radical
scavenging the observed changes in anodic peak current of O is caused by the addition of
different content of ethanolic extracts this decrease in anodic peak can be used for the
calculation of the binding constant where the shift in peak potential values can be employed
for the determination of the mode of interaction in the same manner used for study of
binding of drug molecules to DNA [1415]
Chapter V Phytochemical study of Solanum tubersum L
108
By adding 04 ml of sample extracts in solution of DMF the peak potential was shifted
by ΔE the peak potential was displaced by ΔEf0 mV to more negative for complex
-
Kondor and more positive for the rest of the complexes which associated with the decrease in
oxidation peak current densities ΔIpa which confirms the interaction of ethanolic extracts
with (Table V11 and 12) The significant decrease in oxidation peak current densities can
be attributed to the diminution in concentration due to the formation of sample extract
complex
Table V11 Shifts in peak potential and a decrease in anodic peak current of bound forms
of Roots extract samples 24)جدول رقم ) 11Table V11 Shifts in peak pote ntial and a decrease in anodic peak current of O_2^(∙-) bound for ms of R oots extract samples
Sample Ipa (microA) Epa (V) Epc (V) Ef0 (V) ΔEf0(mV) ΔIpa KoxKred
- 1342672 -07068 -07247 -07157 - - -
Kondor 1042637 -0678 -07566 -07173 -15574 223460 094
- 1373784 -07251 -07714 -07482 - - -
-Bartina 118844 -07251 -07624 -07438 44776 134914 119
- 1375848 -07149 -07438 -07294 - - -
-Spunta 114627 -07021 -07477 -07249 44776 166863 119
- 1424359 -07613 -07800 -07706 - - -
-Kuroda 1237957 -07519 -07617 -07568 138221 130867 171
Chapter V Phytochemical study of Solanum tubersum L
109
-16 -14 -12 -10 -08 -06 -04 -02 00 02
-200
-150
-100
-50
0
50
100
I [micro
Ac
msup2]
Potential [ V]
00
04 ml
(a)
-16 -14 -12 -10 -08 -06 -04 -02 00 02
-200
-150
-100
-50
0
50
100
150
I [micro
Ac
msup2]
Potential [ V]
00 ml
04 ml
(b)
-16 -14 -12 -10 -08 -06 -04 -02 00 02
-200
-150
-100
-50
0
50
100
150
I [micro
Ac
msup2]
Potential [ V]
00 ml
04 ml
(C)
-16 -14 -12 -10 -08 -06 -04 -02 00 02
-200
-150
-100
-50
0
50
100
150
I [micro
Ac
msup2]
Potential [ V]
00 ml
04 ml
(d)
Figure V13 Cyclic voltammograms of oxygen-saturated in the absence and presence of 04
ml sample extract Roots (a) Kondor (b) Bartina (c) Spunta (d) Kuroda at scan rate 100 mVs Figure I 42voltamm ograms of oxygen-sat urated i n the a bse nce a nd prese nce of 04 ml sampl e extract Root s (a) Kondor (b) Barti na (c) Spunta (d) Kuroda at sca n rate 100 mVs
Table V12 Shifts in peak potential and a decrease in anodic peak current of bound forms
of Standard samples 24)جدول رقم ) 12Table V12 Shifts in peak pote ntial and a decrease in anodic peak current of O_2^(∙-) bound for ms of F lesh extract samples
Sample Ipa (microA) Epa(V) Epc(V) Ef0 (V) ΔEf0
(mV)
ΔIpa KoxKred
- 1295016 -07825 -06462 -07143 - - -
-Ascorbic
acid
1208858 -07798 -06676 -07237 -935 66530 069
- 1275129 -06453 -07752 -07102 - - -
-
α-tocopherol
1211147 -06458 -07707 -07080 225 50177 109
Chapter V Phytochemical study of Solanum tubersum L
110
-18 -16 -14 -12 -10 -08 -06 -04 -02 00 02
-150
-100
-50
0
50
100
I [micro
Ac
msup2]
Potential [ V]
00 ml
03 ml(a)
-18 -16 -14 -12 -10 -08 -06 -04 -02 00 02
-150
-100
-50
0
50
100
I [micro
Ac
msup2]
Potential [ V]
00 ml
03 ml(b)
Figure V14 Cyclic voltammograms of oxygen-saturated in the absence and presence
of 03 ml sample extract (a) Ascorbic acid (b) α-tocopherol at scan rate 100 mVs Figure I 34 Cyclic voltammogram s of oxygen-sat urated i n the a bse nce a nd prese nce of 03 ml sampl e extract (a) Ascor bic a cid (b) α-t ocopherol at scan rate 100 mVs
Figure I 44 Cycli c voltammograms of oxygen-saturate d in t he absence and pre sence of differe nt conce ntration of sampl e extract Root s (a) Kondor (b) Bartina (c) Spunta (d) Kuroda at scan rate 10 0 mVs
V2624) Thermodynamic properties
To quantify the results the strength of interaction between superoxide anion radical and
the probable antioxidant in the extract was estimated in terms of binding constant Kb Based
on the decrease in peak current the binding constant (Kb) was calculated using following
equation Feng et al [18]
(5)
Where Ipo and Ip are the peak currents of superoxide anion radical in the absence and
presence of additives respectively [AO] is the concentration of the antioxidant As [AO] is
not known therefore this term was replaced by the volume of the extracts (∆Vext) It is
noticeable that the volume of the solution containing is fixed thus the addition of volume
increments of the extract is proportional to the addition of more number of moles (ie
concentration) of the compound(s) according to Safeer et al [19] Another thermodynamic
parameter standard Gibbs free energy (∆G˚) was calculated using the measured Kb
The obtained values from CVs voltammograms showed in Figure V13 and 14
indicated that the binding constant (Kb) ranged as the follows
- α-tocopherol lt
-Spunta lt Kondor lt
-Ascorbic acid lt -Kuroda lt
-Bartina
The values of free energy varied in the same order as of the binding constant The negative
values of ∆G indicated the spontaneity of interaction The data obtained in Table
V13 were very statistically significant with plt0002
Chapter V Phytochemical study of Solanum tubersum L
111
Table V13 Values of Binding constants and binding free energy of the complexes -
sample extracts 24)جدول رقم ) 13Table V13 Values of Binding constants and binding free energy of the complexes O_2^(∙-)-sample extracts
Compound Equation R2 K ΔG P
Unpeeled
-Kondor y = 09086x + 28778 0990 075474x102 -1642 0000
-Bartina y = 04818x + 31119 0956 131522x102 -1780 0001
-Spunta y = 08952x + 28012 0986 063270x102 -1599 0000
-Kuroda y = 0576x + 29473 0986 088572x102 -1682 0000
Standard
-Ascorbic acid y = 05923x + 28376 0996 068801x102 -1619 0000
-α-tocopherol y = 115x + 2035 0959 010839x102 -1161 0001
V2625) Diffusion coefficients
The redox process of the four sample extracts as a function to scan rates presented in
Figure V15 and 16 The voltammogram contained a couple of a clear stable oxidation and
reduction peaks attributed to the electrochemical behavior of the redox O2 couple In
addition demonstrate clearly the reversibility of the oxidation reaction of the redox couple
O2 as the oxidation peak potentials are not significantly affected by the variation in the
scan rate
The diffusion coefficients of the free radical and its
bounded forms with
ethanolic extract were calculated from the following RandlesndashSevcik equation [20]
Where i presents the oxidation peak current density S presents the surface of the
working electrode (cm2) C is the bulk concentration (molcm
-3) of the electroactive species D
present the diffusion coefficient (cm2s) and v is the scan rate (Vs) The linearity of the plot
of the four adducts Further demonstrates that the kinetic of the oxidation
reaction is limited by the diffusion process The diffusion coefficients were determined from
the slopes of the plot ipa vs the square root of the scan rate Values are given in Table V14
Chapter V Phytochemical study of Solanum tubersum L
112
Table V14 shows that the diffusion coefficient of complexes is lower than
that of the free radical The diffusion coefficients of four adducts are very close because
sample complexes have the same contents the slight difference can only be attributed to the
amount of the phytochemical compound
-16 -14 -12 -10 -08 -06 -04 -02 00 02
-300
-200
-100
0
100
200
a
Potential [ V]
500
400
300
200
100
-16 -14 -12 -10 -08 -06 -04 -02 00 02
-300
-200
-100
0
100
200
b
Potential [ V]
500
400
300
200
100
-16 -14 -12 -10 -08 -06 -04 -02 00 02
-300
-200
-100
0
100
200
C
Potential [ V]
500
400
300
200
100
-16 -14 -12 -10 -08 -06 -04 -02 00 02
-400
-300
-200
-100
0
100
200
d
Potential [ V]
500
400
300
200
100
-16 -14 -12 -10 -08 -06 -04 -02 00 02
-300
-200
-100
0
100
200
e
Potential [ V]
500
100
400
300
200
Figure V15 Succession of cyclic voltammograms at GC electrode in oxygen-saturated
DMF01 TBFP at different scan rates ranging from 100 to 500 mVs unpeeled (a) -
Kondor (b) -Bartina (c)
-Spunta (d) -Kuroda and (e) for
Figure I 45Successi on of cycli c voltammograms at GC electr ode i n oxyge n-saturate d DMF01 T BFP at different sca n rates rangi ng from 100 to 5 00 mVs unpeele d (a) O_2^(∙-) -Kondor (b) O_ 2^(∙-)-Bartina (c) O_2^(∙ -)-Spunta (d) O_ 2^(∙-)-Kur oda a nd (e) for
Chapter V Phytochemical study of Solanum tubersum L
113
10 12 14 16 18 20 22 24
100
120
140
160
180
200
220
240
260
280
ipa [
microA
cm
sup2]
Vfrac12 (mVs)
I A
I Bartina
I Spunta
I Kuroda
I kondor
Figure V16 ipa versus V12 plots of oxygen-saturated DMF A in absence of 04 ml of
unpeeled extract Figure I 46 i pa versus V1 2 pl ots of oxyge n-saturate d DMF A in a bse nce of 04 ml of unpeel ed extract
Table V14 Diffusion coefficient values 24)جدول رقم ) 14Table V14 Diffusion coefficient values
Sample Equation R2 values D (cm
2s)
Roots
Obull2minus y = 11046x + 24721 0998 187x10-6
Obull2minus-Kondor y = 76929x + 25282 0997 909 x10-7
Obull2minus-Bartina y = 68567x + 44991 0978 722 x10-7
Obull2minus-Spunta y = 73768x + 41425 0999 836 x10-7
Obull2minus-Kuroda y = 7941x+ 45149 0999 968 x10-7
Chapter V Phytochemical study of Solanum tubersum L
114
V27) Discussion
As discussed in chapter II5 potatoes contain a number of phytochemicals compounds
which have an antioxidant and antibacterial activity This function had a role in disease
prevention The purpose of this experiment was to assess the relative phenolic and flavonoids
content on the potential antioxidant capacity of four different potatoes varieties
Based on the results which identified the cultivars with the greatest total phenolics
content and flavonoids content all the four potatoes varieties show great levels of phenolic
and flavonoids content Kondor in particular had much greater in phenolics content (101-
216) and flavonoids content (106-229) times greater than other varieties Similar to finding
in HPLC analysis extraction from Kondor root sample has been shown to exhibit variable
degrees of Quercetin acid with a high content 1091 microgmg and Caffeic acid with 053 microgmg
These acids present only in Kondor root variety
The difference of genetic and cultivars condition caused variable effects amongst
phytochemical compounds in potatoe samples The major trends appeared to include a general
difference in the actual quantity of the phytochemical compounds that are present in potatoes
sample the other trends include a disappeared of some compounds such as vanillin
disappeared in Spunta and Kuroda samples for the rutine was present only in Kuroda sample
As expected due to the high phytochemical content Kondor variety has the greatest in
vitro antioxidant capacity Two techniques used to measure antioxidant capacity were
spectrophotometers (FRAP and DppH) and electrochemical (total antioxidant activity and
O2) Results of the FRAP and CV assays from different technique with the same principle
measure directly the antioxidant activity showed that the four potato varieties have an
antioxidant potential Kondor also displayed the greatest protection against radicals DppH and
O2 then the other four potato cultivars
Finally Kondor has a great potential for future development as a marketable food
product Kondor production has also the potential to contribute in useful ways to the
development goals in health more than Bartina Kuroda and Spunta other potato varieties
Chapter V Phytochemical study of Solanum tubersum L
115
V3) Experiment Two Kondor tuber analysis
V31) Aim
The phytochemical content of the tuber of Kondor will then be further quantified to
investigate (a) to what extent of the phenolic and flavonoids content (b) HPLC analysis (c)
antioxidant activity by the two techniques mentioned above and another spectrophotometer
assay Except where stated analyses were carried out on Kondor variety in two cases the first
one is the whole tuber (unpeeled) and the second is the tuber flesh (peeled)
V32) Phytochemical contents
The Table V19 shows the total phenolic contents (TPC) and the total flavonoid
contents (TFC) of Kondor variety in two cases the whole root and the flesh The tuber
samples flesh showed the lower amount of TPC and TFC than the whole tuber sample
Table V19 Determination of total Phenolics contents and total flavonoids of the
unpeeled and the peeled 24)جدول رقم ) 15Table V19 Determination of total P heno lics contents and total flavonoids of t he who le root and the flesh
Kondor Sample Total Polyphenols (mg AG g of
extract)
Total flavonoids (mg rutin g of
extract)
unpeeled 192144 plusmn 0096 250350 plusmn 0125
peeled 146496 plusmn 0102 146878 plusmn 0073
As previously shown in the first experiment with regards to the quantity of total
phenolic in different potato tubers the presence of these compounds contributors with the
order Kondor (unpeeled) gt Bartina (unpeeled) gt Kondor (peeled) gt Spunta (unpeeled) gt
Kuroda (unpeeled)
A return to the total flavonoids content in all five extract samples these compounds
decreasing in contribution was Kondor (unpeeled) gt Bartina (unpeeled) gt Spunta (unpeeled)
gt Kondor (peeled) gt Kuroda (unpeeled)
However these results showed that the extract of peeled Kondor has a great value in
phytochemical content when compared to the whole tuber component in all varieties
Chapter V Phytochemical study of Solanum tubersum L
116
V33) HPLC analysis
The chromatographic profile of extract of the unpeeled sample and the peeled sample of
the variety Kondor represented in Level of the figures (V1 and V17) The results of
quantitative analyses of phenolic compounds Identified are represented in the Table V20 The
analysis of these results shows that in The extract of the variety Kondor in case of peeled the
ascorbic acid (0226 microgmg) the Gallic acid (5764 microgmg) the Chlorogenic acid (1845
microgmg) For the caffeic acid Vanillin and Quercetin present only in the unpeeled sample But
from the point of view of quantity the extract of the whole tuber (unpeeled) of Kondor is
richness than the extract of the peeled
Table V20 Constituents content analyzed by HPLC 24)جدول رقم ) 16Table V20 Constitue nts content ana lyzed by HP LC
Sample extract Kondor
unpeeled peeled
Ascorbic acid [microgmg] 01896 02266
Gallic acid [microgmg] 52946 57646
Chlorogenic acid [microgmg] 30520 18450
Caffeic acid [microgmg] 05322 -
Quercetin [microgmg] 109197 -
Vanillin [microgmg] 00596 -
The HPLC analysis of all five extract samples presented in tables V20 and V4 When
compared to the proximate composition of three bioactive compounds found in all potato
tubers Gallic acid is mostly concentrated in all four varieties (780 - 529 microgmg) greater in
the unpeeled sample and Kondor peeled sample or Chlorogenic acid (305 - 075 microgmg)
followed by Ascorbic acid 031 - 002 microgmg
Chapter V Phytochemical study of Solanum tubersum L
117
Figure V17 Chromatograms of leaf extract(1)Ascorbic acid(2) Gallic acid (3)
Chlorogenic acid Figure I 47Chromatograms of leaf extract(1)Ascorbi c aci d(2) Gallic a cid (3) Chlor ogeni c aci d
V34) Spectrophotometers assays
The phytochemical analysis of bioactive compounds in Kondor variety unpeeled and
peeled samples showed a comprehensive identification of phenolics and flavonoids content
but rather presents an idea of the array of phytochemical compounds As there are many
phenolic compounds with different properties and characteristics Hence one particular assay
may be better at detecting a certain type of antioxidant compound than another and therefore
using more one assay enables a researcher to pick up a wide range of oxidative compounds
V341) FRAP assay
Ferric reducing antioxidant power (FRAP) is based on the ability of the antioxidant to
reduce Fe3+ to Fe2+ according to Rodriquez amp Hadley the ethanolic extracts of potato
tubers showed marked hydrogen-donating activity using reducing power in the Fe(III) AElig Fe
(II) reaction in FRAP assay [9]
Based on the FRAP assay (Table V21) the results indicated that the unpeeled samples
had a reducing antioxidant power more than the peeled sample with a value 388032 and
232443 mg Fe(II) g of extract respectively However the results mentioned above (Table
V5) shows three of potato unpeeled Kondor Bartina and Spunta had higher values of
reducing antioxidant power than Kondor peeled sample but less than Gallic acid and ascorbic
acid
Chapter V Phytochemical study of Solanum tubersum L
118
Table V21 Determination of reducing the antioxidant power of four kinds of potatoes 24)جدول رقم ) 17Table V21 Determination of reducing t he antioxidant power of four kinds of potatoes
Sample FRAP (mg Fe(II) g of
extract)
unpeeled 388032 plusmn 0043
peeled 232443 plusmn 0019
Ascorbic acid 2512985 plusmn 0020
Gallic acid 77782511 plusmn 0388
V342) Total antioxidant capacity
Several assays have been introduced for the measurement of the antioxidant activity of
plant extracts including total antioxidant capacity by the phosphomolybdenum method The
phosphomolybdenum method is based on the reduction of Mo(VI) to Mo(V) by the
antioxidant compounds and the formation of green Mo(V) complexes with a maximal
absorption at 695 nm [21] Using this method the result indicated that both the peeled and
unpeeled extracts of Kondor variety have an antioxidant capacity The unpeeled extract
displayed the higher antioxidant capacity than the peeled extract with value 4708 and 2787
mg ascorbic acid equivalentg extract respectively Overall the two samples had lower
antioxidant activity than the Gallic acid (Table V22)
Table V22 Determination of the Total antioxidant capacity of Kondor 24)جدول رقم ) 18Table V22 Determination of the Total antiox idant capacity of Kondor
Sample Total antioxidant capacity
unpeeled 470873 plusmn 0043
peeled 278784 plusmn 0019
GA 65654263 plusmn 0035
V343) β-carotene bleaching assay
In the β-carotene-linoleic acid coupled oxidation model system the linoleic acid-free
radical (LOO ) formed attacks the highly unsaturated β-carotene molecules and in the
absence of an antioxidant rapidly bleaches the typically orange color of β-carotene which is
monitored spectrophotometrically at 450 nm The extracts reduced the extent of β-carotene
bleaching by neutralizing the linoleate-free radical and other free radicals formed in the
system [22] The antioxidant activities of Kondor peeled and unpeeled extracts were
Chapter V Phytochemical study of Solanum tubersum L
119
determined after 120 min reaction time (Table V23) and compared with a well known
natural antioxidant gallic acid and ascorbic acid
However the results indicated that the extracts ranked in the following order unpeeled
extract (6842 plusmn 0007)gt peeled extract (5333 plusmn 0006) It is clear that the two extracts
are capable of inhibiting β-carotene bleaching and the activity depends on the amount of
extract The unpeeled extract showed the highest level of activity at 4 mgml and also
demonstrated a significant increase in activity compared to the peeled extract In a
comparison of the β-carotene bleaching activity gallic acid and ascorbic acid showed the
highest antioxidative activity at 008 mgml with values 6264 plusmn 0013 and 1651 plusmn
0007 respectively
Table V23 Determination of antioxidant activity of sample extracts using β-carotene
bleaching 24)جدول رقم ) 19Table V23 Determination of antioxidant activity of sample extracts using β-carotene bleaching
Sample extraction Concentration (mgml) Antioxidant activity
Unpeeled 075
15
4
032967 plusmn 0018
281250 plusmn 0014
684210 plusmn 0007
Peeled 075
15
4
084337 plusmn 0005
152941 plusmn 0019
533334 plusmn 0006
Ascorbic acid 003
006
008
046204 plusmn 0005
137500 plusmn 0008
165178 plusmn 0007
Gallic acid 003
006
008
212477 plusmn 0003
425287 plusmn 0005
626436 plusmn 0013
Additionally the inhibition of the antioxidant activity of β-carotene oxidation also
expressed as IC50 (Table V24) The IC50 value of each extract is deducted from the equations
of the curves of the variation in the percentage of inhibition I as a function of the
concentration of each extract as shown in Figure V18 and Annexe (A)
The IC50 scavenging activity of the Kondor unpeeled and peeled extracts were 285
mgml 390 mgml respectively Also for the gallic acid and ascorbic acid showed the highest
Chapter V Phytochemical study of Solanum tubersum L
120
value 0066 mgml and 021 mgml All the results have a very statistically significant with
plt0005 the order of antioxidant activity towards β-carotene oxidation was
Gallic acid gt Ascorbic acid gt Unpeeled gt Peeled
05 10 15 20 25 30 35 40 45
0
10
20
30
40
50
60
70
IC
Concentration
IC50
= 285 mgml
Figure V18 Antioxidant activity () of unpeeled Kondor assayed by β-carotenendash
linoleate bleaching
Figure I 48A ntioxidant activity () of unpeele d Kondor assayed by β-car otene ndashlinoleate bl eaching
Table V24 IC50 values of sample extracts using β-carotene bleaching
24)جدول رقم ) 20Table V24 IC50 values of sample extracts using β-carotene bleaching
Sample extraction Equation R2
IC50 P value
Unpeeled Y = 18779x - 3531 0954 285 0004
Peeled Y= 13231x - 1649 0993 390 0000
Ascorbic acid Y= 24154x - 2069 0918 021 0003
Gallic acid Y= 7848x - 22963 0993 0066 0000
V343) DPPH
DPPH scavenging activity () had increased with the increased concentration of the
extract in all samples (Figure V19) The stable DPPH free radical accepts an electron or
hydrogen radical from donors to form a stable molecule which could be seen as color
reduction
V3431) Calculation of radical inhibition
Kondor extract was the strongest electron or hydrogen donor due to the highest DPPH
scavenging activity The IC50 of DPPH scavenging activity of the Kondor unpeeled and
peeled extracts were 121 mgml 280 mgml respectively Also for the Gallic acid and
Chapter V Phytochemical study of Solanum tubersum L
121
ascorbic acid showed the highest value 00069 mgml and 001 mgml All the results have a
very statistically significant with plt0000 (table V24)
Table V24 IC50 values of sample extracts using DPPH 24)جدول رقم ) 21Table V24 IC50 values of sample extracts using DP PH
Sample DppH
Equation R2 value IC50 P
unpeeled Y = 333 + 383 X 0994 121 0000
peeled Y = - 347 + 257 X 0991 280 0000
Ascorbic acid Y= 094 + 4720X 0972 0010 0000
Gallic acid Y=-678 + 8154X 0982 00069 0000
inhibition expressed as mgml
V3432) Calculation of the binding constant
The electronic spectra of complexes extractndashDppH were recorded in the range 200-900
nm which showed intense absorption at range 515-518 nm The determination of binding
constant Kb of extractndashDppH complex can be calculated from the inhibition of absorbance in
UV-spectra after the addition of sample extract ( Figure V19)
As mention above A plot of Ao (A-Ao ) to 1[extract] has shown linearity which is
suggestive of 11 complex formation of both extracts with DppH The intercept to slope ratio
of this plot gives the value of binding constant ldquoKb rdquo (Annexe A) Kb values were calculated
given in Table V25
UV spectra of DppH showed a hypochromic effect upon addition of sample extract the
intensity decreased rapidly with increasing concentration of the extract were recorded in
Figure V20 In the absence of sample extract the DppH displayed one absorbance peak at 517
nm this peak intensity exhibited hypochromism up from 56 to 77 for 2 mgml
concentration of sample extract
The values of binding constant ldquoKb rdquo were further used to calculate standard Gibbs free
energy ldquo∆Grdquo of extractndashDppH complex using the following equation
Free energy changes of extracts values Table V25 and showed spontaneous of their binding
with DppH The p-value of the results was lt005 which a significant statistically
Chapter V Phytochemical study of Solanum tubersum L
122
400 450 500 550 600 650 700
00
02
04
06
08
10
12
14
Ab
s
Wavelength nm
00 mgml
0005 mgml
001 mgml
005 mgml
01 mgml
025 mgml
075 mgml
05 mgml
1 mgml
125 mgml
15 mgml
(a)
400 450 500 550 600 650 700
00
02
04
06
08
10
12
14
Ab
s
Wavelength nm
00 mgml
025 mgml
05 mgml
075 mgml
1 mgml
15 mgml
2 mgml
25 mgml
(a)
Figure V19 Electronic absorption spectra of 025 mM of DPPH interaction with of (a)
Unpeeled and (b) Peeled Figure I 49Ele ctronic a bsorption spectra of 025 mM of DPPH i nteracti on wit h of (a) Root and (b) Flesh
Table V25 Values of Binding constants and binding free energy of the complexes DppH-
sample extracts 24)جدول رقم ) 22Table V25 Values of Binding constants and binding free energy of the complexes D ppH- sample extracts
Compound Equation R2 K ΔG P
unpeeled
DppH-Kondor Y = -0031x + 24387 09089 786266 -10822 0012
peeled
DppH-Kondor Y = -00289x +19914 09129 689065 -10494 0011
V35) Electrochemistry assay
Table V26 shows The oxidation of Kondor samples extract studied by cyclic
voltammetry showed capacity antioxidant expressed in terms of gallic acids (AG) equivalent
antioxidant capacity obtained from an electrochemical assay in ethanolic extract of two cases
the unpeeled and the peeled This capacity related to the potential peaks which determined
the antioxidant power of sample extracts this potential peak show almost the same value but
the peeled sample has lower antioxidant capacity than the unpeeled
Table V26 Determination of the Antioxidant capacity of Kondor variety by CV 24)جدول رقم ) 23Table V26 Determination of the A ntioxidant capacity of Kondor variety by CV
Sample Antioxidant capacity CVa Eap
b (V)
unpeeled 534813 plusmn 0254 +088
peeled 305753 plusmn 0540 +087
a capacity antioxidant expressed as milligrams of gallic acid equivalent per gram of extract
b Anodic oxidation potential vs GCE
Chapter V Phytochemical study of Solanum tubersum L
123
V352) Electrochemistry assay radical scavenging activity
The quantification of antioxidant in the extract is made by calculating the inhibition
concentration (IC50) value radical scavenging activity was plotted against different
concentrations of extract samples the effect of different concentrations is shown in (Figure
V21) for radical scavenging activity All the voltammograms of superoxide anion radical
Figure V20 showed one electron reversible process having well developed and clear
oxidation and reduction peaks On the level of anodic current the decreasing of peaks
according to the addition of sample extracts
The equation obtained from the linear calibration graph (Annexe) in the studied
concentration range of samples extracts are presented in Table V27 where y stand for the
value of the oxidation peak current density of and x represents the value of the
concentration of ethanolic extracts expressed as mgmL The unpeeled Kondor extracts have
a less IC50 with 103 mgmL than peeled with 202 mgmL All the IC50 values were
considered as very statistically significant with plt0000
Table V27 IC50 values of Kondor sample extracts using radical scavenging activity
24)جدول رقم ) 24Table V27 IC50 values of Kondor sample extracts using O_2^(∙-) radical scaveng ing activity
Sample Equation R2 value IC50 P
unpeeled Y= 156 + 468 X 0989 10350 0000
peeled Y = - 416 + 267 X 0948 20284 0000
-16 -14 -12 -10 -08 -06 -04 -02 00 02
-150
-100
-50
0
50
100
I [micro
Ac
msup2]
Potential [ V]
00 ml
01 ml
014 ml
02 ml
024 ml
03 ml
034ml
04 ml
044 ml
05 ml
06 ml
(a)
-16 -14 -12 -10 -08 -06 -04 -02 00 02
-200
-150
-100
-50
0
50
100
I [micro
Ac
msup2]
Potential [ V]
00 ml
01 ml
02 ml
03 ml
04 ml
05 ml
06 ml
07 ml
08 ml
09 ml
(b)
Figure V20 Cyclic voltammograms of oxygen-saturated in the absence and presence of
different concentration of Kondor sample extract (a) unpeeled (b) peeled at scan rate 100
mVs Figure I 50 Cycli c voltammograms of oxyge n-saturate d in the absence and pre sence of different conce ntration of Kondor sam ple extract (a) unpeele d (b) peel ed at scan rate 1 00 mV
Chapter V Phytochemical study of Solanum tubersum L
124
V3521) Ratio of binding constants (KoxKred)
Figure V21 shows the CVrsquos behavior of oxygen-saturated DMF01 TBFP in the
potential window of -14 to 00 V at a glassy carbon electrode in the absence and presence of
04 mL sample extracts the free O2 redox couple exhibits a single oxidation peak at minus072
V and a single reduction peak at minus074 V These Figures also shows the effect of the addition
of extract on the oxidation peak current of O2
The CV technique was also helpful to determine the mechanism of free radical
scavenging the observed changes in anodic peak current of O is caused by the addition of
different content of ethanolic extracts this decrease in anodic peak can be used for the
calculation of the binding constant where the shift in peak potential values can be employed
for the determination of the mode of interaction in the same manner used for study of
binding of drug molecules to DNA [1415]
By adding 04 ml of sample extracts in a solution of DMF the peak potential was
shifted by ΔE the peak potential was displaced by ΔEf0 mV to more negative for complex
-Kondor in two cases unpeeled and peeled complexes which associated with the decrease
in oxidation peak current densities ΔIpa which confirms the interaction of ethanolic extracts
with (Table V28) The significant decrease in oxidation peak current densities can be
attributed to the diminution in concentration due to the formation of sample extract
complex
Table V28 Shifts in peak potential and a decrease in anodic peak current of bound forms
of Kondor extract samples 24)جدول رقم ) 25Table V28 Shifts in peak pote ntial and a decrease in anodic peak current of O_2^(∙-) bound for ms of Kondor extract samples
Sample Ipa (microA) Epa (V) Epc (V) Ef0 (V) ΔEf
0(mV) ΔIpa KoxKred
- 1342672 -07068 -07247 -07157 - - -
-Unpeeled 1042637 -0678 -07566 -07173 -15574 223460 094
- 1299617 -07114 -07484 -07299 - - -
-Peeled 1216849 -07060 -07570 -07315 -15574 63686 094
Chapter V Phytochemical study of Solanum tubersum L
125
-16 -14 -12 -10 -08 -06 -04 -02 00 02
-200
-150
-100
-50
0
50
100
I [micro
Ac
msup2]
Potential [ V]
00
04 ml(a)
-16 -14 -12 -10 -08 -06 -04 -02 00 02
-200
-150
-100
-50
0
50
100
I [micro
Ac
msup2]
Potential [ V]
00 ml
04 ml
(a)
Figure V21 Cyclic voltammograms of oxygen-saturated in the absence and presence of
04 ml Kondor sample extract (a) Unpeeled (b) Peeled at scan rate 100 mVs Figure I 51Cy clic v oltammograms of oxyge n-saturate d in the absence and presence of 04 ml Kondor sample extra ct (a) Unpeel ed (b) Peel ed at scan rate 1 00 mVs
V3522)Thermodynamic properties
The obtained values from CVs voltammograms showed in Table V29 indicated that the
binding constant (Kb) ranged as the follows
- Peeled lt
-Unpeeled
The values of free energy varied in the same order as of the binding constant The
negative values of ∆G indicated the spontaneity of interaction The data obtained in
Table V29 were very statistically significant with plt0000
Table V29 Values of Binding constants and binding free energy of the complexes -
sample extracts 24)جدول رقم ) 26Table V29 Values of Binding constants and binding free energy of the complexes O_2^(∙-)-sample extracts
Compound Equation R2 K ΔG P
unpeeled
-Kondor y = 09086x + 28778 0990 075474x10
2 -1642 0000
peeled
-Kondor y = 05606x + 27765 0962 059772x10
2 -1585 0000
Chapter V Phytochemical study of Solanum tubersum L
126
V36) Discussion
Finally fresh Kondor tuber including the whole tuber (unpeeled) and the peeled are
each likely to be great bioactive compounds when compared with other potato varieties due to
their higher content of phenolics and flavonoids as well as greater antioxidant capacity
One of the major aims of this work was to provide a preliminary investigation on the
phytochemical composition of one variety which has greater levels of phytochemical
compounds and to compare these results in both the unpeeled and peeled samples
The results of the second experiment suggest that the freshly peeled potato tubers from
Kondor variety show promising potential with regards to greater potential health benefits
from greater phenolics flavonoids as well as antioxidant activity Similar to finding in this
work other researchers have found that total phenolic compounds were greater in the tuber
skin compared to the tuber flesh [23-24]
As found in this experiment the peeled Kondor variety showed higher concentrations
of phenolic and flavonoid compounds compared to unpeeled Spunta and Kuroda respectively
and thus great antioxidant activity
In this manner with regards to health value since the skin of potatoes generally has
greater phytochemical compounds relative to the flesh it would be advisable to eat the whole
potato tuber rather than peeling them
Chapter V Phytochemical study of Solanum tubersum L
127
V4) Statistic analysis
The analysis of variance of the main effect plot between the variable studied and their
significance was performed using GLM To confirm that the antioxidant activity of the
extracts of the potatoes back to their richness in phytochemical compounds we tried to find a
linear correlation between the antioxidant capacity values calculated by the methods measured
the antioxidant activity with their polyphenol total content and flavanoids total content also a
correlation between each other
V41) Main effect plot
Fig V22 23 and Table V15 shows an overall view of the relative of variety on the
level of phytochemical content and the effect of activity antioxidants a further analysis of
variance of the main effect plot between the variable studied and their significance was using
performed using GLM Fig V22 shows the overall effect of variety on the level total phenolic
content and total flavonoid content The average plot of TPC is valued 1488 which presented
with a line across the plot the variety Kondor and Bartina have the higher amount of TPC
with values above the average line for the variety Spunta and Kuroda shows a lower amount
below the average line Moreover the TFC plot three varieties Kondor Bartina and Spunta
have a higher amount above the average line (at 2033) than the Kuroda variety as it can be
seen there is a statistically significant difference in the amounts of TFC TPC and varieties
(p lt 0005- see Table V15)
Furthermore the effect of different varieties on their antioxidants activity can be seen in
Fig V 23 for CV and FRAP assays This plot shows two varieties Kondor and Bartina above
the average line which presented at a value 4236 and 3068 respectively for the other
varieties Spunta and Kuroda have a low average value presented below the average line
These factors have a very significant statistically with p lt 0000
Another antioxidant capacity DppH and O2 their plot of IC50 average presented in
Figure V23 also these plots show two varieties Spunta and Kuroda have values above the
average line in this case means the lowest antioxidant capacity the Kondor and Bartina
variety have the highest antioxidant capacity which presented lower than the average line this
analysis has a statistically significant with plt0005
Chapter V Phytochemical study of Solanum tubersum L
128
Table V15 Analysis of variance for the main effect plot 24)جدول رقم ) 27Table V15 A nalys is of variance for the main effect plot
Main effect plot P value
TPC 0000
TFC 0000
FRAP 0000
CV 0000
DppH 0003
0003
Figure V22 Effect of variety 1 Kondor 2 Bartina 3 Spunta 4 Kuroda on the level
of (a) TPC (b) TFC
Figure I 52Effect of variety 1 Kondor 2 Bartina 3 S punta 4 Kuroda on the level of (a) TPC (b) TFC
Chapter V Phytochemical study of Solanum tubersum L
129
Figure V23 Effect of variety (1) Kondor (2) Bartina (3) Spunta (4) Kuroda on the
level of inhibition IC50 of (a) DppH (b)
Figure I 53Effect of variety (1) Kondor (2) Bartina (3) Spunta (4) Kur oda on the level of inhibiti on IC50 of (a) DppH (b) O_2^(∙ -)
V42) Linear regression
V421) Linear regression between total polyphenol content and
antioxidant activity
From these plots Figure V24 a correlation (Table V16) is observed between the
content of total phenolic content TPC and ethanolic extracts of a different variety of potatoes
and the antioxidant activity as measured by different methods with correlation indices R2
which ranged from 0602 to 0825
Chapter V Phytochemical study of Solanum tubersum L
130
8 10 12 14 16 18 20
22
24
26
28
30
32
34
36
38
40
FR
AP
TPC
(a)
8 10 12 14 16 18 20
30
35
40
45
50
55
CV
TPC
(b)
8 10 12 14 16 18 20
10
15
20
25
30
35
40
IC50
(D
pp
H)
TPC
(c)
8 10 12 14 16 18 20
10
12
14
16
18
20
22
IC50 (
O-
2)
(d)
Figure V24 Correlation graphs for (a) FRAP (b) CV (c) IC50DppH and (d) IC50 with
total phenolic content (TPC) Figure I 54 Correlati on gra phs for (a) FRAP (b) CV (c) IC50D ppH a nd (d) IC50 O_2^(∙-) with t otal phenolic content (TPC )
Table V16 Determination of the correlation between capacity antioxidant and Total
Phenolic content 24)جدول رقم ) 28Table V16 Determination of the correlation between capacity antioxidant and Tota l P henolic content
Assays Equation R2
FRAP Y= 1185 + 1169X 0602
CV Y = 165 + 1586 X 0574
IC50 DppH Y= 5474 ndash 02001X 0825
IC50 Y= 2774 ndash 00814X 0633
Chapter V Phytochemical study of Solanum tubersum L
131
V422) Linear regression between total flavonoids content and antioxidant
activity
From these plots Figure V25 a correlation (Table V17) is observed between the total
flavonoids content TFC and ethanolic extracts of a different variety of potatoes and the
antioxidant activity as measured by the with correlation indices R2 which ranged from 0602
to 0843 The regression coefficient values obtained for total flavonoids content and
antioxidants assay was higher compared with total phenolics content
10 12 14 16 18 20 22 24 26
22
24
26
28
30
32
34
36
38
40
FR
AP
TFC
(a)
10 12 14 16 18 20 22 24 26
30
35
40
45
50
55
CV
TFC
(b)
10 12 14 16 18 20 22 24 26
10
15
20
25
30
35
40
IC5
0 (
Dp
pH
)
TFC
(c)
10 12 14 16 18 20 22 24 26
10
12
14
16
18
20
22
IC5
0 (
O-
2)
TFC
(d)
Figure V25 Correlation graphs for (a)FRAP (b) CV (c) IC50 DppH and (d) IC50 with
total flavonoids content (TFC) Figure I 55 Correlati on gra phs for (a)FRAP (b) CV (c) IC50 D ppH and (d) IC50 O_2^(∙-) wit h total flavonoids conte nt (TFC)
Chapter V Phytochemical study of Solanum tubersum L
132
Table V17 Determination of the correlation between capacity antioxidant and Total
Flavanoids content 24)جدول رقم ) 29Table V17 Determination of the correlation between capacity antioxidant and Tota l Flavanoids content
Assays Equation R2
FRAP Y= 1014 + 0992 X 0837
CV Y = 169 + 1204 X 0638
IC50 DppH Y= 5035 ndash 01458X 0843
IC50 O2 Y= 2664 ndash 00571X 0602
As shown in Table V18 significant positive correlations (R2 = 0547 - 0825 the
average of R2 was 0651) were observed between total phenolic content and FRAP CV
assays and IC50 values for DPPH indicating the significant contribution of phenolics to
these antioxidant assays Also for the same assays the significant positive correlations
(R2 = 0602 - 0843 the average of R
2 was 0730) were observed between them and the total
flavonoids contents this R2-value indicated that total flavonoids contents exert high
antioxidant activity than total phenolic content in sample extracts
However among the four antioxidant assays (FRAP CV DppH and ) the R
2 value
of CV and FRAP show less correlation (0547 and 0602) for TPC respectively this result
indicated that total phenolics content exert a less capacity effect on CV and FRAP than other
assays
Finally R2 values ranged from 0547 to 0843 with average value was 0690 these high
levels indicate that the antioxidant activity of potatoes might in large of the contribution of
phytochemical contents especially flavonoids compounds
Table V18 The R2 values between antioxidant activities and phytochemical content
24)جدول رقم ) 30Table V18 The R2 va lues between ant ioxidant activities and phytoche mical content
FRAP CV IC50 Average
DppH
TPC 0602 0547 0825 0633 0651
TFC 0837 0638 0843 0602 0730
Average 0719 0592 0834 0617 0690
Chapter V Phytochemical study of Solanum tubersum L
133
V423) Linear regression between different methods antioxidant activity
The relation between different methods was measured using different linear
correlations From these plots Figure V26 (a) a significant correlation is observed between
the antioxidants assay FRAP and CV with correlation indices R2 value 0903 and equation
Y= 184 + 0684 X
However for the inhibitory assays and DppH (Figurethinsp V26b) the equation
obtained from the linear regression Y=0670 + 0358 X and the coefficient value R2
=0595
This higher regression coefficient indicated a strong correlation between these assays
30 35 40 45 50 55
22
24
26
28
30
32
34
36
38
40
FR
AP
CV
(a)
10 15 20 25 30 35 40
10
12
14
16
18
20
22
IC50
(O
-
2)
IC50 (DppH)
(b)
Figure V26 Correlation graphs for (a) FRAP and CV (b) IC50 between DppH and
Figure I 56Correlati on graphs for (a) FRAP and CV (b) IC50 betwee n DppH and O_2^(∙-)
Chapter V Phytochemical study of Solanum tubersum L
134
References
[1] M Angela A Meireles Extracting bioactive compounds for Food products Theory and
Applications 2009 CRC Press New York USA P 140
[2] C Da Porto E Porretto D Decorti Comparison of ultrasound-assisted extraction with
conventional extraction methods of oil and polyphenols from grape (Vitis vinifera L) seeds
Ultrason Sonochem 20 (2013) 1076ndash1080
[3] A Golmohamadi G Moumlller J Powers C Nindo Effect of ultrasound frequency on
antioxidant activity total phenolic and anthocyanin content of red raspberry juice Ultrason
Sonochem 20 (2013) 1316ndash1323
[4] M Abid S Jabbar MM hashim B Hu S Lei X Zeng Sonication enhances
polyphenolic compounds sugars carotenoids and mineral elements of apple juice Ultrason
Sonochem 21 (2014) 93ndash97
[5] Achat S Tomao V Madani K Chibane M Elmaataoui M Dangeles O amp Chemat
F (2012) Direct enrichment of olive oil in oleuropien by ultrasound-assisted maceration at
laboratory and pilot scale
[6] Zhou K and L Yu 2004 Effects of extraction solvent on wheat bran antioxidant activity
estimation Lebensmittel-Wissenschatf und Technologie 37717ndash721
[7] DVreugdenhil JBradshaw CGebhardt F Govers D KL Mackerron M A Taylor H
A Ross Potato biology and biotechnology advances and perspectives 2007 Elsevier Ltd p
442
[8] Wilhelm L R Dwayne A Suter Gerarld H Brusewitz 2004 Drying and
Dehydratation Chapter 10 Food amp Process Engineering Technology St joseph Michigan
USA 259-284
[9] Rodriquez de Sotillo DHadley M and Holm E TlsquoPhenolics in aqueous potato peel
extract extraction identification and degradationrsquo J Food Sci 1994 59 649ndash51
[10] GJ Yang JJ Xu HY Chen ZH Leng Chin J Chem 22 (2004) 1325ndash1329
[11] MS Ibrahim Anal Chem Acta 443 (2001) 63ndash72
[12] F Wang Y Xu J Zhao H Shengshui J Bioelectrochem 70 (2007) 356ndash362
[13] Firuzi O Lacanna A Petrucci R Marrosu G Saso L Bioet biophysica 2004 11174-
184
[14] X Lu K Zhu M Zhang H Liu J Kang J Biochem Biophys Methods 52 189 (2002)
[15] M Ozsoz A Erdem P Kara K Kerman D Ozkan Electroanalysis 15 613 (2003)
Chapter V Phytochemical study of Solanum tubersum L
135
[16] X Chu GL Shen JH Jian TF Kang B Xiong RQ Yu Anal Chim Acta 373 29
(1998)
[17] MT Carter M Rodriguez A Bard J Am Chem Soc 111 8901 (1989)
[18] Feng Q Li NQ and Jiang YY (1997) Electrochemical studies of porphyrin interacting
with DNA and determination of DNA Analytica Chimica Acta 344 97-104
[19] S Ahmed F Shakeel Pak J Pharm Sci 25(3) 501 (2012)
[20] CMA Brett AMO Brett Electrochemistry Principles Methods and Applications
(Oxford Science University Publications Oxford 1993) p 427
[21] Prieto P Pineda M Aguilar MM 1999 Spectrophotometric quantitation of
antioxidant capacity through the formation of phosphoolybdenum complex specific
application to the determination of vitamin E Anal Biochem 269 337-341
[22] Jayaprakasha GK Singh RP Sakariah KK Antioxidant activity of grape seed (Vitis
vinifera) extracts on peroxidation modls in vitro Food Chem 2001 73 288-290
[23] Albishi T John JA Al-Khalifa AS and Shahidi F (2013) Phenolic content and
antioxidant activities of selected potato varieties and their processing by-products Journal of
Functional Foods 5(2) 590-600
[24] Zirsha R W(2015) Investigations into the Nutritional and Sensory Potential of Taewa
(Māori Potatoes) Thesis Doctor of philosophy nutritional science p104
General conclusion
136
General conclusion
This study theme sets as the main objective the evaluation in vitro of the
phytochemical content and antioxidant activity of four different varieties of potatoes Solanum
tuberosum L (Bartina Kondor Kuroda and Spunta ) Until now no studies concerning the
antioxidant activity of the potato of the El Oued region have been conducted We think that
the present study is the first to investigate and evaluate the bioactive compounds
For this concern we choose two methods for extracting the higher level of bioactive
compounds from potato These techniques are ultrasonic-assisted extraction combines with
maceration and Soxhlet extraction The obtained results indicated that the amount extracted
from both total phenolic and flavonoids contents is remarkably improved when using UAE-
M The yield of extraction also improved when maceration is used prior to ultrasonic-assisted
extraction The most efficient method for extraction of TPC and TFC is UAE-M with 30 of
amplitude ethanol as solvent and maceration time of 24 hours all obtained results are
confirmed by HPLC analysis
The phytochemical investigation of four varieties detected Alkaloids Coumarins
Phytosterols Carbohydrates phenolic and Flavonoids The presence of phenolic content was
lower when compared with flavonoids content in the whole roots and the flesh All the results
indicate that roots have a higher level of bioactive compounds more than the flesh Overall the
sample Kondor showed the highest amount of total phenolic content and total flavonoids
content than other samples This difference in phytochemical content is clearly shown in
HPLC analysis which is greatly influenced by cultivar condition and their variety also reflect
on their antioxidants activity
The antioxidant capacity of ethanolic extract was evaluated and compared using two
techniques spectrophotometers and electrochemical assays For four different varieties of the
Solanum tuberosum L
According to the spectrophotometers assays the antioxidants capacity was calculated
with Ferric reducing antioxidant power assay (FRAP) and the oxidation of 22-diphenyl-1-
picrylhydrazyl (DPPH) radical scavenging method expressed as IC50 All the results show that
the ethanolic extract of the whole roots of the Kondor variety had a higher antioxidant
General conclusion
137
capacity than the other ethanolic extract in order was Kondor gt Bartina gt Spunta gt Kuroda
This antioxidants capacity was less active than Gallic and Ascorbic acids
For the electrochemical assay we used the cyclic voltammetry technique to evaluate the
antioxidant capacity of ethanolic extract the redox potentials of these compounds used to
calculate the antioxidant capacity in an aqueous solvent (acetate buffer) The redox potentials
also measured in an organic solvent to compare their electrochemical behavior In this mid
the antioxidant property of phenolics extracted were evaluated by the inhibitory effect of
superoxide anion radicals and expressed as IC50 The obtained data shows value ranged as
the follows Kondor gt Bartina gt Spunta gt Kuroda for the whole root
The thermodynamic properties quantify the strength of interaction between radicals and
the probe antioxidant in the ethanolic extract These properties were estimated in terms of
binding constant Kb based on the decrease in peak current and UV-spectra absorbance for
and DppH respectively This constant allows calculating the standard Gibbs free energy
(∆G˚) Their negative values indicated the spontaneity of interaction between radicals and
extracts
The analysis of variance was determined by the main effect plot and linear correlation
between the variable studied All the results show statistically significant positive
correlations were observed between total phenolic content total flavonoids content and
antioxidant capacity measured with different assays This correlation determined with indices
R2 which ranged from medium to high levels the total flavonoids content has exerted less
antioxidant activity than total phenolic content in sample extracts
The evaluation and the quantification of antioxidants content and antioxidants activity
in vitro for all four varieties show that the whole roots of variety Kondor has a high level of
bioactive compounds more than other varieties Based on this results the phytochemical
analysis was carried out on Kondor for two cases the whole root and the flesh and the
information obtained has led to show that the whole roots have a higher amount in
phytochemical content than the flesh for this variety
Kondor has great potential for future development as a marketable food product Thus
we advise to cultivate this variety more than Bartina Kuroda and Spunta other potatoes
varieties
General conclusion
138
This study scientifically valids the traditional use of these plants and reveals their
interest in the framework of an exploitation in biotechnology For the suite it would be
interesting to isolate and characterize the phenolic compounds of the extracts of four varieties
selected and other Also would be very desirable for a better understanding of the mode of
action of the polyphenolic derivatives to evaluate in vitro and in vivo the antioxidant activity
of each of these compounds taken separately What would then highlight the active principle
of plant extracts andor a possible synergy between the various phenolic compounds
Annexe
Annexe
140
00 05 10 15 20 25 30 35 40
0
10
20
30
40
50
60
70
80
In
hib
itio
n
Concentration (mgml)
(1)
00 05 10 15 20
0
10
20
30
40
50
In
hib
itio
n
Concentration (mgml)
(2)
05 10 15 20 25 30 35
0
10
20
30
40
50
In
hib
itio
n
Concentration (mgml)
(3)
0000 0002 0004 0006 0008 0010
0
10
20
30
40
50
60
I
nh
ibitio
n
Concentration (mgml)
(4)
0001 0002 0003 0004 0005 0006 0007 0008 0009 0010
0
10
20
30
40
50
60
70
In
hib
itio
n
Concentration (mgml)
(5)
Figure 1 The percent DPPH radical inhibition of (1) Spunta (2) Bartina (3) Kuroda
(4) Ascorbic acid (5) Gallic acid
Annexe
141
20 30 40 50 60 70
06
08
10
12
14
16
18
20
22
1C
I
(a)
4 6 8 10 12 14 16 18 20 22 24
04
06
08
10
12
14
1C
I
(b)
10 20 30 40 50 60 70 80
025
030
035
040
045
050
055
060
065
070
1C
I
(c)
0 10 20 30 40 50
02
04
06
08
10
12
14
1C
I
(d)
15 20 25 30 35 40
100
120
140
160
180
200
220
240
260
1C
I
(e)
20 30 40 50 60 70
100
150
200
250
300
350
1C
I
(f)
0 10 20 30 40 50 60 70
02
04
06
08
10
12
14
16
18
20
22
1C
I
(g)
Figure 2 A plot of Ao (A-Ao ) to 1[extract] for DppH radical (a) Kondor (b) Bartina (c)
Annexe
142
Spunta (d) Kuroda (e) Ascorbic acid (f) Gallic acid (g) Peeled Kondor
01 02 03 04 05 06 07 08 09
0
5
10
15
20
25
30
35
40
I
Concentration (mgml)
(a)
00 02 04 06 08 10 12
5
10
15
20
25
30
35
I
Concentration (mgml)
(b)
00 02 04 06 08 10
0
5
10
15
20
25
I
Concentration (mgml)
(c)
02 03 04 05 06 07 08 09 10
0
5
10
15
20
I
Concentration (mgml)
(d)
00 02 04 06 08 10
0
5
10
15
20
25
30
35
I
Concentration (mgml)
(e)
01 02 03 04 05 06 07
2
4
6
8
10
I
Concentration (mgml)
(f)
Figure 3 The percent
radical inhibition as a function of the concentration of (a)
Bartina(b) Spunta (c) Kuroda (d)peeled Kondor (e) Ascorbic acid (f) α-tocopherol
Annexe
143
02 04 06 08 10 12 14
30
32
34
36
38
40
LO
G 1
(V
)
LOG I(I0-I)
(a)
00 02 04 06 08 10 12 14 16 18 20
32
34
36
38
40
LO
G 1
(V
)
LOG I(I0-I)
(b)
02 04 06 08 10 12 14
30
32
34
36
38
40
LO
G 1
(V
)
LOG I(I0-I)
(c)
00 02 04 06 08 10 12 14 16 18 20
30
32
34
36
38
40
LO
G 1
(V
)
LOG I(I0-I)
(d)
02 04 06 08 10 12 14 16 18 20 22
30
32
34
36
38
40
LO
G 1
(V
)
LOG I(I0-I)
(e)
08 10 12 14 16 18
30
32
34
36
38
40
LO
G 1
(V
)
LOG I(I0-I)
(f)
04 06 08 10 12
30
31
32
33
34
35
36
LO
G 1
(V
)L
LOG I(I0-I)
(g)
Figure 4 A plot of
to
for
(a) Kondor (b) Bartina (c) Spunta (d)
Kuroda (e) Ascorbic acid (f) α-tocopherol (g) Peeled Kondor
Annexe
144
0 1 2 3 4 5
0
10
20
30
40
50
60
70
I
nh
ibitio
n
Concentration (mgml)
(2)
4 6 8 10 12 14 16 18
003
004
005
006
007
008
In
hib
itio
n
Concentration (mgml)
(2)
000 001 002 003 004 005 006 007 008 009
0
10
20
30
40
50
60
70
I
nh
ibitio
n
Concentration (mgml)
(3)
Figure 5 Antioxidant activity () of (1) peeled Kondor (2) Ascorbic acid (3) Gallic
acid assayed by β-carotenendashlinoleate bleaching
Annexe
145
02 04 06 08 10 12 14
-10
0
10
20
30
40
50I
[micro
Ac
msup2]
Potential [ V]
(a)
02 04 06 08 10 12 14
-5
0
5
10
15
20
25
30
35
40
I [micro
Acm
sup2]
Potential [ V]
(b)
02 04 06 08 10 12 14
-10
0
10
20
30
40
50
60
I [micro
Ac
msup2]
Potential [ V]
(c)
Figure 6 Voltammograms obtained for (a) Bartina (b) Spunta and (c) Kuroda unpeeled
samples by cyclic voltammetry in DMF
I
Acknowledgments
First of all I am grateful to God for the blessing he has bestowed on to complete this
work
Foremost I would like to express my sincere gratitude to my supervisors without whom
this valuable piece of research would never have been completed Prof LANEZ Touhami as a
Director of the thesis for the continuous support to my study and research for his patience
motivation enthusiasm and immense knowledge His guidance helped me during my
research and the writing of this thesis Prof BELAIDI Salah Eddine not only for his
involvement as my Co-Director in the thesis but also for the rigor and the confidence that he
put in me His constant availability and the kindness that he has demonstrated in my regard
and his support during the years of my research
My cordial thanks go also to my thesis jury
Prof BARKAT Djamel Professor and Head of the Department of Industrial Chemistry
Faculty of Sciences and Technology at the University Mohamed Khider Biskra for my honor
to accept to be the president of the jury of my thesis despite their many occupations and
responsibilities
Prof OMARI Mahmoud Professor at the Department of Chemistry Faculty of exact
sciences and sciences of nature and of Life the University Mohamed Khider Biskra of the
same honor to have accepted to judge as an examinator my piece of research
Dr BOUBEKRI Cherifa Teacher at the Department of Industrial Chemistry Faculty of
Sciences and Technology at the University Hamma Lakhder ElOued for the honor of
accepting to participate in the jury of this argument
for their valuable comments and encouragements but also for the questions which
incented me to widen my research from various perspectives
I would like to thank Dr LAOUINI Salah Eddine for the valuable scientific help and all
the advice that he was able to provide me Also all the labmates for their support to my work
to get better quality of results In particular I am grateful to Dr Hammami Hadia and Dr
Henni Meriem for enlightening the first glance of my research
Last but not least I must express my profound gratitude to my teacher Amiri Athmane
as a second reader of this thesis and I am gratefully indebted to him for his very valuable
comments
II
Abstract
Our work focuses on the study of the phytochemistry and antioxidant activities of four
different varieties of Solanum tuberosum L (red and yellow) these varieties are grown in
different area of El-Oued region To extract the bioactive compound we study the effect of
two different commonly applied extraction techniques Soxhlet extraction (SE) and
ultrasonic-assisted extraction combine with maceration (UAE-M) with two ratios of ethanol
as solvent (100 ethanol - 7030 ethanolwater) The use of UAE-M proved to be faster and
more efficient process when compared to Soxhlet extraction with 100 ethanol The
phytochemical screening has highlighted the presence of alkaloids coumarins flavonoids
phytosterols The qualitative analysis of Solanum tuberosum L for the whole root by high-
performance liquid chromatography has revealed the presence of gallic acid ascorbic acid
vanillin and chlorogenic acid in the majority of the tested extracts The methods used to
quantify the phytochemical compounds are Folin-Ciocalteu assay for polyphenols and
tricholorur aluminum assay for the flavonoids The measurement of antioxidant capacities is
determined by two techniques spectrophotometry using DPPH FRAP and voltammetric
using superoxide anion radical (Obull2
minus) The correlation between the antioxidant activity and the
content of phenolic and flavonoids compounds has also been investigated the results of the
analysis show a positive correlation between them All results of this work have statistical
significance and enabled us to assert that the extracts of Kondor variety are studied have a
very high antioxidant property and reveal that their wealth in phytochemical content
Generally extracts of the whole root of Kondor variety was more active and show that the
antioxidant activity in is higher than interest than the flesh of sample
Keywords antioxidant capacity El-Oued potatoes flavonoids polyphenols Cyclic
voltammetry
III
الملخص
و نظرا لهذه الاهمية أوجبت دراستها تحليليا للتعرف تعتبر البطاطس مخزون غذائي شائع على سطح الارض
و لهذا تعرضنا في هذا العمل الى استخلاص عصارة اربعة انواع منها الشائعة الاستعمال في على محتوياتها الغذائية
منطقة الوادي جنوب شرق الجزائر
الأولى حوض المواج الفوق صوتية مرفقة بالنقع و اد ذات الفعالية الحيوية استعملنا طريقتينللاستخلاص المو
و الثاني مزيج من الكحول الايثيلي مع الماء 011و ذلك باستعمال مذيبين الاول كحول ايثيلي الثانية طريقة سوكسلي
ر فعالية من حيث استخلاص المواد الفعالة من الطريقة ان استعمال الطريقة الولى اثبت أنها أسرع و أكث( 01-01)بنسبة
كمذيب 011الثانية و ذلك باستخدام الكحول ايثيلي بنسبة
و عند استعمال تقنية الكومارين والفيتوستيرول الفلافانويدات و قد افضى التحليل الى اظهار المواد التالية
الفانيلين حمض الاسكوربيك حمض الغاليك التعرف على العناصر التاليةالكروماتوعرافيا السائلة ذات الجودة العالية تم
و حمض الكرونولوجيك في اغلب الانواع
كيميائيةولكهرالتقنية و ا (FRAP DPPH)الطيفية أثبتت دراسة الفعالية المضادة للاكسدة المقاسة بتقنيتين
( دة سة تمتلك فعالية مضارولمدت البطاطس امستخلصان لعمل بأا اذهلنا نتائج ت كدأكما للمستخلصات الاربعة (
من جهة أخرى درنة كوندور أكثر من باقي الدرنات تليها بارتينا ثم سبونتا و أخيرا كيرودا عالية في نتكوة اذ جيدة للأكسد
دة لمضاالفعالية العلاقة بين ا يضا بتقييمأكما قمنا توصلنا الى أن درنة البطاطس كاملة أغنى بمضادات الأكسدة من لبها
الفلافانويداتت و لبوليفينولااكمية و لفعالية ةاللأكسد
ةللأكسددة لمضاالفعالية ا ميائيةكيولكهرالتقنية ا حوض المواج الفوق صوتية الفلافانويدات البطاطس الكلمات الدالة
Table of content
V
AcknowledgmenthelliphelliphelliphelliphelliphelliphelliphelliphelliphelliphelliphelliphelliphelliphelliphelliphelliphelliphelliphelliphelliphelliphelliphelliphelliphelliphelliphelliphellipI
Abstract helliphelliphelliphelliphelliphelliphelliphelliphelliphelliphelliphelliphelliphelliphelliphelliphelliphelliphelliphelliphelliphelliphelliphelliphelliphelliphelliphelliphelliphelliphelliphellipII
Table of contenthelliphelliphelliphelliphelliphelliphelliphelliphelliphelliphelliphelliphelliphelliphelliphelliphelliphelliphelliphelliphelliphelliphelliphelliphelliphelliphelliphelliphellipIV
List of FigureshelliphelliphelliphelliphelliphelliphelliphelliphelliphelliphelliphelliphelliphelliphelliphelliphelliphelliphelliphelliphelliphelliphelliphelliphelliphelliphelliphelliphellipXIII
List of TableshelliphelliphelliphelliphelliphelliphelliphelliphelliphelliphelliphelliphelliphelliphelliphelliphelliphelliphelliphelliphelliphelliphelliphelliphelliphelliphelliphelliphelliphellipXVII
List of AbbreviationshelliphelliphelliphelliphelliphelliphelliphelliphelliphelliphelliphelliphelliphelliphelliphelliphelliphelliphelliphelliphelliphelliphelliphelliphelliphelliphellipXX
Bibliographic Part
General introduction 1
References 3
Chapter I Free radical
I) Free radical 5
I1) Generality 5
I2) Sources of Free Radicals 5
I21) Endogenous source 5
I22) Exogenous source 6
I3) Major types of free radicals 7
I31) Reactive Oxygen Species (ROS) 7
I311) Superoxide oxygen ( one electron) 7
I312) Hydrogen Peroxide (H2O2) 7
I313) Hydroxyl Radical (bullOH) 7
I32) Reactive Nitrogen Spices (RNS) 8
I321) Nitric oxide (NObull) 8
I322) Peroxynitrite Anion and Nitrogen dioxide 8
I4) Free radicals reaction 8
I5) Oxidative Stress 9
I6) The Bodyrsquos Antioxidant Defense 9
Table of content
VI
I7) Classification of antioxidants 10
I71)Enzymatic (Endogenous) 10
I72) Non-Enzymatic (Exogenous) 10
I721) Ascorbic acid 10
I722) α-tocopherol 11
I723) Carotenoids 11
I724) Phenolic Compounds 12
I7242) Flavonoids 13
I7243) Tannins 15
I725) Minerals 16
I7252) Iron 16
I8) Synthetic antioxidants 16
I9) Antioxidant mechanism 17
I91) Preventive antioxidants 18
I92) Chain-breaking antioxidants 18
I10) Antioxidants benefits 19
References 20
Chapter II Potato Generality
II) Potato (Solanum tuberosum L) 26
II1) Generality 26
II2) Origin and history 26
II2) Scientific classification 27
II3) Botanic description 28
II31)The above ground portion 28
Table of content
VII
II311) Flowers 28
II312) Leaflets 29
II313) Stem 29
II314) Fruits 29
II32) The below-ground portion 30
II321) Tubers 30
II322) Roots 30
II4) Varieties 30
II41) Russet (a) 31
II42) Yellow (b) 31
II43) White (c) 32
II44) Red (d) 32
II45) Fingerling (e) 32
II46) Purple and Blue (f) 33
II47) PetitesOther (g) 33
II5) Tuber Composition 33
II6) Cultivation 37
II7) Production 38
II8) Non-Food Uses of Potato 38
II9) Potatoes information 39
II10) Materials references and goals 40
References 43
Chapter III Methods
III1) Introduction 49
Table of content
VIII
III1) Methods 49
III11) Soxhlet 49
III12) Maceration 50
III13) Ultrasound-assisted extraction 51
III14) Several variables effect on extraction system 51
III141) Solvent 51
III142) Solvent-to-feed-ratio 52
III143) Temperature 52
III144) Time 53
III145) Particle size 53
III2) Estimation of the water weight percentage in potato roots 53
III3) Phytochemical investigation 54
III31) Screening chemistry 54
III311) Detection of flavonoids 54
III312) Detection of phytosterols 55
III313) Detection of tannins 55
III314) Detection of carbohydrates 55
III315) Detection of alkaloids 55
III315) Detection of coumarins 55
III32) Total flavonoids content (TFC) 56
III33) Total phenolics content (TPC) 56
III34) HPLC analysis 57
III341) Principe 57
III342) HPLC system 57
Table of content
IX
III343) Protocol 59
III4) Antioxidant activity 59
III41) Spectrophotometers assay 60
III411) DPPH assay 60
III412) Evaluation of total antioxidant capacity (TAC) by Phosphomolybdenum method 61
III413) Ferric-reducing antioxidant power (FRAP) assay 61
III414) Beta-carotene bleaching 62
III42) Electrochemical techniques 63
III421) Principle 63
III422) Protocol of antioxidant activity 63
III422) Protocol for scavenging activity of superoxide anion Obull2
minus radicals 64
III5) Calibration curve 64
III51) Totale phenolic content 65
III52) Total Flavonoid content 65
III53) FRAP assay 66
III54) Total antioxidant capacity 67
III55) HPLC calibration curve 67
III6) Determination of IC50 value 69
III7) Statistic analysis 69
III71) Linear regression analysis 69
III72) Main effect plot and interaction plot 70
III73) p-values and R-squared values 70
References 71
Table of content
X
Chapter IV Comparative study of extraction methods
IV1) Introduction 79
IV2) Aim 79
IV32) Preparation of samples 79
IV33) Ultrasonic extraction 79
IV34) Soxhlet extraction 80
IV35) Results and discussion 80
IV351) the total flavonoids content 80
IV352) The total phenolic content 81
IV353) The antioxidant capacity 82
IV354) Statistic analysis 83
IV354) HPLC analysis 86
IV4) Discussion 89
Chapter V
Phytochemical study of Solanum tubersum L
V1) Introduction 91
V2) Experiment One 91
V21) Aim 91
V22) Estimation of the water weight percentage in potato roots 92
V23) Screening chemistry ( Chemical characterizations) 92
V24) Phytochemical contents 93
V25) HPLC analysis 93
V251) Chromatograms of Kondor sample 93
V252) Chromatograms of Bartina sample 94
Table of content
XI
V253) Chromatograms of Spunta sample 95
V254) Chromatograms of Kuroda sample 96
V26) Antioxidant capacity 96
V261) Spectrophotometers 97
V2611) FRAP assay 97
V2612) DPPH 97
V26121) Calculation of radical inhibition 98
V26122) Calculation of the binding constant 99
V262) Electrochemistry assay 101
V2621) Electrochemistry behavior 103
V2622) Electrochemistry assay radical scavenging activity 104
V2623) Ratio of binding constants (KoxKred) 107
V2624) Thermodynamic properties 110
V2625) Diffusion coefficients 111
V27) Discussion 114
V3) Experiment Two Kondor tuber analysis 115
V31) Aim 115
V32) Phytochemical contents 115
V33) HPLC analysis 116
V34) Spectrophotometers assays 117
V341) FRAP assay 117
V342) Total antioxidant capacity 118
V343) β-carotene bleaching assay 118
V343) DPPH 120
Table of content
XII
V3431) Calculation of radical inhibition 120
V3432) Calculation of the binding constant 121
V35) Electrochemistry assay 122
V352) Electrochemistry assay radical scavenging activity 123
V3521) Ratio of binding constants (KoxKred) 124
V3522)Thermodynamic properties 125
V36) Discussion 126
V4) Statistic analysis 127
V41) Main effect plot 127
V42) Linear regression 129
V421) Linear regression between total polyphenol content and antioxidant activity 129
V422) Linear regression between total flavonoids content and antioxidant activity 131
V423) Linear regression between different methods antioxidant activity 133
References 134
General conclusion 136
Annexes
List of Figures
XIII
List of Figures
Figure I 1Mitochondrial ROS production 5
Figure I 2Ascorbic acid 10
Figure I 3α-tocopherol 11
Figure I 4β-carotene 12
Figure I 5phenolic acid derivatives of (a) benzoic and (b) cinnamic acids 13
Figure I 6flavonoids structure 14
Figure I 7Chemical structures of (a)casuarictin and (b) proanthocyanidins 15
Figure I 8Chemical structure of synthetic food antioxidants 17
Figure I 9A selection of potato cultivars 26
Figure I 10The potato plant 28
Figure I 11Different potato variety 31
Figure I 12Major carotenoids in potatoes 36
Figure I 13Top five potato-producing countries in 2014 (FAO 2016 ) 38
Figure I 01 The visual appearance of the four potato tuber varieties analyzed in this thesis 41
Figure I 15Typical conventional soxhlet extractor 50
Figure III 1Typical conventional soxhlet extractor 50
Figure III2Block Diagram of an HPLC 57
Figure III3 Cyclic voltammogram for redox system 63
Figure III4 The calibration curve obtained for Gallic acid 65
Figure III5 The calibration curve obtained for Rutine 66
Figure III6The calibration curve obtained for Ascorbic acid TAC 67
Figure III7Chromatograms of standard phenolic compounds1ascorbic acid 2gallic acid 3
chlorogenic acid CA caffeic acid 4 vanillin Q quercetin 5 rutin 68
Figure III8Voltammograms obtained for gallic acid (a) and (b) The calibration curve
obtained for gallic acid by cyclic voltammetry in pH=36 acetate buffer 69
List of Figures
XIV
Figure IV1 Effect of maceration time (a) amplitude (b) method (c) and the solvent ratio (d)
on the level of total flavonoids content Y-axis shows Total Flavanoids content (expressed as
a mg Rutin g extract) 84
Figure IV2 Effect of maceration time (a) amplitude (b) method (c) and the solvent ratio (d)
on the level of total phenolic content Y-axis shows Total phenolic content (expressed as a mg
gallic acidg extract) 85
Figure IV3 Effect of maceration time (a) amplitude (b) method (c) and the solvent ratio (d)
on the level of total antioxidant capacity Y-axis shows Total antioxidant capacity (expressed
as a mg ascorbic acidg of extract) 86
Figure IV4 Chromatograms of sample extract A(1)Ascorbic acid(2) Gallic acid (3)
Chlorogenic acid(4) Vanillin 87
Figure IV5Chromatograms of sample extract B(1)Ascorbic acid(2) Gallic acid (3)
Chlorogenic acid 70
Figure IV6Chromatograms of sample extract C(1)Ascorbic acid(2) Gallic acid (3)
Chlorogenic acid(4) Vanillin(5)Rutine 88
Figure IV7Chromatograms of sample extract D(1)Ascorbic acid(2) Gallic acid (3)
Chlorogenic acid(4) Vanillin 88
Figure V1Chromatograms of unpeeled Kondor extract(1)Ascorbic acid(2) Gallic acid (3)
Chlorogenic acid(4) Caffeic acid (5) Quercetin (6)Vanillin 94
Figure V2Chromatograms of unpeeled Bartina sample extract(1)Ascorbic acid(2) Gallic
acid (3) Chlorogenic acid(4) Vanillin 95
Figure V3Chromatograms of unpeeled Spunta sample extract(1)Ascorbic acid(2) Gallic
acid (3) Chlorogenic acid 95
Figure V4Chromatograms of unpeeled Kuroda sample extract(1)Ascorbic acid(2) Gallic
acid (3) Chlorogenic acid(4) Rutine 96
Figure V5The percent DPPH radical inhibition as a function of the concentration of of
unpeeled Kondor 98
Figure V6Electronic absorption spectra of 025 mM of DPPH interaction with Roots of (a)
Kondor (b) Bartina (c) Spunta (d) Kuroda 100
Figure V7 Electronic absorption spectra of 025 mM of DPPH interaction with (GA) Gallic
acid (AAS) Ascorbic acid 100
Figure V8 Voltammograms obtained for unpeeled extract of (a) Kondor (b) Bartina (c)
Spunta (d) Kuroda and (e) for Ascorbic acid by cyclic voltammetry in pH=36 acetate buffer
102
Figure V9 Voltammograms obtained for unpeeled Kondor sample by cyclic voltammetry in
DMF 104
List of Figures
XV
Figure V10 The percent O_2^(∙-) radical inhibition as a function of the concentration of
unpeeled Kondor 105
Figure V11 Cyclic voltammograms of oxygen-saturated in the absence and presence of
different concentration of sample extract Roots (a) Kondor (b) Bartina (c) Spunta (d)
Kuroda at scan rate 100 mVs 106
Figure V12Cyclic voltammograms of oxygen-saturated in the absence and presence of
different concentration of standard (a) ascorbic acid (b) α-tocopherol at scan rate 100 mVs
106
Figure V13Voltammograms of oxygen-saturated in the absence and presence of 04 ml
sample extract Roots (a) Kondor (b) Bartina (c) Spunta (d) Kuroda at scan rate 100 mVs
109
Figure V14Cyclic voltammograms of oxygen-saturated in the absence and presence of 03
ml sample extract (a) Ascorbic acid (b) α-tocopherol at scan rate 100 mVs 110
Figure V15 Succession of cyclic voltammograms at GC electrode in oxygen-saturated
DMF01 TBFP at different scan rates ranging from 100 to 500 mVs unpeeled (a) O_2^(∙-) -
Kondor (b) O_2^(∙-)-Bartina (c) O_2^(∙-)-Spunta (d) O_2^(∙-)-Kuroda and (e) for 112
Figure V16 ipa versus V12 plots of oxygen-saturated DMF A in absence of 04 ml of
unpeeled extract 113
Figure V17Chromatograms of leaf extract(1)Ascorbic acid(2) Gallic acid (3) Chlorogenic
acid 116
Figure V18Antioxidant activity () of unpeeled Kondor assayed by β-carotenendashlinoleate
bleaching 120
Figure V19Electronic absorption spectra of 025 mM of DPPH interaction with of (a) Root
and (b) Flesh 122
Figure V20Cyclic voltammograms of oxygen-saturated in the absence and presence of
different concentration of Kondor sample extract (a) unpeeled (b) peeled at scan rate 100
mVs 123
Figure V21Cyclic voltammograms of oxygen-saturated in the absence and presence of 04
ml Kondor sample extract (a) Unpeeled (b) Peeled at scan rate 100 mVs 125
Figure V22Effect of variety 1 Kondor 2 Bartina 3 Spunta 4 Kuroda on the level of (a)
TPC (b) TFC 127
Figure V23Effect of variety (1) Kondor (2) Bartina (3) Spunta (4) Kuroda on the level of
inhibition IC50 of (a) DppH (b) O_2^(∙-) 128
Figure V24Correlation graphs for (a) FRAP (b) CV (c) IC50DppH and (d) IC50 O_2^(∙-)
with total phenolic content (TPC) 129
List of Figures
XVI
Figure V25Correlation graphs for (a)FRAP (b) CV (c) IC50 DppH and (d) IC50 O_2^(∙-)
with total flavonoids content (TFC) 130
Figure V26Correlation graphs for (a) FRAP and CV (b) IC50 between DppH and O_2^(∙-)
132
List of Tables
XVII
List of Tables
Table I1 Endogenous Sources of Free Radicals 6
Table II1 Significant happenings in the history of the potato 27
Table II2 Proximate composition of edible portion of potatoes 34
Table II3 Selected nutrients and vitamins in flesh and peel of raw potatoes (based on 100 g
wet basis) 34
Table II4 Nutrition information of potato (dry weight) 35
Table II5 Concentration levels of the main phenolic compounds in potatoes 36
Table II6 location of four varieties of potatoes 40
Table II7 Tuber physical Characteristics of the four potato cultivars investigated 41
Table III1 Constituents Standard content analyzed by HPLC 68
Table IV1 Total flavonoids content obtained using ethanol water (7030) 80
Table IV2 Total flavonoids content obtained using 100 ethanol 80
Table IV3 Total phenolic content obtained using ethanol water (7030) 81
Table IV4 Total phenolic content content obtained using 100 ethanol 81
Table IV5 Total antioxidant capacity obtained using ethanol water (7030) 82
Table IV6 Total antioxidant capacity obtained using 100 ethanol 82
Table IV7 Analysis of variance for the main effects of factors studied 83
Table IV9 Constituents content analyzed by HPLC88
Table V1 Determination of moisture content for four varieties of potatoes 92
Table V2 Preliminary qualitative phytochemical analysis of various alcoholic extracts of
root parts of potatoes 92
Table V3 Determination of total Phenolics contents and total flavonoids of four kinds of
potatoes 93
Table V4 Constituents content analyzed by HPLC 96
Table V5 Determination of reducing the antioxidant power of four kinds of potatoes 97
List of Tables
XVIII
Table V6 IC50 values of sample extracts using DPPH 98
Table V7 Values of Binding constants and binding free energy of the complexes DppH-
sample extracts 101
Table V9 Determination of the oxidation peaks of four kinds of potatoes by CV in DMF 104
Table V10 IC50 values of sample extracts using O_2^(∙-) radical scavenging activity 105
1Table V11 Shifts in peak potential and a decrease in anodic peak current of O_2^(∙-) bound
forms of Roots extract samples 108
Table V12 Shifts in peak potential and a decrease in anodic peak current of O_2^(∙-) bound
forms of Flesh extract samples 109
Table V13 Values of Binding constants and binding free energy of the complexes O_2^(∙-)-
sample extracts 111
Table V14 Diffusion coefficient values 113
Table V19 Determination of total Phenolics contents and total flavonoids of the whole root
and the flesh 115
Table V20 Constituents content analyzed by HPLC 116
Table V21 Determination of reducing the antioxidant power of four kinds of potatoes 118
Table V22 Determination of the Total antioxidant capacity of Kondor 118
Table V23 Determination of antioxidant activity of sample extracts using β-carotene
bleaching 119
Table V24 IC50 values of sample extracts using β-carotene bleaching 120
Table V24 IC50 values of sample extracts using DPPH 121
Table V25 Values of Binding constants and binding free energy of the complexes DppH-
sample extracts 122
Table V26 Determination of the Antioxidant capacity of Kondor variety by CV 122
Table V27 IC50 values of Kondor sample extracts using O_2^(∙-) radical scavenging
activity 123
Table V28 Shifts in peak potential and a decrease in anodic peak current of O_2^(∙-) bound
forms of Kondor extract samples 124
Table V29 Values of Binding constants and binding free energy of the complexes O_2^(∙-)-
sample extracts 125
List of Tables
XIX
Table V15 Analysis of variance for the main effect plot 128
Table V16 Determination of the correlation between capacity antioxidant and Total Phenolic
content 130
Table V17 Determination of the correlation between capacity antioxidant and Total
Flavanoids content 132
Table V18 The R2 values between antioxidant activities and phytochemical content 132
List of Tables
XX
List of Abbreviations
Abs Absorbance
ABTS 221azinobis(3-ethylbenzothiazoline)-6-sulfonate
ANOVA Analysis of variance
BHA Butylhydroxyanisole
BHT Butylhydroxytoluene
CV Cyclic voltammetry
D Diffusion coefficient
DMF N N-dimethylformamide
DNA Deoxyribonucleic acid
DppH 11-diphenyl 1-2-picrylhydrazyl
Ep Potential peak
Epa Anodic oxidation potential
Epc Cathodic oxidation potential
FAO Food and Agriculture Organization
FDA Food and Drug Administration
FRAP Ferric-reducing antioxidant power
GAE Gallic acid equivalent
GLM General linear model
HPLC High-performance liquid chromatography
Ipa Anodic potential peak
Ipc Cathodic potential peak
LDL Low-density lipoproteins
NADH Nicotinamide adeacutenine dinucleacuteotide reacuteduit
TAC Total antioxidant capacity
TBFB Tetrabutylammonium tetrafluoroborate (Bu4NBF4)
TFC Total flavonoids content
TPC Total phenolics content
TPTZ 246-tris(2-pyridyl)-135-s-triazine
UAE-M Ultrasound-assisted extraction combined with maceration
UV Ultraviolet
General introduction
1
General introduction
Because of todays chase for healthy products the production and purification of
vegetable extracts is an area of interests to the industry and academia Recently researchers
have shown a proof for the role of antioxidants of plant origin on scavenging of free-radical
this property could have great importance as therapeutic agents in several diseases caused due
to oxidative stress such as heart diseases and cancers[1] However plant constituents and
phytochemical compounds were to be found effective as radical scavengers and inhibitors of
lipid peroxidation
The cellular functions and normal respiration produce a free radical Under normal
physiological conditions approximately 2 of oxygen used up by the human body during
respiration is transformed into superoxide anion free radical with a negative charge (Obull2
minus) [2]
which considered as one of a large group of reactive oxygen species (ROS) and reactive
nitrogen species (RNS) This oxygen environment is unfriendly to the living organisms To
survive this organism produces a water- and lipid-soluble antioxidants that can neutralize
these highly reactive free radicals [3] If the bodys antioxidant mechanism does not operate
optimally excess free radicals can damage various bimolecular including lipids proteins
carbohydrates and nucleic acids
A variety of antioxidants is found in dietary sources like fruits and vegetables which
were known as a phytochemicals compounds These plant constituents are classified as
primary or secondary components depending on their role in plant metabolism Primary
constituents include the common sugars amino acids proteins purines and pyrimidines of
nucleic acids chlorophylls etc Secondary constituents are the remaining plant chemicals such
as alkaloids (derived from amino acids) terpenes (a group of lipids) and phenolics (derived
from carbohydrates) [4]
They are present in all parts of higher plants (roots stems leaves flowers pollen fruit
seeds and wood) and are involved in many physiological processes such as cell growth
rhizogenesis germination of the seeds or fruit maturation The most represented are the
anthocyanins flavonoids and tannins [5]
That is why we are interested to make a phytochemical and quantification study of the
plant Solanum tuberosum L (potato) which is considered as an important source of
polyphenolic and flavonoid compounds most recent studies focused on the evaluation of its
antioxidant activities and its phenolic and flavonoid contents [6] Until now no studies related
General introduction
2
to the antioxidant activity of the potato in the region of El Oued (south-east of Algeria) have
been conducted According to the national statistics the production of potato is growing very
fast in this area which may lead her to become the first producer in Algeria and that since
2011
Our study has been divided into two parts the first one contains Bibliographic research
presented in three chapters the first one is a generality and description of the potato plant the
second is devoted to a free radical the Polyphenols and the antioxidant activity and the last
one describes the equipment and methods used in this work
The second one is the experimental part which contains two chapters the fouth chapter
discuss the results of different methods used by focuses on
the solid-liquid extraction by Ultrasound-assisted maceration and soxhlet techniques
determination of the total polyphenols flavonoids by colorimetric methods and liquid
chromatography of high performance (HPLC)
The fifth chapter presents the results obtained and their discussions in two experiments
the first one is Study of the antioxidant activity of extracts from four different varieties by
spectrophotometry Methods ferric reducing antioxidant power (FRAP) assay and the
inhibition of the free radical (DPPHbull ) Electrochemical methods (cyclic voltammetry (CV) )
to evaluate the antioxidant capacity and the inhibition of superoxide anion (Obull2
minus) Finally the
experiment two present more phytochemical analysis for the richness variety
We will complete this piece of research with a general conclusion giving a summary of
the main results obtained during this work as well as the perspectives which will be the
objectives of the future work
General introduction
3
References
[1] Mahantesh SP Gangawane AK PATIL CS free radicals antioxidants diseases and
phytomedicines in human health future prospects World Research Journal of Medicinal amp
Aromatic Plant 2012 (1) pp-06-10
[2] Kunwar A Priyadarsini KI Free radicals oxidative stress and importance of antioxidants
in human health J Med Allied Sci 2011153-60
[3] Davies KJ Oxidative stress the paradox of aerobic life Biochem Soc Symp 199561131
[4] Krishnaiah D Sarbatly R Bono A (2007) Phytochemical antioxidants for health and
medicine A move towards nature Biotechnol Mol Biol Rev 1 97-104
[5] BoizotN Charpentier JP (2006) A rapid method for the evaluation of the content of
phenolic compounds of the organs of a forest tree Methods and tools for observation and
assessment of forestiens environments grassland and aquatic INRA 79-82
[6] Deuszliger H Guignard C Hoffmann L Evers D Polyphenol and glycoalkaloid
contents in potato cultivars grown in Luxembourg Food Chemistry 2012 135 (4) 2814-
2824
Chapter I
Free radical
Chapter I Free radical
5
I) Free radical
I1) Generality
A free radical is an atom or molecular species capable of liberated in existence that hold
at least one or more unpaired electrons in the outermost shell configuration [1] Free radicals
are highly reactive short-lived species generated by a variety of biological mechanisms
including inflammation [2] or as a side effect of the reactions occurring during normal
oxidative metabolism [3] During their short lifespan they readily interact with
macromolecules including lipids proteins and nucleic acids damaging their structures and
often modifying their functionality the most common free radicals are Superoxide anion
radical Hydroxyl radical Hydroperoxyl radical Nitric oxide and Lipid radical [4]
I2) Sources of Free Radicals
In general free radicals can be produced from either endogenous sources or exogenous
sources They are continuously forming in cells and environment [5]
I21) Endogenous source
Under normal conditions the Mitochondria consume oxygen associated with the
process of oxidative phosphorylation approximately 95-97 of the oxygen is reduced to
water a small fraction of the oxygen consumed (3-5) is reduced equivalently to superoxide
anion ( ) as shown in figure II1 Coenzyme Q or ubiquinone is an electron-carrying in
the respiratory chain and it collects electrons from complex NADH and complex FADH2 and
donates electrons to complex III cytochrome bc1 segment This process results in the
formation of QH2 the reduced form of Q which generates coenzyme Q via an intermediate
semiquinone anion The Q-cycle leads to the formation of superoxide radical by transferring
electrons to oxygen molecular [6]
Figure I 1Mit ochondrial ROS producti on
Figure I1 Mitochondrial ROS production
ROS production
Chapter I Free radical
6
The most common endogenous sources of free radicals are summarized in table I1[4]
Table I1 Endogenous Sources of Free Radicals Table ITable I 1 Endogenous Sources of Free Radicals
Physiological
Process
Comment
Infection May produce free radicals because the immune system may try to
neutralize invading microorganisms with a burst of free radicals
Enzymatic
reaction
Many enzymatic reactions involving xanthine oxidase lipoxygenase
aldehyde oxidase etc can generate free radicals
Metal Ions Metal ions such as copper ion and ferrous ion which are essential for the
body can react with hydrogen peroxide to produce free radicals
I22) Exogenous source
Exposure to Solar radiations UV radiations X-rays gamma rays and microwave
radiations has a capacity to generate reactive chemical species including free radicals in
cells [784] Table I2 summarizes most exogenous sources [910]
Table I2 Exogenous Sources of Free Radicals
External
sources
Comments
Air pollution Exposure to particulate matters in polluted air can produce significant
oxidative stress increasing the risk of asthma cardiovascular diseases
chronic pulmonary obstructive disease (COPD) and lung cancer
Tobacco
smoking
Oxidants present in tobacco smoked can damage lungs causing COPD and
even raising the risk of lung cancer
Some
medications
Medications such as bleomycin adriamycin and sulfasalazine may produce
oxidative stress
Chapter I Free radical
7
I3) Major types of free radicals
I31) Reactive Oxygen Species (ROS)
Reactive oxygen species (ROS) is a term used for different reactive molecules derived
from molecular oxygen They are devised in radical derivatives such as superoxide hydroxyl
radical nitric oxide and non-radical derivatives of high reactivity as singlet oxygen hydrogen
peroxide peroxynitrite hypochlorite [11]
I311) Superoxide oxygen ( one electron)
is produced in vivo in a variety of ways the major source being the electron chain in
mitochondria [1213] is not highly reactive with biological substrates in an aqueous
environment Once formed quickly undergoes dismutation to generate H2O2 This
reaction is accelerated by the antioxidative enzyme the SOD [1415] In addition to SOD
several other enzymes that generate H2O2 also exist in human tissues
I312) Hydrogen Peroxide (H2O2)
Hydrogen peroxide (H2O2) itself is not especially toxic unless it is present in high
concentrations within cells H2O2 readily diffuses through cellular membranes and can
thereby reach sites distant from where it was generated Also in the presence of transition
metals mainly Fe2+
but also Cu1+
H2O2 is reduced to the hydroxyl radical (OHdeg) via either the
HaberndashWeiss or Fenton reactions [16-18] In most cells H2O2 is converted to innocuous
products by the actions of two important antioxidant enzymes that is catalase and selenium-
dependent glutathione peroxidase (GPx) GPx utilizes H2O2 hydroperoxides as substrates
during the conversion of reduced glutathione (GSH) to its sulfide (GSSG) [19]
I313) Hydroxyl Radical (bullOH)
The hydroxyl radical (bullOH) is a high reactive radical under normal physiological
conditions the generating of hydroxyl radicals can be produced with the combination of both
H2O2 and O2bullminus
in presence of certain metals [20 ] According to the Haber-Weiss reaction of
bullOH it consists of the following two reactions
In the first reaction
(1)
In the second reaction
(2)
Chapter I Free radical
8
I32) Reactive Nitrogen Spices (RNS)
Reactive nitrogen species (RNS) is a term used for different reactive molecules nitric
and in particular nitric oxide radical considered as major components of oxidative burst and
redox state regulation [21] This spices is also devised into radical spices such as Nitric Oxide
(NObull) Nitrogen dioxide (NO2
bull) and non-radical spices Peroxynitrite (ONOO
-) and Alkyl
peroxynitrites (ROONO)[22]
I321) Nitric oxide (NObull)
Nitric oxide (NObull) contains an unpaired electron thus it is a paramagnetic molecule and
a free radical The convert of L-arginine to L-citrulline with nitric oxide synthases (NOSs)
produce a NObull radical via a five-electron oxidative reaction [23] (equation 3)
It is moderately soluble in water (74 mldl at 0degC) and is more soluble in organic
solvents therefore it can readily diffuse through the cytoplasm and plasma membranes [24] It
has also a greater stability in an environment with a lower oxygen concentration
I322) Peroxynitrite Anion and Nitrogen dioxide
The combination of NObull with
produce the peroxynitrite anion (ONOOndash ) [25] (Eq
4) It is this latter molecule that accounts for much of the toxicity of NObull ONOO
ndash its high
reactive approximately the same as that of bullOH The toxicity of ONOO derives from its ability
to directly nitrate and hydroxylate the aromatic rings of amino acid residues [26]
In an aqueous environment the protonated peroxynitrous acid forms and can rapidly
separate into nitrogen dioxide (NObull2) and a hydroxyl radical (
bullOH)[2728] (Eq 5)
I4) Free radicals reaction
With a wide range of free radicals that can be generated in the cell and in the
microcirculation it is clear that the free radicals attack all cellular (intracellular or
extracellular) molecules It can be considered that hydroxyl radical (HO) and singlet oxygen
are more reactive than superoxide anion (O2ndash
) and hydrogen peroxide (H2O2) However in a
Chapter I Free radical
9
suitable biological setting the two last species may display considerable chemical reactivity
leading to damage of various biomolecules [29]
Generally this damage results from the involvement of free radical in chain reactions a
series of reactions lead to regenerate a radical that can begin a new cycle of reactions [30]
Free radical reactions take three distinct identifiable steps
Initiation step formation of radicals (eq 6)
Propagation step in this step required free radical is regenerated repeatedly as a result
of chain reaction which would take the reaction to completion (eq78)
Termination step the destruction of radicals (eq 9)
I5) Oxidative Stress
Free radicals are highly reactive spices a low concentration of ROS is essential for
normal physiological functions like gene expression cellular growth and defense against
infection They act as the second messenger in intracellular signaling cascades that mediate
several responses in plant cells [31]
However with more formation of free radicals in cells leads to damaging almost all
types of biomolecules (Proteins lipids carbohydrates amp nucleic acid) The excess of free
radicals leads to an imbalanced phenomenon between formation and neutralization of
ROSRNS called oxidative stress If the body cant regulate properly the oxidative stress can
lead to several diseases including cancer atherosclerosis malaria etc[32]
I6) The Bodyrsquos Antioxidant Defense
The body has two mechanisms either enzymatic or non-enzymatic [33] To balance the
damage effects of ROS those mechanisms generate antioxidants from a natural source
(endogenous) or through foods (exogenous) source
Chapter I Free radical
10
The excess of free radicals is neutralized by antioxidants to protect the cells against their
toxic effects and to contribute to disease prevention [34]
An antioxidant is any substance that when present at low concentrations compared
with that of an oxidizable substrate significantly delays or inhibits oxidation of that substrate
[35] In another term the antioxidant is any substance that delays prevents or removes
oxidative damage to a target molecule [36]
I7) Classification of antioxidants
I71)Enzymatic (Endogenous)
The body depends on diverse endogenous defense mechanisms to protect the cells
against free radical damage The antioxidant enzymes are
a) Superoxide dismutases SOD is an antioxidant enzyme which scavenges superoxide anion
into oxygen and hydrogen peroxide [37]
b) catalase (CAT) cytoplasmic enzyme which converts the hydrogen peroxide (H2O2) into
H2O and O2 by disproportionation[38]
c) Glutathione Peroxidase enzyme occurs in the mitochondria during the reaction hydrogen
peroxide (H2O2) is reduced to water and glutathione (GSH) is oxidized to glutathione
disulfide (GSSG)[39]
I72) Non-Enzymatic (Exogenous)
I721) Ascorbic acid
Ascorbic acid is also known as Vitamin C (Figure I2) considered as plasma antioxidant
[40] is found in our body in the form of ascorbate It is located in the aqueous compartments
of tissues due to its high solubility
Figure I2 Ascorbic acid
Figure I 2Ascorbic acid
Chapter I Free radical
11
Ascorbate is a primary antioxidant in that it directly neutralizes radical species acts as a
reducing agent and reducing transition metals (Fe+3
and Cu+2
) present in active sites of
enzymes or in free form in the body Can be oxidized by free radical also can be a good
reducing agent which arrives or is in tissue in an aqueous medium and in the reaction with
free radicals form a radical (semi- dehydroascorbate) which is little reactive The ascorbate
can act as an antioxidant against lipid peroxidation plays a major role in preventing
cardiovascular disease and in conjunction with the alpha-tocopherol [38]
I722) α-tocopherol
α-tocopherol (Figure I3) is a form of the antioxidant vitamin E that is found in vegetable oil
nuts and seeds
Figure I3 α-tocopherol Figure I 3α-tocopherol
alpha-tocopherol is the most active spices in tocopherols family It acts as an important
antioxidant in the inhibition of lipid peroxidation and its efficiency in the presence of
ascorbate (cell membranes) and ubiquinone (mitochondrial membrane) [40] Alpha-
tocopherol is active in cell membranes where reduces ROS and lipid peroxidation from the
radical attack [41]
According to [42] deficiency of this vitamin alone or deficiency associated with
exercise causes a significant increase in the production of free radicals and thus an increase in
cellular disorders such as lipid peroxidation loss of sarcoplasmic reticulum and mitochondrial
uncoupling [4142]
I723) Carotenoids
Vitamin A or carotenoids their chemical structure is composed of conjugated double
bonds which are responsible for its color and for its biological functions They are
responsible for sequester singlet oxygen (free radical) and remove the radical peroxides (Free
Radical) [43]
Chapter I Free radical
12
Figure I4 β-carotene
Figure I 4β-carotene
The function to disable the singlet oxygen carotenoids can sequester the peroxyl
radicals [4043] stated that carotenoids like beta-carotene (Figure II4) lycopene zeaxanthin
and lutein exercise the functions of antioxidants in the lipid phase blocking the free radicals
that cause lesions on the lipoprotein membranes According to [43] lycopene currently
appears as one of the most potent antioxidants mainly in the prevention of carcinogenesis and
atherogenesis for protecting molecules such as lipids low-density lipoproteins (LDL)
proteins and DNA The main sources of carotenoids are found in carrots and pumpkins (alpha
and beta-carotene) tomatoes and derivatives (lycopene) and spinach (lutein) [43]
I724) Phenolic Compounds
Phenolic compounds are a large family of phytonutrients It has more than 2000 family
members [44] distributed in the plant kingdom and those are the secondary metabolites It
can be classified in a number of ways Harborne and Simmonds [45] classified these
compounds into groups based on the number of carbons in the molecule Apart from
antioxidant activity they also possess antifungal anti-infective and antiseptic properties [46]
Phenolic structures are known ranging from simple molecules such as the phenolic
acids to substances highly polymerized as the tannins As indicated in their name they are
compounds having one or more aromatic nuclei with one or several groups of hydroxyl [47]
I7241) Phenolic acid
One of the substances that compose the group of phenolic compounds is the phenol-
acid which is characterized by conferring antioxidant properties both in food and in
organisms being used in the treatment and prevention of diseases This substance is found in
plants in free form or bound to sugars and protein [44]
Phenolic acids (C6-C1or C6-C3) with the sample structure are formed with an aromatic
ring substituted by an alcohol in one or more positions they are hydroxylated derivatives of
benzoic and cinnamic acids (Figure II5) [48]
Chapter I Free radical
13
(a)
(b)
Salicylic acid R1R2R3=H R4=OH Ceramic acid R1R2R3R4=H
p-Hydroxybenzoic acid R1R3R4=H R2=OH o-Coumaric acid R1=OH R2R3R4=H
Gentisic acid R2R4=H R1R3=OH m-Coumaric acid R2=OH R1R3R4=H
Protocatechuic acid R3R4=H R1R2=OH p-Coumaric acid R3=OH R1R2R4=H
Gallic acid R1R2R3=OH R4=H Caffeic acid R2R3=OH R1R4=H
Vanillic acid R1=OCH3R2=OHR3R4=H Ferulic acid R2=OCH3R3=OHR1R4=H
Syringic acid R1R3=OCH3R2=OHR4=H Sinapic acid R2R4=OCH3R3=OHR1=H
Figure I5 phenolic acid derivatives of (a) benzoic and (b) cinnamic acids
Figure I 5phenolic acid derivatives of (a) benzoic and (b) cinnamic acids
Barreiros et al [40] reported that phenolic antioxidants act as radical captors and
occasionally as metal chelators acting both in the initiation stage and propagation of the
oxidative process [4044] They are found in soybeans defatted soybean flour and isolated
soy protein concentrate [44]
I7242) Flavonoids
Flavonoids constitute one of the most wide-ranging groups of all plant phenolics They
are formed by a basic skeleton to 15 carbon atoms The flavonoids are derivatives of the
flavone or 2-Phenyl chromen bearing of the functions free phenols ethers or glycosides all
of which have the structure C6-C3-C6 two six-membered rings linked with a three-carbon
unit which may or may not be parts of a third ring (Figure I5) The rings are labeled A B
and C
Figure I5 flavonoids structure
Figure I 6flavonoids structure
Chapter I Free radical
14
These compounds represent a group of phenolic compounds the most diversified which
are classified into flavanols flavanones flavones isoflavones catechins anthocyanins
proanthocyanidins (Table I3) [49]
Table I3 Chemical structures of the main classes of flavonoids
Flavonoids Basic structure
Flavonols
Flavanones
Flavones
Isoflavones
Flavanols
Anthocyanidins
In plants flavonoids are usually glycosylated mainly with glucose or rhamnose but they
can also be linked with galactose arabinose xylose glucuronic acid or other sugars [50]
The flavonoids are solid crystallized substances Their colors are ranging from white to
yellowish They are soluble in hot water alcohol and polar organic dissolvents [51] The
flavonoids are rapidly oxidizable substances more than other types of substances [52]
Chapter I Free radical
15
However the capacity of the flavonoids decreases with the substitution of hydroxyl
groups for sugars being the glycosides less antioxidants than their corresponding aglycons [53]
I7243) Tannins
Tannins are polyphenolic secondary metabolites of higher molecular weight They are
ranging from (500-3000 D) which may classify into two groups hydrolyzable tannins and
non-hydrolysable or condensed tannins [54] Also there is another group of tannin
phlorotannins rarely consumed by humans It is only found in brown seaweeds [55]
Figure I6 shows the chemical structures of casuarictin (hydrolyzable tannins) and
proanthocyanidins (nonhydrolyzable or condensed tannins)
Figure I6 Chemical structures of (a)casuarictin and (b) proanthocyanidins
Figure I 7C he mical struct ures of (a)casuarictin and (b) proanthocyanidins
a) Hydrolyzable tannins
The hydrolyzable tannins have a center of glucose or a polyhydric alcohol partially or
completely esterified with gallic acid or hexahydroxydiphenic acid forming gallotannin and
ellagitannins respectively [56] These metabolites are readily hydrolyzed with acids bases or
enzymes However they may also be oxidatively condensed to other galoil and
hexahydroxydiphenic molecules and form polymers of high molecular weight The best
known hydrolysable tannin is the tannic acid which is a gallotannin consisting of a
pentagalloyl glucose molecule that can additionally be esterified with another five units of
gallic acid [57]
b) Non-hydrolyzable tannins
The condensed tannins are polymers of catechin andor leucoanthocyanidin not readily
hydrolyzed by acid treatment and constitute the main phenolic fraction responsible for the
Chapter I Free radical
16
characteristics of the astringency of the vegetables Although the term condensed tannins are
still widely used the chemically more descriptive term proanthocyanidins has gained more
acceptance These substances are polymeric flavonoids that form the anthocyanidins
pigments The proanthocyanidins most widely studied are based on flavan-3-ols (-)-
epicatechin and (+)-catechin [58]
I725) Minerals
Other potent antioxidants include minerals such as copper manganese selenium zinc
and iron These minerals exercise their antioxidant function in diverse processes and
metabolic steps in the organism
I7251) Copper
Copper has a role as an antioxidant protecting the cells from the toxic effects of free
radicals and it helps to fix calcium and phosphorous also participates in functions with
antioxidant features of the enzyme family denominated Superoxide dismutase (SOD) which
is responsible for eliminating the superoxide anion [59]
I7252) Iron
Iron forms part of the organismrsquos antioxidant system because it contributes to
eliminating the peroxide groups However its capacity to change valence with ease (2+3+)
renders that it can also intervene depending on the environment in the formation of Free
radicals [60]
I8) Synthetic antioxidants
In the food industry naturally occurring antioxidants impart a certain level of protection
against oxidation However during the food processing or storage the natural antioxidants are
often lost which necessitate the addition of exogenous antioxidants Most of the synthetic
antioxidants whose skeletons are often derived from natural antioxidants are of phenolic type [61]
The differences in their chemical structures reflect their antioxidant activities which also
influence their physical properties such as volatility solubility and thermal stability The
commercially available synthetic antioxidants are butylated hydroxyl toluene (BHT) 2-ferf-
butylhydroquinone (M3HQ) 2-ferpound-butyl-4-hydroxyanisole (BHA) and esters of gallic acid
eg propyl gallate Most of the synthetic phenolic antioxidants used in processed foods are
Chapter I Free radical
17
regulated by the FDA Antioxidants must fulfill the following conditions they must not be
toxic and highly active at low concentrations at the level of 002 of fat or oil content of the
food [62]
Figure I7 Chemical structure of synthetic food antioxidants Figure I 8C he mical struct ure of synt hetic food antiox idants
Figure I7 shows an example of these substances These sterically hindered phenols are
very effective antioxidants and react with free radicals The phenoxy radicals are stabilized by
delocalizing unpaired electrons in the aromatic ring
I9) Antioxidant mechanism
Antioxidants counteract oxidation in two different ways by protecting target lipids from
oxidation initiators or by stalling the propagation phase In the first case the so-called
preventive antioxidants hinder ROS formation or scavenge species responsible for oxidation
initiation (O2 1O2 etc) In the second case the so-called chain-breaking antioxidants
intercept radical oxidation propagators (LOO) or indirectly participate in stopping radical
chain propagation The mechanisms of action are sequentially reviewed here but it should be
kept in mind that antioxidants often act via mixed mechanisms that combine different types of
antioxidation [63]
Chapter I Free radical
18
I91) Preventive antioxidants
There are many different preventive antioxidation pathways because of the diverse
range of available oxidation initiators
Transient metal chelators
Chelators of transition metals such as copper and iron can prevent oxidation by forming
complexes or coordination compounds with the metals These are proteins such as transferrin
ferritin and lactalbumin that sequester iron or ceruloplasmin and albumin that sequester
copper However this type of antioxidation depends directly on the oxidizable target being
protected The mechanism of action is minor for lipid peroxidation inhibition as compared to
the anti-radical activity via ROS scavenging [64] but paramount in the inhibition of DNA
strand breakage [65]
Singlet oxygen quenchers
Carotenoids are the most efficient molecules for 1O2 quenching Hundreds of carotenoids
compounds occur naturally in the environment most of which have 40 carbon atoms They
can be pure hydrocarbons carotenes (lycopene b-carotene etc) or include an oxygenated
functional group [36] carotenoids as many antioxidants have antioxidant activity through
several different but highly complementary mechanisms chain breaking anti-oxidants and 1O2
quenchers This latter mechanism of action occurs through deactivation of 1O2 into
3O2 (eq
10) [66]
1O2 + β-carotene rarr
3O2 + β-carotene
(10)
ROS detoxification
ROS detoxification is a crucial oxidation prevention pathway mainly mediated by
endogenous enzymatic antioxidant systems First superoxide dismutase (SOD) a
metalloenzyme that is omnipresent in eukaryotic organisms catalyzes superoxide anion
dismutation into hydrogen peroxide and oxygen (eq 11)
I92) Chain-breaking antioxidants
In lipid peroxidation chain-breaking antioxidants usually lose a hydrogen radical to
LOO (eq12) thus halting radical oxidation propagation This primarily involves mono-or
poly-hydroxylated phenol compounds (tocopherols flavonoids phenolic acidsetc) with
different substituents on one or several aromatic rings
Chapter I Free radical
19
Chain-Breaking antioxidants induce a lag phase during which the substrate is not
substantially oxidized This phase continues until the antioxidant is completely consumed
Once the antioxidant has disappeared the peroxidation rate rises sharply until it reaches the
same rate as during uninhibited oxidation Conversely retarder antioxidants reduce the
peroxidation rate without inducing a distinct lag phase [63]
I10) Antioxidants benefits
The human body naturally produces reactive oxygen or nitrogen species which are
known as free radicals The overproduction of these compounds leads to oxidative damage to
large biomolecules such as lipids DNA and proteins This damage is responsible for Chronic
diseases like cardiovascular diseases diabetes and cancers However it has been
demonstrated that phytochemical compounds play a significant role in the protective effect
against the development of these chronic diseases In order to benefit the body the
phytochemical compounds neutralize and remove the free radicals [67]
The phytochemical compounds as Antioxidant exist widely in fruits vegetables cereal
grains and medicinal plants [68] Besides wild fruits and fruits wastes (peel and seed) also
contain high contents of antioxidant phytochemicals This antioxidant distributed in a wide
range in nature and classified in groups such as phenolics flavonoids and carotenoidsetc
The polyphenols have a beneficial effect on the plasma Some studies found that
consuming 10 servings of fruit and vegetables each day for 15 days increase their antioxidant
capacity [69] In addition the binding of polyphenols with red blood cells also leads to
improving the total oxidant-scavenging capacities of human blood [70] this role of
polyphenols has an effect on blood pressure which could also protect the cardiovascular
system
Furthermore anthocyanins and flavonoids were also proved to have protective actions
against several cardiovascular risk factors [71] Several other phytochemicals compounds
such as caffeic acid and chlorogenic acid possess potent anti-obesity activity
Antioxidant phytochemicals could possess protective actions against many other
chronic diseases besides the diseases mentioned above Recent studies have suggested that the
appropriate lifestyle modifications could prevent more than two-thirds of human cancers and
the diet contributes to about 35 of human cancer mortality [72] Therefore phytochemicals
compounds as an antioxidant can be good candidates for the prevention and treatment of
human body diseases
Chapter I Free radical
20
References
[1] Halliwell B Gutteridge JMC (1989) Free Radical Biology and Medicine Oxford UK
Oxford University Press
[2] Hussain SP Hofseth LJ and Harris CC (2003) Radical causes of cancer Nature
Reviews Cancer 3 276ndash285
[3] Poulsen HE Jensen BR Weimann A Jensen SA Sorensen M et al (2000)
Antioxidants DNA damage and gene expression Free Radical Research 33 Suppl S33ndash39
[4] A Dasgupta K Klein 2014 Antioxidants in Food Vitamins and Supplements Prevention
and Treatment of Disease Elsevier Inc London UK p 02
[5] SPMahantesh AK Gangawane CS Patil 2012 Free Radicals antioxidants diseases
and phytomedicines in human health future prospects World Research Journal of Medicinal
amp Aromatic Plants 06-10
[6] Finkel T Holbrook NJ Oxidants oxidative stress and the biology of aging Nature
2000408239ndash47
[7] K Jung M Seifert Th Herrling J Fuchs 2008 UV-generated free radicals (FR) in skin
Their prevention by sunscreens and their induction by self-tanning agents Spectrochimica
Acta Part A 69 1423ndash1428
[8] Aroun A Zhong JL Tyrrell RM OrsquoPourzand C Iron oxidative stress and the example of
solar ultraviolet A radiation Photochem Photobiol Sci 201211118
[9] Langrish JP Li X Wang S Lee MM et al Reducing personal exposure to particulate air
pollution improves cardiovascular health in patients with coronary heart disease Environ
Health Perspect 2012120367-72
[10] Centers for Disease Control and Prevention Annual smoking-attributable mortality
years of potential life lost and economic costsmdash the United States 1995-1999 MMWR
200251 (14)300-3
[11] V Rani U C Singh Yadav 2015 Free Radicals in Human Health and Disease
Springer New Delhi India 17 4173
[12] Nohl H Hegner D Do mitochondria produce oxygen free radicals in vivo Eur J
Biochem 197882563ndash7
[13] Sohal RS Mitochondria generate superoxide anion radicals and hydrogen peroxide
FASEB J 1997111269ndash70
[14] Fridovich I Superoxide dismutases An adaptation to a paramagnetic gas J Biol Chem
19892647761ndash4
Chapter I Free radical
21
[15] Touati D The molecular genetics of superoxide dismutase in E coli An approach to
understanding the biological role and regulation of SOD in relation to other elements of the
defense system against oxygen toxicity Free Radic Biol Med 198981ndash9
[16] Imlay JA Chin SM Linn S Toxic DNA damage by hydrogen peroxide through the
Fenton reaction in vivo and in vitro Science 19882401302ndash9
[17] Halliwell B Gutteridge JM Role of free radicals and catalytic metal ions in human
disease an overview Methods Enzymol 19901861ndash85
[18] Yamazaki I Piette LH EPR spin trapping study on the oxidizing species formed in the
reaction of the ferrous ion with hydrogen peroxide J Am Chem Soc 19911137588ndash93
[19] Jain A Martensson J Stole E et al Glutathione deficiency leads to mitochondrial
damage in brain Proc Natl Acad Sci USA 1991881913ndash7
[20] McCord JM (1988) Iron free radicals and oxidative injury Semin Hematol 355ndash12
[21] N Pauly C Pucciariello K Mandon G Innocenti A Jamet E Baudouin D
Heacuterouart P Frendo A Puppo 2006 Reactive oxygen and nitrogen species and glutathione
key players in the legume-Rhizobium symbiosis Journal of Experimental Botany Vol 57
No 8 pp 1769ndash1776
[22] Palmer RM Rees DD Ashton DS et al (1980) L-arginine is the physiological precursor
for the formation of nitric oxide in endothelium-dependent relaxation Biochem Biophys Res
Commun 153(3)1251ndash1256
[23] Ghafourifar P Cadenas E (2005) Mitochondrial nitric oxide synthase Trends Pharmacol
Sci 26 190ndash195
[24] Chiueth CC (1999) Neuroprotective properties of nitric oxide Ann NY Acad Sci 890
301ndash311
[25] Radi R Beckman JS Bush KM et al Peroxynitrite oxidation of sulfhydryls The
cytotoxic potential of superoxide and nitric oxide J Biol Chem 19912664244ndash50
[26] Beckman JS Ischiropoulos H Zhu L et al Kinetics of superoxide dismutase- and iron-
catalyzed nitration of phenolics by peroxynitrite Arch Biochem Biophys 1992298438ndash55
[27] Francis SH Busch JL Corbin JD Sibley D cGMP-dependent protein kinases and cGMP
phosphodiesterases in nitric oxide and cGMP action Pharmacol Rev 201062525ndash63
[28] McDonald LJ Murad F Nitric oxide and cGMP signaling Adv Pharmacol
199534263ndash75
[29] SSen R Chakraborty C Sridhar Y S R Reddy Biplab De 2010 free radicals
antioxidants diseases and phytomedicines current status and future prospect International
Journal of Pharmaceutical Sciences Review and Research 3 (1)91-100
Chapter I Free radical
22
[30] Manavalan K Ramasamy C Physical Pharmaceutics ed 2 Vignesh Publishers
Chennai 2001
[31] P Sharma A Bhushan Jha R Shanker Dubey M Pessarakli 2012 Reactive Oxygen
Species Oxidative Damage and Antioxidative Defense Mechanism in Plants under Stressful
Conditions Journal of Botany 26
[32] A Shinde J Ganu P Naik 2012 Effect of Free Radicals amp Antioxidants on Oxidative
Stress A Review Journal of Dental amp Allied Sciences 1(2)63-66
[33] B Halliwell Antioxidants in human health and disease Ann Rev Nutr 16 (1996) 33ndash50
[34] Pham-Huy L A He H Pham-Huy C Free radicals Antioxidants in Disease and Health
International Journal of Biomedical Science 2008 4(2) 89-96
[35] Halliwell B and Gutteridge JMC The Definition and Measurement of Antioxidants
in Biological Systems Free Radical Biology and Medicinal 18 125-126 (1995)
[36] Halliwell B Biochemistry of Oxidative Stress Bioche- chemical Society Transactions
35 1147-1150 (2007)
[37] Zelko I Mariani T Folz R (2002) Superoxide dismutase multigene family a
comparison of the CuZn-SOD (SOD1) MnSOD (SOD2) and EC-SOD (SOD3) gene
structures evolution and expression Free Radic Biol Med 33 (3) 337-49
[38] TG Cavalli MG Santos2015 The Role of Nutrition in Fighting Free Radicals Journal
of Nutrition and Health Sciences
[39] S U Rakesh P R Patil S R Mane 2010 Use of Natural Antioxidants to Scavenge
Free Radicals A Major Cause of Diseases International Journal of PharmTech Research
2(2)1074-1081
[40] Barreiros Andre LBS Juceni PD (2006) Estresse oxidativo relaccedilatildeo entre geraccedilatildeo de
espeacutecies reativas e defesa do organismo Quiacutem Nova 29 113-23
[41] Zacks MA Wen JJ Vyatkina G Bhatia V Garg N (2005) An overview of chagasic
cardiomyopathy the pathogenic importance of oxidative stress An Acad Bras Cienc 77 695-
715
[42] JI LL (2000) Antioxidants and Oxidative Stress in Exercise Society for Experimental
Biology and Medicine 222 283-91
[43] Esh Shami NJI Machado Moreira EA (2004) Licopeno como agente antioxidante Rev
Nutr 17 227-36
[44] King A Young G Characteristics and occurance of phenolic phytochemicals J Amer
Diet Assoc 1999 99 213-18
Chapter I Free radical
23
[45] Harborne J B and Simmonds N W 1964 Biochemistry of Phenolic Compounds
Academic Press London pp 101
[46] Tabak M Armon R Neeman I Cinnamon extracts inhibitory effect on Helicobacter
pylory J Ethnopharmacol 1999 67 269-77
[47] J Dai RJ Mumper (2010) Plant Phenolics Extraction Analysis and Their Antioxidant
and Anticancer Properties Molecules 15(10)7313-52
[48] Shahidi F and Naczk M (1995) Food Phenolics Sources Chemistry Effects
Applications Technomic Publishing Company Inc Lancaster USA
[49] Sailaja Rao P S Kalva A Yerramilli S Mamidi 2011 Free Radicals and Tissue
Damage Role of Antioxidants Free Radicals and Antioxidants (1) 4 2-7
[50] Vallejo F Tomaacutes-Barberaacuten FA and Ferreres F (2004) Characterisation of flavonols
in broccoli (Brassica oleracea L var italica) by liquid chromatography-UV diode-array
detection-electrospray ionisation mass spectrometry Journal of Chromatography A 1054(1ndash
2) 181ndash193
[51] JA Morales-Gonzaacutelez 2013 oxidative stress and chronic degenerative diesease-a role
for antioxidants InTech Rijeka Croatia
[52] Pratt D E amp Hudson B J F (1990) Natural antioxidant no exploited commercially
In Hudson BJF (ed) Food antioxidants London Elsevier Applied sciences 171-180
[53] Rice-Evans C Miller N J amp Paganga G (1996) Structure-antioxidant activity
relationships of flavonoids and phenolic acids Free Radical Biology and Medicine 20(7)
[54] Chung K T Wong T Y Wei C I Huang Y W amp Lin Y (1998) Tannins and
human health a review Critical Reviews in Food Science and Nutrition 38(6) 421-464
[55] Ragan M A amp Glombitza K (1986) Phlorotannin Brown algal polyphenols Progress
in Physiological Research 4 177-241
[56] Okuda T Yoshida T amp Hatano T (1995) Hidrolyzable tannins and related
polyphenols Fortschritte der Chemie organischer Naturstoffe 66 1-117
[57] Bravo L (1998) Polyphenols chemistry dietary sources metabolism and nutritional
significance Nutrition Reviews 56(11) 317-333
[58] Stafford H A (1983) Enzymic regulation of procyanidin bisynthesis lack of a flav-3-
en-3-ol intermediate Phytochemistry 22 2643-2646
[59] Vilaplana M Antioxidantes presentes en los alimentos O F F A R M Aacutembito
Farmaceacuteutico Bioquimica 2007 Vol 26 Nuacutem 10 Noviembre
Chapter I Free radical
24
[60] Garciacutea-Aacutelvarez JL Saacutenchez-Tovar T y Garciacutea-Vigil JL Uso de antioxidantes para
prevenir enfermedad cardiovascular Metaanaacutelisis de ensayos cliacutenicos Rev Med Inst Mex
Seguro Soc 2009 47 (1) 7-16
[61] F Shahidi PK Wanasundara Critic Rev Food Sei Nutr Vol 32 p 671992
[62] WJ Bauer R Badoud J Loumlliger A Etournaud (2010) Science et Technologie des
aliments Principes de Chimie des constituents et de Technologie des proceacutedeacutes 1egravere eacutedition
Presses polytechniques et Universitaires romandes Lausanne p212
[63] M Laguerre J Lecomte P Villeneuve Evaluation of the ability of antioxidants to
counteract lipid oxidation Existing methods new trends and challenges Progress in Lipid
Research 46 (2007) 244ndash282
[64] Van Acker SABE van Balen GP van den Berg DJ Bast A van der Vijgh WJF
Influence of iron chelation on the antioxidant activity of flavonoids Biochem Pharmacol
199856935ndash43
[65] Sestili P Guidarelli A Dacha M Cantoni O Quercetin prevents DNA single-strand
breakage and cytotoxicity caused by tert-butylhydroperoxide free radical scavenging versus
iron chelating mechanism Free Radic Biol Med 199825196ndash200
[66] Krinsky NI The antioxidant and biological properties of the carotenoids Ann NY Acad
Sci 1998854443ndash7
[67] Kruk J Association between vegetable fruit and carbohydrate intake and breast cancer
risk in relation to physical activity Asian Pac J Cancer Prev 2014 15 4429ndash4436
[68] Deng GF Xu XR Guo YJ Xia EQ Li S Wu S Chen F Ling WH Li
HB Determination of antioxidant property and their lipophilic and hydrophilic phenolic
contents in cereal grains J Funct Food 2012 4 906ndash914
[69] Mazza G Kay CD Cottrell T Holub BJ Absorption of anthocyanins from
blueberries and serum antioxidant status in human subjects J Agric Food Chem 2002 50
7731ndash7737
[70] Koren E Kohen R Ginsburg I Polyphenols enhance total oxidant-scavenging
capacities of human blood by binding to red blood cells Exper Biol Med 2010 235 689ndash
699
[71] Kruger MJ Davies N Myburgh KH Lecour S Proanthocyanidins anthocyanins
and cardiovascular diseases Food Res Int 2014 59 41ndash52
[72] Sak K Site-Specific anticancer effects of dietary flavonoid quercetin Nutr Cancer
2014 66 177ndash193
Chapter II
Potato
Generality
Chapter II Potato Generality
26
II) Potato (Solanum tuberosum L)
II1) Generality
Potatoes (Solanum tuberosum L) Figure I1 are grown and eaten in more countries than
any other crops they are grown in all the continents except Antarctica [1] The potato is
without doubt of ancient origin although our knowledge of its early stages of domestication is
not so precise as that of some other crops such as wheat and barley We know however that
it was domesticated in South America and that it had been dispersed by man over a
considerable area by the time the Spaniards arrived in the sixteenth century[2] In the
sixteenth century Spanish travelers brought a potato to Europe and from there its cultivation
spread to other parts of the world [3]
In the global economy they are presently the fourth most important food crop in the
world after maize wheat and rice with a production of 365 million tons Algeria is the 14th
producer among the top 25 potato producing countries in the world with a total production of
5 million tons [4]
Figure II1 A selection of potato cultivars
Figure I 9A selection of potato cultivars
II2) Origin and history
The white potato is a native of South America and was first cultivated by South
American Indians some 8000 years ago [5-7] It has been the staple commodity of the
inhabitants of Chili Columbia Peru Ecuador and Bolivia In 1537 the first recorded contact
of the white man with the potato was made by Gonzal Jiminez De Quesada stated that ldquothe
potato has floury roots of good flavor a gift very acceptable to Indians and a dainty dish for
Spaniardsrdquo [8] The data in Table I1 show significant happenings in the history of the potato
Chapter II Potato Generality
27
The original name of potato tuber came from the latina word batata (name of sweet potato)
because the European couldnt adopt the word papa (name from the Inca empire ) whose name
came with the Spaniards one of many Latin names such as amka (in Bolivia ) and poni (in
Chile) [2]
Table II1 Significant happenings in the history of the potato
Table IITable II1 Significant happenings in t he history of the potato
Dates(Year) Activities
1536 Potatoes were first encountered by Spanish Conquistadors in The
Andes
1586 Sir Walter Raleigh brought potatoes to England
1620 Bauhia named potato Solanium Tuberosum
1662 Royal Society recommended the plantation of potatoes to prevent
famine
1731 Miller mentioned two varieties of sorts the red and the white
1814 The National Society of Agriculture of France gathered and displayed a
collection of 115 to 120 varieties of potatoes
After Solanum tuberosums introduction to Algeria in the mid-1800s potatoes were
grown mainly for export to French markets By national independence from France in 1962
farmers were harvesting on average 250 000 tonnes a year with about one third marked for
export[9]
II2) Scientific classification
Plant classification is the placing of known plants into groups or categories then
grouping successive categories into a hierarchy The act of classification can be defined as
lsquothe grouping of individuals so that all the individuals in one group have certain features or
properties in commonrsquo According to the rules of taxonomy potatoes are classified as
Order Solanales
Family Solanaceae
Subfamily Solanoideae
Genus Solanum L
Species Solanum tuberosum L
Chapter II Potato Generality
28
Potato is part of a group of plant family Solanaceae The Solanaceae includes 95 genera
with Solanum from which the family gets its name being the largest and most economically
significant In addition to potato the Solanaceae includes other significant crop plants
including tomato (Solanum lycopersicum) eggplant (Solanum melongena)[10] The genus
Solanum ranks among the five largest of plant genera estimated at 1000 to1700 species
[1112]
II3) Botanic description
The potato is a plant whose growth dies down annually but whose roots or other
underground parts survive The figure I2 shows potato plant is devised into an above-ground
portion which contains flowers leaves fruits and stems and a below-ground portion contains
tubers and roots
Figure II2 The potato plant
Figure I 10The potato plant
II31)The above ground portion
II311) Flowers
Potato flowers obtain all four essential parts of flower calyx corolla male and female
elements (flowers are bisexual) The corolla consists of five petals These are also joined at
their base and form a short tube and flat five-lobe surface Each lobe ends a triangular point
The form of the corolla is generally round Some primitive cultivars have pentagonal or star-
like corollas The corolla color may be either white light blue blue red and purple with
different tones and intensities[13]
Chapter II Potato Generality
29
II312) Leaflets
The potato leaflets are attached along a common axis there is a terminal leaflet and
therefore an odd number of leaflets Three to four pairs of leaflets are generally present The
leaflets are borne on petiolules they are ovate (ie they have a tapering point) Secondary
leaflets fill the spaces between the primary leaflets and serve to increase the amount of light
intercepted [14]
The most important role of the leaves is photosynthesis by absorbing sunlight which
may make the leaves the most active organs of the potato plant The plant has a rosette or
semi-rosette habit because of the arrangement of the most of the leaves at or near the base of
short stems and is near the soil surface
According to one variety the leaf may be long or short also its colors may be light
dark or grey-green [15]
II313) Stem
Stem color is generally green or mottled green (Figure I2) occasionally it may be red-
brown or purple Main stems show partial apical dominance plays a major role in
determining tuber yield This is achieved through interstem competition whereby stems
compete for water nutrients and light The intensity of competition controls the number of
tubers formed per stem and then goes on to influence the size distribution of the tuber crop [14]
II314) Fruits
Some potato cultivars will produce small green tomato-like fruits in addition to tubers
These fruits typically contain 25 to 200 seeds each When mature such fruits can be
harvested and their seeds extracted When stored in a dry cool place these seeds can maintain
viability for ten years or more [13]
Chapter II Potato Generality
30
II32) The below-ground portion
II321) Tubers
A tuber is a botanical name for the swollen end of a fleshy underground stem (a stolon)
which arises from a below ground axil at the base of the stem Not all stolons will form
tubers Stolon tips not covered by soil develop into vertical stems with normal foliage Tuber
formation is basically the result of translocation and storage of excess food and is dependent
upon several genetic and environmental factors [13]
The shape of tuber can range from very long fingerling types to round All tubers even
round ones have two ends the heel or stem end where the tuber is attached to the stolon
and the apical rose or seed end The eyes are located on the axils of scalelike leaves or
eyebrows Morphologically the eyes correspond to the nodes of stems Each eye contains
several buds [14]
II322) Roots
A much branched fibrous root system is formed either by the seedling tap root or by
adventitious roots in tuber-grown plants In early stages of growth the root system is
restricted to surface soil the roots turning downward after extending for some distance
horizontally this leaves the area of subsoil directly below a plant almost free of its own roots
[16]
II4) Varieties
The cultivation of potato around the world for years under different climate conditions
[17] has effects on shape size color flavor and nutritional content of potato Actually there
are more than 4000 distinct varieties worldwide but only about 100 are suitable for
commercial use and are consistently available in consumer markets [18]
Potato varieties can be classified and grouped according to size shape color texture
taste and cooking characteristics Potatoes are also classified on the basis of their skin color
(Red yellow and white) texture (smooth slightly netted) tuber shape (round and oval to
round) and flesh color (cream and light yellow)
According to [18] the potato varieties classified according to one of seven subcategories
(Figure II3) Russet yellow white red fingerling purple and blue and petitesother
Chapter II Potato Generality
31
(a) (b)
(c)
(d)
(e)
(f)
(g)
Figure II3 Different potato variety
Figure I 11Different potato variety
II41) Russet (a)
These bulky oval potatoes are characterized by netted brown skin and white flesh In
general Russet-type varieties exhibit high starch content containing between 60 and 70 of
starch Russets also contain low moisture levels [19]
Common Russet varieties are Russet Burbank Kennebec Russet Norkotah Canela
Russet Ranger Russet [20]
II42) Yellow (b)
The yellow potato category is gaining popularity for its diversity Yellow potatoes vary
in size from 1 oz to larger sizes comparable to a Russet The category gets its name from the
yellow interior flesh though the exterior skin is typically light brown to a yellow-golden
Chapter II Potato Generality
32
color The interior of a common yellow variety will be smooth and creamy Moderate levels
of starch and sugar make many yellows a popular choice for a variety of uses
Common yellow varieties are Yukon Gold Satina and Dutch Baby [20]
II43) White (c)
Whites are typically small-medium size and many varieties are oval or oblong in shape
The interior flesh is white and the delicate exterior skin can range from nearly colorless to
shades of tan Common white varieties frequently have a slightly creamy dense texture and
average starch levels and low-sugar content [18]
Common white varieties are Atlantic Snowden Dakota Pearl Superior Kennebec
Shepody Cal White Reba and Pike [20]
II44) Red (d)
The skin of red potatoes tends to be thin and the tubers are often smaller and rounder
than other varieties The interior flesh is commonly cream or white in color and is firm Also
in many red varieties known with her higher levels of sugar and lower starch levels
Common red varieties are Sangre Norland Dakota Rose Chieftain Red La Soda Red
Pontiac Cherry Red and Modoc [20]
II45) Fingerling (e)
Fingerling varieties are named for their comparatively slender and long appearance
Average fingerlings are approximately 10 cm in length although sizes vary greatly by the
variety and desired end use The term ldquofingerlingrdquo characterizes potatoes of a particular shape
and size rather than a specific subset of varieties Thus there is more diversity in color
texture flavor nutrition starch and sugar content within this category of potatoes compared
to others (eg Russet white etc) External fingerling colors range from browntan red
orange yellow white and even purple Interior colors are often cream or white [19]
Common fingerling varieties are Russian Banana French Rose Finn Apple and Purple
Peruvian [21]
Chapter II Potato Generality
33
II46) Purple and Blue (f)
These colorful potatoes are eye-catching and come in a range of hues of blue purple
and even red The skin and the flesh of these varieties tend to be highly pigmented and
contain relatively high levels of antioxidants Category members tend to be small to medium
size and may range in shape from round to oblong and even fingerling size
Common purple and blue varieties are Purple Majesty Purple Peruvian All Blue Mountain
Rose Adirondack Blue Congo Blue and True Blue [2021]
II47) PetitesOther (g)
The category of ldquoPetitesrdquo refers to smaller versions of full-sized potatoes The unifying
characteristic is the C-size class distinction which is no larger than 38 cm in diameter
roughly marble or pearl-sized Category members range significantly in terms of starch and
sugar content flavor color and texture Attractive medleys of yellow red and purple or blue
flesh are increasingly available in US grocery stores [18]
Common petite varieties are smaller sizes of most potato varieties Dutch Babies and
RosaraKlondike Rose
II5) Tuber Composition
The composition of a potato tuber is dependent on a number of factors although the
innate genetic characteristics associated with each cultivar are thought to be among the most
significant [22] Other factors are known to influence potato chemical composition include the
geographic growing location soil type and climate [23] agronomic factors such as fertilizer
or pesticide use [24] the impact of potato pests or diseases [25] and age or maturity at harvest
[24] In addition processing or preparation techniques [26] can affect the actual quantity of
the nutrient that is present at the time the potato is eaten Finally at the time of consumption
factors such as the bioavailability of the nutrient or other foods eaten in conjunction with the
potato can influence how well the nutrient is able to be utilized for nutritional or health
benefits
The nutritional content of potato tuber is important for human health Table II2 shows
the nutritional content of a whole potato tuber 100 g mass provides
Chapter II Potato Generality
34
Table II2 Proximate composition of edible portion of potatoes Table IIITable II2 Prox imate composition of edible portion of potatoes
Component Value100g
Water 7858
Total carbohydrate (by difference) 1807
Starch 1586
Dietary fibre 130
Sugars 061
Protein 214
Total lipids 008
Ash 113
About 80 water (Table II2) A major portion of potato solids is starch followed by
protein and fiber Table I3 gives the proximate composition of an edible portion of a typical
potato tuber Approximately 6 of a potato tuber consists of peel having slightly higher
amounts of ash crude fiber protein riboflavin and folic acid than the flesh
Table II3 Selected nutrients and vitamins in flesh and peel of raw potatoes (based on 100 g
wet basis)
Table IVTable II3 Selected nutrients and v itamins in flesh and peel of raw potatoes (base d on 100 g wet bas is)
Component Potato flesh Potato peel
Dry matter () 216 170
Ash () 086 167
Crude fiber () 037 183
Protein () 181 267
Ascorbicacid(mg) 144 118
Thiamine (mg) 010 003
Riboflavin (mg) 0036 0058
Niacin (mg) 157 105
Folic acid (mg) 128 173
Vitamin B6 (mg) 022 021
Chapter II Potato Generality
35
Although potato contains most of the minerals (Table II4) iron zinc calcium
magnesium selenium manganese of nutritional significance in relatively small amounts it is
considered a valuable source of potassium (5635 mg100 g of edible portion) in our diet
However Potato varieties differ in their mineral compositions [27]
Table II4 Nutrition information of potato (dry weight)
Table VTable II 4 Nutrition information of potato ( dry weight)
Ingredient name Content a (mg100 g)
Energy (kJ100 g) 1492 plusmn 000
Vitamin B1 (thiamine) 076 plusmn 000
Vitamin B2 (riboflavin) 040 plusmn 001
Vitamin B3 (niacin) 904 plusmn 002
Vitamin C 287 plusmn 020
Na 274 plusmn 015
Mg 762 plusmn 003
K 5635 plusmn 000
P 3019 plusmn 000
Ca 140 plusmn 000
Fe 432 plusmn 000
Cu 376 plusmn 000
Zn 103 plusmn 007
Mn 484 plusmn 000
Se (μg100 g) 387 plusmn 130
a Potato cultivar Shepody
Also contain phytochemicals compounds besides a combination of vitamins and
minerals [28] Potato is considered as an important source of phenolic compounds diverse in
groups of tens of thousands of different compounds some of which are effective against
malady or have other health-promoting qualities containing effects on longevity mental
acuity cardiovascular disease and eye health [29-31]
Chapter II Potato Generality
36
The phytochemical compounds are present in the whole potato tuber peel and flesh
however the peel is indicated to have the highest amounts [32] These phytochemical
compounds presented in potatoes as phenolic acids and flavonoids including flavonols and
Anthocyanidins (Table II5)
Phenolic acids such as chronologic acid gallic acid p-hydroxybenzoic acid and vanillic
acid with a content range from 0 to 34 mg [33-35] for flavonoids compounds including
flavanols such as rutin and quercetin-3-o-glu-rut with a content range from 0 to 122 mg
[3637] also anthocyanins [38]
Table II5 Concentration levels of the main phenolic compounds in potatoes
Table VITable II5 Concentration levels of the main phe nolic compounds in potatoes
Phenolic Classes Phenolic Compounds Range (mg100 g Dry
Extract)
Phenolic acids gallic acid 0ndash10
p-hydroxybenzoic acid 0ndash78
vanillic acid 06
chlorogenic acid 04ndash340
Flavonols Rutin 0ndash122
quercetin-3-o-glu-rut 25
Anthocyanidins Anthocyanins 14ndash1633
For carotenoids such as lutein zeaxanthin violaxanthin and neoxanthin (Figure II4)
are major carotenoids found in potatoes and b-carotene is found in trace amounts according to
[32]
Figure II4 Major carotenoids in potatoes
Figure I 12Major caroteno ids in potatoes
Chapter II Potato Generality
37
However another study of potato tubers along with other foods reports of total phenolic
amounts found in other plants these potatoes have more phenolics content than tomatoes
onions carrots Snapbeans [39] These amount of phenolic acids can be higher or less from
the same variety depending on the cultivar condition [40-42]and different variety of the
potato cultivars [43]
Potato contains glycoalkaloids α-chaconine and α-solanine Because of food poisoning
concerns new potato varieties are tested for glycoalkaloid levels and if the amount (total of
α-chaconine and α-solanine) exceeds 20 mg glycoalkaloid 100 g or 200 mgkg tuber on a
wet weight basis the variety will most likely not be released [44]The levels of these
glycoalkaloids can vary in potato varieties The skin contains significantly more glyco
alkaloids (124ndash543 mgkg of wet peel) than the flesh (13ndash148 mgkg)The glycoalkaloid
content of potatoes is not affected by baking cooking and frying Thus potato products
having high skin content should be watched [45] Postharvest factors such as low storage
temperature the light greening of potato (which is a sign of glycoalkaloid ) and mechanical
injury can increase glycoalkaloid content in potatoes [46-48]
II6) Cultivation
The potato plant can be grown from a potato or piece of potato which makes the potato
exceptional in agriculture The new plant can produce 5-20 new tubers They have genetic
clones of the original plant also the plant produces flowers and berries that contain 100-400
botanical seeds These can be planted to produce new tubers which will be genetically
different from the original plant [49]
The development of potatoes can be broken down into three distinct growth stages The
first stage begins with sprouts developing from the eyes and ends at emergence from the soil
The seed piece is the sole energy source for growth during this stage
The second stage at this point the vegetative parts leaves branches roots and stolons
start of formation and last until tubers start to develop The first and the second stages last
from 30 to 70 days depending on planting date soil temperature and other environmental
factors
The last stage is Growth Stage tubers are forming at salon tips but are not yet
enlarging This stage will last approximately 2 weeks Tuber cells expand with the
accumulation of water nutrients and carbohydrates Tuber bulking is the growth stage of
longest duration Depending on the date of planting and cultivar bulking can last up to three
Chapter II Potato Generality
38
months Vines turn yellow and lose leaves photosynthesis gradually decreases tuber growth
rate slows and the vines die [50]
II7) Production
Since 1960s the production of potato has rapid growth in 2005 the combination of
potato production in Africa Asia and South America exceeds that of Europe and the USA
[5152] with 200 million cropping area globally about the half is concentrated in Asia which
include China India and Russia the first three producing countries (Figure I5) with 961 46
and 32 million tonnes respectively [53]
Algeria is the 14th
producer among the top 25 potato producing countries in the world
and the first in Africa with a total production of 5 million tons [4] The potato is grown over
an area of over 160 000 ha and can be planted and harvested somewhere in Algeria in
virtually any month of the year Recently the county of El Oued southeast Algeria become the
first producer in the country with 11 million tons which represent 35 of the national
production [54]
Figure II5 Top five potato-producing countries in 2014 (FAO 2016 ) Figure I 13Top five potato- producing countries in 2014 (FA O 2016 )
II8) Non-Food Uses of Potato
From the economic side the potato is considered as the most widely grown tuber crop
in the world which used for human consumption as the main purpose In addition to its use in
the industrial field like potato starch alcohol etc
In the nutritional side the potatoes are known for their carbohydrate content the
predominant form of this carbohydrate content is starch A small but significant portion of the
starch in potatoes called lsquoresistant starchrsquo which resist the digestion by enzymes in the
Chapter II Potato Generality
39
stomach and small intestine and so reaches the large intestine essentially intact also
considered to have similar physiological effects and health benefits of fiber by offer protection
against colon cancer improve glucose tolerance and insulin sensitivity [55]
Potato starch is a promising biopolymer for different food pharmaceutical and
biomedical applications because of its higher water solubility that raises its degradability and
speed of degradation non-toxicity easy availability and abundance
Presently in nanoscience the potato starch is converted to glucose through enzymatic
hydrolysis which is a raw material for the production of lactic acid Then the lactic acid is
polymerized to produce polylactic acid (PLA) PLA is becoming increasingly popular in the
production of a wide range of biodegradable materials (board sheet films fiber paint etc)
because of low energy requirements during its production compared to other plastics of
petroleum origin Fiber-reinforced PLA composite materials have been used to interior
components for automobiles [56] However the cost of production of these plastics is
significantly high as compared to those of petroleum origin and it is essential to develop a
technology that uses energy more efficiently and is cost-effective
II9) Potatoes information
As a matter of fact the potato has always been a staple food around the world and the
second one in developed countries like European countries and the USA Therefore
conducting the researchers on the potato as a staple food and industrial development became
an inevitable tendency for complying with the continuously growing nutritional and healthy
demand [57]
The potato samples were analyzed for nutrient content by a number of studies
Provision of information has been shown that this crop contains essential amino acids
vitamins and minerals and is thus reported to play a significant role in human nutrition [58]
Many varieties of potatoes offer nutritional quantities of ascorbic acid (up to 42 mg100 g)
potassium (up to 6938 mg100 g) dietary fiber (up to 33)
other bioactive components such as protein with lower amounts (085ndash42) [59]
However almost 50 of potatoes phenolic compounds are located in the peels and adjoining
tissues [6061] since peels have more phenolic compounds than tubers these compounds
could be used in food and non-food applications [62]
In the last decade there has been increasing attention given to new sources of natural
antioxidant phytochemicals as a result of their potential health benefits in addition to their
Chapter II Potato Generality
40
functional properties in traditionally commercialized products such as preserving color and
flavor and hence improving shelf life [63]
Antioxidant activity in potato tubers has been extensively reported [64] pigmented potato
genotypes (mainly cultivars with purple and red flesh) as compared to those with white and
yellow flesh have been shown to contain significantly higher levels of antioxidants [65] At
present the potato grown in the El-Oued county is mainly consumed in the form of fresh
tuber in Algeria
II10) Materials references and goals
Little is known about the chemical composition or antioxidant capacity of potatoes El-
Oued county but a great variation in cultivar condition and difference of genetic
characteristics between varieties may be lead to diverse in their chemical composition
Although there may be as many potato varieties cultivars in this region The most four
popular cultivars of (Solanum tuberosum L) were chosen to provide a reference basis for
chemical composition values
Four potatoes cultivars lsquoBartina Kondor Kuroda and Spuntarsquo were collected in 2015
from different areas located in the region of El-Oued south-east of Algeria (Table II6) were
planted for three months before being used Table II7 describes the tuber physical
characteristics of the four cultivars analyzed and Figure II6 gives a visual representation of
the five chosen cultivars
Table II6 location of four varieties of potatoes Table VIITable II6 location of four varieties of potatoes
Varieties Areas name Areas located
Bartina Ourmas 33deg 24 327 N 6deg 46 4406 E
Kondor Guemar 33deg 30 176 N 6deg 47 507 E
Kuroda Trifaoui 33deg 25 16 N 6deg 56 05 E
Spunta Aarair 33deg 17 203 N 6deg 46 195 E
Chapter II Potato Generality
41
Table II7 Tuber physical Characteristics of the four potato cultivars investigated Table VIIITable II7 Tuber phys ical Characteristics of the four potato c ultivars investigated
Potato
Cultivar
Skin color Flesh
Color
Tuber skin
texture
Tuber Size amp Shape Eye
Depth
Bartina Red Light
yellow
Smooth Large to very large
Oval to round
Medium
Kondor Red Cream Smooth Large to very large
Oval to long
Medium
Kuroda Red Light
yellow
Intermediate Large to very large
Oval
Medium
Spunta Yellow Light
yellow
Smooth Large to very large
Long
Shallow
Note Information for this table was gathered from THE EUROPEAN CULTIVATED
POTATO DATABASE
Bartina Kondor
Kuroda Spunta
Figure II6 The visual appearance of the four potato tuber varieties analyzed in this
thesis
Figure I 41 The visual appearance of the four potato tuber varieties analyzed in t his t hesis
Chapter II Potato Generality
42
The overall goals of this thesis are threefold
1) To choose an extraction technique and a ratio of solvent which gives high yield
extraction of bioactive compounds from one cultivated potato variety
The literature research shows that the use of proper methods has an influence on the level of
phytochemical compounds extracted from plant sample Also the extraction process is
affected by several factors as solvent type contact time and others These will be discussed in
chapter IV by focusses on the level of total phenolic and flavonoids content extracted which
leads to conclude the best technique
2) To investigate and quantification the chemical composition and antioxidant activity of
the whole roots of four different variety of potatoes which are present the most
popular cultivated in the region of El-Oued (Bartina Kondor Kuroda Spunta)
However there are large differences in quantity of phytochemical compounds between
potatoes cultivars Thus chapter V will aim to quantify the total phenolics and total
flavonoids content this investigation will complete with HPLC analysis
The antioxidant activity of four samples measured by two techniques the first one is
spectrophotometer assay and the second one is electrochemical (cyclic voltammetry) assay
Also we will emphasize on comparing the results obtained by linear regression analysis
3) To incorporate the characteristics of the bioactive compounds and antioxidant
activities found in one variety which shows the highest level in phytochemical
compounds thus we will measure the potential antioxidant activity with other
spectrophotometers assays
As discussed in the first experiment (chapter V) The Kondor variety shows the highest
phytochemical compounds we will undertake in order to assess the potential acceptability of
peeled and unpeeled Kondor variety and compare the results in the second experiment in
chapter V
Chapter II Potato Generality
43
References
[1] J J Burke Growing the Potato Crop Vita Equity House Upper Ormond Quay Dublin
7 Ireland p16
[2] PM Harris History of the potato Charpmen amp Hall 1992 p 01
[3] R Navarre M J Pavek 2014 The Potato Botany Production and Uses CAB
International Washington USA p1
[4] httpwwwfaoorgstatisticsfr FAOSTAT 2012 and FAOSTAT 2013 accessed
February 09 2017
[5] Bukasov SM (1978) Systematics of the potato Systematics Breeding and Seed
Production of Potatoes Bulletin of Applied Botany Genetics and Breeding Leningrad
USSR pp 1ndash42
[6] Hawkes JG (1990) The Potato Evolution Biodiversity and Genetic Resources
Smithsonian Institution Press Washington DC USA
[7] Ochoa CM (1990) The Potatoes of South America Bolivia Cambridge Univ Press
Cambridge UK
[8] W A Gould 1999 POTATO PRODUCTION PROCESSING amp TECHNOL CTI
PUBLICATIONS USA p01
[9] httpwwwfaoorgpotato-2008enworldafrica international year of potato accessed
October 10 2017
[10] JM Bradeen Ch Kole Genetics Genomics and Breeding of Crop Plant Science
Publishers USA 2011 p06
[11] DrsquoArcy WG (1991) The Solanaceae since 1976 with a review of its biogeography In
JG Hawkes RN Lester M Nee N Estrada (eds) Solanaceae III Taxonomy Chemistry
Evolution Royal Botanical Gardens Kew UK pp 75ndash137
[12] Mabberley DJ (1997) The Plant Book 2nd edn Cambridge Univ Press Cambridge UK
[13] H D Jong J B Sieczka W D Jong 2011 The Complete Book of Potatoes Timber
Press Portland London p17
[14] Rousselle P Robert Y et Crosnier JC 1996 La pomme de terre INRA Pp 50
[15] (Canadian Food Inspection Agency) Plant Morphology (httpwwwinspectiongcca
accessed 16 November 2017)
[16] D Soltner 1979 Les grandes production veacutegeacutetales phytotechnie speacuteciale Collection
Sciences Et Techniques Agricoles PARIS 10eacutemeacute Edition P 427
Chapter II Potato Generality
44
[17] CIP (International Potato Center) (2012a) Potato Facts and Figures
(httpcipotatoorgpotatofacts accessed 15 December 2012)
[18] USPB (United States Potato Board) (2011a) Potato Types Guide
(httpwwwciaprochefcompotatoespdf PotatoTypespdf accessed 15 December 2012)
[19] R Navarre M J Pavek 2014 The Potato Botany Production and Uses CAB
International Boston USA p 43
[20] (USDA National Agricultural Statistics Service) (2013) Crop
Production(httpwwwnassusdagovPublicationsTodays_Reportsreportscrop1212pdf
accessed 15 May 2013)
[21] WSU (Washington State University Extension) (2012) Potato Varieties A
Comprehensive List (httppotatoes wsueduvarietiesvars-allhtm accessed 15 December
2012)
[22] Tahvonen R Hietanen RM Sihvonen J and Salminen E (2006) Influence of
different processing methods on the glycaemic index of potato (Nicola) Journal of Food
Composition and Analysis 19(4) 372-378
[23] Knuthsen P Jensen U Schmidt B and Larsen I K (2009) Glycoalkaloids in
potatoes Content of glycoalkaloids in potatoes for consumption Journal of Food
Composition and Analysis 22(6) 577-581
[24] Lombardo S Pandino G and Mauromicale G (2012) Nutritional and sensory
characteristics of ldquoearlyrdquo potato cultivars under organic and conventional cultivation systems
Food Chemistry 133(4) 1249-1254
[25] Lambert DH Powelson ML and Stevenson WR (2005) Nutritional interactions
influencing diseases of potato American Journal of Potato Research 82(4) 309-319
[26] Decker EA and Ferruzzi MG (2013) Innovations in food chemistry and processing to
enhance the nutrient profile of the white potato in all forms Advances in Nutrition An
International Review Journal 4(3) 345S-350S
[27] Casanas R Gonzalez M Rodriguez E Marrero A Diaz C 2002 Chemometric studies of
chemical compounds influence cultivars of potatoes from Tenerife J Agric Food Chem
502076ndash2082
[28] T Mu H Sun X Liu Potato Staple Food Processing Technology Springer Briefs in
Food Health and Nutrition 2017 Singapore 53 50-125
[29] Manach C Scalbert A Morand C Remesy C amp Jimenez L (2004) Polyphenols
food sources and bioavailability Am J Clin Nutr 79 727ndash747
Chapter II Potato Generality
45
[30] Parr AJampBolwell GP (2000) Phenols in the plant and in manThe potential for
possible nutritional enhancement of the diet by modifying the phenols content or profile
Journal of the Science of Food and Agriculture 80 985ndash1012
[31] Scalbert A Manach C Morand C Remesy C amp Jimenez L (2005) Dietary
polyphenols and the prevention of diseases Crit Rev Food Sci Nutr 45 287ndash306
[32] Ezekiel R Singh N Sharma S Kaur A Beneficial phytochemicals in potatomdashA
review Food Res Int 2013 50 487ndash496
[33] Maumlder J Rawel H Kroh L Composition of phenolic compounds and glycoalkaloids
α-solanine and α-chaconine during commercial potato processing J Agric Food Chem 2009
57 6292ndash6297
[34] Mattila P Hellstroumlm J Phenolic acids in potatoes vegetables and some of their
products J Food Comp Anal 2007 20 152ndash160
[35] Im H Suh B Lee S Kozukue N Ohnisi-Kameyama M Levin C Friedman M
Analysis of phenolic compounds by high-performance liquid chromatography and liquid
chromatographymass spectrometry in potato plant flowers leaves stems and tubers and in
home-processed potatoes J Agric Food Chem 2008 56 3341ndash3349
[36] Deuszliger H Guignard C Hoffmann L Evers D Polyphenol and glycoalkaloid
contents in potato cultivars grown in Luxembourg Food Chem 2012 135 2814ndash2824
[37] Shakya R Navarre D Rapid screening of ascorbic acid glycoalkaloids and phenolics
in potato using high-performance liquid chromatography J Agric Food Chem 2006 54
5253ndash5260
[38] Andre C Oufir M Guignard C Hoffmann L Hausman J Evers D Larondelle
Y Antioxidant profiling of native andean potato tubers (Solanum tuberosum L) reveals
cultivars with high levels of β-carotene α-tocopherol chlorogenic acid and petanin J Agric
Food Chem 2007 55 10839ndash10849
[39] Wu X Beecher GR Hoden J M Haytowitz D B Gebhardt SE Prior R L 2004
Lipophilic and hydrophilic antioxidant capacities of common foods in the United States J
Agric Food Chem 52 4026ndash4037
[40] Lombardo S Pandino G Mauromicale G 2012 Nutritional and sensory
characteristics of ldquoearlyrdquo potato cultivars under organic and conventional cultivation systems
Food Chemistry 133 (4) 1249ndash1254
[41] Hamouz K Lachman J Pazderů K Hejtmaacutenkovaacute K Cimr J Musilovaacute J Pivec
V Orsaacutek M Svobodovaacute A 2013 Effect of cultivar location and method of cultivation on
Chapter II Potato Generality
46
the content of chlorogenic acid in potatoes with different flesh colour Plant Soil and
Environment 59 (10) 465ndash471
[42] Brazinskiene V Asakaviciute R Miezeliene A Alencikiene G Ivanauskas L
Jakstas V Viskelis P Razukas A 2014 Effect of farming systems on the yield quality
parameters and sensory properties of conventionally and organically grown potato (Solanum
tuberosum L) tubers Food Chemistry 145 903ndash909
[43] Kanatt S Chander R Radhakrishna P Sharma A Potato peel extract natural
antioxidant for retarding lipid peroxidation in radiation processed lamb meat J Agric Food
Chem 2005 53 1499ndash1504
[44] Bushway RJ Bureay JL McGann DF 1983 Alph-chaconine and Alpha-Solanine
content of potato peels and potato peel products J Food Sci 4684ndash86
[45] Friedman M Roitman JN Kozukue N 2003 Glycoalkaloid and calysteigine contents
of eight potato cultivars J Agric Food Chem 512964ndash2973
[46] Fitzpatrick TJ McDermott JA Osman SF 1978 Evaluation of injured potato samples
for total glycoalkaloid content J Food Sci 431617ndash1618
[47] Wu MT Salunkhe DK 1978 After-effect of submersion in water on greening and
glycoalkaloid formation of potato tubers J Food Sci 431330ndash1331
[48] Griffith DW Bain H Dale MFB 1998 Effect of storage temperature on potato
(Solanum tuberosum L) tuber glycoalkaloid content and subsequent accumulation of
glycoalkaloids and chlorophyll in response to light exposure J Agric Food Chem 465262ndash
5268
[49] International Potato Center Potato facts and figures httpcipotatoorgpotatofacts
Accessed July 21 2016
[50] S C Yadav 2008 POTATO Production Processing and Marketing BIOTECH BOOKS
Delhi India p 16
[51] Birch PRJ Bryan G Fenton B Gilroy EM Hein I Jones JT Prashar H
Taylor MA Torrance L Toth IK 2012 Crops that feed the world 8 potato are the
trends of increased global production sustainable Food Security 4 (4) 477ndash508
[52] Food and Agriculture Organization of the United Nations (FAO) 2008 International
Year of the Potato The Global Potato Economy FAO Rome Italy
[53] J Singh L Kaur 2016 Advances in Potato Chemistry and Technology Second Edition
Elsevier Inc London United Kingdom p 12
Chapter II Potato Generality
47
[54] A Ould Rebai T Hartani M N Chabaca M Kuper Une innovation 2017
increacutementielle la conception et la diffusion drsquoun pivot drsquoirrigation artisanal dans le Souf
(Sahara algeacuterien) Cah Agric 26 35005
[55] Hylla S Gostner A Dusel G Anger H Bartram H P Christl S U Kasper H amp
Scheppach W (1998) Effects of resistant starch on the colon in healthy volunteers possible
implications for cancer preventionAmer J Clin Nutr 67 136ndash142
[56] Kawamoto H (2007) Trends in research and development of plastics of plant origin-
from the perspective of nanocomposite polylactic acid for automobile use Science and
Technology Trends 22 62ndash75
[57] Z Hong XU Fen W Yul H Hong-hai1 D Xiao-feng Progress of potato staple food
research and industry development in China Journal of Integrative Agriculture 2017 16(12)
2924ndash2932
[58] Deuszliger H Guignard C Hoffmann L Evers D Polyphenol and glycoalkaloid
contents in potato cultivars grown in Luxembourg Food Chem 2012 135 2814ndash2824
[59] BurlingameB MouilleacuteB CharrondiegravereR Nutrients bioactivenon-nutrients and anti-
nutrients in potatoes J Food Comp Anal 2009 22 494ndash502
[60] Albishi T John J Al-Khalifa A Shahidi F Phenolic content and antioxidant
activities of selected potato varieties and their processing by-products J Funct Foods 2013
5 590ndash600
[61] Al-Weshahy A Venket Rao A Isolation and characterization of functional components
from peel samples of six potatoes varieties growing in Ontario Food Res Int 2009 42
1062ndash1066
[62] H Akyol Y Riciputi E Capanoglu M Fiorenza Caboni V Verardo Phenolic
Compounds in the Potato and Its Byproducts An Overview Int J Mol Sci 2016 17 835
[63] OrsquoShea N Arendt E Gallagher E Dietary fibre and phytochemical characteristics of
fruit and vegetable by-products and their recent applications as novel ingredients in food
products Innov FoodSci Emerg 2012 16 1ndash10
[64] Madiwale G Reddivari L Stone M Holm D Vanamala J Combined effects of
storage and processing on the bioactive compounds and pro-apoptotic properties of color-
fleshed potatoes in human colon cancer cells J Agric Food Chem 2012 60 11088ndash11096
[65] Kuumllen O Stushnoff C Holm D Effect of cold storage on total phenolics content
antioxidant activity and vitamin c level of selected potato clones J Sci Food Agric 2013 93
2437ndash2444
Chapter III
Methods
Chapter III Methods
49
III1) Introduction
For most analytical protocols the procedure for the effective extraction of the specific
compounds from the bulk matrix is one of the most important processes in the analytical
mechanism [1] The composition and nature (simple andor complex) of the phytochemical
compounds to be extracted determine the condition of the extraction process
The extraction process is affected by the chemical structure of the phytochemical
compounds (simple or complex compounds) the extraction technique employed by solvents
solid-phase extraction and supercritical extraction the conditions of storage time and
temperature and the presence of the substance [2] the polymerization of the phytochemical
content is ranged from simple to high polymerized substance Some plants contain different
phenolic acids phenylpropanoids anthocyanins and tannins which can interact with other
plant components such as primary metabolism substances (protein and carbohydrates) these
compounds might be insoluble That is why it is difficult to develop a process capable of
recovering all the phytochemical substances contain in a plant matrix [3] which makes the
choice of the condition extraction solvent and technique an important factor
III1) Methods
III11) Soxhlet
Soxhlet extraction is a common example of an exhaustive solid-liquid extraction
technique and its principle of operations depend on the transfer of the target compound from
the plant (solid) to appropriate organic solvent(s) by ensuring that the extraction solvent
(liquid) maintains continuous contact with the sample at the time of the heat-aided extraction
process[4]
Figure III1 shows the traditional Soxhlet extraction apparatus generally contain a
distillation flask the sample holder (thimble) siphon and condenser In practice a
preweighed and sufficiently dried solid sample is loaded on filter paper and placed inside the
thimble Solvent vapors generated from the heated flask containing the extraction solvent(s)
pass through the thimble and become liquefied in the condenser
The extraction process begins the moment the liquefied solvent maintains contact with
the sample in the thimble The level of the condensed solvent therefore continues to upgrade
until it reaches the overflow level At this point an instant siphon effect rapidly makes the
extract (solute + solvent) to fall back into the distillation flask
Within the flask only the fresh solvent evaporates resulting in a continuous cyclical
Chapter III Methods
50
movement of the extraction solvent A complete cyclical movement of fresh solvent from the
distillation flask until it returns back to the flask as an extract is indicated to as a ldquocyclerdquo The
operation is repeated until complete extraction is achieved [5]
The cyclical movement of evaporated solvent from the flask that is subsequently
condensed facilitates the mass transfer of the target analyte in every cycle completed during
the extraction Generally the more the number of cycles completed the faster the rate of
extraction of the target analyte from the sample matrix [4]
Figure III1 Typical conventional soxhlet extractor Figure I 15Typical conventiona l soxhlet extractor
Figure I 16Typical conventiona l soxhlet extractor
III12) Maceration
Maceration is a method used a long time ago in winemaking and widely used in
medicinal plants research to extract essential oils and bioactive substance this technique
generally has several stages [6] Firstly crushed or cut the plant materials into small pieces to
increase the surface area for proper mixing with solvent Secondly adding the menstruum (the
appropriate solvent) in a closed container Thirdly The mixture then is strained the marc (the
damp solid material) is pressed and the combined liquids are clarified by filtration or
decantation after standing to facilitate the extraction and increase the yield we shake the
container this procedure increase the diffusion and bringing new solvent to the menstruum by
removing the concentrated solution from the sample surface the procedure of maceration is a
slow process taking a few hours up to several weeks also can consume large volumes of
solvent
Chapter III Methods
51
III13) Ultrasound-assisted extraction
Most applications of ultrasound-assisted leaching contain systems using the bath or
ultrasonic probe This kind of equipment has been used for leaching organic and inorganic
compounds with frequencies more than 20 kHz [7] The plant materials placed in a flask
which fixed an ultrasonic bath the mechanical stress produced by ultrasonic on the cells
through the production of cavitations in the sample made the cellular breakdown this damage
increases the solubilization of metabolites in the solvent and develops extraction yields [8]
The condition of sonication frequency time and temperature effect on the level of the
extraction
III14) Several variables effect on extraction system
In general terms the extraction productivity of a target compound is usually a function of
several process variables The most important factors concerning the extraction of phenolic
compounds natural products are the solvent type temperature contact time solvent-to-solid
ratio particle size and among others
The positive or negative effect of each variable on the mass transfer phenomenon which
governs the extraction process is specific to different varieties of the vegetable matrix and is
not always obvious the extraction of soluble phenolic compounds can be performed by
promoting their dispersion from plant tissue using a solvent
Each vegetable material possesses unique properties that might interfere with the
phenolic compounds extraction so it is important to develop optimal extraction technique for
their quantification and identification [9]
III141) Solvent
Solvent composition is always an important variable to be considered when dealing
with the extraction process
This variable should always be optimized in order to produce good extraction yields in
an economically advantageous process Many solvents can be used to extract phenolic
compounds from plant matrices ethanol isopropanol water and their combination these
substances are classified with the GRAS status and for that reason water isopropanol and
ethanol are suitable for the recovery of nutraceuticals [1]
Ethanol is reported to be appropriate solvent to recovery the phenolic compounds and
for that reason it is usually used for the obtaining of this group of compounds especially
Chapter III Methods
52
when it comes to the production of nutraceuticals which is related to its GRAS classification
[1] Ethanol water and their mixtures are the preferable solvent systems currently used for
natural product production
In that context infusions (immersion in hot water) continue to be an interesting way to
produce extracts with high contents of antioxidant compounds further the use of ethanol
should also be considered [10]
III142) Solvent-to-feed-ratio
According to mass transfer principles the driving force during mass transfer is the
concentration gradient between the solid and the bulk of the liquid which is increased when
the ration solvent to solid creased
Therefore according to mass transfer principles independent of the extraction solvent
used the higher the solvent-to-solid ratio the higher the total amount of solids obtained [11]
However from economic side the effect of consumption of the solvent on the extraction
process cost this variable should be carefully analyzed and optimized
There for several studies have reported that the effect of the solvent-to-feed (SF) ratio
variation from 61 to 181 was evaluated in terms of recovery of the antioxidant agents from
several plants [12] The effect of the solvent-to-solid ratio on the recovery of phenolic
compounds from different plant matrices was well studied by several authors [13-15]
III143) Temperature
Many phytochemicals are heat stable and extraction at high temperature has no adverse
effects however there are some phytochemicals which are heat labile In general a higher
extraction temperature causes an increase in the rate of diffusion of the soluble plant
phytochemicals into the extraction solvent An increase in temperature can cause an augment
in the content of some phytochemicals which is possibly due to an increase in the solubility
of many of these bioactive compounds [16-17]
Overall some phytochemicals such as anthocyanins the heat had an effect on
anthocyanins degradation [18-19] therefore high temperatures for long extraction times
would not be suitable for extraction of plants containing these compounds However for
phenolic compounds attention should be paid to their stability during the process phenolic
Chapter III Methods
53
compounds when kept above certain temperatures for certain periods of time can suffer
thermal degradation (oxidation) and activity loss [20]
In this study the temperature was ranged from 33degC in UAE extraction which reached
by the extraction performed by UAE [21] to 70 degC ( Ethanol boiling point) for Soxhlet
extraction
III144) Time
The time necessary for the extraction of phytochemicals compounds from plant tissue
will vary depending on the plant species to be extracted [10] According to Durling et all The
concentration of the target compounds in the extract obtained after a 6-h extraction time was
20 higher than that observed for the sample related to the extraction period of 1 h [12]
Increased contact time between solvents like ethanol and solid matrices might lead to a
progressive release of solute from the solid matrix to solvent [22]
Generally the extraction time using for UAE process ranged from 10ndash60 min and for
Soxhlet extraction ranged from 6ndash24 h [23-25]
III145) Particle size
The variation of in particle size of the sample has a strong influence on The quantity of
polyphenol recovery from plant materials
Mass transfer can be improved by the use of smaller particles to improve the penetration
of solvent in the solid matrix [10] The bigger the particle size of the material the longer the
path that the solvent has to travel which increase the time for maximum phytochemical
content to be extracted [26]
Also the damage of the plant cells caused by the crushing or milling the plant material
lead to increased extraction of phytochemical compounds
III2) Estimation of the water weight percentage in potato roots
No agricultural product in its natural state is completely dry Some water is always
present The percent moisture is an expression used for the description of the quantity of
water in plant material and for this purpose we usually use two methods
Chapter III Methods
54
These methods are the wet basis and dry basis In addition the content may be
expressed as a percent or as a decimal ratio [27] In our work we will use one form (percent)
in analyzing moisture in potatoes roots calculating by the following equation
where
is the moisture content of the sample (mm)
is the sample weight before drying g
is the sample weight after drying g
Two or three parallel measurement has to prepare The final sample moisture content
will be the mean of the two or three parallel measurements
III3) Phytochemical investigation
Analyses of plant materials based on two methods non-chromatographic
spectrophotometric methods or chromatographic methods Spectrophotometric methods are
based on the ability of the phytochemicals that absorb light in the ultraviolet (UV) or visible
range of the spectrum (eg total flavonoids content) or the ability to form such chromophores
after reacting with certain reagents such as total phenolic content and this quantification
depending on Beer-Lambert law This approach does not require separation of individual
compounds in the extract and often quantification is done as the total amount of similar
compounds in the extract
The advantages of the non-chromatographic spectrophotometric methods are simple
fast and of low cost but these methods lack the specificity for individual compounds and the
results are less precise [28]
III31) Screening chemistry
Phytochemical analysis was determined for all the extracts using the standard methods
III311) Detection of flavonoids
The detection of flavonoids done by Alkaline Reagent Test Extracts were treated with
few drops of sodium hydroxide solution Formation of intense yellow color which becomes
colorless on the addition of dilute acid indicates the presence of flavonoids[2930]
Chapter III Methods
55
III312) Detection of phytosterols
a) Liberman and Burchurds The test was done after the extraction and reflux of the plant
material 2 ml extract taken in a test tube 2 ml Chloroform 2 ml Acetic Anhydride and 2 ml
concentrate Sulphuric acid was added to it translucent green color shows the presence of
steroids and formation of deep red color indicates the presence of triterpenoids [3132]
b) Salkowskirsquos test Dissolve the extract in chloroform with few drops of concentrated
Sulfuric acid shake well and allow to stand for some time red color appears in the lower
layer indicates the presence of sterols and formation of yellow colored lower layer indicating
the presence of triterpenoids [32]
III313) Detection of tannins
About 05 g of the extract was boiled in 10 ml of water in a test tube and then filtered A
few drops of 01 ferric chloride was added and observed for brownish green or a blue-black
coloration [33]
III314) Detection of carbohydrates
Fehlingrsquos Test Filtrates were hydrolyzed with diluted HCl neutralized with alkali and
heated with Fehlingrsquos A amp B solutions Formation of red precipitate indicates the presence of
reducing sugars[3034]
III315) Detection of alkaloids
a) Mayerrsquos Test Filtrates were treated with Mayerrsquos reagent (Potassium Mercuric Iodide)
Formation of a yellow colored precipitate indicates the presence of alkaloids[32]
b) Wagnerrsquos Test Filtrates were treated with Wagnerrsquos reagent (Iodine in Potassium Iodide)
Formation of brownreddish precipitate indicates the presence of alkaloids[32]
III315) Detection of coumarins
3 ml of 10 NaOH was added to 2 ml of aqueous extract formation of yellow color
indicates the presence of coumarins [3135]
Chapter III Methods
56
III32) Total flavonoids content (TFC)
a) Principle
The estimation of the total flavonoids content generally used by aluminum chloride
method This method is based on flavonoids capability of forming a stable complex with Al
ions in a solution
The color of the complex depends on the ratio of the Al ions to the flavonoid molecules
and the hydroxylation pattern of the latter For this reason the spectrophotometric readings
used in this method can vary from 367 to 510 nm in different experimental procedures[36]
b)Protocol
Total flavonoids content was determined as described previously by ZOU et AL (2004) [37]
A mixture of 1 ml of extract 2 ml of nanopure water and 015 ml of 5 NaNO2 was prepared
and allowed to react for 6 min Then 015 ml of 10 AlCl3 solution was added and mixed
thoroughly After 6 min 2 ml of 4 NaOH solution was added and allowed to stand for
another 15 min The absorbance of the mixture was measured at 510 nm versus prepared
blank Rutin was used as a standard compound for the quantification of flavonoids content
Results were expressed in mg of rutin equivalents g of extract
III33) Total phenolics content (TPC)
a)Principle
The Folin-Ciocalteu (FC) assay is the most widely used method for the estimation of
total phenolic content (TPC) in extracts fruits vegetables grains and other foods The FC
reagent consists of an oxidizing mixture of phosphotungstic acid and phosphomolybdic acid
which when reduced produce a mixture of blue molybdenum and tungsten oxides (λ max
765 nm) Technically all compounds that can be oxidized by the FC reagent will be measured
[38]
b)Protocol
Total phenolics content was determined with the Folin-Ciocalteu reagent according to a
method described by Singelton-Ross (1956)[39] Briefly 100 microl of the appropriately diluted
extract was added to 05 ml of freshly diluted 10-fold Folin-Ciocalteu reagent Then 2 ml of
Chapter III Methods
57
20 Na2CO3 solution The reaction mixture was kept in the dark for 30 min and its
absorbance was measured at 760 nm against a blank Gallic acid was used as a reference
standard and the results were expressed as gallic acid equivalents g of extract
III34) HPLC analysis
liquid chromatography is a powerful separation method used in phytochemical studies
Practically this technique can be able to resolve mixtures with a large number of similar
analytes HPLC is very efficient it yields excellent separations in a short time [40]
III341) Principe
The procedure of HPLC is depended on the flow of solutes through two non-miscible
phases inside column (mobile phase and stationary phase ) to be separated [41] For this the
sample is dissolved in the mobile phase However this phase is in constant movement relative
to the stationary phase this movement due to the interactions of the constituents with the
stationary phase they separate after sufficient running time and they appear at the end of the
column at different times [40] this detection expressed as chromatograms
III342) HPLC system
According to the basic diagram shown in Figure 2 an HPLC system contains the
following elements
Figure III2 Block Diagram of an HPLC
Figure I 17Bloc k Diagram of an HPLC
Chapter III Methods
58
a) Solvents
Requirements for the solvents used in HPLC are filtering and degassing Filtering the
solvents will get rid of particulates that might contaminate the sample and can block the flow
through the HPLC column Particulates that are large enough can cause permanent damage to
the column Degassing helps to remove dissolved gases that are in the solvent This is
accomplished by pulling a vacuum on the solvent container while vibrating or sonicating
Both the particulates and the dissolved gas bubbles can also cause the efficiency of the
separation to go down Dissolved gas bubbles reduce separation efficiency by causing band
broadening and interfering with some detection systems [42]
b) Pumps
Pumps These are devices that deliver the mobile solvent at a controlled flow rate to the
separation system The pumping system needs to be of a high enough quality that it can
consistently produce a high-pressure [43] High-pressure gradients that are reached by these
pumps provide more accurately different gradients maintained by microprocessor control In
the gradients up to four solvents are presented in a constant relationship
c) Injection systems
Injector this device allows the addition of the liquid sample to the mobile phase Sample
injection systems which work automatically are preferred for prominent precision in sample
introduction [44]
d) Column
In the analytical model stainless steel columns generally have an internal diameter of
46mm The length is 5 10 15 or 25cm The filling (silica grafted silica or polymeric
particles) has a particle size of 3 5 or 10 um The internal diameter of a column is usually 4
or 46 mm If pure substances must be collected at the end of the chromatogram large
diameter columns will be required [45]
e) Detectors
An ideal detector of any type is sensitive to low concentrations of every analyte provides a
linear response and does not expand the eluted peaks according to the characteristic of the
molecules investigated various detectors are used such as its absorption in UV range or its
fluorescence This is the most frequent method used and its application allows for over 70
of detections [45]
Chapter III Methods
59
III343) Protocol
The phenolic compounds were analyzed by HPLC A LC-18 column (150 mm x 46
mm id x 5 mm) maintained at 30 degC was employed Elution was performed at a flow rate of
1 mLbullmin-1 using a mobile phase composed of wateracetic acid (982 vv) (solvent A) and
acetonitrile (solvent B) in gradient elution mode The elution gradient was 0 - 5 min 5 B
10 min 10 B 11 min 20 B 20 min 20 B 30 min 40 B 40 min 50 B 50 min 80
B
Chromatograms were acquired at 300 nm Phenolic compound standards ascorbic acid
gallic acid chlorogenic acid vanillin rutin were dissolved in extraction solvents and used for
identification of phenolic acids presents in different sample extracts Peak identification in
HPLC analysis was achieved by comparison of retention time and UV spectra of reference
standards
Quantification of individual phenolic compounds in the extracts was done using the
peak area of reference compounds and reported as microgmg of extract
III4) Antioxidant activity
According to its definition an antioxidant should have a significantly lower
concentration than the substrate in the antioxidant activity test Depending on the type of
reactive oxygen species (ROS) and target substrate a certain antioxidant may play a
completely different action or have a completely different roleperformance In line with this
some studies support the use of a selection of methods to measure the antioxidant activity [46-
47] The choice of substrate is very important in an antioxidant activity test Depending on the
type of substrate and its amountconcentration different results will be achieved
In our study the methods used to determine total antioxidant activity devised in two
techniques First one is spectrophotometers methods such as 11-diphenyl-2-picrylhydrazyl
(DPPH) assay and ferric ion reducing antioxidant parameter (FRAP) assay Secondly an
electrochemistry technique in this process we used cyclic voltammetry methods to determine
the antioxidant activity
Chapter III Methods
60
III41) Spectrophotometers assay
The Spectrophotometry is a quantitative analytical method that involves measuring the
absorbance or optical density of a given chemical substance in solution More this species is
concentrated plus it absorbs light within the limits of proportionality laid down by the law of
Beer-Lambert The optical density of the solutions is determined by a spectrophotometer
previously calibrated to the absorption wavelength of the chemical species to be studied
when intensity light I0 passes through a solution part of it is absorbed by the solute (s)
Therefore the intensity I of the transmitted light is less than I0 [48]
The absorbance of the solution is a positive value and defined as follows
Or When
III411) DPPH assay
a) Principle
The 11-diphenyl 1-2-picrylhydrazyl ( DPPHbull) - which is also known as αα-diphenyl-
β- picrylhydrazyl 22-diphenyl -1- picrylhydrazyl or 2 2-Diphenyl -1-(246-Trinitrophenyl
hydroxyl) assay originally described by Boils (1958) was designed to take advantage of a
common electron spin resonance reagent a stable free radical with an odd unpaired valence
electron to study antioxidant activity With its odd electron DPPHbull
can be stabilized by
accepting an electron or hydrogen radical from an antioxidant molecule such as a gallic acid
as a reducing agent DPPHbull
is known for its deep violet color and the strong absorbance at
517nm when dissolved in ethanol at concentrations between 1mM and 225microM [49-51] this
absorbance is decreased with the decolorization of DPPHbull which accompanies the pairing of
the lone electron
b) Protocol
The scavenging activity by the DPPH (22-diphenyl-1-picrylhydrazyl) radical scavenging
method according to Ohinishi and others [52] with some modifications a 1 ml of diluted
extract and 1 ml of DPPH (025 mM) were mixed and after 30 min the absorbance was
measured at 517 nm The scavenging activity was measured as the decrease in absorbance of
the samples versus DPPH standard solution Results were expressed as radical scavenging
activity percentage () of the DPPH according to the formula
Chapter III Methods
61
Where
A0 absorbance of the control
As absorbance of the sample
III412) Evaluation of total antioxidant capacity (TAC) by
Phosphomolybdenum method
a) Principle
The total antioxidant capacity of the ethanol extract was evaluated by the
phosphomolybdenum method according to the procedure described by Prieto et al [53]
The assay is based on the reduction of Mo (VI) to Mo (V) by the extract and
subsequent formation of green phosphateMo (V) complex at acid ρH
c) Protocol
The antioxidant activity of different samples was evaluated by the phosphomolybdenum
method of Prieto et al [53] An aliquot of 100 microl of the sample was combined with 1ml of
reagent solution (06 M sulfuric acid 28 mM sodium phosphate and 4 mM ammonium
molybdate) The tubes were capped and incubated in water bath at 95 degC for 90 min After the
samples were cooled to room temperature the absorbance was measured at 695 nm The
antioxidant capacity was expressed as equivalent to ascorbic acid ( mg ascorbic acid g of
extract)
III413) Ferric-reducing antioxidant power (FRAP) assay
a) Principle
The FRAP assay is based on the single electron transfer by an antioxidant to reduce the ferric
to ferrous ion when the ferric- tripyridyltriazine (Fe3+
-TPTZ) complex is reduced to the
ferrous counterpart the complex absorbs at 593 nm with an intense blue color [55]
b) Protocol
The FRAP assay was performed based on the procedure described by Benzie and Strain
[54] 100 microl of the diluted sample was added to 300 microl water then 3 ml of the FRAP reagent
and the reaction was monitored after 30 min in the dark at 593 nm The results were expressed
as mg Fe(II) g of extract
Chapter III Methods
62
III414) Beta-carotene bleaching
a) Principe
This method first developed by Marco [55] and modified by Miller [56]
This technique is sensitive and mainly based on the principle oxidation of linoleic acid
which is an unsaturated fatty acid by Reactive Oxygen Species (ROS) produced by
oxygenated water This complex formed will oxidate the b-carotene this oxidation will lead
to discoloration The retarding of this oxidation correlate with the addition of an antioxidation
compounds [57]
The degradation of b-carotene by linolic acid catalyzed with heat 50 degC in the aqueous
phase the activity is measured at 470 nm [58]
b) Protocol
Two milliliters of a solution of β-carotene in chloroform (2mg10ml) was pipetted into a
flask containing 40mg of linoleic acid and 400 mg of Tween 80The chloroform was removed
by rotary vacuum evaporator at 45 for 4min and 100 ml of distilled water was added
slowly to the semisolid residue with vigorous agitation to form an emulsion A 48ml aliquot
of the emulsion was added to a tube containing 02ml of the antioxidant solution the
absorbance was measured at 470 nm immediately against a blank consisting of the emulsion
without β-carotene [59] The tubes were placed in a water bath at 50 and the absorbance
measurements were conducted again at 15 min intervals up to 120minAll determinations
were carried out in triplicate [60] The antioxidant activity (AA) of the extracts was evaluated
in terms of bleaching of β-carotene using the following formula
where
is the absorbance of values measured at zero time of the incubation for the test sample
is the absorbance of values measured at zero time of the incubation for test control
is the absorbances measured in the test sample
is the absorbances measured in the test control
After incubation for 120 min the total antioxidant activity of acid ascorbic and Gallic acid
was also measured by inhibition of β-carotene bleaching method for comparison
Chapter III Methods
63
III42) Electrochemical techniques
III421) Principle
Recently the Electrochemical technique was applied to determine the antioxidant
content and antioxidant capacity in the phytochemical analysis these interest based on their
advantages of sensitivity and fastness process [61] The broadest technique in
electrochemistry used for redox system is Cyclic voltammetry The CV record the anodic
current produced by the antioxidant compounds which are oxidized on the surface of the
working electrode while the potential of a working electrode is linearly scanned from an
initial value to a final value and back [62] The current produced is proportional to the
combined concentration of the antioxidants [6364] This process can happen multiple times
during a single experiment The current produced is plotted versus the applied potential to
give the cyclic voltammogram as shown in Figure III3
Figure III3 cyclic voltammogram for redox system
Figure I 18
Figure I 19cyclic voltammogram for redox system
The cyclic voltammogram contains the cathodic peak Ic and anodic peak Ic the anodic
oxidation potential (Ea) and the cathodic oxidation potential (Ec) If the only cathodic peak
is present and anodic peak is absent then the process is irreversible and for the reversible
system the values of Epc and Epa are equal [65]
III422) Protocol of antioxidant activity
Electrochemical measurements were performed on a Potentiostat voltammetric signals
of Cyclic Voltammetry and square-wave voltammetry were recorded at room temperature in
an electrochemical cell with a volumetric capacity of 25 mL containing a working electrode
was glassy carbon a saturated calomel HgHg2Cl2KCL electrode was used as a reference and
a platinum wire was used as counter electrode The glassy carbon was polished before every
Chapter III Methods
64
experiment The antioxidant capacity measured of sample varieties was in a buffer solution of
acetate (300 mM pH=36) Cyclic voltammograms were obtained by a single cycle performed
at a scan rate of 100 mVs-1
and potentials range +200 to +1400 mV Gallic acid was used as a
standard in the calculation of antioxidant capacity of the studied sample of potatoes because
of its wide-spreading in nature and also because of its anodic area display excellent linearity
toward gallic acid concentration [66]
III422) Protocol for scavenging activity of superoxide anion Obull2
minus radicals
Superoxide anion radical was generated electrochemically by one electron reduction in
the commercial molecular oxygen in ACN containing 01 M TBFB at room temperature (28 plusmn
1 degC) The samples of each extract were added to this reaction medium and the cyclic
voltammograms were recorded following a modified method of Le Bourvellec et al [67]
Experimentations were carried out using voltalab40 PGZ301 potentiostatgalvanostat
(radiometer analytical SAS) in a double-walled electrochemical cell of 25 mL and the
conventional three-electrode system was employed A glassy carbon (GC) working electrode
(radiometer analytical SAS) having area 0013 cm2 a platinum wire counter electrode and a
HgHg2Cl reference electrode (30 M KCl) were used Data acquisitions were accomplished
with a Pentium IV (CPU 30 GHz and RAM 1 Gb) microcomputer using VoltaMaster4
software version 708 (radiometer analytical SAS) The scan rate was kept at 100 mVs and
potential window was from minus14 to 00 V The studied extract samples were added to the in
situ generated superoxide anion radical Obull2
minus and the cyclic voltammograms were recorded
III5) Calibration curve
Evaluation of the linearity of the calibration curve is favored to prove the acceptability
of any analytical method [68] Generally to verify the linearity five concentration levels of
standard solutions are required to construct the regression line of the calibration curve In this
study a linearity test was performed by plotting the calibration curve between the standard
concentration and the absorbance wave for spectrophotometers analysis and current peaks for
electrochemical analysis The linearity can be investigated through the correlation coefficient
(R) usually used to determine the linearity of the calibration curve In chemical correlation
analysis the coefficient of determination (R2) is the more exact term used [69] In this study
the linearity criterion was chosen using R2 of the regression line which is suggested to be
090 or more
Chapter III Methods
65
III51) Totale phenolic content
The linearity of the calibration curve was tested at ranges of concentrations (003 ndash 03
mgmL) prepared of Gallic acid as standard solutions of total Phenolic content the equation
obtained from the linear calibration graph in the studied concentration Y = 314x+0046
(Rsup2 = 0990) where y represents the value of the Absorbance and x the value of standards
concentration
000 005 010 015 020 025 030
00
02
04
06
08
10
Ab
s
Gallic asid concentration (mgml)
R2=0990
Figure III4 The calibration curve obtained for Gallic acid Figure I 02 Figure III4 The calibration curve obtained for Gallic acid
III52) Total Flavonoid content
The linearity of the regression line of the calibration curve was evaluated by preparing
standard solutions of Rutine in ethanol at concentration ranges of 005 ndash 025 mgmL for total
Flavonoids content The equation obtained from the linear calibration graph in the studied
concentration Y=192X-000567 (Rsup2 = 0997) where y represents the value of the Absorbance
and x the value of standards concentration
Chapter III Methods
66
015 020 025 030 035 040
03
04
05
06
07
08
Ab
s (
nm
)
Con (mgml)
R2=0997
Figure III5 The calibration curve obtained for Rutine
Figure I 21Figure III5 The calibration curve obtained for R utine
III53) FRAP assay
Ferrous sulfate (FeSO4) at concentration ranges 005 ndash 04 mgmL were prepared as
standards solution to assess the linearity of the calibration curve for FRAP antioxidant assay
The equation obtained from the linear calibration graph in the studied concentration
Y= 234746X-003929 (Rsup2 = 0993) where y represents the value of the Absorbance and x the
value of standards concentration
000 005 010 015 020 025 030 035 040 045
00
02
04
06
08
10
Ab
s (
nm
)
Con (mgml)
R2=0993
Figure III6 The calibration curve obtained for Ferrous sulfate
Chapter III Methods
67
III54) Total antioxidant capacity
Linearity was evaluated through the regression line of the calibration curve The
calibration line of Ascorbic acid at a different concentration from 007 to 03 mgmL for Total
antioxidant capacity The equation obtained from the linear calibration graph in the studied
concentration Y= 320228X+003727 (Rsup2 = 0990) where y represents the value of the
Absorbance and x the value of standards concentration
005 010 015 020 025 030
02
03
04
05
06
07
08
09
Ab
s (
nm
)
Con (mgml)
R2=099
Figure III7 The calibration curve obtained for Ascorbic acid TAC Figure I 22T he cali bration curve obtaine d for Ascor bic a cid TA C
III55) HPLC calibration curve
Figure 7 shows the chromatograms of seven mixed standards which analyzed in 300 nm
waves length and concentration (1ugml) peaks from 1 to 7 were Ascorbic acid Gallic acid
Chlorogenic acid Cafiec acid Quercetin Vanillin and Rutine respectively The linearity of
standard preparations was tested The calibration curves were constructed by plotting the peak
area of each compound against the corresponding concentrations The five points of the
regression line offered good linear behavior in the ranges 002 ndash 01 and 02 ndash 10 microgmL The
coefficient of determination (R2) values as shown in the figures below were found to be
acceptable and close to 0990 which was the R2 selected for the linearity criteria in this study
The amount of this standard in samples extracts was determined according to their calibration
curves of retention time and area (Table III1)
Chapter III Methods
68
Figure III8 Chromatograms of standard phenolic compounds1ascorbic acid
2gallic acid 3 chlorogenic acid CA caffeic acid 4 vanillin Q quercetin 5 rutin
Figure I 23hr omatograms of sta ndar d phenolic compounds1ascor bic a cid 2galli c aci d 3 chl oroge nic a cid CA caffeic aci d 4 va nillin Q querceti n 5 r utin
Table III1 Constituents Standard content analyzed by HPLC Table IXTable III1 Constit uents Standard content analyzed by HP LC
Standard Rt(min) Equation R2
Ascorbic acid 421 Y=75728X 09614
Gallic acid 523 Y= 23616X-7232 09986
Chlorogenic acid 1362 Y=39775X-1881 09983
Caffeic acid 163 Y=72328X 09986
Quercetin 2037 Y=548X-2823 0996
Vanillin 2146 Y=82773X-1423 09984
Rutine 2822 Y= 2411298X-1060 0995
The equation obtained from the linear calibration graph in the studied concentration
range for gallic acid in Cyclic Voltammetry (Figure 2b) Y = 2153X - 02432 (Rsup2 = 0999)
where y represents the value of the area of the anodic wave and x the value of standards
concentration expressed as mgml
Chapter III Methods
69
Figure III9 Voltammograms obtained for gallic acid (a) and (b) The calibration curve
obtained for gallic acid by cyclic voltammetry in pH=36 acetate buffer
Figure I 24Voltammograms obtai ned for galli c aci d (a) and (b) The calibrati on curve obtai ned for galli c aci d by cy clic v oltammetry in pH =36 a cetate buffer
III6) Determination of IC50 value
On the basis of screening results of triplicate measurement of the extract the inhibition
concentration (IC50) value was determined from extrapolating the graph of scavenging activity
versus the concentration of extract (using linear regression analysis) which is defined as the
amount of antioxidant necessary to reduce the initial radical concentration by 50 value
higher the antioxidative effects [70] The effective concentration having 50 radical
inhibition activity expressed as mg extractml
III7) Statistic analysis
The statistical analysis is descriptive methods aim to summarise empirical data
expressed in the quantitative form The interpretation of collecting data for any kinds of topics
in technology information used statistical tools such as mean median mode and standard
deviation [71]
III71) Linear regression analysis
Linear regression analysis is the most widely used of all statistical techniques it is the
study of linear additive relationships between variables Let Y denote the ldquodependentrdquo
variable whose values you wish to predict and let X1 hellipXk denote the ldquoindependentrdquo
variables from which you wish to predict it with the value of variable Xi in period t (or in
02 04 06 08 10 12 14
-5
0
5
10
15
20
25
30
I [micro
Ac
msup2]
Potential [ V]
06 ml
05 ml
04 ml
03 ml
02 ml
01 ml
(a)
000 002 004 006 008 010
2
4
6
8
10
12
14
16
18
20
22
I [micro
Ac
msup2]
C (mgml)
(b)
R2=0999
Chapter III Methods
70
row t of the data set) denoted by Xit Then the equation for computing the predicted value
of Yt is
This formula has the property that the prediction for Y is a straight-line function of each
of the X variables holding the others fixed and the contributions of different X variables to
the predictions are additive [72]
III72) Main effect plot and interaction plot
For two-way data an interaction plot shows the mean value of the response variable for
each combination of the independent variables This type of plot gives us some understanding
of the effect of the main factors and their interaction When main effects or interaction effects
are statistically significant post-hoc testing can be conducted to determine which groups
differ significantly from other groups[73]
III73) p-values and R-squared values
p-values and R-squared values measure different things The p-value indicates if there is
a significant relationship described by the model and the R-squared measures the degree to
which the data is explained by the model It is therefore possible to get a significant p-value
with a low R-squared value This often happens when there is a lot of variability in the
dependent variable but there are enough data points for a significant relationship to be
indicated [74]
In this study all the experiments data were performed in triplicate and the results were
expressed as mean plusmn SD (standard deviation) calculated by Excel 2007 These means were
compared using analysis of variance (ANOVA) using the Minitab version 17 (SAS) and
Linear regression the data obtained were considered statistically significant at p lt 005 and
very statistically significant at p lt 0005
Chapter III Methods
71
References
[1] Santana CM Ferrera ZS Padroacuten MET and Rodriacuteguez JJS (2009) Methodologies
for the Extraction of Phenolic Compounds from Environmental Samples New Approaches
Molecules 14 298-320
[2] Naczk M and F Shahidi 2006 Phenolics in cereals fruits and vegetables Occurrence
extraction and analysis Journal of Pharmaceutical and Biomedical Analysis 411523ndash1542
[3] Jin Dai Russell J Mumper Plant Phenolics Extraction Analysis and Their Antioxidant
and Anticancer Properties Molecules 2010 15 7313-7352
[4] MD Luque de Castro F Priego-Capote Soxhlet extraction Past and present panacea
Journal of Chromatography A 1217 (2010) 2383ndash2389
[5] MD Luque de Castro LE GarcotildeAcirca-Ayuso Soxhlet extraction of solid materials an
outdated technique with a promising innovative future Analytica Chimica Acta 369 (1998) 1-
10
[6] J Azmir ISM Zaidul MM Rahman KM Sharif A Mohamed F Sahena MHA
Jahurul K Ghafoor NAN Norulaini AKM Omar 2013 Techniques for extraction of
bioactive compounds from plant materials A review Journal of Food Engineering 117 426ndash
436
[7] Handa SS Khanuja SPS Longo G Rakesh DD(2008) Extraction Technologies for
Medicinal and Aromatic Plants (1stedn) no 66 Italy United Nations Industrial
Development Organization and the International Centre for Science and High Technology
[8] Dhanani T Shah S Gajbhiye NA Kumar S (2013) Effect of extraction methods on yield
phytochemical constituents and antioxidant activity of Withaniasomnifera Arab J Chem
[9] Chirinos R H Rogez D Camposa et al 2007 Optimization of extraction conditions of
antioxidant phenolic compounds from mashua (Tropaeolum tuberosum Ruız amp Pavon) tubers
Separation and Purification Technology 55217ndash225
[10] M Angela A Meireles Extracting bioactive compounds for Food products Theory and
Applications 2009 CRC Press New York USA P 190
[11] Spigno G L Tramelli and D M De Faveri 2007 Effects of extraction time
Chapter III Methods
72
temperature and solvent on concentration and antioxidant activity of grape marc phenolics
Journal of Food Engineering 81200ndash208
[12] Durling N E O J Catchpole J B Grey et al 2007 Extraction of phenolics and
essential oil from dried sage (Salvia officinalis) using ethanol-water mixtures Food
Chemistry 1011417ndash1424
[13] Herodez SS M Hadolin M Skerget et al 2003 Solvent extraction study of
antioxidants from Balm (Melissa officinalis L) leaves Food Chemistry 80275ndash 282
[14] Pinelo M P Del Fabbro L Marzocco et al 2005 Optimization of continuous phenol
extraction from Vitis vinifera byproducts Food Chemistry 92109ndash117
[15] Cacace J E and G Mazza 2003 Optimization of extraction of anthocyanins from
black currants with aqueous ethanol Journal of Food Science 68240ndash248
[16] Lim YY and Murtijaya J (2007) Antioxidant properties of Phyllanthus amarus
extracts as affected by different drying methods LWT ndash Food Science and Technology
40(9) 1664ndash1669
[17] Marete E Jacquier JC and Orsquo Riordan D (2009) Effects of extraction temperature on
the phenolic and parthenolide contents and colour of aqueous feverfew (Tanacetum
parthenium) extracts Food Chemistry 117 226ndash231
[18] Harbourne N Jacquier JC Morgan D and Lyng J (2008) Determination of the
degradation kinetics of anthocyanins in a model juice system using isothermal and non-
isothermal methods Food Chemistry 111 204ndash208
[19] Patras A Brunton N OrsquoDonnell C and Tiwari B (2010) Effect of thermal
processing on anthocyanin stability in foods mechanisms and kinetics of degradation Trends
in Food Science and Technology 21 3ndash11
[20] Lafka T-I V Sinanoglou and E S Lazos 2007 On the extraction and antioxidant
activity of phenolic compounds from winery wastes Food Chemistry 104 (3) 1206ndash1214
[21] Mane S Bremner DH Tziboula-Clarke A Lemos MA Effect of ultrasound on the
extraction of total anthocyanins from Purple Majesty potato Ultrasonics Sonochemistry
2015 27 509-514
Chapter III Methods
73
[22] Pinelo M M A Arnous and A S Meyer 2006 Upgrading of grape skins
Significance of plant cell-wall structural components and extraction techniques for phenol
release Trends in Food Science and Technology 17579ndash590
[23] Bendicho C De La Calle I Pena F Costas M Cabaleiro N Lavilla I Ultrasound-
assisted pretreatment of solid samples in the context of green analytical chemistry TrAC
Trends Anal Chem 2012 31 50ndash60
[24] Armenta S Garrigues S De Guardia M The role of green extraction techniques in
Green Analyticla Chemistry Trends Anal Chem 2015 71 2ndash8
[25] Chemat F Khan MK Applications of ultrasound in food technology Processing
preservation and extraction Ultrason Sonochem 2011 18 813ndash835
[26] Shi J Nawaz H Pohorly J Mittal G Kakuda Y and Jiang Y (2005) Extraction of
polyphenols from plant material for functional foods - Engineering and Technology Food
Reviews International 21 139ndash166
[27] LR Wilhelm DA Suter GH Brusewitz 2004 Food amp Process Engineering
Technology St Joseph Michigan USA p 259-284
[28] BK Tiwari NP Brunton CS Brennan 2013 Handbook of Plant Food
Phytochemicals Sources Stability and Extraction John Wiley amp Sons Ltd Oxford UK p
439
[29] Roopashree TS Dang R Rani SRH Narendra C Antibacterial activity of anti-psoriatic
herbs Cassia tora Momordica charantia and Calendula officinalis International Journal of
Applied Research in Natural Products 2008 1(3) 20-28
[30] Audu SA Mohammed I Kaita HA Phytochemical screening of the leaves of Lophira
lanceolata (Ochanaceae) Life Science Journal 2007 4(4) 75-79
[31] NSAVITHRAMMA MLIMGA RAO AND DSUHRULATHA Screening of
medicinal plants for secondary metabolites Journal of Scientific Research 2011 Vol8 PP
580-581
[32] PARCHANA TSAMATHA BMAHITHA NRAMASWAMY Preliminary
phytochemical screening from leaf and seed extracts of Senna alata LRoxb-an
Chapter III Methods
74
Ethnomedicinal plant Journal of pharmaceutical and biological research 2012 Vol3 PP
8285
[33] Paris R Moyse H Preacutecis de matiegravere meacutedicinale 1969 Paris Masson
[34] Obasi NL Egbuonu ACC Ukoha PO Ejikeme PM Comparative phytochemical and
antimicrobial screening of some solvent extracts of Samanea saman pods African journal of
pure and applied chemistry 2010 4(9) 206-212
[35] Rizk AM 1982 Fitoterapia 52 35-42
[36] BK Tiwari N P Brunton C S Brennan Handbook of Plant Food Phytochemicals
Sources Stability and Extraction 2013 John Wiley amp Sons Ltd Sussex UK P440
[37] Zou Y L Y Wei D 2004 Antioxidant activity of a flavonoid-rich extract of
Hypericum perforatum L in vitro J Agric Food Chem 52 5032-5039
[38] Escarpa A and Gonzalez MC (2001) Approach to the content of total extractable
phenolic compounds from different food samples by comparison of chromatographic and
spectrophotometric methods Anal Chim Acta 427 119ndash127
[39] Singleton V L and Rossi J A 1956 Colorimetry of total phenolics with
phosphomolybdic-phosphotungstic acid reagents American Journal of Enology and
Viticulture 16 144ndash158
[40] VR Meyer 2010 Practical High-Performance Liquid Chromatography Fifth edition
John Wiley amp Sons Ltd United Kingdom p 5
[41] JL Anderson ABerthod VPEsteacutevez A M Stalcup2015 Analytical Separation
Science First Edition Blackwell Verlag Gmb H Berlin Germany p24
[42] Skoog Douglas Holler James Nieman Timothy Principles of Instrumental Analysis
5th ed BrooksCole US 1998 p 728
[43] McMaster Marvin C HPLC A Practical Userrsquos Guide 2nd Ed Wiley New Jersey
USA 2007 p 7
Chapter III Methods
75
[44] S S Handa S P Singh Khanuja G Longo D D Rakesh 2008 Extraction
Technologies for Medicinal and Aromatic Plants international center for science and high
technology Trieste Italy
[45] R Kellner J M Mermet M Otto H M Widmer 1998 Analytical Chemistry
Weinheim Wiley VCH Germany
[46] Yuan YV Bone DE and Carrington MF (2005a) Antioxidant activity of dulse
(Palmaria palmata) extract evaluated in vitro Food Chemistry 91(3) 485-494
[47] Yuan YV Carrington MF and Walsh NA (2005b) Extracts from dulse (Palmaria
palmata) are effective antioxidants and inhibitors of cell proliferation in vitro Food and
Chemical Toxicology 43(7) 1073-1081
[48] T Owen 2000 Fundamentals of modern UV-visible spectroscopy Agilent
Technologies Germany p 16
[49] Blois MS (1958) Antioxidant determinations by the use of a stable free radical Nature
181(4617) 1199-1200
[50] Yen G-C and Chen H-Y (1995) Antioxidant activity of various tea extracts in relation
to their antimutagenicity Journal of Agricultural and Food Chemistry 43 27-32
[51] Sharma OP and Bhat TK (2009) DPPH antioxidant assay revisited Food Chemistry
113 1202-1205
[52] Ohinishi M Morishita H Iwahashi H Shizuo T Yoshiaki S Kimura Mand Kido
R (1994) Inhibitory effects of chlorogenic acids on linoleic acid peroxidation and haemolysis
Phytochemistry 36 579ndash583
[53] Prieto P Pineda M Aguilar MM 1999 Spectrophotometric quantitation of
antioxidant capacity through the formation of phosphoolybdenum complex specific
application to the determination of vitamin E Anal Biochem 269 337-341
[54] Benzie I F F ampStrain J J (1996) The ferric reducing ability of plasma (FRAP) as a
measure of antioxidant power The FRAP assay Analytical Biochemistry 239 70-76
[55] GL Marco A rapid method for evaluation of antioxidants J Am Oil Chem Soc 1968 45
594-8
Chapter III Methods
76
[56] HE Miller A simplified method for the evaluation of antioxidants J Am Oil Chem Soc
1971 4891
[57]Koleva II van Beek TA Linssen JPH de Groot A Evstatieva LN Screening of plant
extracts for antioxidant activity a comparative study on three testing methods Phytochem
Anal 2001 138-17
[58] MLaguerre J Lecompte P Villeneuve Evaluation of the ability of antioxidants to
counteract lipid oxidation Existing methods new trends and challenges Progress in Lipid
Research 2007 46244-282
[59] Tag MS Miller EF Pratt DE 1984 Chia seeds as a source of natural lipid
antioxidants J Am Oil Chem Soc 61 928-931
[60] Md Nur Alam N J Bristi Md Rafiquzzaman Review on in vivo and in vitro methods
evaluation of antioxidant activity Saudi Pharmaceutical Journal (2013) 21 143ndash152
[61] A M Pisoschi C Cimpeanu G Predoi 2015 Electrochemical Methods for Total
Antioxidant Capacity and its Main Contributors Determination A review Open Chem 13
824ndash856
[62] D Hynek L Krejcova J Sochor N Cernei J Kynicky V Adam L Trnkova J
Hubalek R Vrba and R Kizek Int J Electrochem Sci 7 (2012) 1802
[63] P A Kilmartin H L Zou and A L Waterhouse Am J Enol Vitic 53 (2002) 294
[64] A Mittal F Goke R Flint B P T Loveday N Thompson B Delahunt P A
Kilmartin G J S Cooper J MacDonald A Hickey J A Windsor and A R J Phillips
Shock 33 (2010) 460
[65] Chevion S Roberts MA Chevion M(2000) The use of cyclic voltammetry for the
evaluation of antioxidant capacity Free Radic Biol Med 28 860-870
[66] Rebiai A Lanez T Belfar ML In vitro Evaluation of Antioxidant Capacity of Algerian
Propolis by Spectrophotometrical and Electrochemical Assays Int J Pharm 2011 7 113-118
[67] C Le Bourvellec D Hauchard A Darchen JL Burgot ML Abasq Talanta (2008)
doi101016jtalanta200801007
Chapter III Methods
77
[68] GREEN J M (1996) A practical guide to analytical method validation Analytical
Chemistry 68 A305-A309
[69] EXNER O amp ZVARA K (1999) Coefficient of determination in some atypical
situations Use in chemical correlation analysis Journal of Physical Organic Chemistry 12
151-156
[70] Chew AL Jessica JJA Sasidharan S 2012 Antioxidant and antibacterial activity of
different parts of Leucas aspera Asian Pac J trop Biomed 2176-180
[71]GBohm G Zech 2010 Introduction to Statistics and Data Analysis for Physicists
Elektronen-Synchrotron Hamburg Germany p 02
[72]X Yan XG Su 2009 Linear Regression Analysis Theory and Computing World
Scientific Publishing Co Singapore p 04
[73] SS Mangiafico 2016 Summary and Analysis of Extension Program Evaluation in R
Rutgers Cooperative Extension New Brunswick NJ p 325
[74] SS Mangiafico 2016 Summary and Analysis of Extension Program Evaluation in R
Rutgers Cooperative Extension New Brunswick NJ p 336
Chapter IV
Comparative
study of
extraction
methods
Chapter IV Comparative study of extraction methods
79
IV1) Introduction
Sample preparation is a critical step of a successful analytical method Again due to the
large variations in sample matrices for example plant materials food formulations
biological fluid and tissue samples the diverse chemical structures and physicochemical
properties of the phytochemicals it is unrealistic to develop any definitive procedure or
protocol for all types of sample matrices However there are important common precautions
that must be taken for better preparing samples for the subsequent analyses The overall
purposes of sample preparation are to concentrate or dilute the samples so the analytes can be
detected and quantified within the detection limit and linear range to rid any interference that
might affect the detection of the compounds of interest Therefore techniques adopted to
sample preparation must follow these two principles [1] The aim of extraction is to maximize
the yield of compounds of interest while minimizing the time and solvent
IV2) Aim
To decrease the yield of phytochemical compound extract from potato sample We
elected to compare traditional extraction techniques as Soxhlet extraction maceration
extraction and modern extraction techniques as Ultrasound-assisted extraction this three
techniques used to extract the bioactive compound from red potatoes cultivars Kondor In this
chapter we looked for technique with less time and solvent which gives a higher yield
IV32) Preparation of samples
Immediately after receiving all samples of raw potatoes were peeled using a kitchen
knife and prepared by simply cutting into 5 mm thick slices 20 g of the slices of freshly
peeled potatoes was extracted using 120 mL extraction solution (16 S-f-ratio)which is
consisted of a mixture of ethanol and water at a ratio of (7030 vv) Subsequently all the
samples taken after the treatment were filtered before analysis for removal of potato particles
then the filtrate was concentrated under reduced pressure at 60 degC by rotary evaporator and
stored in a refrigerator
IV33) Ultrasonic extraction
In this study the ultrasound-assisted extraction procedure was used for the extraction
thus samples were further submitted to ultrasonication in bath (40 kHz) at three levels of
Chapter IV Comparative study of extraction methods
80
power 30 50 and 70 the extraction being performed at T = 33 plusmn 4 degC The extracts
were kept to macerate for 5 min 2 h and 24 h in dark at room temperature
IV34) Soxhlet extraction
The sliced fresh potatoes (20 g) were continuously extracted with 120 mL using the
appropriate solvent mixture for 3 h (5 cycles) at a maximum temperature of 70 degC in a
Soxhlet apparatus
IV35) Results and discussion
IV351) the total flavonoids content
Table IV1 and 2 show the amount of TFC obtained from the extract using UAE with (7030
ethanol water) and 100 ethanol as solvent
Table IV1 Total flavonoids content obtained using ethanol water (7030) Table XTable IV1 Total flavonoids content obta ine d using ethanol water (7030)
ULTRASOUND
SOXHLET Maceration
time
Amplitude
30 50 70
5 min 93230 plusmn 0043 13073 plusmn 0010 85319 plusmn 0003 69446 plusmn
0019 2 h 117648 plusmn 0007 94793 plusmn 0007 120140 plusmn 0004
24 h 144272 plusmn 0002 130321 plusmn 0043 110244 plusmn 0007
Total flavonoids content was expressed as mg rutin g extract
Table IV2 Total flavonoids content obtained using 100 ethanol Table XITable IV 2 Tota l flavonoids content obtained using 100 ethano l
ULTRASOUND
SOXHLET Maceration
time
Amplitude
30 50 70
5 min 633336 plusmn 001 411461 plusmn 0027 171184 plusmn 0013 113242 plusmn
0024 2 h 611119 plusmn 0006 519105 plusmn 0006 237503 plusmn 0005
24 h 859383 plusmn 0008 691670 plusmn 0049 582295 plusmn 0018
Total flavonoids content was expressed as mg rutin g extract
The UAE showed an advantage over SE but a ratio of 100 ethanol favored the
extraction process resulting in an increase of TFC for the two techniques The amount of TFC
Chapter IV Comparative study of extraction methods
81
obtained after 5 min of ultrasound treatment was higher compared to SE at the two ratios
69446 113242 mg ruting extract (Soxhlet UAE at 7030 solvent ratio) and 85319 171184
mg ruting extract for (Soxhlet UAE at 100 solvent ratio) the three amplitude chosen by
UAE increase the amount extracted from 171184 mg rutin g extract at 70 amplitude to
633336 mg ruting extract at 30 of amplitude Longer times of maceration following
ultrasound extraction lead to the increase of the amount of TFC in the extract
IV352) The total phenolic content
The concentration of TPC in the extracts expressed as mg GAEg sample depends on
the solvent and the method of extraction as shown in Tables IV 3 and 4
Table IV3 Total phenolic content obtained using ethanol water (7030) Table XIITable IV3 Total phenolic content obta ine d using ethanol water (7030)
ULTRASOUND
SOXHLET Maceration
time
Amplitude
30 50 70
5 min 67781 plusmn 0059 79936 plusmn0067 51273 plusmn 0032 67788 plusmn
0017 2 h 93736 plusmn0017 74522 plusmn0094 69002 plusmn0022
24 h 103821 plusmn 0007 81347 plusmn 0018 72793 plusmn 0007
Total phenolic content was expressed as mg gallic acid g extract
Table IV4 Total phenolic content content obtained using 100 ethanol Table XIIITable IV4 Total phe nolic content conte nt obtained us ing 100 ethanol
ULTRASOUND
SOXHLET Maceration
time
Amplitude
30 50 70
5 min 175053 plusmn0053 144904 plusmn 0003 69426 plusmn 0016 139490 plusmn
0023 2 h 152229 plusmn 0065 144378 plusmn 0016 92993 plusmn 0029
24 h 229299 plusmn 0062 140127 plusmn 0064 138694 plusmn 0122
Total phenolic content was expressed as mg gallic acid g extract
The content of phenolic compounds in the UAE extraction increases from amplitude 70
(69426 mg gallic acid g extract) to 30 (175053 mg gallic acid g extract) Also the
maceration time after sonication of the extract has an effect on the level of TPC in samples
eg 24 hours of maceration led to the highest TPC with 222999 mg gallic acidg extract
however using 5 minutes maceration time gave 175053 mg gallic acidg extract The best
Chapter IV Comparative study of extraction methods
82
results were recorded using 100 ethanol which showed an advantage on the ratio of 7030
(ethanol water) The results obtained from SE increased from 677 (using 7030 ethanol
water) to 1394 (using 100 ethanol) but are remarkably lower than those obtained by UAE
IV353) The antioxidant capacity
The antioxidant capacity was evaluated using the phosphomolybdenum method which
is based on the reduction of Mo (VI) to Mo (V) by the antioxidant compounds and the
formation of green Mo (V) complexes with a maximal absorption at 695 nm (Tables IV 5 and
6) The results show an increase of TAC at a lower amplitude and higher maceration time CA
= 106776 to 153348 mg ascorbic acidg of extract for the solvent ratio (7030 ethanol water)
and 363946 to 413346 mg ascorbic acidg of extract for 100 ethanol It is clear that The
TAC with UAE-M has an advantage over Soxhlet at two ratios of solvent
Table IV5 Total antioxidant capacity obtained using ethanol water (7030) Table XIVTable IV 5 Tota l ant ioxidant capacity obtained us ing ethanol water (7030)
ULTRASOUND
SOXHLET Maceration
time
Amplitude
30 50 70
5 min 106776 plusmn 0006 106838 plusmn 0013 99551 plusmn 0017 138983 plusmn
0233 2 h 150973 plusmn 0031 110793 plusmn 0008 132861 plusmn 0039
24 h 153348 plusmn 0003 97450 plusmn 0025 152847 plusmn 0015
Capacity antioxidant was expressed as mg ascorbic acid g of extract
Table IV6 Total antioxidant capacity obtained using 100 ethanolTable XVTable IV6 To tal antiox idant capacity obtained u sing 100 ethanol
ULTRASOUND
SOXHLET Maceration
time
Amplitude
30 50 70
5 min 363946 plusmn 0022 202811 plusmn 0079 113493 plusmn 0014 231124 plusmn
0029 2 h 284836 plusmn 0044 208804 plusmn 0015 195108 plusmn 0060
24 h 413346 plusmn 0057 390802 plusmn 0103 253192 plusmn 0064
Capacity antioxidant was expressed as mg ascorbic acid g of extract
Chapter IV Comparative study of extraction methods
83
IV354) Statistic analysis
Fig IV12 and 3 shows the overall effect of maceration time (Fig 1a2a and 3a)
amplitude (Fig 1b2b and 3b) method (Fig1c 2c and 3c) and the solvent ratio (Fig1d 2d
and 3d) on the TFC TPC extracted from the potatoes and their TAC Table 7 shows relative
between the amounts of TFC TPC and TAC extracted using different conditions of extraction
a further analysis of the variance of the main effects between the variables studied and their
significance was performed using one-way ANOVAs as it can be seen there is a statistically
significant difference in the amounts of TFC TPC and TAC using different maceration time
(p lt 0000- see table 7) with the lowest amount obtained at 5 minutes maceration time
Furthermore a decrease of amplitude lead to an increase in TFC TPC extracted and TAC as
can be seen in Fig 1b2b and 3b respectively The effect of this factor has a significant
statistically with (p lt 0000 - table 7) However the use of UAE-M extraction had an effect on
the amounts of TFC TPC extracted from potato and TAC (Fig 1c2c and 3c) with the lowest
amount obtained from soxhlet extraction Table IV7 show a statistically significant with
(plt0000) It should be pointed out that the amount of TFC TPC and TAC increased with a
higher ratio of ethanol with statistically significant (p lt 0001) (Table 7)
Table IV7 Analysis of variance for the main effects of factors studied Table XV ITable IV 7 Ana lysis of variance for the ma in effects of factors studie d
Factors P value
TPC
Time of maceration
Amplitude
Method
Solvent ratio
0000
0000
0000
0000
TFC
Time of maceration
Amplitude
Method
Solvent ratio
0000
0000
0000
0001
TAC
Time of maceration
Amplitude
Method
Solvent ratio
0000
0000
0000
0000
Chapter IV Comparative study of extraction methods
84
Figure I 25 Effect of macerati on time (a) amplitude (b) method (c) and the solve nt ratio (d) on t he level of total flavonoids content Y-axi s shows T otal Flavanoids content (expre sse d as a mg Rutin g extract)
FigureIV1 Effect of maceration time (a) amplitude (b) method (c) and the solvent ratio (d)
on the level of total flavonoids content Y-axis shows Total Flavanoids content (expressed as
a mg Rutin g extract)
(d)
Solvent Ratio 100 (7030)
50
40
30
20
10
Main Effects Plot (data means) TFC Vs Solvent
Me
an
of
TFC e
xp
resse
d a
s a
mg
Ru
tin
g
ex
tra
ct
(c)
Method UAE Soxhlet
32
31
30
29
28
Main Effects Plot (data means) TFC Vs Method
(b)
Amplitude 70 50 30
40
35
30
25
20
Main Effects Plot (data means) TFC Vs Amplitude
Me
an
of
TFC e
xp
resse
d a
s a
mg
Ru
tin
g
ex
tra
ct
(a)
Time 5min 2h 24h
425
400
375
350
325
300
275
250
Main Effects Plot (data means) TFC Vs Time
Me
an
of
TFC e
xp
resse
d a
s a
mg
Ru
tin
g
ex
tra
ct
Me
an
of
TFC e
xp
resse
d a
s a
mg
Ru
tin
g
ex
tra
ct
Chapter IV Comparative study of extraction methods
85
Figure I 26 Effect of macerati on time (a) amplitude (b) method (c) and t he solvent ratio (d) on the leve l of total phenolic content Y-axis shows T otal phenolic content (expre ssed a s a mg gallic acidg extract)
Figure IV2 Effect of maceration time (a) amplitude (b) method (c) and the solvent ratio
(d) on the level of total phenolic content Y-axis shows Total phenolic content (expressed as a
mg gallic acidg extract)
Chapter IV Comparative study of extraction methods
86
Figure I 27Effect of macerati on time (a) amplitude (b) method (c) and the solvent rati o (d) on the l evel of total anti oxida nt ca pacity Y-axis shows T otal anti oxida nt capacity (expressed a s a mg ascorbi c aci dg of extract)
Figure IV3 Effect of maceration time (a) amplitude (b) method (c) and the solvent ratio (d)
on the level of total antioxidant capacity Y-axis shows Total antioxidant capacity (expressed
as a mg ascorbic acidg of extract)
IV354) HPLC analysis
The chromatographic profile of extract of the leaf of the variety Kondor represented in
Level of the figure (4-7) The four samples A C B and D were extracted by UAE-M
extraction and Soxhlet extraction The results of quantitative analyses of phenolic compounds
Identified are represented in the Table IV8 The analysis of these results shows that in The
extract of this variety the ascorbic acid range from 012 to 118 microgmg the Gallic acid range
from 081 to 137 microgmg the Chlorogenic acid range from 027 to 153 microgmg for all the
sample extract However the Vanillin range from 0004 to 018 microgmg for extract samples A
C D We note that the Rutine (0532 microgmg) showed only in C sample From the point of
view of quantity the A sample has the highest constituents in Ascorbic acid and Chlorogenic
acid
(d)
Solvent Ratio
Me
an
of
TA
C (
ex
pre
sse
d a
s a
mg
asco
rbic
acid
g
of
ex
tra
ct)
100 (7030)
28 26 24 22 20 18 16 14 12
Main Effects Plot (data means) TAC vs Sovent ratio (c)
Method
Me
an
of
TA
C (
ex
pre
sse
d a
s a
mg
asco
rbic
a
cid
g
of
ex
tra
ct)
UAE Soxhlet
1975
1950
1925
1900
1875
1850
Main Effects Plot (data means) TAC vs Method
(b)
Amplitude
Me
an
of
TA
C (
ex
pre
sse
d a
s a
mg
asco
rbic
a
cid
g
of
ex
tra
ct)
70 50 30
250
225
200
175
150
Main Effects Plot (data means) TAC vs Amplitude (a)
Time
Me
an
of
TA
C (
ex
pre
sse
d a
s a
mg
asco
rbic
acid
g
of
ex
tra
ct)
5min 2h 24h
25 24 23 22 21 20 19 18 17 16
Main Effects Plot (data means) TAC vs Time
Chapter IV Comparative study of extraction methods
87
The Results shows that all the samples contain at least three bioactive compounds using
either UAE-M or SE as an extraction technique and two ratios for the ethanol as solvent all
these variables have an effect on the level of the amount of bioactive compound in the Kondor
sample
Figure I 28 Chr omatograms of sample extract A(1)Ascorbi c aci d(2) Galli c aci d (3) Chlor oge nic a cid(4) Vanilli n
Figure IV4 Chromatograms of sample extract A(1)Ascorbic acid(2) Gallic acid (3)
Chlorogenic acid(4) Vanillin
Figure I 29Chromat ograms of sampl e extract B(1)Ascor bic a cid(2) Gallic a cid (3) Chl orog eni c aci d
Figure IV5 Chromatograms of sample extract B(1)Ascorbic acid(2) Gallic acid (3)
Chlorogenic acid
Chapter IV Comparative study of extraction methods
88
Figure I 30Chromatograms of sample extra ct C(1)Ascorbi c aci d(2) Gallic a cid (3) Chlor ogeni c aci d(4) Vanilli n(5)Rutine
Figure IV6 Chromatograms of sample extract C(1)Ascorbic acid(2) Gallic acid (3)
Chlorogenic acid(4) Vanillin(5)Rutine
Figure I 31Chromat ograms of sampl e extract D(1)Ascorbi c aci d(2) Galli c aci d (3) Chl oroge nic a cid(4) Vanilli n
Figure IV7 Chromatograms of sample extract D(1)Ascorbic acid(2) Gallic acid (3)
Chlorogenic acid(4) Vanillin
Table IV9 Constituents content analyzed by HPLC 24)جدول رقم ) 1Table IV9 Constitue nts content ana lyze d by HP LC
Method Ascorbic
acid
[microgmg]
Gallic acid
[microgmg]
Chlorogenic
acid
[microgmg]
Vanillin
[microgmg]
Rutine
[microgmg]
A 11831 08108 15359 00702 -
C 04135 1095 04768 00043 00095
D 03702 13752 06970 01869
B 01288 10670 02768 - -
A C sample extracted with UAE 30 amplitude 24 h maceration and solvent ration [100 ethanol (7030 ethanolwater)]
B D sample extracted with Soxhlet and solvent ration [100 ethanol (7030 ethanolwater)]
Chapter IV Comparative study of extraction methods
89
IV4) Discussion
According to the results previously mentioned the extraction of bioactive compound
from potatoes roots can be affected by several factors One of them was the technique These
results indicated that the amount extracted from both total phenolic and flavonoids contents is
remarkably improved when using UAE-M over Soxhlet extraction also the yield of extraction
improved when maceration is used after to ultrasonic-assisted extraction This fact is in
accordance with other data found in the literature which showed in an enhancement of the
levels of phytochemicals extracted presented in different food matrixes after sonication [2-4]
However the UAE can induce a reduction in the size of vegetables andor changes in the
cell structure Because of the ultrasonic cavitation this structural disruption can provide a
better contact between the solvents and cells allowing an increase in the content of the
extracted compounds [5] Additionally the increase of total phenolic and flavonoids content
depends on UAE conditions as an amplitude The decrease in this factor leads to higher
amount
Secondly the solvent ratio showed significantly affect the amount of TPC TFC and
TAC A higher solvent ratio was used in the extraction had better content than (7030
ethanolwater) Also this results observed by Zhou and Yu [6] all obtained results are
confirmed by HPLC analysis Finally all these factors lead to the UAE combined with
maceration to be a better technique than soxhlet
The most efficient method for amount bioactive compound is to use UAE with 30 of
amplitude ethanol as solvent and kept the sample macerate for 24 hours It should be noted
that the amount of TFC TPC and TAC was observed in 2 hours maceration of the samples
sonicated with 30 of amplitude have higher results than a soxhlet extraction This condition
was used to extract bioactive compounds from four varieties of potatoes
Chapter V
Phytochemical
study of
Solanum
tubersum L
Chapter V Phytochemical study of Solanum tubersum L
91
V1) Introduction
Potatoes can be a good source of phenolic and flavonoid compounds in the diet despite
its moderate levels compared to other plant sources However as mention above The
composition of a potato tuber depends on a number of factors although the innate genetic
characteristics associated with each cultivar are thought to be among the most significant
Other factors known to influence potato chemical composition include the geographic
growing location soil type and climate [7] Thus the nutrient screening of a range of different
cultivars can help classify the potato variety by their phytochemicals compounds
The proximate analysis estimates the moistures phenolic flavonoids and other
phytochemical compounds and antioxidant activity in vegetable or fruits is the method used to
assist in determining potential end use and tuber quality of potato variety Experiment one of
this chapter will discuss the proximate analysis results of four potato tubers in order to qualify
the major phytochemicals content of the tubers and to identify the most richness potato
variety in phytochemicals compounds
The phytochemicals value of the richness tuber will then be further quantified in
Experiment two by assessing the quantity of phytochemical content and their antioxidant
activity in the flesh and the whole tuber
V2) Experiment One
V21) Aim
This experiment aimed to examine the presence and quantity of the certain
phytochemical component in order to gauge health-promoting in four most popular variety of
potatoes cultivated in El-Oued county lsquoBartina Kondor Kuroda and Spuntarsquo This was
achieved by performing analyses to estimate and identify certain phenolic flavonoid content
by spectrophotometers assays and HPLC analysis Also we will take into our consideration
the estimation of moisturewater the presence of phytochemicals compounds by standard
methods The antioxidant activity measured by two techniques spectrophotometer assays and
electrochemical assays All these analysis results will discuss the proximate analysis results of
four different variety of potato cultivars
Chapter V Phytochemical study of Solanum tubersum L
92
V22) Estimation of the water weight percentage in potato roots
The water percentage was measured by weighing fresh roots into a crucible which was
placed in an oven at 100 degC overnight Later the dried roots were weighed to calculate the
amount of water lost The (Table V1) shows the moisture content (H2O ) of four varieties
of potato samples The tuber from red cultivars Bartina showed higher moisture content
84239 then the yellow tuber Spunta 8310 we regarding a high moisture content in
potatoes roots which relates to materials such as fruits and vegetables according to Wilhelm
L et al [8] Many of these products have moisture contents near 90 or more
Table V1 Determination of moisture content for four varieties of potatoes 24)جدول رقم ) 2Table V1 Determination of moist ure content for four varieties of potatoes
Roots Bartina Kuroda Kondor Spunta
H2O 842394 772256 819591 831077
V23) Screening chemistry ( Chemical characterizations)
The present study revealed that the various alcoholic extracts of root parts of potatoes
contained alkaloids coumarins flavonoids phytosterols and carbohydrates (Table V2)
However alkaloids coumarins and carbohydrates were detected in ethanolic extracts of all
roots varieties and the detection of Phytosterols by Liberman and Burchurds shows positive
results with a formation of translucent green color in all varieties which indicate the presence
of steroids for Salkowskirsquos test shows negative results for the detection of Flavonoids all the
roots extracts had a higher number of secondary metabolites with a high degree of
precipitation (++) for Alkalin reagent
Table V2 Preliminary qualitative phytochemical analysis of various alcoholic extracts of
root parts of potatoes 24)جدول رقم ) 3Table V2 Preliminary qualitative phytoche mica l analys is of various alcoholic extracts of root parts of potatoes
Test Bartina Kuroda Kondor Spunta
Alkaloids + + + +
Coumarins + + + +
Flavonoids Alkalin reagent ++ ++ ++ ++
Hydroxyl + + + +
Phytosterols Liberman + + + +
Salkowski - - - -
Carbohydrates + + + +
Tanin - - - -
++ moderately present + Low - absent
Chapter V Phytochemical study of Solanum tubersum L
93
V24) Phytochemical contents
The Table V3 shows the total phenolic contents (TPC) and the total flavonoid contents
(TFC) of four kinds of potato samples unpeeled The amount of TPC from the whole tuber
ranged from 192144 to 088853 mg AG g of extract the results of different extracts showed
that the amount of TFC varied considerably from 109129 to 250350 mg rutin g of extract
Overall the samples showed the lower amount of TPC and TFC The results indicate that all
of the ethanolic extracts of four kinds has the amount of phenolics and flavonoids compound
but their content in ethanolic extract increasing in order was
Kondor gt Bartina gt Spunta gt Kuroda
Table V3 Determination of total Phenolics contents and total flavonoids of four kinds of
potatoes 24)جدول رقم ) 4Table V3 Determination of total P henolics contents and total flavonoids of four kinds of potatoes
Sample Total Polyphenols (mg AG
g of extract)
Total flavonoids (mg rutin g
of extract)
Kondor 192144 plusmn 0096 250350 plusmn 0125
Bartina 189596 plusmn 0094 235592 plusmn 0235
Spunta 124628 plusmn 0124 218057 plusmn 0218
Kuroda 088853 plusmn 0088 109129 plusmn 0076
V25) HPLC analysis
Identification and quantification of marker compounds were performed on the basis of
the coinjections and retention time matching with standards The HPLC fingerprint of
ethanolic extracts of roots and leaf revealed peaks at the retention time 50 min at 300 nm The
quantitive analysis of the chromatograms showed in Table III4
V251) Chromatograms of Kondor sample
The chromatographic profile of unpeeled extract the variety Kondor represented in
Level of the Figure V1 The results of quantitative analyses of phenolic compounds Identified
are represented in the Table V4 The analysis of these results shows that in The extract of the
variety Kondor the ascorbic acid (0189 microgmg) the Gallic acid (5294 microgmg) the
Chlorogenic acid (3052 microgmg) caffeic (0532 microgmg) Vanillin (0059 microgmg) and
Quercetin (1091 microgmg) we note that the Quercetin is the more representative and found
Chapter V Phytochemical study of Solanum tubersum L
94
only in the unpeeled Kondor sample But from the point of view of quantity the extract of
this variety shows a richness in bioactive compounds more than the extract of other varieties
Figure I 32Chromat ograms of unpeel ed Kondor extract(1)Ascorbi c aci d(2) Gallic a cid (3) Chlor ogeni c aci d(4) Caffeic acid (5) Quercet in (6)Vanilli n
Figure V1 Chromatograms of unpeeled Kondor extract(1)Ascorbic acid(2)
Gallic acid (3) Chlorogenic acid(4) Caffeic acid (5) Quercetin (6)Vanillin
V252) Chromatograms of Bartina sample
Figure V2 shows the chromatographic profile of extract of the unpeeled Bartina variety
The results of quantitative analysis of phenolic compounds Identified are represented in the
Table V4 The analysis of these results shows that in The extract of the variety Bartina the
ascorbic acid ( 0317 microgmg) the Gallic acid (7493 microgmg) the Chlorogenic acid (188
microgmg) caffeic (0021 microgmg) and Vanillin (00310 microgmg) We found that the Gallic acid is
the more representative But for Quercetin and rutin not exist in this variety
Chapter V Phytochemical study of Solanum tubersum L
95
Figure V2 Chromatograms of unpeeled Bartina sample extract(1)Ascorbic acid(2)
Gallic acid (3) Chlorogenic acid(4) Vanillin Figure I 33Chromatograms of unpeele d Barti na sample extract(1)Ascorbic a cid(2) Galli c aci d (3) Chl oroge nic a cid(4) Vanilli n
V253) Chromatograms of Spunta sample
The chromatograms qualitative and quantitative analyses of compounds Phenolic
compounds of unpeeled extracts of Spunta are represented below (Figures V3) and the
quantitative assessment of individual compounds identified is a recovery in the Table V4
The analysis of these results shows that in the extract of the variety the ascorbic acid ( 0025
microgmg) the Gallic acid (7804 microgmg) the Chlorogenic acid (0756 microgmg) The Gallic acid
is the more representative For Quercetin rutin and vaniline do not exist in this variety
Figure I 34Chromat ograms of unpeel ed Spunta sample extra ct(1)Ascorbic a cid(2) Gallic a cid (3) Chlorog eni c aci d
Figure V3 Chromatograms of unpeeled Spunta sample extract(1)Ascorbic acid(2)
Gallic acid (3) Chlorogenic acid
Chapter V Phytochemical study of Solanum tubersum L
96
V254) Chromatograms of Kuroda sample
The chromatograms of unpeeled extract of Kuroda variety shows in (Figure V4)
Qualitative and quantitative analyses of Phenolic compounds identified in the Table V4
Through this table it was note that the ascorbic acid ( 0203 microgmg) the Gallic acid (5
microgmg) the Chlorogenic acid (149 microgmg) and rutin (00016 microgmg) for Kuroda only from
this analysis the Gallic acid was the more representative compounds
Figure V4 Chromatograms of unpeeled Kuroda sample extract(1)Ascorbic
acid(2) Gallic acid (3) Chlorogenic acid(4) Rutine Figure I 35Chromat ograms of unpeel ed Kuroda sam ple extract(1)Ascor bic a cid(2) Galli c aci d (3) Chl oroge nic a cid(4) Rutine
Table V4 Constituents content analyzed by HPLC 24)جدول رقم ) 5Table V4 Constituents content analyze d by HP LC
Sample extract Bartina Kondor Kuroda Spunta
Ascorbic acid [microgmg] 03176 01896 02304 00256
Gallic acid [microgmg] 74936 52946 55922 78047
Chlorogenic acid [microgmg] 18864 30520 14900 07566
Caffeic acid [microgmg] - 05322 - -
Quercetin [microgmg] - 109197 - -
Vanillin [microgmg] 00310 00596 - -
Rutine [microgmg] - - 00016 -
V26) Antioxidant capacity
As mentioned above the methods used to determine total antioxidant activity devised in
two techniques First one is spectrophotometers methods Secondly an electrochemistry
Chapter V Phytochemical study of Solanum tubersum L
97
technique in this process we used cyclic voltammetry methods to determine the antioxidant
activity
V261) Spectrophotometers
V2611) FRAP assay
Ferric reducing antioxidant power (FRAP) is based on the ability of the antioxidant to
reduce Fe3+ to Fe2+ according to Rodriquez amp Hadley the ethanolic extracts of potato
tubers showed marked hydrogen-donating activity using reducing power in the Fe(III) AElig Fe
(II) reaction in FRAP assay [9]
Based on the FRAP assay (Table V5) the results indicated that the whole root
(unpeeled) samples had a reducing antioxidant power However the results indicated that
Kondor extract had the highest level of reducing power with value of 388032 mg Fe(II) g of
extract this activity may due to the contents of flavonoids The Kuroda extract indicates the
lowest reducing antioxidant power with a value of 227442 mg Fe(II) g of extract All the
extract samples showed reducing antioxidant power but less than ascorbic acid
Table V5 Determination of reducing the antioxidant power of four kinds of potatoes 24)جدول رقم ) 6Table V5 Determination of reducing the antiox idant power of four kinds of potatoes
Sample FRAP (mg Fe(II) g of extract)
Kondor 388032 plusmn 0043
Bartina 315543 plusmn 0010
Spunta 296169 plusmn 0007
Kuroda 227442 plusmn 0005
Ascorbic acid 2512985 plusmn 0020
Gallic acid 77782511 plusmn 0388
V2612) DPPH
DPPH scavenging activity () had increased with the increased concentration of the
extract in all samples (Figure V 5 6 and 7) The stable DPPH free radical accepts an electron
or hydrogen radical from donors to form a stable molecule which could be seen as color
reduction
Chapter V Phytochemical study of Solanum tubersum L
98
V26121) Calculation of radical inhibition
Kondor extract was the strongest electron or hydrogen donor due to the highest DPPH
scavenging activity The IC50 value of each extract is deducted from the equations of the
curves of the variation in the percentage of inhibition I as a function of the concentration of
each extract as shown in Figure V5 and annexe (A)
The IC50 of DPPH scavenging activity of the Kondor Bartina Spunta and Kuroda
extracts were 121 mgml 212 mgml 254 mgml and 386 mgml respectively for unpeeled
extracts Gallic acid and ascorbic acid however showed the highest value 00069 mgml and
001 mgml All the results have a very statistically significant with plt0000 (Table V6)
00 02 04 06 08 10 12 14 16
0
10
20
30
40
50
60
70
In
hib
itio
n
Concentratio (mgml)
IC50= 121
Figure V5 The percent DPPH radical inhibition as a function of the concentration of
of unpeeled Kondor
Figure I 36T he per ce nt DPPH radi cal inhibiti on a s a functi on of the concentrati on of of unpeele d Kondor
Table V6 IC50 values of sample extracts using DPPH 10)جدول رقم ) 7Table V6 IC50 values of sample extracts us ing DPPH
Sample DppH
Equation R2 value IC50 P
Kondor Y = 333 + 383 X 0994 121 0000
Bartina Y = - 044 + 237 X 0968 212 0000
Spunta Y = - 453 + 214 X 0952 254 0000
Kuroda Y = - 530 + 143 X 0973 386 0000
Ascorbic acid Y= 094 + 4720X 0972 0010 0000
Gallic acid Y=-678 + 8154X 0982 00069 0000
inhibition expressed as mgml
Chapter V Phytochemical study of Solanum tubersum L
99
V26122) Calculation of the binding constant
The electronic spectra of complexes extractndashDppH were recorded in the range 200-900
nm which showed intense absorption at range 515-518 nm The determination of binding
constant Kb of extractndashDppH complex can be calculated from the inhibition of absorbance in
UV-spectra after the addition of unpeeled sample extract ( Figure V6 and 7) Benesi-
Hildebrand equation is used to evaluate binding constants spectrophotometrically [10-12]
Where
Ao and A are the absorbances of free and bound extract
εG and εH-G are their molar extinction coefficients respectively (H and G correspond
to host and guest)
A plot of Ao (A-Ao ) to 1[extract] has shown linearity which is suggestive of 11
complex formation of both extracts with DppH The intercept to slope ratio of this plot gives
the value of binding constant ldquoKb rdquo (Annexe) Kb values were calculated given in Table V7
UV spectra of DppH showed a hypochromic effect upon addition of sample extract the
intensity decreased rapidly with increasing concentration of the extract were recorded in
Figure III5 6 In the absence of sample extract the DppH displayed one absorbance peak at
517 nm this peak intensity exhibited hypochromism up from 56 to 77 for 2 mgml
concentration of sample extract
The values of binding constant ldquoKb rdquo were further used to calculate standard Gibbs free
energy ldquo∆Grdquo of extractndashDppH complex using the following equation
Free energy changes of extracts values Table V7 and showed spontaneous of their binding
with DppH The p-value of the results was lt005 which a significant statistically
HYPOCHROMIC EFFECT decrease in the intensity of a spectral band due to substituents or interactions with the
molecular environment Source PAC 1996 68 2223 (Glossary of terms used in photochemistry (IUPAC Recommendations 1996)) on page 2247
Chapter V Phytochemical study of Solanum tubersum L
100
400 450 500 550 600 650 700
00
02
04
06
08
10
12
14
Abs
Wavelength nm
00 mgml
0005 mgml
001 mgml
005 mgml
01 mgml
025 mgml
075 mgml
05 mgml
1 mgml
125 mgml
15 mgml
(a)
400 450 500 550 600 650 700
00
02
04
06
08
10
12
Abs
Wavelength nm
00 mgml
005 mgml
015 mgml
05 mgml
057 mgml
1 mgml
15 mgml
2 mgml
(b)
400 450 500 550 600 650 700
00
02
04
06
08
10
12
14
16
Ab
s
Wavelength nm
00 mgml
005 mgml
01 mgml
025 mgml
05 mgml
075 mgml
1 mgml
15 mgml
2 mgml
25 mgml
3 mgml
35 mgml
(C)
400 450 500 550 600 650 700
02
04
06
08
10
12
14
16
Ab
s
Wavelength nm
00 mgml
005 mgml
01 mgml
025 mgml
05 mgml
075 mgml
1 mgml
125 mgml
15 mgml
2 mgml
3 mgml
(d)
Figure V6 Electronic absorption spectra of 025 mM of DPPH interaction with Roots of (a)
Kondor (b) Bartina (c) Spunta (d) Kuroda Figure I 37Electr oni c absorpti on spe ctra of 025 mM of DPPH intera ction with Roots of (a) Kondor (b) Bartina (c) Spunta (d) Kuroda
a decrease in absorption intensity
400 450 500 550 600 650 700
00
02
04
06
08
10
12
14
Ab
s
Wavelength nm
00 mgml
15 10-3 mgml
2 10-3 mgml
3 10-3 mgml
4 10-3 mgml
5 10-3 mgml
6 10-3 mgml
7 10-3 mgml
8 10-3 mgml
9 10-3 mgml
10-2 mgml
(GA)
400 450 500 550 600 650 700
00
02
04
06
08
10
12
14
16
Abs
Wavelength nm
00 mgml
15 10-3 mgml
2 10-3 mgml
4 10-3 mgml
5 10-3 mgml
6 10-3 mgml
7 10-3 mgml
8 10-3 mgml
9 10-3 mgml
10-2 mgml
(AAS)
Figure V7 Electronic absorption spectra of 025 mM of DPPH interaction with (GA) Gallic
acid (AAS) Ascorbic acid Figure I 38 Ele ctronic a bsorption spectra of 025 mM of D PPH i nteracti on wit h (GA) Gallic a cid (AAS) Ascorbi c aci d
Chapter V Phytochemical study of Solanum tubersum L
101
Table V7 Values of Binding constants and binding free energy of the complexes DppH-
sample extracts رقم 10)جدول ) 8Table V7 Values of Bind ing cons tants and b inding free energy of the complexes DppH- sample extracts
Compound Equation R2 K ΔG P
Unpeeled
DppH-Kondor Y = -0031x + 24387 09089 786266 -10822 0012
DppH-Bartina Y = -006x + 17288 09289 288133 -08332 0008
DppH-Spunta Y = -00061x +07297 09102 1190375 -11849 0012
DppH-Kuroda Y = -00273x +13812 09804 505934 -09728 0001
Standard
Ascorbic acid Y =-62892x+ 35856 0988 500120 -10024 0000
Gallic acid y = -46163x + 38709 09243 838523 -1098 0001
V262) Electrochemistry assay
All the voltammograms obtained from cyclic voltammetry assay (CV) for the four
samples in fixed pH=36 (acetate buffer 300mM) This assay have the same principle as
FRAP assay thats why this pH value is chosen The CVs present one oxidation peak in range
from +087 V to +102 V (Figure V8) also for ascorbic acid had a peak at +054 V (Figure
V8) and two oxidation peaks at +04V and +07V for gallic acid (Figure III9) The
electrochemical behavior observed for the unpeeled potatoes extracts with oxidation potential
value more positive than gallic acid these peaks indicate that the sample extracts contain
flavonoids compounds showed low or very low activity in the FRAP assay according to Firuzi
and Lacanna [13]
Chapter V Phytochemical study of Solanum tubersum L
102
02 04 06 08 10 12 14
-2
0
2
4
6
8
10
12I
[microA
cm
sup2]
Potential [ V]
(a)
02 04 06 08 10 12 14
-5
0
5
10
15
20
I [micro
Ac
msup2]
Potential [ V]
(b)
02 04 06 08 10 12 14
-2
0
2
4
6
8
10
12
I [micro
Ac
msup2]
Potential [ V]
(c)
02 04 06 08 10 12 14
-4
-2
0
2
4
6
8
10
12
14
16
I [micro
Ac
msup2]
Potential [ V]
(d)
02 04 06 08 10 12 14
-2
0
2
4
6
8
10
12
14
I [micro
Ac
msup2]
AS
Potential [ V]
(e)
Figure V8 Voltammograms obtained for unpeeled extract of (a) Kondor (b) Bartina (c)
Spunta (d) Kuroda and (e) for Ascorbic acid by cyclic voltammetry in pH=36 acetate buffer Figure I 39V oltammograms obtaine d for unpeel ed extra ct of (a) Kondor (b) Bartina (c) Spunta (d) Kuroda and (e) for Ascorbic a cid by cycli c voltammetry in pH=36 a cetate buffer
Table V8 shows The oxidation of samples extract studied by cyclic voltammetry
showed capacity antioxidant expressed in terms of gallic acids (AG) equivalent antioxidant
capacity obtained from an electrochemical assay in ethanolic extract of four samples with
Chapter V Phytochemical study of Solanum tubersum L
103
values ranged from 534813 mg EAGg extract to 345025 mg EAGg extract On the other
hand ascorbic acid showed a higher capacity antioxidant with 6374624 mg EAGg extract
This capacity related to the potential peaks which determined the antioxidant power of sample
extracts according to Firuzi and Lacanna [13] the flavonoids which have potential peaks at
range from +044 to +071 V this groups were active antioxidants in the FRAP assays
Table V8 Determination of the Antioxidant capacity of four kinds of potatoes by CV
Sample Antioxidant capacity CVa Eap
b (V)
Unpeeled
Kondor 534813 plusmn 0254 +088
Bartina 449876 plusmn 0325 +089
Spunta 364515 plusmn 0481 +095
Kuroda 345025 plusmn 0341 +090
Ascorbic acid 6374624 plusmn 0117 +054
a capacity antioxidant expressed as milligrams of gallic acid equivalent per gram of extract
b Anodic oxidation potential vs GCE
V2621) Electrochemistry behavior
Figure V9 shows cyclic voltammograms for unpeeled Kondor extracts in DMF01
TBFP solvent the observed behavior of the extract of all samples the whole roots at potential
range (+200V to +1400V) present one oxidation peak recorded between + 1029V to
+1066V (Table V9 Fig V9) The cyclic voltammograms of all samples extracts depends on
the chemical structures the observed electrochemical behavior of all samples extracts showed
similarly in both solvent cell aqueous buffer acetate PH 36 03 mM (Figure V 8 Table V
8) and organic solvent (DMF) with a shifts to positive potential side up from 1210 to 2113
in case of unpeeled extracts of Spunta and Kondor sample respectively in DMF solution It is
worth noting that all cyclic appearance under the same patterns indicating the producibility of
the resistant of the solution the phenomena
Chapter V Phytochemical study of Solanum tubersum L
104
02 04 06 08 10 12 14
-10
0
10
20
30
40
50
60
I[micro
Ac
msup2]
Potential [ V]
(a)
Figure V9 Voltammograms obtained for unpeeled Kondor sample by cyclic
voltammetry in DMF
Figure I 40Voltamm ograms obta ine d for unpeel ed Kondor sample by cycli c voltammetry in D MF
Table V9 Determination of the oxidation peaks of four kinds of potatoes by CV in DMF 10)جدول رقم ) 9Table V9 Determination of the ox idation peaks of four kinds of potatoes by CV in D MF
Samples Eap (V)
Unpeeled
Kondor + 1066
Bartina + 1047
Spunta + 1065
Kuroda + 1029
Anodic oxidation potential vs GCE
V2622) Electrochemistry assay radical scavenging activity
The quantification of antioxidant in the extract is made by calculating the inhibition
concentration (IC50) value radical scavenging activity was plotted against different
concentrations of extract samples the effect of different concentrations is shown in (Figure
III11 and 12) for radical scavenging activity All the voltammograms of superoxide
anion radical Figure III11 12 showed one electron reversible process having well developed
and clear oxidation and reduction peaks On the level of anodic current the decreasing of
peaks according to the addition of sample extracts
The equation obtained from the linear calibration graph figure V10 In the studied
concentration range of samples extracts are presented in Table V10 where y stand for the
value of the oxidation peak current density of and x represents the value of the
concentration of ethanolic extracts expressed as mgmL The Kondor extracts have a less IC50
Chapter V Phytochemical study of Solanum tubersum L
105
with 103 and for Kuroda sample has the highest IC50 with 1819 mgmL All the IC50 values
were considered as very statistically significant with plt0005
01 02 03 04 05 06 07
5
10
15
20
25
30
35
In
hib
itio
n
Concentration (mgml)
Figure V10 The percent radical inhibition as a function of the concentration
of unpeeled Kondor
Figure I 41T he per ce nt O_2 ^(∙-) radica l inhi bition as a functi on of the conce ntration of unpeel ed Kondor
Table V10 IC50 values of sample extracts using radical scavenging activity
24)جدول رقم ) 10Table V10 IC50 values of sample extracts using O_2^(∙-) radica l scaveng ing activity
Sample Equation R2 value IC50 P
Unpeeled
Kondor Y= 156 + 468 X 0989 10350 0000
Bartina Y= - 752 + 506 X 0923 11367 0002
Spunta Y= - 0134 + 276 X 0988 18164 0000
Kuroda Y = - 423 + 298 X 0987 18197 0000
Standard
Ascorbic acid Y = -3118 + 9284 X 0995 00572 0000
α-tocopherol Y = 210 + 2510 X 0845 01908 0027
Chapter V Phytochemical study of Solanum tubersum L
106
-16 -14 -12 -10 -08 -06 -04 -02 00 02
-150
-100
-50
0
50
100
I [micro
Ac
msup2]
Potential [ V]
00 ml
01 ml
014 ml
02 ml
024 ml
03 ml
034ml
04 ml
044 ml
05 ml
06 ml
(a)
-16 -14 -12 -10 -08 -06 -04 -02 00 02
-200
-150
-100
-50
0
50
100
150
I [micro
Ac
msup2]
Potential [ V]
00 ml
01 ml
02 ml
03 ml
04 ml
044 ml
05 ml
06 ml
(b)
-16 -14 -12 -10 -08 -06 -04 -02 00 02
-200
-150
-100
-50
0
50
100
150
I [micro
Ac
msup2]
Potential [ V]
00 ml
01 ml
02 ml
03 ml
04 ml
05 ml
06 ml
07 ml
(C)
-16 -14 -12 -10 -08 -06 -04 -02 00 02
-200
-150
-100
-50
0
50
100
150
Potential [ V]
I [micro
Ac
msup2]
00 ml
01 ml
02 ml
03 ml
04 ml
05 ml
06 ml
07 ml
086 ml
(d)
Figure V11 Cyclic voltammograms of oxygen-saturated in the absence and presence of
different concentration of sample extract Roots (a) Kondor (b) Bartina (c) Spunta (d) Kuroda
at scan rate 100 mVs
-18 -16 -14 -12 -10 -08 -06 -04 -02 00 02
-150
-100
-50
0
50
100
O2
01 mgml
03 mgml
05mgml
07mgml
1 mgml
I [micro
Ac
m2]
Potentiel [ V]
(a)
-18 -16 -14 -12 -10 -08 -06 -04 -02 00 02
-150
-100
-50
0
50
100
O2
N2
01 mgml
03 mgml
05mgml
07mgml
1 mgml
I[micro
Ac
m2]
Potentiel [ V]
(b)
Figure V12 Cyclic voltammograms of oxygen-saturated in the absence and presence of
different concentration of standard (a) ascorbic acid (b) α-tocopherol at scan rate 100 mVs
Chapter V Phytochemical study of Solanum tubersum L
107
V2623) Ratio of binding constants (KoxKred)
Scheme1 The redox behavior of the free radical and its bounded forms SE
The peak potential shift values additionally pointed out that Obull2
minusis easier to oxidize in
the presence of ethanolic extract because its reduced form Obull2
minusis more strongly bound to
extract than its oxidized form For such a system where both forms of the O2 Obull2minus redox
couple interact with the potential antioxidant compound scheme 2 can be applied [16] Based
on the process presented in scheme 2 the following equation is obtained [17]
Where and
are the formal potentials of the O2 Obull2
minus redox couple in the free and bound
forms respectively and are calculated using the following formulas (3) and (4)
Figure V11 and 12 shows the CVrsquos behavior of oxygen-saturated DMF01 TBFP in the
potential window of -14 to 00 V at a glassy carbon electrode in the absence and presence of
04 mL sample extracts the free O2 redox couple exhibits a single oxidation peak at minus072
V and a single reduction peak at minus074 V These Figures also shows the effect of the addition
of extract on the oxidation peak current of O2
The CV technique was also helpful to determine the mechanism of free radical
scavenging the observed changes in anodic peak current of O is caused by the addition of
different content of ethanolic extracts this decrease in anodic peak can be used for the
calculation of the binding constant where the shift in peak potential values can be employed
for the determination of the mode of interaction in the same manner used for study of
binding of drug molecules to DNA [1415]
Chapter V Phytochemical study of Solanum tubersum L
108
By adding 04 ml of sample extracts in solution of DMF the peak potential was shifted
by ΔE the peak potential was displaced by ΔEf0 mV to more negative for complex
-
Kondor and more positive for the rest of the complexes which associated with the decrease in
oxidation peak current densities ΔIpa which confirms the interaction of ethanolic extracts
with (Table V11 and 12) The significant decrease in oxidation peak current densities can
be attributed to the diminution in concentration due to the formation of sample extract
complex
Table V11 Shifts in peak potential and a decrease in anodic peak current of bound forms
of Roots extract samples 24)جدول رقم ) 11Table V11 Shifts in peak pote ntial and a decrease in anodic peak current of O_2^(∙-) bound for ms of R oots extract samples
Sample Ipa (microA) Epa (V) Epc (V) Ef0 (V) ΔEf0(mV) ΔIpa KoxKred
- 1342672 -07068 -07247 -07157 - - -
Kondor 1042637 -0678 -07566 -07173 -15574 223460 094
- 1373784 -07251 -07714 -07482 - - -
-Bartina 118844 -07251 -07624 -07438 44776 134914 119
- 1375848 -07149 -07438 -07294 - - -
-Spunta 114627 -07021 -07477 -07249 44776 166863 119
- 1424359 -07613 -07800 -07706 - - -
-Kuroda 1237957 -07519 -07617 -07568 138221 130867 171
Chapter V Phytochemical study of Solanum tubersum L
109
-16 -14 -12 -10 -08 -06 -04 -02 00 02
-200
-150
-100
-50
0
50
100
I [micro
Ac
msup2]
Potential [ V]
00
04 ml
(a)
-16 -14 -12 -10 -08 -06 -04 -02 00 02
-200
-150
-100
-50
0
50
100
150
I [micro
Ac
msup2]
Potential [ V]
00 ml
04 ml
(b)
-16 -14 -12 -10 -08 -06 -04 -02 00 02
-200
-150
-100
-50
0
50
100
150
I [micro
Ac
msup2]
Potential [ V]
00 ml
04 ml
(C)
-16 -14 -12 -10 -08 -06 -04 -02 00 02
-200
-150
-100
-50
0
50
100
150
I [micro
Ac
msup2]
Potential [ V]
00 ml
04 ml
(d)
Figure V13 Cyclic voltammograms of oxygen-saturated in the absence and presence of 04
ml sample extract Roots (a) Kondor (b) Bartina (c) Spunta (d) Kuroda at scan rate 100 mVs Figure I 42voltamm ograms of oxygen-sat urated i n the a bse nce a nd prese nce of 04 ml sampl e extract Root s (a) Kondor (b) Barti na (c) Spunta (d) Kuroda at sca n rate 100 mVs
Table V12 Shifts in peak potential and a decrease in anodic peak current of bound forms
of Standard samples 24)جدول رقم ) 12Table V12 Shifts in peak pote ntial and a decrease in anodic peak current of O_2^(∙-) bound for ms of F lesh extract samples
Sample Ipa (microA) Epa(V) Epc(V) Ef0 (V) ΔEf0
(mV)
ΔIpa KoxKred
- 1295016 -07825 -06462 -07143 - - -
-Ascorbic
acid
1208858 -07798 -06676 -07237 -935 66530 069
- 1275129 -06453 -07752 -07102 - - -
-
α-tocopherol
1211147 -06458 -07707 -07080 225 50177 109
Chapter V Phytochemical study of Solanum tubersum L
110
-18 -16 -14 -12 -10 -08 -06 -04 -02 00 02
-150
-100
-50
0
50
100
I [micro
Ac
msup2]
Potential [ V]
00 ml
03 ml(a)
-18 -16 -14 -12 -10 -08 -06 -04 -02 00 02
-150
-100
-50
0
50
100
I [micro
Ac
msup2]
Potential [ V]
00 ml
03 ml(b)
Figure V14 Cyclic voltammograms of oxygen-saturated in the absence and presence
of 03 ml sample extract (a) Ascorbic acid (b) α-tocopherol at scan rate 100 mVs Figure I 34 Cyclic voltammogram s of oxygen-sat urated i n the a bse nce a nd prese nce of 03 ml sampl e extract (a) Ascor bic a cid (b) α-t ocopherol at scan rate 100 mVs
Figure I 44 Cycli c voltammograms of oxygen-saturate d in t he absence and pre sence of differe nt conce ntration of sampl e extract Root s (a) Kondor (b) Bartina (c) Spunta (d) Kuroda at scan rate 10 0 mVs
V2624) Thermodynamic properties
To quantify the results the strength of interaction between superoxide anion radical and
the probable antioxidant in the extract was estimated in terms of binding constant Kb Based
on the decrease in peak current the binding constant (Kb) was calculated using following
equation Feng et al [18]
(5)
Where Ipo and Ip are the peak currents of superoxide anion radical in the absence and
presence of additives respectively [AO] is the concentration of the antioxidant As [AO] is
not known therefore this term was replaced by the volume of the extracts (∆Vext) It is
noticeable that the volume of the solution containing is fixed thus the addition of volume
increments of the extract is proportional to the addition of more number of moles (ie
concentration) of the compound(s) according to Safeer et al [19] Another thermodynamic
parameter standard Gibbs free energy (∆G˚) was calculated using the measured Kb
The obtained values from CVs voltammograms showed in Figure V13 and 14
indicated that the binding constant (Kb) ranged as the follows
- α-tocopherol lt
-Spunta lt Kondor lt
-Ascorbic acid lt -Kuroda lt
-Bartina
The values of free energy varied in the same order as of the binding constant The negative
values of ∆G indicated the spontaneity of interaction The data obtained in Table
V13 were very statistically significant with plt0002
Chapter V Phytochemical study of Solanum tubersum L
111
Table V13 Values of Binding constants and binding free energy of the complexes -
sample extracts 24)جدول رقم ) 13Table V13 Values of Binding constants and binding free energy of the complexes O_2^(∙-)-sample extracts
Compound Equation R2 K ΔG P
Unpeeled
-Kondor y = 09086x + 28778 0990 075474x102 -1642 0000
-Bartina y = 04818x + 31119 0956 131522x102 -1780 0001
-Spunta y = 08952x + 28012 0986 063270x102 -1599 0000
-Kuroda y = 0576x + 29473 0986 088572x102 -1682 0000
Standard
-Ascorbic acid y = 05923x + 28376 0996 068801x102 -1619 0000
-α-tocopherol y = 115x + 2035 0959 010839x102 -1161 0001
V2625) Diffusion coefficients
The redox process of the four sample extracts as a function to scan rates presented in
Figure V15 and 16 The voltammogram contained a couple of a clear stable oxidation and
reduction peaks attributed to the electrochemical behavior of the redox O2 couple In
addition demonstrate clearly the reversibility of the oxidation reaction of the redox couple
O2 as the oxidation peak potentials are not significantly affected by the variation in the
scan rate
The diffusion coefficients of the free radical and its
bounded forms with
ethanolic extract were calculated from the following RandlesndashSevcik equation [20]
Where i presents the oxidation peak current density S presents the surface of the
working electrode (cm2) C is the bulk concentration (molcm
-3) of the electroactive species D
present the diffusion coefficient (cm2s) and v is the scan rate (Vs) The linearity of the plot
of the four adducts Further demonstrates that the kinetic of the oxidation
reaction is limited by the diffusion process The diffusion coefficients were determined from
the slopes of the plot ipa vs the square root of the scan rate Values are given in Table V14
Chapter V Phytochemical study of Solanum tubersum L
112
Table V14 shows that the diffusion coefficient of complexes is lower than
that of the free radical The diffusion coefficients of four adducts are very close because
sample complexes have the same contents the slight difference can only be attributed to the
amount of the phytochemical compound
-16 -14 -12 -10 -08 -06 -04 -02 00 02
-300
-200
-100
0
100
200
a
Potential [ V]
500
400
300
200
100
-16 -14 -12 -10 -08 -06 -04 -02 00 02
-300
-200
-100
0
100
200
b
Potential [ V]
500
400
300
200
100
-16 -14 -12 -10 -08 -06 -04 -02 00 02
-300
-200
-100
0
100
200
C
Potential [ V]
500
400
300
200
100
-16 -14 -12 -10 -08 -06 -04 -02 00 02
-400
-300
-200
-100
0
100
200
d
Potential [ V]
500
400
300
200
100
-16 -14 -12 -10 -08 -06 -04 -02 00 02
-300
-200
-100
0
100
200
e
Potential [ V]
500
100
400
300
200
Figure V15 Succession of cyclic voltammograms at GC electrode in oxygen-saturated
DMF01 TBFP at different scan rates ranging from 100 to 500 mVs unpeeled (a) -
Kondor (b) -Bartina (c)
-Spunta (d) -Kuroda and (e) for
Figure I 45Successi on of cycli c voltammograms at GC electr ode i n oxyge n-saturate d DMF01 T BFP at different sca n rates rangi ng from 100 to 5 00 mVs unpeele d (a) O_2^(∙-) -Kondor (b) O_ 2^(∙-)-Bartina (c) O_2^(∙ -)-Spunta (d) O_ 2^(∙-)-Kur oda a nd (e) for
Chapter V Phytochemical study of Solanum tubersum L
113
10 12 14 16 18 20 22 24
100
120
140
160
180
200
220
240
260
280
ipa [
microA
cm
sup2]
Vfrac12 (mVs)
I A
I Bartina
I Spunta
I Kuroda
I kondor
Figure V16 ipa versus V12 plots of oxygen-saturated DMF A in absence of 04 ml of
unpeeled extract Figure I 46 i pa versus V1 2 pl ots of oxyge n-saturate d DMF A in a bse nce of 04 ml of unpeel ed extract
Table V14 Diffusion coefficient values 24)جدول رقم ) 14Table V14 Diffusion coefficient values
Sample Equation R2 values D (cm
2s)
Roots
Obull2minus y = 11046x + 24721 0998 187x10-6
Obull2minus-Kondor y = 76929x + 25282 0997 909 x10-7
Obull2minus-Bartina y = 68567x + 44991 0978 722 x10-7
Obull2minus-Spunta y = 73768x + 41425 0999 836 x10-7
Obull2minus-Kuroda y = 7941x+ 45149 0999 968 x10-7
Chapter V Phytochemical study of Solanum tubersum L
114
V27) Discussion
As discussed in chapter II5 potatoes contain a number of phytochemicals compounds
which have an antioxidant and antibacterial activity This function had a role in disease
prevention The purpose of this experiment was to assess the relative phenolic and flavonoids
content on the potential antioxidant capacity of four different potatoes varieties
Based on the results which identified the cultivars with the greatest total phenolics
content and flavonoids content all the four potatoes varieties show great levels of phenolic
and flavonoids content Kondor in particular had much greater in phenolics content (101-
216) and flavonoids content (106-229) times greater than other varieties Similar to finding
in HPLC analysis extraction from Kondor root sample has been shown to exhibit variable
degrees of Quercetin acid with a high content 1091 microgmg and Caffeic acid with 053 microgmg
These acids present only in Kondor root variety
The difference of genetic and cultivars condition caused variable effects amongst
phytochemical compounds in potatoe samples The major trends appeared to include a general
difference in the actual quantity of the phytochemical compounds that are present in potatoes
sample the other trends include a disappeared of some compounds such as vanillin
disappeared in Spunta and Kuroda samples for the rutine was present only in Kuroda sample
As expected due to the high phytochemical content Kondor variety has the greatest in
vitro antioxidant capacity Two techniques used to measure antioxidant capacity were
spectrophotometers (FRAP and DppH) and electrochemical (total antioxidant activity and
O2) Results of the FRAP and CV assays from different technique with the same principle
measure directly the antioxidant activity showed that the four potato varieties have an
antioxidant potential Kondor also displayed the greatest protection against radicals DppH and
O2 then the other four potato cultivars
Finally Kondor has a great potential for future development as a marketable food
product Kondor production has also the potential to contribute in useful ways to the
development goals in health more than Bartina Kuroda and Spunta other potato varieties
Chapter V Phytochemical study of Solanum tubersum L
115
V3) Experiment Two Kondor tuber analysis
V31) Aim
The phytochemical content of the tuber of Kondor will then be further quantified to
investigate (a) to what extent of the phenolic and flavonoids content (b) HPLC analysis (c)
antioxidant activity by the two techniques mentioned above and another spectrophotometer
assay Except where stated analyses were carried out on Kondor variety in two cases the first
one is the whole tuber (unpeeled) and the second is the tuber flesh (peeled)
V32) Phytochemical contents
The Table V19 shows the total phenolic contents (TPC) and the total flavonoid
contents (TFC) of Kondor variety in two cases the whole root and the flesh The tuber
samples flesh showed the lower amount of TPC and TFC than the whole tuber sample
Table V19 Determination of total Phenolics contents and total flavonoids of the
unpeeled and the peeled 24)جدول رقم ) 15Table V19 Determination of total P heno lics contents and total flavonoids of t he who le root and the flesh
Kondor Sample Total Polyphenols (mg AG g of
extract)
Total flavonoids (mg rutin g of
extract)
unpeeled 192144 plusmn 0096 250350 plusmn 0125
peeled 146496 plusmn 0102 146878 plusmn 0073
As previously shown in the first experiment with regards to the quantity of total
phenolic in different potato tubers the presence of these compounds contributors with the
order Kondor (unpeeled) gt Bartina (unpeeled) gt Kondor (peeled) gt Spunta (unpeeled) gt
Kuroda (unpeeled)
A return to the total flavonoids content in all five extract samples these compounds
decreasing in contribution was Kondor (unpeeled) gt Bartina (unpeeled) gt Spunta (unpeeled)
gt Kondor (peeled) gt Kuroda (unpeeled)
However these results showed that the extract of peeled Kondor has a great value in
phytochemical content when compared to the whole tuber component in all varieties
Chapter V Phytochemical study of Solanum tubersum L
116
V33) HPLC analysis
The chromatographic profile of extract of the unpeeled sample and the peeled sample of
the variety Kondor represented in Level of the figures (V1 and V17) The results of
quantitative analyses of phenolic compounds Identified are represented in the Table V20 The
analysis of these results shows that in The extract of the variety Kondor in case of peeled the
ascorbic acid (0226 microgmg) the Gallic acid (5764 microgmg) the Chlorogenic acid (1845
microgmg) For the caffeic acid Vanillin and Quercetin present only in the unpeeled sample But
from the point of view of quantity the extract of the whole tuber (unpeeled) of Kondor is
richness than the extract of the peeled
Table V20 Constituents content analyzed by HPLC 24)جدول رقم ) 16Table V20 Constitue nts content ana lyzed by HP LC
Sample extract Kondor
unpeeled peeled
Ascorbic acid [microgmg] 01896 02266
Gallic acid [microgmg] 52946 57646
Chlorogenic acid [microgmg] 30520 18450
Caffeic acid [microgmg] 05322 -
Quercetin [microgmg] 109197 -
Vanillin [microgmg] 00596 -
The HPLC analysis of all five extract samples presented in tables V20 and V4 When
compared to the proximate composition of three bioactive compounds found in all potato
tubers Gallic acid is mostly concentrated in all four varieties (780 - 529 microgmg) greater in
the unpeeled sample and Kondor peeled sample or Chlorogenic acid (305 - 075 microgmg)
followed by Ascorbic acid 031 - 002 microgmg
Chapter V Phytochemical study of Solanum tubersum L
117
Figure V17 Chromatograms of leaf extract(1)Ascorbic acid(2) Gallic acid (3)
Chlorogenic acid Figure I 47Chromatograms of leaf extract(1)Ascorbi c aci d(2) Gallic a cid (3) Chlor ogeni c aci d
V34) Spectrophotometers assays
The phytochemical analysis of bioactive compounds in Kondor variety unpeeled and
peeled samples showed a comprehensive identification of phenolics and flavonoids content
but rather presents an idea of the array of phytochemical compounds As there are many
phenolic compounds with different properties and characteristics Hence one particular assay
may be better at detecting a certain type of antioxidant compound than another and therefore
using more one assay enables a researcher to pick up a wide range of oxidative compounds
V341) FRAP assay
Ferric reducing antioxidant power (FRAP) is based on the ability of the antioxidant to
reduce Fe3+ to Fe2+ according to Rodriquez amp Hadley the ethanolic extracts of potato
tubers showed marked hydrogen-donating activity using reducing power in the Fe(III) AElig Fe
(II) reaction in FRAP assay [9]
Based on the FRAP assay (Table V21) the results indicated that the unpeeled samples
had a reducing antioxidant power more than the peeled sample with a value 388032 and
232443 mg Fe(II) g of extract respectively However the results mentioned above (Table
V5) shows three of potato unpeeled Kondor Bartina and Spunta had higher values of
reducing antioxidant power than Kondor peeled sample but less than Gallic acid and ascorbic
acid
Chapter V Phytochemical study of Solanum tubersum L
118
Table V21 Determination of reducing the antioxidant power of four kinds of potatoes 24)جدول رقم ) 17Table V21 Determination of reducing t he antioxidant power of four kinds of potatoes
Sample FRAP (mg Fe(II) g of
extract)
unpeeled 388032 plusmn 0043
peeled 232443 plusmn 0019
Ascorbic acid 2512985 plusmn 0020
Gallic acid 77782511 plusmn 0388
V342) Total antioxidant capacity
Several assays have been introduced for the measurement of the antioxidant activity of
plant extracts including total antioxidant capacity by the phosphomolybdenum method The
phosphomolybdenum method is based on the reduction of Mo(VI) to Mo(V) by the
antioxidant compounds and the formation of green Mo(V) complexes with a maximal
absorption at 695 nm [21] Using this method the result indicated that both the peeled and
unpeeled extracts of Kondor variety have an antioxidant capacity The unpeeled extract
displayed the higher antioxidant capacity than the peeled extract with value 4708 and 2787
mg ascorbic acid equivalentg extract respectively Overall the two samples had lower
antioxidant activity than the Gallic acid (Table V22)
Table V22 Determination of the Total antioxidant capacity of Kondor 24)جدول رقم ) 18Table V22 Determination of the Total antiox idant capacity of Kondor
Sample Total antioxidant capacity
unpeeled 470873 plusmn 0043
peeled 278784 plusmn 0019
GA 65654263 plusmn 0035
V343) β-carotene bleaching assay
In the β-carotene-linoleic acid coupled oxidation model system the linoleic acid-free
radical (LOO ) formed attacks the highly unsaturated β-carotene molecules and in the
absence of an antioxidant rapidly bleaches the typically orange color of β-carotene which is
monitored spectrophotometrically at 450 nm The extracts reduced the extent of β-carotene
bleaching by neutralizing the linoleate-free radical and other free radicals formed in the
system [22] The antioxidant activities of Kondor peeled and unpeeled extracts were
Chapter V Phytochemical study of Solanum tubersum L
119
determined after 120 min reaction time (Table V23) and compared with a well known
natural antioxidant gallic acid and ascorbic acid
However the results indicated that the extracts ranked in the following order unpeeled
extract (6842 plusmn 0007)gt peeled extract (5333 plusmn 0006) It is clear that the two extracts
are capable of inhibiting β-carotene bleaching and the activity depends on the amount of
extract The unpeeled extract showed the highest level of activity at 4 mgml and also
demonstrated a significant increase in activity compared to the peeled extract In a
comparison of the β-carotene bleaching activity gallic acid and ascorbic acid showed the
highest antioxidative activity at 008 mgml with values 6264 plusmn 0013 and 1651 plusmn
0007 respectively
Table V23 Determination of antioxidant activity of sample extracts using β-carotene
bleaching 24)جدول رقم ) 19Table V23 Determination of antioxidant activity of sample extracts using β-carotene bleaching
Sample extraction Concentration (mgml) Antioxidant activity
Unpeeled 075
15
4
032967 plusmn 0018
281250 plusmn 0014
684210 plusmn 0007
Peeled 075
15
4
084337 plusmn 0005
152941 plusmn 0019
533334 plusmn 0006
Ascorbic acid 003
006
008
046204 plusmn 0005
137500 plusmn 0008
165178 plusmn 0007
Gallic acid 003
006
008
212477 plusmn 0003
425287 plusmn 0005
626436 plusmn 0013
Additionally the inhibition of the antioxidant activity of β-carotene oxidation also
expressed as IC50 (Table V24) The IC50 value of each extract is deducted from the equations
of the curves of the variation in the percentage of inhibition I as a function of the
concentration of each extract as shown in Figure V18 and Annexe (A)
The IC50 scavenging activity of the Kondor unpeeled and peeled extracts were 285
mgml 390 mgml respectively Also for the gallic acid and ascorbic acid showed the highest
Chapter V Phytochemical study of Solanum tubersum L
120
value 0066 mgml and 021 mgml All the results have a very statistically significant with
plt0005 the order of antioxidant activity towards β-carotene oxidation was
Gallic acid gt Ascorbic acid gt Unpeeled gt Peeled
05 10 15 20 25 30 35 40 45
0
10
20
30
40
50
60
70
IC
Concentration
IC50
= 285 mgml
Figure V18 Antioxidant activity () of unpeeled Kondor assayed by β-carotenendash
linoleate bleaching
Figure I 48A ntioxidant activity () of unpeele d Kondor assayed by β-car otene ndashlinoleate bl eaching
Table V24 IC50 values of sample extracts using β-carotene bleaching
24)جدول رقم ) 20Table V24 IC50 values of sample extracts using β-carotene bleaching
Sample extraction Equation R2
IC50 P value
Unpeeled Y = 18779x - 3531 0954 285 0004
Peeled Y= 13231x - 1649 0993 390 0000
Ascorbic acid Y= 24154x - 2069 0918 021 0003
Gallic acid Y= 7848x - 22963 0993 0066 0000
V343) DPPH
DPPH scavenging activity () had increased with the increased concentration of the
extract in all samples (Figure V19) The stable DPPH free radical accepts an electron or
hydrogen radical from donors to form a stable molecule which could be seen as color
reduction
V3431) Calculation of radical inhibition
Kondor extract was the strongest electron or hydrogen donor due to the highest DPPH
scavenging activity The IC50 of DPPH scavenging activity of the Kondor unpeeled and
peeled extracts were 121 mgml 280 mgml respectively Also for the Gallic acid and
Chapter V Phytochemical study of Solanum tubersum L
121
ascorbic acid showed the highest value 00069 mgml and 001 mgml All the results have a
very statistically significant with plt0000 (table V24)
Table V24 IC50 values of sample extracts using DPPH 24)جدول رقم ) 21Table V24 IC50 values of sample extracts using DP PH
Sample DppH
Equation R2 value IC50 P
unpeeled Y = 333 + 383 X 0994 121 0000
peeled Y = - 347 + 257 X 0991 280 0000
Ascorbic acid Y= 094 + 4720X 0972 0010 0000
Gallic acid Y=-678 + 8154X 0982 00069 0000
inhibition expressed as mgml
V3432) Calculation of the binding constant
The electronic spectra of complexes extractndashDppH were recorded in the range 200-900
nm which showed intense absorption at range 515-518 nm The determination of binding
constant Kb of extractndashDppH complex can be calculated from the inhibition of absorbance in
UV-spectra after the addition of sample extract ( Figure V19)
As mention above A plot of Ao (A-Ao ) to 1[extract] has shown linearity which is
suggestive of 11 complex formation of both extracts with DppH The intercept to slope ratio
of this plot gives the value of binding constant ldquoKb rdquo (Annexe A) Kb values were calculated
given in Table V25
UV spectra of DppH showed a hypochromic effect upon addition of sample extract the
intensity decreased rapidly with increasing concentration of the extract were recorded in
Figure V20 In the absence of sample extract the DppH displayed one absorbance peak at 517
nm this peak intensity exhibited hypochromism up from 56 to 77 for 2 mgml
concentration of sample extract
The values of binding constant ldquoKb rdquo were further used to calculate standard Gibbs free
energy ldquo∆Grdquo of extractndashDppH complex using the following equation
Free energy changes of extracts values Table V25 and showed spontaneous of their binding
with DppH The p-value of the results was lt005 which a significant statistically
Chapter V Phytochemical study of Solanum tubersum L
122
400 450 500 550 600 650 700
00
02
04
06
08
10
12
14
Ab
s
Wavelength nm
00 mgml
0005 mgml
001 mgml
005 mgml
01 mgml
025 mgml
075 mgml
05 mgml
1 mgml
125 mgml
15 mgml
(a)
400 450 500 550 600 650 700
00
02
04
06
08
10
12
14
Ab
s
Wavelength nm
00 mgml
025 mgml
05 mgml
075 mgml
1 mgml
15 mgml
2 mgml
25 mgml
(a)
Figure V19 Electronic absorption spectra of 025 mM of DPPH interaction with of (a)
Unpeeled and (b) Peeled Figure I 49Ele ctronic a bsorption spectra of 025 mM of DPPH i nteracti on wit h of (a) Root and (b) Flesh
Table V25 Values of Binding constants and binding free energy of the complexes DppH-
sample extracts 24)جدول رقم ) 22Table V25 Values of Binding constants and binding free energy of the complexes D ppH- sample extracts
Compound Equation R2 K ΔG P
unpeeled
DppH-Kondor Y = -0031x + 24387 09089 786266 -10822 0012
peeled
DppH-Kondor Y = -00289x +19914 09129 689065 -10494 0011
V35) Electrochemistry assay
Table V26 shows The oxidation of Kondor samples extract studied by cyclic
voltammetry showed capacity antioxidant expressed in terms of gallic acids (AG) equivalent
antioxidant capacity obtained from an electrochemical assay in ethanolic extract of two cases
the unpeeled and the peeled This capacity related to the potential peaks which determined
the antioxidant power of sample extracts this potential peak show almost the same value but
the peeled sample has lower antioxidant capacity than the unpeeled
Table V26 Determination of the Antioxidant capacity of Kondor variety by CV 24)جدول رقم ) 23Table V26 Determination of the A ntioxidant capacity of Kondor variety by CV
Sample Antioxidant capacity CVa Eap
b (V)
unpeeled 534813 plusmn 0254 +088
peeled 305753 plusmn 0540 +087
a capacity antioxidant expressed as milligrams of gallic acid equivalent per gram of extract
b Anodic oxidation potential vs GCE
Chapter V Phytochemical study of Solanum tubersum L
123
V352) Electrochemistry assay radical scavenging activity
The quantification of antioxidant in the extract is made by calculating the inhibition
concentration (IC50) value radical scavenging activity was plotted against different
concentrations of extract samples the effect of different concentrations is shown in (Figure
V21) for radical scavenging activity All the voltammograms of superoxide anion radical
Figure V20 showed one electron reversible process having well developed and clear
oxidation and reduction peaks On the level of anodic current the decreasing of peaks
according to the addition of sample extracts
The equation obtained from the linear calibration graph (Annexe) in the studied
concentration range of samples extracts are presented in Table V27 where y stand for the
value of the oxidation peak current density of and x represents the value of the
concentration of ethanolic extracts expressed as mgmL The unpeeled Kondor extracts have
a less IC50 with 103 mgmL than peeled with 202 mgmL All the IC50 values were
considered as very statistically significant with plt0000
Table V27 IC50 values of Kondor sample extracts using radical scavenging activity
24)جدول رقم ) 24Table V27 IC50 values of Kondor sample extracts using O_2^(∙-) radical scaveng ing activity
Sample Equation R2 value IC50 P
unpeeled Y= 156 + 468 X 0989 10350 0000
peeled Y = - 416 + 267 X 0948 20284 0000
-16 -14 -12 -10 -08 -06 -04 -02 00 02
-150
-100
-50
0
50
100
I [micro
Ac
msup2]
Potential [ V]
00 ml
01 ml
014 ml
02 ml
024 ml
03 ml
034ml
04 ml
044 ml
05 ml
06 ml
(a)
-16 -14 -12 -10 -08 -06 -04 -02 00 02
-200
-150
-100
-50
0
50
100
I [micro
Ac
msup2]
Potential [ V]
00 ml
01 ml
02 ml
03 ml
04 ml
05 ml
06 ml
07 ml
08 ml
09 ml
(b)
Figure V20 Cyclic voltammograms of oxygen-saturated in the absence and presence of
different concentration of Kondor sample extract (a) unpeeled (b) peeled at scan rate 100
mVs Figure I 50 Cycli c voltammograms of oxyge n-saturate d in the absence and pre sence of different conce ntration of Kondor sam ple extract (a) unpeele d (b) peel ed at scan rate 1 00 mV
Chapter V Phytochemical study of Solanum tubersum L
124
V3521) Ratio of binding constants (KoxKred)
Figure V21 shows the CVrsquos behavior of oxygen-saturated DMF01 TBFP in the
potential window of -14 to 00 V at a glassy carbon electrode in the absence and presence of
04 mL sample extracts the free O2 redox couple exhibits a single oxidation peak at minus072
V and a single reduction peak at minus074 V These Figures also shows the effect of the addition
of extract on the oxidation peak current of O2
The CV technique was also helpful to determine the mechanism of free radical
scavenging the observed changes in anodic peak current of O is caused by the addition of
different content of ethanolic extracts this decrease in anodic peak can be used for the
calculation of the binding constant where the shift in peak potential values can be employed
for the determination of the mode of interaction in the same manner used for study of
binding of drug molecules to DNA [1415]
By adding 04 ml of sample extracts in a solution of DMF the peak potential was
shifted by ΔE the peak potential was displaced by ΔEf0 mV to more negative for complex
-Kondor in two cases unpeeled and peeled complexes which associated with the decrease
in oxidation peak current densities ΔIpa which confirms the interaction of ethanolic extracts
with (Table V28) The significant decrease in oxidation peak current densities can be
attributed to the diminution in concentration due to the formation of sample extract
complex
Table V28 Shifts in peak potential and a decrease in anodic peak current of bound forms
of Kondor extract samples 24)جدول رقم ) 25Table V28 Shifts in peak pote ntial and a decrease in anodic peak current of O_2^(∙-) bound for ms of Kondor extract samples
Sample Ipa (microA) Epa (V) Epc (V) Ef0 (V) ΔEf
0(mV) ΔIpa KoxKred
- 1342672 -07068 -07247 -07157 - - -
-Unpeeled 1042637 -0678 -07566 -07173 -15574 223460 094
- 1299617 -07114 -07484 -07299 - - -
-Peeled 1216849 -07060 -07570 -07315 -15574 63686 094
Chapter V Phytochemical study of Solanum tubersum L
125
-16 -14 -12 -10 -08 -06 -04 -02 00 02
-200
-150
-100
-50
0
50
100
I [micro
Ac
msup2]
Potential [ V]
00
04 ml(a)
-16 -14 -12 -10 -08 -06 -04 -02 00 02
-200
-150
-100
-50
0
50
100
I [micro
Ac
msup2]
Potential [ V]
00 ml
04 ml
(a)
Figure V21 Cyclic voltammograms of oxygen-saturated in the absence and presence of
04 ml Kondor sample extract (a) Unpeeled (b) Peeled at scan rate 100 mVs Figure I 51Cy clic v oltammograms of oxyge n-saturate d in the absence and presence of 04 ml Kondor sample extra ct (a) Unpeel ed (b) Peel ed at scan rate 1 00 mVs
V3522)Thermodynamic properties
The obtained values from CVs voltammograms showed in Table V29 indicated that the
binding constant (Kb) ranged as the follows
- Peeled lt
-Unpeeled
The values of free energy varied in the same order as of the binding constant The
negative values of ∆G indicated the spontaneity of interaction The data obtained in
Table V29 were very statistically significant with plt0000
Table V29 Values of Binding constants and binding free energy of the complexes -
sample extracts 24)جدول رقم ) 26Table V29 Values of Binding constants and binding free energy of the complexes O_2^(∙-)-sample extracts
Compound Equation R2 K ΔG P
unpeeled
-Kondor y = 09086x + 28778 0990 075474x10
2 -1642 0000
peeled
-Kondor y = 05606x + 27765 0962 059772x10
2 -1585 0000
Chapter V Phytochemical study of Solanum tubersum L
126
V36) Discussion
Finally fresh Kondor tuber including the whole tuber (unpeeled) and the peeled are
each likely to be great bioactive compounds when compared with other potato varieties due to
their higher content of phenolics and flavonoids as well as greater antioxidant capacity
One of the major aims of this work was to provide a preliminary investigation on the
phytochemical composition of one variety which has greater levels of phytochemical
compounds and to compare these results in both the unpeeled and peeled samples
The results of the second experiment suggest that the freshly peeled potato tubers from
Kondor variety show promising potential with regards to greater potential health benefits
from greater phenolics flavonoids as well as antioxidant activity Similar to finding in this
work other researchers have found that total phenolic compounds were greater in the tuber
skin compared to the tuber flesh [23-24]
As found in this experiment the peeled Kondor variety showed higher concentrations
of phenolic and flavonoid compounds compared to unpeeled Spunta and Kuroda respectively
and thus great antioxidant activity
In this manner with regards to health value since the skin of potatoes generally has
greater phytochemical compounds relative to the flesh it would be advisable to eat the whole
potato tuber rather than peeling them
Chapter V Phytochemical study of Solanum tubersum L
127
V4) Statistic analysis
The analysis of variance of the main effect plot between the variable studied and their
significance was performed using GLM To confirm that the antioxidant activity of the
extracts of the potatoes back to their richness in phytochemical compounds we tried to find a
linear correlation between the antioxidant capacity values calculated by the methods measured
the antioxidant activity with their polyphenol total content and flavanoids total content also a
correlation between each other
V41) Main effect plot
Fig V22 23 and Table V15 shows an overall view of the relative of variety on the
level of phytochemical content and the effect of activity antioxidants a further analysis of
variance of the main effect plot between the variable studied and their significance was using
performed using GLM Fig V22 shows the overall effect of variety on the level total phenolic
content and total flavonoid content The average plot of TPC is valued 1488 which presented
with a line across the plot the variety Kondor and Bartina have the higher amount of TPC
with values above the average line for the variety Spunta and Kuroda shows a lower amount
below the average line Moreover the TFC plot three varieties Kondor Bartina and Spunta
have a higher amount above the average line (at 2033) than the Kuroda variety as it can be
seen there is a statistically significant difference in the amounts of TFC TPC and varieties
(p lt 0005- see Table V15)
Furthermore the effect of different varieties on their antioxidants activity can be seen in
Fig V 23 for CV and FRAP assays This plot shows two varieties Kondor and Bartina above
the average line which presented at a value 4236 and 3068 respectively for the other
varieties Spunta and Kuroda have a low average value presented below the average line
These factors have a very significant statistically with p lt 0000
Another antioxidant capacity DppH and O2 their plot of IC50 average presented in
Figure V23 also these plots show two varieties Spunta and Kuroda have values above the
average line in this case means the lowest antioxidant capacity the Kondor and Bartina
variety have the highest antioxidant capacity which presented lower than the average line this
analysis has a statistically significant with plt0005
Chapter V Phytochemical study of Solanum tubersum L
128
Table V15 Analysis of variance for the main effect plot 24)جدول رقم ) 27Table V15 A nalys is of variance for the main effect plot
Main effect plot P value
TPC 0000
TFC 0000
FRAP 0000
CV 0000
DppH 0003
0003
Figure V22 Effect of variety 1 Kondor 2 Bartina 3 Spunta 4 Kuroda on the level
of (a) TPC (b) TFC
Figure I 52Effect of variety 1 Kondor 2 Bartina 3 S punta 4 Kuroda on the level of (a) TPC (b) TFC
Chapter V Phytochemical study of Solanum tubersum L
129
Figure V23 Effect of variety (1) Kondor (2) Bartina (3) Spunta (4) Kuroda on the
level of inhibition IC50 of (a) DppH (b)
Figure I 53Effect of variety (1) Kondor (2) Bartina (3) Spunta (4) Kur oda on the level of inhibiti on IC50 of (a) DppH (b) O_2^(∙ -)
V42) Linear regression
V421) Linear regression between total polyphenol content and
antioxidant activity
From these plots Figure V24 a correlation (Table V16) is observed between the
content of total phenolic content TPC and ethanolic extracts of a different variety of potatoes
and the antioxidant activity as measured by different methods with correlation indices R2
which ranged from 0602 to 0825
Chapter V Phytochemical study of Solanum tubersum L
130
8 10 12 14 16 18 20
22
24
26
28
30
32
34
36
38
40
FR
AP
TPC
(a)
8 10 12 14 16 18 20
30
35
40
45
50
55
CV
TPC
(b)
8 10 12 14 16 18 20
10
15
20
25
30
35
40
IC50
(D
pp
H)
TPC
(c)
8 10 12 14 16 18 20
10
12
14
16
18
20
22
IC50 (
O-
2)
(d)
Figure V24 Correlation graphs for (a) FRAP (b) CV (c) IC50DppH and (d) IC50 with
total phenolic content (TPC) Figure I 54 Correlati on gra phs for (a) FRAP (b) CV (c) IC50D ppH a nd (d) IC50 O_2^(∙-) with t otal phenolic content (TPC )
Table V16 Determination of the correlation between capacity antioxidant and Total
Phenolic content 24)جدول رقم ) 28Table V16 Determination of the correlation between capacity antioxidant and Tota l P henolic content
Assays Equation R2
FRAP Y= 1185 + 1169X 0602
CV Y = 165 + 1586 X 0574
IC50 DppH Y= 5474 ndash 02001X 0825
IC50 Y= 2774 ndash 00814X 0633
Chapter V Phytochemical study of Solanum tubersum L
131
V422) Linear regression between total flavonoids content and antioxidant
activity
From these plots Figure V25 a correlation (Table V17) is observed between the total
flavonoids content TFC and ethanolic extracts of a different variety of potatoes and the
antioxidant activity as measured by the with correlation indices R2 which ranged from 0602
to 0843 The regression coefficient values obtained for total flavonoids content and
antioxidants assay was higher compared with total phenolics content
10 12 14 16 18 20 22 24 26
22
24
26
28
30
32
34
36
38
40
FR
AP
TFC
(a)
10 12 14 16 18 20 22 24 26
30
35
40
45
50
55
CV
TFC
(b)
10 12 14 16 18 20 22 24 26
10
15
20
25
30
35
40
IC5
0 (
Dp
pH
)
TFC
(c)
10 12 14 16 18 20 22 24 26
10
12
14
16
18
20
22
IC5
0 (
O-
2)
TFC
(d)
Figure V25 Correlation graphs for (a)FRAP (b) CV (c) IC50 DppH and (d) IC50 with
total flavonoids content (TFC) Figure I 55 Correlati on gra phs for (a)FRAP (b) CV (c) IC50 D ppH and (d) IC50 O_2^(∙-) wit h total flavonoids conte nt (TFC)
Chapter V Phytochemical study of Solanum tubersum L
132
Table V17 Determination of the correlation between capacity antioxidant and Total
Flavanoids content 24)جدول رقم ) 29Table V17 Determination of the correlation between capacity antioxidant and Tota l Flavanoids content
Assays Equation R2
FRAP Y= 1014 + 0992 X 0837
CV Y = 169 + 1204 X 0638
IC50 DppH Y= 5035 ndash 01458X 0843
IC50 O2 Y= 2664 ndash 00571X 0602
As shown in Table V18 significant positive correlations (R2 = 0547 - 0825 the
average of R2 was 0651) were observed between total phenolic content and FRAP CV
assays and IC50 values for DPPH indicating the significant contribution of phenolics to
these antioxidant assays Also for the same assays the significant positive correlations
(R2 = 0602 - 0843 the average of R
2 was 0730) were observed between them and the total
flavonoids contents this R2-value indicated that total flavonoids contents exert high
antioxidant activity than total phenolic content in sample extracts
However among the four antioxidant assays (FRAP CV DppH and ) the R
2 value
of CV and FRAP show less correlation (0547 and 0602) for TPC respectively this result
indicated that total phenolics content exert a less capacity effect on CV and FRAP than other
assays
Finally R2 values ranged from 0547 to 0843 with average value was 0690 these high
levels indicate that the antioxidant activity of potatoes might in large of the contribution of
phytochemical contents especially flavonoids compounds
Table V18 The R2 values between antioxidant activities and phytochemical content
24)جدول رقم ) 30Table V18 The R2 va lues between ant ioxidant activities and phytoche mical content
FRAP CV IC50 Average
DppH
TPC 0602 0547 0825 0633 0651
TFC 0837 0638 0843 0602 0730
Average 0719 0592 0834 0617 0690
Chapter V Phytochemical study of Solanum tubersum L
133
V423) Linear regression between different methods antioxidant activity
The relation between different methods was measured using different linear
correlations From these plots Figure V26 (a) a significant correlation is observed between
the antioxidants assay FRAP and CV with correlation indices R2 value 0903 and equation
Y= 184 + 0684 X
However for the inhibitory assays and DppH (Figurethinsp V26b) the equation
obtained from the linear regression Y=0670 + 0358 X and the coefficient value R2
=0595
This higher regression coefficient indicated a strong correlation between these assays
30 35 40 45 50 55
22
24
26
28
30
32
34
36
38
40
FR
AP
CV
(a)
10 15 20 25 30 35 40
10
12
14
16
18
20
22
IC50
(O
-
2)
IC50 (DppH)
(b)
Figure V26 Correlation graphs for (a) FRAP and CV (b) IC50 between DppH and
Figure I 56Correlati on graphs for (a) FRAP and CV (b) IC50 betwee n DppH and O_2^(∙-)
Chapter V Phytochemical study of Solanum tubersum L
134
References
[1] M Angela A Meireles Extracting bioactive compounds for Food products Theory and
Applications 2009 CRC Press New York USA P 140
[2] C Da Porto E Porretto D Decorti Comparison of ultrasound-assisted extraction with
conventional extraction methods of oil and polyphenols from grape (Vitis vinifera L) seeds
Ultrason Sonochem 20 (2013) 1076ndash1080
[3] A Golmohamadi G Moumlller J Powers C Nindo Effect of ultrasound frequency on
antioxidant activity total phenolic and anthocyanin content of red raspberry juice Ultrason
Sonochem 20 (2013) 1316ndash1323
[4] M Abid S Jabbar MM hashim B Hu S Lei X Zeng Sonication enhances
polyphenolic compounds sugars carotenoids and mineral elements of apple juice Ultrason
Sonochem 21 (2014) 93ndash97
[5] Achat S Tomao V Madani K Chibane M Elmaataoui M Dangeles O amp Chemat
F (2012) Direct enrichment of olive oil in oleuropien by ultrasound-assisted maceration at
laboratory and pilot scale
[6] Zhou K and L Yu 2004 Effects of extraction solvent on wheat bran antioxidant activity
estimation Lebensmittel-Wissenschatf und Technologie 37717ndash721
[7] DVreugdenhil JBradshaw CGebhardt F Govers D KL Mackerron M A Taylor H
A Ross Potato biology and biotechnology advances and perspectives 2007 Elsevier Ltd p
442
[8] Wilhelm L R Dwayne A Suter Gerarld H Brusewitz 2004 Drying and
Dehydratation Chapter 10 Food amp Process Engineering Technology St joseph Michigan
USA 259-284
[9] Rodriquez de Sotillo DHadley M and Holm E TlsquoPhenolics in aqueous potato peel
extract extraction identification and degradationrsquo J Food Sci 1994 59 649ndash51
[10] GJ Yang JJ Xu HY Chen ZH Leng Chin J Chem 22 (2004) 1325ndash1329
[11] MS Ibrahim Anal Chem Acta 443 (2001) 63ndash72
[12] F Wang Y Xu J Zhao H Shengshui J Bioelectrochem 70 (2007) 356ndash362
[13] Firuzi O Lacanna A Petrucci R Marrosu G Saso L Bioet biophysica 2004 11174-
184
[14] X Lu K Zhu M Zhang H Liu J Kang J Biochem Biophys Methods 52 189 (2002)
[15] M Ozsoz A Erdem P Kara K Kerman D Ozkan Electroanalysis 15 613 (2003)
Chapter V Phytochemical study of Solanum tubersum L
135
[16] X Chu GL Shen JH Jian TF Kang B Xiong RQ Yu Anal Chim Acta 373 29
(1998)
[17] MT Carter M Rodriguez A Bard J Am Chem Soc 111 8901 (1989)
[18] Feng Q Li NQ and Jiang YY (1997) Electrochemical studies of porphyrin interacting
with DNA and determination of DNA Analytica Chimica Acta 344 97-104
[19] S Ahmed F Shakeel Pak J Pharm Sci 25(3) 501 (2012)
[20] CMA Brett AMO Brett Electrochemistry Principles Methods and Applications
(Oxford Science University Publications Oxford 1993) p 427
[21] Prieto P Pineda M Aguilar MM 1999 Spectrophotometric quantitation of
antioxidant capacity through the formation of phosphoolybdenum complex specific
application to the determination of vitamin E Anal Biochem 269 337-341
[22] Jayaprakasha GK Singh RP Sakariah KK Antioxidant activity of grape seed (Vitis
vinifera) extracts on peroxidation modls in vitro Food Chem 2001 73 288-290
[23] Albishi T John JA Al-Khalifa AS and Shahidi F (2013) Phenolic content and
antioxidant activities of selected potato varieties and their processing by-products Journal of
Functional Foods 5(2) 590-600
[24] Zirsha R W(2015) Investigations into the Nutritional and Sensory Potential of Taewa
(Māori Potatoes) Thesis Doctor of philosophy nutritional science p104
General conclusion
136
General conclusion
This study theme sets as the main objective the evaluation in vitro of the
phytochemical content and antioxidant activity of four different varieties of potatoes Solanum
tuberosum L (Bartina Kondor Kuroda and Spunta ) Until now no studies concerning the
antioxidant activity of the potato of the El Oued region have been conducted We think that
the present study is the first to investigate and evaluate the bioactive compounds
For this concern we choose two methods for extracting the higher level of bioactive
compounds from potato These techniques are ultrasonic-assisted extraction combines with
maceration and Soxhlet extraction The obtained results indicated that the amount extracted
from both total phenolic and flavonoids contents is remarkably improved when using UAE-
M The yield of extraction also improved when maceration is used prior to ultrasonic-assisted
extraction The most efficient method for extraction of TPC and TFC is UAE-M with 30 of
amplitude ethanol as solvent and maceration time of 24 hours all obtained results are
confirmed by HPLC analysis
The phytochemical investigation of four varieties detected Alkaloids Coumarins
Phytosterols Carbohydrates phenolic and Flavonoids The presence of phenolic content was
lower when compared with flavonoids content in the whole roots and the flesh All the results
indicate that roots have a higher level of bioactive compounds more than the flesh Overall the
sample Kondor showed the highest amount of total phenolic content and total flavonoids
content than other samples This difference in phytochemical content is clearly shown in
HPLC analysis which is greatly influenced by cultivar condition and their variety also reflect
on their antioxidants activity
The antioxidant capacity of ethanolic extract was evaluated and compared using two
techniques spectrophotometers and electrochemical assays For four different varieties of the
Solanum tuberosum L
According to the spectrophotometers assays the antioxidants capacity was calculated
with Ferric reducing antioxidant power assay (FRAP) and the oxidation of 22-diphenyl-1-
picrylhydrazyl (DPPH) radical scavenging method expressed as IC50 All the results show that
the ethanolic extract of the whole roots of the Kondor variety had a higher antioxidant
General conclusion
137
capacity than the other ethanolic extract in order was Kondor gt Bartina gt Spunta gt Kuroda
This antioxidants capacity was less active than Gallic and Ascorbic acids
For the electrochemical assay we used the cyclic voltammetry technique to evaluate the
antioxidant capacity of ethanolic extract the redox potentials of these compounds used to
calculate the antioxidant capacity in an aqueous solvent (acetate buffer) The redox potentials
also measured in an organic solvent to compare their electrochemical behavior In this mid
the antioxidant property of phenolics extracted were evaluated by the inhibitory effect of
superoxide anion radicals and expressed as IC50 The obtained data shows value ranged as
the follows Kondor gt Bartina gt Spunta gt Kuroda for the whole root
The thermodynamic properties quantify the strength of interaction between radicals and
the probe antioxidant in the ethanolic extract These properties were estimated in terms of
binding constant Kb based on the decrease in peak current and UV-spectra absorbance for
and DppH respectively This constant allows calculating the standard Gibbs free energy
(∆G˚) Their negative values indicated the spontaneity of interaction between radicals and
extracts
The analysis of variance was determined by the main effect plot and linear correlation
between the variable studied All the results show statistically significant positive
correlations were observed between total phenolic content total flavonoids content and
antioxidant capacity measured with different assays This correlation determined with indices
R2 which ranged from medium to high levels the total flavonoids content has exerted less
antioxidant activity than total phenolic content in sample extracts
The evaluation and the quantification of antioxidants content and antioxidants activity
in vitro for all four varieties show that the whole roots of variety Kondor has a high level of
bioactive compounds more than other varieties Based on this results the phytochemical
analysis was carried out on Kondor for two cases the whole root and the flesh and the
information obtained has led to show that the whole roots have a higher amount in
phytochemical content than the flesh for this variety
Kondor has great potential for future development as a marketable food product Thus
we advise to cultivate this variety more than Bartina Kuroda and Spunta other potatoes
varieties
General conclusion
138
This study scientifically valids the traditional use of these plants and reveals their
interest in the framework of an exploitation in biotechnology For the suite it would be
interesting to isolate and characterize the phenolic compounds of the extracts of four varieties
selected and other Also would be very desirable for a better understanding of the mode of
action of the polyphenolic derivatives to evaluate in vitro and in vivo the antioxidant activity
of each of these compounds taken separately What would then highlight the active principle
of plant extracts andor a possible synergy between the various phenolic compounds
Annexe
Annexe
140
00 05 10 15 20 25 30 35 40
0
10
20
30
40
50
60
70
80
In
hib
itio
n
Concentration (mgml)
(1)
00 05 10 15 20
0
10
20
30
40
50
In
hib
itio
n
Concentration (mgml)
(2)
05 10 15 20 25 30 35
0
10
20
30
40
50
In
hib
itio
n
Concentration (mgml)
(3)
0000 0002 0004 0006 0008 0010
0
10
20
30
40
50
60
I
nh
ibitio
n
Concentration (mgml)
(4)
0001 0002 0003 0004 0005 0006 0007 0008 0009 0010
0
10
20
30
40
50
60
70
In
hib
itio
n
Concentration (mgml)
(5)
Figure 1 The percent DPPH radical inhibition of (1) Spunta (2) Bartina (3) Kuroda
(4) Ascorbic acid (5) Gallic acid
Annexe
141
20 30 40 50 60 70
06
08
10
12
14
16
18
20
22
1C
I
(a)
4 6 8 10 12 14 16 18 20 22 24
04
06
08
10
12
14
1C
I
(b)
10 20 30 40 50 60 70 80
025
030
035
040
045
050
055
060
065
070
1C
I
(c)
0 10 20 30 40 50
02
04
06
08
10
12
14
1C
I
(d)
15 20 25 30 35 40
100
120
140
160
180
200
220
240
260
1C
I
(e)
20 30 40 50 60 70
100
150
200
250
300
350
1C
I
(f)
0 10 20 30 40 50 60 70
02
04
06
08
10
12
14
16
18
20
22
1C
I
(g)
Figure 2 A plot of Ao (A-Ao ) to 1[extract] for DppH radical (a) Kondor (b) Bartina (c)
Annexe
142
Spunta (d) Kuroda (e) Ascorbic acid (f) Gallic acid (g) Peeled Kondor
01 02 03 04 05 06 07 08 09
0
5
10
15
20
25
30
35
40
I
Concentration (mgml)
(a)
00 02 04 06 08 10 12
5
10
15
20
25
30
35
I
Concentration (mgml)
(b)
00 02 04 06 08 10
0
5
10
15
20
25
I
Concentration (mgml)
(c)
02 03 04 05 06 07 08 09 10
0
5
10
15
20
I
Concentration (mgml)
(d)
00 02 04 06 08 10
0
5
10
15
20
25
30
35
I
Concentration (mgml)
(e)
01 02 03 04 05 06 07
2
4
6
8
10
I
Concentration (mgml)
(f)
Figure 3 The percent
radical inhibition as a function of the concentration of (a)
Bartina(b) Spunta (c) Kuroda (d)peeled Kondor (e) Ascorbic acid (f) α-tocopherol
Annexe
143
02 04 06 08 10 12 14
30
32
34
36
38
40
LO
G 1
(V
)
LOG I(I0-I)
(a)
00 02 04 06 08 10 12 14 16 18 20
32
34
36
38
40
LO
G 1
(V
)
LOG I(I0-I)
(b)
02 04 06 08 10 12 14
30
32
34
36
38
40
LO
G 1
(V
)
LOG I(I0-I)
(c)
00 02 04 06 08 10 12 14 16 18 20
30
32
34
36
38
40
LO
G 1
(V
)
LOG I(I0-I)
(d)
02 04 06 08 10 12 14 16 18 20 22
30
32
34
36
38
40
LO
G 1
(V
)
LOG I(I0-I)
(e)
08 10 12 14 16 18
30
32
34
36
38
40
LO
G 1
(V
)
LOG I(I0-I)
(f)
04 06 08 10 12
30
31
32
33
34
35
36
LO
G 1
(V
)L
LOG I(I0-I)
(g)
Figure 4 A plot of
to
for
(a) Kondor (b) Bartina (c) Spunta (d)
Kuroda (e) Ascorbic acid (f) α-tocopherol (g) Peeled Kondor
Annexe
144
0 1 2 3 4 5
0
10
20
30
40
50
60
70
I
nh
ibitio
n
Concentration (mgml)
(2)
4 6 8 10 12 14 16 18
003
004
005
006
007
008
In
hib
itio
n
Concentration (mgml)
(2)
000 001 002 003 004 005 006 007 008 009
0
10
20
30
40
50
60
70
I
nh
ibitio
n
Concentration (mgml)
(3)
Figure 5 Antioxidant activity () of (1) peeled Kondor (2) Ascorbic acid (3) Gallic
acid assayed by β-carotenendashlinoleate bleaching
Annexe
145
02 04 06 08 10 12 14
-10
0
10
20
30
40
50I
[micro
Ac
msup2]
Potential [ V]
(a)
02 04 06 08 10 12 14
-5
0
5
10
15
20
25
30
35
40
I [micro
Acm
sup2]
Potential [ V]
(b)
02 04 06 08 10 12 14
-10
0
10
20
30
40
50
60
I [micro
Ac
msup2]
Potential [ V]
(c)
Figure 6 Voltammograms obtained for (a) Bartina (b) Spunta and (c) Kuroda unpeeled
samples by cyclic voltammetry in DMF
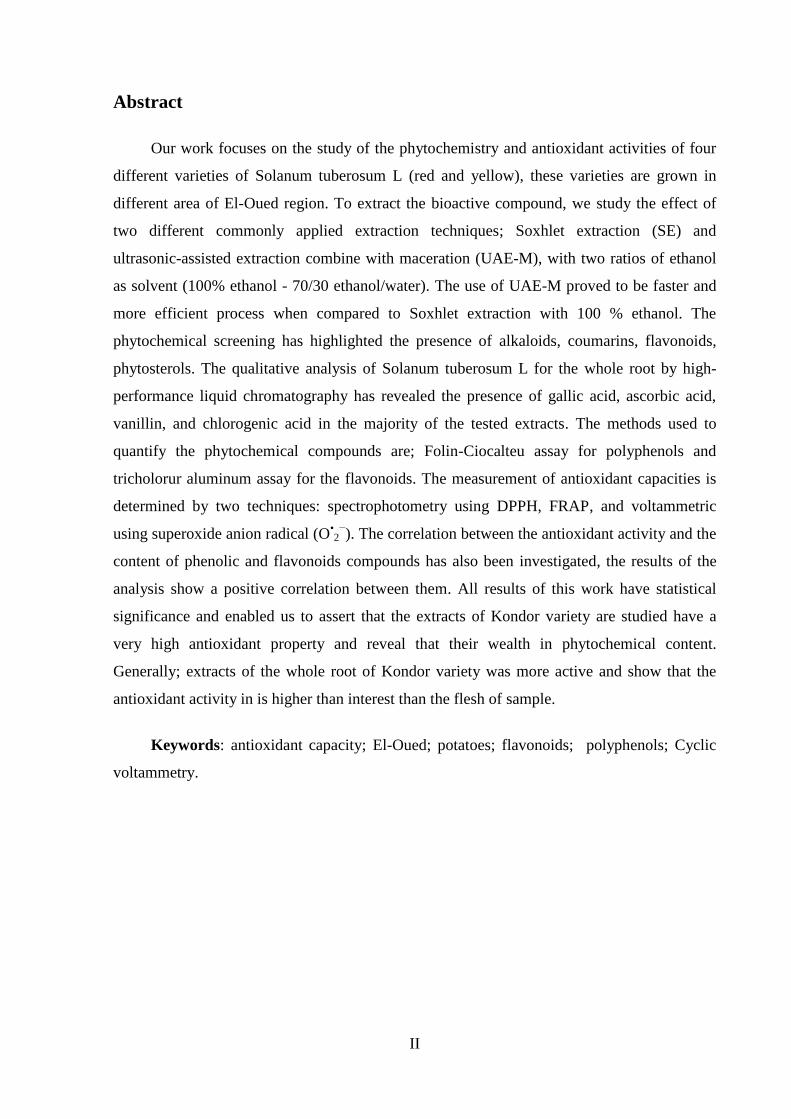
Table of content
VII
II311) Flowers 28
II312) Leaflets 29
II313) Stem 29
II314) Fruits 29
II32) The below-ground portion 30
II321) Tubers 30
II322) Roots 30
II4) Varieties 30
II41) Russet (a) 31
II42) Yellow (b) 31
II43) White (c) 32
II44) Red (d) 32
II45) Fingerling (e) 32
II46) Purple and Blue (f) 33
II47) PetitesOther (g) 33
II5) Tuber Composition 33
II6) Cultivation 37
II7) Production 38
II8) Non-Food Uses of Potato 38
II9) Potatoes information 39
II10) Materials references and goals 40
References 43
Chapter III Methods
III1) Introduction 49
Table of content
VIII
III1) Methods 49
III11) Soxhlet 49
III12) Maceration 50
III13) Ultrasound-assisted extraction 51
III14) Several variables effect on extraction system 51
III141) Solvent 51
III142) Solvent-to-feed-ratio 52
III143) Temperature 52
III144) Time 53
III145) Particle size 53
III2) Estimation of the water weight percentage in potato roots 53
III3) Phytochemical investigation 54
III31) Screening chemistry 54
III311) Detection of flavonoids 54
III312) Detection of phytosterols 55
III313) Detection of tannins 55
III314) Detection of carbohydrates 55
III315) Detection of alkaloids 55
III315) Detection of coumarins 55
III32) Total flavonoids content (TFC) 56
III33) Total phenolics content (TPC) 56
III34) HPLC analysis 57
III341) Principe 57
III342) HPLC system 57
Table of content
IX
III343) Protocol 59
III4) Antioxidant activity 59
III41) Spectrophotometers assay 60
III411) DPPH assay 60
III412) Evaluation of total antioxidant capacity (TAC) by Phosphomolybdenum method 61
III413) Ferric-reducing antioxidant power (FRAP) assay 61
III414) Beta-carotene bleaching 62
III42) Electrochemical techniques 63
III421) Principle 63
III422) Protocol of antioxidant activity 63
III422) Protocol for scavenging activity of superoxide anion Obull2
minus radicals 64
III5) Calibration curve 64
III51) Totale phenolic content 65
III52) Total Flavonoid content 65
III53) FRAP assay 66
III54) Total antioxidant capacity 67
III55) HPLC calibration curve 67
III6) Determination of IC50 value 69
III7) Statistic analysis 69
III71) Linear regression analysis 69
III72) Main effect plot and interaction plot 70
III73) p-values and R-squared values 70
References 71
Table of content
X
Chapter IV Comparative study of extraction methods
IV1) Introduction 79
IV2) Aim 79
IV32) Preparation of samples 79
IV33) Ultrasonic extraction 79
IV34) Soxhlet extraction 80
IV35) Results and discussion 80
IV351) the total flavonoids content 80
IV352) The total phenolic content 81
IV353) The antioxidant capacity 82
IV354) Statistic analysis 83
IV354) HPLC analysis 86
IV4) Discussion 89
Chapter V
Phytochemical study of Solanum tubersum L
V1) Introduction 91
V2) Experiment One 91
V21) Aim 91
V22) Estimation of the water weight percentage in potato roots 92
V23) Screening chemistry ( Chemical characterizations) 92
V24) Phytochemical contents 93
V25) HPLC analysis 93
V251) Chromatograms of Kondor sample 93
V252) Chromatograms of Bartina sample 94
Table of content
XI
V253) Chromatograms of Spunta sample 95
V254) Chromatograms of Kuroda sample 96
V26) Antioxidant capacity 96
V261) Spectrophotometers 97
V2611) FRAP assay 97
V2612) DPPH 97
V26121) Calculation of radical inhibition 98
V26122) Calculation of the binding constant 99
V262) Electrochemistry assay 101
V2621) Electrochemistry behavior 103
V2622) Electrochemistry assay radical scavenging activity 104
V2623) Ratio of binding constants (KoxKred) 107
V2624) Thermodynamic properties 110
V2625) Diffusion coefficients 111
V27) Discussion 114
V3) Experiment Two Kondor tuber analysis 115
V31) Aim 115
V32) Phytochemical contents 115
V33) HPLC analysis 116
V34) Spectrophotometers assays 117
V341) FRAP assay 117
V342) Total antioxidant capacity 118
V343) β-carotene bleaching assay 118
V343) DPPH 120
Table of content
XII
V3431) Calculation of radical inhibition 120
V3432) Calculation of the binding constant 121
V35) Electrochemistry assay 122
V352) Electrochemistry assay radical scavenging activity 123
V3521) Ratio of binding constants (KoxKred) 124
V3522)Thermodynamic properties 125
V36) Discussion 126
V4) Statistic analysis 127
V41) Main effect plot 127
V42) Linear regression 129
V421) Linear regression between total polyphenol content and antioxidant activity 129
V422) Linear regression between total flavonoids content and antioxidant activity 131
V423) Linear regression between different methods antioxidant activity 133
References 134
General conclusion 136
Annexes
List of Figures
XIII
List of Figures
Figure I 1Mitochondrial ROS production 5
Figure I 2Ascorbic acid 10
Figure I 3α-tocopherol 11
Figure I 4β-carotene 12
Figure I 5phenolic acid derivatives of (a) benzoic and (b) cinnamic acids 13
Figure I 6flavonoids structure 14
Figure I 7Chemical structures of (a)casuarictin and (b) proanthocyanidins 15
Figure I 8Chemical structure of synthetic food antioxidants 17
Figure I 9A selection of potato cultivars 26
Figure I 10The potato plant 28
Figure I 11Different potato variety 31
Figure I 12Major carotenoids in potatoes 36
Figure I 13Top five potato-producing countries in 2014 (FAO 2016 ) 38
Figure I 01 The visual appearance of the four potato tuber varieties analyzed in this thesis 41
Figure I 15Typical conventional soxhlet extractor 50
Figure III 1Typical conventional soxhlet extractor 50
Figure III2Block Diagram of an HPLC 57
Figure III3 Cyclic voltammogram for redox system 63
Figure III4 The calibration curve obtained for Gallic acid 65
Figure III5 The calibration curve obtained for Rutine 66
Figure III6The calibration curve obtained for Ascorbic acid TAC 67
Figure III7Chromatograms of standard phenolic compounds1ascorbic acid 2gallic acid 3
chlorogenic acid CA caffeic acid 4 vanillin Q quercetin 5 rutin 68
Figure III8Voltammograms obtained for gallic acid (a) and (b) The calibration curve
obtained for gallic acid by cyclic voltammetry in pH=36 acetate buffer 69
List of Figures
XIV
Figure IV1 Effect of maceration time (a) amplitude (b) method (c) and the solvent ratio (d)
on the level of total flavonoids content Y-axis shows Total Flavanoids content (expressed as
a mg Rutin g extract) 84
Figure IV2 Effect of maceration time (a) amplitude (b) method (c) and the solvent ratio (d)
on the level of total phenolic content Y-axis shows Total phenolic content (expressed as a mg
gallic acidg extract) 85
Figure IV3 Effect of maceration time (a) amplitude (b) method (c) and the solvent ratio (d)
on the level of total antioxidant capacity Y-axis shows Total antioxidant capacity (expressed
as a mg ascorbic acidg of extract) 86
Figure IV4 Chromatograms of sample extract A(1)Ascorbic acid(2) Gallic acid (3)
Chlorogenic acid(4) Vanillin 87
Figure IV5Chromatograms of sample extract B(1)Ascorbic acid(2) Gallic acid (3)
Chlorogenic acid 70
Figure IV6Chromatograms of sample extract C(1)Ascorbic acid(2) Gallic acid (3)
Chlorogenic acid(4) Vanillin(5)Rutine 88
Figure IV7Chromatograms of sample extract D(1)Ascorbic acid(2) Gallic acid (3)
Chlorogenic acid(4) Vanillin 88
Figure V1Chromatograms of unpeeled Kondor extract(1)Ascorbic acid(2) Gallic acid (3)
Chlorogenic acid(4) Caffeic acid (5) Quercetin (6)Vanillin 94
Figure V2Chromatograms of unpeeled Bartina sample extract(1)Ascorbic acid(2) Gallic
acid (3) Chlorogenic acid(4) Vanillin 95
Figure V3Chromatograms of unpeeled Spunta sample extract(1)Ascorbic acid(2) Gallic
acid (3) Chlorogenic acid 95
Figure V4Chromatograms of unpeeled Kuroda sample extract(1)Ascorbic acid(2) Gallic
acid (3) Chlorogenic acid(4) Rutine 96
Figure V5The percent DPPH radical inhibition as a function of the concentration of of
unpeeled Kondor 98
Figure V6Electronic absorption spectra of 025 mM of DPPH interaction with Roots of (a)
Kondor (b) Bartina (c) Spunta (d) Kuroda 100
Figure V7 Electronic absorption spectra of 025 mM of DPPH interaction with (GA) Gallic
acid (AAS) Ascorbic acid 100
Figure V8 Voltammograms obtained for unpeeled extract of (a) Kondor (b) Bartina (c)
Spunta (d) Kuroda and (e) for Ascorbic acid by cyclic voltammetry in pH=36 acetate buffer
102
Figure V9 Voltammograms obtained for unpeeled Kondor sample by cyclic voltammetry in
DMF 104
List of Figures
XV
Figure V10 The percent O_2^(∙-) radical inhibition as a function of the concentration of
unpeeled Kondor 105
Figure V11 Cyclic voltammograms of oxygen-saturated in the absence and presence of
different concentration of sample extract Roots (a) Kondor (b) Bartina (c) Spunta (d)
Kuroda at scan rate 100 mVs 106
Figure V12Cyclic voltammograms of oxygen-saturated in the absence and presence of
different concentration of standard (a) ascorbic acid (b) α-tocopherol at scan rate 100 mVs
106
Figure V13Voltammograms of oxygen-saturated in the absence and presence of 04 ml
sample extract Roots (a) Kondor (b) Bartina (c) Spunta (d) Kuroda at scan rate 100 mVs
109
Figure V14Cyclic voltammograms of oxygen-saturated in the absence and presence of 03
ml sample extract (a) Ascorbic acid (b) α-tocopherol at scan rate 100 mVs 110
Figure V15 Succession of cyclic voltammograms at GC electrode in oxygen-saturated
DMF01 TBFP at different scan rates ranging from 100 to 500 mVs unpeeled (a) O_2^(∙-) -
Kondor (b) O_2^(∙-)-Bartina (c) O_2^(∙-)-Spunta (d) O_2^(∙-)-Kuroda and (e) for 112
Figure V16 ipa versus V12 plots of oxygen-saturated DMF A in absence of 04 ml of
unpeeled extract 113
Figure V17Chromatograms of leaf extract(1)Ascorbic acid(2) Gallic acid (3) Chlorogenic
acid 116
Figure V18Antioxidant activity () of unpeeled Kondor assayed by β-carotenendashlinoleate
bleaching 120
Figure V19Electronic absorption spectra of 025 mM of DPPH interaction with of (a) Root
and (b) Flesh 122
Figure V20Cyclic voltammograms of oxygen-saturated in the absence and presence of
different concentration of Kondor sample extract (a) unpeeled (b) peeled at scan rate 100
mVs 123
Figure V21Cyclic voltammograms of oxygen-saturated in the absence and presence of 04
ml Kondor sample extract (a) Unpeeled (b) Peeled at scan rate 100 mVs 125
Figure V22Effect of variety 1 Kondor 2 Bartina 3 Spunta 4 Kuroda on the level of (a)
TPC (b) TFC 127
Figure V23Effect of variety (1) Kondor (2) Bartina (3) Spunta (4) Kuroda on the level of
inhibition IC50 of (a) DppH (b) O_2^(∙-) 128
Figure V24Correlation graphs for (a) FRAP (b) CV (c) IC50DppH and (d) IC50 O_2^(∙-)
with total phenolic content (TPC) 129
List of Figures
XVI
Figure V25Correlation graphs for (a)FRAP (b) CV (c) IC50 DppH and (d) IC50 O_2^(∙-)
with total flavonoids content (TFC) 130
Figure V26Correlation graphs for (a) FRAP and CV (b) IC50 between DppH and O_2^(∙-)
132
List of Tables
XVII
List of Tables
Table I1 Endogenous Sources of Free Radicals 6
Table II1 Significant happenings in the history of the potato 27
Table II2 Proximate composition of edible portion of potatoes 34
Table II3 Selected nutrients and vitamins in flesh and peel of raw potatoes (based on 100 g
wet basis) 34
Table II4 Nutrition information of potato (dry weight) 35
Table II5 Concentration levels of the main phenolic compounds in potatoes 36
Table II6 location of four varieties of potatoes 40
Table II7 Tuber physical Characteristics of the four potato cultivars investigated 41
Table III1 Constituents Standard content analyzed by HPLC 68
Table IV1 Total flavonoids content obtained using ethanol water (7030) 80
Table IV2 Total flavonoids content obtained using 100 ethanol 80
Table IV3 Total phenolic content obtained using ethanol water (7030) 81
Table IV4 Total phenolic content content obtained using 100 ethanol 81
Table IV5 Total antioxidant capacity obtained using ethanol water (7030) 82
Table IV6 Total antioxidant capacity obtained using 100 ethanol 82
Table IV7 Analysis of variance for the main effects of factors studied 83
Table IV9 Constituents content analyzed by HPLC88
Table V1 Determination of moisture content for four varieties of potatoes 92
Table V2 Preliminary qualitative phytochemical analysis of various alcoholic extracts of
root parts of potatoes 92
Table V3 Determination of total Phenolics contents and total flavonoids of four kinds of
potatoes 93
Table V4 Constituents content analyzed by HPLC 96
Table V5 Determination of reducing the antioxidant power of four kinds of potatoes 97
List of Tables
XVIII
Table V6 IC50 values of sample extracts using DPPH 98
Table V7 Values of Binding constants and binding free energy of the complexes DppH-
sample extracts 101
Table V9 Determination of the oxidation peaks of four kinds of potatoes by CV in DMF 104
Table V10 IC50 values of sample extracts using O_2^(∙-) radical scavenging activity 105
1Table V11 Shifts in peak potential and a decrease in anodic peak current of O_2^(∙-) bound
forms of Roots extract samples 108
Table V12 Shifts in peak potential and a decrease in anodic peak current of O_2^(∙-) bound
forms of Flesh extract samples 109
Table V13 Values of Binding constants and binding free energy of the complexes O_2^(∙-)-
sample extracts 111
Table V14 Diffusion coefficient values 113
Table V19 Determination of total Phenolics contents and total flavonoids of the whole root
and the flesh 115
Table V20 Constituents content analyzed by HPLC 116
Table V21 Determination of reducing the antioxidant power of four kinds of potatoes 118
Table V22 Determination of the Total antioxidant capacity of Kondor 118
Table V23 Determination of antioxidant activity of sample extracts using β-carotene
bleaching 119
Table V24 IC50 values of sample extracts using β-carotene bleaching 120
Table V24 IC50 values of sample extracts using DPPH 121
Table V25 Values of Binding constants and binding free energy of the complexes DppH-
sample extracts 122
Table V26 Determination of the Antioxidant capacity of Kondor variety by CV 122
Table V27 IC50 values of Kondor sample extracts using O_2^(∙-) radical scavenging
activity 123
Table V28 Shifts in peak potential and a decrease in anodic peak current of O_2^(∙-) bound
forms of Kondor extract samples 124
Table V29 Values of Binding constants and binding free energy of the complexes O_2^(∙-)-
sample extracts 125
List of Tables
XIX
Table V15 Analysis of variance for the main effect plot 128
Table V16 Determination of the correlation between capacity antioxidant and Total Phenolic
content 130
Table V17 Determination of the correlation between capacity antioxidant and Total
Flavanoids content 132
Table V18 The R2 values between antioxidant activities and phytochemical content 132
List of Tables
XX
List of Abbreviations
Abs Absorbance
ABTS 221azinobis(3-ethylbenzothiazoline)-6-sulfonate
ANOVA Analysis of variance
BHA Butylhydroxyanisole
BHT Butylhydroxytoluene
CV Cyclic voltammetry
D Diffusion coefficient
DMF N N-dimethylformamide
DNA Deoxyribonucleic acid
DppH 11-diphenyl 1-2-picrylhydrazyl
Ep Potential peak
Epa Anodic oxidation potential
Epc Cathodic oxidation potential
FAO Food and Agriculture Organization
FDA Food and Drug Administration
FRAP Ferric-reducing antioxidant power
GAE Gallic acid equivalent
GLM General linear model
HPLC High-performance liquid chromatography
Ipa Anodic potential peak
Ipc Cathodic potential peak
LDL Low-density lipoproteins
NADH Nicotinamide adeacutenine dinucleacuteotide reacuteduit
TAC Total antioxidant capacity
TBFB Tetrabutylammonium tetrafluoroborate (Bu4NBF4)
TFC Total flavonoids content
TPC Total phenolics content
TPTZ 246-tris(2-pyridyl)-135-s-triazine
UAE-M Ultrasound-assisted extraction combined with maceration
UV Ultraviolet
General introduction
1
General introduction
Because of todays chase for healthy products the production and purification of
vegetable extracts is an area of interests to the industry and academia Recently researchers
have shown a proof for the role of antioxidants of plant origin on scavenging of free-radical
this property could have great importance as therapeutic agents in several diseases caused due
to oxidative stress such as heart diseases and cancers[1] However plant constituents and
phytochemical compounds were to be found effective as radical scavengers and inhibitors of
lipid peroxidation
The cellular functions and normal respiration produce a free radical Under normal
physiological conditions approximately 2 of oxygen used up by the human body during
respiration is transformed into superoxide anion free radical with a negative charge (Obull2
minus) [2]
which considered as one of a large group of reactive oxygen species (ROS) and reactive
nitrogen species (RNS) This oxygen environment is unfriendly to the living organisms To
survive this organism produces a water- and lipid-soluble antioxidants that can neutralize
these highly reactive free radicals [3] If the bodys antioxidant mechanism does not operate
optimally excess free radicals can damage various bimolecular including lipids proteins
carbohydrates and nucleic acids
A variety of antioxidants is found in dietary sources like fruits and vegetables which
were known as a phytochemicals compounds These plant constituents are classified as
primary or secondary components depending on their role in plant metabolism Primary
constituents include the common sugars amino acids proteins purines and pyrimidines of
nucleic acids chlorophylls etc Secondary constituents are the remaining plant chemicals such
as alkaloids (derived from amino acids) terpenes (a group of lipids) and phenolics (derived
from carbohydrates) [4]
They are present in all parts of higher plants (roots stems leaves flowers pollen fruit
seeds and wood) and are involved in many physiological processes such as cell growth
rhizogenesis germination of the seeds or fruit maturation The most represented are the
anthocyanins flavonoids and tannins [5]
That is why we are interested to make a phytochemical and quantification study of the
plant Solanum tuberosum L (potato) which is considered as an important source of
polyphenolic and flavonoid compounds most recent studies focused on the evaluation of its
antioxidant activities and its phenolic and flavonoid contents [6] Until now no studies related
General introduction
2
to the antioxidant activity of the potato in the region of El Oued (south-east of Algeria) have
been conducted According to the national statistics the production of potato is growing very
fast in this area which may lead her to become the first producer in Algeria and that since
2011
Our study has been divided into two parts the first one contains Bibliographic research
presented in three chapters the first one is a generality and description of the potato plant the
second is devoted to a free radical the Polyphenols and the antioxidant activity and the last
one describes the equipment and methods used in this work
The second one is the experimental part which contains two chapters the fouth chapter
discuss the results of different methods used by focuses on
the solid-liquid extraction by Ultrasound-assisted maceration and soxhlet techniques
determination of the total polyphenols flavonoids by colorimetric methods and liquid
chromatography of high performance (HPLC)
The fifth chapter presents the results obtained and their discussions in two experiments
the first one is Study of the antioxidant activity of extracts from four different varieties by
spectrophotometry Methods ferric reducing antioxidant power (FRAP) assay and the
inhibition of the free radical (DPPHbull ) Electrochemical methods (cyclic voltammetry (CV) )
to evaluate the antioxidant capacity and the inhibition of superoxide anion (Obull2
minus) Finally the
experiment two present more phytochemical analysis for the richness variety
We will complete this piece of research with a general conclusion giving a summary of
the main results obtained during this work as well as the perspectives which will be the
objectives of the future work
General introduction
3
References
[1] Mahantesh SP Gangawane AK PATIL CS free radicals antioxidants diseases and
phytomedicines in human health future prospects World Research Journal of Medicinal amp
Aromatic Plant 2012 (1) pp-06-10
[2] Kunwar A Priyadarsini KI Free radicals oxidative stress and importance of antioxidants
in human health J Med Allied Sci 2011153-60
[3] Davies KJ Oxidative stress the paradox of aerobic life Biochem Soc Symp 199561131
[4] Krishnaiah D Sarbatly R Bono A (2007) Phytochemical antioxidants for health and
medicine A move towards nature Biotechnol Mol Biol Rev 1 97-104
[5] BoizotN Charpentier JP (2006) A rapid method for the evaluation of the content of
phenolic compounds of the organs of a forest tree Methods and tools for observation and
assessment of forestiens environments grassland and aquatic INRA 79-82
[6] Deuszliger H Guignard C Hoffmann L Evers D Polyphenol and glycoalkaloid
contents in potato cultivars grown in Luxembourg Food Chemistry 2012 135 (4) 2814-
2824
Chapter I
Free radical
Chapter I Free radical
5
I) Free radical
I1) Generality
A free radical is an atom or molecular species capable of liberated in existence that hold
at least one or more unpaired electrons in the outermost shell configuration [1] Free radicals
are highly reactive short-lived species generated by a variety of biological mechanisms
including inflammation [2] or as a side effect of the reactions occurring during normal
oxidative metabolism [3] During their short lifespan they readily interact with
macromolecules including lipids proteins and nucleic acids damaging their structures and
often modifying their functionality the most common free radicals are Superoxide anion
radical Hydroxyl radical Hydroperoxyl radical Nitric oxide and Lipid radical [4]
I2) Sources of Free Radicals
In general free radicals can be produced from either endogenous sources or exogenous
sources They are continuously forming in cells and environment [5]
I21) Endogenous source
Under normal conditions the Mitochondria consume oxygen associated with the
process of oxidative phosphorylation approximately 95-97 of the oxygen is reduced to
water a small fraction of the oxygen consumed (3-5) is reduced equivalently to superoxide
anion ( ) as shown in figure II1 Coenzyme Q or ubiquinone is an electron-carrying in
the respiratory chain and it collects electrons from complex NADH and complex FADH2 and
donates electrons to complex III cytochrome bc1 segment This process results in the
formation of QH2 the reduced form of Q which generates coenzyme Q via an intermediate
semiquinone anion The Q-cycle leads to the formation of superoxide radical by transferring
electrons to oxygen molecular [6]
Figure I 1Mit ochondrial ROS producti on
Figure I1 Mitochondrial ROS production
ROS production
Chapter I Free radical
6
The most common endogenous sources of free radicals are summarized in table I1[4]
Table I1 Endogenous Sources of Free Radicals Table ITable I 1 Endogenous Sources of Free Radicals
Physiological
Process
Comment
Infection May produce free radicals because the immune system may try to
neutralize invading microorganisms with a burst of free radicals
Enzymatic
reaction
Many enzymatic reactions involving xanthine oxidase lipoxygenase
aldehyde oxidase etc can generate free radicals
Metal Ions Metal ions such as copper ion and ferrous ion which are essential for the
body can react with hydrogen peroxide to produce free radicals
I22) Exogenous source
Exposure to Solar radiations UV radiations X-rays gamma rays and microwave
radiations has a capacity to generate reactive chemical species including free radicals in
cells [784] Table I2 summarizes most exogenous sources [910]
Table I2 Exogenous Sources of Free Radicals
External
sources
Comments
Air pollution Exposure to particulate matters in polluted air can produce significant
oxidative stress increasing the risk of asthma cardiovascular diseases
chronic pulmonary obstructive disease (COPD) and lung cancer
Tobacco
smoking
Oxidants present in tobacco smoked can damage lungs causing COPD and
even raising the risk of lung cancer
Some
medications
Medications such as bleomycin adriamycin and sulfasalazine may produce
oxidative stress
Chapter I Free radical
7
I3) Major types of free radicals
I31) Reactive Oxygen Species (ROS)
Reactive oxygen species (ROS) is a term used for different reactive molecules derived
from molecular oxygen They are devised in radical derivatives such as superoxide hydroxyl
radical nitric oxide and non-radical derivatives of high reactivity as singlet oxygen hydrogen
peroxide peroxynitrite hypochlorite [11]
I311) Superoxide oxygen ( one electron)
is produced in vivo in a variety of ways the major source being the electron chain in
mitochondria [1213] is not highly reactive with biological substrates in an aqueous
environment Once formed quickly undergoes dismutation to generate H2O2 This
reaction is accelerated by the antioxidative enzyme the SOD [1415] In addition to SOD
several other enzymes that generate H2O2 also exist in human tissues
I312) Hydrogen Peroxide (H2O2)
Hydrogen peroxide (H2O2) itself is not especially toxic unless it is present in high
concentrations within cells H2O2 readily diffuses through cellular membranes and can
thereby reach sites distant from where it was generated Also in the presence of transition
metals mainly Fe2+
but also Cu1+
H2O2 is reduced to the hydroxyl radical (OHdeg) via either the
HaberndashWeiss or Fenton reactions [16-18] In most cells H2O2 is converted to innocuous
products by the actions of two important antioxidant enzymes that is catalase and selenium-
dependent glutathione peroxidase (GPx) GPx utilizes H2O2 hydroperoxides as substrates
during the conversion of reduced glutathione (GSH) to its sulfide (GSSG) [19]
I313) Hydroxyl Radical (bullOH)
The hydroxyl radical (bullOH) is a high reactive radical under normal physiological
conditions the generating of hydroxyl radicals can be produced with the combination of both
H2O2 and O2bullminus
in presence of certain metals [20 ] According to the Haber-Weiss reaction of
bullOH it consists of the following two reactions
In the first reaction
(1)
In the second reaction
(2)
Chapter I Free radical
8
I32) Reactive Nitrogen Spices (RNS)
Reactive nitrogen species (RNS) is a term used for different reactive molecules nitric
and in particular nitric oxide radical considered as major components of oxidative burst and
redox state regulation [21] This spices is also devised into radical spices such as Nitric Oxide
(NObull) Nitrogen dioxide (NO2
bull) and non-radical spices Peroxynitrite (ONOO
-) and Alkyl
peroxynitrites (ROONO)[22]
I321) Nitric oxide (NObull)
Nitric oxide (NObull) contains an unpaired electron thus it is a paramagnetic molecule and
a free radical The convert of L-arginine to L-citrulline with nitric oxide synthases (NOSs)
produce a NObull radical via a five-electron oxidative reaction [23] (equation 3)
It is moderately soluble in water (74 mldl at 0degC) and is more soluble in organic
solvents therefore it can readily diffuse through the cytoplasm and plasma membranes [24] It
has also a greater stability in an environment with a lower oxygen concentration
I322) Peroxynitrite Anion and Nitrogen dioxide
The combination of NObull with
produce the peroxynitrite anion (ONOOndash ) [25] (Eq
4) It is this latter molecule that accounts for much of the toxicity of NObull ONOO
ndash its high
reactive approximately the same as that of bullOH The toxicity of ONOO derives from its ability
to directly nitrate and hydroxylate the aromatic rings of amino acid residues [26]
In an aqueous environment the protonated peroxynitrous acid forms and can rapidly
separate into nitrogen dioxide (NObull2) and a hydroxyl radical (
bullOH)[2728] (Eq 5)
I4) Free radicals reaction
With a wide range of free radicals that can be generated in the cell and in the
microcirculation it is clear that the free radicals attack all cellular (intracellular or
extracellular) molecules It can be considered that hydroxyl radical (HO) and singlet oxygen
are more reactive than superoxide anion (O2ndash
) and hydrogen peroxide (H2O2) However in a
Chapter I Free radical
9
suitable biological setting the two last species may display considerable chemical reactivity
leading to damage of various biomolecules [29]
Generally this damage results from the involvement of free radical in chain reactions a
series of reactions lead to regenerate a radical that can begin a new cycle of reactions [30]
Free radical reactions take three distinct identifiable steps
Initiation step formation of radicals (eq 6)
Propagation step in this step required free radical is regenerated repeatedly as a result
of chain reaction which would take the reaction to completion (eq78)
Termination step the destruction of radicals (eq 9)
I5) Oxidative Stress
Free radicals are highly reactive spices a low concentration of ROS is essential for
normal physiological functions like gene expression cellular growth and defense against
infection They act as the second messenger in intracellular signaling cascades that mediate
several responses in plant cells [31]
However with more formation of free radicals in cells leads to damaging almost all
types of biomolecules (Proteins lipids carbohydrates amp nucleic acid) The excess of free
radicals leads to an imbalanced phenomenon between formation and neutralization of
ROSRNS called oxidative stress If the body cant regulate properly the oxidative stress can
lead to several diseases including cancer atherosclerosis malaria etc[32]
I6) The Bodyrsquos Antioxidant Defense
The body has two mechanisms either enzymatic or non-enzymatic [33] To balance the
damage effects of ROS those mechanisms generate antioxidants from a natural source
(endogenous) or through foods (exogenous) source
Chapter I Free radical
10
The excess of free radicals is neutralized by antioxidants to protect the cells against their
toxic effects and to contribute to disease prevention [34]
An antioxidant is any substance that when present at low concentrations compared
with that of an oxidizable substrate significantly delays or inhibits oxidation of that substrate
[35] In another term the antioxidant is any substance that delays prevents or removes
oxidative damage to a target molecule [36]
I7) Classification of antioxidants
I71)Enzymatic (Endogenous)
The body depends on diverse endogenous defense mechanisms to protect the cells
against free radical damage The antioxidant enzymes are
a) Superoxide dismutases SOD is an antioxidant enzyme which scavenges superoxide anion
into oxygen and hydrogen peroxide [37]
b) catalase (CAT) cytoplasmic enzyme which converts the hydrogen peroxide (H2O2) into
H2O and O2 by disproportionation[38]
c) Glutathione Peroxidase enzyme occurs in the mitochondria during the reaction hydrogen
peroxide (H2O2) is reduced to water and glutathione (GSH) is oxidized to glutathione
disulfide (GSSG)[39]
I72) Non-Enzymatic (Exogenous)
I721) Ascorbic acid
Ascorbic acid is also known as Vitamin C (Figure I2) considered as plasma antioxidant
[40] is found in our body in the form of ascorbate It is located in the aqueous compartments
of tissues due to its high solubility
Figure I2 Ascorbic acid
Figure I 2Ascorbic acid
Chapter I Free radical
11
Ascorbate is a primary antioxidant in that it directly neutralizes radical species acts as a
reducing agent and reducing transition metals (Fe+3
and Cu+2
) present in active sites of
enzymes or in free form in the body Can be oxidized by free radical also can be a good
reducing agent which arrives or is in tissue in an aqueous medium and in the reaction with
free radicals form a radical (semi- dehydroascorbate) which is little reactive The ascorbate
can act as an antioxidant against lipid peroxidation plays a major role in preventing
cardiovascular disease and in conjunction with the alpha-tocopherol [38]
I722) α-tocopherol
α-tocopherol (Figure I3) is a form of the antioxidant vitamin E that is found in vegetable oil
nuts and seeds
Figure I3 α-tocopherol Figure I 3α-tocopherol
alpha-tocopherol is the most active spices in tocopherols family It acts as an important
antioxidant in the inhibition of lipid peroxidation and its efficiency in the presence of
ascorbate (cell membranes) and ubiquinone (mitochondrial membrane) [40] Alpha-
tocopherol is active in cell membranes where reduces ROS and lipid peroxidation from the
radical attack [41]
According to [42] deficiency of this vitamin alone or deficiency associated with
exercise causes a significant increase in the production of free radicals and thus an increase in
cellular disorders such as lipid peroxidation loss of sarcoplasmic reticulum and mitochondrial
uncoupling [4142]
I723) Carotenoids
Vitamin A or carotenoids their chemical structure is composed of conjugated double
bonds which are responsible for its color and for its biological functions They are
responsible for sequester singlet oxygen (free radical) and remove the radical peroxides (Free
Radical) [43]
Chapter I Free radical
12
Figure I4 β-carotene
Figure I 4β-carotene
The function to disable the singlet oxygen carotenoids can sequester the peroxyl
radicals [4043] stated that carotenoids like beta-carotene (Figure II4) lycopene zeaxanthin
and lutein exercise the functions of antioxidants in the lipid phase blocking the free radicals
that cause lesions on the lipoprotein membranes According to [43] lycopene currently
appears as one of the most potent antioxidants mainly in the prevention of carcinogenesis and
atherogenesis for protecting molecules such as lipids low-density lipoproteins (LDL)
proteins and DNA The main sources of carotenoids are found in carrots and pumpkins (alpha
and beta-carotene) tomatoes and derivatives (lycopene) and spinach (lutein) [43]
I724) Phenolic Compounds
Phenolic compounds are a large family of phytonutrients It has more than 2000 family
members [44] distributed in the plant kingdom and those are the secondary metabolites It
can be classified in a number of ways Harborne and Simmonds [45] classified these
compounds into groups based on the number of carbons in the molecule Apart from
antioxidant activity they also possess antifungal anti-infective and antiseptic properties [46]
Phenolic structures are known ranging from simple molecules such as the phenolic
acids to substances highly polymerized as the tannins As indicated in their name they are
compounds having one or more aromatic nuclei with one or several groups of hydroxyl [47]
I7241) Phenolic acid
One of the substances that compose the group of phenolic compounds is the phenol-
acid which is characterized by conferring antioxidant properties both in food and in
organisms being used in the treatment and prevention of diseases This substance is found in
plants in free form or bound to sugars and protein [44]
Phenolic acids (C6-C1or C6-C3) with the sample structure are formed with an aromatic
ring substituted by an alcohol in one or more positions they are hydroxylated derivatives of
benzoic and cinnamic acids (Figure II5) [48]
Chapter I Free radical
13
(a)
(b)
Salicylic acid R1R2R3=H R4=OH Ceramic acid R1R2R3R4=H
p-Hydroxybenzoic acid R1R3R4=H R2=OH o-Coumaric acid R1=OH R2R3R4=H
Gentisic acid R2R4=H R1R3=OH m-Coumaric acid R2=OH R1R3R4=H
Protocatechuic acid R3R4=H R1R2=OH p-Coumaric acid R3=OH R1R2R4=H
Gallic acid R1R2R3=OH R4=H Caffeic acid R2R3=OH R1R4=H
Vanillic acid R1=OCH3R2=OHR3R4=H Ferulic acid R2=OCH3R3=OHR1R4=H
Syringic acid R1R3=OCH3R2=OHR4=H Sinapic acid R2R4=OCH3R3=OHR1=H
Figure I5 phenolic acid derivatives of (a) benzoic and (b) cinnamic acids
Figure I 5phenolic acid derivatives of (a) benzoic and (b) cinnamic acids
Barreiros et al [40] reported that phenolic antioxidants act as radical captors and
occasionally as metal chelators acting both in the initiation stage and propagation of the
oxidative process [4044] They are found in soybeans defatted soybean flour and isolated
soy protein concentrate [44]
I7242) Flavonoids
Flavonoids constitute one of the most wide-ranging groups of all plant phenolics They
are formed by a basic skeleton to 15 carbon atoms The flavonoids are derivatives of the
flavone or 2-Phenyl chromen bearing of the functions free phenols ethers or glycosides all
of which have the structure C6-C3-C6 two six-membered rings linked with a three-carbon
unit which may or may not be parts of a third ring (Figure I5) The rings are labeled A B
and C
Figure I5 flavonoids structure
Figure I 6flavonoids structure
Chapter I Free radical
14
These compounds represent a group of phenolic compounds the most diversified which
are classified into flavanols flavanones flavones isoflavones catechins anthocyanins
proanthocyanidins (Table I3) [49]
Table I3 Chemical structures of the main classes of flavonoids
Flavonoids Basic structure
Flavonols
Flavanones
Flavones
Isoflavones
Flavanols
Anthocyanidins
In plants flavonoids are usually glycosylated mainly with glucose or rhamnose but they
can also be linked with galactose arabinose xylose glucuronic acid or other sugars [50]
The flavonoids are solid crystallized substances Their colors are ranging from white to
yellowish They are soluble in hot water alcohol and polar organic dissolvents [51] The
flavonoids are rapidly oxidizable substances more than other types of substances [52]
Chapter I Free radical
15
However the capacity of the flavonoids decreases with the substitution of hydroxyl
groups for sugars being the glycosides less antioxidants than their corresponding aglycons [53]
I7243) Tannins
Tannins are polyphenolic secondary metabolites of higher molecular weight They are
ranging from (500-3000 D) which may classify into two groups hydrolyzable tannins and
non-hydrolysable or condensed tannins [54] Also there is another group of tannin
phlorotannins rarely consumed by humans It is only found in brown seaweeds [55]
Figure I6 shows the chemical structures of casuarictin (hydrolyzable tannins) and
proanthocyanidins (nonhydrolyzable or condensed tannins)
Figure I6 Chemical structures of (a)casuarictin and (b) proanthocyanidins
Figure I 7C he mical struct ures of (a)casuarictin and (b) proanthocyanidins
a) Hydrolyzable tannins
The hydrolyzable tannins have a center of glucose or a polyhydric alcohol partially or
completely esterified with gallic acid or hexahydroxydiphenic acid forming gallotannin and
ellagitannins respectively [56] These metabolites are readily hydrolyzed with acids bases or
enzymes However they may also be oxidatively condensed to other galoil and
hexahydroxydiphenic molecules and form polymers of high molecular weight The best
known hydrolysable tannin is the tannic acid which is a gallotannin consisting of a
pentagalloyl glucose molecule that can additionally be esterified with another five units of
gallic acid [57]
b) Non-hydrolyzable tannins
The condensed tannins are polymers of catechin andor leucoanthocyanidin not readily
hydrolyzed by acid treatment and constitute the main phenolic fraction responsible for the
Chapter I Free radical
16
characteristics of the astringency of the vegetables Although the term condensed tannins are
still widely used the chemically more descriptive term proanthocyanidins has gained more
acceptance These substances are polymeric flavonoids that form the anthocyanidins
pigments The proanthocyanidins most widely studied are based on flavan-3-ols (-)-
epicatechin and (+)-catechin [58]
I725) Minerals
Other potent antioxidants include minerals such as copper manganese selenium zinc
and iron These minerals exercise their antioxidant function in diverse processes and
metabolic steps in the organism
I7251) Copper
Copper has a role as an antioxidant protecting the cells from the toxic effects of free
radicals and it helps to fix calcium and phosphorous also participates in functions with
antioxidant features of the enzyme family denominated Superoxide dismutase (SOD) which
is responsible for eliminating the superoxide anion [59]
I7252) Iron
Iron forms part of the organismrsquos antioxidant system because it contributes to
eliminating the peroxide groups However its capacity to change valence with ease (2+3+)
renders that it can also intervene depending on the environment in the formation of Free
radicals [60]
I8) Synthetic antioxidants
In the food industry naturally occurring antioxidants impart a certain level of protection
against oxidation However during the food processing or storage the natural antioxidants are
often lost which necessitate the addition of exogenous antioxidants Most of the synthetic
antioxidants whose skeletons are often derived from natural antioxidants are of phenolic type [61]
The differences in their chemical structures reflect their antioxidant activities which also
influence their physical properties such as volatility solubility and thermal stability The
commercially available synthetic antioxidants are butylated hydroxyl toluene (BHT) 2-ferf-
butylhydroquinone (M3HQ) 2-ferpound-butyl-4-hydroxyanisole (BHA) and esters of gallic acid
eg propyl gallate Most of the synthetic phenolic antioxidants used in processed foods are
Chapter I Free radical
17
regulated by the FDA Antioxidants must fulfill the following conditions they must not be
toxic and highly active at low concentrations at the level of 002 of fat or oil content of the
food [62]
Figure I7 Chemical structure of synthetic food antioxidants Figure I 8C he mical struct ure of synt hetic food antiox idants
Figure I7 shows an example of these substances These sterically hindered phenols are
very effective antioxidants and react with free radicals The phenoxy radicals are stabilized by
delocalizing unpaired electrons in the aromatic ring
I9) Antioxidant mechanism
Antioxidants counteract oxidation in two different ways by protecting target lipids from
oxidation initiators or by stalling the propagation phase In the first case the so-called
preventive antioxidants hinder ROS formation or scavenge species responsible for oxidation
initiation (O2 1O2 etc) In the second case the so-called chain-breaking antioxidants
intercept radical oxidation propagators (LOO) or indirectly participate in stopping radical
chain propagation The mechanisms of action are sequentially reviewed here but it should be
kept in mind that antioxidants often act via mixed mechanisms that combine different types of
antioxidation [63]
Chapter I Free radical
18
I91) Preventive antioxidants
There are many different preventive antioxidation pathways because of the diverse
range of available oxidation initiators
Transient metal chelators
Chelators of transition metals such as copper and iron can prevent oxidation by forming
complexes or coordination compounds with the metals These are proteins such as transferrin
ferritin and lactalbumin that sequester iron or ceruloplasmin and albumin that sequester
copper However this type of antioxidation depends directly on the oxidizable target being
protected The mechanism of action is minor for lipid peroxidation inhibition as compared to
the anti-radical activity via ROS scavenging [64] but paramount in the inhibition of DNA
strand breakage [65]
Singlet oxygen quenchers
Carotenoids are the most efficient molecules for 1O2 quenching Hundreds of carotenoids
compounds occur naturally in the environment most of which have 40 carbon atoms They
can be pure hydrocarbons carotenes (lycopene b-carotene etc) or include an oxygenated
functional group [36] carotenoids as many antioxidants have antioxidant activity through
several different but highly complementary mechanisms chain breaking anti-oxidants and 1O2
quenchers This latter mechanism of action occurs through deactivation of 1O2 into
3O2 (eq
10) [66]
1O2 + β-carotene rarr
3O2 + β-carotene
(10)
ROS detoxification
ROS detoxification is a crucial oxidation prevention pathway mainly mediated by
endogenous enzymatic antioxidant systems First superoxide dismutase (SOD) a
metalloenzyme that is omnipresent in eukaryotic organisms catalyzes superoxide anion
dismutation into hydrogen peroxide and oxygen (eq 11)
I92) Chain-breaking antioxidants
In lipid peroxidation chain-breaking antioxidants usually lose a hydrogen radical to
LOO (eq12) thus halting radical oxidation propagation This primarily involves mono-or
poly-hydroxylated phenol compounds (tocopherols flavonoids phenolic acidsetc) with
different substituents on one or several aromatic rings
Chapter I Free radical
19
Chain-Breaking antioxidants induce a lag phase during which the substrate is not
substantially oxidized This phase continues until the antioxidant is completely consumed
Once the antioxidant has disappeared the peroxidation rate rises sharply until it reaches the
same rate as during uninhibited oxidation Conversely retarder antioxidants reduce the
peroxidation rate without inducing a distinct lag phase [63]
I10) Antioxidants benefits
The human body naturally produces reactive oxygen or nitrogen species which are
known as free radicals The overproduction of these compounds leads to oxidative damage to
large biomolecules such as lipids DNA and proteins This damage is responsible for Chronic
diseases like cardiovascular diseases diabetes and cancers However it has been
demonstrated that phytochemical compounds play a significant role in the protective effect
against the development of these chronic diseases In order to benefit the body the
phytochemical compounds neutralize and remove the free radicals [67]
The phytochemical compounds as Antioxidant exist widely in fruits vegetables cereal
grains and medicinal plants [68] Besides wild fruits and fruits wastes (peel and seed) also
contain high contents of antioxidant phytochemicals This antioxidant distributed in a wide
range in nature and classified in groups such as phenolics flavonoids and carotenoidsetc
The polyphenols have a beneficial effect on the plasma Some studies found that
consuming 10 servings of fruit and vegetables each day for 15 days increase their antioxidant
capacity [69] In addition the binding of polyphenols with red blood cells also leads to
improving the total oxidant-scavenging capacities of human blood [70] this role of
polyphenols has an effect on blood pressure which could also protect the cardiovascular
system
Furthermore anthocyanins and flavonoids were also proved to have protective actions
against several cardiovascular risk factors [71] Several other phytochemicals compounds
such as caffeic acid and chlorogenic acid possess potent anti-obesity activity
Antioxidant phytochemicals could possess protective actions against many other
chronic diseases besides the diseases mentioned above Recent studies have suggested that the
appropriate lifestyle modifications could prevent more than two-thirds of human cancers and
the diet contributes to about 35 of human cancer mortality [72] Therefore phytochemicals
compounds as an antioxidant can be good candidates for the prevention and treatment of
human body diseases
Chapter I Free radical
20
References
[1] Halliwell B Gutteridge JMC (1989) Free Radical Biology and Medicine Oxford UK
Oxford University Press
[2] Hussain SP Hofseth LJ and Harris CC (2003) Radical causes of cancer Nature
Reviews Cancer 3 276ndash285
[3] Poulsen HE Jensen BR Weimann A Jensen SA Sorensen M et al (2000)
Antioxidants DNA damage and gene expression Free Radical Research 33 Suppl S33ndash39
[4] A Dasgupta K Klein 2014 Antioxidants in Food Vitamins and Supplements Prevention
and Treatment of Disease Elsevier Inc London UK p 02
[5] SPMahantesh AK Gangawane CS Patil 2012 Free Radicals antioxidants diseases
and phytomedicines in human health future prospects World Research Journal of Medicinal
amp Aromatic Plants 06-10
[6] Finkel T Holbrook NJ Oxidants oxidative stress and the biology of aging Nature
2000408239ndash47
[7] K Jung M Seifert Th Herrling J Fuchs 2008 UV-generated free radicals (FR) in skin
Their prevention by sunscreens and their induction by self-tanning agents Spectrochimica
Acta Part A 69 1423ndash1428
[8] Aroun A Zhong JL Tyrrell RM OrsquoPourzand C Iron oxidative stress and the example of
solar ultraviolet A radiation Photochem Photobiol Sci 201211118
[9] Langrish JP Li X Wang S Lee MM et al Reducing personal exposure to particulate air
pollution improves cardiovascular health in patients with coronary heart disease Environ
Health Perspect 2012120367-72
[10] Centers for Disease Control and Prevention Annual smoking-attributable mortality
years of potential life lost and economic costsmdash the United States 1995-1999 MMWR
200251 (14)300-3
[11] V Rani U C Singh Yadav 2015 Free Radicals in Human Health and Disease
Springer New Delhi India 17 4173
[12] Nohl H Hegner D Do mitochondria produce oxygen free radicals in vivo Eur J
Biochem 197882563ndash7
[13] Sohal RS Mitochondria generate superoxide anion radicals and hydrogen peroxide
FASEB J 1997111269ndash70
[14] Fridovich I Superoxide dismutases An adaptation to a paramagnetic gas J Biol Chem
19892647761ndash4
Chapter I Free radical
21
[15] Touati D The molecular genetics of superoxide dismutase in E coli An approach to
understanding the biological role and regulation of SOD in relation to other elements of the
defense system against oxygen toxicity Free Radic Biol Med 198981ndash9
[16] Imlay JA Chin SM Linn S Toxic DNA damage by hydrogen peroxide through the
Fenton reaction in vivo and in vitro Science 19882401302ndash9
[17] Halliwell B Gutteridge JM Role of free radicals and catalytic metal ions in human
disease an overview Methods Enzymol 19901861ndash85
[18] Yamazaki I Piette LH EPR spin trapping study on the oxidizing species formed in the
reaction of the ferrous ion with hydrogen peroxide J Am Chem Soc 19911137588ndash93
[19] Jain A Martensson J Stole E et al Glutathione deficiency leads to mitochondrial
damage in brain Proc Natl Acad Sci USA 1991881913ndash7
[20] McCord JM (1988) Iron free radicals and oxidative injury Semin Hematol 355ndash12
[21] N Pauly C Pucciariello K Mandon G Innocenti A Jamet E Baudouin D
Heacuterouart P Frendo A Puppo 2006 Reactive oxygen and nitrogen species and glutathione
key players in the legume-Rhizobium symbiosis Journal of Experimental Botany Vol 57
No 8 pp 1769ndash1776
[22] Palmer RM Rees DD Ashton DS et al (1980) L-arginine is the physiological precursor
for the formation of nitric oxide in endothelium-dependent relaxation Biochem Biophys Res
Commun 153(3)1251ndash1256
[23] Ghafourifar P Cadenas E (2005) Mitochondrial nitric oxide synthase Trends Pharmacol
Sci 26 190ndash195
[24] Chiueth CC (1999) Neuroprotective properties of nitric oxide Ann NY Acad Sci 890
301ndash311
[25] Radi R Beckman JS Bush KM et al Peroxynitrite oxidation of sulfhydryls The
cytotoxic potential of superoxide and nitric oxide J Biol Chem 19912664244ndash50
[26] Beckman JS Ischiropoulos H Zhu L et al Kinetics of superoxide dismutase- and iron-
catalyzed nitration of phenolics by peroxynitrite Arch Biochem Biophys 1992298438ndash55
[27] Francis SH Busch JL Corbin JD Sibley D cGMP-dependent protein kinases and cGMP
phosphodiesterases in nitric oxide and cGMP action Pharmacol Rev 201062525ndash63
[28] McDonald LJ Murad F Nitric oxide and cGMP signaling Adv Pharmacol
199534263ndash75
[29] SSen R Chakraborty C Sridhar Y S R Reddy Biplab De 2010 free radicals
antioxidants diseases and phytomedicines current status and future prospect International
Journal of Pharmaceutical Sciences Review and Research 3 (1)91-100
Chapter I Free radical
22
[30] Manavalan K Ramasamy C Physical Pharmaceutics ed 2 Vignesh Publishers
Chennai 2001
[31] P Sharma A Bhushan Jha R Shanker Dubey M Pessarakli 2012 Reactive Oxygen
Species Oxidative Damage and Antioxidative Defense Mechanism in Plants under Stressful
Conditions Journal of Botany 26
[32] A Shinde J Ganu P Naik 2012 Effect of Free Radicals amp Antioxidants on Oxidative
Stress A Review Journal of Dental amp Allied Sciences 1(2)63-66
[33] B Halliwell Antioxidants in human health and disease Ann Rev Nutr 16 (1996) 33ndash50
[34] Pham-Huy L A He H Pham-Huy C Free radicals Antioxidants in Disease and Health
International Journal of Biomedical Science 2008 4(2) 89-96
[35] Halliwell B and Gutteridge JMC The Definition and Measurement of Antioxidants
in Biological Systems Free Radical Biology and Medicinal 18 125-126 (1995)
[36] Halliwell B Biochemistry of Oxidative Stress Bioche- chemical Society Transactions
35 1147-1150 (2007)
[37] Zelko I Mariani T Folz R (2002) Superoxide dismutase multigene family a
comparison of the CuZn-SOD (SOD1) MnSOD (SOD2) and EC-SOD (SOD3) gene
structures evolution and expression Free Radic Biol Med 33 (3) 337-49
[38] TG Cavalli MG Santos2015 The Role of Nutrition in Fighting Free Radicals Journal
of Nutrition and Health Sciences
[39] S U Rakesh P R Patil S R Mane 2010 Use of Natural Antioxidants to Scavenge
Free Radicals A Major Cause of Diseases International Journal of PharmTech Research
2(2)1074-1081
[40] Barreiros Andre LBS Juceni PD (2006) Estresse oxidativo relaccedilatildeo entre geraccedilatildeo de
espeacutecies reativas e defesa do organismo Quiacutem Nova 29 113-23
[41] Zacks MA Wen JJ Vyatkina G Bhatia V Garg N (2005) An overview of chagasic
cardiomyopathy the pathogenic importance of oxidative stress An Acad Bras Cienc 77 695-
715
[42] JI LL (2000) Antioxidants and Oxidative Stress in Exercise Society for Experimental
Biology and Medicine 222 283-91
[43] Esh Shami NJI Machado Moreira EA (2004) Licopeno como agente antioxidante Rev
Nutr 17 227-36
[44] King A Young G Characteristics and occurance of phenolic phytochemicals J Amer
Diet Assoc 1999 99 213-18
Chapter I Free radical
23
[45] Harborne J B and Simmonds N W 1964 Biochemistry of Phenolic Compounds
Academic Press London pp 101
[46] Tabak M Armon R Neeman I Cinnamon extracts inhibitory effect on Helicobacter
pylory J Ethnopharmacol 1999 67 269-77
[47] J Dai RJ Mumper (2010) Plant Phenolics Extraction Analysis and Their Antioxidant
and Anticancer Properties Molecules 15(10)7313-52
[48] Shahidi F and Naczk M (1995) Food Phenolics Sources Chemistry Effects
Applications Technomic Publishing Company Inc Lancaster USA
[49] Sailaja Rao P S Kalva A Yerramilli S Mamidi 2011 Free Radicals and Tissue
Damage Role of Antioxidants Free Radicals and Antioxidants (1) 4 2-7
[50] Vallejo F Tomaacutes-Barberaacuten FA and Ferreres F (2004) Characterisation of flavonols
in broccoli (Brassica oleracea L var italica) by liquid chromatography-UV diode-array
detection-electrospray ionisation mass spectrometry Journal of Chromatography A 1054(1ndash
2) 181ndash193
[51] JA Morales-Gonzaacutelez 2013 oxidative stress and chronic degenerative diesease-a role
for antioxidants InTech Rijeka Croatia
[52] Pratt D E amp Hudson B J F (1990) Natural antioxidant no exploited commercially
In Hudson BJF (ed) Food antioxidants London Elsevier Applied sciences 171-180
[53] Rice-Evans C Miller N J amp Paganga G (1996) Structure-antioxidant activity
relationships of flavonoids and phenolic acids Free Radical Biology and Medicine 20(7)
[54] Chung K T Wong T Y Wei C I Huang Y W amp Lin Y (1998) Tannins and
human health a review Critical Reviews in Food Science and Nutrition 38(6) 421-464
[55] Ragan M A amp Glombitza K (1986) Phlorotannin Brown algal polyphenols Progress
in Physiological Research 4 177-241
[56] Okuda T Yoshida T amp Hatano T (1995) Hidrolyzable tannins and related
polyphenols Fortschritte der Chemie organischer Naturstoffe 66 1-117
[57] Bravo L (1998) Polyphenols chemistry dietary sources metabolism and nutritional
significance Nutrition Reviews 56(11) 317-333
[58] Stafford H A (1983) Enzymic regulation of procyanidin bisynthesis lack of a flav-3-
en-3-ol intermediate Phytochemistry 22 2643-2646
[59] Vilaplana M Antioxidantes presentes en los alimentos O F F A R M Aacutembito
Farmaceacuteutico Bioquimica 2007 Vol 26 Nuacutem 10 Noviembre
Chapter I Free radical
24
[60] Garciacutea-Aacutelvarez JL Saacutenchez-Tovar T y Garciacutea-Vigil JL Uso de antioxidantes para
prevenir enfermedad cardiovascular Metaanaacutelisis de ensayos cliacutenicos Rev Med Inst Mex
Seguro Soc 2009 47 (1) 7-16
[61] F Shahidi PK Wanasundara Critic Rev Food Sei Nutr Vol 32 p 671992
[62] WJ Bauer R Badoud J Loumlliger A Etournaud (2010) Science et Technologie des
aliments Principes de Chimie des constituents et de Technologie des proceacutedeacutes 1egravere eacutedition
Presses polytechniques et Universitaires romandes Lausanne p212
[63] M Laguerre J Lecomte P Villeneuve Evaluation of the ability of antioxidants to
counteract lipid oxidation Existing methods new trends and challenges Progress in Lipid
Research 46 (2007) 244ndash282
[64] Van Acker SABE van Balen GP van den Berg DJ Bast A van der Vijgh WJF
Influence of iron chelation on the antioxidant activity of flavonoids Biochem Pharmacol
199856935ndash43
[65] Sestili P Guidarelli A Dacha M Cantoni O Quercetin prevents DNA single-strand
breakage and cytotoxicity caused by tert-butylhydroperoxide free radical scavenging versus
iron chelating mechanism Free Radic Biol Med 199825196ndash200
[66] Krinsky NI The antioxidant and biological properties of the carotenoids Ann NY Acad
Sci 1998854443ndash7
[67] Kruk J Association between vegetable fruit and carbohydrate intake and breast cancer
risk in relation to physical activity Asian Pac J Cancer Prev 2014 15 4429ndash4436
[68] Deng GF Xu XR Guo YJ Xia EQ Li S Wu S Chen F Ling WH Li
HB Determination of antioxidant property and their lipophilic and hydrophilic phenolic
contents in cereal grains J Funct Food 2012 4 906ndash914
[69] Mazza G Kay CD Cottrell T Holub BJ Absorption of anthocyanins from
blueberries and serum antioxidant status in human subjects J Agric Food Chem 2002 50
7731ndash7737
[70] Koren E Kohen R Ginsburg I Polyphenols enhance total oxidant-scavenging
capacities of human blood by binding to red blood cells Exper Biol Med 2010 235 689ndash
699
[71] Kruger MJ Davies N Myburgh KH Lecour S Proanthocyanidins anthocyanins
and cardiovascular diseases Food Res Int 2014 59 41ndash52
[72] Sak K Site-Specific anticancer effects of dietary flavonoid quercetin Nutr Cancer
2014 66 177ndash193
Chapter II
Potato
Generality
Chapter II Potato Generality
26
II) Potato (Solanum tuberosum L)
II1) Generality
Potatoes (Solanum tuberosum L) Figure I1 are grown and eaten in more countries than
any other crops they are grown in all the continents except Antarctica [1] The potato is
without doubt of ancient origin although our knowledge of its early stages of domestication is
not so precise as that of some other crops such as wheat and barley We know however that
it was domesticated in South America and that it had been dispersed by man over a
considerable area by the time the Spaniards arrived in the sixteenth century[2] In the
sixteenth century Spanish travelers brought a potato to Europe and from there its cultivation
spread to other parts of the world [3]
In the global economy they are presently the fourth most important food crop in the
world after maize wheat and rice with a production of 365 million tons Algeria is the 14th
producer among the top 25 potato producing countries in the world with a total production of
5 million tons [4]
Figure II1 A selection of potato cultivars
Figure I 9A selection of potato cultivars
II2) Origin and history
The white potato is a native of South America and was first cultivated by South
American Indians some 8000 years ago [5-7] It has been the staple commodity of the
inhabitants of Chili Columbia Peru Ecuador and Bolivia In 1537 the first recorded contact
of the white man with the potato was made by Gonzal Jiminez De Quesada stated that ldquothe
potato has floury roots of good flavor a gift very acceptable to Indians and a dainty dish for
Spaniardsrdquo [8] The data in Table I1 show significant happenings in the history of the potato
Chapter II Potato Generality
27
The original name of potato tuber came from the latina word batata (name of sweet potato)
because the European couldnt adopt the word papa (name from the Inca empire ) whose name
came with the Spaniards one of many Latin names such as amka (in Bolivia ) and poni (in
Chile) [2]
Table II1 Significant happenings in the history of the potato
Table IITable II1 Significant happenings in t he history of the potato
Dates(Year) Activities
1536 Potatoes were first encountered by Spanish Conquistadors in The
Andes
1586 Sir Walter Raleigh brought potatoes to England
1620 Bauhia named potato Solanium Tuberosum
1662 Royal Society recommended the plantation of potatoes to prevent
famine
1731 Miller mentioned two varieties of sorts the red and the white
1814 The National Society of Agriculture of France gathered and displayed a
collection of 115 to 120 varieties of potatoes
After Solanum tuberosums introduction to Algeria in the mid-1800s potatoes were
grown mainly for export to French markets By national independence from France in 1962
farmers were harvesting on average 250 000 tonnes a year with about one third marked for
export[9]
II2) Scientific classification
Plant classification is the placing of known plants into groups or categories then
grouping successive categories into a hierarchy The act of classification can be defined as
lsquothe grouping of individuals so that all the individuals in one group have certain features or
properties in commonrsquo According to the rules of taxonomy potatoes are classified as
Order Solanales
Family Solanaceae
Subfamily Solanoideae
Genus Solanum L
Species Solanum tuberosum L
Chapter II Potato Generality
28
Potato is part of a group of plant family Solanaceae The Solanaceae includes 95 genera
with Solanum from which the family gets its name being the largest and most economically
significant In addition to potato the Solanaceae includes other significant crop plants
including tomato (Solanum lycopersicum) eggplant (Solanum melongena)[10] The genus
Solanum ranks among the five largest of plant genera estimated at 1000 to1700 species
[1112]
II3) Botanic description
The potato is a plant whose growth dies down annually but whose roots or other
underground parts survive The figure I2 shows potato plant is devised into an above-ground
portion which contains flowers leaves fruits and stems and a below-ground portion contains
tubers and roots
Figure II2 The potato plant
Figure I 10The potato plant
II31)The above ground portion
II311) Flowers
Potato flowers obtain all four essential parts of flower calyx corolla male and female
elements (flowers are bisexual) The corolla consists of five petals These are also joined at
their base and form a short tube and flat five-lobe surface Each lobe ends a triangular point
The form of the corolla is generally round Some primitive cultivars have pentagonal or star-
like corollas The corolla color may be either white light blue blue red and purple with
different tones and intensities[13]
Chapter II Potato Generality
29
II312) Leaflets
The potato leaflets are attached along a common axis there is a terminal leaflet and
therefore an odd number of leaflets Three to four pairs of leaflets are generally present The
leaflets are borne on petiolules they are ovate (ie they have a tapering point) Secondary
leaflets fill the spaces between the primary leaflets and serve to increase the amount of light
intercepted [14]
The most important role of the leaves is photosynthesis by absorbing sunlight which
may make the leaves the most active organs of the potato plant The plant has a rosette or
semi-rosette habit because of the arrangement of the most of the leaves at or near the base of
short stems and is near the soil surface
According to one variety the leaf may be long or short also its colors may be light
dark or grey-green [15]
II313) Stem
Stem color is generally green or mottled green (Figure I2) occasionally it may be red-
brown or purple Main stems show partial apical dominance plays a major role in
determining tuber yield This is achieved through interstem competition whereby stems
compete for water nutrients and light The intensity of competition controls the number of
tubers formed per stem and then goes on to influence the size distribution of the tuber crop [14]
II314) Fruits
Some potato cultivars will produce small green tomato-like fruits in addition to tubers
These fruits typically contain 25 to 200 seeds each When mature such fruits can be
harvested and their seeds extracted When stored in a dry cool place these seeds can maintain
viability for ten years or more [13]
Chapter II Potato Generality
30
II32) The below-ground portion
II321) Tubers
A tuber is a botanical name for the swollen end of a fleshy underground stem (a stolon)
which arises from a below ground axil at the base of the stem Not all stolons will form
tubers Stolon tips not covered by soil develop into vertical stems with normal foliage Tuber
formation is basically the result of translocation and storage of excess food and is dependent
upon several genetic and environmental factors [13]
The shape of tuber can range from very long fingerling types to round All tubers even
round ones have two ends the heel or stem end where the tuber is attached to the stolon
and the apical rose or seed end The eyes are located on the axils of scalelike leaves or
eyebrows Morphologically the eyes correspond to the nodes of stems Each eye contains
several buds [14]
II322) Roots
A much branched fibrous root system is formed either by the seedling tap root or by
adventitious roots in tuber-grown plants In early stages of growth the root system is
restricted to surface soil the roots turning downward after extending for some distance
horizontally this leaves the area of subsoil directly below a plant almost free of its own roots
[16]
II4) Varieties
The cultivation of potato around the world for years under different climate conditions
[17] has effects on shape size color flavor and nutritional content of potato Actually there
are more than 4000 distinct varieties worldwide but only about 100 are suitable for
commercial use and are consistently available in consumer markets [18]
Potato varieties can be classified and grouped according to size shape color texture
taste and cooking characteristics Potatoes are also classified on the basis of their skin color
(Red yellow and white) texture (smooth slightly netted) tuber shape (round and oval to
round) and flesh color (cream and light yellow)
According to [18] the potato varieties classified according to one of seven subcategories
(Figure II3) Russet yellow white red fingerling purple and blue and petitesother
Chapter II Potato Generality
31
(a) (b)
(c)
(d)
(e)
(f)
(g)
Figure II3 Different potato variety
Figure I 11Different potato variety
II41) Russet (a)
These bulky oval potatoes are characterized by netted brown skin and white flesh In
general Russet-type varieties exhibit high starch content containing between 60 and 70 of
starch Russets also contain low moisture levels [19]
Common Russet varieties are Russet Burbank Kennebec Russet Norkotah Canela
Russet Ranger Russet [20]
II42) Yellow (b)
The yellow potato category is gaining popularity for its diversity Yellow potatoes vary
in size from 1 oz to larger sizes comparable to a Russet The category gets its name from the
yellow interior flesh though the exterior skin is typically light brown to a yellow-golden
Chapter II Potato Generality
32
color The interior of a common yellow variety will be smooth and creamy Moderate levels
of starch and sugar make many yellows a popular choice for a variety of uses
Common yellow varieties are Yukon Gold Satina and Dutch Baby [20]
II43) White (c)
Whites are typically small-medium size and many varieties are oval or oblong in shape
The interior flesh is white and the delicate exterior skin can range from nearly colorless to
shades of tan Common white varieties frequently have a slightly creamy dense texture and
average starch levels and low-sugar content [18]
Common white varieties are Atlantic Snowden Dakota Pearl Superior Kennebec
Shepody Cal White Reba and Pike [20]
II44) Red (d)
The skin of red potatoes tends to be thin and the tubers are often smaller and rounder
than other varieties The interior flesh is commonly cream or white in color and is firm Also
in many red varieties known with her higher levels of sugar and lower starch levels
Common red varieties are Sangre Norland Dakota Rose Chieftain Red La Soda Red
Pontiac Cherry Red and Modoc [20]
II45) Fingerling (e)
Fingerling varieties are named for their comparatively slender and long appearance
Average fingerlings are approximately 10 cm in length although sizes vary greatly by the
variety and desired end use The term ldquofingerlingrdquo characterizes potatoes of a particular shape
and size rather than a specific subset of varieties Thus there is more diversity in color
texture flavor nutrition starch and sugar content within this category of potatoes compared
to others (eg Russet white etc) External fingerling colors range from browntan red
orange yellow white and even purple Interior colors are often cream or white [19]
Common fingerling varieties are Russian Banana French Rose Finn Apple and Purple
Peruvian [21]
Chapter II Potato Generality
33
II46) Purple and Blue (f)
These colorful potatoes are eye-catching and come in a range of hues of blue purple
and even red The skin and the flesh of these varieties tend to be highly pigmented and
contain relatively high levels of antioxidants Category members tend to be small to medium
size and may range in shape from round to oblong and even fingerling size
Common purple and blue varieties are Purple Majesty Purple Peruvian All Blue Mountain
Rose Adirondack Blue Congo Blue and True Blue [2021]
II47) PetitesOther (g)
The category of ldquoPetitesrdquo refers to smaller versions of full-sized potatoes The unifying
characteristic is the C-size class distinction which is no larger than 38 cm in diameter
roughly marble or pearl-sized Category members range significantly in terms of starch and
sugar content flavor color and texture Attractive medleys of yellow red and purple or blue
flesh are increasingly available in US grocery stores [18]
Common petite varieties are smaller sizes of most potato varieties Dutch Babies and
RosaraKlondike Rose
II5) Tuber Composition
The composition of a potato tuber is dependent on a number of factors although the
innate genetic characteristics associated with each cultivar are thought to be among the most
significant [22] Other factors are known to influence potato chemical composition include the
geographic growing location soil type and climate [23] agronomic factors such as fertilizer
or pesticide use [24] the impact of potato pests or diseases [25] and age or maturity at harvest
[24] In addition processing or preparation techniques [26] can affect the actual quantity of
the nutrient that is present at the time the potato is eaten Finally at the time of consumption
factors such as the bioavailability of the nutrient or other foods eaten in conjunction with the
potato can influence how well the nutrient is able to be utilized for nutritional or health
benefits
The nutritional content of potato tuber is important for human health Table II2 shows
the nutritional content of a whole potato tuber 100 g mass provides
Chapter II Potato Generality
34
Table II2 Proximate composition of edible portion of potatoes Table IIITable II2 Prox imate composition of edible portion of potatoes
Component Value100g
Water 7858
Total carbohydrate (by difference) 1807
Starch 1586
Dietary fibre 130
Sugars 061
Protein 214
Total lipids 008
Ash 113
About 80 water (Table II2) A major portion of potato solids is starch followed by
protein and fiber Table I3 gives the proximate composition of an edible portion of a typical
potato tuber Approximately 6 of a potato tuber consists of peel having slightly higher
amounts of ash crude fiber protein riboflavin and folic acid than the flesh
Table II3 Selected nutrients and vitamins in flesh and peel of raw potatoes (based on 100 g
wet basis)
Table IVTable II3 Selected nutrients and v itamins in flesh and peel of raw potatoes (base d on 100 g wet bas is)
Component Potato flesh Potato peel
Dry matter () 216 170
Ash () 086 167
Crude fiber () 037 183
Protein () 181 267
Ascorbicacid(mg) 144 118
Thiamine (mg) 010 003
Riboflavin (mg) 0036 0058
Niacin (mg) 157 105
Folic acid (mg) 128 173
Vitamin B6 (mg) 022 021
Chapter II Potato Generality
35
Although potato contains most of the minerals (Table II4) iron zinc calcium
magnesium selenium manganese of nutritional significance in relatively small amounts it is
considered a valuable source of potassium (5635 mg100 g of edible portion) in our diet
However Potato varieties differ in their mineral compositions [27]
Table II4 Nutrition information of potato (dry weight)
Table VTable II 4 Nutrition information of potato ( dry weight)
Ingredient name Content a (mg100 g)
Energy (kJ100 g) 1492 plusmn 000
Vitamin B1 (thiamine) 076 plusmn 000
Vitamin B2 (riboflavin) 040 plusmn 001
Vitamin B3 (niacin) 904 plusmn 002
Vitamin C 287 plusmn 020
Na 274 plusmn 015
Mg 762 plusmn 003
K 5635 plusmn 000
P 3019 plusmn 000
Ca 140 plusmn 000
Fe 432 plusmn 000
Cu 376 plusmn 000
Zn 103 plusmn 007
Mn 484 plusmn 000
Se (μg100 g) 387 plusmn 130
a Potato cultivar Shepody
Also contain phytochemicals compounds besides a combination of vitamins and
minerals [28] Potato is considered as an important source of phenolic compounds diverse in
groups of tens of thousands of different compounds some of which are effective against
malady or have other health-promoting qualities containing effects on longevity mental
acuity cardiovascular disease and eye health [29-31]
Chapter II Potato Generality
36
The phytochemical compounds are present in the whole potato tuber peel and flesh
however the peel is indicated to have the highest amounts [32] These phytochemical
compounds presented in potatoes as phenolic acids and flavonoids including flavonols and
Anthocyanidins (Table II5)
Phenolic acids such as chronologic acid gallic acid p-hydroxybenzoic acid and vanillic
acid with a content range from 0 to 34 mg [33-35] for flavonoids compounds including
flavanols such as rutin and quercetin-3-o-glu-rut with a content range from 0 to 122 mg
[3637] also anthocyanins [38]
Table II5 Concentration levels of the main phenolic compounds in potatoes
Table VITable II5 Concentration levels of the main phe nolic compounds in potatoes
Phenolic Classes Phenolic Compounds Range (mg100 g Dry
Extract)
Phenolic acids gallic acid 0ndash10
p-hydroxybenzoic acid 0ndash78
vanillic acid 06
chlorogenic acid 04ndash340
Flavonols Rutin 0ndash122
quercetin-3-o-glu-rut 25
Anthocyanidins Anthocyanins 14ndash1633
For carotenoids such as lutein zeaxanthin violaxanthin and neoxanthin (Figure II4)
are major carotenoids found in potatoes and b-carotene is found in trace amounts according to
[32]
Figure II4 Major carotenoids in potatoes
Figure I 12Major caroteno ids in potatoes
Chapter II Potato Generality
37
However another study of potato tubers along with other foods reports of total phenolic
amounts found in other plants these potatoes have more phenolics content than tomatoes
onions carrots Snapbeans [39] These amount of phenolic acids can be higher or less from
the same variety depending on the cultivar condition [40-42]and different variety of the
potato cultivars [43]
Potato contains glycoalkaloids α-chaconine and α-solanine Because of food poisoning
concerns new potato varieties are tested for glycoalkaloid levels and if the amount (total of
α-chaconine and α-solanine) exceeds 20 mg glycoalkaloid 100 g or 200 mgkg tuber on a
wet weight basis the variety will most likely not be released [44]The levels of these
glycoalkaloids can vary in potato varieties The skin contains significantly more glyco
alkaloids (124ndash543 mgkg of wet peel) than the flesh (13ndash148 mgkg)The glycoalkaloid
content of potatoes is not affected by baking cooking and frying Thus potato products
having high skin content should be watched [45] Postharvest factors such as low storage
temperature the light greening of potato (which is a sign of glycoalkaloid ) and mechanical
injury can increase glycoalkaloid content in potatoes [46-48]
II6) Cultivation
The potato plant can be grown from a potato or piece of potato which makes the potato
exceptional in agriculture The new plant can produce 5-20 new tubers They have genetic
clones of the original plant also the plant produces flowers and berries that contain 100-400
botanical seeds These can be planted to produce new tubers which will be genetically
different from the original plant [49]
The development of potatoes can be broken down into three distinct growth stages The
first stage begins with sprouts developing from the eyes and ends at emergence from the soil
The seed piece is the sole energy source for growth during this stage
The second stage at this point the vegetative parts leaves branches roots and stolons
start of formation and last until tubers start to develop The first and the second stages last
from 30 to 70 days depending on planting date soil temperature and other environmental
factors
The last stage is Growth Stage tubers are forming at salon tips but are not yet
enlarging This stage will last approximately 2 weeks Tuber cells expand with the
accumulation of water nutrients and carbohydrates Tuber bulking is the growth stage of
longest duration Depending on the date of planting and cultivar bulking can last up to three
Chapter II Potato Generality
38
months Vines turn yellow and lose leaves photosynthesis gradually decreases tuber growth
rate slows and the vines die [50]
II7) Production
Since 1960s the production of potato has rapid growth in 2005 the combination of
potato production in Africa Asia and South America exceeds that of Europe and the USA
[5152] with 200 million cropping area globally about the half is concentrated in Asia which
include China India and Russia the first three producing countries (Figure I5) with 961 46
and 32 million tonnes respectively [53]
Algeria is the 14th
producer among the top 25 potato producing countries in the world
and the first in Africa with a total production of 5 million tons [4] The potato is grown over
an area of over 160 000 ha and can be planted and harvested somewhere in Algeria in
virtually any month of the year Recently the county of El Oued southeast Algeria become the
first producer in the country with 11 million tons which represent 35 of the national
production [54]
Figure II5 Top five potato-producing countries in 2014 (FAO 2016 ) Figure I 13Top five potato- producing countries in 2014 (FA O 2016 )
II8) Non-Food Uses of Potato
From the economic side the potato is considered as the most widely grown tuber crop
in the world which used for human consumption as the main purpose In addition to its use in
the industrial field like potato starch alcohol etc
In the nutritional side the potatoes are known for their carbohydrate content the
predominant form of this carbohydrate content is starch A small but significant portion of the
starch in potatoes called lsquoresistant starchrsquo which resist the digestion by enzymes in the
Chapter II Potato Generality
39
stomach and small intestine and so reaches the large intestine essentially intact also
considered to have similar physiological effects and health benefits of fiber by offer protection
against colon cancer improve glucose tolerance and insulin sensitivity [55]
Potato starch is a promising biopolymer for different food pharmaceutical and
biomedical applications because of its higher water solubility that raises its degradability and
speed of degradation non-toxicity easy availability and abundance
Presently in nanoscience the potato starch is converted to glucose through enzymatic
hydrolysis which is a raw material for the production of lactic acid Then the lactic acid is
polymerized to produce polylactic acid (PLA) PLA is becoming increasingly popular in the
production of a wide range of biodegradable materials (board sheet films fiber paint etc)
because of low energy requirements during its production compared to other plastics of
petroleum origin Fiber-reinforced PLA composite materials have been used to interior
components for automobiles [56] However the cost of production of these plastics is
significantly high as compared to those of petroleum origin and it is essential to develop a
technology that uses energy more efficiently and is cost-effective
II9) Potatoes information
As a matter of fact the potato has always been a staple food around the world and the
second one in developed countries like European countries and the USA Therefore
conducting the researchers on the potato as a staple food and industrial development became
an inevitable tendency for complying with the continuously growing nutritional and healthy
demand [57]
The potato samples were analyzed for nutrient content by a number of studies
Provision of information has been shown that this crop contains essential amino acids
vitamins and minerals and is thus reported to play a significant role in human nutrition [58]
Many varieties of potatoes offer nutritional quantities of ascorbic acid (up to 42 mg100 g)
potassium (up to 6938 mg100 g) dietary fiber (up to 33)
other bioactive components such as protein with lower amounts (085ndash42) [59]
However almost 50 of potatoes phenolic compounds are located in the peels and adjoining
tissues [6061] since peels have more phenolic compounds than tubers these compounds
could be used in food and non-food applications [62]
In the last decade there has been increasing attention given to new sources of natural
antioxidant phytochemicals as a result of their potential health benefits in addition to their
Chapter II Potato Generality
40
functional properties in traditionally commercialized products such as preserving color and
flavor and hence improving shelf life [63]
Antioxidant activity in potato tubers has been extensively reported [64] pigmented potato
genotypes (mainly cultivars with purple and red flesh) as compared to those with white and
yellow flesh have been shown to contain significantly higher levels of antioxidants [65] At
present the potato grown in the El-Oued county is mainly consumed in the form of fresh
tuber in Algeria
II10) Materials references and goals
Little is known about the chemical composition or antioxidant capacity of potatoes El-
Oued county but a great variation in cultivar condition and difference of genetic
characteristics between varieties may be lead to diverse in their chemical composition
Although there may be as many potato varieties cultivars in this region The most four
popular cultivars of (Solanum tuberosum L) were chosen to provide a reference basis for
chemical composition values
Four potatoes cultivars lsquoBartina Kondor Kuroda and Spuntarsquo were collected in 2015
from different areas located in the region of El-Oued south-east of Algeria (Table II6) were
planted for three months before being used Table II7 describes the tuber physical
characteristics of the four cultivars analyzed and Figure II6 gives a visual representation of
the five chosen cultivars
Table II6 location of four varieties of potatoes Table VIITable II6 location of four varieties of potatoes
Varieties Areas name Areas located
Bartina Ourmas 33deg 24 327 N 6deg 46 4406 E
Kondor Guemar 33deg 30 176 N 6deg 47 507 E
Kuroda Trifaoui 33deg 25 16 N 6deg 56 05 E
Spunta Aarair 33deg 17 203 N 6deg 46 195 E
Chapter II Potato Generality
41
Table II7 Tuber physical Characteristics of the four potato cultivars investigated Table VIIITable II7 Tuber phys ical Characteristics of the four potato c ultivars investigated
Potato
Cultivar
Skin color Flesh
Color
Tuber skin
texture
Tuber Size amp Shape Eye
Depth
Bartina Red Light
yellow
Smooth Large to very large
Oval to round
Medium
Kondor Red Cream Smooth Large to very large
Oval to long
Medium
Kuroda Red Light
yellow
Intermediate Large to very large
Oval
Medium
Spunta Yellow Light
yellow
Smooth Large to very large
Long
Shallow
Note Information for this table was gathered from THE EUROPEAN CULTIVATED
POTATO DATABASE
Bartina Kondor
Kuroda Spunta
Figure II6 The visual appearance of the four potato tuber varieties analyzed in this
thesis
Figure I 41 The visual appearance of the four potato tuber varieties analyzed in t his t hesis
Chapter II Potato Generality
42
The overall goals of this thesis are threefold
1) To choose an extraction technique and a ratio of solvent which gives high yield
extraction of bioactive compounds from one cultivated potato variety
The literature research shows that the use of proper methods has an influence on the level of
phytochemical compounds extracted from plant sample Also the extraction process is
affected by several factors as solvent type contact time and others These will be discussed in
chapter IV by focusses on the level of total phenolic and flavonoids content extracted which
leads to conclude the best technique
2) To investigate and quantification the chemical composition and antioxidant activity of
the whole roots of four different variety of potatoes which are present the most
popular cultivated in the region of El-Oued (Bartina Kondor Kuroda Spunta)
However there are large differences in quantity of phytochemical compounds between
potatoes cultivars Thus chapter V will aim to quantify the total phenolics and total
flavonoids content this investigation will complete with HPLC analysis
The antioxidant activity of four samples measured by two techniques the first one is
spectrophotometer assay and the second one is electrochemical (cyclic voltammetry) assay
Also we will emphasize on comparing the results obtained by linear regression analysis
3) To incorporate the characteristics of the bioactive compounds and antioxidant
activities found in one variety which shows the highest level in phytochemical
compounds thus we will measure the potential antioxidant activity with other
spectrophotometers assays
As discussed in the first experiment (chapter V) The Kondor variety shows the highest
phytochemical compounds we will undertake in order to assess the potential acceptability of
peeled and unpeeled Kondor variety and compare the results in the second experiment in
chapter V
Chapter II Potato Generality
43
References
[1] J J Burke Growing the Potato Crop Vita Equity House Upper Ormond Quay Dublin
7 Ireland p16
[2] PM Harris History of the potato Charpmen amp Hall 1992 p 01
[3] R Navarre M J Pavek 2014 The Potato Botany Production and Uses CAB
International Washington USA p1
[4] httpwwwfaoorgstatisticsfr FAOSTAT 2012 and FAOSTAT 2013 accessed
February 09 2017
[5] Bukasov SM (1978) Systematics of the potato Systematics Breeding and Seed
Production of Potatoes Bulletin of Applied Botany Genetics and Breeding Leningrad
USSR pp 1ndash42
[6] Hawkes JG (1990) The Potato Evolution Biodiversity and Genetic Resources
Smithsonian Institution Press Washington DC USA
[7] Ochoa CM (1990) The Potatoes of South America Bolivia Cambridge Univ Press
Cambridge UK
[8] W A Gould 1999 POTATO PRODUCTION PROCESSING amp TECHNOL CTI
PUBLICATIONS USA p01
[9] httpwwwfaoorgpotato-2008enworldafrica international year of potato accessed
October 10 2017
[10] JM Bradeen Ch Kole Genetics Genomics and Breeding of Crop Plant Science
Publishers USA 2011 p06
[11] DrsquoArcy WG (1991) The Solanaceae since 1976 with a review of its biogeography In
JG Hawkes RN Lester M Nee N Estrada (eds) Solanaceae III Taxonomy Chemistry
Evolution Royal Botanical Gardens Kew UK pp 75ndash137
[12] Mabberley DJ (1997) The Plant Book 2nd edn Cambridge Univ Press Cambridge UK
[13] H D Jong J B Sieczka W D Jong 2011 The Complete Book of Potatoes Timber
Press Portland London p17
[14] Rousselle P Robert Y et Crosnier JC 1996 La pomme de terre INRA Pp 50
[15] (Canadian Food Inspection Agency) Plant Morphology (httpwwwinspectiongcca
accessed 16 November 2017)
[16] D Soltner 1979 Les grandes production veacutegeacutetales phytotechnie speacuteciale Collection
Sciences Et Techniques Agricoles PARIS 10eacutemeacute Edition P 427
Chapter II Potato Generality
44
[17] CIP (International Potato Center) (2012a) Potato Facts and Figures
(httpcipotatoorgpotatofacts accessed 15 December 2012)
[18] USPB (United States Potato Board) (2011a) Potato Types Guide
(httpwwwciaprochefcompotatoespdf PotatoTypespdf accessed 15 December 2012)
[19] R Navarre M J Pavek 2014 The Potato Botany Production and Uses CAB
International Boston USA p 43
[20] (USDA National Agricultural Statistics Service) (2013) Crop
Production(httpwwwnassusdagovPublicationsTodays_Reportsreportscrop1212pdf
accessed 15 May 2013)
[21] WSU (Washington State University Extension) (2012) Potato Varieties A
Comprehensive List (httppotatoes wsueduvarietiesvars-allhtm accessed 15 December
2012)
[22] Tahvonen R Hietanen RM Sihvonen J and Salminen E (2006) Influence of
different processing methods on the glycaemic index of potato (Nicola) Journal of Food
Composition and Analysis 19(4) 372-378
[23] Knuthsen P Jensen U Schmidt B and Larsen I K (2009) Glycoalkaloids in
potatoes Content of glycoalkaloids in potatoes for consumption Journal of Food
Composition and Analysis 22(6) 577-581
[24] Lombardo S Pandino G and Mauromicale G (2012) Nutritional and sensory
characteristics of ldquoearlyrdquo potato cultivars under organic and conventional cultivation systems
Food Chemistry 133(4) 1249-1254
[25] Lambert DH Powelson ML and Stevenson WR (2005) Nutritional interactions
influencing diseases of potato American Journal of Potato Research 82(4) 309-319
[26] Decker EA and Ferruzzi MG (2013) Innovations in food chemistry and processing to
enhance the nutrient profile of the white potato in all forms Advances in Nutrition An
International Review Journal 4(3) 345S-350S
[27] Casanas R Gonzalez M Rodriguez E Marrero A Diaz C 2002 Chemometric studies of
chemical compounds influence cultivars of potatoes from Tenerife J Agric Food Chem
502076ndash2082
[28] T Mu H Sun X Liu Potato Staple Food Processing Technology Springer Briefs in
Food Health and Nutrition 2017 Singapore 53 50-125
[29] Manach C Scalbert A Morand C Remesy C amp Jimenez L (2004) Polyphenols
food sources and bioavailability Am J Clin Nutr 79 727ndash747
Chapter II Potato Generality
45
[30] Parr AJampBolwell GP (2000) Phenols in the plant and in manThe potential for
possible nutritional enhancement of the diet by modifying the phenols content or profile
Journal of the Science of Food and Agriculture 80 985ndash1012
[31] Scalbert A Manach C Morand C Remesy C amp Jimenez L (2005) Dietary
polyphenols and the prevention of diseases Crit Rev Food Sci Nutr 45 287ndash306
[32] Ezekiel R Singh N Sharma S Kaur A Beneficial phytochemicals in potatomdashA
review Food Res Int 2013 50 487ndash496
[33] Maumlder J Rawel H Kroh L Composition of phenolic compounds and glycoalkaloids
α-solanine and α-chaconine during commercial potato processing J Agric Food Chem 2009
57 6292ndash6297
[34] Mattila P Hellstroumlm J Phenolic acids in potatoes vegetables and some of their
products J Food Comp Anal 2007 20 152ndash160
[35] Im H Suh B Lee S Kozukue N Ohnisi-Kameyama M Levin C Friedman M
Analysis of phenolic compounds by high-performance liquid chromatography and liquid
chromatographymass spectrometry in potato plant flowers leaves stems and tubers and in
home-processed potatoes J Agric Food Chem 2008 56 3341ndash3349
[36] Deuszliger H Guignard C Hoffmann L Evers D Polyphenol and glycoalkaloid
contents in potato cultivars grown in Luxembourg Food Chem 2012 135 2814ndash2824
[37] Shakya R Navarre D Rapid screening of ascorbic acid glycoalkaloids and phenolics
in potato using high-performance liquid chromatography J Agric Food Chem 2006 54
5253ndash5260
[38] Andre C Oufir M Guignard C Hoffmann L Hausman J Evers D Larondelle
Y Antioxidant profiling of native andean potato tubers (Solanum tuberosum L) reveals
cultivars with high levels of β-carotene α-tocopherol chlorogenic acid and petanin J Agric
Food Chem 2007 55 10839ndash10849
[39] Wu X Beecher GR Hoden J M Haytowitz D B Gebhardt SE Prior R L 2004
Lipophilic and hydrophilic antioxidant capacities of common foods in the United States J
Agric Food Chem 52 4026ndash4037
[40] Lombardo S Pandino G Mauromicale G 2012 Nutritional and sensory
characteristics of ldquoearlyrdquo potato cultivars under organic and conventional cultivation systems
Food Chemistry 133 (4) 1249ndash1254
[41] Hamouz K Lachman J Pazderů K Hejtmaacutenkovaacute K Cimr J Musilovaacute J Pivec
V Orsaacutek M Svobodovaacute A 2013 Effect of cultivar location and method of cultivation on
Chapter II Potato Generality
46
the content of chlorogenic acid in potatoes with different flesh colour Plant Soil and
Environment 59 (10) 465ndash471
[42] Brazinskiene V Asakaviciute R Miezeliene A Alencikiene G Ivanauskas L
Jakstas V Viskelis P Razukas A 2014 Effect of farming systems on the yield quality
parameters and sensory properties of conventionally and organically grown potato (Solanum
tuberosum L) tubers Food Chemistry 145 903ndash909
[43] Kanatt S Chander R Radhakrishna P Sharma A Potato peel extract natural
antioxidant for retarding lipid peroxidation in radiation processed lamb meat J Agric Food
Chem 2005 53 1499ndash1504
[44] Bushway RJ Bureay JL McGann DF 1983 Alph-chaconine and Alpha-Solanine
content of potato peels and potato peel products J Food Sci 4684ndash86
[45] Friedman M Roitman JN Kozukue N 2003 Glycoalkaloid and calysteigine contents
of eight potato cultivars J Agric Food Chem 512964ndash2973
[46] Fitzpatrick TJ McDermott JA Osman SF 1978 Evaluation of injured potato samples
for total glycoalkaloid content J Food Sci 431617ndash1618
[47] Wu MT Salunkhe DK 1978 After-effect of submersion in water on greening and
glycoalkaloid formation of potato tubers J Food Sci 431330ndash1331
[48] Griffith DW Bain H Dale MFB 1998 Effect of storage temperature on potato
(Solanum tuberosum L) tuber glycoalkaloid content and subsequent accumulation of
glycoalkaloids and chlorophyll in response to light exposure J Agric Food Chem 465262ndash
5268
[49] International Potato Center Potato facts and figures httpcipotatoorgpotatofacts
Accessed July 21 2016
[50] S C Yadav 2008 POTATO Production Processing and Marketing BIOTECH BOOKS
Delhi India p 16
[51] Birch PRJ Bryan G Fenton B Gilroy EM Hein I Jones JT Prashar H
Taylor MA Torrance L Toth IK 2012 Crops that feed the world 8 potato are the
trends of increased global production sustainable Food Security 4 (4) 477ndash508
[52] Food and Agriculture Organization of the United Nations (FAO) 2008 International
Year of the Potato The Global Potato Economy FAO Rome Italy
[53] J Singh L Kaur 2016 Advances in Potato Chemistry and Technology Second Edition
Elsevier Inc London United Kingdom p 12
Chapter II Potato Generality
47
[54] A Ould Rebai T Hartani M N Chabaca M Kuper Une innovation 2017
increacutementielle la conception et la diffusion drsquoun pivot drsquoirrigation artisanal dans le Souf
(Sahara algeacuterien) Cah Agric 26 35005
[55] Hylla S Gostner A Dusel G Anger H Bartram H P Christl S U Kasper H amp
Scheppach W (1998) Effects of resistant starch on the colon in healthy volunteers possible
implications for cancer preventionAmer J Clin Nutr 67 136ndash142
[56] Kawamoto H (2007) Trends in research and development of plastics of plant origin-
from the perspective of nanocomposite polylactic acid for automobile use Science and
Technology Trends 22 62ndash75
[57] Z Hong XU Fen W Yul H Hong-hai1 D Xiao-feng Progress of potato staple food
research and industry development in China Journal of Integrative Agriculture 2017 16(12)
2924ndash2932
[58] Deuszliger H Guignard C Hoffmann L Evers D Polyphenol and glycoalkaloid
contents in potato cultivars grown in Luxembourg Food Chem 2012 135 2814ndash2824
[59] BurlingameB MouilleacuteB CharrondiegravereR Nutrients bioactivenon-nutrients and anti-
nutrients in potatoes J Food Comp Anal 2009 22 494ndash502
[60] Albishi T John J Al-Khalifa A Shahidi F Phenolic content and antioxidant
activities of selected potato varieties and their processing by-products J Funct Foods 2013
5 590ndash600
[61] Al-Weshahy A Venket Rao A Isolation and characterization of functional components
from peel samples of six potatoes varieties growing in Ontario Food Res Int 2009 42
1062ndash1066
[62] H Akyol Y Riciputi E Capanoglu M Fiorenza Caboni V Verardo Phenolic
Compounds in the Potato and Its Byproducts An Overview Int J Mol Sci 2016 17 835
[63] OrsquoShea N Arendt E Gallagher E Dietary fibre and phytochemical characteristics of
fruit and vegetable by-products and their recent applications as novel ingredients in food
products Innov FoodSci Emerg 2012 16 1ndash10
[64] Madiwale G Reddivari L Stone M Holm D Vanamala J Combined effects of
storage and processing on the bioactive compounds and pro-apoptotic properties of color-
fleshed potatoes in human colon cancer cells J Agric Food Chem 2012 60 11088ndash11096
[65] Kuumllen O Stushnoff C Holm D Effect of cold storage on total phenolics content
antioxidant activity and vitamin c level of selected potato clones J Sci Food Agric 2013 93
2437ndash2444
Chapter III
Methods
Chapter III Methods
49
III1) Introduction
For most analytical protocols the procedure for the effective extraction of the specific
compounds from the bulk matrix is one of the most important processes in the analytical
mechanism [1] The composition and nature (simple andor complex) of the phytochemical
compounds to be extracted determine the condition of the extraction process
The extraction process is affected by the chemical structure of the phytochemical
compounds (simple or complex compounds) the extraction technique employed by solvents
solid-phase extraction and supercritical extraction the conditions of storage time and
temperature and the presence of the substance [2] the polymerization of the phytochemical
content is ranged from simple to high polymerized substance Some plants contain different
phenolic acids phenylpropanoids anthocyanins and tannins which can interact with other
plant components such as primary metabolism substances (protein and carbohydrates) these
compounds might be insoluble That is why it is difficult to develop a process capable of
recovering all the phytochemical substances contain in a plant matrix [3] which makes the
choice of the condition extraction solvent and technique an important factor
III1) Methods
III11) Soxhlet
Soxhlet extraction is a common example of an exhaustive solid-liquid extraction
technique and its principle of operations depend on the transfer of the target compound from
the plant (solid) to appropriate organic solvent(s) by ensuring that the extraction solvent
(liquid) maintains continuous contact with the sample at the time of the heat-aided extraction
process[4]
Figure III1 shows the traditional Soxhlet extraction apparatus generally contain a
distillation flask the sample holder (thimble) siphon and condenser In practice a
preweighed and sufficiently dried solid sample is loaded on filter paper and placed inside the
thimble Solvent vapors generated from the heated flask containing the extraction solvent(s)
pass through the thimble and become liquefied in the condenser
The extraction process begins the moment the liquefied solvent maintains contact with
the sample in the thimble The level of the condensed solvent therefore continues to upgrade
until it reaches the overflow level At this point an instant siphon effect rapidly makes the
extract (solute + solvent) to fall back into the distillation flask
Within the flask only the fresh solvent evaporates resulting in a continuous cyclical
Chapter III Methods
50
movement of the extraction solvent A complete cyclical movement of fresh solvent from the
distillation flask until it returns back to the flask as an extract is indicated to as a ldquocyclerdquo The
operation is repeated until complete extraction is achieved [5]
The cyclical movement of evaporated solvent from the flask that is subsequently
condensed facilitates the mass transfer of the target analyte in every cycle completed during
the extraction Generally the more the number of cycles completed the faster the rate of
extraction of the target analyte from the sample matrix [4]
Figure III1 Typical conventional soxhlet extractor Figure I 15Typical conventiona l soxhlet extractor
Figure I 16Typical conventiona l soxhlet extractor
III12) Maceration
Maceration is a method used a long time ago in winemaking and widely used in
medicinal plants research to extract essential oils and bioactive substance this technique
generally has several stages [6] Firstly crushed or cut the plant materials into small pieces to
increase the surface area for proper mixing with solvent Secondly adding the menstruum (the
appropriate solvent) in a closed container Thirdly The mixture then is strained the marc (the
damp solid material) is pressed and the combined liquids are clarified by filtration or
decantation after standing to facilitate the extraction and increase the yield we shake the
container this procedure increase the diffusion and bringing new solvent to the menstruum by
removing the concentrated solution from the sample surface the procedure of maceration is a
slow process taking a few hours up to several weeks also can consume large volumes of
solvent
Chapter III Methods
51
III13) Ultrasound-assisted extraction
Most applications of ultrasound-assisted leaching contain systems using the bath or
ultrasonic probe This kind of equipment has been used for leaching organic and inorganic
compounds with frequencies more than 20 kHz [7] The plant materials placed in a flask
which fixed an ultrasonic bath the mechanical stress produced by ultrasonic on the cells
through the production of cavitations in the sample made the cellular breakdown this damage
increases the solubilization of metabolites in the solvent and develops extraction yields [8]
The condition of sonication frequency time and temperature effect on the level of the
extraction
III14) Several variables effect on extraction system
In general terms the extraction productivity of a target compound is usually a function of
several process variables The most important factors concerning the extraction of phenolic
compounds natural products are the solvent type temperature contact time solvent-to-solid
ratio particle size and among others
The positive or negative effect of each variable on the mass transfer phenomenon which
governs the extraction process is specific to different varieties of the vegetable matrix and is
not always obvious the extraction of soluble phenolic compounds can be performed by
promoting their dispersion from plant tissue using a solvent
Each vegetable material possesses unique properties that might interfere with the
phenolic compounds extraction so it is important to develop optimal extraction technique for
their quantification and identification [9]
III141) Solvent
Solvent composition is always an important variable to be considered when dealing
with the extraction process
This variable should always be optimized in order to produce good extraction yields in
an economically advantageous process Many solvents can be used to extract phenolic
compounds from plant matrices ethanol isopropanol water and their combination these
substances are classified with the GRAS status and for that reason water isopropanol and
ethanol are suitable for the recovery of nutraceuticals [1]
Ethanol is reported to be appropriate solvent to recovery the phenolic compounds and
for that reason it is usually used for the obtaining of this group of compounds especially
Chapter III Methods
52
when it comes to the production of nutraceuticals which is related to its GRAS classification
[1] Ethanol water and their mixtures are the preferable solvent systems currently used for
natural product production
In that context infusions (immersion in hot water) continue to be an interesting way to
produce extracts with high contents of antioxidant compounds further the use of ethanol
should also be considered [10]
III142) Solvent-to-feed-ratio
According to mass transfer principles the driving force during mass transfer is the
concentration gradient between the solid and the bulk of the liquid which is increased when
the ration solvent to solid creased
Therefore according to mass transfer principles independent of the extraction solvent
used the higher the solvent-to-solid ratio the higher the total amount of solids obtained [11]
However from economic side the effect of consumption of the solvent on the extraction
process cost this variable should be carefully analyzed and optimized
There for several studies have reported that the effect of the solvent-to-feed (SF) ratio
variation from 61 to 181 was evaluated in terms of recovery of the antioxidant agents from
several plants [12] The effect of the solvent-to-solid ratio on the recovery of phenolic
compounds from different plant matrices was well studied by several authors [13-15]
III143) Temperature
Many phytochemicals are heat stable and extraction at high temperature has no adverse
effects however there are some phytochemicals which are heat labile In general a higher
extraction temperature causes an increase in the rate of diffusion of the soluble plant
phytochemicals into the extraction solvent An increase in temperature can cause an augment
in the content of some phytochemicals which is possibly due to an increase in the solubility
of many of these bioactive compounds [16-17]
Overall some phytochemicals such as anthocyanins the heat had an effect on
anthocyanins degradation [18-19] therefore high temperatures for long extraction times
would not be suitable for extraction of plants containing these compounds However for
phenolic compounds attention should be paid to their stability during the process phenolic
Chapter III Methods
53
compounds when kept above certain temperatures for certain periods of time can suffer
thermal degradation (oxidation) and activity loss [20]
In this study the temperature was ranged from 33degC in UAE extraction which reached
by the extraction performed by UAE [21] to 70 degC ( Ethanol boiling point) for Soxhlet
extraction
III144) Time
The time necessary for the extraction of phytochemicals compounds from plant tissue
will vary depending on the plant species to be extracted [10] According to Durling et all The
concentration of the target compounds in the extract obtained after a 6-h extraction time was
20 higher than that observed for the sample related to the extraction period of 1 h [12]
Increased contact time between solvents like ethanol and solid matrices might lead to a
progressive release of solute from the solid matrix to solvent [22]
Generally the extraction time using for UAE process ranged from 10ndash60 min and for
Soxhlet extraction ranged from 6ndash24 h [23-25]
III145) Particle size
The variation of in particle size of the sample has a strong influence on The quantity of
polyphenol recovery from plant materials
Mass transfer can be improved by the use of smaller particles to improve the penetration
of solvent in the solid matrix [10] The bigger the particle size of the material the longer the
path that the solvent has to travel which increase the time for maximum phytochemical
content to be extracted [26]
Also the damage of the plant cells caused by the crushing or milling the plant material
lead to increased extraction of phytochemical compounds
III2) Estimation of the water weight percentage in potato roots
No agricultural product in its natural state is completely dry Some water is always
present The percent moisture is an expression used for the description of the quantity of
water in plant material and for this purpose we usually use two methods
Chapter III Methods
54
These methods are the wet basis and dry basis In addition the content may be
expressed as a percent or as a decimal ratio [27] In our work we will use one form (percent)
in analyzing moisture in potatoes roots calculating by the following equation
where
is the moisture content of the sample (mm)
is the sample weight before drying g
is the sample weight after drying g
Two or three parallel measurement has to prepare The final sample moisture content
will be the mean of the two or three parallel measurements
III3) Phytochemical investigation
Analyses of plant materials based on two methods non-chromatographic
spectrophotometric methods or chromatographic methods Spectrophotometric methods are
based on the ability of the phytochemicals that absorb light in the ultraviolet (UV) or visible
range of the spectrum (eg total flavonoids content) or the ability to form such chromophores
after reacting with certain reagents such as total phenolic content and this quantification
depending on Beer-Lambert law This approach does not require separation of individual
compounds in the extract and often quantification is done as the total amount of similar
compounds in the extract
The advantages of the non-chromatographic spectrophotometric methods are simple
fast and of low cost but these methods lack the specificity for individual compounds and the
results are less precise [28]
III31) Screening chemistry
Phytochemical analysis was determined for all the extracts using the standard methods
III311) Detection of flavonoids
The detection of flavonoids done by Alkaline Reagent Test Extracts were treated with
few drops of sodium hydroxide solution Formation of intense yellow color which becomes
colorless on the addition of dilute acid indicates the presence of flavonoids[2930]
Chapter III Methods
55
III312) Detection of phytosterols
a) Liberman and Burchurds The test was done after the extraction and reflux of the plant
material 2 ml extract taken in a test tube 2 ml Chloroform 2 ml Acetic Anhydride and 2 ml
concentrate Sulphuric acid was added to it translucent green color shows the presence of
steroids and formation of deep red color indicates the presence of triterpenoids [3132]
b) Salkowskirsquos test Dissolve the extract in chloroform with few drops of concentrated
Sulfuric acid shake well and allow to stand for some time red color appears in the lower
layer indicates the presence of sterols and formation of yellow colored lower layer indicating
the presence of triterpenoids [32]
III313) Detection of tannins
About 05 g of the extract was boiled in 10 ml of water in a test tube and then filtered A
few drops of 01 ferric chloride was added and observed for brownish green or a blue-black
coloration [33]
III314) Detection of carbohydrates
Fehlingrsquos Test Filtrates were hydrolyzed with diluted HCl neutralized with alkali and
heated with Fehlingrsquos A amp B solutions Formation of red precipitate indicates the presence of
reducing sugars[3034]
III315) Detection of alkaloids
a) Mayerrsquos Test Filtrates were treated with Mayerrsquos reagent (Potassium Mercuric Iodide)
Formation of a yellow colored precipitate indicates the presence of alkaloids[32]
b) Wagnerrsquos Test Filtrates were treated with Wagnerrsquos reagent (Iodine in Potassium Iodide)
Formation of brownreddish precipitate indicates the presence of alkaloids[32]
III315) Detection of coumarins
3 ml of 10 NaOH was added to 2 ml of aqueous extract formation of yellow color
indicates the presence of coumarins [3135]
Chapter III Methods
56
III32) Total flavonoids content (TFC)
a) Principle
The estimation of the total flavonoids content generally used by aluminum chloride
method This method is based on flavonoids capability of forming a stable complex with Al
ions in a solution
The color of the complex depends on the ratio of the Al ions to the flavonoid molecules
and the hydroxylation pattern of the latter For this reason the spectrophotometric readings
used in this method can vary from 367 to 510 nm in different experimental procedures[36]
b)Protocol
Total flavonoids content was determined as described previously by ZOU et AL (2004) [37]
A mixture of 1 ml of extract 2 ml of nanopure water and 015 ml of 5 NaNO2 was prepared
and allowed to react for 6 min Then 015 ml of 10 AlCl3 solution was added and mixed
thoroughly After 6 min 2 ml of 4 NaOH solution was added and allowed to stand for
another 15 min The absorbance of the mixture was measured at 510 nm versus prepared
blank Rutin was used as a standard compound for the quantification of flavonoids content
Results were expressed in mg of rutin equivalents g of extract
III33) Total phenolics content (TPC)
a)Principle
The Folin-Ciocalteu (FC) assay is the most widely used method for the estimation of
total phenolic content (TPC) in extracts fruits vegetables grains and other foods The FC
reagent consists of an oxidizing mixture of phosphotungstic acid and phosphomolybdic acid
which when reduced produce a mixture of blue molybdenum and tungsten oxides (λ max
765 nm) Technically all compounds that can be oxidized by the FC reagent will be measured
[38]
b)Protocol
Total phenolics content was determined with the Folin-Ciocalteu reagent according to a
method described by Singelton-Ross (1956)[39] Briefly 100 microl of the appropriately diluted
extract was added to 05 ml of freshly diluted 10-fold Folin-Ciocalteu reagent Then 2 ml of
Chapter III Methods
57
20 Na2CO3 solution The reaction mixture was kept in the dark for 30 min and its
absorbance was measured at 760 nm against a blank Gallic acid was used as a reference
standard and the results were expressed as gallic acid equivalents g of extract
III34) HPLC analysis
liquid chromatography is a powerful separation method used in phytochemical studies
Practically this technique can be able to resolve mixtures with a large number of similar
analytes HPLC is very efficient it yields excellent separations in a short time [40]
III341) Principe
The procedure of HPLC is depended on the flow of solutes through two non-miscible
phases inside column (mobile phase and stationary phase ) to be separated [41] For this the
sample is dissolved in the mobile phase However this phase is in constant movement relative
to the stationary phase this movement due to the interactions of the constituents with the
stationary phase they separate after sufficient running time and they appear at the end of the
column at different times [40] this detection expressed as chromatograms
III342) HPLC system
According to the basic diagram shown in Figure 2 an HPLC system contains the
following elements
Figure III2 Block Diagram of an HPLC
Figure I 17Bloc k Diagram of an HPLC
Chapter III Methods
58
a) Solvents
Requirements for the solvents used in HPLC are filtering and degassing Filtering the
solvents will get rid of particulates that might contaminate the sample and can block the flow
through the HPLC column Particulates that are large enough can cause permanent damage to
the column Degassing helps to remove dissolved gases that are in the solvent This is
accomplished by pulling a vacuum on the solvent container while vibrating or sonicating
Both the particulates and the dissolved gas bubbles can also cause the efficiency of the
separation to go down Dissolved gas bubbles reduce separation efficiency by causing band
broadening and interfering with some detection systems [42]
b) Pumps
Pumps These are devices that deliver the mobile solvent at a controlled flow rate to the
separation system The pumping system needs to be of a high enough quality that it can
consistently produce a high-pressure [43] High-pressure gradients that are reached by these
pumps provide more accurately different gradients maintained by microprocessor control In
the gradients up to four solvents are presented in a constant relationship
c) Injection systems
Injector this device allows the addition of the liquid sample to the mobile phase Sample
injection systems which work automatically are preferred for prominent precision in sample
introduction [44]
d) Column
In the analytical model stainless steel columns generally have an internal diameter of
46mm The length is 5 10 15 or 25cm The filling (silica grafted silica or polymeric
particles) has a particle size of 3 5 or 10 um The internal diameter of a column is usually 4
or 46 mm If pure substances must be collected at the end of the chromatogram large
diameter columns will be required [45]
e) Detectors
An ideal detector of any type is sensitive to low concentrations of every analyte provides a
linear response and does not expand the eluted peaks according to the characteristic of the
molecules investigated various detectors are used such as its absorption in UV range or its
fluorescence This is the most frequent method used and its application allows for over 70
of detections [45]
Chapter III Methods
59
III343) Protocol
The phenolic compounds were analyzed by HPLC A LC-18 column (150 mm x 46
mm id x 5 mm) maintained at 30 degC was employed Elution was performed at a flow rate of
1 mLbullmin-1 using a mobile phase composed of wateracetic acid (982 vv) (solvent A) and
acetonitrile (solvent B) in gradient elution mode The elution gradient was 0 - 5 min 5 B
10 min 10 B 11 min 20 B 20 min 20 B 30 min 40 B 40 min 50 B 50 min 80
B
Chromatograms were acquired at 300 nm Phenolic compound standards ascorbic acid
gallic acid chlorogenic acid vanillin rutin were dissolved in extraction solvents and used for
identification of phenolic acids presents in different sample extracts Peak identification in
HPLC analysis was achieved by comparison of retention time and UV spectra of reference
standards
Quantification of individual phenolic compounds in the extracts was done using the
peak area of reference compounds and reported as microgmg of extract
III4) Antioxidant activity
According to its definition an antioxidant should have a significantly lower
concentration than the substrate in the antioxidant activity test Depending on the type of
reactive oxygen species (ROS) and target substrate a certain antioxidant may play a
completely different action or have a completely different roleperformance In line with this
some studies support the use of a selection of methods to measure the antioxidant activity [46-
47] The choice of substrate is very important in an antioxidant activity test Depending on the
type of substrate and its amountconcentration different results will be achieved
In our study the methods used to determine total antioxidant activity devised in two
techniques First one is spectrophotometers methods such as 11-diphenyl-2-picrylhydrazyl
(DPPH) assay and ferric ion reducing antioxidant parameter (FRAP) assay Secondly an
electrochemistry technique in this process we used cyclic voltammetry methods to determine
the antioxidant activity
Chapter III Methods
60
III41) Spectrophotometers assay
The Spectrophotometry is a quantitative analytical method that involves measuring the
absorbance or optical density of a given chemical substance in solution More this species is
concentrated plus it absorbs light within the limits of proportionality laid down by the law of
Beer-Lambert The optical density of the solutions is determined by a spectrophotometer
previously calibrated to the absorption wavelength of the chemical species to be studied
when intensity light I0 passes through a solution part of it is absorbed by the solute (s)
Therefore the intensity I of the transmitted light is less than I0 [48]
The absorbance of the solution is a positive value and defined as follows
Or When
III411) DPPH assay
a) Principle
The 11-diphenyl 1-2-picrylhydrazyl ( DPPHbull) - which is also known as αα-diphenyl-
β- picrylhydrazyl 22-diphenyl -1- picrylhydrazyl or 2 2-Diphenyl -1-(246-Trinitrophenyl
hydroxyl) assay originally described by Boils (1958) was designed to take advantage of a
common electron spin resonance reagent a stable free radical with an odd unpaired valence
electron to study antioxidant activity With its odd electron DPPHbull
can be stabilized by
accepting an electron or hydrogen radical from an antioxidant molecule such as a gallic acid
as a reducing agent DPPHbull
is known for its deep violet color and the strong absorbance at
517nm when dissolved in ethanol at concentrations between 1mM and 225microM [49-51] this
absorbance is decreased with the decolorization of DPPHbull which accompanies the pairing of
the lone electron
b) Protocol
The scavenging activity by the DPPH (22-diphenyl-1-picrylhydrazyl) radical scavenging
method according to Ohinishi and others [52] with some modifications a 1 ml of diluted
extract and 1 ml of DPPH (025 mM) were mixed and after 30 min the absorbance was
measured at 517 nm The scavenging activity was measured as the decrease in absorbance of
the samples versus DPPH standard solution Results were expressed as radical scavenging
activity percentage () of the DPPH according to the formula
Chapter III Methods
61
Where
A0 absorbance of the control
As absorbance of the sample
III412) Evaluation of total antioxidant capacity (TAC) by
Phosphomolybdenum method
a) Principle
The total antioxidant capacity of the ethanol extract was evaluated by the
phosphomolybdenum method according to the procedure described by Prieto et al [53]
The assay is based on the reduction of Mo (VI) to Mo (V) by the extract and
subsequent formation of green phosphateMo (V) complex at acid ρH
c) Protocol
The antioxidant activity of different samples was evaluated by the phosphomolybdenum
method of Prieto et al [53] An aliquot of 100 microl of the sample was combined with 1ml of
reagent solution (06 M sulfuric acid 28 mM sodium phosphate and 4 mM ammonium
molybdate) The tubes were capped and incubated in water bath at 95 degC for 90 min After the
samples were cooled to room temperature the absorbance was measured at 695 nm The
antioxidant capacity was expressed as equivalent to ascorbic acid ( mg ascorbic acid g of
extract)
III413) Ferric-reducing antioxidant power (FRAP) assay
a) Principle
The FRAP assay is based on the single electron transfer by an antioxidant to reduce the ferric
to ferrous ion when the ferric- tripyridyltriazine (Fe3+
-TPTZ) complex is reduced to the
ferrous counterpart the complex absorbs at 593 nm with an intense blue color [55]
b) Protocol
The FRAP assay was performed based on the procedure described by Benzie and Strain
[54] 100 microl of the diluted sample was added to 300 microl water then 3 ml of the FRAP reagent
and the reaction was monitored after 30 min in the dark at 593 nm The results were expressed
as mg Fe(II) g of extract
Chapter III Methods
62
III414) Beta-carotene bleaching
a) Principe
This method first developed by Marco [55] and modified by Miller [56]
This technique is sensitive and mainly based on the principle oxidation of linoleic acid
which is an unsaturated fatty acid by Reactive Oxygen Species (ROS) produced by
oxygenated water This complex formed will oxidate the b-carotene this oxidation will lead
to discoloration The retarding of this oxidation correlate with the addition of an antioxidation
compounds [57]
The degradation of b-carotene by linolic acid catalyzed with heat 50 degC in the aqueous
phase the activity is measured at 470 nm [58]
b) Protocol
Two milliliters of a solution of β-carotene in chloroform (2mg10ml) was pipetted into a
flask containing 40mg of linoleic acid and 400 mg of Tween 80The chloroform was removed
by rotary vacuum evaporator at 45 for 4min and 100 ml of distilled water was added
slowly to the semisolid residue with vigorous agitation to form an emulsion A 48ml aliquot
of the emulsion was added to a tube containing 02ml of the antioxidant solution the
absorbance was measured at 470 nm immediately against a blank consisting of the emulsion
without β-carotene [59] The tubes were placed in a water bath at 50 and the absorbance
measurements were conducted again at 15 min intervals up to 120minAll determinations
were carried out in triplicate [60] The antioxidant activity (AA) of the extracts was evaluated
in terms of bleaching of β-carotene using the following formula
where
is the absorbance of values measured at zero time of the incubation for the test sample
is the absorbance of values measured at zero time of the incubation for test control
is the absorbances measured in the test sample
is the absorbances measured in the test control
After incubation for 120 min the total antioxidant activity of acid ascorbic and Gallic acid
was also measured by inhibition of β-carotene bleaching method for comparison
Chapter III Methods
63
III42) Electrochemical techniques
III421) Principle
Recently the Electrochemical technique was applied to determine the antioxidant
content and antioxidant capacity in the phytochemical analysis these interest based on their
advantages of sensitivity and fastness process [61] The broadest technique in
electrochemistry used for redox system is Cyclic voltammetry The CV record the anodic
current produced by the antioxidant compounds which are oxidized on the surface of the
working electrode while the potential of a working electrode is linearly scanned from an
initial value to a final value and back [62] The current produced is proportional to the
combined concentration of the antioxidants [6364] This process can happen multiple times
during a single experiment The current produced is plotted versus the applied potential to
give the cyclic voltammogram as shown in Figure III3
Figure III3 cyclic voltammogram for redox system
Figure I 18
Figure I 19cyclic voltammogram for redox system
The cyclic voltammogram contains the cathodic peak Ic and anodic peak Ic the anodic
oxidation potential (Ea) and the cathodic oxidation potential (Ec) If the only cathodic peak
is present and anodic peak is absent then the process is irreversible and for the reversible
system the values of Epc and Epa are equal [65]
III422) Protocol of antioxidant activity
Electrochemical measurements were performed on a Potentiostat voltammetric signals
of Cyclic Voltammetry and square-wave voltammetry were recorded at room temperature in
an electrochemical cell with a volumetric capacity of 25 mL containing a working electrode
was glassy carbon a saturated calomel HgHg2Cl2KCL electrode was used as a reference and
a platinum wire was used as counter electrode The glassy carbon was polished before every
Chapter III Methods
64
experiment The antioxidant capacity measured of sample varieties was in a buffer solution of
acetate (300 mM pH=36) Cyclic voltammograms were obtained by a single cycle performed
at a scan rate of 100 mVs-1
and potentials range +200 to +1400 mV Gallic acid was used as a
standard in the calculation of antioxidant capacity of the studied sample of potatoes because
of its wide-spreading in nature and also because of its anodic area display excellent linearity
toward gallic acid concentration [66]
III422) Protocol for scavenging activity of superoxide anion Obull2
minus radicals
Superoxide anion radical was generated electrochemically by one electron reduction in
the commercial molecular oxygen in ACN containing 01 M TBFB at room temperature (28 plusmn
1 degC) The samples of each extract were added to this reaction medium and the cyclic
voltammograms were recorded following a modified method of Le Bourvellec et al [67]
Experimentations were carried out using voltalab40 PGZ301 potentiostatgalvanostat
(radiometer analytical SAS) in a double-walled electrochemical cell of 25 mL and the
conventional three-electrode system was employed A glassy carbon (GC) working electrode
(radiometer analytical SAS) having area 0013 cm2 a platinum wire counter electrode and a
HgHg2Cl reference electrode (30 M KCl) were used Data acquisitions were accomplished
with a Pentium IV (CPU 30 GHz and RAM 1 Gb) microcomputer using VoltaMaster4
software version 708 (radiometer analytical SAS) The scan rate was kept at 100 mVs and
potential window was from minus14 to 00 V The studied extract samples were added to the in
situ generated superoxide anion radical Obull2
minus and the cyclic voltammograms were recorded
III5) Calibration curve
Evaluation of the linearity of the calibration curve is favored to prove the acceptability
of any analytical method [68] Generally to verify the linearity five concentration levels of
standard solutions are required to construct the regression line of the calibration curve In this
study a linearity test was performed by plotting the calibration curve between the standard
concentration and the absorbance wave for spectrophotometers analysis and current peaks for
electrochemical analysis The linearity can be investigated through the correlation coefficient
(R) usually used to determine the linearity of the calibration curve In chemical correlation
analysis the coefficient of determination (R2) is the more exact term used [69] In this study
the linearity criterion was chosen using R2 of the regression line which is suggested to be
090 or more
Chapter III Methods
65
III51) Totale phenolic content
The linearity of the calibration curve was tested at ranges of concentrations (003 ndash 03
mgmL) prepared of Gallic acid as standard solutions of total Phenolic content the equation
obtained from the linear calibration graph in the studied concentration Y = 314x+0046
(Rsup2 = 0990) where y represents the value of the Absorbance and x the value of standards
concentration
000 005 010 015 020 025 030
00
02
04
06
08
10
Ab
s
Gallic asid concentration (mgml)
R2=0990
Figure III4 The calibration curve obtained for Gallic acid Figure I 02 Figure III4 The calibration curve obtained for Gallic acid
III52) Total Flavonoid content
The linearity of the regression line of the calibration curve was evaluated by preparing
standard solutions of Rutine in ethanol at concentration ranges of 005 ndash 025 mgmL for total
Flavonoids content The equation obtained from the linear calibration graph in the studied
concentration Y=192X-000567 (Rsup2 = 0997) where y represents the value of the Absorbance
and x the value of standards concentration
Chapter III Methods
66
015 020 025 030 035 040
03
04
05
06
07
08
Ab
s (
nm
)
Con (mgml)
R2=0997
Figure III5 The calibration curve obtained for Rutine
Figure I 21Figure III5 The calibration curve obtained for R utine
III53) FRAP assay
Ferrous sulfate (FeSO4) at concentration ranges 005 ndash 04 mgmL were prepared as
standards solution to assess the linearity of the calibration curve for FRAP antioxidant assay
The equation obtained from the linear calibration graph in the studied concentration
Y= 234746X-003929 (Rsup2 = 0993) where y represents the value of the Absorbance and x the
value of standards concentration
000 005 010 015 020 025 030 035 040 045
00
02
04
06
08
10
Ab
s (
nm
)
Con (mgml)
R2=0993
Figure III6 The calibration curve obtained for Ferrous sulfate
Chapter III Methods
67
III54) Total antioxidant capacity
Linearity was evaluated through the regression line of the calibration curve The
calibration line of Ascorbic acid at a different concentration from 007 to 03 mgmL for Total
antioxidant capacity The equation obtained from the linear calibration graph in the studied
concentration Y= 320228X+003727 (Rsup2 = 0990) where y represents the value of the
Absorbance and x the value of standards concentration
005 010 015 020 025 030
02
03
04
05
06
07
08
09
Ab
s (
nm
)
Con (mgml)
R2=099
Figure III7 The calibration curve obtained for Ascorbic acid TAC Figure I 22T he cali bration curve obtaine d for Ascor bic a cid TA C
III55) HPLC calibration curve
Figure 7 shows the chromatograms of seven mixed standards which analyzed in 300 nm
waves length and concentration (1ugml) peaks from 1 to 7 were Ascorbic acid Gallic acid
Chlorogenic acid Cafiec acid Quercetin Vanillin and Rutine respectively The linearity of
standard preparations was tested The calibration curves were constructed by plotting the peak
area of each compound against the corresponding concentrations The five points of the
regression line offered good linear behavior in the ranges 002 ndash 01 and 02 ndash 10 microgmL The
coefficient of determination (R2) values as shown in the figures below were found to be
acceptable and close to 0990 which was the R2 selected for the linearity criteria in this study
The amount of this standard in samples extracts was determined according to their calibration
curves of retention time and area (Table III1)
Chapter III Methods
68
Figure III8 Chromatograms of standard phenolic compounds1ascorbic acid
2gallic acid 3 chlorogenic acid CA caffeic acid 4 vanillin Q quercetin 5 rutin
Figure I 23hr omatograms of sta ndar d phenolic compounds1ascor bic a cid 2galli c aci d 3 chl oroge nic a cid CA caffeic aci d 4 va nillin Q querceti n 5 r utin
Table III1 Constituents Standard content analyzed by HPLC Table IXTable III1 Constit uents Standard content analyzed by HP LC
Standard Rt(min) Equation R2
Ascorbic acid 421 Y=75728X 09614
Gallic acid 523 Y= 23616X-7232 09986
Chlorogenic acid 1362 Y=39775X-1881 09983
Caffeic acid 163 Y=72328X 09986
Quercetin 2037 Y=548X-2823 0996
Vanillin 2146 Y=82773X-1423 09984
Rutine 2822 Y= 2411298X-1060 0995
The equation obtained from the linear calibration graph in the studied concentration
range for gallic acid in Cyclic Voltammetry (Figure 2b) Y = 2153X - 02432 (Rsup2 = 0999)
where y represents the value of the area of the anodic wave and x the value of standards
concentration expressed as mgml
Chapter III Methods
69
Figure III9 Voltammograms obtained for gallic acid (a) and (b) The calibration curve
obtained for gallic acid by cyclic voltammetry in pH=36 acetate buffer
Figure I 24Voltammograms obtai ned for galli c aci d (a) and (b) The calibrati on curve obtai ned for galli c aci d by cy clic v oltammetry in pH =36 a cetate buffer
III6) Determination of IC50 value
On the basis of screening results of triplicate measurement of the extract the inhibition
concentration (IC50) value was determined from extrapolating the graph of scavenging activity
versus the concentration of extract (using linear regression analysis) which is defined as the
amount of antioxidant necessary to reduce the initial radical concentration by 50 value
higher the antioxidative effects [70] The effective concentration having 50 radical
inhibition activity expressed as mg extractml
III7) Statistic analysis
The statistical analysis is descriptive methods aim to summarise empirical data
expressed in the quantitative form The interpretation of collecting data for any kinds of topics
in technology information used statistical tools such as mean median mode and standard
deviation [71]
III71) Linear regression analysis
Linear regression analysis is the most widely used of all statistical techniques it is the
study of linear additive relationships between variables Let Y denote the ldquodependentrdquo
variable whose values you wish to predict and let X1 hellipXk denote the ldquoindependentrdquo
variables from which you wish to predict it with the value of variable Xi in period t (or in
02 04 06 08 10 12 14
-5
0
5
10
15
20
25
30
I [micro
Ac
msup2]
Potential [ V]
06 ml
05 ml
04 ml
03 ml
02 ml
01 ml
(a)
000 002 004 006 008 010
2
4
6
8
10
12
14
16
18
20
22
I [micro
Ac
msup2]
C (mgml)
(b)
R2=0999
Chapter III Methods
70
row t of the data set) denoted by Xit Then the equation for computing the predicted value
of Yt is
This formula has the property that the prediction for Y is a straight-line function of each
of the X variables holding the others fixed and the contributions of different X variables to
the predictions are additive [72]
III72) Main effect plot and interaction plot
For two-way data an interaction plot shows the mean value of the response variable for
each combination of the independent variables This type of plot gives us some understanding
of the effect of the main factors and their interaction When main effects or interaction effects
are statistically significant post-hoc testing can be conducted to determine which groups
differ significantly from other groups[73]
III73) p-values and R-squared values
p-values and R-squared values measure different things The p-value indicates if there is
a significant relationship described by the model and the R-squared measures the degree to
which the data is explained by the model It is therefore possible to get a significant p-value
with a low R-squared value This often happens when there is a lot of variability in the
dependent variable but there are enough data points for a significant relationship to be
indicated [74]
In this study all the experiments data were performed in triplicate and the results were
expressed as mean plusmn SD (standard deviation) calculated by Excel 2007 These means were
compared using analysis of variance (ANOVA) using the Minitab version 17 (SAS) and
Linear regression the data obtained were considered statistically significant at p lt 005 and
very statistically significant at p lt 0005
Chapter III Methods
71
References
[1] Santana CM Ferrera ZS Padroacuten MET and Rodriacuteguez JJS (2009) Methodologies
for the Extraction of Phenolic Compounds from Environmental Samples New Approaches
Molecules 14 298-320
[2] Naczk M and F Shahidi 2006 Phenolics in cereals fruits and vegetables Occurrence
extraction and analysis Journal of Pharmaceutical and Biomedical Analysis 411523ndash1542
[3] Jin Dai Russell J Mumper Plant Phenolics Extraction Analysis and Their Antioxidant
and Anticancer Properties Molecules 2010 15 7313-7352
[4] MD Luque de Castro F Priego-Capote Soxhlet extraction Past and present panacea
Journal of Chromatography A 1217 (2010) 2383ndash2389
[5] MD Luque de Castro LE GarcotildeAcirca-Ayuso Soxhlet extraction of solid materials an
outdated technique with a promising innovative future Analytica Chimica Acta 369 (1998) 1-
10
[6] J Azmir ISM Zaidul MM Rahman KM Sharif A Mohamed F Sahena MHA
Jahurul K Ghafoor NAN Norulaini AKM Omar 2013 Techniques for extraction of
bioactive compounds from plant materials A review Journal of Food Engineering 117 426ndash
436
[7] Handa SS Khanuja SPS Longo G Rakesh DD(2008) Extraction Technologies for
Medicinal and Aromatic Plants (1stedn) no 66 Italy United Nations Industrial
Development Organization and the International Centre for Science and High Technology
[8] Dhanani T Shah S Gajbhiye NA Kumar S (2013) Effect of extraction methods on yield
phytochemical constituents and antioxidant activity of Withaniasomnifera Arab J Chem
[9] Chirinos R H Rogez D Camposa et al 2007 Optimization of extraction conditions of
antioxidant phenolic compounds from mashua (Tropaeolum tuberosum Ruız amp Pavon) tubers
Separation and Purification Technology 55217ndash225
[10] M Angela A Meireles Extracting bioactive compounds for Food products Theory and
Applications 2009 CRC Press New York USA P 190
[11] Spigno G L Tramelli and D M De Faveri 2007 Effects of extraction time
Chapter III Methods
72
temperature and solvent on concentration and antioxidant activity of grape marc phenolics
Journal of Food Engineering 81200ndash208
[12] Durling N E O J Catchpole J B Grey et al 2007 Extraction of phenolics and
essential oil from dried sage (Salvia officinalis) using ethanol-water mixtures Food
Chemistry 1011417ndash1424
[13] Herodez SS M Hadolin M Skerget et al 2003 Solvent extraction study of
antioxidants from Balm (Melissa officinalis L) leaves Food Chemistry 80275ndash 282
[14] Pinelo M P Del Fabbro L Marzocco et al 2005 Optimization of continuous phenol
extraction from Vitis vinifera byproducts Food Chemistry 92109ndash117
[15] Cacace J E and G Mazza 2003 Optimization of extraction of anthocyanins from
black currants with aqueous ethanol Journal of Food Science 68240ndash248
[16] Lim YY and Murtijaya J (2007) Antioxidant properties of Phyllanthus amarus
extracts as affected by different drying methods LWT ndash Food Science and Technology
40(9) 1664ndash1669
[17] Marete E Jacquier JC and Orsquo Riordan D (2009) Effects of extraction temperature on
the phenolic and parthenolide contents and colour of aqueous feverfew (Tanacetum
parthenium) extracts Food Chemistry 117 226ndash231
[18] Harbourne N Jacquier JC Morgan D and Lyng J (2008) Determination of the
degradation kinetics of anthocyanins in a model juice system using isothermal and non-
isothermal methods Food Chemistry 111 204ndash208
[19] Patras A Brunton N OrsquoDonnell C and Tiwari B (2010) Effect of thermal
processing on anthocyanin stability in foods mechanisms and kinetics of degradation Trends
in Food Science and Technology 21 3ndash11
[20] Lafka T-I V Sinanoglou and E S Lazos 2007 On the extraction and antioxidant
activity of phenolic compounds from winery wastes Food Chemistry 104 (3) 1206ndash1214
[21] Mane S Bremner DH Tziboula-Clarke A Lemos MA Effect of ultrasound on the
extraction of total anthocyanins from Purple Majesty potato Ultrasonics Sonochemistry
2015 27 509-514
Chapter III Methods
73
[22] Pinelo M M A Arnous and A S Meyer 2006 Upgrading of grape skins
Significance of plant cell-wall structural components and extraction techniques for phenol
release Trends in Food Science and Technology 17579ndash590
[23] Bendicho C De La Calle I Pena F Costas M Cabaleiro N Lavilla I Ultrasound-
assisted pretreatment of solid samples in the context of green analytical chemistry TrAC
Trends Anal Chem 2012 31 50ndash60
[24] Armenta S Garrigues S De Guardia M The role of green extraction techniques in
Green Analyticla Chemistry Trends Anal Chem 2015 71 2ndash8
[25] Chemat F Khan MK Applications of ultrasound in food technology Processing
preservation and extraction Ultrason Sonochem 2011 18 813ndash835
[26] Shi J Nawaz H Pohorly J Mittal G Kakuda Y and Jiang Y (2005) Extraction of
polyphenols from plant material for functional foods - Engineering and Technology Food
Reviews International 21 139ndash166
[27] LR Wilhelm DA Suter GH Brusewitz 2004 Food amp Process Engineering
Technology St Joseph Michigan USA p 259-284
[28] BK Tiwari NP Brunton CS Brennan 2013 Handbook of Plant Food
Phytochemicals Sources Stability and Extraction John Wiley amp Sons Ltd Oxford UK p
439
[29] Roopashree TS Dang R Rani SRH Narendra C Antibacterial activity of anti-psoriatic
herbs Cassia tora Momordica charantia and Calendula officinalis International Journal of
Applied Research in Natural Products 2008 1(3) 20-28
[30] Audu SA Mohammed I Kaita HA Phytochemical screening of the leaves of Lophira
lanceolata (Ochanaceae) Life Science Journal 2007 4(4) 75-79
[31] NSAVITHRAMMA MLIMGA RAO AND DSUHRULATHA Screening of
medicinal plants for secondary metabolites Journal of Scientific Research 2011 Vol8 PP
580-581
[32] PARCHANA TSAMATHA BMAHITHA NRAMASWAMY Preliminary
phytochemical screening from leaf and seed extracts of Senna alata LRoxb-an
Chapter III Methods
74
Ethnomedicinal plant Journal of pharmaceutical and biological research 2012 Vol3 PP
8285
[33] Paris R Moyse H Preacutecis de matiegravere meacutedicinale 1969 Paris Masson
[34] Obasi NL Egbuonu ACC Ukoha PO Ejikeme PM Comparative phytochemical and
antimicrobial screening of some solvent extracts of Samanea saman pods African journal of
pure and applied chemistry 2010 4(9) 206-212
[35] Rizk AM 1982 Fitoterapia 52 35-42
[36] BK Tiwari N P Brunton C S Brennan Handbook of Plant Food Phytochemicals
Sources Stability and Extraction 2013 John Wiley amp Sons Ltd Sussex UK P440
[37] Zou Y L Y Wei D 2004 Antioxidant activity of a flavonoid-rich extract of
Hypericum perforatum L in vitro J Agric Food Chem 52 5032-5039
[38] Escarpa A and Gonzalez MC (2001) Approach to the content of total extractable
phenolic compounds from different food samples by comparison of chromatographic and
spectrophotometric methods Anal Chim Acta 427 119ndash127
[39] Singleton V L and Rossi J A 1956 Colorimetry of total phenolics with
phosphomolybdic-phosphotungstic acid reagents American Journal of Enology and
Viticulture 16 144ndash158
[40] VR Meyer 2010 Practical High-Performance Liquid Chromatography Fifth edition
John Wiley amp Sons Ltd United Kingdom p 5
[41] JL Anderson ABerthod VPEsteacutevez A M Stalcup2015 Analytical Separation
Science First Edition Blackwell Verlag Gmb H Berlin Germany p24
[42] Skoog Douglas Holler James Nieman Timothy Principles of Instrumental Analysis
5th ed BrooksCole US 1998 p 728
[43] McMaster Marvin C HPLC A Practical Userrsquos Guide 2nd Ed Wiley New Jersey
USA 2007 p 7
Chapter III Methods
75
[44] S S Handa S P Singh Khanuja G Longo D D Rakesh 2008 Extraction
Technologies for Medicinal and Aromatic Plants international center for science and high
technology Trieste Italy
[45] R Kellner J M Mermet M Otto H M Widmer 1998 Analytical Chemistry
Weinheim Wiley VCH Germany
[46] Yuan YV Bone DE and Carrington MF (2005a) Antioxidant activity of dulse
(Palmaria palmata) extract evaluated in vitro Food Chemistry 91(3) 485-494
[47] Yuan YV Carrington MF and Walsh NA (2005b) Extracts from dulse (Palmaria
palmata) are effective antioxidants and inhibitors of cell proliferation in vitro Food and
Chemical Toxicology 43(7) 1073-1081
[48] T Owen 2000 Fundamentals of modern UV-visible spectroscopy Agilent
Technologies Germany p 16
[49] Blois MS (1958) Antioxidant determinations by the use of a stable free radical Nature
181(4617) 1199-1200
[50] Yen G-C and Chen H-Y (1995) Antioxidant activity of various tea extracts in relation
to their antimutagenicity Journal of Agricultural and Food Chemistry 43 27-32
[51] Sharma OP and Bhat TK (2009) DPPH antioxidant assay revisited Food Chemistry
113 1202-1205
[52] Ohinishi M Morishita H Iwahashi H Shizuo T Yoshiaki S Kimura Mand Kido
R (1994) Inhibitory effects of chlorogenic acids on linoleic acid peroxidation and haemolysis
Phytochemistry 36 579ndash583
[53] Prieto P Pineda M Aguilar MM 1999 Spectrophotometric quantitation of
antioxidant capacity through the formation of phosphoolybdenum complex specific
application to the determination of vitamin E Anal Biochem 269 337-341
[54] Benzie I F F ampStrain J J (1996) The ferric reducing ability of plasma (FRAP) as a
measure of antioxidant power The FRAP assay Analytical Biochemistry 239 70-76
[55] GL Marco A rapid method for evaluation of antioxidants J Am Oil Chem Soc 1968 45
594-8
Chapter III Methods
76
[56] HE Miller A simplified method for the evaluation of antioxidants J Am Oil Chem Soc
1971 4891
[57]Koleva II van Beek TA Linssen JPH de Groot A Evstatieva LN Screening of plant
extracts for antioxidant activity a comparative study on three testing methods Phytochem
Anal 2001 138-17
[58] MLaguerre J Lecompte P Villeneuve Evaluation of the ability of antioxidants to
counteract lipid oxidation Existing methods new trends and challenges Progress in Lipid
Research 2007 46244-282
[59] Tag MS Miller EF Pratt DE 1984 Chia seeds as a source of natural lipid
antioxidants J Am Oil Chem Soc 61 928-931
[60] Md Nur Alam N J Bristi Md Rafiquzzaman Review on in vivo and in vitro methods
evaluation of antioxidant activity Saudi Pharmaceutical Journal (2013) 21 143ndash152
[61] A M Pisoschi C Cimpeanu G Predoi 2015 Electrochemical Methods for Total
Antioxidant Capacity and its Main Contributors Determination A review Open Chem 13
824ndash856
[62] D Hynek L Krejcova J Sochor N Cernei J Kynicky V Adam L Trnkova J
Hubalek R Vrba and R Kizek Int J Electrochem Sci 7 (2012) 1802
[63] P A Kilmartin H L Zou and A L Waterhouse Am J Enol Vitic 53 (2002) 294
[64] A Mittal F Goke R Flint B P T Loveday N Thompson B Delahunt P A
Kilmartin G J S Cooper J MacDonald A Hickey J A Windsor and A R J Phillips
Shock 33 (2010) 460
[65] Chevion S Roberts MA Chevion M(2000) The use of cyclic voltammetry for the
evaluation of antioxidant capacity Free Radic Biol Med 28 860-870
[66] Rebiai A Lanez T Belfar ML In vitro Evaluation of Antioxidant Capacity of Algerian
Propolis by Spectrophotometrical and Electrochemical Assays Int J Pharm 2011 7 113-118
[67] C Le Bourvellec D Hauchard A Darchen JL Burgot ML Abasq Talanta (2008)
doi101016jtalanta200801007
Chapter III Methods
77
[68] GREEN J M (1996) A practical guide to analytical method validation Analytical
Chemistry 68 A305-A309
[69] EXNER O amp ZVARA K (1999) Coefficient of determination in some atypical
situations Use in chemical correlation analysis Journal of Physical Organic Chemistry 12
151-156
[70] Chew AL Jessica JJA Sasidharan S 2012 Antioxidant and antibacterial activity of
different parts of Leucas aspera Asian Pac J trop Biomed 2176-180
[71]GBohm G Zech 2010 Introduction to Statistics and Data Analysis for Physicists
Elektronen-Synchrotron Hamburg Germany p 02
[72]X Yan XG Su 2009 Linear Regression Analysis Theory and Computing World
Scientific Publishing Co Singapore p 04
[73] SS Mangiafico 2016 Summary and Analysis of Extension Program Evaluation in R
Rutgers Cooperative Extension New Brunswick NJ p 325
[74] SS Mangiafico 2016 Summary and Analysis of Extension Program Evaluation in R
Rutgers Cooperative Extension New Brunswick NJ p 336
Chapter IV
Comparative
study of
extraction
methods
Chapter IV Comparative study of extraction methods
79
IV1) Introduction
Sample preparation is a critical step of a successful analytical method Again due to the
large variations in sample matrices for example plant materials food formulations
biological fluid and tissue samples the diverse chemical structures and physicochemical
properties of the phytochemicals it is unrealistic to develop any definitive procedure or
protocol for all types of sample matrices However there are important common precautions
that must be taken for better preparing samples for the subsequent analyses The overall
purposes of sample preparation are to concentrate or dilute the samples so the analytes can be
detected and quantified within the detection limit and linear range to rid any interference that
might affect the detection of the compounds of interest Therefore techniques adopted to
sample preparation must follow these two principles [1] The aim of extraction is to maximize
the yield of compounds of interest while minimizing the time and solvent
IV2) Aim
To decrease the yield of phytochemical compound extract from potato sample We
elected to compare traditional extraction techniques as Soxhlet extraction maceration
extraction and modern extraction techniques as Ultrasound-assisted extraction this three
techniques used to extract the bioactive compound from red potatoes cultivars Kondor In this
chapter we looked for technique with less time and solvent which gives a higher yield
IV32) Preparation of samples
Immediately after receiving all samples of raw potatoes were peeled using a kitchen
knife and prepared by simply cutting into 5 mm thick slices 20 g of the slices of freshly
peeled potatoes was extracted using 120 mL extraction solution (16 S-f-ratio)which is
consisted of a mixture of ethanol and water at a ratio of (7030 vv) Subsequently all the
samples taken after the treatment were filtered before analysis for removal of potato particles
then the filtrate was concentrated under reduced pressure at 60 degC by rotary evaporator and
stored in a refrigerator
IV33) Ultrasonic extraction
In this study the ultrasound-assisted extraction procedure was used for the extraction
thus samples were further submitted to ultrasonication in bath (40 kHz) at three levels of
Chapter IV Comparative study of extraction methods
80
power 30 50 and 70 the extraction being performed at T = 33 plusmn 4 degC The extracts
were kept to macerate for 5 min 2 h and 24 h in dark at room temperature
IV34) Soxhlet extraction
The sliced fresh potatoes (20 g) were continuously extracted with 120 mL using the
appropriate solvent mixture for 3 h (5 cycles) at a maximum temperature of 70 degC in a
Soxhlet apparatus
IV35) Results and discussion
IV351) the total flavonoids content
Table IV1 and 2 show the amount of TFC obtained from the extract using UAE with (7030
ethanol water) and 100 ethanol as solvent
Table IV1 Total flavonoids content obtained using ethanol water (7030) Table XTable IV1 Total flavonoids content obta ine d using ethanol water (7030)
ULTRASOUND
SOXHLET Maceration
time
Amplitude
30 50 70
5 min 93230 plusmn 0043 13073 plusmn 0010 85319 plusmn 0003 69446 plusmn
0019 2 h 117648 plusmn 0007 94793 plusmn 0007 120140 plusmn 0004
24 h 144272 plusmn 0002 130321 plusmn 0043 110244 plusmn 0007
Total flavonoids content was expressed as mg rutin g extract
Table IV2 Total flavonoids content obtained using 100 ethanol Table XITable IV 2 Tota l flavonoids content obtained using 100 ethano l
ULTRASOUND
SOXHLET Maceration
time
Amplitude
30 50 70
5 min 633336 plusmn 001 411461 plusmn 0027 171184 plusmn 0013 113242 plusmn
0024 2 h 611119 plusmn 0006 519105 plusmn 0006 237503 plusmn 0005
24 h 859383 plusmn 0008 691670 plusmn 0049 582295 plusmn 0018
Total flavonoids content was expressed as mg rutin g extract
The UAE showed an advantage over SE but a ratio of 100 ethanol favored the
extraction process resulting in an increase of TFC for the two techniques The amount of TFC
Chapter IV Comparative study of extraction methods
81
obtained after 5 min of ultrasound treatment was higher compared to SE at the two ratios
69446 113242 mg ruting extract (Soxhlet UAE at 7030 solvent ratio) and 85319 171184
mg ruting extract for (Soxhlet UAE at 100 solvent ratio) the three amplitude chosen by
UAE increase the amount extracted from 171184 mg rutin g extract at 70 amplitude to
633336 mg ruting extract at 30 of amplitude Longer times of maceration following
ultrasound extraction lead to the increase of the amount of TFC in the extract
IV352) The total phenolic content
The concentration of TPC in the extracts expressed as mg GAEg sample depends on
the solvent and the method of extraction as shown in Tables IV 3 and 4
Table IV3 Total phenolic content obtained using ethanol water (7030) Table XIITable IV3 Total phenolic content obta ine d using ethanol water (7030)
ULTRASOUND
SOXHLET Maceration
time
Amplitude
30 50 70
5 min 67781 plusmn 0059 79936 plusmn0067 51273 plusmn 0032 67788 plusmn
0017 2 h 93736 plusmn0017 74522 plusmn0094 69002 plusmn0022
24 h 103821 plusmn 0007 81347 plusmn 0018 72793 plusmn 0007
Total phenolic content was expressed as mg gallic acid g extract
Table IV4 Total phenolic content content obtained using 100 ethanol Table XIIITable IV4 Total phe nolic content conte nt obtained us ing 100 ethanol
ULTRASOUND
SOXHLET Maceration
time
Amplitude
30 50 70
5 min 175053 plusmn0053 144904 plusmn 0003 69426 plusmn 0016 139490 plusmn
0023 2 h 152229 plusmn 0065 144378 plusmn 0016 92993 plusmn 0029
24 h 229299 plusmn 0062 140127 plusmn 0064 138694 plusmn 0122
Total phenolic content was expressed as mg gallic acid g extract
The content of phenolic compounds in the UAE extraction increases from amplitude 70
(69426 mg gallic acid g extract) to 30 (175053 mg gallic acid g extract) Also the
maceration time after sonication of the extract has an effect on the level of TPC in samples
eg 24 hours of maceration led to the highest TPC with 222999 mg gallic acidg extract
however using 5 minutes maceration time gave 175053 mg gallic acidg extract The best
Chapter IV Comparative study of extraction methods
82
results were recorded using 100 ethanol which showed an advantage on the ratio of 7030
(ethanol water) The results obtained from SE increased from 677 (using 7030 ethanol
water) to 1394 (using 100 ethanol) but are remarkably lower than those obtained by UAE
IV353) The antioxidant capacity
The antioxidant capacity was evaluated using the phosphomolybdenum method which
is based on the reduction of Mo (VI) to Mo (V) by the antioxidant compounds and the
formation of green Mo (V) complexes with a maximal absorption at 695 nm (Tables IV 5 and
6) The results show an increase of TAC at a lower amplitude and higher maceration time CA
= 106776 to 153348 mg ascorbic acidg of extract for the solvent ratio (7030 ethanol water)
and 363946 to 413346 mg ascorbic acidg of extract for 100 ethanol It is clear that The
TAC with UAE-M has an advantage over Soxhlet at two ratios of solvent
Table IV5 Total antioxidant capacity obtained using ethanol water (7030) Table XIVTable IV 5 Tota l ant ioxidant capacity obtained us ing ethanol water (7030)
ULTRASOUND
SOXHLET Maceration
time
Amplitude
30 50 70
5 min 106776 plusmn 0006 106838 plusmn 0013 99551 plusmn 0017 138983 plusmn
0233 2 h 150973 plusmn 0031 110793 plusmn 0008 132861 plusmn 0039
24 h 153348 plusmn 0003 97450 plusmn 0025 152847 plusmn 0015
Capacity antioxidant was expressed as mg ascorbic acid g of extract
Table IV6 Total antioxidant capacity obtained using 100 ethanolTable XVTable IV6 To tal antiox idant capacity obtained u sing 100 ethanol
ULTRASOUND
SOXHLET Maceration
time
Amplitude
30 50 70
5 min 363946 plusmn 0022 202811 plusmn 0079 113493 plusmn 0014 231124 plusmn
0029 2 h 284836 plusmn 0044 208804 plusmn 0015 195108 plusmn 0060
24 h 413346 plusmn 0057 390802 plusmn 0103 253192 plusmn 0064
Capacity antioxidant was expressed as mg ascorbic acid g of extract
Chapter IV Comparative study of extraction methods
83
IV354) Statistic analysis
Fig IV12 and 3 shows the overall effect of maceration time (Fig 1a2a and 3a)
amplitude (Fig 1b2b and 3b) method (Fig1c 2c and 3c) and the solvent ratio (Fig1d 2d
and 3d) on the TFC TPC extracted from the potatoes and their TAC Table 7 shows relative
between the amounts of TFC TPC and TAC extracted using different conditions of extraction
a further analysis of the variance of the main effects between the variables studied and their
significance was performed using one-way ANOVAs as it can be seen there is a statistically
significant difference in the amounts of TFC TPC and TAC using different maceration time
(p lt 0000- see table 7) with the lowest amount obtained at 5 minutes maceration time
Furthermore a decrease of amplitude lead to an increase in TFC TPC extracted and TAC as
can be seen in Fig 1b2b and 3b respectively The effect of this factor has a significant
statistically with (p lt 0000 - table 7) However the use of UAE-M extraction had an effect on
the amounts of TFC TPC extracted from potato and TAC (Fig 1c2c and 3c) with the lowest
amount obtained from soxhlet extraction Table IV7 show a statistically significant with
(plt0000) It should be pointed out that the amount of TFC TPC and TAC increased with a
higher ratio of ethanol with statistically significant (p lt 0001) (Table 7)
Table IV7 Analysis of variance for the main effects of factors studied Table XV ITable IV 7 Ana lysis of variance for the ma in effects of factors studie d
Factors P value
TPC
Time of maceration
Amplitude
Method
Solvent ratio
0000
0000
0000
0000
TFC
Time of maceration
Amplitude
Method
Solvent ratio
0000
0000
0000
0001
TAC
Time of maceration
Amplitude
Method
Solvent ratio
0000
0000
0000
0000
Chapter IV Comparative study of extraction methods
84
Figure I 25 Effect of macerati on time (a) amplitude (b) method (c) and the solve nt ratio (d) on t he level of total flavonoids content Y-axi s shows T otal Flavanoids content (expre sse d as a mg Rutin g extract)
FigureIV1 Effect of maceration time (a) amplitude (b) method (c) and the solvent ratio (d)
on the level of total flavonoids content Y-axis shows Total Flavanoids content (expressed as
a mg Rutin g extract)
(d)
Solvent Ratio 100 (7030)
50
40
30
20
10
Main Effects Plot (data means) TFC Vs Solvent
Me
an
of
TFC e
xp
resse
d a
s a
mg
Ru
tin
g
ex
tra
ct
(c)
Method UAE Soxhlet
32
31
30
29
28
Main Effects Plot (data means) TFC Vs Method
(b)
Amplitude 70 50 30
40
35
30
25
20
Main Effects Plot (data means) TFC Vs Amplitude
Me
an
of
TFC e
xp
resse
d a
s a
mg
Ru
tin
g
ex
tra
ct
(a)
Time 5min 2h 24h
425
400
375
350
325
300
275
250
Main Effects Plot (data means) TFC Vs Time
Me
an
of
TFC e
xp
resse
d a
s a
mg
Ru
tin
g
ex
tra
ct
Me
an
of
TFC e
xp
resse
d a
s a
mg
Ru
tin
g
ex
tra
ct
Chapter IV Comparative study of extraction methods
85
Figure I 26 Effect of macerati on time (a) amplitude (b) method (c) and t he solvent ratio (d) on the leve l of total phenolic content Y-axis shows T otal phenolic content (expre ssed a s a mg gallic acidg extract)
Figure IV2 Effect of maceration time (a) amplitude (b) method (c) and the solvent ratio
(d) on the level of total phenolic content Y-axis shows Total phenolic content (expressed as a
mg gallic acidg extract)
Chapter IV Comparative study of extraction methods
86
Figure I 27Effect of macerati on time (a) amplitude (b) method (c) and the solvent rati o (d) on the l evel of total anti oxida nt ca pacity Y-axis shows T otal anti oxida nt capacity (expressed a s a mg ascorbi c aci dg of extract)
Figure IV3 Effect of maceration time (a) amplitude (b) method (c) and the solvent ratio (d)
on the level of total antioxidant capacity Y-axis shows Total antioxidant capacity (expressed
as a mg ascorbic acidg of extract)
IV354) HPLC analysis
The chromatographic profile of extract of the leaf of the variety Kondor represented in
Level of the figure (4-7) The four samples A C B and D were extracted by UAE-M
extraction and Soxhlet extraction The results of quantitative analyses of phenolic compounds
Identified are represented in the Table IV8 The analysis of these results shows that in The
extract of this variety the ascorbic acid range from 012 to 118 microgmg the Gallic acid range
from 081 to 137 microgmg the Chlorogenic acid range from 027 to 153 microgmg for all the
sample extract However the Vanillin range from 0004 to 018 microgmg for extract samples A
C D We note that the Rutine (0532 microgmg) showed only in C sample From the point of
view of quantity the A sample has the highest constituents in Ascorbic acid and Chlorogenic
acid
(d)
Solvent Ratio
Me
an
of
TA
C (
ex
pre
sse
d a
s a
mg
asco
rbic
acid
g
of
ex
tra
ct)
100 (7030)
28 26 24 22 20 18 16 14 12
Main Effects Plot (data means) TAC vs Sovent ratio (c)
Method
Me
an
of
TA
C (
ex
pre
sse
d a
s a
mg
asco
rbic
a
cid
g
of
ex
tra
ct)
UAE Soxhlet
1975
1950
1925
1900
1875
1850
Main Effects Plot (data means) TAC vs Method
(b)
Amplitude
Me
an
of
TA
C (
ex
pre
sse
d a
s a
mg
asco
rbic
a
cid
g
of
ex
tra
ct)
70 50 30
250
225
200
175
150
Main Effects Plot (data means) TAC vs Amplitude (a)
Time
Me
an
of
TA
C (
ex
pre
sse
d a
s a
mg
asco
rbic
acid
g
of
ex
tra
ct)
5min 2h 24h
25 24 23 22 21 20 19 18 17 16
Main Effects Plot (data means) TAC vs Time
Chapter IV Comparative study of extraction methods
87
The Results shows that all the samples contain at least three bioactive compounds using
either UAE-M or SE as an extraction technique and two ratios for the ethanol as solvent all
these variables have an effect on the level of the amount of bioactive compound in the Kondor
sample
Figure I 28 Chr omatograms of sample extract A(1)Ascorbi c aci d(2) Galli c aci d (3) Chlor oge nic a cid(4) Vanilli n
Figure IV4 Chromatograms of sample extract A(1)Ascorbic acid(2) Gallic acid (3)
Chlorogenic acid(4) Vanillin
Figure I 29Chromat ograms of sampl e extract B(1)Ascor bic a cid(2) Gallic a cid (3) Chl orog eni c aci d
Figure IV5 Chromatograms of sample extract B(1)Ascorbic acid(2) Gallic acid (3)
Chlorogenic acid
Chapter IV Comparative study of extraction methods
88
Figure I 30Chromatograms of sample extra ct C(1)Ascorbi c aci d(2) Gallic a cid (3) Chlor ogeni c aci d(4) Vanilli n(5)Rutine
Figure IV6 Chromatograms of sample extract C(1)Ascorbic acid(2) Gallic acid (3)
Chlorogenic acid(4) Vanillin(5)Rutine
Figure I 31Chromat ograms of sampl e extract D(1)Ascorbi c aci d(2) Galli c aci d (3) Chl oroge nic a cid(4) Vanilli n
Figure IV7 Chromatograms of sample extract D(1)Ascorbic acid(2) Gallic acid (3)
Chlorogenic acid(4) Vanillin
Table IV9 Constituents content analyzed by HPLC 24)جدول رقم ) 1Table IV9 Constitue nts content ana lyze d by HP LC
Method Ascorbic
acid
[microgmg]
Gallic acid
[microgmg]
Chlorogenic
acid
[microgmg]
Vanillin
[microgmg]
Rutine
[microgmg]
A 11831 08108 15359 00702 -
C 04135 1095 04768 00043 00095
D 03702 13752 06970 01869
B 01288 10670 02768 - -
A C sample extracted with UAE 30 amplitude 24 h maceration and solvent ration [100 ethanol (7030 ethanolwater)]
B D sample extracted with Soxhlet and solvent ration [100 ethanol (7030 ethanolwater)]
Chapter IV Comparative study of extraction methods
89
IV4) Discussion
According to the results previously mentioned the extraction of bioactive compound
from potatoes roots can be affected by several factors One of them was the technique These
results indicated that the amount extracted from both total phenolic and flavonoids contents is
remarkably improved when using UAE-M over Soxhlet extraction also the yield of extraction
improved when maceration is used after to ultrasonic-assisted extraction This fact is in
accordance with other data found in the literature which showed in an enhancement of the
levels of phytochemicals extracted presented in different food matrixes after sonication [2-4]
However the UAE can induce a reduction in the size of vegetables andor changes in the
cell structure Because of the ultrasonic cavitation this structural disruption can provide a
better contact between the solvents and cells allowing an increase in the content of the
extracted compounds [5] Additionally the increase of total phenolic and flavonoids content
depends on UAE conditions as an amplitude The decrease in this factor leads to higher
amount
Secondly the solvent ratio showed significantly affect the amount of TPC TFC and
TAC A higher solvent ratio was used in the extraction had better content than (7030
ethanolwater) Also this results observed by Zhou and Yu [6] all obtained results are
confirmed by HPLC analysis Finally all these factors lead to the UAE combined with
maceration to be a better technique than soxhlet
The most efficient method for amount bioactive compound is to use UAE with 30 of
amplitude ethanol as solvent and kept the sample macerate for 24 hours It should be noted
that the amount of TFC TPC and TAC was observed in 2 hours maceration of the samples
sonicated with 30 of amplitude have higher results than a soxhlet extraction This condition
was used to extract bioactive compounds from four varieties of potatoes
Chapter V
Phytochemical
study of
Solanum
tubersum L
Chapter V Phytochemical study of Solanum tubersum L
91
V1) Introduction
Potatoes can be a good source of phenolic and flavonoid compounds in the diet despite
its moderate levels compared to other plant sources However as mention above The
composition of a potato tuber depends on a number of factors although the innate genetic
characteristics associated with each cultivar are thought to be among the most significant
Other factors known to influence potato chemical composition include the geographic
growing location soil type and climate [7] Thus the nutrient screening of a range of different
cultivars can help classify the potato variety by their phytochemicals compounds
The proximate analysis estimates the moistures phenolic flavonoids and other
phytochemical compounds and antioxidant activity in vegetable or fruits is the method used to
assist in determining potential end use and tuber quality of potato variety Experiment one of
this chapter will discuss the proximate analysis results of four potato tubers in order to qualify
the major phytochemicals content of the tubers and to identify the most richness potato
variety in phytochemicals compounds
The phytochemicals value of the richness tuber will then be further quantified in
Experiment two by assessing the quantity of phytochemical content and their antioxidant
activity in the flesh and the whole tuber
V2) Experiment One
V21) Aim
This experiment aimed to examine the presence and quantity of the certain
phytochemical component in order to gauge health-promoting in four most popular variety of
potatoes cultivated in El-Oued county lsquoBartina Kondor Kuroda and Spuntarsquo This was
achieved by performing analyses to estimate and identify certain phenolic flavonoid content
by spectrophotometers assays and HPLC analysis Also we will take into our consideration
the estimation of moisturewater the presence of phytochemicals compounds by standard
methods The antioxidant activity measured by two techniques spectrophotometer assays and
electrochemical assays All these analysis results will discuss the proximate analysis results of
four different variety of potato cultivars
Chapter V Phytochemical study of Solanum tubersum L
92
V22) Estimation of the water weight percentage in potato roots
The water percentage was measured by weighing fresh roots into a crucible which was
placed in an oven at 100 degC overnight Later the dried roots were weighed to calculate the
amount of water lost The (Table V1) shows the moisture content (H2O ) of four varieties
of potato samples The tuber from red cultivars Bartina showed higher moisture content
84239 then the yellow tuber Spunta 8310 we regarding a high moisture content in
potatoes roots which relates to materials such as fruits and vegetables according to Wilhelm
L et al [8] Many of these products have moisture contents near 90 or more
Table V1 Determination of moisture content for four varieties of potatoes 24)جدول رقم ) 2Table V1 Determination of moist ure content for four varieties of potatoes
Roots Bartina Kuroda Kondor Spunta
H2O 842394 772256 819591 831077
V23) Screening chemistry ( Chemical characterizations)
The present study revealed that the various alcoholic extracts of root parts of potatoes
contained alkaloids coumarins flavonoids phytosterols and carbohydrates (Table V2)
However alkaloids coumarins and carbohydrates were detected in ethanolic extracts of all
roots varieties and the detection of Phytosterols by Liberman and Burchurds shows positive
results with a formation of translucent green color in all varieties which indicate the presence
of steroids for Salkowskirsquos test shows negative results for the detection of Flavonoids all the
roots extracts had a higher number of secondary metabolites with a high degree of
precipitation (++) for Alkalin reagent
Table V2 Preliminary qualitative phytochemical analysis of various alcoholic extracts of
root parts of potatoes 24)جدول رقم ) 3Table V2 Preliminary qualitative phytoche mica l analys is of various alcoholic extracts of root parts of potatoes
Test Bartina Kuroda Kondor Spunta
Alkaloids + + + +
Coumarins + + + +
Flavonoids Alkalin reagent ++ ++ ++ ++
Hydroxyl + + + +
Phytosterols Liberman + + + +
Salkowski - - - -
Carbohydrates + + + +
Tanin - - - -
++ moderately present + Low - absent
Chapter V Phytochemical study of Solanum tubersum L
93
V24) Phytochemical contents
The Table V3 shows the total phenolic contents (TPC) and the total flavonoid contents
(TFC) of four kinds of potato samples unpeeled The amount of TPC from the whole tuber
ranged from 192144 to 088853 mg AG g of extract the results of different extracts showed
that the amount of TFC varied considerably from 109129 to 250350 mg rutin g of extract
Overall the samples showed the lower amount of TPC and TFC The results indicate that all
of the ethanolic extracts of four kinds has the amount of phenolics and flavonoids compound
but their content in ethanolic extract increasing in order was
Kondor gt Bartina gt Spunta gt Kuroda
Table V3 Determination of total Phenolics contents and total flavonoids of four kinds of
potatoes 24)جدول رقم ) 4Table V3 Determination of total P henolics contents and total flavonoids of four kinds of potatoes
Sample Total Polyphenols (mg AG
g of extract)
Total flavonoids (mg rutin g
of extract)
Kondor 192144 plusmn 0096 250350 plusmn 0125
Bartina 189596 plusmn 0094 235592 plusmn 0235
Spunta 124628 plusmn 0124 218057 plusmn 0218
Kuroda 088853 plusmn 0088 109129 plusmn 0076
V25) HPLC analysis
Identification and quantification of marker compounds were performed on the basis of
the coinjections and retention time matching with standards The HPLC fingerprint of
ethanolic extracts of roots and leaf revealed peaks at the retention time 50 min at 300 nm The
quantitive analysis of the chromatograms showed in Table III4
V251) Chromatograms of Kondor sample
The chromatographic profile of unpeeled extract the variety Kondor represented in
Level of the Figure V1 The results of quantitative analyses of phenolic compounds Identified
are represented in the Table V4 The analysis of these results shows that in The extract of the
variety Kondor the ascorbic acid (0189 microgmg) the Gallic acid (5294 microgmg) the
Chlorogenic acid (3052 microgmg) caffeic (0532 microgmg) Vanillin (0059 microgmg) and
Quercetin (1091 microgmg) we note that the Quercetin is the more representative and found
Chapter V Phytochemical study of Solanum tubersum L
94
only in the unpeeled Kondor sample But from the point of view of quantity the extract of
this variety shows a richness in bioactive compounds more than the extract of other varieties
Figure I 32Chromat ograms of unpeel ed Kondor extract(1)Ascorbi c aci d(2) Gallic a cid (3) Chlor ogeni c aci d(4) Caffeic acid (5) Quercet in (6)Vanilli n
Figure V1 Chromatograms of unpeeled Kondor extract(1)Ascorbic acid(2)
Gallic acid (3) Chlorogenic acid(4) Caffeic acid (5) Quercetin (6)Vanillin
V252) Chromatograms of Bartina sample
Figure V2 shows the chromatographic profile of extract of the unpeeled Bartina variety
The results of quantitative analysis of phenolic compounds Identified are represented in the
Table V4 The analysis of these results shows that in The extract of the variety Bartina the
ascorbic acid ( 0317 microgmg) the Gallic acid (7493 microgmg) the Chlorogenic acid (188
microgmg) caffeic (0021 microgmg) and Vanillin (00310 microgmg) We found that the Gallic acid is
the more representative But for Quercetin and rutin not exist in this variety
Chapter V Phytochemical study of Solanum tubersum L
95
Figure V2 Chromatograms of unpeeled Bartina sample extract(1)Ascorbic acid(2)
Gallic acid (3) Chlorogenic acid(4) Vanillin Figure I 33Chromatograms of unpeele d Barti na sample extract(1)Ascorbic a cid(2) Galli c aci d (3) Chl oroge nic a cid(4) Vanilli n
V253) Chromatograms of Spunta sample
The chromatograms qualitative and quantitative analyses of compounds Phenolic
compounds of unpeeled extracts of Spunta are represented below (Figures V3) and the
quantitative assessment of individual compounds identified is a recovery in the Table V4
The analysis of these results shows that in the extract of the variety the ascorbic acid ( 0025
microgmg) the Gallic acid (7804 microgmg) the Chlorogenic acid (0756 microgmg) The Gallic acid
is the more representative For Quercetin rutin and vaniline do not exist in this variety
Figure I 34Chromat ograms of unpeel ed Spunta sample extra ct(1)Ascorbic a cid(2) Gallic a cid (3) Chlorog eni c aci d
Figure V3 Chromatograms of unpeeled Spunta sample extract(1)Ascorbic acid(2)
Gallic acid (3) Chlorogenic acid
Chapter V Phytochemical study of Solanum tubersum L
96
V254) Chromatograms of Kuroda sample
The chromatograms of unpeeled extract of Kuroda variety shows in (Figure V4)
Qualitative and quantitative analyses of Phenolic compounds identified in the Table V4
Through this table it was note that the ascorbic acid ( 0203 microgmg) the Gallic acid (5
microgmg) the Chlorogenic acid (149 microgmg) and rutin (00016 microgmg) for Kuroda only from
this analysis the Gallic acid was the more representative compounds
Figure V4 Chromatograms of unpeeled Kuroda sample extract(1)Ascorbic
acid(2) Gallic acid (3) Chlorogenic acid(4) Rutine Figure I 35Chromat ograms of unpeel ed Kuroda sam ple extract(1)Ascor bic a cid(2) Galli c aci d (3) Chl oroge nic a cid(4) Rutine
Table V4 Constituents content analyzed by HPLC 24)جدول رقم ) 5Table V4 Constituents content analyze d by HP LC
Sample extract Bartina Kondor Kuroda Spunta
Ascorbic acid [microgmg] 03176 01896 02304 00256
Gallic acid [microgmg] 74936 52946 55922 78047
Chlorogenic acid [microgmg] 18864 30520 14900 07566
Caffeic acid [microgmg] - 05322 - -
Quercetin [microgmg] - 109197 - -
Vanillin [microgmg] 00310 00596 - -
Rutine [microgmg] - - 00016 -
V26) Antioxidant capacity
As mentioned above the methods used to determine total antioxidant activity devised in
two techniques First one is spectrophotometers methods Secondly an electrochemistry
Chapter V Phytochemical study of Solanum tubersum L
97
technique in this process we used cyclic voltammetry methods to determine the antioxidant
activity
V261) Spectrophotometers
V2611) FRAP assay
Ferric reducing antioxidant power (FRAP) is based on the ability of the antioxidant to
reduce Fe3+ to Fe2+ according to Rodriquez amp Hadley the ethanolic extracts of potato
tubers showed marked hydrogen-donating activity using reducing power in the Fe(III) AElig Fe
(II) reaction in FRAP assay [9]
Based on the FRAP assay (Table V5) the results indicated that the whole root
(unpeeled) samples had a reducing antioxidant power However the results indicated that
Kondor extract had the highest level of reducing power with value of 388032 mg Fe(II) g of
extract this activity may due to the contents of flavonoids The Kuroda extract indicates the
lowest reducing antioxidant power with a value of 227442 mg Fe(II) g of extract All the
extract samples showed reducing antioxidant power but less than ascorbic acid
Table V5 Determination of reducing the antioxidant power of four kinds of potatoes 24)جدول رقم ) 6Table V5 Determination of reducing the antiox idant power of four kinds of potatoes
Sample FRAP (mg Fe(II) g of extract)
Kondor 388032 plusmn 0043
Bartina 315543 plusmn 0010
Spunta 296169 plusmn 0007
Kuroda 227442 plusmn 0005
Ascorbic acid 2512985 plusmn 0020
Gallic acid 77782511 plusmn 0388
V2612) DPPH
DPPH scavenging activity () had increased with the increased concentration of the
extract in all samples (Figure V 5 6 and 7) The stable DPPH free radical accepts an electron
or hydrogen radical from donors to form a stable molecule which could be seen as color
reduction
Chapter V Phytochemical study of Solanum tubersum L
98
V26121) Calculation of radical inhibition
Kondor extract was the strongest electron or hydrogen donor due to the highest DPPH
scavenging activity The IC50 value of each extract is deducted from the equations of the
curves of the variation in the percentage of inhibition I as a function of the concentration of
each extract as shown in Figure V5 and annexe (A)
The IC50 of DPPH scavenging activity of the Kondor Bartina Spunta and Kuroda
extracts were 121 mgml 212 mgml 254 mgml and 386 mgml respectively for unpeeled
extracts Gallic acid and ascorbic acid however showed the highest value 00069 mgml and
001 mgml All the results have a very statistically significant with plt0000 (Table V6)
00 02 04 06 08 10 12 14 16
0
10
20
30
40
50
60
70
In
hib
itio
n
Concentratio (mgml)
IC50= 121
Figure V5 The percent DPPH radical inhibition as a function of the concentration of
of unpeeled Kondor
Figure I 36T he per ce nt DPPH radi cal inhibiti on a s a functi on of the concentrati on of of unpeele d Kondor
Table V6 IC50 values of sample extracts using DPPH 10)جدول رقم ) 7Table V6 IC50 values of sample extracts us ing DPPH
Sample DppH
Equation R2 value IC50 P
Kondor Y = 333 + 383 X 0994 121 0000
Bartina Y = - 044 + 237 X 0968 212 0000
Spunta Y = - 453 + 214 X 0952 254 0000
Kuroda Y = - 530 + 143 X 0973 386 0000
Ascorbic acid Y= 094 + 4720X 0972 0010 0000
Gallic acid Y=-678 + 8154X 0982 00069 0000
inhibition expressed as mgml
Chapter V Phytochemical study of Solanum tubersum L
99
V26122) Calculation of the binding constant
The electronic spectra of complexes extractndashDppH were recorded in the range 200-900
nm which showed intense absorption at range 515-518 nm The determination of binding
constant Kb of extractndashDppH complex can be calculated from the inhibition of absorbance in
UV-spectra after the addition of unpeeled sample extract ( Figure V6 and 7) Benesi-
Hildebrand equation is used to evaluate binding constants spectrophotometrically [10-12]
Where
Ao and A are the absorbances of free and bound extract
εG and εH-G are their molar extinction coefficients respectively (H and G correspond
to host and guest)
A plot of Ao (A-Ao ) to 1[extract] has shown linearity which is suggestive of 11
complex formation of both extracts with DppH The intercept to slope ratio of this plot gives
the value of binding constant ldquoKb rdquo (Annexe) Kb values were calculated given in Table V7
UV spectra of DppH showed a hypochromic effect upon addition of sample extract the
intensity decreased rapidly with increasing concentration of the extract were recorded in
Figure III5 6 In the absence of sample extract the DppH displayed one absorbance peak at
517 nm this peak intensity exhibited hypochromism up from 56 to 77 for 2 mgml
concentration of sample extract
The values of binding constant ldquoKb rdquo were further used to calculate standard Gibbs free
energy ldquo∆Grdquo of extractndashDppH complex using the following equation
Free energy changes of extracts values Table V7 and showed spontaneous of their binding
with DppH The p-value of the results was lt005 which a significant statistically
HYPOCHROMIC EFFECT decrease in the intensity of a spectral band due to substituents or interactions with the
molecular environment Source PAC 1996 68 2223 (Glossary of terms used in photochemistry (IUPAC Recommendations 1996)) on page 2247
Chapter V Phytochemical study of Solanum tubersum L
100
400 450 500 550 600 650 700
00
02
04
06
08
10
12
14
Abs
Wavelength nm
00 mgml
0005 mgml
001 mgml
005 mgml
01 mgml
025 mgml
075 mgml
05 mgml
1 mgml
125 mgml
15 mgml
(a)
400 450 500 550 600 650 700
00
02
04
06
08
10
12
Abs
Wavelength nm
00 mgml
005 mgml
015 mgml
05 mgml
057 mgml
1 mgml
15 mgml
2 mgml
(b)
400 450 500 550 600 650 700
00
02
04
06
08
10
12
14
16
Ab
s
Wavelength nm
00 mgml
005 mgml
01 mgml
025 mgml
05 mgml
075 mgml
1 mgml
15 mgml
2 mgml
25 mgml
3 mgml
35 mgml
(C)
400 450 500 550 600 650 700
02
04
06
08
10
12
14
16
Ab
s
Wavelength nm
00 mgml
005 mgml
01 mgml
025 mgml
05 mgml
075 mgml
1 mgml
125 mgml
15 mgml
2 mgml
3 mgml
(d)
Figure V6 Electronic absorption spectra of 025 mM of DPPH interaction with Roots of (a)
Kondor (b) Bartina (c) Spunta (d) Kuroda Figure I 37Electr oni c absorpti on spe ctra of 025 mM of DPPH intera ction with Roots of (a) Kondor (b) Bartina (c) Spunta (d) Kuroda
a decrease in absorption intensity
400 450 500 550 600 650 700
00
02
04
06
08
10
12
14
Ab
s
Wavelength nm
00 mgml
15 10-3 mgml
2 10-3 mgml
3 10-3 mgml
4 10-3 mgml
5 10-3 mgml
6 10-3 mgml
7 10-3 mgml
8 10-3 mgml
9 10-3 mgml
10-2 mgml
(GA)
400 450 500 550 600 650 700
00
02
04
06
08
10
12
14
16
Abs
Wavelength nm
00 mgml
15 10-3 mgml
2 10-3 mgml
4 10-3 mgml
5 10-3 mgml
6 10-3 mgml
7 10-3 mgml
8 10-3 mgml
9 10-3 mgml
10-2 mgml
(AAS)
Figure V7 Electronic absorption spectra of 025 mM of DPPH interaction with (GA) Gallic
acid (AAS) Ascorbic acid Figure I 38 Ele ctronic a bsorption spectra of 025 mM of D PPH i nteracti on wit h (GA) Gallic a cid (AAS) Ascorbi c aci d
Chapter V Phytochemical study of Solanum tubersum L
101
Table V7 Values of Binding constants and binding free energy of the complexes DppH-
sample extracts رقم 10)جدول ) 8Table V7 Values of Bind ing cons tants and b inding free energy of the complexes DppH- sample extracts
Compound Equation R2 K ΔG P
Unpeeled
DppH-Kondor Y = -0031x + 24387 09089 786266 -10822 0012
DppH-Bartina Y = -006x + 17288 09289 288133 -08332 0008
DppH-Spunta Y = -00061x +07297 09102 1190375 -11849 0012
DppH-Kuroda Y = -00273x +13812 09804 505934 -09728 0001
Standard
Ascorbic acid Y =-62892x+ 35856 0988 500120 -10024 0000
Gallic acid y = -46163x + 38709 09243 838523 -1098 0001
V262) Electrochemistry assay
All the voltammograms obtained from cyclic voltammetry assay (CV) for the four
samples in fixed pH=36 (acetate buffer 300mM) This assay have the same principle as
FRAP assay thats why this pH value is chosen The CVs present one oxidation peak in range
from +087 V to +102 V (Figure V8) also for ascorbic acid had a peak at +054 V (Figure
V8) and two oxidation peaks at +04V and +07V for gallic acid (Figure III9) The
electrochemical behavior observed for the unpeeled potatoes extracts with oxidation potential
value more positive than gallic acid these peaks indicate that the sample extracts contain
flavonoids compounds showed low or very low activity in the FRAP assay according to Firuzi
and Lacanna [13]
Chapter V Phytochemical study of Solanum tubersum L
102
02 04 06 08 10 12 14
-2
0
2
4
6
8
10
12I
[microA
cm
sup2]
Potential [ V]
(a)
02 04 06 08 10 12 14
-5
0
5
10
15
20
I [micro
Ac
msup2]
Potential [ V]
(b)
02 04 06 08 10 12 14
-2
0
2
4
6
8
10
12
I [micro
Ac
msup2]
Potential [ V]
(c)
02 04 06 08 10 12 14
-4
-2
0
2
4
6
8
10
12
14
16
I [micro
Ac
msup2]
Potential [ V]
(d)
02 04 06 08 10 12 14
-2
0
2
4
6
8
10
12
14
I [micro
Ac
msup2]
AS
Potential [ V]
(e)
Figure V8 Voltammograms obtained for unpeeled extract of (a) Kondor (b) Bartina (c)
Spunta (d) Kuroda and (e) for Ascorbic acid by cyclic voltammetry in pH=36 acetate buffer Figure I 39V oltammograms obtaine d for unpeel ed extra ct of (a) Kondor (b) Bartina (c) Spunta (d) Kuroda and (e) for Ascorbic a cid by cycli c voltammetry in pH=36 a cetate buffer
Table V8 shows The oxidation of samples extract studied by cyclic voltammetry
showed capacity antioxidant expressed in terms of gallic acids (AG) equivalent antioxidant
capacity obtained from an electrochemical assay in ethanolic extract of four samples with
Chapter V Phytochemical study of Solanum tubersum L
103
values ranged from 534813 mg EAGg extract to 345025 mg EAGg extract On the other
hand ascorbic acid showed a higher capacity antioxidant with 6374624 mg EAGg extract
This capacity related to the potential peaks which determined the antioxidant power of sample
extracts according to Firuzi and Lacanna [13] the flavonoids which have potential peaks at
range from +044 to +071 V this groups were active antioxidants in the FRAP assays
Table V8 Determination of the Antioxidant capacity of four kinds of potatoes by CV
Sample Antioxidant capacity CVa Eap
b (V)
Unpeeled
Kondor 534813 plusmn 0254 +088
Bartina 449876 plusmn 0325 +089
Spunta 364515 plusmn 0481 +095
Kuroda 345025 plusmn 0341 +090
Ascorbic acid 6374624 plusmn 0117 +054
a capacity antioxidant expressed as milligrams of gallic acid equivalent per gram of extract
b Anodic oxidation potential vs GCE
V2621) Electrochemistry behavior
Figure V9 shows cyclic voltammograms for unpeeled Kondor extracts in DMF01
TBFP solvent the observed behavior of the extract of all samples the whole roots at potential
range (+200V to +1400V) present one oxidation peak recorded between + 1029V to
+1066V (Table V9 Fig V9) The cyclic voltammograms of all samples extracts depends on
the chemical structures the observed electrochemical behavior of all samples extracts showed
similarly in both solvent cell aqueous buffer acetate PH 36 03 mM (Figure V 8 Table V
8) and organic solvent (DMF) with a shifts to positive potential side up from 1210 to 2113
in case of unpeeled extracts of Spunta and Kondor sample respectively in DMF solution It is
worth noting that all cyclic appearance under the same patterns indicating the producibility of
the resistant of the solution the phenomena
Chapter V Phytochemical study of Solanum tubersum L
104
02 04 06 08 10 12 14
-10
0
10
20
30
40
50
60
I[micro
Ac
msup2]
Potential [ V]
(a)
Figure V9 Voltammograms obtained for unpeeled Kondor sample by cyclic
voltammetry in DMF
Figure I 40Voltamm ograms obta ine d for unpeel ed Kondor sample by cycli c voltammetry in D MF
Table V9 Determination of the oxidation peaks of four kinds of potatoes by CV in DMF 10)جدول رقم ) 9Table V9 Determination of the ox idation peaks of four kinds of potatoes by CV in D MF
Samples Eap (V)
Unpeeled
Kondor + 1066
Bartina + 1047
Spunta + 1065
Kuroda + 1029
Anodic oxidation potential vs GCE
V2622) Electrochemistry assay radical scavenging activity
The quantification of antioxidant in the extract is made by calculating the inhibition
concentration (IC50) value radical scavenging activity was plotted against different
concentrations of extract samples the effect of different concentrations is shown in (Figure
III11 and 12) for radical scavenging activity All the voltammograms of superoxide
anion radical Figure III11 12 showed one electron reversible process having well developed
and clear oxidation and reduction peaks On the level of anodic current the decreasing of
peaks according to the addition of sample extracts
The equation obtained from the linear calibration graph figure V10 In the studied
concentration range of samples extracts are presented in Table V10 where y stand for the
value of the oxidation peak current density of and x represents the value of the
concentration of ethanolic extracts expressed as mgmL The Kondor extracts have a less IC50
Chapter V Phytochemical study of Solanum tubersum L
105
with 103 and for Kuroda sample has the highest IC50 with 1819 mgmL All the IC50 values
were considered as very statistically significant with plt0005
01 02 03 04 05 06 07
5
10
15
20
25
30
35
In
hib
itio
n
Concentration (mgml)
Figure V10 The percent radical inhibition as a function of the concentration
of unpeeled Kondor
Figure I 41T he per ce nt O_2 ^(∙-) radica l inhi bition as a functi on of the conce ntration of unpeel ed Kondor
Table V10 IC50 values of sample extracts using radical scavenging activity
24)جدول رقم ) 10Table V10 IC50 values of sample extracts using O_2^(∙-) radica l scaveng ing activity
Sample Equation R2 value IC50 P
Unpeeled
Kondor Y= 156 + 468 X 0989 10350 0000
Bartina Y= - 752 + 506 X 0923 11367 0002
Spunta Y= - 0134 + 276 X 0988 18164 0000
Kuroda Y = - 423 + 298 X 0987 18197 0000
Standard
Ascorbic acid Y = -3118 + 9284 X 0995 00572 0000
α-tocopherol Y = 210 + 2510 X 0845 01908 0027
Chapter V Phytochemical study of Solanum tubersum L
106
-16 -14 -12 -10 -08 -06 -04 -02 00 02
-150
-100
-50
0
50
100
I [micro
Ac
msup2]
Potential [ V]
00 ml
01 ml
014 ml
02 ml
024 ml
03 ml
034ml
04 ml
044 ml
05 ml
06 ml
(a)
-16 -14 -12 -10 -08 -06 -04 -02 00 02
-200
-150
-100
-50
0
50
100
150
I [micro
Ac
msup2]
Potential [ V]
00 ml
01 ml
02 ml
03 ml
04 ml
044 ml
05 ml
06 ml
(b)
-16 -14 -12 -10 -08 -06 -04 -02 00 02
-200
-150
-100
-50
0
50
100
150
I [micro
Ac
msup2]
Potential [ V]
00 ml
01 ml
02 ml
03 ml
04 ml
05 ml
06 ml
07 ml
(C)
-16 -14 -12 -10 -08 -06 -04 -02 00 02
-200
-150
-100
-50
0
50
100
150
Potential [ V]
I [micro
Ac
msup2]
00 ml
01 ml
02 ml
03 ml
04 ml
05 ml
06 ml
07 ml
086 ml
(d)
Figure V11 Cyclic voltammograms of oxygen-saturated in the absence and presence of
different concentration of sample extract Roots (a) Kondor (b) Bartina (c) Spunta (d) Kuroda
at scan rate 100 mVs
-18 -16 -14 -12 -10 -08 -06 -04 -02 00 02
-150
-100
-50
0
50
100
O2
01 mgml
03 mgml
05mgml
07mgml
1 mgml
I [micro
Ac
m2]
Potentiel [ V]
(a)
-18 -16 -14 -12 -10 -08 -06 -04 -02 00 02
-150
-100
-50
0
50
100
O2
N2
01 mgml
03 mgml
05mgml
07mgml
1 mgml
I[micro
Ac
m2]
Potentiel [ V]
(b)
Figure V12 Cyclic voltammograms of oxygen-saturated in the absence and presence of
different concentration of standard (a) ascorbic acid (b) α-tocopherol at scan rate 100 mVs
Chapter V Phytochemical study of Solanum tubersum L
107
V2623) Ratio of binding constants (KoxKred)
Scheme1 The redox behavior of the free radical and its bounded forms SE
The peak potential shift values additionally pointed out that Obull2
minusis easier to oxidize in
the presence of ethanolic extract because its reduced form Obull2
minusis more strongly bound to
extract than its oxidized form For such a system where both forms of the O2 Obull2minus redox
couple interact with the potential antioxidant compound scheme 2 can be applied [16] Based
on the process presented in scheme 2 the following equation is obtained [17]
Where and
are the formal potentials of the O2 Obull2
minus redox couple in the free and bound
forms respectively and are calculated using the following formulas (3) and (4)
Figure V11 and 12 shows the CVrsquos behavior of oxygen-saturated DMF01 TBFP in the
potential window of -14 to 00 V at a glassy carbon electrode in the absence and presence of
04 mL sample extracts the free O2 redox couple exhibits a single oxidation peak at minus072
V and a single reduction peak at minus074 V These Figures also shows the effect of the addition
of extract on the oxidation peak current of O2
The CV technique was also helpful to determine the mechanism of free radical
scavenging the observed changes in anodic peak current of O is caused by the addition of
different content of ethanolic extracts this decrease in anodic peak can be used for the
calculation of the binding constant where the shift in peak potential values can be employed
for the determination of the mode of interaction in the same manner used for study of
binding of drug molecules to DNA [1415]
Chapter V Phytochemical study of Solanum tubersum L
108
By adding 04 ml of sample extracts in solution of DMF the peak potential was shifted
by ΔE the peak potential was displaced by ΔEf0 mV to more negative for complex
-
Kondor and more positive for the rest of the complexes which associated with the decrease in
oxidation peak current densities ΔIpa which confirms the interaction of ethanolic extracts
with (Table V11 and 12) The significant decrease in oxidation peak current densities can
be attributed to the diminution in concentration due to the formation of sample extract
complex
Table V11 Shifts in peak potential and a decrease in anodic peak current of bound forms
of Roots extract samples 24)جدول رقم ) 11Table V11 Shifts in peak pote ntial and a decrease in anodic peak current of O_2^(∙-) bound for ms of R oots extract samples
Sample Ipa (microA) Epa (V) Epc (V) Ef0 (V) ΔEf0(mV) ΔIpa KoxKred
- 1342672 -07068 -07247 -07157 - - -
Kondor 1042637 -0678 -07566 -07173 -15574 223460 094
- 1373784 -07251 -07714 -07482 - - -
-Bartina 118844 -07251 -07624 -07438 44776 134914 119
- 1375848 -07149 -07438 -07294 - - -
-Spunta 114627 -07021 -07477 -07249 44776 166863 119
- 1424359 -07613 -07800 -07706 - - -
-Kuroda 1237957 -07519 -07617 -07568 138221 130867 171
Chapter V Phytochemical study of Solanum tubersum L
109
-16 -14 -12 -10 -08 -06 -04 -02 00 02
-200
-150
-100
-50
0
50
100
I [micro
Ac
msup2]
Potential [ V]
00
04 ml
(a)
-16 -14 -12 -10 -08 -06 -04 -02 00 02
-200
-150
-100
-50
0
50
100
150
I [micro
Ac
msup2]
Potential [ V]
00 ml
04 ml
(b)
-16 -14 -12 -10 -08 -06 -04 -02 00 02
-200
-150
-100
-50
0
50
100
150
I [micro
Ac
msup2]
Potential [ V]
00 ml
04 ml
(C)
-16 -14 -12 -10 -08 -06 -04 -02 00 02
-200
-150
-100
-50
0
50
100
150
I [micro
Ac
msup2]
Potential [ V]
00 ml
04 ml
(d)
Figure V13 Cyclic voltammograms of oxygen-saturated in the absence and presence of 04
ml sample extract Roots (a) Kondor (b) Bartina (c) Spunta (d) Kuroda at scan rate 100 mVs Figure I 42voltamm ograms of oxygen-sat urated i n the a bse nce a nd prese nce of 04 ml sampl e extract Root s (a) Kondor (b) Barti na (c) Spunta (d) Kuroda at sca n rate 100 mVs
Table V12 Shifts in peak potential and a decrease in anodic peak current of bound forms
of Standard samples 24)جدول رقم ) 12Table V12 Shifts in peak pote ntial and a decrease in anodic peak current of O_2^(∙-) bound for ms of F lesh extract samples
Sample Ipa (microA) Epa(V) Epc(V) Ef0 (V) ΔEf0
(mV)
ΔIpa KoxKred
- 1295016 -07825 -06462 -07143 - - -
-Ascorbic
acid
1208858 -07798 -06676 -07237 -935 66530 069
- 1275129 -06453 -07752 -07102 - - -
-
α-tocopherol
1211147 -06458 -07707 -07080 225 50177 109
Chapter V Phytochemical study of Solanum tubersum L
110
-18 -16 -14 -12 -10 -08 -06 -04 -02 00 02
-150
-100
-50
0
50
100
I [micro
Ac
msup2]
Potential [ V]
00 ml
03 ml(a)
-18 -16 -14 -12 -10 -08 -06 -04 -02 00 02
-150
-100
-50
0
50
100
I [micro
Ac
msup2]
Potential [ V]
00 ml
03 ml(b)
Figure V14 Cyclic voltammograms of oxygen-saturated in the absence and presence
of 03 ml sample extract (a) Ascorbic acid (b) α-tocopherol at scan rate 100 mVs Figure I 34 Cyclic voltammogram s of oxygen-sat urated i n the a bse nce a nd prese nce of 03 ml sampl e extract (a) Ascor bic a cid (b) α-t ocopherol at scan rate 100 mVs
Figure I 44 Cycli c voltammograms of oxygen-saturate d in t he absence and pre sence of differe nt conce ntration of sampl e extract Root s (a) Kondor (b) Bartina (c) Spunta (d) Kuroda at scan rate 10 0 mVs
V2624) Thermodynamic properties
To quantify the results the strength of interaction between superoxide anion radical and
the probable antioxidant in the extract was estimated in terms of binding constant Kb Based
on the decrease in peak current the binding constant (Kb) was calculated using following
equation Feng et al [18]
(5)
Where Ipo and Ip are the peak currents of superoxide anion radical in the absence and
presence of additives respectively [AO] is the concentration of the antioxidant As [AO] is
not known therefore this term was replaced by the volume of the extracts (∆Vext) It is
noticeable that the volume of the solution containing is fixed thus the addition of volume
increments of the extract is proportional to the addition of more number of moles (ie
concentration) of the compound(s) according to Safeer et al [19] Another thermodynamic
parameter standard Gibbs free energy (∆G˚) was calculated using the measured Kb
The obtained values from CVs voltammograms showed in Figure V13 and 14
indicated that the binding constant (Kb) ranged as the follows
- α-tocopherol lt
-Spunta lt Kondor lt
-Ascorbic acid lt -Kuroda lt
-Bartina
The values of free energy varied in the same order as of the binding constant The negative
values of ∆G indicated the spontaneity of interaction The data obtained in Table
V13 were very statistically significant with plt0002
Chapter V Phytochemical study of Solanum tubersum L
111
Table V13 Values of Binding constants and binding free energy of the complexes -
sample extracts 24)جدول رقم ) 13Table V13 Values of Binding constants and binding free energy of the complexes O_2^(∙-)-sample extracts
Compound Equation R2 K ΔG P
Unpeeled
-Kondor y = 09086x + 28778 0990 075474x102 -1642 0000
-Bartina y = 04818x + 31119 0956 131522x102 -1780 0001
-Spunta y = 08952x + 28012 0986 063270x102 -1599 0000
-Kuroda y = 0576x + 29473 0986 088572x102 -1682 0000
Standard
-Ascorbic acid y = 05923x + 28376 0996 068801x102 -1619 0000
-α-tocopherol y = 115x + 2035 0959 010839x102 -1161 0001
V2625) Diffusion coefficients
The redox process of the four sample extracts as a function to scan rates presented in
Figure V15 and 16 The voltammogram contained a couple of a clear stable oxidation and
reduction peaks attributed to the electrochemical behavior of the redox O2 couple In
addition demonstrate clearly the reversibility of the oxidation reaction of the redox couple
O2 as the oxidation peak potentials are not significantly affected by the variation in the
scan rate
The diffusion coefficients of the free radical and its
bounded forms with
ethanolic extract were calculated from the following RandlesndashSevcik equation [20]
Where i presents the oxidation peak current density S presents the surface of the
working electrode (cm2) C is the bulk concentration (molcm
-3) of the electroactive species D
present the diffusion coefficient (cm2s) and v is the scan rate (Vs) The linearity of the plot
of the four adducts Further demonstrates that the kinetic of the oxidation
reaction is limited by the diffusion process The diffusion coefficients were determined from
the slopes of the plot ipa vs the square root of the scan rate Values are given in Table V14
Chapter V Phytochemical study of Solanum tubersum L
112
Table V14 shows that the diffusion coefficient of complexes is lower than
that of the free radical The diffusion coefficients of four adducts are very close because
sample complexes have the same contents the slight difference can only be attributed to the
amount of the phytochemical compound
-16 -14 -12 -10 -08 -06 -04 -02 00 02
-300
-200
-100
0
100
200
a
Potential [ V]
500
400
300
200
100
-16 -14 -12 -10 -08 -06 -04 -02 00 02
-300
-200
-100
0
100
200
b
Potential [ V]
500
400
300
200
100
-16 -14 -12 -10 -08 -06 -04 -02 00 02
-300
-200
-100
0
100
200
C
Potential [ V]
500
400
300
200
100
-16 -14 -12 -10 -08 -06 -04 -02 00 02
-400
-300
-200
-100
0
100
200
d
Potential [ V]
500
400
300
200
100
-16 -14 -12 -10 -08 -06 -04 -02 00 02
-300
-200
-100
0
100
200
e
Potential [ V]
500
100
400
300
200
Figure V15 Succession of cyclic voltammograms at GC electrode in oxygen-saturated
DMF01 TBFP at different scan rates ranging from 100 to 500 mVs unpeeled (a) -
Kondor (b) -Bartina (c)
-Spunta (d) -Kuroda and (e) for
Figure I 45Successi on of cycli c voltammograms at GC electr ode i n oxyge n-saturate d DMF01 T BFP at different sca n rates rangi ng from 100 to 5 00 mVs unpeele d (a) O_2^(∙-) -Kondor (b) O_ 2^(∙-)-Bartina (c) O_2^(∙ -)-Spunta (d) O_ 2^(∙-)-Kur oda a nd (e) for
Chapter V Phytochemical study of Solanum tubersum L
113
10 12 14 16 18 20 22 24
100
120
140
160
180
200
220
240
260
280
ipa [
microA
cm
sup2]
Vfrac12 (mVs)
I A
I Bartina
I Spunta
I Kuroda
I kondor
Figure V16 ipa versus V12 plots of oxygen-saturated DMF A in absence of 04 ml of
unpeeled extract Figure I 46 i pa versus V1 2 pl ots of oxyge n-saturate d DMF A in a bse nce of 04 ml of unpeel ed extract
Table V14 Diffusion coefficient values 24)جدول رقم ) 14Table V14 Diffusion coefficient values
Sample Equation R2 values D (cm
2s)
Roots
Obull2minus y = 11046x + 24721 0998 187x10-6
Obull2minus-Kondor y = 76929x + 25282 0997 909 x10-7
Obull2minus-Bartina y = 68567x + 44991 0978 722 x10-7
Obull2minus-Spunta y = 73768x + 41425 0999 836 x10-7
Obull2minus-Kuroda y = 7941x+ 45149 0999 968 x10-7
Chapter V Phytochemical study of Solanum tubersum L
114
V27) Discussion
As discussed in chapter II5 potatoes contain a number of phytochemicals compounds
which have an antioxidant and antibacterial activity This function had a role in disease
prevention The purpose of this experiment was to assess the relative phenolic and flavonoids
content on the potential antioxidant capacity of four different potatoes varieties
Based on the results which identified the cultivars with the greatest total phenolics
content and flavonoids content all the four potatoes varieties show great levels of phenolic
and flavonoids content Kondor in particular had much greater in phenolics content (101-
216) and flavonoids content (106-229) times greater than other varieties Similar to finding
in HPLC analysis extraction from Kondor root sample has been shown to exhibit variable
degrees of Quercetin acid with a high content 1091 microgmg and Caffeic acid with 053 microgmg
These acids present only in Kondor root variety
The difference of genetic and cultivars condition caused variable effects amongst
phytochemical compounds in potatoe samples The major trends appeared to include a general
difference in the actual quantity of the phytochemical compounds that are present in potatoes
sample the other trends include a disappeared of some compounds such as vanillin
disappeared in Spunta and Kuroda samples for the rutine was present only in Kuroda sample
As expected due to the high phytochemical content Kondor variety has the greatest in
vitro antioxidant capacity Two techniques used to measure antioxidant capacity were
spectrophotometers (FRAP and DppH) and electrochemical (total antioxidant activity and
O2) Results of the FRAP and CV assays from different technique with the same principle
measure directly the antioxidant activity showed that the four potato varieties have an
antioxidant potential Kondor also displayed the greatest protection against radicals DppH and
O2 then the other four potato cultivars
Finally Kondor has a great potential for future development as a marketable food
product Kondor production has also the potential to contribute in useful ways to the
development goals in health more than Bartina Kuroda and Spunta other potato varieties
Chapter V Phytochemical study of Solanum tubersum L
115
V3) Experiment Two Kondor tuber analysis
V31) Aim
The phytochemical content of the tuber of Kondor will then be further quantified to
investigate (a) to what extent of the phenolic and flavonoids content (b) HPLC analysis (c)
antioxidant activity by the two techniques mentioned above and another spectrophotometer
assay Except where stated analyses were carried out on Kondor variety in two cases the first
one is the whole tuber (unpeeled) and the second is the tuber flesh (peeled)
V32) Phytochemical contents
The Table V19 shows the total phenolic contents (TPC) and the total flavonoid
contents (TFC) of Kondor variety in two cases the whole root and the flesh The tuber
samples flesh showed the lower amount of TPC and TFC than the whole tuber sample
Table V19 Determination of total Phenolics contents and total flavonoids of the
unpeeled and the peeled 24)جدول رقم ) 15Table V19 Determination of total P heno lics contents and total flavonoids of t he who le root and the flesh
Kondor Sample Total Polyphenols (mg AG g of
extract)
Total flavonoids (mg rutin g of
extract)
unpeeled 192144 plusmn 0096 250350 plusmn 0125
peeled 146496 plusmn 0102 146878 plusmn 0073
As previously shown in the first experiment with regards to the quantity of total
phenolic in different potato tubers the presence of these compounds contributors with the
order Kondor (unpeeled) gt Bartina (unpeeled) gt Kondor (peeled) gt Spunta (unpeeled) gt
Kuroda (unpeeled)
A return to the total flavonoids content in all five extract samples these compounds
decreasing in contribution was Kondor (unpeeled) gt Bartina (unpeeled) gt Spunta (unpeeled)
gt Kondor (peeled) gt Kuroda (unpeeled)
However these results showed that the extract of peeled Kondor has a great value in
phytochemical content when compared to the whole tuber component in all varieties
Chapter V Phytochemical study of Solanum tubersum L
116
V33) HPLC analysis
The chromatographic profile of extract of the unpeeled sample and the peeled sample of
the variety Kondor represented in Level of the figures (V1 and V17) The results of
quantitative analyses of phenolic compounds Identified are represented in the Table V20 The
analysis of these results shows that in The extract of the variety Kondor in case of peeled the
ascorbic acid (0226 microgmg) the Gallic acid (5764 microgmg) the Chlorogenic acid (1845
microgmg) For the caffeic acid Vanillin and Quercetin present only in the unpeeled sample But
from the point of view of quantity the extract of the whole tuber (unpeeled) of Kondor is
richness than the extract of the peeled
Table V20 Constituents content analyzed by HPLC 24)جدول رقم ) 16Table V20 Constitue nts content ana lyzed by HP LC
Sample extract Kondor
unpeeled peeled
Ascorbic acid [microgmg] 01896 02266
Gallic acid [microgmg] 52946 57646
Chlorogenic acid [microgmg] 30520 18450
Caffeic acid [microgmg] 05322 -
Quercetin [microgmg] 109197 -
Vanillin [microgmg] 00596 -
The HPLC analysis of all five extract samples presented in tables V20 and V4 When
compared to the proximate composition of three bioactive compounds found in all potato
tubers Gallic acid is mostly concentrated in all four varieties (780 - 529 microgmg) greater in
the unpeeled sample and Kondor peeled sample or Chlorogenic acid (305 - 075 microgmg)
followed by Ascorbic acid 031 - 002 microgmg
Chapter V Phytochemical study of Solanum tubersum L
117
Figure V17 Chromatograms of leaf extract(1)Ascorbic acid(2) Gallic acid (3)
Chlorogenic acid Figure I 47Chromatograms of leaf extract(1)Ascorbi c aci d(2) Gallic a cid (3) Chlor ogeni c aci d
V34) Spectrophotometers assays
The phytochemical analysis of bioactive compounds in Kondor variety unpeeled and
peeled samples showed a comprehensive identification of phenolics and flavonoids content
but rather presents an idea of the array of phytochemical compounds As there are many
phenolic compounds with different properties and characteristics Hence one particular assay
may be better at detecting a certain type of antioxidant compound than another and therefore
using more one assay enables a researcher to pick up a wide range of oxidative compounds
V341) FRAP assay
Ferric reducing antioxidant power (FRAP) is based on the ability of the antioxidant to
reduce Fe3+ to Fe2+ according to Rodriquez amp Hadley the ethanolic extracts of potato
tubers showed marked hydrogen-donating activity using reducing power in the Fe(III) AElig Fe
(II) reaction in FRAP assay [9]
Based on the FRAP assay (Table V21) the results indicated that the unpeeled samples
had a reducing antioxidant power more than the peeled sample with a value 388032 and
232443 mg Fe(II) g of extract respectively However the results mentioned above (Table
V5) shows three of potato unpeeled Kondor Bartina and Spunta had higher values of
reducing antioxidant power than Kondor peeled sample but less than Gallic acid and ascorbic
acid
Chapter V Phytochemical study of Solanum tubersum L
118
Table V21 Determination of reducing the antioxidant power of four kinds of potatoes 24)جدول رقم ) 17Table V21 Determination of reducing t he antioxidant power of four kinds of potatoes
Sample FRAP (mg Fe(II) g of
extract)
unpeeled 388032 plusmn 0043
peeled 232443 plusmn 0019
Ascorbic acid 2512985 plusmn 0020
Gallic acid 77782511 plusmn 0388
V342) Total antioxidant capacity
Several assays have been introduced for the measurement of the antioxidant activity of
plant extracts including total antioxidant capacity by the phosphomolybdenum method The
phosphomolybdenum method is based on the reduction of Mo(VI) to Mo(V) by the
antioxidant compounds and the formation of green Mo(V) complexes with a maximal
absorption at 695 nm [21] Using this method the result indicated that both the peeled and
unpeeled extracts of Kondor variety have an antioxidant capacity The unpeeled extract
displayed the higher antioxidant capacity than the peeled extract with value 4708 and 2787
mg ascorbic acid equivalentg extract respectively Overall the two samples had lower
antioxidant activity than the Gallic acid (Table V22)
Table V22 Determination of the Total antioxidant capacity of Kondor 24)جدول رقم ) 18Table V22 Determination of the Total antiox idant capacity of Kondor
Sample Total antioxidant capacity
unpeeled 470873 plusmn 0043
peeled 278784 plusmn 0019
GA 65654263 plusmn 0035
V343) β-carotene bleaching assay
In the β-carotene-linoleic acid coupled oxidation model system the linoleic acid-free
radical (LOO ) formed attacks the highly unsaturated β-carotene molecules and in the
absence of an antioxidant rapidly bleaches the typically orange color of β-carotene which is
monitored spectrophotometrically at 450 nm The extracts reduced the extent of β-carotene
bleaching by neutralizing the linoleate-free radical and other free radicals formed in the
system [22] The antioxidant activities of Kondor peeled and unpeeled extracts were
Chapter V Phytochemical study of Solanum tubersum L
119
determined after 120 min reaction time (Table V23) and compared with a well known
natural antioxidant gallic acid and ascorbic acid
However the results indicated that the extracts ranked in the following order unpeeled
extract (6842 plusmn 0007)gt peeled extract (5333 plusmn 0006) It is clear that the two extracts
are capable of inhibiting β-carotene bleaching and the activity depends on the amount of
extract The unpeeled extract showed the highest level of activity at 4 mgml and also
demonstrated a significant increase in activity compared to the peeled extract In a
comparison of the β-carotene bleaching activity gallic acid and ascorbic acid showed the
highest antioxidative activity at 008 mgml with values 6264 plusmn 0013 and 1651 plusmn
0007 respectively
Table V23 Determination of antioxidant activity of sample extracts using β-carotene
bleaching 24)جدول رقم ) 19Table V23 Determination of antioxidant activity of sample extracts using β-carotene bleaching
Sample extraction Concentration (mgml) Antioxidant activity
Unpeeled 075
15
4
032967 plusmn 0018
281250 plusmn 0014
684210 plusmn 0007
Peeled 075
15
4
084337 plusmn 0005
152941 plusmn 0019
533334 plusmn 0006
Ascorbic acid 003
006
008
046204 plusmn 0005
137500 plusmn 0008
165178 plusmn 0007
Gallic acid 003
006
008
212477 plusmn 0003
425287 plusmn 0005
626436 plusmn 0013
Additionally the inhibition of the antioxidant activity of β-carotene oxidation also
expressed as IC50 (Table V24) The IC50 value of each extract is deducted from the equations
of the curves of the variation in the percentage of inhibition I as a function of the
concentration of each extract as shown in Figure V18 and Annexe (A)
The IC50 scavenging activity of the Kondor unpeeled and peeled extracts were 285
mgml 390 mgml respectively Also for the gallic acid and ascorbic acid showed the highest
Chapter V Phytochemical study of Solanum tubersum L
120
value 0066 mgml and 021 mgml All the results have a very statistically significant with
plt0005 the order of antioxidant activity towards β-carotene oxidation was
Gallic acid gt Ascorbic acid gt Unpeeled gt Peeled
05 10 15 20 25 30 35 40 45
0
10
20
30
40
50
60
70
IC
Concentration
IC50
= 285 mgml
Figure V18 Antioxidant activity () of unpeeled Kondor assayed by β-carotenendash
linoleate bleaching
Figure I 48A ntioxidant activity () of unpeele d Kondor assayed by β-car otene ndashlinoleate bl eaching
Table V24 IC50 values of sample extracts using β-carotene bleaching
24)جدول رقم ) 20Table V24 IC50 values of sample extracts using β-carotene bleaching
Sample extraction Equation R2
IC50 P value
Unpeeled Y = 18779x - 3531 0954 285 0004
Peeled Y= 13231x - 1649 0993 390 0000
Ascorbic acid Y= 24154x - 2069 0918 021 0003
Gallic acid Y= 7848x - 22963 0993 0066 0000
V343) DPPH
DPPH scavenging activity () had increased with the increased concentration of the
extract in all samples (Figure V19) The stable DPPH free radical accepts an electron or
hydrogen radical from donors to form a stable molecule which could be seen as color
reduction
V3431) Calculation of radical inhibition
Kondor extract was the strongest electron or hydrogen donor due to the highest DPPH
scavenging activity The IC50 of DPPH scavenging activity of the Kondor unpeeled and
peeled extracts were 121 mgml 280 mgml respectively Also for the Gallic acid and
Chapter V Phytochemical study of Solanum tubersum L
121
ascorbic acid showed the highest value 00069 mgml and 001 mgml All the results have a
very statistically significant with plt0000 (table V24)
Table V24 IC50 values of sample extracts using DPPH 24)جدول رقم ) 21Table V24 IC50 values of sample extracts using DP PH
Sample DppH
Equation R2 value IC50 P
unpeeled Y = 333 + 383 X 0994 121 0000
peeled Y = - 347 + 257 X 0991 280 0000
Ascorbic acid Y= 094 + 4720X 0972 0010 0000
Gallic acid Y=-678 + 8154X 0982 00069 0000
inhibition expressed as mgml
V3432) Calculation of the binding constant
The electronic spectra of complexes extractndashDppH were recorded in the range 200-900
nm which showed intense absorption at range 515-518 nm The determination of binding
constant Kb of extractndashDppH complex can be calculated from the inhibition of absorbance in
UV-spectra after the addition of sample extract ( Figure V19)
As mention above A plot of Ao (A-Ao ) to 1[extract] has shown linearity which is
suggestive of 11 complex formation of both extracts with DppH The intercept to slope ratio
of this plot gives the value of binding constant ldquoKb rdquo (Annexe A) Kb values were calculated
given in Table V25
UV spectra of DppH showed a hypochromic effect upon addition of sample extract the
intensity decreased rapidly with increasing concentration of the extract were recorded in
Figure V20 In the absence of sample extract the DppH displayed one absorbance peak at 517
nm this peak intensity exhibited hypochromism up from 56 to 77 for 2 mgml
concentration of sample extract
The values of binding constant ldquoKb rdquo were further used to calculate standard Gibbs free
energy ldquo∆Grdquo of extractndashDppH complex using the following equation
Free energy changes of extracts values Table V25 and showed spontaneous of their binding
with DppH The p-value of the results was lt005 which a significant statistically
Chapter V Phytochemical study of Solanum tubersum L
122
400 450 500 550 600 650 700
00
02
04
06
08
10
12
14
Ab
s
Wavelength nm
00 mgml
0005 mgml
001 mgml
005 mgml
01 mgml
025 mgml
075 mgml
05 mgml
1 mgml
125 mgml
15 mgml
(a)
400 450 500 550 600 650 700
00
02
04
06
08
10
12
14
Ab
s
Wavelength nm
00 mgml
025 mgml
05 mgml
075 mgml
1 mgml
15 mgml
2 mgml
25 mgml
(a)
Figure V19 Electronic absorption spectra of 025 mM of DPPH interaction with of (a)
Unpeeled and (b) Peeled Figure I 49Ele ctronic a bsorption spectra of 025 mM of DPPH i nteracti on wit h of (a) Root and (b) Flesh
Table V25 Values of Binding constants and binding free energy of the complexes DppH-
sample extracts 24)جدول رقم ) 22Table V25 Values of Binding constants and binding free energy of the complexes D ppH- sample extracts
Compound Equation R2 K ΔG P
unpeeled
DppH-Kondor Y = -0031x + 24387 09089 786266 -10822 0012
peeled
DppH-Kondor Y = -00289x +19914 09129 689065 -10494 0011
V35) Electrochemistry assay
Table V26 shows The oxidation of Kondor samples extract studied by cyclic
voltammetry showed capacity antioxidant expressed in terms of gallic acids (AG) equivalent
antioxidant capacity obtained from an electrochemical assay in ethanolic extract of two cases
the unpeeled and the peeled This capacity related to the potential peaks which determined
the antioxidant power of sample extracts this potential peak show almost the same value but
the peeled sample has lower antioxidant capacity than the unpeeled
Table V26 Determination of the Antioxidant capacity of Kondor variety by CV 24)جدول رقم ) 23Table V26 Determination of the A ntioxidant capacity of Kondor variety by CV
Sample Antioxidant capacity CVa Eap
b (V)
unpeeled 534813 plusmn 0254 +088
peeled 305753 plusmn 0540 +087
a capacity antioxidant expressed as milligrams of gallic acid equivalent per gram of extract
b Anodic oxidation potential vs GCE
Chapter V Phytochemical study of Solanum tubersum L
123
V352) Electrochemistry assay radical scavenging activity
The quantification of antioxidant in the extract is made by calculating the inhibition
concentration (IC50) value radical scavenging activity was plotted against different
concentrations of extract samples the effect of different concentrations is shown in (Figure
V21) for radical scavenging activity All the voltammograms of superoxide anion radical
Figure V20 showed one electron reversible process having well developed and clear
oxidation and reduction peaks On the level of anodic current the decreasing of peaks
according to the addition of sample extracts
The equation obtained from the linear calibration graph (Annexe) in the studied
concentration range of samples extracts are presented in Table V27 where y stand for the
value of the oxidation peak current density of and x represents the value of the
concentration of ethanolic extracts expressed as mgmL The unpeeled Kondor extracts have
a less IC50 with 103 mgmL than peeled with 202 mgmL All the IC50 values were
considered as very statistically significant with plt0000
Table V27 IC50 values of Kondor sample extracts using radical scavenging activity
24)جدول رقم ) 24Table V27 IC50 values of Kondor sample extracts using O_2^(∙-) radical scaveng ing activity
Sample Equation R2 value IC50 P
unpeeled Y= 156 + 468 X 0989 10350 0000
peeled Y = - 416 + 267 X 0948 20284 0000
-16 -14 -12 -10 -08 -06 -04 -02 00 02
-150
-100
-50
0
50
100
I [micro
Ac
msup2]
Potential [ V]
00 ml
01 ml
014 ml
02 ml
024 ml
03 ml
034ml
04 ml
044 ml
05 ml
06 ml
(a)
-16 -14 -12 -10 -08 -06 -04 -02 00 02
-200
-150
-100
-50
0
50
100
I [micro
Ac
msup2]
Potential [ V]
00 ml
01 ml
02 ml
03 ml
04 ml
05 ml
06 ml
07 ml
08 ml
09 ml
(b)
Figure V20 Cyclic voltammograms of oxygen-saturated in the absence and presence of
different concentration of Kondor sample extract (a) unpeeled (b) peeled at scan rate 100
mVs Figure I 50 Cycli c voltammograms of oxyge n-saturate d in the absence and pre sence of different conce ntration of Kondor sam ple extract (a) unpeele d (b) peel ed at scan rate 1 00 mV
Chapter V Phytochemical study of Solanum tubersum L
124
V3521) Ratio of binding constants (KoxKred)
Figure V21 shows the CVrsquos behavior of oxygen-saturated DMF01 TBFP in the
potential window of -14 to 00 V at a glassy carbon electrode in the absence and presence of
04 mL sample extracts the free O2 redox couple exhibits a single oxidation peak at minus072
V and a single reduction peak at minus074 V These Figures also shows the effect of the addition
of extract on the oxidation peak current of O2
The CV technique was also helpful to determine the mechanism of free radical
scavenging the observed changes in anodic peak current of O is caused by the addition of
different content of ethanolic extracts this decrease in anodic peak can be used for the
calculation of the binding constant where the shift in peak potential values can be employed
for the determination of the mode of interaction in the same manner used for study of
binding of drug molecules to DNA [1415]
By adding 04 ml of sample extracts in a solution of DMF the peak potential was
shifted by ΔE the peak potential was displaced by ΔEf0 mV to more negative for complex
-Kondor in two cases unpeeled and peeled complexes which associated with the decrease
in oxidation peak current densities ΔIpa which confirms the interaction of ethanolic extracts
with (Table V28) The significant decrease in oxidation peak current densities can be
attributed to the diminution in concentration due to the formation of sample extract
complex
Table V28 Shifts in peak potential and a decrease in anodic peak current of bound forms
of Kondor extract samples 24)جدول رقم ) 25Table V28 Shifts in peak pote ntial and a decrease in anodic peak current of O_2^(∙-) bound for ms of Kondor extract samples
Sample Ipa (microA) Epa (V) Epc (V) Ef0 (V) ΔEf
0(mV) ΔIpa KoxKred
- 1342672 -07068 -07247 -07157 - - -
-Unpeeled 1042637 -0678 -07566 -07173 -15574 223460 094
- 1299617 -07114 -07484 -07299 - - -
-Peeled 1216849 -07060 -07570 -07315 -15574 63686 094
Chapter V Phytochemical study of Solanum tubersum L
125
-16 -14 -12 -10 -08 -06 -04 -02 00 02
-200
-150
-100
-50
0
50
100
I [micro
Ac
msup2]
Potential [ V]
00
04 ml(a)
-16 -14 -12 -10 -08 -06 -04 -02 00 02
-200
-150
-100
-50
0
50
100
I [micro
Ac
msup2]
Potential [ V]
00 ml
04 ml
(a)
Figure V21 Cyclic voltammograms of oxygen-saturated in the absence and presence of
04 ml Kondor sample extract (a) Unpeeled (b) Peeled at scan rate 100 mVs Figure I 51Cy clic v oltammograms of oxyge n-saturate d in the absence and presence of 04 ml Kondor sample extra ct (a) Unpeel ed (b) Peel ed at scan rate 1 00 mVs
V3522)Thermodynamic properties
The obtained values from CVs voltammograms showed in Table V29 indicated that the
binding constant (Kb) ranged as the follows
- Peeled lt
-Unpeeled
The values of free energy varied in the same order as of the binding constant The
negative values of ∆G indicated the spontaneity of interaction The data obtained in
Table V29 were very statistically significant with plt0000
Table V29 Values of Binding constants and binding free energy of the complexes -
sample extracts 24)جدول رقم ) 26Table V29 Values of Binding constants and binding free energy of the complexes O_2^(∙-)-sample extracts
Compound Equation R2 K ΔG P
unpeeled
-Kondor y = 09086x + 28778 0990 075474x10
2 -1642 0000
peeled
-Kondor y = 05606x + 27765 0962 059772x10
2 -1585 0000
Chapter V Phytochemical study of Solanum tubersum L
126
V36) Discussion
Finally fresh Kondor tuber including the whole tuber (unpeeled) and the peeled are
each likely to be great bioactive compounds when compared with other potato varieties due to
their higher content of phenolics and flavonoids as well as greater antioxidant capacity
One of the major aims of this work was to provide a preliminary investigation on the
phytochemical composition of one variety which has greater levels of phytochemical
compounds and to compare these results in both the unpeeled and peeled samples
The results of the second experiment suggest that the freshly peeled potato tubers from
Kondor variety show promising potential with regards to greater potential health benefits
from greater phenolics flavonoids as well as antioxidant activity Similar to finding in this
work other researchers have found that total phenolic compounds were greater in the tuber
skin compared to the tuber flesh [23-24]
As found in this experiment the peeled Kondor variety showed higher concentrations
of phenolic and flavonoid compounds compared to unpeeled Spunta and Kuroda respectively
and thus great antioxidant activity
In this manner with regards to health value since the skin of potatoes generally has
greater phytochemical compounds relative to the flesh it would be advisable to eat the whole
potato tuber rather than peeling them
Chapter V Phytochemical study of Solanum tubersum L
127
V4) Statistic analysis
The analysis of variance of the main effect plot between the variable studied and their
significance was performed using GLM To confirm that the antioxidant activity of the
extracts of the potatoes back to their richness in phytochemical compounds we tried to find a
linear correlation between the antioxidant capacity values calculated by the methods measured
the antioxidant activity with their polyphenol total content and flavanoids total content also a
correlation between each other
V41) Main effect plot
Fig V22 23 and Table V15 shows an overall view of the relative of variety on the
level of phytochemical content and the effect of activity antioxidants a further analysis of
variance of the main effect plot between the variable studied and their significance was using
performed using GLM Fig V22 shows the overall effect of variety on the level total phenolic
content and total flavonoid content The average plot of TPC is valued 1488 which presented
with a line across the plot the variety Kondor and Bartina have the higher amount of TPC
with values above the average line for the variety Spunta and Kuroda shows a lower amount
below the average line Moreover the TFC plot three varieties Kondor Bartina and Spunta
have a higher amount above the average line (at 2033) than the Kuroda variety as it can be
seen there is a statistically significant difference in the amounts of TFC TPC and varieties
(p lt 0005- see Table V15)
Furthermore the effect of different varieties on their antioxidants activity can be seen in
Fig V 23 for CV and FRAP assays This plot shows two varieties Kondor and Bartina above
the average line which presented at a value 4236 and 3068 respectively for the other
varieties Spunta and Kuroda have a low average value presented below the average line
These factors have a very significant statistically with p lt 0000
Another antioxidant capacity DppH and O2 their plot of IC50 average presented in
Figure V23 also these plots show two varieties Spunta and Kuroda have values above the
average line in this case means the lowest antioxidant capacity the Kondor and Bartina
variety have the highest antioxidant capacity which presented lower than the average line this
analysis has a statistically significant with plt0005
Chapter V Phytochemical study of Solanum tubersum L
128
Table V15 Analysis of variance for the main effect plot 24)جدول رقم ) 27Table V15 A nalys is of variance for the main effect plot
Main effect plot P value
TPC 0000
TFC 0000
FRAP 0000
CV 0000
DppH 0003
0003
Figure V22 Effect of variety 1 Kondor 2 Bartina 3 Spunta 4 Kuroda on the level
of (a) TPC (b) TFC
Figure I 52Effect of variety 1 Kondor 2 Bartina 3 S punta 4 Kuroda on the level of (a) TPC (b) TFC
Chapter V Phytochemical study of Solanum tubersum L
129
Figure V23 Effect of variety (1) Kondor (2) Bartina (3) Spunta (4) Kuroda on the
level of inhibition IC50 of (a) DppH (b)
Figure I 53Effect of variety (1) Kondor (2) Bartina (3) Spunta (4) Kur oda on the level of inhibiti on IC50 of (a) DppH (b) O_2^(∙ -)
V42) Linear regression
V421) Linear regression between total polyphenol content and
antioxidant activity
From these plots Figure V24 a correlation (Table V16) is observed between the
content of total phenolic content TPC and ethanolic extracts of a different variety of potatoes
and the antioxidant activity as measured by different methods with correlation indices R2
which ranged from 0602 to 0825
Chapter V Phytochemical study of Solanum tubersum L
130
8 10 12 14 16 18 20
22
24
26
28
30
32
34
36
38
40
FR
AP
TPC
(a)
8 10 12 14 16 18 20
30
35
40
45
50
55
CV
TPC
(b)
8 10 12 14 16 18 20
10
15
20
25
30
35
40
IC50
(D
pp
H)
TPC
(c)
8 10 12 14 16 18 20
10
12
14
16
18
20
22
IC50 (
O-
2)
(d)
Figure V24 Correlation graphs for (a) FRAP (b) CV (c) IC50DppH and (d) IC50 with
total phenolic content (TPC) Figure I 54 Correlati on gra phs for (a) FRAP (b) CV (c) IC50D ppH a nd (d) IC50 O_2^(∙-) with t otal phenolic content (TPC )
Table V16 Determination of the correlation between capacity antioxidant and Total
Phenolic content 24)جدول رقم ) 28Table V16 Determination of the correlation between capacity antioxidant and Tota l P henolic content
Assays Equation R2
FRAP Y= 1185 + 1169X 0602
CV Y = 165 + 1586 X 0574
IC50 DppH Y= 5474 ndash 02001X 0825
IC50 Y= 2774 ndash 00814X 0633
Chapter V Phytochemical study of Solanum tubersum L
131
V422) Linear regression between total flavonoids content and antioxidant
activity
From these plots Figure V25 a correlation (Table V17) is observed between the total
flavonoids content TFC and ethanolic extracts of a different variety of potatoes and the
antioxidant activity as measured by the with correlation indices R2 which ranged from 0602
to 0843 The regression coefficient values obtained for total flavonoids content and
antioxidants assay was higher compared with total phenolics content
10 12 14 16 18 20 22 24 26
22
24
26
28
30
32
34
36
38
40
FR
AP
TFC
(a)
10 12 14 16 18 20 22 24 26
30
35
40
45
50
55
CV
TFC
(b)
10 12 14 16 18 20 22 24 26
10
15
20
25
30
35
40
IC5
0 (
Dp
pH
)
TFC
(c)
10 12 14 16 18 20 22 24 26
10
12
14
16
18
20
22
IC5
0 (
O-
2)
TFC
(d)
Figure V25 Correlation graphs for (a)FRAP (b) CV (c) IC50 DppH and (d) IC50 with
total flavonoids content (TFC) Figure I 55 Correlati on gra phs for (a)FRAP (b) CV (c) IC50 D ppH and (d) IC50 O_2^(∙-) wit h total flavonoids conte nt (TFC)
Chapter V Phytochemical study of Solanum tubersum L
132
Table V17 Determination of the correlation between capacity antioxidant and Total
Flavanoids content 24)جدول رقم ) 29Table V17 Determination of the correlation between capacity antioxidant and Tota l Flavanoids content
Assays Equation R2
FRAP Y= 1014 + 0992 X 0837
CV Y = 169 + 1204 X 0638
IC50 DppH Y= 5035 ndash 01458X 0843
IC50 O2 Y= 2664 ndash 00571X 0602
As shown in Table V18 significant positive correlations (R2 = 0547 - 0825 the
average of R2 was 0651) were observed between total phenolic content and FRAP CV
assays and IC50 values for DPPH indicating the significant contribution of phenolics to
these antioxidant assays Also for the same assays the significant positive correlations
(R2 = 0602 - 0843 the average of R
2 was 0730) were observed between them and the total
flavonoids contents this R2-value indicated that total flavonoids contents exert high
antioxidant activity than total phenolic content in sample extracts
However among the four antioxidant assays (FRAP CV DppH and ) the R
2 value
of CV and FRAP show less correlation (0547 and 0602) for TPC respectively this result
indicated that total phenolics content exert a less capacity effect on CV and FRAP than other
assays
Finally R2 values ranged from 0547 to 0843 with average value was 0690 these high
levels indicate that the antioxidant activity of potatoes might in large of the contribution of
phytochemical contents especially flavonoids compounds
Table V18 The R2 values between antioxidant activities and phytochemical content
24)جدول رقم ) 30Table V18 The R2 va lues between ant ioxidant activities and phytoche mical content
FRAP CV IC50 Average
DppH
TPC 0602 0547 0825 0633 0651
TFC 0837 0638 0843 0602 0730
Average 0719 0592 0834 0617 0690
Chapter V Phytochemical study of Solanum tubersum L
133
V423) Linear regression between different methods antioxidant activity
The relation between different methods was measured using different linear
correlations From these plots Figure V26 (a) a significant correlation is observed between
the antioxidants assay FRAP and CV with correlation indices R2 value 0903 and equation
Y= 184 + 0684 X
However for the inhibitory assays and DppH (Figurethinsp V26b) the equation
obtained from the linear regression Y=0670 + 0358 X and the coefficient value R2
=0595
This higher regression coefficient indicated a strong correlation between these assays
30 35 40 45 50 55
22
24
26
28
30
32
34
36
38
40
FR
AP
CV
(a)
10 15 20 25 30 35 40
10
12
14
16
18
20
22
IC50
(O
-
2)
IC50 (DppH)
(b)
Figure V26 Correlation graphs for (a) FRAP and CV (b) IC50 between DppH and
Figure I 56Correlati on graphs for (a) FRAP and CV (b) IC50 betwee n DppH and O_2^(∙-)
Chapter V Phytochemical study of Solanum tubersum L
134
References
[1] M Angela A Meireles Extracting bioactive compounds for Food products Theory and
Applications 2009 CRC Press New York USA P 140
[2] C Da Porto E Porretto D Decorti Comparison of ultrasound-assisted extraction with
conventional extraction methods of oil and polyphenols from grape (Vitis vinifera L) seeds
Ultrason Sonochem 20 (2013) 1076ndash1080
[3] A Golmohamadi G Moumlller J Powers C Nindo Effect of ultrasound frequency on
antioxidant activity total phenolic and anthocyanin content of red raspberry juice Ultrason
Sonochem 20 (2013) 1316ndash1323
[4] M Abid S Jabbar MM hashim B Hu S Lei X Zeng Sonication enhances
polyphenolic compounds sugars carotenoids and mineral elements of apple juice Ultrason
Sonochem 21 (2014) 93ndash97
[5] Achat S Tomao V Madani K Chibane M Elmaataoui M Dangeles O amp Chemat
F (2012) Direct enrichment of olive oil in oleuropien by ultrasound-assisted maceration at
laboratory and pilot scale
[6] Zhou K and L Yu 2004 Effects of extraction solvent on wheat bran antioxidant activity
estimation Lebensmittel-Wissenschatf und Technologie 37717ndash721
[7] DVreugdenhil JBradshaw CGebhardt F Govers D KL Mackerron M A Taylor H
A Ross Potato biology and biotechnology advances and perspectives 2007 Elsevier Ltd p
442
[8] Wilhelm L R Dwayne A Suter Gerarld H Brusewitz 2004 Drying and
Dehydratation Chapter 10 Food amp Process Engineering Technology St joseph Michigan
USA 259-284
[9] Rodriquez de Sotillo DHadley M and Holm E TlsquoPhenolics in aqueous potato peel
extract extraction identification and degradationrsquo J Food Sci 1994 59 649ndash51
[10] GJ Yang JJ Xu HY Chen ZH Leng Chin J Chem 22 (2004) 1325ndash1329
[11] MS Ibrahim Anal Chem Acta 443 (2001) 63ndash72
[12] F Wang Y Xu J Zhao H Shengshui J Bioelectrochem 70 (2007) 356ndash362
[13] Firuzi O Lacanna A Petrucci R Marrosu G Saso L Bioet biophysica 2004 11174-
184
[14] X Lu K Zhu M Zhang H Liu J Kang J Biochem Biophys Methods 52 189 (2002)
[15] M Ozsoz A Erdem P Kara K Kerman D Ozkan Electroanalysis 15 613 (2003)
Chapter V Phytochemical study of Solanum tubersum L
135
[16] X Chu GL Shen JH Jian TF Kang B Xiong RQ Yu Anal Chim Acta 373 29
(1998)
[17] MT Carter M Rodriguez A Bard J Am Chem Soc 111 8901 (1989)
[18] Feng Q Li NQ and Jiang YY (1997) Electrochemical studies of porphyrin interacting
with DNA and determination of DNA Analytica Chimica Acta 344 97-104
[19] S Ahmed F Shakeel Pak J Pharm Sci 25(3) 501 (2012)
[20] CMA Brett AMO Brett Electrochemistry Principles Methods and Applications
(Oxford Science University Publications Oxford 1993) p 427
[21] Prieto P Pineda M Aguilar MM 1999 Spectrophotometric quantitation of
antioxidant capacity through the formation of phosphoolybdenum complex specific
application to the determination of vitamin E Anal Biochem 269 337-341
[22] Jayaprakasha GK Singh RP Sakariah KK Antioxidant activity of grape seed (Vitis
vinifera) extracts on peroxidation modls in vitro Food Chem 2001 73 288-290
[23] Albishi T John JA Al-Khalifa AS and Shahidi F (2013) Phenolic content and
antioxidant activities of selected potato varieties and their processing by-products Journal of
Functional Foods 5(2) 590-600
[24] Zirsha R W(2015) Investigations into the Nutritional and Sensory Potential of Taewa
(Māori Potatoes) Thesis Doctor of philosophy nutritional science p104
General conclusion
136
General conclusion
This study theme sets as the main objective the evaluation in vitro of the
phytochemical content and antioxidant activity of four different varieties of potatoes Solanum
tuberosum L (Bartina Kondor Kuroda and Spunta ) Until now no studies concerning the
antioxidant activity of the potato of the El Oued region have been conducted We think that
the present study is the first to investigate and evaluate the bioactive compounds
For this concern we choose two methods for extracting the higher level of bioactive
compounds from potato These techniques are ultrasonic-assisted extraction combines with
maceration and Soxhlet extraction The obtained results indicated that the amount extracted
from both total phenolic and flavonoids contents is remarkably improved when using UAE-
M The yield of extraction also improved when maceration is used prior to ultrasonic-assisted
extraction The most efficient method for extraction of TPC and TFC is UAE-M with 30 of
amplitude ethanol as solvent and maceration time of 24 hours all obtained results are
confirmed by HPLC analysis
The phytochemical investigation of four varieties detected Alkaloids Coumarins
Phytosterols Carbohydrates phenolic and Flavonoids The presence of phenolic content was
lower when compared with flavonoids content in the whole roots and the flesh All the results
indicate that roots have a higher level of bioactive compounds more than the flesh Overall the
sample Kondor showed the highest amount of total phenolic content and total flavonoids
content than other samples This difference in phytochemical content is clearly shown in
HPLC analysis which is greatly influenced by cultivar condition and their variety also reflect
on their antioxidants activity
The antioxidant capacity of ethanolic extract was evaluated and compared using two
techniques spectrophotometers and electrochemical assays For four different varieties of the
Solanum tuberosum L
According to the spectrophotometers assays the antioxidants capacity was calculated
with Ferric reducing antioxidant power assay (FRAP) and the oxidation of 22-diphenyl-1-
picrylhydrazyl (DPPH) radical scavenging method expressed as IC50 All the results show that
the ethanolic extract of the whole roots of the Kondor variety had a higher antioxidant
General conclusion
137
capacity than the other ethanolic extract in order was Kondor gt Bartina gt Spunta gt Kuroda
This antioxidants capacity was less active than Gallic and Ascorbic acids
For the electrochemical assay we used the cyclic voltammetry technique to evaluate the
antioxidant capacity of ethanolic extract the redox potentials of these compounds used to
calculate the antioxidant capacity in an aqueous solvent (acetate buffer) The redox potentials
also measured in an organic solvent to compare their electrochemical behavior In this mid
the antioxidant property of phenolics extracted were evaluated by the inhibitory effect of
superoxide anion radicals and expressed as IC50 The obtained data shows value ranged as
the follows Kondor gt Bartina gt Spunta gt Kuroda for the whole root
The thermodynamic properties quantify the strength of interaction between radicals and
the probe antioxidant in the ethanolic extract These properties were estimated in terms of
binding constant Kb based on the decrease in peak current and UV-spectra absorbance for
and DppH respectively This constant allows calculating the standard Gibbs free energy
(∆G˚) Their negative values indicated the spontaneity of interaction between radicals and
extracts
The analysis of variance was determined by the main effect plot and linear correlation
between the variable studied All the results show statistically significant positive
correlations were observed between total phenolic content total flavonoids content and
antioxidant capacity measured with different assays This correlation determined with indices
R2 which ranged from medium to high levels the total flavonoids content has exerted less
antioxidant activity than total phenolic content in sample extracts
The evaluation and the quantification of antioxidants content and antioxidants activity
in vitro for all four varieties show that the whole roots of variety Kondor has a high level of
bioactive compounds more than other varieties Based on this results the phytochemical
analysis was carried out on Kondor for two cases the whole root and the flesh and the
information obtained has led to show that the whole roots have a higher amount in
phytochemical content than the flesh for this variety
Kondor has great potential for future development as a marketable food product Thus
we advise to cultivate this variety more than Bartina Kuroda and Spunta other potatoes
varieties
General conclusion
138
This study scientifically valids the traditional use of these plants and reveals their
interest in the framework of an exploitation in biotechnology For the suite it would be
interesting to isolate and characterize the phenolic compounds of the extracts of four varieties
selected and other Also would be very desirable for a better understanding of the mode of
action of the polyphenolic derivatives to evaluate in vitro and in vivo the antioxidant activity
of each of these compounds taken separately What would then highlight the active principle
of plant extracts andor a possible synergy between the various phenolic compounds
Annexe
Annexe
140
00 05 10 15 20 25 30 35 40
0
10
20
30
40
50
60
70
80
In
hib
itio
n
Concentration (mgml)
(1)
00 05 10 15 20
0
10
20
30
40
50
In
hib
itio
n
Concentration (mgml)
(2)
05 10 15 20 25 30 35
0
10
20
30
40
50
In
hib
itio
n
Concentration (mgml)
(3)
0000 0002 0004 0006 0008 0010
0
10
20
30
40
50
60
I
nh
ibitio
n
Concentration (mgml)
(4)
0001 0002 0003 0004 0005 0006 0007 0008 0009 0010
0
10
20
30
40
50
60
70
In
hib
itio
n
Concentration (mgml)
(5)
Figure 1 The percent DPPH radical inhibition of (1) Spunta (2) Bartina (3) Kuroda
(4) Ascorbic acid (5) Gallic acid
Annexe
141
20 30 40 50 60 70
06
08
10
12
14
16
18
20
22
1C
I
(a)
4 6 8 10 12 14 16 18 20 22 24
04
06
08
10
12
14
1C
I
(b)
10 20 30 40 50 60 70 80
025
030
035
040
045
050
055
060
065
070
1C
I
(c)
0 10 20 30 40 50
02
04
06
08
10
12
14
1C
I
(d)
15 20 25 30 35 40
100
120
140
160
180
200
220
240
260
1C
I
(e)
20 30 40 50 60 70
100
150
200
250
300
350
1C
I
(f)
0 10 20 30 40 50 60 70
02
04
06
08
10
12
14
16
18
20
22
1C
I
(g)
Figure 2 A plot of Ao (A-Ao ) to 1[extract] for DppH radical (a) Kondor (b) Bartina (c)
Annexe
142
Spunta (d) Kuroda (e) Ascorbic acid (f) Gallic acid (g) Peeled Kondor
01 02 03 04 05 06 07 08 09
0
5
10
15
20
25
30
35
40
I
Concentration (mgml)
(a)
00 02 04 06 08 10 12
5
10
15
20
25
30
35
I
Concentration (mgml)
(b)
00 02 04 06 08 10
0
5
10
15
20
25
I
Concentration (mgml)
(c)
02 03 04 05 06 07 08 09 10
0
5
10
15
20
I
Concentration (mgml)
(d)
00 02 04 06 08 10
0
5
10
15
20
25
30
35
I
Concentration (mgml)
(e)
01 02 03 04 05 06 07
2
4
6
8
10
I
Concentration (mgml)
(f)
Figure 3 The percent
radical inhibition as a function of the concentration of (a)
Bartina(b) Spunta (c) Kuroda (d)peeled Kondor (e) Ascorbic acid (f) α-tocopherol
Annexe
143
02 04 06 08 10 12 14
30
32
34
36
38
40
LO
G 1
(V
)
LOG I(I0-I)
(a)
00 02 04 06 08 10 12 14 16 18 20
32
34
36
38
40
LO
G 1
(V
)
LOG I(I0-I)
(b)
02 04 06 08 10 12 14
30
32
34
36
38
40
LO
G 1
(V
)
LOG I(I0-I)
(c)
00 02 04 06 08 10 12 14 16 18 20
30
32
34
36
38
40
LO
G 1
(V
)
LOG I(I0-I)
(d)
02 04 06 08 10 12 14 16 18 20 22
30
32
34
36
38
40
LO
G 1
(V
)
LOG I(I0-I)
(e)
08 10 12 14 16 18
30
32
34
36
38
40
LO
G 1
(V
)
LOG I(I0-I)
(f)
04 06 08 10 12
30
31
32
33
34
35
36
LO
G 1
(V
)L
LOG I(I0-I)
(g)
Figure 4 A plot of
to
for
(a) Kondor (b) Bartina (c) Spunta (d)
Kuroda (e) Ascorbic acid (f) α-tocopherol (g) Peeled Kondor
Annexe
144
0 1 2 3 4 5
0
10
20
30
40
50
60
70
I
nh
ibitio
n
Concentration (mgml)
(2)
4 6 8 10 12 14 16 18
003
004
005
006
007
008
In
hib
itio
n
Concentration (mgml)
(2)
000 001 002 003 004 005 006 007 008 009
0
10
20
30
40
50
60
70
I
nh
ibitio
n
Concentration (mgml)
(3)
Figure 5 Antioxidant activity () of (1) peeled Kondor (2) Ascorbic acid (3) Gallic
acid assayed by β-carotenendashlinoleate bleaching
Annexe
145
02 04 06 08 10 12 14
-10
0
10
20
30
40
50I
[micro
Ac
msup2]
Potential [ V]
(a)
02 04 06 08 10 12 14
-5
0
5
10
15
20
25
30
35
40
I [micro
Acm
sup2]
Potential [ V]
(b)
02 04 06 08 10 12 14
-10
0
10
20
30
40
50
60
I [micro
Ac
msup2]
Potential [ V]
(c)
Figure 6 Voltammograms obtained for (a) Bartina (b) Spunta and (c) Kuroda unpeeled
samples by cyclic voltammetry in DMF