Embed Size (px)
Citation preview
QUÉBECINFRASTRUCTURE PLAN
EXPENDITUREBUDGET
2020 • 2021
VOL. 7
2020 • 2030

EXPENDITUREBUDGET
2020 • 2021
VOL. 7
2020 • 2030
QUÉBEC INFRASTRUCTURE PLAN
This document does not satisfy the Québec government’s Web accessibility standards. However, an assistance service will nonetheless be available upon request to anyone wishing to consult the contents of the document. Please call 418-643-1529 or submit the request by email ([email protected]).
The masculine gender is used throughout this document solely to make the text easier to read and therefore applies to both men and women.
2020-2030 Québec Infrastructure Plan
Legal Deposit − March 2020 Bibliothèque et Archives nationales du Québec
ISBN: 978-2-550-86171-3 (Print Version) ISBN: 978-2-550-86172-0 (Online)
ISSN 2563-1225 (Print Version) ISSN 2563-1233 (Online)
© Gouvernement du Québec − 2020
Message from the Minister responsible for Government Administration and Chair of the Conseil du trésor
The second version of the Québec Infrastructure Plan (QIP) presented by our Government is the response to the colossal challenges that Québec must face in order to maintain and enhance its infrastructure portfolio.
QIP investments have reached a historic high, i.e. $130.5 billion over the next 10 years, up $15.1 billion from the last fiscal year. This means a total increase of over $30.1 billion that our Government is dedicating to the QIP for two years, an unprecedented but essential initiative to keep the infrastructure portfolio in good condition and support its growth based on emerging needs.
Four priorities have been put forward in the development of the 2020-2030 QIP: education, with an additional $5.9 billion, mainly to expand and build primary and secondary schools; public transit, with an additional $3.3 billion and several new projects under study; health, which will benefit from an additional $2.9 billion, in part to build seniors' residences; and culture, with the deployment of the cultural itinerary of various cultural infrastructure in different regions of Québec.
In light of the Government's resolution to reduce Greenhouse gas (GHGs) and adapt to climate change, more funds have been earmarked for new public transit projects ($10.4 billion) compared with road transportation ($4.5 billion).
This trend will continue over the course of the coming years. Based on the Government's forecasts, projected investments in public transit will ultimately amount to almost $43.8 billion, including the eventual participation of financial partners. No other government in history has gone so far to address traffic congestion problems while reducing GHG emissions associated with public mobility in the medium and long term.
For the first time since its implementation, the government intends to balance total investments in public transit with investments allocated to the road network, which could total $42.5 billion. Not only are we granting record amounts to modernize our network and guarantee the road transportation service offer, but we are also investing huge amounts to acquire hybrid and electric buses and to carry out structuring electric public transit projects with rapid bus service and reserved lanes.
This QIP is proof that the Government is listening to the needs and priorities of the people. It reflects Québec's ambitions for educational success, environmental protection, improved healthcare and cultural development.
And to achieve better public accountability, the Government has committed to expanding its public communications by publishing information related to every infrastructure project of $20.0 million or more in this document and in its Tableau de bord des projets d'infrastructure publique, which is available online.
The courage and transparency we have demonstrated since last year to fulfil the expectations of Quebecers are generating the desired outcome. While the economic context is favourable, it is time to step up our efforts to go ahead with projects that are essential to our social and economic prosperity by addressing the obsolescence of our long-neglected assets and spearheading our vision of a greener and prouder Québec.
Christian Dubé

2020-2030 Québec Infrastructure Plan Terms Acronyms Introduction Highlights Section A A strong plan for the future
Section B Investments planned by sector
Section C Report on the condition of public infrastructure

7
Terms
ADDITION
Acquisition or construction of new infrastructure.
IMPROVEMENT
Increase in the service potential of existing infrastructure.
ENHANCEMENT
Increase in the government service offer through the addition of a new infrastructure or the improvement of an existing infrastructure.
ASSET MAINTENANCE DEFICIT
Value of the work required to restore the physical condition of a specific structure to a satisfactory or better condition (government condition indicator of A, B or C) with the aim of protecting the health and safety of individuals, ensuring its continued use for its intended purposes, and reducing the likelihood of breakdown or counteracting physical wear and tear.
DISPOSITION
Alienation of a building, civil engineering structure or equipment by sale, transfer or disposal.
MAINTENANCE
Work of limited scope normally performed as part of an infrastructure's daily use. Asset maintenance does not include maintenance work.
SECTOR ENVELOPE
Envelope, under the responsibility of a government department or body, providing the required government financial contribution to implement prioritized and authorized projects
CENTRAL ENVELOPE
Envelope providing funding that will be required to implement the projects that have been selected and prioritized by the government among those studied. Transfer to the sectors requires a Cabinet decision.
SURPLUS BUILDING
Building owned by a public body for which no use, for the purpose of providing a government service, is planned.
INFRASTRUCTURE
Building, equipment or civil engineering structure that is part of the Government's service supply.
PLANNED INVESTMENT
Value of the financial contribution from the Gouvernement du Québec for a public infrastructure investment listed in the Québec Infrastructure Plan (QIP).
8
PROBABLE INVESTMENT
Probable cost of an investment from the Gouvernement du Québec for the government fiscal year that is ending.
ACTUAL INVESTMENT
Real cost of an investment from the Gouvernement du Québec for a government fiscal year that is closed.
ASSET MAINTENANCE
Value of the work required to keep an infrastructure in satisfactory or better condition with the aim of protecting the health and safety of individuals, ensuring its continued use for its intended purposes, and reducing the likelihood of breakdown or counteracting physical wear and tear.
ADDRESSING THE ASSET MAINTENANCE DEFICIT
Investments (maintenance projects and envelopes) planned in the Québec Infrastructure Plan and specifically dedicated to reducing the asset maintenance deficit accounted for infrastructures included in an annual investment management plan.
MAJOR PROJECT
Public infrastructure project subject to the Directive sur la gestion des projets majeurs d'infrastructure publique since its estimated cost is $50.0 million or more, or $100.0 million for a roadway project or a public transit infrastructure project. In addition, the Conseil du trésor may decide to consider any infrastructure project as a major project, if deemed appropriate.
REPLACEMENT
Acquisition, construction or reconstruction of an infrastructure to replace an existing infrastructure that is usually at the end of its useful life, so as to ensure continuity in service delivery.
REPLACEMENT VALUE
Total investment required to build or acquire an infrastructure of the same dimensions and utility, with equivalent technical features, based on the construction techniques, building codes and materials or technical specifications in effect at the time of the estimate.
USEFUL LIFE
Time period during which an infrastructure or component should serve its intended purposes.
9
Acronyms
ARQ Agence du revenu Québec
ARTM Autorité régionale de transport métropolitain
CIB Canada Infrastructure Bank
CDPQ Caisse de dépôt et placement du Québec
CERIU Centre d'expertise et de recherche en infrastructures urbaines
CHSLD Residential and long-term care centre
CLSC Local community service centre
Directive Directive sur la gestion des investissements en infrastructure publique
AMD Asset maintenance deficit
IBA Integrated Bilateral Agreement
DMAF Disaster Mitigation and Adaptation Fund
BCFQ Building Canada Fund – Québec
FEPTEU Drinking Water and Wastewater Treatment Fund
FIMEAU Fonds pour l'infrastructure municipale d'eau
NTCF National Trade Corridors Fund
FRISSSS Fonds des ressources informationnelles du secteur de la santé et des services sociaux
GHG Greenhouse gas
GCI Government condition indicator
IRI International Roughness Index
ITHQ Institut de tourisme et d'hôtellerie du Québec
LEED Leadership in Energy and Environmental Design
LGGRI Act respecting the governance and management of the information resources of public bodies and government enterprises
PIA Public Infrastructure Act
MADA Senior-friendly municipality
MAMH Ministère des Affaires municipales et de l'Habitation
MEES Ministère de l'Éducation et de l'Enseignement supérieur
MELCC Ministère de l’Environnement et de la Lutte contre les changements climatiques
DB Departments and bodies
MSP Ministère de la Sécurité publique
MSSS Ministère de la Santé et des Services sociaux
MTESS Ministère du Travail, de l’Emploi et de la Solidarité sociale
MTQ Ministère des Transports
NBCFQ New Building Canada Fund – Québec
AMPI Annual Management Plans for Public Infrastructure Investments
PIQM Programme d'infrastructures Québec–Municipalité
QIP Québec Infrastructure Plan
10
PRIMADA Senior-friendly municipality infrastructure program
PRIMEAU Programme d'infrastructures municipales d'eau
RÉCIM Réfection et construction des infrastructures municipales
REM Réseau express métropolitain
IR Information resource
RSSCE Réseau stratégique en soutien au commerce extérieur
RSSS Health and social services network
SCT Secrétariat du Conseil du trésor
Sépaq Société des établissements de plein air du Québec
SQI Société québécoise des infrastructures
SSIP Sous-secrétariat aux infrastructures publiques
TECQ Programs for the Gasoline Tax and for the Québec Contribution
UBS Use of bypass shoulders by buses
11
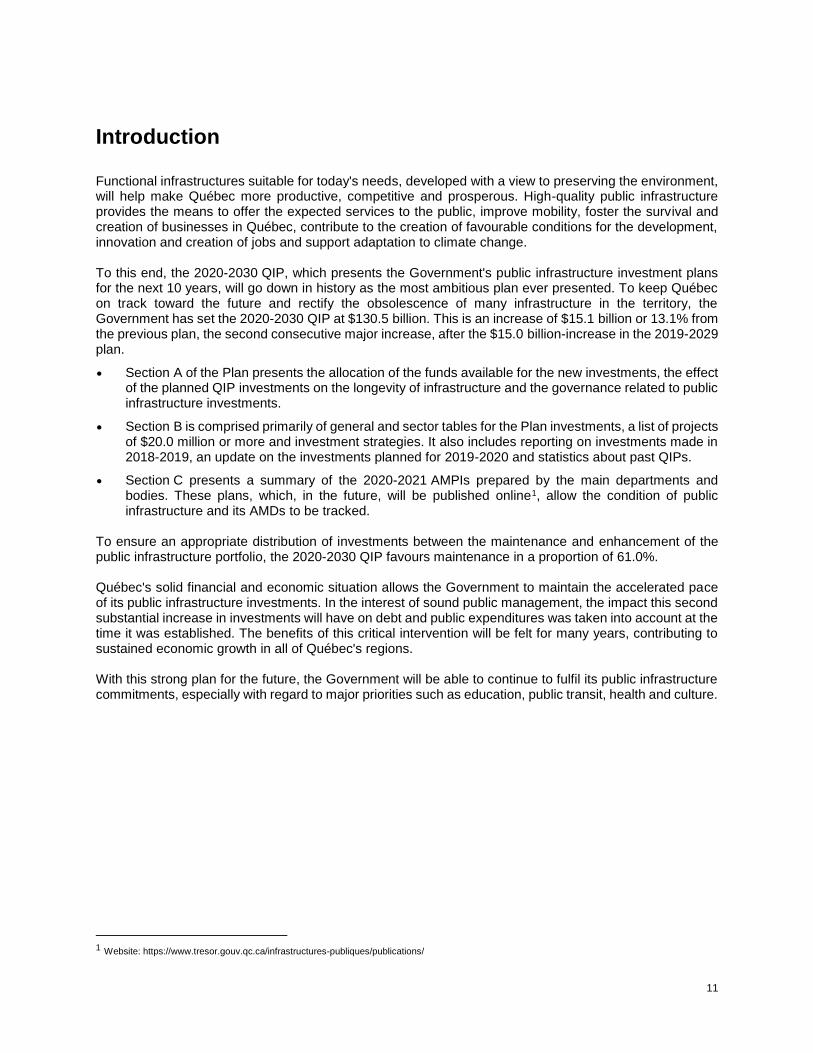
Introduction Functional infrastructures suitable for today's needs, developed with a view to preserving the environment, will help make Québec more productive, competitive and prosperous. High-quality public infrastructure provides the means to offer the expected services to the public, improve mobility, foster the survival and creation of businesses in Québec, contribute to the creation of favourable conditions for the development, innovation and creation of jobs and support adaptation to climate change. To this end, the 2020-2030 QIP, which presents the Government's public infrastructure investment plans for the next 10 years, will go down in history as the most ambitious plan ever presented. To keep Québec on track toward the future and rectify the obsolescence of many infrastructure in the territory, the Government has set the 2020-2030 QIP at $130.5 billion. This is an increase of $15.1 billion or 13.1% from the previous plan, the second consecutive major increase, after the $15.0 billion-increase in the 2019-2029 plan.
Section A of the Plan presents the allocation of the funds available for the new investments, the effect of the planned QIP investments on the longevity of infrastructure and the governance related to public infrastructure investments.
Section B is comprised primarily of general and sector tables for the Plan investments, a list of projects of $20.0 million or more and investment strategies. It also includes reporting on investments made in 2018-2019, an update on the investments planned for 2019-2020 and statistics about past QIPs.
Section C presents a summary of the 2020-2021 AMPIs prepared by the main departments and bodies. These plans, which, in the future, will be published online1, allow the condition of public infrastructure and its AMDs to be tracked.
To ensure an appropriate distribution of investments between the maintenance and enhancement of the public infrastructure portfolio, the 2020-2030 QIP favours maintenance in a proportion of 61.0%. Québec's solid financial and economic situation allows the Government to maintain the accelerated pace of its public infrastructure investments. In the interest of sound public management, the impact this second substantial increase in investments will have on debt and public expenditures was taken into account at the time it was established. The benefits of this critical intervention will be felt for many years, contributing to sustained economic growth in all of Québec's regions. With this strong plan for the future, the Government will be able to continue to fulfil its public infrastructure commitments, especially with regard to major priorities such as education, public transit, health and culture.
1 Website: https://www.tresor.gouv.qc.ca/infrastructures-publiques/publications/

Highlights 13
Highlights
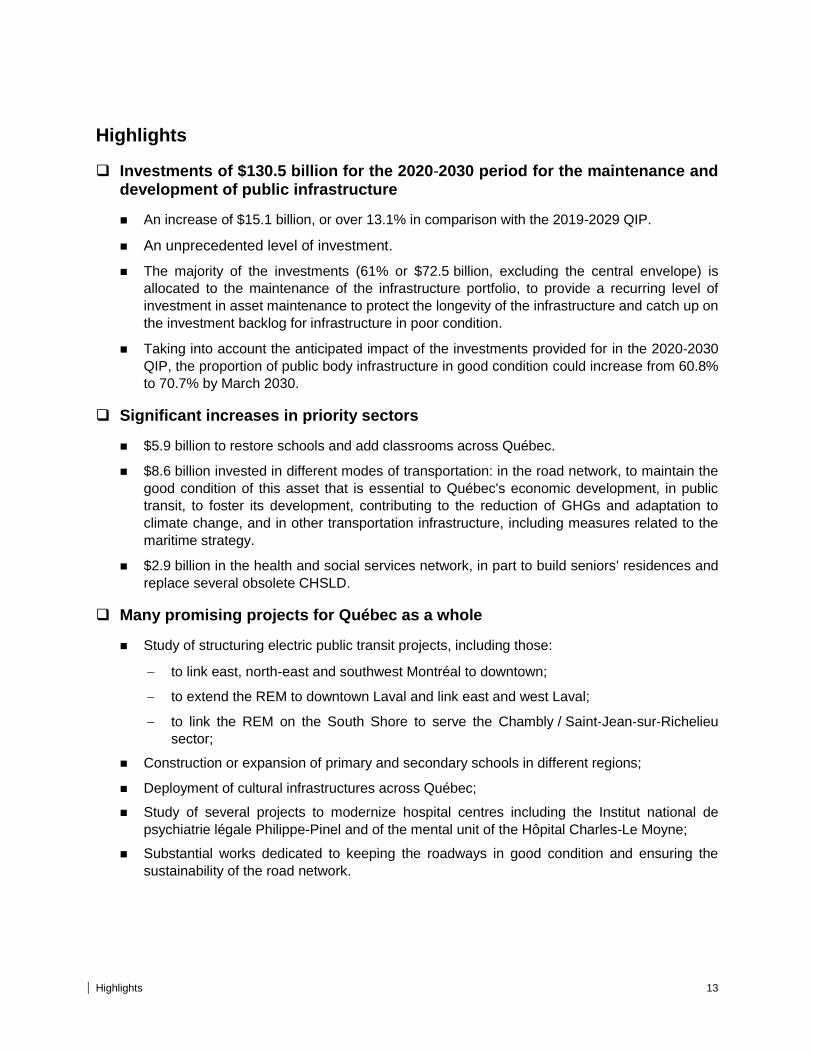
Investments of $130.5 billion for the 2020-2030 period for the maintenance and development of public infrastructure
An increase of $15.1 billion, or over 13.1% in comparison with the 2019-2029 QIP.
An unprecedented level of investment.
The majority of the investments (61% or $72.5 billion, excluding the central envelope) is
allocated to the maintenance of the infrastructure portfolio, to provide a recurring level of
investment in asset maintenance to protect the longevity of the infrastructure and catch up on
the investment backlog for infrastructure in poor condition.
Taking into account the anticipated impact of the investments provided for in the 2020‑2030
QIP, the proportion of public body infrastructure in good condition could increase from 60.8%
to 70.7% by March 2030.
Significant increases in priority sectors
$5.9 billion to restore schools and add classrooms across Québec.
$8.6 billion invested in different modes of transportation: in the road network, to maintain the
good condition of this asset that is essential to Québec's economic development, in public
transit, to foster its development, contributing to the reduction of GHGs and adaptation to
climate change, and in other transportation infrastructure, including measures related to the
maritime strategy.
$2.9 billion in the health and social services network, in part to build seniors' residences and
replace several obsolete CHSLD.
Many promising projects for Québec as a whole
Study of structuring electric public transit projects, including those:
to link east, north-east and southwest Montréal to downtown;
to extend the REM to downtown Laval and link east and west Laval;
to link the REM on the South Shore to serve the Chambly / Saint‑Jean‑sur‑Richelieu
sector;
Construction or expansion of primary and secondary schools in different regions;
Deployment of cultural infrastructures across Québec;
Study of several projects to modernize hospital centres including the Institut national de
psychiatrie légale Philippe-Pinel and of the mental unit of the Hôpital Charles-Le Moyne;
Substantial works dedicated to keeping the roadways in good condition and ensuring the
sustainability of the road network.

A.1
Section A
A strong plan for the future
1. A second major increase ....................................................................................... 3
1.1 $21.7 billion in additional availabilities to distribute ................................................... 3
1.2 Substantial new investments in priority sectors ......................................................... 4
1.3 A central envelope to carry out major projects under study ......................................19
1.4 Diversified investments of $130.5 billion ..................................................................20
2. Partnerships to carry out a greater number of projects .................................... 23
2.1 An estimated contribution of $35.5 billion from partners .......................................... 23
2.2 An innovative partnership with the Caisse de dépôt et placement du Québec ........ 25
3. Planning investments to secure the sustainability of existing infrastructure . 26
3.1 Prioritizing investments dedicated to infrastructure maintenance ............................ 26
3.2 A commitment to increase investments to keep the infrastructure in goodcondition ................................................................................................................. 28
3.3 Addressing 78% of the asset maintenance deficit over 10 years ............................. 29
3.4 A foreseeable improvement in the condition of public infrastructure in the coming years .......................................................................................................... 30
4. An increase in investments that respect public finances in the context ofeffervescence in the construction market .......................................................... 32
4.1 Substantial investments while controlling the impact on the debt ............................ 32
4.2 A ten-year investment plan ..................................................................................... 33
4.3 Maximizing the impact of Québec Infrastructure Plan investments ......................... 34
5. Enhanced governance of infrastructure investments ....................................... 36
5.1 Strategic investment planning ................................................................................. 36
5.2 A flexible Directive .................................................................................................. 36
5.3 A Directive that applies to major public transit projects ........................................... 36
5.4 Tableau de bord of infrastructure projects of $20 million or more ............................ 38
Appendix 1 – Development of the 2020-2030 QIP..................................................... 39
Appendix 2 – Investments by type of body and by type .......................................... 42

Section
A
A strong plan for the future A.3
1. A second major increase
1.1 $21.7 billion in additional availabilities to distribute
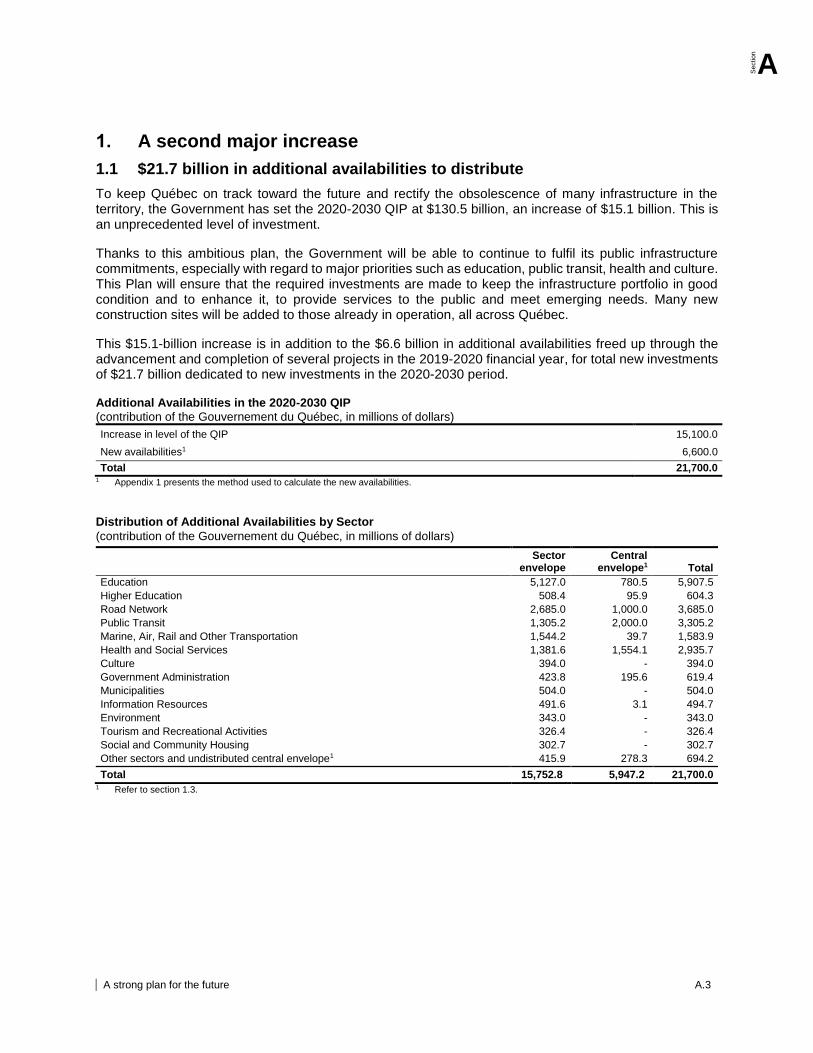
To keep Québec on track toward the future and rectify the obsolescence of many infrastructure in the territory, the Government has set the 2020-2030 QIP at $130.5 billion, an increase of $15.1 billion. This is an unprecedented level of investment.
Thanks to this ambitious plan, the Government will be able to continue to fulfil its public infrastructure commitments, especially with regard to major priorities such as education, public transit, health and culture. This Plan will ensure that the required investments are made to keep the infrastructure portfolio in good condition and to enhance it, to provide services to the public and meet emerging needs. Many new construction sites will be added to those already in operation, all across Québec.
This $15.1-billion increase is in addition to the $6.6 billion in additional availabilities freed up through the advancement and completion of several projects in the 2019-2020 financial year, for total new investments of $21.7 billion dedicated to new investments in the 2020-2030 period. Additional Availabilities in the 2020-2030 QIP
(contribution of the Gouvernement du Québec, in millions of dollars)
Increase in level of the QIP 15,100.0
New availabilities1 6,600.0
Total 21,700.0 1 Appendix 1 presents the method used to calculate the new availabilities.
Distribution of Additional Availabilities by Sector
(contribution of the Gouvernement du Québec, in millions of dollars)
Sector envelope
Central envelope1 Total
Education 5,127.0 780.5 5,907.5
Higher Education 508.4 95.9 604.3
Road Network 2,685.0 1,000.0 3,685.0
Public Transit 1,305.2 2,000.0 3,305.2
Marine, Air, Rail and Other Transportation 1,544.2 39.7 1,583.9
Health and Social Services 1,381.6 1,554.1 2,935.7
Culture 394.0 - 394.0
Government Administration 423.8 195.6 619.4
Municipalities 504.0 - 504.0
Information Resources 491.6 3.1 494.7
Environment 343.0 - 343.0
Tourism and Recreational Activities 326.4 - 326.4
Social and Community Housing 302.7 - 302.7
Other sectors and undistributed central envelope1 415.9 278.3 694.2
Total 15,752.8 5,947.2 21,700.0 1 Refer to section 1.3.
A.4 The 2020-2030 Québec Infrastructure Plan
1.2 Substantial new investments in priority sectors
An additional $5.9 billion to repair and add spaces in education
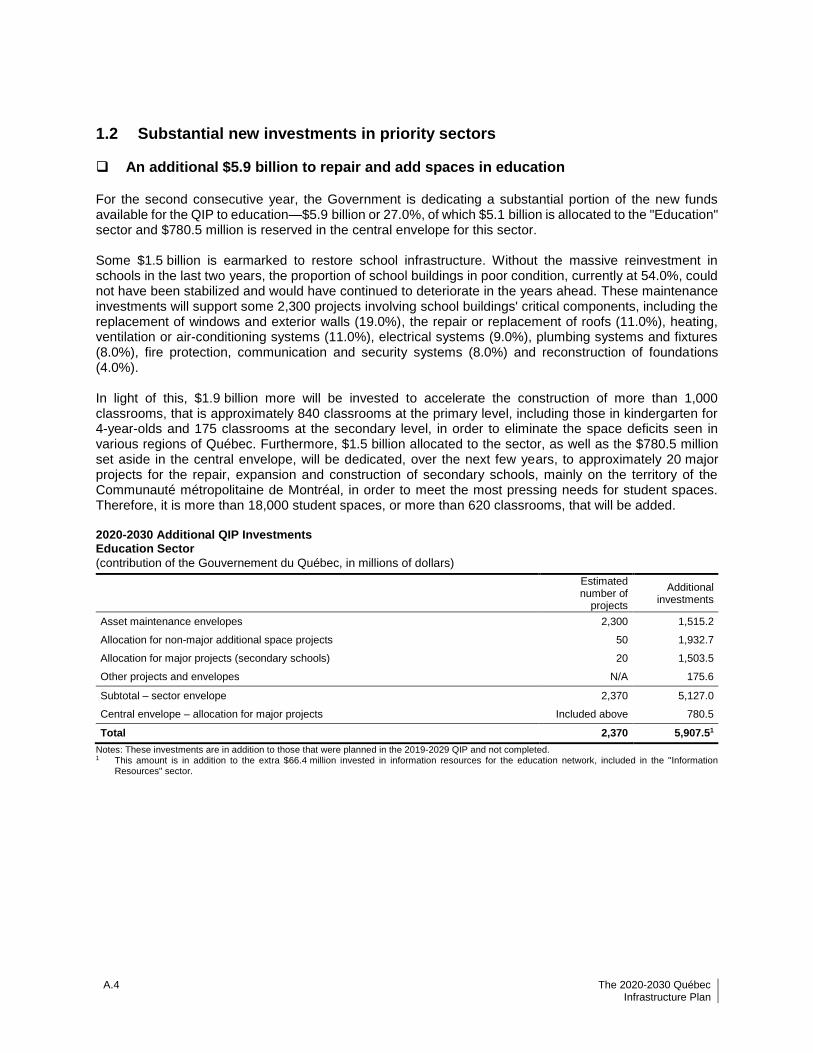
For the second consecutive year, the Government is dedicating a substantial portion of the new funds available for the QIP to education—$5.9 billion or 27.0%, of which $5.1 billion is allocated to the "Education" sector and $780.5 million is reserved in the central envelope for this sector. Some $1.5 billion is earmarked to restore school infrastructure. Without the massive reinvestment in schools in the last two years, the proportion of school buildings in poor condition, currently at 54.0%, could not have been stabilized and would have continued to deteriorate in the years ahead. These maintenance investments will support some 2,300 projects involving school buildings' critical components, including the replacement of windows and exterior walls (19.0%), the repair or replacement of roofs (11.0%), heating, ventilation or air-conditioning systems (11.0%), electrical systems (9.0%), plumbing systems and fixtures (8.0%), fire protection, communication and security systems (8.0%) and reconstruction of foundations (4.0%). In light of this, $1.9 billion more will be invested to accelerate the construction of more than 1,000 classrooms, that is approximately 840 classrooms at the primary level, including those in kindergarten for 4-year-olds and 175 classrooms at the secondary level, in order to eliminate the space deficits seen in various regions of Québec. Furthermore, $1.5 billion allocated to the sector, as well as the $780.5 million set aside in the central envelope, will be dedicated, over the next few years, to approximately 20 major projects for the repair, expansion and construction of secondary schools, mainly on the territory of the Communauté métropolitaine de Montréal, in order to meet the most pressing needs for student spaces. Therefore, it is more than 18,000 student spaces, or more than 620 classrooms, that will be added. 2020-2030 Additional QIP Investments Education Sector
(contribution of the Gouvernement du Québec, in millions of dollars)
Estimated number of
projects
Additional investments
Asset maintenance envelopes 2,300 1,515.2
Allocation for non-major additional space projects 50 1,932.7
Allocation for major projects (secondary schools) 20 1,503.5
Other projects and envelopes N/A 175.6
Subtotal – sector envelope 2,370 5,127.0
Central envelope – allocation for major projects Included above 780.5
Total 2,370 5,907.51
Notes: These investments are in addition to those that were planned in the 2019-2029 QIP and not completed. 1 This amount is in addition to the extra $66.4 million invested in information resources for the education network, included in the "Information
Resources" sector.
Section
A
A strong plan for the future A.5
The MEES took the first step in summer 2019, by producing a building planning guide for primary schools. The guide sets out the vision and orientations adopted by the Government and recognizes best practices, some of which were established by the Lab-École2. Thus, the Government is pursuing a massive school repair and construction program so that Québec will eventually have beautiful, functional, distinctive, evolving and sustainable schools. The guide presents the main design criteria for building primary schools, in order to achieve the following objectives:
Make students the top concern and prime determinant in design decisions in order to support educational success, with regard to environmental (air quality, acoustics, visual elements, lighting, natural spaces), physical and technological factors.
Guide the design of quality school spaces, meeting quality and performance standards based on the needs identified and in keeping with sustainable development principles (at least 75 years of useful life, use of renewable energy, reduction in water use, etc.).
Ensure a safe and secure living environment for all users.
Design spaces that adapt to changes over time and to changes in use.
Suggest possible ways for schools to become inclusive living environments (accessibility, diversity, location, implementation, sharing with the community, schoolyards).
This tool will be key to carrying out numerous primary school construction and expansion projects. Where possible, the guide's vision and orientations will be taken into consideration, along with the required adjustments, in primary school renovation projects. A building planning guide for secondary schools is also being developed and will be tabled shortly to support the design of the buildings and the renovation work.
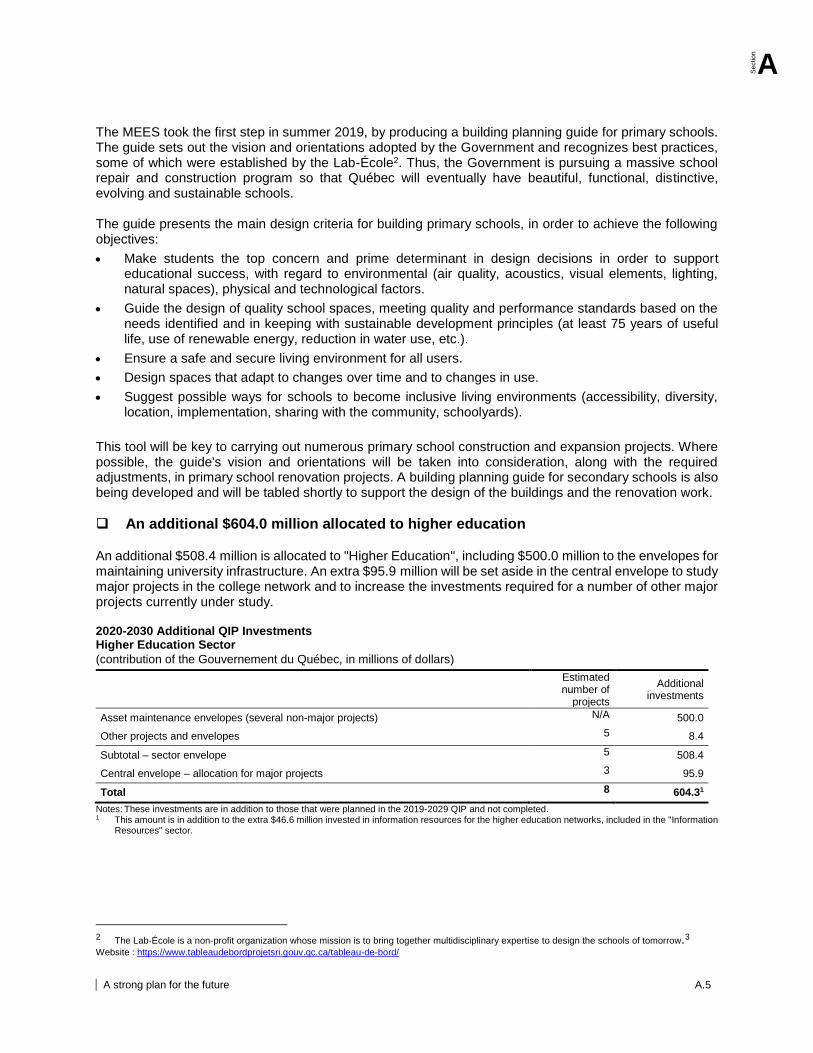
An additional $604.0 million allocated to higher education An additional $508.4 million is allocated to "Higher Education", including $500.0 million to the envelopes for maintaining university infrastructure. An extra $95.9 million will be set aside in the central envelope to study major projects in the college network and to increase the investments required for a number of other major projects currently under study. 2020-2030 Additional QIP Investments Higher Education Sector
(contribution of the Gouvernement du Québec, in millions of dollars)
Estimated number of
projects
Additional investments
Asset maintenance envelopes (several non-major projects) N/A 500.0
Other projects and envelopes 5 8.4
Subtotal – sector envelope 5 508.4
Central envelope – allocation for major projects 3 95.9
Total 8 604.31
Notes: These investments are in addition to those that were planned in the 2019-2029 QIP and not completed. 1 This amount is in addition to the extra $46.6 million invested in information resources for the higher education networks, included in the "Information
Resources" sector.
2 The Lab-École is a non-profit organization whose mission is to bring together multidisciplinary expertise to design the schools of tomorrow.3 Website : https://www.tableaudebordprojetsri.gouv.qc.ca/tableau-de-bord/
A.6 The 2020-2030 Québec Infrastructure Plan
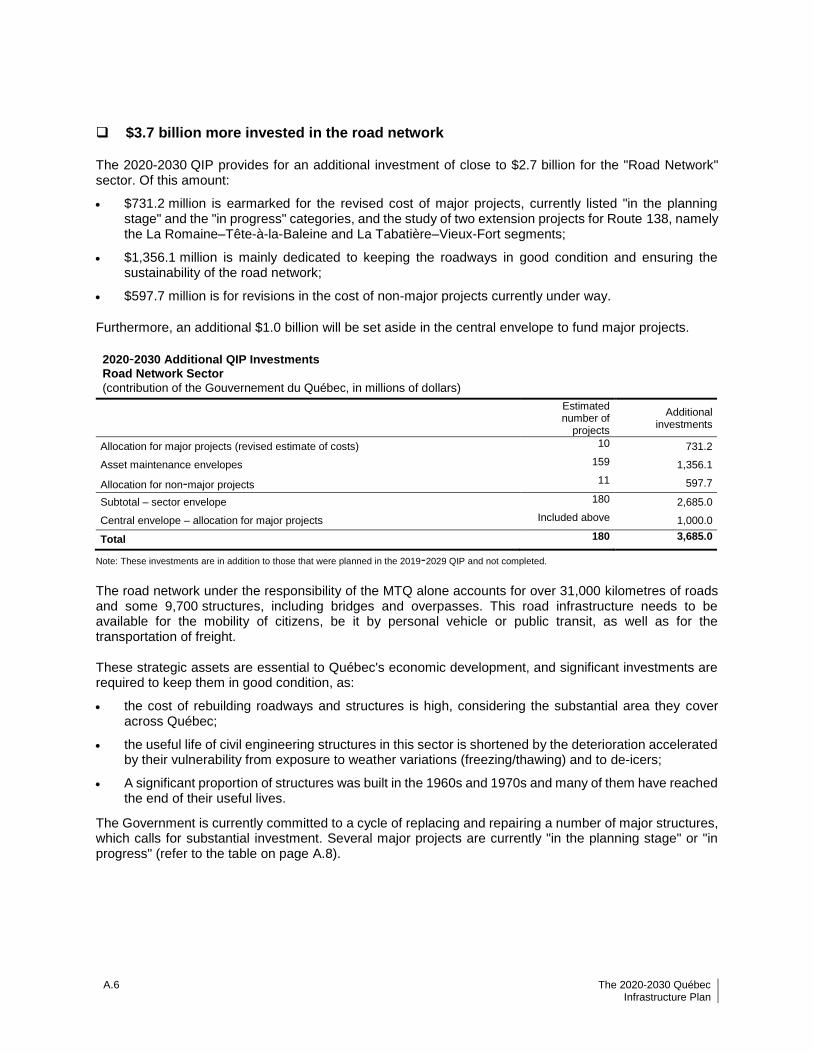
$3.7 billion more invested in the road network
The 2020-2030 QIP provides for an additional investment of close to $2.7 billion for the "Road Network" sector. Of this amount:
$731.2 million is earmarked for the revised cost of major projects, currently listed "in the planning stage" and the "in progress" categories, and the study of two extension projects for Route 138, namely the La Romaine–Tête-à-la-Baleine and La Tabatière–Vieux-Fort segments;
$1,356.1 million is mainly dedicated to keeping the roadways in good condition and ensuring the sustainability of the road network;
$597.7 million is for revisions in the cost of non-major projects currently under way.
Furthermore, an additional $1.0 billion will be set aside in the central envelope to fund major projects.
2020-2030 Additional QIP Investments
Road Network Sector
(contribution of the Gouvernement du Québec, in millions of dollars)
Estimated number of
projects
Additional investments
Allocation for major projects (revised estimate of costs) 10 731.2
Asset maintenance envelopes 159 1,356.1
Allocation for non-major projects 11 597.7
Subtotal – sector envelope 180 2,685.0
Central envelope – allocation for major projects Included above 1,000.0
Total 180 3,685.0
Note: These investments are in addition to those that were planned in the 2019-2029 QIP and not completed.
The road network under the responsibility of the MTQ alone accounts for over 31,000 kilometres of roads and some 9,700 structures, including bridges and overpasses. This road infrastructure needs to be available for the mobility of citizens, be it by personal vehicle or public transit, as well as for the transportation of freight. These strategic assets are essential to Québec's economic development, and significant investments are required to keep them in good condition, as:
the cost of rebuilding roadways and structures is high, considering the substantial area they cover across Québec;
the useful life of civil engineering structures in this sector is shortened by the deterioration accelerated by their vulnerability from exposure to weather variations (freezing/thawing) and to de-icers;
A significant proportion of structures was built in the 1960s and 1970s and many of them have reached the end of their useful lives.
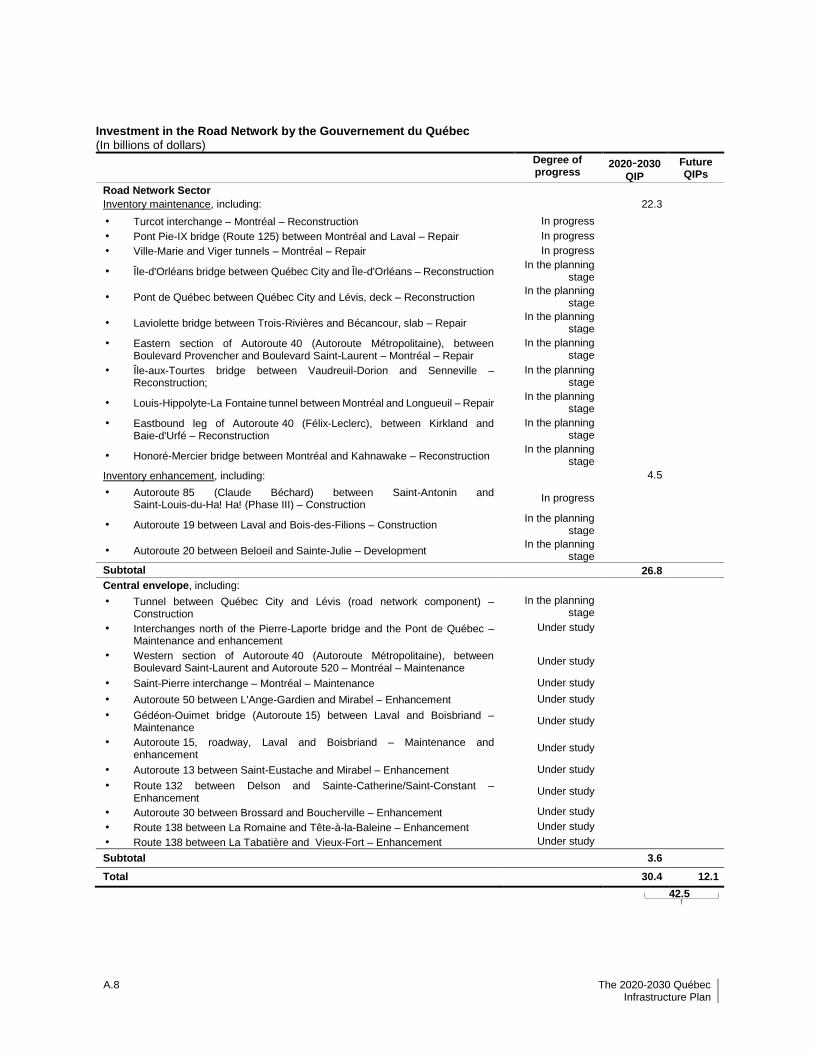
The Government is currently committed to a cycle of replacing and repairing a number of major structures, which calls for substantial investment. Several major projects are currently "in the planning stage" or "in progress" (refer to the table on page A.8).
Section
A
A strong plan for the future A.7
In addition, the Government must continue to invest in the road infrastructure to ensure user safety, reduce its AMD, improve its condition and promote use by various modes of public transit. The AMD of the road infrastructure in poor condition (GCI of D or E) is assessed at $18.7 billion, or 66.0% of the AMD of all public infrastructure under the Government's responsibility ($28.2 billion). This is mainly due to a lack of investment in maintaining assets over the past few decades.
Taking into account the additional investment of $2.7 billion for the "Road Network" sector, the $26.8 billion
budgeted in the 2020-2030 QIP for this sector reflects the Government's will to improve the road
infrastructure. The majority of this investment, i.e. $22.3 billion (83.0%), is planned for maintenance (refer to the box on page A.13).
If we consider the $3.6 billion set aside in the central envelope for this sector, which got an injection of
$1.0 billion in additional funding under the QIP, the total investment planned in the 2020-2030 QIP is $30.4 billion. In the end, road network investments could reach around $42.5 billion, if we include the $12.1 billion planned for future QIPs for the completion of projects under study.
A.8 The 2020-2030 Québec Infrastructure Plan
Investment in the Road Network by the Gouvernement du Québec
(In billions of dollars)
Degree of progress
2020-2030
QIP
Future QIPs
Road Network Sector
Inventory maintenance, including: 22.3
• Turcot interchange – Montréal – Reconstruction In progress
• Pont Pie-IX bridge (Route 125) between Montréal and Laval – Repair In progress
• Ville-Marie and Viger tunnels – Montréal – Repair In progress
• Île-d'Orléans bridge between Québec City and Île-d'Orléans – Reconstruction In the planning
stage
• Pont de Québec between Québec City and Lévis, deck – Reconstruction In the planning
stage
• Laviolette bridge between Trois-Rivières and Bécancour, slab – Repair In the planning
stage
• Eastern section of Autoroute 40 (Autoroute Métropolitaine), between Boulevard Provencher and Boulevard Saint-Laurent – Montréal – Repair
In the planning stage
• Île-aux-Tourtes bridge between Vaudreuil-Dorion and Senneville – Reconstruction;
In the planning stage
• Louis-Hippolyte-La Fontaine tunnel between Montréal and Longueuil – Repair In the planning
stage
• Eastbound leg of Autoroute 40 (Félix-Leclerc), between Kirkland and Baie-d'Urfé – Reconstruction
In the planning stage
• Honoré-Mercier bridge between Montréal and Kahnawake – Reconstruction In the planning
stage
Inventory enhancement, including: 4.5
• Autoroute 85 (Claude Béchard) between Saint-Antonin and Saint-Louis-du-Ha! Ha! (Phase III) – Construction
In progress
• Autoroute 19 between Laval and Bois-des-Filions – Construction In the planning
stage
• Autoroute 20 between Beloeil and Sainte-Julie – Development In the planning
stage
Subtotal 26.8
Central envelope, including:
• Tunnel between Québec City and Lévis (road network component) – Construction
In the planning stage
• Interchanges north of the Pierre-Laporte bridge and the Pont de Québec – Maintenance and enhancement
Under study
• Western section of Autoroute 40 (Autoroute Métropolitaine), between Boulevard Saint-Laurent and Autoroute 520 – Montréal – Maintenance
Under study
• Saint-Pierre interchange – Montréal – Maintenance Under study
• Autoroute 50 between L'Ange-Gardien and Mirabel – Enhancement Under study
• Gédéon-Ouimet bridge (Autoroute 15) between Laval and Boisbriand – Maintenance
Under study
• Autoroute 15, roadway, Laval and Boisbriand – Maintenance and enhancement
Under study
• Autoroute 13 between Saint-Eustache and Mirabel – Enhancement Under study
• Route 132 between Delson and Sainte-Catherine/Saint-Constant – Enhancement
Under study
• Autoroute 30 between Brossard and Boucherville – Enhancement Under study
• Route 138 between La Romaine and Tête-à-la-Baleine – Enhancement Under study
• Route 138 between La Tabatière and Vieux-Fort – Enhancement Under study
Subtotal 3.6
Total 30.4 12.1
42.5
Section
A
A strong plan for the future A.9
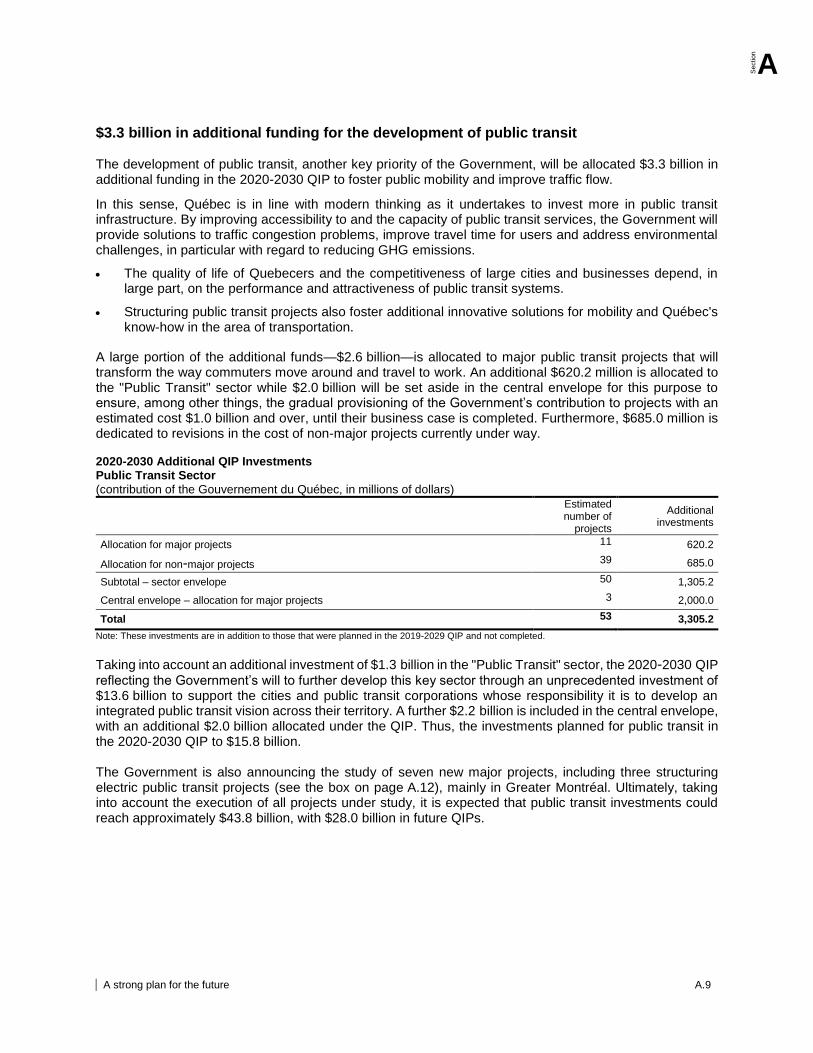
$3.3 billion in additional funding for the development of public transit
The development of public transit, another key priority of the Government, will be allocated $3.3 billion in additional funding in the 2020-2030 QIP to foster public mobility and improve traffic flow.
In this sense, Québec is in line with modern thinking as it undertakes to invest more in public transit infrastructure. By improving accessibility to and the capacity of public transit services, the Government will provide solutions to traffic congestion problems, improve travel time for users and address environmental challenges, in particular with regard to reducing GHG emissions.
The quality of life of Quebecers and the competitiveness of large cities and businesses depend, in large part, on the performance and attractiveness of public transit systems.
Structuring public transit projects also foster additional innovative solutions for mobility and Québec's know-how in the area of transportation.
A large portion of the additional funds—$2.6 billion—is allocated to major public transit projects that will transform the way commuters move around and travel to work. An additional $620.2 million is allocated to the "Public Transit" sector while $2.0 billion will be set aside in the central envelope for this purpose to ensure, among other things, the gradual provisioning of the Government’s contribution to projects with an estimated cost $1.0 billion and over, until their business case is completed. Furthermore, $685.0 million is dedicated to revisions in the cost of non-major projects currently under way. 2020-2030 Additional QIP Investments Public Transit Sector
(contribution of the Gouvernement du Québec, in millions of dollars)
Estimated number of
projects
Additional investments
Allocation for major projects 11 620.2
Allocation for non-major projects 39 685.0
Subtotal – sector envelope 50 1,305.2
Central envelope – allocation for major projects 3 2,000.0
Total 53 3,305.2
Note: These investments are in addition to those that were planned in the 2019-2029 QIP and not completed.
Taking into account an additional investment of $1.3 billion in the "Public Transit" sector, the 2020-2030 QIP
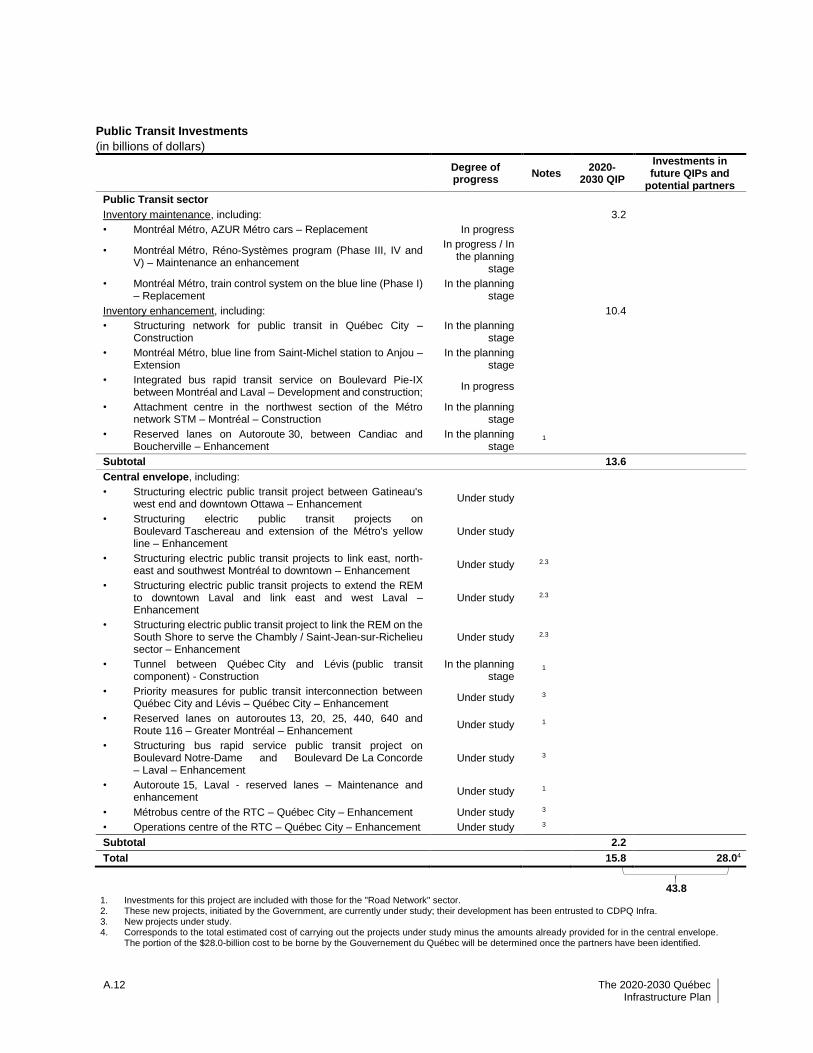
reflecting the Government’s will to further develop this key sector through an unprecedented investment of $13.6 billion to support the cities and public transit corporations whose responsibility it is to develop an integrated public transit vision across their territory. A further $2.2 billion is included in the central envelope, with an additional $2.0 billion allocated under the QIP. Thus, the investments planned for public transit in the 2020-2030 QIP to $15.8 billion. The Government is also announcing the study of seven new major projects, including three structuring electric public transit projects (see the box on page A.12), mainly in Greater Montréal. Ultimately, taking into account the execution of all projects under study, it is expected that public transit investments could reach approximately $43.8 billion, with $28.0 billion in future QIPs.
A.10 The 2020-2030 Québec Infrastructure Plan
These investments do not take into account the development of the $6.5-billion REM project currently under way in Greater Montréal by CDPQ Infra, a subsidiary of the CDPQ. Besides the Gouvernement du Québec, other partners may be called on to contribute to the financing of these new projects, in particular the CDPQ, the federal government, the CIB and public transit corporations.
For example, with regard to the IBA signed with the federal government in June 2018, $5.2 billion of federal funds have been set aside for Québec for the 2018-2028 period for the development of public transit infrastructure projects by the 10 largest public transit corporations. For its part, the CIB plans on investing at least $5.0 billion in innovative public transit projects across Canada by 2028.
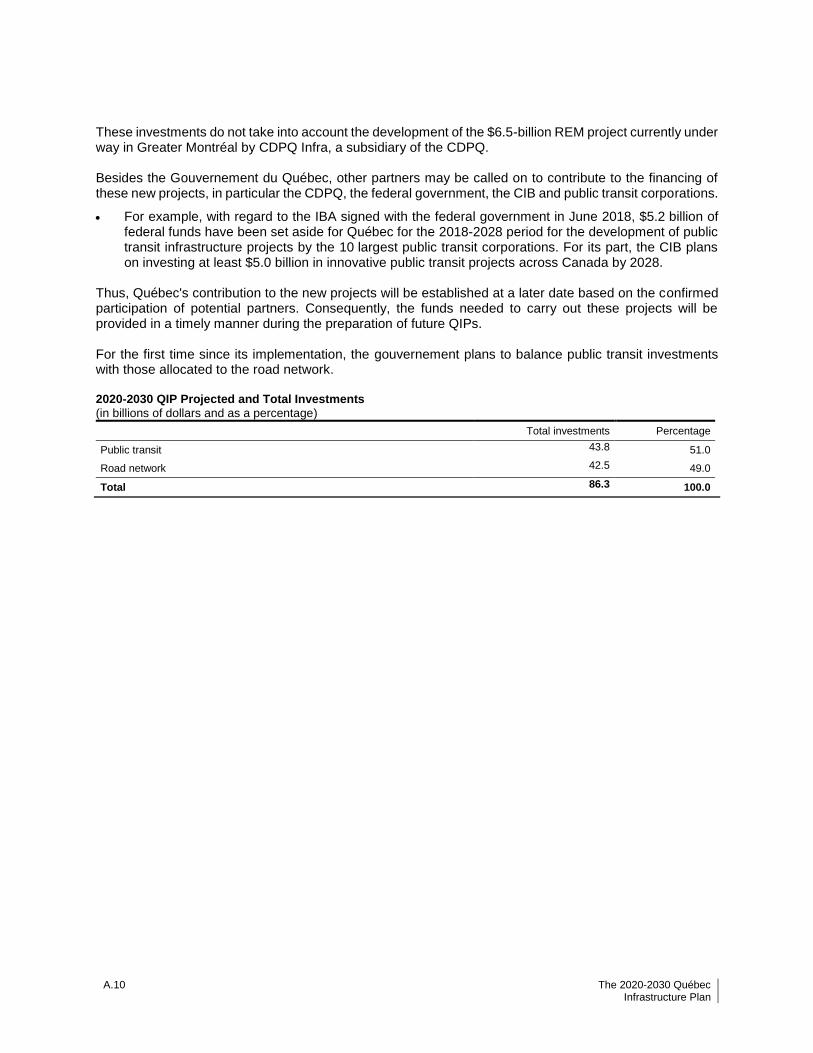
Thus, Québec's contribution to the new projects will be established at a later date based on the confirmed participation of potential partners. Consequently, the funds needed to carry out these projects will be provided in a timely manner during the preparation of future QIPs. For the first time since its implementation, the gouvernement plans to balance public transit investments with those allocated to the road network. 2020-2030 QIP Projected and Total Investments
(in billions of dollars and as a percentage)
Total investments Percentage
Public transit 43.8 51.0
Road network 42.5 49.0
Total 86.3 100.0
Section
A
A strong plan for the future A.11
SIX STRUCTURING ELECTRIC PUBLIC TRANSIT PROJECTS
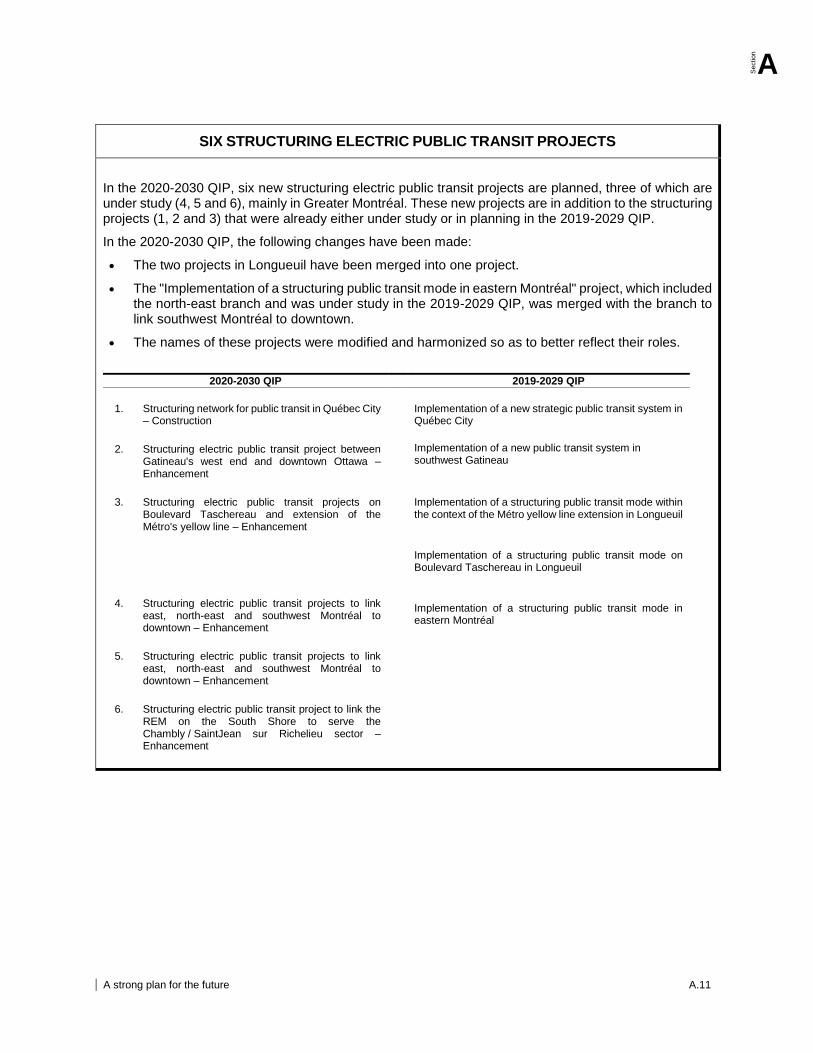
In the 2020-2030 QIP, six new structuring electric public transit projects are planned, three of which are under study (4, 5 and 6), mainly in Greater Montréal. These new projects are in addition to the structuring projects (1, 2 and 3) that were already either under study or in planning in the 2019-2029 QIP.
In the 2020-2030 QIP, the following changes have been made:
The two projects in Longueuil have been merged into one project.
The "Implementation of a structuring public transit mode in eastern Montréal" project, which included the north-east branch and was under study in the 2019-2029 QIP, was merged with the branch to link southwest Montréal to downtown.
The names of these projects were modified and harmonized so as to better reflect their roles.
2020-2030 QIP 2019-2029 QIP
1. Structuring network for public transit in Québec City – Construction
Implementation of a new strategic public transit system in Québec City
2. Structuring electric public transit project between Gatineau's west end and downtown Ottawa – Enhancement
Implementation of a new public transit system in southwest Gatineau
3. Structuring electric public transit projects on Boulevard Taschereau and extension of the Métro's yellow line – Enhancement
Implementation of a structuring public transit mode within the context of the Métro yellow line extension in Longueuil
Implementation of a structuring public transit mode on Boulevard Taschereau in Longueuil
Implementation of a structuring public transit mode in eastern Montréal
4. Structuring electric public transit projects to link east, north-east and southwest Montréal to downtown – Enhancement
5. Structuring electric public transit projects to link east, north-east and southwest Montréal to downtown – Enhancement
6. Structuring electric public transit project to link the REM on the South Shore to serve the Chambly / SaintJean sur Richelieu sector – Enhancement
A.12 The 2020-2030 Québec Infrastructure Plan
Public Transit Investments
(in billions of dollars)
Degree of progress
Notes 2020-
2030 QIP
Investments in future QIPs and
potential partners
Public Transit sector
Inventory maintenance, including: 3.2
• Montréal Métro, AZUR Métro cars – Replacement In progress
• Montréal Métro, Réno-Systèmes program (Phase III, IV and V) – Maintenance an enhancement
In progress / In the planning
stage
• Montréal Métro, train control system on the blue line (Phase I) – Replacement
In the planning stage
Inventory enhancement, including: 10.4
• Structuring network for public transit in Québec City – Construction
In the planning stage
• Montréal Métro, blue line from Saint-Michel station to Anjou – Extension
In the planning stage
• Integrated bus rapid transit service on Boulevard Pie-IX between Montréal and Laval – Development and construction;
In progress
• Attachment centre in the northwest section of the Métro network STM – Montréal – Construction
In the planning stage
• Reserved lanes on Autoroute 30, between Candiac and Boucherville – Enhancement
In the planning stage
1
Subtotal 13.6
Central envelope, including:
• Structuring electric public transit project between Gatineau's west end and downtown Ottawa – Enhancement
Under study
• Structuring electric public transit projects on Boulevard Taschereau and extension of the Métro's yellow line – Enhancement
Under study
• Structuring electric public transit projects to link east, north-east and southwest Montréal to downtown – Enhancement
Under study 2.3
• Structuring electric public transit projects to extend the REM to downtown Laval and link east and west Laval – Enhancement
Under study 2.3
• Structuring electric public transit project to link the REM on the South Shore to serve the Chambly / Saint-Jean-sur-Richelieu sector – Enhancement
Under study 2.3
• Tunnel between Québec City and Lévis (public transit component) - Construction
In the planning stage
1
• Priority measures for public transit interconnection between Québec City and Lévis – Québec City – Enhancement
Under study 3
• Reserved lanes on autoroutes 13, 20, 25, 440, 640 and Route 116 – Greater Montréal – Enhancement
Under study 1
• Structuring bus rapid service public transit project on Boulevard Notre-Dame and Boulevard De La Concorde – Laval – Enhancement
Under study 3
• Autoroute 15, Laval - reserved lanes – Maintenance and enhancement
Under study 1
• Métrobus centre of the RTC – Québec City – Enhancement Under study 3
• Operations centre of the RTC – Québec City – Enhancement Under study 3
Subtotal 2.2
Total 15.8 28.04
43.8 1. Investments for this project are included with those for the "Road Network" sector. 2. These new projects, initiated by the Government, are currently under study; their development has been entrusted to CDPQ Infra. 3. New projects under study. 4. Corresponds to the total estimated cost of carrying out the projects under study minus the amounts already provided for in the central envelope.
The portion of the $28.0-billion cost to be borne by the Gouvernement du Québec will be determined once the partners have been identified.
Section
A
A strong plan for the future A.13
CHANGES IN PUBLIC TRANSIT AND ROAD NETWORK INVESTMENTS
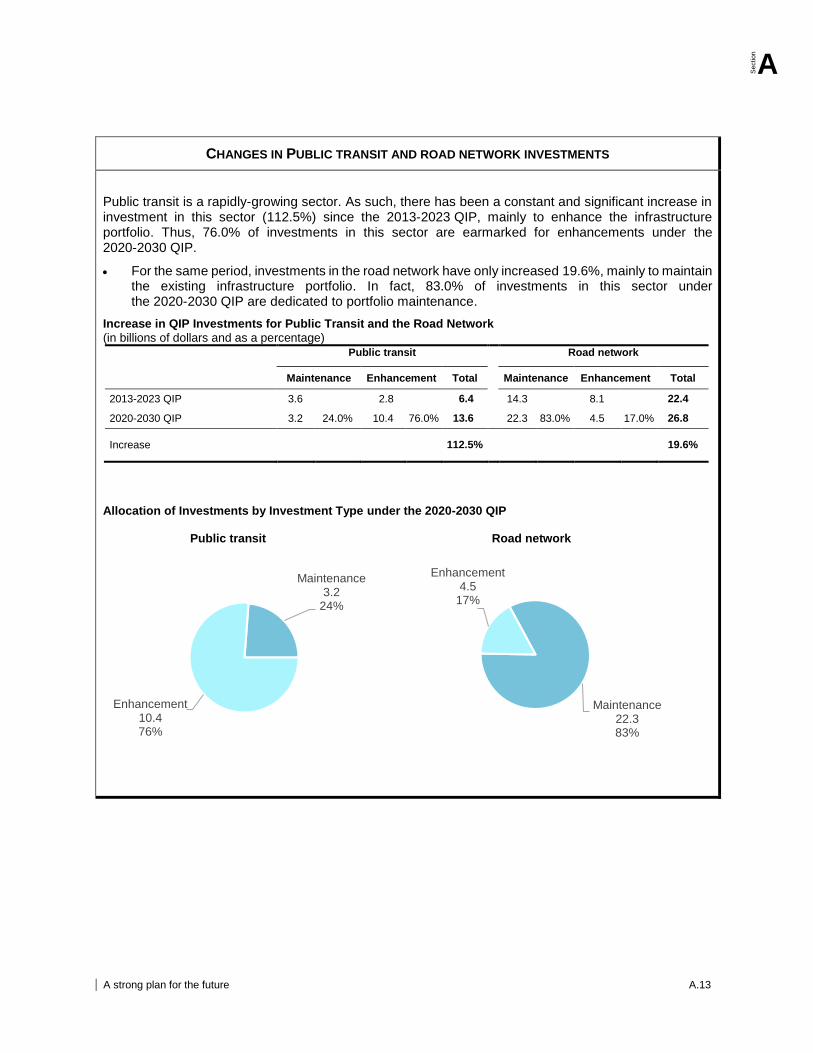
Public transit is a rapidly-growing sector. As such, there has been a constant and significant increase in investment in this sector (112.5%) since the 2013-2023 QIP, mainly to enhance the infrastructure portfolio. Thus, 76.0% of investments in this sector are earmarked for enhancements under the 2020-2030 QIP.
For the same period, investments in the road network have only increased 19.6%, mainly to maintain the existing infrastructure portfolio. In fact, 83.0% of investments in this sector under the 2020-2030 QIP are dedicated to portfolio maintenance.
Increase in QIP Investments for Public Transit and the Road Network
(in billions of dollars and as a percentage)
Public transit Road network
Maintenance Enhancement Total Maintenance Enhancement Total
2013-2023 QIP 3.6 2.8 6.4 14.3 8.1 22.4
2020-2030 QIP 3.2 24.0% 10.4 76.0% 13.6 22.3 83.0% 4.5 17.0% 26.8
Increase
112.5%
19.6%
Allocation of Investments by Investment Type under the 2020-2030 QIP Public transit Road network
Maintenance3.2
24%
Enhancement10.476%
Maintenance22.383%
Enhancement4.5
17%
A.14 The 2020-2030 Québec Infrastructure Plan
$1.6 billion in additional funding for other modes of transportation The development and maintenance of other modes of transportation, particularly maritime, air, rail or active, provide a range of options to travel and transport goods, particularly in outlying regions. These infrastructures help support Québec's economy, and in some cases like active transportation, achieve the environmental objectives pursued by the Government. Additional investments of nearly $1.6 billion are allocated to infrastructure in this sector, in particular for measures related to the Maritime Strategy ($300.0 million), for financial assistance programs to meet the needs of active transportation ($109.0 million) and the local road network ($500.0 million), for follow-up to the recent Sommet sur le transport ferroviaire ($104.2 million), as well as for additional investments to the rail network in Gaspésie.
The allocation of $300.0 million for the implementation of the latest version of the Maritime Strategy, focused on economic development, covers investments in the maritime infrastructure, in the development of maritime transportation services over short distances and in interventions to foster intermodality in maritime transportation.
$2.9 billion in additional funding for health and social services In order to give Quebecers access to quality healthcare establishments, the Government is allocating $1.4 billion in additional investments to the "Health and Social Services" sector, and $1.5 billion to the central envelope, for a total of $2.9 billion. Of this additional amount, $2.1 billion is being allocated to major projects ($518.2 million to the sector and $1,554.1 million to the central envelope), so as to advance to the "in the planning stage" category, carry out new studies, as well as ensure the gradual provisioning of contributions to studies carried out on projects with an estimated cost of $1.0 billion and over.
Among the projects that should advance to the "in the planning stage" category by the end of 2020-2021 is the operating room and day surgery unit project at Hôpital Charles-Le Moyne.The new projects under study include: projects to replace nine CHSLDs, a project to modernize the Centre d'hébergement Saint-Augustin, projects involving the Institut national de psychiatrie légale Philippe-Pinel, Hôpital Fleury, Hôpital de Sept-Îles and the Douglas Mental Health University Institute, as well as projects involving the operating room at Hôpital Santa Cabrini and the mental health and oncology units at Hôpital Charles-Le Moyne.
Furthermore, given Québec's ageing population and the deterioration of the health and social services network, the Government has proposed a plan to overhaul residential and long-term care centres for seniors and adults with special needs. This plan is centred on the creation of a new architectural and organizational concept, called seniors' residences and alternative residences, which aims to offer a more human and modern model that is better suited to the specific needs of seniors with reduced mobility and an adult clientele with special needs. The concept of seniors' residences and alternative residences is significantly changing the way in which infrastructure is designed and care is offered to residents. It is based on the following guiding principles:
Residential units, each grouping 12 residents with similar characteristics and interests;
Larger single rooms, each equipped with a private bathroom and adapted shower to facilitate hygiene care based on needs;
Section
A
A strong plan for the future A.15
Common areas that foster the involvement of residents and their families in stimulating activities;
A dedicated area for caregivers to encourage visits and offer them respite, both day and night;
A design that will eliminate, as much as possible, any resemblance to institutional settings by featuring hidden nurses' stations;
Accessible, safe outdoor areas that are open to the community;
A design targeting LEED certification, in line with government orientations regarding sustainable development.
These new residential spaces will provide a more suitable and functional living environment, making them interesting and motivating workplaces for their staff. This will improve staff attraction and retention. The Government would like to implement this new concept across Québec and is committed to developing new spaces and gradually renewing deteriorated CHSLDs throughout Québec. In November 2019, the Government also announced the development of at least 2,600 spaces by September 2022. In addition, non-adapted or deteriorated spaces will be rebuilt as part of the process aimed at developing new spaces.
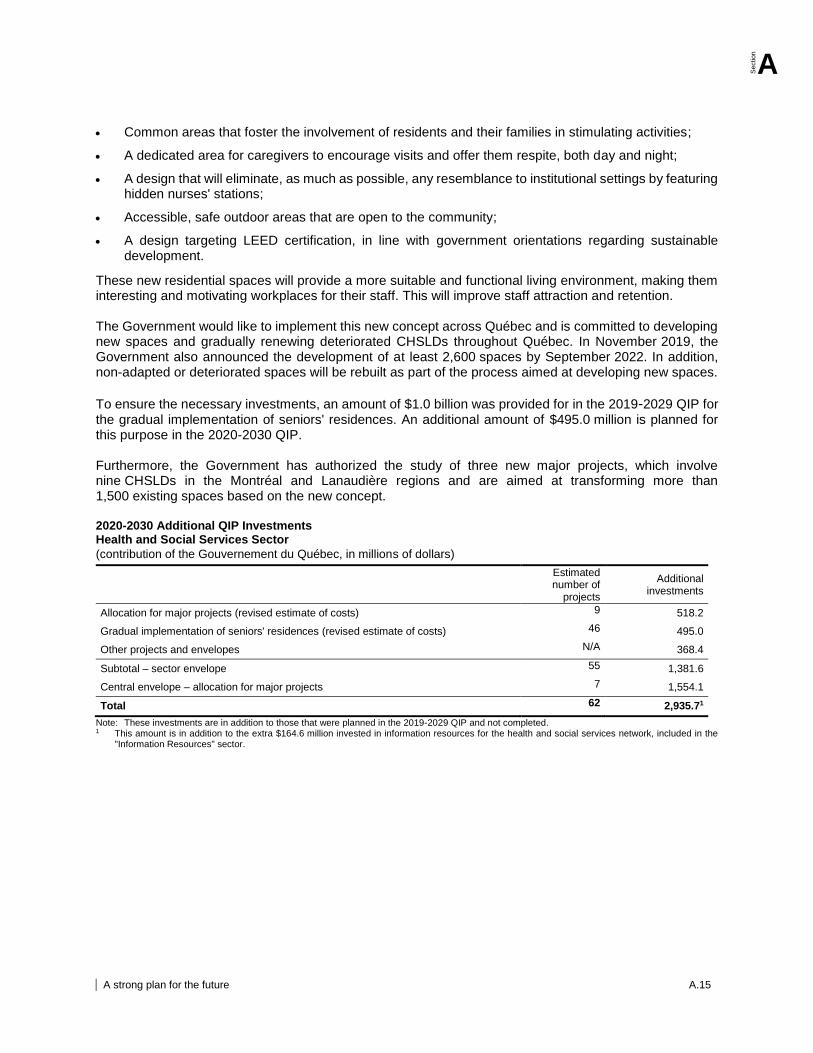
To ensure the necessary investments, an amount of $1.0 billion was provided for in the 2019-2029 QIP for the gradual implementation of seniors' residences. An additional amount of $495.0 million is planned for this purpose in the 2020-2030 QIP. Furthermore, the Government has authorized the study of three new major projects, which involve nine CHSLDs in the Montréal and Lanaudière regions and are aimed at transforming more than 1,500 existing spaces based on the new concept. 2020-2030 Additional QIP Investments Health and Social Services Sector
(contribution of the Gouvernement du Québec, in millions of dollars)
Estimated number of
projects
Additional investments
Allocation for major projects (revised estimate of costs) 9 518.2
Gradual implementation of seniors' residences (revised estimate of costs) 46 495.0
Other projects and envelopes N/A 368.4
Subtotal – sector envelope 55 1,381.6
Central envelope – allocation for major projects 7 1,554.1
Total 62 2,935.71
Note: These investments are in addition to those that were planned in the 2019-2029 QIP and not completed. 1 This amount is in addition to the extra $164.6 million invested in information resources for the health and social services network, included in the
"Information Resources" sector.
A.16 The 2020-2030 Québec Infrastructure Plan
An additional $394.0 million for culture
The additional amounts injected into the "Culture” sector are aimed primarily at deploying cultural infrastructure and supporting public libraries in the regions. These cultural infrastructure consists of heritage buildings located in various Québec regions, which will be acquired, restored, redeveloped and converted. While aiming to preserve and enhance Québec’s built heritage, these infrastructures will be used, among other things, for cultural dissemination, creation and mediation in order to promote Québec’s cultural heritage.
An additional $619.0 million for government administration infrastructure
The Government has allocated an additional $423.8 million for government administration buildings, mainly for maintenance work required on buildings under the responsibility of the SQI, namely office buildings, detention centres, courthouses and Sûreté du Québec police stations. An additional $195.6 million has been set aside in the central envelope to fund potential new major projects.
An additional $504.0 million to support municipalities To meet the needs of municipalities, an additional $504.0 million has been allocated to the "Municipalities" sector, including $300.0 million to cover Québec's share, in tandem with that of the federal government allocated under the DMAF, for disaster mitigation projects. The Government will also invest $100.0 million for the new flood resilience and adaptation program, as well as $101.0 million as part of a financial assistance program for the construction and improvement of municipal infrastructure in northern municipalities.
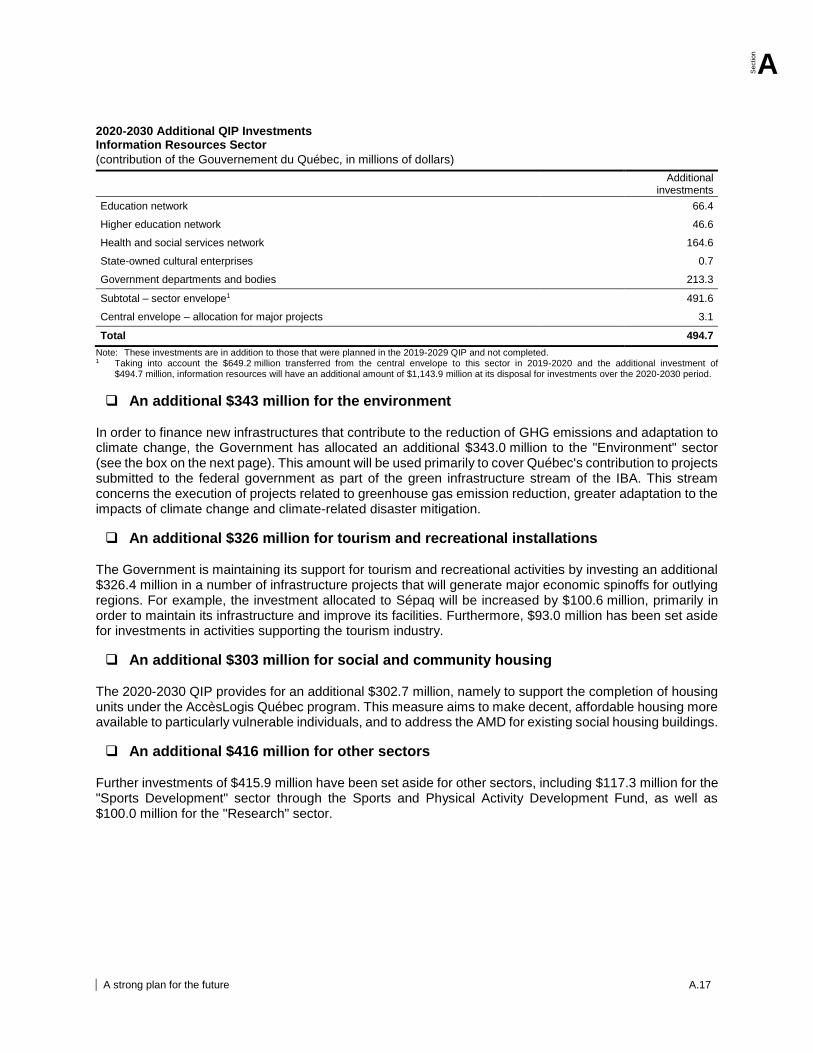
An additional $495.0 million for information resources
An additional investment of $494.7 million has been allocated to information resources, to be used primarily to continue implementing the Government's digital transformation and ensure the replacement and addition of information assets. The preliminary breakdown of this additional amount allocated to the "Information Resources" sector for 2020-2030 is presented in the table below. In June 2019, the Gouvernement du Québec unveiled its Stratégie de transformation numérique gouvernementale 2019-2023. It mobilizes all public bodies toward achieving a priority target: offering more intuitive and user-friendly public services to citizens and improving government efficiency. Following the authorization of a project that complies with planning codes and management of information resources, it is included in the Tableau de bord sur l'état de santé des projets en ressources informationnelles, which is available online3.
3 Website : https://www.tableaudebordprojetsri.gouv.qc.ca/tableau-de-bord/
Section
A
A strong plan for the future A.17
2020-2030 Additional QIP Investments Information Resources Sector
(contribution of the Gouvernement du Québec, in millions of dollars)
Additional
investments
Education network 66.4
Higher education network 46.6
Health and social services network 164.6
State-owned cultural enterprises 0.7
Government departments and bodies 213.3
Subtotal – sector envelope1 491.6
Central envelope – allocation for major projects 3.1
Total 494.7
Note: These investments are in addition to those that were planned in the 2019-2029 QIP and not completed. 1 Taking into account the $649.2 million transferred from the central envelope to this sector in 2019-2020 and the additional investment of
$494.7 million, information resources will have an additional amount of $1,143.9 million at its disposal for investments over the 2020-2030 period.
An additional $343 million for the environment In order to finance new infrastructures that contribute to the reduction of GHG emissions and adaptation to climate change, the Government has allocated an additional $343.0 million to the "Environment" sector (see the box on the next page). This amount will be used primarily to cover Québec's contribution to projects submitted to the federal government as part of the green infrastructure stream of the IBA. This stream concerns the execution of projects related to greenhouse gas emission reduction, greater adaptation to the impacts of climate change and climate-related disaster mitigation.
An additional $326 million for tourism and recreational installations The Government is maintaining its support for tourism and recreational activities by investing an additional $326.4 million in a number of infrastructure projects that will generate major economic spinoffs for outlying regions. For example, the investment allocated to Sépaq will be increased by $100.6 million, primarily in order to maintain its infrastructure and improve its facilities. Furthermore, $93.0 million has been set aside for investments in activities supporting the tourism industry.
An additional $303 million for social and community housing The 2020-2030 QIP provides for an additional $302.7 million, namely to support the completion of housing units under the AccèsLogis Québec program. This measure aims to make decent, affordable housing more available to particularly vulnerable individuals, and to address the AMD for existing social housing buildings.
An additional $416 million for other sectors Further investments of $415.9 million have been set aside for other sectors, including $117.3 million for the "Sports Development" sector through the Sports and Physical Activity Development Fund, as well as $100.0 million for the "Research" sector.
A.18 The 2020-2030 Québec Infrastructure Plan
INVESTMENTS FOCUSED ON THE REDUCTION OF GHG EMISSIONS AND ADAPTATION TO CLIMATE CHANGE
With an investment of $52.3 billion in infrastructure provided for in the 2020-2030 QIP and future QIPs, the Government is promoting reducing GHG emissions and adapting to climate change.
$15.8 billion for public transit is provided for in the 2020-2030 QIP, which includes $13.6 billion for the sector and $2.2 billion for the central envelope, in order to improve access to public transit and electric transportation, primarily through:
the measures for the implementation of the Sustainable Mobility Policy, in particular by investing in active transportation through the development of bicycle paths;
the funding of the acquisition of hybrid and electric buses, and the implementation of reserved lanes;
the completion of large-scale projects, such as the extension of the Montréal Métro's blue line and the new structuring public transit network in Québec City, so as to offer reliable and efficient alternatives to cars;
the Government's commitment to investing in projects related to the Greater Montréal decongestion plan.
In addition to these investments of $15.8 billion, an amount of $28.0 billion has been planned for future QIPs to complete projects that are currently under study, for a total of $43.8 billion.
An investment of $930.6 million is provided for in the "Environment" sector, including funding for biomethanization and composting projects, for ensuring the sustainability and safety of public dams that control water flow, and for work aimed at reducing GHG emissions and adapting to climate change.
The Government has set aside more than $7.5 billion for the "Municipalities" sector, primarily to support municipalities in their construction, repair and expansion work on drinking water and wastewater treatment infrastructure and the replacement of drinking water and sewer lines, as well as in their work carried out as part of measures targeting flood resilience and adaptation. These projects are intended to maintain and improve the quality of life for the public in their communities.
$80.0 million for the "Maritime, Air, Rail and Other Transportation" sector, so as to develop, under the Maritime Strategy, infrastructure for maritime transportation services over short distances and deliver interventions to foster intermodality in maritime transportation, which will reduce GHG emissions resulting from the transportation of goods.
To support these investments, $7.2 billion in federal contributions have been allocated to Québec as part of Phase 2 of the Investing in Canada infrastructure plan.
Thus, all of the investments represent a total of $59.5 billion which will be dedicated to reducing GHG emissions and adapting to climate change.
Section
A
A strong plan for the future A.19
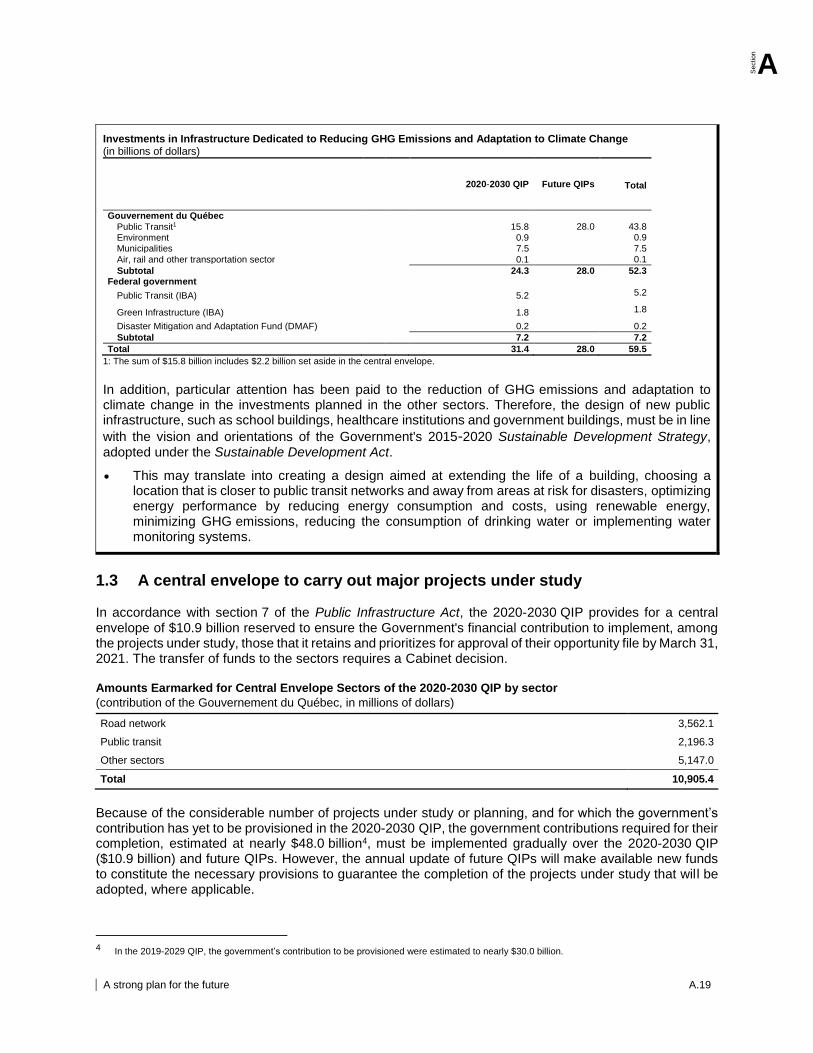
Investments in Infrastructure Dedicated to Reducing GHG Emissions and Adaptation to Climate Change (in billions of dollars)
2020-2030 QIP Future QIPs
Total
Gouvernement du Québec
Public Transit1 15.8 28.0 43.8
Environment 0.9 0.9
Municipalities 7.5 7.5
Air, rail and other transportation sector 0.1 0.1
Subtotal 24.3 28.0 52.3 Federal government
Public Transit (IBA)
5.2 5.2
Green Infrastructure (IBA) 1.8 1.8
Disaster Mitigation and Adaptation Fund (DMAF) 0.2 0.2
Subtotal 7.2 7.2
Total 31.4 28.0 59.5
1: The sum of $15.8 billion includes $2.2 billion set aside in the central envelope.
In addition, particular attention has been paid to the reduction of GHG emissions and adaptation to climate change in the investments planned in the other sectors. Therefore, the design of new public infrastructure, such as school buildings, healthcare institutions and government buildings, must be in line
with the vision and orientations of the Government's 2015-2020 Sustainable Development Strategy, adopted under the Sustainable Development Act.
This may translate into creating a design aimed at extending the life of a building, choosing a location that is closer to public transit networks and away from areas at risk for disasters, optimizing energy performance by reducing energy consumption and costs, using renewable energy, minimizing GHG emissions, reducing the consumption of drinking water or implementing water monitoring systems.
1.3 A central envelope to carry out major projects under study In accordance with section 7 of the Public Infrastructure Act, the 2020-2030 QIP provides for a central envelope of $10.9 billion reserved to ensure the Government's financial contribution to implement, among the projects under study, those that it retains and prioritizes for approval of their opportunity file by March 31, 2021. The transfer of funds to the sectors requires a Cabinet decision. Amounts Earmarked for Central Envelope Sectors of the 2020-2030 QIP by sector
(contribution of the Gouvernement du Québec, in millions of dollars)
Road network 3,562.1
Public transit 2,196.3
Other sectors 5,147.0
Total 10,905.4
Because of the considerable number of projects under study or planning, and for which the government’s contribution has yet to be provisioned in the 2020-2030 QIP, the government contributions required for their completion, estimated at nearly $48.0 billion4, must be implemented gradually over the 2020-2030 QIP ($10.9 billion) and future QIPs. However, the annual update of future QIPs will make available new funds to constitute the necessary provisions to guarantee the completion of the projects under study that will be adopted, where applicable.
4 In the 2019-2029 QIP, the government’s contribution to be provisioned were estimated to nearly $30.0 billion.
A.20 The 2020-2030 Québec Infrastructure Plan
As a result, projects that require a contribution from the Gouvernement du Québec of over $1.0 billion are funded from the central envelope based on the approval date of their business case, so as to free up funds between the opportunity file date and the business case date and provide for a greater number of projects and envelopes in the interim.
Projects that are funded from the central envelope are not made public, in order to respect the Cabinet's decision-making authority regarding their implementation and to reduce the risk of collusion in their execution.
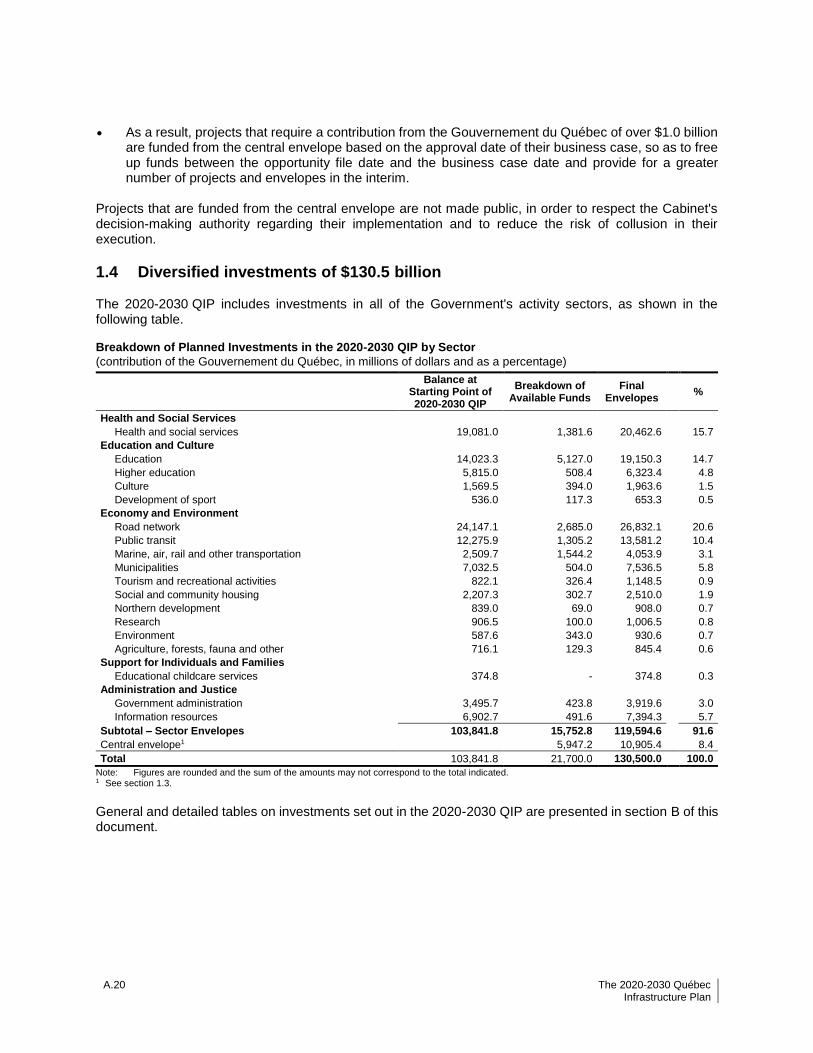
1.4 Diversified investments of $130.5 billion The 2020-2030 QIP includes investments in all of the Government's activity sectors, as shown in the following table.
Breakdown of Planned Investments in the 2020-2030 QIP by Sector
(contribution of the Gouvernement du Québec, in millions of dollars and as a percentage)
Balance at
Starting Point of 2020-2030 QIP
Breakdown of Available Funds
Final Envelopes
%
Health and Social Services
Health and social services 19,081.0 1,381.6 20,462.6 15.7
Education and Culture
Education 14,023.3 5,127.0 19,150.3 14.7
Higher education 5,815.0 508.4 6,323.4 4.8
Culture 1,569.5 394.0 1,963.6 1.5
Development of sport 536.0 117.3 653.3 0.5
Economy and Environment
Road network 24,147.1 2,685.0 26,832.1 20.6
Public transit 12,275.9 1,305.2 13,581.2 10.4
Marine, air, rail and other transportation 2,509.7 1,544.2 4,053.9 3.1
Municipalities 7,032.5 504.0 7,536.5 5.8
Tourism and recreational activities 822.1 326.4 1,148.5 0.9
Social and community housing 2,207.3 302.7 2,510.0 1.9
Northern development 839.0 69.0 908.0 0.7
Research 906.5 100.0 1,006.5 0.8
Environment 587.6 343.0 930.6 0.7
Agriculture, forests, fauna and other 716.1 129.3 845.4 0.6
Support for Individuals and Families
Educational childcare services 374.8 - 374.8 0.3
Administration and Justice
Government administration 3,495.7 423.8 3,919.6 3.0
Information resources 6,902.7 491.6 7,394.3 5.7
Subtotal – Sector Envelopes 103,841.8 15,752.8 119,594.6 91.6
Central envelope1 5,947.2 10,905.4 8.4
Total 103,841.8 21,700.0 130,500.0 100.0
Note: Figures are rounded and the sum of the amounts may not correspond to the total indicated. 1 See section 1.3.
General and detailed tables on investments set out in the 2020-2030 QIP are presented in section B of this document.
Section
A
A strong plan for the future A.21
NEW PRESENTATION OF INVESTMENTS FOCUSED ON GOVERNMENT MISSIONS
To improve the presentation of information and consistency with the other budget documents, the presentation of public infrastructure investments between the Government's various activity sectors was reviewed to compile the information based on the five government missions related to the delivery of public services. Breaking down the Government's expenditures and investments on the basis of these missions in the budget documents is intended to be a stable indicator over time, since missions are not generally influenced by changes in department responsibilities.
The missions allocated to public services are:
Health and Social Services: includes infrastructure in the health and social services network.
Education and Culture: includes mainly the infrastructure in the education and higher education networks, as well as those related to the Culture sector and to programs for the development of sport and physical activity.
Economy and Environment: includes the infrastructure for the various modes of transportation; economic development activities, research, the northern territory, tourism and recreational activities; municipal infrastructure and infrastructure linked to social and community housing, the environment and the exploitation of natural resources.
Support for Individuals and Families: includes childcare centre infrastructure.
Administration and Justice: includes the infrastructure required for the delivery of services by government departments and bodies—including those managed by the Société québécoise des infrastructures, and information resources.
Two sectors presented in the 2019-2029 QIP, or "Sports, Community, Tourism and Recreational Infrastructure" and "Other Sectors," covered more than one government mission. To enable the presentation of infrastructure investments focused on the missions going forward, these two sectors were split into seven new sectors in the 2020-2030 QIP:
Development of Sport
Tourism and Recreational Activities
Northern Development
Environment
Agriculture, Forests, Fauna and Other
Educational Childcare Services
Government Administration
Moreover, due to their nature, "Government Buildings" sector investments allocated to the SQI were joined with those linked to the acquisitions of movable and immovable property by government departments and bodies—formerly included in "Other Sectors"—to create the new "Government Administration" sector.
A.22 The 2020-2030 Québec Infrastructure Plan
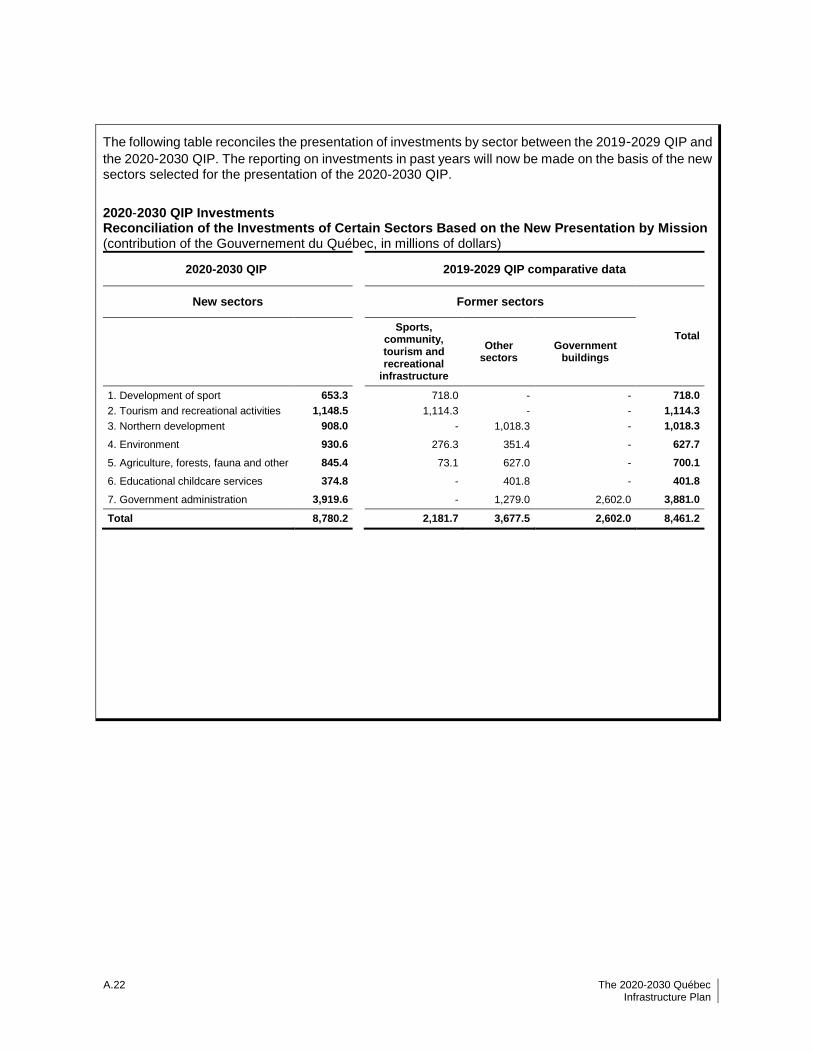
The following table reconciles the presentation of investments by sector between the 2019-2029 QIP and
the 2020-2030 QIP. The reporting on investments in past years will now be made on the basis of the new sectors selected for the presentation of the 2020-2030 QIP.
2020-2030 QIP Investments Reconciliation of the Investments of Certain Sectors Based on the New Presentation by Mission (contribution of the Gouvernement du Québec, in millions of dollars)
2020-2030 QIP
2019-2029 QIP comparative data
New sectors
Former sectors
Total
Sports, community, tourism and recreational
infrastructure
Other sectors
Government buildings
1. Development of sport 653.3
718.0 - - 718.0
2. Tourism and recreational activities 1,148.5
1,114.3 - - 1,114.3
3. Northern development 908.0
- 1,018.3 - 1,018.3
4. Environment 930.6
276.3 351.4 - 627.7
5. Agriculture, forests, fauna and other 845.4
73.1 627.0 - 700.1
6. Educational childcare services 374.8
- 401.8 - 401.8
7. Government administration 3,919.6
- 1,279.0 2,602.0 3,881.0
Total 8,780.2
2,181.7 3,677.5 2,602.0 8,461.2
Section
A
AA strong plan for the future A.23
2. Partnerships to carry out a greater number of projects
2.1 An estimated contribution of $35.5 billion from partners
The financial participation of other partners for many projects deemed a priority for Québec, as part of agreements with the Government du Québec, makes it possible to carry them out or even do the work ahead of schedule in some cases. The main partners are the federal government, municipalities, public transit corporations and universities. Their contributions top up those of the Gouvernement du Québec in the QIP.
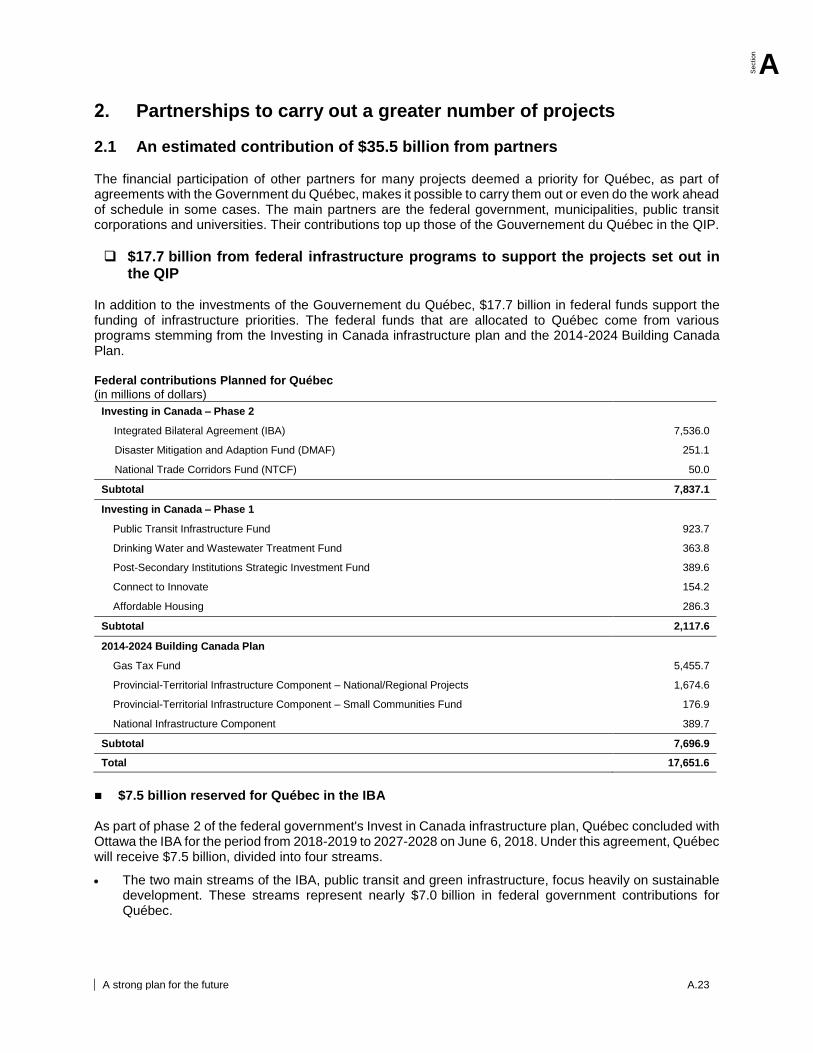
$17.7 billion from federal infrastructure programs to support the projects set out in the QIP
In addition to the investments of the Gouvernement du Québec, $17.7 billion in federal funds support the funding of infrastructure priorities. The federal funds that are allocated to Québec come from various programs stemming from the Investing in Canada infrastructure plan and the 2014-2024 Building Canada Plan. Federal contributions Planned for Québec (in millions of dollars)
Investing in Canada – Phase 2
Integrated Bilateral Agreement (IBA) 7,536.0
Disaster Mitigation and Adaption Fund (DMAF) 251.1
National Trade Corridors Fund (NTCF) 50.0
Subtotal 7,837.1
Investing in Canada – Phase 1
Public Transit Infrastructure Fund 923.7
Drinking Water and Wastewater Treatment Fund 363.8
Post-Secondary Institutions Strategic Investment Fund 389.6
Connect to Innovate 154.2
Affordable Housing 286.3
Subtotal 2,117.6
2014-2024 Building Canada Plan
Gas Tax Fund 5,455.7
Provincial-Territorial Infrastructure Component – National/Regional Projects 1,674.6
Provincial-Territorial Infrastructure Component – Small Communities Fund 176.9
National Infrastructure Component 389.7
Subtotal 7,696.9
Total 17,651.6
$7.5 billion reserved for Québec in the IBA As part of phase 2 of the federal government's Invest in Canada infrastructure plan, Québec concluded with Ottawa the IBA for the period from 2018-2019 to 2027-2028 on June 6, 2018. Under this agreement, Québec will receive $7.5 billion, divided into four streams.
The two main streams of the IBA, public transit and green infrastructure, focus heavily on sustainable development. These streams represent nearly $7.0 billion in federal government contributions for Québec.
A.24 2020-2030 Québec Infrastructure Plan
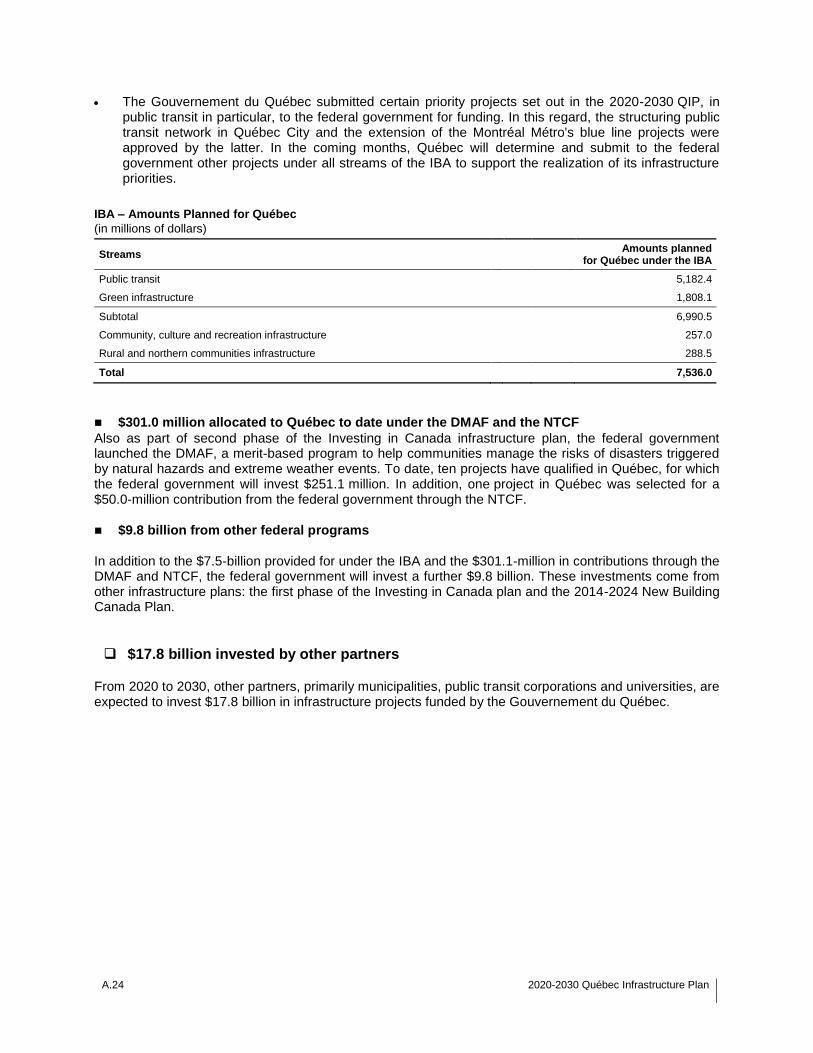
The Gouvernement du Québec submitted certain priority projects set out in the 2020-2030 QIP, in public transit in particular, to the federal government for funding. In this regard, the structuring public transit network in Québec City and the extension of the Montréal Métro's blue line projects were approved by the latter. In the coming months, Québec will determine and submit to the federal government other projects under all streams of the IBA to support the realization of its infrastructure priorities.
IBA – Amounts Planned for Québec
(in millions of dollars)
Streams
Amounts planned for Québec under the IBA
Public transit
5,182.4
Green infrastructure
1,808.1
Subtotal 6,990.5
Community, culture and recreation infrastructure
257.0
Rural and northern communities infrastructure 288.5
Total 7,536.0
$301.0 million allocated to Québec to date under the DMAF and the NTCF
Also as part of second phase of the Investing in Canada infrastructure plan, the federal government launched the DMAF, a merit-based program to help communities manage the risks of disasters triggered by natural hazards and extreme weather events. To date, ten projects have qualified in Québec, for which the federal government will invest $251.1 million. In addition, one project in Québec was selected for a $50.0-million contribution from the federal government through the NTCF.
$9.8 billion from other federal programs
In addition to the $7.5-billion provided for under the IBA and the $301.1-million in contributions through the DMAF and NTCF, the federal government will invest a further $9.8 billion. These investments come from other infrastructure plans: the first phase of the Investing in Canada plan and the 2014-2024 New Building Canada Plan.
$17.8 billion invested by other partners From 2020 to 2030, other partners, primarily municipalities, public transit corporations and universities, are expected to invest $17.8 billion in infrastructure projects funded by the Gouvernement du Québec.
Section
A
AA strong plan for the future A.25
2.2 An innovative partnership with the Caisse de dépôt et placement du Québec
The framework public infrastructure agreement concluded in 2015 between the Gouvernement du Québec and the Caisse makes use of the international expertise of the Caisse in public infrastructure project development to help bring new projects to fruition in Québec. The first project to start up under the agreement is the REM. Assessed at $6.5-billion, the project is overseen by the Caisse, which seeks to link downtown Montréal, the South Shore, the West Island, the North Shore (Deux-Montagnes) and Pierre-Elliott-Trudeau International Airport with a single, automated, electric public transit system. Once completed, the REM, which is currently under construction, will significantly enhance the public transit system in the greater Montréal area and support the Government's decongestion plan.
The Québec and Canadian governments are major financial partners in the project, with the former investing $1.3 billion in the form of capital stock, and the latter providing a CIB loan for the same amount. The Gouvernement du Québec will also contribute to the goals of integrating all of Montréal's transportation services through peripheral investments and through financial assistance for the ARTM, which is involved in operating the integrated network. Through state-owned enterprise Hydro-Québec, it will also contribute to the part of the project centred on the shift to an electric transit system.
In addition to the major project to widen a segment of Autoroute 30 between the A-20 and A-10, which is currently being studied, the Government is doing short-term work to create favourable bus bypass shoulder conditions to optimize traffic flow in this busy corridor and thereby facilitate access to the REM. The shoulder enhancements completed by 2021 will therefore allow public transit to move more efficiently along this stretch of Autoroute 30 toward the REM stations near the A-10/A-30 interchange. For the stretch of Autouroute 30 between the A-10 and A-15, the Government is in the process of finalizing the needs assessment and discussions with its private-sector partner for the rollout of bus bypass shoulders by 2020-2021.
Based on the experience gained through the development of the REM, in the summer of 2019, the Government provided the Caisse with the major priorities for the planning of other public infrastructure development projects, to determine its interest. These projects are presented in the table on page A.12. The Caisse will confirm whether it is interested in carrying out these projects in the spring of 2020.
A.26 2020-2030 Québec Infrastructure Plan
3. Planning investments to secure the sustainability of existing infrastructure
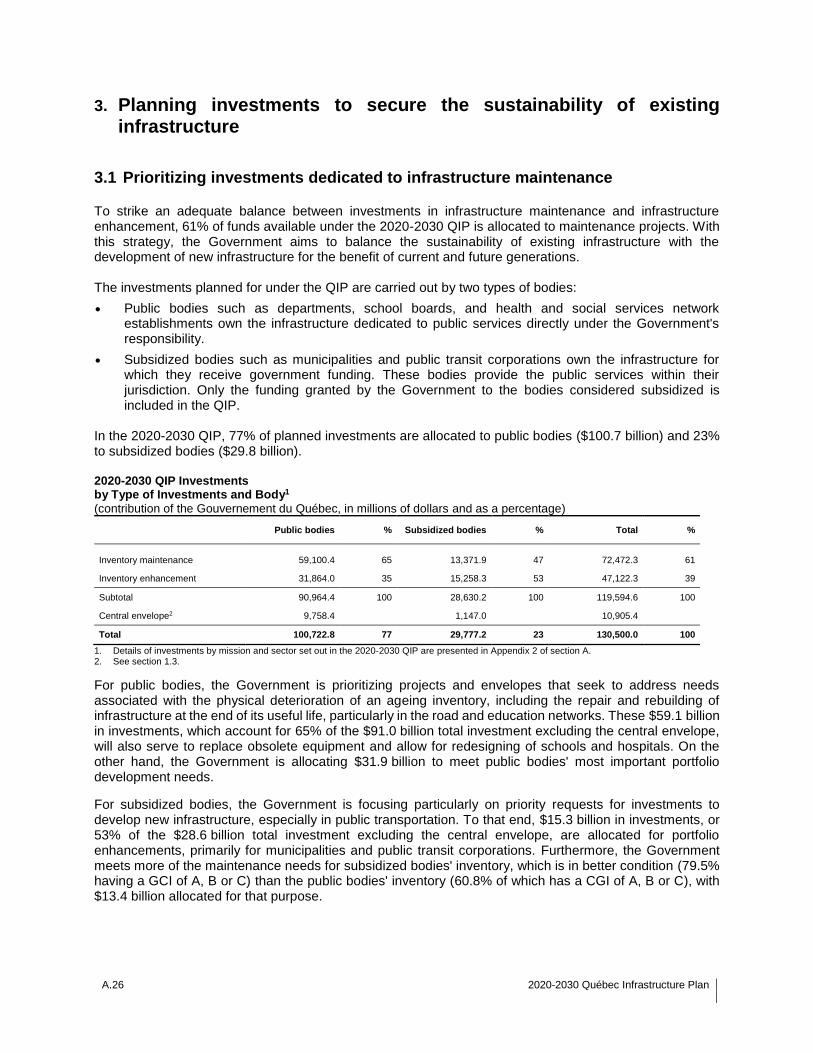
3.1 Prioritizing investments dedicated to infrastructure maintenance To strike an adequate balance between investments in infrastructure maintenance and infrastructure enhancement, 61% of funds available under the 2020-2030 QIP is allocated to maintenance projects. With this strategy, the Government aims to balance the sustainability of existing infrastructure with the development of new infrastructure for the benefit of current and future generations. The investments planned for under the QIP are carried out by two types of bodies:
Public bodies such as departments, school boards, and health and social services network establishments own the infrastructure dedicated to public services directly under the Government's responsibility.
Subsidized bodies such as municipalities and public transit corporations own the infrastructure for which they receive government funding. These bodies provide the public services within their jurisdiction. Only the funding granted by the Government to the bodies considered subsidized is included in the QIP.
In the 2020-2030 QIP, 77% of planned investments are allocated to public bodies ($100.7 billion) and 23% to subsidized bodies ($29.8 billion). 2020-2030 QIP Investments
by Type of Investments and Body1
(contribution of the Gouvernement du Québec, in millions of dollars and as a percentage)
Public bodies % Subsidized bodies % Total %
Inventory maintenance 59,100.4 65 13,371.9 47 72,472.3 61
Inventory enhancement 31,864.0 35 15,258.3 53 47,122.3 39
Subtotal 90,964.4 100 28,630.2 100 119,594.6 100
Central envelope2 9,758.4 1,147.0 10,905.4
Total 100,722.8 77 29,777.2 23 130,500.0 100
1. Details of investments by mission and sector set out in the 2020-2030 QIP are presented in Appendix 2 of section A. 2. See section 1.3.
For public bodies, the Government is prioritizing projects and envelopes that seek to address needs associated with the physical deterioration of an ageing inventory, including the repair and rebuilding of infrastructure at the end of its useful life, particularly in the road and education networks. These $59.1 billion in investments, which account for 65% of the $91.0 billion total investment excluding the central envelope, will also serve to replace obsolete equipment and allow for redesigning of schools and hospitals. On the other hand, the Government is allocating $31.9 billion to meet public bodies' most important portfolio development needs.
For subsidized bodies, the Government is focusing particularly on priority requests for investments to develop new infrastructure, especially in public transportation. To that end, $15.3 billion in investments, or 53% of the $28.6 billion total investment excluding the central envelope, are allocated for portfolio enhancements, primarily for municipalities and public transit corporations. Furthermore, the Government meets more of the maintenance needs for subsidized bodies' inventory, which is in better condition (79.5% having a GCI of A, B or C) than the public bodies' inventory (60.8% of which has a CGI of A, B or C), with $13.4 billion allocated for that purpose.
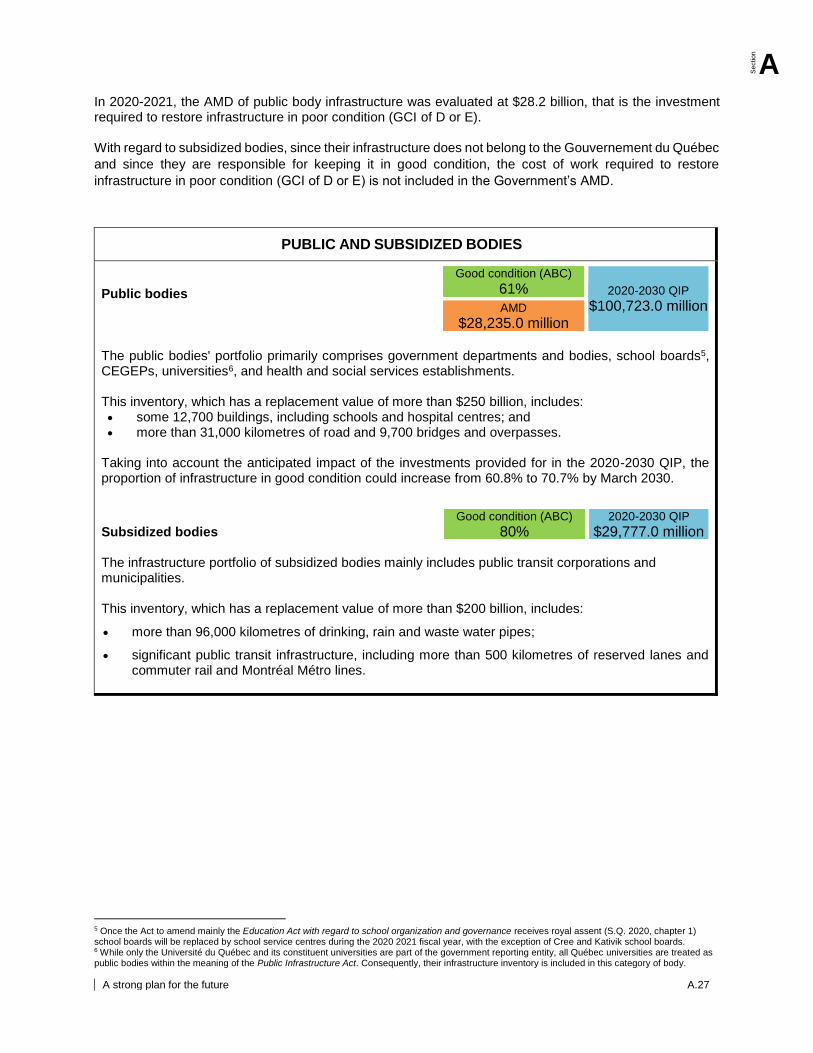
Section
A
AA strong plan for the future A.27
In 2020-2021, the AMD of public body infrastructure was evaluated at $28.2 billion, that is the investment required to restore infrastructure in poor condition (GCI of D or E). With regard to subsidized bodies, since their infrastructure does not belong to the Gouvernement du Québec
and since they are responsible for keeping it in good condition, the cost of work required to restore
infrastructure in poor condition (GCI of D or E) is not included in the Government’s AMD.
PUBLIC AND SUBSIDIZED BODIES
Public bodies
The public bodies' portfolio primarily comprises government departments and bodies, school boards5, CEGEPs, universities6, and health and social services establishments. This inventory, which has a replacement value of more than $250 billion, includes: some 12,700 buildings, including schools and hospital centres; and more than 31,000 kilometres of road and 9,700 bridges and overpasses.
Taking into account the anticipated impact of the investments provided for in the 2020-2030 QIP, the proportion of infrastructure in good condition could increase from 60.8% to 70.7% by March 2030.
Subsidized bodies The infrastructure portfolio of subsidized bodies mainly includes public transit corporations and municipalities. This inventory, which has a replacement value of more than $200 billion, includes:
more than 96,000 kilometres of drinking, rain and waste water pipes;
significant public transit infrastructure, including more than 500 kilometres of reserved lanes and commuter rail and Montréal Métro lines.
Good condition (ABC)
61%
2020-2030 QIP
$100,723.0 million AMD
$28,235.0 million
Good condition (ABC)
80%
2020-2030 QIP
$29,777.0 million
5 Once the Act to amend mainly the Education Act with regard to school organization and governance receives royal assent (S.Q. 2020, chapter 1) school boards will be replaced by school service centres during the 2020 2021 fiscal year, with the exception of Cree and Kativik school boards. 6 While only the Université du Québec and its constituent universities are part of the government reporting entity, all Québec universities are treated as public bodies within the meaning of the Public Infrastructure Act. Consequently, their infrastructure inventory is included in this category of body.
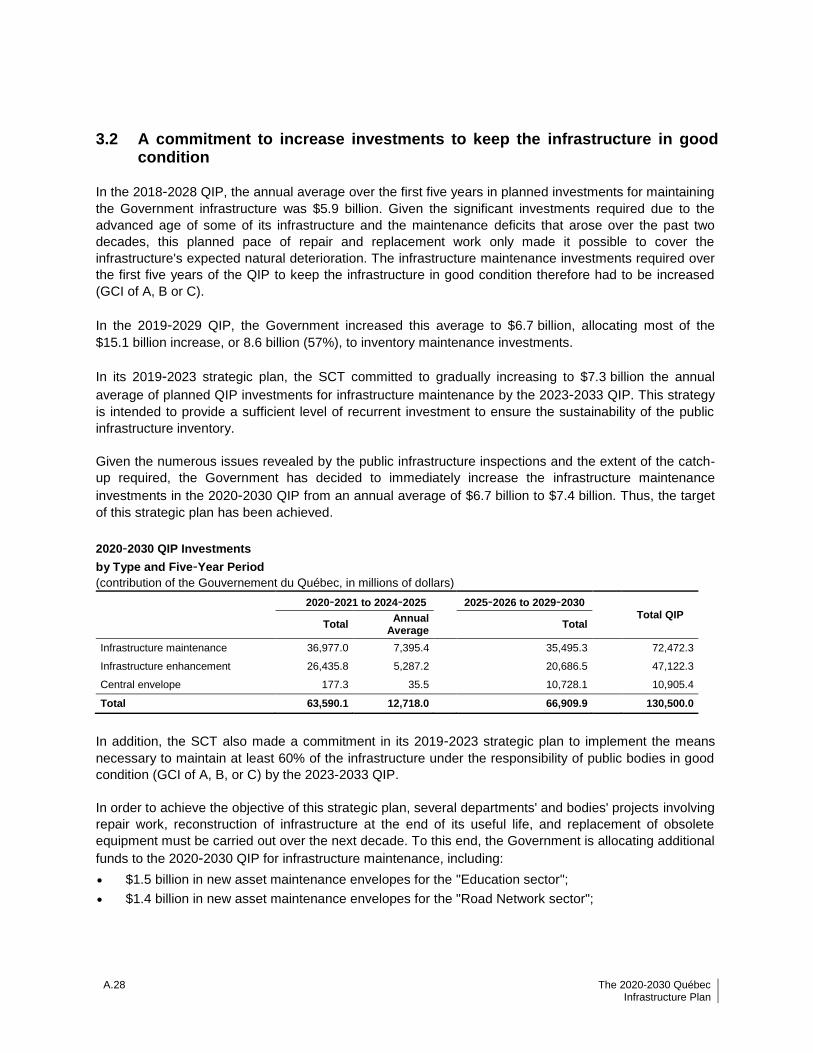
A.28 The 2020-2030 Québec Infrastructure Plan
3.2 A commitment to increase investments to keep the infrastructure in good condition
In the 2018-2028 QIP, the annual average over the first five years in planned investments for maintaining
the Government infrastructure was $5.9 billion. Given the significant investments required due to the
advanced age of some of its infrastructure and the maintenance deficits that arose over the past two
decades, this planned pace of repair and replacement work only made it possible to cover the
infrastructure's expected natural deterioration. The infrastructure maintenance investments required over
the first five years of the QIP to keep the infrastructure in good condition therefore had to be increased
(GCI of A, B or C).
In the 2019-2029 QIP, the Government increased this average to $6.7 billion, allocating most of the
$15.1 billion increase, or 8.6 billion (57%), to inventory maintenance investments.
In its 2019-2023 strategic plan, the SCT committed to gradually increasing to $7.3 billion the annual
average of planned QIP investments for infrastructure maintenance by the 2023-2033 QIP. This strategy
is intended to provide a sufficient level of recurrent investment to ensure the sustainability of the public
infrastructure inventory.
Given the numerous issues revealed by the public infrastructure inspections and the extent of the catch-
up required, the Government has decided to immediately increase the infrastructure maintenance
investments in the 2020-2030 QIP from an annual average of $6.7 billion to $7.4 billion. Thus, the target
of this strategic plan has been achieved.
2020-2030 QIP Investments
by Type and Five-Year Period
(contribution of the Gouvernement du Québec, in millions of dollars)
2020-2021 to 2024-2025 2025-2026 to 2029-2030
Total QIP Total
Annual Average
Total
Infrastructure maintenance 36,977.0 7,395.4 35,495.3 72,472.3
Infrastructure enhancement 26,435.8 5,287.2 20,686.5 47,122.3
Central envelope 177.3 35.5 10,728.1 10,905.4
Total 63,590.1 12,718.0 66,909.9 130,500.0
In addition, the SCT also made a commitment in its 2019-2023 strategic plan to implement the means
necessary to maintain at least 60% of the infrastructure under the responsibility of public bodies in good
condition (GCI of A, B, or C) by the 2023-2033 QIP.
In order to achieve the objective of this strategic plan, several departments' and bodies' projects involving
repair work, reconstruction of infrastructure at the end of its useful life, and replacement of obsolete
equipment must be carried out over the next decade. To this end, the Government is allocating additional
funds to the 2020-2030 QIP for infrastructure maintenance, including:
$1.5 billion in new asset maintenance envelopes for the "Education sector";
$1.4 billion in new asset maintenance envelopes for the "Road Network sector";
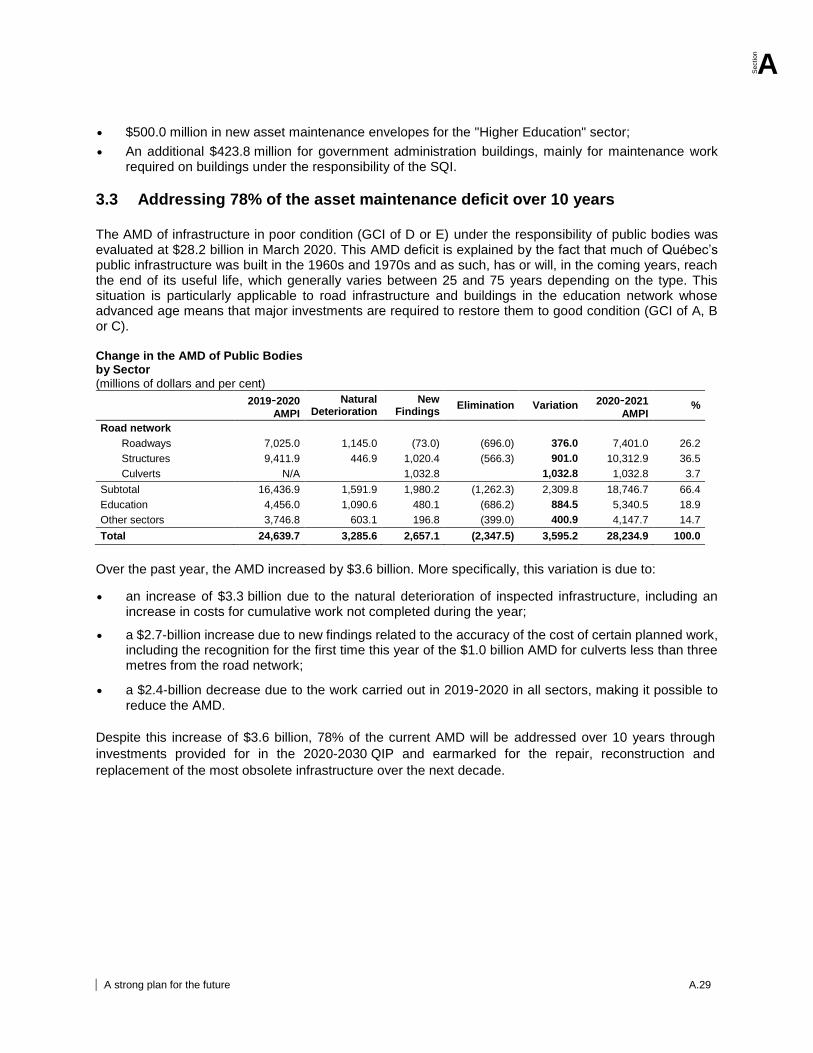
Section
A
AA strong plan for the future A.29
$500.0 million in new asset maintenance envelopes for the "Higher Education" sector;
An additional $423.8 million for government administration buildings, mainly for maintenance work required on buildings under the responsibility of the SQI.
3.3 Addressing 78% of the asset maintenance deficit over 10 years The AMD of infrastructure in poor condition (GCI of D or E) under the responsibility of public bodies was evaluated at $28.2 billion in March 2020. This AMD deficit is explained by the fact that much of Québec’s public infrastructure was built in the 1960s and 1970s and as such, has or will, in the coming years, reach the end of its useful life, which generally varies between 25 and 75 years depending on the type. This situation is particularly applicable to road infrastructure and buildings in the education network whose advanced age means that major investments are required to restore them to good condition (GCI of A, B or C). Change in the AMD of Public Bodies by Sector
(millions of dollars and per cent)
2019-2020
AMPI
Natural Deterioration
New Findings
Elimination Variation 2020-2021
AMPI %
Road network Roadways 7,025.0 1,145.0 (73.0) (696.0) 376.0 7,401.0 26.2
Structures 9,411.9 446.9 1,020.4 (566.3) 901.0 10,312.9 36.5
Culverts N/A 1,032.8 1,032.8 1,032.8 3.7
Subtotal 16,436.9 1,591.9 1,980.2 (1,262.3) 2,309.8 18,746.7 66.4
Education 4,456.0 1,090.6 480.1 (686.2) 884.5 5,340.5 18.9
Other sectors 3,746.8 603.1 196.8 (399.0) 400.9 4,147.7 14.7
Total 24,639.7 3,285.6 2,657.1 (2,347.5) 3,595.2 28,234.9 100.0
Over the past year, the AMD increased by $3.6 billion. More specifically, this variation is due to:
an increase of $3.3 billion due to the natural deterioration of inspected infrastructure, including an increase in costs for cumulative work not completed during the year;
a $2.7-billion increase due to new findings related to the accuracy of the cost of certain planned work, including the recognition for the first time this year of the $1.0 billion AMD for culverts less than three metres from the road network;
a $2.4-billion decrease due to the work carried out in 2019-2020 in all sectors, making it possible to reduce the AMD.
Despite this increase of $3.6 billion, 78% of the current AMD will be addressed over 10 years through
investments provided for in the 2020-2030 QIP and earmarked for the repair, reconstruction and
replacement of the most obsolete infrastructure over the next decade.
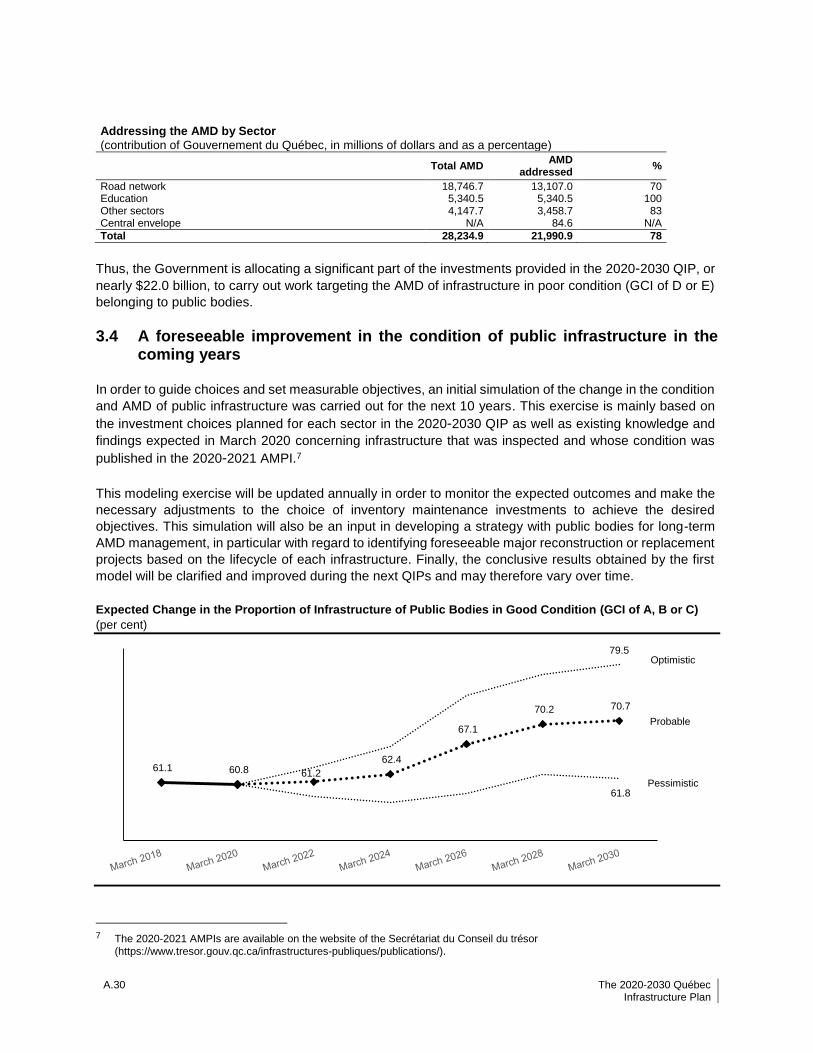
A.30 The 2020-2030 Québec Infrastructure Plan
Addressing the AMD by Sector
(contribution of Gouvernement du Québec, in millions of dollars and as a percentage)
Total AMD AMD
addressed %
Road network 18,746.7 13,107.0 70 Education 5,340.5 5,340.5 100 Other sectors 4,147.7 3,458.7 83 Central envelope N/A 84.6 N/A
Total 28,234.9 21,990.9 78
Thus, the Government is allocating a significant part of the investments provided in the 2020-2030 QIP, or
nearly $22.0 billion, to carry out work targeting the AMD of infrastructure in poor condition (GCI of D or E)
belonging to public bodies.
3.4 A foreseeable improvement in the condition of public infrastructure in the coming years
In order to guide choices and set measurable objectives, an initial simulation of the change in the condition
and AMD of public infrastructure was carried out for the next 10 years. This exercise is mainly based on
the investment choices planned for each sector in the 2020-2030 QIP as well as existing knowledge and
findings expected in March 2020 concerning infrastructure that was inspected and whose condition was
published in the 2020-2021 AMPI.7
This modeling exercise will be updated annually in order to monitor the expected outcomes and make the
necessary adjustments to the choice of inventory maintenance investments to achieve the desired
objectives. This simulation will also be an input in developing a strategy with public bodies for long-term
AMD management, in particular with regard to identifying foreseeable major reconstruction or replacement
projects based on the lifecycle of each infrastructure. Finally, the conclusive results obtained by the first
model will be clarified and improved during the next QIPs and may therefore vary over time.
Expected Change in the Proportion of Infrastructure of Public Bodies in Good Condition (GCI of A, B or C)
(per cent)
7 The 2020-2021 AMPIs are available on the website of the Secrétariat du Conseil du trésor
(https://www.tresor.gouv.qc.ca/infrastructures-publiques/publications/).
61.1 60.8 61.2
62.4
67.1
70.2 70.7
61.8
79.5Optimistic
Pessimistic
Probable
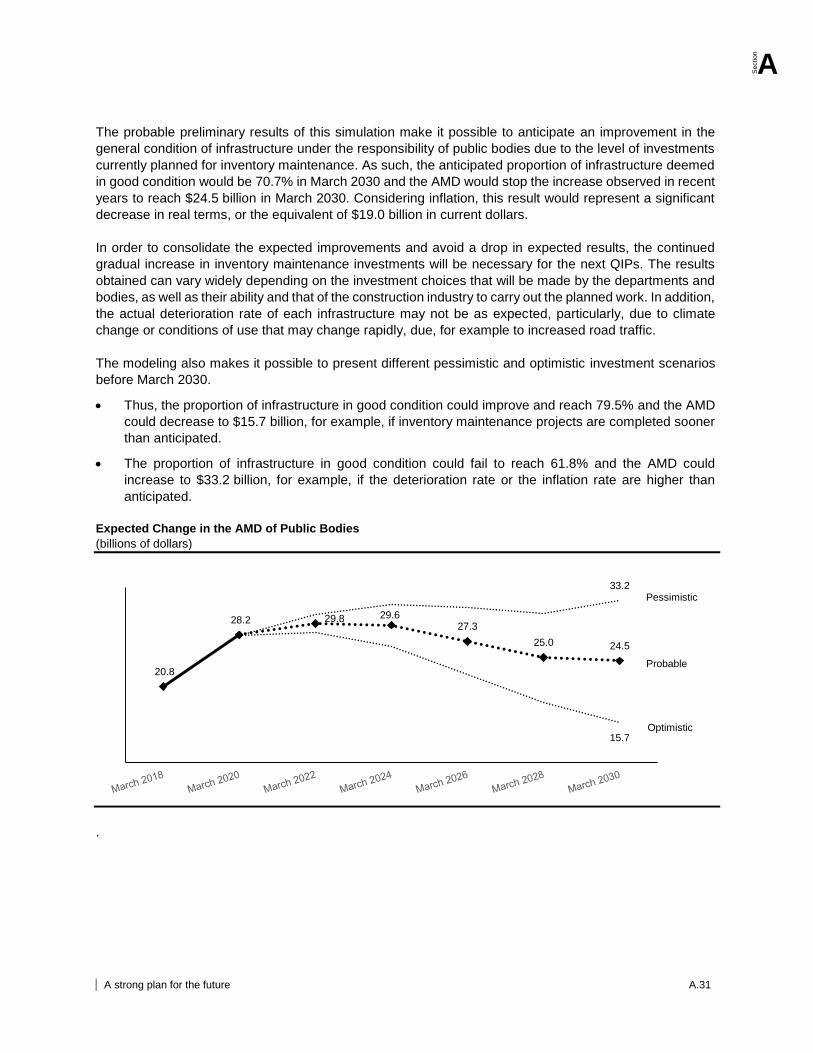
Section
A
AA strong plan for the future A.31
The probable preliminary results of this simulation make it possible to anticipate an improvement in the
general condition of infrastructure under the responsibility of public bodies due to the level of investments
currently planned for inventory maintenance. As such, the anticipated proportion of infrastructure deemed
in good condition would be 70.7% in March 2030 and the AMD would stop the increase observed in recent
years to reach $24.5 billion in March 2030. Considering inflation, this result would represent a significant
decrease in real terms, or the equivalent of $19.0 billion in current dollars.
In order to consolidate the expected improvements and avoid a drop in expected results, the continued
gradual increase in inventory maintenance investments will be necessary for the next QIPs. The results
obtained can vary widely depending on the investment choices that will be made by the departments and
bodies, as well as their ability and that of the construction industry to carry out the planned work. In addition,
the actual deterioration rate of each infrastructure may not be as expected, particularly, due to climate
change or conditions of use that may change rapidly, due, for example to increased road traffic.
The modeling also makes it possible to present different pessimistic and optimistic investment scenarios
before March 2030.
Thus, the proportion of infrastructure in good condition could improve and reach 79.5% and the AMD
could decrease to $15.7 billion, for example, if inventory maintenance projects are completed sooner
than anticipated.
The proportion of infrastructure in good condition could fail to reach 61.8% and the AMD could
increase to $33.2 billion, for example, if the deterioration rate or the inflation rate are higher than
anticipated.
Expected Change in the AMD of Public Bodies
(billions of dollars)
.
20.8
28.2 29.8 29.627.3
25.0 24.5
33.2
15.7
Probable
Pessimistic
Optimistic
A.32 The 2020-2030 Québec Infrastructure Plan
4. An increase in investments that respect public finances in the context of effervescence in the construction market
4.1 Substantial investments while controlling the impact on the debt
Much of Québec's public infrastructure was built in the 1960s and 1970s. From the 1990s through the middle of the following decade, the Gouvernement du Québec cut back on its investments in this area. Since the first QIP was implemented in 2007 after enactment of the Act to promote the maintenance and renewal of public infrastructures8, the Government has reinvested massively in all of its infrastructure, particularly in transportation, health and education.
Responding to the need for investment while respecting our capacity to pay Given the importance of the public infrastructure inventory, Québec must dedicate significant amounts to keep the structures in good condition and ensure that they are developed as needed to provide the expected level of services to citizens and businesses. The investment needs are immense, and some are pressing, but the resources available to deal with them are limited. The Government's initiatives must therefore generate benefits efficiently, keeping in mind the taxpayers’ ability to pay. The Government is constantly having to make tough choices between the scope of its infrastructure investment and its goal of reducing the public debt. It is a major challenge. The Government must therefore prioritize its investments within the limits it has set based on the recommendations of the Minister of Finance. The 10-year investment plan drawn up under the QIP is tool the Government has created to guide it in this prioritization exercise.
8 That Act was superseded by the Public Infrastructure Act in 2013.
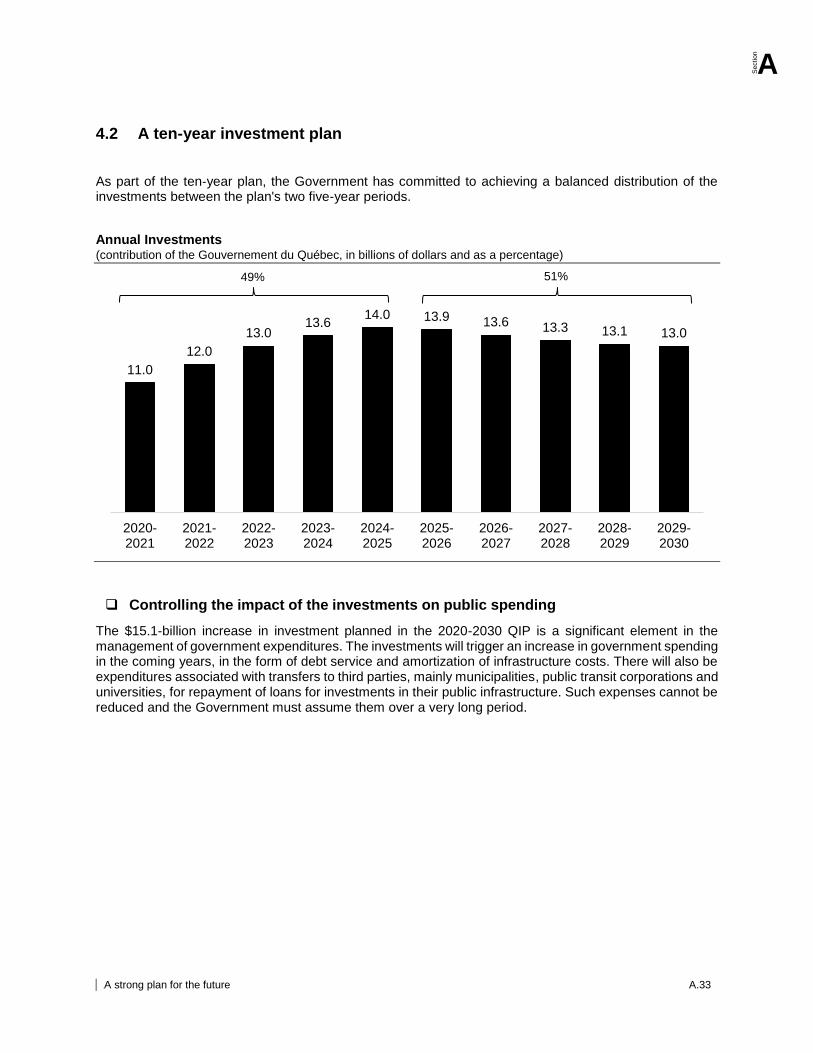
Section
A
AA strong plan for the future A.33
4.2 A ten-year investment plan
As part of the ten‑year plan, the Government has committed to achieving a balanced distribution of the investments between the plan's two five-year periods.
Annual Investments (contribution of the Gouvernement du Québec, in billions of dollars and as a percentage)
Controlling the impact of the investments on public spending
The $15.1-billion increase in investment planned in the 2020-2030 QIP is a significant element in the management of government expenditures. The investments will trigger an increase in government spending in the coming years, in the form of debt service and amortization of infrastructure costs. There will also be expenditures associated with transfers to third parties, mainly municipalities, public transit corporations and universities, for repayment of loans for investments in their public infrastructure. Such expenses cannot be reduced and the Government must assume them over a very long period.
11.0
12.0
13.013.6
14.0 13.9 13.6 13.3 13.1 13.0
2020-2021
2021-2022
2022-2023
2023-2024
2024-2025
2025-2026
2026-2027
2027-2028
2028-2029
2029-2030
49% 51%
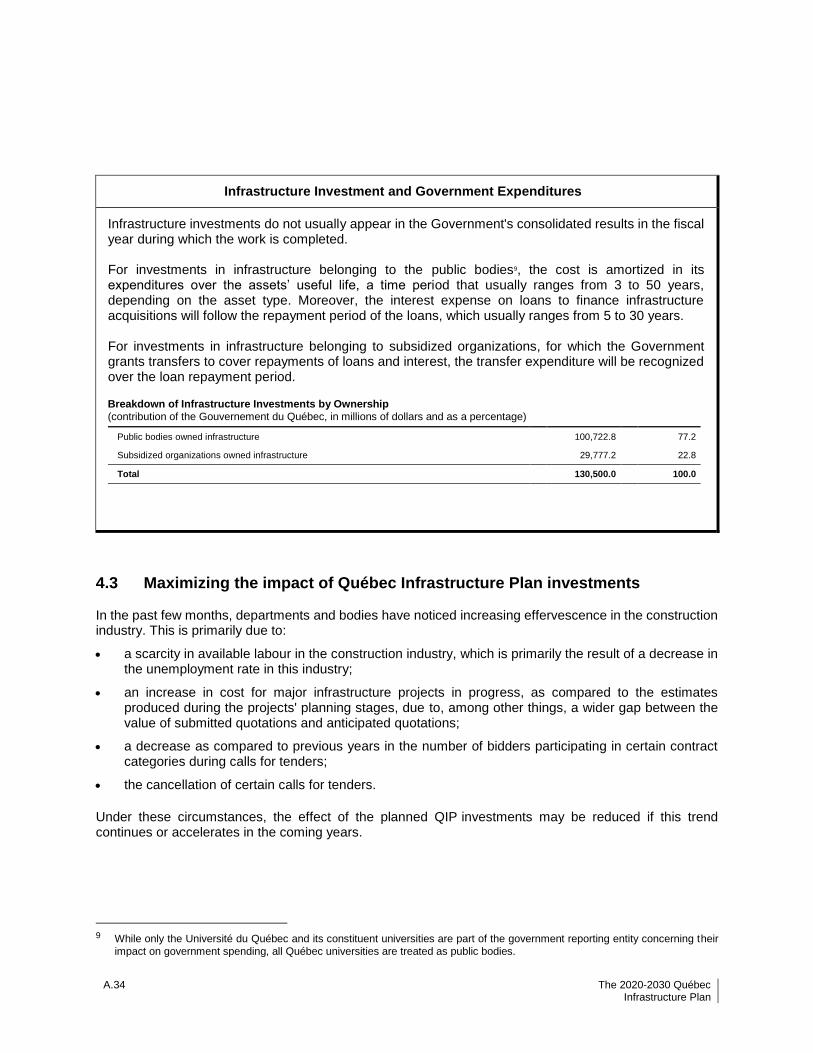
A.34 The 2020-2030 Québec Infrastructure Plan
Infrastructure Investment and Government Expenditures
Infrastructure investments do not usually appear in the Government's consolidated results in the fiscal year during which the work is completed. For investments in infrastructure belonging to the public bodies9, the cost is amortized in its expenditures over the assets’ useful life, a time period that usually ranges from 3 to 50 years, depending on the asset type. Moreover, the interest expense on loans to finance infrastructure acquisitions will follow the repayment period of the loans, which usually ranges from 5 to 30 years. For investments in infrastructure belonging to subsidized organizations, for which the Government grants transfers to cover repayments of loans and interest, the transfer expenditure will be recognized over the loan repayment period.
Breakdown of Infrastructure Investments by Ownership
(contribution of the Gouvernement du Québec, in millions of dollars and as a percentage)
Public bodies owned infrastructure 100,722.8 77.2
Subsidized organizations owned infrastructure 29,777.2 22.8
Total 130,500.0 100.0
4.3 Maximizing the impact of Québec Infrastructure Plan investments In the past few months, departments and bodies have noticed increasing effervescence in the construction industry. This is primarily due to:
a scarcity in available labour in the construction industry, which is primarily the result of a decrease in the unemployment rate in this industry;
an increase in cost for major infrastructure projects in progress, as compared to the estimates produced during the projects' planning stages, due to, among other things, a wider gap between the value of submitted quotations and anticipated quotations;
a decrease as compared to previous years in the number of bidders participating in certain contract categories during calls for tenders;
the cancellation of certain calls for tenders.
Under these circumstances, the effect of the planned QIP investments may be reduced if this trend continues or accelerates in the coming years.
9 While only the Université du Québec and its constituent universities are part of the government reporting entity concerning their
impact on government spending, all Québec universities are treated as public bodies.
Section
A
A strong plan for the future A.35
The Government is mindful of the impact that the large number of projects launched simultaneously can have on the construction industry's ability to deliver projects on time and at the expected cost. This is why the $15.1-billion increase announced in the present QIP will be planned mainly over the second five-year period and follow the forecast growth of 3.0% for all sectors of the economy. This approach is intended to allow the industry to adapt, in the medium and long terms, to this increase in infrastructure investment. This is a concrete measure aimed at maximizing the impact of QIP investments and limiting the negative consequences of effervescence in the construction industry.
The Government also plans to propose other promising measures ensuring that each contract is awarded at a fair price and maximizes value for the public. To do so, the SCT is responsible for evaluating the situation, identifying the causes of the effervescence in the construction market and targeting appropriate solutions. This initiative will be rolled out through two parallel components:
setting up an interdepartmental committee consisting of the government departments and bodies most affected by the situation;
consultation with the key players in the construction industry in order to obtain their proposals. The Government will then be in a position to announce an action plan in late spring 2020.
A.36 The 2020-2030 Québec Infrastructure Plan
5. Enhanced governance of infrastructure investments
5.1 Strategic investment planning The Public Infrastructure Act sets out governance rules for the planning of public investments and the management of public infrastructure. Among other things, this has led to the creation of a 10-year investment plan (QIP), monitoring of the implementation of the Directive and the obligation for departments and bodies to produce an AMPI. Responsible for planning and monitoring of public infrastructure investments, the SCT created the SSIP to support it in this role. It also set up an infrastructure project governance committee to monitor the issues associated with major projects from planning right through to their commissioning.
5.2 A flexible Directive The Directive, which the Government approved in 2014, introduced a rigorous framework and management rules to support Cabinet’s decision-making process for the study, planning and execution of major projects. As stated in the 2019-2029 QIP, the Directive must be reviewed to accelerate the repair of infrastructure in poor condition when an option has already been identified. Work has begun and is progressing well, but it seems that a more extensive review is necessary to factor in the implementation issues encountered in the past years. In the meantime, certain ad hoc Cabinet decisions have allowed projects for infrastructure with a government condition indicator of D or E for which only one option has been determined to move directly to the business case step. This will speed up renovation of FACE, a school of the Commission scolaire de Montréal, rehabilitation of the railway between Port-Daniel-Gascon and Gaspé, repair of the Autoroute Métropolitaine between Saint-Laurent and Provencher boulevards and repair of the Pont de Québec deck.
5.3 A Directive that applies to major public transit projects Given the number and scope of public transit investment projects funded primarily by the Gouvernement du Québec, Conseil du trésor decided in July 2019, as announced in the 2019-2029 QIP, that with the exception of projects entrusted to CDPQ Infra, projects of $100.0 million and more would be subject to the Directive. Thus, major public transit projects are now subject to the same decision-making process and the same structure as other building and road projects, namely study, planning and execution.
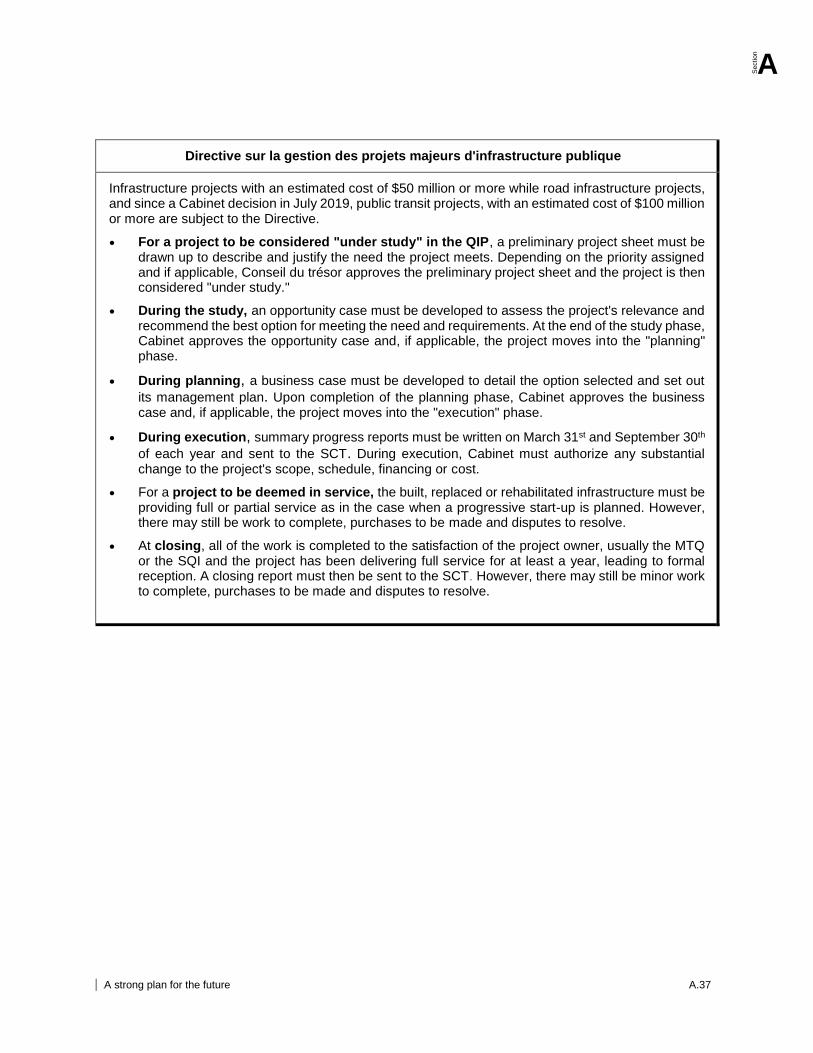
Section
A
AA strong plan for the future A.37
Directive sur la gestion des projets majeurs d'infrastructure publique
Infrastructure projects with an estimated cost of $50 million or more while road infrastructure projects, and since a Cabinet decision in July 2019, public transit projects, with an estimated cost of $100 million or more are subject to the Directive.
For a project to be considered "under study" in the QIP, a preliminary project sheet must be drawn up to describe and justify the need the project meets. Depending on the priority assigned and if applicable, Conseil du trésor approves the preliminary project sheet and the project is then considered "under study."
During the study, an opportunity case must be developed to assess the project's relevance and recommend the best option for meeting the need and requirements. At the end of the study phase, Cabinet approves the opportunity case and, if applicable, the project moves into the "planning" phase.
During planning, a business case must be developed to detail the option selected and set out
its management plan. Upon completion of the planning phase, Cabinet approves the business case and, if applicable, the project moves into the "execution" phase.
During execution, summary progress reports must be written on March 31st and September 30th
of each year and sent to the SCT. During execution, Cabinet must authorize any substantial change to the project's scope, schedule, financing or cost.
For a project to be deemed in service, the built, replaced or rehabilitated infrastructure must be providing full or partial service as in the case when a progressive start-up is planned. However, there may still be work to complete, purchases to be made and disputes to resolve.
At closing, all of the work is completed to the satisfaction of the project owner, usually the MTQ or the SQI and the project has been delivering full service for at least a year, leading to formal reception. A closing report must then be sent to the SCT. However, there may still be minor work to complete, purchases to be made and disputes to resolve.
A.38 The 2020-2030 Québec Infrastructure Plan
5.4 Tableau de bord of infrastructure projects of $20 million or more Since July 2018, the SCT has been posting its Tableau de bord10 of infrastructure projects of $50 million or more. Information (brief description, region, activity sector, etc.) concerning some 250 projects has been made available to the public on an ongoing basis for close to two years. During the 2020-2021 fiscal year, the SCT will improve online communication by integrating information pertaining to the 140 projects of $20 million or more published for the first time in the 2020-2030 QIP. This information not only allows the public to learn about infrastructure projects and their objectives, but also to follow their progress according to government decisions. In addition, to make it easier to identify projects and ensure uniformity throughout government departments and bodies, the SCT has revised the names of all the projects. To this end, it has defined a standard structure for identification of the infrastructure, the location and the type of work. This type may change as the project progresses.
10 Website: https://www.tresor.gouv.qc.ca/infrastructures-publiques/tableau-de-bord/
Section
A
AA strong plan for the future A.39
Appendix 1 – Development of the 2020-2030 QIP
The annual QIP planning takes into account the progress on current projects, the needs expressed by the government departments and bodies and the Government's priorities. Starting with the previous year’s plan, the following factors are considered:
Change during 2019-2020 (first year of previous QIP)
The starting point of the 2020-2030 QIP does not correspond to the published 2019-2029 QIP. In fact, the following elements must be considered to update the 2019-2029 QIP in order to reflect the transactions carried out in 2019-2020, namely:
Cabinet decisions in 2019-2020. For all major projects that Cabinet has approved for the current year, funds are transferred from the central envelope to the sector envelopes of the government departments and bodies responsible for these projects.
For certain projects, the revised costs have resulted in changes to the Government's planned contribution, particularly for major projects.
The removal of the first year of the previous Plan (2019-2020) and the addition of the last year
(2029-2030) for an equivalent amount, to ensure that the 10-year level of investments remains constant. However, the distribution between the sector and central envelopes of the added year is different from the one subtracted.
In fact, the funds allocated to sector envelopes for the new year (2029-2030) primarily represent recurring asset maintenance allowances. The unallocated balance consists of the funds available to carry out new projects.
The progress and completion of several projects release funds that become available for other investments.
Thus, the result of these operations makes it possible to determine the balance available in the sectoral envelopes and central envelope when preparation of the 2020-2030 begins.
Government decisions
Every year, the Government determines the level of QIP investment based on identified needs and government priorities, while taking into account the impact of these investments on the public finance.
Finally, the Government allocates the available funds of $21.7 billion (available balance of $6.6 billion and increase of $15.1 billion) between, on the one hand, the sector envelopes in order to execute the projects under the responsibility of the government departments and bodies, and, on the other hand, the central envelope to reserve funds that may be required for future major projects.
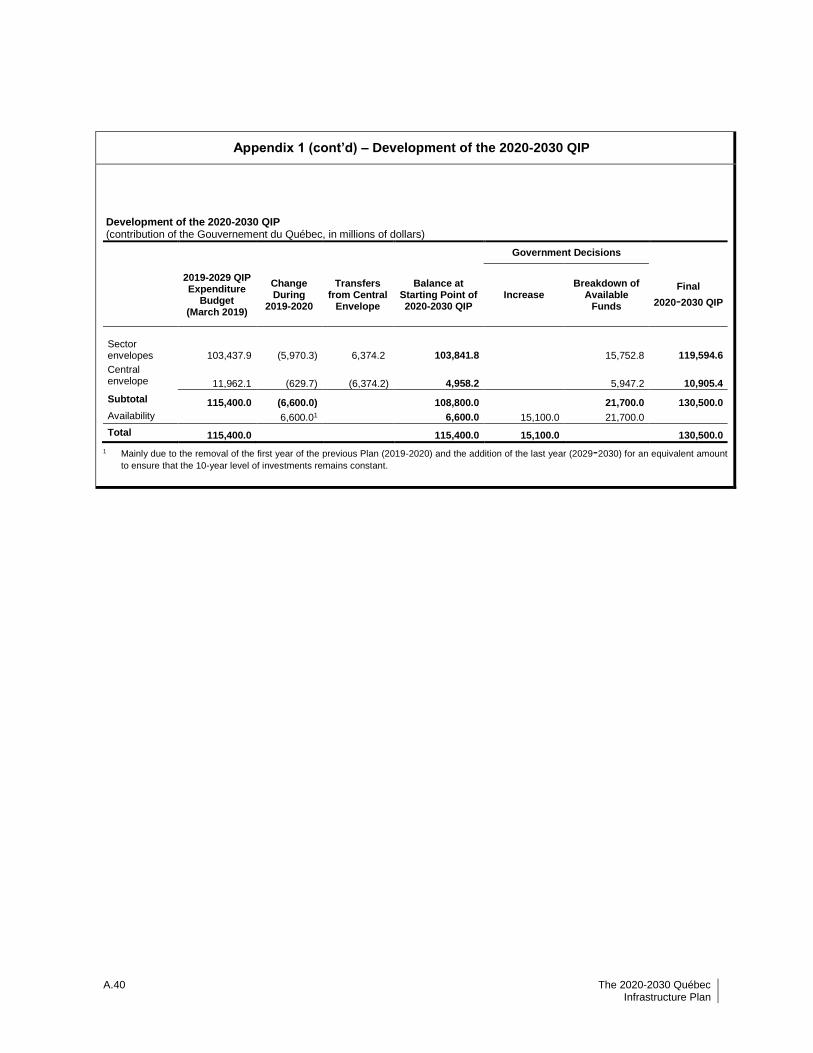
A.40 The 2020-2030 Québec Infrastructure Plan
Appendix 1 (cont’d) – Development of the 2020-2030 QIP
Development of the 2020-2030 QIP (contribution of the Gouvernement du Québec, in millions of dollars)
Government Decisions
2019-2029 QIP Expenditure
Budget (March 2019)
Change During
2019-2020
Transfers from Central
Envelope
Balance at Starting Point of 2020-2030 QIP
Increase Breakdown of
Available Funds
Final
2020-2030 QIP
Sector envelopes 103,437.9 (5,970.3) 6,374.2 103,841.8 15,752.8 119,594.6
Central envelope 11,962.1 (629.7) (6,374.2) 4,958.2 5,947.2 10,905.4
Subtotal 115,400.0 (6,600.0) 108,800.0 21,700.0 130,500.0
Availability 6,600.01 6,600.0 15,100.0 21,700.0
Total 115,400.0
115,400.0 15,100.0 130,500.0
1 Mainly due to the removal of the first year of the previous Plan (2019-2020) and the addition of the last year (2029-2030) for an equivalent amount
to ensure that the 10-year level of investments remains constant.
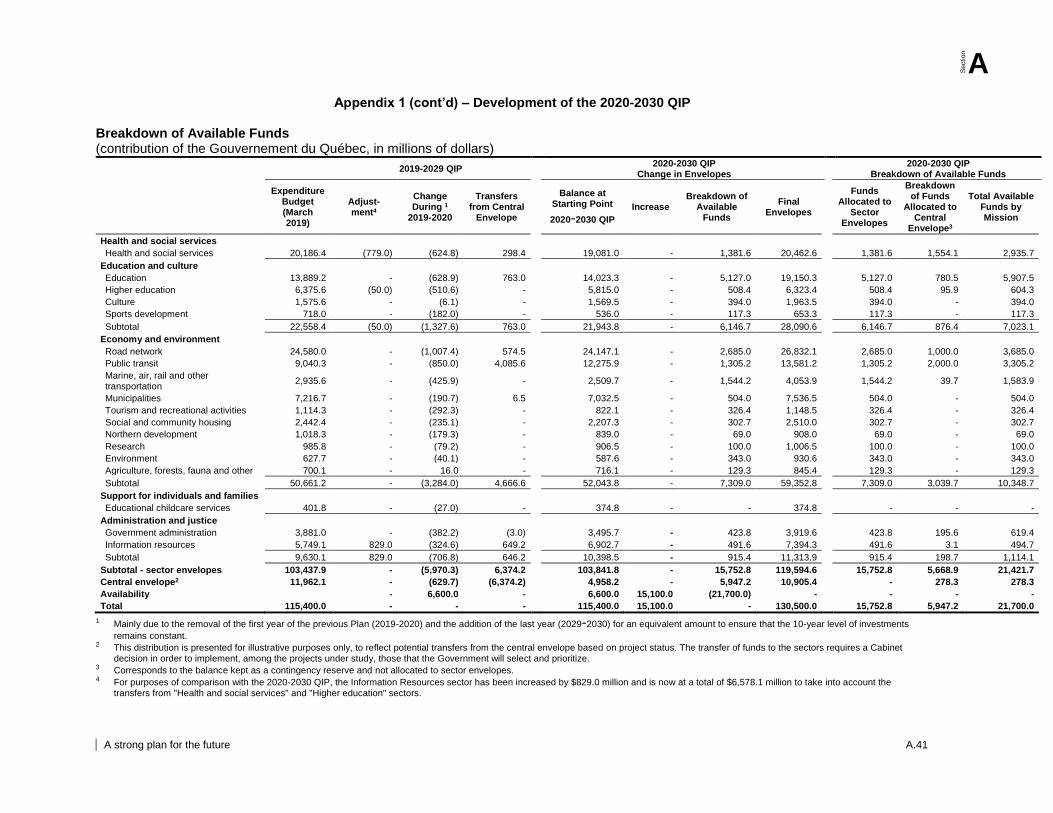
Section
A
AA strong plan for the future A.41
Appendix 1 (cont’d) – Development of the 2020-2030 QIP Breakdown of Available Funds (contribution of the Gouvernement du Québec, in millions of dollars)
2019-2029 QIP
2020-2030 QIP Change in Envelopes
2020-2030 QIP Breakdown of Available Funds
Expenditure
Budget (March 2019)
Adjust-ment4
Change During 1
2019-2020
Transfers from Central
Envelope
Balance at Starting Point
2020-2030 QIP
Increase Breakdown of
Available Funds
Final Envelopes
Funds
Allocated to Sector
Envelopes
Breakdown of Funds
Allocated to Central
Envelope3
Total Available Funds by Mission
Health and social services
Health and social services 20,186.4 (779.0) (624.8) 298.4 19,081.0 - 1,381.6 20,462.6 1,381.6 1,554.1 2,935.7
Education and culture
Education 13,889.2 - (628.9) 763.0 14,023.3 - 5,127.0 19,150.3 5,127.0 780.5 5,907.5
Higher education 6,375.6 (50.0) (510.6) - 5,815.0 - 508.4 6,323.4 508.4 95.9 604.3
Culture 1,575.6 - (6.1) - 1,569.5 - 394.0 1,963.5 394.0 - 394.0
Sports development 718.0 - (182.0) - 536.0 - 117.3 653.3 117.3 - 117.3
Subtotal 22,558.4 (50.0) (1,327.6) 763.0 21,943.8 - 6,146.7 28,090.6 6,146.7 876.4 7,023.1
Economy and environment
Road network 24,580.0 - (1,007.4) 574.5 24,147.1 - 2,685.0 26,832.1 2,685.0 1,000.0 3,685.0
Public transit 9,040.3 - (850.0) 4,085.6 12,275.9 - 1,305.2 13,581.2 1,305.2 2,000.0 3,305.2
Marine, air, rail and other transportation
2,935.6 - (425.9) - 2,509.7 - 1,544.2 4,053.9 1,544.2 39.7 1,583.9
Municipalities 7,216.7 - (190.7) 6.5 7,032.5 - 504.0 7,536.5 504.0 - 504.0
Tourism and recreational activities 1,114.3 - (292.3) - 822.1 - 326.4 1,148.5 326.4 - 326.4
Social and community housing 2,442.4 - (235.1) - 2,207.3 - 302.7 2,510.0 302.7 - 302.7
Northern development 1,018.3 - (179.3) - 839.0 - 69.0 908.0 69.0 - 69.0
Research 985.8 - (79.2) - 906.5 - 100.0 1,006.5 100.0 - 100.0
Environment 627.7 - (40.1) - 587.6 - 343.0 930.6 343.0 - 343.0
Agriculture, forests, fauna and other 700.1 - 16.0 - 716.1 - 129.3 845.4 129.3 - 129.3
Subtotal 50,661.2 - (3,284.0) 4,666.6 52,043.8 - 7,309.0 59,352.8 7,309.0 3,039.7 10,348.7
Support for individuals and families
Educational childcare services 401.8 - (27.0) - 374.8 - - 374.8 - - -
Administration and justice
Government administration 3,881.0 - (382.2) (3.0) 3,495.7 - 423.8 3,919.6 423.8 195.6 619.4
Information resources 5,749.1 829.0 (324.6) 649.2 6,902.7 - 491.6 7,394.3 491.6 3.1 494.7
Subtotal 9,630.1 829.0 (706.8) 646.2 10,398.5 - 915.4 11,313.9 915.4 198.7 1,114.1
Subtotal - sector envelopes 103,437.9 - (5,970.3) 6,374.2 103,841.8 - 15,752.8 119,594.6 15,752.8 5,668.9 21,421.7
Central envelope2 11,962.1 - (629.7) (6,374.2) 4,958.2 - 5,947.2 10,905.4 - 278.3 278.3
Availability - 6,600.0 - 6,600.0 15,100.0 (21,700.0) - - - -
Total 115,400.0 - - - 115,400.0 15,100.0 - 130,500.0 15,752.8 5,947.2 21,700.0
1 Mainly due to the removal of the first year of the previous Plan (2019-2020) and the addition of the last year (2029-2030) for an equivalent amount to ensure that the 10-year level of investments
remains constant. 2 This distribution is presented for illustrative purposes only, to reflect potential transfers from the central envelope based on project status. The transfer of funds to the sectors requires a Cabinet
decision in order to implement, among the projects under study, those that the Government will select and prioritize. 3 Corresponds to the balance kept as a contingency reserve and not allocated to sector envelopes. 4 For purposes of comparison with the 2020-2030 QIP, the Information Resources sector has been increased by $829.0 million and is now at a total of $6,578.1 million to take into account the
transfers from "Health and social services" and "Higher education" sectors.
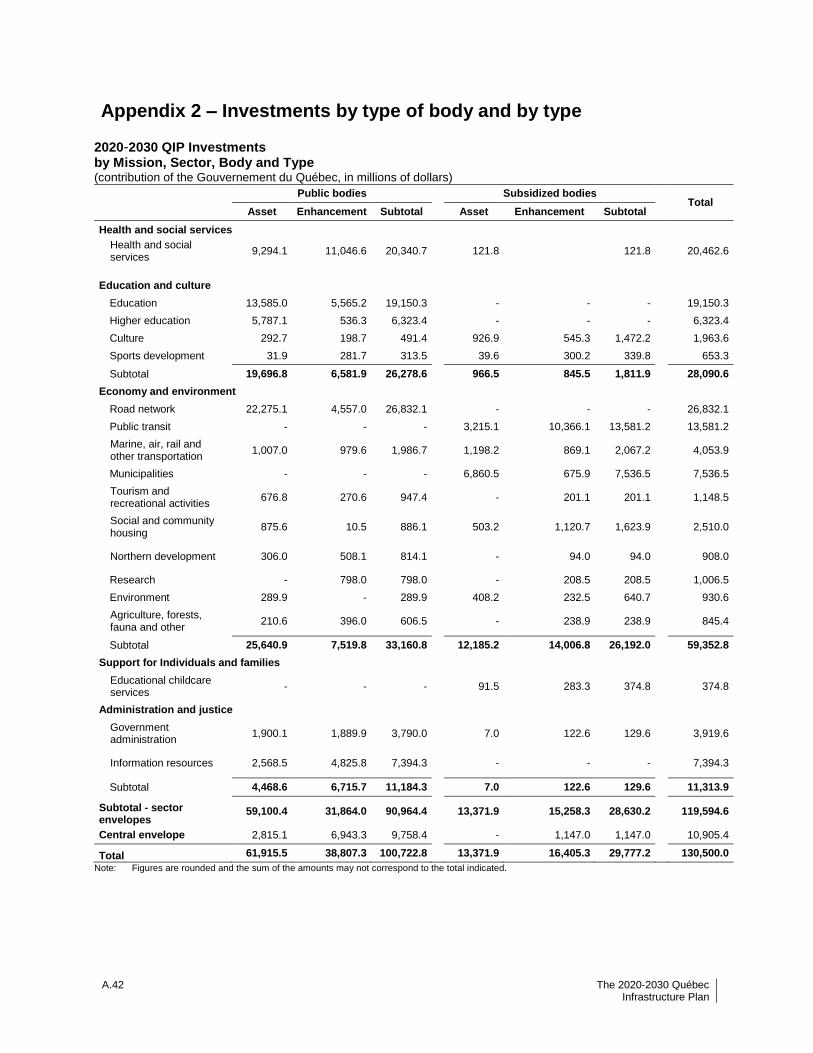
A.42 The 2020-2030 Québec Infrastructure Plan
Appendix 2 – Investments by type of body and by type 2020-2030 QIP Investments by Mission, Sector, Body and Type (contribution of the Gouvernement du Québec, in millions of dollars)
Public bodies Subsidized bodies Total
Asset Enhancement Subtotal Asset Enhancement Subtotal
Health and social services Health and social services
9,294.1 11,046.6 20,340.7 121.8 121.8
20,462.6
Education and culture
Education 13,585.0 5,565.2 19,150.3 - - -
19,150.3
Higher education 5,787.1 536.3 6,323.4 - - -
6,323.4
Culture 292.7 198.7 491.4 926.9 545.3 1,472.2
1,963.6
Sports development 31.9 281.7 313.5 39.6 300.2 339.8
653.3
Subtotal 19,696.8 6,581.9 26,278.6 966.5 845.5 1,811.9
28,090.6
Economy and environment
Road network 22,275.1 4,557.0 26,832.1 - - -
26,832.1
Public transit - - - 3,215.1 10,366.1 13,581.2
13,581.2
Marine, air, rail and other transportation
1,007.0 979.6 1,986.7 1,198.2 869.1 2,067.2
4,053.9
Municipalities - - - 6,860.5 675.9 7,536.5
7,536.5
Tourism and recreational activities
676.8 270.6 947.4 - 201.1 201.1
1,148.5
Social and community housing
875.6 10.5 886.1 503.2 1,120.7 1,623.9
2,510.0
Northern development 306.0 508.1 814.1 - 94.0 94.0
908.0
Research - 798.0 798.0 - 208.5 208.5
1,006.5
Environment 289.9 - 289.9 408.2 232.5 640.7
930.6
Agriculture, forests, fauna and other
210.6 396.0 606.5 - 238.9 238.9
845.4
Subtotal 25,640.9 7,519.8 33,160.8 12,185.2 14,006.8 26,192.0
59,352.8
Support for Individuals and families
Educational childcare services
- - - 91.5 283.3 374.8
374.8
Administration and justice Government administration
1,900.1 1,889.9 3,790.0 7.0 122.6 129.6
3,919.6
Information resources 2,568.5 4,825.8 7,394.3 - - -
7,394.3
Subtotal 4,468.6 6,715.7 11,184.3 7.0 122.6 129.6
11,313.9
Subtotal - sector envelopes
59,100.4 31,864.0 90,964.4 13,371.9 15,258.3 28,630.2
119,594.6
Central envelope 2,815.1 6,943.3 9,758.4 - 1,147.0 1,147.0
10,905.4
Total 61,915.5 38,807.3 100,722.8 13,371.9 16,405.3 29,777.2 130,500.0
Note: Figures are rounded and the sum of the amounts may not correspond to the total indicated.
Section
B
B.1
Section B
Planned investments by sector 1. Summary tables ...................................................................................................... 4
1.1 Investments by mission and by sector ................................................................... 4
1.2 Investments by mission, sector and by year .......................................................... 6
1.3 Investments by investment type and by year ......................................................... 8
1.4 Investments by mission, sector and by investment type .................................... 10
1.5 Authorized and announced projects of $20.0 million or more and other 2020-2030 QIP investments by mission, sector and by project and envelope .. 12
1.6 Investments by mission, sector and by administrative region ........................... 14
2. Planned investments by sector ........................................................................... 16
2.1 Health and social services ..................................................................................... 18
2.1.1 2020-2030 QIP investments ....................................................................................... 18
2.1.2 Authorized and announced projects of $20.0 million or more, by degree of progress ................................................................................................. 18
2.1.3 Profile of infrastructure and investment strategies – Health and Social Services ...... 23
2.2 Education ................................................................................................................. 26
2.2.1 2020-2030 QIP investments ....................................................................................... 26
2.2.2 Authorized and announced projects of $20.0 million or more, by degree of progress ................................................................................................. 26
2.2.3 Profile of infrastructure and investment strategies – Education ................................. 30
2.3 Higher education ..................................................................................................... 33
2.3.1 2020-2030 QIP investments ....................................................................................... 33
2.3.2 Authorized and announced projects of $20.0 million or more, by degree of progress ................................................................................................. 33
2.3.3 Profile of infrastructure and investment strategies – Higher Education ..................... 35
2.4 Road network ........................................................................................................... 38
2.4.1 2020-2030 QIP investments ....................................................................................... 38
2.4.2 Authorized and announced projects of $20.0 million or more, by degree of progress ................................................................................................. 38
2.4.3 Profile of infrastructure and investment strategies – Road Network .......................... 43
2.5 Public transit ............................................................................................................ 48
2.5.1 2020-2030 QIP investments ....................................................................................... 48
B.2
2.5.2 Authorized and announced projects of $20.0 million or more, by degree of progress ................................................................................................. 48
2.5.3 Profile of infrastructure and investment strategies – Public transit ............................ 52
2.6 Municipalities ........................................................................................................... 55
2.6.1 2020-2030 QIP investments ....................................................................................... 55
2.6.2 Authorized and announced projects of $20.0 million or more, by degree of progress ................................................................................................. 55
2.6.3 Profile of infrastructure and investment strategies – Municipalities ........................... 57
2.7 Government administration ................................................................................... 60
2.7.1 2020-2030 QIP investments ....................................................................................... 60
2.7.2 Authorized and announced projects of $20.0 million or more, by degree of progress ................................................................................................. 60
2.7.3 Profile of infrastructure and investment strategies – Société québécoise des infrastructures ............................................................................................................. 62
2.8 Culture ...................................................................................................................... 65
2.8.1 2020-2030 QIP investments ....................................................................................... 65
2.8.2 Authorized and announced projects of $20.0 million or more, by degree of progress ................................................................................................. 65
2.9 Development of sport ............................................................................................. 67
2.9.1 2020-2030 QIP investments ....................................................................................... 67
2.9.2 Authorized and announced projects of $20.0 million or more, by degree of progress ................................................................................................. 67
2.10 Marine, air, rail and other transportation .............................................................. 69
2.10.1 2020-2030 QIP investments ....................................................................................... 69
2.10.2 Authorized and announced projects of $20.0 million or more, by degree of progress ................................................................................................. 69
2.11 Tourism and recreational activities ....................................................................... 71
2.11.1 2020-2030 QIP investments ....................................................................................... 71
2.11.2 Authorized and announced projects of $20.0 million or more, by degree of progress ................................................................................................. 71
2.12 Social and community housing ............................................................................. 73
2.12.1 2020-2030 QIP investments ....................................................................................... 73
2.13 Northern development ............................................................................................ 74
2.13.1 2020-2030 QIP investments ....................................................................................... 74
2.13.2 Authorized and announced projects of $20.0 million or more, by degree of progress ................................................................................................. 74
2.14 Research .................................................................................................................. 75
2.14.1 2020-2030 QIP investments ....................................................................................... 75
Section
B
B.3
2.14.2 Authorized and announced projects of $20.0 million or more, by degree of progress ................................................................................................. 75
2.15 Environment ............................................................................................................ 77
2.15.1 2020-2030 QIP investments ....................................................................................... 77
2.15.2 Authorized and announced projects of $20.0 million or more, by degree of progress ................................................................................................. 77
2.16 Agriculture, forests, fauna and other .................................................................... 79
2.16.1 2020-2030 QIP investments ....................................................................................... 79
2.16.2 Authorized and announced projects of $20.0 million or more, by degree of progress ................................................................................................. 79
2.17 Educational childcare services .............................................................................. 80
2.17.1 2020-2030 QIP investments ....................................................................................... 80
2.18 Information resources ............................................................................................ 81
2.18.1 2020-2030 QIP investments ....................................................................................... 81
2.18.2 Authorized and announced projects of $20.0 million or more, by degree of progress ................................................................................................. 81
3. Update of planned investments for 2019-2020 ..................................................... 83
4. Report on investments made in 2018-2019 ........................................................... 84
Appendix 1 – Investments made in 2018-2019 in relation to those planned for this year in the 2018-2028 QIP ........................................................................... 85
Appendix 2 – History of investments made compared to those planned for 2015-2016 to 2018-2019 ............................................................................... 88
Appendix 3 – History of investment levels planned in the Québec Infrastructure Plan ....................................................................................................................... 90
Appendix 4 – Investments by mission, sector, type and by administrative region ... 92
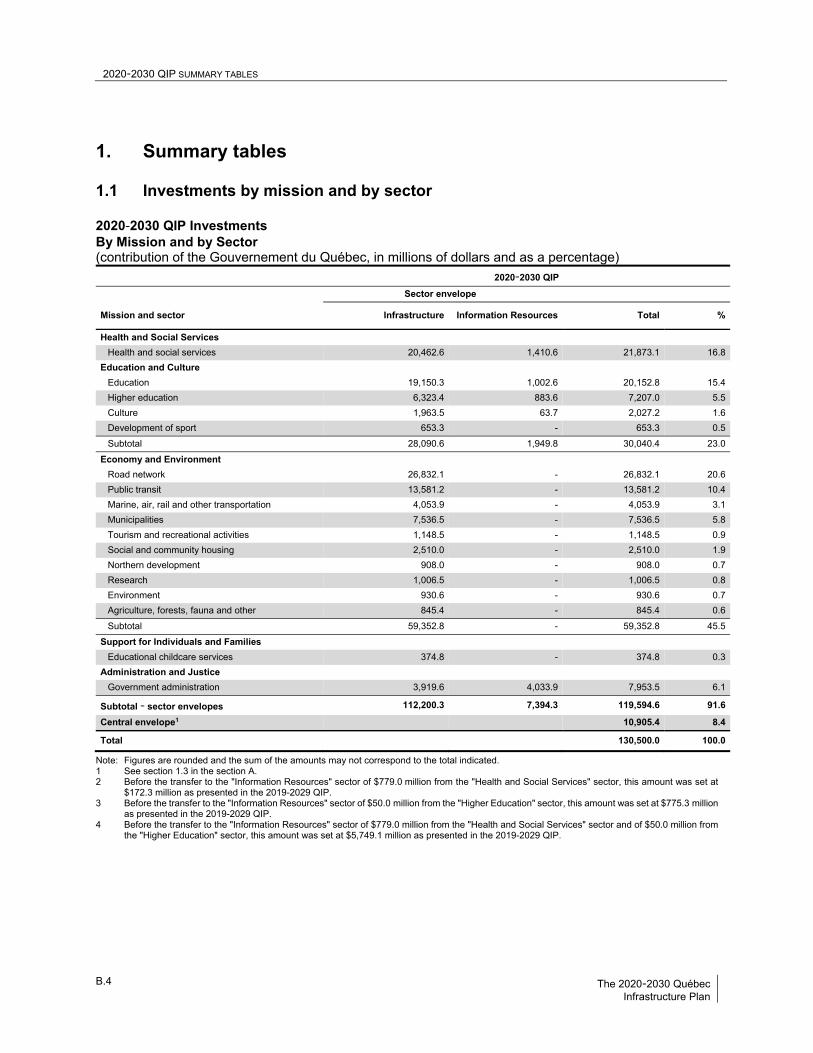
2020-2030 QIP SUMMARY TABLES B
B.4 The 2020-2030 Québec Infrastructure Plan
1. Summary tables
1.1 Investments by mission and by sector 2020‐2030 QIP Investments By Mission and by Sector (contribution of the Gouvernement du Québec, in millions of dollars and as a percentage) 2020‐2030 QIP
Sector envelope
Mission and sector Infrastructure Information Resources Total %
Health and Social Services
Health and social services 20,462.6 1,410.6 21,873.1 16.8
Education and Culture
Education 19,150.3 1,002.6 20,152.8 15.4
Higher education 6,323.4 883.6 7,207.0 5.5
Culture 1,963.5 63.7 2,027.2 1.6
Development of sport 653.3 - 653.3 0.5
Subtotal 28,090.6 1,949.8 30,040.4 23.0
Economy and Environment
Road network 26,832.1 - 26,832.1 20.6
Public transit 13,581.2 - 13,581.2 10.4
Marine, air, rail and other transportation 4,053.9 - 4,053.9 3.1
Municipalities 7,536.5 - 7,536.5 5.8
Tourism and recreational activities 1,148.5 - 1,148.5 0.9
Social and community housing 2,510.0 - 2,510.0 1.9
Northern development 908.0 - 908.0 0.7
Research 1,006.5 - 1,006.5 0.8
Environment 930.6 - 930.6 0.7
Agriculture, forests, fauna and other 845.4 - 845.4 0.6
Subtotal 59,352.8 - 59,352.8 45.5
Support for Individuals and Families
Educational childcare services 374.8 - 374.8 0.3
Administration and Justice
Government administration 3,919.6 4,033.9 7,953.5 6.1
Subtotal ‐ sector envelopes 112,200.3 7,394.3 119,594.6 91.6
Central envelope1 10,905.4 8.4
Total 130,500.0 100.0
Note: Figures are rounded and the sum of the amounts may not correspond to the total indicated. 1 See section 1.3 in the section A. 2 Before the transfer to the "Information Resources" sector of $779.0 million from the "Health and Social Services" sector, this amount was set at
$172.3 million as presented in the 2019-2029 QIP. 3 Before the transfer to the "Information Resources" sector of $50.0 million from the "Higher Education" sector, this amount was set at $775.3 million
as presented in the 2019-2029 QIP. 4 Before the transfer to the "Information Resources" sector of $779.0 million from the "Health and Social Services" sector and of $50.0 million from
the "Higher Education" sector, this amount was set at $5,749.1 million as presented in the 2019-2029 QIP.
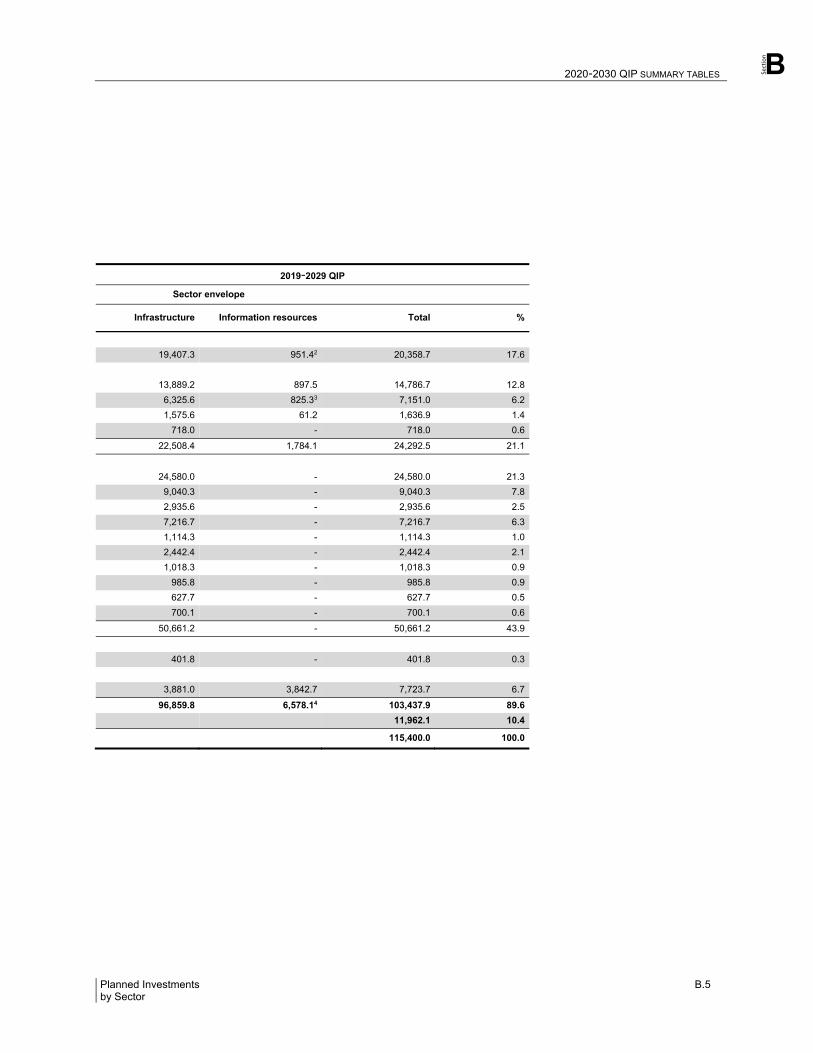
Section
2020-2030 QIP SUMMARY TABLES B
Planned Investments B.5 by Sector
2019‐2029 QIP
Sector envelope
Infrastructure Information resources Total %
19,407.3 951.42 20,358.7 17.6
13,889.2 897.5 14,786.7 12.8
6,325.6 825.33 7,151.0 6.2
1,575.6 61.2 1,636.9 1.4
718.0 - 718.0 0.6
22,508.4 1,784.1 24,292.5 21.1
24,580.0 - 24,580.0 21.3
9,040.3 - 9,040.3 7.8
2,935.6 - 2,935.6 2.5
7,216.7 - 7,216.7 6.3
1,114.3 - 1,114.3 1.0
2,442.4 - 2,442.4 2.1
1,018.3 - 1,018.3 0.9
985.8 - 985.8 0.9
627.7 - 627.7 0.5
700.1 - 700.1 0.6
50,661.2 - 50,661.2 43.9
401.8 - 401.8 0.3
3,881.0 3,842.7 7,723.7 6.7
96,859.8 6,578.14 103,437.9 89.6
11,962.1 10.4
115,400.0 100.0
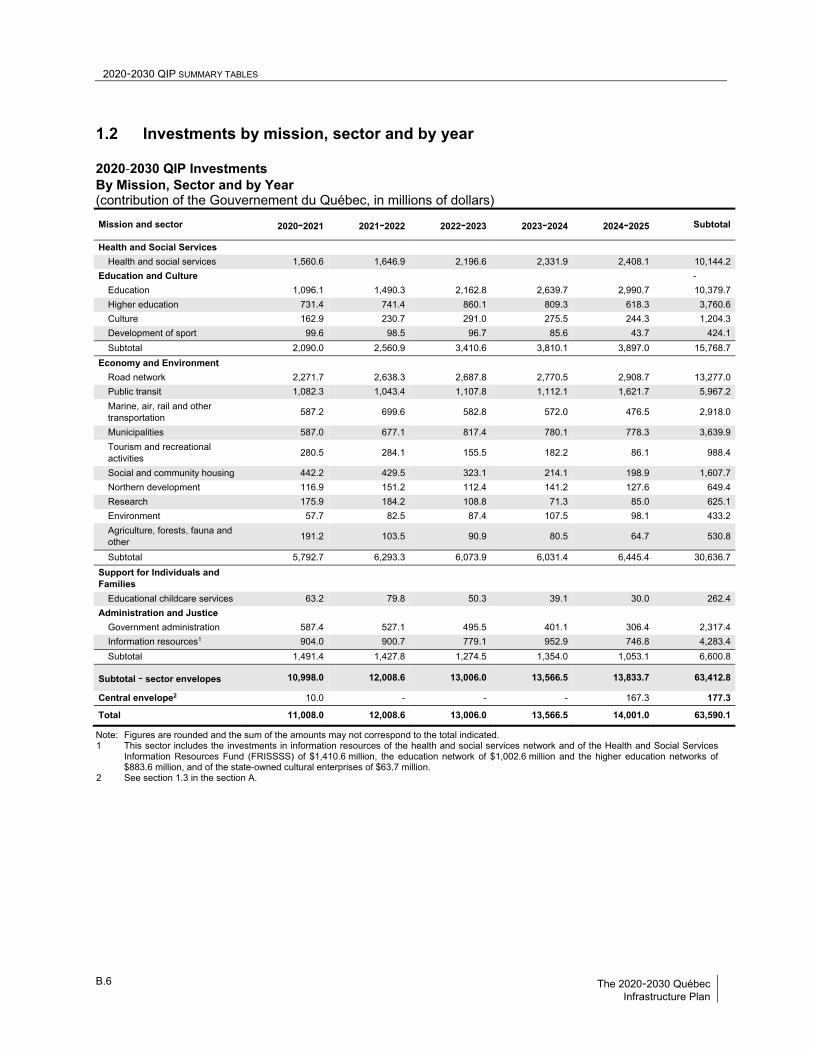
2020-2030 QIP SUMMARY TABLES B
B.6 The 2020-2030 Québec Infrastructure Plan
1.2 Investments by mission, sector and by year 2020‐2030 QIP Investments By Mission, Sector and by Year (contribution of the Gouvernement du Québec, in millions of dollars)
Mission and sector 2020-2021 2021-2022 2022-2023 2023-2024 2024-2025 Subtotal
Health and Social Services
Health and social services 1,560.6 1,646.9 2,196.6 2,331.9 2,408.1 10,144.2
Education and Culture -
Education 1,096.1 1,490.3 2,162.8 2,639.7 2,990.7 10,379.7
Higher education 731.4 741.4 860.1 809.3 618.3 3,760.6
Culture 162.9 230.7 291.0 275.5 244.3 1,204.3
Development of sport 99.6 98.5 96.7 85.6 43.7 424.1
Subtotal 2,090.0 2,560.9 3,410.6 3,810.1 3,897.0 15,768.7
Economy and Environment
Road network 2,271.7 2,638.3 2,687.8 2,770.5 2,908.7 13,277.0
Public transit 1,082.3 1,043.4 1,107.8 1,112.1 1,621.7 5,967.2
Marine, air, rail and other transportation
587.2 699.6 582.8 572.0 476.5 2,918.0
Municipalities 587.0 677.1 817.4 780.1 778.3 3,639.9
Tourism and recreational activities
280.5 284.1 155.5 182.2 86.1 988.4
Social and community housing 442.2 429.5 323.1 214.1 198.9 1,607.7
Northern development 116.9 151.2 112.4 141.2 127.6 649.4
Research 175.9 184.2 108.8 71.3 85.0 625.1
Environment 57.7 82.5 87.4 107.5 98.1 433.2
Agriculture, forests, fauna and other
191.2 103.5 90.9 80.5 64.7 530.8
Subtotal 5,792.7 6,293.3 6,073.9 6,031.4 6,445.4 30,636.7
Support for Individuals and Families
Educational childcare services 63.2 79.8 50.3 39.1 30.0 262.4
Administration and Justice
Government administration 587.4 527.1 495.5 401.1 306.4 2,317.4
Information resources1 904.0 900.7 779.1 952.9 746.8 4,283.4
Subtotal 1,491.4 1,427.8 1,274.5 1,354.0 1,053.1 6,600.8
Subtotal ‐ sector envelopes 10,998.0 12,008.6 13,006.0 13,566.5 13,833.7 63,412.8
Central envelope2 10.0 - - - 167.3 177.3
Total 11,008.0 12,008.6 13,006.0 13,566.5 14,001.0 63,590.1
Note: Figures are rounded and the sum of the amounts may not correspond to the total indicated. 1 This sector includes the investments in information resources of the health and social services network and of the Health and Social Services
Information Resources Fund (FRISSSS) of $1,410.6 million, the education network of $1,002.6 million and the higher education networks of $883.6 million, and of the state-owned cultural enterprises of $63.7 million.
2 See section 1.3 in the section A.
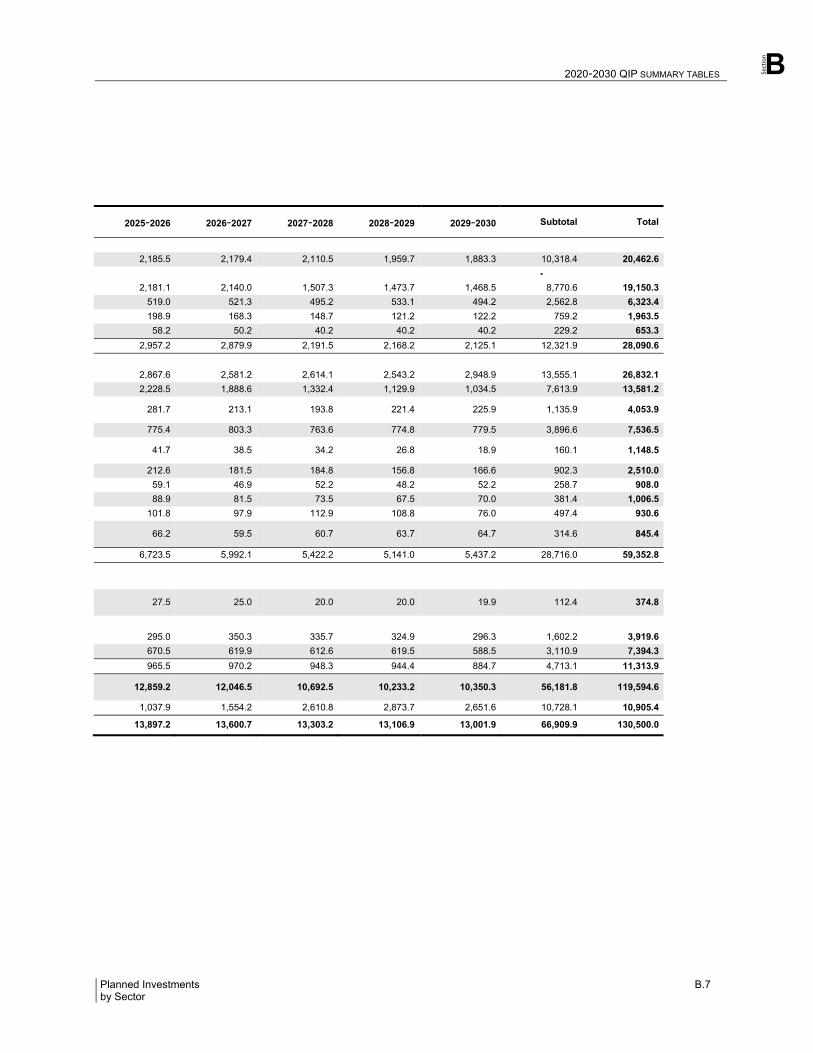
Section
2020-2030 QIP SUMMARY TABLES B
Planned Investments B.7 by Sector
2025‐2026 2026‐2027 2027‐2028 2028‐2029 2029‐2030 Subtotal Total
2,185.5 2,179.4 2,110.5 1,959.7 1,883.3 10,318.4 20,462.6
-
2,181.1 2,140.0 1,507.3 1,473.7 1,468.5 8,770.6 19,150.3
519.0 521.3 495.2 533.1 494.2 2,562.8 6,323.4
198.9 168.3 148.7 121.2 122.2 759.2 1,963.5
58.2 50.2 40.2 40.2 40.2 229.2 653.3
2,957.2 2,879.9 2,191.5 2,168.2 2,125.1 12,321.9 28,090.6
2,867.6 2,581.2 2,614.1 2,543.2 2,948.9 13,555.1 26,832.1
2,228.5 1,888.6 1,332.4 1,129.9 1,034.5 7,613.9 13,581.2
281.7 213.1 193.8 221.4 225.9 1,135.9 4,053.9
775.4 803.3 763.6 774.8 779.5 3,896.6 7,536.5
41.7 38.5 34.2 26.8 18.9 160.1 1,148.5
212.6 181.5 184.8 156.8 166.6 902.3 2,510.0
59.1 46.9 52.2 48.2 52.2 258.7 908.0
88.9 81.5 73.5 67.5 70.0 381.4 1,006.5
101.8 97.9 112.9 108.8 76.0 497.4 930.6
66.2 59.5 60.7 63.7 64.7 314.6 845.4
6,723.5 5,992.1 5,422.2 5,141.0 5,437.2 28,716.0 59,352.8
27.5 25.0 20.0 20.0 19.9 112.4 374.8
295.0 350.3 335.7 324.9 296.3 1,602.2 3,919.6
670.5 619.9 612.6 619.5 588.5 3,110.9 7,394.3
965.5 970.2 948.3 944.4 884.7 4,713.1 11,313.9
12,859.2 12,046.5 10,692.5 10,233.2 10,350.3 56,181.8 119,594.6
1,037.9 1,554.2 2,610.8 2,873.7 2,651.6 10,728.1 10,905.4
13,897.2 13,600.7 13,303.2 13,106.9 13,001.9 66,909.9 130,500.0
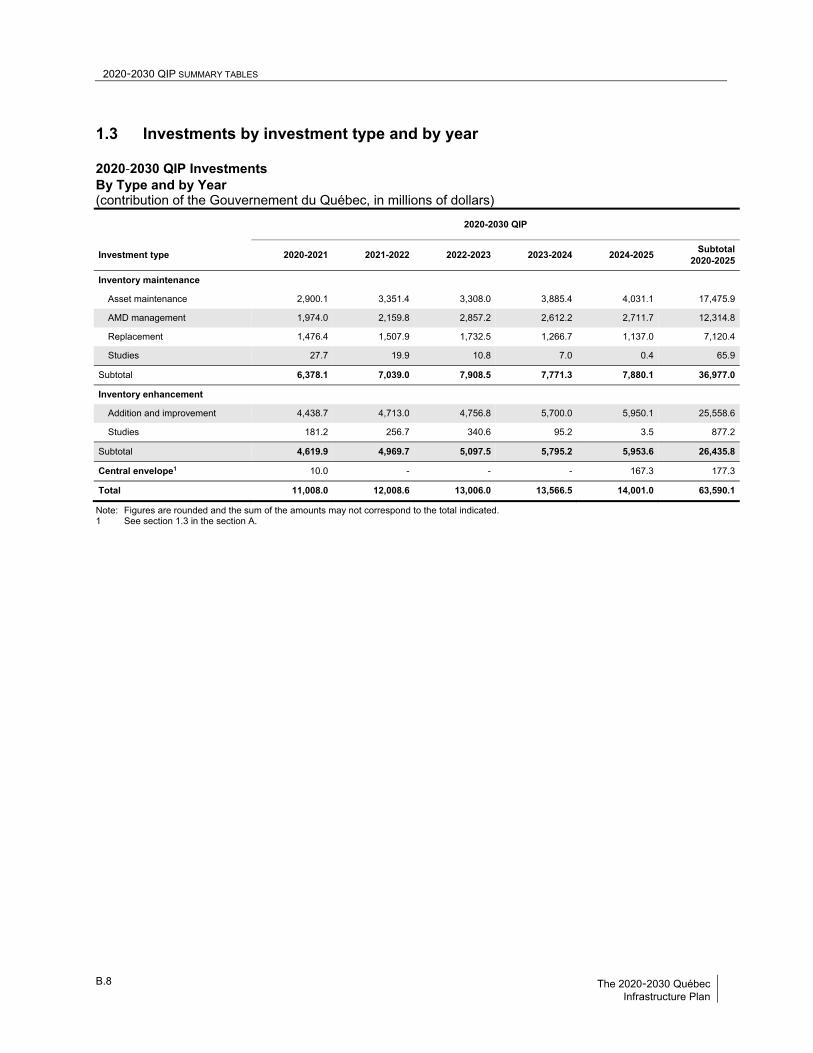
2020-2030 QIP SUMMARY TABLES B
B.8 The 2020-2030 Québec Infrastructure Plan
1.3 Investments by investment type and by year 2020‐2030 QIP Investments By Type and by Year (contribution of the Gouvernement du Québec, in millions of dollars)
2020-2030 QIP
Investment type 2020-2021 2021-2022 2022-2023 2023-2024 2024-2025 Subtotal
2020-2025
Inventory maintenance
Asset maintenance 2,900.1 3,351.4 3,308.0 3,885.4 4,031.1 17,475.9
AMD management 1,974.0 2,159.8 2,857.2 2,612.2 2,711.7 12,314.8
Replacement 1,476.4 1,507.9 1,732.5 1,266.7 1,137.0 7,120.4
Studies 27.7 19.9 10.8 7.0 0.4 65.9
Subtotal 6,378.1 7,039.0 7,908.5 7,771.3 7,880.1 36,977.0
Inventory enhancement
Addition and improvement 4,438.7 4,713.0 4,756.8 5,700.0 5,950.1 25,558.6
Studies 181.2 256.7 340.6 95.2 3.5 877.2
Subtotal 4,619.9 4,969.7 5,097.5 5,795.2 5,953.6 26,435.8
Central envelope1 10.0 - - - 167.3 177.3
Total 11,008.0 12,008.6 13,006.0 13,566.5 14,001.0 63,590.1
Note: Figures are rounded and the sum of the amounts may not correspond to the total indicated. 1 See section 1.3 in the section A.
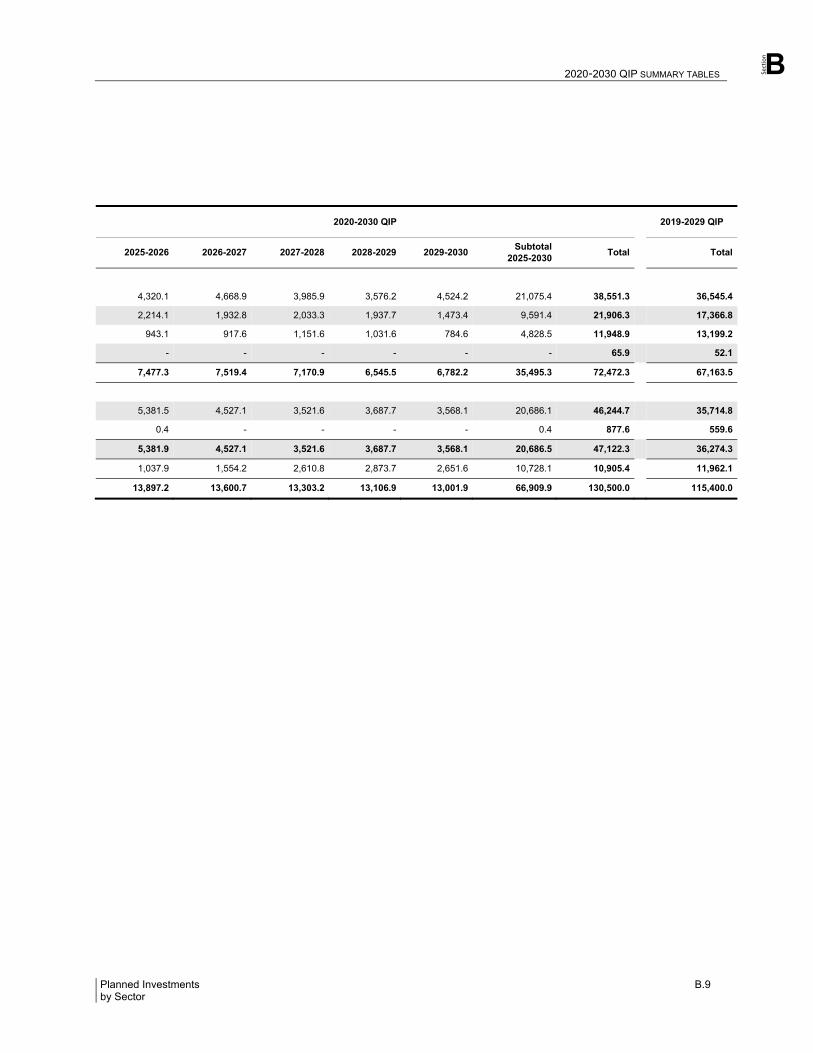
Section
2020-2030 QIP SUMMARY TABLES B
Planned Investments B.9 by Sector
2020-2030 QIP 2019-2029 QIP
2025-2026 2026-2027 2027-2028 2028-2029 2029-2030 Subtotal
2025-2030 Total
Total
4,320.1 4,668.9 3,985.9 3,576.2 4,524.2 21,075.4 38,551.3 36,545.4
2,214.1 1,932.8 2,033.3 1,937.7 1,473.4 9,591.4 21,906.3 17,366.8
943.1 917.6 1,151.6 1,031.6 784.6 4,828.5 11,948.9 13,199.2
- - - - - - 65.9 52.1
7,477.3 7,519.4 7,170.9 6,545.5 6,782.2 35,495.3 72,472.3 67,163.5
5,381.5 4,527.1 3,521.6 3,687.7 3,568.1 20,686.1 46,244.7 35,714.8
0.4 - - - - 0.4 877.6 559.6
5,381.9 4,527.1 3,521.6 3,687.7 3,568.1 20,686.5 47,122.3 36,274.3
1,037.9 1,554.2 2,610.8 2,873.7 2,651.6 10,728.1 10,905.4 11,962.1
13,897.2 13,600.7 13,303.2 13,106.9 13,001.9 66,909.9 130,500.0 115,400.0
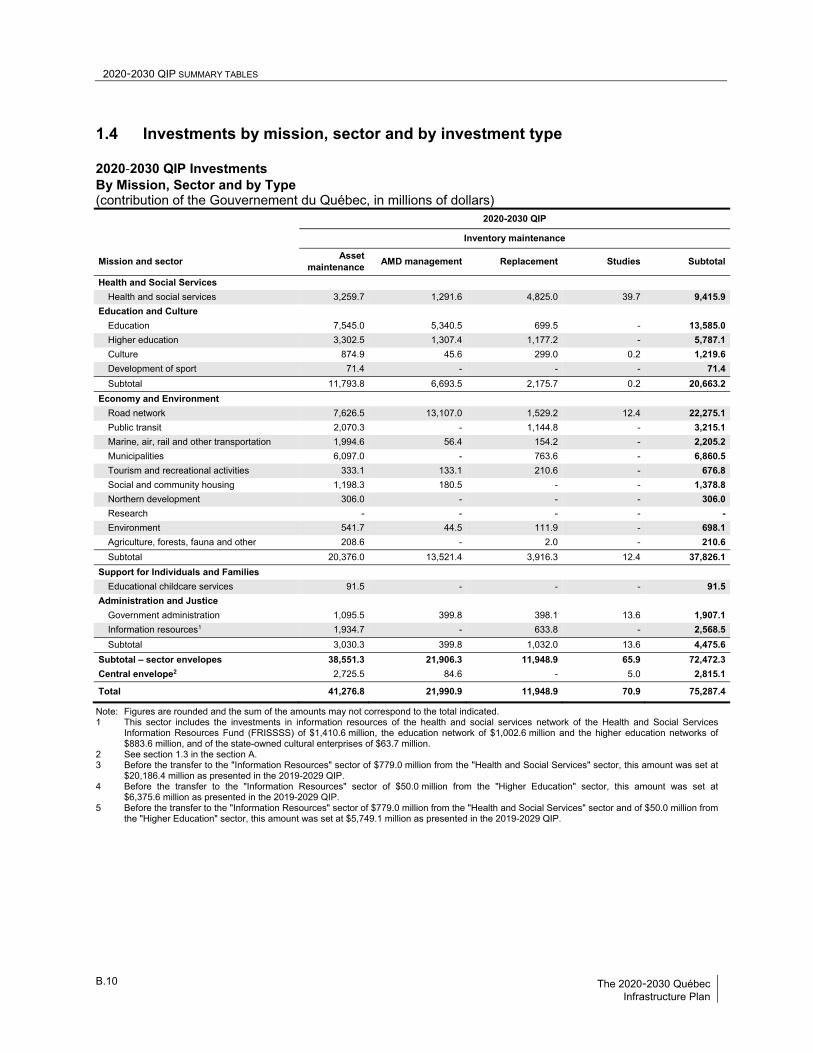
2020-2030 QIP SUMMARY TABLES B
B.10 The 2020-2030 Québec Infrastructure Plan
1.4 Investments by mission, sector and by investment type 2020‐2030 QIP Investments By Mission, Sector and by Type (contribution of the Gouvernement du Québec, in millions of dollars) 2020-2030 QIP
Inventory maintenance
Mission and sector Asset
maintenance AMD management Replacement Studies Subtotal
Health and Social Services
Health and social services 3,259.7 1,291.6 4,825.0 39.7 9,415.9
Education and Culture
Education 7,545.0 5,340.5 699.5 - 13,585.0
Higher education 3,302.5 1,307.4 1,177.2 - 5,787.1
Culture 874.9 45.6 299.0 0.2 1,219.6
Development of sport 71.4 - - - 71.4
Subtotal 11,793.8 6,693.5 2,175.7 0.2 20,663.2
Economy and Environment
Road network 7,626.5 13,107.0 1,529.2 12.4 22,275.1
Public transit 2,070.3 - 1,144.8 - 3,215.1
Marine, air, rail and other transportation 1,994.6 56.4 154.2 - 2,205.2
Municipalities 6,097.0 - 763.6 - 6,860.5
Tourism and recreational activities 333.1 133.1 210.6 - 676.8
Social and community housing 1,198.3 180.5 - - 1,378.8
Northern development 306.0 - - - 306.0
Research - - - - -
Environment 541.7 44.5 111.9 - 698.1
Agriculture, forests, fauna and other 208.6 - 2.0 - 210.6
Subtotal 20,376.0 13,521.4 3,916.3 12.4 37,826.1
Support for Individuals and Families
Educational childcare services 91.5 - - - 91.5
Administration and Justice
Government administration 1,095.5 399.8 398.1 13.6 1,907.1
Information resources1 1,934.7 - 633.8 - 2,568.5
Subtotal 3,030.3 399.8 1,032.0 13.6 4,475.6
Subtotal – sector envelopes 38,551.3 21,906.3 11,948.9 65.9 72,472.3
Central envelope2 2,725.5 84.6 - 5.0 2,815.1
Total 41,276.8 21,990.9 11,948.9 70.9 75,287.4
Note: Figures are rounded and the sum of the amounts may not correspond to the total indicated. 1 This sector includes the investments in information resources of the health and social services network of the Health and Social Services
Information Resources Fund (FRISSSS) of $1,410.6 million, the education network of $1,002.6 million and the higher education networks of $883.6 million, and of the state-owned cultural enterprises of $63.7 million.
2 See section 1.3 in the section A. 3 Before the transfer to the "Information Resources" sector of $779.0 million from the "Health and Social Services" sector, this amount was set at
$20,186.4 million as presented in the 2019-2029 QIP. 4 Before the transfer to the "Information Resources" sector of $50.0 million from the "Higher Education" sector, this amount was set at
$6,375.6 million as presented in the 2019-2029 QIP. 5 Before the transfer to the "Information Resources" sector of $779.0 million from the "Health and Social Services" sector and of $50.0 million from
the "Higher Education" sector, this amount was set at $5,749.1 million as presented in the 2019-2029 QIP.
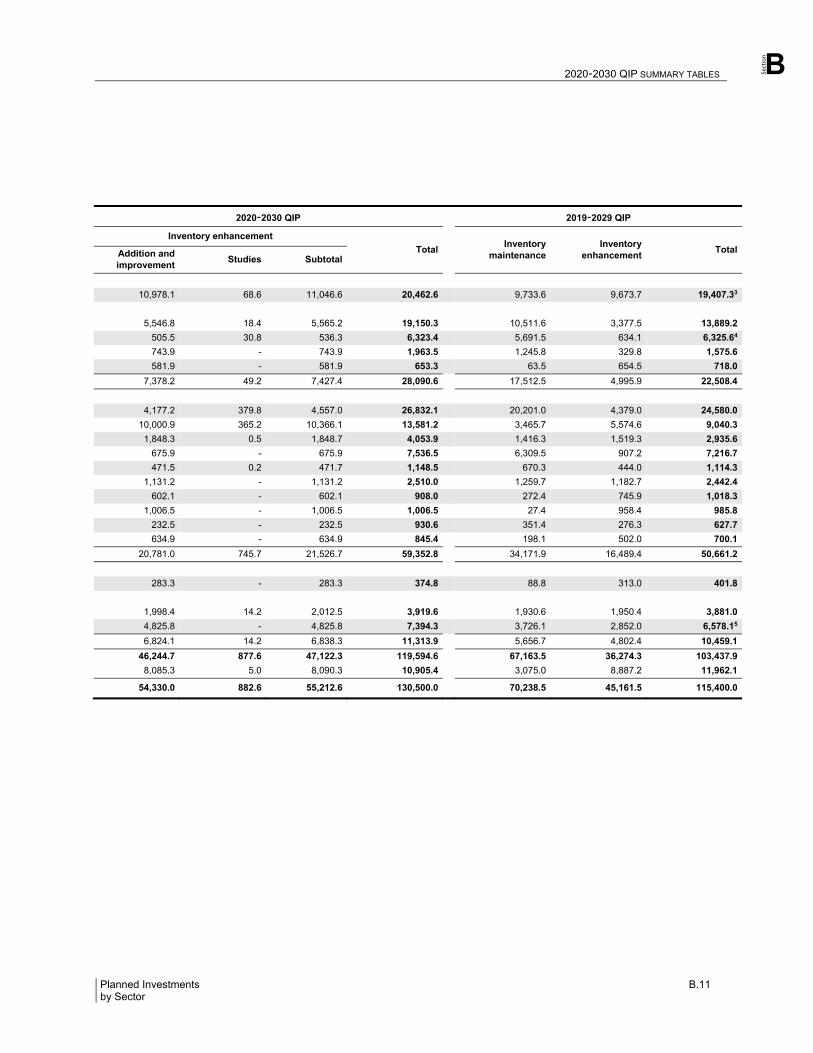
Section
2020-2030 QIP SUMMARY TABLES B
Planned Investments B.11 by Sector
2020‐2030 QIP
2019‐2029 QIP
Inventory enhancement
Total
Inventory
maintenance Inventory
enhancement Total Addition and
improvement Studies Subtotal
10,978.1 68.6 11,046.6 20,462.6 9,733.6 9,673.7 19,407.33
5,546.8 18.4 5,565.2 19,150.3 10,511.6 3,377.5 13,889.2
505.5 30.8 536.3 6,323.4 5,691.5 634.1 6,325.64
743.9 - 743.9 1,963.5 1,245.8 329.8 1,575.6
581.9 - 581.9 653.3 63.5 654.5 718.0
7,378.2 49.2 7,427.4 28,090.6 17,512.5 4,995.9 22,508.4
4,177.2 379.8 4,557.0 26,832.1 20,201.0 4,379.0 24,580.0
10,000.9 365.2 10,366.1 13,581.2 3,465.7 5,574.6 9,040.3
1,848.3 0.5 1,848.7 4,053.9 1,416.3 1,519.3 2,935.6
675.9 - 675.9 7,536.5 6,309.5 907.2 7,216.7
471.5 0.2 471.7 1,148.5 670.3 444.0 1,114.3
1,131.2 - 1,131.2 2,510.0 1,259.7 1,182.7 2,442.4
602.1 - 602.1 908.0 272.4 745.9 1,018.3
1,006.5 - 1,006.5 1,006.5 27.4 958.4 985.8
232.5 - 232.5 930.6 351.4 276.3 627.7
634.9 - 634.9 845.4 198.1 502.0 700.1
20,781.0 745.7 21,526.7 59,352.8 34,171.9 16,489.4 50,661.2
283.3 - 283.3 374.8 88.8 313.0 401.8
1,998.4 14.2 2,012.5 3,919.6 1,930.6 1,950.4 3,881.0
4,825.8 - 4,825.8 7,394.3 3,726.1 2,852.0 6,578.15
6,824.1 14.2 6,838.3 11,313.9 5,656.7 4,802.4 10,459.1
46,244.7 877.6 47,122.3 119,594.6 67,163.5 36,274.3 103,437.9
8,085.3 5.0 8,090.3 10,905.4 3,075.0 8,887.2 11,962.1
54,330.0 882.6 55,212.6 130,500.0 70,238.5 45,161.5 115,400.0
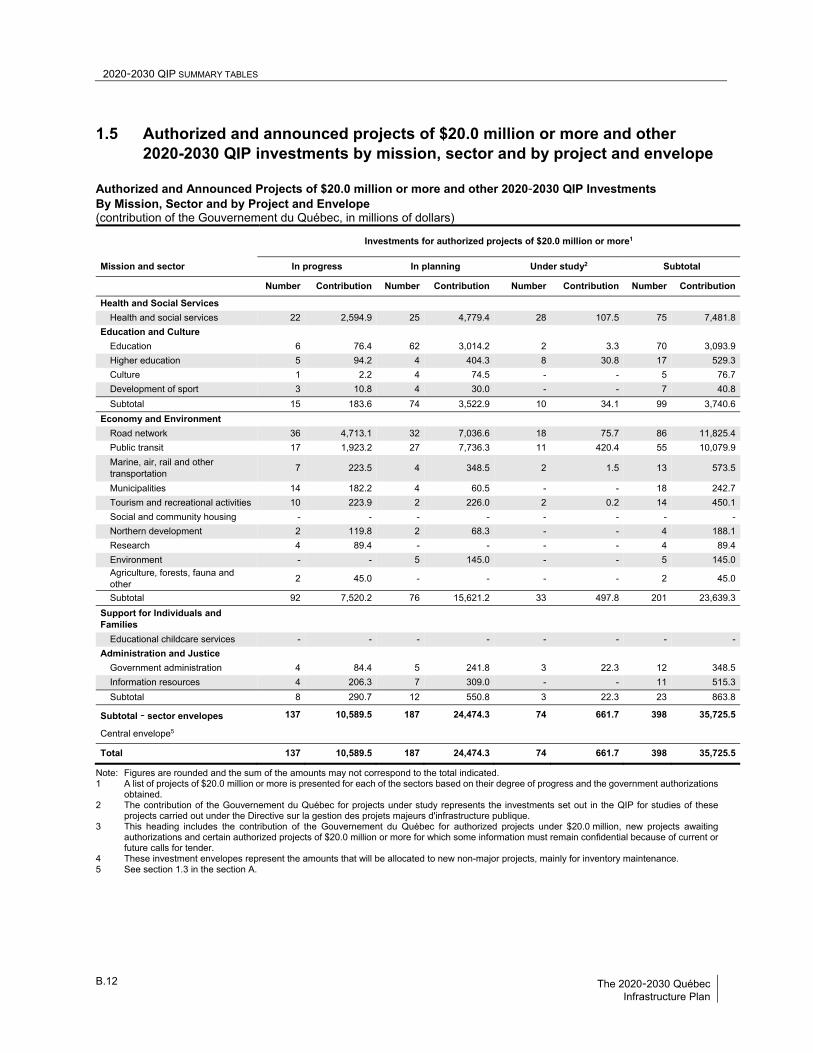
2020-2030 QIP SUMMARY TABLES B
B.12 The 2020-2030 Québec Infrastructure Plan
1.5 Authorized and announced projects of $20.0 million or more and other 2020-2030 QIP investments by mission, sector and by project and envelope
Authorized and Announced Projects of $20.0 million or more and other 2020‐2030 QIP Investments By Mission, Sector and by Project and Envelope (contribution of the Gouvernement du Québec, in millions of dollars)
Investments for authorized projects of $20.0 million or more1
Mission and sector In progress In planning Under study2 Subtotal
Number Contribution Number Contribution Number Contribution Number Contribution
Health and Social Services
Health and social services 22 2,594.9 25 4,779.4 28 107.5 75 7,481.8
Education and Culture
Education 6 76.4 62 3,014.2 2 3.3 70 3,093.9
Higher education 5 94.2 4 404.3 8 30.8 17 529.3
Culture 1 2.2 4 74.5 - - 5 76.7
Development of sport 3 10.8 4 30.0 - - 7 40.8
Subtotal 15 183.6 74 3,522.9 10 34.1 99 3,740.6
Economy and Environment
Road network 36 4,713.1 32 7,036.6 18 75.7 86 11,825.4
Public transit 17 1,923.2 27 7,736.3 11 420.4 55 10,079.9
Marine, air, rail and other transportation
7 223.5 4 348.5 2 1.5 13 573.5
Municipalities 14 182.2 4 60.5 - - 18 242.7
Tourism and recreational activities 10 223.9 2 226.0 2 0.2 14 450.1
Social and community housing - - - - - - - -
Northern development 2 119.8 2 68.3 - - 4 188.1
Research 4 89.4 - - - - 4 89.4
Environment - - 5 145.0 - - 5 145.0 Agriculture, forests, fauna and other
2 45.0 - - - - 2 45.0
Subtotal 92 7,520.2 76 15,621.2 33 497.8 201 23,639.3
Support for Individuals and Families
Educational childcare services - - - - - - - -
Administration and Justice
Government administration 4 84.4 5 241.8 3 22.3 12 348.5
Information resources 4 206.3 7 309.0 - - 11 515.3
Subtotal 8 290.7 12 550.8 3 22.3 23 863.8
Subtotal ‐ sector envelopes 137 10,589.5 187 24,474.3 74 661.7 398 35,725.5
Central envelope5
Total 137 10,589.5 187 24,474.3 74 661.7 398 35,725.5
Note: Figures are rounded and the sum of the amounts may not correspond to the total indicated. 1 A list of projects of $20.0 million or more is presented for each of the sectors based on their degree of progress and the government authorizations
obtained. 2 The contribution of the Gouvernement du Québec for projects under study represents the investments set out in the QIP for studies of these
projects carried out under the Directive sur la gestion des projets majeurs d'infrastructure publique. 3 This heading includes the contribution of the Gouvernement du Québec for authorized projects under $20.0 million, new projects awaiting
authorizations and certain authorized projects of $20.0 million or more for which some information must remain confidential because of current or future calls for tender.
4 These investment envelopes represent the amounts that will be allocated to new non-major projects, mainly for inventory maintenance. 5 See section 1.3 in the section A.
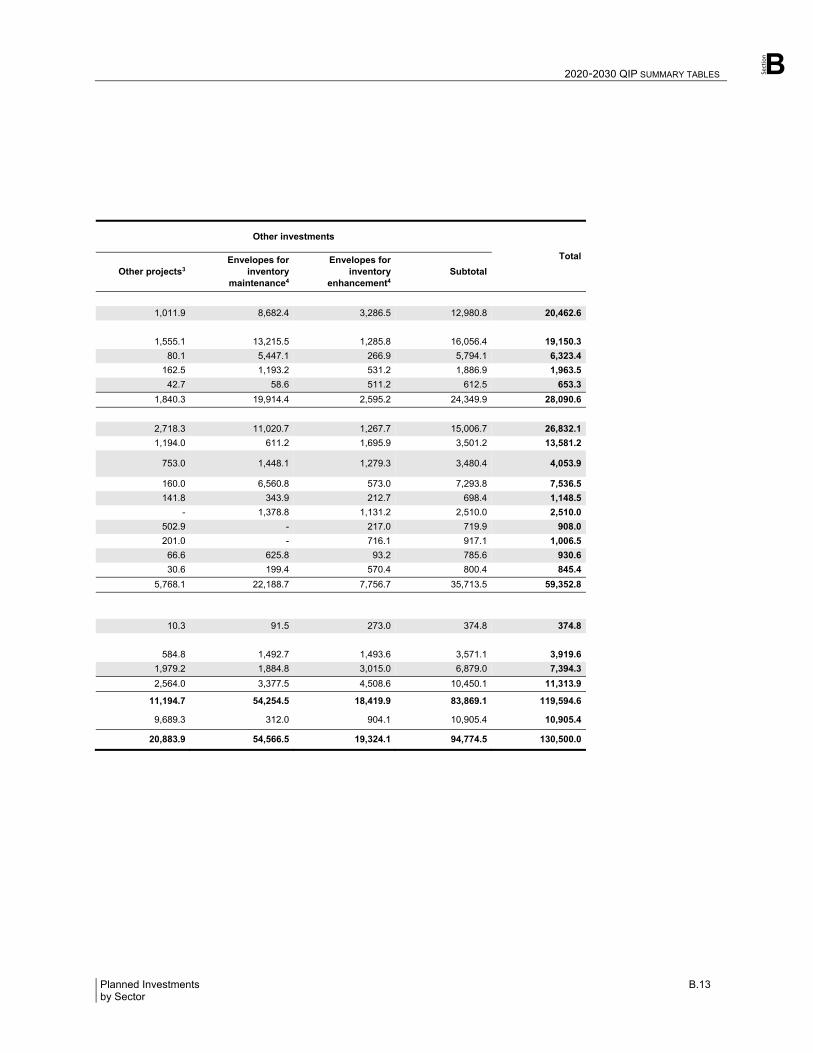
Section
2020-2030 QIP SUMMARY TABLES B
Planned Investments B.13 by Sector
Other investments
Total
Other projects3 Envelopes for
inventory maintenance4
Envelopes for inventory
enhancement4 Subtotal
1,011.9 8,682.4 3,286.5 12,980.8 20,462.6
1,555.1 13,215.5 1,285.8 16,056.4 19,150.3
80.1 5,447.1 266.9 5,794.1 6,323.4
162.5 1,193.2 531.2 1,886.9 1,963.5
42.7 58.6 511.2 612.5 653.3
1,840.3 19,914.4 2,595.2 24,349.9 28,090.6
2,718.3 11,020.7 1,267.7 15,006.7 26,832.1
1,194.0 611.2 1,695.9 3,501.2 13,581.2
753.0 1,448.1 1,279.3 3,480.4 4,053.9
160.0 6,560.8 573.0 7,293.8 7,536.5
141.8 343.9 212.7 698.4 1,148.5
- 1,378.8 1,131.2 2,510.0 2,510.0
502.9 - 217.0 719.9 908.0
201.0 - 716.1 917.1 1,006.5
66.6 625.8 93.2 785.6 930.6
30.6 199.4 570.4 800.4 845.4
5,768.1 22,188.7 7,756.7 35,713.5 59,352.8
10.3 91.5 273.0 374.8 374.8
584.8 1,492.7 1,493.6 3,571.1 3,919.6
1,979.2 1,884.8 3,015.0 6,879.0 7,394.3
2,564.0 3,377.5 4,508.6 10,450.1 11,313.9
11,194.7 54,254.5 18,419.9 83,869.1 119,594.6
9,689.3 312.0 904.1 10,905.4 10,905.4
20,883.9 54,566.5 19,324.1 94,774.5 130,500.0
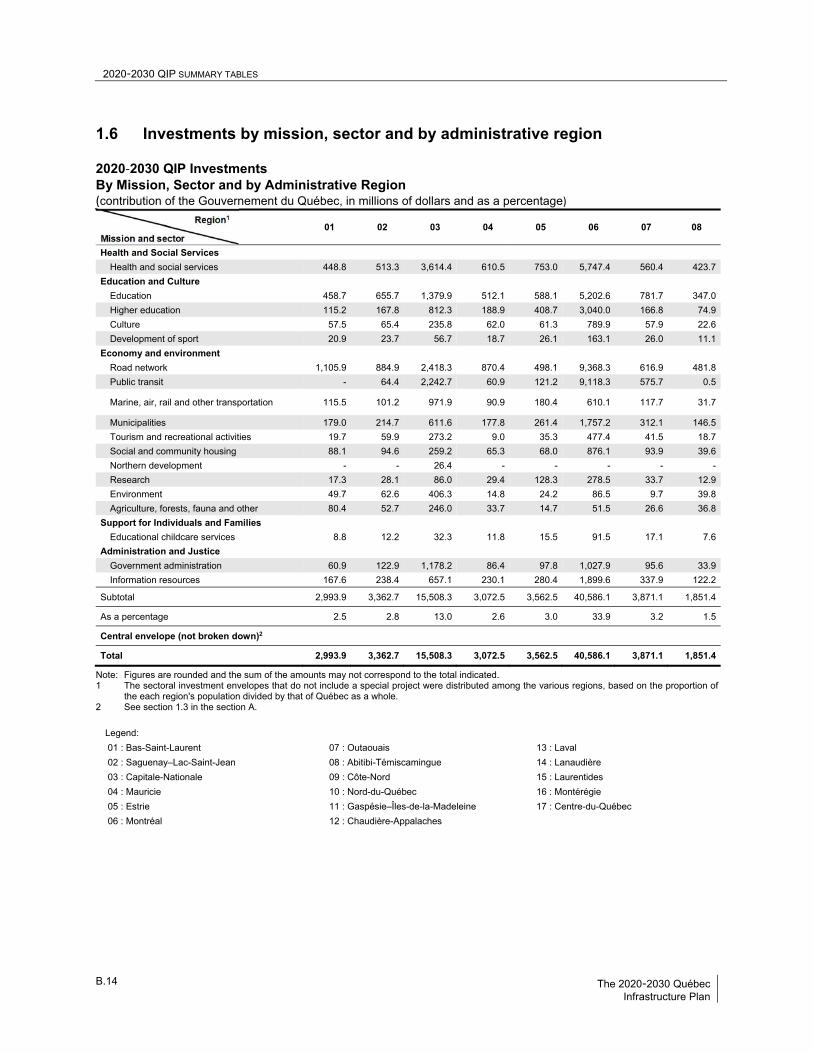
2020-2030 QIP SUMMARY TABLES B
B.14 The 2020-2030 Québec Infrastructure Plan
1.6 Investments by mission, sector and by administrative region 2020‐2030 QIP Investments By Mission, Sector and by Administrative Region (contribution of the Gouvernement du Québec, in millions of dollars and as a percentage)
Mission and sector
Region1
01 02 03 04 05 06 07 08
Health and Social Services
Health and social services 448.8 513.3 3,614.4 610.5 753.0 5,747.4 560.4 423.7
Education and Culture
Education 458.7 655.7 1,379.9 512.1 588.1 5,202.6 781.7 347.0
Higher education 115.2 167.8 812.3 188.9 408.7 3,040.0 166.8 74.9
Culture 57.5 65.4 235.8 62.0 61.3 789.9 57.9 22.6
Development of sport 20.9 23.7 56.7 18.7 26.1 163.1 26.0 11.1
Economy and environment
Road network 1,105.9 884.9 2,418.3 870.4 498.1 9,368.3 616.9 481.8
Public transit - 64.4 2,242.7 60.9 121.2 9,118.3 575.7 0.5
Marine, air, rail and other transportation 115.5 101.2 971.9 90.9 180.4 610.1 117.7 31.7
Municipalities 179.0 214.7 611.6 177.8 261.4 1,757.2 312.1 146.5
Tourism and recreational activities 19.7 59.9 273.2 9.0 35.3 477.4 41.5 18.7
Social and community housing 88.1 94.6 259.2 65.3 68.0 876.1 93.9 39.6
Northern development - - 26.4 - - - - -
Research 17.3 28.1 86.0 29.4 128.3 278.5 33.7 12.9
Environment 49.7 62.6 406.3 14.8 24.2 86.5 9.7 39.8
Agriculture, forests, fauna and other 80.4 52.7 246.0 33.7 14.7 51.5 26.6 36.8
Support for Individuals and Families
Educational childcare services 8.8 12.2 32.3 11.8 15.5 91.5 17.1 7.6
Administration and Justice
Government administration 60.9 122.9 1,178.2 86.4 97.8 1,027.9 95.6 33.9
Information resources 167.6 238.4 657.1 230.1 280.4 1,899.6 337.9 122.2
Subtotal 2,993.9 3,362.7 15,508.3 3,072.5 3,562.5 40,586.1 3,871.1 1,851.4
As a percentage 2.5 2.8 13.0 2.6 3.0 33.9 3.2 1.5
Central envelope (not broken down)2
Total 2,993.9 3,362.7 15,508.3 3,072.5 3,562.5 40,586.1 3,871.1 1,851.4
Note: Figures are rounded and the sum of the amounts may not correspond to the total indicated. 1 The sectoral investment envelopes that do not include a special project were distributed among the various regions, based on the proportion of
the each region's population divided by that of Québec as a whole. 2 See section 1.3 in the section A.
Legend:
01 : Bas-Saint-Laurent
02 : Saguenay–Lac-Saint-Jean
03 : Capitale-Nationale
04 : Mauricie
05 : Estrie
06 : Montréal
07 : Outaouais
08 : Abitibi-Témiscamingue
09 : Côte-Nord
10 : Nord-du-Québec
11 : Gaspésie–Îles-de-la-Madeleine
12 : Chaudière-Appalaches
13 : Laval
14 : Lanaudière
15 : Laurentides
16 : Montérégie
17 : Centre-du-Québec
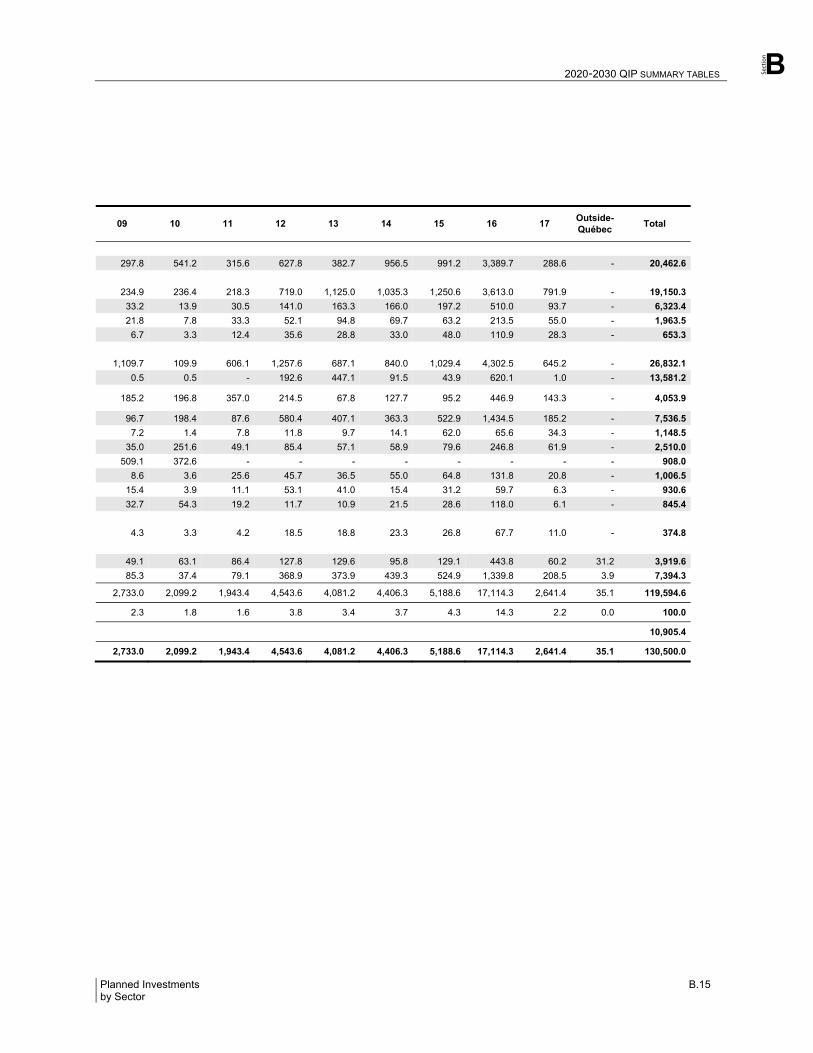
Section
2020-2030 QIP SUMMARY TABLES B
Planned Investments B.15 by Sector
09 10 11 12 13 14 15 16 17 Outside-Québec
Total
297.8 541.2 315.6 627.8 382.7 956.5 991.2 3,389.7 288.6 - 20,462.6
234.9 236.4 218.3 719.0 1,125.0 1,035.3 1,250.6 3,613.0 791.9 - 19,150.3
33.2 13.9 30.5 141.0 163.3 166.0 197.2 510.0 93.7 - 6,323.4
21.8 7.8 33.3 52.1 94.8 69.7 63.2 213.5 55.0 - 1,963.5
6.7 3.3 12.4 35.6 28.8 33.0 48.0 110.9 28.3 - 653.3
1,109.7 109.9 606.1 1,257.6 687.1 840.0 1,029.4 4,302.5 645.2 - 26,832.1
0.5 0.5 - 192.6 447.1 91.5 43.9 620.1 1.0 - 13,581.2
185.2 196.8 357.0 214.5 67.8 127.7 95.2 446.9 143.3 - 4,053.9
96.7 198.4 87.6 580.4 407.1 363.3 522.9 1,434.5 185.2 - 7,536.5
7.2 1.4 7.8 11.8 9.7 14.1 62.0 65.6 34.3 - 1,148.5
35.0 251.6 49.1 85.4 57.1 58.9 79.6 246.8 61.9 - 2,510.0
509.1 372.6 - - - - - - - - 908.0
8.6 3.6 25.6 45.7 36.5 55.0 64.8 131.8 20.8 - 1,006.5
15.4 3.9 11.1 53.1 41.0 15.4 31.2 59.7 6.3 - 930.6
32.7 54.3 19.2 11.7 10.9 21.5 28.6 118.0 6.1 - 845.4
4.3 3.3 4.2 18.5 18.8 23.3 26.8 67.7 11.0 - 374.8
49.1 63.1 86.4 127.8 129.6 95.8 129.1 443.8 60.2 31.2 3,919.6
85.3 37.4 79.1 368.9 373.9 439.3 524.9 1,339.8 208.5 3.9 7,394.3
2,733.0 2,099.2 1,943.4 4,543.6 4,081.2 4,406.3 5,188.6 17,114.3 2,641.4 35.1 119,594.6
2.3 1.8 1.6 3.8 3.4 3.7 4.3 14.3 2.2 0.0 100.0
10,905.4
2,733.0 2,099.2 1,943.4 4,543.6 4,081.2 4,406.3 5,188.6 17,114.3 2,641.4 35.1 130,500.0
PLANNED INVESTMENTS BY SECTOR B
B.16 The 2020-2030 Québec Infrastructure Plan
2. Planned investments by sector The investments set out in the 2020‐2030 QIP are divided into 18 major sectors of government activity.
Activity sectors under the 2020-2030 QIP
Health and Social Services
1. Health and social services: institutions in the health and social services network
Education and Culture
2. Education: school board institutions1
3. Higher education: CEGEP and university institutions
4. Culture: museums, libraries, performance halls, cultural complexes
5. Development of sport: sports complexes and equipment
Economy and Environment
6. Road network: highways, roads, tunnels, bridges, interchanges and overpasses
7. Public transit: metro, buses, commuter trains, tramways, platforms, stations, garages, maintenance centres, reserved lanes, tunnels, railway tracks
8. Marine, air, rail and other transportation: ferries, wharves, stations, airports, railways, local roads, rest stops, the Government's vehicle fleet
9. Municipalities: drinking water and wastewater treatment plants, aqueduct and sewer pipes, parks and municipal infrastructure, adapting to climate change program
10. Tourism and recreational activities: tourism facilities and complexes, conferences centres, national park facilities
11. Social and community housing
12. Northern development: infrastructure funded by the Société du Plan Nord
13. Research: laboratories, research equipment and centres
14. Environment: biomethanization and composting plants, public and municipal dams, infrastructure for mitigating the risks of coastal erosion and submergence and for adapting to climate change
1 Once the Act to amend mainly the Education Act with regard to school organization and governance (S.Q. 2020, chapter 1) receives royal assent,
school boards will be replaced by school service centres during the 2020‐2021 fiscal year, with the exception of Cree and Kativik school boards.
Section
PLANNED INVESTMENTS BY SECTOR B
Planned Investments B.17 by Sector
15. Agriculture, forests, fauna and other: agricultural training and research facilities, multi-resource roads on public land, digital infrastructure across Québec
Support for Individuals and Families
16. Educational childcare services: childcare centre infrastructure
Administration and Justice
17. Government administration: office buildings, courthouses, detention facilities, Sûreté du Québec police stations, acquisitions of movable and immovable property by government departments and bodies
18. Information resources: information resource development and equipment in the various departments and bodies as well as the health and social services, education and higher education networks
The following pages present, for each of the 18 sectors, a summary table of investments and the list of authorized and announced projects with an estimated cost of $20.0 million or more for which investments are set out in the 2020‐2030 QIP. The first five notes at the bottom of each table presented in the project lists are the same for all the sectors. Accordingly, some notes may not apply to a particular sector. Subsequent notes are specific to each sector, however. Moreover, a portrait of the infrastructure inventory and investment strategies for the sectors associated with public bodies is also presented.
A description of projects with an estimated cost of $50 million or more is also available in the online Tableau de bord des projets d'infrastructures2. In the coming months projects with a cost of between $20 and $50 million will be added to this Tableau de bord.
More information regarding the information resource projects is presented in the Government's online Tableau de bord sur l'état de santé des projets ressources informationnelles.3
The legend for Québec's 17 administrative regions is as follows:
01 : Bas-Saint-Laurent
02 : Saguenay–Lac-Saint-Jean
03 : Capitale-Nationale
04 : Mauricie
05 : Estrie
06 : Montréal
07 : Outaouais
08 : Abitibi-Témiscamingue
09 : Côte-Nord
10 : Nord-du-Québec
11 : Gaspésie–Îles-de-la-Madeleine
12 : Chaudière-Appalaches
13 : Laval
14 : Lanaudière
15 : Laurentides
16 : Montérégie
17 : Centre-du-Québec
2 Website: https://www.tresor.gouv.qc.ca/infrastructures-publiques/tableau-de-bord/ 3 Website: https://www.tableaudebordprojetsri.gouv.qc.ca/tableau-de-bord/
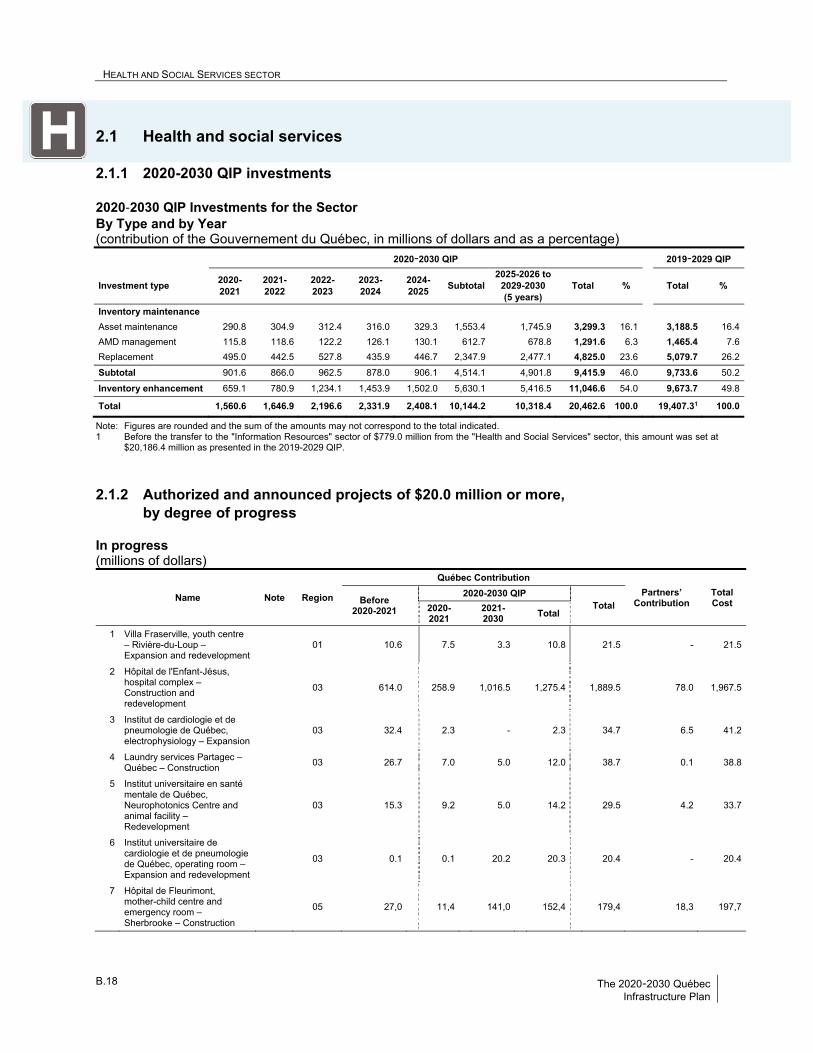
HEALTH AND SOCIAL SERVICES SECTOR B
B.18 The 2020-2030 Québec Infrastructure Plan
2.1 Health and social services
2.1.1 2020-2030 QIP investments 2020‐2030 QIP Investments for the Sector By Type and by Year (contribution of the Gouvernement du Québec, in millions of dollars and as a percentage)
2020‐2030 QIP 2019‐2029 QIP
Investment type 2020-2021
2021-2022
2022-2023
2023-2024
2024-2025
Subtotal 2025-2026 to
2029-2030 (5 years)
Total % Total %
Inventory maintenance
Asset maintenance 290.8 304.9 312.4 316.0 329.3 1,553.4 1,745.9 3,299.3 16.1 3,188.5 16.4
AMD management 115.8 118.6 122.2 126.1 130.1 612.7 678.8 1,291.6 6.3 1,465.4 7.6
Replacement 495.0 442.5 527.8 435.9 446.7 2,347.9 2,477.1 4,825.0 23.6 5,079.7 26.2
Subtotal 901.6 866.0 962.5 878.0 906.1 4,514.1 4,901.8 9,415.9 46.0 9,733.6 50.2
Inventory enhancement 659.1 780.9 1,234.1 1,453.9 1,502.0 5,630.1 5,416.5 11,046.6 54.0 9,673.7 49.8
Total 1,560.6 1,646.9 2,196.6 2,331.9 2,408.1 10,144.2 10,318.4 20,462.6 100.0 19,407.31 100.0
Note: Figures are rounded and the sum of the amounts may not correspond to the total indicated. 1 Before the transfer to the "Information Resources" sector of $779.0 million from the "Health and Social Services" sector, this amount was set at
$20,186.4 million as presented in the 2019-2029 QIP.
2.1.2 Authorized and announced projects of $20.0 million or more, by degree of progress
In progress (millions of dollars)
Name Note Region
Québec Contribution
Partners’ Contribution
Total Cost
Before 2020-2021
2020-2030 QIP
Total
2020-2021
2021-2030
Total
1 Villa Fraserville, youth centre – Rivière-du-Loup – Expansion and redevelopment
01 10.6 7.5 3.3 10.8 21.5 - 21.5
2 Hôpital de l'Enfant-Jésus, hospital complex – Construction and redevelopment
03 614.0 258.9 1,016.5 1,275.4 1,889.5 78.0 1,967.5
3 Institut de cardiologie et de pneumologie de Québec, electrophysiology – Expansion
03 32.4 2.3 - 2.3 34.7 6.5 41.2
4 Laundry services Partagec – Québec – Construction
03 26.7 7.0 5.0 12.0 38.7 0.1 38.8
5 Institut universitaire en santé mentale de Québec, Neurophotonics Centre and animal facility – Redevelopment
03 15.3 9.2 5.0 14.2 29.5 4.2 33.7
6 Institut universitaire de cardiologie et de pneumologie de Québec, operating room – Expansion and redevelopment
03 0.1 0.1 20.2 20.3 20.4 - 20.4
7 Hôpital de Fleurimont, mother-child centre and emergency room – Sherbrooke – Construction
05 27,0 11,4 141,0 152,4 179,4 18,3 197,7
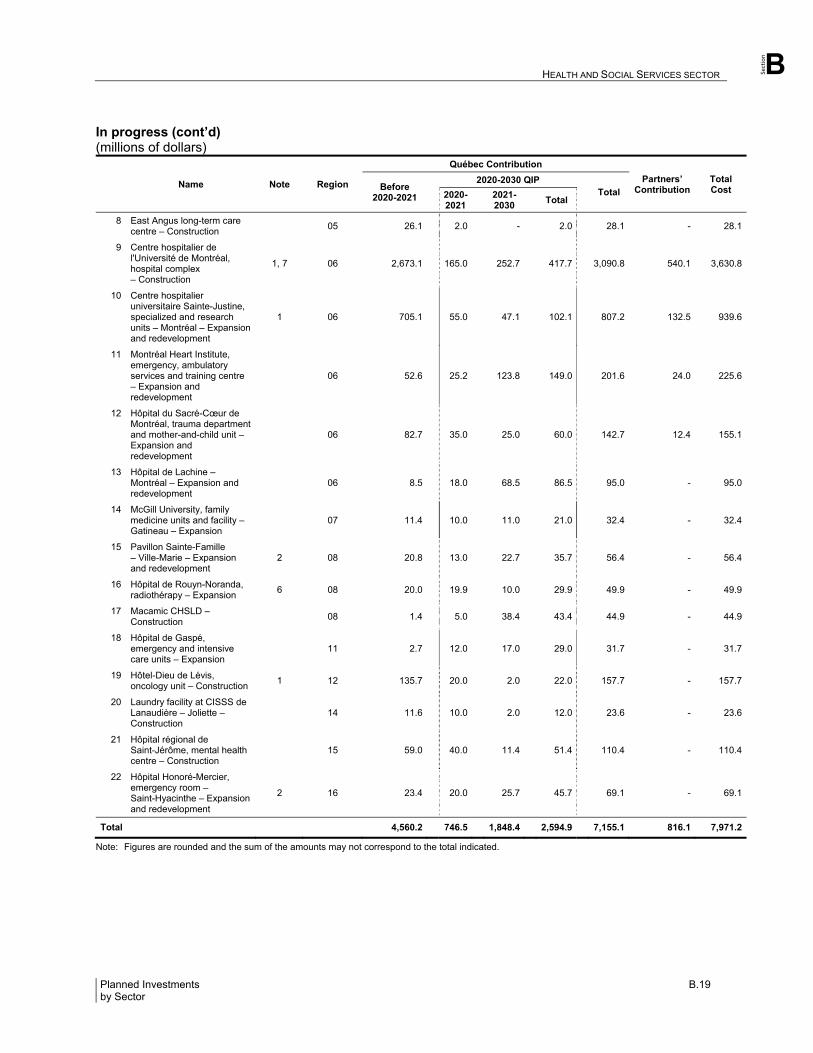
Section
HEALTH AND SOCIAL SERVICES SECTOR B
Planned Investments B.19 by Sector
In progress (cont’d) (millions of dollars)
Name Note Region
Québec Contribution
Partners’ Contribution
Total Cost
Before 2020-2021
2020-2030 QIP
Total
2020-2021
2021-2030
Total
8 East Angus long-term care centre – Construction 05 26.1 2.0 - 2.0 28.1 - 28.1
9 Centre hospitalier de l'Université de Montréal, hospital complex – Construction
1, 7 06 2,673.1 165.0 252.7 417.7 3,090.8 540.1 3,630.8
10 Centre hospitalier universitaire Sainte-Justine, specialized and research units – Montréal – Expansion and redevelopment
1 06 705.1 55.0 47.1 102.1 807.2 132.5 939.6
11 Montréal Heart Institute, emergency, ambulatory services and training centre – Expansion and redevelopment
06 52.6 25.2 123.8 149.0 201.6 24.0 225.6
12 Hôpital du Sacré-Cœur de Montréal, trauma department and mother-and-child unit – Expansion and redevelopment
06 82.7 35.0 25.0 60.0 142.7 12.4 155.1
13 Hôpital de Lachine – Montréal – Expansion and redevelopment
06 8.5 18.0 68.5 86.5 95.0 - 95.0
14 McGill University, family medicine units and facility – Gatineau – Expansion
07 11.4 10.0 11.0 21.0 32.4 - 32.4
15 Pavillon Sainte-Famille – Ville-Marie – Expansion and redevelopment
2 08 20.8 13.0 22.7 35.7 56.4 - 56.4
16 Hôpital de Rouyn-Noranda, radiothérapy – Expansion
6 08 20.0 19.9 10.0 29.9 49.9 - 49.9
17 Macamic CHSLD – Construction 08 1.4 5.0 38.4 43.4 44.9 - 44.9
18 Hôpital de Gaspé, emergency and intensive care units – Expansion
11 2.7 12.0 17.0 29.0 31.7 - 31.7
19 Hôtel-Dieu de Lévis, oncology unit – Construction
1 12 135.7 20.0 2.0 22.0 157.7 - 157.7
20 Laundry facility at CISSS de Lanaudière – Joliette – Construction
14 11.6 10.0 2.0 12.0 23.6 - 23.6
21 Hôpital régional de Saint-Jérôme, mental health centre – Construction
15 59.0 40.0 11.4 51.4 110.4 - 110.4
22 Hôpital Honoré-Mercier, emergency room – Saint-Hyacinthe – Expansion and redevelopment
2 16 23.4 20.0 25.7 45.7 69.1 - 69.1
Total 4,560.2 746.5 1,848.4 2,594.9 7,155.1 816.1 7,971.2
Note: Figures are rounded and the sum of the amounts may not correspond to the total indicated.
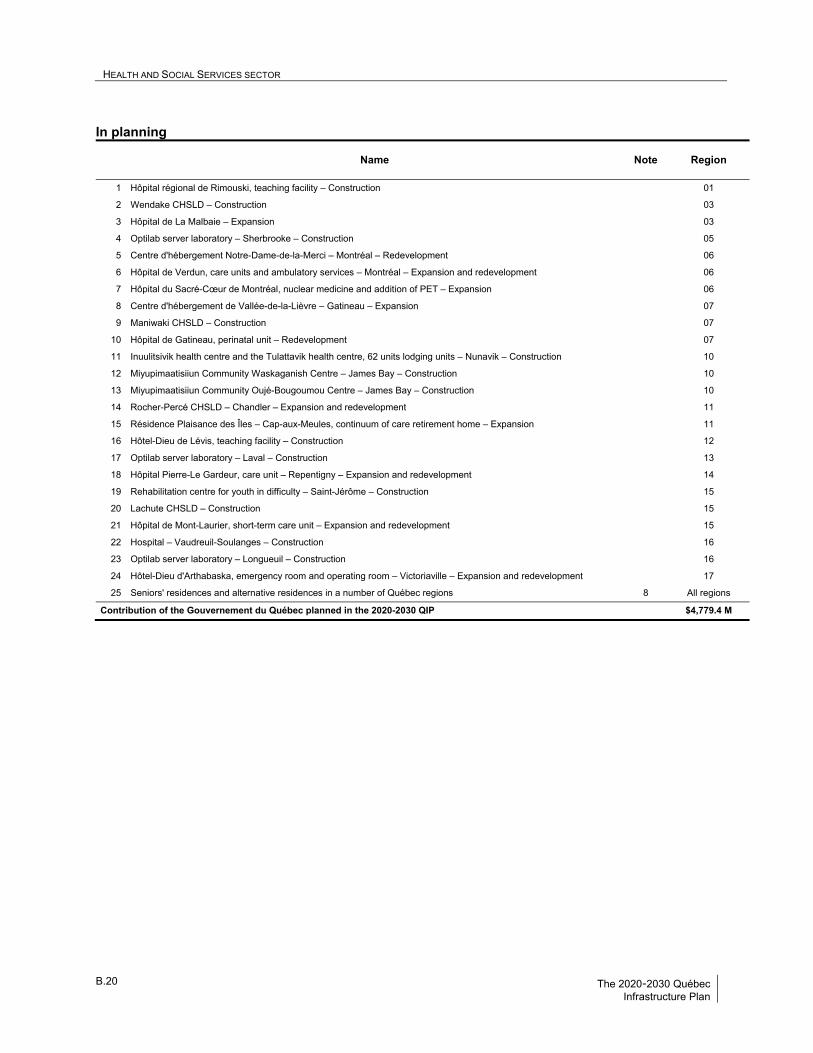
HEALTH AND SOCIAL SERVICES SECTOR B
B.20 The 2020-2030 Québec Infrastructure Plan
In planning
Name Note Region
1 Hôpital régional de Rimouski, teaching facility – Construction 01
2 Wendake CHSLD – Construction 03
3 Hôpital de La Malbaie – Expansion 03
4 Optilab server laboratory – Sherbrooke – Construction 05
5 Centre d'hébergement Notre-Dame-de-la-Merci – Montréal – Redevelopment 06
6 Hôpital de Verdun, care units and ambulatory services – Montréal – Expansion and redevelopment 06
7 Hôpital du Sacré-Cœur de Montréal, nuclear medicine and addition of PET – Expansion 06
8 Centre d'hébergement de Vallée-de-la-Lièvre – Gatineau – Expansion 07
9 Maniwaki CHSLD – Construction 07
10 Hôpital de Gatineau, perinatal unit – Redevelopment 07
11 Inuulitsivik health centre and the Tulattavik health centre, 62 units lodging units – Nunavik – Construction 10
12 Miyupimaatisiiun Community Waskaganish Centre – James Bay – Construction 10
13 Miyupimaatisiiun Community Oujé-Bougoumou Centre – James Bay – Construction 10
14 Rocher-Percé CHSLD – Chandler – Expansion and redevelopment 11
15 Résidence Plaisance des Îles – Cap-aux-Meules, continuum of care retirement home – Expansion 11
16 Hôtel-Dieu de Lévis, teaching facility – Construction 12
17 Optilab server laboratory – Laval – Construction 13
18 Hôpital Pierre-Le Gardeur, care unit – Repentigny – Expansion and redevelopment 14
19 Rehabilitation centre for youth in difficulty – Saint-Jérôme – Construction 15
20 Lachute CHSLD – Construction 15
21 Hôpital de Mont-Laurier, short-term care unit – Expansion and redevelopment 15
22 Hospital – Vaudreuil-Soulanges – Construction 16
23 Optilab server laboratory – Longueuil – Construction 16
24 Hôtel-Dieu d'Arthabaska, emergency room and operating room – Victoriaville – Expansion and redevelopment 17
25 Seniors' residences and alternative residences in a number of Québec regions 8 All regions
Contribution of the Gouvernement du Québec planned in the 2020-2030 QIP $4,779.4 M
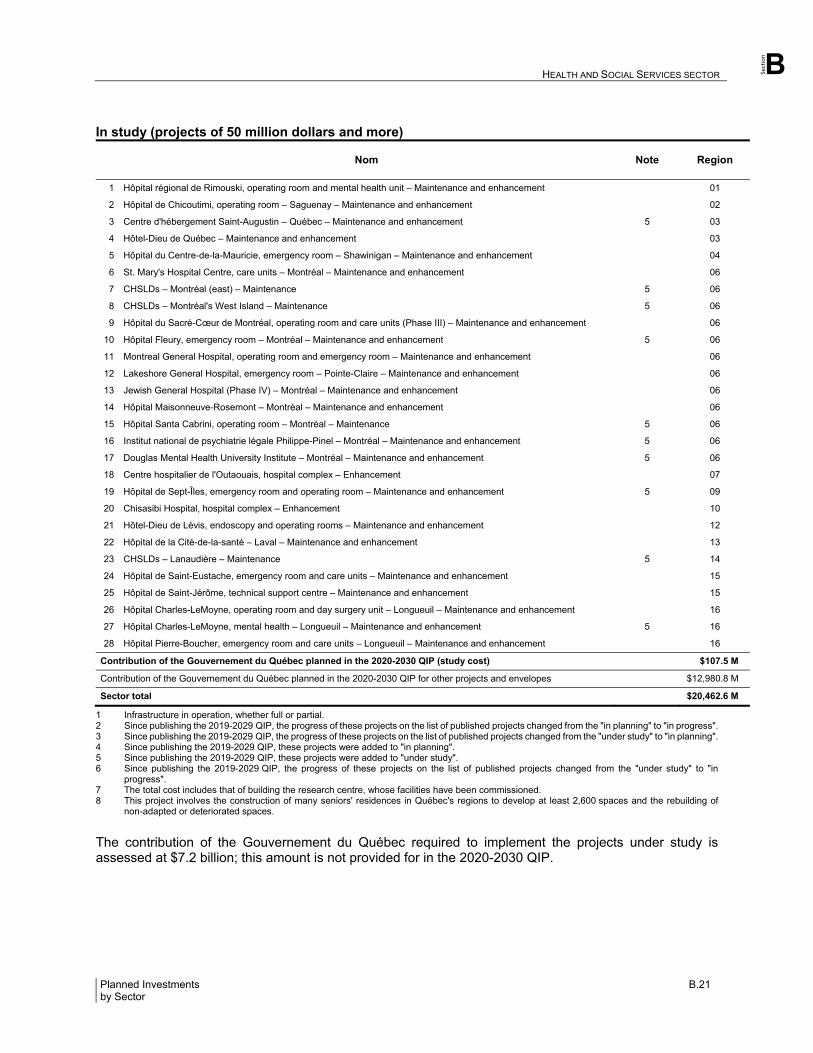
Section
HEALTH AND SOCIAL SERVICES SECTOR B
Planned Investments B.21 by Sector
In study (projects of 50 million dollars and more)
Nom Note Region
1 Hôpital régional de Rimouski, operating room and mental health unit – Maintenance and enhancement 01
2 Hôpital de Chicoutimi, operating room – Saguenay – Maintenance and enhancement 02
3 Centre d'hébergement Saint-Augustin – Québec – Maintenance and enhancement 5 03
4 Hôtel-Dieu de Québec – Maintenance and enhancement 03
5 Hôpital du Centre-de-la-Mauricie, emergency room – Shawinigan – Maintenance and enhancement 04
6 St. Mary's Hospital Centre, care units – Montréal – Maintenance and enhancement 06
7 CHSLDs – Montréal (east) – Maintenance 5 06
8 CHSLDs – Montréal's West Island – Maintenance 5 06
9 Hôpital du Sacré-Cœur de Montréal, operating room and care units (Phase III) – Maintenance and enhancement 06
10 Hôpital Fleury, emergency room – Montréal – Maintenance and enhancement 5 06
11 Montreal General Hospital, operating room and emergency room – Maintenance and enhancement 06
12 Lakeshore General Hospital, emergency room – Pointe-Claire – Maintenance and enhancement 06
13 Jewish General Hospital (Phase IV) – Montréal – Maintenance and enhancement 06
14 Hôpital Maisonneuve-Rosemont – Montréal – Maintenance and enhancement 06
15 Hôpital Santa Cabrini, operating room – Montréal – Maintenance 5 06
16 Institut national de psychiatrie légale Philippe-Pinel – Montréal – Maintenance and enhancement 5 06
17 Douglas Mental Health University Institute – Montréal – Maintenance and enhancement 5 06
18 Centre hospitalier de l'Outaouais, hospital complex – Enhancement 07
19 Hôpital de Sept-Îles, emergency room and operating room – Maintenance and enhancement 5 09
20 Chisasibi Hospital, hospital complex – Enhancement 10
21 Hôtel-Dieu de Lévis, endoscopy and operating rooms – Maintenance and enhancement 12
22 Hôpital de la Cité-de-la-santé – Laval – Maintenance and enhancement 13
23 CHSLDs – Lanaudière – Maintenance 5 14
24 Hôpital de Saint-Eustache, emergency room and care units – Maintenance and enhancement 15
25 Hôpital de Saint-Jérôme, technical support centre – Maintenance and enhancement 15
26 Hôpital Charles-LeMoyne, operating room and day surgery unit – Longueuil – Maintenance and enhancement 16
27 Hôpital Charles-LeMoyne, mental health – Longueuil – Maintenance and enhancement 5 16
28 Hôpital Pierre-Boucher, emergency room and care units – Longueuil – Maintenance and enhancement 16
Contribution of the Gouvernement du Québec planned in the 2020-2030 QIP (study cost) $107.5 M
Contribution of the Gouvernement du Québec planned in the 2020-2030 QIP for other projects and envelopes $12,980.8 M
Sector total $20,462.6 M
1 Infrastructure in operation, whether full or partial. 2 Since publishing the 2019-2029 QIP, the progress of these projects on the list of published projects changed from the "in planning" to "in progress". 3 Since publishing the 2019-2029 QIP, the progress of these projects on the list of published projects changed from the "under study" to "in planning". 4 Since publishing the 2019-2029 QIP, these projects were added to "in planning". 5 Since publishing the 2019-2029 QIP, these projects were added to "under study". 6 Since publishing the 2019-2029 QIP, the progress of these projects on the list of published projects changed from the "under study" to "in
progress". 7 The total cost includes that of building the research centre, whose facilities have been commissioned. 8 This project involves the construction of many seniors' residences in Québec's regions to develop at least 2,600 spaces and the rebuilding of
non-adapted or deteriorated spaces.
The contribution of the Gouvernement du Québec required to implement the projects under study is assessed at $7.2 billion; this amount is not provided for in the 2020-2030 QIP.
HEALTH AND SOCIAL SERVICES SECTOR B
B.22 The 2020-2030 Québec Infrastructure Plan
Projects withdrawn from the list of published projects in the 2020-2030 QIP
The commissioning of the following infrastructure projects in the "Health and Social Services" sector has been finalized since the 2019‐2029 QIP. Accordingly, these projects were withdrawn from the list of projects in progress:
1. Hôpital de Baie‐Saint‐Paul – Reconstruction and redevelopment (region 03);
2. Centre hospitalier régional de Trois‐Rivières, care units in the Pavillon Sainte‐Marie (Phase II) – Expansion and redevelopment (region 04);
3. Hôpital Maisonneuve‐Rosemont, hemodialysis unit – Montréal – Construction (region 06) ;
4. Long‐term care centre – Saint‐Jérôme – Construction (region 15);
5. Hôpital du Haut‐Richelieu, emergency room and operating room – Saint‐Jean‐sur‐Richelieu – Expansion and redevelopment (region 16).
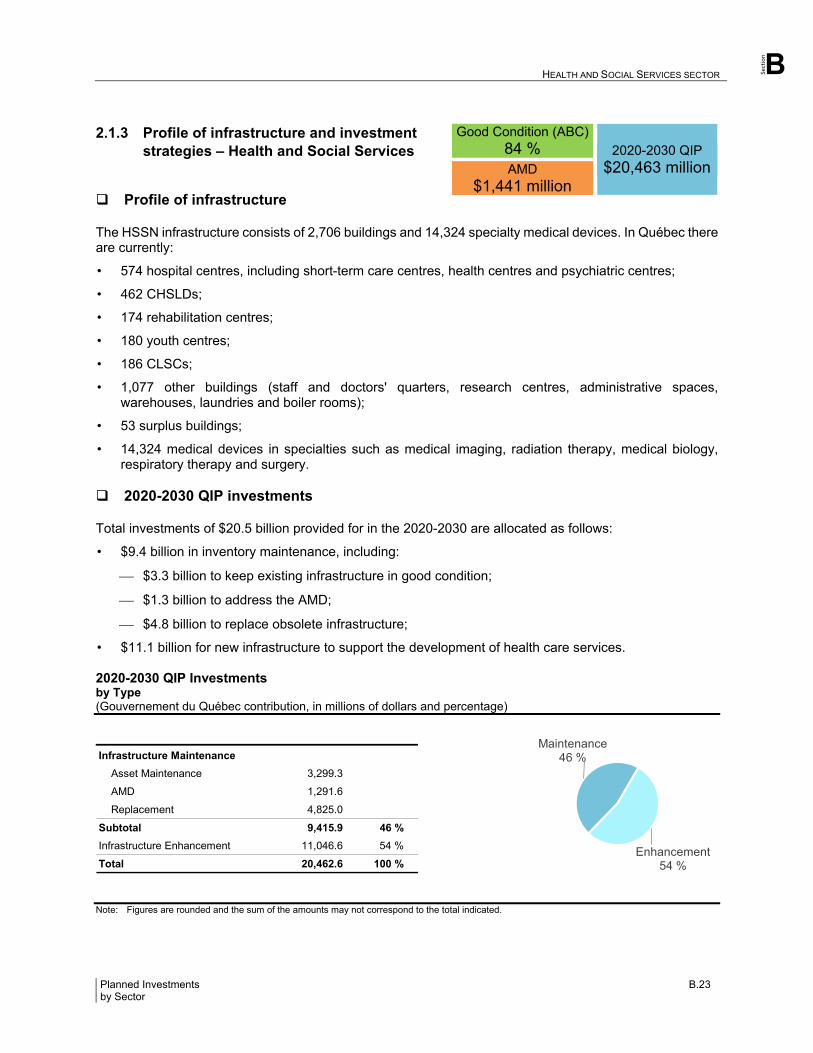
Section
HEALTH AND SOCIAL SERVICES SECTOR B
Planned Investments B.23 by Sector
2.1.3 Profile of infrastructure and investment strategies – Health and Social Services
Profile of infrastructure The HSSN infrastructure consists of 2,706 buildings and 14,324 specialty medical devices. In Québec there are currently:
• 574 hospital centres, including short-term care centres, health centres and psychiatric centres;
• 462 CHSLDs;
• 174 rehabilitation centres;
• 180 youth centres;
• 186 CLSCs;
• 1,077 other buildings (staff and doctors' quarters, research centres, administrative spaces, warehouses, laundries and boiler rooms);
• 53 surplus buildings;
• 14,324 medical devices in specialties such as medical imaging, radiation therapy, medical biology, respiratory therapy and surgery.
2020-2030 QIP investments Total investments of $20.5 billion provided for in the 2020-2030 are allocated as follows:
• $9.4 billion in inventory maintenance, including:
$3.3 billion to keep existing infrastructure in good condition;
$1.3 billion to address the AMD;
$4.8 billion to replace obsolete infrastructure;
• $11.1 billion for new infrastructure to support the development of health care services. 2020-2030 QIP Investments by Type (Gouvernement du Québec contribution, in millions of dollars and percentage)
Note: Figures are rounded and the sum of the amounts may not correspond to the total indicated.
Infrastructure Maintenance
Asset Maintenance 3,299.3
AMD 1,291.6
Replacement 4,825.0
Subtotal 9,415.9 46 %
Infrastructure Enhancement 11,046.6 54 %
Total 20,462.6 100 %
Good Condition (ABC) 84 %
2020-2030 QIP
$20,463 million AMD $1,441 million
Maintenance46 %
Enhancement54 %
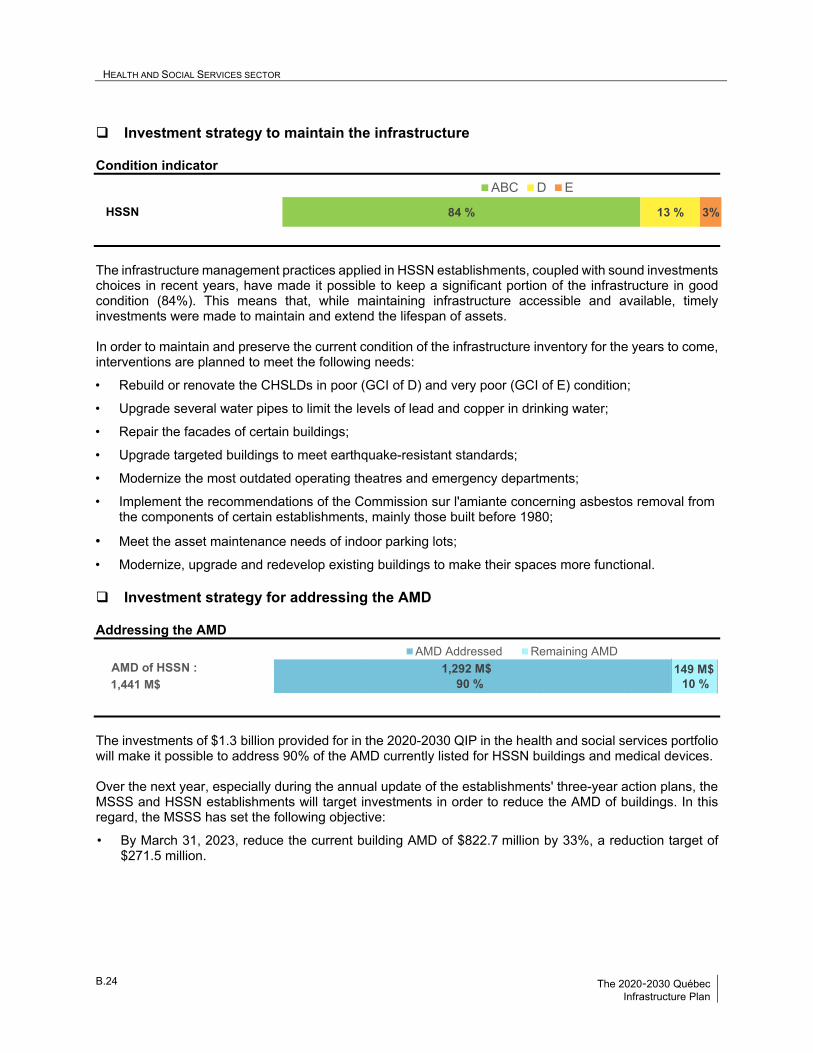
HEALTH AND SOCIAL SERVICES SECTOR B
B.24 The 2020-2030 Québec Infrastructure Plan
Investment strategy to maintain the infrastructure Condition indicator
The infrastructure management practices applied in HSSN establishments, coupled with sound investments choices in recent years, have made it possible to keep a significant portion of the infrastructure in good condition (84%). This means that, while maintaining infrastructure accessible and available, timely investments were made to maintain and extend the lifespan of assets. In order to maintain and preserve the current condition of the infrastructure inventory for the years to come, interventions are planned to meet the following needs:
• Rebuild or renovate the CHSLDs in poor (GCI of D) and very poor (GCI of E) condition;
• Upgrade several water pipes to limit the levels of lead and copper in drinking water;
• Repair the facades of certain buildings;
• Upgrade targeted buildings to meet earthquake-resistant standards;
• Modernize the most outdated operating theatres and emergency departments;
• Implement the recommendations of the Commission sur l'amiante concerning asbestos removal from the components of certain establishments, mainly those built before 1980;
• Meet the asset maintenance needs of indoor parking lots;
• Modernize, upgrade and redevelop existing buildings to make their spaces more functional.
Investment strategy for addressing the AMD Addressing the AMD
The investments of $1.3 billion provided for in the 2020-2030 QIP in the health and social services portfolio will make it possible to address 90% of the AMD currently listed for HSSN buildings and medical devices. Over the next year, especially during the annual update of the establishments' three-year action plans, the MSSS and HSSN establishments will target investments in order to reduce the AMD of buildings. In this regard, the MSSS has set the following objective:
• By March 31, 2023, reduce the current building AMD of $822.7 million by 33%, a reduction target of $271.5 million.
84 % 13 % 3%HSSN
ABC D E
1,292 M$90 %
149 M$10 %1,441 M$
AMD of HSSN :AMD Addressed Remaining AMD
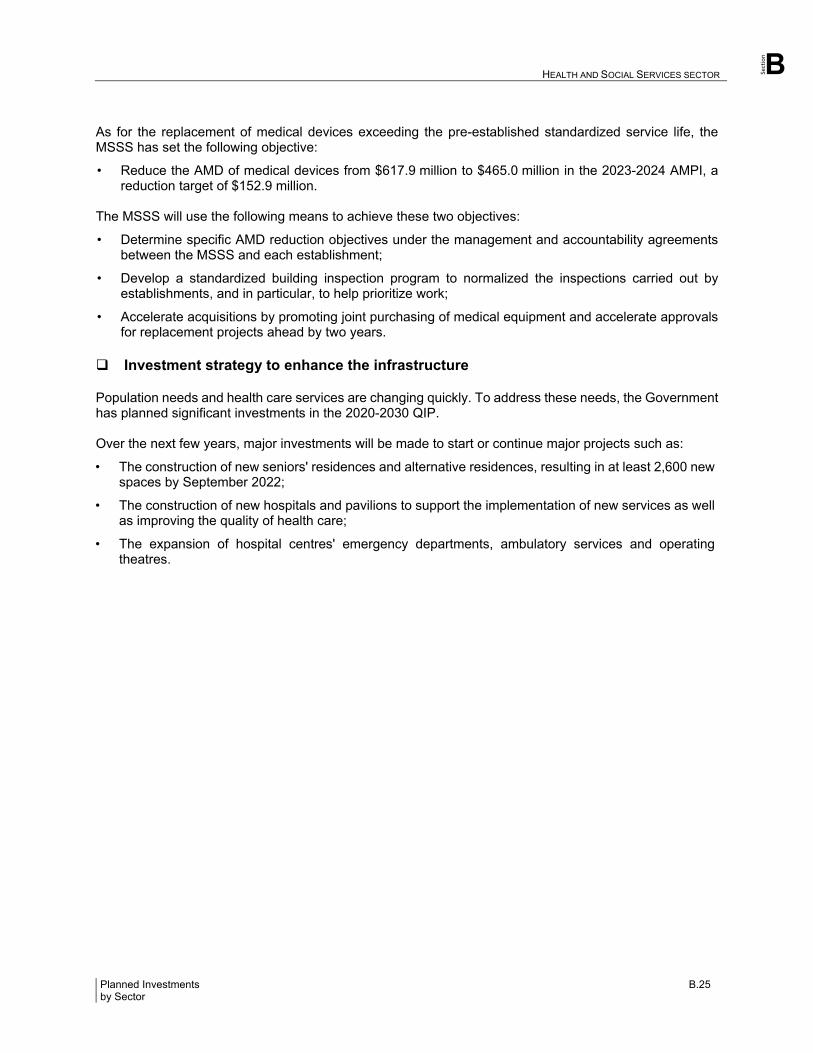
Section
HEALTH AND SOCIAL SERVICES SECTOR B
Planned Investments B.25 by Sector
As for the replacement of medical devices exceeding the pre-established standardized service life, the MSSS has set the following objective:
• Reduce the AMD of medical devices from $617.9 million to $465.0 million in the 2023-2024 AMPI, a reduction target of $152.9 million.
The MSSS will use the following means to achieve these two objectives:
• Determine specific AMD reduction objectives under the management and accountability agreements between the MSSS and each establishment;
• Develop a standardized building inspection program to normalized the inspections carried out by establishments, and in particular, to help prioritize work;
• Accelerate acquisitions by promoting joint purchasing of medical equipment and accelerate approvals for replacement projects ahead by two years.
Investment strategy to enhance the infrastructure Population needs and health care services are changing quickly. To address these needs, the Government has planned significant investments in the 2020-2030 QIP. Over the next few years, major investments will be made to start or continue major projects such as:
• The construction of new seniors' residences and alternative residences, resulting in at least 2,600 new spaces by September 2022;
• The construction of new hospitals and pavilions to support the implementation of new services as well as improving the quality of health care;
• The expansion of hospital centres' emergency departments, ambulatory services and operating theatres.
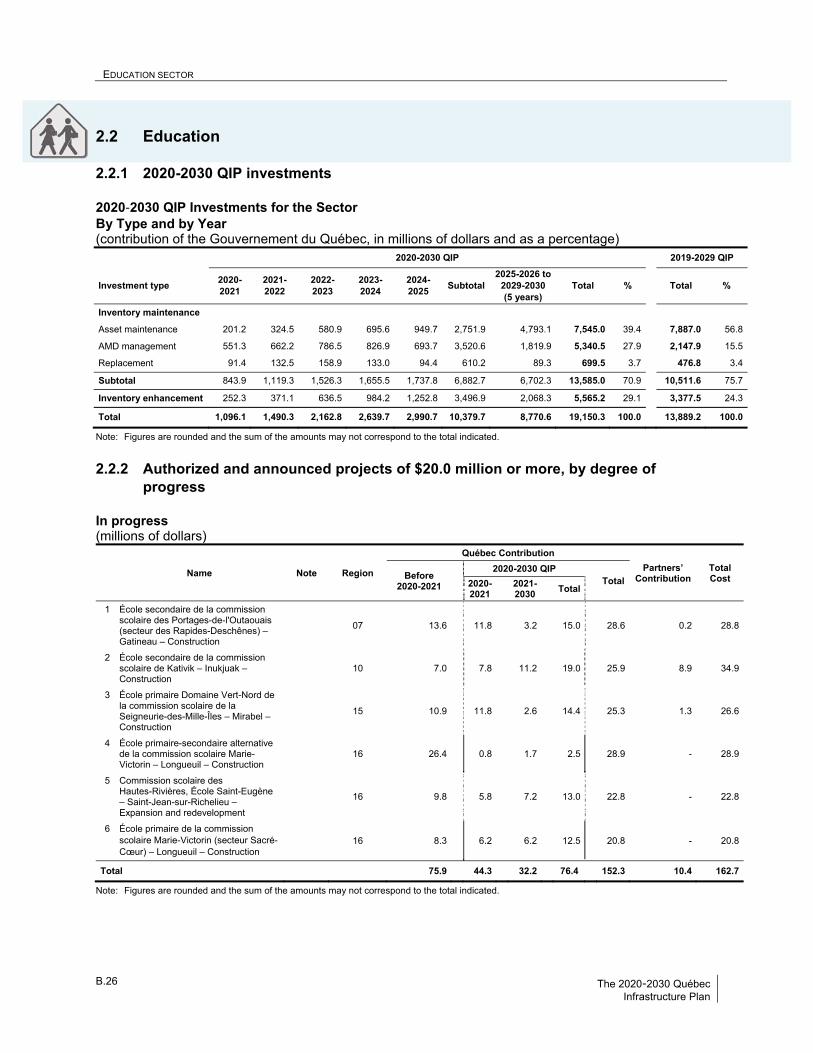
EDUCATION SECTOR B
B.26 The 2020-2030 Québec Infrastructure Plan
2.2 Education
2.2.1 2020-2030 QIP investments 2020‐2030 QIP Investments for the Sector By Type and by Year (contribution of the Gouvernement du Québec, in millions of dollars and as a percentage) 2020-2030 QIP 2019-2029 QIP
Investment type 2020-2021
2021-2022
2022-2023
2023-2024
2024-2025
Subtotal 2025-2026 to
2029-2030 (5 years)
Total % Total %
Inventory maintenance
Asset maintenance 201.2 324.5 580.9 695.6 949.7 2,751.9 4,793.1 7,545.0 39.4 7,887.0 56.8
AMD management 551.3 662.2 786.5 826.9 693.7 3,520.6 1,819.9 5,340.5 27.9 2,147.9 15.5
Replacement 91.4 132.5 158.9 133.0 94.4 610.2 89.3 699.5 3.7 476.8 3.4
Subtotal 843.9 1,119.3 1,526.3 1,655.5 1,737.8 6,882.7 6,702.3 13,585.0 70.9 10,511.6 75.7
Inventory enhancement 252.3 371.1 636.5 984.2 1,252.8 3,496.9 2,068.3 5,565.2 29.1 3,377.5 24.3
Total 1,096.1 1,490.3 2,162.8 2,639.7 2,990.7 10,379.7 8,770.6 19,150.3 100.0 13,889.2 100.0
Note: Figures are rounded and the sum of the amounts may not correspond to the total indicated.
2.2.2 Authorized and announced projects of $20.0 million or more, by degree of progress
In progress (millions of dollars)
Name Note Region
Québec Contribution
Partners’ Contribution
Total Cost
Before 2020-2021
2020-2030 QIP
Total
2020-2021
2021-2030
Total
1 École secondaire de la commission scolaire des Portages-de-l'Outaouais (secteur des Rapides-Deschênes) – Gatineau – Construction
07 13.6 11.8 3.2 15.0 28.6 0.2 28.8
2 École secondaire de la commission scolaire de Kativik – Inukjuak – Construction
10 7.0 7.8 11.2 19.0 25.9 8.9 34.9
3 École primaire Domaine Vert-Nord de la commission scolaire de la Seigneurie-des-Mille-Îles – Mirabel – Construction
15 10.9 11.8 2.6 14.4 25.3 1.3 26.6
4 École primaire-secondaire alternative de la commission scolaire Marie-Victorin – Longueuil – Construction
16 26.4 0.8 1.7 2.5 28.9 - 28.9
5 Commission scolaire des Hautes-Rivières, École Saint-Eugène – Saint-Jean-sur-Richelieu – Expansion and redevelopment
16 9.8 5.8 7.2 13.0 22.8 - 22.8
6 École primaire de la commission scolaire Marie-Victorin (secteur Sacré-Cœur) – Longueuil – Construction
16 8.3 6.2 6.2 12.5 20.8 - 20.8
Total 75.9 44.3 32.2 76.4 152.3 10.4 162.7
Note: Figures are rounded and the sum of the amounts may not correspond to the total indicated.
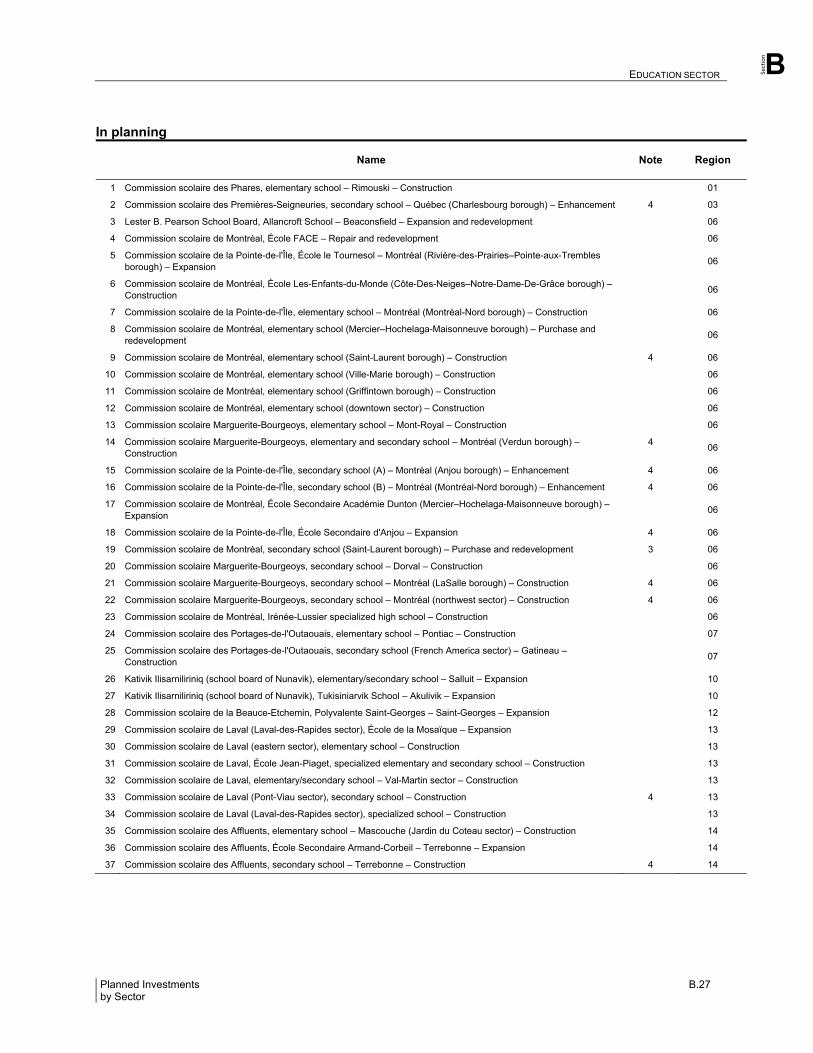
Section
EDUCATION SECTOR B
Planned Investments B.27 by Sector
In planning
Name Note Region
1 Commission scolaire des Phares, elementary school – Rimouski – Construction 01
2 Commission scolaire des Premières-Seigneuries, secondary school – Québec (Charlesbourg borough) – Enhancement 4 03
3 Lester B. Pearson School Board, Allancroft School – Beaconsfield – Expansion and redevelopment 06
4 Commission scolaire de Montréal, École FACE – Repair and redevelopment 06
5 Commission scolaire de la Pointe-de-l'Île, École le Tournesol – Montréal (Rivière-des-Prairies–Pointe-aux-Trembles borough) – Expansion
06
6 Commission scolaire de Montréal, École Les-Enfants-du-Monde (Côte-Des-Neiges–Notre-Dame-De-Grâce borough) – Construction
06
7 Commission scolaire de la Pointe-de-l'Île, elementary school – Montréal (Montréal-Nord borough) – Construction 06
8 Commission scolaire de Montréal, elementary school (Mercier–Hochelaga-Maisonneuve borough) – Purchase and redevelopment
06
9 Commission scolaire de Montréal, elementary school (Saint-Laurent borough) – Construction 4 06
10 Commission scolaire de Montréal, elementary school (Ville-Marie borough) – Construction 06
11 Commission scolaire de Montréal, elementary school (Griffintown borough) – Construction 06
12 Commission scolaire de Montréal, elementary school (downtown sector) – Construction 06
13 Commission scolaire Marguerite-Bourgeoys, elementary school – Mont-Royal – Construction 06
14 Commission scolaire Marguerite-Bourgeoys, elementary and secondary school – Montréal (Verdun borough) – Construction
4 06
15 Commission scolaire de la Pointe-de-l'Île, secondary school (A) – Montréal (Anjou borough) – Enhancement 4 06
16 Commission scolaire de la Pointe-de-l'Île, secondary school (B) – Montréal (Montréal-Nord borough) – Enhancement 4 06
17 Commission scolaire de Montréal, École Secondaire Académie Dunton (Mercier–Hochelaga-Maisonneuve borough) – Expansion
06
18 Commission scolaire de la Pointe-de-l'Île, École Secondaire d'Anjou – Expansion 4 06
19 Commission scolaire de Montréal, secondary school (Saint-Laurent borough) – Purchase and redevelopment 3 06
20 Commission scolaire Marguerite-Bourgeoys, secondary school – Dorval – Construction 06
21 Commission scolaire Marguerite-Bourgeoys, secondary school – Montréal (LaSalle borough) – Construction 4 06
22 Commission scolaire Marguerite-Bourgeoys, secondary school – Montréal (northwest sector) – Construction 4 06
23 Commission scolaire de Montréal, Irénée-Lussier specialized high school – Construction 06
24 Commission scolaire des Portages-de-l'Outaouais, elementary school – Pontiac – Construction 07
25 Commission scolaire des Portages-de-l'Outaouais, secondary school (French America sector) – Gatineau – Construction
07
26 Kativik Ilisarniliriniq (school board of Nunavik), elementary/secondary school – Salluit – Expansion 10
27 Kativik Ilisarniliriniq (school board of Nunavik), Tukisiniarvik School – Akulivik – Expansion 10
28 Commission scolaire de la Beauce-Etchemin, Polyvalente Saint-Georges – Saint-Georges – Expansion 12
29 Commission scolaire de Laval (Laval-des-Rapides sector), École de la Mosaïque – Expansion 13
30 Commission scolaire de Laval (eastern sector), elementary school – Construction 13
31 Commission scolaire de Laval, École Jean-Piaget, specialized elementary and secondary school – Construction 13
32 Commission scolaire de Laval, elementary/secondary school – Val-Martin sector – Construction 13
33 Commission scolaire de Laval (Pont-Viau sector), secondary school – Construction 4 13
34 Commission scolaire de Laval (Laval-des-Rapides sector), specialized school – Construction 13
35 Commission scolaire des Affluents, elementary school – Mascouche (Jardin du Coteau sector) – Construction 14
36 Commission scolaire des Affluents, École Secondaire Armand-Corbeil – Terrebonne – Expansion 14
37 Commission scolaire des Affluents, secondary school – Terrebonne – Construction 4 14
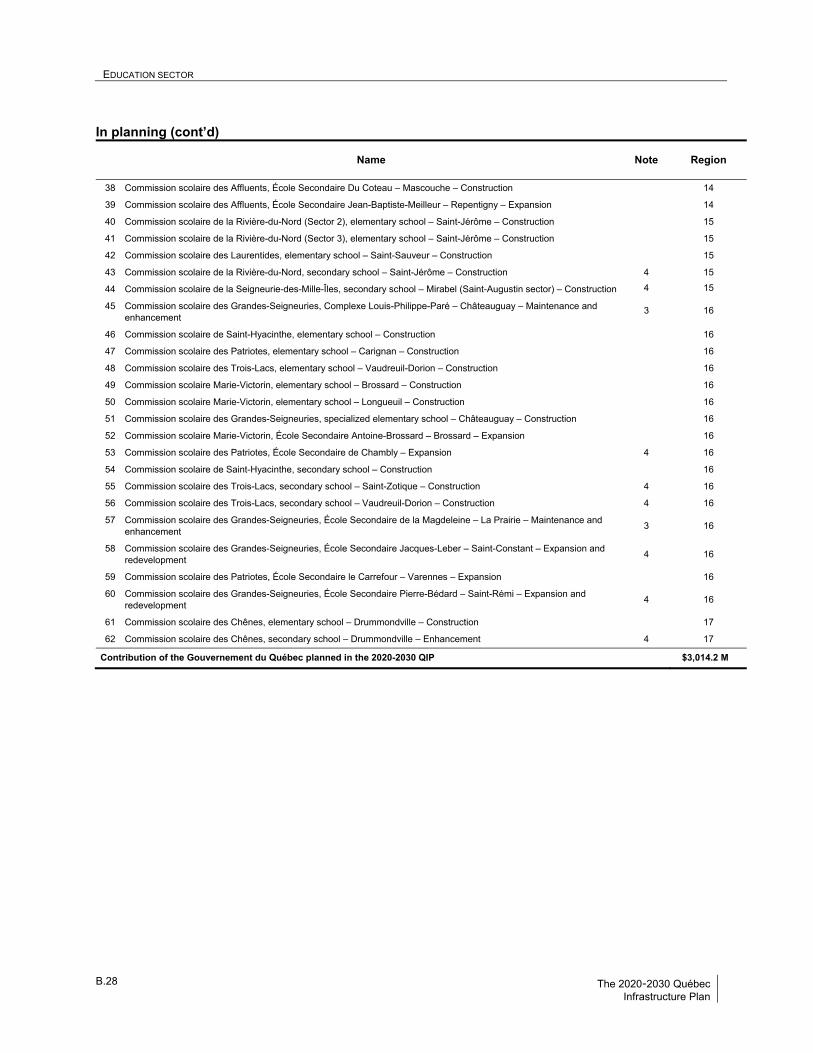
EDUCATION SECTOR B
B.28 The 2020-2030 Québec Infrastructure Plan
In planning (cont’d)
Name Note Region
38 Commission scolaire des Affluents, École Secondaire Du Coteau – Mascouche – Construction 14
39 Commission scolaire des Affluents, École Secondaire Jean-Baptiste-Meilleur – Repentigny – Expansion 14
40 Commission scolaire de la Rivière-du-Nord (Sector 2), elementary school – Saint-Jérôme – Construction 15
41 Commission scolaire de la Rivière-du-Nord (Sector 3), elementary school – Saint-Jérôme – Construction 15
42 Commission scolaire des Laurentides, elementary school – Saint-Sauveur – Construction 15
43 Commission scolaire de la Rivière-du-Nord, secondary school – Saint-Jérôme – Construction 4 15
44 Commission scolaire de la Seigneurie-des-Mille-Îles, secondary school – Mirabel (Saint-Augustin sector) – Construction 4 15
45 Commission scolaire des Grandes-Seigneuries, Complexe Louis-Philippe-Paré – Châteauguay – Maintenance and enhancement
3 16
46 Commission scolaire de Saint-Hyacinthe, elementary school – Construction 16
47 Commission scolaire des Patriotes, elementary school – Carignan – Construction 16
48 Commission scolaire des Trois-Lacs, elementary school – Vaudreuil-Dorion – Construction 16
49 Commission scolaire Marie-Victorin, elementary school – Brossard – Construction 16
50 Commission scolaire Marie-Victorin, elementary school – Longueuil – Construction 16
51 Commission scolaire des Grandes-Seigneuries, specialized elementary school – Châteauguay – Construction 16
52 Commission scolaire Marie-Victorin, École Secondaire Antoine-Brossard – Brossard – Expansion 16
53 Commission scolaire des Patriotes, École Secondaire de Chambly – Expansion 4 16
54 Commission scolaire de Saint-Hyacinthe, secondary school – Construction 16
55 Commission scolaire des Trois-Lacs, secondary school – Saint-Zotique – Construction 4 16
56 Commission scolaire des Trois-Lacs, secondary school – Vaudreuil-Dorion – Construction 4 16
57 Commission scolaire des Grandes-Seigneuries, École Secondaire de la Magdeleine – La Prairie – Maintenance and enhancement
3 16
58 Commission scolaire des Grandes-Seigneuries, École Secondaire Jacques-Leber – Saint-Constant – Expansion and redevelopment
4 16
59 Commission scolaire des Patriotes, École Secondaire le Carrefour – Varennes – Expansion 16
60 Commission scolaire des Grandes-Seigneuries, École Secondaire Pierre-Bédard – Saint-Rémi – Expansion and redevelopment
4 16
61 Commission scolaire des Chênes, elementary school – Drummondville – Construction 17
62 Commission scolaire des Chênes, secondary school – Drummondville – Enhancement 4 17
Contribution of the Gouvernement du Québec planned in the 2020-2030 QIP $3,014.2 M
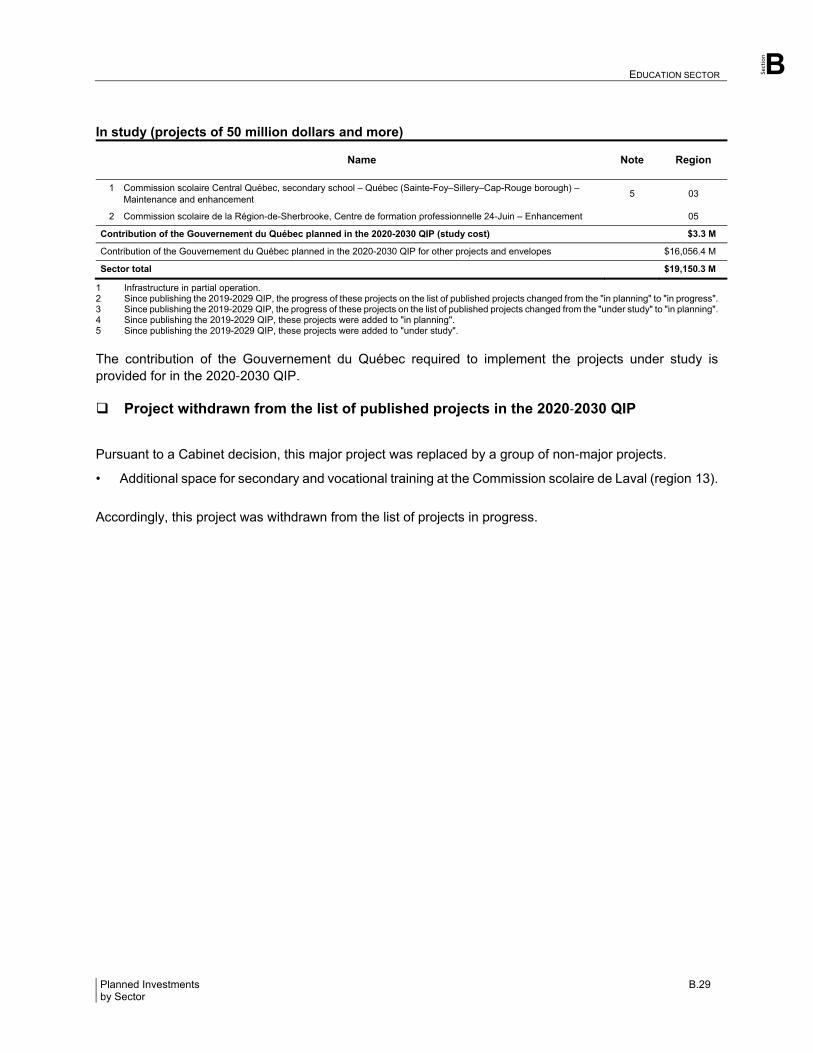
Section
EDUCATION SECTOR B
Planned Investments B.29 by Sector
In study (projects of 50 million dollars and more)
Name Note Region
1 Commission scolaire Central Québec, secondary school – Québec (Sainte-Foy–Sillery–Cap-Rouge borough) – Maintenance and enhancement
5 03
2 Commission scolaire de la Région-de-Sherbrooke, Centre de formation professionnelle 24-Juin – Enhancement 05
Contribution of the Gouvernement du Québec planned in the 2020-2030 QIP (study cost) $3.3 M
Contribution of the Gouvernement du Québec planned in the 2020-2030 QIP for other projects and envelopes $16,056.4 M
Sector total $19,150.3 M
1 Infrastructure in partial operation. 2 Since publishing the 2019-2029 QIP, the progress of these projects on the list of published projects changed from the "in planning" to "in progress". 3 Since publishing the 2019-2029 QIP, the progress of these projects on the list of published projects changed from the "under study" to "in planning". 4 Since publishing the 2019-2029 QIP, these projects were added to "in planning". 5 Since publishing the 2019-2029 QIP, these projects were added to "under study".
The contribution of the Gouvernement du Québec required to implement the projects under study is provided for in the 2020‐2030 QIP. Project withdrawn from the list of published projects in the 2020‐2030 QIP
Pursuant to a Cabinet decision, this major project was replaced by a group of non‐major projects.
• Additional space for secondary and vocational training at the Commission scolaire de Laval (region 13).
Accordingly, this project was withdrawn from the list of projects in progress.
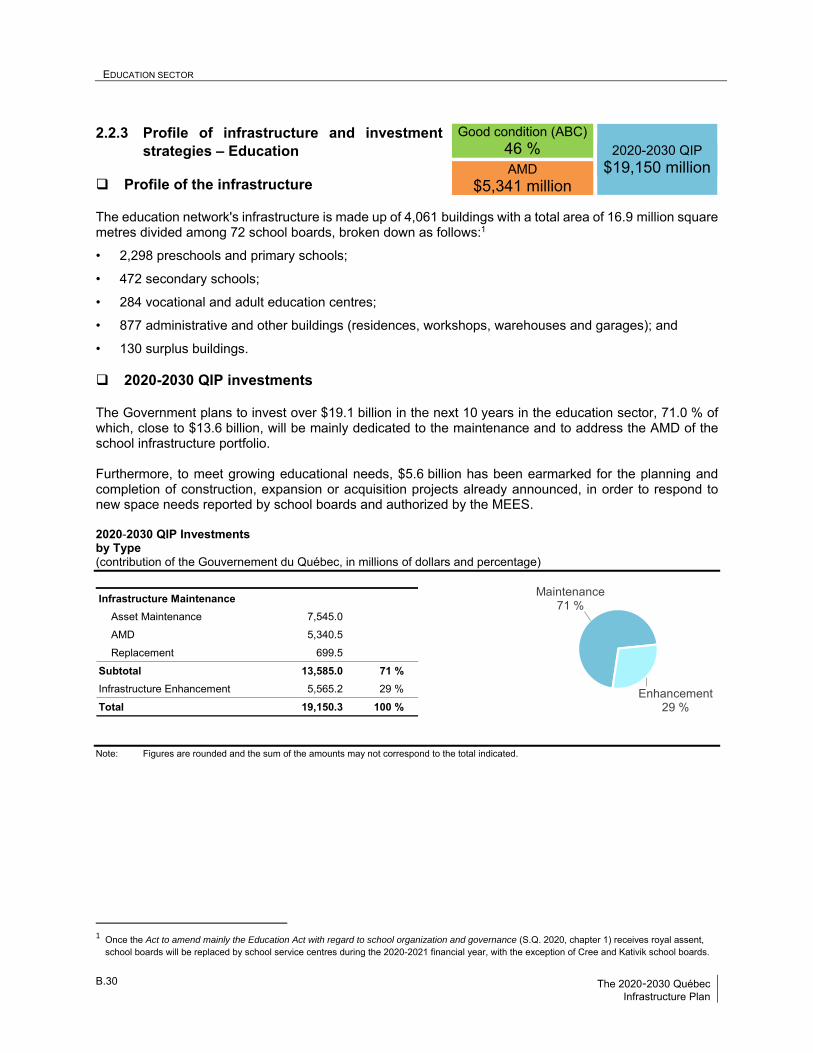
EDUCATION SECTOR B
B.30 The 2020-2030 Québec Infrastructure Plan
2.2.3 Profile of infrastructure and investment strategies – Education
Profile of the infrastructure The education network's infrastructure is made up of 4,061 buildings with a total area of 16.9 million square metres divided among 72 school boards, broken down as follows:1
• 2,298 preschools and primary schools;
• 472 secondary schools;
• 284 vocational and adult education centres;
• 877 administrative and other buildings (residences, workshops, warehouses and garages); and
• 130 surplus buildings. 2020-2030 QIP investments The Government plans to invest over $19.1 billion in the next 10 years in the education sector, 71.0 % of which, close to $13.6 billion, will be mainly dedicated to the maintenance and to address the AMD of the school infrastructure portfolio. Furthermore, to meet growing educational needs, $5.6 billion has been earmarked for the planning and completion of construction, expansion or acquisition projects already announced, in order to respond to new space needs reported by school boards and authorized by the MEES. 2020-2030 QIP Investments by Type (contribution of the Gouvernement du Québec, in millions of dollars and percentage)
Note: Figures are rounded and the sum of the amounts may not correspond to the total indicated.
1 Once the Act to amend mainly the Education Act with regard to school organization and governance (S.Q. 2020, chapter 1) receives royal assent,
school boards will be replaced by school service centres during the 2020-2021 financial year, with the exception of Cree and Kativik school boards.
Infrastructure Maintenance
Asset Maintenance 7,545.0
AMD 5,340.5
Replacement 699.5
Subtotal 13,585.0 71 %
Infrastructure Enhancement 5,565.2 29 %
Total 19,150.3 100 %
Good condition (ABC) 46 %
2020-2030 QIP $19,150 million AMD
$5,341 million
Maintenance71 %
Enhancement29 %
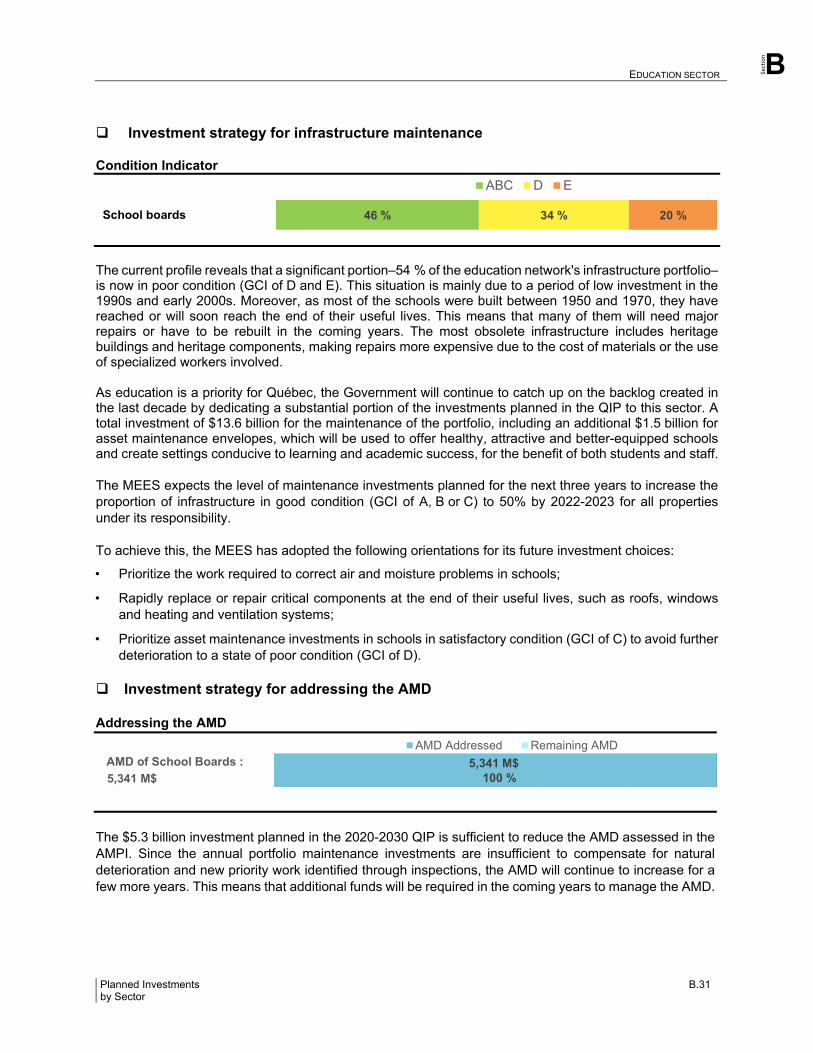
Section
EDUCATION SECTOR B
Planned Investments B.31 by Sector
Investment strategy for infrastructure maintenance Condition Indicator
The current profile reveals that a significant portion–54 % of the education network's infrastructure portfolio–is now in poor condition (GCI of D and E). This situation is mainly due to a period of low investment in the 1990s and early 2000s. Moreover, as most of the schools were built between 1950 and 1970, they have reached or will soon reach the end of their useful lives. This means that many of them will need major repairs or have to be rebuilt in the coming years. The most obsolete infrastructure includes heritage buildings and heritage components, making repairs more expensive due to the cost of materials or the use of specialized workers involved. As education is a priority for Québec, the Government will continue to catch up on the backlog created in the last decade by dedicating a substantial portion of the investments planned in the QIP to this sector. A total investment of $13.6 billion for the maintenance of the portfolio, including an additional $1.5 billion for asset maintenance envelopes, which will be used to offer healthy, attractive and better-equipped schools and create settings conducive to learning and academic success, for the benefit of both students and staff. The MEES expects the level of maintenance investments planned for the next three years to increase the proportion of infrastructure in good condition (GCI of A, B or C) to 50% by 2022-2023 for all properties under its responsibility. To achieve this, the MEES has adopted the following orientations for its future investment choices:
• Prioritize the work required to correct air and moisture problems in schools;
• Rapidly replace or repair critical components at the end of their useful lives, such as roofs, windows and heating and ventilation systems;
• Prioritize asset maintenance investments in schools in satisfactory condition (GCI of C) to avoid further deterioration to a state of poor condition (GCI of D).
Investment strategy for addressing the AMD Addressing the AMD
The $5.3 billion investment planned in the 2020-2030 QIP is sufficient to reduce the AMD assessed in the AMPI. Since the annual portfolio maintenance investments are insufficient to compensate for natural deterioration and new priority work identified through inspections, the AMD will continue to increase for a few more years. This means that additional funds will be required in the coming years to manage the AMD.
46 % 34 % 20 %School boards
ABC D E
5,341 M$100 %5,341 M$
AMD of School Boards :AMD Addressed Remaining AMD
EDUCATION SECTOR B
B.32 The 2020-2030 Québec Infrastructure Plan
To reduce the AMD, the MEES is planning on using the following means: • Accelerate the confirmation of annual investment budgets for the school boards, to allow them to
undertake the work more quickly;
• Immediately allocate budgets to school boards for the coming years, to allow them to plan their priority projects more effectively;
• Plan for separate maintenance budgets, allocated in the school board operation envelopes, which must be used for this purpose;
• Develop mechanisms to optimize the contracting process, to benefit, in some cases, from economies of scale (qualification of suppliers and purchasing groups);
• Allow school boards to acquire modular units to free up space in schools that require priority repair work;
• Encourage school boards to develop investment master plans to plan their renovation, construction and replacement projects over the medium and long term;
• Deploy new information management systems to improve the tracking of investment needs in schools, including the effect of completed work on changes in their condition and the asset maintenance deficit, which will allow optimal interventions to be prioritized.
The MEES has also developed a reconstruction plan for the most obsolete schools that are nearing the end of their life cycle:
• Allocate over $300.0 million to the reconstruction of schools based on priorities identified by school boards supported by a cost-benefit analysis demonstrating that it is more beneficial to reconstruct the building than to renovate it;
• Target the most obsolete schools and, where possible, combine their reconstruction with the creation of new student spaces to meet the most urgent space deficits.
Investment strategy to enhance the infrastructure In response to growing needs in education, the Government plans $5.6 billion in the QIP. By 2023-2024, the MEES foresees a deficit of over 600 classes in primary schools and, by 2028-2029, a deficit of over 25,000 student spaces in secondary schools, mainly in the Montréal, Montérégie, Laval, Laurentides and Lanaudière regions. Furthermore, to accommodate the introduction of universal kindergarten for 4-year-olds over the longer term, 1,200 classes are expected to be added in primary schools. This level of investments to enhance the portfolio will allow the MEES to:
• Continue the planning and completion of close to 250 additional space projects that have been authorized in recent years;
• Announce many new projects to build or expand schools, enabling additional primary school classrooms and additional secondary student spaces to be added, benefiting thousands of students by 2023-2024;
• Build the premises necessary to open 1,9561 new kindergarten classes for 4-year-olds by the 2023-2024 school year.
1 Including new classrooms and transformation of current classrooms.
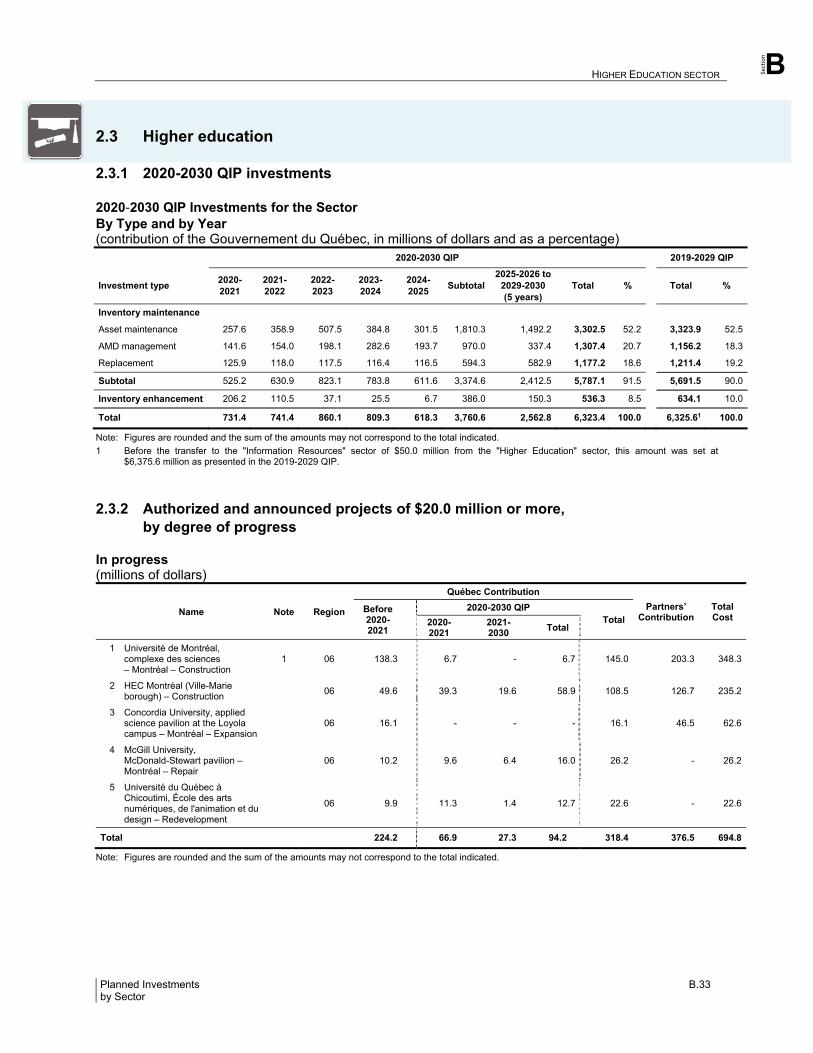
Section
HIGHER EDUCATION SECTOR B
Planned Investments B.33 by Sector
2.3 Higher education
2.3.1 2020-2030 QIP investments 2020‐2030 QIP Investments for the Sector By Type and by Year (contribution of the Gouvernement du Québec, in millions of dollars and as a percentage) 2020-2030 QIP 2019-2029 QIP
Investment type 2020-2021
2021-2022
2022-2023
2023-2024
2024-2025
Subtotal 2025-2026 to
2029-2030 (5 years)
Total % Total %
Inventory maintenance
Asset maintenance 257.6 358.9 507.5 384.8 301.5 1,810.3 1,492.2 3,302.5 52.2 3,323.9 52.5
AMD management 141.6 154.0 198.1 282.6 193.7 970.0 337.4 1,307.4 20.7 1,156.2 18.3
Replacement 125.9 118.0 117.5 116.4 116.5 594.3 582.9 1,177.2 18.6 1,211.4 19.2
Subtotal 525.2 630.9 823.1 783.8 611.6 3,374.6 2,412.5 5,787.1 91.5 5,691.5 90.0
Inventory enhancement 206.2 110.5 37.1 25.5 6.7 386.0 150.3 536.3 8.5 634.1 10.0
Total 731.4 741.4 860.1 809.3 618.3 3,760.6 2,562.8 6,323.4 100.0 6,325.61 100.0
Note: Figures are rounded and the sum of the amounts may not correspond to the total indicated.
1 Before the transfer to the "Information Resources" sector of $50.0 million from the "Higher Education" sector, this amount was set at $6,375.6 million as presented in the 2019-2029 QIP.
2.3.2 Authorized and announced projects of $20.0 million or more, by degree of progress
In progress (millions of dollars)
Name Note Region
Québec Contribution
Partners’ Contribution
Total Cost
Before 2020-2021
2020-2030 QIP
Total
2020-2021
2021-2030
Total
1 Université de Montréal, complexe des sciences – Montréal – Construction
1 06 138.3 6.7 - 6.7 145.0 203.3 348.3
2 HEC Montréal (Ville-Marie borough) – Construction 06 49.6 39.3 19.6 58.9 108.5 126.7 235.2
3 Concordia University, applied science pavilion at the Loyola campus – Montréal – Expansion
06 16.1 - - - 16.1 46.5 62.6
4 McGill University, McDonald-Stewart pavilion – Montréal – Repair
06 10.2 9.6 6.4 16.0 26.2 - 26.2
5 Université du Québec à Chicoutimi, École des arts numériques, de l'animation et du design – Redevelopment
06 9.9 11.3 1.4 12.7 22.6 - 22.6
Total 224.2 66.9 27.3 94.2 318.4 376.5 694.8
Note: Figures are rounded and the sum of the amounts may not correspond to the total indicated.
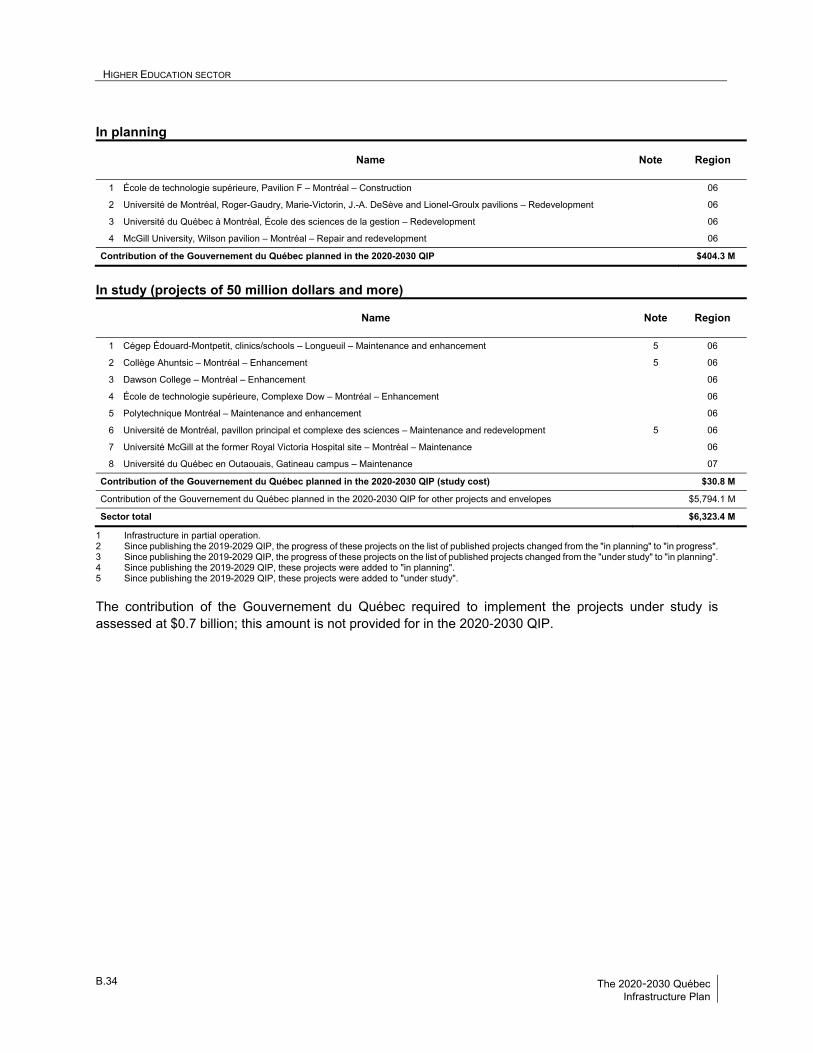
HIGHER EDUCATION SECTOR B
B.34 The 2020-2030 Québec Infrastructure Plan
In planning
Name Note Region
1 École de technologie supérieure, Pavilion F – Montréal – Construction 06
2 Université de Montréal, Roger-Gaudry, Marie-Victorin, J.-A. DeSève and Lionel-Groulx pavilions – Redevelopment 06
3 Université du Québec à Montréal, École des sciences de la gestion – Redevelopment 06
4 McGill University, Wilson pavilion – Montréal – Repair and redevelopment 06
Contribution of the Gouvernement du Québec planned in the 2020-2030 QIP $404.3 M
In study (projects of 50 million dollars and more)
Name Note Region
1 Cégep Édouard-Montpetit, clinics/schools – Longueuil – Maintenance and enhancement 5 06
2 Collège Ahuntsic – Montréal – Enhancement 5 06
3 Dawson College – Montréal – Enhancement 06
4 École de technologie supérieure, Complexe Dow – Montréal – Enhancement 06
5 Polytechnique Montréal – Maintenance and enhancement 06
6 Université de Montréal, pavillon principal et complexe des sciences – Maintenance and redevelopment 5 06
7 Université McGill at the former Royal Victoria Hospital site – Montréal – Maintenance 06
8 Université du Québec en Outaouais, Gatineau campus – Maintenance 07
Contribution of the Gouvernement du Québec planned in the 2020-2030 QIP (study cost) $30.8 M
Contribution of the Gouvernement du Québec planned in the 2020-2030 QIP for other projects and envelopes $5,794.1 M
Sector total $6,323.4 M
1 Infrastructure in partial operation. 2 Since publishing the 2019-2029 QIP, the progress of these projects on the list of published projects changed from the "in planning" to "in progress". 3 Since publishing the 2019-2029 QIP, the progress of these projects on the list of published projects changed from the "under study" to "in planning". 4 Since publishing the 2019-2029 QIP, these projects were added to "in planning". 5 Since publishing the 2019-2029 QIP, these projects were added to "under study".
The contribution of the Gouvernement du Québec required to implement the projects under study is assessed at $0.7 billion; this amount is not provided for in the 2020‐2030 QIP.
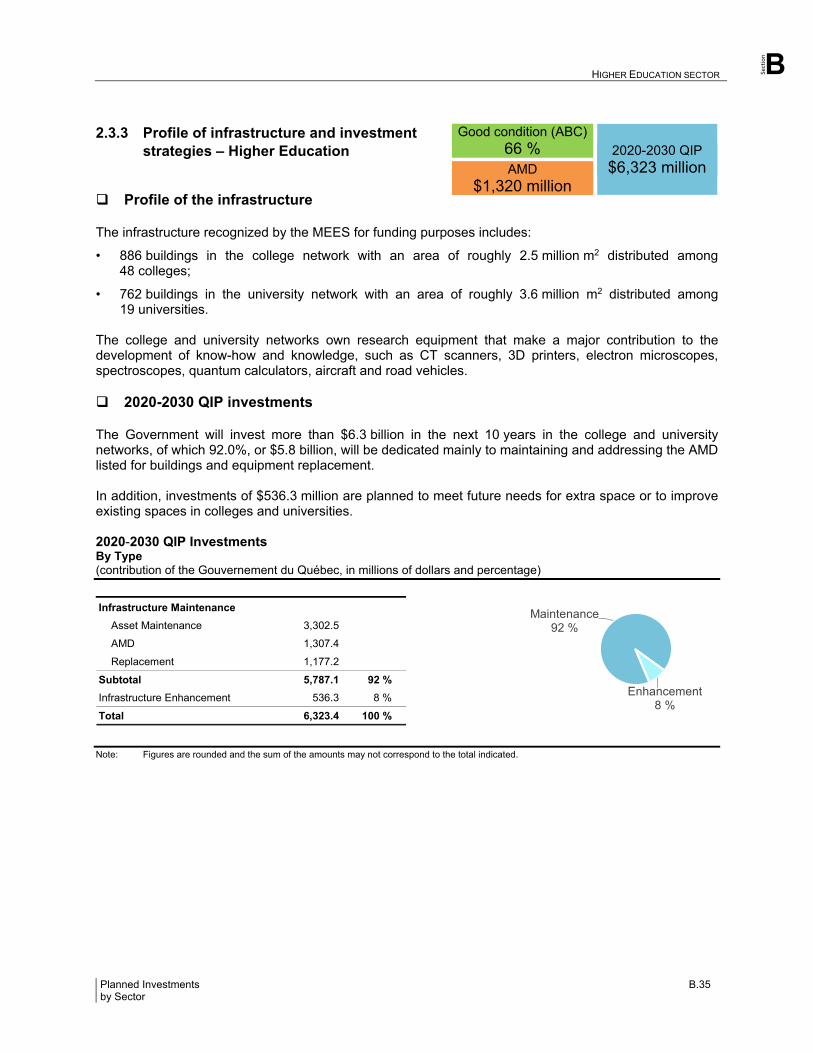
Section
HIGHER EDUCATION SECTOR B
Planned Investments B.35 by Sector
2.3.3 Profile of infrastructure and investment strategies – Higher Education
Profile of the infrastructure The infrastructure recognized by the MEES for funding purposes includes:
• 886 buildings in the college network with an area of roughly 2.5 million m2 distributed among 48 colleges;
• 762 buildings in the university network with an area of roughly 3.6 million m2 distributed among 19 universities.
The college and university networks own research equipment that make a major contribution to the development of know-how and knowledge, such as CT scanners, 3D printers, electron microscopes, spectroscopes, quantum calculators, aircraft and road vehicles. 2020-2030 QIP investments The Government will invest more than $6.3 billion in the next 10 years in the college and university networks, of which 92.0%, or $5.8 billion, will be dedicated mainly to maintaining and addressing the AMD listed for buildings and equipment replacement. In addition, investments of $536.3 million are planned to meet future needs for extra space or to improve existing spaces in colleges and universities. 2020-2030 QIP Investments By Type (contribution of the Gouvernement du Québec, in millions of dollars and percentage)
Note: Figures are rounded and the sum of the amounts may not correspond to the total indicated.
Infrastructure Maintenance
Asset Maintenance 3,302.5
AMD 1,307.4
Replacement 1,177.2
Subtotal 5,787.1 92 %
Infrastructure Enhancement 536.3 8 %
Total 6,323.4 100 %
Good condition (ABC) 66 %
2020-2030 QIP $6,323 million AMD
$1,320 million
Maintenance92 %
Enhancement8 %
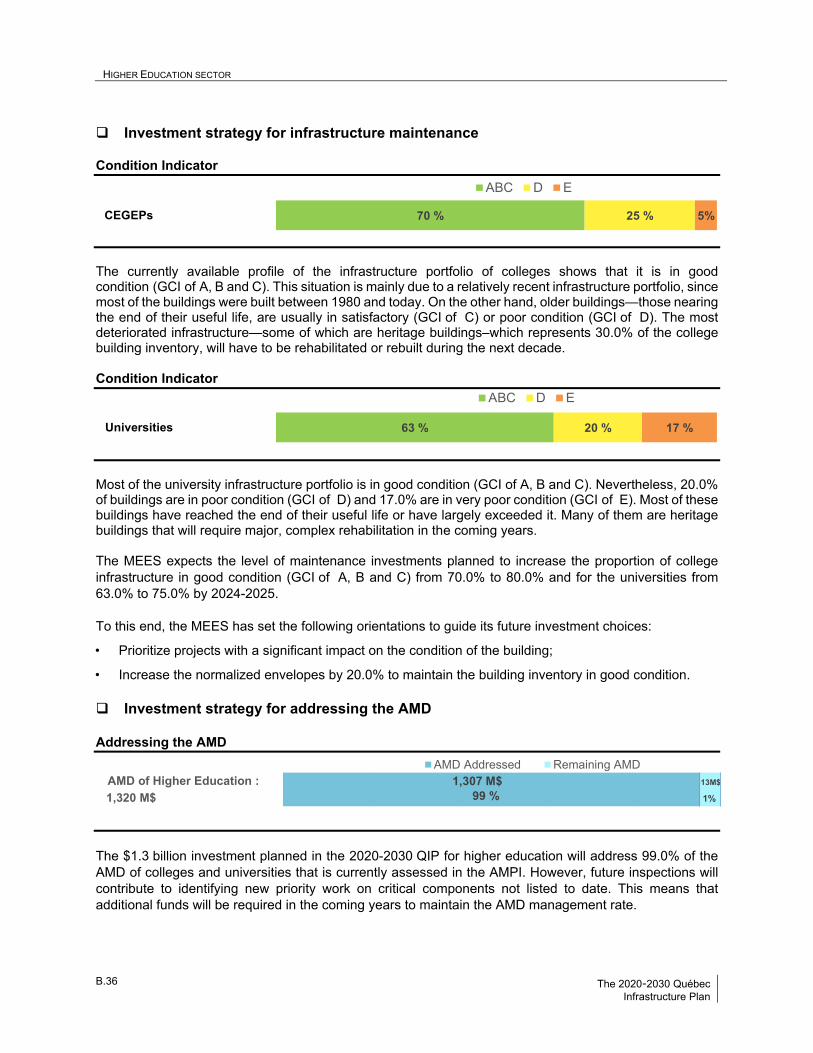
HIGHER EDUCATION SECTOR B
B.36 The 2020-2030 Québec Infrastructure Plan
Investment strategy for infrastructure maintenance Condition Indicator
The currently available profile of the infrastructure portfolio of colleges shows that it is in good condition (GCI of A, B and C). This situation is mainly due to a relatively recent infrastructure portfolio, since most of the buildings were built between 1980 and today. On the other hand, older buildings—those nearing the end of their useful life, are usually in satisfactory (GCI of C) or poor condition (GCI of D). The most deteriorated infrastructure—some of which are heritage buildings–which represents 30.0% of the college building inventory, will have to be rehabilitated or rebuilt during the next decade. Condition Indicator
Most of the university infrastructure portfolio is in good condition (GCI of A, B and C). Nevertheless, 20.0% of buildings are in poor condition (GCI of D) and 17.0% are in very poor condition (GCI of E). Most of these buildings have reached the end of their useful life or have largely exceeded it. Many of them are heritage buildings that will require major, complex rehabilitation in the coming years. The MEES expects the level of maintenance investments planned to increase the proportion of college infrastructure in good condition (GCI of A, B and C) from 70.0% to 80.0% and for the universities from 63.0% to 75.0% by 2024-2025. To this end, the MEES has set the following orientations to guide its future investment choices:
• Prioritize projects with a significant impact on the condition of the building;
• Increase the normalized envelopes by 20.0% to maintain the building inventory in good condition. Investment strategy for addressing the AMD Addressing the AMD
The $1.3 billion investment planned in the 2020-2030 QIP for higher education will address 99.0% of the AMD of colleges and universities that is currently assessed in the AMPI. However, future inspections will contribute to identifying new priority work on critical components not listed to date. This means that additional funds will be required in the coming years to maintain the AMD management rate.
70 % 25 % 5%CEGEPs
ABC D E
63 % 20 % 17 %Universities
ABC D E
1,307 M$99 %
13M$
1%1,320 M$
AMD of Higher Education :AMD Addressed Remaining AMD
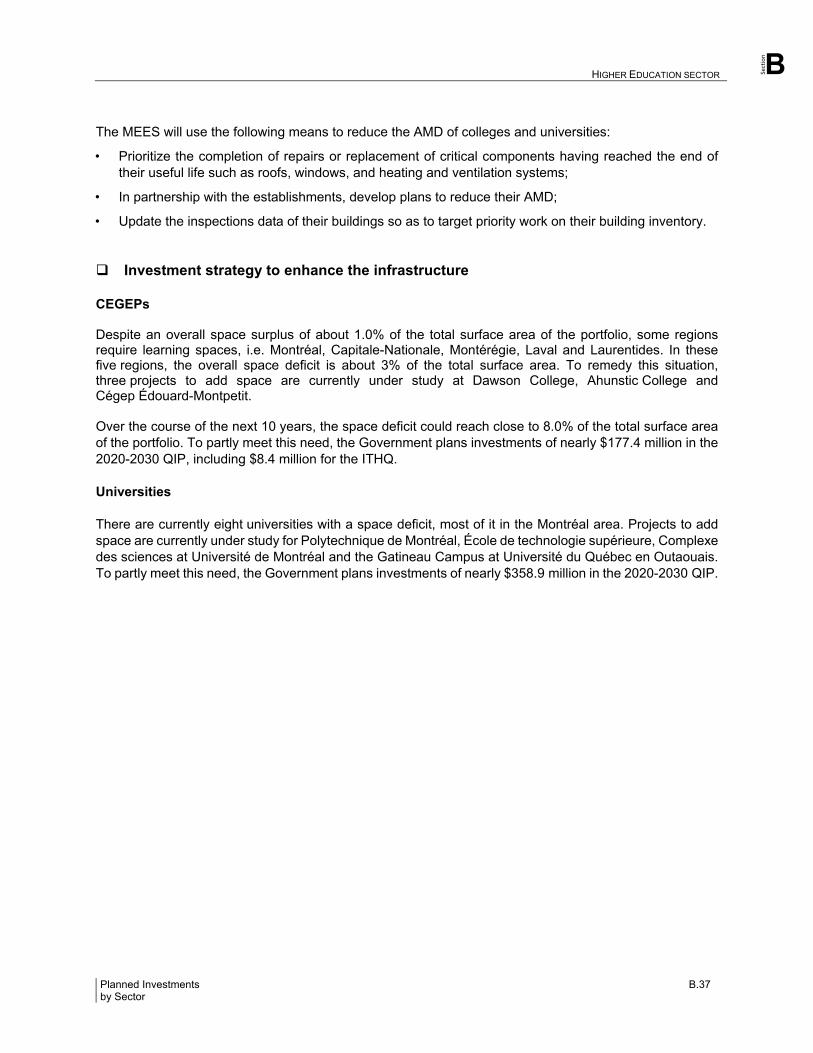
Section
HIGHER EDUCATION SECTOR B
Planned Investments B.37 by Sector
The MEES will use the following means to reduce the AMD of colleges and universities:
• Prioritize the completion of repairs or replacement of critical components having reached the end of their useful life such as roofs, windows, and heating and ventilation systems;
• In partnership with the establishments, develop plans to reduce their AMD;
• Update the inspections data of their buildings so as to target priority work on their building inventory.
Investment strategy to enhance the infrastructure CEGEPs Despite an overall space surplus of about 1.0% of the total surface area of the portfolio, some regions require learning spaces, i.e. Montréal, Capitale-Nationale, Montérégie, Laval and Laurentides. In these five regions, the overall space deficit is about 3% of the total surface area. To remedy this situation, three projects to add space are currently under study at Dawson College, Ahunstic College and Cégep Édouard-Montpetit. Over the course of the next 10 years, the space deficit could reach close to 8.0% of the total surface area of the portfolio. To partly meet this need, the Government plans investments of nearly $177.4 million in the 2020-2030 QIP, including $8.4 million for the ITHQ. Universities There are currently eight universities with a space deficit, most of it in the Montréal area. Projects to add space are currently under study for Polytechnique de Montréal, École de technologie supérieure, Complexe des sciences at Université de Montréal and the Gatineau Campus at Université du Québec en Outaouais. To partly meet this need, the Government plans investments of nearly $358.9 million in the 2020-2030 QIP.
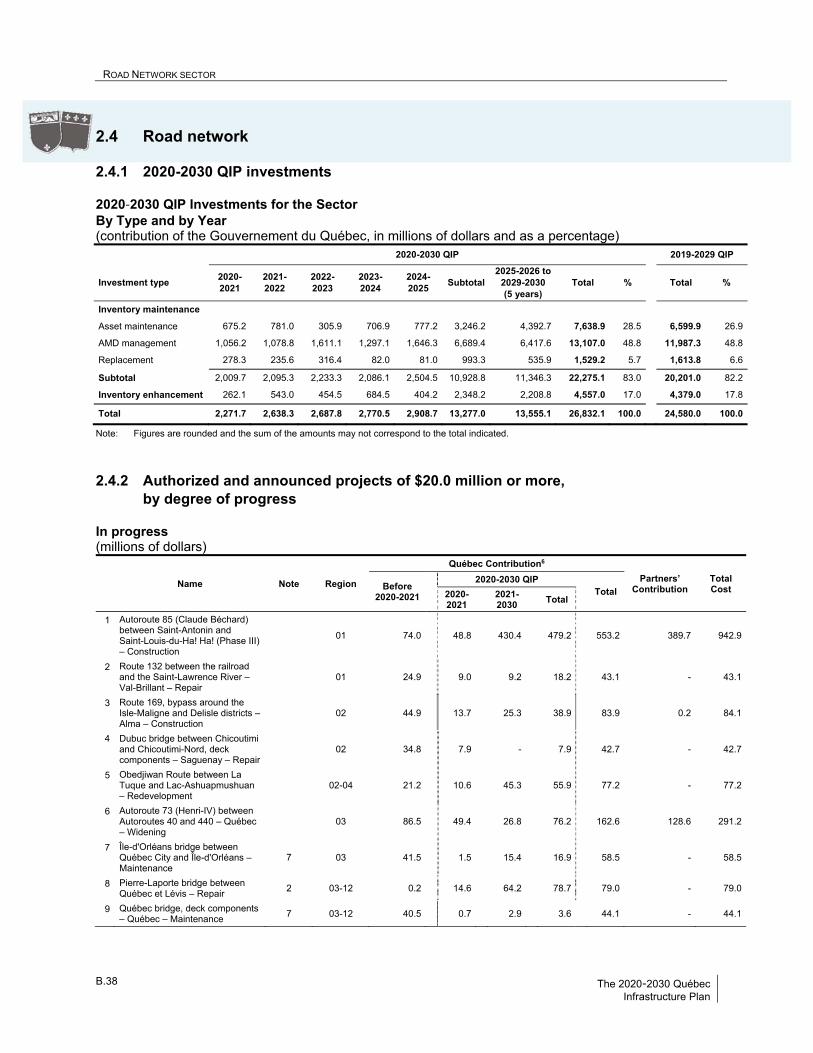
ROAD NETWORK SECTOR B
B.38 The 2020-2030 Québec Infrastructure Plan
2.4 Road network
2.4.1 2020-2030 QIP investments 2020‐2030 QIP Investments for the Sector By Type and by Year (contribution of the Gouvernement du Québec, in millions of dollars and as a percentage) 2020-2030 QIP 2019-2029 QIP
Investment type 2020-2021
2021-2022
2022-2023
2023-2024
2024-2025
Subtotal 2025-2026 to
2029-2030 (5 years)
Total % Total %
Inventory maintenance
Asset maintenance 675.2 781.0 305.9 706.9 777.2 3,246.2 4,392.7 7,638.9 28.5 6,599.9 26.9
AMD management 1,056.2 1,078.8 1,611.1 1,297.1 1,646.3 6,689.4 6,417.6 13,107.0 48.8 11,987.3 48.8
Replacement 278.3 235.6 316.4 82.0 81.0 993.3 535.9 1,529.2 5.7 1,613.8 6.6
Subtotal 2,009.7 2,095.3 2,233.3 2,086.1 2,504.5 10,928.8 11,346.3 22,275.1 83.0 20,201.0 82.2
Inventory enhancement 262.1 543.0 454.5 684.5 404.2 2,348.2 2,208.8 4,557.0 17.0 4,379.0 17.8
Total 2,271.7 2,638.3 2,687.8 2,770.5 2,908.7 13,277.0 13,555.1 26,832.1 100.0 24,580.0 100.0
Note: Figures are rounded and the sum of the amounts may not correspond to the total indicated.
2.4.2 Authorized and announced projects of $20.0 million or more, by degree of progress
In progress (millions of dollars)
Name Note Region
Québec Contribution6
Partners’ Contribution
Total Cost
Before 2020-2021
2020-2030 QIP
Total
2020-2021
2021-2030
Total
1 Autoroute 85 (Claude Béchard) between Saint-Antonin and Saint-Louis-du-Ha! Ha! (Phase III) – Construction
01 74.0 48.8 430.4 479.2 553.2 389.7 942.9
2 Route 132 between the railroad and the Saint-Lawrence River – Val-Brillant – Repair
01 24.9 9.0 9.2 18.2 43.1 - 43.1
3 Route 169, bypass around the Isle-Maligne and Delisle districts – Alma – Construction
02 44.9 13.7 25.3 38.9 83.9 0.2 84.1
4 Dubuc bridge between Chicoutimi and Chicoutimi-Nord, deck components – Saguenay – Repair
02 34.8 7.9 - 7.9 42.7 - 42.7
5 Obedjiwan Route between La Tuque and Lac-Ashuapmushuan – Redevelopment
02-04 21.2 10.6 45.3 55.9 77.2 - 77.2
6 Autoroute 73 (Henri-IV) between Autoroutes 40 and 440 – Québec – Widening
03 86.5 49.4 26.8 76.2 162.6 128.6 291.2
7 Île-d'Orléans bridge between Québec City and Île-d'Orléans – Maintenance
7 03 41.5 1.5 15.4 16.9 58.5 - 58.5
8 Pierre-Laporte bridge between Québec et Lévis – Repair
2 03-12 0.2 14.6 64.2 78.7 79.0 - 79.0
9 Québec bridge, deck components – Québec – Maintenance
7 03-12 40.5 0.7 2.9 3.6 44.1 - 44.1
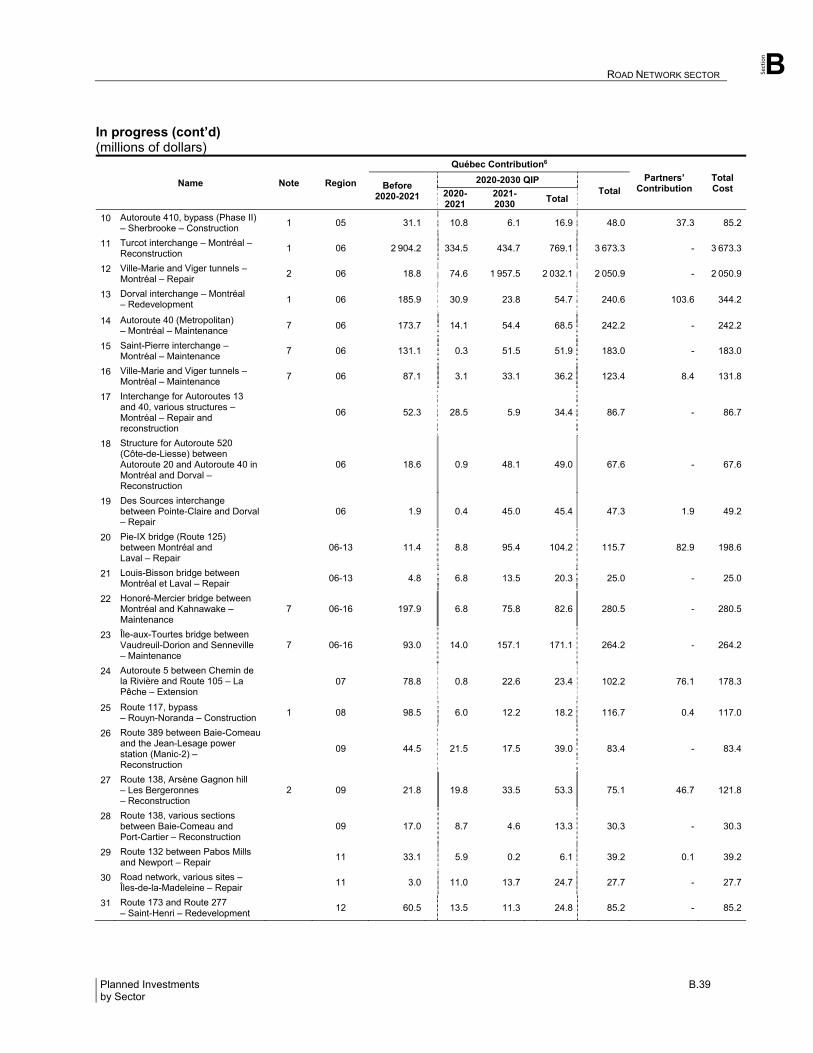
Section
ROAD NETWORK SECTOR B
Planned Investments B.39 by Sector
In progress (cont’d) (millions of dollars)
Name Note Region
Québec Contribution6
Partners’ Contribution
Total Cost
Before 2020-2021
2020-2030 QIP
Total
2020-2021
2021-2030
Total
10 Autoroute 410, bypass (Phase II) – Sherbrooke – Construction
1 05 31.1 10.8 6.1 16.9 48.0 37.3 85.2
11 Turcot interchange – Montréal – Reconstruction
1 06 2 904.2 334.5 434.7 769.1 3 673.3 - 3 673.3
12 Ville-Marie and Viger tunnels – Montréal – Repair
2 06 18.8 74.6 1 957.5 2 032.1 2 050.9 - 2 050.9
13 Dorval interchange – Montréal – Redevelopment 1 06 185.9 30.9 23.8 54.7 240.6 103.6 344.2
14 Autoroute 40 (Metropolitan) – Montréal – Maintenance
7 06 173.7 14.1 54.4 68.5 242.2 - 242.2
15 Saint-Pierre interchange – Montréal – Maintenance
7 06 131.1 0.3 51.5 51.9 183.0 - 183.0
16 Ville-Marie and Viger tunnels – Montréal – Maintenance
7 06 87.1 3.1 33.1 36.2 123.4 8.4 131.8
17 Interchange for Autoroutes 13 and 40, various structures – Montréal – Repair and reconstruction
06 52.3 28.5 5.9 34.4 86.7 - 86.7
18 Structure for Autoroute 520 (Côte-de-Liesse) between Autoroute 20 and Autoroute 40 in Montréal and Dorval – Reconstruction
06 18.6 0.9 48.1 49.0 67.6 - 67.6
19 Des Sources interchange between Pointe-Claire and Dorval – Repair
06 1.9 0.4 45.0 45.4 47.3 1.9 49.2
20 Pie-IX bridge (Route 125) between Montréal and Laval – Repair
06-13 11.4 8.8 95.4 104.2 115.7 82.9 198.6
21 Louis-Bisson bridge between Montréal et Laval – Repair
06-13 4.8 6.8 13.5 20.3 25.0 - 25.0
22 Honoré-Mercier bridge between Montréal and Kahnawake – Maintenance
7 06-16 197.9 6.8 75.8 82.6 280.5 - 280.5
23 Île-aux-Tourtes bridge between Vaudreuil-Dorion and Senneville – Maintenance
7 06-16 93.0 14.0 157.1 171.1 264.2 - 264.2
24 Autoroute 5 between Chemin de la Rivière and Route 105 – La Pêche – Extension
07 78.8 0.8 22.6 23.4 102.2 76.1 178.3
25 Route 117, bypass – Rouyn-Noranda – Construction
1 08 98.5 6.0 12.2 18.2 116.7 0.4 117.0
26 Route 389 between Baie-Comeau and the Jean-Lesage power station (Manic-2) – Reconstruction
09 44.5 21.5 17.5 39.0 83.4 - 83.4
27 Route 138, Arsène Gagnon hill – Les Bergeronnes – Reconstruction
2 09 21.8 19.8 33.5 53.3 75.1 46.7 121.8
28 Route 138, various sections between Baie-Comeau and Port-Cartier – Reconstruction
09 17.0 8.7 4.6 13.3 30.3 - 30.3
29 Route 132 between Pabos Mills and Newport – Repair
11 33.1 5.9 0.2 6.1 39.2 0.1 39.2
30 Road network, various sites – Îles-de-la-Madeleine – Repair
11 3.0 11.0 13.7 24.7 27.7 - 27.7
31 Route 173 and Route 277 – Saint-Henri – Redevelopment
12 60.5 13.5 11.3 24.8 85.2 - 85.2
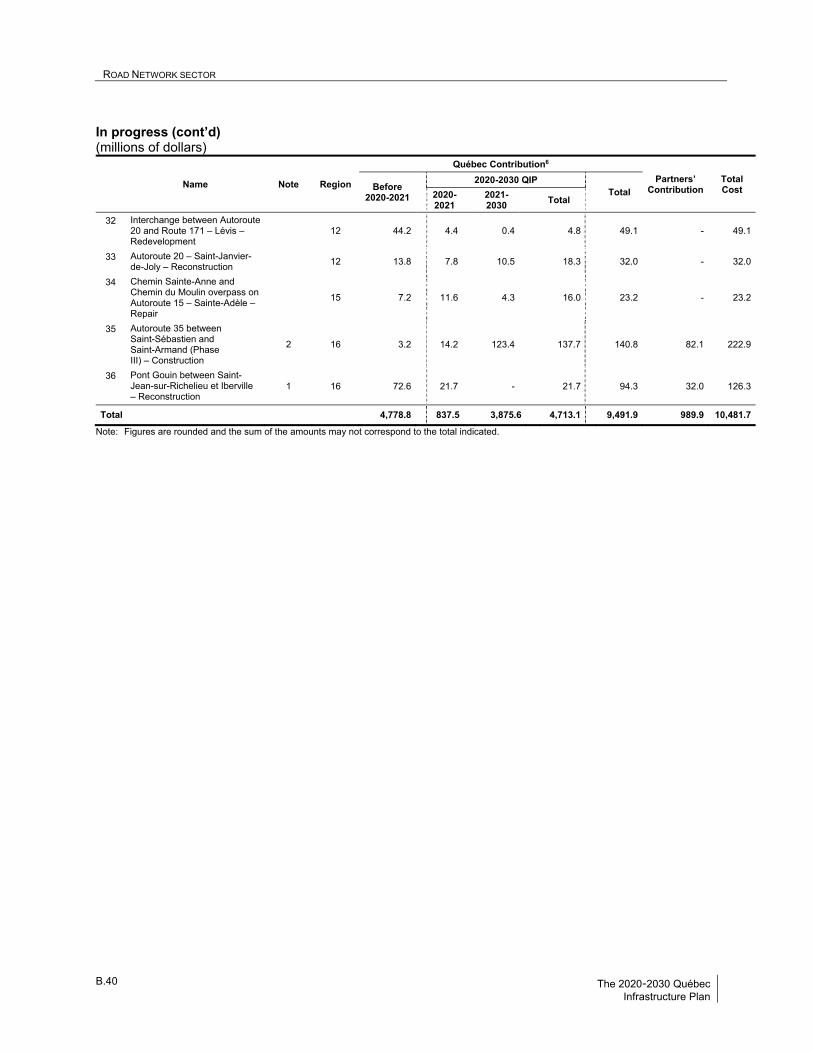
ROAD NETWORK SECTOR B
B.40 The 2020-2030 Québec Infrastructure Plan
In progress (cont’d) (millions of dollars)
Name Note Region
Québec Contribution6
Partners’ Contribution
Total Cost
Before 2020-2021
2020-2030 QIP
Total
2020-2021
2021-2030
Total
32 Interchange between Autoroute 20 and Route 171 – Lévis – Redevelopment
12 44.2 4.4 0.4 4.8 49.1 - 49.1
33 Autoroute 20 – Saint-Janvier-de-Joly – Reconstruction 12 13.8 7.8 10.5 18.3 32.0 - 32.0
34 Chemin Sainte-Anne and Chemin du Moulin overpass on Autoroute 15 – Sainte-Adèle – Repair
15 7.2 11.6 4.3 16.0 23.2 - 23.2
35 Autoroute 35 between Saint-Sébastien and Saint-Armand (Phase III) – Construction
2 16 3.2 14.2 123.4 137.7 140.8 82.1 222.9
36 Pont Gouin between Saint-Jean-sur-Richelieu et Iberville – Reconstruction
1 16 72.6 21.7 - 21.7 94.3 32.0 126.3
Total 4,778.8 837.5 3,875.6 4,713.1 9,491.9 989.9 10,481.7
Note: Figures are rounded and the sum of the amounts may not correspond to the total indicated.
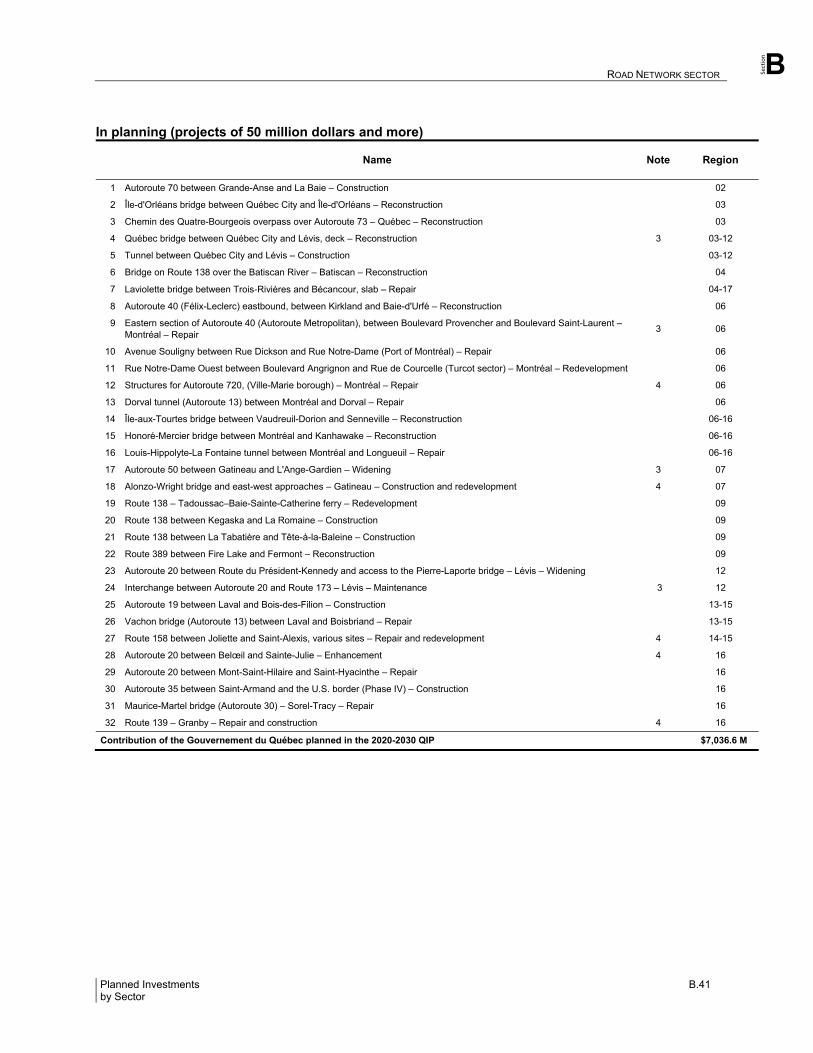
Section
ROAD NETWORK SECTOR B
Planned Investments B.41 by Sector
In planning (projects of 50 million dollars and more)
Name Note Region
1 Autoroute 70 between Grande-Anse and La Baie – Construction 02
2 Île-d'Orléans bridge between Québec City and Île-d'Orléans – Reconstruction 03
3 Chemin des Quatre-Bourgeois overpass over Autoroute 73 – Québec – Reconstruction 03
4 Québec bridge between Québec City and Lévis, deck – Reconstruction 3 03-12
5 Tunnel between Québec City and Lévis – Construction 03-12
6 Bridge on Route 138 over the Batiscan River – Batiscan – Reconstruction 04
7 Laviolette bridge between Trois-Rivières and Bécancour, slab – Repair 04-17
8 Autoroute 40 (Félix-Leclerc) eastbound, between Kirkland and Baie-d'Urfé – Reconstruction 06
9 Eastern section of Autoroute 40 (Autoroute Metropolitan), between Boulevard Provencher and Boulevard Saint-Laurent – Montréal – Repair
3 06
10 Avenue Souligny between Rue Dickson and Rue Notre-Dame (Port of Montréal) – Repair 06
11 Rue Notre-Dame Ouest between Boulevard Angrignon and Rue de Courcelle (Turcot sector) – Montréal – Redevelopment 06
12 Structures for Autoroute 720, (Ville-Marie borough) – Montréal – Repair 4 06
13 Dorval tunnel (Autoroute 13) between Montréal and Dorval – Repair 06
14 Île-aux-Tourtes bridge between Vaudreuil-Dorion and Senneville – Reconstruction 06-16
15 Honoré-Mercier bridge between Montréal and Kanhawake – Reconstruction 06-16
16 Louis-Hippolyte-La Fontaine tunnel between Montréal and Longueuil – Repair 06-16
17 Autoroute 50 between Gatineau and L'Ange-Gardien – Widening 3 07
18 Alonzo-Wright bridge and east-west approaches – Gatineau – Construction and redevelopment 4 07
19 Route 138 – Tadoussac–Baie-Sainte-Catherine ferry – Redevelopment 09
20 Route 138 between Kegaska and La Romaine – Construction 09
21 Route 138 between La Tabatière and Tête-à-la-Baleine – Construction 09
22 Route 389 between Fire Lake and Fermont – Reconstruction 09
23 Autoroute 20 between Route du Président-Kennedy and access to the Pierre-Laporte bridge – Lévis – Widening 12
24 Interchange between Autoroute 20 and Route 173 – Lévis – Maintenance 3 12
25 Autoroute 19 between Laval and Bois-des-Filion – Construction 13-15
26 Vachon bridge (Autoroute 13) between Laval and Boisbriand – Repair 13-15
27 Route 158 between Joliette and Saint-Alexis, various sites – Repair and redevelopment 4 14-15
28 Autoroute 20 between Belœil and Sainte-Julie – Enhancement 4 16
29 Autoroute 20 between Mont-Saint-Hilaire and Saint-Hyacinthe – Repair 16
30 Autoroute 35 between Saint-Armand and the U.S. border (Phase IV) – Construction 16
31 Maurice-Martel bridge (Autoroute 30) – Sorel-Tracy – Repair 16
32 Route 139 – Granby – Repair and construction 4 16
Contribution of the Gouvernement du Québec planned in the 2020-2030 QIP $7,036.6 M
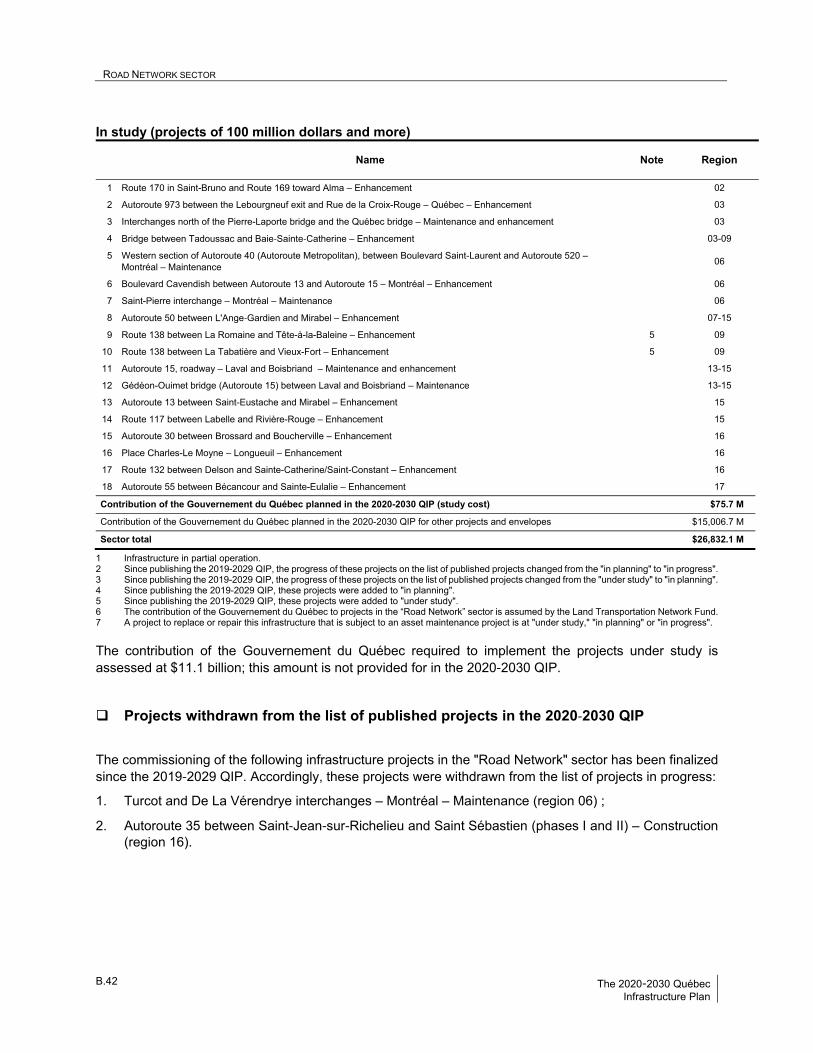
ROAD NETWORK SECTOR B
B.42 The 2020-2030 Québec Infrastructure Plan
In study (projects of 100 million dollars and more)
Name Note Region
1 Route 170 in Saint-Bruno and Route 169 toward Alma – Enhancement 02
2 Autoroute 973 between the Lebourgneuf exit and Rue de la Croix-Rouge – Québec – Enhancement 03
3 Interchanges north of the Pierre-Laporte bridge and the Québec bridge – Maintenance and enhancement 03
4 Bridge between Tadoussac and Baie-Sainte-Catherine – Enhancement 03-09
5 Western section of Autoroute 40 (Autoroute Metropolitan), between Boulevard Saint-Laurent and Autoroute 520 – Montréal – Maintenance
06
6 Boulevard Cavendish between Autoroute 13 and Autoroute 15 – Montréal – Enhancement 06
7 Saint-Pierre interchange – Montréal – Maintenance 06
8 Autoroute 50 between L'Ange-Gardien and Mirabel – Enhancement 07-15
9 Route 138 between La Romaine and Tête-à-la-Baleine – Enhancement 5 09
10 Route 138 between La Tabatière and Vieux-Fort – Enhancement 5 09
11 Autoroute 15, roadway – Laval and Boisbriand – Maintenance and enhancement 13-15
12 Gédéon-Ouimet bridge (Autoroute 15) between Laval and Boisbriand – Maintenance 13-15
13 Autoroute 13 between Saint-Eustache and Mirabel – Enhancement 15
14 Route 117 between Labelle and Rivière-Rouge – Enhancement 15
15 Autoroute 30 between Brossard and Boucherville – Enhancement 16
16 Place Charles-Le Moyne – Longueuil – Enhancement 16
17 Route 132 between Delson and Sainte-Catherine/Saint-Constant – Enhancement 16
18 Autoroute 55 between Bécancour and Sainte-Eulalie – Enhancement 17
Contribution of the Gouvernement du Québec planned in the 2020-2030 QIP (study cost) $75.7 M
Contribution of the Gouvernement du Québec planned in the 2020-2030 QIP for other projects and envelopes $15,006.7 M
Sector total $26,832.1 M
1 Infrastructure in partial operation. 2 Since publishing the 2019-2029 QIP, the progress of these projects on the list of published projects changed from the "in planning" to "in progress". 3 Since publishing the 2019-2029 QIP, the progress of these projects on the list of published projects changed from the "under study" to "in planning". 4 Since publishing the 2019-2029 QIP, these projects were added to "in planning". 5 Since publishing the 2019-2029 QIP, these projects were added to "under study". 6 The contribution of the Gouvernement du Québec to projects in the “Road Network” sector is assumed by the Land Transportation Network Fund. 7 A project to replace or repair this infrastructure that is subject to an asset maintenance project is at "under study," "in planning" or "in progress".
The contribution of the Gouvernement du Québec required to implement the projects under study is assessed at $11.1 billion; this amount is not provided for in the 2020‐2030 QIP. Projects withdrawn from the list of published projects in the 2020‐2030 QIP
The commissioning of the following infrastructure projects in the "Road Network" sector has been finalized since the 2019‐2029 QIP. Accordingly, these projects were withdrawn from the list of projects in progress:
1. Turcot and De La Vérendrye interchanges – Montréal – Maintenance (region 06) ;
2. Autoroute 35 between Saint‐Jean‐sur‐Richelieu and Saint Sébastien (phases I and II) – Construction (region 16).
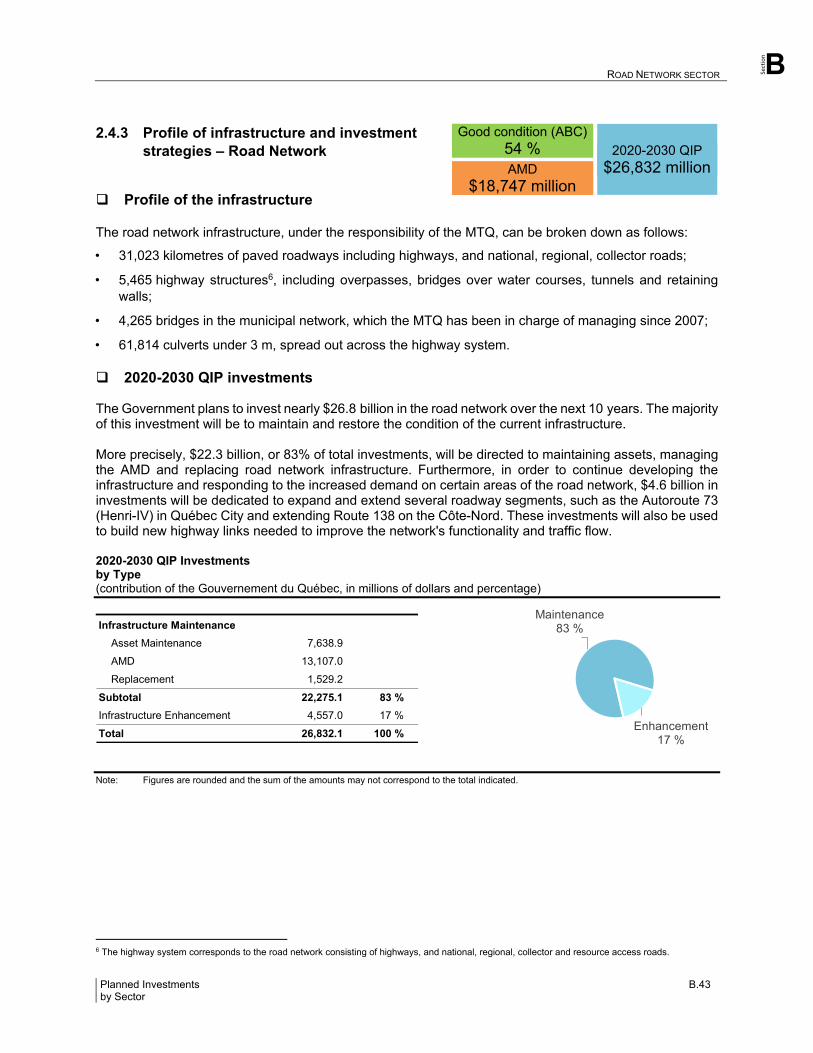
Section
ROAD NETWORK SECTOR B
Planned Investments B.43 by Sector
2.4.3 Profile of infrastructure and investment strategies – Road Network
Profile of the infrastructure The road network infrastructure, under the responsibility of the MTQ, can be broken down as follows:
• 31,023 kilometres of paved roadways including highways, and national, regional, collector roads;
• 5,465 highway structures6, including overpasses, bridges over water courses, tunnels and retaining walls;
• 4,265 bridges in the municipal network, which the MTQ has been in charge of managing since 2007;
• 61,814 culverts under 3 m, spread out across the highway system. 2020-2030 QIP investments The Government plans to invest nearly $26.8 billion in the road network over the next 10 years. The majority of this investment will be to maintain and restore the condition of the current infrastructure. More precisely, $22.3 billion, or 83% of total investments, will be directed to maintaining assets, managing the AMD and replacing road network infrastructure. Furthermore, in order to continue developing the infrastructure and responding to the increased demand on certain areas of the road network, $4.6 billion in investments will be dedicated to expand and extend several roadway segments, such as the Autoroute 73 (Henri-IV) in Québec City and extending Route 138 on the Côte-Nord. These investments will also be used to build new highway links needed to improve the network's functionality and traffic flow. 2020-2030 QIP Investments by Type (contribution of the Gouvernement du Québec, in millions of dollars and percentage)
Note: Figures are rounded and the sum of the amounts may not correspond to the total indicated.
6 The highway system corresponds to the road network consisting of highways, and national, regional, collector and resource access roads.
Infrastructure Maintenance
Asset Maintenance 7,638.9
AMD 13,107.0
Replacement 1,529.2
Subtotal 22,275.1 83 %
Infrastructure Enhancement 4,557.0 17 %
Total 26,832.1 100 %
Good condition (ABC) 54 %
2020-2030 QIP $26,832 million AMD
$18,747 million
Maintenance83 %
Enhancement17 %
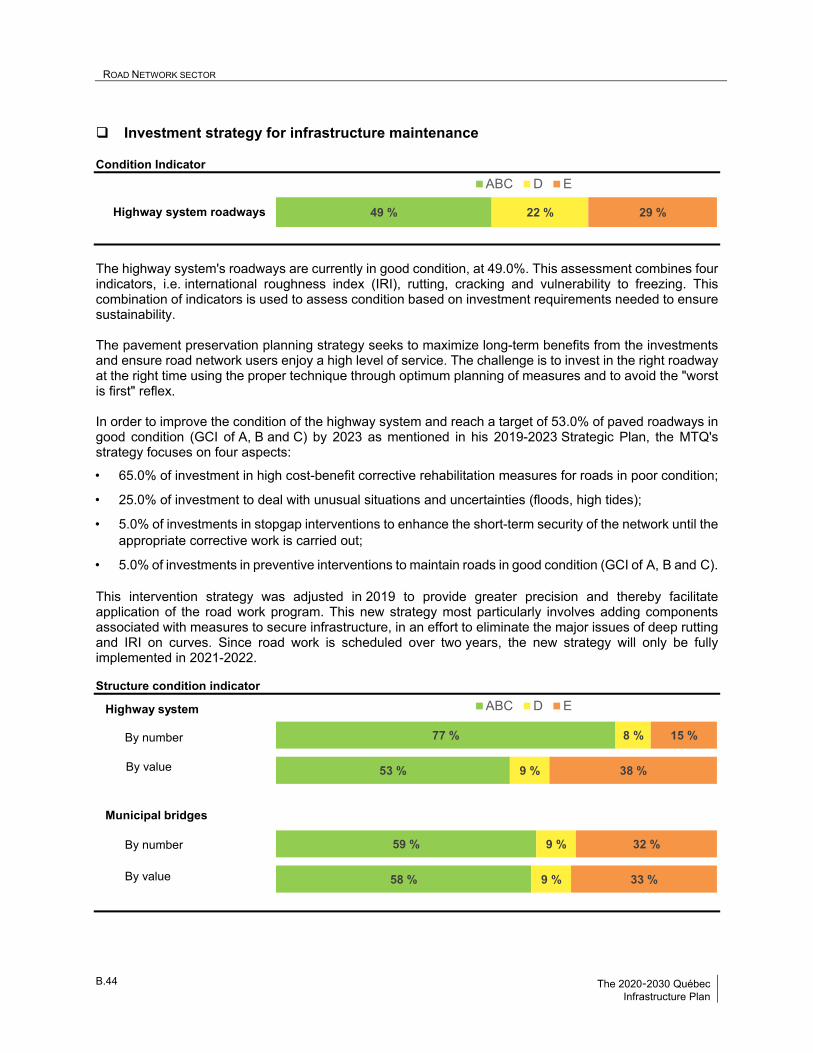
ROAD NETWORK SECTOR B
B.44 The 2020-2030 Québec Infrastructure Plan
Investment strategy for infrastructure maintenance Condition Indicator
The highway system's roadways are currently in good condition, at 49.0%. This assessment combines four indicators, i.e. international roughness index (IRI), rutting, cracking and vulnerability to freezing. This combination of indicators is used to assess condition based on investment requirements needed to ensure sustainability. The pavement preservation planning strategy seeks to maximize long-term benefits from the investments and ensure road network users enjoy a high level of service. The challenge is to invest in the right roadway at the right time using the proper technique through optimum planning of measures and to avoid the "worst is first" reflex. In order to improve the condition of the highway system and reach a target of 53.0% of paved roadways in good condition (GCI of A, B and C) by 2023 as mentioned in his 2019-2023 Strategic Plan, the MTQ's strategy focuses on four aspects:
• 65.0% of investment in high cost-benefit corrective rehabilitation measures for roads in poor condition;
• 25.0% of investment to deal with unusual situations and uncertainties (floods, high tides);
• 5.0% of investments in stopgap interventions to enhance the short-term security of the network until the appropriate corrective work is carried out;
• 5.0% of investments in preventive interventions to maintain roads in good condition (GCI of A, B and C).
This intervention strategy was adjusted in 2019 to provide greater precision and thereby facilitate application of the road work program. This new strategy most particularly involves adding components associated with measures to secure infrastructure, in an effort to eliminate the major issues of deep rutting and IRI on curves. Since road work is scheduled over two years, the new strategy will only be fully implemented in 2021-2022. Structure condition indicator
49 % 22 % 29 %Highway system roadways
ABC D E
53 %
77 %
9 %
8 %
38 %
15 %
Highway system
Highway system
ABC D E
58 %
59 %
9 %
9 %
33 %
32 %
Municipal bridges
Municipal bridges
Highway system
Municipal bridges
By number
By value
By number
By value
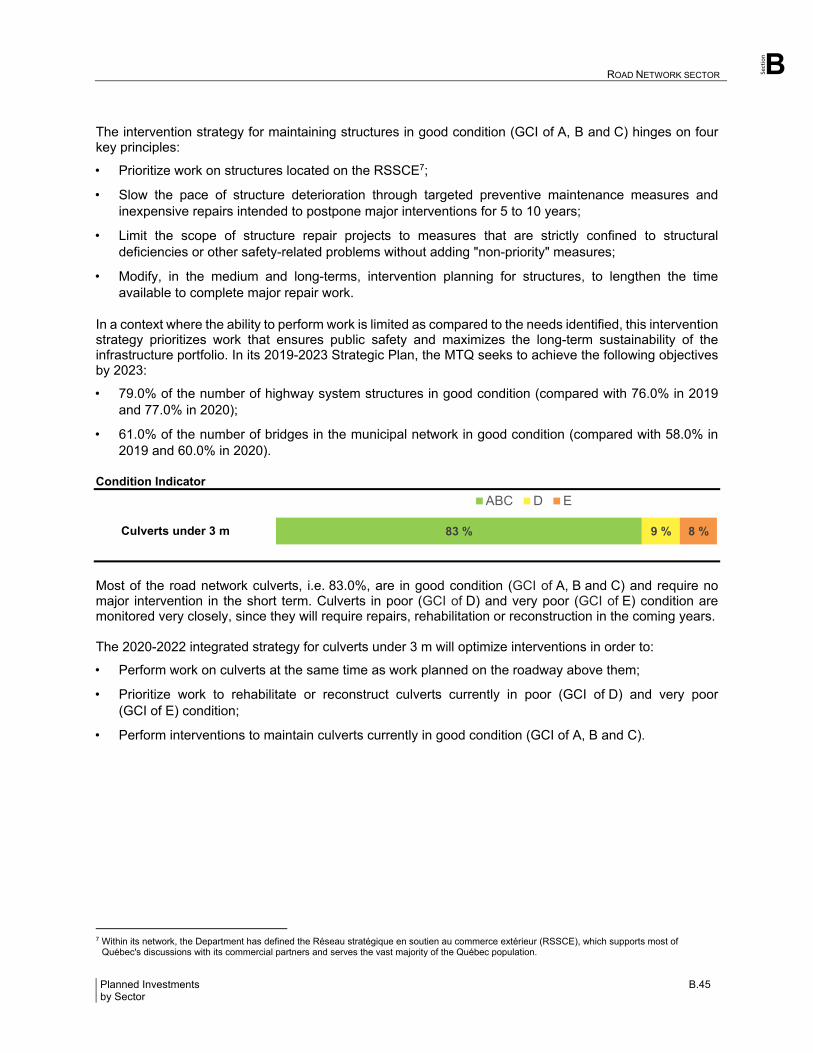
Section
ROAD NETWORK SECTOR B
Planned Investments B.45 by Sector
The intervention strategy for maintaining structures in good condition (GCI of A, B and C) hinges on four key principles:
• Prioritize work on structures located on the RSSCE7;
• Slow the pace of structure deterioration through targeted preventive maintenance measures and inexpensive repairs intended to postpone major interventions for 5 to 10 years;
• Limit the scope of structure repair projects to measures that are strictly confined to structural deficiencies or other safety-related problems without adding "non-priority" measures;
• Modify, in the medium and long-terms, intervention planning for structures, to lengthen the time available to complete major repair work.
In a context where the ability to perform work is limited as compared to the needs identified, this intervention strategy prioritizes work that ensures public safety and maximizes the long-term sustainability of the infrastructure portfolio. In its 2019-2023 Strategic Plan, the MTQ seeks to achieve the following objectives by 2023:
• 79.0% of the number of highway system structures in good condition (compared with 76.0% in 2019 and 77.0% in 2020);
• 61.0% of the number of bridges in the municipal network in good condition (compared with 58.0% in 2019 and 60.0% in 2020).
Condition Indicator
Most of the road network culverts, i.e. 83.0%, are in good condition (GCI of A, B and C) and require no major intervention in the short term. Culverts in poor (GCI of D) and very poor (GCI of E) condition are monitored very closely, since they will require repairs, rehabilitation or reconstruction in the coming years. The 2020-2022 integrated strategy for culverts under 3 m will optimize interventions in order to:
• Perform work on culverts at the same time as work planned on the roadway above them;
• Prioritize work to rehabilitate or reconstruct culverts currently in poor (GCI of D) and very poor (GCI of E) condition;
• Perform interventions to maintain culverts currently in good condition (GCI of A, B and C).
7 Within its network, the Department has defined the Réseau stratégique en soutien au commerce extérieur (RSSCE), which supports most of
Québec's discussions with its commercial partners and serves the vast majority of the Québec population.
83 % 9 % 8 %Culverts under 3 m
ABC D E
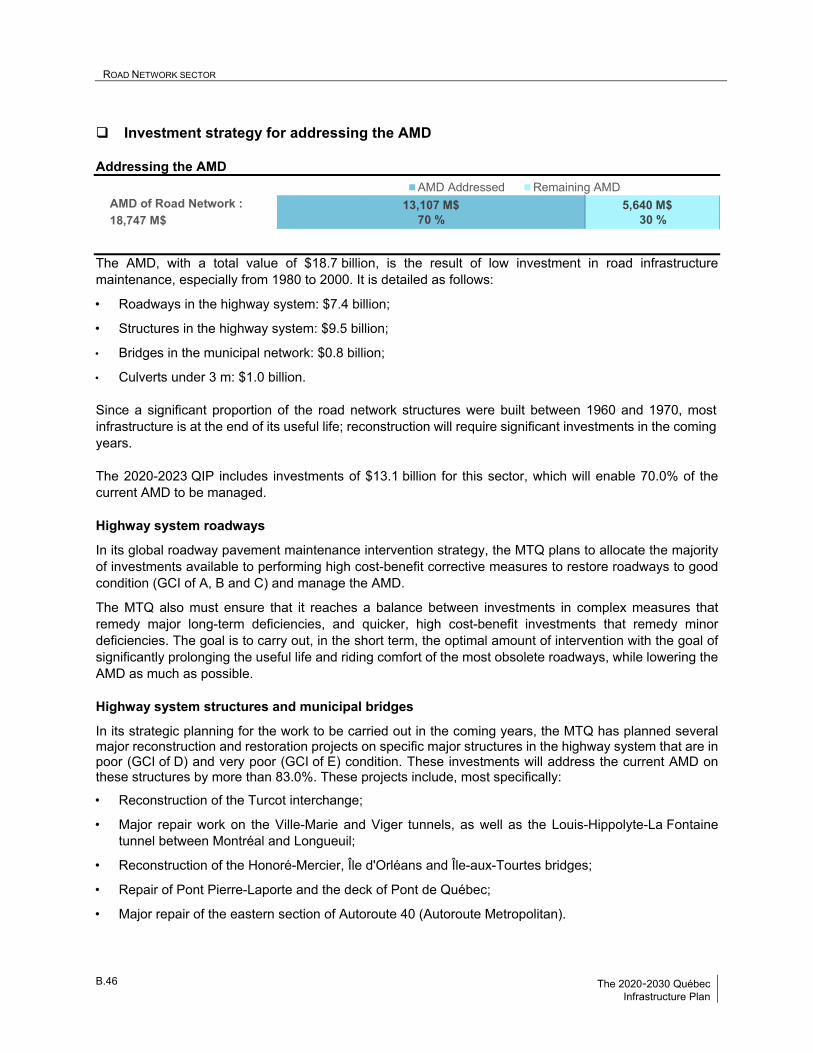
ROAD NETWORK SECTOR B
B.46 The 2020-2030 Québec Infrastructure Plan
Investment strategy for addressing the AMD Addressing the AMD
The AMD, with a total value of $18.7 billion, is the result of low investment in road infrastructure maintenance, especially from 1980 to 2000. It is detailed as follows:
• Roadways in the highway system: $7.4 billion;
• Structures in the highway system: $9.5 billion;
• Bridges in the municipal network: $0.8 billion;
• Culverts under 3 m: $1.0 billion. Since a significant proportion of the road network structures were built between 1960 and 1970, most infrastructure is at the end of its useful life; reconstruction will require significant investments in the coming years. The 2020-2023 QIP includes investments of $13.1 billion for this sector, which will enable 70.0% of the current AMD to be managed. Highway system roadways
In its global roadway pavement maintenance intervention strategy, the MTQ plans to allocate the majority of investments available to performing high cost-benefit corrective measures to restore roadways to good condition (GCI of A, B and C) and manage the AMD.
The MTQ also must ensure that it reaches a balance between investments in complex measures that remedy major long-term deficiencies, and quicker, high cost-benefit investments that remedy minor deficiencies. The goal is to carry out, in the short term, the optimal amount of intervention with the goal of significantly prolonging the useful life and riding comfort of the most obsolete roadways, while lowering the AMD as much as possible. Highway system structures and municipal bridges
In its strategic planning for the work to be carried out in the coming years, the MTQ has planned several major reconstruction and restoration projects on specific major structures in the highway system that are in poor (GCI of D) and very poor (GCI of E) condition. These investments will address the current AMD on these structures by more than 83.0%. These projects include, most specifically:
• Reconstruction of the Turcot interchange;
• Major repair work on the Ville-Marie and Viger tunnels, as well as the Louis-Hippolyte-La Fontaine tunnel between Montréal and Longueuil;
• Reconstruction of the Honoré-Mercier, Île d'Orléans and Île-aux-Tourtes bridges;
• Repair of Pont Pierre-Laporte and the deck of Pont de Québec;
• Major repair of the eastern section of Autoroute 40 (Autoroute Metropolitan).
13,107 M$70 %
5,640 M$30 %18,747 M$
AMD of Road Network :AMD Addressed Remaining AMD

Section
ROAD NETWORK SECTOR B
Planned Investments B.47 by Sector
Culverts under 3 m
The MTQ is currently developing a method to assess the AMD for culverts under 3 m, in order to target the highest priority interventions on those in poor (GCI of D) and very poor (GCI of E) condition. For this time this year, the AMD value was estimated taking into consideration the cost to reconstruct these culverts. The MTQ prioritizes interventions on the culverts in poor (GCI of D) and very poor (GCI of E) condition that can be integrated into paving projects currently in progress. This will optimize costs and lower the impact on traffic.
Investment strategy to enhance the infrastructure In order to meet the increasing demand on the road network in certain areas that have reached the saturation point, the MTQ's investment strategy to enhance the portfolio in the coming years hinges on the following intervention priorities:
• Improve user safety;
• Improve network functionality by optimizing traffic flow where congestion occurs;
• Increase the transportation network's resilience to natural hazards and climate change:
The MTQ's 2019-2023 Strategic Plan outlines 25 roadway projects in answer to climate changes.
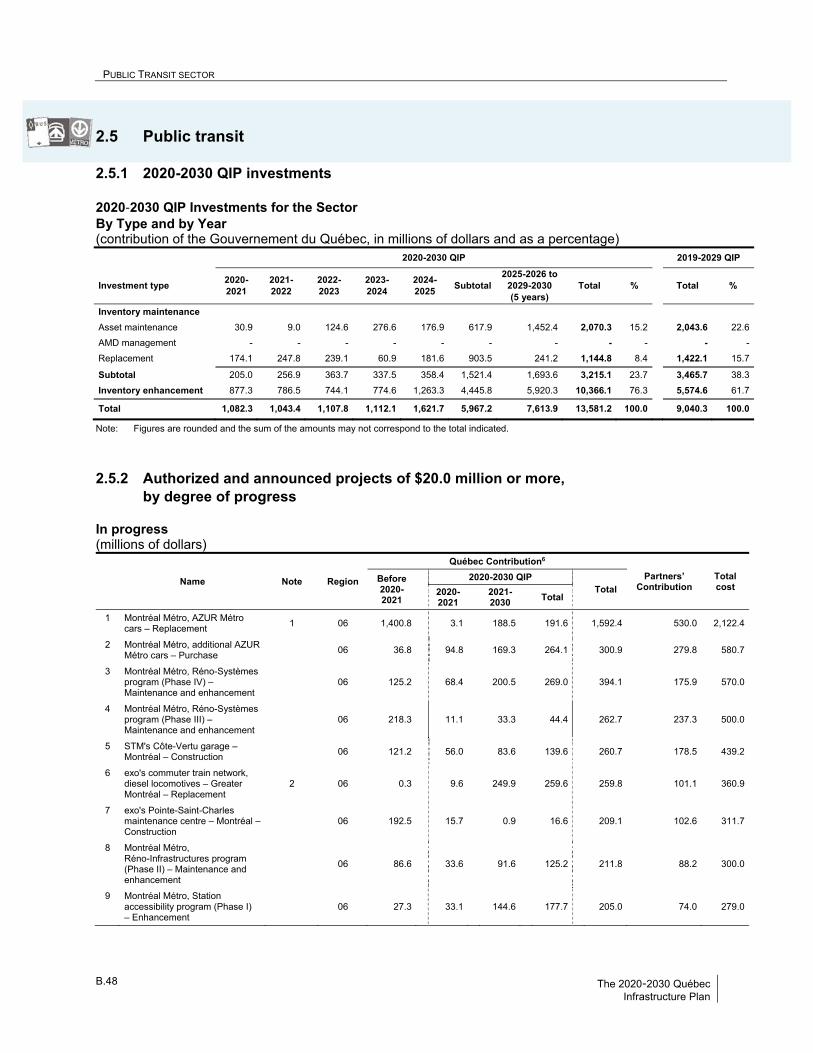
PUBLIC TRANSIT SECTOR B
B.48 The 2020-2030 Québec Infrastructure Plan
2.5 Public transit
2.5.1 2020-2030 QIP investments 2020‐2030 QIP Investments for the Sector By Type and by Year (contribution of the Gouvernement du Québec, in millions of dollars and as a percentage) 2020-2030 QIP 2019-2029 QIP
Investment type 2020-2021
2021-2022
2022-2023
2023-2024
2024-2025
Subtotal 2025-2026 to
2029-2030 (5 years)
Total % Total %
Inventory maintenance
Asset maintenance 30.9 9.0 124.6 276.6 176.9 617.9 1,452.4 2,070.3 15.2 2,043.6 22.6
AMD management - - - - - - - - - - -
Replacement 174.1 247.8 239.1 60.9 181.6 903.5 241.2 1,144.8 8.4 1,422.1 15.7
Subtotal 205.0 256.9 363.7 337.5 358.4 1,521.4 1,693.6 3,215.1 23.7 3,465.7 38.3
Inventory enhancement 877.3 786.5 744.1 774.6 1,263.3 4,445.8 5,920.3 10,366.1 76.3 5,574.6 61.7
Total 1,082.3 1,043.4 1,107.8 1,112.1 1,621.7 5,967.2 7,613.9 13,581.2 100.0 9,040.3 100.0
Note: Figures are rounded and the sum of the amounts may not correspond to the total indicated.
2.5.2 Authorized and announced projects of $20.0 million or more, by degree of progress
In progress (millions of dollars)
Name Note Region
Québec Contribution6
Partners’ Contribution
Total cost
Before 2020-2021
2020-2030 QIP
Total
2020-2021
2021-2030
Total
1 Montréal Métro, AZUR Métro cars – Replacement
1 06 1,400.8 3.1 188.5 191.6 1,592.4 530.0 2,122.4
2 Montréal Métro, additional AZUR Métro cars – Purchase
06 36.8 94.8 169.3 264.1 300.9 279.8 580.7
3 Montréal Métro, Réno-Systèmes program (Phase IV) – Maintenance and enhancement
06 125.2 68.4 200.5 269.0 394.1 175.9 570.0
4 Montréal Métro, Réno-Systèmes program (Phase III) – Maintenance and enhancement
06 218.3 11.1 33.3 44.4 262.7 237.3 500.0
5 STM's Côte-Vertu garage – Montréal – Construction
06 121.2 56.0 83.6 139.6 260.7 178.5 439.2
6 exo's commuter train network, diesel locomotives – Greater Montréal – Replacement
2 06 0.3 9.6 249.9 259.6 259.8 101.1 360.9
7 exo's Pointe-Saint-Charles maintenance centre – Montréal – Construction
06 192.5 15.7 0.9 16.6 209.1 102.6 311.7
8 Montréal Métro, Réno-Infrastructures program (Phase II) – Maintenance and enhancement
06 86.6 33.6 91.6 125.2 211.8 88.2 300.0
9 Montréal Métro, Station accessibility program (Phase I) – Enhancement
06 27.3 33.1 144.6 177.7 205.0 74.0 279.0
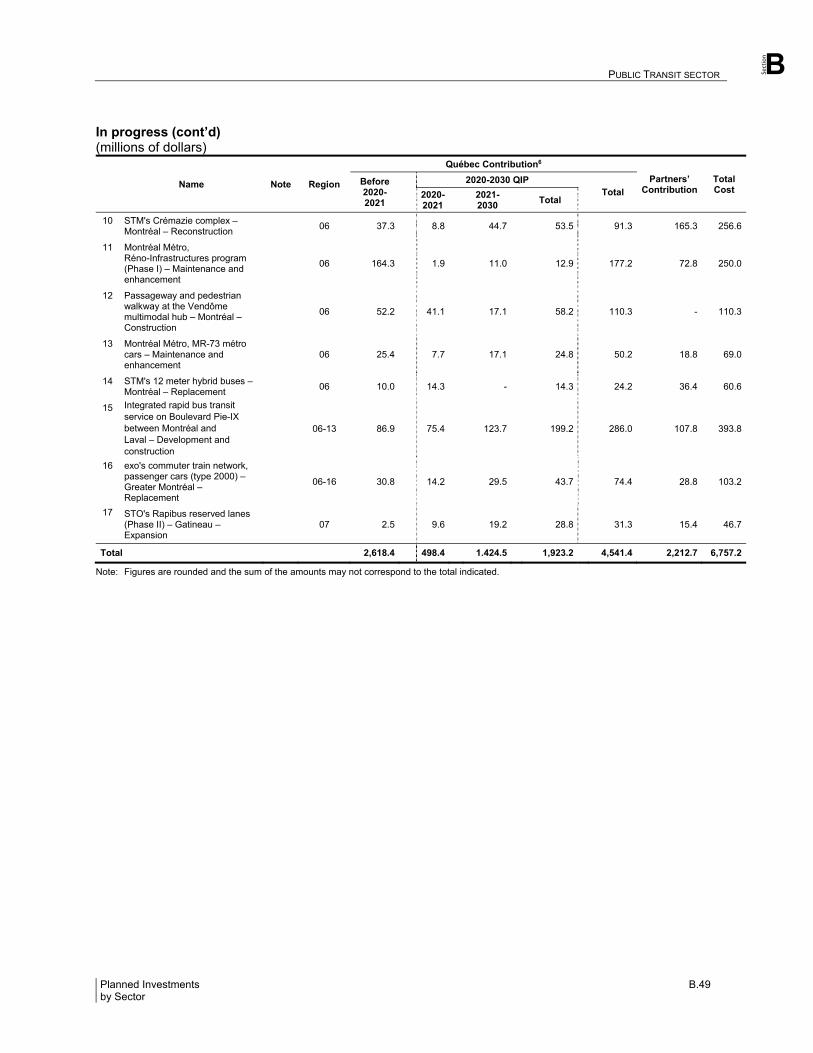
Section
PUBLIC TRANSIT SECTOR B
Planned Investments B.49 by Sector
In progress (cont’d) (millions of dollars)
Name Note Region
Québec Contribution6
Partners’ Contribution
Total Cost
Before 2020-2021
2020-2030 QIP
Total
2020-2021
2021-2030
Total
10 STM's Crémazie complex – Montréal – Reconstruction
06 37.3 8.8 44.7 53.5 91.3 165.3 256.6
11 Montréal Métro, Réno-Infrastructures program (Phase I) – Maintenance and enhancement
06 164.3 1.9 11.0 12.9 177.2 72.8 250.0
12 Passageway and pedestrian walkway at the Vendôme multimodal hub – Montréal – Construction
06 52.2 41.1 17.1 58.2 110.3 - 110.3
13 Montréal Métro, MR-73 métro cars – Maintenance and enhancement
06 25.4 7.7 17.1 24.8 50.2 18.8 69.0
14 STM's 12 meter hybrid buses – Montréal – Replacement
06 10.0 14.3 - 14.3 24.2 36.4 60.6
15 Integrated rapid bus transit service on Boulevard Pie-IX between Montréal and Laval – Development and construction
06-13 86.9 75.4 123.7 199.2 286.0 107.8 393.8
16 exo's commuter train network, passenger cars (type 2000) – Greater Montréal – Replacement
06-16 30.8 14.2 29.5 43.7 74.4 28.8 103.2
17 STO's Rapibus reserved lanes (Phase II) – Gatineau – Expansion
07 2.5 9.6 19.2 28.8 31.3 15.4 46.7
Total 2,618.4 498.4 1.424.5 1,923.2 4,541.4 2,212.7 6,757.2
Note: Figures are rounded and the sum of the amounts may not correspond to the total indicated.
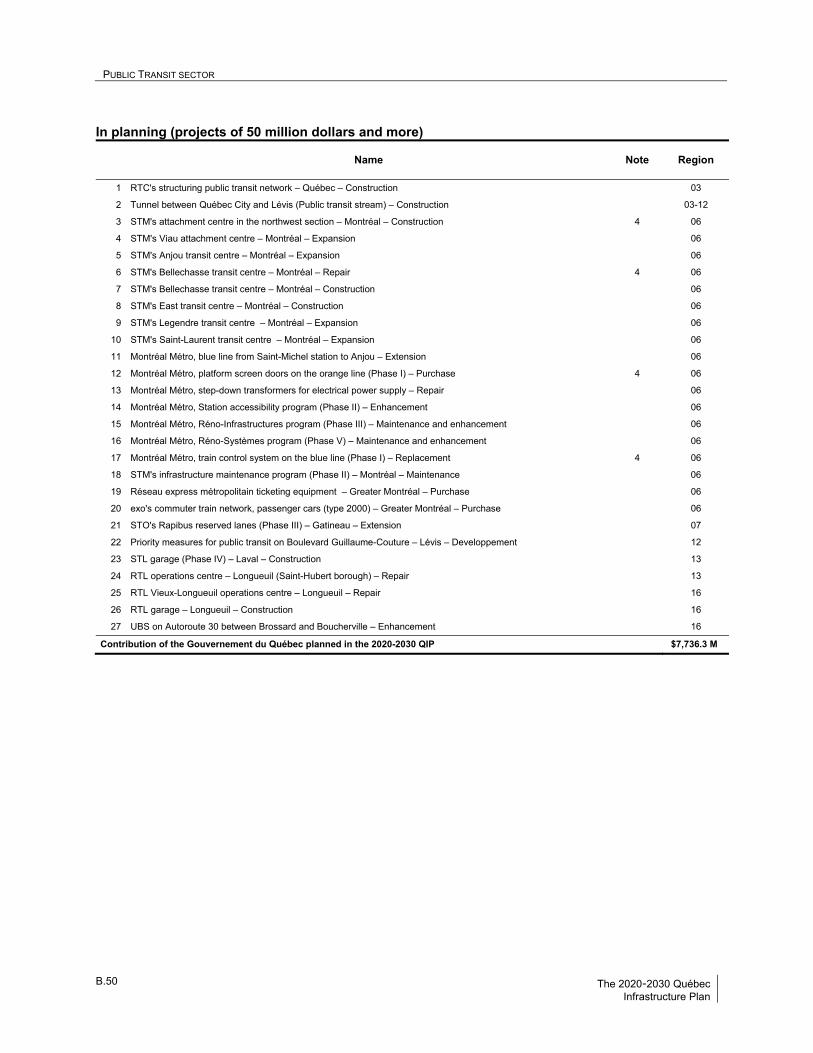
PUBLIC TRANSIT SECTOR B
B.50 The 2020-2030 Québec Infrastructure Plan
In planning (projects of 50 million dollars and more)
Name Note Region
1 RTC's structuring public transit network – Québec – Construction 03
2 Tunnel between Québec City and Lévis (Public transit stream) – Construction 03-12
3 STM's attachment centre in the northwest section – Montréal – Construction 4 06
4 STM's Viau attachment centre – Montréal – Expansion 06
5 STM's Anjou transit centre – Montréal – Expansion 06
6 STM's Bellechasse transit centre – Montréal – Repair 4 06
7 STM's Bellechasse transit centre – Montréal – Construction 06
8 STM's East transit centre – Montréal – Construction 06
9 STM's Legendre transit centre – Montréal – Expansion 06
10 STM's Saint-Laurent transit centre – Montréal – Expansion 06
11 Montréal Métro, blue line from Saint-Michel station to Anjou – Extension 06
12 Montréal Métro, platform screen doors on the orange line (Phase I) – Purchase 4 06
13 Montréal Métro, step-down transformers for electrical power supply – Repair 06
14 Montréal Métro, Station accessibility program (Phase II) – Enhancement 06
15 Montréal Métro, Réno-Infrastructures program (Phase III) – Maintenance and enhancement 06
16 Montréal Métro, Réno-Systèmes program (Phase V) – Maintenance and enhancement 06
17 Montréal Métro, train control system on the blue line (Phase I) – Replacement 4 06
18 STM's infrastructure maintenance program (Phase II) – Montréal – Maintenance 06
19 Réseau express métropolitain ticketing equipment – Greater Montréal – Purchase 06
20 exo's commuter train network, passenger cars (type 2000) – Greater Montréal – Purchase 06
21 STO's Rapibus reserved lanes (Phase III) – Gatineau – Extension 07
22 Priority measures for public transit on Boulevard Guillaume-Couture – Lévis – Developpement 12
23 STL garage (Phase IV) – Laval – Construction 13
24 RTL operations centre – Longueuil (Saint-Hubert borough) – Repair 13
25 RTL Vieux-Longueuil operations centre – Longueuil – Repair 16
26 RTL garage – Longueuil – Construction 16
27 UBS on Autoroute 30 between Brossard and Boucherville – Enhancement 16
Contribution of the Gouvernement du Québec planned in the 2020-2030 QIP $7,736.3 M
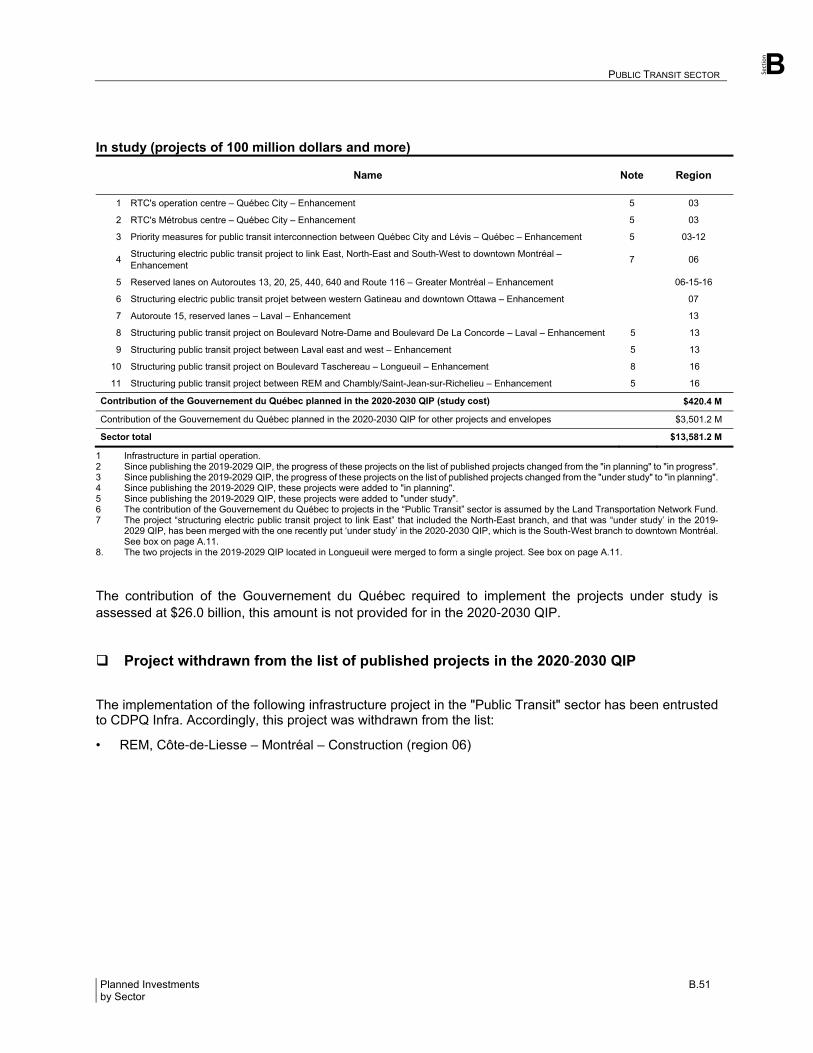
Section
PUBLIC TRANSIT SECTOR B
Planned Investments B.51 by Sector
In study (projects of 100 million dollars and more)
Name Note Region
1 RTC's operation centre – Québec City – Enhancement 5 03
2 RTC's Métrobus centre – Québec City – Enhancement 5 03
3 Priority measures for public transit interconnection between Québec City and Lévis – Québec – Enhancement 5 03-12
4 Structuring electric public transit project to link East, North-East and South-West to downtown Montréal – Enhancement
7 06
5 Reserved lanes on Autoroutes 13, 20, 25, 440, 640 and Route 116 – Greater Montréal – Enhancement 06-15-16
6 Structuring electric public transit projet between western Gatineau and downtown Ottawa – Enhancement 07
7 Autoroute 15, reserved lanes – Laval – Enhancement 13
8 Structuring public transit project on Boulevard Notre-Dame and Boulevard De La Concorde – Laval – Enhancement 5 13
9 Structuring public transit project between Laval east and west – Enhancement 5 13
10 Structuring public transit project on Boulevard Taschereau – Longueuil – Enhancement 8 16
11 Structuring public transit project between REM and Chambly/Saint-Jean-sur-Richelieu – Enhancement 5 16
Contribution of the Gouvernement du Québec planned in the 2020-2030 QIP (study cost) $420.4 M
Contribution of the Gouvernement du Québec planned in the 2020-2030 QIP for other projects and envelopes $3,501.2 M
Sector total $13,581.2 M
1 Infrastructure in partial operation. 2 Since publishing the 2019-2029 QIP, the progress of these projects on the list of published projects changed from the "in planning" to "in progress". 3 Since publishing the 2019-2029 QIP, the progress of these projects on the list of published projects changed from the "under study" to "in planning". 4 Since publishing the 2019-2029 QIP, these projects were added to "in planning". 5 Since publishing the 2019-2029 QIP, these projects were added to "under study". 6 The contribution of the Gouvernement du Québec to projects in the “Public Transit” sector is assumed by the Land Transportation Network Fund. 7 The project “structuring electric public transit project to link East” that included the North-East branch, and that was “under study’ in the 2019-
2029 QIP, has been merged with the one recently put ‘under study’ in the 2020-2030 QIP, which is the South-West branch to downtown Montréal. See box on page A.11.
8. The two projects in the 2019-2029 QIP located in Longueuil were merged to form a single project. See box on page A.11.
The contribution of the Gouvernement du Québec required to implement the projects under study is assessed at $26.0 billion, this amount is not provided for in the 2020‐2030 QIP. Project withdrawn from the list of published projects in the 2020‐2030 QIP
The implementation of the following infrastructure project in the "Public Transit" sector has been entrusted to CDPQ Infra. Accordingly, this project was withdrawn from the list:
• REM, Côte‐de‐Liesse – Montréal – Construction (region 06)
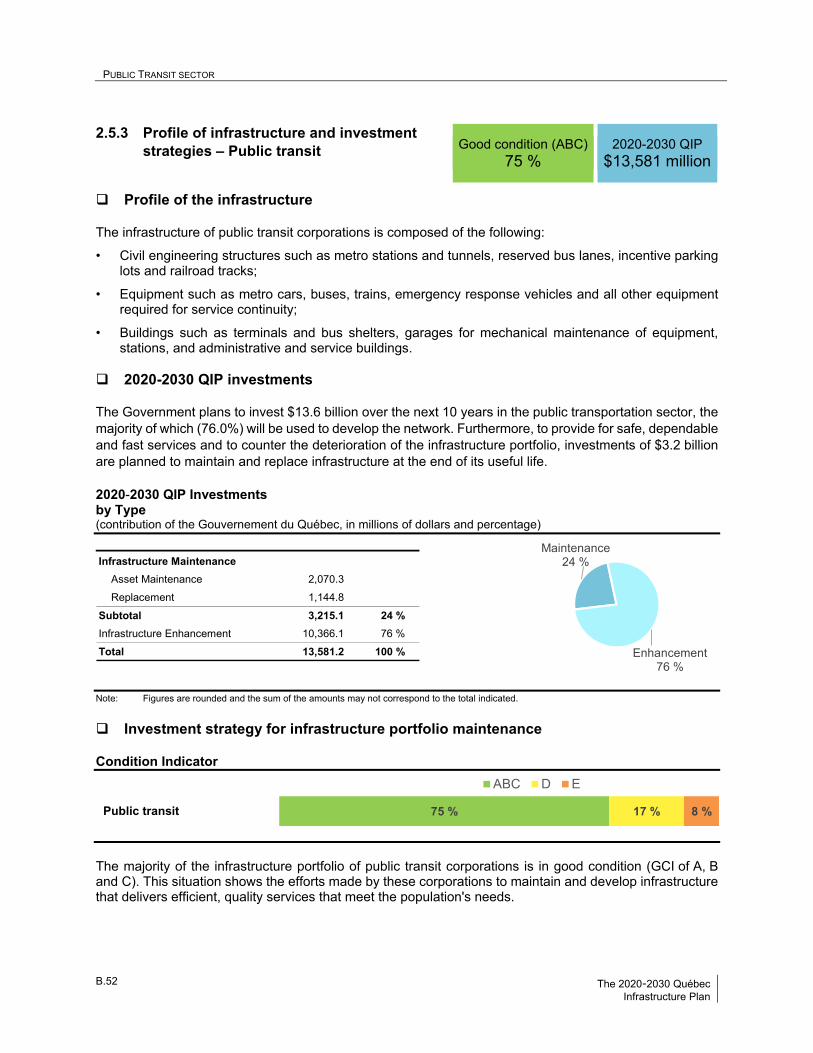
PUBLIC TRANSIT SECTOR B
B.52 The 2020-2030 Québec Infrastructure Plan
2.5.3 Profile of infrastructure and investment strategies – Public transit
Profile of the infrastructure The infrastructure of public transit corporations is composed of the following:
• Civil engineering structures such as metro stations and tunnels, reserved bus lanes, incentive parking lots and railroad tracks;
• Equipment such as metro cars, buses, trains, emergency response vehicles and all other equipment required for service continuity;
• Buildings such as terminals and bus shelters, garages for mechanical maintenance of equipment, stations, and administrative and service buildings.
2020-2030 QIP investments The Government plans to invest $13.6 billion over the next 10 years in the public transportation sector, the majority of which (76.0%) will be used to develop the network. Furthermore, to provide for safe, dependable and fast services and to counter the deterioration of the infrastructure portfolio, investments of $3.2 billion are planned to maintain and replace infrastructure at the end of its useful life. 2020-2030 QIP Investments by Type (contribution of the Gouvernement du Québec, in millions of dollars and percentage)
Note: Figures are rounded and the sum of the amounts may not correspond to the total indicated.
Investment strategy for infrastructure portfolio maintenance Condition Indicator
The majority of the infrastructure portfolio of public transit corporations is in good condition (GCI of A, B and C). This situation shows the efforts made by these corporations to maintain and develop infrastructure that delivers efficient, quality services that meet the population's needs.
Infrastructure Maintenance
Asset Maintenance 2,070.3
Replacement 1,144.8
Subtotal 3,215.1 24 %
Infrastructure Enhancement 10,366.1 76 %
Total 13,581.2 100 %
75 % 17 % 8 %Public transit
ABC D E
Good condition (ABC) 75 %
2020-2030 QIP
$13,581 million
Maintenance24 %
Enhancement76 %
Section
PUBLIC TRANSIT SECTOR B
Planned Investments B.53 by Sector
The portfolio maintenance strategy is based on the following priorities:
• Offer safe, high-quality services that meet to current standards;
• Maintain existing assets in good condition (GCI of A, B and C) by continuous replacement and repair of equipment, rolling stock and infrastructure at the end of its useful life.
Specifically, the key investment projects planned to maintain the portfolio aim to:
• Replace fixed metro equipment, including escalators, ventilation, elevators and train control equipment;
• Perform general repairs to critical civil engineering structures such as electrical, mechanical and structural systems;
• Reconstruct and upgrade buildings such as the Société de transport de Montréal's Complexe Crémazie and the Réseau de transport de Longueuil operations centre in Saint-Hubert;
• Replace rolling stock, including trains, metro cars and buses.
Investment strategy to enhance the infrastructure The investment strategy to enhance public transport infrastructure consists in developing a network that allows to bring solutions to congestion issues and to address environmental issues by reducing GHG emissions. These investments will make it possible to meet the following priorities:
• Network expansion, primarily by:
Extending the Montréal Métro's blue line from Saint-Michel station to Anjou;
Construction of a RTC’s structuring public transit network in Québec City;
Adding a structuring electric public transit projet between western Gatineau and downtown Ottawa;
• Service optimization by enhancing the technical and operational features of existing infrastructures:
Implementation of new reserved bus lanes, for instance on Autoroutes 13, 20, 25, 440, 640 and Route 116 in greater Montréal. In particular, the stretch of near 13 km on Autoroute 20 offers a great opportunity for implementing a reserved lane for carpool and buses considering frequent traffic congestion, high flow of vehicles and the very few physical constraint making it possible to proceed to a prescribed enlargement of the roadway;
Ticket distributor automation;
Improvement of accessibility to public transit networks;
The addition of smart screens displaying bus arrival times in real time.
PUBLIC TRANSIT SECTOR B
B.54 The 2020-2030 Québec Infrastructure Plan
Furthermore, these investments are part of the contributing factors that will help in attaining, by 2030, several targets of the Gouvernement du Québec’s Sustainable Mobility Policy – 2030, such as:
• To provide 70.0% of the Québec population with access to at least four sustainable mobility services;
• A 20.0% reduction of the average travel time between home and work;
• A 20.0% reduction of solo car trips throughout Québec;
• A 40.0% reduction of petroleum consumption in the transportation sector below the 2013 level;
• A 37.5% reduction of GHG emissions in the transportation sector below the 1990 level.
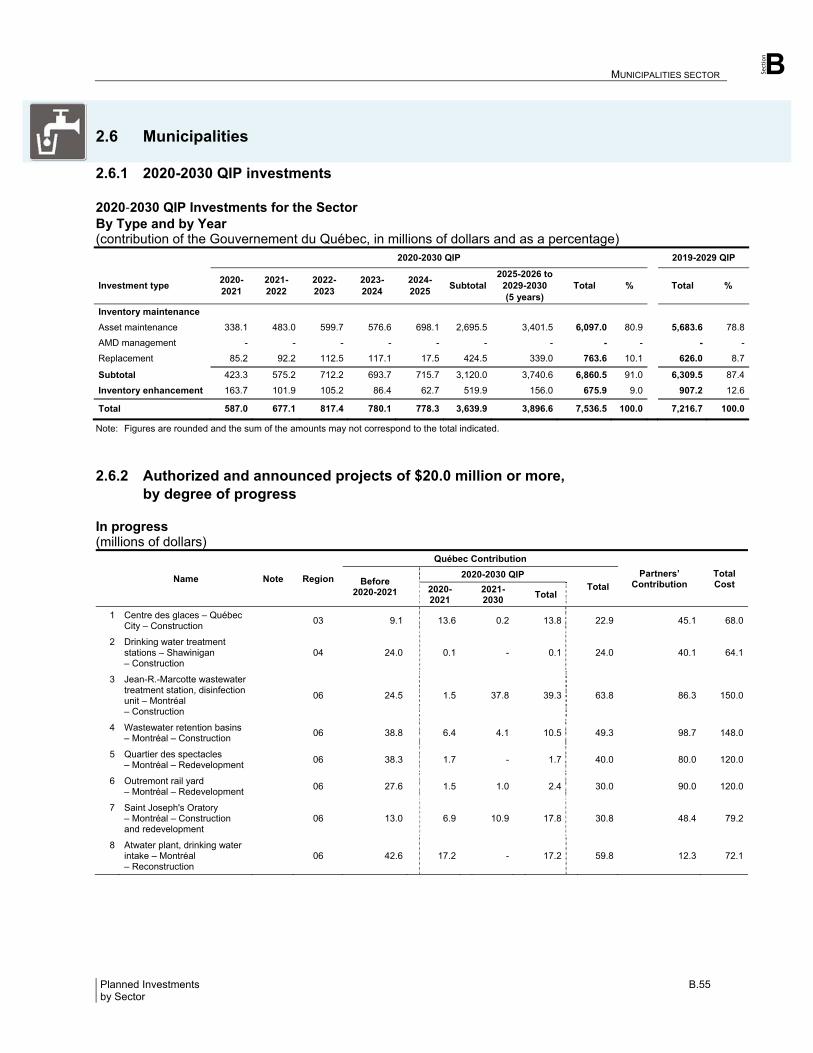
Section
MUNICIPALITIES SECTOR B
Planned Investments B.55 by Sector
2.6 Municipalities
2.6.1 2020-2030 QIP investments 2020‐2030 QIP Investments for the Sector By Type and by Year (contribution of the Gouvernement du Québec, in millions of dollars and as a percentage) 2020-2030 QIP 2019-2029 QIP
Investment type 2020-2021
2021-2022
2022-2023
2023-2024
2024-2025
Subtotal 2025-2026 to
2029-2030 (5 years)
Total % Total %
Inventory maintenance
Asset maintenance 338.1 483.0 599.7 576.6 698.1 2,695.5 3,401.5 6,097.0 80.9 5,683.6 78.8
AMD management - - - - - - - - - - -
Replacement 85.2 92.2 112.5 117.1 17.5 424.5 339.0 763.6 10.1 626.0 8.7
Subtotal 423.3 575.2 712.2 693.7 715.7 3,120.0 3,740.6 6,860.5 91.0 6,309.5 87.4
Inventory enhancement 163.7 101.9 105.2 86.4 62.7 519.9 156.0 675.9 9.0 907.2 12.6
Total 587.0 677.1 817.4 780.1 778.3 3,639.9 3,896.6 7,536.5 100.0 7,216.7 100.0
Note: Figures are rounded and the sum of the amounts may not correspond to the total indicated.
2.6.2 Authorized and announced projects of $20.0 million or more, by degree of progress
In progress (millions of dollars)
Name Note Region
Québec Contribution
Partners’ Contribution
Total Cost
Before 2020-2021
2020-2030 QIP
Total
2020-2021
2021-2030
Total
1 Centre des glaces – Québec City – Construction
03 9.1 13.6 0.2 13.8 22.9 45.1 68.0
2 Drinking water treatment stations – Shawinigan – Construction
04 24.0 0.1 - 0.1 24.0 40.1 64.1
3 Jean-R.-Marcotte wastewater treatment station, disinfection unit – Montréal – Construction
06 24.5 1.5 37.8 39.3 63.8 86.3 150.0
4 Wastewater retention basins – Montréal – Construction
06 38.8 6.4 4.1 10.5 49.3 98.7 148.0
5 Quartier des spectacles – Montréal – Redevelopment
06 38.3 1.7 - 1.7 40.0 80.0 120.0
6 Outremont rail yard – Montréal – Redevelopment
06 27.6 1.5 1.0 2.4 30.0 90.0 120.0
7 Saint Joseph's Oratory – Montréal – Construction and redevelopment
06 13.0 6.9 10.9 17.8 30.8 48.4 79.2
8 Atwater plant, drinking water intake – Montréal – Reconstruction
06 42.6 17.2 - 17.2 59.8 12.3 72.1
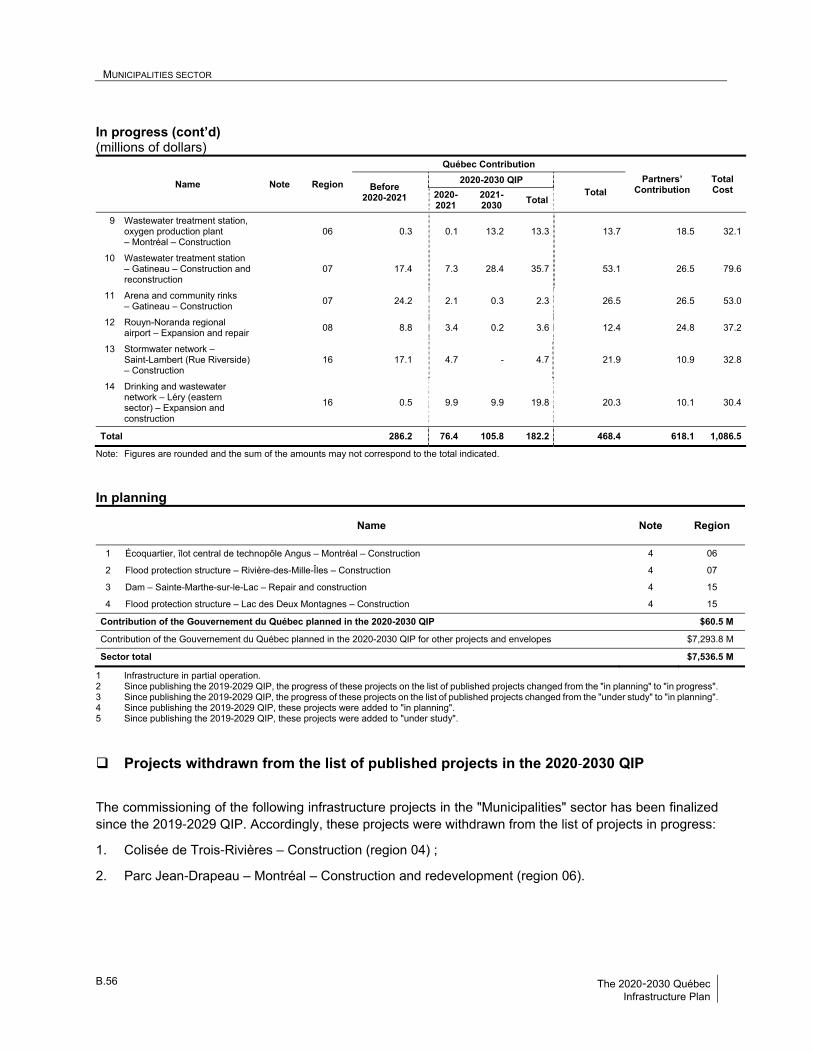
MUNICIPALITIES SECTOR B
B.56 The 2020-2030 Québec Infrastructure Plan
In progress (cont’d) (millions of dollars)
Name Note Region
Québec Contribution
Partners’ Contribution
Total Cost
Before 2020-2021
2020-2030 QIP
Total
2020-2021
2021-2030
Total
9 Wastewater treatment station, oxygen production plant – Montréal – Construction
06 0.3 0.1 13.2 13.3 13.7 18.5 32.1
10 Wastewater treatment station – Gatineau – Construction and reconstruction
07 17.4 7.3 28.4 35.7 53.1 26.5 79.6
11 Arena and community rinks – Gatineau – Construction
07 24.2 2.1 0.3 2.3 26.5 26.5 53.0
12 Rouyn-Noranda regional airport – Expansion and repair
08 8.8 3.4 0.2 3.6 12.4 24.8 37.2
13 Stormwater network – Saint-Lambert (Rue Riverside) – Construction
16 17.1 4.7 - 4.7 21.9 10.9 32.8
14 Drinking and wastewater network – Léry (eastern sector) – Expansion and construction
16 0.5 9.9 9.9 19.8 20.3 10.1 30.4
Total 286.2 76.4 105.8 182.2 468.4 618.1 1,086.5
Note: Figures are rounded and the sum of the amounts may not correspond to the total indicated. In planning
Name Note Region
1 Écoquartier, îlot central de technopôle Angus – Montréal – Construction 4 06
2 Flood protection structure – Rivière-des-Mille-Îles – Construction 4 07
3 Dam – Sainte-Marthe-sur-le-Lac – Repair and construction 4 15
4 Flood protection structure – Lac des Deux Montagnes – Construction 4 15
Contribution of the Gouvernement du Québec planned in the 2020-2030 QIP $60.5 M
Contribution of the Gouvernement du Québec planned in the 2020-2030 QIP for other projects and envelopes $7,293.8 M
Sector total $7,536.5 M
1 Infrastructure in partial operation. 2 Since publishing the 2019-2029 QIP, the progress of these projects on the list of published projects changed from the "in planning" to "in progress". 3 Since publishing the 2019-2029 QIP, the progress of these projects on the list of published projects changed from the "under study" to "in planning". 4 Since publishing the 2019-2029 QIP, these projects were added to "in planning". 5 Since publishing the 2019-2029 QIP, these projects were added to "under study".
Projects withdrawn from the list of published projects in the 2020‐2030 QIP
The commissioning of the following infrastructure projects in the "Municipalities" sector has been finalized since the 2019‐2029 QIP. Accordingly, these projects were withdrawn from the list of projects in progress:
1. Colisée de Trois‐Rivières – Construction (region 04) ;
2. Parc Jean‐Drapeau – Montréal – Construction and redevelopment (region 06).
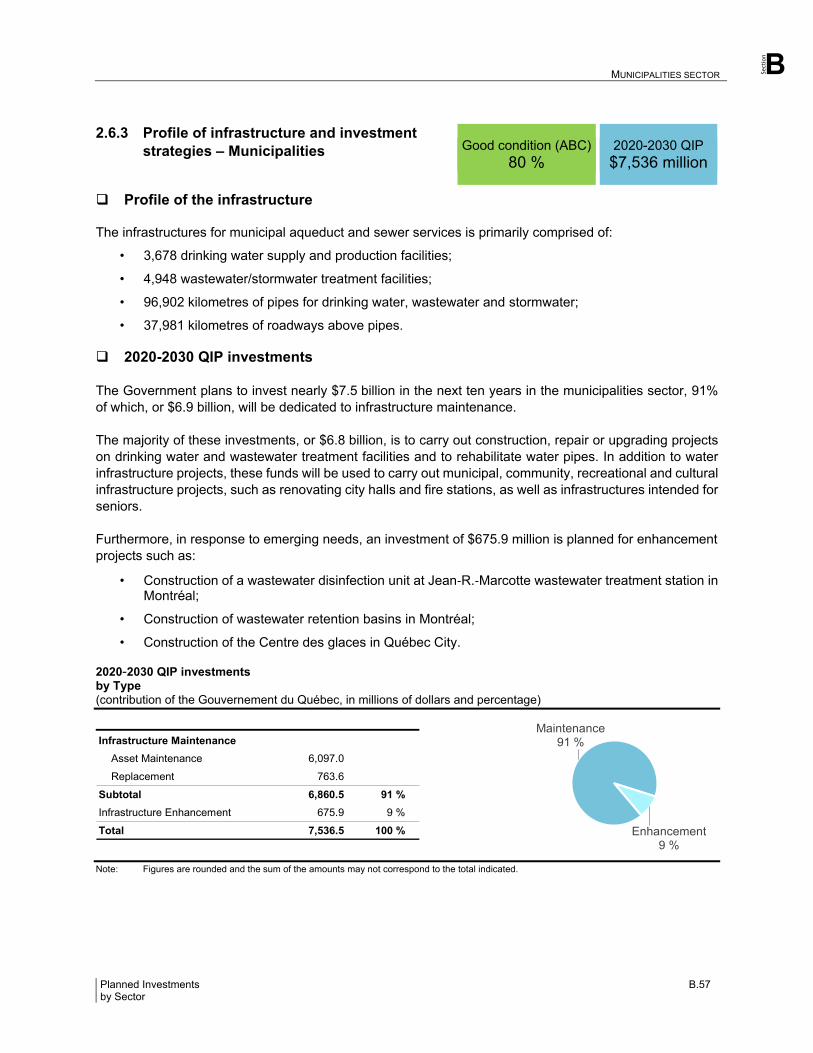
Section
MUNICIPALITIES SECTOR B
Planned Investments B.57 by Sector
2.6.3 Profile of infrastructure and investment strategies – Municipalities
Profile of the infrastructure The infrastructures for municipal aqueduct and sewer services is primarily comprised of:
• 3,678 drinking water supply and production facilities;
• 4,948 wastewater/stormwater treatment facilities;
• 96,902 kilometres of pipes for drinking water, wastewater and stormwater;
• 37,981 kilometres of roadways above pipes. 2020-2030 QIP investments The Government plans to invest nearly $7.5 billion in the next ten years in the municipalities sector, 91% of which, or $6.9 billion, will be dedicated to infrastructure maintenance. The majority of these investments, or $6.8 billion, is to carry out construction, repair or upgrading projects on drinking water and wastewater treatment facilities and to rehabilitate water pipes. In addition to water infrastructure projects, these funds will be used to carry out municipal, community, recreational and cultural infrastructure projects, such as renovating city halls and fire stations, as well as infrastructures intended for seniors. Furthermore, in response to emerging needs, an investment of $675.9 million is planned for enhancement projects such as:
• Construction of a wastewater disinfection unit at Jean-R.-Marcotte wastewater treatment station in Montréal;
• Construction of wastewater retention basins in Montréal;
• Construction of the Centre des glaces in Québec City. 2020-2030 QIP investments by Type (contribution of the Gouvernement du Québec, in millions of dollars and percentage)
Infrastructure Maintenance
Asset Maintenance 6,097.0
Replacement 763.6
Subtotal 6,860.5 91 %
Infrastructure Enhancement 675.9 9 %
Total 7,536.5 100 %
Note: Figures are rounded and the sum of the amounts may not correspond to the total indicated.
Good condition (ABC) 80 %
2020-2030 QIP $7,536 million
Maintenance91 %
Enhancement9 %
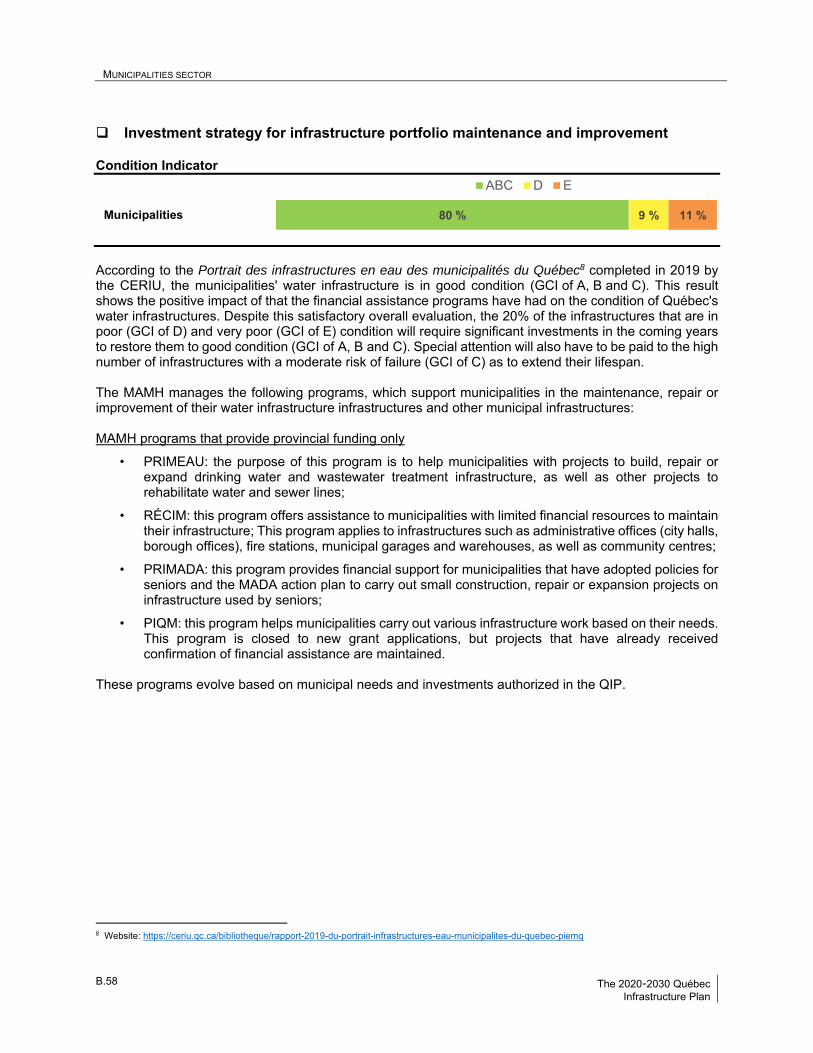
MUNICIPALITIES SECTOR B
B.58 The 2020-2030 Québec Infrastructure Plan
Investment strategy for infrastructure portfolio maintenance and improvement Condition Indicator
According to the Portrait des infrastructures en eau des municipalités du Québec8 completed in 2019 by the CERIU, the municipalities' water infrastructure is in good condition (GCI of A, B and C). This result shows the positive impact of that the financial assistance programs have had on the condition of Québec's water infrastructures. Despite this satisfactory overall evaluation, the 20% of the infrastructures that are in poor (GCI of D) and very poor (GCI of E) condition will require significant investments in the coming years to restore them to good condition (GCI of A, B and C). Special attention will also have to be paid to the high number of infrastructures with a moderate risk of failure (GCI of C) as to extend their lifespan. The MAMH manages the following programs, which support municipalities in the maintenance, repair or improvement of their water infrastructure infrastructures and other municipal infrastructures: MAMH programs that provide provincial funding only
• PRIMEAU: the purpose of this program is to help municipalities with projects to build, repair or expand drinking water and wastewater treatment infrastructure, as well as other projects to rehabilitate water and sewer lines;
• RÉCIM: this program offers assistance to municipalities with limited financial resources to maintain their infrastructure; This program applies to infrastructures such as administrative offices (city halls, borough offices), fire stations, municipal garages and warehouses, as well as community centres;
• PRIMADA: this program provides financial support for municipalities that have adopted policies for seniors and the MADA action plan to carry out small construction, repair or expansion projects on infrastructure used by seniors;
• PIQM: this program helps municipalities carry out various infrastructure work based on their needs. This program is closed to new grant applications, but projects that have already received confirmation of financial assistance are maintained.
These programs evolve based on municipal needs and investments authorized in the QIP.
8 Website: https://ceriu.qc.ca/bibliotheque/rapport-2019-du-portrait-infrastructures-eau-municipalites-du-quebec-piemq
80 % 9 % 11 %Municipalities
ABC D E
Section
MUNICIPALITIES SECTOR B
Planned Investments B.59 by Sector
MAMH programs that provide both provincial and federal funding
These programs result from specific agreements between the Québec and federal governments:
• NFCCQ, Fonds des petites collectivités component: this program offers financial support to municipalities with 100,000 or less residents to maintain and upgrade their water infrastructure, as well as for their cultural, tourism, recreational and sports facilities and local and regional airports. This program is closed to new grant applications, but projects that have already received confirmation of financial assistance are maintained;
• FCCQ, Collectivités, Grandes villes and Grands Projets components: the purpose of this program is to provide municipalities with water infrastructure to improve the quality of drinking water or reduce the negative impacts of wastewater on the environment and public health. It also aims to provide communities or regions with service infrastructure that can spur their development in terms of culture, economy, sports and tourism, among other things. This program is closed to new grant applications, but projects that have already received confirmation of financial assistance are maintained;
• FEPTEU: this program supports projects targeting drinking water and wastewater treatment infrastructure in an effort to boost the economy. This program is closed to new grant applications, but projects that have already received confirmation of financial assistance are maintained.
The MAMH also announced two new programs in 2019, namely the 2019-2023 TECQ and FIMEAU, which will allow an increase of investments over the coming years. These programs will make an additional $4.9 billion in government funding available to carry out high-priority projects, $3.3 billion from Canada and $1.6 billion from Québec.
• TECQ: this program transfers to municipalities a portion of the federal gasoline excise tax revenue plus a contribution from the Gouvernement du Québec for drinking water, wastewater treatment, local roads and other types of infrastructure projects. Under the TECQ, all eligible project expenditures are fully refundable.
The 2019-2023 TECQ program includes investments of approximately $3.4 billion (from both Canada and Québec) for new drinking water, wastewater, local road network and other types of infrastructure projects that will be prioritized by 2023.
• FIMEAU: this new program arose from the implementation of the Integrated Bilateral Agreement for the Investing in Canada Infrastructure Program (IBA). It funds work to build, repair, expand or add municipal drinking water and wastewater treatment infrastructure.
The FIMEAU program plans investments of approximately $1.5 billion (from both Canada and Québec) for new projects to build, repair, expand or add municipal drinking water and wastewater infrastructure that will be prioritized by 2025.
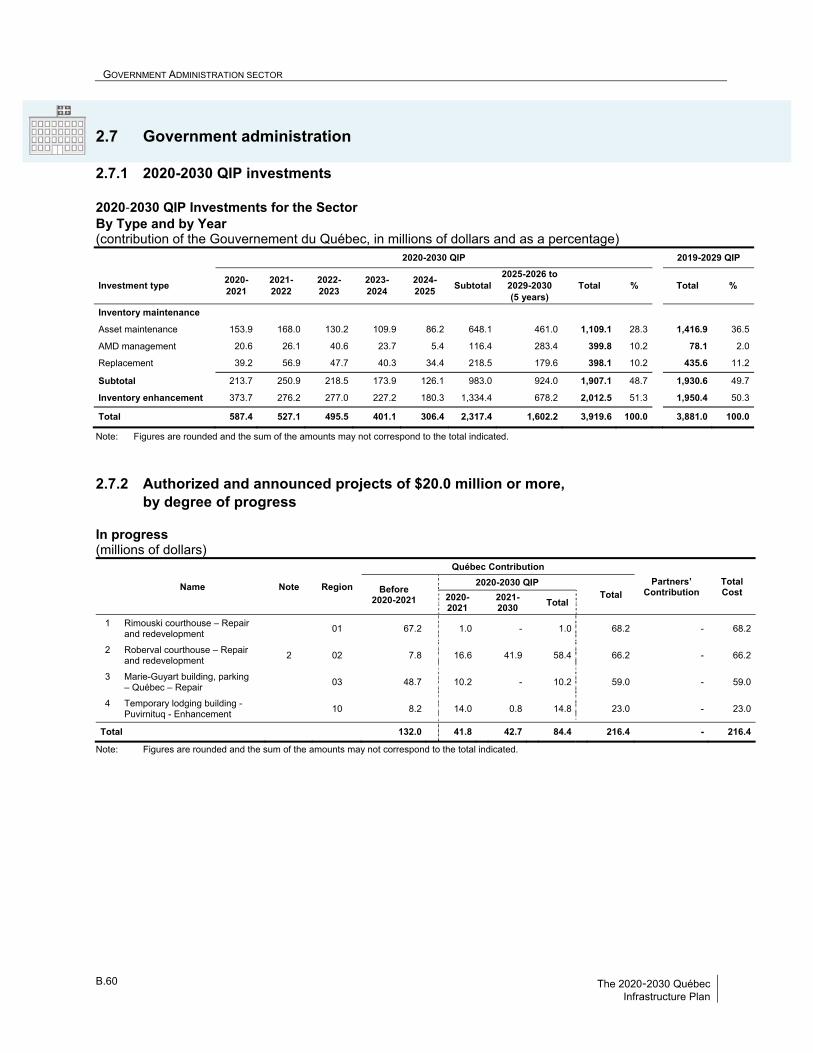
GOVERNMENT ADMINISTRATION SECTOR B
B.60 The 2020-2030 Québec Infrastructure Plan
2.7 Government administration
2.7.1 2020-2030 QIP investments 2020‐2030 QIP Investments for the Sector By Type and by Year (contribution of the Gouvernement du Québec, in millions of dollars and as a percentage) 2020-2030 QIP 2019-2029 QIP
Investment type 2020-2021
2021-2022
2022-2023
2023-2024
2024-2025
Subtotal 2025-2026 to
2029-2030 (5 years)
Total % Total %
Inventory maintenance
Asset maintenance 153.9 168.0 130.2 109.9 86.2 648.1 461.0 1,109.1 28.3 1,416.9 36.5
AMD management 20.6 26.1 40.6 23.7 5.4 116.4 283.4 399.8 10.2 78.1 2.0
Replacement 39.2 56.9 47.7 40.3 34.4 218.5 179.6 398.1 10.2 435.6 11.2
Subtotal 213.7 250.9 218.5 173.9 126.1 983.0 924.0 1,907.1 48.7 1,930.6 49.7
Inventory enhancement 373.7 276.2 277.0 227.2 180.3 1,334.4 678.2 2,012.5 51.3 1,950.4 50.3
Total 587.4 527.1 495.5 401.1 306.4 2,317.4 1,602.2 3,919.6 100.0 3,881.0 100.0
Note: Figures are rounded and the sum of the amounts may not correspond to the total indicated.
2.7.2 Authorized and announced projects of $20.0 million or more, by degree of progress
In progress (millions of dollars)
Name Note Region
Québec Contribution
Partners’ Contribution
Total Cost
Before 2020-2021
2020-2030 QIP
Total
2020-2021
2021-2030
Total
1 Rimouski courthouse – Repair and redevelopment
01 67.2 1.0 - 1.0 68.2 - 68.2
2 Roberval courthouse – Repair and redevelopment
2 02 7.8 16.6 41.9 58.4 66.2 - 66.2
3 Marie-Guyart building, parking – Québec – Repair
03 48.7 10.2 - 10.2 59.0 - 59.0
4 Temporary lodging building - Puvirnituq - Enhancement
10 8.2 14.0 0.8 14.8 23.0 - 23.0
Total 132.0 41.8 42.7 84.4 216.4 - 216.4
Note: Figures are rounded and the sum of the amounts may not correspond to the total indicated.
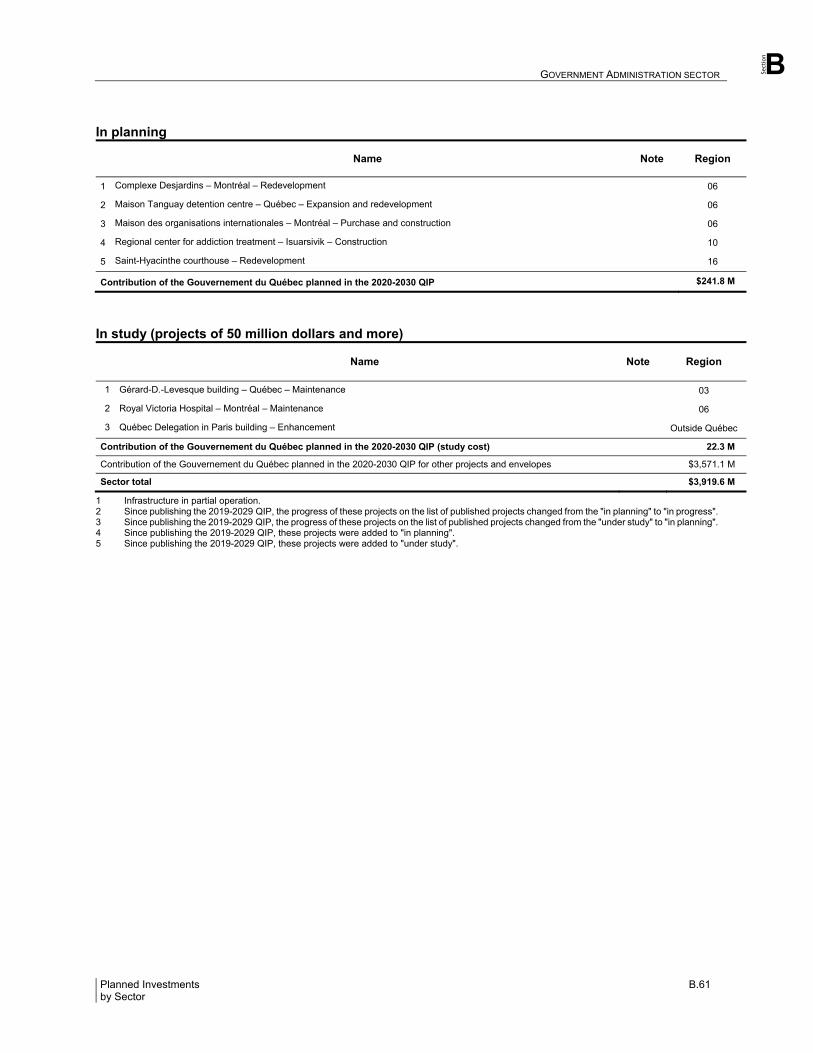
Section
GOVERNMENT ADMINISTRATION SECTOR B
Planned Investments B.61 by Sector
In planning
Name Note Region
1 Complexe Desjardins – Montréal – Redevelopment 06
2 Maison Tanguay detention centre – Québec – Expansion and redevelopment 06
3 Maison des organisations internationales – Montréal – Purchase and construction 06
4 Regional center for addiction treatment – Isuarsivik – Construction 10
5 Saint-Hyacinthe courthouse – Redevelopment 16
Contribution of the Gouvernement du Québec planned in the 2020-2030 QIP $241.8 M
In study (projects of 50 million dollars and more)
Name Note Region
1 Gérard-D.-Levesque building – Québec – Maintenance 03
2 Royal Victoria Hospital – Montréal – Maintenance 06
3 Québec Delegation in Paris building – Enhancement Outside Québec
Contribution of the Gouvernement du Québec planned in the 2020-2030 QIP (study cost) 22.3 M
Contribution of the Gouvernement du Québec planned in the 2020-2030 QIP for other projects and envelopes $3,571.1 M
Sector total $3,919.6 M
1 Infrastructure in partial operation. 2 Since publishing the 2019-2029 QIP, the progress of these projects on the list of published projects changed from the "in planning" to "in progress". 3 Since publishing the 2019-2029 QIP, the progress of these projects on the list of published projects changed from the "under study" to "in planning". 4 Since publishing the 2019-2029 QIP, these projects were added to "in planning". 5 Since publishing the 2019-2029 QIP, these projects were added to "under study".
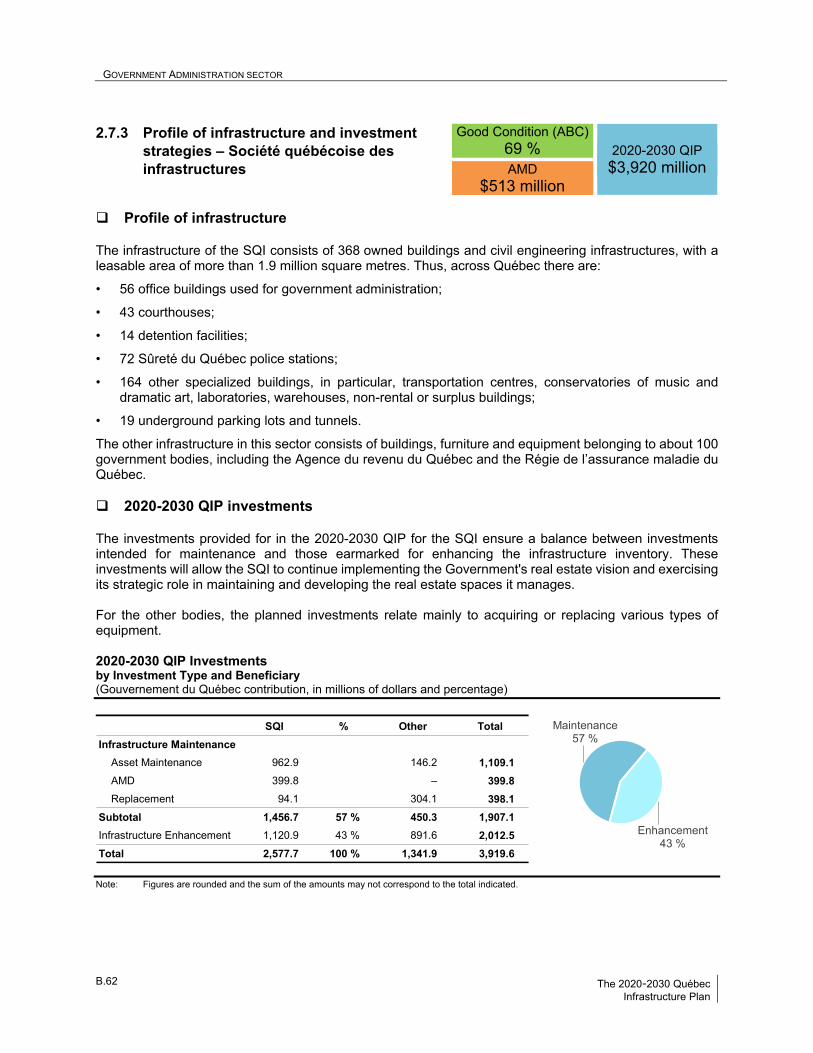
GOVERNMENT ADMINISTRATION SECTOR B
B.62 The 2020-2030 Québec Infrastructure Plan
2.7.3 Profile of infrastructure and investment strategies – Société québécoise des infrastructures
Profile of infrastructure The infrastructure of the SQI consists of 368 owned buildings and civil engineering infrastructures, with a leasable area of more than 1.9 million square metres. Thus, across Québec there are:
• 56 office buildings used for government administration;
• 43 courthouses;
• 14 detention facilities;
• 72 Sûreté du Québec police stations;
• 164 other specialized buildings, in particular, transportation centres, conservatories of music and dramatic art, laboratories, warehouses, non-rental or surplus buildings;
• 19 underground parking lots and tunnels.
The other infrastructure in this sector consists of buildings, furniture and equipment belonging to about 100 government bodies, including the Agence du revenu du Québec and the Régie de l’assurance maladie du Québec. 2020-2030 QIP investments The investments provided for in the 2020-2030 QIP for the SQI ensure a balance between investments intended for maintenance and those earmarked for enhancing the infrastructure inventory. These investments will allow the SQI to continue implementing the Government's real estate vision and exercising its strategic role in maintaining and developing the real estate spaces it manages. For the other bodies, the planned investments relate mainly to acquiring or replacing various types of equipment. 2020-2030 QIP Investments by Investment Type and Beneficiary (Gouvernement du Québec contribution, in millions of dollars and percentage)
Note: Figures are rounded and the sum of the amounts may not correspond to the total indicated.
SQI % Other Total
Infrastructure Maintenance
Asset Maintenance 962.9 146.2 1,109.1
AMD 399.8 – 399.8
Replacement 94.1 304.1 398.1
Subtotal 1,456.7 57 % 450.3 1,907.1
Infrastructure Enhancement 1,120.9 43 % 891.6 2,012.5
Total 2,577.7 100 % 1,341.9 3,919.6
Good Condition (ABC) 69 %
2020-2030 QIP $3,920 million AMD
$513 million
Maintenance57 %
Enhancement43 %
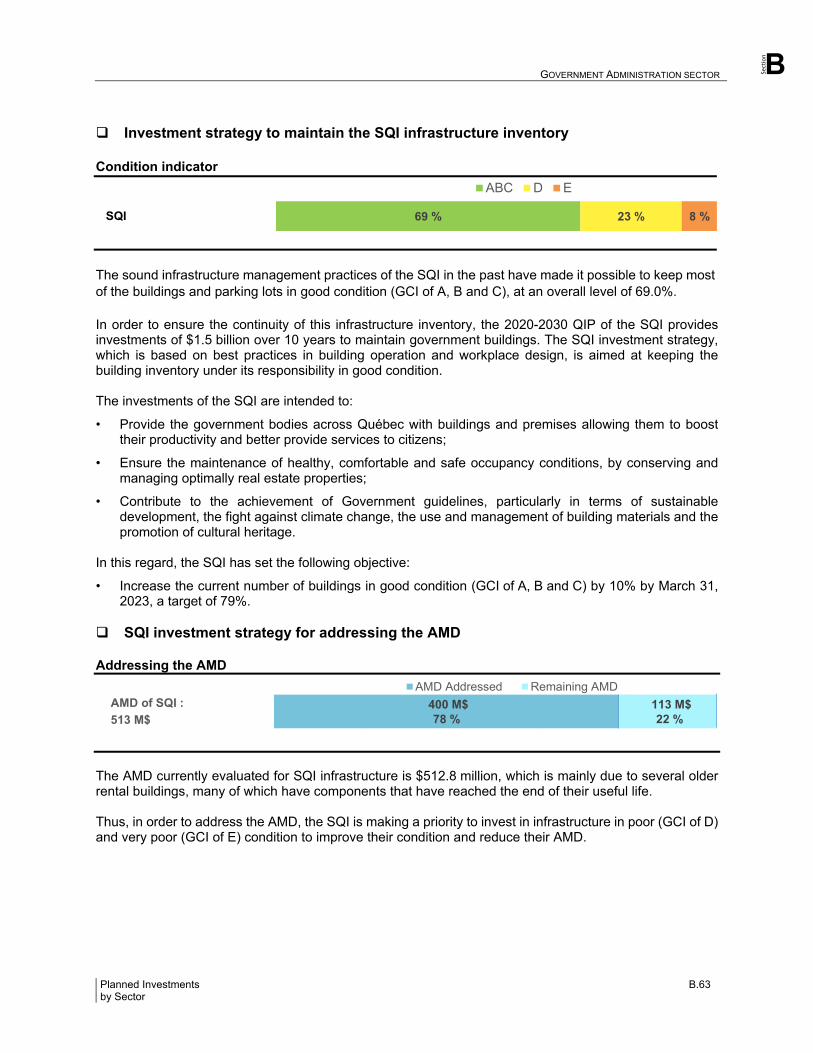
Section
GOVERNMENT ADMINISTRATION SECTOR B
Planned Investments B.63 by Sector
Investment strategy to maintain the SQI infrastructure inventory Condition indicator
The sound infrastructure management practices of the SQI in the past have made it possible to keep most of the buildings and parking lots in good condition (GCI of A, B and C), at an overall level of 69.0%. In order to ensure the continuity of this infrastructure inventory, the 2020-2030 QIP of the SQI provides investments of $1.5 billion over 10 years to maintain government buildings. The SQI investment strategy, which is based on best practices in building operation and workplace design, is aimed at keeping the building inventory under its responsibility in good condition. The investments of the SQI are intended to:
• Provide the government bodies across Québec with buildings and premises allowing them to boost their productivity and better provide services to citizens;
• Ensure the maintenance of healthy, comfortable and safe occupancy conditions, by conserving and managing optimally real estate properties;
• Contribute to the achievement of Government guidelines, particularly in terms of sustainable development, the fight against climate change, the use and management of building materials and the promotion of cultural heritage.
In this regard, the SQI has set the following objective:
• Increase the current number of buildings in good condition (GCI of A, B and C) by 10% by March 31, 2023, a target of 79%.
SQI investment strategy for addressing the AMD Addressing the AMD
The AMD currently evaluated for SQI infrastructure is $512.8 million, which is mainly due to several older rental buildings, many of which have components that have reached the end of their useful life. Thus, in order to address the AMD, the SQI is making a priority to invest in infrastructure in poor (GCI of D) and very poor (GCI of E) condition to improve their condition and reduce their AMD.
69 % 23 % 8 %SQI
ABC D E
400 M$ 78 %
113 M$ 22 %513 M$
AMD of SQI :AMD Addressed Remaining AMD
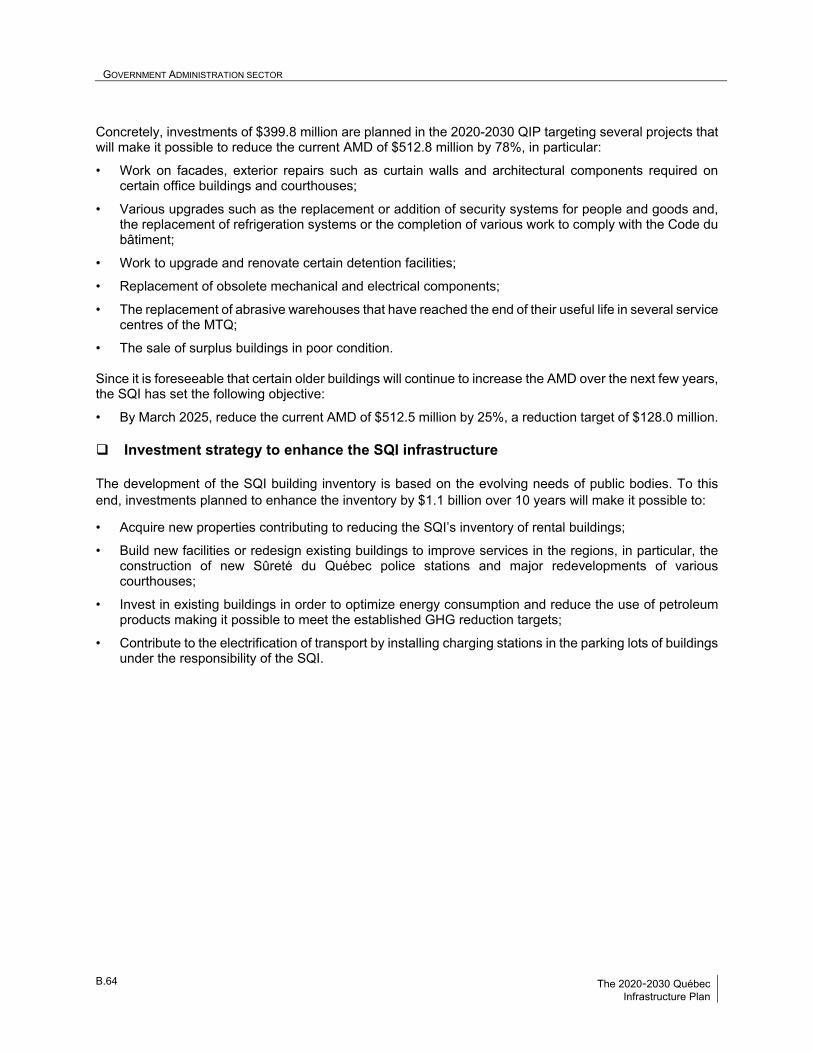
GOVERNMENT ADMINISTRATION SECTOR B
B.64 The 2020-2030 Québec Infrastructure Plan
Concretely, investments of $399.8 million are planned in the 2020-2030 QIP targeting several projects that will make it possible to reduce the current AMD of $512.8 million by 78%, in particular:
• Work on facades, exterior repairs such as curtain walls and architectural components required on certain office buildings and courthouses;
• Various upgrades such as the replacement or addition of security systems for people and goods and, the replacement of refrigeration systems or the completion of various work to comply with the Code du bâtiment;
• Work to upgrade and renovate certain detention facilities;
• Replacement of obsolete mechanical and electrical components;
• The replacement of abrasive warehouses that have reached the end of their useful life in several service centres of the MTQ;
• The sale of surplus buildings in poor condition. Since it is foreseeable that certain older buildings will continue to increase the AMD over the next few years, the SQI has set the following objective:
• By March 2025, reduce the current AMD of $512.5 million by 25%, a reduction target of $128.0 million. Investment strategy to enhance the SQI infrastructure The development of the SQI building inventory is based on the evolving needs of public bodies. To this end, investments planned to enhance the inventory by $1.1 billion over 10 years will make it possible to:
• Acquire new properties contributing to reducing the SQI’s inventory of rental buildings;
• Build new facilities or redesign existing buildings to improve services in the regions, in particular, the construction of new Sûreté du Québec police stations and major redevelopments of various courthouses;
• Invest in existing buildings in order to optimize energy consumption and reduce the use of petroleum products making it possible to meet the established GHG reduction targets;
• Contribute to the electrification of transport by installing charging stations in the parking lots of buildings under the responsibility of the SQI.
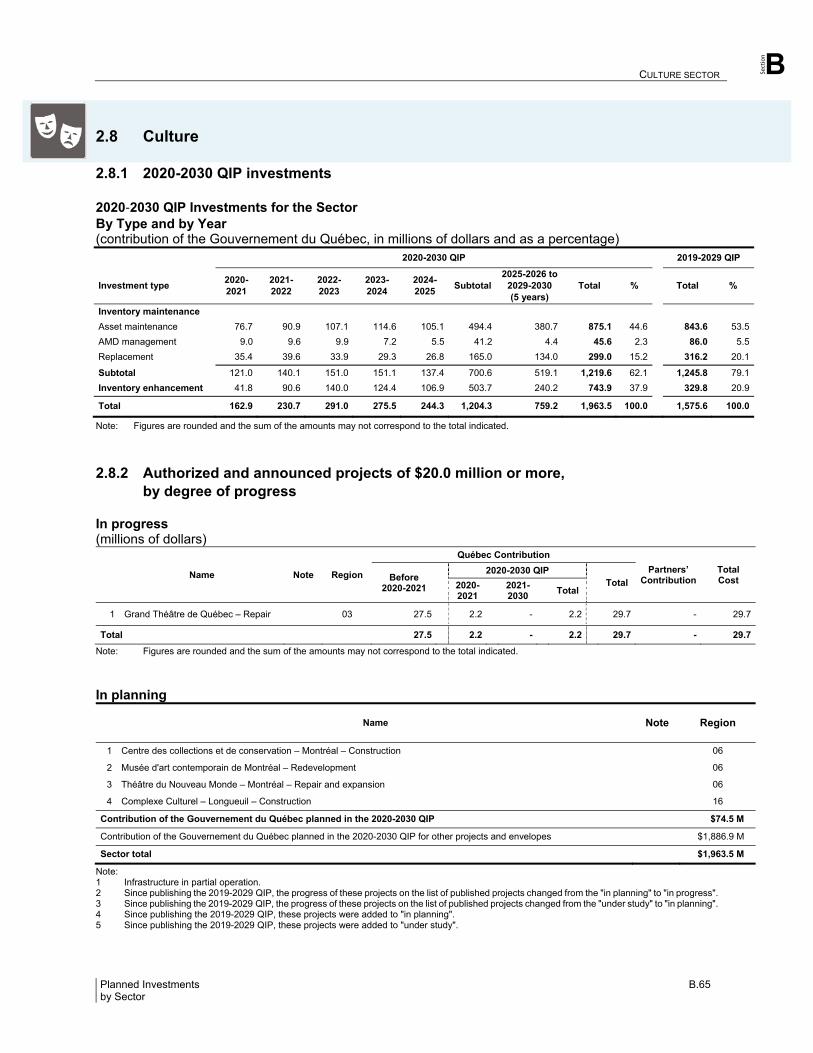
Section
CULTURE SECTOR B
Planned Investments B.65 by Sector
2.8 Culture
2.8.1 2020-2030 QIP investments 2020‐2030 QIP Investments for the Sector By Type and by Year (contribution of the Gouvernement du Québec, in millions of dollars and as a percentage) 2020-2030 QIP 2019-2029 QIP
Investment type 2020-2021
2021-2022
2022-2023
2023-2024
2024-2025
Subtotal 2025-2026 to
2029-2030 (5 years)
Total % Total %
Inventory maintenance
Asset maintenance 76.7 90.9 107.1 114.6 105.1 494.4 380.7 875.1 44.6 843.6 53.5
AMD management 9.0 9.6 9.9 7.2 5.5 41.2 4.4 45.6 2.3 86.0 5.5
Replacement 35.4 39.6 33.9 29.3 26.8 165.0 134.0 299.0 15.2 316.2 20.1
Subtotal 121.0 140.1 151.0 151.1 137.4 700.6 519.1 1,219.6 62.1 1,245.8 79.1
Inventory enhancement 41.8 90.6 140.0 124.4 106.9 503.7 240.2 743.9 37.9 329.8 20.9
Total 162.9 230.7 291.0 275.5 244.3 1,204.3 759.2 1,963.5 100.0 1,575.6 100.0
Note: Figures are rounded and the sum of the amounts may not correspond to the total indicated.
2.8.2 Authorized and announced projects of $20.0 million or more, by degree of progress
In progress (millions of dollars)
Name Note Region
Québec Contribution
Partners’ Contribution
Total Cost
Before 2020-2021
2020-2030 QIP
Total
2020-2021
2021-2030
Total
1 Grand Théâtre de Québec – Repair 03 27.5 2.2 - 2.2 29.7 - 29.7
Total 27.5 2.2 - 2.2 29.7 - 29.7
Note: Figures are rounded and the sum of the amounts may not correspond to the total indicated.
In planning
Name Note Region
1 Centre des collections et de conservation – Montréal – Construction 06
2 Musée d'art contemporain de Montréal – Redevelopment 06
3 Théâtre du Nouveau Monde – Montréal – Repair and expansion 06
4 Complexe Culturel – Longueuil – Construction 16
Contribution of the Gouvernement du Québec planned in the 2020-2030 QIP $74.5 M
Contribution of the Gouvernement du Québec planned in the 2020-2030 QIP for other projects and envelopes $1,886.9 M
Sector total $1,963.5 M
Note: 1 Infrastructure in partial operation. 2 Since publishing the 2019-2029 QIP, the progress of these projects on the list of published projects changed from the "in planning" to "in progress". 3 Since publishing the 2019-2029 QIP, the progress of these projects on the list of published projects changed from the "under study" to "in planning". 4 Since publishing the 2019-2029 QIP, these projects were added to "in planning". 5 Since publishing the 2019-2029 QIP, these projects were added to "under study".
CULTURE SECTOR B
B.66 The 2020-2030 Québec Infrastructure Plan
Project withdrawn from the list of published projects in the 2020‐2030 QIP
The commissioning of the following infrastructure project in the "Culture" sector has been finalized since the 2019‐2029 QIP. Accordingly, this project was withdrawn from the list of projects in progress:
• Théâtre Le Diamant – Québec – Construction (region 03).
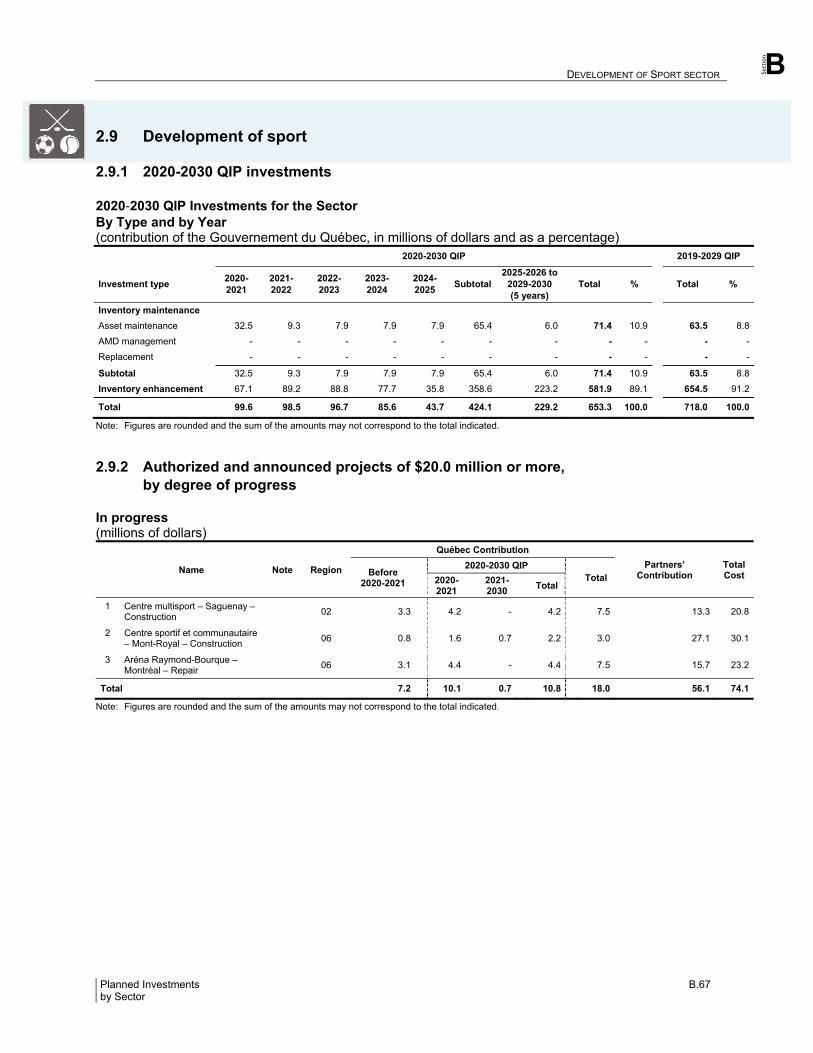
Section
DEVELOPMENT OF SPORT SECTOR B
Planned Investments B.67 by Sector
2.9 Development of sport
2.9.1 2020-2030 QIP investments 2020‐2030 QIP Investments for the Sector By Type and by Year (contribution of the Gouvernement du Québec, in millions of dollars and as a percentage) 2020-2030 QIP 2019-2029 QIP
Investment type 2020-2021
2021-2022
2022-2023
2023-2024
2024-2025
Subtotal 2025-2026 to
2029-2030 (5 years)
Total % Total %
Inventory maintenance
Asset maintenance 32.5 9.3 7.9 7.9 7.9 65.4 6.0 71.4 10.9 63.5 8.8
AMD management - - - - - - - - - - -
Replacement - - - - - - - - - - -
Subtotal 32.5 9.3 7.9 7.9 7.9 65.4 6.0 71.4 10.9 63.5 8.8
Inventory enhancement 67.1 89.2 88.8 77.7 35.8 358.6 223.2 581.9 89.1 654.5 91.2
Total 99.6 98.5 96.7 85.6 43.7 424.1 229.2 653.3 100.0 718.0 100.0
Note: Figures are rounded and the sum of the amounts may not correspond to the total indicated.
2.9.2 Authorized and announced projects of $20.0 million or more, by degree of progress
In progress (millions of dollars)
Name Note Region
Québec Contribution
Partners’ Contribution
Total Cost
Before 2020-2021
2020-2030 QIP
Total
2020-2021
2021-2030
Total
1 Centre multisport – Saguenay – Construction 02 3.3 4.2 - 4.2 7.5 13.3 20.8
2 Centre sportif et communautaire – Mont-Royal – Construction 06 0.8 1.6 0.7 2.2 3.0 27.1 30.1
3 Aréna Raymond-Bourque – Montréal – Repair 06 3.1 4.4 - 4.4 7.5 15.7 23.2
Total 7.2 10.1 0.7 10.8 18.0 56.1 74.1
Note: Figures are rounded and the sum of the amounts may not correspond to the total indicated.
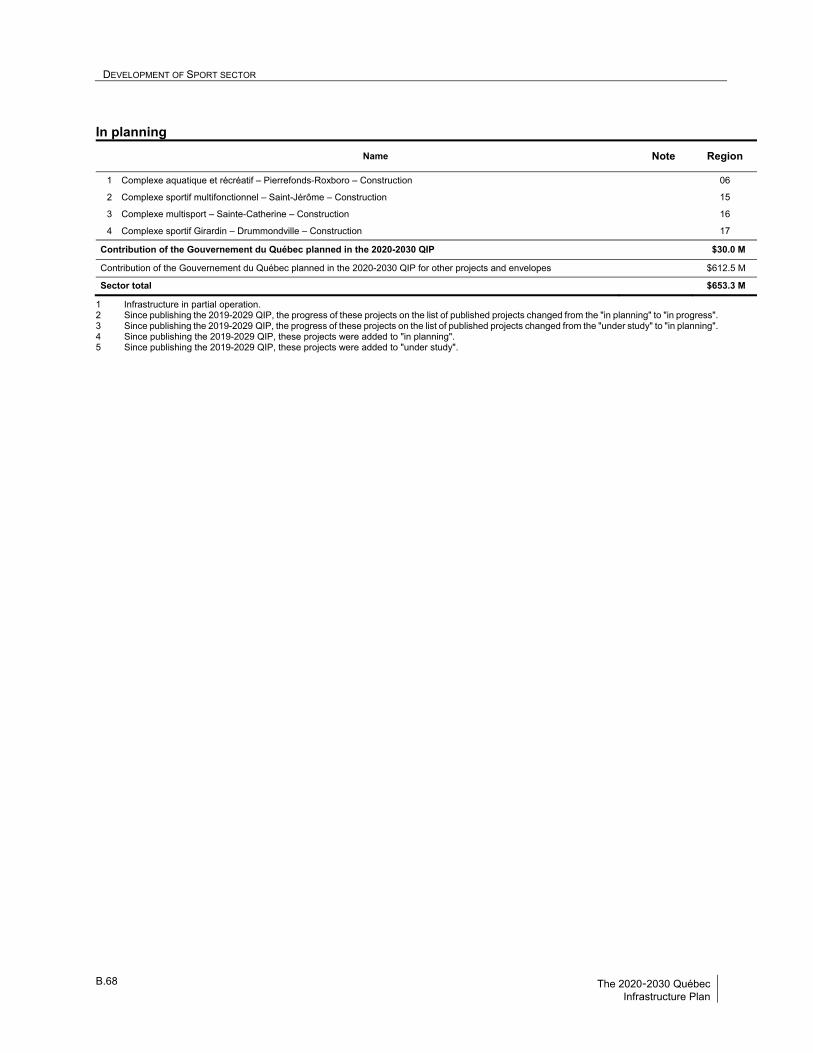
DEVELOPMENT OF SPORT SECTOR B
B.68 The 2020-2030 Québec Infrastructure Plan
In planning
Name Note Region
1 Complexe aquatique et récréatif – Pierrefonds-Roxboro – Construction 06
2 Complexe sportif multifonctionnel – Saint-Jérôme – Construction 15
3 Complexe multisport – Sainte-Catherine – Construction 16
4 Complexe sportif Girardin – Drummondville – Construction 17
Contribution of the Gouvernement du Québec planned in the 2020-2030 QIP $30.0 M
Contribution of the Gouvernement du Québec planned in the 2020-2030 QIP for other projects and envelopes $612.5 M
Sector total $653.3 M
1 Infrastructure in partial operation. 2 Since publishing the 2019-2029 QIP, the progress of these projects on the list of published projects changed from the "in planning" to "in progress". 3 Since publishing the 2019-2029 QIP, the progress of these projects on the list of published projects changed from the "under study" to "in planning". 4 Since publishing the 2019-2029 QIP, these projects were added to "in planning". 5 Since publishing the 2019-2029 QIP, these projects were added to "under study".
Section
MARINE, AIR, RAIL AND OTHER TRANSPORTATION SECTOR B
Planned Investments B.69 by Sector
2.10 Marine, air, rail and other transportation
2.10.1 2020-2030 QIP investments 2020‐2030 QIP Investments for the Sector By Type and by Year (contribution of the Gouvernement du Québec, in millions of dollars and as a percentage) 2020-2030 QIP 2019-2029 QIP
Investment type 2020-2021
2021-2022
2022-2023
2023-2024
2024-2025
Subtotal 2025-2026 to
2029-2030 (5 years)
Total % Total %
Inventory maintenance
Asset maintenance 316.1 319.1 239.2 272.8 169.4 1.316.6 678.0 1.994.6 49.2 1.270.3 43.3
AMD management 10.0 19.8 4.7 7.5 5.3 47.4 9.0 56.4 1.4 - -
Replacement 19.8 24.2 45.5 28.4 25.8 143.7 10.5 154.2 3.8 145.9 5.0
Subtotal 345.9 363.1 289.4 308.7 200.6 1.507.7 697.5 2.205.2 54.4 1.416.3 48.2
Inventory enhancement 241.3 336.5 293.4 263.3 275.9 1.410.3 438.4 1.848.7 45.6 1.519.3 51.8
Total 587.2 699.6 582.8 572.0 476.5 2.918.0 1.135.9 4.053.9 100.0 2.935.6 100.0
Note: Figures are rounded and the sum of the amounts may not correspond to the total indicated.
2.10.2 Authorized and announced projects of $20.0 million or more, by degree of progress
In progress (millions of dollars)
Name Note Region
Québec Contribution
Partners’ Contribution
Total Cost
Before 2020-2021
2020-2030 QIP
Total
2020-2021
2021-2030
Total
1 MV Saaremaa I Vessel – Rivière-du-Loup–Saint-Siméon ferry – Purchase and repair
01-03 42.2 6.6 - 6.6 48.8 - 48.8
2 Modernization of avionics of the CL-415
03 18.1 0.9 37.2 38.0 56.2 - 56.2
3 Salluit airport terminal and hangar – Construction
10 17.3 10.2 0.6 10.8 28.1 - 28.1
4 Kangiqsujuaq airport terminal and hangar – Construction
10 0.1 0.1 27.1 27.2 27.3 - 27.3
5 Gaspésie railway between Caplan and Port-Daniel–Gascons – Repair and reconstruction
2 11 10.1 28.9 57.9 86.9 96.9 2.0 98.9
6 Gaspésie railway between Matapédia and Caplan – Repair and reconstruction
2 11 16.1 18.6 19.8 38.4 54.5 - 54.5
7 Rest areas and service area – Lavaltrie – Repair
14 1.6 13.5 2.0 15.5 17.1 5.0 22.1
Total 105.5 78.9 144.6 223.5 328.9 7.0 335.9
Note: Figures are rounded and the sum of the amounts may not correspond to the total indicated.
MARINE, AIR, RAIL AND OTHER TRANSPORTATION SECTOR B
B.70 The 2020-2030 Québec Infrastructure Plan
In planning (projects of 50 million dollars and more)
Name Note Region
1 MV Joseph-Savard vessel – Île-aux-Coudres–Saint-Joseph-de-la-Rive – Repair and redevelopment 4 03
2 Backup vessel – Central and western Québec – Purchase 4 03-09-12-
14-16
3 Railway network, diversion track – Lac-Mégantic – Construction 05
4 Gaspésie railway between Port-Daniel–Gascons and Gaspé – Maintenance and enhancement 3 11
Contribution of the Gouvernement du Québec planned in the 2020-2030 QIP $348.5 M
In study (projects of 50 million dollars and more)
Name Note Region
1 Shore-to-shore link between Sorel-Tracy and Saint-Ignace-de-Loyola – Enhancement 14-16
2 Logistics hub – Vaudreuil-Soulanges – Enhancement 16
Contribution of the Gouvernement du Québec planned in the 2020-2030 QIP (study cost) $1.5 M
Contribution of the Gouvernement du Québec planned in the 2020-2030 QIP for other projects and envelopes $3,480.4 M
Sector total $4,053.9 M
1 Infrastructure in partial operation. 2 Since publishing the 2019-2029 QIP, the progress of these projects on the list of published projects changed from the "in planning" to "in progress". 3 Since publishing the 2019-2029 QIP, the progress of these projects on the list of published projects changed from the "under study" to "in planning". 4 Since publishing the 2019-2029 QIP, these projects were added to "in planning". 5 Since publishing the 2019-2029 QIP, these projects were added to "under study".
Section
TOURISM AND RECREATIONAL ACTIVITIES SECTOR B
Planned Investments B.71 by Sector
2.11 Tourism and recreational activities
2.11.1 2020-2030 QIP investments 2020‐2030 QIP Investments for the Sector By Type and by Year (contribution of the Gouvernement du Québec, in millions of dollars and as a percentage) 2020-2030 QIP 2019-2029 QIP
Investment type 2020-2021
2021-2022
2022-2023
2023-2024
2024-2025
Subtotal 2025-2026 to
2029-2030 (5 years)
Total % Total %
Inventory maintenance
Asset maintenance 62.3 69.3 41.2 25.3 17.8 215.9 117.2 333.1 29.0 290.2 26.0
AMD management 41.6 26.3 13.9 10.4 9.2 101.3 31.7 133.1 11.6 157.8 14.2
Replacement 9.9 12.2 16.7 120.8 51.0 210.6 - 210.6 18.3 222.3 20.0
Subtotal 113.7 107.8 71.7 156.5 78.1 527.8 149.0 676.8 58.9 670.3 60.2
Inventory enhancement 166.8 176.2 83.8 25.7 8.0 460.6 11.2 471.7 41.1 444.0 39.8
Total 280.5 284.1 155.5 182.2 86.1 988.4 160.1 1,148.5 100.0 1,114.3 100.0
Note: Figures are rounded and the sum of the amounts may not correspond to the total indicated.
2.11.2 Authorized and announced projects of $20.0 million or more, by degree of progress
In progress (millions of dollars)
Name Note Region
Québec Contribution
Partners’ Contribution
Total Cost
Before 2020-2021
2020-2030 QIP
Total
2020-2021
2021-2030
Total
1 Saint-Félicien Zoo, Centre for the conservation of boreal biodiversity – Construction and purchase
02 17.7 6.7 1.6 8.3 26.0 6.5 32.5
2 Promenade Samuel-De Champlain (Phase III) – Québec City – Construction
03 18.4 62.3 78.7 141.1 159.5 11.6 171.1
3 Docking facilities for international cruise ships – Québec City – Construction and purchase
03 9.9 4.3 0.7 5.1 15.0 15.0 30.0
4 New fire stations – Québec – Repair 03 11.1 3.7 5.2 8.9 20.0 - 20.0
5 Owl’s Head tourist station – Construction and purchase
05 2.1 3.8 14.5 18.3 20.4 141.5 161.9
6 Alexandra Pier and terminal – Montréal – Expansion and repair
06 17.0 3.0 - 3.0 20.0 58.0 78.0
7 Parc national d'Opémican – Laniel – Construction
08 22.3 4.8 8.9 13.7 36.0 - 36.0
8 Bromont, mountain adventure – Construction and purchase
16 2.4 2.5 4.7 7.2 9.6 66.1 75.7
9 Granby Zoo – Construction and purchase
16 6.4 2.0 9.6 11.6 18.0 18.0 36.0
10 Parc Safari – Saint-Bernard-de-Lacolle – Construction and purchase
16 5.3 4.9 1.8 6.7 12.0 12.0 24.0
Total 112.6 98.0 125.9 223.9 336.5 328.7 665.2
Note: Figures are rounded and the sum of the amounts may not correspond to the total indicated.
TOURISM AND RECREATIONAL ACTIVITIES SECTOR B
B.72 The 2020-2030 Québec Infrastructure Plan
In planning
Name Note Region
1 Olympic Stadium, roof – Montréal – Reconstruction 06
2 Olympic Stadium, funicular tower – Montréal – Repair 06
Contribution of the Gouvernement du Québec planned in the 2020-2030 QIP $226.0 M
In study (projects of 50 million dollars and more)
Name Note Region
1 Aquarium du Québec predator pavilion – Québec City – Enhancement 03
2 Palais des congrès de Montréal – Enhancement 06
Contribution of the Gouvernement du Québec planned in the 2020-2030 QIP (study cost) $0.2 M
Contribution of the Gouvernement du Québec planned in the 2020-2030 QIP for other projects and envelopes $698.4 M
Sector total $1,148.5 M
1 Infrastructure in partial operation. 2 Since publishing the 2019-2029 QIP, the progress of these projects on the list of published projects changed from the "in planning" to "in progress". 3 Since publishing the 2019-2029 QIP, the progress of these projects on the list of published projects changed from the "under study" to "in planning". 4 Since publishing the 2019-2029 QIP, these projects were added to "in planning". 5 Since publishing the 2019-2029 QIP, these projects were added to "under study".
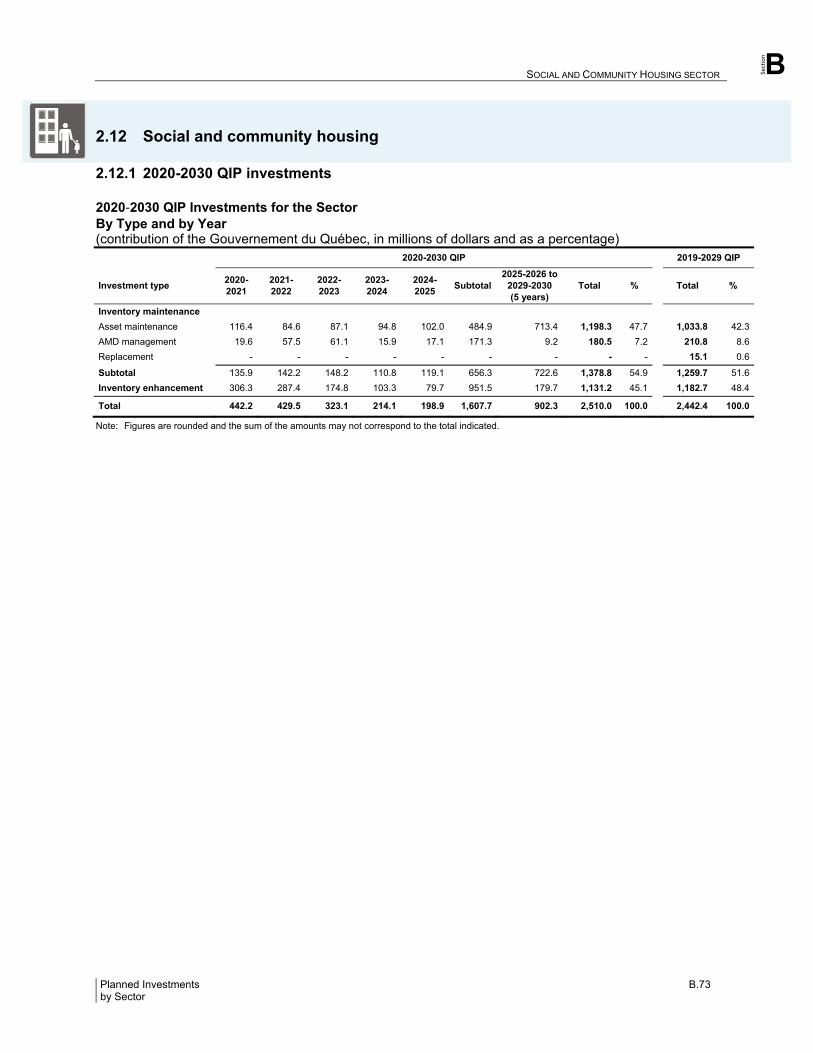
Section
SOCIAL AND COMMUNITY HOUSING SECTOR B
Planned Investments B.73 by Sector
2.12 Social and community housing
2.12.1 2020-2030 QIP investments 2020‐2030 QIP Investments for the Sector By Type and by Year (contribution of the Gouvernement du Québec, in millions of dollars and as a percentage) 2020-2030 QIP 2019-2029 QIP
Investment type 2020-2021
2021-2022
2022-2023
2023-2024
2024-2025
Subtotal 2025-2026 to
2029-2030 (5 years)
Total % Total %
Inventory maintenance
Asset maintenance 116.4 84.6 87.1 94.8 102.0 484.9 713.4 1,198.3 47.7 1,033.8 42.3
AMD management 19.6 57.5 61.1 15.9 17.1 171.3 9.2 180.5 7.2 210.8 8.6
Replacement - - - - - - - - - 15.1 0.6
Subtotal 135.9 142.2 148.2 110.8 119.1 656.3 722.6 1,378.8 54.9 1,259.7 51.6
Inventory enhancement 306.3 287.4 174.8 103.3 79.7 951.5 179.7 1,131.2 45.1 1,182.7 48.4
Total 442.2 429.5 323.1 214.1 198.9 1,607.7 902.3 2,510.0 100.0 2,442.4 100.0
Note: Figures are rounded and the sum of the amounts may not correspond to the total indicated.
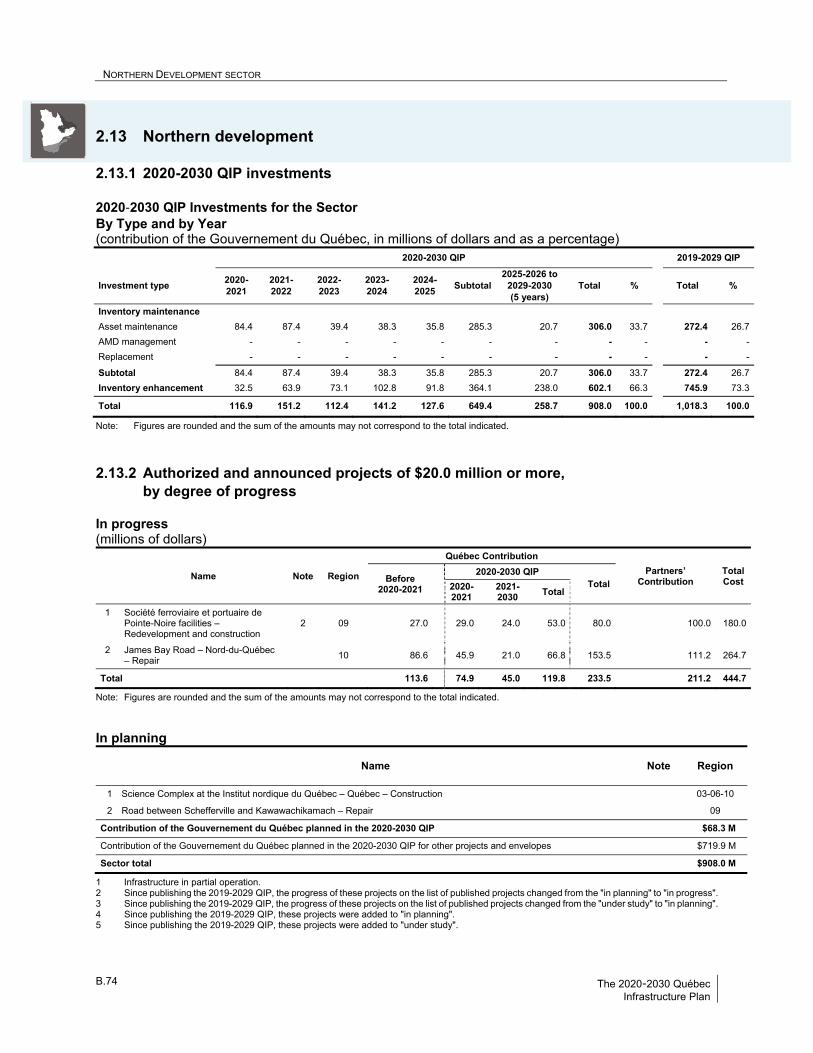
NORTHERN DEVELOPMENT SECTOR B
B.74 The 2020-2030 Québec Infrastructure Plan
2.13 Northern development
2.13.1 2020-2030 QIP investments 2020‐2030 QIP Investments for the Sector By Type and by Year (contribution of the Gouvernement du Québec, in millions of dollars and as a percentage) 2020-2030 QIP 2019-2029 QIP
Investment type 2020-2021
2021-2022
2022-2023
2023-2024
2024-2025
Subtotal 2025-2026 to
2029-2030 (5 years)
Total % Total %
Inventory maintenance
Asset maintenance 84.4 87.4 39.4 38.3 35.8 285.3 20.7 306.0 33.7 272.4 26.7
AMD management - - - - - - - - - - -
Replacement - - - - - - - - - - -
Subtotal 84.4 87.4 39.4 38.3 35.8 285.3 20.7 306.0 33.7 272.4 26.7
Inventory enhancement 32.5 63.9 73.1 102.8 91.8 364.1 238.0 602.1 66.3 745.9 73.3
Total 116.9 151.2 112.4 141.2 127.6 649.4 258.7 908.0 100.0 1,018.3 100.0
Note: Figures are rounded and the sum of the amounts may not correspond to the total indicated.
2.13.2 Authorized and announced projects of $20.0 million or more, by degree of progress
In progress (millions of dollars)
Name Note Region
Québec Contribution
Partners’ Contribution
Total Cost
Before 2020-2021
2020-2030 QIP
Total
2020-2021
2021-2030
Total
1 Société ferroviaire et portuaire de Pointe-Noire facilities – Redevelopment and construction
2 09 27.0 29.0 24.0 53.0 80.0 100.0 180.0
2 James Bay Road – Nord-du-Québec – Repair
10 86.6 45.9 21.0 66.8 153.5 111.2 264.7
Total 113.6 74.9 45.0 119.8 233.5 211.2 444.7
Note: Figures are rounded and the sum of the amounts may not correspond to the total indicated. In planning
Name Note Region
1 Science Complex at the Institut nordique du Québec – Québec – Construction 03-06-10
2 Road between Schefferville and Kawawachikamach – Repair 09
Contribution of the Gouvernement du Québec planned in the 2020-2030 QIP $68.3 M
Contribution of the Gouvernement du Québec planned in the 2020-2030 QIP for other projects and envelopes $719.9 M
Sector total $908.0 M
1 Infrastructure in partial operation. 2 Since publishing the 2019-2029 QIP, the progress of these projects on the list of published projects changed from the "in planning" to "in progress". 3 Since publishing the 2019-2029 QIP, the progress of these projects on the list of published projects changed from the "under study" to "in planning". 4 Since publishing the 2019-2029 QIP, these projects were added to "in planning". 5 Since publishing the 2019-2029 QIP, these projects were added to "under study".
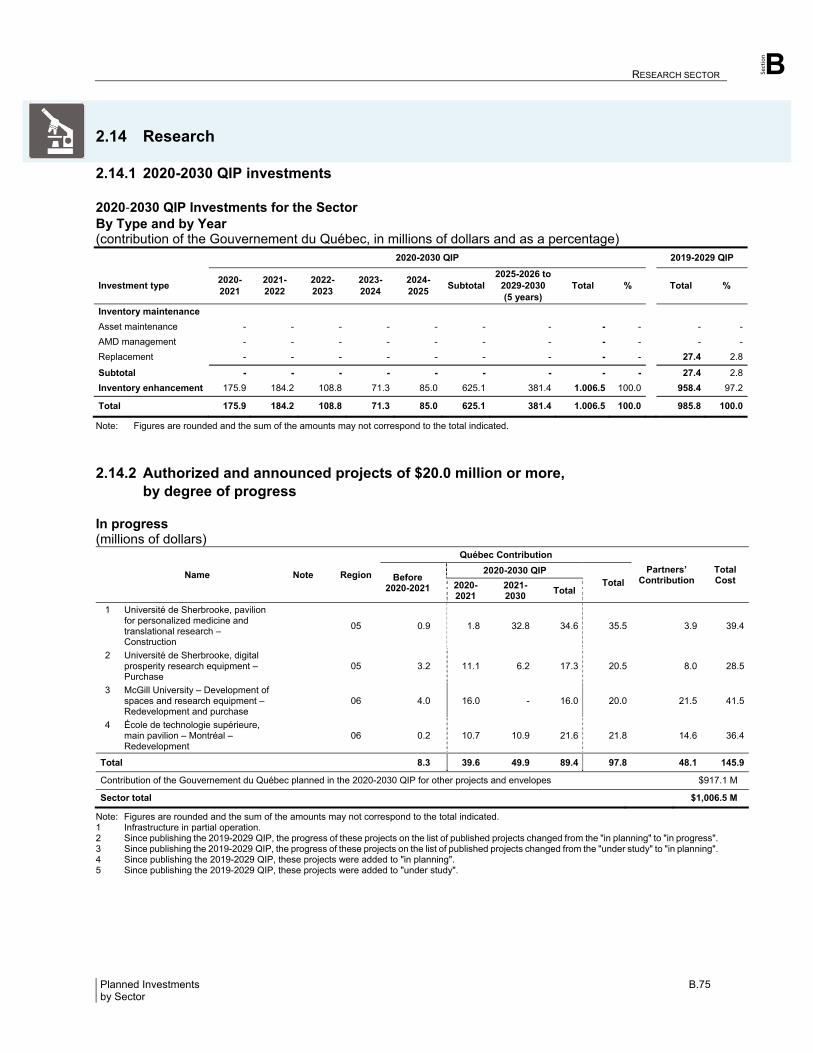
Section
RESEARCH SECTOR B
Planned Investments B.75 by Sector
2.14 Research
2.14.1 2020-2030 QIP investments 2020‐2030 QIP Investments for the Sector By Type and by Year (contribution of the Gouvernement du Québec, in millions of dollars and as a percentage) 2020-2030 QIP 2019-2029 QIP
Investment type 2020-2021
2021-2022
2022-2023
2023-2024
2024-2025
Subtotal 2025-2026 to
2029-2030 (5 years)
Total % Total %
Inventory maintenance
Asset maintenance - - - - - - - - - - -
AMD management - - - - - - - - - - -
Replacement - - - - - - - - - 27.4 2.8
Subtotal - - - - - - - - - 27.4 2.8
Inventory enhancement 175.9 184.2 108.8 71.3 85.0 625.1 381.4 1.006.5 100.0 958.4 97.2
Total 175.9 184.2 108.8 71.3 85.0 625.1 381.4 1.006.5 100.0 985.8 100.0
Note: Figures are rounded and the sum of the amounts may not correspond to the total indicated.
2.14.2 Authorized and announced projects of $20.0 million or more, by degree of progress
In progress (millions of dollars)
Name Note Region
Québec Contribution
Partners’ Contribution
Total Cost
Before 2020-2021
2020-2030 QIP
Total
2020-2021
2021-2030
Total
1 Université de Sherbrooke, pavilion for personalized medicine and translational research – Construction
05 0.9 1.8 32.8 34.6 35.5 3.9 39.4
2 Université de Sherbrooke, digital prosperity research equipment – Purchase
05 3.2 11.1 6.2 17.3 20.5 8.0 28.5
3 McGill University – Development of spaces and research equipment – Redevelopment and purchase
06 4.0 16.0 - 16.0 20.0 21.5 41.5
4 École de technologie supérieure, main pavilion – Montréal – Redevelopment
06 0.2 10.7 10.9 21.6 21.8 14.6 36.4
Total 8.3 39.6 49.9 89.4 97.8 48.1 145.9
Contribution of the Gouvernement du Québec planned in the 2020-2030 QIP for other projects and envelopes $917.1 M
Sector total $1,006.5 M
Note: Figures are rounded and the sum of the amounts may not correspond to the total indicated. 1 Infrastructure in partial operation. 2 Since publishing the 2019-2029 QIP, the progress of these projects on the list of published projects changed from the "in planning" to "in progress". 3 Since publishing the 2019-2029 QIP, the progress of these projects on the list of published projects changed from the "under study" to "in planning". 4 Since publishing the 2019-2029 QIP, these projects were added to "in planning". 5 Since publishing the 2019-2029 QIP, these projects were added to "under study".
RESEARCH SECTOR B
B.76 The 2020-2030 Québec Infrastructure Plan
Project withdrawn from the list of published projects in the 2020‐2030 QIP
The commissioning of the following infrastructure project in the "Research" sector has been finalized since the 2019‐2029 QIP. Accordingly, this project was withdrawn from the list of projects in progress:
• École de technologie supérieure, Pavilion D – Montréal – Construction (region 06).
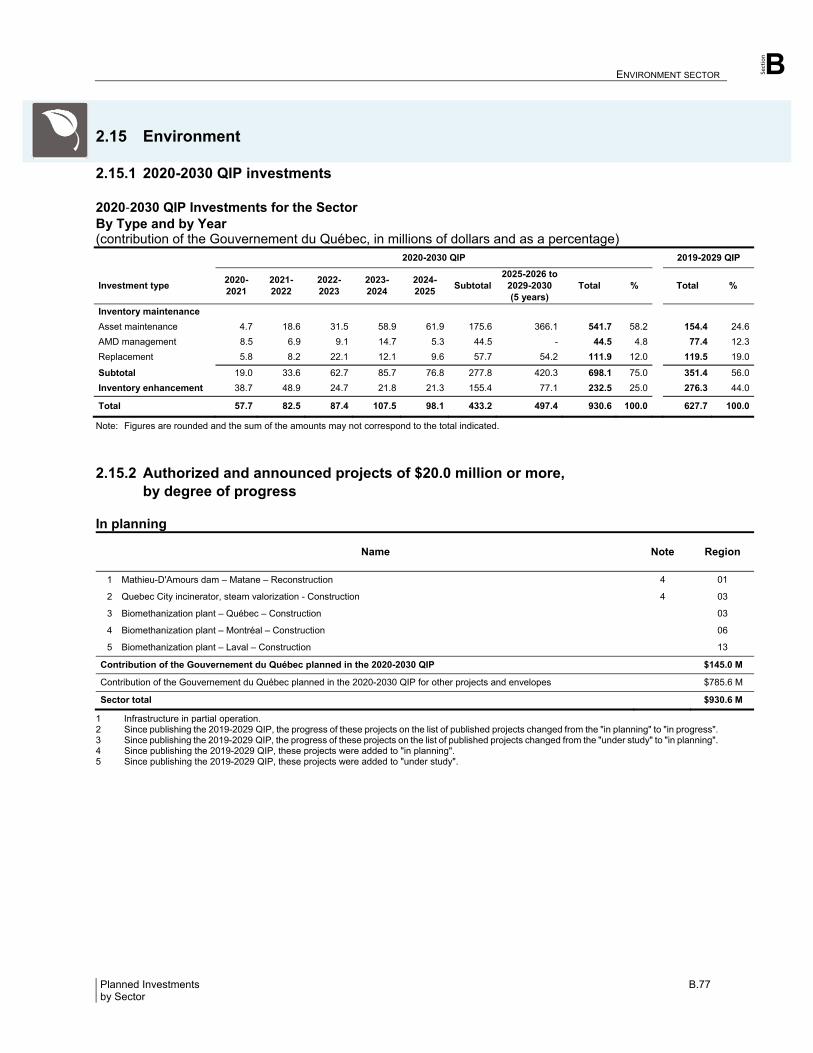
Section
ENVIRONMENT SECTOR B
Planned Investments B.77 by Sector
2.15 Environment
2.15.1 2020-2030 QIP investments 2020‐2030 QIP Investments for the Sector By Type and by Year (contribution of the Gouvernement du Québec, in millions of dollars and as a percentage) 2020-2030 QIP 2019-2029 QIP
Investment type 2020-2021
2021-2022
2022-2023
2023-2024
2024-2025
Subtotal 2025-2026 to
2029-2030 (5 years)
Total % Total %
Inventory maintenance
Asset maintenance 4.7 18.6 31.5 58.9 61.9 175.6 366.1 541.7 58.2 154.4 24.6
AMD management 8.5 6.9 9.1 14.7 5.3 44.5 - 44.5 4.8 77.4 12.3
Replacement 5.8 8.2 22.1 12.1 9.6 57.7 54.2 111.9 12.0 119.5 19.0
Subtotal 19.0 33.6 62.7 85.7 76.8 277.8 420.3 698.1 75.0 351.4 56.0
Inventory enhancement 38.7 48.9 24.7 21.8 21.3 155.4 77.1 232.5 25.0 276.3 44.0
Total 57.7 82.5 87.4 107.5 98.1 433.2 497.4 930.6 100.0 627.7 100.0
Note: Figures are rounded and the sum of the amounts may not correspond to the total indicated.
2.15.2 Authorized and announced projects of $20.0 million or more, by degree of progress
In planning
Name Note Region
1 Mathieu-D'Amours dam – Matane – Reconstruction 4 01
2 Quebec City incinerator, steam valorization - Construction 4 03
3 Biomethanization plant – Québec – Construction 03
4 Biomethanization plant – Montréal – Construction 06
5 Biomethanization plant – Laval – Construction 13
Contribution of the Gouvernement du Québec planned in the 2020-2030 QIP $145.0 M
Contribution of the Gouvernement du Québec planned in the 2020-2030 QIP for other projects and envelopes $785.6 M
Sector total $930.6 M
1 Infrastructure in partial operation. 2 Since publishing the 2019-2029 QIP, the progress of these projects on the list of published projects changed from the "in planning" to "in progress". 3 Since publishing the 2019-2029 QIP, the progress of these projects on the list of published projects changed from the "under study" to "in planning". 4 Since publishing the 2019-2029 QIP, these projects were added to "in planning". 5 Since publishing the 2019-2029 QIP, these projects were added to "under study".
ENVIRONMENT SECTOR B
B.78 The 2020-2030 Québec Infrastructure Plan
Projects withdrawn from the list of published projects in the 2020‐2030 QIP
The commissioning of the following infrastructure project in the "Environment" sector has been finalized since the 2019-2029 QIP:
• Biomethanization plant – Varennes – Construction (region 16). Furthermore, this project is no longer applicable because the City of Longueuil will be serviced by the plant belonging to the City of Varennes:
• Biomethanization plant – Longueuil – Construction (region 16). Accordingly, these projects were withdrawn from the list of projects in progress.
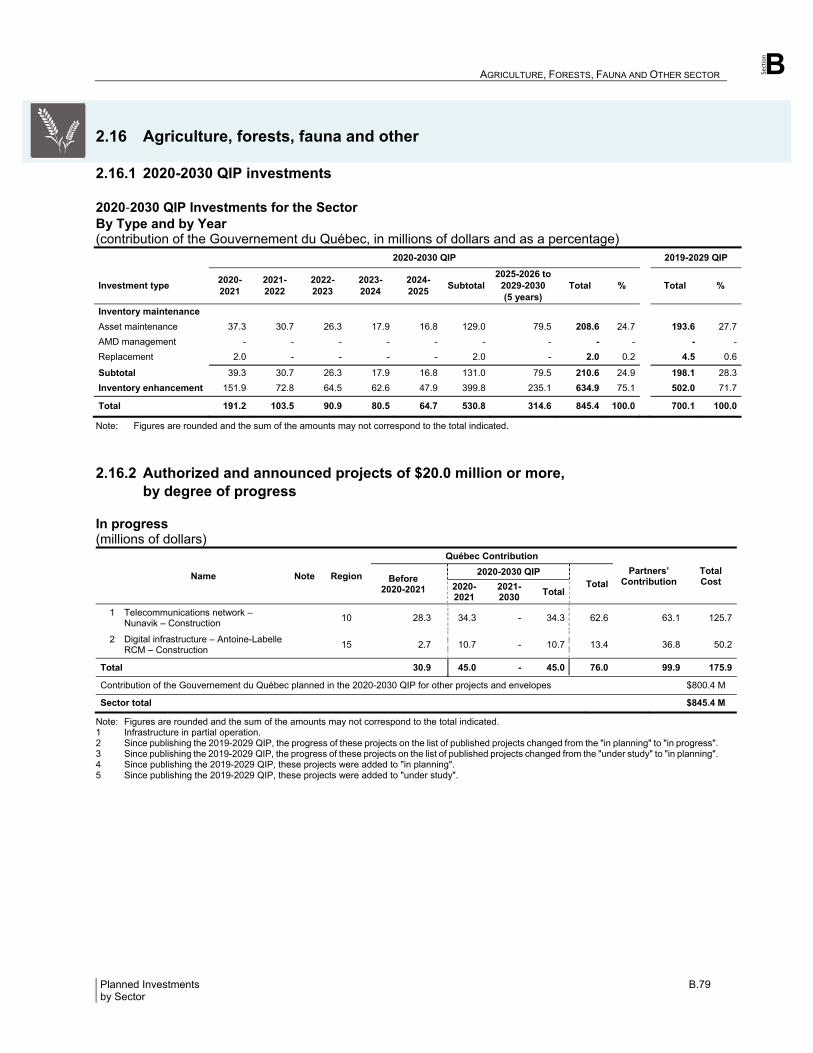
Section
AGRICULTURE, FORESTS, FAUNA AND OTHER SECTOR B
Planned Investments B.79 by Sector
2.16 Agriculture, forests, fauna and other
2.16.1 2020-2030 QIP investments 2020‐2030 QIP Investments for the Sector By Type and by Year (contribution of the Gouvernement du Québec, in millions of dollars and as a percentage) 2020-2030 QIP 2019-2029 QIP
Investment type 2020-2021
2021-2022
2022-2023
2023-2024
2024-2025
Subtotal 2025-2026 to
2029-2030 (5 years)
Total % Total %
Inventory maintenance
Asset maintenance 37.3 30.7 26.3 17.9 16.8 129.0 79.5 208.6 24.7 193.6 27.7
AMD management - - - - - - - - - - -
Replacement 2.0 - - - - 2.0 - 2.0 0.2 4.5 0.6
Subtotal 39.3 30.7 26.3 17.9 16.8 131.0 79.5 210.6 24.9 198.1 28.3
Inventory enhancement 151.9 72.8 64.5 62.6 47.9 399.8 235.1 634.9 75.1 502.0 71.7
Total 191.2 103.5 90.9 80.5 64.7 530.8 314.6 845.4 100.0 700.1 100.0
Note: Figures are rounded and the sum of the amounts may not correspond to the total indicated.
2.16.2 Authorized and announced projects of $20.0 million or more, by degree of progress
In progress (millions of dollars)
Name Note Region
Québec Contribution
Partners’ Contribution
Total Cost
Before 2020-2021
2020-2030 QIP
Total
2020-2021
2021-2030
Total
1 Telecommunications network – Nunavik – Construction
10 28.3 34.3 - 34.3 62.6 63.1 125.7
2 Digital infrastructure – Antoine-Labelle RCM – Construction
15 2.7 10.7 - 10.7 13.4 36.8 50.2
Total 30.9 45.0 - 45.0 76.0 99.9 175.9
Contribution of the Gouvernement du Québec planned in the 2020-2030 QIP for other projects and envelopes $800.4 M
Sector total $845.4 M
Note: Figures are rounded and the sum of the amounts may not correspond to the total indicated. 1 Infrastructure in partial operation. 2 Since publishing the 2019-2029 QIP, the progress of these projects on the list of published projects changed from the "in planning" to "in progress". 3 Since publishing the 2019-2029 QIP, the progress of these projects on the list of published projects changed from the "under study" to "in planning". 4 Since publishing the 2019-2029 QIP, these projects were added to "in planning". 5 Since publishing the 2019-2029 QIP, these projects were added to "under study".
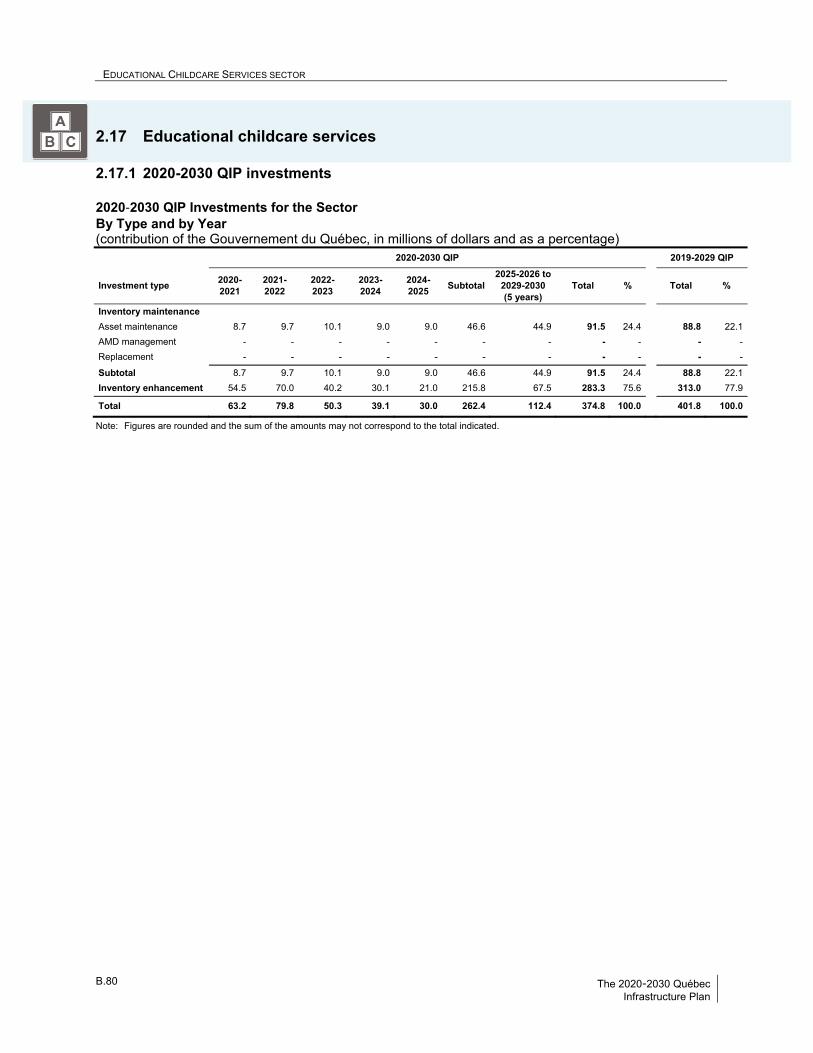
EDUCATIONAL CHILDCARE SERVICES SECTOR B
B.80 The 2020-2030 Québec Infrastructure Plan
2.17 Educational childcare services
2.17.1 2020-2030 QIP investments 2020‐2030 QIP Investments for the Sector By Type and by Year (contribution of the Gouvernement du Québec, in millions of dollars and as a percentage) 2020-2030 QIP 2019-2029 QIP
Investment type 2020-2021
2021-2022
2022-2023
2023-2024
2024-2025
Subtotal 2025-2026 to
2029-2030 (5 years)
Total % Total %
Inventory maintenance
Asset maintenance 8.7 9.7 10.1 9.0 9.0 46.6 44.9 91.5 24.4 88.8 22.1
AMD management - - - - - - - - - - -
Replacement - - - - - - - - - - -
Subtotal 8.7 9.7 10.1 9.0 9.0 46.6 44.9 91.5 24.4 88.8 22.1
Inventory enhancement 54.5 70.0 40.2 30.1 21.0 215.8 67.5 283.3 75.6 313.0 77.9
Total 63.2 79.8 50.3 39.1 30.0 262.4 112.4 374.8 100.0 401.8 100.0
Note: Figures are rounded and the sum of the amounts may not correspond to the total indicated.
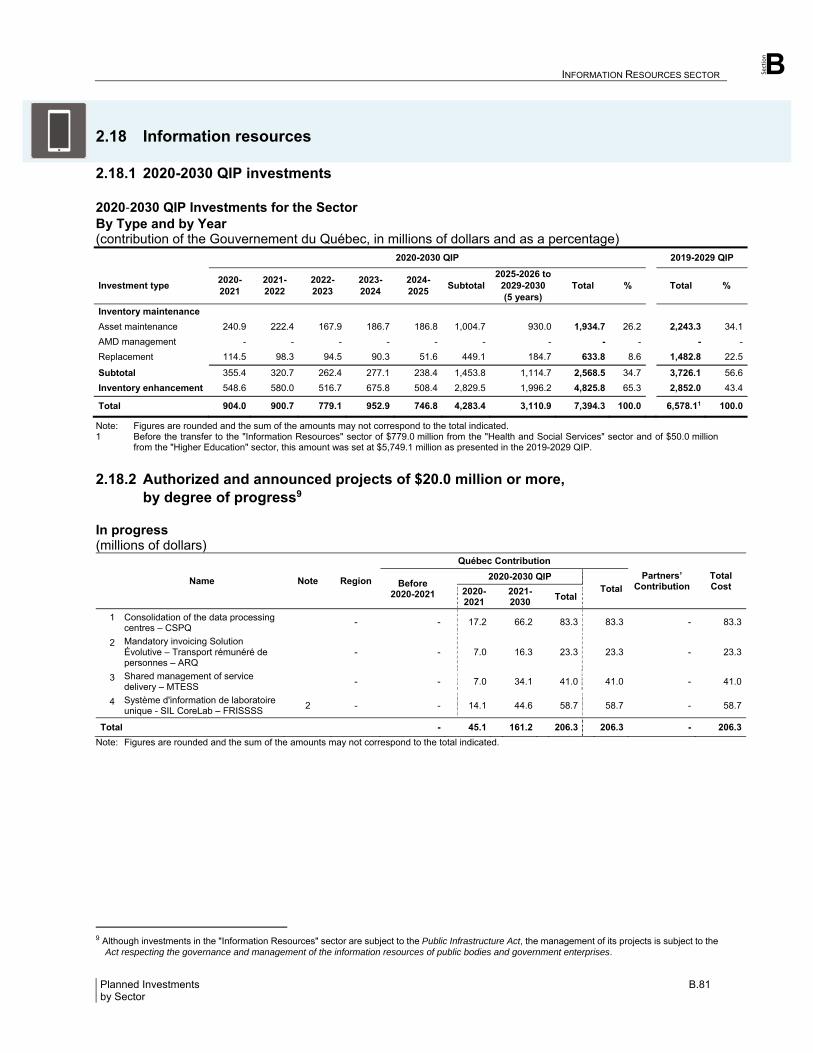
Section
INFORMATION RESOURCES SECTOR B
Planned Investments B.81 by Sector
2.18 Information resources
2.18.1 2020-2030 QIP investments 2020‐2030 QIP Investments for the Sector By Type and by Year (contribution of the Gouvernement du Québec, in millions of dollars and as a percentage) 2020-2030 QIP 2019-2029 QIP
Investment type 2020-2021
2021-2022
2022-2023
2023-2024
2024-2025
Subtotal 2025-2026 to
2029-2030 (5 years)
Total % Total %
Inventory maintenance
Asset maintenance 240.9 222.4 167.9 186.7 186.8 1,004.7 930.0 1,934.7 26.2 2,243.3 34.1
AMD management - - - - - - - - - - -
Replacement 114.5 98.3 94.5 90.3 51.6 449.1 184.7 633.8 8.6 1,482.8 22.5
Subtotal 355.4 320.7 262.4 277.1 238.4 1,453.8 1,114.7 2,568.5 34.7 3,726.1 56.6
Inventory enhancement 548.6 580.0 516.7 675.8 508.4 2,829.5 1,996.2 4,825.8 65.3 2,852.0 43.4
Total 904.0 900.7 779.1 952.9 746.8 4,283.4 3,110.9 7,394.3 100.0 6,578.11 100.0
Note: Figures are rounded and the sum of the amounts may not correspond to the total indicated. 1 Before the transfer to the "Information Resources" sector of $779.0 million from the "Health and Social Services" sector and of $50.0 million
from the "Higher Education" sector, this amount was set at $5,749.1 million as presented in the 2019-2029 QIP.
2.18.2 Authorized and announced projects of $20.0 million or more, by degree of progress9
In progress (millions of dollars)
Name Note Region
Québec Contribution
Partners’ Contribution
Total Cost
Before 2020-2021
2020-2030 QIP
Total
2020-2021
2021-2030
Total
1 Consolidation of the data processing centres – CSPQ
- - 17.2 66.2 83.3 83.3 - 83.3
2 Mandatory invoicing Solution Évolutive – Transport rémunéré de personnes – ARQ
- - 7.0 16.3 23.3 23.3 - 23.3
3 Shared management of service delivery – MTESS
- - 7.0 34.1 41.0 41.0 - 41.0
4 Système d'information de laboratoire unique - SIL CoreLab – FRISSSS
2 - - 14.1 44.6 58.7 58.7 - 58.7
Total - 45.1 161.2 206.3 206.3 - 206.3
Note: Figures are rounded and the sum of the amounts may not correspond to the total indicated.
9 Although investments in the "Information Resources" sector are subject to the Public Infrastructure Act, the management of its projects is subject to the
Act respecting the governance and management of the information resources of public bodies and government enterprises.
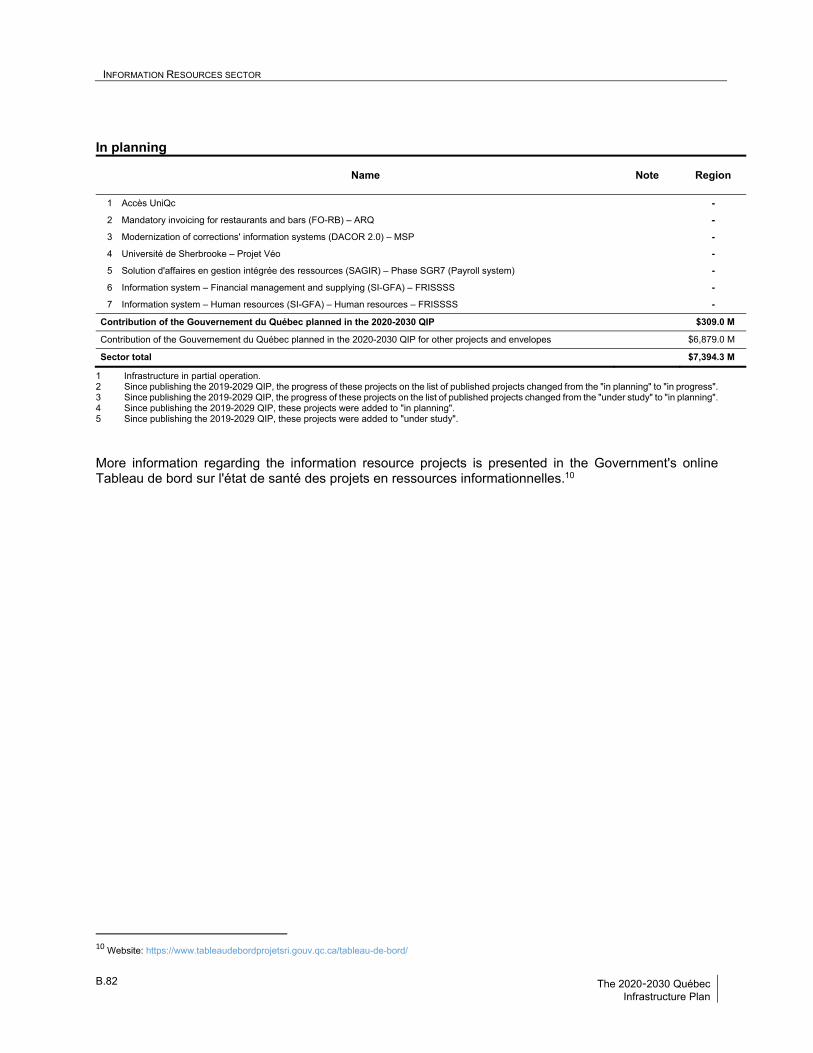
INFORMATION RESOURCES SECTOR B
B.82 The 2020-2030 Québec Infrastructure Plan
In planning
Name Note Region
1 Accès UniQc -
2 Mandatory invoicing for restaurants and bars (FO-RB) – ARQ -
3 Modernization of corrections' information systems (DACOR 2.0) – MSP -
4 Université de Sherbrooke – Projet Véo -
5 Solution d'affaires en gestion intégrée des ressources (SAGIR) – Phase SGR7 (Payroll system) -
6 Information system – Financial management and supplying (SI-GFA) – FRISSSS -
7 Information system – Human resources (SI-GFA) – Human resources – FRISSSS -
Contribution of the Gouvernement du Québec planned in the 2020-2030 QIP $309.0 M
Contribution of the Gouvernement du Québec planned in the 2020-2030 QIP for other projects and envelopes $6,879.0 M
Sector total $7,394.3 M
1 Infrastructure in partial operation. 2 Since publishing the 2019-2029 QIP, the progress of these projects on the list of published projects changed from the "in planning" to "in progress". 3 Since publishing the 2019-2029 QIP, the progress of these projects on the list of published projects changed from the "under study" to "in planning". 4 Since publishing the 2019-2029 QIP, these projects were added to "in planning". 5 Since publishing the 2019-2029 QIP, these projects were added to "under study".
More information regarding the information resource projects is presented in the Government's online Tableau de bord sur l'état de santé des projets en ressources informationnelles.10
10 Website: https://www.tableaudebordprojetsri.gouv.qc.ca/tableau-de-bord/
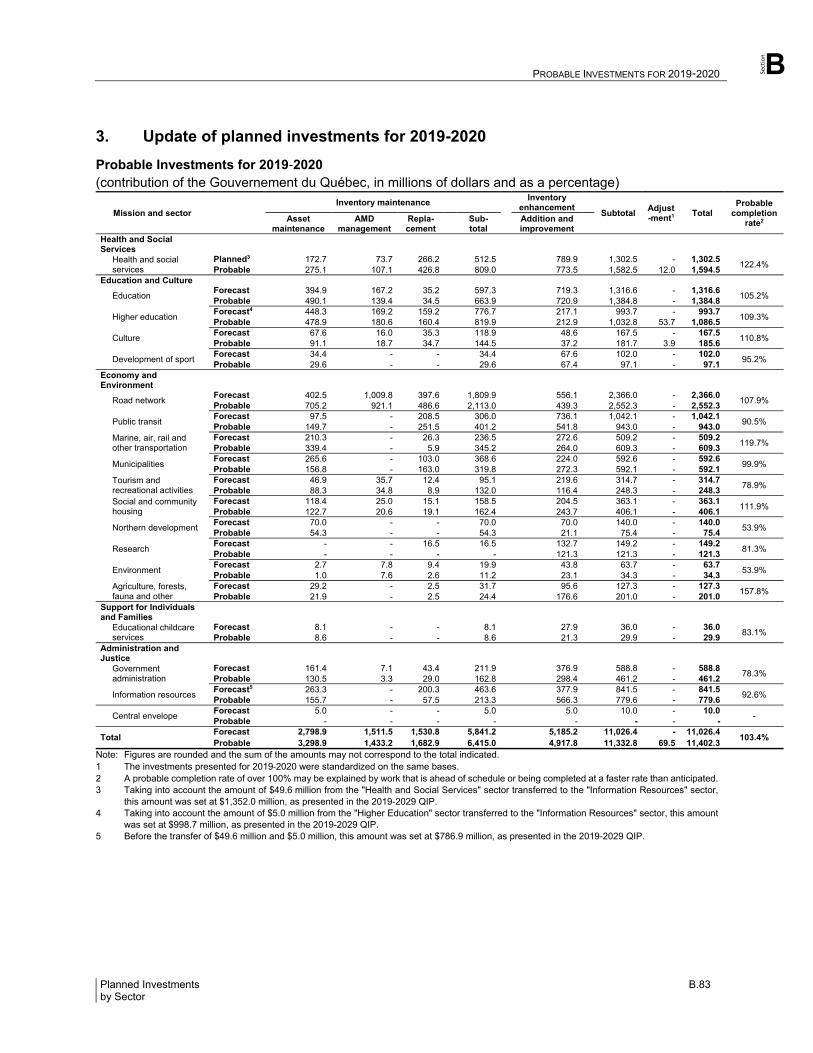
Section
PROBABLE INVESTMENTS FOR 2019-2020 B
Planned Investments B.83 by Sector
3. Update of planned investments for 2019-2020
Probable Investments for 2019‐2020 (contribution of the Gouvernement du Québec, in millions of dollars and as a percentage)
Mission and sector Inventory maintenance
Inventory
enhancement Subtotal
Adjust-ment1
Total Probable
completion rate2 Asset
maintenance AMD
management Repla-cement
Sub-total
Addition and improvement
Health and Social Services
Health and social services
Planned3 172.7 73.7 266.2 512.5 789.9 1,302.5 - 1,302.5 122.4%
Probable 275.1 107.1 426.8 809.0 773.5 1,582.5 12.0 1,594.5 Education and Culture
Education Forecast 394.9 167.2 35.2 597.3 719.3 1,316.6 - 1,316.6
105.2% Probable 490.1 139.4 34.5 663.9 720.9 1,384.8 - 1,384.8
Higher education Forecast4 448.3 169.2 159.2 776.7 217.1 993.7 - 993.7
109.3% Probable 478.9 180.6 160.4 819.9 212.9 1,032.8 53.7 1,086.5
Culture Forecast 67.6 16.0 35.3 118.9 48.6 167.5 - 167.5
110.8% Probable 91.1 18.7 34.7 144.5 37.2 181.7 3.9 185.6
Development of sport Forecast 34.4 - - 34.4 67.6 102.0 - 102.0
95.2% Probable 29.6 - - 29.6 67.4 97.1 - 97.1
Economy and Environment
Road network Forecast 402.5 1,009.8 397.6 1,809.9 556.1 2,366.0 - 2,366.0
107.9% Probable 705.2 921.1 486.6 2,113.0 439.3 2,552.3 - 2,552.3
Public transit Forecast 97.5 - 208.5 306.0 736.1 1,042.1 - 1,042.1
90.5% Probable 149.7 - 251.5 401.2 541.8 943.0 - 943.0
Marine, air, rail and other transportation
Forecast 210.3 - 26.3 236.5 272.6 509.2 - 509.2 119.7%
Probable 339.4 - 5.9 345.2 264.0 609.3 - 609.3
Municipalities Forecast 265.6 - 103.0 368.6 224.0 592.6 - 592.6
99.9% Probable 156.8 - 163.0 319.8 272.3 592.1 - 592.1
Tourism and recreational activities
Forecast 46.9 35.7 12.4 95.1 219.6 314.7 - 314.7 78.9%
Probable 88.3 34.8 8.9 132.0 116.4 248.3 - 248.3
Social and community housing
Forecast 118.4 25.0 15.1 158.5 204.5 363.1 - 363.1 111.9%
Probable 122.7 20.6 19.1 162.4 243.7 406.1 - 406.1
Northern development Forecast 70.0 - - 70.0 70.0 140.0 - 140.0
53.9% Probable 54.3 - - 54.3 21.1 75.4 - 75.4
Research Forecast - - 16.5 16.5 132.7 149.2 - 149.2
81.3% Probable - - - - 121.3 121.3 - 121.3
Environment Forecast 2.7 7.8 9.4 19.9 43.8 63.7 - 63.7
53.9% Probable 1.0 7.6 2.6 11.2 23.1 34.3 - 34.3
Agriculture, forests, fauna and other
Forecast 29.2 - 2.5 31.7 95.6 127.3 - 127.3 157.8%
Probable 21.9 - 2.5 24.4 176.6 201.0 - 201.0 Support for Individuals and Families
Educational childcare services
Forecast 8.1 - - 8.1 27.9 36.0 - 36.0 83.1%
Probable 8.6 - - 8.6 21.3 29.9 - 29.9 Administration and Justice
Government administration
Forecast 161.4 7.1 43.4 211.9 376.9 588.8 - 588.8 78.3%
Probable 130.5 3.3 29.0 162.8 298.4 461.2 - 461.2
Information resources Forecast5 263.3 - 200.3 463.6 377.9 841.5 - 841.5
92.6% Probable 155.7 - 57.5 213.3 566.3 779.6 - 779.6
Central envelope Forecast 5.0 - - 5.0 5.0 10.0 - 10.0
- Probable - - - - - - - -
Total Forecast 2,798.9 1,511.5 1,530.8 5,841.2 5,185.2 11,026.4 - 11,026.4
103.4% Probable 3,298.9 1,433.2 1,682.9 6,415.0 4,917.8 11,332.8 69.5 11,402.3
Note: Figures are rounded and the sum of the amounts may not correspond to the total indicated. 1 The investments presented for 2019‐2020 were standardized on the same bases. 2 A probable completion rate of over 100% may be explained by work that is ahead of schedule or being completed at a faster rate than anticipated. 3 Taking into account the amount of $49.6 million from the "Health and Social Services" sector transferred to the "Information Resources" sector,
this amount was set at $1,352.0 million, as presented in the 2019-2029 QIP. 4 Taking into account the amount of $5.0 million from the "Higher Education" sector transferred to the "Information Resources" sector, this amount
was set at $998.7 million, as presented in the 2019-2029 QIP. 5 Before the transfer of $49.6 million and $5.0 million, this amount was set at $786.9 million, as presented in the 2019-2029 QIP.
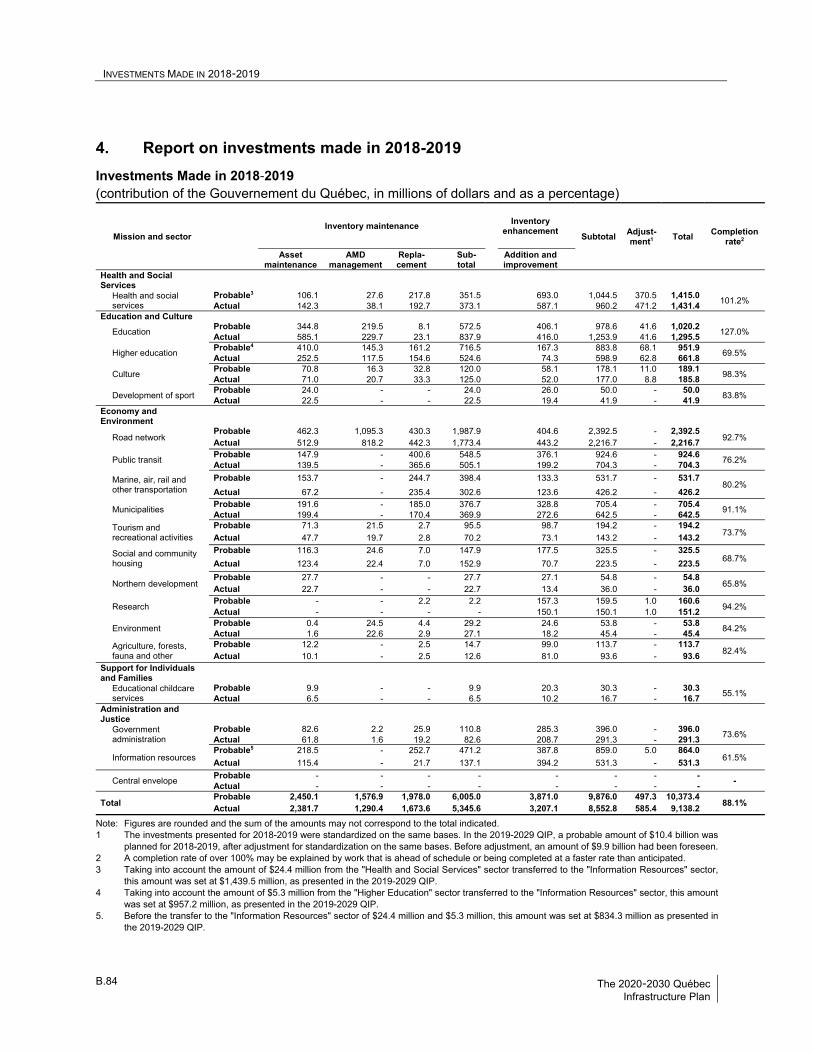
INVESTMENTS MADE IN 2018-2019 B
B.84 The 2020-2030 Québec Infrastructure Plan
4. Report on investments made in 2018-2019
Investments Made in 2018‐2019 (contribution of the Gouvernement du Québec, in millions of dollars and as a percentage)
Mission and sector Inventory maintenance
Inventory enhancement
Subtotal
Adjust-ment1
Total Completion
rate2
Asset maintenance
AMD management
Repla-cement
Sub-total
Addition and improvement
Health and Social Services
Health and social services
Probable3 106.1 27.6 217.8 351.5 693.0 1,044.5 370.5 1,415.0 101.2%
Actual 142.3 38.1 192.7 373.1 587.1 960.2 471.2 1,431.4 Education and Culture
Education Probable 344.8 219.5 8.1 572.5 406.1 978.6 41.6 1,020.2
127.0% Actual 585.1 229.7 23.1 837.9 416.0 1,253.9 41.6 1,295.5
Higher education Probable4 410.0 145.3 161.2 716.5 167.3 883.8 68.1 951.9
69.5% Actual 252.5 117.5 154.6 524.6 74.3 598.9 62.8 661.8
Culture Probable 70.8 16.3 32.8 120.0 58.1 178.1 11.0 189.1
98.3% Actual 71.0 20.7 33.3 125.0 52.0 177.0 8.8 185.8
Development of sport Probable 24.0 - - 24.0 26.0 50.0 - 50.0
83.8% Actual 22.5 - - 22.5 19.4 41.9 - 41.9
Economy and Environment
Road network Probable 462.3 1,095.3 430.3 1,987.9 404.6 2,392.5 - 2,392.5
92.7% Actual 512.9 818.2 442.3 1,773.4 443.2 2,216.7 - 2,216.7
Public transit Probable 147.9 - 400.6 548.5 376.1 924.6 - 924.6
76.2% Actual 139.5 - 365.6 505.1 199.2 704.3 - 704.3
Marine, air, rail and other transportation
Probable 153.7 - 244.7 398.4 133.3 531.7 - 531.7 80.2%
Actual 67.2 - 235.4 302.6 123.6 426.2 - 426.2
Municipalities Probable 191.6 - 185.0 376.7 328.8 705.4 - 705.4
91.1% Actual 199.4 - 170.4 369.9 272.6 642.5 - 642.5
Tourism and recreational activities
Probable 71.3 21.5 2.7 95.5 98.7 194.2 - 194.2 73.7%
Actual 47.7 19.7 2.8 70.2 73.1 143.2 - 143.2
Social and community housing
Probable 116.3 24.6 7.0 147.9 177.5 325.5 - 325.5 68.7%
Actual 123.4 22.4 7.0 152.9 70.7 223.5 - 223.5
Northern development Probable 27.7 - - 27.7 27.1 54.8 - 54.8
65.8% Actual 22.7 - - 22.7 13.4 36.0 - 36.0
Research Probable - - 2.2 2.2 157.3 159.5 1.0 160.6
94.2% Actual - - - - 150.1 150.1 1.0 151.2
Environment Probable 0.4 24.5 4.4 29.2 24.6 53.8 - 53.8
84.2% Actual 1.6 22.6 2.9 27.1 18.2 45.4 - 45.4
Agriculture, forests, fauna and other
Probable 12.2 - 2.5 14.7 99.0 113.7 - 113.7 82.4%
Actual 10.1 - 2.5 12.6 81.0 93.6 - 93.6 Support for Individuals and Families
Educational childcare services
Probable 9.9 - - 9.9 20.3 30.3 - 30.3 55.1%
Actual 6.5 - - 6.5 10.2 16.7 - 16.7 Administration and Justice
Government administration
Probable 82.6 2.2 25.9 110.8 285.3 396.0 - 396.0 73.6%
Actual 61.8 1.6 19.2 82.6 208.7 291.3 - 291.3
Information resources Probable5 218.5 - 252.7 471.2 387.8 859.0 5.0 864.0
61.5% Actual 115.4 - 21.7 137.1 394.2 531.3 - 531.3
Central envelope Probable - - - - - - - -
- Actual - - - - - - - -
Total Probable 2,450.1 1,576.9 1,978.0 6,005.0
3,871.0 9,876.0 497.3 10,373.4
88.1% Actual 2,381.7 1,290.4 1,673.6 5,345.6
3,207.1 8,552.8 585.4 9,138.2
Note: Figures are rounded and the sum of the amounts may not correspond to the total indicated. 1 The investments presented for 2018-2019 were standardized on the same bases. In the 2019-2029 QIP, a probable amount of $10.4 billion was
planned for 2018-2019, after adjustment for standardization on the same bases. Before adjustment, an amount of $9.9 billion had been foreseen. 2 A completion rate of over 100% may be explained by work that is ahead of schedule or being completed at a faster rate than anticipated. 3 Taking into account the amount of $24.4 million from the "Health and Social Services" sector transferred to the "Information Resources" sector,
this amount was set at $1,439.5 million, as presented in the 2019-2029 QIP. 4 Taking into account the amount of $5.3 million from the "Higher Education" sector transferred to the "Information Resources" sector, this amount
was set at $957.2 million, as presented in the 2019-2029 QIP. 5. Before the transfer to the "Information Resources" sector of $24.4 million and $5.3 million, this amount was set at $834.3 million as presented in
the 2019-2029 QIP.
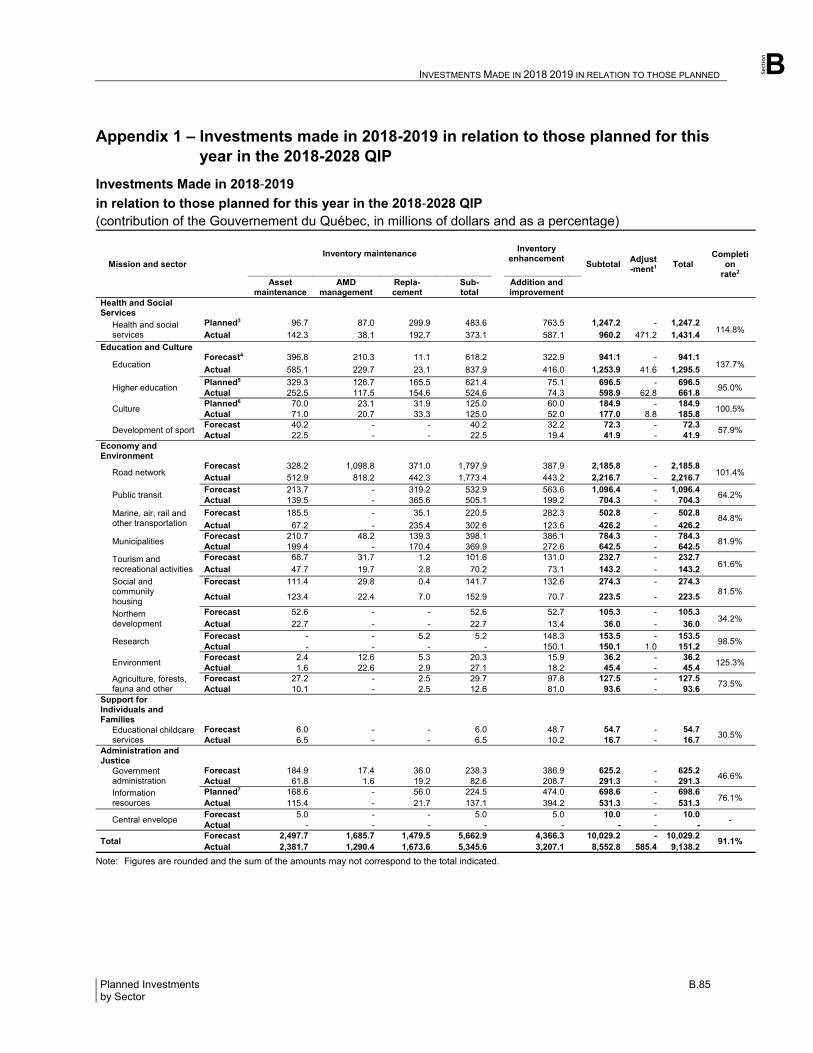
Section
INVESTMENTS MADE IN 2018 2019 IN RELATION TO THOSE PLANNED B
Planned Investments B.85 by Sector
Appendix 1 – Investments made in 2018-2019 in relation to those planned for this year in the 2018-2028 QIP
Investments Made in 2018‐2019
in relation to those planned for this year in the 2018‐2028 QIP (contribution of the Gouvernement du Québec, in millions of dollars and as a percentage)
Mission and sector Inventory maintenance
Inventory enhancement
Subtotal
Adjust-ment1
Total Completi
on rate2
Asset maintenance
AMD management
Repla-cement
Sub-total
Addition and improvement
Health and Social Services
Health and social services
Planned3 96.7 87.0 299.9 483.6 763.5 1,247.2 - 1,247.2 114.8%
Actual 142.3 38.1 192.7 373.1 587.1 960.2 471.2 1,431.4
Education and Culture
Education Forecast4 396.8 210.3 11.1 618.2 322.9 941.1 - 941.1
137.7% Actual 585.1 229.7 23.1 837.9 416.0 1,253.9 41.6 1,295.5
Higher education Planned5 329.3 126.7 165.5 621.4 75.1 696.5 - 696.5
95.0% Actual 252.5 117.5 154.6 524.6 74.3 598.9 62.8 661.8
Culture Planned6 70.0 23.1 31.9 125.0 60.0 184.9 - 184.9
100.5% Actual 71.0 20.7 33.3 125.0 52.0 177.0 8.8 185.8
Development of sport Forecast 40.2 - - 40.2 32.2 72.3 - 72.3
57.9% Actual 22.5 - - 22.5 19.4 41.9 - 41.9
Economy and Environment
Road network Forecast 328.2 1,098.8 371.0 1,797.9 387.9 2,185.8 - 2,185.8
101.4% Actual 512.9 818.2 442.3 1,773.4 443.2 2,216.7 - 2,216.7
Public transit Forecast 213.7 - 319.2 532.9 563.6 1,096.4 - 1,096.4
64.2% Actual 139.5 - 365.6 505.1 199.2 704.3 - 704.3
Marine, air, rail and other transportation
Forecast 185.5 - 35.1 220.5 282.3 502.8 - 502.8 84.8%
Actual 67.2 - 235.4 302.6 123.6 426.2 - 426.2
Municipalities Forecast 210.7 48.2 139.3 398.1 386.1 784.3 - 784.3
81.9% Actual 199.4 - 170.4 369.9 272.6 642.5 - 642.5
Tourism and recreational activities
Forecast 68.7 31.7 1.2 101.6 131.0 232.7 - 232.7 61.6%
Actual 47.7 19.7 2.8 70.2 73.1 143.2 - 143.2
Social and community housing
Forecast 111.4 29.8 0.4 141.7 132.6 274.3 - 274.3 81.5%
Actual 123.4 22.4 7.0 152.9 70.7 223.5 - 223.5
Northern development
Forecast 52.6 - - 52.6 52.7 105.3 - 105.3 34.2%
Actual 22.7 - - 22.7 13.4 36.0 - 36.0
Research Forecast - - 5.2 5.2 148.3 153.5 - 153.5
98.5% Actual - - - - 150.1 150.1 1.0 151.2
Environment Forecast 2.4 12.6 5.3 20.3 15.9 36.2 - 36.2
125.3% Actual 1.6 22.6 2.9 27.1 18.2 45.4 - 45.4
Agriculture, forests, fauna and other
Forecast 27.2 - 2.5 29.7 97.8 127.5 - 127.5 73.5%
Actual 10.1 - 2.5 12.6 81.0 93.6 - 93.6 Support for Individuals and Families
Educational childcare services
Forecast 6.0 - - 6.0 48.7 54.7 - 54.7 30.5%
Actual 6.5 - - 6.5 10.2 16.7 - 16.7 Administration and Justice
Government administration
Forecast 184.9 17.4 36.0 238.3 386.9 625.2 - 625.2 46.6%
Actual 61.8 1.6 19.2 82.6 208.7 291.3 - 291.3
Information resources
Planned7 168.6 - 56.0 224.5 474.0 698.6 - 698.6 76.1%
Actual 115.4 - 21.7 137.1 394.2 531.3 - 531.3
Central envelope Forecast 5.0 - - 5.0 5.0 10.0 - 10.0
- Actual - - - - - - - -
Total Forecast 2,497.7 1,685.7 1,479.5 5,662.9
4,366.3 10,029.2 - 10,029.2
91.1% Actual 2,381.7 1,290.4 1,673.6 5,345.6
3,207.1 8,552.8 585.4 9,138.2
Note: Figures are rounded and the sum of the amounts may not correspond to the total indicated.
INVESTMENTS MADE IN 2018 2019 IN RELATION TO THOSE PLANNED B
B.86 The 2020-2030 Québec Infrastructure Plan
1 The investments presented for 2018-2019 were standardized on the same bases. 2 A completion rate of over 100% may be explained by work that is ahead of schedule or being completed at a faster rate than anticipated. 3 Taking into account the amount of $54.8 million from the "Health and Social Services" sector transferred to the "Information Resources" sector,
this amount was set at $1,301.9 million, as presented in the 2019-2029 QIP. 4 The education network's information resources investments of $84.2 million were presented separately from the "Education" sector in the
2018-2028 QIP. 5 The higher education networks' information resources investments of $110.4 million were presented separately form the "Higher Education"
sector in the 2018-2028 QIP, to which $5.3 million is added. 6 Taking into account the amount of $8.6 million from the "Culture" sector transferred to the "Information Resources" sector, this amount was set
at $193.9 million, as presented in the 2018-2028 QIP. 7 Before the transfer to "Information Resources" sector of $263.3 million (54.8 + 84.2 + 110.4 + 5.3 + 8.6) from the "Health and Social Services,"
"Education," "Higher Education" and "Culture" sectors, this amount was set at $435.3 million as presented in the 2018-2028 QIP.

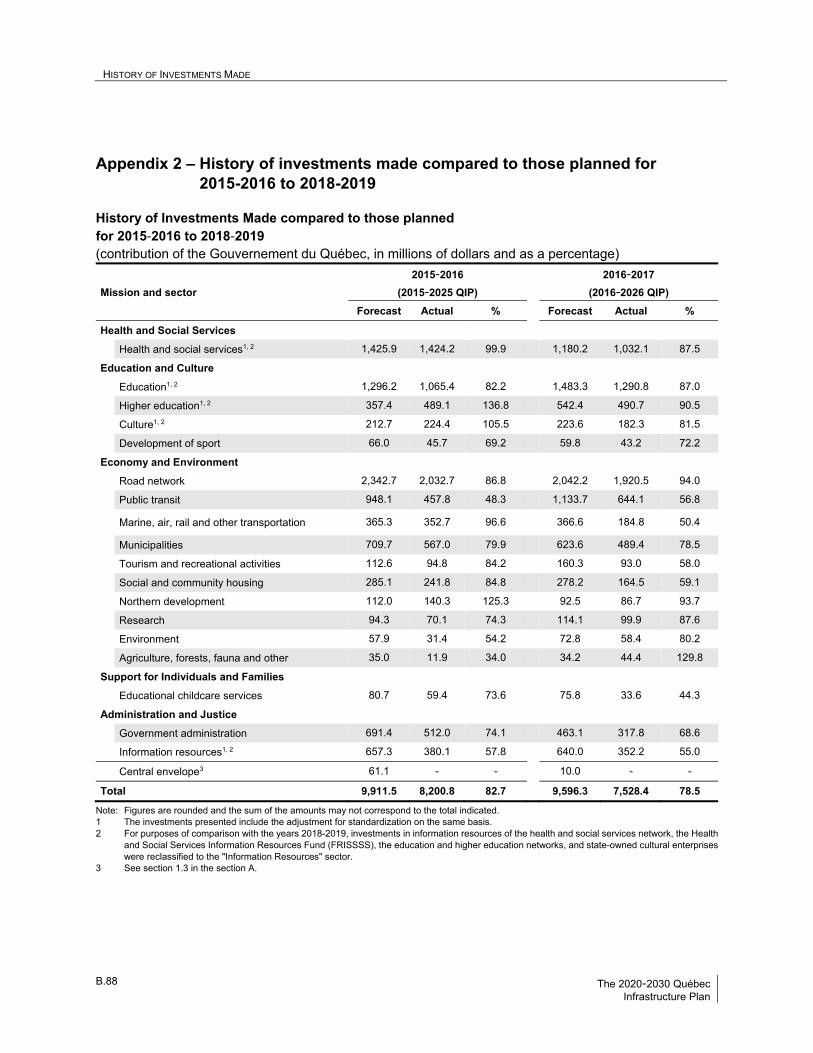
HISTORY OF INVESTMENTS MADE B
B.88 The 2020-2030 Québec Infrastructure Plan
Appendix 2 – History of investments made compared to those planned for 2015-2016 to 2018-2019
History of Investments Made compared to those planned for 2015‐2016 to 2018‐2019 (contribution of the Gouvernement du Québec, in millions of dollars and as a percentage)
Mission and sector
2015‐2016
(2015‐2025 QIP)
2016‐2017
(2016‐2026 QIP)
Forecast Actual % Forecast Actual %
Health and Social Services
Health and social services1, 2 1,425.9 1,424.2 99.9 1,180.2 1,032.1 87.5
Education and Culture
Education1, 2 1,296.2 1,065.4 82.2 1,483.3 1,290.8 87.0
Higher education1, 2 357.4 489.1 136.8 542.4 490.7 90.5
Culture1, 2 212.7 224.4 105.5 223.6 182.3 81.5
Development of sport 66.0 45.7 69.2 59.8 43.2 72.2
Economy and Environment
Road network 2,342.7 2,032.7 86.8 2,042.2 1,920.5 94.0
Public transit 948.1 457.8 48.3 1,133.7 644.1 56.8
Marine, air, rail and other transportation 365.3 352.7 96.6 366.6 184.8 50.4
Municipalities 709.7 567.0 79.9 623.6 489.4 78.5
Tourism and recreational activities 112.6 94.8 84.2 160.3 93.0 58.0
Social and community housing 285.1 241.8 84.8 278.2 164.5 59.1
Northern development 112.0 140.3 125.3 92.5 86.7 93.7
Research 94.3 70.1 74.3 114.1 99.9 87.6
Environment 57.9 31.4 54.2 72.8 58.4 80.2
Agriculture, forests, fauna and other 35.0 11.9 34.0 34.2 44.4 129.8
Support for Individuals and Families
Educational childcare services 80.7 59.4 73.6 75.8 33.6 44.3
Administration and Justice
Government administration 691.4 512.0 74.1 463.1 317.8 68.6
Information resources1, 2 657.3 380.1 57.8 640.0 352.2 55.0
Central envelope3 61.1 - - 10.0 - -
Total 9,911.5 8,200.8 82.7 9,596.3 7,528.4 78.5
Note: Figures are rounded and the sum of the amounts may not correspond to the total indicated. 1 The investments presented include the adjustment for standardization on the same basis. 2 For purposes of comparison with the years 2018-2019, investments in information resources of the health and social services network, the Health
and Social Services Information Resources Fund (FRISSSS), the education and higher education networks, and state-owned cultural enterprises were reclassified to the "Information Resources" sector.
3 See section 1.3 in the section A.
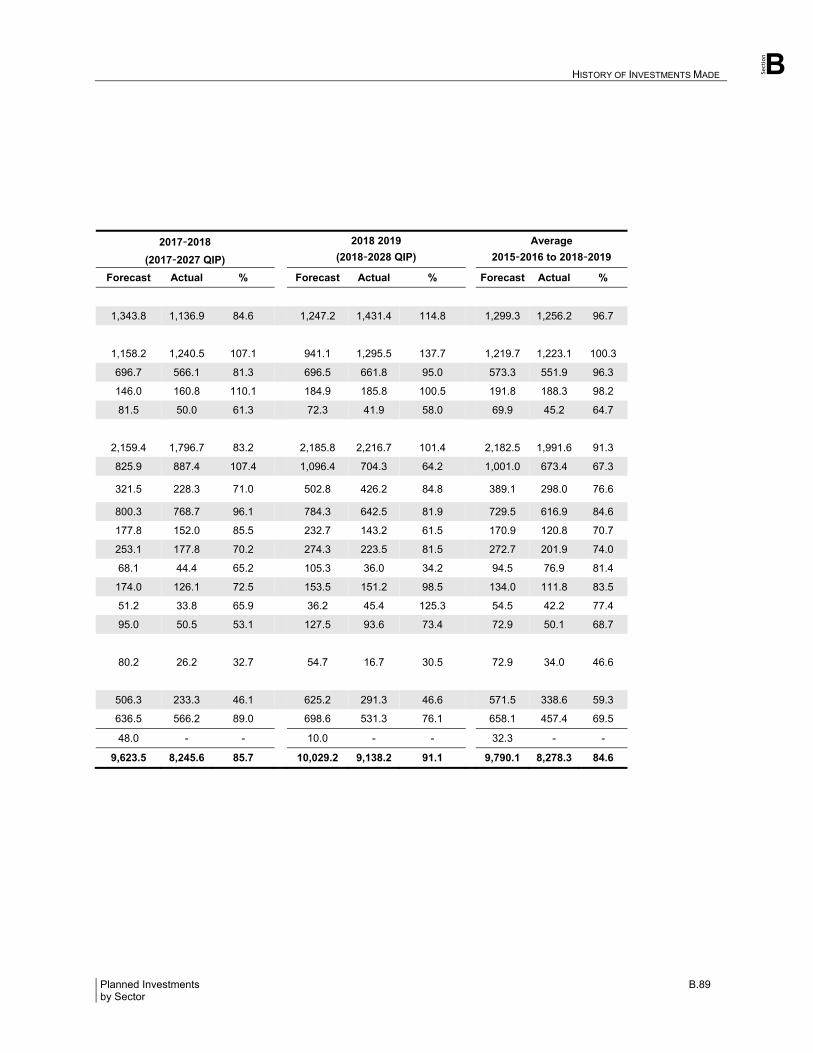
Section
HISTORY OF INVESTMENTS MADE B
Planned Investments B.89 by Sector
2017‐2018
(2017‐2027 QIP)
2018 2019
(2018‐2028 QIP)
Average
2015‐2016 to 2018‐2019
Forecast Actual % Forecast Actual % Forecast Actual %
1,343.8 1,136.9 84.6 1,247.2 1,431.4 114.8 1,299.3 1,256.2 96.7
1,158.2 1,240.5 107.1 941.1 1,295.5 137.7 1,219.7 1,223.1 100.3
696.7 566.1 81.3 696.5 661.8 95.0 573.3 551.9 96.3
146.0 160.8 110.1 184.9 185.8 100.5 191.8 188.3 98.2
81.5 50.0 61.3 72.3 41.9 58.0 69.9 45.2 64.7
2,159.4 1,796.7 83.2 2,185.8 2,216.7 101.4 2,182.5 1,991.6 91.3
825.9 887.4 107.4 1,096.4 704.3 64.2 1,001.0 673.4 67.3
321.5 228.3 71.0 502.8 426.2 84.8
389.1 298.0 76.6
800.3 768.7 96.1 784.3 642.5 81.9 729.5 616.9 84.6
177.8 152.0 85.5 232.7 143.2 61.5 170.9 120.8 70.7
253.1 177.8 70.2 274.3 223.5 81.5 272.7 201.9 74.0
68.1 44.4 65.2 105.3 36.0 34.2 94.5 76.9 81.4
174.0 126.1 72.5 153.5 151.2 98.5 134.0 111.8 83.5
51.2 33.8 65.9 36.2 45.4 125.3 54.5 42.2 77.4
95.0 50.5 53.1 127.5 93.6 73.4 72.9 50.1 68.7
80.2 26.2 32.7 54.7 16.7 30.5 72.9 34.0 46.6
506.3 233.3 46.1 625.2 291.3 46.6 571.5 338.6 59.3
636.5 566.2 89.0 698.6 531.3 76.1 658.1 457.4 69.5
48.0 - - 10.0 - - 32.3 - -
9,623.5 8,245.6 85.7 10,029.2 9,138.2 91.1 9,790.1 8,278.3 84.6
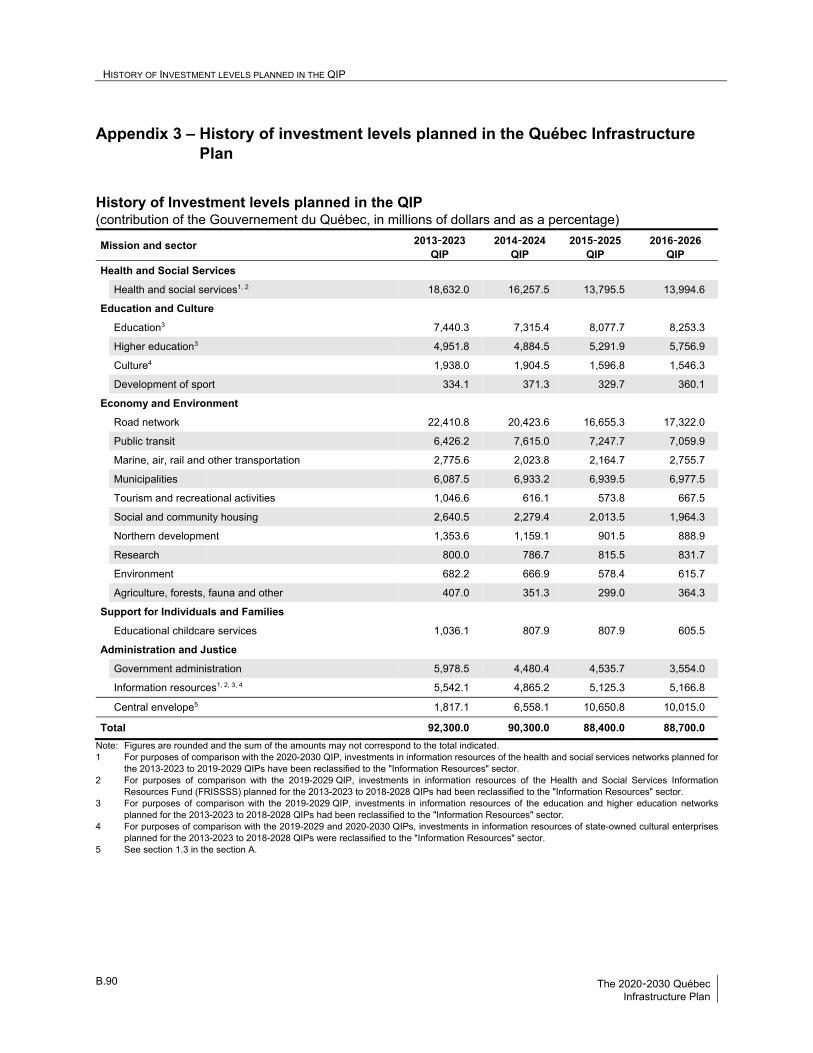
HISTORY OF INVESTMENT LEVELS PLANNED IN THE QIP B
B.90 The 2020-2030 Québec Infrastructure Plan
Appendix 3 – History of investment levels planned in the Québec Infrastructure Plan
History of Investment levels planned in the QIP (contribution of the Gouvernement du Québec, in millions of dollars and as a percentage)
Mission and sector 2013‐2023 QIP
2014‐2024 QIP
2015‐2025 QIP
2016‐2026 QIP
Health and Social Services
Health and social services1, 2 18,632.0 16,257.5 13,795.5 13,994.6
Education and Culture
Education3 7,440.3 7,315.4 8,077.7 8,253.3
Higher education3 4,951.8 4,884.5 5,291.9 5,756.9
Culture4 1,938.0 1,904.5 1,596.8 1,546.3
Development of sport 334.1 371.3 329.7 360.1
Economy and Environment
Road network 22,410.8 20,423.6 16,655.3 17,322.0
Public transit 6,426.2 7,615.0 7,247.7 7,059.9
Marine, air, rail and other transportation 2,775.6 2,023.8 2,164.7 2,755.7
Municipalities 6,087.5 6,933.2 6,939.5 6,977.5
Tourism and recreational activities 1,046.6 616.1 573.8 667.5
Social and community housing 2,640.5 2,279.4 2,013.5 1,964.3
Northern development 1,353.6 1,159.1 901.5 888.9
Research 800.0 786.7 815.5 831.7
Environment 682.2 666.9 578.4 615.7
Agriculture, forests, fauna and other 407.0 351.3 299.0 364.3
Support for Individuals and Families
Educational childcare services 1,036.1 807.9 807.9 605.5
Administration and Justice
Government administration 5,978.5 4,480.4 4,535.7 3,554.0
Information resources1, 2, 3, 4 5,542.1 4,865.2 5,125.3 5,166.8
Central envelope5 1,817.1 6,558.1 10,650.8 10,015.0
Total 92,300.0 90,300.0 88,400.0 88,700.0
Note: Figures are rounded and the sum of the amounts may not correspond to the total indicated. 1 For purposes of comparison with the 2020-2030 QIP, investments in information resources of the health and social services networks planned for
the 2013-2023 to 2019-2029 QIPs have been reclassified to the "Information Resources" sector. 2 For purposes of comparison with the 2019-2029 QIP, investments in information resources of the Health and Social Services Information
Resources Fund (FRISSSS) planned for the 2013-2023 to 2018-2028 QIPs had been reclassified to the "Information Resources" sector. 3 For purposes of comparison with the 2019-2029 QIP, investments in information resources of the education and higher education networks
planned for the 2013-2023 to 2018-2028 QIPs had been reclassified to the "Information Resources" sector. 4 For purposes of comparison with the 2019-2029 and 2020-2030 QIPs, investments in information resources of state-owned cultural enterprises
planned for the 2013-2023 to 2018-2028 QIPs were reclassified to the "Information Resources" sector. 5 See section 1.3 in the section A.
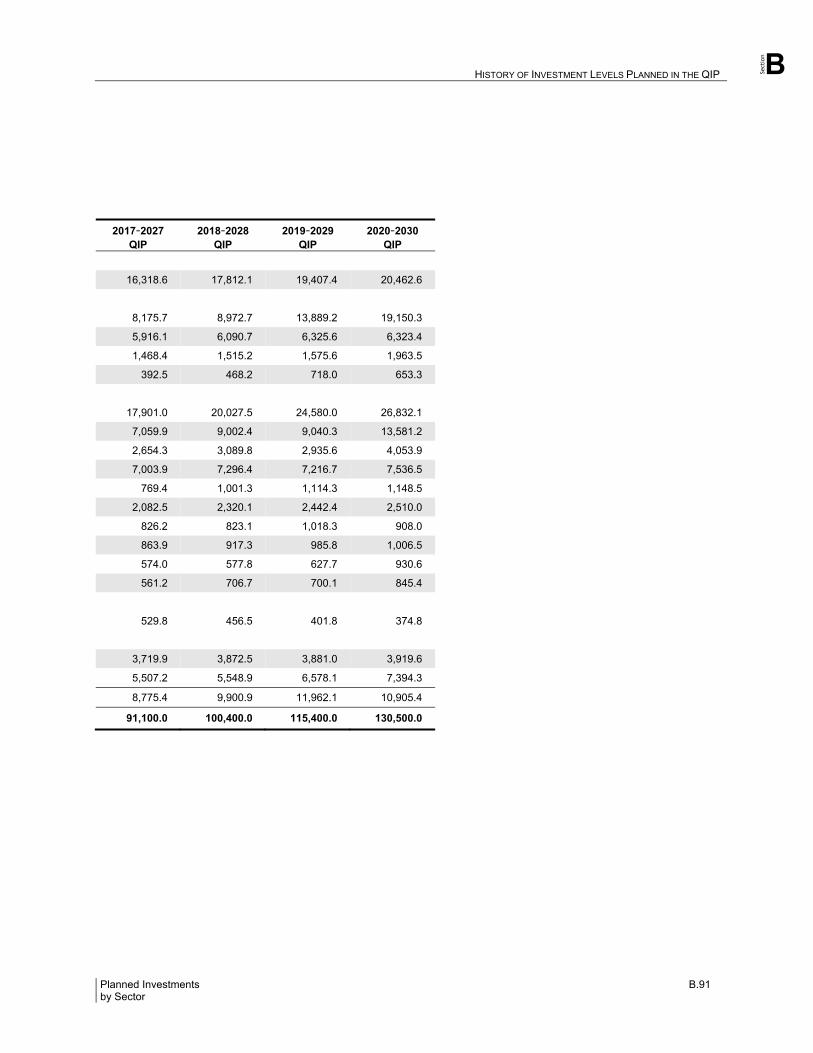
Section
HISTORY OF INVESTMENT LEVELS PLANNED IN THE QIP B
Planned Investments B.91 by Sector
2017‐2027 QIP
2018‐2028 QIP
2019‐2029 QIP
2020‐2030 QIP
16,318.6 17,812.1 19,407.4 20,462.6
8,175.7 8,972.7 13,889.2 19,150.3
5,916.1 6,090.7 6,325.6 6,323.4
1,468.4 1,515.2 1,575.6 1,963.5
392.5 468.2 718.0 653.3
17,901.0 20,027.5 24,580.0 26,832.1
7,059.9 9,002.4 9,040.3 13,581.2
2,654.3 3,089.8 2,935.6 4,053.9
7,003.9 7,296.4 7,216.7 7,536.5
769.4 1,001.3 1,114.3 1,148.5
2,082.5 2,320.1 2,442.4 2,510.0
826.2 823.1 1,018.3 908.0
863.9 917.3 985.8 1,006.5
574.0 577.8 627.7 930.6
561.2 706.7 700.1 845.4
529.8 456.5 401.8 374.8
3,719.9 3,872.5 3,881.0 3,919.6
5,507.2 5,548.9 6,578.1 7,394.3
8,775.4 9,900.9 11,962.1 10,905.4
91,100.0 100,400.0 115,400.0 130,500.0
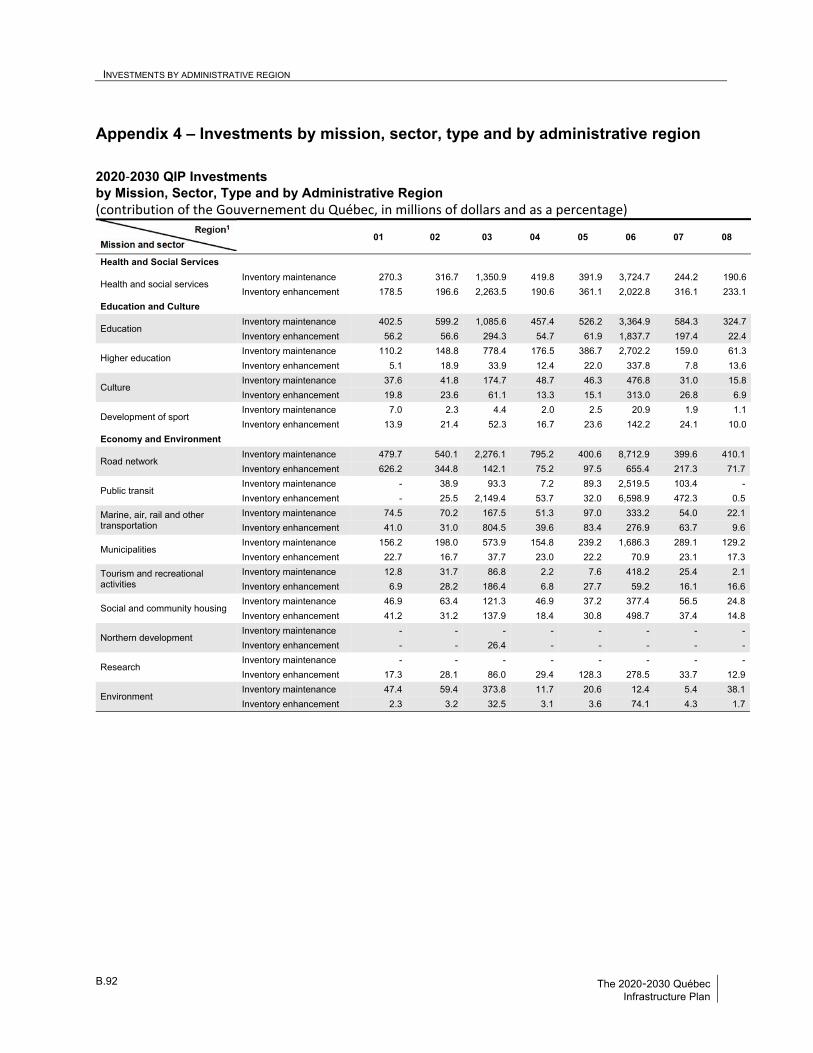
INVESTMENTS BY ADMINISTRATIVE REGION B
B.92 The 2020-2030 Québec Infrastructure Plan
Appendix 4 – Investments by mission, sector, type and by administrative region
2020‐2030 QIP Investments by Mission, Sector, Type and by Administrative Region (contribution of the Gouvernement du Québec, in millions of dollars and as a percentage)
Mission and sector
Region1 01 02 03 04 05 06 07 08
Health and Social Services
Health and social services Inventory maintenance 270.3 316.7 1,350.9 419.8 391.9 3,724.7 244.2 190.6
Inventory enhancement 178.5 196.6 2,263.5 190.6 361.1 2,022.8 316.1 233.1
Education and Culture
Education Inventory maintenance 402.5 599.2 1,085.6 457.4 526.2 3,364.9 584.3 324.7
Inventory enhancement 56.2 56.6 294.3 54.7 61.9 1,837.7 197.4 22.4
Higher education Inventory maintenance 110.2 148.8 778.4 176.5 386.7 2,702.2 159.0 61.3
Inventory enhancement 5.1 18.9 33.9 12.4 22.0 337.8 7.8 13.6
Culture Inventory maintenance 37.6 41.8 174.7 48.7 46.3 476.8 31.0 15.8
Inventory enhancement 19.8 23.6 61.1 13.3 15.1 313.0 26.8 6.9
Development of sport Inventory maintenance 7.0 2.3 4.4 2.0 2.5 20.9 1.9 1.1
Inventory enhancement 13.9 21.4 52.3 16.7 23.6 142.2 24.1 10.0
Economy and Environment
Road network Inventory maintenance 479.7 540.1 2,276.1 795.2 400.6 8,712.9 399.6 410.1
Inventory enhancement 626.2 344.8 142.1 75.2 97.5 655.4 217.3 71.7
Public transit Inventory maintenance - 38.9 93.3 7.2 89.3 2,519.5 103.4 -
Inventory enhancement - 25.5 2,149.4 53.7 32.0 6,598.9 472.3 0.5
Marine, air, rail and other transportation
Inventory maintenance 74.5 70.2 167.5 51.3 97.0 333.2 54.0 22.1
Inventory enhancement 41.0 31.0 804.5 39.6 83.4 276.9 63.7 9.6
Municipalities Inventory maintenance 156.2 198.0 573.9 154.8 239.2 1,686.3 289.1 129.2
Inventory enhancement 22.7 16.7 37.7 23.0 22.2 70.9 23.1 17.3
Tourism and recreational activities
Inventory maintenance 12.8 31.7 86.8 2.2 7.6 418.2 25.4 2.1
Inventory enhancement 6.9 28.2 186.4 6.8 27.7 59.2 16.1 16.6
Social and community housing Inventory maintenance 46.9 63.4 121.3 46.9 37.2 377.4 56.5 24.8
Inventory enhancement 41.2 31.2 137.9 18.4 30.8 498.7 37.4 14.8
Northern development Inventory maintenance - - - - - - - -
Inventory enhancement - - 26.4 - - - - -
Research Inventory maintenance - - - - - - - -
Inventory enhancement 17.3 28.1 86.0 29.4 128.3 278.5 33.7 12.9
Environment Inventory maintenance 47.4 59.4 373.8 11.7 20.6 12.4 5.4 38.1
Inventory enhancement 2.3 3.2 32.5 3.1 3.6 74.1 4.3 1.7
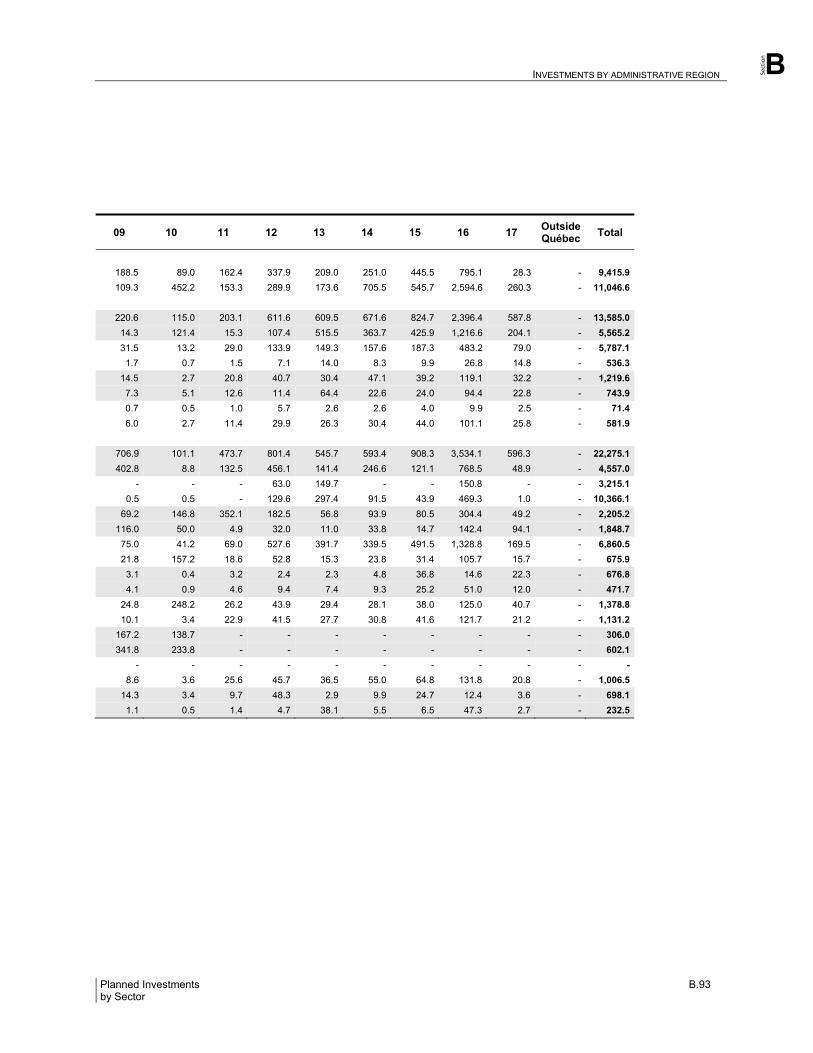
Section
INVESTMENTS BY ADMINISTRATIVE REGION B
Planned Investments B.93 by Sector
09 10 11 12 13 14 15 16 17 Outside Québec
Total
188.5 89.0 162.4 337.9 209.0 251.0 445.5 795.1 28.3 - 9,415.9
109.3 452.2 153.3 289.9 173.6 705.5 545.7 2,594.6 260.3 - 11,046.6
220.6 115.0 203.1 611.6 609.5 671.6 824.7 2,396.4 587.8 - 13,585.0
14.3 121.4 15.3 107.4 515.5 363.7 425.9 1,216.6 204.1 - 5,565.2
31.5 13.2 29.0 133.9 149.3 157.6 187.3 483.2 79.0 - 5,787.1
1.7 0.7 1.5 7.1 14.0 8.3 9.9 26.8 14.8 - 536.3
14.5 2.7 20.8 40.7 30.4 47.1 39.2 119.1 32.2 - 1,219.6
7.3 5.1 12.6 11.4 64.4 22.6 24.0 94.4 22.8 - 743.9
0.7 0.5 1.0 5.7 2.6 2.6 4.0 9.9 2.5 - 71.4
6.0 2.7 11.4 29.9 26.3 30.4 44.0 101.1 25.8 - 581.9
706.9 101.1 473.7 801.4 545.7 593.4 908.3 3,534.1 596.3 - 22,275.1
402.8 8.8 132.5 456.1 141.4 246.6 121.1 768.5 48.9 - 4,557.0
- - - 63.0 149.7 - - 150.8 - - 3,215.1
0.5 0.5 - 129.6 297.4 91.5 43.9 469.3 1.0 - 10,366.1
69.2 146.8 352.1 182.5 56.8 93.9 80.5 304.4 49.2 - 2,205.2
116.0 50.0 4.9 32.0 11.0 33.8 14.7 142.4 94.1 - 1,848.7
75.0 41.2 69.0 527.6 391.7 339.5 491.5 1,328.8 169.5 - 6,860.5
21.8 157.2 18.6 52.8 15.3 23.8 31.4 105.7 15.7 - 675.9
3.1 0.4 3.2 2.4 2.3 4.8 36.8 14.6 22.3 - 676.8
4.1 0.9 4.6 9.4 7.4 9.3 25.2 51.0 12.0 - 471.7
24.8 248.2 26.2 43.9 29.4 28.1 38.0 125.0 40.7 - 1,378.8
10.1 3.4 22.9 41.5 27.7 30.8 41.6 121.7 21.2 - 1,131.2
167.2 138.7 - - - - - - - - 306.0
341.8 233.8 - - - - - - - - 602.1
- - - - - - - - - - -
8.6 3.6 25.6 45.7 36.5 55.0 64.8 131.8 20.8 - 1,006.5
14.3 3.4 9.7 48.3 2.9 9.9 24.7 12.4 3.6 - 698.1
1.1 0.5 1.4 4.7 38.1 5.5 6.5 47.3 2.7 - 232.5
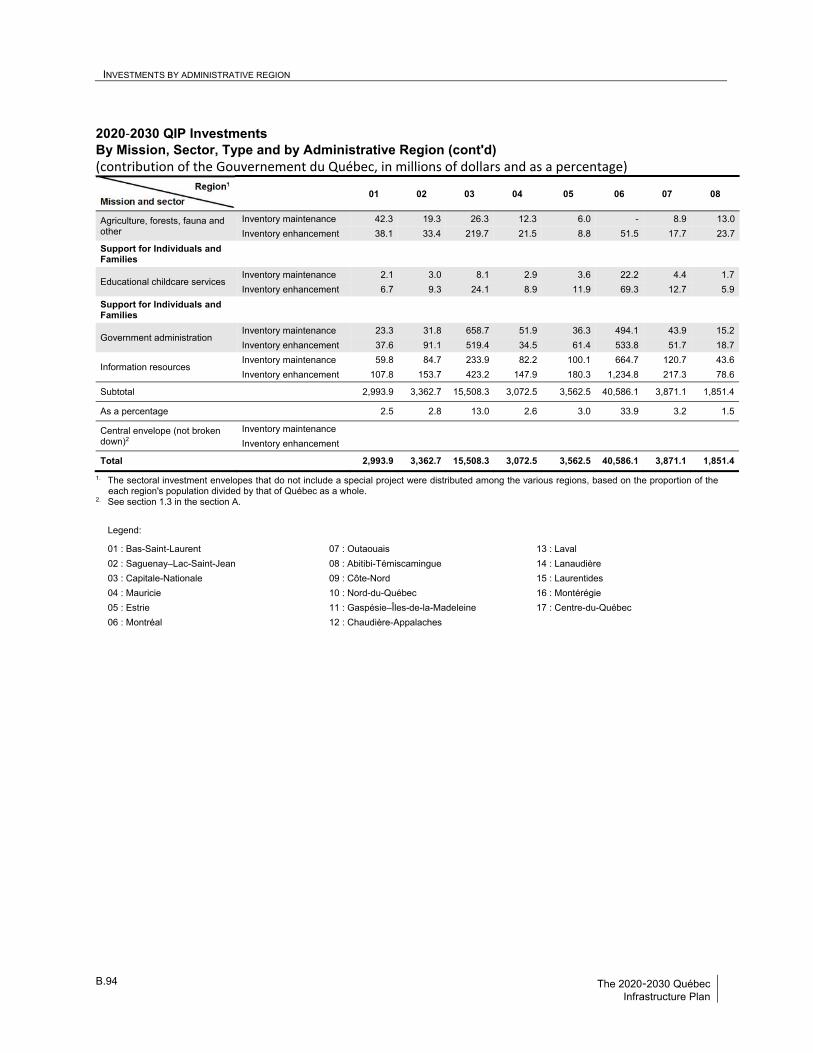
INVESTMENTS BY ADMINISTRATIVE REGION B
B.94 The 2020-2030 Québec Infrastructure Plan
2020‐2030 QIP Investments By Mission, Sector, Type and by Administrative Region (cont'd) (contribution of the Gouvernement du Québec, in millions of dollars and as a percentage)
Mission and sector
Region1 01 02 03 04 05 06 07 08
Agriculture, forests, fauna and other
Inventory maintenance 42.3 19.3 26.3 12.3 6.0 - 8.9 13.0
Inventory enhancement 38.1 33.4 219.7 21.5 8.8 51.5 17.7 23.7
Support for Individuals and Families
Educational childcare services Inventory maintenance 2.1 3.0 8.1 2.9 3.6 22.2 4.4 1.7
Inventory enhancement 6.7 9.3 24.1 8.9 11.9 69.3 12.7 5.9
Support for Individuals and Families
Government administration Inventory maintenance 23.3 31.8 658.7 51.9 36.3 494.1 43.9 15.2
Inventory enhancement 37.6 91.1 519.4 34.5 61.4 533.8 51.7 18.7
Information resources Inventory maintenance 59.8 84.7 233.9 82.2 100.1 664.7 120.7 43.6
Inventory enhancement 107.8 153.7 423.2 147.9 180.3 1,234.8 217.3 78.6
Subtotal 2,993.9 3,362.7 15,508.3 3,072.5 3,562.5 40,586.1 3,871.1 1,851.4
As a percentage 2.5 2.8 13.0 2.6 3.0 33.9 3.2 1.5
Central envelope (not broken down)2
Inventory maintenance
Inventory enhancement
Total 2,993.9 3,362.7 15,508.3 3,072.5 3,562.5 40,586.1 3,871.1 1,851.4
1. The sectoral investment envelopes that do not include a special project were distributed among the various regions, based on the proportion of the each region's population divided by that of Québec as a whole.
2. See section 1.3 in the section A.
Legend:
01 : Bas-Saint-Laurent
02 : Saguenay–Lac-Saint-Jean
03 : Capitale-Nationale
04 : Mauricie
05 : Estrie
06 : Montréal
07 : Outaouais
08 : Abitibi-Témiscamingue
09 : Côte-Nord
10 : Nord-du-Québec
11 : Gaspésie–Îles-de-la-Madeleine
12 : Chaudière-Appalaches
13 : Laval
14 : Lanaudière
15 : Laurentides
16 : Montérégie
17 : Centre-du-Québec
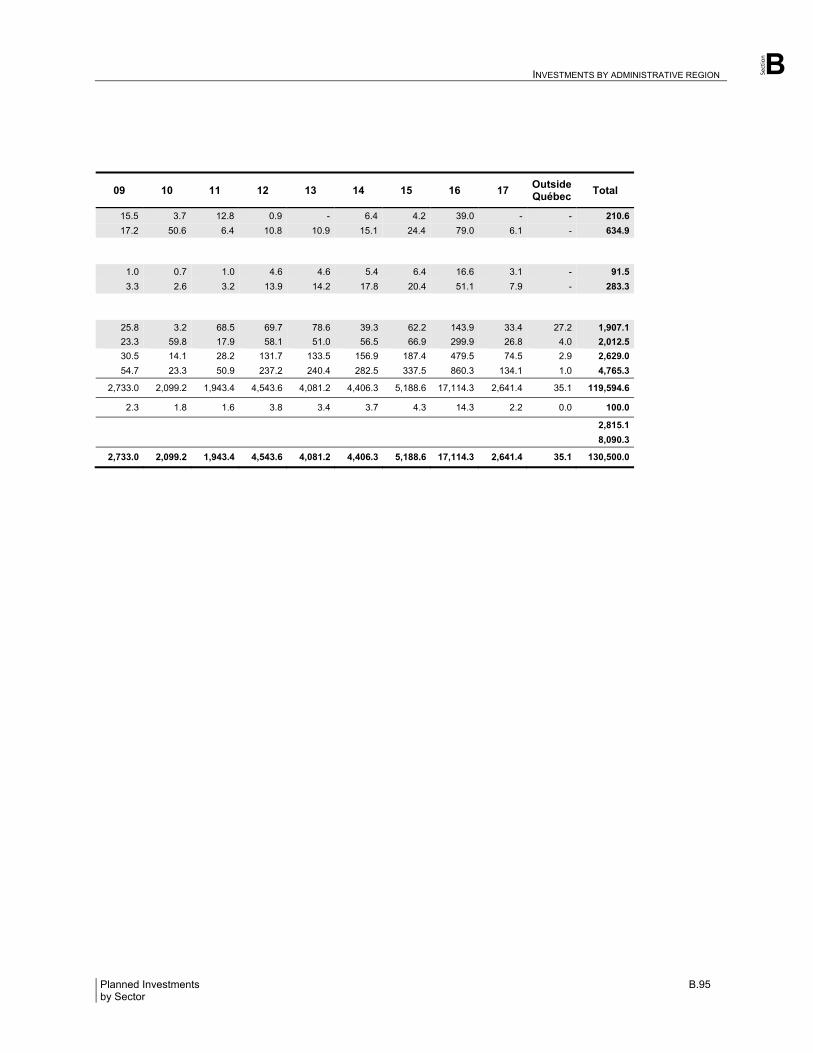
Section
INVESTMENTS BY ADMINISTRATIVE REGION B
Planned Investments B.95 by Sector
) )
09 10 11 12 13 14 15 16 17 Outside Québec
Total
15.5 3.7 12.8 0.9 - 6.4 4.2 39.0 - - 210.6
17.2 50.6 6.4 10.8 10.9 15.1 24.4 79.0 6.1 - 634.9
1.0 0.7 1.0 4.6 4.6 5.4 6.4 16.6 3.1 - 91.5
3.3 2.6 3.2 13.9 14.2 17.8 20.4 51.1 7.9 - 283.3
25.8 3.2 68.5 69.7 78.6 39.3 62.2 143.9 33.4 27.2 1,907.1
23.3 59.8 17.9 58.1 51.0 56.5 66.9 299.9 26.8 4.0 2,012.5
30.5 14.1 28.2 131.7 133.5 156.9 187.4 479.5 74.5 2.9 2,629.0
54.7 23.3 50.9 237.2 240.4 282.5 337.5 860.3 134.1 1.0 4,765.3
2,733.0 2,099.2 1,943.4 4,543.6 4,081.2 4,406.3 5,188.6 17,114.3 2,641.4 35.1 119,594.6
2.3 1.8 1.6 3.8 3.4 3.7 4.3 14.3 2.2 0.0 100.0
2,815.1
8,090.3
2,733.0 2,099.2 1,943.4 4,543.6 4,081.2 4,406.3 5,188.6 17,114.3 2,641.4 35.1 130,500.0

C.1
Section C
Report on the Condition of Public Infrastructure
1. A Long-Term Vision of Government Investments ............................................... 2
Highlights of the 2020-2021 AMPIs .............................................................................. 4
2.1 61% of the Infrastructure of Public Bodies Is Deemed in Good Condition ................. 4
2.2 80% of the Infrastructure of Subsidized Bodies Is Deemed in Good Condition ......... 4
2.3 The Asset Maintenance Deficit Is Assessed at $28.2 Billion ..................................... 6
2. 2020-2021 Annual Management Plans for Public Infrastructure investments ............................................................................................................. 9
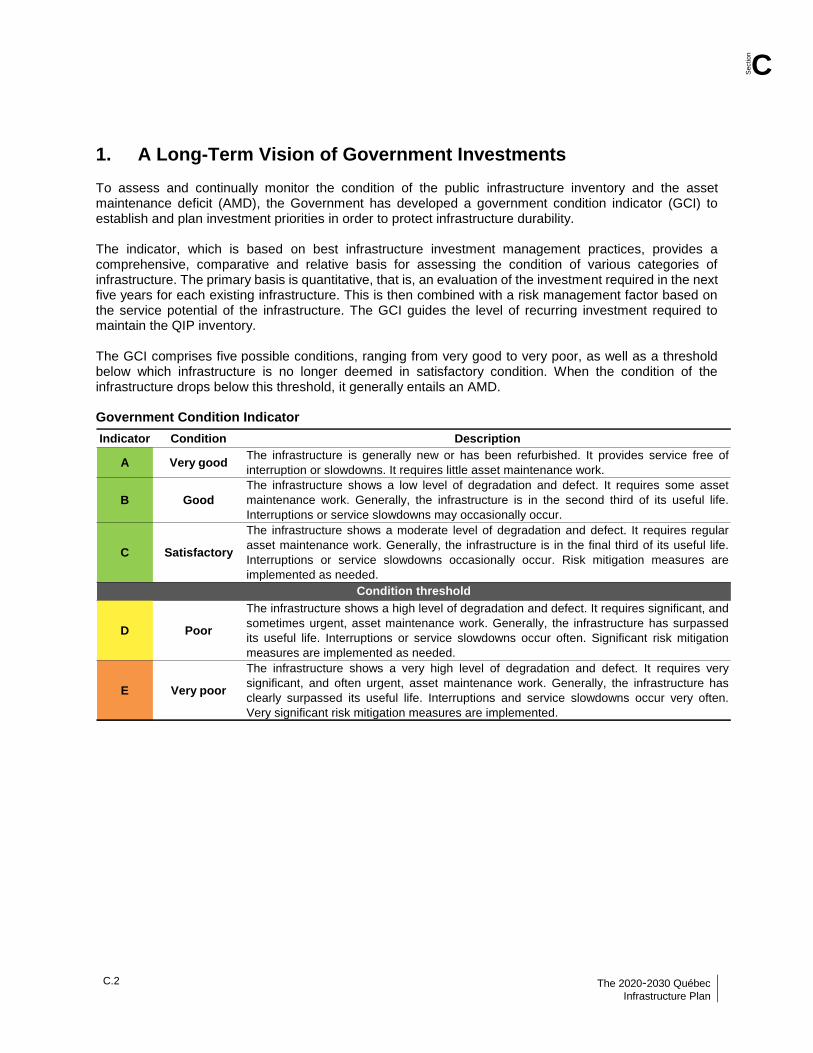
Section
C
C.2 The 2020-2030 Québec Québec's Public
Infrastructure Plan Infrastructure – March 2020
1. A Long-Term Vision of Government Investments To assess and continually monitor the condition of the public infrastructure inventory and the asset maintenance deficit (AMD), the Government has developed a government condition indicator (GCI) to establish and plan investment priorities in order to protect infrastructure durability. The indicator, which is based on best infrastructure investment management practices, provides a comprehensive, comparative and relative basis for assessing the condition of various categories of infrastructure. The primary basis is quantitative, that is, an evaluation of the investment required in the next five years for each existing infrastructure. This is then combined with a risk management factor based on the service potential of the infrastructure. The GCI guides the level of recurring investment required to maintain the QIP inventory. The GCI comprises five possible conditions, ranging from very good to very poor, as well as a threshold below which infrastructure is no longer deemed in satisfactory condition. When the condition of the infrastructure drops below this threshold, it generally entails an AMD. Government Condition Indicator
Indicator Condition Description
A Very goodThe infrastructure is generally new or has been refurbished. It provides service free of
interruption or slowdowns. It requires little asset maintenance work.
B Good
The infrastructure shows a low level of degradation and defect. It requires some asset
maintenance work. Generally, the infrastructure is in the second third of its useful life.
Interruptions or service slowdowns may occasionally occur.
C Satisfactory
The infrastructure shows a moderate level of degradation and defect. It requires regular
asset maintenance work. Generally, the infrastructure is in the final third of its useful life.
Interruptions or service slowdowns occasionally occur. Risk mitigation measures are
implemented as needed.
D Poor
The infrastructure shows a high level of degradation and defect. It requires significant, and
sometimes urgent, asset maintenance work. Generally, the infrastructure has surpassed
its useful life. Interruptions or service slowdowns occur often. Significant risk mitigation
measures are implemented as needed.
E Very poor
The infrastructure shows a very high level of degradation and defect. It requires very
significant, and often urgent, asset maintenance work. Generally, the infrastructure has
clearly surpassed its useful life. Interruptions and service slowdowns occur very often.
Very significant risk mitigation measures are implemented.
Condition threshold
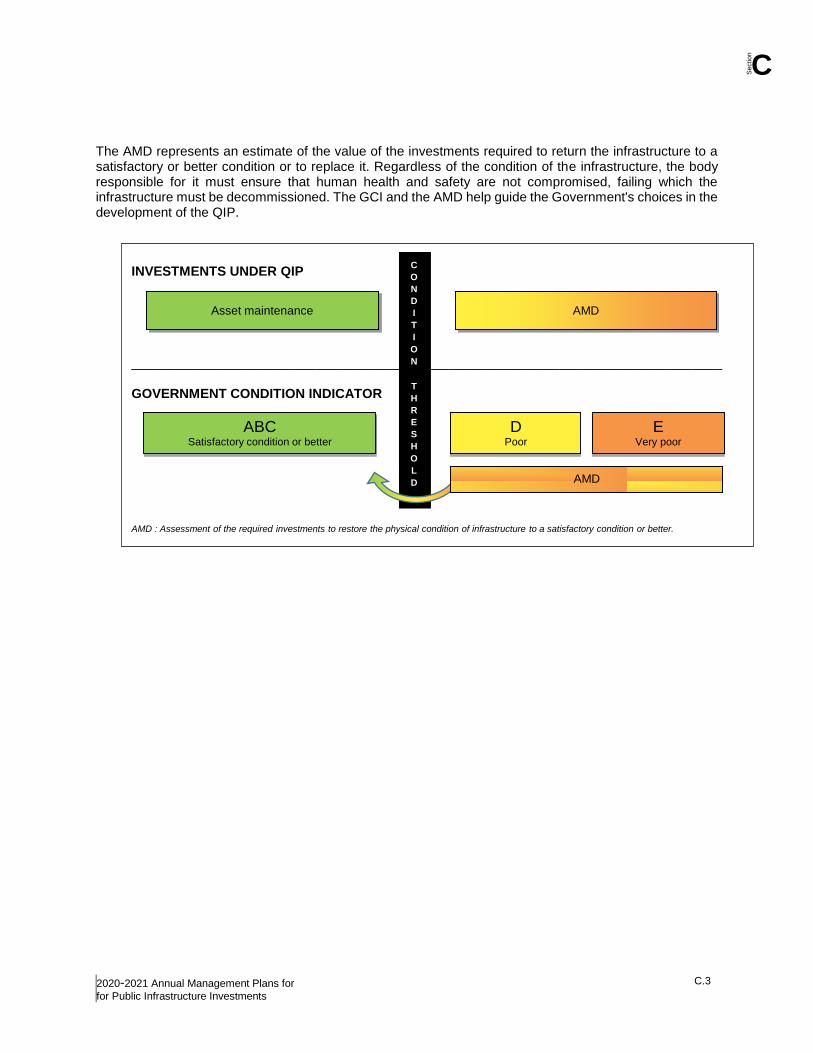
Section
C
2020-2021 Annual Management Plans for C.3
for Public Infrastructure Investments
The AMD represents an estimate of the value of the investments required to return the infrastructure to a satisfactory or better condition or to replace it. Regardless of the condition of the infrastructure, the body responsible for it must ensure that human health and safety are not compromised, failing which the infrastructure must be decommissioned. The GCI and the AMD help guide the Government's choices in the development of the QIP.
INVESTMENTS UNDER QIP
________________________________________________________________________________
GOVERNMENT CONDITION INDICATOR
AMD : Assessment of the required investments to restore the physical condition of infrastructure to a satisfactory condition or better.
DPoor
EVery poor
ABCSatisfactory condition or better
Asset maintenance AMD
C
O
N
D
I
T
I
O
N
T
H
R
E
S
H
O
L
D AMD
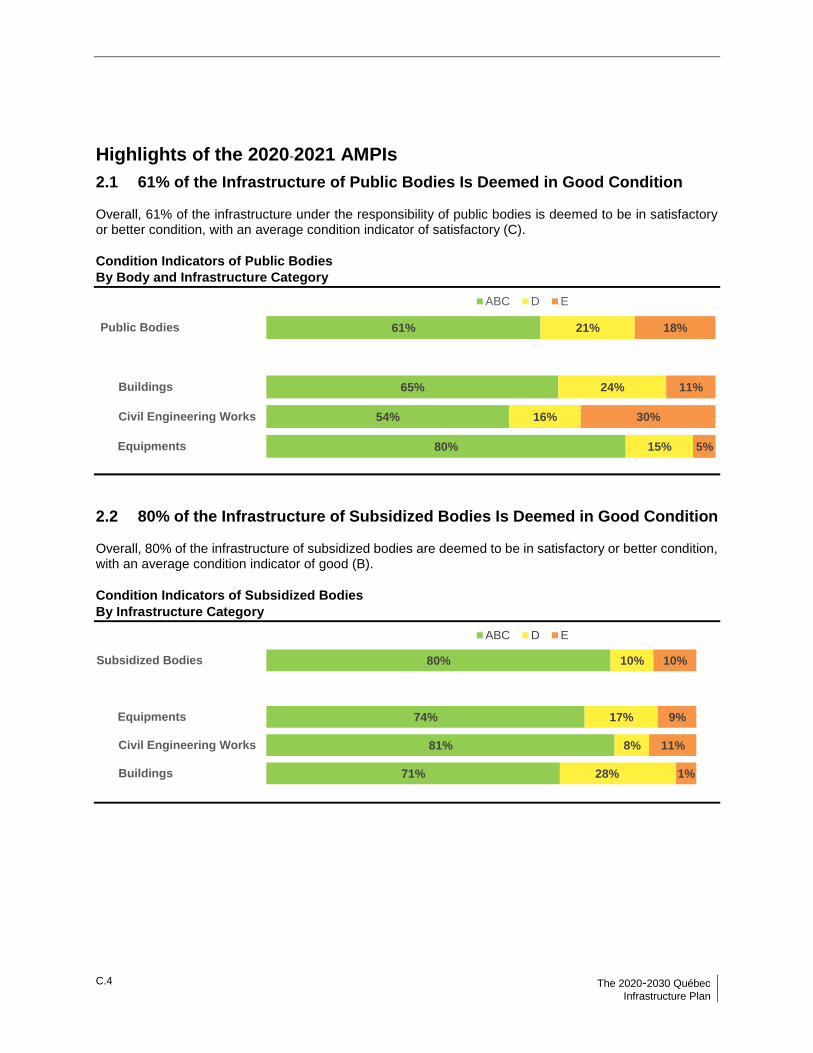
C.4 The 2020-2030 Québec
Infrastructure Plan
Highlights of the 2020-2021 AMPIs
2.1 61% of the Infrastructure of Public Bodies Is Deemed in Good Condition Overall, 61% of the infrastructure under the responsibility of public bodies is deemed to be in satisfactory or better condition, with an average condition indicator of satisfactory (C).
Condition Indicators of Public Bodies
By Body and Infrastructure Category
2.2 80% of the Infrastructure of Subsidized Bodies Is Deemed in Good Condition Overall, 80% of the infrastructure of subsidized bodies are deemed to be in satisfactory or better condition, with an average condition indicator of good (B).
Condition Indicators of Subsidized Bodies
By Infrastructure Category
80%
54%
65%
61%
15%
16%
24%
21%
5%
30%
11%
18%
Equipments
Civil Engineering Works
Buildings
Public Bodies
ABC D E
71%
81%
74%
80%
28%
8%
17%
10%
1%
11%
9%
10%
Buildings
Civil Engineering Works
Equipments
Subsidized Bodies
ABC D E
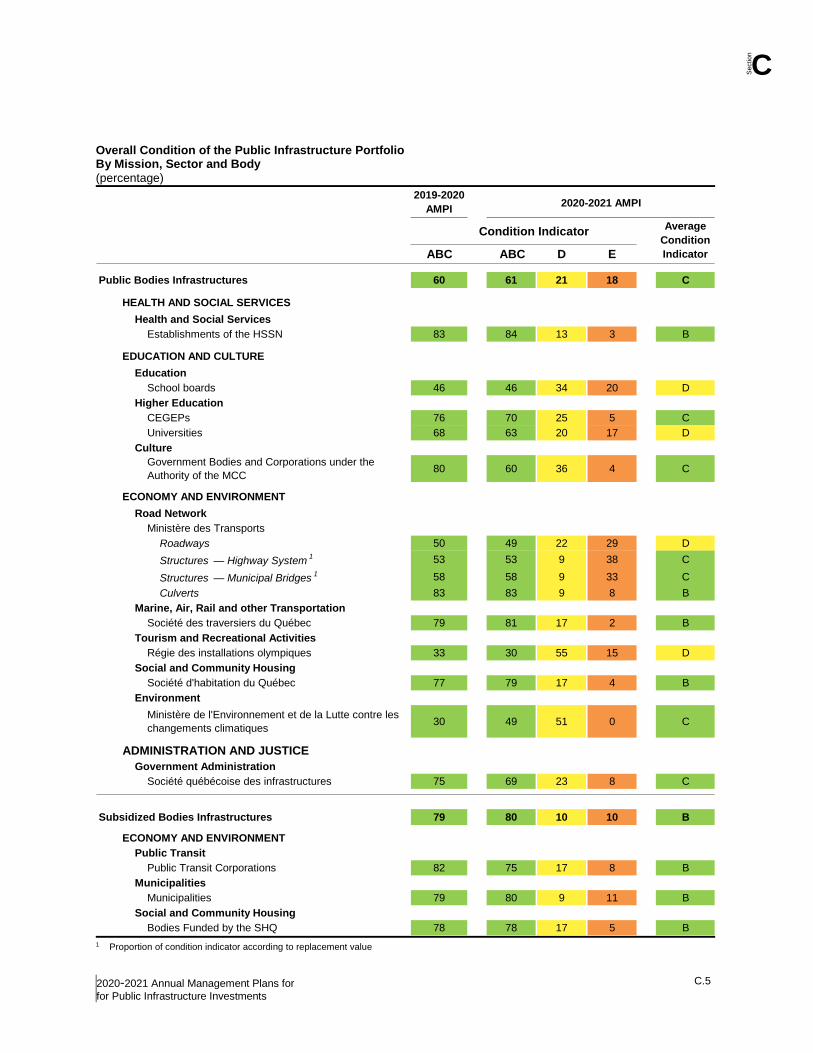
Section
C
2020-2021 Annual Management Plans for C.5
for Public Infrastructure Investments
Overall Condition of the Public Infrastructure Portfolio By Mission, Sector and Body
(percentage)
2019-2020
AMPI2020-2021 AMPI
Condition Indicator
ABC ABC D E
Public Bodies Infrastructures 60 61 21 18 C
HEALTH AND SOCIAL SERVICES
Health and Social Services
Establishments of the HSSN 83 84 13 3 B
EDUCATION AND CULTURE
Education
School boards 46 46 34 20 D
Higher Education
CEGEPs 76 70 25 5 C
Universities 68 63 20 17 D
Culture
Government Bodies and Corporations under the
Authority of the MCC80 60 36 4 C
ECONOMY AND ENVIRONMENT
Road Network
Ministère des Transports
Roadways 50 49 22 29 D
Structures — Highway System1 53 53 9 38 C
Structures — Municipal Bridges1 58 58 9 33 C
Culverts 83 83 9 8 B
Marine, Air, Rail and other Transportation
Société des traversiers du Québec 79 81 17 2 B
Tourism and Recreational Activities
Régie des installations olympiques 33 30 55 15 D
Social and Community Housing
Société d'habitation du Québec 77 79 17 4 B
Environment
Ministère de l'Environnement et de la Lutte contre les
changements climatiques30 49 51 0 C
ADMINISTRATION AND JUSTICE
Government Administration
Société québécoise des infrastructures 75 69 23 8 C
Subsidized Bodies Infrastructures 79 80 10 10 B
ECONOMY AND ENVIRONMENT
Public Transit
Public Transit Corporations 82 75 17 8 B
Municipalities
Municipalities 79 80 9 11 B
Social and Community Housing
Bodies Funded by the SHQ 78 78 17 5 B
Average
Condition
Indicator
1 Proportion of condition indicator according to replacement value
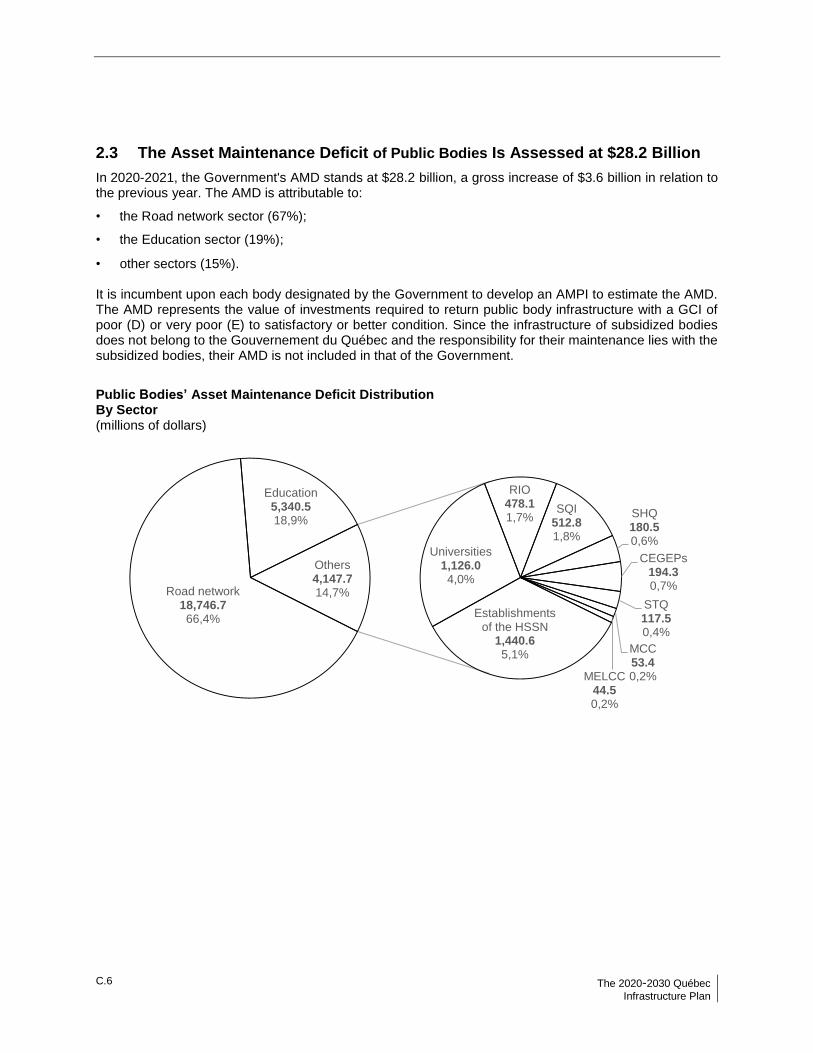
C.6 The 2020-2030 Québec
Infrastructure Plan
2.3 The Asset Maintenance Deficit of Public Bodies Is Assessed at $28.2 Billion
In 2020-2021, the Government's AMD stands at $28.2 billion, a gross increase of $3.6 billion in relation to the previous year. The AMD is attributable to:
• the Road network sector (67%);
• the Education sector (19%);
• other sectors (15%).
It is incumbent upon each body designated by the Government to develop an AMPI to estimate the AMD. The AMD represents the value of investments required to return public body infrastructure with a GCI of poor (D) or very poor (E) to satisfactory or better condition. Since the infrastructure of subsidized bodies does not belong to the Gouvernement du Québec and the responsibility for their maintenance lies with the subsidized bodies, their AMD is not included in that of the Government.
Public Bodies’ Asset Maintenance Deficit Distribution By Sector (millions of dollars)
Road network18,746.766,4%
Education5,340.518,9%
Establishments of the HSSN
1,440.65,1%
Universities1,126.04,0%
RIO478.11,7%
SQI512.81,8%
SHQ180.50,6%
CEGEPs194.30,7%
STQ117.50,4%
MCC53.40,2%MELCC
44.50,2%
Others4,147.714,7%
Section
C
2020-2021 Annual Management Plans for C.7
for Public Infrastructure Investments
The Net Increase in the AMD Stands at $0.9 billion
The change in the AMD stems from three main causes: the natural deterioration of infrastructure over its useful life, including the increased cost of cumulative work not done during the year, new needs identified in recent inspections and investments made to reduce the AMD during the period. Compared to last year's AMD ($24.6 billion), there is a net increase of $0.9 billion for 2020-2021, after the effect of new needs identified during the year in the amount of $2.7 billion, meaning that the natural deterioration of infrastructure in poor condition outstripped the repair work carried out during the year. This result demonstrates the need to increase investments to maintain the inventory in good condition, which is being done under the 2020-2030 QIP. More specifically, changes in the AMD for 2020-2021 stem from:
• The natural deterioration of infrastructure, which contributed to an increase of $3.3 billion, including:
$1.8 billion related to the natural deterioration of civil engineering structures, especially roadways and road network structures;
$1.5 billion related to the aging of buildings, especially those in the education network.
• New findings observed during the period and the update of prior AMD assessments, for a value of
$2.7 billion, including:
$1.0 billion for the very first AMD identified for culverts of less than 3 m in diameter in the road network;
$0.9 billion stemming from the reassessment of the scope and cost of planned repairs to structures in the road network;
$0.8 billion mainly for new work in the education sector.
• Investments made during the period reduced the overall AMD by $2.4 billion, including:
$1.3 billion in repair and reconstruction work on roadways and road network structures;
$1.0 billion for work and upgrades of obsolete critical components, mainly in buildings in the health and social services, education and higher education networks;
$0.1 billion to replace outdated medical equipment in the health and social services network.
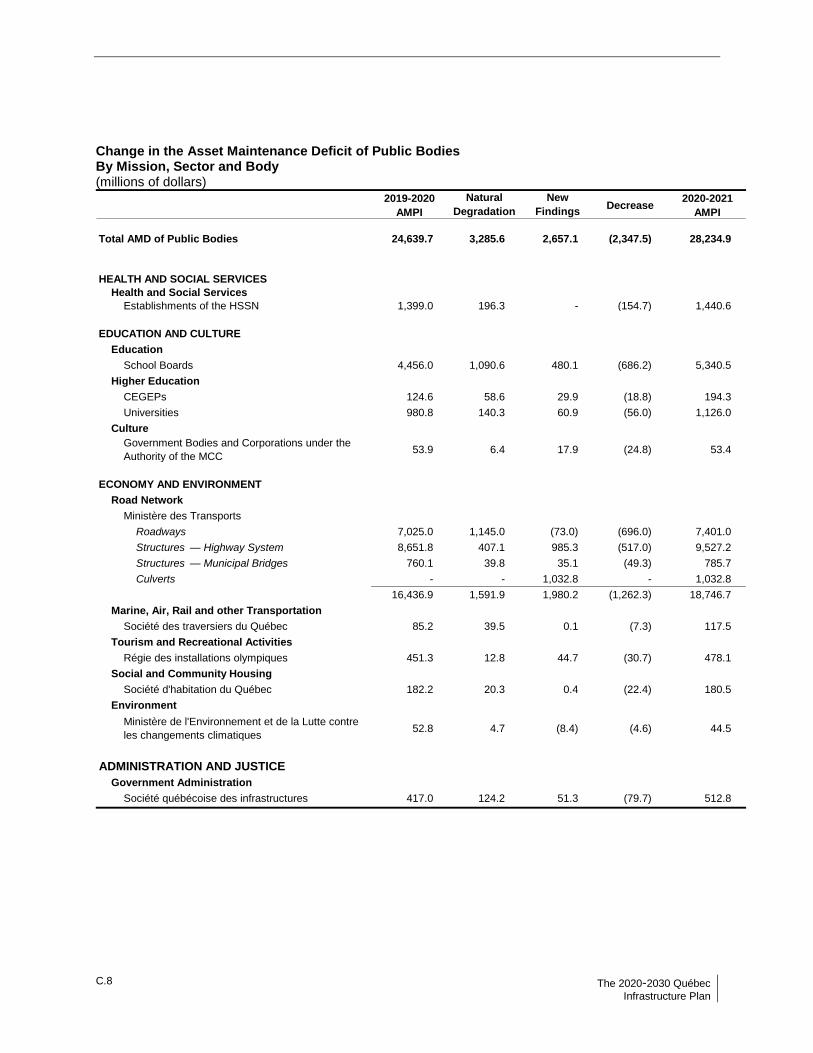
C.8 The 2020-2030 Québec
Infrastructure Plan
Change in the Asset Maintenance Deficit of Public Bodies By Mission, Sector and Body (millions of dollars)
2019-2020
AMPI
Natural
Degradation
New
FindingsDecrease
2020-2021
AMPI
Total AMD of Public Bodies 24,639.7 3,285.6 2,657.1 (2,347.5) 28,234.9
HEALTH AND SOCIAL SERVICES
Health and Social Services
Establishments of the HSSN 1,399.0 196.3 - (154.7) 1,440.6
EDUCATION AND CULTURE
Education
School Boards 4,456.0 1,090.6 480.1 (686.2) 5,340.5
Higher Education
CEGEPs 124.6 58.6 29.9 (18.8) 194.3
Universities 980.8 140.3 60.9 (56.0) 1,126.0
Culture
Government Bodies and Corporations under the
Authority of the MCC 53.9 6.4 17.9 (24.8) 53.4
ECONOMY AND ENVIRONMENT
Road Network
Ministère des Transports
Roadways 7,025.0 1,145.0 (73.0) (696.0) 7,401.0
Structures — Highway System 8,651.8 407.1 985.3 (517.0) 9,527.2
Structures — Municipal Bridges 760.1 39.8 35.1 (49.3) 785.7
Culverts - - 1,032.8 - 1,032.8
16,436.9 1,591.9 1,980.2 (1,262.3) 18,746.7
Marine, Air, Rail and other Transportation
Société des traversiers du Québec 85.2 39.5 0.1 (7.3) 117.5
Tourism and Recreational Activities
Régie des installations olympiques 451.3 12.8 44.7 (30.7) 478.1
Social and Community Housing
Société d'habitation du Québec 182.2 20.3 0.4 (22.4) 180.5
Environment
Ministère de l'Environnement et de la Lutte contre
les changements climatiques 52.8 4.7 (8.4) (4.6) 44.5
ADMINISTRATION AND JUSTICE
Government Administration
Société québécoise des infrastructures 417.0 124.2 51.3 (79.7) 512.8
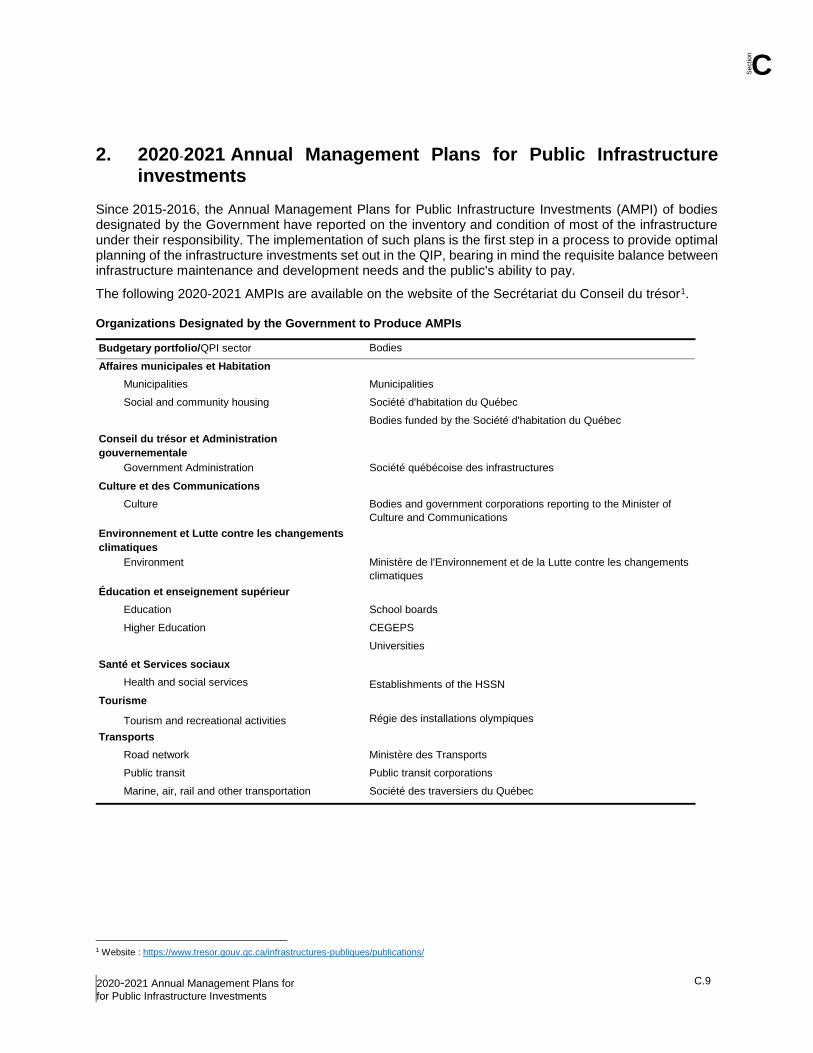
Section
C
2020-2021 Annual Management Plans for C.9
for Public Infrastructure Investments
2. 2020-2021 Annual Management Plans for Public Infrastructure investments
Since 2015-2016, the Annual Management Plans for Public Infrastructure Investments (AMPI) of bodies designated by the Government have reported on the inventory and condition of most of the infrastructure under their responsibility. The implementation of such plans is the first step in a process to provide optimal planning of the infrastructure investments set out in the QIP, bearing in mind the requisite balance between infrastructure maintenance and development needs and the public's ability to pay.
The following 2020-2021 AMPIs are available on the website of the Secrétariat du Conseil du trésor1. Organizations Designated by the Government to Produce AMPIs
Budgetary portfolio/QPI sector Bodies
Affaires municipales et Habitation
Municipalities Municipalities
Social and community housing Société d'habitation du Québec
Bodies funded by the Société d'habitation du Québec
Conseil du trésor et Administration
gouvernementale
Government Administration Société québécoise des infrastructures
Culture et des Communications
Culture Bodies and government corporations reporting to the Minister of
Culture and Communications
Environnement et Lutte contre les changements
climatiques
Environment Ministère de l'Environnement et de la Lutte contre les changements
climatiques
Éducation et enseignement supérieur
Education School boards
Higher Education CEGEPS
Universities
Santé et Services sociaux
Health and social services Establishments of the HSSN
Tourisme
Tourism and recreational activities Régie des installations olympiques
Transports
Road network Ministère des Transports
Public transit Public transit corporations
Marine, air, rail and other transportation Société des traversiers du Québec
1 Website : https://www.tresor.gouv.qc.ca/infrastructures-publiques/publications/