Embed Size (px)
Citation preview
Socioeconomic differentiation in urban Canada
T.R. BALAKRISHNAN I University of
GEORGE K . JARVIS I University ofAlberta
Western Ontario
La differentiation dans les regions metropolitaines du Canada est examinee a partir des donnees par secteurs de recensement pour 1961. Pour chaque secteur de recensement, trois mesures ont ete mises a point pour le niveau socioeconomique, la situation familiale, et le statut ethnique. Des zones de distance sont etablies de telle sorte que les secteurs de recensement sont groupes en zones d’un mile du centre-ville ainsi qu’en quatre zones concentriques contenant a peu pres le m h e nombre de secteurs. En se servant des arteres comme frontieres ainsi que comme bissectrices, des secteurs urbains sont etablis. En general, le niveau socioeconomique augmente a mesure qu’on s’eloigne du centre-ville. Dans la plupart des cas, les variations par secteur sont cependant plus grandes que les variations par zone. La taille de la famille est fortement reliee a la distance du centre-ville. I1 n’y a pas de configuration evidente par zones ou par secteurs dans la distribution du statut ethnique.
Differentiation in the metropolitan areas of Canada is examined using 1961 census tract data. Three measures are constructed for each tract to measure socioeconomic status (SES), family status, and ethnic status. Distance zones are constructed by grouping census tracts into one-mile zones from the centre of the city as well as grouping them into four concentric zones to contain approximately equal numbers of tracts. Sectors are constructed by considering arteries as boundaries as well as bisectors. Generally SES increases with distance from the centre. However, sectoral variation is greater than zonal variation in most cases. Family size has a strong relationship to distance from the centre ofthe city. N o distinct zonal or sectoral pattern is evident in the distribution of ethnic status.
Three models of urban spatial structure have occupied the attention of students of the city - the concentric zone, the sector pattern, and the multiple nuclei pattern (Burgess, 1924; Hoyt, 1939; Harris and Ullman, 1945). The last of the three is not a general model in the sense of the first two in that it represents the relatively unique adaptation of functions to specific areas within each city.
An examination of recent urban ecological research on social differentiation reveals a trend towards reexamination of the zonal and sectoral models in an attempt to arrive at generalizations concerning their cross-cultural applicability. Though far from conclusive, cer- tain generalizations seem to emerge from the extensive research performed to date (Timms, 1971; Schwirian, 1970, 1971; Anderson and Egeland, 1961; McElrath, 1962; Berry and
Rees, 1969; Murdie, 1969; Guest, 1969). First, the assumptions implicit in the zonal and sec- toral hypotheses are true to a greater extent in more industrialized countries than in some older European cities or cities in developing areas (Caplow, 1952; McElrath, 1962; Gist, 1957). Often the positive relation of socio- economic status to distance from the centre does not hold true for the latter (Hayner, 1945; Leonard, 1948; Hawley, 1954). A second generalization emerging from past research is that city size is an important variable in the differentiation of pattern. Larger cities exhibit greater differentiation and the zonal and sec- toral hypotheses seem to be more valid in these cities. In smaller cities, socioeconomic status often does not appear to be directly related to distance from the centre (Schnore, 1965; Guest, 1969). A third emerging generalization is that
Rev. canad. SOC. &Anth.lCanad. Rev. SOC. &Anth. 13(2) 1976
Socioeconomic differentiation / 205
different characteristics may not follow the same pattern in an urban area. Thus studies in social area analysis show that social rank is more zonally differentiated (Anderson and Ege- land, 1961). These are broad generalizations as there are many exceptions to the rule. A n im- portant limitation of many of the earlier studies has been that they are restricted to a single community; moreover. any synthesis of indi- vidual studies is beset with problems of com- parison because of differing methodology.
This paper is an attempt to study the applica- bility of the zonal and sectoral hypotheses for socioeconomic status, family size, and ethnic differentiation in the metropolitan areas of Canada. Studies in the Canadian context have been few and have bzen based on one or at most a small number of cities.' Moreover, the methods used have been various, making com- parisons hazardous. We have included more metropolitan areas than one finds in earlier studies, and we have made methodological im- provements in the analysis of the data.
D A T A A N D M t [ H O D S
All the twenly-three metropolitan areas for which the Census Division of Statistics Canada published data by census tracts in 1961 are in- cluded in this study.' A few tracts which were very small in population size (less than 1000) or had very inadequate socioeconomic data were eliminated from the analysis. The remaining 1478 tracts represent 94 per cent of all tracts in the twenty-three metropolitan areas.3 Raw data on a number of characteristics were taken from the 1961 census and converted into averages. ratios. and percentages before analysis.
ConJtrrrction oj' \ociocw)nornic status ( S E S ) index A socioeconomic status (SES) index was con- structed for each census tract by combining values for the tract on three variables: occupa- tion, education, and income. It was assumed that a combination of these three variables indi-
cates SES better than any one taken separately. The three variables were operationalized as fol- lows: Occupation per cent of employed males in
higher status occupations, namely, managerial, professional, and technical occupations in 1961. per cent of adults not attending school (approximated by those not attending school. excluding chil- dren under five years of age) with some high school or higher educa- tion in 1961. per cent of families with annual income of more than $7 000 in 1961.
The three variables were first standardized to the same overall mean of 50 and a standard deviation of 10. The individual score for any census tract is given by the formula:
Education
Income
x - x .v = (+) lo + 50,
where .i = the mean score on occupation. edu- cation, ot income for all the 1478 tracts.
u, = the standard deviation of the dis- tribution o f r for all the 1478 tracts.
The socioeconomic status (SES) index for census tract is then calculated by averaging the standardized scores on occupation, education, and income.
Socioeconomic Status Index =
' / 3CYI + yz +- y,).
where y,. y 2 . and y3 are standardized scores on occupation, education, and income respec- tively.
Ftimily size Family size is measured by the average number of persons per family in each census tract in 1961. It is used here to represent one of the major dimensions in social area analysis, the index of urbanization or family status. As fertil-
I Murdie's excellent study is restricted to Toronto. Guest studied only the zonal pattern and in only a few areas. Schwirian's study was more ambitious and included I I cities. However, it was restricted to city limits and did not include parts of metropolitan areas farther removed from the city centre. z A study comparing 1961 and 1971 patterns is currently under way and should reach completion by the middle of 1975. 3 The census tract bulletins for the metropolitan areas present data by tracts for central cities and other towns and for a few suburbs which are so small that they are not tracted. These suburban towns are usually no bigger than an average tract and for our purposes are treated as tracts. Our aim has been to include as many subareas as possible in a metropolitan area.
206 / T.R. Balakrishnan and George K. Jarvis
TABLE 1
MEAN SOCIOECONOMIC INDEX (SES) OF THE METROPOLITAN AREAS OF CANADA - 1961
Number of Mean SES Standard Metropolitan area tracts index deciation
Atlantic St John’s, Nfld Halifax Saint John, NB
Montreal Quebec City Sherbrooke Trois-Rivieres
Toronto Ottawa-Hull Hamilton London Kitchener-Waterloo Windsor Kingston Oshawa Sudbury
Winnipeg Edmonton Calgary Regina Saskatoon
Vancouver Victoria
Quebec
Ontario
Prairies
British Columbia
TOTAL
18 29 25
3 69 71 18 17
301 78 78 37 29 40 15 17 22
83 49 27 1 1 17
117 23
1478
47 .7 51.6 47 .0
48 .0 47 .4 44 .8 44 .6
52 .6 54 .0 47 .7 51 .6 48 .2 47 .5 51.7 47 .7 45 .4
50 .7 52.6 52.1 49.8 4 9 . 4
52 .4 51 . O 50.0
7 . 5 8 . 5 5 . 8
10.5 8 . 1 6 . 4 5 . 9
10.7 9 . 4 7 . 0 7 . 8 6 . 6 6 . 8 7 . 6 5 . 1 5.0
8 . 5 8 . 4 7 . 1 6 . 7 7 . 3
5 . 2 5 . 5
ity ratios, female labour force participation, and per cent multiple dwelling are replaced by fam- ily size in our measure, our measure is not ex- actly comparable with measures of familism used in some other social area studies. Increas- ingly, this dimension is thought to represent not so much urbanization as different stages of and preoccupation with the family life cycle. For this reason we have chosen to go directly to a measure of family size in this analysis.
Ethnicitg To measure ethnic status we used an index con- structed to indicate the ethnic heterogeneity of each census tract.4 The index of ethnic diver- sity is calculated by the formula
index of Ethnic Diversity = I - X P , ~ ,
where p i equals the proportion of the population
of the tract of ith ethnic origin. The index will lie between o and I . The greater the value, the greater the ethnic diversity of the tract. Ameri- can studies have typically used per cent non- white as the principal indicator of ethnic diver- sity. In the Canadian case this is not a valid measure. Per cent non-British ethnic origin could have been used, but the index we have utilized is a superior indicator of diversity in ethnic composition because it takes into ac- count the pattern of heterogeneity among all ethnic origin categories.
Construction of zones and sectors Usually variations by distance are studied by grouping census tracts in concentric zones of one mile radius from the city centre. We have followed the same procedure in part of the analysis. However, though adequate for the
4 This index was originally proposed and used by Lieberson (1969).
Socioeconomic differentiation / 207
~ ~~~~ ~~~
TABLE 11
MEAN SOCIOECONOMIC STATUS (SES) INDEX BY DISTANCE FROM THE CENTRE OF METROPOLITAN AREAS BY MILE ZONES ~~ ~
I0 or more Less than I to 2 2 to 3 3 to 5 5 to 9 Metropolitan area I mile miles miles miles miles miles
Population size 500,000 or mow
Montreal Toronto Vancouver
TOTAL
200,000499,999 Winnipeg Ottawa-Hull Hamilton Quebec City Edmonton Calgary
TOTAL
100,000-199,999 Windsor Halifax London Victoria Kitchener-Waterloo Regina Sudbury
TOTAL
Less than 100,OOU Saskatoon Saint John, NH Sherbr ooke St John's, Nfld Kingston Oshawa Trois-Rivieres
TOTAL
37.6 38.0 49.4 39.6
41.4 47.7 44.7 43.2 44.4 43.6 44.1
42.8 43.5 45.3 47.2 47.7 49.6 46.4 46.1
46.5 47.0 42.8 49.6 47.2 43.8 44.6 46.2
42.4 44.1 51.6 44 .6
47.6 50.0 48.0 46.7 50.1 50.5 48.4
46.4 55.2 50 .5 48.4 49.4 51 .O 47.4 50.2
52.5 44.7 44.8 53.7 55 .7 46.8 49.3 48.2
44.7 48.7 53.9 47 .1
52.2 51.4 46.7 47.5 52.9 56.1 51.1
46.6 53.2 53.3 55.6 52.9 47 .4 46.3 51 .O
50.0 53.0 47 .1 46.6 54.8 51.7 40.8 49.2
49.8 5 1 . 1 53.4 50.6
57.6 59.9 48.5 52.4 55.4 60.2 54.8
49.7 47.8 55.5 53.3 42.9
43.6 49 .4
45.3 48 .4 49 .6 42.6 49.7 50.2 44.3 46.1
-
51.7 51.3 55.7 56.6 55.0 48.4 54.3 53.1
49.9 -_ 58.8 - 51 .0 - 47.0 - 51.2 - 47.4 -
52.1 -
53.0 -
48.6 - 51 .? - 45.4 -
41.1 -
49.6 -
- -
- -
45.8
testing of a gradient hypothesis, equidistant zones of one mile violate a basic principle be- hind zones as stated by Burgess. One-mile zones will result in a large number of zones for the bigger cities and only two or three for the smaller metropolitan areas, whereas zones should be independent of the land area of the metropolitan area. Therefore, as an alternate method we have constructed four concentric zones for all the metropolitan areas in such a way that each zone has one-fourth of the total census tracts in the city grouped to approximate concentric rings. These quartiles, a s we have named them, are not necessarily equidistant as are one-mile zones. Theoretically these zones are comparable to the inner four of Burgess's
five zones, the fifth being the commuter zone which lies at least partly outside the tracted area.
Studies of urban sectors disagree in the method of sector construction. T h e idea of the sectors is based on the premise that city de- velopment takes place along the main transport- ation arteries emanating from the centre of the city. As a result, any sector construction should theoretically take the main arteries as the basis for construction of sectors. Nevertheless, many studies ignore the arteries altogether and con- struct sectors by dividing the whole community into an arbitrary number of sectors forming equal angles at the ~ e n t r e . ~ This has been criti- cized by others who have used the main
5 Anderson and Egeland. Murdie, and Schwirian all use 3o"angles to delineate sectors.
208 / T.R. Balakrishnan and George K. Jarvis
TABLE 111
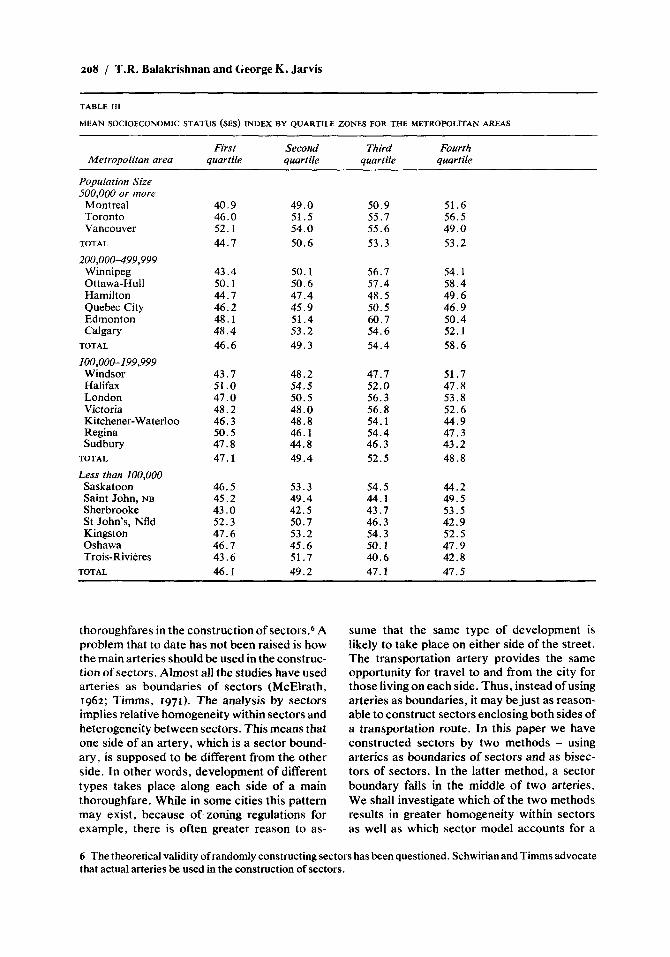
MEAN SOCIOECONOMIC STATUS (SES) INDEX BY QUARTILE ZONES FOR THE METROPOLITAN AREAS
First Second Third Fourth Metropoliian area quartile quartile quartile quartile
Population Size 500,000 or more
Montreal Toronto Vancouver
TOTAL
200,000499,999 Winnipeg Ottawa-Hull Hamilton Quebec City Edmonton Calgary
TOTAL
100,000-199,999 Windsor Halifax London Victoria Kitchener-Waterloo Regina Sudbury
TOTAL
Less than 100,000 Saskatoon Saint John, NB Sherbrooke St John’s, Nfld Kingston Oshawa Trois-Rivitres
TOTAL
40 .9 46 .0 52.1 44 .7
43 .4 50.1 44 .7 46 .2 48.1 48 .4 46 .6
43 .7 51 .O 47.0 48 .2 46 .3 50 .5 47.8 47.1
46.5 45 .2 43 .0 52 .3 47 .6 46 .7 43 .6 46.1
49 .0 51.5 54 .0 50.6
50 .1 50 .6 47 .4 45 .9 51 .4 53 .2 49 .3
48 .2 54.5 5 0 . 5 48 .0 48.8 46 .1 44 .8 49 .4
53 .3 49 .4 42.5 50.7 53 .2 45 .6 51.7 49 .2
50.9 55.7 55 .6 53 .3
56.7 57 .4 48 .5 50.5 60.7 54.6 54 .4
47.7 52 .0 56 .3 56.8 54.1 54 .4 46 .3 52.5
54.5 4 4 . 1 43.7 46.3 54.3 50.1 40.6 47. 1
51 .6 56.5 49 .0 53 .2
54.1 58 .4 49 .6 46 .9 50.4 52.1 58.6
51.7 47 .8 53.8 52.6 44 .9 47 .3 43 .2 48 .8
44 .2 49 .5 53 .5 42 .9 52.5 47 .9 42 .8 47 .5
thoroughfares in the construction of sectors.6 A problem that to date has not been raised is how the main arteries should be used in the construc- tion of sectors. Almost all the studies have used arteries as boundaries of sectors (McElrath, rg6z; Timms, 1971). The analysis by sectors implies relative homogeneity within sectors and heterogeneity between sectors. This means that one side of an artery, which is a sector bound- ary, is supposed to be different from the other side. In other words, development of different types takes place along each side of a main thoroughfare. While in some cities this pattern may exist, because of zoning regulations for example, there is often greater reason to as-
sume that the same type of development is likely to take place on either side of the street. The transportation artery provides the same opportunity for travel to and from the city for those living on each side. Thus, instead of using arteries as boundaries, it may be just as reason- able to construct sectors enclosing both sides of a transportation route. In this paper we have constructed sectors by two methods - using arteries as boundaries of sectors and as bisec- tors of sectors. In the latter method, a sector boundary falls in the middle of two arteries. We shall investigate which of the two methods results in greater homogeneity within sectors as well as which sector model accounts for a
6 The theoretical validity of randomly constructing sectors has been questioned. Schwirian and Timms advocate that actual arteries be used in the construction of sectors.
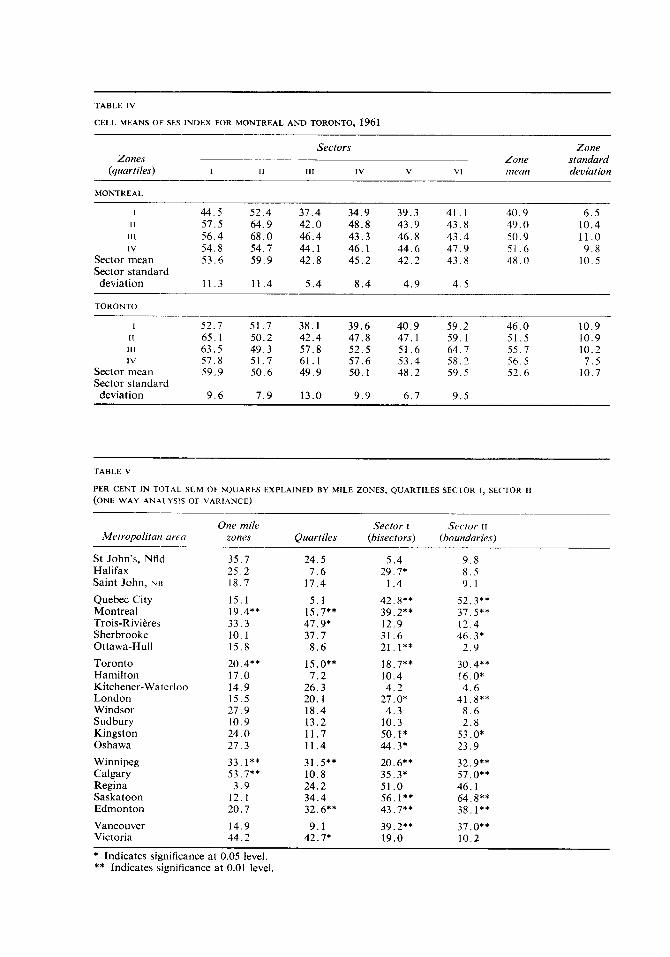
TABLE IV
CELL MEANS OF SES INDEX FOR MONTREAL AND TORONTO, 1961
Sectors Zone Zones Zone standard
(quurtiles) I I1 Ill IV V VI mean deviation
MONTREAL
1 44.5 52.4 37.4 34.9 39.3 41.1 40.9 6 .5 II 57.5 64 .9 42.0 48.8 43 .9 43.8 49.0 10.4
111 56.4 68 .0 46.4 43.3 46.8 43.4 50.9 11.0 IV 54.8 54 .7 44.1 46.1 44.6 47 .9 51 6 9 . 8
Sector mean 53 .6 59.9 42.8 45.2 42.2 43.8 48 .0 10.5 Sector standard deviation 11.3 11 .4 5 .4 8 . 4 4 . 9 4 . 5
TORONTO
I 52.7 51.7 38.1 39.6 40 .9 59 .2 46 .0 10.9 I1 65.1 50.2 42.4 47.8 47.1 59.1 51.5 10.9 Ill 63.5 49.3 57.8 52.5 51 .6 64 .7 55.7 10.2 IV 57.8 51 .7 61.1 57.6 53.4 58 .2 56 .5 7 . 5
Sector mean 59.9 50.6 49 .9 50.1 48.2 59.5 52.6 10 .7 Sector standard
deviation 9 . 6 7 . 9 13.0 9 . 9 6 .7 9 . 5
TABLE V
PER CENT IN TOTAI SUM OF SQUARES EXPLAINED BY MILE ZONES, QUARTILES SECTOR I , SECTOR 11
(ONE WAY ANALYSIS OF VARIANCE)
One mile Sector I Sector 11 Metropolitarr orea zones Quartiles (bisectors) (boundaries) -___
St John’s, Nfld 35.7 24.5 5 .4 9 . 8 Halifax 25.2 7 . 6 29.7* 8 . 5 Saint John, N I I 18.7 17.4 1 .4 9 . 1 Quebec City 15.1 5.1 42.8** 52.3** Montreal 19.4** 15.7** 39.2** 37.5** Trois-Rivieres 33.3 47.9* 12.9 12.4 Sherbrooke 10.1 37.7 31 .6 46.3* Ottawa-Hull 15.8 8 . 6 21, I * * 2 . 9 Toronto 20.4** 15.0** 18.7** 30.4** Hamilton 17 .0 7 .2 10.4 16.0* Kitchener-Waterloo 14.9 26.3 4 . 2 4 . 6 London 15.5 20.1 27.0* 41.8** Windsor 27.9 18.4 4 . 3 8 . 6 Sudbury 10.9 13.2 10.3 2 .8 Kingston 24.0 11.7 50. I * 53.0* Oshawa 27.3 11.4 44.3* 23.9 Winnipeg 33. I * * 31.5** 20.6** 32.9** Calgary 53.7** 10.8 35.3* 57.0** Regina 3 .9 24.2 51 . O 46.1 Saskatoon 12.1 34.4 56. I** 64.8** Edmonton 20.7 32.6** 43.7** 38. I** Vancouver 14.9 9 .1 39.2** 37.0** Victoria 44.2 42.7* 19 .0 10.2
* Indicates significance at 0.05 level. ** Indicates significance at 0.01 level.
Z I O / T.R. Balakrishnan and George K. Jarvis
TABLE VI
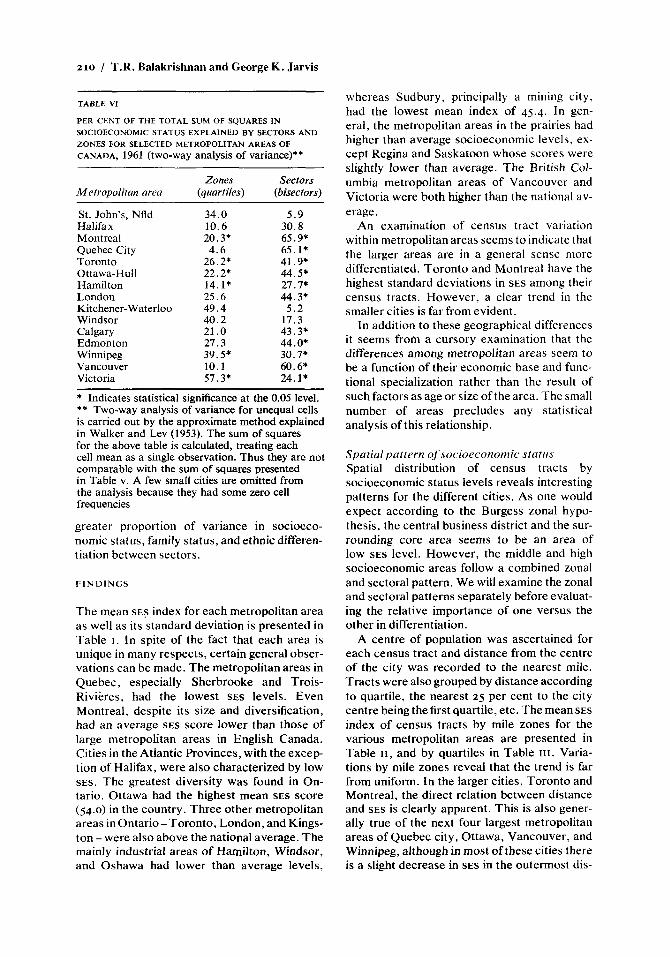
PER CENT OF THE TOTAL SUM OF SQUARES 1N SOCIOECONOMIC STATUS EXPLAINED BY SECTORS AND ZONES FOR SELECTED METROPOLITAN AREAS OF CANADA, 1961 (two-way analysis of variance)**
Zones Sectors Metropolitan area (quartiles) (bisectors)
St. John’s, Nfld 34.0 5 .9 Halifax 10.6 30.8 Montreal 20.3* 65.9* Quebec City 4.6 65.1* Toronto 26.2* 41.9* Ottawa-Hull 22.2* 44.5* Hamilton 14. I* 27.7* London 25.6 44.3* Kitchener-Waterloo 49.4 5 . 2 Windsor 40.2 17.3 Calgary 21 .o 43.3* Edmonton 27.3 44.0* Winnipeg 39.5* 30.7* Vancouver 10.1 60.6* Victoria 57.3* 24.1*
* Indicates statistical significance at the 0.05 level. ** Two-way analysis of variance for unequal cells is carried out by the approximate method explained in Walker and Lev (1953). The sum of squares for the above table is calculated, treating each cell mean as a single observation. Thus they are not comparable with the sum of squares presented in Table v. A few small cities are omitted from the analysis because they had some zero cell frequencies
greater proportion of variance in socioeco- nomic status, family status, and ethnic differen- tiation between sectors.
F I N D I N G S
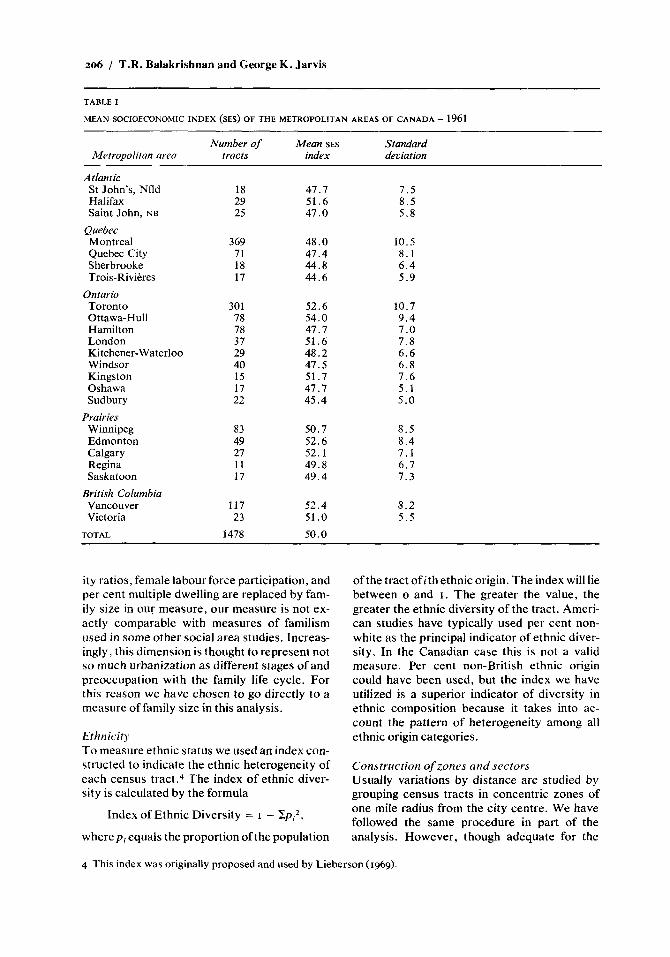
The mean SES index for each metropolitan area as well as its standard deviation is presented in Table I . In spite of the fact that each area is unique in many respects, certain general obser- vations can be made. The metropolitan areas in Quebec, especially Sherbrooke and Trois- Rivieres, had the lowest SES levels. Even Montreal, despite its size and diversification, had an average SES score lower than those of large metropolitan areas in English Canada. Cities in the Atlantic Provinces, with the excep tion of Halifax, were also characterized by low SES. The greatest diversity was found in On- tario. Ottawa had the highest mean SES score (54.0) in the country. Three other metropolitan areas in Ontario-Toronto, London, and Kings- ton - were also above the national average. The mainly industrial areas of Hamilton, Windsor, and Oshawa had lower than average levels,
whereas Sudbury , principally a mining city, had the lowest mean index of 45.4. In gen- eral, the metropolitan areas in the prairies had higher than average socioeconomic levels, ex- cept Regina and Saskatoon whose scores were slightly lower than average. The British Col- umbia metropolitan areas of Vancouver and Victoria were both higher than the national av- erage.
An examination of census tract variation within metropolitan areas seems to indicate that the larger areas are in a general sense more differentiated. Toronto and Montreal have the highest standard deviations in SES among their census tracts. However, a clear trend in the smaller cities is far from evident.
In addition to these geographical differences it seems from a cursory examination that the differences among metropolitan areas seem to be a function of their economic base and func- tional specialization rather than the result of such factors as age or size of the area. The small number of areas precludes any statistical analysis of this relationship.
Spatial pattern of socioeconomic status Spatial distribution of census tracts by socioeconomic status levels reveals interesting patterns for the different cities. As one would expect according to the Burgess zonal hypo- thesis, the central business district and the sur- rounding core area seems to be an area of low SES level. However, the middle and high socioeconomic areas follow a combined zonal and sectoral pattern. We will examine the zonal and sectoral patterns separately before evaluat- ing the relative importance of one versus the other in differentiation.
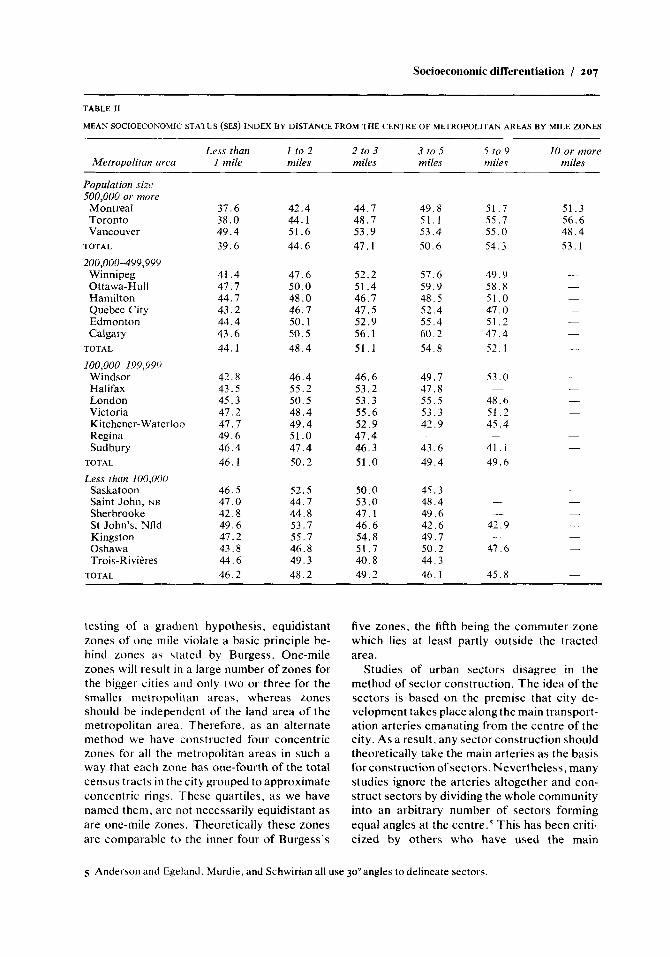
A centre of population was ascertained for each census tract and distance from the centre of the city was recorded to the nearest mile. Tracts were also grouped by distance according to quartile, the nearest 25 per cent to the city centre being the first quartile, etc. The mean SES index of census tracts by mile zones for the various metropolitan areas are presented in Table 11, and by quartiles in Table I I I . Varia- tions by mile zones reveal that the trend is far from uniform. In the larger cities, Toronto and Montreal, the direct relation between distance and SES is clearly apparent. This is also gener- ally true of the next four largest metropolitan areas of Quebec city, Ottawa, Vancouver, and Winnipeg, although in most of these cities there is a slight decrease in SES in the outermost dis-
Socioeconomic differentiation / 2 I I
TABLE VII
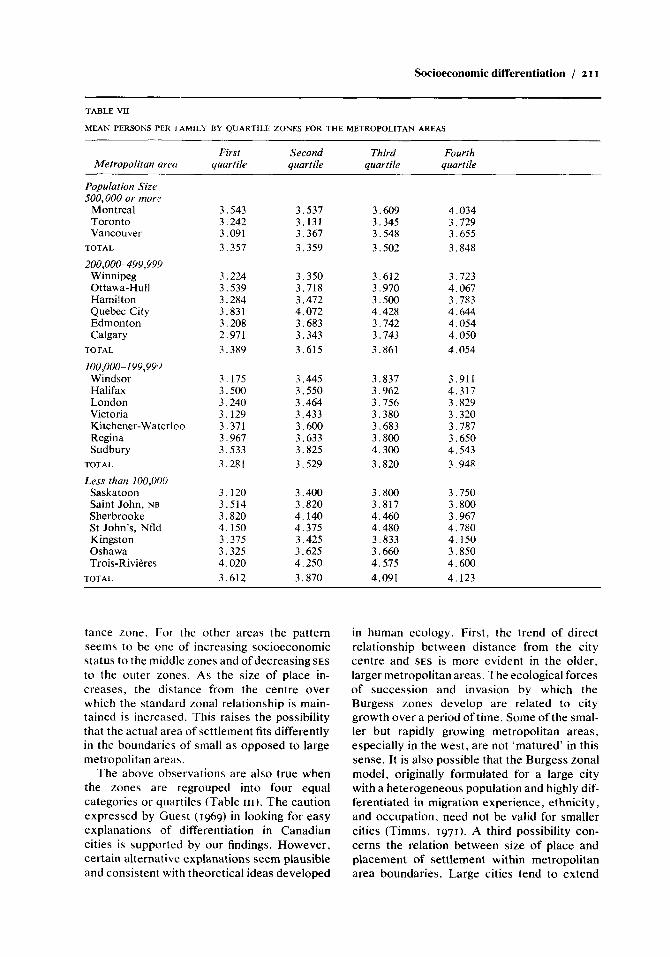
MEAN PERSONS PER FAMILY BY QUARTILE ZONES FOR THE METROPOLITAN AREAS
First Second Third Fourth M e fropolitan areu quartile quartile quartile quartile
Population Size 500,000 or more
Montreal Toronto Vancouver
TOTAL
200,000499,999 Winnipeg Ottawa-Hull Hamilton Quebec City Edmonton Calgary
TOTAL
100,000-1 99,999 Windsor Halifax London Victoria Kitchener-Waterloo Regina Sudbury
TOTAL
Less thtrn 100,000 Saskatoon Saint John, NB Sherbrooke St John’s, Nfld Kingston Oshawa Trois-Rivieres
TOTAL
3.543 3.242 3.091 3.357
3.224 3.539 3.284 3.831 3.208 2.971 3.389
3.175 3.500 3.240 3.129 3.371 3.967 3.533 3.281
3.120 3.514 3.820 4 . I50 3.375 3.325 4.020 3.612
3.537 3.131 3.367 3.359
3.350 3.718 3.472 4.072 3.683 3.343 3.615
3,445 3.550 3.464 3.433 3.600 3.633 3.825 3.529
3.400 3.820 4.140 4.375 3.425 3.625 4.250 3.870
3.609 3.345 3.548 3.502
3.612 3.970 3.500 4.428 3.742 3.743 3.861
3.837 3.962 3.756 3.380 3.683 3.800 4.300 3.820
3.800 3.817 4.460 4.480 3.833 3.660 4.5.75 4.091
4.034 3.729 3.655 3.848
3.723 4.067 3.783 4.644 4.054 4.050 4.054
3.911 4.317 3.829 3.320 3.787 3.650 4.543 3.948
3.750 3.800 3.967 4.780 4 . I50 3.850 4.600 4.123
tance zone. For the other areas the pattern seems to be one of increasing socioeconomic status to the middle zones and o f d e c r e a s i n g s ~ s to the outer zones. As the size of place in- creases, the distance from the centre over which the standard zonal relationship is rnain- tained is increased. This raises the possibility that the actual area of settlement fits differently in the boundaries of small as opposed to large metropolitan area\.
The above observations are also true when the zones are regrouped into four equal categories or quartiles (Table 111) . T h e caution expressed by Guest (1969) in looking for easy explanations of differentiation in Canadian cities is supported by our findings. However, certain alternative explanations seem plausible and consistent with theoretical ideas developed
in human ecology. First, the trend of direct relationship between distance from the city centre and SES is more evident in the older, larger metropolitan areas. The ecological forces of succession and invasion by which the Burgess zones develop are related to city growth over a period of time. Some of the smal- ler but rapidly growing metropolitan areas, especially in the west. are not ‘matured’ in this sense. It is also possible that the Burgess zonal model, originally formulated for a large city with a heterogeneous population and highly dif- ferentiated in migration experience, ethnicity , and occupation, need not be valid for smaller cities (Timms, 1971). A third possibility con- cerns the relation between size of place and placement of settlement within metropolitan area boundaries. Large cities tend to extend
ZIZ / T.R. Balakrishnan and George K. Jarvis
TABLE VIII
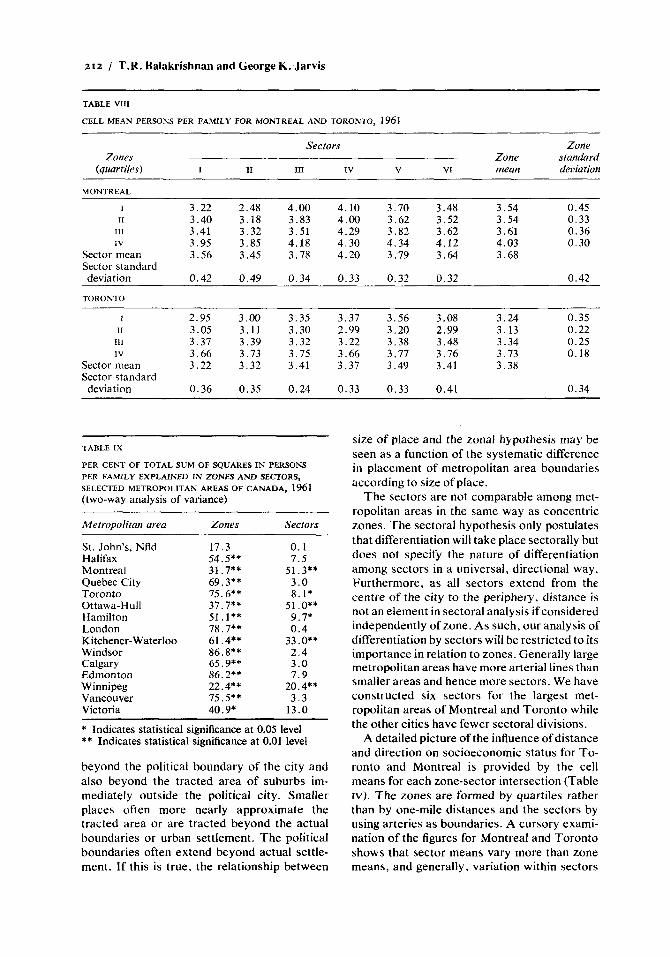
CELL MEAN PERSONS PER FAMILY FOR MONTREAL AND TORONTU, 1961
Sectors Zone Zones Zone standard
(quartiles) I I1 I l l IV V VI mean deviation
MONTREAL
I 3.22 2.48 4.00 4.10 3.70 3.48 3.54 0.45 IT 3.40 3.18 3.83 4.00 3.62 3.52 3.54 0.33
111 3.41 3.32 3.51 4.29 3.82 3.62 3.61 0.36 IV 3.95 3.85 4.18 4.30 4.34 4.12 4.03 0.30
Sector mean 3.56 3.45 3.78 4.20 3.79 3.64 3.68 Sector standard deviation 0.42 0.49 0.34 0.33 0.32 0.32 0.42
TORONTO
1 2.95 3.00 3.35 3.37 3.56 3.08 3.24 0.35 I I 3.05 3.11 3.30 2.99 3.20 2.99 3.13 0.22
I11 3.31 3.39 3.32 3.22 3.38 3.48 3.34 0.25 IV 3.66 3.73 3.75 3.66 3.77 3.76 3.73 0.18
Sector mean 3.22 3.32 3.41 3.37 3.49 3.41 3.38 Sector standard deviation 0.36 0.35 0.24 0.33 0.33 0.41 0.34
TABLE 1X
PER CENT OF TOTAL SUM OF SQUARES IN PERSONS PER FAMILY EXPLAINED IN ZONES A N D SECTORS, SELECTED METROPOLITAN AREAS OF CANADA, 1961 (two-way analysis of variance)
Metropolitan area Zones Sectors
St. John’s, Nfld 17.3 0.1 Halifax 54.5** 7.5 Montreal 31.7** 51.3** Quebec City 69.3** 3.0 Toronto 75.6** 8.1* Ottawa-Hull 37.7** 51 .O** Hamilton 51.1** 9.7* London 78.7** 0 .4 Kitchener-Waterloo 61 .4** 33.0** Windsor 86.8** 2.4 Calgary 65.9** 3.0 Edmonton 86.2** 7.9 Winnipeg 22.4** 20.4** Vancouver 75.5** 3.3 Victoria 40.9* 13.0
* Indicates statistical significance at 0.05 level ** Indicates statistical significance at 0.01 level
beyond the political boundary of the city and also beyond the tracted area of suburbs im- mediately outside the political city. Smaller places often more nearly approximate the tracted area or are tracted beyond the actual boundaries or urban settlement. The political boundaries often extend beyond actual settle- ment. If this is true, the relationship between
size of place and the zonal hypothesis may be seen as a function of the systematic difference in placement of metropolitan area boundaries according to size ofplace.
The sectors are not comparable among met- ropolitan areas in the same way as concentric zones. The sectoral hypothesis only postulates that differentiation will take place sectorally but does not specify the nature of differentiation among sectors in a universal, directional way. Furthermore, as all sectors extend from the centre of the city to the periphery, distance is not an element in sectoral analysis if considered independently of zone. As such, our analysis of differentiation by sectors will be restricted to its importance in relation to zones. Generally large metropolitan areas have more arterial lines than smaller areas and hence more sectors. We have constructed six sectors for the largest met- ropolitan areas of Montreal and Toronto while the other cities have fewer sectoral divisions.
A detailed picture of the influence of distance and direction on socioeconomic status for To- ronto and Montreal is provided by the cell means for each zone-sector intersection (Table IV). The zones are formed by quartiles rather than by one-mile distances and the sectors by using arteries as boundaries. A cursory exami- nation of the figures for Montreal and Toronto shows that sector means vary more than zone means, and generally. variation within sectors
Socioeconomic differentiation / 213
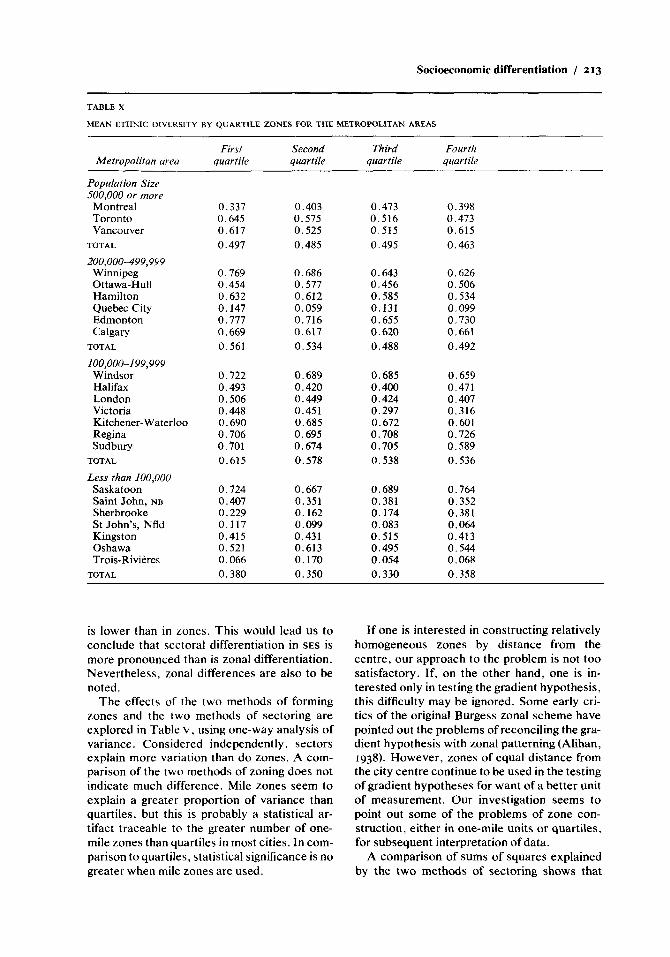
TABLE X
MEAN ETHNIC DlVERSITY BY QUARTILE ZONES FOR THE METROPOLITAN AREAS ~ ~~~~~ ~
First Second Third Fourth Metropolitan area quartile quartile quartile quarfile
Population Sizrz 500,000 or more Montreal Toronto Vancouver
TOTAL
200,000499,999 Winnipeg Ottawa-Hull Hamilton Quebec City Edmonton Calgary
TOTAL
I00,000-199,999 Windsor Halifax London Victoria Kitchener-Waterloo Regina Sudbury
TOTAL
Less than 100,000 Saskatoon Saint John, NH Sherbrooke St John’s, Nfld Kingston Oshawa Trois-Rivieres
TOTAL
0.337 0.645 0.617 0.497
0.769 0.454 0.632 0.147 0.777 0.669 0.561
0.722 0.493 0.506 0.448 0.690 0.706 0.701 0.615
0.724 0.407 0.229 0.117 0.415 0.521 0.066 0.380
0.403 0.575 0.525 0.485
0.686 0.577 0.612 0.059 0.716 0.617 0.534
0.689 0.420 0.449 0.451 0.685 0.695 0.674 0.578
0.667 0.351 0.162 0.099 0.431 0.613 0.170 0.350
0.473 0.516 0.515 0.495
0.643 0.456 0.585 0.131 0.655 0.620 0.488
0.685 0.400 0.424 0.297 0.672 0.708 0.705 0.538
0.689 0.381 0.174 0.083 0.515 0.495 0.054 0.330
0.398 0.473 0.615 0.463
0.626 0.506 0.534 0.099 0.730 0.661 0.492
0.659 0.471 0.407 0.316 0.601 0.726 0.589 0.536
0.764 0.352 0.381 0.064 0.413 0.544 0.068 0.358
is lower than in zones. This would lead us to conclude that sectoral differentiation in SES is more pronounced than is zonal differentiation. Nevertheless, zonal differences are also to be noted.
The effects of the two methods of forming zones and the two methods of sectoring are explored in Table v , using one-way analysis of variance. Considered independently, sectors explain more variation than do zones. A com- parison of the two methods of zoning does not indicate much difference. Mile zones seem to explain a greater proportion of variance than quartiles, but this is probably a statistical ar- tifact traceable to the greater number of one- mile zones than quartiles in most cities. In com- parison to quartiles, statistical significance is no greater when mile zones are used.
If one is interested in constructing relatively homogeneous zones by distance from the centre, our approach to the problem is not too satisfactory. If, on the other hand. one is in- terested only in testing the gradient hypothesis, this difficulty may be ignored. Some early cri- tics of the original Burgess zonal scheme have pointed out the problems of reconciling the gra- dient hypothesis with zonal patterning (Alihan, 1938). However, zones of equal distance from the city centre continue to be used in the testing of gradient hypotheses for want of a better unit of measurement. Our investigation seems to point out some of the problems of zone con- struction, either in one-mile units or quartiles, for subsequent interpretation of data.
A comparison of sums of squares explained by the two methods of sectoring shows that
214 / T.R. Balakrishnan and George K. Jarvis
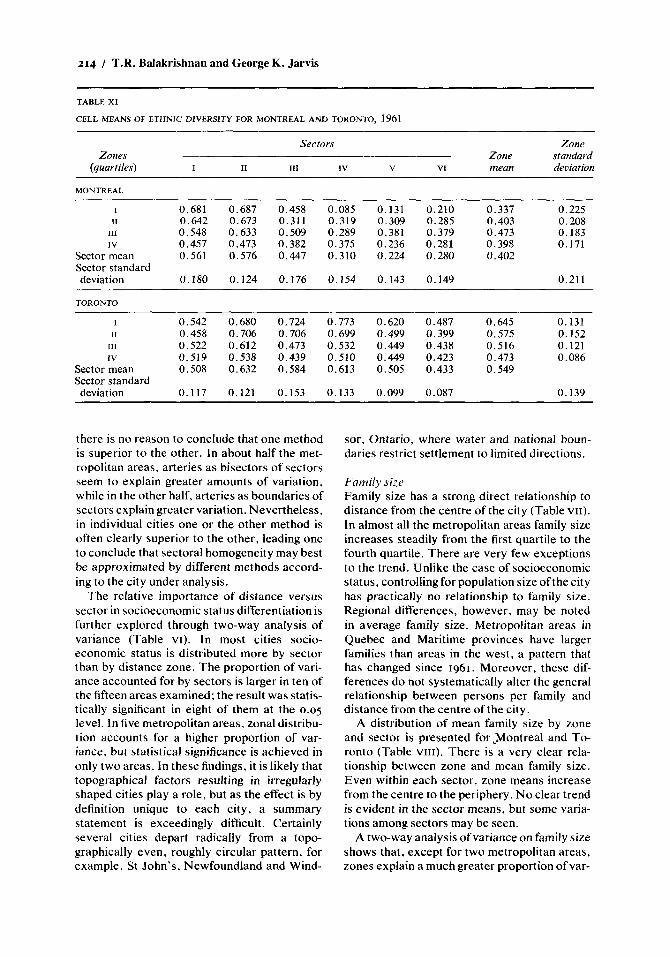
TABLE XI
CELL MEANS OF ETHNIC DlVERSlTY FOR MONTREAL AND TORONTO, 1961
Sectors Zone Zones Zone standard
(quartiles) I I1 111 IV V VI mean deviation
MONTREAL
I 0.681 0.687 0.458 0.085 0.131 0.210 0.337 0.225 I1 0.642 0.673 0.311 0.319 0.309 0.285 0.403 0.208
I11 0.548 0.633 0.509 0.289 0.381 0.379 0.473 0.183 IV 0.457 0.473 0.382 0.375 0.236 0.281 0.398 0.171
Sector mean 0.561 0.576 0.447 0.310 0.224 0.280 0.402 Sector standard deviation 0.180 0.124 0.176 0.154 0.143 0.149 0.211
TORONTO
I 0.542 0.680 0.724 0.773 0.620 0.487 0.645 0.131 I1 0.458 0.706 0.706 0.699 0.499 0.399 0.575 0.152
I11 0.522 0.612 0.473 0.532 0.449 0.438 0.516 0.121 IV 0.519 0.538 0.439 0.510 0.449 0.423 0.473 0.086
Sector mean 0.508 0.632 0.584 0.613 0.505 0.433 0.549 Sector standard deviation 0.117 0.121 0.153 0.133 0.099 0.087 0.139
there is no reason to conclude that one method is superior to the other. In about half the met- ropolitan areas, arteries as bisectors of sectors seem to explain greater amounts of variation, while in the other half, arteries as boundaries of sectors explain greater variation. Nevertheless, in individual cities one or the other method is often clearly superior to the other, leading one to conclude that sectoral homogeneity may best be approximated by different methods accord- ing to the city under analysis.
The relative importance of distance versus sector in socioeconomic status differentiation is further explored through two-way analysis of variance (Table VI). In most cities socio- economic status is distributed more by sector than by distance zone. The proportion of vari- ance accounted for by sectors is larger in ten of the fifteen areas examined; the result was statis- tically significant in eight of them at the 0.05 level. In five metropolitan areas, zonal distribu- tion accounts for a higher proportion of var- iance. but statistical significance is achieved in only two areas. In these findings, it is likely that topographical factors resulting in irregularly shaped cities play a role, but as the effect is by definition unique to each city, a summary statement is exceedingly difficult. Certainly several cities depart radically from a topo- graphically even, roughly circular pattern, for example, St John’s, Newfoundland and Wind-
sor, Ontario, where water and national boun- daries restrict settlement to limited directions.
Family size Family size has a strong direct relationship to distance from the centre of the city (Table VII). In almost all the metropolitan areas family size increases steadily from the first quartile to the fourth quartile. There are very few exceptions to the trend. Unlike the case of socioeconomic status, controlling for population size ofthe city has practically no relationship to family size. Regional differences, however, may be noted in average family size. Metropolitan areas in Quebec and Maritime provinces have larger families than areas in the west, a pattern that has changed since 1961. Moreover, these dif- ferences do not systematically alter the general relationship between persons per family and distance from the centre of the city.
A distribution of mean family size by zone and sector is presented for LMontreal and To- ronto (Table V I I I ) . There is a very clear rela- tionship between zone and mean family size. Even within each sector, zone means increase from the centre to the periphery. N o clear trend is evident in the sector means, but some varia- tions among sectors may be seen.
A two-way analysis of variance on family size shows that, except for two metropolitan areas, zones explain a much greater proportion of var-
Socioeconomic differentiation / 215
TABLE XI1
PER CENT OF TOTAL SUM OF SQUARES IN ETHNIC DIVERSITY EXPLAIKED BY ZONES AND SECTORS (two-way analysis of variance)
Metropolitan area
St. John’s, Nfld Halifax Montreal Quebec City Toronto Ottawa-Hull Hamilton London Kitchener-Waterloo Windsor Calgary Edmonton Winnipeg Vancouver Victoria
Zones Sectors
30.9 28.8 4 .6
20.9** 32.6* 2.7
23.4** 52.7 56.8 39.2 14.9 40.4 21 .o 19.2 51.2
42.9 18.1 74.3** 44.4** 43.4* 63.5** 33.8** 12.6 26.4 15.0 33.1 38.6 38.2* 50.9* 20.5
* Indicates statistical significance at 0.05 level- ** Indicates statistical significance at 0.01 level
iance in family sire than d o sectors (Table IX) . Zonal variation was statistically significant at the 0.01 level in all but two of the areas. Only in St John’s, Newfoundland, was it not significant at the 0.05 level. I n ten out of the fifteen met- ropolitan areas sectoral variation explained less than 1 0 per cent of the variation in family size, although in six cases sectoral variation was significant at least at the 0.05 level. Our finding that family size is more prominently distributed zonally than sectorally is consistent with the findings of others (Timms, 1971; Schwirian, 1971).
Ethnic, stt i t i rs
N o distinct patterns of spatial differentiation by distance are to be found in ethnic diversity. Though in some metropolitan areas there is a tendency for ethnic diversity to decrease with distance from the centre. there are a number of exceptions (Table x). Variations among met- ropolitan areas are substantial and involve sev- eral different patterns of relationship between e thnk status and distance from the centre. In general. Quebec cities and St John’s, New- foundland have low ethnic diversity and met- ropolitan areas in the west have high ethnic diversity. as do some of the more industrial cities in Ontario. .4 breakdown by zone (quar- tile) and sector for Torontoand Montreal shows that trends by sector are also not too apparent (Table X I ) . A two-way analysis of variance of
ethnic diversity for the different metropolitan areas confirms that ethnic diversity is not well explained by zonal or sectoral patterns (Table X I I ) . The low statistical significance of variance indicates that variation within zones and sec- tors is just as high as variation between them. This finding is consistent with the assertion that ethnic differentiation is more random and site-specific than is that of socioeconomic and family status.
S U M M A R Y A N D C O N C L U S I O K S
The pattern of socioeconomic >tatus differenti- ation in Canadian metropolitan areas is gener- ally consistent in two respects with similar studies done in other industrialized com- munities. First. the direct relation between SES and distance from the centre is clearer in the larger and older metropolitan areas. In smaller metropolitan areas the most common pattern from the centre is first one of increase and later decrease as the most outlying zones are reached. Second, sectoral differentiation in SES is more pronounced than zonal differentiation. Alternative methods of sectoring have different effects in each city indicating that arterial de- velopment does not take place in a uniform way. More thought must go into the construc- tion of zones and sectors. Though different methods were explored in this study, no clear mandate for any particular method emerges.
Family size is predominantly distributed zonally, with sectoral differentiation present in only a few cases. Spatial patterns in family size are even more pronounced than in socio- economic status or ethnic status. Ethnic status seems to have the least consistent relationship t o spatial patterns as described by zones or sectors. Only a modest zonal and sectoral dif- ferentiation is evident. It seems that any quest for understanding ethnic differentiation must look beyond zones and sectors in the metropoli- tan areas of Canada.
R E F E R E N C E S
Alihan, M.A. 1938 Social Ecology: A Critical Analysis.
New York: Columbia University Press Anderson. T.R.. and J. Egeland 1961 ‘Spatial aspects of social area analysis.’
Berry. Brian, and Philip H. Rees American Sociological Review 26: 392-9
216 / T.R. Balakrishnan and George K. Jarvis
1969 ‘The factorial ecology of Calcutta.’
Burgess, E.W. 1924 ‘The Growth of the city: an introduction
to a research project,’ Publications of the American Sociological Society XVIII, pp.
American Journal of Sociology 74: 445-91
85-97 Caplow, T. 1952 ‘Urban structure in France,’ American
Gist, N .P. 1957 ’The ecology of Bangalore, India.’ Social
Guest, A.M. 1969 ‘The applicability of the Burgess zonal
hypothesis to urban Canada,’ Demog- raphy 6: 271-7
Sociological Review 17: 544-9
Forces 35: 356-65
Harris, C.D., and E.L. Ullman 1945 ‘The nature of cities,’ The Annals ofThe
Academy of Political and Social Sciences CCXLII, pp. 7-17
Hawley, A.H. 1954 ‘Land use pattern in Manila,’ in Papers in
Demography and Public Administration, Institute of Public Administration, The University of the Philippines, Manila
Hayner, N.S. 1945 ‘Mexico City: its growth and
configuration,’ America1 Journal of Sociology 50: 295-304
Hoyt , H. 1939 The Structure and Growth of Residential
Neighborhoods in American Cities. Federal Housing Administration Wash- ington, DC
Leonard, O.E. 1948 ‘La Paz, Bolivia: its population and
growth.’ American Sociological Review, 13: 448-54
Lieberson, S. 1969 ‘Measuring population diversity.’ Ameri-
can Sociological Review 34: 850-62 Murdie, R.A. 1969 Factorial Ecology of Metropolitan To-
ronto: 1951-1961. Department of Geog- raphy, The University of Chicago, Re- search Paper # I 16
McElrath, D.C. 1962 ‘The social areas of Rome.’ American
Sociological Review, 27: 37-1 Schnore, L.F. 1965 Urban Scene. New York: The Free Press Schwirian, K. 1970 ‘Analytical convergence in ecological re-
search: factorial analysis, gradient and sector models.’ In Sweet, D., Models of Urban Structure. Columbus: Ohio State University and Battelle Memorial Insti- tute
cities’ (unpublished manuscript). Ohio State University, Columbus
1971 ‘The ecological structure of Canadian
Timms, D. 1971 Urban Mosaic. Cambridge University
Press Walker, H.M., and J. Lev 1953 Statistical Inference. New York: Holt,
Rinehart & Winston


![Anomalies de position des testicules dans renfance ...9 Royaume Uni examen ~ l'age de 18 mois ... mination du sexe ou de la differentiation sexuelle [50]; mais ces atteintes ne repr~sen-](https://img.pdfslide.fr/doc/110x75/5aea7a267f8b9a66258c14ba/anomalies-de-position-des-testicules-dans-renfance-9-royaume-uni-examen-lage.jpg)