Embed Size (px)
Citation preview

ISSN: 2148-9173 Vol: 8 Issue:1 March 2021
International Journal of Environment and Geoinformatics (IJEGEO) is an international, multidisciplinary, peer reviewed, open access journal.
Chief in Editor
Prof. Dr. Cem Gazioğlu
Co-Editors
Prof. Dr. Dursun Zafer Şeker, Prof. Dr. Şinasi Kaya,
Prof. Dr. Ayşegül Tanık and Assist. Prof. Dr. Volkan Demir
Editorial Committee (January 2021)
Assoc. Prof. Dr. Abdullah Aksu (TR), Assit. Prof. Dr. Uğur Algancı (TR), Prof. Dr. Bedri Alpar (TR), Assoc. Prof. Dr. Aslı Aslan (US), Prof. Dr. Levent Bat (TR), Prof. Dr. Paul Bates (UK), İrşad Bayırhan (TR), Prof. Dr. Bülent Bayram (TR), Prof. Dr. Luis M. Botana (ES), Prof. Dr. Nuray Çağlar (TR), Prof. Dr. Sukanta Dash (IN), Dr. Soofia T. Elias (UK), Prof. Dr. A. Evren Erginal (TR), Assoc. Prof. Dr. Cüneyt Erenoğlu (TR), Dr. Dieter Fritsch (DE), Prof. Dr. Çiğdem Göksel (TR), Prof.Dr. Lena Halounova (CZ), Prof. Dr. Manik Kalubarme (IN), Dr. Hakan Kaya (TR), Assist. Prof. Dr. Serkan Kükrer (TR), Assoc. Prof. Dr. Maged Marghany (MY), Prof. Dr. Michael Meadows (ZA), Prof. Dr. Nebiye Musaoğlu (TR), Prof. Dr. Masafumi Nakagawa (JP), Prof. Dr. Hasan Özdemir (TR), Prof. Dr. Chryssy Potsiou (GR), Prof. Dr. Erol Sarı (TR), Prof. Dr. Maria Paradiso (IT), Prof. Dr. Petros Patias (GR), Prof. Dr. Elif Sertel (TR), Prof. Dr. Nüket Sivri (TR), Prof. Dr. Füsun Balık Şanlı (TR), Prof. Dr. Uğur Şanlı (TR), Duygu Ülker (TR), Prof. Dr. Seyfettin Taş (TR), Assoc. Prof. Dr. Ömer Suat Taşkın (TR), Assist. Prof. Dr. Tuba Ünsal (TR), Dr. Manousos Valyrakis (UK), Dr. İnese Varna (LV), Dr. Petra Visser (NL), Prof. Dr. Selma Ünlü (TR), Assoc. Prof. Dr. Oral Yağcı (TR), Prof. Dr. Murat Yakar (TR), Assoc. Prof. Dr. İ. Noyan Yılmaz (AU); Assit. Prof. Dr. Sibel Zeki (TR)
Abstracting and Indexing: TR DIZIN, DOAJ, Index Copernicus, OAJI, Scientific Indexing Services, International Scientific Indexing, Journal Factor, Google Scholar, Ulrich's Periodicals Directory, WorldCat, DRJI, ResearchBib, SOBIAD
Soil Moisture Estimation using Sentinel-1 SAR data and Land Surface Temperature in Panchmahal district, Gujarat State
Sachin SUTARIYA., Ankur HIRAPARA, Momin MEHERBANALI, M.K. TIWARI, Vijay SINGH, Manik H. KALUBARME
65
Soil Moisture Estimation using Sentinel-1 SAR data and Land Surface Temperature in
Panchmahal district, Gujarat State
Sachin Sutariya1,*, Ankur Hirapara
1, Momin Meherbanali
1, M.K. Tiwari
1,
Vijay Singh2, Manik H. Kalubarme
2
1 Anand Agricultural University, College of Agricultural Engineering and Technology, Department of Irrigation and Drainage Engineering, Godhra, Gujarat, India 2 Ministry of Electronics & Information Technology (MEITY), Bhaskaracharya Institute for Space Applications and Geo-informatics (BISAG-N),
India
Corresponding Author: S. Sutariya Received: 07 Agu 2020
E-mail: [email protected] Accepted: 25 Nov 2020
Abstract
This paper presents the potential for soil moisture (SM) retrieval using Sentinel-1 C-band Synthetic Aperture Radar (SAR) data
acquired in Interferometric Wide Swath (IW) mode along with Land Surface Temperature (LST) estimated from analysis of
LANDSAT-8 digital thermal data. In this study Sentinel-1 data acquired on 27 February 2020 was downloaded from Copernicus
website and LANDSAT-8 OLI data acquired on 24 February 2020 from the website https://earthexplorer.usgs.gov/.The soil samples
were collected from 70 test fields in different villages of three talukas for estimating soil moisture content using the gravimetric
method. The Sentinel-1 SAR microwave data was analysed using open source tools of Sentinel Application Platform (SNAP)
software for estimation of backscattering coefficient. Land surface temperature estimated using Landsat-8 thermal data. The Landsat-
8, Thermal infrared sensor Band-10 data and operational land imager Band-4 and Band-5 data were used in estimating LST. The Soil
Moisture Index (SMI) for all field test sites was computed using the LST values. The regression analysis using σ0VV and σ0VH
polarization with soil moisture indicated that σ0VV polarization was more sensitive to soil moisture content as compared to σ0VH
polarization. The multiple regression analysis using field measured soil moisture (MS %) as dependent variable, and σ0VV and SMI
as independent variable was carried which resulted in the coefficient of determination (R2) of 0.788, 0.777 and 0.778 for Godhra,
Goghamba and Kalol talukas, respectively. These linear regression equations were used to compute the predicted soil moisture in
three talukas.
Keywords: Analysis Soil Moisture, Sentinel-1 SAR data, LST, SMI, Backscattering coefficient, LANDSAT 8 OLI, TIRS data
Introduction
The Sentinel-1, a polar orbiting satellite system mission
is a part of the Global Monitoring for Environment and
Security (GMES) program of the European Space
Agency (ESA) and the European Commission (EC) and
is intended to provide continuous global all weather, day
and night radar imaging in support of GMES
applications (Drusch et al., 2012). Soil moisture content
plays a key role in the crop production as it acts as a
nutrient and serves as a solvent for other nutrients such
as sodium, potassium, carbon, and nitrogen. It makes a
significant impact on plant growth, percolation, and
evaporation, microbiological decomposition of the soil
organic matter. For many applications in hydrology,
horticulture, geotechnical, agriculture and meteorology
moisture content on surface of the soil is an important
parameter (Ansari and Deshmukh, 2017). In agriculture
point of view, soil moisture information is essential for
many applications like plant stress, plant turgidity,
irrigation scheduling and improving crop yield. The soil
moisture affects the amount of water available for
vegetation growth (Bezerra, et al., 2013). Soil moisture
has a vigorous structure and thus, monitoring spatial and
temporal variations in soil moisture is great importance
for ecological balance.
Microwave Remote Sensing for Soil Moisture
estimation
Microwave remote sensing, both active and passive, has
already revealed its potential in soil moisture retrieval
independent of weather conditions. This capacity is due
to the fact that microwave signals are influenced by
dielectric properties (and thus the water content) of the
soils (Wang, 1980). There are many studies on
estimating soil moisture using both passive and active
remote sensing satellites. Active microwave remote
sensing systems have been recently preferred in soil
moisture studies because of the remarkable penetrating
capabilities of radar signal into the surface. In SAR
images, the sigma naught (σ0) which is considered as
backscattering coefficient, presents the amplitude of the
signal returned from target to SAR antenna that is
influenced by the soil surface characteristics which is
linked to the soil moisture and soil surface roughness
(Mirsoleimani, et al., 2019). Retrieval of soil surface
parameters from SAR data normally can be realized
using the backscattering model that presents the relation
between the target parameters (soil moisture and
International Journal of Environment and Geoinformatics 8(1):065-077 (2021)
Research Article
How to cite: Sutariya et al., (2021 Soil Moisture Estimation using Sentinel-1 SAR data and Land Surface Temperature in Panchmahal
district, Gujarat State, International Journal of Environment and Geoinformatics (IJEGEO), 8(1):065-077. doi: 10.30897/ijegeo.777434
Sutariya et al., / IJEGEO 8(1):65-77 (2021)
66
roughness) and the SAR sensor configurations such as
incidence angle, polarization, and frequency (Sahebi et
al., 2002). The backscattered SAR signal is affected
strongly from soil moisture and surface roughness on
bare soil (Ulaby, Moore, and Fung, 1986; Zribi et al.,
2007). For bare soils, different theoretical and empirical
approaches have been developed and many approaches
assumed that there is a linear behaviour between surface
soil moisture and SAR backscattering coefficient (sigma-
nought:σ0) (Esetlili and Kurucu, 2016; Esetlili et al.,
2018; Gao, Zribi, Escorihuela, and Baghdadi, 2017;
Zribi, Baghdadi, Holah, and Fafin, 2005). The relative
SMC ranges from zero in dry soil to unity (or 100%) in a
completely saturated soil. Wagner et al., 1999a, b,
developed a SMC retrieval algorithm for the ERS
scatterometer. ERS backscattering is described in terms
of empirical backscatter parameters and the relative
surface SMC according to σ0 (θ, t) = σ0dry (θ, t) +
S(t)ms(t), where θ is the local incidence angle, t is the
time, σ0 dry is the backscattering coefficient observed
under completely dry soil conditions in decibels, and S is
the sensitivity in decibels of the σ0 to changes in soil
moisture.
Water Cloud Model (WCM) to estimate the soil
moisture
A semi-empirical model i.e. water cloud model (WCM)
was used to estimate the SM in the area of Varanasi
district, India using C- band Sentinel -1A SAR data. The
potential of inversion scheme was checked using three
types of vegetation descriptors (LWAI, LAI and fveg).
WCM parameterization was done using non-linear least
square optimization algorithm and the results indicated
high correlation between the estimated SM with the in-
situ observation (R2 = 0.847, RMSE = 3.23). Landsat-8
derived vegetation descriptor was found better in WCM
for the estimation of SM more accurately (Yadav, et al.,
2019; Küçükmatçı and Avdan, 2019). The prospects of
semi-empirical Water Cloud Model (WCM) to estimate
the soil moisture content was tested in a fragmented
agricultural region for different time periods. The
concurrent satellite data obtained from Sentinel-1A and
Landsat 8 were utilized to supply the inputs for inversion
modelling based on the Levenberg-Marquardt approach.
The current research introduced ‘virtual Normalized
Difference Vegetation Index’ concept to refine the
WCM and yielded reliable soil moisture output for
supplementing the anchor pixel selection process. The
research results indicated that the anchor pixel selection
with and without soil moisture criterion has a significant
impact on actual evapotranspiration estimation. The
research also explores the scope of the synergetic use of
optical and Synthetic Aperture Radar (SAR) inputs in
SEBAL (Prakash Mohan et al, 2019).
Sentinel-1 and Landsat-8 data were used to retrieve soil
moisture from top soil surface (0–5 cm depth) at
agricultural land (area under wheat crop). Water Cloud
Model (WCM) was used for removal of vegetation
influence (r-veg), total backscattering coefficient (r total)
and Normalized Difference Vegetation Index (NDVI)
were used to simulate backscattering from soil (r soil.
Further, modelled soil moisture was evaluated using in
situ soil moisture measurements and a Time Domain
Reflectometer during Sentinel-1 overpass (24 January,
25 February and 13 March 2018). Statistical tests
showed that an integrated approach has potential to
improve soil moisture estimates over the
vegetated/cropped area for agricultural and hydrological
studies (Rawat et al. 2019).
Multi-sensor fusion for soil moisture retrieval
In recent few years, there has been growing interest in
multi-sensor fusion for retrieving soil moisture.
Synthetic aperture radar (SAR) and optic data fusion is
one of the most foremost used approaches (Gao et al.,
2017 and Prakash et al., 2012). An approach for retrieval
of soil moisture content (SMC) by coupling single
polarization C band synthetic aperture radar (SAR) and
optical data at the plot scale in vegetated areas was
presented by Reza Attarzadeh, 2018.The study was
carried out at five different sites with dominant
vegetation cover located in Kenya. Within the initial
state of the study, different features are extracted from
single polarization mode (VV polarization) SAR and
optical data. A complicated advance state of the art
machine learning regression approach, the support vector
regression (SVR) technique, is used to retrieve soil
moisture. This paper takes a new look at soil moisture
retrieval in vegetated areas considering the needs of
practical applications. Using optical, thermal infrared
(TIR), and microwave (MW) sensors different retrieval
of soil moisture approaches have been developed
(Barrett et al., 2013). Optical sensors in the thermal
spectrum are able to identify temperature differences,
which can be related to surface soil moisture. Microwave
soil moisture estimations are based on the strong contrast
between the dielectric properties of water (≈80) and dry
soil (<5) (Zhuo and Han, 2016). Surface SMC can be
estimated based on Normalized Difference Vegetation
Index (NDVI) and LST. Petropoulos et al., (2009)
described this LST/NDVI relationship as a linear
relationship with the SMC. Zeng et al., 2004 proposed a
method to retrieve SMC based on the integration of LST
and NDVI called Triangle method. LST is determined
from thermal emission, and NDVI is estimated based on
surface reflectance of red and the near infrared portions
of the electromagnetic spectrum, so these methods
sometimes are termed as optical, thermal infrared remote
sensing (Amato et al., 2015; Rahimzadeh-Bajgiran et al.,
2013; Traore et al., 2020).
Thermal Remote Sensing for Soil Moisture
Estimation
For alternatively use to microwave remote sensing
approaches, thermal remote sensing has also been
extensively used to monitor soil moisture and its related
variables (Amazirh et al., 2018). The land surface
temperature (LST) derived from (Avdan and
Jovanovska, 2016; Şekertekin et al., 2016; İncekara et
al., 2017; Çelik et al., 2019; Sekertekin, and Bonafoni, S.
2020) the use of the LANDSAT 8 thermal infrared
sensor Band 10 data and operational land imager Band 4
and Band 5 data. To understand the interaction between
SAR signals and the surface many models have been
developed. Different theoretical and empirical
Sutariya et al., / IJEGEO 8(1):65-77 (2021)
67
approaches have been developed for estimating soil
moisture and many approaches assumed that there is a
linear correlation between surface soil moisture and SAR
backscattering coefficient (σ0) (Amazirh et al., 2018;
Mirsoleimani et al., 2019; Şekertekin et al., 2018;
Paloscia et al., 2013 and Esetlili and Kurucu, 2016).
The soil moisture distribution was estimated using C-
band Synthetic Aperture Radar (SAR) data in an
agricultural region in Bergama, a district of İzmir city
(Şekertekin et al, 2016). In-situ soil moisture
measurements were carried out in 20 test fields
simultaneously with SAR data acquisition. The effects of
soil moisture and local incidence angle on backscattering
coefficient were analysed using these acquisition data,
and then a multiple regression analysis was performed to
generate an empirical model. The proposed model was
evaluated using statistical metrics namely coefficient of
determination (R2) and Root Mean Square Error
(RMSE), and the results were 0.84 and 2.46 %,
respectively. Mohamed et al, 2019, carried out a study
was in the east of Nile Delta of Egypt to predict soil
moisture content using optical remote sensing data and
Synthetic Aperture Radar (SAR) Sentinel-1 data. A
number of 100 surface soil samples were collected to
represent different soil types in the study area. Soil
Moisture Index (SMI) is assessed based on thermal
remote sensing data as Land Surface Temperature (LST)
besides, Sentinel-1 data. The results showed a high
correlation between SMC and SMI, coefficient of
determination (R2) reached 0.81 between actual soil
moisture and SMI. Furthermore, a significant correlation
was also shown by Sentinel-1 data, with R2 of 0.83
between actual soil moisture content and backscattering
coefficient (dB).
The main objective of this study is to estimate and map
soil moisture distribution using Sentinel-1 C-band SAR
data in combination with LST estimated from Landsat-8
OLI data.
Materials and Methods
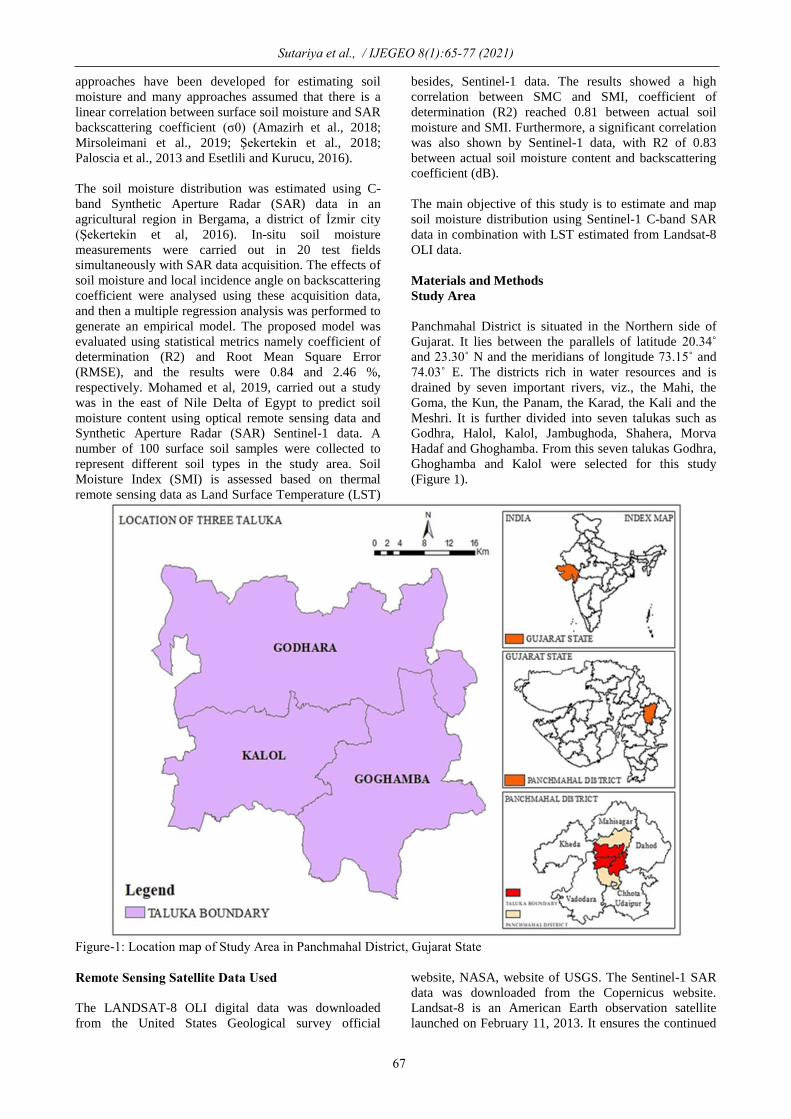
Study Area
Panchmahal District is situated in the Northern side of
Gujarat. It lies between the parallels of latitude 20.34˚
and 23.30˚ N and the meridians of longitude 73.15˚ and
74.03˚ E. The districts rich in water resources and is
drained by seven important rivers, viz., the Mahi, the
Goma, the Kun, the Panam, the Karad, the Kali and the
Meshri. It is further divided into seven talukas such as
Godhra, Halol, Kalol, Jambughoda, Shahera, Morva
Hadaf and Ghoghamba. From this seven talukas Godhra,
Ghoghamba and Kalol were selected for this study
(Figure 1).
Figure-1: Location map of Study Area in Panchmahal District, Gujarat State
Remote Sensing Satellite Data Used
The LANDSAT-8 OLI digital data was downloaded
from the United States Geological survey official
website, NASA, website of USGS. The Sentinel-1 SAR
data was downloaded from the Copernicus website.
Landsat-8 is an American Earth observation satellite
launched on February 11, 2013. It ensures the continued
Sutariya et al., / IJEGEO 8(1):65-77 (2021)
68
acquisition and availability of Landsat data utilizing a
two-sensor payload, the Operational Land Imager (OLI)
and the Thermal Infrared Sensor (TIRS). These two
instruments collect data for nine shortwave bands and
two long wave thermal bands (Department of the Interior
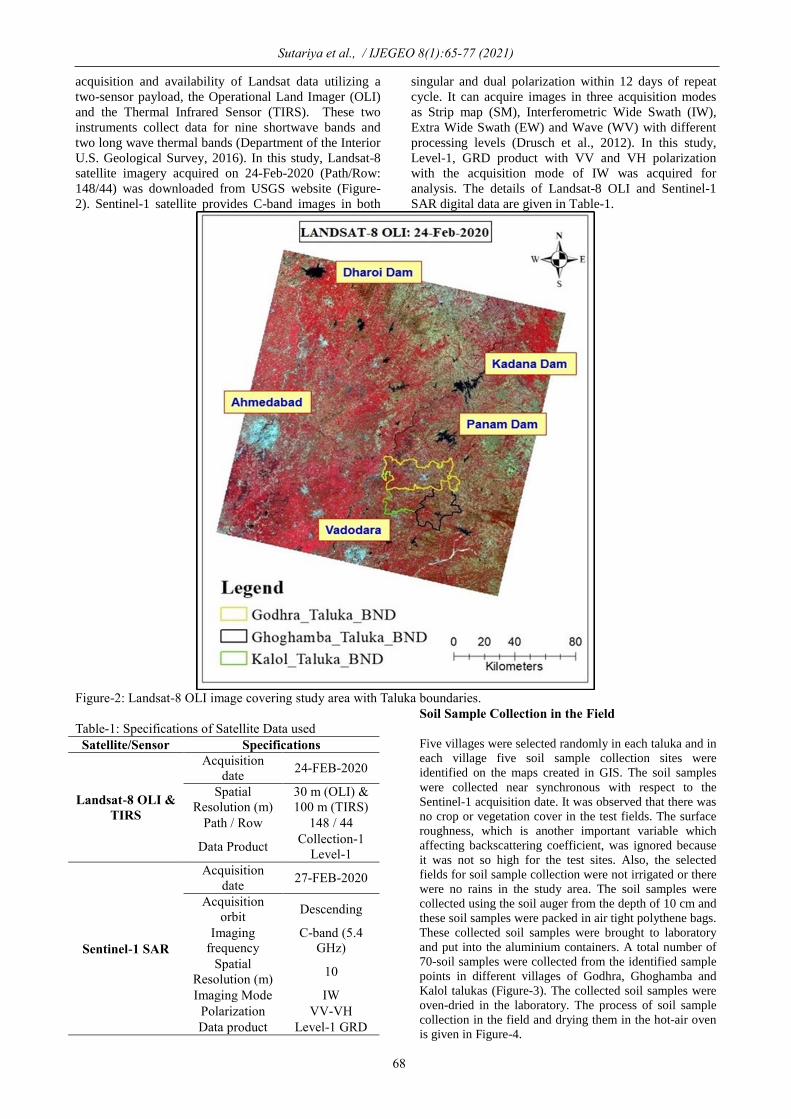
U.S. Geological Survey, 2016). In this study, Landsat-8
satellite imagery acquired on 24-Feb-2020 (Path/Row:
148/44) was downloaded from USGS website (Figure-
2). Sentinel-1 satellite provides C-band images in both
singular and dual polarization within 12 days of repeat
cycle. It can acquire images in three acquisition modes
as Strip map (SM), Interferometric Wide Swath (IW),
Extra Wide Swath (EW) and Wave (WV) with different
processing levels (Drusch et al., 2012). In this study,
Level-1, GRD product with VV and VH polarization
with the acquisition mode of IW was acquired for
analysis. The details of Landsat-8 OLI and Sentinel-1
SAR digital data are given in Table-1.
Figure-2: Landsat-8 OLI image covering study area with Taluka boundaries.
Table-1: Specifications of Satellite Data used
Satellite/Sensor Specifications
Landsat-8 OLI &
TIRS
Acquisition
date 24-FEB-2020
Spatial
Resolution (m)
30 m (OLI) &
100 m (TIRS)
Path / Row 148 / 44
Data Product Collection-1
Level-1
Sentinel-1 SAR
Acquisition
date 27-FEB-2020
Acquisition
orbit Descending
Imaging
frequency
C-band (5.4
GHz)
Spatial
Resolution (m) 10
Imaging Mode IW
Polarization VV-VH
Data product Level-1 GRD
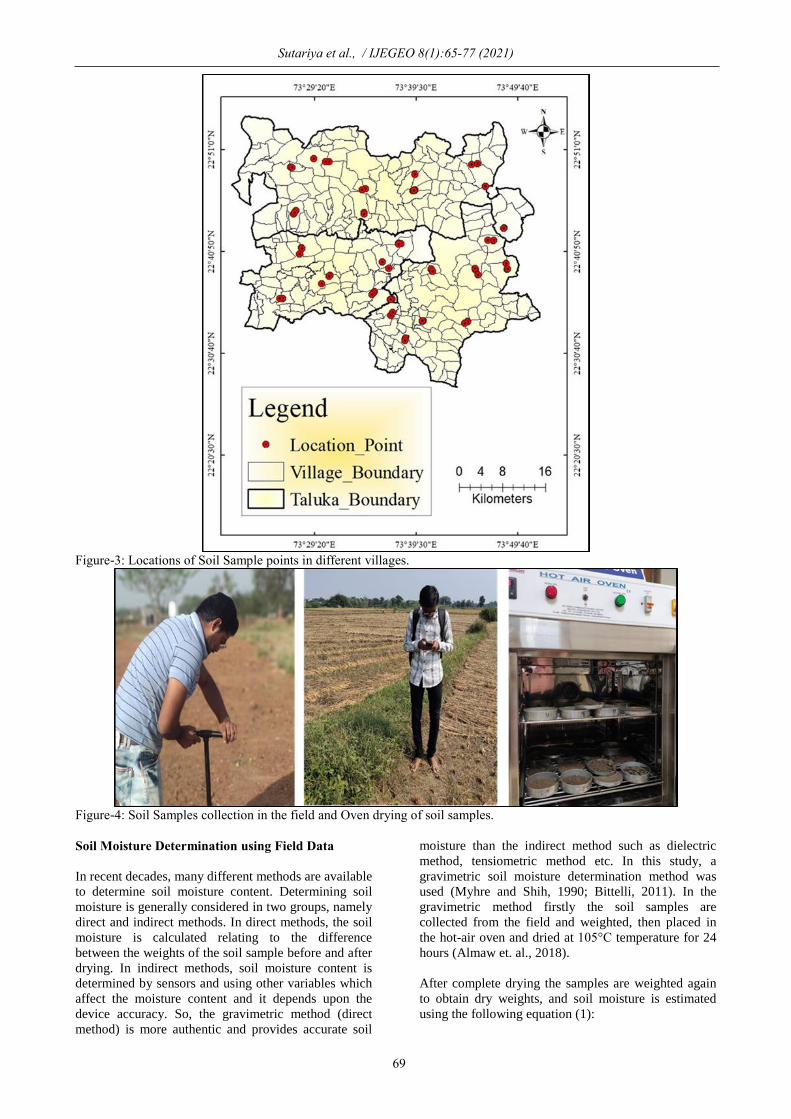
Soil Sample Collection in the Field
Five villages were selected randomly in each taluka and in
each village five soil sample collection sites were
identified on the maps created in GIS. The soil samples
were collected near synchronous with respect to the
Sentinel-1 acquisition date. It was observed that there was
no crop or vegetation cover in the test fields. The surface
roughness, which is another important variable which
affecting backscattering coefficient, was ignored because
it was not so high for the test sites. Also, the selected
fields for soil sample collection were not irrigated or there
were no rains in the study area. The soil samples were
collected using the soil auger from the depth of 10 cm and
these soil samples were packed in air tight polythene bags.
These collected soil samples were brought to laboratory
and put into the aluminium containers. A total number of
70-soil samples were collected from the identified sample
points in different villages of Godhra, Ghoghamba and
Kalol talukas (Figure-3). The collected soil samples were
oven-dried in the laboratory. The process of soil sample
collection in the field and drying them in the hot-air oven
is given in Figure-4.
Sutariya et al., / IJEGEO 8(1):65-77 (2021)
69
Figure-3: Locations of Soil Sample points in different villages.
Figure-4: Soil Samples collection in the field and Oven drying of soil samples.
Soil Moisture Determination using Field Data
In recent decades, many different methods are available
to determine soil moisture content. Determining soil
moisture is generally considered in two groups, namely
direct and indirect methods. In direct methods, the soil
moisture is calculated relating to the difference
between the weights of the soil sample before and after
drying. In indirect methods, soil moisture content is
determined by sensors and using other variables which
affect the moisture content and it depends upon the
device accuracy. So, the gravimetric method (direct
method) is more authentic and provides accurate soil
moisture than the indirect method such as dielectric
method, tensiometric method etc. In this study, a
gravimetric soil moisture determination method was
used (Myhre and Shih, 1990; Bittelli, 2011). In the
gravimetric method firstly the soil samples are
collected from the field and weighted, then placed in
the hot-air oven and dried at 105°C temperature for 24
hours (Almaw et. al., 2018).
After complete drying the samples are weighted again
to obtain dry weights, and soil moisture is estimated
using the following equation (1):
Sutariya et al., / IJEGEO 8(1):65-77 (2021)
70
Soil Moisture (%) = (Mw / Ms) ×100 ……
1
Where, Mw is mass of water and Ms is the mass of dry
soil.
Mw = (weight of wet soil + can) – (weight of oven dry
soil + can)
Ms = (weight of oven dry soil + can) – weight of can
The average mean values for each plot were computed
from all the soil samples within each plot. The range of
the soil moisture values are between 5 to 15, 5 to 17
and 3 to 13 vol. %, for Godhra, Goghamba and Kalol
Talukas, respectively.
Land Surface Temperature (LST) Estimation
The Landsat-8 OLI and TIRS digital data was analyzed
for estimation of Land Surface Temperature (LST) of
the study area. Thermal infrared sensor Band-10 data
and operational land imager Band-4 and Band-5 data
were used in estimating LST and characteristic of these
bands (Department of the Interior U.S. Geological
Survey, 2016) shown in Table-2.
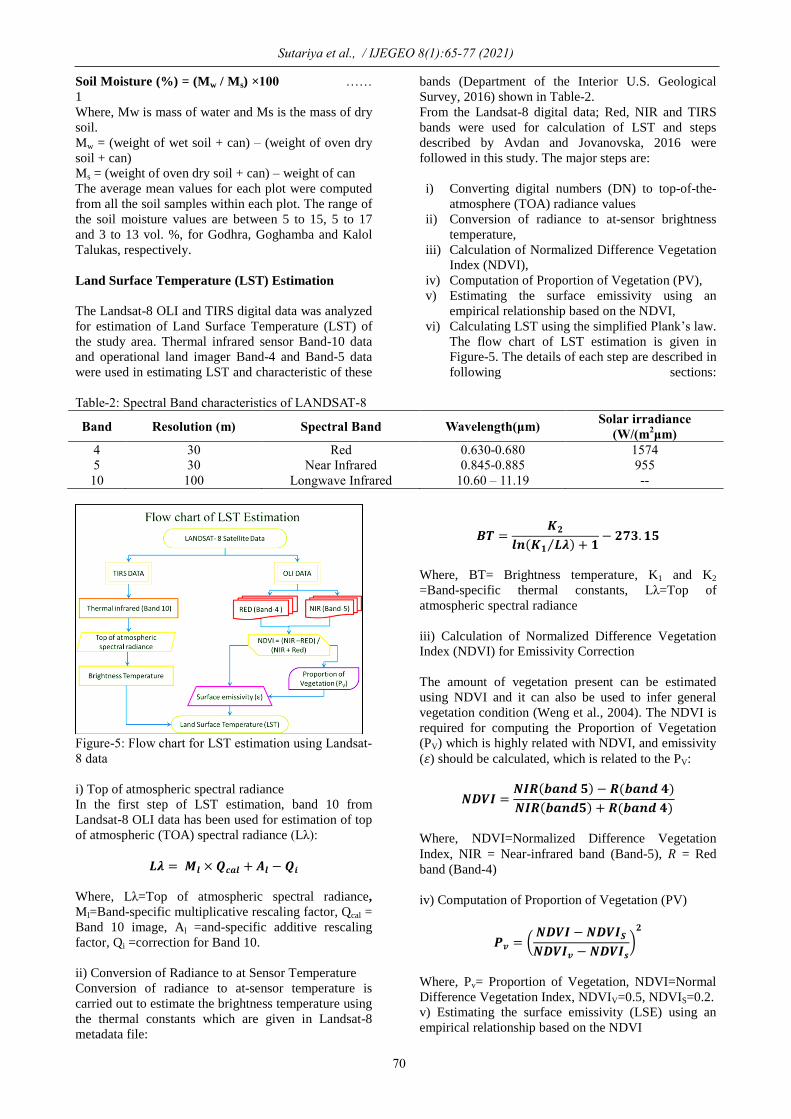
From the Landsat-8 digital data; Red, NIR and TIRS
bands were used for calculation of LST and steps
described by Avdan and Jovanovska, 2016 were
followed in this study. The major steps are:
i) Converting digital numbers (DN) to top-of-the-
atmosphere (TOA) radiance values
ii) Conversion of radiance to at-sensor brightness
temperature,
iii) Calculation of Normalized Difference Vegetation
Index (NDVI),
iv) Computation of Proportion of Vegetation (PV),
v) Estimating the surface emissivity using an
empirical relationship based on the NDVI,
vi) Calculating LST using the simplified Plank’s law.
The flow chart of LST estimation is given in
Figure-5. The details of each step are described in
following sections:
Table-2: Spectral Band characteristics of LANDSAT-8
Band Resolution (m) Spectral Band Wavelength(μm) Solar irradiance
(W/(m2μm)
4 30 Red 0.630-0.680 1574
5 30 Near Infrared 0.845-0.885 955
10 100 Longwave Infrared 10.60 – 11.19 --
Figure-5: Flow chart for LST estimation using Landsat-
8 data
i) Top of atmospheric spectral radiance
In the first step of LST estimation, band 10 from
Landsat-8 OLI data has been used for estimation of top
of atmospheric (TOA) spectral radiance (Lλ):
𝑳𝝀 = 𝑴𝒍 × 𝑸𝒄𝒂𝒍 + 𝑨𝒍 − 𝑸𝒊
Where, Lλ=Top of atmospheric spectral radiance,
Ml=Band-specific multiplicative rescaling factor, Qcal =
Band 10 image, Al =and-specific additive rescaling
factor, Qi =correction for Band 10.
ii) Conversion of Radiance to at Sensor Temperature
Conversion of radiance to at-sensor temperature is
carried out to estimate the brightness temperature using
the thermal constants which are given in Landsat-8
metadata file:
𝑩𝑻 =𝑲𝟐
𝒍𝒏(𝑲𝟏 𝑳𝝀⁄ ) + 𝟏− 𝟐𝟕𝟑. 𝟏𝟓
Where, BT= Brightness temperature, K1 and K2
=Band-specific thermal constants, Lλ=Top of
atmospheric spectral radiance
iii) Calculation of Normalized Difference Vegetation
Index (NDVI) for Emissivity Correction
The amount of vegetation present can be estimated
using NDVI and it can also be used to infer general
vegetation condition (Weng et al., 2004). The NDVI is
required for computing the Proportion of Vegetation
(PV) which is highly related with NDVI, and emissivity
(𝜀) should be calculated, which is related to the PV:
𝑵𝑫𝑽𝑰 =𝑵𝑰𝑹(𝒃𝒂𝒏𝒅 𝟓) − 𝑹(𝒃𝒂𝒏𝒅 𝟒)
𝑵𝑰𝑹(𝒃𝒂𝒏𝒅𝟓) + 𝑹(𝒃𝒂𝒏𝒅 𝟒)
Where, NDVI=Normalized Difference Vegetation
Index, NIR = Near-infrared band (Band-5), 𝑅 = Red
band (Band-4)
iv) Computation of Proportion of Vegetation (PV)
𝑷𝒗 = (𝑵𝑫𝑽𝑰 − 𝑵𝑫𝑽𝑰𝑺
𝑵𝑫𝑽𝑰𝒗 − 𝑵𝑫𝑽𝑰𝒔
)𝟐
Where, Pv= Proportion of Vegetation, NDVI=Normal
Difference Vegetation Index, NDVIV=0.5, NDVIS=0.2.
v) Estimating the surface emissivity (LSE) using an
empirical relationship based on the NDVI
Sutariya et al., / IJEGEO 8(1):65-77 (2021)
71
For calculating LSE in the model when the NDVI
value is less than 0, it is classified as water, and the
emissivity value 0.991 is considered. For NDVI values
between 0 to 0.2, it is classified as the land is covered
with soil and there is no vegetation, and the emissivity
value 0.996 is considered and the NDVI value is
greater than 0.5, it is classified as land covered with
vegetation and the emissivity value of 0.973 is
considered. The NDVI values between 0.2 and 0.5 are
classified as mixtures of soil and vegetation and the
emissivity can be calculated follows,
𝜺𝝀 = 𝜺𝒗𝝀𝑷𝒗 + 𝜺𝒔𝝀(𝟏 − 𝑷𝒗) + 𝑪𝝀
Where, ελ= Land Surface Emissivity, Pv= Proportion of
Vegetation, εvλ=0.973, εsλ=0.996, Cλ=Surface
roughness (0.005)
vi) Land surface temperature Computation
Land surface temperature (LST) is computed using the
following equation:
𝑻𝒔 =𝑩𝑻
{𝟏 + [𝝀𝑩𝑻𝝆
] 𝐥𝐧 𝜺𝝀}
Where, Ts=land surface temperature (℃),
BT=Brightness temperature, ελ= Land Surface
Emissivity, λ= limiting wave length (10.895), ρ =
1.438 ×10⁻²
m
Soil Moisture Index (SMI) Computation using LST
The soil moisture index (SMI) is defined as the
proportion of the difference between the current soil
moisture and the permanent wilting point to the field
capacity and the residual soil moisture. The index
values range from 0 to 1 with 0 indicating extreme dry
conditions and 1 indicating extreme wet conditions
(Chandrasekar, 2016). The SMI has been retrieved
directly according to (Moawad, 2012) using LST as
follows:
SMI = (LSTmax - LST) / (LSTmax –LSTmin)
Where: SMI is Soil Moisture Index, LST max, LST min,
LST are the maximum, minimum and value of the
retrieved LST respectively. The SMI for all the sample
plots in three talukas was computed and the range of
SMI values were between 0.148 to 0.868; 0.167 to
0.857; and 0.115 to 0.889 for Godhra, Goghamba and
Kalol Talukas, respectively
Sentinel-1 Image Pre-processing
Sentinel-1 provides data with a spatial resolution of 10
m and a temporal resolution of 12 days, in both VV
and VH polarizations. In this present study, VV
polarization data were used to estimate the soil
moisture. Previous studies have shown that VH data
has only a limited potential for the estimation of soil
moisture, in particular as a consequence of its high
sensitivity to volume scattering, which depends
strongly on the geometrical alignment and
characteristics of the vegetation (Karjalainen, et l.,
2004; Chauhan, and Srivastava, 2016). ESA announced
some steps to be performed with open source tools of
Sentinel Application Platform (SNAP) software for
determining backscattering coefficient (σ0). The steps
of this analysis included: apply orbit file, thermal noise
removal, border noise removal, radiometric calibration,
speckle filtering, range doppler terrain correction and
Conversion to dB (Filipponi, 2019). After applying all
these steps, final backscattering coefficient image was
generated from the high-resolution Level-1 Ground
Range Detected (GRD) product with a spatial
resolution of 10 m x 10 m.
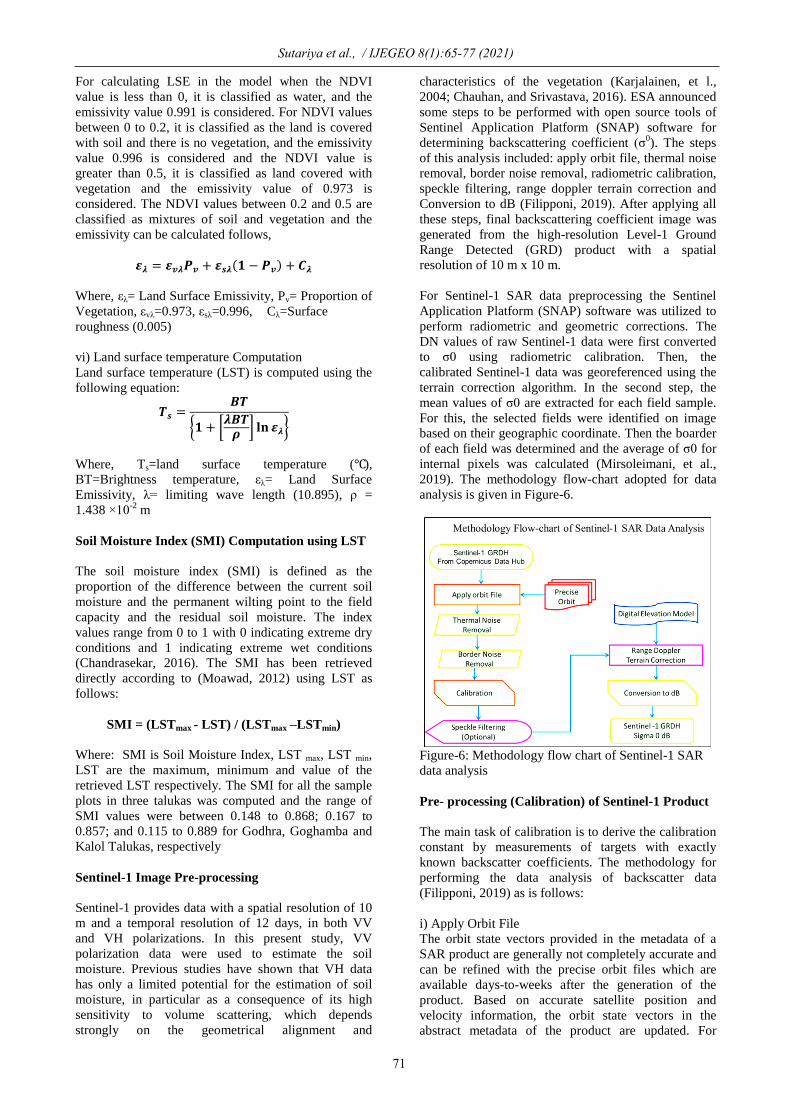
For Sentinel-1 SAR data preprocessing the Sentinel
Application Platform (SNAP) software was utilized to
perform radiometric and geometric corrections. The
DN values of raw Sentinel-1 data were first converted
to σ0 using radiometric calibration. Then, the
calibrated Sentinel-1 data was georeferenced using the
terrain correction algorithm. In the second step, the
mean values of σ0 are extracted for each field sample.
For this, the selected fields were identified on image
based on their geographic coordinate. Then the boarder
of each field was determined and the average of σ0 for
internal pixels was calculated (Mirsoleimani, et al.,
2019). The methodology flow-chart adopted for data
analysis is given in Figure-6.
Figure-6: Methodology flow chart of Sentinel-1 SAR
data analysis
Pre- processing (Calibration) of Sentinel-1 Product
The main task of calibration is to derive the calibration
constant by measurements of targets with exactly
known backscatter coefficients. The methodology for
performing the data analysis of backscatter data
(Filipponi, 2019) as is follows:
i) Apply Orbit File
The orbit state vectors provided in the metadata of a
SAR product are generally not completely accurate and
can be refined with the precise orbit files which are
available days-to-weeks after the generation of the
product. Based on accurate satellite position and
velocity information, the orbit state vectors in the
abstract metadata of the product are updated. For
Sutariya et al., / IJEGEO 8(1):65-77 (2021)
72
Sentinel-1, resituated orbit files and precise orbit files
may be applied. Precise orbits are produced a few
weeks after acquisition.
ii) Thermal Noise Removal
Thermal noise removal reduces noise effects in the
inter-sub-swath texture, in particular, normalizing the
backscatter signal within the entire Sentinel-1 scene
and resulting in reduced discontinuities between sub-
swaths for scenes in multi-swath acquisition modes. It
can be applied to Sentinel-1 Level-1 SLC products as
well as Level-1 GRD products which have not already
been corrected. The operator can also remove this
correction based on the product annotations (i.e. to
reintroduce the noise signal that was removed).
Accordingly, to allow for re-application of the
correction product annotations will be updated. The
Level-1 products provide a noise LUT for each data.
iii) Border Noise Removal
While generating level-1 products, it is necessary to
correct the sampling start time in order to compensate
for the change of the Earth’s curvature. At the same
time, azimuth and range compression leads to
radiometric artefacts at the image borders. The border
noise removal algorithm, available as an operator in
SNAP, was designed in order to remove low intensity
noise and invalid data on scene edges.
iv) Calibration
Calibration is the procedure that converts digital pixel
values to radio metrically calibrated SAR backscatter.
The information required to apply the calibration
equation is included within the Sentinel-1 GRD
product; specifically, a calibration vector included as
an annotation in the product allows simple conversion
of image intensity values into sigma nought values.
The calibration reverses the scaling factor applied
during level-1 product generation, and applies a
constant offset and a range-dependent gain, including
the absolute calibration constant.
v) Conversion to dB
As a last step of the pre-processing workflow, the unit
less backscatter coefficient is converted to dB using a
logarithmic transformation, to dB as 10*log10 σ0. The
scattering behaviour depends on the physical
characteristics of the terrain, primarily the geometry of
the terrain elements and their electromagnetic
characteristics.
Landsat-8 and Sentinel-1 Satellite data analysis
In this study, back scattering coefficient σ0vv (dB) and
soil moisture index (SMI) is considered as a function of
soil moisture as given in Equation -9.
MC (%) = X1* SMI + X2 * σ0vv (dB) + c
Where σ0 (dB) is backscattering coefficient, and SMI is
the Soil Moisture Index. In this multiple regression
analysis, MC (%) is considered as a dependent
variable, whereas σ0 (dB) and SMI are independent
variables.
Validation of Soil Moisture
For the validation of the predicted soil moisture,
performance indices namely coefficient of
determination (R2) and standard deviation (S) were
utilized. The equation of these performance indices is
presented in Equation 10 and 11.
𝑹𝟐 =
[
∑ (𝑶𝒊 − �̅�)(𝑷𝒊 − �̅�)𝒏𝒊=𝟏
√∑ (𝑶𝒊 − �̅�)𝟐𝒏𝒊=𝟏 ∑ (𝑷𝒊 − �̅�)𝟐𝒏
𝒊=𝟏 ] 𝟐
Where Oi and Pi are the observed soil moisture and
predicated soil moisture respectively, O̅ and P̅ are the
mean values of the observed soil moisture and
predicated soil moisture respectively and n is the
number of data sets.
S = √∑ (𝒙𝒊−𝒙 )𝟐𝒏
𝒊=𝟏
(𝒏−𝟏)
Where, S is the standard deviation of data set, xi is each
value in the data set, x̄ is the mean of all values in data
set and n is the total number of data sets.
The shape files were created for each test site, and
mean LST and mean σ0 (dB) values of each sample test
site in three talukas were extracted using the shape files
in ArcGIS software. The Soil Moisture Index (SMI)
values for each sample plots were computed using the
LST data. The multiple regression analysis was carried
out between back scattering coefficient σ0 (dB) & and
Soil Moisture Index (SMI) with field measured soil
moisture values.
Results and Discussion
Estimation of Land Surface Temperature from
Landsat-8 Satellite Data
The algorithm was created in ArcGIS for estimating land
surface temperature using Landsat-8 OLI and TIRS data.
For estimating LST, the TIRS band-10 was used to
estimate brightness temperature and bands-4 (Red) and 5
(NIR) were used for calculating the NDVI. Land surface
temperature of Godhra, Goghamba and Kalol talukas of
Panchmahal district was estimated using the LANDSAT-8
data of 24-FEB-2020 and the results of one of the talukas
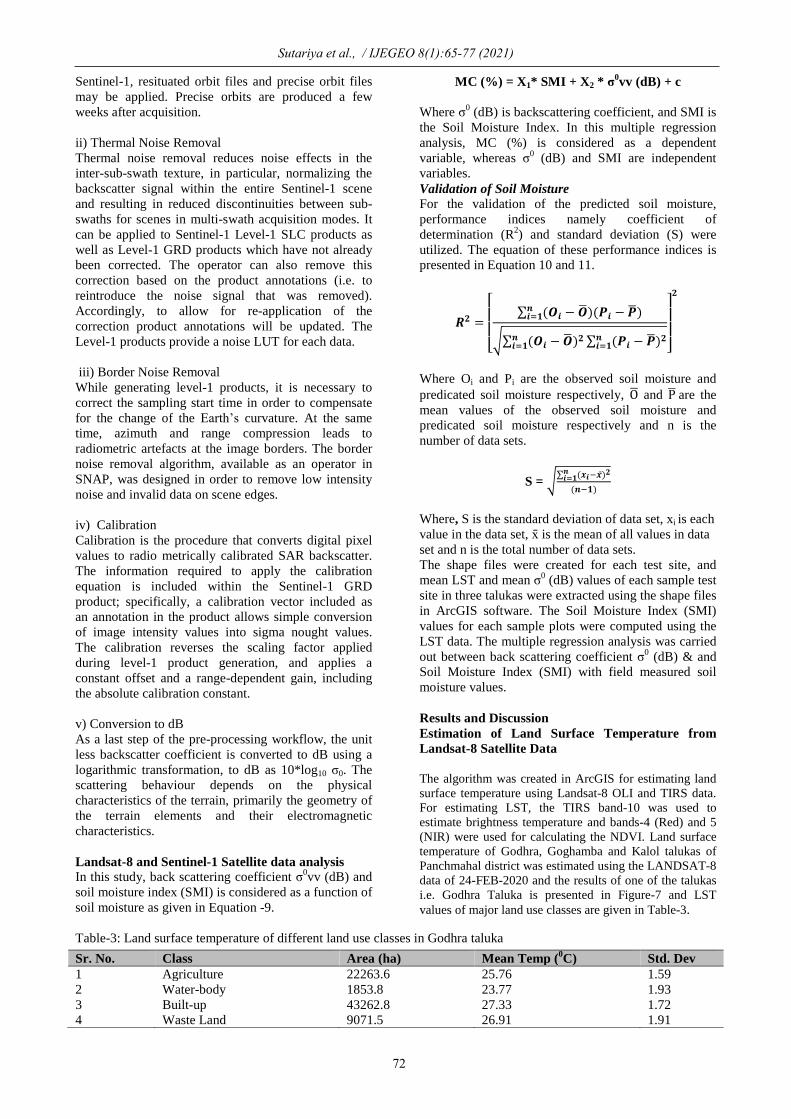
i.e. Godhra Taluka is presented in Figure-7 and LST
values of major land use classes are given in Table-3.
Table-3: Land surface temperature of different land use classes in Godhra taluka
Sr. No. Class Area (ha) Mean Temp (0C) Std. Dev
1 Agriculture 22263.6 25.76 1.59
2 Water-body 1853.8 23.77 1.93
3 Built-up 43262.8 27.33 1.72
4 Waste Land 9071.5 26.91 1.91
Sutariya et al., / IJEGEO 8(1):65-77 (2021)
73
Figure-7: Land Surface Temperature (LST) map of Godhra Taluka
Estimation of Backscattering Coefficient σ0
VV (dB)
from Sentinel-1 Satellite Data
The open source tools of Sentinel Application Platform
(SNAP) software was used for determining
backscattering coefficient values from Sentinel-1 data.
All the steps were described in this software from
applying orbit file to conversion to dB were applied
and the backscatter image of VV and VH polarization
was generated for each 10 cm × 10 cm grid. The
efficiency of single polarization (VV) is better than the
cross polarization (VH) of backscatter data for soil
moisture estimation. Backscattering coefficient images
of Godhra, Goghamba and Kalol talukas were
generated using the Sentinel-1 data for the date of 27-
Feb-2020. The Backscatter Coefficient, σ0VV (dB)
values of major land use classes in Godhra Taluka are
given in Table-4.
Table-4: Backscattering coefficient σ0
VV (dB) VV of different land use classes for Godhra
Sr. No. Class Area (ha) Mean σ0VV (dB) Std. Dev
1 Agriculture 22263.6 -10.21 1.81
2 Water body 1853.8 -12.98 1.76
3 Built-up 43262.4 -11.00 1.66
4 Waste Land 9071.5 -10.93 1.85
Linear Regression Analysis
For estimate the soil moisture content of sample fields in
three talukas, the shape files of each field were created
and mean LST and mean σ0
(dB) values of each test site
were extracted using the shape files in ArcGIS software.
The datasets of field measured soil moisture (%) of
sample test sites in each village, σ0
VV (dB), and Soil
Moisture Index (SMI) generated using LST data were
created for three talukas separately. These datasets were
used in the multiple regression analysis to estimate and
map soil moisture content.
The field measured soil moisture (MS %) was
considered as dependent variable, and σ0
VV and SMI
were chosen as independent variables. While all test sites
were utilized in order to generate model for each taluka
separately, while 5 test sites in taluka were used for the
accuracy assessment. As a result of multiple regression
analysis, mathematical models for soil moisture
estimation from σ0
VV and SMI were generated for three
taluka and these regression equations are as follows:
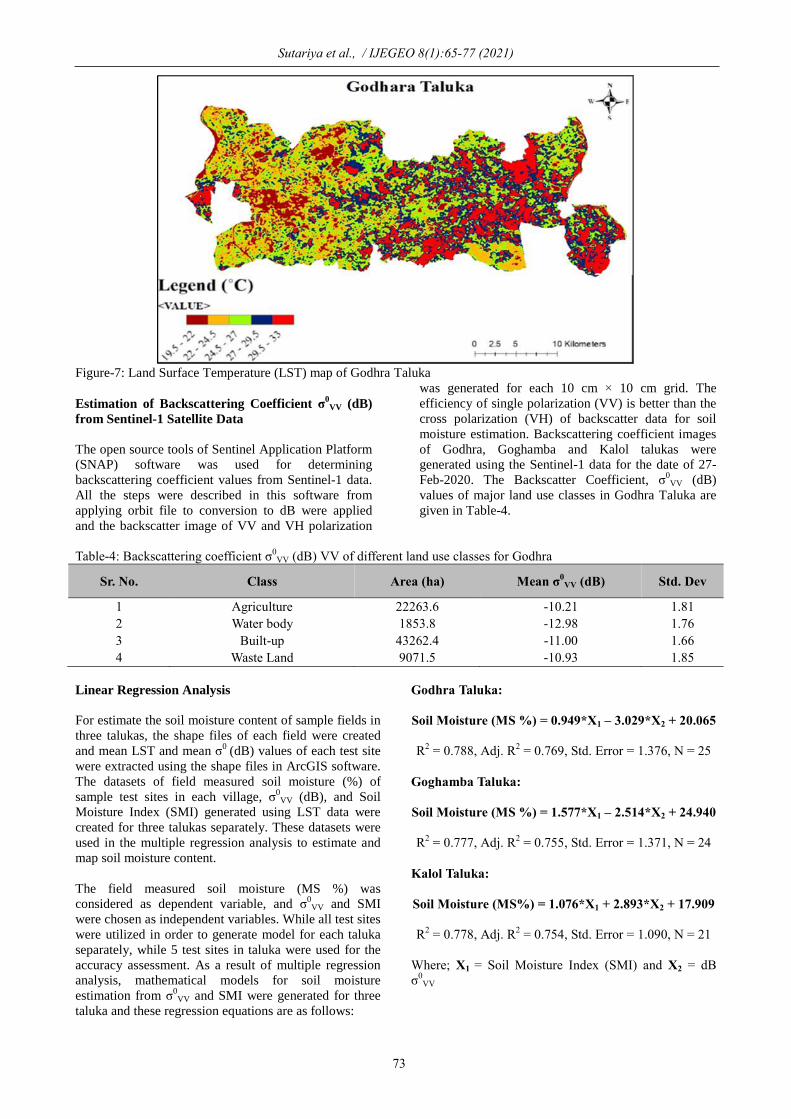
Godhra Taluka:
Soil Moisture (MS %) = 0.949*X1 – 3.029*X2 + 20.065
R2 = 0.788, Adj. R
2 = 0.769, Std. Error = 1.376, N = 25
Goghamba Taluka:
Soil Moisture (MS %) = 1.577*X1 – 2.514*X2 + 24.940
R2 = 0.777, Adj. R
2 = 0.755, Std. Error = 1.371, N = 24
Kalol Taluka:
Soil Moisture (MS%) = 1.076*X1 + 2.893*X2 + 17.909
R2 = 0.778, Adj. R
2 = 0.754, Std. Error = 1.090, N = 21
Where; X1 = Soil Moisture Index (SMI) and X2 = dB
σ0VV
Sutariya et al., / IJEGEO 8(1):65-77 (2021)
74
These linear regression equations were used to compute
the predicted soil moisture and observed and predicted
soil moisture in three talukas are given Figure-8.
Figure-8: Linear regression analysis between observed
and predicted soil moisture in Godhra, Goghamba and
Kalol Talukas
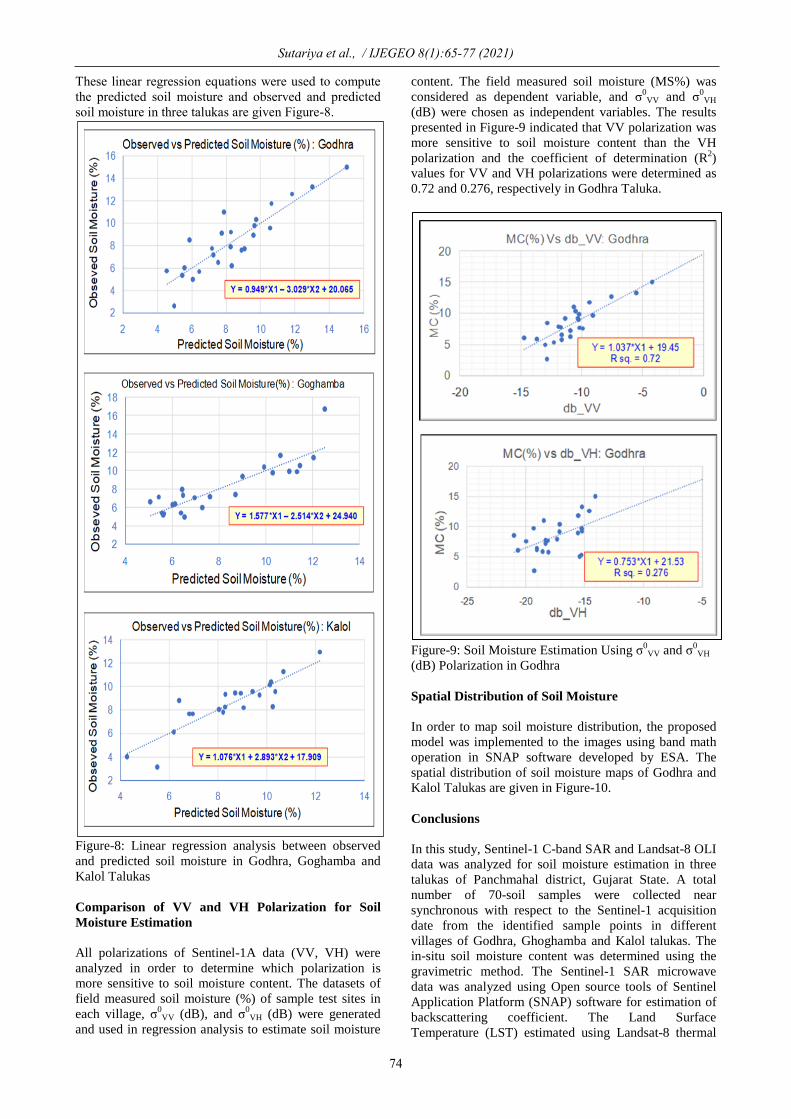
Comparison of VV and VH Polarization for Soil
Moisture Estimation
All polarizations of Sentinel-1A data (VV, VH) were
analyzed in order to determine which polarization is
more sensitive to soil moisture content. The datasets of
field measured soil moisture (%) of sample test sites in
each village, σ0VV (dB), and σ
0VH (dB) were generated
and used in regression analysis to estimate soil moisture
content. The field measured soil moisture (MS%) was
considered as dependent variable, and σ0VV and σ
0VH
(dB) were chosen as independent variables. The results
presented in Figure-9 indicated that VV polarization was
more sensitive to soil moisture content than the VH
polarization and the coefficient of determination (R2)
values for VV and VH polarizations were determined as
0.72 and 0.276, respectively in Godhra Taluka.
Figure-9: Soil Moisture Estimation Using σ0VV and σ
0VH
(dB) Polarization in Godhra
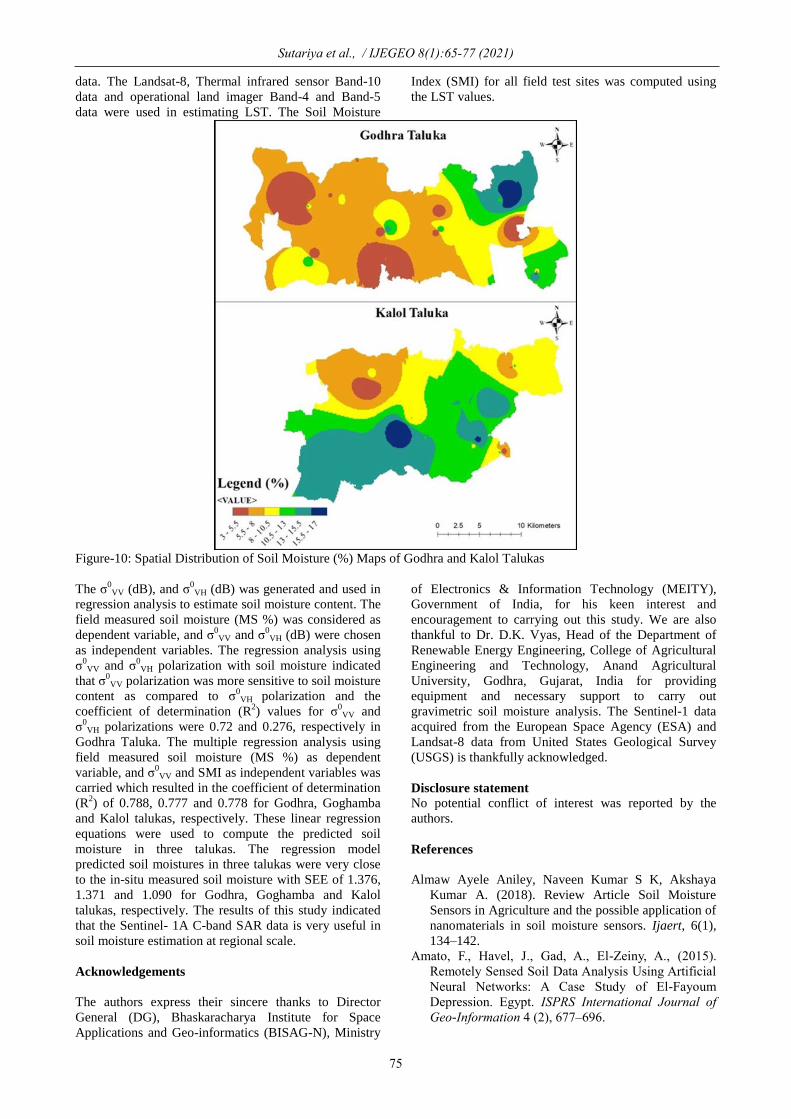
Spatial Distribution of Soil Moisture
In order to map soil moisture distribution, the proposed
model was implemented to the images using band math
operation in SNAP software developed by ESA. The
spatial distribution of soil moisture maps of Godhra and
Kalol Talukas are given in Figure-10.
Conclusions
In this study, Sentinel-1 C-band SAR and Landsat-8 OLI
data was analyzed for soil moisture estimation in three
talukas of Panchmahal district, Gujarat State. A total
number of 70-soil samples were collected near
synchronous with respect to the Sentinel-1 acquisition
date from the identified sample points in different
villages of Godhra, Ghoghamba and Kalol talukas. The
in-situ soil moisture content was determined using the
gravimetric method. The Sentinel-1 SAR microwave
data was analyzed using Open source tools of Sentinel
Application Platform (SNAP) software for estimation of
backscattering coefficient. The Land Surface
Temperature (LST) estimated using Landsat-8 thermal
Sutariya et al., / IJEGEO 8(1):65-77 (2021)
75
data. The Landsat-8, Thermal infrared sensor Band-10
data and operational land imager Band-4 and Band-5
data were used in estimating LST. The Soil Moisture
Index (SMI) for all field test sites was computed using
the LST values.
Figure-10: Spatial Distribution of Soil Moisture (%) Maps of Godhra and Kalol Talukas
The σ0VV (dB), and σ
0VH (dB) was generated and used in
regression analysis to estimate soil moisture content. The
field measured soil moisture (MS %) was considered as
dependent variable, and σ0
VV and σ0
VH (dB) were chosen
as independent variables. The regression analysis using
σ0
VV and σ0VH polarization with soil moisture indicated
that σ0VV polarization was more sensitive to soil moisture
content as compared to σ0
VH polarization and the
coefficient of determination (R2) values for σ
0VV and
σ0
VH polarizations were 0.72 and 0.276, respectively in
Godhra Taluka. The multiple regression analysis using
field measured soil moisture (MS %) as dependent
variable, and σ0VV and SMI as independent variables was
carried which resulted in the coefficient of determination
(R2) of 0.788, 0.777 and 0.778 for Godhra, Goghamba
and Kalol talukas, respectively. These linear regression
equations were used to compute the predicted soil
moisture in three talukas. The regression model
predicted soil moistures in three talukas were very close
to the in-situ measured soil moisture with SEE of 1.376,
1.371 and 1.090 for Godhra, Goghamba and Kalol
talukas, respectively. The results of this study indicated
that the Sentinel- 1A C-band SAR data is very useful in
soil moisture estimation at regional scale.
Acknowledgements
The authors express their sincere thanks to Director
General (DG), Bhaskaracharya Institute for Space
Applications and Geo-informatics (BISAG-N), Ministry
of Electronics & Information Technology (MEITY),
Government of India, for his keen interest and
encouragement to carrying out this study. We are also
thankful to Dr. D.K. Vyas, Head of the Department of
Renewable Energy Engineering, College of Agricultural
Engineering and Technology, Anand Agricultural
University, Godhra, Gujarat, India for providing
equipment and necessary support to carry out
gravimetric soil moisture analysis. The Sentinel-1 data
acquired from the European Space Agency (ESA) and
Landsat-8 data from United States Geological Survey
(USGS) is thankfully acknowledged.
Disclosure statement
No potential conflict of interest was reported by the
authors.
References
Almaw Ayele Aniley, Naveen Kumar S K, Akshaya
Kumar A. (2018). Review Article Soil Moisture
Sensors in Agriculture and the possible application of
nanomaterials in soil moisture sensors. Ijaert, 6(1),
134–142.
Amato, F., Havel, J., Gad, A., El-Zeiny, A., (2015).
Remotely Sensed Soil Data Analysis Using Artificial
Neural Networks: A Case Study of El-Fayoum
Depression. Egypt. ISPRS International Journal of
Geo-Information 4 (2), 677–696.
Sutariya et al., / IJEGEO 8(1):65-77 (2021)
76
Amazirh A., Merlin Olivier, Er-Raki S., Gao Q.,
Rivalland V., Malbeteau Y., Khabba S., Escorihuela
M. J. (2018). Retrieving surface soil moisture at high
spatio-temporal resolution from a synergy between
Sentinel-1 radar and Landsat thermal data: a study
case over bare soil. Remote Sensing of Environment,
211, 321-337.
Ansari, S., Deshmukh, R. R. (2017). Estimation of Soil
Moisture Content: A Review. International Journal
of Theoretical and Applied Mechanics, 12(3), 571–
577.
Avdan, U., Jovanovska, G. (2016). Algorithm for
Automated Mapping of Land Surface Temperature
Using LANDSAT 8 Satellite Data. 2016.
Barrett, B.; Petropoulos, G.P. (2013). Satellite Remote
Sensing of Surface Soil Moisture. In Remote Sensing
of Energy Fluxes and Soil Moisture Content; CRC
Press: Boca Raton, FL, USA, 85–120, ISBN 978-1-
4665-0578-0.
Bezerra, B.G.; Santos, C.A.C.; Silva, B.B.; Perez-Marin,
A.M.; Bezerra, M.V.C.; Berzerra, J.R.C.; Rao,
T.V.R. (2013). Estimation of soil moisture in the
root-zone from remote sensing data. Rev. Bras.
Cienc. Solo 2013, 37, 596–603.
Bittelli, M. (2011). Measuring Soil Water Content: A
Review. 3861(June), 293–300.
Brdjanovic, D., Meijer, S. C., Lopez-Vazquez, C. M.,
Hooijmans, C. M., van Loosdrecht, M. C. (Eds.).
(2015). Applications of activated sludge models. Iwa
Publishing.
Celik, B., Kaya, Ş., Alganci, U., Seker, DZ. (2019).
Assessment of the relationship between land
use/cover changes and land surface temperatures: a
case study of thermal remote sensing, FEB Fresenius
Environ. Bull.,3, 541
Chandrasekar, K. Geo-spatial Meteorological Products
for Agricultural Drought Assessment, NRSC User
Interaction Meet- PPT. 2016. Available online:
Chauhan, S.; Srivastava, H.S. (2016). Comparative
evaluation of the sensitivity of multi-polarized SAR
nd optical data for various land cover classed. Int. J.
Remote Sens. 4, 01–14.
Department of the Interior U.S. Geological Survey.
(2016). Landsat 8 Data Users Handbook. Nasa,
8(June),97.
Drusch, M., Del Bello, U., Carlier, S., Colin, O.,
Fernandez, V., Gascon, F., Bargellini, P. (2012).
Sentinel-2: ESA’s Optical High-Resolution Mission
for GMES Operational Services. In Remote Sensing
of Environment (Vol.120).
Esetlili, M. T., Kurucu, Y. (2016). Determination of
Main Soil Properties Using Synthetic Aperture
Radar. Fresenius Environmental Bulletin, 25(1), 23–
36.
Esetlili, M., Bektas Balcik, F., Balik Sanli, F., Kalkan,
K., Ustuner, M., Goksel, Ç., Gazioğlu, C., Kurucu,
Y. (2018). Comparison of Object and Pixel-Based
Classifications for Mapping Crops Using Rapideye
Imagery: A Case Study of Menemen Plain, Turkey.
International Journal of Environment and
Geoinformatics, 5(2), 231-243. DOI:
10.30897/ijegeo.442002.
Filipponi, F. (2019). Sentinel-1 GRD Preprocessing
Workflow. Proceedings, 18(1), 11.
Gao, Q.; Zribi, M.; Escorihuela, M.J.; Baghdadi, N.
Synergetic use of sentinel-1 and sentinel-2 data for
soil moisture mapping at 100 m resolution. Sensors,
2017.
İncekara, A., Seker, D. Z., Tezcan, C. S., Bozkutoglu, E.,
Gazioglu, C. (2017). Interpreting temperaturebased
discontinuity and roughness of rock surfaces by using
photogrammetric technique. International Journal of
Environment and Geoinformatics (IJEGEO) ,4(3),
206–213. DOI: 10.30897/ijegeo.348806.
Karjalainen, M.; Kaartinen, H.; Hyyppä, J.; Laurila, H.;
Kuittinen, R. (2004). The Use of ENVISAT
Alternating Ploarization SAR Images in
Agricultureal Monitoring in Compatison with
RADARSAT-1 SAR Images. In Proceedings of the
ISPRS Congress, Istanbul, Turkey, 12–23 July 2004.
Küçük Matçı, D., Avdan, U. (2019). Optimization of
Remote Sensing Image Attributes to Improve
Classification Accuracy, International Journal of
Environment and Geoinformatics (IJEGEO), 6(1):
50-56. DOI: 10.30897/ijegeo.466985.
Mirsoleimani, H. R., Sahebi, M. R., Baghdadi, N., El
Hajj, M. (2019). Bare soil surface moisture retrieval
from sentinel-1 SAR data based on the calibrated
IEM and dubois models using neural networks.
Sensors (Switzerland), 19(14), 1–12.
Moawad, B.M. (2012). Geoscience general tool package.
Max-Planck Institute fürChemie, Mainz, Germany.
Mohamed, E.S., Ali, Abdelraouf, El-Shirbeny,
Mohammed, Abutaleba, Khaled and Shaddad, Sameh
M. (2019). Mapping soil moisture and their
correlation with crop pattern using remotely sensed
data in arid region. The Egyptian Journal of Remote
Sensing and Space Sciences xxx (xxxx) xxx (Article
in Press).
Myhre, B. E., Shih, S. F. (1990). Using Infrared
Thermometry to Estimate Soil Water Content for a
Sandy Soil. 33 (October), 1479–1486.
Paloscia, S., Pettinato, S., Santi, E., Notarnicola, C.,
Pasolli, L., Reppucci, A. (2013). Remote Sensing of
Environment Soil moisture mapping using Sentinel-1
images: Algorithm and preliminary validation.
Remote Sensing of Environment, 134, 234–248.
Petropoulos, G., Carlson, T.N., Wooster, M.J., Islam, S.
(2009). A review of T-s/VI remote sensing-based
methods for the retrieval of land surface energy
fluxes and soil surface moisture Prog. Phys.
Geography, 33, 224-250.
Prakash Mohan, M, Rajitha, K. Varma, Murari R (2019).
Integration of soil moisture as an auxiliary parameter
for the anchor pixel selection process in SEBAL
using Landsat 8 and Sentinel - 1A images,
International Journal of Remote Sensing, 41:3, 1214-
123.
Prakash, R.; Singh, D.; Pathak, N.P. A (2012). Fusion
approach to retrieve soil moisture with SAR and
optical data. IEEE J. Sel. Top. Appl. Earth Obs.
Remote Sens. 5, 196–206.
Rahimzadeh-Bajgiran, P., Berg, A.A., Champagne, C.,
Omasa, K. (2013). Estimation of soil moisture using
optical/thermal infrared remote sensing in the
Sutariya et al., / IJEGEO 8(1):65-77 (2021)
77
Canadian Prairies. ISPRS J. Photogrammetry Remote
Sens, 83, 94–103.
Rawat, Kishan Singh, Singh, Sudhir Kumar, Ray, Ram
Lakhan (2019). An integrated approach to estimate
surface soil moisture in agricultural lands, Geocarto
International.
Reza Attarzadeh, Jalal Amini, Claudia Notarnicola and
Felix Greifeneder (2018). Synergetic Use of Sentinel-
1 and Sentinel-2 Data for Soil Moisture Mapping at
Plot Scale. Remote Sensing, 10, 2 -18.
Sahebi, M.R.; Angles, J.; Bonn, F. (2002). A
comparison of multi-polarization and multi angular
approaches for estimating bare soil surface roughness
from space-borne radar data. Can. J. Remote Sens,
2002, 28, 641–652.
Sekertekin, A., Kutoglu, S.H.; Kaya, Ş. (2016).
Evaluation of spatio-temporal variability in land
surface temperature: A case study of Zonguldak,
Turkey. Environ. Monit. Assess, 188, 30.
Sekertekin, A.; Bonafoni, S. (2020). Land Surface
Temperature Retrieval from Landsat 5, 7, and 8 over
Rural Areas: Assessment of Different Retrieval
Algorithms and Emissivity Models and Toolbox
Implementation. Remote Sens. 12, 294.
Sekertekin, Aliihsan, Marangoz, Aycan Murat, and
Abdikan, Saygın, (2016). Soil Moisture Mapping
Using Sentinel-1A Synthetic Aperture Radar Data.
International Journal of Environment and
Geoinformatics 5(2): 178- 188 (2016).
Traore, M , Çan, T , Tekı̇n, S . (2020). Discriminatiοn of
Irοn Deposits Using Feature Οriented Principal
Cοmpοnent Selectiοn and Band Ratiο Methοds:
Eastern Taurus /Turkey, International Journal of
Environment and Geoinformatics, 7(2), 147-156. doi:
10.30897/ijegeo.673143,
Ulaby, F. T., Moore, R. K., Fung, A. K. (1986).
Microwave remote sensing: Active and passive; from
theory to applications (Vol. Volume III, 1065–2162).
Wagner, W., Lemoine, G., Borgeaud, M., Rott, H.
(1999a). A study of vegetation cover effects on ERS
scatterometer data. IEEE Transactions on Geoscience
and Remote Sensing, 37(2), 938–948.
Wagner, W., Lemoine, G., Rott, H. (1999b). A method
for estimating soil moisture from ERS scatterometer
and soil data. Remote Sensing of Environment, 70,
191–207.
Wang, J.R. (1980). The dielectric properties of soil-
water mixtures at microwave frequencies. Radio Sci,
1980, 15, 977–985.
Weng, Qihao, Lu, Dengsheng,, Schubring, Jacquelyn
(2004). Estimation of land surface temperature-
vegetation abundance relationship for urban heat
island studies. Remote Sensing of Environment
89(4):467–483, February 2004.
Yadav, Vijay Pratap, Rajendra Prasad, Bala, Ruchi,
Vishwakarma, Ajeet kumar, (2019). Estimation of
soil moisture through water cloud model using
sentinel -1A SAR data. Proceeding URSI AP-RASC
2019, New Delhi, India, 09 - 15 March 2019.
Zeng, Y., Feng, Z., Xiang, N. (2004). Assessment of soil
moisture using Landsat ETM+
Temperature/vegetation index in semiarid
environment. IEEE, 4306–4309.
Zhuo, L.; Han, D. (2016). The relevance of soil moisture
by remote sensing and hydrological modelling.
Procedia Eng. 154, 1368–1375.
Zribi, M., Baghdadi, N., Holah, N., and Fafin, O. (2005).
New methodology for soil surface moisture
estimation and its application to ENVISAT-ASAR
multi-incidence data inversion. Remote Sensing of
Environment, 96(3-4), 485–496.