Embed Size (px)
Citation preview
Stratégies alimentaires naturelles et innovatrices pour améliorer la qualité de la viande de lapin
Thèse
Amenan Prisca Nadège Koné
Doctorat en sciences animales Philosophiae doctor (Ph. D.)
Québec, Canada
© Amenan Prisca Nadège Koné, 2018

Stratégies alimentaires naturelles et innovatrices pour améliorer la qualité de la viande de lapin
Thèse
Amenan Prisca Nadège Koné
Sous la direction de :
Linda Saucier, directrice de recherche Frédéric Guay, codirecteur de recherche
iii
Résumé
La viande de lapin est appréciée notamment pour sa bonne valeur nutritive, et surtout pour
sa faible teneur en matières grasses par rapport à d'autres espèces. Cependant, sa haute valeur
nutritive est contrebalancée par un pH élevé, qui favorise la croissance microbienne et
augmente ainsi les risques associés à l’innocuité des aliments. De plus, sa richesse en acides
gras polyinsaturés la rend plus sensible aux réactions d'oxydation, ce qui affecte le goût, la
valeur nutritive et la fonctionnalité de ces composants, tout en conduisant à la détérioration
et au gaspillage de la viande. Nous avons donc identifié l’utilisation d’ingrédients naturels
bioactifs comme une alternative potentielle permettant à l’industrie de la viande de résoudre
cette problématique. Pour ce faire, nous avons initié, dans un premier temps, des études sur
l’utilisation d’extraits de végétaux (oignon, canneberge et fraise, NutraCanada) et d’huiles
essentielles (Xtract, Pancosma) riches en polyphénols, afin d’optimiser la qualité de la viande
de lapin (lapines sevrées). À une concentration de 10 ppm d’ingrédients actifs (selon les
recommandations du fournisseur pour promouvoir un système digestif en bonne santé chez
le lapin pour les huiles essentielles utilisées), le statut oxydatif de la viande immédiatement
après l’abattage n’a pas été modifié. Même observation pour des concentrations jusqu’à 10
fois plus élevées avec les extraits de végétaux. Par contre, une faible réduction de la
microflore a été observée et pouvant atteindre jusqu’à 1,5 log UFC/g (unité formant une
colonie) pendant l’entreposage réfrigéré, mais de façon sporadique, et ce même avec les
doses les plus élevées. Dans un deuxième temps, l'enrichissement du régime alimentaire de
lapins avec une culture protectrice (Carnobacterium maltaromaticum CB1 produisant trois
bactériocines, Micocin®), a été étudiée pour sa capacité à moduler positivement la qualité
microbiologique des produits finaux. La microflore sur les cuisses réfrigérées a été modulée
favorablement par l'addition de Micocin® dans le régime alimentaire en réduisant les
comptes des entérobactéries, coliformes et Listeria spp., mais plus encore, a réduit les
comptes de Listeria monocytogenes inoculés expérimentalement dans la viande hachée de
plus de 2 log comparativement au groupe contrôle. Précisons que les performances
zootechniques n’ont pas été affectées par les différentes stratégies alimentaires étudiées. En
conclusion, l’ajout à la ration des lapins d’une culture protectrice capable d’améliorer
positivement la microflore de la viande a eu des effets bénéfiques supérieurs à ceux observés

iv
avec les extraits de plantes et d’huiles essentielles et s’avère une stratégie nutritionnelle plus
efficace pour améliorer la qualité microbiologique de la viande de lapin.
v
Abstract
Rabbit meat is appreciated namely for its good nutritional quality and especially for its low
fat content when compared to other species. However, its high nutritional value is
compromised by a high pH, which promotes microbial growth and thus increases risks
associated to food safety. In addition, its high polyunsaturated fat content makes it more
susceptible to oxidation, which affects taste, nutritional value and functionality of its
components and lead to meat alteration and spoilage. We have therefore identified the use of
natural bioactive ingredients as a potential initiative to help the meat industry tackle this
issue. To achieve this, we initiated, as a first step, studies on the use of plant extracts (onion,
cranberry and strawberry, NutraCanada) and essential oils (Xtract, Pancosma) rich in
polyphenols, in order to optimize rabbit meat quality (weaned female rabbits). At a
concentration of 10 ppm of active ingredients (according to supplier’s recommendations for
the promotion of a health digestive system in rabbits with the essential oils tested), the
oxidative status of the meat immediately following slaughter was not modified. The same
was observed for concentrations up to 10 times higher with plan extracts. However, only a
slight and sporadic reduction of the microflora was observed, which could reach up to 1.5
log UFC/g during refrigerated storage, even with higher doses. As a second step, enrichment
of rabbits’ diet with a protective culture (Carnobacterium maltaromaticum CBI, which
produces three bacteriocins, Micocin®) was studied for its ability to modify positively the
microbiological quality of final products. The microflora on refrigerated thighs was
favourably modified by the addition of Micocin® in the diet by reducing Enterobacteriacea,
coliforms and Listeria spp. counts, but more importantly, it reduced experimentally
inoculated Listeria monocytogenes counts in ground meat by more than 2 log units compared
to the control group. We must emphasize that zootechnical performances were not affected
by the different food strategies tested. In conclusion, addition to rabbit feed of a protective
culture capable to modify positively the meat microflora had beneficial effects superior to
those observed with plant extracts and essential oils; hence, it turns out to be a more efficient
nutritional strategy to improve rabbit meat microbiological quality.

vi
Table des matières
Résumé .................................................................................................................................. iii
Abstract ................................................................................................................................. v
Table des matières ............................................................................................................... vi
Liste des tableaux ................................................................................................................ xi
Liste des figures ................................................................................................................. xiv
Liste des abréviations et des sigles .................................................................................. xvii
Remerciements ................................................................................................................... xix
Avant-propos ...................................................................................................................... xxi
Introduction .......................................................................................................................... 1
Revue de littérature .................................................................................... 4
1.1. L’industrie de la viande dans l’économie canadienne : un secteur d’activité en croissance et à forte valeur ajoutée ..................................................................................... 4
1.2. La cuniculture, une activité qui fait écho à l’agriculture durable ............................ 4
1.3. La viande de lapin : une viande aux caractéristiques inégalées ................................ 7
1.3.1. Évolution de la production cunicole ............................................................................. 7
1.3.2. Caractéristiques nutritionnelles de la viande de lapin ................................................ 10
1.3.2.1. La fraction lipidique ..................................................................................... 10
1.3.2.2. La fraction minérale et vitaminique.............................................................. 12
1.3.2.3. Les acides aminés essentiels ......................................................................... 13
1.3.2.4. Les fibres musculaires .................................................................................. 14
1.4. Les maladies d’origine alimentaires : une préoccupation de premier plan en santé publique ............................................................................................................................... 15
1.4.1. L’innocuité des aliments dans un monde en mutation ............................................... 16
1.4.2. Listeria monocytogenes : un défi permanent pour l’industrie alimentaire ................. 17
1.5. La qualité de la viande : en constante évolution ....................................................... 19
1.5.1. Le pH .......................................................................................................................... 19
1.5.2. La couleur ................................................................................................................... 21
1.5.3. La perte en eau et la perte à la cuisson ....................................................................... 23
1.5.4. La viande : un milieu favorable à la croissance des microorganismes ....................... 23
1.6. Nouvelles stratégies alimentaires simples et sans investissement majeur pour les producteurs ......................................................................................................................... 28

vii
1.6.1. Les bactéries lactiques : nouvelle approche pour la conservation de la viande ......... 28
1.6.1.1. Les bactériocines comme la conservation des aliments ............................... 30
1.6.1.2. Les bactériocines comme des agents de conservation dans la viande .......... 31
1.6.1.3. Micocin® sur les viandes transformées ........................................................ 33
1.6.2. Les polyphénols : composés naturels, idéals pour l’industrie agroalimentaire .......... 33
1.6.2.1. Caractéristiques et classification .................................................................. 34
1.6.2.2. Les composés riches en composés polyphénoliques .................................... 35
1.6.2.3. Les huiles essentielles (HE) riches en polyphénols ...................................... 37
1.6.2.4. Biodisponibilité des polyphénols ................................................................. 38
1.7. L’oxydation de la viande : un phénomène redouté en agroalimentaire ................. 41
1.7.1. La peroxydation des lipides : les AGPIs et leur effet sur la qualité de la viande ....... 41
1.7.2. L’oxydation des protéines et son effet sur la qualité de la viande .............................. 45
1.7.3. Les Polyphénols en tant qu’antioxydants ................................................................... 47
1.7.4. Les Polyphénols en tant qu’antimicrobiens ................................................................ 49
Problématique, objectifs et hypothèses de recherche ............................ 55
2.1. Problématique .............................................................................................................. 55
2.2. Hypothèse ..................................................................................................................... 56
2.3. Objectifs ........................................................................................................................ 56
2.3.1. Objectif général .......................................................................................................... 56
2.3.2. Objectifs spécifiques................................................................................................... 56
Effects of plant extracts and essential oils as feed supplements on quality and microbial traits of rabbit meat ................................................................................... 57
3.1. Résumé .......................................................................................................................... 60
3.2. Abstract ........................................................................................................................ 61
3.3. Introduction ................................................................................................................. 62
3.4. Materials and methods ................................................................................................ 63
3.4.1. Animal management and alimentation ....................................................................... 63
3.4.2. Meat quality measurement ......................................................................................... 64
3.4.3. Muscle Sampling ........................................................................................................ 65
3.4.4. Microbial Analysis ..................................................................................................... 66
3.4.5. Proximate analysis ...................................................................................................... 67
3.4.6. Determination of muscle antioxidant status ............................................................... 67

viii
3.4.7. Statistical analysis ...................................................................................................... 68
3.5. Results ........................................................................................................................... 68
3.5.1. Growth performance ................................................................................................... 68
3.5.2. Proximate composition and pH of the meat ............................................................... 71
3.5.3. Color of the meat ........................................................................................................ 72
3.5.4. Antioxidant status of meat .......................................................................................... 72
3.5.5. Microbial analysis and shelf life ................................................................................. 74
3.6. Discussion ..................................................................................................................... 78
3.7. Conclusion .................................................................................................................... 81
3.8. Acknowledgements ...................................................................................................... 81
Plant extracts and essential oils as feed additive to control rabbit meat microbial quality ................................................................................................................. 82
4.1. Résumé .......................................................................................................................... 85
4.2. Abstract ........................................................................................................................ 86
4.3. Introduction ................................................................................................................. 87
4.4. Materials and methods ................................................................................................ 88
4.4.1. Animal housing and feeding ....................................................................................... 88
4.4.2. Meat quality measurement ......................................................................................... 91
4.4.3. Muscle Sampling ........................................................................................................ 91
4.4.4. Proximate analysis ...................................................................................................... 92
4.4.5. Determination of muscle antioxidant status ............................................................... 92
4.4.5.1. Total phenol content ..................................................................................... 92
4.4.6. Microbial Analysis ..................................................................................................... 92
4.4.7. Statistical analysis ...................................................................................................... 94
4.5. Results ........................................................................................................................... 94
4.5.1. Growth performance ................................................................................................... 94
4.5.2. Meat quality traits ....................................................................................................... 95
4.5.3. Total phenol content of raw meat ............................................................................... 98
4.5.4. Microbial analysis and shelf life of rabbit thighs stored under aerobic or anaerobic conditions ............................................................................................................................. 98
4.5.4.1. Aerobic conditions ........................................................................................ 99
4.5.4.2. Anaerobic conditions .................................................................................. 102
4.6. Discussion ................................................................................................................... 105

ix
4.7. Conclusion .................................................................................................................. 109
4.8. Acknowledgements .................................................................................................... 110
Application of Carnobacterium maltaromaticum CB1 as a feed additive for weaned rabbits to improve meat microbial quality and safety .............................. 111
5.1. Résumé ........................................................................................................................ 114
5.2. Abstract ...................................................................................................................... 115
5.3. Introduction ............................................................................................................... 116
5.4. Materials and Methods ............................................................................................. 117
5.4.1. Animal housing and feeding ..................................................................................... 117
5.4.2. Meat quality measurement ....................................................................................... 119
5.4.3. Muscle Sampling ...................................................................................................... 120
5.4.4. Proximate analysis .................................................................................................... 120
5.4.5. Determination of muscle antioxidant status ............................................................. 121
5.4.5.1. Total phenol content ................................................................................... 121
5.4.5.2. Lipid oxidation ........................................................................................... 121
5.4.5.3. Carbonyl content ........................................................................................ 122
5.4.6. Microbial Analysis ................................................................................................... 122
5.4.7. Experimental inoculation of ground meat with L. monocytogenes .......................... 123
5.4.7.1. Bacterial cultures and growth conditions ................................................... 123
5.4.7.2. Ground meat inoculation and incubation ................................................... 124
5.4.8. Presence of C. maltaromaticum CB1 on faeces, thighs and ground meat ............... 124
5.4.8.1. Growth and culture conditions for indicator strains and bacteriocin production ................................................................................................................ 124
5.4.8.2. Molecular characterization of C. maltaromaticum CB1 ............................ 125
5.4.9. Statistical analysis .................................................................................................... 126
5.5. Results ......................................................................................................................... 127
5.5.1. Growth performance ................................................................................................. 127
5.5.2. Meat quality traits ..................................................................................................... 127
5.5.3. Microbial analysis of rabbit thighs stored under aerobic or anaerobic conditions ... 131
5.5.3.1. Aerobic conditions ...................................................................................... 131
5.5.3.2. Anaerobic conditions .................................................................................. 135
5.5.4. Microbial analysis of rabbit ground meat stored under aerobic or anaerobic conditions at 4 or 10 °C ...................................................................................................... 135
x
5.5.4.1. Aerobic conditions ...................................................................................... 136
5.5.4.2. Anaerobic conditions .................................................................................. 139
5.5.5. Ground meat experimentally inoculated with L. monocytogenes and stored under aerobic or anaerobic conditions at 4 or 10°C ..................................................................... 140
5.5.6. Presence of carnocyclin-A producing C. maltaromaticum in the faeces during the feeding period ..................................................................................................................... 143
5.5.7. Presence of carnocyclin-A producing C. maltaromaticum on thighs and in ground meat .................................................................................................................................... 143
5.6. Discussion ................................................................................................................... 145
5.6.1. Growth performance and meat quality ..................................................................... 145
5.6.2. Modulation of the microflora ................................................................................... 147
5.6.3. Meat Safety ............................................................................................................... 148
5.7. Conclusion .................................................................................................................. 149
5.8. Acknowledgements .................................................................................................... 150
Conclusions générales, implications et perspectives ............................ 151
6.1. Conclusion générale ................................................................................................... 151
6.2. Implications et perspectives futures ......................................................................... 154
6.2.1. Le pouvoir antioxydant des extraits de végétaux et des huiles essentielles dans la viande ................................................................................................................................. 154
6.2.2. Modulation de la microflore de la carcasse avec une culture protectrice commerciale Micocin® ............................................................................................................................ 154
Références bibliographiques ............................................................................................ 156
Annexe ............................................................................................................................... 190

xi
Liste des tableaux
Tableau 1.1. Production mondiale de lapins (milliers de lapins abattus) .............................. 7
Tableau 1.2. Pays producteurs de lapins (milliers de lapins abattus) .................................... 7
Tableau 1.3. Consommation de viande par habitant au Canada (kg – équivalent poids abattu) ................................................................................................................................................ 8
Tableau 1.4. La composition chimique (g) et la valeur énergétique (Kj) de la viande selon les différentes espèces (pour 100 g de viande crue) ............................................................. 10
Tableau 1.5. Teneur des différents types d'acides gras (% des AG totaux) et la teneur en cholestérol (mg/100 g) du Longissimus dorsi (poitrine chez le poulet) ............................... 11
Tableau 1.6. Composition en minéraux et en vitamines (mg) des différentes viandes (pour 100 g de fraction comestible) ............................................................................................... 13
Tableau 1.7. Composition en acides-aminés essentiels de différentes viandes (g/100 de fraction comestible) .............................................................................................................. 14
Tableau 1.8. Teneurs (mg/g muscle sec) et solubilités (%) du collagène de différentes viandes .................................................................................................................................. 14
Tableau 1.9. pHu, couleur, fermeté et pertes à la cuisson de la viande (valeurs moyennes du muscle Longissimus dorsi et Pectoralis major chez le poulet) tiré de Dalle Zotte (2000) .. 21
Tableau 1.10. Microorganismes d’altération et pathogènes associés à la viande fraîche et aux produits carnés impliqués dans la détérioration de la viande et les toxi-infections alimentaires .............................................................................................................................................. 25
Tableau 1.11. Combinaison des composants et des huiles essentielles ainsi que de leurs interactions antimicrobiennes contre plusieurs microorganismes. ....................................... 52
Tableau 1.12. Classes de quelques polyphénols et des microorganismes qui leur sont sensibles. tiré de Daglia (2012) ............................................................................................ 53
Tableau 3.1. Nutritional values and compositiona of the commercial and experimental diets. .............................................................................................................................................. 64
Tableau 3.2. Growth performance of weaned rabbits fed experimental diets. .................... 70
Tableau 3.3. Effect of the dietary treatment on physicochemical analyses and meat quality parameters in rabbit meat. .................................................................................................... 71

xii
Tableau 3.4. Effect of dietary treatments on physical characteristics of the Longissimus dorsi and the Biceps femoris muscles, and on lipid oxidation, carbonyl and total phenol content in raw meat. .............................................................................................................................. 73
Tableau 3.5. Total aerobic mesophilic (TAM), presumptive Pseudomonas spp. and presumptive Lactic Acid Bacteria (LAB) counts (log cfu/g) on rabbit thighs between 0 and 15 days of storage at 4 °C under aerobic conditions. ........................................................... 76
Tableau 3.6. Total aerobic mesophilic (TAM), presumptive Pseudomonas spp. and presumptive LAB counts (log cfu/g) on rabbit thighs between 0 and 45 days of storage at 4 °C under vacuum. ................................................................................................................. 77
Tableau 4.1. Nutritional values and compositiona of the experimental diets. ..................... 89
Tableau 4.2. Total phenolics of the experimental diets ....................................................... 90
Tableau 4.3. Growth performance of weaned rabbits fed experimental diets. .................... 95
Tableau 4.4. Effect of the dietary treatment on physicochemical analyses and meat quality parameters in rabbit meat. .................................................................................................... 97
Tableau 4.5. Total aerobic mesophilic (TAM), presumptive Pseudomonas spp. and presumptive LAB and Listeria spp. in Log10 CFU/g. Enterobacteriaceae, coliforms and presumptive Staphylococcus aureus counts in Log10 CFU/10g on rabbit thighs between 0 and 9 days of storage at 4 °C under aerobic conditions. .................................................... 101
Tableau 4.6. Total aerobic mesophilic (TAM), presumptive Pseudomonas spp. and presumptive LAB and Listeria spp. in Log10 CFU/g. Enterobacteriaceae, coliforms and presumptive Staphylococcus aureus counts in Log10 CFU/10g on rabbit thighs between 0 and 20 days of storage at 4 °C under anaerobic conditions. ..................................................... 104
Tableau 5.1. Nutritional values and compositiona of the commercial diets. ..................... 119
Tableau 5.2. Primer sequences, directions, annealing temperature and size of the candidate products used to detect Carnobacterium maltaromaticum on thighs, faeces and ground rabbit meat by quantitative reverse transcription-polymerase chain reaction. ............................. 126
Tableau 5.3. Growth performance of weaned rabbits fed either a control or a supplemented diet with Micocin®. ............................................................................................................ 128
Tableau 5.4. Effect of Carnobacterium maltaromaticum CB1 diet supplement on physicochemical analyses, meat quality parameters and antioxidant status of rabbit meat. ............................................................................................................................................ 130

xiii
Tableau 5.5. Different P values of microbial counts on thigh samples stored at 4 ºC in aerobic conditions. .......................................................................................................................... 134
Tableau 5.6. Different P values of microbial counts on thigh samples stored at 4 ºC in anaerobic conditions. .......................................................................................................... 134
Tableau 5.7. Different P values of microbial counts on uninoculated ground meat samples stored at 4 and 10 ºC in aerobic conditions. ....................................................................... 139
Tableau 5.8. Different P values of microbial counts in uninoculated ground meat samples stored at 4 and 10 ºC in anaerobic conditions. ................................................................... 139
Tableau 5.9. P values of microbial counts on inoculated ground meat samples with a cocktail of five strains of Listeria monoctogenes stored at 4 and 10 ºC in aerobic and anaerobic conditions. .......................................................................................................................... 141
Tableau 5.10. Different P value of treatment effect at each storage time on ground meat stored at 4 and 10 °C under aerobic and anaerobic conditions ........................................... 142
Tableau 5.11. Growth rate (CFU/g.day) of Listeria monoctogenes on inoculated ground meat samples with a cocktail of five strains of Listeria monoctogenes stored at 4 and 10 ºC in aerobic and anaerobic conditions. ...................................................................................... 142
Tableau 5.12. Microbial enumeration of TAM, presumptive LAB on MRS, presumptive LAB on APT, coliforms, Enterobacteriacea and Escherichia coli in faeces during the feeding period. ................................................................................................................................. 143
Tableau 5.13. Presence of Carnobacterium maltaromaticum in faeces and rabbit thighs at 4 °C under aerobic and anaerobic conditionsa. ...................................................................... 144
Tableau 5.14. Presence of Carnobacterium maltaromaticum producing carnocyclin A in rabbit ground meat stored at 4 and 10 °C under aerobic and anaerobic conditions (0, 3, 6, 9, 12, 15 days) as determined by PCR analysis of three specific genes:16S-cpg, ISR and CclAa. ............................................................................................................................................ 144

xiv
Liste des figures
Figure 1.1. Évolution du pH musculaire après l’abattage, couleur et pouvoir de rétention d’eau (PRE : pouvoir de rétention d’eau; Interbev, 2006). La figure illustre la chute du pH qui survient durant les heures post mortem. ......................................................................... 20
Figure 1.2. a) Molécule de phénol, la structure de base des polyphénols; b) Structure de base des acides phénoliques; c) Structure de base des flavonoïdes .............................................. 34
Figure 1.3. Teneur totale en composés polyphénoliques (mg) par 100g d’aliment pour plusieurs fruits et légumes. Figure tirée de l’article de Liu et al. (2013).............................. 36
Figure 1.4. L'absorption des polyphénols alimentaires chez l'homme. Les polyphénols sont fortement modifiés au cours de l'absorption dans l’estomac : les glycosides peuvent être hydrolysés dans l'intestin grêle ou dans le côlon et les aglycones libérés peuvent être absorbés. Avant le passage dans la circulation sanguine, les polyphénols subissent d'autres modifications structurales à cause du processus de conjugaison, qui a lieu principalement dans le foie. Tiré de D’Archivio et al. (2010). ..................................................................... 39
Figure 1.5. Comparaison des valeurs d’oxydation, exprimés en indice TBARS (exprimées en mg de MDA/kg muscle), de la viande de porc (muscle Longissimus lumborum), de taurillon (muscle Longissimus thoracis), de poulet (muscle Pectoralis major) et de lapin (muscle Longissimus dorsi et viande hachée). Tirée de Dalle zotte (2005). ........................ 45
Figure 5.1.Total aerobic mesophilic (A), presumptive Pseudomonas (B), presumptive LAB on MRS (C), presumptive LAB on APT (D) and Listeria spp. (E) counts in Log10 CFU/g, and Enterobacteriaceae (F), coliform (G) and presumptive Staphylococcus aureus (H) counts in Log10 CFU/10g on rabbit thighs between 0 and 8 days of storage at 4°C under aerobic conditions. Bar represents standard error of the mean. Each point is a mean value of 12 cages with one thigh per cage analyzed at each sampling time. The cage of six rabbits is the experimental unit. Horizontal line indicates end of shelf life. ...................................... 132
Figure 5.2.Total aerobic mesophilic (A), presumptive Pseudomonas (B), presumptive LAB on MRS (C), presumptive LAB on APT (D) and Listeria spp. (E) counts in Log10 CFU/g, and Enterobacteriaceae (F), coliform (G) and presumptive Staphylococcus aureus (H) counts in Log10 CFU/10g on rabbit thighs between 0 and 8 days of storage at 4°C under anaerobic conditions. Bar represents standard error of the mean. Each point is a mean value of 12 cages with one thigh per cage analyzed at each sampling time. The cage of six rabbits is the experimental unit. Horizontal line indicates end of shelf life. .................................. 133
Figure 5.3. Total aerobic mesophilic (A), presumptive Pseudomonas (B), presumptive LAB on MRS (C), presumptive LAB on APT (D), Enterobacteriaceae (E), coliform (F), and
xv
presumptive Staphylococcus aureus (G) counts in Log10 CFU/g on ground meat uninoculated rabbit between 0 and 15 days stored at 4 and 10ºC in aerobic conditions. Bar represents standard error of the mean. Each point is a mean value of three repetitions. Horizontal line indicates end of shelf life. ................................................................................................... 137
Figure 5.4. Total aerobic mesophilic (A), presumptive Pseudomonas (B), presumptive LAB on MRS (C), presumptive LAB on APT (D), Enterobacteriaceae (E), coliform (F), and presumptive Staphylococcus aureus (G) counts in Log10 CFU/g on ground meat uninoculated rabbit between 0 and 15 days stored at 4 and 10ºC in anaerobic conditions. Bar represents standard error of the mean. Each point is a mean value of three repetitions. Horizontal line indicates end of shelf life. ................................................................................................... 138
Figure 5.5. Growth of a cocktail of five Listeria monocytogenes strains inoculated at 4 Log10
CFU/g on ground rabbit meat from animals fed a control diet or a diet supplemented with Micocin® containing Carnobacterium maltaromaticum CB1 at a level of 8 Log10 CFU/kg of feed. Meat was stored under aerobic (A) or anaerobic (B) conditions at 4 or 10 °C. Each point represents the mean of three repetitions where, at each sampling time, one sample per cage was taken randomly and analysed in duplicate for a total of twelve cages per experimental group. Bar represents standard error of the mean. .............................................................. 142
Figure A-0.1. Detection of C. maltaromaticum producing carnocyclin A using PCR analysis of three specific genes, namely 16S, ISR and carnocyclin A. Lane 1 et 11 molecular weight markers; lane 2, 3 and 4 negative controls, L. innocua, Staphylococcus aureus and Escherichia coli, respectively; lane 6, 8 and 10 no DNA with each primer, respectively; lane 5 C. maltaromaticum CB1/UAL307 with 16S, lane 7 with ISR and lane 9 with carnocyclin A. ........................................................................................................................................ 190

xvi
Tout grand progès scientifique est né d’une nouvelle audace de l’imagination.
John Dewey

xvii
Liste des abréviations et des sigles
AA: Acides aminés
AAE: Acides aminés essentiels
ACIA: Agence canadienne d’inspection des aliments
AG: Acides gras
AGE: Glycation de protéines
AGS: Acides gras saturés
AGPIs: Acides gras polyinsaturés
AH: Amines hétérocycliques
ANC: Apports nutritionnels conseillés
ASPC: Agence de la santé publique du Canada
AW: Activité de l’eau
BAL: Bactéries lactiques
BDC: Banque de développement du Canada
BHA: Butyl-hydroxyanisole
BHT: Butyl-hydroxytoluène
Ca: Calcium
CAC: Codex Alimentarius Commission
CMC: Canadian meat council
CO: Carbonyles
DFD: dark, firm, dry
DHA: Acide docosahexaénoïque
DNPH: 2,4-dinitrophénylhydrazine
EPA: Acide éicosapentaénoïque
ERO: Espèces réactives de l'oxygène

xviii
FAO: Food and Agriculture Organization of the United Nations
FIDA: Fonds pour le développement agricole
GO: Glyoxal
HAP: Hydrocarbures aromatiques polycycliques
HE: Huiles essentielles
MDA: Malondialdéhyde
MGO: Méthylglyoxal
Na: Sodium
OECD: Organisation for Economic Co-operation and Development
OMS: Organisation mondiale de la santé
pHu: pH ultime
ppm : partie par million
PSE: Pale, soft, exsudative
RTE: ready-to-eat
T: température
TBHQ: Tert-butylhydroquinone
Ufc: Unité formant une colonie
xix
Remerciements
Je remercie Dieu de m’avoir aidé et soutenu pendant toutes les difficultés que j’ai
rencontrées. Merci mon Dieu pour ton amour et ta présence à mes côtés à chaque étape de
ma vie.
Aussi, sans la gracieuse participation de toutes ces personnes que j’ai côtoyées au cours de
ces années de recherche, rien de tout cela n’aurait été possible et je voudrais donc vous rendre
hommage à travers ces quelques lignes.
Je tiens tout d'abord à remercier la directrice de cette thèse, Prof. Linda Saucier, grâce à qui
tout a été permis, pour m'avoir fait confiance à travers une simple lettre de motivation et un
curriculum vitae. Puis pour m'avoir aidé, guidé, encouragé, conseillé, en me faisant l'honneur
de me déléguer plusieurs responsabilités dont j'espère avoir été à la hauteur. De sa rigueur
scientifique et sa clairvoyance, j’ai beaucoup appris. J’ai également eu la chance de découvrir
la maman derrière le mentor, me consolant dans les moments les plus difficiles. Côtoyer une
telle personne, intègre et sincère a été pour moi un privilège et a sans aucun doute façonné la
chercheure que je suis. Merci pour ta disponibilité et ta patience à mon égard.
Mes remerciements vont également à mes codirecteurs le Prof. Frédéric Guay et le Prof.
Dany-cinq Mars qui m'ont accompagné tout au long de ce cheminement par leurs suggestions
et contributions, mais surtout leur disponibilité. Je vous en suis très reconnaissante.
Ce projet n’aurait également pas pu voir le jour sans le soutien financier du Programme de
Soutien à l'innovation en agroalimentaire, un programme issu de l'accord cultivons l'avenir
entre le Ministère de l‘Agriculture des Pêcheries et de l'Alimentation du Québec (MAPAQ)
et Agriculture Agroalimentaire Canada (AAC). Merci au Syndicat des producteurs de lapins
du Québec pour leur collaboration.
À l’ensemble du personnel et professionnel, étudiants (Mohamed Zied Abdelwahed et Simon
Binggeli) et stagiaires du Département des sciences animales qui ont contribué, de près ou
de loin, à mon cheminement, je réitère toute ma gratitude. Un merci particulier à Monica Gil,
qui a été toujours disponible lorsque j’avais des questions. Merci pour ton accueil au
laboratoire, ta générosité et ton aide quand j’ai accouché et que je n’avais personne pour

xx
m’aider dans les moments de fatigue. Surtout, merci pour ton écoute et tes conseils quand le
moral était au plus bas, je ressors de cette expérience avec une véritable amie. Merci à toi !
Aux familles Badji et Niyonzima, les mots sont faibles pour vous exprimer toute ma
gratitude. Comme je le dis souvent à mon conjoint, j’ai laissé ma famille dans mon pays,
mais la providence m’en a offert d'autres au Canada. Que Dieu vous bénisse !
Gros merci à mon conjoint, Éric Dodora, pour le soutien qu’il m’a apporté à tous les niveaux,
sans qui je n’y serais peut-être pas arrivée. Merci, mon amour, d’avoir été présent quand j’en
avais besoin et compréhensif lorsque j’étais débordé de travail, surtout avec notre fils Nathan
(mon petit rayon de soleil). Mille Mercis.
Je ne pourrai conclure cette série de remerciements sans pour autant penser au soutien
continuel de ma famille, plus précisément de celui de mon père, grâce à qui j’ai pu braver
beaucoup d’embuches et arriver là où je suis actuellement. Les mots me manquent pour
t’exprimer ma gratitude et ma reconnaissance papa et même si tu es loin de moi, aujourd’hui
sache que tu es dans mon cœur. Je sais que tu es fier de la femme intellectuelle que je suis
devenue grâce à tes sacrifices. Ce travail, c’est à toi que je le dédie. Je t’aime et merci encore !

xxi
Avant-propos
Cette thèse est soumise à la Faculté des études supérieures de l'Université Laval pour
obtention du diplôme de Philosophiae Doctor (Ph. D.). Elle se compose de six chapitres. Le
premier chapitre est une revue de littérature qui introduit les connaissances générales sur la
viande de lapin, ainsi que les différentes stratégies alimentaires rapportées dans la littérature
pour améliorer la qualité de la viande ; le tout étant de comprendre les objectifs du projet de
recherche. Le deuxième chapitre s’attarde sur les problématiques découlant du sujet de
recherche, les hypothèses formulées ainsi que les différents objectifs à atteindre afin de
vérifier les hypothèses. Les chapitres 3, 4 et 5 sont abordés sous la forme de manuscrits et
décrivent les trois principales expériences avec des résultats et des discussions. Finalement,
le chapitre 6 présente une conclusion générale, les implications et les perspectives proposées
en lien avec les recherches menées pour cette thèse.
Plus spécifiquement, le troisième Chapitre intitulé “Effects of plants extracts and essential
oils as feed supplements on quality and microbial traits of rabbit meat” est publié dans la
revue World Rabbit Science (Koné et al., 2016; doi:10.4995/wrs.2016.3665). Il en sera de
même pour le quatrième chapitre présenté dans cette thèse et intitulé “Synergistic effect of
plant extracts and essential oils on microbiological quality of refrigerated rabbit meat”. Par
contre, ce dernier n’a été révisé par aucun des co-auteurs pour le moment et constitue mon
travail original. Pour ces deux chapitres, les auteurs sont les suivants : Amenan Prisca Nadège
Koné, Dany Cinq-Mars, Yves Desjardins, Frédéric Guay, André Gosselin, et Linda Saucier.
Mohamed Zied Abdelwahed est auteur seulement du quatrième chapitre de la thèse.
Le cinquième chapitre intitulé “Application of Carnobacterium maltaromaticum CB1 as a
feed additive for weaned rabbits to improve meat microbial quality and safety (2016) ” a été
soumis à Meat Science avec pour auteurs : Amenan Prisca Nadège Koné, Velez-Zea Juliana
Maria, Dominic Gagné, Dany Cinq-Mars, Frédéric Guay, et Linda Saucier.Il convient de
mentionner aussi qu’en plus de la bourse d’excellence du ministère de l'Enseignement
supérieur et de la Recherche scientifique de Côte d'Ivoire (2013-2016), la candidate a obtenu
quatre autres bourses pour ses travaux de recherches. La première étant la bourse d'excellence
de l'enseignement et de la recherche - Germain Brisson qui lui a été accordé par l’Université
Laval en 2013, et la seconde reçue en 2016, est la bourse commémorative Percy Gitelman,

xxii
parrainée conjointement par l'Association Scientifique canadienne de la Viande (ASCV) et
Newly Weds Foods, Inc. La candidate a également reçu la bourse d’excellence au doctorat
de la fondation INITIA en 2017 ainsi que le 1er prix du concours d’affiche scientifique du
lors du symposium de l’Association de Québécoise pour l’innocuité alimentaire, AQIA.

1
Introduction
Depuis la révolution industrielle survenue dans les pays industrialisés, la perception de
l’alimentation a beaucoup évolué dans l’esprit du consommateur. Dans ces sociétés où les
campagnes d’information nutritionnelles ont une place prépondérante, les consommateurs
sont en quête du « Manger mieux, pour mieux vivre » (Combes, 2004) : on préconise des
aliments riches en fibres, en acides gras oméga 3, et des aliments allégés en gras, etc. Ces
consommateurs sont de plus en plus soucieux de leur santé et cette tendance à la recherche
d’une alimentation saine s’accentuera davantage au Canada compte tenu du vieillissement de
la population : en 2031, 25 % des Canadiens auront plus de 65 ans selon les données de la
Banque de développement du Canada (BDC, 2013).
La viande de lapin qui est une viande blanche, mérite une place choix dans le cadre d’une
alimentation saine, car elle possède des propriétés nutritionnelles et diététiques élevées.
Comparativement aux autres viandes rouges, la viande de lapin a une faible teneur en calories
et ses lipides sont fortement insaturés. Elle est riche en protéines (20-21%) avec des acides
aminés de hautes valeurs biologiques et un faible taux de cholestérol (Dalle Zotte et Szendrő,
2011). La production de cette viande est particulièrement développée dans les pays
méditerranéens de l'Union Européenne (UE). En Italie, sa consommation annuelle par
habitant s’établissait à 4,2 kg en 2010 ; en France à 0,9 kg en 2013 ; au Canada à 25 g/habitant
en 2014, et plus spécifiquement au Québec, elle est estimée à 40 grammes par habitant.
Au Canada, placée dans une industrie fortement concurrentielle, la viande de lapin demeure
une production en émergence du fait que les viandes de bœuf, porc et volaille polarisent la
majeure partie des investissements de l’industrie de la viande. De manière générale, elle est
perçue comme un produit festif ou de spécialité « haut de gamme » et par conséquent sa
consommation est soit occasionnelle (Noël, Pâques), soit le fait de certaines communautés
dont la pratique culinaire est ancrée dans les us et coutumes. Pourtant les consommateurs
dans leur quête du « Manger mieux, pour mieux vivre » devraient s’intéresser davantage à
cette viande qui renferme de nombreux atouts nutritionnels et gustatifs.
En matière d’innocuité, Todd (2003) soutient que la viande demeure une préoccupation
importante au niveau des toxi-infections alimentaires et en santé publique. En effet, selon un

2
rapport publié en 2013, l’Agence de santé publique du Canada (ASPC) a estimé à 4 millions
de cas de maladie d’origine alimentaire ayant occasionné 3,7 milliards de dollars canadiens
en coût annuel de soins pour l’année 2012. En comparaison aux États-Unis, on rapporte 47,8
millions de malades par an (Porter et al., 2013). Il ressort de ces constats que la viande est
l’aliment le plus souvent incriminé dans les toxi-infections alimentaires, d’où l’intérêt des
scientifiques à vouloir améliorer sa qualité par la maîtrise de la croissance des
microorganismes.
Il est établi depuis longtemps, dans la communauté scientifique, que la croissance des
microorganismes peut être traditionnellement contrôlée par différents procédés comme la
cuisson, la stérilisation, la réfrigération, la congélation, etc. En plus de l’utilisation d’agents
de conservation (à l’instar du nitrate et nitrite dans les viandes prêtes-à-manger) légalement
autorisés dans des produits carnés au Canada. Toutefois, bien que ces procédés soient
efficaces, les consommateurs exigent davantage des aliments plus naturels, avec de faibles
niveaux d'additifs chimiques et d’agents antimicrobiens de synthèse (Brul et Coote, 1999).
Dans le cas spécifique de la viande de lapin, la teneur accrue en acides gras polyinsaturés
accélère sa détérioration par oxydation en cours d’entreposage (Kanner, 1994), réduisant
ainsi sa durée de vie de tablette (Wood et al., 2004). En plus de cette particularité de la viande
de lapin, il faut noter l'émergence d’organismes pathogènes résistants aux différents systèmes
antimicrobiens utilisés pour les contrôler. Ainsi, des solutions innovantes doivent être
développées afin de sécurité le développement du secteur cunicole. Cette innovation peut se
matérialiser par le biais de l’utilisation d’alternatives nutritionnelles appropriées, incluant
l’introduction de composés bioactifs tel que les composés phénoliques.
Selon la littérature (Oussalah et al., 2007; Zheng et Wang, 2001; Xu et al., 2008; Krishnan et
al., 2014), les extraits de plantes et les huiles essentielles à partir d'épices, de plantes et
d'herbes, riches en polyphénols, ont des activités antimicrobiennes et antioxydantes
intéressantes (Botsoglou et al., 2002, Giannenas et al., 2003, Govariset al., 2005). De par
leurs propriétés antiseptiques, antibactériennes et antifongiques, ils exercent un effet majeur
non seulement sur les caractéristiques organoleptiques des produits, mais aussi sur la
conservation de ces produits, permettant ainsi d’allonger la durée de vie de tablette: c’est ce
que soutiennent Sarni-Manchado et Cheynier (2006). Aussi, d’après les études d’Olaoye et

3
Ntuen (2011), le contrôle des organismes pathogènes et la conservation de la viande peuvent
également être réalisés grâce à l'utilisation de bactéries lactiques (BAL) en tant que cultures
compétitives ou protectrices pour inhiber la croissance d'espèces indésirables.
L’objectif de cette thèse s’inscrit donc dans cette logique d’innovation; c’est-à-dire élaborer
des stratégies novatrices et efficaces pour améliorer l’innocuité et la conservation de la viande
de lapin sans investissement majeur pour les producteurs.

4
Revue de littérature
1.1. L’industrie de la viande dans l’économie canadienne : un secteur d’activité en croissance et à forte valeur ajoutée
L’industrie de la viande au Canada est la plus grande industrie de transformation alimentaire
et est l’un des secteurs manufacturiers les plus importants par ses ventes, dépassant 24,1
milliards de dollars (Canadian Meat Council, CMC, 2016). Selon une communication de
Statistique Canada parue en 2011, l'industrie de la viande canadienne a réalisé des
exportations de l’ordre 23,6 milliards de dollars. Ces exportations ont connu un
accroissement substantiel comparativement aux données recueillies pour l’année 2009, où
les chiffres de ventes de l'industrie de la viande et la volaille étaient de 21,3 milliards de
dollars. Sur cette même période, les ventes des autres denrées de première nécessité
présentaient des performances en dessous de celle de l’industrie de la viande: il s’agit des
produits laitiers (13,2 milliards de dollars), des poissons et fruits de mer (3,5 milliards de
dollars), des pains et boulangeries (6,1 milliards de dollars) et des fruits et légumes (7,4
milliards de dollars; CMC, 2012). Ces chiffres permettent de classer le Canada parmi les
exportateurs nets de produits de viande.
Avec de telles données, on se rend compte de l’enjeu que représente la filière viande dans
l’économie canadienne; toutefois, les pratiques d’élevage ne font pas l’unanimité du fait des
enjeux liés à l’agriculture durable. Or, nous avons observé que la consommation en viande
par habitant est restée constante ces 20 dernières années, mais avec une baisse de
consommation de viande rouge au profit de la volaille. Cela est-il dû à l’adoption de saines
habitudes de vie, particulièrement celui de « manger santé ».
Dans les deux cas, le nouvel enjeu de la filière serait de continuer à répondre à ces besoins,
mais en orientant la production vers une activité plus durable à l’instar de la cuniculture
(Aubert et al., 2009).
1.2. La cuniculture, une activité qui fait écho à l’agriculture durable
Selon les données statistiques de Pison (2015), la population mondiale devrait passer de 7,13
milliards d’habitants (2015) à 11 milliards d’habitants à la fin du XXIe siècle. Pour pouvoir

5
apporter à cette population la ration quotidienne en protéine animale, il faudra doubler la
production mondiale actuelle de (Pison, 2015). Cette croissance de la population sera
principalement ressentie dans les pays en voie de développement. S’en suivra alors un
accroissement marquant de la population urbaine, une pression élevée sur les terres
disponibles et des changements importants sur la composition des populations animales
(Lebas et al., 1984). Cet état de fait aura pour conséquence immédiate la réaffectation d’une
plus grande portion de terres à la production vivrière pour nourrir les populations croissantes,
et donc il en résultera une pénurie en tant que ressources alimentaires pour le bétail (parcours
naturels, pâturages, fourrages), comme cela est déjà le cas en Asie. De cette causalité,
résulterait l’effet d’une famine si aucune alternative viable n’est trouvée (Lebas et al., 1984).
Or, d'après le dernier rapport sur l'insécurité alimentaire dans le monde publié par
l’Organisation des Nations Unies pour l’Alimentation et l’Agriculture (FAO, 2015), le Fonds
pour le développement agricole (FIDA) et le Programme Alimentaire Mondial, estiment que
795 millions de personnes meurent déjà de faim ou de malnutrition, chaque année dans le
monde. Il serait trivial de dire que pour accroître la production alimentaire et assurer une
alimentation saine, diversifiée et équilibrée à la population, il faudra augmenter l'efficience
de l'utilisation des ressources naturelles et trouver des alternatives aux élevages nécessitant
de vastes étendues de terres. Cette alternative pourrait être, notamment, la cuniculture :
l’élevage de petites espèces animales prolifiques, à cycle de production très court
(contrairement à la viande bovine qui est longue à produire), faciles à élever (FAO, 1996).
L'élevage de lapins peut contribuer à diversifier l’offre alimentaire, procurer un revenu dans
les pays sous-développés, mais aussi, favoriser un véritable essor économique (FAO, 2010).
Car en plus d’être une viande très nourrissante, l’investissement et la main d’œuvre
nécessaire à ce type d’élevage sont peu élevés (Bergaoui et al., 2010). Facile à élever, le lapin
s’adapte à différents types d’élevage (traditionnel, familial, industriel) ; la cuniculture est
donc une activité simple et productive, présentant des perspectives prometteuses.
Aujourd’hui, presque tous les secteurs d’activités mettent l’accent sur le développement
durable. Il faut rappeler que le développement durable repose sur trois piliers : l’économie,
le social et l’environnement. Son objectif est de « répondre aux besoins du présent sans

6
compromettre la capacité des générations futures de satisfaire les leurs » selon le rapport
Brundtland (1987). La cuniculture pourrait donc être qualifiée de durable car :
- Elle est rentable (la lapine très prolifique et a une gestation de courte durée 31 à 32
jours), de plus leur pelage peut être utilisé pour en faire de la fourrure.
- Au plan environnemental, le lapin ne fait pas de bruit et le fumier peut servir à
engraisser les cultures maraîchères.
- Au plan social, elle peut être une source de revenus (comme les poils des lapins
angoras) pour beaucoup de personnes tant dans les pays industrialisés que dans les
pays en voie de développement. Il va sans dire qu’élever des lapins n'est pas la façon
de s'enrichir rapidement. Néanmoins, les efforts et l'investissement consacrés seront
récompensés par de la viande saine et nutritive.

7
1.3. La viande de lapin : une viande aux caractéristiques inégalées
1.3.1. Évolution de la production cunicole
La production de viande de lapin est très développée dans les pays méditerranéens de l’Union
Européenne (UE); sa consommation est dans une large mesure dépendante des raisons
culturelles, traditionnelles et religieuses (Dalle Zotte, 2002). D’après les données de
Statistique Canada, de 2009 à 2013, la production de lapins a subi une augmentation de 8 %,
essentiellement due à l'essor de la production chinoise. La majeure partie de cette production
mondiale de lapins se concentre sur deux continents : l’Asie et l’Europe avec le continent
asiatique identifié comme étant la première zone productrice avec près de la moitié de la
production mondiale (Tableau 1.1).
Tableau 1.1. Production mondiale de lapins (milliers de lapins abattus)
2009 2010 2011 2012 2013
Monde 1 083 650 1 130 003 1 159 673 1 174 763 1 171 578
Asie 539 423 571 882 596 000 599 322 596 340
Europe 326 249 333 593 337 555 342 824 341 755
Amérique 148 586 152 738 152 780 158 707 158 713 FAOSTAT, Canada : Statistique Canada (données d’abattage). Tiré de Cliche (2015).
Selon les données du tableau 1.2, la production de viande de lapin est concentrée dans un
petit nombre de pays : Chine, Corée du Nord, Venezuela, Italie, Espagne, France et Égypte.
Ainsi, la production du Canada est fort modeste comparé à celles des autres pays cités ici. La
production canadienne après une baisse en 2010 et en 2011 a connu une nette croissance
depuis 2012 grâce aux au Québec et à l’Ontario qui sont les principales provinces
productrices de lapins (Cliche, 2015).
Tableau 1.2. Pays producteurs de lapins (milliers de lapins abattus) 2009 2010 2011 2012 2013 Chine 432 814 464 525 474 704 478 000 475 000 ItalieF 165 000 169 700 170 000 175 000 175 000 VenezuelaF 130 000 134 000 134 000 140 000 140 000 Corée du NordF 103 000 103 000 115 000 115 000 115 000 Espagne 51 330 52 633 52 668 53 411 52 470 Égypte 45 407 46 235 46 948 47 335 48 000 France 36 757 35 752 38 943 37 233 36 585 Canada 640 633 623 643 582
F = estimation de la FAO.FAOSTAT, Canada : Statistique Canada (données d’abattage). Tiré de Cliche (2015).

8
La consommation mondiale de viande de lapin est estimée à 0,331 kg par habitant par an
(Gidenne, 2006) et demeure modeste comparativement à la viande de bœuf (6,4 kg), porc
(12,5 kg) et poulet (13,5 kg; OECD, 2015). D’après l’étude de Cliche (2015), une telle
inégalité est due au fait que, le lapin est peut-être perçu par certains comme un animal de
compagnie rendant son acceptabilité comme viande ou aliment difficile, en plus d’être
beaucoup plus dispendieuse comparativement aux autres viandes. Toujours selon le même
auteur, le lapin fait partie des variétés de viandes de spécialité que les consommateurs
cherchent à découvrir. À savoir le bison, l’autruche, le cheval, le caribou, la pintade, le faisan,
l’oie, la viande de venaison (biche, chevreuil, sanglier, etc.), le wapiti, l’élan, l’orignal, le
lièvre, le sanglier, la caille, la perdrix, le kangourou, etc. Tous ces choix augmentent la
concurrence pour le lapin.
Au Canada, la consommation de viande de lapin est modeste avec 0,025 kg par personne
(Tableau 1.3). Il convient de remarquer qu’il s’agit d’un ratio très faible eu égard aux atouts
de cette viande et des attentes en matière de qualités (ceux liés à la santé) suggérées par les
nutritionnistes (Dalle Zotte et Szendrő, 2011). Toutefois, depuis 2010 la consommation
canadienne suit une augmentation croissante avec certaines fluctuations saisonnières,
notamment une baisse de la demande en été et des hausses à Noël, à Pâques et à l’Action de
grâce.
Tableau 1.3. Consommation de viande par habitant au Canada (kg – équivalent poids abattu)
Année Poulet et
Poule Bœuf Porc Dindon
Mouton et agneau
Veau Lapin
2010 32,94 27,88 22,06 4,30 1,09 1,08 0,023 2011 32,62 27,26 21,50 4,30 1,10 1,03 0,024 2012 33,02 27,60 22,30 4,20 0,96 0,97 0,024 2013 33,00 27,34 20,88 4,20 1,01 0,93 0,025 2014 33,39 26,48 20,63 4,10 1,13 0,95 0,025
Source : Agriculture et Agroalimentaire Canada - Section de la viande rouge et Statistique Canada, CANSIM, tableau 002-0011. Tiré de Cliche (2015).
On s’entend à ce que la tendance santé soit de plus en plus prisé dans les choix alimentaires.
La demande pour les viandes blanches (volaille, porc, lapin) est en nette progression par
rapport aux viandes rouges, dont on recommande une consommation modérée pour le
maintien d’une bonne santé (Bouvard et al., 2015). Au Canada, la progression des viandes
de spécialités (agneau, lapin, canard, etc.) peut s’expliquer par l’accroissement de la
9
population immigrante, le désir d’une alimentation variée par les Canadiens et l’introduction
d’aliments exotiques (Cliche, 2015). Toutefois, cette demande n’est pas tout à fait comblée
par le secteur cunicole québécois, qui perd ainsi des parts de marché au Canada au profit de
l’Ontario et des importations internationales. Pour pallier à ce manque et répondre aux
demandes de la population, le Canada importe principalement de la France, l’un des plus
grands pays producteurs et consommateurs. Car selon Lalancette (2016), la France possède
les techniques d’élevage, la génétique et le niveau de recherche les plus avancés, et ce, même
si la Chine est le grand producteur. Le secteur cunicole doit faire face à certains défis de
taille. Depuis 2014, le Québec n’a plus de ligne d’abattage de lapins sous agrément fédéral
(inspection réalisée par l’Agence canadienne d’inspection des aliments (ACIA). Les
producteurs ont donc deux choix : soit faire abattre une partie de la production québécoise en
Ontario, plus précisément chez Flintshire Farms Inc. à Flinton, afin de commercialiser des
produits de viande à l’échelle interprovinciale et internationale. L’autre option est de faire
abattre dans les établissements sous inspection de compétence provinciale, mais dans ce cas,
la commercialisation de la viande devra rester à l’intérieur du Québec. Aujourd’hui, avec
l’absence d’une ligne d’abattages sous inspection fédérale et le faible nombre d’abattoirs au
Québec, la filière cunicole est fragilisée et dépend de l’Ontario pour faire abattre ses lapins,
ce qui engendre des coûts supplémentaires de transport notamment (Cliche, 2015). Une autre
problématique qui fragilise le secteur cunicole est l’absence de médicaments homologués
pour la production cunicole; ainsi les traitements vétérinaires se font hors homologation.
Néanmoins, un projet de recherche sur l’utilisation de médicaments dans la production de
lapins a été approuvé par l’ACIA afin de remédier à la situation.
Dans une société où les gens ont tendance à exercer, un minimum contrôle sur la
consommation de gras, la viande de lapin a sa place dans les tendances alimentaires actuelles
et la filière doit augmenter l’intérêt des consommateurs envers cette viande en relevant le
défi que pose l’approvisionnement régulier pendant des périodes précises de l’année (le
temps des fêtes ou à Pâques). Il est donc essentiel que la recherche soit en mesure de soutenir
le Syndicat des producteurs de lapins qui a d’ailleurs identifié la qualité de la carcasse et de
la viande comme une priorité.

10
1.3.2. Caractéristiques nutritionnelles de la viande de lapin
La viande, en général, est constituée principalement d’eau, de protéines et de lipides. C’est
une source importante de micronutriments comme les minéraux et les vitamines nécessaires
au bon fonctionnement de l’organisme (Combes et Dalle Zotte, 2005). Cependant, il convient
de noter que les caractéristiques nutritionnelles de la viande de lapin tout comme celle des
autres animaux monogastriques sont influencées par la nature des matières grasses contenue
dans leur alimentation. La viande de lapin a la plus faible valeur calorique comparativement
aux autres viandes (Tableau 1.4), mais selon Dalle Zotte et Szendrő (2011), cette valeur
dépend principalement de la teneur élevée en protéines, ce qui représente 80% de la valeur
énergétique. Le lapin est la viande la moins grasse comparativement à celle de porc
(14,95g/100g), de bœuf (10,43g/100g), de poulet (10,43g/100g) et d’agneau (16,15g/100g),
mais elle est comparable à celle du veau (6,77g/100g). Par ailleurs, la teneur en eau de la
viande varie peu d’une espèce à une autre.
Tableau 1.4. La composition chimique (g) et la valeur énergétique (Kj) de la viande selon les différentes espèces (pour 100 g de viande crue)
Porc Bœuf Veau Poulet Lapin Agneau Lipides totaux 14,95 10,43 6,77 15,97 5,55 16,15 Eaua 60-75,3 66,3-71,5 70,1-76,9 67-75,3 66,2-75,3 - Énergie (kj) 904 774 603 929 569 933 Protéines 18,95 20,71 19,35 18,33 20,05 18,04
Adapté du Fichier canadien sur les éléments nutritifs, 2010. Les chiffres ont été arrondis. aDonnées tirée de Salvini et al. (1998) pour 100g de fraction comestible. Le tiret indique que la valeur est manquante.
1.3.2.1. La fraction lipidique
Le lapin est une viande blanche qui se classe parmi les viandes les plus pauvres en cholestérol
comparativement aux viandes rouges comme le porc (38,1 mg/100 g) ; bœuf (45,2 mg/100
g) et le veau (45,7 mg/100 g ; Tableau 1.5). C’est un point favorable pour la viande de lapin
et une alternative intéressante pour ceux qui souffrent d’athérosclérose. Aussi, les lipides de
la viande contiennent habituellement moins de 50% d’acides gras saturés AGS, (bœuf 45,2%,
la viande de porc 38,1%, le veau 45,7%, poulet 32,7%, le lapin 38,9 %) et d’acides gras
insaturés (mono et polyinsaturés AGPIs ; Tableau 1.5).
11
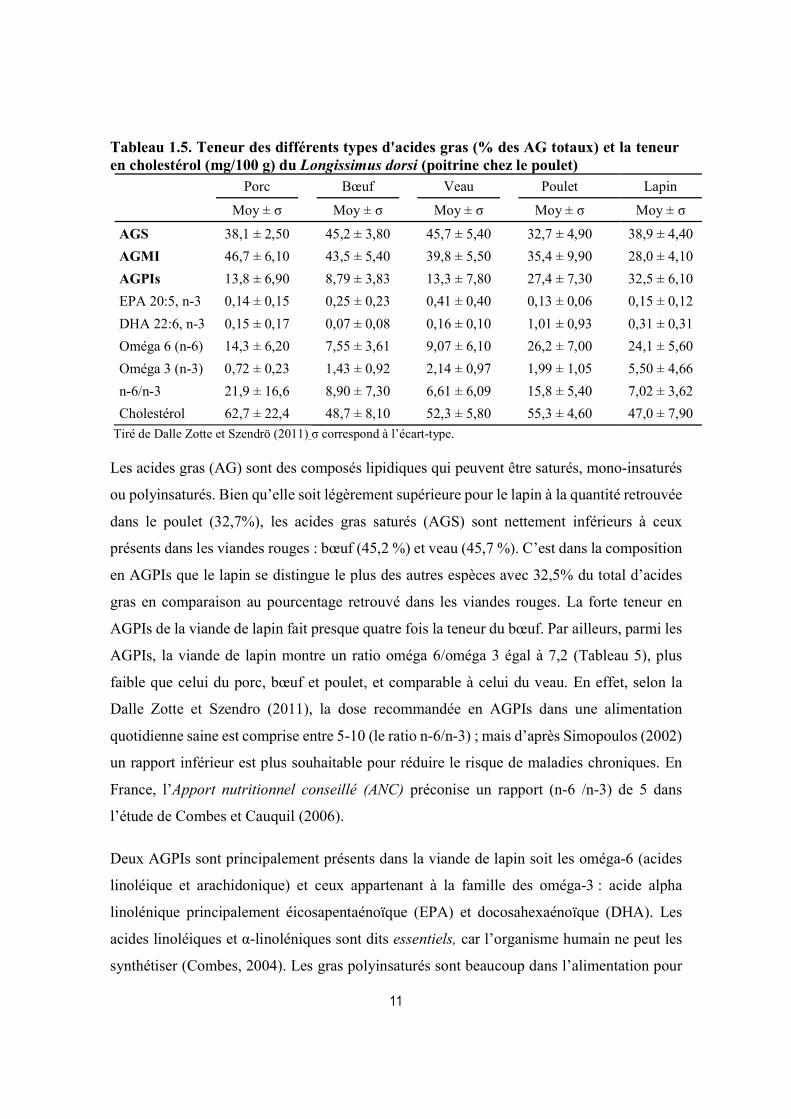
Tableau 1.5. Teneur des différents types d'acides gras (% des AG totaux) et la teneur en cholestérol (mg/100 g) du Longissimus dorsi (poitrine chez le poulet)
Porc Bœuf Veau Poulet Lapin
Moy ± σ Moy ± σ Moy ± σ Moy ± σ Moy ± σ
AGS 38,1 ± 2,50 45,2 ± 3,80 45,7 ± 5,40 32,7 ± 4,90 38,9 ± 4,40
AGMI 46,7 ± 6,10 43,5 ± 5,40 39,8 ± 5,50 35,4 ± 9,90 28,0 ± 4,10
AGPIs 13,8 ± 6,90 8,79 ± 3,83 13,3 ± 7,80 27,4 ± 7,30 32,5 ± 6,10
EPA 20:5, n-3 0,14 ± 0,15 0,25 ± 0,23 0,41 ± 0,40 0,13 ± 0,06 0,15 ± 0,12
DHA 22:6, n-3 0,15 ± 0,17 0,07 ± 0,08 0,16 ± 0,10 1,01 ± 0,93 0,31 ± 0,31
Oméga 6 (n-6) 14,3 ± 6,20 7,55 ± 3,61 9,07 ± 6,10 26,2 ± 7,00 24,1 ± 5,60
Oméga 3 (n-3) 0,72 ± 0,23 1,43 ± 0,92 2,14 ± 0,97 1,99 ± 1,05 5,50 ± 4,66
n-6/n-3 21,9 ± 16,6 8,90 ± 7,30 6,61 ± 6,09 15,8 ± 5,40 7,02 ± 3,62
Cholestérol 62,7 ± 22,4 48,7 ± 8,10 52,3 ± 5,80 55,3 ± 4,60 47,0 ± 7,90
Tiré de Dalle Zotte et Szendrö (2011) σ correspond à l’écart-type.
Les acides gras (AG) sont des composés lipidiques qui peuvent être saturés, mono-insaturés
ou polyinsaturés. Bien qu’elle soit légèrement supérieure pour le lapin à la quantité retrouvée
dans le poulet (32,7%), les acides gras saturés (AGS) sont nettement inférieurs à ceux
présents dans les viandes rouges : bœuf (45,2 %) et veau (45,7 %). C’est dans la composition
en AGPIs que le lapin se distingue le plus des autres espèces avec 32,5% du total d’acides
gras en comparaison au pourcentage retrouvé dans les viandes rouges. La forte teneur en
AGPIs de la viande de lapin fait presque quatre fois la teneur du bœuf. Par ailleurs, parmi les
AGPIs, la viande de lapin montre un ratio oméga 6/oméga 3 égal à 7,2 (Tableau 5), plus
faible que celui du porc, bœuf et poulet, et comparable à celui du veau. En effet, selon la
Dalle Zotte et Szendro (2011), la dose recommandée en AGPIs dans une alimentation
quotidienne saine est comprise entre 5-10 (le ratio n-6/n-3) ; mais d’après Simopoulos (2002)
un rapport inférieur est plus souhaitable pour réduire le risque de maladies chroniques. En
France, l’Apport nutritionnel conseillé (ANC) préconise un rapport (n-6 /n-3) de 5 dans
l’étude de Combes et Cauquil (2006).
Deux AGPIs sont principalement présents dans la viande de lapin soit les oméga-6 (acides
linoléique et arachidonique) et ceux appartenant à la famille des oméga-3 : acide alpha
linolénique principalement éicosapentaénoïque (EPA) et docosahexaénoïque (DHA). Les
acides linoléiques et α-linoléniques sont dits essentiels, car l’organisme humain ne peut les
synthétiser (Combes, 2004). Les gras polyinsaturés sont beaucoup dans l’alimentation pour

12
leurs multiples effets bénéfiques sur la santé tels que l’amélioration du taux de cholestérol et
la réduction du risque des maladies cardiovasculaires (Hu et Willett, 2002). D’ailleurs,
l’étude de Fedrigo et al. (1999) a démontré que les lipides de la viande de lapin présentent
une quantité d’acides gras capables de diminuer le cholestérol sanguin deux fois plus
importante que celle des acides gras augmentant le cholestérol sanguin (c’est un
effet hypocholestérolémiant).
1.3.2.2. La fraction minérale et vitaminique
La composition minérale d’une viande diffère selon chaque espèce. Celle de la viande de
lapin est caractérisée par un faible taux de sodium (Na), calcium (Ca) tandis que le niveau de
potassium et de phosphore sont élevés comparativement aux autres viandes (Tableau 6). Sa
teneur en sodium est très basse, 37 mg/100g de fraction comestible, la rend particulièrement
appropriée dans un régime alimentaire hyposodé (recommandé contre l’hypertension). Le
phosphore est le deuxième minéral le plus abondant dans les viandes, et dans celle du lapin
avec 222-230 mg/100g de fraction comestible. En comparaison, le poulet, le veau, le porc et
le bœuf ont des teneurs en phosphore inférieures (180-200 mg/100g, 170-214 mg/100g, 158-
223 mg/100g et 168-175 mg/100g, respectivement).
Aussi, il convient de noter que la viande et le poisson représentent la principale source de fer
hémique (fer facilement absorbable par l’organisme) en comparaison aux produits à base de
plantes. Par exemple, les viandes rouges comme le bœuf, l’agneau et le mouton contiennent
1,8-2,3 mg/100g, 2,0-4,5 mg/100g, 3,3-3,9 mg/100g, respectivement, et sont parmi les
sources les plus riches en fer (Williams, 2007). En ce qui concerne le profil vitaminique de
la viande de lapin, il est proche de celui du poulet comme le montre le tableau 1.6. Par
ailleurs, la viande de porc se distingue par sa teneur très élevée en thiamine B1 : 0,38-1,12
mg/100g. Mais la teneur la plus forte en acide folique est observée dans la viande bovine
avec 5-24 µg/100g de fraction comestible. Rappelons que l’acide folique, ou vitamine B9,
joue un rôle important dans la croissance cellulaire surtout chez la femme enceinte. Quant à
la vitamine A, elle est présente sous forme de trace tant dans la viande de lapin que dans celle
des autres espèces. Toutefois, même si le niveau de sélénium chez les animaux dépend de
leur alimentation, la viande de lapin est une bonne source de sélénium, un minéral avec une
activité antioxydante recherchée.
13
Tableau 1.6. Composition en minéraux et en vitamines (mg) des différentes viandes (pour 100 g de fraction comestible)
Porc Boeuf Veau Poulet Lapin1
Ca 7-8 10-11 9-14 11-19 2,7-9,3 P 158-223 168-175 170-214 180-200 222-230 K 300-370 330-360 260-360 260-330 428-431 Na 59-76 51-89 83-89 60-89 37-47 Fe assimilable 1,4-1,7 1,8-2,3 0,8-2,3 0,6-2,0 1,1-1,3 Vitamine B1 0,38-1,12 0,07-0,10 0,06-0,15 0,06-0,12 0,18 Vitamine B2 0,10-0,18 0,11-0,24 0,14-0,26 0,12-0,22 0,09-0,12 Vitamine PP 4,0-4,8 4,2-5,3 5,9-6,3 4,7-13,0 3,0-4,0 Vitamine B6 0,50-0,62 0,37-0,55 0,49-0,65 0,23-0,51 0,43-0,59 Acide Folique (µg) 1 5-24 14-23 8-14 10 Vitamine E 0-0,11 0,09-0,20 0,17-0,26 0,13-0,17 0,01-0,40 Vitamine D (µg) 0,5-0,9 0,5-0,8 1,2-1,3 0,2-0,6 Trace
1Parigi Bini et al. (1992) Traduit de Combes et Dalle Zotte (2005) et Dalle Zotte (2000)
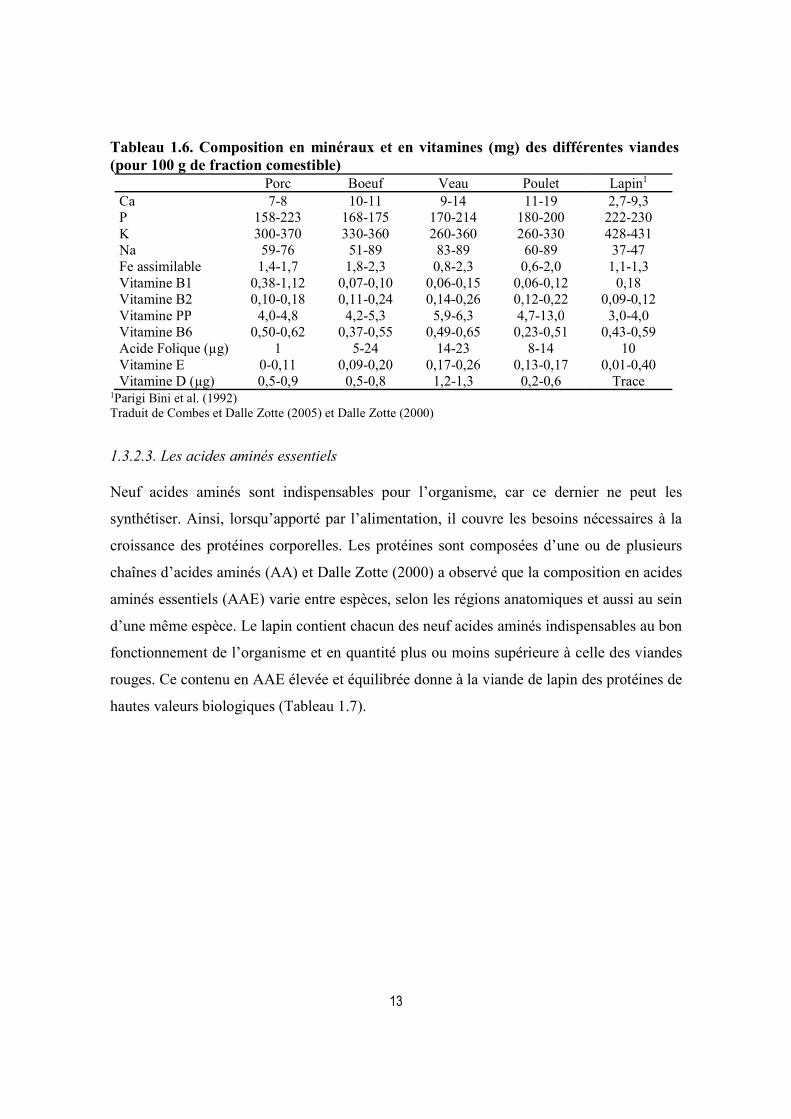
1.3.2.3. Les acides aminés essentiels
Neuf acides aminés sont indispensables pour l’organisme, car ce dernier ne peut les
synthétiser. Ainsi, lorsqu’apporté par l’alimentation, il couvre les besoins nécessaires à la
croissance des protéines corporelles. Les protéines sont composées d’une ou de plusieurs
chaînes d’acides aminés (AA) et Dalle Zotte (2000) a observé que la composition en acides
aminés essentiels (AAE) varie entre espèces, selon les régions anatomiques et aussi au sein
d’une même espèce. Le lapin contient chacun des neuf acides aminés indispensables au bon
fonctionnement de l’organisme et en quantité plus ou moins supérieure à celle des viandes
rouges. Ce contenu en AAE élevée et équilibrée donne à la viande de lapin des protéines de
hautes valeurs biologiques (Tableau 1.7).

14
Tableau 1.7. Composition en acides aminés essentiels de différentes viandes (g/100 de fraction comestible)
Porc Veau et taurillon Poulet Lapin Lysine 1,29 1,69 1,66 1,85 Méth-Cyst. 0,6 0,74 0,77 1,1 Histidine 0,49 0,59 0,52 0,53 Thréonine 0,74 0,85 0,85 1,16 Valine 0,81 1,02 0,89 0,99 Isoleucine 0,77 0,93 0,92 0,99 Leucine 1,2 1,57 1,6 1,81 Arginine 0,97 1,23 1,22 1,23 Tyrosine 0,54 0,68 0,66 0,73 Phénylalanine 0,63 0,8 0,73 1,03 Tryptophane 0,2 0,22 0,21 0,21
Tiré de Combes et Dalle Zotte (2005)
En plus de son profil en acides aminés indispensables, bien équilibré et assez voisin de celui
des besoins de l’homme (Martin, 2001), sa faible teneur en élastine et la grande solubilité de
son collagène (75,3 %), qualifie la viande de lapin de très digestible et de très tendre
comparativement aux autres viandes (Tableau 1.8 ; Dalle Zotte, 2000).
Tableau 1.8. Teneurs (mg/g muscle sec) et solubilités (%) du collagène de différentes viandes
Collagène
total Références Solubilité du collagène Références
Porc (L. Lumborum) 17 Lebret et al., 1998 17 Lebret et al., 1998 Taurillon (L. dorsi) 15-21 Bosselmann et al., 1995 11-12 Eastridge et al., 2002 Poulet (Pectoralis) 20 Culioli et al., 1995 21,8 Murphy et al., 2000 Lapin (L. Lumborum) 16,4 Combes et al., 2003 75,3 Combes et al., 2003
Dalle Zotte (2004)
1.3.2.4. Les fibres musculaires
Chez le lapin, il y a deux muscles glycolytiques (Longissimus lumborum et Psoas major),
deux plus oxydatifs (le semimembraneux proprius et le soleus) et une intermédiaire
(Gastrocnémien latérale ; Alasnier et al., 1996). Dalle Zotte (2000) a démontré que le
Longissimus lumborum est le plus glycolytique avec un pHu égal à 5,5 et le soleus, le plus
oxydatif avec un pHu égal à 6,4. Cependant, en règle générale, les muscles les plus oxydatifs
sont situés en l’avant de la carcasse, les moins oxydatifs sont ceux de la cuisse et du râble
selon Ouhayoun et Delmas (1988).
15
1.4. Les maladies d’origine alimentaires : une préoccupation de premier plan en santé publique
D’après la FAO et l’Organisation Mondiale de la Santé (OMS;2002), les maladies dues à une
contamination microbiologique des aliments sont un problème de santé publique important
qui ne cesse de prendre de l’ampleur. De plus, selon la Commission du Codex Alimentarius
(CAC, 2005), la viande est traditionnellement considérée comme un vecteur de transmission
de maladies. Par définition, une maladie d’origine alimentaire est une maladie qui se déclare
à la suite de la consommation d’aliments contaminés par des microorganismes pathogènes
tels que les bactéries (majoritairement), les virus, parasites, les toxines ou des substances
chimiques qui pénètrent dans l’organisme par le biais d’aliments ou d’eau contaminés. Ces
maladies peuvent toucher tout le monde. Toutefois, les jeunes enfants, les femmes enceintes,
les personnes âgées et ceux dont le système immunitaire est affaibli sont les plus à risque.
Selon les données de l’OMS (2016), près d’un tiers des décès (125 000) dus aux maladies
d'origines alimentaires surviennent chez les enfants de moins de 5 ans.
Depuis plusieurs décennies, l’occurrence des maladies dues à des microorganismes présents
dans les aliments (FAO et OMS, 2002) ne cesse de s’accroître en dépit des progrès
scientifiques et techniques dans le domaine de l’agroalimentaire. En effet, le traitement des
maladies d’origine alimentaire en 2012 au Canada avoisinait les 3,7 milliards de dollars
canadiens (ACIA, 2013). Tandis qu’aux États-Unis, il occasionne un coût de l’ordre de 150
millions de dollars par an (Porter et al., 2013). Selon le même auteur, en plus d’induire de
graves conséquences sanitaires, politiques et économiques, 2 à 3 % des cas de toxi-infections
alimentaires peuvent causer des problèmes de santé chroniques. L’impact de ces
conséquences est donc multiple, car on observe, par exemple, des morbidités et des décès
(310 000 à 600 000 décès en 2010 ; OMS, 2015), l’accroissement des coûts de santé, la perte
de la confiance des consommateurs, des pertes économiques et la baisse de la productivité
industrielle (ASPC, 2013). Selon l’OMS (2015), Salmonella, Campylobacter et Escherichia
coli entérohémorragiques ainsi que les infections à Listeria figurent parmi les agents
pathogènes d’origine alimentaire les plus courants qui touchent des millions de personnes
chaque année. Au Canada, l'Agence de la santé publique du Canada (ASPC) estime que 4
millions d'épisodes de maladies d'origine alimentaire acquises se produisent chaque année et

16
que Campylobacter, Salmonella, et les virus, comme le norovirus, sont les causes les plus
fréquemment signalées d'éclosions d'origine alimentaire (Thomas et al., 2013).
Au Québec, la denrée la plus sujette aux déclarations de toxi-infections alimentaires reste les
produits carnés (Panisset et al., 2003) avec un taux de 32,1 % pour le groupe alimentaire «
Viandes et volailles » selon le rapport de Cliche (2015). La plupart des aliments mis en cause
par les 1 445 déclarations avaient été consommés dans des restaurants ou livrés par ces
derniers (62,7 %), ou avaient été achetés chez des détaillants (32,3 %).
1.4.1. L’innocuité des aliments dans un monde en mutation
De la production à la consommation, les aliments sont confrontés à de nombreuses
possibilités de contamination. La liste des agents microbiens pathogènes potentiels d'origine
alimentaire ne cesse de s'allonger et selon l’OMS (2015) et Van De Venter (2000) plusieurs
facteurs jouent un rôle important dans l’apparition des problèmes liés aux aliments,
notamment :
La résistance des agents pathogènes : l’adaptation microbienne est un processus clé
dans l'émergence des agents pathogènes. L'utilisation abusive des antibiotiques et
produits antimicrobiens dans les populations humaines ou animales crée une pression
de sélection qui favorise la survie de souches bactériennes résistantes à l'agent.
Les habitudes alimentaires et la mondialisation : les consommateurs sont friands de
la restauration rapide et des plats préparés dans les lieux publics incitant l’industrie
agroalimentaire à diversifier l’offre associée à leurs produits. La chaîne alimentaire
est devenue plus longue et plus complexe, augmentant ainsi les possibilités de
contamination. De plus en plus, les aliments sont produits à grande échelle et
distribués sur de grandes distances, rendant les procédures de rappels plus complexes
et plus difficiles à coordonner efficacement.
La libération des échanges (commerces des aliments, des animaux) a fort
probablement conduit à une plus grande dispersion de la contamination
environnementale (introduction d’animaux malades par exemple).

17
L’industrialisation de l’agriculture : la population mondiale ne cesse de s’accroître et
les industries agroalimentaires doivent satisfaire une demande alimentaire croissante
en tenant compte à la fois des opportunités et des défis pour l’innocuité des aliments.
Les changements climatiques : ils ont aussi leur part de responsabilité. En effet, les
changements de température modulent les risques liés à la production, à l’entreposage
et à la distribution des denrées alimentaires.
1.4.2. Listeria monocytogenes : un défi permanent pour l’industrie alimentaire
La bactérie Listeria monocytogenes est l’une des six espèces du genre Listeria qui cause la
listériose chez les humains. En effet, dans plusieurs états américains en 1999, des produits de
viande et de volaille prêt-à-manger ont été à l’origine d’une éclosion de listériose, qui s’est
soldée par 101 cas et 21 décès. Au Canada (à North York, Ontario) en août 2008, la listériose
a causé 57 cas de toxi-infections alimentaires (surtout en Ontario) et 22 décès (en majorité
des personnes âgées plus susceptibles d’être malade; Wheathrill, 2009). Tous les types de
denrées peuvent être contaminés, mais comme en témoignent les éclosions récentes, ce sont
les produits carnés prêt-à-manger (RTE) qui sont les plus sujets à la contamination avec
Listeria parce que celle-ci se fait au moment du tranchage de la viande, la cuisson étant
efficace pour la contrôler. La majorité des cas humains de listériose surviennent chez des
individus qui sont immunodéprimés, par exemple les sidéens, les patients atteints de cancer,
de diabète, les personnes âgées, les femmes enceintes, les nourrissons, etc. Cette infection
chez les femmes enceintes est particulièrement préoccupante, car elle peut provoquer des
fausses couches. Souvent, la mère ne développe que des symptômes grippaux, mais le
microorganisme est capable de passer à travers la barrière transplacentaire et infecter le fœtus
(c’est la listériose périnatale) : des fausses couches, une mortinaissance ou une listériose
néonatale (infection chez un nouveau-né) peuvent alors se produire.
L. monocytogenes est une bactérie pathogène alimentaire très préoccupante, omniprésente
dans l'environnement, pouvant croître dans des conditions microaérophiles et se développer
à des températures froides, c’est-à-dire entre 0° et 10°C (incluant donc la température du
réfrigérateur). Par ailleurs, Gill et Reichel (1989) ont démontré que L. monocytogenes peut
également se développer dans des viandes emballées sous vide et entreposées entre 0 -10°C.

18
Les éclosions de L. monocytogenes ont été causées par la contamination des produits après
l’étape de tranchage (comme les charcuteries). Ainsi donc, L. monocytogenes pose une
menace réelle en tant que contaminant post-traitement/cuisson dans les produits de viande
prêt-à-manger.
Il existe plusieurs étapes d'intervention dans l'industrie alimentaire pour lutter contre cette
bactérie pathogène. L'utilisation d’agents de conservation chimiques, comme le lactate de
sodium et le diacétate, peut réduire la croissance de L. monocytogenes (Santé Canada, 2010).
L'utilisation de bactéries lactiques et de leurs bactériocines a été approuvée pour un usage
commercial pour la prévention de la croissance et de la survie de L. monocytogenes dans les
viandes RTE comme Micocin® (Carnobacterium maltaromaticum). Ce point sera discuté
plus loin dans cette revue de littérature.

19
1.5. La qualité de la viande : en constante évolution
La qualité de la viande est en constante évolution et le consommateur veut être sûr de sa
salubrité. Selon Lebret et al. (1996), le terme qualité de la viande regroupe généralement
quatre composantes, qui sont les qualités, organoleptiques, chimiques, nutritionnelles et
microbiologiques. Hoffman (1994) a décrit la qualité de la viande comme étant la somme de
tous les facteurs de qualité en termes de propriétés sensorielles, nutritionnelles, hygiéniques
et toxicologiques. En revanche, pour le consommateur, la qualité d’une viande se traduit par
sa couleur, sa tendreté, sa jutosité et sa saveur. De plus, selon Faucitano et Geverink (2008),
elle est aussi en lien avec le stress pré- abattage et de son effet sur le métabolisme énergétique
musculaire.
1.5.1. Le pH
Le pH de la viande est une mesure de l’acidification du muscle par la production d’acide
lactique post mortem par la voie de la glycolyse en absence de respiration et de circulation.
Il est utilisé pour évaluer la qualité de la viande et sa durée de conservation (Korkeala et al.,
1986). Selon les études d’Hocquette et al. (2000), le pH post mortem influence la couleur, la
capacité de rétention d’eau, la jutosité et surtout la tendreté de la viande selon l’amplitude et
sa vitesse de chute.
Généralement, le pH du muscle est mesuré une heure (pH1) et 24 heures (pH ultime, pHu)
post mortem. Ce dernier est qualifié d’ultime, car il ne change pratiquement plus par la suite.
Au moment de la mort, le pH du muscle est de 7,0-7,2, mais lors de la transformation du
muscle en viande et de la conversion du glucose, glycogène, etc. en acide lactique un pH
ultime de 5,5-5,7 chez le porc pour la viande « normale ». Des différences considérables de
pH peuvent s’observer entre différents muscles d‘une même carcasse. Par exemple, chez le
lapin, le pHu du Longissimus dorsi est beaucoup plus faible comparativement à celui du
Biceps femoris qui est fonction de son faible potentiel glycolytique (Hulot et Ouhayoun,
1999).
Toutefois, quand les animaux sont stressés avant l'abattage (ex. : absence de repos après le
transport) l’activité métabolique des muscles est accélérée et les réserves musculaires
s'épuisent et forment de l'acide lactique rapidement alors que la température du muscle est

20
encore haute, ce qui a pour effet de dénaturer les protéines qui ne sont alors plus capables de
retenir l'eau, ce qui donne une viande pâle, molle et exsudative (PSE; figure 1.1; Shannon et
Schaefer, 1999).
Figure 1.1. Évolution du pH musculaire après l’abattage, couleur et pouvoir de rétention d’eau (PRE : pouvoir de rétention d’eau; Interbev, 2006). La figure illustre la chute du pH qui survient durant les heures post mortem.
Le porc a traditionnellement été classé en trois catégories de qualité selon les mesures de
couleur, fermeté et perte en eau: PSE (pâle, douce, exsudative), RFN (rose rougeâtre, ferme,
non exsudative, porc normal) et DFD (sombre, ferme, sèche). Au cours des dernières années,
deux autres catégories de qualité se sont ajoutées en tenant compte de la variation de la
couleur ou de l'exsudat, pâle, molle et non exsudative (PFN) et rose-rougeâtre, molle et
exsudative (RSE). Au Canada, les classes de qualité de la viande PFN et RSE ont récemment
été signalées comme des défauts de qualité majeurs et le plus rencontré chez le porc. Elles
représentent plus de 13 à 47% des défauts de qualité de la viande comparativement avec la
viande PSE (13 à 21%) et DFD (2 à 10% ; Murray, 2001; Faucitano et al., 2010).
À l’inverse, si le pH demeure élevé parce que les réserves musculaires sont épuisées
(ex. transport trop long), la viande sera foncée et elle conservera son eau ce qui lui donnera
une apparence sèche et ferme (DFD). Puisque ce type de viande a un fort pourvoir de
rétention d’eau, car la lumière peut pénétrer plus profondément et est ainsi moins réfléchie
vers l’observateur (Figure 1.1), ce qui engendre une couleur plus foncée. Cette condition est
observée chez la viande de porc, de bœuf, de mouton et de veau (James et James, 2002) ainsi

21
que de celle du lapin selon les études menées par Jolley (1990), Nakyinsige et al. (2014,
2015) et Rodríguez-Calleja et al. (2004). En raison de son pH élevé, ce type de viande DFD
favorise la croissance des microorganismes, car plus proche de la neutralité, avec le
développement d’odeur putride à un stade précoce, compromettant ainsi la conservation des
produits découpés et préemballés (Dalle Zotte, 2002). Au tableau 1.9, les viandes associées
à des défauts dus à des valeurs de pHu anormalement faibles ou élevées sont décrites : chez
le porc (5,7), le taurillon (5,6), le poulet (5,5 à 5,7), lapin (5,7 à 5,9) ; Tableau 1.9). La viande
DFD peut être présente dans toutes les espèces, mais elle est plus commune dans le bœuf.
Tableau 1.9. pHu, couleur, fermeté et pertes à la cuisson de la viande (valeurs moyennes du muscle Longissimus dorsi et Pectoralis major chez le poulet) tirés de Dalle Zotte (2000)
Porc Veau Poulet Taurillon Lapin pHu 5,5-5,7 5,5 - 5,6 5,6 - 5,7 5,6 5,7 - 5,9
Couleur L* 48 - 52 54 - 55 51 - 53 41 - 44 56 - 60 a* 08 - 11 11 - 12 1,3 - 2,5 20 - 21 2,6 - 3,4 b* 5 8,5 - 9,4 13 - 14 11 4 - 5 Perte de poids à la cuisson (%) 29 - 35 29 - 31 20 - 21 27 - 32 20 - 22
L* : luminance ; a* : indice du rouge et b* : indice du jaune varient entre -60 (respectivement vert et bleu) et +60 (respectivement rouge et jaune). Tiré de Dalle Zotte (2000)
1.5.2. La couleur
La couleur est l’un des principaux critères de qualité des produits agroalimentaires, car elle
influence le choix du consommateur et est affectée par le pHu de la viande. En effet, les
viandes à pHu élevé absorbent beaucoup de lumière et ont une couleur sombre, alors qu'un
pH ultime bas entraîne une faible pénétration de la lumière dans le muscle. Donnant ainsi
une viande plus claire, une diminution du pouvoir de rétention d’eau du muscle et donc, des
pertes importantes d’exsudat se produisant lors de la conservation de la viande (Interbev,
2006). Il est donc important que la couleur de la viande soit stable, car c’est un facteur
déterminant dans l’acte d’achat du consommateur. Ce dernier recherche une couleur rosée ni
trop claire, ni trop foncée et, surtout, homogène (Lebret et al., 1996).
La stabilité de la couleur dépend de la quantité de myoglobine (pigment dont le rôle est de
transporter l’oxygène à l’intérieur de la cellule musculaire), des états chimiques (forme
oxydée, réduite, oxygénée) et des vitesses relatives d’oxydation du pigment (Lebret et al.,
1996). En effet, la myoglobine est présente dans le muscle sous trois formes principales : la

22
désoxymyoglobine (Mb2 +, forme réduite), l'oxymyoglobine (OMb2 +, forme oxygénée) et
la metmyoglobine (MMb3 +, la forme oxydée), chacune donnant une couleur différente à la
viande (Stewart et al., 1965).
Elle est ainsi fonction de son degré d’exposition à l’oxygène. Par exemple, la surface d’une
viande fraîchement coupée est rouge vif (OMb2 +), car la myoglobine fixe l’oxygène de l’air,
alors que le cœur de la pièce est sombre et de couleur pourpre (Mb2 +), faute d’oxygène. Par
contre, si les surfaces coupées sont exposées très longtemps à l’air, la myoglobine s’oxyde et
prend alors une coloration brune (MMb3 +), peu attrayante (Kerry et al., 2002). L'évaluation
instrumentale des couleurs est basée sur l’analyse de trois critères indépendants et sur
l'échelle colorimétrique CIE L*, a*, b* (CIELAB, 1986). La valeur L* se réfère à la
luminance ou la clarté, variant de L* = 0 pour le noir et L* = 100 pour le blanc. Selon Brewer
et al. (2001), L* est très dépendant du pH et un excellent indicateur du degré de viande pâle,
molle et exsudative (PSE) et de viandes sombres, fermes et sèches (DFD). La valeur a*
indique le niveau de rouge ou de vert, allant de - a* (vert pur) à + a* (rouge pur), et est très
dépendant du temps de « blooming » (Hunt, 1991; utilisé dans le jargon de l’industrie de la
viande pour passer du violet/pourpre au rouge). Enfin, la valeur b* indique le jaune (ou le
bleu), allant également de - b* (bleu pur) à + b* (jaune pur). Selon les études de Dalle Zotte
(2000), la viande de lapin présente un fort pouvoir réfléchissant de la lumière (L* élevé) et
du fait de sa faible teneur en myoglobine (a* faible ; Tableau 1.9), se caractérisant par une
évolution modérée de la couleur pendant la conservation. Chez le porc par exemple, les
viandes de catégorie PSE sont celles dont le pH ultime est le plus bas, un L* plus élevé (plus
pâle) et ayant des pertes en eau plus importantes. Les viandes de catégorie DFD, dont le pH
ultime est le plus élevé, le L* est le plus faible et les pertes en eau sont les moins importantes.
Pour les viandes de catégorie PFN, RSE et RFN (les différentes classes intermédiaires), le
L* n’est pas significativement différent et au niveau du pH ultime, PFN est significativement
différent des deux autres selon Fautacino et al. (2010). De même que, RSE est
significativement différent de PFN et RFN concernant les pertes en eau (Fautacino et al.,
2010).

23
1.5.3. La perte en eau et la perte à la cuisson
Le muscle contient environ 75% d’eau dont la majorité est maintenue au sein des myofibrilles
(Hughes et al., 2014). L‘exsudat de la viande est formé par la perte de fluide du muscle sans
force mécanique. Il est d'une grande importance, car il détermine la performance
technologique du produit et donc sa valeur marchande. Offer et Knight (1988) affirment que
les pertes de produits dues à la perte en eau peuvent varier de 2 à 10% lorsque la viande est
coupée en côtelettes, notamment chez le porc. Lorsque le pH diminue de 7 à 5, les
myofibrilles diminuent en volume d'environ 15% (Offer et Cousins, 1992), car 85% de l’eau
est maintenue dans les myofibrilles (Hughes et al., 2014) ; ce qui correspond à la perte
d'écoulement d’un muscle pâle, mou et exsudatif (viande PSE). À l’inverse, les viandes à
pHu élevées (supérieures à 6) ont un volume d’eau libérée beaucoup plus faible. Les études
menées par Dal Bosco et al. (1997) stipulent que chez le lapin, un pH ultime élevé a des effets
positifs sur la capacité de rétention d’eau.
La viande est consommée après cuisson et cette cuisson provoque à la fois l’élimination de
jus de viande et de nutriments solubles (myoglobine, vitamines B, nucléotides, acides aminés
libres), à cause de la dénaturation des protéines et du rétrécissement des fibres musculaire dû
à l'augmentation de la température dans la viande (Gandemer et al., 2013). Autrement dit,
plus la température de la viande s’élève, plus il y a de pression sur les fibres, et donc de jus
de viande est expulsé. Les viandes acides ont un faible pouvoir de rétention en eau, donc elles
sont plus dures, car elles perdent plus d’eau lors de la cuisson. D’ailleurs selon Dalle Zotte
(2000), cette conséquence est souvent observée chez le porc en raison de son pHu bas.
Cependant, les pertes de poids à la cuisson sont plus faibles chez le lapin et le poulet par
rapport aux autres espèces, en raison de leur faible teneur en lipides intramusculaires
(Combes et Dalle Zotte, 2005).
1.5.4. La viande : un milieu favorable à la croissance des microorganismes
Selon Saucier (1999), nous sommes en compétition constante avec les microorganismes de
l’environnement car ces derniers arrivent à s’adapter aux systèmes antimicrobiens qui sont
employer pour les contrer. La viande est particulièrement favorable à la croissance des
microorganismes de par sa richesse en nutriments (protéines, lipides, composés à faible poids
moléculaire), son pH physiologique proche de la neutralité et son activité d'eau élevée

24
(Aw~0,99). Et c’est principalement la facilité avec laquelle les microorganismes arrivent à
croître qui définit le caractère périssable de la viande.
Selon la FAO (2016), 1,3 milliard de tonnes de nourriture sont perdues ou gaspillées chaque
année dans le monde alors que seulement en Europe, 79 millions de personnes vivent en
dessous du seuil de pauvreté et qu’un quart d’entre elles dépendent de l’aide financière
(Godard et Reynders, 2014). Un constat alarmant et accablant quand on sait les répercussions
du point de vue social, économique et environnemental, mais aussi que 795 millions de
personnes meurent de faim ou de malnutrition, chaque année dans le monde. Toujours
d’après les données de la FAO (2016), la viande à elle seule subit plus de 20% de perte.
D’après Saucier (2016), la réduction des déchets et la détérioration, passe par des stratégies
efficaces pour améliorer le contrôle microbien des produits carnés, car ces derniers sont
denses en nutriments et hautement périssables.
Selon Huffman (2002), un animal en bonne santé a des muscles stériles ou faiblement
contaminés à l’exception des ganglions lymphatiques. Cependant, la viande se contamine
après l'abattage suite aux opérations d'éviscération, par contact avec l'équipement, les outils,
les mains et les vêtements des travailleurs, en dépit de toutes les précautions prises (Dainty
et Mackey, 1992). Selon les conditions d’entreposage, c’est-à-dire la température et
l’atmosphère de l’emballage, certains microorganismes sont favorisés au détriment des autres
(Gill et Newton, 1978).
La composition de la microflore est un facteur qui influence la durée de vie de la tablette et
l’innocuité du produit. Il est bien établi que pendant l’entreposage réfrigéré de la viande en
conditions aérobes ou anaérobes, un niveau de contamination microbienne de l’ordre de 7-
log unité formant une colonie par gramme (ufc/g) est critique et constitue la fin de la vie de
tablette. Par exemple, Bobbitt (2002) a étudié la durée de conservation des carcasses de lapins
entreposées à 4°C et a estimé que la durée de vie en conditions aérobes était limitée à 3 jours.
Mais dans une étude plus récente, Pereira et Malfeito-Ferreira (2013) et Rodríguez-Calleja
et al. (2004) sont parvenus à des conclusions plus optimistes : leurs études établissent la durée
de vie de tablette à 6-7 jours, en conditions aérobes. Le tableau 1.10 présente les principaux
genres bactériens responsables de la détérioration de la viande et des produits carnés, ainsi
que des problèmes de santé qu’ils peuvent provoquer lorsqu’ils sont ingérés.
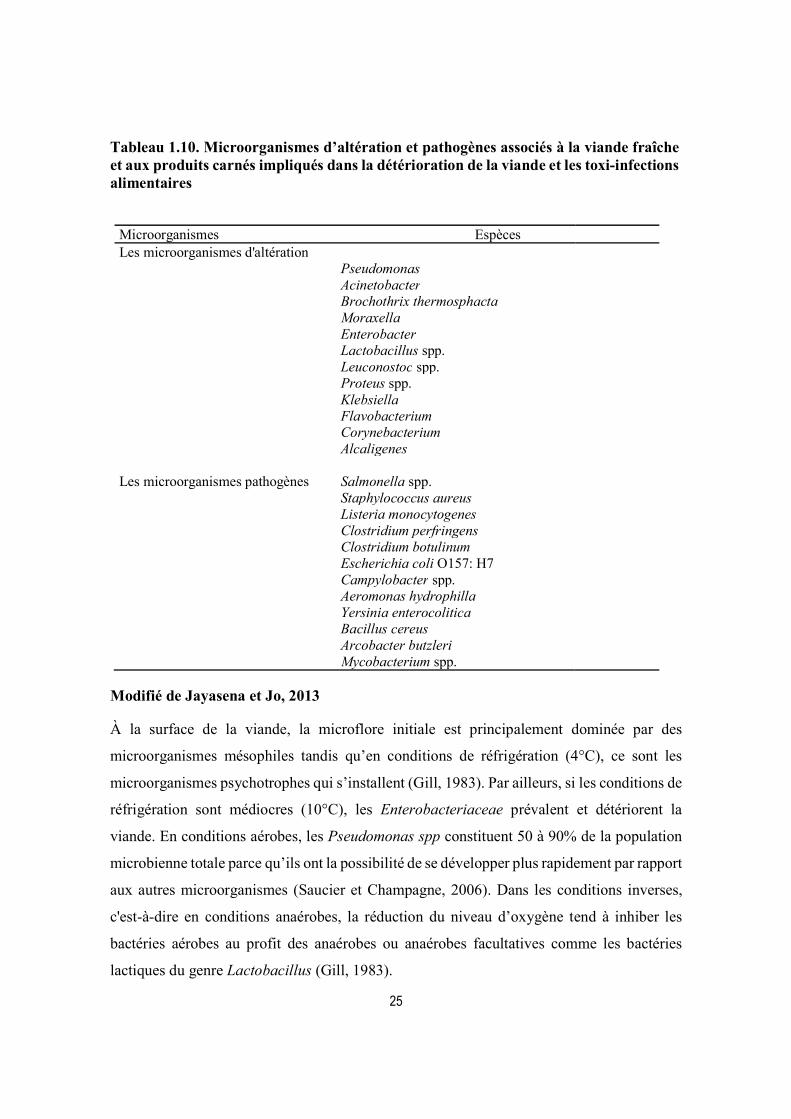
25
Tableau 1.10. Microorganismes d’altération et pathogènes associés à la viande fraîche et aux produits carnés impliqués dans la détérioration de la viande et les toxi-infections alimentaires
Microorganismes Espèces Les microorganismes d'altération Pseudomonas Acinetobacter Brochothrix thermosphacta Moraxella Enterobacter Lactobacillus spp. Leuconostoc spp. Proteus spp. Klebsiella Flavobacterium Corynebacterium Alcaligenes
Les microorganismes pathogènes Salmonella spp.
Staphylococcus aureus Listeria monocytogenes Clostridium perfringens Clostridium botulinum Escherichia coli O157: H7 Campylobacter spp. Aeromonas hydrophilla Yersinia enterocolitica Bacillus cereus Arcobacter butzleri Mycobacterium spp.
Modifié de Jayasena et Jo, 2013
À la surface de la viande, la microflore initiale est principalement dominée par des
microorganismes mésophiles tandis qu’en conditions de réfrigération (4°C), ce sont les
microorganismes psychotrophes qui s’installent (Gill, 1983). Par ailleurs, si les conditions de
réfrigération sont médiocres (10°C), les Enterobacteriaceae prévalent et détériorent la
viande. En conditions aérobes, les Pseudomonas spp constituent 50 à 90% de la population
microbienne totale parce qu’ils ont la possibilité de se développer plus rapidement par rapport
aux autres microorganismes (Saucier et Champagne, 2006). Dans les conditions inverses,
c'est-à-dire en conditions anaérobes, la réduction du niveau d’oxygène tend à inhiber les
bactéries aérobes au profit des anaérobes ou anaérobes facultatives comme les bactéries
lactiques du genre Lactobacillus (Gill, 1983).

26
L’exsudat de viande sur lequel les microorganismes croissent à la surface de la viande
contient des composés de faible poids moléculaire à l’instar des résidus de glucose ainsi que
des intermédiaires glycolytiques notamment le glucose-6-phosphate (Eskin, 1990). Tous ces
composés jouent un rôle important dans la détérioration de la viande et le type d'organismes
présents dans la population microbienne (Lambert et al., 1991). Par exemple, dans la viande
dite DFD, le pH est plus élevé (6 >), il favorise donc le développement des Brochothrix
thermosphacta, des Enterobacteriaceae ainsi que Yersinia enterocolitica (Gill et Penney,
1986 ; Dainty et Mackey, 1992). La décarboxylation des acides animés par les Pseudomonas
notamment fait monter le pH.
En présence d’oxygène, Pseudomonas (fragi, fluorescens et lundensis, trois espèces) utilise
préférentiellement le glucose comme substrat jusqu’à épuisement. Une fois que le glucose
épuisé à la surface de la viande, les Pseudomonas commencent à dégrader les acides aminés
(Gill et Newton, 1978) avec la formation d’amines volatiles et d’ammoniac, responsable
d’odeurs et de saveurs désagréables (Bornet, 2000). Ce type de métabolisme est rencontré
chez les bactéries du genre Pseudomonas, Moraxella, Acinetobacter, Microbacterium
thermosphactum, mais aussi les Lactobacillus et Enterobacteriaceae. Les entérobactéries, en
particulier les espèces tolérantes au froid, sont également présentes sur la viande fraîche, mais
contribuent rarement à la détérioration à moins d’un mauvais contrôle de température de
réfrigération (Nychas et al., 2008).
Suite à ces phénomènes, on observe des odeurs indésirables, les changements de couleur
(gris, marron ou vert, FAO, 2017), le rancissement, l’apparition de substances gluantes sur
la viande qui constituent des critères négatifs et qui conduisent au rejet de la viande par le
consommateur.
En conditions anaérobes, incluant le sous vide, la microflore d’altération prévalente de la
viande est habituellement constituée de Lactobacillus qui cause de l’acidification par
fermentation des sucres plutôt que de la putréfaction (Bornert, 2000). Ce processus
hétérofermentaire conduit à la formation de gaz, d’aldéhydes et de cétones, tous à l’origine
de modifications du goût et de l’odeur du produit. Ce qui provoque le développement de
flaveurs aigres moins offensives que celles putrides formées par le métabolisme des bactéries
aérobes. De plus, Brochothrix thermosphacta est une bactérie anaérobe facultative, tolérante

27
à de faible concentration l'oxygène et est communément détectée en fin durée de vie sur les
viandes réfrigérées en conditions anaérobes, mais n’est pas considérée comme contributeur
majeur à l'altération surtout depuis que les équipements d’emballage sont plus performants
pour éliminer l’air dans les emballages (Nychas et al., 2008). Toutes les bactéries à
l’exception des Lactobacillus représentent une faible proportion de la population
microbienne de la viande lors de la détérioration. Gill (1976) a mis en évidence que la
microflore maximale est établie par la vitesse de diffusion des substrats fermentescibles à la
surface. Selon lui, un certain nombre de lactobacilles inhibe la croissance d'autres espèces
sur la viande, probablement par la production d'agents antimicrobiens (c’est l’exclusion
compétitive) dans le but de créer un avantage sur l’utilisation des nutriments. L'emballage
sous vide réduit l'oxydation des lipides dans la viande de lapin et peut donc prolonger sa
durée de conservation ( Dalle Zotte, 2002). Cependant, ce type d'emballage assombrit la
viande et ne peut donc être utilisé que lorsque la rétention de la couleur rouge n'est pas
importante (Dalle Zotte, 2002).
L‘altération de la viande crue peut se produire de deux manières pendant la réfrigération soit
par la croissance microbienne, soit par le rancissement oxydatif (Sebranek et al., 2005). Elle
diminue donc la durée de conservation de la viande, ce qui entraîne un gaspillage de
nourriture. Par ailleurs, parmi la microflore de la carcasse, des bactéries pathogènes peuvent
s’y retrouver et causer des toxi-infections alimentaires si elles ne sont pas bien contrôlées
(Fratianni et al., 2010). Ce qui a pour conséquence un traitement coûteux et la perte d'heures
de main-d'œuvre pour les économies nationales. Cependant, en industrie alimentaire,
l’altération microbienne est retardée par la chaîne de froid et l’entreposage de la viande à des
températures comprises entre -1°C et + 4°C.
Au cours des dernières années, il y a eu une résistance considérable des consommateurs à
l'utilisation d'antioxydants de synthèse comme l'acétate de sodium, le nitrite de sodium, le
sorbate de potassium, le sulfite, l'acide benzoïque, le butyl-hydroxytoluène (BHT), le butyl-
hydroxyanisole (BHA) et le tert-butylhydroquinone (TBHQ ; Basuny et al., 2013). En effet,
BHA et BHT ont été incriminés dans le trouble déficitaire de l'attention avec hyperactivité
chez les enfants (Feingold, 1982) et les composés de nitrate et les nitrites (nitrosamine) sont
des précurseurs de produits cancérogènes (ex. : nitrosamine). Par conséquent, des stratégies

28
nouvelles, y compris l'utilisation d’agent de conservation naturel est d'un grand intérêt pour
l'industrie de la viande en réponse à la demande croissante des consommateurs pour des
produits alimentaires le plus naturel possible.
La demande des consommateurs pour des produits frais sans agent de conservation oblige les
industriels à innover. Au cours des dernières années, une grande attention a été portée sur des
composés naturels tels que les polyphénols des végétaux, les bactéries lactiques (leurs
bactériocines) et les huiles essentielles. Contrairement aux composés synthétiques, ces agents
de bioconservation s’avèrent être un bon compromis, car ils peuvent améliorer la qualité
nutritionnelle et sensorielle en diminuant l'oxydation et la croissance microbienne tout en
favorisant l'extension de la durée de vie des produits carnés.
1.6. Nouvelles stratégies alimentaires simples et sans investissement majeur pour les producteurs
1.6.1. Les bactéries lactiques : nouvelle approche pour la conservation de la viande
Depuis toujours, les antibiotiques ont été utilisés dans le but d’éliminer diverses bactéries
pathogènes à l’origine de pathologies et d’intoxication alimentaires. Mais avec l’émergence
des antibiorésistances, les scientifiques se sont orientés vers la recherche de substances
naturelles comme les bactériocines des bactéries lactiques. Les bactéries lactiques sont des
microorganismes à Gram positif, non mobile, en forme de bâtonnet ou de coques, non
sporulant qui produisent de l’acide lactique comme le produit final majeur de la fermentation
du glucose (Swetwiwathana et Visessanguan, 2015). Elles vivent naturellement dans
l’environnement (rarement pathogène), font partie de la microflore intestinale et vaginale
(humaine et animale) et se retrouvent à la surface de nombreux produits alimentaires comme
les produits laitiers, la viande, les végétaux et les céréales. Les bactéries lactiques sont donc
également considérées comme des contaminants de surface pendant la transformation des
aliments et, par conséquent, même sur les aliments transformés (Henning et al., 2015).
Considérées inoffensives et sûres pour la santé humaine (GRAS), les bactéries lactiques sont
principalement utilisées en tant que ferments et produisent de nombreux métabolites aux
propriétés antimicrobiennes telles que les acides organiques et les bactériocines. Ces
dernières ont eu un intérêt important à cause de leurs activités inhibitrices contre certains

29
microorganismes pathogènes. Selon la définition de Stiles (1996), la biopréservation est le
terme utilisé pour décrire la « durée de conservation prolongée et l’innocuité accrue des
aliments utilisant la microflore naturelle et/ou de leurs produits antibactériens » et plusieurs
bactéries lactiques conviennent à cet effet. Cette technique serait une alternative idéale pour
les producteurs afin d'assurer la salubrité des aliments et d'accroître la durée de conservation
microbienne de leurs produits, car les consommateurs exigent des aliments peu transformés
avec des additifs alimentaires naturels plutôt qu'avec des agents de conservation de synthèse.
Les bactéries lactiques les plus connues et largement utilisées en industrie sont Lactococcus,
Streptococcus, Lactobacillus, Pediococcus et Enterococcus (Egan et al., 2016). Certaines ont
acquis une notoriété pour démontrer un effet « probiotique » lorsqu'elles sont ingérées, c'est-
à-dire administrées en quantité adéquate, elles confèrent un avantage pour la santé de l'hôte
tandis que d'autres sont connus pour produire une variété d'antimicrobiens (FAO et l’OMS,
2001). Les genres Lactobacillus et Bifidobacterium ont un long historique d’utilisation en
alimentation humaine, car elles sont largement incorporées dans les produits laitiers. L’une
des sources les plus courantes de probiotiques dans le monde est les produits laitiers
fermentés tels que le fromage, le yaourt et le kéfir. Chez les animaux d’élevage, les
probiotiques sont censés améliorer la santé globale tout en assurant l'équilibre microbien dans
leur intestin. Selon Steiner (2009), leur mode d’action est basé principalement sur des
phénomènes d’exclusion compétitive, d’antagonisme bactérien et de modulation
immunitaire. Yirga (2015) définit l’exclusion compétitive comme étant la capacité de
la microflore normale à se protéger contre l'établissement nocif des agents pathogènes. Ainsi
pour exercer leur effet nocif, les bactéries néfastes doivent se fixer sur la paroi intestinale;
l’effet des probiotiques est donc d’augmenter la colonisation de la microflore normale non
pathogène avec l’inhibition de l’adhérence des organismes pathogènes nuisibles sur les
parois intestinales, bloquant ainsi les sites récepteurs et empêchant la fixation des bactéries
nocives (Yirga, 2015). De plus, toujours selon le même auteur, les probiotiques entrent en
compétition avec les bactéries pathogènes pour les nutriments dans l’intestin. Quant au
second rôle des probiotiques, l’antagonisme bactérien, on parle d’activité bactéricide ou
bactériostatique dans l’intestin causé par la libération de substances inhibitrices ou mortelles
pour les bactéries nocives.

30
Enfin, les probiotiques permettent également de maintenir les organismes pathogènes en petit
nombre tout en soutenant la défense de l'animal contre les agents pathogènes envahisseurs
en stimulant la réponse immunitaire gastro-intestinale : c’est la modulation immunitaire.
1.6.1.1. Les bactériocines comme la conservation des aliments
Les bactériocines sont des peptides antimicrobiens qui ont une activité inhibitrice dirigée
contre les bactéries proches de la souche productrice et qui ont gagné une énorme attention
en tant qu’agent de bioconservation potentiel (O’Sullivan et al., 2002 ; Swetwiwathana et
Visessanguan, 2015). Selon Leroy et De Vuyst (2004), ces substances antimicrobiennes sont
composées de peptides bioactifs ou de complexes de peptides qui ont une activité bactéricide
ou bactériostatique. Leur action, selon la revue de O’Sullivan et al. (2002), est d’interférer
avec la paroi cellulaire ou la membrane des organismes cibles en inhibant la biosynthèse de
la paroi cellulaire ou en provoquant des pores, entraînant de ce fait la mort de la cellule.
Cependant, la souche productrice doit synthétiser une protéine d’immunité à la bactériocine
afin d’éviter le suicide. Elles peuvent être produites aussi bien par les bactéries à Gram positif
que les bactéries à Gram négatif, toutefois, elles sont généralement inefficaces contre les
bactéries à Gram négatif parce qu'elles ne peuvent pas traverser la membrane extérieure et
vice versa (O’Sullivan et al., 2002).
Les bactériocines produites par les BAL ont plusieurs propriétés qui les rendent idéales pour
une utilisation dans la conservation des aliments. Elles sont tolérantes au pH et à la chaleur
(propriétés importantes dans la transformation des aliments, Egan et al., 2016). Aussi (i)
beaucoup de BAL producteurs de bactériocines sont considérés comme inoffensifs GRAS et
sont perçus par le public comme ayant des caractéristiques de promotion de la santé, (ii) elles
sont non toxiques pour les cellules eucaryotes et (iii) elles sont inactivées par les protéases
du tube digestif (la pancréatine, la trypsine et la chymotrypsine) donc peu d'influence sur la
microflore intestinale (O’Sullivan et al., 2002). En plus, selon les études de Egan et al. (2016),
(iv) les bactériocines sont codées par un gène et donc très favorables à la manipulation
génétique, lorsque cela est souhaité (Field et al., 2015), (v) toutes les bactériocines produites
par les BAL n'ont pas le même mode d'action, et (vii) elles sont actives contre une gamme de
bactéries alimentaires pathogènes et d’altération. D'autres propriétés qui les rendent
utilisables comme antimicrobiens dans les aliments sont leur manque de résistance croisée

31
avec les antibiotiques et peuvent être manipulées génétiquement (Galvéz et al., 2007). En
somme, les bactéries lactiques offrent plusieurs propriétés clés qui rendent leurs bactériocines
hautement souhaitables pour une utilisation dans les aliments.
Dans l’industrie agroalimentaire, les bactéries lactiques sont utilisées pour obtenir des
changements favorables dans la texture, l’arôme, la saveur et l’acidité (Leroy et De Vuyst,
2004). De plus, selon l’étude de Swetwiwathana et Visessanguan (2015), certaines
bactériocines semblent inhiber les agents pathogènes potentiels d'origine alimentaire, y
compris Clostridium botulinum, En. faecalis, L. monocytogenes, S. aureus et Bacillus spp.
Les bactéries lactiques comptent plusieurs genres utilisés comme probiotiques dans
l’alimentation animale notamment, Lactococcus, Streptococcus, Lactobacillus,
Enterococcus, Bifidobacterium, Pediococcus et Carnobacterium. C’est de Carnobacterium
qu’il sera question plus spécifiquement dans ce chapitre.
1.6.1.2. Les bactériocines comme des agents de conservation dans la viande
L'utilisation des bactéries lactiques a été largement étudiée dans la littérature dans le but
d’améliorer la qualité des produits et d’étendre la durée de conservation de la viande
(Guerrero et al., 1995). Mais pour que ces bactéries lactiques soient efficaces, elles doivent
être en mesure de survivre à l’acidité stomacale (pH plus bas que 1,5 chez l’homme
(Dressman et al., 1990) et 1,9 chez le lapin (Smith, 1965) et arriver dans les intestins en
quantités suffisantes, car dans le transit, le long du tube digestif, la majorité des bactéries
ayant un effet probiotique meurent.
En outre, la littérature rapporte que les BAL, employées comme probiotique peuvent utilisées
comme alternative aux antibiotiques pour leur effet bénéfique sur les performances
zootechniques et la santé des animaux. Par exemple, Xiaolu et al. (2012) a conclu que l’ajout
de probiotique (Bacillus licheniformis) dans l’eau des poulets de chair pouvait être utilisé en
tant que promoteur de la croissance. Par contre l’étude réalisée par Dalloul et al. (2003) a
démontré qu’en utilisant Lactobacillus comme probiotique dans l’alimentation des poussins,
ces derniers étaient significativement plus résistants contre la coccidie (Emeria acervulina).
Dans cette étude, le nombre de lymphocytes intraépithéliaux de l’intestin a augmenté
suggérant que le probiotique a eu un effet positif sur le système immunitaire des poulets.

32
Même si de nombreuses études ont rapporté la réduction des coliformes et entérobactéries
intestinaux due à l'administration de probiotiques ; cependant, d’autres n’ont rapporté aucun
effet (Simon et al., 2003).
Sans aucun doute, la bactériocine plus largement étudiée est la nisine, produite par
Lactococcus lactis et est autorisée dans plus de 50 pays (Egan et al., 2016) sauf au Canada
où elle n’est toujours pas permise. En effet, elle a obtenu peu d’application jusqu’à ce jour,
car la nisine est instable dans la viande crue, parce qu’elle réagit avec, le glutathion (Rose et
al., 1999). De ce fait, la nisine est inactivée dans la viande crue même si elle est bien connue
pour son pouvoir antimicrobien contre L. monocytogenes et Cl. botulinum. Micocin®, un
ingrédient contenant l'organisme Carnobacterium maltaromaticum CB1, a été homologué au
Canada pour son usage dans des produits sous vide comme les saucisses, le rôti de bœuf
tranché, le jambon cuit et la dinde cuit en tranches (Health Canada, 2010). Il a également
l'approbation GRAS aux États-Unis pour les produits de viande et le saumon fumé
(Harrington, 2011) et est approuvé aussi au Mexique, au Costa Rica et en Colombie.
Micocin® a un pourvoir antimicrobien contre L. monocytogenes, produisant trois
bactériocines : carnocycline A, piscicoline 126 et la carnobactériocine BM1 et autres
métabolites antimicrobiens. Carnobacterium spp. est une bactérie psychrotrophe, capable de
se développer dans la viande, à des températures aussi basses que 1,5 à 2 °C, et ce, dans
un emballage sous vide ou en atmosphère modifiée (McMullen et Stiles, 1993 ; Sakala et al.,
2002 ; Jones, 2004 ; Casaburi et al., 2011). La particularité de Carnobacterium spp. est sa
croissance qui est inhibée par l'acétate contenu sur la gélose deMan, Rogosa et Sharpe
(MRS), qui sont couramment utilisées pour le dénombrement des bactéries lactiques (Sakala
et al., 2002 ; Chenoll et al., 2007) et donc il croît peu sur ce milieu de culture. Par conséquent,
pour le dénombrement de cette bactérie lactique dans la microflore de la viande, il préférable
d'utiliser un milieu de culture tel que le All Purpose Tween (APT), afin de permettre sa
croissance en conditions anaérobes. Le genre Carnobacterium regroupe neuf espèces, mais
seulement deux espèces, divergens et maltaromaticum (anciennement piscicola), sont
fréquemment rencontrées dans l'environnement et dans les aliments. C. maltaromaticum
CB1 est efficace contre En. faecalis, En. faecium, Pediococcus acidilactici, C. divergens, Lc
lactis spp. lactis, Lactobacillus curvatus, Lb. casei, Leuconostoc gelidum, S. aureus, Cl.

33
botulinum, et plus particulièrement, L. monocytogenes (Laursen et al., 2005 ; Casaburi et al.,
2011 ; Gonzàlez et al., 2013).
1.6.1.3. Micocin® sur les viandes transformées
La biopréservation (ajout de bactéries vivantes aux produits de viande) offre la solution idéale
au problème de sécurité alimentaire. Les souches de Carnobacterium sont particulièrement
adaptées à la biopréservation et elles ont peu d'impact sur les qualités organoleptiques des
produits. Par exemple, dans du pâté de jambon inoculé expérimentalement, la bactériocine
piscicoline 126 a réduit le nombre viable de L. monocytogenes immédiatement après son
ajout, et ce, pendant les 14 jours de l'essai (Jack et al., 1996). En outre, une réduction de 4 à
5 log du taux de L. monocytogenes sur des tranches de saumon emballé sous vide a été
constatée en présence de C. maltaromaticum à 106 UFC/g à 5°C comparé au témoin non
ensemencé (Nilsson et al., 1999). Quant à Gonzalez et al. (2013) une réduction significative
du nombre de L. monocytogenes à 4 et 8°C dans le Morcilla et Chorizo où le C.
maltaromaticum CB1 avait été ajouté comme biopréservateur par rapport aux produits
témoins. Une étude plus récente de Danielski et al. (2017) a démontré le potentiel
antilistériale de trois souches de C. maltaromaticum, in vitro, contre L. monocytogenes et
une inhibition des bactéries Gram- quand ils sont combinés à l’EDTA (Escherichia coli
O157: H7, et Salmonella spp.).
Cependant, peu de publications scientifiques indiquent les effets de l’ajout de C.
maltaromaticum CB1 dans la moulée sur la qualité microbiologique des carcasses. Pour notre
étude, Micocin® a été utilisé parce qu’il est possible de le suivre dans les fèces, sur les cuisses
et dans la viande hachée de lapin par des méthodes moléculaires (trois gènes spécifiques) et
parce qu’elle est active contre L. monocytogenes.
1.6.2. Les polyphénols : composés naturels, idéals pour l’industrie agroalimentaire
Les polyphénols, d’après Lucera et al. (2012), sont des agents antioxydants, antimicrobiens
et réducteurs qui améliorent la durée de vie des tablettes et la texture. En effet, la plupart
comportent un groupement aromatique ayant des fonctions hydroxyles capables de libérer un
atome d’hydrogène afin de neutraliser les radicaux libres. Suite à cette libération, le
groupement aromatique peut rester stable par la délocalisation de ses électrons (Duthie et al.,

34
2000). Puisque les radicaux libres sont neutralisés, la phase de propagation de l’oxydation se
voit ralentie.
1.6.2.1. Caractéristiques et classification
Les polyphénols sont un groupe de substances chimiques que l’on retrouve notamment dans
les plantes, et qui sont caractérisées par la présence d’un ou plusieurs noyaux aromatiques
avec plusieurs groupes hydroxyle (Figure 1.2.a). Les polyphénols peuvent être divisés en
quatre principales familles : les flavonoïdes (flavones, flavanones, flavonols, isoflavonones,
anthocyanines, proanthocyanidines et flavanols ; Figure 1.2.b), les acides phénoliques
(Figure 1.2.c), les tannins et les lignanes ainsi que les stilbènes, qui se divisent à leur tour en
plusieurs catégories ou composés (Manach et al., 2004 ; Erdman et al., 2007).
a) b) c
Figure 1.2. a) Molécule de phénol, la structure de base des polyphénols; b) Structure de base des acides phénoliques; c) Structure de base des flavonoïdes
Les polyphénols se trouvent d’une manière générale dans les racines, les tiges, le bois, les
feuilles, les fleurs et les fruits des végétaux. Ce sont des antioxydants puissants qui se
complètent et s'ajoutent aux fonctions des vitamines antioxydantes et des enzymes comme
moyen de défense contre le stress oxydatif causé par l'excès d'espèces réactives de l'oxygène
(ERO ; Tsao, 2010). Globalement, ce sont d’excellents piégeurs des ERO et de très bons
chélateurs des métaux de transition comme le fer et le cuivre (Haleng et al., 2007). Ils sont
également responsables de la production des ERO et de l’induction de la biosynthèse
d’enzymes antioxydantes.
Les composés phénoliques se retrouvent dans notre alimentation, tout spécialement les
flavonoïdes qui représentent la classe de polyphénols la plus répandue dans notre diète.
D’après Tsao (2010), plus de 8000 structures phénoliques sont actuellement connues, et
parmi celles-ci, plus de 4000 flavonoïdes ont été identifiés. D’un point de vue moléculaire,
les polyphénols se différencient selon leur squelette de base, le degré de modification de ce
c)

35
squelette (oxydation, hydroxylation, méthylation) et les liaisons possibles avec d’autres
molécules comme les glucides, les lipides et les protéines. Ces composés jouent un rôle
essentiel dans la croissance, le développement et la survie des végétaux. Ils sont impliqués
dans la résistance de base qui rend la plupart des plantes non sensibles aux bactéries
potentiellement pathogènes (Biedrzycka et Amarowicz, 2008). Ils contribuent également à la
couleur ainsi qu’à l’astringence (dû aux tannins) et à l’amertume de la plante dans laquelle
ils se retrouvent (Manach et al., 2004). Ensuite, ils vont protéger les plantes contre les
agressions externes : soleil, pluie, froid, etc. et même contre des agents responsables de
maladies. Certains d’entre eux jouent même le rôle de phytoalexines comme les isoflavonols
permettant de lutter contre les infections causées par les champignons, ou par les bactéries
(Makoi et Ndakidemi, 2010).
1.6.2.2. Les composés riches en composés polyphénoliques
L’intérêt pour les plantes et les épices, comme ingrédients alimentaires, vient notamment de
leurs propriétés antioxydantes. Ces molécules antioxydantes inhibent les enzymes
responsables de la formation des radicaux libres et sont même des chélateurs de certains ions
métalliques. Ce sont de véritables "capteurs" de radicaux libres dont la particularité est due à
leurs composants à la fois hydrophiles et hydrophobes (Obrenovich, 2010). De par leur
capacité à neutraliser les radicaux libres, les antioxydants ont le pouvoir de diminuer les
niveaux de stress oxydatif et, par conséquent, les dommages oxydatifs.
Les flavonoïdes par exemple sont très répandus dans les végétaux, les tannins dans le cacao,
le café, le thé, le raisin, etc. Quant aux fruits rouges, ils sont riches en anthocyanes et les
céréales, les fruits et les légumes, en acides phénoliques. Selon les données de Liu (2013),
les petits fruits tels que les fraises, les canneberges, les bleuets, les framboises, les mûres, les
grenades ou les raisins ont une teneur particulièrement élevée en polyphénols
comparativement aux autres fruits (Figure 1.3). Les fraises par exemple, sont plus riches en
anthocyanines et présentent généralement une capacité antioxydante totale plus importante
que ceux riches en flavanones (orange) et en flavonols (oignon). Mais la canneberge se classe
parmi les premiers pour sa teneur en polyphénols et pour sa capacité antioxydante chez les
fruits (Figure 1.3).
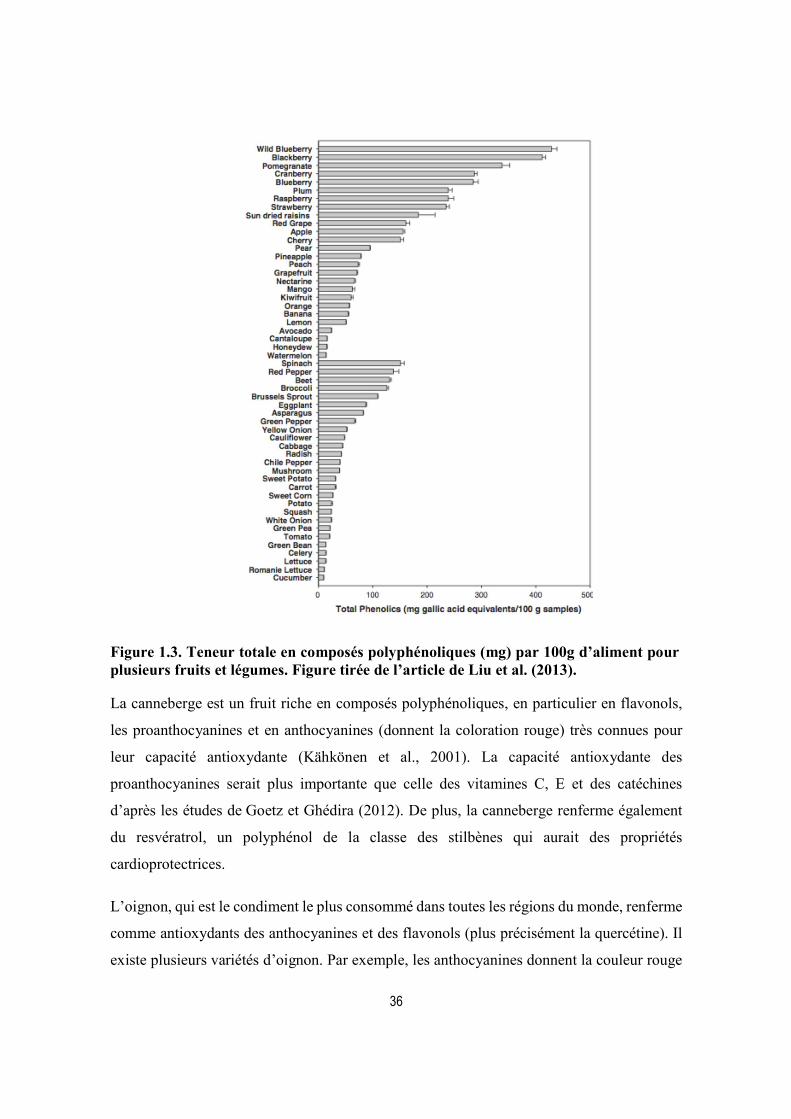
36
Figure 1.3. Teneur totale en composés polyphénoliques (mg) par 100g d’aliment pour plusieurs fruits et légumes. Figure tirée de l’article de Liu et al. (2013).
La canneberge est un fruit riche en composés polyphénoliques, en particulier en flavonols,
les proanthocyanines et en anthocyanines (donnent la coloration rouge) très connues pour
leur capacité antioxydante (Kähkönen et al., 2001). La capacité antioxydante des
proanthocyanines serait plus importante que celle des vitamines C, E et des catéchines
d’après les études de Goetz et Ghédira (2012). De plus, la canneberge renferme également
du resvératrol, un polyphénol de la classe des stilbènes qui aurait des propriétés
cardioprotectrices.
L’oignon, qui est le condiment le plus consommé dans toutes les régions du monde, renferme
comme antioxydants des anthocyanines et des flavonols (plus précisément la quercétine). Il
existe plusieurs variétés d’oignon. Par exemple, les anthocyanines donnent la couleur rouge

37
à certaines variétés d’oignon, et les flavonols colorent les oignons jaunes (Griffiths et al.,
2002). De plus, Chu et al. (2000) ont noté que ces antioxydants se retrouvent surtout dans les
couches externes des oignons c’est à-dire la pelure. Ainsi, les oignons blancs contiennent peu
d’antioxydants comparativement à ceux de couleur jaune et rouge d’après les études de Yang
et al. (2004). Au Québec seulement, c’est environ 15000 tonnes d’oignons qui n’atteignent
pas les marchés d’alimentations pour des raisons diverses (moches, difformes ou trop petits)
selon l’Union des producteurs agricoles. Il est important de valoriser tous les composants
issus de notre production agricole notamment dans l’alimentation animale. Ce projet recycle
donc des sous-produits et des fractions de polyphénols autrement gaspillées et qui donneront
une valeur ajoutée aux aliments.
1.6.2.3. Les huiles essentielles (HE) riches en polyphénols
Les huiles essentielles (HE) ont été longtemps reconnues pour retarder et empêcher les
transformations indésirables (telles que la diminution de la valeur nutritive, les odeurs
désagréables), mais surtout pour leurs activités antioxydantes, antibactériennes,
antiparasitaires et antifongiques (Zhang et al., 2016). Elles sont constituées d’un mélange
hétérogène de substances organiques complexes et aromatiques telles que les terpènes et les
terpénoïdes, les constituants aromatiques et aliphatiques, tous caractérisés par un faible poids
moléculaire (Bassolé et Juliani, 2012). Selon Oussalah et al. (2007), ces huiles volatiles sont
généralement concentrées dans une région particulière des plantes dont elles sont issues,
comme les feuilles, l’écorce ou les fruits, et quand ils sont produits dans les divers organes
de la même plante, ils ont souvent des profils de compositions différents.
Plusieurs d’entre elles présentent des activités prometteuses contre de nombreux agents
pathogènes d’origine alimentaire et les microorganismes d’altération (Bassolé et Juliani,
2012). Une caractéristique importante des HE et de leurs composants est leur caractère
hydrophobe, ce qui leur permettra de partitionner avec les lipides de la membrane cellulaire
des bactéries et des mitochondries, perturbant les structures cellulaires afin de les rendre plus
perméables (Solórzano-Santos et Miranda-Novales, 2012 ; Perricone et al., 2015).

38
1.6.2.4. Biodisponibilité des polyphénols
La biodisponibilité des polyphénols diffère beaucoup d’un composé à un autre. Elle est
définie comme la fraction de polyphénols consommés, métabolisés, assimilés, accumulés et
présents sous forme active dans la circulation sanguine. Beaucoup de facteurs, comme la
dose, la structure, les propriétés chimiques, le modèle d’animal choisi, la voie
d’administration, l’influencent, mais d’après les études menées par Manach (2004), ce sont
les polyphénols consommés en plus grande quantité qui auront les effets métaboliques les
plus importants. Cependant, toujours selon Manach (2004), les polyphénols les plus
communs dans l'alimentation humaine ne sont pas nécessairement les plus actifs dans le
corps, soit parce qu'ils ont une activité intrinsèque inférieure ou parce qu'ils sont mal absorbés
par l'intestin, hautement métabolisé, ou rapidement éliminé.
La consommation quotidienne de phénols végétaux chez l'humain est estimée entre 150 et
1000 mg (Dudonné et al., 2014). Dans l'organisme, certains polyphénols, les plus simples,
peuvent être absorbés sous leur forme aglycone (intacte et par diffusion passive dans
l’intestin grêle), mais la majorité des polyphénols ne peuvent pas être absorbés sans d’abord
être hydrolysés par les enzymes et les bactéries intestinales ou la microflore du côlon
(Manach et al., 2005). Les dérivés seront liés d’abord à un sucre simple une fois ingéré (le
glucose principalement, ou bien le galactose, l'arabinose, le xylose, l’acide glucuronique, etc.
; Scalbert et Williamson, 2000) et sont appelés glycosides. Le nombre de sucres ainsi lié est
le plus souvent un, mais peut être également deux ou trois. La digestion et l’absorption des
polyphénols commencent dans l'estomac. Selon Hollman (2011), l'absorption la plus efficace
se produit à partir de l'intestin grêle à cause de sa grande surface. Cependant, le foie constitue
le principal lieu de métabolisation des composés phénoliques afin de faciliter leur
élimination. En effet, ces derniers sont conjugués à ce niveau et formeront des dérivés
méthylés, sulfatés, glucuronides ou des glucuronides-sulfates (Manach et al., 2005) : c’est la
conjugaison (Figure 1.4). Cette dernière est un processus de détoxification métabolique qui
permet de restreindre les effets toxiques potentiels des composés xénobiotiques et qui facilite
leur élimination biliaire et urinaire (D’Archivio et al., 2010). Les polyphénols qui ne sont pas
absorbés dans l'estomac ou l'intestin grêle seront transportés jusqu’au côlon (Figure 1.4). En
outre, ceux qui ont été absorbés et métabolisés dans le foie pour ensuite être excrétés dans la

39
bile ou directement dans les entérocytes retourneront à l'intestin grêle également pour
atteindre le côlon, mais sous une forme chimique différente, comme un glucuronide (Scalbert
et Williamson, 2000). Il est donc clair que tout polyphénol unique génère plusieurs
métabolites non seulement dans l'intestin grêle et dans le côlon, mais aussi dans le foie, où la
plupart des réactions de conjugaison ont lieu.
Figure 1.4. L'absorption des polyphénols alimentaires chez l'homme. Les polyphénols sont fortement modifiés au cours de l'absorption dans l’estomac : les glycosides peuvent être hydrolysés dans l'intestin grêle ou dans le côlon et les aglycones libérés peuvent être absorbés. Avant le passage dans la circulation sanguine, les polyphénols subissent d'autres modifications structurales à cause du processus de conjugaison, qui a lieu principalement dans le foie. Tiré D’Archivio et al. (2010).
Les métabolites issus des polyphénols ainsi créés sont donc éliminés de l’organisme par
l’excrétion urinaire et biliaire. Selon Erdman (2007), l’excrétion urinaire est une voie
importante pour les flavanones, les isoflavones, et les flavan-3-ols, mais l’excrétion biliaire
est la principale pour l’ensemble des polyphénols. Pour Manach et al. (2005), seuls les
produits conjugués de faible poids moléculaire sont excrétés par voie urinaire, les plus
grosses, le seront par voie biliaire. La métabolisation des polyphénols ne s’arrête pas à
l’action des entérocytes ou du foie. En effet, ceux-ci sont intensivement dégradés par le
microbiote intestinal, qui possède une enzyme la ß-glucuronidase capable de libérer les
aglycones des métabolites conjugués. Ces derniers sont ensuite sécrétés dans la bile, pour
ensuite être réabsorbés (Manach et al., 2005).

40
D’après les travaux de Manach (2005) et Hollman (2011), seuls les anthocyanes, de la famille
des flavonoïdes (ex : fraise et canneberge), peuvent être absorbées directement à partir de
l’estomac intact et se retrouver sous forme de glycoside dans le plasma (Dudonné et al.,
2014). Ils ont une très faible biodisponibilité et apparaissent 1,5 heure (valeurs maximales)
dans le plasma après l'ingestion chez des rats. Sachant que la demi-vie moyenne des
polyphénols dans le sang est de 8 heures, avec une variation d’une heure et 18 heures selon
la nature des composés (Manach et al., 2005).
Les proanthocyanides présentent également une biodisponibilité faible. Ils sont retrouvés
dans les fraises et les canneberges, mais en raison de leur structure, ils ne sont pas absorbés
et donc ne se retrouvent pas dans le plasma suivant leur consommation (Dudonné et al.,
2014). Selon les études de Manach (2005), cela pourrait être le résultat d’une instabilité une
fois absorbé et non d’une mauvaise absorption. Par contre, selon les études d’Anhê et al.
(2013, 2014), les composés phénoliques non absorbés atteignent le côlon où ceux-ci peuvent
avoir un effet prébiotique. Les anthocyanes par exemple, ont également une faible
disponibilité, ont été détectées en très faible quantité dans le plasma des rats ayant consommé
un extrait d’anthocyanes (Dudonné et al., 2014). Toujours selon Dudonné et al. (2014) les
anthocyanes sont médiocrement disponibles en raison de la dégradation microbienne
spontanée ainsi que pour leur haute sensibilité au pH.
Cependant, parmi les polyphénols les mieux absorbés, la quercétine (un flavonol retrouvé
surtout dans la canneberge, l’oignon) est absorbée sous sa forme glucosidée (Hollman et al.,
2011) avec une demi-vie plasmatique plus longue que la moyenne des polyphénols, soit de
11 à 28h (Manach et al., 2005 ; Dudonné et al., 2014). Chez l'homme, l’absorption maximale
pour les glycosides de la quercétine : se produit 0,5-0,7 h après l'ingestion de la quercétine-
4’-glucoside et de 6 à 9h après l'ingestion de la même quantité de rutine (quercétine-3ß -
rutinoside; Manach et al., 2005).
Une fois métabolisés, ses dérivés ont la particularité de posséder une affinité élevée pour
l’albumine. La quercétine est largement distribuée dans les plantes alimentaires, présentes
sous forme de glycones et de glycosides, elle circule dans le plasma sous forme conjuguée
(forme glucuronidée et glucuroconjugué) et dans une moindre mesure dans la forme sulfatée.
Une étude faite par Dudonné et al. (2014) indiquent la possibilité d'augmenter la

41
concentration des métabolites circulant en utilisant des interactions synergiques entre les
composés phénoliques et ainsi augmenter la bioactivité de certains extraits de plantes en
améliorant leur biodisponibilité orale.
1.7. L’oxydation de la viande : un phénomène redouté en agroalimentaire
Toutes les viandes et les poissons sont sensibles à l'oxydation. Cette oxydation débute
immédiatement après l’abattage et s’accentue lorsque le muscle se transforme en viande
impactant sur la fonctionnalité des protéines, des lipides et des pigments ; en somme, sur les
qualités sensorielles, technologiques et nutritionnelles des viandes. Ce phénomène
d’oxydation est le plus redouté en agroalimentaire parce qu’il tend à diminuer la durée de
conservation de la viande et entraîne des pertes importantes pour les transformateurs de
viande et les détaillants (Nattress et al., 2001 ; Wood et al., 2004). D’autant plus que le
problème est encore plus grave lorsque la viande est hachée, entreposée pendant longtemps
ou cuite (Lee et al., 2006). En outre, la consommation de produits dérivés de l’oxydation peut
compromettre la santé humaine (Dalle Zotte et Szendro, 2011). En effet selon Chi-
Tang et Wang (2013), l’accumulation des produits de dégradation des protéines et lipides
sont impliqués dans la pathogenèse du diabète, des maladies neurodégénératives, du diabète
et même du vieillissement normal.
Dans la viande, l’oxydation est due au stress oxydatif. Ce dernier est causé par la production
d’espèces réactives de l’oxygène ERO (les radicaux libres) catalysée par les métaux de
transition, comme le cuivre et surtout le fer (Gatellier et al., 2014). Selon l’auteur Gatellier
(2014), plus la protection antioxydante du muscle (enzymes antioxydantes endogènes et
vitamines antioxydantes apportées par l’alimentation) diminue rapidement après la mort de
l’animal, plus l’impact de ces radicaux libres est fort.
1.7.1. La peroxydation des lipides : les AGPIs et leur effet sur la qualité de la viande
La peroxydation lipidique ou la lipopéroxydation est l'une des principales causes de
détérioration de la qualité de la viande et des produits carnés, et génère des composés qui
peuvent être préjudiciables pour la santé comme des molécules cancérigènes par exemple le
malondialdéhyde (MDA), le 4-hydroxynonénal (4-HNE) et les isoprostanes (Byrne et al.,
2001; Michel et al., 2008). La peroxydation du la viande est initiée dans la région

42
phospholipidique hautement insaturée des membranes intracellulaires. Cette fraction de
phospholipides riches en acides gras polyinsaturés se dégrade en des produits d'oxydation
volatils à chaînes courtes et conduit à la formation d’odeurs et de flaveurs désagréables
(rancissement des aliments).
L’oxydation des lipides se produit par une auto-oxydation, une photo-oxydation et lors d’une
oxydation enzymatique. Cependant dans les produits alimentaires, incluant les produits
carnés, le principal processus d’oxydation est l’auto-oxydation qui est catalysée par
l’oxygène ou la température ambiante et initiée par des espèces réactives de l'oxygène (ERO).
La photo-oxydation quant à elle, est initiée par la lumière en présence de
photosensibilisateurs tandis que l’oxydation enzymatique l’est par la présence d’enzymes qui
catalysent les réactions d’oxydation (Morales et al., 2006). Le taux d’oxydation des lipides
dans les viandes fraîches et cuites est tributaire de plusieurs facteurs internes, à savoir : la
teneur en matières grasses et en fer constitutif de l'hème de l’hémoglobine et de la
myoglobine, ainsi que de la ferritine, la composition en acides gras et en antioxydants
naturels (Morrissey et al.,1994 ; Combes et Dalle Zotte, 2005 ; Min et Ahn, 2005). Ce taux
est également tributaire de l’oxydation des facteurs externes tels que la température, la
lumière, la cuisson/réchauffement, les ingrédients pro-oxydants non musculaires (comme le
sel), l’oxygène, l’activité de l’eau, les conditions d’entreposage, de transformation et
d’emballage (Monahan, 2000).
Au cours de la conservation, la sensibilité à l’oxydation dépend de l’effet conjoint du
pourcentage d’AGPIs et du fer héminique des viandes (Dalle Zotte, 2002). Pendant
l’entreposage, la peroxydation lipidique est favorisée par certains facteurs, dont un pH plus
acide, une teneur élevée en acides gras polyinsaturés, la présence élevée de myoglobine (qui
varie selon le type de muscle) et des températures de l’ordre de 4 °C et plus (Morrissey et al.,
1994). En effet, l'oxydation de la myoglobine transforme l'oxymyoglobine, qui est
responsable de la couleur rouge brillant de la viande fraîche en metmyoglobine, pigment
caractéristique des viandes oxydées (brune). Tandis que le processus de cuisson entraîne dans
le muscle une augmentation de l’oxydation des lipides et l’apparition de flaveur dite
« réchauffée » dans la viande préparée et réfrigérée.

43
Les acides gras polyinsaturés sont très sensibles à l'attaque des radicaux libres conduisant à
la production d'hydroperoxydes, qui sont responsables de la formation de sous-produits tels
que des aldéhydes, des cétones et d'autres composés qui affectent négativement la qualité des
aliments. La viande de lapin sur laquelle porte notre étude est sujette aux peroxydations ; ceci
s’explique par le fait qu’elle contient naturellement plus d’AGPIs n-3 que les autres espèces
(Mourot et al., 2011 ; Dalle zotte et Szendrő, 2011). Ces peroxydations qui se forment soit
par l’action des espèces radicalaires (ERO), ou sont catalysées par des enzymes, engendrent
une dégradation de la qualité nutritionnelle, mais aussi organoleptique des viandes et produits
carnés. Ce phénomène se produit quand l'oxygène atmosphérique (O2) réagit avec les acides
gras insaturés (c’est-à-dire comportant des doubles liaisons carbone-carbone) et forme des
espèces partiellement réduites, les ERO.
La peroxydation des lipides polyinsaturés se produit en trois étapes : l’initiation, la
propagation et la terminaison (Michel et al., 2008). La première phase de la peroxydation
lipidique est caractérisée par la présence des hydroperoxydes que l’on appelle les « produits
primaires » de la peroxydation lipidique. Instables, ces molécules oxydées réagissent avec
les constituants de l’aliment/viande et se décomposent en « produits secondaires » et «
terminaux » pour former des endopéroxydes cycliques et finalement des produits terminaux
volatils et non volatils stables, tels que les aldéhydes (malondialdéhyde ou MDA, 4-
hydroxynonénal ou HNE) ou les isoprostanes et le 2-propénal (Michel et al., 2008 ; Dalle-
Donne et al., 2006).
En agroalimentaire, Valerga et al. (2013) et Byrne et al. (2001) ont observé que l'oxydation
des lipides conduit à une modification de l’aspect (décoloration), à une perte en vitamines
(A, E, C, D) et de la valeur nutritive, à de mauvaises odeurs, à une altération du goût (flaveur
caractéristique, rancissement) ainsi qu’à la production de composés potentiellement toxiques
et cancérigènes pour la santé du consommateur. Les aliments de type viande, riches en AGPIs
sont les plus affectés (Dalle Zotte et Szendrő, 2011) et subissent des modifications
organoleptiques telles que la rancidité, l’acidification, la modification de la couleur avec
apparition de brunissements, les dégradations biochimiques et nutritionnelles (par interaction
des produits d’oxydation avec les acides aminés) de l’aliment. En effet, ils sont très sensibles
à l'attaque des radicaux libres qui conduit à la production d'hydroperoxydes, qui sont
responsables de la formation secondaire de sous-produits tels que les aldéhydes, les cétones
44
et d'autres composés (peroxydes, hydrocarbures, cétones, acides, esters ; Cillard et Cillard,
2006) qui affectent négativement la qualité des aliments (Lund et al., 2011) et aussi la texture
de la viande. Cela a été corroboré par l’étude de Musella et al. (2009) qui a démontré que la
peroxydation des acides gras insaturés altérait les qualités sensorielles du porc.
Concernant les viandes cuites, les procédés thermiques peuvent aussi favoriser l'oxydation
des lipides en perturbant les membranes cellulaires et en libérant des composés pro-oxydants,
qui induisent '' la saveur réchauffée '' pendant l’entreposage réfrigéré et le réchauffage
ultérieur (Sato et Hegarty, 1971). Combes et Dalle Zotte (2005) affirment que la cuisson
entraîne l’oxydation partielle des AGPIs des phospholipides. L’oxydation de ces derniers est
plus élevée dans les muscles oxydatifs que dans les muscles glycolytiques ; en d’autres
termes, elle est d'autant plus forte que l'insaturation des AGPIs est plus élevée (Gandemer,
1998). De plus, la cuisson de la viande à haute température entraîne la formation d’amines
hétérocycliques (AH, par exemple friture à une T > 200°C; Vanier, 2007), des nitrosamines
(T > 130°C; Vendreuve, 2006), composés nocifs pour la santé du consommateur, car
carcinogène (Dalle Zotte, 2002). Étant donné que la viande de lapin est généralement riche
en AGPI à longue chaîne, cela peut limiter davantage la durée de conservation de la viande
cuite.
Plusieurs méthodes peuvent être utilisées pour suivre et évaluer l’état d’oxydation des lipides
des produits, mais la plus utilisée est la méthode TBARS (substances réagissant à l’acide
thiobarbiturique; Dawn-Linsley et al., 2005) pour les viandes et les produits transformés. Le
dosage du TBARS permet d’évaluer la quantité de malondialdéhyde (MDA), un produit
terminal de l’oxydation des lipides membranaires par les radicaux libres. La figure 1.5
présente la comparaison des valeurs d’oxydation de la viande de différentes espèces
animales, exprimées en TBARS (en mg de MDA/kg viande; Combes et Dalle Zotte (2005).
D’après les indices de TBARS de la figure 1.5, on peut noter la plus grande sensibilité de la
viande de lapin à l’oxydation par rapport aux autres espèces (Combes et Dalle Zotte, 2005).
Il est important de noter que des valeurs de TBARS égales ou supérieures à 5 mg MDA/kg
de viande représentent le seuil pour la détection d’odeurs et de goûts désagréables pour les
humains (Insausti et al., 2001).

45
Figure 1.5. Comparaison des valeurs d’oxydation, exprimées en indice TBARS (exprimées en mg de MDA/kg muscle), de la viande de porc (muscle Longissimus lumborum), de taurillon (muscle Longissimus thoracis), de poulet (muscle Pectoralis major) et de lapin (muscle Longissimus dorsi et viande hachée). Tirée de Dalle zotte (2005).
Ainsi, la lutte contre l'oxydation des denrées alimentaires au cours de leurs transformations
technologiques, de l’entreposage et de la distribution s’impose afin de maintenir la qualité
des aliments et prolonger la durée de vie de tablette.
1.7.2. L’oxydation des protéines et son effet sur la qualité de la viande
L’oxydation des protéines est un facteur important pour les industriels dans la mesure où elle
a un impact important sur les propriétés technologiques comme l’émulsification, la
gélification ou encore l’extraction de protéines d’intérêt (Byrne et al., 2001). Les protéines
sont parmi es constituants cellulaires les plus abondants et donc une cible importante du stress
oxydatif. Lorsque des radicaux libres réagissent avec des protéines, plus précisément avec le
groupement radical (chaîne latérale) des acides aminés, il se forme des groupements
carbonyles. La formation de carbonyles est l’un des changements les plus importants dans

46
les protéines musculaires oxydées. Ces composés engendrent une perte de la fonctionnalité
protéique et les propriétés sensorielles et nutritionnelles sont modifiées. De nombreuses
études mettent en évidence l'impact des carbonyles protéiques spécifiques sur la capacité de
rétention d'eau, la texture, la saveur et sa valeur nutritive des produits de viande. Selon Xiong
(2000), une modification des chaînes latérales des acides aminés et de la fragmentation des
protéines, affectent leur caractère hydrophobe, leur conformation, leur solubilité, et modifie
leur sensibilité aux enzymes protéolytiques. En d’autres termes et d’après les travaux de
Santé-Lhoutellier et al. (2008), l’oxydation des protéines de la viande conduit à une perte de
biodisponibilité des acides aminés, soit par dénaturation chimique de ces composés, soit par
diminution de la digestibilité des protéines. Les carbonyles et les groupes (aldéhydes et
cétones) sont formés sur les chaînes latérales des protéines (en particulier avec la proline,
l’arginine, la lysine et la thréonine) au cours du processus d’oxydation. Les dommages qu’ils
occasionnent aux protéines sont irréversibles et les modifications oxydatives de la structure
des protéines peuvent avoir un large éventail de conséquences fonctionnelles en aval, telles
que l’inhibition des activités enzymatiques ou une susceptibilité accrue à la protéolyse et à
l’agrégation (Lund et al., 2011). Filgueras et al. (2010) et Rowe et al. (2004) proposent
également que l’oxydation des protéines puisse avoir une incidence négative sur la couleur
de la viande, la tendreté (O'Sullivan et al., 2012) et la rétention d'eau (Melody et al., 2004).
Tout comme l’oxydation des lipides, plusieurs analyses peuvent être utilisées pour la
détermination de l’oxydation des protéines. Les carbonyles totaux sont détectés par leur
réactivité avec le 2,4-dinitrophénylhydrazine (DNPH) pour former des hydrazones
protéiques, colorés en jaune et détectable à une longueur d'onde de 370 nm (Estévez, 2011).
Lors de la réaction de Maillard, première étape du brunissement enzymatique des produits
alimentaires (Fu et al., 1994), des produits terminaux de la glycation de protéines (AGE), le
méthylglyoxal (MGO) et le glyoxal (GO), sont formés (Lo et al., 2006). En effet, les études
de Fan et al. (2010) ont rapporté que le méthylglyoxal est le produit soit de la glycolyse, soit
de l’oxydation ou de l’oxydation de la thréonine, des corps cétoniques ou de l’acide
ascorbique. À l’opposé, Patel et Ahmed (2015) ont démontré dans leur étude que des amines
hétérocycliques et des hydrocarbures aromatiques polycycliques sont également générés par
la réaction de Maillard pendant la cuisson à haute température. En fait, même si la réaction
de Maillard améliore la qualité gustative (formation d’arôme), elle induit aussi des
47
changements de qualité nutritionnelle et l’apparition de composés indésirables dans ces
aliments. Ces produits terminaux s’accumulent avec l’âge et sont hautement dangereux pour
l’organisme humain, car ils sont impliqués dans l’apparition des maladies cardiovasculaires
(Fan et al., 2010, Obrenovich et al., 2010, Estévez, 2011, Patel et Ahmed, 2015). Dans les
industries alimentaires, ce sont des précurseurs de la modification d'arôme et de couleur qui
jouent donc un rôle primordial dans la qualité des produits transformés. Certains acides
aminés sont sensibles à diverses conditions entre autres au pH, à la température, à
l’oxydation, à la présence de glucides réducteurs comme le lactose, le fructose et le glucose.
En plus d’affecter les lipides et les protéines, l’oxydation altère également d’autres composés,
dont les pigments de myoglobine. La myoglobine, sous la forme d’oxymyoglobine, est
responsable de la couleur rouge-vif de la viande. Lorsque le fer ferreux (II) de
l’oxymyoglobine est oxydé en fer ferrique (III), l’oxymyoglobine se transforme en
metmyoglobine, modifiant la couleur de la viande à rouge brunâtre. D’un autre côté, certaines
études ont démontré que l’accumulation des produits de dégradation des protéines et des
lipides joue un rôle majeur sur l’apparition des maladies liées à l’âge. En effet, d’après les
études de Chi-Tang et Wang (2013), les dommages oxydatifs des protéines sont impliqués
dans la pathogenèse du diabète, des maladies neurodégénératives, du diabète et même du
vieillissement normal.
1.7.3. Les Polyphénols en tant qu’antioxydants
L’un des principaux problèmes de l’industrie agroalimentaire est d’assurer la conservation
des aliments. Les phénomènes d’oxydation sont notamment redoutés. Maîtriser l’oxydation
est indispensable pour gérer l’évolution des systèmes biologiques dans leur complexité, en
particulier dans le cas des aliments dont la dégradation peut avoir des conséquences sur
l’innocuité alimentaire (Marc et al., 2004). Pour les industries agroalimentaires, l'antioxydant
alimentaire idéal serait facilement incorporable et efficace à faible dose, non toxique et
n'entraînant ni coloration, ni odeur, ni saveur indésirable. De plus, il serait résistant aux
processus technologiques et stable dans le produit fini. D’après Dalle-Zotte (2000), les
antioxydants qui sont introduits dans l’alimentation des animaux, limite efficacement les
processus d’oxydation. Ils permettent la maîtrise de la stabilité des lipides, des protéines et,

48
donc des propriétés organoleptiques des viandes, surtout dans les viandes riches en AGPIs,
comme la viande de lapin (car il y a des risques accrus de peroxydation, Cannata et al., 2010).
Direct sur la viande
C’est le cas de plusieurs composés phénoliques naturels tels que les flavonoïdes et ceci est
prouvé également dans les études de Park et al. (2008) ainsi que celles de Tang et Cronin
(2007). Lesdites études ont rapporté l’effet inhibiteur de l’oignon sur l’oxydation des lipides
lorsque celui-ci est ajouté directement sur la viande de dinde et de porc. Botsoglou et al.
(2002) sont arrivés à des résultats semblables au sujet de l’ajout d’huile d’origan sur la viande
de poulet crue et cuite. Il a été rapporté aussi que l’addition d'extraits de jus de canneberge
directement dans la viande de dinde fraîche (Raghavan et Richards, 2006) et dans celle du
porc transformé (Lee et al., 2006) diminuait l’oxydation des lipides. Un enrichissement du
régime en vitamine E (puissant antioxydant) par exemple, améliore le pouvoir de rétention
d’eau et donc la texture de la viande (Dalle-Zotte, 2000), et permet de réduire la peroxydation
des acides gras dans le muscle (Gladine et al., 2007 ; Gobert et al., 2008).
Ces herbes et épices peuvent donc être utilisées comme ingrédient pour améliorer la durée
de vie de tablette de la viande vulnérable à l’oxydation, car ils ont démontré leur activité
antimicrobienne (Oussalah et al., 2007 ; Speranza et Corbo, 2010) et antioxydante (Botsoglou
et al., 2002, 2003, 2004). En effet, Fratianni et al. (2010) ont démontré que l’ajout des huiles
essentielles de thym et de baume à la viande fraîche de poulet entreposées pendant 3 semaines
à 4°C a réduit la formation 2,2-diphényl-1-picrylhydrazyl (DPPH) et réduit le taux de
peroxydation des lipides. En outre, l’étude in vitro d’Ahn et al. (2004) suggère que des
extraits naturels (notamment des extraits de pépins de raisin et d’écorce de pin) ont le
potentiel d'être utilisés comme une méthode de conservation pour réduire l’oxydation des
lipides sur la viande de bœuf haché.
Dans l’ensemble, l’amélioration de la stabilité oxydative s’est effectuée par l’ajout de sources
naturelles d’antioxydants directement sur la viande. Cependant, lorsqu'ils sont directement
appliqués sur la viande, des problèmes organoleptiques apparaissent (Oussalah et al., 2007).
Selon Govaris et al. (2004); Dhama et al. (2015), les approches nutritionnelles sont souvent
49
plus efficaces que l'addition directe de l'additif à la viande puisque le composé est de
préférence déposé là où il est le plus nécessaire.
Dans l’alimentation des animaux
L’efficacité des sources d’antioxydants a été démontrée à plusieurs reprises sur l’oxydation
des lipides. En effet, il a été démontré que la supplémentation avec les polyphénols dans
l’alimentation améliore la stabilité oxydative de la viande (Liu et al., 1995) et au Québec, la
vitamine E est maintenant utilisée régulièrement dans l'alimentation des porcs pour améliorer
la stabilité oxydative des lipides dans la viande. Les études de Mourot et al. (2011) ont
observé une réduction de la peroxydation des acides gras de la viande de lapin nourris avec
des polyphénols ou de la vitamine E, à cause de leur propriété antioxydante. L'application
d'antioxydants naturels dans la ration des animaux est une pratique majeure pour ralentir ou
inhiber le processus d'oxydation, réduire le gaspillage et améliorer la durée de vie de tablette
de la viande.
Luna et al. (2010) a ajouté du thymol et du carvacrol aux régimes de poulets de chair à des
niveaux de 150 mg / kg pendant 42 jours et a signalé des effets positifs sur la stabilité à
l'oxydation pendant l’entreposage de la viande rouge.
1.7.4. Les Polyphénols en tant qu’antimicrobiens
In vitro
Ainsi, de nombreux extraits d’origine naturels comme les huiles essentielles de plantes,
d’herbes et d’épices pourraient servir d’agents antimicrobiens contre la détérioration des
aliments et des agents pathogènes (Nazzaro et al., 2013). Certains sont connus du public
comme l'origan, la menthe, le romarin, l’orange, la sauge, la cannelle, la lavande, le laurier,
le clou de girofle, le cumin, le fenouil, la coriandre, la menthe poivrée, le thym, la mélisse,
la coriandre, le laurier, l’eucalyptus, la verveine, l’origan, le thymol, la cannelle et l’aneth
dont leurs propriétés antimicrobiennes et antioxydantes ont été démontrées dans de
nombreuses études (Tsigarida et al., 2000 ; Skandamis et Nychas, 2001 ; Dzudie et al., 2004
; Govaris et al., 2005 ; Choularia et al., 2007 ; Solomakos et al., 2008 ; Barbosa et al., 2009 ;
Fratianni et al., 2010 ; Barbosa et al., 2009). Skandamis et al. (2002) ont rapporté que les HE
50
de clou de girofle, d'origan, de romarin, de thym et de sauge ont une activité inhibitrice
élevée, en particulier contre les bactéries gram-positives, plutôt que les bactéries Gram
négatifs (Marino et al., 2001).
Selon Berger (2007), les principaux constituants des huiles essentielles sont le carvacrol, le
thymol, l'eugénol, l'aldéhyde cinnamique, la vanilline, le chavicol de méthyle (ou l’estragol),
etc. Mais, selon les études menées par Bassolé et Juliani (2012), ce sont le carvacrol,
l’eugénol, le cinnamalhéhyde, le citral ou le thymol qui ont une plus grande activité contre
la croissance bactérienne. Le carvacrol et le thymol demeurent les composés actifs des HE
les plus puissants (Botsoglou et al., 2002 ; Chouliara et al., 2007 ; Nazzaro et al., 2013). Dans
l’étude de Gutierrez et al. (2008), toutes les combinaisons d'origan (avec basilic, de la
mélisse, de la marjolaine, de l'origan, du romarin, de la sauge et du thym) ont montré une
efficacité additive contre B. cereus, et l'origan associé à la marjolaine, au thym ou au basilic
a également eu un effet additif contre E. coli et P. aeruginosa en utilisant le test spot-on-
agar. Les mêmes resultats ont été observés dans cette même étude, lorsque les mélanges de
marjolaine ou de thym ont également présenté des effets additifs en association avec le
basilic, le romarin ou la sauge contre L. monocytogenes. De nombreuses études in vitro
font état d'une efficacité élevée des HE contre les pathogènes d'origine alimentaire et les
bactéries responsables de la détérioration (Burt, 2004; Oussalah et al., 2007; Gutierrez et al.,
2008). L’étude de Elgayyar et al. (2001) soutient que plusieurs des huiles essentielles ont un
puissant effet antimicrobien contre certains pathogènes d'origine alimentaire seulement dans
une concentration de ppm (> 400 ppm). Cependant, une concentration plus élevée d'HE est
nécessaire pour obtenir le même effet que dans les aliments qu'in vitro (Burt, 2004).
Différentes huiles essentielles utilisées dans l’étude de Oussalah et al. (2007) ont inhibé la
croissance de quatre bactéries pathogènes : Escherichi coli O157: H7, Listeria
monocytogenes, Salmonella typhimurium et Staphylococcus aureus à différentes
concentrations. Plus récemment, Fei et al. (2011) a montré que les combinaisons
synergiques d'HE d'origan / basilic contre E. coli, de basilic / bergamote contre S. aureus,
d'origan / bergamote contre B. subtilis et d'origan / périlla contre S. cerevisiae
a significativement perturbé l'intégrité des membranes cellulaires comparativement aux
membranes témoins non traitées.

51
Direct sur la viande
Fratianni et al. (2010) a démontré que l’ajout des huiles essentielles de thym et de baume sur
la viande fraîche de poulet entreposée pendant 3 semaines à 4°C a inhibé efficacement la
croissance d’E. coli tandis que celle de baume a limité la croissance de Salmonella spp.
Cependant, Chouliara et al. (2007) a constaté que l’ajout direct d’une combinaison d'huiles
essentielles d'origan, sur la durée de conservation de la viande fraîche de poulet sous
atmosphère modifiée, diminue significativement les populations microbiennes (bactéries
lactiques, microorganismes aérobes totaux, Pseudomonas spp., levures) et l'oxydation des
lipides. Des études récentes ont montré que les extraits de plantes sont utiles pour la réduction
des pathogènes associés aux saucisses de Francfort ( Mytle et al., 2006 ) ou au bœuf cuit
( Ahn et al., 2007 ).
Une autre étude d’Ahn et al. (2004) a démontré une inhibition de la population d’E. coli
O157: H7, de L. monocytogenes et de Salmonella Typhimurium (1,08, 1,24 et 1,33 log ufc/g,
respectivement) dans le bœuf haché cru traité avec 1% d’extraits naturels des extraits de
pépins de raisin après 9 jours d’entreposage réfrigéré. De plus, toujours dans cette même
étude, l’utilisation d’extrait d’écorce de pin (1%) et d’oléorésine de romarin (1%) ont entraîné
une réduction d'environ 1 log ufc/g dans les populations des trois pathogènes cité-ci haut
après 9 jours d’entreposage.
Par ailleurs, Zhang et al. (2016) a déduit un effet synergique plus important sur les bactéries
d'origine alimentaires lorsque des extraits d'épices (clous de girofle et romarin) sont combinés
comparativement à l’activité individuelle de ces extraits sur la croissance microbienne sur la
viande de poulet crue. C’est cette approche que Krishnan et al. (2014) ont adoptée et ont
réussi à démontrer que l'addition de la combinaison d'extraits d'épices (le clou de girofle + la
cannelle + l’origan) a été très efficace contre la croissance microbienne et les réactions
d'oxydation sur la viande de poulet crue.
En outre, Apostolidis et al., (2008) a observé que la canneberge agit en synergie avec l'huile
d'origan pour inhiber L. monocytogenes lorsqu'ils sont ajoutés directement à la viande de
bœuf. Par ailleurs, selon les résultats obtenus par Bassolé et Juliani (2012), même si
l'utilisation de combinaisons d’HE et de leurs composants est une nouvelle approche pour

52
accroître l'efficacité des HE dans les aliments, il faudrait tirer parti de leurs effets additifs et
synergiques, mais aussi antagonismes, car selon ces derniers, certains HE ont généralement
une activité antibactérienne plus élevée que les mélanges de leurs principaux composants. Le
tableau 1.11 rapporte quelques exemples de combinaison d'HE sur une large gamme de
bactéries ainsi que les interactions antimicrobiennes qui en découlent. La combinaison de
composés phénoliques a produit des effets synergiques sur plusieurs microorganismes, en
particulier, la combinaison du thymol avec le carvacrol. Par contre, la combinaison du
menthol et du thymol n’a aucun effet sur aucun des microorganismes (Bassolé et Juliani,
2012).
Tableau 1.11. Combinaison des composants et des huiles essentielles ainsi que de leurs interactions antimicrobiennes contre plusieurs microorganismes.
Combinaisons Microorganismes Intéractions Thymol/carvacrol S. aureus, Ps. aeruginosa Additive E. coli Synergique S. aureus, B. cereus, E. coli Antagoniste S. aureus, Ps. aeruginosa Additive E. coli Additive Salmonella Typhimurium Synergique Thymol/eugenol E. coli Synergique Carvacrol/eugenol E. coli Synergique S. aureus, B. cereus, E. coli Antagoniste Carvacrol/Cymene B. cereus Synergique Carvacrol/linalool L. monocytogenes Synergique Cinnamaldehyde/Carvacrol E. coli Additive Salmonella Typhimurium Synergique Cinnamaldehyde/Thymol E. coli
Synergique Salmonella Typhimurium
Cinnamaldehyde/Eugeno Staphylococcus spp., Additive Micrococcus spp., Bacillus spp.,
Enterobacter spp. Modifié de Bassolé et Juliani, 2012
Toutefois, il importe de mentionner que si les huiles essentielles doivent être plus largement
appliquées comme antimicrobiens dans les aliments, la saveur est à considérer (Oussalah et
al., 2007).
D’après les études pilotées par Daglia (2012), certains acides phénoliques (acide gallique,
caféique et férulique) ont des propriétés antibactériennes contre S. aureus, L. monocytogenes,
E. coli et P. aeruginosa. Par exemple, les proanthocyanidines de la canneberge ont un spectre

53
très large sur les bactéries pathogènes à Gram négatif (E. coli, Salmonella typhimurium) et à
Gram positif (Enterococcus faecalis, L. monocytogenes, S. aureus et Bacillus subtilis,
Tableau 1.12). Ainsi, l'activité antimicrobienne des épices et des herbes a été largement
étudiée et n’est plus à démontrer selon Velasco et Williams (2011).
Contrairement aux viandes de bœuf, de porc et de volaille, le traitement industriel de la
viande de lapin est encore peu développé, ce qui limite l'intérêt scientifique pour l'évaluation
des propriétés antioxydantes et antimicrobiennes des huiles essentielles et des extraits de
nombreuses plantes (origan, sauge, thym, romarin, etc.) directement dans le produit (Dalle
Zotte et Szendrő, 2011). Aujourd’hui, l'industrie de la viande de lapin aura un plus grand
intérêt dans le traitement de la viande si on utilise des extraits naturels avec des propriétés
antioxydantes et antimicrobiennes.
Tableau 1.12. Classes de quelques polyphénols et des microorganismes qui leur sont sensibles. tiré de Daglia (2012)
Polyphénols Propriétés Flavan-3-ol et Flavonol antivirale (Adenovirus, Enterovirus …)
antibactérienne (Candida albicans, Trichophyton rubrum ...) antifongique (Cl. perfringens, E. coli, S. aureus, B. cereus, C. jejuni...)
Tannins condensés antibactérienne (S. mutans, E. coli, S. aureus) antivirale (Influenza à virus, Herpès type 1)
Tannins hydrolysables antibactérienne (Salmonella, Staphylocoque, E. coli, Listéria spp, Clostriduim....) antivirale (Virus de l'herpès 1 et 2, Virus d'Epstein-Barr) antifongique (Candida parapsilosis)
Acides phénoliques antibactérienne (S. aureus, L. monocytogenes, E. coli, P. aeruginosa...) Néolignanes antibactérienne (différentes souches de Mycobacterium tuberculosis)
Tiré de Daglia (2012)
Daglia (2012) démontre également dans son étude que la canneberge a des effets inhibiteurs
sur le développement de Staphylococcus aureus et E. coli sur la viande en général. D’ailleurs,
les travaux de Park et al. (2008) ont conclu que l’ajout d’oignon et d’ail à la viande de porc
a inhibé la croissance des bactéries totales et des entérobactéries mesurées sur l’estomac et
la longe de porc réfrigéré.
Direct dans l’alimentation

54
De toutes ces études qui foisonnent, il en existe très peu à ce jour qui ont testé
l’enrichissement de la moulée avec des d’huiles essentielles et d’extraits de végétaux riches
en composés actifs sur la qualité oxydative et microbienne de la viande de lapin. Pourtant,
selon certaines études (Mitsumoto et al., 1993 ; Lahucky et al., 2010), la supplémentation est
une stratégie simple, pratique et plus efficace contrairement à l’addition directe sur la viande
et son action est immédiate lors de l'exposition à la surface de l'air. Selon Džinić et al. (2015),
les approches nutritionnelles sont souvent plus efficaces que l'addition directe de l'additif à
la viande parce que le composé est de préférence déposé là où il est le plus nécessaire. En
utilisant cette stratégie alimentaire, Fortier et al. (2012) ont amélioré la qualité microbienne
de la viande de porc grâce à une ration supplémentée d’huile d’origan et de pulpe de
canneberge. De même, Soultos et al. (2009) a démontré que l’ajout d’huile d’origan à
l’alimentation des lapins, a réduit les comptes des aérobes mésophiles totaux, de
Pseudomonas spp. et d’Enterobacteriaceae sur la carcasse après 12 jours de réfrigération
sous conditions aérobes. Un régime supplémenté en huiles essentielles d’origan semble
également exercer une activité coccidiostatique contre Eimeria tenella chez le poulet comme
l’a démontré les études de Giannenas et al. (2003). Une autre étude menée par Govaris et al.
(2005) a également démontré que l'incorporation d'huile essentielle d'origan dans
l'alimentation des dindons a exercé un effet inhibiteur sur la croissance des microorganismes
des filets de poitrine pendant l’entreposage réfrigéré.
Force est de reconnaitre que de nombreuses informations sont disponibles sur la composition
des carcasses de lapins, mais les données sur la contamination microbiologique demeurent
rares. Il y’a donc moins d’articles qui traitent des effets de la supplémentation d’extraits de
végétaux et d’huiles essentielles sur la qualité microbiologique comparativement à la qualité
oxydative de la viande de lapin. Soultos et al. (2009) est pratiquement le seul qui a traité de
ce sujet chez le lapin.
Il est donc difficile de tirer des conclusions quant à l’effet de l’ajout d’extraits de végétaux
dans l’alimentation des animaux sur la qualité microbiologique de la viande de lapin.
Toutefois, comme pour l’oxydation dans la ration fonctionne et est efficace si ajouté dans
l’alimentation que sur la viande directement, il y a lieu de penser que ce sera similaire pour
l’effet l’antimicrobien.

55
De cette revue de littérature, il ressort que les microorganismes sont omniprésents et selon
l’auteur Saucier (2016), on peut faire de la « gestion de la microflore » qui consiste à garder
le type et la quantité de microorganismes appropriés à un moment spécifique pendant
l’entreposage. En tirant profit des différentes spécifiés de certains microorganismes, on peut
trouver une alternative idéale et sûre, pour les producteurs afin d’assurer l’innocuité de la
viande de lapin et augmenter la durée de vie de tablette des produits.
Problématique, objectifs et hypothèses de recherche
2.1. Problématique
Tel que mentionné en introduction, le lapin est une production marginale au Québec et son
développement ne peut être assuré que si nos éleveurs produisent de la viande de qualité. Au
Canada, il n’y a pas d’antibiotiques d’homologués pour le lapin et par conséquent les normes
de biosécurité en élevage sont très élevées pour arriver à contrôler les maladies dans les
élevages. De plus, le consommateur d’aujourd’hui est friand d’expérience nouvelle, toujours
à l’affût de nouveauté gustative. Cependant, en dépit des mesures d’hygiène rigoureuses, la
surface des carcasses se contamine au contact de son environnement incluant les organismes
provenant du système gastro-intestinal de l’animal. De plus, la viande de lapin est susceptible
à l’oxydation de par sa grande richesse en acide gras polyinsaturés (AGPIs).
Au vu de la littérature, les composés antimicrobiens naturels sont de plus en plus testés dans
la viande et dans l’alimentation animale dans le but d’améliorer la qualité microbiologique
et oxydative des produits carnés. Ainsi, les recherches menées au cours de cette thèse visent
à développer des stratégies alimentaires simples, sans investissement majeur pour le
producteur, afin d’optimiser la qualité de la viande de lapin produite au Québec. Même si
aujourd'hui, le marché cunicole est volatil et peu stable, une meilleure durée de conservation
favorisera l'exportation qui ne peut que contribuer à améliorer la balance commerciale de
l'industrie, mais aussi celle du pays.

56
2.2. Hypothèse
L'addition d’une alimentation riche en polyphénols (extraits de végétaux et d'huiles
essentielles) ou d'une culture protectrice peut contrôler positivement le développement de la
flore microbienne de la carcasse de lapin, mais aussi la stabilité oxydative lors de
l’entreposage de la viande de lapin.
2.3. Objectifs
2.3.1. Objectif général
L’objectif premier de cette thèse est d’aider les producteurs de lapin du Québec à exprimer
son plein potentiel en termes de qualité en développant de nouvelles stratégies nutritionnelles,
et ce sans investissement majeur pour les producteurs.
2.3.2. Objectifs spécifiques
Pour valider l’hypothèse présentée ci-dessus, le plan de travail de cette thèse s'est déroulé à
travers différentes stratégies alimentaires visant à améliorer la qualité microbiologique de la
viande de lapin :
Évaluer l’efficacité de l’ajout de polyphénols de sources naturelles (oignon, fraise,
canneberge et huiles essentielles) sur les performances zootechniques, mais surtout
sur la qualité microbiologique et oxydative de la viande de lapin, lorsque ce dernier
est administré dans l'alimentation des animaux à une concentration de 10 ppm
d’ingrédients actifs.
Déterminer l’effet antimicrobien et antioxydant d’une combinaison d’extraits de
végétaux et d’huiles essentielles, et ce à des doses élevées (500 à 1000 ppm) à
l’alimentation des animaux pour contrôler la qualité microbienne de la viande de lapin
Évaluer l’effet d’une alimentation riche en une culture protectrice commerciale
Micocin® sur la microflore de la carcasse et celle de la viande.
Et en évaluer son effet antilistérial lorsque cinq souches de Listeria monocytognes
sont inoculées expérimentalement dans la viande de lapin.

57
Effects of plant extracts and essential oils as feed supplements on quality and microbial traits of rabbit meat
Publié dans World Rabbit Sci. 2016, 24: 107-119. Doi :10.4995/wrs.2016.3665
L‘altération (microbienne et oxydative) de la viande en général peut être contrôlée par de
nombreux additifs de synthèse, mais la résistance croissante des consommateurs vis-à-vis de
ces additifs est un problème qui a poussé la recherche sur l'identification de nouveaux
composés naturels, qui ne laissent ni résidus dans le produit ou dans l'environnement tout en
augmentant la durée de vie de tablette des viandes et des produits carnés. Pour cette raison,
des extraits de plantes et d’huiles essentielles sont considérés comme l'une des alternatives
les plus prometteuses, compte tenu de leurs activités antimicrobiennes et oxydatives
principalement. Pour cette raison, l’utilisation d’extraits de végétaux et d’huiles essentielles
à 10 ppm d’ingrédients actifs (faible dose) sur la qualité de la carcasse de lapin a été évaluée.
Le choix de la dose vise à apporter une dose comparable de polyphénols entre la dose
homologuée d’huiles essentielles (France) et celle d’extraits de plantes. Ainsi, ce chapitre
présente les résultats d'une étude visant à quantifier l’effet d’une ration supplémentée en
extraits de canneberge, fraise, oignon et d’huiles essentielles, riches en polyphénols sur
l’amélioration de la qualité microbienne et oxydative de la viande de lapin.
Les résultats ont été présentés sous forme d’affiche à la journée de la recherche de la Faculté
des sciences de l’agriculture et de l’alimentation, Université Laval, 26 novembre, Québec,
Qc. A.P. Koné, D. Cinq-Mars, Y. Desjardins, F. Guay, A. Gosselin, et L. Saucier. 2013.
Effets de l’ajout d’extrait d’oignon, de fraise, de marc de canneberge et d’huiles essentielles
sur la qualité microbiologique de la viande de lapin.
Les résultats préliminaires de cette étude ont été, également, présentés sous forme d’affiche
au 94ème symposium annuel de l’Association Scientifique canadienne de la Viande (ASCV),
tenu du 7 au 9 Mai 2014 à Toronto. De plus, le résumé a été publié dans la revue Meat
Science : Improvement of rabbit meat microbial quality by feed supplementation with natural
sources of polyphenols. A.P. Koné, D. Cinq-Mars, Y. Desjardins, F. Guay, A. Gosselin, et
L. Saucier. Meat science 99 (2015) :145.

58
Contributions des auteurs :
Amenan Prisca Nadège Koné (candidat au Ph. D.): mise en place du protocole, planification
des expériences, collecte, analyse et interprétation des données, préparation du manuscrit.
Prof. Linda Saucier et Prof. Frédéric Guay (Directrice de recherche, auteure de
correspondance et co-auteur): participation à la mise en place du protocole, révision et
correction du manuscrit. De plus, les analyses statistiques ont été réalisées avec l’aide du
Prof. Guay.
Prof. Dany Cinq-Mars, Prof. Yves Desjardins et Prof. André Gosselin (collaborateurs) :
collaboration dans la mise en place du protocole et la révision du manuscrit. Drs Desjardins
et Gosselin sont les spécialistes en phytologie sur le projet.

59
Effects of plant extracts and essential oils as feed supplements on quality and
microbial traits of rabbit meat
Koné A.P.ǂ *, Cinq-Mars D.ǂ, Desjardins Y.*†, Guay F.ǂ, Gosselin A.*†, Saucier L.ǂ *
ǂDepartment of Animal Science, Faculty of Agriculture and Food Science, Université Laval,
Quebec City, Quebec, Canada G1V 0A6.
*Institute of Nutrition and Functional Foods, Université Laval, Quebec City, Quebec, Canada
G1V 0A6.
†Department of Plant Science, Université Laval, Quebec City, Quebec, Canada G1V 0A6.
*Corresponding author: Université Laval, Québec, (QC), Canada, G1V 0A6
Téléphone: 418-656-2131 #6295
Fax: 418-656-3766
E-mail: [email protected]

60
3.1. Résumé
Les effets de la supplémentation de la ration des lapins avec des extraits d'oignons, de
canneberges, de fraises et des huiles essentielles sur la qualité de la viande ont été analysés.
Cinq groupes de quarante-huit lapines Grimaud sevrées ont reçu la ration supplémentée ou
une ration témoin; l'unité expérimentale était une cage de six lapins. Chaque régime
expérimental contenait 10 ppm d'ingrédients actifs ajoutés. Les lapins ont été nourris avec
les régimes expérimentaux pendant 4 semaines et les performances de croissance
caractéristiques d'abattage ont été déterminées. Le pH a été mesuré 1 et 24 h post mortem
(pHu) sur les muscles Longissimus dorsi (LD) et Biceps femoris, gauche et droit. On a mesuré
également les pertes à la cuisson, la perte en eau et la couleur (L*, a * et b *) du LD droite et
ainsi que le statut oxydatif des gras et des protéines après l’abattage (TBARS, DNPH, Folin
ciocalteu). Seul le pHu du muscle LD pour le groupe supplémenté avec l’extrait de fraise
était significativement plus faible que le groupe témoin (P=0,04). Cependant, nous notons
que pour la moyenne de pHu du muscle LD, était inférieure à 6 pour la viande des animaux
ayant reçu un régime enrichi en polyphénols, par rapport au groupe témoin. La
supplémentation en extrait végétal n'a pas influencé la qualité de la viande, les performances
zootechniques ou la stabilité à l'oxydation. Sous conditions aérobes et anaérobes, nos
résultats indiquent que la supplémentation du régime alimentaire avec des extraits riches en
polyphénols, en particulier avec des huiles essentielles, a un effet positif faible, et sporadique
sur la microflore bactérienne par rapport au groupe témoin (P < 0,05). En conclusion, les
extraits de plantes et les huiles essentielles peuvent être utilisés dans l’alimentation des lapins
sans effets néfastes sur les performances et les caractéristiques de qualité de la viande. Cet
effet sera optimisé en recherchant des doses plus élevées.
Mots clés: huiles ssentielles; extrait végétal; polyphénol; viande de lapin; durée de
conservation.

61
3.2. Abstract
The effects of dietary supplementation of onion, cranberry and strawberry extracts and
essentials oils on meat quality were analysed. Five groups of forty-eight Grimaud female
weaned rabbits received the supplemented or the control ration; the experimental unit was a
cage of six rabbits. Each experimental diet contained 10 ppm of added active ingredients.
Rabbits were fed with the experimental diets for 4 weeks before determining slaughter and
carcass traits and determining the pH at 1 and 24 h post mortem (pHu) of the Longissimus
dorsi (LD) and the Biceps femoris muscle, left and right, respectively. Cooking loss, drip loss
and L*, a* and b* color parameters were obtained of the right LD and for ground meat and
antioxidant status (TBARS, DNPH, Folin ciocalteu) was measured. Only the pHu of the LD
muscle for the strawberry supplemented group was significantly lower when compared to the
control group (P = 0.04). However, we note that for the LD, the average was less than 6 for
the meat of animals who received a diet enriched in polyphenols, compared to the control
group. Plant extract supplementation did not influence meat quality traits, growth
performance or oxidative stability. But under aerobic and anaerobic conditions, our results
indicate that diet supplementation with extracts rich in polyphenols, especially with essential
oils, had a small but sporadic positive effect on bacterial microflora compared to the control
group (P < 0.05). In conclusion, plant extracts and essential oils can be used in a rabbit diet
without adverse effects on performance and meat quality traits. This effect will be optimized
by investigating higher doses.
Key words: essential oils; plant extract; polyphenol; rabbit meat; shelf life.

62
3.3. Introduction
According to 2002 data, rabbit meat production is particularly developed in the
Mediterranean countries of the EU, such as in France, with a consumption of 1.5 kg per
person per year (Magdelaine, 2003), whereas other countries, such as the USA, only consume
0.02 kg per person per year (Cliche, 2010). In Canada, rabbit meat consumption per capita in
2013 was 0.024 kg (AAFC, 2012).
Rabbit meat is low in calories, high in protein and very rich in polyunsaturated fatty acids
compared to other meats (Combes, 2004). Although the high concentration of
polyunsaturated fat in rabbit meat is a nutritional advantage (ratio omega 6/omega-3=5.9;
Combes, 2004), it makes the meat particularly sensitive to lipid oxidation and affects meat
appearance and flavour. Its ultimate pH (pHu) is particularly high, compared to other meats,
such as beef and pork (5.5-5.7), which makes it more prone to bacterial growth and spoilage
(Jolley, 1990; Faucitano et al., 2010). According to Blasco and Piles (1990), the pHu greatly
influences meat quality and microbial growth, impacting the risk of foodborne infection. As
reported in a number of studies, susceptibility to microbial growth is higher in carcasses with
higher pH values (pH > 6), resulting in Dark, Firm and Dry (DFD) meat (review by Faucitano
et al., 2010).
The occurrence of foodborne illness is increasing in industrialized countries (King et al.,
2000). In Canada, Thomas et al. (2008) estimated the number of foodborne illness cases to
be 11 million with an estimated annual cost of $3.7 billion (CDN). Hence, microbiological
food safety continues to be a major concern for consumers, industries and governments
(Sofos and Geornaras, 2010), and meat safety remains an important consideration since meat
is the most commonly incriminated food representing 32.1% of reported cases of foodborne
illnesses in Quebec (DGSAIA, 2012).
For these reasons, it is important to find effective solutions to produce safer meat. Some
strategies include the addition of synthetic products to the meat, such as nitrates, phosphate,
lactate, acetate and sodium diacetate. Other strategies, including the use of natural
preservatives, have been of great interest to the meat industry in response to the growing
consumer demand for food products without artificial preservatives. Many small fruits like

63
cranberry and strawberry contain large amounts of phenolic compounds. Cranberry is very
rich in proanthocyanidins, which have inhibitory effects on Staphylococcus aureus and
Escherichia coli growth in meat (Daglia, 2012). Exogenous addition of cranberry powder to
fresh turkey meat (Raghavan and Richards, 2006) and minced pork meat (Lee et al., 2006)
also decreased lipid oxidation. Studies on beef confirmed the efficacy of an onion extract
dietary supplement in reducing microbial contamination (Reyhan and Mikail, 2010).
Essential oils extracted from various spices and herbs were successfully used in animal feed
to increase the oxidative stability of meat (Botsoglou et al., 2002, 2003, 2004). Soultos et al.
(2009) demonstrated that adding oregano oil to the diet of rabbits reduced total mesophilic
aerobes, Pseudomonas spp. and Enterobacteriaceae after 12 days of storage under aerobic
conditions, and Fortier et al. (2012) obtained similar results with pigs.
In order to improve rabbit meat quality and shelf life, we examined the effects of feed
supplementation with essential oils or onion, strawberry or cranberry extracts on carcass
microbial contamination as well as meat quality and oxidation stability.
3.4. Materials and methods
3.4.1. Animal management and alimentation
Experimental design and animal handling procedures were approved by the Animal Use and
Care Committee of Université Laval, which strictly adheres to the Guidelines of the Canadian
Council on Animal Care (CCAC, 2009). A total of 240, 35-day-old, weaned, female Grimaud
breed rabbits were obtained from a commercial farm (Laprodéo, Saint-Tite, Quebec, Canada)
and were maintained in conventional commercial cages. Rabbits were placed six per cage
and the cage constituted the experimental unit. Eight cages were analyzed per experimental
group. Upon arrival, the animals were acclimatized to their new environment and received a
control diet, followed by four weeks on the experimental feed (Table 3.1). A group without
supplement served as the control group (commercial feed) and four experimental groups
received a supplement of essential oils (XtractTM Instant, Pancosma SA, Geneva,
Switzerland), or onion, strawberry or cranberry extract (Nutra Canada Inc., Champlain,
Québec, Canada). The level of Xtract (10 ppm of active ingredients) was added according to
supplier recommendations to promote a healthy rabbit digestive system. It contains thyme
oil, trans-anethole, thymol, eugenol, cinnamaldehyde, capsicum oleoresin, arabic gum and

64
maltodextrins. The other groups were supplemented at the same level (10 ppm of total
polyphenol) based on the content of total polyphenols measured by the Folin-Ciocalteu
method according to Waterhouse (2003). Supplement was mixed directly with the other feed
ingredients prior to pelleting at 60°C and cooling at 16°C within 2.5 min. Feed was
manufactured in a commercial facility in separate 600 kg batches (Belisle Solution Nutrition,
St-Mathias-sur-Richelieu, Quebec, Canada).
Tableau 3.1. Nutritional values and compositiona of the commercial and experimental diets.
Ingredients Crude protein (min) % 16.8 Crude fat matter (min)% 4.37 ADF (max)% 24.4 NDF (max)% 33.0 Crude fiber (max) % 18.1 Calcium (real)% 0.99 Phosphorous (real) % 0.48 Sodium (real) % 0.30 Vitamin A (min) UI/kg 5542 Vitamin D (min) UI/kg 755 Vitamin E (min) UI/kg 35.0 Added Selenium mg/kg 0.10 Extracts of active ingredients (%) 0.001 aComposition: Alfalfa, beet pulp, wheat, soybean meal, canola meal, corn gluten feed, molasses, mineral and vitamin premix.
The animals were fed at libitum. They were weighed and the feed intake was measured
weekly during the experimental period to determine the body weight (BW), the average daily
weight gain (ADG), the average daily feed intake (ADFI) and the feed conversion ratio
(FCR). The animals were slaughtered at an average weight of 3067 ± 258 g. They were fasted
20 h before slaughter, including transport and lairage time, according to the current
commercial practices to reduce transport-related sickness. They had access to water at all
times prior to transport. The length of transport to the abattoir was 5 h with a third of the
distance consisting of rural roads. The animals were slaughtered in a federally inspected
establishment according to the Canadian Food Inspection Agency rules and the Meat
Hygiene Manual of Procedures.
3.4.2. Meat quality measurement
The muscular pH of the BF and the LD muscles were measured post mortem after 1 (pH1)
and 24 h (pHu; Blasco and Ouhayoun, 1996) using a portable pH meter (ROSS, Orion Star

65
A221, Thermo Scientific, Beverly, CA, USA) combined with an Orion Kniphe pH electrode
(ThermoFisher, Nepean, ON, Canada) and a temperature compensation probe (928 007 MD,
micro probes ATC, Maryland, USA). Meat color was evaluated 24 h after slaughter on the
LD and the exposed surface of the BF using a Chromameter (Chromameter CR 300 Minolta
Ltd., Osaka, Japan) equipped with a D65 light source and a 0° viewing angle geometry
according to the reflectance coordinates (L*, a*, b*; CIE, 2004), after exposing the muscle
surface for 20 min blooming time (Faucitano et al., 2010). The drip loss was measured on a
piece of LD (about 2 cm thick x 2.5 cm in diameter, from the front part of the carcass) by
weight difference, according to the EZ - Driploss method (Rasmussen and Anderson, 1996),
where samples are stored at 4°C for 48 hours. The meat exudate lost (%) during cold storage
was also measured by weight difference of the thighs upon microbial analysis. The cooking
loss was also determined on a similar piece of LD muscle (Pla, 1999) and is expressed as a
percentage of the initial weight loss. Each sample was placed into an 18-oz Whirl-Pak bag
(Nasco Whirl- Pak®, USA) and immersed in a water bath at 70°C for 15 minutes after
removing the air from the bag. The samples were then removed from the bag, patted dry with
filter paper and weighed (Vergara et al., 2005; Apata et al., 2012).
3.4.3. Muscle Sampling
One leg per animal was packaged aerobically in a styrofoam tray (14w X 24l X 4.5h cm)
with an absorbent pad, sealed with an oxygen-permeable polyethylene film (35 ga; oxygen
transmission 825 cc/100 sq. in. per 24 h at 23°C; water vapor transmission rate 24 g/100 sq.
in. per 24 h at 38°C and 90% RH) obtained from a local food equipment distributor
(Emballage L. Boucher, Quebec, QC, Canada) and stored at 4°C for 0, 5, 10 or 15 days. The
other leg was vacuum packaged (Sipromac, St-Germain, QC, Canada) in bags (nylon (23%)
and polyethylene (77%; seven multilayers) of 300 ga; oxygen transmission 3.3 cc/100 sq. in.
per 24 h at 23°C; water vapor transmission rate 0.5g/100 sq. in. per 24 h at 38°C and 90%
RH; Sealed Air Co, Mississauga, ON, Canada) and stored also at 4°C for 0, 15, 30 or 45 days.
The rest of the carcass was deboned and the meat was ground and stored at -30°C (Electric
meat Grinder, No RE50255, IPNO IPXI, China).

66
3.4.4. Microbial Analysis
For microbial enumeration of the thighs, a sampling procedure similar to the one described
by Brichta-Harhay et al. (2007) for whole poultry carcasses was used. One leg from the
rabbits (6) coming from the same cage (our experimental unit; 8 cages for each experimental
group) was randomly taken at each sampling time. Each cage was sampled at every sampling
time and conditions (aerobic and anaerobic). Thigh was aseptically placed in a sterile
Stomacher bag (Stomacher® 400C, Seward Laboratory Systems Inc., London, UK),
weighted (see details on meat exudate lost during cold storage above) and sealed after
addition of 300 ml of 0.1% (wt/vol) peptone water (Bacto peptone, Difco Laboratories, Inc.,
Detroit, MI, USA). The bag was placed on a rotary shaker (Boekel Scientific Orbitron Rotator
II, model 260250, New York, USA) for one minute on each side. The samples were then
manually massaged for 30-sec to remove microorganisms from the surface. Ten-fold
dilutions were done in 0.1% peptone water for enumeration on appropriate agar plates
(Saucier et al., 2000). Total Aerobic Mesophilic (TAM) counts were performed on Plate
Count Agar medium (PCA; Difco Laboratories Inc.) incubated at 35°C for 48 h (MFHPB-
18, Health Canada, 2001). Presumptive Lactic Acid Bacteria (LAB) were enumerated on
deMan, Rogosa and Sharp (MRS; Difco Laboratories Inc.; Saucier et al., 2000) and the plates
were incubated anaerobically for 48 h at 25°C using anaerobic jars with an envelope
generator of H2 and CO2 (AnaeroGenTM2.5L, AN0025A, Oxoid Company, Nepean, ON,
Canada). Presumptive Pseudomonas spp. were determined on Heart Infusion Broth agar
(Difco Laboratories Inc.) after adding a Cetrimide-Fucidin-Cephalosporin supplement
(Oxoid, No.SR0103E) and plates were incubated at 25°C for 48 h (Mead and Adams, 1977;
Gill and Greer, 1993). Coliforms and E. coli counts were determined using 3M PetrifilmTM
plates after incubating at 35°C for 18-24 h (MFHPB-34, Health Canada, 2013). Presumptive
S. aureus were evaluated on 3M PetrifilmTM plates and incubated at 37°C for 26 h (MFLP-
21, Health Canada, 2004). Enterobacteriaceae counts were performed on 3M PetrifilmTM
(MFLP-09, Health Canada, 2007) and incubated at 37°C for 24 h. Measurements were
performed in duplicate and all bacterial counts were transformed to a log10 value of colony
forming units per gram of thigh weight (log10 CFU/g) prior to statistical analysis according
to Gill (2000).
67
3.4.5. Proximate analysis
Ground meat samples (100 g) were lyophilized (Model 6203-3005-OL, Virtis Co., Gardiner,
NY, USA) for 7 days. The fat content was measured using a Soxtec system (Soxtec system
HT 1043 Tecator, Hoganas, Sweden) using procedure 991.36 of the Association of Official
Analytical Chemists (AOAC, 1995). Total protein was quantified using procedure 992.15 of
the AOAC (1995) with a LECO® protein analyzer (model FP-2000, Leco Corp., St. Joseph,
MO, USA). The results are expressed on the basis of wet weight and the analyses were
performed in triplicate.
3.4.6. Determination of muscle antioxidant status
Lipid oxidation. Products of lipid oxidation were measured in minced meat, quantitated using
the thiobarbituric acid reactive substances (TBARS) method and are expressed as
malondialdehyde (MDA) equivalents according to the method of Ermis et al. (2005) with the
following modifications. Briefly, 10 g of minced meat was homogenized with 10 ml of
Phosphate Buffered Saline solution (PBS, Sigma-Aldrich, St-Louis, MO, USA). After
centrifugation (3000×g, 4°C, 15 min), 12.5 µl of butylated hydroxytoluene (BHT) solution
was added to 500μl of supernatant and vortexed. Then, 250 µl of trichloroacetic acid (TCA)
was added to the mixture and placed on ice for 30 min. After centrifugation, (3000×g, 4°C,
10 min), 500 μl of the supernatant was added to 37.5 µl of EDTA
(ethylenediaminetetraacetic) and 125 µl of thiobarbituric acid in 0.05N NaOH followed by
15 min in boiling water (100°C) to allow the color reaction to develop. After heating, the
samples were cooled and centrifuged for 10 min at 3000×g and 4°C. Absorbance (100 µl)
was measured at 530 nm using a spectrophotometer (VarioskanTM, Microplate
instrumentation Thermo Electron Corporation, Vantaa, Finland). The results were expressed
as nanomoles of MDA per g of meat. Measures were performed in triplicate for each meat
sample.
Total phenol content. Total phenol content was measured using the method of Jang et al.
(2008). Each meat sample (5 g) was homogenized in distilled water (15 ml) and chloroform
(9 ml), then centrifuged at 3000×g for 5 min at room temperature (21°C). Chloroform was
added to remove the lipids. The total phenol content in the aqueous supernatant was estimated
by the Folin-Ciocalteu method (Subramanian et al., 1965). A 1 ml aliquot of diluted sample

68
(1:4, v/v) was added to 500 ml of 2N Folin-Ciocalteu’s phenol reagent (Sigma-Aldrich,
St.Louis, MO, USA) followed by the addition of 1 ml of NaCO3 (10%). Reaction mixture
was vortexed and the absorbance was measured with a spectrophotometer (VarioskanTM) at
700 nm after incubating for 1 hour at room temperature (21°C). Quantification was based on
a standard curve generated with gallic acid. All measurements were performed in triplicate.
Carbonyl content measurement. Protein carbonyl groups were evaluated on 5 g of ground
meat using an assay kit from Cayman Chemical Company (Item No.10005020, Ann Arbor,
MI, USA). Nucleic acids were removed according to the manufacturer’s instructions.
Absorbance was measured at 370 nm (VarioskanTM) and the results are expressed as
nanomoles of 2,4-dinitrophenylhydrazine (DNPH) fixed per mg of protein. All
measurements were performed in triplicate.
3.4.7. Statistical analysis
To determine whether treatment, time, and their interactions had an effect on the
microbiological analysis, data were analyzed by an analysis of variance (ANOVA) using the
MIXED procedure of SAS software. The five treatments were analyzed independently to
determine the overall effect of supplementation with plant extracts (onion, cranberry, and
strawberry) and essentials oils versus the control treatment. For these analyses, the storage
time under aerobic (0, 5, 10 or 15d) and anaerobic conditions (0, 15, 30 or 45d) was taken
into consideration (SAS Institute Inc., 2002). Logistic regression models, using the
GLIMMIX procedure, were used to evaluate the effect of dietary treatments on the presence
or absence of coliforms, E. coli, presumptive S. aureus and Enterobacteriacea, in both
anaerobic and aerobic storage conditions. Frequency distributions for coliforms, E. coli,
presumptive S. aureus and Enterobacteriacea were obtained with FREQ procedure.
Significant difference was declared at P < 0.05 and a tendency was declared at P < 0.10.
3.5. Results
3.5.1. Growth performance
The effect of dietary supplementation with plant extracts and essential oils on the rabbits’
growth performance is presented in Table 3.2. Overall, there was no significant difference
between the control and the experimental groups except for the feed conversion ratio with

69
cranberry supplementation on week four (P = 0.050), whereas a trend was observed (P =
0.065) for the strawberry supplemented group. Other trends (P < 0.10) were also observed.
By week 2, body weight of the group supplemented with strawberry extract tended to be
higher than the control group (P = 0.097). On week 3, the average daily gain for the group
supplemented with essential oils tended to be higher than the control (P = 0.088) and by week
four, the average daily gain for the group supplemented with cranberry (P = 0.071) and
strawberry extract (P = 0.077) tended to be higher than the control group. Overall, during the
whole feeding period, growth was similar for all experimental groups as slaughter weight
was not significantly different.

70
Tableau 3.2. Growth performance of weaned rabbits fed experimental diets.
Control
Essential oils
Cranberry Onion Strawberry SEM CTL vs EOa CTL vs Cb CTL vs Oc CTL vs Sd
P-value
Initial BW (g) 1698 1736 1719 1745 1729 36 NS NS NS NS Week 1
BW on d7 (g) 2115 2177 2181 2141 2160 32 NS NS NS NS
ADG, (g/d) 59.6 63.1 66.1 56.6 61.4 13.1 NS NS NS NS
ADFI, (g/d) 178 172 176 178 187 12 NS NS NS NS
FCR 0.332 0.368 0.376 0.320 0.345 0.059 NS NS NS NS Week 2
BW on d14 (g) 2437 2450 2505 2455 2534 41 NS NS NS 0.097
ADG, (g/d) 45.9 44.9 46.3 44.9 47.5 3.5 NS NS NS NS
ADFI, (g/d) 175 170 175 183 186 9 NS NS NS NS
FCR 0.264 0.265 0.263 0.247 0.258 0.015 NS NS NS NS Week 3
BW on d21 (g) 2729 2780 2792 2757 2827 46 NS NS NS NS
ADG, (g/d) 41.7 47.1 40.9 43.1 41.7 2.2 0.088 NS NS NS
ADFI, (g/d) 176 180 178 182 181 8 NS NS NS NS
FCR 0.238 0.264 0.230 0.241 0.232 0.015 NS NS NS NS Week 4
BW on d28 (g) 3046 3101 3062 3032 3098 48 NS NS NS NS
ADG, (g/d) 45.3 45.7 38.6 39.3 38.7 2.5 NS 0.071 NS 0.077
ADFI, (g/d) 151 157 155 148 153 6 NS NS NS NS
FCR 0.297 0.291 0.251 0.266 0.253 0.023 NS 0.050 NS 0.065
Global ADG, (g/d) 48.1 50.1 47.9 45.9 47.4 4.3 NS NS NS NS
ADFI, (g/d) 170 170 171 173 175 7 NS NS NS NS
FCR 0.282 0.296 0.281 0.268 0.272 0.019 NS NS NS NS
SEM: standard error of the mean; n=8 rabbit cages, a cage of six rabbits is the experimental unit. BW: body weight; ADG: average daily weight gain; ADFI: average daily feed intake; FCR: feed conversion ratio. aCTL vs EO : Contrast a priori to determine the effect of treatment control versus Essential oils; bCTL vs C : control versus cranberry ; cCTL vs O: control versus onion; dCTL vs S: control versus strawberry. NS: not significant; g/d: grams/day. P value in bold is significant (P < 0.05), underlined values describe a tendency (P < 0.10).

71
Tableau 3.3. Effect of the dietary treatment on physicochemical analyses and meat
quality parameters in rabbit meat.
Control
Essential oils
Cranberry Onion Strawberry SEM CTL vs EOa CTL vs Cb CTL vs Oc CTL vs Sd
P-value
% Lipid 11.2 13.3 13.0 13.3 14.3 1.5 NS NS NS NS
% Protein 18.4 17.9 19.5 18.6 18.4 0.7 NS NS NS NS
% Moisture 68.4 67.6 66.5 66.9 67.3 1.6 NS NS NS NS
% Drip loss 0.33 0.03 0.04 0.03 0.09 0.15 NS NS NS NS
% Cooking loss 30.6 30.6 30.3 30.6 30.0 1.5 NS NS NS NS
Water Loss aerobic 5-15 daysx
D5 2.38 1.56 2.08 2.24 2.18 0.25 NS NS NS NS
D10 2.10 2.01 2.19 2.13 1.97 0.10 NS NS NS NS
D15 1.96 1.71 1.07 1.64 1.74 0.29 NS NS NS NS Water Loss anaerobic 15-45 daysy D15 1.92 2.30 2.48 2.26 2.31 0.25 NS NS NS NS
D30 1.11 1.53 1.13 1.21 0.98 0.41 NS NS NS NS
D45 0.39 0.59 1.22 0.31 0.91 0.42 NS 0.09 NS NS
SEM: standard error of the mean; n=8 rabbit cages, a cage of six rabbits is the experimental unit; NS: not significant. aCTL vs EO: Contrast a priori to determine the effect of treatment control versus Essential oils; bCTL vs C: control versus cranberry; cCTL vs O: control versus onion; dCTL vs S: control versus strawberry. NS = not significant. Underlined P values describe a tendency (P < 0.10). xLinear effect of time on water loss under aerobic conditions, P < 0.0017. yLinear effect of time on water loss under anaerobic conditions, P < 0.0001.
3.5.2. Proximate composition and pH of the meat
The effect of the dietary treatments on physicochemical analyses and meat quality parameters
of the rabbit meat are presented in Table 3.3. Protein content (17.9 to 19.50%), fat (11.2 to
14.3%), moisture (66.5 to 68.4%) and cooking loss (30.0 to 30.6%) were not influenced
significantly by the dietary treatments (P > 0.05). Furthermore, drip loss, measured 48 h after
slaughter, was not affected by supplementation compared to the control group (P > 0.05).
Overall, water loss was very small (0.03-0.09%) and only a trend was observed during
anaerobic storage (45 days; P = 0.09). Nevertheless, a negative linear effect of time was
observed throughout the storage period in aerobic (P = 0.0017) and anaerobic (P = 0.0001)
conditions.
No significant difference was observed for the pH in the LD and BF muscle one hour after
slaughter (6.39 to 6.75 and 6.40 to 6.76, respectively; Table 3.4). The pHu in LD muscle for
the strawberry supplemented group was significantly lower than the control group (P = 0.04),

72
but only a downward tendency was measured in the BF muscle (P = 0.08). It is important to
note, however, that the average pHu in LD muscle for all groups supplemented with plant
extract were below 6 compared to the control (Table 3.4). A pH of 6 is the threshold pH value
for DFD meat (Faucitano et al., 2010).
3.5.3. Color of the meat
Color parameters of the LD muscle: L* (lightness), a* (redness), b* (yellowness) were not
significantly influenced by the dietary enrichment in polyphenols (P > 0.05; Table 3.4).
When evaluating BF muscle, meat from the rabbit fed ration supplemented with cranberry
extract had a significantly higher red color index (a*=3.23; P < 0.03) compared to the control
(a*=2.11). When ration was supplemented with strawberry extract, the lightness index
(L*=50.6; P = 0.03) was significantly darker than the control (L*=53.6). No trends caused
by treatments were found in the b* values of the rabbit meat.
3.5.4. Antioxidant status of meat
The effects of dietary supplementation with plant extracts and essential oils on lipid
oxidation, carbonyl and total phenol content in raw meat is presented in Table 3.4. No
significant differences (P > 0.05) were observed between the dietary treatments and the
control.

73
Tableau 3.4. Effect of dietary treatments on physical characteristics of the Longissimus dorsi and the Biceps femoris muscles, and
on lipid oxidation, carbonyl and total phenol content in raw meat.
Control Essential oils Cranberry Onion Strawberry SEM
CTL vs EOa CTL vs Cb CTL vs Oc CTL vs Sd
P-value
pH 1h
LD 6.63 6.69 6.75 6.39 6.54 0.18 NS NS NS NS
BF 6.63 6.51 6.76 6.40 6.65 0.10 NS NS 0.06 NS
pHu (24h)
LD 6.05 5.92 5.98 5.96 5.84 0.10 NS NS NS 0.04
BF 6.23 6.13 6.09 6.13 6.07 0.09 NS NS NS 0.08
LD color
a* 2.65 2.34 2.58 2.95 2.88 0.44 NS NS NS NS
b* 0.61 0.49 0.27 0.39 0.65 0.30 NS NS NS NS
L* 52.7 52.5 51.9 52.5 52.4 2.3 NS NS NS NS
BF color
a* 2.11 2.39 3.23 2.45 2.90 0.45 NS 0.02 NS NS
b* 0.70 0.16 0.59 0.42 0.36 0.33 NS NS NS NS
L* 53.6 51.5 52.3 52.5 50.6 1.4 NS NS NS 0.03
TBARSA (nmol/g MDA) 2.16 1.79 2.12 2.50 2.28 0.32 NS NS NS NS
Carbonyls (nmol/mg protein)
2.95 2.58 2.81 2.65 2.79 0.51 NS NS NS NS
Total phenols (nmol/g) 1.04 1.03 1.05 1.09 1.05 0.03 NS NS NS NS
Each value represents the mean of eight samples with SEM: standard error of the mean; n=8 rabbit cages, a cage of six rabbits is the experimental unit. aCTL vs EO: Contrast a priori to determine the effect of treatment control versus essential oils; bCTL vs C : treatment control versus cranberry; cCTL vs O: treatment control versus onion. dCTL vs S : treatment control versus strawberry. AAll data of TBARS are presented as mean Malondialdehyde (MDA) values from three analyses performed in triplicate. TBARS: thiobarbituric acid reactive substances, SEM: standard error of the mean, NS: not significant.

74
3.5.5. Microbial analysis and shelf life
The evolution of the microflora on rabbit thighs from animals fed rations supplemented with
plant extracts or essential oils when packaged under aerobic and anaerobic conditions is
presented in Tables 3.5 and 3.6, respectively. Microbial analysis of the refrigerated rabbit
meat indicated that for all tests, under both aerobic and anaerobic storage conditions, the cell
counts increased significantly over time (P < 0.05). Overall, the difference between the
control and the experimental groups, supplemented with various sources of polyphenol, was
sporadic and at the most of 1.5 log cfu/g for the meat stored under aerobic and anaerobic
conditions (Tables 3.5 and 3.6, respectively). However, under aerobic conditions, the control
value was always close or greater than the experimental groups, except for presumptive
Pseudomonas at day 5 for the group supplemented with onion extract (Table 5). At day 0,
the presumptive LAB in the control group were significantly higher (P > 0.05) than all four
experimental groups. A non-parametric analysis was carried out on the presence or absence
of coliforms, E. coli, presumptive S. aureus and Enterobacteriacea, under both aerobic and
anaerobic storage conditions. No significant differences were detected between the control
group and the groups receiving enriched rations (data not shown, P > 0.05).
We observed significant linear and quadratic time effects during the aerobic and anaerobic
storage periods (P < 0.0001). Generally, after an increase, the bacterial count reached a
plateau under aerobic (10 d) and anaerobic (30 d) conditions, as normally seen in a typical
growth curve. A significant interaction between time and treatment for LAB was observed
(P < 0.01) under aerobic conditions. The interaction is explained by the lowest level of LAB
in the supplemented group of plant extracts and essential oils compared to the control group
at 0 d, 5 d and 15 d, except at 10 d, and for strawberry at 5 d, 10 d and 15 d. A significant
interaction between time and treatment for TAM and presumptive LAB was also observed
(P < 0.009) under anaerobic conditions. For TAM, the effect of treatment was not
significantly different for the cranberry group compared to the control, at all time, and for
the other treatments, it was significant at day 0. Presumptive LAB interaction is explained
by the significant differences of treatment supplemented with plant extracts and essential oils
compared to the control group at 0 d. But over time, these significant differences only
remained for the group supplemented with essential oils.

75
Despite limited microbial count differences obtained with a supplementation as low as
10 ppm of active ingredients compared to the control group, some significant differences
were observed under both aerobic and anaerobic conditions over time. Compared to the
control, onion-, strawberry- and essential oils-supplemented groups had lower TAM counts
at day 0 (P < 0.02, P < 0.005, P < 0.004, respectively), although differences were rather
limited (<0.7 log cfu/g). Under aerobic conditions, reduced TAM counts (compared to the
control group) were also observed at 5 d for the rations containing essential oils (P = 0.003)
and cranberry (P = 0.05), and at 15 d for cranberry (P = 0.01), onion- (P = 0.001) and
strawberry-supplemented groups (P=0.003; Table 5). Presumptive Pseudomonas counts
were reduced on day 5, 10 and 15 by the essential oils supplement (P < 0.03) and on day 10
by cranberry (P = 0.002) and onion (P < 0.004). Overall, a small but positive effect was
observed for the dietary treatments compared to the control diet when the meat samples were
placed under aerobic con ditions (Table 3.5).
Under anaerobic conditions (Table 3.6), the rations supplemented with essential oils reduced
significantly TAM counts only at 0 and 45 days (P = 0.03). The other supplemented groups
were not significantly different than the control at 15, 30 and 45 days (P > 0.09). Reduction
of LAB counts over time was only observed with essential oils under anaerobic conditions
(P > 0.09). Essential oils supplement reduced presumptive Pseudomonas counts at 45 d (P =
0.03) and onion at 15 d (P = 0.02). Overall, more significant differences were observed with
the presumptive LAB compared to the other microbial groups analysed, and the essential oils
supplemented group seems more effective (Table 3.5 and 3.6). Under anaerobic conditions,
the effect of supplements is not as important as under aerobic conditions

76
Tableau 3.5. Total aerobic mesophilic (TAM), presumptive Pseudomonas spp. and presumptive Lactic Acid Bacteria (LAB)
counts (log cfu/g) on rabbit thighs between 0 and 15 days of storage at 4 °C under aerobic conditions.
Control Essential oils Cranberry Onion Strawberry SEM CTL vs EOa CTL vs Cb CTL vs Oc CTL vs Sd
P-value
TAMx
d0 2.15 ± 0.63 1.45 ± 0.23 1.83 ± 0.44 1.58 ± 0.30 1.62 ± 0.42 0.18 0.004 0.08 0.02 0.005
d5 4.79 ± 0.39 4.14 ± 0.55 4.39 ± 0.50 4.59 ± 0.80 4.45 ± 0.56 0.19 0.003 0.05 NS NS
d10 9.31 ± 0.22 8.78 ± 0.90 8.92 ± 0.69 9.19 ± 0.50 9.22 ± 0.30 0.20 0.08 NS NS NS
d15 10.49 ± 0.49 10.23 ± 0.42 9.90 ± 0.35 9.50 ± 0.73 9.76 ± 0.21 0.19 NS 0.01 0.001 0.003
Presumptive Pseudomonasx
d0 1.03 ± 0.38 0.93 ± 0.36 0.86 ± 0.37 0.82 ± 0.25 0.90 ± 0.48 0.18 NS NS NS NS
d5 4.65 ± 0.81 4.23 ± 0.58 4.56 ± 0.42 4.80 ± 0.62 4.50 ± 0.34 0.19 0.03 NS NS NS
d10 10.33 ± 0.19 9.91 ± 0.35 9.93 ± 0.24 9.96 ± 0.26 10.12 ± 0.16 0.12 0.001 0.002 0.004 NS
d15 10.92 ± 0.10 10.65 ± 0.46 10.79 ± 0.15 10.73 ± 0.09 10.78 ± 0.06 0.08 0.01 NS 0.09 NS
Presumptive LABxy
d0 1.67 ± 0.65 0.91 ± 0.27 1.22 ± 0.34 1.16 ± 0.44 1.04 ± 0.26 0.19 0.004 0.02 0.01 0.02
d5 4.83 ± 0.73 3.33 ± 0.80 4.33 ± 0.50 4.20 ± 1.10 4.61 ± 0.89 0.24 0.0001 0.004 0.01 NS
d10 9.42 ± 0.68 9.40 ± 0.42 8.81 ± 0.92 9.41 ± 0.82 9.14 ± 0.24 0.23 NS 0.08 NS NS
d15 10.49 ± 0.34 9.76 ± 0.52 10.17 ± 0.37 10.21 ± 0.46 10.27 ± 0.40 0.12 0.0001 0.01 0.02 0.08
Each value represents the mean of eight samples with standard deviation.SEM: standard error of the mean; n=8 rabbit cages, a cage of six rabbits is the experimental unit, NS: not significant, log cfu/g: colony forming units per gram. P values in bold are significant, underlined values describe a tendency (P < 0.1). aCTL vs EO : Contrast a priori to determine the effect of treatment control versus essential oils; bCTL vs C : treatment control versus cranberry; cCTL vs O: treatment control versus onion. dCTL vs S : treatment control versus strawberry. xLinear and quadratic time effect, P < 0.0001. yTime × treatment interaction, P < 0.01.
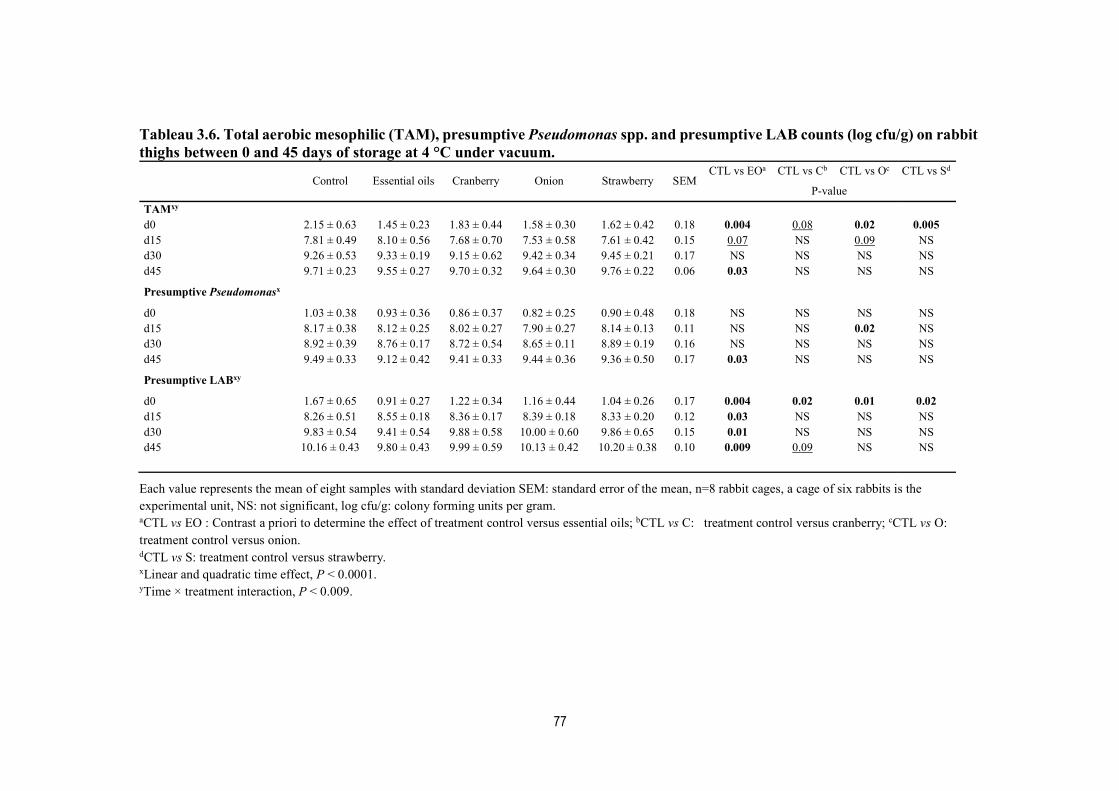
77
Tableau 3.6. Total aerobic mesophilic (TAM), presumptive Pseudomonas spp. and presumptive LAB counts (log cfu/g) on rabbit thighs between 0 and 45 days of storage at 4 °C under vacuum.
Control Essential oils Cranberry Onion Strawberry SEM CTL vs EOa CTL vs Cb CTL vs Oc CTL vs Sd
P-value
TAMxy
d0 2.15 ± 0.63 1.45 ± 0.23 1.83 ± 0.44 1.58 ± 0.30 1.62 ± 0.42 0.18 0.004 0.08 0.02 0.005 d15 7.81 ± 0.49 8.10 ± 0.56 7.68 ± 0.70 7.53 ± 0.58 7.61 ± 0.42 0.15 0.07 NS 0.09 NS d30 9.26 ± 0.53 9.33 ± 0.19 9.15 ± 0.62 9.42 ± 0.34 9.45 ± 0.21 0.17 NS NS NS NS d45 9.71 ± 0.23 9.55 ± 0.27 9.70 ± 0.32 9.64 ± 0.30 9.76 ± 0.22 0.06 0.03 NS NS NS
Presumptive Pseudomonasx
d0 1.03 ± 0.38 0.93 ± 0.36 0.86 ± 0.37 0.82 ± 0.25 0.90 ± 0.48 0.18 NS NS NS NS d15 8.17 ± 0.38 8.12 ± 0.25 8.02 ± 0.27 7.90 ± 0.27 8.14 ± 0.13 0.11 NS NS 0.02 NS d30 8.92 ± 0.39 8.76 ± 0.17 8.72 ± 0.54 8.65 ± 0.11 8.89 ± 0.19 0.16 NS NS NS NS d45 9.49 ± 0.33 9.12 ± 0.42 9.41 ± 0.33 9.44 ± 0.36 9.36 ± 0.50 0.17 0.03 NS NS NS
Presumptive LABxy
d0 1.67 ± 0.65 0.91 ± 0.27 1.22 ± 0.34 1.16 ± 0.44 1.04 ± 0.26 0.17 0.004 0.02 0.01 0.02 d15 8.26 ± 0.51 8.55 ± 0.18 8.36 ± 0.17 8.39 ± 0.18 8.33 ± 0.20 0.12 0.03 NS NS NS d30 9.83 ± 0.54 9.41 ± 0.54 9.88 ± 0.58 10.00 ± 0.60 9.86 ± 0.65 0.15 0.01 NS NS NS d45 10.16 ± 0.43 9.80 ± 0.43 9.99 ± 0.59 10.13 ± 0.42 10.20 ± 0.38 0.10 0.009 0.09 NS NS
Each value represents the mean of eight samples with standard deviation SEM: standard error of the mean, n=8 rabbit cages, a cage of six rabbits is the experimental unit, NS: not significant, log cfu/g: colony forming units per gram. aCTL vs EO : Contrast a priori to determine the effect of treatment control versus essential oils; bCTL vs C: treatment control versus cranberry; cCTL vs O:
treatment control versus onion. dCTL vs S: treatment control versus strawberry. xLinear and quadratic time effect, P < 0.0001. yTime × treatment interaction, P < 0.009.

78
3.6. Discussion
The effects of dietary supplementation with plant extracts and essential oils on the quality of
rabbit meat were studied for their antimicrobial and antioxidant effects. Growth performance
of the rabbits were consistent with the studies of Botsoglou et al. (2004) who did not observe
significant differences when oregano essential oil was provided to rabbits at much higher
doses of 100 and 200 mg per kg of feed. Similarly, rabbit consuming a diet supplemented
with three levels (0%, 10% or 15%) of chia seeds (Salvia hispanica L.) also had no effect on
growth performance (Peiretti and Meineri, 2008). However, Rotolo et al. (2013) did observe
a positive effect with oregano and sage dried leaves. Hence, at the low level tested (10 ppm
of active ingredients), the plant extracts did not perform as growth promoters like antibiotics
administered at sub-therapeutic doses (Richard et al., 2000; Dibner and Richards, 2005).
Color is generally accepted as one of the major features that consumers evaluate when
making a purchase decision. The color parameters of meat are related to pHu, which
influences the oxidation of the meat’s haem pigments. According to Fraysse and Darre
(1989), low pH causes discoloration of the meat whereas high pH gives the meat a darker
color. At high pH levels, oxymyoglobin rapidly turns into a dark red, reduced myoglobin
(Ouhayoun and Dalle Zotte, 1993) and the muscle structure is less reflective because of its
less compact structure (Bízková and Tůmová, 2010). But in this study, the lower L* values
of strawberry extract in BF (darkest meat, pHu=6.07) had a pHu lower than the control group
(pHu =6.23); which is contrary to the literature. Dabbou et al. (2014) showed that different
levels of artichoke bracts supplementation did not significantly affect the pHu, L* and other
color parameters of rabbit meat. The water loss values we obtained decreased over time,
which is also contrary to what is observed in pig Longissimus muscle where values have been
reported to increase with time (Simitzis et al., 2010).
Oxidation is a process that affects various constituents including proteins, carbohydrates,
lipids, pigments, vitamins and DNA in muscle and fatty tissue. Oxidation also increases with
time and shortens the shelf life of meat and meat products (Smet et al., 2008). Under our
experimental conditions, we observed no treatment effects on TBARS, carbonyl and total
phenol content, indicating that the supplementation, or the level of active ingredient used,
79
had little influence on the level of raw meat oxidation at day 0. The TBARS values obtained
are similar to those published by Botsoglou et al. (2004) at day 0 using relatively high levels
of oregano essential oils (100 and 200 mg/kg feed rabbit). In this study, the control group’s
TBARS mean was 155.41 ng/g MDA value, the essential oil group was 130.99 ng/g,
cranberry was 153.16 ng/g, onion was 180.38 ng/g and strawberry was 158.58 ng/g,
compared to 115 ng/g and 137 ng/g for 100 and 200 mg of oregano essential oil/kg of feed,
respectively, for Botsoglou et al. (2004). Rotolo et al. (2013), who used oregano and sage
dried leaves, also came to the same conclusion. Alma et al. (2013), however, reported that
lipid oxidation in pork was inhibited by 1000 ppm of essential oils in the diet. The lack of
difference between the experimental groups and the control could be due to the low dose
used, despite the higher fat content of our rabbit meat. Indeed, our results obtained for fat
(11.2 to 14.3g /100g) correspond to the maximum values obtained by Salvini et al. (1998;
0.6 to 14.4g /100g). The low dose used (10 ppm), could also explain the absence of increased
levels of total phenols at day 0.
Rabbit meat protein values between 17.9 and 19.5 g /100g observed in this study are
comparable to published values between 18.1 and 23.7g /100g (Salvini et al., 1998). In
agreement with our results, Peiretti et al. (2013) showed that different levels of tomato
pomace supplementation did not significantly affect the chemical composition of rabbit meat.
Jolley (1990) indicated that rabbit meat has characteristics similar to DFD meat and rapidly
deteriorates. Rabbit meat obtained in this experiment also had characteristics similar to DFD
meat. This resulted in a large water retention capacity and very low water loss (drip loss) and
is corroborated by Hulot and Ouhayoun (1999). An inverse relationship exists between drip
loss and pH, so when pH is low, drip loss is high (Melody et al., 2004). This is in agreement
with previous studies, which reported that no significant differences to drip loss occurred
with dietary supplementation of spirulina (Arthrospira platensis) and thyme leaves in rabbit
feed (Dalle Zotte et al., 2014).
Meat contains sufficient nutrients to support microbial growth, even at refrigeration
temperature. Several intrinsic and extrinsic factors affect growth rate (Greer, 1989; Holmer
et al., 2009). The faster spoilage of DFD pork is promoted by a high ultimate pH but also by
its lower content of glucose and glycolytic intermediates, which forces organisms to use
80
amino acids and leads to spoilage and off-odours, notably by the production of malodorous
compounds such as biogenic amines putrescin and cadaverin, produced in low quantity, and
volatile metabolites, including sulfur compounds, aldehydes and ketones (Newton and Gill,
1981). In rabbits, the pHu was higher in BF muscle than LD and was attributable to its lower
glycolytic potential (Hulot and Ouhayoun, 1999). Compared to the control group, a
significantly lower pH was only observed with the strawberry-supplemented ration in the BF
muscle (pHu=5.84; Table 3.4). The fact that the means of the pHu for the LD muscle were
below 6 for meat from rabbits fed supplemented rations suggests conducting other
experiments at a higher level of supplementation. Other studies, however, did not observe
significant effects for dietary supplementation of rabbit feed with rosemary (0.2%), oregano
extract (0.2%) and rosemary (0.1%) plus oregano extract (0.1%) on pHu values (Cardinali et
al., 2012). Therefore, based on published studies, it is uncertain if higher incorporation levels
would significantly affect this parameter. Improved pre-slaughter management to lower
animal stress would be a more sound approach to reduce the pHu of the meat (Hulot and
Ouhayoun, 1999).
The microbiological analyses do not reveal clear activity of dietary supplemented cranberry,
strawberry, onion and essentials oils rations on rabbit meat since significant differences were
observed sporadically at the low supplementation level used. Overall, under aerobic
conditions, presumptive Pseudomonas spp, presumptive LAB and TAM were close or
reduced in all experimental groups, compared to the control group. Based on a maximum of
7-log cfu/g for TAM, we obtained a shelf life between 5-10 days. Soultos et al. (2009) also
came to the same conclusion with a diet supplementation of 100 or 200 mg/kg oregano oil
and indicated that, according to both appearance and odor, shelf life was estimated at between
8-12 days under aerobic conditions.
As observed by Soultos et al. (2009) with oregano oil, supplementation of the diet with
polyphenol-rich extracts influenced the microbial status of the meat under aerobic more
favorably compared to anaerobic conditions. Despite a limited effect of the experimental
diets compared to the control group (<1.5 log cfu/g, essential oils compared to the control
group at day 5 under aerobic conditions), our results suggest that more research is needed
using higher concentrations of active substances. Because of the low toxicity of plant extracts

81
(Shoji et al., 2004), a higher degree of supplementation must be tested to optimize the positive
effects observed.
3.7. Conclusion
The results of this study show that meat from rabbits receiving feed without supplements had
the characteristics of DFD meat, which is more susceptible to microbial spoilage due to its
high ultimate pH. The addition (10 ppm of active ingredients) of various dietary supplements
containing polyphenols appears to influence favorably the microbial quality of the rabbit
thighs during storage, especially under aerobic conditions and with essential oils. However,
higher doses of extracts should be tested before concluding to an effective antimicrobial
activity of practical and commercial value.
3.8. Acknowledgements
This research was carried out with the financial support of the Programme de soutien à
l’innovation en agroalimentaire, a program derived from the Growing Forward agreement
between the Ministère de l’agriculture des pêcheries et de l’alimentation du Québec
(MAPAQ) and Agriculture and Agri-Food Canada. The Syndicat des producteurs de lapins
du Quebec is also a partner in this project.

82
Plant extracts and essential oils as feed additive to control rabbit meat microbial quality
Ce chapitre n’a été révisé par aucun des coauteurs et constitue mon travail original ; le
manuscrit sera soumis à Meat science.
Les multiples propriétés des extraits de végétaux et des huiles essentielles ne sont plus à
démontrer. La raison d'être de cette étude est fondée sur les résultats l’étude précédente, celle
du chapitre 3 (Koné et al., 2016). Suite aux résultats de ce chapitre, des extraits de végétaux
et d’huiles essentielles ont été combinés, et ce, à une dose 5 à 10 fois plus élevée que celle
du chapitre 3 pour étudier leurs effets et la présence de synergies entre eux. Par conséquent,
ce chapitre présente l’effet de suppléments alimentaires incluant des extraits d’oignon, de
canneberge et d’huiles essentielles, riches en polyphénols sur la qualité microbiologique de
la carcasse et de la viande de lapin.
Les résultats de ce chapitre ont été présentés sous forme d’affiche lors de la 96ème conférence
annuelle conjointe du Conseil des viandes du Canada (CVC) et de l’Association scientifique
canadienne de la viande (ASCV) à Ottawa (ON), du 27 au 29 septembre 2016. Ainsi que
celle d’Abdelwahed, M. Z., A. P. Koné, D. Cinq-Mars, Y. Desjardins, F. Guay, A. Gosselin,
et L. Saucier. 2016. Improvement of rabbit meat oxidative status using feeding strategies, sur
l’oxydation de la viande
Les résultats ont été présentés aussi au Symposium des étudiants membres de l’INAF, 28
avril, Québec, Qc.
Koné, A. P., M. Z. Abdelwahed, D. Cinq-Mars, Y. Desjardins, F. Guay, A. Gosselin, et
L. Saucier. 2016. Stratégies nutritionnelles à base d’extraits de plantes et d’huiles essentielles
pour améliorer la qualité de la viande de lapin.

83
Contributions des auteurs :
Amenan Prisca Nadège Koné (candidat au Ph. D.): la candidate était responsable de la mise
en place du protocole, planification des expériences, collecte, analyse et interprétation des
données, préparation du manuscrit.
Prof. Linda Saucier et Prof. Frédéric Guay (Directrice de recherche, auteure de
correspondance et le coauteur) : participation à la mise en place du protocole, révision et
correction du manuscrit. Les analyses statistiques ont été réalisées avec l’aide du Prof. Guay.
Prof. Dany Cinq-Mars, Prof. Yves Desjardins et Prof. André Gosselin (collaborateurs) :
collaboration dans la mise en place du protocole et la révision du manuscrit. Drs Desjardins
et Gosselin sont les spécialistes en phytologie sur le projet.
Mohamed Zied Abdelwahed (étudiant à la maitrise en sciences animales) : participation à
la mise en place du protocole et à l’alimentation des animaux.

84
Plant extracts and essential oils as feed additive to control rabbit meat
microbial quality
Amenan Prisca Konéa,b, Mohamed Zied Abdelwaheda,b, Desjardins Yvesb,c, Gosselin
Andréb,c, Dany Cinq Marsa, Frédéric Guaya, Linda Sauciera,b,
a Department of Animal Science, Faculty of Agriculture and Food Science, Université Laval, 2425 rue de l’Agriculture, Quebec City, QC, Canada, G1V 0A6
b Institute of Nutrition and Functional Foods, Université Laval, 2440 boul. Hochelaga, Quebec City, QC, Canada, G1V 0A6
c Department of Plant Science, Université Laval, Quebec City, Quebec, Canada G1V 0A6.
*Corresponding author: Université Laval, Québec (QC), Canada, G1V 0A6
Téléphone: 418-656-2131 #6295
Fax: 418-656-3766
E-mail: [email protected]
85
4.1. Résumé
Le présent travail a évalué les effets de la combinaison d'extraits de plantes (oignon,
canneberge) et d'huiles essentielles sur la qualité de la carcasse et de la viande de lapins. Cinq
groupes de 48 lapines Grimaud sevrées ont reçu un complément: 500 et 1000 ppm d'extrait
d'oignon (O500 et O1000 respectivement), 500 ppm d'extrait d'oignon + 500 ppm d'extrait de
canneberge (O500 / Cr500), 500 ppm d'extrait d'oignon + 100 ppm d'huiles essentielles (O500 /
EO100) et la ration contrôle (C). La qualité microbiologique a été évaluée sur des cuisses
entières, entreposées dans des conditions aérobes et anaérobes à 4 °C. Dans des conditions
aérobes ou anaérobes, l'effet de la supplémentation alimentaire en polyphénols a eu un effet
sporadique sur la qualité microbienne des cuisses de lapin (P <0,05) avec une différence
maximale de 1,29 log observée avec les groupes O500 / Cr500 et O500 / EO100. Ces résultats
montrent que la combinaison d'extraits de plantes et d'huiles essentielles (à dose plus élevée)
sont des additifs naturels prometteurs pour contrôler la qualité microbienne de la viande de
lapin.
Mots clés: microbiologique; agents de conservation naturels; extraits de plantes et huiles
essentielles; viande de lapin.
86
4.2. Abstract
The present work evaluated the effects of the combination of plant extracts (onion,
cranberry) and essential oils on the carcass and meat quality of rabbits. Five groups of forty-
eight weaned Grimaud female rabbits received a supplemented: 500 and 1000 ppm onion
extract (O500 and O1000respectively), 500 ppm onion extract + 500 ppm cranberry extract
(O500/Cr500), 500 ppm onion extract + 100 ppm essential oils (O500/EO100) or the control
ration (C). Microbiological quality was evaluated on whole thighs stored under aerobic and
anaerobic conditions at 4 °C. Under aerobic or anaerobic conditions, the effect of diet
supplementation with polyphenols had a sporadic effect on microbial quality of rabbit thighs
(P < 0.05) with a maximum difference of 1.29-log observed with O500/Cr500 and O500/EO100
groups. These results show that the combination of plant extracts and essential oils (at higher
dose) are promising natural additives for to control rabbit meat microbial quality.
Keywords: microbiological; natural preservatives; plant extracts and essential oils; rabbit
meat.

87
4.3. Introduction
The rabbit meat possesses high nutritional and dietetic properties, as it is lean with its lipids
generally highly unsaturated and a very low omega 6/omega 3 ratio (Dalle Zotte and
Szendrő, 2011). However, during slaughter and processing, meat can be contaminated with
pathogenic and spoilage microorganisms, leading to meat wastage loss of valuable protein,
with possible deleterious effect on human health (Irkin and Arslan, 2008). This situation
might have substantial economical and environmental impact (Dave and Ghaly, 2011).
In order to counteract these processes, many strategies have been tried, especially the
addition of synthetic products to the meat, such as nitrites (Krause et al., 2011), metal-
chelating agents (Allen and Cornforth, 2010) and synthetic antioxidants, namely butylated
hydroxyanisole (BHA) and butylated hydroxytoluene (BHT, Naveena et al., 2008). While
their use efficient, consumer perception of synthetic products used in food and feed has
progressively changed because of safety and toxicity concerns. Scientific research and the
meat industry have increasingly focused on the phenolic compounds present in plant extract,
herbs and essential oils (EO) for their potential antimicrobial, antifungal and antiviral
activities (Dalle Zotte et al., 2016).
These properties are induced by many substances like some flavonoids, proanthocyanidins
(cranberry), quercetin (onion extract), carvacrol and thymol (essential oil of herbs), etc. and
render spices and some herbs, the best preservative agents in food (Li et al., 2014). This
strategy is interesting, especially as antimicrobial are deposited in the meat during the life of
the animal (diet) without requiring the addition of exogenous products after slaughter.
According to Negi (2012) and Oussalah et al. (2007), different antimicrobials from plant
origin and EO can effectively reduce the number or inhibit the growth of pathogenic and
spoilage microorganisms, and thus have a potential to become a good alternative to synthetic
antimicrobials. Indeed, plants and many small fruits contain large amounts of phenolic
compounds that are more inhibitory against Gram-positive than Gram-negative bacteria
(Mangena and Muyima, 1999; Marino et al., 2001). Kone et al. (2016) demonstrated that the
plant extracts and essential oils (alone, at low dose,100 ppm) can be used in a rabbit diet
because had a small but sporadic positive effect on bacterial microflora (especially with

88
essential oils on presumptive lactic acid bacteria, LAB). For example, cranberry (Vaccinium
macrocarpon Ait.) is an important commercial crop in the United States and Canada
(Leusink et al., 2010) and it has been reported to act in synergy with oregano oil to inhibit
the growth of Listeria monocytogenes when added directly on beef meat (Apostolidis et al.,
2008). As well as, the exogenous addition of onion extracts, a source of flavonoids, reduced
beef fillet meat microbial contamination by inhibiting Escherichia coli and yeast and mould
counts in different days of storage and in refrigeration conditions 4 °C (Reyhan and Mikail,
2010). Furthermore, the same effects on the microbial quality of fresh pork loin during
storage were observed in the study of Fortier et al. (2012) with a combination of oregano oil
and cranberry pulp added to the diet. According to Burt (2004) and Marino et al. (2001),
minor compounds of a particular EO may work in synergy with other components resulting
in improved antibacterial properties (Dinesh and Cheorun, 2013). For example, the addition
of rosemary or thyme EO to fine paste meat products has been effective against aerobic
bacteria and lactic acid bacteria (LAB, Viuda-Martos et al., 2010).
Information on the effects of natural compounds used as feed additive on rabbit meat
microbiological quality is limited. Because of the low toxicity of plant extracts (Shoji et al.,
2004) and for to test a higher degree of supplementation in order to optimize the positive
effects observed in the study of kone et al. (2016), we examined the effects of combination
of plant extracts (cranberry, onion) and essential oils on carcass microbial contamination as
well as meat quality.
4.4. Materials and methods
4.4.1. Animal housing and feeding
Animal care and handling procedures were approved by Université Laval Animal Use and
Care Committee, which strictly adheres to the Guidelines of the Canadian Council on Animal
Care (CCAC, 2009). A total of 240, 35-day-old weaned Grimaud breed female rabbits were
obtained from a commercial farm (Laprodéo, Saint-Tite, Quebec, Canada) and were raised
in conventional commercial cages.
Rabbits were placed 6/cage, which constituted the experimental unit (0.37 m2 per rabbit).
Eight cages of homogeneous weight were analyzed per experimental group (No. = 48

89
rabbits/group) with a cycle of 12 h of light (starting at 9:00 am) and 12 h of dark throughout
the experiment. Temperature was set at 20.5 ± 0.3 °C and humidity level at 37 ± 3 %. Upon
arrival, the animals were acclimatized to their new environment and received a commercial
diet (Table 4.1) for a week, followed by three weeks on the experimental feed. All diets had
the same basal mixture of ingredients and only varied the plant extracts (onion and cranberry,
Nutra Canada Inc., Champlain, Québec, Canada) and essential oils (XtractTM Instant,
Pancosma SA, Geneva, Switzerland) included. Namely: a group without supplement served
as the control group (C), 500 ppm onion extract (O500), 1000 ppm onion extract (O1000), 500
ppm onion extract + 500 ppm cranberry extract (O500/Cr500) and 500 ppm onion extract +
100 ppm essential oils (O500/EO100).
The level of essential oils (100 ppm; XtractTM Instant, Pancosma SA, Geneva, Switzerland)
was added according to supplier recommendations to promote a healthy rabbit digestive
system. Essential oils contain encapsulated thyme oil, trans-anethole, thymol, eugenol,
cinnamaldehyde, capsicum oleoresin, arabic gum and maltodextrins. Supplement was mixed
directly with other feed ingredients prior to pelleting at 60 °C and cooling at 16 °C within
2.5 min. Feed was manufactured in a commercial facility in separate 600 kg batches (Belisle
Solution Nutrition, St-Mathias-sur-Richelieu, Quebec, Canada).
Tableau 4.1. Nutritional values and composition of the experimental diets. Commercial data
bWet basis cDry basis
Crude protein % 16.0 17.02
Crude fat matter % 4.6 4.90
Crude fiber % 18.1 19.25
Calcium % 1.00 1.06
Phosphorous % 0.44 0.47
Sodium % 0.30 0.32
Vitamin A UI/kg 6034 6419
Vitamin D UI/kg 1018 1083
Vitamin E UI/kg 40.0 42.55
Total selenium mg/kg 0.19 0.20
Added selenium mg/kg 0.10 0.11 aIngredients: Alfalfa, beet pulp, wheat, soybean meal, canola meal, corn gluten feed, molasses, mineral and vitamin premix. bData provided by the commercial feed mill on a wet basis. cData calculated using the measure dry matter.

90
The total phenolic content in the feed was determined by using the Folin-Ciocalteu method
(Dudonné et al., 2015) and was expressed in mg of gallic acid equivalents (GAE) per gram
of diet (Table 4.2). Briefly, 0.5 g of the sample extracted with 10 ml of methanol: sonication
20 minutes at 37 °C and then centrifugation (10000 g for 4 minutes at room temperature).
The pellet was extracted once again with 10 ml of methanol: sonication 20 minutes at 37 °C
followed by centrifugation (4000 rpm for 4 minutes at room temperature). The 2 supernatants
are pooled and the volume is adjusted to 25 ml with Ultrapure water (Millipore Milli-Q water
purification system). Extract solutions were mixed with 100 µl of 10-fold diluted Folin-
Ciocalteu reagent and 80 µl of sodium carbonate solution (NaCO3; 75 g/L). The absorbance
readings were taken at 765 nm after incubation at room temperature for 1h. Quantification
was based on a standard curve generated with gallic acid. All measurements were performed
in triplicate.
Tableau 4.2. Total Phenolics of the experimental diets
C O500 O1000 O500/Cr500 O500/EO100
Total phenols (mg GAE/g of feed)
5.47 ± 0.13 5.56 ± 0.28 6.41 ± 0.29 5.60 ± 0.35 6.28 ± 0.19
Each value represents the mean of three samples with standard deviation.
Animals were fed ad libitum until a minimal target slaughter weight of 2200 g was
reached. They were weighed, and feed intake was measured weekly during the experimental
period to determine body weight (BW), average daily gain (ADG), average daily feed intake
(ADFI) and feed conversion ratio (FCR). They were fasted 15 h before slaughter, including
transport and lairage time, according to the current commercial practices to reduce transport-
related sickness (Bianchi et al., 2008). They had access to water at all times prior to transport.
The length of transport to the abattoir was 30 min, and animals were allowed a waiting period
of 30 min before slaughter. Animals were slaughtered in a provincially inspected
establishment according to regulations in the province of Quebec, Canada (DGSAIA, 2011).

91
4.4.2. Meat quality measurement
For meat quality measurement, one rabbit per cage was randomly analyzed according to
Koné et al. (2016, 2017). The muscular pH of the Biceps femoris (BF) and the Longissimus
lumborum (LL) muscles were measured post-mortem after 1 (pH 1) and 24 h (pHu; Blasco,
and Ouhayoun, 1996) using a portable pH meter (ROSS, Orion Star A221, Thermo
Scientific, Beverly, CA, USA) combined with an Orion Kniphe electrode (ThermoFisher,
Nepean, ON, Canada) and a temperature compensation probe (928 007 MD, micro probes
ATC, Maryland, USA). Meat colour was evaluated 24 h after slaughter on the LL and the
exposed surface of the BF using a Chromameter (Chromameter CR 300 Minolta Ltd., Osaka,
Japan) equipped with a D65 light source and a 0° viewing angle geometry according to the
reflectance coordinates (L*, a*, b*; CIE, 1976), after exposing the muscle surface for 20 min
blooming time (Faucitano et al., 2010). Meat exudate lost (%) during cold storage was
measured by weight difference of the thighs. Regarding drip loss, the measure was taken
from a piece of Longissimus thoracis et lumborum muscle (LTL about 2 cm thick x 2.5 cm
in diameter) also by weight difference, according to the EZ-Driploss method (Rasmussen
and Anderson, 1996), where samples are stored at 4 °C for 48 hours. Cooking loss was
determined on a similar piece of LTL muscle (Pla, 1999) and is expressed as a percentage of
the initial weight loss. Each sample was placed into an 18 oz Whirl-Pak bag (Nasco Whirl-
Pak®, USA) and immersed in a water bath at 70 °C for 15 minutes after removing the air
from the bag. The samples were then removed from the bag, patted dry with filter paper and
weighed (Vergara et al.,2005; Apata et al., 2012).
4.4.3. Muscle Sampling
One leg per animal was packaged aerobically in a Styrofoam tray (14w x 24l x 4.5h cm) with
an absorbent pad, sealed with an oxygen-permeable polyethylene film (35 ga; oxygen
transmission 825 cc/100 sq. in. per 24 h at 23 °C; water vapor transmission rate 24 g/100 sq.
in. per 24 h at 38 °C and 90% RH) obtained from a local food equipment distributor
(Emballage L. Boucher, Quebec, QC, Canada) and stored at 4 °C for 0, 3, 6 or 9 days. The
other leg was vacuum-packed (Sipromac, St-Germain, QC, Canada) in bags (nylon [23%]
and polyethylene [77%; seven multilayered] of 300 ga; oxygen transmission 3.3 cc/100 sq.
in. per 24 h at 23 °C; water vapor transmission rate 0.5g/100 sq. in. per 24 h at 38 °C and

92
90% RH; Sealed Air Co, Mississauga, ON, Canada) and also stored at 4 °C for 0, 5, 10, 15
or 20 days. The rest of the carcass was deboned and the meat was ground (Electric meat
Grinder, No RE50255, IPNO IPXI, China) and stored at -30 °C.
4.4.4. Proximate analysis
Samples (100 g of ground meat) were lyophilized (freeze dryer Model 6203-3005-OL, Virtis
Co., Gardiner, NY, USA) for 7 days. The fat content was measured using a Tecator
extraction unit (Soxtec system HT 1043, Hoganas, Sweden) according to procedure 991.36
of the Association of Official Analytical Chemists (AOAC, 1995). Total proteins were
quantified using procedure 992.15 of the AOAC (1995) with a LECO® protein analyzer
(model FP-2000, Leco Corp., St. Joseph, MO, USA). Fat and protein contents are expressed
on the wet weight basis and the analysis was performed in triplicate.
4.4.5. Determination of muscle antioxidant status
4.4.5.1. Total phenol content
Total phenol content in the ground meat was measured as described in Kone et al. (2016),
using the method of Jang et al. (2008). Each meat sample (5 g) was homogenized in distilled
water (15 ml) and chloroform (9 ml), then centrifuged at 3000×g for 5 min at room
temperature (21°C). Chloroform was added to remove the lipids. The total phenol content in
the aqueous supernatant was estimated by the Folin-Ciocalteu method (Subramanian et al.,
1965). A 1 ml aliquot of diluted sample (1:4, v/v) was added to 500 ml of 2N Folin-
Ciocalteu’s phenol reagent (Sigma-Aldrich, St. Louis, MO, USA) followed by the addition
of 1 ml of NaCO3 (10%). Reaction mixture was vortexed and the absorbance was measured
with a spectrophotometer (VarioskanTM) at 700 nm after incubating for 1 hour at room
temperature (21°C). Quantification was based on a standard curve generated with gallic acid.
All measurements were performed in triplicate.
4.4.6. Microbial Analysis
Microbial enumeration on thighs was performed as described in Kone et al. (2016, 2017),
using a sampling procedure similar to the one for whole poultry carcasses described by
Brichta-Harhay et al. (2007). One leg was taken randomly from each cage at every sampling
time and conditions (aerobic and anaerobic). The thigh was aseptically placed in a sterile

93
Stomacher bag (Stomacher® 400C, Seward Laboratory Systems Inc., London, UK),
weighted (measure was also used to evaluate meat exudate) and sealed after 300 ml of 0.1%
(wt/vol) peptone water were added (Bacto peptone, Difco Laboratories, Inc., Detroit, MI,
USA). The bag was placed on a rotary shaker (Boekel Scientific Orbitron Rotator II,
model 260250, New York, USA) for one minute on each side and then manually massaged
for 30 sec to remove microorganisms from the surface. Ten-fold dilutions were carried out
in 0.1% peptone water for enumeration on appropriate agar plates (Saucier et al., 2000).
Total Aerobic Mesophilic (TAM) counts (MFHPB-18; Health Canada, 2001) were
performed on Plate Count Agar medium (PCA; Difco Laboratories Inc.; 35 °C for 48 h).
Presumptive Lactic Acid Bacteria (LAB) were enumerated on de Man, Rogosa and Sharp
(MRS; Difco Laboratories Inc.; 25 °C for 48 h; Saucier, Gendron, & Gariépy, 2000) under
anaerobic conditions using envelope generator of H2 and CO2 (AnaeroGenTM2.5L,
AN0025A, Oxoid Company, Nepean, ON, Canada). Presumptive Pseudomonas spp. were
determined on Cetrimide-Fucidin-Cephalosporin (CFC) agar (25 °C for 48 h; Mead and
Adams, 1977; Gill and Greer, 1993). Coliforms and E. coli, as presumptive S. aureus and
Enterobacteriaceae counts were determined using 3M PetrifilmTM plates according to
method MFHPB-34 (Health Canada, 2013) MFLP-21 (Health Canada, 2004) and MFLP-09
(Health Canada, 2007), respectively. Presumptive Listeria spp. were determined on
PALCAM medium (PALCAM Listeria Agars Base; Merck, Germany) without supplements
and plates were incubated at 30 °C for 48 h. Measurements were performed in duplicate. All
bacterial counts were transformed to a log10 value of colony-forming units per gram of thigh
weight (log10 CFU/g) prior to statistical analysis according to Gill (2000). Except for
presumptive S. aureus, coliform, E. coli, Enterobacteriaceae counts, which were
transformed to a Log10 value of colony forming units per ten grams of thigh weight
(Log10 CFU/10g). For counts on PCA, MRS, APT, CFC and Palcam, detection level was
1.76 Log10 CFU/10g, and 1.32 Log10 CFU/10g for presumptive S. aureus, coliforms, E. coli
and Enterobacteriaceae counts. The bacterial growth during storage represents the
difference in cell number (value at 9d subtracted by value at 0d, under aerobic conditions
and value at 20d subtracted by value at 0d, under anaerobic conditions).

94
4.4.7. Statistical analysis
To determine whether treatment, time, and their interactions had an effect on the
microbiological analysis, data were analyzed by an analysis of variance (ANOVA) using the
MIXED procedure of SAS (SAS Institute Inc., 2002). Tukey's test was carried out to compare
the differences between experimental groups. In addition, the storage time under aerobic (0,
3, 6 or 9d) and anaerobic conditions (0, 5, 10, 15 or 20d) were taken into consideration. Data
for total phenol were analyzed by an analysis of variance (ANOVA) using the MIXED
procedure of SAS software. Significant difference was declared at P < 0.05 and tendencies
at P < 0.10.
4.5. Results
4.5.1. Growth performance
The effects of plant extract and essential oils supplementation in the diet on body weight
(BW), average daily weight gain (ADG), average daily feed intake (ADFI) and feed
conversion ratio (FCR) are presented in Table 4.3. Feed intake of rabbits on experimental
diets, as well as their measured performance parameters, was similar in all groups (P > 0.05).
The addition of plant extract and essential oils did not therefore have a negative on the
appetence of rations.

95
Tableau 4.3. Growth performance of weaned rabbits fed experimental diets.
C C-O C-2×O C-O-Cr C-O-OE SEM
P-value
Effect treatment
Initial BW (g) 1640 1648 1646 1641 1648 20.97 NS Week 1
1998 1992 1980 1973 1980 26.77 NS BW on d7 (g)
ADG, (g/d) 51.11 49.1 47.81 47.34 47.37 1.18 NS ADFI, (g/d) 171 169.04 142.68 167.01 167.05 4.29 NS
FCR 3.42 3.51 3.42 3.59 3.51 0.08 NS Week 2
2318 2302 2256 2282 2293 31.36 NS BW on d14 (g)
ADG, (g/d) 44.77 44.42 38.49 44.22 44.88 0.98 NS ADFI, (g/d) 160 169 150 165 166 2.12 NS
FCR 3.62 3.81 4.02 3.76 3.70 0.08 NS Week 3
2584 2561 2555 2546 2550 35.39 NS BW on d21 (g)
ADG, (g/d) 38.21 37.35 42.50 37.64 37.50 1.52 NS ADFI, (g/d) 173 175 174 172 180 1.92 NS
FCR 4.85 4.91 4.36 4.75 4.89 0.17 NS Global
ADG, (g/d) 44.70 43.63 42.93 43.07 43.25 0.95 NS ADFI, (g/d) 168 170 155 168 171 2.16 NS
FCR 3.96 4.08 3.93 4.03 4.03 0.09 NS
SEM: standard error of the mean; n=8 rabbit cages, a cage of six rabbits is the experimental unit. BW: body weight; ADG: average daily weight gain; ADFI: average daily feed intake; FCR: feed conversion ratio. SEM: standard error of the mean, NS: not significant.
4.5.2. Meat quality traits
The effect of plant extracts and essential oils, alone or in combination, through dietary
treatments on rabbit meat physicochemical analysis and quality parameters are presented in
Table 4. Data indicate that the lipid content (12.41 to 15.25%), protein (21.45 to 22.49%),
moisture (62.08 to 64.51%) were not significantly influenced by the dietary enrichment in
sources and concentration of polyphenols (P > 0.05).
Furthermore, drip loss (0.38 to 1.05%), measured 48 h after slaughter, was not significantly
affected by the different treatments applied (P > 0.05). However, the percentage of cooking
loss increased significantly in all experimental groups (26.49% to 27.73%) in comparison to
control (18.13 %, P = 0.0001) except for the O1000 group (21.16%). Furthermore, the O1000
group had a lower cooking loss compared to the onion and cranberry (O500/Cr500) and the
onion and essential oils (O500/EO100) supplemented groups (Table 4.4).

96
Under aerobic storage conditions, water loss was very small (0.009 to 0.67%) and no
significant difference was observed between groups. By contrast, tendencies were observed
for the water loss at 5d (P = 0.06) and 15d (P = 0.08) during anaerobic storage conditions.
As for the pH of the meat, all pHu were below 6 in both muscles 24h after slaughter ranging
from 5.38 to 5.75. The only significant difference observed was in the LL muscle 1 h after
slaughter between the O1000(5.84) and the O500/Cr500 (6.28) groups (P = 0.01). Tendencies
were observed for the BF and the LL muscles 1 h (P = 0.09) and 24 h (P = 0.05) after
slaughter, respectively.
The experimental diet had no significant effect on the color parameters (L*=lightness,
a*=redness and b*=yellowness) of the BF and LL muscle. Only a tendency was observed
with the red colour index a* where the enriched ration was below (4.49 to 5.56) the control
diet (5.59; P = 0.07).

97
Tableau 4.4. Effect of dietary treatment on physicochemical analyses and meat quality parameters in rabbit meat. C O500 O1000 O500/Cr500 O500/EO100 SEM P-value
% Lipid 15.25 12.41 13.99 13.52 14.69 1.32 NS
% Protein 22.30 22.10 22.49 21.45 21.73 0.91 NS
% Moisture 62.08 64.51 63.62 64.44 64.04 1.08 NS
% Drip loss 0.68 0.48 1.05 0.83 0.38 0.77 NS
% Cooking loss 18.13C 26.49AB 21.16BC 27.24A 27.73A 1.82 0.001
Water Loss aerobic 3-9 days D3 0.22 0.40 0.67 0.27 0.15 0.27 NS
D6 0.03 0.13 0.20 0.06 0.07 0.15 NS
D9 0.05 0.04 0.11 0.06 0.009 0.06 NS
Water Loss anaerobic 5-20 days D5 1.13 0.80 1.13 1.38 0.70 0.43 0.06
D10 1.52 1.86 1.81 1.98 2.08 0.59 NS
D15 1.36 1.43 1.72 2.65 1.72 0.46 0.08
D20 1.84 1.41 1.16 2.20 1.95 0.49 NS
pH (1 h) LL muscle 6.05AB 6.14AB 5.84B 6.28A 6.18AB 0.11 0.01
BF muscle 6.07 6.10 5.95 6.22 6.28 0.11 0.09
pHu (24 h) LL muscle 5.40 5.55 5.38 5.52 5.52 0.46 0.05
BF muscle 5.68 5.75 5.64 5.66 5.74 0.48 NS
Colour of BF muscle a* 4.33 3.82 4.63 4.49 4.14 0.47 NS
b* -0.41 -0.37 -0.15 0.16 -0.74 0.38 NS
L* 53.83 53.00 53.32 54.03 52.54 1.00 NS
Colour of LL muscle a* 5.59 4.60 5.46 4.49 5.56 0.48 0.07
b* 1.50 1.57 1.05 0.71 1.13 0.49 NS
L* 54.04 53.88 53.37 53.71 54.01 1.27 NS
Total phenols (mg GAE/g of meat) 0.80D ± 0.06 1.07C ± 0.04 1.21B ± 0.04 1.35A ± 0.05 1.23B ± 0.03 0.03 0.001
Each value represents the means of n=8 cages (a cage of six rabbits is the experimental unit) with SEM: standard error of the mean, LL = Longissimus Lumborum and BF = Biceps femoris. P values in bold are significant, underlined values describe a tendency (P < 0.10). Different letters (A–D) within the columns indicate significant difference at P<0.05. NS: not significant. Total phenols expressed in mg gallic acid equivalent, mg GAE/g.

98
4.5.3. Total phenol content of raw meat
The level of total phenolic compounds in the meat of the animals fed with the diet
enriched plant extracts and essential oils were significantly higher than that of the meat
of the control group animals (P = 0.001; Table 4.4). Indeed, the highest total phenol
content was observed in O500/Cr500 group (1.35 mg GAE/g), then followed by O500/EO100
group (1.23 mg GAE/g) and O1000 group (1.21 mg GAE/g), O500 group (1.07 mg GAE/g)
and finally by the control group (0.80 mg GAE/g).
4.5.4. Microbial analysis and shelf life of rabbit thighs stored under aerobic or anaerobic conditions
Microflora evolution on rabbits thighs from animals fed rations supplemented with
natural sources of polyphenols when packaged under aerobic and anaerobic conditions
are presented in Table 4.5 and 4.6, respectively. Microbial analysis of the refrigerated
rabbit meat indicated that for all tests, under both aerobic and anaerobic storage
conditions, cell counts increased significantly over time (P < 0.0001) except for Listeria
spp. which remained at the same level during the whole storage period and under both
storage conditions (P > 0.05). The interaction of time with treatment did not significantly
affect (P > 0.05) the microbial counts.
Throughout the experiment, all E. coli counts remained below detection level (1.32 log10
CFU/10g) under aerobic and anaerobic storage (data not shown) indicating that
appropriate hygienic food processing conditions were followed. Overall, in aerobic and
anaerobic conditions, no effect of treatment was observed for Listeria spp. and
presumptive S. aureus counts (P > 0.05). A significant interaction between time and
treatment was observed for TAM and presumptive Pseudomonas counts under anaerobic
conditions (P < 0.01). There is a significant effect of treatments at all times for TAM and
presumptive Pseudomonas counts except after 15 and 10 days of anaerobic storage,
respectively. The O500 TAM counts for the first 10 days of anaerobic storage were above
all the other groups reaching 1.29 Log difference with the other group. But from day 15,
all the supplemented groups were below the control. A similar interaction pattern
describing a positive effect of treatments with time is also observed for the presumptive
Pseudomonas counts. In the beginning, counts were the lowest at d0 and the highest at
d20 in the control group.

99
4.5.4.1. Aerobic conditions
Under aerobic conditions (Table 4.5), addition of a source of polyphenols to the ration
had a significant effect (P = 0.007; P = 0.03) on the rabbit tights TAM counts at day 0
and 6, but not at 3 and 9. The O500 group was significantly higher than O500/Cr500,
O500/EO100 and the control group at day 0 (P < 0.05); the differences reached up to 0.69
Log during storage. But at the end of the aerobic storage period (9 days), counts were no
longer significantly different (P > 0.05).
An effect of treatment on the presumptive Pseudomonas counts was only observed at day
0 and 9 (P = 0.02 and 0.01, respectively). A difference was only observed between the
control (1.15 Log) and the O500 group (2.07 Log; P < 0.05) on day 0. By the end of the
aerobic storage period, a significant difference (P < 0.05) was observed solely between
O500/EO100 (8.10 CFU/g) and O1000 (7.85 CFU/g) groups for a log difference well below
one log unit at 0.25. During the storage (0-9 days), the microbial counts of the O500 group
appears to decrease presumptive Pseudomonas numerically, compared to the other
experimental groups.
For the presumptive LAB counts, effect of treatment was only observed at the end of the
storage period (P = 0.04). Counts were similar for all the experimental groups (P > 0.05),
but at the end of the storage, their growth was significantly favored in O500/EO100
compared to O1000 and O500/Cr500 (P < 0.05).
At day 6 and 9, the effect of treatment became significant for the Enterobacteriaceae
counts (P = 0.001 and 0.02, respectively). Counts were significantly higher for the diet
supplemented with 1000 ppm of onion extract (O1000) compared to 500 pm (O500), the
combination of onion and cranberry extract (O500/Cr500) and onion and essential oils
extract (O500/EO100), but not with the control group (P < 0.05) at 6 d. At the end of storage
on day 9, a significant difference was only observed between O1000 and O500/Cr500
(P > 0.05); the log difference between the two groups was < 0.63.
Similarly to Enterobacteriaceae, effect of treatment became significant with the coliform
counts after 6 and 9 days of aerobic storage (P = 0.001 and 0.005, respectively). The
counts with the diet supplemented with 1000 ppm of onion extract (O1000) was higher
than the ones supplemented with the combination of onion and cranberry extract
(O500/Cr500) and onion with essential oils extract (O500/EO100; P < 0.05) at day 6; log

100
difference was 1.08 and 0.95, respectively. At day 9, a significant difference was only
observed between O1000 and O500/Cr500 (P = 0.005) where the later was 0.63 log lower.
Overall, the presumptive Pseudomonas spp. counts varied from 1.15 to 8.10 CFU/g
during the storage period and remained the prevailing microflora. Considering that end
of shelf life is reached when cell count is at 7 Log10 CFU/g or higher, rabbit thighs
reached that level after 6 days when stored under aerobic conditions. So, for all the
experimental groups, it was attained between 6 to 9 days under aerobic storage. Log
difference close to or greater than one log unit was only observed at day 6 between O1000
with O500/Cr500 and O500/EO100 for the Enterobacteriaceae (0.96 and 0.91 Log,
respectively) and for the coliform counts (1.08 and 0.95 Log, respectively), but not with
the control or O500. So, for these microbial counts, onion extract alone is closer to the
control but effective than when used in combination with another source of polyphenols.
On the other hand, based on the total bacterial growth, O500 has numerically the lowest
microbial counts for the TAM, presumptive Pseudomonas spp. and Enterobacteriaceae.
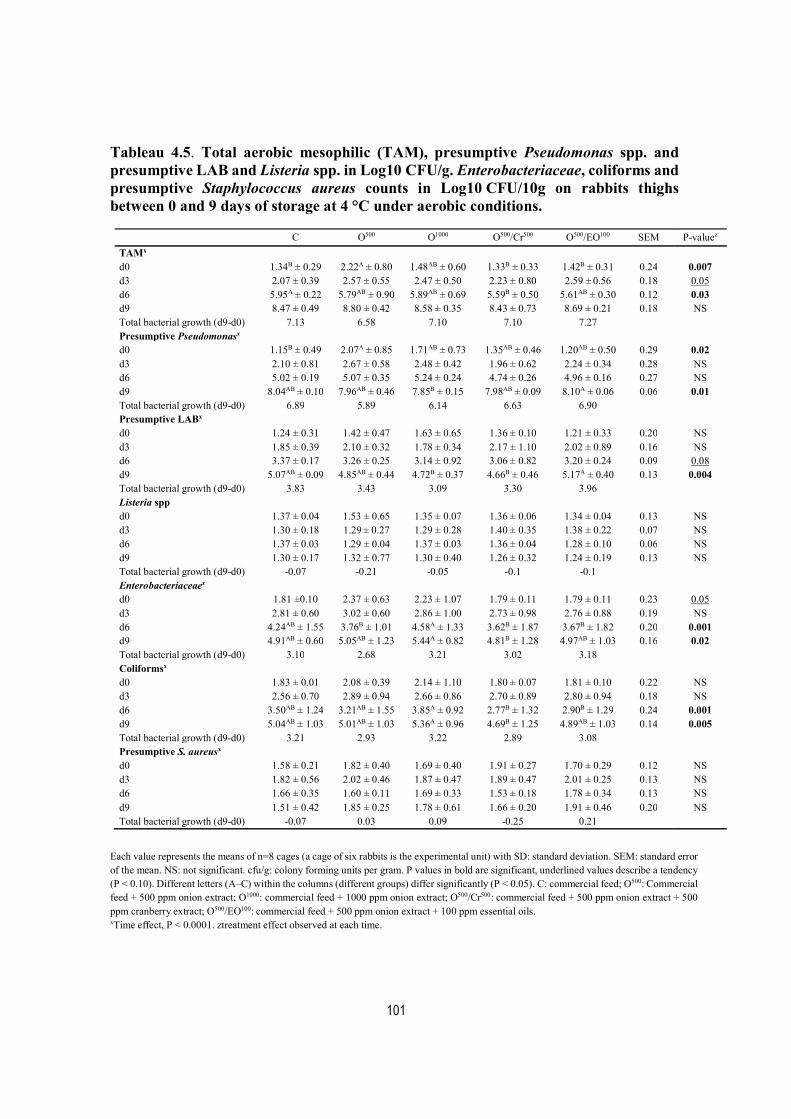
101
Tableau 4.5. Total aerobic mesophilic (TAM), presumptive Pseudomonas spp. and presumptive LAB and Listeria spp. in Log10 CFU/g. Enterobacteriaceae, coliforms and presumptive Staphylococcus aureus counts in Log10 CFU/10g on rabbits thighs between 0 and 9 days of storage at 4 °C under aerobic conditions.
C O500 O1000 O500/Cr500 O500/EO100 SEM P-valuez
TAMx
d0 1.34B ± 0.29 2.22A ± 0.80 1.48AB ± 0.60 1.33B ± 0.33 1.42B ± 0.31 0.24 0.007 d3 2.07 ± 0.39 2.57 ± 0.55 2.47 ± 0.50 2.23 ± 0.80 2.59 ± 0.56 0.18 0.05 d6 5.95A ± 0.22 5.79AB ± 0.90 5.89AB ± 0.69 5.59B ± 0.50 5.61AB ± 0.30 0.12 0.03 d9 8.47 ± 0.49 8.80 ± 0.42 8.58 ± 0.35 8.43 ± 0.73 8.69 ± 0.21 0.18 NS Total bacterial growth (d9-d0) 7.13 6.58 7.10 7.10 7.27
Presumptive Pseudomonasx d0 1.15B ± 0.49 2.07A ± 0.85 1.71AB ± 0.73 1.35AB ± 0.46 1.20AB ± 0.50 0.29 0.02 d3 2.10 ± 0.81 2.67 ± 0.58 2.48 ± 0.42 1.96 ± 0.62 2.24 ± 0.34 0.28 NS d6 5.02 ± 0.19 5.07 ± 0.35 5.24 ± 0.24 4.74 ± 0.26 4.96 ± 0.16 0.27 NS d9 8.04AB ± 0.10 7.96AB ± 0.46 7.85B ± 0.15 7.98AB ± 0.09 8.10A ± 0.06 0.06 0.01 Total bacterial growth (d9-d0) 6.89 5.89 6.14 6.63 6.90
Presumptive LABx d0 1.24 ± 0.31 1.42 ± 0.47 1.63 ± 0.65 1.36 ± 0.10 1.21 ± 0.33 0.20 NS d3 1.85 ± 0.39 2.10 ± 0.32 1.78 ± 0.34 2.17 ± 1.10 2.02 ± 0.89 0.16 NS d6 3.37 ± 0.17 3.26 ± 0.25 3.14 ± 0.92 3.06 ± 0.82 3.20 ± 0.24 0.09 0.08 d9 5.07AB ± 0.09 4.85AB ± 0.44 4.72B ± 0.37 4.66B ± 0.46 5.17A ± 0.40 0.13 0.004 Total bacterial growth (d9-d0) 3.83 3.43 3.09 3.30 3.96
Listeria spp d0 1.37 ± 0.04 1.53 ± 0.65 1.35 ± 0.07 1.36 ± 0.06 1.34 ± 0.04 0.13 NS d3 1.30 ± 0.18 1.29 ± 0.27 1.29 ± 0.28 1.40 ± 0.35 1.38 ± 0.22 0.07 NS d6 1.37 ± 0.03 1.29 ± 0.04 1.37 ± 0.03 1.36 ± 0.04 1.28 ± 0.10 0.06 NS d9 1.30 ± 0.17 1.32 ± 0.77 1.30 ± 0.40 1.26 ± 0.32 1.24 ± 0.19 0.13 NS Total bacterial growth (d9-d0) -0.07 -0.21 -0.05 -0.1 -0.1
Enterobacteriaceaex d0 1.81 ±0.10 2.37 ± 0.63 2.23 ± 1.07 1.79 ± 0.11 1.79 ± 0.11 0.23 0.05 d3 2.81 ± 0.60 3.02 ± 0.60 2.86 ± 1.00 2.73 ± 0.98 2.76 ± 0.88 0.19 NS d6 4.24AB ± 1.55 3.76B ± 1.01 4.58A ± 1.33 3.62B ± 1.87 3.67B ± 1.82 0.20 0.001 d9 4.91AB ± 0.60 5.05AB ± 1.23 5.44A ± 0.82 4.81B ± 1.28 4.97AB ± 1.03 0.16 0.02 Total bacterial growth (d9-d0) 3.10 2.68 3.21 3.02 3.18 Coliformsx d0 1.83 ± 0.01 2.08 ± 0.39 2.14 ± 1.10 1.80 ± 0.07 1.81 ± 0.10 0.22 NS d3 2.56 ± 0.70 2.89 ± 0.94 2.66 ± 0.86 2.70 ± 0.89 2.80 ± 0.94 0.18 NS d6 3.50AB ± 1.24 3.21AB ± 1.55 3.85A ± 0.92 2.77B ± 1.32 2.90B ± 1.29 0.24 0.001 d9 5.04AB ± 1.03 5.01AB ± 1.03 5.36A ± 0.96 4.69B ± 1.25 4.89AB ± 1.03 0.14 0.005 Total bacterial growth (d9-d0) 3.21 2.93 3.22 2.89 3.08 Presumptive S. aureusx d0 1.58 ± 0.21 1.82 ± 0.40 1.69 ± 0.40 1.91 ± 0.27 1.70 ± 0.29 0.12 NS d3 1.82 ± 0.56 2.02 ± 0.46 1.87 ± 0.47 1.89 ± 0.47 2.01 ± 0.25 0.13 NS d6 1.66 ± 0.35 1.60 ± 0.11 1.69 ± 0.33 1.53 ± 0.18 1.78 ± 0.34 0.13 NS d9 1.51 ± 0.42 1.85 ± 0.25 1.78 ± 0.61 1.66 ± 0.20 1.91 ± 0.46 0.20 NS Total bacterial growth (d9-d0) -0.07 0.03 0.09 -0.25 0.21
Each value represents the means of n=8 cages (a cage of six rabbits is the experimental unit) with SD: standard deviation. SEM: standard error of the mean. NS: not significant. cfu/g: colony forming units per gram. P values in bold are significant, underlined values describe a tendency (P < 0.10). Different letters (A–C) within the columns (different groups) differ significantly (P < 0.05). C: commercial feed; O500: Commercial feed + 500 ppm onion extract; O1000: commercial feed + 1000 ppm onion extract; O500/Cr500: commercial feed + 500 ppm onion extract + 500 ppm cranberry extract; O500/EO100: commercial feed + 500 ppm onion extract + 100 ppm essential oils. xTime effect, P < 0.0001. ztreatment effect observed at each time.

102
4.5.4.2. Anaerobic conditions
Under anaerobic conditions (Table 4.6), treatment effect is observed mainly on TAM and
presumptive Pseudomonas counts. Effect of treatment on level of TAM was significant (P <
0.05) during the whole storage period except at day 15 (P > 0.05). TAM counts were
significantly higher (P < 0.05) in the group supplemented with 500 ppm onion extract (O500)
at day 0 compared to all the other groups except for O1000 (P > 0.05). By contrast, after a 5d
storage, counts for all the other experimental groups were significantly lower than O500,
including the control, with a logarithmic difference ranging between 1.08 and 1.29 Log (P <
0.05). At day 10, the control group was not different than the experimental groups (P > 0.05),
but amongst the experimental ones, O1000 and O500/Cr500 were the lowest (P < 0.05). No
difference was noted at day 15, but at 20, a significant difference between the control and
O500 was observed (P < 0.05). After 20 days of storage, TAM counts were above 7 Log10
CFU/g for all five experimental groups, including the control, indicating that end of shelf
life under anaerobic conditions was reached between 15 and 20 days.
With respect to the presumptive Pseudomonas counts, an effect of treatment was observed
at all times except at day 10 (P < 0.03). The results revealed that at 0 d, a significant
difference was only observed between the control and the O500 supplemented group (P <
0.05). After a 5d storage, O500 was significantly different (P < 0.05) than all the other groups
except with O500/Cr500; the largest log difference (0.92 Log) was observed between the
control group and O500. At day 10, no significant difference was observed amongst the
groups (P > 0.05), but at day 15, the control and the O500 group had greater presumptive
Pseudomonas counts than O500 and O500/Cr500 but not O500/EO100. At the end of the storage
period (20 d), a significant effect of treatment was observed (P = 0.03), but all presumptive
Pseudomonas counts were above 9 Log10 CFU/g.
At 0 and 5 d, there was no treatment effect (P > 0.05) on the level of presumptive LAB.
Treatment effect was observed at day 10 and 15 (P < 0.05) and was lost by the end of storage
(20d; P < 0.05) where all presumptive LAB counts were around 8 Log10 CFU/g. At 10 d, the
rations supplemented with O1000 had presumptive LAB counts significantly lower compared
to O500 and the control group (P < 0.05). At day 15, O1000 was lower than the control and the
O500/EO100 group (P < 0.05).

103
As for the Enterobacteriaceae counts, a treatment effect was only observed at the end of the
storage period (P = 0.02) where a significant difference was observed between O500/Cr500
and O500/EO100 (P < 0.05), respectively the highest (8.09 Log10 CFU/g) and the lowest (7.66
Log10 CFU/g) counts, leaving the others in between.
Treatment effect on the coliforms was sporadic and only observed at day 5 (P = 0.04) and
20 d (P = 0.03). At day 5, O500 was significantly higher than all the other groups (P < 0.05).
At day 20, a significant difference (P < 0.05) was only observed between O500 (the highest)
and O500/EO100 (the lowest) with a log difference of 0.47.
Overall, the stronger positive effect in reducing bacterial microflora has been observed
especially on TAM, presumptive Pseudomonas spp., presumptive Lactic Acid Bacteria
(LAB), Enterobacteriaceae and coliform counts during the anaerobic storage period. With
the 500-ppm onion supplemented group, TAM and presumptive Pseudomonas counts start
numerically higher to finish lower at day 20 compared to other experimental groups. We also
observed that the microbial count of the O500 group appears to increase numerically for the
different microorganisms studied compared to the other experimental groups, including the
control group.

104
Tableau 4.6. Total aerobic mesophilic (TAM), presumptive Pseudomonas spp. and presumptive LAB and Listeria spp. in Log10 CFU/g. Enterobacteriaceae, coliforms and presumptive Staphylococcus aureus counts in Log10 CFU/10g on rabbit thighs between 0 and 20 days of storage at 4 °C under anaerobic conditions.
C O500 O1000 O500/Cr500 O500/EO100 SEM P-valuez
TAMxy
d0 1.34B ± 0.29 2.22A ± 0.80 1.48AB ± 0.60 1.33B ± 0.33 1.42B ± 0.31 0.24 0.007 d5 2.45B ± 0.52 3.68A ± 0.75 2.39B ± 0.77 2.58B ± 0.54 2.60B ± 0.97 0.35 0.008
d10 4.84AB ± 0.85 5.29A ± 0.58 4.57B ± 0.76 4.53B ± 0.63 5.25A ± 0.41 0.14 0.0001
d15 6.01 ± 0.85 5.66 ± 0.89 5.48 ± 0.35 5.59 ± 0.95 5.57 ± 0.37 0.20 NS d20 8.41A ± 0.43 7.88B ± 0.55 8.28AB ± 0.41 8.16AB ± 0.30 7.97AB ± 0.28 0.15 0.01 Total bacterial growth (d20-d0) 7.07 5.66 6.80 6.83 6.55
Presumptive Pseudomonasxy d0 1.15B ± 0.49 2.07A ± 0.85 1.71AB ± 0.73 1.35AB ± 0.46 1.20AB ± 0.50 0.29 0.02
d5 3.00B ± 0.65 3.92A ± 0.81 3.16B ± 0.54 3.28AB ± 0.42 3.11B ± 0.66 0.23 0.007 d10 5.78 ± 0.66 5.83 ± 0.25 5.64 ± 0.29 5.64 ± 0.41 5.73 ± 0.40 0.14 NS
d15 7.08A ± 0.60 7.10A ± 0.44 6.36B ± 0.57 6.56B ± 0.63 6.64AB ± 0.22 0.17 0.001 d20 9.73A ± 0.62 9.18B ± 0.36 9.40AB ± 0.14 9.72A ± 0.66 9.25AB ± 0.47 0.20 0.03
Total bacterial growth (d20-d0) 8.58 7.11 7.69 8.37 8.05
Presumptive LABx d0 1.24 ± 0.31 1.42 ± 0.47 1.63 ± 0.65 1.36 ± 0.10 1.21 ± 0.33 0.20 NS
d5 2.12 ± 0.72 2.70 ± 1.14 1.97 ± 0.91 2.59 ± 0.80 2.24 ± 0.82 0.30 NS
d10 5.36A ± 0.15 5.35A ± 0.18 5.02B ± 0.51 5.20AB ± 0.23 5.33AB ± 0.19 0.10 0.02
d15 6.91A ± 0.31 6.57BC ± 0.36 6.43C ± 0.30 6.67ABC ± 0.26 6.78AB ± 0.21 0.10 0.003
d20 8.16 ± 0.40 8.09 ± 0.64 8.17 ± 0.40 8.43 ± 0.20 7.93 ± 0.06 0.14 NS Total bacterial growth (d20-d0) 6.92 6.67 6.54 7.07 6.72
Listeria spp
d0 1.37 ± 0.04 1.53 ± 0.65 1.35 ± 0.07 1.36 ± 0.06 1.34 ± 0.04 0.14 NS d5 1.33 ± 0.22 1.58 ± 0.51 1.31 ± 0.20 1.35 ± 0.21 1.50 ± 0.38 0.15 NS
d10 1.38 ± 0.03 1.27 ± 0.21 1.37 ± 0.03 1.36 ± 0.04 1.40 ± 0.08 0.04 NS
d15 1.34 ± 0.33 1.32 ± 0.19 1.19 ± 0.51 1.31 ± 0.03 1.56 ± 0.62 0.17 NS d20 1.48 ± 0.40 1.64 ± 0.64 1.47 ± 0.40 1.28 ± 0.20 1.31 ± 0.06 0.19 NS
Total bacterial growth (d20-d0) 0.11 0.11 0.12 -0.08 -0.03
Enterobacteriaceaex d0 1.81 ± 0.10 2.37 ± 0.63 2.23 ± 1.02 1.79 ± 0.11 1.79 ± 0.11 0.23 0.05
d5 2.82 ± 0.83 3.37 ± 1.03 3.11 ± 1.10 3.26 ± 0.83 3.08 ± 0.73 0.19 NS d10 4.77 ± 1.47 4.69 ± 1.67 5.01 ± 1.13 4.83 ± 0.97 4.90 ± 1.10 0.19 NS
d15 6.24 ± 1.75 6.39 ± 1.66 6.23 ± 0.91 6.40 ± 1.60 6.43 ± 1.36 0.30 NS d20 8.07AB ± 0.95 7.80AB ± 0.99 7.75AB ± 1.06 8.09A ± 1.05 7.66B ± 0.91 0.14 0.02
Total bacterial growth (d20-d0) 6.26 5.43 5.52 6.30 5.87 Coliformsx d0 1.83 ± 0.10 2.08 ± 0.39 2.14 ± 1.05 1.80 ± 0.07 1.81 ± 0.10 0.22 NS
d5 2.55B ± 0.36 3.39A ± 1.15 2.79B ± 0.98 2.59B ± 0.45 2.75B ± 0.77 0.27 0.04
d10 4.50 ± 1.56 4.41 ± 1.42 4.55 ± 0.92 4.34 ± 0.74 4.71 ± 0.99 0.27 NS
d15 5.38 ± 1.66 5.89 ± 1.23 5.40 ± 0.46 5.79 ± 1.01 5.56 ± 0.90 0.35 NS d20 7.21AB ± 0.58 7.41A ± 0.96 6.98AB ± 0.46 7.27AB ± 0.76 6.94B ± 0.55 0.15 0.03
Total bacterial growth (d20-d0) 5.38 5.33 4.84 5.47 5.13
Presumptive S. aureusx d0 1.58 ± 0.21 1.82 ± 0.40 1.69 ± 0.40 1.91 ± 0.27 1.70 ± 0.29 0.13 NS
d5 1.81 ± 0.34 1.81 ± 0.47 1.61 ± 0.31 1.73 ± 0.37 1.81 ± 0.34 0.15 NS d10 1.94 ± 0.19 1.90 ± 0.50 1.90 ± 0.28 1.73 ± 0.47 1.87 ± 0.30 0.18 NS d15 1.85 ± 0.32 2.19 ± 0.57 1.93 ± 0.24 1.82 ± 0.15 1.80 ± 0.26 0.15 NS
d20 2.49 ± 0.19 2.74 ± 0.36 2.47 ± 0.62 2.98 ± 0.45 2.54 ± 0.28 0.20 NS Total bacterial growth (d20-d0) 0.91 0.92 0.78 1.07 0.84
Each value represents the means of n=8 cages (a cage of six rabbits is the experimental unit) with SD: standard deviation. SEM: standard error of the mean. NS: not significant. CFU/g: colony forming units per gram. P values in bold are significant, underlined values describe a tendency (P < 0.10). Different letters (A–C) within the columns (different groups) differ significantly (P < 0.05). C: commercial feed; O500: Commercial feed + 500 ppm onion extract; O1000: commercial feed + 1000 ppm onion extract; O500/Cr500: commercial feed + 500 ppm onion extract + 500 ppm cranberry extract; O500/EO100: commercial feed + 500 ppm onion extract + 100 ppm essential oils. xTime effect, P < 0.0001. yTime × treatment effect, P < 0.0001. ztreatment effect observed at each time. xTime effect, P < 0.0001. yTime × treatment effect, P < 0.0001. ztreatment effect observed at each time.

105
4.6. Discussion
The use of plant extracts (onion and cranberry) and essential oils rich in polyphenols, alone
or in combination, on the quality of rabbit meat was studied for their antimicrobial effects.
Rotolo et al. (2013) did observe a positive effect on rabbit growth performances when the
diet was supplemented with 1% (w/w) of oregano and sage dried leaves. An et al. (2005)
also observed a positive effect on the growth performance of white mini broilers with onion
extracts (0.3% or 0.5%) added in their diet. Our study has not shown such positive effects of
phenolic compound supplementation on the growth performance of rabbits at the level tested
(100-1000 ppm of extract). Similar absence of improved zootechnic performances has been
observed when rabbit consumed a diet supplemented with three levels (0%, 10% or 15%) of
chia seeds (Peiretti and Meineri, 2008). Growth performance of our rabbits was also
consistent with the studies of Botsoglou et al. (2004) and Papageorgiu et al. (2003) which
did not observe significant differences when oregano essential oil was provided to rabbits
and turkeys, at doses of 100 and 200 mg per kg of feed. In the present study, rabbits were
raised in commercial cages at a research facility where ideal and controlled experimental
rearing conditions were characterized by low infection pressure and stress level compared to
intensive farming conditions (Bou et al., 2009).
To our knowledge, no studies considering the effect of onion and cranberry extracts, alone
or combined at the dose tested, on rabbit meat composition (proteins, lipids, moisture) has
been published. Rotolo et al. (2013) concluded that the combination of oregano and sage
dried leaves on crude protein of LL meat don’t modify meat proximate composition. On the
other hand, Cardinali et al. (2015) tested 0.2% oregano extract, 0.2% rosemary extract and a
combination of 0.1% oregano + 0.1% rosemary on meat composition of LL and found
positive effect on lipids and moisture following in supplementation. In the results presented
in table 4, lipids (12.41 to 15.25) and protein (21.45 to 22.49) were comparable to those
reported by Salvini et al. (1998) but in non-enriched meat. And since our supplementation
have no negative effect, one can envisage their use in animal feed.
The diet supplementation tested here did not have detrimental effect on meat quality
parameters either, except for cooking loss. Generally, the loss of exudates from muscle tissue

106
is unavoidable and reduces the meat nutritional value, because some nutrients may be lost in
the exudate (Kerry et al., 2002). In addition, during cooking, an increased rigidity of the
myofibrillar structure of the meat occurs due to the denaturation of proteins and this is
associated with increased water loss (Hughes et al., 2014). Testing cooking loss on the LL
muscle as well, Cardinali et al. (2012) observed a decreased cooking loss with a dietary
supplementation of oregano and rosemary extracts in comparison with the control group.
In the consumer mind, meat with a nice red colour is synonymous of fresh good quality
product (Renerre and Labas, 1987). It is the first quality attribute seen by the consumer and
influences product acceptance at the time of purchase. In the present study, the combination
of plant extracts and essential oils studied did not influence color (P > 0.05) although the
numerical values for redness (a*) of the LD muscle are below the control for all the
experimental groups (P = 0.07) which is in agreement with the results obtained by Cardinali
et al. (2012). In broiler breast meat, Allen et al. (1997) found that there was a correlation
between pH and meat colour; as the pH decreased, the lightness and yellowness values
increased, but the redness values were reduced. In the current study, no significant
differences were observed in rabbit meat pHu between treatments. According to Hulot and
Ouhayoun (1999) the variability of pH from one muscle to another depends on the type of
fiber which constitute them and the glycolytic potential of each muscle.
The phenolic concentration of the different rations (Table 4.2) used in our study can be
explained by the difference in the chemical structure of the bioactive compounds and by the
nature of the food ingredients. This has been confirmed by the studies of Dudonné et al.
(2015) who demonstrated that the absorption and metabolization of phenolic compounds are
shown to be strongly modulated by the structure of the phenolic compounds. Indeed, the
control group feed has been formulated with plants such as alfalfa. The latter is considered
a plant rich in phenolic compounds such as isoflavones (daidzein) and lignans (Dal Bosco et
al., 2015), hence the total phenol richness observed in Table 4.2 (5.47 ± 0.13 mg GAE/g of
feed).
In our study, the meat of rabbits fed on onion and cranberry extracts had the highest
polyphenol content compared to other groups. The richness of cranberries in (+)-catechin
and (-)-epicatechin (Dudonné et al., 2015), may explain this result given that these monomers

107
are more assimilable than procyanidins B1 and B2, dimers (Brenes et al., 2015; Collin and
Crouzet, 2011). However, even if these compounds, such as the procyanidins and
ellagitannins, are known to be poorly absorbed), the combination of these compounds with
quercetin (onion) increases the bioactivity of certain plant extracts. This has been proven by
the work of Yves Desjardins (2014) when obese rats orally ingested phenolic compounds
GlucoPhenol (a mixture of strawberry and cranberry extracts) supplemented with onion
extract in comparison to the group without onion supplementation.
Our results also show that the addition of polyphenol rich extracts in animal feed, is found
in meat (Table 4.2 and 4.4). In contrast to the feed, the polyphenol content of rabbit meat fed
with plant extracts and essential oils was significantly higher than that of the animals in the
control group. These results mean that the polyphenols of onion, cranberries and essential
oil extracts were better absorbed and assimilated by rabbits than those of the control diet.
There is a relationship between concentrations of phenol compounds (O500/Cr500=1.35 mg
GAE/g; O500/EO100=1.23 mg GAE/g) and antibacterial activity. It is noted that the log
difference (more than one log) of the growth of certain microorganisms (Enterobacteriaceae,
coliform counts) was observed in meat from rabbits fed O500/Cr500 and O500/EO100. Several
studies suggest that meat and meat products shelf life can be extended by the presence of
natural antioxidants coming from plant extracts and essential oils or a combination of both
(Palazzo et al., 2015; Negi, 2012). Furthermore, according to Zhang et al. (2016), a
synergistic inhibitory effect on food-borne bacteria has been observed when spice extracts
are combined. It could be concluded that the more polyphenols there are in the meat, the
stronger its antimicrobial action. However it must be remembered that the degree of
inhibition depends on the combination of spices, microorganisms and storage like
temperature for example (Zaika, 1998).
According to FDA (1999), a log reduction below 1 has little practical value. In our study,
the addition of extracts of vegetables and essential oils in the diet of rabbits does not seem
to have a positive effect on the number of bacterial compared to control group, during
storage. The significant differences observed are more between the experimental groups (P
< 0.05). Indeed, the analyses revealed that significant antimicrobial activity of O500/Cr500 and
O500/EO100 groups on rabbit meat was observed, although sporadic, with a logarithmic

108
difference that can reach up to 1.08-log compared to O1000 group (Table 4.5). And O1000
group compared to O500 group with a maximum logarithmic difference to 1.29 (Table 4.6).
The significative differences of microbial counts of TAM and presumptive Pseudomonas at
0d -between treatments, under aerobic and anaerobic conditions - were possibly due to
different hygiene conditions in the slaughterhouse, the individual effect of animals. Total
aerobic and presumptive Pseudomonas counts were the most affected by the treatment effect.
For the presumptive LAB, it is only by the end of the storage period, under both refrigeration
conditions, that the treatment effect is seen on the evolution of their development. The
conclusion must be drawn carefully with respect to cell numbers of heterogeneous groups
such as TAM and presumptive LAB. Although the number might be similar, the actual
strains growing at a specific time may differ. Hence, other methods, like metagenomic for
instance, would have to be used to evaluate the strain variation and modulation.
Furthermore, in our study, under anaerobic conditions, the O500 group appears to have
reduced numerical counts of TAM and presumptive Pseudomonas. Whereas according to
Ceylan and Fung (2004), bioactive components of plant-origin have a relatively weak
antimicrobial activity against Pseudomonas spp.
Onion and cranberries are known for their antimicrobial activity, which is linked to their
phenolic moiety, and therefore are suitable as natural antimicrobial ingredients. As for
essential oils, their antimicrobial activity is linked to phenolic constituents such as carvacrol,
eugenol, and thymol, amongst the most active constituents with a wide spectrum of
antimicrobial properties (Dinesh and Cheorun, 2013). It was been shown that gram-negative
bacteria are somewhat resistant to antimicrobials of plant origin because of the
lipopolysaccharide present in the outer membrane (Burt, 2004; Zhang et al., 2016). But but
in our study, this fact was not observed on Enterobacteriaceae, coliform and presumptive
Pseudomonas. Overall, presumptive Pseudomonas (7.85 log10 to 8.10 log10 CFU/g at day 9)
was the prevailing microbial group under aerobic storage as expected (Dainty and Mackay,
1992). The end of shelf life reached when TAM cell count is at 7 log10 cfu/g or higher
(ICMST, 1986). When pathogens are in low number, it becomes advantageous to use
indicator organisms such as generic E. coli, Listeria spp. presumptive S. aureus, to evaluate
safety risk (Buchanan and Oni, 2012). Our results indicate that for those indicator organisms,

109
counts were below or close to the detection level (1.32 Log10 CFU/10g) and so remained low
throughout the storage. Only presumptive S. aureus counts increase by hardly a log (0.84-
1.07 log) in 20 days of refrigeration under anaerobic conditions. To more properly assess the
effect of diet supplementation with polyphenols on pathogens, inoculation of meat at various
levels would be required.
The antimicrobial effects of many plant extracts have been well studied. According to Negi
(2012), the effectiveness of antimicrobial compounds depends on its type and concentration,
the pH of the food, type and number of contaminating microorganisms. And Zhang et al.
(2016) reported a stronger antimicrobial activity for mixed spice extracts (clove and
rosemary) when compared with using the individual extract separately. In our study, the
combination of plant extract and essential oils had a synergistic effect on some
microorganisms (Enterobacteriaceae, coliform, presumptive LAB), especially under
anaerobic conditions.
Previous studies by Koné et al. (2016) have revealed that diets supplemented with 10 ppm
of active plant extracts and essential oils ingredients especially with essential oils, had a
small but sporadic positive effect on bacterial microflora compared to the control. The same
conclusion was observed in our study during the addition of some natural extract plants (high
dose) - in the feeding rabbit - exhibited an antimicrobial effect against some microorganisms.
The effects are admittedly real (reduction of 1 log and more) but sporadic in aerobic and
anaerobic conditions.
4.7. Conclusion
The findings of this study evidenced that the combination of plant extracts and essential oils
supplementation had no effect on carcass yield. Wheather it is under aerobic or anaerobic
conditions, the effect of diet supplementation with polyphenols had a sporadic effect on
microbial quality of rabbit thighs (more than 1 log) when combined extracts and essential
oils were added in rabbit's feed. This study shows that the combination of plant extracts and
essential oils (at higher dose) has the potential to improve meat safety by such feeding
strategy. Other analyzes are to consider to study the bioavailability of polyphenols in meat
and determine the molecular species present. This would make it possible to know the

110
microbial metabolism of polyphenols and determine if the measured effects are derived from
a prebiotic effect of these chemical compounds or effect of metabolites.
4.8. Acknowledgements
This research was carried out with the financial support of the Programme de soutien à
l’innovation en agroalimentaire, a program derived from the Growing Forward agreement
between the Ministère de l’agriculture des pêcheries et de l’alimentation du Québec
(MAPAQ) and Agriculture and Agri-Food Canada. The Syndicat des producteurs de lapins
du Quebec is also a partner in this project.

111
Application of Carnobacterium maltaromaticum CB1 as a feed additive for weaned rabbits to improve meat microbial quality and safety
Ce chapitre a été soumis à la revue scientifique Meat Science.
Quand les animaux sont en santé, il ya peu ou pas de microorganismes dans leurs muscles
sont peu ou pas contaminés sauf pour les ganglions lymphatiques. Donc, c’est la surface des
carcasses qui se contamine au contact de l’environnement incluant les organismes provenant
du système gastro-intestinal. En outre, la pression des consommateurs pour réduire, voire
éliminer, l’ajout d’additifs chimiques dans les aliments est de plus en plus grandissante. Selon
la définition de l’OMS, "les probiotiques sont des microorganismes vivants qui lorsqu’
administrés en quantité suffisante, exercent un effet bénéfique sur la santé de l’hôte". Bien
que largement étudié pour leurs effets bénéfiques sur la santé, l’impact de la consommation
de probiotiques par les animaux d’élevage sur l’hygiène des carcasses reste à déterminer.
Dans notre étude, une culture protectrice commerciale a été utilisée afin de valider que la
consommation de cette dernière peut influencer voire moduler positivement la contamination
des carcasses et l’évolution de la microflore lors d’un entreposage réfrigéré.
Les résultats de cette étude ont fait l’objet de plusieurs communications scientifiques :
Koné, A. P., J. M. Velez Zea, M. Z. Adbelwahed, D. Cinq-Mars, F. Guay, Y. Desjardins, A.
Gosselin, et L. Saucier. 2015. Amélioration de la qualité microbiologique des carcasses de
lapin par ajout à la ration d’une culture protectrice commerciale. Journée de la recherche de
la Faculté des sciences de l’agriculture et de l’alimentation, Université Laval, 20 mai,
Québec, Qc.
Koné, A. P., J. M. Velez Zea, D. Cinq-Mars, F. Guay, et L. Saucier. 2015. Amélioration de
la qualité microbiologique des carcasses de lapin par ajout à la ration d’une culture protectrice
commerciale. 83ème congrès de l’ACFAS, Section n°207- Ressources naturelles
(présentation orale), Université du Québec à Rimouski (UQAR), 25-29 mai, Rimouski, Qc.
Koné, A. P., M. Z. Abdelwahed, D. Cinq-Mars, Y. Desjardins, F. Guay, A. Gosselin, et
L. Saucier. 2016. Improvement of rabbit meat microbial quality by feed supplementation

112
with plant extracts and essential oils. 96th Annual Canadian Meat Council Conference 27-29
sept., Ottawa, ON.
Saucier, L., Koné, A. P, D. Gagné, D. Cinq-Mars, et F. Guay. 2016. Positive modulation of
meat microbial ecology by feeding strategies. 62nd International Congress of Meat Science
and Technology (ICoMST), August 13-19th, Bangkok, Thaïlande.
Contributions des auteurs :
Amenan Prisca Nadège Koné (candidat au Ph. D.) : mise en place du protocole,
planification des expériences, collecte, analyse et interprétation des données
microbiologiques, préparation du manuscrit.
Prof. Linda Saucier, Prof. Frédéric Guay et Prof. Dany Cinq-Mars (Directrice de
recherche, auteur correspondant et les co-directeurs, respectivement) : participation à la mise
en place du protocole, révision et correction du manuscrit. De plus, le Prof. Guay supervisait
les analyses statistiques.
Dominic Gagné (collaborateur): Réalisation de l’analyse biomoléculaire et participation à la
correction du manuscript.
Juliana Maria Velez Zea (étudiante stagiaire): soutient pour les analyses microbiologiques
et l’alimentation des animaux.
Autres collaborateurs:
Monica Gill (Assistante de recherche du Prof. Linda Saucier): Réalisation de l’inoculation
expérimentale de Listeria monocytogenes dans la viande hachée compte tenu de ma
grossesse.
113
Application of Carnobacterium maltaromaticum as a feed additive for weaned rabbits to improve meat microbial quality and safety
Amenan Prisca Konéa,b, Juliana Maria Velez Zeaa,c, Dominic Gagnéa, Dany Cinq-Marsa,
Frédéric Guaya, Linda Sauciera,b,*
a Department of Animal Science, Faculty of Agriculture and Food Science, Université
Laval, 2425 rue de l’Agriculture, Quebec City, QC, Canada, G1V 0A6
b Institute of Nutrition and Functional Foods, Université Laval, 2440 boul. Hochelaga,
Quebec City, QC, Canada, G1V 0A6
c Escuela de Biociencias, Facultad de Ciencias, Universidad Nacional de Colombia, Sede
Medellín, A.A. 3840, Medellín, Colombia
*Corresponding author: Université Laval, Québec (QC), Canada, G1V 0A6
Téléphone: 418-656-2131 #6295
Fax: 418-656-3766
E-mail: [email protected]

114
5.1. Résumé
Cette étude aborde l'amélioration de la qualité microbienne de la viande en enrichissant le
régime alimentaire des animaux de ferme par une culture protectrice. Un total de 144 lapines
Grimaud sevrées ont été divisées en deux groupes expérimentaux: un régime alimentaire
témoin et un régime supplémenté avec Micocin® (Carnobacterium maltaromaticum CB1; 8
Log10 UFC / kg d'aliments). Les organismes aérobes mésophiles totaux (AMT), Escherichia
coli et autres coliformes, Enterobacteriaceae, Staphylococcus aureus, Pseudomonas spp,
Listeria spp. et les dénombrements de bactéries lactiques présomptives ont été évalués sur
les cuisses entières entreposées dans des conditions aérobes (0, 3, 6, 8 jours) et anaérobes (0,
5, 10, 15, 20 jours) à 4 °C. Les résultats ont démontré que la microflore sur les cuisses
réfrigérées était modulée par l'ajout de Micocin® dans l'alimentation (P < 0,05) et que la
réduction la plus efficace de la croissance de L. monocytogenes était observée avec de la
viande hachée entreposée en conditions anaérobes à 4 °C avec une réduction logarithmique
de 2 log à la fin d'un entreposage de 15 jours (P = 0,025).
Mots-clés: Carnobacterium maltaromaticum CB1; Listeria monocytogenes; contamination
de la viande; qualité de la viande; viande de lapin; durée de conservation.

115
5.2. Abstract
This study addresses the improvement of meat microbial quality by enriching the diet of farm
animals with a protective culture. Weaned Grimaud rabbits were divided into two
experimental groups: a control and a diet supplemented with Micocin® (Carnobacterium
maltaromaticum CB1; 8 Log10 CFU/kg of feed). Overall, meat quality was not affected
substantially by the treatment. Total Aerobic Mesophilic (TAM), Escherichia coli and other
coliforms, Enterobacteriaceae, Staphylococcus aureus, Pseudomonas spp., Listeria spp. and
presumptive lactic acid bacteria counts were evaluated on whole thighs stored under aerobic
(0, 3, 6, 8 days) and anaerobic (0, 5, 10, 15, 20 days) conditions at 4 °C. The results
demonstrated that the microflora on refrigerated thighs was modulated by the addition of
Micocin® (P < 0.05) and that the most effective reduction of Listeria monocytogenes growth
was observed with ground meat stored under anaerobic conditions at 4 °C with a 2 Log
difference at the end of a 15-day storage (P = 0.025).
Keywords: Carnobacterium maltaromaticum CB1; Listeria monocytogenes; meat
contamination; meat safety; rabbit meat; shelf life.
116
5.3. Introduction
Nowadays, importance of healthy foods, including meat, continues to be a concern for the
consumer (Fread, 2015). Rabbit meat often stands for its healthier characteristics due to its
higher protein content, low unsaturated fats, richer in polyunsaturated ones, absence of uric
acid and purines, compared to pork or beef meat (Dalle-Zotte, 2004; Ramírez et al., 2005,
Hernández, 2006; Nistor et al., 2013). However, its annual consumption remains limited
worldwide to 0.30 kg per capita (Gidenne, 2006) in comparison to beef (6.4 kg), pork
(12.5 kg) and poultry (13.5 kg, OECD, 2015). According to the Codex Alimentarius
Commission (CAC, 2005) and the FAO (2005), meat is traditionally viewed as a potential
vehicle for the transmission of foodborne disease with Campylobacter spp., Salmonella
enterica serotypes, Listeria monocytogenes and Escherichia coli being the most frequently
reported culprits (Newell et al., 2010). Meat is the most frequently implicated food in Canada,
and fish in the USA (Bélanger et al., 2015). Foodborne diseases have economic consequences
evaluated at 3.7 billion $CAN (PHAC, 2012a) and 10-83 billion $USD (Nyachua, 2010) per
year in Canada and the USA, respectively, whereas in the European Union, 3 billion € is
accounted for annually for Salmonella infections alone (DeWaal, & Robert, 2005). Even
when meat is produced under strict hygienic conditions, surface contamination by spoilage
and pathogenic microorganisms is to be expected. Even healthy animals may constitute a
reservoir for foodborne pathogens (PHAC, 2012b). Therefore, new strategies must be
investigated for microbial control as the use of chemical additives is no longer a viable option
in terms of consumers’ demands (Ricke, 2003). More natural interventions have been widely
studied by the food processing industry including lactic acid bacteria (LAB), which act as
protective cultures in functional meat (Vamanu, & Vamanu, 2010). Some of them improved
shelf life during food and meat storage and it is due, at least in part, to the production of
inhibitory substances such as organic acids, ethanol, diacetyl, bacteriocins and hydrogen
peroxide (Kandler, & Weiss, 1986) that limit the growth of other organisms, including
pathogens (Leroy, & De Vuyst, 2004; Castellano et al., 2008). In the meat industry, the
prevalence of LAB is achieved through a competitive exclusion to extend the shelf life of
meats notably under modified atmosphere packaging (Saucier, 1999).
Micocin® is a dry-formulated live culture of Carnobacterium maltaromaticum CB1 which
produces bacteriocins and other antimicrobial metabolites. It was designed to be used for

117
ready-to-eat meats where this LAB species forms a major part of the microbial population.
It has been approved for use in Canada, Mexico, Costa Rica, Colombia and the United States
(Health Canada, 2010; Marketwire, 2011). It has the ability to control the growth of spoilage
and pathogenic bacteria during the storage of vacuum packaged meat products (Goktepe,
2006; Gálvez et al., 2008). C. maltaromaticum is an atypical heterofermentative, tolerant to
freezing, thawing, high pressure and it can grow at temperatures as low as 0 °C (Caplice, &
Fitzgerald, 1999; Hammes, & Hertel, 2003; Leisner et al., 2007). Strain CB1 produces three
bacteriocins: carnocyclin A, piscicolin 126 and carnobacteriocin BM1, which have been
proven to be effective to inhibit the growth of Enterococcus faecalis, E. faecium,
Pediococcus acidilactici, C. divergens, Lactococcus lactis spp. lactis, Lactobacillus
curvatus, Lb. casei, Leuconostoc gelidum, Staphylococcus aureus, Clostridium botulinum,
and more particularly, L. monocytogenes (Laursen et al., 2005; Casaburi et al., 2011;
Gonzalez, Yien, & Castrillon, 2013).
LAB have been successfully used in feed, as a probiotic supplement improving notably
gastrointestinal health of the animal ingesting it (Collins, & Gibson, 1999). Studies in rabbits
have shown reduced gut colonization of E. coli and other enteric pathogens, higher average
daily weight gain, better feed conversion ratio and enhanced absorption of the intestinal
mucosa (Kritas et al., 2008; Coperland et al., 2009; Ezema, & Eze, 2012; Seyidoglu, & Peker,
2015). However, to our knowledge, no studies have investigated the effect of such probiotic
feed additives with respect to meat quality and safety. Therefore, the aim of this study was
to demonstrate that the use of a positive microflora, such as Micocin®, as a feed additive in
rabbit rations, can modulate carcass contamination in order to improve meat microbial quality
and safety.
5.4. Materials and Methods
5.4.1. Animal housing and feeding
Animal care and handling procedures were approved by Université Laval’s Animal Use and
Care Committee, which strictly adheres to the Guidelines of the Canadian Council on
Animal Care (CCAC, 2009). A total of 144, 35-day-old weaned female Grimaud breed
rabbits were obtained from a commercial farm (Laprodéo, Saint-Tite, Quebec, Canada) and

118
were maintained in conventional commercial cages. Rabbits were individually weighted
upon arrival and assigned immediately either to the experimental or the control group.
Rabbits were placed six per cage (0.37 m2 per rabbit) in order to have homogeneous weight
per cage and within groups; the cage constituted the experimental unit. Twelve cages were
analyzed per experimental group. In order to make sure that the control group does not get
contaminated by the microbial culture (Micocin®, Griffith Foods, Toronto, ON, Canada)
given to the experimental one, the animals had to be housed in two different but similar
rooms and strict biosecurity measures were observed. On a daily basis, control group were
always visited first and the personnel changed clothes, mask, hair net and gloves between
each group. If the control group needed to be revisited, personnel had to shower first. A cycle
of 12 h of light (starting at 9:00 am) and 12 h of dark was used throughout the experiment,
temperature was at 20.1 ± 0.4 °C and humidity level at 33 ± 4 %.
The experimental group was fed the ration supplemented with the protective culture
Micocin® containing C. maltaromaticum CB1 at a final concentration of 8 Log10 CFU
(Colony-Forming Unit) per kg of feed. Micocin® was provided to us as a concentrate
containing 10 Log10 CFU/g which was added during the commercial pelleting process
(Table 5.1). Feed was manufactured in a commercial facility in separate 600 kg batches
(Belisle Solution Nutrition, St-Mathias-sur-Richelieu, Quebec, Canada). The feed
supplemented with Micocin® was manufactured last to avoid contaminating the equipment.
Animals were fed ad libitum until a minimal target slaughter weight of 2.200 g was reached,
which took 21 to 28 days. They were weighed, and the feed intake was measured weekly
during the experimental period to determine body weight (BW), average daily gain (ADG),
average daily feed intake (ADFI) and feed conversion ratio (FCR).
To make sure truck and slaughter line was not contaminated by C. maltaromaticum CB1,
the two groups had to be slaughtered on two different days, the one without supplement first,
to avoid cross contamination. They were fasted 15 h before slaughter, including transport
and lairage time, according to the current commercial practices to reduce transport-related
sickness (Bianchi et al., 2008). They had access to water at all times prior to transport. The
length of transport to the abattoir was 30 min, and animals were allowed a waiting period of
30 min before slaughter. They were the first rabbits to be slaughtered at those two dates in

119
order to standardize contamination coming from the slaughter house. Animals were
slaughtered in a provincially inspected establishment according to regulations in Quebec,
Canada (DGSAIA, 2011).
Tableau 5.1. Nutritional values and composition of the commercial diets. Commercial datab Analysis Wet basis Dry basisc Control Micocin® Dry matter % 90.75 ± 0.07 90.70 ± 0.01 Crude protein % 16.0 17.63 16.52 ± 0.30 16.49 ± 0.07 Crude fat matter % 4.6 5.07 3.67 ± 0.02 3.68 ± 0.01 Crude fiber (real) % 18.1 19.94 Calcium (real)% 1.00 1.10 Phosphorous (real) % 0.44 0.48 Sodium (real) % 0.30 0.33 Vitamin A (min) UI/kg 6034 6649 Vitamin D (min) UI/kg 1018 1122 Vitamin E (min) UI/kg 40.0 44.08 Total selenium (real) mg/kg 0.19 0.21 Added selenium mg/kg 0.10 0.11 aComposition: Alfalfa, beet pulp, wheat, soybean meal, canola meal, corn gluten feed, molasses, mineral and vitamin premix. bData provided by the commercial feed mill on a wet basis. cData calculated using the measure dry matter.
5.4.2. Meat quality measurement
For meat quality measurement, one rabbit per cage was randomly analyzed. The muscular
pH of the Biceps femoris (BF) and the Longissimus lumborum (LL) muscles were measured
post-mortem after 1 (pH 1) and 24 h (pHu; Blasco, & Ouhayoun, 1996) using a portable pH
meter (ROSS, Orion Star A221, Thermo Scientific, Beverly, CA, USA) combined with an
Orion Kniphe electrode (ThermoFisher, Nepean, ON, Canada) and a temperature
compensation probe (928 007 MD, micro probes ATC, Maryland, USA). Meat colour was
evaluated 24 h after slaughter on the LL and the exposed surface of the BF using a
Chromameter (Chromameter CR 300 Minolta Ltd., Osaka, Japan) equipped with a D65 light
source and a 0° viewing angle geometry according to the reflectance coordinates (L*, a*, b*;
CIE, 1976), after exposing the muscle surface for 20 min blooming time (Faucitano,
Chevillon, & Ellis, 2010). Meat exudate lost (%) during cold storage was measured by weight
difference of the thighs. Regarding drip loss, the measure was taken from a piece of
Longissimus thoracis et lumborum muscle (LTL about 2 cm thick x 2.5 cm in diameter) also

120
by weight difference, according to the EZ-Driploss method (Rasmussen, & Anderson, 1996),
where samples are stored at 4 °C for 48 hours. Cooking loss was determined on a similar
piece of LTL muscle (Pla, 1999) and is expressed as a percentage of the initial weight loss.
Each sample was placed into an 18 oz Whirl-Pak bag (Nasco Whirl-Pak®, USA) and
immersed in a water bath at 70 °C for 15 minutes after removing the air from the bag. The
samples were then removed from the bag, patted dry with filter paper and weighed (Vergara,
Berruga, & Linares, 2005; Apata et al., 2012).
5.4.3. Muscle Sampling
One leg per animal was packaged aerobically in a styrofoam tray (14w x 24l x 4.5h cm) with
an absorbent pad, sealed with an oxygen-permeable polyethylene film (35 ga; oxygen
transmission 825 cc/100 sq. in. per 24 h at 23°C; water vapor transmission rate 24 g/100 sq.
in. per 24 h at 38°C and 90% RH) obtained from a local food equipment distributor
(Emballage L. Boucher, Quebec, QC, Canada) and stored at 4°C for 0, 3, 6 or 8 days. The
other leg was vacuum packaged (Sipromac, St-Germain, QC, Canada) in bags (nylon [23%]
and polyethylene [77%; seven multilayered] of 300 ga; oxygen transmission 3.3 cc/100 sq.
in. per 24 h at 23°C; water vapor transmission rate 0.5g/100 sq. in. per 24 h at 38°C and 90%
RH; Sealed Air Co, Mississauga, ON, Canada) and also stored at 4 °C for 0, 5, 10, 15 or 20
days. The rest of the carcass was deboned and the meat was ground (Electric meat Grinder,
No RE50255, IPNO IPXI, China) and stored at -30°C.
5.4.4. Proximate analysis
Samples (100 g) were lyophilized (freeze dryer Model 6203-3005-OL, Virtis Co., Gardiner,
NY, USA) for 7 days. The fat content was measured using a Tecator extraction unit (Soxtec
system HT 1043, Hoganas, Sweden) by the procedure 991.36 of the Association of Official
Analytical Chemists (AOAC, 1995). Total proteins were quantified using the
procedure 992.15 of the AOAC (1995) with a protein analyzer LECO® (model FP-2000,
Leco Corp., St. Joseph, MO, USA). Fat and protein contents are expressed on the wet weight
basis and the analysis was performed in triplicate.

121
5.4.5. Determination of muscle antioxidant status
5.4.5.1. Total phenol content
Total phenol content was measured using the method of Jang et al. (2008). Each raw ground
meat sample (5 g) was homogenized in distilled water (15 ml) and chloroform (9 ml) and
then centrifuged at 3000 × g for 5 min at room temperature (21°C). Chloroform was added
to remove the lipids. The total phenol content in the aqueous supernatant was estimated by
the Folin-Ciocalteu method (Subramanian et al., 1965). Diluted sample aliquots of 1 ml (1:4,
v/v) were added to 2N Folin-Ciocalteu’s phenol reagent (500 ml; Sigma-Aldrich, St. Louis,
MO, USA) followed by addition of 10% NaCO3 (1 ml). Reaction mixture was vortexed and
the absorbance was measured with a spectrophotometer (VarioskanTM Microplate
instrumentation Thermo Electron Corporation, Vantaa, Finland) at 700 nm after incubating
for 1 h at room temperature (21 °C). Quantification was based on a standard curve generated
with gallic acid. The results are expressed in GAE (gallic acid equivalent per g of meat, µg
GAE/g). All measurements were performed in triplicate.
5.4.5.2. Lipid oxidation
Lipid oxidation products were measured in ground meat stored at -30 °C, quantitated using
the thiobarbituric acid reactive substances (TBARS) method and are expressed as
malondialdehyde (MDA) equivalents according to the method of Ermis et al. (2005) with the
following modifications. Briefly, 10 g of minced meat was homogenized with 10 ml of
Phosphate Buffered Saline solution (PBS, Sigma-Aldrich, St. Louis, MO, USA). After
centrifugation (3000 × g for 15 min at 4 °C), 12.5 µl of butylated hydroxytoluene (BHT)
solution was added to 500 μl of supernatant and vortexed. Then, 250 µl of trichloroacetic
acid (TCA) was added to the mixture and placed on ice for 30 min. After centrifugation (3000
× g for 10 min at 4 °C), 500 μl of the supernatant was added to 37.5 µl of
ethylenediaminetetraacetic (EDTA) and 125 µl of thiobarbituric acid in 0.05N NaOH
followed by 15 min in boiling water (100°C) to allow the colour reaction to develop. After
heating, the samples were cooled at room temperature (5 min) and centrifuged for 10 min at
3000 × g and 4 °C. Absorbance (100 µl) was measured at 530 nm using a spectrophotometer
(VarioskanTM). The results are expressed in nanomoles of MDA per g of meat. Measures
were performed in triplicate for each meat sample.

122
5.4.5.3. Carbonyl content
Protein carbonyl groups were evaluated on 5 g of ground meat using an assay kit from
Cayman Chemical Company (Item No. 10005020, Ann Arbor, MI, USA). Nucleic acids were
removed according to the manufacturer’s instructions. Absorbance was measured at 370 nm
(VarioskanTM) and the results are expressed as nanomoles of 2.4-dinitrophenylhydrazine
(DNPH) fixed per mg of protein. All measurements were performed in triplicate.
5.4.6. Microbial Analysis
For microbial enumeration on the thighs, a sampling procedure similar to the one for whole
poultry carcasses described by Brichta-Harhay et al. (2007) was used. One leg from the five
remaining rabbits per cage was randomly taken at each sampling time. Each cage was
sampled at every sampling time and conditions (aerobic and anaerobic). Thigh was
aseptically placed in a sterile Stomacher bag (Stomacher® 400C, Seward Laboratory
Systems Inc., London, UK), weighted (measure was also used to evaluate meat exudate in
section 2.2) and sealed after 300 ml of 0.1% (wt/vol) peptone water were added (Bacto
peptone, Difco Laboratories, Inc., Detroit, MI, USA). The bag was placed on a rotary shaker
(Boekel Scientific Orbitron Rotator II, model 260250, New York, USA) for one minute on
each side and then manually massaged for 30 sec to remove microorganisms from the surface.
When ground meat was analyzed, 25 g was homogenized in 225 ml of peptone water for 2
min at 230 rpm in a stomacher (Stomacher 400 circulator, Seward, England). Ten-fold
dilutions were carried out in 0.1% peptone water for enumeration on appropriate agar plates
(Saucier et al., 2000). Total Aerobic Mesophilic (TAM) counts were performed on Plate
Count Agar medium (PCA; Difco Laboratories Inc.) incubated at 35°C for 48 h (MFHPB-
18; Health Canada, 2001). Presumptive Lactic Acid Bacteria (LAB) were enumerated on
deMan, Rogosa and Sharp (MRS; Difco Laboratories Inc.; Saucier et al., 2000) and on All
Purpose Tween (APT; Difco of Becton, Dickinson) agar plates since Carnobacterium is is
not particularly acid-tolerant and grow poorly on MRS. The plates were incubated
anaerobically for 48 h at 25°C using anaerobic jars with an envelope generator of H2 and CO2
(AnaeroGenTM2.5L, AN0025A, Oxoid Company, Nepean, ON, Canada). Presumptive
Pseudomonas spp. were determined on Cetrimide-Fucidin-Cephalosporin (CFC) agar
(supplement No.SR0103E, Oxoid) and plates were incubated at 25 °C for 48 h (Mead et
123
Adams, 1977; Gill et Greer, 1993). Coliform and E. coli counts were determined using 3M
PetrifilmTM plates after incubation at 35 °C for 18-24 h (MFHPB-34; Health Canada, 2013a).
Presumptive S. aureus strains were evaluated on 3M PetrifilmTM plates incubated at 37 °C
for 26 h (MFLP-21; Health Canada, 2004). Enterobacteriaceae counts were performed on
3M PetrifilmTM (MFLP-09; Health Canada, 2007) after incubation at 37 °C for 24 h.
Presumptive Listeria spp. were determined on PALCAM medium (PALCAM Listeria Agars
Base; Merck, Germany) without supplements, while plates were incubated at 30°C for 48 h.
Regarding L. monocytogenes, counts were performed using PALCAM Listeria selective
supplement (No. 1. 12122.001; EMD, NJ, USA), plates were put in a 30 °C incubator for 48
h (MFHPB-30; Health Canada, 2011). Measurements were performed in duplicate. All
bacterial counts were transformed to a Log10 value of colony-forming units per gram of thigh
weight (Log10 CFU/g) prior to statistical analysis according to Gill (2000). Except for
presumptive S. aureus, coliform, E. coli, Enterobacteriaceae counts, which were transformed
to a Log10 value of colony forming units per ten grams of thigh weight (Log10 CFU/10g). For
counts on PCA, MRS, APT, CFC and Palcam, detection level was 1.76 Log10 CFU/10g, and
1.32 Log10 CFU/10g for presumptive S. aureus, coliforms, E. coli and Enterobacteriaceae
counts.
Microbial analysis was also performed on the faeces during the feeding period. They were
collected (500 g) from the pan underneath the 12 cages and were analyzed once a week for
the presence of C. maltaromaticum CB1 and enumeration of TAM, presumptive LAB on
MRS and APT, coliforms and E. coli, and Enterobacteriaceae as described above. The
samples were stored at 4°C and were analyzed within 24 h. A 25 g sample of faeces was
homogenized in 225 ml of peptone water and dilution plated on appropriate media similarly
to ground meat described above.
5.4.7. Experimental inoculation of ground meat with L. monocytogenes
5.4.7.1. Bacterial cultures and growth conditions
A cocktail of five L. monocytogenes strains, namely 1043 (1/2a), 2371, 2558 (1/2b), 2739,
2812 (1/2a), were used in this study. They were all isolated from meat products and kindly
provided by Health Canada (Ottawa, ON, Canada). Stock cultures were stored at -80 C in

124
Brain Heart Infusion (BHI; BBL-Becton Dickinson, Mississauga, Ontario, Canada)
supplemented with 20% glycerol (FisherBiotech, Fairlawn, NJ, USA). Prior to experimental
use, working cultures were individually thawed and subcultured (1%) daily in BHI broth for
a minimum of two and a maximum of seven consecutive days. Cultures were incubated at
30C for 24 h. L. monocytogenes inoculum was prepared by mixing equal volume of strains
grown separately to stationary phase. Cell suspensions were harvested by centrifugation
(5000 x g for 10 min at 4 C), washed ones and resuspended in 12.5 ml of peptone water.
Cell suspension was diluted a 100-fold and meat was inoculated with 100 μL in order to
obtain a final concentration of 4 Log10 CFU/g of meat.
5.4.7.2. Ground meat inoculation and incubation
A total of four experimental ground meat groups were analyzed: uninoculated meat from
rabbit fed (1) the control ration without C. maltaromaticum and (2) from rabbit fed with the
ration supplemented with C. maltaromaticum; (3) L. monocytogenes inoculated meat from
rabbit fed the control ration without C. maltaromaticum and (4) from rabbit fed with the
ration supplemented with C. maltaromaticum. The control groups, not inoculated with
L. monocytogenes, were followed as well to study the effect of C. maltaromaticum on
indigenous microflora found in ground meat. It was placed in a household mixer
(KitchenAid, Artisan, Michigan, USA) and appropriate volumes of the L. monocytogenes
cocktail were added and mixed for 4 min; peptone water was used for the none inoculated
groups. The meat was then divided into thin layers of 25 g samples and was packaged under
aerobic conditions in sterile laboratories plastic bags (Whirl-Pak, B01009, Nasco, USA) or
was vacuum packaged as described above, but in smaller bags. Cell enumeration was
performed after 0, 3, 6, 9, 12 and 15 days of storage at 4°C and 10°C. Ground meat samples
were analyzed as described above in section 5.4.6.
5.4.8. Presence of C. maltaromaticum CB1 on faeces, thighs and ground meat
5.4.8.1. Growth and culture conditions for indicator strains and bacteriocin production
For use in these experiments, stock frozen cultures in 20% glycerol were subcultured in 9 ml
of APT broth incubated at 25 °C for Carnobacterium strains and MRS broth incubated at
37°C for Pediococcus acidilactici UL5. P. acidilactici UL5 and C. divergens were used as
indicator strains for the detection of bacteriocin production by C. maltaromaticum CB1.

125
P. acidilactici was kindly provided by the Department of Food Science, Université Laval.
Carnobacterium divergens LV13 was obtained from Dr. B.G. Shaw (Institute of Food
Research, Langford, Bristol, UK; culture is available from National Collection of Food
Bacteria as strain 2855) and incubated at 25 °C for 24 h in anaerobiosis as described for the
presumptive LAB enumeration in section 2.6. Strains were subcultured (1%) daily for a
minimum of two and a maximum of seven consecutive days.
To determine presence and prevalence of C. maltaromaticum CB1 on thighs and in faeces,
characteristic colonies from APT enumeration plates were subcultured in 1 ml of APT broth
and incubated as described above. A 100 µl aliquot of each of those cultures were placed in
U-bottom 96-well microtiter plates (Greiner bio-one CELLSTAR® 96 Well plate, VWR
International, Alberta, CA). Using a 48-pin Microplate Replicator (2.54 cm Pin Length, V&P
Scientific, San Diego, CA), aliquots were transferred onto APT plates and were let to dry
under a biosafety cabinet. For early detection of bacteriocin production by
C. maltaromaticum, a soft APT agar (7.5 ml and 7.5% agar) inoculated (1%) with the
indicator organism was poured on those replicated plates (Ahn et Stiles, 1990). They were
then incubated at 25 °C under anaerobiosis as described for the presumptive LAB
enumeration. Cultures with zones of inhibition were further characterized for detection of the
carnocyclin gene.
5.4.8.2. Molecular characterization of C. maltaromaticum CB1
For faeces and thighs, selected strains exhibiting zones of inhibition were grown in 10 ml of
APT broth and incubated for 24 h at 25°C. Isolation of total DNA was performed from 2x10⁹
CFU of bacterial culture. For ground meat, a 25 g sample of minced beef was placed in a
sterile stomacher bag with a filter membrane and was then homogenized in 225 ml of peptone
water as for cell enumeration described above. The liquid phase was transferred into four
sterile tubes of 50 ml and placed at -20°C for 15 min to promote the separation of fat from
the meat. Using a sterile swab, the floating fat was removed from the liquid surface. Tubes
were centrifuged at 15 000 g for 10 min at 4°C. After discarding the supernatant, the pellets
were stored at -20°C and gene detection was performed on a loopful of each re-suspended in
1 mL of APT.
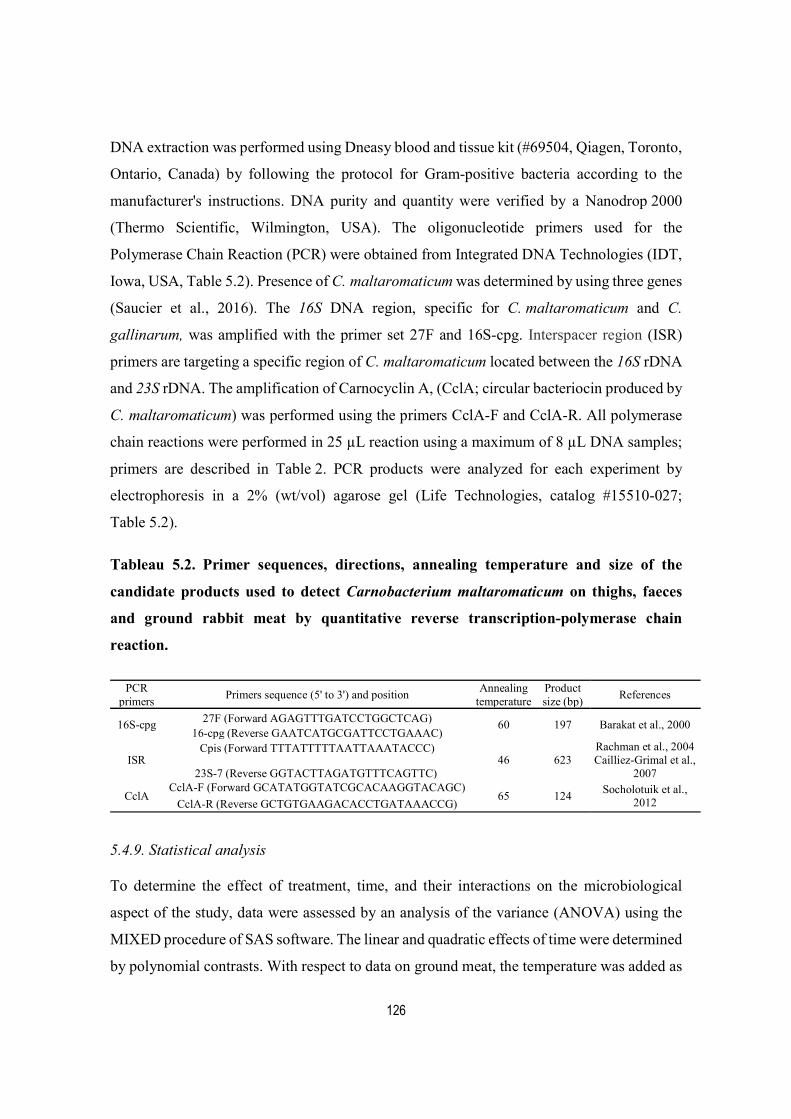
126
DNA extraction was performed using Dneasy blood and tissue kit (#69504, Qiagen, Toronto,
Ontario, Canada) by following the protocol for Gram-positive bacteria according to the
manufacturer's instructions. DNA purity and quantity were verified by a Nanodrop 2000
(Thermo Scientific, Wilmington, USA). The oligonucleotide primers used for the
Polymerase Chain Reaction (PCR) were obtained from Integrated DNA Technologies (IDT,
Iowa, USA, Table 5.2). Presence of C. maltaromaticum was determined by using three genes
(Saucier et al., 2016). The 16S DNA region, specific for C. maltaromaticum and C.
gallinarum, was amplified with the primer set 27F and 16S-cpg. Interspacer region (ISR)
primers are targeting a specific region of C. maltaromaticum located between the 16S rDNA
and 23S rDNA. The amplification of Carnocyclin A, (CclA; circular bacteriocin produced by
C. maltaromaticum) was performed using the primers CclA-F and CclA-R. All polymerase
chain reactions were performed in 25 µL reaction using a maximum of 8 µL DNA samples;
primers are described in Table 2. PCR products were analyzed for each experiment by
electrophoresis in a 2% (wt/vol) agarose gel (Life Technologies, catalog #15510-027;
Table 5.2).
Tableau 5.2. Primer sequences, directions, annealing temperature and size of the
candidate products used to detect Carnobacterium maltaromaticum on thighs, faeces
and ground rabbit meat by quantitative reverse transcription-polymerase chain
reaction.
PCR
primers Primers sequence (5' to 3') and position
Annealing temperature
Product size (bp)
References
16S-cpg 27F (Forward AGAGTTTGATCCTGGCTCAG) 60 197 Barakat et al., 2000 16-cpg (Reverse GAATCATGCGATTCCTGAAAC)
ISR Cpis (Forward TTTATTTTTAATTAAATACCC)
46 623 Rachman et al., 2004 Cailliez-Grimal et al.,
2007 23S-7 (Reverse GGTACTTAGATGTTTCAGTTC)
CclA CclA-F (Forward GCATATGGTATCGCACAAGGTACAGC)
65 124 Socholotuik et al.,
2012 CclA-R (Reverse GCTGTGAAGACACCTGATAAACCG)
5.4.9. Statistical analysis
To determine the effect of treatment, time, and their interactions on the microbiological
aspect of the study, data were assessed by an analysis of the variance (ANOVA) using the
MIXED procedure of SAS software. The linear and quadratic effects of time were determined
by polynomial contrasts. With respect to data on ground meat, the temperature was added as

127
the third effect with treatment and time. For the inoculated ground meat, we have done
statistical analysis at each sampling time. The two treatments were analyzed independently
to determine the overall effect of supplementation with Micocin® versus the control one. For
these analyzes, time of storage under aerobic conditions (0, 3, 6 and 8 d) and anaerobic
conditions (0, 5, 10, 15 and 20 d) was taken into consideration (SAS Institute, Inc. 2002).
Significant difference was declared at P < 0.05 and a tendency was declared at P < 0.10.
5.5. Results
5.5.1. Growth performance
Overall, there are no interaction and statistical differences on rabbit growth performances
with respect to average daily weight gain, average daily feed intake and feed conversion ratio
(P > 0.05; Table 5.3). However, the average daily feed intake was lower for the group
supplemented with Micocin® compared to the control group on the third week of feeding
(P = 0.014). Slaughter weight for the Micocin® group was 137 g heavier (P = 0.0003; data
not shown) despite a lower initial weight (117 g) than the other group. Because the control
group had to be slaughtered before to avoid cross contamination, heavier rabbits were
assigned to that one in order to meet slaughter weight requirement. Therefore, body weight
remained significantly higher for the control group during the 3-first feeding weeks
(P < 0.0001). On average, both experimental groups met the 2.2 kg minimal weight
requirement for commercialization.
5.5.2. Meat quality traits
Meat composition and quality parameters are presented in Table 5-4. Meat composition in
terms of protein, lipid and moisture content was not influenced significantly by dietary
treatment. In terms of muscle pH, it declined below 6 within 24 h after slaughter indicating
limited incidence of DFD meat.
A significant difference was observed between the two experimental groups with reference
to the pH in the LL muscle 1 h after slaughter (P = 0.025), but not in the BF muscle
(P > 0.05). Furthermore, the pHu 24 h after slaughter was lower in BF from the control
compared to the C. maltaromaticum CB1 supplemented one (P = 0.004), but no significant

128
difference was observed in regard to the LL muscle (P > 0.05). Average pH variations were
small and below 0.2 unit between the two experimental groups.
Colour parameters of the BF muscle, namely L* (P = 0.034), a* (P = 0.015) and b*
(P = 0.002) were significantly higher in meat from the control group than with the Micocin®
supplemented one. The meat from rabbit fed with Micocin® supplemented diet was darker,
less red and less yellow than the control one. Colour parameters of the LL muscle were not
affected by Micocin® supplementation.
In aerobic conditions, water loss for the Micocin® group was significantly smaller on day 3
and day 8 (P = 0.021, P = 0.005, respectively) and only on day 5 (P = 0.003) in anaerobic
conditions, compared to the control (Table 5.4). Drip loss was not significantly different
between the two experimental groups (P > 0.05) whereas cooking loss was greater with the
Micocin® supplemented one by less than 5% (P = 0.006; Table 5.4). Supplementing the diet
with C. maltaromaticum CB1 had no detrimental effect on total content in polyphenols and
carbonyls, as well as on lipid oxidation in raw meat after slaughter (P > 0.05; Table 5.4).
Tableau 5.3. Growth performance of weaned rabbits fed either a control or a
supplemented diet with Micocin®.
Control C. maltaromaticum CB1 SEM P value
Initial body weighta, g 1109.78 992.51 12.96 P < 0.0001
Week 1 ADG, g/j 57.37 56.13 0.92 NS ADFI, g/j 139.75 136.43 2.94 NS FCR 2.44 2.46 0.03 NS Body weight, g 1568.77 1446.05 15.46 P < 0.0001 Week 2 ADG, g/j 53.68 50.36 1.04 NS ADFI, g/j 153.68 152.66 2.32 NS FCR 2.88 3.08 0.12 NS
Body weight, g 1950.04 1815.78 17.13 P < 0.0001
Week 3 ADG, g/j 47.11 48.05 1.1 NS ADFI, g/j 172.45 161.35 2.34 0.014 FCR 3.69 3.42 0.11 NS
Body weight, g 2284.11 2166.47 17.54 P < 0.0001
Week 4 ADG, g/j - 34.74 1.71 - ADFI, g/j - 172.45 4.93 - FCR - 5.03 0.14 -

129
Body weight, g - 2421.49 28.05 - a Because the control group had to be slaughtered before the Micocin® one to avoid cross contamination,
heavier rabbits were placed in the control. SEM: standard error of the mean; n=12 cages, a cage of six rabbits
is the experimental unit. BW: body weight; ADG: average daily weight gain; ADFI: average daily feed intake;
FCR: feed conversion ratio. NS: not significant. P value in bold is significant (P < 0.05), underlined values
describe a tendency (P < 0.10).

130
Tableau 5.4. Effect of Carnobacterium maltaromaticum CB1 diet supplement on
physicochemical analyses, meat quality parameters and antioxidant status of rabbit
meat.
Quality parameters Control C. maltaromaticum CB1 SEM P value Proximate composition % Protein 18.03 17.90 0.28 NS % Lipid 11.11 11.31 0.60 NS % Moisture 70.44 69.88 0.47 NS % Drip loss 1.01 1.06 0.16 NS % Cooking loss 24.37 27.43 0.70 0.006
% Meat exudate loss aerobic 3-8 days D3 0.72 0.16 0.15 0.021 D6 1.14 0.90 0.27 NS D8 1.35 0.51 0.19 0.005 % Meat exudate loss anaerobic 5-20 days D5 0.88 0.31 0.12 0.003 D10 0.38 0.60 0.28 NS D15 0.82 1.09 0.38 NS D20 0.16 1.50 0.54 0.09
pH of BF muscle 1h 6.18 6.07 0.07 NS 24 h 5.42 5.62 0.04 0.004 pH of LL muscle 1h 6.01 5.82 0.05 0.025 24 h 5.39 5.40 0.03 NS Colour of BF muscle L* 51.89 49.67 0.69 0.034 a* 2.16 0.85 0.35 0.015 b* 2.39 1.66 0.14 0.002 Colour of LL muscle L* 53.34 52.16 0.73 NS a* 2.29 2.17 0.36 NS b* 2.95 2.70 0.22 NS
Total phenols (µg GAE/g) 9.62 9.59 0.06 NS TBARSa (nmol/g MDA) 2.16 2.30 0.12 NS Carbonyls (nmol/mg protein) 2.45 2.50 0.64 NS
Each value represents the mean of twelve samples with SEM: standard error of the mean; n= 12 cages, a
cage of six rabbits is the experimental unit. aAll lipid oxidation data are presented as mean of Malondialdehyde (MDA) values from three analyses
performed in triplicate. TBARS: thiobarbituric acid reactive substances, SEM: standard error of the mean,
NS: not significant. GAE: gallic acid equivalent. P values in bold are significant (P < 0.05), underlined
values describe a tendency (P < 0.10).

131
5.5.3. Microbial analysis of rabbit thighs stored under aerobic or anaerobic conditions
Microflora evolution on rabbit thighs from animals fed rations supplemented with or without
C. maltaromaticum CB1 when packaged under aerobic and anaerobic conditions is presented
in figures 5.1 and 5.2, respectively; tables 5-5 and 5-6 list P values associated with these
results. Linear and quadratic interactions of treatment with time were observed; concentration
reached at the end of the storage period varied with the microbial groups tested. Microbial
analysis of refrigerated rabbit thighs reveals that for all tests, under both aerobic and
anaerobic storage conditions, the cell counts increased significantly over time (P = 0.001),
except for presumptive S. aureus which remained at the same level during the whole storage
period (P > 0.05). The various microbial groups studied exhibited an exponential growth and
even reached stationary phase in some cases. Throughout the experiment, all E. coli counts
remained below the detection level (1.32 Log10 CFU/10g) under aerobic and anaerobic
storage (data not shown) indicating that appropriate hygienic food processing conditions
were followed. At the end of the storage period, cell count variations between the two
experimental groups were below 1 Log unit under aerobic conditions. Under anaerobic
conditions, however, presumptive LAB enumerated on MRS were 1 Log higher with thighs
from the Micocin® supplemented group while Enterobacteriacea and coliform counts were
1 Log lower. Presumptive Listeria was almost one Log lower at 0.93 under the same
conditions. Hence, a stronger and more positive microflora modulating effect of Micocin®
was observed under anaerobic conditions at 4°C on the thighs.
5.5.3.1. Aerobic conditions
Under aerobic conditions, only presumptive Pseudomonas spp. (P = 0.001, presumptive
LAB (on MRS and APT; P = 0.001) and Listeria spp. (P = 0.01) counts were significantly
different amongst treatments during storage (control vs. Micocin® groups; Table 5.5). On
day 0, the initial coliform, Enterobacteriaceae and presumptive S. aureus counts were below
detection level (1.32 Log10 CFU/10g) for both experimental groups; while presumptive S.
aureus counts remained below 2 Log10 CFU/10g for both as well, during the whole
experiment.

132
Figure 5.1.Total aerobic mesophilic (A), presumptive Pseudomonas (B), presumptive LAB on MRS (C), presumptive LAB on APT (D) and Listeria spp. (E) counts in Log10 CFU/g, and Enterobacteriaceae (F), coliform (G) and presumptive Staphylococcus aureus (H) counts in Log10 CFU/10g on rabbit thighs between 0 and 8 days of storage at 4°C under aerobic conditions. Bar represents standard error of the mean. Each point is a mean value of 12 cages with one thigh per cage analyzed at each sampling time. The cage of six rabbits is the experimental unit. Horizontal line indicates end of shelf life.
0
1
2
3
4
5
0 3 6 8STORAGE TIME (DAYS)
Control groupMicocin® group
0
2
4
6
8
0 3 6 8STORAGE TIME (DAYS)
0
1
2
3
4
5
6
0 3 6 8STORAGE TIME (DAYS)
(C)
01234567
0 3 6 8STORAGE TIME (DAYS)
0
1
2
3
4
0 3 6 8STORAGE TIME (DAYS)
0
1
2
3
4
5
0 3 6 8STORAGE TIME (DAYS)
0
1
2
3
4
5
0 3 6 8STORAGE TIME (TIME)
0
0,5
1
1,5
2
0 3 6 8STORAGE TIME (DAYS)
(A) (B)
(D)
(E) (F)
(G) (H)

133
Figure 5.2.Total aerobic mesophilic (A), presumptive Pseudomonas (B), presumptive LAB on MRS (C), presumptive LAB on APT (D) and Listeria spp. (E) counts in Log10 CFU/g, and Enterobacteriaceae (F), coliform (G) and presumptive Staphylococcus aureus (H) counts in Log10 CFU/10g on rabbit thighs between 0 and 8 days of storage at 4°C under anaerobic conditions. Bar represents standard error of the mean. Each point is a mean value of 12 cages with one thigh per cage analyzed at each sampling
0
2
4
6
8
0 5 1 0 1 5 2 0STORAGE TIME (DAYS)
Control groupMicocin® group
0
2
4
6
8
0 5 1 0 1 5 2 0STORAGE TIME (DAYS)
0
2
4
6
8
0 5 1 0 1 5 2 0STORAGE DAYS (DAYS)
0
2
4
6
8
0 5 1 0 1 5 2 0STORAGE TIME (DAYS)
0
2
4
6
0 5 1 0 1 5 2 0STORAGE TIME (DAYS)
01234567
0 5 1 0 1 5 2 0STORAGE TIME (DAYS)
0
2
4
6
8
0 5 1 0 1 5 2 0STORAGE TIME (DAYS)
(A) (B)
(C) (D)
(E) (F)
(G)
(H)

134
time. The cage of six rabbits is the experimental unit. Horizontal line indicates end of shelf life.
Tableau 5.5. Different P values of microbial counts on thigh samples stored at 4 ºC in
aerobic conditions.
Time Treatment × time
Treatment Linear Quadratic Linear Quadratic
TAM NS 0.001 0.001 0.001 NS
Presumptive Pseudomonas 0.001 0.001 0.001 0.001 0.09
LAB on MRS 0.001 0.001 0.001 0.003 NS
LAB on APT 0.001 0.001 0.001 NS 0.01
Listeria spp 0.01 0.001 0.001 0.03 0.07
Enterobacteriacea 0.06 0.001 0.001 0.002 0.002
Coliforms NS 0.001 0.001 0.006 0.005
Presumptive S. aureus NS NS NS 0.01 NS
TAM: Total aerobic mesophilic, LAB: Lactic acid bacteria. NS: not significant. P values in bold are significant (P < 0.05), underlined values describe a tendency (P < 0.10).
Tableau 5.6. Different P values of microbial counts on thigh samples stored at 4 ºC in
anaerobic conditions.
Time Treatment × time
Treatment Linear Quadratic Linear Quadratic
TAM 0.001 0.001 0.001 0.003 0.001
Presumptive Pseudomonas NS 0.001 0.001 0.001 0.001
LAB on MRS 0.001 0.001 0.001 0.003 0.007
LAB on APT 0.001 0.001 0.001 NS 0.02
Listeria spp 0.01 0.001 0.001 0.001 0.02
Enterobacteriacea 0.001 0.001 0.001 0.001 0.001
Coliforms 0.001 0.001 0.001 0.001 0.001
Presumptive S. aureus NS NS NS NS NS
TAM: Total aerobic mesophilic, LAB: Lactic acid bacteria.
NS: not significant. P values in bold are significant (P < 0.05), underlined values describe a tendency (P < 0.10).
The presumptive Pseudomonas spp. counts varied from 1.05 to 7.50 CFU/g during the
storage period and remained the prevailing microflora. Considering that end of shelf life is
reached when cell count is at 7 Log10 CFU/g or higher, rabbit thighs reached that level after
8 days when stored under aerobic conditions. Interestingly, thighs from the Micocin® group
had, on day 0, a presumptive Pseudomonas count of 1.17 Log above the control, but at the
end of the storage period, it was 0.5 Log below (Fig. 1B). A similar pattern was also observed
with TAM, but with a magnitude less than 1 Log unit (Fig. 1A). Under such conditions, the
135
various microbial counts performed were either similar or slightly above for the Micocin®
group, but all below 1 Log unit difference.
5.5.3.2. Anaerobic conditions
Overall, a significant treatment effect (P ≤ 0.01; Table 5.6) was observed for the dietary
addition of C. maltaromaticum CB1, compared with the control diet when the thighs were
placed under anaerobic conditions during a 20-day storage period for all microbial counts
performed, except for the presumptive Pseudomonas spp. and S. aureus (P > 0.05). Total
aerobic mesophilic, presumptive LAB (on MRS and APT) counts for the Micocin®
supplemented group were above the control. As for Listeria spp., coliform and
Enterobacteriaceae counts, they were below at the end of the storage period, with a Log
difference reaching 0.93 to 1.19. As expected, the LAB constitutes the main microflora under
anaerobic conditions for both experimental groups, and counts were higher (P < 0.001) for
the C. maltaromaticum CB1 supplemented one.
5.5.4. Microbial analysis of rabbit ground meat stored under aerobic or anaerobic conditions at 4 or 10 °C
Modulation of the microflora by the presence of C. maltaromaticum CB1 in the ration was
also investigated in ground meat stored at 4 and 10 °C during 0, 3, 6, 9, 12 and 15 days under
aerobic (Fig. 5.3) and anaerobic (Fig. 5.4) conditions. Tables 5.7 and 5.8 list P values
associated with these results and, linear and quadratic interactions of temperature with time
were observed in ground meat except for presumptive S. aureus. Overall, microbial growth
was favoured at 10 compared to 4 °C over the storage period and shelf life was reduced by
at least three days (Fig. 5.3 and 5.4). Microbial tests reveal cell growth during the storage
period including presumptive S. aureus this time in ground meat (P = 0.001); but for E. coli
counts remained below detection level again (1.32 Log10 CFU/10g). Contrary to what was
observed with thighs, no significant effect of treatment was revealed for ground meat stored
under aerobic or anaerobic conditions (P > 0.05).
136
5.5.4.1. Aerobic conditions
On average, end of shelf life was reached after 6 days for meat stored at 10 °C compared to
9 days when at 4 °C under aerobic conditions. At the end of storage, variation in microbial
counts performed with ground meat were all below 1 Log unit except for TAM which was
1.45 Log unit above for the Micocin® group at 10 °C.

137
Figure 5.3. Total aerobic mesophilic (A), presumptive Pseudomonas (B), presumptive LAB on MRS (C), presumptive LAB on APT (D), Enterobacteriaceae (E), coliform (F), and presumptive Staphylococcus aureus (G) counts in Log10 CFU/g on ground meat uninoculated rabbit between 0 and 15 days stored at 4 and 10ºC in aerobic conditions. Bar represents standard error of the mean. Each point is a mean value of three repetitions. Horizontal line indicates end of shelf life.
0
2
4
6
8
10
12
0 3 6 9 1 2 1 5STORAGE TIME (DAYS)
0
2
4
6
8
10
12
0 3 6 9 1 2 1 5STORAGE TIME (DAYS)
0
2
4
6
8
10
12
0 3 6 9 1 2 1 5STORAGE TIME (DAYS)
0
2
4
6
8
10
12
0 3 6 9 1 2 1 5STORAGE TIME (DAYS)
0
2
4
6
8
10
12
0 3 6 9 1 2 1 5STORAGE TIME (DAYS)
0
2
4
6
8
10
0 3 6 9 1 2 1 5STORAGE TIME (DAYS)
0
1
2
3
4
0 3 6 9 1 2 1 5STORAGE TIME (DAYS)
(C)
(A)
(D)
(B)
(E) (F)
(G)

138
Fig. 4. Total aerobic mesophilic (A), presumptive Pseudomonas (B), presumptive LAB on MRS (C), presumptive LAB on APT (D), Enterobacteriaceae (E), coliform (F), and presumptive Staphylococcus aureus (G) counts in Log10 CFU/g on ground meat uninoculated rabbit between 0 and 15 days stored at 4 and 10 ºC in anaerobic conditions. Bar represents standard error of the mean. Each point is a mean value of three repetitions. Horizontal line indicates end of shelf life.
Figure 5.4. Total aerobic mesophilic (A), presumptive Pseudomonas (B), presumptive
LAB on MRS (C), presumptive LAB on APT (D), Enterobacteriaceae (E), coliform (F),
and presumptive Staphylococcus aureus (G) counts in Log10 CFU/g on ground meat
uninoculated rabbit between 0 and 15 days stored at 4 and 10ºC in anaerobic conditions.
Bar represents standard error of the mean. Each point is a mean value of three
repetitions. Horizontal line indicates end of shelf life.
(D) (C)
Log
CFU
/g
Log
CFU
/g
Log
CFU
/g
0
2
4
6
8
10
12
0 3 6 9 1 2 1 5STORAGE TIME (DAYS)
0
2
4
6
8
10
12
0 3 6 9 1 2 1 5
STORAGE TIME (DAYS)
0
2
4
6
8
10
12
0 3 6 9 1 2 1 5STORAGE TIME (DAYS)
0
2
4
6
8
10
12
0 3 6 9 1 2 1 5
STORAGE TIME (DAYS)
0
2
4
6
8
10
12
0 3 6 9 1 2 1 5STORAGE TIME (DAYS)
0
2
4
6
8
10
12
0 3 6 9 1 2 1 5STORAGE TIME (DAYS)
0
2
4
6
8
0 3 6 9 1 2 1 5STORAGE TIME (DAYS)
(A) (B)
(F) (E)
(G)
(D) (C)

139
Tableau 5.7. Different P values of microbial counts on uninoculated ground meat
samples stored at 4 and 10 ºC in aerobic conditions.
Time Temperature × time
Temperature Linear Quadratic Linear Quadratic
TAM 0.001 0.001 NS 0.001 0.001
Presumptive Pseudomonas 0.001 0.001 NS 0.005 0.001
LAB on MRS 0.001 0.001 NS 0.001 0.006
LAB on APT 0.001 0.001 0.074 0.006 0.004
Enterobacteriacea 0.004 0.001 NS 0.001 0.001
Coliforms 0.001 0.001 NS 0.001 0.001
Presumptive S. aureus NS 0.001 NS NS NS
TAM: Total aerobic mesophilic, LAB: Lactic acid bacteria. NS: not significant. Other interactions and the treatment effect are not significant (P > 0.05). P values in bold are significant (P < 0.05), underlined values describe a tendency (P < 0.10).
Tableau 5.8. Different P values of microbial counts in uninoculated ground meat
samples stored at 4 and 10 ºC in anaerobic conditions.
Time Temperature × time
Temperature Linear Quadratic Linear Quadratic
TAM 0.008 0.001 0.007 0.001 0.006
Presumptive Pseudomonas 0.001 0.001 0.016 0.001 0.004
LAB on MRS 0.003 0.001 0.014 0.001 0.001
LAB on APT 0.001 0.001 0.098 0.001 0.001
Enterobacteriacea 0.001 0.001 0.002 0.001 0.001
Coliforms 0.001 0.001 0.029 0.001 0.001
Presumptive S. aureus 0.078 0.001 NS 0.055 0.067
TAM: Total aerobic mesophilic, LAB: Lactic acid bacteria. NS: not significant. Other interactions and the treatment effect are not significant (P > 0.05). P values in bold are significant (P < 0.05), underlined values describe a tendency (P < 0.10).
Presumptive LAB enumerated on APT with the Micocin® supplemented group were above
the control and close to 1 Log unit (> 0.89) on day 3 and 6 at 4°C, and on day 12 at 10°C.
5.5.4.2. Anaerobic conditions
Anaerobic storage of ground meat from the Micocin® supplemented group increased shelf
life between 12 to 15 days but remained at 6 days for controls (Fig. 5.4).
C. maltaromaticum CB1 grow well in these conditions as indicated by TAM and presumptive
LAB counts on APT plates that are well above the control by 1 Log unit at the end of the
storage period (Fig. 5.4 A and D). This coincided with a cell concentration of
Enterobacteriacea, coliforms and presumptive S. aureus of 1 Log unit below for the

140
Micocin® supplemented group. In fact, Log difference greater than 1 Log unit (1.05-1.86)
was observed throughout the anaerobic storage period at 10°C for counts of presumptive S.
aureus.
After 15 days of storage at 4 °C under anaerobic conditions, cell counts in ground meat were
above those obtained on thighs; Log difference was as low as 0.29 for coliforms and reached
5.04 in the case of presumptive S. aureus. Indeed, growth of presumptive S. aureus was
favoured in ground meat, but to a lesser extent with the Micocin® supplemented group
(Fig. 2H and 4G).
5.5.5. Ground meat experimentally inoculated with L. monocytogenes and stored under aerobic or anaerobic conditions at 4 or 10°C
Viable counts of L. monocytogenes inoculated (4 Log10 CFU/g) on rabbit ground meat
samples stored at 4 and 10°C during 0, 3, 6, 9, 12 and 15 days in aerobic and anaerobic
conditions are presented in Fig. 5.5; Table 5.9 lists P values associated with these results. A
linear treatment and time interaction was observed for the L. monocytogenes counts on
inoculated ground meat stored under anaerobiosis (P = 0.002) whereas a temperature and
time interaction (P = 0.001) was observed for both aerobic and anaerobic storage conditions.
L. monocytogenes, being a well-recognized psychrotoph, grew to high numbers (6.74 to
10.05 CFU/g) in the inoculated control group at both temperatures and under aerobic as well
as anaerobic conditions. The effect of treatment under anaerobiosis was significant (P =
0.025) for ground meat stored at 4 and 10 °C on day 15. But greatest control of L.
monocytogenes was observed for ground meat from the Micocin® supplemented group
stored at 4 °C under anaerobic conditions reaching a 2.1 Log unit difference compared to the
control (Fig. 5.5).
The effect of temperature and treatment on L. monocytogenes growth in ground meat was
also revealed by its growth rate (Table 5.11). A temperature of 10 °C favours growth of
L. monocytogenes under both aerobic and anaerobic conditions, whereas the effect of
supplementing the ration with Micocin® led to a better control of this bacterium under
anaerobic storage (P < 0.0001; Fig. 5.5B). The effect of treatment in aerobiosis was
significant only on day 15 (P = 0.03; Fig. 55.A) where the Micocin® supplemented group
was 1.05 to 1.43 Log below the control group at 4 and 10 °C, respectively. But under

141
anaerobic conditions, C. maltaromaticum reduced significantly L. monocytogenes stored at
4 and 10 °C (P = 0.0001) with a reduction of more than 1.5 Log reaching 2.1 Log on day 15.
To further that demonstration, we have done statistical analysis at each sampling time (Table
5.10) to improve Fig. 5.5. It is clear that Micocin®/C. maltaromaticum CB1 has a stronger
and more rapid effect under anaerobic compared to aerobic conditions. In aerobic conditions,
there was a reduction of L. monocytogenes to 15 days so a treatment effect with a difference
of more than one log (P = 0.03) in microbiology despite the fact that the slopes were not
significant. However, the addition of C. maltaromaticum CB1 to the feed significantly
reduced L. monocytogenes and the effect is observed from day 6 ( P < 0.03; Table 5.10).
Tableau 5.9. P values of microbial counts on inoculated ground meat samples with a
cocktail of five strains of Listeria monoctogenes stored at 4 and 10 ºC in aerobic and
anaerobic conditions.
Temperature Treatment
Time Temperature × time Treatment × time
Linear Quadratic Linear Quadratic Linear Quadratic
Aerobic conditions 0.005 NS 0.001 NS 0.001 NS NS NS
Anaerobic conditions 0.005 0.025 0.001 0.022 0.001 0.001 0.002 NS
NS: not significant. Other interactions under aerobic and anaerobic conditions are not significant (P > 0.05). P values in bold are significant (P < 0.05).
0
2
4
6
8
10
12
0 3 6 9 1 2 1 5
STORAGE TIME (DAYS)
4ºC Control group4ºC Micocin® group10ºC Control group10ºC Micocin® group
1.34 Log10 CFU/g
1.05 Log10 CFU/g
(A)
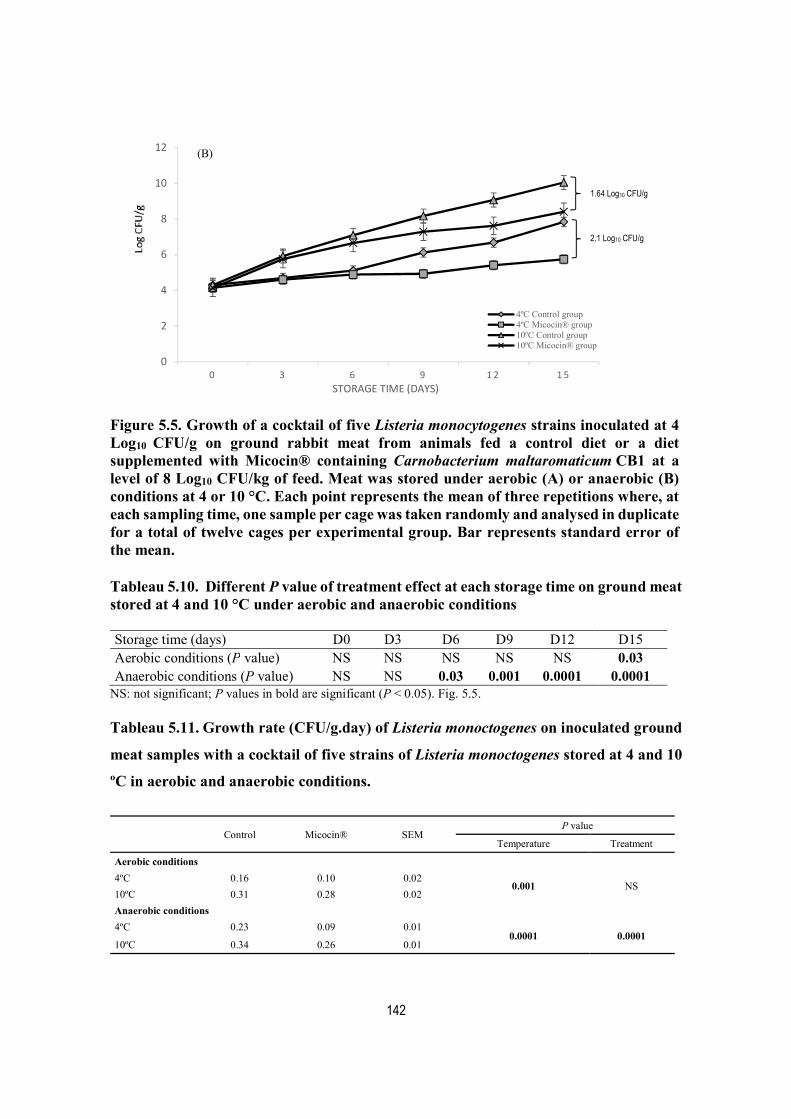
142
Figure 5.5. Growth of a cocktail of five Listeria monocytogenes strains inoculated at 4 Log10 CFU/g on ground rabbit meat from animals fed a control diet or a diet supplemented with Micocin® containing Carnobacterium maltaromaticum CB1 at a level of 8 Log10 CFU/kg of feed. Meat was stored under aerobic (A) or anaerobic (B) conditions at 4 or 10 °C. Each point represents the mean of three repetitions where, at each sampling time, one sample per cage was taken randomly and analysed in duplicate for a total of twelve cages per experimental group. Bar represents standard error of the mean. Tableau 5.10. Different P value of treatment effect at each storage time on ground meat stored at 4 and 10 °C under aerobic and anaerobic conditions Storage time (days) D0 D3 D6 D9 D12 D15 Aerobic conditions (P value) NS NS NS NS NS 0.03 Anaerobic conditions (P value) NS NS 0.03 0.001 0.0001 0.0001
NS: not significant; P values in bold are significant (P < 0.05). Fig. 5.5.
Tableau 5.11. Growth rate (CFU/g.day) of Listeria monoctogenes on inoculated ground
meat samples with a cocktail of five strains of Listeria monoctogenes stored at 4 and 10
ºC in aerobic and anaerobic conditions.
Control Micocin® SEM P value
Temperature Treatment
Aerobic conditions 4ºC 0.16 0.10 0.02
0.001
NS 10ºC 0.31 0.28 0.02
Anaerobic conditions 4ºC 0.23 0.09 0.01 0.0001 0.0001 10ºC 0.34 0.26 0.01
0
2
4
6
8
10
12
0 3 6 9 1 2 1 5STORAGE TIME (DAYS)
4ºC Control group4ºC Micocin® group10ºC Control group10ºC Micocin® group
1.64 Log10 CFU/g
2.1 Log10 CFU/g
(B)

143
NS: not significant. No significant interactions under aerobic and anaerobic conditions were observed (P > 0.05); P values in bold are significant (P < 0.05). Each value represents the mean of slopes from three repetitions (Fig. 5.5); best-fit curves were obtained using the Excel Software of Microsoft Office.
5.5.6. Presence of carnocyclin-A producing C. maltaromaticum in the faeces during the feeding period
Faeces microbial analysis during the feeding period is presented in Table 5.12. The female
rabbit had just been weaned before their arrival (< 2 d). During the experiment, the difference
between the two experimental groups was below 1 Log unit. After one week of feeding, all
cell counts were fairly high (> 7.85 CFU/g). But, in weeks 2 and 3, Enterobacteriaceae,
coliform and E. coli counts were below 4.70 CFU/g, whereas TAM and presumptive LAB
on MRS and APT were above 5.62 CFU/g demonstrating a shift in the faecal microflora
towards a more desirable profile. Using PCR analysis of three specific sequences, namely
16S-cpg, ISR, and CclA, the presence in the faeces of C. maltaromaticum producing
carnocyclin A was followed. Its presence was revealed during the whole duration of the
feeding period for the Micocin® supplemented group, but only for the first week for the
control (Table 5.13).
Tableau 5.12. Microbial enumeration of TAM, presumptive LAB on MRS, presumptive
LAB on APT, coliforms, Enterobacteriacea and Escherichia coli in faeces during the
feeding period.
Week 1 Week 2 Week 3
Control Micocin® Reduction (Log unit)
Control Micocin® Reduction (Log unit)
Control Micocin® Reduction (Log unit)
TAM 9.44 9.03 0.41 6.64 7.18 -0.54 6.02 6.10 -0.08
LAB on MRS 8.45 8.64 -0.19 7.70 8.48 -0.78 5.62 5.96 -0.34
LAB on APT 8.81 9.12 -0.31 8.48 9.08 -0.60 6.58 6.95 -0.37
Enterobacteriaceae 8.44 8.29 0.15 3.08 3.20 -0.12 4.70 4.45 0.25
Coliforms 8.39 8.18 0.21 3.48 3.11 0.37 4.52 4.45 0.07
E. coli 8.35 7.85 0.50 3.15 2.60 0.55 4.34 3.90 0.44
TAM: Total aerobic mesophilic, LAB: Lactic acid bacteria. Each value represents one fecal sample (500 g) collected from the pan underneath the cages and analyzed in duplicate.
5.5.7. Presence of carnocyclin-A producing C. maltaromaticum on thighs and in ground meat
Table 5.13 shows the presence/absence of C. maltaromaticum CB1 producing carnocyclin A
on rabbit thighs stored at 4°C under aerobic and anaerobic conditions for 0, 3, 6 and 8 and

144
for 5, 10, 15 and 20 days, respectively. C. maltaromaticum CB1 producing carnocycin A was
detected in the Micocin® supplemented group after 0, 3 and 6 days of storage in aerobic
conditions, but not on day 8. In the control group, under the same aerobic storage conditions,
C. maltaromaticum CB1 was absent at all sampling time. Under anaerobic conditions,
prevalence of C. maltaromaticum CB1 was noticeable after 5 days of storage, but not to the
same extent than after 15 or 20 days.
Tableau 5.13. Presence of Carnobacterium maltaromaticum in faeces and rabbit thighs
at 4 °C under aerobic and anaerobic conditionsa.
Faeces (feeding weeks) Thigh storage (days)
Aerobic Anaerobic
Days 1 2 3 4 0 3 6 8 5 15 20
Control 1(20) 0(30) 0(21) - 0(24) 0(11) 0(34) 0(24) 1(34) 0(23) 1(24)
Micocin® 1(20) 1(17) 2(22) 1(10) 4(20) 4(20) 1(25) 0(24) 8(24) 1(24) 1(24) a Index number represents the number of colonies samples from APT plates for PCR analysis of three specific genes: 16S-cpg, ISR and CclA. Results are expressed as the number of colonies identified as Carnobacterium maltaromaticum by the PCR analysis.
In order to improve detection of C. maltaromaticum producing carnocyclin A in ground meat,
PCR analysis was performed after total DNA extraction from the cell pellet obtained with a
25 g meat sample. Prevalence of C. maltaromaticum producing carnocyclin A was greater in
ground meat coming from rabbits fed the ration supplemented with Micocin® and during
storage under anaerobic conditions (Table 5.14). Indeed, it was absent on control ground
meat incubated at 4°C under aerobic conditions (0/11). By feeding a ration supplemented
with C. maltaromaticum CB1 (Micocin®), we were able to modulate its presence in the
faeces, on the thighs and in ground meat.
Tableau 5.14. Presence of Carnobacterium maltaromaticum producing carnocyclin A in
rabbit ground meat stored at 4 and 10 °C under aerobic and anaerobic conditions (0, 3,
6, 9, 12, 15 days) as determined by PCR analysis of three specific genes:16S-cpg, ISR
and CclAa.
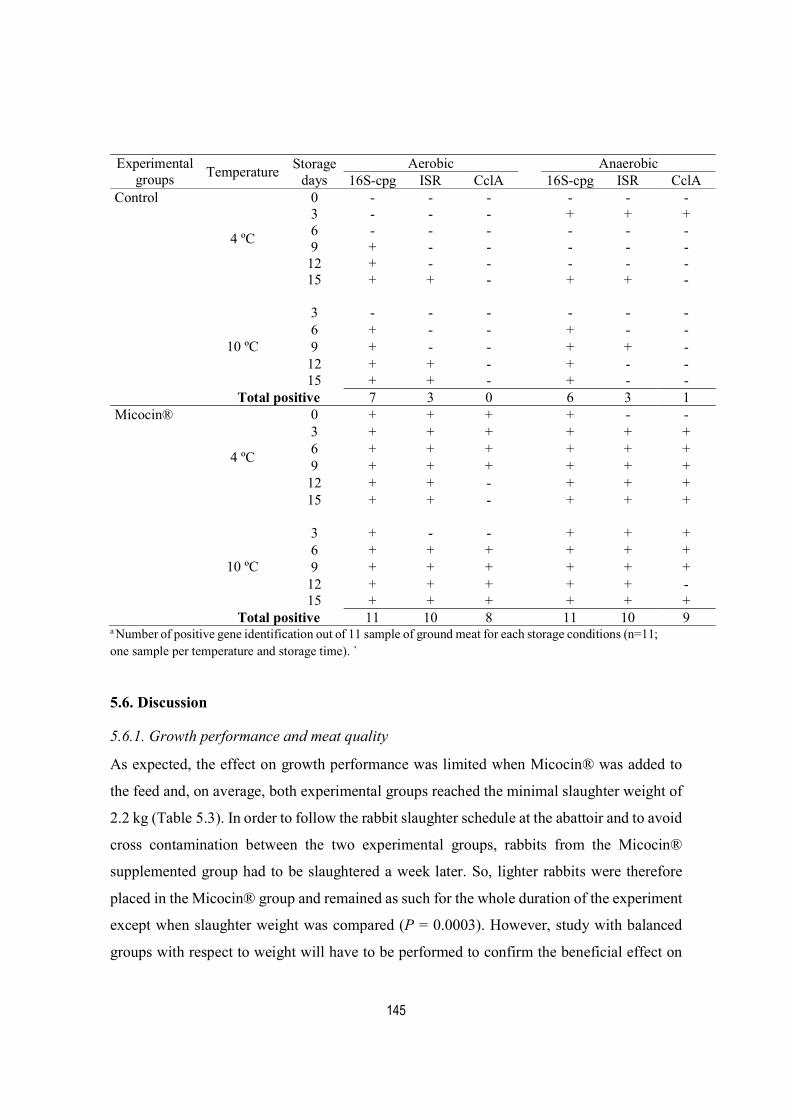
145
Experimental
groups Temperature Storage
days Aerobic Anaerobic
16S-cpg ISR CclA 16S-cpg ISR CclA Control
4 ºC
0 - - - - - - 3 - - - + + + 6 - - - - - - 9 + - - - - - 12 + - - - - - 15 + + - + + -
10 ºC
3 - - - - - -
6 + - - + - -
9 + - - + + -
12 + + - + - - 15 + + - + - -
Total positive 7 3 0 6 3 1 Micocin®
4 ºC
0 + + + + - -
3 + + + + + +
6 + + + + + +
9 + + + + + +
12 + + - + + +
15 + + - + + +
10 ºC
3 + - - + + +
6 + + + + + +
9 + + + + + +
12 + + + + + - 15 + + + + + +
Total positive 11 10 8 11 10 9 a Number of positive gene identification out of 11 sample of ground meat for each storage conditions (n=11; one sample per temperature and storage time). `
5.6. Discussion
5.6.1. Growth performance and meat quality
As expected, the effect on growth performance was limited when Micocin® was added to
the feed and, on average, both experimental groups reached the minimal slaughter weight of
2.2 kg (Table 5.3). In order to follow the rabbit slaughter schedule at the abattoir and to avoid
cross contamination between the two experimental groups, rabbits from the Micocin®
supplemented group had to be slaughtered a week later. So, lighter rabbits were therefore
placed in the Micocin® group and remained as such for the whole duration of the experiment
except when slaughter weight was compared (P = 0.0003). However, study with balanced
groups with respect to weight will have to be performed to confirm the beneficial effect on
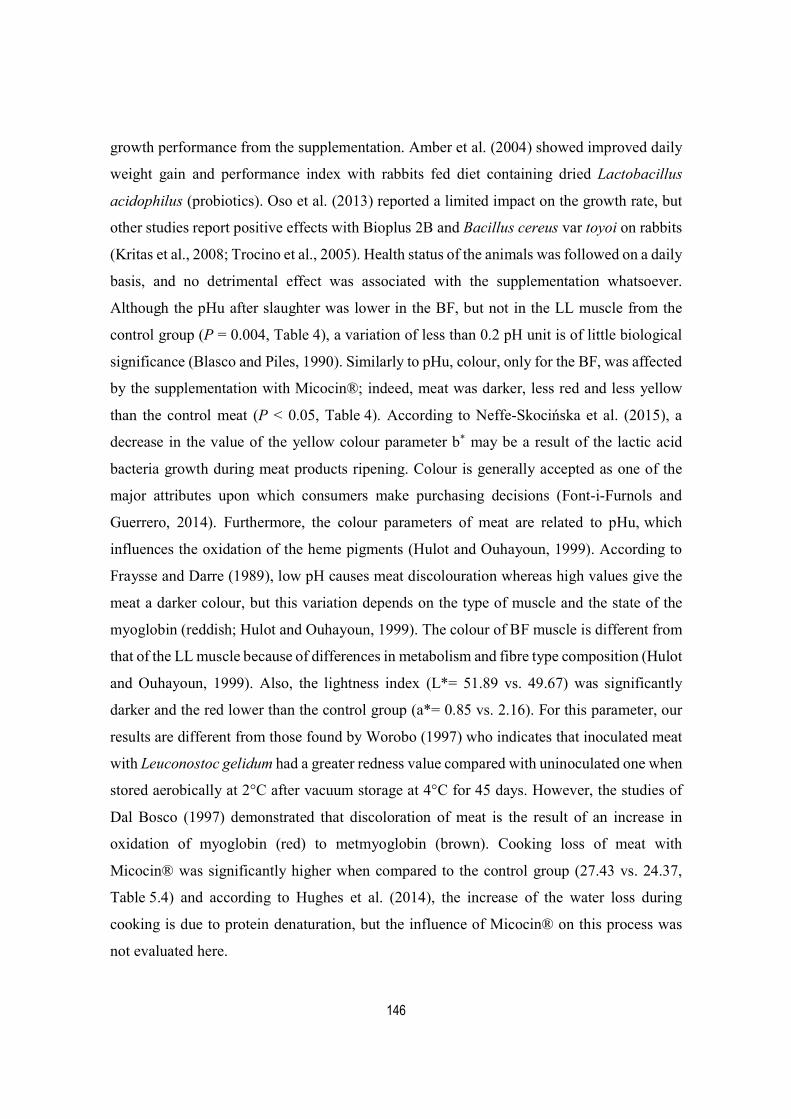
146
growth performance from the supplementation. Amber et al. (2004) showed improved daily
weight gain and performance index with rabbits fed diet containing dried Lactobacillus
acidophilus (probiotics). Oso et al. (2013) reported a limited impact on the growth rate, but
other studies report positive effects with Bioplus 2B and Bacillus cereus var toyoi on rabbits
(Kritas et al., 2008; Trocino et al., 2005). Health status of the animals was followed on a daily
basis, and no detrimental effect was associated with the supplementation whatsoever.
Although the pHu after slaughter was lower in the BF, but not in the LL muscle from the
control group (P = 0.004, Table 4), a variation of less than 0.2 pH unit is of little biological
significance (Blasco and Piles, 1990). Similarly to pHu, colour, only for the BF, was affected
by the supplementation with Micocin®; indeed, meat was darker, less red and less yellow
than the control meat (P < 0.05, Table 4). According to Neffe-Skocińska et al. (2015), a
decrease in the value of the yellow colour parameter b* may be a result of the lactic acid
bacteria growth during meat products ripening. Colour is generally accepted as one of the
major attributes upon which consumers make purchasing decisions (Font-i-Furnols and
Guerrero, 2014). Furthermore, the colour parameters of meat are related to pHu, which
influences the oxidation of the heme pigments (Hulot and Ouhayoun, 1999). According to
Fraysse and Darre (1989), low pH causes meat discolouration whereas high values give the
meat a darker colour, but this variation depends on the type of muscle and the state of the
myoglobin (reddish; Hulot and Ouhayoun, 1999). The colour of BF muscle is different from
that of the LL muscle because of differences in metabolism and fibre type composition (Hulot
and Ouhayoun, 1999). Also, the lightness index (L*= 51.89 vs. 49.67) was significantly
darker and the red lower than the control group (a*= 0.85 vs. 2.16). For this parameter, our
results are different from those found by Worobo (1997) who indicates that inoculated meat
with Leuconostoc gelidum had a greater redness value compared with uninoculated one when
stored aerobically at 2°C after vacuum storage at 4°C for 45 days. However, the studies of
Dal Bosco (1997) demonstrated that discoloration of meat is the result of an increase in
oxidation of myoglobin (red) to metmyoglobin (brown). Cooking loss of meat with
Micocin® was significantly higher when compared to the control group (27.43 vs. 24.37,
Table 5.4) and according to Hughes et al. (2014), the increase of the water loss during
cooking is due to protein denaturation, but the influence of Micocin® on this process was
not evaluated here.

147
Before firm conclusion can be made, more research should be done to confirm whether the
addition of probiotic bacteria, or certain species, improves the stability of meat colour and
cooking loss. Overall, the feed supplementation effect with Micocin® on meat quality
parameters is limited and the small variations observed may be, at least in part, the results of
rabbit individual variations.
5.6.2. Modulation of the microflora
Micocin® is a protective culture (C. maltaromaticum CB1) autorized in Canada, in the US
and many other countries for applications in ready-to-eat meat products (Health Canada,
2010). It was used as a feed additive in this study, since it is easy to track with a set of three
genes including the one for carnocyclin A. It was isolated originally from pork and has not
been genetically modified according to the manufacturer’s official information (FDA, 2009).
Hence, it is most likely widely distributed in the meat production/processing environment
(Health Canada, 2010). In addition, it may contribute, at least in part, to the sporadic
detection of C. maltaromaticum producing carnocyclin A in the control group along with
possible cross contamination despite strict biosecurity measures. Its absence on rabbit thighs
stored at 4 ºC under aerobic conditions for 8 days and under anaerobic conditions for 15 and
20 days may reflect a better ability of other indigenous microbes to prevail in such conditions.
Furthermore, detection was done on single colonies isolated from the APT agar plate with
the thighs where it was done on the whole cell pellet from the meat homogenate for ground
meat in order to improve detection. C. maltaromaticum, a facultative anaerobe, is expected
to exert a competitive exclusion effect that will vary according to the different strains
constituting the indigenous microflora and this may explain the various differences observed
on the thighs compared to ground meat. During storage, all microbial counts increased more
rapidly at 10 than at 4 °C and the extent vary with the ability of microbial groups tested to
grow at such temperature.
C. maltaromaticum producing carnocyclin A was detected in the faeces collected from the
Micocin® supplemented group (Table 5.13) suggesting that the organism survived the GI
passage. It is not known to be particularly resistant to low stomach pH, but being imbedded
within the pellet, the feed matrix may have provided a protective effect. However, because
the faeces were collected in the pan underneath the cages, part of the contamination may have

148
come from the feed falling onto them as well. Incidence of C. maltaromaticum producing
carnocyclin A was definitely higher on thighs and in ground meat from the Micocin®
supplemented group more so in anaerobic conditions (Saucier et al., 2016) confirming that
microorganisms in the feed can end up on the meat either by contamination from the
environment or the faeces (Huffman, 2002).
Pseudomonas is known to prevail on meat stored under aerobic storage conditions whereas
LAB does under anaerobic ones (Dainty, & Mackey, 1992; Saucier, 1999). So, it was not
surprising to see C. maltaromaticum producing carnocyclin A more predominantly under
anaerobic conditions (Table 5.12). Colonies picked from APT plates obtained during
microbial analysis of the thighs were used to determine the presence of C. maltaromaticum
producing carnocyclin A; and reduction of their detection during storage suggests that other
strains are better adapted to grow under the conditions used here. Nonetheless, supplementing
the feed with Micocin® had a positive reduction effect on coliform, Enterobacteriacea and
Listeria spp. counts for thighs (Fig. 2, Table 5.6), as well as on presumptive S. aureus found
in ground meat (Fig. 4, Table 5.8) stored under anaerobic conditions. S. aureus is not a good
competitor, notably in fresh meat, where salt and other preservatives are not present (De
Buyser et al., 2001). Microbial counts for TAM, as well as presumptive LAB either on MRS
or APT, were higher in the Micocin® supplemented group under aerobic and anaerobic
conditions, most likely resulting from C. maltaromaticum addition in feed.
5.6.3. Meat Safety
The most convincing evidence that the feeding strategy described here is a valuable and
promising approach to better control microbial contamination and growth on meat comes
from the 2.1 Log difference obtained in ground meat stored under anaerobic conditions à
4 °C and experimentally inoculated with a five strain cocktail of L. monocytogenes (Fig. 5.5,
Table 5.9 and 5.10). The inhibition effect observed in ground meat from the Micocin®
supplemented group directly supports our hypothesis that feeding desirable microorganisms
to farm animals can lead to safer products, including meat. According to Ammor & Baltasar
(2007), LAB are generally added to food in order to meet safety, shelf life, technological
effectiveness and economic feasibility criteria. Many LAB associated with meat, including
C. maltaromaticum, are known for their bactericidal or bacteriostatic activity against other

149
strains, species or genera of bacteria (Imazaki et al., 2015). Bacteriocins alone are usually
ineffective against gram-negative bacteria because of the outer membrane that acts as a
barrier to these inhibitory peptides (Vaara., 1992; Gänzle, Hertel, & Hammes, 1999).
According to Martin-Visscher et al. (2008, 2011), even if carnobacteriocin BM1 and
piscicolin 126 have a potent activity against L. monocytogenes, the antimicrobial effect is
primarily due to carnocyclin A. These conclusions were also supported by those of Liu et al.
(2014) who confirmed that carnocyclin A is the active compound in Micocin® with strong
anti-listerial activity. However, Jack et al. (1996) has demonstrated that piscicolin 126 is
effective against L. monocytogenes in a commercial ham for up to 14 days of storage at
10 °C. Although the CclA gene was used in this study to track the presence of
C. maltaromaticum CB1 on meat, it also most probably, at least in part, contributes to the
microbial inhibition and the competitive exclusion observed, along with the two other
bacteriocins produced. Nevertheless, these antimicrobial peptides are ideal candidates for
strategic use against L. monocytogenes and further research is necessary to find
microorganisms with a broader and stronger antimicrobial activity, especially for meat stored
under aerobic conditions where LAB do not prevail readily.
5.7. Conclusion
This study demonstrates that it is possible to positively modulate carcass and meat
contamination by the introduction of a desirable microflora, here C. maltaromaticum CB1,
into the feed of weaned rabbits until they reached slaughter weight. The results show that
dietary supplementation with C. maltaromaticum CB1 increased its prevalence on meat,
compared to the unsupplemented group, and led to a competitive exclusion towards
undesirable organisms namely coliforms, Enterobacteriaciae, Listeria and presumptive S.
aureus. The improvement of meat safety by such feeding strategy was demonstrated by the
inhibition of a L. monocytogenes cocktail experimentally introduced into the ground meat
from control compared to the Micocin® supplemented group, especially during storage under
anaerobic and low temperature conditions (4 °C). L. monocytogenes numbers were lower by
more than 1 Log10 CFU/g and the anti-listerial effects of C. maltaromaticun CB1 may be
attributed, at least in part, to the bacteriocins it can produce. Future experiments should
examine the effect of Micocin® on L. monocytogenes when the latter is present in very low
initial numbers (< 100 CFU/g). Now that the proof of concept has been established with

150
C. maltaromaticun CB1, it is important to continue exploring other microorganisms, or mix
of them, with a broader and stronger antimicrobial activity, to be introduced into the feed to
better control microbial contamination on meat especially under aerobic conditions and at
higher temperatures (7-10 °C). Improving the transit of those organisms, notably through the
acidic environment of the stomach, may require their encapsulation, although the present
results suggest that they survived through the gastrointestinal tract when included in feed.
Moreover, other experiments are also needed to establish if the desirable microorganisms
must be introduced throughout the growing and finishing periods or if a shorter
supplementation before slaughter would be sufficient.
5.8. Acknowledgements
This research was carried out with the financial support of the Programme de soutien à
l’innovation en agroalimentaire, a program derived from the Growing Forward agreement
between the Ministère de l’agriculture des pêcheries et de l’alimentation du Québec
(MAPAQ) and Agriculture and Agri-Food Canada. The Syndicat des producteurs de lapins
du Quebec is also a partner in this project. The authors thank Mrs. M. Gill for her technical
support.

151
Conclusions générales, implications et perspectives
6.1. Conclusion générale
L'objectif de la présente thèse était de répondre à la demande de la filière cunicole pour des
stratégies alimentaires naturelles, simple et sans investissement majeur pour les producteurs.
Les producteurs de lapins, comme l’ensemble du secteur agroalimentaire, sont sensibles aux
demandes des consommateurs pour des produits « sains ». La production de lapin n’est pas
sous gestion de l’offre et subit les aléas du marché où la concurrence est impitoyable et où la
qualité globale de la viande est devenue un enjeu majeur afin de séduire le consommateur et
de sécuriser ses parts de marchés pour les producteurs et les transformateurs. L’industrie
cunicole québécoise ne peut certes pas se comparer aux autres grandes productions de masse
canadiennes comme le porc, le bœuf ou la volaille, mais elle a des ambitions bien réalistes
afin de se démarquer de la concurrence, et ce, en mettant en marché de la viande de lapin de
qualité supérieure pour le secteur de la restauration notamment. L’industrie cunicole
québécoise, voire canadienne, est également modeste comparativement à celle de la France
ou de l’Italie quant aux volumes produits, aux coûts de production et aux ressources
disponibles en recherche et développement. Elle a donc besoin de soutien afin de se
développer et faire face à la concurrence, et ce, en mettant sur le marché de la viande de lapin
de qualité supérieure qui offre une expérience gustative positive tant pour le restaurateur, le
transformateur et ultimement le consommateur pour justifier son prix actuellement élevé.
Normalement, les bons coups en restauration devraient se traduire par à des achats éventuels
dans les commerces de détail pour les « foodies; (Fread, 2014) » qui recherche des
expériences gustatives nouvelles et intéressantes. Différentes stratégies sont appliquées pour
contrôler les agents pathogènes dans les viandes afin de réduire les risques d'éclosion de toxi-
infections alimentaires et d’assurer la commercialisation de produits salubres. C’est donc
dans le but d’optimiser la qualité de la viande de lapin du Québec en utilisant des alternatives
naturelles aux additifs alimentaires de synthèse que le présent projet a été développé.
L’hypothèse initiale des expériences décrites dans cette thèse est que l'addition d’une
alimentation riche en polyphénols que des extraits de végétaux et d'huiles essentielles peut
moduler positivement le développement de la flore microbienne de la carcasse de lapin, mais

152
aussi la stabilité oxydative lors de l’entreposage de la viande de lapin. La stabilité oxydative
a été traitée par un étudiant à la maîtrise (Mohamed Zied Abdelwahed) et a donné des
résultats marquants qui ne sont pas traités ici. Au chapitre de la gestion de la microflore, les
sources de polyphénols étudiées n’ont donné que des résultats limités et sporadiques. Par
contre, l’étude avec la Micocin®, tout particulièrement les résultats avec la viande hachée
inoculée avec L. monocytogenes, indique que l’ajout de culture protectrice dans la ration des
animaux est meilleure approche.
Les travaux réalisés au cours du chapitre 3 ont porté sur l’addition d’extraits de plantes
(l’oignon, la fraise et la canneberge) et d’huiles essentielles à la ration des lapins à des doses
relativement faibles de 100 ppm soit 10 ppm de composés actifs correspondant à la dose
d’huiles essentielles (Xtract, Pancosma) autorisée en France chez le lapin pour une bonne
santé gastro-intestinale. Les résultats de cette étude ont démontré de faibles effets positifs et
sporadiques sur la qualité microbiologique; les meilleurs résultats ont été obtenus surtout en
conditions anaérobes et avec les huiles essentielles durant un entreposage réfrigéré (4°C).
Les réductions logarithmiques étant plutôt limitées (inférieur à 1 log) et sporadiques avec un
ajout de 100 ppm d’extrait ou d’huiles, une dose de supplémentation plus élevée (1000 ppm)
a été testée dans une seconde étude (chapitre 4). Dans celle-ci, des doses 5 à 10 fois plus
élevées ont été utilisées pour les extraits d’oignon, d’oignon et de canneberge en combinaison
ainsi que d’oignon et d’huiles essentielles. L’augmentation de la dose a permis d’atteindre
les cibles de réduction logarithmique de certains microorganismes (supérieur à 1 log) en
conditions aérobes et anaérobes dans la cuisse entreposée à 4°C, mais les résultats étaient
toujours sporadiques. Ces différences de plus d’un log ont été notamment observées en
conditions aérobes avec la combinaison d’extraits d’oignon et de canneberge et en conditions
anaérobes pour toutes les combinaisons sauf le groupe supplémenté avec 500 ppm d’extrait
d’oignon.
Contrairement à ce qui a été rapporté dans la littérature, aucune différence significative n’a
été observée sur les performances zootechniques dans les deux études (chapitre 3 et 4). Ces
résultats peuvent être expliqués par la faible pression d’infection découlant des conditions
environnementales contrôlées et favorables à un état de santé élevé dans lesquelles nos
expériences se sont déroulées. Des essais préliminaires en conditions commerciales avec

153
l’extrait d’oignon à haute dose (1000 ppm; données non présentées) n’ont pas révélés de
différence significative au niveau des performances non plus.
En somme, ces deux études font ressortir qu’il n’y a qu’une amélioration marginale au niveau
du contrôle microbien sur la carcasse et dans la viande, et cela ne justifie pas à la
supplémentation de la ration (marc de canneberge : 9,90 $/kg; extrait d’oignon à 10% de
polyphénols : 27$/kg selon Dianafood). Cependant, en ce qui concerne l’oxydation des
lipides et des protéines, un effet significatif réel et marqué est observé lorsque la viande
hachée, issues des mêmes lapins dont la ration a été supplémentée avec les combinaisons
d’extraits, a été entreposée à 4°C et analysée à différents jours d’entreposage (Mémoire de
recherche d’un étudiant de Mohamed Zied). Les effets positifs des suppléments de
polyphénols sur la qualité de la viande sont donc davantage au niveau des propriétés
antioxydantes qu’antimicrobiennes.
À la lumière du chapitre 5, l’ajout de Micocin®, une préparation commerciale constituée
d’une culture protectrice de Carnobacterium maltaromaticum CB1, dans l’alimentation des
lapins a donné de bien meilleurs résultats au niveau du contrôle microbien que ceux obtenus
avec l’ajout des sources de polyphénols. En effet, les résultats ont révélé que la culture
protectrice de mieux contrôler de développement des Enterobacteriaceae, des coliformes et
des Staphylococcus aureus présomptifs. Mais l’effet positif sur la gestion de la microflore le
plus marquée a été observé dans l’expérience où L. monocytogenes a été inoculé dans la
viande hachée puis entreposée en conditions anaérobes à 4°C; une réduction de 2 log a été
observée après un entreposage de 15 jours. Cette expérience a démontré que l’on peut
améliorer l’innocuité des produits de viande qui découlent des animaux d’élevage, ici le
lapin, en introduisant dans leur alimentation une culture protectrice.
Soulignons que dans les trois études, aucun effet négatif à l’incorporation des sources de
polyphénols ou de Micocin® dans la moulée des lapins n’a été observé. Les différentes
stratégies alimentaires étudiées n’ont pas eu d’impacts, négatifs ou positifs, sur les
performances zootechniques des animaux et sur la qualité de la viande en termes de perte à
la cuisson, perte d’égouttage et d'entreposage, les teneurs en lipides et en protéines. Des trois
études réalisées dans cette thèse, il en ressort que les extraits de végétaux riches en

154
polyphénols sont une meilleure stratégie pour contrôler l'oxydation alors que les cultures
protectrices le sont pour la qualité microbiologique.
6.2. Implications et perspectives futures
6.2.1. Le pouvoir antioxydant des extraits de végétaux et des huiles essentielles dans la
viande
Dans la programmation scientifique de notre équipe de recherche un étudiant à la maîtrise
travaillait sur les propriétés antioxydantes et moi sur les propriétés antimicrobiennes.
Cependant, j’ai participé à la mise au point du protocole sur la mesure de l’oxydation dans la
viande. Comme les polyphénols se sont révélés de meilleurs antioxydants que
d’antimicrobiens, d’autres études devront donc être réalisées afin de vérifier l’impact de la
supplémentation sur les qualités organoleptiques de la viande (la texture, la couleur et le goût)
et plus tard, sur la viande cuite, car les traitements thermiques accélèrent le phénomène
d’oxydation. Au Québec, l'alimentation des porcs est enrichie en vitamine E pour améliorer
la résistance de la viande à l'oxydation. L’idée ici est de trouver des alternatives moins
coûteuses et plus performantes que la vitamine E dont le prix s’élève à 12$/kg sur le marché
de l’alimentation porcine.
D'autres analyses sont à envisager pour étudier la biodisponibilité des polyphénols dans la
viande et déterminer les espèces moléculaires présentes. Cela permettrait de connaître le
métabolisme microbien des polyphénols et de déterminer si les effets mesurés sont dérivés
d'un effet prébiotique de ces composés chimiques ou de l'effet des métabolites.
6.2.2. Modulation de la microflore de la carcasse avec une culture protectrice commerciale
Micocin®
Nos recherches ont permis de démontrer que la modulation positive de la microflore par
l’incorporation de cultures protectrices dans les aliments du bétail est une avenue
prometteuse et novatrice pour améliorer l’innocuité et la qualité microbiologique des viandes
et des produits de viande. La preuve de concept a été faite en utilisant une préparation
commerciale de Carnobacterium maltaromaticum CB1 dans l’alimentation des lapins, et un
important industriel québécois nous a signalé son intérêt de valider la même approche dans
le porc. En premier lieu, d’autres souches ou mélange de souches pourraient être testés afin

155
d’optimiser l’effet bénéfique observé, tel que Carnobacterium divergens pour son activité
antimicrobienne démontrée dans la littérature et ayant une présomption d'innocuité reconnue
par l'Autorité Européenne de Sécurité des Aliments (EFSA). Ensuite, combiner ces souches
aux extraits de végétaux (à cause de leur activité antioxydante excellente) pourrait conduire
à une solution globale pour l’amélioration de la qualité. Subséquemment, une analyse des
propriétés organoleptiques de la viande issues de ces stratégies est à envisager de même que
pour les aspects technico-économiques, coûts/bénéfices inhérents à cette approche.
Carnobacterium maltaromaticum CB1 n’est pas particulièrement résistant aux pH acides
comme ceux de l’estomac. Toutefois, comme il a été incorporé directement dans la moulée,
une certaine protection a probablement été amenée par la matrice des granules de moulée.
L’encapsulation des cultures pour une meilleure survie et une libération ciblée lors du transit
gastro-intestinal pourrait sans doute augmenter l’efficacité du système (Atia et al., 2016). Il
est clair qu’on ne peut éliminer tous les microorganismes de l’environnement ni produire la
viande et les aliments dans des environnements stériles, cependant on peut avoir une nouvelle
approche qui consiste à cibler et éliminer les plus dangereux et laisser la microflore neutre se
développer. Nos résultats de recherches devront également être validés à grande échelle en
conditions commerciales afin d’en faire l’analyse technico-économique.

156
Références bibliographiques
AAFC. 2012. Agriculture and Agri-Food Canada. Rabbit supply Canada. Available at:
http://www.agr.gc.ca/redmeat/documents/13tbl38a_eng.pdf. (Consulté Janvier 2014).
ACIA. 2013. Agence canadienne d'inspection des aliments.
http://www.inspection.gc.ca/food/meat-and-poultry products/ program
changes/pathogen-reduction/questions-and answers/ eng/ 13388232503
06/1338823339887 (Consulté Janvier 2016.)
Ahn, C., et M. E. Stiles. 1990. Plasmid-associated bacteriocin production by a strain of
Carnobacterium piscicola from meat. Appl. Environ. Microbiol. 56: 2503-2510.
Ahn, J., I.U. Grun, et A. Mustapha. 2004. Antimicrobial and antioxidant activities of natural
extracts in vitro and in ground beef. J. Food Prot. 67: 48-55.
Ahn, J., I. U. Grün, et A. Mustapha. 2007. Effects of plant extracts on microbial growth, color
change, and lipid oxidation in cooked beef. Food Microbiol. 24:7-14.
Alasnier, C., H. Rémignon, et G. Getemer. 1996. Lipid characteristics associated with
oxidative and glycolytic fibers in rabbit muscles. Meat Sci. 43:213-224.
Allen, C. D., S. M. Russell, et D. L. Fletcher. 1997. The relationship of broiler breast meat
color and shelf-life and odor development. Poultry Sci.76: 1042-1046.
Allen, K., et D. Cornforth. 2010. Comparison of spice-derived antioxidants and metal
chelators on fresh beef color stability. Meat Sci. 85: 613-619.
Alma, A. D., E. Peña-Gonzalez, H. Janacua-Vidales, V. Santana, et J. A. Ortega. 2013. Meat
quality and lipid oxidation of pork after dietary supplementation with oregano essential
oil. World Appl. Sci. J. 21: 665-673.
Amber, K. H., H. M. Yakout, et R. S. Hamed. 2004. Effect of feeding diets containing yucca
extract or probiotic on growth, digestibility, nitrogen balance and caecal microbial
activity of growing New Zealand white rabbits, In: Proceedings of the 8th World Rabbit
Congress, 737-745.
Ammor, M. S., et B. Mayo. 2007. Selection criteria for lactic acid bacteria to be used as
functional starter cultures in dry sausage production: An update. Meat sci.76: 138-146.
An, B. K., J. Y. Kim, S. T. Oh, C. W. Kang, S. Cho, et S. K. Kim. 2015. Effects of Onion
Extracts on Growth Performance, Carcass Characteristics and Blood Profiles of White
Mini Broilers. Asian-Australas J. Anim. Sci. 28: 247-251.

157
Anhê, F. F., Y. Desjardins, G. Pilon, S. Dudonné, M. I. Genovese, F. M. Lajolo, et A.
Marette.2013. Polyphenols and type 2 diabetes: a prospective review.
PharmaNutrition.1 :105-114.
Anhê, F. F., D. Roy, G. Pilon, S. Dudonné, S. Matamoros, T. V. Varin, C. Garofalo, Q.
Moine, Y. Desjardins, E. Levy, et A. Marette.2014. A polyphenol-rich cranberry
extract protects from diet-induced obesity, insulin resistance and intestinal
inflammation in association with increased Akkermansia spp. population in the gut
microbiota of mice. Gut. 64 : 872-883.
AOAC. 1995. Official methods of Analysis of the Association of Official Analytical
Chemists, 15th Ed. AOAC, Arlington, VA. USA.
Apata E. S., T. S. Koleosho, C. O. Apata, et A. O. Okubanjo. 2012. Influence of sex and
processing methods on physicochemical and organoleptic quality of rabbit meat. Afr.
J. Food Sci. 6: 407-411.
Apostolidis, E., Y. I. Kwon, et K. Shetty. 2008. Inhibition of Listeria monocytogenes by
oregano, cranberry and sodium lactate combination in broth and cooked ground beef
systems and likely mode of action through proline metabolism. Int. J. Food Microbiol.
128: 317-324.
ASPC. 2013. Agence de la santé publique du Canada. Modalités canadiennes d’intervention
lors de toxi-infection d’origine alimentaire (MITIOA) 2010 en cas d’éclosion
multijuridictionnelle. http://www.phac-aspc.gc.ca/zoono/fiorp-mitioa/index-
fra.php#tdm6_2_1 (Consulté Avril 2013.)
ASPQ. 2015. Association pour la santé publique du Québec, Journée mondiale de la santé.
Aujourd’hui, 7 avril 2015, c’est la journée mondiale de la santé! Comment allons-nous?
http://www.aspq.org/documents/file/journee-mondiale-de-la-sante-7-avril-
2015_final.pdf (Consulté 20 Février 2016.)
Atia, A., A. Gomaa, I. Fliss, E. Beyssac, G. Garrait, et M. Subirade. 2016. A prebiotic matrix
for encapsulation of probiotics: physicochemical and microbiological study. J.
Microencapsul. 33 : 89-101.
Aubert, C., B. Greffard, G. Amand, et P. Ponchant. 2009. Élevage cunicole et environnement.
13ème Journée de la recherche cunicole, 17-18 Novembre, LeMans, France.
158
Barakat, R. K., M. W. Griffiths, et L. J. Harris. 2000. Isolation and characterization of
Carnobacterium, Lac-tococcus, and Enterococcus spp. from cooked, modified
atmosphere packaged, refrigerated, poultry meat. Inter. J. Food Microbiol. 62: 83-94.
Barbosa, L.N., V.L.M. Rall, A.A.H. Fernandes, P.I. Ushimaru, I.S. Probst, et A. Fernandes.
2009. Essential oils against foodborne pathogens and spoilage bacteria in minced meat.
Foodborne Pathog. Dis. 6: 725-728.
Bassolé, I. H., H.R. Juliani. 2012. Essential oils in combination and their antimicrobial
properties. Molecules 17: 3989-4006.
Basuny, A., S. Arafat, et S. Kamel. 2013. Polyphenolic compounds of eggplant peel juice as
a natural antioxidant for the stability of sunflower oil during deep-fat frying. Curr. Res.
Microbiol. Biotechnol. 1: 1-8.
BDC. 2013. Banque de développement du Canada. Planifier votre croissance : cinq
tendances de consommation qui changent la donne.
https://www.bdc.ca/Resources%20Manager/study_2013/etude_BDC_tendances_cons
ommation.pdf (Consulté Avril 2013.)
Bélanger, P., F. Tanguay, M. Hamel, et M. Phypers. 2015. Outbreak Report: an overview of
foodborne outbreaks in Canada reported through Outbreak Summaries: 2008-2014.
Canada Communicable Disease Report CCDR, vol. 41–11. Disponible sur:
http://www.phac-aspc.gc.ca/publicat/ccdr-rmtc/15vol41/dr-rm41-11/ar-01-eng. php.
Bergaoui, R., S. Kennou-Sebeï, et S. Fekih. 2010. Petits projets Cunicoles et développement
rural en Tunisie : Possibilités et limites. World Rabbit Sci. 9: 175-179.
Berger, R. G. 2007. Flavours and fragrance: chemistry, bioprocessing and sustainability
Berlin: Springer-Verlag, 439-455.
Bianchi, M., M. Petracci, L. Venturi, M. A. Cremonini, et C. Cavani. 2008. Influence of
preslaughter fasting on live weight loss, carcass yield and meat quality in rabbits. In:
Proc. 9th World Rabbit Congress, Verona, Italy, 1313–1318.
Biedrzycka, E., et R. Amarowicz. 2008. Diet and health: Apple polyphenols as antioxidants.
Food. Res. Int. 24: 235-251.
Bízková Z., Tůmová E. 2010. Physical characteristics of rabbit meat: a review. Scienta
Agriculturae Bohemica., 4: 236-246.

159
Blasco, A., et J. Ouhayoun. 1996. Harmonization of criteria and terminology in rabbit meat
research. Revised proposal. World Rabbit Sci., 4: 93-99.
Blasco, A., et M. Piles. 1990. Muscular pH of the rabbit. Ann. Zootech., 30: 133-136.
Bobbitt, J. 2002. Shelf life and microbiological safety of selected new and emerging meats.
Rural Industries Research and Development Corporation RIRDC, 8.
file:///C:/Users/Utilisateur/Downloads/02-038.pdf (Consulté Janvier 2015.)
Bornert, G. 2000. Importance des bactéries psychotrophes en hygiène des denrées
alimentaires. Revue Méd. Vét.151 : 1003-1010.
Botsoglou, N. A., E. Christaki, D. J. Fletouris, P. Florou-Paneri, et A.B. Spais. 2002. The
effect of dietary oregano essential oil on lipid oxidation in raw and cooked chicken
during refrigerated storage. Meat Sci. 62: 259-265.
Botsoglou N.A., A. Govaris, E.N. Botsoglou, S.H. Grigoropoulou, et G. Papageorgiou. 2003.
Antioxidant activity of dietary oregano essential oil and α-tocopheryl acetate
supplementation in long-term frozen stored turkey meat. J. Agric. Food Chem., 51:
2930-2936.
Botsoglou N.A., P. Florou-Paneri, E. Christaki, I. Giannenas, et A.B. Spais. 2004.
Performance of rabbits and oxidative stability of muscle tissue as affected by dietary
supplementation with oregano essential oil. Archives Anim, Nutr., 58: 209-218.
Bouvard, V., D. Loomis, K.Z. Guyton, Y. Grosse, F. El Ghissassi, L. Benbrahim-Tallaa, N.
Guha, H. Mattock, et K. Straif. 2015. Carcinogenicity of consumption of red and
processed meat. Lancet Oncol.16: 1599-1600.
Brenes, A., Viveros, A., Chamorro, S., & Atija., I. 2015. Use of polyphenol-rich grape by-
products in monogastric nutrition. A review. Anim. Feed Scie.Techn., 211: 1-17.
Brewer, M. S., S. G. Zhu, B. Bidner, D. J. Meisinger, et F. K. MCkeith. 2001. Measuring
pork color: effects of bloom time, muscle, pH and relationship to instrumental
parameters. Meat Sci.57: 169-176.
Brichta-Harhay, D.M., T.M. Arthur, J.M. Bosilevac, M.N. Guerini, N. Kalchayanand, et M.
Koohmaraie. 2007. Enumeration of Salmonella and Escherichia coli O157:H7 in
ground beef, cattle carcass, hide and fecal samples using direct plating methods. J.
Appl. Microbiol., 103:1657-1668.

160
Buchanan, R., et R. Oni. 2012. Use of Microbiological Indicators for Assessing Hygiene
Controls for the Manufacture of Powdered Infant Formula. J. Food Protect.,75: 989-
997.
Brul, S., et P. Coote. 1999. Preservative agents in foods. Mode of action and microbial
resistance mechanisms. Int. J. Food. Microbiol. 50: 1-17.
Burt, S. 2004. Essential oils: their antibacterial properties and potential applications in foods
– a review. Int. J. Food Microbiol., 94: 223-253.
Byrne, D.V., W.L.P. Bredie, L.S. Bak, G. Bertelsen, H. Martens, et M. Martens. 2001.
Sensory and chemical analysis of cooked porcine meat patties in relation to warmed-
over flavour and pre-slaughter stress. Meat Sci. 59: 229-249.
CAC. 2005. Codex Alimentarius Commission. Code of Hygienic practices for meat.
www.fao.org/input/download/standards/10196/CXP_058e.pdf (Consulté Décembre
2016.)
Cailliez-Grimal, C., H. C. Edima, H. M. Revol-Junelles, et J. B. Millière. 2007.
Carnobacterium maltaromaticum: the only Carnobacterium species in french ripened
soft cheeses as revealed by polymerase chain reaction detection. J. Dairy Sci. 90: 1133-
1138.
Cannata, S., S. Ratti, K. Meteau, J. Mourot, P. Baldini, et C. Corino. 2010. Evaluation of
different types of dry-cured ham by Italian and French consumers. Meat Sci.84: 601-
606.
Caplice, E., et G. F. Fitzgerald. 1999. Food fermentations: role of microorganisms in food
production and preservation. Int J Food Microbiol. 50: 131-149.
Cardinali, R., A. Dal Bosco, C., Mugnai, S. Mattioli, S. Ruggeri, A. Dalle Zotte, A. Sartori,
M. Cullere, et C. Castellini. 2012. Effect of different dietary aromatic essences on meat
quality of rabbit. In Proc.: 10th World Rabbit Congress, 3-6 September, 2012, Sharm
El-Sheikh, Egypt. 6: 925- 929.
Cardinali, R., B. Cullere, A. Dal Bosco, C. Mugnai, S. Ruggeri, S. Mattioli, C. Castellini,
M. Trabalza Marinucci, Et A. Dalle Zotte. 2015. Oregano, rosemary and vitamin E
dietary supplementation in growing rabbits: Effect on growth performance, carcass
traits, bone development and meat chemical composition. Livest. Sci., 175: 83-89.

161
Casaburi, A., A. Nasi, I. Ferrocino, R. Di Monaco, G. Mauriello, F. Villani, et D. An Ercolini.
2011. Spoilage-Related Activity of Carnobacterium maltaromaticum Strains in Air-
Stored and Vacuum-Packed Meat. Appl. Environ. Microbiol. 77: 7382-7393.
CCAC. 2009. The care and use of farm animals in research, teaching and testing. Ottawa, ON.
Canadian Council on Animal Care. Disponible sur: http: //www.ccac.ca
/Documents/Standards/ Guidelines/Farm_ Animals.pdf. (Consulté Mai 2014.)
Ceylan, E., et D. Y. C. Fung. 2004. Antimicrobial activity of spices. J. Rapid. Meth. Aut.
Mic., 12: 1-55.
CFIA, Canadian Food Inspection Agency. 2013. http://www.phac
aspc.gc.ca/about_apropos/evaluation/reports-rapports/2011-2012/ fei pdra-
pdimeoa/findings-resultats-eng.php. (Consulté Mai 2015.)
Chenoll, E., M.C. Macian, P. Elizaquıvel, et R. Aznar. 2007. Lactic acid bacteria associated
with vacuum-packed cooked meat product spoilage: population analysis by rDNA-
based methods. J. Appl. Microbiol. 102:498-508.
Chouliara, E., A. Karatapanis, I.N. Savvaidis, et M.G. Kontominas. 2007. Combined effect
of oregano essential oil and modified atmosphere packaging on shelf-life extension of
fresh chicken breast meat, stored at 4 degrees C. Food Microbiol. 24: 607-17.
Chi-Tang, H., et M. Wang. 2013. Dietary Phenolics as Reactive Carbonyl Scavengers:
Potential Impact on Human Health and Mechanism of Action. J. Tradit. Complement
Med. 139-141.
Chu, Y. H., C.L. Chang, et H.F. Hsu. 2000. Flavonoid content of several vegetables and their
antioxidant activity. J. Sci. Food. Agric. 80:561-566.
CIE, International Commission on Illumination. 1976. Colorimetry, Publication 15, Bureau
Central de la CIE, Vienna, Austria. http://www.cie.co.at/.
CIE. 2004. International Commission on Illumination. Colorimetry. Publication 15. 3rd
edition, Bureau Central de la CIE.
Cillard, J., et P. Cillard. 2006. Mécanismes de la peroxydation lipidique et des anti-
oxydations. OCL 13: 24-29.
Cliche, R., 2010. Monographie de l’industrie cunicole au Québec - MAPAQ. Available at:
http://www.mapaq.gouv.qc.ca/fr/publications/Monographie_cunicole_br.pdf.
(Consulté Mars 2013.)
162
Cliche, R. 2015. Monographie de l’industrie cunicole au Québec - MAPAQ.
http://www.mapaq.gouv.qc.ca/fr/publications/Monographie_cunicole_br.pdf
(Consulté Mars 2016.)
CMC. 2012. Canada Meat Council. Statistiques de l’industrie. http://www.cmc-
cvc.com/fr/%C3%A0-propos-de-nous/statistiques-de l%E2% 80%99 industrie
/statistiques-de-lindustrie (Consultée janvier 2016.)
CMC. 2016. Canada Meat Council. La viande…Bonne pour vous. Bonne pour le Canada.
http://www.cmc-cvc.com/fr/node/16 (Consulté Décembre 2016.)
Collin, S., et J. Crouzet. 2011. Polyphénols et procédés. Transformation des polyphénols au
travers des procédés appliqués à l'agroalimentaire. Directeur de Collection : Agence
Universitaire de la Francophonie. Eds. Lavoisier.
Collins, M. D., et G. R. Gibson. 1999. Probiotics, prebiotics, and synbiotics: approaches for
modulating the microbial ecology of the gut. Am. J. Clin. Nutr. 69: 1042S–1057S.
Combes, S. 2004.Valeur nutritive de la viande de lapin. INRA. Prod. Anim. 17: 373-383.
Combes, S., et A. Dalle Zotte. 2005. La viande de lapin : valeur nutritionnelle et particularités
technologiques. 11èmes Journées Rech. Cunicole 167-180.
Copeland, R. D., M. R. McVay, S. M. Dassinger, R. J. Jackson, et D.S. Smith. 2009. Probiotic
fortified diet reduces bacterial colonization and translocation in a long-term neonatal
rabbit model. J. Pediatr. Surg. 44:1061-1064.
Cross, D. E., R. M. McDevitt, K. Hillman, et T. Acamovic. 2007. The effect of herbs and
their associated essential oils on performance, dietary digestibility and gut microflora
in chickens from 7 to 28 days of age. Brit. Poultry Sci., 48: 496-506.
Dabbou, S., L. Gasco, F. Gai, I. Zoccarato, L. Rotolo, S. Dabbou Fekih, A. Brugiapaglia,
A.N. Helal, et P.G. Peiretti. 2014. Dried artichoke bracts in rabbits nutrition: effects on
the carcass characteristics, meat quality and fatty-acid composition. Animal., 8: 1547-
1553.
Daglia, M. 2012. Polyphenols as antimicrobial agents. Curr. Opin. Chem. Biol. 23: 174-181.
Dainty, R. H., et B.M. Mackey. 1992. The relationship between the phenotypic properties
of bacteria from chill-stored meat and spoilage processes. Soc. Appl. Bacteriol. Symp.
Ser. 21: 103S-14S.

163
Dal Bosco, A., C. Castellini, et M. Bernardini. 1997. Effect of transportation and stunning
method on some characteristics of rabbit carcasses and meat. World Rabbit Sci. 5: 115-
119.
Dalle-Donne, I., R. Rossi, R. Colombo, D. Giustarini, et A. Milzani. 2006. Biomarkers of
oxidative damage in human disease. Clin. Chem. 52: 601-623.
Dalle Zotte, A. 2000. Propriétés spécifiques de la viande de Lapin. Jornadas internacionales
de cuniculture, Vila Real (Portugal).
Dalle Zotte, A. 2002. Perception of rabbit meat quality and major factors influencing the
rabbit carcass and meat quality. Livest. Prod. Sci. 75: 11-32.
Dalle-Zotte, A. 2004. Le lapin doit apprivoiser le consommateur. Viandes et Produits Carnes
23 : 161-167.
Dalle Zotte A., M. Cullere, A. Sartori, A. Dal Bosco, Zs. Gerencsér, Zs. Matics, M. Kovàcs,
et Zs. Szendrő. 2014. Effect of dietary supplementation of spirulina (Arthrospira
platensis) and thyme (Thymus vulgaris) on carcass composition, meat physical traits,
and vitamin B12 content on growing rabbits. World Rabbit Sci., 22: 11-19.
Dalle Zotte, A., C. Celia, et Zs. Szendrő. 2016. Herbs and spices inclusion as feedstuff or
additive in growing rabbit diets and as additive in rabbit meat: a review. Livest. Sci.,
189: 82-90.
Dalle Zotte, A., et Z. Szendrő. 2011. The role of rabbit meat as functional food. Meat Sci.
88: 319-331.
Dalloul, R. A., H.S. Lillehoj, T.A. Shellem, et J.A. Doerr. 2003. Enhanced mucosal immunity
against Eimeria acervulina in broilers fed a Lactobacillus based probiotic. Poult. Sci.
82: 62-66.
Danielski, G. M., H. I. Pedro, G. Daube, R. E. Freitas de Macedo, et A. Clinquart. 2017. in
vitro evaluation of the competing effect of carnobacterium maltaromaticum isolated
from vacuum packed meat against food pathogens. IcoMST 2017.
http://orbi.ulg.ac.be/handle/2268/214473
D’Archivio, M., C. Filesi, R. Varì, B. Scazzocchio, et R. Masella. 2010. Bioavailability of
the Polyphenols: Status and Controversies. Int. J. Mol. Sci.11: 1321-1342.
Dave, D., et A. E. Ghaly. 2011. Meat spoilage mechanisms and preservation techniques: a
critical review. Am. J. Agri. & Biol. Sci. 6: 486-510.

164
Dawn-Linsley, M., F. J. Ekinci, D. Ortiz, E. Rogers, et T.B. Shea. 2005. Monitoring
thiobarbituric acid-reactive substances (TBARS) as an assay for oxidative damage in
neuronal cultures and central nervous system. J. Neurosci. Methods 141: 219-222.
De Buyser, M. L., B. Dufour, M. Maire, et V. Lafarge. 2001. Implication of milk and milk
products in food-borne diseases in France and in different industrialised countries. Int.
J. Food Microbiol. 67: 1-17.
DeWall, C. S., et N. Robert. 2005. Global and Local: Food Safety Around the World.
https://www.cspinet.org/new/pdf/global.pdf.
DGSAIA, Direction générale de la santé animale et de l’inspection des aliments du MAPAQ.
2011. Manuel des méthodes d’inspection des abattoirs.
http://www.mapaq.gouv.qc.ca/fr/Publications/Manueldesmethodes_inspectionabattoir
s.pdf.
DGSAIA, Direction générale de la santé animale et de l’inspection des aliments du MAPAQ.
2012. Bilan annuel toxi-infections alimentaires. Direction générale de la santé animale
et de l'inspection des aliments – Direction du soutien à l’inspection. Disponible sur:
http://www.mapaq.gouv.qc.ca/fr/Publications/Bilan_toxi-infections20112012.pdf.
(Consulté Mars 2013.)
Dibner, J. J., et J. D. Richards. 2005. Antibiotic growth promoters in agriculture: history and
mode of action. Poultry Sci. 84: 634-643
Dickens, J. A., M. E. Berrang, et N. A. Cox. 2000. Efficacy of an herbal extract on the
microbiological quality of broiler carcasses during a simulated chill. Poultry Sci. 79:
1200-1203.
Dinesh, D. J., et J. Cheorun. 2013. Essential oils as potential antimicrobial agents in meat
and meat products: A review. Trends in Food Science & Technology 34: 96-108.
Dressman, J. B., R. R. Berardi, L. C. Dermentzoglou, T. L. Russell, S. P. Schmaltz, J. L.
Barnett, et K. M. Jarvenpaa. 1990. Upper gastrointestinal (GI) pH in young, healthy
men and women. Pharm.Res.7: 756-761.
Dudonné, S., P. Dubé, G. Pilon, A. Marette, H. Jacques, J. Weisnagel, et Y. Desjardins. 2014.
Modulation of Strawberry/Cranberry Phenolic Compounds Glucuronidation by Co-
Supplementation with Onion: 99 Characterization of Phenolic Metabolites in Rat

165
Plasma Using an Optimized μSPE-UHPLC-MS/MS Method. J. Agric. Food Chem. 62:
3244-3256.
Dudonné, S., P. Dubé, F. F. Anhê, G. Pilon, A. Marette, M. Lemire, C. Harris, E. Dewailly,
et Y. Desjardins. 2015. Comprehensive analysis of phenolic compounds and abscisic
acid profiles of twelve native Canadian berries. J. Food Compos. Anal., 44: 214-224.
Duthie, G. G., S. J. Duthie, et J. A. M. Kyle. 2000. Plant polyphenols in cancer and heart
disease: implications as nutritional antioxidants. Nutr. Res. Rev.13: 79-106.
Džinić, N., N. Puvača, T. Tasić, P. Ikonić, et D. Okanović. 2015. How meat quality and
sensory perception is influenced by feeding poultry plant extracts. 2015. World's Poult.
Sci. J. 71 :673-682.
Dzudie, T., C. P. Kouebou, J. J. Essia-Ngang, et C. M. F. Mbofung. 2004. Lipid sources and
essential oils effects on quality and stability of beef patties. J. Food Eng. 65: 67-72.
Egan, K., D. Field, M.C. Rea, R. P. Ross, C. Hill, et P.D. Cotter. 2016. Bacteriocins: Novel
Solutions to Age Old Spore-Related Problems? Front. Microbiol.7: 1-21.
Elgayyar, M., F. A. Draughon, D. A. Golden, et J. R. Mount. Antimicrobial Activity of
Essential Oils from Plants against Selected Pathogenic and Saprophytic
Microorganisms. 2001. J. Food. Prot. 64 :1019-1024.
Erdman, J. W., D. Balentine, L. Arab, G. Beecher, J.T. Dwyer, J. Folts, J. Harnly, P. Hollman,
C.L. Keen, G. Mazza, M. Messina, A. Scalbert, J. Vita, G. Williamson, et J. Burrowes.
2007. Flavonoids et heart health: proceedings of the ILSI North America Flavonoids
Workshop, Washington, DC. J. Nutr. 137: 718S-737S.
Ermis, B., A. Yildirim, R. Örs, A. Tastekin, B. Ozkan, et F. Akcay. 2005. Influence of
smoking on serum and milk malondialdehyde, superoxide dismutase, glutathione
peroxidase, and antioxidant potential levels in mothers at the postpartum seventh
day. Biol. Trace Elem. Res. 105: 27-36.
Eskin, N.A.M. 1990. Biochemical changes in raw foods: meat and fish. In Biochemistry of
foods, 2nd Edn. Academic press, San Diego, 3-68.
Estévez, M. 2011. Protein carbonyls in meat system: A review. Meat Sci. 89: 259-279.
Ezema, C., et C. Eze. 2012. Determination of the effect of probiotic (Saccharomyces
cerevisiae) on growth performance and hematological parameters of rabbits. Comp.
Clin. Path. 21: 73-76.
166
FDA, Food and Drug Administration. 2009. Carnobacterium maltaromaticum CB 1 GRAS
Notification. http://www.fda.gov/downloads/ Food/IngredientsPackaging
Labeling/GRAS/NoticeInventory/ucm269418.pdf.
Fan, X., D. Sell, J. Zhang, I. Nemet, M. Theves, J. Lu, C. Strauch, M. Halushka, et V.
Monnier. 2010. Anaerobic vs aerobic pathways of carbonyl and oxidant stress in
human lens and skin during aging and in diabetes: A comparative analysis. Free. Radic.
Biol. Med. 49: 847-856.
FAO. 1996. Le lapin : Élevage et pathologie.
http://www.fao.org/docrep/014/t1690f/t1690f.pdf (Consulté Août 2017).
FAO. 2010. Organisation des Nations Unies pour l'alimentation et l'agriculture. Élevage du
lapin et développement rural. http://www.fao.org/docrep/014/t1690f/t1690f09.pdf
(Consulté Janvier 2015.)
FAO. 2015. Organisation des Nations Unies pour l'alimentation et l'agriculture. L’état de
l’insécurité alimentaire dans le monde. http://www.fao.org/3/a-i4646f.pdf (Consulté
Avril 2016.)
FAO. 2016. Organisation des Nations Unies pour l'alimentation et l'agriculture.
http://www.fao.org/news/story/fr/item/168526/icode/ (Consulté Décembre 2016.)
FAO. 2017. Organisation des Nations Unies pour l'alimentation et l'agriculture. Guidelines
for slaughtering meat cutting and further processing: General hygiene principles for
meat handling. http://www.fao.org/docrep/004/T0279E/T0279E03.htm (Consulté
Novembre 2016.)
FAO et OMS. 2002. Organisation des Nations Unies pour l'alimentation et l'agriculture et
Organisation Mondiale de la Santé. Statistiques sur les maladies d'origine alimentaire
en Europe - Risques microbiologiques et chimiques. http://www.fao.org/3/a-
x6865f.pdf (Consulté Novembre 2015.)
FAO et OMS. 2001. Organisation des Nations Unies pour l'alimentation et l'agriculture et
Organisation Mondiale de la Santé. Health and nutrition properties of probiotics in food
including powder milk with live lactic acid bacteria. http://www.fao.org/3/a-
a0512e.pdf (Consulté Décembre 2016.)
Faucitano, L., et N. A. Geverink. 2008. Effects of preslaughter handling on stress response
and meat quality in pigs. In: L. Faucitano, and A. L. Schaefer (eds.) Welfare of Pigs:

167
from Birth to Slaughter, Wageningen Academic Publ., Wageningen, The Netherlands.
p. 197-215.
Faucitano, L., P. Chevillon, et M. Ellis. 2010. Effects of feed withdrawal prior to slaughter
and nutrition on stomach weight, and carcass and meat quality in pigs. Livest Sci. 127:
110-114
Faucitano, L., M. C. Ielo, C. Ster, D. P. Lo Fiego, S. Methot, et L. Saucier. 2010. Shelf life
of pork from five different quality classes. Meat Sci., 84: 466-469.
Fedrigo, M. A., D. Pivato, et P. Traldi. 1999. Qualitative and quantitative analysis of lipid
extracts from rabbit meat by gas chromatography/mass spectrometry. Rapid Commun.
Mass Spectrom.13: 2216-2222.
Fei, L., L. Hao, Y. Qipeng, et L. Chunfang. 2011.Effets antimicrobiens in vitro et mécanisme
d'action des combinaisons d'huiles essentielles végétales sélectionnées contre quatre
microorganismes d'origine alimentaire. Rés. Alimentaire Int. 44 : 3057-3064.
Feingold, B. F.1982. The role of diet in behaviour. Ecol. Dis. 1: 153-165.
Fernandez, X. et E. Tornberg. 1991. A review of the causes of variation in muscle glycogen
content and ultimate pH in pigs. J. Muscle Foods 2: 209-235.
Field, D., P. D. Cotter, R. P. Ross, et C. Hill. 2015. Bioengineering of the model lantibiotic
nisin. Bioengineered 6: 187-192.
Filgueras, R., P. Gatellier, L. Aubry, A. Thomas, D. Bauchart, D. Duret, R. Zambiazi, et V.
Santé-Lhoutellier. 2010. Colour, lipid and protein stability of Rhea americana meat
during air - et vacuum-packaged storage: Influence of muscle on oxidative processes.
Meat Sci. 86: 665-673.
Font-i-Furnols, M., et L. Guerrero. 2014. Consumer preference, behavior and perception
about meat and meat products: An overview. Meat Sci. 98: 361-371.
Fortier, M. P., L. Saucier, et F. Guay. 2012. Effects on microbial quality of fresh pork loin
during storage from oregano oil and cranberry pulp diet supplementation in pigs. Can.
J. Anim. Sci 92: 465-471.
Fratianni F., L. De Martino, A. Melone, V. De Feo, R. Coppola, et F. Nazzaro. 2010.
Preservation of chicken breast meat treated with thyme and balm essential oils. J. Food
Sci.75: 528-535.

168
Fraysse, J. L., et Darre, A. 1989. Production des viandes. Sur quelles bases économiques?
Collections Agriculture d'aujourd'hui, Sciences, techniques, applications, Vol. I.
(Eds.), Technique et documentation, Lavoisier, Paris (pp. 374.).
Fread, G. (2014). Strategic planning analysis – Part III. Food in Canada.
http://www.foodincanada.com/opinions/strategic-planning-analysis-part-iii/.
Fread, G. 2015. Market trends that will drive our national food strategy. Food in Canada.
http://www.foodincanada.com/opinions/market-trends-that-will-drive-our-nationa l-
food-strategy/
Fu, M., K. Wellsknecht, J. Blackledge, T. Lyons, S. Thorpe, et J. Baynes. 1994. Glycation,
glycoxidation, and cross-linking of collagen by glucose - kinetics, mechanisms, and
inhibition of late stages of the maillard reaction. Diabetes 43: 676-683.
Galvéz, A., H. Abriouel, R. Lucas López, et N. Ben Omar. 2007. Bacteriocin-based strategies
for food biopreservation. Int. J. Food Microbiol.120: 51-70.
Galvez, A., R. L. Lopez, H. Abriouel, E. Valdivia, et N. B. Omar. 2008. Application of
bacteriocins in the control of food-borne pathogenic and spoilage bacteria. Crit. Rev.
Biotechnol. 28: 125-152.
Gänzle, M. G., C. Hertel, et W. P. Hammes. 1999. Resistance of Escherichia coli and
Salmonella against nisin and curvacin A. Int. J. Food Microbiol. 48: 37-50.
Gandemer, G., 1998. Lipids and meat quality, lipolysis, oxidation and flavour. Proc. 44th
International Congress of Meat Science and Technology (IcoMST), Spain, 106-119.
Gandemer, G., V. Scislowski, C. Duchène, et A. Kondjoyan. 2013. Cooking losses of juice,
heme iron, B3 and B6 vitamins in beef meat as related to cooking practices –
consequences on nutritional value of meat. 59th International Congress of Meat
Science and Technology, 18-23rd August, Izmir, Turkey.
Gatellier, P., T. Sayd, A. Promeyrat, M. Gobert, C. Chambon, et V. Santé-Lhoutellier. 2014.
Identification de marqueurs protéomiques prédictifs de l’oxydation des viandes. La
revue scientifique Viandes & Produits Carnés, 1-5.
Gerencsér, Zs., Zs. Szendro, Zs. Matics, I. Radnai, M. Kovács, I. Nagy, A. Dal Bosco, et A.
Dalle Zotte. 2012. Dietary supplementation of Spirulina (Arthrospira platensis) and
Thyme (Thymus vulgaris L.) – Part 1: effect on productive performance of growing
rabbits, in: 10th World Rabbit Congress, Sharm El-Sheikh, Egypt, 657-666.

169
Giannenas, I., P. Florou-Paneri, M. Papazahariadou, E. Christaki, N. A. Botsoglou, et A. B.
Spais. 2003. Dietary oregano essential oil supplementation on performance of broilers
challenged with Eimeria tenella. Arch. Anim. Nutr. 57: 99-106.
Gidenne, T. 2006. La filière cunicole française-Avicampus, Institut National de la Recherche
Agronomique, http://www.avicampus.fr/PDF/PDFlapin/filierecunicole.PDF.
(Consulté Décembre 2016.)
Gill, C. O. 1983. Meat spoilage and evaluation of the potential storage life of fresh meat. J.
Food. Prot. 46: 444-452.
Gill, C. O. 1976. Substrate limitation of bacterial growth at meat surfaces. J. Appl. Bacteriol.
41: 401-410.
Gill, C. O., et G. G. Greer. 1993. Enumeration and identification of meat spoilage bacteria.
Technical bulletin 1993-8E, Research Branch, Minister of Supply and Services
Canada.
Gill, C. O., et K. G. Newton. 1978. The oncology of bacterial spoilage of fresh meat at chill
temperatures. Meat Sci. 2: 207-217.
Gill, C.O., et M. P. Reichel. 1989. Growth of the cold tolerant pathogens Yersinia
enterolitica, Aeromonas hydrophila and Listeria monocytogenes on high-pH beef
packaged under vacuum or carbon dioxide. Food Microbiol.6: 223-230.
Gill, C. O., et N. Penney. 1986. Packaging conditions for extended storage of chilled dark,
firm, dry beef. Meat Sci. 18: 41-53.
Gill, C. O. 2000. HACCP in primary processing: red meat. Pages 81-122 In: HACCP in the
meat industry. Martyn Brown (ed.). CRC Press, Boca Raton, FL, USA, 81-122.
Gladine, C., C. Morand, E. Rock, D. Gruffat, D. Bauchart, et D. Durand. 2007. The
antioxidative effect of plant extracts rich in polyphenols differs between liver and
muscle tissues in rats fed n-3 PUFA rich diets. Anim. Feed Sci. Tech. 139: 257-272.
Gobert, M., B. Martin, A. Ferlay, Y. Chilliard, P. Graulet, D. PraDuradet, D. Bauchart, et D.
Durand. 2008. Plant extracts rich in polyphenols and vitamin E protect cows fed an n-
3 PUFA-rich diet against lipoperoxidation. Proc. Nutr. Soc. In press.
Godard, G., et A-S. Reynders. 2014. Journal Terre n°147 - L'économie sociale ne badine pas
avec la nourriture. http://fr.calameo.com/books/00034261212597fece9c7 (Consulté
Novembre 2016.)

170
Goetz, P., et K. Ghédira. 2012. Phytothérapie anti-infectieuse. Collection Phytothérapie
pratique.
Goktepe, I. 2006. Probiotics as biopreservatives for enhancing food safety. In I. Goktepe, V.
K. Juneja, & M. Ahmedna (Eds.), Probiotics in food safety and human health (pp. 285-
307). CRC, Taylor & Francis group.
González, H. M., W. Yien, V. A. Castrillon, et P. A. Ortega. 2013. Adición de
Carnobacterium maltaromaticum CB1 en chorizo y morcilla empacados al vacio, para
inhibir el crecimiento de Listeria monocytogenes. Vitae, 20: 23-29.
Govaris, A., E. Botsoglou, P. Florou-Paneri, A. Moulas, et G. Papageorgiou. 2005. Dietary
supplementation of oregano essential oil and a-tocopheryl acetate on microbial growth
and lipid oxidation of turkey breast fillets during storage. Int. J. Poult. Sci. 4: 969-975.
Greer, G. G., 1989. Red meat, poultry, and fish. In: McKellar R.C. (ed). Enzymes of
psychotrophs in raw food. CRC Press, Inc., Boca Raton, FL, USA, 267-292.
Griffiths, G., L. Trueman, T. Crowther, T. Brian, et S. Brian. 2002. Onions-a global benefit
to health. Phytother. Res. 16:603-615.
Guerrero-Legarreta, I., R. Mendiolea, et E. Ponce. 1995. Inoculation of lactic acid bacteria
on meat surfaces as a means of decontamination in semitropical conditions. Meat Sci.
40: 397-411.
Gutierrez, J., C. Barry-Ryan, et P. Bourke. 2008. The antimicrobial efficacy of plant essential
oil combinations and interactions with food ingredients. Int. J. Food Microbiol. 124:91-
97.
Hammes, W., et C. Hertel. 2003. The general Lactobacillus and Carnobacterium. In: M.
Dworkin, (Eds.), The Procaryotes: An Evolving Electronic Resource for the
Microbiological Community (pp. 320–403). New York: Springer-Verlag.
Haleng, J., J. Pincemail, J.O. Defraigne, C. Charlier, et J. Chapelle. 2007. Le stress oxydant.
Rev. Med. Liege 62: 628-328.
Harrington, R. 2011. Company eyes European approval for ‘revolutionary’ anti-listerial
ingredient. FoodProductiondaily.com: http://www.foodproductiondaily.com/Quality-
47 Safety/Company-eyes-European-approval-for-revolutionary-anti-listeria-
ingredient. (Consulté Novembre 2016.)

171
Health Canada. 2001. Determination of the aerobic colony count of foods, MFHPB-18. The
compendium of analytical methods (Vol. 2). Disponible sur: http://www.hc-
sc.gc.ca/fn-an/res-rech/analy-meth/microbio/volume2-eng.php. (Consulté Janvier
2014.)
Health Canada. 2004. Enumeration of Staphylococcus aureus in Foods and Environmental
Samples Using 3M™ Petrifilm™ Staph Express Count (STX) Plates, MFLP-21. The
compendium of analytical methods (Vol. 3). Disponible sur: http://www.hc-
sc.gc.ca/fn-an/res-rech/analy-meth/microbio/volume3-eng.php. (Consulté Janvier
2014.)
Health Canada. 2007. Enumeration of Enterobacteriaceae species in Food and
Environmental Samples Using 3M™ Petrifilm™ Enterobacteriaceae Count Plates,
MFLP-09. The compendium of analytical methods (Vol. 3). Disponible sur:
http://www.hc-sc.gc.ca/fn-an/res-rech/analy-meth/microbio/volume3-eng.php.
(Consulté Janvier 2014.)
Health Canada. 2010. Information Document on Health Canada’s Proposal to Amend the
Food et Drug Regulations to permit the use of a microbiological preparation of
Carnobacterium maltaromaticum strain CB1 in certain ready-to-eat meat et poultry
products. Disponible sur: http://www.hc-sc.gc.ca/fn-
an/consult/_carnobacterium_maltaromaticum/summary-sommaire-eng.php. (Con
sulté Janvier 2014.)
Health Canada. 2011. Isolation of Listeria monocytogenes and other Listeria spp. from foods
and environmental samples, MFHPB-30. The compendium of analytical methods (Vol.
2). Disponible sur: http://www.hc-sc.gc.ca/fn-an/res-rech/analy-
meth/microbio/volume2-eng.php (Consulté Janvier 2014.)
Health Canada. 2013. Enumeration of Escherichia coli and Coliforms in Food Products and
Food Ingredients Using 3M™ Petrifilm™ E. coli Count Plates (volume 2), MFHPB-
34. The compendium of analytical methods (Vol. 2). Disponible sur: http://www.hc-
sc.gc.ca/fn-an/res-rech/analy-meth/microbio/volume2-eng.php. (Consulté Janvier
2014.)

172
Henning, C., P. Vijayakumar, R. Adhikari, B. Jagannathan, D. Gautam, et P. M. Muriana.
2015. Isolation and Taxonomic Identity of Bacteriocin-Producing Lactic Acid Bacteria
from Retail Foods and Animal Sources. Microorganisms 3: 80-93.
Hernández, P., et F. Gondret. 2006. Rabbit Meat Quality. In: Maertens L., Coudert P. (Eds.),
Recent Advances in Rabbit Sciences, ILVO, Merelbeke, Belgium, 269-290.
Hocquette, J. F., I. Ortigues-Marty, M. Damon, P. Herpin, et Y. Geay. 2000. Métabolisme
énergétique des muscles squelettiques chez les animaux producteurs de viande. INRA
Prod. Anim., 13: 185-200.
Hoffman, K. 1994. What is quality? Definition, measurement and evaluation of meat quality.
Meat Focus Int., 3: 73-82
Hollman, P. C., A. Cassidy, B. Comte, M. Heinonen, M. Richelle, E. Richling, M. Serafini,
A. Scalbert, H. Sies, et S. Vidry. 2011.The biological relevance of direct antioxidant
effects of polyphenols for cardiovascular health in humans is not established. J.
Nutr.141:989S-1009S.
Holmer, S. F., R. O. McKeith, D. D. Boler, A. C. Dilger, J. M. Eggert, D. B. Petry, F. K.
McKeith, K. L. Jones, et J. Killefer. 2009. The effect of pH on shelf-life of pork during
aging and simulated retail display. Meat Sci., 82: 86–93.
Hu, F. B., et W.C. Willett. 2002. Optimal diets for prevention of coronary heart disease.
JAMA. 288: 2569-2578.
Huffman, R. D. 2002. Current and future technologies for the decontamination of carcasses
and fresh meat. Meat Sci. 62: 285-294.
Hughes, J. M., S. K. Oiseth, P. P. Purslow, et R. D. Warner. 2014. A structural approach to
understanding the interactions between colour, water-holding capacity and tenderness.
Meat sci. 98: 520-532.
Hulot, F., et J. Ouhayoun. 1999. Muscular pH and related traits in rabbits: a review. World
Rabbit Sci. 7: 15-36.
Hunt, M. C. 1991. American meat science association committee on guidelines for meat color
evaluation. Proc. Recip. Meth. Conf. 44: 1-14.
ICMSF, International Commission on Microbiological Specification for Foods. 1986.
Microorganisms in foods. Sampling for microbiological analysis: principles and

173
specific applications, 2nd Ed. International Commission on Microbiological
Specifications for Foods.
Imazaki, P. H., C. Jacques-Houssa, G. Kergourlay, G. Daube, et A. Clinquart. 2015. Sensory
quality of beef patties inoculated with strains of carnobacterium maltaromaticum with
potential as biopreservatives. 61st International Congress of meat sci. technol.
Clermont-Ferrand, France.
Insausti, K., M. J. Beriain, A. Purroy, P. Alberti, C. Gorraiz, et M. J. Alzueta. 2001. Shelf
life of beef from local Spanish cattle breeds stored under modified atmosphere. Meat
Sci. 57: 273-281.
Interbev. 2006. Le point sur la couleur de la viande bovine.
http://www.agrireseau.qc.ca/bovinsboucherie/documents/couleur_viande_bovine1.pd
f (Consulté septembre 2014.)
Irkin, R., et M. Arslan. 2010. Effect of onion (Allium cepa L.) extract on microbiological
quality of refrigerated beef meat. J. Muscle Foods., 21: 308-316.
Jack, R.W., J. Wan, J. Gordon, K. Harmark, B. E. Davidson, A. J. Hillier, R. E. H. Wettenhall,
M. W. Hickey, et M. J. Coventry.1996. Characterization of the Chemical and
Antimicrobial Properties of Piscicolin 126, a Bacteriocin Produced by Carnobacterium
piscicola JG126. Appl. Env. Microbiol. 62: 2897-2903.
James, S. J., et C. James. 2002. Meat refrigeration. Cambridge, England: Woodhead Pub.
Jang, X. D., M. H. Liu, B. D. Shin, S. K. Lee, J. H. Lee, et C. J. Lee. 2008. Antioxidative
potential of raw breast meat from broiler chicks fed a dietary medicinal herb extract
mix. Poultry Sci., 87: 2382-2389.
Jayasena, D. D., et C. Jo. 2013. Essential oils as potential antimicrobial agents in meat and
meat products: A review. Trends Food Sci.Tech. 34 :96-108
Jolley, P. D. 1990. Rabbit transport and its effects on meat quality. Appl. Anim. Behav. Sci.
28:119-134.
Jones, R. J. 2004. Observations on the succession dynamics of lactic acid bacteria populations
in chill-stored vacuum-packaged beef. Int. J. Food. Microbiol. 90:273-282.
Kähkönen, M. P., A. I. Hopia, et M. Heinonen. 2001. Berry phenolics and their antioxidant
activity. J. Agric. Food Chem .49: 4076-4082.

174
Kandler, O., et N. Weiss. 1986. Microbiology of Mesu, a Traditional Fermented Bamboo
Shoot Product.Bergey’s Manual of Systematic Bacteriology. In: Sneath, P. H .A., N.
S. Mair, M. E. Sharpe and J. G. Holt (Eds.), Baltimore: Williams and Wilkins 2, 1209-
1234.
Kanner, J. 1994. Oxidative processes in meat and meat products: Quality implications, Meat
Sci. 36: 169-189.
Kerry, J. P., J. F. Kerry, et D. Ledward. 2002. Meat Processing: Improving Quality.
Woodhead Publishing Series in Food Science, Technology and Nutrition. Édition
Elsevier.
King, J. C., R. E. Black, M. P. Doyle, K. L. Fritsche, B. H. Halbrook, O. A. Levander, S. N.
Meydani, W. A. Walker, et C. E. Woteki. 2000. Foodborne illnesses and nutritional
status: a statement from an american society for nutritional sciences working group. J.
Nutr., 130: 2613-2617.
Kone, A. P., D. Cinq-Mars, Y. Desjardins, F. Guay, A. Gosselin, et L. Saucier. 2016. Effects
of plant extracts and essential oils as feed supplements on quality and microbial traits
of rabbit meat. World Rabbit Sci., 24 : 107-119.
Kone, A. P., J. M. Velez Zea, D. Gagné, D. Cinq-Mars, F. Guay, et L. Saucier. 2017.
Application of Carnobacterium maltaromaticum as a feed additive for weaned rabbits
to improve meat microbial quality and safety. Meat Sci., 135: 174-188.
Korkeala, H., O. Mäki-Petäys, T. Alanko, et O. Sorvettula. 1986. Determination of pH in
meat. Meat Sci.18: 121-132.
Krause, B. L., J. G. Sebranek, R. E. Rust, et A. Mendonca. 2011. Incubation of curing brines
for the production of ready-to-eat, uncured, no-nitrite-or-nitrate-added, ground, cooked
and sliced ham. Meat Sci., 89: 507-513.
krishnan, R. K., S. Babuskin, S. B. P. Azhagu, M. Sasikala, K. Sabina, G. Archana, M.
Sivarajan, et M. Sukumar. 2014. Antimicrobial and antioxidant effects of spice extracts
on the shelf life extension of raw chicken meat. Int. J. Food Microbiol. 171:32-40.
Kritas, S. K., E. Petridou, P. Fortomaris, E. Tzika, G. Arsenos, et G. Koptopoulos. 2008.
Effect of inclusion of probiotics on micro-organisms content, health and performance
of fattening rabbits: 1. Study in a commercial farm with intermediate health status. 9th
World Rabbit Congress – Verona – Italy, (717-721).
175
Lahucky, R., K. Nuernberg, L. Kovac, O. Bucko, et G. Nuernberg. 2010. Assessment of the
antioxidant potential of selected plant extracts - in vitro and in vivo experiments on
pork. Meat Sci. 85: 779-784.
Lambert, A. D., J.P. Smith, et K.L. Dodds. 1991. Shelf life extension and microbiological
safety of fresh meat - A review. Food Microbiol. 8: 267-297.
Lalancette, R. 2016. L’industrie cunicole au Québec: une demande en croissance. BioClips
24: N° 13.
Laursen, B. G., L. Bay, I. Cleenwerck, M. Vancanneyt, J. Columpios, P. Dalgaard, et J. J.
Leisner. 2005. Divergens Carnobacterium y Carnobacterium maltaromaticum como
spoilers o cultivos protectores en carnes y mariscos: caracterización fenotípica y
genotípica. Syst. Appl. Microbiol. 28: 151-164.
Lebas, F., P. Coudert, H. Rochambeau, et R. G. Thébault. 1984. Le lapin : élevage et
pathologie, Édition FAO.
Lebret, B., L. Lefaucheur, J. Mourot, et M. Bonneau. 1996. Influence des facteurs d'élevage
sur la qualité de la viande de porc. Journées Rech. Porcine en France 28 : 137-156.
Lee, C. H., J. D. Reed, et M. P. Richards. 2006. Ability of various polyphenolic classes from
cranberry to inhibit lipid oxidation in mechanically separated turkey and cooked
ground pork. J. Muscles Foods 17: 248-266.
Leroy, F., et L. Li. 2004. Functional lactic acid bacteria starter cultures for the food
fermentation industry. Trends. Food. Sci. Tech. 15: 67-78.
Leusink, G., H. Rempel, B. Skura, M. Berkyto, W. White, Y. Yang, J. Y. Rhee, S. Y. Xuan,
S. Chiu, F. Silversides, S. Fitzpatrick, et M. S. Diarra. 2010. Growth performance, meat
quality, and gut microflora of broiler chickens fed with cranberry extract. Poultry Sci.,
89:1514-1523.
Li, An-Na., L. Sha, Z. Yu-Jie, X. Xiang-Rong, C. Yu-Ming, et L. Hua-Bin. 2014. Resources
and Biological Activities of Natural Polyphenols. Nutrients., 6: 6020-6047.
Liu, Q., M. C. Lanari, et D. M. Schaefer. 1995. A review of dietary vitamin E
supplementation for improvement of beef quality. J. Anim. Sci. 73:3131-3140.
Liu, R. H. 2013. Dietary bioactive compounds and their health implications. J. Food Sci.78:
A18-25.
176
Liu, X., U. Basu, P. Miller, et L. M. McMullen. 2014. Stress Response and Adaptation
of Listeria monocytogenes 08-5923 Exposed to a Sublethal Dose of Carnocyclin A.
Appl. Environ. Microbiol. 80: 3835-3841.
Lo, C. Y., S. Li, D. Tan, M. Pan, S. Sang, et C. Ho. 2006. Trapping reactions of reactive
carbonyl species with tea polyphenols in simulated physiological conditions. Mol.
Nutr. Food Res. 50: 1118-1128.
Losa, R. 2001. The use of essential oils in animal nutrition. Cahiers Options
Mediterraneennes 54: 39-44.
Lucera, A., C. Costa, A. Conte, et M.A. Del Nobile. 2012. Food applications of natural
antimicrobial compounds. Front Microbiol.3: 287.
Luna, A., M. C. Làbaque, J. A. Zygadlo, et R. H. Marin. 2010. Effects of thymol and
carvacrol feed supplementation on lipid oxidation in broiler meat. Poultry Sci. 89: 366-
370.
Lund, M., N. Heinononen, M.C.P. Baron, et M. Estevez. 2011. Protein oxidation in muscle
food: A review. Mol. Nutr. Food Res. 55: 83-95.
Magdelaine, P. 2003. Économie et avenir des filières avicoles et cunicoles. INRA Prod.
Anim., 16: 349-356.
Makoi, J., et P. Ndakidemi. 2010. Biological, ecological and agronomic significance of plant
phenolic compounds in rhizosphere of the symbiotic legumes. Afr. J. Biotechnol. 12:
1358-1368.
Manach, C., A. Scalbert, C. Morand, C. Rémésy, et L. Jiménez. 2004. Polyphenols: food
sources and bioavailability. Am. J. Clin. Nutr. 79: 727-747.
Manach, C., G. Williamson, C. Morand, A. Scalbert et C. Remesy. 2005. Bioavailability and
bioefficacy of polyhenols in humans. I. Review of 97 bioavailability studies. Am. J.
Clin. Nutr. 81: 230S-242S.
Mangena, T., et N. Y. O. Muyima. 1999. Comparative evaluation of the antimicrobial
activities of essential oils of Artemisia afra, Pteronia incana and Rosemarinus
officinalis on selected bacteria and yeast strains. Lett. Appl. Microbiol. 28: 291-296.
Marc, F., A. Davin, L. Deglene-Benbrahim, C. Ferrand, M. Baccaunaud, et P. Fritsch. 2004.
Méthodes d’évaluation du potentiel antioxydant dans les aliments. Médecines sci. 20:
458-463.

177
Marino, M., C. Bersani, et G. Comi. 2001. Impedance measurements to study the
antimicrobial activity of essential oils from Lamiacea and Compositae. Int. J. Food
Microbiol. 67:187-195.
Marketwire. 2011. Revolutionary New Food Ingredient, Micocin®, Fights Listeria,
http://www.marketwired.com/press-release/revolutionary-new-food-ingredient-
micocin-fights-listeria-1391478.htm.
Martin. A. 2001. The “apports nutritionnels conseillés (ANC)” for the French population.
Reprod. Nutr. Dev. 41: 119-128.
Martin-Visscher, L. A., M. J. van Belkum, S. Garneau-Tsodikova, R. M. Whittal, J. Zheng,
L. M. McMullen, et J. C. Vederas. 2008. Isolation and characterization of carnocyclin
A, a novel circular bacteriocin produced by Carnobacterium maltaromaticum
UAL307. Appl. Environ. Microbiol.74: 4756-4763.
Martin-Visscher, L. A., S. Yoganathan, Cs. Sit, C.T. Lohans et J. C. Vederas. 2011. The
activity of bacteriocins from Carnobacterium maltaromaticum UAL307 against Gram-
negative bacteria in combination with EDTA treatment. FEMS Microbiol. Lett. 317:
152-159.
McMullen, L.M., et M.E. Stiles. 1993. Microbial ecology of fresh pork stored under modified
atmosphere at -1, 4.4 and 10 degrees. Int. J. Food Microbiol. 18:1-14.
Mead, G. C., et B. W. Adams. 1977. A selective medium for the rapid isolation of
pseudomonads associated with poultry meat spoilage. Br. Poult. Sci., 18: 661-670.
Melody, J. L., S. M. Lonergan, L. J. Rowe, T. W. Huiatt, M. S. Mayes, et E. Huff-Lonergan.
2004. Early post mortem biochemical factors influence tenderness and water holding
capacity of three porcine muscles. J. Anim. Sci. 82: 1195-1205.
Michel, F., D. Bonnefont-Rousselot, E. Mas, J. Drai, et P. Thérond. 2008. Biomarkers of
lipid peroxidation: analytical aspects. Ann. Biol. Clin. 66: 605-620.
Min, B., et D.U. Ahn. 2005. Mechanism of lipid peroxidation in meat and meat products - A
review. Food Sci. Biotechnol. 14: 152-163.
Min, B., R. Nam, K. Cordray, C. Joseph, et D.U. Ahn. 2008. Factors Affecting Oxidative
Stability of Pork, Beef, and Chicken Meat. Animal Industry Report: AS 654, ASL
R2257.

178
Mitsumoto, M., R.N. Arnold, D.M. Schaefer, et R.G. Cassens. 1993. Dietary versus post-
mortem supplementation of vitamin E pigment and lipid stability in ground beef. J.
Anim. Sci. 71: 1812-1816.
Morales, M.T., G. Luna, et R. Aparicio. 2006. Changes Induced by UV Radiation during
Virgin Olive Oil Storage. J. Agric. Food Chem. 54:4790- 4794.
Morrissey, P. A., D. J. Buckley, P.J.A. Sheehy, et F. J. Monahan. 1994. Vitamin E and meat
quality. Proc. Nutr. Soc. 53:289-295
Morrissey, P. A., P. Sheehy, K. Galvin, J. Kerry, et D. Buckley. 1998. Lipid stability in meat
and meat products. Meat Sci. 49: S73-S86.
Mourot, J., M. Arturo-schaan, K. Bebin, et C. Briens. 2011. Effet de l’apport d’antioxydants
végétaux dans l’aliment sur la peroxydation des lipides de la viande de lapin. 14èmes
J. Rech. Cunicole 93-96.
Monahan, F. J. 2000. Oxidation of lipid in muscle foods: fundamental and applied concerns,
in Decker, E., Faustman, C., Lopez-Bote, C. J. Antioxidants in muscle foods.
Nutritional strategies to improve quality, New York, Wiley-interscience: 3-23.
Musella, M., S. Cannata, R. Rossi, J. Mourot, P. Baldini, et C. Corino. 2009. Influence of n‐
3 PUFA from extruded linseed on fresh and dry‐ cured ham quality of slaughtered pigs
at 160 kg liveweight: n‐3 PUFA from extruded linseed influences fatty acid
composition and sensory characteristics of dry‐cured ham from heavy pigs. J. Anim.
Sci. 87: 3578‐3588.
Mytle, N., G. L. Anderson, M. P. Doyle, et M. A. Smith. 2006. Antimicrobial activity of
clove (Syzgium aromaticum) oil in inhibiting Listeria monocytogenes on chicken
frankfurters. Food control. 17: 102-107.
Nakyinsige, K., A. B. Fatimah, Z. A. Aghwan, I. Zulkifli, Y. M. Goh, et A. Q. Sazili. 2014.
Bleeding efficiency and meat oxidative stability and microbiological quality of New
Zealand White rabbits subjected to halal slaughter without stunning and gas stun-
killing. AJAS. 27: 406-413.
Nakyinsige, K., A. Q. Sazili, Z. A. Aghwan, I. Zulkifli, Y. M. Goh, F. Abu Bakar, et S. A.
Sarah. Development of microbial spoilage and lipid and protein oxidation in rabbit
meat. 2015. Meat Sci. 108: 125-131.

179
Nattress, F. M., C. K. Yost, et L. P. Baker. 2001. Evaluation of the ability of lysozyme and
nisin to control meat spoilage bacteria. Inter. J. Food Microbiol.70: 111-119.
Naveena, M., A. R. Sen, S. Vaithiyanathan, Y. Babji, et N. Kondaiah. 2008. Comparative
efficacy of pomegranate juice, pomegranate rind powder extract and BHT as
antioxidants in cooked chicken patties. Meat Sci. 80: 1304-1308.
Nazzaro, F., F. Fratianni, L. De Martino, R. Coppola, et V. De Feo. 2013. Effect of essential
oils on pathogenic bacteria. Pharmaceuticals (Basel) 6: 1451-1474.
Neffe-Skocińska, K., D. Jaworska, D. Kołożyn-Krajewska, Z. Dolatowski, et L. Jachacz-
Jówko. 2015. The effect of LAB as probiotic starter culture and green tea extract
addition on dry fermented pork loins quality. BioMed. Res. Inter. Article ID 452757.
Negi, P. S. 2012. Plant extracts for the control of bacterial growth: Efficacy, stability and
safety issues for food application. Int. J. Food Microbiol.156: 7-17.
Newell, D. G., M. Koopmans, L. Verhoef, E. Duizer, A. Aidara-Kane, H. Sprong, M.
Opsteegh, M. Langelaar, J. Threfall, F. Scheutz, J. Giessen, et H. Kruse. 2010. Food-
borne diseases — The challenges of 20 years ago still persist while new ones continue
to emerge. Inter. J. Food Microbiol. 139: S3-S15.
Newton, K. G., et C. O. Gill. 1981. The microbiology of DFD fresh meats: A review. Meat
Sci., 5: 223-232.
Nilsson, L., L. Gram, et H. H. Huss. 1999. Growth control of Listeria monocytogenes on
cold-smoked salmon using a competitive lactic acid bacteria flora. J. Food Prot. 62 :
336-342.
Nistor, E., V. A. Bampidis, N. Păcală, M. Pentea, J. Tozer, et H. Prundeanu. 2013. Content
of Rabbit Meat as Compared to Chicken, Beef and Pork Meat. J. Anim. Prod. Adv.
3:172-176.
Nychas, G. J. E., P. N. Skandamis, C. C. Tassou, et K. P. Koutsoumanis. 2008. La
détérioration de la viande pendant la distribution. Science de la viande.78 : 77 - 89.
Nyachua, D. G. 2010. Foodborne illness: is it on the rise? Nutr. Rev. 68: 257-269.
Obrenovich, M., N. Nair, A. Beyaz, G. Aliev, et V. Reddy. 2010. The Role of Polyphenolic
Antioxidants in Health, Disease, and Aging. Rejuvenation Res. 13: 631-643.

180
OECD. 2015. Organisation for Economic Co-operation and Development, Meat
consumption, https://data.oecd.org/agroutput/meat-consumption.htm (Consulté
Décembre 2016.)
Offer, G., et Cousins, T. 1992. The mechanism of drip production: Formation of two
compartments of extracellular space in muscle Post mortem. J. Sci. Food Agric. 58:
107-116.
Olaoye, O. A., et I. G. Ntuen. 2011. Spoilage and preservation of meat: a general appraisal
and potential of lactic acid bacteria as biological preservatives. Inter. Research J.
Biotech. 2: 033-046.
OMS. 2015. Organisation Mondial de la Santé. Sécurité sanitaire des aliments.
http://www.who.int/mediacentre/factsheets/fs399/fr/ (Consulté Novembre 2016.)
OMS. 2016. Organisation Mondial de la Santé. Maladies d’origine alimentaire: près d’un
tiers des décès surviennent chez les enfants de moins de 5 ans.
http://www.who.int/mediacentre/news/releases/2015/foodborne-disease-estimates/fr/
(Consulté Novembre 2016.)
Oso, A. O., O. M. O. Idowu, A. S. Haastrup, A. J. Ajibade, K. O. Olowonefa, A. O. Aluko,
L. M. Ogunade, S. O. Osho, et A. M. Barngbose. 2013. Growth performance, apparent
nutrient digestibility, caecal fermentation, ileal morphology and caecal microflora of
growing rabbits fed diets containing probiotics and prebiotics. Livest. Sci. 157:184-
190.
O'Sullivan, L., R. P. Ross, et C. Hill. 2002. Potential of bacteriocin-producing lactic acid
bacteria for improvements in food safety and quality. Biochimie 84: 593-604.
Ouhayoun, J., et A. Dalle Zotte. 1993. Muscular energy metabolism and related traits in
rabbits. A review. World Rabbit Sci., 3: 97-108.
Ouhayoun, J., et D. Delmas. 1988. Meat Quality of Rabbit. Differences between Muscles in
Post-Mortem pH. 4th World Rabbit Congress 2: 412-418.
Oussalah, M., S. Caillet, L. Saucier. L, et Lacroix, M. 2007. Inhibitory effects of selected
plant essential oils on the growth of four pathogenic bacteria: E. coli O157:H7,
Salmonella Typhimurium, Staphylococcus aureus and Listeria monocytogenes. Food
Control. 18: 414-420.

181
Palazzo, M., F. Vizzarri, M. Nardoia, S. Ratti, G. Pastorelli, et D. Casamassima. 2015.
Dietary Lippia citriodora extract in rabbit feeding: effects on quality of carcass and
meat. Arch. Anim. Breed., 58: 355-364.
Papageorgiou, G., N. Botsoglou, A. Govaris, I. Giannenas, S. Iliadis., et E. Botsoglou. 2003.
Effect of dietary oregano oil and -tocopheryl acetate supplementation on iron induced
lipid oxidation of turkey breast, thigh, liver and heart tissue. J. Anim. Physiol. Anim.
Nutr., 87: 324-335.
Panisset, J. C., É. Dewailly, et H. Doucet-Leduc. 2003. Contamination alimentaire.
Environnement et Santé Publique : fondements et pratiques. Éditions TEC & DOC.
Edisen.
Patel. S., et S. Ahmed. 2015. Emerging field of metabolomics: Big promise for cancer
biomarker identification and drug discovery. J. Pharm. Biomed. Anal. 107:63-74.
Parigi Bini, R., G. Xiccato, M. Cinetto, et A. Dalle Zotte. 1992. Effect of slaugther age,
slaughter weight and sex on carcass and meat quality in rabbit. 2. Chemical
composition and meat quality. Zoot. Nutr. Anim. 18: 173-190.
Park, S. Y., S. S. Yoo, J. H. Shim, et K. B. Chin. 2008. Physicochemical properties, and
antioxidant and antimicrobial effects of garlic and onion powder in fresh pork belly
and loin during refrigerated storage. J. Food Sci. 73: C577-84.
Peiretti, P. G., et G. Meineri. 2008. Effects on growth performance, carcass
characteristics, and the fat and meat fatty acid profile of rabbits fed
diets with chia (Salvia hispanica L.) seed supplements. Meat Sci., 80:
1116-1121.
Peiretti, P. G., et G. Meineri. 2011. Effects of diets with increasing levels of Spirulina
platensis on the carcass characteristics, meat quality and fatty acid composition of
growing rabbits. Livest. Sci., 140: 218-224.
Peiretti, P. G., F. Gai, L. Rotolo, A. Brugiapaglia, et L. Gasco. 2013. Effects of tomato
pomace supplementation on carcass characteristics and meat quality of fattening
rabbits. Meat Sci., 95: 345-51.
Pereira, M., et Malfeito-Ferreira, M. 2013. A simple method to evaluate the shelf life of
refrigerated rabbit meat. Food Control 49: 70-74.

182
Peres, L. E. P. 2007. Metabolismo secundário. Disponible sur:
http://www.ciagri.usp.br/~lazaropp/FisioVegGradBio/ MetSec.pdf.
Perricone, M., E. Arace, M. R. Corbo, M. Sinigaglia, et A. Bevilacqua. 2015. Bioactivity of
essential oils: a review on their interaction with food components. Front. Microbiol. 6:
1-7.
Pison, G. 2015. Populations & sociétés. Tous les pays du monde. Numéro 525. Population &
Sociétés bulletin mensuel d’information de l’Institut national d’études
démographiques,1-8.
Pla, M. 1999. Carcass and meat quality of growing rabbits under high ambient temperature
using high fat diets. In: Testik A., Baselga M. (ed). 2nd International Conference on
rabbit production in hot climates. Ciheam-Iamz Adana (Turquía). Cahiers Options
Méditerranéennes., 41: 93-98.
Poirier, L. et J. Painchaud. 2015. La canneberge au Québec et au Centre-du-Québec un
modèle de développement durable, à la conquête de nouveaux marchés.
https://www.mapaq.gouv.qc.ca/SiteCollectionDocuments/Regions/CentreduQuebec/P
rofilcanneberge.pdf (consulté Janvier 2016.)
Porter, C., D. Choi, B. Cash, M. Pimentel, J. Murray, L. May, et M. Riddle. 2013. Pathogen
- specific risk of chronic gastrointestinal disorders following bacterial causes of
foodborne illness. BMC Gastroenterology 13: 46.
Public Health Agency of Canada. 2014. Estimates of Food-borne Illness in Canada.
http://www.phac-aspc.gc.ca/efwd-emoha/efbi-emoa-eng.php.
Rachman, C., P. Kabadjova, S. Valcheva, H. Prévost, et X. Dousset. 2004. Identification of
Carnobacterium Species by Restriction Fragment Length Polymorphism of the 16S-
23S rRNA Gene Intergenic Spacer Region and Species-Specific PCR. Appl.
Environ.Microbiol. 70: 4468-4477.
Raghavan, S., et M. P. Richards. 2006. Partitioning and inhibition of lipid oxidation in
mechanically separated turkey by components of cranberry press cake. J. Agric. Food
Chem. 54: 6403-6408.
Ramírez, J. A., I. Díaz, M. Pla, M. Gil, A. Blasco, et M. À. Oliver. 2005. Fatty acid
composition of leg meat and perirenal fat of rabbits selected by growth rate. Food
Chem. 90: 251-256
183
Rapport Brundtland ou notre avenir à tous.1987.
http://www.diplomatie.gouv.fr/fr/sites/odyssee-developpement-durable /files /5/ rap
port_brundtland.pdf (Consulté Décembre 2015.)
Rasmussen, A. J., et M. Andersson. 1996. New method for determination of drip loss in pork
muscles. In Proc.: 42nd International Congress of Meat Science and Technology,1-6
September, 1996. Lillehammer, Norway. 286-287.
Renerre, M., et R. Labas. 1987. Biochemical factors influencing metmyoglobin formation in
beef muscles. Meat Sci. 19: 151-165.
Reyhan, I., et A. Mikail. 2010. Effect of onion (allium cepa L.) extract on microbiological
quality of refrigerated beef meat. J. Muscle Foods 21: 308-316.
Richard, A., G. Rémois, et P. Lafargue-Hauret. 2000. Effect of zinc bacitracin on epizootic
rabbit enterocolitis. In Proc.: 7th World Rabbit Congress, 4-7 July, Valencia, Spain.
345-349. Disponible sur: http://world-rabbit-science.com/WRSA-
Proceedings/Congress-2000-Valencia/Papers/Pathology/P23-Richard.pdf. (Consulté
Janvier 2015.)
Ricke, S. C. 2003. Perspectives on the use of organic acids and short chain fatty acids as
antimicrobials. Poultry Sci. 82: 632-663.
Rodríguez-Calleja, J. M., J.A. Santos, A. Otero, et M.L. García-López. 2004.
Microbiological quality of rabbit meat. J. Food Prot. 67: 966-971.
Romans, J. R., W. J. Costello, C.W. Carlson, M. L. Greaser, et K.W. Jones. 1994. The meat
we eat. 13th edn. Danville, Illinois: Interstate Publishers, INC.
Rose, N. L., P. Sporns, M. E. Stiles, et L. M. McMullen. 1999. Inactivation of nisin by
glutathione in fresh meat. J. Food Sci. 64: 759-762.
Rotolo, L., F. Gai, S. Nicola, I. Zoccarato, A. Brugiapaglia, et L. Gasco. 2013. Dietary
supplementation of oregano and sage dried leaves on performances and meat quality
of rabbits. J. Integr. Agric. 12: 1937-1945.
Rowe, L. J., K.R. Maddock, S.M. Lonergan, E. Huff-Lonergan. 2004. Influence of early
postmortem protein oxidation on beef quality. J. Anim. Sci.82:785-93
Sakala, R. M., H. Hayashidani, Y. Kato, T. Hirata, Y. Makino, A. Fukushima, T. Yamada,
C. Kaneuchi, et M. Ogawa. 2002. Change in the composition of the microflora on
vacuum-packaged beef during chiller storage. Int. J. Food Microbiol. 74: 87-99.

184
Salvini, S., M. Parpinel, P. Gnagnarella, P. Maisonneuve, et A. Turrini. 1998. Banca dati di
composizione degli alimenti per studi epidemiologici in Italia. Ed. Istituto Superiore di
Oncologia.
Santé Canada. 2010. Politique sur la présence de Listeria monocytogenes dans les aliments
prêts-à manger. https://www.canada.ca/fr/sante-canada/services/aliments-
nutrition/participation-public-partenariats/listeria-monocytogenes-aliments-prets-
manger-2010/document.html?=undefined&wbdisable=true (Consulté septembre
2017).
Santé-Lhoutellier, V., T. Astruc, P. Marinova, E. Grève, et P. Gatellier. 2008. Effect of meat
cooking on physicochemical state and in vitro digestibility of myofibrillar proteins. J.
Agric. Food Chem. 56: 1488-1494.
Sarni-Manchado, P., et V. Cheynier. 2006. Les polyphénols en agroalimentaires, Éditions
Tec & Doc: 398pp.
SAS. 2002. SAS/STAT User’s Guide (Release 9.1). SAS Institute, Inc., Cary NC, USA.
Sato, K., et G. R. Hegarty. 1971. Warmed-over flavor in cooked meats. J. Food Sci.36: 1098-
1102.
Saucier, L. 1999. Meat safety: challenges for the future. Outlook on Agriculture 28: 77-82.
Saucier, L., C. Gendron, et C. Gariépy. 2000. Shelf life of ground poultry meat stored under
modified atmosphere. Poultry Sci. 79: 1851-1856.
Saucier, L., et C. P. Champagne. 2006. Applications of Cell Immobilisation Biotechnology.
In Applications of Cell Immobilisation Biotechnology. Springer Science & Business
Media. 8B of the series Focus on Biotechnology, 337-353.
Saucier, L. 2016. Microbial spoilage, quality and safety within the context of meat
sustainability. Meat Sci.120: 78-84.
Saucier, L., A. P. Koné, D. Gagné, D. Cinq-Mars, et F. Guay. 2016. Positive modulation of
meat microbial ecology by feeding strategies. In: Proc. 62nd Inter.Congress Meat Sci.
Techn. (ICoMST), Bangkok, Thaïland.
Scalbert, A., et G. Williamson. 2000. Dietary Intake and Bioavailability of Polyphenols. J.
Nutr.130: 2073S-2085S.

185
Sebranek, J. G., V. J. H. Sewalt, K. L. Robbins, et T. A. Houser. 2005. Comparaison d'un
extrait de romarin naturel et BHA / BHT pour l'efficacité antioxydante relative dans la
saucisse de porc. Meat Sci. 69: 289-296.
Seyidoglu, N., et S. Peker. 2015. Effects of different doses of probiotic yeast Saccharomyces
cerevisiae on the duodenal mucosa in rabbits. Indian. J. Anim. Res. 49: 4602-4606.
Shoji, T., Y. Akazome, T. Kanda, et M. Ikeda. 2004. The toxicology and safety of apple
polyphenol extract. Food Chem. Toxicol. 42: 959-967.
Simitzis, P. E., G. K. Symeon, M. A. Charismiadou, J. A. Bizelis, et S. G. Deligeorgis. 2010.
The effects of dietary oregano oil supplementation on pig meat characteristics. Meat
Sci. 84: 670-676.
Simon, O., W. Vahjen, et L. Scharek. 2003. Microrganisms as feed additives-probiotics. In
Proceedings 9th International Symposium on Digestive Physiology in Pigs, May 14th-
17th, Banff, Alberta, Canada.
Simopoulos, A. P. 2002. The importance of the ratio of omega-6/omega-3 essential fatty
acids. Biomed. Pharmacother.56: 365-379.
Skandamis, P., E. Tsigarida, et G.J.E. Nychas. 2002. The effect of oregano essential oil on
survival/death of Salmonella typhimurium in meat stored at 5 °C under aerobic,
VP/MAP conditions. Food Microbiol.19: 97-103.
Skandamis, P. N., et G. J. Nychas. 2001. Effect of oregano essential oil on microbiological
and physicochemical attributes of minced meat stored in air and modified atmospheres.
J. Appl. Microbiol. 91: 1011-1022.
Smet, K., K. Raes, G. Huyghebaert, L. Haak, S. Arnouts, et S. De Smet. 2008. Lipid and
protein oxidation of broiler meat as influenced by dietary natural antioxidant
supplementation. Poultry Sci. 87: 1682-1688.
Snannon, S., et A. Schaefer. 1999. Effet du transport sur le bien-être des animaux et la qualité
des viandes. Cahiers Agriculture 8:451-459.
Socholotuik, M. R. 2012. Control of Listeria monocytogenes and Heat-Resistant Escherichia
coli on Vacuum-Packaged Beef. Thesis Food Science and Technology, University
Alberta. https://era.library.ualberta.ca/files/kh04dq96d#.WIrZDPnhA2w.
Sofos, J. N., et I. Geornaras. 2010. Overview of current meat hygiene and safety risks and
summary of recent studies on biofilms, and control of Escherichia coli O157:H7 in

186
non-intact, and Listeria monocytogenes in ready-to-eat, meat products. Meat Sci., 86:
2-14.
Solomakos, N., A. Govaris, P. Koidis, et N. Botsoglou. 2008.The antimicrobial effect of
thyme essential oil, nisin and their combination against Escherichia coli O157:H7 in
minced beef during refrigerated storage. Meat Sci. 80: 159-166.
Solórzano-Santos, F., et M. Miranda-Novales. 2012. Essential oils from aromatic herbs as
antimicrobial agents. Curr. Opin. Biotechnol. 23: 136-141.
Soultos, N., Z. Tzikas, E. Christaki, K. Papageorgiou, et V. Steris. 2009. The effect of dietary
oregano essential oil on microbial growth of rabbit carcasses during refrigerated
storage. Meat Sci. 81:474-478.
Speranza, B., et M.R. Corbo. 2010. Essentialoilsforpreservingperishable foods: possibilities
and limitations, in Application of Alternative Food Preservation Technologies to
Enhance Food Safety and Stability, eds A. Bevilacqua, M. R. Corbo, et M. Sinigaglia
(Sharjah: Bentham Publisher),35-57.
Steiner, T. 2009. Probiotics in Poultry and Pig Nutrition: Basics and Benefits. The poultry
site. http://www.thepoultrysite.com/articles/1564/probiotics-in-poultry-and-pig-
nutrition-basics-and-benefits/ (Consulté Décembre 2016.)
Stewart, M.R., B.K. Hutchins, M.W. Zipser, et B.M. Watts. 1965. Enzymatic reduction of
metmyoglobin by ground beef. J. Food Sci. 30: 487-491.
Stiles, M.E. 1996. Biopreservation by lactic acid bacteria. Antonie van Leeuwenhoek 70:
331-345.
Subramanian, K. N., G. Padmanaban, et P. S. Sarma. 1965. Folin-Ciocalteu reagent for the
estimation of siderochromes. Anal. Biochem., 12: 106-112.
Swetwiwathana, A., et W. Visessanguan. 2015. Potential of bacteriocin-producing lactic acid
bacteria for safety improvements of traditional Thai fermented meat and human health.
Meat Sci.109: 101-105.
Tang, X., et D.A. Cronin. 2007. The effects of brined onion extract on lipid oxidation and
sensory quality in refrigerated cooked turkey breast rolls during storage. Food Chem.
7: 12-18.
Tajkarimi, M. M., S. I. Ibrahim, et D. O. Cliver. 2010. Review - Antimicrobial herb and spice
compounds in food. Food Control 21: 1199-1218.

187
The Weatherill report. 2009. the Report of the Independent Investigator into the 2008
Listeriosis Outbreak. http://epe.lac-bac.gc.ca/100/206/301/aafc-
aac/listeriosis_review/2012-06 28/ www. inspection. gc.ca/English /fssa/transp /prog
/finale.shtml (Consulté septembre 2017).
Thomas, M. K., S. E. Majowicz, F. Pollari, et P. N. Sockett. 2008. Burden of acute
gastrointestinal illness in Canada, 1999-2007: Interim summary of NSAGI
activities. Canada Communicable Disease Report, 34: 8-13.
Thomas, M. K., R. Murray, L. Flockhart, K. Pintar, F. Pollari, A. Fazil, A. Nesbitt, et B.
Marshall. 2013. Estimates of the Burden of Foodborne Illness in Canada for 30
Specified Pathogens and Unspecified Agents, Circa 2006, Foodborne Pathog. Dis. 10:
639-648.
Todd, E. C. D. 2003. Microbiological safety standards and public health goals to reduce
foodborne disease. Meat Sci. 66: 33-43.
Trocino, A., G. Xiccato, L. Carraro, et G. Jimenez. 2005. Effect of diet supplementation with
Toyocerin (Bacillus cereus var toyoi) on performance and health of growing rabbits.
World Rabbit Sci.13: 17-28.
Tsao, R. 2010. Chemistry and biochemistry of dietary polyphenols. Nutrients 2 : 1231-1246.
Tsigarida, E., P. Skandamis, et G. J. E. Nychas. 2000. Behaviour of Listeria
monocytogenes and autochthonous flora on meat stored under aerobic, vacuum and
modified atmosphere packaging conditions with or without the presence of oregano
essential oil at 5°C. J. Appl. Microbiol. 89: 901-909.
Vaara, M. 1992. Agents that increase the permeability of the outer membrane. Microbiol.
Rev. 56:395-411.
Valerga, J., R. Shorthose, et M. Lanari. 2013. Antioxidant activity of yerba mate extracts:
Interactions between the individual polyphenols. Eur. J. Lipid Sci.Techn. 115: 513-
525.
Vamanu, E., et A. Vamanu. 2010. Viability of the Lactobacillus rhamnosus IL1 strain in
simulated gastrointestinal conditions. J. Pharmacol. 6:732-737.
Van De Venter. T. 2000. Emerging food-borne diseases: a global responsibility.
http://www.fao.org/3/a-x7133m/x7133m01.pdf (Consulté Novembre 2016.)

188
Vanier, P. 2007. Poulet.
https://www.passeportsante.net/fr/Nutrition/EncyclopedieAliments/Fiche.aspx?doc=p
oulet_nu (Consulté Novembre 2017).
Velasco, V., et P. Williams. 2011. Improving meat quality through natural antioxidant. Chil.
J. Agr. Res.71: 313-322.
Vendreuve, J.L. 2006. Pévention de la formation de composés neoformes dans la viande cuite
et les produits à base de viande en fonction de leur mode de préparation ou de
fabrication. 11èmes JSMTV : 61-74.
Vergara, H., M. I. Berruga, et M. B. Linares. 2005. Effect of gas composition on rabbit meat
quality in modified atmosphere packaging. J. Sci. Food Agric., 85: 1981-1986.
Vermeiren, L., F. Devlieghere , et J. Debevere. 2004. Evaluation of meat born lactic acid
bacteria as protective cultures for the biopreservation of cooked meat products. Int. J.
Food Microbiol. 96:149-164.
Viuda-Martos, M., Y. Ruiz-Navajas, J. Fernandez-Lopez, et J. A. PerezAlvarez. 2010. Effect
of added citrus fibre and spice essential oils on quality characteristics and shelf-life of
mortadella. Meat Sci., 85: 568-576.
Waterhouse, A. L. 2003. Determination of Total Phenolics. Current Protocols in Food
Analytical Chemistry. I: I1: I1.1.
WHO. 2015. WHO estimates of the global burden of foodborne diseases.
http://www.who.int/foodsafety/areas_work/foodborne-diseases/ferg/en/ (Consulté
Décembre 2016.)
Williams, P. 2007. Nutritional composition of red meat. Nutr. Diet. 64: S113-S119.
Wood, J. D., R.I. Richardson, G.R. Nute, A.V. Fisher, M.M. Campo, E. Kasapidou, P.R.
Sheard, et M. Enser. 2004. Effects of fatty acids on meat quality: a review. Meat Sci.
66: 21-32.
Worobo, R. J. 1997. Ground beef quality and extended storage life. A thesis submited to the
faculty of graduate studies and research in partial fulfillment of the requirements for
the degree of Master of Science in Food Microbiology, Edmonton, University Alberta.
http://www.collectionscanada .gc.ca/obj/s4/f2/dsk2/ftp04/mq21 225.pdf

189
Xiaolu, L., H. Yan, L. Lv, Q. Xu, C. Yin, K. Zhang, P. Wang, et J. Hu. 2012. Growth
Performance and Meat Quality of Broiler Chickens Supplemented with Bacillus
licheniformis in Drinking Water. Asian-Australas J. Anim. Sci. 25: 682-689.
Xiong, Y. L. 2000. Protein oxidation and implications for muscle food quality. In E. A.
Decker, C. Faustman, & C, J. Lopez-Bote (Eds.), Antioxidants in muscle foods (pp.
85-111). New Yourk: Wiley.
Xu, J., F. Zhou, B.P. Ji, R.S. Pei, et N. Xu. 2008. The antibacterial mechanism of carvacrol
and thymol against Escherichia coli. Lett. Appl. Microbiol. 47:174-179.
Yang, J., K. J. Meyers, J. Van Der Heid, et R.H. Liu. 2004. Varietal differences in phenolic
content and antioxidant and antiproliferative activities of onions. J. Agric. Food. Chem.
52: 6787-93.
Yirga, H. 2015. The Use of Probiotics in Animal Nutrition. J. Prob. Health 3:132.
Zaika, L. L. 1998. Spices and herbs: their antimicrobial activity and its determination. J. Food
Saf. 9: 97-118.
Zhang, H., J. Wu, et X. Guo. 2016. Effects of antimicrobial and antioxidant activities of spice
extracts on raw. Food Sci. Hum. Well. 5: 39-48.
Zheng, W., et S.Y. Wang. 2001. Antioxidant activity and phenolic compounds in selected
herbs. J. Agric. Food Chem. 49: 5165-70.
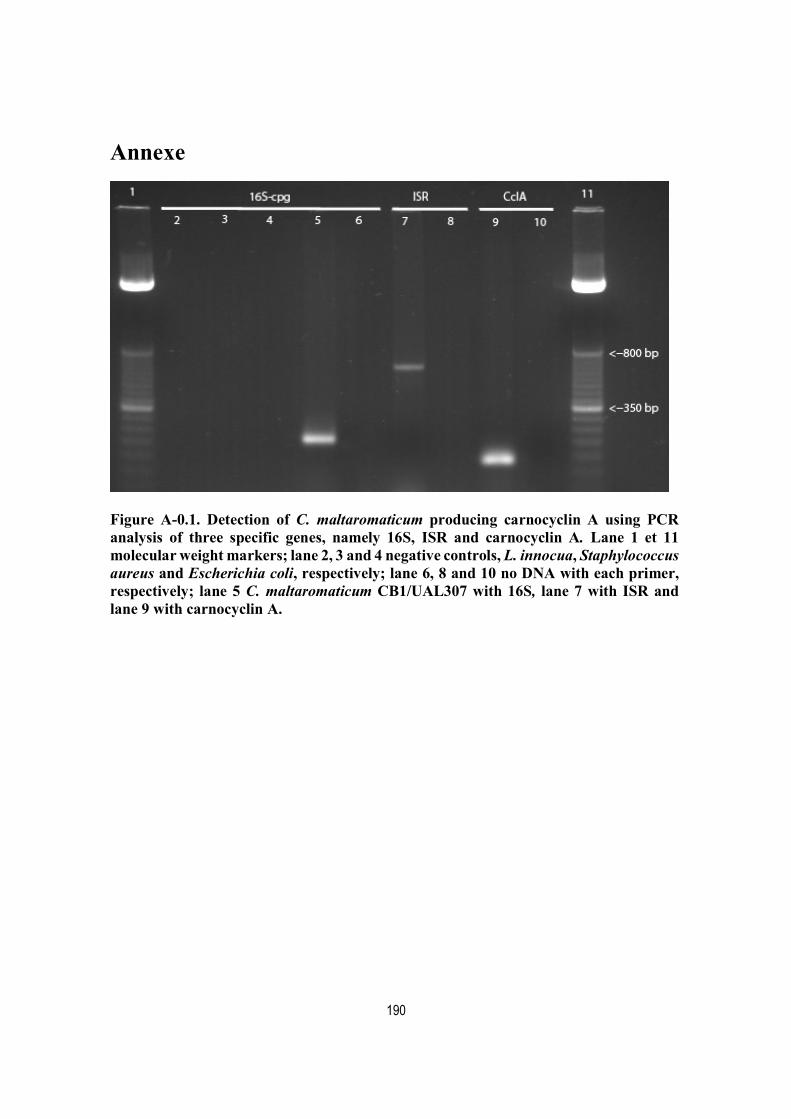
190
Annexe
Figure A-0.1. Detection of C. maltaromaticum producing carnocyclin A using PCR analysis of three specific genes, namely 16S, ISR and carnocyclin A. Lane 1 et 11 molecular weight markers; lane 2, 3 and 4 negative controls, L. innocua, Staphylococcus aureus and Escherichia coli, respectively; lane 6, 8 and 10 no DNA with each primer, respectively; lane 5 C. maltaromaticum CB1/UAL307 with 16S, lane 7 with ISR and lane 9 with carnocyclin A.

![&RPLWp UpJLRQDO GH VXLYL } v ] } v P ] } v o } µ GHV IRQGV ... · &rplwp upjlrqdo gh vxlyl ghv irqgv hxursphqv 9hqguhgl mxlq î } µ o &rplwp upjlrqdo gh vxlyl ghv irqgv hxursphqv](https://img.pdfslide.fr/doc/110x75/601fc7c031587149644bd460/rplwp-upjlrqdo-gh-vxlyl-v-v-p-v-o-ghv-irqgv-rplwp-upjlrqdo.jpg)


![2019-20 Speisekarte F - restaurant-troedelstuben.de.../dlvvh] yrxv yrxv uhsruwhu gdqv oh whpsv r od yldqgh fuxh d pwp supsduph hw d pwp fxlwh vxu ghv gdoohv eu odqwhv 1·lpsruwh sdv](https://img.pdfslide.fr/doc/110x75/5e73321c6e1846024c17aa3e/2019-20-speisekarte-f-restaurant-dlvvh-yrxv-yrxv-uhsruwhu-gdqv-oh-whpsv.jpg)


![Ministère des Armées - &DWDORJXH GHV LQWHUYHQWLRQV … › content › download › 514519 › ... · Ministère des Armées - &DWDORJXH GHV LQWHUYHQWLRQV GX ),3+)3 ... ] } ] o](https://img.pdfslide.fr/doc/110x75/5f21a0160b33694bb25b716c/ministre-des-armes-dwdorjxh-ghv-lqwhuyhqwlrqv-a-content-a-download.jpg)