Embed Size (px)
Citation preview
Sede Amministrativa: Università degli Studi di Padova
Dipartimento di Studi Linguistici e Letterari
CORSO DI DOTTORATO DI RICERCA IN SCIENZE LINGUISTICHE, FILOLOGICHE E LETTERARIE
CICLO XXXI
THE COMMUNICATION OF SCIENCE AND TECHNOLOGY IN ONLINE NEWSPAPERS
A MULTIDIMENSIONAL PERSPECTIVE
Coordinatore: Ch.mo Prof. Rocco Coronato
Supervisore: Ch.ma Prof.ssa Maria Teresa Musacchio
Co-Supervisore: Ch.mo Prof. Federico Neresini
Dottorando: Virginia Zorzi

CONTENTS
Chapter 1. Introduction ........................................................................................................................ 1
1. The importance of communicating science and technology ........................................................ 1
2. The complex task of communicating science and technology ..................................................... 4
3. The news coverage of technoscience ........................................................................................... 7
4. Some remarks on the role of language in the development of science and technology ............ 10
5. Introducing research questions on the language of science and technology in newspapers ...... 11
6. Conclusion ................................................................................................................................. 14
Chapter 2. Background for a linguistic study of the communication of science and technology in
newspapers ......................................................................................................................................... 16
1. Introduction ................................................................................................................................ 16
2. A broad contextualisation: applied linguistics and discourse analytical approaches ................. 19
3. The use of corpora in discourse analysis ................................................................................... 23
4. Research methods: the quantitative-qualitative continuum and the rise of mixed methods ...... 25
5. Exploring language variation through corpora: register and genre analysis .............................. 26
6. News texts as a field of inquiry .................................................................................................. 27
7. Research on the language of science and technology communication: a thematic overview .... 29
8. Science communication from practitioners‘ viewpoint ............................................................. 33
9. An overview of sociological approaches to technoscientific knowledge production and
communication ................................................................................................................................... 34
10. Conclusion .............................................................................................................................. 38
Chapter 3. Corpus and method ........................................................................................................... 40
1. Introduction ................................................................................................................................ 40
2. The corpus .................................................................................................................................. 41
2.1. The TIPS database as a source for corpus collection .......................................................... 41
2.2. Corpus design: issues of representativeness and balance .................................................... 42
2.2.1. Representativeness in corpus linguistics ...................................................................... 43
2.2.2. Corpus balance and MDA ............................................................................................ 43
2.2.3. Selection of source newspapers ................................................................................... 44
2.2.4. Corpus structure and size ............................................................................................. 45
2.2.5. Sample extraction ......................................................................................................... 47
3. Identification and counting of a set of linguistic features .......................................................... 53
3.1. Selection and description of linguistic features ................................................................... 53
3.2. Devising a method for the automatic identification and counting of linguistic features .... 57
3.2.1. Text pre-processing ...................................................................................................... 58
3.2.2. Describing linguistic features: a regex-based approach ............................................... 60
3.2.3. Choosing a suitable PoS-tagger ................................................................................... 60
3.2.4. From PoS-tagged texts to linguistic feature counts: the BoRex Match tool ................ 63
3.2.5. On a regex-based method for linguistic analysis and its possible applications in a
wider context .............................................................................................................................. 66
4. Factor analysis............................................................................................................................ 66
4.1. Performing exploratory factor analysis on an online newspaper corpus............................. 68
4.1.1. Number of factors to be extracted ................................................................................ 69
4.1.2. Factor rotation .............................................................................................................. 72
4.1.3. Production and structure of a factorial solution ........................................................... 73
4.1.4. Factor scores ................................................................................................................ 74
4.1.5. Further analyses based on factor scores: a multidimensional description of texts in the
corpus 79
5. Lexical analysis .......................................................................................................................... 82
6. Conclusion ................................................................................................................................. 89
Chapter 4. Dimensions of variation in the news corpus .................................................................... 91
1. Introduction ................................................................................................................................ 91
2. Final stages of the exploratory factor analysis ........................................................................... 91
2.1. Comparison of different factorial solutions and selection of the most suitable one ........... 91
2.2. Comparison of different factor score computation methods and selection of the most
suitable one .................................................................................................................................... 94
3. From factors to dimensions of variation .................................................................................... 96
3.1. Interpretation of Factor 1 ..................................................................................................... 97
3.1.1. Qualitative analysis: high score on F1 ....................................................................... 101
3.1.2. Qualitative analysis: low score on F1 ........................................................................ 103
3.1.3. Qualitative analysis: unmarked score on F1 .............................................................. 104
3.1.4. Distribution of corpus articles with respect to F1 ...................................................... 105
3.2. Interpretation of Factor 2 ................................................................................................... 108
3.2.1. Qualitative analysis: high score on F2 ....................................................................... 110
3.2.2. Qualitative analysis: low score on F2 ........................................................................ 112
3.2.3. Qualitative analysis: unmarked score on F2 .............................................................. 114
3.2.4. Distribution of corpus articles with respect to F2 ...................................................... 115
3.3. Interpretation of Factor 3 ................................................................................................... 117
3.3.1. Qualitative analysis: high score on F3 ....................................................................... 118
3.3.2. Qualitative analysis: low score on F3 ........................................................................ 120
3.3.3. Qualitative analysis: unmarked score on F3 .............................................................. 122
3.3.4. Distribution of corpus articles with respect to F3 ...................................................... 123
3.4. Interpretation of Factor 4 ................................................................................................... 124
3.4.1. Qualitative analysis: high score on F4 ....................................................................... 125
3.4.2. Qualitative analysis: low score on F4 ........................................................................ 126
3.4.3. Qualitative analysis: unmarked score on F4 .............................................................. 127
3.4.4. Distribution of corpus articles with respect to F4 ...................................................... 129
4. Conclusion ............................................................................................................................... 130
Chapter 5. Dimensions of variation in ‗Science and Technology‘ articles ...................................... 132
1. Introduction .............................................................................................................................. 132
2. Assessing the distributions of factor scores to enable reliable statistical comparisons ........... 132
3. ST articles along Dimension 1: ‗Interactional/Conversational vs. Informative/Formal
Communication‘............................................................................................................................... 135
3.1. Qualitative analysis of ST articles: high score on F1 ........................................................ 135
3.2. Qualitative analysis of ST articles: low score on F1 ......................................................... 137
3.3. Qualitative analysis of ST articles: unmarked score on F1 ............................................... 138
3.4. Distribution of ST articles with respect to F1 and comparisons within the corpus ........... 139
4. ST articles along Dimension 2: ‗Reported Account of Recent Events vs. Direct/Factual
Communication‘............................................................................................................................... 144
4.1. Qualitative analysis of ST articles: high score on F2 ........................................................ 144
4.2. Qualitative analysis of ST articles: low score on F2 ......................................................... 145
4.3. Qualitative analysis of ST articles: unmarked score on F2 ............................................... 146
4.4. Distribution of ST articles with respect to F2 and comparisons within the corpus ........... 147
5. ST articles along Dimension 3: ‗Explicit Argumentation/Explanation vs. Topic Focused
Communication‘............................................................................................................................... 152
5.1. Qualitative analysis of ST articles: high score on F3 ........................................................ 152
5.2. Qualitative analysis of ST articles: low score on F3 ......................................................... 154
5.3. Qualitative analysis of ST articles: unmarked score on F3 ............................................... 155
5.4. Distribution of ST articles with respect to F3 and comparisons within the corpus ........... 156
6. ST articles along Dimension 4: ‗Narration of Past Events vs. Present/Future Focus‘ ............. 161
6.1. Qualitative analysis of ST articles: high score on F4 ........................................................ 161
6.2. Qualitative analysis of ST articles: low score on F4 ......................................................... 163
6.3. Qualitative analysis of ST articles: unmarked score on F4 ............................................... 164
6.4. Distribution of ST articles with respect to F4 and comparisons within the corpus ........... 165
7. The multidimensional representation of a text ......................................................................... 170
8. Do different newspapers differ significantly along the four dimensions? ............................... 173
8.1. ST articles across different source newspapers ................................................................. 180
9. Lexical analysis ........................................................................................................................ 188
9.1. Word frequency lists ......................................................................................................... 188
9.2. Keyword analysis: the whole corpus in relation to general British English ..................... 196
9.3. Keyword analysis: the ST section in relation to the rest of the news corpus .................... 199
10. Using linguistic analysis to trace the life of technoscientific facts and objects in newspapers
207
11. Conclusion ............................................................................................................................ 215
Chapter 6. General Conclusion ........................................................................................................ 218
1. Further remarks on the linguistic analysis of science and technology in a newspaper corpus 219
1.1. Addressing research questions and hypothesis ................................................................. 220
1.2. Possible shared communicative functions ......................................................................... 221
1.3. Discourse and the construction of technoscientific facts .................................................. 224
2. New tools and opportunities for method development ............................................................ 225
3. Limitations of the study ........................................................................................................... 226
4. Further research ........................................................................................................................ 231
5. Concluding remarks ................................................................................................................. 232
References ........................................................................................................................................ 234
Appendix A. Factorial solutions obtained through different methodological choices for exploratory
factor analysis .................................................................................................................................. 254
Appendix B. Q-Q plots for normality tests ...................................................................................... 260
1
CHAPTER 1. INTRODUCTION
1. The importance of communicating science and technology
Visiting the website of the European Organization for Nuclear Research laboratory (CERN) can be
a fascinating experience from the point of view of a lay person who knows very little or nothing
about physics. It is also interesting for anyone engaged in the study of communication. What draws
attention in both cases – although in different ways – is related to the resources and strategies used
by CERN to communicate to the public about the scientific activities taking place at the laboratory.
The website features relatively small amounts of texts, carefully arranged in order to be as clear as
possible. Pictures and images accompany many pages and links in the website. In particular, they
are given the most prominence in the home page, where ever-changing graphical representations of
experiment simulations welcome the online visitor with impressive, colourful and captivating
shapes, accompanied by short, technical captions. From the simple and modern looking CERN
logo, to the instructional video animations and the featured slogans (e.g. ―Accelerating science‖,
―Exploring the frontiers of knowledge‖), the whole design of this website reflects an intention to
communicate and appeal to an audience largely including non-specialists.
The practice of reaching a general public using online resources is not a prerogative of CERN
alone, but of all institutions involved in scientific research. Take the European Research Council
(ERC) and the Royal Society, to name two more. The layout of their websites is also designed to be
appealing and comprehensible. Visuals occupy most of the space in the home pages. Moreover,
both websites feature a ‗news‘ section, a magazine or links to public events. They also regularly
publish content about the importance of communicating science and technology to the general
public (examples are Montgomery 2018 and European Research Council 2018). National
governments and international policy institutions are also involved in promoting scientific and
technological knowledge. For example, the Italian Ministry of Education, University and Research
(MIUR) lists the spread of scientific culture among its ‗special initiatives‘,1 providing yearly
funding to support it. At international level, the European Union research and innovation
programme Horizon 2020 features a thematic section entitled ―Science with and for Society‖, where
communication plays an important role in defining the relationship between science and society
(European Union 2018a: 42).
These examples testify to the importance of the communication of science and technology in the
agenda of many policy and research institutions (Bucchi and Trench 2008:i). There are a number of
reasons for this, mainly related to the positive impact of science and technology on many aspects of
human activity and on people‘s quality of life. Moreover, science and technology are attributed a
prominent role in managing future challenges, concerning issues such as globalisation, climate
change, and economic crises (European Union 2010). The promotion of scientific literacy is also
1 See the corresponding section of the MIUR website at http://www.miur.gov.it/web/guest/iniziative-speciali-e-grandi-
ricerche.
2
considered a key item in the development of knowledge-based societies and economies,2 which is
perceived as a strategic goal to be achieved in today‘s globalised, scientifically and technologically
advanced world.
Science and technology are often mentioned together. However, they are generally regarded as two
distinct entities (Musacchio 2017: 16). Science is associated with the development of abstract
knowledge, derived from a methodologically established observation and examination of the world.
On the other hand, technology is generally considered to be the application of scientific knowledge,
and is to do with the development of methods, devices and skills, derived from empirical
knowledge, which modify the world. However, the boundaries between the two are not always
clearly definable, especially when it comes to practical situations. Let us return to the CERN
example for a moment. The visuals in the website home page graphically represent simulations and
experimental outputs, which can undeniably be regarded as state-of-the-art science. At the same
time, what one sees in those graphical representations is the result of multiple technological
processes, from the use of instruments to perform the experiments, detect particle behaviour and
produce data, to the realisation of graphs to be published on the website.
In general, therefore, it can be said that numerous technological achievements result from the
application of scientific principles; yet, scientific knowledge can also result from the use of
technology, which plays a role in shaping scientific outcomes. In short, scientific and technological
practices are closely intertwined. They have been so for quite a long time. From a historical
perspective, the relationship between traditionally theoretical scholarly fields – e.g. natural
philosophy – and more practical and technical domains – e.g. artisans‘ work, architecture, early
engineering, painting and sculpture – was found to be variously acknowledged both before and
during the emergence of modern science (Rossi 2006: 104-105). Such interaction accompanied
science and technology through the historical transformations of modern and contemporary
societies. It evolved to the point that ―one of the distinctive features of contemporary science, in
fact, is its increasing overlap with technological development, so that scientists work in typically
applied sectors while engineers engage in research‖ (Bucchi 2004: 80). Due to this growing
proximity, it is often problematic to discuss the role of science and technology and their
communication while neatly distinguishing scientific entities and events from technological ones.
Therefore, the present study will draw on the concept of ‗technoscience‘: the term was coined by
Latour (1987) to indicate a proximity, interdependence and ultimately an overlap between the two
entities. Latour distinguished between ‗technoscience‘, defined as science and technology ‗in the
making‘, and ‗science and technology‘, indicating a sort of finished, polished ‗public image‘ of
technoscience (Latour 1987: 174-175). However, the two are here understood as expressing two
closely related concepts, although from different perspectives. Moreover, in most of Latour‘s
analysis, ‗technoscience‘ was de facto used interchangeably with ‗science and technology‘ (Latour
1987: 29). Thus, here ‗technoscience‘ and ‗technoscientific‘ will be used as an equivalent to
‗science and technology‘ and the related adjectives.
2 ‗Knowledge-based‘, or ‗knowledge‘ society or economy refer to the role of knowledge as the main driver of a socio-
economic system, where it becomes the ―basic economic resource‖ and the main source of value (Drucker 1993: 7).
Ideally, in a knowledge-based society the continuous circulation and sharing of information constitute the primary
source of the development and improvement of human communities (UNESCO 2005).
3
As mentioned above, technoscience is considered to be of paramount importance to our knowledge
of the world and to our way of existing and acting in it. It is regarded as a strategic resource for
contemporary societies to progress and address approaching challenges. At the same time, however,
technoscience needs to be supported by society at large in order to continue to exist. Scientific and
technological research would not take place without funding, an adequate education system and
people pursuing technoscience-related careers. Furthermore, it would not be essential to so many
human activities if it did not enjoy epistemic authority and public trust. On this account, the
scientific community continues to pursue societal support, which is highly valued within research
and policy institutions. Society can here be thought of as consisting of many different groups,
among which private citizens, policy makers, entrepreneurs, advocacy groups, etc. – all variously
involved in and affected by technoscientific activities. Thus, a successful engagement of different
social groups with technoscience is thought to favour a positive relationship among all stakeholders,
including the scientific community. Such mutual interaction can in turn result in a beneficial effect
of technoscientific achievements on society, as well as in constructive, shared decision-making.
Public communication of the activities and outcomes related to technoscience is an essential
component of engagement processes and is therefore strategic in supporting research and
innovation. In particular, it is generally thought that widespread (techno)scientific literacy among
non-experts will ultimately result in a generalised positive attitude towards science and technology:
as claimed by Kennedy (2010), communication may favour understanding and thus constructive
interactions between science and the rest of society.
The communication of technoscience to lay people is generally described as a process aimed at
providing information. However, spreading knowledge is not its only purpose. The assumption that
effective communication ultimately leads to public support for science and technology points itself
– at least partly – to promotional and persuasive intentions towards the audience. Moreover,
especially when it takes place in the media, the communication of science and technology is almost
certainly aimed at entertaining those who watch or read, for example by fascinating and surprising
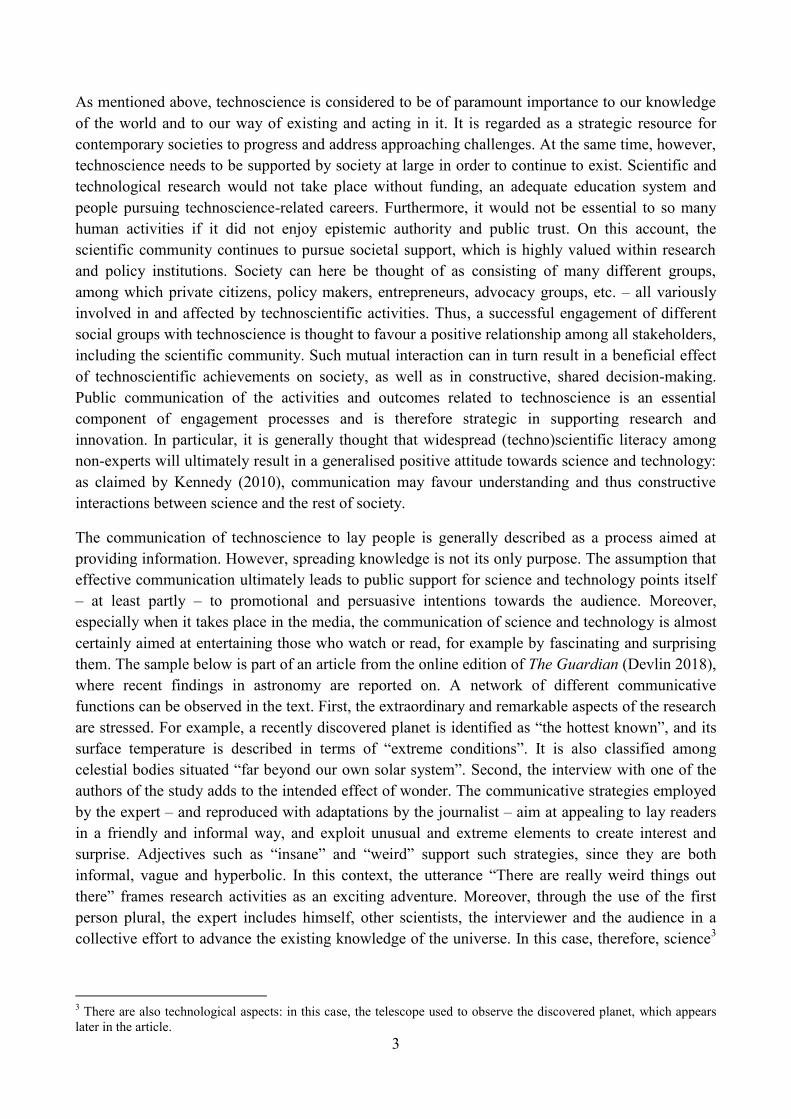
them. The sample below is part of an article from the online edition of The Guardian (Devlin 2018),
where recent findings in astronomy are reported on. A network of different communicative
functions can be observed in the text. First, the extraordinary and remarkable aspects of the research
are stressed. For example, a recently discovered planet is identified as ―the hottest known‖, and its
surface temperature is described in terms of ―extreme conditions‖. It is also classified among
celestial bodies situated ―far beyond our own solar system‖. Second, the interview with one of the
authors of the study adds to the intended effect of wonder. The communicative strategies employed
by the expert – and reproduced with adaptations by the journalist – aim at appealing to lay readers
in a friendly and informal way, and exploit unusual and extreme elements to create interest and
surprise. Adjectives such as ―insane‖ and ―weird‖ support such strategies, since they are both
informal, vague and hyperbolic. In this context, the utterance ―There are really weird things out
there‖ frames research activities as an exciting adventure. Moreover, through the use of the first
person plural, the expert includes himself, other scientists, the interviewer and the audience in a
collective effort to advance the existing knowledge of the universe. In this case, therefore, science3
3 There are also technological aspects: in this case, the telescope used to observe the discovered planet, which appears
later in the article.
4
is communicated to inform, but also to engage, arouse curiosity and make readers feel ‗at ease‘ thus
favouring a positive attitude on their part towards science.
Sample Text 1. 1
Title ―Hottest of 'ultra-hot' planets is so hot its air contains vaporised metal‖
Date 15 August 2018
Newspaper The Guardian (online edition)
New observations of the hottest known planet have revealed temperatures similar to those typically seen at the surface
of a star, as well as an atmosphere of vaporised iron and titanium.
The findings add to the diverse and, in some cases, extreme conditions seen on planets far beyond our own solar
system.
Kevin Heng, a professor at the University of Bern, and co-author of the latest work, said: ―The temperatures are so
insane that even though it is a planet it has the atmosphere of a star.‖
―The main lesson that exoplanets are teaching us is that we can‘t just look in the solar system,‖ Heng added. ―There are
really weird things out there.‖
[...]
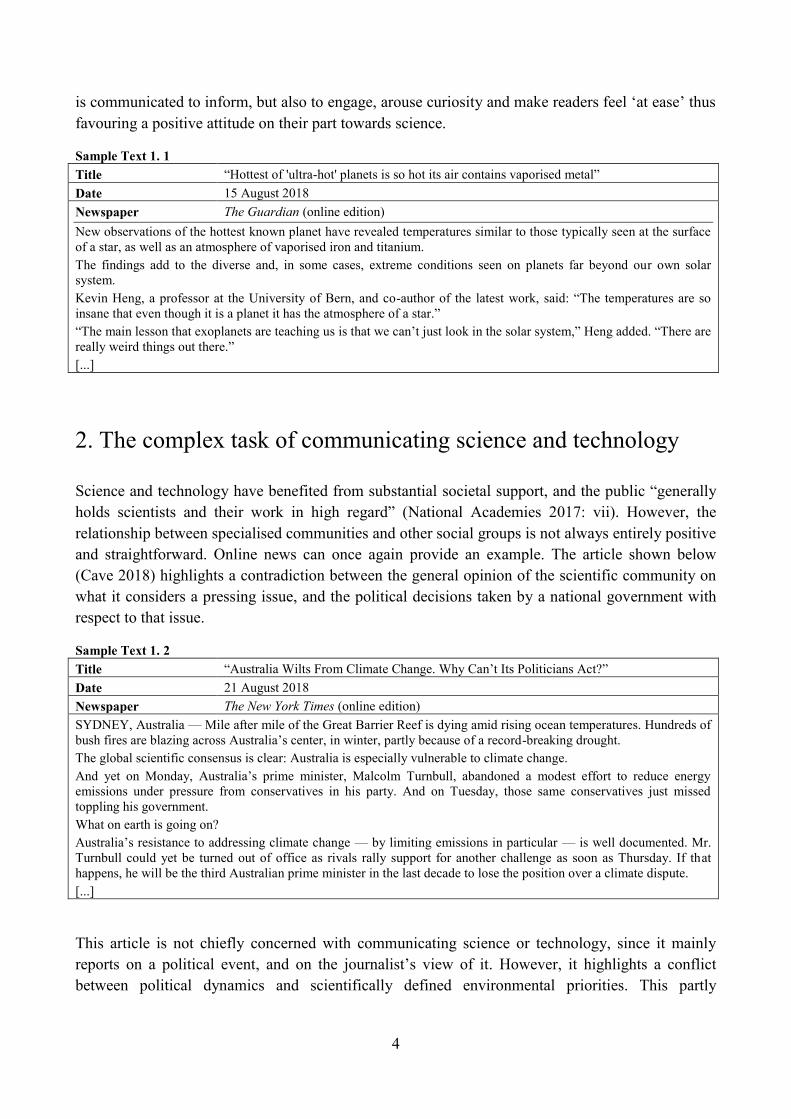
2. The complex task of communicating science and technology
Science and technology have benefited from substantial societal support, and the public ―generally
holds scientists and their work in high regard‖ (National Academies 2017: vii). However, the
relationship between specialised communities and other social groups is not always entirely positive
and straightforward. Online news can once again provide an example. The article shown below
(Cave 2018) highlights a contradiction between the general opinion of the scientific community on
what it considers a pressing issue, and the political decisions taken by a national government with
respect to that issue.
Sample Text 1. 2
Title ―Australia Wilts From Climate Change. Why Can‘t Its Politicians Act?‖
Date 21 August 2018
Newspaper The New York Times (online edition)
SYDNEY, Australia — Mile after mile of the Great Barrier Reef is dying amid rising ocean temperatures. Hundreds of
bush fires are blazing across Australia‘s center, in winter, partly because of a record-breaking drought.
The global scientific consensus is clear: Australia is especially vulnerable to climate change.
And yet on Monday, Australia‘s prime minister, Malcolm Turnbull, abandoned a modest effort to reduce energy
emissions under pressure from conservatives in his party. And on Tuesday, those same conservatives just missed
toppling his government.
What on earth is going on?
Australia‘s resistance to addressing climate change — by limiting emissions in particular — is well documented. Mr.
Turnbull could yet be turned out of office as rivals rally support for another challenge as soon as Thursday. If that
happens, he will be the third Australian prime minister in the last decade to lose the position over a climate dispute.
[...]
This article is not chiefly concerned with communicating science or technology, since it mainly
reports on a political event, and on the journalist‘s view of it. However, it highlights a conflict
between political dynamics and scientifically defined environmental priorities. This partly
5
challenges the often reiterated remark that science and technology are seen as key to the
development of societies and economies.
Scientific knowledge can also constitute a contentious element in legal disputes, where it plays a
deciding role, but what its evidence proves is itself controversial. On 10 August 2018, in the US,
after a month-long trial, the agrochemical corporation Monsanto was ordered to pay a huge
compensation to a former groundskeeper who was diagnosed with terminal cancer after years spent
using one of their herbicides.4 The man was the first person ever to take the corporation to trial
claiming that they had failed to warn him of the health risks connected to the exposure to the
herbicide. The dispute centred on the hazards from glyphosate, a substance contained in the
herbicide. The plaintiff‘s team presented scientific arguments claiming that glyphosate had caused
his disease; on the other hand, Monsanto presented different studies, supporting the safety of the
product. The final verdict was in favour of the plaintiff‘s argument, but it came after a lengthy
process, where science was inextricably tied to legal, economic, and personal aspects. Trials such as
this one, moreover, highlight the fact that deadly risks might be related to the use of an object – in
this case, the herbicide – which is itself a product of scientific and technological activities. The
perceived standing of science and technology is therefore inevitably flawed by such episodes.
Concerning this ambivalence, which at times characterises public attitudes towards technoscience, a
2015 Eurobarometer survey stated that
The widespread confidence in the benefits that science and technology will bring in the
foreseeable future is [...] tempered by concern that these improvements to the quality of our
lives will at the same time also worsen aspects of life that are currently on the top of many
people‘s minds. (European Union 2015: 3)
Therefore, apart from general perceptions of technoscience, some specific issues can become
controversial, both within and beyond specialised communities (National Academies 2017: 51). The
safety of vaccines, the production of nuclear energy, the methods and applications of stem cell
research, and the creation of genetically modified organisms are all examples of technoscience-
related controversies particularly widespread among non-specialised social groups. Especially in
these cases, the assumption that the higher people‘s scientific awareness is, the more their opinions
and choices will be consistent with scientific evidence, has not been fully tested yet. Thus, on the
one hand, controversy may arise from uncertainty, when scientific findings are inconclusive or there
is no agreement among experts. On the other hand, it may also emerge when established
technoscientific knowledge and applications are in conflict with non-scientific long-held
perceptions, or with moral, ethical and social values. In such circumstances, knowing about
scientific evidence may not make any difference in people‘s attitudes, opinions and decisions.
Moreover, controversial or not, most technoscientific subjects are extremely specific, complex, and
not directly observable, nor relatable to common sense (Musacchio 2017: 17). It follows that, in
most cases, a type of communication solely focused on conveying notions may be useful, but not
sufficient to foster public support, let alone to find solutions and mitigate conflicts (National
Academies 2017: 51). Furthermore, the context of technoscience communication involves many
variables that need to be taken into account, such as the type of audience, the medium used and its
4 Articles about the trial were published in several online newspapers. See for example Telegraph Reporters (2018),
Giordano (2018), and Greenfield and Levin (2018).
6
production norms or constraints, the scientific issue being communicated, and its socio-cultural
perception. Overall, the communication of science and technology to lay audiences emerges as an
extremely complex task. In order for it to be effective, not only does specialised knowledge have to
be made accessible to those with no background in it; but it also needs to be adapted to a range of
contextual factors.
As highlighted by sociologists, technoscience-related controversies are particularly effective in
showing that many of the boundaries we rely on to conceptualise science and technology are not as
distinct as they may appear (cf. Latour 1993). Among these blurring dividing lines are those
between connected fields of study. In the case of climate change, for example, different areas of
research and application are involved. Without the collaboration among researchers in climatology,
biology, demography, energy engineering, and others, accounts on this complex and wide-ranging
phenomenon would be much poorer. Besides, all the disciplines mentioned include knowledge from
other areas of study: for example, ecology within biology, statistics for demography, and physics
and economy for energy engineering. In this context, it is therefore hard to identify boundaries
among disciplines in practice. Moreover, climate change cannot be considered – let alone tackled –
without taking into account political action, economic interests, deeply rooted cultural and social
practices, and so on. All these aspects inextricably and simultaneously contribute to the unfolding of
climate change-related events. While it can be useful to categorise them into different areas, they
are in fact connected in an uninterrupted flow. The situation does not change when established, non-
controversial science is considered. The same interdisciplinarity applies to the event described in
the text sample at the end of Section 1, namely the observation of a new planet outside the solar
system, orbiting around its host star. In order to identify and describe celestial bodies, observational
astronomy draws on powerful telescope technologies, as well as on knowledge in physics,
mathematics, and chemistry. All of them are combined and overlap in researchers‘ practice.
Moreover, that same practice was made possible by public and/or private funds, established after
strategic political decisions. Observational astronomy thus does not consist in a ‗pure‘ pursuit of
knowledge about the universe. It also comprises wide-ranging knowledge and technological efforts,
political priorities and economic power, as well as leading researchers‘ take on the most promising
directions for research.
The separations between technoscience and society, and between specialised and non-specialised
communities can also be problematic. Firstly, people in science and technology work and live
within their socio-cultural environment. They develop their opinions, values and beliefs inside that
environment, and there they can engage in a range of practices – e.g. religion, leisure activities,
political participation, personal interests – external to technoscientific research. Scientists are
members of society, and socio-cultural aspects do exist within technoscience. Therefore, its impact
upon society cannot be discussed without considering its socio-cultural elements. Secondly, while
technoscience encompasses intertwined fields of research, its different branches involve extremely
specific knowledge. Therefore, a member of a particular community – e.g. a molecular
neurobiologist – is an expert in their own field, and at the same time a lay person in an unrelated
field – say, earthquake engineering. Thirdly, expert communities are themselves ambiguous
categories, and it is not always clear whether a particular group is to be considered ‗expert‘ or not.
For example, should medical doctors be considered members of the scientific community? Should
PR managers or administrative staff with a high-level technical or scientific qualification be
7
included among experts or not (see also Hilgartner 1990: 525)? Moreover, it has been argued that
some technoscience-related areas, such as biomedicine or information technology, are increasingly
characterised by networks ―connecting scientific experts with non-experts and quasi-experts (patient
organisations, citizen groups, users)‖ (Bucchi and Trench 2014: 2), so that tracing boundaries
among degrees of expertise becomes quite cumbersome.
These aspects are extremely relevant to a discussion of technoscience communication to non-
experts. It has been argued that traditional views of it see scientists as producers of ‗genuine
knowledge‘, which is then delivered to lay people in a necessarily simplified and often distorted
version. This approach potentially works as a political resource in the hands of experts, and of
―others who derive their authority from science‖, when acting through public discourse (Hilgartner
1990: 520). Contrary to traditional views, however, the public communication of science and
technology emerges as a complex and diverse task, which can assume different forms and be
performed to accomplish a range of purposes. Above all, to be effective, it should aim at providing
information without overlooking socio-cultural factors. Such communication is increasingly
needed, particularly in cases of controversy (Musacchio 2017: 10). Today, ―the global spread and
the digitalisation of science communication‖ have increased its volume and reach, contributing to
the complexity of its forms and to the interactions among different stakeholders (Bucchi and Trench
2014: xiv; see also section 2.1 in Chapter 3).
3. The news coverage of technoscience
The media – broadcasting, publishing and the Internet – are the primary channels through which
technoscience is communicated. As such, they are key to its public representation. The media also
promote the interaction among stakeholders. For example, they allow scientists and other experts to
speak about their field of expertise to lay people, through the mediation of journalists and
presenters. Or they host debates involving experts, policymakers, entrepreneurs, advocacy groups,
and concerned citizens. And they of course deliver their content to the general public. In the case of
the Internet, members of the audience may respond through online comments or other user-
produced content. As noted above, people may participate in different groups and cover different
social roles according to the situation, and to the issue being discussed. Within the media context,
news outlets, including newspapers, are one of the possible forms in which science and technology
can be communicated. In particular, they mostly deal with topics of immediate relevance and
interest for the general public. Not only is news production relevant for lay audiences: experts can
also turn to news to find out about different fields of study from their own, or to learn about the
latest development of technoscience-related disputes (see Bucchi 2004: 113).
In the last decades, there have been major changes in the way people encounter information on
science and technology. Such changes also involve news production and consumption, and are to do
with the main shift from traditional media – e.g. TV and print newspapers and magazines – to
online-supplemented or online-only media. In online environments, enormous amounts of news are
issued at an extremely high speed. Moreover, these media operate in new, interconnected ways,
often interacting with one another. For example, a search engine, a social media post, or other
online platforms might link to technoscientific information contained in different resources,
8
including newspapers, science blogs, or scientific institutions‘ websites. More than ever, the
environment in which information is produced is multimedial, combining written text, podcasts,
images and videos. Furthermore, these can be interactive, and allow users to directly participate in
content creation, sharing, or discussion, through online comments and social media publications.
Thus, lay audiences can take part in technoscience communication (Brossard 2013) and affect the
circulation of technoscience-related news and content. On the other hand, it has become much more
difficult to filter bad quality, inaccurate and misleading content from this expanding flow of
information.
In such context, the significance of online newspapers as providers of scientific and technological
information is hard to grasp and define precisely. According to Dunwoody (2008), during the first
decade of the 2000s newspapers still represented one of the main channels through which citizens
who have completed their formal education could learn about science, while the Web was already
starting to grow massively. Some years later, Brossard (2013) stated that American lay audiences
increasingly look for scientific information outside of traditional, mainstream journalistic channels.
However, according to a report by the National Academies (2017), ―much of the scientific
information Americans receive through the media still originates from traditional journalism,
including information transmitted via links on social media‖. Comparable situations may be found
in other similar national or transnational contexts.
A Eurobarometer survey about media use in the European Union (European Union 2018b), for
example, showed that, in general, the written press was the third most commonly used medium after
television and the Internet. While TV was watched at least once a week by 90% of the respondents,
around 75% of them said they used the Internet, and 60% of them said that they read written news.
The survey also revealed that the usage of written press media – at least in their traditional supports
– was decreasing with respect to the previous years, while the use of the Internet and online social
networks had steadily increased among European citizens. It is reasonable to think that information
about science and technology will largely be provided through these two channels. Therefore,
online newspapers – whose content partly overlaps with that of printed newspapers – are likely to
have an important role in this context, also as a source of scientific information.
Data specific to science information in the UK can be found in the Public Attitude to Science survey
(Castell et al. 2014). According to its report, ―people still tend to get most of their science news
from traditional media such as television and print newspapers‖, with 59% of respondents
mentioning TV as one of their most regular sources of information on science, and 23% mentioning
print newspapers (Castell et al. 2014: 45). However, the survey found that the use of online sources
including news websites, online newspapers, and social networks was increasing, and that it was
one of the main sources of science information for around 15% of participants. More specifically,
online sources are particularly popular among people between 16 and 24 years of age: 24% of them
said that online newspapers or news websites were their main source of science information, while
21% indicated social networks. Typically, people actively seeking out information consult these
sources, while the approach to TV and printed newspapers is essentially passive. There, people
encounter science information without actively looking for it. Although they do not reach the same
popularity as TV programmes, online news can be considered a relatively widespread source of
9
science information in the UK. Their content partly corresponds to print sources, and their articles
often appear as links in social networks. Besides, they are particularly popular among young people.
Overall, although their status as a source of scientific information is debated, newspapers have an
established presence online, and can still represent a relatively reliable source of scientific
information among a growing amount of unofficial and unchecked contributions. As Dunwoody
(2008) points out, ―many people seek the sites of established news media on the internet, just as
they do in more traditional modes‖, since journalists historically represent a filter for credible
information. Therefore, online newspapers constitute large repositories of publicly available,
naturally produced language, and they represent a unique opportunity for medium- and long-term
analysis (Neresini 2017), both from a linguistic and a sociological perspective.
Online news feature important changes concerning its production and consumption, with respect to
traditional news. These in turn affect the way technoscience is communicated. For example, the
unprecedented speed characterising article publication and circulation emphasises timeliness,
potentially favouring brief, short-term, ‗striking‘ pieces of news even more than before, and
sometimes negatively affecting accuracy. The way science news reaches its audience has also
changed. News articles are not ‗consumed‘ as single isolated items, as they used to be: they are
instead, ‗contextualised‘ by features such as comments, social media posts referring to them,
Facebook ‗likes‘, number of views, Reddit upvotes, retweets on Twitter, and similar surrounding
and hyperlinked information, which might in some cases affect news perception (Brossard and
Scheufele 2013, National Academies 2017). Moreover, the possibility of being reached from other
platforms such as social media, news aggregators, blogs, and online encyclopaedias, contributes to
the total views of news items and can affect the popularity and success of a topic or a news story.
Sometimes, such ‗integration‘ even blurs the boundaries among different resources, as when online
newspapers incorporate blogs among their Web pages, whereby the distinction between news and
opinion also becomes less clear (Brossard 2013).
Digital intermediaries such as Google and Facebook employ algorithms controlling the selection
and placement of news which may be retrieved through them (Tambini and Labo 2016). Thus,
algorithm-based principles operate in partial substitution to newsroom decisions, sometimes
tailoring information on the users and thus limiting the range of news to be accessed through user
searches. This potentially influences the way information, including scientific content, is
encountered and understood. Finally, although in general a higher amount of scientific information
potentially circulates through the Web, its coverage in traditional news media has decreased
dramatically, whilst the number of science journalists employed full-time in newsrooms has
dropped (Russell 2010, Scheufele 2013). The type of content of science and technology-related
news might be affected by such editorial policies, which include a tendency to devote much of the
remaining space in science sections to consumer-oriented content, specialised on ‗health and
fitness‘ (Dunwoody 2008, Russell 2010) or on commercialised technological devices, rather than
actual scientific research, generally considered as ‗typical‘ technoscientific information. All these
aspects need considering to better understand the value of newspaper texts in the present study.
. Although the coverage of these subjects has been reduced with respect to the past, newspapers still
cover prominent technoscience-related news events and maintain sections dedicated either to
science and technology in general, or to more specific fields, such as health or technological
10
innovation. Besides print editions, most daily newspapers have online versions, allowing them to
reach a wider public and to be linked to from other websites, including social media. On the whole,
if ―information consumers have embraced the digital revolution‖, and ― science information
consumers are migrating online‖ (Brossard 2013: 14097), then looking into online news media such
as newspapers can still contribute to the ongoing research about the communication of
technoscientific content and its language.
4. Some remarks on the role of language in the development of
science and technology
Traditional views of the communication of science and technology to lay audiences describe it as a
simplified or translated version of specialised accounts by scientists, seen as the source of genuine
knowledge (cf. Section 2 above). Such views imply a clear distinction between scientific truths,
which would be uncovered and turned into knowledge by research practices, and the linguistic form
of that knowledge as it circulates within and across different communities. Specialised language is
traditionally regarded as a perfectly accurate description of the facts discovered, while popular
accounts are seen as ―simplified, distorted, hyped up, and dumbed down‖ translations of the same
content (Myers 2003: 266). In fact, language plays a decisive role in the construction of
technoscientific knowledge, at all levels of specialisation. It is essential when experimental results
need to be discussed for the first time among members of a research team, and it is equally
necessary to publish papers in scientific journals, as well as in press conferences and interviews for
newspapers, TV programs or other media productions. Therefore, in a sense, communicating
science is an important part of doing science, both at specialised and non-specialised levels
(Musacchio 2017: 9, 12). In this sense, language cannot be considered as a neutral instrument
employed in specialised environments to reflect an external reality. In any context of use, linguistic
choices are never neutral: they always select some aspect of reality, and selections are always in
some way ideological (Stubbs 2017: 255). This is connected to the nature of language as a social
practice: any communicative event, including scientific accounts, takes place in a social context and
is a ―tool for social action‖ (Bhatia et al. 2008: 1).
Examples of how textual analysis can highlight socially defined functions in scientific
communication can be found in Myers (1990). In his book Writing Biology, he described the
rhetorical strategies adopted by some biologists to communicate about their research in various
forms, including grant proposals, journal articles and other specialised publications. He then applied
the same approach to articles from science magazines with a wider, less specialised readership. The
study emphasized how language was used as a flexible tool, not only to convey information, but
also to negotiate its importance, to trigger particular implications and to achieve professional goals.
This confirms the non-neutrality of language, and its role in shaping the objects it represents.
Language is necessary to make sense of the complex reality resulting from research activities; and
whenever it does so, it is socially contextualised, performs particular functions and enacts a
selection. As Jasanoff et al. (1995: 319) argue, ―syntax, grammar, and word are not merely the
form, they ineluctably affect the content of the communication‖. Thus, the meanings and functions
11
of technoscience are appropriated and negotiated in every context in which they are communicated,
and language is the fundamental means of these processes.
5. Introducing research questions on the language of science and
technology in newspapers
As discussed above, language contributes to shaping technoscientific knowledge; it does so by
denoting scientific entities and applications, and by attaching qualities and functions to them. At the
same time, it serves social functions, dependent on the speaker/author and context of production.
This process is also at work when technoscience is communicated to the general public, and is thus
instrumental in constructing scientific knowledge out of specialised environments. Therefore, it
would be useful to acquire an understanding of how language is used to represent science and
technology in these circumstances. Newspapers have been identified as one of the main sources of
information on science and technology for a public including non-experts (see Section 3 above).
This is also supported by the relatively wide circulation of some – especially national – newspapers,
which is increased by their presence on the Internet. Online websites moreover constitute a useful
resource for linguistic research, since they contain large amounts of texts in digital form, which can
be retrieved and analysed using appropriate tools (as will be explained in detail in Chapter 3). Thus,
an analysis of the language used to communicate science and technology in newspapers could
provide useful insights into the way this knowledge is shaped in the public sphere.
The aim of the present study is to provide an account of the media coverage of science and
technology, focusing on the language of online newspapers. The analysis will be performed on texts
written in English, with the prospect of being extended to other languages in future research.
English was thus taken as a sort of starting point, mainly because it is a lingua franca, both for
science and technology and in the context of globalised media (Bielsa and Bassnet 2009: 29-30;
Wright 2016: 181). This potentially allows English-language newspapers to reach a wider, more
international audience, with respect to other national newspapers. Moreover, since the present study
can be situated within a scholarly tradition which was originally developed in English linguistics, it
can draw upon numerous resources, both theoretical and practical, to bring about further
developments.
In order to approach newspaper language in relation to technoscience, a general question can be
formalised:
―What are the linguistic features of the communication of science and technology in
newspaper language?‖
Such question entails identifying suitable texts and describing their characteristics from a linguistic
point of view. Useful as this can be, it would not highlight what is peculiar about technoscience in
newspapers. To obtain a more comprehensive account, the specific type of communication being
analysed should be compared to a reference language variety, as could be, in this case, newspaper
language in general. Lexical content intuitively emerges as the most obvious distinctive element in
a text, since it largely depends on its topic, so that technoscience-related lexis would result as
12
typical of technoscience news articles, with respect to newspaper lexis in general. Lexical features
can indeed provide interesting information about recurring themes in the representation of
technoscience. However, further elements can be encoded through grammatical and syntactic
choices,5 which also ultimately contribute to the overall style and purposes of a text. On this
account, two more specific questions arise:
―Is there any internal variation within newspaper language, which includes and goes beyond
lexical differences?‖
―Where can the coverage of science and technology be located with respect to this
variation?‖
Since it is based upon the examination of language in use, the present study can take advantage of
the presence of news material online, and exploit the existing technologies to perform computer-
assisted language analyses on a news corpus. Such approach would allow one to survey large
numbers of texts, providing quantitative evidence concerning language use in newspapers.
Consequently, online newspapers, rather than print editions, will be the object of this analysis. It is
important to bear in mind that any quantitative set of data needs qualitative descriptions, both to
define the linguistic categories to be analysed and to produce meaningful interpretations. For this
reason, the present study will combine quantitative and qualitative aspects, as will be further
explained in Chapter 3. To operationalise the above questions, it is necessary to define their scope
more precisely, by specifying the meaning here attributed to a set of basic concepts.
As mentioned above, grammatical, syntactic and lexical features in a text can be valuable indicators
of how language is used in that text to select and mediate aspects of the surrounding reality. Such
selection and mediation are in turn related to the functions the text is made to perform. In this
context, partly following Halliday‘s systemic functional tradition, function refers to the things that
can be done – and are done – with language, most basically ―making sense of our experience, and
acting out our social relationships‖ (Halliday and Matthiessen 2004: 29).6 In the news writing
context, more specific realisations of such basic functions might be providing information,
persuading the audience into agreeing with an opinion, engaging readers, presenting a piece of news
as a story, and so on. Due to the meaning which ‗function‘ takes in this context, throughout the
study it will be used interchangeably with ‗purpose‘ or ‗goal‘.
5 These categories refer to the traditional ‗stratification‘ of language into different levels, extremely useful in dealing
with such a complex semiotic system as verbal language. However, it is acknowledged that, precisely for its
complexity, such distinctions are not clear-cut. For example, Sinclair (2004: 164-176) suggested that lexis and grammar
should be considered as a unified whole, and used ‗syntax‘ and ‗structure‘ as equivalent to ‗grammar‘. Systemic
functional linguistics sees grammar and vocabulary as poles of a ‗lexico-grammatical continuum‘, and syntax, in a
similar relation to morphology, as embedded in grammar itself (Morley 2000; Halliday and Matthiessen 2004: 24; also
cf. Section 2 in Chapter 2). 6 The systemic functional approach to language does not simply see function as a purpose or way to use language, but
as an integral part of it, since ―Language is as it is because of the functions in which it has evolved in the human
species‖ (Halliday and Matthiessen 2004: 31). To emphasize its being part of the whole theory of language, and to
distinguish themselves from previous approaches, linguists following this approach use the term ‗metafunction‘ instead
of function. The present study follows the above definition and the corresponding description of function. However, it
does not thoroughly apply systemic functional categories. Therefore, the more generic term ‗function‘, as also described
in Hart (2014: 1) is here maintained, while acknowledging the contribution of systemic functional linguistics to its
definition.
13
Another notion to be defined is that of linguistic variation. This is an extremely wide-ranging
concept, and could be dealt with from many perspectives. The one here adopted is mainly practical,
in that it focuses on variation in the use of grammatical, syntactic and lexical items in texts, taken as
the main units of analysis. As noted above, choices made with respect to these three levels of
language can be seen as indicating particular communicative functions. It follows that variation in
lexis, grammar and syntax should reflect variation in related functions. Since quantitative and
qualitative approaches are here combined, the assessment of variation is based upon the frequency
of use of a set of linguistic items covering grammatical, syntactic and lexical levels (see Section 3.1
in Chapter 3). In other words, changes in the frequency of use of these items through different texts
are taken to mark variation, thus providing information on the communicative functions performed
in the texts analysed.
Finally, it is necessary to define the notion of communication of science and technology in
newspapers. To do so, an internal classification system for newspaper articles is needed, according
to which any article can be identified as reporting on science and technology or not. In the present
work, newspaper articles are categorised according to the section where they were published in their
source newspaper website (e.g. news, politics, business, opinion, lifestyle, culture, etc.). Science and
technology or similarly labelled sections are regularly featured in newspapers, which makes it
possible to locate technoscience news within this categorisation. The assumption that science and
technology are only communicated in these sections is of course a simplification: they can appear in
many different parts of a newspaper – e.g. national news or opinion articles – besides those
explicitly labelled as science and technology. However, the text-external classification based on
news sections was here maintained. This was regarded as the most suitable option to the method of
analysis adopted, as well as the easiest way to automatically categorise the articles (as further
explained in Section 2.2.4 of Chapter 3). Moreover, it should guarantee that articles classified as
dealing with technoscience are actually pertinent to the topic.
Having provided specific definitions for the above concepts, it is now possible to formulate a more
detailed and practical set of research questions:
In the context of newspaper language, given a set of syntactic, grammatical and lexical
features, is there variation in their use among different categories of articles?
Does the use of any of the above mentioned linguistic features distinguish the
communication of science and technology from the communication of other types of news?
Linguistic variation may be explained in terms of production context and communicative
functions: taking into account that news articles generally share the former, which functions
characterise the communication of science and technology?
Underlying these questions is a research hypothesis stating that linguistic variation exists within
newspaper language, and that the communication of science and technology in newspapers does
have specific linguistic characteristics which differentiate it from other types of news
communication. At this point, it is necessary to devise a method of analysis to address these
questions and obtain evidence on whose grounds the hypothesis can be reasonably accepted or
rejected.
14
The Multidimensional Analysis (MDA) proposed by Biber (1988) was regarded as a useful resource
for the present study. Originally devised to survey linguistic variation among different genres of the
English language, it collects quantitative data about the use of a wide-ranging set of linguistic
features, incorporating syntactic, grammatical and lexical aspects. MDA uses multivariate statistics7
techniques to find out whether and how different linguistic features tend to be used together or in
complementary fashion. It focuses on the patterns of use among features rather than on the use of
single features, and is based on the assumption that those patterns reflect particular communicative
functions. They are indeed related to what Biber called ‗dimensions of variation‘ (Biber 1988: 9),
from which the term ‗multidimensional‘ comes. The dimensions emerging from a MDA are thus
used in this method to characterise texts both from a linguistic and functional point of view. MDA
was applied to a number of studies to investigate linguistic variation among and within genres in
different languages. However, to the best of my knowledge, it was never specifically applied to
news language. One of the aims of the present study is to exploit its potential as a wide-ranging,
statistically-based method, by applying it to the language of online newspapers. The MDA can
highlight patterns of grammatical, syntactic, and lexical variation within such language, and might
therefore be used to obtain new insights into the newspaper coverage of science and technology and
its underlying purposes, by contextualising it as a sub-genre within news.
6. Conclusion
Technoscience is perceived as a strategic enterprise and a source of reliable knowledge, and plays
an important role in most human activities. It is produced by communities of experts, and is based
on explicit rules of method and validation, which contribute to its reliability and authority. It
comprises theoretical and applicative components, and covers a myriad of interrelated
specialisations concerning all aspects of our surrounding reality. It also exists as a part of the
society in which it is conceived and developed. There are no clear-cut boundaries separating
scientific practices from other social practices, nor scientists from non-scientists. Rather, clines and
overlapped layers of activities and roles may better explain the relationship between technoscience
and society. Most importantly for the present work, there can be no technoscience in society
without the former being communicated at all levels of specialisation. Not only does language play
a fundamental role in expressing scientific and technological results and entities; it is a tool to
perform social functions related to technoscience. It can be used in different circumstances by
different stakeholders with various purposes: information can therefore coexist with argumentation,
persuasion, entertainment, etc. In each context, the meaning of scientific and technological entities
is appropriated and negotiated; as a result, scientific knowledge itself is partly re-shaped and
socially constructed through language. The present study analyses the linguistic features and
communicative functions characterising the communication of science and technology in one of the
contexts where it is encountered by the general public, namely online newspapers. Focusing on
English, the analysis combines quantitative and qualitative approaches to locate technoscience
7 Multivariate statistics refer to an assortment of techniques developed to handle situations involving complicated
datasets, which feature many different variables (Tabachnick and Fidell 2012; Harris 2013: 10). ‗Variable‘ refers to an
element, feature or factor that is liable to vary or change, that is, it can exist ―in more than one amount or in more than
one form‖ (Spatz 2011: 408).
15
communication within news language. The aim is to contribute to a better understanding of such
communication in order to provide insights into the media representation of technoscience and its
perceived status in the public sphere.
The study is structured as follows. Chapter 2 consists in a literature review which places this work
in the context of applied linguistics, traces its connections with discourse analysis and corpus
analysis, and finally links it to the sociology of science and technology. Chapter 3 starts by
describing the collection and structure of a corpus of English-language articles from various online
newspapers. It then goes on to explain the method of analysis, which reproduces MDA with new
tools and integrates it with a lexical analysis. In Chapter 4, the MDA results for the whole news
corpus are shown and interpreted, with the aid of qualitative analysis. Chapter 5 is centred around
the results and qualitative analysis of articles reporting on science and technology, which are
subsequently compared with the rest of the corpus. The comparison is integrated by the lexical
analysis, and overall results are connected to relevant concepts elaborated in the field of sociology.
Finally, Chapter 6 features further comments on the obtained results, addressing the initial research
questions and hypothesis. The chapter goes on to discuss the main limitations of the study; it then
identifies scope for further research and closes the entire work with some final remarks.
16
CHAPTER 2. BACKGROUND FOR A LINGUISTIC STUDY
OF THE COMMUNICATION OF SCIENCE AND
TECHNOLOGY IN NEWSPAPERS
1. Introduction
Since the second half of the 20th century, the contribution of science and technology to our lifestyle
has increased substantially (Greco 2006). Given the current impact of scientific and technological
applications at all levels of society (National Academies 2017: vii) communication between the
scientific community and its numerous interlocutors is of great importance in policy making
processes. Besides, it affects the relationship between specialised communities and the lay public at
large. Therefore, not only do science and technology fascinate the lay public because they arouse
their curiosity and strike their imagination, but they also affect people in their everyday lives.
Because of its key role within society, and for its distinguishing features, the discourse – or rather,
the discourses – of the public communication of science and technology are a topic of great interest
for scholarly research.
The role of technoscience in society as it is intended and perceived today has its historical roots in
the post-World War II period, when political and economic powers identified science and
technology as key strategic resources for their capability to produce economic wealth, military
power and social progress (Bucchi and Trench 2016: 153). Awareness led to large amounts of
public – and progressively also private – funds being allocated in the research sectors. This resulted
in a new definition of the role of the scientific community, whose work began to feature interactions
with multiple social actors, from companies, politicians and officials, to the whole community of
citizens, whose everyday life was increasingly affected by applications and practices relating to
science and technology at all levels (Greco 2006: 19). From this new strategic role of technoscience
in society, some distinctive elements in technoscientific knowledge were identified by Gibbons et
al. (1994). They made a distinction between a traditional knowledge production mode, called
‗Mode 1‘, and a new, developing ‗Mode 2‘. Mode 1 mainly took place in a disciplinary, chiefly
cognitive context, characterised by a certain epistemological homogeneity. Scientific problems were
set and solved within specific academic communities and according to their interests. In this context
hierarchy – as well as its preservation – was fundamental. By contrast, Mode 2 takes place in a
broader context, which encompasses heterogeneous, transdisciplinary approaches. It includes social
and economic environments, and is more socially accountable and reflexive as a result. In Mode 2,
knowledge is produced, legitimated, and spread with a view to its application.
Ziman (1996) drew on Gibbons et al.‘s idea of ongoing transition from Mode 1 to Mode 2, and
proposed the notion of ‗post-academic science‘, which originated in the US after World War II, and
subsequently reached most Western countries. In line with Gibbons et al.‘s hypothesis, scientific
research only became a fully developed professional activity in the 19th century, when Mode 1
developed (Ziman 1996: xx). In the period covered by Mode 1, science was considered as a
distinctive cultural form, detached from other social spheres – such as the economic one – and was
17
more often associated with the pursuit of knowledge, rather than with military, technological and
industrial development. Decisions regarding research problems and research goals were taken
within the scientific community itself. By contrast, the post-academic era, characterised by the new
strategic role of technoscience and its applications in all sectors of society, constitutes the context of
development of Mode 2.
At the same time, the ‗new‘, post-World-War-II role of technoscience did not result in an
unambiguously positive view of constant development beneficial to the whole society. After the
positivist era, when it was seen as steadily advancing towards an increasingly certain knowledge
and control of our world, technoscience also started to be seen in relation to critical issues, such as
the idea that uncertainty is unavoidable, or that environmental problems are caused by human
activity. These are open-ended questions. Technoscience forms the very basis of our globalised
industrial system. Considering the post-modern disillusionment deriving from this new awareness
of the role of technoscience, Funtowicz and Ravetz (1993) claimed that new styles of scientific
activity, which they called ‗post-normal‘, had started to develop. Post-normal science involves a
systemic approach to knowledge, overcoming the traditional, reductionist tendency to build clear-
cut categorisations dividing every aspect of reality into ever smaller elements. Moreover, post-
normal science acknowledges ―unpredictability, incomplete control, and a plurality of legitimate
perspectives‖ (Funtowicz and Ravetz 1993: 739), introducing social practices – echoed in the social
accountability of Mode 2 – alongside the traditional, intellectual ones. According to the authors,
social awareness emerges as a way to tackle the most problematic aspects of technoscience, whose
applications can sometimes bring about serious issues and threats to humanity or to the environment
– e.g., climate change or nuclear accidents.
Whether or not scientific institutions have been deliberately transitioning towards a post-normal
mode, they have become increasingly aware of the importance of maintaining social support and
trust (see Sections 1 and 2 in Chapter 1). An effective communication between the scientific
community and its numerous interlocutors is fundamental in this context. On the one hand, lay
publics1
need to be informed about, and become familiar with some basic scientific concepts,
although these may be highly technical, specific, complex, and even counterintuitive. On the other
hand, scientists need to provide accessible information about their research in order to earn support,
funds, and legitimization for their activity (Greco 2006: 22; National Academies 2017:vii). By and
large, science and technology still enjoy prestige and receive substantial support from society today.
However, they are in some cases subjected to criticism and scepticism, especially when
controversial science/technology-related decisions can be perceived by the community as having an
important societal impact, for example with respect to food safety, collective health issues and
environmental protection (see Section 2 in Chapter 1). An effective communication of science and
technology to lay audiences is valued even more in these circumstances by governments and
research institutions. In general, it is supposed to have a positive impact both on scientific research
activities and on society at large, although it is difficult to decide what exactly effective or
successful communication is (Lewenstein 2003: 288).
1 The use of the plural form 'publics' here indicates that the public should not be regarded as a fixed entity. On the
contrary, it is complex, heterogeneous, and context-specific (cf. Einsiedel in Bucchi and Trench 2008: 174).
18
Indeed, scientific communication for lay audiences is not a straightforward matter, in that there is
no single successful practice preventing misconceptions, ethical issues, scepticism and conflicts in
general. It is even more so in today‘s complex information system, fundamentally based on the
increasing importance of the Internet. Public technoscientific information is found in online
newspapers, scientific institutions websites, science blogs, but also in social networks and in users‘
comments to online articles, in addition to traditional sources such as paper news articles or books.
In this context, the communication flow does not follow a single direction from the scientific
community outwards; interlocutors can affect research agendas through their relative power and
their expectations.
Since science and technology are ―prominently featured in the flow of digital communication‖
(Neresini 2017: 2), new technologies, including online genres such as blogs or social media have
become valuable sources for social research (Rogers 2013; for an analysis of the combination
between ‗physical and digital ethnography‘ for social research, see Murthy 2008). Moreover, thanks
to the digitisation of traditional media such as newspapers, researchers can exploit the availability
of large amounts of published data to study the media coverage of technoscience, at the same time
indirectly exploring its social representation, and the public attitudes towards it. Basing research on
this type of sources has some limitations, in that the nature and extent of the correspondence
between media representations and the rest of the societal context remains open to debate, and any
instance of communication always results from a process of representation and mediation, which is
strongly influenced by authors and context. However, taking into account that media representations
and the general social context do in some way affect each other, newspapers can be considered a
valuable source to explore not only the representation, but also, indirectly, the role of technoscience
in the wider social context (Neresini 2017). News media represent one of the main channels where
technoscientific information directed at the lay public is provided with the mediation of
professionals, most of the times journalists (Brand 2008: 1). Do news media contribute to the
information flow between the scientific community and society at large? And what kind of
communication do they provide? Does the communicative approach change across cultures and
languages?
In addressing these issues, the linguistic aspect of technoscience communication is of primary
importance, since it is key to the process of knowledge production and dissemination at all levels of
specialisation (see Section 4 in Chapter 1). Linguists have analysed different levels of science
communication from different perspectives, mainly as languages for specific purposes, as genres,
and as types of discourse that enact socio-cultural practices within a certain community. As such,
science communication has also been studied in the field of rhetoric, with particular attention to the
strategies it employs. Moreover, science communication cannot be considered without bearing in
mind its production circumstances, the status of scientific knowledge, and the purposes of
communication, be it specialised or popular. This makes sociological theories particularly important
in analysing both the production and the circulation of scientific and technological content. Most
linguistic and rhetoric studies are, to different extents, aware of sociological accounts of the public
communication of technoscience, not just as a textual category, but as a process that opens up
questions about the actors, institutions, and forms of authority involved (Myers 2003: 267). In the
next paragraphs, the study of public communication of science and technology will be
contextualised within the research areas of linguistics and sociology, by reviewing the branches
19
which most contributed to its description and interpretation. An integration between linguistic and
sociological accounts might be further developed and enriched. This could be achieved by applying
methods of linguistic analysis capable of going beyond the exclusively content-based accounts
found in sociology, and by further drawing on the theoretical contribution of sociology to this field
of study. In this perspective, a combination of qualitative and quantitative analysis might be
instrumental in capturing interesting aspects of the public communication of science and
technology, and in general, of media language.
2. A broad contextualisation: applied linguistics and discourse
analytical approaches
Applied linguistics has been broadly defined as covering ―any application of language to the
solution of real-life problems‖ (Hunston 2002: 2). In a more nuanced way, Davies and Elder (2004:
11-13) characterise it as a continuum between two main definitions. On the one hand, they identify
‗applied linguistics‘, focused on language problems affecting people‘s daily lives, and aiming at
researching language to ameliorate those problems, which is why it is traditionally connected to
domains like language learning or speech therapy. On the other hand, they identify ‗linguistics-
applied‘, closely connected with linguistics, and ―primarily concerned with language in itself and
with language problems in so far as they provide evidence for better language description‖ (Davies
and Elder 2004: 11-13). A linguistic analysis of the communication of science and technology may
fall within the ‗linguistics-applied‘ definition, since it deals with language-related issues in specific
situations of actual language use, with a descriptive purpose. Such definition partly overlaps with
the wide-ranging area of discourse analysis. It has been argued that discourse analysis has an
important role within applied linguistics as a whole, since it addresses language as a context-
specific practice. Addressing language in concrete situations of use is a goal and a means of
education; it can be an instrument of social control, as well as of social change (Trappes-Lomax
2004: 133). This fits perfectly within the scope of applied linguistics. Moreover, as Gee (2011: 10)
claims, all discourse analysis is by nature practical and applied. In other words, discourse analysis
may be viewed as forming part of the domain of applied linguistics, without exclusively belonging
to it: much discourse analysis is indeed done by applied linguists, although contributions also come
from other scholars even from outside the area of linguistics (Trappes-Lomax 2004: 133).
The interest in language in use, at the basis of the development of discourse studies, gained
momentum in linguistics, as well as in other research areas such as psychology, anthropology, and
sociology, in the 1970s. In linguistics, this marked a shift from the then prevailing generative-
transformational paradigm, with its context-free, sentence-based accounts, to approaches based on
naturally occurring language, with greater awareness of its production context. At the same time,
linguistics and the other disciplines interested in language use, as well as literary analysis,
semiotics, and philosophy became more closely intertwined (van Dijk 1983: 2-4). One example of
such interdisciplinary nature concerns the recent developments of social theories of culture at their
intersection with language and discourse analysis. In these studies, socio-cultural phenomena are
explored through language, for instance by analysing the way information is structured in oral
20
interactions to achieve cognitive goals (Saferstein 2007); or by applying text mining tools to address
the public representation of contentious issues (DiMaggio et al. 2013).
Defining discourse analysis is not a straightforward task: its boundaries are not clear, nor
universally acknowledged by scholars: what counts as discourse analysis for some may be included
in other disciplines – such as pragmatics or semantics – by others (Paltridge and Wang 2010: 257-
8). The main reason why there cannot be a succinct and comprehensive definition of discourse
analysis is probably the absence of a univocal definition of discourse. As suggested above,
discourse can be broadly defined as ‗language in use‘, or ‗language in action‘. But this leads to a
range of possible interpretations: for example, language as a system beyond the sentence level; or
language as a social and semiotic practice, which transforms our surrounding environment into a
socially and culturally meaningful one. Note that the latter sense might include non-linguistic
semiotic systems, such as the visual and acoustic ones (Blommaert 2005: 2).
According to Trappes-Lomax (2004: 133), discourse analysis is about systematically, deliberately
and – as far as possible – objectively noticing and describing patterns of language in use and the
circumstance with which these are typically associated. Therefore, it could be defined as ―the study
of language viewed communicatively and/or of communication viewed linguistically‖ (Trappes-
Lomax 2004: 133). In Paltridge and Wang‘s view (2010: 256), discourse analysis can help explain
the connection between what people say and the meaning they intend to convey in a particular
context. According to Gee and Handford (2012: 1), discourse studies deal with meanings in
language use, and the actions carried out when using language in a certain context.
In other words, depending on how broad the definition of discourse is, discourse analysis can deal
with different aspects of language in use. A classification of discourse studies proposed, among
others by Schiffrin et al. (2001: 1; cf. also Gray and Biber 2011: 138) comprises three main
categories:
studies focusing on linguistic variation, or on how different forms are employed to serve
different functions;
studies analysing language structure above the sentence level, and exploring how texts are
organised and constructed;
studies focusing on the association between social or ideological practices and language, and
exploring people‘s linguistic choices in relation to socio-political and cultural formations,
which reflect and shape social order and individuals or groups‘ interaction with society
(Trappes-Lomax 2004: 133).
This latter category especially emphasises the multidisciplinary nature of discourse analysis,
because an awareness of the social, political and cultural context where language is used implies
that research requires an interaction between linguistics and other areas. In commenting on
multidisciplinary aspects of discourse studies, Gee (2011: 8) distinguishes between two main types
of approach, one more rooted in linguistics and one mainly attributed to non-linguistic
contributions. Of these, the former is more concerned with language structures at the grammatical
level, and how these structures function to produce meaning in different contexts of use, while the
latter is more content-based, that is focused on the themes and issues featured in the communicative
events being analysed. Accordingly, Gee and Handford (2012: 5) see discourse analysis as both a
branch of linguistics and a contribution to the social sciences.
21
Among the different approaches rooted in linguistics that can be found in discourse studies, some
partly overlap with the field of pragmatics, and aim at uncovering principles through which people
work out the meaning of what is communicated in a certain context (cf. Levinson 1983; Grundy
2013). Others refer to the field of conversation analysis, exploring the norms regulating spoken
interaction (cf. Psathas 1995; Ten Have 2007). Other studies adopt an ethnographic approach: they
explore language use variation in relation to the situational and cultural context, and provide tools to
understand communicative events as performed by particular communities, exploiting notions of
appropriateness and convention to uncover the beliefs and attitudes which might underlie those
events (e.g. Gumperz and Hymes 1986). There are approaches whose main focus is on ―linguistic
patterns occurring across stretches of oral or written texts‖ and their communicative functions
(Paltridge and Wang 2010: 257). This structural-functional approach encompasses text linguistics
(e.g. Hoey 1991) and Systemic Functional Linguistics – or SFL (Halliday 1985; Martin 1992;
Halliday and Matthiessen 2004). In SFL, grammar and lexis, treated as two poles of a cline named
‗lexico-grammar‘, are seen as meaning-production tools, used by the speaker to simultaneously
perform three ‗metafunctions‘: representing experience (ideational), managing interpersonal
relationships (interpersonal), and producing a cohesive and coherent communication (textual).
Be it more rooted in linguistics or more oriented towards the social sciences (cf. the critical
approaches covered in the second part of this section), discourse analysis can be applied to survey a
wide range of language varieties, both spoken and written. It can also be applied to language
variation from a genre-based perspective (cf. Section 5). Some examples of the varieties and genres
covered by discourse studies are conversation (see above), academic discourse (Hyland 2009), PC-
mediated and online communication (Myers 2010; Herring and Androutsopoulos 2015), and media
discourse (Aitchison and Lewis 2003; Machin and Van Leeuwen 2007; Bednarek and Caple 2012).
Moreover, these forms of communication can be analysed cross- or inter-culturally and in a multi-
modal perspective (Kress and Van Leeuwen 2006; Kress 2009). (For a terminological discussion
and a field overview see Scollon and Scollon 2001: 539; Fitzgerald 2003.)
As hinted at above, some forms of discourse analysis are primarily – although not exclusively –
interested in description and explanation, while others are more focused on tying language to
political, social and cultural issues (Gee and Handford 2012: 5), in an explicit attempt at tackling
those issues and have some sort of effect on them. This is the type of approach adopted in critical
discourse analysis (CDA). CDA has produced research on a range of topics, employing a variety of
methods. They all share an effort in identifying linkages between instances of language in use and
broader social processes, formations and discourses, thus examining the role of language in
reflecting, producing, sustaining, challenging and transforming situations of power distribution,
discrimination or identity-related issues. CDA is closely linked to Critical Theory studies in
philosophy, anthropology and the social sciences (for an overview see Talmy 2010: 128, or
Blommaert 2005: 5-13), and it is as well connected to rhetoric studies, media studies, cultural
studies and communication studies.
The anthropologist Clifford Geertz identified some fundamental concepts for this scholarly field.
He proposed a semiotic concept of culture, which he defined as ―a system of inherited conceptions
expressed in symbolic forms by means of which men communicate, perpetuate and develop their
knowledge about and attitude toward life‖ (Geertz 1973: 89). Therefore, he takes the analysis of
22
culture to be ―not an experimental science in search of law, but an interpretive one, in search of
meaning‖ (Geertz 1973: 5). This view encompasses the idea of discourse as a semiotic practice,
which is at the basis of a critical approach to discourse. CDA focuses on language as much as on
socio-cultural dynamics, and typically treats issues such as discrimination and social inequality or
injustice. Within discourse analysis, CDA ―does not constitute a well-defined empirical method but
rather a cluster of approaches with a similar theoretical base and similar research questions‖ (Meyer
2001: 23). In this sense, it could be better understood as a critical perspective ―that may be found in
all areas of discourse studies‖, and where ―all methods of the cross-discipline of discourse studies,
as well as other relevant methods in the humanities and social sciences, may be used‖ (van Dijk
2015: 466).
As for the research methods and procedures applied, CDA generally locates itself in the
hermeneutic rather than in the analytical-deductive tradition. Compared to the (causal) explanations
of the natural sciences, hermeneutics can be understood as a method of grasping and producing
meaning relations. In order to accomplish this interpretive process, a strong theoretical basis is
generally claimed in CDA. Theories may vary widely, including microsociological2 perspectives
(e.g. Scollon and Scollon 2003), theories on society and power partly referring to Foucault‘s
tradition (Jäger and Maier 2009), theories of social cognition (van Dijk 1988) and grammar -
especially Systemic Functional Grammar (Meyer 2001). The subjects under investigation may
include gender issues, issues of racism, media and political discourses or dimensions of identity
research (Wodak 2011). As for the object of analysis, most CDA studies analyse ‗typical texts‘, and
some of the authors, such as Scollon and Wodak, explicitly refer to the ethnographic tradition of
field research for text collection. There is little discussion about statistical or theoretical
representativeness, and it can be assumed that many CDA studies mostly deal with only small
―typical‖ corpora (Meyer 2001). This does not however exclude the use of larger corpora, which
constitute a more recent development in the field (Mautner 2016; Baker et al. 2008; Baker and
McEnery 2005). Methodological approaches also vary widely, depending on the theoretical
framework, the subject under investigation and the material being collected and analysed.
According to Wodak (2011), most CDA studies involve some form of close textual and/or
multimodal analysis, which results in a ―thick description‖, defined as an account of findings able to
show the full complexity and depth of the observed phenomenon (Geertz 1973; Holliday 2010: 99).
Besides topics and content, CDA strongly relies on linguistically-defined categories, among which
actors, verbal mode, time, tense, argumentation can be found: their selection mainly depends on the
research questions being asked.
It has been argued that because it is socially contextualised, all language in use is to some extent
political, and therefore all discourse analysis needs to be to some extent critical (Gee 2011: 9). This
observation also applies to the language(s) used to communicate science and technology: although
its analysis may not prioritise political aspects, scientific and technological knowledge has a social
value and has to do with authority, power and important political decisions. One particularly
2 Microsociology is the study, often conducted through direct observation, of social phenomena at the microscopic
level. It involves the analysis of small-scale contexts, and a focus on the details of individuals‘ or small groups‘
behaviours and their interactions ―in the actual flow of momentary experience‖ (Collins 1981: 984). It is contrasted with
the complementary perspective of macrosociology, focused on large-scale, long-term processes, referred to entities such
as political organisations, social classes, and cultural identities.
23
relevant aspect for a study focused on the circulation of scientific knowledge is that of power
relationships. Van Dijk (2001: 355) defines the social power of groups and institutions in terms of
control of actions and mind, which presupposes a privileged access to social resources such as
force, money, fame, status, but also knowledge, authority and information. He goes on to describe
current manifestations of power as seldom absolute. This means that they can be limited to some
situations and groups, and can face several degrees of submission or resistance. Moreover, they are
not necessarily explicit nor oppressive: rather, they can occur in many taken-for-granted everyday
actions, among which writing or reading a piece of science and technology news in any online
newspaper might be included. As a result, a privileged access to specific forms of discourse,
including media discourse and scientific discourse, is itself a power resource. Thus, the language(s)
used for the public communication of technoscience can be analysed as a potential means of
expression, production, support, challenge or transformation of power dynamics linked to
knowledge and discourse access and control.
Within CDA, discourse has also been described from a cognitive perspective as the medium
through which our surrounding environment is turned into something which is socio-culturally
meaningful. This process, however, is enacted under linguistic and socio-cultural (therefore
contextual) conditions (Blommaert 2005: 4). This implies that language in use cannot be analysed
just in its sheer propositional content or informational purpose, but also in its ability to support
human affiliation and power relations within cultures, social groups and institutions (Gee 2011: 5).
One implication of these expressive, productive and transformative possibilities of discourse, is its
performative aspect: discourse is socially constitutive, as well as socially shaped (Wodak 2011: 39).
In this sense, language resources can be used to create perspectives, with certain implications: for
example, they might emphasise one aspect of a controversial issue over others; or they might
signify a certain relationship between experts and lay people. Therefore, if science and technology-
related practices are carried out within a system where power is unequally distributed among
stakeholders – scientists, lay citizens, politicians, company members, etc. –, the flow of
communication among them might embed their own intended perspectives, implications and the
power relationships at work.
3. The use of corpora in discourse analysis
Since the advent of computers in language research, the study of language in use has seen the rise of
new research perspectives, often regarded as falling within the domain of corpus linguistics, based
on the possibility of carrying out partially automatic analyses on large amounts of texts otherwise
not analysable by a single linguist. Hunston (2002: 20) defines collections of texts or corpora as a
way to collect and store data, which can be accessed and observed through software tools. Biber,
Conrad and Reppen (1998: 4), define corpora as large and principled collections of natural texts.
The use of corpora made it possible to research language on the basis of frequency and of patterns
of use, which exceeds the researcher‘s own intuition, by providing fundamental probabilistic
information about the structure of language in use (Halliday 1991; Sinclair 2004b). The
development of such research practices brought about new theories of language and new ways to
describe language (Hunston 2002: 2), as shown by basic corpus-inspection techniques, such as
frequency, phraseology or collocation analysis. These can provide a sufficient amount of evidence
24
to confirm or disprove previously formulated assumptions about language, and about the actual
extent to which linguistic phenomena are used; additionally, they might reveal previously unnoticed
patterns.3
The present study substantially draws on concepts and methodological tools related to corpus
linguistics. Corpus linguistics can be briefly defined as ―the study of language based on examples of
‗real life‘ language use‖ (McEnery and Wilson 2001: 1). Taking into account the role of computers
and the use of large corpora, McEnery and Hardie (2011: i) defined it as ―the study of language data
on a large scale – the computer-aided analysis of very extensive collections of transcribed
utterances or written texts.‖ However, there is debate over the nature of corpus linguistics, and
particularly on whether it should be considered a theory, a branch of linguistics, or it should be
rather attributed a methodological status. For example, Leech (1992: 105-106) claimed that it is a
branch of linguistics, but a peculiar one, since it does not refer to a domain of study, but rather to a
―methodological basis‖ for linguistic research. In describing some important principles underlying
research in corpus linguistics, Stubbs (1993: 1) refers to ―a cluster of ideas [...] which form an
enduring and distinctive vision of language study‖, and to ―a tradition of language study.‖ Teubert
(2005: 2) sees it as ―a theoretical approach to the study of language.‖ He also rejects the view that it
is a method (Teubert 2005: 4), observing that it rather involves many different methods, all based
upon the guiding principle that language should be studied through real-life data gathered into
principled collections (i.e., corpora). Other scholars dissent from Teubert‘s views, emphasising the
methodological nature of corpus linguistics. McEnery and Hardie (2011: i), for example, refer to
―the discipline of corpus linguistics‖, and later define it as ―an area which focuses upon a set of
procedures, or methods, for studying language‖ (McEnery and Hardie 2011: 1). The present work is
more in line with this ‗methodological‘ perspective rather than with views of corpus linguistics as a
theory. Following Lee (2008: 87), corpus linguistics is here seen as a ―methodological innovation‖ -
a set of methods, techniques and tools, rather than a method, which would entail an established
procedure. At the same time, it should be acknowledged that a study falling within the area of
corpus linguistics does imply a set of theoretical statements about the study of language and
ultimately its nature (see Stubbs 1996: 22-24), and consequently an approach to its analysis. Such
approaches can be traced back to the work of some influential scholars (see the above citations in
this section), which are seen as founders of and contributors to actual traditions of research.
Moreover, as mentioned above, the outcome of corpus linguistics may help to develop new theories
of language. These features, however, do not make a theory of corpus linguistics (cf. Gries 2010),
whose perspectives and procedures can be applied to different branches of linguistics, among which
genre analysis (see Section 5 below), sociolinguistics, and discourse analysis.
As suggested in Section 2, a study of technoscience in newspapers is connected to critical
approaches to language. However, instead of taking a ‗traditional‘ close-reading approach, it can be
useful to extend the methodological scope and exploit larger text corpora through corpus-based
techniques, thus taking advantage of the ubiquity and availability of news materials, especially
online. The use of corpora in discourse analysis entails a particular approach to language in use
(Lee 2008: 87-9), since it introduces a quantitative, frequency-based perspective, whereby
3 A complementary approach partly overlapping with corpus methods is the computational one, where concepts such as
‗distant reading‘ and techniques like data mining are put into practise to derive information from large amounts of
textual data (cf., for example, Mimno 2012).
25
automatic and interactive computer programs are used to aid in the analysis (Gray and Biber 2011:
139). The use of large corpora can obscure contextual features peculiar to individual texts, while the
numerical and statistical basis of most corpus analyses should not, obviously, lead to associate
corpus usage with completely objective and unbiased work. Still, corpus linguistics can be fruitfully
applied to carry out discourse-analytical tasks (Wodak 2011: 45; Hunston 2002: 13-14, 109; Baker
et al. 2008). When discourse is seen as ―situationally embedded used and re-used language‖ (Lee
2008: 88), the frequency of linguistic features – whether lexical, grammatical, syntactical, or
anything which can be automatically identified and counted – becomes a means of enquiry.
Therefore, corpus techniques of discourse analysis can provide more reliable results in terms of
repeatability and generalisability (see, for example, Sinclair 2004b: 115).
4. Research methods: the quantitative-qualitative continuum and
the rise of mixed methods
The role of corpus-based techniques in discourse analysis might also be considered in light of the
methodological distinction between quantitative and qualitative research methods. Frequency
counts and statistical techniques for data description and interpretation associate these research
practices with quantitative methods. In principle, this could be perceived as almost incompatible
with the qualitative methods traditionally adopted in discourse analysis. However, it has been noted
that a dichotomy between qualitative and quantitative approaches may not capture a wide range of
current and past research approaches (Duff 2006: 66; Dörnyei 2007: 25). Therefore, a quantitative-
to-qualitative continuum might constitute a better representation (Brown 2005: 486-491; Angouri
2010: 29). This methodological continuum is useful to describe corpus linguistics approaches to
discourse analysis. Following this description, a study of the communication of technoscience to the
general public based on a corpus of newspaper texts can be categorised as leaning towards the
quantitative end of the continuum. However, because of the contextual and socio-cultural awareness
entailed in the interpretation of findings, it also involves qualitative elements. As a result, it can be
considered as an example of mixed-method, or methodological triangulation research (Dörnyei
2007: 20; Tashakkori and Creswell 2007). In theory, ―mixed methods design arguably contributes
to a better understanding of the various phenomena under investigation: while quantitative research
is useful towards generalising research findings [...] qualitative approaches are particularly valuable
in providing in-depth, rich data‖ (Angouri 2010: 35). To corroborate the importance of mixed-
method linguistic research in relation to corpus methods, Lee (2008: 88) argues that, contrary to a
stereotyped view of qualitative and quantitative methods as mostly separated practices, the vast
majority of corpus-based research is both quantitative and qualitative. This view is in line with that
pointed out, among others, by Biber et al. (1998: 4), who defined corpus linguistics as depending on
―both quantitative and qualitative analytical techniques‖.
26
5. Exploring language variation through corpora: register and
genre analysis
An important feature of natural languages is their internal variation along time, geographical, social,
and situational axes. With respect to linguistic variation, a key assumption to the application of
corpus methods is that language variation is reflected by variation in the frequency of certain
linguistic features, and that these changes are systematic and functional. Hence the importance of
comparing language phenomena across different sectors of language. Emerging quantitative
patterns of variation should then be examined in relation to the functions of the observed linguistic
phenomena, and to the way these functions match their communicative context (Gray and Biber
2011). There might be a correspondence between this approach and the concept of repertoires of
language use, one of the principles identified in CDA by Blommaert, (2005: 15). Each repertoire is
described as consisting of unequally distributed linguistic elements, on the basis of social
constraints. Therefore, also in corpus-based studies, which focus on language in use, a socio-
culturally aware – even critical – attitude might be adopted when interpreting quantitative linguistic
data. In the present study, exploring language variation means being able to describe a certain type
of communication against other communicative categories, on the basis of linguistic feature
frequency. This approach can be applied to science and technology news articles, locating them
within a system of linguistic variation. From a methodological point of view, according to Biber
and Conrad (2009), there are three perspectives to study text varieties: register, genre, and style.
Registers are defined by their linguistic characteristics in relation to their situation of use; register
description can be more or less fine grained, thus resulting in the definition of more or less
specialised registers. Moreover, registers – or their representation – can be embedded within other
registers, as is the case with dialogues in novels, or reported speech in a piece of news. Genre is also
contextually defined, but genre distinctions focus more on the conventional, organizational structure
of linguistic productions, so that, while registers can be placed along a continuum of variation,
genres are considered as more discrete entities. The study of genre analysis ranges from Systemic
Functional Linguistics, through English for Specific Purposes to rhetorical studies. Within these
approaches, genres have been defined as regularised and socially recognised forms of discourse
arising in response to specific needs, and as such they embody the involved social groups‘
expectations (Tardy 2011: 54), as also pointed out in Berkenkotter and Huckin‘s seminal work
(1995;see Section 7). News, for example, is written with precise audience demands in mind, and has
been shown to reflect socially situated models of knowledge (van Dijk 1988). Finally, style is
primarily linguistically defined, but not functionally motivated by its context. Stylistic analysis
could even be used to describe instances of language within the same register or genre. Among the
three perspectives, genre and register are here considered relevant to an analysis of science and
technology articles, in that they might be described as a sub-register or sub-genre within news, and
could be characterised by peculiar linguistic features. These features can be considered from a
functional and situational point of view, to then be linked to a social dimension.
One particular corpus-based approach to the analysis of register variation is Multidimensional
Analysis (MDA) (Biber 1988), where multivariate statistics is applied to derive what have been
called ‗dimensions of register variation‘ from the co-occurrence patterns obtained from the
27
frequency counts of a set of grammatical, lexical and syntactic linguistic features throughout
individual texts in a corpus. The dimensions are functional interpretations of co-occurrence
patterns: some may, for instance, reflect an informative style, others a persuasive type of
communication, and so on. Dimensions, visualised as a continuum between opposite
communicative styles, can be present to various extents in a text: their presence depends on the
distribution of the initial set of linguistic features serving as a basis for frequency counts, and is thus
measurable in individual texts. As any other method, MDA has limitations and several issues have
been raised concerning its application. Firstly, its automatic linguistic feature tagging is not easily
realisable using existing tools (Stamatatos et al. 2000), which also makes it more difficult to
transpose the method to other languages than English. Secondly, although it is a powerful tool, its
complexity both in computational and statistical terms requires a high level of competence, and it
has been argued that similar, although approximate results could be achieved through simpler
methods (Xiao and McEnery 2005). Thirdly, a critical review of its statistical procedures
highlighted the possibility of obtaining different solutions as an effect of slight methodological
changes, leading to sound a note of caution on the application and interpretation of MDA (Lee
2000). Despite its drawbacks, MDA is a linguistically comprehensive, statistically grounded
method of linguistic analysis, and its power to highlight linguistic patterns and potential
communicative functions should not be underestimated. MDA was initially devised to explore
general language corpora: Biber (1988) applied it to English and extended it to Somali, Nukulaelae
Tuvaluan and Korean (Biber 1995); Biber et al. (2008) applied it to Spanish. It has been used in
numerous studies4 to analyse different linguistic varieties: among these are direct mail letters
(Connor and Upton 2003), university language (Biber 2006), international varieties of English
(Xiao 2009), written L2 corpora (Asenciòn Delaney and Collentine 2011), linguistic authenticity in
TV shows (Al Surmi 2012 ), discourse in the workplace (Friginal et al. 2013), and written academic
papers (Egbert 2015). So far, to the best of my knowledge, no MDA has specifically focused on the
public communication of technoscience in any language: an MDA of newspaper language might
therefore provide interesting insights into how science and technology in the news can be located
within its macro-register. Moreover, a functional interpretation of linguistic patterns found in
science popularization texts might contribute to describing their communicative functions. MDA
therefore constitutes a possible integration of corpus-based lexical or grammar-based analyses
which focus on one or very few linguistic aspects.
6. News texts as a field of inquiry
The choice of analysing newspapers to assess the discourse of public technoscientific
communication is not only motivated by the availability of analysable texts. In today‘s extremely
complex system of mass communication, revolutionised by the Internet, newspapers remain an
important source of scientific knowledge for those who do not belong to the specialised
communities where that knowledge is produced (National Academies 2017; Calsamiglia 2003:
140). News (especially in written form) have received extensive scholarly attention, including
detailed linguistic investigation. In thematic terms, prototypical news items deal with recent events
considered to be of public importance and interest. Its focus is more probably negative than positive
4 For an exhaustive and detailed overview, see Biber (2009).
28
(although this could be somewhat contradicted by some science and technology articles), and it
favours immediate, concrete and personal matters rather than abstract and complex ones;
furthermore, it is preferably sketched in culturally recognizable and unambiguous terms
(Montgomery 2011: 214). News is a sub-set of media productions, which have been analysed
through many disciplinary and methodological lenses. In an overview of the field, Cotter (2015:
797) notes that approaches to media language research were initially based on content analysis.
Lexical choices, the positioning of information, and the use of quotations were evaluated and
offered as evidence of bias in the press (Glasgow University Media Group in Cotter 2015; for a
detailed overview of early contributions to news studies, see also van Dijk 1988: 5-16). Subsequent
major contributions also borrowed from semiotics and critical theory-oriented traditions, thus
extending the field to CDA, multimodality, social semiotics, and linguistics. Other contributions
came from Systemic Functional Linguistics and cultural studies. Therefore, the methods used by
media language researchers often are multifaceted and multidisciplinary: Cotter (2015) identifies
several areas around which research methods tend to cluster. The main and most widely developed
are:
a critical discourse area, informed by social theory and by the systemic-functional approach
(Halliday 1985), and influenced by earlier critical linguistics (Fowler et al. 1979) as well as
by notions of mediated action (e.g. van Dijk 1988; Fowler 1991; Fairclough 1995). Here
news, as any mediated, representational process, is always seen as somewhat biased by
factors such as newsworthiness-based content selection, and adjustments of the content to
audience expectations (Fowler 1991). Linguistic aspects surveyed in this area include micro-
structures of grammar, lexis and syntax, but also macro-structural, text-level semantic and
rhetorical features that point to culturally shared and influential conventions and schemata.
Some of these critical studies also adopt a socio-cognitive perspective, exploring readers'
perception and understanding of the news (van Dijk 1988).
an area focused on narrative and pragmatics, mainly referring to discourse analysis and
sociolinguistics, where presentation and perspective, style and register, and audience
response are investigated (Bell 1991; Meinhof 1994).
a comparative or intercultural area, mostly located within discourse analysis and
sociolinguistics, concerned with the role of culture and politics in news production (e.g.
Scollon 1997; Leitner 1998).
an area, based more on communication studies than on linguistics, where researchers mainly
engage in content analysis and apply insights from cultural studies, semiotics, social theory,
and social history (e.g. Hardt 1992; Hall 2006).
Relevant concepts for a linguistic analysis of technoscientific discourse in the news are used across
some of these areas. One is the idea of exploring the encoding of perspective and ideology in news,
despite journalists‘ claims of objectivity, and the problematisation of power relationships emerging
from news production. For example, while news might be shaped in an apparently unbiased
language, this may only be implicitly conveying the authors‘ or newsroom‘s judgments by bringing
them to the background of linguistic structure (see for example the discussion of appraisal theory by
Martin and White 2005), which often results in an indirectly persuasive message. No investigation
covers the linguistic features of technoscience communication in newspapers situating it in its wider
context, that is analysing it in relation to the language of news in general. Since mass media reach
29
wide audiences and produce a large amount of news content, it might be interesting to observe the
representation of technoscience within the broader system of newspaper production.
7. Research on the language of science and technology
communication: a thematic overview
To integrate the disciplinary and methodological contextualization presented in Sections 2 to 6, a
more ‗thematic‘ overview of the research explicitly focused on scientific communication (and in
particular, on scientific communication to lay publics) is presented here. The scholarly interest in
science communication spans different domains: historians, sociologists, philosophers, journalists,
rhetoricians, scientists themselves, and applied linguists have all dealt with this subject. These
multiple approaches have different starting points and theoretical premises, but tend to interconnect,
blurring to some extent the boundaries between different domains, and circulating concepts among
disciplines. Some of these studies – most of which are carried out on English texts – will be
outlined here, to build a framework in which a corpus-based analysis of the communication of
science and technology in English-language news can be situated. The overview will adopt a broad
perspective on scientific communication, and will not be confined to descriptions of newspaper
language alone, since this would mean neglecting research areas with relevant contributions to the
field, and overlooking the connections existing between forms of public communication of science
and technology in different genres.
In linguistics, the types of technoscientific communication produced within research or technical
communities are normally included among specialised languages, or languages for specific
purposes (LSP) (Gea-Valor et al. 2010: 9; Parkinson 2013). Specialised languages are described in
lexical and terminological terms (Gotti 2003; examples about scientific research articles can be
found in Hyland 2008 or Zambrana 2010). However, they also have typical syntactic, grammatical
and discursive features (Gotti 2003; Paltridge and Starfield 2011; on the language of science,
Halliday and Martin 1993), and feature typical rhetorical aspects (Bazerman 1988 on research
articles, Swales 1990; Parkinson 2013). Much of this work involves an idea of scientific
communities as discursive communities, since novices in scientific disciplines need to learn
specialised discursive systems in order to acquire the specialised community membership they
aspire to. This aspect was surveyed in sociolinguistics, notably by Berkenkotter and Huckin (1995).
Many of these studies pointed out that specialised scientific texts, presenting an apparently
objective and informative, propositional content, have articulate interpersonal functions, dealing
with the organisation and life of the academic community, and with the discipline being
communicated (Gea-Valor et al. 2010: 9). This brings specialised scientific communication out of a
positivistic, un-critical view, into a domain where it can be considered as a socio-culturally specific
activity (cf. Section 9).
Different types of scientific communication taking place outside specialised communities have been
described from several disciplinary perspectives. In Talking Science, Lemke (1990) discusses the
discursive features characterising the spoken language used to teach scientific subjects in the
classroom. In their influential work, Halliday and Martin (1993) treat the language of science in
textbooks, using a Systemic Functional Linguistics approach. Other minor contributions deal with
30
science communication in the industry: for example, a Computer-Assisted Critical Discourse
Analysis method is adopted by Szymanski (2016) to analyse written science communication in the
Washington State wine industry. However, the area of non- specialised science communication
which has received the most scholarly attention is that of public communication, also referred to as
popularisation,5 usually directed at wide, non-specialised audiences.
As discussed at the beginning of Chapter 1 and in Section 1 above, communication scholars,
linguists and sociologists were not the only ones with a keen interest in the public communication
of science and technology: society at large, including public institutions, private companies and
scientists themselves, have become increasingly aware of the importance to communicate research
activities and results outside specialised contexts. Citizens as well claim their right to be informed
about technoscientific research applications, especially when they feel that these directly affect their
lives. This has prompted numerous reflections about how science communication should be
structured according to the various contexts where it takes place, while science communication
programmes have been established in higher education courses, to train professionals in this
important practice.
Rhetoric studies dealt with these issues by exploring strategies used to ‗accommodate‘ specialised
content to lay publics (Fahnestock 1986) and analysed the relationship between rhetorical tools
employed in the communication of science and the ‗public understanding of science‘ – a term that
refers to the way scientific information is perceived and interpreted by non-specialised audiences
(Gross 1994). Science studies closer to the social sciences explored the role and status of the
communication of science and technology in contemporary western societies (Whitley 1985). The
contributions from communication studies (Nisbet et al. 2002; Scheufele and Lewenstein 2005)
focused on how lay publics receive and react to scientific content as shaped by the media. In
agreement with Science and Technology Studies (cf. Section 9), these works pointed out that non-
specialised receivers can use both scientific knowledge and non-scientific interpretive tools in their
evaluation of science. Historians discussed the role and the development of science in popular
culture especially since mass culture emerged (Cooter and Pumphrey 1994), challenging ideas of
public understanding of science as a wholly passive process.
Within and across the blurred boundaries of the applied linguistics area, different aspects have been
surveyed in various forms of public communication of science and technology, adopting a range of
perspectives. For example, the concept of politeness was applied to analyse, compare and contrast
pragmatic elements in specialised and popular science (Myers 1989). The authority of the expert‘s
voice and the construction of their readership, together with narrative strategies in a popular science
book were studied by Fuller (1998). Other studies dealt with the exploitation of linguistic (e.g.
narrative) strategies to shape the collective imagery and normalise technoscientific applications
(Myers 1994; Brown 1999; Seguin 2001). The discursive strategy of hedging6 was reviewed and
5 The term ―popularisation‖ is widely used to refer to this type of discourse. However, it has been considered
problematic because it is usually associated to a set of simplistic assumptions about scientific literacy and the way
technoscientific knowledge is produced. This issue will be addressed at the end of this section and in Section 9, while
the expression ‗public communication of science and technology‘ will be preferred throughout. 6 Hedges are linguistic devices – they can be any type of phrase or part of speech – used to present information as an
opinion rather than a fact. For example, possibility modals may and might, or adverbials such as maybe, approximately,
and sort of can be used as hedges to ―withhold complete commitment to a proposition‖ (Hyland 2009: 75). The strategy
31
compared across specialised articles and popularised texts (Varttala 2001). Metaphor also drew
researchers‘ attention (Väliverronen and Hellsten 2002, while Gülich 2003 included metaphors
among the illustration strategies employed in doctor-patient spoken interactions). Hellsten (2002)
analysed the rhetoric of hope and progress in some ads by two life sciences companies. Other
discourse studies focused on scientist‘s voices in reported speech in newspapers (Calsamiglia and
Lopez Ferrero 2003), or described the discourse of scientific innovation in the press (Moirand
2003). Some works dealt with the public communication of science in more general and theoretical
terms, trying to account for its complexity and diversity. Among these, Myers (2003) challenged the
traditional view that scientific knowledge follows a one-directional flow from scientists to the lay
public, claiming that information can instead follow non-linear paths within society, and different
layers and groups (including non-specialist ones) can contribute to the messages being circulated. In
their discourse-based and cognitive-epistemic analysis of the Spanish press, Calsamiglia and van
Dijk (2004) offer a definition of popular science that attempts at representing the complex processes
at play in this wide-ranging category:
Popularization is a vast class of various types of communicative events or genres that involve
the transformation of specialized knowledge into ‗everyday‘ or ‗lay‘ knowledge, as well as a
recontextualization of scientific discourse, for instance, in the realm of the public discourses of
the mass media or other institutions. (Calsamiglia and van Dijk 2004: 370)
Hyland (2009: 152-173) also emphasises the importance of recontextualisation, pointing out that the
communication of science to non-experts does not just report the same content of, say, a research
paper, for a different audience: it represents phenomena in different ways to achieve different
purposes, ranging from entertainment to persuasion (see Section 1 in Chapter 1). This variation in
communicative function parallels the different types of audience and the different forms and
contexts of technoscientific communication. Thus, a documentary needs to be different from a
book, which is in turn different from a newspaper article. Linguistic differences can be found in
features such as text organisation, accommodation strategies, stance expression, and proximity, that
is the way authors interact and construct alignment with readers (Hyland 2010).
Other overviews of the discourses characterising forms of public communication of science and
technology come from scholars in the LSP area, who include popularisation as a language for
specific purposes of its own, either in comparison with specialised technical and/or academic texts
or in its own sake. Garzone (2006), for example, traces a broad contextualisation of the public
communication of science and technology, to then focus on science articles in newspapers. She
provides examples of several discursive phenomena, including text structure and organisation,
concept repetition, semantic vagueness, expository as opposed to argumentative language,
colloquial register, reader construction, the use of metaphors and the attribution of statements to
experts‘ voices as a way of marking authority and hedging statements. Gotti (2012) focuses on the
concept of rewriting and analyses instances of definitions, metaphors and similes, extending the
scope of his overview to summaries of product characteristics in medicine and to the potentially
misleading communication in (pseudo)informative materials (e.g. leaflets) aimed at marketing
medical products, such as nutritional supplements. Exploring different sources of scientific
of hedging is key in managing opinions and uncertainty, and creates the space for alternative interpretations concerning
the subject of discussion.
32
information is important, as a range of different genres is used in communicating technoscience to
lay audiences, including science blogs which were analysed linguistically with a focus on their
authors‘ capacity to address different types of audience (Luzón 2013).
Translation studies is another area where the public communication of technoscience has been
addressed, introducing a cross-linguistic aspect which is not easily found elsewhere in this field (cf.
Sharkas 2009; Martinez-Sierra 2010; Shuttleworth 2011; Merakchi and Rogers 2013; Musacchio
2017). Other theoretical frameworks applied to the public communication of science and
technology are CDA (Grego 2013) and Systemic Functional Linguistics, used by Minelli de
Oliveira and Pagano (2006) in their analysis of direct speech representation in research articles and
popular science articles; Hunston (2013) combined categories from Systemic Functional Linguistics
with a corpus linguistics approach to analyse a popular science book. Most of the reviewed works
apply qualitative methods of analysis to small corpora. However, as this last example shows,
corpus-based, computer-assisted work has also been conducted: besides the already mentioned
papers by Varttala (2001), Hunston (2013) and Szymanski (2016), other examples are Brand‘s
(2008) research on the SARS coverage in the English media and Taylor‘s (2010) diachronic
analysis on three UK newspapers applying Modern Diachronic Computer-Assisted Discourse
Studies (MD-CADS) methods. Finally, an analysis of the public communication of science and
technology can combine linguistic perspectives with non-linguistic theories, leading to interesting
insights such as in Dahl (2015), who integrates text linguistics with the sociological theory of
framing (Goffman 1981; Entman 1993).
Communicating science and technology to non-experts has sometimes been regarded as a form of
translation – more specifically, of intra-lingual translation (Jakobson 1959: 233) – of specialised
texts, with the aim of making science and technology understandable for an audience of non-
experts. Although quite popular in general culture, this notion is controversial among researchers,
and it clearly depends on the definition of translation applied by each scholar. In Shinn and Whitley
(1985), several contributing authors use the terms ‗translation‘ and ‗translatability‘ when referring
to the public communication of science and technology, although the sociological implications of
this use are not ignored (Whitley 1985: 5-6). Reference to popular science as (intralingual)
translation can be found in Gotti (1996, 2012) and Martin and Veel (1998: 31-33). As Garzone
(2006) argues, such definition may work if a broad concept of translation, encompassing rewriting
and reformulation, is adopted. Moreover, popular accounts of technoscientific activity hardly ever
result in a text-to-text transfer, as happens with ‗typical‘ translations. Rather, there can often be
multiple sources (research articles, interviews, press releases, etc.). Zethsen (2009) lists ‗expert-to-
layman‘ communication among examples of intra-lingual translation, and Cooke (2012) describes it
as a process by which the same scientific information produced by experts is translated into
everyday language. Maksymski et al. (2015) tackle the debate by comparing popularisation to
several definitions of translation, highlighting how much the applicability of the concept of
translation depends on the definition of translation that is adopted. However, the idea of public
communication of science and technology as a form of translation, as well as the use of the term
‗popularisation‘, have been criticised, especially but not exclusively by sociologists (cf. Section 9).
Some scholars have found that these concepts often reflect an oversimplified view of the process
through which technoscientific knowledge is produced, shaped and circulated in society (Hilgartner
1990; Grundmann and Cavaillé 2000). Within this framework, scientific knowledge is created in its
33
original and genuine version in the scientific community, to then be transformed (and possibly
distorted) in popularisation. People supporting this viewpoint may overlook the diversity of
specialised communities, the existence of different levels of expertise, and may assume that
scientific knowledge only flows in one direction, from scientists to the lay members of society. The
distinction between genuine and popularised knowledge could thus be politically exploited. For
example, some scientists may use it to maintain the epistemic hierarchy that contributes to their
power. Therefore, the pairing of translation and public communication of technoscience is
problematic and ambiguous, especially if sociological theories are taken into account.
The present study aims at applying corpus-based lexico-grammatical analyses, including MDA, to
highlight some main communicative functions underlying the linguistic features which most
characterise the representation of science and technology in the analysed texts. However, the
discourse of science and technology in newspapers also needs to be connected to at least two other
important aspects: news production norms and sociological theories of technoscientific knowledge
production and communication.
8. Science communication from practitioners‘ viewpoint
Work centred on the practice of science writing (mainly aimed at guiding or commenting on the
activity of science journalism) adds important elements to an overall picture of science
popularisation. It indeed emphasizes the importance of readers‘ engagement for successful
reporting, and the limits and difficulties which characterise the reporting of science and technology
news. Journalists need, for instance, to critically review and select news stories and reliable sources,
sometimes seeing themselves as a sort of watchdog against false news spreading (Rensberger 2000),
without having, most of the time, any training in scientific or technological subjects. Moreover, they
need to cope with embargo policies imposed on news releases by scientific journals (Siegfried
2006: 11). They also find themselves in extremely competitive arenas, where technoscientific news
have to contend for space, both among themselves and with other types of news, such as politics,
foreign affairs or gossip news. As more than one science writer would argue, one of the main
purposes is to entertain, rather than educate (Highfield 2000). Hence, the need to tailor news in
order to make them interesting and attractive for readers, by exploiting those aspects of science and
technology which are potentially the most entertaining, surprising, even anomalous ones (Blum et
al. 2006; Bianucci 2008: 14-16). In this sense, Bianucci argues that science news is not different in
structure and purpose from any other type of news. These considerations mark the communicative
difference between specialised and popular science and technology; once again, the communication
of science and technology to non-experts cannot be just considered as a simpler version of
specialised science.
Overall, any guide to good science reporting in the news, be it addressed to trained journalists or
trained scientists (an example for Italian is Carrada 2005), or both, stresses the need for clarity and
simplicity. It strives for a balance between effective communicative strategies and intellectual
honesty in reporting news, which should be of the best quality and the highest reliability possible.
Science and technology news articles are not all authored by experts in scientific reporting.
However, although it receives less space in news outlets than in the past, science journalism is

34
increasingly regarded as a specific, and fully developed profession. Even from a science writer‘s
point of view, therefore, the discipline should be informed by and aware of the major sociological
contributions to this topic.
9. An overview of sociological approaches to technoscientific
knowledge production and communication
Any account of the language employed to produce and circulate scientific and technological
knowledge is necessarily bound to the way research activity is developed, to the processes
characterising the life of the scientific community, and to the modes of interaction between the
scientific community and the numerous other layers of society they are in contact with. Moreover,
linguistic descriptions need to acknowledge that such communicative processes occur in a number
of different situations, and have different characteristics and functions according to their context (cf.
Section 2 in Chapter 1). This requires adopting a comprehensive and critical perspective on science
and technology in society, addressed in depth by seminal work in the field of the sociology of
science, where scientific knowledge is understood as a socially situated practice. The current
section will briefly outline some aspects which, in my view, can contribute to a description of the
language of science and technology for lay audiences. Since it is not intended as an exhaustive
account of the history and different approaches of the sociology of science, only some among the
existing theories and approaches will be introduced and touched upon with some simplification (for
more in-depth overview of the sociology of science, see Bucchi 2004).
The early stages of the sociology of science are traditionally associated with the work of the
American sociologist R. K. Merton, who most notably described what he termed ‗normative
structure of science‘, which consisted in a set of rules and principles behind the organisations and
functions of the scientific community (Merton 1942). These norms revolved around the concepts of
universality, collaboration, disinterest and scientific scepticism. Although Merton himself
understood them as ‗ideal‘ guidelines, considering how different the actual research practice could
be, his theories were later regarded as only grasping surface aspects of the scientific enterprise.
A major shift towards a more critical perspective came with the celebrated work The Structure of
Scientific Revolutions by Kuhn (1962), a historian and philosopher of science with a former
academic training in physics. The publication of Kuhn‘s work brought a set of extremely important
aspects to the attention of scholars. Firstly, the contingent aspects of scientific practice were
highlighted, thus challenging the objectivity of scientific data and facts, together with the
cumulative development of science, intended as a linear path of progress towards an absolute and
objective truth. Secondly, in order to understand what constitutes the scientific inquiry, Kuhn
pointed to the importance of the historical component of scientific development, and, more
generally, of regarding science as a social activity, embedded in the culture where it is carried out.
Thirdly, he claimed that scientific change is driven by disruptive phases, called ‗revolutions‘, which
interrupt stable periods, and bring in new paradigms, that is founding sets of notions and results
shared within a community and leading its research practice. The publication of Structure sparked
debate among sociologists and had a strong influence on subsequent theories. Moreover, by quoting
it, Kuhn led to the rediscovery of Fleck‘s study, Genesis and Development of a Scientific Fact, first
35
published in 1935 (Fleck 1979). Fleck, originally a microbiologist whose research also covered
epistemology and the history and philosophy of science, had anticipated many of the concepts
expressed in Structure. His work focused on the ways scientific and extra-scientific communities
intertwine and overlap, thus concurring in determining research agendas and scientific concepts.
Moreover, Fleck had described the process through which scientific knowledge becomes a
‗scientific fact‘ when it moves from inner specialised circles to outer non-expert groups.
The process of factualisation described by Fleck, together with Kuhn's theory of scientific change,
contributed to the development of new perspectives on the processes that lead to the establishment
of scientific knowledge. Sociologists of science began to reflect on the changes undergone by
scientific notions when they are presented in different contexts (e.g., in the laboratory versus in a
research paper for a scientific journal). Scholars also started to find connections between the status
of scientific claims and the social and cultural environments where scientific activities take place.
To explore all these aspects, a group of scholars started, between the 1970s and the 1980s, to carry
out social research in scientific laboratories. They realised a series of ethnomethodological,7
microsociological descriptions of how scientists worked (Latour and Woolgar 1986). This approach
aimed at uncovering various aspects: the reasons behind researcher‘s choices regarding subjects,
procedures and methods; the existence of ‗dead ends‘ and failures in research; and the strategies and
tools (including some linguistic ones) used to legitimise and defend scientific theses. These studies
adopted a constructivist8 approach in claiming that scientific knowledge is not just affected by the
societal context, but is in fact constructed through micro-social aspects – for example, a particular
experimental setting, the availability or lack of equipment on a given occasion, or even the
individual skills, training and views of different researchers (Bucchi 2004: 65). Thus, research
papers emerge as selective, rationalised reconstructions, linguistically crafted in order to present and
legitimise the scientist‘s work (Knorr-Cetina 1995).
Partly deriving from these ‗laboratory studies‘, actor-network theory (Latour 2005) was developed
to extend their scope to the nature of scientific knowledge outside the laboratory. A distinction was
drawn between ‗science in the making‘ and science as it is presented in the broader scientific
community and then in the public domain. While ‗science in the making‘ is tentative, multifaceted,
and does not always follow a single, rational course, its public counterpart is wholly accountable in
terms of proofs and of objective experimental results, faithfully reported in scientific publications.
‗Science in the making‘ and ‗public science‘ are dominated by two distinct types of discourse,
which coexist in a sort of stereophonic account, i.e. a combination of circumstance, power, events
and collective dynamics. These can determine whether a hypothesis will finally turn into a fact, or
7 Ethnomethodology is a particular approach to research in sociology ―dedicated to explicating the ways in which
collectivity members create and maintain a sense of order and intelligibility in social life‖ (Ten Have 2004: 14).
Ethnomethodological studies focus on how members of social groups make their everyday activities meaningful,
reasonable, ―accountable‖ (Garfinkel 1967: vii), and part of common sense in their social contexts. Thus, while other
approaches aim at explaining social facts, ethnomethodology aims at explaining how social facts become what they are,
or how they are constituted as such by members of society (Ten Have 2004: 14). 8 In the context of the sociology of science, social constructivism refers to the view that technoscientific entities such as
facts, knowledge and theories do not provide a direct correspondence between the concepts they convey about nature
and nature itself; rather, they are regarded as the result of selections, transformations and constructions from nature. The
studies adopting a constructivist approach see such construction processes as closely related to scientific activities as
social practices (Knorr-Cetina 1981: 3). In this sense, they claim to show the social construction of science and
technology, although it is important to note that there are different interpretations of this concept (Hacking 1999;
Sismondo 2010: 57).
36
will remain in the domain of artefacts. They can also decide which view will prevail over others in
the case of controversy. In such combinations, both human and non-human entities (such as
laboratory equipment, research papers, institutions, epidemics, and even guinea pigs) should be
taken into account as actors. Thus, analysing science and technology means delving into the
processes which brought to the construction of technoscientific facts, re-opening a sort of ‗black
box‘9(Latour 1987: 2) after it had been closed and never questioned again by scientists themselves.
Actor-network theory can be regarded as one interpretive model within the broader framework of
Science and Technology Studies (STS), which emphasise the socio-cultural dynamics at work
within the life of the scientific community and in the production of scientific knowledge. There is
debate about the nature, the extent and the implications of such dynamics, whose sociological
descriptions converge into the comprehensive notion of ―social construction of science and
technology‖. Nevertheless, some key points seem to characterise this notion through different
approaches:
Scientific and technological activities are seen as being part of society rather than a separate
sector with completely different features, only occasionally communicating with society.
Research in science and technology is not taken to be a linear and completely objective
process, through which researchers gradually uncover the truth about nature, but rather as a
social activity. Consequently, the view of science and technology as an unproblematic and
cumulative path of epistemic and practical progress is rejected. On the contrary, although
characterised by a definite method and set of norms, the process of investigation is also
acknowledged in its subjective and arbitrary moves, in its possible inconsistencies, mistakes
or dead ends. It is moreover seen as affected by factors not generally considered as purely
scientific, e.g. resource availability, personal dispositions, reputation, and cultural aspects.
All these dynamics are at work in experimental practices whose outcomes are most of the
time not univocal, that is, partly opaque and ambiguous. This can give rise to different, often
contentious interpretations, which makes uncertainty a constant fact of technoscientific
research in all its stages (Knorr-Cetina 1995: 152).
Taking all of the above into account, scientific facts (and related technological principles)
are not considered to be pre-existing entities of reality that are discovered, and named
accordingly, by scientists. Rather, they are considered man-made – not natural – entities that
make it possible for researchers to ‗encounter‘ and make sense of the physical reality
(Knorr-Cetina 1995: 161). Therefore, they cannot directly and unequivocally reflect the
physical reality; they are working conceptualisations, socially and culturally affected and
subject to change.
STS draw from different disciplinary fields, among which history, anthropology, philosophy, and
political sciences (Edge 1995: 4). According to STS, there is no fixed, universal scientific method,
but a complex system of communities. Within this system, standards and frames for the evaluation
of knowledge claims are set. In this context, rhetorical work is crucial, since members of specialised
9 Latour borrowed the expression ‗black box‘ from the field of cybernetics, where it stands for a piece of machinery or
set of commands whose extreme complexity do not need to be specified or known. In technical descriptions, these are
therefore substituted by a black box symbol, where only its input and output are made explicit.
37
communities are constantly engaged in a self-promotional effort to access funds and resources
(Sismondo 2010: 11).
Alongside studies on the production of scientific knowledge, Public Communication of Science and
Technology (PCST) studies adopt a sociological perspective to investigate the communication of
science and technology to audiences outside specialised communities. Practices of public
communication of science developed between the end of the 19th
and the beginning of the 20th
century, in relation to the institutionalisation of research as a prestigious profession and the
emerging of mass culture and mass communication. PCST studies however developed much later,
in the last decades of the 20th
century (Bucchi 2008). One of the first concerns for scholars in this
field was to critically review the traditional model of public communication and public
understanding of science and technology, which had dominated the communication of
technoscience to non-experts since its early stages. In this model (cf. Hilgartner 1990, quoted in
Section 7), communication is intended as a linear and pedagogical process, necessary to educate a
passive lay public, by transferring – or translating, as discussed in Section 7 – knowledge from the
authentic, pristine form produced by scientists to an adapted, simplified and diluted or even
corrupted version, understandable by non-experts. Moreover, this perspective implies a link
between a high scientific literacy and a positive and trustful attitude towards science. Because it
assumes a default deficiency in the public‘s scientific literacy, this was referred to as the ‗deficit
model‘ (Bucchi 2008). Its underlying assumptions were called into question by PCST studies, since
the deficit model promoted a simplistic view of the public communication of science and
technology. It further implied a neat distinction between the scientific community as a whole and
the rest of society (a problematic assumption, as explained in Section 2 of Chapter 1). An
alternative model was Cloître and Shinn‘s (1985), which describes expository science as a
continuum joining four main levels:
the intraspecialist level, taking place among specialists researching in the same discipline
and typically appearing in specialized scientific journals;
the interspecialist level, performed among specialists from different fields;
the pedagogic level, found for example in science text books;
the popular level, typical of science articles in the daily press, or of television
documentaries.
The shape and quality of the scientific content, as well as the type of audience, change along the
continuum. In specialized contexts, the style and conclusions are tentative. However, the less
specialised and the more popular the level is, the more factual the style becomes, and the more
definite and didactic the content is. Scientific knowledge routinely flows from within the scientific
community (interspecialist and intraspecialist levels) to the lay public (pedagogic and popular
levels). Subsequently, the newly consolidated scientific facts can be accepted and reproduced by the
scientific community as an established piece of knowledge (or a ‗back box‘, cf. Latour 1987 above).
There are, nevertheless, cases in which scientific facts (and the corresponding technological
applications) are not so straightforwardly accepted, and become objects of debate, either in early
stages among researchers, or among groups external to the specialised community. This is usually
38
what happens during technoscientific controversies. On these occasions, scientific knowledge
follows atypical trajectories with respect to the continuum model, and scientific uncertainty may
spill over, together with heated debate, into non-specialised contexts. This kind of phenomena have
been described through the concept of ‗deviation‘ from the conventional flow of scientific
communication (Cloître and Shinn 1985; Bucchi 2004). In cases of deviation, technical and
scientific discourse reaches the public without being previously agreed upon within the specialized
levels; at the same time, the debate in non-specialised arenas may have effects on the scientific
practice itself.
Through such models and theories, PCST studies also address the role of lay knowledge, which is
not regarded as inferior to specialised knowledge, but as different from it. Lay knowledge is crucial
in establishing and managing the role and status of technoscience in society: deviation is an
example, and many others have been shown in STS studies when they insist on the social
construction of scientific facts. Therefore, this aspect should not be overlooked in public
communication practices. In line with these remarks, some scholars in PCST have suggested that
the deficit model and the traditional view on public understanding of science be overcome, in
favour of a more nuanced description. ‗Dialogic‘ models, eliciting a more frequent and fruitful
exchange between scientists and non-experts, have been proposed. The idea of participation has
been further elaborated through notions of knowledge co-construction and of public engagement
with science and technology; non-deficit public communication practices have sometimes been
adopted at an institutional level (Lock 2011). However, none of these models is unproblematic and
universally effective; rather than recommending the adoption of one model over the others, PCST
theories draw attention to the complexity and multiplicity of situations in which technoscientific
communication takes place. It may be performed following different models, and it has been
suggested that the context, the issue at stake and the type of audience involved should be crucial in
choosing a more instructional versus a more participatory model (Bucchi 2004).
10. Conclusion
Science communication has been examined from a wide range of different but interrelated
perspectives; what most studies agree on is the importance of such practice, given the societal
relevance of technoscience. Despite the numerous institutional calls for a better devised and more
effective communication of science and technology, effectiveness and quality are not univocally
defined, and are likely to change according to the communicative context. News has been identified
as one of the possible contexts for the public communication of technoscience. This study thus aims
at integrating existing studies on the discourse of the public communication of science and
technology with an analysis which is firmly grounded on news – specifically newspaper – language,
and adds functional interpretations informed by sociological theories on how the nature of scientific
practices is transformed while circulating among specialised and lay publics. Moreover, from a
methodological point of view, the application of MDA (see Section 5) to this particular
communicative context, with prospects of extending it to other languages – firstly, Italian – may
result in an integration of existing MDA studies. Ultimately, a combination of analytical approaches
can contribute to the study of communicative strategies of science and technology in the media, thus
addressing this specific discursive production at the intersection of multiple information flows and

39
interests such as scientific production criteria, journalistic news-values and the public need for
entertainment and information.
40
CHAPTER 3. CORPUS AND METHOD
1. Introduction
With respect to methodology, the aim of this work is to devise a practice that draws upon the pre-
existing guidelines of MDA and is applied to a type of language to which MDA had never
specifically been applied so far, namely the language of newspapers. In particular, the analysis aims
at characterising articles whose main intended purpose is to communicate science and technology.
At the same time, it seeks to re-elaborate the established methodological procedure for MDA,
exploiting new and different tools at hand, as well as to contribute to a range of new possible
applications for these tools. This approach was adopted in order to maintain as much control as
possible over the whole analytical procedure, and to critically identify and attempt to address
emerging problems, as will be further explained below. The overall result consists in a
comprehensive, statistically grounded linguistic analysis, as well as in a set of tools that could be
useful for other studies, and may be further developed and extended in scope, both to other
languages and to other linguistic phenomena.
In general, the MDA model, as conceived by Biber and followed by most of the studies in which it
was applied, consists of various steps:
collecting a corpus whose internal variation is to be analysed;
identifying, tagging and compiling frequency counts of a set of linguistic features (listed in
Table 3.4 below) in each text1 of the corpus;
performing a factor analysis, a multivariate statistical technique used to identify some
underlying latent variables2 – or factors – which might be responsible for most of the
variance in the frequency of the linguistic features across different texts;
measuring the presence of each factor in each text of the corpus.
interpreting the obtained factors as expression of ‗dimensions‘ of linguistic variation. The
interpretation should follow from an analysis of the communicative functions which might
better explain the composition of each factor, and from a qualitative inspection of texts.
re-assessing the corpus by taking into account its dimensions of linguistic variation.
These methodological steps were here taken as a benchmark, but some elements were adjusted,
changed or further developed to suit the present research. This was mainly the case with regard to
the automated parts of the linguistic analysis, as well as to the final interpretive stage and the
subsequent comparisons between texts on the basis of the obtained dimensions. As news about
science and technology is the main focus in this study, particular attention will be paid to texts
published in ‗science and technology‘ newspaper sections, both on their own and in comparison
with articles published in other sections. As anticipated in Chapter 2, linguistic variation is here
closely related to the concepts of register and genre, both of which can be used to distinguish and
describe linguistically different productions. These two concepts have not always been clearly
separated in linguistics (see Swales 1990: 40). However, while registers tend to be most often
1 ‗Text‘ is used to refer to the units which constitute a corpus. Here, it is synonymous with ‗news article‘.
2 Latent variables are variables which cannot be observed nor directly measured (Bartholomew et al. 2011: 175).
41
associated to different situations of use, genre distinctions are generally based upon conventional
and organisational structures within a particular socio-cultural system (Biber and Conrad 2009), and
also follow criteria that can be considered as external to language (Biber 1988: 70). Swales defined
genres as classes of communicative events which share sets of communicative purposes, some of
which can be intuitive and explicitly stated, while others can be more implicit (Swales 1990: 45-
47). In accordance with these criteria, news is treated as a genre in the present study. As such, it is
understood as consisting of several sub-genres, generally distinguished by language-external
criteria, as will be further explained in Section 2.2.4 below. Science and technology articles are thus
considered a news sub-genre. The research hypothesis formulated in Chapter 1 implies that different
subgenres differ in some of their communicative purposes, which could be identified by the MDA.
A description of the corpus in terms of its MD features needs to be integrated with other text-based
analyses: this step is crucial to the interpretation of statistical results. Useful tools for this
integration will be the qualitative analysis of a restricted set of examples from the corpus, and – in
particular for science and technology articles – quantitative lexical analyses based on lexical word
frequencies, keywords, and collocations, as explained in Section 5.
2. The corpus
2.1. The TIPS database as a source for corpus collection
The corpus should include a range of different newspaper article types, including texts where
science and technology are communicated. The collection of online newspaper articles compiled
within the TIPS (Technoscientific Issues in the Public Sphere) project could provide such variety.
TIPS3 was developed as a tool to monitor the public representation of science and technology in
selected online sources, including newspapers, blogs and Facebook posts in different languages –
currently, Italian, English (from the US, the UK and India), French and Portuguese (Giardullo and
Lorenzet 2016; Neresini 2017; Giardullo, forthcoming). Monitoring the communication of science
and technology to lay audiences by exploiting large amounts of textual data available online is
motivated by the assumption that the mass media – including online newspapers – can indirectly
indicate the role and relevance of technoscience in society, as well as the changes such role and
relevance can undergo over time (Neresini and Lorenzet 2016; Giardullo and Lorenzet 2016;
Neresini 2017). The monitoring activity devised within the TIPS project is realised through a
purpose-built ICT infrastructure, which includes a system to crawl online newspaper articles,
maintaining a set of attached metadata. Texts are subsequently indexed and stored into a large
database, from where they can be retrieved and analysed for research purposes.4 Collection takes
place on a daily basis, and covers entire editions of online newspapers, thus maintaining the widest
scope possible. Such approach provides for the possibility that scientific content is not exclusively
found in explicitly dedicated sections of newspapers, but may appear in different types of articles.
For this purpose, researchers in the project have created a lexis-based ‗classifier‘ for Italian, that can
3The website of the TIPS research project can be found at http://www.tipsproject.eu/tips/#/public/home
4 Within the TIPS project, the crawling is only performed on publicly available (i.e., without access restrictions) online
news articles. This means that all retrieved news articles were publicly available when they were crawled. These texts
are by no means made available to third parties, and are safely stored and analysed for research purposes only. When
partly reproduced for exemplification, their bibliographical information is provided (with the exception of one or two-
sentence examples in Table 3.4 below, throughout Chapter 4, and in Section 10 of Chapter 5).
42
measure the relevance of a text with respect to the technoscientific domain (Giardullo and Lorenzet
2016). Thus, the database can be exploited to carry out comparisons among the media coverage of
different issues, as well as to characterise a specific issue against the general content covered by the
media. Moreover, the infrastructure was developed to cover long time periods of news production,
so as to make longitudinal studies possible. Within the TIPS project, texts from both Italian and
English language sources have been collected, respectively since 2010 and 2014; both include
national newspapers, which enhances the potential of the infrastructure for source-to-source as well
as for language-to-language comparisons.
2.2. Corpus design: issues of representativeness and balance
When corpora are used for research purposes, their design and collection criteria must be specified
as clearly as possible. These criteria depend on a number of factors. As Sinclair (1991: 13) points
out, ―The first consideration is the aim of the activity of corpus creation.‖ In the present case, the
aim is to address a set of research questions about linguistic and communicative variation in online
newspapers, and more precisely, about possible linguistic and communicative differences between
articles dealing with science and technology and other types of article. As acknowledged by
McEnery and Hardie (2011: 6), matching the analysed data to the research questions, which mainly
depends on data collection, is critical to corpus linguistic research, and has been a guideline in the
creation of the present corpus. Corpora may be created for a range of purposes. They could aim to
reflect an entire language, or a more or less restricted language variety, such as a genre – here,
newspaper language. Furthermore, a corpus could be continuously updated and extended, thus
maintaining a historical dimension as well as a contemporary section – Sinclair (1991: 24-25) called
this a ‗monitor corpus‘. Alternatively, it could reflect a certain language or variety within a fixed
time span – what is sometimes called a ‗balanced‘, ‗sample‘, or ‗snapshot‘ corpus (McEnery and
Hardie 2011: 6-9). The TIPS database has some features of a monitor corpus of newspaper
language, since it is automatically updated with new texts every day. By contrast, the present study
is based upon a ‗sample‘ corpus, which covers current newspaper language published online in the
years 2014-2016.
In describing his corpus design criteria for MDA, Biber (1988: 65) states that a corpus should
represent a range of variation in ―communicative situations and purposes‖. It is therefore necessary
to establish what communicative situations and purposes are to be taken into consideration, to then
collect a corpus of texts, which can represent their range of variation. The usefulness and relevance
of a corpus for linguistic research largely resides in its representative power. As other forms of
scientific investigation, most linguistic research cannot not rely on a ‗population‘ – the set of items
that need to be observed and analysed – which is entirely retrievable and/or finite. By contrast, the
linguistic reality of interest – embodied by the concept of population – is often realised through
potentially infinite instances, whose comprehensive retrieval is impossible. Therefore, a restricted
and manageable sample needs to be drawn from the population, and it needs to be representative of
it. In other words, whatever the type and purpose of a corpus, it needs to be created so that
observations based upon its analysis can stand proxy for features of the entire language or variety it
should represent (Leech 2007).
43
2.2.1. Representativeness in corpus linguistics
Issues of representativeness have long been present in corpus linguists‘ accounts. Sinclair (1991:
13-14) claims that, in order to achieve a realistic view of language use, corpora need to comprise
―what is central and typical in the language‖. According to McEnery and Wilson (2001: 29) a
maximally representative corpus provides ―as accurate a picture as possible of the tendencies‖ of
the language or variety of interest. In outlining an ideal corpus design process, they suggest that the
first step be a rigorous definition of the ‗sampling frame‘ (McEnery and Wilson 2001: 77) – that is
the population to be sampled, its subdivisions, scope and boundaries. The sampling frame
specification should be followed by a definition of sampling modalities – as to what type of data is
being collected, how and from what source(s) – and sample size. Some further notions,
conceptualised within the field of content analysis, can be employed to operationalise data
collection and observation by identifying some basic units. They are the sampling unit, i.e. the basis
for the identification of the population and the creation of the sample; the unit of data collection,
that is, the element(s) on which each variable is measured; and the unit of analysis, or the
element(s) on which data are analysed and results reported (Neuendorf 2002).
If a corpus does not rigorously adhere to a sampling frame, and only represents the data it contains,
it can be referred to as ‗opportunistic‘ (McEnery and Hardie 2011: 11). A corpus can be
opportunistic because technical reasons or limitations in text availability may have prevented
researchers from populating an ideal sampling frame. Although such restrictions were more
common before the introduction of electronic publishing, limitations are still being encountered in
any corpus creation process. Therefore, unless researchers have massive resources at their disposal,
an ‗opportunistic‘ component will likely be present in many contemporary corpora. This applies as
well to the present study, whose reference population is online newspaper language. The boundaries
and features of the sampling frame are partly provided by the TIPS infrastructure. Despite its wide
scope and the valuable opportunities it offers for text retrieval and analysis, some limitations should
be considered concerning the possibilities for corpus collection offered by the TIPS infrastructure.
Firstly, the RSS feed system at its basis does not allow researchers to retrieve the very same version
of the newspaper edition available online, although it can be taken as a very close approximation.
Secondly, the choice of newspapers was in part affected by the level of availability and accessibility
of their RSS feeds. Thirdly, access regulations and the HTML format of the pages to be downloaded
can change over time. Although the TIPS infrastructure is regularly monitored, these changes can
nonetheless cause the loss or incomplete retrieval of some articles. These issues will be addressed in
Section 2.2.5. As for the units to be employed, in the present study the news article – or text – will
be both the unit of sampling and the unit of data collection, Moreover, according to the different
analytical levels of the study, the unit of analysis will correspond to the news article, to the sub-
genres identified within news and to the different newspapers, as further explained in the following
sections.
2.2.2. Corpus balance and MDA
Often, a sampling frame requires identifying sections, or sub-varieties that are more or less
conventionally intended as constituting the language or variety of interest. Dividing a population
into groups so that its internal variation can be managed is also referred to as stratification (Mooi et
al. 2018: 44-45). Since here stratification does not reflect categories that are naturally inherent
44
within the language, it entails an act of interpretation and a degree of subjective choice on the part
of the researcher. In order for a corpus to be representative, it should feature sections corresponding
in size and characteristics to the population sub-varieties (McEnery and Wilson 2001). Within
corpus linguistics, this proportionality is also defined ‗balance‘ (Leech 2007: 136; McEnery and
Hardie 2011: 9): it should prevent data from sub-varieties regarded as uncommon or marginal to
‗prevail‘ over central tendencies in a corpus, thus skewing its analysis.
A different approach to balance is however adopted in the present study, for statistical and
methodological reasons. The statistical technique here used to elaborate frequency data – factor
analysis – has the purpose of uncovering some major patterns underlying linguistic variation within
a language, variety, or genre. This is why the corpus needs to mirror their whole range of variation,
which means featuring equally-represented sections, regardless of how much space they are given
in the real world. The stratified sampling is thus uniform rather than proportional. Leech (2007:
141) also describes the MDA corpus structure as respecting the internal variation of the population.
Therefore, he is more inclined to define it as ‗heterogeneity‘, rather than balance or
representativeness, although the final purpose – to obtain results which can be extrapolated to
language outside the corpus – is the same.
2.2.3. Selection of source newspapers
When discussing criteria for proportionality and balance, Leech (2007) suggested that varieties and
sub-varieties in a corpus should be represented not only on the basis of how many instances of these
are produced, or on their perceived importance – as most studies tend to do – but also according to
the number of receivers they have. This does not only concern the internal structure of a corpus, but
also the initial text selection. In determining which newspapers should be included in the present
analysis (among those available from the TIPS database in English), issues of text circulation
emerged, because a first choice needed to be made about whether to include The Daily Mirror, the
only tabloid collected by the TIPS infrastructure, in the current MDA. The traditional distinction
between tabloids and broadsheets is mostly associated to the British context. Although the
terminology is based upon format classifications which are now outdated, differences are still there
with respect to the content, style and intended audience of news outlets, which could justify the use
of terms such as ‗quality‘ or ‗highbrow‘ versus ‗lowbrow‘ newspapers. Traditional broadsheets, or
quality newspapers, are taken to adopt a more sober and formal style, and to deal with more serious
topics, with respect to traditional tabloids, or ‗lowbrow‘ newspapers, whose style is regarded as
more sensationalist, and whose content is generally considered less serious and more focused on
gossip, lifestyle and the like.
Following Leech‘s argument, tabloids should unquestionably be included in a corpus made to
represent newspaper language, because they generally have a larger audience than traditional
broadsheets. It should be noted, however, that since the Web versions of news outlets were made
available online, circulation data referring to paper editions no longer constitute a sufficient
measure of how many readers each newspaper has, and data about the amount of views or users of
news websites are rarely accurate or publicly available. Therefore, achieving an estimate of how
many readers a certain newspaper has is extremely problematic. Moreover, including tabloids in the
corpus would have meant introducing a variable that cannot be replicated in other languages, since
there is no full equivalent for British tabloids in many other countries (see, for example, Semino
45
2002: 137 and Taylor 2014: 376 about Italy). Therefore, the safest option in order to keep the
present study open to cross-linguistic comparisons was to exclude tabloids from the MDA, thus
limiting text collection to broadsheets.
The TIPS infrastructure collects articles from a range of broadsheets: The Daily Telegraph, The
Guardian, The Times, The Financial Times, The New York Times, and The Times of India. To avoid
a high degree of diatopic5 and cultural variation in the corpus, the collection was limited to UK- and
US-based sources, although nowadays any of these newspapers features international staff as well
as an international readership, and consequently editorial guidelines might not be strictly based on
national varieties. The Times, The Daily Telegraph and The Guardian are generally acknowledged
as leading daily newspapers in the UK: they are based in London, and their history dates back to the
XIX century (even earlier for The Times). Their traditional political orientations are different and
tend to appeal to different categories of readers. The Daily Telegraph is traditionally considered as
leaning towards a right-wing, conservative editorial stance, while The Guardian is generally
associated to liberal left-wing views. The Times is seen as politically independent – since it
supported different political parts in its history – but it is also considered an expression of the values
and opinions of the UK establishment. The New York Times, a leading US daily, has a similarly
long history; it is based in New York, but its paper version can be bought all over the world. Its
editorial stance is often regarded as liberal, and leaning towards ideas generally more in line with
Democratic rather than Republican views. The Financial Times is considered the most important
financial daily newspaper, with its special focus on business and economics news. Its editorial
stance is in favour of a globalised, free-market economic system. While each of the newspapers
here considered has some degree of specificity, linked to its orientation and editorial policy, the
focus of The Financial Times on business and economy may be seen as a reason to exclude it from
the present corpus, which was designed as a general newspaper corpus; nevertheless, it was decided
to keep it among the analysed sources. While its availability within the TIPS infrastructure played a
role in this choice, yet this does not alter the fact that The Financial Times is a useful resource for
the present analysis. Firstly, it still features a range of different types of news articles, covering all
the categories identified as relevant for the present analysis (see Section 2.2.4 below), except for
sports articles. This makes for a readership that does not exclusively consist of expert economists,
although the newspaper does aim at an elite rather than a general audience.6 Furthermore, including
The Financial Times contributed to drawing informative linguistic comparisons among different
newspaper sources (see Chapter 5).
2.2.4. Corpus structure and size
Having selected the news sources, it was necessary to devise an internal structure suitable for a
MDA, which means that the corpus sections should represent its internal variation. In his first MD
study, Biber covered a wide range of genres in his general English language corpus (e.g. ‗press
reportage‘, ‗editorial‘, ‗press reviews‘, ‗official documents‘, ‗telephone conversations‘, etc.). He
defined genres as ―text categorisations made on the basis of external criteria relating to author-
speaker purpose‖ (Biber 1988: 67). An ‗external‘ type of classification was also applied to the
5 Diatopic variation is linked to geographically defined language varieties – such as British English and Indian English.
6 See Corcoran and Fahy (2009). Moreover, The Financial Times itself states that its ―readers are senior business
decision-makers, high net worth consumers and influential policymakers‖
(https://fttoolkit.co.uk/d/audience/statistics.php).
46
corpus analysed in the present study, where the news sub-genres identified follow the – mainly
topic-based – sections found in newspaper websites. Within the TIPS infrastructure, the section
where an article is published can be identified through its individual feed. The retrieval system
within the TIPS infrastructure uses all the RSS Feeds by each online newspaper as a source of
continuous update, and the feed through which texts are collected points to the section or sections in
which the article was published. These sections are not homogeneous among different newspapers,
and often include sub-categories. Therefore, to find a common framework to consistently classify
articles in the corpus, seven ‗macro-feed‘ categories, standing for the main types of section
generally found in newspapers, were created. The classification of each single feed into the macro-
feed categories was performed manually, and was based upon semantic criteria, as well as upon
inspection of the corresponding web pages from the online newspapers, whenever possible. The list
and general descriptions of the macro-feed categories are given below, while an account of single
feeds and their classification in the final version of the corpus is provided in Section 2.2.5 (see
Table 3.3).
‗Business‘ encompasses news about the economic domain. It can include articles ranging
from financial reports, through international political economy, to tips on personal asset
management.
‗Comments and Opinions‘ include forms of texts overtly expressing the author‘s point of
view, without any limitation as to the topic being treated. Both articles by professional
contributors and reader‘s contributions can be found here.
‗Culture, Arts and Leisure‘ include articles about art and culture-related activities and
events, but also about entertainment, lifestyle and fashion. Book reviews, reports on new
fashion trends, accounts of recently opened exhibitions are all examples of articles which
can be found in this section.
‗News and Politics‘ comprise local, national and international news. Texts in this category
mainly cover political and social issues, international relations and the like.
‗Homepage‘ gathers texts shown in the home page of these online newspapers, as if it were
a sort of front page in a paper edition. It contains all sorts of news, with a predominance of
national and international politics.
‗Science and Technology‘ includes traditional instances of technoscience communication –
usually long texts with high informational content regarding the latest developments in
different research fields – but also other technoscience-related news. Healthy lifestyles,
technological applications and products, and the Web – especially social media such as
Facebook or Twitter – are all possible topics that can be found in this macro-feed category,
although they may not be typically associated with popular science.
‗Sport‘ obviously deals with sports news, reporting on various types of sport-related events:
matches, races and other competitions, but also interviews and news concerning people
involved in such events, such as players, athletes, coaches, etc.
Thus, a stratified structure was designed for the sample to be drawn from the TIPS database.
Applying stratified sampling affects the probability of single texts in the database to be included in
the corpus. On the other hand, it allows one to frame it in order to better reflect the initial research
questions, and is often regarded as a more representative sampling technique than pure random
47
sampling (Biber 1993). Having defined the sampling frame and the stratification criteria, a suitable
size for the corpus and its sections needed to be established. With respect to corpus size, Biber
(1993) claimed that standard statistical equations traditionally used to determine the optimal sample
size in other disciplines – such as the social sciences – are problematic in corpus building. Taking
that into account, the linguistic features of interest in MDA intuitively needed to be sufficiently
frequent in the corpus, in order to be analysed: in this sense, the larger the corpus, the better for the
analysis. Following this assumption, the entire TIPS database could have been used as a corpus.
However, this would have prevented a uniform stratification. Moreover, the corpus needed to
maintain a size of 1 or 1.5 million words, manageable by standard concordance programs, such as
AntConc (Anthony 2018) or Wordsmith Tools (Scott 2004), useful to perform the lexical analysis
which would integrate the MDA. Finally, opting for a stratified sampling from the main database
offered the possibility of devising strata based not only upon macro-feeds, but also on the year of
publication and the source newspaper, regarded as worth retaining for additional analyses.
Therefore, the general principle adopted for the first samples, which served as a test for the final
version of the corpus, was to retrieve 20-30 texts published by each newspaper, each year in each
macro-feed, applying random extraction techniques within each section of the TIPS database.
2.2.5. Sample extraction
The corpus sampling criteria, and all the subsequent adjustments, were shared with the authors of
the TIPS infrastructure, in a collaborative corpus building process.7 If an article was included in
more than one feed, the output of the extraction would report them in a list ordered by relevance.
Thus, the first feed was kept and recorded for that article. During the first sample extractions, issues
concerning text quality and corpus structure emerged, requiring some adjustments. They are listed
below.
Gaps were identified within the stratified structure of the corpus: in particular, articles from
one newspaper pertaining to some macro-feed categories were wholly lacking for all three
publication years. While this was expected and inevitable for ‗Sport‘ articles in The
Financial Times, it was not as justifiable in the case of ‗Homepage‘ articles in The
Guardian. This gap was caused by the way individual feeds had been indexed and grouped
into macro-feeds. Thus, a Guardian feed previously indexed otherwise, and found to link to
the UK home page feed, was re-indexed as ‗Homepage‘, making it possible to partly
populate that section.
The inspection of a set of texts revealed that some were not complete: they had been only
partially downloaded by the TIPS infrastructure. This was probably caused by problems in
accessing web pages, or by flaws in managing some of the complex HTML page structures
behind online articles. This problem was found to be systematic in articles from The Times,
which had therefore to be excluded altogether from the corpus. As for the other sources,
where missing sections were less common, a minimum length of 200 words per article was
set. Very short texts, which were more likely to be incomplete, were thus excluded. This
unfortunately lowered the amount of articles available for each section, but the corpus
maintained a reasonable size (see Tables 3.1 and 3.2) and a much better quality.
7The present author wishes to thank Dr. Emanuele Di Buccio for collecting the corpus from the TIPS database and
making it available for analysis.
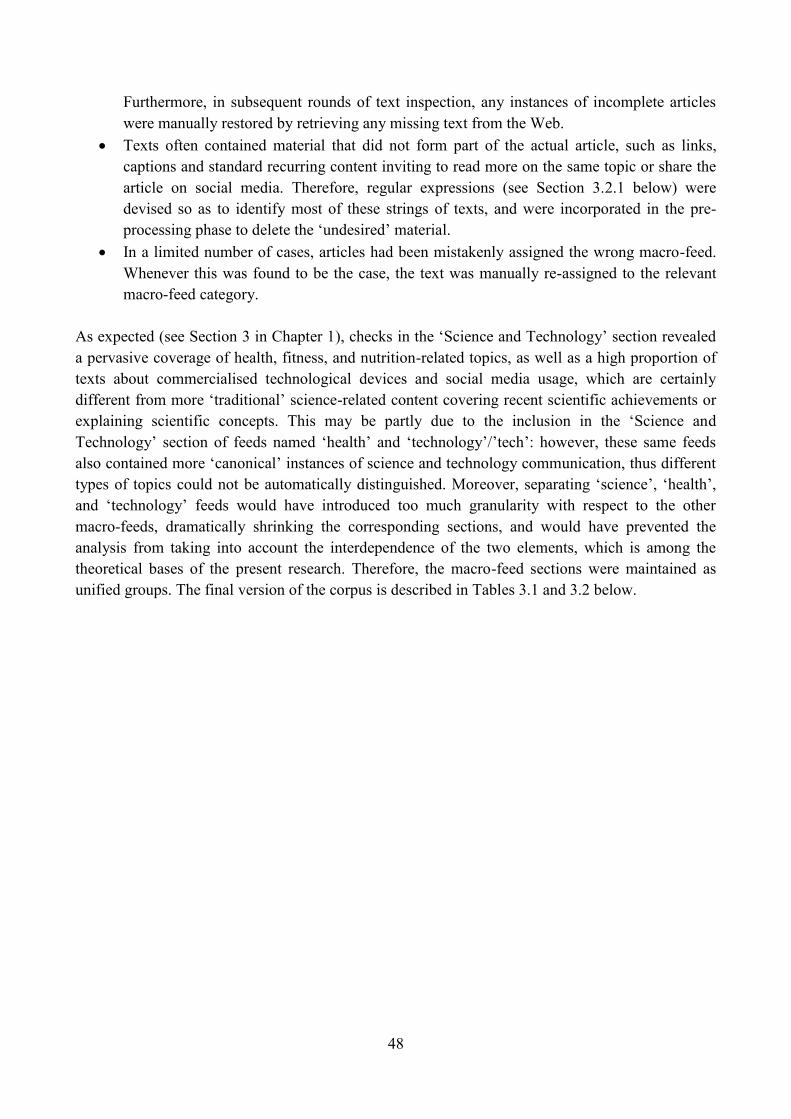
48
Furthermore, in subsequent rounds of text inspection, any instances of incomplete articles
were manually restored by retrieving any missing text from the Web.
Texts often contained material that did not form part of the actual article, such as links,
captions and standard recurring content inviting to read more on the same topic or share the
article on social media. Therefore, regular expressions (see Section 3.2.1 below) were
devised so as to identify most of these strings of texts, and were incorporated in the pre-
processing phase to delete the ‗undesired‘ material.
In a limited number of cases, articles had been mistakenly assigned the wrong macro-feed.
Whenever this was found to be the case, the text was manually re-assigned to the relevant
macro-feed category.
As expected (see Section 3 in Chapter 1), checks in the ‗Science and Technology‘ section revealed
a pervasive coverage of health, fitness, and nutrition-related topics, as well as a high proportion of
texts about commercialised technological devices and social media usage, which are certainly
different from more ‗traditional‘ science-related content covering recent scientific achievements or
explaining scientific concepts. This may be partly due to the inclusion in the ‗Science and
Technology‘ section of feeds named ‗health‘ and ‗technology‘/‘tech‘: however, these same feeds
also contained more ‗canonical‘ instances of science and technology communication, thus different
types of topics could not be automatically distinguished. Moreover, separating ‗science‘, ‗health‘,
and ‗technology‘ feeds would have introduced too much granularity with respect to the other
macro-feeds, dramatically shrinking the corresponding sections, and would have prevented the
analysis from taking into account the interdependence of the two elements, which is among the
theoretical bases of the present research. Therefore, the macro-feed sections were maintained as
unified groups. The final version of the corpus is described in Tables 3.1 and 3.2 below.
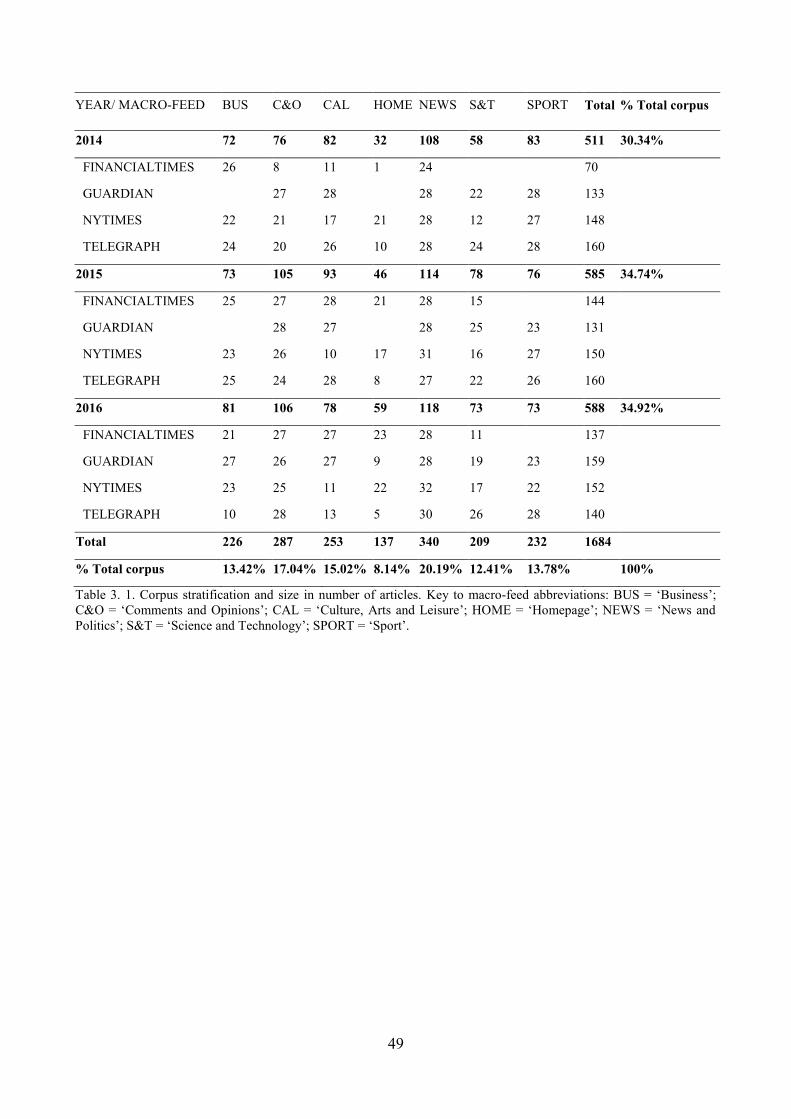
49
YEAR/ MACRO-FEED BUS C&O CAL HOME NEWS S&T SPORT Total % Total corpus
2014 72 76 82 32 108 58 83 511 30.34%
FINANCIALTIMES 26 8 11 1 24
70
GUARDIAN
27 28
28 22 28 133
NYTIMES 22 21 17 21 28 12 27 148
TELEGRAPH 24 20 26 10 28 24 28 160
2015 73 105 93 46 114 78 76 585 34.74%
FINANCIALTIMES 25 27 28 21 28 15
144
GUARDIAN
28 27
28 25 23 131
NYTIMES 23 26 10 17 31 16 27 150
TELEGRAPH 25 24 28 8 27 22 26 160
2016 81 106 78 59 118 73 73 588 34.92%
FINANCIALTIMES 21 27 27 23 28 11
137
GUARDIAN 27 26 27 9 28 19 23 159
NYTIMES 23 25 11 22 32 17 22 152
TELEGRAPH 10 28 13 5 30 26 28 140
Total 226 287 253 137 340 209 232 1684
% Total corpus 13.42% 17.04% 15.02% 8.14% 20.19% 12.41% 13.78%
100%
Table 3. 1. Corpus stratification and size in number of articles. Key to macro-feed abbreviations: BUS = ‗Business‘;
C&O = ‗Comments and Opinions‘; CAL = ‗Culture, Arts and Leisure‘; HOME = ‗Homepage‘; NEWS = ‗News and
Politics‘; S&T = ‗Science and Technology‘; SPORT = ‗Sport‘.
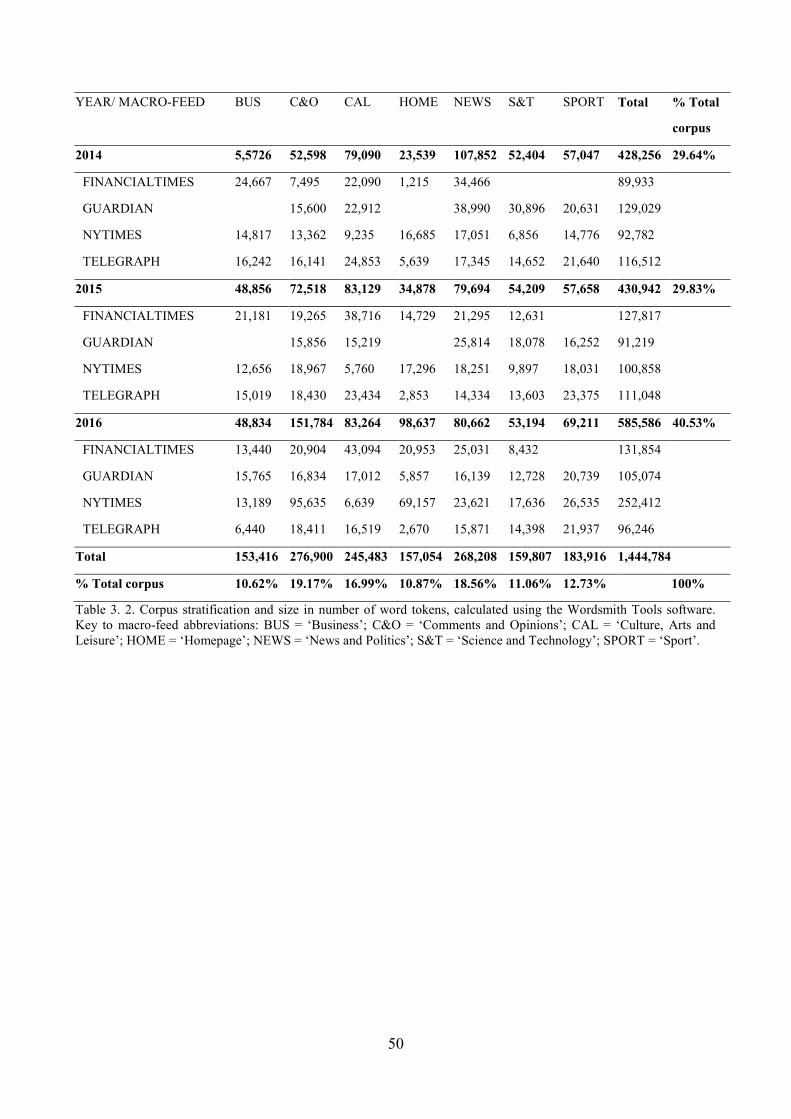
50
YEAR/ MACRO-FEED BUS C&O CAL HOME NEWS S&T SPORT Total % Total
corpus
2014 5,5726 52,598 79,090 23,539 107,852 52,404 57,047 428,256 29.64%
FINANCIALTIMES 24,667 7,495 22,090 1,215 34,466
89,933
GUARDIAN
15,600 22,912
38,990 30,896 20,631 129,029
NYTIMES 14,817 13,362 9,235 16,685 17,051 6,856 14,776 92,782
TELEGRAPH 16,242 16,141 24,853 5,639 17,345 14,652 21,640 116,512
2015 48,856 72,518 83,129 34,878 79,694 54,209 57,658 430,942 29.83%
FINANCIALTIMES 21,181 19,265 38,716 14,729 21,295 12,631
127,817
GUARDIAN
15,856 15,219
25,814 18,078 16,252 91,219
NYTIMES 12,656 18,967 5,760 17,296 18,251 9,897 18,031 100,858
TELEGRAPH 15,019 18,430 23,434 2,853 14,334 13,603 23,375 111,048
2016 48,834 151,784 83,264 98,637 80,662 53,194 69,211 585,586 40.53%
FINANCIALTIMES 13,440 20,904 43,094 20,953 25,031 8,432
131,854
GUARDIAN 15,765 16,834 17,012 5,857 16,139 12,728 20,739 105,074
NYTIMES 13,189 95,635 6,639 69,157 23,621 17,636 26,535 252,412
TELEGRAPH 6,440 18,411 16,519 2,670 15,871 14,398 21,937 96,246
Total 153,416 276,900 245,483 157,054 268,208 159,807 183,916 1,444,784
% Total corpus 10.62% 19.17% 16.99% 10.87% 18.56% 11.06% 12.73%
100%
Table 3. 2. Corpus stratification and size in number of word tokens, calculated using the Wordsmith Tools software.
Key to macro-feed abbreviations: BUS = ‗Business‘; C&O = ‗Comments and Opinions‘; CAL = ‗Culture, Arts and
Leisure‘; HOME = ‗Homepage‘; NEWS = ‗News and Politics‘; S&T = ‗Science and Technology‘; SPORT = ‗Sport‘.
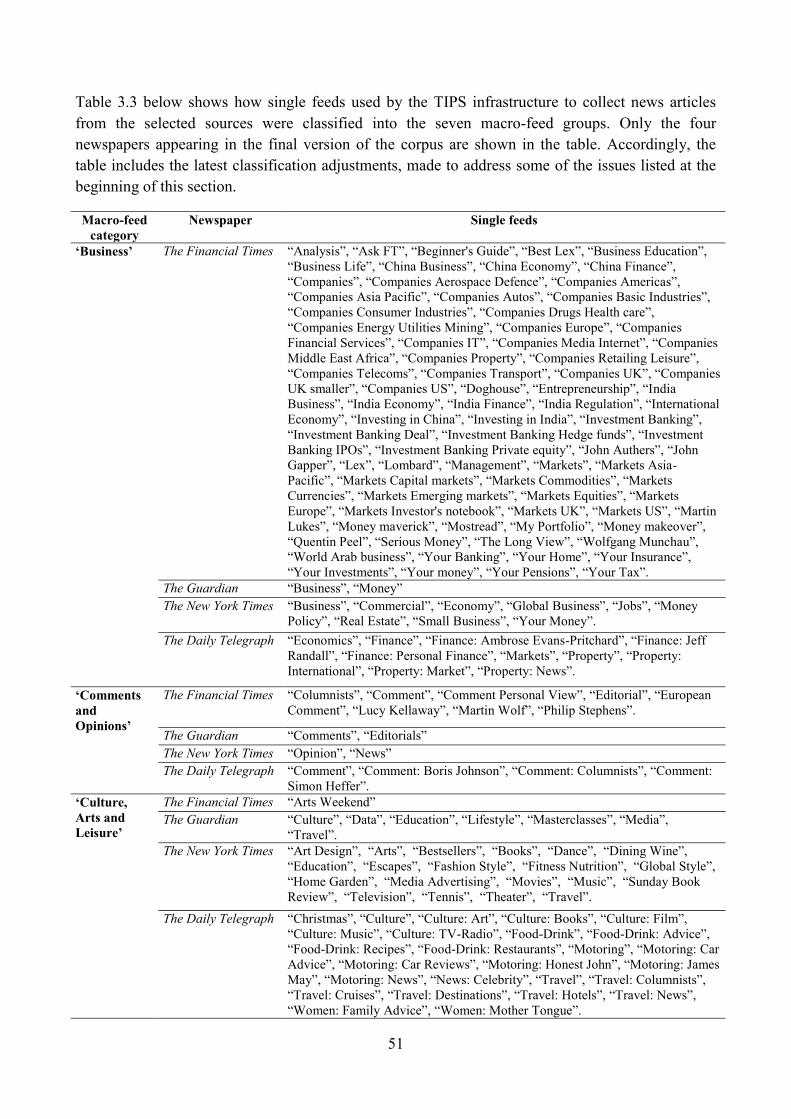
51
Table 3.3 below shows how single feeds used by the TIPS infrastructure to collect news articles
from the selected sources were classified into the seven macro-feed groups. Only the four
newspapers appearing in the final version of the corpus are shown in the table. Accordingly, the
table includes the latest classification adjustments, made to address some of the issues listed at the
beginning of this section.
Macro-feed
category
Newspaper Single feeds
‗Business‘ The Financial Times ―Analysis‖, ―Ask FT‖, ―Beginner's Guide‖, ―Best Lex‖, ―Business Education‖,
―Business Life‖, ―China Business‖, ―China Economy‖, ―China Finance‖,
―Companies‖, ―Companies Aerospace Defence‖, ―Companies Americas‖,
―Companies Asia Pacific‖, ―Companies Autos‖, ―Companies Basic Industries‖,
―Companies Consumer Industries‖, ―Companies Drugs Health care‖,
―Companies Energy Utilities Mining‖, ―Companies Europe‖, ―Companies
Financial Services‖, ―Companies IT‖, ―Companies Media Internet‖, ―Companies
Middle East Africa‖, ―Companies Property‖, ―Companies Retailing Leisure‖,
―Companies Telecoms‖, ―Companies Transport‖, ―Companies UK‖, ―Companies
UK smaller‖, ―Companies US‖, ―Doghouse‖, ―Entrepreneurship‖, ―India
Business‖, ―India Economy‖, ―India Finance‖, ―India Regulation‖, ―International
Economy‖, ―Investing in China‖, ―Investing in India‖, ―Investment Banking‖,
―Investment Banking Deal‖, ―Investment Banking Hedge funds‖, ―Investment
Banking IPOs‖, ―Investment Banking Private equity‖, ―John Authers‖, ―John
Gapper‖, ―Lex‖, ―Lombard‖, ―Management‖, ―Markets‖, ―Markets Asia-
Pacific‖, ―Markets Capital markets‖, ―Markets Commodities‖, ―Markets
Currencies‖, ―Markets Emerging markets‖, ―Markets Equities‖, ―Markets
Europe‖, ―Markets Investor's notebook‖, ―Markets UK‖, ―Markets US‖, ―Martin
Lukes‖, ―Money maverick‖, ―Mostread‖, ―My Portfolio‖, ―Money makeover‖,
―Quentin Peel‖, ―Serious Money‖, ―The Long View‖, ―Wolfgang Munchau‖,
―World Arab business‖, ―Your Banking‖, ―Your Home‖, ―Your Insurance‖,
―Your Investments‖, ―Your money‖, ―Your Pensions‖, ―Your Tax‖.
The Guardian ―Business‖, ―Money‖
The New York Times ―Business‖, ―Commercial‖, ―Economy‖, ―Global Business‖, ―Jobs‖, ―Money
Policy‖, ―Real Estate‖, ―Small Business‖, ―Your Money‖.
The Daily Telegraph ―Economics‖, ―Finance‖, ―Finance: Ambrose Evans-Pritchard‖, ―Finance: Jeff
Randall‖, ―Finance: Personal Finance‖, ―Markets‖, ―Property‖, ―Property:
International‖, ―Property: Market‖, ―Property: News‖.
‗Comments
and
Opinions‘
The Financial Times ―Columnists‖, ―Comment‖, ―Comment Personal View‖, ―Editorial‖, ―European
Comment‖, ―Lucy Kellaway‖, ―Martin Wolf‖, ―Philip Stephens‖.
The Guardian ―Comments‖, ―Editorials‖
The New York Times ―Opinion‖, ―News‖
The Daily Telegraph ―Comment‖, ―Comment: Boris Johnson‖, ―Comment: Columnists‖, ―Comment:
Simon Heffer‖.
‗Culture,
Arts and
Leisure‘
The Financial Times ―Arts Weekend‖
The Guardian ―Culture‖, ―Data‖, ―Education‖, ―Lifestyle‖, ―Masterclasses‖, ―Media‖,
―Travel‖.
The New York Times ―Art Design‖, ―Arts‖, ―Bestsellers‖, ―Books‖, ―Dance‖, ―Dining Wine‖,
―Education‖, ―Escapes‖, ―Fashion Style‖, ―Fitness Nutrition‖, ―Global Style‖,
―Home Garden‖, ―Media Advertising‖, ―Movies‖, ―Music‖, ―Sunday Book
Review‖, ―Television‖, ―Tennis‖, ―Theater‖, ―Travel‖.
The Daily Telegraph ―Christmas‖, ―Culture‖, ―Culture: Art‖, ―Culture: Books‖, ―Culture: Film‖,
―Culture: Music‖, ―Culture: TV-Radio‖, ―Food-Drink‖, ―Food-Drink: Advice‖,
―Food-Drink: Recipes‖, ―Food-Drink: Restaurants‖, ―Motoring‖, ―Motoring: Car
Advice‖, ―Motoring: Car Reviews‖, ―Motoring: Honest John‖, ―Motoring: James
May‖, ―Motoring: News‖, ―News: Celebrity‖, ―Travel‖, ―Travel: Columnists‖,
―Travel: Cruises‖, ―Travel: Destinations‖, ―Travel: Hotels‖, ―Travel: News‖,
―Women: Family Advice‖, ―Women: Mother Tongue‖.
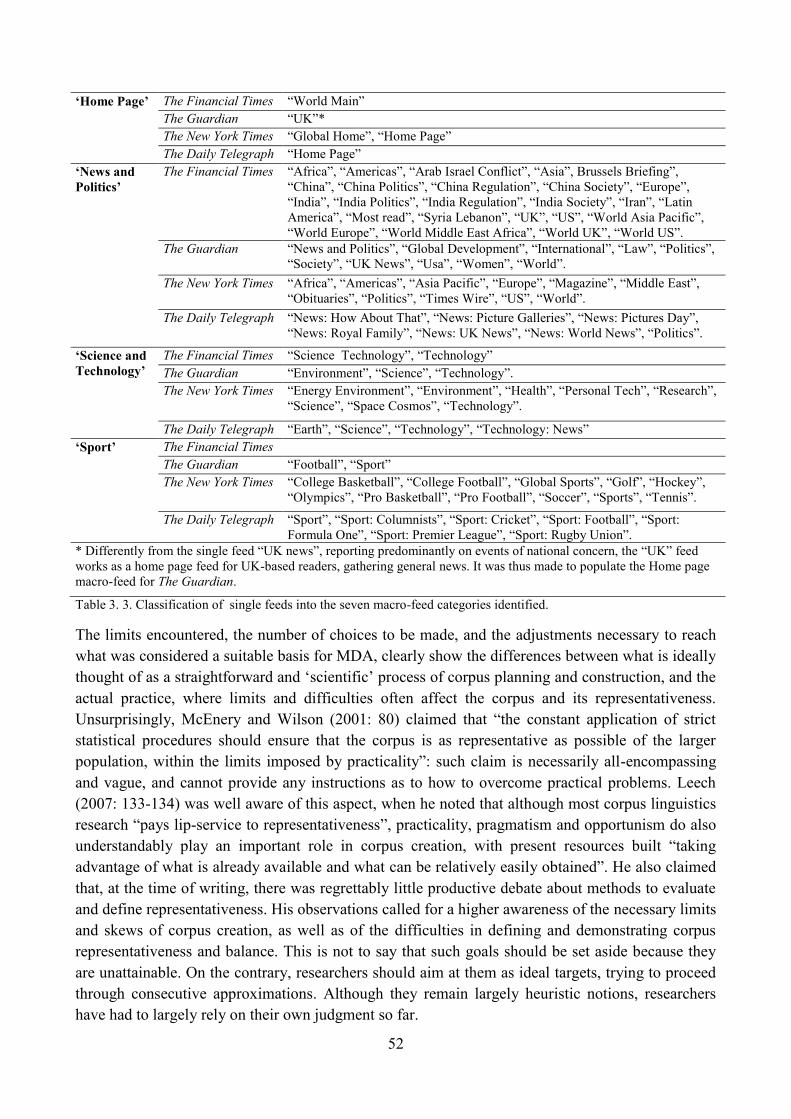
52
‗Home Page‘ The Financial Times ―World Main‖
The Guardian ―UK‖*
The New York Times ―Global Home‖, ―Home Page‖
The Daily Telegraph ―Home Page‖
‗News and
Politics‘
The Financial Times ―Africa‖, ―Americas‖, ―Arab Israel Conflict‖, ―Asia‖, Brussels Briefing‖,
―China‖, ―China Politics‖, ―China Regulation‖, ―China Society‖, ―Europe‖,
―India‖, ―India Politics‖, ―India Regulation‖, ―India Society‖, ―Iran‖, ―Latin
America‖, ―Most read‖, ―Syria Lebanon‖, ―UK‖, ―US‖, ―World Asia Pacific‖,
―World Europe‖, ―World Middle East Africa‖, ―World UK‖, ―World US‖.
The Guardian ―News and Politics‖, ―Global Development‖, ―International‖, ―Law‖, ―Politics‖,
―Society‖, ―UK News‖, ―Usa‖, ―Women‖, ―World‖.
The New York Times ―Africa‖, ―Americas‖, ―Asia Pacific‖, ―Europe‖, ―Magazine‖, ―Middle East‖,
―Obituaries‖, ―Politics‖, ―Times Wire‖, ―US‖, ―World‖.
The Daily Telegraph ―News: How About That‖, ―News: Picture Galleries‖, ―News: Pictures Day‖,
―News: Royal Family‖, ―News: UK News‖, ―News: World News‖, ―Politics‖.
‗Science and
Technology‘
The Financial Times ―Science Technology‖, ―Technology‖
The Guardian ―Environment‖, ―Science‖, ―Technology‖.
The New York Times ―Energy Environment‖, ―Environment‖, ―Health‖, ―Personal Tech‖, ―Research‖,
―Science‖, ―Space Cosmos‖, ―Technology‖.
The Daily Telegraph ―Earth‖, ―Science‖, ―Technology‖, ―Technology: News‖
‗Sport‘ The Financial Times
The Guardian ―Football‖, ―Sport‖
The New York Times ―College Basketball‖, ―College Football‖, ―Global Sports‖, ―Golf‖, ―Hockey‖,
―Olympics‖, ―Pro Basketball‖, ―Pro Football‖, ―Soccer‖, ―Sports‖, ―Tennis‖.
The Daily Telegraph ―Sport‖, ―Sport: Columnists‖, ―Sport: Cricket‖, ―Sport: Football‖, ―Sport:
Formula One‖, ―Sport: Premier League‖, ―Sport: Rugby Union‖.
* Differently from the single feed ―UK news‖, reporting predominantly on events of national concern, the ―UK‖ feed
works as a home page feed for UK-based readers, gathering general news. It was thus made to populate the Home page
macro-feed for The Guardian.
Table 3. 3. Classification of single feeds into the seven macro-feed categories identified.
The limits encountered, the number of choices to be made, and the adjustments necessary to reach
what was considered a suitable basis for MDA, clearly show the differences between what is ideally
thought of as a straightforward and ‗scientific‘ process of corpus planning and construction, and the
actual practice, where limits and difficulties often affect the corpus and its representativeness.
Unsurprisingly, McEnery and Wilson (2001: 80) claimed that ―the constant application of strict
statistical procedures should ensure that the corpus is as representative as possible of the larger
population, within the limits imposed by practicality‖: such claim is necessarily all-encompassing
and vague, and cannot provide any instructions as to how to overcome practical problems. Leech
(2007: 133-134) was well aware of this aspect, when he noted that although most corpus linguistics
research ―pays lip-service to representativeness‖, practicality, pragmatism and opportunism do also
understandably play an important role in corpus creation, with present resources built ―taking
advantage of what is already available and what can be relatively easily obtained‖. He also claimed
that, at the time of writing, there was regrettably little productive debate about methods to evaluate
and define representativeness. His observations called for a higher awareness of the necessary limits
and skews of corpus creation, as well as of the difficulties in defining and demonstrating corpus
representativeness and balance. This is not to say that such goals should be set aside because they
are unattainable. On the contrary, researchers should aim at them as ideal targets, trying to proceed
through consecutive approximations. Although they remain largely heuristic notions, researchers
have had to largely rely on their own judgment so far.
53
3. Identification and counting of a set of linguistic features
3.1. Selection and description of linguistic features
In the MDA approach, multivariate statistics techniques are used to investigate the distribution of a
set of linguistic elements, called ‗linguistic features‘(LFs). In most English versions of MDA,
including the present one, the set of analysed LFs is largely based on those selected by Biber in his
1988 study. Biber was interested in exploring the differences between spoken and written English
genres, and had based his LF selection upon previous research, in order to identify features
―associated with particular communicative functions‖ (Biber 1988: 72). Precisely because they
might be serving some function or purpose, and can vary considerably across different contexts of
use, these features have a frequency that might also vary among different genres or sub-genres
within a corpus. LFs concern different linguistic aspects. First, they can be classified from a
grammatical point of view, according to the part(s) of speech they consist of. Second, they concern
syntax, as long as they result from the combination of different components. Third, if they involve
lexical words, semantic aspects also need to be considered. Fourth, they all have discursive
functions, which is the reason why they were included in the MDA.8 It should be noted that LFs are
linguistic concepts resulting from a superimposed classification of the language on the part of
scholars. Moreover, in this type of analysis they undergo a work of reduction and ‗representation‘,
whose aim is to make them at least partly identifiable by a software tool, as will be explained
below. Further research would be needed in order to review and update the methodological choices
bringing to this LF selection and formulation. Biber claimed to have adopted an inclusive approach
in compiling his list, in order to obtain the ―widest possible range of potentially important‖ LFs
(Biber 1988: 72). He finally devised a list of 67 items, which was also adopted here, although with
slight changes:
One item, relative clauses referring to a whole clause (e.g. ―We need to replace eight out of
the 30 existing trees, but we will plant 17, which means the road is gaining an extra nine
trees‖)9 had to be excluded, because its identification would not have been possible without
disambiguation from non-restrictive relative clauses (e. g. ―What the three founded has
become Tachyus, which aims to create an array of sensors and mobile applications‖);
Three items were added:
8 Another approach to the analysis of text corpora which is based upon frequency data of multiple and multi-level
linguistic variables is found in social psychology studies. It is called Linguistic Inquiry and Word Count (LIWC), and
consists in surveying 90 among lexical, textual and grammatical linguistic variables, all regarded as being
psychologically relevant, in that they potentially reflect beliefs, thinking patterns, social relationships and personalities
of speakers and authors (Pennebaker et al. 2015). Similarly to Biber‘s approach, the LIWC one deals with lexical
classes, parts of speech, verbal tenses, function or grammatical words, and word length among other variables, and
quantifies their presence or extent in texts or text groups. However, unlike MDA, it features more lexical and semantic
categories than grammatical ones; moreover, it does not include syntactic features. There are also technical differences,
since LIWC is entirely based on lists of words identifying each linguistic variable, which required devising a complex
and comprehensive dictionary including almost 6,400 items. MDA, on the other hand, is based upon a more complex
tagging, aimed at identifying specific sentence and phrase structures as well as semantic and grammatical classes.
Overall, the two approaches seem to have some aspects in common, but at the same time they differ in their focus on
language as well as in their general fields of application (psychometric assessment for LIWC and the analysis of
functional and genre variation for MDA). 9 All the examples mentioned in this section were taken from the analysed news corpus.
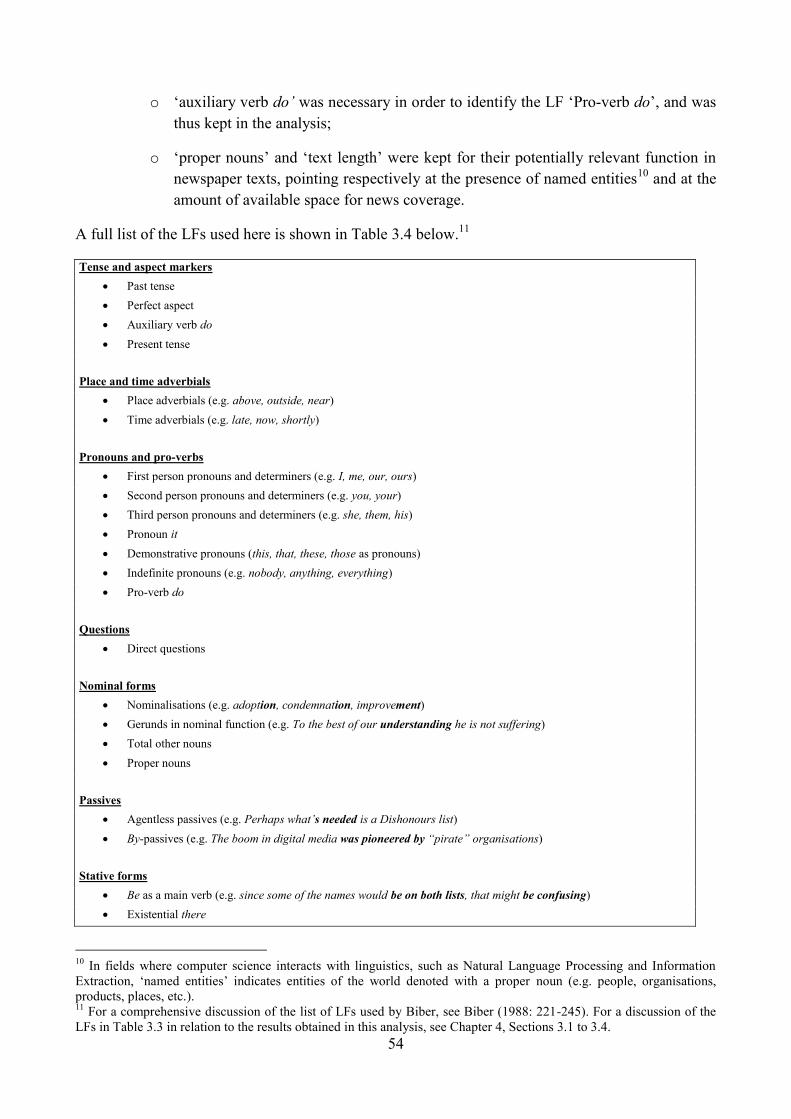
54
o ‗auxiliary verb do‘ was necessary in order to identify the LF ‗Pro-verb do‘, and was
thus kept in the analysis;
o ‗proper nouns‘ and ‗text length‘ were kept for their potentially relevant function in
newspaper texts, pointing respectively at the presence of named entities10
and at the
amount of available space for news coverage.
A full list of the LFs used here is shown in Table 3.4 below.11
Tense and aspect markers
Past tense
Perfect aspect
Auxiliary verb do
Present tense
Place and time adverbials
Place adverbials (e.g. above, outside, near)
Time adverbials (e.g. late, now, shortly)
Pronouns and pro-verbs
First person pronouns and determiners (e.g. I, me, our, ours)
Second person pronouns and determiners (e.g. you, your)
Third person pronouns and determiners (e.g. she, them, his)
Pronoun it
Demonstrative pronouns (this, that, these, those as pronouns)
Indefinite pronouns (e.g. nobody, anything, everything)
Pro-verb do
Questions
Direct questions
Nominal forms
Nominalisations (e.g. adoption, condemnation, improvement)
Gerunds in nominal function (e.g. To the best of our understanding he is not suffering)
Total other nouns
Proper nouns
Passives
Agentless passives (e.g. Perhaps what‘s needed is a Dishonours list)
By-passives (e.g. The boom in digital media was pioneered by ―pirate‖ organisations)
Stative forms
Be as a main verb (e.g. since some of the names would be on both lists, that might be confusing)
Existential there
10
In fields where computer science interacts with linguistics, such as Natural Language Processing and Information
Extraction, ‗named entities‘ indicates entities of the world denoted with a proper noun (e.g. people, organisations,
products, places, etc.). 11
For a comprehensive discussion of the list of LFs used by Biber, see Biber (1988: 221-245). For a discussion of the
LFs in Table 3.3 in relation to the results obtained in this analysis, see Chapter 4, Sections 3.1 to 3.4.
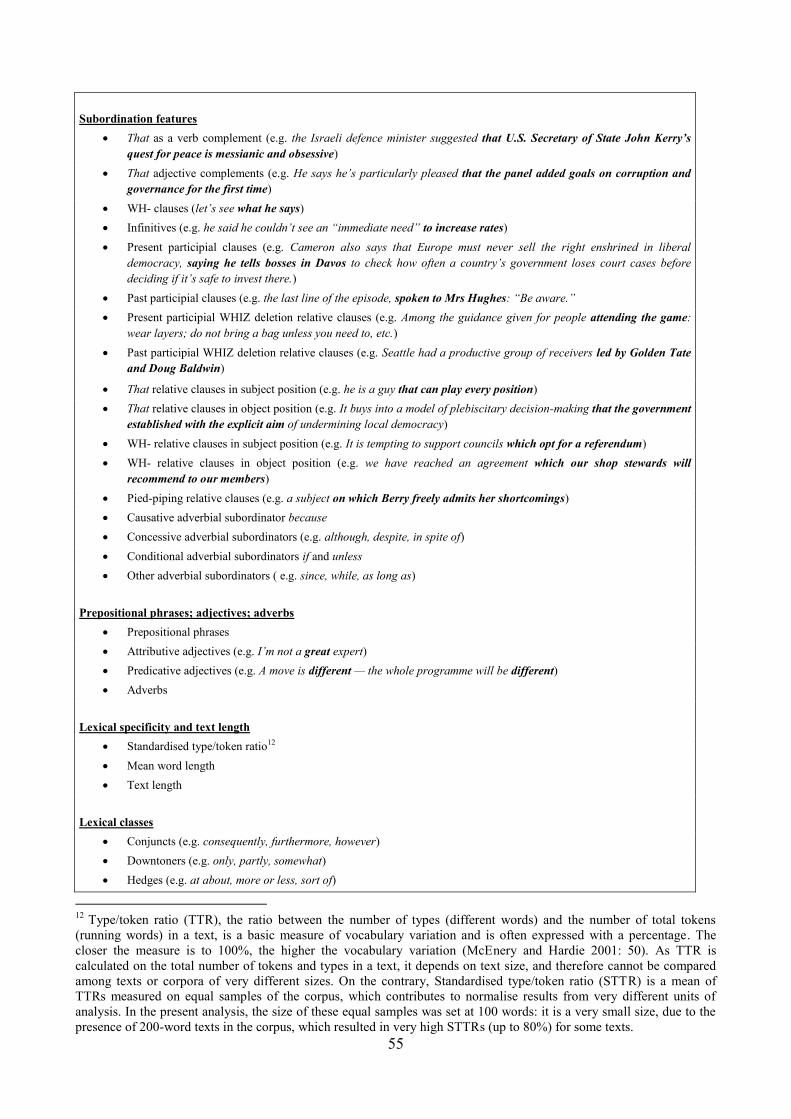
55
Subordination features
That as a verb complement (e.g. the Israeli defence minister suggested that U.S. Secretary of State John Kerry’s
quest for peace is messianic and obsessive)
That adjective complements (e.g. He says he‘s particularly pleased that the panel added goals on corruption and
governance for the first time)
WH- clauses (let‘s see what he says)
Infinitives (e.g. he said he couldn‘t see an ―immediate need‖ to increase rates)
Present participial clauses (e.g. Cameron also says that Europe must never sell the right enshrined in liberal
democracy, saying he tells bosses in Davos to check how often a country‘s government loses court cases before
deciding if it‘s safe to invest there.)
Past participial clauses (e.g. the last line of the episode, spoken to Mrs Hughes: ―Be aware.‖
Present participial WHIZ deletion relative clauses (e.g. Among the guidance given for people attending the game:
wear layers; do not bring a bag unless you need to, etc.)
Past participial WHIZ deletion relative clauses (e.g. Seattle had a productive group of receivers led by Golden Tate
and Doug Baldwin)
That relative clauses in subject position (e.g. he is a guy that can play every position)
That relative clauses in object position (e.g. It buys into a model of plebiscitary decision-making that the government
established with the explicit aim of undermining local democracy)
WH- relative clauses in subject position (e.g. It is tempting to support councils which opt for a referendum)
WH- relative clauses in object position (e.g. we have reached an agreement which our shop stewards will
recommend to our members)
Pied-piping relative clauses (e.g. a subject on which Berry freely admits her shortcomings)
Causative adverbial subordinator because
Concessive adverbial subordinators (e.g. although, despite, in spite of)
Conditional adverbial subordinators if and unless
Other adverbial subordinators ( e.g. since, while, as long as)
Prepositional phrases; adjectives; adverbs
Prepositional phrases
Attributive adjectives (e.g. I‘m not a great expert)
Predicative adjectives (e.g. A move is different — the whole programme will be different)
Adverbs
Lexical specificity and text length
Standardised type/token ratio12
Mean word length
Text length
Lexical classes
Conjuncts (e.g. consequently, furthermore, however)
Downtoners (e.g. only, partly, somewhat)
Hedges (e.g. at about, more or less, sort of)
12
Type/token ratio (TTR), the ratio between the number of types (different words) and the number of total tokens
(running words) in a text, is a basic measure of vocabulary variation and is often expressed with a percentage. The
closer the measure is to 100%, the higher the vocabulary variation (McEnery and Hardie 2001: 50). As TTR is
calculated on the total number of tokens and types in a text, it depends on text size, and therefore cannot be compared
among texts or corpora of very different sizes. On the contrary, Standardised type/token ratio (STTR) is a mean of
TTRs measured on equal samples of the corpus, which contributes to normalise results from very different units of
analysis. In the present analysis, the size of these equal samples was set at 100 words: it is a very small size, due to the
presence of 200-word texts in the corpus, which resulted in very high STTRs (up to 80%) for some texts.
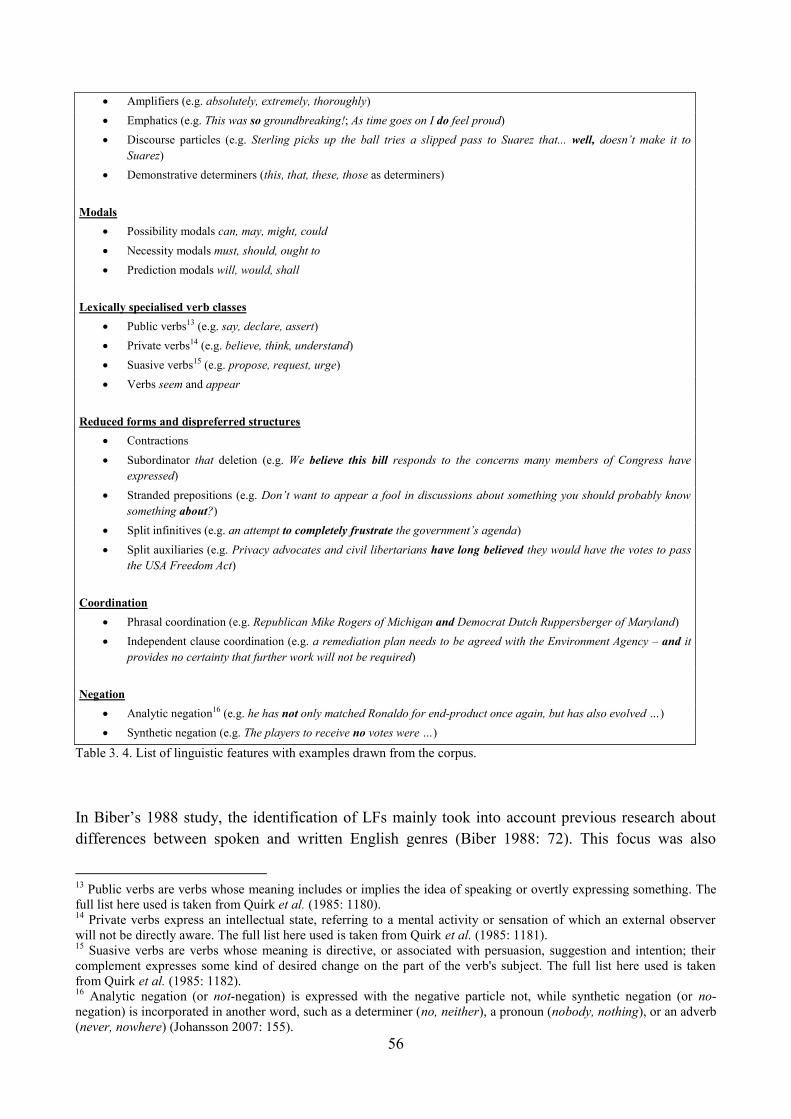
56
Amplifiers (e.g. absolutely, extremely, thoroughly)
Emphatics (e.g. This was so groundbreaking!; As time goes on I do feel proud)
Discourse particles (e.g. Sterling picks up the ball tries a slipped pass to Suarez that... well, doesn‘t make it to
Suarez)
Demonstrative determiners (this, that, these, those as determiners)
Modals
Possibility modals can, may, might, could
Necessity modals must, should, ought to
Prediction modals will, would, shall
Lexically specialised verb classes
Public verbs13 (e.g. say, declare, assert)
Private verbs14 (e.g. believe, think, understand)
Suasive verbs15 (e.g. propose, request, urge)
Verbs seem and appear
Reduced forms and dispreferred structures
Contractions
Subordinator that deletion (e.g. We believe this bill responds to the concerns many members of Congress have
expressed)
Stranded prepositions (e.g. Don‘t want to appear a fool in discussions about something you should probably know
something about?)
Split infinitives (e.g. an attempt to completely frustrate the government‘s agenda)
Split auxiliaries (e.g. Privacy advocates and civil libertarians have long believed they would have the votes to pass
the USA Freedom Act)
Coordination
Phrasal coordination (e.g. Republican Mike Rogers of Michigan and Democrat Dutch Ruppersberger of Maryland)
Independent clause coordination (e.g. a remediation plan needs to be agreed with the Environment Agency – and it
provides no certainty that further work will not be required)
Negation
Analytic negation16 (e.g. he has not only matched Ronaldo for end-product once again, but has also evolved …)
Synthetic negation (e.g. The players to receive no votes were …)
Table 3. 4. List of linguistic features with examples drawn from the corpus.
In Biber‘s 1988 study, the identification of LFs mainly took into account previous research about
differences between spoken and written English genres (Biber 1988: 72). This focus was also
13
Public verbs are verbs whose meaning includes or implies the idea of speaking or overtly expressing something. The
full list here used is taken from Quirk et al. (1985: 1180). 14
Private verbs express an intellectual state, referring to a mental activity or sensation of which an external observer
will not be directly aware. The full list here used is taken from Quirk et al. (1985: 1181). 15
Suasive verbs are verbs whose meaning is directive, or associated with persuasion, suggestion and intention; their
complement expresses some kind of desired change on the part of the verb's subject. The full list here used is taken
from Quirk et al. (1985: 1182). 16
Analytic negation (or not-negation) is expressed with the negative particle not, while synthetic negation (or no-
negation) is incorporated in another word, such as a determiner (no, neither), a pronoun (nobody, nothing), or an adverb
(never, nowhere) (Johansson 2007: 155).
57
reflected in his MDA results, which primarily highlighted the contrast between more informal and
dialogic modes of communication – broadly associated with speech –, and styles with a higher
degree of planning and informational load – broadly associated with writing. The centrality of this
contrast might also be brought to the foreground in the present analysis, because it is based on the
same LFs. This could be regarded as potentially concealing other important aspects of variation
relevant for the present corpus, such as speech attribution or sensationalism. However, even in
Biber‘s study, that major oral-literate distinction could not in fact be reduced to ‗spoken versus
written‘ differences, and enabled the identification of new dimensions of variation across genres.
This could also be the case for the present study. Moreover, the 1988 MDA did point to other facets
besides the oral-literate distinction, characterising linguistic and communicative variation in the
corpus, such as persuasion and narration. Similarly interesting aspects might be brought out by a
MDA performed on the present newspaper corpus. The results thus obtained will offer the
opportunity to plot the communication of science and technology against and within newspaper
communication, taking into account its main communicative purposes and pointing to possible
directions for further research.
3.2. Devising a method for the automatic identification and counting of
linguistic features
The multidimensional approach relies on the analysis of multiple linguistic variables, because it is
based upon the assumption that no single LF can account for the complex communicative functions
which underlie linguistic variation across genres. MDA is therefore an attempt at combining
frequency data of multiple linguistic elements in a comprehensive account, through a statistical
procedure called ‗factor analysis‘. As will be further clarified below, this entails performing
frequency counts of every LF in every text of the corpus, which in turn calls for a tagging-and-
counting system to be operated on the corpus. To make LFs automatically identifiable, they can be
defined as basically consisting of: parts of speech; lexical items or classes; or combinations of the
two, sometimes involving punctuation. It is therefore necessary to use software tools capable of
dealing with such combinatory systems across different linguistic levels (grammatical, lexical, and
syntactic). With no computer science background, it was impossible to autonomously find or build a
suitable tool. Moreover, the program employed for LF tagging in Biber‘s MDA is not available to
users outside Biber‘s research group. The only way to obtain an analysis based on that software
would have been to have it performed by their owners. At the same time, relying on external actors
or institutions by delegating tagging and counting tasks would have meant losing control on one of
the most delicate phases of the analysis. An alternative option might have been to use the freely
available MAT (Multidimensional Analysis Tagger) software (Nini 2014), which measures the
‗dimensions of variation‘ originally obtained by Biber on the corpus to be analysed. One of the
intermediate outputs of MAT is a tagged version of the uploaded corpus, where all 67 LFs are
identified. Another tool which can be used for MDA is available as part of the Lancaster Stats Tool
online17
(Brezina 2018): after uploading the data with the frequencies of all LFs in each text of the
analysed corpus, the tool automatically extracts the dimensions of variation, and the final output can
be downloaded locally. Therefore, MAT could have been used in combination with the Lancaster
17
The tools and several tutorials about statistics for corpus linguistics are available at
http://corpora.lancs.ac.uk/stats/index.php
58
MD analysis tool online. However, while this appeared to be a useful procedure for preliminary or
exploratory surveys, it was not considered entirely appropriate to the present situation. Its main
drawback lies, once again, in the lack of control over the analysis on the part of the researcher. This
is due to the fact that that most procedures – e.g. the tagging system and the statistical analysis – are
largely opaque to the end user, who may however need to access their intermediate stages,
understand why they obtained particular results, or modulate some analyses. In the present work,
for example, some minor adjustments were required to make the LFs more comprehensive and/or
accurate whenever possible (see Section 3.1), and to make their identification more effective in
written texts only (see Section 3.2.2). Moreover, intermediate results were essential in motivating
and interpreting the dimensions. Another downside is that, in order to count LFs, MAT relies on a
set of grammatical tags, called the Penn Treebank tagset, which was considered problematic for the
present analysis (see Section 3.2.3). Finally, the available tools would have substantially limited the
possibility of extending the present analysis to other languages in future works. After pondering
various options, the possibility of creating a new software tool in collaboration with computer
scientists in the TIPS project was regarded as the most suitable one, at least in a long-term
perspective. This option had some advantages, such as a higher control over each phase of the
process, and the possibility of making adjustments during software creation. Moreover, it resulted in
a tool whose components might be usefully extended to languages other than English, and exploited
in other studies where the analysis of language entails the identification of linguistic structures
similar to the LFs in MDA. In line with the multidimensional procedure, the tool or set of tools
needed to perform four main tasks, in the following order:
pre-processing texts, if necessary (e.g. cleaning them, and preparing them for the next task);
automatically identifying the LFs – as explained in Sections 3.2.2-3.2.4 below, this requires
prior part-of-speech annotation, followed by further format adjustments to make the actual
LF identification possible;
counting them in each unit of analysis from the corpus (i.e., each text);
producing a table with LF names as columns and single text identifiers (text IDs) as rows,
where the LF frequency in each text of the corpus is reported.
3.2.1. Text pre-processing
The identification and counting of the LFs had to be performed on text files containing individual
newspaper articles, headings included. As explained in Section 2.2.5, however, one of the problems
arising while collecting texts was the presence of content that was not part of the article itself –
links, captions, etc. – and might negatively affect word counts and other automated analyses.
Therefore, it was necessary to devise a pre-processing phase to eliminate such content and obtain
clean text files to be submitted to the next stages of the analysis. The cleaning procedure here
employed was made possible by using regular expressions, in line with the practices followed by
the TIPS group for Italian articles.
A regular expression (also ‗regexp‘ or ‗regex‘) is a sequence of characters denoting a pattern or
string within a text. Regular expressions can be useful for a range of purposes, the most basic one
being searching for a string (Thompson 1968). The language of regular expressions includes literal
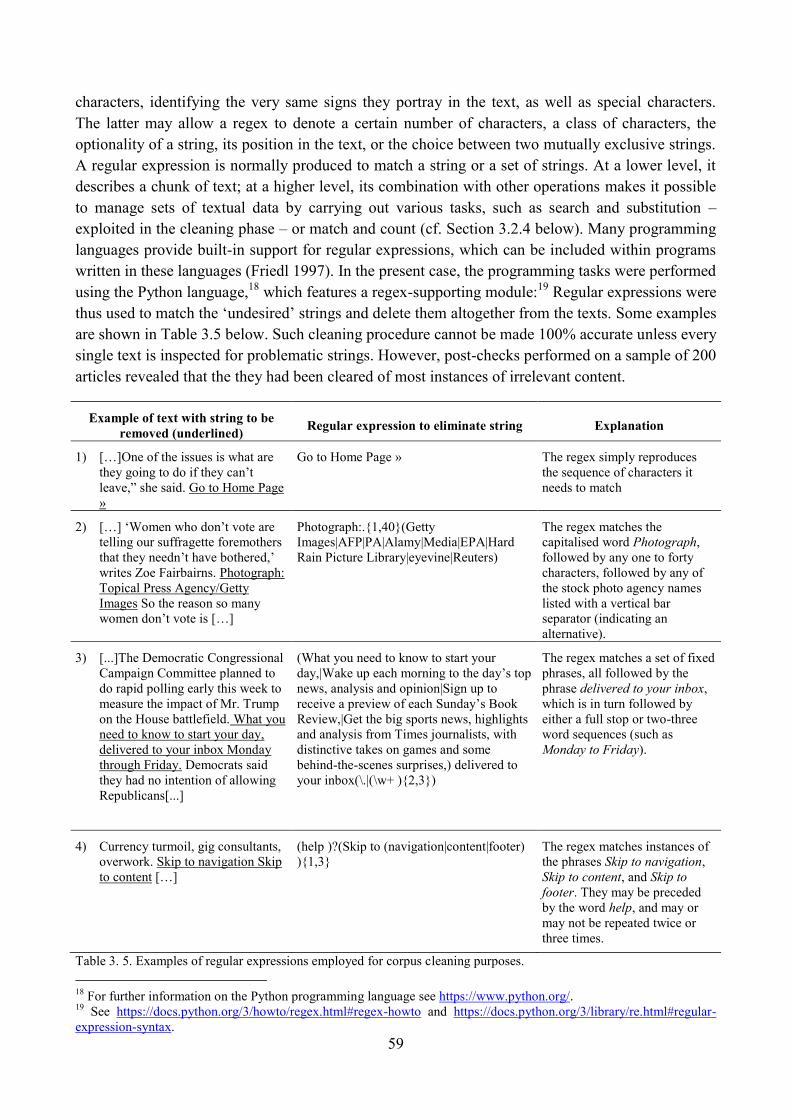
59
characters, identifying the very same signs they portray in the text, as well as special characters.
The latter may allow a regex to denote a certain number of characters, a class of characters, the
optionality of a string, its position in the text, or the choice between two mutually exclusive strings.
A regular expression is normally produced to match a string or a set of strings. At a lower level, it
describes a chunk of text; at a higher level, its combination with other operations makes it possible
to manage sets of textual data by carrying out various tasks, such as search and substitution –
exploited in the cleaning phase – or match and count (cf. Section 3.2.4 below). Many programming
languages provide built-in support for regular expressions, which can be included within programs
written in these languages (Friedl 1997). In the present case, the programming tasks were performed
using the Python language,18
which features a regex-supporting module:19
Regular expressions were
thus used to match the ‗undesired‘ strings and delete them altogether from the texts. Some examples
are shown in Table 3.5 below. Such cleaning procedure cannot be made 100% accurate unless every
single text is inspected for problematic strings. However, post-checks performed on a sample of 200
articles revealed that the they had been cleared of most instances of irrelevant content.
Example of text with string to be
removed (underlined) Regular expression to eliminate string Explanation
1) […]One of the issues is what are
they going to do if they can‘t
leave,‖ she said. Go to Home Page
»
Go to Home Page » The regex simply reproduces
the sequence of characters it
needs to match
2) […] ‗Women who don‘t vote are
telling our suffragette foremothers
that they needn‘t have bothered,‘
writes Zoe Fairbairns. Photograph:
Topical Press Agency/Getty
Images So the reason so many
women don‘t vote is […]
Photograph:.{1,40}(Getty
Images|AFP|PA|Alamy|Media|EPA|Hard
Rain Picture Library|eyevine|Reuters)
The regex matches the
capitalised word Photograph,
followed by any one to forty
characters, followed by any of
the stock photo agency names
listed with a vertical bar
separator (indicating an
alternative).
3) [...]The Democratic Congressional
Campaign Committee planned to
do rapid polling early this week to
measure the impact of Mr. Trump
on the House battlefield. What you
need to know to start your day,
delivered to your inbox Monday
through Friday. Democrats said
they had no intention of allowing
Republicans[...]
(What you need to know to start your
day,|Wake up each morning to the day‘s top
news, analysis and opinion|Sign up to
receive a preview of each Sunday‘s Book
Review,|Get the big sports news, highlights
and analysis from Times journalists, with
distinctive takes on games and some
behind-the-scenes surprises,) delivered to
your inbox(\.|(\w+ ){2,3})
The regex matches a set of fixed
phrases, all followed by the
phrase delivered to your inbox,
which is in turn followed by
either a full stop or two-three
word sequences (such as
Monday to Friday).
4) Currency turmoil, gig consultants,
overwork. Skip to navigation Skip
to content […]
(help )?(Skip to (navigation|content|footer)
){1,3}
The regex matches instances of
the phrases Skip to navigation,
Skip to content, and Skip to
footer. They may be preceded
by the word help, and may or
may not be repeated twice or
three times.
Table 3. 5. Examples of regular expressions employed for corpus cleaning purposes.
18
For further information on the Python programming language see https://www.python.org/. 19
See https://docs.python.org/3/howto/regex.html#regex-howto and https://docs.python.org/3/library/re.html#regular-
expression-syntax.
60
3.2.2. Describing linguistic features: a regex-based approach
For their characteristics, LFs cover lexical, grammatical and syntactic aspects. Since they can be
described in combinatory terms, they also might be regarded as sequences encoding lexical,
grammatical and syntactic information: Biber‘s detailed description of LFs (Biber 1988: 221-245),
expressed in similar terms, was the starting point to devise the LF identification method used here.
With the exception of STTR, mean word length and text length, which already provide the
numerical information needed, it is thus possible to use regular expressions to match the sequences
expressing LFs, provided that all of the three linguistic levels in question are encoded in the text:
lexical aspects concern written words, made of characters, and can be therefore directly
matched by regular expressions;
syntactic aspects concern the structure of sentences and of their constituents, which special
regex characters can help to describe in abstract terms;
By contrast, grammatical information about the part-of-speech classification of words is not
normally indicated in texts. However, this type of information can be added through an
annotation procedure (McEnery and Hardie 2011: 13). In the present case, an automatic
part-of-speech classification of all tokens in the corpus can be performed by running an
existing Part-of-Speech (PoS) tagger on the corpus. Normally, the output of a PoS tagger
consists in an edited version of the corpus, where a tag indicating the grammatical class is
added next to each token.
Therefore, the software which identifies LFs was made to operate on a PoS-tagged text, exploiting
regular expressions to match the combinations of characters which can describe the LFs in the
annotated corpus. For example, the LF ‗perfect aspect‘ in its affirmative or negative form can be
described as a sequence consisting of an auxiliary verb have, followed by an optional negation
particle (not), followed by one or two optional adverbs, followed by a past participle verb. Starting
from a PoS-tagged text, the regex corresponding to this LF has to reproduce this combination with
an appropriate pattern. Since the present study is focused on written language, the regular
expressions here used to identify the LFs only work on written material, and do not apply to
transcriptions from oral samples. However, they could be adapted and integrated to fit new symbols
and annotations.
It is important to consider the nature and limits of this regex-based approach: here, regular
expressions are representations of certain linguistic structures. Consequently, they cannot be
expected to cover all possible instances of a LF, nor to be absolutely accurate: there can be elements
they cannot detect, and cases which they cannot disambiguate. Moreover, here they were applied to
the result of a PoS-tagging procedure, which has its own limits in terms of accuracy and
disambiguation power. However, the regex-based approach proved to be powerful and versatile,
and the PoS-tagger was also selected for its accuracy and consistency with current grammatical
classifications (see the next section). Therefore, this identification system was overall effective in
detecting the LFs.
3.2.3. Choosing a suitable PoS-tagger
In order to be used to produce an intermediate level of annotation prior to LF identification, the
PoS-tagger needed to meet some requirements. First, its tagset (i.e., the set of tags indicating the
61
parts of speech) had to suit the present linguistic analysis (this aspect will be discussed below in this
section). Second, it needed to be – preferably freely – available for download and use. Third, it
needed to achieve relatively high results (above 96%) in accuracy tests. Among the taggers which
potentially met all requirements, TreeTagger20
(Schmid 1995) was the first to be selected.
TreeTagger is a widely used tool (as acknowledged for example in Tian and Lo 2015: 572) which
can be applied to a range of languages including German, English, French, Italian, and Spanish.
When it was created, the English version of TreeTagger was trained and tested upon annotated data
collected for the Penn Treebank Project (Marcus, Marcinkiewicz, and Santorini 1993). These data
consist of over 4.5 million words of American English from a range of genres including ―IBM
computer manuals, nursing notes, Wall Street Journal articles, and transcribed telephone
conversations, among others‖ (Taylor, Marcus, and Santorini 2003: 5). Moreover, the tagset
featured in TreeTagger was originally created within the Penn Treebank Project. In order to test
how accurate TreeTagger was on data external to its training/testing, and to understand whether it
was compatible with the present analysis, it was run on a set of short sentences. Some of them were
randomly taken from newspaper articles from the Web; others were constructed with ad hoc
characteristics in order to verify how the software managed ambiguous forms and whether its output
could be used to identify LFs. As a support concerning part-of-speech classification, some reference
grammars were consulted to achieve a sounder evaluation (Quirk et al. 1985; Biber et al. 1999;
Huddleston and Pullum 2002; Carter and McCarthy 2006).
Commonly used automatic PoS-taggers still face disambiguation problems that have not been
solved so far. For instance, there is no way to disambiguate words which, according to most
reference grammars can have both determiner and pronominal functions (e.g. demonstratives this,
that, these, those; or quantifiers much, any, some, etc.). Even more problematic is the
disambiguation of words with more functions, such as that (demonstrative determiner,
demonstrative pronoun, relative pronoun, complementiser, adverb) or some wh-words, each of
which has multiple possible classifications and can be used in a range of different structures (among
which interrogatives, relatives, complementising, and exclamations). As expected, such issues were
observed in the output from TreeTagger: although they can limit the identification of certain LFs,
they cannot be avoided, and could often be by-passed through a careful construction of regular
expressions. Setting these questions aside, however, other problematic aspects emerged while
testing TreeTagger. They concern the systematic attribution of tags which do not reflect most
current part-of-speech classifications. Particularly relevant examples are:
indefinite pronouns, such as anybody, anyone, anything, nobody, nothing, everybody,
everyone, everything, which are regularly tagged as singular nouns;
quantifiers much, less, more, most, which are tagged as adjectives when functioning as
determiners;
tomorrow, today, yesterday, which can be either adverbs (as in ―The test will take place
tomorrow‖) or nouns (as in ―Today has been sunny‖), but are always tagged as nouns;
20
Information about the software and downloadable versions are available at http://www.cis.uni-
muenchen.de/~schmid/tools/TreeTagger/
62
possessive forms, whose classification within TreeTagger does not follow standard criteria.
In most classification systems, they are divided into determiners (my, your, etc.) and
pronouns (mine, yours etc.); possessive pronouns are moreover generally distinguished from
personal pronouns (I, you, me, them, etc.). However, in the output from TreeTagger,
possessive determiners are classified as possessive pronouns, while possessive pronouns are
classified as personal pronouns.
Such output may affect the identification of LFs, which largely involve the use of word classes. In
other words, a regex containing tags assigned by TreeTagger could result in the misclassification of
certain items, thus running the risk of not identifying LFs correctly. It appears that the difficulties
here encountered in applying TreeTagger largely depend on the way its tagset and tagging rules
were originally conceived within the Penn Treebank Project (Santorini 1991). In that context, a
simplified tagset with respect to other existing resources was needed, mainly in order to avoid
sparse data (i.e., PoS categories that never occurred in training or test material, as a result of very
detailed classifications) as well as lexically recoverable distinctions (i.e., tags corresponding to one
single word (Marcus, Marcinkiewicz, and Santorini 1993). Most importantly, one of the main
achievements of the Penn Treebank Project was the syntactic annotation of its data, which was also
based on the PoS-tagging. As they are instrumental to syntactic analysis, tags were assigned
according to their syntactic function, not their grammatical behaviour.
Dependency structures and syntactic annotation were not as prominent in MDA, which is more
concerned with grammatical classes when it comes to representing LFs. Consequently, TreeTagger
proved not to be the best option for the present analysis. In fact, it was necessary to find an
alternative whose focus was more on grammatical than syntactic behaviour. The Textpro21
NLP tool
suite (Pianta, Girardi and Zanoli 2008) was finally selected as a suitable option: it can be freely
requested, downloaded and used, and is available for English, Italian, German and French. In its
English version, TextPro employs the C5 tagset, originally used for the annotation of the British
National Corpus22
(Leech et al. 1994), and it was evaluated on the BNC itself, reaching an accuracy
of 97.80%. The C5 tagset was found to be more consistent with the part-of-speech classifications
found in most reference grammars, as well as with the identification of LFs for MDA. For example:
indefinite pronouns form a separate category and have their own tag;
quantifiers and demonstratives are treated as ‗determiners/pronouns‘ rather than adjectives,
thus distinguishing them from both predicative and attributive adjectives;
possessive determiners are tagged as such and separated from possessive and personal
pronouns, with relatively good outcomes in case of homonym disambiguation (e.g. her as
determiner vs. her as accusative pronoun).
The process of software evaluation and selection performed for the present study shows how
important it is to critically review the available resources for automatic linguistic analysis, so as to
21
Information about the software and downloadable versions are available at http://textpro.fbk.eu/ 22
The tagset is shown in the TextPro website at http://textpro.fbk.eu/annotation-layers; further information on the tagset
and its function within the British National Corpus can be found at
http://www.natcorp.ox.ac.uk/docs/bnc2guide.htm#tagset.
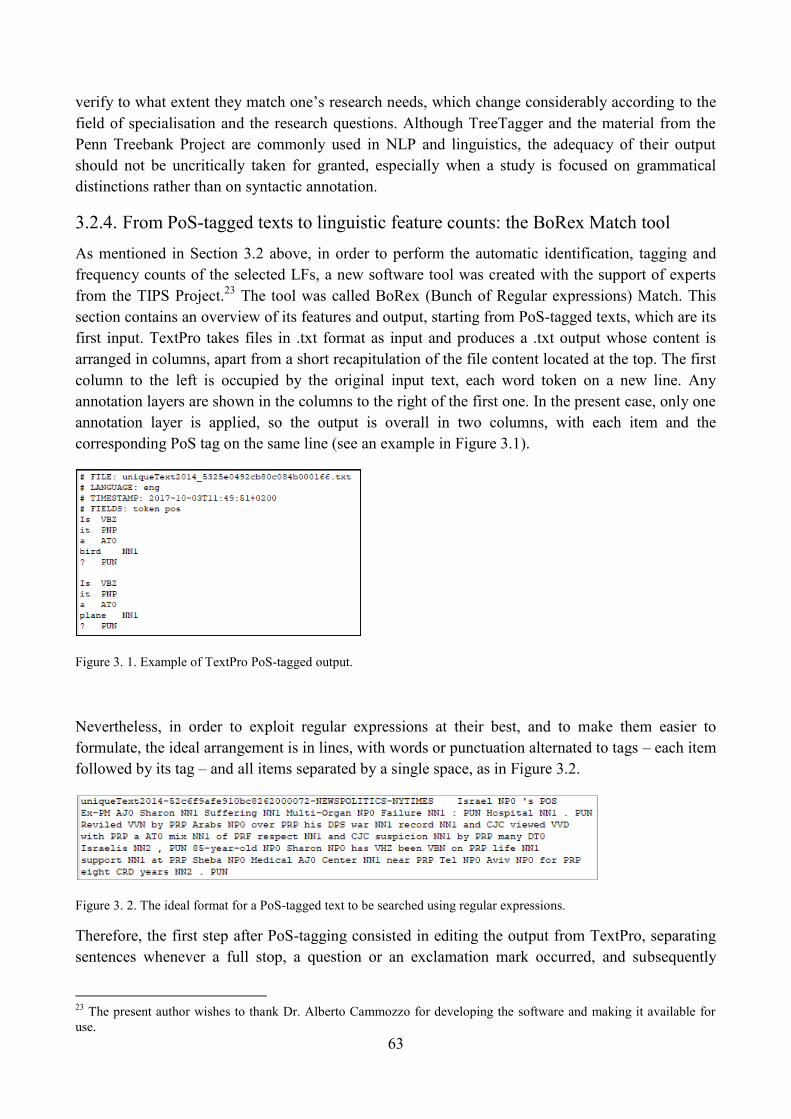
63
verify to what extent they match one‘s research needs, which change considerably according to the
field of specialisation and the research questions. Although TreeTagger and the material from the
Penn Treebank Project are commonly used in NLP and linguistics, the adequacy of their output
should not be uncritically taken for granted, especially when a study is focused on grammatical
distinctions rather than on syntactic annotation.
3.2.4. From PoS-tagged texts to linguistic feature counts: the BoRex Match tool
As mentioned in Section 3.2 above, in order to perform the automatic identification, tagging and
frequency counts of the selected LFs, a new software tool was created with the support of experts
from the TIPS Project.23
The tool was called BoRex (Bunch of Regular expressions) Match. This
section contains an overview of its features and output, starting from PoS-tagged texts, which are its
first input. TextPro takes files in .txt format as input and produces a .txt output whose content is
arranged in columns, apart from a short recapitulation of the file content located at the top. The first
column to the left is occupied by the original input text, each word token on a new line. Any
annotation layers are shown in the columns to the right of the first one. In the present case, only one
annotation layer is applied, so the output is overall in two columns, with each item and the
corresponding PoS tag on the same line (see an example in Figure 3.1).
Figure 3. 1. Example of TextPro PoS-tagged output.
Nevertheless, in order to exploit regular expressions at their best, and to make them easier to
formulate, the ideal arrangement is in lines, with words or punctuation alternated to tags – each item
followed by its tag – and all items separated by a single space, as in Figure 3.2.
Figure 3. 2. The ideal format for a PoS-tagged text to be searched using regular expressions.
Therefore, the first step after PoS-tagging consisted in editing the output from TextPro, separating
sentences whenever a full stop, a question or an exclamation mark occurred, and subsequently
23
The present author wishes to thank Dr. Alberto Cammozzo for developing the software and making it available for
use.
64
arranging text files as in Figure 3.2. In the meantime, a list of regular expressions devised to match
each of the LFs in Table 3.4 was compiled. Each regex was tested both on ad-hoc invented
sentences and on text strings taken from the corpus. There were several assessment-and-adjustment
rounds, until the matching results were satisfactory.24
These tests were carried out manually,
therefore it was not possible to find and address all the existing issues in LF identification.
However, the entire tool was progressively improved, and overall it can be regarded as effective.
Some regular expressions were extremely simple, such as that matching indefinite pronouns, shown
in example (1). Some were more complex, and contained both literal and special characters, as in
example (2), matching ‗split infinitives‘.
1) PNI – matches tags corresponding to indefinite pronouns (PNI).
2) TO0 ([!\‖#$%&‘()*+,-.–—/:;<=>?@\\[\]^_`{|}~]|\w*) AV0 – matches tags corresponding
to the infinitive marker to(TO0), followed by any word PoS-tagged as an adverb – i.e.,
followed by the adverb tag AV0.
The regex input file was arranged in three columns. The first one was for single regex identification
names (abbreviations referring to the LFs represented by the regular expressions). The second
column contained ‗regex group‘ identification names, similar to single regex names. In cases when
a single LF needed more than one regex to represent its possible realisations, regex groups were
necessary to aggregate all the different forms – and corresponding regular expressions – under the
same count. If a single regex was sufficient to match a LF, its corresponding group would contain
that same regex, and the regex group identification name would correspond to the single regex
name. The third column contained the actual regular expressions. The LF frequency counts used in
the subsequent stages of the analysis thus ultimately referred to regex groups.
In some cases, the patterns expressed by regular expressions did not succeed in capturing all and
only the strings realising their corresponding linguistic features, but matched some false positives.
For example, the regex for the pro-verb do matched also the instances of do as auxiliary, and the
regex for nominalisation matched also words like city and moment, which are not considered
instances of nominalisation. These could not be embedded as exceptions within regular expressions,
but needed to be distinguished from the true positives. To deal with these instances, a hierarchy was
created as an additional input into the identification tool. The word ‗hierarchy‘ is used here because
this system is based upon couples of regular expressions, one of which is ‗prioritised‘ over the
other. First of all, regular expressions were devised to match the false positives of each regex
known to be ‗problematic‘. Then, each ‗false positive regex‘ was coupled to its corresponding
problematic regex, in a single .txt file. This was used as an input to implement a further operational
step for the software, following the first round of frequency counts. At this stage, the software was
instructed to ‗prioritise‘ the regex matching the false positive over the corresponding problematic
regex, and to subtract the occurrences of the false positive from the occurrences of the respective
24
In order to assess the accuracy of BoRex Match, checks were performed by manually identifying and counting each
LF in articles randomly selected from the corpus, subsequently comparing manual counts to software counts. For each
LF, true positives (TP), true negatives (TN), false positives (FP) and false negatives (FN) in the software performance
were quantified. Such procedure is extremely time consuming, and only two articles could so far be manually checked.
The overall results for accuracy, calculated as (TP + TN)/(TP + TN + FP + FN), were 84.92%. Precision, i.e., TP / (TP
+ FP) is 92.19% and recall, calculated as TP / (TP + FN) is 90.08%. Performing more reliable and comprehensive
accuracy tests is prioritised among prospects for further research.
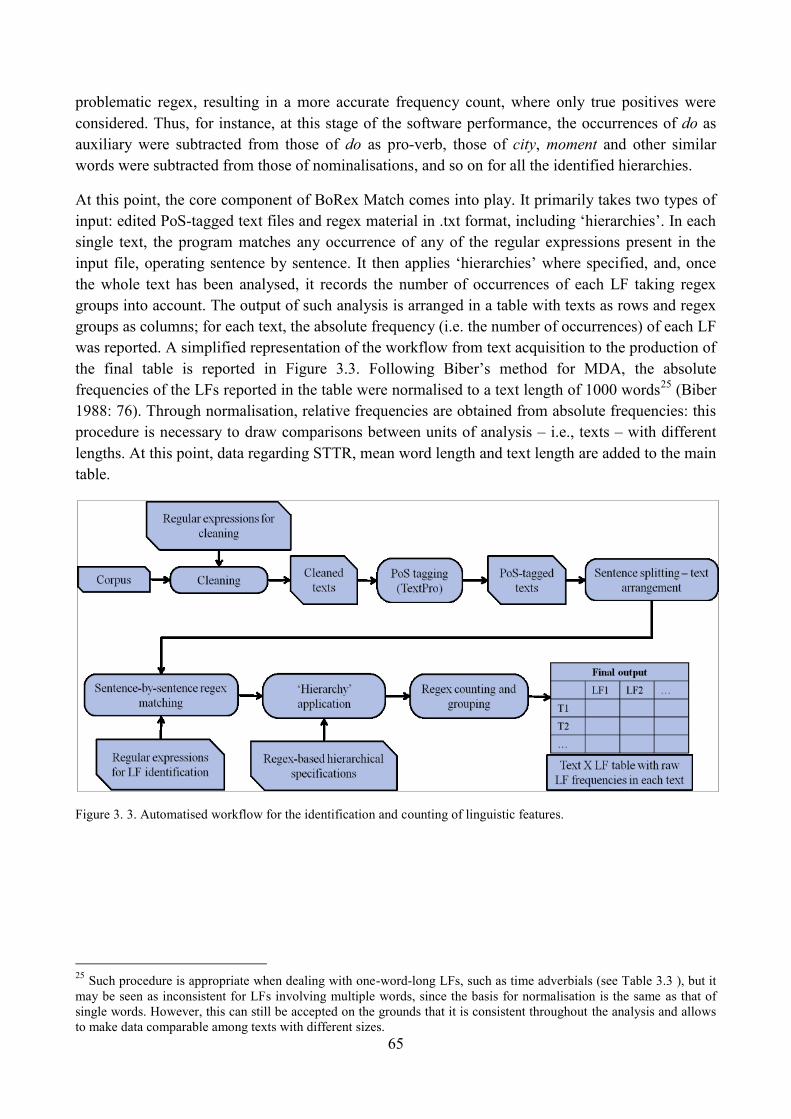
65
problematic regex, resulting in a more accurate frequency count, where only true positives were
considered. Thus, for instance, at this stage of the software performance, the occurrences of do as
auxiliary were subtracted from those of do as pro-verb, those of city, moment and other similar
words were subtracted from those of nominalisations, and so on for all the identified hierarchies.
At this point, the core component of BoRex Match comes into play. It primarily takes two types of
input: edited PoS-tagged text files and regex material in .txt format, including ‗hierarchies‘. In each
single text, the program matches any occurrence of any of the regular expressions present in the
input file, operating sentence by sentence. It then applies ‗hierarchies‘ where specified, and, once
the whole text has been analysed, it records the number of occurrences of each LF taking regex
groups into account. The output of such analysis is arranged in a table with texts as rows and regex
groups as columns; for each text, the absolute frequency (i.e. the number of occurrences) of each LF
was reported. A simplified representation of the workflow from text acquisition to the production of
the final table is reported in Figure 3.3. Following Biber‘s method for MDA, the absolute
frequencies of the LFs reported in the table were normalised to a text length of 1000 words25
(Biber
1988: 76). Through normalisation, relative frequencies are obtained from absolute frequencies: this
procedure is necessary to draw comparisons between units of analysis – i.e., texts – with different
lengths. At this point, data regarding STTR, mean word length and text length are added to the main
table.
Figure 3. 3. Automatised workflow for the identification and counting of linguistic features.
25
Such procedure is appropriate when dealing with one-word-long LFs, such as time adverbials (see Table 3.3 ), but it
may be seen as inconsistent for LFs involving multiple words, since the basis for normalisation is the same as that of
single words. However, this can still be accepted on the grounds that it is consistent throughout the analysis and allows
to make data comparable among texts with different sizes.
66
3.2.5. On a regex-based method for linguistic analysis and its possible applications in
a wider context
The output from BoRex Match is not a further annotation of the text, as it seems to be the case for
other MDA-related software, such as Biber‘s tagger or MAT: it is instead a report of the matches of
a set of regular expressions in a collection of texts, operated at the sentence level. The regex-based
approach was regarded as more convenient from a programmer‘s standpoint, but also with a view to
other possible developments and applications of the program, whose scope potentially spreads
beyond the set of LFs used for MDA. This approach could indeed contribute to investigating the use
of any linguistic pattern that can be described through a regular expression, exploiting both
annotated and unannotated corpora. Any research encompassing an interest in phraseology from a
quantitative point of view, for example, could successfully exploit this resource, and maybe use its
outcome for more detailed analyses. The integration of regex groups and hierarchies also points to
the possibility of adding multiple layers of manipulation of frequency counts, according to one‘s
research purposes, provided that the computational workload is acceptable and the terms of
manipulation are reasonable and carefully set. The options offered by the workflow and the
software tool here described may be affected by the limits of automatic PoS annotation and regular
expressions. Nonetheless, they would allow a high level of flexibility, complexity and control of the
analysis, in a less constrained setting with respect to commonly used websites for the online
consultation of reference corpora. Moreover, this LF counting tool could be extended to other
languages, after selecting a set of relevant LFs and creating the corresponding regular expressions.
4. Factor analysis
One of the advantages of the multidimensional approach is that it is based on the analysis of many
linguistic structures in use. However, these cannot be examined individually. The considerable
amount of data produced by the automatic identification of LFs cannot be informative in itself; in
fact, it needs to be aggregated in order to be better explored, understood and interpreted. Factor
analysis is a multivariate statistics procedure which belongs to a family of methods common in the
social and behavioural sciences, and is generally used to ―summarise the interrelationships among a
large group of variables in a concise fashion‖ (Biber 1988: 64). Factor analysis and other similar
methods involve what are called latent variables, that is variables which cannot be directly observed
nor measured: examples in the social sciences would be intelligence, political attitude, and
socioeconomic status. In order to measure a latent variable, other observable variables, considered
to be likely indicators of the latent one, may be collected (Bartholomew et al. 2008: 175-176). Biber
followed precisely this approach, when he selected observable LFs and collected data about them as
potential indicators of a smaller number of latent variables, which he then interpreted as
‗dimensions of linguistic variation‘. MDA assumes the existence of these dimensions, which spread
through different genres, and associates dimensions to underlying communicative functions. In
brief, Biber applied a technique widely used in the social sciences to a set of linguistic data. The
aim of factor analysis is to reveal a small number of latent variables that cause the manifest set of
observed variables to co-vary, that is, to vary together. In a factor analysis, the strength of the
relationships between the observed variables, known as correlation, is taken as an indicator of the
67
existence of latent variables, comprising groups of correlated observed variables (see Mooi 2018:
117 for a definition and discussion of covariance and correlation).
A distinction can be made between factor analysis and Principal Components analysis (PCA),
another statistical technique which, like factor analysis, is used to reduce the dimensionality of a
large set of variables to a smaller number of entities (components), based on the correlation among
variables (Barholomew et al. 2008: 175). The two techniques share some aims and are closely
linked, so much so that they are sometimes described within the same framework26
(for example, in
Basilevsky 1994). Nevertheless, other accounts regard them as separate: the main difference lies in
the basic approaches assumed by the two methods. On the one hand, ―PCA is a descriptive
technique which does not assume an underlying statistical model‖, and ―makes no prior
assumptions about how many components are being looked for or what they might represent‖
(Bartholomew et al. 2008: 175, 200). Its purpose is producing a summary of the initial data
matrix,27
accounting for as much as possible of the total variance28
of the data. On the other hand,
factor analysis is a model-based technique, in that it implies prior assumptions regarding the
number of entities (factors) reducing data dimensionality (Bartholomew et al. 2008: 175, 200). In
most cases, the use of factor analysis implies some prior notion of what factors may represent, since
its purpose is to uncover underlying constructs explaining the original observed data.
A difference also exists between exploratory and confirmatory factor analysis. In an exploratory
factor analysis (EFA), the number of factors and the aspects they may represent are only assumed;
one needs to make several attempts to find a ‗suitable‘ number of factors explaining the
interrelationships among variables, and the final factors are interpreted and labelled ex post, on the
basis of some indicators resulting from the analysis. By contrast, a confirmatory factor analysis
(CFA) ―is mainly used for testing a hypothesis arising from theory. Therefore, the number of latent
variables and the indicators that will be used to measure each latent variable are known in advance‖
(Barholomew et al. 2008: 189-190) and tested through the factor analysis. In the present study, in
line with Biber‘s procedure,29
an EFA is performed, because its methodological features were
perceived as consistent with MDA. The choice of EFA over PCA reflects the aim of ―uncovering
latent dimensions underlying a data set‖ (DiStefano et al. 2009), and Biber‘s selection of LFs was
driven by some prior assumptions of what emerging factors could represent. Since, at the same
time, there was no initial theory to confirm, and the actual number and nature of factor was not
known, EFA had to be used instead of CFA.
26
In Biber (1988: 82), PCA seems to be considered as a type of ―factoring procedure‖. 27
The term 'matrix' comes from mathematics and indicates a rectangular array of elements, arranged in rows and
columns, which is treated and manipulated as a single entity. In statistics, a data matrix can be employed to display
statistical data; being treated as an entity, it can be used as a starting point for further analyses (Bartholomew et al.
2008: 5). The table containing LF frequencies in each text of the corpus is, in fact, a data matrix which will be used for
the factor analysis. 28
Variance is a measure of the variability of the data, and provides a general idea of how far they are spread out: a
dataset consisting of the numbers 11, 11, 12, 12, 13 will have a very small variance (0.70); on the contrary, a data set
formed by the numbers 1, 3, 47, 72, 117 will have a much higher variance (2393). 29
Biber (1988: 82) refers to a Principal Factor Analysis (Gorsuch 1974: 85), which he applies to perform an EFA. In the
present work, a different but equally common procedure that can be used for EFA – maximum likelihood factor analysis
(Gorsuch 1974: 113) – was used. It was chosen because it is the closest to Biber‘s original procedure among those
available in the R software (see the following section), and it gives the same results as the Lancaster Stats Tool online
(see Section 3.2), which was taken to indicate that it is sufficiently reliable.
68
Factor analysis is a complex technique, involving several methodological options and no
established guidelines suitable to all types of studies. Therefore, applying factor analysis entails
dealing with several complex methodological choices. In general, it is hoped that the resulting latent
constructs will explain a good proportion of the variance present in the initial data matrix, so that
they can ―be used to represent the observed variables‖ (Henson and Roberts 2006: 394). At the
basis of MDA lies the assumption that the co-occurrence of LFs can be explained in terms of shared
communicative functions (Biber 1988: 13). Since the correlation of LFs within a corpus expresses
their co-occurrence patterns, factor analysis was used to make those patterns visible. Thus factors
represent ―grouping[s] of linguistic features that co-occur with high frequency.‖(Biber 1988: 79)
and can be interpreted as underlying dimensions of linguistic variation. These were associated to
several communicative functions, whose presence could be detected and measured through the
dimensions themselves.
4.1. Performing exploratory factor analysis on an online newspaper
corpus
In this section, the main methodological steps leading to the final set of factors for the above-
described corpus will be reported. The present account is intended as methodological overview; an
in-depth discussion of all the technical, mathematical and statistical details of the procedures and
the software resource here used is beyond the scope of this study. Whenever possible, specialised
references and user‘s manuals are indicated.
To perform the EFA, the R software facility30
(R Core Team 2017) was used. R is a programming
language and a software environment31
for statistical computing and graphics. It is available as a
Free Software under a GNU General Public Licence,32
and is extended through a wide range of
packages which form a coherent system: some are included in the main R distribution, but most of
them are user-contributed. Within the R system, ‗stats‘ is a package used to perform a range of
statistical calculations, among which factor analysis. The ‗FactoMiner‘, ‗psych‘, and ‗nparcomp‘
packages (described respectively in Le et al. 2008, Revelle 2017, and Konietschke et al. 2015) were
also used in the present statistical analysis. The first is specialised in multivariate exploratory
analyses and data mining. The second is more focused on psychological and psychometric research,
but also features functions for descriptive statistics (Kabacoff 2011). The third is used to compare
multiple datasets. Each R package features several functions,33
performing different types and
pieces of analysis. The base function for EFA in R is called ‗factanal‘, and is included in the ‗stats‘
package. More customisable alternatives were available (Kabacoff 2011: 333). However, given the
complexity of this technique, the base function was regarded as the simplest and safest option.
According to its documentation,34
‗factanal‘ performs factor analysis on a data matrix using
30
Detailed information, downloads and user‘s manuals are available at https://www.r-project.org/ 31
In computing, an environment is an operating system, a program or a suite of programs that provide the facilities
necessary for an application to work. An application is a piece of software designed to perform a particular task. 32
The licence can be viewed at https://www.r-project.org/COPYING 33
In programming, ‗function‘ refers to a piece of code written to carry out a particular task. Functions work on several
inputs, many of which can be variables, and their output usually involves some principled changes to variable values or
operations based on them. Through their code, functions incorporate sets of instructions which, because they are
particularly complex, or because they need to be used repeatedly, are self-contained and called whenever necessary. 34
The documentation regarding this function can be viewed at
https://www.rdocumentation.org/packages/stats/versions/3.5.0/topics/factanal
69
‗maximum likelihood‘, one of the techniques devised to estimate a statistical model which best
describes the observed data.35
The final outcome produced by the BoRex Match tool, containing LF
frequencies in each text, is a data matrix. Once its data were normalised and thus made comparable
among different text sizes (except for the already-normalised ‗text length‘, ‗average word length‘
and ‗STTR‘), the matrix could be fed into the R facility. Factor analysis involves several
methodological choices, each of which can have an impact on the outcomes and possible
interpretation of the analysis (cf. Henson and Roberts 2006). In the present study, Biber‘s work was
taken as the main reference; at the same time, other possible solutions were considered and tested.
4.1.1. Number of factors to be extracted
Having selected the factoring procedure to be followed – in this case, an EFA – the next step
consists in choosing the number of factors to be retained in the analysis. To better explain why this
step is relevant, it is necessary to briefly introduce the concept of ‗shared variance‘. As specified
above, factors represent constructs comprising groups of correlated variables: because of
correlation, such variables ‗share‘ some amount of their individual variances. This implies that the
variance of one variable can explain, to a certain extent, the variance of a correlated variable. That
extent is the shared variance, which can be measured by the r-squared (R2) coefficient (Farrell
2010), usually expressed with a percentage. By encompassing correlated variables, factors have the
power of explaining some portion of the overall shared variance of the LFs in the corpus.
In the process of EFA, factor extraction does not follow a random order: if there is correlation
among the observed variables, the first factor extracted will typically account for most of the shared
variance. The second factor will then account for most of the remaining shared variance, and the
process will be repeated until all of the shared variance has been explained (Mooi et al. 2018).
Thus, ―only the first few factors are likely to account for a nontrivial amount of shared variance‖
(Biber 1988: 82), while many other factors may not contribute substantially to the overall
interpretability of the obtained factorial solution, and may even represent noise or error.36
Therefore, as Henson and Roberts (2006: 398) argue, ―Given that the goal of EFA is to retain the
fewest possible factors while explaining the most variance of the observed variables, it is critical
that the researcher extract the correct number of factors.‖ Preacher et al. (2013: 30) criticise this
type of statement as misleading, in that it conveys the idea that there exists one correct and finite
number of factors for each dataset, which would in turn imply that the factor model can perfectly
describe the real unobservable structures characterising the data. They claim that ―in most
circumstances there is no true operating model, regardless of how much the analyst would like to
believe such is the case.‖ Consequently, they suggest that the analyst should not consider the
‗correct‘, but rather the ‗optimal‘ number of factors worth retaining to achieve a potentially useful
explanation of the observed data. Both overextraction and underextraction with respect to that
optimal number can be deleterious for the results (Costello and Osborne 2005). To further
complicate the task, it is acknowledged that there is no mathematically exact rule to calculate it
(Biber 1988: 82). There is, nonetheless, a range of methods providing some hints as to what the best
35
Maximum likelihood involves highly complex mathematics, which cannot be dealt with here. A relatively accessible
overview of some features of maximum likelihood factor analysis can be found in Kline (1994: 49-50). 36 In statistics, noise refers to random irregularities or fluctuations usually found in real-life data. They have no pattern
and may obscure meaningful data, or may not contain any relevant information at all. They might emerge from
differences between the observed (i.e. measured) and real values, or between the observed and expected values.
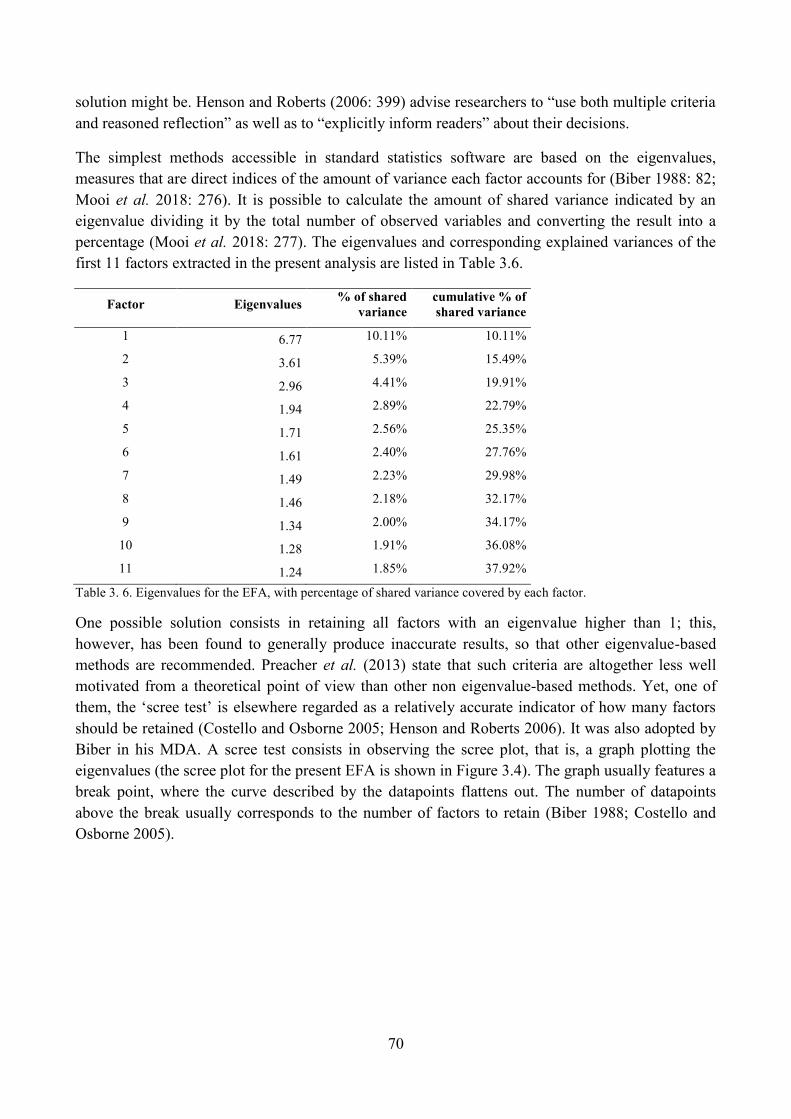
70
solution might be. Henson and Roberts (2006: 399) advise researchers to ―use both multiple criteria
and reasoned reflection‖ as well as to ―explicitly inform readers‖ about their decisions.
The simplest methods accessible in standard statistics software are based on the eigenvalues,
measures that are direct indices of the amount of variance each factor accounts for (Biber 1988: 82;
Mooi et al. 2018: 276). It is possible to calculate the amount of shared variance indicated by an
eigenvalue dividing it by the total number of observed variables and converting the result into a
percentage (Mooi et al. 2018: 277). The eigenvalues and corresponding explained variances of the
first 11 factors extracted in the present analysis are listed in Table 3.6.
Factor Eigenvalues % of shared
variance
cumulative % of
shared variance
1 6.77 10.11% 10.11%
2 3.61 5.39% 15.49%
3 2.96 4.41% 19.91%
4 1.94 2.89% 22.79%
5 1.71 2.56% 25.35%
6 1.61 2.40% 27.76%
7 1.49 2.23% 29.98%
8 1.46 2.18% 32.17%
9 1.34 2.00% 34.17%
10 1.28 1.91% 36.08%
11 1.24 1.85% 37.92%
Table 3. 6. Eigenvalues for the EFA, with percentage of shared variance covered by each factor.
One possible solution consists in retaining all factors with an eigenvalue higher than 1; this,
however, has been found to generally produce inaccurate results, so that other eigenvalue-based
methods are recommended. Preacher et al. (2013) state that such criteria are altogether less well
motivated from a theoretical point of view than other non eigenvalue-based methods. Yet, one of
them, the ‗scree test‘ is elsewhere regarded as a relatively accurate indicator of how many factors
should be retained (Costello and Osborne 2005; Henson and Roberts 2006). It was also adopted by
Biber in his MDA. A scree test consists in observing the scree plot, that is, a graph plotting the
eigenvalues (the scree plot for the present EFA is shown in Figure 3.4). The graph usually features a
break point, where the curve described by the datapoints flattens out. The number of datapoints
above the break usually corresponds to the number of factors to retain (Biber 1988; Costello and
Osborne 2005).
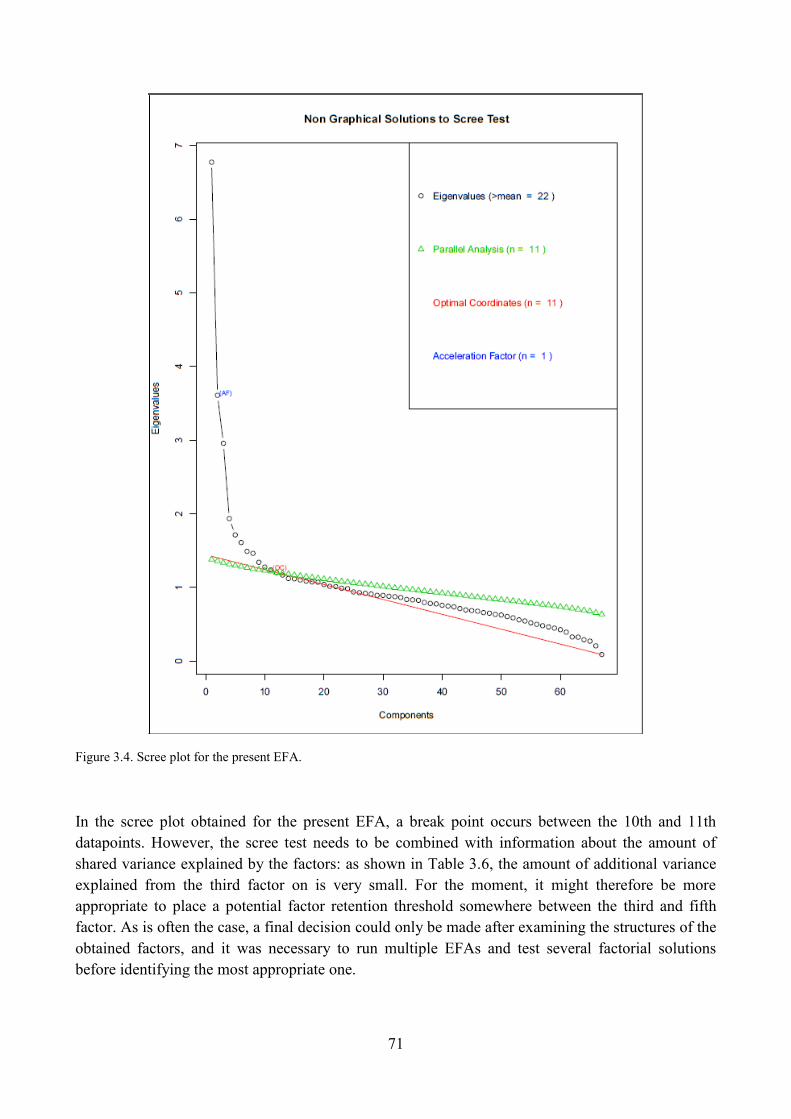
71
Figure 3.4. Scree plot for the present EFA.
In the scree plot obtained for the present EFA, a break point occurs between the 10th and 11th
datapoints. However, the scree test needs to be combined with information about the amount of
shared variance explained by the factors: as shown in Table 3.6, the amount of additional variance
explained from the third factor on is very small. For the moment, it might therefore be more
appropriate to place a potential factor retention threshold somewhere between the third and fifth
factor. As is often the case, a final decision could only be made after examining the structures of the
obtained factors, and it was necessary to run multiple EFAs and test several factorial solutions
before identifying the most appropriate one.
72
4.1.2. Factor rotation
In order to run the EFA, a further decision to be made regards the factor rotation method. Rotation
is a technique commonly applied in EFA. It cannot improve basic features such as the amount of
shared variance explained (Costello and Osborne 2005: 3), but it greatly contributes to the clarity of
the results. Its goal is mainly to facilitate the interpretation of the obtained factors by simplifying
the factorial structure (Henson and Roberts 2006: 399; Costello and Osborne 2005: 3). When
unrotated factors are extracted, the majority of the variables are included within the first factor, and
less of them will form part of subsequent factors. Since there is a degree of correlation between
variables and factors, this means that the first unrotated factor generally correlates more strongly
with the variables, whereas other factors correlate weakly with them. This tends to hide the
presence of potentially interesting latent variables besides the one represented by the first factor,
since it will ‗attract‘ the great majority of the observed variables (Biber 1988: 84; Mooi 2018: 281).
Rotation techniques have been devised to obtain factorial solutions in which each observed variable
is included in as few factors as possible. ―In a rotated solution, each factor is characterised by the
few features that are most representative of a particular amount of shared variance‖ (Biber 1988:
84). In other words, in the rotated solution a set of variables is made extremely relevant on only one
factor, while another set of different variables is relevant on another (Mooi et al. 2018: 281).
Therefore, rotation should result in a clearer, more easily interpretable set of factors. Preacher and
MacCallum (2003: 25) describe factor rotation as a way to select the best and simplest factor
structure among an infinite number of existing options, which could equally account for the
variances of the observed variables. Variables are thus distributed so that non-overlapping subsets
of them are highly representative of different factors, while variables present in more than one
factor are less so.
There are several different methods for rotation. In the literature, a major distinction is drawn
between methods for orthogonal and oblique rotation. Orthogonal rotation methods, among which
Varimax is the most commonly used, require the assumption that factors are completely
uncorrelated with each other, while oblique methods admit a correlation (Biber 1988: 85; Henson
and Roberts 2006: 399). Costello and Osborne (2005: 3) assert that there is no widely preferred
oblique rotation method, and mention direct Oblimin, Quartimin, and Promax as examples.
According to Mooi et al. (2018: 281) Promax is the best-known one. In general, choosing
orthogonal rotation methods usually produces more definite and interpretable results (Mooi et al.
2018: 281). However, Biber (1988: 85) argues that ―from a theoretical perspective, all aspects of
language use appear to be interrelated to at least some extent‖. Consequently, as in other social
sciences, ―we generally expect some correlation among factors, since behaviour is rarely partitioned
into neatly packaged units that function independently of one another‖ (Costello & Osborne 2005:
3). Therefore, in the description of textual variation, ―there is no reason to assume that the factors
are completely uncorrelated‖ (Biber 1988: 85). This argument is supported by Preacher and
MacCallum (2003: 25), when they state that ―in general, if the researcher does not know how the
factors are related to each other, there is no reason to assume that they are completely independent.
It is almost always safer [...] to use oblique rotation instead of orthogonal rotation.‖ In the present
study, solutions obtained with both Varimax and Promax, and with different numbers of retained
factors, were compared. The comparison was necessary to make methodological choices, but these
solutions were regarded as results in themselves, however partial. Therefore, they are shown and
73
discussed in Chapter 4, Section 2.1. However, a brief overview of the structure and characteristics
of a factorial solution will be provided in the next section, so as to make the subsequent
methodological choices clearer.
4.1.3. Production and structure of a factorial solution
The R function for EFA requires the number of factors and rotation methods to be specified, in
order to run on the input dataset; it then finally produces a factorial solution, according to the initial
specifications. In the present analysis, each factor comprises a set of LFs which tend to co-occur in
the texts of the corpus. Each variable forming part of a factorial solution is assigned a ‗factor
loading‘. Factor loadings can be either positive or negative, and indicate the degree of correlation
between a single variable – in this case, a LF – and a factor, that is, ―the extent to which the
variation in the frequency of that feature correlates with the overall variation of the factor‖ (Biber
1988: 85-86). This means that ―the farther the factor loading is from zero, the more one can
generalize from that factor to the variable‖ (Gorsuch 1974: 2). Therefore, variables with a loading
close to zero within a particular factor will tend to be regarded as not salient for that factor. In
general, an absolute value of 0.30 is taken as a salience threshold (Biber 1988: 85), and was also
adopted in the present case. LFs with positive and negative loadings have a complementary
distribution in the corpus: where positively-loaded features tend to occur together, negatively-
loaded features tend to be absent, and vice versa (Biber 1988: 88).
It is possible to assess and evaluate a particular factorial solution by looking at the composition of
its factors. Here, the number and nature of LFs involved in each factor can give a first idea of its
interpretability, because positively or negatively correlated LFs may be so due to particular
communicative functions determining their distribution. In MDA, identifying those functions is part
of the interpretation process leading to the identification of the dimensions of linguistic variation.
Such preliminary interpretation, however, can be as well useful to make a final decision regarding
the number of factors to be retained. For example, if a factor includes too few variables to be
interpretable, it may not be worth retaining – according to Biber (1988: 88), ―In general, five salient
loadings are required for a meaningful interpretation of the construct underlying a factor.‖ If, on the
other hand, a factor includes a large number of variables, but is too difficult to interpret, it might in
fact consist of two or more conflated latent constructs, which means that a higher number of factors
could result in a clearer solution. In the present case, solutions for three, four and five factors were
produced using both Varimax and Promax rotation methods. Comparisons between them (see
Section 2.1 in Chapter 4 and Appendix A) show that the two rotation methods overall produced
consistent results, although according to the requirements of the different rotation methods, Promax
remains the most appropriate choice. Subsequently, after a careful evaluation of Promax solutions
with different numbers of factors, the four-factor solution was considered to be the best among the
three, and was thus chosen as the most appropriate for the present MDA.
It is important to bear in mind that the main goal of EFA is to capture as much shared variance as
possible. In this respect, the results obtained in the present analysis only manage to explain a small
percentage of the overall variance (see Table 3.6 above). The first factor is the only one with an
explained variance above 10%, and all subsequent factors cover much lower proportions of it –
from 5.39% to 2.89%, for a total cumulative percentage of 22.79%. Such outcome and its
implications will be discussed and compared to Biber‘s in Chapter 5 and 6. For the moment, it will
74
be sufficient to keep this aspect in mind when reflecting upon the interpretation and explanatory
power of these factors on the corpus.
Each of the obtained factors is understood as representing an underlying latent construct – or
dimension – which might be determinant for the variation of LF use within the corpus. As explained
above, their interpretation needs to be based on the potentially relevant communicative functions of
the LFs contributing to each factor, and on the specific characteristics of the analysed texts. Biber
used dimensions to characterise and explain the similarities and differences among genres with
respect to their underlying communicative styles and purposes (cf. Biber1988: 93); in other words,
dimensions can be present in different ways and to different extents within texts, and this can be
interpreted as an indicator of the type of communication realised in those texts. Each dimension can
be represented in terms of a continuum, with a positive end, an unmarked centre and a negative end.
Thus any text within the corpus could be characterised with respect to any of the dimensions
emerging from the EFA, resulting in a ‗multidimensional‘ description.37
In order to understand and
further explore the presence and the role of the obtained factors – and deriving dimensions – in the
corpus, it is necessary to make them measurable in single texts. Factor scores serve this purpose.
4.1.4. Factor scores
Factor scores can be assigned to each unit of analysis (be it a participant in an experiment, a text
within a corpus, etc.), and indicate how each unit rates, or is placed, on the factors. Factor scores are
directly related to the observed variables at the basis of the extracted factors (cf. Mooi et al. 2018:
269). They can in turn be treated as variables and ―used in a wide variety of subsequent statistical
analyses‖ (Grice 2001: 430): for example, to compare different groups within the population or
sample, or to verify whether any elements characterising the sample or population are determinant
(i.e., have a predictive value) for factor scores (DiStefano et al. 2009: 1). According to Biber, ―The
relations among spoken and written genres can be considered through plots of the mean values of
the factor scores‖; in other words, once ―a factor score for each factor is computed for each text‖,
the mean factor scores for each genre-based section can be computed in order to draw a comparison
among genres (Biber 1988: 94).
However, one aspect which Biber did not mention in his 1988 study is that there are a variety of
different methods for factor score computation, and that the application of different methods on the
same dataset may result in different sets of factor scores, with widely discrepant rankings of the
same unit of analysis along the factors (Grice 2001: 430). Two main classes of factor score
computation methods can be identified: refined and non-refined (or coarse) (DiStefano et al. 2009:
1). While the latter involve non-sophisticated, cumulative procedures which are relatively simple to
apply, refined methods adopt more technical approaches, and are overall considered more exact as
well as complex in nature.
4.1.4.1. Non-refined methods
Non-refined methods are sum-based: to compute the non-refined factor score of a particular unit of
analysis on a particular factor, it is necessary to sum the values of the observable variables which
37
Here, single texts are being used as the basic unit of analysis: this is one of the numerous choices to be made on the
part of the researcher. It can be justified by the fact that texts are generally perceived and produced as units; on the other
hand, they might consist of several components, serving different communicative purposes (cf. Section 3 in Chapter 6).
75
load on the factor in question, as initially detected in that single unit of analysis. In the present
study, this entails identifying the LFs which load on a particular factor, counting them in a single
text (unit of analysis), and then summing their normalised frequencies (values). If a variable has a
negative loading on the factor in question, then its value is subtracted rather than added to the final
factor score. An example of this procedure, applied to compute the factor score for Factor 4 on an
article from the corpus, is shown in Table 3.7 below. Factor 4 consists of four LFs: past tense
(loading: 0.98), third person pronouns and determiners (loading: 0.36), prediction modals (loading:
-0.32) and present tense (loading: -0.64). Non-refined methods are generally considered acceptable
for most exploratory researches (Tabachnick and Fidell 2013: 655), and feature several variants:
The sum may include all the variables loading on a factor, or only variables considered
salient (see Section 4.1.3), which allows researchers to characterise each unit with respect to
the ‗marker‘ variables for the factor being considered. However, it also involves an arbitrary
decision about the cut-off value to be used.
Factor 4 - Factor scores based on the sum of normalised frequencies
Sample Text: ―City Room: Big Ticket | Two Faces of Luxury, $15.5 Million Each‖,
Year: 2014
Source: The New York Times
Macro-feed: ‗Business‘
LF in Factor 4 Sign of Factor
loading
No. Of
occurrences in
text (raw freq.)
Normalised freq.
Past tense + 19 34.86
3rd pers. pron./det. + 3 5.50
Prediction modals - 0 0.00
Present tense - 9 16.51
Factor 4 score = 34.86+5.50-0-16.51 = 23.85
Table 3. 7. Factor score calculation for factor 4 on a sample text. The method used consists in summing the normalised
frequencies of the salient LFs for factor 4.
Instead of using raw scores, these can be standardised before being summed. Standardisation
is a procedure that changes the scale of the data being manipulated. In the present study,
standardisation would take place on the normalised frequencies (values) of each salient LF
(variable) in each text of the corpus (sample). Standardisation essentially uses two measures:
the mean score of a particular variable in a given sample and its standard deviation: in this
procedure, it is said that values are standardised to a mean of zero and a standard deviation
of one. While the mean (or average) is a measure of the central tendency of a particular
variable in the sample, the standard deviation is a measure of its dispersion, that is of how
much single values of the variable spread with respect to the mean (see Spatz 2011: 58). The
standard deviation is equal to the square root of the variance: the two ―provide similar
information, but while the variance is expressed on the same scale as the original variable,
the standard deviation is standardized‖ (Mooi et al. 2018: 55). In most cases, and according
to how the values of a particular variable are distributed,38
more than half of all these values
fall within a range between plus and minus one standard deviation from the mean value. The
38
Reference is made here to the properties of the normal distribution, further described in Section 4.1.5; for additional
information see Spatz 2011 (129-132).
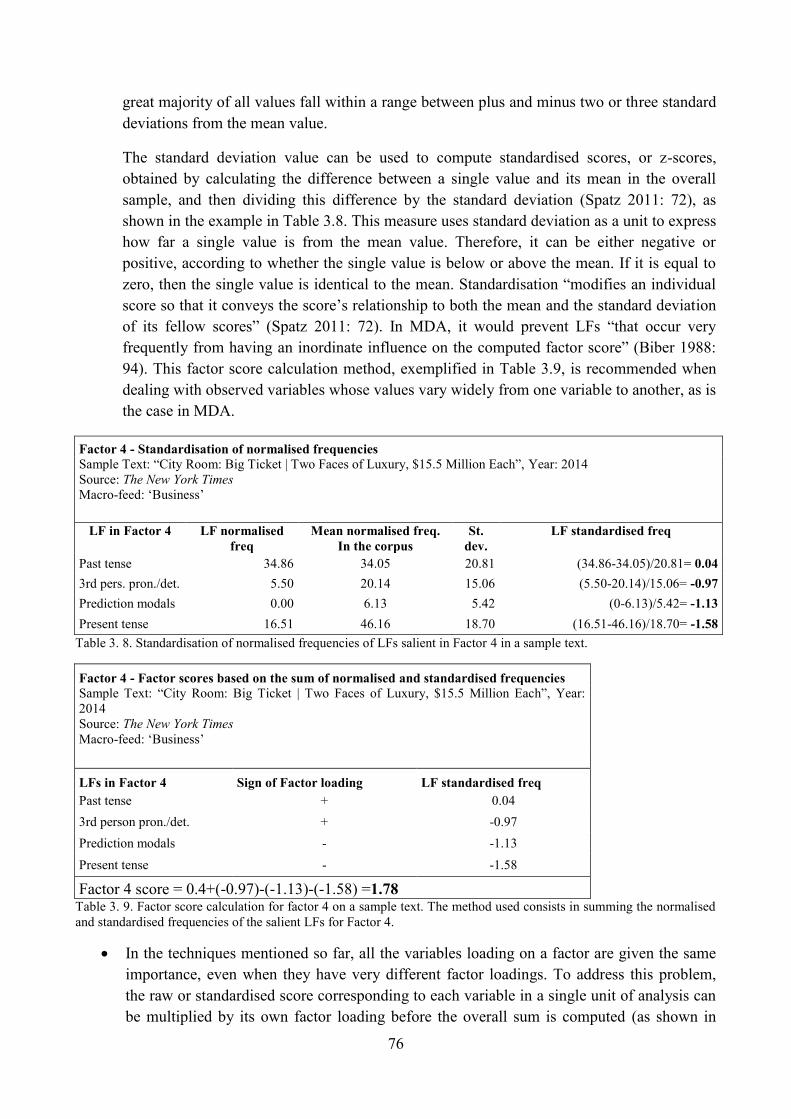
76
great majority of all values fall within a range between plus and minus two or three standard
deviations from the mean value.
The standard deviation value can be used to compute standardised scores, or z-scores,
obtained by calculating the difference between a single value and its mean in the overall
sample, and then dividing this difference by the standard deviation (Spatz 2011: 72), as
shown in the example in Table 3.8. This measure uses standard deviation as a unit to express
how far a single value is from the mean value. Therefore, it can be either negative or
positive, according to whether the single value is below or above the mean. If it is equal to
zero, then the single value is identical to the mean. Standardisation ―modifies an individual
score so that it conveys the score‘s relationship to both the mean and the standard deviation
of its fellow scores‖ (Spatz 2011: 72). In MDA, it would prevent LFs ―that occur very
frequently from having an inordinate influence on the computed factor score‖ (Biber 1988:
94). This factor score calculation method, exemplified in Table 3.9, is recommended when
dealing with observed variables whose values vary widely from one variable to another, as is
the case in MDA.
Factor 4 - Standardisation of normalised frequencies
Sample Text: ―City Room: Big Ticket | Two Faces of Luxury, $15.5 Million Each‖, Year: 2014
Source: The New York Times
Macro-feed: ‗Business‘
LF in Factor 4 LF normalised
freq
Mean normalised freq.
In the corpus
St.
dev.
LF standardised freq
Past tense 34.86 34.05 20.81 (34.86-34.05)/20.81= 0.04
3rd pers. pron./det. 5.50 20.14 15.06 (5.50-20.14)/15.06= -0.97
Prediction modals 0.00 6.13 5.42 (0-6.13)/5.42= -1.13
Present tense 16.51 46.16 18.70 (16.51-46.16)/18.70= -1.58
Table 3. 8. Standardisation of normalised frequencies of LFs salient in Factor 4 in a sample text.
Factor 4 - Factor scores based on the sum of normalised and standardised frequencies
Sample Text: ―City Room: Big Ticket | Two Faces of Luxury, $15.5 Million Each‖, Year:
2014
Source: The New York Times
Macro-feed: ‗Business‘
LFs in Factor 4 Sign of Factor loading LF standardised freq
Past tense + 0.04
3rd person pron./det. + -0.97
Prediction modals - -1.13
Present tense - -1.58
Factor 4 score = 0.4+(-0.97)-(-1.13)-(-1.58) =1.78
Table 3. 9. Factor score calculation for factor 4 on a sample text. The method used consists in summing the normalised
and standardised frequencies of the salient LFs for Factor 4.
In the techniques mentioned so far, all the variables loading on a factor are given the same
importance, even when they have very different factor loadings. To address this problem,
the raw or standardised score corresponding to each variable in a single unit of analysis can
be multiplied by its own factor loading before the overall sum is computed (as shown in
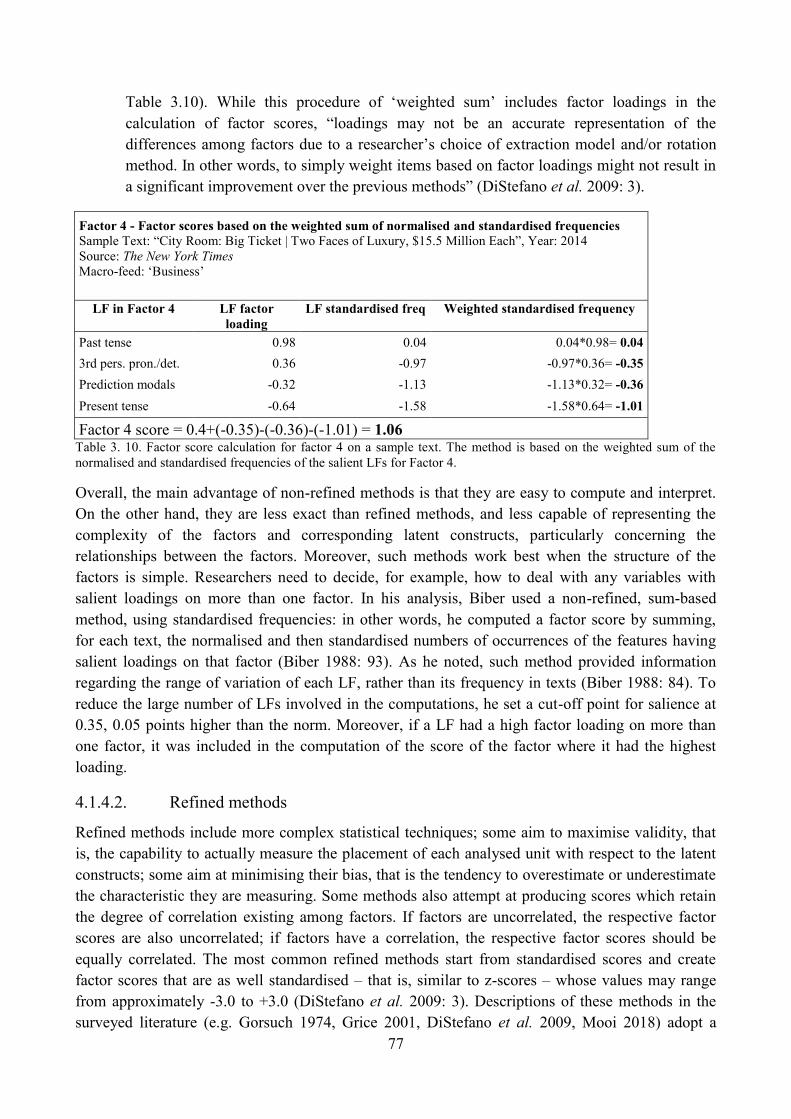
77
Table 3.10). While this procedure of ‗weighted sum‘ includes factor loadings in the
calculation of factor scores, ―loadings may not be an accurate representation of the
differences among factors due to a researcher‘s choice of extraction model and/or rotation
method. In other words, to simply weight items based on factor loadings might not result in
a significant improvement over the previous methods‖ (DiStefano et al. 2009: 3).
Factor 4 - Factor scores based on the weighted sum of normalised and standardised frequencies
Sample Text: ―City Room: Big Ticket | Two Faces of Luxury, $15.5 Million Each‖, Year: 2014
Source: The New York Times
Macro-feed: ‗Business‘
LF in Factor 4 LF factor
loading
LF standardised freq Weighted standardised frequency
Past tense 0.98 0.04 0.04*0.98= 0.04
3rd pers. pron./det. 0.36 -0.97 -0.97*0.36= -0.35
Prediction modals -0.32 -1.13 -1.13*0.32= -0.36
Present tense -0.64 -1.58 -1.58*0.64= -1.01
Factor 4 score = 0.4+(-0.35)-(-0.36)-(-1.01) = 1.06
Table 3. 10. Factor score calculation for factor 4 on a sample text. The method is based on the weighted sum of the
normalised and standardised frequencies of the salient LFs for Factor 4.
Overall, the main advantage of non-refined methods is that they are easy to compute and interpret.
On the other hand, they are less exact than refined methods, and less capable of representing the
complexity of the factors and corresponding latent constructs, particularly concerning the
relationships between the factors. Moreover, such methods work best when the structure of the
factors is simple. Researchers need to decide, for example, how to deal with any variables with
salient loadings on more than one factor. In his analysis, Biber used a non-refined, sum-based
method, using standardised frequencies: in other words, he computed a factor score by summing,
for each text, the normalised and then standardised numbers of occurrences of the features having
salient loadings on that factor (Biber 1988: 93). As he noted, such method provided information
regarding the range of variation of each LF, rather than its frequency in texts (Biber 1988: 84). To
reduce the large number of LFs involved in the computations, he set a cut-off point for salience at
0.35, 0.05 points higher than the norm. Moreover, if a LF had a high factor loading on more than
one factor, it was included in the computation of the score of the factor where it had the highest
loading.
4.1.4.2. Refined methods
Refined methods include more complex statistical techniques; some aim to maximise validity, that
is, the capability to actually measure the placement of each analysed unit with respect to the latent
constructs; some aim at minimising their bias, that is the tendency to overestimate or underestimate
the characteristic they are measuring. Some methods also attempt at producing scores which retain
the degree of correlation existing among factors. If factors are uncorrelated, the respective factor
scores are also uncorrelated; if factors have a correlation, the respective factor scores should be
equally correlated. The most common refined methods start from standardised scores and create
factor scores that are as well standardised – that is, similar to z-scores – whose values may range
from approximately -3.0 to +3.0 (DiStefano et al. 2009: 3). Descriptions of these methods in the
surveyed literature (e.g. Gorsuch 1974, Grice 2001, DiStefano et al. 2009, Mooi 2018) adopt a
78
technical approach which makes distinctions among different methods difficult to access without
full training and expertise in statistics. Here, only two refined methods, namely ‗regression‘ and
‗Bartlett‘, will be considered, since they were the most frequently mentioned and widely used in the
literature. While their results were computed and compared to other methods, their statistical value
and specific features will not be discussed here.
An important consideration to be made about refined methods regards factor indeterminacy. As it
happens, although different among themselves, none of these methods can be straightforwardly
defined more or less accurate, let alone right or wrong: in general, any of them is equally consistent
with the initial factorial solution. As Mooi et al. (2018: 269) explain, ―a factor analysis does not
produce determinate factor scores. In other words, the factor is indeterminate, which means that part
of it remains an arbitrary quantity, capable of taking on an infinite range of values.‖ This means that
―an infinite number of sets of such scores can be created for the same analysis that will be all
equally consistent with the factor loadings‖, with no way to assess which method is best suited, on
the sole basis of the factor analysis results (Grice 2001: 432). Factor score indeterminacy is a
feature of the mathematics lying behind factor analysis, which means that it cannot be avoided, and
is tied to the existence of different factor score computation methods. The issue of indeterminacy
sparked a historical debate, which still remains unresolved (Grice 2001: 431-433). According to
Grice (2001: 430), indeterminacy should be regularly assessed and reported; moreover, the obtained
scores should be ―thoroughly evaluated‖ before being used in subsequent analyses, since the choice
of the computation method has an effect on the quality of both factor scores and subsequent
analyses.
4.1.4.3. Choice of a factor score computation method
It is not easy to select the most appropriate method among such complex system of different options
and measures. Here, four different methods were applied and compared: non-weighted sum of
standardised frequencies (used by Biber in his MDA), weighted sum of standardised frequencies,
regression, and Bartlett. The non-refined methods were calculated manually using spreadsheets to
manipulate LF frequency data, and when a feature loaded on more than one factor, it was retained
in the calculation of the factor score where it had the highest loading. Options for score calculation
with the two refined methods were featured in the R function for EFA. It was not possible to check
and compare the rankings and scores of each of the 1,684 texts forming part of the corpus, to then
aggregate and interpret all the resulting information. Consequently, comparisons were drawn by
calculating average factor scores for each macro-feed-based section of the corpus (see Section 2.2.4
above) and by contrasting them across different methods. Similarly to the comparison among
different factorial solutions mentioned in Section 4.1.2, comparing different score calculation
methods also produced preliminary results, detailed in Section 2.2 of Chapter 4. What was
compared were not the values of factor scores, whose scale changes considerably among methods –
especially between refined and non-refined methods. Rather, the rankings of the corpus sections
with respect to each other were contrasted to establish, for example, whether ‗Science and
Technology‘ had a higher or lower score than, say, ‗Business‘, in a particular factor across all
methods, or if its ranking changed for some methods. Although inspections on single texts revealed
larger differences in rankings, the way macro-feed sections are positioned relative to one another
79
seemed overall consistent through all of the four methods. In the end, it was decided to follow
Biber‘s method, as it is the most widely – if not the only – method used in MDA.
4.1.5. Further analyses based on factor scores: a multidimensional description of texts
in the corpus
In MDA, the use of factor scores is based on the assumption that the frequency of use of LFs which
are salient for a particular factor can provide information on how the dimensions represented by the
factors characterise a particular text or group of texts. Since the dimensions are represented as a
continuum, a negative factor score will reflect a prominent use of LFs which load negatively on that
factor, thus expressing a communicative style associated to the negative end of the dimension. On
the contrary, a positive score will reflect a prominent use of features loading positively on the same
factor, thus placing the style at the positive end of the corresponding dimension. A factor score
close to zero means that a text is ‗unmarked‘ with respect to the corresponding dimension: that is,
either salient LFs on that factor are absent, or the frequency of positive and negative LFs is
balanced.
Therefore, in the present analysis the primary function of factor scores was to aid in the
interpretation of the factors themselves. After a preliminary interpretation resulting from the
observation of the communicative functions which may be expressed by LFs belonging to each
factor (see Section 4.1.3 above), texts with extremely high, low and unmarked factor scores on each
factor were individually analysed adopting a qualitative approach, to gain a better understanding of
the latent dimensions. This, which could be considered the final step of the MDA together with the
section comparisons described below, featured articles from the whole corpus as well as specifically
from the ‗Science and Technology‘ section. It also included a full multidimensional description of a
single ‗Science and Technology‘ text. Subsequently, factor scores were used to characterise sections
of the corpus, with a focus on the established ‗macro-feed‘ categories. In particular, articles in the
‗Science and Technology‘ section were plotted with respect to each of the four dimensions and in
relation to other sections of the corpus.
In general, observed differences between average factor scores of different sections of the corpus
may be assumed to reflect actual characteristics distinguishing the examined samples. In statistics,
making such an assumption equals to formulating a hypothesis, that is a statement about a particular
relation or characteristic applying to a population (see Mooi 218: 154; Spatz 2010: 173). Here,
statements could be made about the language of newspapers based on the corpus, which functions
as a representative sample of it. In order to be able to establish how likely it is that a hypothesis is
true, it is possible to perform particular statistical procedures, called hypothesis tests, on the
observed data from the sample. It is important to bear in mind that hypothesis testing based on
sample data cannot evaluate the validity of a hypothesis with absolute certainty: there is always
some probability, however small, that a hypothesis is erroneously accepted or rejected (Mooi et al.
2018: 158).
There are many different statistical tests, which apply to different types of hypotheses. According to
Mooi et al. (2018: 154) one particular type of hypothesis ―may comprise a claim about the
difference between two sample parameters,‖ as in the comparison of factor scores among different
macro-feed sections of the corpus. Whatever the hypothesis, statistical tests provide evidence
80
against or in favour of the original statement. Such evidence is generally formulated in terms of
significance: an observed relation or characteristic is normally regarded as significant when it is
highly unlikely to have occurred by chance, because of its own size, of the amount of variation in
the sample data and/or of the sample size itself (Mooi et al. 2018: 154). In most cases, researchers
acknowledge significance when the probability of observing a particular feature by chance – usually
referred to as ‗p-value‘ – is lower than 0.05, or 5%.
When samples are being compared, another very important aspect in choosing the most suitable
statistical test concerns whether they are ‗paired‘ or ‗independent‘. Each observation contained in
one sample may have a related observation in the other sample, as happens when the two
observations are performed on the same subject under different circumstances, or when both
observations are related to the same stimulus. Such samples are considered dependent, or paired. On
the contrary, if there is no such connection between the observations in the two samples, they are
called independent, or unpaired; this also means that each subject is observed once and receives
only one score (Levshina 2015: 87). In the present study, tests are applied to factor scores across
text sections, but always within the same factor, because scores from different factors are not
comparable. Therefore, here the samples are independent, and each text is scored only once within
the same factor.
Another important choice to be made in order to test a hypothesis concerns the distribution of the
observed values – in this case, factor scores. A frequency distribution is an ordered arrangement
where the frequency of each score – or of all the scores comprised within each of a number of
equally-sized intervals – is shown (Spatz 2011: 26). Such arrangement is useful to make a high
amount of different, unordered values – here, one for each text – more informative. The distribution
of factor scores throughout the corpus can be visualised through a graph, called ‗histogram‘, where
intervals are arranged from lowest to highest, and bars show the frequency of texts falling within
each interval (cf. Sections 3.1.4, 3.2.4, 3.3.4, 3.4.4 in Chapter 4). Some significance tests, called
‗parametric‘, apply only to distributions, called ‗normal‘, with particular characteristics. In the
histogram representation of a normal distribution, most observed data gather around the mean
value. They form a symmetrical bell shape, since the amounts of data to the left and right of the
mean value are the same, and decrease in a similar way towards extreme values, so that the two
sides of the bell mirror each other. The normal distribution is mathematically defined and
theoretical, but usually, also an empirical distribution whose form is extremely close to the normal
one is defined so (Spatz 2010: 407). ‗Nonparametric‘ tests, on the other hand, do not imply any
particular requirements for the data distribution (Mooi et al. 2018: 154). Therefore, in order to
establish the most appropriate significance test for a particular data set, it is necessary to assess how
close – or far – its distribution is to the normal distribution: there are a number of statistical tests,
called normality tests, which can be used for this purpose.
In the present study, two normality tests were applied – always using R – to the distributions of
factor scores for the ‗Science and Technology‘ and non-‗Science and Technology‘ articles (that is,
articles included in all the other sections) taken as a whole.39
The first test is called Shapiro-Wilk,
and has a mathematical basis. It produces the Shapiro-Wilk statistics, a number called W, used to
39
No other macro-feed categories were tested, because the results obtained did not overall indicate normality, and were
a sufficient condition to look for a nonparametric test.
81
derive the p-value, that is the probability that the analysed sample comes from a normally
distributed population (Levshina 2015: 56). Consequently, the smaller the p-value is, the more
likely it is that the sample does not come from a normally distributed population. A threshold of
0.05 is usually established as the minimum value within which the distribution can be considered
normal. The test was run for each of the four factors separately, and revealed that most datasets
were likely to be non-normal (see Section 2 in Chapter 5). However, the Shapiro-Wilk normality
test is highly sensitive to the sample size, in that the larger it is, the more easily the testing
procedure will find deviations from the theoretical normal distribution, and will thus provide a
small p-value. Thus a second test, the Q-Q plot test, was applied (cf. Levshina 2015: 53-56). This
test produces a graph with a visual comparison between the normal distribution and that of the data
being analysed: the more similar they are, the closer the data is to a normal distribution. In the
present analysis, differences were noticed between the data and the normal distribution, especially
concerning ‗Science and Technology‘ texts (see Section 2 in Chapter 5 and Appendix B).
Therefore, not assuming their normality was considered the safest option. As a result, to test
differences in factor score distribution among different corpus sections, a nonparametric test
suitable to evaluate independent sample differences was finally regarded as the most appropriate
choice.
The Kruskal-Wallis test can help to establish whether a group of samples have equal (or the same)
probability distributions (Kabacoff 2011: 168; Levshina 2015: 178). The smaller the resulting p-
value is, the more likely it is that the distributions are different from one another. The values
obtained from this test (also shown in Chapter 5, Section 2) suggested that there are significant
differences between the distributions of different corpus sections, in all the four factors. The
Kruskal-Wallis test does not however specify which sections significantly differ from each other.
Therefore, other procedures were applied to check the statistical significance of observed
differences between ‗Science and Technology‘ and other single corpus sections, as well as between
‗Science and Technology‘ and all the rest of the corpus, in the four factors. Among nonparametric
tests, the Wilcoxon rank sum test (also known as Mann-Whitney U test) is generally recommended
in cases such as the present one. Very similarly to the Kruskal-Wallis test, which can be considered
its extension (Levshina 2015: 179), the Wilcoxon rank sum test is used ―to assess whether the
observations are sampled from the same probability distribution‖ (Kabacoff 2011: 166). The higher
the p-value, the more likely it is that any observed difference between the two distributions is due to
chance; a p-value lower than 0.05 indicates that the difference between the two samples is
statistically significant. Two different R versions of this test were applied. One, corresponding to
the ‗wilcox.test‘ function, was performed by comparing sections pair by pair. In the second version,
the ‗pairwise.wilcox.test‘ function was used to perform the test simultaneously on all pairs among
the macro-feed categories (therefore excluding all non-‗Science and Technology‘ texts). This
function features the possibility of applying a correction that adjusts the p-values for multiple
comparisons. The Bonferroni correction is described as the most conservative one among those
available, and was used in the present test.40
Levshina (2015: 179) suggests another nonparametric test, classified as a ‗post hoc‘ test, that is, to
be performed after procedures such as the Kruskal-Wallis one, ―to find out which groups differ
40
Brief descriptions and instructions on how this and other functions of the same package work are available at
https://stat.ethz.ch/R-manual/R-devel/library/stats/html/00Index.html.
82
significantly‖. It corresponds to the ‗nparcomp‘ function, and is described in its user manual as
computing ―the estimator of a nonparametric relative contrast effects‖.41
The output provides a set
of information, including p-values, concerning each pair of compared groups. Similarly to the
previous tests, p-values smaller than 0.05 indicate a statistically significant difference. Having
applied these three procedures, all p-values obtained from different tests comparing ‗Science and
Technology‘ with the other groups were combined into a table – one for each factor, shown and
discussed in Sections 3.4, 4.4, 5.4, and 6.4 of Chapter 5. It was thus possible to establish where the
‗Science and Technology‘ section was located within the corpus from a multidimensional
perspective, and in which cases it could be confidently regarded as different from other sections.
Through factor interpretation and section comparisons, the possible communicative functions
underlying the analysed texts could be proposed and discussed (see Chapters 4 and 5).
Subsequently, the findings of the MDA were integrated with a lexical analysis of the corpus, with
particular attention to the ‗Science and Technology‘ section. A methodological overview of this
analysis is provided in Section 5 below.
5. Lexical analysis
The main purpose of the lexical analysis was to provide some insights into the general content of
the analysed articles, and especially of those dealing with technoscience communication. On the
one hand, the factor analysis within the MDA can reveal mainly grammatical and syntactic patterns
– lexical classes are quite generic, and only constitute a small part of the LFs counted. On the other
hand, the qualitative analysis can provide information on single realisations of the patterns
emerging from the statistical analysis. In contrast, the lexical analysis described below can usefully
complement MDA results by producing an overview of what ‗Science and Technology‘ articles are
mainly about. In practical terms, its main purpose was to identify the most frequently and typically
used lexical items in the corpus, with a focus on texts dealing with the communication of science
and technology. While these techniques for corpus analysis cannot have the same depth and
exhaustiveness of a fully qualitative approach, they can be much more effective in identifying the
topics generally covered in technoscience news. They can also help to reveal overarching trends in
the connotations of particular words and established semantic relations among them. Throughout
Chapters 4 and 5, attempts will be made at building links and connections between results obtained
with all the above-mentioned methods. Therefore, for some aspects, the present approach may be
considered as an example of triangulation, since it involves adopting different methodological
perspectives on the same data, although in this case the main purpose of such combination is not
cross-checking results (Baker and Levon 2015: 223), but widening their scope. Whether this study
is or not a case of methodological triangulation, it features three of its main advantages (see Baker
and Egbert 2016: 201-202). First, on some occasions different methods were in fact useful for
cross-validation (e.g. the qualitative analysis in explaining the factors). Second, a more thorough
and complete picture of the sample analysed was achieved than that which could have been
described with a single method. Third, this work created and reinforced a collaboration among
researchers from different fields. The lexical analysis was mainly performed with the software
41
The user‘s manual to the corresponding package, also called ‗nparcomp‘, is available at https://cran.r-
project.org/web/packages/nparcomp/index.html.
83
AntConc, while Wordsmith Tools was used to produce some additional data. The analysis relied on
some basic and widely used tools in corpus-related studies. These tools are essentially quantitative;
however, a qualitative analysis of individual instances is necessary to interpret quantitative results.
Therefore, once again the approach adopted might be defined as ‗combined‘.
The starting point for this analysis was an inspection of frequency lists for the whole corpus and its
sections. In a frequency list, all words appearing in a corpus are listed, together with their number of
occurrences in that corpus (Sinclair 1991: 30-32; McEnery and Hardie 2011: 2). They can be
ordered by frequency, so that the most frequent items will appear at the top of the list, thus
obtaining a first indication concerning the prevailing lexical choices in the whole corpus or in any
of its sections. Usually, the top ranks of any frequency list are occupied by grammatical (or
function) words, such as prepositions, determiners, pronouns, conjunctions, and auxiliary verbs
(Hunston 2002: 3). These are in general the most frequent words in a language (Wynne 2008: 728),
regardless of the genre being considered. Their function is ―mostly to glue texts together by
supplying grammatical information to a lexical warp of nouns, verbs, adjectives and adverbs‖ (Scott
and Tribble 2006: 23-24). These other word classes are the lexical (or content) ones, which
typically reflect the subject matter of a text (Hunston 2002: 3). Therefore, when the focus of the
analysis is on content, as in the present case, grammatical words are overall regarded as less
informative than content words, and thus a ‗stoplist‘ (Anthony 2004: 10; Wynne 2008: 728) can be
uploaded into the text analysis software. A stoplist is a list of words, typically grammatical ones, to
be automatically excluded from frequency lists. The stoplist used in the present analysis was taken
from the Natural Language ToolKit platform.42
A frequency list reports all the word forms (or types) in a corpus, but different forms might indicate
the same concept, as the singular and plural of a common noun, or different forms of the same verb.
It is thus possible to associate each word form to a primary form – the one found in dictionaries –
called ‗lemma‘, by means of a process called lemmatisation (McEnery and Hardie 2011: 245). The
association of word forms to a corresponding lemma is specified in a list which is uploaded into the
text analysis software. In the present analysis, however, lemmatisation was not applied: while it can
be useful in aggregating different components with essentially the same meaning, it might turn out
to be problematic in some cases. Homographs are an example: unless integrated by other annotation
layers, standard procedures for both non-lemmatised and lemmatised lists cannot distinguish
between, for example, like as preposition and like as a verb, or between wish as a verb and wish as a
noun. Lemmatisation would add to the ambiguity of the list, since it would collapse the distinctions
between not only homographs, but all their forms. Therefore, like as preposition would be counted
together with the verb forms like, likes, liking and liked; wish as noun, as well as its plural wishes,
would be counted together with the verbal forms wish, wishes, wished, wishing. This is not to say
that lemmatisation in general should not be applied. On the contrary, it can be appropriate and
extremely useful in some cases. Simply, here the advantages of maintaining word form lists were
considered more suitable to the purposes of the present analysis with respect to the opportunities
offered by lemmatisation. Moreover, even if all ambiguities were effectively dealt with, ―it cannot
be assumed that all forms of a lemma behave in the same way‖ (Hunston 2002: 81).
42
Downloaded from the NLTK website at http://www.nltk.org/nltk_data/ (last accessed in August 2018).
84
Concordances are another basic tool featured in corpus analysis programs. They are useful to
explore the meanings and patterns of use of particular words or phrases identified by prior
assumptions or previous analyses as interesting and relevant. In a concordance, all the occurrences
of a specific word or phrase are shown in their own textual environment, usually in a KWIC (Key
Word In Context) format, with the highlighted search word at the centre and the co-text at both
sides of it (Sinclair 1991: 33-34; Hunston 2002: 38-66).
Alongside frequency lists, keyword lists43
were also useful to characterise ‗Science and
Technology‘ articles. Keyness is a quality of words whose ―frequency (or infrequency) in a text or
corpus is statistically significant, when compared to the standards set by a reference corpus‖ (Bondi
2010: 3; cf. Scott 1997; Scott and Tribble 2006). Scott and Tribble (2006: 56) see keywords as
reflecting the ‗aboutness‘ and style of a text. In the present analysis, keywords were extracted for
the whole news corpus using two general corpora, the British National Corpus,44
or BNC (Leech et
al. 1994), and the British English 2006,45
orBE06 (Baker 2009), as a reference. The BNC consists
of a 100 million word collection of samples from a range of spoken and written genres, dating from
1960 to 1993; the BE06 includes written language samples from different genres, dating from 2003
to 2008. British English was chosen as a reference because three out of the four newspapers in the
corpus (The Financial Times, The Guardian, and The Daily Telegraph) are based in the UK.
Keywords for the whole corpus were extracted in order to understand what topics are typically
covered by newspapers in the present corpus with respect to what is assumed to be general English.
Subsequently, keywords were also extracted for texts in the ‗Science and Technology‘ section using
all non-‗Science and Technology‘ texts from the rest of the corpus as a reference. Such comparison
is in line with the MDA, and its main purpose was to identify any lexical choices which
significantly differentiate texts classified as communicating science and technology from other
news texts.
Keyword analysis can also provide information concerning authors‘ stance and identity, as well as
reveal some assumptions, values and beliefs of the discourse community in which a text was
produced (Bondi 2010). This aspect marks the interdependence of semantic and social analysis, and
can contribute to a better understanding of the value and role of technoscientific communication in
online newspapers. Moreover, it is claimed that since keywords are typically recurrent words, they
might be regarded as indicators of textual cohesion (Stubbs 2010), which is extremely important for
readers‘ comprehension of a text - even more so when technoscience is communicated to a lay
audience. Keyness can be attributed to words, but also to other entities, such as multi-word
expressions and phrases, and precisely because it indicates typicality in a text or corpus, it is text-
dependent rather than language-dependent (Scott 2010: 43).
Essentially, keywords should be shown to have a higher frequency than what is estimated to be their
‗expected frequency‘ (Scott 2010: 59) – i.e. the frequency they can be reasonably expected to have
in standard language use. Such difference in frequency should be statistically significant (Wynne
43
Note that ‗key word‘, or ‗keyword‘, is used with different meanings in corpus linguistics methods. Here, ―it refers to
the most typical and representative words in a corpus‖, while in the expression KWIC (Key Word In Context) it means
a search term whose concordances are extracted (Wynne 2008: 730). 44
Information about the BNC and links to consultation platforms can be found at http://www.natcorp.ox.ac.uk/. 45
Information about the BE06 ad links to consultation platforms can be found at
http://www.lancaster.ac.uk/linguistics/about-us/people/Paul-Baker.
85
2008: 730; see also McEnery and Hardie 2011: 52). Two measures are involved when assessing
keyness: a measure of the frequency difference of a word between analysed and reference corpus,
and a measure of statistical significance for that difference. Both measures refer to individual words
(each keyword has its own), rather than to the whole set of keywords extracted by the software.
There is a clear distinction between the entities which these two measures assess. On the one hand,
frequency difference refers to the magnitude of the result observed – that is, it answers the question
―How different is the relative frequency of this word across the two corpora?‖ In statistics, such
magnitude is called ‗effect size‘ (Muijs 2004: 79-81), although it might not be semantically
appropriate in the case of keyness, where no actual effect is occurring (Gabrielatos 2018). On the
other hand, statistical significance compares the extent of the observed difference to that ―which
would be obtained if all the results were shared out as equally as possible, that is to say a purely
chance outcome‖ (Scott 2010: 48). Therefore, in keyword analysis, depending on the type of output,
measures of statistical significance answer the questions: ―How likely is it that the frequency
difference of this word across the two corpora is due to chance? That is to say: how likely is it that,
although this difference was observed, there is no such real difference between the language
varieties being compared?‖; or ―How confident can the analyst be that the frequency difference of
this word across the two corpora has not been observed by chance?‖ Normally, what is visualised in
textual analysis programs as ‗keyness value‘ refers to a statistical significance measure.
It is important to stress that the difference between these two measures might sometimes produce
diverging results. Indeed, keywords selected for their markedly large effect size might have little
statistical significance, which means that they might result as key for reasons which have nothing to
do with actual differences among the compared corpora. At the same time, highly significant
keywords might have very small effect sizes, i.e. they could be of little consequence, relevance and
importance. This is partly due to the sensitivity of statistical significance to corpus size and to the
overall frequencies of the analysed items. The larger the corpus is and the more frequent one item is
in both corpora, the higher the statistical significance of all effect sizes, however small, tends to be.
Therefore, as Gabrielatos (2018) argues, significance alone cannot be taken as a reliable indicator of
keyness, since it only shows one aspect of this property of words. Overall, keyness needs to be
established by taking into consideration – that is, combining – both effect size and statistical
significance, bearing in mind that the latter becomes less useful as the corpus size increases.
Moreover, if the two measures are combined, the stricter the thresholds established for both, the
smaller the final set of extracted keywords. Gabrielatos (2018) recommends that effect size be used
to rank keywords, while statistical significance should be used for further assessment on the
reliability of the obtained results.
There are different measures and variants to quantify both effect size and statistical significance.
Differences between methods and mathematical details will not be discussed here;46
however, some
points relevant to the selection of the presently applied measures will be mentioned. As McEnery
and Hardie explain, ―to extract keywords, we need to test for significance every word that occurs in
a corpus, comparing its frequency with that of the same word in a reference corpus‖(McEnery and
Hardie 2011: 51). However, every significance test is expected to produce a false result every now
and then, ―just by chance.‖ With such a high number of simultaneous tests, the frequency of false
46
For an overview of the main keyness measures and a list of relevant publications on the debate over their application,
see http://ucrel.lancs.ac.uk/llwizard.html
86
positives potentially increases. Consequently, the established p-value threshold to accept a result as
significant was here lowered from 0.05 to 0.01, which equals to a minimum keyness value of 6.63.
According to McEnery and Hardie, this should minimise – although it cannot exclude – the chances
of extracting ‗false‘ keywords. As for the significance measure, Log-Likelihood was used in the
present analysis, on the grounds that it is the default and recommended option by the software
author.47
Log Ratio was used to measure the effect size: it takes into consideration the relative (or
normalised) frequency of a word in the two corpora being used and is one of the simplest effect size
measures (as listed by Gabrielatos 2018), which makes it relatively easy to interpret.
There are some caveats when considering keyword extraction for corpus analysis. Scott (2010: 50-
51) mentions the fact that keyness is based upon word frequency in two collections of texts, but it
cannot take into account that frequency of use is affected by word order, and word order is never
random in a text, but rather it is constrained by many different factors (e.g. grammar, context of
production, and adjacent or close words). Moreover, keyness values are not ―intrinsically
trustworthy‖, because they depend not only on their frequency in the analysed corpus, but also on
their frequency in the reference corpus; as general or well-designed as the second may be, no corpus
is completely neutral with respect to any other one, and the features and scope of the reference
corpus are extremely important in determining which words will result as key. Topics emerging
from a keyword list may, for example, be partly determined by the different time periods in which
the compared corpora were compiled, or by the specificity of the analysed corpus with respect to
the reference one. Quite importantly, moreover, the proportions among different sub-samples in a
corpus affect keyness. More specifically, the frequency of domain-specific items, which may be
typical of a general corpus sub-sample, depends on how much space that sub-sample occupies
within the corpus. This in turn varies according to the sampling criteria adopted to design reference
corpora. For example, in stratified sampling, all corpus sections have equal or similar sizes, while
in balanced sampling they reflect some proportions.
In the present case, therefore, the keyness of words typical of the news language also depends on
the proportion of news texts within the reference corpus. According to a document produced by
Oxford University for the BNC Consortium,48
around 90% of the BNC consists of written language,
while the remaining 10% consists of transcripts of spoken material. The written component includes
fictional and literary works (around 25% of all written documents), and non-fictional ones (around
75%). Moreover, approximately 60% of these documents came from books, 30% from periodicals
and the remaining 10% was labelled ‗miscellaneous‘ and included both published and unpublished
work, as well as documents written to be spoken. The BE06, on the other hand, only consists of
written texts, originally in paper format, which have been archived on the Web. Approximately
40% of the 2000-word samples composing the corpus are labelled ‗general prose‘, and were
retrieved from magazines, company websites, publisher websites and institutional ones. Around
25% comes from fiction works, while 17% consists of press articles and 16% of academic papers.49
Such diversity in the design approach is one of the reasons why two different reference corpora
47
See the description of the keyword list function in the user manual for AntConc 3.5.7, available at
http://www.laurenceanthony.net/software/antconc/releases/AntConc357/help.pdf 48
See the Reference Guide for the British National Corpus (XML Edition), available from
http://www.natcorp.ox.ac.uk/docs/URG/. 49
The percentages were calculated from Baker (2009: 17).
87
were used: it is an attempt at providing different perspectives, leading to a more comprehensive
insight.
The keyness of an item is related to its overall frequency. However, there might be key items whose
occurrences are all found in very few texts, or even one text, within the analysed corpus. They
clearly cannot be considered typical nor representative of the corpus (Wynne 2008: 730), if it
consists of many different texts (as in the present case). Consequently, it is necessary to filter them
out. The concept of ‗key keyword‘ was particularly useful in this circumstance. Key keywords are
―words which are key in a large number of texts of a given type‖ (Scott 1997: 37), and could be
therefore regarded as more reliable than simple keywords in characterising the analysed corpus. The
concept of key keyness was useful in devising a method for keyword selection in the present
analysis: after a list of keywords was produced by AntConc, additional information about the
number of texts in which each of these items occurred (both in the corpus and in the ‗Science and
Technology‘ section) was integrated from the program Wordsmith Tools in an Excel sheet.
Although the two programs process word tokens slightly differently, the information about the
number of texts in which words occur was consistent between the two, and could therefore be used
for the integration. Subsequently, only keywords appearing in at least 10-15% of the texts were
considered: this corresponds to 240 articles in the whole news corpus, and 30 in the ‗Science and
Technology‘ section. This threshold does not have a theoretical basis: rather, it was empirically set
with the aim to choose widespread items in such thematically heterogeneous text collections
without excluding meaningful and interesting words, which could moreover be semantically related
to other key items. The obtained set of (key) keywords were then ranked by effect size, and only
those with a Log-ratio higher than or equal to one – which corresponds to a double frequency in the
analysed corpus with respect to the reference corpus – were selected. Overall, keywords should be
regarded as a statistically relevant starting point for further analysis, for example through
concordance inspection (Scott 2010: 51). Accordingly, the keyword lists here obtained were further
examined, especially to explore the use of semantically related keywords, which could be taken as
―a good indicator of propositional content‖ (Stubbs 2010: 28).
Collocation analysis was one of the tools through which potentially relevant words were examined
in the corpus. In the present study, as in much work done within the framework of corpus
linguistics, collocation is intended as the tendency of two words to co-occur within a certain
window of co-text. According to Sinclair (1991: 170), collocation can be defined as ―the occurrence
of two or more words within a short space of each other in a text‖: it is therefore a type of
syntagmatic relation between words (Stubbs 1996). Baker et al. (2008: 278) define it as ―the above-
chance frequent co-occurrence of two words within a pre-determined span.‖ A collocation analysis
is normally performed in a single direction, that is, starting from one word, usually called ‗node
word‘, and finding the words which most tend to co-occur with it, that is its collocates. However,
commonly used measures for collocations are bi-directional, which means that given two words
collocating with each other, the collocation measure will be the same regardless of which among the
two is taken as node. Collocations are defined within a given ‗span‘, or window, which corresponds
to the number of words to the left and right of the node – its co-text – which need to be considered
by the software when looking for collocates. The span or window must be specified before
extracting collocates, and it does not take into account sentence boundaries. Given a node word, all
words appearing within its established span are theoretically its candidate collocates. In the present
88
study, a span of three words to the left and right of the node word was set, to focus more
specifically on its immediate context.
The strength of collocation is determined by the frequency of the node-collocate co-occurrence, and
can be quantified by mathematical association measures; ―high association scores indicate strong
attraction [...] but there is no standard scale of measurement to draw a clear distinction between
collocations and non-collocations‖ (Evert 2009: 1242). Measures for collocation depend on two
elements. The first one is the number of instances in which any one candidate collocate is observed
to co-occur with the node within the designated span, and is referred to as the ‗observed frequency‘,
or O. The second element is the ‗expected frequency‘, or E, i.e. the number of instances in which
that candidate might be expected to appear within the designated span if there was no association at
all. E depends on the frequency of the candidate collocate in the corpus. Evert (2009: 1228)
explains that ―E is important as a reference point for the interpretation of O, since two frequent
words might co-occur quite often purely by chance‖, maybe because one or both of them is a high
frequency word in general.
As in the assessment of keyness, methods to measure collocation can be divided into effect size
measures, such as MI or MIk, and statistical significance measures, such as log-likelihood, z-score
or t-score.50
The former quantify the extent to which O exceeds E, while the latter quantify the
probability of observing the O-E difference by chance (the p-value), and provide a corresponding
score to quantify the significance. Although it is likely that a collocation with a large effect size is
also statistically significant, the two measures do indeed concern different aspects, and have
different characteristics: for example, effect size measures tend to produce an extremely high result
when E is very small, which means that they might assign high collocation scores even to
infrequent co-occurrences, because they still find a marked difference between O and E.
Conversely, statistical significance measures tend to stress highly frequent collocates, which means
that ―if O is sufficiently large, even a small relative difference between O and E, i.e. a small effect
size, can be highly significant‖ (Evert 2009: 1228). There is no universally recommended
collocation measure to be used; the choice depends on the research questions, on the corpus being
analysed and on the tools used for textual analysis. Considering both effect size and statistical
significance to obtain different perspectives on the same texts is generally a reasonable option.
The present analysis was mainly focused on the ‗Science and Technology‘ section, which is small
in size and diverse in content. This entailed working with relatively small co-occurrence
frequencies, as well as with a small amount of candidate collocates. Therefore, measures of
statistical significance would tend to place grammatical words at the top of collocate lists, making it
necessary to look at lower ranks to spot lexical collocates. On the other hand, effect size measures
would overall select low-frequency collocates. Since, however, their bias could be mitigated by
setting a minimum collocation frequency, the MI score effect size measure – the default setting in
the AntConc software – was adopted for the present analysis, in combination with minimum
frequency thresholds. Generally, if a very low minimum collocation frequency is set, the emerging
collocates will still show very infrequent patterns, which might not be relevant to the research
questions. Conversely, when the threshold is very high, the program is likely to extract mostly
grammatical collocates (such as articles or prepositions), often equally uninteresting in analyses
50
Further information about different collocation measures can be found at http://www.collocations.de/AM/.
89
such as the present one. The purpose of this analysis was to identify trends with the largest possible
scope, rather than marginal uses that are only relevant to a very small portion of the corpus. This
would call for a relatively high minimum frequency threshold. However, the size of the corpus or
section being analysed, as well as the raw frequency of each node word, also needed to be taken
into account when setting minimum collocate frequencies. In the present analysis, the raw
frequencies of words appearing in the whole corpus frequency list range from 5,131 (0.36%) to
1,453 (0.10%), while they range from 692 (0.44%) to 176 (0.10%) for the ST section frequency list.
Therefore, a threshold of 10 occurrences seemed enough to highlight both strong and frequent
collocations in ST texts, and 40 occurrences were set as minimum in the general corpus.
Occasionally, such thresholds were lowered to allow for a higher number of lexical collocates to be
detected, especially when dealing with the least frequent items in the lists. The threshold was
always reported above the collocation table. In some cases, such adjustments helped to highlight
different but semantically related collocates, thus enabling a more comprehensive analysis.
Once collocates were extracted, those with the highest statistical values – normally, around the 10
strongest collocates –51
were considered for further analyses. Even then, when their concordances
were inspected, not all of them revealed uses that could reflect particular patterns or recurrent
meanings. Considerations of space did not allow for a discussion of concordances for all the
collocations identified. This is why only collocates considered interesting and relevant to the
present analysis were selected to be mentioned and/or further analysed. An analysis of collocations
can help to summarise the information found in potentially large amounts of concordance lines. The
collocates of a word contribute to its meaning and function (Baker et al. 2008): for example, the
collocates of pursue in a general English corpus reveal that its figurative meaning is much more
common than its literal one (Sinclair 1991: 113). Collocation analysis can thus highlight different
meanings of the same word form, its dominant phraseology and its own semantic field (Hunston
2002). The collocates of a word can also contribute to its connotation: this concept, called semantic
prosody, applies for example to the verb happen, which tends to be associated with unpleasant
events, such as accidents (Sinclair 1991: 112). Finally, concordances were used throughout the
analysis to integrate quantitative results with more qualitative observations. The lexical analysis
was necessary to achieve a more comprehensive, although by no means complete picture of how
science and technology are communicated in the analysed texts.
6. Conclusion
In this chapter, the corpus collection process and the method of analysis applied in the present study
were described in detail. To address the research questions formulated in Chapter 1, a linguistic
comparison between online news articles on science and technology and other categories of online
news was established. MDA was chosen as the main methodological reference for this analysis,
because it allows researchers to explore a corpus in terms of its own internal linguistic variation.
The variation potentially characterising a newspaper corpus also involves articles about science and
technology. Therefore, MDA can be useful in understanding whether there are linguistic and
51
The number of collocates to be shown is based on two main criteria: collocates whose MI score is lower than 2 are
not generally reported; moreover, if a list features few lexical collocates followed by grammatical ones, the list reported
in the present study will tend to focus on lexical rather than grammatical items.
90
functional differences among different types of news articles, and how technoscience in the news is
characterised with respect to such differences. The corpus was created through sampling from a
larger database of articles, and includes texts from four different UK and US newspapers. In order
to perform MDA properly, the corpus was designed to represent the range of variation of newspaper
language, and therefore it consists of approximately equally-sized samples of articles published in
different categories of news sections, including ‗Science and Technology‘. To perform MDA, a
regex-based identification and counting tool for the analysed LFs was created and included into a
larger textual analysis workflow. The tool and other modules from the workflow were devised to be
as versatile as possible, so as to be potentially employed in new MDAs and other types of linguistic
analysis. Exploratory factor analysis (EFA) is at the core of MDA, and was here applied following
the main MDA tradition, At the same time, alternative solutions were surveyed, and the
implications of each methodological choice were assessed. This also resulted in an overview of
some merits and limits of this method, that might be useful to other researchers working with it.
MDA focuses on general lexis, grammar and syntax to characterise relevant communicative
functions underlying the whole newspaper corpus and single articles or sections with respect to the
corpus. Its last stages involve selecting the most appropriate structure to be assigned to the final
results, and interpreting them through qualitative analyses. By contrast, the lexical analysis can
provide an overview of the content of the corpus and of the ‗Science and Technology‘ section. In
particular, it was used to assess how technoscience-related content was represented and
linguistically framed. The final structure of the statistical analysis and the results obtained from the
MD and lexical analyses are shown and discussed in Chapters 4 and 5.
91
CHAPTER 4. DIMENSIONS OF VARIATION IN THE NEWS
CORPUS
1. Introduction
In the previous chapter, all the stages of the analysis were described from a methodological point of
view. The present chapter will focus on the linguistic description resulting from the application of
those methods to the news corpus collected from the TIPS database. In the first part of the chapter,
the ‗intermediate‘ results of the statistical analysis, necessary to complete the MDA, will be
described and discussed, thus exhaustively justifying the methodological choices described in
Sections 4.1.1-4.1.4 of Chapter 3. Subsequently, an interpretation of the factors accompanied by a
qualitative analysis of single texts is provided, along with statistical descriptions of the corpus in
relation to the four extracted factors. The results shown and discussed in this chapter will be
complemented by those in Chapter 5, where the attention will focus on articles in the ‗Science and
Technology‘ section, which were analysed both individually and as a group, and compared to the
rest of the corpus taken as a whole, as well as to all its other macro-feed sections.
2. Final stages of the exploratory factor analysis
2.1. Comparison of different factorial solutions and selection of the most
suitable one
An exploratory factor analysis (EFA) is a statistical procedure whose purpose is to reveal a small
number of latent – i.e., not directly observable – variables, the factors, by summarising the
interrelationships among a larger number of observable variables. As explained in Sections 4.1.1
and 4.1.2 of Chapter 3, in an EFA, two main choices need to be made before performing the
procedure.1 The first concerns the number of factors to be retained, while the second one concerns
factor rotation, which contributes to factor interpretability by including each of the observed
variables – in this case, linguistic features (LFs) – in as few factors as possible. There are
orthogonal and oblique rotation methods; either category entails some assumptions about factor
correlation. To decide how many factors should form part of the final set, it was necessary to
examine the scree test (cf. Section 4.1.1 in Chapter 3) and the amount of shared variance explained
by the factors (reported in Table 4.1 below). They suggested that the optimal number of factors
might be between three and five. Consequently, the exploratory factor analysis (EFA) was run
several times, to then compare results for solutions with three, four, and five factors. As for factor
rotation, both an oblique and an orthogonal method, namely Promax and Varimax, were applied.
The resulting six factorial solutions – three, four and five factors rotated with Promax, plus three,
four and five factors rotated with Varimax – were compared in order to select the most appropriate
1 Sections 2.1 and 2.2 concern both results and methodology: the two aspects could not be separated at this stage of the
analysis. Therefore, as explained in Sections 4.1.2 and 4.1.4.3 of Chapter 3, the solutions and scores here compared
were regarded as preliminary results in the analysis. This is the reason why they were placed in the results chapter.
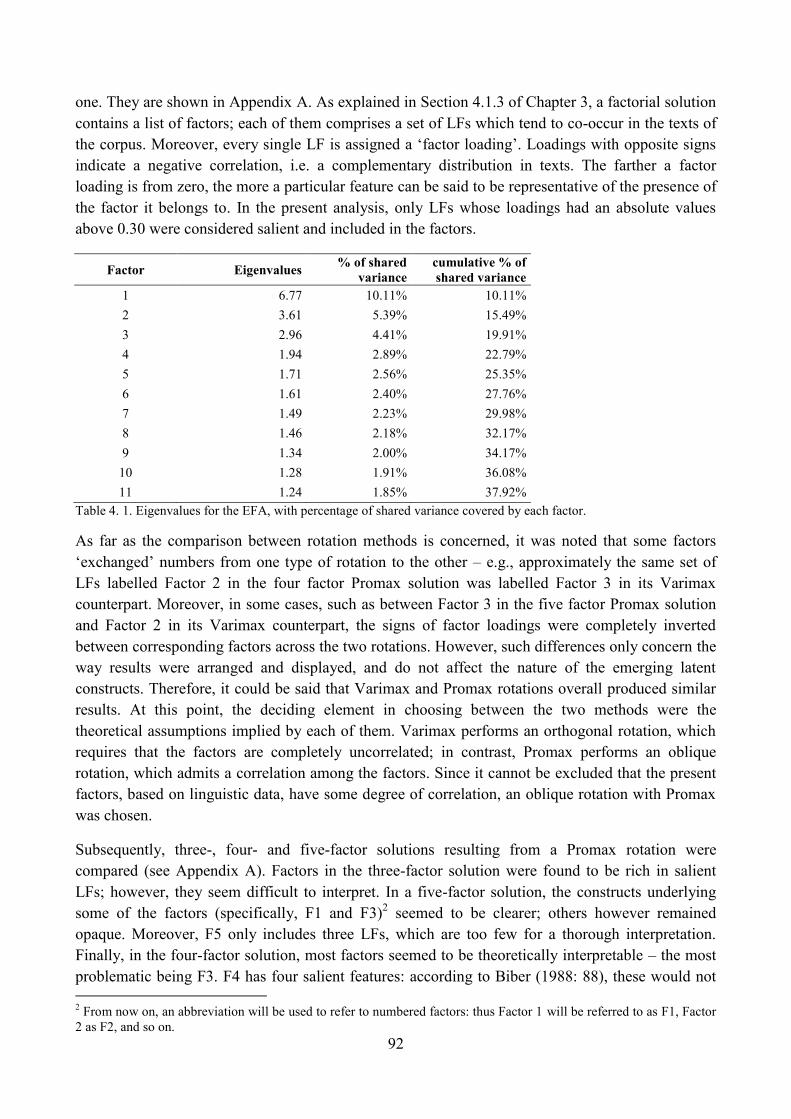
92
one. They are shown in Appendix A. As explained in Section 4.1.3 of Chapter 3, a factorial solution
contains a list of factors; each of them comprises a set of LFs which tend to co-occur in the texts of
the corpus. Moreover, every single LF is assigned a ‗factor loading‘. Loadings with opposite signs
indicate a negative correlation, i.e. a complementary distribution in texts. The farther a factor
loading is from zero, the more a particular feature can be said to be representative of the presence of
the factor it belongs to. In the present analysis, only LFs whose loadings had an absolute values
above 0.30 were considered salient and included in the factors.
Factor Eigenvalues % of shared
variance
cumulative % of
shared variance
1 6.77 10.11% 10.11%
2 3.61 5.39% 15.49%
3 2.96 4.41% 19.91%
4 1.94 2.89% 22.79%
5 1.71 2.56% 25.35%
6 1.61 2.40% 27.76%
7 1.49 2.23% 29.98%
8 1.46 2.18% 32.17%
9 1.34 2.00% 34.17%
10 1.28 1.91% 36.08%
11 1.24 1.85% 37.92%
Table 4. 1. Eigenvalues for the EFA, with percentage of shared variance covered by each factor.
As far as the comparison between rotation methods is concerned, it was noted that some factors
‗exchanged‘ numbers from one type of rotation to the other – e.g., approximately the same set of
LFs labelled Factor 2 in the four factor Promax solution was labelled Factor 3 in its Varimax
counterpart. Moreover, in some cases, such as between Factor 3 in the five factor Promax solution
and Factor 2 in its Varimax counterpart, the signs of factor loadings were completely inverted
between corresponding factors across the two rotations. However, such differences only concern the
way results were arranged and displayed, and do not affect the nature of the emerging latent
constructs. Therefore, it could be said that Varimax and Promax rotations overall produced similar
results. At this point, the deciding element in choosing between the two methods were the
theoretical assumptions implied by each of them. Varimax performs an orthogonal rotation, which
requires that the factors are completely uncorrelated; in contrast, Promax performs an oblique
rotation, which admits a correlation among the factors. Since it cannot be excluded that the present
factors, based on linguistic data, have some degree of correlation, an oblique rotation with Promax
was chosen.
Subsequently, three-, four- and five-factor solutions resulting from a Promax rotation were
compared (see Appendix A). Factors in the three-factor solution were found to be rich in salient
LFs; however, they seem difficult to interpret. In a five-factor solution, the constructs underlying
some of the factors (specifically, F1 and F3)2 seemed to be clearer; others however remained
opaque. Moreover, F5 only includes three LFs, which are too few for a thorough interpretation.
Finally, in the four-factor solution, most factors seemed to be theoretically interpretable – the most
problematic being F3. F4 has four salient features: according to Biber (1988: 88), these would not
2 From now on, an abbreviation will be used to refer to numbered factors: thus Factor 1 will be referred to as F1, Factor
2 as F2, and so on.
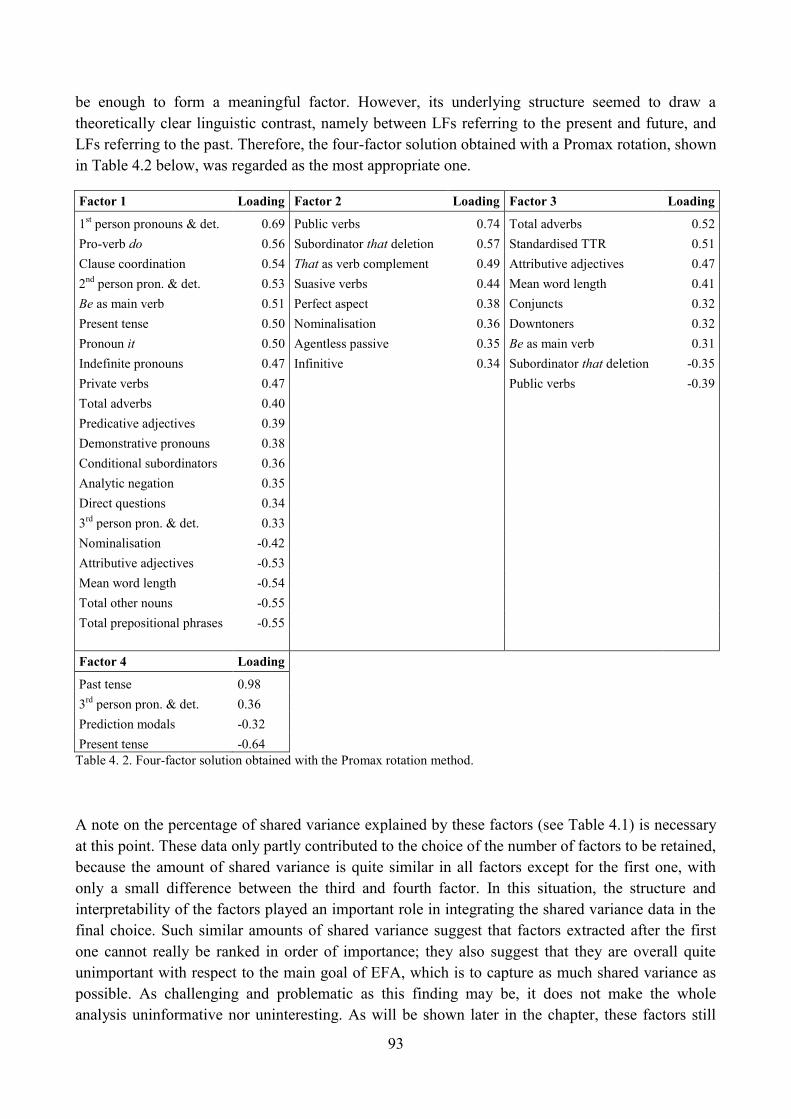
93
be enough to form a meaningful factor. However, its underlying structure seemed to draw a
theoretically clear linguistic contrast, namely between LFs referring to the present and future, and
LFs referring to the past. Therefore, the four-factor solution obtained with a Promax rotation, shown
in Table 4.2 below, was regarded as the most appropriate one.
Factor 1 Loading Factor 2 Loading Factor 3 Loading
1st person pronouns & det. 0.69 Public verbs 0.74 Total adverbs 0.52
Pro-verb do 0.56 Subordinator that deletion 0.57 Standardised TTR 0.51
Clause coordination 0.54 That as verb complement 0.49 Attributive adjectives 0.47
2nd
person pron. & det. 0.53 Suasive verbs 0.44 Mean word length 0.41
Be as main verb 0.51 Perfect aspect 0.38 Conjuncts 0.32
Present tense 0.50 Nominalisation 0.36 Downtoners 0.32
Pronoun it 0.50 Agentless passive 0.35 Be as main verb 0.31
Indefinite pronouns 0.47 Infinitive 0.34 Subordinator that deletion -0.35
Private verbs 0.47
Public verbs -0.39
Total adverbs 0.40
Predicative adjectives 0.39
Demonstrative pronouns 0.38
Conditional subordinators 0.36
Analytic negation 0.35
Direct questions 0.34
3rd
person pron. & det. 0.33
Nominalisation -0.42
Attributive adjectives -0.53
Mean word length -0.54
Total other nouns -0.55
Total prepositional phrases -0.55
Factor 4 Loading
Past tense 0.98
3rd
person pron. & det. 0.36
Prediction modals -0.32
Present tense -0.64
Table 4. 2. Four-factor solution obtained with the Promax rotation method.
A note on the percentage of shared variance explained by these factors (see Table 4.1) is necessary
at this point. These data only partly contributed to the choice of the number of factors to be retained,
because the amount of shared variance is quite similar in all factors except for the first one, with
only a small difference between the third and fourth factor. In this situation, the structure and
interpretability of the factors played an important role in integrating the shared variance data in the
final choice. Such similar amounts of shared variance suggest that factors extracted after the first
one cannot really be ranked in order of importance; they also suggest that they are overall quite
unimportant with respect to the main goal of EFA, which is to capture as much shared variance as
possible. As challenging and problematic as this finding may be, it does not make the whole
analysis uninformative nor uninteresting. As will be shown later in the chapter, these factors still
94
represent patterns of language use that significantly change across texts in the corpus. Although
these patterns are not comprehensive, they can still be seen as a useful tool for the analysis of
communicative functions in these texts. In this sense, they can be considered as expressing
dimensions of variation, although their scope is narrower than that of other MDA studies.
Nevertheless, the possible reasons and implications of obtaining such low percentages of explained
variance have to be acknowledged, and will be further examined in Chapter 6.
2.2. Comparison of different factor score computation methods and
selection of the most suitable one
Once an optimal number of factors has been selected, it is important to recover their role in the texts
from which they had been originally extracted. This is the purpose of computing factor scores,
measures which rate each unit of analysis with respect to any of the retained factors (see Section
4.1.4 in Chapter 3). Factor scores are essential in interpreting the factors. Furthermore, they can be
used as a variable in further analyses: in the present analysis, they were used to compare the
different macro-feed categories within the corpus. There are several methods for the computation of
factor scores, and there is no agreement about any of them being the most reliable one. Rather,
factor scores are generally acknowledged to be indeterminate: for mathematical reasons, more than
one set of scores can reflect the extracted factors. Therefore, four of the available methods were
applied and compared: non-weighted sum of standardised frequencies (also used in Biber‘s MDA),
weighted sum of standardised frequencies, regression, and Bartlett.3
The comparison was made among the average factor scores for each macro-feed section of the
corpus, and in particular among the rankings of these sections along each of the factors. As shown
in Figures 4.1 to 4.4, the location of macro-feed sections in relation to each other was overall
consistent across different methods. For example, ‗Sport‘ and ‗Business‘ were always respectively
the highest- and lowest-ranking sections across F1; ‗Science and Technology‘ is always slightly
above zero, between ‗Business‘ and ‗Culture, arts and Leisure‘, in F3. In the end, therefore, the non-
weighted sum method was adopted, maintaining Biber‘s work as the main reference.
3 For a more detailed discussion and description of the factor score calculation methods here applied, see Section 4.1.4.1
in Chapter 3.
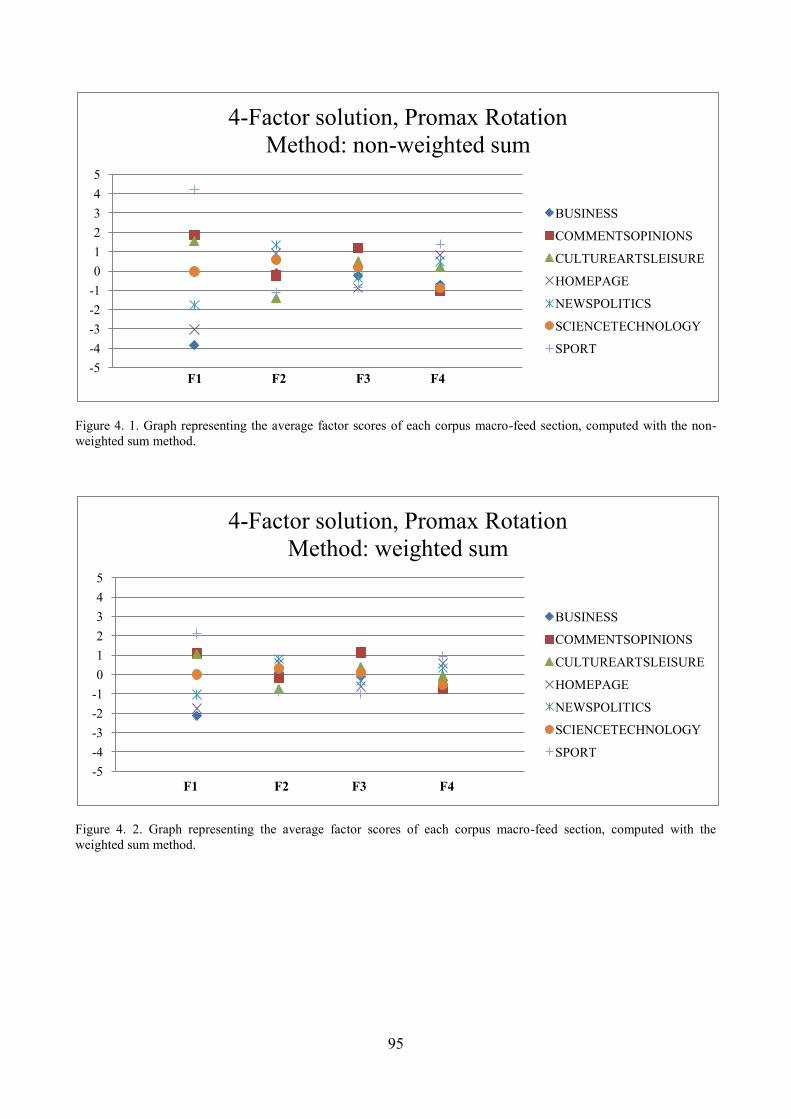
95
Figure 4. 1. Graph representing the average factor scores of each corpus macro-feed section, computed with the non-
weighted sum method.
Figure 4. 2. Graph representing the average factor scores of each corpus macro-feed section, computed with the
weighted sum method.
-5
-4
-3
-2
-1
0
1
2
3
4
5
F1 F2 F3 F4
4-Factor solution, Promax Rotation
Method: non-weighted sum
BUSINESS
COMMENTSOPINIONS
CULTUREARTSLEISURE
HOMEPAGE
NEWSPOLITICS
SCIENCETECHNOLOGY
SPORT
-5
-4
-3
-2
-1
0
1
2
3
4
5
F1 F2 F3 F4
4-Factor solution, Promax Rotation
Method: weighted sum
BUSINESS
COMMENTSOPINIONS
CULTUREARTSLEISURE
HOMEPAGE
NEWSPOLITICS
SCIENCETECHNOLOGY
SPORT

96
Figure 4. 3. Graph representing the average factor scores of each corpus macro-feed section, computed with the
regression method.
Figure 4. 4. Graph representing the average factor scores of each corpus macro-feed section, computed with the Bartlett
method.
3. From factors to dimensions of variation
The computation of factor scores is essential to create a multidimensional description of the corpus.
Such description involves grammatical, syntactic and lexical aspects, but also communicative
functions, the type of content being communicated and the context of production. Interpreting the
factors by taking into account their presence and variation throughout the corpus, as well as in
-0.8
-0.6
-0.4
-0.2
0
0.2
0.4
0.6
0.8
F1 F2 F3 F4
4-Factor solution, Promax Rotation
Method: regression
BUSINESS
COMMENTSOPINIONS
CULTUREARTSLEISURE
HOMEPAGE
NEWSPOLITICS
SCIENCETECHNOLOGY
SPORT
-1.2
-1
-0.8
-0.6
-0.4
-0.2
0
0.2
0.4
0.6
0.8
1
F1 F2 F3 F4
4-Factor solution, Promax Rotation
Method: Bartlett
BUSINESS
COMMENTSOPINIONS
CULTUREARTSLEISURE
HOMEPAGE
NEWSPOLITICS
SCIENCETECHNOLOGY
SPORT
97
single texts, is necessary in order to cover all these different aspects. Through this interpretive work,
the MDA should make it possible to identify the dimensions of linguistic variation characterising
the corpus. In the present case, all interpretations will need to take into account that the factor
analysis did not in fact capture major dimensions able to explain most internal changes in the
language of the corpus, provided that such changes – i.e., linguistic variation – existed. Therefore,
these factors would be better understood as capturing some portions of variation, thus revealing
‗minor‘ communicative functions whose presence varies throughout the texts. These are nonetheless
interesting and informative elements, since they highlight patterns so far unexplored in the language
of newspapers.
MDA is based on the assumption that a group of linguistic structures which share co-occurrence
patterns potentially also share communicative functions. Correlated LFs are thus taken to be a proxy
for the presence of some latent constructs, associated to the communicative functions they may
share. Consequently, the interpretation of the obtained factors ―involves an assessment of the
communicative function(s) most widely shared by the co-occurring features.‖(Biber 1988: 101).
This process needs to be based both on previous studies and on the analysis of single LFs as they
are used in texts. Therefore, in the present analysis, factor interpretation will start from Biber‘s
review of LF functions (Biber 1988: 101-115 and 223-245); at this stage, possible functional
reasons explaining the observed correlations among LFs in the same factor will be suggested.
Subsequently, the interpretation will be completed by qualitative analyses, whose goal is to assess
the use and functions of LFs in single texts from the corpus. This combined procedure will be
performed for each of the four factors extracted. It will be completed in the next chapter, where
another set of qualitative analyses will be performed exclusively on articles from the ‗Science and
Technology‘ (from now on ST) section, with the purpose of producing a multidimensional account
of the communication of technoscience in the present corpus. The four factors will be regarded as
representing four dimensions, each expressing a continuum between differing communicative
functions. According to these functions, the first dimension was labelled
‗Interactional/Conversational vs. Informative/Formal Communication‘; the second dimension was
labelled ‗Reported Account of Recent Events vs. Direct/Factual Communication‘; the third one,
‗Explicit Argumentation/Explanation vs. Topic-Focused Communication‘; and the fourth,
‗Narration of Past Events vs. Present/Future Focus‘. All factors and the related dimensions and
labels will be described in detail in the next sections.
3.1. Interpretation of Factor 1
F1 is the most important factor, because it explains the highest percentage of shared variance in the
use of the LFs analysed (see Table 4.1 above). Furthermore, it also includes the largest number of
salient LFs. The feature with the highest positive loading in F1 is first person pronouns and
determiners. These are the most obvious index of personal involvement on the part of the referent
of the pronoun or determiner – it may be the author or someone whose spoken or written words are
directly reported in the text. In F1, they co-occur with second person pronouns and determiners,
which indicates an interpersonal focus, and some amount of interaction with a specific addressee.
This aspect can also be found in direct questions, another positive feature in F1: they imply the
presence – or construction in absentia – of an interlocutor, whom the speaker or author wants to
involve and with whom they want to interact. Another feature with positive loading is pro-verb do.
98
According to Biber (1988: 226), this LF substitutes a fuller verb phrase or clause, thus creating an
unspecified verbal referent and reducing the (explicit) informational density of a text. This may
derive, Biber adds, from interpersonal purposes prevailing over informational ones, and/or from
processing constraints that favour vague and unplanned language over more precise choices.
However, the sequence Biber indicates to identify this LF, which served as basis for the
corresponding regex in the present study, matches all the occurrences of the verb do, excluding
instances of do as an auxiliary (see Example 1 below). The remaining uses include do as a substitute
for an entire clause (Examples 2 and 3), as well as uses of do as a main verb (Examples 4 and 5).
Therefore, this LF cannot be understood as always pointing to a clause replacement, with a
consequent lowering of the informational focus. However, it can still mark a general rather than
specific lexical choice.
Examples
1) ‗How bad does it have to get before Manchester United sack David Moyes?‘ Or, ‗Will he really survive until
summer if the hidings continue?‘ It was a question those at the top of the club did not answer when it was posed on
Wednesday morning.
2) ‗Say what you will, but I know you care about these things as much as I do.‘
3) The ensuing public dispute with the show‘s director, while unusual, suggested that racial identity remained a
potential source of friction within the world of New York theatre, as did a recent casting call for that was criticised
by Actors‘ Equity for specifically requesting non-white actors
4) States use hackers to do cyber dirty work.
5) The state subsidizes 75 per cent of childcare costs and men routinely take time out in the day to undertake the
school run, bring toddlers to the playpark or do housework.
F1 is also characterised by clause coordination, realised by the conjunction and, ―a general
purpose connective that can mark many different logical relations‖ between clauses (Biber 1988:
245). Clause coordination creates a sort of chaining of propositions, which results in a fragmented
style usually associated to production constraints typical of spoken language. Another LF found in
fragmented styles, be as a main verb, has a positive loading here, which matches with the presence
of predicative adjectives, since they can be combined in noun-modifying predicative structures of
the type ―The house is huge‖. Such structures are considered more fragmented than attributive
constructions (e.g.―That huge house‖), where information is integrated into the noun phrase. The
next positive LF, analytic negation, is also considered an indicator of fragmented communication,
at least compared to synthetic negation (see Table 3.4 in Chapter 3). Positive features in F1 include
present tense, which, in combination with the fragmented and interactional LFs considered so far,
indicates that texts with a high score in this factor deal with topics or actions of immediate
relevance. The unspecified, vague and implicit reference conveyed by certain uses of the verb do is
also reflected in the positive loadings of the generic pronoun it and of indefinite pronouns. It can
stand for a wide range of referents, from animate beings to abstract concepts, and can be used to
substitute nouns, phrases or whole clauses. Biber associates it with strict time constraints for
linguistic production, and with a non-informational focus. In some cases, it could also reflect a high
density of text-internal reference, where its function is to recall something that had already been
mentioned. Demonstrative pronouns may also contribute to building a network of cohesive text-
internal references, either pointing to a specific nominal entity, or to more abstract concepts.
99
Generally demonstratives are also used for text-external deixis,4 but such use is less likely to appear
in a newspaper corpus, since it would require knowledge of the immediate extra-textual context, in
order to be understood. Private verbs usually express affective, intellectual and emotional activities
and are thus associated with cognitive aspects. The positive part of the F1 continuum also contains
general adverbs. Together with adjectives, they expand and elaborate information. However, this
LF has a higher loading on F3, and therefore was not considered in computing F1 scores.
Conditional clauses introduced by if or unless are among the positive LFs of F1: they mainly serve
discourse framing purposes, since they set conditions for propositional content. Their function may
vary according to whether they their precede or follow the main clause, but this distinction could
not be made automatically, and therefore it was not taken into account here. The LF with the lowest
salient positive loading is third person pronouns and determiners, from which it is excluded.
Except for the third person plural, they intuitively mark the reference to animate – typically human
– referents who are not the speaker nor the addressee, and are therefore external to the interaction.
Third person is generally considered a marker of narrative and reporting purposes. This feature had
a smaller loading on F1 than on F4, and was therefore excluded from the computation of F1 scores.
Taken as a whole, all positive features contribute to a fragmented, interactive type of
communication that is close, in some respects, to spoken language.
As for negative features, they are less numerous, but seem consistent in representing a
communicative style that contrasts with that reflected by the positive LFs. Prepositional phrases
have the main function of integrating information into idea units,5 while making them richer in
content. Nouns are ―the primary bearers of referential meaning in a text‖ (Biber 1988: 104).
Consequently, a high frequency of nouns is an indicator of high information density. Mean word
length is in line with such informational focus. As found by Zipf (1949), shorter words are more
frequently used and more general in meaning than longer ones, which usually convey more specific
meanings and can be taken as a marker of careful and precise lexical choices, which increases the
amount of information that can be conveyed. As anticipated above, attributive adjectives elaborate
and expand nominal information in a more integrated and less fragmented way than their
predicative counterpart, by packing information into noun phrases. Finally, nominalisations6
constitute compact sets of information, since they can reduce full sentences to one or a series of
noun phrases, sometimes presenting information in an abstract rather than situated way. Considered
as a whole, negative features seem to point to a high informational focus in communication,
combined with a careful integration of information.
Overall, F1 is similar to the first factor obtained by Biber in his analysis (Biber 1988: 102-108).
There, he had associated positive features to a primarily verbal and fragmented style, interactive or
4 Deixis is a complex linguistic process closely linked with indexicality, that consists in using words or phrases – called
deictics – ―whose reference must be determined from context‖ (Gee 2011: 8). Their meaning is thus largely dependent
on the context where they are used (examples are the words and phrases here, I, you, next June, that person over there).
For a detailed discussion, see Levinson (2006). 5 An idea unit, related to the speaker or writer‘s psychological reality, is a chunk of information that is perceived as
cohesive by a speaker or writer, as it is given a surface form. Idea units are particularly visible in spontaneous speech,
which is naturally more fragmented. Chafe (1980: 15) sees them as ―linguistic expressions of focuses of consciousness‖
(see also Crookes 1990). 6 For the difference between general nouns – or ‗total other nouns‘, adopting Biber‘s term – and nominalisations, see
Table 3.3 in Chapter 3, as well as Biber (1988: 221-245). During the automatic identification of LFs, the frequency
counts of these two LFs were kept separate by means of a hierarchy (see Section 3.2.4 in Chapter 3).
100
affective in purpose and non-specific in content. By contrast, he related negative features to a
nominal and informative style where the lack of time constraints allowed for precise lexical choices,
and for the integration of information into relatively complex nominal structures. In addition to
these aspects, Biber also took into account the role of another ―communicative parameter‖ (1988:
104), namely production circumstances and constraints. In particular, he focused on real-time
production circumstances typical of speech, characterised by time constraints and lack of careful
planning, versus circumstances typical of writing, allowing for in-advance planning and lacking the
presence of interlocutors. Correspondence was found between real-time circumstances and
interactional/involved purposes, and between circumstances allowing for careful planning and
informative purposes. The present case is quite different from Biber‘s study, where the corpus was
meant to include a wide range of genres as well as production circumstances. Here, production
circumstances are assumed to be similar throughout the corpus, at least with respect to Biber‘s
observations: newspaper articles are a form of written communication, which needs careful
planning as well as conciseness, since it takes place and is consumed at a high rate of speed, and is
produced under constant pressure. Therefore, it would be problematic to explain different sides of
this F1 in terms of different production circumstances. Biber described his first factor as ―obviously
[...] very powerful‖, and ―representing a very basic dimension of variation among spoken and
written texts in English‖ (Biber 1988: 104). The two factor ends did not coincide with spoken vs.
written genres, but rather identified an ‗oral‘/‗literate‘ continuum which cuts across both spoken and
written language as a fundamental parameter of variation. The fact that F1 in the present analysis is
similar to Biber‘s first factor points to the prominent role of this parameter also in newspaper
language.
A factor can be represented as a continuum. This features a ‗positive‘ end, which is characterised by
the presence of any salient positive LFs, a centre, and a ‗negative‘ end, characterised by the
presence of any salient negative LFs. Since factor score calculation methods take into account the
presence of salient LFs in a text, they are able to characterise the text with respect to a factor. For
example, a text with many LFs loading positively in one factor is likely to be attributed a positive
score on that factor. In a graphical representation like those found in Figures 4.1-4.4, such score will
place the text in the positive end of that factor, that is, in the upper part of the graph. By contrast, a
text with many negative LFs will be assigned a negative score, which will place it to the opposite
end of the factor, and in the lower part of the graph. A text where positive and negative LFs are
equally present or equally absent will be assigned a score close to zero and will tend to be placed
towards the centre of the continuum. In the present study, the positive end will be indicated with the
adjective ‗high‘, while the negative end will be identified by ‗low‘ and the centre by ‗unmarked‘.
For the qualitative analysis, one or more texts with high, low and unmarked factor scores will be
analysed individually.
When the corpus was automatically analysed for LF detection, each LF was assigned a raw
frequency, a relative frequency, and a standardised frequency (or z-score)7 in each text.
Standardised frequencies are at the basis of the factor score computation method used here.
Therefore, during the qualitative analysis, single texts were examined especially in relation to the
standardised frequencies of the salient LFs on the factor being considered, in order to understand
7 As explained in Section 4.1.4.1 of Chapter 3, standardised or z-scores correspond to the distance of LF frequencies
from the corpus mean, expressed using standard deviations as units.
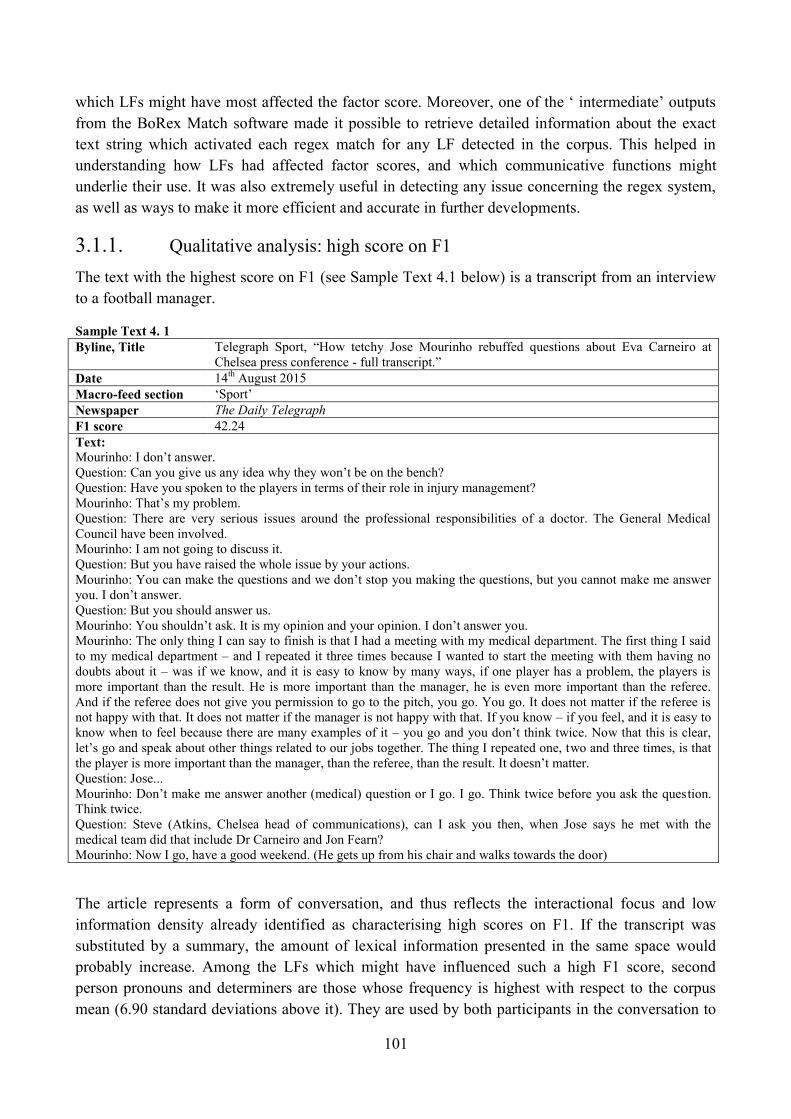
101
which LFs might have most affected the factor score. Moreover, one of the ‗ intermediate‘ outputs
from the BoRex Match software made it possible to retrieve detailed information about the exact
text string which activated each regex match for any LF detected in the corpus. This helped in
understanding how LFs had affected factor scores, and which communicative functions might
underlie their use. It was also extremely useful in detecting any issue concerning the regex system,
as well as ways to make it more efficient and accurate in further developments.
3.1.1. Qualitative analysis: high score on F1
The text with the highest score on F1 (see Sample Text 4.1 below) is a transcript from an interview
to a football manager.
Sample Text 4. 1
Byline, Title Telegraph Sport, ―How tetchy Jose Mourinho rebuffed questions about Eva Carneiro at
Chelsea press conference - full transcript.‖
Date 14th
August 2015
Macro-feed section ‗Sport‘
Newspaper The Daily Telegraph
F1 score 42.24
Text:
Mourinho: I don‘t answer.
Question: Can you give us any idea why they won‘t be on the bench?
Question: Have you spoken to the players in terms of their role in injury management?
Mourinho: That‘s my problem.
Question: There are very serious issues around the professional responsibilities of a doctor. The General Medical
Council have been involved.
Mourinho: I am not going to discuss it.
Question: But you have raised the whole issue by your actions.
Mourinho: You can make the questions and we don‘t stop you making the questions, but you cannot make me answer
you. I don‘t answer.
Question: But you should answer us.
Mourinho: You shouldn‘t ask. It is my opinion and your opinion. I don‘t answer you.
Mourinho: The only thing I can say to finish is that I had a meeting with my medical department. The first thing I said
to my medical department – and I repeated it three times because I wanted to start the meeting with them having no
doubts about it – was if we know, and it is easy to know by many ways, if one player has a problem, the players is
more important than the result. He is more important than the manager, he is even more important than the referee.
And if the referee does not give you permission to go to the pitch, you go. You go. It does not matter if the referee is
not happy with that. It does not matter if the manager is not happy with that. If you know – if you feel, and it is easy to
know when to feel because there are many examples of it – you go and you don‘t think twice. Now that this is clear,
let‘s go and speak about other things related to our jobs together. The thing I repeated one, two and three times, is that
the player is more important than the manager, than the referee, than the result. It doesn‘t matter.
Question: Jose...
Mourinho: Don‘t make me answer another (medical) question or I go. I go. Think twice before you ask the question.
Think twice.
Question: Steve (Atkins, Chelsea head of communications), can I ask you then, when Jose says he met with the
medical team did that include Dr Carneiro and Jon Fearn?
Mourinho: Now I go, have a good weekend. (He gets up from his chair and walks towards the door)
The article represents a form of conversation, and thus reflects the interactional focus and low
information density already identified as characterising high scores on F1. If the transcript was
substituted by a summary, the amount of lexical information presented in the same space would
probably increase. Among the LFs which might have influenced such a high F1 score, second
person pronouns and determiners are those whose frequency is highest with respect to the corpus
mean (6.90 standard deviations above it). They are used by both participants in the conversation to
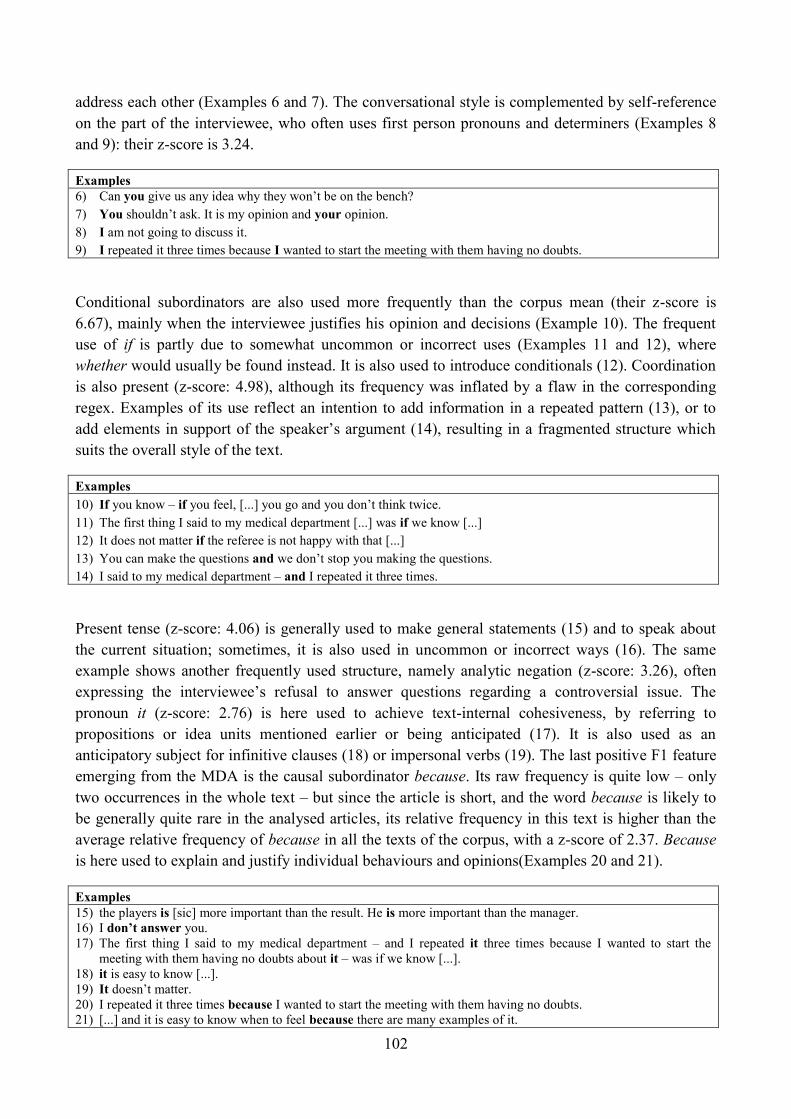
102
address each other (Examples 6 and 7). The conversational style is complemented by self-reference
on the part of the interviewee, who often uses first person pronouns and determiners (Examples 8
and 9): their z-score is 3.24.
Examples
6) Can you give us any idea why they won‘t be on the bench?
7) You shouldn‘t ask. It is my opinion and your opinion.
8) I am not going to discuss it.
9) I repeated it three times because I wanted to start the meeting with them having no doubts.
Conditional subordinators are also used more frequently than the corpus mean (their z-score is
6.67), mainly when the interviewee justifies his opinion and decisions (Example 10). The frequent
use of if is partly due to somewhat uncommon or incorrect uses (Examples 11 and 12), where
whether would usually be found instead. It is also used to introduce conditionals (12). Coordination
is also present (z-score: 4.98), although its frequency was inflated by a flaw in the corresponding
regex. Examples of its use reflect an intention to add information in a repeated pattern (13), or to
add elements in support of the speaker‘s argument (14), resulting in a fragmented structure which
suits the overall style of the text.
Examples
10) If you know – if you feel, [...] you go and you don‘t think twice.
11) The first thing I said to my medical department [...] was if we know [...]
12) It does not matter if the referee is not happy with that [...]
13) You can make the questions and we don‘t stop you making the questions.
14) I said to my medical department – and I repeated it three times.
Present tense (z-score: 4.06) is generally used to make general statements (15) and to speak about
the current situation; sometimes, it is also used in uncommon or incorrect ways (16). The same
example shows another frequently used structure, namely analytic negation (z-score: 3.26), often
expressing the interviewee‘s refusal to answer questions regarding a controversial issue. The
pronoun it (z-score: 2.76) is here used to achieve text-internal cohesiveness, by referring to
propositions or idea units mentioned earlier or being anticipated (17). It is also used as an
anticipatory subject for infinitive clauses (18) or impersonal verbs (19). The last positive F1 feature
emerging from the MDA is the causal subordinator because. Its raw frequency is quite low – only
two occurrences in the whole text – but since the article is short, and the word because is likely to
be generally quite rare in the analysed articles, its relative frequency in this text is higher than the
average relative frequency of because in all the texts of the corpus, with a z-score of 2.37. Because
is here used to explain and justify individual behaviours and opinions(Examples 20 and 21).
Examples 15) the players is [sic] more important than the result. He is more important than the manager.
16) I don‘t answer you.
17) The first thing I said to my medical department – and I repeated it three times because I wanted to start the
meeting with them having no doubts about it – was if we know [...].
18) it is easy to know [...].
19) It doesn‘t matter.
20) I repeated it three times because I wanted to start the meeting with them having no doubts.
21) [...] and it is easy to know when to feel because there are many examples of it.
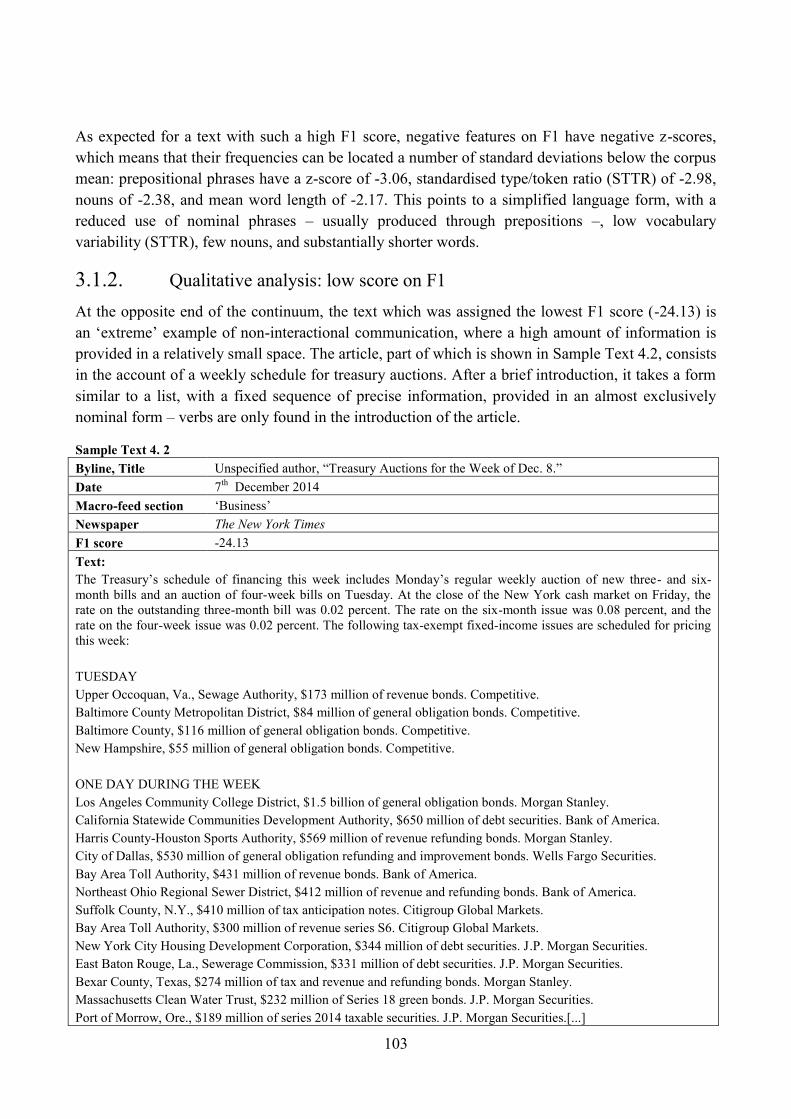
103
As expected for a text with such a high F1 score, negative features on F1 have negative z-scores,
which means that their frequencies can be located a number of standard deviations below the corpus
mean: prepositional phrases have a z-score of -3.06, standardised type/token ratio (STTR) of -2.98,
nouns of -2.38, and mean word length of -2.17. This points to a simplified language form, with a
reduced use of nominal phrases – usually produced through prepositions –, low vocabulary
variability (STTR), few nouns, and substantially shorter words.
3.1.2. Qualitative analysis: low score on F1
At the opposite end of the continuum, the text which was assigned the lowest F1 score (-24.13) is
an ‗extreme‘ example of non-interactional communication, where a high amount of information is
provided in a relatively small space. The article, part of which is shown in Sample Text 4.2, consists
in the account of a weekly schedule for treasury auctions. After a brief introduction, it takes a form
similar to a list, with a fixed sequence of precise information, provided in an almost exclusively
nominal form – verbs are only found in the introduction of the article.
Sample Text 4. 2
Byline, Title Unspecified author, ―Treasury Auctions for the Week of Dec. 8.‖
Date 7th
December 2014
Macro-feed section ‗Business‘
Newspaper The New York Times
F1 score -24.13
Text:
The Treasury‘s schedule of financing this week includes Monday‘s regular weekly auction of new three- and six-
month bills and an auction of four-week bills on Tuesday. At the close of the New York cash market on Friday, the
rate on the outstanding three-month bill was 0.02 percent. The rate on the six-month issue was 0.08 percent, and the
rate on the four-week issue was 0.02 percent. The following tax-exempt fixed-income issues are scheduled for pricing
this week:
TUESDAY
Upper Occoquan, Va., Sewage Authority, $173 million of revenue bonds. Competitive.
Baltimore County Metropolitan District, $84 million of general obligation bonds. Competitive.
Baltimore County, $116 million of general obligation bonds. Competitive.
New Hampshire, $55 million of general obligation bonds. Competitive.
ONE DAY DURING THE WEEK
Los Angeles Community College District, $1.5 billion of general obligation bonds. Morgan Stanley.
California Statewide Communities Development Authority, $650 million of debt securities. Bank of America.
Harris County-Houston Sports Authority, $569 million of revenue refunding bonds. Morgan Stanley.
City of Dallas, $530 million of general obligation refunding and improvement bonds. Wells Fargo Securities.
Bay Area Toll Authority, $431 million of revenue bonds. Bank of America.
Northeast Ohio Regional Sewer District, $412 million of revenue and refunding bonds. Bank of America.
Suffolk County, N.Y., $410 million of tax anticipation notes. Citigroup Global Markets.
Bay Area Toll Authority, $300 million of revenue series S6. Citigroup Global Markets.
New York City Housing Development Corporation, $344 million of debt securities. J.P. Morgan Securities.
East Baton Rouge, La., Sewerage Commission, $331 million of debt securities. J.P. Morgan Securities.
Bexar County, Texas, $274 million of tax and revenue and refunding bonds. Morgan Stanley.
Massachusetts Clean Water Trust, $232 million of Series 18 green bonds. J.P. Morgan Securities.
Port of Morrow, Ore., $189 million of series 2014 taxable securities. J.P. Morgan Securities.[...]
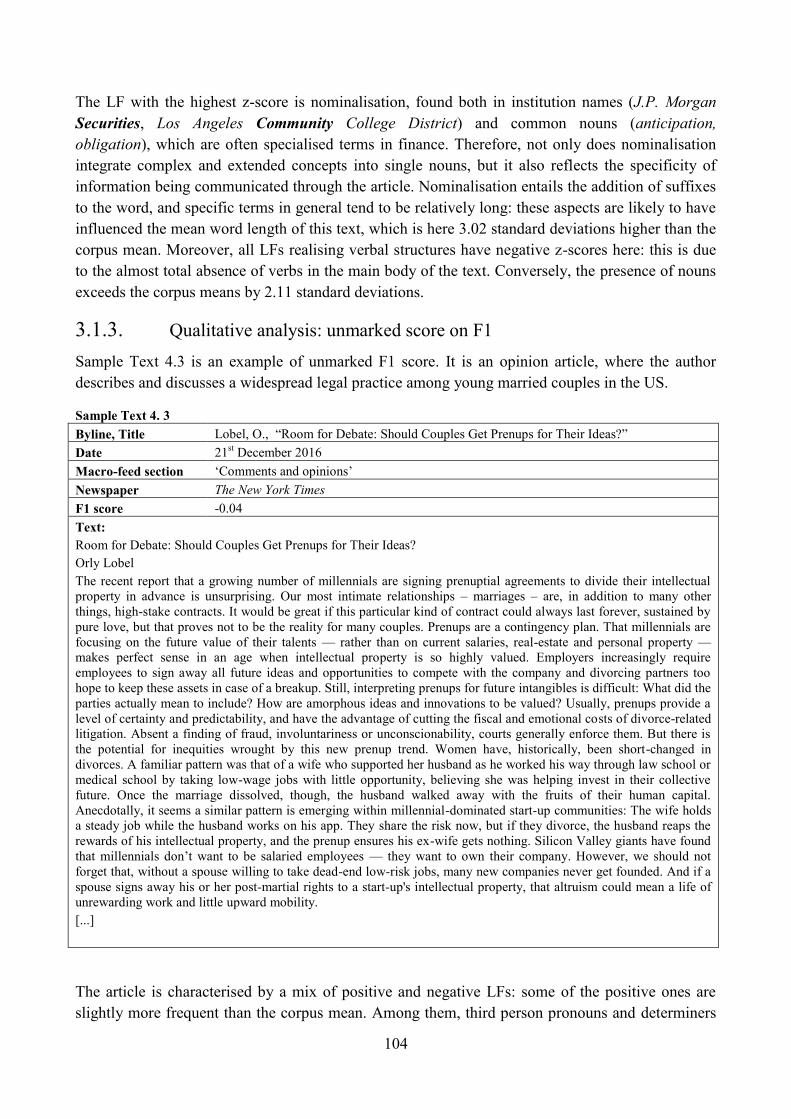
104
The LF with the highest z-score is nominalisation, found both in institution names (J.P. Morgan
Securities, Los Angeles Community College District) and common nouns (anticipation,
obligation), which are often specialised terms in finance. Therefore, not only does nominalisation
integrate complex and extended concepts into single nouns, but it also reflects the specificity of
information being communicated through the article. Nominalisation entails the addition of suffixes
to the word, and specific terms in general tend to be relatively long: these aspects are likely to have
influenced the mean word length of this text, which is here 3.02 standard deviations higher than the
corpus mean. Moreover, all LFs realising verbal structures have negative z-scores here: this is due
to the almost total absence of verbs in the main body of the text. Conversely, the presence of nouns
exceeds the corpus means by 2.11 standard deviations.
3.1.3. Qualitative analysis: unmarked score on F1
Sample Text 4.3 is an example of unmarked F1 score. It is an opinion article, where the author
describes and discusses a widespread legal practice among young married couples in the US.
Sample Text 4. 3
Byline, Title Lobel, O., ―Room for Debate: Should Couples Get Prenups for Their Ideas?‖
Date 21st December 2016
Macro-feed section ‗Comments and opinions‘
Newspaper The New York Times
F1 score -0.04
Text:
Room for Debate: Should Couples Get Prenups for Their Ideas?
Orly Lobel
The recent report that a growing number of millennials are signing prenuptial agreements to divide their intellectual
property in advance is unsurprising. Our most intimate relationships – marriages – are, in addition to many other
things, high-stake contracts. It would be great if this particular kind of contract could always last forever, sustained by
pure love, but that proves not to be the reality for many couples. Prenups are a contingency plan. That millennials are
focusing on the future value of their talents — rather than on current salaries, real-estate and personal property —
makes perfect sense in an age when intellectual property is so highly valued. Employers increasingly require
employees to sign away all future ideas and opportunities to compete with the company and divorcing partners too
hope to keep these assets in case of a breakup. Still, interpreting prenups for future intangibles is difficult: What did the
parties actually mean to include? How are amorphous ideas and innovations to be valued? Usually, prenups provide a
level of certainty and predictability, and have the advantage of cutting the fiscal and emotional costs of divorce-related
litigation. Absent a finding of fraud, involuntariness or unconscionability, courts generally enforce them. But there is
the potential for inequities wrought by this new prenup trend. Women have, historically, been short-changed in
divorces. A familiar pattern was that of a wife who supported her husband as he worked his way through law school or
medical school by taking low-wage jobs with little opportunity, believing she was helping invest in their collective
future. Once the marriage dissolved, though, the husband walked away with the fruits of their human capital.
Anecdotally, it seems a similar pattern is emerging within millennial-dominated start-up communities: The wife holds
a steady job while the husband works on his app. They share the risk now, but if they divorce, the husband reaps the
rewards of his intellectual property, and the prenup ensures his ex-wife gets nothing. Silicon Valley giants have found
that millennials don‘t want to be salaried employees — they want to own their company. However, we should not
forget that, without a spouse willing to take dead-end low-risk jobs, many new companies never get founded. And if a
spouse signs away his or her post-martial rights to a start-up's intellectual property, that altruism could mean a life of
unrewarding work and little upward mobility.
[...]
The article is characterised by a mix of positive and negative LFs: some of the positive ones are
slightly more frequent than the corpus mean. Among them, third person pronouns and determiners
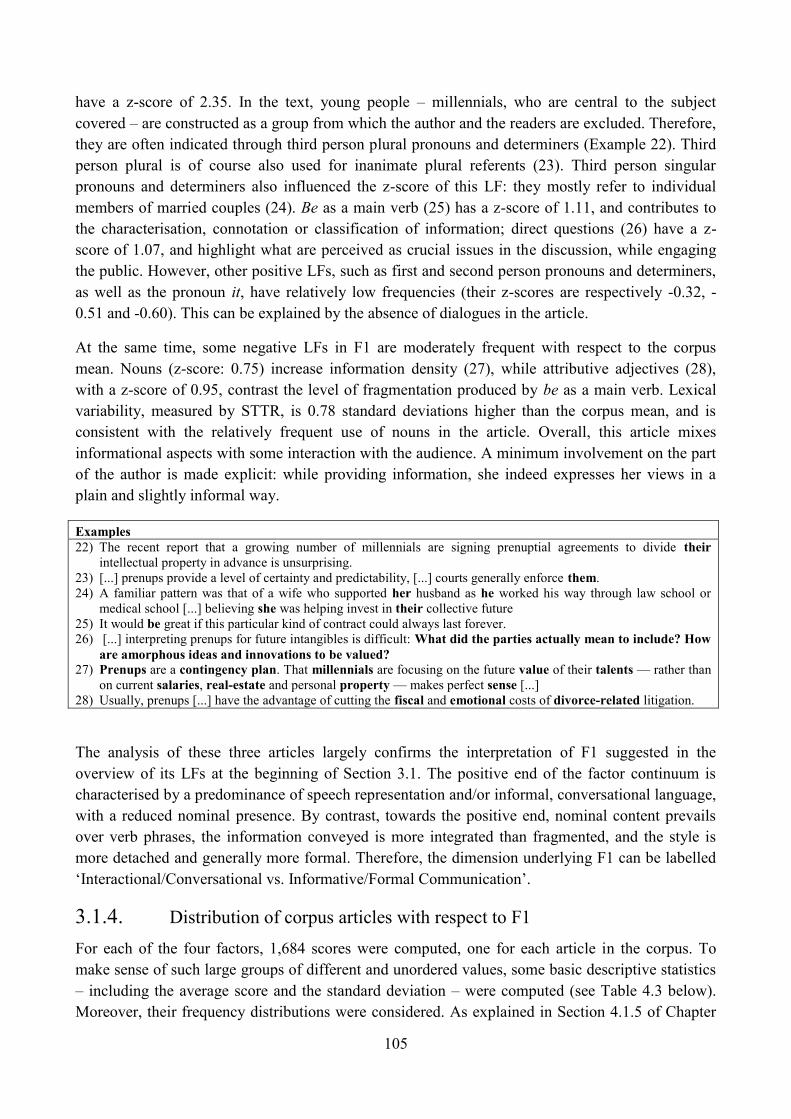
105
have a z-score of 2.35. In the text, young people – millennials, who are central to the subject
covered – are constructed as a group from which the author and the readers are excluded. Therefore,
they are often indicated through third person plural pronouns and determiners (Example 22). Third
person plural is of course also used for inanimate plural referents (23). Third person singular
pronouns and determiners also influenced the z-score of this LF: they mostly refer to individual
members of married couples (24). Be as a main verb (25) has a z-score of 1.11, and contributes to
the characterisation, connotation or classification of information; direct questions (26) have a z-
score of 1.07, and highlight what are perceived as crucial issues in the discussion, while engaging
the public. However, other positive LFs, such as first and second person pronouns and determiners,
as well as the pronoun it, have relatively low frequencies (their z-scores are respectively -0.32, -
0.51 and -0.60). This can be explained by the absence of dialogues in the article.
At the same time, some negative LFs in F1 are moderately frequent with respect to the corpus
mean. Nouns (z-score: 0.75) increase information density (27), while attributive adjectives (28),
with a z-score of 0.95, contrast the level of fragmentation produced by be as a main verb. Lexical
variability, measured by STTR, is 0.78 standard deviations higher than the corpus mean, and is
consistent with the relatively frequent use of nouns in the article. Overall, this article mixes
informational aspects with some interaction with the audience. A minimum involvement on the part
of the author is made explicit: while providing information, she indeed expresses her views in a
plain and slightly informal way.
Examples 22) The recent report that a growing number of millennials are signing prenuptial agreements to divide their
intellectual property in advance is unsurprising.
23) [...] prenups provide a level of certainty and predictability, [...] courts generally enforce them.
24) A familiar pattern was that of a wife who supported her husband as he worked his way through law school or
medical school [...] believing she was helping invest in their collective future
25) It would be great if this particular kind of contract could always last forever.
26) [...] interpreting prenups for future intangibles is difficult: What did the parties actually mean to include? How
are amorphous ideas and innovations to be valued? 27) Prenups are a contingency plan. That millennials are focusing on the future value of their talents — rather than
on current salaries, real-estate and personal property — makes perfect sense [...]
28) Usually, prenups [...] have the advantage of cutting the fiscal and emotional costs of divorce-related litigation.
The analysis of these three articles largely confirms the interpretation of F1 suggested in the
overview of its LFs at the beginning of Section 3.1. The positive end of the factor continuum is
characterised by a predominance of speech representation and/or informal, conversational language,
with a reduced nominal presence. By contrast, towards the positive end, nominal content prevails
over verb phrases, the information conveyed is more integrated than fragmented, and the style is
more detached and generally more formal. Therefore, the dimension underlying F1 can be labelled
‗Interactional/Conversational vs. Informative/Formal Communication‘.
3.1.4. Distribution of corpus articles with respect to F1
For each of the four factors, 1,684 scores were computed, one for each article in the corpus. To
make sense of such large groups of different and unordered values, some basic descriptive statistics
– including the average score and the standard deviation – were computed (see Table 4.3 below).
Moreover, their frequency distributions were considered. As explained in Section 4.1.5 of Chapter
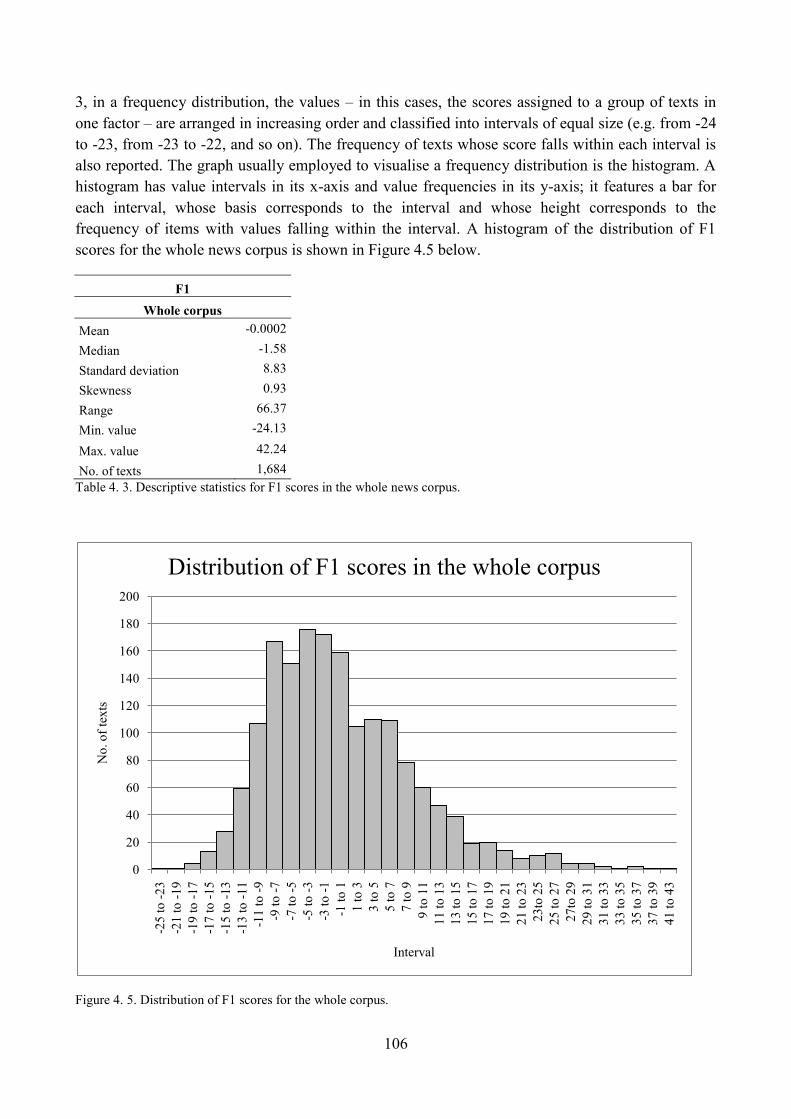
106
3, in a frequency distribution, the values – in this cases, the scores assigned to a group of texts in
one factor – are arranged in increasing order and classified into intervals of equal size (e.g. from -24
to -23, from -23 to -22, and so on). The frequency of texts whose score falls within each interval is
also reported. The graph usually employed to visualise a frequency distribution is the histogram. A
histogram has value intervals in its x-axis and value frequencies in its y-axis; it features a bar for
each interval, whose basis corresponds to the interval and whose height corresponds to the
frequency of items with values falling within the interval. A histogram of the distribution of F1
scores for the whole news corpus is shown in Figure 4.5 below.
F1
Whole corpus
Mean -0.0002
Median -1.58
Standard deviation 8.83
Skewness 0.93
Range 66.37
Min. value -24.13
Max. value 42.24
No. of texts 1,684
Table 4. 3. Descriptive statistics for F1 scores in the whole news corpus.
Figure 4. 5. Distribution of F1 scores for the whole corpus.
0
20
40
60
80
100
120
140
160
180
200
-25
to
-2
3
-21
to
-1
9
-19
to
-1
7
-17
to
-1
5
-15
to
-1
3
-13
to
-1
1
-11
to
-9
-9 t
o -
7
-7 t
o -
5
-5 t
o -
3
-3 t
o -
1
-1 t
o 1
1 t
o 3
3 t
o 5
5 t
o 7
7 t
o 9
9 t
o 1
1
11
to
13
13
to
15
15
to
17
17
to
19
19
to
21
21
to
23
23
to 2
5
25
to
27
27
to 2
9
29
to
31
31
to
33
33
to
35
35
to
37
37
to
39
41
to
43
No
. o
f te
xts
Interval
Distribution of F1 scores in the whole corpus
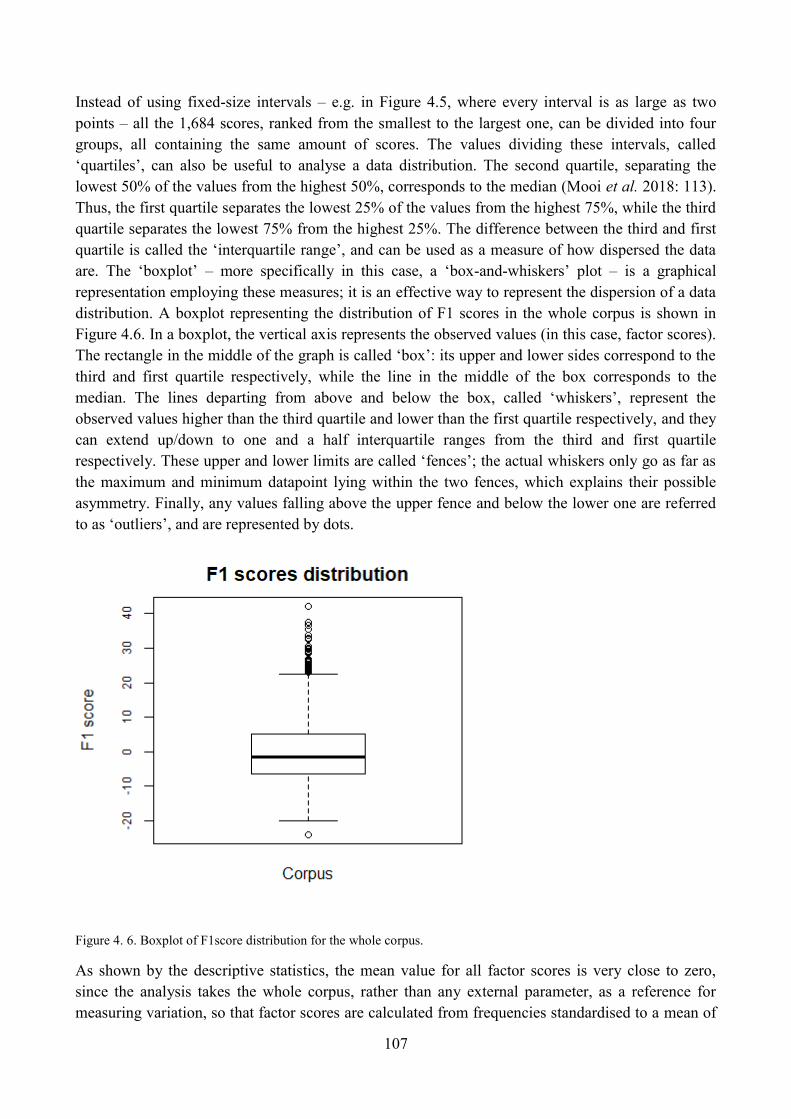
107
Instead of using fixed-size intervals – e.g. in Figure 4.5, where every interval is as large as two
points – all the 1,684 scores, ranked from the smallest to the largest one, can be divided into four
groups, all containing the same amount of scores. The values dividing these intervals, called
‗quartiles‘, can also be useful to analyse a data distribution. The second quartile, separating the
lowest 50% of the values from the highest 50%, corresponds to the median (Mooi et al. 2018: 113).
Thus, the first quartile separates the lowest 25% of the values from the highest 75%, while the third
quartile separates the lowest 75% from the highest 25%. The difference between the third and first
quartile is called the ‗interquartile range‘, and can be used as a measure of how dispersed the data
are. The ‗boxplot‘ – more specifically in this case, a ‗box-and-whiskers‘ plot – is a graphical
representation employing these measures; it is an effective way to represent the dispersion of a data
distribution. A boxplot representing the distribution of F1 scores in the whole corpus is shown in
Figure 4.6. In a boxplot, the vertical axis represents the observed values (in this case, factor scores).
The rectangle in the middle of the graph is called ‗box‘: its upper and lower sides correspond to the
third and first quartile respectively, while the line in the middle of the box corresponds to the
median. The lines departing from above and below the box, called ‗whiskers‘, represent the
observed values higher than the third quartile and lower than the first quartile respectively, and they
can extend up/down to one and a half interquartile ranges from the third and first quartile
respectively. These upper and lower limits are called ‗fences‘; the actual whiskers only go as far as
the maximum and minimum datapoint lying within the two fences, which explains their possible
asymmetry. Finally, any values falling above the upper fence and below the lower one are referred
to as ‗outliers‘, and are represented by dots.
Figure 4. 6. Boxplot of F1score distribution for the whole corpus.
As shown by the descriptive statistics, the mean value for all factor scores is very close to zero,
since the analysis takes the whole corpus, rather than any external parameter, as a reference for
measuring variation, so that factor scores are calculated from frequencies standardised to a mean of
108
0. For F1, there is a standard deviation of almost nine points, which indicates that a good part of the
texts in the corpus is likely to have a score between 9 and -9. This seems a wide range, but it is quite
small compared to the overall range, that is, the difference between the lowest and highest score,
which exceeds 66 points. As for the distribution of F1 scores, the histogram confirms that most
texts have scores somewhat close to the mean – and therefore unmarked for the factor. There is a
moderately positive skewness, meaning that the bulk of the texts tends to be found to the left side of
the graph with respect to the mean (see Spatz 2011: 34), that is towards negative scores. There are
several texts with moderately low scores (-4 to -8) and decreasing numbers of texts with lower
scores (down to around -24). At the positive end of the continuum, extreme scores – the outliers on
the boxplot – tend to be higher in absolute terms and larger in number – although spanning a much
wider range of scores – than the negative ones.
3.2. Interpretation of Factor 2
Factor 2 only has positive salient LFs. The one with the largest loading is the lexical class of public
verbs (e.g. claim, say, report) which often mark reported speech. Biber primarily associates them
with indirect statements, such as the one in Example (29). The public verb say is among the most
frequent words in the present corpus (see Section 9.1 in Chapter 5), and it is used to introduce both
direct and indirect speech (see also Example 30, where said follows the direct speech). In the
language of news, reported statements play a key role; in the present analysis, however, their
inclusion within one of two opposite communicative trends in the corpus suggests that there might
be a high variability in their use across different types of articles.
Examples 29) Friends said he blamed himself for the defeat.
30) His next goal is to make himself redundant from his position as figurehead of the movement. "I'm not the wick nor
wax but the spark," he said.
Another important LF in this factor is subordinator that deletion, exemplified in (31), where the
deletion results in a ‗reduced‘ form of (32). As this is a form of clause subordination, it is generally
taken as a marker of syntactic complexity. However, subordination is not a unified construct and
different types of structural dependency have different discourse functions, so that they can be
found in different genres (Halliday and Matthiessen 2004: 654). For example, finite nominal
clauses, such as that- and wh- clauses were found to be more frequent in speech, while non-finite
nominal clauses, such as infinitive and participial clauses, are thought to be more frequent in
writing (Biber 1988: 229). This reduced form is classified by Biber among the ‗dispreferred‘ ones in
edited writing, and is regarded as conveying a somewhat more generalised content than its non-
reduced counterpart. In the present corpus, however, That as verb complement (see Example 33)
also has a positive loading on F2, which means that it often co-occurs with subordinator that
deletion. That as verb complement is typically associated with informational elaboration through
the expansion of idea units, where the complement clause presents the propositional content, which
is somehow evaluated in the main clause. Here, concordance inspection and qualitative analyses
seem to suggest that the one of the main purposes of that- subordination might be reporting, which
would be in line with the overall factor.
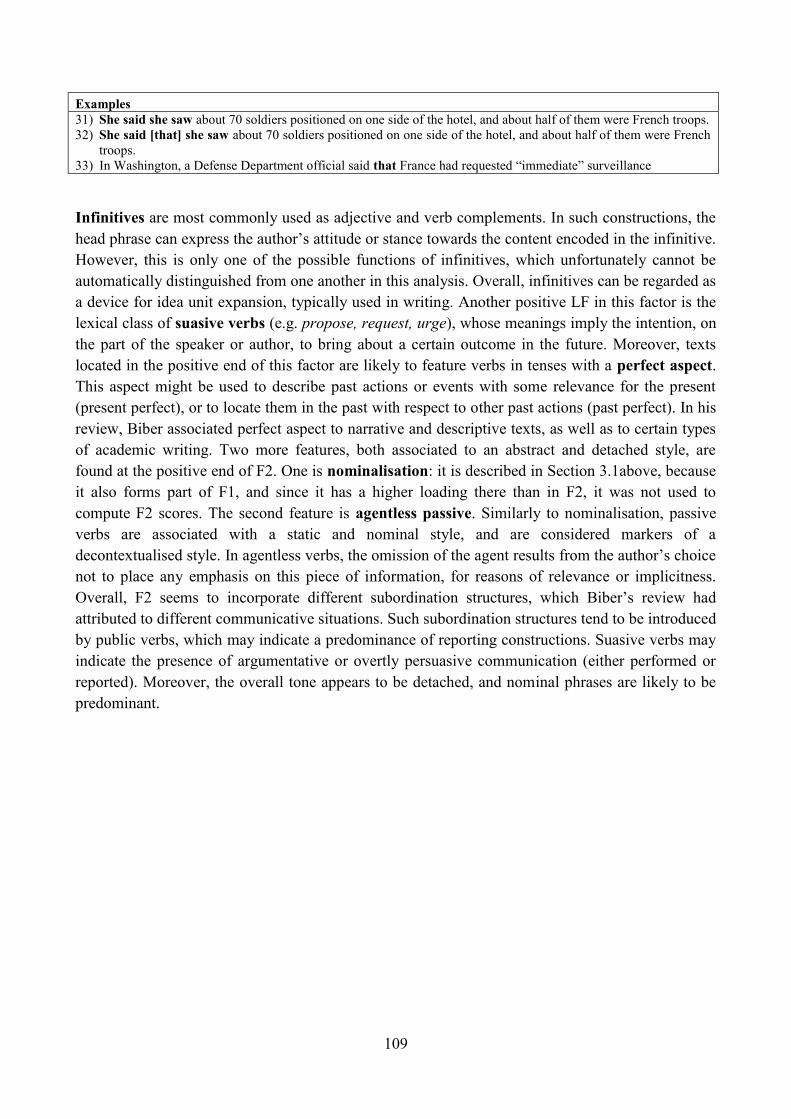
109
Examples 31) She said she saw about 70 soldiers positioned on one side of the hotel, and about half of them were French troops.
32) She said [that] she saw about 70 soldiers positioned on one side of the hotel, and about half of them were French
troops. 33) In Washington, a Defense Department official said that France had requested ―immediate‖ surveillance
Infinitives are most commonly used as adjective and verb complements. In such constructions, the
head phrase can express the author‘s attitude or stance towards the content encoded in the infinitive.
However, this is only one of the possible functions of infinitives, which unfortunately cannot be
automatically distinguished from one another in this analysis. Overall, infinitives can be regarded as
a device for idea unit expansion, typically used in writing. Another positive LF in this factor is the
lexical class of suasive verbs (e.g. propose, request, urge), whose meanings imply the intention, on
the part of the speaker or author, to bring about a certain outcome in the future. Moreover, texts
located in the positive end of this factor are likely to feature verbs in tenses with a perfect aspect.
This aspect might be used to describe past actions or events with some relevance for the present
(present perfect), or to locate them in the past with respect to other past actions (past perfect). In his
review, Biber associated perfect aspect to narrative and descriptive texts, as well as to certain types
of academic writing. Two more features, both associated to an abstract and detached style, are
found at the positive end of F2. One is nominalisation: it is described in Section 3.1above, because
it also forms part of F1, and since it has a higher loading there than in F2, it was not used to
compute F2 scores. The second feature is agentless passive. Similarly to nominalisation, passive
verbs are associated with a static and nominal style, and are considered markers of a
decontextualised style. In agentless verbs, the omission of the agent results from the author‘s choice
not to place any emphasis on this piece of information, for reasons of relevance or implicitness.
Overall, F2 seems to incorporate different subordination structures, which Biber‘s review had
attributed to different communicative situations. Such subordination structures tend to be introduced
by public verbs, which may indicate a predominance of reporting constructions. Suasive verbs may
indicate the presence of argumentative or overtly persuasive communication (either performed or
reported). Moreover, the overall tone appears to be detached, and nominal phrases are likely to be
predominant.
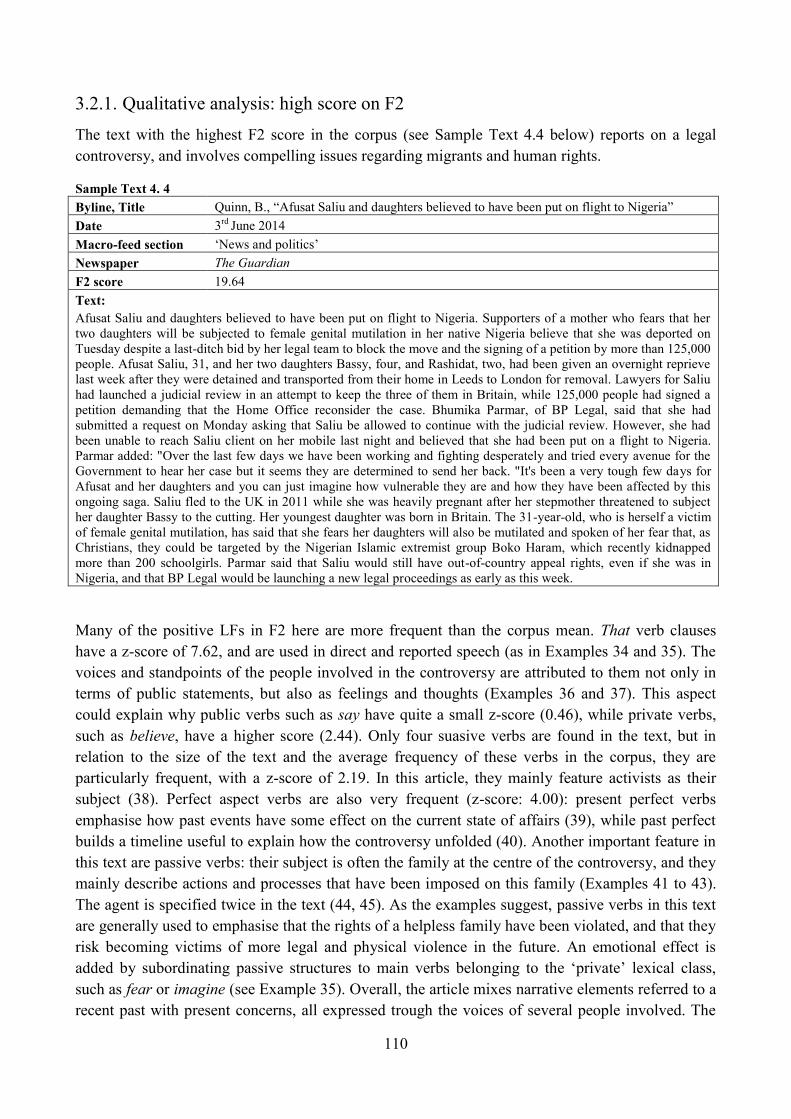
110
3.2.1. Qualitative analysis: high score on F2
The text with the highest F2 score in the corpus (see Sample Text 4.4 below) reports on a legal
controversy, and involves compelling issues regarding migrants and human rights.
Sample Text 4. 4
Byline, Title Quinn, B., ―Afusat Saliu and daughters believed to have been put on flight to Nigeria‖
Date 3rd
June 2014
Macro-feed section ‗News and politics‘
Newspaper The Guardian
F2 score 19.64
Text:
Afusat Saliu and daughters believed to have been put on flight to Nigeria. Supporters of a mother who fears that her
two daughters will be subjected to female genital mutilation in her native Nigeria believe that she was deported on
Tuesday despite a last-ditch bid by her legal team to block the move and the signing of a petition by more than 125,000
people. Afusat Saliu, 31, and her two daughters Bassy, four, and Rashidat, two, had been given an overnight reprieve
last week after they were detained and transported from their home in Leeds to London for removal. Lawyers for Saliu
had launched a judicial review in an attempt to keep the three of them in Britain, while 125,000 people had signed a
petition demanding that the Home Office reconsider the case. Bhumika Parmar, of BP Legal, said that she had
submitted a request on Monday asking that Saliu be allowed to continue with the judicial review. However, she had
been unable to reach Saliu client on her mobile last night and believed that she had been put on a flight to Nigeria.
Parmar added: "Over the last few days we have been working and fighting desperately and tried every avenue for the
Government to hear her case but it seems they are determined to send her back. "It's been a very tough few days for
Afusat and her daughters and you can just imagine how vulnerable they are and how they have been affected by this
ongoing saga. Saliu fled to the UK in 2011 while she was heavily pregnant after her stepmother threatened to subject
her daughter Bassy to the cutting. Her youngest daughter was born in Britain. The 31-year-old, who is herself a victim
of female genital mutilation, has said that she fears her daughters will also be mutilated and spoken of her fear that, as
Christians, they could be targeted by the Nigerian Islamic extremist group Boko Haram, which recently kidnapped
more than 200 schoolgirls. Parmar said that Saliu would still have out-of-country appeal rights, even if she was in
Nigeria, and that BP Legal would be launching a new legal proceedings as early as this week.
Many of the positive LFs in F2 here are more frequent than the corpus mean. That verb clauses
have a z-score of 7.62, and are used in direct and reported speech (as in Examples 34 and 35). The
voices and standpoints of the people involved in the controversy are attributed to them not only in
terms of public statements, but also as feelings and thoughts (Examples 36 and 37). This aspect
could explain why public verbs such as say have quite a small z-score (0.46), while private verbs,
such as believe, have a higher score (2.44). Only four suasive verbs are found in the text, but in
relation to the size of the text and the average frequency of these verbs in the corpus, they are
particularly frequent, with a z-score of 2.19. In this article, they mainly feature activists as their
subject (38). Perfect aspect verbs are also very frequent (z-score: 4.00): present perfect verbs
emphasise how past events have some effect on the current state of affairs (39), while past perfect
builds a timeline useful to explain how the controversy unfolded (40). Another important feature in
this text are passive verbs: their subject is often the family at the centre of the controversy, and they
mainly describe actions and processes that have been imposed on this family (Examples 41 to 43).
The agent is specified twice in the text (44, 45). As the examples suggest, passive verbs in this text
are generally used to emphasise that the rights of a helpless family have been violated, and that they
risk becoming victims of more legal and physical violence in the future. An emotional effect is
added by subordinating passive structures to main verbs belonging to the ‗private‘ lexical class,
such as fear or imagine (see Example 35). Overall, the article mixes narrative elements referred to a
recent past with present concerns, all expressed trough the voices of several people involved. The
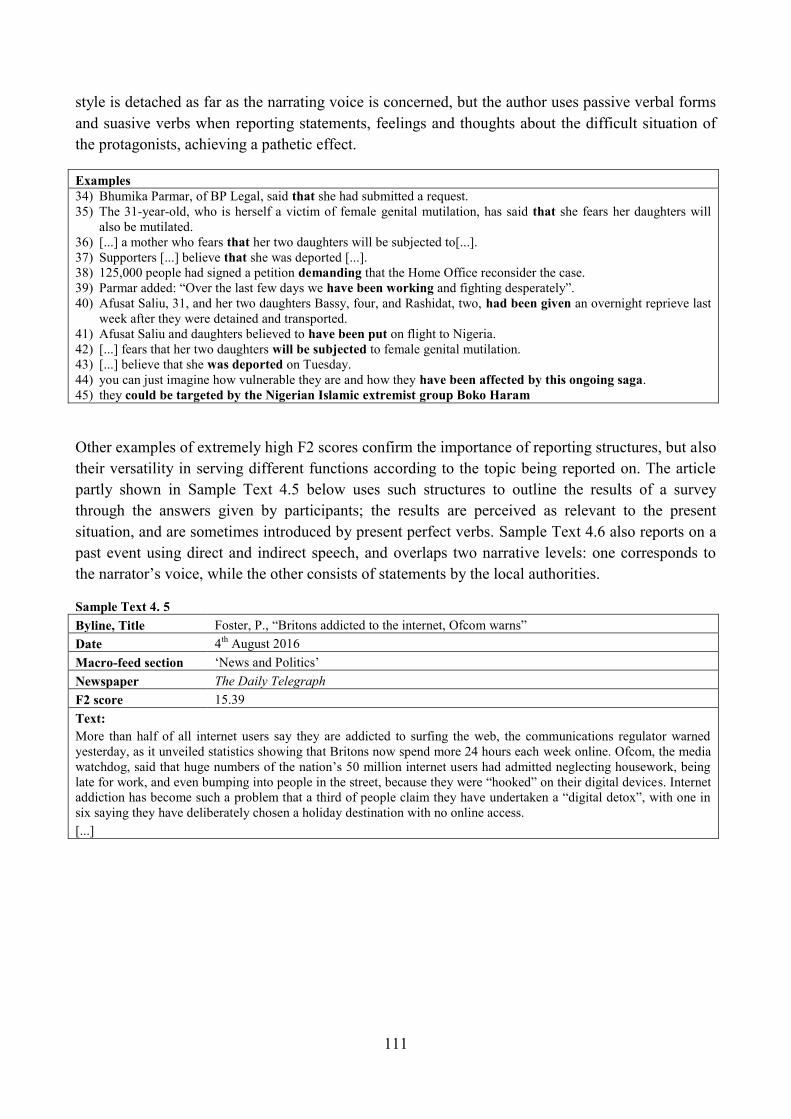
111
style is detached as far as the narrating voice is concerned, but the author uses passive verbal forms
and suasive verbs when reporting statements, feelings and thoughts about the difficult situation of
the protagonists, achieving a pathetic effect.
Examples
34) Bhumika Parmar, of BP Legal, said that she had submitted a request.
35) The 31-year-old, who is herself a victim of female genital mutilation, has said that she fears her daughters will
also be mutilated. 36) [...] a mother who fears that her two daughters will be subjected to[...].
37) Supporters [...] believe that she was deported [...].
38) 125,000 people had signed a petition demanding that the Home Office reconsider the case.
39) Parmar added: ―Over the last few days we have been working and fighting desperately‖.
40) Afusat Saliu, 31, and her two daughters Bassy, four, and Rashidat, two, had been given an overnight reprieve last
week after they were detained and transported.
41) Afusat Saliu and daughters believed to have been put on flight to Nigeria.
42) [...] fears that her two daughters will be subjected to female genital mutilation.
43) [...] believe that she was deported on Tuesday.
44) you can just imagine how vulnerable they are and how they have been affected by this ongoing saga.
45) they could be targeted by the Nigerian Islamic extremist group Boko Haram
Other examples of extremely high F2 scores confirm the importance of reporting structures, but also
their versatility in serving different functions according to the topic being reported on. The article
partly shown in Sample Text 4.5 below uses such structures to outline the results of a survey
through the answers given by participants; the results are perceived as relevant to the present
situation, and are sometimes introduced by present perfect verbs. Sample Text 4.6 also reports on a
past event using direct and indirect speech, and overlaps two narrative levels: one corresponds to
the narrator‘s voice, while the other consists of statements by the local authorities.
Sample Text 4. 5
Byline, Title Foster, P., ―Britons addicted to the internet, Ofcom warns‖
Date 4th
August 2016
Macro-feed section ‗News and Politics‘
Newspaper The Daily Telegraph
F2 score 15.39
Text:
More than half of all internet users say they are addicted to surfing the web, the communications regulator warned
yesterday, as it unveiled statistics showing that Britons now spend more 24 hours each week online. Ofcom, the media
watchdog, said that huge numbers of the nation‘s 50 million internet users had admitted neglecting housework, being
late for work, and even bumping into people in the street, because they were ―hooked‖ on their digital devices. Internet
addiction has become such a problem that a third of people claim they have undertaken a ―digital detox‖, with one in
six saying they have deliberately chosen a holiday destination with no online access.
[...]
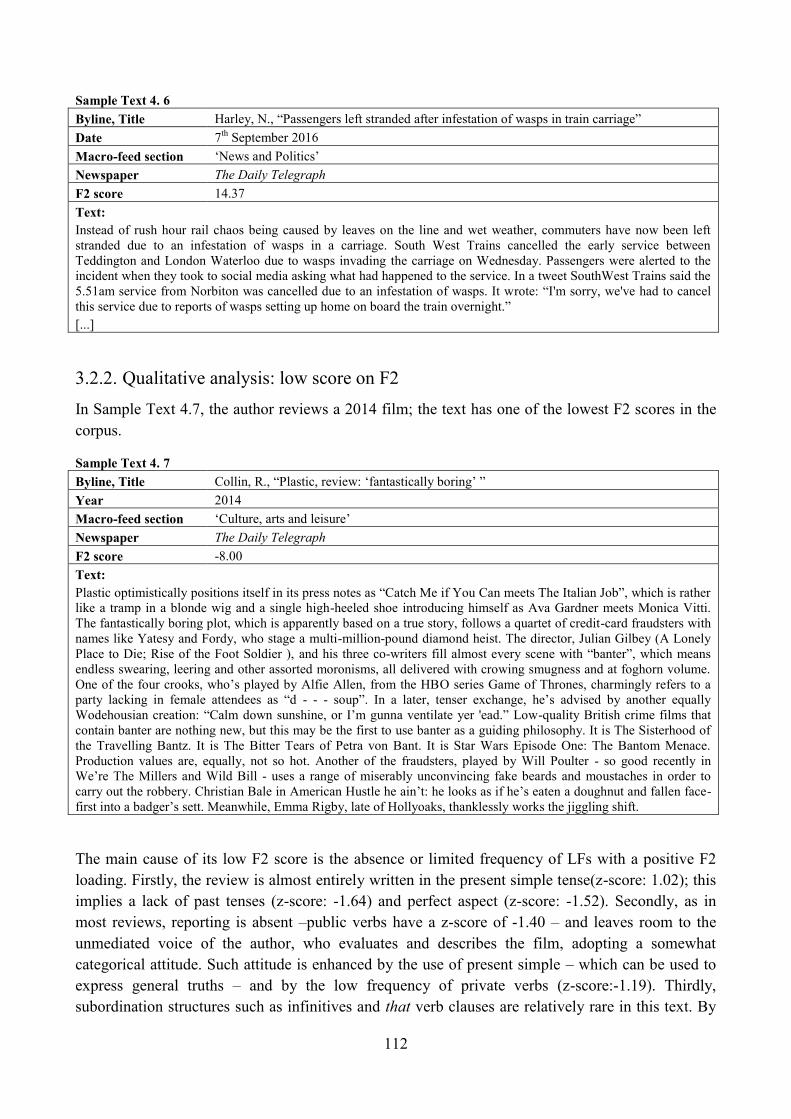
112
Sample Text 4. 6
Byline, Title Harley, N., ―Passengers left stranded after infestation of wasps in train carriage‖
Date 7th
September 2016
Macro-feed section ‗News and Politics‘
Newspaper The Daily Telegraph
F2 score 14.37
Text:
Instead of rush hour rail chaos being caused by leaves on the line and wet weather, commuters have now been left
stranded due to an infestation of wasps in a carriage. South West Trains cancelled the early service between
Teddington and London Waterloo due to wasps invading the carriage on Wednesday. Passengers were alerted to the
incident when they took to social media asking what had happened to the service. In a tweet SouthWest Trains said the
5.51am service from Norbiton was cancelled due to an infestation of wasps. It wrote: ―I'm sorry, we've had to cancel
this service due to reports of wasps setting up home on board the train overnight.‖
[...]
3.2.2. Qualitative analysis: low score on F2
In Sample Text 4.7, the author reviews a 2014 film; the text has one of the lowest F2 scores in the
corpus.
Sample Text 4. 7
Byline, Title Collin, R., ―Plastic, review: ‗fantastically boring‘ ‖
Year 2014
Macro-feed section ‗Culture, arts and leisure‘
Newspaper The Daily Telegraph
F2 score -8.00
Text:
Plastic optimistically positions itself in its press notes as ―Catch Me if You Can meets The Italian Job‖, which is rather
like a tramp in a blonde wig and a single high-heeled shoe introducing himself as Ava Gardner meets Monica Vitti.
The fantastically boring plot, which is apparently based on a true story, follows a quartet of credit-card fraudsters with
names like Yatesy and Fordy, who stage a multi-million-pound diamond heist. The director, Julian Gilbey (A Lonely
Place to Die; Rise of the Foot Soldier ), and his three co-writers fill almost every scene with ―banter‖, which means
endless swearing, leering and other assorted moronisms, all delivered with crowing smugness and at foghorn volume.
One of the four crooks, who‘s played by Alfie Allen, from the HBO series Game of Thrones, charmingly refers to a
party lacking in female attendees as ―d - - - soup‖. In a later, tenser exchange, he‘s advised by another equally
Wodehousian creation: ―Calm down sunshine, or I‘m gunna ventilate yer 'ead.‖ Low-quality British crime films that
contain banter are nothing new, but this may be the first to use banter as a guiding philosophy. It is The Sisterhood of
the Travelling Bantz. It is The Bitter Tears of Petra von Bant. It is Star Wars Episode One: The Bantom Menace.
Production values are, equally, not so hot. Another of the fraudsters, played by Will Poulter - so good recently in
We‘re The Millers and Wild Bill - uses a range of miserably unconvincing fake beards and moustaches in order to
carry out the robbery. Christian Bale in American Hustle he ain‘t: he looks as if he‘s eaten a doughnut and fallen face-
first into a badger‘s sett. Meanwhile, Emma Rigby, late of Hollyoaks, thanklessly works the jiggling shift.
The main cause of its low F2 score is the absence or limited frequency of LFs with a positive F2
loading. Firstly, the review is almost entirely written in the present simple tense(z-score: 1.02); this
implies a lack of past tenses (z-score: -1.64) and perfect aspect (z-score: -1.52). Secondly, as in
most reviews, reporting is absent –public verbs have a z-score of -1.40 – and leaves room to the
unmediated voice of the author, who evaluates and describes the film, adopting a somewhat
categorical attitude. Such attitude is enhanced by the use of present simple – which can be used to
express general truths – and by the low frequency of private verbs (z-score:-1.19). Thirdly,
subordination structures such as infinitives and that verb clauses are relatively rare in this text. By
113
contrast, wh-relative clauses in subject position, whose function here is to develop idea units and
add information, have a z-score of 1.37. The text also relies upon parataxis and juxtaposition. The
latter is realised through a sequence of independent clauses towards the end of the article, and is
enriched by an anaphoric structure introducing a series of word plays (Example 46) in the second
half of the article.
Examples 46) It is The Sisterhood of the Travelling Bantz. It is The Bitter Tears of Petra von Bant. It is Star Wars Episode One:
The Bantom Menace.
The absence of positive F2 features results in a more direct and fragmented style, where reporting
has little or no role. While reporting structures are useful in giving the impression of authenticity
and reliability, they are also forms of attribution which transfer the responsibility of what is being
communicated to an external source. On the contrary, the absence of reporting, may be used to
present information either as more matter-of-fact, or as a direct expression of the author‘s opinion.
Other texts with extremely low F2 scores include sport articles, like Sample Text 4.8 below, whose
focus is a recent basketball game. The style is concise and the main purpose is to provide essential
information about the game and its context – the names of players or teams, their current situation
and overall placing, who is the favourite, the main events and final results of the game, etc.
Sample Text 4. 8
Byline, Title Peterson, A. M., ―Aldridge Leads Trail Blazers to 108-87 Win Over Suns‖
Date 6th
February 2015
Macro-feed section ‗Sport‘
Newspaper The New York Times
F2 score -8.23
Text:
PORTLAND, Ore. — LaMarcus Aldridge had 19 points and 13 rebounds for his team-record 220th double-double,
and the Portland Trail Blazers beat the Phoenix Suns 108-87 on Thursday night. Nicolas Batum scored 20 points and
Robin Lopez, playing his second game after missing 23 with a broken right hand, had 11 points and 12 rebounds for
the Blazers, who won their second straight after a three-game skid. Markieff Morris had 18 points for the Suns, who
dropped their third in a row. Phoenix climbed back into the game in the third period after trailing by 19 in the first half,
but ultimately the Blazers thwarted the rally with a dominant fourth quarter. Portland opened the fourth with a 9-2 run
to go up 75-67.
[...]
Sample Text 4.9, which also received a markedly negative F2 score, is a listing for opera and
classical music in New York City within a particular period of time. The listing contains a brief
presentation of each production, accompanied by concise information about its cast, as well as show
dates, locations and ticket prices. The article on treasury auctions commented on in Section 3.1.2
also has a very low F2 score (-9.14), mainly due to its nominal and schematic style. In all these
examples, the absence of reporting structures results in a barer, simplified communicative style; the
author‘s is usually the only voice explicitly or implicitly contributing to the text. Present aspect
verbs are infrequent, which implies a focus either on past events as clearly distinguished from the
present, or on the current situation. Moreover, few passive verbs are found, which may contribute,
at least in some of these cases, to a less abstract style.
114
Sample Text 4. 9
Byline, Title da Fonseca-Wollheim, C., Tommasini, A., Woolfe, Z., Schweitzer, V., ―Opera and Classical
Music Listings for Jan. 10-16.‖
Date 9th
January 2014
Macro-feed section ‗Culture, arts and leisure‘
Newspaper The New York Times
F2 score -7.82
Text:
Opera ‗Angel‘s Bone‘ (Sunday and Wednesday) The visionary new-opera festival Prototype, running through Jan. 19,
returns with a full program of works. Among the pieces being performed: ―Angel‘s Bone,‖ a supernatural tale of
angels and middle-class greed, by the composer Du Yun and the librettist Royce Vavrick. Trinity Wall Street‘s music
director, Julian Wachner, conducts a mixed chamber ensemble that includes trumpets and lute and a quartet of soloists
led by Jennifer Charles from Elysian Fields. Sunday at 5 p.m., Wednesday at 9 p.m., Trinity Church, Broadway at Wall
Street, Lower Manhattan, (212) 352-3101, prototypefestival.org; $15.
[...]
3.2.3. Qualitative analysis: unmarked score on F2
The following article (see Sample Text 4.10 below), unmarked with respect to F2, deals with the
length and structure of higher education courses in the US and Europe discussing some contentious
aspects regarding the differences between the two.
Sample Text 4. 10
Byline, Title Moules, J., ―Europe‘s shorter courses dent US MBA‖
Year 25th September 2016
Macro-feed section ‗News and Politics‘
Newspaper The Financial Times
F2 score 0.008
Text:
Brian Scullin is a Washington DC-born, New Hampshire-educated executive and, by his own admission, an ―all-
American‖ guy. Except he does not hold that most American of qualifications, the MBA. Mr Scullin, who works for
Marsh, a New York insurance group, had started studying for the two-year postgraduate degree at the Smith School of
Business, University of Maryland, a few years ago, but dropped out after one term. A job transfer to Marsh‘s
Manhattan headquarters had made travelling to classes complicated. Having moved, however, Mr Scullin was
persuaded by his new colleagues, many of who had studied overseas, to switch to the part-time masters in management
programme at the London School of Economics. ―It was a matter of getting out of my comfort zone,‖ he recalls. ―It
was about becoming a more global citizen.‖ Not only was this a cheaper option but by having to travel to London only
for a few days every couple of months, Mr Scullin could keep his day job. A few months into the course he bagged a
promotion and a salary rise — a direct result of what he had learnt, Mr Scullin says. ―I could see how I could get an
edge, and I was able to put it into effect as soon as I got back to the office.‖ The two-year MBA remains the most
popular masters level degree course in the US. But applications are under pressure in 2016, according to figures
published last week by the Graduate Management Admission Council, which runs GMAT, the graduate management
admission test. For the first time since 2012, fewer than half of all full-time two-year MBA courses globally
experienced a growth in applications. This trend was more marked in the US, where only 40 per cent of schools
reported a rise in applications for their two-year MBA programmes, compared with 43 per cent worldwide. More than
half of US schools, 53 per cent, reported a decline. There is a sense of a flight to quality. Globally, applications were
up in 57 per cent of the MBA programmes with enrolment of more than 120 students, which tend to be judged as better
in business school rankings, while only a third of the programmes with 53 or fewer places saw an increase.
[...]
Here, subordination structures that load positively on F2 have a limited presence: that verb clauses
have a z-score of 0.36, and subordinator that deletions have a z-score of 0.22. Moreover, the
frequency of public verbs is very close to the mean (z-score: -0.09). Reported and direct speech are
indeed only partly used, since they are combined with explanations provided by the author. As for
115
verbal tenses, accounts of the current situation are combined with the interviewees‘ narration of past
events, which feature both past simple and past perfect verbs (the z-score for present aspect is 0.47).
Overall, F2 is based on reporting structures, combined with a focus on past events that are
perceived as recent and/or still relevant for the present situation. Reporting can serve different
functions – as suggested, for example, by the texts analysed in Section 3.2.1.However, it always
results in a form of attribution, and incorporates different voices into the text. Moreover, passive
verbs – especially without explicit agent – are particularly frequent in some of the high-score texts.
The qualitative analysis revealed that their function might not always be to create an abstract and
decontextualised style, but they might sometimes be used to elicit the reader‘s involvement or
empathy, when the patients8 of passive verbs are depicted as victims of unjust or unpleasant
processes or courses of action. On the basis of LF interpretation and qualitative analysis, the
dimension emerging from F2 can be labelled ‗Reported Account of Recent Events vs.
Direct/Factual Communication‘.
3.2.4. Distribution of corpus articles with respect to F2
The distribution of F2 scores for the whole corpus is somewhat similar to that of F1: as shown in
Figure 4.7, most of the texts are located around the mean value, that is very close to zero. The
distribution of factor scores is moderately skewed towards positive values: the ‗peak‘ indicating the
interval of scores within which the largest number of articles is included is located immediately
below zero. Moreover, while negative scores continue to decrease down to a minimum of -9.42,
fewer texts in the positive side reach higher extremes – up to 19.64 – visually creating a longer,
thinner ‗tail‘ to the right side of the mean in the histogram.
F2
Whole corpus
Mean -4.9E-17
Median -0.42
Standard deviation 3.81
Skewness 0.66
Range 29.06
Min. value -9.42
Max. value 19.64
No. of texts 1684
Table 4. 4. Descriptive statistics for F2 scores in the whole news corpus.
8 In linguistics, ‗patient‘ indicates the semantic role assigned to a noun phrase referring to someone or something
affected or acted upon by the action of a verb. Therefore, in a clause whose verb is passive, the grammatical subject has
the role of patient.
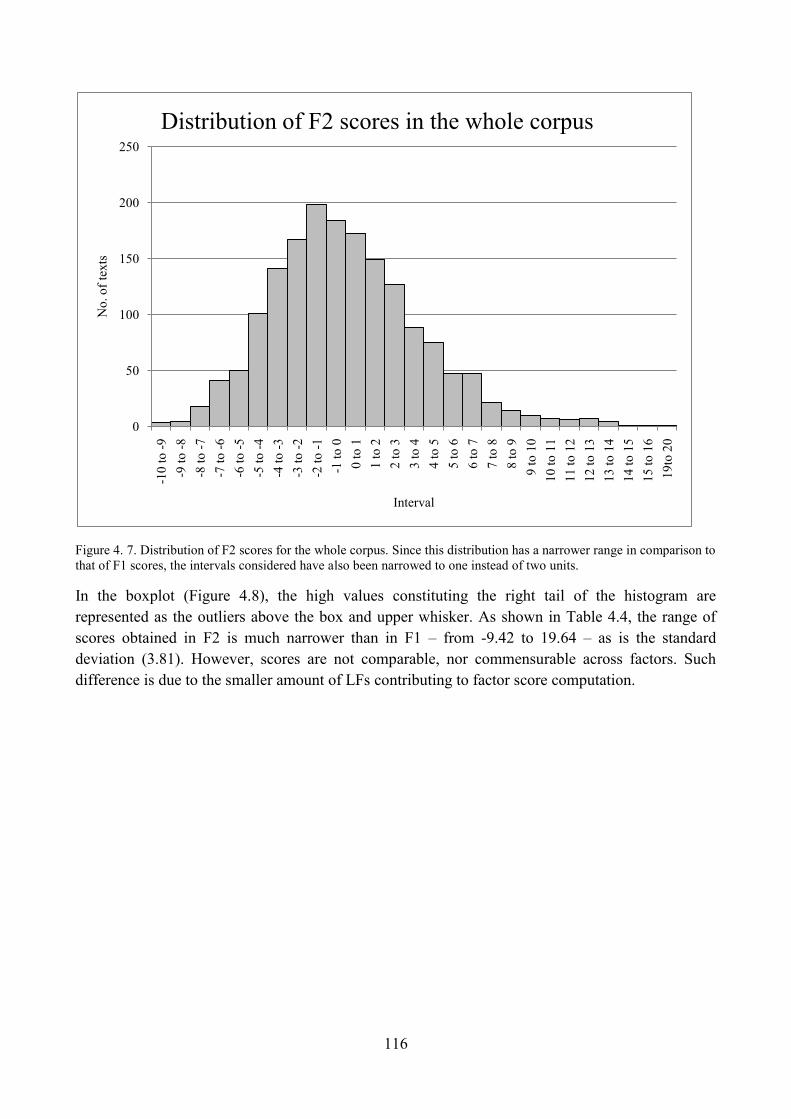
116
Figure 4. 7. Distribution of F2 scores for the whole corpus. Since this distribution has a narrower range in comparison to
that of F1 scores, the intervals considered have also been narrowed to one instead of two units.
In the boxplot (Figure 4.8), the high values constituting the right tail of the histogram are
represented as the outliers above the box and upper whisker. As shown in Table 4.4, the range of
scores obtained in F2 is much narrower than in F1 – from -9.42 to 19.64 – as is the standard
deviation (3.81). However, scores are not comparable, nor commensurable across factors. Such
difference is due to the smaller amount of LFs contributing to factor score computation.
0
50
100
150
200
250-1
0 t
o -
9
-9 t
o -
8
-8 t
o -
7
-7 t
o -
6
-6 t
o -
5
-5 t
o -
4
-4 t
o -
3
-3 t
o -
2
-2 t
o -
1
-1 t
o 0
0 t
o 1
1 t
o 2
2 t
o 3
3 t
o 4
4 t
o 5
5 t
o 6
6 t
o 7
7 t
o 8
8 t
o 9
9 t
o 1
0
10
to
11
11
to
12
12
to
13
13
to
14
14
to
15
15
to
16
19
to 2
0
No
. o
f te
xts
Interval
Distribution of F2 scores in the whole corpus
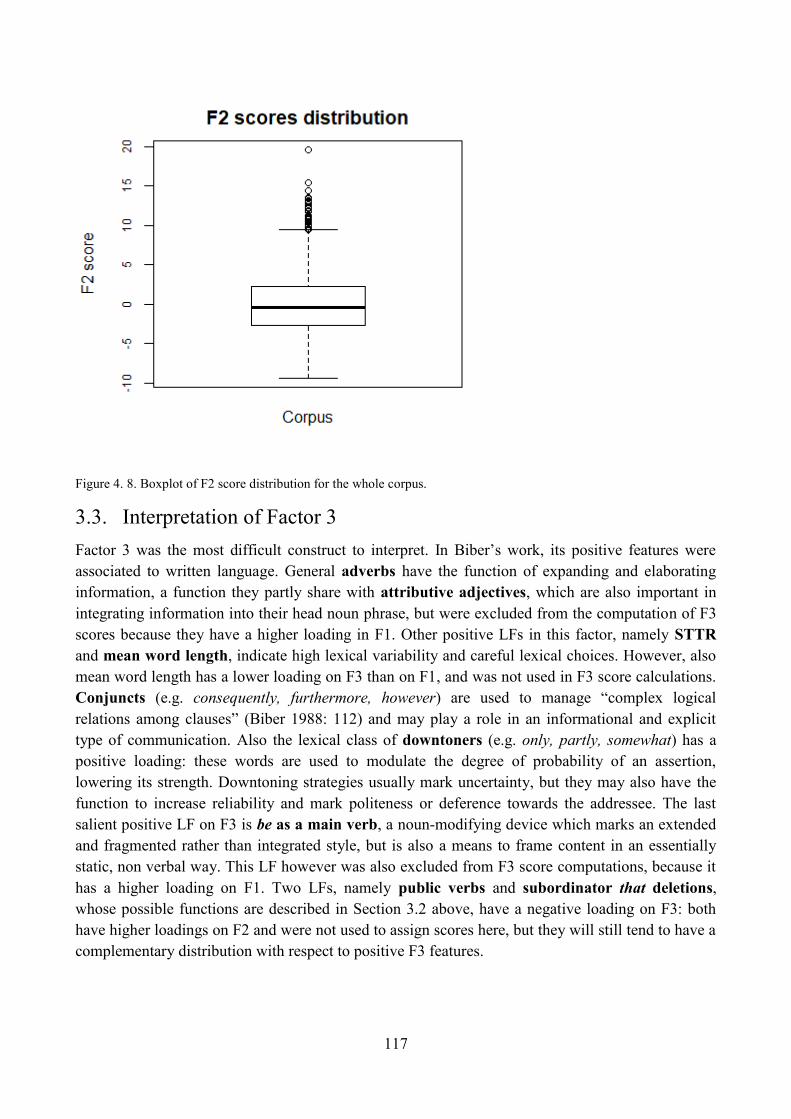
117
Figure 4. 8. Boxplot of F2 score distribution for the whole corpus.
3.3. Interpretation of Factor 3
Factor 3 was the most difficult construct to interpret. In Biber‘s work, its positive features were
associated to written language. General adverbs have the function of expanding and elaborating
information, a function they partly share with attributive adjectives, which are also important in
integrating information into their head noun phrase, but were excluded from the computation of F3
scores because they have a higher loading in F1. Other positive LFs in this factor, namely STTR
and mean word length, indicate high lexical variability and careful lexical choices. However, also
mean word length has a lower loading on F3 than on F1, and was not used in F3 score calculations.
Conjuncts (e.g. consequently, furthermore, however) are used to manage ―complex logical
relations among clauses‖ (Biber 1988: 112) and may play a role in an informational and explicit
type of communication. Also the lexical class of downtoners (e.g. only, partly, somewhat) has a
positive loading: these words are used to modulate the degree of probability of an assertion,
lowering its strength. Downtoning strategies usually mark uncertainty, but they may also have the
function to increase reliability and mark politeness or deference towards the addressee. The last
salient positive LF on F3 is be as a main verb, a noun-modifying device which marks an extended
and fragmented rather than integrated style, but is also a means to frame content in an essentially
static, non verbal way. This LF however was also excluded from F3 score computations, because it
has a higher loading on F1. Two LFs, namely public verbs and subordinator that deletions,
whose possible functions are described in Section 3.2 above, have a negative loading on F3: both
have higher loadings on F2 and were not used to assign scores here, but they will still tend to have a
complementary distribution with respect to positive F3 features.
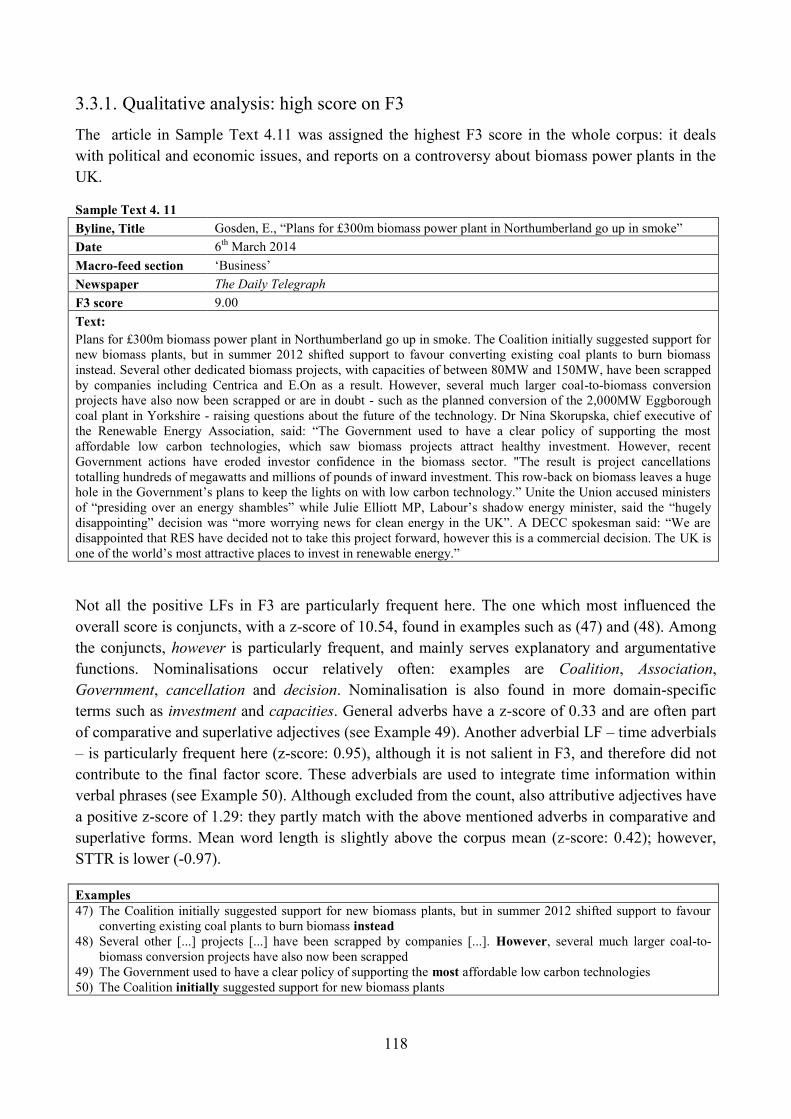
118
3.3.1. Qualitative analysis: high score on F3
The article in Sample Text 4.11 was assigned the highest F3 score in the whole corpus: it deals
with political and economic issues, and reports on a controversy about biomass power plants in the
UK.
Sample Text 4. 11
Byline, Title Gosden, E., ―Plans for £300m biomass power plant in Northumberland go up in smoke‖
Date 6th
March 2014
Macro-feed section ‗Business‘
Newspaper The Daily Telegraph
F3 score 9.00
Text:
Plans for £300m biomass power plant in Northumberland go up in smoke. The Coalition initially suggested support for
new biomass plants, but in summer 2012 shifted support to favour converting existing coal plants to burn biomass
instead. Several other dedicated biomass projects, with capacities of between 80MW and 150MW, have been scrapped
by companies including Centrica and E.On as a result. However, several much larger coal-to-biomass conversion
projects have also now been scrapped or are in doubt - such as the planned conversion of the 2,000MW Eggborough
coal plant in Yorkshire - raising questions about the future of the technology. Dr Nina Skorupska, chief executive of
the Renewable Energy Association, said: ―The Government used to have a clear policy of supporting the most
affordable low carbon technologies, which saw biomass projects attract healthy investment. However, recent
Government actions have eroded investor confidence in the biomass sector. "The result is project cancellations
totalling hundreds of megawatts and millions of pounds of inward investment. This row-back on biomass leaves a huge
hole in the Government‘s plans to keep the lights on with low carbon technology.‖ Unite the Union accused ministers
of ―presiding over an energy shambles‖ while Julie Elliott MP, Labour‘s shadow energy minister, said the ―hugely
disappointing‖ decision was ―more worrying news for clean energy in the UK‖. A DECC spokesman said: ―We are
disappointed that RES have decided not to take this project forward, however this is a commercial decision. The UK is
one of the world‘s most attractive places to invest in renewable energy.‖
Not all the positive LFs in F3 are particularly frequent here. The one which most influenced the
overall score is conjuncts, with a z-score of 10.54, found in examples such as (47) and (48). Among
the conjuncts, however is particularly frequent, and mainly serves explanatory and argumentative
functions. Nominalisations occur relatively often: examples are Coalition, Association,
Government, cancellation and decision. Nominalisation is also found in more domain-specific
terms such as investment and capacities. General adverbs have a z-score of 0.33 and are often part
of comparative and superlative adjectives (see Example 49). Another adverbial LF – time adverbials
– is particularly frequent here (z-score: 0.95), although it is not salient in F3, and therefore did not
contribute to the final factor score. These adverbials are used to integrate time information within
verbal phrases (see Example 50). Although excluded from the count, also attributive adjectives have
a positive z-score of 1.29: they partly match with the above mentioned adverbs in comparative and
superlative forms. Mean word length is slightly above the corpus mean (z-score: 0.42); however,
STTR is lower (-0.97).
Examples 47) The Coalition initially suggested support for new biomass plants, but in summer 2012 shifted support to favour
converting existing coal plants to burn biomass instead
48) Several other [...] projects [...] have been scrapped by companies [...]. However, several much larger coal-to-
biomass conversion projects have also now been scrapped 49) The Government used to have a clear policy of supporting the most affordable low carbon technologies 50) The Coalition initially suggested support for new biomass plants
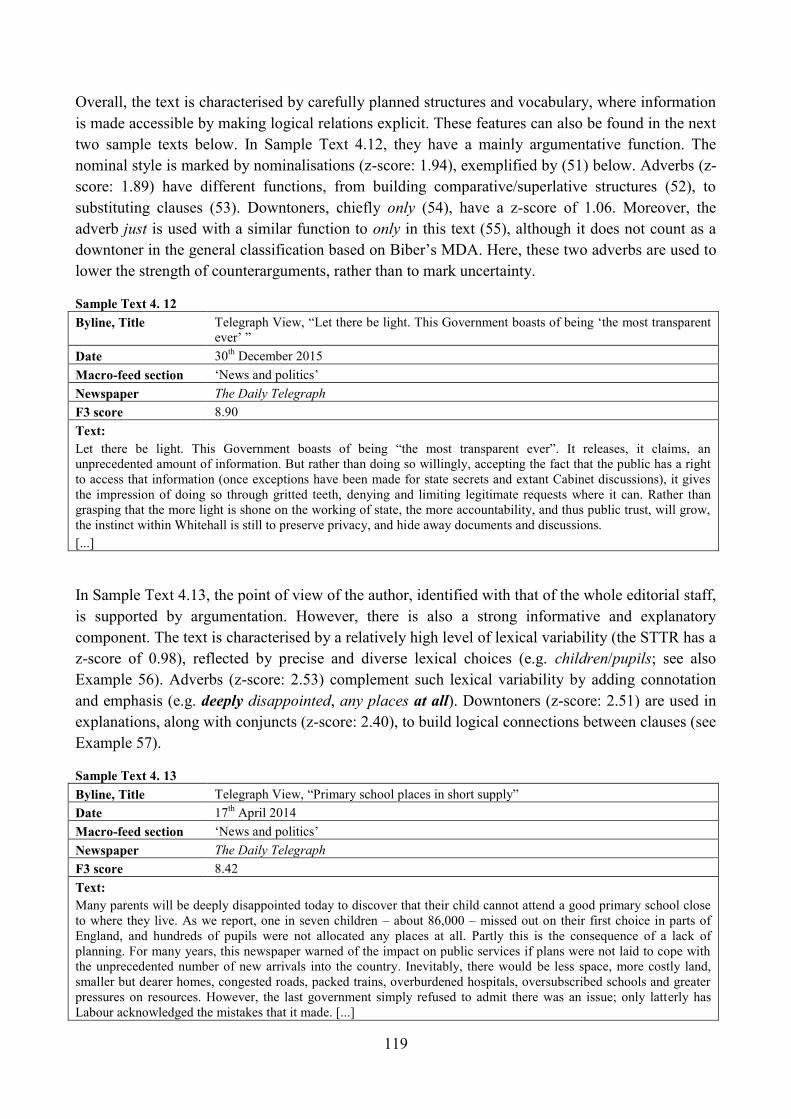
119
Overall, the text is characterised by carefully planned structures and vocabulary, where information
is made accessible by making logical relations explicit. These features can also be found in the next
two sample texts below. In Sample Text 4.12, they have a mainly argumentative function. The
nominal style is marked by nominalisations (z-score: 1.94), exemplified by (51) below. Adverbs (z-
score: 1.89) have different functions, from building comparative/superlative structures (52), to
substituting clauses (53). Downtoners, chiefly only (54), have a z-score of 1.06. Moreover, the
adverb just is used with a similar function to only in this text (55), although it does not count as a
downtoner in the general classification based on Biber‘s MDA. Here, these two adverbs are used to
lower the strength of counterarguments, rather than to mark uncertainty.
Sample Text 4. 12
Byline, Title Telegraph View, ―Let there be light. This Government boasts of being ‗the most transparent
ever‘ ‖
Date 30th
December 2015
Macro-feed section ‗News and politics‘
Newspaper The Daily Telegraph
F3 score 8.90
Text:
Let there be light. This Government boasts of being ―the most transparent ever‖. It releases, it claims, an
unprecedented amount of information. But rather than doing so willingly, accepting the fact that the public has a right
to access that information (once exceptions have been made for state secrets and extant Cabinet discussions), it gives
the impression of doing so through gritted teeth, denying and limiting legitimate requests where it can. Rather than
grasping that the more light is shone on the working of state, the more accountability, and thus public trust, will grow,
the instinct within Whitehall is still to preserve privacy, and hide away documents and discussions.
[...]
In Sample Text 4.13, the point of view of the author, identified with that of the whole editorial staff,
is supported by argumentation. However, there is also a strong informative and explanatory
component. The text is characterised by a relatively high level of lexical variability (the STTR has a
z-score of 0.98), reflected by precise and diverse lexical choices (e.g. children/pupils; see also
Example 56). Adverbs (z-score: 2.53) complement such lexical variability by adding connotation
and emphasis (e.g. deeply disappointed, any places at all). Downtoners (z-score: 2.51) are used in
explanations, along with conjuncts (z-score: 2.40), to build logical connections between clauses (see
Example 57).
Sample Text 4. 13
Byline, Title Telegraph View, ―Primary school places in short supply‖
Date 17th
April 2014
Macro-feed section ‗News and politics‘
Newspaper The Daily Telegraph
F3 score 8.42
Text:
Many parents will be deeply disappointed today to discover that their child cannot attend a good primary school close
to where they live. As we report, one in seven children – about 86,000 – missed out on their first choice in parts of
England, and hundreds of pupils were not allocated any places at all. Partly this is the consequence of a lack of
planning. For many years, this newspaper warned of the impact on public services if plans were not laid to cope with
the unprecedented number of new arrivals into the country. Inevitably, there would be less space, more costly land,
smaller but dearer homes, congested roads, packed trains, overburdened hospitals, oversubscribed schools and greater
pressures on resources. However, the last government simply refused to admit there was an issue; only latterly has
Labour acknowledged the mistakes that it made. [...]
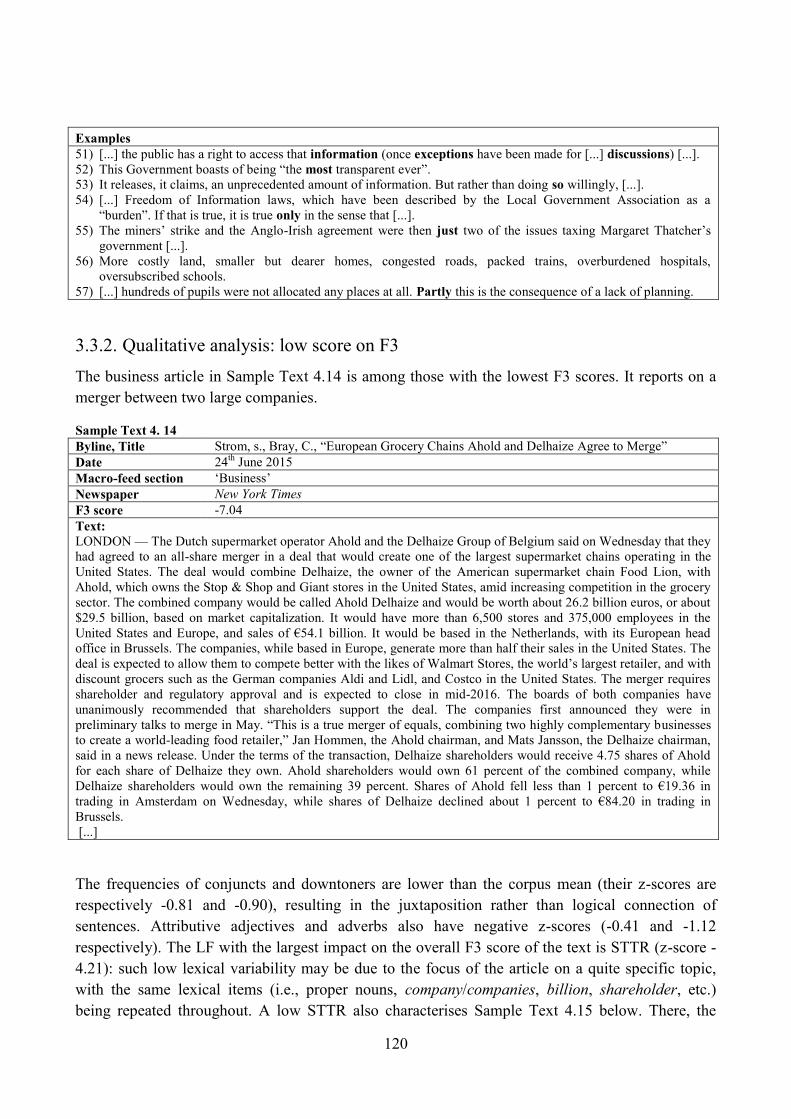
120
Examples
51) [...] the public has a right to access that information (once exceptions have been made for [...] discussions) [...].
52) This Government boasts of being ―the most transparent ever‖.
53) It releases, it claims, an unprecedented amount of information. But rather than doing so willingly, [...].
54) [...] Freedom of Information laws, which have been described by the Local Government Association as a
―burden‖. If that is true, it is true only in the sense that [...].
55) The miners‘ strike and the Anglo-Irish agreement were then just two of the issues taxing Margaret Thatcher‘s
government [...].
56) More costly land, smaller but dearer homes, congested roads, packed trains, overburdened hospitals,
oversubscribed schools.
57) [...] hundreds of pupils were not allocated any places at all. Partly this is the consequence of a lack of planning.
3.3.2. Qualitative analysis: low score on F3
The business article in Sample Text 4.14 is among those with the lowest F3 scores. It reports on a
merger between two large companies.
Sample Text 4. 14
Byline, Title Strom, s., Bray, C., ―European Grocery Chains Ahold and Delhaize Agree to Merge‖
Date 24th
June 2015
Macro-feed section ‗Business‘
Newspaper New York Times
F3 score -7.04
Text:
LONDON — The Dutch supermarket operator Ahold and the Delhaize Group of Belgium said on Wednesday that they
had agreed to an all-share merger in a deal that would create one of the largest supermarket chains operating in the
United States. The deal would combine Delhaize, the owner of the American supermarket chain Food Lion, with
Ahold, which owns the Stop & Shop and Giant stores in the United States, amid increasing competition in the grocery
sector. The combined company would be called Ahold Delhaize and would be worth about 26.2 billion euros, or about
$29.5 billion, based on market capitalization. It would have more than 6,500 stores and 375,000 employees in the
United States and Europe, and sales of €54.1 billion. It would be based in the Netherlands, with its European head
office in Brussels. The companies, while based in Europe, generate more than half their sales in the United States. The
deal is expected to allow them to compete better with the likes of Walmart Stores, the world‘s largest retailer, and with
discount grocers such as the German companies Aldi and Lidl, and Costco in the United States. The merger requires
shareholder and regulatory approval and is expected to close in mid-2016. The boards of both companies have
unanimously recommended that shareholders support the deal. The companies first announced they were in
preliminary talks to merge in May. ―This is a true merger of equals, combining two highly complementary businesses
to create a world-leading food retailer,‖ Jan Hommen, the Ahold chairman, and Mats Jansson, the Delhaize chairman,
said in a news release. Under the terms of the transaction, Delhaize shareholders would receive 4.75 shares of Ahold
for each share of Delhaize they own. Ahold shareholders would own 61 percent of the combined company, while
Delhaize shareholders would own the remaining 39 percent. Shares of Ahold fell less than 1 percent to €19.36 in
trading in Amsterdam on Wednesday, while shares of Delhaize declined about 1 percent to €84.20 in trading in
Brussels.
[...]
The frequencies of conjuncts and downtoners are lower than the corpus mean (their z-scores are
respectively -0.81 and -0.90), resulting in the juxtaposition rather than logical connection of
sentences. Attributive adjectives and adverbs also have negative z-scores (-0.41 and -1.12
respectively). The LF with the largest impact on the overall F3 score of the text is STTR (z-score -
4.21): such low lexical variability may be due to the focus of the article on a quite specific topic,
with the same lexical items (i.e., proper nouns, company/companies, billion, shareholder, etc.)
being repeated throughout. A low STTR also characterises Sample Text 4.15 below. There, the
121
referents of recurring words such as Mosul, Tikrit, government, and forces, are central to the topic
being reported on. Adverbs and conjuncts have slightly negative z-scores (-1.81 and -0.81
respectively), probably because the article reports on war events rather than an analysing them, and
is not particularly concerned with making logical links explicit. Overall, a negative F3 score seems
to be associated with texts with a strong focus on a specific topic resulting in a smaller lexical
variability, where the lack of explicit logical links might point to a reduced presence of
argumentation or explanation.
Sample Text 4. 15
Byline, Title Nordland, R., Rubin, A., ―Iraq Rebels Stall North of Baghdad as Residents Brace for a
Siege‖
Date 14th
June 2014
Macro-feed section ‗Homepage‘
Newspaper New York Times
F3 score -12.02
Text:
[Marching to Baghdad Related Maps and Multimedia » Related article »]9 After capturing Mosul, Tikrit and parts of a
refinery in Baiji earlier last week, insurgents attacked Samarra, where Shiite militias helped pro-government forces. On
Friday, they seized Jalawla and Sadiyah but were forced back by government troops backed by Kurdish forces. There
were new clashes in Ishaki and Dujail on Saturday. Insurgents swept across the Syrian border and captured Mosul,
Tikrit and parts of the oil refinery in Baiji early last week. On Thursday, they deployed north and east of Samarra,
while Shiite militias reinforced pro-government forces in the city. Insurgents also pressed south and took Dhuluiya. On
Friday, they temporarily seized two towns, Jalawla and Sadiyah, but were forced to withdraw by government troops,
backed by Kurdish forces. There were fresh clashes in Dujail, Ishaki and Dhuluiya on Saturday.
[...]
9 This string of text should not have been included in the analysis, but the regex-based cleaning system failed to detect
and remove it.
122
3.3.3. Qualitative analysis: unmarked score on F3
Sample Text 4.16 below combines political aspects with biographical information. Here, all the
positive LFs in F3 have z-scores whose absolute value is lower than 1, which means that their
frequencies are relatively close to the average values for the whole corpus. The content is only
partly developed through logical links and is largely constructed with juxtaposition. To some extent,
such fragmentation also results from direct speech(see Example 58 below).
Sample Text 4. 16
Byline, Title Siddiqui, S., ―Rubio shows his personal side and Cruz aims fire at Trump in South Carolina‖
Date 17th
February 2016
Macro-feed section ‗News and politics‘
Newspaper The Guardian
F3 score -0.03
Text:
In Greenville, South Carolina Republican presidential candidate Marco Rubio addressed the issue of race in deeply
personal terms on Wednesday, drawing on his experience as a Cuban American whose family was occasionally
confronted with racist comments. Speaking at a town hall forum hosted by CNN, Rubio cited his childhood years
living in Las Vegas during the Mariel boat lift in 1980. Some neighborhood kids ―taunted‖ his family, Rubio said, by
asking: ―Why don‘t you go back on your boat and go back to your country?‖ ―I didn‘t know what they were talking
about. What boat? My mom doesn‘t even swim. [She‘s] afraid of water,‖ Rubio said. But his parents – immigrants
from Cuba who worked as a bartender and a maid – raised him and his siblings to not be resentful, Rubio added.
―Don‘t blame the kids. They must be hearing it from somebody,‖ he recalled his parents as saying. ―That disturbed me
as a young child. For the most part in my life, I never saw that as a reflection on America but as a reflection on those
kids. My parents never raised us to feel that we were victims.‖ Marco Rubio addresses racism in America Rubio has
often discussed race relations on the campaign trail, largely in response to questions from the audience. But he has
seldom spoken from experience. Rubio‘s opponents have sought to portray him as robotic after the senator repeated the
same line, almost verbatim, at least four times in a memorable encounter with New Jersey governor Chris Christie at a
Republican debate in New Hampshire. The torrent of criticism over Rubio‘s scripted demeanor prompted the Florida
senator to fall to a disappointing fifth-place finish in the state, setting back his campaign‘s momentum. Marco Rubio's
broken record blunder costs him New Hampshire debate Rubio is seeking a comeback in South Carolina, where he is
polling in third behind Senator Ted Cruz of Texas and businessman Donald Trump. Cruz also appeared at
Wednesday‘s forum, as did retired neurosurgeon Ben Carson. Other Republican candidates will participate in a second
town hall on Thursday in Columbia. During his response on race, Rubio also brought an anecdote he has told on the
campaign trail about a black friend who is frequently pulled over by police – even though he is a police officer. ―He
gets pulled over, never gets a ticket. No one has any explanation. What is he supposed to think?‖ Rubio said, adding
that a significant number of young African American men ―feel as if they are treated differently than the rest of
society‖.
[...]
Examples
58) ―Don‘t blame the kids. They must be hearing it from somebody,‖ he recalled his parents as saying. ―That disturbed
me as a young child. For the most part in my life, I never saw that as a reflection on America but as a reflection on
those kids. My parents never raised us to feel that we were victims.‖
The positive end of the F3 continuum is characterised by a type of communication where logical
links are made explicit with the aim of supporting some argument, or explaining some content to
the reader. Such attitude is matched with a relatively rich vocabulary. To the opposite end of the
factor continuum lies a more fragmented style from the point of view of clause and sentence
structure. Moreover, texts located in this area of the factor seem to focus on a particular topic,
which determines low lexical variability. Therefore, this third dimension can be labelled ‗Explicit
Argumentation/Explanation vs. Topic-Focused Communication‘.
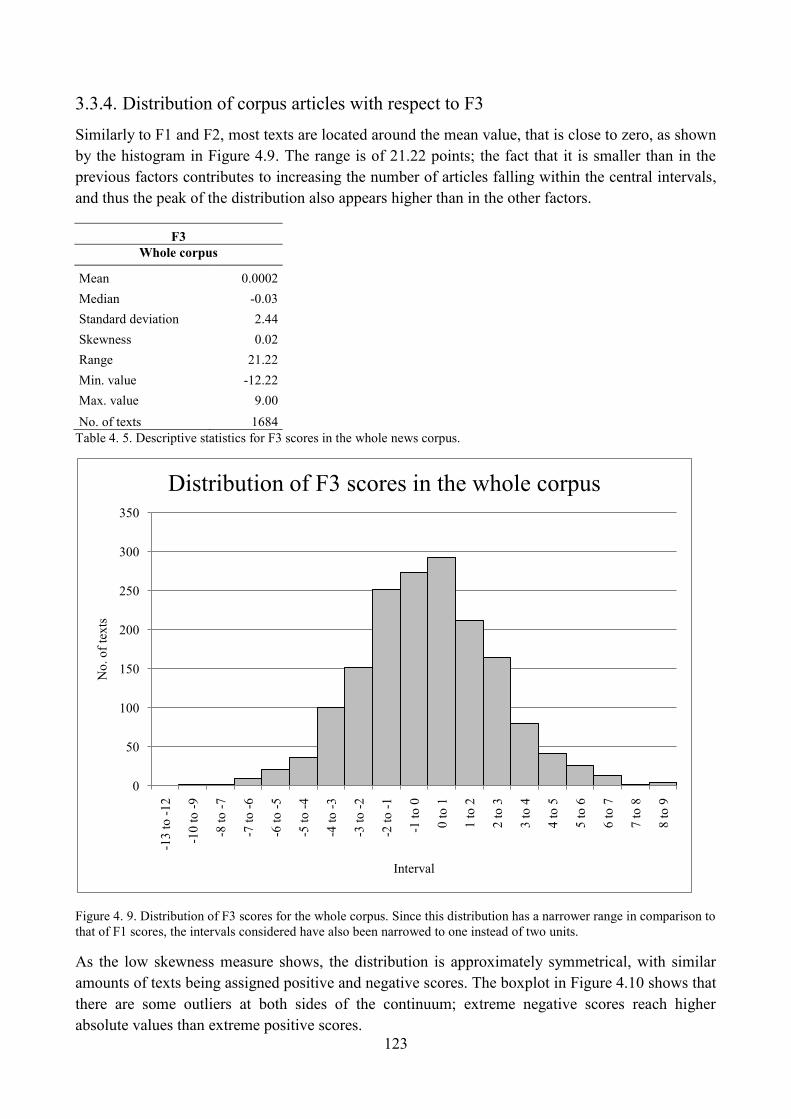
123
3.3.4. Distribution of corpus articles with respect to F3
Similarly to F1 and F2, most texts are located around the mean value, that is close to zero, as shown
by the histogram in Figure 4.9. The range is of 21.22 points; the fact that it is smaller than in the
previous factors contributes to increasing the number of articles falling within the central intervals,
and thus the peak of the distribution also appears higher than in the other factors.
F3
Whole corpus
Mean 0.0002
Median -0.03
Standard deviation 2.44
Skewness 0.02
Range 21.22
Min. value -12.22
Max. value 9.00
No. of texts 1684
Table 4. 5. Descriptive statistics for F3 scores in the whole news corpus.
Figure 4. 9. Distribution of F3 scores for the whole corpus. Since this distribution has a narrower range in comparison to
that of F1 scores, the intervals considered have also been narrowed to one instead of two units.
As the low skewness measure shows, the distribution is approximately symmetrical, with similar
amounts of texts being assigned positive and negative scores. The boxplot in Figure 4.10 shows that
there are some outliers at both sides of the continuum; extreme negative scores reach higher
absolute values than extreme positive scores.
0
50
100
150
200
250
300
350
-13
to
-1
2
-10
to
-9
-8 t
o -
7
-7 t
o -
6
-6 t
o -
5
-5 t
o -
4
-4 t
o -
3
-3 t
o -
2
-2 t
o -
1
-1 t
o 0
0 t
o 1
1 t
o 2
2 t
o 3
3 t
o 4
4 t
o 5
5 t
o 6
6 t
o 7
7 t
o 8
8 t
o 9
No
. o
f te
xts
Interval
Distribution of F3 scores in the whole corpus
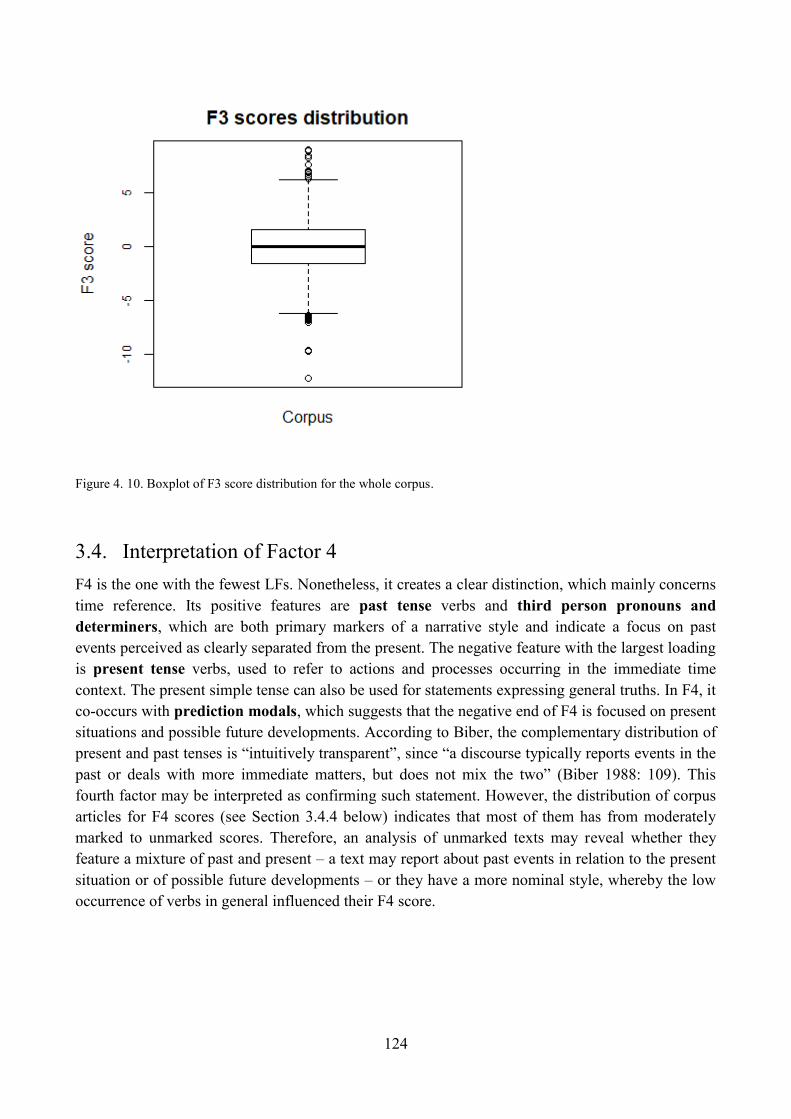
124
Figure 4. 10. Boxplot of F3 score distribution for the whole corpus.
3.4. Interpretation of Factor 4
F4 is the one with the fewest LFs. Nonetheless, it creates a clear distinction, which mainly concerns
time reference. Its positive features are past tense verbs and third person pronouns and
determiners, which are both primary markers of a narrative style and indicate a focus on past
events perceived as clearly separated from the present. The negative feature with the largest loading
is present tense verbs, used to refer to actions and processes occurring in the immediate time
context. The present simple tense can also be used for statements expressing general truths. In F4, it
co-occurs with prediction modals, which suggests that the negative end of F4 is focused on present
situations and possible future developments. According to Biber, the complementary distribution of
present and past tenses is ―intuitively transparent‖, since ―a discourse typically reports events in the
past or deals with more immediate matters, but does not mix the two‖ (Biber 1988: 109). This
fourth factor may be interpreted as confirming such statement. However, the distribution of corpus
articles for F4 scores (see Section 3.4.4 below) indicates that most of them has from moderately
marked to unmarked scores. Therefore, an analysis of unmarked texts may reveal whether they
feature a mixture of past and present – a text may report about past events in relation to the present
situation or of possible future developments – or they have a more nominal style, whereby the low
occurrence of verbs in general influenced their F4 score.
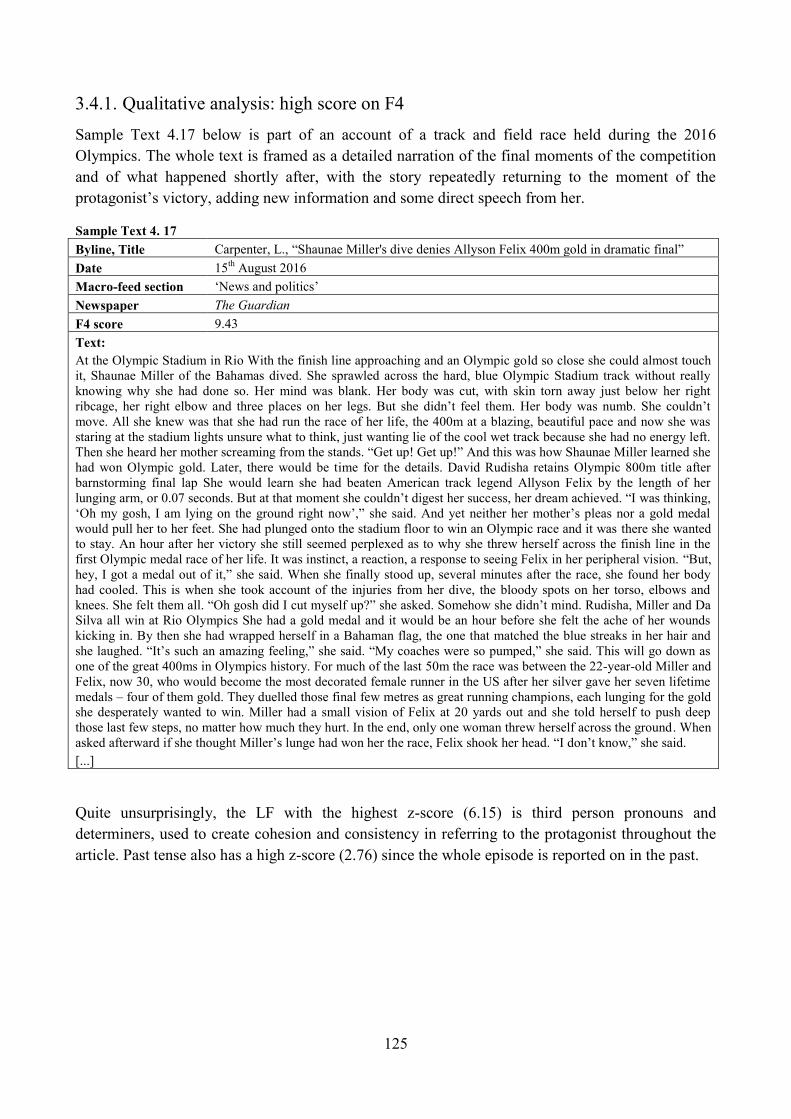
125
3.4.1. Qualitative analysis: high score on F4
Sample Text 4.17 below is part of an account of a track and field race held during the 2016
Olympics. The whole text is framed as a detailed narration of the final moments of the competition
and of what happened shortly after, with the story repeatedly returning to the moment of the
protagonist‘s victory, adding new information and some direct speech from her.
Sample Text 4. 17
Byline, Title Carpenter, L., ―Shaunae Miller's dive denies Allyson Felix 400m gold in dramatic final‖
Date 15th
August 2016
Macro-feed section ‗News and politics‘
Newspaper The Guardian
F4 score 9.43
Text:
At the Olympic Stadium in Rio With the finish line approaching and an Olympic gold so close she could almost touch
it, Shaunae Miller of the Bahamas dived. She sprawled across the hard, blue Olympic Stadium track without really
knowing why she had done so. Her mind was blank. Her body was cut, with skin torn away just below her right
ribcage, her right elbow and three places on her legs. But she didn‘t feel them. Her body was numb. She couldn‘t
move. All she knew was that she had run the race of her life, the 400m at a blazing, beautiful pace and now she was
staring at the stadium lights unsure what to think, just wanting lie of the cool wet track because she had no energy left.
Then she heard her mother screaming from the stands. ―Get up! Get up!‖ And this was how Shaunae Miller learned she
had won Olympic gold. Later, there would be time for the details. David Rudisha retains Olympic 800m title after
barnstorming final lap She would learn she had beaten American track legend Allyson Felix by the length of her
lunging arm, or 0.07 seconds. But at that moment she couldn‘t digest her success, her dream achieved. ―I was thinking,
‗Oh my gosh, I am lying on the ground right now‘,‖ she said. And yet neither her mother‘s pleas nor a gold medal
would pull her to her feet. She had plunged onto the stadium floor to win an Olympic race and it was there she wanted
to stay. An hour after her victory she still seemed perplexed as to why she threw herself across the finish line in the
first Olympic medal race of her life. It was instinct, a reaction, a response to seeing Felix in her peripheral vision. ―But,
hey, I got a medal out of it,‖ she said. When she finally stood up, several minutes after the race, she found her body
had cooled. This is when she took account of the injuries from her dive, the bloody spots on her torso, elbows and
knees. She felt them all. ―Oh gosh did I cut myself up?‖ she asked. Somehow she didn‘t mind. Rudisha, Miller and Da
Silva all win at Rio Olympics She had a gold medal and it would be an hour before she felt the ache of her wounds
kicking in. By then she had wrapped herself in a Bahaman flag, the one that matched the blue streaks in her hair and
she laughed. ―It‘s such an amazing feeling,‖ she said. ―My coaches were so pumped,‖ she said. This will go down as
one of the great 400ms in Olympics history. For much of the last 50m the race was between the 22-year-old Miller and
Felix, now 30, who would become the most decorated female runner in the US after her silver gave her seven lifetime
medals – four of them gold. They duelled those final few metres as great running champions, each lunging for the gold
she desperately wanted to win. Miller had a small vision of Felix at 20 yards out and she told herself to push deep
those last few steps, no matter how much they hurt. In the end, only one woman threw herself across the ground. When
asked afterward if she thought Miller‘s lunge had won her the race, Felix shook her head. ―I don‘t know,‖ she said.
[...]
Quite unsurprisingly, the LF with the highest z-score (6.15) is third person pronouns and
determiners, used to create cohesion and consistency in referring to the protagonist throughout the
article. Past tense also has a high z-score (2.76) since the whole episode is reported on in the past.
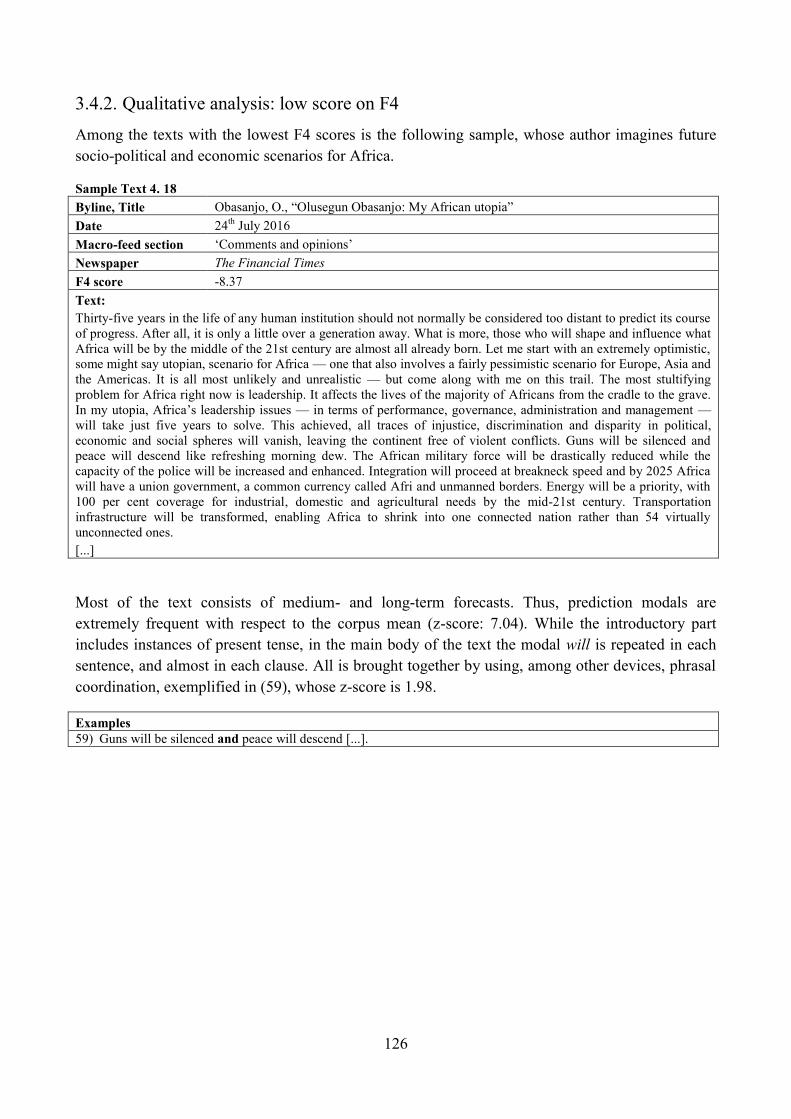
126
3.4.2. Qualitative analysis: low score on F4
Among the texts with the lowest F4 scores is the following sample, whose author imagines future
socio-political and economic scenarios for Africa.
Sample Text 4. 18
Byline, Title Obasanjo, O., ―Olusegun Obasanjo: My African utopia‖
Date 24th
July 2016
Macro-feed section ‗Comments and opinions‘
Newspaper The Financial Times
F4 score -8.37
Text:
Thirty-five years in the life of any human institution should not normally be considered too distant to predict its course
of progress. After all, it is only a little over a generation away. What is more, those who will shape and influence what
Africa will be by the middle of the 21st century are almost all already born. Let me start with an extremely optimistic,
some might say utopian, scenario for Africa — one that also involves a fairly pessimistic scenario for Europe, Asia and
the Americas. It is all most unlikely and unrealistic — but come along with me on this trail. The most stultifying
problem for Africa right now is leadership. It affects the lives of the majority of Africans from the cradle to the grave.
In my utopia, Africa‘s leadership issues — in terms of performance, governance, administration and management —
will take just five years to solve. This achieved, all traces of injustice, discrimination and disparity in political,
economic and social spheres will vanish, leaving the continent free of violent conflicts. Guns will be silenced and
peace will descend like refreshing morning dew. The African military force will be drastically reduced while the
capacity of the police will be increased and enhanced. Integration will proceed at breakneck speed and by 2025 Africa
will have a union government, a common currency called Afri and unmanned borders. Energy will be a priority, with
100 per cent coverage for industrial, domestic and agricultural needs by the mid-21st century. Transportation
infrastructure will be transformed, enabling Africa to shrink into one connected nation rather than 54 virtually
unconnected ones.
[...]
Most of the text consists of medium- and long-term forecasts. Thus, prediction modals are
extremely frequent with respect to the corpus mean (z-score: 7.04). While the introductory part
includes instances of present tense, in the main body of the text the modal will is repeated in each
sentence, and almost in each clause. All is brought together by using, among other devices, phrasal
coordination, exemplified in (59), whose z-score is 1.98.
Examples 59) Guns will be silenced and peace will descend [...].
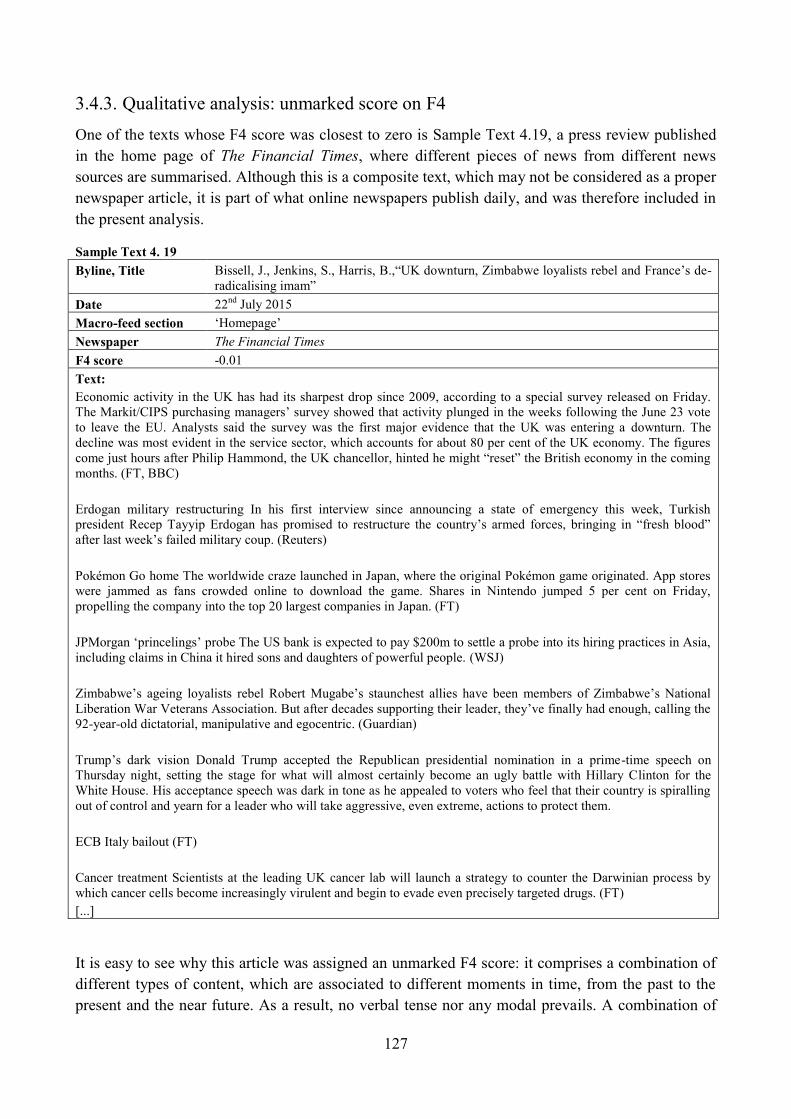
127
3.4.3. Qualitative analysis: unmarked score on F4
One of the texts whose F4 score was closest to zero is Sample Text 4.19, a press review published
in the home page of The Financial Times, where different pieces of news from different news
sources are summarised. Although this is a composite text, which may not be considered as a proper
newspaper article, it is part of what online newspapers publish daily, and was therefore included in
the present analysis.
Sample Text 4. 19
Byline, Title Bissell, J., Jenkins, S., Harris, B.,―UK downturn, Zimbabwe loyalists rebel and France‘s de-
radicalising imam‖
Date 22nd
July 2015
Macro-feed section ‗Homepage‘
Newspaper The Financial Times
F4 score -0.01
Text:
Economic activity in the UK has had its sharpest drop since 2009, according to a special survey released on Friday.
The Markit/CIPS purchasing managers‘ survey showed that activity plunged in the weeks following the June 23 vote
to leave the EU. Analysts said the survey was the first major evidence that the UK was entering a downturn. The
decline was most evident in the service sector, which accounts for about 80 per cent of the UK economy. The figures
come just hours after Philip Hammond, the UK chancellor, hinted he might ―reset‖ the British economy in the coming
months. (FT, BBC)
Erdogan military restructuring In his first interview since announcing a state of emergency this week, Turkish
president Recep Tayyip Erdogan has promised to restructure the country‘s armed forces, bringing in ―fresh blood‖
after last week‘s failed military coup. (Reuters)
Pokémon Go home The worldwide craze launched in Japan, where the original Pokémon game originated. App stores
were jammed as fans crowded online to download the game. Shares in Nintendo jumped 5 per cent on Friday,
propelling the company into the top 20 largest companies in Japan. (FT)
JPMorgan ‗princelings‘ probe The US bank is expected to pay $200m to settle a probe into its hiring practices in Asia,
including claims in China it hired sons and daughters of powerful people. (WSJ)
Zimbabwe‘s ageing loyalists rebel Robert Mugabe‘s staunchest allies have been members of Zimbabwe‘s National
Liberation War Veterans Association. But after decades supporting their leader, they‘ve finally had enough, calling the
92-year-old dictatorial, manipulative and egocentric. (Guardian)
Trump‘s dark vision Donald Trump accepted the Republican presidential nomination in a prime-time speech on
Thursday night, setting the stage for what will almost certainly become an ugly battle with Hillary Clinton for the
White House. His acceptance speech was dark in tone as he appealed to voters who feel that their country is spiralling
out of control and yearn for a leader who will take aggressive, even extreme, actions to protect them.
ECB Italy bailout (FT)
Cancer treatment Scientists at the leading UK cancer lab will launch a strategy to counter the Darwinian process by
which cancer cells become increasingly virulent and begin to evade even precisely targeted drugs. (FT)
[...]
It is easy to see why this article was assigned an unmarked F4 score: it comprises a combination of
different types of content, which are associated to different moments in time, from the past to the
present and the near future. As a result, no verbal tense nor any modal prevails. A combination of
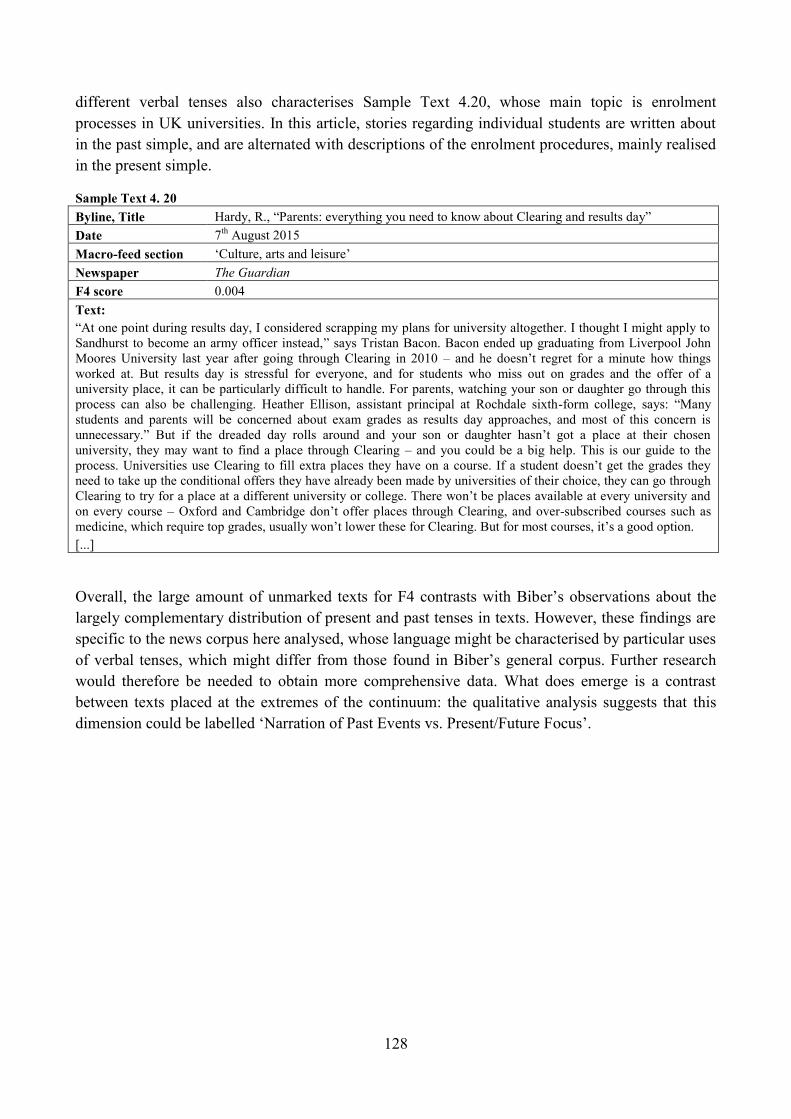
128
different verbal tenses also characterises Sample Text 4.20, whose main topic is enrolment
processes in UK universities. In this article, stories regarding individual students are written about
in the past simple, and are alternated with descriptions of the enrolment procedures, mainly realised
in the present simple.
Sample Text 4. 20
Byline, Title Hardy, R., ―Parents: everything you need to know about Clearing and results day‖
Date 7th
August 2015
Macro-feed section ‗Culture, arts and leisure‘
Newspaper The Guardian
F4 score 0.004
Text:
―At one point during results day, I considered scrapping my plans for university altogether. I thought I might apply to
Sandhurst to become an army officer instead,‖ says Tristan Bacon. Bacon ended up graduating from Liverpool John
Moores University last year after going through Clearing in 2010 – and he doesn‘t regret for a minute how things
worked at. But results day is stressful for everyone, and for students who miss out on grades and the offer of a
university place, it can be particularly difficult to handle. For parents, watching your son or daughter go through this
process can also be challenging. Heather Ellison, assistant principal at Rochdale sixth-form college, says: ―Many
students and parents will be concerned about exam grades as results day approaches, and most of this concern is
unnecessary.‖ But if the dreaded day rolls around and your son or daughter hasn‘t got a place at their chosen
university, they may want to find a place through Clearing – and you could be a big help. This is our guide to the
process. Universities use Clearing to fill extra places they have on a course. If a student doesn‘t get the grades they
need to take up the conditional offers they have already been made by universities of their choice, they can go through
Clearing to try for a place at a different university or college. There won‘t be places available at every university and
on every course – Oxford and Cambridge don‘t offer places through Clearing, and over-subscribed courses such as
medicine, which require top grades, usually won‘t lower these for Clearing. But for most courses, it‘s a good option.
[...]
Overall, the large amount of unmarked texts for F4 contrasts with Biber‘s observations about the
largely complementary distribution of present and past tenses in texts. However, these findings are
specific to the news corpus here analysed, whose language might be characterised by particular uses
of verbal tenses, which might differ from those found in Biber‘s general corpus. Further research
would therefore be needed to obtain more comprehensive data. What does emerge is a contrast
between texts placed at the extremes of the continuum: the qualitative analysis suggests that this
dimension could be labelled ‗Narration of Past Events vs. Present/Future Focus‘.
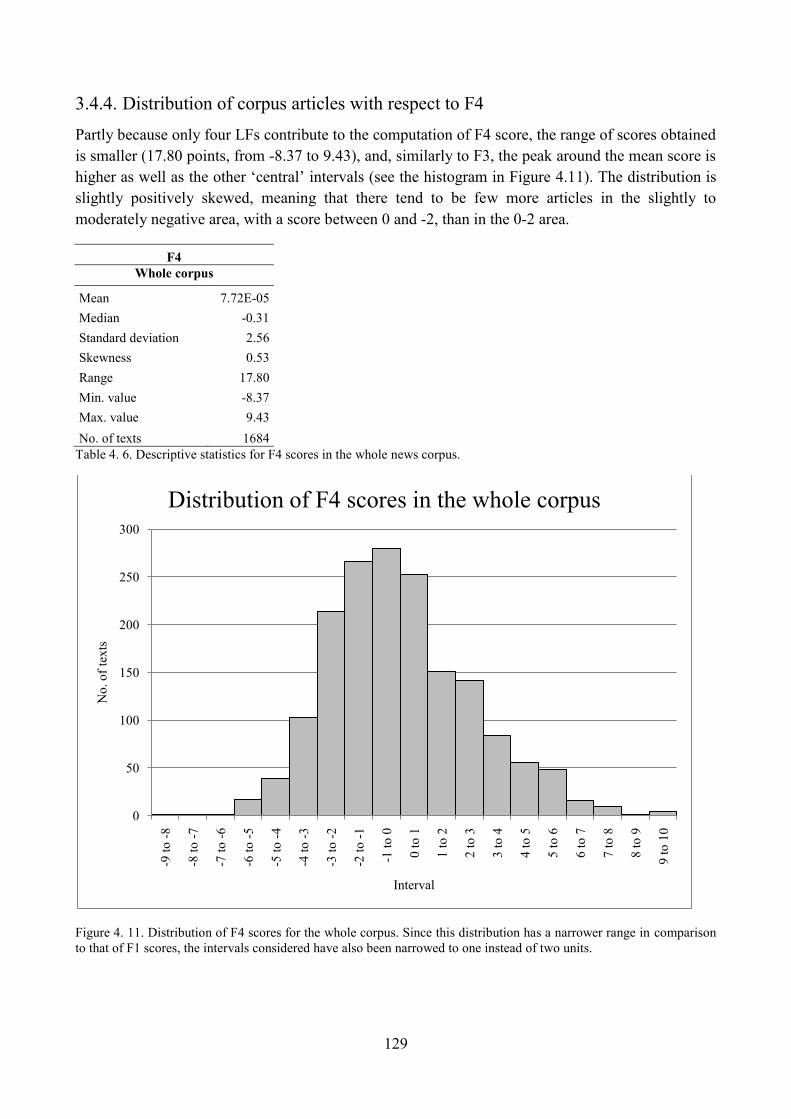
129
3.4.4. Distribution of corpus articles with respect to F4
Partly because only four LFs contribute to the computation of F4 score, the range of scores obtained
is smaller (17.80 points, from -8.37 to 9.43), and, similarly to F3, the peak around the mean score is
higher as well as the other ‗central‘ intervals (see the histogram in Figure 4.11). The distribution is
slightly positively skewed, meaning that there tend to be few more articles in the slightly to
moderately negative area, with a score between 0 and -2, than in the 0-2 area.
F4
Whole corpus
Mean 7.72E-05
Median -0.31
Standard deviation 2.56
Skewness 0.53
Range 17.80
Min. value -8.37
Max. value 9.43
No. of texts 1684
Table 4. 6. Descriptive statistics for F4 scores in the whole news corpus.
Figure 4. 11. Distribution of F4 scores for the whole corpus. Since this distribution has a narrower range in comparison
to that of F1 scores, the intervals considered have also been narrowed to one instead of two units.
0
50
100
150
200
250
300
-9 t
o -
8
-8 t
o -
7
-7 t
o -
6
-6 t
o -
5
-5 t
o -
4
-4 t
o -
3
-3 t
o -
2
-2 t
o -
1
-1 t
o 0
0 t
o 1
1 t
o 2
2 t
o 3
3 t
o 4
4 t
o 5
5 t
o 6
6 t
o 7
7 t
o 8
8 t
o 9
9 t
o 1
0
No
. o
f te
xts
Interval
Distribution of F4 scores in the whole corpus
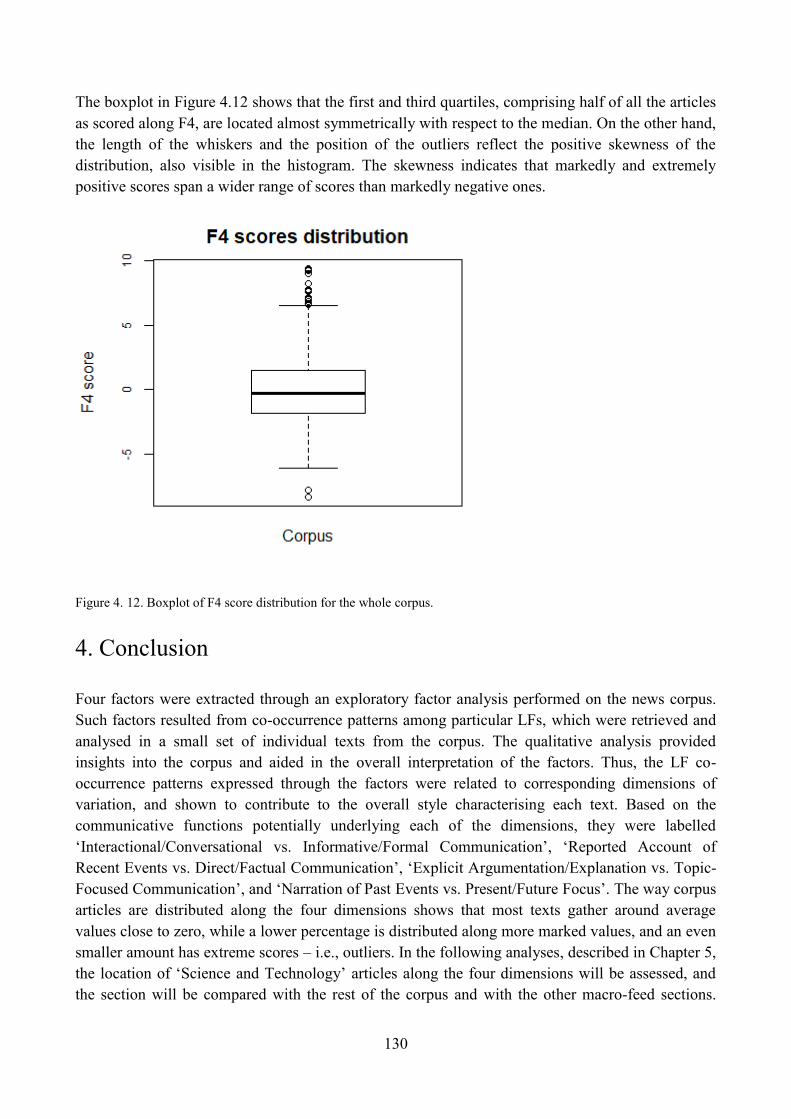
130
The boxplot in Figure 4.12 shows that the first and third quartiles, comprising half of all the articles
as scored along F4, are located almost symmetrically with respect to the median. On the other hand,
the length of the whiskers and the position of the outliers reflect the positive skewness of the
distribution, also visible in the histogram. The skewness indicates that markedly and extremely
positive scores span a wider range of scores than markedly negative ones.
Figure 4. 12. Boxplot of F4 score distribution for the whole corpus.
4. Conclusion
Four factors were extracted through an exploratory factor analysis performed on the news corpus.
Such factors resulted from co-occurrence patterns among particular LFs, which were retrieved and
analysed in a small set of individual texts from the corpus. The qualitative analysis provided
insights into the corpus and aided in the overall interpretation of the factors. Thus, the LF co-
occurrence patterns expressed through the factors were related to corresponding dimensions of
variation, and shown to contribute to the overall style characterising each text. Based on the
communicative functions potentially underlying each of the dimensions, they were labelled
‗Interactional/Conversational vs. Informative/Formal Communication‘, ‗Reported Account of
Recent Events vs. Direct/Factual Communication‘, ‗Explicit Argumentation/Explanation vs. Topic-
Focused Communication‘, and ‗Narration of Past Events vs. Present/Future Focus‘. The way corpus
articles are distributed along the four dimensions shows that most texts gather around average
values close to zero, while a lower percentage is distributed along more marked values, and an even
smaller amount has extreme scores – i.e., outliers. In the following analyses, described in Chapter 5,
the location of ‗Science and Technology‘ articles along the four dimensions will be assessed, and
the section will be compared with the rest of the corpus and with the other macro-feed sections.

131
This will allow for a characterisation of articles reporting on technoscience from a linguistic and
communicative point of view.
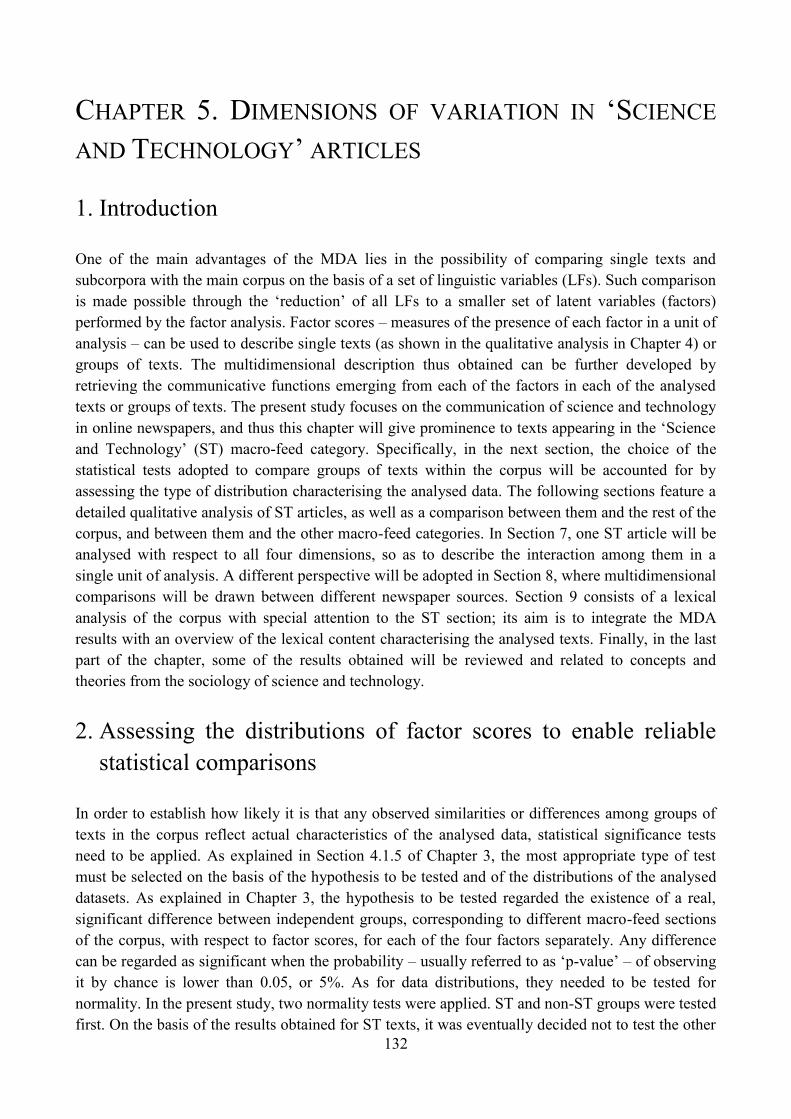
132
CHAPTER 5. DIMENSIONS OF VARIATION IN ‗SCIENCE
AND TECHNOLOGY‘ ARTICLES
1. Introduction
One of the main advantages of the MDA lies in the possibility of comparing single texts and
subcorpora with the main corpus on the basis of a set of linguistic variables (LFs). Such comparison
is made possible through the ‗reduction‘ of all LFs to a smaller set of latent variables (factors)
performed by the factor analysis. Factor scores – measures of the presence of each factor in a unit of
analysis – can be used to describe single texts (as shown in the qualitative analysis in Chapter 4) or
groups of texts. The multidimensional description thus obtained can be further developed by
retrieving the communicative functions emerging from each of the factors in each of the analysed
texts or groups of texts. The present study focuses on the communication of science and technology
in online newspapers, and thus this chapter will give prominence to texts appearing in the ‗Science
and Technology‘ (ST) macro-feed category. Specifically, in the next section, the choice of the
statistical tests adopted to compare groups of texts within the corpus will be accounted for by
assessing the type of distribution characterising the analysed data. The following sections feature a
detailed qualitative analysis of ST articles, as well as a comparison between them and the rest of the
corpus, and between them and the other macro-feed categories. In Section 7, one ST article will be
analysed with respect to all four dimensions, so as to describe the interaction among them in a
single unit of analysis. A different perspective will be adopted in Section 8, where multidimensional
comparisons will be drawn between different newspaper sources. Section 9 consists of a lexical
analysis of the corpus with special attention to the ST section; its aim is to integrate the MDA
results with an overview of the lexical content characterising the analysed texts. Finally, in the last
part of the chapter, some of the results obtained will be reviewed and related to concepts and
theories from the sociology of science and technology.
2. Assessing the distributions of factor scores to enable reliable
statistical comparisons
In order to establish how likely it is that any observed similarities or differences among groups of
texts in the corpus reflect actual characteristics of the analysed data, statistical significance tests
need to be applied. As explained in Section 4.1.5 of Chapter 3, the most appropriate type of test
must be selected on the basis of the hypothesis to be tested and of the distributions of the analysed
datasets. As explained in Chapter 3, the hypothesis to be tested regarded the existence of a real,
significant difference between independent groups, corresponding to different macro-feed sections
of the corpus, with respect to factor scores, for each of the four factors separately. Any difference
can be regarded as significant when the probability – usually referred to as ‗p-value‘ – of observing
it by chance is lower than 0.05, or 5%. As for data distributions, they needed to be tested for
normality. In the present study, two normality tests were applied. ST and non-ST groups were tested
first. On the basis of the results obtained for ST texts, it was eventually decided not to test the other
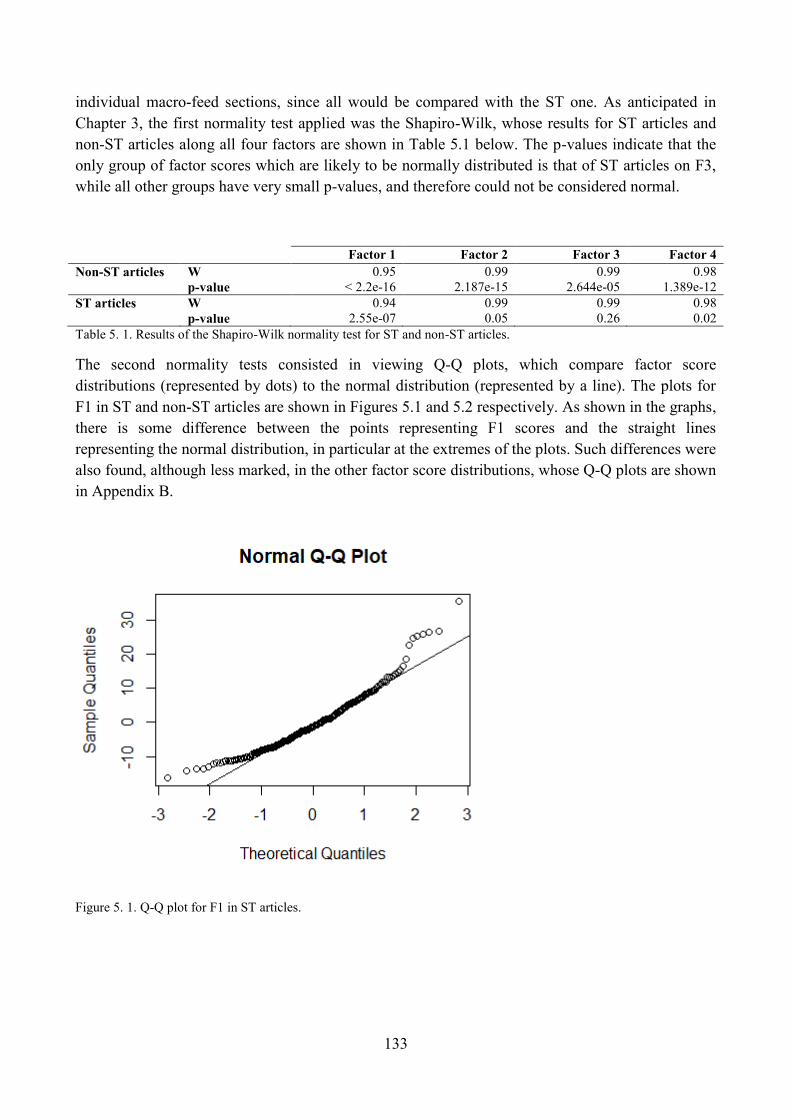
133
individual macro-feed sections, since all would be compared with the ST one. As anticipated in
Chapter 3, the first normality test applied was the Shapiro-Wilk, whose results for ST articles and
non-ST articles along all four factors are shown in Table 5.1 below. The p-values indicate that the
only group of factor scores which are likely to be normally distributed is that of ST articles on F3,
while all other groups have very small p-values, and therefore could not be considered normal.
Factor 1 Factor 2 Factor 3 Factor 4
Non-ST articles W 0.95 0.99 0.99 0.98
p-value < 2.2e-16 2.187e-15 2.644e-05 1.389e-12
ST articles W 0.94 0.99 0.99 0.98
p-value 2.55e-07 0.05 0.26 0.02
Table 5. 1. Results of the Shapiro-Wilk normality test for ST and non-ST articles.
The second normality tests consisted in viewing Q-Q plots, which compare factor score
distributions (represented by dots) to the normal distribution (represented by a line). The plots for
F1 in ST and non-ST articles are shown in Figures 5.1 and 5.2 respectively. As shown in the graphs,
there is some difference between the points representing F1 scores and the straight lines
representing the normal distribution, in particular at the extremes of the plots. Such differences were
also found, although less marked, in the other factor score distributions, whose Q-Q plots are shown
in Appendix B.
Figure 5. 1. Q-Q plot for F1 in ST articles.
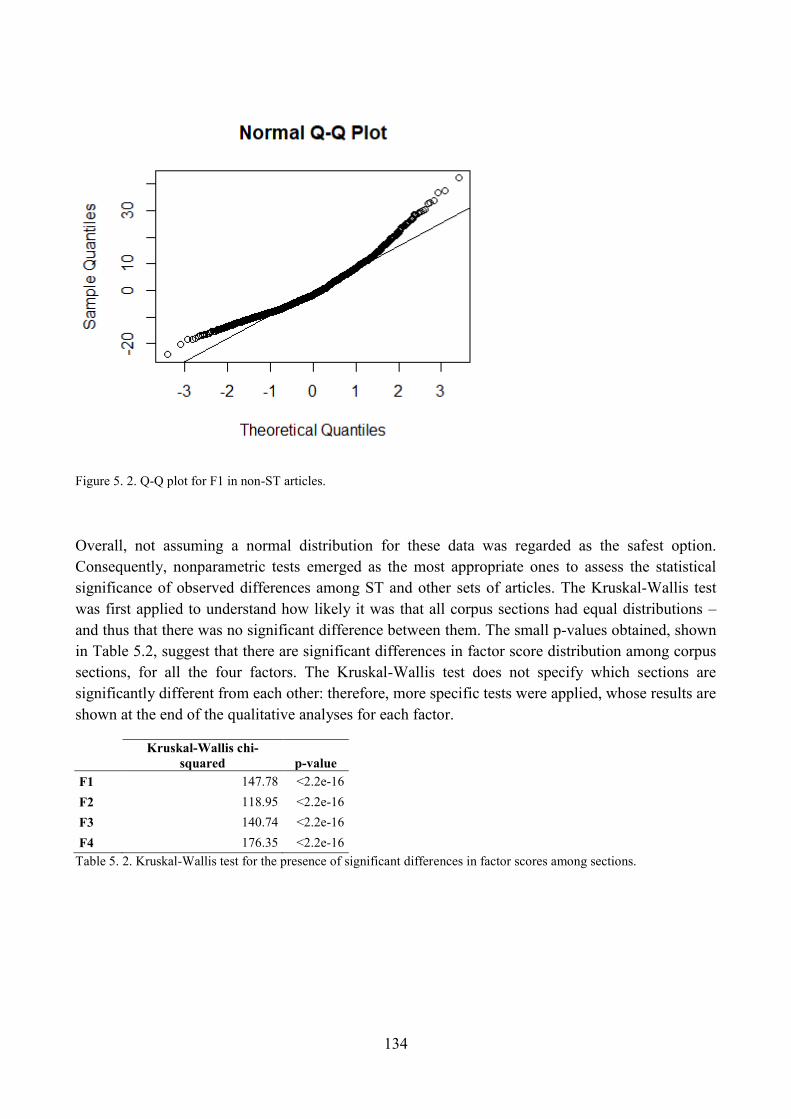
134
Figure 5. 2. Q-Q plot for F1 in non-ST articles.
Overall, not assuming a normal distribution for these data was regarded as the safest option.
Consequently, nonparametric tests emerged as the most appropriate ones to assess the statistical
significance of observed differences among ST and other sets of articles. The Kruskal-Wallis test
was first applied to understand how likely it was that all corpus sections had equal distributions –
and thus that there was no significant difference between them. The small p-values obtained, shown
in Table 5.2, suggest that there are significant differences in factor score distribution among corpus
sections, for all the four factors. The Kruskal-Wallis test does not specify which sections are
significantly different from each other: therefore, more specific tests were applied, whose results are
shown at the end of the qualitative analyses for each factor.
Kruskal-Wallis chi-
squared p-value
F1 147.78 <2.2e-16
F2 118.95 <2.2e-16
F3 140.74 <2.2e-16
F4 176.35 <2.2e-16
Table 5. 2. Kruskal-Wallis test for the presence of significant differences in factor scores among sections.
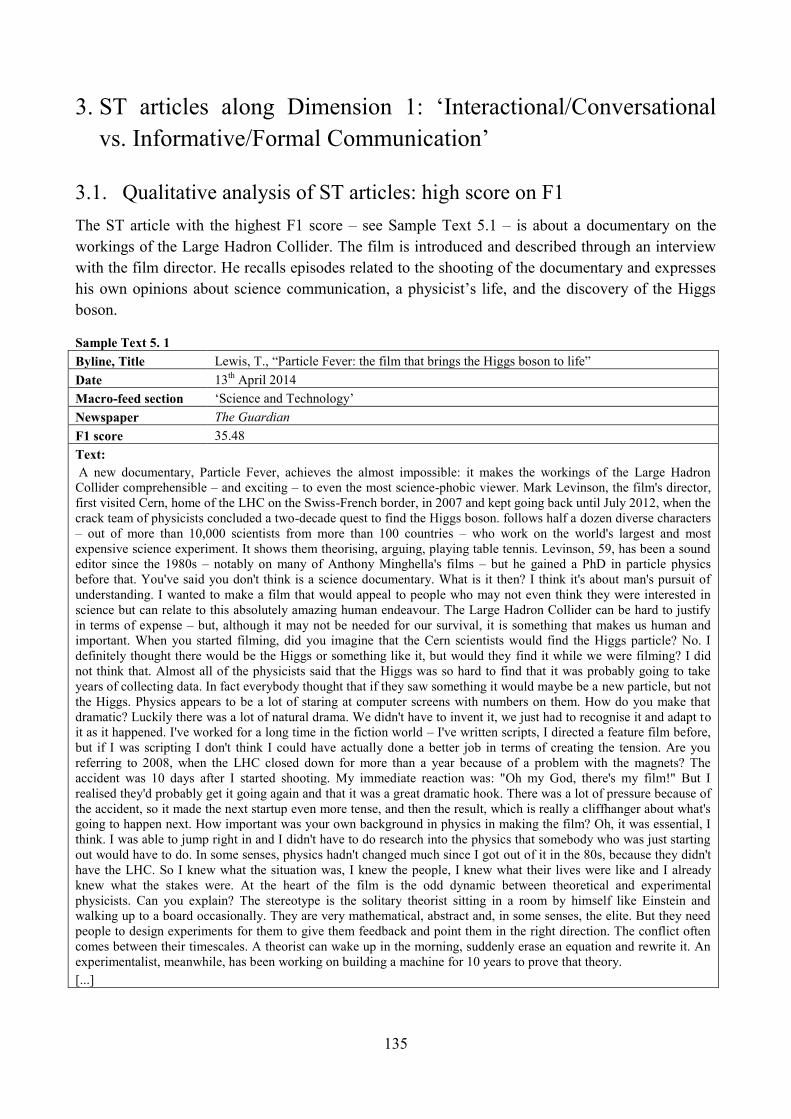
135
3. ST articles along Dimension 1: ‗Interactional/Conversational
vs. Informative/Formal Communication‘
3.1. Qualitative analysis of ST articles: high score on F1
The ST article with the highest F1 score – see Sample Text 5.1 – is about a documentary on the
workings of the Large Hadron Collider. The film is introduced and described through an interview
with the film director. He recalls episodes related to the shooting of the documentary and expresses
his own opinions about science communication, a physicist‘s life, and the discovery of the Higgs
boson.
Sample Text 5. 1
Byline, Title Lewis, T., ―Particle Fever: the film that brings the Higgs boson to life‖
Date 13th
April 2014
Macro-feed section ‗Science and Technology‘
Newspaper The Guardian
F1 score 35.48
Text:
A new documentary, Particle Fever, achieves the almost impossible: it makes the workings of the Large Hadron
Collider comprehensible – and exciting – to even the most science-phobic viewer. Mark Levinson, the film's director,
first visited Cern, home of the LHC on the Swiss-French border, in 2007 and kept going back until July 2012, when the
crack team of physicists concluded a two-decade quest to find the Higgs boson. follows half a dozen diverse characters
– out of more than 10,000 scientists from more than 100 countries – who work on the world's largest and most
expensive science experiment. It shows them theorising, arguing, playing table tennis. Levinson, 59, has been a sound
editor since the 1980s – notably on many of Anthony Minghella's films – but he gained a PhD in particle physics
before that. You've said you don't think is a science documentary. What is it then? I think it's about man's pursuit of
understanding. I wanted to make a film that would appeal to people who may not even think they were interested in
science but can relate to this absolutely amazing human endeavour. The Large Hadron Collider can be hard to justify
in terms of expense – but, although it may not be needed for our survival, it is something that makes us human and
important. When you started filming, did you imagine that the Cern scientists would find the Higgs particle? No. I
definitely thought there would be the Higgs or something like it, but would they find it while we were filming? I did
not think that. Almost all of the physicists said that the Higgs was so hard to find that it was probably going to take
years of collecting data. In fact everybody thought that if they saw something it would maybe be a new particle, but not
the Higgs. Physics appears to be a lot of staring at computer screens with numbers on them. How do you make that
dramatic? Luckily there was a lot of natural drama. We didn't have to invent it, we just had to recognise it and adapt to
it as it happened. I've worked for a long time in the fiction world – I've written scripts, I directed a feature film before,
but if I was scripting I don't think I could have actually done a better job in terms of creating the tension. Are you
referring to 2008, when the LHC closed down for more than a year because of a problem with the magnets? The
accident was 10 days after I started shooting. My immediate reaction was: "Oh my God, there's my film!" But I
realised they'd probably get it going again and that it was a great dramatic hook. There was a lot of pressure because of
the accident, so it made the next startup even more tense, and then the result, which is really a cliffhanger about what's
going to happen next. How important was your own background in physics in making the film? Oh, it was essential, I
think. I was able to jump right in and I didn't have to do research into the physics that somebody who was just starting
out would have to do. In some senses, physics hadn't changed much since I got out of it in the 80s, because they didn't
have the LHC. So I knew what the situation was, I knew the people, I knew what their lives were like and I already
knew what the stakes were. At the heart of the film is the odd dynamic between theoretical and experimental
physicists. Can you explain? The stereotype is the solitary theorist sitting in a room by himself like Einstein and
walking up to a board occasionally. They are very mathematical, abstract and, in some senses, the elite. But they need
people to design experiments for them to give them feedback and point them in the right direction. The conflict often
comes between their timescales. A theorist can wake up in the morning, suddenly erase an equation and rewrite it. An
experimentalist, meanwhile, has been working on building a machine for 10 years to prove that theory.
[...]
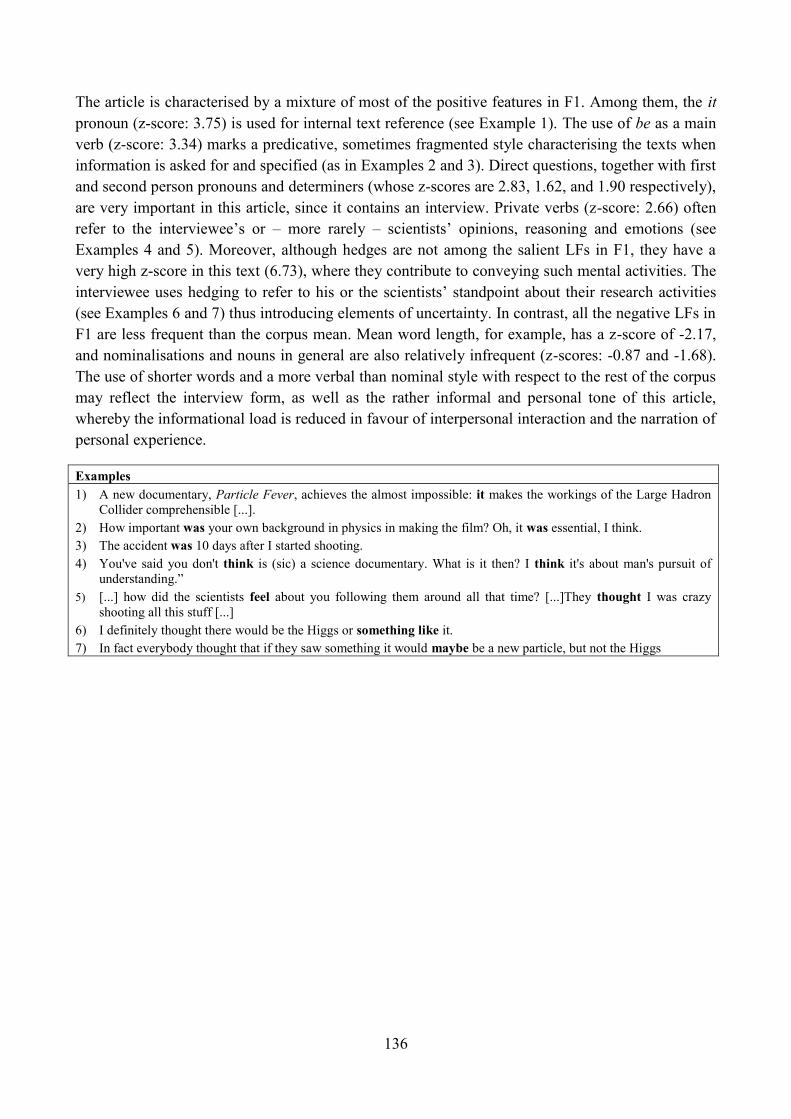
136
The article is characterised by a mixture of most of the positive features in F1. Among them, the it
pronoun (z-score: 3.75) is used for internal text reference (see Example 1). The use of be as a main
verb (z-score: 3.34) marks a predicative, sometimes fragmented style characterising the texts when
information is asked for and specified (as in Examples 2 and 3). Direct questions, together with first
and second person pronouns and determiners (whose z-scores are 2.83, 1.62, and 1.90 respectively),
are very important in this article, since it contains an interview. Private verbs (z-score: 2.66) often
refer to the interviewee‘s or – more rarely – scientists‘ opinions, reasoning and emotions (see
Examples 4 and 5). Moreover, although hedges are not among the salient LFs in F1, they have a
very high z-score in this text (6.73), where they contribute to conveying such mental activities. The
interviewee uses hedging to refer to his or the scientists‘ standpoint about their research activities
(see Examples 6 and 7) thus introducing elements of uncertainty. In contrast, all the negative LFs in
F1 are less frequent than the corpus mean. Mean word length, for example, has a z-score of -2.17,
and nominalisations and nouns in general are also relatively infrequent (z-scores: -0.87 and -1.68).
The use of shorter words and a more verbal than nominal style with respect to the rest of the corpus
may reflect the interview form, as well as the rather informal and personal tone of this article,
whereby the informational load is reduced in favour of interpersonal interaction and the narration of
personal experience.
Examples
1) A new documentary, Particle Fever, achieves the almost impossible: it makes the workings of the Large Hadron
Collider comprehensible [...].
2) How important was your own background in physics in making the film? Oh, it was essential, I think.
3) The accident was 10 days after I started shooting.
4) You've said you don't think is (sic) a science documentary. What is it then? I think it's about man's pursuit of
understanding.‖
5) [...] how did the scientists feel about you following them around all that time? [...]They thought I was crazy
shooting all this stuff [...]
6) I definitely thought there would be the Higgs or something like it.
7) In fact everybody thought that if they saw something it would maybe be a new particle, but not the Higgs
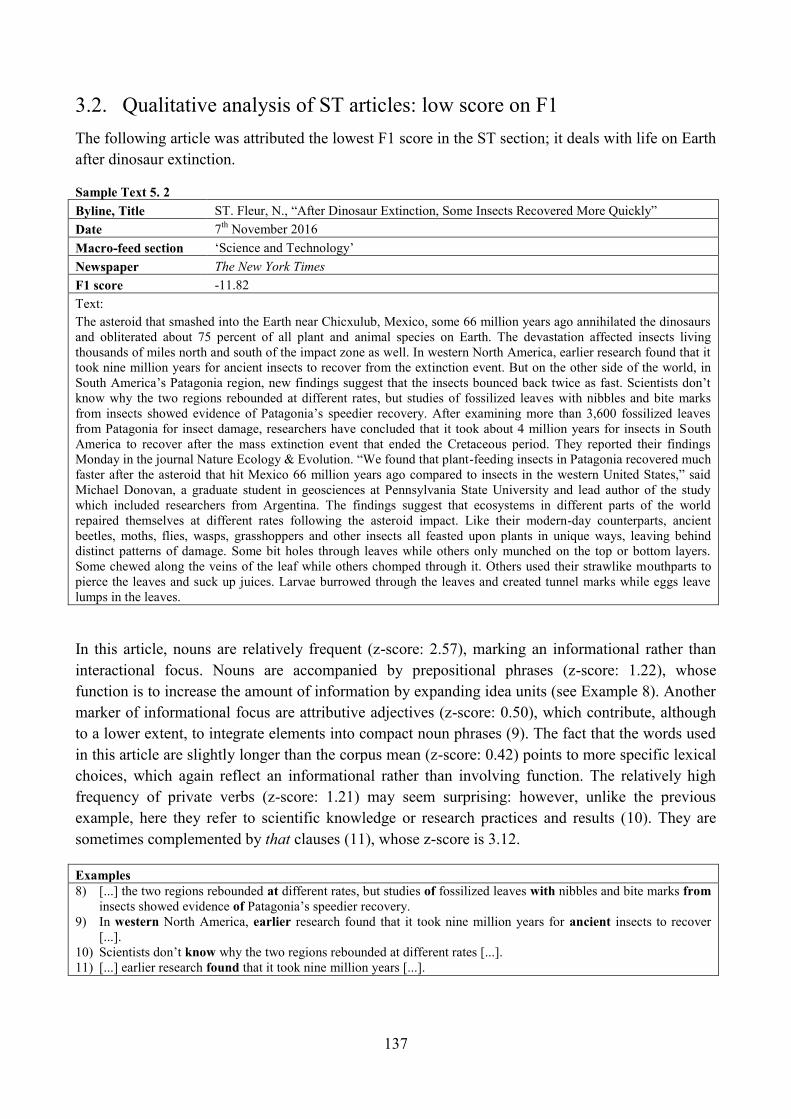
137
3.2. Qualitative analysis of ST articles: low score on F1
The following article was attributed the lowest F1 score in the ST section; it deals with life on Earth
after dinosaur extinction.
Sample Text 5. 2
Byline, Title ST. Fleur, N., ―After Dinosaur Extinction, Some Insects Recovered More Quickly‖
Date 7th
November 2016
Macro-feed section ‗Science and Technology‘
Newspaper The New York Times
F1 score -11.82
Text:
The asteroid that smashed into the Earth near Chicxulub, Mexico, some 66 million years ago annihilated the dinosaurs
and obliterated about 75 percent of all plant and animal species on Earth. The devastation affected insects living
thousands of miles north and south of the impact zone as well. In western North America, earlier research found that it
took nine million years for ancient insects to recover from the extinction event. But on the other side of the world, in
South America‘s Patagonia region, new findings suggest that the insects bounced back twice as fast. Scientists don‘t
know why the two regions rebounded at different rates, but studies of fossilized leaves with nibbles and bite marks
from insects showed evidence of Patagonia‘s speedier recovery. After examining more than 3,600 fossilized leaves
from Patagonia for insect damage, researchers have concluded that it took about 4 million years for insects in South
America to recover after the mass extinction event that ended the Cretaceous period. They reported their findings
Monday in the journal Nature Ecology & Evolution. ―We found that plant-feeding insects in Patagonia recovered much
faster after the asteroid that hit Mexico 66 million years ago compared to insects in the western United States,‖ said
Michael Donovan, a graduate student in geosciences at Pennsylvania State University and lead author of the study
which included researchers from Argentina. The findings suggest that ecosystems in different parts of the world
repaired themselves at different rates following the asteroid impact. Like their modern-day counterparts, ancient
beetles, moths, flies, wasps, grasshoppers and other insects all feasted upon plants in unique ways, leaving behind
distinct patterns of damage. Some bit holes through leaves while others only munched on the top or bottom layers.
Some chewed along the veins of the leaf while others chomped through it. Others used their strawlike mouthparts to
pierce the leaves and suck up juices. Larvae burrowed through the leaves and created tunnel marks while eggs leave
lumps in the leaves.
In this article, nouns are relatively frequent (z-score: 2.57), marking an informational rather than
interactional focus. Nouns are accompanied by prepositional phrases (z-score: 1.22), whose
function is to increase the amount of information by expanding idea units (see Example 8). Another
marker of informational focus are attributive adjectives (z-score: 0.50), which contribute, although
to a lower extent, to integrate elements into compact noun phrases (9). The fact that the words used
in this article are slightly longer than the corpus mean (z-score: 0.42) points to more specific lexical
choices, which again reflect an informational rather than involving function. The relatively high
frequency of private verbs (z-score: 1.21) may seem surprising: however, unlike the previous
example, here they refer to scientific knowledge or research practices and results (10). They are
sometimes complemented by that clauses (11), whose z-score is 3.12.
Examples
8) [...] the two regions rebounded at different rates, but studies of fossilized leaves with nibbles and bite marks from
insects showed evidence of Patagonia‘s speedier recovery.
9) In western North America, earlier research found that it took nine million years for ancient insects to recover
[...].
10) Scientists don‘t know why the two regions rebounded at different rates [...].
11) [...] earlier research found that it took nine million years [...].
138
Most negative F1 features have negative z-scores in this article: in particular, the relatively low
frequencies of be as a main verb and predicative adjectives (z-scores: -2.09 and -1.45) point to
information integration rather than fragmentation, and to a more typically written language with
respect, for instance, to the article in Section 3.1 above. Moreover, the reduced use of present tenses
in favour of past tenses removes the attention from immediate concerns. Overall, the scientific
content is here communicated to readers by providing highly informative explanations, especially in
a nominal form, which is further developed by adjectives and prepositions. The source of this
information is regularly recovered through that clauses of the type ‗research + found + that ...‘.
There is only one case of direct speech from an expert, which further justifies the closeness of this
text to typical writing.
3.3. Qualitative analysis of ST articles: unmarked score on F1
An example of ST article with an unmarked F1 score is shown in Sample Text 5.3 below: it lists
possible explanations for the presence of stripes on the coat of zebras, and combines Darwin‘s
theories with more recent research.
Sample Text 5. 3
Byline, Title Nicholls, H., ―Why do zebras have stripes? Scientists have the answer‖
Date 2nd
April 2014
Macro-feed section ‗Science and Technology‘
Newspaper The Guardian
F1 score 0.64
Text:
Why do zebras have stripes? Scientists have the answer. The zebra‘s striped coat is simultaneously extraordinary and
stunning. So wondrous, in fact, that many people have imagined it to be evidence of God‘s infinitely artistic hand.
Over the years, there have been many more rational explanations, but that all-important scientific consensus has
remained elusive. Charles Darwin certainly found the zebra‘s stripes to be a conundrum. In The Descent of Man, he
dismissed the idea they could act as camouflage, citing William Burchell ‘s observations of a herd: Although both
males and female zebras are similarly striped, Darwin hedged that ―he who attributes the white and dark vertical stripes
on the flanks of various antelopes to sexual selection, will probably extend the same view to the … beautiful zebra.‖ In
other words, the stripes help males and females make sensible choices about whom they mate with. Alfred Russel
Wallace begged to differ. ―It is in the evening, or on moonlight nights, when they go to drink, that they are chiefly
exposed to attack,‖ he wrote in Darwinism. ―In twilight they are not at all conspicuous, the stripes of white and black
so merging together into a grey tint it is difficult to see them at a little distance.‖ There are other possibilities too.
Perhaps the stripes act as some kind of zoological barcode, allowing one individual to recognise another. It has been
suggested they could somehow help with thermoregulation. Or perhaps they are there to deter parasitic flies. Tim Caro
of the University of California, Davis, has puzzled over contrasting colouration in mammals before. Now, in a new
study published in Nature Communications this week, he and his colleagues have focused their attention on the zebra.
They take a completely original approach, stepping back from one species of zebra and attempting to account for the
differences in patterning across different species and subspecies of zebras, horses and asses. Is there anything about the
habitat or ecology of these different equids that hints at the function of stripes? ―I was amazed by our results,‖ says
Caro. ―Again and again, there was greater striping on areas of the body in those parts of the world where there was
more annoyance from biting flies.‖ Where there are tsetse flies, for instance, the equids tend to come in stripes. Where
there aren't, they don't.
[...]
Among the LFs whose frequency of use in this text is higher than the average values of the corpus,
only few are from the positive end of F1, namely present tense (z-score: 1.12), and direct questions
(z-score: 1.06). Verbs in the present are used to indicate general statements perceived as invariable,
such as the colour of animals‘ coats. Hypotheses regarding the origin of these natural facts are also
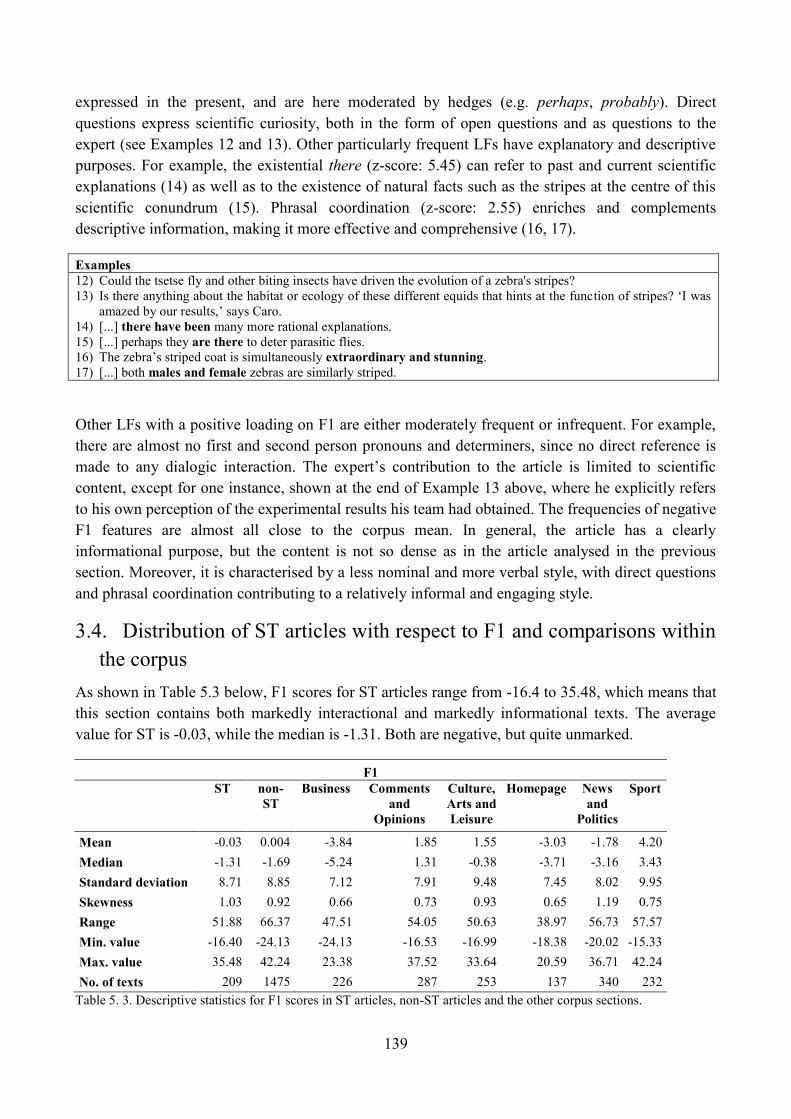
139
expressed in the present, and are here moderated by hedges (e.g. perhaps, probably). Direct
questions express scientific curiosity, both in the form of open questions and as questions to the
expert (see Examples 12 and 13). Other particularly frequent LFs have explanatory and descriptive
purposes. For example, the existential there (z-score: 5.45) can refer to past and current scientific
explanations (14) as well as to the existence of natural facts such as the stripes at the centre of this
scientific conundrum (15). Phrasal coordination (z-score: 2.55) enriches and complements
descriptive information, making it more effective and comprehensive (16, 17).
Examples
12) Could the tsetse fly and other biting insects have driven the evolution of a zebra's stripes?
13) Is there anything about the habitat or ecology of these different equids that hints at the function of stripes? ‗I was
amazed by our results,‘ says Caro.
14) [...] there have been many more rational explanations.
15) [...] perhaps they are there to deter parasitic flies.
16) The zebra‘s striped coat is simultaneously extraordinary and stunning.
17) [...] both males and female zebras are similarly striped.
Other LFs with a positive loading on F1 are either moderately frequent or infrequent. For example,
there are almost no first and second person pronouns and determiners, since no direct reference is
made to any dialogic interaction. The expert‘s contribution to the article is limited to scientific
content, except for one instance, shown at the end of Example 13 above, where he explicitly refers
to his own perception of the experimental results his team had obtained. The frequencies of negative
F1 features are almost all close to the corpus mean. In general, the article has a clearly
informational purpose, but the content is not so dense as in the article analysed in the previous
section. Moreover, it is characterised by a less nominal and more verbal style, with direct questions
and phrasal coordination contributing to a relatively informal and engaging style.
3.4. Distribution of ST articles with respect to F1 and comparisons within
the corpus
As shown in Table 5.3 below, F1 scores for ST articles range from -16.4 to 35.48, which means that
this section contains both markedly interactional and markedly informational texts. The average
value for ST is -0.03, while the median is -1.31. Both are negative, but quite unmarked.
F1
ST non-
ST
Business Comments
and
Opinions
Culture,
Arts and
Leisure
Homepage News
and
Politics
Sport
Mean -0.03 0.004 -3.84 1.85 1.55 -3.03 -1.78 4.20
Median -1.31 -1.69 -5.24 1.31 -0.38 -3.71 -3.16 3.43
Standard deviation 8.71 8.85 7.12 7.91 9.48 7.45 8.02 9.95
Skewness 1.03 0.92 0.66 0.73 0.93 0.65 1.19 0.75
Range 51.88 66.37 47.51 54.05 50.63 38.97 56.73 57.57
Min. value -16.40 -24.13 -24.13 -16.53 -16.99 -18.38 -20.02 -15.33
Max. value 35.48 42.24 23.38 37.52 33.64 20.59 36.71 42.24
No. of texts 209 1475 226 287 253 137 340 232
Table 5. 3. Descriptive statistics for F1 scores in ST articles, non-ST articles and the other corpus sections.
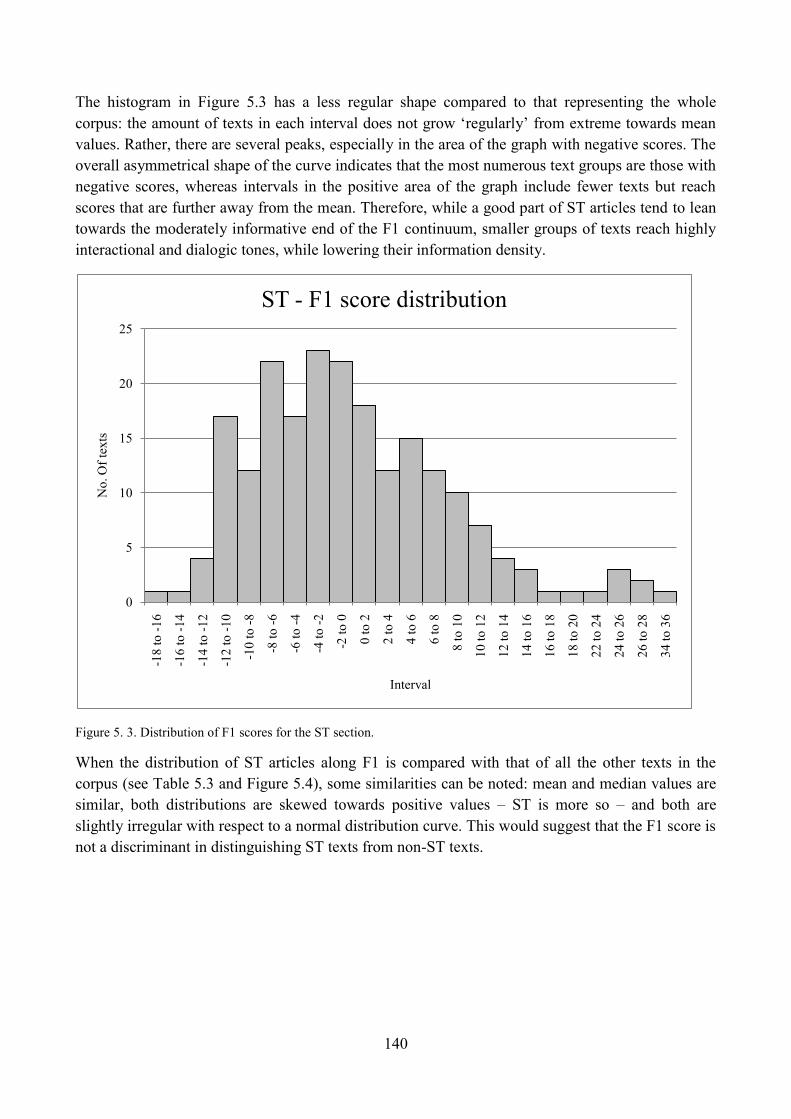
140
The histogram in Figure 5.3 has a less regular shape compared to that representing the whole
corpus: the amount of texts in each interval does not grow ‗regularly‘ from extreme towards mean
values. Rather, there are several peaks, especially in the area of the graph with negative scores. The
overall asymmetrical shape of the curve indicates that the most numerous text groups are those with
negative scores, whereas intervals in the positive area of the graph include fewer texts but reach
scores that are further away from the mean. Therefore, while a good part of ST articles tend to lean
towards the moderately informative end of the F1 continuum, smaller groups of texts reach highly
interactional and dialogic tones, while lowering their information density.
Figure 5. 3. Distribution of F1 scores for the ST section.
When the distribution of ST articles along F1 is compared with that of all the other texts in the
corpus (see Table 5.3 and Figure 5.4), some similarities can be noted: mean and median values are
similar, both distributions are skewed towards positive values – ST is more so – and both are
slightly irregular with respect to a normal distribution curve. This would suggest that the F1 score is
not a discriminant in distinguishing ST texts from non-ST texts.
0
5
10
15
20
25
-18
to
-1
6
-16
to
-1
4
-14
to
-1
2
-12
to
-1
0
-10
to
-8
-8 t
o -
6
-6 t
o -
4
-4 t
o -
2
-2 t
o 0
0 t
o 2
2 t
o 4
4 t
o 6
6 t
o 8
8 t
o 1
0
10
to
12
12
to
14
14
to
16
16
to
18
18
to
20
22
to
24
24
to
26
26
to
28
34
to
36
No
. O
f te
xts
Interval
ST - F1 score distribution
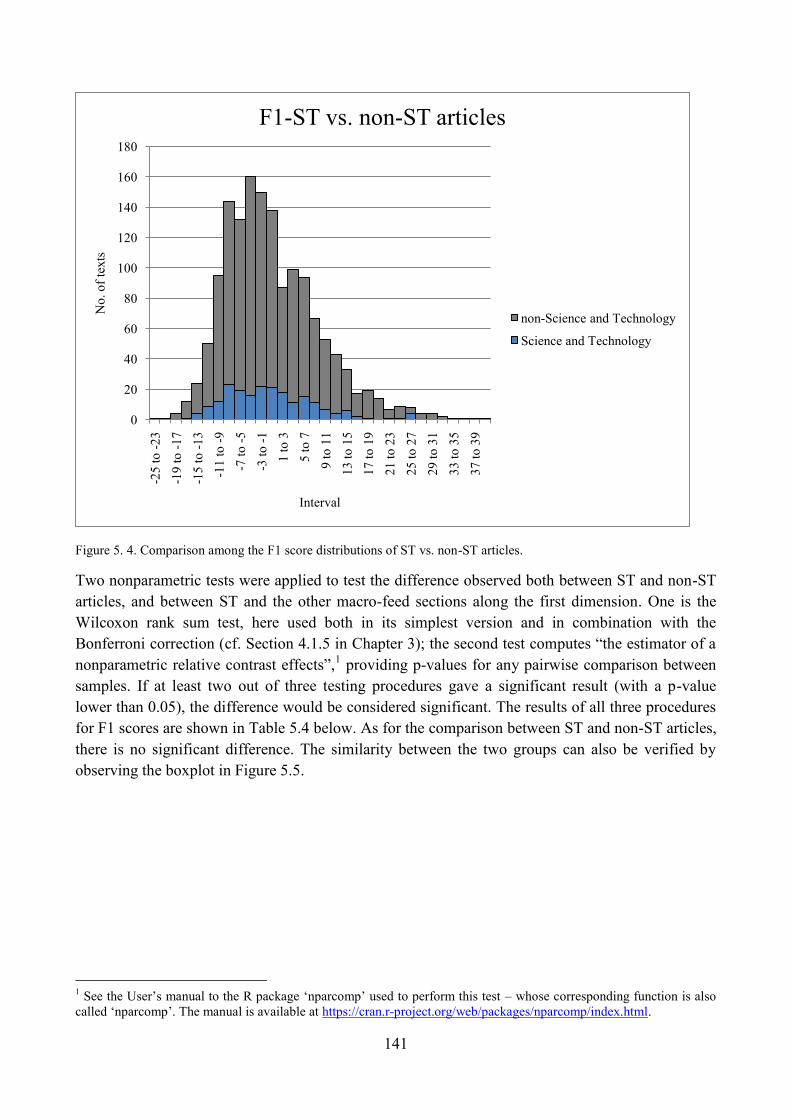
141
Figure 5. 4. Comparison among the F1 score distributions of ST vs. non-ST articles.
Two nonparametric tests were applied to test the difference observed both between ST and non-ST
articles, and between ST and the other macro-feed sections along the first dimension. One is the
Wilcoxon rank sum test, here used both in its simplest version and in combination with the
Bonferroni correction (cf. Section 4.1.5 in Chapter 3); the second test computes ―the estimator of a
nonparametric relative contrast effects‖,1 providing p-values for any pairwise comparison between
samples. If at least two out of three testing procedures gave a significant result (with a p-value
lower than 0.05), the difference would be considered significant. The results of all three procedures
for F1 scores are shown in Table 5.4 below. As for the comparison between ST and non-ST articles,
there is no significant difference. The similarity between the two groups can also be verified by
observing the boxplot in Figure 5.5.
1 See the User‘s manual to the R package ‗nparcomp‘ used to perform this test – whose corresponding function is also
called ‗nparcomp‘. The manual is available at https://cran.r-project.org/web/packages/nparcomp/index.html.
0
20
40
60
80
100
120
140
160
180-2
5 t
o -
23
-19
to
-1
7
-15
to
-1
3
-11
to
-9
-7 t
o -
5
-3 t
o -
1
1 t
o 3
5 t
o 7
9 t
o 1
1
13
to
15
17
to
19
21
to
23
25
to
27
29
to
31
33
to
35
37
to
39
No
. o
f te
xts
Interval
F1-ST vs. non-ST articles
non-Science and Technology
Science and Technology
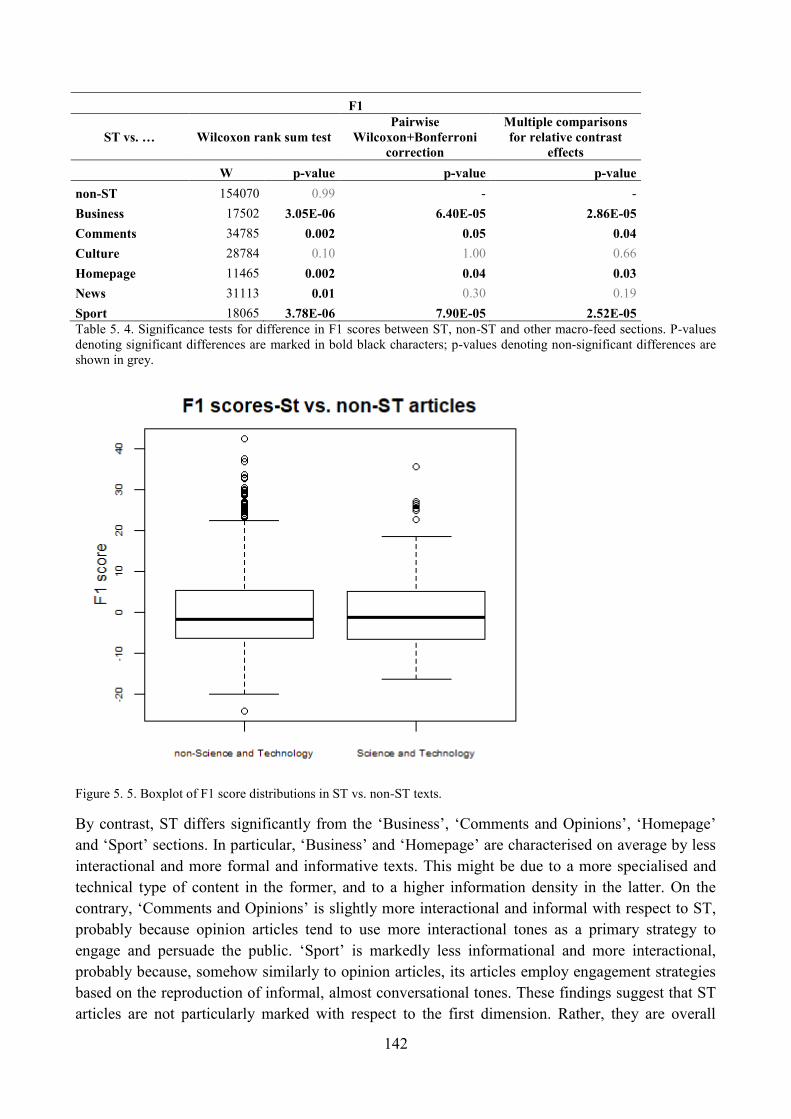
142
F1
ST vs. … Wilcoxon rank sum test
Pairwise
Wilcoxon+Bonferroni
correction
Multiple comparisons
for relative contrast
effects
W p-value p-value p-value
non-ST 154070 0.99 - -
Business 17502 3.05E-06 6.40E-05 2.86E-05
Comments 34785 0.002 0.05 0.04
Culture 28784 0.10 1.00 0.66
Homepage 11465 0.002 0.04 0.03
News 31113 0.01 0.30 0.19
Sport 18065 3.78E-06 7.90E-05 2.52E-05
Table 5. 4. Significance tests for difference in F1 scores between ST, non-ST and other macro-feed sections. P-values
denoting significant differences are marked in bold black characters; p-values denoting non-significant differences are
shown in grey.
Figure 5. 5. Boxplot of F1 score distributions in ST vs. non-ST texts.
By contrast, ST differs significantly from the ‗Business‘, ‗Comments and Opinions‘, ‗Homepage‘
and ‗Sport‘ sections. In particular, ‗Business‘ and ‗Homepage‘ are characterised on average by less
interactional and more formal and informative texts. This might be due to a more specialised and
technical type of content in the former, and to a higher information density in the latter. On the
contrary, ‗Comments and Opinions‘ is slightly more interactional and informal with respect to ST,
probably because opinion articles tend to use more interactional tones as a primary strategy to
engage and persuade the public. ‗Sport‘ is markedly less informational and more interactional,
probably because, somehow similarly to opinion articles, its articles employ engagement strategies
based on the reproduction of informal, almost conversational tones. These findings suggest that ST
articles are not particularly marked with respect to the first dimension. Rather, they are overall
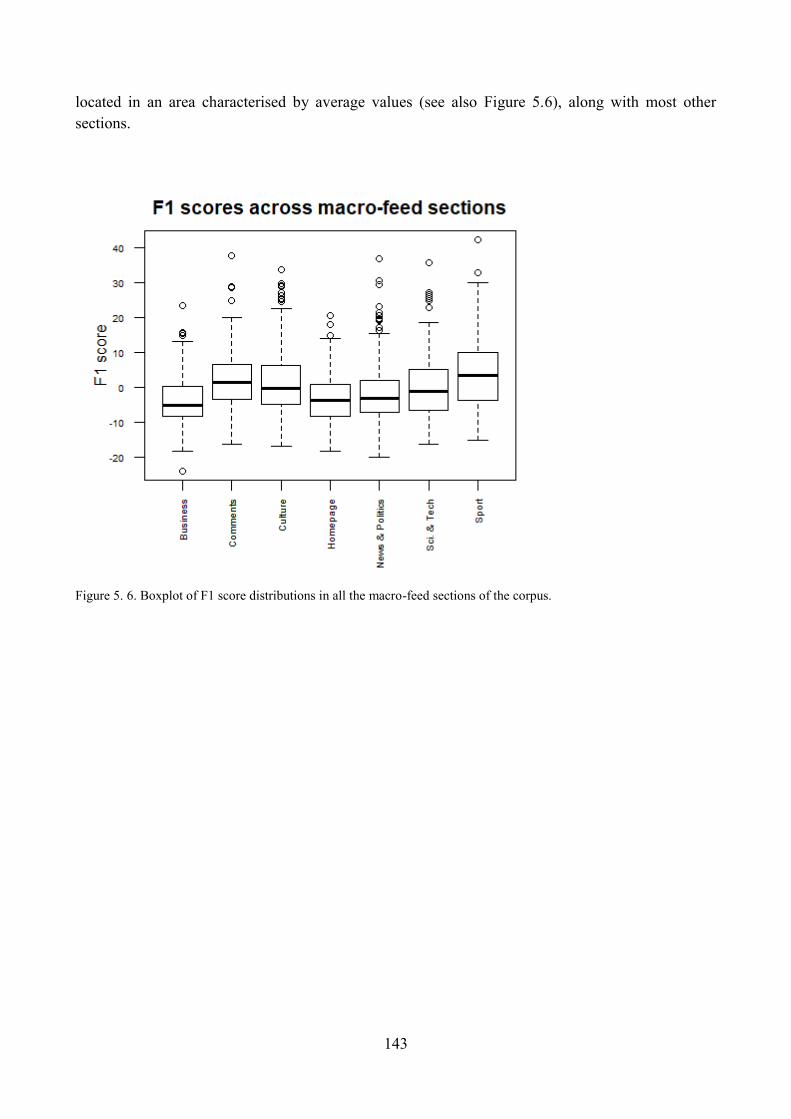
143
located in an area characterised by average values (see also Figure 5.6), along with most other
sections.
Figure 5. 6. Boxplot of F1 score distributions in all the macro-feed sections of the corpus.
144
4. ST articles along Dimension 2: ‗Reported Account of Recent
Events vs. Direct/Factual Communication‘
4.1. Qualitative analysis of ST articles: high score on F2
One of the articles with the highest F2 scores (see Sample Text 5.4 below) deals with the
consequences of plastic use upon human and animal male fertility, reporting on recently published
research about the topic. The content is framed as topical, and therefore it is closely related to the
present, as often happens in texts with markedly high scores on F2–where present perfect is a
salient LF. The impact of plastic chemicals on male fertility is discussed through many references to
published studies and expert‘s comments, which makes reporting structures particularly frequent.
Sample Text 5. 4
Byline, Title Knapton, S., ―Chemicals in food wrappings could harm human and dog fertility‖
Date 9th
August 2016
Macro-feed section ‗Science and Technology‘
Newspaper The Daily Telegraph
F2 score 7.85
Text:
Chemicals found in plastic wrappings and the environment could be behind the drop in sperm counts, scientists have
suggested, after discovering that dogs are also losing their fertility because they live alongside humans. Last year
research showed that just 25 per cent of young men now produce good quality sperm and the average semen volume
has declined by a quarter since the 1940s.But scientists were unclear what was causing the problem, with everything
from sunscreen to a rise in vegetarianism blamed for the decline. Now researchers at the University of Nottingham
have discovered that the same issue is also occurring in dogs whose sperm motility has fallen by around 35 per cent
since 1988.The study also showed that all dog food tested contained high levels of chemicals which are known to
disrupt hormones. Chemicals used to make plastics more bendy or furniture flame retardant can end up in food, both
through leaching from wrappings, and because they are taken in by plants and livestock and so end up in the food
chain. The same chemicals were also present in the dog testes. Although the team say that it is too early to say that the
chemicals are definitely causing infertility, they say that factories should review their processes to make sure food is as
chemical free as possible. Dr Richard Lea, reader in reproductive biology at the university's School of Veterinary
Medicine and Science, who led the research, said: "This is the first time that such a decline in male fertility has been
reported in the dog and we believe this is due to environmental contaminants, some of which we have detected in dog
food and in the sperm and testes of the animals themselves."While further research is needed to conclusively
demonstrate a link, the dog may indeed be a sentinel for humans - it shares the same environment, exhibits the same
range of diseases, many with the same frequency, and responds in a similar way to therapies. Dr Lea and his team
collected semen from between 42 and 97 stud dogs every year over 26 years at an assistance dogs breeding centre.
Semen samples were then analysed to assess the percentage of sperm that appeared normal and had the expected
pattern of motility. Sperm motility declined by 2.5 per cent per year between 1988 and 1998, and then at a rate of 1.2
per cent per year from 2002 to 2014.
[...]
In this text, all the positive LFs in F2 have frequencies above the corpus mean. Some of these are
particularly relevant to reporting functions: for example, that verb clauses have a z-score of 4.15,
and reflect scientists‘ statements or the results of their research (see Examples 18 and 19). Public
verbs (z-score: 1.38) such as say, discover and report often introduce reporting structures, along
with suasive verbs (z-score: 1.12) – in particular, suggest, as in Example 20. Another LF loading
positively on F2, nominalisations (e.g. fertility, infertility, motility), has a positive z-score of 0.66.
Here, nominalisations indicate precise lexical choices and contribute to integrating information into
nominal phrases. Finally, verbs with a perfect aspect (Examples 21 and 22) have a z-score of 0.62.
145
They are combined with past simple and present simple verbs. Overall, the article refers to a recent
past, perceived as relevant to the present, in line with the communicative characteristics of F2.
Examples
18) [...] after discovering that dogs are also losing their fertility [...].
19) Last year research showed that just 25 per cent of young men now produce [...].
20) Indeed, because dogs share the human home, this could suggest that they might be a useful model species.
21) [...] scientists have suggested [...].
22) Now researchers [...] have discovered that [...].
4.2. Qualitative analysis of ST articles: low score on F2
Sample Text 5.5 below is among those which were assigned low F2 scores. It is meant as a
description and a guidance to observe the night sky during a certain period of time (corresponding
to the time of publishing).
Sample Text 5. 5
Byline, Title Lawrence, P., ―Night Sky - December 2016: Orion the mighty hunter returns‖
Date 5th
December 2016
Macro-feed section ‗Science and Technology‘
Newspaper The Daily Telegraph
F2 score -5.61
Text:
The intensely bright object currently visible in the evening twilight is the planet Venus. This Earth-sized world is
covered in a thick, dense, mostly carbon-dioxide atmosphere. This makes it highly reflective, sending over 75 per cent
of incoming sunlight back into space. This is a high value – our planet reflects 39 per cent - and makes Venus the
brightest planet visible from Earth. Its position improves throughout December, setting four hours after the Sun on
New Year‘s Eve. Look for it low above the south to west-southwest horizon, 20 minutes after sunset. A lovely waxing
crescent Moon sits nearby from Dec 31 through to Jan 2. Full Moon this month occurs on Dec 14 and this year it will
interfere with the annual Geminid meteor shower. This peaks on the night of Dec 13-14 when all but the brightest
Geminid trails will be hidden by the Moon‘s extensive glare. The annual Ursid meteor shower is a better prospect,
being most active on Dec 22 when the Moon‘s influence will have waned. Its peak visual rate of just a few meteors per
hour demands warm clothes and a certain amount of resilience to watch throughout a long, cold December night. The
skies will be darkest at the start and end of December. With no Moon to spoil the view, the most prominent
constellation is Orion the Hunter. This has an easily recognisable pattern, centred on a straight line of three similar
brightness stars that form the hunter‘s belt. Hanging down from his belt is his sword, defined by a misty line of
relatively faint stars. Orion is full of nebulosity and represents one of the most active sites of star formation visible in
the night sky. The bright and dark nebulae that occupy the region are part of what‘s known as the Orion Molecular
Cloud (OMC) Complex located between 1500 and 1600 light years away. Long exposure photographs here reveal a
giant loop of glowing nebulosity known as Barnard‘s Loop which has an apparent diameter, three-quarters the height
of the main pattern of Orion. Outside of the main pattern, the star representing Orion‘s head is Lambda Orionis or
Meissa.
[...]
Most F2 features here are either slightly or markedly less frequent than the corpus mean. The few
private verbs present in the article (z-score: -1:40) do not always express a ‗mental activity‘: for
example, expressions such as known as are used as part of definitions or descriptions. Infinitives
are also relatively infrequent (z-score: -1.21), as are many of the LFs which expand idea units,
including subordinating structures. Rather, the article unfolds through a sequence of independent
clauses, and cohesion is maintained through demonstrative pronouns, which have a z-score of 2.93.
(see Example 23 below). Moreover, the prevailing verbal tense is the present simple, while perfect
aspect verbs have a negative z-score of -1.26. This is a descriptive and instructional text, and
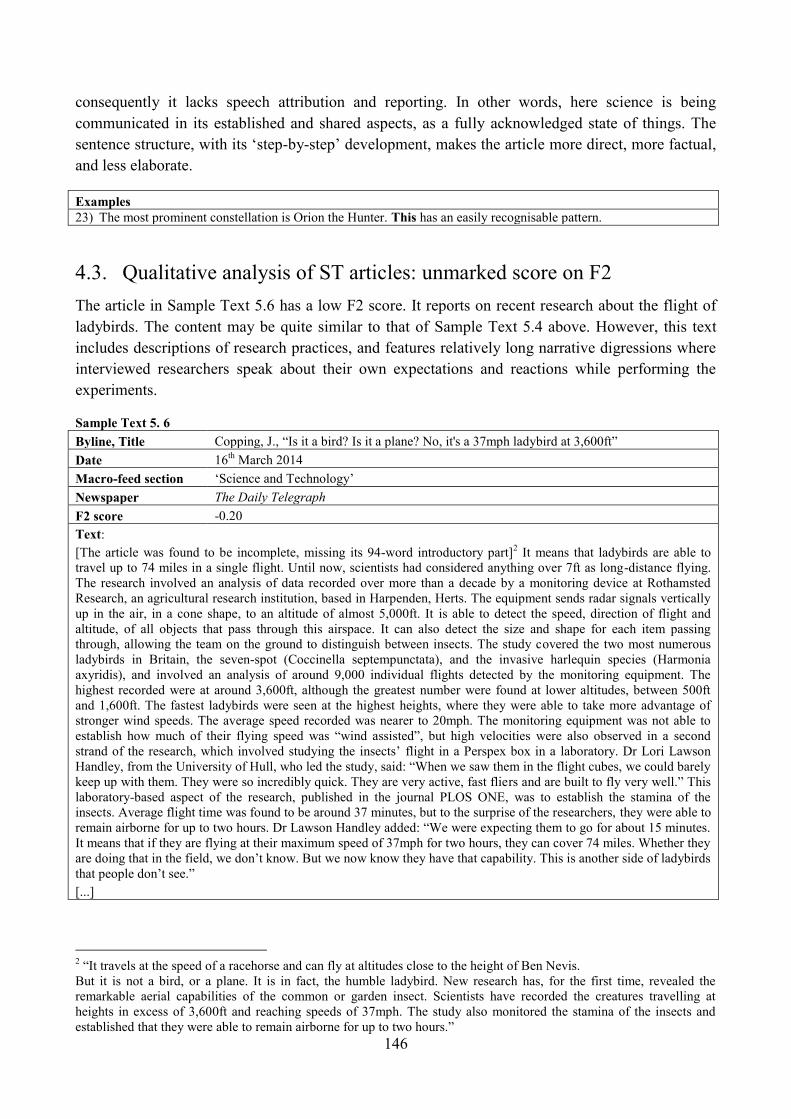
146
consequently it lacks speech attribution and reporting. In other words, here science is being
communicated in its established and shared aspects, as a fully acknowledged state of things. The
sentence structure, with its ‗step-by-step‘ development, makes the article more direct, more factual,
and less elaborate.
Examples
23) The most prominent constellation is Orion the Hunter. This has an easily recognisable pattern.
4.3. Qualitative analysis of ST articles: unmarked score on F2
The article in Sample Text 5.6 has a low F2 score. It reports on recent research about the flight of
ladybirds. The content may be quite similar to that of Sample Text 5.4 above. However, this text
includes descriptions of research practices, and features relatively long narrative digressions where
interviewed researchers speak about their own expectations and reactions while performing the
experiments.
Sample Text 5. 6
Byline, Title Copping, J., ―Is it a bird? Is it a plane? No, it's a 37mph ladybird at 3,600ft‖
Date 16th
March 2014
Macro-feed section ‗Science and Technology‘
Newspaper The Daily Telegraph
F2 score -0.20
Text:
[The article was found to be incomplete, missing its 94-word introductory part]2 It means that ladybirds are able to
travel up to 74 miles in a single flight. Until now, scientists had considered anything over 7ft as long-distance flying.
The research involved an analysis of data recorded over more than a decade by a monitoring device at Rothamsted
Research, an agricultural research institution, based in Harpenden, Herts. The equipment sends radar signals vertically
up in the air, in a cone shape, to an altitude of almost 5,000ft. It is able to detect the speed, direction of flight and
altitude, of all objects that pass through this airspace. It can also detect the size and shape for each item passing
through, allowing the team on the ground to distinguish between insects. The study covered the two most numerous
ladybirds in Britain, the seven-spot (Coccinella septempunctata), and the invasive harlequin species (Harmonia
axyridis), and involved an analysis of around 9,000 individual flights detected by the monitoring equipment. The
highest recorded were at around 3,600ft, although the greatest number were found at lower altitudes, between 500ft
and 1,600ft. The fastest ladybirds were seen at the highest heights, where they were able to take more advantage of
stronger wind speeds. The average speed recorded was nearer to 20mph. The monitoring equipment was not able to
establish how much of their flying speed was ―wind assisted‖, but high velocities were also observed in a second
strand of the research, which involved studying the insects‘ flight in a Perspex box in a laboratory. Dr Lori Lawson
Handley, from the University of Hull, who led the study, said: ―When we saw them in the flight cubes, we could barely
keep up with them. They were so incredibly quick. They are very active, fast fliers and are built to fly very well.‖ This
laboratory-based aspect of the research, published in the journal PLOS ONE, was to establish the stamina of the
insects. Average flight time was found to be around 37 minutes, but to the surprise of the researchers, they were able to
remain airborne for up to two hours. Dr Lawson Handley added: ―We were expecting them to go for about 15 minutes.
It means that if they are flying at their maximum speed of 37mph for two hours, they can cover 74 miles. Whether they
are doing that in the field, we don‘t know. But we now know they have that capability. This is another side of ladybirds
that people don‘t see.‖
[...]
2 ―It travels at the speed of a racehorse and can fly at altitudes close to the height of Ben Nevis.
But it is not a bird, or a plane. It is in fact, the humble ladybird. New research has, for the first time, revealed the
remarkable aerial capabilities of the common or garden insect. Scientists have recorded the creatures travelling at
heights in excess of 3,600ft and reaching speeds of 37mph. The study also monitored the stamina of the insects and
established that they were able to remain airborne for up to two hours.‖
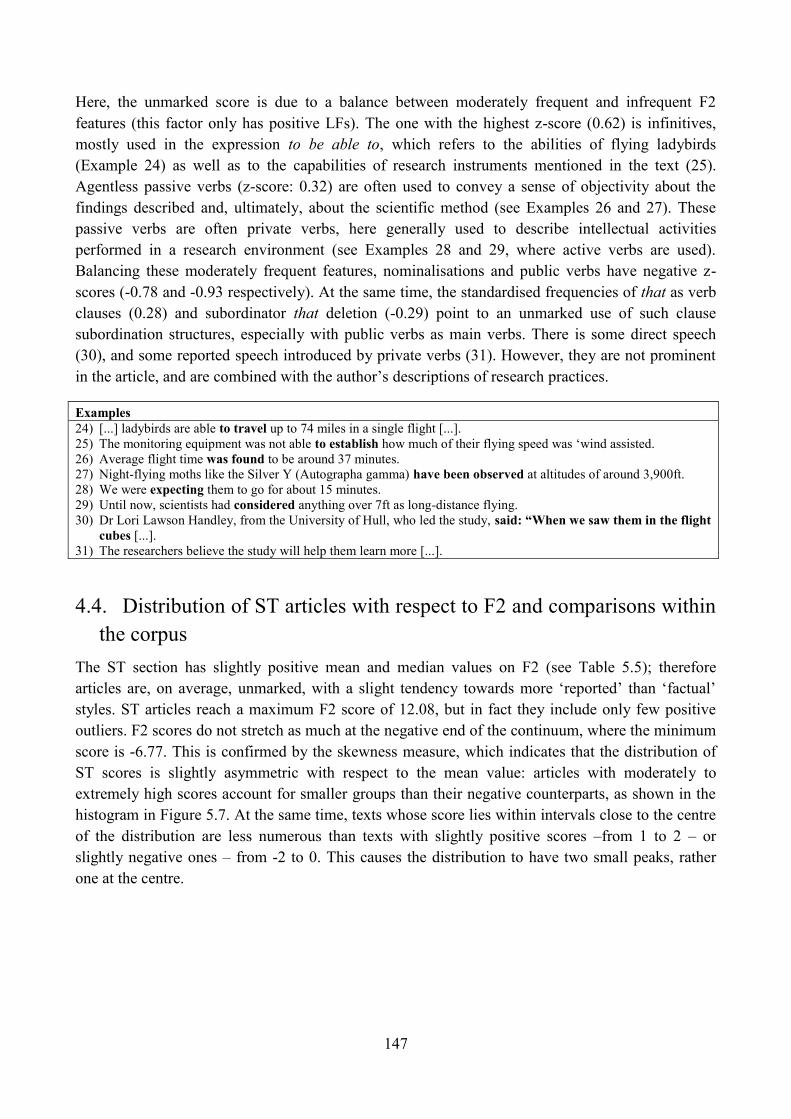
147
Here, the unmarked score is due to a balance between moderately frequent and infrequent F2
features (this factor only has positive LFs). The one with the highest z-score (0.62) is infinitives,
mostly used in the expression to be able to, which refers to the abilities of flying ladybirds
(Example 24) as well as to the capabilities of research instruments mentioned in the text (25).
Agentless passive verbs (z-score: 0.32) are often used to convey a sense of objectivity about the
findings described and, ultimately, about the scientific method (see Examples 26 and 27). These
passive verbs are often private verbs, here generally used to describe intellectual activities
performed in a research environment (see Examples 28 and 29, where active verbs are used).
Balancing these moderately frequent features, nominalisations and public verbs have negative z-
scores (-0.78 and -0.93 respectively). At the same time, the standardised frequencies of that as verb
clauses (0.28) and subordinator that deletion (-0.29) point to an unmarked use of such clause
subordination structures, especially with public verbs as main verbs. There is some direct speech
(30), and some reported speech introduced by private verbs (31). However, they are not prominent
in the article, and are combined with the author‘s descriptions of research practices.
Examples
24) [...] ladybirds are able to travel up to 74 miles in a single flight [...].
25) The monitoring equipment was not able to establish how much of their flying speed was ‗wind assisted.
26) Average flight time was found to be around 37 minutes.
27) Night-flying moths like the Silver Y (Autographa gamma) have been observed at altitudes of around 3,900ft.
28) We were expecting them to go for about 15 minutes.
29) Until now, scientists had considered anything over 7ft as long-distance flying.
30) Dr Lori Lawson Handley, from the University of Hull, who led the study, said: ―When we saw them in the flight
cubes [...].
31) The researchers believe the study will help them learn more [...].
4.4. Distribution of ST articles with respect to F2 and comparisons within
the corpus
The ST section has slightly positive mean and median values on F2 (see Table 5.5); therefore
articles are, on average, unmarked, with a slight tendency towards more ‗reported‘ than ‗factual‘
styles. ST articles reach a maximum F2 score of 12.08, but in fact they include only few positive
outliers. F2 scores do not stretch as much at the negative end of the continuum, where the minimum
score is -6.77. This is confirmed by the skewness measure, which indicates that the distribution of
ST scores is slightly asymmetric with respect to the mean value: articles with moderately to
extremely high scores account for smaller groups than their negative counterparts, as shown in the
histogram in Figure 5.7. At the same time, texts whose score lies within intervals close to the centre
of the distribution are less numerous than texts with slightly positive scores –from 1 to 2 – or
slightly negative ones – from -2 to 0. This causes the distribution to have two small peaks, rather
one at the centre.
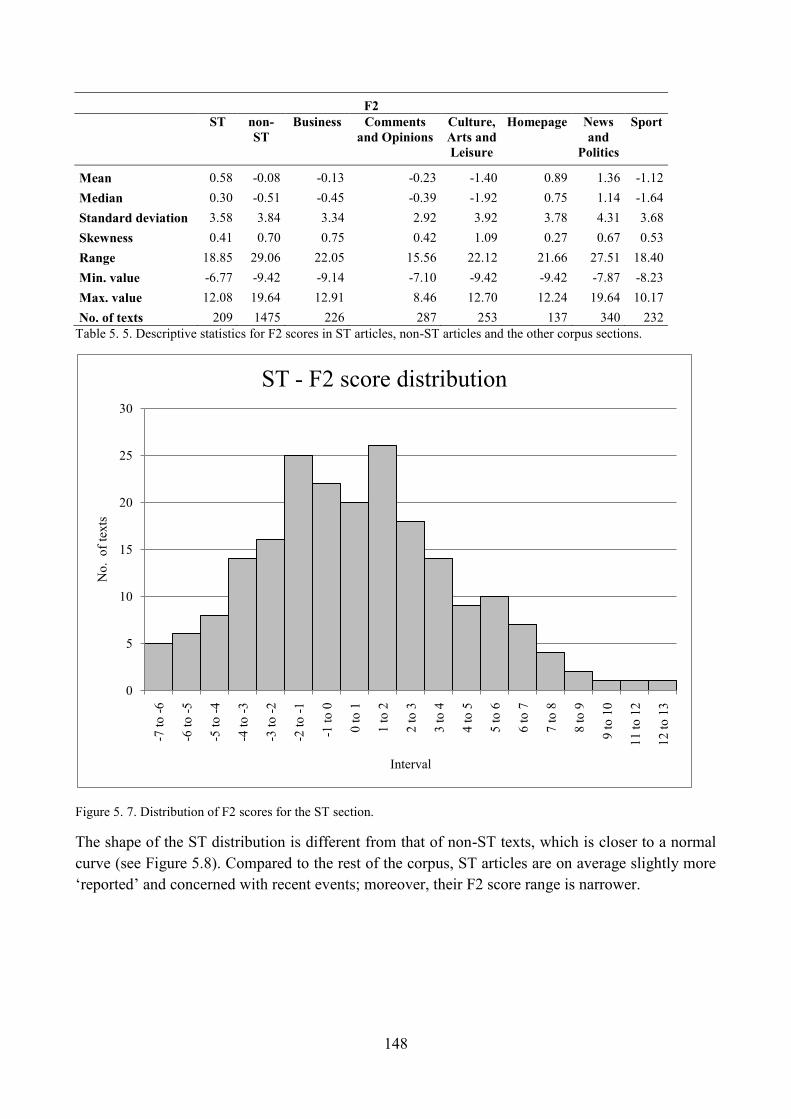
148
F2
ST non-
ST
Business Comments
and Opinions
Culture,
Arts and
Leisure
Homepage News
and
Politics
Sport
Mean 0.58 -0.08 -0.13 -0.23 -1.40 0.89 1.36 -1.12
Median 0.30 -0.51 -0.45 -0.39 -1.92 0.75 1.14 -1.64
Standard deviation 3.58 3.84 3.34 2.92 3.92 3.78 4.31 3.68
Skewness 0.41 0.70 0.75 0.42 1.09 0.27 0.67 0.53
Range 18.85 29.06 22.05 15.56 22.12 21.66 27.51 18.40
Min. value -6.77 -9.42 -9.14 -7.10 -9.42 -9.42 -7.87 -8.23
Max. value 12.08 19.64 12.91 8.46 12.70 12.24 19.64 10.17
No. of texts 209 1475 226 287 253 137 340 232
Table 5. 5. Descriptive statistics for F2 scores in ST articles, non-ST articles and the other corpus sections.
Figure 5. 7. Distribution of F2 scores for the ST section.
The shape of the ST distribution is different from that of non-ST texts, which is closer to a normal
curve (see Figure 5.8). Compared to the rest of the corpus, ST articles are on average slightly more
‗reported‘ and concerned with recent events; moreover, their F2 score range is narrower.
0
5
10
15
20
25
30
-7 t
o -
6
-6 t
o -
5
-5 t
o -
4
-4 t
o -
3
-3 t
o -
2
-2 t
o -
1
-1 t
o 0
0 t
o 1
1 t
o 2
2 t
o 3
3 t
o 4
4 t
o 5
5 t
o 6
6 t
o 7
7 t
o 8
8 t
o 9
9 t
o 1
0
11
to
12
12
to
13
No
. o
f te
xts
Interval
ST - F2 score distribution
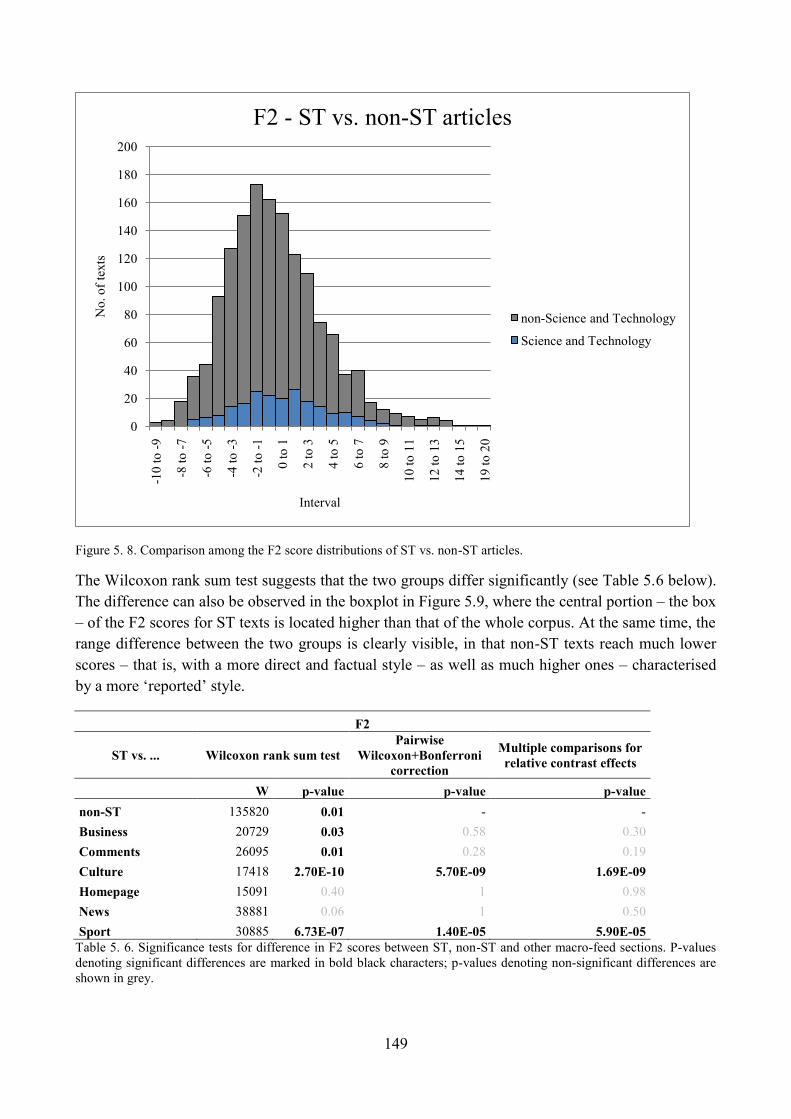
149
Figure 5. 8. Comparison among the F2 score distributions of ST vs. non-ST articles.
The Wilcoxon rank sum test suggests that the two groups differ significantly (see Table 5.6 below).
The difference can also be observed in the boxplot in Figure 5.9, where the central portion – the box
– of the F2 scores for ST texts is located higher than that of the whole corpus. At the same time, the
range difference between the two groups is clearly visible, in that non-ST texts reach much lower
scores – that is, with a more direct and factual style – as well as much higher ones – characterised
by a more ‗reported‘ style.
F2
ST vs. ... Wilcoxon rank sum test
Pairwise
Wilcoxon+Bonferroni
correction
Multiple comparisons for
relative contrast effects
W p-value p-value p-value
non-ST 135820 0.01 - -
Business 20729 0.03 0.58 0.30
Comments 26095 0.01 0.28 0.19
Culture 17418 2.70E-10 5.70E-09 1.69E-09
Homepage 15091 0.40 1 0.98
News 38881 0.06 1 0.50
Sport 30885 6.73E-07 1.40E-05 5.90E-05
Table 5. 6. Significance tests for difference in F2 scores between ST, non-ST and other macro-feed sections. P-values
denoting significant differences are marked in bold black characters; p-values denoting non-significant differences are
shown in grey.
0
20
40
60
80
100
120
140
160
180
200-1
0 t
o -
9
-8 t
o -
7
-6 t
o -
5
-4 t
o -
3
-2 t
o -
1
0 t
o 1
2 t
o 3
4 t
o 5
6 t
o 7
8 t
o 9
10
to
11
12
to
13
14
to
15
19
to
20
No
. o
f te
xts
Interval
F2 - ST vs. non-ST articles
non-Science and Technology
Science and Technology
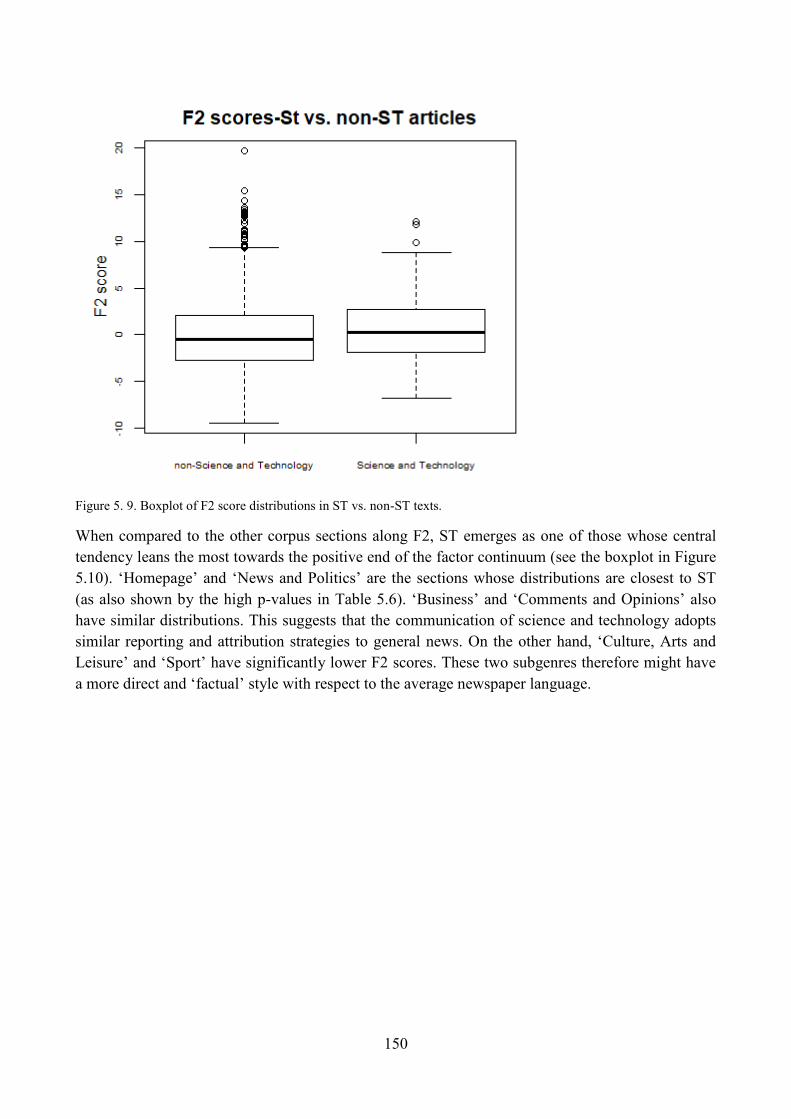
150
Figure 5. 9. Boxplot of F2 score distributions in ST vs. non-ST texts.
When compared to the other corpus sections along F2, ST emerges as one of those whose central
tendency leans the most towards the positive end of the factor continuum (see the boxplot in Figure
5.10). ‗Homepage‘ and ‗News and Politics‘ are the sections whose distributions are closest to ST
(as also shown by the high p-values in Table 5.6). ‗Business‘ and ‗Comments and Opinions‘ also
have similar distributions. This suggests that the communication of science and technology adopts
similar reporting and attribution strategies to general news. On the other hand, ‗Culture, Arts and
Leisure‘ and ‗Sport‘ have significantly lower F2 scores. These two subgenres therefore might have
a more direct and ‗factual‘ style with respect to the average newspaper language.
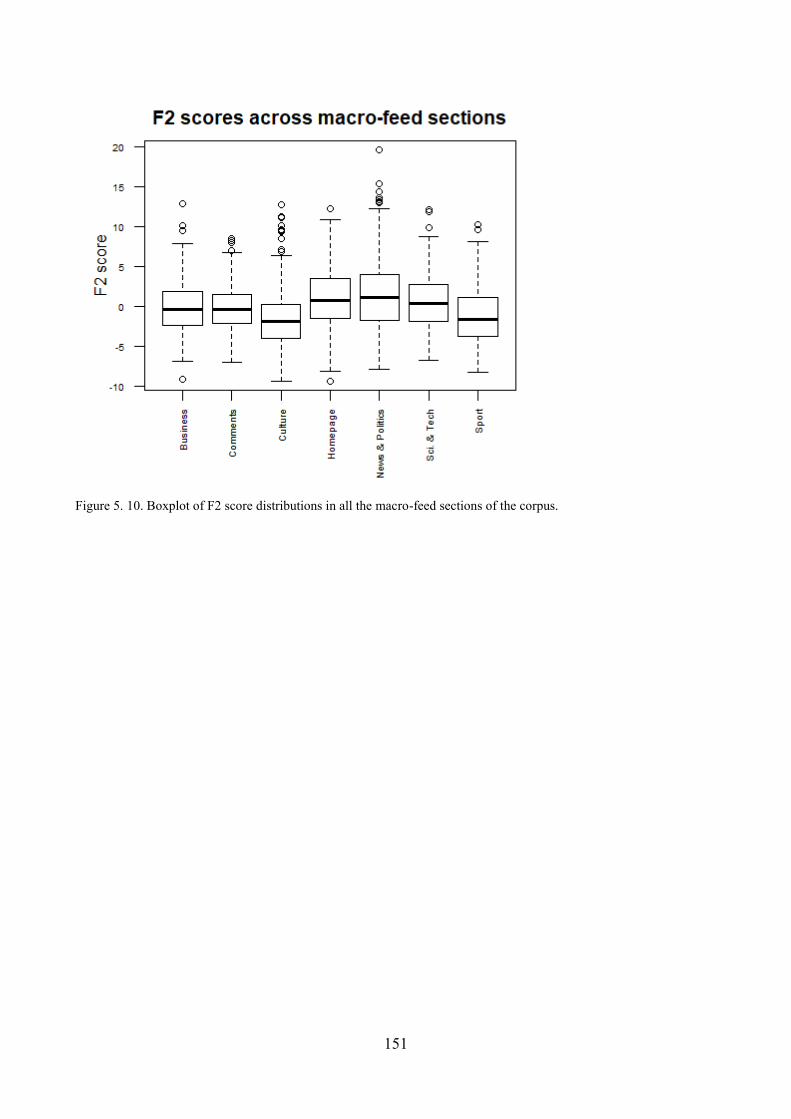
151
Figure 5. 10. Boxplot of F2 score distributions in all the macro-feed sections of the corpus.
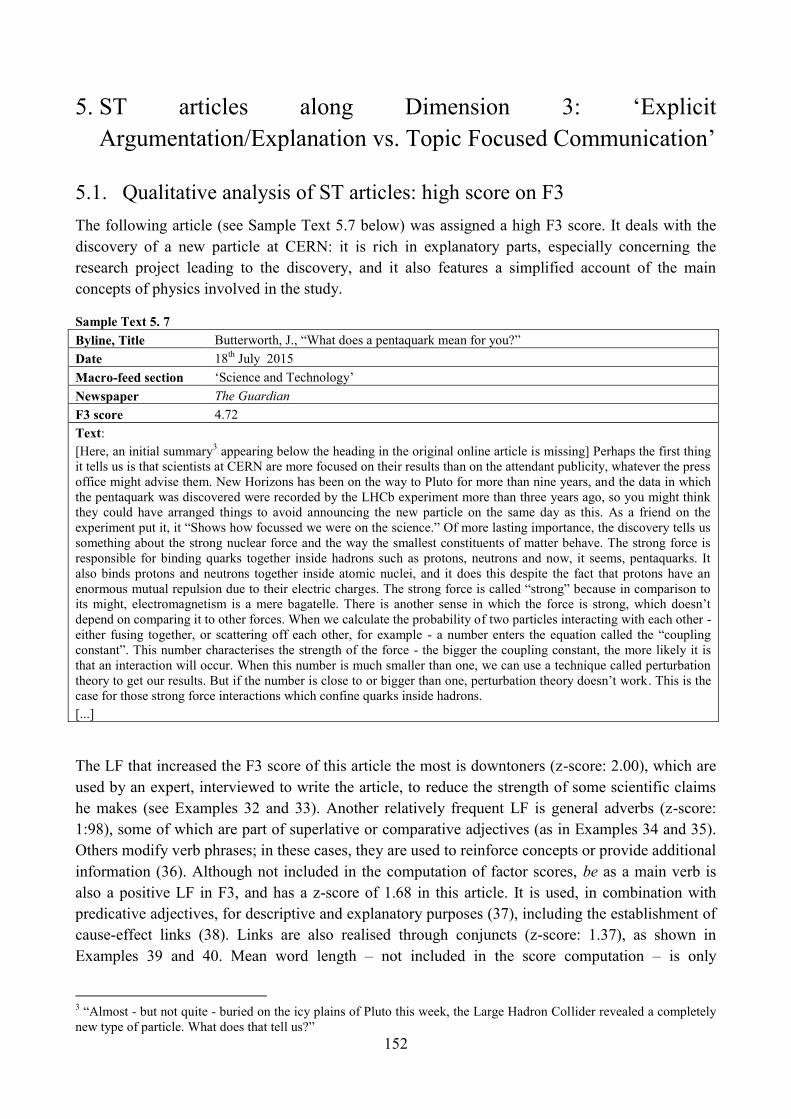
152
5. ST articles along Dimension 3: ‗Explicit
Argumentation/Explanation vs. Topic Focused Communication‘
5.1. Qualitative analysis of ST articles: high score on F3
The following article (see Sample Text 5.7 below) was assigned a high F3 score. It deals with the
discovery of a new particle at CERN: it is rich in explanatory parts, especially concerning the
research project leading to the discovery, and it also features a simplified account of the main
concepts of physics involved in the study.
Sample Text 5. 7
Byline, Title Butterworth, J., ―What does a pentaquark mean for you?‖
Date 18th
July 2015
Macro-feed section ‗Science and Technology‘
Newspaper The Guardian
F3 score 4.72
Text:
[Here, an initial summary3 appearing below the heading in the original online article is missing] Perhaps the first thing
it tells us is that scientists at CERN are more focused on their results than on the attendant publicity, whatever the press
office might advise them. New Horizons has been on the way to Pluto for more than nine years, and the data in which
the pentaquark was discovered were recorded by the LHCb experiment more than three years ago, so you might think
they could have arranged things to avoid announcing the new particle on the same day as this. As a friend on the
experiment put it, it ―Shows how focussed we were on the science.‖ Of more lasting importance, the discovery tells us
something about the strong nuclear force and the way the smallest constituents of matter behave. The strong force is
responsible for binding quarks together inside hadrons such as protons, neutrons and now, it seems, pentaquarks. It
also binds protons and neutrons together inside atomic nuclei, and it does this despite the fact that protons have an
enormous mutual repulsion due to their electric charges. The strong force is called ―strong‖ because in comparison to
its might, electromagnetism is a mere bagatelle. There is another sense in which the force is strong, which doesn‘t
depend on comparing it to other forces. When we calculate the probability of two particles interacting with each other -
either fusing together, or scattering off each other, for example - a number enters the equation called the ―coupling
constant‖. This number characterises the strength of the force - the bigger the coupling constant, the more likely it is
that an interaction will occur. When this number is much smaller than one, we can use a technique called perturbation
theory to get our results. But if the number is close to or bigger than one, perturbation theory doesn‘t work. This is the
case for those strong force interactions which confine quarks inside hadrons.
[...]
The LF that increased the F3 score of this article the most is downtoners (z-score: 2.00), which are
used by an expert, interviewed to write the article, to reduce the strength of some scientific claims
he makes (see Examples 32 and 33). Another relatively frequent LF is general adverbs (z-score:
1:98), some of which are part of superlative or comparative adjectives (as in Examples 34 and 35).
Others modify verb phrases; in these cases, they are used to reinforce concepts or provide additional
information (36). Although not included in the computation of factor scores, be as a main verb is
also a positive LF in F3, and has a z-score of 1.68 in this article. It is used, in combination with
predicative adjectives, for descriptive and explanatory purposes (37), including the establishment of
cause-effect links (38). Links are also realised through conjuncts (z-score: 1.37), as shown in
Examples 39 and 40. Mean word length – not included in the score computation – is only
3 ―Almost - but not quite - buried on the icy plains of Pluto this week, the Large Hadron Collider revealed a completely
new type of particle. What does that tell us?‖
153
moderately above the corpus mean (z-score: 0.42). Two positive F3 LFs have negative z-scores,
although small. The first is STTR (z-score: -0.64), and indicates that the text is not particularly rich
from a lexical point of view, although this is not fully in line with positivity along F3. The second
are attributive adjectives (z-score: -0.43), which had to be excluded from F3 score computation
because of their higher loading on F1. Nonetheless, its low frequency in this article could point to a
predominantly predicative style, resulting in a relatively fragmented, less dense way of presenting
such a complex subject as particle physics.
Examples
32) [...] the binding energy of the strong force which holds the quarks together inside them is responsible for almost
all of the mass of protons and neutrons.
33) Certainly at least one columnist in this paper regularly insists that the money we spend on exploratory science is a
frivolous waste, when we could be spending it on prisons, medicine, art or practically anything else I presume.
34) it is very hard to predict the consequences of the strong force.
35) Of more lasting importance, the discovery tells us something about the strong nuclear force.
36) We would like to know is whether pentaquarks are made up of all four quarks and the antiquark clumped
together, or whether they consist of a quark-antiquark pair more loosely bound to the other three quarks.
37) There is another sense in which the force is strong.
38) The strong force is responsible for binding quarks together.
39) When we calculate the probability of two particles interacting with each other - either fusing together, or scattering
off each other, for example - a number enters the equation [...].
40) [...]the binding energy of the strong force which holds the quarks together inside them is responsible for almost all
of the mass of protons and neutrons, and hence almost all of the mass of you.
154
5.2. Qualitative analysis of ST articles: low score on F3
The article with the lowest F3 score in the ST section – shown in Sample Text 5.8 – is more to do
with the use of technological devices and applications than with scientists and recently published
research. It reports on the use of the multimedia messaging app Snapchat by Muslim worshippers in
Mecca, and the subsequent trends which their published content created on the online news and
social networking service Twitter. This topic is deeply connected with the world of Internet and
Web technologies, but might also have relevant social and cultural implications.
Sample Text 5. 8
Byline, Title Gani, A., ―Mecca worshippers stream their stories live on Snapchat.‖
Date 14th
July 2015
Macro-feed section ‗Science and Technology‘
Newspaper The Guardian
F3 score -5.40
Text:
Worshippers in Mecca are streaming their stories live on Snapchat, opening up the Saudi city to non-Muslims online.
#Mecca_Live began to trend on twitter this weekend as hundreds of thousands of people campaigned for the mobile
app to feature the city as a live story. The online push was successful and Snapchat users are able to get a glimpse of
the Muslim holy city on the 27th
night of Ramadan – which some believe to be Laylat al-Qadr, or the ―night of power‖.
From worshippers breaking their fast in the largest mosque in the world to streaming the call to prayer – the snaps
provide an insight into a city that is closed to non-Muslims. The snaps were screengrabbed and shared widely on
twitter. The story opens with the caption: ―Join us as we travel to Mecca,‖ with users sharing their rituals of their
Umrah pilgrimage. So far this year, around 14 million Muslims have traveled to the city during Ramadan.
[Mecca snapchat Photograph: Snapchat screebgrab Mecca snapchat Photograph: Snapchat screebgrab Mecca snapchat
Photograph: Snapchat screebgrab Mecca snapchat Photograph: Snapchat screebgrab]4
The mobile messaging app had launched its ―live‖ feature last year, which allows users to contribute videos and
pictures to a live stream that disappears after a short period of time. The company says the app receives 2bn video
views a day. Although Snapchat chooses the locations it features – today showcasing London, Los Angeles and
Brasilia – users on social media have recently begun lobbying for stories from places they want to see. After a Tel
Aviv live stream last week, an online campaign was launched to feature a West Bank story, which the app did the next
day. [...]
Here, most features with positive loadings on F3 are less frequent than the corpus average. Adverbs
have a z-score of -1.99, pointing to a reduced amount of information elaboration, in favour of a
more ‗basic‘ style. The low STTR value (z-score: -1.70) points to a system of recurring rather than
varying lexical items (worshippers, users, names of apps and services, etc. ). Also be as a main verb
and public verbs have negative z-scores (-1.14 and -0.94 respectively), but since they have higher
loadings on other factors, they did not contribute to the F3 score of this article. Conjuncts are
moderately infrequent (z-score: -0.81): here, logical links are not essential, since the main function
of the article is to inform readers about a particular fact rather than explaining how or why it
happened. Articles with these characteristics indicate that technoscience is not only communicated
adopting a didactic attitude, but can also take different forms. Here, for instance, readers are
informed about facts, uses and trends concerning technologies which form part of many people‘s
daily lives, rather than ‗being taught‘ about the workings of those technologies. More in general,
4 This string of text should not have been included in the analysis, but the cleaning system could not detect and remove
it.
155
diversity within the ST section also suggests that there may not be a definite set of LFs
distinguishing science and technology news from other sets of news in the newspapers here
analysed.
5.3. Qualitative analysis of ST articles: unmarked score on F3
Sample Text 5.9 has an unmarked F3 score. Like the previous example, it deals with widely used
technological devices – in this case, personal computers (PC). Differently from the article about
Snapchat, however, this one is about technical details about PC security and how it risks being
violated. It also features an interview with a customer with expertise in the field, who had
discovered a spyware (a software violating PC security) on his own PC. Statements by the involved
technology company are also reported.
Sample Text 5. 9
Byline, Title Perlroth, N., ―Bits Blog: Researcher Discovers Superfish Spyware Installed on Lenovo PCs‖
Date 19th
February 2015
Macro-feed section ‗Science and Technology‘
Newspaper The New York Times
F3 score -0.04
Text:
Lenovo, the Chinese tech giant, was shipping PCs with spyware that tracks its customers‘ every move online, and
renders the computers vulnerable to hackers. Lenovo, the world‘s largest PC manufacturer, was installing Superfish, a
particularly pernicious form of adware that siphons data from a user‘s machine via web browser. Banking and e-
commerce sites, or any web page that purports to be secure with the image of a tiny padlock, are made vulnerable. The
adware discovery was made early last month by Peter Horne, a 25-year veteran of the financial services technology
industry, after he bought a brand-new Lenovo Yoga 2 Notepad at a computer retailer in Sydney, Australia. Even
though the PC came with McAfee antivirus software, Mr. Horne said, he installed antivirus software made by Trend
Micro. Neither virus scanner picked up any adware on the machine. But Mr. Horne noted that traffic from the PC was
being redirected to a website called best-deals-products.com. When he dug further, he found that website‘s server was
making calls to Superfish adware. Superfish‘s ―visual discovery‖ adware, Mr. Horne and others now say, is far more
intrusive than typical adware. It not only drops ads into a user‘s web browser sessions, it hijacks a secure browsing
session and scoops up data as users enter it into secure websites. Superfish does this so it can introduce ads into an
otherwise encrypted web page, but the way it does so compromises the security of trusted websites and makes it easy
for other hackers to intercept users‘ communications. Mr. Horne returned his PC, and went on to test Lenovo‘s
demonstration machines at Best Buys in New York and Boston, and other retailers in Sydney and Perth. There, he
found the adware on other Lenovo Yoga 2 models and the Lenovo Edge 15. ―The company had placed the adware a
very low-level part of the operating system,‖ Mr. Horne said in an interview. ―If they can do that, they can do
anything.‖ In a statement issued Thursday, Lenovo said it had included Superfish in some consumer notebook products
shipped between September and December ―to help customers potentially discover interesting products while
shopping.‖ Citing bad user reviews, the company said it stopped including the adware in January, the same month Mr.
Horne brought the issue to the company‘s attention. ―The problem is: what can we trust?‖ Mr. Horne said. Using facial
recognition algorithms and a chat bot, a developer automates Tinder. It may not be creepy, writes Robinson Meyer, but
it does take the commodification of dating to the next level -- "treating people not just as data entries within Tinder but
as piles of data themselves."
The two LFs with negative loadings on F3, namely public verbs and subordinator that deletions,
exemplified in (41), have positive z-scores (0.70 and 1.18 respectively). However, since they have
higher loadings on F2, they were not counted in the computation of F3 scores. Two among the
positive F3 features are relatively infrequent in this text with respect to the corpus mean. The first is
be as a main verb (z-score: -1.16), which leaves room for more integrated forms of noun phrase
elaboration – for example, attributive adjectives (42), whose z-score is 0.36. However, the style of
the article is more verbal than static and nominal, since it focuses on how spyware acts upon PC
156
security systems. The second positive F3 feature with a negative z-score (-0.88) is general adverbs,
whose relatively low frequency points to a limited level of information elaboration and
characterisation. All the other LFs loading positively on F3 have slightly higher frequencies with
respect to the corpus mean, thus counterbalancing those with negative z-scores. The only
occurrence of a downtoner (z-score: 0.25) is preceded by a negation, and therefore does not perform
a ‗limiting‘ function but rather a ‗cumulative‘ one (43). The only conjunct (z-score: 0.27) is part of
a noun-modifying past participial clause (44). The slightly positive values for mean word length (z-
score: 0.42) and STTR (0.33) point to a moderate amount of lexical variability. Their z-scores might
have been increased by the presence of some terms that are used, without being defined, throughout
the article (e.g. spyware, antivirus, adware, demonstration machines). Therefore, the informative
and explanatory purpose of the text is visible in some aspects – mainly concerning the way the
spyware problem emerged and was managed – but it is limited, and combined with more practical
information of immediate interest.
Examples
41) In a statement issued Thursday, Lenovo said it had included Superfish in some consumer notebook products.
42) Superfish does this so it can introduce ads into an otherwise encrypted web page, but the way it does so
compromises the security of trusted websites and makes it easy for other hackers to intercept users‘
communications
43) It not only drops ads into a user‘s web browser sessions, it hijacks a secure browsing session [...].
44) [...] an otherwise encrypted web page [...].
5.4. Distribution of ST articles with respect to F3 and comparisons within
the corpus
Along the third dimension, ST articles have unmarked, slightly positive mean and median values,
namely 0.18 and 0.17 (see Table 5.7 below). The standard deviation of 2.29 indicates that a good
part – probably more than half – of ST texts have a score between -2 and 2. The histogram in Figure
5.11 confirms this result, and also shows that texts with moderately to extremely high scores –
whose purpose is likely to be explicitly argumentative or explanatory – are less numerous than
those with moderately to extremely negative scores – which are more likely to make less logical
links explicit and to use a more homogenous vocabulary. Texts with positive scores reach higher
values: 7.57 is the maximum value, while the minimum is -5.40. This is reflected by the slightly
asymmetrical shape of the distribution. However, the skewness value – 0.26 –is quite close to zero,
which means that the distribution is in fact approximately symmetrical.
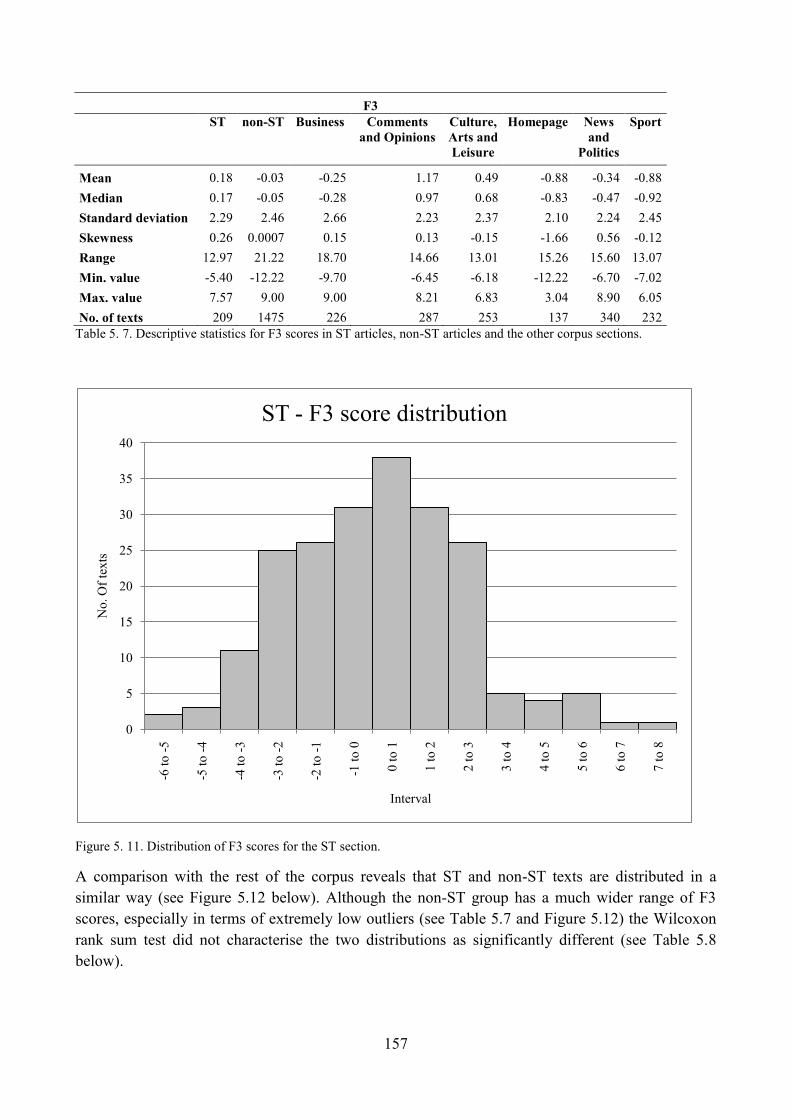
157
F3
ST non-ST Business Comments
and Opinions
Culture,
Arts and
Leisure
Homepage News
and
Politics
Sport
Mean 0.18 -0.03 -0.25 1.17 0.49 -0.88 -0.34 -0.88
Median 0.17 -0.05 -0.28 0.97 0.68 -0.83 -0.47 -0.92
Standard deviation 2.29 2.46 2.66 2.23 2.37 2.10 2.24 2.45
Skewness 0.26 0.0007 0.15 0.13 -0.15 -1.66 0.56 -0.12
Range 12.97 21.22 18.70 14.66 13.01 15.26 15.60 13.07
Min. value -5.40 -12.22 -9.70 -6.45 -6.18 -12.22 -6.70 -7.02
Max. value 7.57 9.00 9.00 8.21 6.83 3.04 8.90 6.05
No. of texts 209 1475 226 287 253 137 340 232
Table 5. 7. Descriptive statistics for F3 scores in ST articles, non-ST articles and the other corpus sections.
Figure 5. 11. Distribution of F3 scores for the ST section.
A comparison with the rest of the corpus reveals that ST and non-ST texts are distributed in a
similar way (see Figure 5.12 below). Although the non-ST group has a much wider range of F3
scores, especially in terms of extremely low outliers (see Table 5.7 and Figure 5.12) the Wilcoxon
rank sum test did not characterise the two distributions as significantly different (see Table 5.8
below).
0
5
10
15
20
25
30
35
40
-6 t
o -
5
-5 t
o -
4
-4 t
o -
3
-3 t
o -
2
-2 t
o -
1
-1 t
o 0
0 t
o 1
1 t
o 2
2 t
o 3
3 t
o 4
4 t
o 5
5 t
o 6
6 t
o 7
7 t
o 8
No
. O
f te
xts
Interval
ST - F3 score distribution
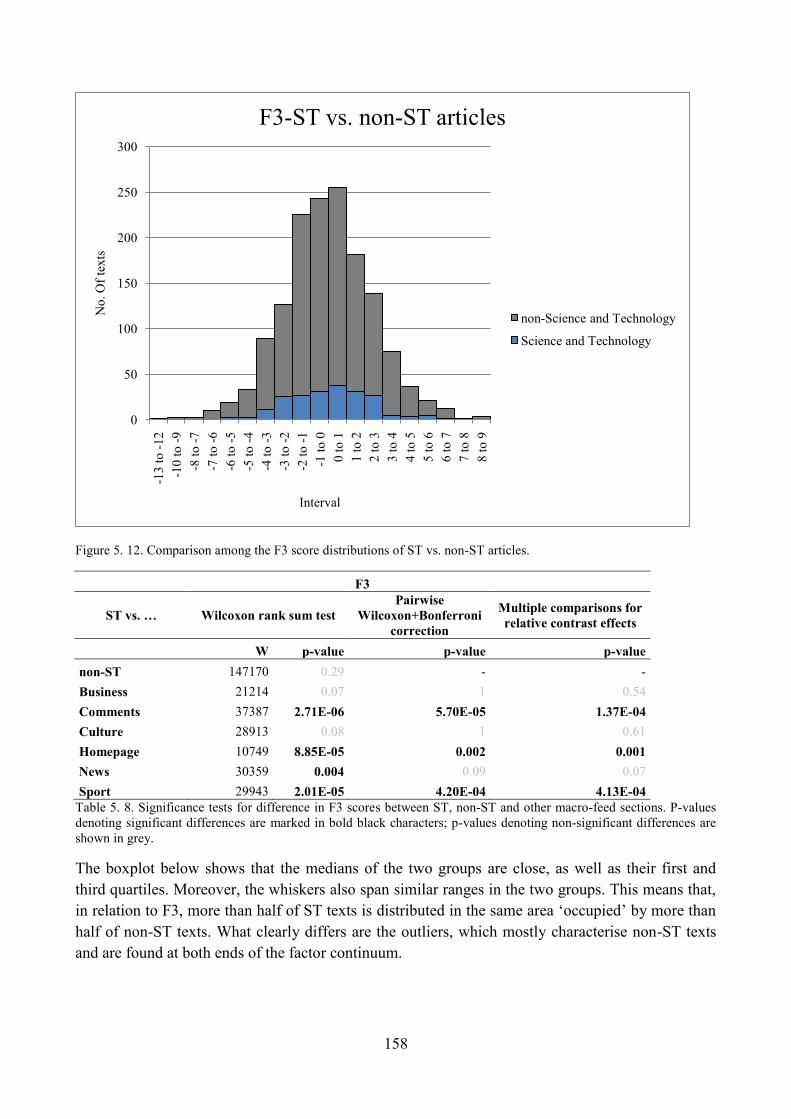
158
Figure 5. 12. Comparison among the F3 score distributions of ST vs. non-ST articles.
F3
ST vs. … Wilcoxon rank sum test
Pairwise
Wilcoxon+Bonferroni
correction
Multiple comparisons for
relative contrast effects
W p-value p-value p-value
non-ST 147170 0.29 - -
Business 21214 0.07 1 0.54
Comments 37387 2.71E-06 5.70E-05 1.37E-04
Culture 28913 0.08 1 0.61
Homepage 10749 8.85E-05 0.002 0.001
News 30359 0.004 0.09 0.07
Sport 29943 2.01E-05 4.20E-04 4.13E-04
Table 5. 8. Significance tests for difference in F3 scores between ST, non-ST and other macro-feed sections. P-values
denoting significant differences are marked in bold black characters; p-values denoting non-significant differences are
shown in grey.
The boxplot below shows that the medians of the two groups are close, as well as their first and
third quartiles. Moreover, the whiskers also span similar ranges in the two groups. This means that,
in relation to F3, more than half of ST texts is distributed in the same area ‗occupied‘ by more than
half of non-ST texts. What clearly differs are the outliers, which mostly characterise non-ST texts
and are found at both ends of the factor continuum.
0
50
100
150
200
250
300-1
3 t
o -
12
-10
to
-9
-8 t
o -
7
-7 t
o -
6
-6 t
o -
5
-5 t
o -
4
-4 t
o -
3
-3 t
o -
2
-2 t
o -
1
-1 t
o 0
0 t
o 1
1 t
o 2
2 t
o 3
3 t
o 4
4 t
o 5
5 t
o 6
6 t
o 7
7 t
o 8
8 t
o 9
No
. O
f te
xts
Interval
F3-ST vs. non-ST articles
non-Science and Technology
Science and Technology
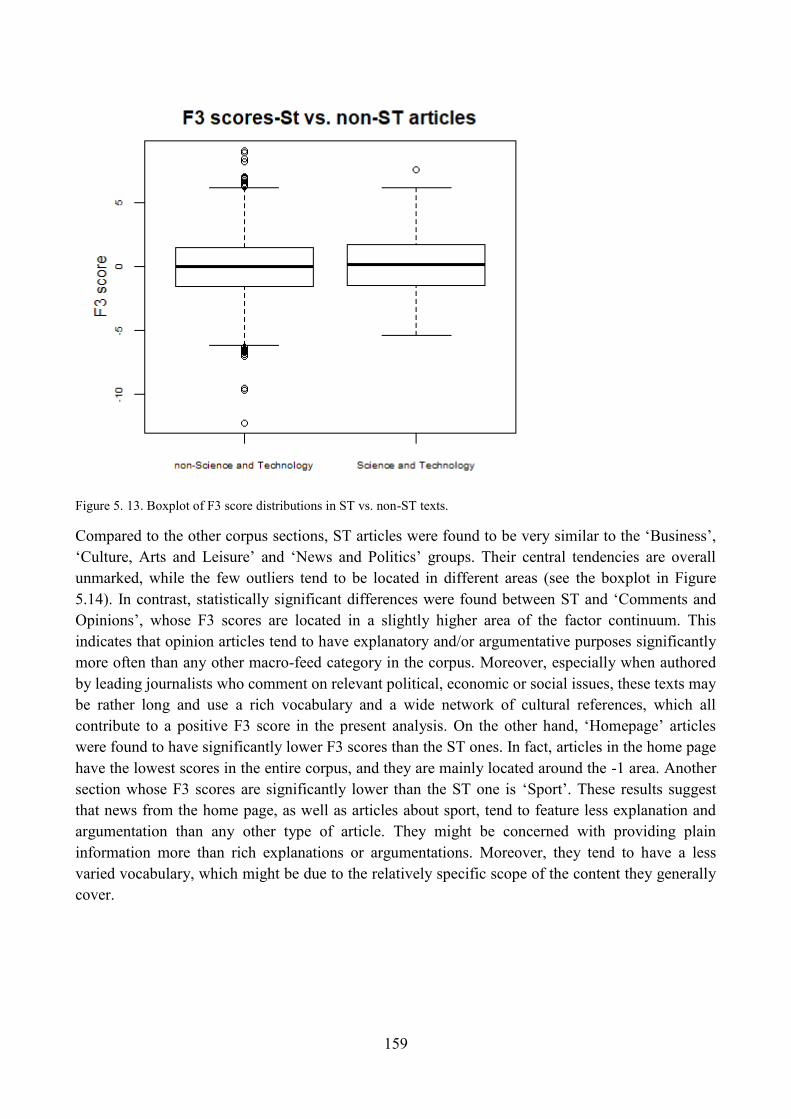
159
Figure 5. 13. Boxplot of F3 score distributions in ST vs. non-ST texts.
Compared to the other corpus sections, ST articles were found to be very similar to the ‗Business‘,
‗Culture, Arts and Leisure‘ and ‗News and Politics‘ groups. Their central tendencies are overall
unmarked, while the few outliers tend to be located in different areas (see the boxplot in Figure
5.14). In contrast, statistically significant differences were found between ST and ‗Comments and
Opinions‘, whose F3 scores are located in a slightly higher area of the factor continuum. This
indicates that opinion articles tend to have explanatory and/or argumentative purposes significantly
more often than any other macro-feed category in the corpus. Moreover, especially when authored
by leading journalists who comment on relevant political, economic or social issues, these texts may
be rather long and use a rich vocabulary and a wide network of cultural references, which all
contribute to a positive F3 score in the present analysis. On the other hand, ‗Homepage‘ articles
were found to have significantly lower F3 scores than the ST ones. In fact, articles in the home page
have the lowest scores in the entire corpus, and they are mainly located around the -1 area. Another
section whose F3 scores are significantly lower than the ST one is ‗Sport‘. These results suggest
that news from the home page, as well as articles about sport, tend to feature less explanation and
argumentation than any other type of article. They might be concerned with providing plain
information more than rich explanations or argumentations. Moreover, they tend to have a less
varied vocabulary, which might be due to the relatively specific scope of the content they generally
cover.
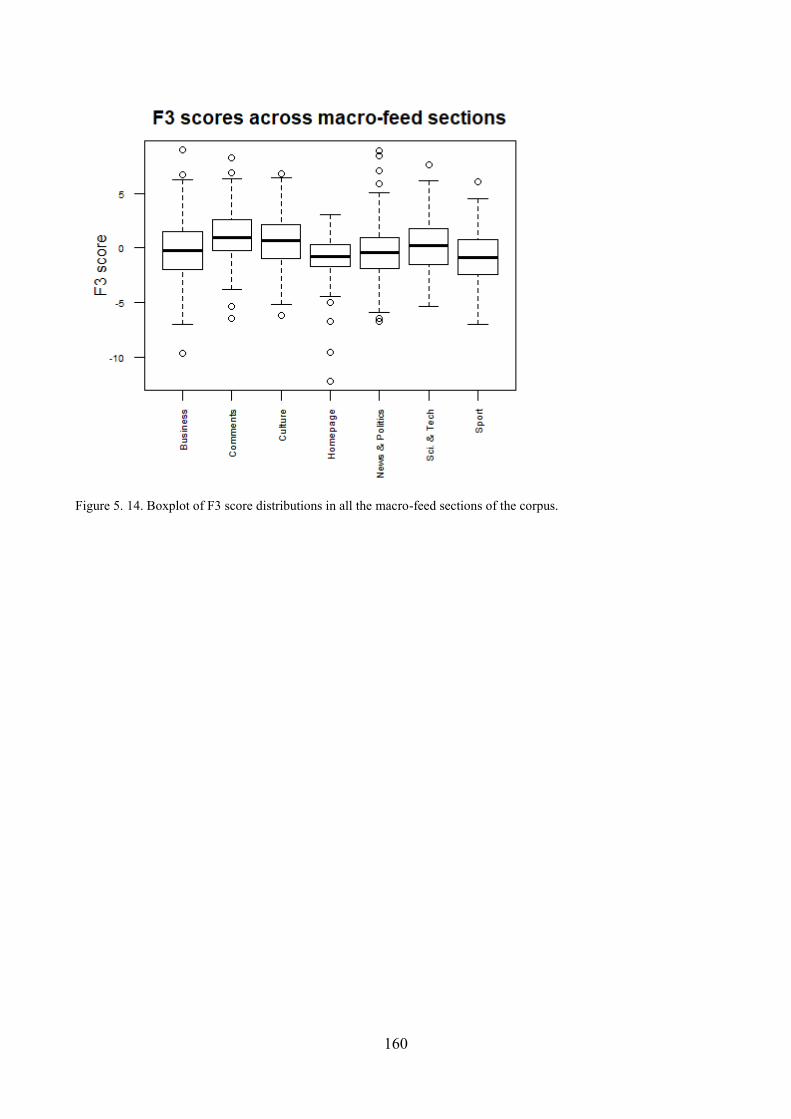
160
Figure 5. 14. Boxplot of F3 score distributions in all the macro-feed sections of the corpus.
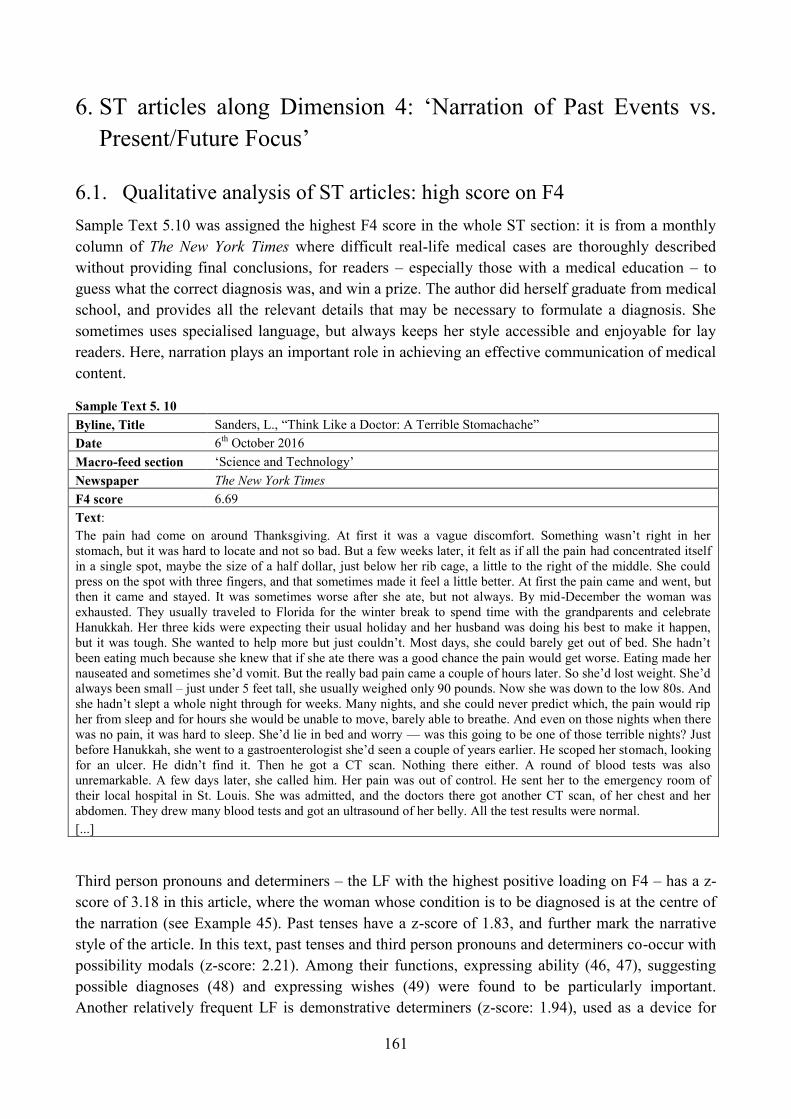
161
6. ST articles along Dimension 4: ‗Narration of Past Events vs.
Present/Future Focus‘
6.1. Qualitative analysis of ST articles: high score on F4
Sample Text 5.10 was assigned the highest F4 score in the whole ST section: it is from a monthly
column of The New York Times where difficult real-life medical cases are thoroughly described
without providing final conclusions, for readers – especially those with a medical education – to
guess what the correct diagnosis was, and win a prize. The author did herself graduate from medical
school, and provides all the relevant details that may be necessary to formulate a diagnosis. She
sometimes uses specialised language, but always keeps her style accessible and enjoyable for lay
readers. Here, narration plays an important role in achieving an effective communication of medical
content.
Sample Text 5. 10
Byline, Title Sanders, L., ―Think Like a Doctor: A Terrible Stomachache‖
Date 6th
October 2016
Macro-feed section ‗Science and Technology‘
Newspaper The New York Times
F4 score 6.69
Text:
The pain had come on around Thanksgiving. At first it was a vague discomfort. Something wasn‘t right in her
stomach, but it was hard to locate and not so bad. But a few weeks later, it felt as if all the pain had concentrated itself
in a single spot, maybe the size of a half dollar, just below her rib cage, a little to the right of the middle. She could
press on the spot with three fingers, and that sometimes made it feel a little better. At first the pain came and went, but
then it came and stayed. It was sometimes worse after she ate, but not always. By mid-December the woman was
exhausted. They usually traveled to Florida for the winter break to spend time with the grandparents and celebrate
Hanukkah. Her three kids were expecting their usual holiday and her husband was doing his best to make it happen,
but it was tough. She wanted to help more but just couldn‘t. Most days, she could barely get out of bed. She hadn‘t
been eating much because she knew that if she ate there was a good chance the pain would get worse. Eating made her
nauseated and sometimes she‘d vomit. But the really bad pain came a couple of hours later. So she‘d lost weight. She‘d
always been small – just under 5 feet tall, she usually weighed only 90 pounds. Now she was down to the low 80s. And
she hadn‘t slept a whole night through for weeks. Many nights, and she could never predict which, the pain would rip
her from sleep and for hours she would be unable to move, barely able to breathe. And even on those nights when there
was no pain, it was hard to sleep. She‘d lie in bed and worry — was this going to be one of those terrible nights? Just
before Hanukkah, she went to a gastroenterologist she‘d seen a couple of years earlier. He scoped her stomach, looking
for an ulcer. He didn‘t find it. Then he got a CT scan. Nothing there either. A round of blood tests was also
unremarkable. A few days later, she called him. Her pain was out of control. He sent her to the emergency room of
their local hospital in St. Louis. She was admitted, and the doctors there got another CT scan, of her chest and her
abdomen. They drew many blood tests and got an ultrasound of her belly. All the test results were normal.
[...]
Third person pronouns and determiners – the LF with the highest positive loading on F4 – has a z-
score of 3.18 in this article, where the woman whose condition is to be diagnosed is at the centre of
the narration (see Example 45). Past tenses have a z-score of 1.83, and further mark the narrative
style of the article. In this text, past tenses and third person pronouns and determiners co-occur with
possibility modals (z-score: 2.21). Among their functions, expressing ability (46, 47), suggesting
possible diagnoses (48) and expressing wishes (49) were found to be particularly important.
Another relatively frequent LF is demonstrative determiners (z-score: 1.94), used as a device for
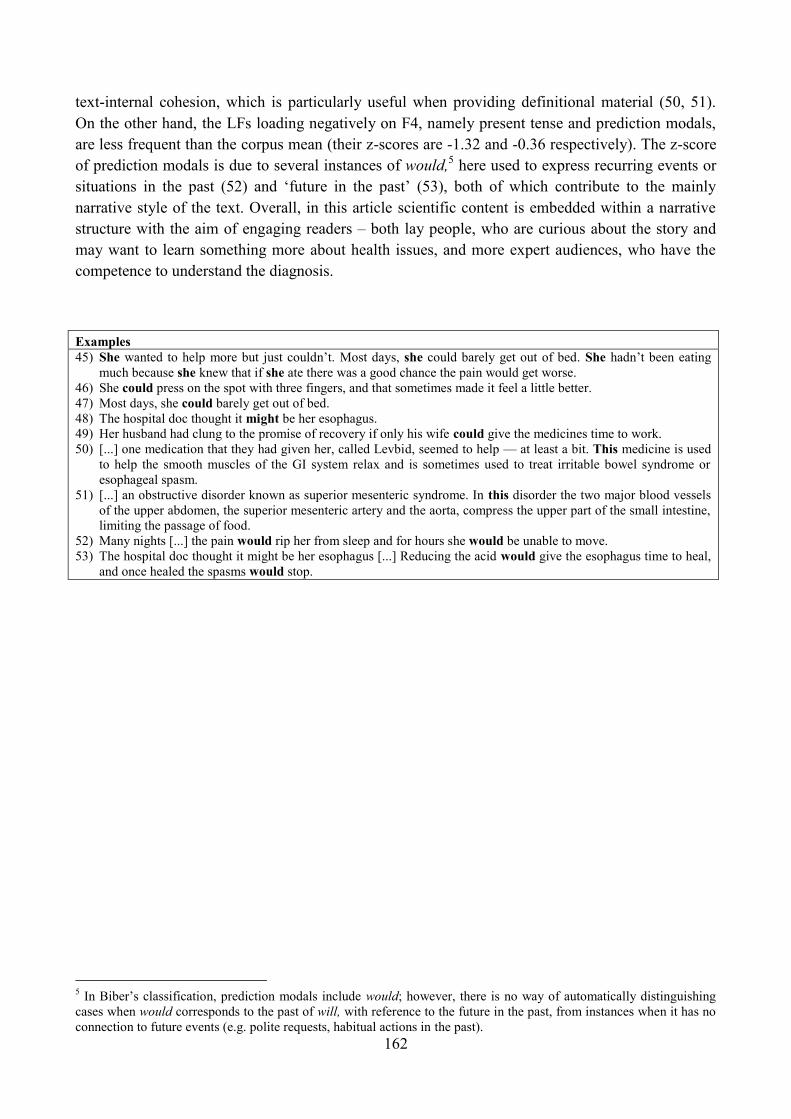
162
text-internal cohesion, which is particularly useful when providing definitional material (50, 51).
On the other hand, the LFs loading negatively on F4, namely present tense and prediction modals,
are less frequent than the corpus mean (their z-scores are -1.32 and -0.36 respectively). The z-score
of prediction modals is due to several instances of would,5 here used to express recurring events or
situations in the past (52) and ‗future in the past‘ (53), both of which contribute to the mainly
narrative style of the text. Overall, in this article scientific content is embedded within a narrative
structure with the aim of engaging readers – both lay people, who are curious about the story and
may want to learn something more about health issues, and more expert audiences, who have the
competence to understand the diagnosis.
Examples
45) She wanted to help more but just couldn‘t. Most days, she could barely get out of bed. She hadn‘t been eating
much because she knew that if she ate there was a good chance the pain would get worse.
46) She could press on the spot with three fingers, and that sometimes made it feel a little better.
47) Most days, she could barely get out of bed.
48) The hospital doc thought it might be her esophagus.
49) Her husband had clung to the promise of recovery if only his wife could give the medicines time to work.
50) [...] one medication that they had given her, called Levbid, seemed to help — at least a bit. This medicine is used
to help the smooth muscles of the GI system relax and is sometimes used to treat irritable bowel syndrome or
esophageal spasm.
51) [...] an obstructive disorder known as superior mesenteric syndrome. In this disorder the two major blood vessels
of the upper abdomen, the superior mesenteric artery and the aorta, compress the upper part of the small intestine,
limiting the passage of food.
52) Many nights [...] the pain would rip her from sleep and for hours she would be unable to move.
53) The hospital doc thought it might be her esophagus [...] Reducing the acid would give the esophagus time to heal,
and once healed the spasms would stop.
5 In Biber‘s classification, prediction modals include would; however, there is no way of automatically distinguishing
cases when would corresponds to the past of will, with reference to the future in the past, from instances when it has no
connection to future events (e.g. polite requests, habitual actions in the past).
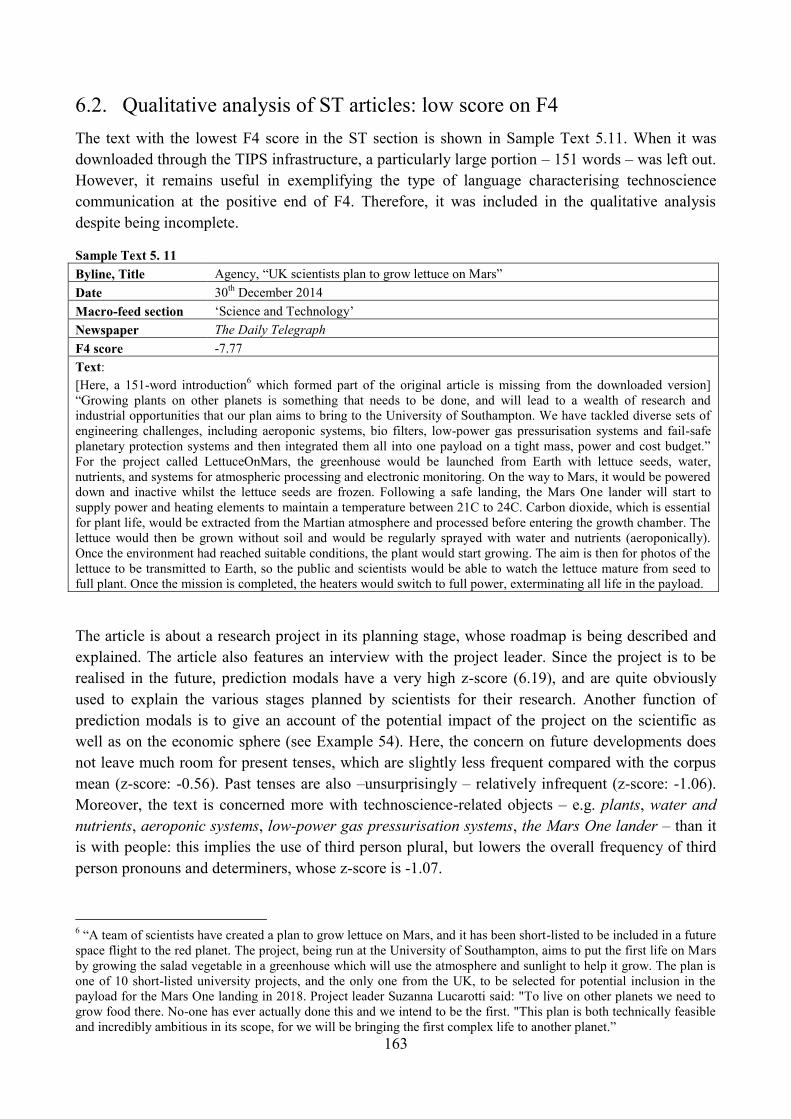
163
6.2. Qualitative analysis of ST articles: low score on F4
The text with the lowest F4 score in the ST section is shown in Sample Text 5.11. When it was
downloaded through the TIPS infrastructure, a particularly large portion – 151 words – was left out.
However, it remains useful in exemplifying the type of language characterising technoscience
communication at the positive end of F4. Therefore, it was included in the qualitative analysis
despite being incomplete.
Sample Text 5. 11
Byline, Title Agency, ―UK scientists plan to grow lettuce on Mars‖
Date 30th
December 2014
Macro-feed section ‗Science and Technology‘
Newspaper The Daily Telegraph
F4 score -7.77
Text:
[Here, a 151-word introduction6 which formed part of the original article is missing from the downloaded version]
―Growing plants on other planets is something that needs to be done, and will lead to a wealth of research and
industrial opportunities that our plan aims to bring to the University of Southampton. We have tackled diverse sets of
engineering challenges, including aeroponic systems, bio filters, low-power gas pressurisation systems and fail-safe
planetary protection systems and then integrated them all into one payload on a tight mass, power and cost budget.‖
For the project called LettuceOnMars, the greenhouse would be launched from Earth with lettuce seeds, water,
nutrients, and systems for atmospheric processing and electronic monitoring. On the way to Mars, it would be powered
down and inactive whilst the lettuce seeds are frozen. Following a safe landing, the Mars One lander will start to
supply power and heating elements to maintain a temperature between 21C to 24C. Carbon dioxide, which is essential
for plant life, would be extracted from the Martian atmosphere and processed before entering the growth chamber. The
lettuce would then be grown without soil and would be regularly sprayed with water and nutrients (aeroponically).
Once the environment had reached suitable conditions, the plant would start growing. The aim is then for photos of the
lettuce to be transmitted to Earth, so the public and scientists would be able to watch the lettuce mature from seed to
full plant. Once the mission is completed, the heaters would switch to full power, exterminating all life in the payload.
The article is about a research project in its planning stage, whose roadmap is being described and
explained. The article also features an interview with the project leader. Since the project is to be
realised in the future, prediction modals have a very high z-score (6.19), and are quite obviously
used to explain the various stages planned by scientists for their research. Another function of
prediction modals is to give an account of the potential impact of the project on the scientific as
well as on the economic sphere (see Example 54). Here, the concern on future developments does
not leave much room for present tenses, which are slightly less frequent compared with the corpus
mean (z-score: -0.56). Past tenses are also –unsurprisingly – relatively infrequent (z-score: -1.06).
Moreover, the text is concerned more with technoscience-related objects – e.g. plants, water and
nutrients, aeroponic systems, low-power gas pressurisation systems, the Mars One lander – than it
is with people: this implies the use of third person plural, but lowers the overall frequency of third
person pronouns and determiners, whose z-score is -1.07.
6 ―A team of scientists have created a plan to grow lettuce on Mars, and it has been short-listed to be included in a future
space flight to the red planet. The project, being run at the University of Southampton, aims to put the first life on Mars
by growing the salad vegetable in a greenhouse which will use the atmosphere and sunlight to help it grow. The plan is
one of 10 short-listed university projects, and the only one from the UK, to be selected for potential inclusion in the
payload for the Mars One landing in 2018. Project leader Suzanna Lucarotti said: "To live on other planets we need to
grow food there. No-one has ever actually done this and we intend to be the first. "This plan is both technically feasible
and incredibly ambitious in its scope, for we will be bringing the first complex life to another planet.‖
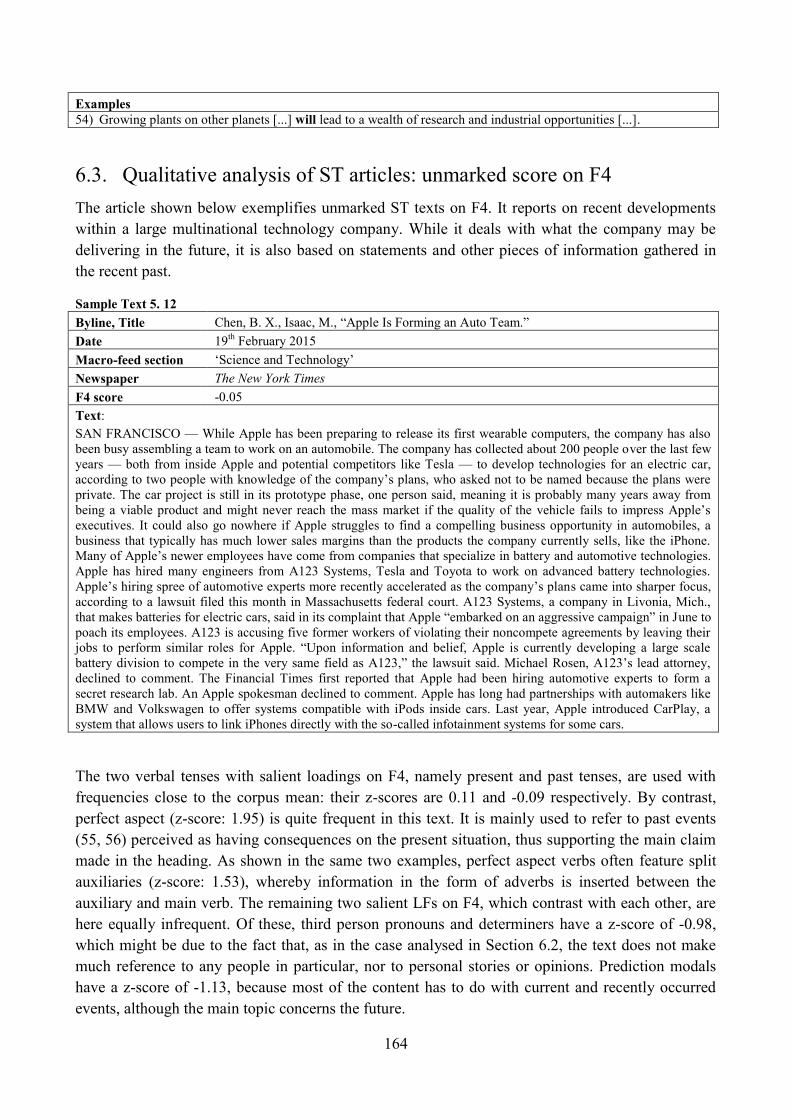
164
Examples
54) Growing plants on other planets [...] will lead to a wealth of research and industrial opportunities [...].
6.3. Qualitative analysis of ST articles: unmarked score on F4
The article shown below exemplifies unmarked ST texts on F4. It reports on recent developments
within a large multinational technology company. While it deals with what the company may be
delivering in the future, it is also based on statements and other pieces of information gathered in
the recent past.
Sample Text 5. 12
Byline, Title Chen, B. X., Isaac, M., ―Apple Is Forming an Auto Team.‖
Date 19th
February 2015
Macro-feed section ‗Science and Technology‘
Newspaper The New York Times
F4 score -0.05
Text:
SAN FRANCISCO — While Apple has been preparing to release its first wearable computers, the company has also
been busy assembling a team to work on an automobile. The company has collected about 200 people over the last few
years — both from inside Apple and potential competitors like Tesla — to develop technologies for an electric car,
according to two people with knowledge of the company‘s plans, who asked not to be named because the plans were
private. The car project is still in its prototype phase, one person said, meaning it is probably many years away from
being a viable product and might never reach the mass market if the quality of the vehicle fails to impress Apple‘s
executives. It could also go nowhere if Apple struggles to find a compelling business opportunity in automobiles, a
business that typically has much lower sales margins than the products the company currently sells, like the iPhone.
Many of Apple‘s newer employees have come from companies that specialize in battery and automotive technologies.
Apple has hired many engineers from A123 Systems, Tesla and Toyota to work on advanced battery technologies.
Apple‘s hiring spree of automotive experts more recently accelerated as the company‘s plans came into sharper focus,
according to a lawsuit filed this month in Massachusetts federal court. A123 Systems, a company in Livonia, Mich.,
that makes batteries for electric cars, said in its complaint that Apple ―embarked on an aggressive campaign‖ in June to
poach its employees. A123 is accusing five former workers of violating their noncompete agreements by leaving their
jobs to perform similar roles for Apple. ―Upon information and belief, Apple is currently developing a large scale
battery division to compete in the very same field as A123,‖ the lawsuit said. Michael Rosen, A123‘s lead attorney,
declined to comment. The Financial Times first reported that Apple had been hiring automotive experts to form a
secret research lab. An Apple spokesman declined to comment. Apple has long had partnerships with automakers like
BMW and Volkswagen to offer systems compatible with iPods inside cars. Last year, Apple introduced CarPlay, a
system that allows users to link iPhones directly with the so-called infotainment systems for some cars.
The two verbal tenses with salient loadings on F4, namely present and past tenses, are used with
frequencies close to the corpus mean: their z-scores are 0.11 and -0.09 respectively. By contrast,
perfect aspect (z-score: 1.95) is quite frequent in this text. It is mainly used to refer to past events
(55, 56) perceived as having consequences on the present situation, thus supporting the main claim
made in the heading. As shown in the same two examples, perfect aspect verbs often feature split
auxiliaries (z-score: 1.53), whereby information in the form of adverbs is inserted between the
auxiliary and main verb. The remaining two salient LFs on F4, which contrast with each other, are
here equally infrequent. Of these, third person pronouns and determiners have a z-score of -0.98,
which might be due to the fact that, as in the case analysed in Section 6.2, the text does not make
much reference to any people in particular, nor to personal stories or opinions. Prediction modals
have a z-score of -1.13, because most of the content has to do with current and recently occurred
events, although the main topic concerns the future.
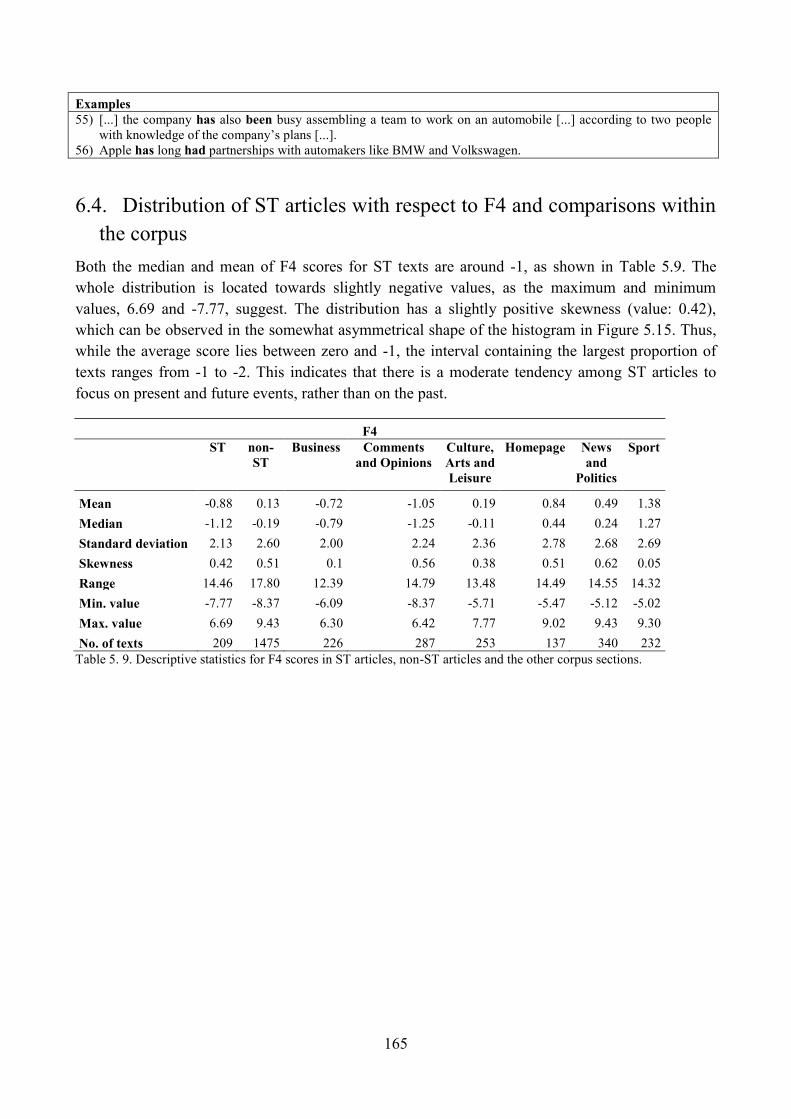
165
Examples
55) [...] the company has also been busy assembling a team to work on an automobile [...] according to two people
with knowledge of the company‘s plans [...].
56) Apple has long had partnerships with automakers like BMW and Volkswagen.
6.4. Distribution of ST articles with respect to F4 and comparisons within
the corpus
Both the median and mean of F4 scores for ST texts are around -1, as shown in Table 5.9. The
whole distribution is located towards slightly negative values, as the maximum and minimum
values, 6.69 and -7.77, suggest. The distribution has a slightly positive skewness (value: 0.42),
which can be observed in the somewhat asymmetrical shape of the histogram in Figure 5.15. Thus,
while the average score lies between zero and -1, the interval containing the largest proportion of
texts ranges from -1 to -2. This indicates that there is a moderate tendency among ST articles to
focus on present and future events, rather than on the past.
F4
ST non-
ST
Business Comments
and Opinions
Culture,
Arts and
Leisure
Homepage News
and
Politics
Sport
Mean -0.88 0.13 -0.72 -1.05 0.19 0.84 0.49 1.38
Median -1.12 -0.19 -0.79 -1.25 -0.11 0.44 0.24 1.27
Standard deviation 2.13 2.60 2.00 2.24 2.36 2.78 2.68 2.69
Skewness 0.42 0.51 0.1 0.56 0.38 0.51 0.62 0.05
Range 14.46 17.80 12.39 14.79 13.48 14.49 14.55 14.32
Min. value -7.77 -8.37 -6.09 -8.37 -5.71 -5.47 -5.12 -5.02
Max. value 6.69 9.43 6.30 6.42 7.77 9.02 9.43 9.30
No. of texts 209 1475 226 287 253 137 340 232
Table 5. 9. Descriptive statistics for F4 scores in ST articles, non-ST articles and the other corpus sections.
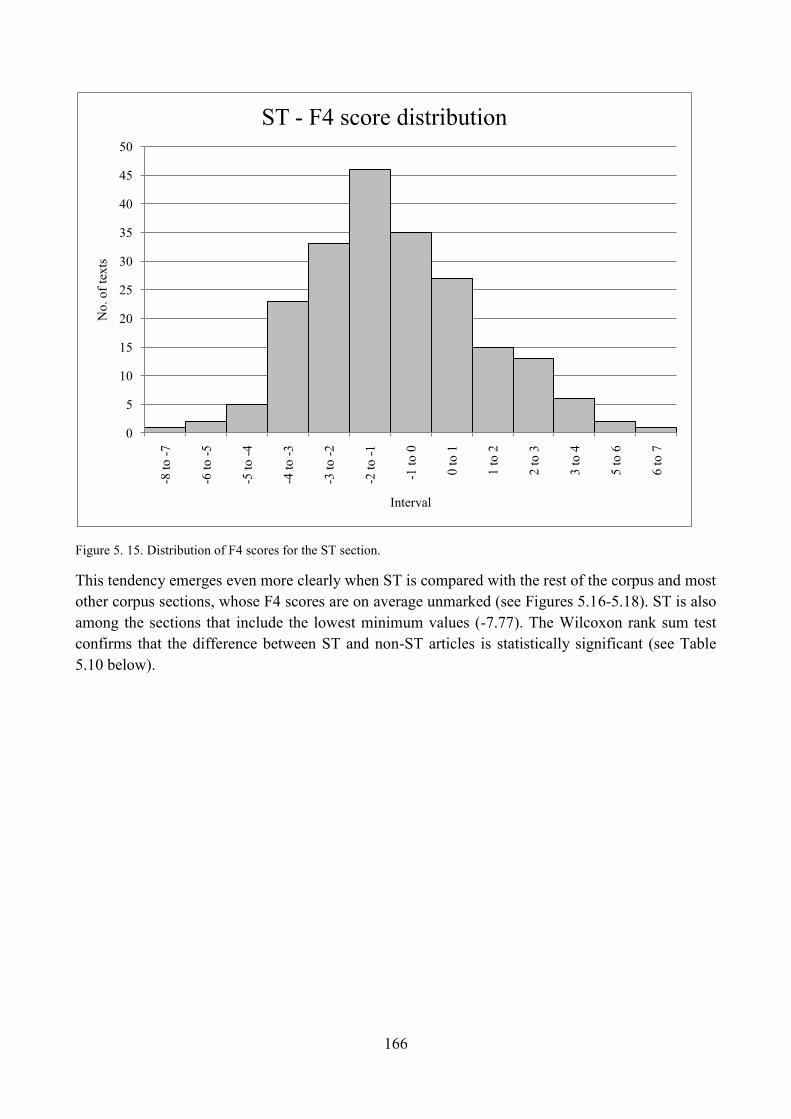
166
Figure 5. 15. Distribution of F4 scores for the ST section.
This tendency emerges even more clearly when ST is compared with the rest of the corpus and most
other corpus sections, whose F4 scores are on average unmarked (see Figures 5.16-5.18). ST is also
among the sections that include the lowest minimum values (-7.77). The Wilcoxon rank sum test
confirms that the difference between ST and non-ST articles is statistically significant (see Table
5.10 below).
0
5
10
15
20
25
30
35
40
45
50
-8 t
o -
7
-6 t
o -
5
-5 t
o -
4
-4 t
o -
3
-3 t
o -
2
-2 t
o -
1
-1 t
o 0
0 t
o 1
1 t
o 2
2 t
o 3
3 t
o 4
5 t
o 6
6 t
o 7
No
. o
f te
xts
Interval
ST - F4 score distribution
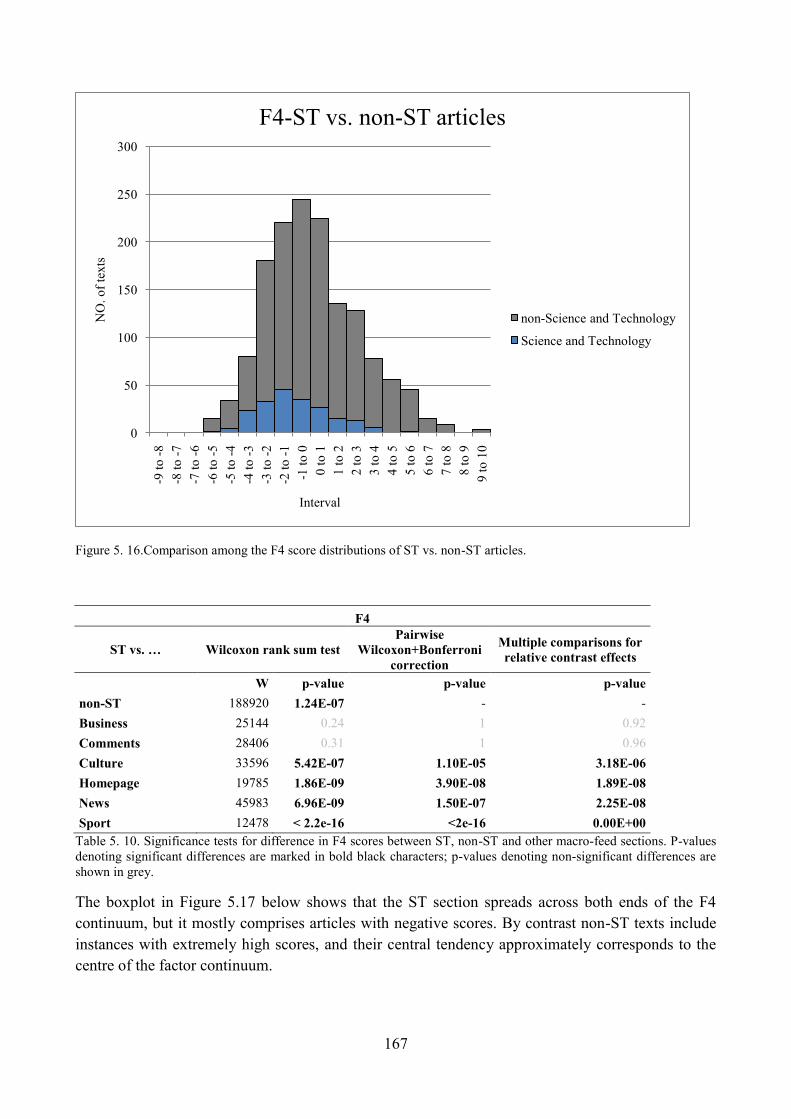
167
Figure 5. 16.Comparison among the F4 score distributions of ST vs. non-ST articles.
F4
ST vs. … Wilcoxon rank sum test
Pairwise
Wilcoxon+Bonferroni
correction
Multiple comparisons for
relative contrast effects
W p-value p-value p-value
non-ST 188920 1.24E-07 - -
Business 25144 0.24 1 0.92
Comments 28406 0.31 1 0.96
Culture 33596 5.42E-07 1.10E-05 3.18E-06
Homepage 19785 1.86E-09 3.90E-08 1.89E-08
News 45983 6.96E-09 1.50E-07 2.25E-08
Sport 12478 < 2.2e-16 <2e-16 0.00E+00
Table 5. 10. Significance tests for difference in F4 scores between ST, non-ST and other macro-feed sections. P-values
denoting significant differences are marked in bold black characters; p-values denoting non-significant differences are
shown in grey.
The boxplot in Figure 5.17 below shows that the ST section spreads across both ends of the F4
continuum, but it mostly comprises articles with negative scores. By contrast non-ST texts include
instances with extremely high scores, and their central tendency approximately corresponds to the
centre of the factor continuum.
0
50
100
150
200
250
300-9
to
-8
-8 t
o -
7
-7 t
o -
6
-6 t
o -
5
-5 t
o -
4
-4 t
o -
3
-3 t
o -
2
-2 t
o -
1
-1 t
o 0
0 t
o 1
1 t
o 2
2 t
o 3
3 t
o 4
4 t
o 5
5 t
o 6
6 t
o 7
7 t
o 8
8 t
o 9
9 t
o 1
0
NO
. o
f te
xts
Interval
F4-ST vs. non-ST articles
non-Science and Technology
Science and Technology
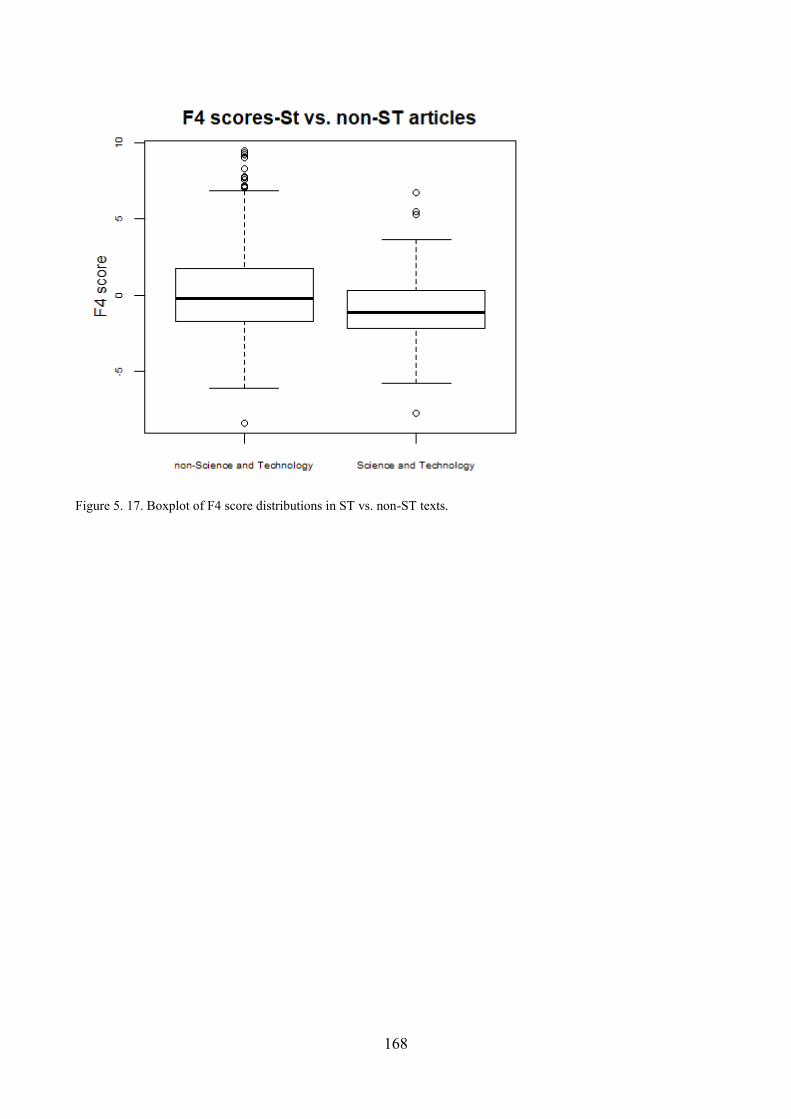
168
Figure 5. 17. Boxplot of F4 score distributions in ST vs. non-ST texts.
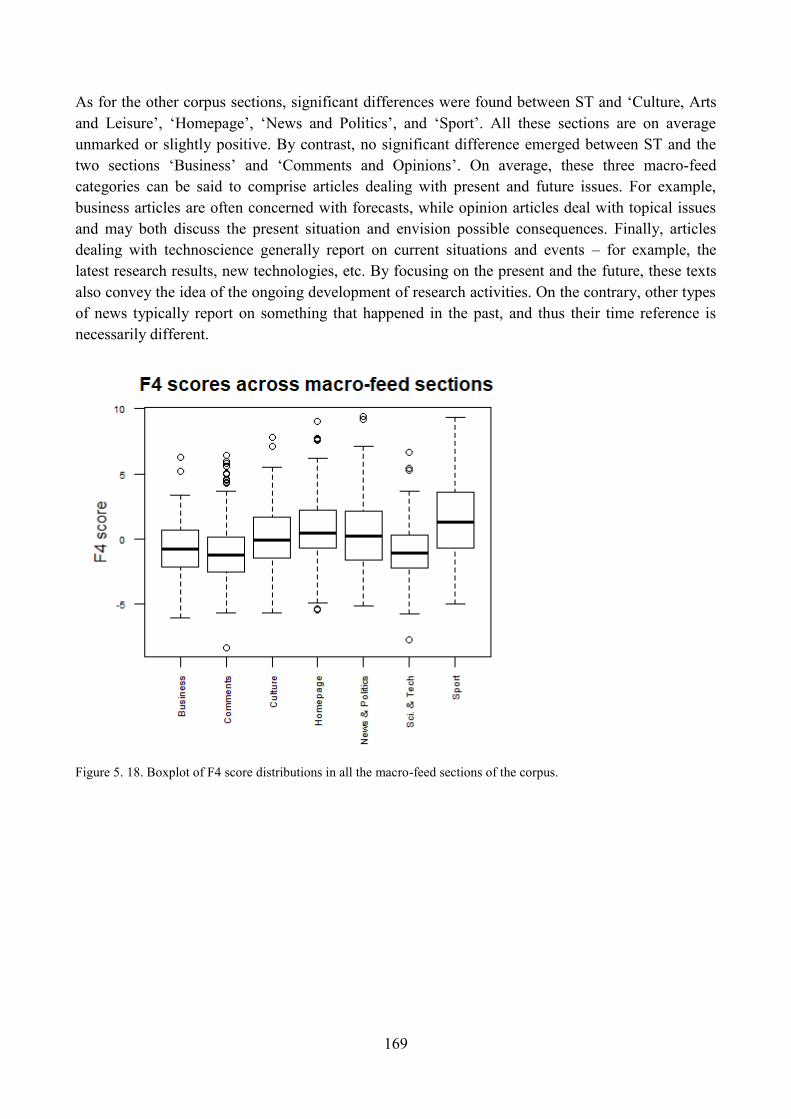
169
As for the other corpus sections, significant differences were found between ST and ‗Culture, Arts
and Leisure‘, ‗Homepage‘, ‗News and Politics‘, and ‗Sport‘. All these sections are on average
unmarked or slightly positive. By contrast, no significant difference emerged between ST and the
two sections ‗Business‘ and ‗Comments and Opinions‘. On average, these three macro-feed
categories can be said to comprise articles dealing with present and future issues. For example,
business articles are often concerned with forecasts, while opinion articles deal with topical issues
and may both discuss the present situation and envision possible consequences. Finally, articles
dealing with technoscience generally report on current situations and events – for example, the
latest research results, new technologies, etc. By focusing on the present and the future, these texts
also convey the idea of the ongoing development of research activities. On the contrary, other types
of news typically report on something that happened in the past, and thus their time reference is
necessarily different.
Figure 5. 18. Boxplot of F4 score distributions in all the macro-feed sections of the corpus.
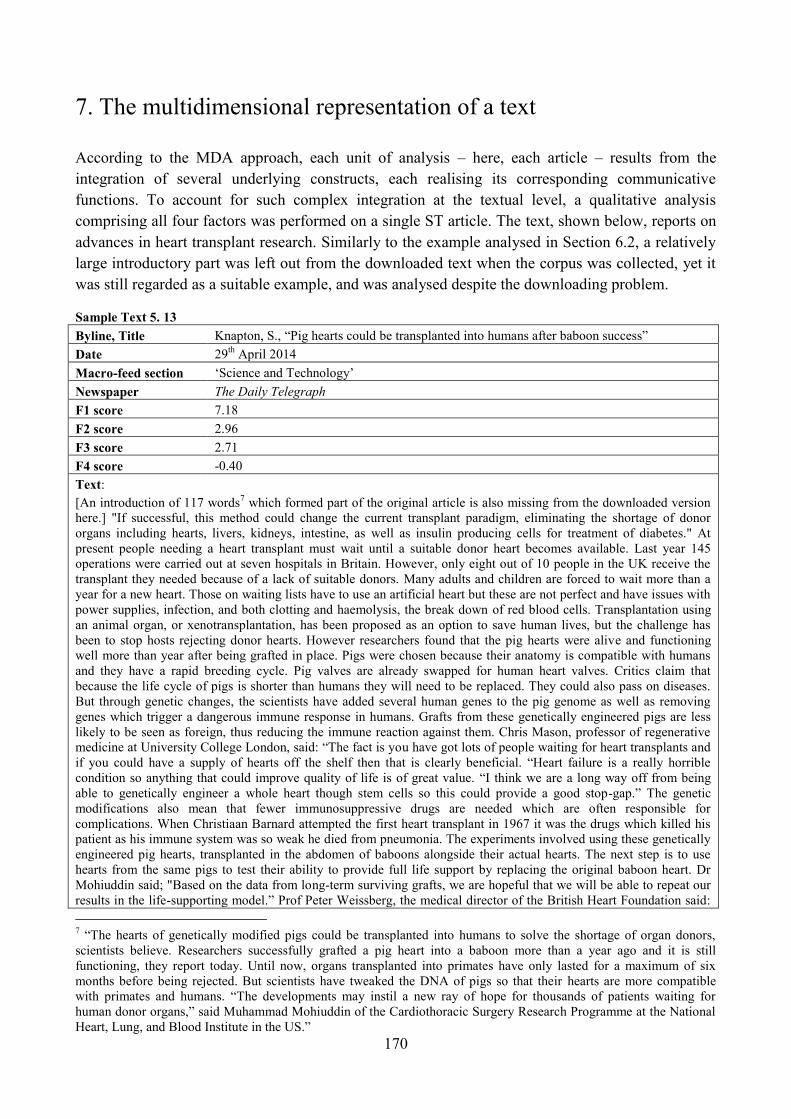
170
7. The multidimensional representation of a text
According to the MDA approach, each unit of analysis – here, each article – results from the
integration of several underlying constructs, each realising its corresponding communicative
functions. To account for such complex integration at the textual level, a qualitative analysis
comprising all four factors was performed on a single ST article. The text, shown below, reports on
advances in heart transplant research. Similarly to the example analysed in Section 6.2, a relatively
large introductory part was left out from the downloaded text when the corpus was collected, yet it
was still regarded as a suitable example, and was analysed despite the downloading problem.
Sample Text 5. 13
Byline, Title Knapton, S., ―Pig hearts could be transplanted into humans after baboon success‖
Date 29th
April 2014
Macro-feed section ‗Science and Technology‘
Newspaper The Daily Telegraph
F1 score 7.18
F2 score 2.96
F3 score 2.71
F4 score -0.40
Text:
[An introduction of 117 words7 which formed part of the original article is also missing from the downloaded version
here.] "If successful, this method could change the current transplant paradigm, eliminating the shortage of donor
organs including hearts, livers, kidneys, intestine, as well as insulin producing cells for treatment of diabetes." At
present people needing a heart transplant must wait until a suitable donor heart becomes available. Last year 145
operations were carried out at seven hospitals in Britain. However, only eight out of 10 people in the UK receive the
transplant they needed because of a lack of suitable donors. Many adults and children are forced to wait more than a
year for a new heart. Those on waiting lists have to use an artificial heart but these are not perfect and have issues with
power supplies, infection, and both clotting and haemolysis, the break down of red blood cells. Transplantation using
an animal organ, or xenotransplantation, has been proposed as an option to save human lives, but the challenge has
been to stop hosts rejecting donor hearts. However researchers found that the pig hearts were alive and functioning
well more than year after being grafted in place. Pigs were chosen because their anatomy is compatible with humans
and they have a rapid breeding cycle. Pig valves are already swapped for human heart valves. Critics claim that
because the life cycle of pigs is shorter than humans they will need to be replaced. They could also pass on diseases.
But through genetic changes, the scientists have added several human genes to the pig genome as well as removing
genes which trigger a dangerous immune response in humans. Grafts from these genetically engineered pigs are less
likely to be seen as foreign, thus reducing the immune reaction against them. Chris Mason, professor of regenerative
medicine at University College London, said: ―The fact is you have got lots of people waiting for heart transplants and
if you could have a supply of hearts off the shelf then that is clearly beneficial. ―Heart failure is a really horrible
condition so anything that could improve quality of life is of great value. ―I think we are a long way off from being
able to genetically engineer a whole heart though stem cells so this could provide a good stop-gap.‖ The genetic
modifications also mean that fewer immunosuppressive drugs are needed which are often responsible for
complications. When Christiaan Barnard attempted the first heart transplant in 1967 it was the drugs which killed his
patient as his immune system was so weak he died from pneumonia. The experiments involved using these genetically
engineered pig hearts, transplanted in the abdomen of baboons alongside their actual hearts. The next step is to use
hearts from the same pigs to test their ability to provide full life support by replacing the original baboon heart. Dr
Mohiuddin said; "Based on the data from long-term surviving grafts, we are hopeful that we will be able to repeat our
results in the life-supporting model.‖ Prof Peter Weissberg, the medical director of the British Heart Foundation said:
7 ―The hearts of genetically modified pigs could be transplanted into humans to solve the shortage of organ donors,
scientists believe. Researchers successfully grafted a pig heart into a baboon more than a year ago and it is still
functioning, they report today. Until now, organs transplanted into primates have only lasted for a maximum of six
months before being rejected. But scientists have tweaked the DNA of pigs so that their hearts are more compatible
with primates and humans. ―The developments may instil a new ray of hope for thousands of patients waiting for
human donor organs,‖ said Muhammad Mohiuddin of the Cardiothoracic Surgery Research Programme at the National
Heart, Lung, and Blood Institute in the US.‖

171
―I think this stands a high chance of happening but it is still a very long way off. ―There were similar projects
happening in the 1990s but they ground to a halt because they struggled to deal with the problems of rejection. ―There
is a shortage of organs so this could be potentially promising and we already use pig valves in heart surgery. ―But there
is a long way to go. They still have to prove this would work in humans.‖ The study was presented at the 94th
American Association for Thoracic Surgery annual meeting in Toronto.
The F1 of this article is 7.18: it is moderately positive, and should therefore reflect a style that is
more interactional than informative. In fact, the most ‗interactional‘ features in F1, those which are
most typically used in conversational styles, are not so relevant in the present article: the
frequencies of first and second person pronouns and determiners are quite close to the corpus mean
(their z-scores are -0.02 and -0.03 respectively), while direct questions have a slightly negative z-
score (-0.47). Moreover, markers of generic reference such as the pro-verb do and the pronoun it are
relatively infrequent (their z- scores are -0.76 and -0.85). A few sections of the text – especially
when experts provide answers and comments – do have a moderately informal and interactional
tone (see Example 57 below). However, most of the article is structured differently. Indeed, the
features which substantially contributed to the positive F1 score of the article are predicative
adjectives (z-score: 3.32) and be as a main verb (z-score: 2.35). Rather than reflecting
conversational tones, such fragmented forms of noun phrase or noun clause elaboration have a
clearly informational purpose (Examples 58 and 59). Fragmentation is further stressed by the use of
clause coordination (z-score: 2.04), which is essential in adding information without creating
complex structures (Examples 60 and 61). Other LFs with a positive loading on F1 are particularly
frequent in this article. For example, demonstrative pronouns (z-score: 3.01) contribute to text
cohesion. Conditional subordinators (z-score: 0.64) establish logical links, useful in making such a
specific and delicate issue as heart transplant more accessible to a lay audience (see Example 62).
The frequencies of LFs loading negatively on F1 are all slightly above the corpus mean, thus
counterbalancing the contribution of the positive ones to the factor score. Most importantly, general
nouns (z-score: 0.70), nominalisation (z-score: 0.45) and mean word length (z-score: 0.42) indicate
that specific nominal information does play a role in the article despite its positive F1 score, as
shown by the long and nominally dense sentence in Example 63. Overall, the text maintains a
certain amount of informational focus and does not realise a high degree of interaction between
referents or with the public. Yet, although with some exceptions, it mostly uses a fragmented,
structurally simple form rather than highly integrated information in long and compact phrases and
sentences.
Examples
57) The fact is you have got lots of people waiting for heart transplants and if you could have a supply of hearts off the
shelf then that is clearly beneficial
58) Pigs were chosen because their anatomy is compatible with humans and they have a rapid breeding cycle.
59) Critics claim that because the life cycle of pigs is shorter than humans they will need to be replaced.
60) Those on waiting lists have to use an artificial heart but these are not perfect and have issues with power supplies.
61) There is a shortage of organs so this could be potentially promising and we already use pig valves in heart
surgery.
62) If successful, this method could change the current transplant paradigm [...].
63) Those on waiting lists have to use an artificial heart but these are not perfect and have issues with power supplies,
infection, and both clotting and haemolysis, the break down of red blood cells. Transplantation using an animal
organ, or xenotransplantation, has been proposed as an option to save human lives, but the challenge has been to
stop hosts rejecting donor hearts.
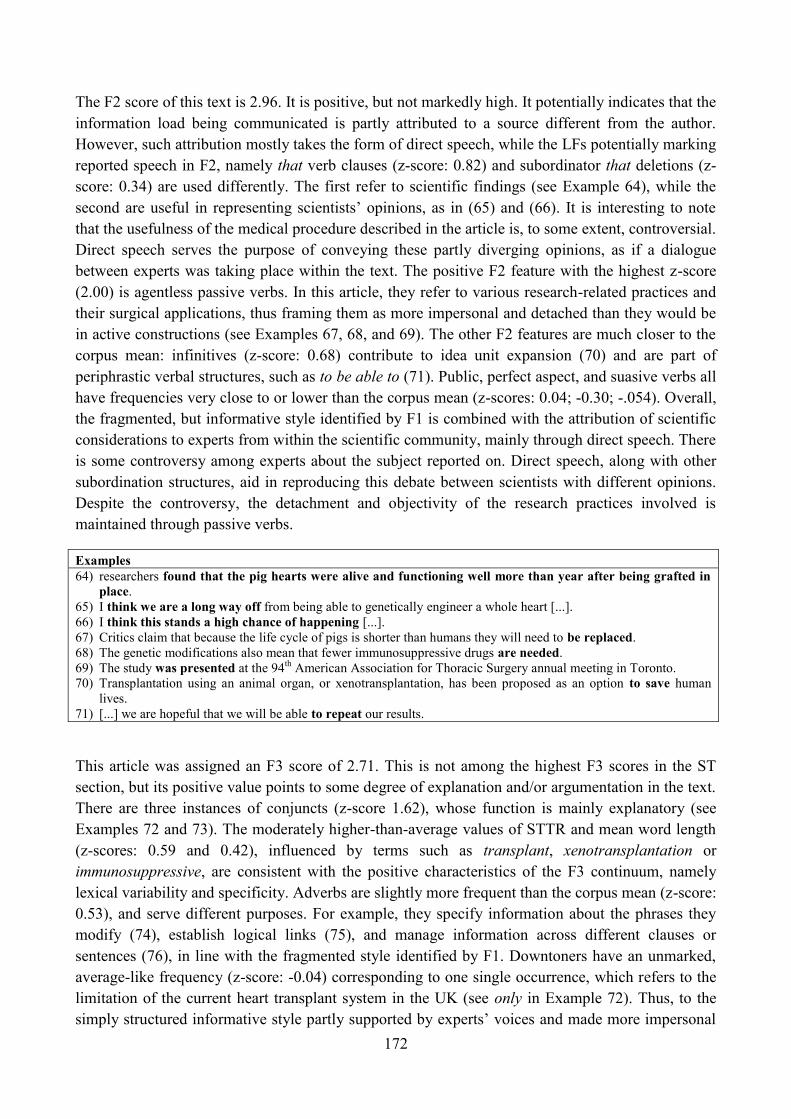
172
The F2 score of this text is 2.96. It is positive, but not markedly high. It potentially indicates that the
information load being communicated is partly attributed to a source different from the author.
However, such attribution mostly takes the form of direct speech, while the LFs potentially marking
reported speech in F2, namely that verb clauses (z-score: 0.82) and subordinator that deletions (z-
score: 0.34) are used differently. The first refer to scientific findings (see Example 64), while the
second are useful in representing scientists‘ opinions, as in (65) and (66). It is interesting to note
that the usefulness of the medical procedure described in the article is, to some extent, controversial.
Direct speech serves the purpose of conveying these partly diverging opinions, as if a dialogue
between experts was taking place within the text. The positive F2 feature with the highest z-score
(2.00) is agentless passive verbs. In this article, they refer to various research-related practices and
their surgical applications, thus framing them as more impersonal and detached than they would be
in active constructions (see Examples 67, 68, and 69). The other F2 features are much closer to the
corpus mean: infinitives (z-score: 0.68) contribute to idea unit expansion (70) and are part of
periphrastic verbal structures, such as to be able to (71). Public, perfect aspect, and suasive verbs all
have frequencies very close to or lower than the corpus mean (z-scores: 0.04; -0.30; -.054). Overall,
the fragmented, but informative style identified by F1 is combined with the attribution of scientific
considerations to experts from within the scientific community, mainly through direct speech. There
is some controversy among experts about the subject reported on. Direct speech, along with other
subordination structures, aid in reproducing this debate between scientists with different opinions.
Despite the controversy, the detachment and objectivity of the research practices involved is
maintained through passive verbs.
Examples
64) researchers found that the pig hearts were alive and functioning well more than year after being grafted in
place.
65) I think we are a long way off from being able to genetically engineer a whole heart [...].
66) I think this stands a high chance of happening [...].
67) Critics claim that because the life cycle of pigs is shorter than humans they will need to be replaced.
68) The genetic modifications also mean that fewer immunosuppressive drugs are needed.
69) The study was presented at the 94th
American Association for Thoracic Surgery annual meeting in Toronto.
70) Transplantation using an animal organ, or xenotransplantation, has been proposed as an option to save human
lives.
71) [...] we are hopeful that we will be able to repeat our results.
This article was assigned an F3 score of 2.71. This is not among the highest F3 scores in the ST
section, but its positive value points to some degree of explanation and/or argumentation in the text.
There are three instances of conjuncts (z-score 1.62), whose function is mainly explanatory (see
Examples 72 and 73). The moderately higher-than-average values of STTR and mean word length
(z-scores: 0.59 and 0.42), influenced by terms such as transplant, xenotransplantation or
immunosuppressive, are consistent with the positive characteristics of the F3 continuum, namely
lexical variability and specificity. Adverbs are slightly more frequent than the corpus mean (z-score:
0.53), and serve different purposes. For example, they specify information about the phrases they
modify (74), establish logical links (75), and manage information across different clauses or
sentences (76), in line with the fragmented style identified by F1. Downtoners have an unmarked,
average-like frequency (z-score: -0.04) corresponding to one single occurrence, which refers to the
limitation of the current heart transplant system in the UK (see only in Example 72). Thus, to the
simply structured informative style partly supported by experts‘ voices and made more impersonal
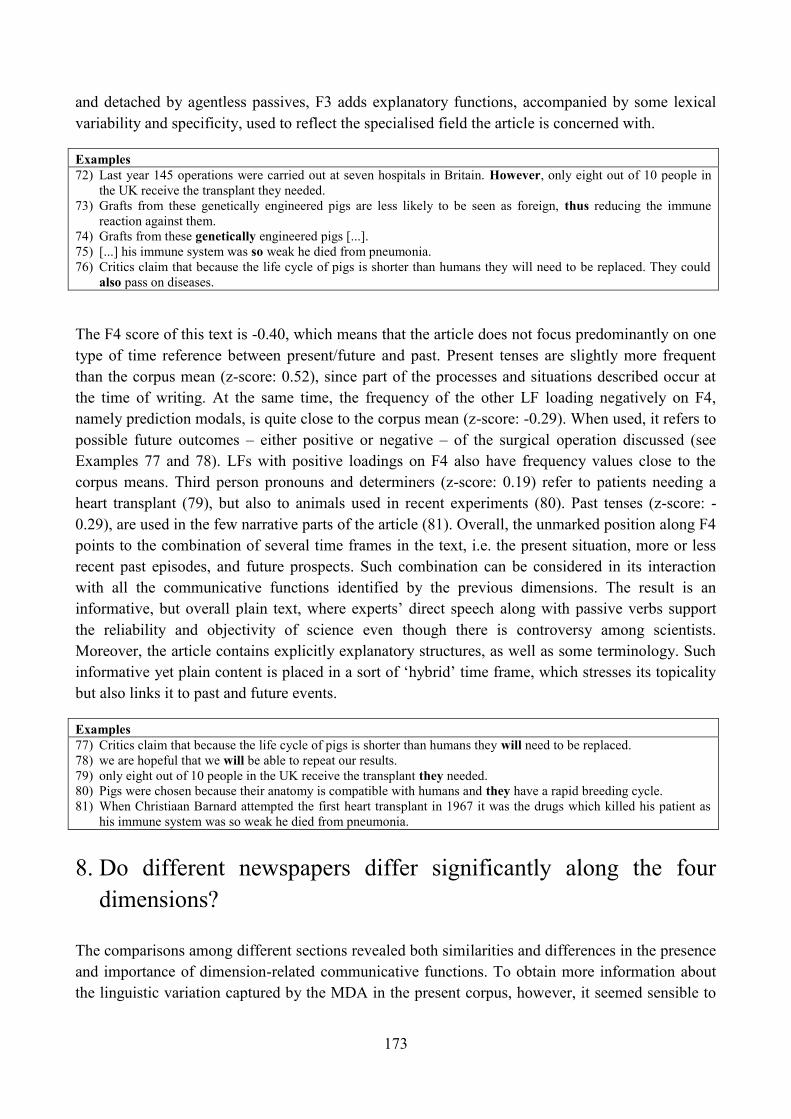
173
and detached by agentless passives, F3 adds explanatory functions, accompanied by some lexical
variability and specificity, used to reflect the specialised field the article is concerned with.
Examples
72) Last year 145 operations were carried out at seven hospitals in Britain. However, only eight out of 10 people in
the UK receive the transplant they needed.
73) Grafts from these genetically engineered pigs are less likely to be seen as foreign, thus reducing the immune
reaction against them.
74) Grafts from these genetically engineered pigs [...].
75) [...] his immune system was so weak he died from pneumonia.
76) Critics claim that because the life cycle of pigs is shorter than humans they will need to be replaced. They could
also pass on diseases.
The F4 score of this text is -0.40, which means that the article does not focus predominantly on one
type of time reference between present/future and past. Present tenses are slightly more frequent
than the corpus mean (z-score: 0.52), since part of the processes and situations described occur at
the time of writing. At the same time, the frequency of the other LF loading negatively on F4,
namely prediction modals, is quite close to the corpus mean (z-score: -0.29). When used, it refers to
possible future outcomes – either positive or negative – of the surgical operation discussed (see
Examples 77 and 78). LFs with positive loadings on F4 also have frequency values close to the
corpus means. Third person pronouns and determiners (z-score: 0.19) refer to patients needing a
heart transplant (79), but also to animals used in recent experiments (80). Past tenses (z-score: -
0.29), are used in the few narrative parts of the article (81). Overall, the unmarked position along F4
points to the combination of several time frames in the text, i.e. the present situation, more or less
recent past episodes, and future prospects. Such combination can be considered in its interaction
with all the communicative functions identified by the previous dimensions. The result is an
informative, but overall plain text, where experts‘ direct speech along with passive verbs support
the reliability and objectivity of science even though there is controversy among scientists.
Moreover, the article contains explicitly explanatory structures, as well as some terminology. Such
informative yet plain content is placed in a sort of ‗hybrid‘ time frame, which stresses its topicality
but also links it to past and future events.
Examples
77) Critics claim that because the life cycle of pigs is shorter than humans they will need to be replaced.
78) we are hopeful that we will be able to repeat our results.
79) only eight out of 10 people in the UK receive the transplant they needed.
80) Pigs were chosen because their anatomy is compatible with humans and they have a rapid breeding cycle.
81) When Christiaan Barnard attempted the first heart transplant in 1967 it was the drugs which killed his patient as
his immune system was so weak he died from pneumonia.
8. Do different newspapers differ significantly along the four
dimensions?
The comparisons among different sections revealed both similarities and differences in the presence
and importance of dimension-related communicative functions. To obtain more information about
the linguistic variation captured by the MDA in the present corpus, however, it seemed sensible to
174
verify whether other corpus-internal groupings were significantly different in relation to the four
dimensions.
The most obvious distinction, besides the macro-feed based one, was that among different
newspapers, which were therefore compared by grouping texts, with their four factor scores,
according to the source newspaper they come from, rather than the section where they were
published. Observed differences were tested for statistical significance using the same methods and
tools as in the macro-feed comparison. The main results will be provided here, but they will not be
discussed in detail, since they would require a study of their own. They nevertheless contribute to
making the present analysis more comprehensive and highlight useful elements for further research.
Descriptive statistics for all four factors on each newspaper are reported in Table 5.11 below. There
are no markedly high or low measures of central tendency, which suggests that different
newspapers might be quite similar to each other.
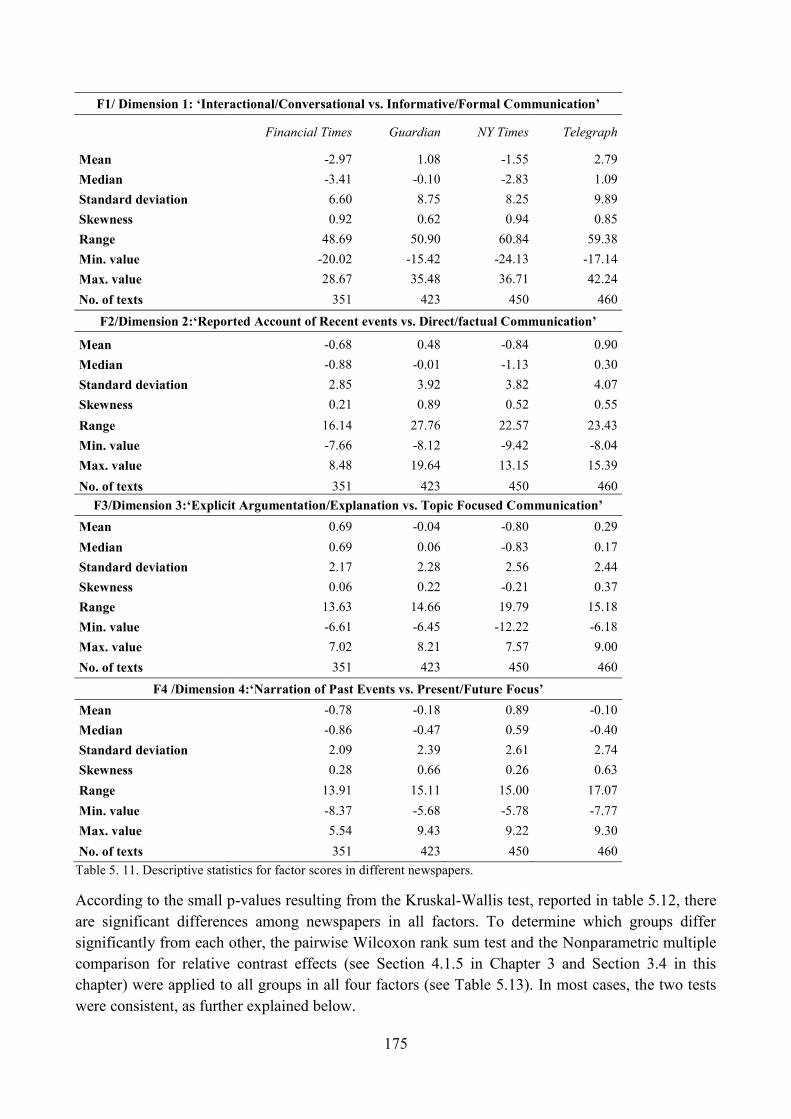
175
F1/ Dimension 1: ‗Interactional/Conversational vs. Informative/Formal Communication‘
Financial Times Guardian NY Times Telegraph
Mean -2.97 1.08 -1.55 2.79
Median -3.41 -0.10 -2.83 1.09
Standard deviation 6.60 8.75 8.25 9.89
Skewness 0.92 0.62 0.94 0.85
Range 48.69 50.90 60.84 59.38
Min. value -20.02 -15.42 -24.13 -17.14
Max. value 28.67 35.48 36.71 42.24
No. of texts 351 423 450 460
F2/Dimension 2:‗Reported Account of Recent events vs. Direct/factual Communication‘
Mean -0.68 0.48 -0.84 0.90
Median -0.88 -0.01 -1.13 0.30
Standard deviation 2.85 3.92 3.82 4.07
Skewness 0.21 0.89 0.52 0.55
Range 16.14 27.76 22.57 23.43
Min. value -7.66 -8.12 -9.42 -8.04
Max. value 8.48 19.64 13.15 15.39
No. of texts 351 423 450 460
F3/Dimension 3:‗Explicit Argumentation/Explanation vs. Topic Focused Communication‘
Mean 0.69 -0.04 -0.80 0.29
Median 0.69 0.06 -0.83 0.17
Standard deviation 2.17 2.28 2.56 2.44
Skewness 0.06 0.22 -0.21 0.37
Range 13.63 14.66 19.79 15.18
Min. value -6.61 -6.45 -12.22 -6.18
Max. value 7.02 8.21 7.57 9.00
No. of texts 351 423 450 460
F4 /Dimension 4:‗Narration of Past Events vs. Present/Future Focus‘
Mean -0.78 -0.18 0.89 -0.10
Median -0.86 -0.47 0.59 -0.40
Standard deviation 2.09 2.39 2.61 2.74
Skewness 0.28 0.66 0.26 0.63
Range 13.91 15.11 15.00 17.07
Min. value -8.37 -5.68 -5.78 -7.77
Max. value 5.54 9.43 9.22 9.30
No. of texts 351 423 450 460
Table 5. 11. Descriptive statistics for factor scores in different newspapers.
According to the small p-values resulting from the Kruskal-Wallis test, reported in table 5.12, there
are significant differences among newspapers in all factors. To determine which groups differ
significantly from each other, the pairwise Wilcoxon rank sum test and the Nonparametric multiple
comparison for relative contrast effects (see Section 4.1.5 in Chapter 3 and Section 3.4 in this
chapter) were applied to all groups in all four factors (see Table 5.13). In most cases, the two tests
were consistent, as further explained below.
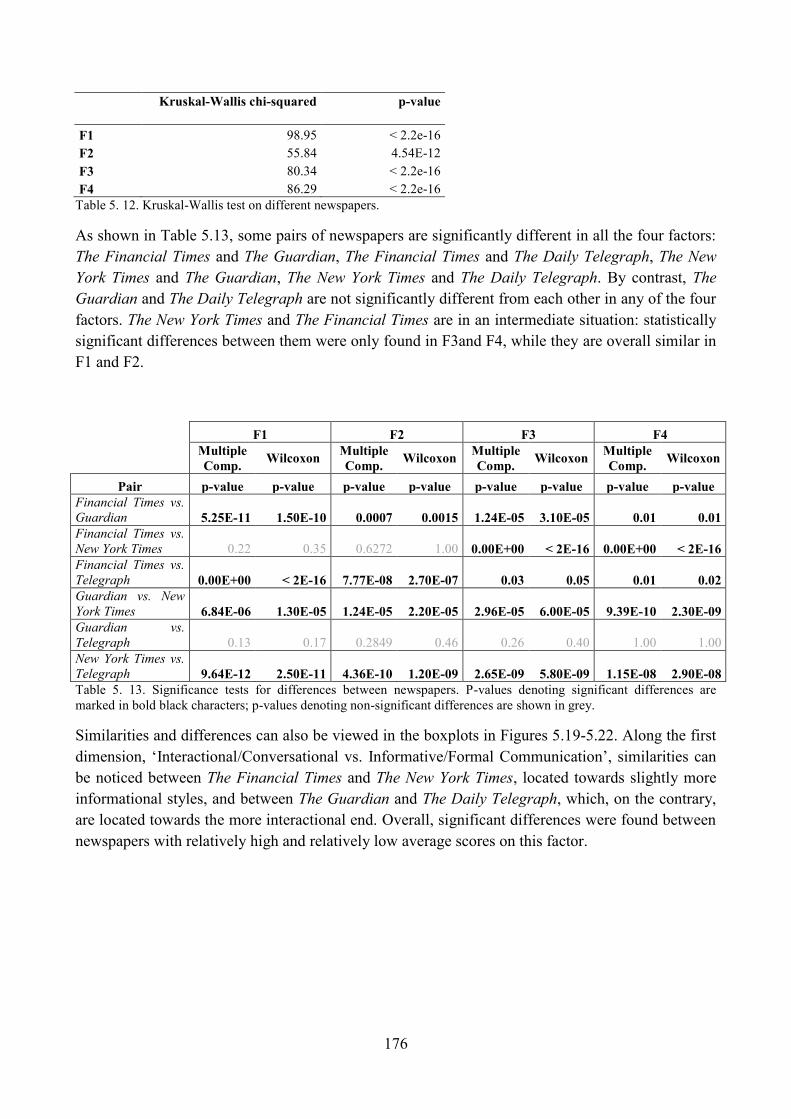
176
Kruskal-Wallis chi-squared p-value
F1 98.95 < 2.2e-16
F2 55.84 4.54E-12
F3 80.34 < 2.2e-16
F4 86.29 < 2.2e-16
Table 5. 12. Kruskal-Wallis test on different newspapers.
As shown in Table 5.13, some pairs of newspapers are significantly different in all the four factors:
The Financial Times and The Guardian, The Financial Times and The Daily Telegraph, The New
York Times and The Guardian, The New York Times and The Daily Telegraph. By contrast, The
Guardian and The Daily Telegraph are not significantly different from each other in any of the four
factors. The New York Times and The Financial Times are in an intermediate situation: statistically
significant differences between them were only found in F3and F4, while they are overall similar in
F1 and F2.
F1 F2 F3 F4
Multiple
Comp. Wilcoxon
Multiple
Comp. Wilcoxon
Multiple
Comp. Wilcoxon
Multiple
Comp. Wilcoxon
Pair p-value p-value p-value p-value p-value p-value p-value p-value
Financial Times vs.
Guardian 5.25E-11 1.50E-10 0.0007 0.0015 1.24E-05 3.10E-05 0.01 0.01
Financial Times vs.
New York Times 0.22 0.35 0.6272 1.00 0.00E+00 < 2E-16 0.00E+00 < 2E-16
Financial Times vs.
Telegraph 0.00E+00 < 2E-16 7.77E-08 2.70E-07 0.03 0.05 0.01 0.02
Guardian vs. New
York Times 6.84E-06 1.30E-05 1.24E-05 2.20E-05 2.96E-05 6.00E-05 9.39E-10 2.30E-09
Guardian vs.
Telegraph 0.13 0.17 0.2849 0.46 0.26 0.40 1.00 1.00
New York Times vs.
Telegraph 9.64E-12 2.50E-11 4.36E-10 1.20E-09 2.65E-09 5.80E-09 1.15E-08 2.90E-08
Table 5. 13. Significance tests for differences between newspapers. P-values denoting significant differences are
marked in bold black characters; p-values denoting non-significant differences are shown in grey.
Similarities and differences can also be viewed in the boxplots in Figures 5.19-5.22. Along the first
dimension, ‗Interactional/Conversational vs. Informative/Formal Communication‘, similarities can
be noticed between The Financial Times and The New York Times, located towards slightly more
informational styles, and between The Guardian and The Daily Telegraph, which, on the contrary,
are located towards the more interactional end. Overall, significant differences were found between
newspapers with relatively high and relatively low average scores on this factor.
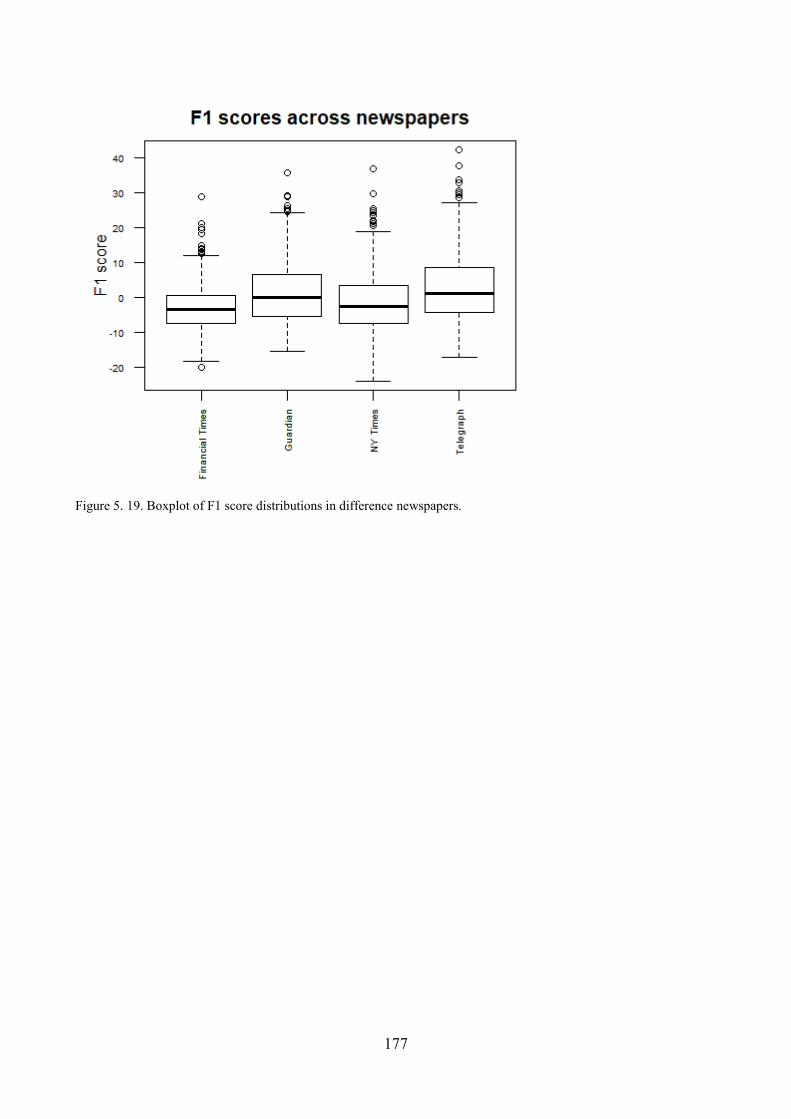
177
Figure 5. 19. Boxplot of F1 score distributions in difference newspapers.
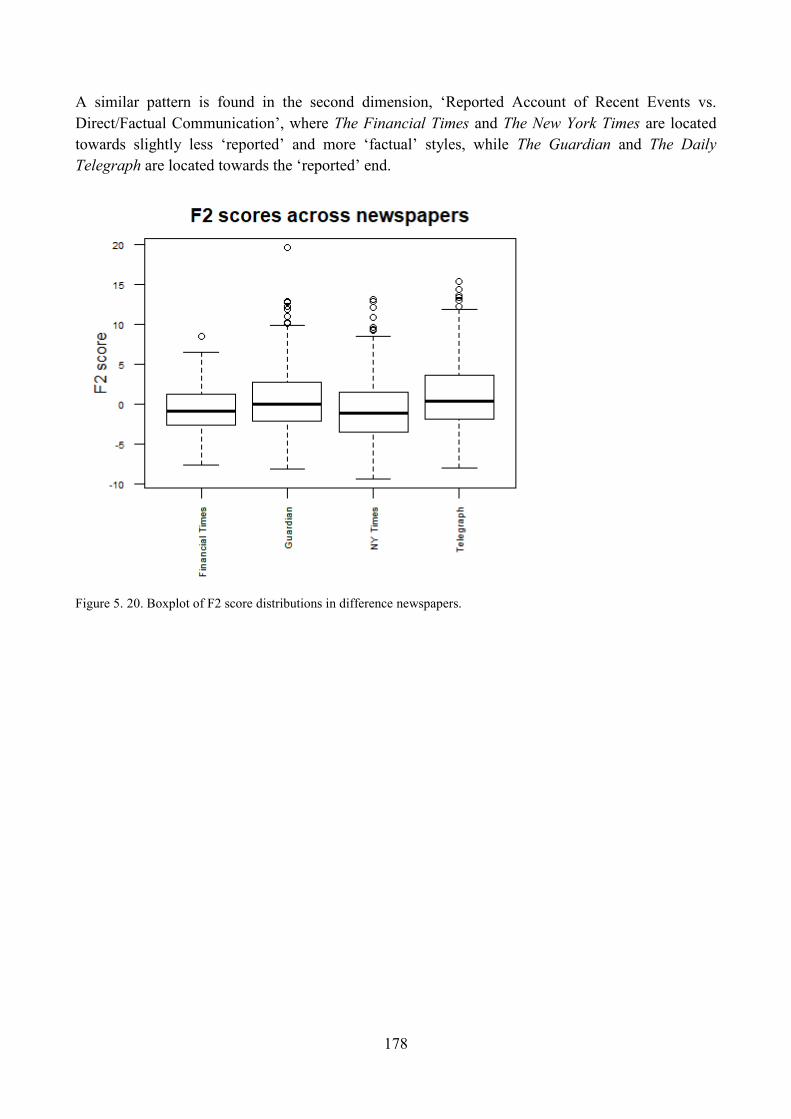
178
A similar pattern is found in the second dimension, ‗Reported Account of Recent Events vs.
Direct/Factual Communication‘, where The Financial Times and The New York Times are located
towards slightly less ‗reported‘ and more ‗factual‘ styles, while The Guardian and The Daily
Telegraph are located towards the ‗reported‘ end.
Figure 5. 20. Boxplot of F2 score distributions in difference newspapers.
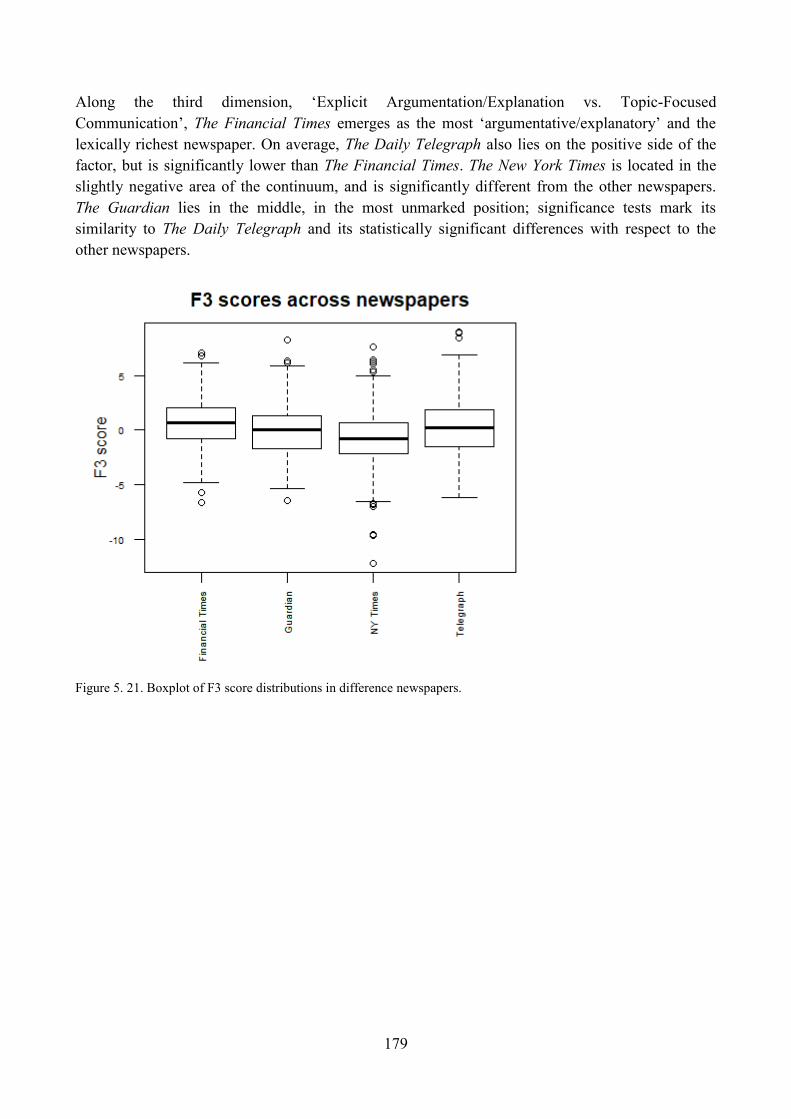
179
Along the third dimension, ‗Explicit Argumentation/Explanation vs. Topic-Focused
Communication‘, The Financial Times emerges as the most ‗argumentative/explanatory‘ and the
lexically richest newspaper. On average, The Daily Telegraph also lies on the positive side of the
factor, but is significantly lower than The Financial Times. The New York Times is located in the
slightly negative area of the continuum, and is significantly different from the other newspapers.
The Guardian lies in the middle, in the most unmarked position; significance tests mark its
similarity to The Daily Telegraph and its statistically significant differences with respect to the
other newspapers.
Figure 5. 21. Boxplot of F3 score distributions in difference newspapers.
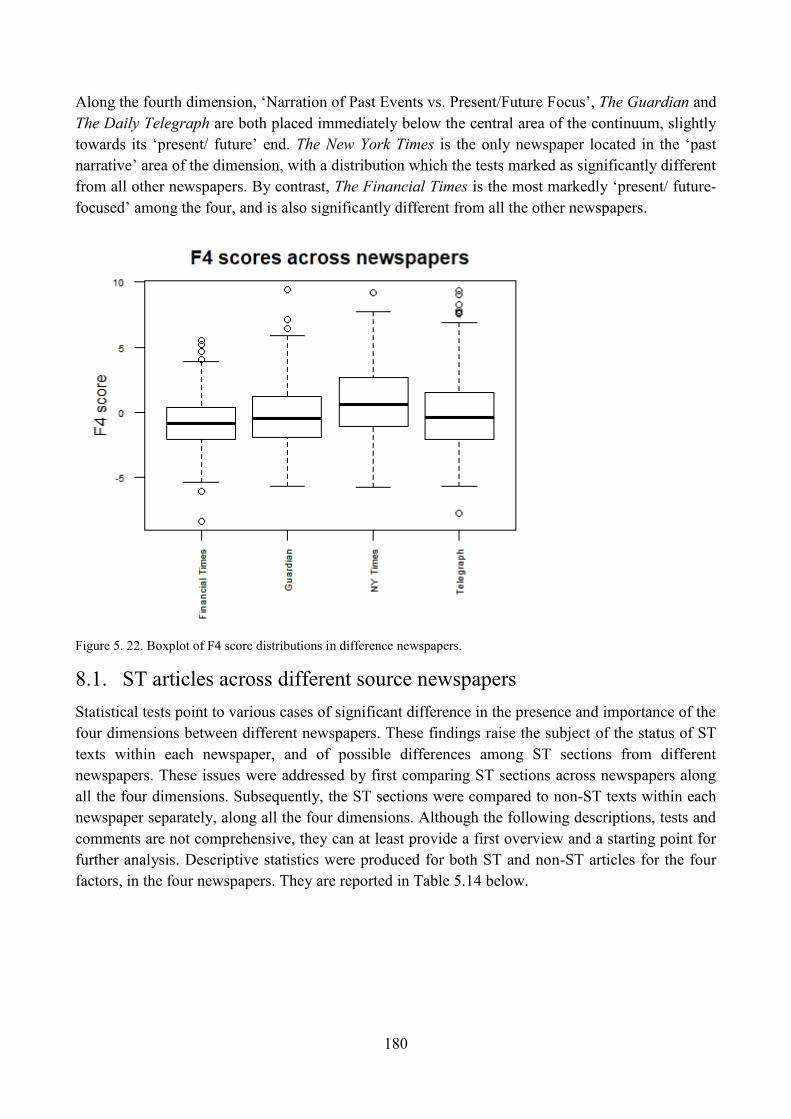
180
Along the fourth dimension, ‗Narration of Past Events vs. Present/Future Focus‘, The Guardian and
The Daily Telegraph are both placed immediately below the central area of the continuum, slightly
towards its ‗present/ future‘ end. The New York Times is the only newspaper located in the ‗past
narrative‘ area of the dimension, with a distribution which the tests marked as significantly different
from all other newspapers. By contrast, The Financial Times is the most markedly ‗present/ future-
focused‘ among the four, and is also significantly different from all the other newspapers.
Figure 5. 22. Boxplot of F4 score distributions in difference newspapers.
8.1. ST articles across different source newspapers
Statistical tests point to various cases of significant difference in the presence and importance of the
four dimensions between different newspapers. These findings raise the subject of the status of ST
texts within each newspaper, and of possible differences among ST sections from different
newspapers. These issues were addressed by first comparing ST sections across newspapers along
all the four dimensions. Subsequently, the ST sections were compared to non-ST texts within each
newspaper separately, along all the four dimensions. Although the following descriptions, tests and
comments are not comprehensive, they can at least provide a first overview and a starting point for
further analysis. Descriptive statistics were produced for both ST and non-ST articles for the four
factors, in the four newspapers. They are reported in Table 5.14 below.
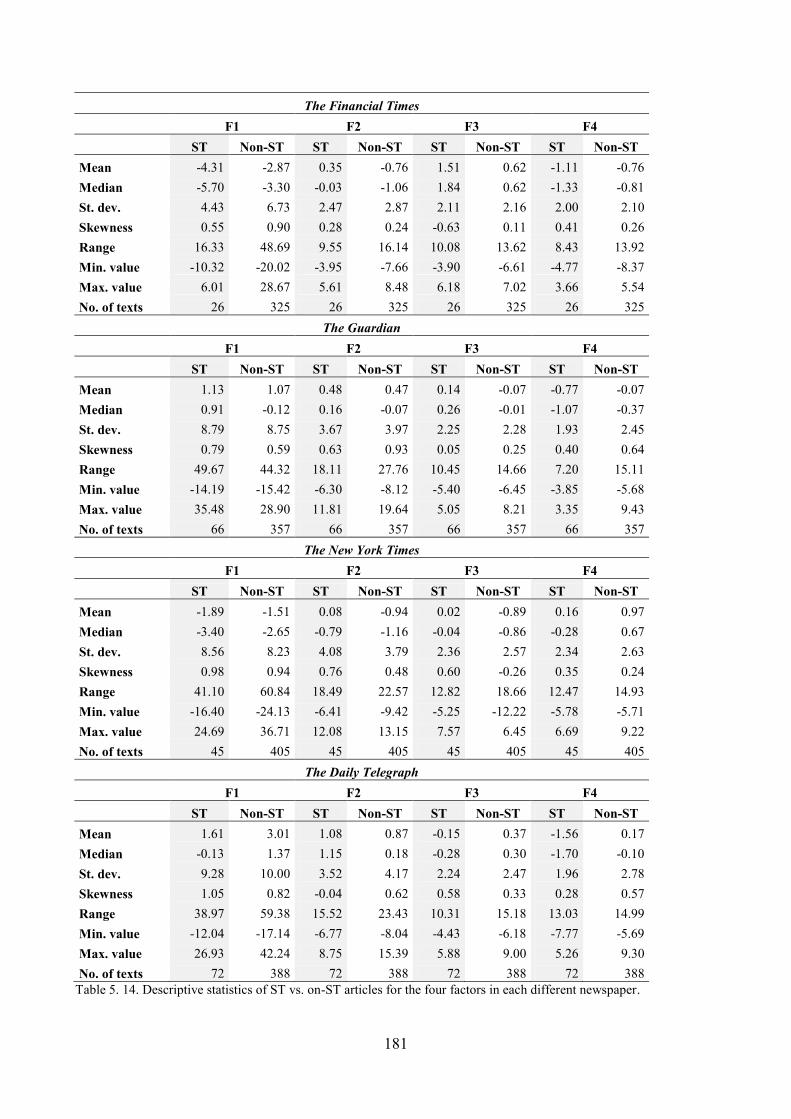
181
The Financial Times
F1 F2 F3 F4
ST Non-ST ST Non-ST ST Non-ST ST Non-ST
Mean -4.31 -2.87 0.35 -0.76 1.51 0.62 -1.11 -0.76
Median -5.70 -3.30 -0.03 -1.06 1.84 0.62 -1.33 -0.81
St. dev. 4.43 6.73 2.47 2.87 2.11 2.16 2.00 2.10
Skewness 0.55 0.90 0.28 0.24 -0.63 0.11 0.41 0.26
Range 16.33 48.69 9.55 16.14 10.08 13.62 8.43 13.92
Min. value -10.32 -20.02 -3.95 -7.66 -3.90 -6.61 -4.77 -8.37
Max. value 6.01 28.67 5.61 8.48 6.18 7.02 3.66 5.54
No. of texts 26 325 26 325 26 325 26 325
The Guardian
F1 F2 F3 F4
ST Non-ST ST Non-ST ST Non-ST ST Non-ST
Mean 1.13 1.07 0.48 0.47 0.14 -0.07 -0.77 -0.07
Median 0.91 -0.12 0.16 -0.07 0.26 -0.01 -1.07 -0.37
St. dev. 8.79 8.75 3.67 3.97 2.25 2.28 1.93 2.45
Skewness 0.79 0.59 0.63 0.93 0.05 0.25 0.40 0.64
Range 49.67 44.32 18.11 27.76 10.45 14.66 7.20 15.11
Min. value -14.19 -15.42 -6.30 -8.12 -5.40 -6.45 -3.85 -5.68
Max. value 35.48 28.90 11.81 19.64 5.05 8.21 3.35 9.43
No. of texts 66 357 66 357 66 357 66 357
The New York Times
F1 F2 F3 F4
ST Non-ST ST Non-ST ST Non-ST ST Non-ST
Mean -1.89 -1.51 0.08 -0.94 0.02 -0.89 0.16 0.97
Median -3.40 -2.65 -0.79 -1.16 -0.04 -0.86 -0.28 0.67
St. dev. 8.56 8.23 4.08 3.79 2.36 2.57 2.34 2.63
Skewness 0.98 0.94 0.76 0.48 0.60 -0.26 0.35 0.24
Range 41.10 60.84 18.49 22.57 12.82 18.66 12.47 14.93
Min. value -16.40 -24.13 -6.41 -9.42 -5.25 -12.22 -5.78 -5.71
Max. value 24.69 36.71 12.08 13.15 7.57 6.45 6.69 9.22
No. of texts 45 405 45 405 45 405 45 405
The Daily Telegraph
F1 F2 F3 F4
ST Non-ST ST Non-ST ST Non-ST ST Non-ST
Mean 1.61 3.01 1.08 0.87 -0.15 0.37 -1.56 0.17
Median -0.13 1.37 1.15 0.18 -0.28 0.30 -1.70 -0.10
St. dev. 9.28 10.00 3.52 4.17 2.24 2.47 1.96 2.78
Skewness 1.05 0.82 -0.04 0.62 0.58 0.33 0.28 0.57
Range 38.97 59.38 15.52 23.43 10.31 15.18 13.03 14.99
Min. value -12.04 -17.14 -6.77 -8.04 -4.43 -6.18 -7.77 -5.69
Max. value 26.93 42.24 8.75 15.39 5.88 9.00 5.26 9.30
No. of texts 72 388 72 388 72 388 72 388
Table 5. 14. Descriptive statistics of ST vs. on-ST articles for the four factors in each different newspaper.
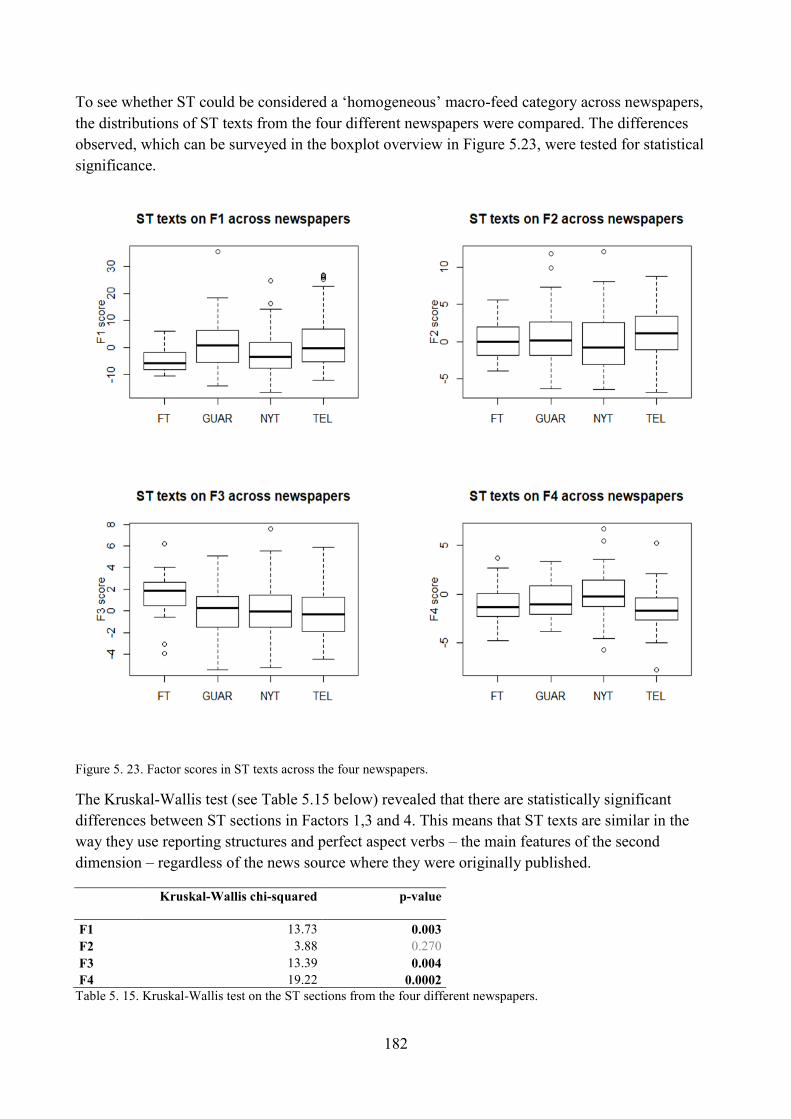
182
To see whether ST could be considered a ‗homogeneous‘ macro-feed category across newspapers,
the distributions of ST texts from the four different newspapers were compared. The differences
observed, which can be surveyed in the boxplot overview in Figure 5.23, were tested for statistical
significance.
Figure 5. 23. Factor scores in ST texts across the four newspapers.
The Kruskal-Wallis test (see Table 5.15 below) revealed that there are statistically significant
differences between ST sections in Factors 1,3 and 4. This means that ST texts are similar in the
way they use reporting structures and perfect aspect verbs – the main features of the second
dimension – regardless of the news source where they were originally published.
Kruskal-Wallis chi-squared p-value
F1 13.73 0.003
F2 3.88 0.270
F3 13.39 0.004
F4 19.22 0.0002
Table 5. 15. Kruskal-Wallis test on the ST sections from the four different newspapers.
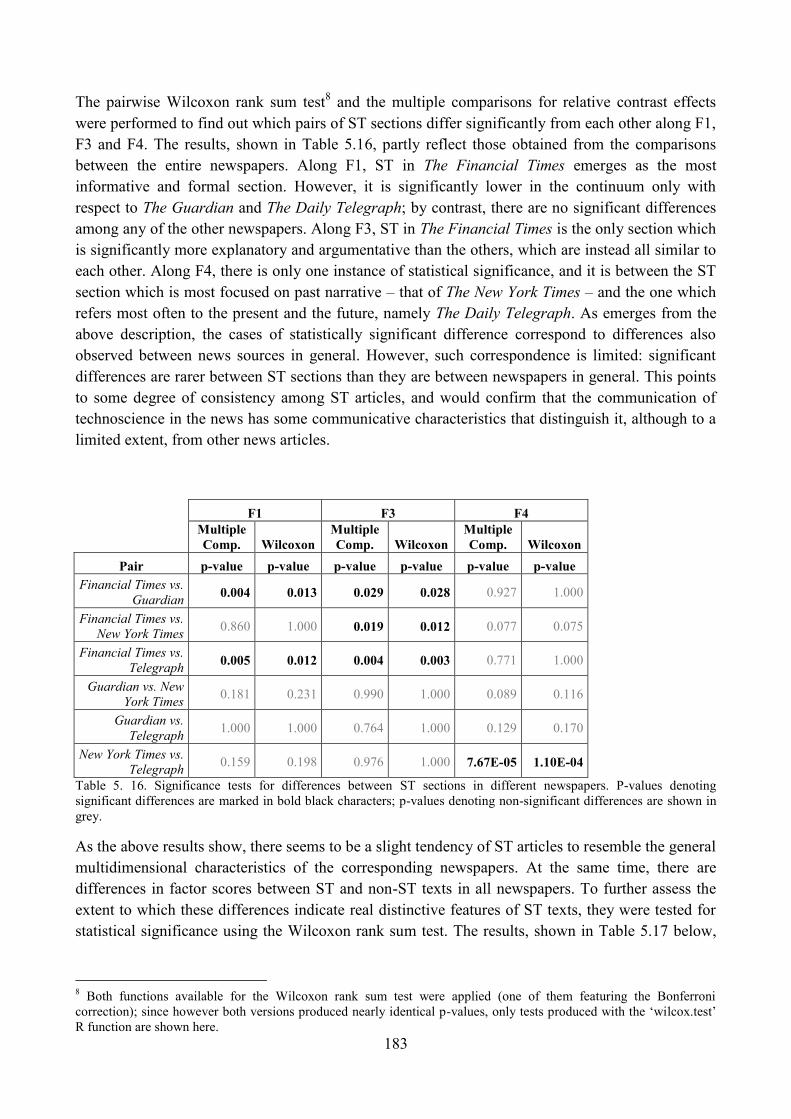
183
The pairwise Wilcoxon rank sum test8 and the multiple comparisons for relative contrast effects
were performed to find out which pairs of ST sections differ significantly from each other along F1,
F3 and F4. The results, shown in Table 5.16, partly reflect those obtained from the comparisons
between the entire newspapers. Along F1, ST in The Financial Times emerges as the most
informative and formal section. However, it is significantly lower in the continuum only with
respect to The Guardian and The Daily Telegraph; by contrast, there are no significant differences
among any of the other newspapers. Along F3, ST in The Financial Times is the only section which
is significantly more explanatory and argumentative than the others, which are instead all similar to
each other. Along F4, there is only one instance of statistical significance, and it is between the ST
section which is most focused on past narrative – that of The New York Times – and the one which
refers most often to the present and the future, namely The Daily Telegraph. As emerges from the
above description, the cases of statistically significant difference correspond to differences also
observed between news sources in general. However, such correspondence is limited: significant
differences are rarer between ST sections than they are between newspapers in general. This points
to some degree of consistency among ST articles, and would confirm that the communication of
technoscience in the news has some communicative characteristics that distinguish it, although to a
limited extent, from other news articles.
F1 F3 F4
Multiple
Comp. Wilcoxon
Multiple
Comp. Wilcoxon
Multiple
Comp. Wilcoxon
Pair p-value p-value p-value p-value p-value p-value
Financial Times vs.
Guardian 0.004 0.013 0.029 0.028 0.927 1.000
Financial Times vs.
New York Times 0.860 1.000 0.019 0.012 0.077 0.075
Financial Times vs.
Telegraph 0.005 0.012 0.004 0.003 0.771 1.000
Guardian vs. New
York Times 0.181 0.231 0.990 1.000 0.089 0.116
Guardian vs.
Telegraph 1.000 1.000 0.764 1.000 0.129 0.170
New York Times vs.
Telegraph 0.159 0.198 0.976 1.000 7.67E-05 1.10E-04
Table 5. 16. Significance tests for differences between ST sections in different newspapers. P-values denoting
significant differences are marked in bold black characters; p-values denoting non-significant differences are shown in
grey.
As the above results show, there seems to be a slight tendency of ST articles to resemble the general
multidimensional characteristics of the corresponding newspapers. At the same time, there are
differences in factor scores between ST and non-ST texts in all newspapers. To further assess the
extent to which these differences indicate real distinctive features of ST texts, they were tested for
statistical significance using the Wilcoxon rank sum test. The results, shown in Table 5.17 below,
8 Both functions available for the Wilcoxon rank sum test were applied (one of them featuring the Bonferroni
correction); since however both versions produced nearly identical p-values, only tests produced with the ‗wilcox.test‘
R function are shown here.
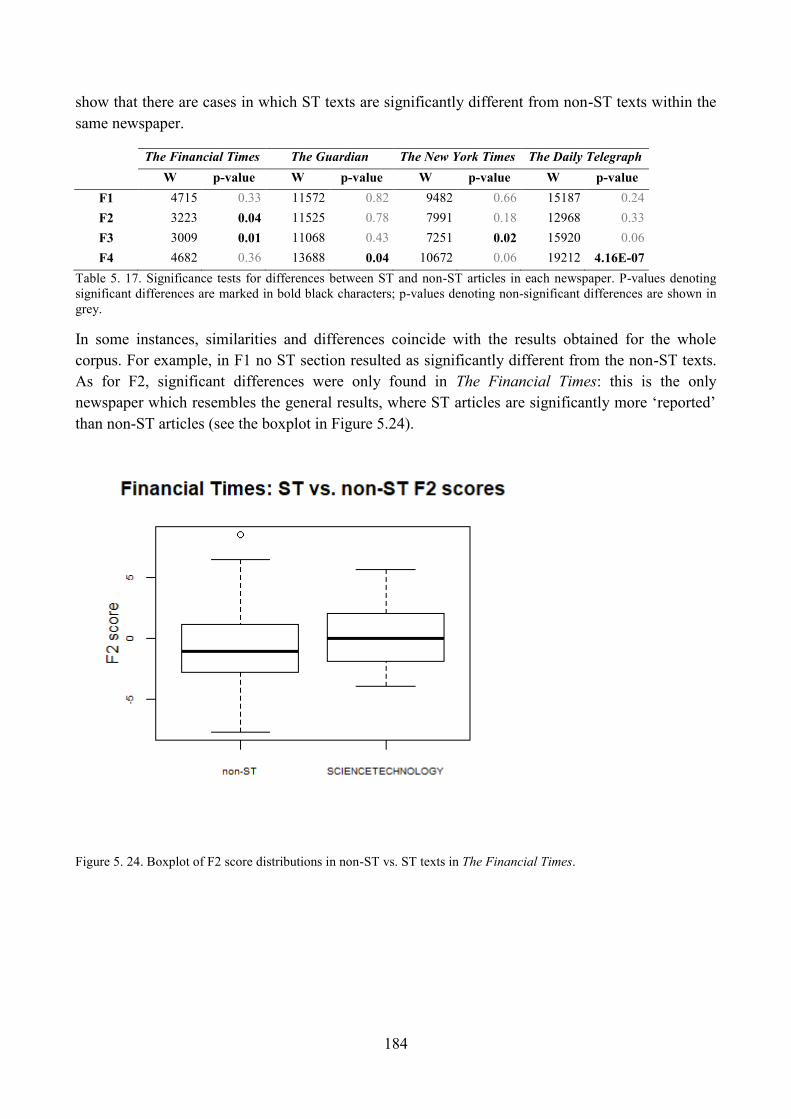
184
show that there are cases in which ST texts are significantly different from non-ST texts within the
same newspaper.
The Financial Times The Guardian The New York Times The Daily Telegraph
W p-value W p-value W p-value W p-value
F1 4715 0.33 11572 0.82 9482 0.66 15187 0.24
F2 3223 0.04 11525 0.78 7991 0.18 12968 0.33
F3 3009 0.01 11068 0.43 7251 0.02 15920 0.06
F4 4682 0.36 13688 0.04 10672 0.06 19212 4.16E-07
Table 5. 17. Significance tests for differences between ST and non-ST articles in each newspaper. P-values denoting
significant differences are marked in bold black characters; p-values denoting non-significant differences are shown in
grey.
In some instances, similarities and differences coincide with the results obtained for the whole
corpus. For example, in F1 no ST section resulted as significantly different from the non-ST texts.
As for F2, significant differences were only found in The Financial Times: this is the only
newspaper which resembles the general results, where ST articles are significantly more ‗reported‘
than non-ST articles (see the boxplot in Figure 5.24).
Figure 5. 24. Boxplot of F2 score distributions in non-ST vs. ST texts in The Financial Times.
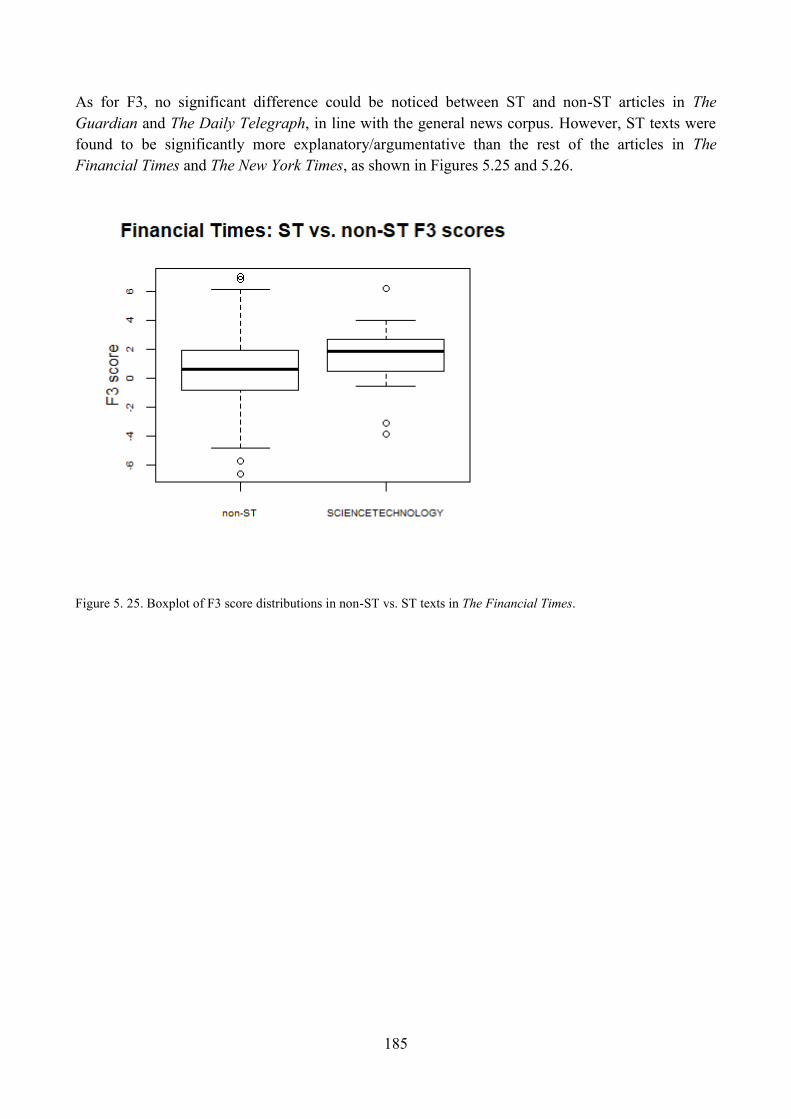
185
As for F3, no significant difference could be noticed between ST and non-ST articles in The
Guardian and The Daily Telegraph, in line with the general news corpus. However, ST texts were
found to be significantly more explanatory/argumentative than the rest of the articles in The
Financial Times and The New York Times, as shown in Figures 5.25 and 5.26.
Figure 5. 25. Boxplot of F3 score distributions in non-ST vs. ST texts in The Financial Times.
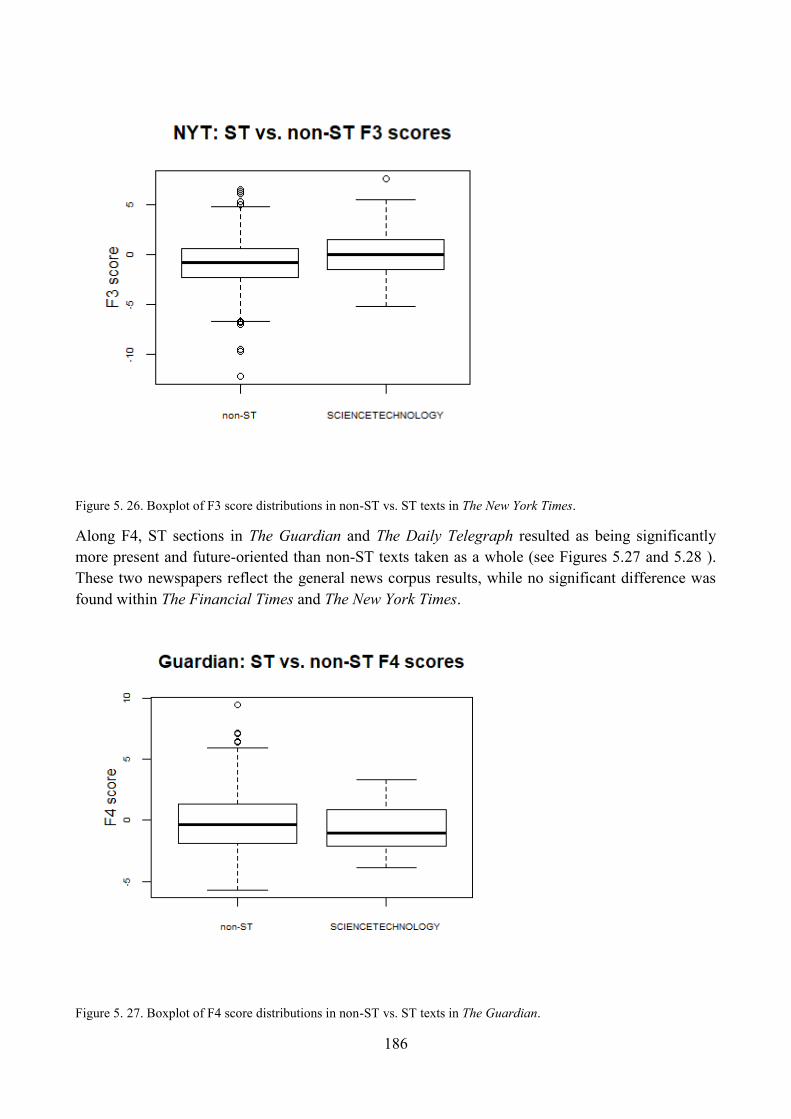
186
Figure 5. 26. Boxplot of F3 score distributions in non-ST vs. ST texts in The New York Times.
Along F4, ST sections in The Guardian and The Daily Telegraph resulted as being significantly
more present and future-oriented than non-ST texts taken as a whole (see Figures 5.27 and 5.28 ).
These two newspapers reflect the general news corpus results, while no significant difference was
found within The Financial Times and The New York Times.
Figure 5. 27. Boxplot of F4 score distributions in non-ST vs. ST texts in The Guardian.
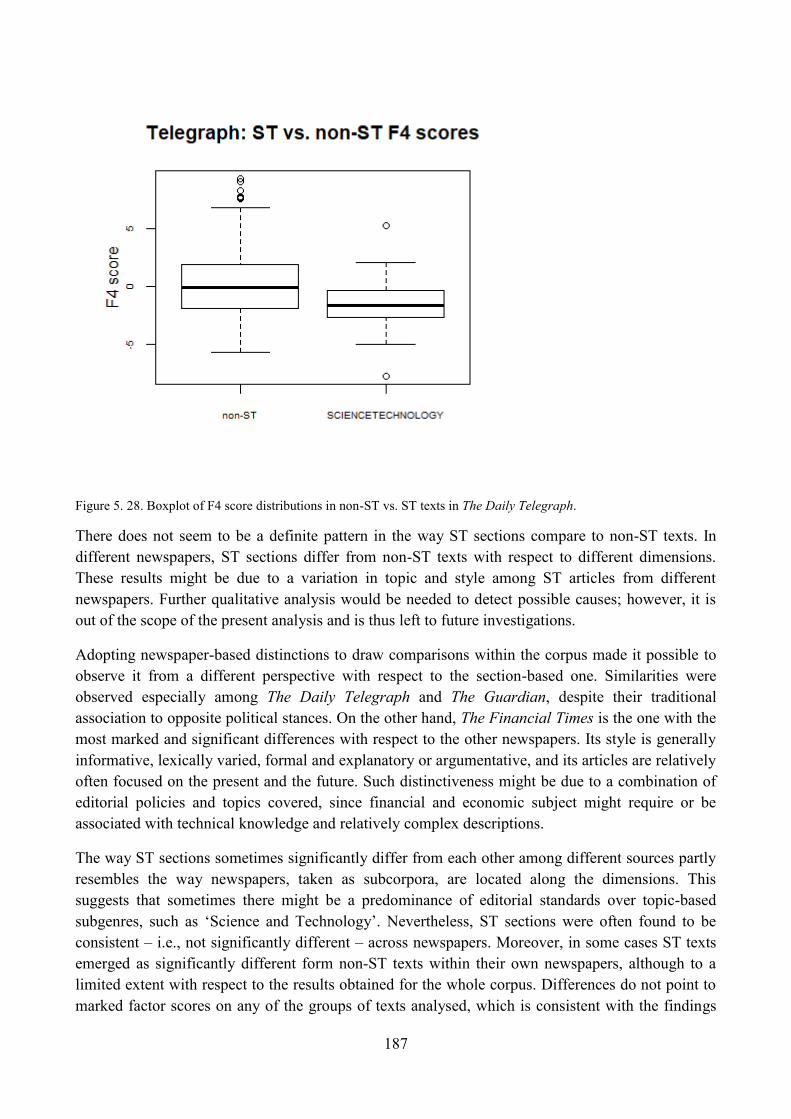
187
Figure 5. 28. Boxplot of F4 score distributions in non-ST vs. ST texts in The Daily Telegraph.
There does not seem to be a definite pattern in the way ST sections compare to non-ST texts. In
different newspapers, ST sections differ from non-ST texts with respect to different dimensions.
These results might be due to a variation in topic and style among ST articles from different
newspapers. Further qualitative analysis would be needed to detect possible causes; however, it is
out of the scope of the present analysis and is thus left to future investigations.
Adopting newspaper-based distinctions to draw comparisons within the corpus made it possible to
observe it from a different perspective with respect to the section-based one. Similarities were
observed especially among The Daily Telegraph and The Guardian, despite their traditional
association to opposite political stances. On the other hand, The Financial Times is the one with the
most marked and significant differences with respect to the other newspapers. Its style is generally
informative, lexically varied, formal and explanatory or argumentative, and its articles are relatively
often focused on the present and the future. Such distinctiveness might be due to a combination of
editorial policies and topics covered, since financial and economic subject might require or be
associated with technical knowledge and relatively complex descriptions.
The way ST sections sometimes significantly differ from each other among different sources partly
resembles the way newspapers, taken as subcorpora, are located along the dimensions. This
suggests that sometimes there might be a predominance of editorial standards over topic-based
subgenres, such as ‗Science and Technology‘. Nevertheless, ST sections were often found to be
consistent – i.e., not significantly different – across newspapers. Moreover, in some cases ST texts
emerged as significantly different form non-ST texts within their own newspapers, although to a
limited extent with respect to the results obtained for the whole corpus. Differences do not point to
marked factor scores on any of the groups of texts analysed, which is consistent with the findings
188
described in Sections 3 to 6. Therefore, it can be said that source comparison does not diverge from
section-based distinctions. On the one hand, the fact that there are significant differences among
newspapers stresses the relevance of newsroom decisions to the communicative features of news
articles. On the other hand, the fact that ST sections are more similar to each other than the entire
newspapers where they come from might point at the existence of some distinctive communicative
features partly characterising ST articles.
One additional analysis was carried out to find out whether the presence of direct speech – that is,
the main representation of spoken language in news – had any role in positioning the texts along the
four dimensions. For this analysis, 250 texts were randomly selected from the corpus and manually
classified according to whether they featured at least three instances of direct speech or not. This
criterion was slightly adjusted case by case according to the length of direct quotations and the size
of the article. Subsequently, the Wilcoxon rank sum test was run to compare the factor scores of
texts classified as containing direct speech to those of texts not containing it. For reasons of space,
the results will not be shown in detail here, but will only be summarised. They pointed to
statistically significant differences in F2 scores (slightly higher in articles with direct speech), in F3
scores (slightly higher in articles with no direct speech), and in F4 scores(slightly higher in articles
with direct speech). However, the differences among the two groups were quite small, which again
points to a relatively small amount of variation within the corpus, as far as the use of the LFs here
considered is concerned.
9. Lexical analysis
The results of the present lexical analysis are intended to complement and integrate those of the
MDA, especially concerning the communication of technoscience in online news. The main goal of
the lexical analysis is thus to provide insights into the content of ST articles. Such insights can
integrate the grammatical, syntactic and partly lexical information provided by the MDA approach.9
The current lexical analysis will use frequency wordlists and keyword lists to identify outstanding
lexical items. Throughout the analysis, lexical items – mainly words – whose use was regarded as
potentially informative and useful to address the research questions will be analysed in further
detail. This implies the inspection of concordances and the analysis of collocations.10
Most of the
analyses were performed using the AntConc software (Anthony 2018), but some data were also
obtained from Wordsmith Tools (Scott 2004).
9.1. Word frequency lists
In order to obtain some general information concerning the prevailing topics in the corpus,
frequency wordlists were compiled. Generally, topics and themes are most visible in lexical words;
in contrast, grammatical words are not as informative when analysing content, because they tend to
be very frequent in most natural language corpora. Therefore, a stoplist was used to remove
9 The LFs analysed in the present MDA include lexical classes such as private, public and suasive verbs, emphatics,
hedges, etc. Such word classes provide relatively general lexical information, whereas the following lexical analysis
focuses on aspects that are more specific to the present corpus and ST texts in particular. 10
For a description and discussion of the corpus analysis techniques used in the present study, see Section 7 in Chapter
3.
189
grammatical words. As explained in Section 5 of Chapter 3, no lemmatisation was applied. Lists
were obtained for the whole corpus and for the ST section, and are shown in Table 5.18 below.
Together with their rank in the frequency list, the raw frequency of words (i.e. the number of
occurrences) and their relative frequency per 100 words are provided.11
As in any group of texts
concerning a range of different topics, many of these lexical words tend to be generally frequent,
and to be used with diverse and generic meanings. In most cases, these provide little information,
since no particular pattern emerges from their analysis. By contrast, other items in the list stand out,
either for their specificity or because they may potentially show peculiar patterns of use. Here,
concordance inspection, together with the researcher‘s judgment, were the main tools to detect
potentially interesting items, further analysed below. In this section, data from the whole corpus –
including ST texts – and from the ST section alone will be shown and discussed. In this first part of
the analysis, it was decided to analyse the whole corpus, instead of immediately comparing ST and
non-ST texts, with the aim of obtaining information about newspaper language in general, including
texts about technoscience. A comparison between ST and non-ST texts was instead performed
through the keyword analysis, discussed in Section 9.3 below. In that case, it was decided to use
non-ST texts – rather than the whole corpus and/or general English – as a ‗reference corpus‘
because it was in line with the MDA approach as well as with the present study, whose main
purpose was to identify linguistic choices that significantly differentiate texts classified as
communicating science and technology from other news texts.
11
As explained above, the present word lists and most of the lexical analysis were produced with AntConc. However,
other data, among which the word counts shown in Table 3.2 of Chapter 3, were obtained with Wordsmith Tools. This
choice was motivated by the fact that both programs have advantages and limitations. For example, AntConc is more
up-to-date with respect to the freely available version of Wordsmith here used, but Wordsmith allows researchers to
perform a wider range of tasks, among which producing separate word counts for each text in a corpus to create the
above mentioned table. However, the two programs differ in the way they identify tokens – i.e., words – thus producing
slightly different results in terms of word counts on the same data. In the present case, Wordsmith counted 1.86% more
tokens than AntConc for the whole corpus and 1.66% for the ST section. This explains possible discrepancies in
frequency data – and their further elaborations – produced by the two programs.
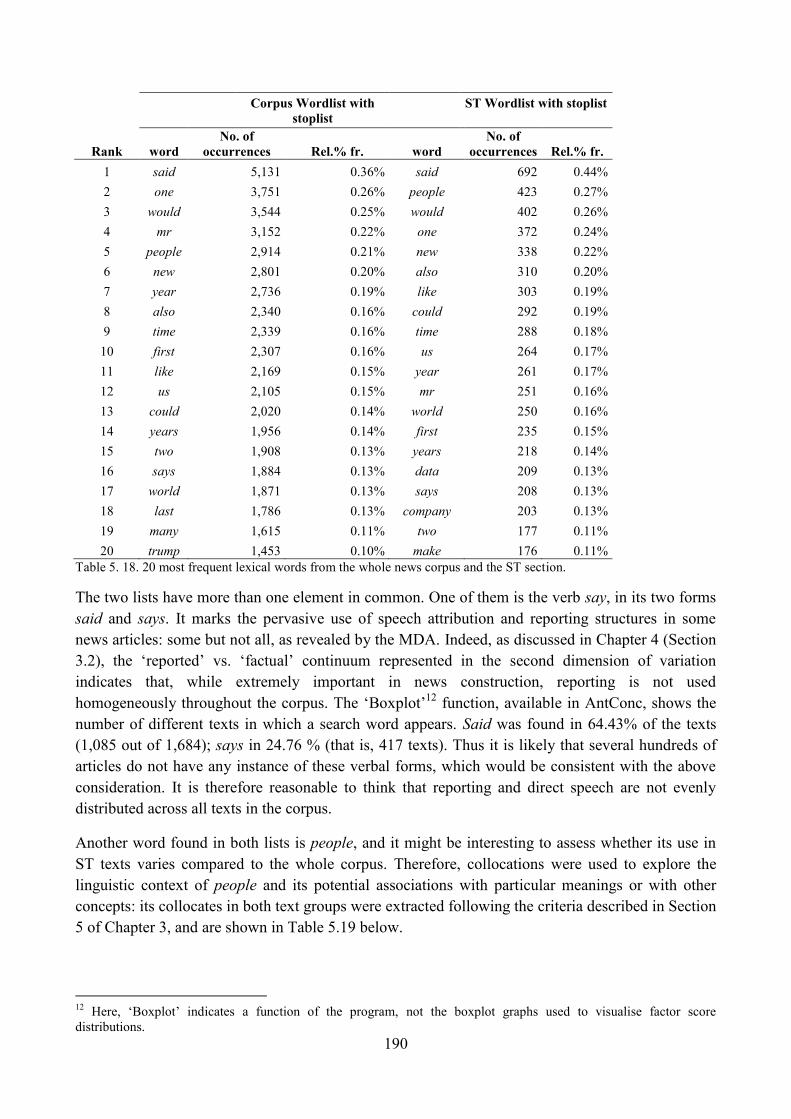
190
Corpus Wordlist with
stoplist
ST Wordlist with stoplist
Rank word
No. of
occurrences Rel.% fr. word
No. of
occurrences Rel.% fr.
1 said 5,131 0.36% said 692 0.44%
2 one 3,751 0.26% people 423 0.27%
3 would 3,544 0.25% would 402 0.26%
4 mr 3,152 0.22% one 372 0.24%
5 people 2,914 0.21% new 338 0.22%
6 new 2,801 0.20% also 310 0.20%
7 year 2,736 0.19% like 303 0.19%
8 also 2,340 0.16% could 292 0.19%
9 time 2,339 0.16% time 288 0.18%
10 first 2,307 0.16% us 264 0.17%
11 like 2,169 0.15% year 261 0.17%
12 us 2,105 0.15% mr 251 0.16%
13 could 2,020 0.14% world 250 0.16%
14 years 1,956 0.14% first 235 0.15%
15 two 1,908 0.13% years 218 0.14%
16 says 1,884 0.13% data 209 0.13%
17 world 1,871 0.13% says 208 0.13%
18 last 1,786 0.13% company 203 0.13%
19 many 1,615 0.11% two 177 0.11%
20 trump 1,453 0.10% make 176 0.11%
Table 5. 18. 20 most frequent lexical words from the whole news corpus and the ST section.
The two lists have more than one element in common. One of them is the verb say, in its two forms
said and says. It marks the pervasive use of speech attribution and reporting structures in some
news articles: some but not all, as revealed by the MDA. Indeed, as discussed in Chapter 4 (Section
3.2), the ‗reported‘ vs. ‗factual‘ continuum represented in the second dimension of variation
indicates that, while extremely important in news construction, reporting is not used
homogeneously throughout the corpus. The ‗Boxplot‘12
function, available in AntConc, shows the
number of different texts in which a search word appears. Said was found in 64.43% of the texts
(1,085 out of 1,684); says in 24.76 % (that is, 417 texts). Thus it is likely that several hundreds of
articles do not have any instance of these verbal forms, which would be consistent with the above
consideration. It is therefore reasonable to think that reporting and direct speech are not evenly
distributed across all texts in the corpus.
Another word found in both lists is people, and it might be interesting to assess whether its use in
ST texts varies compared to the whole corpus. Therefore, collocations were used to explore the
linguistic context of people and its potential associations with particular meanings or with other
concepts: its collocates in both text groups were extracted following the criteria described in Section
5 of Chapter 3, and are shown in Table 5.19 below.
12
Here, ‗Boxplot‘ indicates a function of the program, not the boxplot graphs used to visualise factor score
distributions.
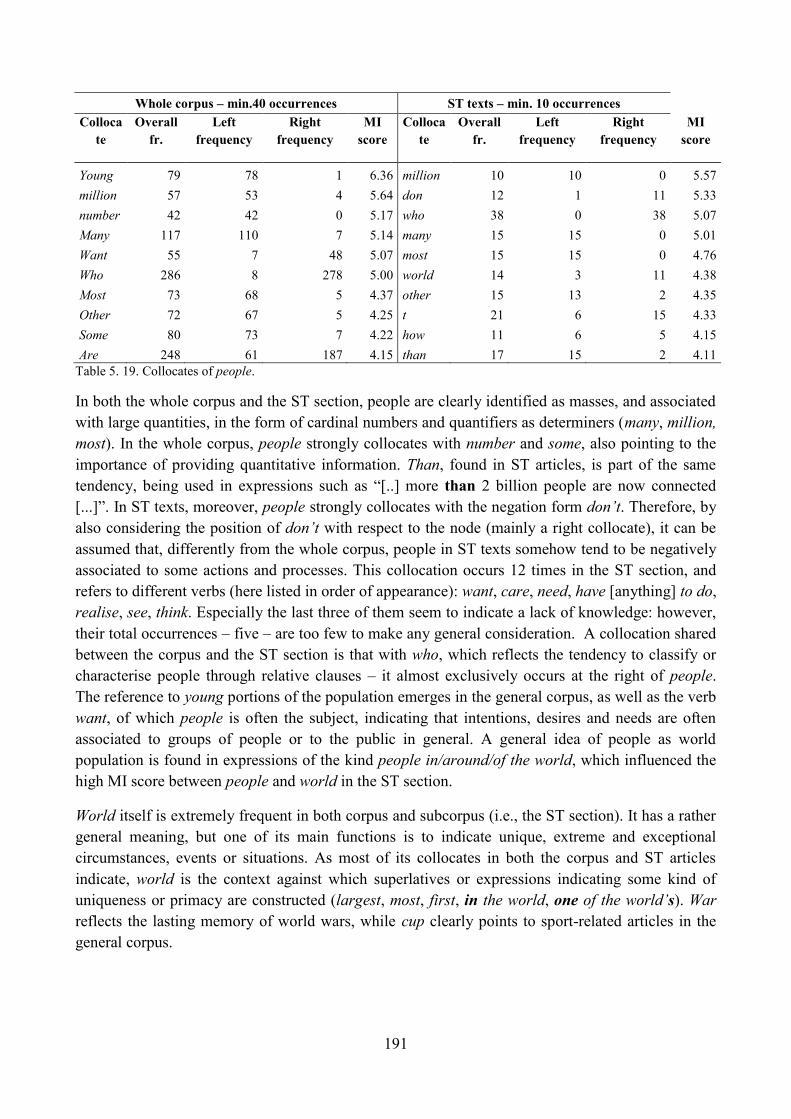
191
Whole corpus – min.40 occurrences ST texts – min. 10 occurrences
Colloca
te
Overall
fr.
Left
frequency
Right
frequency
MI
score
Colloca
te
Overall
fr.
Left
frequency
Right
frequency
MI
score
Young 79 78 1 6.36 million 10 10 0 5.57
million 57 53 4 5.64 don 12 1 11 5.33
number 42 42 0 5.17 who 38 0 38 5.07
Many 117 110 7 5.14 many 15 15 0 5.01
Want 55 7 48 5.07 most 15 15 0 4.76
Who 286 8 278 5.00 world 14 3 11 4.38
Most 73 68 5 4.37 other 15 13 2 4.35
Other 72 67 5 4.25 t 21 6 15 4.33
Some 80 73 7 4.22 how 11 6 5 4.15
Are 248 61 187 4.15 than 17 15 2 4.11
Table 5. 19. Collocates of people.
In both the whole corpus and the ST section, people are clearly identified as masses, and associated
with large quantities, in the form of cardinal numbers and quantifiers as determiners (many, million,
most). In the whole corpus, people strongly collocates with number and some, also pointing to the
importance of providing quantitative information. Than, found in ST articles, is part of the same
tendency, being used in expressions such as ―[..] more than 2 billion people are now connected
[...]‖. In ST texts, moreover, people strongly collocates with the negation form don‘t. Therefore, by
also considering the position of don‘t with respect to the node (mainly a right collocate), it can be
assumed that, differently from the whole corpus, people in ST texts somehow tend to be negatively
associated to some actions and processes. This collocation occurs 12 times in the ST section, and
refers to different verbs (here listed in order of appearance): want, care, need, have [anything] to do,
realise, see, think. Especially the last three of them seem to indicate a lack of knowledge: however,
their total occurrences – five – are too few to make any general consideration. A collocation shared
between the corpus and the ST section is that with who, which reflects the tendency to classify or
characterise people through relative clauses – it almost exclusively occurs at the right of people.
The reference to young portions of the population emerges in the general corpus, as well as the verb
want, of which people is often the subject, indicating that intentions, desires and needs are often
associated to groups of people or to the public in general. A general idea of people as world
population is found in expressions of the kind people in/around/of the world, which influenced the
high MI score between people and world in the ST section.
World itself is extremely frequent in both corpus and subcorpus (i.e., the ST section). It has a rather
general meaning, but one of its main functions is to indicate unique, extreme and exceptional
circumstances, events or situations. As most of its collocates in both the corpus and ST articles
indicate, world is the context against which superlatives or expressions indicating some kind of
uniqueness or primacy are constructed (largest, most, first, in the world, one of the world‘s). War
reflects the lasting memory of world wars, while cup clearly points to sport-related articles in the
general corpus.
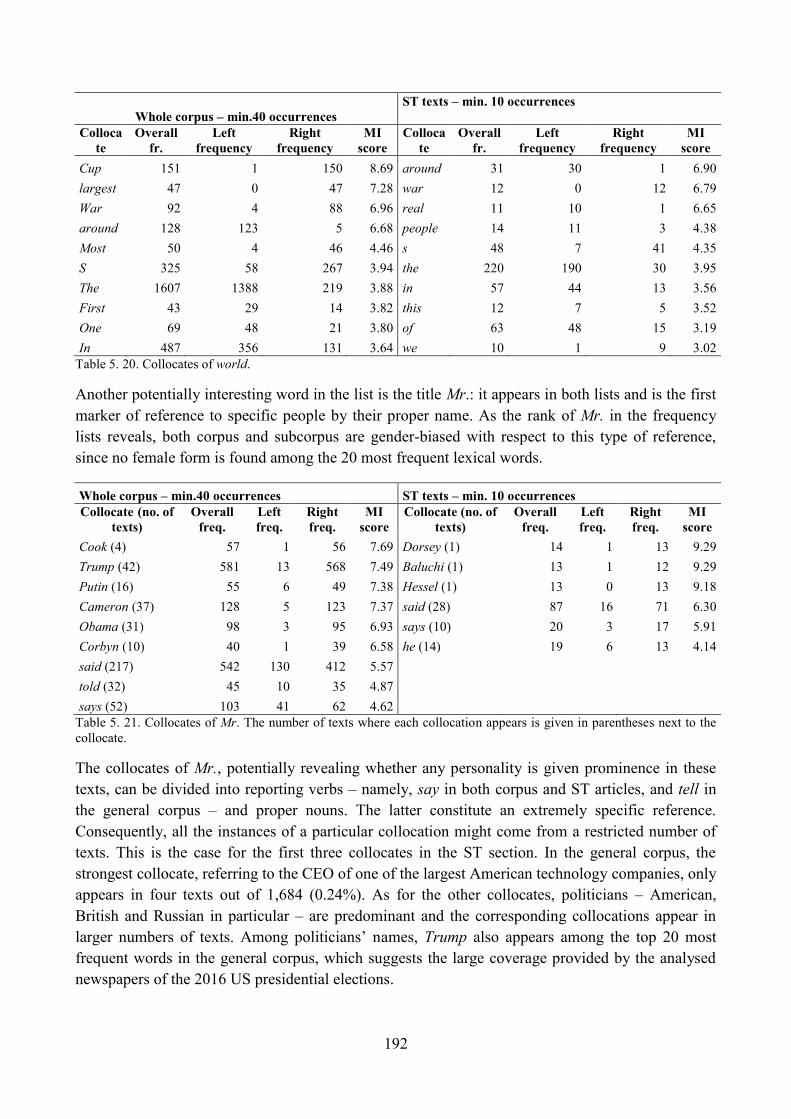
192
Whole corpus – min.40 occurrences
ST texts – min. 10 occurrences
Colloca
te
Overall
fr.
Left
frequency
Right
frequency
MI
score
Colloca
te
Overall
fr.
Left
frequency
Right
frequency
MI
score
Cup 151 1 150 8.69 around 31 30 1 6.90
largest 47 0 47 7.28 war 12 0 12 6.79
War 92 4 88 6.96 real 11 10 1 6.65
around 128 123 5 6.68 people 14 11 3 4.38
Most 50 4 46 4.46 s 48 7 41 4.35
S 325 58 267 3.94 the 220 190 30 3.95
The 1607 1388 219 3.88 in 57 44 13 3.56
First 43 29 14 3.82 this 12 7 5 3.52
One 69 48 21 3.80 of 63 48 15 3.19
In 487 356 131 3.64 we 10 1 9 3.02
Table 5. 20. Collocates of world.
Another potentially interesting word in the list is the title Mr.: it appears in both lists and is the first
marker of reference to specific people by their proper name. As the rank of Mr. in the frequency
lists reveals, both corpus and subcorpus are gender-biased with respect to this type of reference,
since no female form is found among the 20 most frequent lexical words.
Whole corpus – min.40 occurrences ST texts – min. 10 occurrences
Collocate (no. of
texts) Overall
freq.
Left
freq.
Right
freq.
MI
score
Collocate (no. of
texts)
Overall
freq.
Left
freq.
Right
freq.
MI
score
Cook (4) 57 1 56 7.69 Dorsey (1) 14 1 13 9.29
Trump (42) 581 13 568 7.49 Baluchi (1) 13 1 12 9.29
Putin (16) 55 6 49 7.38 Hessel (1) 13 0 13 9.18
Cameron (37) 128 5 123 7.37 said (28) 87 16 71 6.30
Obama (31) 98 3 95 6.93 says (10) 20 3 17 5.91
Corbyn (10) 40 1 39 6.58 he (14) 19 6 13 4.14
said (217) 542 130 412 5.57
told (32) 45 10 35 4.87
says (52) 103 41 62 4.62
Table 5. 21. Collocates of Mr. The number of texts where each collocation appears is given in parentheses next to the
collocate.
The collocates of Mr., potentially revealing whether any personality is given prominence in these
texts, can be divided into reporting verbs – namely, say in both corpus and ST articles, and tell in
the general corpus – and proper nouns. The latter constitute an extremely specific reference.
Consequently, all the instances of a particular collocation might come from a restricted number of
texts. This is the case for the first three collocates in the ST section. In the general corpus, the
strongest collocate, referring to the CEO of one of the largest American technology companies, only
appears in four texts out of 1,684 (0.24%). As for the other collocates, politicians – American,
British and Russian in particular – are predominant and the corresponding collocations appear in
larger numbers of texts. Among politicians‘ names, Trump also appears among the top 20 most
frequent words in the general corpus, which suggests the large coverage provided by the analysed
newspapers of the 2016 US presidential elections.
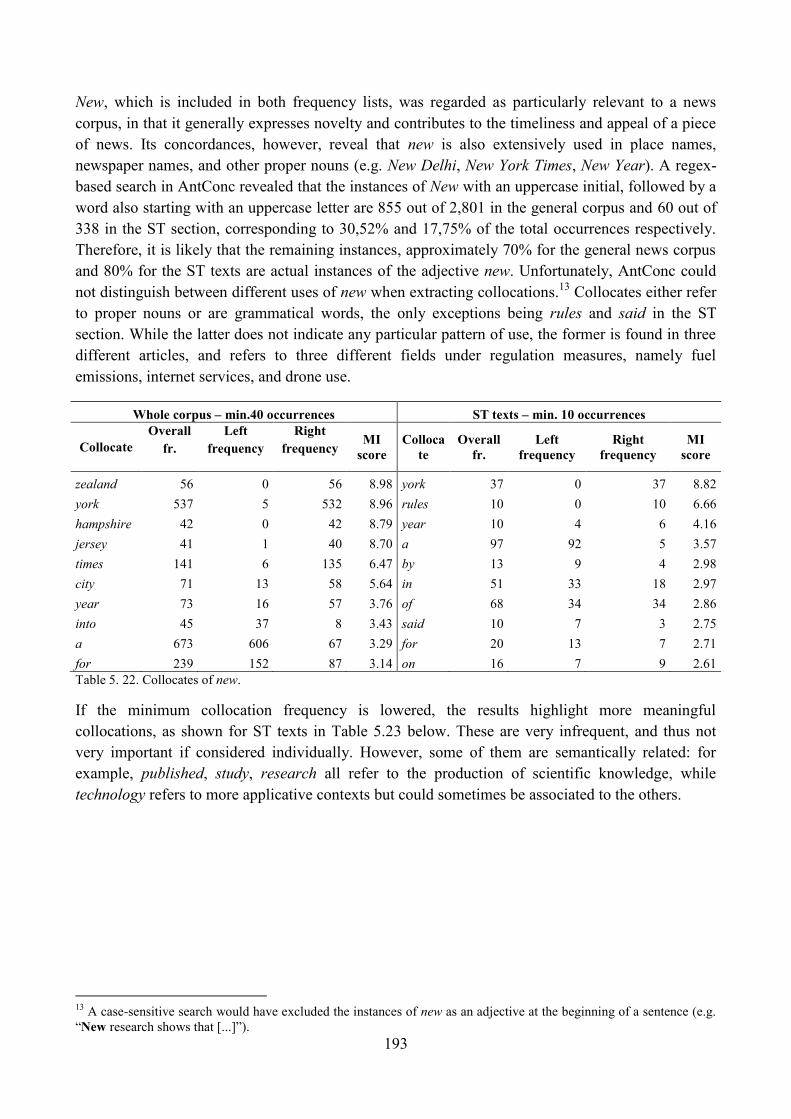
193
New, which is included in both frequency lists, was regarded as particularly relevant to a news
corpus, in that it generally expresses novelty and contributes to the timeliness and appeal of a piece
of news. Its concordances, however, reveal that new is also extensively used in place names,
newspaper names, and other proper nouns (e.g. New Delhi, New York Times, New Year). A regex-
based search in AntConc revealed that the instances of New with an uppercase initial, followed by a
word also starting with an uppercase letter are 855 out of 2,801 in the general corpus and 60 out of
338 in the ST section, corresponding to 30,52% and 17,75% of the total occurrences respectively.
Therefore, it is likely that the remaining instances, approximately 70% for the general news corpus
and 80% for the ST texts are actual instances of the adjective new. Unfortunately, AntConc could
not distinguish between different uses of new when extracting collocations.13
Collocates either refer
to proper nouns or are grammatical words, the only exceptions being rules and said in the ST
section. While the latter does not indicate any particular pattern of use, the former is found in three
different articles, and refers to three different fields under regulation measures, namely fuel
emissions, internet services, and drone use.
Whole corpus – min.40 occurrences ST texts – min. 10 occurrences
Collocate
Overall
fr.
Left
frequency
Right
frequency MI
score
Colloca
te
Overall
fr.
Left
frequency
Right
frequency
MI
score
zealand 56 0 56 8.98 york 37 0 37 8.82
york 537 5 532 8.96 rules 10 0 10 6.66
hampshire 42 0 42 8.79 year 10 4 6 4.16
jersey 41 1 40 8.70 a 97 92 5 3.57
times 141 6 135 6.47 by 13 9 4 2.98
city 71 13 58 5.64 in 51 33 18 2.97
year 73 16 57 3.76 of 68 34 34 2.86
into 45 37 8 3.43 said 10 7 3 2.75
a 673 606 67 3.29 for 20 13 7 2.71
for 239 152 87 3.14 on 16 7 9 2.61
Table 5. 22. Collocates of new.
If the minimum collocation frequency is lowered, the results highlight more meaningful
collocations, as shown for ST texts in Table 5.23 below. These are very infrequent, and thus not
very important if considered individually. However, some of them are semantically related: for
example, published, study, research all refer to the production of scientific knowledge, while
technology refers to more applicative contexts but could sometimes be associated to the others.
13
A case-sensitive search would have excluded the instances of new as an adjective at the beginning of a sentence (e.g.
―New research shows that [...]‖).
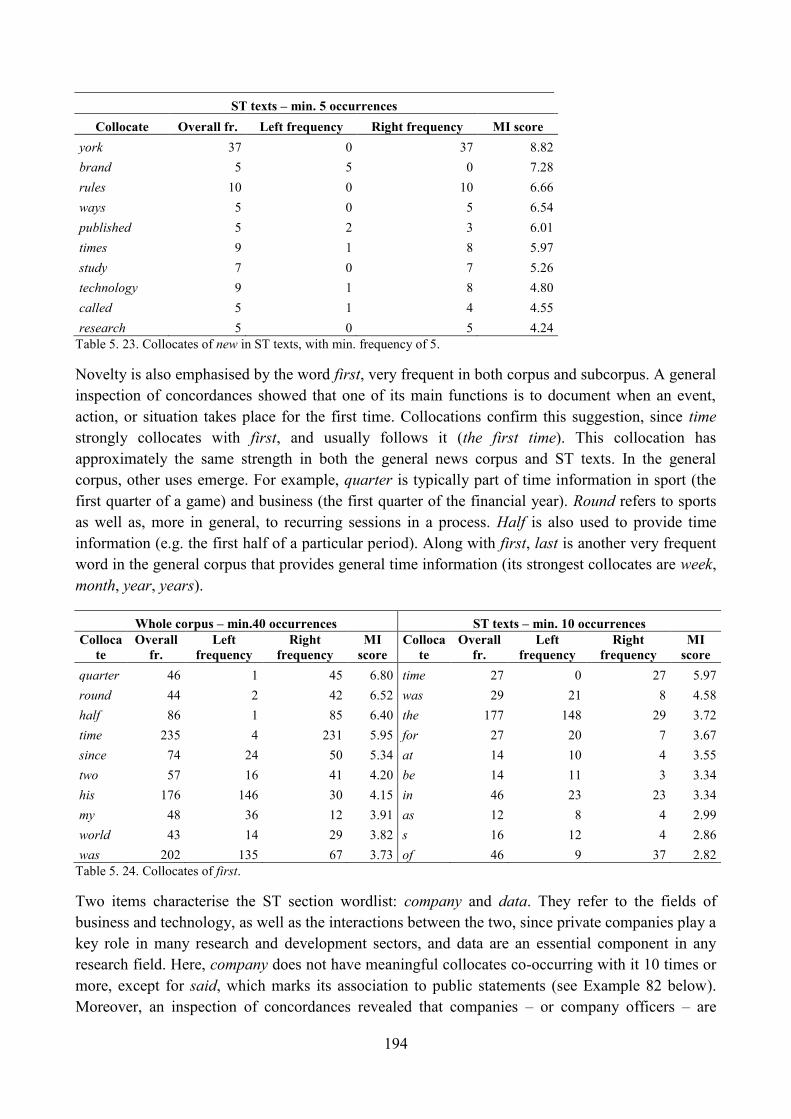
194
ST texts – min. 5 occurrences
Collocate Overall fr. Left frequency Right frequency MI score
york 37 0 37 8.82
brand 5 5 0 7.28
rules 10 0 10 6.66
ways 5 0 5 6.54
published 5 2 3 6.01
times 9 1 8 5.97
study 7 0 7 5.26
technology 9 1 8 4.80
called 5 1 4 4.55
research 5 0 5 4.24
Table 5. 23. Collocates of new in ST texts, with min. frequency of 5.
Novelty is also emphasised by the word first, very frequent in both corpus and subcorpus. A general
inspection of concordances showed that one of its main functions is to document when an event,
action, or situation takes place for the first time. Collocations confirm this suggestion, since time
strongly collocates with first, and usually follows it (the first time). This collocation has
approximately the same strength in both the general news corpus and ST texts. In the general
corpus, other uses emerge. For example, quarter is typically part of time information in sport (the
first quarter of a game) and business (the first quarter of the financial year). Round refers to sports
as well as, more in general, to recurring sessions in a process. Half is also used to provide time
information (e.g. the first half of a particular period). Along with first, last is another very frequent
word in the general corpus that provides general time information (its strongest collocates are week,
month, year, years).
Whole corpus – min.40 occurrences ST texts – min. 10 occurrences
Colloca
te
Overall
fr.
Left
frequency
Right
frequency
MI
score
Colloca
te
Overall
fr.
Left
frequency
Right
frequency
MI
score
quarter 46 1 45 6.80 time 27 0 27 5.97
round 44 2 42 6.52 was 29 21 8 4.58
half 86 1 85 6.40 the 177 148 29 3.72
time 235 4 231 5.95 for 27 20 7 3.67
since 74 24 50 5.34 at 14 10 4 3.55
two 57 16 41 4.20 be 14 11 3 3.34
his 176 146 30 4.15 in 46 23 23 3.34
my 48 36 12 3.91 as 12 8 4 2.99
world 43 14 29 3.82 s 16 12 4 2.86
was 202 135 67 3.73 of 46 9 37 2.82
Table 5. 24. Collocates of first.
Two items characterise the ST section wordlist: company and data. They refer to the fields of
business and technology, as well as the interactions between the two, since private companies play a
key role in many research and development sectors, and data are an essential component in any
research field. Here, company does not have meaningful collocates co-occurring with it 10 times or
more, except for said, which marks its association to public statements (see Example 82 below).
Moreover, an inspection of concordances revealed that companies – or company officers – are
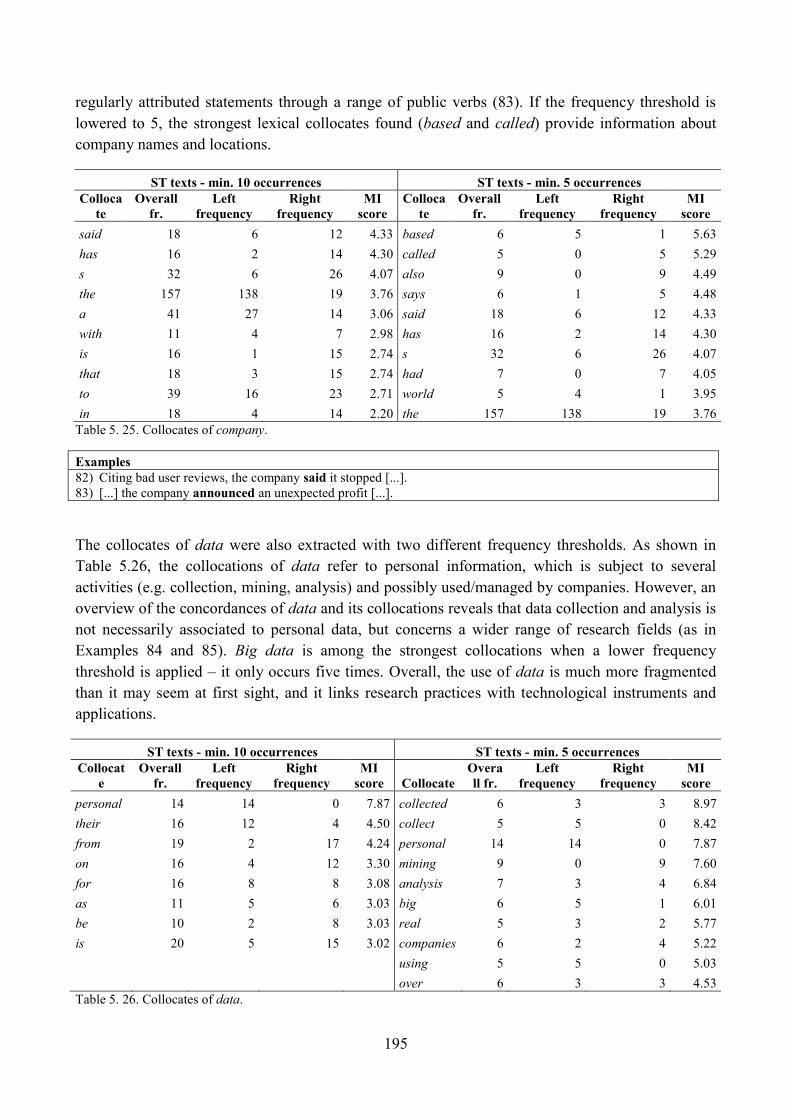
195
regularly attributed statements through a range of public verbs (83). If the frequency threshold is
lowered to 5, the strongest lexical collocates found (based and called) provide information about
company names and locations.
ST texts - min. 10 occurrences ST texts - min. 5 occurrences
Colloca
te
Overall
fr.
Left
frequency
Right
frequency
MI
score
Colloca
te
Overall
fr.
Left
frequency
Right
frequency
MI
score
said 18 6 12 4.33 based 6 5 1 5.63
has 16 2 14 4.30 called 5 0 5 5.29
s 32 6 26 4.07 also 9 0 9 4.49
the 157 138 19 3.76 says 6 1 5 4.48
a 41 27 14 3.06 said 18 6 12 4.33
with 11 4 7 2.98 has 16 2 14 4.30
is 16 1 15 2.74 s 32 6 26 4.07
that 18 3 15 2.74 had 7 0 7 4.05
to 39 16 23 2.71 world 5 4 1 3.95
in 18 4 14 2.20 the 157 138 19 3.76
Table 5. 25. Collocates of company.
Examples
82) Citing bad user reviews, the company said it stopped [...].
83) [...] the company announced an unexpected profit [...].
The collocates of data were also extracted with two different frequency thresholds. As shown in
Table 5.26, the collocations of data refer to personal information, which is subject to several
activities (e.g. collection, mining, analysis) and possibly used/managed by companies. However, an
overview of the concordances of data and its collocations reveals that data collection and analysis is
not necessarily associated to personal data, but concerns a wider range of research fields (as in
Examples 84 and 85). Big data is among the strongest collocations when a lower frequency
threshold is applied – it only occurs five times. Overall, the use of data is much more fragmented
than it may seem at first sight, and it links research practices with technological instruments and
applications.
ST texts - min. 10 occurrences ST texts - min. 5 occurrences
Collocat
e
Overall
fr.
Left
frequency
Right
frequency
MI
score Collocate
Overa
ll fr.
Left
frequency
Right
frequency
MI
score
personal 14 14 0 7.87 collected 6 3 3 8.97
their 16 12 4 4.50 collect 5 5 0 8.42
from 19 2 17 4.24 personal 14 14 0 7.87
on 16 4 12 3.30 mining 9 0 9 7.60
for 16 8 8 3.08 analysis 7 3 4 6.84
as 11 5 6 3.03 big 6 5 1 6.01
be 10 2 8 3.03 real 5 3 2 5.77
is 20 5 15 3.02 companies 6 2 4 5.22
using 5 5 0 5.03
over 6 3 3 4.53
Table 5. 26. Collocates of data.
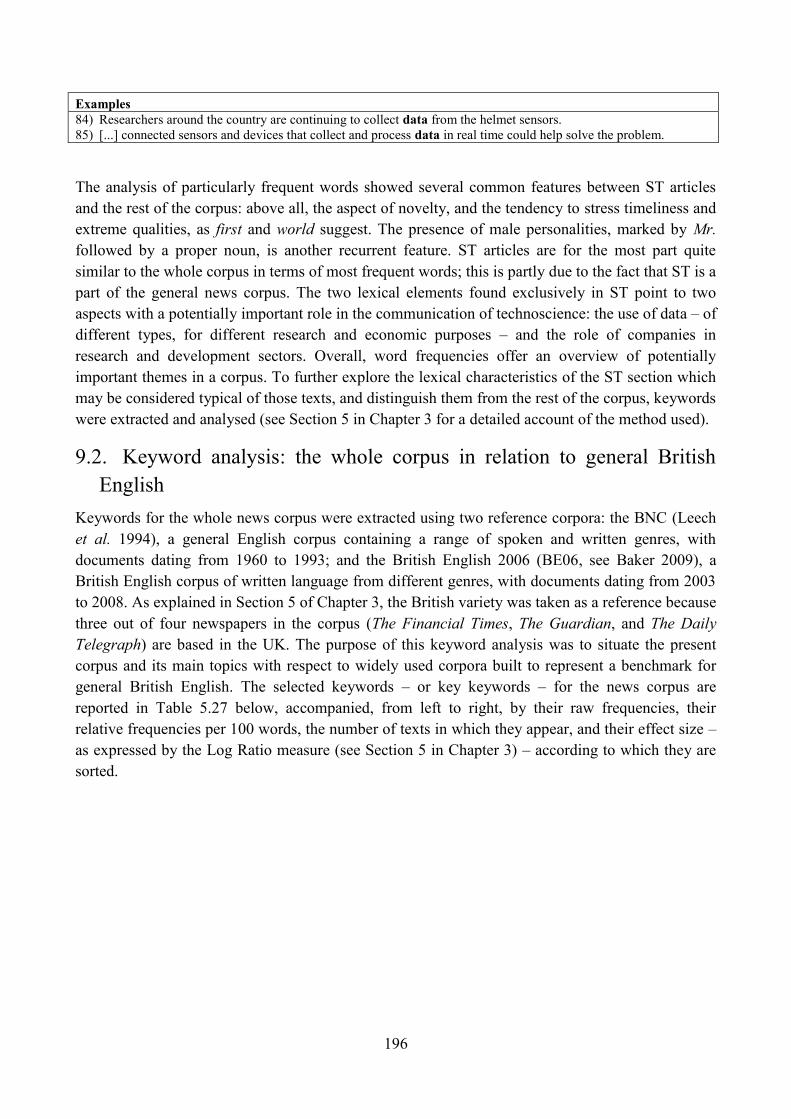
196
Examples
84) Researchers around the country are continuing to collect data from the helmet sensors.
85) [...] connected sensors and devices that collect and process data in real time could help solve the problem.
The analysis of particularly frequent words showed several common features between ST articles
and the rest of the corpus: above all, the aspect of novelty, and the tendency to stress timeliness and
extreme qualities, as first and world suggest. The presence of male personalities, marked by Mr.
followed by a proper noun, is another recurrent feature. ST articles are for the most part quite
similar to the whole corpus in terms of most frequent words; this is partly due to the fact that ST is a
part of the general news corpus. The two lexical elements found exclusively in ST point to two
aspects with a potentially important role in the communication of technoscience: the use of data – of
different types, for different research and economic purposes – and the role of companies in
research and development sectors. Overall, word frequencies offer an overview of potentially
important themes in a corpus. To further explore the lexical characteristics of the ST section which
may be considered typical of those texts, and distinguish them from the rest of the corpus, keywords
were extracted and analysed (see Section 5 in Chapter 3 for a detailed account of the method used).
9.2. Keyword analysis: the whole corpus in relation to general British
English
Keywords for the whole news corpus were extracted using two reference corpora: the BNC (Leech
et al. 1994), a general English corpus containing a range of spoken and written genres, with
documents dating from 1960 to 1993; and the British English 2006 (BE06, see Baker 2009), a
British English corpus of written language from different genres, with documents dating from 2003
to 2008. As explained in Section 5 of Chapter 3, the British variety was taken as a reference because
three out of four newspapers in the corpus (The Financial Times, The Guardian, and The Daily
Telegraph) are based in the UK. The purpose of this keyword analysis was to situate the present
corpus and its main topics with respect to widely used corpora built to represent a benchmark for
general British English. The selected keywords – or key keywords – for the news corpus are
reported in Table 5.27 below, accompanied, from left to right, by their raw frequencies, their
relative frequencies per 100 words, the number of texts in which they appear, and their effect size –
as expressed by the Log Ratio measure (see Section 5 in Chapter 3) – according to which they are
sorted.
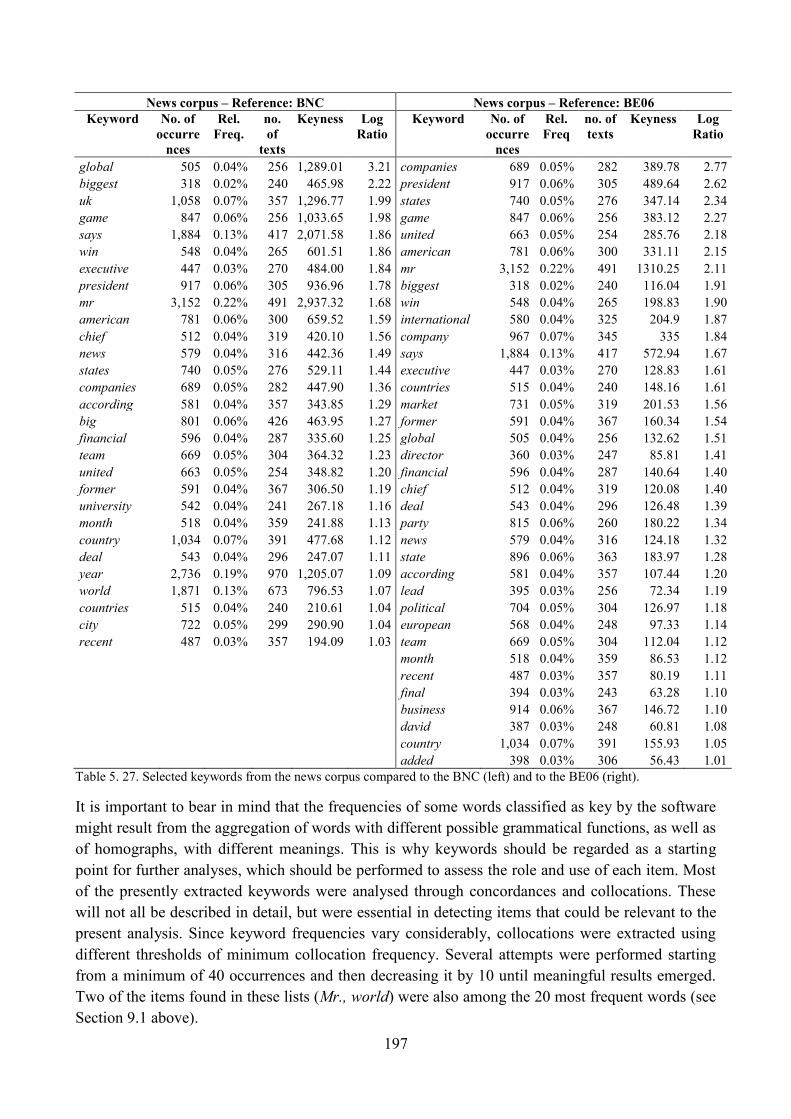
197
News corpus – Reference: BNC News corpus – Reference: BE06
Keyword No. of
occurre
nces
Rel.
Freq.
no.
of
texts
Keyness Log
Ratio
Keyword No. of
occurre
nces
Rel.
Freq
no. of
texts
Keyness Log
Ratio
global 505 0.04% 256 1,289.01 3.21 companies 689 0.05% 282 389.78 2.77
biggest 318 0.02% 240 465.98 2.22 president 917 0.06% 305 489.64 2.62
uk 1,058 0.07% 357 1,296.77 1.99 states 740 0.05% 276 347.14 2.34
game 847 0.06% 256 1,033.65 1.98 game 847 0.06% 256 383.12 2.27
says 1,884 0.13% 417 2,071.58 1.86 united 663 0.05% 254 285.76 2.18
win 548 0.04% 265 601.51 1.86 american 781 0.06% 300 331.11 2.15
executive 447 0.03% 270 484.00 1.84 mr 3,152 0.22% 491 1310.25 2.11
president 917 0.06% 305 936.96 1.78 biggest 318 0.02% 240 116.04 1.91
mr 3,152 0.22% 491 2,937.32 1.68 win 548 0.04% 265 198.83 1.90
american 781 0.06% 300 659.52 1.59 international 580 0.04% 325 204.9 1.87
chief 512 0.04% 319 420.10 1.56 company 967 0.07% 345 335 1.84
news 579 0.04% 316 442.36 1.49 says 1,884 0.13% 417 572.94 1.67
states 740 0.05% 276 529.11 1.44 executive 447 0.03% 270 128.83 1.61
companies 689 0.05% 282 447.90 1.36 countries 515 0.04% 240 148.16 1.61
according 581 0.04% 357 343.85 1.29 market 731 0.05% 319 201.53 1.56
big 801 0.06% 426 463.95 1.27 former 591 0.04% 367 160.34 1.54
financial 596 0.04% 287 335.60 1.25 global 505 0.04% 256 132.62 1.51
team 669 0.05% 304 364.32 1.23 director 360 0.03% 247 85.81 1.41
united 663 0.05% 254 348.82 1.20 financial 596 0.04% 287 140.64 1.40
former 591 0.04% 367 306.50 1.19 chief 512 0.04% 319 120.08 1.40
university 542 0.04% 241 267.18 1.16 deal 543 0.04% 296 126.48 1.39
month 518 0.04% 359 241.88 1.13 party 815 0.06% 260 180.22 1.34
country 1,034 0.07% 391 477.68 1.12 news 579 0.04% 316 124.18 1.32
deal 543 0.04% 296 247.07 1.11 state 896 0.06% 363 183.97 1.28
year 2,736 0.19% 970 1,205.07 1.09 according 581 0.04% 357 107.44 1.20
world 1,871 0.13% 673 796.53 1.07 lead 395 0.03% 256 72.34 1.19
countries 515 0.04% 240 210.61 1.04 political 704 0.05% 304 126.97 1.18
city 722 0.05% 299 290.90 1.04 european 568 0.04% 248 97.33 1.14
recent 487 0.03% 357 194.09 1.03 team 669 0.05% 304 112.04 1.12
month 518 0.04% 359 86.53 1.12
recent 487 0.03% 357 80.19 1.11
final 394 0.03% 243 63.28 1.10
business 914 0.06% 367 146.72 1.10
david 387 0.03% 248 60.81 1.08
country 1,034 0.07% 391 155.93 1.05
added 398 0.03% 306 56.43 1.01
Table 5. 27. Selected keywords from the news corpus compared to the BNC (left) and to the BE06 (right).
It is important to bear in mind that the frequencies of some words classified as key by the software
might result from the aggregation of words with different possible grammatical functions, as well as
of homographs, with different meanings. This is why keywords should be regarded as a starting
point for further analyses, which should be performed to assess the role and use of each item. Most
of the presently extracted keywords were analysed through concordances and collocations. These
will not all be described in detail, but were essential in detecting items that could be relevant to the
present analysis. Since keyword frequencies vary considerably, collocations were extracted using
different thresholds of minimum collocation frequency. Several attempts were performed starting
from a minimum of 40 occurrences and then decreasing it by 10 until meaningful results emerged.
Two of the items found in these lists (Mr., world) were also among the 20 most frequent words (see
Section 9.1 above).
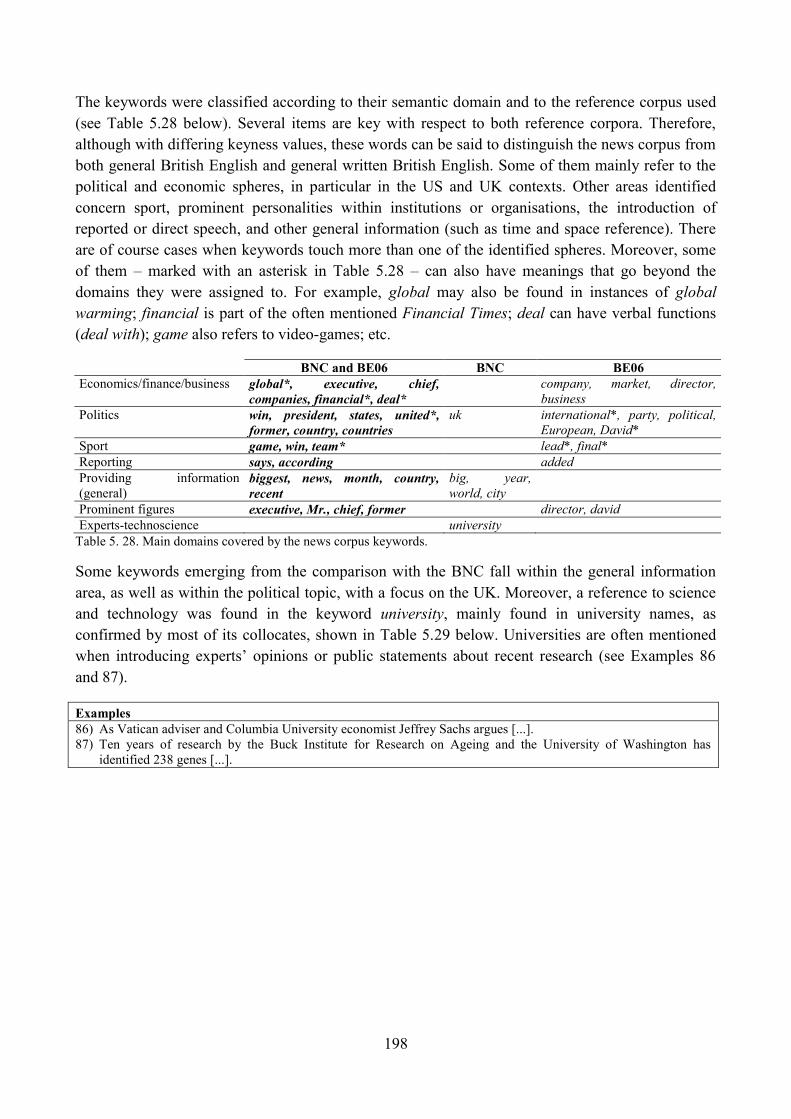
198
The keywords were classified according to their semantic domain and to the reference corpus used
(see Table 5.28 below). Several items are key with respect to both reference corpora. Therefore,
although with differing keyness values, these words can be said to distinguish the news corpus from
both general British English and general written British English. Some of them mainly refer to the
political and economic spheres, in particular in the US and UK contexts. Other areas identified
concern sport, prominent personalities within institutions or organisations, the introduction of
reported or direct speech, and other general information (such as time and space reference). There
are of course cases when keywords touch more than one of the identified spheres. Moreover, some
of them – marked with an asterisk in Table 5.28 – can also have meanings that go beyond the
domains they were assigned to. For example, global may also be found in instances of global
warming; financial is part of the often mentioned Financial Times; deal can have verbal functions
(deal with); game also refers to video-games; etc.
BNC and BE06 BNC BE06
Economics/finance/business global*, executive, chief,
companies, financial*, deal*
company, market, director,
business
Politics win, president, states, united*,
former, country, countries
uk international*, party, political,
European, David*
Sport game, win, team* lead*, final*
Reporting says, according added
Providing information
(general) biggest, news, month, country,
recent
big, year,
world, city
Prominent figures executive, Mr., chief, former director, david
Experts-technoscience university Table 5. 28. Main domains covered by the news corpus keywords.
Some keywords emerging from the comparison with the BNC fall within the general information
area, as well as within the political topic, with a focus on the UK. Moreover, a reference to science
and technology was found in the keyword university, mainly found in university names, as
confirmed by most of its collocates, shown in Table 5.29 below. Universities are often mentioned
when introducing experts‘ opinions or public statements about recent research (see Examples 86
and 87).
Examples
86) As Vatican adviser and Columbia University economist Jeffrey Sachs argues [...].
87) Ten years of research by the Buck Institute for Research on Ageing and the University of Washington has
identified 238 genes [...].
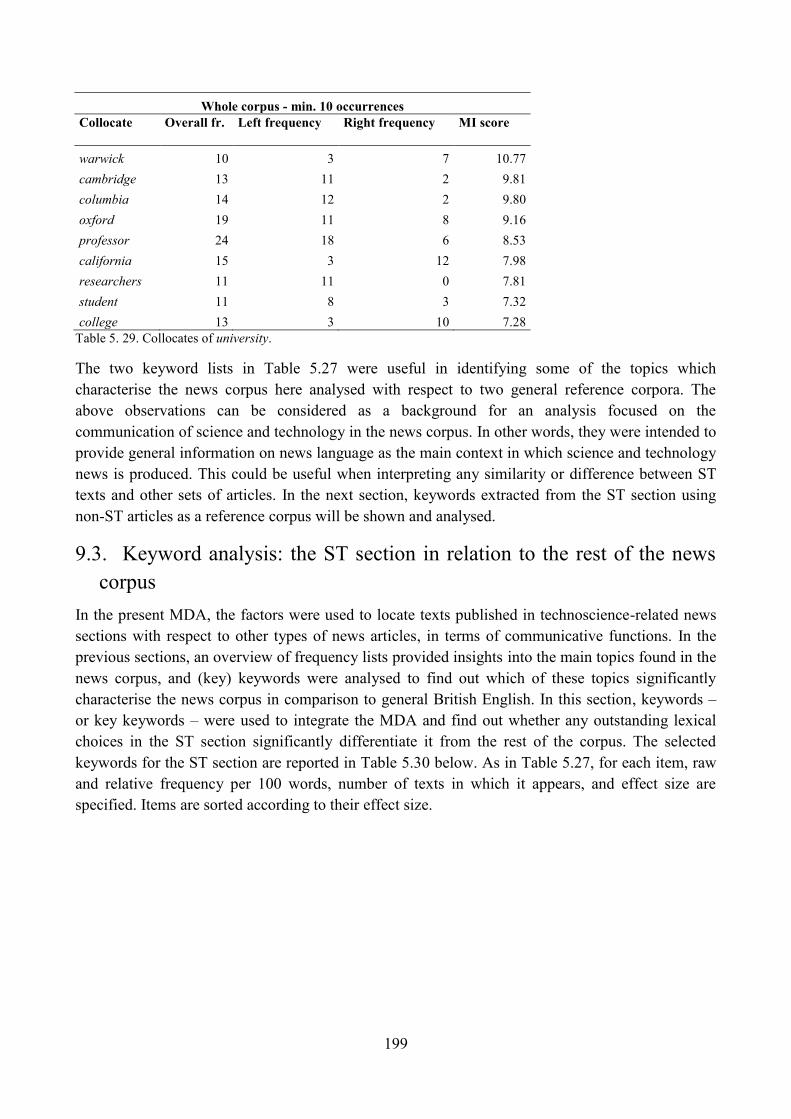
199
Whole corpus - min. 10 occurrences Collocate Overall fr. Left frequency Right frequency MI score
warwick 10 3 7 10.77
cambridge 13 11 2 9.81
columbia 14 12 2 9.80
oxford 19 11 8 9.16
professor 24 18 6 8.53
california 15 3 12 7.98
researchers 11 11 0 7.81
student 11 8 3 7.32
college 13 3 10 7.28
Table 5. 29. Collocates of university.
The two keyword lists in Table 5.27 were useful in identifying some of the topics which
characterise the news corpus here analysed with respect to two general reference corpora. The
above observations can be considered as a background for an analysis focused on the
communication of science and technology in the news corpus. In other words, they were intended to
provide general information on news language as the main context in which science and technology
news is produced. This could be useful when interpreting any similarity or difference between ST
texts and other sets of articles. In the next section, keywords extracted from the ST section using
non-ST articles as a reference corpus will be shown and analysed.
9.3. Keyword analysis: the ST section in relation to the rest of the news
corpus
In the present MDA, the factors were used to locate texts published in technoscience-related news
sections with respect to other types of news articles, in terms of communicative functions. In the
previous sections, an overview of frequency lists provided insights into the main topics found in the
news corpus, and (key) keywords were analysed to find out which of these topics significantly
characterise the news corpus in comparison to general British English. In this section, keywords –
or key keywords – were used to integrate the MDA and find out whether any outstanding lexical
choices in the ST section significantly differentiate it from the rest of the corpus. The selected
keywords for the ST section are reported in Table 5.30 below. As in Table 5.27, for each item, raw
and relative frequency per 100 words, number of texts in which it appears, and effect size are
specified. Items are sorted according to their effect size.
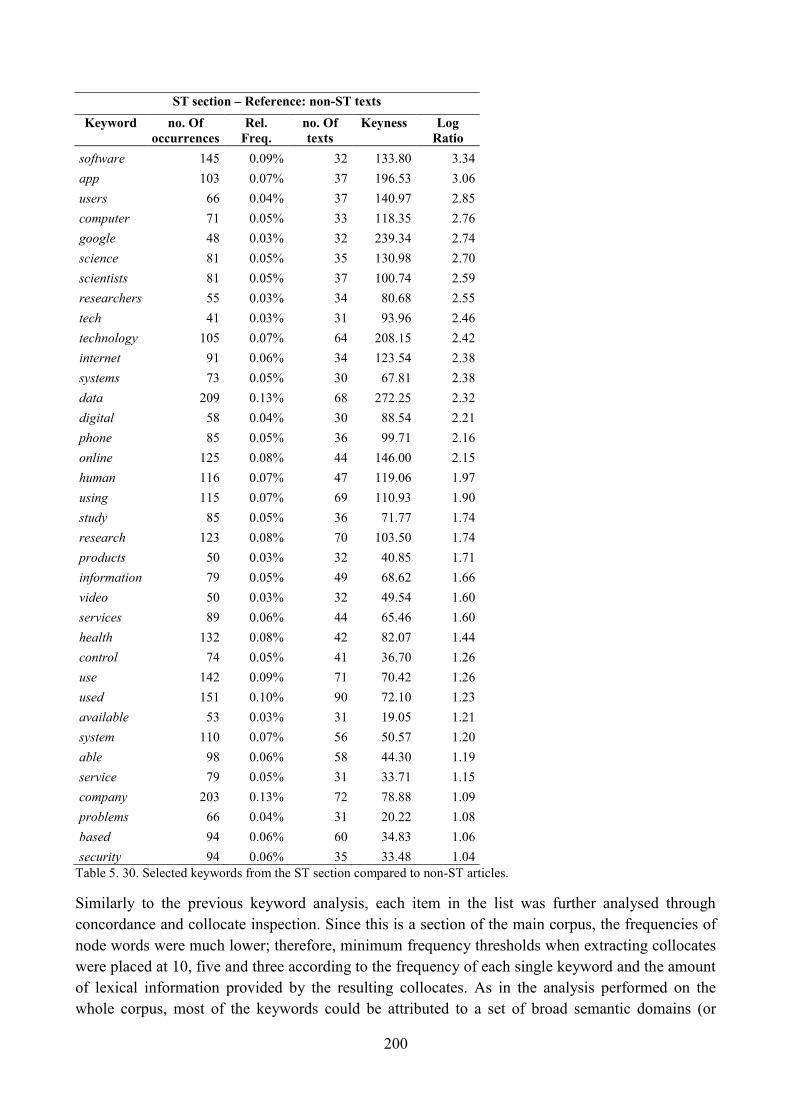
200
ST section – Reference: non-ST texts
Keyword no. Of
occurrences
Rel.
Freq.
no. Of
texts
Keyness Log
Ratio
software 145 0.09% 32 133.80 3.34
app 103 0.07% 37 196.53 3.06
users 66 0.04% 37 140.97 2.85
computer 71 0.05% 33 118.35 2.76
google 48 0.03% 32 239.34 2.74
science 81 0.05% 35 130.98 2.70
scientists 81 0.05% 37 100.74 2.59
researchers 55 0.03% 34 80.68 2.55
tech 41 0.03% 31 93.96 2.46
technology 105 0.07% 64 208.15 2.42
internet 91 0.06% 34 123.54 2.38
systems 73 0.05% 30 67.81 2.38
data 209 0.13% 68 272.25 2.32
digital 58 0.04% 30 88.54 2.21
phone 85 0.05% 36 99.71 2.16
online 125 0.08% 44 146.00 2.15
human 116 0.07% 47 119.06 1.97
using 115 0.07% 69 110.93 1.90
study 85 0.05% 36 71.77 1.74
research 123 0.08% 70 103.50 1.74
products 50 0.03% 32 40.85 1.71
information 79 0.05% 49 68.62 1.66
video 50 0.03% 32 49.54 1.60
services 89 0.06% 44 65.46 1.60
health 132 0.08% 42 82.07 1.44
control 74 0.05% 41 36.70 1.26
use 142 0.09% 71 70.42 1.26
used 151 0.10% 90 72.10 1.23
available 53 0.03% 31 19.05 1.21
system 110 0.07% 56 50.57 1.20
able 98 0.06% 58 44.30 1.19
service 79 0.05% 31 33.71 1.15
company 203 0.13% 72 78.88 1.09
problems 66 0.04% 31 20.22 1.08
based 94 0.06% 60 34.83 1.06
security 94 0.06% 35 33.48 1.04
Table 5. 30. Selected keywords from the ST section compared to non-ST articles.
Similarly to the previous keyword analysis, each item in the list was further analysed through
concordance and collocate inspection. Since this is a section of the main corpus, the frequencies of
node words were much lower; therefore, minimum frequency thresholds when extracting collocates
were placed at 10, five and three according to the frequency of each single keyword and the amount
of lexical information provided by the resulting collocates. As in the analysis performed on the
whole corpus, most of the keywords could be attributed to a set of broad semantic domains (or
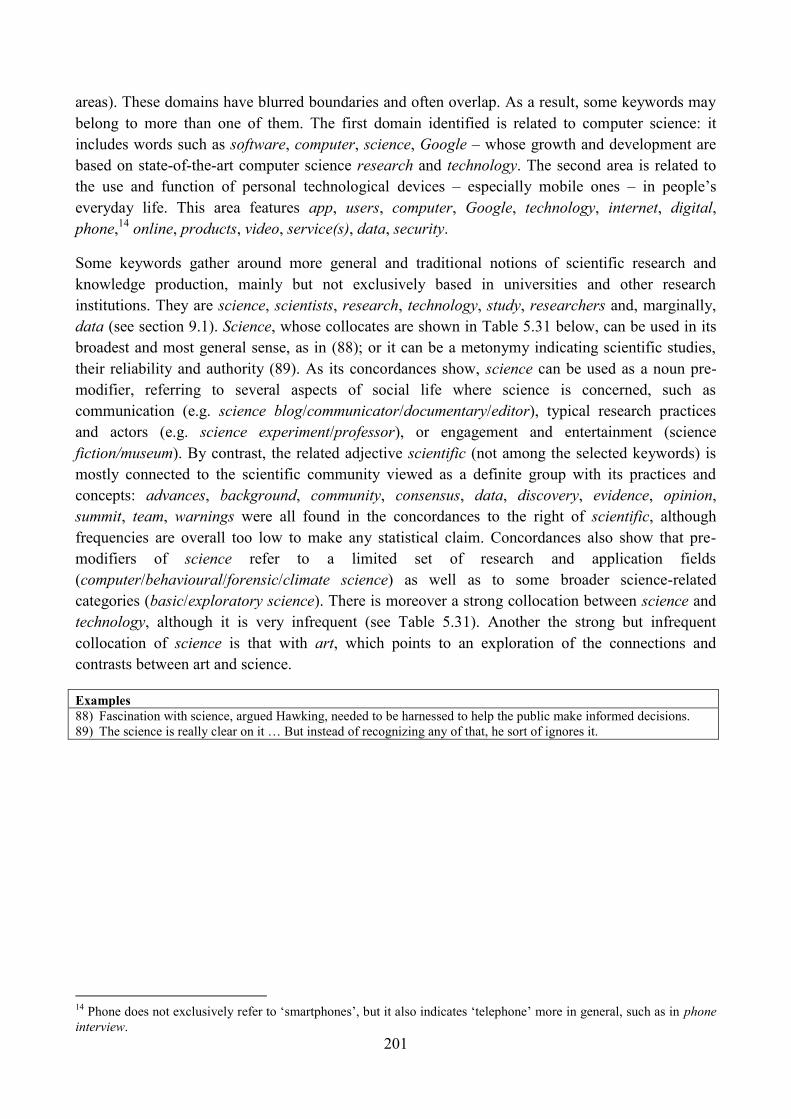
201
areas). These domains have blurred boundaries and often overlap. As a result, some keywords may
belong to more than one of them. The first domain identified is related to computer science: it
includes words such as software, computer, science, Google – whose growth and development are
based on state-of-the-art computer science research and technology. The second area is related to
the use and function of personal technological devices – especially mobile ones – in people‘s
everyday life. This area features app, users, computer, Google, technology, internet, digital,
phone,14
online, products, video, service(s), data, security.
Some keywords gather around more general and traditional notions of scientific research and
knowledge production, mainly but not exclusively based in universities and other research
institutions. They are science, scientists, research, technology, study, researchers and, marginally,
data (see section 9.1). Science, whose collocates are shown in Table 5.31 below, can be used in its
broadest and most general sense, as in (88); or it can be a metonymy indicating scientific studies,
their reliability and authority (89). As its concordances show, science can be used as a noun pre-
modifier, referring to several aspects of social life where science is concerned, such as
communication (e.g. science blog/communicator/documentary/editor), typical research practices
and actors (e.g. science experiment/professor), or engagement and entertainment (science
fiction/museum). By contrast, the related adjective scientific (not among the selected keywords) is
mostly connected to the scientific community viewed as a definite group with its practices and
concepts: advances, background, community, consensus, data, discovery, evidence, opinion,
summit, team, warnings were all found in the concordances to the right of scientific, although
frequencies are overall too low to make any statistical claim. Concordances also show that pre-
modifiers of science refer to a limited set of research and application fields
(computer/behavioural/forensic/climate science) as well as to some broader science-related
categories (basic/exploratory science). There is moreover a strong collocation between science and
technology, although it is very infrequent (see Table 5.31). Another the strong but infrequent
collocation of science is that with art, which points to an exploration of the connections and
contrasts between art and science.
Examples
88) Fascination with science, argued Hawking, needed to be harnessed to help the public make informed decisions.
89) The science is really clear on it … But instead of recognizing any of that, he sort of ignores it.
14
Phone does not exclusively refer to ‗smartphones‘, but it also indicates ‗telephone‘ more in general, such as in phone
interview.
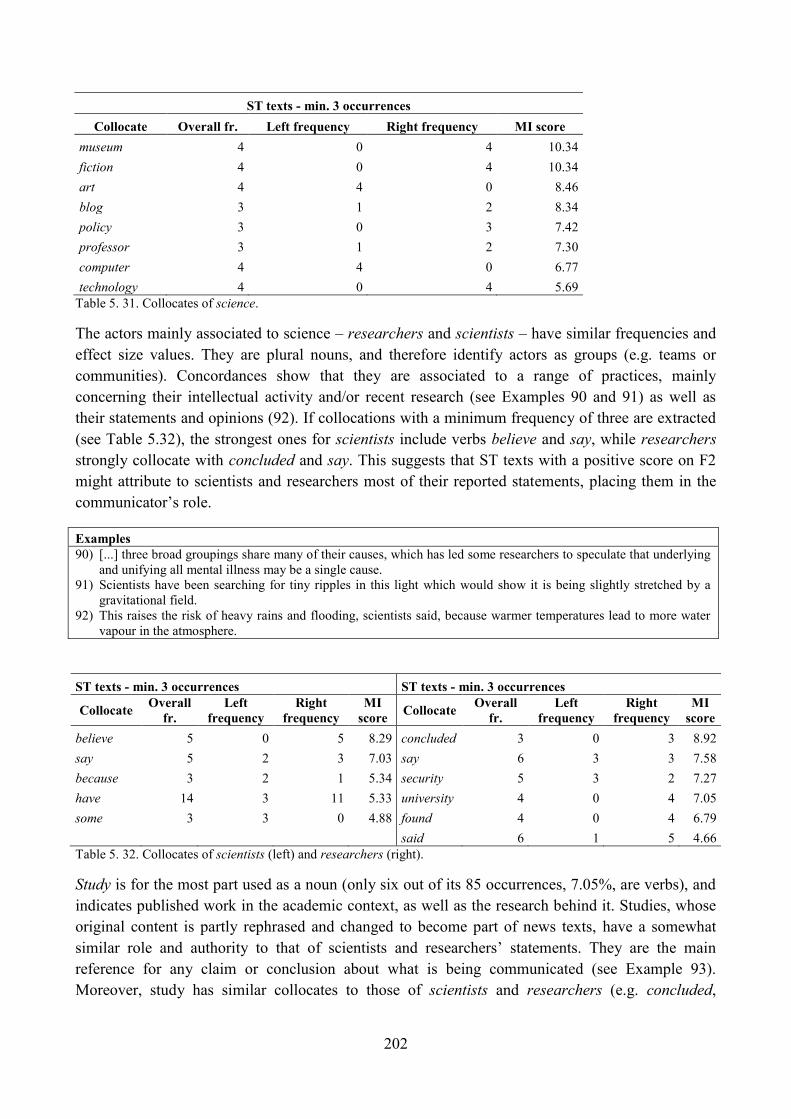
202
ST texts - min. 3 occurrences
Collocate Overall fr. Left frequency Right frequency MI score
museum 4 0 4 10.34
fiction 4 0 4 10.34
art 4 4 0 8.46
blog 3 1 2 8.34
policy 3 0 3 7.42
professor 3 1 2 7.30
computer 4 4 0 6.77
technology 4 0 4 5.69
Table 5. 31. Collocates of science.
The actors mainly associated to science – researchers and scientists – have similar frequencies and
effect size values. They are plural nouns, and therefore identify actors as groups (e.g. teams or
communities). Concordances show that they are associated to a range of practices, mainly
concerning their intellectual activity and/or recent research (see Examples 90 and 91) as well as
their statements and opinions (92). If collocations with a minimum frequency of three are extracted
(see Table 5.32), the strongest ones for scientists include verbs believe and say, while researchers
strongly collocate with concluded and say. This suggests that ST texts with a positive score on F2
might attribute to scientists and researchers most of their reported statements, placing them in the
communicator‘s role.
Examples
90) [...] three broad groupings share many of their causes, which has led some researchers to speculate that underlying
and unifying all mental illness may be a single cause.
91) Scientists have been searching for tiny ripples in this light which would show it is being slightly stretched by a
gravitational field.
92) This raises the risk of heavy rains and flooding, scientists said, because warmer temperatures lead to more water
vapour in the atmosphere.
ST texts - min. 3 occurrences ST texts - min. 3 occurrences
Collocate Overall
fr.
Left
frequency
Right
frequency
MI
score Collocate
Overall
fr.
Left
frequency
Right
frequency
MI
score
believe 5 0 5 8.29 concluded 3 0 3 8.92
say 5 2 3 7.03 say 6 3 3 7.58
because 3 2 1 5.34 security 5 3 2 7.27
have 14 3 11 5.33 university 4 0 4 7.05
some 3 3 0 4.88 found 4 0 4 6.79
said 6 1 5 4.66
Table 5. 32. Collocates of scientists (left) and researchers (right).
Study is for the most part used as a noun (only six out of its 85 occurrences, 7.05%, are verbs), and
indicates published work in the academic context, as well as the research behind it. Studies, whose
original content is partly rephrased and changed to become part of news texts, have a somewhat
similar role and authority to that of scientists and researchers‘ statements. They are the main
reference for any claim or conclusion about what is being communicated (see Example 93).
Moreover, study has similar collocates to those of scientists and researchers (e.g. concluded,
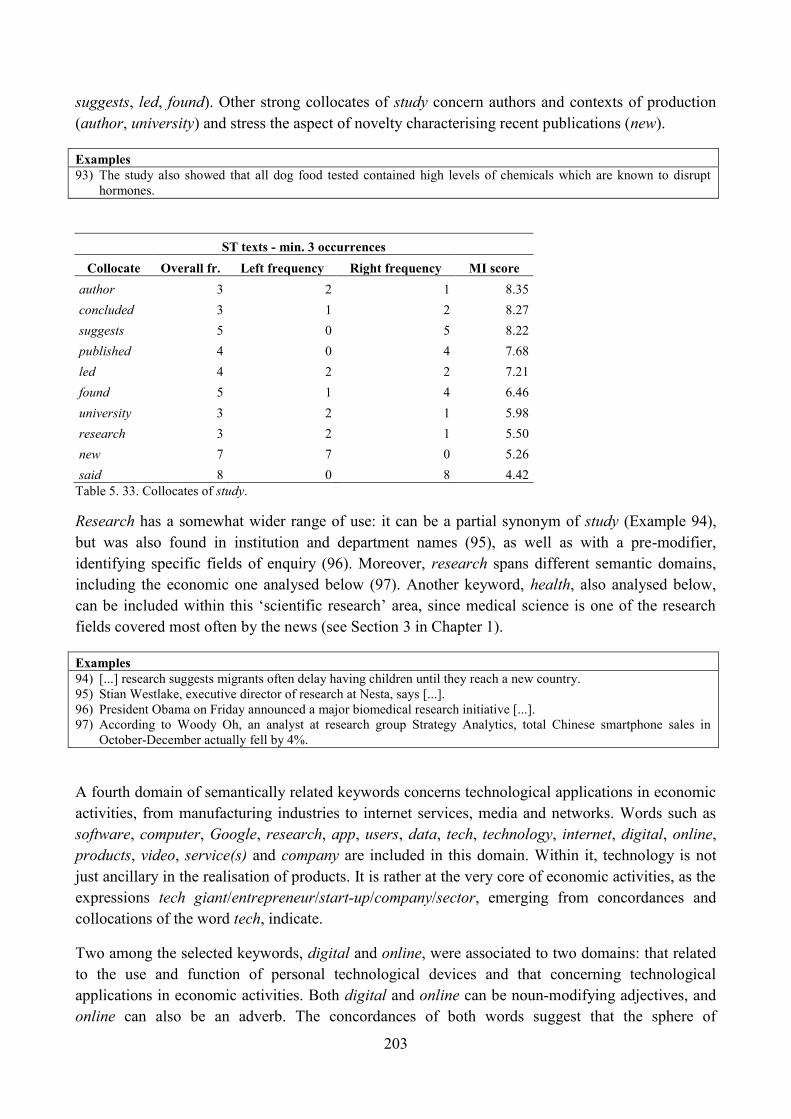
203
suggests, led, found). Other strong collocates of study concern authors and contexts of production
(author, university) and stress the aspect of novelty characterising recent publications (new).
Examples
93) The study also showed that all dog food tested contained high levels of chemicals which are known to disrupt
hormones.
ST texts - min. 3 occurrences
Collocate Overall fr. Left frequency Right frequency MI score
author 3 2 1 8.35
concluded 3 1 2 8.27
suggests 5 0 5 8.22
published 4 0 4 7.68
led 4 2 2 7.21
found 5 1 4 6.46
university 3 2 1 5.98
research 3 2 1 5.50
new 7 7 0 5.26
said 8 0 8 4.42
Table 5. 33. Collocates of study.
Research has a somewhat wider range of use: it can be a partial synonym of study (Example 94),
but was also found in institution and department names (95), as well as with a pre-modifier,
identifying specific fields of enquiry (96). Moreover, research spans different semantic domains,
including the economic one analysed below (97). Another keyword, health, also analysed below,
can be included within this ‗scientific research‘ area, since medical science is one of the research
fields covered most often by the news (see Section 3 in Chapter 1).
Examples
94) [...] research suggests migrants often delay having children until they reach a new country.
95) Stian Westlake, executive director of research at Nesta, says [...].
96) President Obama on Friday announced a major biomedical research initiative [...].
97) According to Woody Oh, an analyst at research group Strategy Analytics, total Chinese smartphone sales in
October-December actually fell by 4%.
A fourth domain of semantically related keywords concerns technological applications in economic
activities, from manufacturing industries to internet services, media and networks. Words such as
software, computer, Google, research, app, users, data, tech, technology, internet, digital, online,
products, video, service(s) and company are included in this domain. Within it, technology is not
just ancillary in the realisation of products. It is rather at the very core of economic activities, as the
expressions tech giant/entrepreneur/start-up/company/sector, emerging from concordances and
collocations of the word tech, indicate.
Two among the selected keywords, digital and online, were associated to two domains: that related
to the use and function of personal technological devices and that concerning technological
applications in economic activities. Both digital and online can be noun-modifying adjectives, and
online can also be an adverb. The concordances of both words suggest that the sphere of
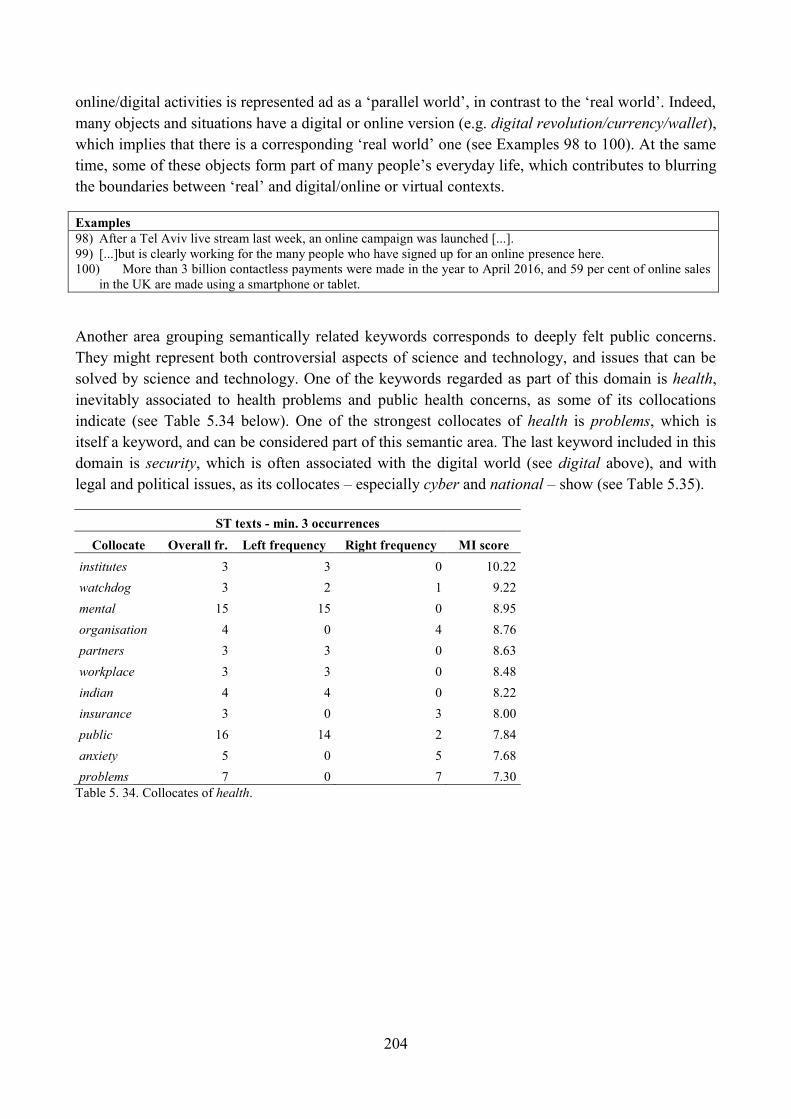
204
online/digital activities is represented ad as a ‗parallel world‘, in contrast to the ‗real world‘. Indeed,
many objects and situations have a digital or online version (e.g. digital revolution/currency/wallet),
which implies that there is a corresponding ‗real world‘ one (see Examples 98 to 100). At the same
time, some of these objects form part of many people‘s everyday life, which contributes to blurring
the boundaries between ‗real‘ and digital/online or virtual contexts.
Examples
98) After a Tel Aviv live stream last week, an online campaign was launched [...].
99) [...]but is clearly working for the many people who have signed up for an online presence here.
100) More than 3 billion contactless payments were made in the year to April 2016, and 59 per cent of online sales
in the UK are made using a smartphone or tablet.
Another area grouping semantically related keywords corresponds to deeply felt public concerns.
They might represent both controversial aspects of science and technology, and issues that can be
solved by science and technology. One of the keywords regarded as part of this domain is health,
inevitably associated to health problems and public health concerns, as some of its collocations
indicate (see Table 5.34 below). One of the strongest collocates of health is problems, which is
itself a keyword, and can be considered part of this semantic area. The last keyword included in this
domain is security, which is often associated with the digital world (see digital above), and with
legal and political issues, as its collocates – especially cyber and national – show (see Table 5.35).
ST texts - min. 3 occurrences
Collocate Overall fr. Left frequency Right frequency MI score
institutes 3 3 0 10.22
watchdog 3 2 1 9.22
mental 15 15 0 8.95
organisation 4 0 4 8.76
partners 3 3 0 8.63
workplace 3 3 0 8.48
indian 4 4 0 8.22
insurance 3 0 3 8.00
public 16 14 2 7.84
anxiety 5 0 5 7.68
problems 7 0 7 7.30
Table 5. 34. Collocates of health.
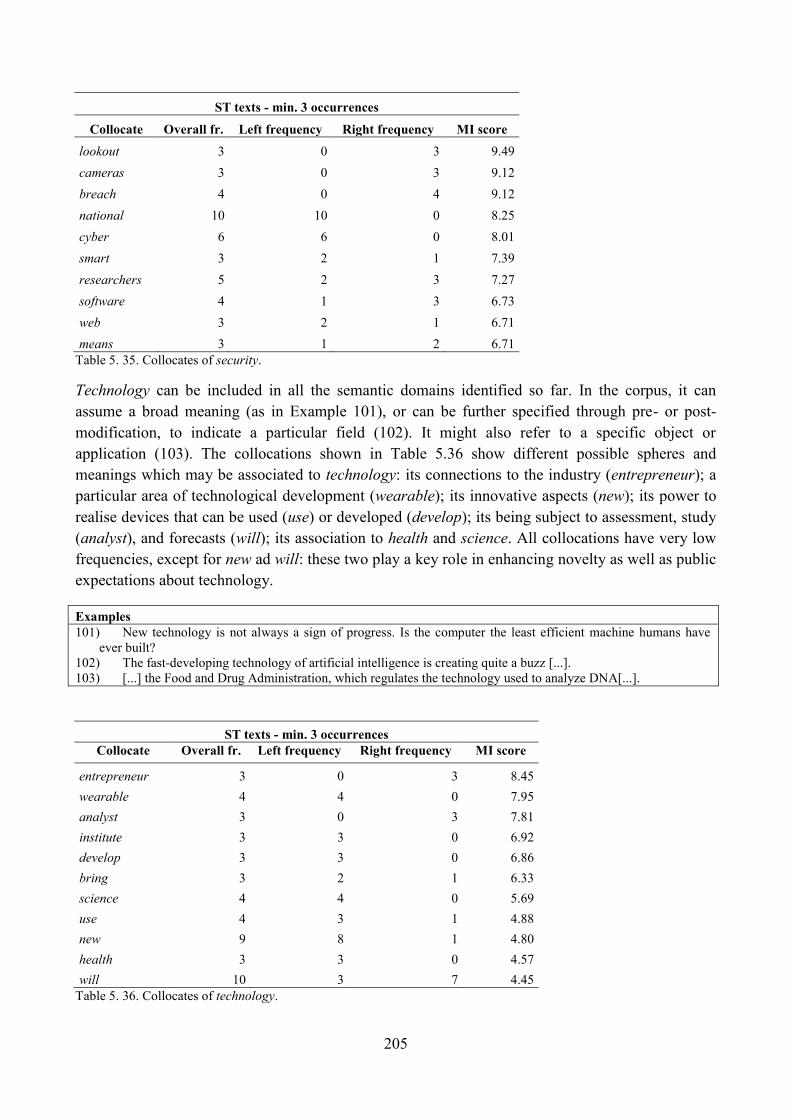
205
ST texts - min. 3 occurrences
Collocate Overall fr. Left frequency Right frequency MI score
lookout 3 0 3 9.49
cameras 3 0 3 9.12
breach 4 0 4 9.12
national 10 10 0 8.25
cyber 6 6 0 8.01
smart 3 2 1 7.39
researchers 5 2 3 7.27
software 4 1 3 6.73
web 3 2 1 6.71
means 3 1 2 6.71
Table 5. 35. Collocates of security.
Technology can be included in all the semantic domains identified so far. In the corpus, it can
assume a broad meaning (as in Example 101), or can be further specified through pre- or post-
modification, to indicate a particular field (102). It might also refer to a specific object or
application (103). The collocations shown in Table 5.36 show different possible spheres and
meanings which may be associated to technology: its connections to the industry (entrepreneur); a
particular area of technological development (wearable); its innovative aspects (new); its power to
realise devices that can be used (use) or developed (develop); its being subject to assessment, study
(analyst), and forecasts (will); its association to health and science. All collocations have very low
frequencies, except for new ad will: these two play a key role in enhancing novelty as well as public
expectations about technology.
Examples
101) New technology is not always a sign of progress. Is the computer the least efficient machine humans have
ever built?
102) The fast-developing technology of artificial intelligence is creating quite a buzz [...].
103) [...] the Food and Drug Administration, which regulates the technology used to analyze DNA[...].
ST texts - min. 3 occurrences
Collocate Overall fr. Left frequency Right frequency MI score
entrepreneur 3 0 3 8.45
wearable 4 4 0 7.95
analyst 3 0 3 7.81
institute 3 3 0 6.92
develop 3 3 0 6.86
bring 3 2 1 6.33
science 4 4 0 5.69
use 4 3 1 4.88
new 9 8 1 4.80
health 3 3 0 4.57
will 10 3 7 4.45
Table 5. 36. Collocates of technology.
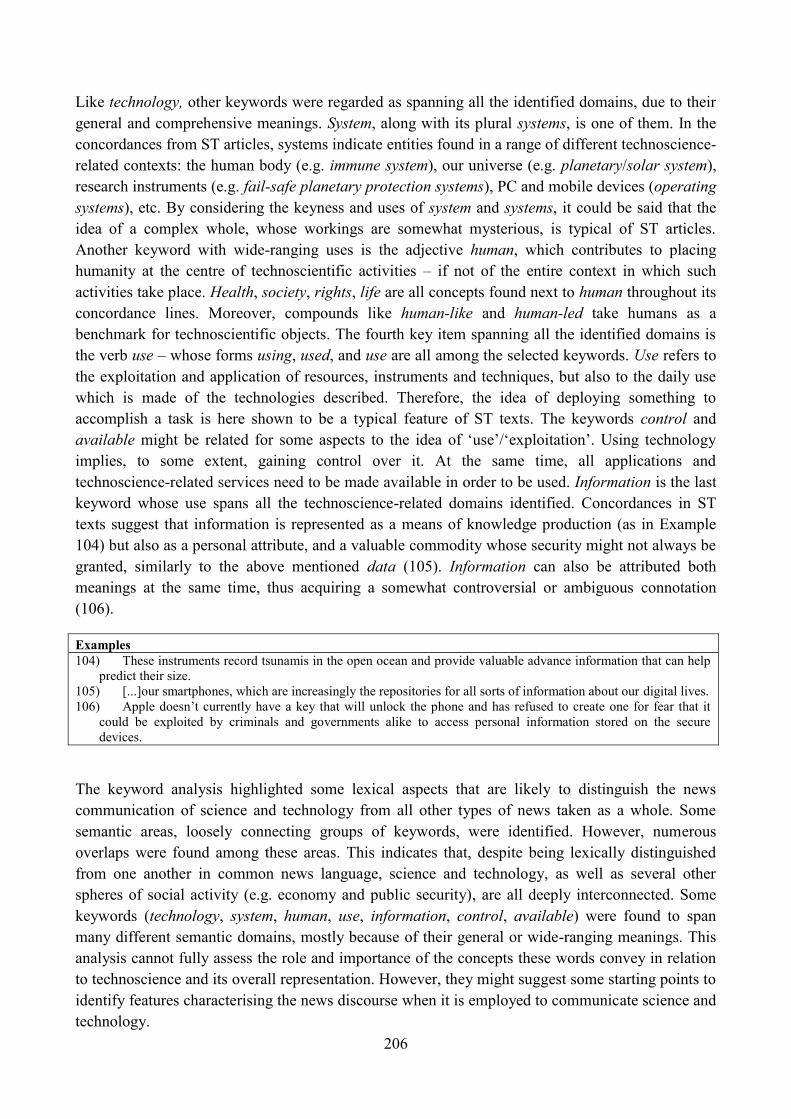
206
Like technology, other keywords were regarded as spanning all the identified domains, due to their
general and comprehensive meanings. System, along with its plural systems, is one of them. In the
concordances from ST articles, systems indicate entities found in a range of different technoscience-
related contexts: the human body (e.g. immune system), our universe (e.g. planetary/solar system),
research instruments (e.g. fail-safe planetary protection systems), PC and mobile devices (operating
systems), etc. By considering the keyness and uses of system and systems, it could be said that the
idea of a complex whole, whose workings are somewhat mysterious, is typical of ST articles.
Another keyword with wide-ranging uses is the adjective human, which contributes to placing
humanity at the centre of technoscientific activities – if not of the entire context in which such
activities take place. Health, society, rights, life are all concepts found next to human throughout its
concordance lines. Moreover, compounds like human-like and human-led take humans as a
benchmark for technoscientific objects. The fourth key item spanning all the identified domains is
the verb use – whose forms using, used, and use are all among the selected keywords. Use refers to
the exploitation and application of resources, instruments and techniques, but also to the daily use
which is made of the technologies described. Therefore, the idea of deploying something to
accomplish a task is here shown to be a typical feature of ST texts. The keywords control and
available might be related for some aspects to the idea of ‗use‘/‗exploitation‘. Using technology
implies, to some extent, gaining control over it. At the same time, all applications and
technoscience-related services need to be made available in order to be used. Information is the last
keyword whose use spans all the technoscience-related domains identified. Concordances in ST
texts suggest that information is represented as a means of knowledge production (as in Example
104) but also as a personal attribute, and a valuable commodity whose security might not always be
granted, similarly to the above mentioned data (105). Information can also be attributed both
meanings at the same time, thus acquiring a somewhat controversial or ambiguous connotation
(106).
Examples
104) These instruments record tsunamis in the open ocean and provide valuable advance information that can help
predict their size.
105) [...]our smartphones, which are increasingly the repositories for all sorts of information about our digital lives.
106) Apple doesn‘t currently have a key that will unlock the phone and has refused to create one for fear that it
could be exploited by criminals and governments alike to access personal information stored on the secure
devices.
The keyword analysis highlighted some lexical aspects that are likely to distinguish the news
communication of science and technology from all other types of news taken as a whole. Some
semantic areas, loosely connecting groups of keywords, were identified. However, numerous
overlaps were found among these areas. This indicates that, despite being lexically distinguished
from one another in common news language, science and technology, as well as several other
spheres of social activity (e.g. economy and public security), are all deeply interconnected. Some
keywords (technology, system, human, use, information, control, available) were found to span
many different semantic domains, mostly because of their general or wide-ranging meanings. This
analysis cannot fully assess the role and importance of the concepts these words convey in relation
to technoscience and its overall representation. However, they might suggest some starting points to
identify features characterising the news discourse when it is employed to communicate science and
technology.
207
Keyword extraction does not take into account disambiguation issues (e.g. polysemic words) and its
methodological options are still debated. Moreover, the low frequencies of the selected items make
the analysis less reliable in quantitative terms. However, many steps were taken to ensure that these
items were maximally informative and relevant to the ST section. Performing multiple comparisons,
using other macro-feed sections as reference corpora for the extraction of keywords from ST
articles might have provided even more valuable insights than simply using non-ST texts as the
only reference. On the other hand, MDA, which is the main focus of the present study, already
provides sub-section comparisons, while the main purpose of the lexical analysis was to find
outstanding lexical features in ST articles. Therefore, performing a detailed analysis of keywords
with respect to one reference corpus was deemed more useful than carrying out multiple
comparisons without going into as much detail.
10. Using linguistic analysis to trace the life of technoscientific
facts and objects in newspapers
As acknowledged chiefly by Science and Technology Studies (STS), the representation of
technoscientific knowledge and practices in the media is one of the modalities through which
science and technology are socially situated and constructed. Some traces of such constitutive
processes seem to emerge the present analysis. As explained in Section 9 of Chapter 2, the notion of
a socially constructed technoscience – or science – has characterised, in its different interpretations,
numerous scholarly accounts, dating from Fleck, whose work was first published in 1935. However,
terms such as ‗social construction‘ and ‗social constructivism‘ only began to be used in reference to
the STS field of study in the late 1970s (Sismondo 2010: 57).
In the STS framework, the linguistic configuration and the communication of technoscientific
knowledge, both among experts and to lay people, is acknowledged as key to the development of
technoscientific facts and objects. Latour and Woolgar (1986: 174-183) claimed that the fate of
scientific conclusions resulting from research practices is suspended within a continuum between
two states. At one end lies the state of ‗artefacts‘: an artefact is a statement, produced by an author
and expressing their perspective about some technoscientific outcome. Artefacts belong to the realm
of assumptions ad hypotheses, and may be verified or not; thus they can be questioned and subject
to debate, which means they could be controversial. At the opposite end of the continuum lies the
state of facts, that is of statements that have come to be established as valid and true, being
generally supported by the majority of the scientific community. Facts belong to the realm of
reality: they are not simple statements, but denote real objects whose existence and attributes, once
established, are generally taken for granted, although they may not be directly observable and/or
result from ambiguous research outcomes in the first place. The metaphor of the ‗black box‘ (see
Section 9 in Chapter 2) is particularly effective in depicting the unquestioned status of
technoscientific facts and objects: ―no matter how controversial their history, how complex their
inner workings, how large the commercial or academic networks that hold them in place‖; they are
taken for granted and ‗used‘ in further researches and applications (Latour 1987: 3), as well as in
specialised and public discourse.
208
A statement is not necessarily treated in the same way by different communities: for example, it
could be more of a fact among experts, but still questioned among lay people. Certainly, the more
members within society support it, the more it is likely to become a generally established fact:
Latour (1987: 26) uses the expression ―collective fate of fact-making‖ to describe such processes.
What is key to the social construction of technoscience is that statements become widespread and
gain support not only on the grounds of their theoretical and practical validity, but also of complex
socio-cultural factors, active among scientists as well as among all other social groups. Moreover,
every time it reaches a particular context or group (e.g., the laboratory, a scientific journal, company
meetings, newspapers, or advocacy groups) a statement is re-appropriated and its meaning can be
subject to negotiations and changes to fit the context, which can bring it closer either to the state of
fact or to that of artefact.
The linguistic formulation of a technoscientific statement is closely connected to its course of
stabilisation. Normally, in becoming stabilised, it is referred to in a less and less problematic way,
and undergoes a process of factualisation, where all the ambiguities and uncertainties that
characterised it when it was first produced are systematically omitted. As mentioned above, news is
one of the contexts where statements about scientific and technological entities are formulated and
negotiated. Therefore, the ST articles here analysed may be considered as part of that ―collective
fate‖ attributing more or less factual features to scientific and technological statements. The news
context is different from that of, say, laboratory reports or scientific publications. Therefore, when
scientific statements are reproduced in the news, they generally need to be adapted to the features
and conventions of news production. For example, they are directed at general audiences, and
reported by journalists who may or may not have a scientific background. Moreover, they enter an
environment characterised by an extremely fast production pace, where they need to meet news
selection criteria such as drama, entertainment and recency (O‘Neill and Harcup 2009: 166).
Latour and Woolgar (1986: 75-81) developed a classification of statements based on their linguistic
form. They related different linguistic forms to different levels of factuality, although they warned
that no one-to-one correspondence could be drawn between the two, due to the context-specificity
of statements, and to the consequent possibility of interpreting the same statement type in different
ways. More specifically, in order to categorise technoscientific statements, they borrowed the
concept of ‗modality‘ from the philosophy of language (Latour and Woolgar 1986: 77, 90).15
They
defined modalities as statements about other statements, acknowledging that the way a statement is
– or is not – embedded into the structure of the sentence can partly affect its general meaning and
implications. Modality can, for example, weaken a statement by expressing doubts about its validity
(e.g. supporters of ‗x‘ may claim that ...), or, on the contrary, provide it with more solid grounds by
framing it as a widely acknowledged truth (everybody knows that ...). Latour (1987: 22-26) called
‗negative‘ the former category, and ‗positive‘ the latter. Modalities can elicit different questions and
conclusions in the audience. On the one hand, positive ones can plausibly conduct the audience
‗downstream‘ (Latour 1987: 22), seeing the statement more as a fact and reasoning about its
consequences – for example, future applications of a newly discovered principle or technique. On
15
Latour and Woolgar referred to Ducrot and Todorov‘s (1972: 389-397) description of modality. The application of
this notion by Latour and Woolgar to describe the social construction of technoscience is closely related, although not
exactly equivalent to the notion of modality as a semantic domain found in linguistics (see Bybee and Fleischman 1995:
1-14).
209
the other hand, negative modalities can plausibly lead the audience ‗upstream‘, to track the origin of
the statement and maybe question its validity. If, for instance, a claim concerning the safety of a
medical procedure was negatively framed through modality, the audience would possibly be more
compelled to seek various experts‘ opinions about it than to promote its application. In an ideal
course of establishment of a technoscientific fact, modalities are said to be extremely variable at
first, when the corresponding statement starts circulating. Its linguistic representations become more
and more consistent as the statement stabilises as a fact (Latour and Woolgar 1986: 176). When the
statement is taken ‗back‘ towards the artefact state, on the contrary, its modalities might remain
unstable, or negative ones might prevail, as sometimes happens during scientific and technological
controversies.
It would be quite far-fetched to draw a correspondence between modalities and the dimensions
identified by the MDA on the present corpus. While the analysed LFs can be employed in the
construction of modalities, these are too complex and context-specific to be identified in a corpus
perspective. Moreover, ST articles contain statements about a range of topics besides what can
count as a technoscientific fact or artefact – e.g. the circumstances of a discovery, research policies,
personal life experiences and opinions, business strategies of technological companies, and much
more. Thus, any quantitative account of modalities as referred to science and technology (if it was
feasible) would probably require that technoscience-related statements be isolated from the rest of
the texts. Despite these limitations, however, some of the co-occurrence patterns and related
communicative goals detected by MDA might be proposed as a potential indicator of the presence
of modality. As explained above, generalisations should be avoided for now: therefore, only
individual instances will be taken into account here.
One possible indicator of modality is the second dimension, underlying F2: chiefly focused on
reported speech introduced by public verbs, its positive end includes texts where statements are
attributed to an external voice via complement clauses, as exemplified in (107) below. Here, the
appropriateness of a technological object – sensors in football players‘ helmets – for particular
research purposes is being discussed. An expert is attributed a statement limiting the accurateness of
the sensors, thus questioning their validity and reinforcing the implication, mentioned earlier in the
text, that ―the committee [...] wants more time to determine if there is a better system available.‖ A
text with a low F2 score may as well contain forms of speech attribution (direct speech), although
these are less likely to appear, since they are often introduced by public verbs, which belong in the
positive end of F2. What seems more in line with low F2 scores are examples like (108). In this
case, laboratory equipment, past experiments and previous discoveries, as well as the animal species
being studied are all taken for granted as definite and undisputed entities.
Examples
107) Cantu said the sensors the league had used were less accurate when the helmets were not hit squarely.
108) Dr. Hackmann used electron microscopes, video recordings and other experiments to study the cleaning
mechanism that is found at a joint in each front leg of the carpenter ant Camponotus rufifemur.
Single instances cannot justify conclusions on whether a certain article contributes or not to the
factualisation of a technoscientific statement. However, the second dimension might function as
some sort of indicator for possible attribution-related modalities being realised – which would
210
however need more qualitative analysis to be confirmed. As pointed out in the previous section,
speech attribution can serve differing and sometimes ambiguous purposes. Thus, when used as a
modality for particular statements in science and technology, it can result in both positive and
negative modalities, as also Latour and Woolgar (1986: 79-80) had specified, by resorting to
experts‘ epistemic authority to support a statement or by devolving responsibility to them for such
statement.
As for single LFs, downtoners, hedges and amplifiers can contribute to modalisation. Of these, only
downtoners were salient on one of the factors, namely F3. However, when texts with high F3 scores
were inspected in search of downtoner-related modalities, this LF had too few occurrences and was
sometimes not accurately identified, since adverbs such as only, here classified as a downtoner, are
not always used with a downtoning function. However, F3 in general might be related to modality
construction. Its characterising explanation and argumentation strategies might be employed, for
example, to lead the reader ‗downstream‘, discussing applications of existing concepts, as in
Examples 109 and 110. Here, the reader is led to focus on ‗what comes after‘ a discovery, or the
production of a particular technology. However, modalities based upon argumentation might also be
aimed at challenging common views on science and technology, as in (111), where an attempt at
deconstructing ―computer and mobile technology‖ is performed by calling into question the
advantages usually attributed to them. Later in the text, this leads the author – and perhaps the
reader – to speculate that ―There are other routes that we could have taken with technology.‖
Examples
109) If persistent worry is potentially so damaging to our mental health, what can be done to combat it?
Interestingly, we tend to worry less as we grow older. People aged 65-85, for example, report fewer worries than
those aged 16-29.
110) ―This means a third of smartphone users have no data connection at all.‖ Instead they rely on occasional WiFi
connections, or what is known as ―side loading‖, in which videos or music are loaded on to the phone via data
cards, a service often provided at local neighbourhood electronics shops or mobile stores.
111) Understanding this helps to explain the mysterious ―productivity paradox‖ — the fact that all the new
computer and mobile technology of the past 20 years has not led to an increase in productivity. Employees must
constantly learn new ways to perform the same task over and over again as technology changes. However, this
does not necessarily increase the speed at which jobs are done. Moreover, modern computers and mobile phones
— for all their functionality — are hampered by a design flaw that dates back to the 1940s: a clock that dictates
that only one tiny process can happen at a time.
These were only a few possible links between the MDA results and communicative strategies
identified by sociologists as relevant to the social construction of science and technology. So far,
they cannot be extended to corpus surveys but can only concern single instances. However, they
show that dimensions might constitute a starting point to detect the presence of factualising or de-
factualising strategies in ST texts.
In analysing the processes through which facts gain their status, Latour and Woolgar identified two
phenomena denoting the transformation of ‗simple‘ statements into facts, which they named
‗splitting‘ and ‗inversion‘. Through splitting, from mere set of words, the statement comes to
represent an external reality and at the same time it corresponds to that reality, and takes a life of its
own (Latour and Woolgar 1986: 177). Inversion indicates that the reality in question, with the exact
characteristics which the statement attributes to it, is perceived as pre-existing to the statement
211
itself. Consequently, it is regarded as the cause for the production of the statement, while any initial
role of the statement in shaping it is rejected.
Lexical choices surrounding technoscientific entities in the text can work as devices to enact these
processes: one example from the ST articles here analysed is the use of verbs such as discover, find,
and reveal when referred to research activities. For example, in (112) discover indicates that the
object pentaquark is regarded as an unequivocal and definite physical entity, entirely and
autonomously existing prior to the experiments. Its discovery is located in some data, whose
production is not described, but is somehow taken for granted. Moreover, the use of passive forms
may have a role in splitting the pentaquark as an object from its linguistic reference, thus erasing
researchers‘ role in its identification and conceptualisation.
Examples
112) New Horizons has been on the way to Pluto for more than nine years, and the data in which the pentaquark
was discovered were recorded by the LHCb experiment more than three years ago
Splitting and inversion thus contribute to the creation of a black box, an object whose origin,
internal workings and possible problematic aspects have become completely opaque and accepted,
thus making it usable as a coherent whole. In the corpus, some of the nominal keywords selected
from the ST section can be considered black boxes: in particular, software, app, computer, internet,
phone, video, and health. Software, for example, is never defined in the corpus. This means that in
newspapers, explaining and discussing what it is, how it was created and how it works is considered
irrelevant for several reasons. First, long and thorough explanations may not be in line with news
writing criteria. Moreover, the object software is ingrained both in news language and in common
everyday experiences. Therefore, it evokes a set of practical and generalised assumptions without
requiring technical and terminological accuracy. In the corpus, software is used both as a noun and
as a modifier (software project/company/engineer), which might stress its black box status. In
general, the examples of black boxes found among ST keywords belong to semantic domains
related to computer science and the use of personal technological devices (cf. Section 9.3 in this
chapter). This is not to say, however, that there are no black boxes related to other scientific and
technological fields: simply, they might be too infrequent to stand out as typical of this set of
articles; once again, qualitative analysis would be needed to identify more of them.
Software is an example of an established entity resulting from technoscientific practices, whose
characteristics, attributes and linguistic representations have undergone a process of stabilisation
and factualisation. Factualisation as a representational phenomenon has been described as
particularly frequent in the communication of science to lay audiences (e.g., Fleck 1979: 115-125).
This is consistent with a public perception and representation of technoscience as a source of
authoritative knowledge, useful applications and progress. When factualised, technoscientific
notions are decontextualised from their conditions of production, which is made easier by the social,
linguistic and practical distance between research and mass media contexts (Whitley 1985: 13).
However, it has been argued that such stabilising and reifying routine is not the only one performed
in the public communication of science and technology. Indeed, scientific statements can reach
contexts of non-expert communication even without having full support form experts, that is when
they are not yet fully stabilised (see Cloître and Shinn 1985: 55-58; Lewenstein 1995: 425-431;
212
Neresini 2000: 361; Bucchi 2004: 117-122). Accordingly, non specialised levels of technoscience
communication can constitute arenas for debate on more or less controversial technoscientific
objects and practices. An analysis of technoscientific controversies is out of the scope of the present
research. However, the above mentioned studies make a point of the complexity and diversity of the
production and circulation of scientific and technological knowledge across different domains,
including news. The representation of technoscientific entities in news articles is thus not only
characterised by factualisation and reification strategies, but can also be used to negotiate their
status.
In STS and PCST studies, the negotiation and re-contextualisation of statements and entities –
whether controversial or not – has been associated to the presence of ‗boundary objects‘. Boundary
objects are ―entities that enhance the capacity of an idea, theory or practice to translate across
culturally defined boundaries, for example, between communities of knowledge or practice‖ (Fox
2011: 70), as are expert and lay groups with respect to a particular field of science and technology.
According to Star and Griesemer (1989: 393), boundary objects ―have different meanings in
different social worlds but their structure is common enough to more than one world to make them
recognizable, a means of translation.‖ From these descriptions, it seems clear that these objects exist
through discourse, because it is through language and discourse that they are assigned relevant
meanings. Famous examples of such objects are genes, DNA, Big Bang, and AIDS (Bucchi 2008:
67). The presently analysed ST articles potentially contain further examples. As in the case of black
boxes, some of them may be found among the selected keywords. Although an accurate description
would certainly involve a survey of their meanings in contexts outside newspapers, a couple of
words will be considered whose use seems consistent with boundary functions, that is, whose
meaning is particularly vague, flexible, and/or related to non-specialised activities in spite of their
technical value.
One example could be, once again, software; its concordances in ST articles revealed it is
associated, in a general way, to the capacity to perform a wide range of tasks in a computer
environment. It is used interchangeably with program – see (113) below – although the two have
slightly different meanings in specialised environments.16
Moreover, as both (113) and (114) show,
it is closely associated to the type of task it performs – in these two cases, it is primarily identified
as a security device. At the same time, it is a commercial product, as the explicit reference in (114)
shows. All these aspects go beyond and bypass what software is and how it works among those who
build or theorise it. However, through these other aspects, social groups such as news readers, end
users or company members come in contact with software objects and interact with specialists.
Examples
113) When popular security software TrueCrypt closed its doors, many users simply couldn't believe that the
stated reason – that the developers had decided to stop work because Microsoft had rendered their software
obsolete – was true. The most widely held interpretation, two weeks on, is that the developers decided to stop
working because the task of maintaining a widely used cryptography program just became too much work. Other
users claim that the program contains "duress canaries", small signals designed to indicate that the work is being
released under duress.
114) GCHQ-developed software for secure phone calls open to 'eavesdropping'. A security software designed and
backed by the UK government could allow third parties to eavesdrop on voice and video conversations. As
16
About the difference between software and program, see for example
http://www.math.utah.edu/~wisnia/glossary.html#s or http://marvin.cs.uidaho.edu/Teaching/CS112/terms.pdf
213
detailed by UCL research fellow and security expert Steven Murdoch, the system, known as MIKKEY-SAKKEY,
was built by GCHQ through their information security arm, CESG. However, the software has a security
backdoor which means that security services (or a hacker or a foreign intelligence agency) could intercept and
listen to all past and present calls made using the software. The parties on the call would be unaware of the
interference. This also implies, in theory, that if it were used for sensitive communications by the Cabinet Office,
voice calls that use this product could be intercepted and compromised by foreign hackers, without our
knowledge.
Another potential instance of boundary object is data, a word which is extremely flexible and
fragmented from a semantic point of view, even within ST articles (see Section 9.1 in this chapter).
Data intended as personal information is often related to personal and public concerns for privacy
(115), while representing a commercial object for companies (116). At the same time, data is at the
basis of technoscientific research, which uses (117) and produces it (118). Data can also be relevant
to technological innovation (119). It is an ubiquitous although vague concept, capable of connecting
many different areas, and a pivot for topical debates about the role of technology in society.
Examples
115) ―All data is vulnerable even when in the process of being deleted, and Office should have had stringent
measures in place regardless of the server or system used,‖ said Sally-Anne Poole, the ICO‘s group manager.
116) Many companies manage our data; most of them have no enforceable legal responsibility to us.
117) President Obama on Friday announced a major biomedical research initiative, including plans to collect
genetic data on one million Americans so scientists could develop drugs and treatments tailored to the
characteristics of individual patients.
118) Long-term studies with Spector‘s UK Twins Registry, containing about 12,000 twins, have produced a wealth
of data about the genetic and environmental factors affecting health, disease and physical appearance.
119) Legal & General is using retina scanning in India to speed up the process of applying for life insurance
products. The retina scan immediately brings up personal data that can be used to fill in online forms.
As mentioned earlier in this section, boundary objects are among the indicators of the complex
dynamics at work when technoscientific knowledge circulates in the public sphere. Because of such
complexity, it would be difficult to identify any prevailing model of science communication (see
Section 9 in Chapter 2) in the analysed articles. The deficit model could be the standard for a
medium such as newspapers, which are meant to be read; however, different trends might emerge,
especially online, where readers have the opportunity to post comments below published articles.
Bucchi (2008: 69) claims that ―most communicative situations would have to be described by a
combination‖ of diffusionist, dialogic and participatory models. Moreover, as the use of the Internet
has become pervasive, communication has grown in extent and accessibility, and it has become
easier for non-scientist stakeholders to participate in debates and produce content. Such interactive
aspects contributed to blurring the boundaries between contexts of knowledge production and
dissemination, thus favouring the mixing of different models. The variety of communicative
functions characterising ST texts may be regarded as a feature of newspaper language as a whole,
because of their general resemblance to the rest of the corpus. At the same time, however, it could
be situated in the above described framework, where different communicative purposes are
compatible with different models of communication. Accordingly, some texts mainly appeal to
readers by creating the illusion of a spoken exchange – sometimes involving readers themselves.
Others deliver high amounts of accurate information adopting a detached style. Some use reported
speech either to achieve a sense of reliability or to relativise certain standpoints, while others
214
generally adopt more direct styles. Some ‗instruct‘ and ‗persuade‘ readers through articulate and
accurate language, while others tend to maintain less complex structures and adhere to a limited but
focused vocabulary. Some engage readers through narration, others by envisioning the future. Many
texts result from a combination among different purposes and strategies. These findings about the
heterogeneity of ST articles suggest that they may not form a consistent news sub-genre, which can
be clearly distinguished from other sub-genres; the implication of these results for the initial
research questions and hypothesis will be dealt with in Section 1.1 of Chapter 6.
The presence of a variety of interacting stakeholders contributing to the development of
technoscience in society is one of the main features of what has been referred to as Mode 2 or post-
academic science (Gibbons et al. 1994, and Ziman 1996 respectively). Compared to the past,
contemporary science is also characterised by ―a greater proximity to the contexts of its application,
by the marked intersection of disciplinary fields, [...] and by what commentators term ‗reflexivity‘
and ‗social accountability‘‖(Bucchi 2004: 134).17
Different stakeholders do in fact populate the ST
section. In particular, the importance of economic actors is marked by the identification of a domain
of economic activities connecting some of the selected keywords (see Section 9.3 above): software,
computer, Google, research, app, users, data, tech, technology, internet, digital, online, products,
video, service(s) and, above all, company. Consequently, it can be said that in the ST articles, the
key role of these stakeholders in the development of technoscience is somehow acknowledged.
However, more detailed analyses and a larger ST corpus would be needed to investigate whether
scientific and economic aspects are actually intertwined within single texts, or there is still a neat
distinction among more ‗purely research-centred‘ articles and more ‗tech company/product-centred‘
ones. The greater proximity between research and application contexts is another typical element of
Mode 2 science emerging from the group of selected keywords for ST texts. The concordances of
keywords like science and research indicate that they are used within different semantic domains,
both related to more traditional scientific activity and to technological development.
The interaction and overlap among areas traditionally considered separate calls into question the
very distinctions among them. In this perspective, hybrid rather than separate areas of knowledge
and practice emerge. The notion of hybridity was used by Latour (1993) to point out what he
depicted as a fundamental contradiction of modern Western culture. On the one hand, modernity
continuously creates hybrid networks seamlessly mixing both nature and culture. One example of
hybrid entity is the ozone hole, which draws together chemists, chemical elements and
measurements, meteorologists, large companies and lawsuits, ecologists, politicians and so on. On
the other hand, the modern mentality draws on a fundamental, ontological ‗Human/Cultural‘ versus
‗Nonhuman/Natural‘ distinction. Reality needs therefore to be classified and ―purified‖ by
separating human beings and all their definite fields of knowledge and practice from everything not
human – that is the natural world. In fact, following Latour, all these aspects are tied together in
hybrids.
Like any instance of communication of science and technology, ST texts often represent – and
contribute to constructing – hybrids. At the same time, they show tendencies to clearly separate
hybrid phenomena. The keyword analysis provided some examples of such tendencies, among
which the modifier human seems particularly relevant. A range of entities are classified as human
17
For a more detailed account of post-academic science, see Section 1 in Chapter 2.
215
(e.g. health, rights, and life), which somehow implies an opposite, non-human quality. Moreover,
humanity is taken as a parameter (human-like, human-led) against which non humans can be
described (cf. Section 9.3). In actual fact, however, people‘s actions become one with machine-
performed tasks, humans participate in ecosystems like any other existing species, and interact with
a wealth of elements and factors which affect their health as well as the surrounding situation.
Another ‗pure‘ distinction is indicated by the keywords digital and online. Both are often used to
circumscribe an ideally definite environment, a sort of parallel world made possible by
technological applications. People may carry out certain activities (e.g. purchases, campaigns,
personal life) using technologies belonging to this parallel world, but these often need to be
specified by the modifiers online and digital. At the same time, numerous technological objects are
part of people‘s everyday life and are designed to increasingly and seamlessly integrate all sorts of
activities into their systems.
Overall, the above findings and comments show that the social construction of technoscience can be
analysed in the language of newspapers, by taking into account multiple linguistic aspects. Those
suggested here are only some of the possible points which could be further developed. A higher
sociological, historical, and cultural awareness could be useful in such development. Cognitive
approaches might also prove relevant and helpful to make the investigation more comprehensive (in
a sense, more hybrid), because practices such as the creation of black boxes and the separation
between ‗human/cultural‘ and ‗non-human/natural‘ realities form part of the cognitive tools we use
to make sense of the world.
11. Conclusion
MDA was used to identify patterns of variation in the use of LFs in the news corpus. These patterns
were summarised in four constructs, referred to as factors, with underlying dimensions of variation.
Different communicative purposes are expressed by each dimension. In the present chapter, the
dimensions were used to characterise the section of the corpus containing articles about
technoscience. Such characterisation was based on the comparison between ST articles and all the
other texts in the corpus, as well as between ST and the other macro-feed based sections.
When compared to all non-ST articles taken as a whole, the ST section emerged as featuring
significantly more speech attribution structures potentially referring to recent past events.
Moreover, ST texts refer more often to present and future situations. On the other hand, no
statistically significant differences emerged concerning the density of information, the level of
interaction and the presence of explicit explanation or argumentation.
Significant communicative differences also emerged from the comparisons between ST and the
other macro-feed based sections. In particular, with respect to the first dimension, ST emerged as
unmarked, and similar to most other section. At the same time, it is less informative and formal than
business articles, while it is more informative and less interactional than sports articles. As for the
second dimension, ST is one of the sections where speech attribution and reporting structures are, in
general, slightly more common than direct and/or factual styles are. It is similar to most sections,
but it uses significantly more speech attribution and reporting structures than the ‗Culture, Arts and
Leisure‘ and ‗Sport‘ sections. Along the third dimension, ST articles emerged as significantly
216
plainer and more lexically repetitive than opinion articles, while being more
explanatory/argumentative and lexically diverse than home page and sport articles. In the fourth
dimension, which is related to narration and time reference, ST articles are located towards the
present and future-focused area of the continuum. They were found to be overall similar to business
and opinion articles, while they are significantly less narrative and more concerned with the present
and the future than all the remaining sections.
Some statistically significant differences were also found between different newspapers. The
Guardian and The Daily Telegraph seem to display their multidimensional features in all the four
dimensions. In particular, they are relatively more interactional and less dense in informational
content than The Financial Times and The New York Times. They also generally use more speech
attribution and reporting structures, while The Financial Times and The New York Times tend to be
more ‗direct‘ and factual in style. The Guardian and The Daily Telegraph are moreover similarly
unmarked in the third and fourth dimensions. By contrast, The Financial Times tends to be more
explanatory/argumentative and lexically variable, and to refer more often to the present and the
future with respect to all the other newspapers. At the same time, The New York Times emerged as
less explanatory and lexically diverse, while overall using a more narrative style, and referring more
often to the past.
The differences among newspapers were generally mirrored by the difference between ST sections
across newspapers. At the same time, the difference between ST and non-ST texts within each
newspaper did not always reflect those found for the general corpus. For example, only ST articles
in The Financial Times were significantly more ‗reported‘ in style than non-ST texts. They emerged
as significantly more explanatory/argumentative and lexically diverse than non-ST texts only in The
Financial Times and The New York Times. Moreover, only The Guardian and The Daily Telegraph
had significantly more present and future-focused ST articles with respect to the non-ST ones.
Despite resulting in some statistically significant differences, however, the present MDA revealed
that the magnitude of such differences is limited, and that none of the groups of texts compared was
characterised by marked scores in any of the factors. Rather, all groups tended to gather around the
measures of central tendency of the entire corpus.
The lexical analysis provided some information as for the main topics covered in the news corpus.
Among a significant portion of general lexis – typical of corpora dealing with many different topics
– frequency wordlists and especially keyword lists suggested that politics and economy/finance are
among the prevailing themes. Against this background, ST texts feature much general lexis, but also
a set of keywords, most of which were semantically related, whose analysis highlighted some broad
domains characterising the communication of technoscience in the corpus. There is a complex
interaction between keywords, and across different domains. The traditional idea of ‗popularisation‘
of academic research findings is here combined with other aspects, among which the role of
technological applications in everyday life and the economic aspects of such applications. Some of
the elements highlighted by the present linguistic analyses were used to draw connections with
sociological theories which stressed the role played by language in the social construction of
technoscientific knowledge. Thus, the evolution of technoscientific facts and objects, described by
sociologists as a collective process of social construction, was connected to some of the linguistic

217
characteristics found in ST texts. The present considerations, however, are only based on individual
examples, and cannot but be tentative and preliminary to further work.
218
CHAPTER 6. GENERAL CONCLUSION
Technoscientific practices are complex processes, characterised by a continuum from basic through
applied research, to technological implementation. Such practices cannot exist without their
methods, outcomes, motivations and possible implications being continuously communicated
within different networks of social actors, characterised by different levels of expertise. Given the
pervasive presence of scientific and technological applications in numerous sectors of society, and
the blurred boundaries between research environments and other social domains, the circulation of
technoscientific knowledge across a range of different contexts is essential to the life and
development of research activities.
The present study originated from an interest in the status and characteristics of technoscientific
knowledge and practices as they are represented and communicated in one of the contexts
mentioned above, namely daily newspapers. Preliminary research was based on the working
hypothesis that the technoscientific information provided to non-specialised audiences by the mass
media could partly reflect widespread views about science and technology. These concern, for
example, the research fields covered most often, the level of reliability and authority of the
scientific community, and the way uncertainty and controversy are managed in news articles. At the
same time, the media coverage of science and technology could encode particular attitudes towards
readers who may be implicitly treated as passive audiences, or variously engaged, as if they were
taking part in a real exchange. The role of journalists and experts might also be encoded: the former
could be represented as mediators and/or watchdogs, while experts may be usually represented as
reliable sources of information.
One of the possible ways to investigate the status and characteristics of technoscientific knowledge
in newspapers was to identify whether it had peculiar linguistic attributes, and what they were. This
was the key point of the first and second research questions. The third research question centred on
the possible implications of such linguistic characteristics: in particular, it asked what
communicative purposes they might realise. Answering these questions was seen as a useful starting
point to infer views and attitudes about technoscientific issues, their agreed-upon or controversial
nature, the roles attributed to experts, and some information about the models of communication
(see Section 9 in Chapter 2) employed in the analysed texts. The MDA method was identified as a
potentially useful tool, which could combine a comprehensive analysis of multiple linguistic
characteristics with a functional interpretation of those characteristics. The first MDA study (Biber
1988) had highlighted the presence of various communicative functions throughout a general
English corpus, and had made it possible to attribute different functions (or combinations of them)
to different genres in English. Thus, in terms of method, one further question implicitly asked here
was whether MDA could reveal similar information if applied to the language of newspapers. If this
was the case, it might contribute to identifying possible purposes characterising the communication
of science and technology, thus helping to answer the three research questions outlined above.
MDA was combined with qualitative, and lexical analysis to provide a more comprehensive
description
In the next section, the main findings of the analysis will be summarised and further commented on.
Section 2 will focus on the opportunities and positive outcomes offered by the tools developed for
219
the present study and the methods outlined for automatic linguistic analysis. Subsequently, the main
limitations of the study will be described in Section 3. Some possible future developments of this
study will then be sketched in Section 4, while the final remarks in Section 5 will conclude the
chapter.
1. Further remarks on the linguistic analysis of science and
technology in a newspaper corpus
The multidimensional approach to corpus analysis aims at detecting latent constructs or dimensions
that can explain and are reflected in the linguistic variation within a corpus. Performing a MDA
implies the assumption that there might be differences internal to the corpus, such as genre-based or
situational ones. Thus, the corpus should be representative of the range of variation which needs to
be explored, and should therefore consist of several subcorpora reflecting such range. In the present
study, different sections of online newspapers served as marker of sub-genre variation. Linguistic
variation is understood here – following Biber – as the variation in the frequency of use of a set of
linguistic structures – here called linguistic features, or LFs – and more precisely, to the way
frequencies of several LFs are correlated. Following the multidimensional model, the higher amount
of overlap in the frequency variation among LFs (shared variance) can be explained, the more
comprehensive and powerful the analysis will be. However, the factors extracted in the present
analysis do not explain but a small percentage of shared variance. This might be due to low
correlation values between the analysed variables, and more in general to the fact that the obtained
factorial model does not have the power to fully capture the behaviour of the analysed LFs. This
leads to the possibility that there might not be comprehensive latent variables concerning the
language of the corpus, or else that such variables might lie elsewhere with respect to the LFs,
and/or to the texts as units of analysis. It should be stressed, however, that in a corpus whose texts
all belong to the same genre, little variation can indeed be expected, and therefore smaller
differences and smaller correlations acquire greater relevance in the analysis. Another important
aspect concerns the distribution of texts from different sections of the corpus in relation to the
dimensions obtained through MDA. Most of them are located around unmarked scores, relatively
close to the mean values of the whole corpus. Accordingly, despite being in some cases statistically
significant, the differences between corpus sections are generally very small. The same applies to
differences among newspaper sources and between articles containing direct speech and those not
containing it (see Section 8 in Chapter 5). This seems to support the inference that, on average,
these texts do not differ substantially from each other with respect to the set of LFs used in MDA.
Such small extent of variation in the corpus could indicate – overall – a high standardisation of
online newspaper language. Regardless of the topic being reported on, reflected by lexical elements,
the grammatical and syntactic characteristics of these articles may therefore have been largely
influenced by the context of production of news in general, rather than by sub-genre conventions.
The editorial standards adopted by newspapers may also have contributed to these results, since
maintaining a uniform style – or house style – throughout the whole set of articles produced is a
priority within most newsrooms, especially in the case of long-established news outlets such as
those here analysed. Moreover, a relative homogeneity between articles dealing with technoscience
and other types of news could reflect the fact that most of them were written by journalists who are
220
not specialised in science writing, given that less and less professional science journalists are hired
full time in newsrooms (see Section 3 in Chapter 1). Rather, many authors may not be specialised in
a particular sector, thus reporting on a range of different topics. However, this assumption would
require verification, mainly by retrieving byline data and checking whether authors of ST texts also
wrote articles classified into other macro-feed categories. These data were not systematically
collected when building the present corpus (author names were manually retrieved from the Web
for referencing purposes only), but this could be a useful starting point for further research.
1.1. Addressing research questions and hypothesis
Linguistic analysis, including MDA, was ultimately performed in order to answer a set of initial
research questions and accept or reject a research hypothesis concerning the existence and nature of
linguistic differences between news texts communicating science and technology and other types of
news articles. The answers suggested by the present analysis appear rather more complicated than
the questions. If a plain and short answer had to be provided, however, it would be that the articles
published in newspaper sections related to science and/or technology cannot be entirely
distinguished from other news subgenres, other than through lexical choices, which reflect their
topics. Nevertheless, a more elaborate line of reasoning is also advisable to fully exploit the
possibilities as well as the limitations of this study. Overall, the multidimensional method did not
capture polarising differences among corpus sections. Leaving aside for now issues related to the
nature of corpus sections (examined in Section 3 below), results also disproved the assumption,
underlying the research questions and hypothesis, that science and technology in the news could be
regarded as a unified construct. In other words, the results were in conflict with the initial
assumption that the linguistic similarities among articles dealing with science and technology
prevailed over differences and distinguished them from the rest, so that they could be dealt with as a
linguistically homogeneous sub-genre of news.
Instead, most ST articles turned out to combine ‗a bit of each end‘ of the factor continuums. This
aspect makes them similar to the average values of the whole corpus – the central reference for
placing the texts on the continuums. Moreover, it extends to most of the other sections of the
corpus. Being similar to other corpus sections and overall unmarked in the four dimensions does not
however make ST articles unworthy of consideration. Firstly, the possibility that different
communicative tendencies are at work within the ST section – and often within the same text –
points to the range of strategies that can be adopted to communicate science and technology.
Secondly, not every ST text combines LFs in the same way across all dimensions, each of which
can be present in different proportions. Thirdly, besides central tendencies, there is still a percentage
of texts whose characteristics are quite marked along some of the four dimensions: their presence is
indicated by the wide ranges of scores characterising ST texts in all four dimensions and can be
visualised above and below the first and third quartiles in the boxplots representing the ST section
(cf. Chapter 5, Sections 3.4, 4.4, 5.4, and 6.4). This is also partly – although not exhaustively –
supported by the qualitative analysis, where different styles to communicate technoscience-related
content stood out in marked and unmarked texts. Finally, as far as ST as a section is concerned,
although it cannot be concluded that particular communicative functions clearly and always
distinguish it from the other sections, some minor but significant differences emerged from the
comparisons. As a whole, the MDA results only lead to a partial rejection of the research
221
hypothesis. Therefore, given a set of LFs relevant to the realisation of communicative goals, the
articles classified as reporting on science and technology do not have linguistic peculiarities capable
of completely and always setting them apart from other types of news.
1.2. Possible shared communicative functions
Although the dimensions resulting from this MDA cannot be regarded as fully explanatory with
respect to the linguistic categorisation of online news, they highlight some linguistic patterns of co-
occurrence whose presence does vary across the texts. There is no reason, therefore, not to assume
that such patterns gather LFs with shared functions, used to achieve particular communicative
goals. The interpretation of the factors, supported by the qualitative analysis, helped to identify a set
of communicative functions and propose them as a tool to characterise news texts. These functions,
summarised below in this section, could be confirmed, disproved or integrated by further research.
The first dimension, ‗Interactional/Conversational vs. Informative/Formal Communication‘
embodies an oral-literate continuum which seems to closely reproduce that characterising the whole
English language in Biber‘s work. However, it seems likely that the shared communicative
purposes underlying a more oral or literate production in a general corpus do not completely
overlap with those at work in news articles. For example, an informal conversation is interactive,
vague and low in nominal information because it is structured in turns and has a strong
interpersonal component often prevailing over the informative one; it is also influenced by the
context of production, often characterised by lack of planning and time constraints. On the contrary,
similar linguistic characteristics in a news article cannot be explained with exactly the same
functions: to begin with, there is no actual interlocutor; moreover, an article always results from
planning, however strict time restrictions can be. On the whole, the oral component found in the
present news corpus is there to reproduce speech: it can be direct speech as in an interview, or the
author might approach readers as if they were having some kind of conversation. In most cases, the
spoken registers reproduced in articles with an oral component – that is with a more or less marked
positive score on Factor 1, will be informal and/or will make direct reference to the represented
interlocutors (e.g. the author and an imagined reader). This might have several purposes: for
example they could aim at realistically reproducing an exchange or a person‘s attitude; or they
could aim at directly involving the audience, reducing the distance between them and the author. On
the other hand, linguistic productions on the literate side of this continuum are more in line with the
typical functions generally attributed to news, namely providing information. More precisely, such
information is dense with nominal phrases, and, according to the qualitative analysis, characterised
by a rather formal register. A formal and nominal register conveys the idea of reliable and detached
information, occasionally rich in details and overall precise, even specialised, and therefore more
accurate. As results from the ST section show, in communicating science and technology, there is a
literate, informative component; however, it is often mixed with interactional, less formal aspects,
similarly to non-ST texts. The informative component could be said to fulfil the function of
conveying the objectivity associated with technoscientific knowledge, thus adhering to socially
acknowledged representations of technoscience in the public sphere. At the same time, the
interactional and more informal component coming from the positive LFs in the first dimension
might be employed to make the text overall more appealing for non-expert audiences.
222
Only two among the corpus sections stand out with respect to the first dimension: ‗Business‘, for its
tendency towards literate and informative styles; and ‗Sport‘ for its interactional and informal
aspects. These findings frame the former section as characterised by a particularly high information
density, potentially representing economic and financial subjects as technical and esoteric, even
more than technoscientific ones. ‗Sport‘, which also reports on a body of disciplines characterised
by their own specialised terms and rules, is in contrast represented more informally, being probably
associated with more relaxed and informal experiences. The finding that technoscientific subjects
tend to be framed in a more informal and less specialised way with respect to economic and
financial ones is particularly interesting. One might expect the two to be roughly similar relative to
the first dimension: they are both related to specialised areas of knowledge and research, and are
regarded as essential to the development of contemporary societies. Moreover, their public
communication often relies upon experts‘ accounts. The difference that emerged between them
from the present analysis might be influenced by the editorial lines of the source newspapers
involved, and more specifically by the stylistic choices adopted throughout news sections. It could
also reflect a difference in status between technoscience and economy, which may be perceived
differently, in terms of public appeal and accessibility, within the public sphere. Further analyses
would be needed to clarify communicative aspects and social implications of their observed
distance along the first dimension.
The second dimension, ‗Reported Account of Recent Events vs. Direct/Factual Communication‘, is
concerned with delivering the latest news while including the voices of those involved. Reported
speech is at its heart, and is accompanied by verbal tenses generally used to indicate events whose
relevance persists into the present. Other co-occurring features, especially passive verbs, point to a
somewhat detached style, but can also emphasise the position of patients1 being acted upon (e.g.
victims, as in Section 3.2.1 of Chapter 4). Overall, a combination of some or all of these
characteristics in a news text may contribute to conveying the idea of an up-to-date documentation
of events, made more reliable by the attribution of some content to people somehow involved in or
expert about the events reported on, and occasionally made more impersonal and detached by the
use of passive verbs. As far as ST articles are concerned, the lexical analysis suggested that
scientists and researchers – together with their published works – are the main source of
technoscience-related statements in texts where speech attribution and reporting structures are used.
Economic organisations, chiefly companies, also stand out as key actors in ST texts. As their strong
collocation with the verb said suggests, they are also explicitly represented as sources of
information. However, concordance inspection suggests that companies‘ statements only partly
concern scientific and technological issues, which, by contrast, characterise all the instances where
scientists are associated to reporting verbs. In some respect, the finding that members of the
scientific community, and secondly companies, seem to be almost the only actors to be explicitly
given the power and responsibility to talk about technoscience might contrast with the actual
involvement of many more different stakeholders in the production, negotiation and application of
technoscientific knowledge. At the same time, it should be noted that speech attribution may not
exclusively be employed to enhance reliability, for example by exploiting someone‘s authority: it is
also a device to remove the responsibility of what is being said from the author of the article to an
1 Here, ‗patient‘ is used in its linguistic sense, where it indicates a semantic role. The role of patient is assigned to a
noun phrase referring to someone or something affected or acted upon by the action of a verb (see Section 3.2.3 in
Chapter 4). Therefore, in this case, ‗patient‘ identifies the grammatical subject in a clause whose verb is passive.
223
external source. By contrast, a negative score on the second dimension reflects communicative
situations where authors simply provide the audience with stories, descriptions or even personal
opinions exclusively based on their own voice. Texts located to the negative side of this dimension
may in general adopt a direct style, which can sometimes be perceived as factual, since unmediated
by external voices. On average, ST texts tend to employ positive F2 strategies slightly more than the
negative ones, but it is not a marked tendency. Rather, it seems that reliability through attribution
and impersonality is often balanced with more direct and factual communication. The section is
moreover characterised by texts with extremely high levels of ‗reported‘ articles as well as by some
markedly low example.
The third dimension, ‗Explicit Argumentation/Explanation vs. Topic-Focused Communication‘, has
to do with the way the audience is guided through the text. Its positive end is characterised by a
discourse where coherence and lexical diversification are highly valued, together with a careful
arrangement of information. A combination of these features seems to point to one main purpose:
that of making information explicit, sensible and ultimately understandable for the audience, which
explains why the positive end of this dimension covers a range of purposes, from sheer explanation
to argumentation and possibly persuasion. Unsurprisingly, ‗Comments and Opinions‘ is the section
whose central tendencies are located in the highest part of the factor continuum. The type of
discourse located towards the opposite end of the continuum lacks these devices of explicitness and
coherence and it is not as lexically variable as that at the positive end of the continuum. Not
stressing logical links and maintaining a low lexical variability may be a way to keep information
simple and in its most basic form. Most ST articles are distributed in a range of F3 scores between
the moderately negative – where information tends to be delivered in a basic form and with little
logical explanation – and moderately positive – where readers are carefully guided through the
content as it is logically developed. Within this range, there are slightly more articles on the positive
side than on the negative one, but this tendency is not as marked as in ‗Comments and Opinion‘,
already mentioned above. Two sections standing out for their lower scores with respect to ST are
‗Homepage‘ and ‗Sports‘, both characterised, for different reasons, by particularly plain and concise
styles.
The fourth dimension, ‗Narration of Past Events vs. Present/Future Focus‘, represents a contrast
between narrative and non-narrative news content. A narrative account captivates the reader‘s
attention and satisfies their curiosity through the unfolding of a story. Similar linguistic
characteristics are found in past descriptions, which do not necessarily imply a sequence of events
but do at least partly involve a narrative dimension (e.g. in obituaries, where the personality and life
events of the deceased are remembered). In contrast, the opposite end of the continuum includes
texts whose content is framed as extremely relevant either to the present or to the future: in the
former case, topicality is the key to appeal to readers; in the latter, making forecasts and envisioning
the future are employed to attract their interest. These present- and future-oriented communicative
purposes characterise, although not markedly, the ST section, where they tend to be mixed with
some references to past events. Expectably, the idea of science and technology as topical and key to
the future of humanity is slightly more widespread than its narrative and past aspects.
224
1.3. Discourse and the construction of technoscientific facts
The linguistic analysis provided a framework through which some communicative purposes could
be identified in ST texts. The functions and strategies retrieved from the analysis were thus regarded
as a valuable source of information about the meaning and status that news articles assign to
technoscientific entities, thus contributing to their establishment as undisputed facts, or questioning
them as artefacts (cf. Section 10 in Chapter 5).
The usefulness of a linguistic approach to factualising or de-factualising strategies was shown in
relation to modality, a concept used by some sociologists to indicate the way scientific statements
are linguistically framed and modified. Modalities cannot be automatically detected, for their
complexity and context-specificity. However, some of the co-occurrence patterns identified through
MDA might serve as a framework to identify a particular modality or set of modalities. Thus, the
extent to which speech attribution – relevant to the second dimension – is used in technoscience
communication could be related to the use of positive modalities, reinforcing a statement through
the authority of an expert, or negative ones, for example where conflicting opinions are expressed
and uncertainty prevails. Moreover, further research might investigate the functions of
argumentation, explanation and lexical variability – relevant to the third dimension – in articles
reporting on science and technology. For example, they might be mostly employed to describe
scientific and technological entities as widely accepted, thus opening perspectives for further
implications. However, they could also be used to question technoscientific achievements, urging
readers to reflect upon their value and consequences.
The lexical analysis offered opportunities to explore factualisation processes, enacted by word
choices surrounding technoscience-related keywords. In some cases, the semantic associations
between some keywords and verbs referring to discovery ad revelation were shown to reflect widely
held views depicting science as a way to uncover the true nature of our surrounding reality. In fact,
sociologists pointed out that language plays a fundamental role in shaping the way we perceive and
know reality. Only part of such shaping processes are performed in the mass media. To produce a
more comprehensive account of the evolution and life of scientific notions through the different
contexts where they are communicated, however, it would be necessary to analyse different genres
where technoscience communication is performed (adding, for example, the analysis of press
releases from research institutions and/or scientific journal papers to that of news articles), adopting
moreover a diachronic perspective. Along with semantic associations among technoscience-related
keywords, semantic fragmentation and flexibility emerged as characterising some of them, thus
potentially marking them as boundary objects, which are essential in the interaction among various
stakeholders involved in the development and application of technoscience-related knowledge in
different sectors of society.
Another aspect emerging from this sociologically based elaboration of linguistic findings is the
presence, in the same corpus and quite often within the same texts, of different communicative
purposes, which might reflect different possible approaches to the communication of science and
technology through news media. This seems to be partly consistent with PCST studies, according to
which most instances of public communication of science and technology result from the combined
use of different models (see Section 9 in Chapter 2).
225
The ST section here analysed could be distinguished from the rest of the corpus by a set of
keywords pointing to some broad topics – for example, the Internet, technological devices, and
research in general. The frequent semantic connections identified among words and topics through
concordance and collocation analysis were linked to the hybridity of scientific and technological
issues. These can be regarded as complex networks of interrelated areas, actors and elements. At the
same time, however, sociologists have pointed out that there is a tendency towards the
differentiation, classification and ‗purification‘ of aspects of reality – and of technoscience –
perceived as separate. Discourse is central to such theories, since while it is necessary to refer to
hybrid realities, it is continuously employed to classify, purify and separate them, with the aim of
understanding and controlling them.
The possible connections between linguistic and sociological descriptions might contribute to an
understanding of the role of news in shaping part of what the general public knows about science. In
the present analysis, newspaper articles have been associated to a range of possible communicative
functions: these can be regarded as tools to negotiate technoscience-related meanings and combine
them with the purposes of news reporting. Thus, the present considerations may be seen as starting
points for further investigations into the role of discourse in the construction of science and
technology.
2. New tools and opportunities for method development
The application of MDA to the present study consisted in autonomously reproducing the established
procedure described in Biber (1988). The choice of autonomous reproduction was partly due to the
limited availability of tools, but mainly motivated by the necessity to learn about, become aware of,
and control as many methodological details as possible. Only such awareness would make it
possible to explain the outcome of the analysis and understand its implications. Reproducing MDA
required a considerable amount of work and a ‗critical‘, or ‗engaged‘ attitude, in that some aspects
needed to be reviewed and adjusted to the present analysis (cf. Section 1 in Chapter 3). These
included some minor changes to the set of LFs analysed, and a different approach to their automatic
identification, further discussed below. Throughout the process, alternative approaches to some
stages of the statistical analysis were explored and accounted for. Although the established,
‗traditional‘ MDA procedure was generally followed, reviewing other options was helpful in
clarifying and providing a stronger basis for the methodological choices made. The statistical tests
applied to compare ST articles to the rest of the corpus and to other corpus sections were also
chosen independently of Biber‘s reference (Biber 1988: 95-97), on the basis of data distribution,
availability of software packages and advice from statisticians. The full procedure was thoroughly
documented, so as to provide a clear background for result interpretation, and hopefully useful
points of comparison for other researchers basing their work on MDA.
Besides producing the results discussed in Chapters 4 and 5 and further commented on in Sections
1.1-1.3 above, the present study made it possible to identify problematic aspects of the
multidimensional method, which can be addressed through new research problems and questions
(cf. Section 3 below). Moreover, devising and putting into practice this version of the method
brought about a close collaboration with researchers in the TIPS project, whose expertise in
226
computer science and data analysis was positive and enriching for the present study. The main
result of this collaboration was a software workflow which pre-processes texts and exploits regular
expressions to automatically identify and count the LFs used in MDA. One of the aspects which
most contribute to the value of such workflow – and especially of its regex-based identification tool
– lies in its potential to be extended and adapted to different types of quantitative textual analysis. It
could be applied to automatically identify and count any text string that can be expressed through a
regular expression, both in annotated and unannotated texts. Thus, the workflow devised for MDA
is not language-specific; if a set of LFs and a PoS-tagged version of the texts to be analysed were
produced, this set of tools could be used to extend MDA to new languages. It could also find
applications beyond the scope of MDA, for example in phraseology studies, or to explore the use of
words from multiple lexical classes established by the researcher, or even to identify the presence of
named entities that can be expressed in multiple ways. One concomitant result of the creation of
these tools was a critical review of PoS-taggers available for English, conducted while selecting a
suitable tagger for LF identification. Some substantial differences were found between taggers
devised with a view to syntactic analysis and taggers focusing on grammatical behaviour. It was
thus claimed that researchers using PoS-taggers should be fully aware that the tool used needs to be
consistent with the focus of their analysis in order to obtain reliable results.
Therefore, the tools and procedures created and employed to perform the present study did not only
serve the purpose of producing a MDA on a news corpus. On the one hand, the aim of this work
was to offer a new perspective on MDA, partly independent from its main ‗tradition‘, thus
contributing to its use and assessment, as well as to potential improvements. On the other hand, the
present study also involved creating new tools for the computer-assisted analysis of language,
which might hopefully be of use in future research.
3. Limitations of the study
In this conclusive chapter, it is useful and necessary to discuss the main shortcomings that have
been found to affect the study. Limitations arose at various stages of the present analysis. They must
be acknowledged in order for interpretations and conclusive remarks to be more accurate, and are
essential to the improvement of the analysis itself, as well as to the identification of directions for
future research (see Section 4 below).
The first set of limitations concerns the way the initial research questions and hypothesis were
conceived. As suggested in Section 1.1, grouping articles classified by editorial staffs as dealing
with science and/or technology implies treating them as a unified sub-genre. The research questions
and hypothesis implicitly assumed that these texts were characterised by a certain homogeneity,
either for their content or for their linguistic characteristics and communicative functions, or both.
Yet, the ST section turned out to include quite a wide range of topics and types of article, from
reports on the latest findings in physics, to reviews of the most exciting videogames coming out the
following week. While a set of keywords was helpful in identifying some overarching themes
throughout the ST section, the MDA did not highlight patterns or communicative functions pointing
to widespread similarities. The heterogeneity of the ST section is related to a more general corpus
227
design issue, namely the choice of maintaining the ‗official‘ classification of articles based on the
sections found in news websites.
Such classification makes sense because it reflects the way readers are led by authors to view and
categorise news – in other words, it reflects societal and discursive values concerning news, and
may help readers find their way through the large amounts of content available. However, it mixes
more or less specific topic distinctions – e.g. sport or business articles – with differences based on
the style and goal of the articles – e.g. commentaries and opinion articles – and on their prominence
within the website – e.g. home page news. This is not entirely consistent as far as communicative
purposes and linguistic analysis are concerned: topic, purpose and prominence are variables in
themselves, and the present analysis did not account for this aspect. As anticipated in Section 2.2.4
of Chapter 3, and mentioned at the beginning of this section, one consequence consisted in
obtaining a heterogeneous ST section with respect to scope and explicit communicative function,
where the shared linguistic and communicative aspects might be less noteworthy than the
differences. Another implication was that whenever articles dealing with science and technology
appeared outside of ‗Science and Technology‘ newspaper sections, as easily happens for example in
the home page, in general news or in opinion articles, these were not analysed as instances of
technoscience communication. Moreover, the macro-feed categories identified result from the
aggregation of different subsections, which entails a loss of information and complexity, especially
concerning technoscience articles. Therefore, considering different classification systems in the
future could result in a more accurate linguistic analysis (see Section 4 for further discussion on this
point and the related risks of triggering a circular process).
Another issue not fully accounted for in laying the bases of this work is the concept of linguistic
variation. The study almost completely relies on the definition of variation implied by the MDA
method which constitutes the core of this analysis. In the multidimensional framework, linguistic
variation is defined and measured in terms of frequency of use of a set of LFs. Thus, ‗variation‘
refers to the variation in the co-occurrence patterns of these LFs and their communicative functions,
which is necessarily a simplified view of a complex phenomenon. The results of the present
analysis are therefore referred to linguistic variation as defined within the MDA framework, with an
integration of lexical aspects. It is also true that elaborating a simplified model to make sense of
complex phenomena is a first, necessary step towards their understanding. At this point, however,
deeper consideration of other ways in which linguistic variation can be conceptualised, assessed and
measured would have a positive impact on further development of studies such as the present one.
A second set of limitations concerns the representativeness of the corpus, and its capacity to yield
informative results on the communicative functions underlying its texts. As discussed in Section 2.2
of Chapter 3, several factors can limit the representative power of a corpus. In the present case, the
corpus was designed to be representative of online newspaper language, on the grounds that it was a
widely used source of news, including news about science and technology. However, online daily
news is not only issued by online newspapers; websites of news agencies and broadcasting
companies are also potentially important sources of information for the general public. The present
analysis focused only on newspapers because, being part of the TIPS database, they were the most
widely and readily available source for principled sampling. Another main issue concerns the
representativeness of the source newspapers selected to be included in the corpus. While they may
228
operate in a global environment and hire international reporters, they reflect a focus on the UK and
US, and a quantitative bias towards the UK, which limit the scope of the analysis to the
corresponding national contexts. It is possible that analysing newspapers from a wider range of
English-speaking countries might result in a higher degree of variation, due to the presence of
different geographical varieties of English (i.e. diatopic variation), as well as of different editorial
choices and cultural factors. These elements should be adequately defined and controlled through a
sound sampling frame; moreover, they should be accounted for, along with functional and
contextual factors, in the result interpretation. The present analysis excluded the diatopic
perspective precisely to avoid adding complexity to the overall picture; yet, it might be interesting
to conduct a study on news language variation across language varieties – partly following Xiao‘s
(2009) version of MDA, which he applied to five varieties of English.
Only including quality newspapers also circumscribes the breadth of this analysis. Although
justified from a cross-linguistic perspective (that is, with a view to extending the method to other
languages, as explained in Section 2.2.3 of Chapter 3), this choice excludes some of the most
widely read news sources in the UK, namely tabloids, one of which – The Daily Mail – could have
been available from the TIPS database. The selection among quality newspapers to be included in
the analysis, also based upon source availability in the TIPS database, is itself a form of limitation,
because it does not include all the main existing UK and US broadsheets. The TIPS crawling
facility was moreover affected by the accessibility of online newspaper websites through RSS feeds.
The quality of retrieved texts is another aspect that might have in some cases adversely affected the
analysis. For example, the bad state of all texts downloaded from one of the sources originally
available, The Times, led to its exclusion from the corpus (cf. Section 2.2.5 in Chapter 3). As shown
in the qualitative analysis in Chapters 4 and 5, some texts from all source newspapers were not
completely downloaded. Moreover, in spite of the cleaning routine applied, some still contained
Web-related content that was irrelevant to, or even disturbed the linguistic analysis. Corpus size
may also be questioned; constructed to be easily manageable for standard concordances, the corpus
proved to be relatively small both when considering the frequencies of certain LFs and when
looking for patterns in the use of keywords. Consequently, results could not be fully generalised.
Yet, this limitation could not be avoided at the present time, since a much larger corpus is not yet
analysable with the currently available tools.
A third set of limitations could be called ‗methodological‘. Some of them, concerning the linguistic
variables analysed and the way they were identified, are mainly related to the multidimensional
approach. One of the advantages of this approach is that it applies multivariate statistics to a set of
LFs, thus allowing the researcher to keep track of many different linguistic elements at the same
time. However, LFs themselves result from a selection based on a set of assumptions on language
and its working units, from part-of-speech classification to actual LF formulation. However useful,
this selection cannot be all-encompassing, and entails its own limitations. For example, classes of
expressions such as downtoners, amplifiers and hedges, whose use involves lexical and pragmatic
choices, cannot be comprehensive: they are not closed classes, and they can be realised through a
range of different options which would be impossible to list exhaustively. Similar limitations apply
to adverbial classes. Moreover, cases of polysemy cause disambiguation issues in the LFs, some of
which remain unresolvable: for instance, only does not always have downtoning functions, and the
229
verb move does not always have a suasive meaning. Such limitations are, to a certain extent,
inevitable for this kind of classification systems. Even more so, when they are devised for
automated identification, since the tagging, matching and counting stages have their own issues in
managing the complexities and ambiguities of actual language use (see Sections 3.2.3 and 3.2.4 in
Chapter 3). For example, LFs involving relative clauses can match some of the possible realisations
of relative clauses, but fail to recognise others, although they might be – at least intuitively –
generally less frequent. Overall, the set of LFs used here could be said to have come as a sort of
black box, ready to be applied to a new set of linguistic data. Clearly, these features were originally
selected on the basis of relevance criteria (Biber 1988: 72; cf. Section 3.1 in Chapter 3); moreover,
integrating LFs with more comprehensive but infrequent items might bring about very small or no
improvements in the final results. However, it could be useful to revise and re-discuss the original
LFs, as well as to update the research at the basis of their selection.
In a broader perspective with respect to what has been discussed so far, another methodological
limitation should be mentioned: it concerns the use of visual content in news articles. The
representation of the world conveyed through media such as online news providers increasingly
involves the use of images, from pictures to graphs and charts. These aspects are completely
excluded from the present analysis, whose focus is on written language. Taking into account images
would have required the integration of a whole different methodological approach with the one here
adopted, with all the difficulties connected to the lack of accurate and available tools for the
retrieval and automatic annotation of images. This integration could not be achieved here, for
obvious time reasons. However, it is important to bear in mind that an analysis of communicative
aspects exclusively focused on written language overlooks a fundamental component of the
message being conveyed.
Further issues emerge from the results obtained by applying the MDA to the news corpus. The main
limitation lies in the low amount of shared variance – only around 23% – explained by the factors
extracted. Already addressed in Chapters 4-5 and in Section 1.1 above, it marks the reduced
capacity of the method applied to capture linguistic differences within the analysed corpus. The
lexical analysis easily highlighted content variation between ST and non-ST texts, probably due to
the presence of considerably different topics within news language. By contrast, the results obtained
from the MDA, whose focus is on grammatical, syntactic and only partly lexical aspects, were less
definite in terms of variation. Compared with Biber‘s first MDA, whose six factors almost covered
50% of the shared variance (see Biber 1988: 83), much less variation is identified by the present
analysis. If Biber‘s results are observed in further detail, however, most of the difference in
explained variance depends on the first few factors, and especially on the first one, which alone
explains more than 25% of the shared variance. Biber‘s first factor is very similar, in terms of LFs,
to F1 in this analysis: they both can be said to reflect an ‗oral/literate‘ continuum (see Section 1.2
above and Section 3.1 in Chapter 4), but here F1 only explains around 10% of the shared variance.
The remaining factors in Biber‘s study explain amounts of variance that are very similar to those
obtained for Factors 2, 3 and 4 in the present study. Considering that Biber had used a much more
diverse corpus, designed to represent the variety of genres of the English language as a whole, it
seems therefore that the differing overall results largely depend on the type of language analysed.
However, they mostly depend on the lower weight of the oral/literate continuum in the present
corpus, while other factors are similarly ‗weak‘ in both analyses. Further research would be
230
therefore needed to assess the value and power of this method of linguistic analysis, and to explore
the role of the ‗oral/literate‘ continuum in relation to linguistic variation in general.
Overall, the fact that the MDA here applied covered little shared variance in the use of the analysed
LFs, also with respect to some of Biber‘s findings, could reflect a lack of variation. This could be
determined by a relative homogeneity of the corpus, which suggests that – apart from the content,
which widely varies because of the numerous topics covered –newspaper language is itself quite
standardised, as proposed in Section 1.1. However, alternative explanations can be proposed: some
variation could be there, but cannot be detected by a MDA – at least, not as it was devised here. For
example, other LFs may be more appropriate, since their use could be more telling of different
communicative functions within newspaper language. This is connected to the methodological
issues identified above concerning the problematic aspects of the LFs. Moreover, the use of articles
as a unit of analysis may be called into question, since several linguistic processes might be
performed within a text as it unfolds, thus evening out in a final, unmarked result, and not allowing
actual differences to stand out. In that case, using sentences or text sections may be a viable
alternative. The second option would however require a method to consistently identify new units
across a corpus whose texts feature many different formats. Moreover, using units of analysis below
the text level would make most LFs extremely infrequent in single units of analysis – some of them
are already quite rare in single texts – thus posing problems as far as statistical analyses are
concerned.
The last problematic aspect regards the possibility that two texts that are attributed similar factor
scores, which should normally mark similarity in LF co-occurrence patterns, might contain different
LF configurations, therefore serving potentially diverging communicative functions. For example,
two texts might both have very high F2 scores, but while one of them features many that-clauses,
the other only contains two instances of them and plenty of passive voices. In such case, MDA drew
together texts whose underlying communicative functions may not have a close similarity. This can
be a limiting aspect, yet the statistical procedure here used should make sure that salient LFs in each
factor are strongly correlated; therefore the probability of encountering diverging LF configurations
in similarly scored texts is rare. This is demonstrated by the interpretability and descriptive power
of Biber‘s work, and by the numerous linguistic analyses based on the MDA model (see Section 5
in Chapter 2), as well as by most qualitative analyses performed in the present study, whose
factorial model is however weaker than that in Biber‘s study. At the same time, let us consider a LF
which is salient in one of the factors but overall quite infrequent in the corpus. If a text contained
even one single occurrence of this LF above the corpus mean, this would boost its standardised
frequency, consequently affecting the final factor score. In short texts, such effect might result in
extremely different factor scores determined by linguistic differences which would be almost
imperceptible for readers. This could point to the necessity of using overall longer texts – quite the
contrary of what was suggested above – or, again, switching to different LFs.
The limitations here mentioned should be taken into account when drawing conclusions based on
the present analysis. While most limitations can be difficult to avoid, new ways to address them
should continuously be devised. For example, different research questions could be asked which
took into account the different existing forms of science and technology communication. Other sets
of questions could spark debate on the nature and measurability of linguistic variation. Moreover,
231
by ‗opening some methodological black boxes‘, a discussion of what linguistic structures can be
considered markers of particular communicative functions could be developed. Finally, another
advantage of addressing these limitations would possibly be an improvement in textual data
collection and classification.
4. Further research
Some directions for further research can be identified, starting from the results and tools obtained so
far, and addressing the most problematic aspects of the present analysis. One of the most interesting
lines of research to be developed would be that of cross-linguistic comparisons, in particular
between English and Italian. Thus, further research would be aimed at producing an Italian version
of this analysis, creating a set of Italian LFs and working on possible regex-based representations of
such features. Italian would pose new challenges in identifying links between linguistic structures
and their possible communicative purposes, as well as in devising solutions for their automatic
retrieval.
As far as addressing limitations is concerned, a larger corpus could be useful to obtain more reliable
and significant results; however, this would be bound to the availability of sufficiently powerful
corpus inspection tools and to the quality of downloaded texts. Moreover, different methods for the
classification of texts within the corpus could be experimented with. With respect to science and
technology, further collaboration with the TIPS research group could be aimed at creating an
English version of their vocabulary-based classifier (see Section 2.1 in Chapter 3). On the one hand,
a vocabulary-based classification relies on linguistic criteria, which are internal to the texts; basing
corpus design on text-internal aspects entails the risk of performing a circular process, where the
final results reflect the initial criteria. On the other hand, the above-mentioned classifier would
enable one to address the consistence issues associated to news sections (see Section 3 above),
precisely by referring to the topics being reported on. This would make it possible to distinguish
articles reporting on research and innovation, and circulating technoscientific knowledge, from
articles referring to commercial aspects of technology, or to health and fitness. Moreover, the
communication of science and technology could be detected in all news sections, also when not
explicitly classified as ‗Science and Technology‘ news. Using a vocabulary-based classifier may
also contribute to verifying which ones among the numerous subsections making up for the
‗Science and Technology‘ macro-feed contain the most relevant news items. While vocabulary is a
text-internal criterion, which requires that it be used carefully, it is also to do with the overall
intended function of a news item, and may be contribute to homogeneity within the components of
the corpus, which is generally desirable when designing a corpus (Sinclair 2004a).
Within a framework of methodological revision and development, it would also be interesting to
perform a cluster analysis based on the factor scores of each text. A cluster analysis is a statistical
procedure that could be used to group together texts that are maximally similar to each other with
respect to all factor scores, and separate texts that maximally differ. It was used by Biber (1989) on
his own MDA outcomes, and resulted in a ‗typology‘ of English texts which was not based on
external genre classification, but on the use of LFs and the presence of corresponding
communicative functions identified by the MDA. A similar procedure could prove useful in finding
232
out whether MDA can ultimately identify any markedly different classes of news articles based on
syntax and lexico-grammar rather than on external classification and lexical content.
Research could also be conducted to explore more of the possible sociological implications of the
present analysis. Here, the suggestions made in Section 1.3 about possible strategies used to
perpetuate or affect the life of scientific and technological facts could be explored in a more
principled and systematic way. Following this approach, meaningful expressions and structures
could be identified and analysed. Different linguistic features may serve the same function;
conversely, the same feature may be employed to perform different functions. These issues could be
addressed by first carrying out a qualitative analysis or a manual annotation; subsequently, some of
the meaningful structures could be analysed in a corpus perspective. Moreover, in order to better
connect sociological theories to the analysis of language, future works would certainly benefit from
a review of the historical and cultural circumstances in which the analysed language is produced.
Finally, further efforts could be usefully directed towards making the regex-based identification
software BoRex Match more accurate for MDA, mainly by adjusting some of the regular
expressions at its core. Moreover, its accuracy should be more thoroughly accounted for (cf. Section
3.2.4 in Chapter 3). In a broader perspective, it would be useful to make it available for research
purposes beyond the present analysis, as anticipated in Section 2 above. One of the possibilities to
further exploit this tool would be, for example, to incorporate it into the TIPS retrieval and analysis
infrastructure.
5. Concluding remarks
Science and technology need to be communicated in order to exist and develop within society.
Investigating language is therefore key to understanding how research activities are socially
situated. More specifically, analysing the communication of technoscience is essential to frame
research, innovation and scientific knowledge production as social practices. Such communication
takes place at different levels of specialisation, in different contexts and among different groups,
with all these contexts affecting each other continuously. Newspapers, and even more so online
newspapers, are one of the communicative contexts where readers – and authors – with different
backgrounds come together and participate – more or less actively – to the public image and
function of science and technology, by producing some representations of it, by leaving comments
to an article, by looking for scientific information, by simply reading the news and receiving its
message, and so on.
What emerged from this analysis is that science and technology appear to be linguistically blended
in newspaper communication, with few lexico-grammatical and syntactic patterns moderately
distinguishing technoscience-related articles from the rest. At the same time, a range of possible
styles to communicate extremely different aspects of science and technology emerged. This calls
into question the sub-genre distinctions adopted as the basis for this study, and suggests further
reflection upon the internal variation of the news genre. At the same time, some of the main themes
characterising the communication of science and technology with respect to news in general were
identified by the lexical analysis; they suggest a coexistence of ‗canonical‘ science and research

233
with technological applications and a strong commercial component focused on technological
devices that are part of many people‘s everyday life.
Several conclusions on the nature of the analysed texts have been proposed, along with an overview
of the main achievements and limitations of this work and some suggestions for further research.
These aim at addressing some problematic aspects to improve and extend the present research, and
more generally at identifying innovative approaches to text analysis, focusing on linguistic aspects
so far overlooked, especially with respect to the MDA approach. Overall, the present work
hopefully provided interesting insights into the communication of science and technology in
newspapers, and opened new possibilities, in terms of method and tools, for the analysis of
language in a corpus perspective.
234
REFERENCES
Aitchison, J., & Lewis, D. M. (Eds.). (2003). New Media Language. London, New York:
Routledge.
Al‐Surmi Mansoor. (2012). Authenticity and TV Shows: A Multidimensional Analysis Perspective.
TESOL Quarterly, 46(4), 671–694.
Angouri, J. (2010). Quantitative, Qualitative or Both? Combining Methods in Linguistic Research.
In L. Litosseliti (Ed.), Research Methods in Linguistics (pp. 29–45). London: Continuum.
Anthony, L. (2004). Antconc: A Learner and Classroom Friendly, Multi-Platform Corpus Analysis
Toolkit. In Proceedings of IWLeL 2004: An Interactive Workshop on Language e-Learning (pp. 7–
13).
Anthony, L. (2018). AntConc (Version 3.5.7). Tokyo, Japan: Waseda University. Retrieved from
http://www.laurenceanthony.net/software (Last accessed in August 2018).
Asención-Delaney, Y., & Collentine, J. (2011). A Multidimensional Analysis of a Written L2
Spanish Corpus. Applied Linguistics, 32(3), 299–322.
Baker, P. (2009). The BE06 Corpus of British English and recent language change. International
Journal of Corpus Linguistics, 14(3), 312–337.
Baker, P., & Egbert, J. (2016). Triangulating Methodological Approaches in Corpus Linguistic
Research. New York, London: Routledge.
Baker, P., Gabrielatos, C., Khosravinik, M., Krzyżanowski, M., McEnery, T., & Wodak, R. (2008).
A Useful Methodological Synergy? Combining Critical Discourse Analysis and Corpus Linguistics
to Examine Discourses of Refugees and Asylum Seekers in the Uk Press. Discourse & Society,
19(3), 273–306.
Baker, P., & Levon, E. (2015). Picking the Right Cherries? A Comparison of Corpus-Based and
Qualitative Analyses of News Articles About Masculinity. Discourse & Communication, 9(2), 221–
236.
Baker, P., & McEnery, T. (2005). A Corpus-Based Approach to Discourses of Refugees and
Asylum Seekers in Un and Newspaper Texts. Journal of Language and Politics, 4(2), 197–226.
Bartholomew, D. J., Steele, F., Galbraith, J., & Moustaki, I. (2008). Analysis of Multivariate Social
Science Data. Boca Raton, London, New York: CRC Press-Taylor & Francis Group.
Basilevsky, A. (1994). Statistical Factor Analysis and Related Methods: Theory and Applications.
New York: Wiley-Blackwell.
Bazerman, C. (1988). Shaping Written Knowledge: The Genre and Activity of the Experimental
Article in Science. Madison: University of Wisconsin Press.
Bednarek, M., & Caple, H. (2012). News Discourse. New York, London: Continuum.
235
Bell, A. (1991). The Language of News Media. Oxford: Blackwell.
Berkenkotter, C., & Huckin, T. N. (1995). Genre Knowledge in Disciplinary Communication.
Hillsdale, NJ: Lawrence Erlbaum Associates.
Bhatia, V. K., Flowerdew, J., & Jones, R. H. (2008). Approaches to Discourse Analysis. In V. K.
Bhatia, J. Flowerdew, & R. H. Jones (Eds.), Advances in Discourse Studies (pp. 1–18). London,
New York: Routledge.
Bianucci, P. (2008). Te lo dico con parole tue. Bologna: Zanichelli.
Biber, D. (1988). Variation across Speech and Writing. Cambridge: Cambridge University Press.
Biber, D. (1989). A Typology of English Texts. Linguistics, 27(1), 3–44.
Biber, D. (1993). Representativeness in Corpus Design. Literary and Linguistic Computing, 8(4),
243–257.
Biber, D. (1995). Dimensions of Register Variation: A Cross-Linguistic Comparison. Cambridge:
Cambridge University Press.
Biber, D. (2006). University Language: A Corpus-Based Study of Spoken and Written Registers
(Vol. 23). Amsterdam, Philadelphia: John Benjamins Publishing.
Biber, D. (2009). Multi-Dimensional Approaches. In A. Lüdeling & M. Kytö (Eds.), Corpus
Linguistics: an International Handbook (Vol. 2, pp. 822–855). Berlin, New York: de Gruyter.
Biber, D., & Conrad, S. (2009). Register, Genre, and Style. Cambridge University Press.
Biber, D., Conrad, S., & Reppen, R. (1998). Corpus Linguistics: Investigating Language Structure
and Use. Cambridge: Cambridge University Press.
Biber, D., Davies, M., Jones, J. K., & Tracy-Ventura, N. (2008). Spoken and Written Register
Variation in Spanish: A Multi-Dimensional Analysis. Corpora, 1(1), 1–37.
Biber, D., Johansson, S., Leech, G., Conrad, S., & Finegan, E. (1999). Longman Grammar of
Spoken and Written English. London: Longman.
Bielsa, E., & Bassnett, S. (2009). Translation in Global News. London, New York: Routledge.
Blommaert, J. (2005). Discourse: A Critical Introduction. Cambridge: Cambridge University Press.
Blum, D., Knudson, M., Dunwoody, S., Finkbeiner, A., Levy Guyer, R., & Wilkes, J. (2006).
Writing Well about Science: Techniques from Teachers of Science Writing. In D. Blum, M.
Knudson, & R. M. Henig (Eds.), A Field Guide for Science Writers (Second Edition, pp. 26–33).
New York: Oxford University Press.
Bondi, M. (2010). Perspectives on Keywords and Keyness: An Introduction. In M. Bondi & M.
Scott (Eds.), Keyness in Texts (pp. 1–20). Amsterdam, Philadelphia: John Benjamins.
236
Brand, C. (2008). Lexical Processes in Scientific Discourse Popularisation: A Corpus-Linguistic
Study of the Sars Coverage. Peter Lang.
Březina, V. (2018). Statistics in Corpus Linguistics: A Practical Guide. Cambridge: Cambridge
University Press.
Brezina, V. (2018). Statistics in Corpus Linguistics: A Practical Guide. Cambridge: Cambridge
University Press.
Brossard, D. (2013). New Media Landscapes and the Science Information Consumer. Proceedings
of the National Academy of Sciences of the United States of America, 110(Suppl 3), 14096–14101.
Brossard, D., & Scheufele, D. A. (2013). Science, New Media, and the Public. Science, 339(6115),
40–41.
Brown, J. D. (2004). Research Methods for Applied Linguistics: Scope, Characteristics, and
Standards. In A. Davies & C. Elder (Eds.), The Handbook of Applied Linguistics (pp. 476–500).
Oxford: Blackwell.
Brown, N. (1999). Xenotransplantation: Normalizing Disgust. Science as Culture, 8(3), 327–355.
Bucchi, M. (2004). Science in Society: An Introduction to Social Studies of Science. London, New
York: Routledge.
Bucchi, M. (2008). Of Deficits, Deviations and Dialogues: Theories of Public Communication of
Science. In M. Bucchi & B. Trench (Eds.), Handbook of Public Communication of Science and
Technology (pp. 71–90). New York: Routledge.
Bucchi, M., & Trench, B. (2008). Handbook of Public Communication of Science and Technology.
Routledge.
Bucchi, M., & Trench, B. (2014). Routledge Handbook of Public Communication of Science and
Technology. New York: Routledge.
Bucchi, M., & Trench, B. (2016). Science Communication and Science in Society: A Conceptual
Review in Ten Keywords. Tecnoscienza (Italian Journal of Science & Technology Studies), 7(2),
151–168.
Bybee, J. L., & Fleischman, S. (1995). Modality in Grammar and Discourse. John Benjamins
Publishing.
Calsamiglia, H. (2003). Popularization Discourse. Discourse Studies, 5(2), 139–146.
Calsamiglia, H., & López Ferrero, C. L. (2003). Role and Position of Scientific Voices: Reported
Speech in the Media. Discourse Studies, 5(2), 147–173.
Calsamiglia, H., & van Dijk, T. A. (2004). Popularization Discourse and Knowledge About the
Genome. Discourse & Society, 15(4), 369–389.
Carrada, G. (2005). Comunicare la scienza. Milano: Sironi.
237
Carter, R., & McCarthy, M. (2006). Cambridge Grammar of English: a Comprehensive Guide;
Spoken and Written English Grammar and Usage. Ernst Klett Sprachen.
Castell, S., Charlton, A., Clemence, M., Pettigrew, N., Pope, S., Quigley, A., Navin Shah, J.,
Silman, T. (2014). Public Attitudes to Science 2014: Main Report. UK Department for Business,
Innovation and Skills (BIS), now part of the Department for Business, Energy and Industrial
Strategy (BEIS). Retrieved from https://www.gov.uk/government/publications/public-attitudes-to-
science-2014 (Last accessed in August 2018).
Cave, D. (2018, August 23). Australia Wilts From Climate Change. Why Can‘t Its Politicians Act?
The New York Times. Retrieved from
https://www.nytimes.com/2018/08/21/world/australia/australia-climate-change-malcolm-
turnbull.html (Last accessed in August 2018).
CERN | Accelerating science. (n.d.). Retrieved from https://home.cern/ (Last accessed in August
2018).
Chafe, W. L. (1980). The Deployment of Consciousness in the Production of a Narrative. In W. L.
Chafe (Ed.), The Pear Stories: Cognitive, Cultural, and Linguistic Aspects of Narrative Production.
Norwood, NJ: Ablex Publishing Corporation.
Cloître, M., & Shinn, T. (1985). Expository Practice: Social, Cognitive and Epistemological
Linkages. In T. Shinn & R. Whitley (Eds.), Expository Science. Forms and Functions of
Popularization (pp. 31–60). Dordrecht: Reidel.
Collins, R. (1981). On the Microfoundations of Macrosociology. American Journal of Sociology,
86(5), 984–1014.
Connor, U., & Upton, T. A. (2003). Linguistic Dimensions of Direct Mail Letters. In P. Letsyna &
C. F. Meyer (Eds.), Corpus Analysis: Language Structure and Language Use (pp. 72–86).
Amsterdam, New York: Rodopi.
Cooke, M. (Ed.). (2012). Tell It Like It Is? Science, Society and the Ivory Tower. Frankfurt: Peter
Lang.
Cooter, R., & Pumfrey, S. (1994). Separate Spheres and Public Places: Reflections on the History of
Science Popularization and Science in Popular Culture. History of Science, 32(3), 237–267.
Corcoran, F., & Fahy, D. (2009). Exploring the European Elite Sphere: The Role of the Financial
Times. Journalism Studies, 10(1), 100–113.
Costello, A. B., & Osborne, J. W. (2005). Best Practices in Exploratory Factor Analysis: Four
Recommendations for Getting the Most from Your Analysis. Practical Assessment, Research &
Evaluation, 10(7), 1–9.
Cotter, C. (2015). Discourse and Media. In D. Schiffrin, D. Tannen, & H. E. Hamilton (Eds.), The
Handbook of Discourse Analysis (pp. 416–436). Oxford: Blackwell.
238
Crookes, G. (1990). The Utterance, and Other Basic Units for Second Language Discourse
Analysis. Applied Linguistics, 11(2), 183–199.
Dahl, T. (2015). Contested Science in the Media: Linguistic Traces of News Writers‘ Framing
Activity. Written Communication, 32(1), 39–65.
Davies, A., & Elder, C. (2004). General Introduction-Applied Linguistics: Subject to Discipline? In
A. Davies & C. Elder (Eds.), The Handbook of Applied Linguistics (pp. 1–15). Oxford: Blackwell.
Devlin, H. (2018, August 15). Hottest of ‗Ultra-Hot‘ Planets Is so Hot Its Air Contains Vaporised
Metal. The Guardian. Retrieved from https://www.theguardian.com/science/2018/aug/15/hottest-of-
ultra-hot-planets-is-so-hot-its-air-contains-vaporised-metal (Last accessed in August 2018).
DiMaggio, P., Nag, M., & Blei, D. (2013). Exploiting Affinities Between Topic Modeling and the
Sociological Perspective on Culture: Application to Newspaper Coverage of Us Government Arts
Funding. Poetics, 41(6), 570–606.
DiStefano, C., Zhu, M., & Mîndrilă, D. (2009). Understanding and Using Factor Scores:
Considerations for the Applied Researcher. Practical Assessment, Research & Evaluation, 14(20),
1–11.
Dörnyei, Z. (2007). Research Methods in Applied Linguistics: Quantitative, Qualitative, and Mixed
Methodologies. New York: Oxford University Press.
Drucker, P. F. (1993). Post-capitalist Society. London, New York: Routledge.
Ducrot, O., & Todorov, T. (1972). Dictionnaire encyclopédique des sciences du langage. Paris:
Éditions du Seuil.
Duff, P. A. (2006). Beyond Generalizability: Contextualization, Complexity, and Credibility in
Applied Linguistics Research. In M. Chalhoub-Deville, C. A. Chapelle, & P. A. Duff (Eds.),
Inference and Generalizability in Applied Linguistics: Multiple Perspectives (pp. 65–96).
Amsterdam, Philadelphia: John Benjamins.
Dunwoody, S. (2008). Science Journalism. In M. Bucchi & B. Trench (Eds.), Handbook of Public
Communication of Science and Technology (pp. 15–26). London, New York: Routledge.
Edge, D. (1995). Reinventing the Wheel. In S. Jasanoff, G. E. Markle, J. C. Petersen, & T. Pinch
(Eds.), Handbook of Science and Technology Studies (pp. 3–24). Thousand Oaks, London, New
Delhi: Sage.
Egbert, J. (2015). Publication Type and Discipline Variation in Published Academic Writing:
Investigating Statistical Interaction in Corpus Data. International Journal of Corpus Linguistics,
20(1), 1–29.
Entman, R. M. (1993). Framing: Toward Clarification of a Fractured Paradigm. Journal of
Communication, 43(4), 51–58.
ERC: European Research Council. (n.d.). Retrieved 29 September 2018, from https://erc.europa.eu/
239
European Research Council. (2018, July 19). Can Communication Improve Your Science? The
European Research Council Magazine. Retrieved from https://erc.europa.eu/news-
events/magazine/can-communication-improve-your-science (Last accessed in August 2018).
European Union. (2010). Special Eurobarometer 340: ‗Science and Technology‘-Report. Retrieved
from http://ec.europa.eu/commfrontoffice/publicopinion/archives/ebs/ebs_340_en.pdf (Last
accessed in August 2018).
European Union. (2015). Eurobarometer Qualitative study - ―Public opinion on future innovations,
science and technology‖ - Aggregate Report. Retrieved from
http://ec.europa.eu/commfrontoffice/publicopinion/archives/quali/ql_futureofscience_en.pdf (Last
accessed in August 2018).
European Union. (2018a). Horizon 2020-Work Programme 2018-2020: 16. Science with and for
Society. Retrieved from http://ec.europa.eu/research/participants/data/ref/h2020/wp/2018-
2020/main/h2020-wp1820-swfs_en.pdf (Last accessed in August 2018).
European Union. (2018b). Standard Eurobarometer 88: ‗Media Use in the European Union‘-
Report. Retrieved from
http://ec.europa.eu/commfrontoffice/publicopinion/index.cfm/Survey/getSurveyDetail/instruments/
STANDARD/surveyKy/2143 (Last accessed in August 2018).
Evert, S. (2009). Corpora and Collocations. In A. Lüdeling & M. Kytö (Eds.), Corpus Linguistics:
an International Handbook (Vol. 2, pp. 1212–1248). Berlin, New York: de Gruyter.
Fahnestock, J. (1986). Accommodating Science: The Rhetorical Life of Scientific Facts. Written
Communication, 3(3), 275–296.
Fairclough, N. (1995). Media Discourse. London: Edward Arnold.
Farrell, A. M. (2010). Insufficient Discriminant Validity: A Comment on Bove, Pervan, Beatty, and
Shiu (2009). Journal of Business Research, 63(3), 324–327.
Fitzgerald, H. G. (2003). How Different Are We?: Spoken Discourse in Intercultural
Communication: The Significance of the Situational Context (Vol. 4). Clevedon: Multilingual
Matters.
Fleck, L. (1979). Genesis and Development of a Scientific Fact. Chicago, London: University of
Chicago Press.
Fowler, R. (1991). Language in the News: Discourse and Ideology in the Press. London, New
York: Routledge.
Fowler, R., Hodge, B., Kress, G., & Trew, T. (1979). Language and Control. London: Routledge
and Kegan Paul.
Fox, N. J. (2011). Boundary Objects, Social Meanings and the Success of New Technologies.
Sociology, 45(1), 70–85.
240
Friedl, J. E. F. (1997). Mastering Regular Expressions: Powerful Techniques for Perl and Other
Tools. Sebastopol: O‘Reilly.
Friginal, E., Pearson, P., Di Ferrante, L., Pickering, L., & Bruce, C. (2013). Linguistic
Characteristics of Aac Discourse in the Workplace. Discourse Studies, 15(3), 279–298.
Fuller, G. (1998). Cultivating Science: Negotiating Discourse in the Popular Texts of Stephen Jay
Gould. In J. R. Martin & R. Veel (Eds.), Reading Science: Critical and Functional Perspectives on
Discourses of Dcience (pp. 35–63). London: Routledge.
Funk, C., Gottfried, J., & Mitchell, A. (2017). Science News and Information Today. Pew Research
Center. Retrieved from http://assets.pewresearch.org/wp-
content/uploads/sites/13/2017/09/14122431/PJ_2017.09.20_Science-and-News_FINAL.pdf (Last
accessed in August 2018).
Funtowicz, S. O., & Ravetz, J. R. (1993). Science for the Post-Normal Age. Futures, 25(7), 739–
755.
Gabrielatos, C. (2018). Keyness Analysis: Nature, Metrics and Techniques. In C. Taylor & A.
Marchi (Eds.), Corpus Approaches to Discourse: A Critical Review: Routledge (pp. 225–258).
London, New York: Routledge.
Garfinkel, H. (1967). Studies in Ethnomethodology. Englewood Cliffs, NJ: Prentice-Hall.
Garzone, G. (2006). Perspectives on ESP and Popularization. Milano: CUEM.
Gea-Valor, M. L., García-Izquierdo, I., & Esteve, M. J. (Eds.). (2010). Linguistic and Translation
Studies in Scientific Communication. Bern: Peter Lang.
Gee, J. P. (2011). An Introduction to Discourse Analysis: Theory and Method. New York, London:
Routledge.
Gee, J. P., & Handford, M. (2012). Introduction. In J. P. Gee & M. Handford (Eds.), The Routledge
Handbook of Discourse Analysis (pp. 1–6). Abingdon, New York: Routledge.
Geertz, C. (1973). The Interpretation of Cultures. New York: Basic Books.
Giardullo, P. (in press). Spreading Mosquitoes: A Media Analysis of Italian National Newspaper
Coverage of Mosquito-Borne Diseases and Related Interventions. In C. Claeys (Ed.), Mosquito
Management: Environmental Issues and Health Concerns. Bruxelles: Peter Lang.
Giardullo, P., & Lorenzet, A. (2016). Techno-scientific Issues in the Public Sphere (TIPS). EASST
Review, 35(4), 14–17.
Gibbons, M., Limoges, C., Nowotny, H., Schwartzman, S., Scott, P., & Trow, M. (1994). The New
Production of Knowledge: The Dynamics of Science and Research in Contemporary Societies.
London: Sage.
Giordano, C. (2018, August 11). Roundup Maker Defends Weedkiller After Being Told to Pay
$289m to Cancer Sufferer. The Independent. Retrieved from
241
https://www.independent.co.uk/news/world/americas/roundup-weedkiller-289-million-terminal-
cancer-school-groundskeeper-dewayne-johnson-a8487336.html (Last accessed in August 2018).
Goffman, E. (1981). Forms of Talk. Philadelphia: University of Pennsylvania Press.
Gorsuch, R. L. (1974). Factor Analysis. Philadelphia, London, Toronto: W.B. Saunders Company.
Gotti, M. (1996). Il linguaggio della divulgazione: problematiche di traduzione intralinguistica. In
G. Cortese (Ed.), Tradurre i linguaggi settoriali (pp. 217–235). Torino: Edizioni Libreria Cortina.
Gotti, M. (2003). Specialized Discourse: Linguistic Features and Changing Conventions. Bern:
Peter Lang.
Gotti, M. (2008). Investigating Specialized Discourse. Bern: Peter Lang.
Gotti, M. (2012). La riscrittura del testo da specialistico a divulgativo. Altre Modernità, 11, 145–
159.
Gray, B., & Biber, D. (2011). Corpus Approaches to the Study of Discourse. In K. Hyland & B.
Paltridge (Eds.), The Continuum Companion to Discourse Analysis (pp. 138–154). London, New
York: Continuum.
Greco, P. (2006). Il modello Venezia: La comunicazione nell‘era post-accademica della scienza. In
N. Pitrelli & G. Sturloni (Eds.), La comunicazione della scienza. Atti del I e II Convegno Nazionale
(pp. 11–35). Roma: Zadigroma.
Greenfield, P., & Levin, S. (2018, August 11). Monsanto Ordered to Pay $289m as Jury Rules
Weedkiller Caused Man‘s Cancer. The Guardian. Retrieved from
https://www.theguardian.com/business/2018/aug/10/monsanto-trial-cancer-dewayne-johnson-ruling
(Last accessed in August 2018).
Grego, K. (2013). ‗The Physics you Buy in Supermarkets‘, Writing Science for the General Public:
the Case of Stephen Hawking. In S. Kermas & T. Christiansen (Eds.), The Popularization of
Specialized Discourse and Knowledge across Communities and Cultures (pp. 149–172). Bari:
Edipuglia.
Grice, J. W. (2001). Computing and Evaluating Factor Scores. Psychological Methods, 6(4), 430–
450.
Gries, S. T. (2010). Corpus Linguistics and Theoretical Linguistics: A Love–Hate Relationship?
Not Necessarily…. International Journal of Corpus Linguistics, 15(3), 327–343.
Gross, A. G. (1994). The Roles of Rhetoric in the Public Understanding of Science. Public
Understanding of Science, 3(1), 3–24.
Grundmann, R., & Cavaillé, J.-P. (2000). Simplicity in Science and its Publics. Science as Culture,
9(3), 353–389.
Grundy, P. (2013). Doing Pragmatics. New York: Routledge.
242
Gülich, E. (2003). Conversational Techniques Used in Transferring Knowledge Between Medical
Experts and Non-Experts. Discourse Studies, 5(2), 235–263.
Gumperz, J., & Hymes, D. (Eds.). (1986). Directions in Sociolinguistics: The Ethnography of
Speaking. New York: Blackwell.
Hacking, I. (1999). The Social Construction of What? Cambridge, MA, London: Harvard
University Press.
Hall, S. (2006). Encoding/Decoding. In M. G. Durham & D. M. Kellner (Eds.), Media and Cultural
Studies: Keyworks (pp. 163–173). Oxford: Blackwell.
Halliday, M. A. K. (1985). Introduction to Functional Grammar. London: Edward Arnold.
Halliday, M. A. K. (1991). Corpus Studies and Probabilistic Grammar. In K. Aijmer & B.
Altenberg (Eds.), English Corpus Linguistics: Studies on Honour of Jan Svartvik (pp. 30–43). New
York: Longman.
Halliday, M. A. K., & Martin, J. R. (1993). Writing Science: Literacy and Discursive Power.
Bristol, London: Falmer Press.
Halliday, M. A. K., & Matthiessen, C. M. I. M. (2004). An Introduction to Functional Grammar.
London: Hodder Arnold.
Hardt, H. (1992). Critical Communication Studies: Communication, History and Theory in
America. London, New York: Routledge.
Harris, R. J. (2013). A Primer of Multivariate Statistics. New York, Hove: Psychology Press.
Hart, C. (2014). Discourse, Grammar and Ideology: Functional and Cognitive Perspectives.
London, New Delhi, New York, Sydney: Bloomsbury Publishing.
Hellsten, I. (2002). Selling the Life Sciences: Promises of a Better Future in Biotechnology
Advertisements. Science as Culture, 11(4), 459–479.
Henson, R. K., & Roberts, J. K. (2006). Use of Exploratory Factor Analysis in Published Research:
Common Errors and Some Comment on Improved Practice. Educational and Psychological
Measurement, 66(3), 393–416.
Herring, S. C., & Androutsopoulos, J. (2015). Computer-Mediated Discourse 2.0. In D. Schiffrin,
D. Tannen, & H. E. Hamilton (Eds.), The Handbook of Discourse Analysis (pp. 127–151). Oxford:
Blackwell.
Highfield, R. (2000, July 7). Selling Science to the Public. Science (New Series), 289(5476), 59.
Hilgartner, S. (1990). The Dominant View of Popularization: Conceptual Problems, Political Uses.
Social Studies of Science, 20(3), 519–539.
Hoey, M. (1991). Patterns of Lexis in Text. Oxford: Oxford University Press.
243
Holliday, A. (2010). Analysing Qualitative Data. In B. Paltridge & A. Phakiti (Eds.), Continuum
Companion to Research Methods in Applied Linguistics (pp. 98–110). London, New York:
Continuum.
Huddleston, R., & Pullum, G. K. (2002). The Cambridge Grammar of the English Language.
Cambridge: Cambridge University Press.
Hunston, S. (2002). Corpora in Applied Linguistics. Cambridge: Cambridge University Press.
Hunston, S. (2013). Systemic Functional Linguistics, Corpus Linguistics, and the Ideology of
Science. Text & Talk, 33(4–5), 617–640.
Hyland, K. (2008). As Can Be Seen: Lexical Bundles and Disciplinary Variation. English for
Specific Purposes, 27(1), 4–21.
Hyland, K. (2009). Academic Discourse: English in a Global Context. London, New York:
Continuum.
Hyland, K. (2010). Constructing Proximity: Relating to Readers in Popular and Professional
Science. Journal of English for Academic Purposes, 9(2), 116–127.
Jäger, S., & Maier, F. (2009). Theoretical and Methodological Aspects of Foucauldian Critical
Discourse Analysis and Dispositive Analysis. In R. Wodak & M. Meyer (Eds.), Methods of Critical
Discourse Analysis (pp. 34–61). London: Sage.
Jakobson, R. (1959). On Linguistic Aspects of Translation. In R. A. Brower (Ed.), On Translation
(pp. 232–239). Cambridge: Harvard University Press.
Jasanoff, S., Markle, G. E., Petersen, J. C., & Pinch, T. (1995). Communicating Science and
Technology. In S. Jasanoff, G. E. Markle, J. C. Petersen, & T. Pinch (Eds.), Handbook of Science
and Technology Studies (pp. 317–319). Thousand Oaks, London, New Delhi: Sage.
Johansson, S. (2007). Seeing through Multilingual Corpora: On the use of corpora in contrastive
studies. Amsterdam, Philadelphia: John Benjamins Publishing.
Kabacoff, R. (2011). R in Action: Data Analysis and Graphics with R. Shelter Island: Manning
Publications.
Kennedy, D. (2010). Science and the Media. In D. Kennedy & G. Overholser (Eds.), Science and
the Media (pp. 1–9). American Academy of Arts and Sciences.
Kline, P. (1994). An Easy Guide to Factor Analysis. New York: Routledge.
Knorr-Cetina, K. (1981). The Manufacture of Knowledge. Oxford: Pergamon Press.
Knorr-Cetina, K. (1995). Laboratory Studies: The Cultural Approach to the Study of Science. In S.
Jasanoff, G. E. Markle, J. C. Petersen, & T. Pinch (Eds.), Handbook of Science and Technology
Studies (pp. 140–166). Thousand Oaks: Sage.
244
Konietschke, F., Placzek, M., Schaarschmidt, F., & Hothorn, L. A. (2015). nparcomp: An R
Software Package for Nonparametric Multiple Comparisons and Simultaneous Confidence
Intervals. Journal of Statistical Software, 64(9), 1–17.
Kress, G. (2009). Multimodality: A Social Semiotic Approach to Contemporary Communication.
London: Routledge.
Kress, G. R., & Van Leeuwen, T. (2006). Reading Images: The Grammar of Visual Design. New
York, London: Routledge.
Kuhn, T. S. (1962). The Structure of Scientific Revolutions. Chicago: University of Chicago Press.
Latour, B. (1987). Science in Action: How to Follow Scientists and Engineers Through Society.
Cambridge, MA: Harvard University Press.
Latour, B. (1993). We Have Never Been Modern. Cambridge, MA: Harvard University Press.
Latour, B. (2005). Reassembling the Social: An Introduction to Actor-Network-Theory. New York:
Oxford University Press.
Latour, B., & Woolgar, S. (1986). Laboratory Life: The Construction of Scientific Facts. Princeton,
Chichester: Princeton University Press.
Law, J. (2008). On Sociology and STS. The Sociological Review, 56(4), 623–649.
Law, J., & Singleton, V. (2000). Performing Technology‘s Stories: On Social Constructivism,
Performance, and Performativity. Technology and Culture, 41(4), 765–775.
Le, S., Josse, J., & Husson, F. (2008). FactoMineR: An R Package for Multivariate Analysis.
Journal of Statistical Software, 25(1), 1–18.
Lee, D. Y. W. (2000). Modelling Variation in Spoken and Written English: the Multi-Dimensional
Approach Revisited. Lancaster University.
Lee, D. Y. W. (2008). Corpora and Discourse Analysis: New Ways of Doing Old Things. In V. K.
Bhatia, J. Flowerdew, & R. H. Jones (Eds.), Advances in Discourse Studies (pp. 86–99). New York:
Routledge.
Leech, G. (1992). Corpora and Theories of Linguistic Performance. In J. Svartvik (Ed.), Directions
in Corpus Linguistics: Proceedings of Nobel Symposium 82, Stockholm, 4-8 August 1991 (pp. 105–
122).
Leech, G. (2007). New Resources, or Just Better Old Ones? The Holy Grail of Representativeness.
In M. Hundt, N. Nesselhauf, & C. Biewer (Eds.), Corpus Linguistics and the Web (pp. 133–149).
Amsterdam, New York: Rodopi.
Leech, G., Garside, R., & Bryant, M. (1994). CLAWS4: the Tagging of the British National
Corpus. In Proceedings of the 15th conference on Computational linguistics-Volume 1 (pp. 622–
628). Association for Computational Linguistics.
245
Leitner, G. (1998). The Sociolinguistics of Communication Media. In F. Coulmas (Ed.), The
Handbook of Sociolinguistics (pp. 187–208). Oxford: Blackwell.
Lemke, J. L. (1990). Talking Science: Language, Learning, and Values. Norwood, NJ: Ablex
Publishing Corporation.
Levinson, S. C. (1983). Pragmatics. Cambridge: Cambridge University Press.
Levinson, S. C. (2006). Deixis. In L. R. Horn & G. Ward (Eds.), The Handbook of Pragmatics (pp.
97–121). Oxford: Blackwell.
Levshina, N. (2015). How to Do Linguistics with R: Data Exploration and Statistical Analysis.
Amsterdam, Philadelphia: John Benjamins.
Lewenstein, B. V. (1995). From Fax to Facts: Communication in the Cold Fusion Saga. Social
Studies of Science, 25(3), 403–436.
Lewenstein, B. V. (2003). Models of Public Communication of Science and Technology, 16, 1–11.
Lock, S. J. (2011). Deficits and Dialogues: Science Communication and the Public Understanding
of Science in the Uk. In D. J. Bennett, R. C. Jennings, & W. Bodmer (Eds.), Successful Science
Communication: Telling It Like It Is (pp. 17–30). Cambridge: Cambridge University Press.
Luzón, M. J. (2013). Public Communication of Science in Blogs: Recontextualizing Scientific
Discourse for a Diversified Audience. Written Communication, 30(4), 428–457.
Machin, D., & Van Leeuwen, T. (2007). Global Media Discourse: A Critical Introduction. London,
New York: Routledge.
Maksymski, K., Gutermuth, S., & Hansen-Schirra, S. (Eds.). (2015). Translation and
Comprehensibility. Berlin: Frank & Timme.
Marcus, M. P., Marcinkiewicz, M. A., & Santorini, B. (1993). Building a Large Annotated Corpus
of English: The Penn Treebank. Computational Linguistics, 19(2), 313–330.
Martin, James R. (1992). English Text: System and Structure. Amsterdam, Philadelphia: John
Benjamins Publishing.
Martin, James R., & Veel, R. (1998). Reading Science: Critical and Functional Perspectives on
Discourses of Science. London: Routledge.
Martin, James R., & White, P. R. (2005). The Language of Evaluation: Appraisal in English. New
York: Palgrave Macmillan.
Martínez Sierra, J. J. (2010). Science and Technology on the Screen: the Traslation of
Documentaries. In M. L. Gea-Valor, I. García-Izquierdo, & M. J. Esteve (Eds.), Linguistic and
Translation Studies in Scientific Communication (pp. 277–294). Bern: Peter Lang.
246
Mautner, G. (2016). Checks and Balances: How Corpus Linguistics Can Contribute to Cda. In R.
Wodak & M. Meyer (Eds.), Methods of Critical Discourse Studies (pp. 154–179). London,
Thousand Oaks: Sage.
McEnery, A. M., & Wilson, A. (2001). Corpus Linguistics: an Introduction. Edinburgh University
Press.
McEnery, T., & Hardie, A. (2011). Corpus Linguistics: Method, Theory and Practice. Cambridge
University Press.
Meinhof, U. H. (1994). Double Talk in News Broadcasts: A Cross-Cultural Comparison of Pictures
and Texts in Television News. In D. Graddol & O. Boyd-Barrett (Eds.), Media Texts: Authors and
Readers (pp. 212–223). Clevedon: Multilingual Matters.
Merakchi, K., & Rogers, M. (2013). The Translation of Culturally Bound Metaphors in the Genre
of Popular Science Articles: A Corpus-Based Case Study from Scientific American Translated into
Arabic. Intercultural Pragmatics, 10(2), 341–372.
Merton, R. K. (1942). Science and Technology in a Democratic Order. Journal of Legal and
Political Sociology, 1 , 115-126. Reprinted as Merton, R. K. (1973). The Normative Structure of
Science. In Merton, R. K., The Sociology of Science: Theoretical and Empirical Investigations (pp.
267-279). Chicago: University of Chicago Press.
Meyer, M. (2001). Between Theory, Method, and Politics: Positioning of the Approaches to CDA.
In R. Wodak & M. Meyer (Eds.), Methods of Critical Discourse Analysis (pp. 14–31). London,
Thousand Oaks, New Delhi: Sage.
Mimno, D. (2012). Computational Historiography: Data Mining in a Century of Classics Journals.
Journal on Computing and Cultural Heritage, 5(1), 3:1-3:19.
Minelli De Oliveira, J. M., & Pagano, A. S. (2006). The Research Article and the Science
Popularization Article: A Probabilistic Functional Grammar Perspective on Direct Discourse
Representation. Discourse Studies, 8(5), 627–646.
Moirand, S. (2003). Communicative and Cognitive Dimensions of Discourse on Science in the
French Mass Media. Discourse Studies, 5(2), 175–206.
Montgomery, J. (2018, August 13). How We Talk About AI, and Why It Matters: Emerging
Debates at the International Conference for Machine Learning 2018. Retrieved 29 September 2018,
from https://blogs.royalsociety.org/in-verba/2018/08/13/how-we-talk-about-ai-and-why-it-matters-
emerging-debates-at-the-international-conference-for-machine-learning-2018/ (Last accessed in
August 2018).
Montgomery, M. (2011). Discourse and the News. In K. Hyland & B. Paltridge (Eds.), Continuum
Companion to Discourse Analysis (pp. 213–227). London, New York: Continuum.
Mooi, E., Sarstedt, M., & Mooi-Reci, I. (2018). Market Research: The Process, Data, and Methods
Using Stata. Singapore: Springer.
247
Morley, G. D. (2000). Syntax in Functional Grammar: An Introduction to Lexicogrammar in
Systemic Linguistics. London, New York: Continuum.
Muijs, D. (2004). Doing Quantitative Research in Education with Spss. London, Thousand Oaks,
New Delhi: Sage.
Musacchio, M. T. (2017). Translating Popular Science. Padova: Cleup.
Myers, G. (1989). The Pragmatics of Politeness in Scientific Articles. Applied Linguistics, 10(1), 1–
35.
Myers, G. (1990). Writing Biology: Texts in the Social Construction of Scientific Knowledge.
Madison: The University of Winconsin Press.
Myers, G. (1994). Narratives of Science and Nature in Popularizing Molecular Genetics. In M.
Coulthard (Ed.), Advances in Written Text Analysis (pp. 179–190). London, New York: Routledge.
Myers, G. (2003). Discourse Studies of Scientific Popularization: Questioning the Boundaries.
Discourse Studies, 5(2), 265–279.
Myers, G. (2010). The Discourse of Blogs and Wikis. London, New York: Continuum.
National Academies of Sciences, Engineering, and Medicine. (2017). Communicating Science
Effectively: A Research Agenda. Washington, DC: The National Academies Press.
Neresini, F. (2000). And Man Descended from the Sheep: The Public Debate on Cloning in the
Italian Press. Public Understanding of Science, 9, 359–382.
Neresini, F. (2017). Old Media and New Opportunities for a Computational Social Science on
PCST. Journal of Science Communication, 16(2), 13.
Neresini, F., & Lorenzet, A. (2016). Can Media Monitoring be a Proxy for Public Opinion about
Technoscientific Controversies? The Case of the Italian Public Debate on Nuclear Power. Public
Understanding of Science, 25(2), 171–185.
Neuendorf, K. A. (2002). The Content Analysis Guidebook. London, Thousand Oaks, New Delhi:
Sage.
Nini, A. (2014). Multidimensional Analysis Tagger (Version 1.2). Retrieved from
https://sites.google.com/site/multidimensionaltagger/versions (Last accessed in August 2018).
Nisbet, M. C., Scheufele, D. A., Shanahan, J., Moy, P., Brossard, D., & Lewenstein, B. V. (2002).
Knowledge, Reservations, or Promise? A Media Effects Model for Public Perceptions of Science
and Technology. Communication Research, 29(5), 584–608.
O‘Neill, D., & Harcup, T. (2009). News Values and Selectivity. In K. Wahl-Jorgensen & T.
Hanitzsch (Eds.), The Handbook of Journalism Studies (pp. 161–174). New York: Routledge.
248
Paltridge, B., & Starfield, S. (2011). Research in English for Specific Purposes. In E. Hinkel (Ed.),
Handbook of Research in Second Language Teaching and Learning (Vol. 2, pp. 106–121). New
York: Routledge.
Paltridge, B., & Wang, W. (2010). Researching Discourse. In B. Paltridge & A. Phakiti (Eds.),
Continuum Companion to Research Methods in Applied Linguistics (pp. 256–273). London, New
York: Continuum.
Parkinson, J. (2013). English for Science and Technology. In B. Paltridge & S. Starfield (Eds.), The
Handbook of English for Specific Purposes (pp. 156–174). Boston: Wiley-Blackwell.
Pennebaker, J. W., Boyd, R. L., Jordan, K., & Blackburn, K. (2015). The Development and
Psychometric Properties of LIWC2015 . Austin, TX: University of Texas at Austin.
Pianta, E., Girardi, C., Zanoli, R., & Kessler, F. B. (2008). The Textpro Tool Suite. In Proceedings
of the 6th language resources and evaluation conference (LREC 2008).
Preacher, K. J., & MacCallum, R. C. (2003). Repairing Tom Swift‘s Electric Factor Analysis
Machine. Understanding Statistics: Statistical Issues in Psychology, Education, and the Social
Sciences, 2(1), 13–43.
Preacher, K. J., Zhang, G., Kim, C., & Mels, G. (2013). Choosing the Optimal Number of Factors
in Exploratory Factor Analysis: A Model Selection Perspective. Multivariate Behavioral Research,
48(1), 28–56.
Psathas, G. (1995). Conversation Analysis: The Study of Talk-in-Interaction. London: Sage.
Quirk, R., Greenbaum, S., Leech, G., & Svartvik, J. (1985). A Comprehensive Grammar of the
English Language. New York: Longman.
R Core Team. (2017). R: A Language and Environment for Statistical Computing. Vienna, Austria:
R Foundation for Statistical Computing. Retrieved from https://www.R-project.org/ (Last accessed
in August 2018).
Rensberger, B. (2000, July 7). The Nature of Evidence. Science (New Series), 289(5476), 61.
Revelle, W. (2017). psych: Procedures for Personality and Psychological Research (Version 1.7.8).
Evanston, Illinois, USA: Northwestern University. Retrieved from https://CRAN.R-
project.org/package=psych (Last accessed in August 2018).
Rogers, R. (2013). Digital Methods. Cambridge: MIT Press.
Rossi, P. (2006). I meccanici, gli ingegneri, l‘idea di progresso. In P. Rossi (Ed.), Storia della
scienza (Vol. 1, pp. 85–106). Novara: Istituto Geografico De Agostini.
Russell, C. (2010). Covering Controversial Science: Improving Reporting on Science and Public
Policy. In D. Kennedy & G. Overholser (Eds.), Science and the Media. American Academy of Arts
and Sciences.
249
Saferstein, B. (2007). Process Narratives, Grey Boxes, and Discourse Frameworks: Cognition,
Interaction, and Constraint in Understanding Genetics and Medicine. European Journal of Social
Theory, 10(3), 424–447.
Santorini, B. (1991). Part-of-Speech Tagging Guidelines for the Penn Treebank Project. Technical
Reports (CIS).
Scheufele, D. A. (2013). Communicating science in social settings. Proceedings of the National
Academy of Sciences, 110(Supplement 3), 14040–14047.
Scheufele, D. A., & Lewenstein, B. V. (2005). The Public and Nanotechnology: How Citizens
Make Sense of Emerging Technologies. Journal of Nanoparticle Research, 7(6), 659–667.
Schiffrin, D., Tannen, D., & Hamilton, H. E. (2001). The Handbook of Discourse Analysis (First
edition). Oxford: Blackwell.
Schmid, H. (1995). Improvements in Part-of-Speech Tagging with an Application to German. In
Proceedings of the ACL SIGDAT-Workshop.
Scollon, R. (1997). Attribution and Power in Hong Kong News Discourse. World Englishes, 16(3),
383–393.
Scollon, R., & Scollon, S. W. (2001). Discourse and Intercultural Communication. In D. Schiffrin,
D. Tannen, & H. E. Hamilton (Eds.), The Handbook of Discourse Analysis (pp. 538–547). Oxford:
Blackwell.
Scollon, R., & Scollon, S. W. (2003). Discourses in Place: Language in the Material World.
London, New York: Routledge.
Scott, M. (1997). Pc Analysis of Key Words—and Key Key Words. System, 25(2), 233–245.
Scott, M. (2004). Wordsmith Tools (Version 4) [Windows]. Retrieved from
http://www.lexically.net/wordsmith/version4/ (Last accessed in August 2018).
Scott, M. (2010). Problems in Investigating Keyness, or Clearing the Undergrowth and Marking
Out Trails... In M. Bondi & M. Scott (Eds.), Keyness in Texts (pp. 43–57). Amsterdam,
Philadelphia: John Benjamins.
Scott, M., & Tribble, C. (2006). Textual Patterns: Key Words and Corpus Analysis in Language
Education (Vol. 22). Philadelphia, Amsterdam: John Benjamins Publishing.
Seguin, È. (2001). Narration and Legitimation: The Case of in Vitro Fertilization. Discourse &
Society, 12(2), 195–215.
Semino, E. (2002). A Sturdy Baby or a Derailing Train? Metaphorical Representations of the Euro
in British and Italian Newspapers. Text - Interdisciplinary Journal for the Study of Discourse, 22(1),
107–140.
Sharkas, H. (2009). Translation Quality Assessment of Popular Science Articles. Transkom
Zeitschrift Für Translation Und Kommunikation, 2(1), 42–62.
250
Shinn, T., & Whitley, R. P. (1985). Expository Science: Forms and Functions of Popularisation
(Vol. 9). Dordrecht: Springer.
Shuttleworth, M. (2011). Translational Behaviour at the Frontiers of Scientific Knowledge: A
Multilingual Investigation into Popular Science Metaphor in Translation. The Translator, 17(2),
301–323.
Siegfried, T. (2006). Reporting from Science Journals. In D. Blum, M. Knudson, & R. M. Henig
(Eds.), A Field Guide for Science Writers, Second Edition (pp. 11–17). Oxford: Oxford University
Press.
Sinclair, J. (1991). Corpus, Concordance, Collocation. Oxford: Oxford University Press.
Sinclair, J. (2004a). Developing Linguistic Corpora: a Guide to Good Practice. Retrieved 25
November 2018, from https://ota.ox.ac.uk/documents/creating/dlc/chapter1.htm.
Sinclair, J. (2004b). Trust the Text: Language, Corpus, and Discourse. London, New York:
Routledge.
Sismondo, S. (2010). An Introduction to Science and Technology Studies. Malden, Oxford,
Chichester: John Wiley & Sons.
Spatz, C. (2011). Basic Statistics: Tales of Distributions. Belmont: Wadsworth, Cengage Learning.
Stamatatos, E., Fakotakis, N., & Kokkinakis, G. (2000). Text Genre Detection Using Common
Word Frequencies. In Proceedings of the 18th Conference on Computational Linguistics-Volume 2
(pp. 808–814). Association for Computational Linguistics.
Star, S. L. (1988). Introduction: The Sociology of Science and Technology. Social Problems, 35(3),
197–205.
Star, S. L., & Griesemer, J. R. (1989). Institutional Ecology, Translations and Boundary Objects:
Amateurs and Professionals in Berkeley‘s Museum of Vertebrate Zoology, 1907-39. Social Studies
of Science, 19(3), 387–420.
Stubbs, M. (1993). British Traditions in Text Analysis: from Firth to Sinclair. In M. Baker, G.
Francis, & E. Tognini-Bonelli (Eds.), Text and Technology: in Honour of John Sinclair (pp. 1–33).
Philadelphia, Amsterdam: John Benjamins.
Stubbs, M. (1996). Text and Corpus Analysis: Computer-Assisted Studies of Language and Culture.
Blackwell Oxford.
Stubbs, M. (2010). Three Concepts of Keywords. In M. Bondi & M. Scott (Eds.), Keyness in Texts
(pp. 21–42). Amsterdam, Philadelphia: John Benjamins.
Stubbs, M. (2017). Language and the Mediation of Experience: Linguistic Representation and
Cognitive Orientation. In F. Coulmas (Ed.), The Handbook of Sociolinguistics (pp. 246–256).
Blackwell Reference Online.
251
Swales, J. (1990). Genre Analysis: English in Academic and Research Settings. Cambridge:
Cambridge University Press.
Szymanski, E. A. (2016). Constructing Relationships Between Science and Practice in the Written
Science Communication of the Washington State Wine Industry. Written Communication, 33(2),
184–215.
Tabachnick, B. G., & Fidell, L. S. (2013). Using Multivariate Statistics. Boston: Allyn &
Bacon/Pearson Education.
Talmy, S. (2010). Critical Research in Applied Linguistics. In B. Paltridge & A. Phakiti (Eds.),
Continuum Companion to Research Methods in Applied Linguistics (pp. 127–142). London, New
York: Continuum.
Tambini, D., & Labo, S. (2016). Digital Intermediaries in the Uk: Implications for News Plurality.
Digital Policy, Regulation and Governance, 18(4), 33–58.
Tardy, C. M. (2011). Genre Analysis. In K. Hyland & B. Paltridge (Eds.), Continuum Companion
to Discourse Analysis (pp. 54–68). London, New York: Continuum.
Tashakkori, A., & Creswell, J. W. (2007). The New Era of Mixed Methods. Journal of Mixed
Methods Research, 1(1), 3–7.
Taylor, A., Marcus, M., & Santorini, B. (2003). The Penn Treebank: an Overview. In A. Abeillé
(Ed.), Treebanks: Building and Using Parsed Corpora (pp. 5–22). New York: Springer.
Taylor, C. (2010). Science in the News: A Diachronic Perspective. Corpora, 5(2), 221–250.
Taylor, C. (2014). Investigating the Representation of Migrants in the UK and Italian Press.
International Journal of Corpus Linguistics, 19(3), 368–400.
Telegraph Reporters. (2018, August 11). Monsanto Ordered to Pay $289m to Terminally Ill
Groundsman Who Used Roundup Weedkiller. The Daily Telegraph. Retrieved from
https://www.telegraph.co.uk/business/2018/08/11/monsanto-ordered-pay-289-million-cancer-
patient/ (Last accessed in August 2018).
Ten Have, P. (2004). Understanding Qualitative Research and Ethnomethodology. London,
Thousand Oaks, New Delhi: Sage.
Ten Have, P. (2007). Doing Conversation Analysis. London: Sage.
Teubert, W. (2005). My Version of Corpus Linguistics. International Journal of Corpus
Linguistics, 10(1), 1–13.
Thompson, K. (1968). Programming Techniques: Regular Expression Search Algorithm.
Communications of the ACM, 11(6), 419–422.
Tian, Y., & Lo, D. (2015). A Comparative Study on the Effectiveness of Part-of-Speech Tagging
Techniques on Bug Reports. In Software Analysis, Evolution and Reengineering (SANER), 2015
IEEE 22nd International Conference (pp. 570–574). IEEE.
252
TIPS - Technoscientific Issues in the Public Sphere. (n.d.). Retrieved 29 September 2018, from
http://www.tipsproject.eu/tips/#/public/home (Last accessed in August 2018).
Trappes-Lomax, H. (2004). Discourse Analysis. In A. Davies & C. Elder (Eds.), The Handbook of
Applied Linguistics (pp. 133–164). Oxford: Blackwell.
UNESCO. (2005). UNESCO World Report: Towards Knowledge Societies. Paris. Retrieved from
http://unesdoc.unesco.org/images/0014/001418/141843e.pdf (Last accessed in August 2018).
Väliverronen, E., & Hellsten, I. (2002). From ―Burning Library‖ to ―Green Medicine‖ the Role of
Metaphors in Communicating Biodiversity. Science Communication, 24(2), 229–245.
van Dijk, T. A. (1988). News as discourse. Hillsdale: L. Erlbaum associates.
van Dijk, T. A. (2015). Critical Discourse Analysis. In D. Schiffrin, D. Tannen, & H. E. Hamilton
(Eds.), The Handbook of Discourse Analysis (pp. 466–485). Oxford: Blackwell.
van Dijk, T. A., & Kintsch, W. (1983). Strategies of Discourse Comprehension. New York:
Academic Press.
Varttala, T. (2001). Hedging in Scientifically Oriented Discourse. Exploring Variation According to
Discipline and Intended Audience. Tampere: Tampere University Press.
Whitley, R. (1985). Knowledge Producers and Knowledge Acquirers: Popularisation as a Relation
Between Scientific Fields and Their Publics. In R. Whitley & T. Shinn (Eds.), Expository Science:
Forms and Functions of Popularisation (pp. 3–28). Dordrecht, Boston, Lancaster: D. Reidel
Publishing Company.
Wodak, R. (2011). Critical Discourse Analysis. In B. Paltridge & K. Hyland (Eds.) (pp. 38–53).
London, New York: Continuum.
Wright, S. (2016). Language Policy and Language Planning: From Nationalism to Globalisation.
Basingstoke, New York: Palgrave Macmillan.
Wynne, M. (2008). Searching and Concordancing. In A. Lüdeling & M. Kytö (Eds.), Corpus
Linguistics: an International Handbook (Vol. 1, pp. 706–737). Berlin, New York: de Gruyter.
Xiao, R. (2009). Multidimensional Analysis and the Study of World Englishes. World Englishes,
28(4), 421–450.
Xiao, Z., & McEnery, A. (2005). Two Approaches to Genre Analysis: Three Genres in Modern
American English. Journal of English Linguistics, 33(1), 62–82.
Zambrana, M. R. B. (2010). Ontologies for Scientific-Technical Translation. In M. L. Gea-Valor, I.
García-Izquierdo, & M. J. Esteve (Eds.), Linguistic and Translation Studies in Scientific
Communication (pp. 295–312). Bern: Peter Lang.
Zethsen, K. (2009). Intralingual Translation: An Attempt at Description. Meta: Translators‘
Journal, 54(4), 795–812.

253
Ziman, J. (1996). ‗Postacademic Science‘: Constructing Knowledge with Networks and Norms.
Science Studies, 9(1), 67–80.
Zipf, G. K. (1949). Human Behaviour and the Principle of Least-Effort. Cambridge Ma Edn.
Cambridge: Addison-Wesley.
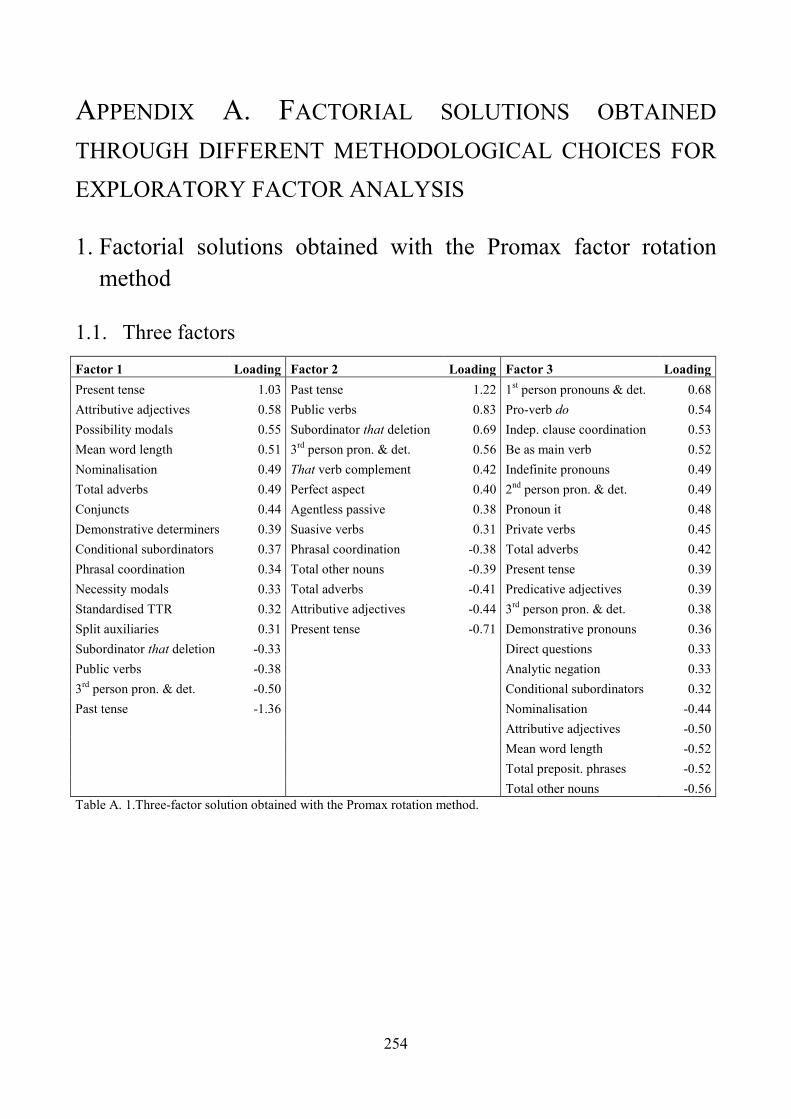
254
APPENDIX A. FACTORIAL SOLUTIONS OBTAINED
THROUGH DIFFERENT METHODOLOGICAL CHOICES FOR
EXPLORATORY FACTOR ANALYSIS
1. Factorial solutions obtained with the Promax factor rotation
method
1.1. Three factors
Factor 1 Loading Factor 2 Loading Factor 3 Loading
Present tense 1.03 Past tense 1.22 1st person pronouns & det. 0.68
Attributive adjectives 0.58 Public verbs 0.83 Pro-verb do 0.54
Possibility modals 0.55 Subordinator that deletion 0.69 Indep. clause coordination 0.53
Mean word length 0.51 3rd
person pron. & det. 0.56 Be as main verb 0.52
Nominalisation 0.49 That verb complement 0.42 Indefinite pronouns 0.49
Total adverbs 0.49 Perfect aspect 0.40 2nd
person pron. & det. 0.49
Conjuncts 0.44 Agentless passive 0.38 Pronoun it 0.48
Demonstrative determiners 0.39 Suasive verbs 0.31 Private verbs 0.45
Conditional subordinators 0.37 Phrasal coordination -0.38 Total adverbs 0.42
Phrasal coordination 0.34 Total other nouns -0.39 Present tense 0.39
Necessity modals 0.33 Total adverbs -0.41 Predicative adjectives 0.39
Standardised TTR 0.32 Attributive adjectives -0.44 3rd
person pron. & det. 0.38
Split auxiliaries 0.31 Present tense -0.71 Demonstrative pronouns 0.36
Subordinator that deletion -0.33
Direct questions 0.33
Public verbs -0.38
Analytic negation 0.33
3rd
person pron. & det. -0.50
Conditional subordinators 0.32
Past tense -1.36
Nominalisation -0.44
Attributive adjectives -0.50
Mean word length -0.52
Total preposit. phrases -0.52
Total other nouns -0.56
Table A. 1.Three-factor solution obtained with the Promax rotation method.
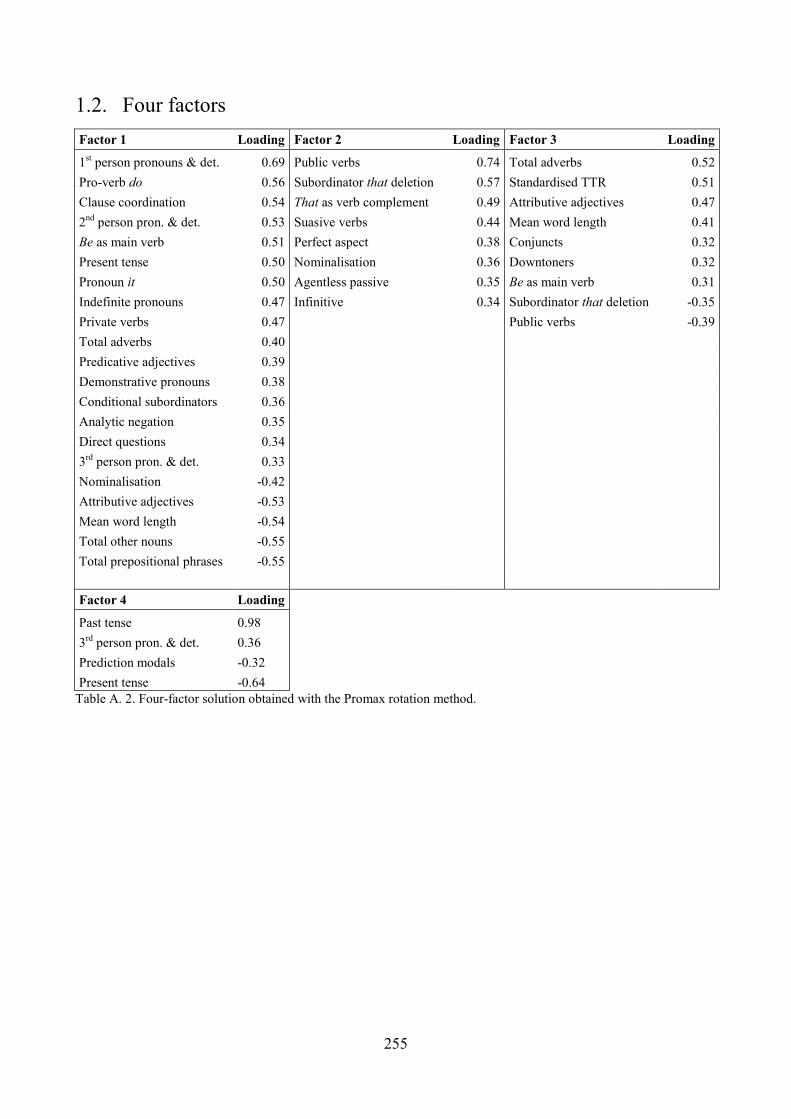
255
1.2. Four factors
Factor 1 Loading Factor 2 Loading Factor 3 Loading
1st person pronouns & det. 0.69 Public verbs 0.74 Total adverbs 0.52
Pro-verb do 0.56 Subordinator that deletion 0.57 Standardised TTR 0.51
Clause coordination 0.54 That as verb complement 0.49 Attributive adjectives 0.47
2nd
person pron. & det. 0.53 Suasive verbs 0.44 Mean word length 0.41
Be as main verb 0.51 Perfect aspect 0.38 Conjuncts 0.32
Present tense 0.50 Nominalisation 0.36 Downtoners 0.32
Pronoun it 0.50 Agentless passive 0.35 Be as main verb 0.31
Indefinite pronouns 0.47 Infinitive 0.34 Subordinator that deletion -0.35
Private verbs 0.47
Public verbs -0.39
Total adverbs 0.40
Predicative adjectives 0.39
Demonstrative pronouns 0.38
Conditional subordinators 0.36
Analytic negation 0.35
Direct questions 0.34
3rd
person pron. & det. 0.33
Nominalisation -0.42
Attributive adjectives -0.53
Mean word length -0.54
Total other nouns -0.55
Total prepositional phrases -0.55
Factor 4 Loading
Past tense 0.98
3rd
person pron. & det. 0.36
Prediction modals -0.32
Present tense -0.64
Table A. 2. Four-factor solution obtained with the Promax rotation method.
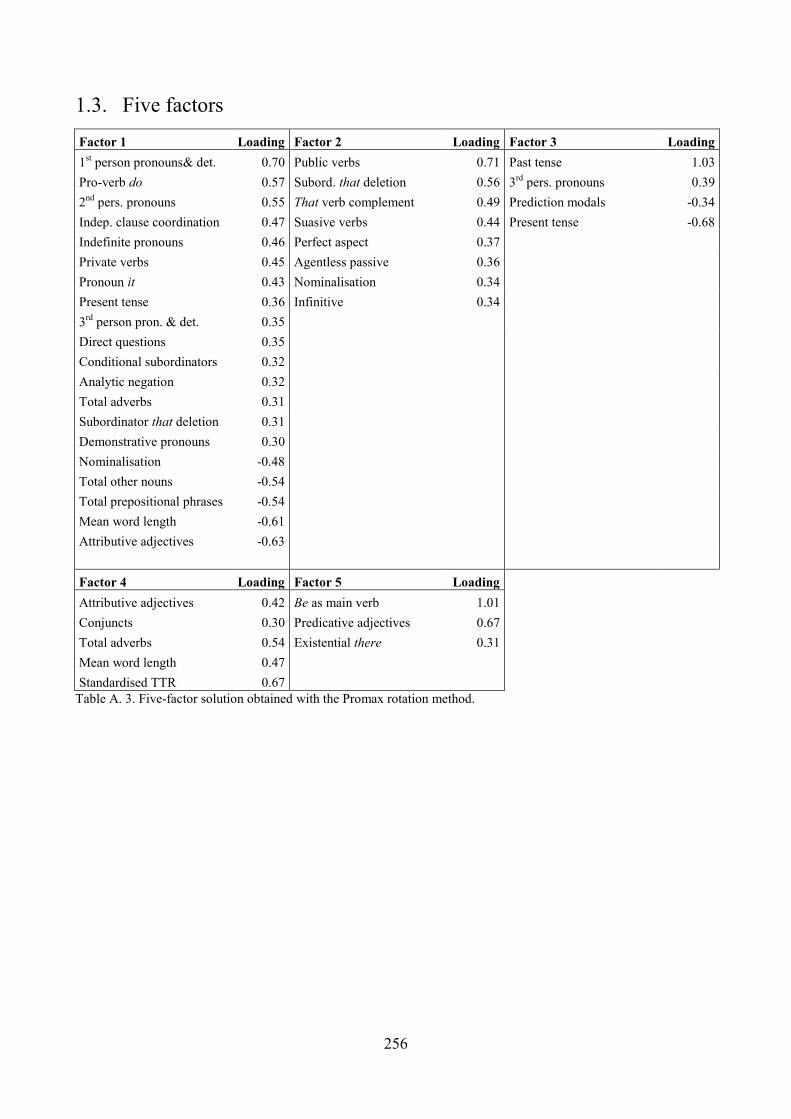
256
1.3. Five factors
Factor 1 Loading Factor 2 Loading Factor 3 Loading
1st person pronouns& det. 0.70 Public verbs 0.71 Past tense 1.03
Pro-verb do 0.57 Subord. that deletion 0.56 3rd
pers. pronouns 0.39
2nd
pers. pronouns 0.55 That verb complement 0.49 Prediction modals -0.34
Indep. clause coordination 0.47 Suasive verbs 0.44 Present tense -0.68
Indefinite pronouns 0.46 Perfect aspect 0.37
Private verbs 0.45 Agentless passive 0.36
Pronoun it 0.43 Nominalisation 0.34
Present tense 0.36 Infinitive 0.34
3rd
person pron. & det. 0.35
Direct questions 0.35
Conditional subordinators 0.32
Analytic negation 0.32
Total adverbs 0.31
Subordinator that deletion 0.31
Demonstrative pronouns 0.30
Nominalisation -0.48
Total other nouns -0.54
Total prepositional phrases -0.54
Mean word length -0.61
Attributive adjectives -0.63
Factor 4 Loading Factor 5 Loading
Attributive adjectives 0.42 Be as main verb 1.01
Conjuncts 0.30 Predicative adjectives 0.67
Total adverbs 0.54 Existential there 0.31
Mean word length 0.47
Standardised TTR 0.67
Table A. 3. Five-factor solution obtained with the Promax rotation method.
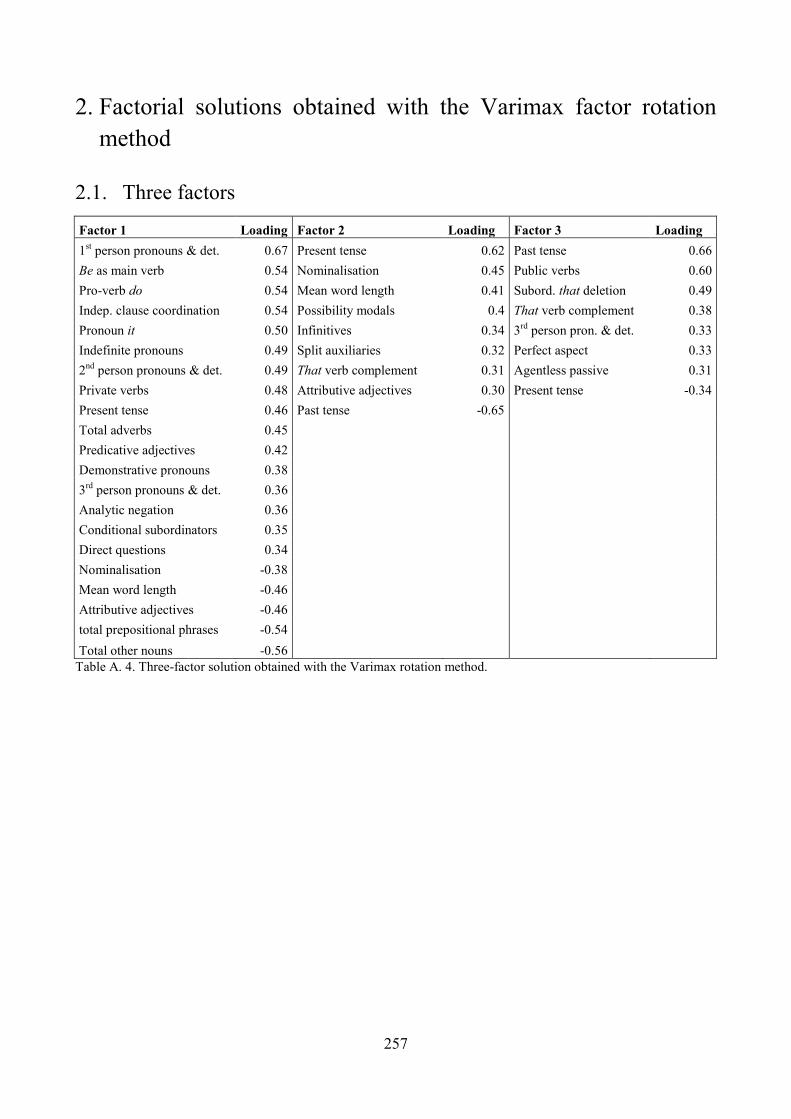
257
2. Factorial solutions obtained with the Varimax factor rotation
method
2.1. Three factors
Factor 1 Loading Factor 2 Loading Factor 3 Loading
1st person pronouns & det. 0.67 Present tense 0.62 Past tense 0.66
Be as main verb 0.54 Nominalisation 0.45 Public verbs 0.60
Pro-verb do 0.54 Mean word length 0.41 Subord. that deletion 0.49
Indep. clause coordination 0.54 Possibility modals 0.4 That verb complement 0.38
Pronoun it 0.50 Infinitives 0.34 3rd
person pron. & det. 0.33
Indefinite pronouns 0.49 Split auxiliaries 0.32 Perfect aspect 0.33
2nd
person pronouns & det. 0.49 That verb complement 0.31 Agentless passive 0.31
Private verbs 0.48 Attributive adjectives 0.30 Present tense -0.34
Present tense 0.46 Past tense -0.65
Total adverbs 0.45
Predicative adjectives 0.42
Demonstrative pronouns 0.38
3rd
person pronouns & det. 0.36
Analytic negation 0.36
Conditional subordinators 0.35
Direct questions 0.34
Nominalisation -0.38
Mean word length -0.46
Attributive adjectives -0.46
total prepositional phrases -0.54
Total other nouns -0.56 Table A. 4. Three-factor solution obtained with the Varimax rotation method.
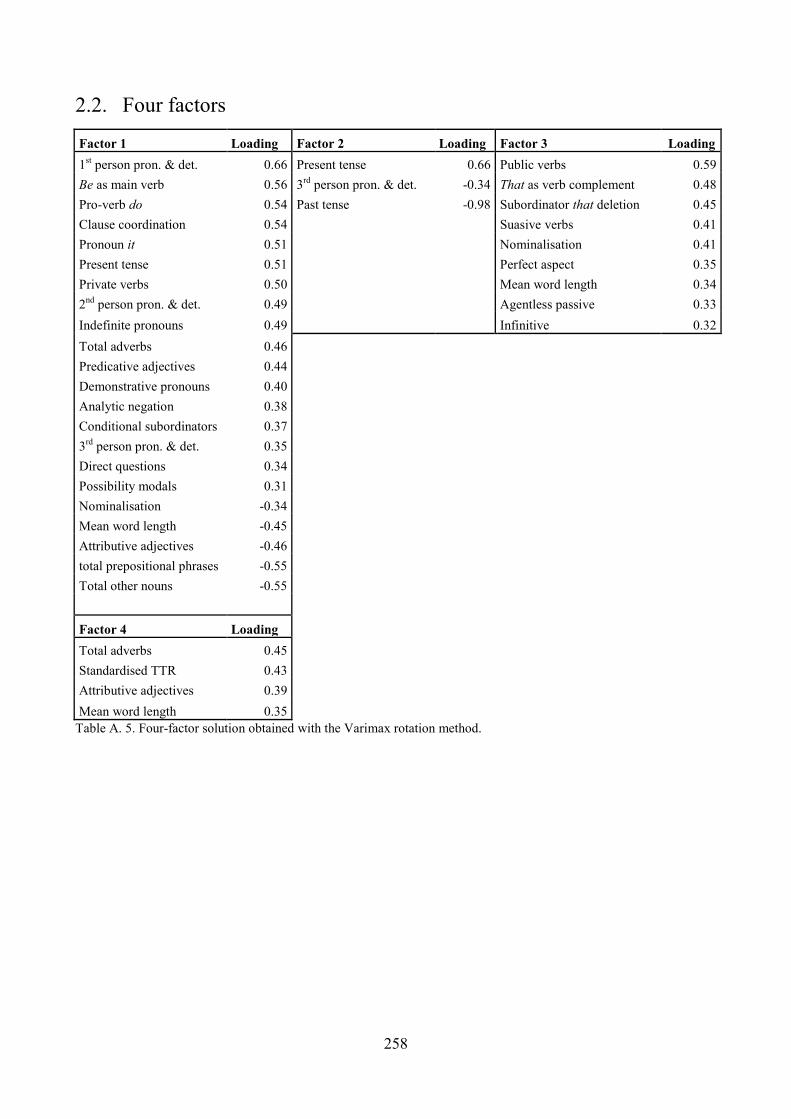
258
2.2. Four factors
Factor 1 Loading Factor 2 Loading Factor 3 Loading
1st person pron. & det. 0.66 Present tense 0.66 Public verbs 0.59
Be as main verb 0.56 3rd
person pron. & det. -0.34 That as verb complement 0.48
Pro-verb do 0.54 Past tense -0.98 Subordinator that deletion 0.45
Clause coordination 0.54
Suasive verbs 0.41
Pronoun it 0.51
Nominalisation 0.41
Present tense 0.51
Perfect aspect 0.35
Private verbs 0.50
Mean word length 0.34
2nd
person pron. & det. 0.49
Agentless passive 0.33
Indefinite pronouns 0.49 Infinitive 0.32
Total adverbs 0.46
Predicative adjectives 0.44
Demonstrative pronouns 0.40
Analytic negation 0.38
Conditional subordinators 0.37
3rd
person pron. & det. 0.35
Direct questions 0.34
Possibility modals 0.31
Nominalisation -0.34
Mean word length -0.45
Attributive adjectives -0.46
total prepositional phrases -0.55
Total other nouns -0.55
Factor 4 Loading
Total adverbs 0.45
Standardised TTR 0.43
Attributive adjectives 0.39
Mean word length 0.35
Table A. 5. Four-factor solution obtained with the Varimax rotation method.
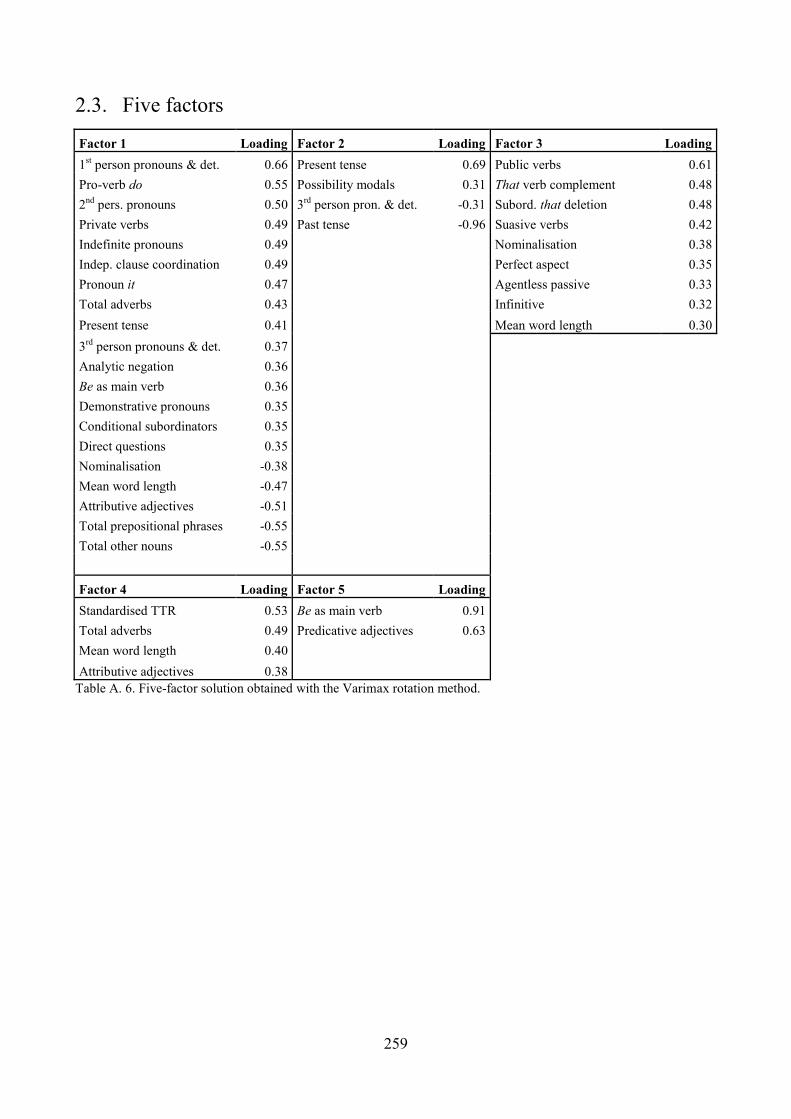
259
2.3. Five factors
Factor 1 Loading Factor 2 Loading Factor 3 Loading
1st person pronouns & det. 0.66 Present tense 0.69 Public verbs 0.61
Pro-verb do 0.55 Possibility modals 0.31 That verb complement 0.48
2nd
pers. pronouns 0.50 3rd
person pron. & det. -0.31 Subord. that deletion 0.48
Private verbs 0.49 Past tense -0.96 Suasive verbs 0.42
Indefinite pronouns 0.49
Nominalisation 0.38
Indep. clause coordination 0.49
Perfect aspect 0.35
Pronoun it 0.47
Agentless passive 0.33
Total adverbs 0.43
Infinitive 0.32
Present tense 0.41
Mean word length 0.30
3rd
person pronouns & det. 0.37
Analytic negation 0.36
Be as main verb 0.36
Demonstrative pronouns 0.35
Conditional subordinators 0.35
Direct questions 0.35
Nominalisation -0.38
Mean word length -0.47
Attributive adjectives -0.51
Total prepositional phrases -0.55
Total other nouns -0.55
Factor 4 Loading Factor 5 Loading
Standardised TTR 0.53 Be as main verb 0.91
Total adverbs 0.49 Predicative adjectives 0.63
Mean word length 0.40
Attributive adjectives 0.38 Table A. 6. Five-factor solution obtained with the Varimax rotation method.
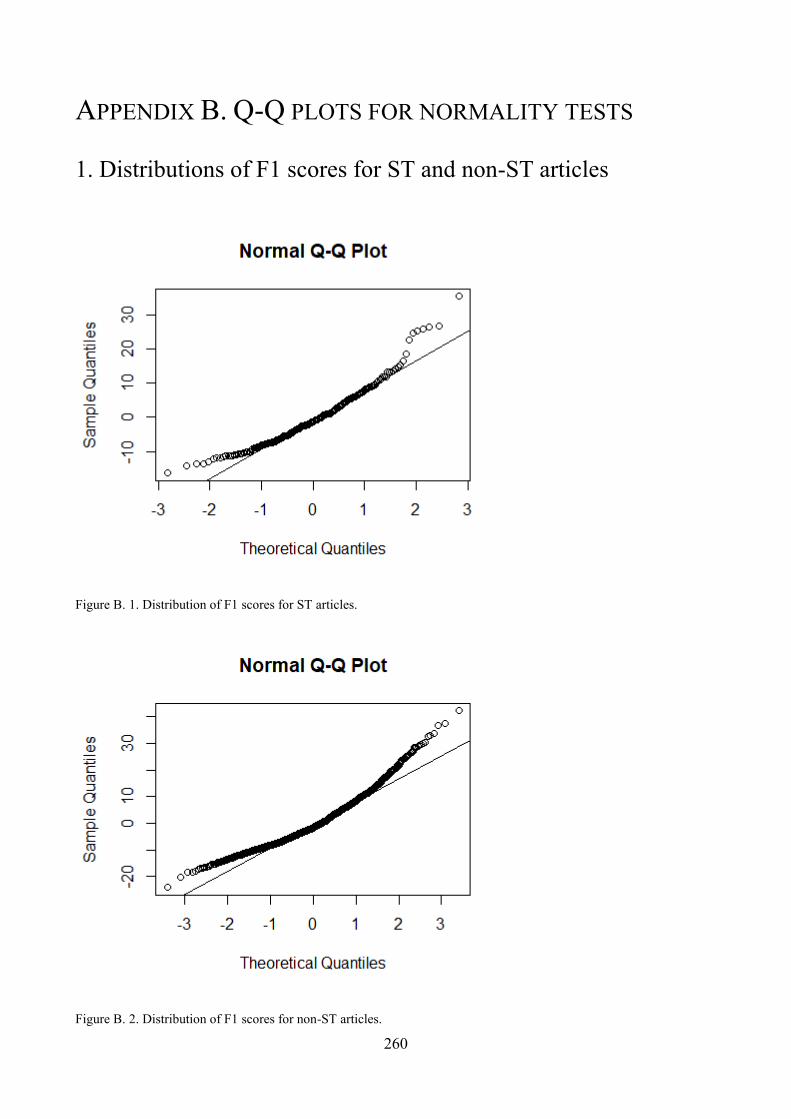
260
APPENDIX B. Q-Q PLOTS FOR NORMALITY TESTS
1. Distributions of F1 scores for ST and non-ST articles
Figure B. 1. Distribution of F1 scores for ST articles.
Figure B. 2. Distribution of F1 scores for non-ST articles.
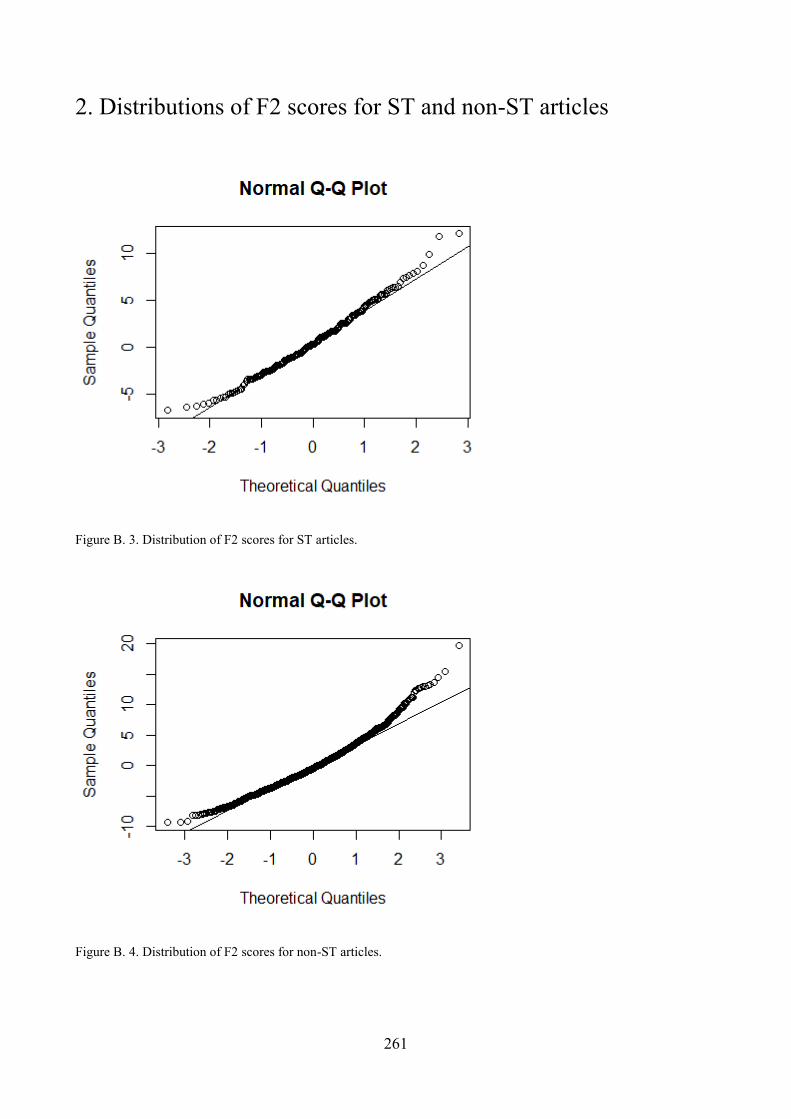
261
2. Distributions of F2 scores for ST and non-ST articles
Figure B. 3. Distribution of F2 scores for ST articles.
Figure B. 4. Distribution of F2 scores for non-ST articles.
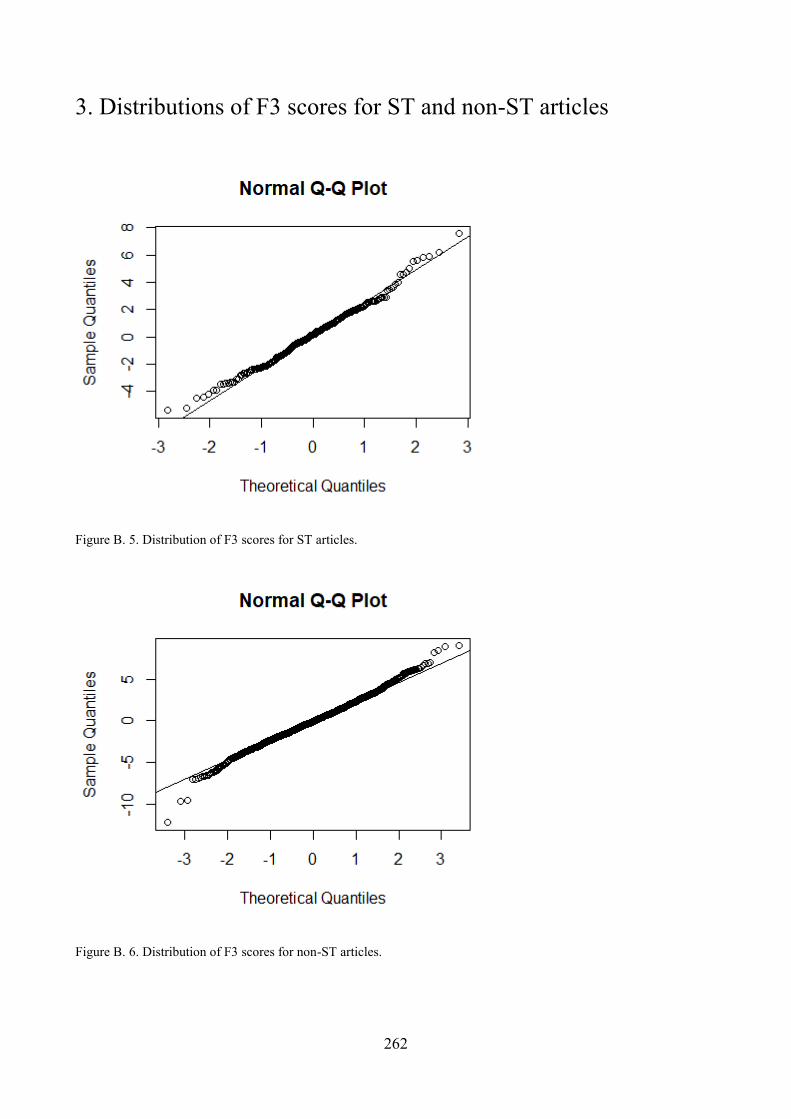
262
3. Distributions of F3 scores for ST and non-ST articles
Figure B. 5. Distribution of F3 scores for ST articles.
Figure B. 6. Distribution of F3 scores for non-ST articles.
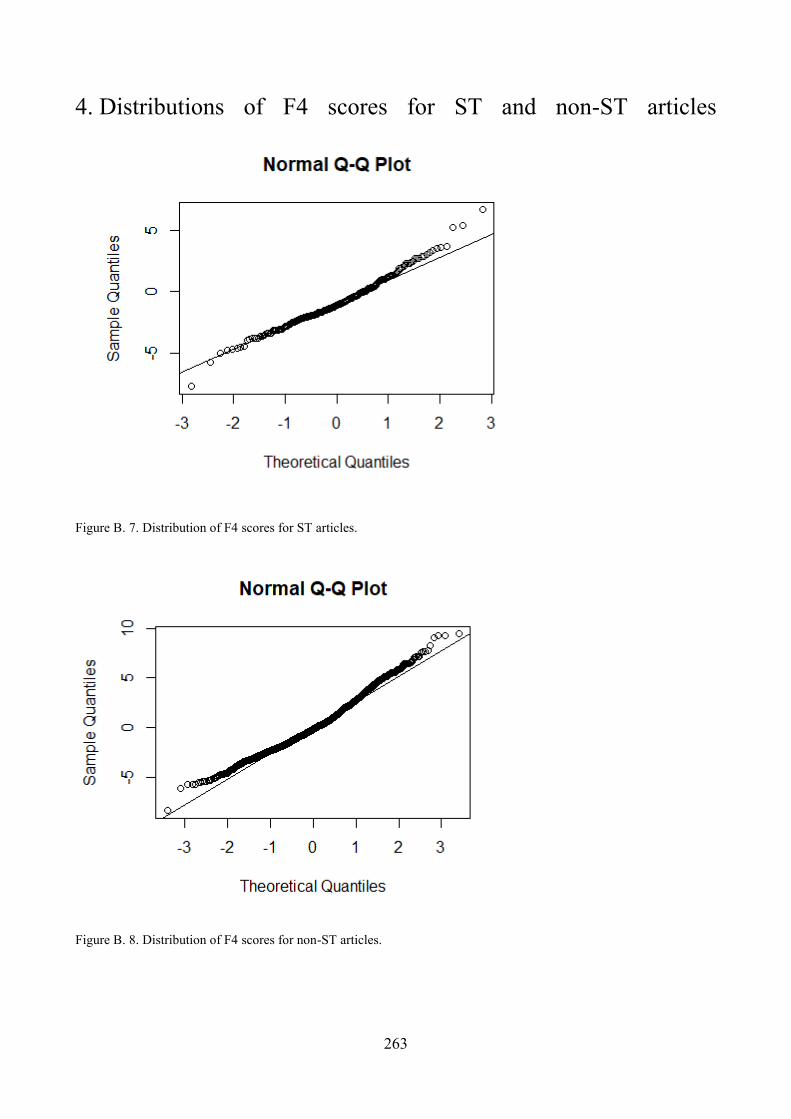
263
4. Distributions of F4 scores for ST and non-ST articles
Figure B. 7. Distribution of F4 scores for ST articles.
Figure B. 8. Distribution of F4 scores for non-ST articles.


![USE OF INFORMATION COMMUNICATION TECHNOLOGY BY …11]_113-130.pdfKeywords: Information Communication Technology, Users’, Jaypee University of Engineering and Technology, JUET, Guna](https://img.pdfslide.fr/doc/110x75/5f6a584546511272a02bd2fe/use-of-information-communication-technology-by-11113-130pdf-keywords-information.jpg)