Embed Size (px)
Citation preview

The DRASTIC-Sg model: an extension to the DRASTIC approach
for mapping groundwater vulnerability in aquifers subject
to differential land subsidence, with application to Mexico City
Antonio Hernández-Espriú & J. Antonio Reyna-Gutiérrez &
Emilio Sánchez-León & Enrique Cabral-Cano &
Jaime Carrera-Hernández & Pedro Martínez-Santos &
Sergio Macías-Medrano & Giacomo Falorni &Davide Colombo
Abstract Mexico City relies on groundwater for most of itsdomestic supply. Over the years, intensive pumping has ledto significant drawdowns and, subsequently, to severe landsubsidence. Tensile cracks have also developed or reacti-vated as a result. All such processes cause damage to urbaninfrastructure, increasing the risk of spills and favoring
contaminant propagation into the aquifer. The effects ofground deformation are frequently ignored in groundwatervulnerability studies, but can be relevant in subsiding cities.This report presents an extension to the DRASTIC method-ology, named DRASTIC-Sg, which focuses on evaluatinggroundwater vulnerability in urban aquifers affected bydifferential subsidence. A subsidence parameter is devel-oped to represent the ground deformation gradient (Sg), andthen used to depict areas where damage risk to urbaninfrastructure is higher due to fracture propagation. Space-geodetic SqueeSAR data and global positioning system(GPS) validation were used to evaluate subsidence rates andgradients, integrating hydrogeological and geomechanicalvariables into a GIS environment. Results show that classicDRASTIC approaches may underestimate groundwatervulnerability in settings such as the one at hand. Hence, itis concluded that the Sg parameter is a welcome contributionto develop reliable vulnerability assessments in subsidingbasins.
Keywords DRASTIC-Sg . Groundwatervulnerability . Subsidence . Synthetic aperture radar(SAR) . Mexico
Introduction
The Mexico City Metropolitan Area (MCMA), locatedwithin the southwestern sector of the Basin of Mexico(Fig. 1), is home to about 21 million people (INEGI2010). Mexico City is one of the world’s largestmegacities and depends mostly on groundwater as itsmain source of domestic supply. Providing water to anever-growing population poses a major managementchallenge. Currently, water consumption in the basinamounts to 61.6 m3/s, out of which 66 % are suppliedby wells. Most of the extractions take place from aregional complex of Quaternary-Tertiary alluvial, pyro-clastic and fractured aquifers, overlain by a compressiblelacustrine aquitard.
Received: 11 August 2013 /Accepted: 7 March 2014
* Springer-Verlag Berlin Heidelberg 2014
A. Hernández-Espriú ()) : J. A. Reyna-Gutiérrez : E. Sánchez-León : S. Macías-MedranoHydrogeology Group, Earth Sciences Division, Faculty ofEngineering,Universidad Nacional Autónoma de México (UNAM), CiudadUniversitaria, México, DF 04360, Mexicoe-mail: [email protected].: +52-55-56220850Fax: +52-55-56220850
J. A. Reyna-GutiérrezDepartment of Environmental Engineering,Danmarks Tekniske Universitet, Kongens Lyngby, Denmark
E. Sánchez-LeónCenter for Applied Geoscience,Eberhard Karls Universität Tübingen, Tübingen, Germany
E. Cabral-CanoDepartment of Geomagnetism and Exploration,Institute of Geophysics, Universidad Nacional Autónoma deMéxico, Mexico City, Mexico
J. Carrera-HernándezCentro de Geociencias,Universidad Nacional Autónoma de México, Juriquilla, Querétaro,Mexico
P. Martínez-SantosDepartment of Geodynamics, Faculty of Geological Sciences,Universidad Complutense de Madrid, Madrid, Spain
G. FalorniTRE Canada Inc., Vancouver, BC, Canada
D. ColomboTele-Rilevamento Europa T.R.E. s.r.l., Milan, Italy
Hydrogeology JournalDOI 10.1007/s10040-014-1130-4
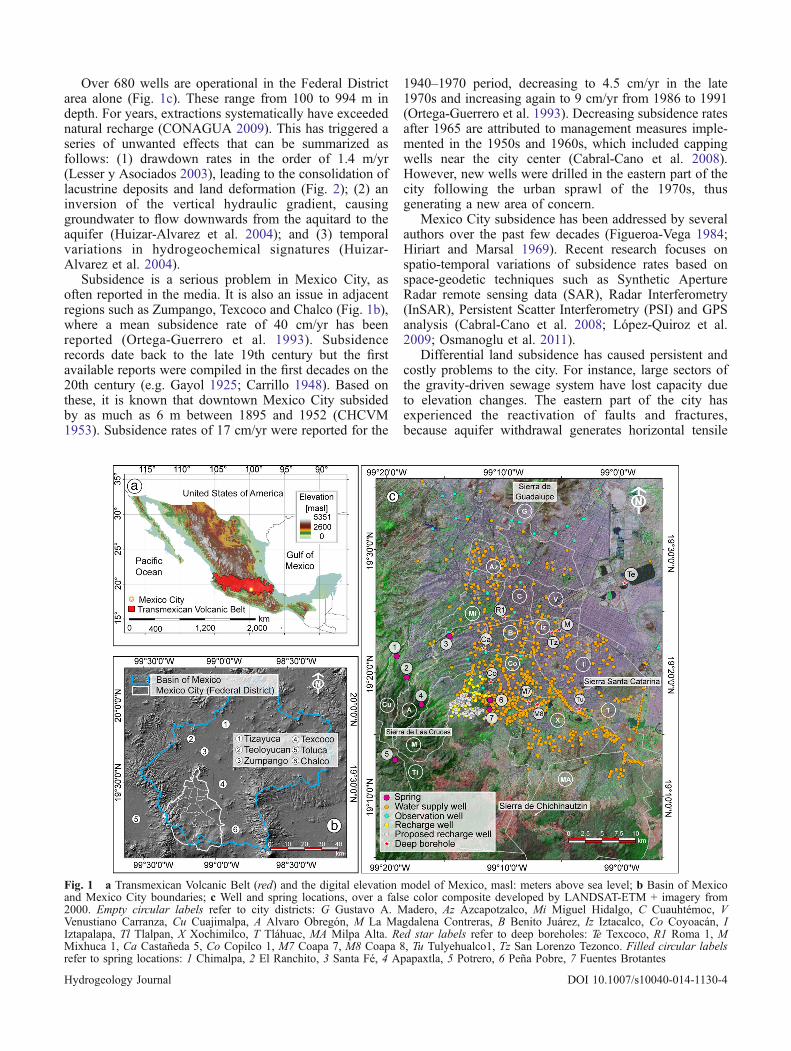
Over 680 wells are operational in the Federal Districtarea alone (Fig. 1c). These range from 100 to 994 m indepth. For years, extractions systematically have exceedednatural recharge (CONAGUA 2009). This has triggered aseries of unwanted effects that can be summarized asfollows: (1) drawdown rates in the order of 1.4 m/yr(Lesser y Asociados 2003), leading to the consolidation oflacustrine deposits and land deformation (Fig. 2); (2) aninversion of the vertical hydraulic gradient, causinggroundwater to flow downwards from the aquitard to theaquifer (Huizar-Alvarez et al. 2004); and (3) temporalvariations in hydrogeochemical signatures (Huizar-Alvarez et al. 2004).
Subsidence is a serious problem in Mexico City, asoften reported in the media. It is also an issue in adjacentregions such as Zumpango, Texcoco and Chalco (Fig. 1b),where a mean subsidence rate of 40 cm/yr has beenreported (Ortega-Guerrero et al. 1993). Subsidencerecords date back to the late 19th century but the firstavailable reports were compiled in the first decades on the20th century (e.g. Gayol 1925; Carrillo 1948). Based onthese, it is known that downtown Mexico City subsidedby as much as 6 m between 1895 and 1952 (CHCVM1953). Subsidence rates of 17 cm/yr were reported for the
1940–1970 period, decreasing to 4.5 cm/yr in the late1970s and increasing again to 9 cm/yr from 1986 to 1991(Ortega-Guerrero et al. 1993). Decreasing subsidence ratesafter 1965 are attributed to management measures imple-mented in the 1950s and 1960s, which included cappingwells near the city center (Cabral-Cano et al. 2008).However, new wells were drilled in the eastern part of thecity following the urban sprawl of the 1970s, thusgenerating a new area of concern.
Mexico City subsidence has been addressed by severalauthors over the past few decades (Figueroa-Vega 1984;Hiriart and Marsal 1969). Recent research focuses onspatio-temporal variations of subsidence rates based onspace-geodetic techniques such as Synthetic ApertureRadar remote sensing data (SAR), Radar Interferometry(InSAR), Persistent Scatter Interferometry (PSI) and GPSanalysis (Cabral-Cano et al. 2008; López-Quiroz et al.2009; Osmanoglu et al. 2011).
Differential land subsidence has caused persistent andcostly problems to the city. For instance, large sectors ofthe gravity-driven sewage system have lost capacity dueto elevation changes. The eastern part of the city hasexperienced the reactivation of faults and fractures,because aquifer withdrawal generates horizontal tensile
Fig. 1 a Transmexican Volcanic Belt (red) and the digital elevation model of Mexico, masl: meters above sea level; b Basin of Mexicoand Mexico City boundaries; c Well and spring locations, over a false color composite developed by LANDSAT-ETM + imagery from2000. Empty circular labels refer to city districts: G Gustavo A. Madero, Az Azcapotzalco, Mi Miguel Hidalgo, C Cuauhtémoc, VVenustiano Carranza, Cu Cuajimalpa, A Alvaro Obregón, M La Magdalena Contreras, B Benito Juárez, Iz Iztacalco, Co Coyoacán, IIztapalapa, Tl Tlalpan, X Xochimilco, T Tláhuac, MA Milpa Alta. Red star labels refer to deep boreholes: Te Texcoco, R1 Roma 1, MMixhuca 1, Ca Castañeda 5, Co Copilco 1, M7 Coapa 7, M8 Coapa 8, Tu Tulyehualco1, Tz San Lorenzo Tezonco. Filled circular labelsrefer to spring locations: 1 Chimalpa, 2 El Ranchito, 3 Santa Fé, 4 Apapaxtla, 5 Potrero, 6 Peña Pobre, 7 Fuentes Brotantes
Hydrogeology Journal DOI 10.1007/s10040-014-1130-4
stresses that lead to permanent fracture propagation. Theseeffects typically result in ongoing damage to urbaninfrastructures such as roads, gas stations, undergroundstorage tanks or oil pipelines.
Tension cracks due to groundwater depletion anddifferential land subsidence can reach up to severalmeters; thus, Holzer and Galloway (2005) established thattensile fissures may act as conduits for large quantities ofwater. In turn, fissures provide preferential flow paths forcontaminants into aquifers, as reported for the MexicoCity aquifer by Mazari (1996). Therefore, potential andcurrent oil spills combined with induced infiltrationpathways of several tens of meters depth, increase aquifervulnerability and risk pollution; however, very few studieshave explored the relationship between the infiltrationpathways, controlled by differential subsidence andaquifer vulnerability.
Groundwater vulnerability (GWV) has been an impor-tant topic of discussion among hydrogeologists over thelast three decades. A literature review led to theidentification of about 60 different methodologies toevaluate groundwater vulnerability. Most of them arebased on one of the following techniques: (1) flow andmass-transport numerical modeling (e.g. Butscher andHuggenberger 2009), (2) statistical/geostatistical/probabi-listic approaches (e.g. Sorichetta et al. 2011), (3) wellhead/well capture zones (e.g. Molson and Frind 2012) and (4)parametric and rating models, which are the most widelyused, especially applying GIS tools.
The DRASTIC methodology, developed by Aller et al.(1987), is the most widespread approach. Despite itslimitations (Panagopoulos et al. 2006), DRASTIC hasbeen successfully applied in many different hydrogeolog-ical settings (Chen et al. 2013; Ducci and Sellerino 2013;
Kumar Prasad et al. 2011). Enhancements of the DRAS-TIC methodology have also been proposed by differentauthors. These include improvements in weighting factors(Oliva-Soto 2007), hydrogeochemical calibrations (Pan-agopoulos et al. 2006) or the subtraction or addition ofkey parameters depending on site-specific features. Forinstance, Lima et al. (2011) proposed a methodology toassess actual and forecasted GWV by adding a land-useparameter (DRASTIC-P). In turn, Denny et al. (2007)developed a modified methodology for mapping intrinsicvulnerability by adding regional structural characteristicsof bedrock aquifers in British Columbia, Canada (DRAS-TIC-Fm).
Studies dealing with the role of tensile cracks due todifferential land subsidence in groundwater vulnerabilityare comparatively scarce. Thus, the aim of this paper istwo-fold. From the scientific point of view, the goal is todevelop a new extension to the DRASTIC methodologythat caters for the effects of differential ground subsidenceon aquifer vulnerability. This method is referred to as theDRASTIC-Sg model (where Sg stands for subsidencegradient), and has been tested within the Federal Districtarea (Fig. 1b,c). From the engineering point of view, thepurpose is to present the first groundwater vulnerabilitymapping of the study area that includes the effects ofsubsidence. This is intended to serve as a managementtool for water, urban and environmental authorities.
Geological and hydrogeological setting
Mexico City is located within the Basin of Mexico(Fig. 1b,c), which in turn lies between the southernboundary of the south Mesa Central and the eastern part
Fig. 2 Photographs showing subsidence effects in Mexico City: a Subsidence in the eastern part of the Federal District (measures use agroundwater well as a benchmark). Land surface subsided by approximately 8 m between 1936 and 2013. WP well pump, WC well casing;b Damage to urban infrastructure due to subsidence processes; c Black hatch lines mark the reactivation of a shallow fracture zonedevelopment
Hydrogeology Journal DOI 10.1007/s10040-014-1130-4
of the Transmexican Volcanic Belt (Fig. 1a). During theearly Tertiary period, intense volcanic activity gave way tothe Chichinautzin volcanic field called Sierra del Chichi-nautzin (Fig. 1c). As a result, the basin’s flow patternchanged from exorheic to endorheic (Tapia-Varela andLópez-Blanco 2002). The Sierra, which is made up offractured basalts, represents the southern boundary ofMexico City’s aquifer and has been found to recharge theaquifer (Carrera-Hernandez and Gaskin 2007). Rechargealso takes place through Quaternary alluvial deposits.
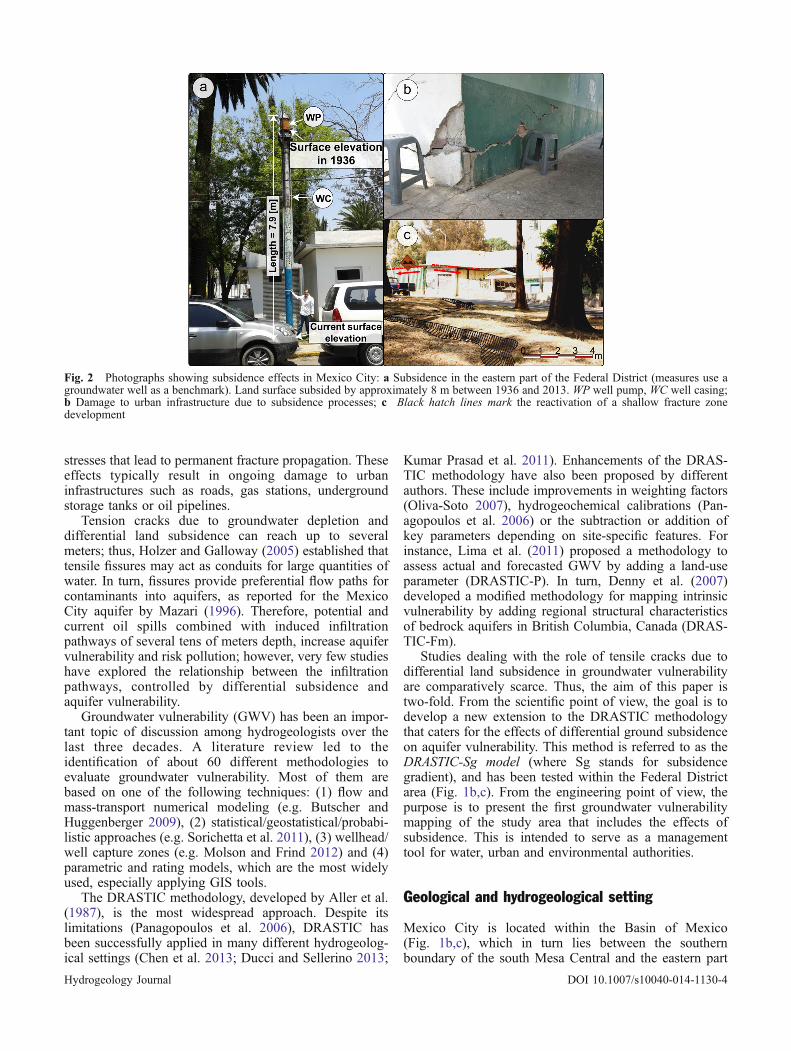
The surface geology of Mexico City consists of alluvialand lacustrine deposits (Fig. 3a). These are combined withQuaternary andesitic-basaltic lava flow and scoria andTertiary volcaniclastic deposits. The hydrostratigraphy ofthe system can be summarized into the following majorunits (Fig. 4) (Mooser et al. 1996; Pérez-Cruz 1988;Santoyo et al. 2005; Vázquez-Sánchez and Jaimes-Palomera 1989):
1. A confining aquitard. The uppermost unit is made up ofQuaternary alluvial, fluvial and lacustrine deposits.These are dominated by saturated fine sediments,interbedded with sands, pumitic lenses and scarcegravels. Average aquitard thickness is ~40–50 m withinthe Federal District. The thickest sectors (350–400 m)are found outside the city limits, around the Chalcobasin and Texcoco areas (Vargas and Ortega-Guerrero2004).
2. An upper granular aquifer. This unit is made up ofQuaternary alluvial deposits, volcaniclastic and pyro-clastic rocks and Plio-Quaternary basaltic-andesitic
rocks. For practical purposes, this is the aquifer thatprovides drinking water for most of the population.Groundwater depth ranges between 60 and 170 m,while saturated thickness might exceed 800 m in someareas. Extraction wells are screened within the upper-most 300–400 m of this unit (Herrera et al. 1989).Therefore, in this work, the vulnerability was evaluatedfor this interval. The Federal District area extendsacross ~1,500 km2, out of which 30 % correspond tothe aquitard surface area. Hence, a large share of theaquifer is actually unconfined (Fig. 4). Prior tointensive extraction (1950s), the main aquifer behavedas a leaky aquifer within the full extent of the aquitard.Currently, there are several parts were the potentiomet-ric surface is below the aquitard-aquifer interface.Therefore, a part of the aquifer is now unconfined.
3. A lower fractured aquifer. This unit is made up ofMiocene andesitic rocks and Oligocene basaltic andrhyolitic materials. Pliocene lacustrine clays predomi-nate in the upper part, whereas conglomerates andshales from the Balsas and Mezcala Formation,respectively, prevail in the lower sector (Mooser et al.1996). Thickness ranges between 830 and 2,590 m,according to data from the Mixhuca and Roma-1 wells.These were drilled by Mexico’s state oil company(PEMEX) in the late 1980s (Fig. 1c). Little is knownabout this unit and there is no reliable data regarding itsgeometry, spatial distribution, depth to potentiometricsurface, or recharge and discharge processes.
4. The Cretaceous basement. The lowermost unit is madeup of massive folded and fractured limestones,
Fig. 3 Geological setting of the Federal District: a Depth to groundwater (10 m contour lines) for the 2010 data set superimposed onto thegeological map; b Relative vulnerability of the groundwater depth, Dr (normalized)
Hydrogeology Journal DOI 10.1007/s10040-014-1130-4
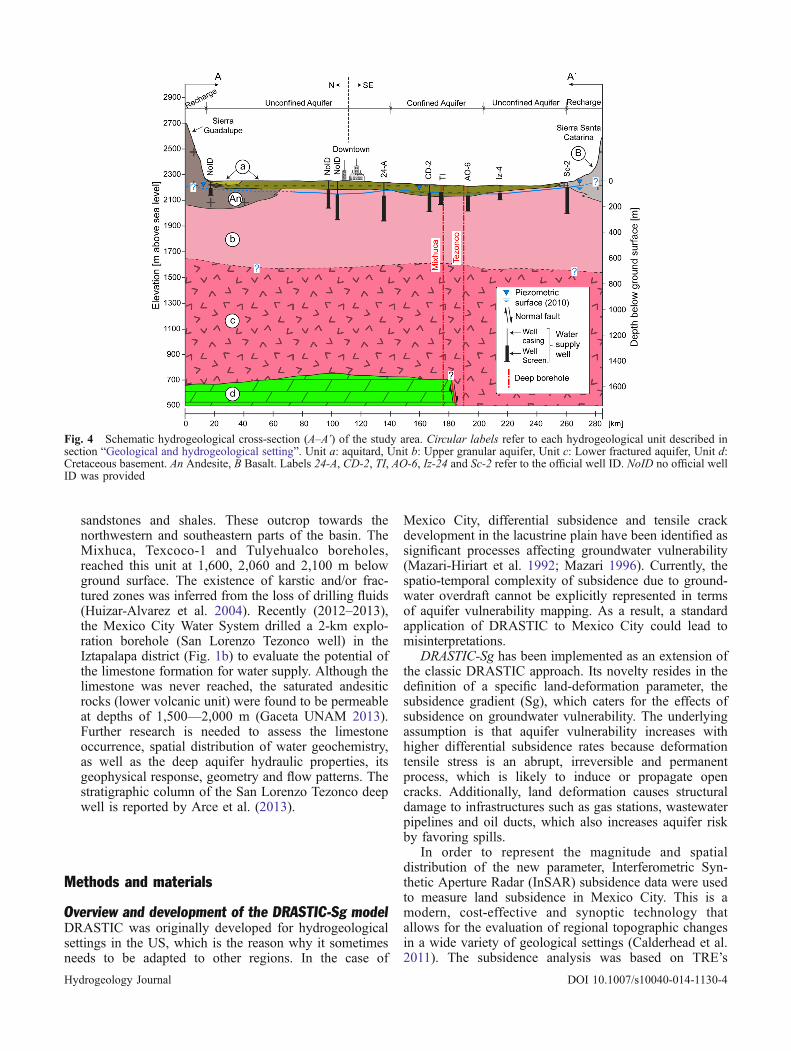
sandstones and shales. These outcrop towards thenorthwestern and southeastern parts of the basin. TheMixhuca, Texcoco-1 and Tulyehualco boreholes,reached this unit at 1,600, 2,060 and 2,100 m belowground surface. The existence of karstic and/or frac-tured zones was inferred from the loss of drilling fluids(Huizar-Alvarez et al. 2004). Recently (2012–2013),the Mexico City Water System drilled a 2-km explo-ration borehole (San Lorenzo Tezonco well) in theIztapalapa district (Fig. 1b) to evaluate the potential ofthe limestone formation for water supply. Although thelimestone was never reached, the saturated andesiticrocks (lower volcanic unit) were found to be permeableat depths of 1,500––2,000 m (Gaceta UNAM 2013).Further research is needed to assess the limestoneoccurrence, spatial distribution of water geochemistry,as well as the deep aquifer hydraulic properties, itsgeophysical response, geometry and flow patterns. Thestratigraphic column of the San Lorenzo Tezonco deepwell is reported by Arce et al. (2013).
Methods and materials
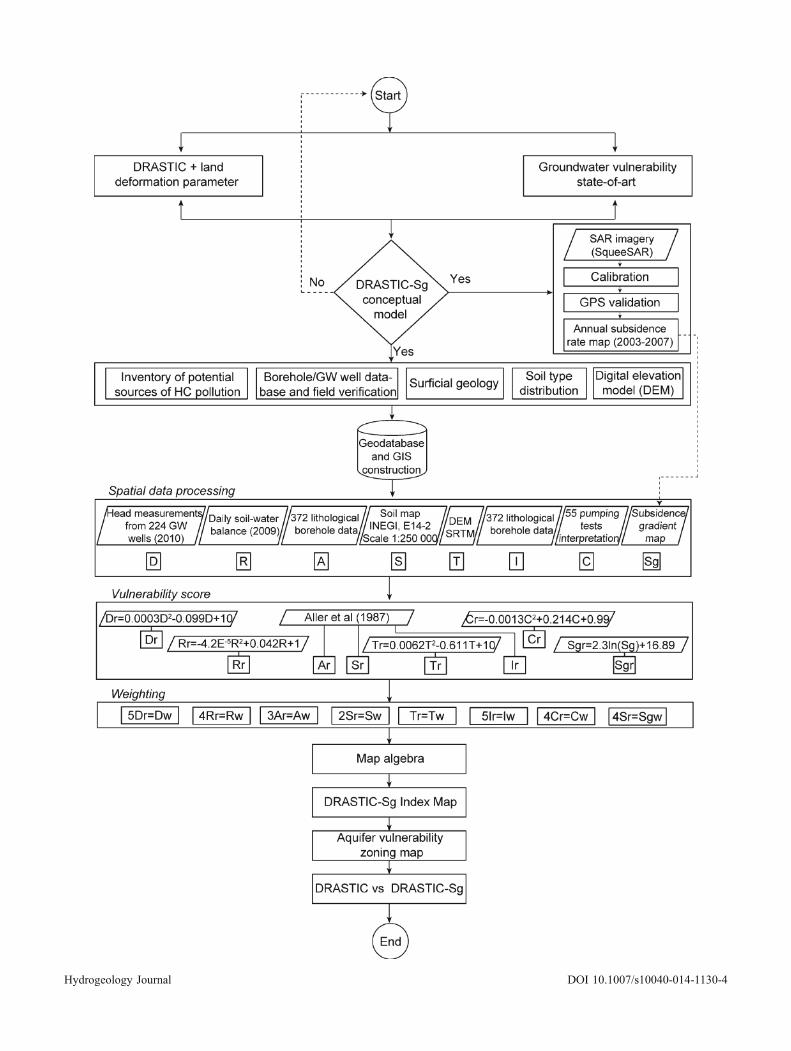
Overview and development of the DRASTIC-Sg modelDRASTIC was originally developed for hydrogeologicalsettings in the US, which is the reason why it sometimesneeds to be adapted to other regions. In the case of
Mexico City, differential subsidence and tensile crackdevelopment in the lacustrine plain have been identified assignificant processes affecting groundwater vulnerability(Mazari-Hiriart et al. 1992; Mazari 1996). Currently, thespatio-temporal complexity of subsidence due to ground-water overdraft cannot be explicitly represented in termsof aquifer vulnerability mapping. As a result, a standardapplication of DRASTIC to Mexico City could lead tomisinterpretations.
DRASTIC-Sg has been implemented as an extension ofthe classic DRASTIC approach. Its novelty resides in thedefinition of a specific land-deformation parameter, thesubsidence gradient (Sg), which caters for the effects ofsubsidence on groundwater vulnerability. The underlyingassumption is that aquifer vulnerability increases withhigher differential subsidence rates because deformationtensile stress is an abrupt, irreversible and permanentprocess, which is likely to induce or propagate opencracks. Additionally, land deformation causes structuraldamage to infrastructures such as gas stations, wastewaterpipelines and oil ducts, which also increases aquifer riskby favoring spills.
In order to represent the magnitude and spatialdistribution of the new parameter, Interferometric Syn-thetic Aperture Radar (InSAR) subsidence data were usedto measure land subsidence in Mexico City. This is amodern, cost-effective and synoptic technology thatallows for the evaluation of regional topographic changesin a wide variety of geological settings (Calderhead et al.2011). The subsidence analysis was based on TRE’s
Fig. 4 Schematic hydrogeological cross-section (A–A’) of the study area. Circular labels refer to each hydrogeological unit described insection “Geological and hydrogeological setting”. Unit a: aquitard, Unit b: Upper granular aquifer, Unit c: Lower fractured aquifer, Unit d:Cretaceous basement. An Andesite, B Basalt. Labels 24-A, CD-2, TI, AO-6, Iz-24 and Sc-2 refer to the official well ID. NoID no official wellID was provided
Hydrogeology Journal DOI 10.1007/s10040-014-1130-4
Hydrogeology Journal DOI 10.1007/s10040-014-1130-4

SqueeSAR algorithm. SqueeSAR represents the secondgeneration of Permanent Scatterer InSAR techniques (PSI)for the detection of ground displacements using satellitedata (Ferretti et al. 2011). In contrast with differential SARinterferometry, PSI and SqueeSAR provide a time seriesof displacement for individual points, allowing theinvestigation of subsidence over time. This contributes tothe understanding of non-linear behaviors. An extensivereview of subsidence research and applications pertainingto aquifer-system compaction caused by the removal ofsubsurface fluids can be found in Galloway and Burbey(2011). Galloway and Hoffmann (2007) provide acomprehensive description of InSAR applications inhydrogeology.
The SqueeSAR algorithm is useful to identify point-wisepermanent scatters (PSs), and advances previous algorithmsby also exploiting spatially distributed scatters (DSs). WhilstPSs usually correspond to man-made objects, DSs aretypically identified from homogeneous ground, roads,scattered outcrops, non-cultivated lands and desert areas.This new approach provides a higher density of measure-ment points, as it produces additional data in low-reflectivityhomogeneous areas (Ferretti et al. 2011).
A stack of radar imagery acquired by the ENVISATsatellite between 2003 and 2010 was processed with theSqueeSAR algorithm. Topography data from the ShuttleRadar Topography Mission (SRTM) were used for topo-graphic correction. As SqueeSAR-derived measurementspoints produce accumulated line-of-sight elevation changesat a single location over time—and because it was observedthat subsidence process has a prevalently linear trend inMexico City (Osmanoglu et al. 2011)—the annual subsi-dence rates were calculated by dividing the accumulatedsubsidence over the total observation time. Nine permanent
Table 1 Development of DRASTIC parameters
Parameter Method
D A total of 224 points were used to delineate groundwater contours, using 54 piezometric records from monitoring andextraction wells as provided by The Basin Council for the Valley of Mexico (OCAVM, unpublished report, 2010). In orderto increase the static level coverage, historical information from other wells outside the monitoring network was processed.170 hydrographs were computed in order to predict groundwater depth for 2010, using drawdown rates as a proxy method (aleast-square trend-line was fitted to each well, while outliers were eliminated in the process)
R Vertical recharge was estimated by means of the method developed by Carrera-Hernández and Gaskin (2008). Potentialrecharge calculation is based on a daily soil-water balance, which involves different vegetation and soil types, as well as theeffect of topography on climatological variables. Satellite imagery was used to develop albedo and land-cover maps, usingLandsat imagery from the year 2000. Datasets for all climatological variables were developed using “R” software (RDevelopment Core Team 2005). The model was calibrated and validated based on the observed daily flows for threewatersheds in the southern part of the Basin of Mexico. These correspond to rivers Hondo, Magdalena and Compañia(located at the western part of the study area) and were selected because they present longer reliable records than others.Recharge was estimated for 2009 and for the area that corresponds to the Federal District (Fig. 1b). Carrera-Hernández andGaskin (2008) provide a detailed description of the underlying equations, as well as of the calibration process
A and I In terms of the unsaturated zone (I) and the aquifer lithology (A), vulnerability was determined by developing a qualitativecorrelation between the specific lithological properties of the geological materials and the rating scale proposed by Aller etal. (1987). Vulnerability values were established at each well based on litho-stratigraphic data, and then extrapolated to theremainder of the study area. The resulting maps are based on 372 official borehole records provided by the Mexico CityWater System (SACM 2006)
S Relative vulnerability values for the soil cover were determined by adapting the rating values proposed by Aller et al. (1987)to the soil type distribution in the study area. Spatial soil distribution was obtained from the 1:250,000 map of Mexico City(E14-2) (INEGI 1983). Andosols, Solonchaks, Gleysols, Histosols and Luvisols of the Basin of Mexico are clay-rich andpresent high organic matter contents. Therefore, they were assigned a relative vulnerability value of 1. Feozems andFluvisols are coarser due to the presence of sands. Since they present a greater potential for pollution, these soils wereassigned an index of 9. Finally, Cambisols, Litosols and Regosols are typically thin, ephemeral and poorly developed. Thesewere assigned with a vulnerability value of 10, since they provide an even lower degree of protection
T Digital elevation models (DEM) from NASA’s Shuttle Radar Topography Mission were used to create a mosaic over the studyarea from which slopes were obtained. Two DEMs scenes were used with an original pixel resolution of 3 by 3 arcsec.Individual scenes were re-projected to a UTM coordinate system (zone 14 N) with a 90×90 m pixel size. This is consideredsuitable to represent relevant topographic structures at the regional scale. Bilinear resampling was used during re-projectionto account for realistic spatial deformation. Once the final elevation dataset was completed, slope values were derived usingthe 8-cell neighborhood algorithm proposed by Burroughs and McDonald (1998)
C Saturated hydraulic conductivity (k) was derived from aquifer tests carried out in previous years (SACM 2006; Vázquez-Sánchez 1995). A total of 55 pumping tests, ranging from 6 to 72 h and constant rates of 5–79 L/s, were analyzed, processedand reinterpreted. Fifty-one tests, located mainly at the alluvial plain, were used to obtain the spatial distribution aquifertransmissivity and/or k. Four were discarded due to field data uncertainties, including those of 6 h long. Pumping tests wereinterpreted by classic analytical methods. For comparison and validation reasons, ten pumping tests were also analyzed bymeans of the numerical model developed by Rushton and Redshaw (1979) and Rathod and Rusthon (1984, 1992). Thismodel is based on finite-difference approximations. In some cases it provides a greater flexibility than analytical methodsbecause it allows for the representation of non-radial flow components. The Open-source software Visual Two-Zone Modelwith Vertical Flow and Leakage (VTZM) was used for this purpose (available from the Faculty of Engineering (UNAM)Hydrogeology Group website–see Hernandez-Laloth 2008)
�Fig. 5 Conceptual framework. Sg subsidence gradient, HChydrocarbon, GW Groundwater; DEM digital elevation model,SRTM Shuttle Radar Topography Mission, r rating, D depth togroundwater, R vertical recharge, A aquifer lithology, S soilcoverage, T topographic gradient, I impact of the vadose zone, Csaturated hydraulic conductivity, w weight
Hydrogeology Journal DOI 10.1007/s10040-014-1130-4
GPS stations were used to validate the SqueeSAR measure-ments, covering the same period. Finally, annual rates wereprocessed in a GIS environment to compute a full extentraster map of the Mexico City superficial area.
The subsidence gradient was developed as a tool toevaluate faulting potential and its associated damage to theurban infrastructure in cities subject to strong subsidence(Cabral-Cano et al. 2008). The concept of a subsidencegradient (Sg) is analogous to that of the hydraulic gradientthat is commonly used in groundwater hydrology, but itinvolves subsidence rates instead of hydraulic heads. It iscomputed as the maximum slope between neighboringpoints divided by the pixel distance. Previous work in theMCMA surface faulting gathered from direct fieldevidence, urban infrastructure maintenance reports andthe spatial distribution of subsidence strongly suggeststhat the principal factor for assessing subsidence-induceddamage potential is best determined by combiningsubsidence magnitude rates with a horizontal subsidencegradient analysis (Cabral-Cano et al. 2008).
The Sg factor was included in the groundwatervulnerability model as a continuous normalized variable,where a relative subsidence vulnerability rating value(Sgr) of 1 was assigned to the lower computed horizontalsubsidence gradient (0.001) and 10 to the highest (0.05).Intermediate Sgr values were obtained by fitting the initialand final value, as well as the midpoint of the subsidencevulnerability class, by means of Eq. (1). The best possiblefit of the Sg variable was achieved using a logarithmicfunction, as follows:
Sgr ¼10; Sg > 0:05
2:3ln Sgð Þ þ 16:88; 0:001 < Sg < 0:051; Sg < 0:001
8<
:ð1Þ
where Sgr represents the relative subsidence vulnerabilityrating values (1 ≤ Sgr ≤ 10) and Sg the subsidencegradient. Equation (1) was implemented in the subsidencegradient map by means of standard conditional operatorsand map algebra.
The Sg weighting factor was determined by judging itsrelevance against other parameters as proposed by Aller etal. (1987). Weights of 3, 4 and 5 were tested. Sg wasfinally assigned a weight of 4, since 3 and 5 underestimateand overestimate the subsidence effect in the groundwatervulnerability map, respectively. Finally, Sg was combinedinto the eight-parameter DRASTIC-Sg index, which inturn is calculated as:
DRASTIC−Sg Index ¼ 5Dr þ 4Rr þ 3Ar þ 2Sr þ T r þ 5I r þ 3Cr þ 4Sgr
ð2Þ
where r is the relative vulnerability rating of the depth togroundwater (D), R corresponds to vertical recharge, A toaquifer lithology, S to soil coverage, T to the topographicgradient, I to the effect of the vadose zone, C to the
saturated hydraulic conductivity and Sg to the subsidencegradient. The attached numbers (5, 4, 3, 2 and 1) refer tothe relative weight of each variable and correspond to theparameter ’s contribution to the overall aquifervulnerability.
DRASTIC-Sg index and DRASTIC-Sg vulnerabilityzoning maps were performed based on this equation. Astandard DRASTIC map was also computed as abenchmark for comparison. ArcGIS 9.3 (ESRI 2008)was used to process the spatial geodatabase, manipulatedata and develop and analyse contour maps. Theconceptual framework is shown in Fig. 5.
DRASTIC parametersThis work focuses on the development of the DRASTIC-Sg model and the subsidence gradient component. Hence,Table 1 summarizes the overall methodology employed todevelop the remaining DRASTIC parameters.
Potential sources of hydrocarbon pollution inventoryand groundwater geodatabase integrationA detailed field campaign was carried out betweenSeptember 2010 and February 2011 in order to establishpollution sources in the Federal District area. About 600sources were identified and classified into three maincategories, as per Foster et al. (2002): gas stations (368points), out-of-service bus stations (189 points) and otherspecific sources (43 points) such as former refineries or oildistribution and storage stations, among others.
Site managers were interviewed to complement thedigital database with important pieces of information suchas the historical background of each site, its operationlifespan, its fuel storage capacity, the environmentalmonitoring system information (if available), the existenceof ongoing remediation projects (if any) and the existenceof neighboring water-supply wells. A handheld TrimbleJuno ST with GPS receiver, mobile GIS and integratedWAAS receiver was used to perform real-time correctionsto geo-referenced data. Field records were integrated intoan ArcGIS 9.3 database.
Aside from the pollution inventory, the groundwatergeodatabase includes borehole and well logs as providedby the Mexico City Water System (SACM 2006) and theBasin Council for the Valley of Mexico (OCAVM,unpublished report, 2010). It also includes digital eleva-tion models (SRTM), data from climate stations (NationalMeteorological Survey), soil coverage maps (INEGI, soilmap E14-2, Mexico City, 1983), surface geology maps(Mooser et al. 1996; Vázquez-Sánchez and Jaimes-Palomera 1989) and aquifer test information (SACM2006; Vázquez-Sánchez 1995).
The borehole database was crafted with care due to itsimportance in further spatial data processing. Raw data(SACM 2006; OCAVM, unpublished report, 2010) weregrouped into a single database and transferred into the GISsystem. The location of 364 wells was verified with StreetView and Google Earth, and then confirmed by means of a
Hydrogeology Journal DOI 10.1007/s10040-014-1130-4
field visit. Several mistakes were found in the officialrecords as a result. For instance, well ID “Jardines delPedregal-5” was mistakenly positioned in the officialdatabases in the southwestern part of the city (AlvaroObregon district), whereas it is actually located about17 km away (Gustavo A. Madero district). Approximately300 wells were relocated following this process.
Results and discussion
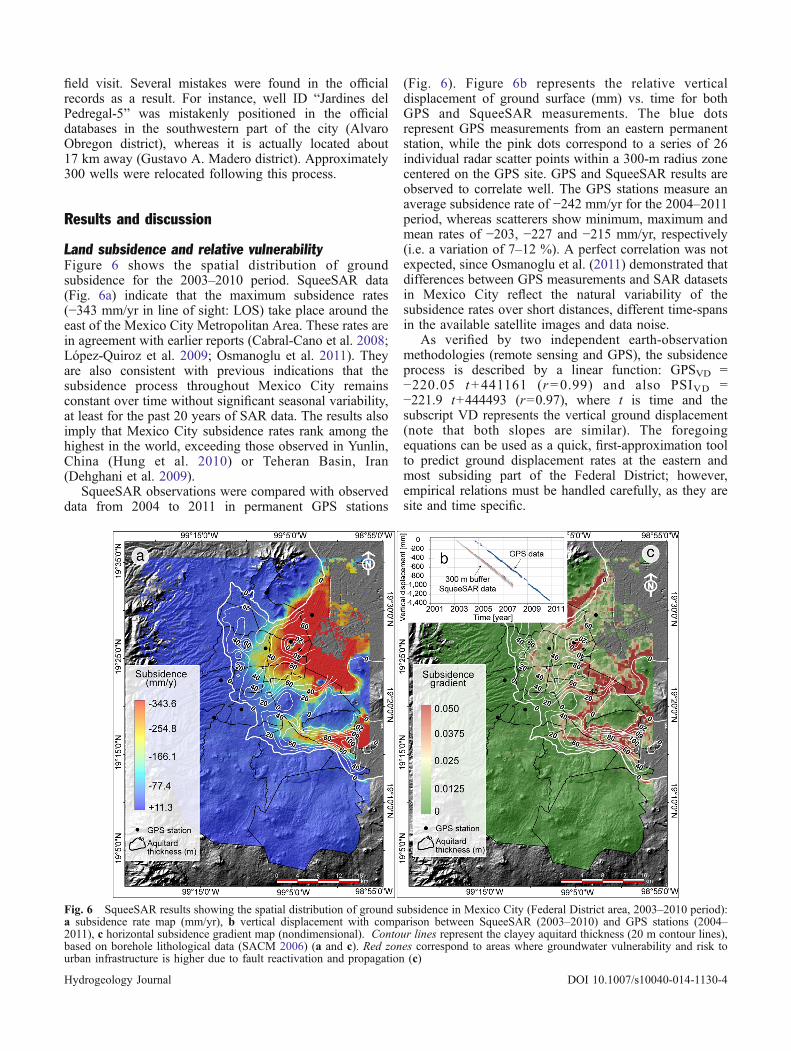
Land subsidence and relative vulnerabilityFigure 6 shows the spatial distribution of groundsubsidence for the 2003–2010 period. SqueeSAR data(Fig. 6a) indicate that the maximum subsidence rates(−343 mm/yr in line of sight: LOS) take place around theeast of the Mexico City Metropolitan Area. These rates arein agreement with earlier reports (Cabral-Cano et al. 2008;López-Quiroz et al. 2009; Osmanoglu et al. 2011). Theyare also consistent with previous indications that thesubsidence process throughout Mexico City remainsconstant over time without significant seasonal variability,at least for the past 20 years of SAR data. The results alsoimply that Mexico City subsidence rates rank among thehighest in the world, exceeding those observed in Yunlin,China (Hung et al. 2010) or Teheran Basin, Iran(Dehghani et al. 2009).
SqueeSAR observations were compared with observeddata from 2004 to 2011 in permanent GPS stations
(Fig. 6). Figure 6b represents the relative verticaldisplacement of ground surface (mm) vs. time for bothGPS and SqueeSAR measurements. The blue dotsrepresent GPS measurements from an eastern permanentstation, while the pink dots correspond to a series of 26individual radar scatter points within a 300-m radius zonecentered on the GPS site. GPS and SqueeSAR results areobserved to correlate well. The GPS stations measure anaverage subsidence rate of −242 mm/yr for the 2004–2011period, whereas scatterers show minimum, maximum andmean rates of −203, −227 and −215 mm/yr, respectively(i.e. a variation of 7–12 %). A perfect correlation was notexpected, since Osmanoglu et al. (2011) demonstrated thatdifferences between GPS measurements and SAR datasetsin Mexico City reflect the natural variability of thesubsidence rates over short distances, different time-spansin the available satellite images and data noise.
As verified by two independent earth-observationmethodologies (remote sensing and GPS), the subsidenceprocess is described by a linear function: GPSVD =−220.05 t+441161 (r=0.99) and also PSIVD =−221.9 t+444493 (r=0.97), where t is time and thesubscript VD represents the vertical ground displacement(note that both slopes are similar). The foregoingequations can be used as a quick, first-approximation toolto predict ground displacement rates at the eastern andmost subsiding part of the Federal District; however,empirical relations must be handled carefully, as they aresite and time specific.
Fig. 6 SqueeSAR results showing the spatial distribution of ground subsidence in Mexico City (Federal District area, 2003–2010 period):a subsidence rate map (mm/yr), b vertical displacement with comparison between SqueeSAR (2003–2010) and GPS stations (2004–2011), c horizontal subsidence gradient map (nondimensional). Contour lines represent the clayey aquitard thickness (20 m contour lines),based on borehole lithological data (SACM 2006) (a and c). Red zones correspond to areas where groundwater vulnerability and risk tourban infrastructure is higher due to fault reactivation and propagation (c)
Hydrogeology Journal DOI 10.1007/s10040-014-1130-4
Subsidence analysis and further correlation with pie-zometric records from 144 abstraction wells show thatland subsidence does not directly correlate to aquiferdrawdown rates throughout the city. For instance, well IDs“Ampliacion Tlahuac-Neza 19” and “Tlacotal”, locatedtowards the northern edge of Xochimilco and thenorthwestern part of Iztapalapa districts, respectively,exhibited dissimilar drawdown rates (−0.1 and −0.5 m/yr). In contrast, the observed subsidence rates are similarat −101 and −103 mm/yr. Alternatively, in the high-ratesubsidence area (the lacustrine plain shown with thewarmer colors in Fig. 6a), well ID “Peñón 4” presents adrawdown rate of −1.3 m/yr and a subsidence rate of−211 mm/yr, whilst in the southern part of Mexico City(where Quaternary basalts are located), well ID “PeriféricoSur 24” exhibited the same drawdown rate that the wellPeñón 4, but with a considerably lower subsidence rate(−4 mm/yr). This dissimilarity suggests that land subsi-dence is a consequence of several geological and hydro-geological factors, rather than of groundwater abstractionalone.
According to poroelasticity theory, unconsolidatedmaterials may undergo elastic and plastic deformationwhen subject to loading or stress (Biot 1941). Sandaquifers can expand elastically when water is extracted orinjected through the pore space. In contrast, when a stressis applied to fine sediments (i.e. aquitards) over longperiods of time, deformation tends to be plastic (i.e. non-recoverable). The consequence is soil consolidation,triggering an increase in bulk density and a decrease inporosity. Shearing does not necessarily reduce pore space,but may instead destroy the continuity of macro-pores(Horn et al. 2001). The ability of a soil to resist non-recoverable deformation during loading is often defined asthe soil pre-compression strength (Casagrande 1936).When pumping-induced stresses are stronger than thepre-compression strength, soil particles rearrange to carrythe additional load. These may undergo weak chemicalbonding as a result, leading to non-recoverable deforma-tion (Sneed et al. 2003).
Besides elasto-plastic behavior, there are additionalfactors that control subsidence processes in aquitards.These include sediment thickness, water content anddepressurization of the porous media. The potentialcorrelation between subsidence and aquitard thicknesswas analyzed. An initial attempt to correlate the large-subsidence areas with the location of the upper lacustrinesediment, using Pérez-Cruz (1988) indirect seismic anal-ysis, was made by Cabral-Cano et al. (2008). In this study,372 borehole lithological descriptions (SACM 2006) wereused to compute the spatial distribution of the lacustrineaquitard thickness (Fig. 6a,c, white contour lines). Basedon our new SqueeSAR subsidence analysis and aquitardthickness, the highest subsidence rate areas are observedto correspond to the areas with the largest lacustrinesediment thickness (Fig. 6a). At the eastern edge of thecity, where subsidence rates ranges from −343 to−280 mm/yr, the lacustrine sediment package is 70–100 m thick. The maximum sediment thickness of ~110 m
within the study area is located at the southern sector ofthe Sierra de Santa Catarina, where subsidence rates reachup to −212 mm/yr. At the central-east region, subsidenceranges between −190 and −80 mm/yr and the sedimentpackage is 50–80 m thick. Both subsidence rates and theclay-rich unit thickness sharply diminish westward, reach-ing −40 to −10 mm/yr and 10–40 m thick, respectively, Inaddition, the minimum subsidence rates are located at theaquitard boundary.
On the other hand, Or and Ghezzehei (2002) showedthat soil deformation and compaction depends on theduration of the load and water content. Thus, theconsistency limits for a given soil obtained as a functionof moisture content may be useful to predict the behaviorof aquitards during stress (Trautner et al. 2003). Reports ofthe Mexico City lacustrine aquitard indicate a porosity of70–90 % and average water content of 200–400 %(Marsal and Mazari-Hiriart 1959, 1990). Hernandez-Marín et al. (2005) studied the intrinsic properties,mechanical behavior and response of the clayey aquitardin the Chalco basin (Fig. 1b) where they found consisten-cy limits ranging between 50 and 350 % in the uppermost15 m. Based on the contribution of the Atterberg limits,these authors concluded that, under natural moistureconditions, the shallow aquitard deforms as a plasticmaterial regardless what the pumping-induced stress maybe.
Furthermore, once these clays have been stressed andthe water has been removed, they can shrink to 25–30 %of their original volume (Alberto-Jaime and Méndez-Sánchez 2010). Observations of this process elsewhere(Galloway and Burbey 2011) also indicate that largesubsidence is not attributed only to large pumping ratesbut also to the nature of clayey allophones, in whichintermolecular water became part of the structure of thegeomaterial during deposition and diagenesis.
Based on the previous discussion, it is concluded thatthe magnitude of subsidence in the study area is not linkedto a single hydrogeological process such as head draw-down. It is also observed that groundwater pumping incombination with naturally compressible aquitards canstrongly enhance subsidence.
The horizontal subsidence gradient map (Sg) is shownin Fig. 6c. Higher gradients are depicted in warmer colors,representing high differential ground displacement sur-rounding the Sierra de Santa Catarina, Peñon de los Baños(near the Mexico City Airport) and the northern Sierra deGuadalupe, where the larger aquitard thicknesses areidentified. It was found that large Sg zones occur whereQuaternary volcanic structures are next to lacustrinesediments and mark the location of abrupt transitionsbetween the subsidence-prone lacustrine beds and stablevolcanic outcrops. This in turn corresponds to areas wheredamage to urban infrastructure develops as the response tothe subsidence-induced destructive cracks.
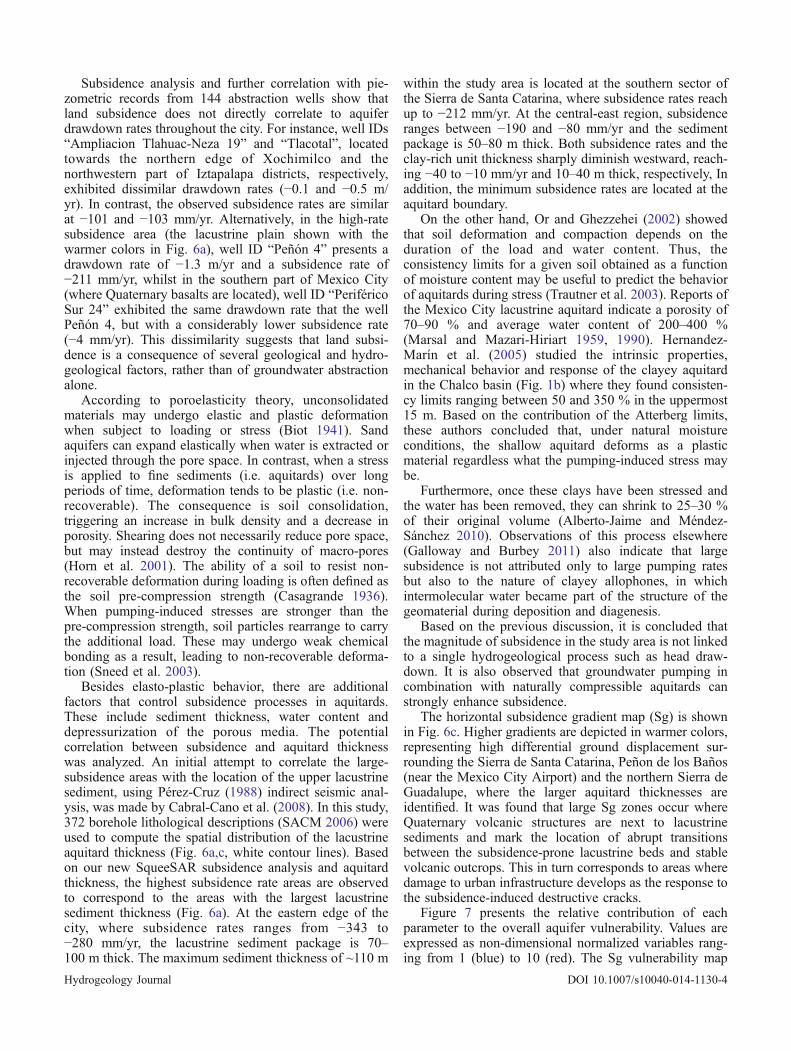
Figure 7 presents the relative contribution of eachparameter to the overall aquifer vulnerability. Values areexpressed as non-dimensional normalized variables rang-ing from 1 (blue) to 10 (red). The Sg vulnerability map
Hydrogeology Journal DOI 10.1007/s10040-014-1130-4
reveals that higher vulnerability zones are closely associ-ated to large horizontal gradients in subsidence rates.Outside the aquitard boundary, where subsidence effectsare negligible, a fixed vulnerability value of 1 wasestablished.
The remaining DRASTIC-Sg parameters (Fig. 7),represent vulnerability areas of a different nature. Vulner-ability indices depend mostly on hydrogeological features.For instance, the Dr parameter places the highestvulnerability scores around the southern slopes of theSierra de Guadalupe and the surrounding areas of theSierra de Santa Catarina, respectively, where groundwateris found about 50 m below the surface. On the other hand,the effect of the vadose zone (Ir) shows the lowestvulnerability scores for roughly 35 % of the study area,due to the presence of the lacustrine aquitard.
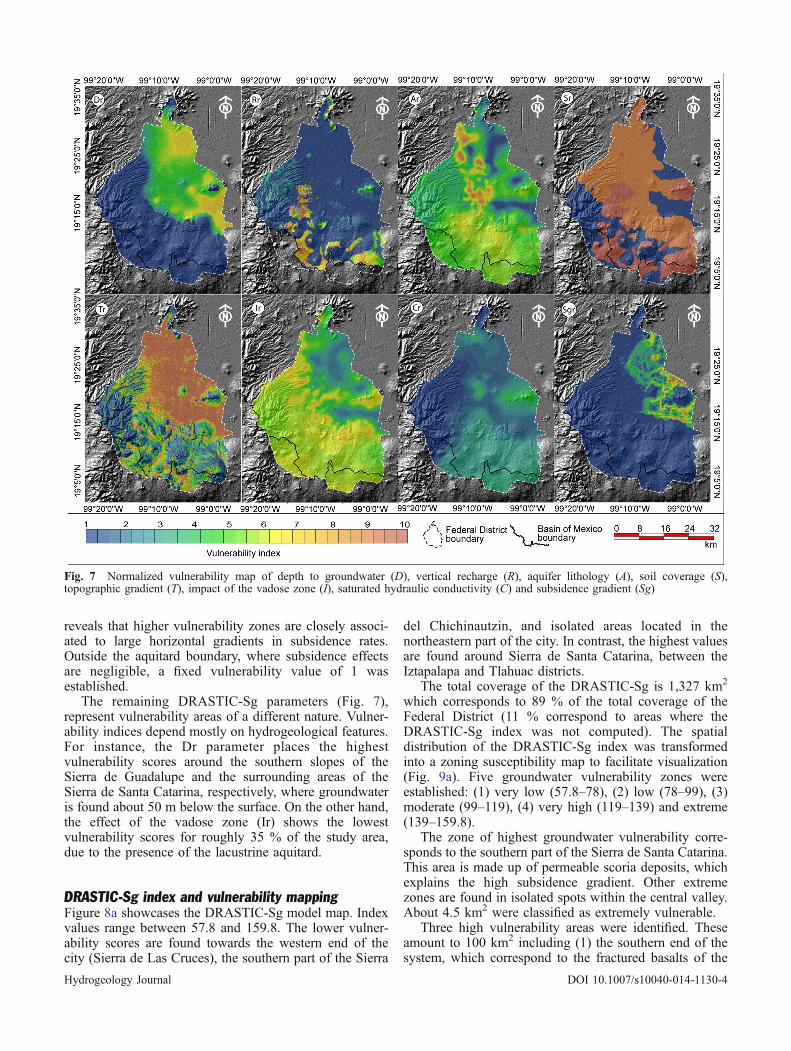
DRASTIC-Sg index and vulnerability mappingFigure 8a showcases the DRASTIC-Sg model map. Indexvalues range between 57.8 and 159.8. The lower vulner-ability scores are found towards the western end of thecity (Sierra de Las Cruces), the southern part of the Sierra
del Chichinautzin, and isolated areas located in thenortheastern part of the city. In contrast, the highest valuesare found around Sierra de Santa Catarina, between theIztapalapa and Tlahuac districts.
The total coverage of the DRASTIC-Sg is 1,327 km2
which corresponds to 89 % of the total coverage of theFederal District (11 % correspond to areas where theDRASTIC-Sg index was not computed). The spatialdistribution of the DRASTIC-Sg index was transformedinto a zoning susceptibility map to facilitate visualization(Fig. 9a). Five groundwater vulnerability zones wereestablished: (1) very low (57.8–78), (2) low (78–99), (3)moderate (99–119), (4) very high (119–139) and extreme(139–159.8).
The zone of highest groundwater vulnerability corre-sponds to the southern part of the Sierra de Santa Catarina.This area is made up of permeable scoria deposits, whichexplains the high subsidence gradient. Other extremezones are found in isolated spots within the central valley.About 4.5 km2 were classified as extremely vulnerable.
Three high vulnerability areas were identified. Theseamount to 100 km2 including (1) the southern end of thesystem, which correspond to the fractured basalts of the
Fig. 7 Normalized vulnerability map of depth to groundwater (D), vertical recharge (R), aquifer lithology (A), soil coverage (S),topographic gradient (T), impact of the vadose zone (I), saturated hydraulic conductivity (C) and subsidence gradient (Sg)
Hydrogeology Journal DOI 10.1007/s10040-014-1130-4

Sierra del Chichinautzin (the main recharge zone withinfiltration values of ~420 mm/yr), (2) the central part ofMexico City, where depth to groundwater varies between65 and 70 m and (3) the eastern edge of the city,surrounding the Sierra de Santa Catarina. Figure 2b,c
illustrate damaged urban infrastructure and recent groundfaulting examples in these areas.
The moderate vulnerability zone is the most widelydistributed throughout the study area, comprising489 km2, and includes the remaining parts of the Sierra
Fig. 8 a DRASTIC-Sg index map and b DRASTIC map of the Mexico City Aquifer-Aquitard System (Federal District area)
Fig. 9 Groundwater vulnerability zoning map of the Mexico City Aquifer-Aquitard System (Federal District area) for a DRASTIC-Sgmodel and b classic DRASTIC approach
Hydrogeology Journal DOI 10.1007/s10040-014-1130-4
del Chichinautzin as well as east-central, north andnortheastern sectors of the Federal District. These areaspresent moderate subsidence gradients (0.025–0.037), arelatively thin aquitard (20–40 m) and depths to ground-water of 55–85 m.
The low and very low vulnerability areas take up 35 %of the city. The 466 km2 low-vulnerability sector includesthe remainder of the northeastern part of the city,characterized by the presence of lacustrine deposits whosethickness ranges between 40 and 60 m. Althoughsubsidence rate within this area can reach up to−200 mm/yr, its low differential effect (0.01 ≤ Sg ≤0.02) suggest a low potential to tensile crack development;thus, aquifer vulnerability is low.
The DRASTIC-Sg model relates to intrinsic vulnera-bility. However contaminant loadings can have a majorimpact on pollution risk. The inventory of pollutionsources reveals the presence of gas stations in the extreme,high and moderate vulnerability regions (Fig. 9). High-risk areas comprise (1) the western part of the Sierra deSanta Catarina, where several individual gas stations store100–150 m3 of fuel (mostly gasoline) in extremelyvulnerable areas and 250–300 m3 in high vulnerabilityareas; (2) the limits between Cuauhtemoc and BenitoJuarez districts (highly vulnerability), where there are 12gas stations with storage capacities in the order of 50 to250 m3 each; and (3) the northern boundary of theIztapalapa district, where there are 15 gas stations, with acombined 4,300 m3 of fuel. The latter are located along amoderate vulnerability strip, associated with an intensiveactive fracture zone and controlled by major differentialsubsidence processes (the highest Sg value was computedwithin this swath).
Overall, DRASTIC-Sg outcomes are consistent withfield observations. However, the results must be handledwith care. This is mostly because some field datasets aresubject to uncertainty. In particular, further work is neededin terms of developing more reliable borehole records,carrying out new pumping tests and enhancing thegroundwater monitoring network.
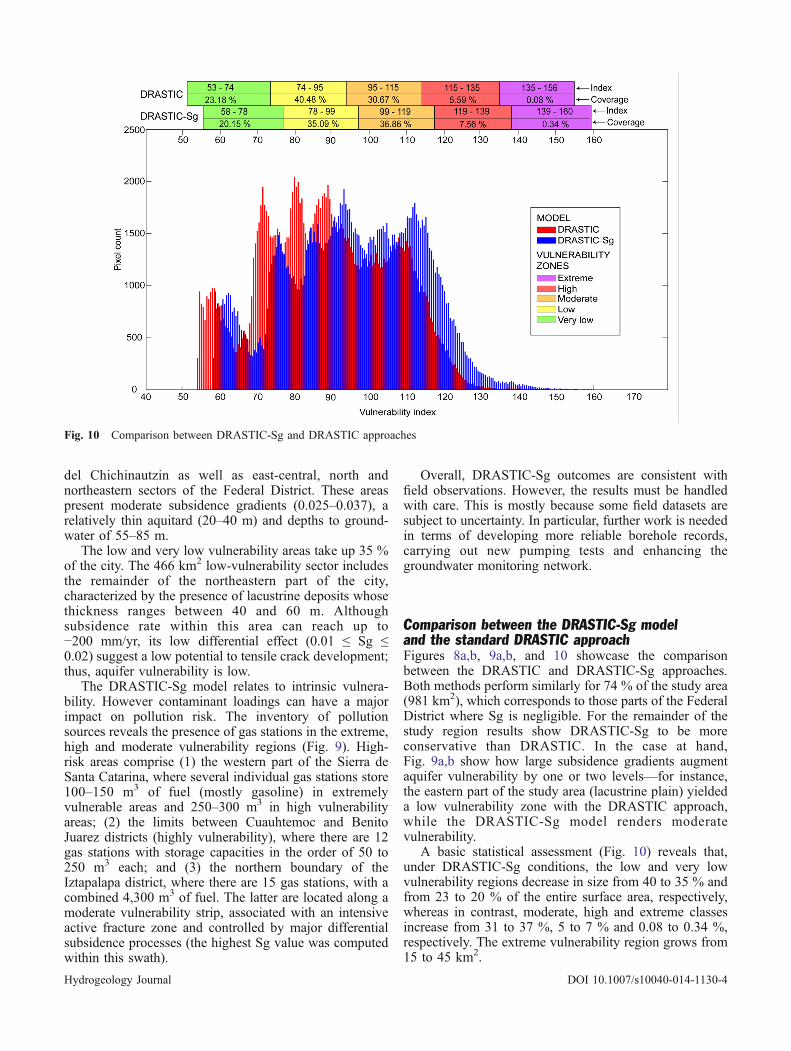
Comparison between the DRASTIC-Sg modeland the standard DRASTIC approachFigures 8a,b, 9a,b, and 10 showcase the comparisonbetween the DRASTIC and DRASTIC-Sg approaches.Both methods perform similarly for 74 % of the study area(981 km2), which corresponds to those parts of the FederalDistrict where Sg is negligible. For the remainder of thestudy region results show DRASTIC-Sg to be moreconservative than DRASTIC. In the case at hand,Fig. 9a,b show how large subsidence gradients augmentaquifer vulnerability by one or two levels—for instance,the eastern part of the study area (lacustrine plain) yieldeda low vulnerability zone with the DRASTIC approach,while the DRASTIC-Sg model renders moderatevulnerability.
A basic statistical assessment (Fig. 10) reveals that,under DRASTIC-Sg conditions, the low and very lowvulnerability regions decrease in size from 40 to 35 % andfrom 23 to 20 % of the entire surface area, respectively,whereas in contrast, moderate, high and extreme classesincrease from 31 to 37 %, 5 to 7 % and 0.08 to 0.34 %,respectively. The extreme vulnerability region grows from15 to 45 km2.
Fig. 10 Comparison between DRASTIC-Sg and DRASTIC approaches
Hydrogeology Journal DOI 10.1007/s10040-014-1130-4
If one takes into consideration the subsiding areabounded by the −10 mm/yr isoline (Figs. 8 and 9), modelscompare as follows: 2 % (DRASTIC-Sg) vs. 13 % (DRAS-TIC) for the very low class; 33 % (DRASTIC-Sg) vs. 51 %(DRASTIC) for the low class; 50 % (DRASTIC-Sg) vs.28 % (DRASTIC) for the moderate class; 14 % (DRASTIC-Sg) vs. 7 % (DRASTIC) for the high class and 1 %(DRASTIC-Sg) vs. 0 % (DRASTIC) for the extremevulnerability class. Table 2 summarizes these results.
The subsidence rate and gradient behavior within eachvulnerability class were analyzed for both models. Basedon the results shown in Table 2, it can be established thatclassic DRASTIC approach exhibits higher subsidencegradients at the “most protected zones” in terms ofpollution susceptibility. The highest mean rates andhorizontal gradients are found in the low and very lowvulnerability zones, respectively, which reveals an unex-pected low-vulnerability/high-subsidence trend, since highSg values depict large tensile crack regions due todifferential rates of ground subsidence. In contrast,DRASTIC-Sg provides a strong correlation betweenvulnerability and subsidence.
It is argued that these tensile cracks provide preferentialpaths for contaminants to potentially reach groundwater. Theremoval of interstitial water due to aquifer overdraft leads tosediment consolidation. This causes land subsidence and, atsome point, it can reduce the average permeability of theground. Nevertheless, as demonstrated by the SqueeSARresults, ground subsidence is not uniform or homogeneous.Large tensile crack regions are common impacts ofdifferential settlement rates, caused by bending of the surfacelayer. As reported by Carreón-Freyre et al. (2006), thetriggering mechanism behind crack development is themechanical imbalance of the lacustrine deposits, inducedby the static and dynamic overloading and depressurizationof geological media when groundwater abstraction takesplace. As aquifer pore pressure drops, sediments tend toconsolidate and volume decreases in the vertical dimension,while the consolidation of silty-clayey materials alsogenerates horizontal tensile stresses. These processes explainthe existence of large tensile cracks in areas such as theIztapalapa district (Fig. 1c). Currently, about 870 tensile
crack sites have been identified in the Federal District(Auvinet et al. 2013).
Alberro and Hernandez (1990) demonstrated thathorizontal tensile stresses can generate sudden verticalcracks which propagate not only at the surface, but also indepth. Cracks can be several kilometers long, while theirdepth may reach up to 30–40 m. The sharp correlation ofsubsidence and the aquitard thickness suggests that a largeportion of the clay-rich sediment package undergoessubsidence, and not only the shallower part. Carreón-Freyre et al. (2006) reported open fractures at a depth of16 m depth in the lacustrine aquitard, around the Chalcobasin. On the other hand, Civil Protection of the FederalDistrict Government (CPFDG) has identified several openfractures at depths exceeding 30 m in the eastern part ofthe Iztapalapa district (Alfredo Alanis-Alcántara, CPFDG,Federal District Government, personal communication,2013). Such cracks are a matter of growing concern forthe population. As reported by the local media, a car andits driver were found inside an open crack in Iztapalapa, at16 and 22 m depth, respectively (CNNexpansion 2007).
From the geomechanical point of view, tensile fracturepropagation can be roughly inferred from relatively simpleempirical expressions. Carrillo (1948) shows that thetensile crack depth (h) depends on the clay cohesion (c)and density (ρ), as h=3.57 c/ρ. Considering c and ρ valuesup to 1.25 (kg/cm2) and 1.3 (ton/m3) at the downtown area(Mazari 1996), tensile cracks within this area can beinferred to reach a depth of 34 m.
Cracking due to groundwater overdraft has beenexplored by Bouwer (1978). Bouwer developed analyticalexpressions based on rotating-slab theory, demonstratingthat a hypothetic tensile crack of 50 m depth, with verticaloffset in a subsidence basin of 10 km, under an accumulatedland subsidence of 2 m, might initially have started with a 1-cm-wide crack at the surface. Note that the accumulatedsubsidence in Mexico City is larger (~9 m).
Based on the aforementioned, the Sg parameter isadvocated as a proxy for the detection of areas with alarge potential of fracturing propagation. Since thesemight provide preferential conduits for surface contami-nants into aquifers (Holzer and Galloway 2005), the Sg
Table 2 Subsidence rate and gradient behavior within each groundwater vulnerability class comparing DRASTIC and DRASTIC-Sgmodels
Model Aquifer vulnerability class Subsidence rate (mm/year) Subsidence gradient, Sg (–) Surface area (%)Min Max Mean Min Max Mean EEA SR
DRASTIC Very low −0.0057 −278.74 −26.45 0 0.0491 0.0009 23.18 13.81Low −0.0035 −343.60 −46.86 0 0.0548 0.0021 40.48 54.09Moderate −0.0006 −212.06 −10.90 0 0.0327 0.0007 30.67 28.05High −0.0117 −112.65 −8.40 0 0.0158 0.0007 5.59 4.05Extreme −0.0999 −8.09 −2.70 0 0.0019 0.0004 0.08 0.00
DRASTIC-Sg Very low −0.0057 −272.75 −6.70 0 0.0059 0.0003 20.15 2.72Low −0.0035 −339.27 −40.29 0 0.0164 0.0010 35.09 35.83Moderate −0.0006 −343.60 −29.96 0 0.0548 0.0017 36.86 49.37High −0.0117 −211.27 −21.32 0 0.0548 0.0022 7.56 11.17Extreme −0.0999 −142.00 −37.73 0 0.0169 0.0073 0.34 0.91
EEA effective extent area of the federal district = 1,327 km2
SR subsidence region = 343 km2 ; bounded by the −10 mm/yr subsidence rate isoline marked in Figs. 8 and 9
Hydrogeology Journal DOI 10.1007/s10040-014-1130-4

parameter is presented as a welcome addition forvulnerability assessments in subsiding basins.
DRASTIC-Sg and other MCMA vulnerability mapsAs far as the authors know, two groundwater vulnerabilitymaps of the Mexico City Metropolitan Area (MCMA)have been made in the past (Mazari-Hiriart et al. 2006;Ramos-Leal et al. 2010). These are not strictly equivalentto DRASTIC-Sg because their authors worked at differentscales and under different assumptions; besides, neither ofthe two maps takes into account differential land subsi-dence. However, establishing an overall comparison canstill be useful to evaluate how considering the subsidencegradient may lead to different results.
Mazari-Hiriart et al. (2006) developed a vulnerabilitymap for the full metropolitan area of Mexico City(4,616 km2). This is considerably larger than the DRAS-TIC-Sg map, which is restricted to the Federal District(1,493 km2). Based on fuzzy multicriteria procedures,Mazari-Hiriart et al. (2006) combined potential contaminantsources with the spatial distribution of subjective hydraulicconductivities to obtain a five-level groundwater vulnerabil-ity map. Their results showcase homogeneous moderate-vulnerability scores for most of the recharge zones. Sectorsdominated by alluvial and clayey sediments were classifiedas high vulnerability, with some exceptions. These outcomesdiffer partly from DRASTIC-Sg (Fig. 9a), largely becauseMazari-Hiriart et al. (2006) were striving to map contami-nation risk, rather than intrinsic vulnerability. For this reason,they focused on two key parameters, rather than eight, anddid not consider land subsidence.
On the other hand, Ramos-Leal et al. (2010) developed agroundwater vulnerability map for the entire Basin ofMexico (16,320 km2) by using the SINTACS method(Civita and De Maio 1997), which is more akin toDRASTIC-Sg than the approach by Mazari-Hiriart et al.(2006). Ramos-Leal et al. (2010) took into account therecharge, computed as the difference between precipitationand actual evapotranspiration, instead of using a daily soil-water balance. Despite the differences in scale, their outcomeis generally similar to DRASTIC-Sg. Some discrepanciesare however noted—for instance, they obtained a highvulnerability score for the Sierra del Chichinautzin and LasCruces, instead of high-moderate-low and low-very lowcombinations provided by the DRASTIC-Sg model. Differ-ences are also observed around the lacustrine plain, whereRamos-Leal et al. (2010) obtained low and very lowvulnerability indices. Since DRASTIC and SINTACS areroughly similar, discrepancies in this area can be attributed tothe ground deformation parameter.
Conclusions
This report has presented the DRASTIC-Sg model, anextension to the standard DRASTIC approach for map-ping groundwater vulnerability in urban aquifers subjectto differential land subsidence effects. A subsidence
gradient parameter (Sg) was designed to represent grounddeformation, which is useful to depict areas wheresubsidence may cause structural damage to urban infra-structures, thus favoring contaminant spillage and propa-gation along newly developed fractures. The DRASTIC-Sg model was tested in Mexico City, where intensesubsidence has been recorded for over one century.
A new SqueeSAR analysis coupled with GPS validationwas used to evaluate the spatial distribution of subsidencerates and horizontal gradients. There is no linear correlationbetween land subsidence and groundwater drawdown for theexisting well distribution, which suggests that grounddeformation cannot be attributed solely to intensive ground-water pumping. Further variables such as lithology, aquitardthickness, water content, elasto-plastic behavior and poredepressurization also play an important role.
A statistical comparison of DRASTIC and DRASTIC-Sg reveals that the former is likely to underestimategroundwater vulnerability in subsiding areas. In turn, theDRASTIC-Sg model was found to provide a moreaccurate depiction of groundwater vulnerability for theaquifer at hand. In particular, DRASTIC-Sg is moreeffective at establishing a correlation between subsidencegradients and overall groundwater vulnerability. It alsoallows for a more detailed assessment, and accounts forfuture dynamics conditions such as tensile crack regionsthat can increase aquifer vulnerability to contamination.
A comparison with analogous works carried out inMexico City suggests that land subsidence plays a relativelyimportant role in groundwater vulnerability, and that itshould be taken into account in prospective studies.Therefore, the DRASTIC-Sg model is advocated as avaluable decision-making tool to underpin urban, environ-mental and water management strategies in Mexico City.
Acknowledgements This research was funded by the CONACyTand the former Instituto de Ciencia y Tecnología del Distrito Federal(ICyTDF), currently the Secretaría de Ciencia, Tecnología eInnovación del Distrito Federal (to A. Hernández-Espriú), Projectnumber CONACyT 121128. E. Cabral-Cano has been supported bygrants from NASA-ROSES NNH10ZDA001N-ESI, UNAMPAPIIT IN121515, IN114907, IN117909, IN108611‐2, IN104213‐2 and CONACyT CB‐10151. The authors are grateful to FernandoOlalde and Jaime Ravelo (Secretaría del Medio Ambiente delDistrito Federal; Mexico City Government) for providing logisticsupport during the field campaigns. We also thank H.Macías-González,A. Ramos-Leal J. Goya, A. Arias, M. Vidal, A. Meneses, J.L. Arcos, E.López and D. Solano for their contributions. Finally, we are grateful toProf. Stephen Foster for his enthusiastic ideas regarding this project,during the 39th IAH Congress, at Niagara Falls, Canada.
References
Alberro J, Hernandez R (1990) Genesis de las grietas de tension en elValle de Mexico [Genesis of tensile cracks in the Valley of Mexico].Mexican Society of Soil Mechanics (SMMS), Mexico City, 95 pp
Alberto-Jaime P, Méndez-Sánchez E (2010) Evolution of MexicoCity clay properties affected by land subsidence. In: Carreón-Freyre D, Cerca M, Galloway DL, Silva-Corona JJ (eds) Landsubsidence, associated hazards and the role of natural resourcesdevelopment. IAHS Publ. 339, IAHS, Wallingford, UK
Hydrogeology Journal DOI 10.1007/s10040-014-1130-4
Aller L, Lehr JH, Petty R (1987) DRASTIC: a standardized systemto evaluate groundwater pollution potential using hydrogeologicsettings. NWWA/US EPA Ser., EPA600/287035, US EPA,Washington, DC, 455 pp
Arce JL, Layer PW, Morales-Casique E, Benowitz J, Rangel E,Escolero O (2013) New constraints on the subsurface geologyof the Mexico City Basin: the San Lorenzo Tezonco deep well,on the basis of 40Ar/39Ar geochronology and whole-rockchemistry. J Volcanol Geotherm Res 266:34–49. doi:10.1016/j.jvolgeores.2013.09.004
Auvinet G, Méndez E, Juárez M (2013) Fracturation des solsinduite par la subsidence de la ville de Mexico [Soil fracturinginduced by land subsidence in Mexico City]. Proceedings of the18th International Conference on Soil Mechanics and Geotech-nical Engineering, Paris, September 2013
Biot MA (1941) General theory of three-dimensional consolidation.J Appl Phys 12:155–165
Bouwer H (1978) Land subsidence and cracking due to ground-water depletion. Ground Water 15(5):358–364
Burrough PA, McDonnell RA (1998) Principles of GeographicalInformation Systems, Oxford University Press, Oxford
Butscher C, Huggenberger P (2009) Enhanced vulnerabilityassessment in karst areas by combining mapping with modelingapproaches. Sci Total Environ 407:1153–1163
Cabral-Cano E, Dixon TH, Miralles-Wilhelm F, Díaz-Molina O,Sánchez-Zamora O, Carande RE (2008) Space geodetic imagingof rapid ground subsidence in Mexico City. Geol Soc Am Bull120:1556–1566
Calderhead AI, Therrien R, Rivera A, Martel R, Garfias J (2011)Simulating pumping-induced regional land subsidence with theuse of InSAR and field data in the Toluca Valley, Mexico. AdvWater Resour. doi:10.1016/j.advwatres.2010.09.017
Carreón-freyre DC, Hidalgo-moreno CM, Hernández-marín M(2006) Mecanismos de fracturamiento de depósitos arcillososen zonas urbanas. Caso de deformación diferencial en Chalco,Estado de México [Fracture mechanisms in lacustrine depositswithin urban areas: differential deformation case-study atChalco, Mexico state]. Bol Soc Geol Mex (Spec. Issue UrbanGeology) 2:237–250
Carrera-Hernandez JJ, Gaskin S (2007) Spatio temporal analysis ofdaily precipitation and temperature in the Basin of Mexico. JHydrol. doi:10.1016/j.jhydrol.2006.12.021
Carrera-Hernández JJ, Gaskin SJ (2008) Spatio-temporal analysis ofpotential aquifer recharge: application to the Basin of Mexico. JHydrol. doi:10.1016/j.jhydrol.2008.02.012
Carrillo N (1948) Influence of artesian wells on the sinking ofMéxico City. In: Proc. of the 2nd Int. Conf. on Soils Mechanics,Rotterdam, The Netherlands, June 1948, 7:7–14
Casagrande A (1936) The determination of the preconsolidationload and its practical significance. Proc First Int Conf Soil MechFound Eng 3:60–64
Chen S-K, Jang C-S, Peng Y-H (2013) Developing a probability-based model of aquifer vulnerability in an agricultural region. JHydrol 486:494–504
Civita M, De Maio M (1997) SINTACS Un sistema parametrico perla valutazione e la cartografia per la valutazione dellavulnerabilità degli acquiferi all’inquinamento, metodologia eautomazione [A parametric system for the assessment andmapping of groundwater vulnerability to pollution, methodolo-gy and automatization]. Pitagora, Bologna, Italy
CHCVM -Comisión Hidrológica de la Cuenca del Valle de México(1953) Datos diarios del Valle de México correspondientes a1953 [Daily data of the Valley of Mexico for 1953], Bol MecánSuel 1, CHCVM, Mexico City
CNNexpansion (2007) Hallan cadaver en grieta de Iztapalapa [Deadbody found inside a crack in Iztapalapa]. http://www.cnnexpan-sion.com/actualidad/2007/7/11/hallan-cadaver-en-grieta-de-izta-palapa. Accessed 22 November 2013
Comisión Nacional del Agua (2009) Actualización de la disponibilidadmedia anual de agua subterránea: Acuífero (0901) Zona Zetropo-litana de la Cd. de México [Update of the annual mean groundwaterdisponibility: Aquifer 0901, Mexico City]. Diario Oficial de la
Federación. Available via http://www.conagua.gob.mx/disponibili-dad.aspx?n1=3&n2=62&n3=94. Accessed 19 November 2013
Dehghani M, Valadan Z, Mohammad J, Entezam I, Mansourian A,Saatchi S (2009) InSAR monitoring of progressive landsubsidence in Neyshabour, northeast Iran. Geophys J Int178(1):47–56
Denny SC, Allen DM, Journeay JM (2007) DRASTIC-Fm: amodified vulnerability mapping method for structurally con-trolled aquifers in the southern Gulf Islands, British Columbia,Canada. Hydrogeol J 15:483–493
Ducci D, Sellerino M (2013) Vulnerability mapping of groundwatercontamination based on 3D lithostratigraphical models ofporous aquifers . Sci Total Environ. doi :10.1016/j.scitotenv.2012.12.090
ESRI-Environmental Sciences Research Institute (2008) ArcGIS:ArcMap and extensions. Environmental Sciences ResearchInst., Redlands, CA
Ferretti A, Fumagalli A, Novali F, Prati C, Rocca F, Rucci A (2011)A new algorithm for processing interferometric data-stacks:SqueeSAR. IEEE Trans Geosci Remote Sens 49(9):3460–3470.doi:10.1109/TGRS.2011.2124465
Figueroa-Vega F (1984) Case history no. 9.8, Mexico. In: Poland JF(ed) Guidebook to studies of land subsidence due to ground-water withdrawal, UNESCO, Paris
Foster SSD, Hirata RA, Gomes D, D’Elia M, Paris M (2002)Groundwater quality protection: a guide for water utilities,municipal authorities and environment agencies. World Bank,Washington, DC
Gaceta UNAM (2013) Necesarios, más estudios sobre el pozoprofundo en el DF. Mexico City, Mexico. [Necessary, morestudies concerning the deep borehole in Mexico City]. No.4486, Gaceta UNAM, Mexico City. Available via http://www.dgcs.unam.mx/gacetaweb/2013/130131/gaceta.pdf.Accessed 11 February 2014
Galloway DL, Burbey TJ (2011) Review: regional land subsidenceaccompanying groundwater extraction. Hydrogeol J 19:1459–1486
Galloway DL, Hoffmann J (2007) The application of satellitedifferential SAR interferometry-derived ground displacementsin hydrogeology. Hydrogeol J. doi:10.1007/s10040-006-0121-5
Gayol R (1925) Estudio de las perturbaciones que en el fondo de laCiudad de México ha producido el drenaje de las aguas delsubsuelo, por las obras del desagüe y rectificación de los erroresa que ha dado lugar una incorrecta interpretación de los efectosproducidos [A study of the disturbances that drainage ofgroundwater has caused in Mexico City, due to urbaninfrastructure development and correction of errors that haveled to an incorrect interpretation of the produced effects]. RevMex Ing Arquitect 3:96–132
Hernandez-Laloth N (2008) Visual two-zone model with verticalflow and leakage: a GUI for aquifer test interpretation usingnumerical methods. Available via http://www.ingenieria.unam.mx/hydrogeology. Accessed 11 February 2014
Hernandez-Marín M, Carreón-Freyre DC, Cerca M (2005) Mechan-ical and physical properties of the montmorillonitic andallophanic clays in the near-surface sediments of Chalco Valley,Mexico: analysis of contributing factors to land subsidence.-Shanghai Sci. and Tech., Shanghai
Herrera I, Martinez R, Hernandez G (1989) Contribución para laadministración científica del agua subterranea de la Cuenca deMéxico [Contribution for the scientific management of thegroundwater in the Basin of Mexico]. Geofis Int 28:297–334
Hiriart F, Marsal RJ (1969) The subsidence of Mexico City. In:Volumen Nabor Carrillo, Comisión Impulsora y Coordinadorade la Investigación Científica (ed), Secretaria de Hacienda yCrédito Público, Mexico City
Holzer TL, Galloway DL (2005) Impacts of land subsidence causedby withdrawal of underground fluids in the United States. GeolSoc Am Rev Eng Geol 16:87–99
Horn R, Way T, Rostek J (2001) Effect of repeated wheeling onstress/strain properties and ecological consequences in struc-tured arable soils. Rev Cien Suelo Nutr Veg 1:34–40
Hydrogeology Journal DOI 10.1007/s10040-014-1130-4
Huizar-Alvarez R, Carrillo-Rivera JJ, Hergts T, Serrano A, CardonaAC (2004) Chemical response to groundwater abstractionsoutheast of Mexico City. Hydrogeol J 12(4):436–450
Hung WC, Hwang C, Chang CP, Yen JY, Liu CH, Yang WH (2010)Monitoring severe aquifer-system compaction and land subsidencein Taiwan using multiple sensors: Yunlin, the southern ChoushuiRiver Alluvial Fan. Environ Earth Sci 59(7):1535–1548
INEGI-Instituto Nacional de Estadística y Geografía (1983) Cartaedafológica escala 1:250 000 E14-2 [Soil map, Scale 1:250 000E14-2]. INEGI, Oxaca, Mexico
INEGI-Instituto Nacional de Estadística y Geografía (2010) Censode población y vivienda 2010/Estadísitca [Population andhousing census/statistics]. INEGI, Oxaca, Mexico. Availablevia http://www.censo2010.org.mx. Accessed February, 2014
Kumar Prasad R, SinghVS,Krishnamacharyulu SKG,Banerjee P (2011)Application of drastic model and GIS: for assessing vulnerability inhard rock granitic aquifer. Environ Monit Assess 176(1–4):143–155
Lesser y Asociados (2003) Piezometría del Valle de Mexico, Año2003 [Piezometric records of the Valley of Mexico, year 2003].Sistema de Aguas de la Ciudad de Mexico, Tech. report, Lesser,Querétaro, Mexico
Lima ML, Zelaya K, Massone H (2011) Groundwater vulnerabilityassessment combining the DRASTIC and dyna-Clue model inthe Argentine pampas. Environ Manag 47:828–839
López-Quiroz P, Doin MP, Tupin F, Briole P, Nicolas JM (2009)Time series analysis of Mexico City subsidence constrained byradar Interferometry. J Appl Geophys 69(1):1–15
Marsal RJ, Mazari-Hiriart M (1959) The subsoil of Mexico City.Facultad de Ingeniería, Universidad Nacional Autónoma deMéxico, Mexico
Marsal RJ, Mazari-Hiriart M (1990) Desarrollo de la mecánica desuelos en la Ciudad de México [Evolution of soil mechanics inMexico City]. In: El subsuelo de la Cuenca del Valle de Méxicoy su relación con la ingeniería de cimentaciones a cinco añosdel sismo. Soc Mexicana Mecánica Suelos México 1:3–24
Mazari M (1996) Hacia el Tercer Mileno [Towards the thirdmillennium]. El Colegio Nacional, Mexico City
Mazari-Hiriart M, Mazari HM, Ramírez C, Alberro J (1992) Efectosde la extracción de agua en la zona lacustre del valle de México[Effects of water extraction in the lacustrine zone of the VAlleyof Mexico]. Volumen Raúl J. Marsal, Sociedad Mexicana deMecánica de Suelos, A.C. México, pp 37–48
Mazari-Hiriart M, Cruz BG, Bojorquez TLA, Juarez ML, AlcantarLG, Marin LE, Soto GE (2006) Groundwater vulnerabilityassessment for organic compounds: fuzzy multicriteria approachfor Mexico City. Environ Manag 37(3):410–421
Molson JW, Frind EO (2012) On the use of mean groundwater age,life expectancy and capture probability for defining aquifervulnerability and time-of-travel zones for source water protec-tion. J Contam Hydrol. doi:10.1016/j.jconhyd.2011.06.001
Mooser R, Montiel A, Zúñiga A (1996) Nuevo mapa geológico de lascuencas deMéxico, Toluca y Puebla. Estratigrafía tectónica regional yaspectos geotérmicos [New gelogical map for the Basins of Mexico,Toluca and Puebla]. Comisión Federal de Electricidad, Mexico
Oliva-Soto LG (2007) Interval and fuzzy regressions to enhanceDRASTIC aquifer vulnerability assessments, MSc Thesis,Texas A&M University, USA
Or D, Ghezzehei TA (2002) Modeling post-tillage structural dynamicsin aggregated soils: a review. Soil Tillage Res 64:41–59
Ortega-Guerrero A, Cherry JA, Rudolph DL (1993) Large-scaleaquitard consolidation near Mexico City. Ground Water.doi:10.1111/j.1745-6584.1993.tb00841
Osmanoglu B, Dixon TH, Wdowinski S, Cabral-Cano E, Jiang Y(2011) Mexico City subsidence observed with persistentscatterer InSAR. Int J Appl Earth Obs Geoinfor 13(1):1–12
Panagopoulos GP, Antonakos AK, Lambrakis NJ (2006) Optimiza-tion of the DRASTIC method for groundwater vulnerabilityassessment via the use of simple statistical methods and GIS.Hydrogeol J. doi:10.1007/s10040-005-0008-x
Pérez-Cruz GA (1988) Estudio sismológico de reflexión delsubsuelo de la Ciudad de México [Reflective seismologic studyof the subsoil of Mexico City], MSc Thesis, UniversidadNacional Autónoma de México, Mexico City
R Development Core Team (2005) R: a language and environmentfor statistical computing. R Foundation for Statistical Comput-ing, Vienna, Austria. Available via http://www.R-project.org.Accessed 11 February 2014
Ramos-Leal JA, Noyola Medrano C, Tapia Silva FO (2010) Aquifervulnerability and groundwater quality inmega cities: case of the Basinof Mexico. Environ Earth Sci. doi:10.1007/s12665-009-0434-5
Rathod KS, Rusthon KR (1984) Numerical method of pumping testanalysis using microcomputers. Groundwater 22:14–27
Rathod KS, Rusthon KR (1992) Interpretation of pumping fromtwo-zone layered aquifers using a numerical model. Ground-water 29(4):499–509
Rushton KR, Redshaw SC (1979) Seepage and ground-water flow.Wiley, Chichester, UK
SACM-Sistema de Aguas de la Ciudad de México (2006) Modelohidrodinámico del acuífero de la Zona Metropolitana de laCiudad de México [Hydrodynamic model of the Mexico Cityaquifer]. Instituto Mexicano de Tecnología del Agua (IMTA).Technical report, Contract no. 06-CD-03-1O-0272-1-06,SACM, Mexico City
Santoyo E, Ovando E, Mooser F, León, E (2005) SíntesisGeotécnica de la Cuenca del Valle de México [Geotechnicalsynthesis of the Basin of Mexico]. TGC Geotecnia, FederalDistrict, Mexico
Sneed M, Ikehara ME, Stork SV, Amelung F, Galloway DL (2003)Detection and measurement of land subsidence usinginterferometric synthetic aperture radar and global position-ing system, San Bernardino County, Mojave Desert, Cal-ifornia. U.S. Geological Survey Water Resour Invest Rep03-4015
Sorichetta A, Masetti M, Ballabio C, Sterlacchini S, Beretta JP(2011) Reliability of groundwater vulnerability maps obtainedthrough statistical methods. J Environ Manag. doi:10.1016/j.jenvman.2010.12.009
Tapia-Varela G, López-Blanco J (2002) Mapeo geomorfológicoanalítico de la porción central de la Cuenca de México:Unidades Morfogenéticas a escala 1:100 000 [Analytic geo-morphologic mapping of the central portion of the Basin ofMexico: morphogenetic units scale 1:100 000]. Rev Mex CiencGeol 19(1):50–65
Trautner A, van den Akker JJH, Fleige H, Arvidsson J, Horn R(2003) A subsoil compaction database: its development,structure and content. Soil Tillage Res. doi:10.1016/S0167-1987(03)00095-3
Vargas C, Ortega-Guerrero MA (2004) Fracture hydraulic conduc-tivity in the Mexico City clayey aquitard: field piezometerrising-head tests. Hydrogeol J 12:336–344
Vázquez-Sánchez E (1995) Modelo conceptual hidrológico ycaracterísticas hidráulicas del acuífero en explotación en laparte meridional de la Cuenca de México [Conceptualhydrologic model and hydraulic characteristics of the aquiferunder exploitation in the meridional part of the Basin ofMexico]. Universidad Nacional Autónoma de México,Mexico City
Vázquez-Sánchez E, Jaimes-Palomera R (1989) Geología de laCuenca de México [Geology of the Basin of Mexico]. Geofis Int28(2):133–189
Hydrogeology Journal DOI 10.1007/s10040-014-1130-4