Embed Size (px)
Citation preview
i
TITLE PAGE
THE PROSPECTS OF TOTAL QUALITY MANAGEMENT
IN THE NIGERIA POWER SECTOR
BY
UMAR, TALATU RAIYAUMAR, TALATU RAIYAUMAR, TALATU RAIYAUMAR, TALATU RAIYA PG/M.Sc/04/38286
A DISSERTATION SUBMITTED IN PARTIAL FULFILMENT OF THE REQUIREMENTS FOR THE AWARD OF MASTERS OF
SCIENCE (M.Sc) DEGREE IN MANAGEMENT
DEPARTMENT OF MANAGEMENT, UNIVERSITY OF NIGERIA,
ENUGU CAMPUS
FEBRUARY, 2010
ii
DECLARATION
I hereby declare that this dissertation has been conducted solely by me under the
supervision and guidance of Dr. U.J.F. Ewurum, Department of Management
Studies, UNEC, and I have neither copied someone’s work nor has someone else
done it for me. Authors whose works have been referred to in this work have been
dully acknowledged.
Umar, Talatu Raiya __________________ _______________
PG/M.Sc/04/38286 Signature Date
iii
APPROVAL PAGE
This is to certify that, this thesis is an original work undertaken by Umar, Talatu
Raiya of the Department of Management Studies and has been prepared in
accordance with the rules and regulations governing the preparations and
presentation of research thesis in University of Nigeria, Enugu Campus.
Dr. U.J.F. Ewurum __________________ _______________
Supervisor Signature Date
C.O. Chukwu __________________ _______________
Head of Department Signature Date

iv
DEDICATION
This thesis is dedicated to Almighty Allah.
v
ACKNOWLEDGEMENTS
I am indeed very grateful to God Almighty for sparing, caring, leading and
protecting me throughout my academic career in UNEC.
While conducting this research project I received support from many people in one
way or another, without whose support, this thesis would not have been completed
in its present form.
First I would like to deeply thank my project supervisor Dr. U.J.F Ewurum who
provided me with the freedom to explore research directions and choose the routes
that I wanted to investigate. Your encouragement, excellent guidance, creative
suggestions, and critical comments have greatly contributed to this thesis. I would
like to thank you very much, I enjoyed our discussions and have learned a great
deal from you.
I strongly believed that what I have learned during M.Sc study period, will be
definitely profitable for the rest of my life. For this I am eternally grateful.
I especially thank Mr. H.N. Okoye, a classmate at UNEC for his help, without his
help and assistance my life would have been more difficult.
vi
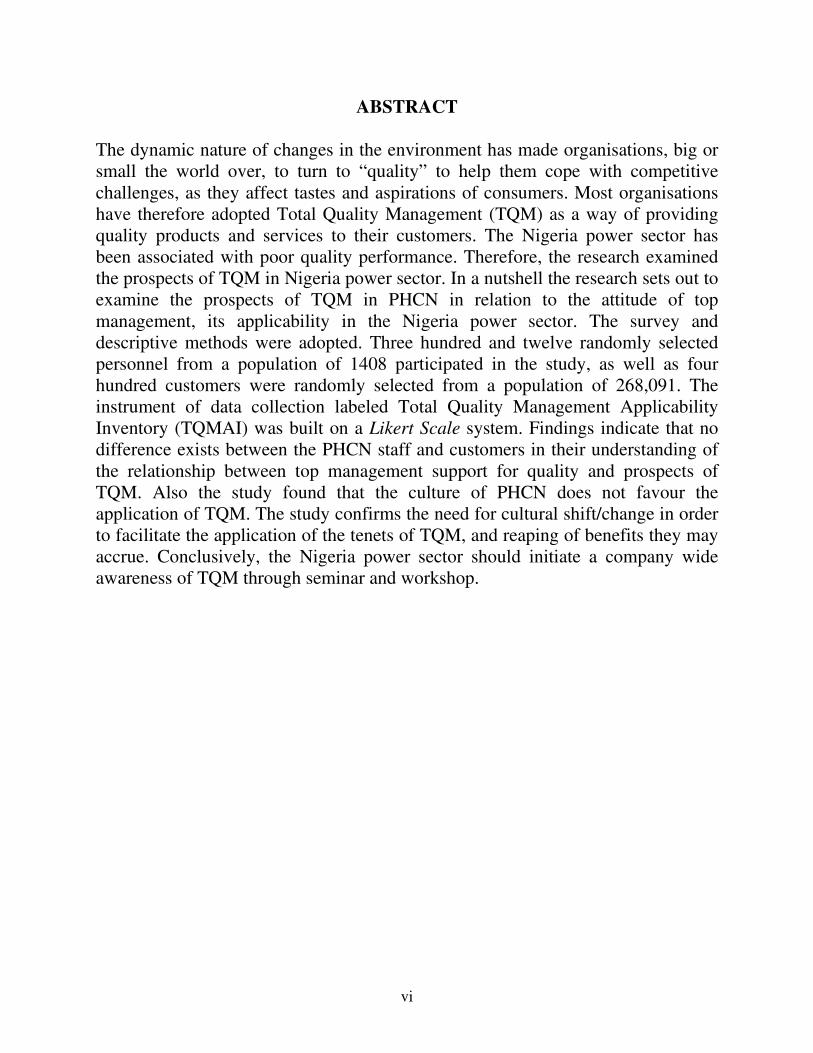
ABSTRACT
The dynamic nature of changes in the environment has made organisations, big or
small the world over, to turn to “quality” to help them cope with competitive
challenges, as they affect tastes and aspirations of consumers. Most organisations
have therefore adopted Total Quality Management (TQM) as a way of providing
quality products and services to their customers. The Nigeria power sector has
been associated with poor quality performance. Therefore, the research examined
the prospects of TQM in Nigeria power sector. In a nutshell the research sets out to
examine the prospects of TQM in PHCN in relation to the attitude of top
management, its applicability in the Nigeria power sector. The survey and
descriptive methods were adopted. Three hundred and twelve randomly selected
personnel from a population of 1408 participated in the study, as well as four
hundred customers were randomly selected from a population of 268,091. The
instrument of data collection labeled Total Quality Management Applicability
Inventory (TQMAI) was built on a Likert Scale system. Findings indicate that no
difference exists between the PHCN staff and customers in their understanding of
the relationship between top management support for quality and prospects of
TQM. Also the study found that the culture of PHCN does not favour the
application of TQM. The study confirms the need for cultural shift/change in order
to facilitate the application of the tenets of TQM, and reaping of benefits they may
accrue. Conclusively, the Nigeria power sector should initiate a company wide
awareness of TQM through seminar and workshop.
vii
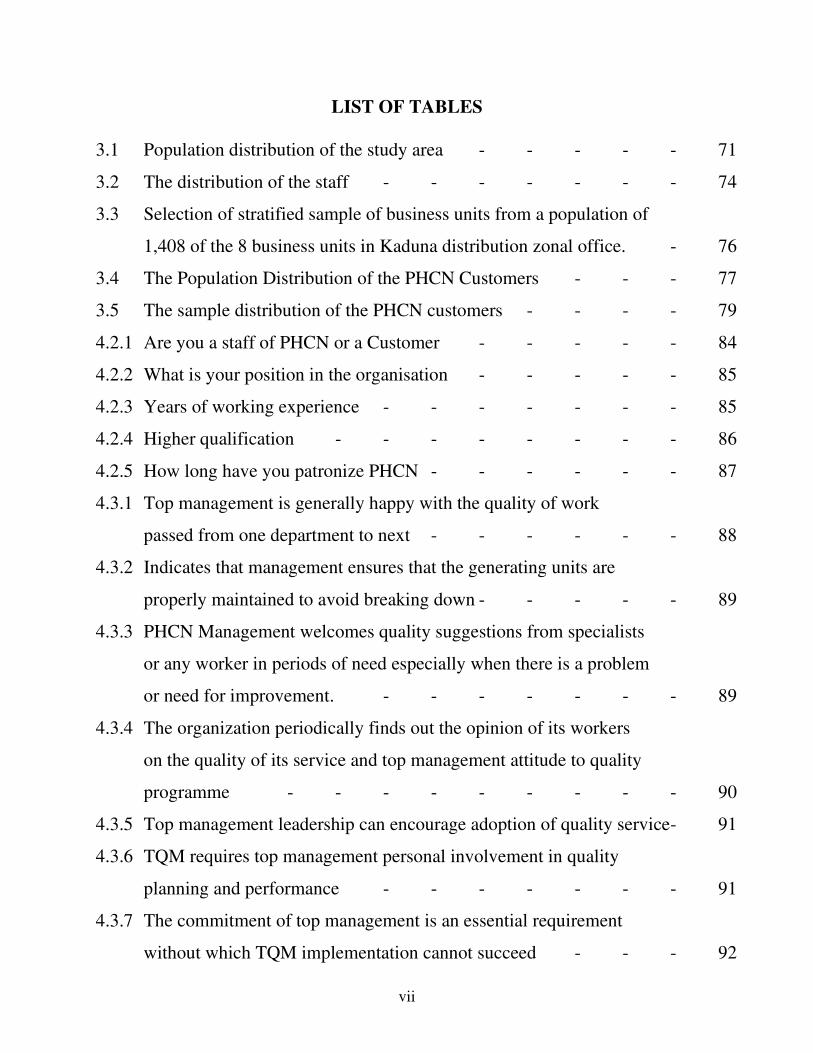
LIST OF TABLES
3.1 Population distribution of the study area - - - - - 71
3.2 The distribution of the staff - - - - - - - 74
3.3 Selection of stratified sample of business units from a population of
1,408 of the 8 business units in Kaduna distribution zonal office. - 76
3.4 The Population Distribution of the PHCN Customers - - - 77
3.5 The sample distribution of the PHCN customers - - - - 79
4.2.1 Are you a staff of PHCN or a Customer - - - - - 84
4.2.2 What is your position in the organisation - - - - - 85
4.2.3 Years of working experience - - - - - - - 85
4.2.4 Higher qualification - - - - - - - - 86
4.2.5 How long have you patronize PHCN - - - - - - 87
4.3.1 Top management is generally happy with the quality of work
passed from one department to next - - - - - - 88
4.3.2 Indicates that management ensures that the generating units are
properly maintained to avoid breaking down - - - - - 89
4.3.3 PHCN Management welcomes quality suggestions from specialists
or any worker in periods of need especially when there is a problem
or need for improvement. - - - - - - - 89
4.3.4 The organization periodically finds out the opinion of its workers
on the quality of its service and top management attitude to quality
programme - - - - - - - - - 90
4.3.5 Top management leadership can encourage adoption of quality service - 91
4.3.6 TQM requires top management personal involvement in quality
planning and performance - - - - - - - 91
4.3.7 The commitment of top management is an essential requirement
without which TQM implementation cannot succeed - - - 92
viii
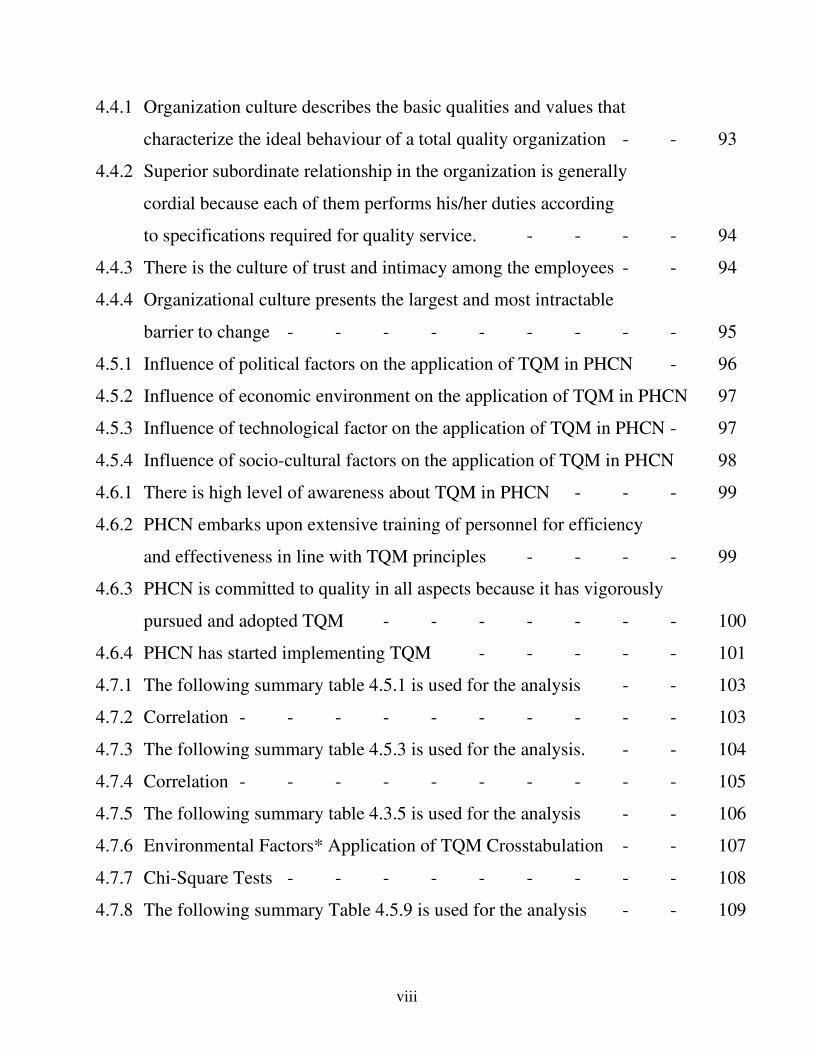
4.4.1 Organization culture describes the basic qualities and values that
characterize the ideal behaviour of a total quality organization - - 93
4.4.2 Superior subordinate relationship in the organization is generally
cordial because each of them performs his/her duties according
to specifications required for quality service. - - - - 94
4.4.3 There is the culture of trust and intimacy among the employees - - 94
4.4.4 Organizational culture presents the largest and most intractable
barrier to change - - - - - - - - - 95
4.5.1 Influence of political factors on the application of TQM in PHCN - 96
4.5.2 Influence of economic environment on the application of TQM in PHCN 97
4.5.3 Influence of technological factor on the application of TQM in PHCN - 97
4.5.4 Influence of socio-cultural factors on the application of TQM in PHCN 98
4.6.1 There is high level of awareness about TQM in PHCN - - - 99
4.6.2 PHCN embarks upon extensive training of personnel for efficiency
and effectiveness in line with TQM principles - - - - 99
4.6.3 PHCN is committed to quality in all aspects because it has vigorously
pursued and adopted TQM - - - - - - - 100
4.6.4 PHCN has started implementing TQM - - - - - 101
4.7.1 The following summary table 4.5.1 is used for the analysis - - 103
4.7.2 Correlation - - - - - - - - - - 103
4.7.3 The following summary table 4.5.3 is used for the analysis. - - 104
4.7.4 Correlation - - - - - - - - - - 105
4.7.5 The following summary table 4.3.5 is used for the analysis - - 106
4.7.6 Environmental Factors* Application of TQM Crosstabulation - - 107
4.7.7 Chi-Square Tests - - - - - - - - - 108
4.7.8 The following summary Table 4.5.9 is used for the analysis - - 109
ix
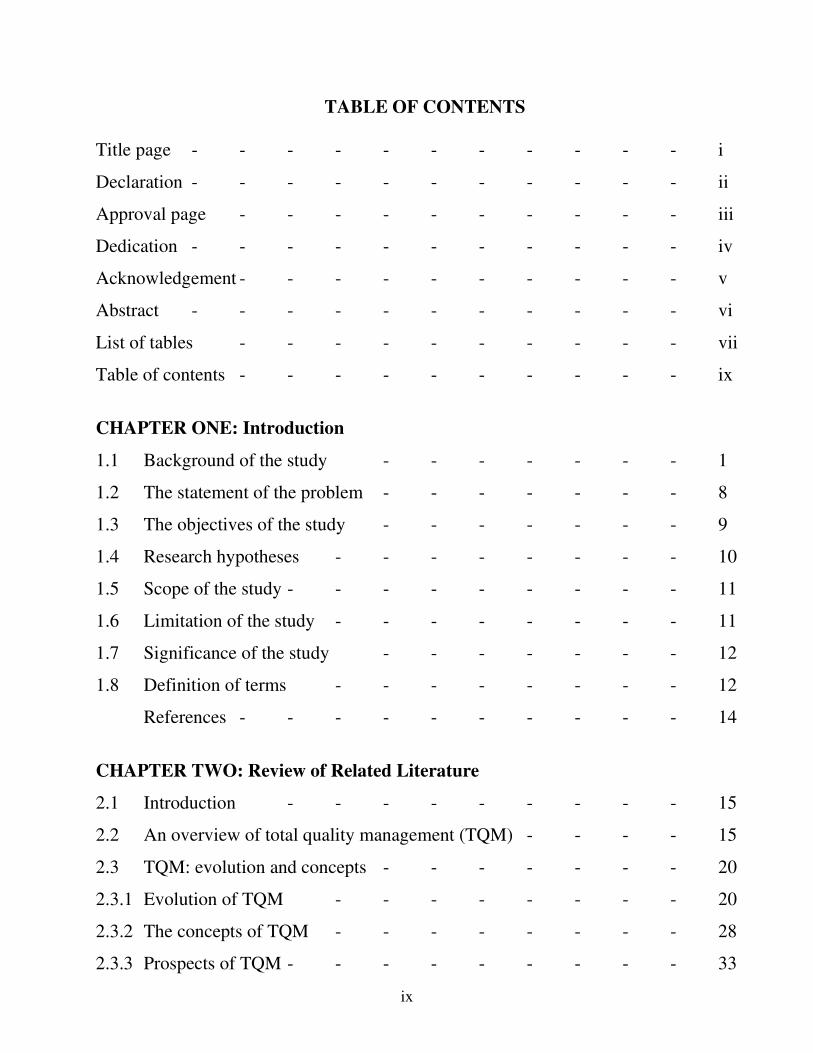
TABLE OF CONTENTS
Title page - - - - - - - - - - - i
Declaration - - - - - - - - - - - ii
Approval page - - - - - - - - - - iii
Dedication - - - - - - - - - - - iv
Acknowledgement - - - - - - - - - - v
Abstract - - - - - - - - - - - vi
List of tables - - - - - - - - - - vii
Table of contents - - - - - - - - - - ix
CHAPTER ONE: Introduction
1.1 Background of the study - - - - - - - 1
1.2 The statement of the problem - - - - - - - 8
1.3 The objectives of the study - - - - - - - 9
1.4 Research hypotheses - - - - - - - - 10
1.5 Scope of the study - - - - - - - - - 11
1.6 Limitation of the study - - - - - - - - 11
1.7 Significance of the study - - - - - - - 12
1.8 Definition of terms - - - - - - - - 12
References - - - - - - - - - - 14
CHAPTER TWO: Review of Related Literature
2.1 Introduction - - - - - - - - - 15
2.2 An overview of total quality management (TQM) - - - - 15
2.3 TQM: evolution and concepts - - - - - - - 20
2.3.1 Evolution of TQM - - - - - - - - 20
2.3.2 The concepts of TQM - - - - - - - - 28
2.3.3 Prospects of TQM - - - - - - - - - 33
x
2.4 The traditional concept of quality - - - - - - 35
2.5 Determinants of service quality - - - - - - - 40
2.6 TQM concept of quality and service - - - - - - 41
2.7 TQM concept of quality and customer satisfaction - - - - 43
2.8 Organisational culture and the applicability of TQM - - - 46
2.8.1 Application of TQM in the electric power sector - - - - 54
2.9 Influence of environmental factors - - - - - - 56
2.10 Summary of related literature - - - - - - - 61
References - - - - - - - - - - 64
CHAPTER THREE: Research Methodology
3.1 Research design - - - - - - - - - 68
3.2 Sources of data - - - - - - - - - 68
3.2.1 Primary data - - - - - - - - - 69
3.2.2 Secondary data - - - - - - - - - 69
3.3 Area of the study - - - - - - - - - 69
3.4 Population of study - - - - - - - - 70
3.5 Sample size and its determination - - - - - - 72
3.6 Instrument for data collection - - - - - - - 79
3.7 Method of data analysis - - - - - - - - 80
3.8 Reliability and validity of the instrument - - - - - 81
3.8.1 Reliability - - - - - - - - - - 81
3.8.2 Validity - - - - - - - - - - 82
3.8.3 Test: test retest - - - - - - - - - 82
References - - - - - - - - - - 83
CHAPTER FOUR: Data Presentation and Analysis
4.1 Presentation of data - - - - - - - - 84
4.2 Respondents profile - - - - - - - - 84
xi
4.3 Hypothesis I - - - - - - - - - 88
4.4 Hypothesis II - - - - - - - - - 93
4.5 Hypothesis III - - - - - - - - - 96
4.6 Hypothesis IV - - - - - - - - - 99
4.7 Test of hypothesis - - - - - - - - - 102
4.8 Discussion of results - - - - - - - - 110
CHAPTER FIVE: Summary of Findings, Conclusion and Recommendations
5.1 Introduction - - - - - - - - - 116
5.2 Summary of findings - - - - - - - - 116
5.3 Conclusion - - - - - - - - - - 117
5.4 Implications of the study - - - - - - - - 117
5.5 Specific recommendations - - - - - - - 119
5.6 Suggestion for further reading - - - - - - - 121
Bibliography - - - - - - - - - 122
Appendices
xii
CHAPTER ONE
INTRODUCTION
1.1 BACKGROUND OF THE STUDY
The dynamic nature of changes in the environment, particularly as they
affect the tastes and aspirations of consumers, underscore the need to
respond effectively to challenges posed by the changes. On the account of
deregulation of our economy, competition has become a major challenge
which chief executives must meet effectively in order to remain in business.
Most managers agree that if an organisation is to be successful, it must
change continually in response to significant development, such as customer
needs, technological breakthroughs and government regulations (Eke,
2001:44).
Globalization of market and operations forces organisations to think over
their quality problems and in turn their overall organisational
competitiveness. In order to be successful in this global market,
organisations should dedicate themselves to improving productivity and
quality in a timely and collaborative manner (Dobyns and Crawford,
1994:102).
Almaraz (1994:141) indicates that productivity and quality are integral
components of organisational strategies. Designing and developing suitable
xiii
strategies, techniques, tools and models for improving productivity and
quality have become an essential function of researchers and practitioners in
a networked global economy. To this end, organisations have undergone
numerous changes over the years in terms of implementing new operational
strategies, methods and technologies.
In recent times, the concept of customer services has risen to the centre stage
of modern business. As a result of this development, the management
vocabulary is now replete with all kinds of technologies which are used to
describe one and the same thing, customer service. Among these
terminologies are customer satisfaction, customer care, customer relations,
etc. (Nwosu, 1996:36).
To achieve world class customer service, Total Quality Management (TQM)
techniques, supported by management commitment and good organisation
will provide objective means of improving quality and hence the overall
organisational competitiveness (Christopher, 1994:49).
Total quality management is among the new techniques which modern
organisations now employ with very good result to secure and keep their
customers permanently satisfied. It is therefore a way of managing to
improve the effectiveness, efficiency, flexibility and competitiveness of a
business as a whole (Christopher, 1994:23).
xiv
Benson and Savaph (1991:107) assert that TQM involves the whole
organisation, getting organized in every department, in every activity with
every single person at every level. This involves putting in place, process
and system which will ensure that every aspect of its activity is aligned to
satisfying customer needs and the organisation’s objectives. Thus for an
organisation to be fully effective, every single part of it must work properly
together because every person and every activity affect and in turn is
affected by others.
Dobyns and Crawford (1994:94) expatiate further that TQM involves deep
understanding of three basic components, namely; the system, the process
and the philosophy from which the organisation is extracted.
The process here approximates to the necessary economic transformation
from an underdeveloped economy to a modern industrial state. It also
involves the uplifting of the basic quality of life of its people through
modern processes of production. It involves still, the harnessing of the
human and material resources for the goal of fitting into the system above.
The third component of TQM, the philosophy involves the identification of
goals which have been partially addressed under the process as well as the
means of attaining the goals.
xv
Thus, TQM involves any attempt to improve quality at every phase of an
organisation’s work whether it is on corporate plan initiation, implementation,
personnel selection or customer satisfaction. Therefore, the ability to meet
customer requirement is vital not only between two separate organisations
but also within the same organisation.
Ryan (1998:68) argues that quality has to be managed, it will not just
happen. Clearly it must involve everyone in the process and be applied
throughout an organisation. Failure to meet the requirements in any part of
the quality chains has a way of multiplying, as failure in one part of the
system creates problems elsewhere leading to a cycle of yet more failures
and more problems. The price of quality is the continued examination of the
requirements and the ability to meet them. This will lead to a continuous
improvement.
PROFILE OF POWER HOLDING COMPANY OF NIGERIA (PHCN)
Major energy product which has emerged from the development of Nigeria’s
energy resources is electricity. Although at independence in 1960 the
country inherited a rudimentary electric power generation and distribution
system under the Electricity Corporation of Nigeria (ECN) and later changed
to NEPA.

xvi
Nigeria’s Electricity Grid is being run on hydroelectric and thermal plants.
The former are predominantly utilized in the northern part of Nigeria while
the later which are fueled by petroleum appear to be largely favoured in the
southern parts. The disadvantages of these approaches become evident in the
harmattan seasons when the water level drops and in the chronic spate of
fuel scarcity.
Nigeria has about 5,900 megawatts of installed electric generating capacity
consisting of 3 hydro-based stations and 5 thermal power plants (Imoke, L.).
Nigeria faces a serious energy crisis due to declining electricity generation
from the power plants. Power outages are frequent and the power sector
operates well below its capacity. NEPA is in charge of a sector which is
grossly inefficient.
The previous Nigerian government set a 10,000MW target capacity for
electricity generation by 2007 as a way of increasing power supply which
has been epileptic over a long period.
When Chief Obasanjo administration came on board in May of 1999 one of
the first tasks it undertook was to charge the then Minister of Power and
Steel to put an end to power outages. The minister wasted no time in making
some necessary changes in the composition of PHCN. PHCN was reconstituted
xvii
and new appointments were made bringing a team of specialists and
technocrats to replace most of the politically appointed members of the
management board. Yet the country recorded no significant improvement in
its power sector. Indeed somewhat that the situation got more worse.
A new technical board directly answerable to Mr. President under the
chairmanship of Senator Liyel Imoke was appointed in 2006 to oversee the
administration of PHCN and its eventual privatization. An improvement is
still yet to be seen.
On July, 1st 2006, NEPA was transformed to PHCN in line with the on-
going government power sector reform programme.
The Nigeria Electricity Regulatory Commission (NERC) was thereby
established under the Electric Power Sector Reforms Act 2005 to provide
regulatory oversight in electricity sector. PHCN was set up to have a life
span of one year after which successor companies owned by private
operations would take over from the firm. But, however, exactly a year after
the company was established and the exact date it was scheduled to cease to
exist, nothing happened.
Part of the efforts to realize this ambition is the on-going power plants
construction in different parts of the country. Ten power stations are in the

xviii
pipeline. They include the 414MW Geregu power station in Kogi State,
335MW Omotosho Gas Turbine Power Station in Ondo State, 335MW
Papalanto Thermal Station in Ogun State, others include the Mambilla
Station in Taraba State, a 250MW in Calabar, a 500MW plant in Eyaea, Edo
State, a 270MW in Ikot Abasi, Akwa Ibom State, a 500MW in Sapele, Delta
State and a 230MW plant in Omoku, River State. The existing power
stations and their installed capacities are Egbin Thermal Station, Lagos
(1320MW) Afam Thermal Station, Delta State (1020MW) Ijoro Thermal
Plant, Lagos (40MW), Kainji Hydro Station, Niger State (760MW), Jebba
Hydro Station, Niger State (578MW) and Shiroro Hydro, Niger State
(600MW). But the actual power capacity currently generating in the country
is presumed to be below 4000MW.
The country’s power generating potential is said to be the highest in Africa.
This is attributed to her abundant natural resources (Imoke, Ibid). With
natural gas reserve of about 188 trillion cubic feet, the country has enough
associated gas potential to power the biggest thermal station in Africa. While
other countries are busy encouraging investment in nuclear power in
addition to the sources of energy, Nigeria is still struggling to exploit the
areas other countries have left behind. South Africa for instance has hit a
power generating capacity of 26,000MW and is planning to construct
xix
additional 5,000MW by 2010. 4000MW is not enough for the country and
the projected target of 10,000MW of electricity in 2009 might be hampered.
There is still over dependence on the aged plants and obsolete equipment,
and also the incessant vandalization of election cables nationwide.
1.2 THE STATEMENT OF THE PROBLEM
The role played by the power sector, as a vital input in the socio-economic
and welfare development of any nation cannot be overestimated. Nigeria is
blessed with abundant energy resources, but suffers from perennial energy
crisis that has so far defied every solution.
Evidence abounds that poor quality culture has been the bane of
management in Nigeria. This record contrasts sharply with empirical
evidence from developed nations, where tremendous improvement has been
recorded in almost all fields of human endeavour. Final delivery is still
judged to fall below expectation in Nigeria and lack of customer focus has
been given as the main reason for the suboptimal performance of many
organisations. Many industries are said to believe in the concept of ‘sellers
market’ which makes them start from the stand point that the customer has
to look for them and not necessarily that managers look for the customer.
Nigeria faces a serious power crisis due to declining electricity generation
from the power plants. Power outages are frequent and the power sector
xx
operates well below its capacity. Despite efforts by government to end the
country’s chronic electricity problems, an assured power supply is still a
distant dream. Even though the country is endowed with huge power
generating potentials, the country’s power supply is still abysmally low.
Given the deteriorating power supply and unsatisfactory performance of the
power sector, there is a strong feeling that the pursuit of quality has not been
given its rightful place in the organisational scheme of things. The persistent
power problem has tended to disrupt productive activities, especially in the
industrial sector, where effective operation of machinery and equipment is
energy dependent. The situation has become so usual that when there is
uninterrupted supply of power for say, one week, people become really
amazed.
One is therefore compelled to ask, in this period of TQM, what are the
prospects of TQM in the Nigeria power sector?
1.3 THE OBJECTIVES OF THE STUDY
This study is aimed at examining the prospects of Total Quality
Management in Nigeria power sector. This project seeks ways by which the
quality of service rendered by the power sector can be improved. The
epileptic nature of electricity supply calls for serious management effort. To
this end, the following specific objectives will be pursued:
xxi
1. To ascertain the level of awareness and readiness of the management
of PHCN.
2. To examine the prospects of TQM in PHCN in relation to the attitude
of top management.
3. To ascertain if the culture of PHCN will favour the application of
TQM in the organisation.
4. To assess the effect of environmental factors on the application of
TQM in PHCN.
1.4 RESEARCH HYPOTHESES
In order to provide focus for the study, the following hypotheses have been
proposed to guide the researcher in the pursuit of the objectives of the study.
1. There is a significant difference between the extent to which
employees are ready and the swiftness for adoption of TQM.
2. There is a positive relationship between top management support for
quality and prospects of TQM in PHCN.
3. There is positive relationship between the culture of PHCN and the
application of TQM.
4. External environmental factors exert positive influence on the
application of TQM.
xxii
1.5 SCOPE OF THE STUDY
This research work is confined to the prospects of Total Quality
Management in the Nigeria power sector, a study of PHCN Kaduna Zonal
Office, as a management paradigm based on the principles of total customer
satisfaction, employee involvement, and continuous improvement in Nigeria
power sector.
In a nutshell, emphasis was focus on TQM, as a concept that holds that, no
matter how well you are already doing you can always do better.
1.6 LIMITATION OF THE STUDY
There is no doubt that researchers experience some difficulties in the course
of undertaking a research. It is noteworthy to mention that the researcher
encountered some difficulties, among which included bureaucratic
bottlenecks in the administrative procedures of the case study, obtaining all
the necessary information needed in producing a comprehensive research
work was not an easy task.
Also the process of going through some records to obtain data was very
tedious and herculean task as some materials needed were labeled “Top
Secret”. Cooperation from the staff of the case study limited the research to
some vital documents and information, necessary to support this study
xxiii
were withheld as either confidential matter or the uncertainty of the
information.
1.7 SIGNIFICANCE OF THE STUDY
The study is important because it will make tremendous contribution
towards improving the power sector.
It is in the light of the aforementioned that it becomes paramount to carry
out this study because it will help in determining the prospects of TQM in
the Nigeria power sector. This will in no small measure, increase
performance in terms of profitability and customer satisfaction and thus
contribute to knowledge in the field of quality management.
It is hoped that this study will serve as an avenue to managers of PHCN to
have a better understanding on ways of handling the power sector for better
economic development which will invariably lead to customer satisfaction.
The study will also be of immense significance to managers and future
researchers who may wish to probe further on the topic.
1.8 DEFINITION OF TERMS
Deregulation Economics: This refers to those economies whose political
superstructure is based on capitalist ideology.
xxiv
TQM: This is an abbreviation for Total Quality Management
TQM Principles: This refers to doing things right the first time, be
customer-centered, build term work and staff empowerment.
PIMS: This is defined as the Profit Impact of Market Strategy, one of the
first solid pieces of evidence linking TQM.
NERC: This is an abbreviation for Nigeria Electricity Regulatory
Commission, which was established under the Electric Power Sector
Reforms Act of 2005.
PHCN: This is acronym for Power Holding Company of Nigeria.
ZEST: This refers to good service delivery as the special emotional plus that
keeps the customer coming back time and time again.
xxv
REFERENCES
Almaraz, Y. (1994), “Quality Management and the Process of Change”, Journal of
Organisational Change Management 2(1).
Benson, P.G. and Savaph, J.V. (1991), “The Effects of Organisational Context on
Total Quality Management: An Empirical Investigation”, Management
Sciences, 37, No. 9.
Christopher, M. (1994), Customer Service and Logistic Strategy. 3rd
Edition:
Torrent, Heinemann.
Dobyns, B. and Craw, F.J. (1994), Organisational Change and Development: A
System View. California: Good Year Publishing Company.
Eke, A.O. (2001), “SWOT Analysis and Managing Change”, in Erurum UJT (ed),
Managing Service Quality in the Nigerian Public Sector. Enugu: Smart Link
Publishers.
Nwosu, I.E. (2001), “Service Quality and Customer Expectations”, in Ewurum
UJF (ed), Managing Service Quality in the Nigerian Public Sector. Enugu:
Smart Link Publishers.
Ryan, F.R. (1998), “The Proverbs of Total Quality Management: Recharting the
Path”, Public Productivity and Management Review, 16(1).
xxvi
CHAPTER TWO
REVIEW OF RELATED LITERATURE
2.1 INTRODUCTION
The chapter deals with the review of related literature which has to do with
the conceptual and theoretical considerations, relating to the problem under
investigation.
Major ideas of this chapter are presented under the following sub-headings:
An Overview of Total Quality Management (TQM); TQM: Evolution,
Concepts and Prospects; the Traditional Concept of Quality; Determinants of
Service Quality; TQM Concept of Quality and Service; TQM concept of
Quality and Customer Satisfaction; Organisational Culture and the
Applicability of TQM in the Nigeria Power Sector; Influence of
Environmental Factors on Electric Power Sector; and Summary of Related
Literature.
2.2 AN OVERVIEW OF TOTAL QUALITY MANAGEMENT (TQM)
To have an understanding of the concept, we need to define the component
words. The word ‘total’ according to Macdonald (1993:6) and Kermally
(1996:41) means that everyone in the organisation, all process systems,
levels of management and employees must be involved in satisfying the
customer.
xxvii
The word ‘quality’ on the other hand means so many things to so many
people. In the words of Garvin (1988:11), quality is an unusually slippery
concept easy to visualize and yet exasperatedly difficult to define. According
to Wilkinson et al. (1998:8), quality include conformance to standards,
fitness to use, excellence, meeting or exceeding customer expectations right
first time, customer satisfaction.
Similarly, the word ‘management’ according to Macdonald (1993:6)
recognizes that TQM is not an accidental phenomenon of an organisation’s
activities. It is a managed process which involves systems and supporting
tools and techniques. It also implies that continuous quality improvement
must be planned, measured and controlled.
Designing and developing suitable strategies, techniques, tools and models
for improving productivity and quality have become an essential function of
researchers and practitioners in a networked global economy. Quality
management has become an important part of management culture. To this
end, organisations have undergone numerous changes over the years in
terms of implementing new operation strategies, methods and technologies.
The general pattern of relationship shows that TQM is contributing to
company outcomes, especially to direct performance outcomes. This
assertion is supported by the finding that the amount of coverage by TQM
xxviii
practices is strongly related to company performance (Lawler et al,
1995:78).
According to Robert (2003:411), the definitions of TQM are many and
varied today. However, for our present purposes, TQM is defined as creating
an organisational culture committed to the continuous improvement of skills,
teamwork, process product service, quality and customer satisfaction.
Therefore, the application of Total Quality Management (TQM) as a
management philosophy and company practice that is aimed at harnessing
the human and material resources of an organisation in the most effective
way in order to achieve the objectives of the organisation cannot be
overemphasized.
Easton and Jarrell (1999:82) argue that, the motivation for quality
improvement comes from conscious awareness shared by all members of an
organisation that every process can be done more effectively giving
increased value and satisfaction to customers and more efficiently, with less
waste and resource consumption.
This increase in effectiveness and efficiency benefit customers, the
organisation and its members, and the society in general. The rate of price
may be a critical factor for patronage but another factor is the quality of the
xxix
service. Infact quality is often the major issue because poor quality can lead
to erosion of goodwill. TQM is among the new techniques which when
employed can keep customers permanently satisfied (Martin, 1993:68).
Total Quality Management (TQM) is an integrated management philosophy
that is supported by a coherent set of principles and practices (Dean and
Bowen, 1994:25).
The core principles of TQM include customer focus, process of orientation
and treating the organisation as a total system. The goals of satisfying
customers are fundamental to TQM and are expressed by organisational
emphasis on the design and delivery of products/services that fulfill
customer needs. Process orientation stresses that quality processes are a
necessary prerequisite for delivery quality products/services, that customer
needs (Demming, 1986:13).
TQM can be seen as a change in management style that aims to continuously
increase value to customers by designing and continuously improving
organisational processes and systems. For Dahlgaard et al (1998:19), TQM
is a corporate culture characterized by increased customer satisfaction
through continuous improvements in which employees in the firm actively
participates.
xxx
Iornum (1998:127) defines TQM as “the continuous improvement of
individuals, groups, departments and of organisational processes focused on
meeting customer requirements first time and always”. Ciampa (1992:41)
sees it as “the state of an organisation in which all the activities of all
functions are designed and carried out in such a way that all external
customer requirements are met while reducing internal tune and cost and
enhancing the workplace climate”. Gilbert (1992:9) gives a quantitative
definition of TQM as “a process designed to focus on customer expectations,
preventing problems, building commitment to quality in the workplace and
promoting open decision making”.
Dean and Bowen (1994:29) note that TQM principles are supported by a set
of practices; these practices emphasize among other things, creating a
quality vision, implementing policies and structure, supporting the quality
vision, engaging the continuous process, improvement, promoting teamwork
and cooperation among employees and fostering participation of key
external agents.
Weihrich and Koontz (1994:650) see TQM as an “organisation’s long term
commitment to the continuous improvement of quality throughout the
organisation, and with the active participation of all members at all levels to
meet and exceed customer’s expectation.
xxxi
2.3 TQM: EVOLUTION AND CONCEPTS
Total Quality Management (TQM) refers to management methods used to
enhance quality and productivity in organisations, it is a comprehensive
system approach that works horizontally across an organisation, involving
all departments and employees, and extending backward and forward to
include both suppliers and customers/clients. It is only one of the many
acronyms used to label management systems that focus on quality. Other
acronyms that have been used to describe similar quality management
philosophies and programs include Continuous Quality Improvement (CQI),
Statistical Quality Control (SQC), Quality Function Deployment (QFD),
Quality in Daily Work (QDW), Total Quality Control (TQC), etc. Like
many of these other systems, TQM provides a framework for implementing
effective quality and productivity initiatives that can increase the
profitability and competitiveness of organisations.
2.3.1 EVOLUTION OF TQM
Although, TQM techniques were adopted prior to World War II by a number
of organisations, the creation of the Total Quality Management philosophy is
generally attributed to Dr. W. Edwards Deming. In the late 1920s, while
working as a summer employee at Western Electric Company in Chicago, he
found worker motivation systems to be degrading and economically
xxxii
unproductive; incentives were tied directly to quantity of output, and
inefficient post-production inspection systems were used to find flawed
goods.
Deming teamed up in the 1930s with Walter A. Shewhart, whose work
convinced Deming that statistical control techniques could be used to
supplant traditional management methods. Using Shewhart’s theories,
Deming devised a statistically controlled management process that provided
managers with a means of determining when to intervene in an industrial
process and when to leave it alone. Deming got a chance to put Shewhart’s-
quality-control techniques, as well as his own management philosophies, to
the test during World War II. Government managers found that his
techniques could be easily taught to engineers and workers, and then quickly
implemented in over-burdened war production plants.
One of Deming’s clients, the U.S. State Department, sent him to Japan in
1947 as part of a national effort to revitalize the war-devastated Japanese
economy. It was in Japan that Deming found an enthusiastic reception for
his management ideas. Deming introduced his statistical process control, or
statistical quality control, programmes into Japan’s ailing manufacturing
sector. Those techniques are credited with instilling a dedication to quality
xxxiii
and productivity in the Japanese industrial and service sectors that allowed
the country to become a dominant force in the global economy by the 1980s.
While Japan’s industrial sector embarked on a quality initiative during the
middle 1900s, most American companies continued to produce mass
quantities of goods using traditional management techniques. America
prospered, while war-ravaged European countries looked to the United
States for manufactured goods In addition, a domestic population boomed
resulted in surging for U.S. markets. But by the 1970s, some American
industries had come to be regarded as inferior to their Asian and European
competitors. As a result of increasing economic globalization during the
1980s, made possible in part by advanced information technologies, the U.S.
manufacturing sector fell prey to more competitive producers, particularly in
Japan.
In response to massive market share gains achieved by Japanese companies
during the late 1970s and 1980s, U.S. producers scrambled to adopt quality
and productivity techniques that might restore their competitiveness. Indeed,
Deming’s philosophies and systems were finally recognized in the United
States, and Deming himself became a highly-sought-after lecturer and
author. The “Deming Management Method” became the model for many
American corporations eager to improve, and Total Quality Management,
xxxiv
the phrase applied to quality initiatives proffered by Deming and other
management scholars, became a staple of American enterprise by the late
1980s. By the early 1990s, the U.S. manufacturing sector had achieved
marked gains in quality and productivity.
TQM evolved from the concepts of quality control. During earlier times
quality was determined by the time spent in training to instill pride in the
workers for quality products. These conditions are the actual use and the
selling price of the product. Feiganbaum (1961:39) sees control, on the other
hand, as a management tool with four steps namely: setting quality
standards, appraising conformance to these standards, acting when the
standards are exceeded, and planning for improvements in the standards.
The underlying principle of this total quality view and its basic difference
from all other concepts is that, to provide genuine effectiveness, control
must start the design of the product or service and end only when the
product of service has been placed in the hands of the customer who remains
satisfied.
TQC evolved within a half century period. In its evolution there have been
five stages, each generally taken a 20 year period from inception to
realization. Within these steps are highlights of events and the key players
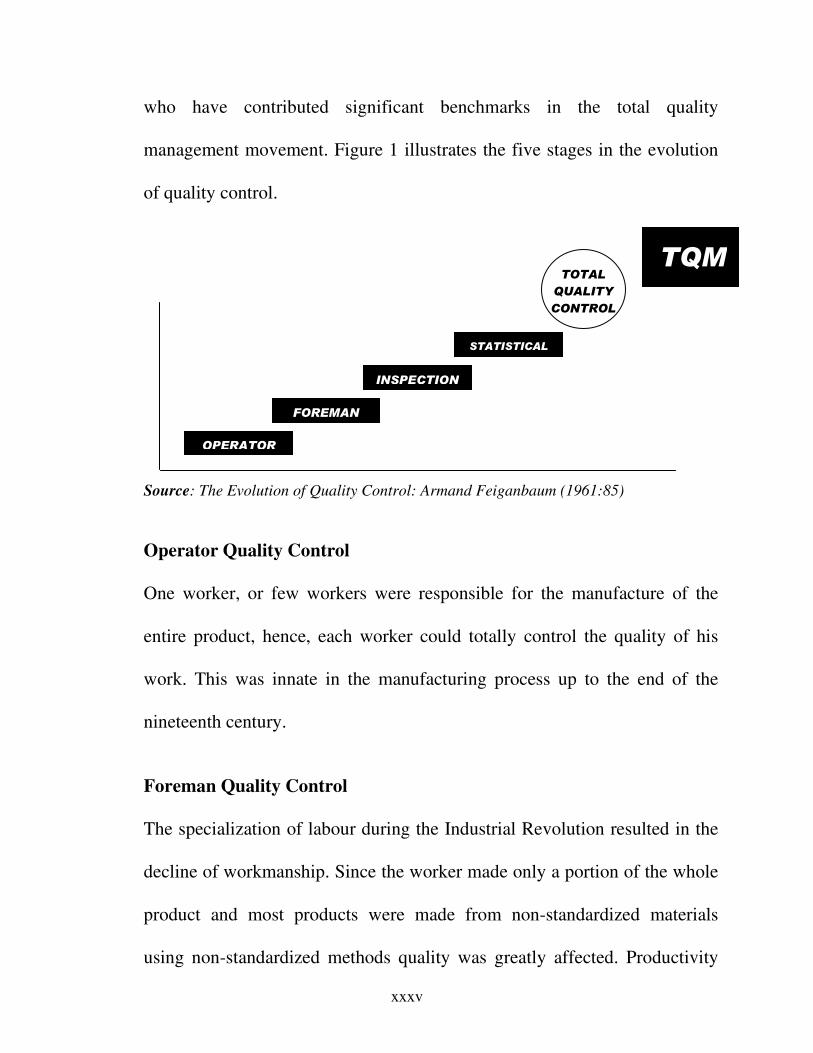
xxxv
who have contributed significant benchmarks in the total quality
management movement. Figure 1 illustrates the five stages in the evolution
of quality control.
Source: The Evolution of Quality Control: Armand Feiganbaum (1961:85)
Operator Quality Control
One worker, or few workers were responsible for the manufacture of the
entire product, hence, each worker could totally control the quality of his
work. This was innate in the manufacturing process up to the end of the
nineteenth century.
Foreman Quality Control
The specialization of labour during the Industrial Revolution resulted in the
decline of workmanship. Since the worker made only a portion of the whole
product and most products were made from non-standardized materials
using non-standardized methods quality was greatly affected. Productivity
OPERATOR
FOREMAN
INSPECTION
STATISTICAL
TOTAL QUALITY CONTROL
TQM
xxxvi
increased and cost decreased, however, lower customer expectations. It
became necessary to inspect products after manufacture. Inspection by the
purchaser was the most common form of quality control. Many workers
performing a similar task were grouped together so that they could be
supervised by a foreman, who then assumed responsibilities for the quality
of their work.
A statistical chart for the control of product variable was developed by Dr.
Waiter A Shewhart of Bell Telephone Laboratories in 1924. This chart
became the start of more structured quality control. Later on during the
century, Frederick Taylor developed his system of scientific management
which productivity at the expense of quality.
Inspection Quality Control
Centralised inspection departments were organized to check for quality at
the end of the production line. At its peak in 1928, the Hawthorne Works at
Western Electric Company employed 40,000 persons in the manufacturing
plant, 5,200 were in the inspection department. Visual inspection or testing
of the product was employed to detect manufacturing problems. Large
numbers of workers doing more complex tasks reported to a production
foreman, an inspector. Full time inspectors of large inspection organisations
ensure quality control.
xxxvii
Statistical Quality Control
The quality for man’s production necessitated the expansion of the
inspection phase and big inspection organisations more efficient. A few
statistical tools such as sampling and control charts were made available to
inspectors doing shop-floor inspection job.
A substitute for 100% inspection, statistical quality control, was developed
by HF Dodge and HG Romig, both of Bell Telephone laboratories later in
the same century. There was a recognition of the value of statistical quality
control in 1942. Its value, however, failed to be recognized by the US
managers.
In 1946, the American Society for Quality Control was organized. The
organisation promoted the use of quality control for all types of production
and service through its publication, conferences and training sessions.
Total Quality Control
A total quality control approach was espoused by Armand Feiganbaum
(1961:4). He promoted a system for integrating efforts to develop, maintain,
and improve quality by the various groups in an organisation. To do
otherwise would be to inspect for control quality after the fact rather than
build it in an earlier stage of the process. He further defines total quality
xxxviii
control as an effective system for integrating the quality-development,
quality maintenance, and quality improvement efforts of the various groups
in an organisation so as to enable production and service at the most
economical levels which allow for full customer satisfaction.
For quality improvement the first quality circles were formed in the 1960s.
Simple statistical techniques were learned and utilized by Japanese workers.
Total Quality Management
US managers made frequent trips to Japan in the late 1970s and early 1980s
and a quality renaissance began to occur in US products and services and by
the middle of 1980 the concepts of TQM were being publicized.
Statistical Process Control (SPC) was emphasized in the automotive industry
in the late 1980s. Industries and the US Department of Defense also
implemented SPC. The Malcolm Baldrige National Quality Award was
established and became the tool to measure TQM.
A resurgence of design of experiments as a valuable quality improvement
tool took place when Genechi Taguchi introduced his concepts of parameter
and tolerance design.
Continued emphasis on quality invaded the auto industry in the 1990s when
the Saturn automobile ranked third in customer satisfaction behind two most
xxxix
expensive Japanese cars. ISO 9000 became the worldwide model for quality
system.
2.3.2 THE CONCEPTS OF TQM
Quality has evolved as the managerial essential and inescapable thing of the
times. Almost every professional or trade journal includes an aphorism like
‘quality counts’ or ‘the key to survival is quality’ (Creech, 1994:52).
It has been discussed earlier that quality was a serious issue in the olden
times. Obsession with quality may be explained by the meagerness of
resources. Then, starvation became an actuality and handcrafted goods have
become extremely costly.
Today, we are all victims of quality failures one way or another, such as
malfunctioning of electricity facilities, leaking roof, premature expiration of
goods, etc. The losses incurred as a result of quality failure is usually of
greater proportion than the actual value of the imperfect item.
Organisations everywhere are increasingly and invariably aware of the
competitive capability of quality. Many social services must now compete
for work in a way not conceivable about a decade ago Jablonski (1992:94)
believes that today, rivalry focuses not on price but quality. Such is the
climate that today, ever-higher standards are demanded in the face of
xl
decreased or decreasing resources and amidst the impact of modernization
and globalization. This situation calls for not merely quality but beyond
quality. Something like taking quality as a means to an end, where end is
continued viability. What is referred now is known as Total Quality
Management is a new management approach.
A great deal of attention has been given in recent years to the TQM process
as an important quality and productivity improvement strategy. With TQM
concepts, companies have learned that quality improvement truly goes
beyond the product or service specifications required by the customer
(Depew, 1994).
Total Quality Management is a management approach that originated in the
1950’s and has steadily become more popular since the early 1980’s. George
(2002:32) opines that Total quality is a description of the culture, attitude
and organisation of a company that strives to provide customers with
products and services that satisfy their needs. The culture requires quality in
all aspects of the company’s operations, with processes being done right the
first time and defects and waste eradicated from operations.
Cole (1999:12) considers Total Quality Management as a method by which
management and employees carry continuous improvement of the
xli
production of goods and services. It is a combination of all tools aimed at
increasing business and reducing losses due to wasteful practices.
Similarly, Teck and Tobia (2000:49) believe that TQM is a comprehensive
system of satisfying the customer continuously whose philosophy is based
on total integration of the business to achieve the desired result. The goal is
to achieve greater efficiency and effectiveness, lower operating costs and
increased market share.
TQM practices focus on satisfying of customer needs, this means making the
needs of the customer a priority, expanding the relationship beyond
traditional services and incorporating customer’s needs in the company’s
business planned corporate strategies (Jeffrey, 2001:62).
According to Bernard and Roberts (1993:54) TQM is seen as a people
focused management system that aims at continual increase in customer
satisfaction at continually lower real cost.
Martin (1993:68) assert that TQM is a management philosophy that seeks to
interpret all organisational functions (manufacturing, engineering and
production, customer service etc.) to focus on meeting customer needs. This
means that TQM views an organisation as a collection of processes. It
maintains that organisations improve these processes by incorporating the
xlii
knowledge and experiences of worker. TQM is “Do the right things, right
the first time, every time”.
Benson and Savaph (1991:71) believe that TQM is mainly concerned with
continuous improvement in all work from high level strategy to detailed
execution of work elements on the shop floor. It stems from the belief that
mistakes can be avoided and defects can be prevented. It leads to
continuously improving results, in all aspects of continuously improving
capabilities, people, processes, technology.
Hendricks and Singhal (1997:1258) stress that the central principle of TQM
is that, mistakes may be made by people, but most of them are caused by
faulty systems and processes. This means that the root cause of such
mistakes eliminated, and repetition can be prevented by changing the
process. Thus, there are three major mechanisms of prevention.
i. preventing mistakes (defects) from occurring (mistake-proofing or
poka-yoke).
ii. where mistakes cannot be absolutely prevented, detecting them early
(inspection at source or by the next operation).
iii. where mistakes occur, stopping production until the process can be
corrected (stop in time).
xliii
TQM can be seen as an organisation’s approach in supply, customer focus,
product and service quality management style, process management and
organisational culture to achieve the common value and achievement of
quality (Ismaila; 2004:74). This view is also shared by Charles (1998:123).
To top management, TQM means improving the internal financial and
operational management of the company, thereby satisfying the needs of all
shareholders. TQM means changing the way of the people do things so as to
minimize the potential for error and or defects. The TQM approach uses the
statistical approach to find problems that cause errors or defect.
Badiru and Ayeni (1999:18) emphasize that the business customer
integration requires that business look out for the customer while the
customer looks out for the survival of the business. Because if there is no
business, there will be no product, if there is no product, customer needs
cannot be met. If the customers are satisfied, they will be more willing to
embrace the products offered by the business thereby creating profit
potential for the business.
TQM views the organisation as a collection of processes, infact the customer
is regarded as the ultimate judge of quality.
xliv
2.3.3 PROSPECTS OF TQM
Change has become a management by-word today as the key to survival of
any service based organisation. PHCN not only should manage change, but
will have to cope and lead change if it were to survive and be responsive for
the development of quality workforce. There are many factors to be taken
into account in shifting the approach of managing PHCN, Kaduna distribution
zone from its traditional orientation into TQManaged organisations. Some of
the more important factors are:
� it is important to view organisations as open and dynamic systems.
� TQManaged organisations are learning organisations
� TQM combines and makes used of many management approaches.
Buzzell and Gale (1990:36) stress that “in nearly all cases, companies that
used Total Quality Management practices achieved better employee
relations, higher productivity, greater customer satisfaction, increased
market share and improved profitability”.
This view is also shared by the GAO (United States General Accounting
Office) (1993:52) researchers, who identified six common features
contributing to improved performance that appeared consistently among the
companies quality efforts: customer focus, management leadership, employee
xlv
involvement, open corporate culture, fact-based decision making and
partnership with suppliers.
When you consider applying the philosophy and concept of TQM in PHCN
Plc., it is good to think of the following that are likely to affect the quality of
performance:
1. high moral values,
2. good teamwork, etc.
Taking a look at the succeeding list of some factors (which by no means is a
comprehensive one) below shows that there is a considerable scope of
improving quality of service under each item and hence shows the great
prospect of TQM in the management of the PHCN Plc. Thus, the six
elements identified as crucial to successful TQM implementation are:
a. Quality of Personnel: The degrees of personnel employed by the
organisation will go a long way to determining the impact of TQM
application. If the quality is high, there is the probability that they will
quickly grasp the training in TQM and vice versa.
b. Computerization: This is to said to hasten the processing of data and
transactions. Computerization engenders fast service time.
c. Attitude to Work by Employees: The attitudes to work by employees
also go a long way to influencing the TQM implementation. If the
xlvi
attitudes of the workers are negative, it is not likely that the TQM will
be successfully implemented.
d. Awareness of Organisation Objectives: If the employees are aware
of organisation’s objectives they will work towards achieving the
objectives. But a situation, where the objectives are not communicated
to the employees, the employees will only believe that whatever they
are doing is the right thing.
e. The Level of Motivation: This factor is about reward compensation
for hard work and promotion as the case may be. The higher the level
of motivation, the greater the commitment of the employees.
f. Participation and Involvement in Decision Making. This refers to
the extent to which jobs are delegated to the employees.
2.4 THE TRADITIONAL CONCEPT OF QUALITY
There is the need to differentiate between the traditional concept of quality
and the TQM concept of quality.
The traditional concept of quality makes quality a function of the attributes
of the product or service, for example, a quality product/service is one that
meets all the specifications laid down by the provider of the product/service.
Within this conception of quality, there is the implied relationship between
xlvii
quality and costs (in short by implication is that the higher the quality, the
higher is the cost of product/service).
Nonetheless, Robson (2000:43) define quality as “meeting the agreed
requirements of the customer, now and in the future”. Adedeji and Basiru
(1989:12) provide the following systems-oriented definition of quality:
Quality refers to an equilibrium level of functionality possessed by a
product or service based on the product’s capability and the
customers need.
Quality for a product or service has two aspects (Wakhlu, 1995:63). The first
relates to the features and attributes of the product or service. These ensure
that the product meets the needs of its users. The second aspect concerns the
absence of deficiencies in the product. The users of products (customers) are
satisfied by a product only if it meets their expectations through these
attributes.
Organisations owe their success to good service quality. Companies that
differentiate on the basis of service, can ask higher prices for comparative
products or services and achieve superior profit margins. These same
companies are more resistant in economic down turns and experience greater
growth in economic boom periods (Horovits and Panak, 2002:102).
It is an attractive option because unlike most strategies, a strategy based on
excellent service quality is nearly impossible to imitate or duplicate. Service
xlviii
quality converts a company from a anonymous object into a familiar face
(Horovitx and Panak, 2002:120).
A good service company has a personality in its customers’ eyes, and every
good services company has a personality which is unique and different from
any other. Most customers who have already experienced and service with a
company will not want to take the risk of experiencing bad service with a
new company. Customers will always be willing to pay a slightly superior
price for a guarantee of good service.
It is hard to achieve service quality. This is because service is complex and
multidimensional. According to (Horovitz and Panak, 2002:128), selling a
service means not only selling a commitment to do something, it also means
selling the way in which it is done. Thus, the service quality battle is fought
on two fronts – decision and delivery. In order to be a service leader,
companies must do both well.
Customers generally have expectation on a number of aspects of the service.
An organisation should adjust or fine-tune its service to match its customer
expectations. If a company says that it provides “perfectly customized
service, then that is what its customers expect to receive – to the better”
(Horovits and Panak; 2002:69).
xlix
Panak and Horovitz (2002:87), further stress that Woe betide the company
that promises that it cannot or does not intend to provide besides losing the
customer, it gives him a wonderful opportunity to tell others how he was
misled. Studies show that, on average, a customer will tell eleven people
about a bad service experience.
Customer expectations must not only be met in service design, but also in
service delivery. Providing well-delivered service means being able to
ensure that the service package is provided without fault, wherever and
whenever the customers comes into contact with the company. This is
referred to as a zero-default service.
Good service delivery also means creating an environment in which the
customer will experience a positive ‘fit’ with the company – the special
emotional plus that keeps him coming back time and time again. This is
referred to as service zest.
Zero-default concerns the consistency of the service. Customers expect
consistency in three ways, namely:
a. between visits;
b. between different geographical locations; and
c. between employees.
l
Consistency in service between visits primarily involves influencing the
behaviour of employees. Consistency between locations involves not only
influencing employees’ behaviour, but also ensuring that the company and
its products or services are presented in the same manner.
Consistency in service between locations also means ensuring that the same
advantages are offered in each location. While managing for zero-default
service involves the standardization of behaviour and practices, managing
for service zest involve the development of employee creativity and
independence. Employees who offer customers ZEST in service are
confident, competent, motivated and people-oriented.
Confidence and competence go hand-in-hand. Employees are confident
because they know their jobs and they are prepared to handle any situation
that might be presented to them. Confident employees mean reassured
customers. The fact is that customers want to be reassured. Customers do not
want to worry that what they are buying is substandard or unreliable.
Contact with a confident and seemingly competent employee reduces the
insecurity of the purchase.
Zest service also means having motivated employees. Motivated employees
increase the pleasure of purchase. The positive energy which they generate
li
can make a purchase become an adventure or a novelty for the customer.
The emotional attainment which customers develop for certain companies,
and which keeps them loyal, comes from such employees.
Motivated employees are also more ready to respond to customers and will
make greater efforts to ensure that they are truly satisfied. The competent but
non-motivated employee may be perfectly able to resolve the customers’
problem, but will not execute it with the same enthusiasm as will motivate
employee. Motivated employees means employees who are prepared to take
special initiatives to give customers a service plus.
2.5 DETERMINANTS OF SERVICE QUALITY
Customers use basically similar criteria regardless of the type of service. The
criteria are:
Access: This refers to the receptiveness of the service provider to the
customer requests, the service is easy to access in convenient locations at
convenient times with little waiting.
Courtesy: The employees are friendly, respectful, polite, considerate,
empathetic.
Communication: This refers to the ability to listen to the customer, keep the
customer informed, describe the service accurately in the customer’s
language, and accept customer feedback.
lii
Competence: This refers to the adequacy of skills and knowledge required
to deliver service by employees.
Credibility: The company and employees are honest, trustworthy and have
the customers’ best interest at heart.
Reliability: This deals with the consistency, accuracy, and dependability of
services.
Responsiveness: The employees respond quickly, willingly, promptly and
creatively to customers’ request and problems. Responsiveness encompasses
timeliness.
Understanding (comprehension): The readiness of the service provider and
all employees to know the customer, understand the customers’ needs, and
provide the individual attention.
Security: The service is free from danger, risk or doubt.
Tangibles (Tools): This deals with the appearance of physical facilities,
equipment, personnel and communication materials.
2.6 TQM CONCEPT OF QUALITY AND SERVICE
Robson (2000), views TQM concept of quality as consistently providing
goods and services in a way that fully means or even exceeds the
needs/expectations of the customer. This view of quality is radically
different from the traditional view on the following grand:
liii
� it is customer centered. It means that quality is not quality if it does
not meet the needs of the customer as defined by the customer.
� customer expectations/needs in a product or service can be precisely
defined or measured. Indeed, from the point of view, if the expectation/
need is not precisely measured/defined, then it is not quality.
Service is any act or performance that one party can offer to another that is
essentially intangible and does not result in the ownership of anything,
(Kotler, 1988). The concept of service differs from a product based on the
following held perceptions:
� sales, production and consumption of a service take place almost
simultaneously,
� a service cannot be demonstrated, nor can a sample be sent for
customer approval or tried in advance of purchase. The provider can
explain, promise, and tell how the service has benefited others but the
service does not exist for the prospective customer,
� a service cannot be centrally produced, inspected, stockpiled or
warehoused. It is usually delivered to wherever the customer is, by
people who are beyond the immediate influence of management,
� the person receiving the service generally owns nothing tangible once
the service has been delivered. The value is frequently internal to the
customer,
liv
� a service is frequently an experience that cannot be shared, passed
ground or given away to someone else once it is delivered,
� the more people are involved in the deliver of the service the less
likely it is the receiver will be satisfied,
� the receiver of the service frequently has a critical role to perform in
the actualization of the service. The customers then have to know their
role in the delivery process,
� delivery of the service usually requires some form of human contact.
Receiver and deliverer frequently come into contact in some relatively
personal way,
� the receivers’ expectations are critical to their satisfaction with the
service. What they get compared or contrasted to what they expect to
get determines satisfaction, and
� exerting quality control over a service requires monitoring of
processes and attitudes.
2.7 TQM CONCEPT OF QUALITY AND CUSTOMER SATISFACTION
The quality concept has been expanded and evolved from the product-
oriented one which can satisfy the customer’s needs and expectations. TQM,
as an important source of the quality competition, especially is a tool for the
lv
firm’s growth in the long run. TQM is a strategic tool for the growth of the
firm in the long run.
Customer satisfaction is the driving force that propels organisation existence
(Oaklan, 1995:20). In considering the extent of customer satisfaction in
Total Quality Practice the US Department of Commerce in a 1993 Quality
Award Criteria examined organisations relationship with customers and
knowledge of customer requirements and of the key quality factors that drive
market place competition. They inferred that an understanding of customer
requirements derives from thoroughness and objectivity of the organisation,
customer types and service features.
Other key excellence indications for customer satisfaction, according to
Ross (1955:211) are a resolution by management to empower frontline staff,
strategic infrastructure support for frontline employees and attention to
living, training, attitude, and morale for frontline employees. Ross is of the
view that these activities will help employees relate to customers in highly
professional manners and also provide services that will satisfy their
requirements.
Unruh (1996:2) opines that even if an organisation is not focused on its
customer, its competitors are. And the customers know where to find those
lvi
competitors. He also believes that “the customer focus is not a one-time
programme. It requires a permanent on going commitment of all
organisational resources”.
For an organisation to achieve success in any customer focus initiative, it is
crucial that it has an understanding of customers. Unruh (1996:39) believes
that customer needs and values should influence every aspect of the
organisation.
The focus on customer satisfaction applies to internal customer as much as it
applies to external customers. Ross (1995:208) defines internal customers as
“the people, the activities and the functions within the company that are the
customers of other people, activities and functions”.
According to Dahlgaard et al (1998:20) “before you can satisfy external
customers, however, you must first eliminate some of the obstacles to the
internal customers (employees) and create the conditions necessary for them
to produce and deliver quality. What they are saying is that it will be
difficult if not impossible to meet and exceed the expectations of the
external customers if quality is not delivered to internal customers.
Myoung et al (2000:137) assert that TQM focuses on customer-oriented
approach so as to pursue strategically the continuous improvement of the
lvii
results from all process. There are various models that have been developed
to evaluate customer’s judgement about service experience.
2.8 ORGANISATIONAL CULTURE AND THE APPLICABILITY OF TQM
The themes of customer-focus, horizontal process management and
continuous improvement have become central to the values and culture of
Total Quality Organisations. Ross (1995:40) sees culture as “the pattern of
shared believes and values that provides members of an organisation rules of
behaviour or accepted norms for conducting operations.
What Ross is saying here is that organisational culture describes the best
qualities and values that characterize the ideal behaviour of a Total Quality
Organisation including the interaction of employees with one another and
with customers. In the words of Kilmar et al (1986:89), culture is “the
philosophies, ideologies, value, assumptions, beliefs, expectations
attitudes and norms that knit an organisation together and are shared by
employees.
Organisational culture includes the beliefs and attitudes of people about the
way things are being done, how work should be organized, assessed and
rewarded and the way people think and feel about the organisations they
work for (Cluther buck et al, 1993:80).
lviii
Oakland (1995:22) states that the culture within an organisation is formed by
a number of components:
i. behaviour based on people interactions;
ii. norms resulting from working groups;
iii. dominant values adopted by the organisation;
iv. rules of the game for getting on; and
v. the climate.
He then defines culture “as the beliefs that pervade the organisation about
how business should be conducted and how employees should behave and
should be treated”.
TQM requires an organisation to change its culture so that it can readily
adapt to and take advantage of quality practices. The fundamental issue
which these various views of organisational culture underline is the
principles and rules which holds an organisation together as a corporate
entity and upon which its operational strategies are based. Certainly every
organisation desires a culture that supports its goals and objectives. An
organisation’s culture is defined by the way it is structured and managed.
Concepts like, authority, bureaucracy, creativity, good followership and
accountability are experienced by organisations in different ways.
lix
Macdonald (1993:53) sees Total Quality culture as having distinct values
and beliefs. Total quality organisations have at the moment taken into
consideration the key levers and mechanisms of customer values, continuous
improvement and cross functional process as the focus of their culture, belief
and attitude. This according to Stahl (1995:261) is why continuous
improvement needs to be part of the culture of Total Quality Organisations.
A quality culture, as viewed by Wilkins (1994:60), is the final expression of
an organisation goals, objectives requirements and values; it is an
embodiment of what an organisation is. Wilkins maintains that a culture
cannot be forced into existence by policy, but it can be effectively steered
and evolved through the resolute application of appropriate employee
education and training.
Atkinson (1990:256) states that the effect of TQM on organisational culture
should not be estimated, as it radically influences an organisation’s strategy
and is geared to changing culture in a long term. He maintains that effective
cultural change is the key to successful application and implementation of
TQM.
The culture and beliefs of traditional organisations may however, be
different. Some traditional organisations were established based on culture
and belief systems that support bureaucracy and firm control. In this class of
lx
organisations, there is inward focus on internal processes rather than on
customers, while the process culture is usually characterized by slow
feedback and low-rise decisions. As Lou Gerstner remarked shortly, after
taking over as Chief Executive Officer (CEO) at IBM in 1983:
I have never seen a company that is introspective, caught up in its own
underwear, so preoccupied with internal processes. Some dealings required
18 signatures. It was a bureaucracy run amok (Stahl 1995:297).
Gerstner’s observation of IBM is that of an organisation with very high
bureaucratic undertone and in which the idea of total quality values and
beliefs is alien to the idea of “why change when what we have been doing
over the years have earned us business success?”.
Cluther Buck et al (1993:180) believe in organisational culture because of its
all encompassing and frequently intangible nature, presents for many
organisations, the largest and most intractable barrier to change. Since TQM
is all about satisfying customer organisation should as a matter of fact audit
those aspects of their culture and belief systems that tend to impede meeting
and exceeding customer needs and expectations.
However, whether an organisation has distinct Total Quality Values and
beliefs or the traditional bureaucratic culture it must provide basic qualities
and value that characterize the interaction of employees with one another
and with customers and also serve as the cornerstone for operating business.
lxi
Specifics related to the framework and implementation of TQM vary
between different management professionals and TQM programme
facilitators, and the passage of time has inevitably brought changes in TQM
emphases and language. But all TQM philosophies share common threads
that emphasize quality, teamwork, and proactive philosophies of
management and process improvement. As Howard Weiss and Mark
Gershon observed in Production and Operations Management, “the terms
Quality Management, Quality Control, and Quality Assurance often are used
interchangeably. Regardless of the term used within any business, this
function is directly responsible for the continual evaluation of the
effectiveness of the total quality system”. They go on to delineate the basic
elements of total quality management as expounded by the American
Society for Quality Control: (1) policy, planning, and administration; (2)
product design and design change control; (3) control of purchased material;
(4) production quality control; (5) user contact and field performance;
(6) corrective action; and (7) employee selection, training and motivation.
All of these factors as cornerstones of total quality philosophies. Companies
needed to create an overall business environment that emphasized
improvement of products and services over short-term financial goals. If
such a philosophy was adhered to, various aspects of business-ranging from
lxii
training to system improvement to manager-worker relationships would
become far more healthy and, ultimately, profitable. A well-conceived
system of statistical process control could be an invaluable TQM tool. Only
through the use of statistics, Deming argued, can managers know exactly
what their problems are, learn how to fix them, and gauge the company’s
progress in achieving quality and organisational objectives.
Jablonski (1992:60) identifies three characteristics necessary for TQM to
succeed within an organisation. They are participative management;
continuous process improvement; and the utilization of teams. Participative
management refers to the intimate involvement of all members of a company
in the management process, thus de-emphasizing traditional top-down
management methods. In other words, managers set policies and make key
decisions only with the input and guidance of the subordinates that will have
to implement and adhere to the directives. This technique improves upper
management’s grasp of operations.
Continuous process improvement, the second characteristic, entails the
recognition of small, incremental gains toward the goal of total quality.
Large gains are accomplished by small, sustainable improvements over a
long term. This concept necessitates a long-term approach by managers and
the willingness to invest in the present for benefits that manifest themselves
lxiii
in the future. A corollary of continuous improvement is that workers and
management develop an appreciation for, and confidence in, TQM over a
period of time.
Teamwork, the third necessary ingredient for the success of TQM, involves
the organisation of cross-functional teams within the company. This
multidisciplinary team approach helps workers to share knowledge, identify
problems and opportunities, derive a comprehensive understanding of their
role in the over-all process, and align their work goals with those of the
organisation.
Jablonski (1992:37) also identifies six attributes of successful TQM
programmes:
� customer focus (includes internal customers such as other departments
and coworkers as well as external customers);
� process focus;
� prevention versus inspection (development of a process that
incorporates quality during production, rather than a process that
attempts to achieve quality through inspection after resources have
already been consumed to produce the good or service);
� employee empowerment and compensation;
� fact-based decision making; and
lxiv
� receptiveness to feedback.
Jablonski (1992) offers a three-phase guideline for implementing Total
Quality Management; these are preparation, planning, assessment. Each
phase is designed to be executed as part of a long-term goal of continually
increasing quality and productivity. Jablonski’s approach is one of many that
has been applied to achieve TQM, but it contains the key elements
commonly associated with other popular total quality systems.
� Preparation: During preparation, management decides whether or not
to pursue a TQM programme. They undergo initial training, identify
needs for outside consultants, develop a specific vision and goals,
draft a corporate policy, commit the necessary resources, and
communicate the goals throughout the organisation.
� Planning: In the planning stage, a detailed plan of implementation is
drafted (including budget and schedule), the infrastructure that will
support the programme is established, and the resources necessary to
begin the plan are earmarked and secured.
� Assessment: This stage emphasizes a thorough self-assessment with
input from customers/clients of the qualities and characteristics of
individuals in the company, as well as the company as a whole.
lxv
2.8.1 APPLICATION OF TQM IN THE ELECTRIC POWER SECTOR
One of the first solid pieces of evidence linking TQM and business results
was the ground breaking Profit Impact of Market Strategy (PIMS) research.
Begun in 1972, this program was described in detail by Robert and Bradley
(1987:74). Over a period of years, PIMS amassed a large database
documenting the strategies and financial results of more than 450 companies
and nearly 3000 business units in order to study the general relationships
between strategy and company performance. Its purpose was not to improve
a link between quality and profitability but rather to discover those strategic
principles most strongly related to performance. Among all the strategic
principles distilled from the PIMS studies, one linkage between strategy and
performance stood out above all the rest, TQM in the long run the most
important factor affecting a business units performance is the quality of its
products and services.
PIMS found that businesses offering superior products/service quality are
more profitable than those with inferior quality, based on the measures
return on sales and return on investment.
PIMS revealed other benefits of supervisor perceived quality: stronger
customer loyalty more repeat purchases, less vulnerability to price wars and
lower marketing costs.
lxvi
One other frequently referenced study on the linkages between quality and
firm performance is the 1991 review of Baldrige Award applicants by the
United States General Accounting Office. The GAO examined the impact of
formal TQM practices on the performance of U.S. companies, its report
studied twenty companies that were among the highest scoring applicants in
the 1988 and 1989 award cycles of the Malcom Balbrige National Quality
awards. The principle funding, companies that adopted TQM practices
experienced an overall improvement in corporate performance. In nearly all
cases, companies that used TQM practices achieved better employee
relations, higher productivity, greater customer satisfaction, increased
market share and improved profitability.
Jarell (1999:56) finds that eight of the nine studies conducted showed
positive quality related performance effects. Overall, the vast majority of the
studies show positive impact associated with TQM.
A related study published by Hendricks and Singhal (2001:94) found that,
effective implementation of TQM principles and philosophies does lead to
improvement in long term financial performance. They sum up their findings
with three guidelines for companies implementing TQM practices:
a. TQM is a good investment “Don’t give up on TQM, when
implemented effectively, it improves financial performance”.
lxvii
b. be patient “the benefits of TQM are achieved over a long period
…even after effective implementation, it still takes a couple of years
before financial performance starts to improve”.
c. be realistic “set realistic expectations on the potential impact of
TQM”.
Edward et al (1995:18) carried out a study on both utilization and
effectiveness of employee involvement and TQM practice and also sought to
determine what combination of TQM and employee involvement
programmes has a positive impact. The results: organisations consistently
find that employee involvement and TQM practices have helped improve
their internal operations and their financial results. There is also the evidence
that organisations that have better financial performance are more likely to
use employee involvement programmes.
2.9 INFLUENCE OF ENVIRONMENTAL FACTORS
An organisation’s environment is defined as those physical and social
factors that are outside the boundary of the organisation but are still relevant
for its success (Duncan, 1972:401). The environment creates contingencies
to which the organisations have to respond, typically through the product
and process innovations. Systems theory suggests that organisations should
strive to ensure compatibility with their environment, and that such
lxviii
compatibility may be essential for the organisation’s long-term survival and
growth (Thompson, 1967:28).
Bird (1989:102) conceptualizes the environment as events, circumstances,
situations, settings and niches, which surround organisational activity. In the
same vein, Gnyawali and Fogel (1994:78) see the environment as the overall
economic, socio-cultural and political factors that influence people’s
willingness and ability to undertake organisational activities. A good
environment will encourage firms to be well managed and efficient, be
profitable to grow, create jobs, increase the rate of economic growth and
reduce poverty (Development Gateway, 2004).
Nemickas, Senchuk and Babanin (2002) are of the opinion that every
organisation consists of environmental conditions, circumstances and
influences that can affect its operations, which is made of both external and
internal components.
A system view of the industry would normally place the electric power
sector within the industry boundary, where the government regulatory
policies and bureaucratic practice, infrastructure, availability of operational
resources, political climate and customers, would usually be external
environment, which focuses on issues and conditions generally outside the
organisation, some of them beyond the control of the organisation. The
lxix
internal environment focuses on the internal structure, culture and process of
the organisation, including organisational structure, managerial practice,
incentive systems, collegial relationships and other organisational
idiosyncrasies (Kilby, 2003:44).
Issues and problems experienced within the organisation may stem either
externally or internally (Castrogiovanne, 1991:69).
Support for this view which centres on problems experienced in the Nigeria
electric power sector can be found in a recent publication, Kilby (2003:63)
reiterates his long standing thesis on the problems of managerial
coordination and control in developing countries. He noted that the
managerial gaps, especially the reluctance to delegate power and authority,
would have been more visible if the external turbulence has been less
extreme. He therefore recognizes that the external environment can
confound our capacity to clearly understand and explain the nature and
degree of organisational bottlenecks in Nigeria power sector.
As study by McKinsey revealed that 85% of the variables affecting
productivity in American companies are internal to the organisation and
controllable by management, while 15% are external and beyond
management control. A Kepner-Tregor study further showed that 80% of the
lxx
internal variables can be influenced or changed by management, while 20%
are influenced by labour. If these figures are close to reality, around 70% of
productivity factors in the industrialized market economy countries are
under managerial control.
In developing countries or in countries undergoing a transition to a market
economy the reverse could often be true, in view of their economic crises
and unnecessarily high level of government intervention as well as their
dependence upon the developed economies, indeed too much government
intervention could kill the business or drive it underground (Agboli,
2004:62). However, it is essential to know and understand the intensity and
interplay of the external and internal factors, which will go a long way in
helping the Power Holding Company of Nigeria (PHCN) to secure
competitive advantage as well as to achieving compatibility which requires
organisations to adopt on a continuous basis by government creating
conducive and enabling environment.
The decision by government to influence the electric power sector through
its environment rests upon its policy towards intervention. The role of
government in the new classical context is to provide the enabling
environment, where material, administrative or regulatory policies are
available for PHCN to operate. Government seems to have anticipated that
lxxi
there was no going back in the privatization of the then NEPA, where the
laws of the Federation of Nigeria promulgated in 1998, specially provided
that “a licence… may be granted to any person, other than the National
Electric Power Authority… a state government or any of its agencies…”
such licensee under these provisions shall have the same rights and
obligations as NEPA or any other government agency would have. This
position was reiterated in the NEPA (Amendment) Decree No. 29 of 1998.
On July 2006, NEPA was transformed to PHCN in line with the going
government power sector reform programme.
However, even in the so-called free market approaches adopted by
developed nations, government plays a vital role. In an unpublished
manuscript (Agboli, 2004) states that the idea after independence in 1960
was that Nigeria would graduate from import substitution to an exported
industrialization. Post-independence found expression in simultaneous
government and private investment in service enterprises. Government
involvement in the economy was alone in good faith as a way to fill the gaps
created by the incapacities of an embryonic entrepreneurial class with its
fragile capital base.
The policy and action of successive governments were indeed consistent
with Gerschenkron’s (1965:49) statement that a country’s lateness to
lxxii
economic development coupled with economic backwardness necessitates
state intervention and involvement in economic activity. Consequently, post-
independence and subsequent governments invested in strategic sections
such as electricity.
The above assertion shows that despite concerns about the need to reduce
the intervention of the government and allow market forces to shape the
economy destiny of nations, government continuous to play a dominant part
in the industry. The World Economic Forum Survey (WEF; 2003) shows
that the Nigeria has turned its policy attention to private sector development.
This new policy, anchored in neoliberalism, precludes government from
direct participation in economic activity, but assigns it the role of providing
an enabling environment for the successful operation of activities, whilst at
the same time playing the role of a regulator.
2.10 SUMMARY OF RELATED LITERATURE
The reviews have been given impetus by both internal and external trends
which indicate a challenging future for the Nigeria power sector. Evidently,
it can be seen that all commentators are in support of the fact that quality
improvement activities are on the rise, TQM efforts are often considered by
executives to have a beneficial effect on their firm’s performance.
lxxiii
The chapter focuses on the identification of the concept of TQM on the basis
of the literature review. The sector describes the evolution, and prospects of
TQM as well as organisational culture and the applicability of TQM in the
Nigeria power sector.
Worldwide, much research has been conducted in the filed of TQM
prospects. After a review of the relevant TQM literature, it has been found
that different researchers adopted different TQM definitions and frameworks
based on their understanding of TQM and research objectives consequently
there is less consensus on what TQM is and what constitutes it.
Convinced that TQM is a fundamentally better way to conduct business and
is necessary for the economic wellbeing of the Nigeria power sector.
The phenomenal spread of TQM has generated an ironic controversy. The
controversy pits TQM advocates, who see it as a uniquely effective
method for improving organisational performance, against opponents who
see it as the latest of many organisational facts (Hackman and Wageman,
1995:67).
Most managers at organisations using TQM say it does work, the various
empirical studies suggest TQM is having a widespread, generally positive on
organisational performance. None of the studies reviewed provides any
lxxiv
substantial evidence that TQM is having a negative impact on organisational
performance.
lxxv
REFERENCES
Badiru, A. and Ayeni, B. (1999), Think About Quality Advances in Management.
Vol. 18, No. 2.
Benson, P.G. and Savaph, J.V. (1990), “The Effects of Organisation Context on
Total Quality Management: An Empirical Investigation; Management
Sciences”, 37, No. 9.
Buzzell, R.D. and Gale, B.T. (1990), The PIMS Principles; Linking Strategy to
Performance. New York: The Free Press.
Clampa, D. (1992), Total Quality: A Uder’s Reference Guide for Implementation.
New Jersey: Addison Wesley Publishing Co.
Clutter Buck, David, et al (1993), Inspired Customer Service: Strategies for
Service Quality. London: Kogan Page Ltd.
Cole, R.E. (1999), Managing Quality Fads. Oxford: Oxford University Press.
Creech, B. (1994), The Five Pillars of Total Quality Management, New York
Truma Tailley Books.
Croning, E. and Taylor, R.L. (1994), “Don’t Count Total Quality Management
(TQM) Out” Quality Process.
Dahlgaard, J.; Kristensen; Kai, K. & Gopal, K. (1998), Fundamentals of Total
Quality Management. London: Chapman and Hall.
Dean, J.W. & Bowan, D.E. (1994), “Management Theory and Total Quality:
improving Research and Practice Theory Development”. Academy of
Management Review, 19(3).
Deming, E. (1986), Out of the Crisis. Cambridge, MA: MIT Centre for Advanced
Engineering.
Depew, D. (1994), “Implementing Total Quality Management in Higher
Education”. ATEA Journal.
lxxvi
Dobyns, B. & Crawford, J. (1994), Organisational Changes and Development: A
System View. California: Good Year Publishing Company.
Easton, G.S & Jarell, S.L. (1998), “The Effects of Total Quality Management on
Corporate Performance: An Empirical Investigation”, Journal of Business
Vol. 71, No. 2.
Edward, E. & Lawlex Gerald, E.L. (1995), “Creating High Performance
Organisation”. Practices and Results of Employee Employment in Total
Quality Management. San Francisco, Jossey-Bais Publishers.
Feiganbaum, A.V. (1961), Total Quality Engineering and Management. New
Delhi: McGraw Hill Book Company Inc.
Garvin, A.D. (1988), Managing Quality. New York: Free Press.
George, S. (2002), “Bull or Bear?” The Q-100 Proves That If You Have Quality
You will Beat The Market. Quality Progress Journal Vol. 8.
Gilbert, J. (1992), A Slice to Slice Guide to Total Quality Management. New Delhi:
Tudor Business Publishing.
Heller, B. (1995), Quality Costing. 3rd
edition, London: Chapman and Heul.
Henderick, K.B. & Singhal, V.R. (2001), “Does Implementing and Effective Total
Quality Management Programme Actually Improve Operating Performance”.
Management Service, Vol. 43, No. 9.
Horovits, E.B. & Panak, G. (2002), “Is Quality Dead?”, 11E Solution. Heinemann:
Retrieved from www.isixsingma.com.
Iornum, D. (1998), How to be a Good Manager in 10 Minutes and Other Essay.
Kaduna: JVC Press.
Ismaila, H. (2004), An Introduction to the Study of Total Quality Management.
University Press, Zaria.
Jablonski, J.R. (1992), Implementing Total Quality Management. 2nd
edition,
Technical Management Consortium Inc.
lxxvii
Kilman, H.R.; SDaxton, J.M.; & Serpa, R. (1986), Understanding and Changing
Culture. California: Management Review, Winter.
MacDonald, J. (1993), Understanding Total Quality Management in a Week,
Corby: Institute of Management Foundation.
Management Practices: “US Companies Improves Performance through Quality”.
United States General Accounting Office (GAO/NSIAD), 1994.
Martin, L. (1993), “Total Quality Management in the Public Sector”. National
Productivity.
Meekyaa, U.J. (1992), The Preparation and Presentation of Research Projects: An
Electric Guide. Jos, Nigeria: Planning Research Publication.
Myoung, et al. (2002), Total Quality Management. New Jersey: Prentice Hall, Inc.
Oakland, J. (1995), Total Quality Management: Text with Cases, Oxford Butterworth
Heinemann.
Omanchonu, V.K. & Ross, J.E. (1994), Principles of Total Quality. Florida: St.
Lucie Press.
Ranpsey, J. & Roberts, H. (1992), Perspectives on Total Quality: Proceedings of
Total Quality Forum IV. Cincinnati, Ohio.
Roass, E.J. (1995), “Total Quality Management”. Text Cases and Readings,
Florida: St Lucie Press.
Robson, J. (2002), Adapting Quality Management: Public Administration Review.
Ryan, F.R. (1998), “The Proverbs of Total Quality Management: Recharting the
Path”, Public Productivity and Management Review, 16(1).
Stahl, J.M. (1995), Management: Total Quality in a Global Environment. Oxford:
Blackwell Publishers Ltd.
Teck, D.C. & Tobia, P.M. (2000), Moving Organisational Mountains. New Delhi:
Quality Press.
Unruh, A.J. (1996), “Customers Mean Business”. Six Steps to Building
Relationships that Last Reading. Addison-Wesley Publishing Co.
lxxviii
Wakhilu, N. (1995), Total Quality Management: Quality in Manufacturing. Vol.
18, No. 2.
Weihrich, Heinz and Koontz (1994), Management: A Global Perspective Lothed,
New York: McGraw-Hill.
Wilkins, H.R. (1994), The Quality Empowered Business. New Jersey: Prentice
Hall.
Wilkinson, Adrain, Redman, TOM (1998), Managing With Total Quality
Management: Theory and Practice. London: Macmillan Business.
lxxix
CHAPTER THREE
RESEARCH METHODOLOGY
The description of the procedures is done under the following headings:
- Research Design
- Source of Data
- The Area and Population of the Study
- Sample Size and its Determination
- Instrument for Data Collection
- Method of Data Analysis
- Validity and Reliability of the Instrument
3.1 RESEARCH DESIGN
Given the nature of the study, the researcher used both the survey and
descriptive methods of data collection so that the required objectives can be
achieved.
Similarly, the choice of the survey method was suitable for the study,
because it served as the convenient approach for accurate data collection.
3.2 SOURCES OF DATA
Sources of information were generally categorized as primary or secondary
depending on their relevance and their proximity to the source or origin. For
lxxx
the purpose of this study, both the primary and secondary sources of data
were used.
3.2.1 PRIMARY DATA
For this study, the source of primary data included interview with both staff
and some customers of PHCN, Kaduna distribution zone.
Questionnaire was also used for this study. The information obtained from
the questionnaire described, compared or predicted facts. The questionnaire
and personal interviews constituted the primary source of data.
3.2.2 SECONDARY DATA
Secondary source in the context of this study consists of information already
in existence which includes information obtained from, books, journals,
internet, etc. Information from this source were sought to complement the
primary data from the field survey.
3.3 AREA OF THE STUDY
The study examined the prospects of Total Quality Management in Nigeria
power sector, with focus on PHCN (Power Holding Company of Nigeria),
Kaduna distribution zone, made up of eight business units, spreading across
four states namely; Doka, Makera, Rigasa, Kafanchan, and Zaria in Kaduna
State, while Sokoto, Gusau, and Birnin Kebbi are located in Sokoto,
lxxxi
Zamfara and Kebbi States respectively. The population of the study shall
therefore cover the customers and staff of the zone.
3.4 POPULATION OF STUDY
The target population of the study consists of management, staff and
customers of the distribution zone. The zone has a total staff-strength of
1408. This is made of senior staff (EG-SS3) 788 (seven hundred and eighty
eight) and the Junior (SS4-JS4), 620 (six hundred and twenty). The zone
consists of an executive management team headed by a chief operating
officer, and supported by 7 (seven) heads of departments, namely:
i. Head, technical services
ii. Head, administration and services
iii. Head, finance and accounts
iv. Head, customer services
v. Principal manager, public affairs
vi. Principal manager, Audit
vii. Principal manager, performance management
Eight (8) Business Units
a. Doka
b. Makera
c. Rigasa
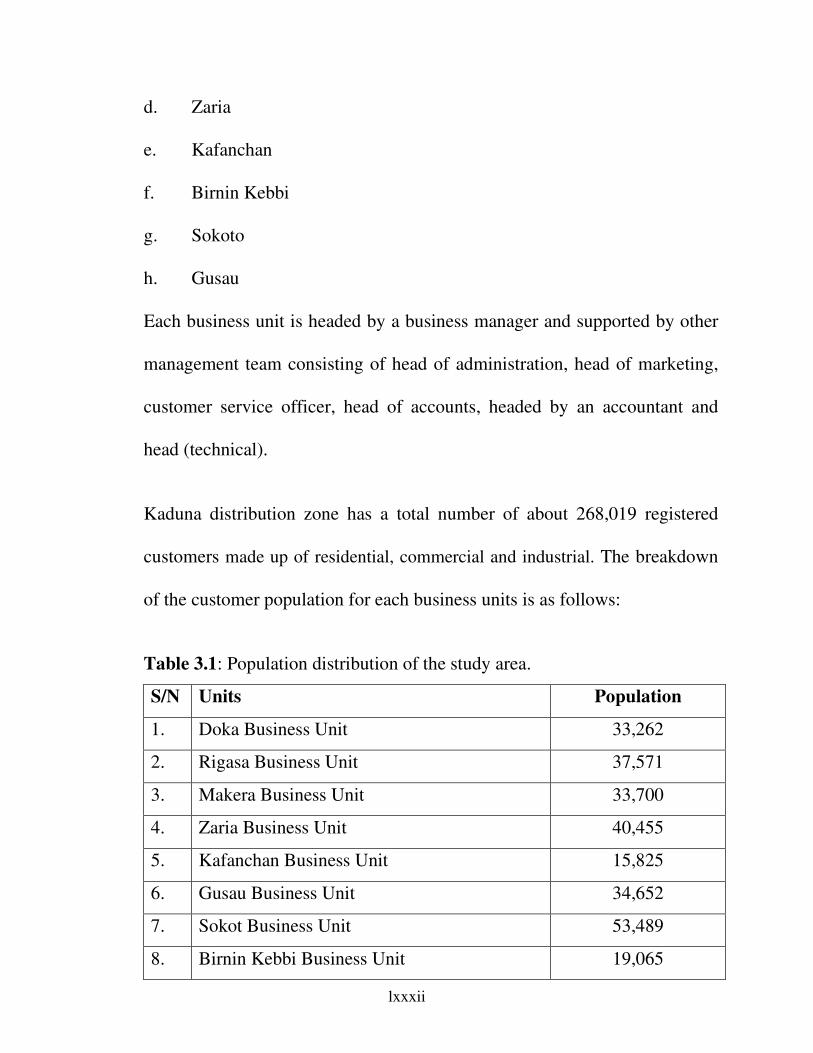
lxxxii
d. Zaria
e. Kafanchan
f. Birnin Kebbi
g. Sokoto
h. Gusau
Each business unit is headed by a business manager and supported by other
management team consisting of head of administration, head of marketing,
customer service officer, head of accounts, headed by an accountant and
head (technical).
Kaduna distribution zone has a total number of about 268,019 registered
customers made up of residential, commercial and industrial. The breakdown
of the customer population for each business units is as follows:
Table 3.1: Population distribution of the study area.
S/N Units Population
1. Doka Business Unit 33,262
2. Rigasa Business Unit 37,571
3. Makera Business Unit 33,700
4. Zaria Business Unit 40,455
5. Kafanchan Business Unit 15,825
6. Gusau Business Unit 34,652
7. Sokot Business Unit 53,489
8. Birnin Kebbi Business Unit 19,065
lxxxiii
The above information was obtained from KED Newsline, official journal of
Kaduna Electricity Distribution Plc., Vol. 1, April-June, 2006.
3.5 SAMPLE SIZE AND ITS DETERMINATION
Sampling approaches are usually adopted in collecting the data from their
sources, either through probability or non-probability sampling design.
Sampling simple means; taking any portion of a population as a
representative of the entire population. Several methods have been used for
selecting samples that serve as representative of a population. Some of them
are random, stratified, double, cluster sampling etc.
However, a simple random sampling was used to select the samples from the
total population of the zone. Information were obtained from the entire
executive management team, consisting of a chief operating officer and 7
senior managers. However, samples from the eight Business Units were
selected based on proportionate sampling. In each of these business units
respondents were selected from both staff and customers with the aid of
table random numbers.
This is because the population of the staff is not homogenous, rather it is
heterogeneous therefore, the best way of obtaining a representative sample
in such a heterogeneous population is to draw its members from the
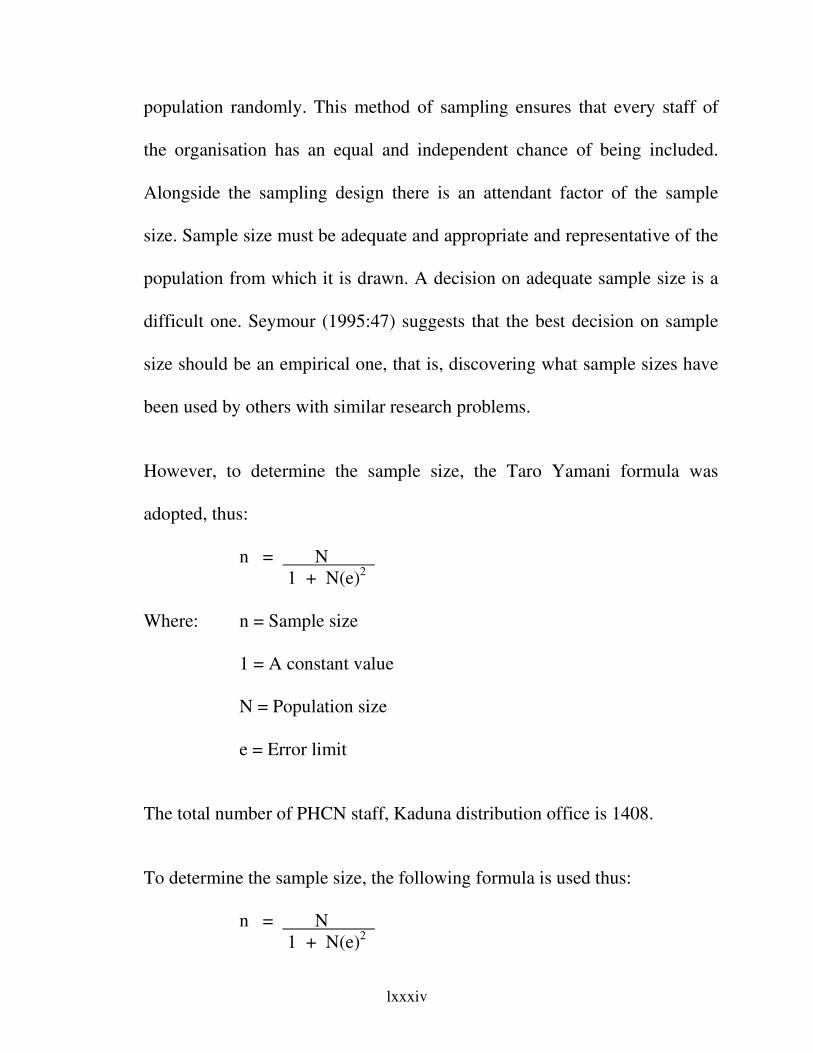
lxxxiv
population randomly. This method of sampling ensures that every staff of
the organisation has an equal and independent chance of being included.
Alongside the sampling design there is an attendant factor of the sample
size. Sample size must be adequate and appropriate and representative of the
population from which it is drawn. A decision on adequate sample size is a
difficult one. Seymour (1995:47) suggests that the best decision on sample
size should be an empirical one, that is, discovering what sample sizes have
been used by others with similar research problems.
However, to determine the sample size, the Taro Yamani formula was
adopted, thus:
n = N
1 + N(e)2
Where: n = Sample size
1 = A constant value
N = Population size
e = Error limit
The total number of PHCN staff, Kaduna distribution office is 1408.
To determine the sample size, the following formula is used thus:
n = N
1 + N(e)2
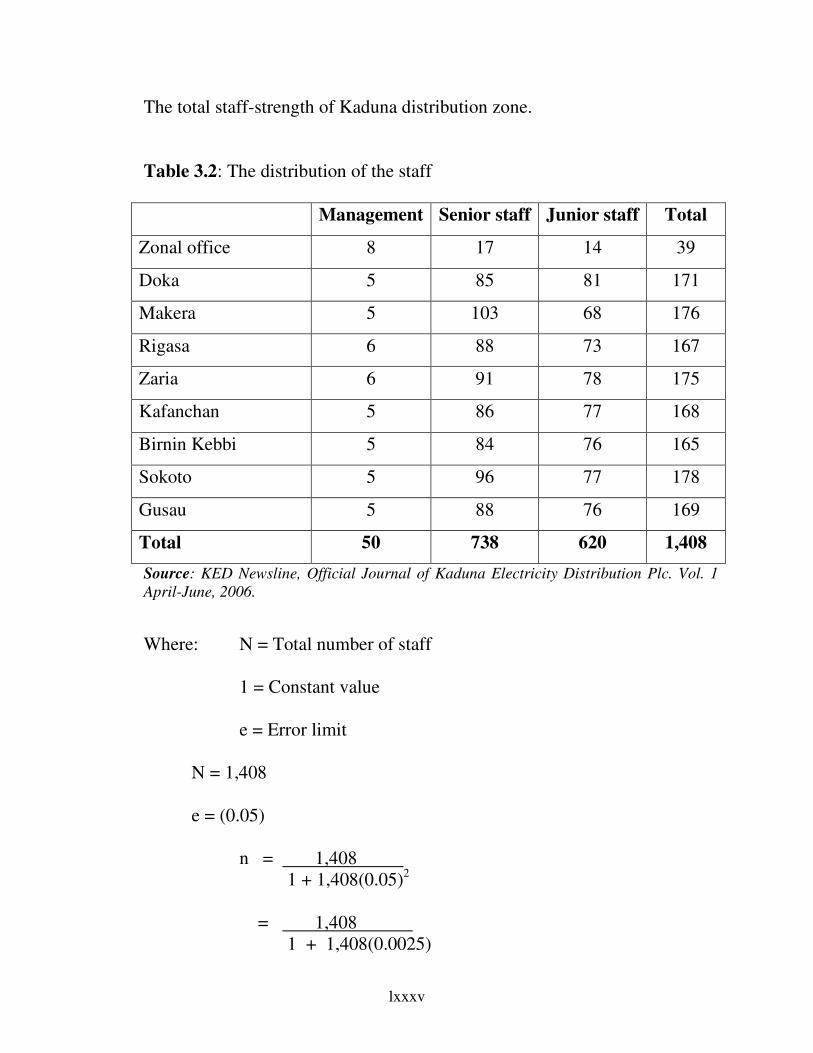
lxxxv
The total staff-strength of Kaduna distribution zone.
Table 3.2: The distribution of the staff
Management Senior staff Junior staff Total
Zonal office 8 17 14 39
Doka 5 85 81 171
Makera 5 103 68 176
Rigasa 6 88 73 167
Zaria 6 91 78 175
Kafanchan 5 86 77 168
Birnin Kebbi 5 84 76 165
Sokoto 5 96 77 178
Gusau 5 88 76 169
Total 50 738 620 1,408
Source: KED Newsline, Official Journal of Kaduna Electricity Distribution Plc. Vol. 1
April-June, 2006.
Where: N = Total number of staff
1 = Constant value
e = Error limit
N = 1,408
e = (0.05)
n = 1,408
1 + 1,408(0.05)2
= 1,408
1 + 1,408(0.0025)
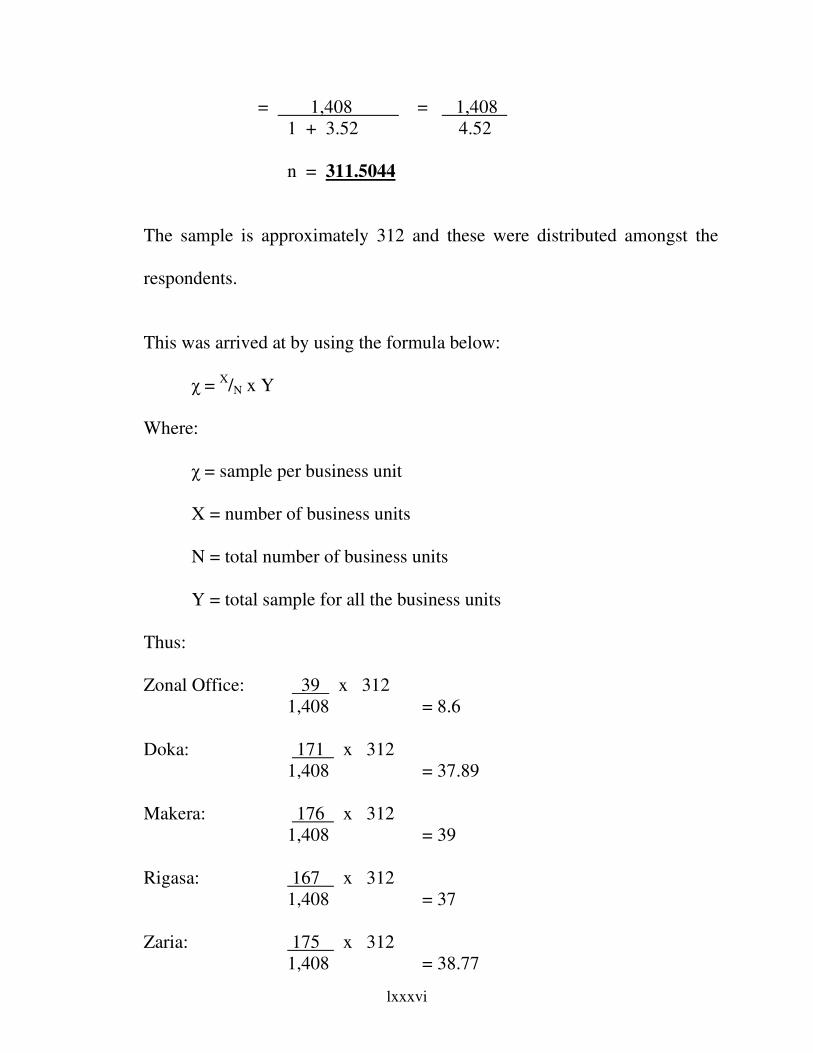
lxxxvi
= 1,408 = 1,408
1 + 3.52 4.52
n = 311.5044
The sample is approximately 312 and these were distributed amongst the
respondents.
This was arrived at by using the formula below:
χ = X/N x Y
Where:
χ = sample per business unit
X = number of business units
N = total number of business units
Y = total sample for all the business units
Thus:
Zonal Office: 39 x 312
1,408 = 8.6
Doka: 171 x 312
1,408 = 37.89
Makera: 176 x 312
1,408 = 39
Rigasa: 167 x 312
1,408 = 37
Zaria: 175 x 312
1,408 = 38.77
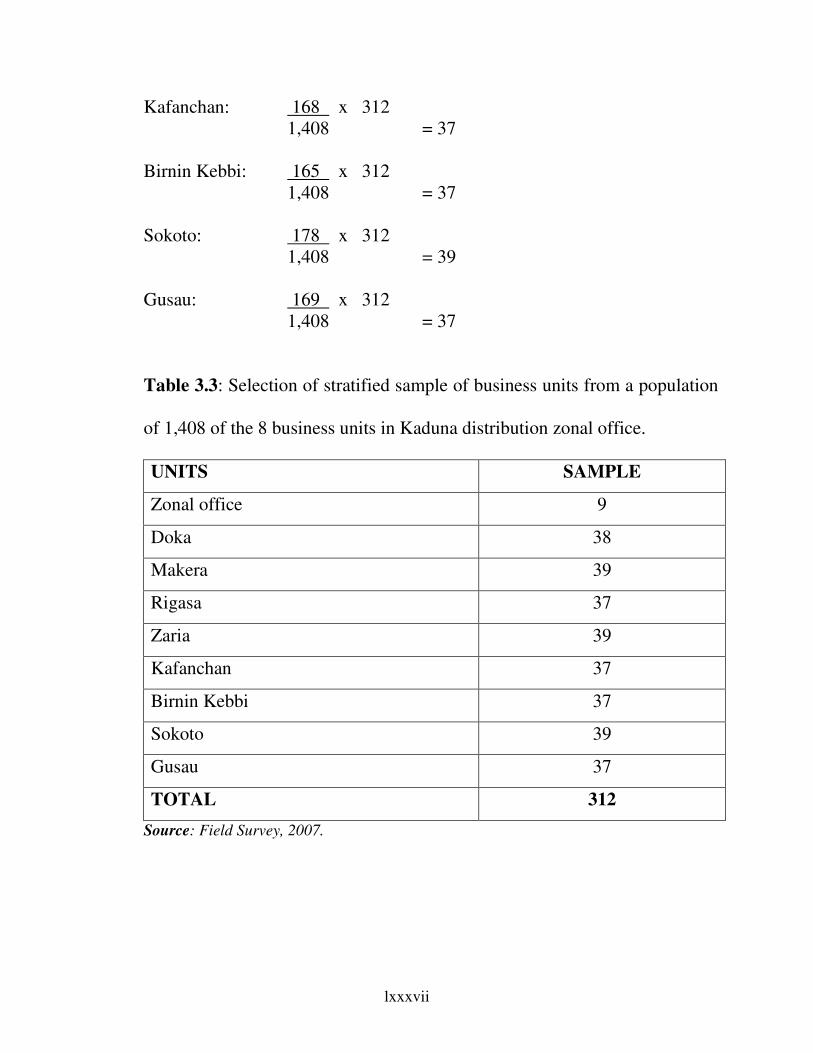
lxxxvii
Kafanchan: 168 x 312
1,408 = 37
Birnin Kebbi: 165 x 312
1,408 = 37
Sokoto: 178 x 312
1,408 = 39
Gusau: 169 x 312
1,408 = 37
Table 3.3: Selection of stratified sample of business units from a population
of 1,408 of the 8 business units in Kaduna distribution zonal office.
UNITS SAMPLE
Zonal office 9
Doka 38
Makera 39
Rigasa 37
Zaria 39
Kafanchan 37
Birnin Kebbi 37
Sokoto 39
Gusau 37
TOTAL 312
Source: Field Survey, 2007.
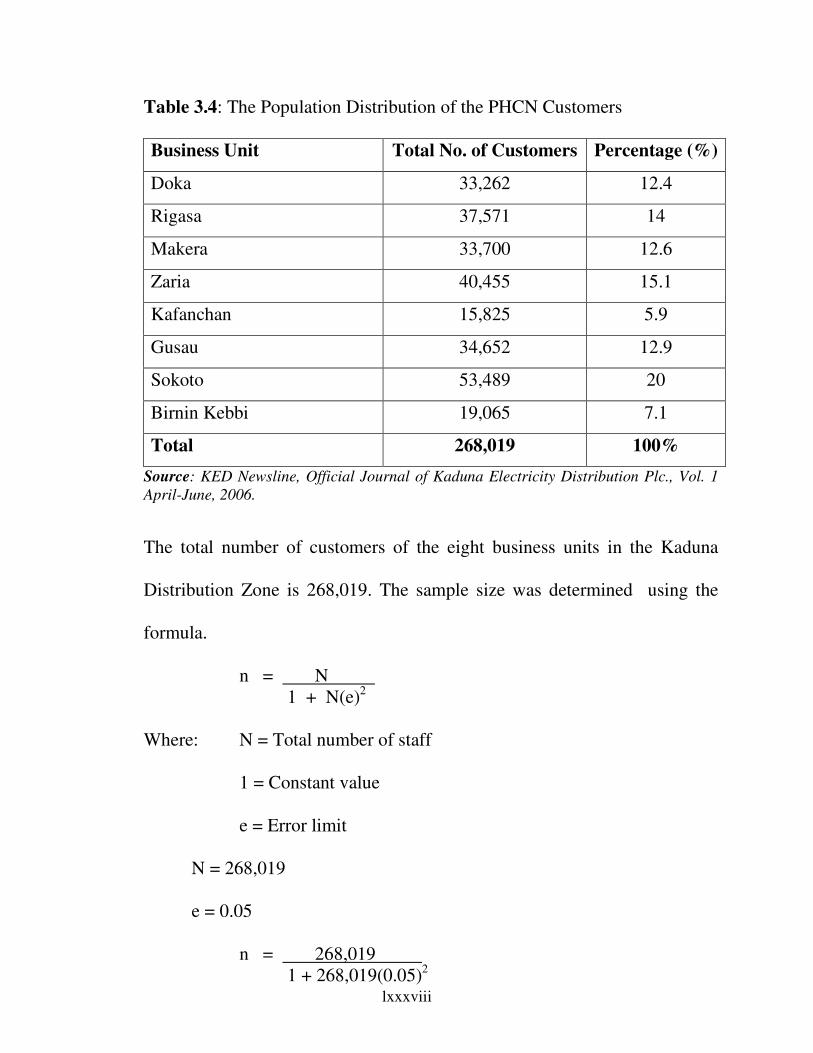
lxxxviii
Table 3.4: The Population Distribution of the PHCN Customers
Business Unit Total No. of Customers Percentage (%)
Doka 33,262 12.4
Rigasa 37,571 14
Makera 33,700 12.6
Zaria 40,455 15.1
Kafanchan 15,825 5.9
Gusau 34,652 12.9
Sokoto 53,489 20
Birnin Kebbi 19,065 7.1
Total 268,019 100%
Source: KED Newsline, Official Journal of Kaduna Electricity Distribution Plc., Vol. 1
April-June, 2006.
The total number of customers of the eight business units in the Kaduna
Distribution Zone is 268,019. The sample size was determined using the
formula.
n = N
1 + N(e)2
Where: N = Total number of staff
1 = Constant value
e = Error limit
N = 268,019
e = 0.05
n = 268,019
1 + 268,019(0.05)2
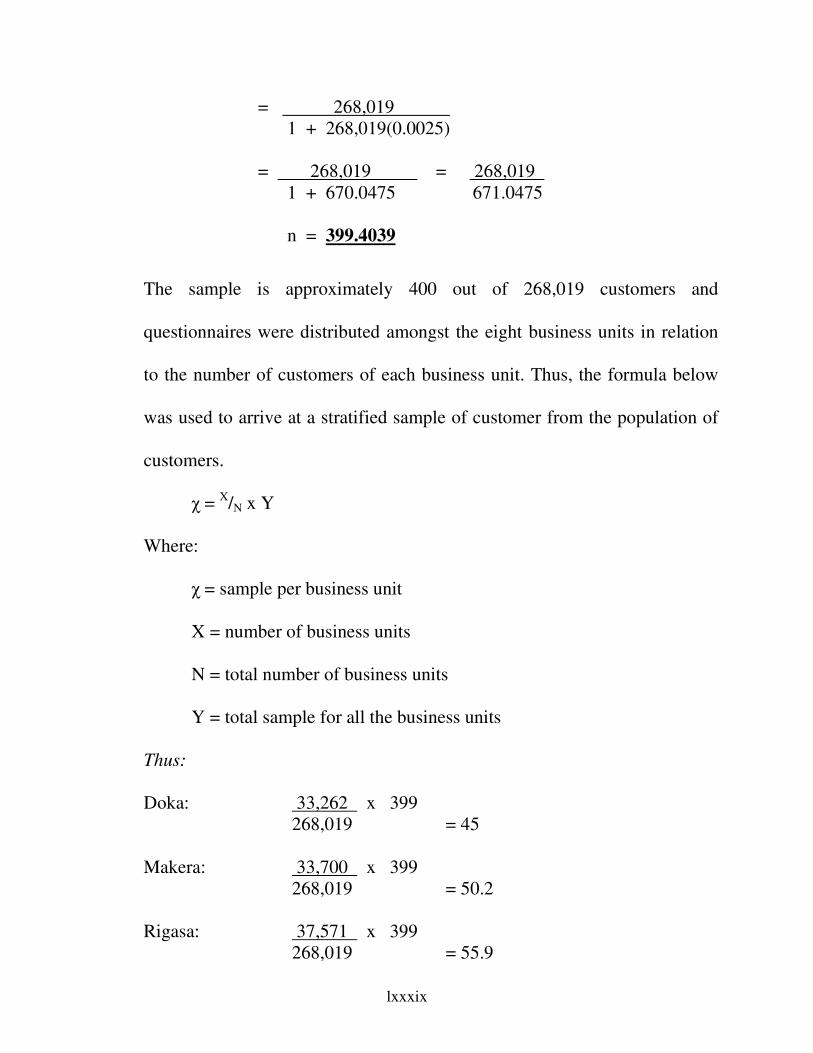
lxxxix
= 268,019
1 + 268,019(0.0025)
= 268,019 = 268,019
1 + 670.0475 671.0475
n = 399.4039
The sample is approximately 400 out of 268,019 customers and
questionnaires were distributed amongst the eight business units in relation
to the number of customers of each business unit. Thus, the formula below
was used to arrive at a stratified sample of customer from the population of
customers.
χ = X/N x Y
Where:
χ = sample per business unit
X = number of business units
N = total number of business units
Y = total sample for all the business units
Thus:
Doka: 33,262 x 399
268,019 = 45
Makera: 33,700 x 399
268,019 = 50.2
Rigasa: 37,571 x 399
268,019 = 55.9
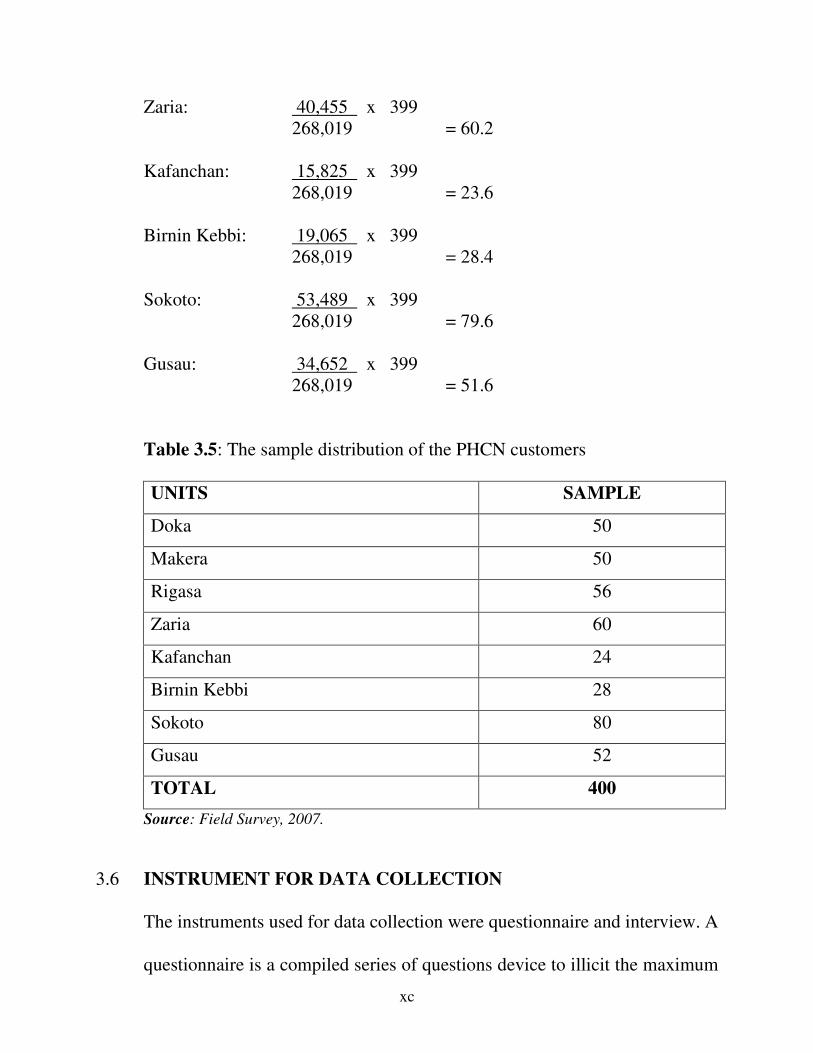
xc
Zaria: 40,455 x 399
268,019 = 60.2
Kafanchan: 15,825 x 399
268,019 = 23.6
Birnin Kebbi: 19,065 x 399
268,019 = 28.4
Sokoto: 53,489 x 399
268,019 = 79.6
Gusau: 34,652 x 399
268,019 = 51.6
Table 3.5: The sample distribution of the PHCN customers
UNITS SAMPLE
Doka 50
Makera 50
Rigasa 56
Zaria 60
Kafanchan 24
Birnin Kebbi 28
Sokoto 80
Gusau 52
TOTAL 400
Source: Field Survey, 2007.
3.6 INSTRUMENT FOR DATA COLLECTION
The instruments used for data collection were questionnaire and interview. A
questionnaire is a compiled series of questions device to illicit the maximum
xci
possible information for a research, which could either be “closed” or
“open”. The designing of questionnaire, is made in such a way as to cover
the period of time with which this research work is concerned. A well
structured questionnaire was distributed to respondents who were part of the
sample size.
The advantage in this system are that it consumes less time, permits wider
coverage, the respondent has more time and can even consult references.
However, the disadvantages that must be considered include the problem of
non-return of questionnaires.
Interviewing is also an instrument for data collection, which involves a face-
to-face interpersonal contact, in which the interviewer asks the interviewee
questions designed to obtain answers.
3.7 METHOD OF DATA ANALYSIS
In an attempt to achieve the aim and objectives of this study, the use of both
descriptive and inferential statistical methods of analysis become necessary.
The research exercise required a technique that will bring about the degree
of accuracy desired. In the quest to achieve this, the researcher employed the
use of simple percentage to present and analyse data collected from
questionnaire and interview schedules, while the Pearson Product Moment
xcii
correlation coefficient was used to determine the reliability of the
instrument.
Frequencies, percentages, mean, standard deviation and standard error and t-
test, and chi-square were used.
Cross tabulation was used for scores to determine responses of the two
groups of respondents on the strategy to decide either rejecting or not
rejecting the null hypothesis.
3.8 RELIABILITY AND VALIDITY OF THE INSTRUMENT
3.8.1 RELIABILITY
Reliability work contains elements of consistency in the measures and facts
presented. Two questions are suggested to guide a researcher in establishing
the reliability of referred material, Bulmer, 1996:26). The questions are as
follows:
i. would the method adopted, if repeated by a different researcher at the
same time or same person at a later time, yield the same results as a
second?
ii. are the results achieved reproducible under other circumstances?
Only when the above questions are answered that an instrument is said to be
reliable. Validity, on the other hand is used as a test of the method of data
xciii
collection. Here too, the questions below should guide one in the collection
as well as in examining the quality of works reviewed thus: does the
researcher obtain measurements of what he/she is really trying to measure?
3.8.2 VALIDITY
Validity test of the instrument helps the researcher in assessing the value of
particular methods, results and conclusion of a study and also for making a
self-assessment of one’s personal work. There is no credit for massive
compilations or summaries of works which are not evaluated in terms of
their relevance to the study and validity and reliability (Meekyaa, 1992:12).
3.8.3 TEST: TEST RETEST
Distributed questionnaires after interval of 3 weeks distributed to know
constancy in response.
Split half, gave half and later exchanged the other half, result still constant.
xciv
REFERENCES
Bulmer, M. (1986), Social Research in Developing Countries: Surveys and
Censuses in Third World. 3rd
Edition, Chichester: John Wiley and Sons
Limited.
Hedges. B. (1996), Sampling Survey Research Practice. London: Heinemann.
Meekyaa, U.J. (1992), The Preparation and Presentation of Research Projects: An
Electric Guide. Jos: Planning Research Publication.
Osuala, E.C. (1991), Introduction to Research Methodology. Enugu: Africana-FEP
Publishers Limited.
Walpole, R.E. (1984), Introduction to Statistics. 2nd
Edition, New York: Macmillan
Publishing Co. Inc.
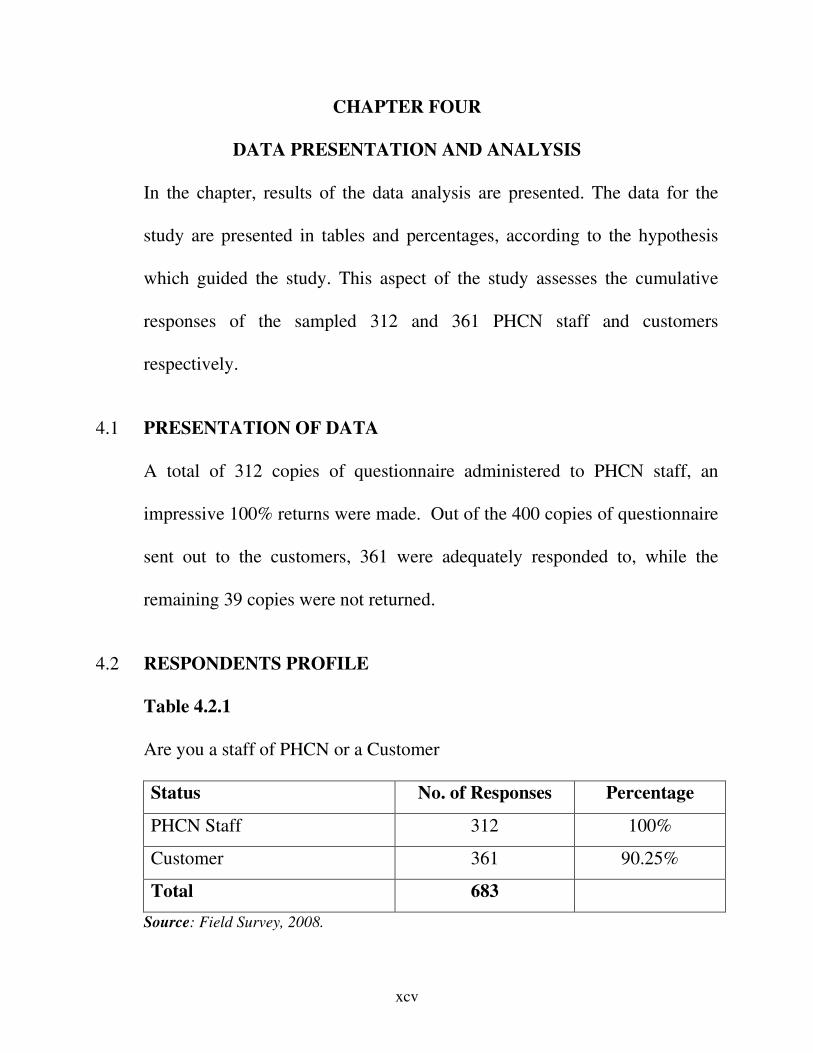
xcv
CHAPTER FOUR
DATA PRESENTATION AND ANALYSIS
In the chapter, results of the data analysis are presented. The data for the
study are presented in tables and percentages, according to the hypothesis
which guided the study. This aspect of the study assesses the cumulative
responses of the sampled 312 and 361 PHCN staff and customers
respectively.
4.1 PRESENTATION OF DATA
A total of 312 copies of questionnaire administered to PHCN staff, an
impressive 100% returns were made. Out of the 400 copies of questionnaire
sent out to the customers, 361 were adequately responded to, while the
remaining 39 copies were not returned.
4.2 RESPONDENTS PROFILE
Table 4.2.1
Are you a staff of PHCN or a Customer
Status No. of Responses Percentage
PHCN Staff 312 100%
Customer 361 90.25%
Total 683
Source: Field Survey, 2008.
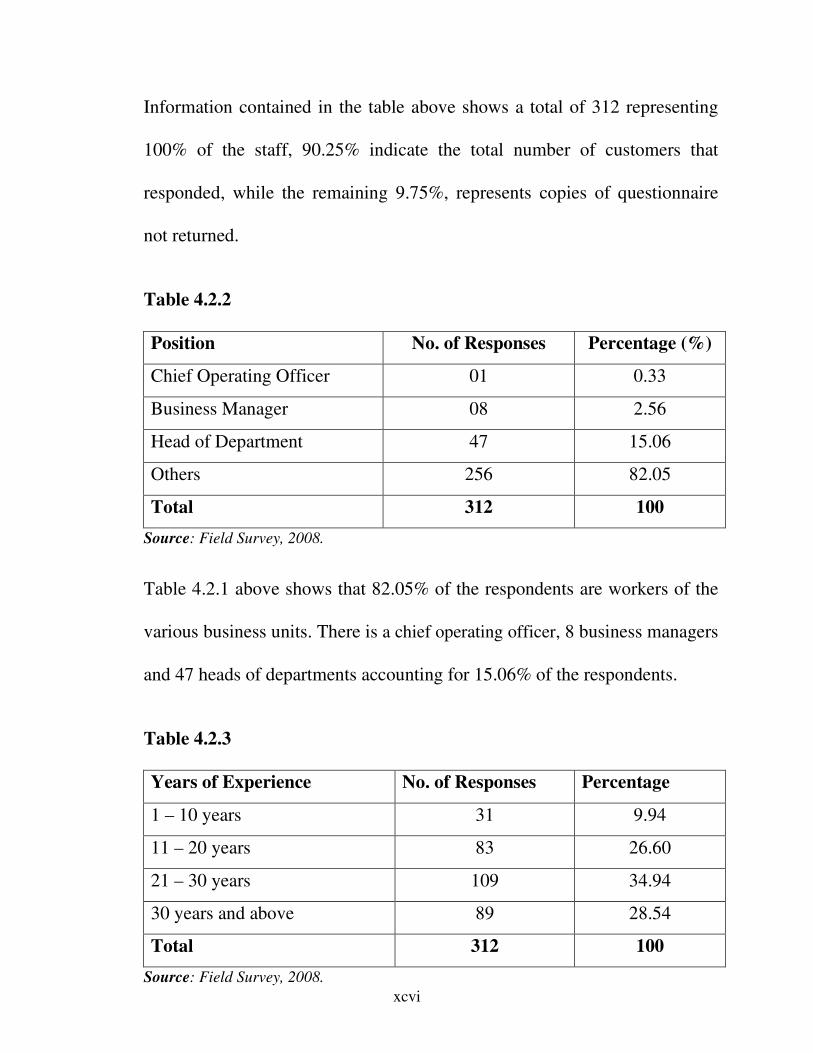
xcvi
Information contained in the table above shows a total of 312 representing
100% of the staff, 90.25% indicate the total number of customers that
responded, while the remaining 9.75%, represents copies of questionnaire
not returned.
Table 4.2.2
Position No. of Responses Percentage (%)
Chief Operating Officer 01 0.33
Business Manager 08 2.56
Head of Department 47 15.06
Others 256 82.05
Total 312 100
Source: Field Survey, 2008.
Table 4.2.1 above shows that 82.05% of the respondents are workers of the
various business units. There is a chief operating officer, 8 business managers
and 47 heads of departments accounting for 15.06% of the respondents.
Table 4.2.3
Years of Experience No. of Responses Percentage
1 – 10 years 31 9.94
11 – 20 years 83 26.60
21 – 30 years 109 34.94
30 years and above 89 28.54
Total 312 100
Source: Field Survey, 2008.
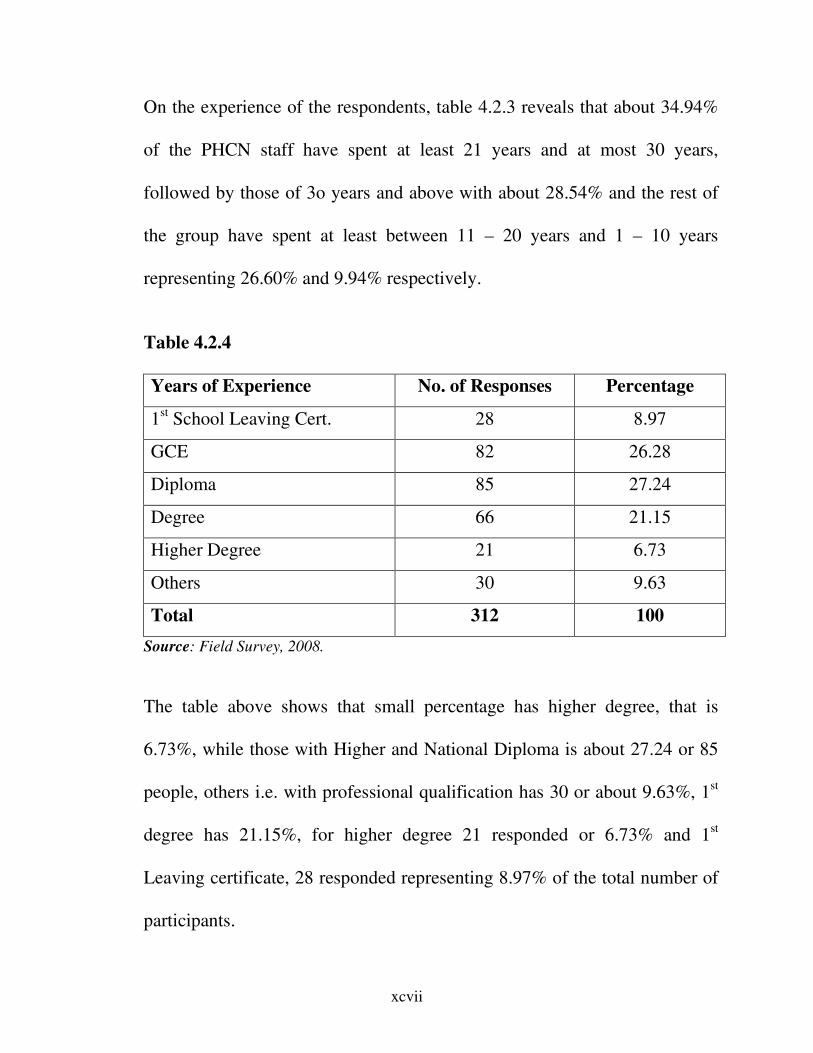
xcvii
On the experience of the respondents, table 4.2.3 reveals that about 34.94%
of the PHCN staff have spent at least 21 years and at most 30 years,
followed by those of 3o years and above with about 28.54% and the rest of
the group have spent at least between 11 – 20 years and 1 – 10 years
representing 26.60% and 9.94% respectively.
Table 4.2.4
Years of Experience No. of Responses Percentage
1st School Leaving Cert. 28 8.97
GCE 82 26.28
Diploma 85 27.24
Degree 66 21.15
Higher Degree 21 6.73
Others 30 9.63
Total 312 100
Source: Field Survey, 2008.
The table above shows that small percentage has higher degree, that is
6.73%, while those with Higher and National Diploma is about 27.24 or 85
people, others i.e. with professional qualification has 30 or about 9.63%, 1st
degree has 21.15%, for higher degree 21 responded or 6.73% and 1st
Leaving certificate, 28 responded representing 8.97% of the total number of
participants.
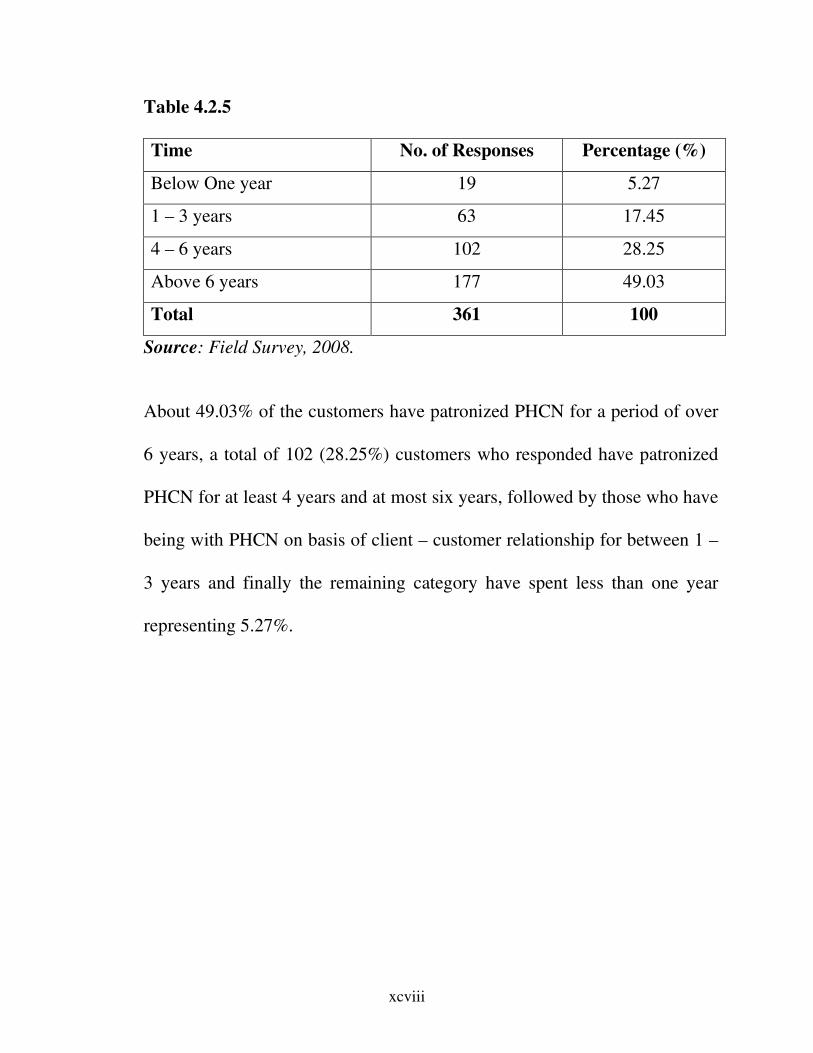
xcviii
Table 4.2.5
Time No. of Responses Percentage (%)
Below One year 19 5.27
1 – 3 years 63 17.45
4 – 6 years 102 28.25
Above 6 years 177 49.03
Total 361 100
Source: Field Survey, 2008.
About 49.03% of the customers have patronized PHCN for a period of over
6 years, a total of 102 (28.25%) customers who responded have patronized
PHCN for at least 4 years and at most six years, followed by those who have
being with PHCN on basis of client – customer relationship for between 1 –
3 years and finally the remaining category have spent less than one year
representing 5.27%.
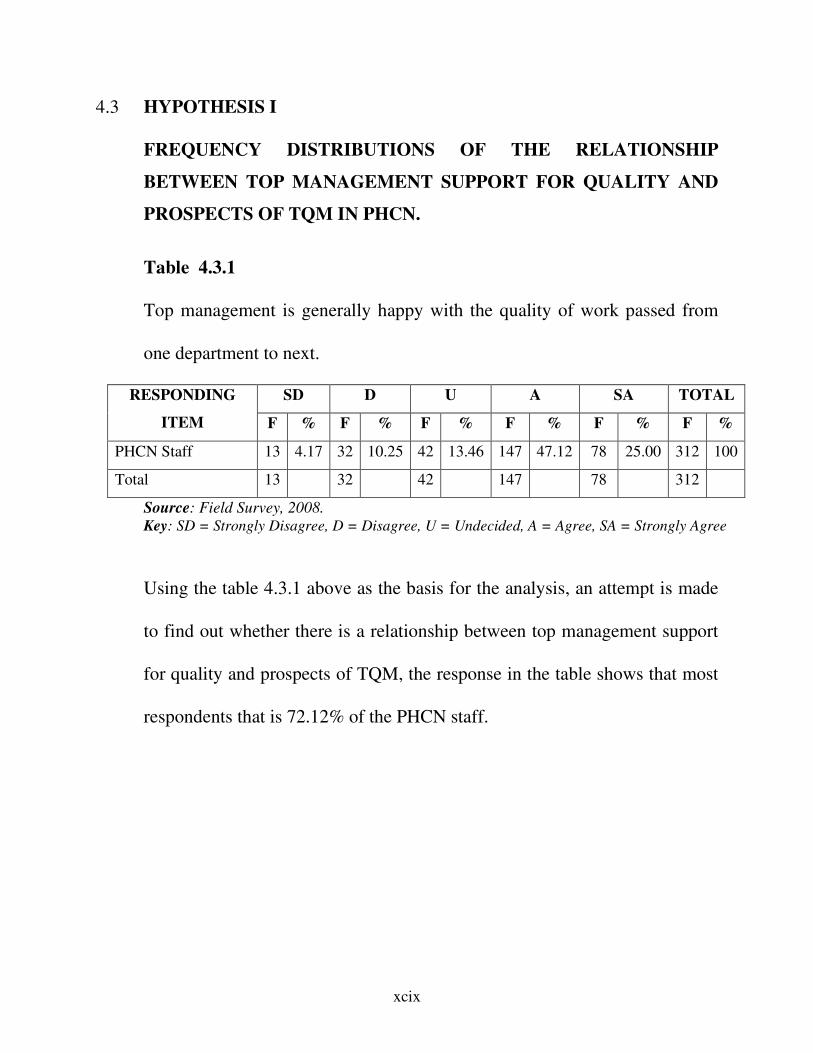
xcix
4.3 HYPOTHESIS I
FREQUENCY DISTRIBUTIONS OF THE RELATIONSHIP
BETWEEN TOP MANAGEMENT SUPPORT FOR QUALITY AND
PROSPECTS OF TQM IN PHCN.
Table 4.3.1
Top management is generally happy with the quality of work passed from
one department to next.
RESPONDING
ITEM
SD D U A SA TOTAL
F % F % F % F % F % F %
PHCN Staff 13 4.17 32 10.25 42 13.46 147 47.12 78 25.00 312 100
Total 13 32 42 147 78 312
Source: Field Survey, 2008.
Key: SD = Strongly Disagree, D = Disagree, U = Undecided, A = Agree, SA = Strongly Agree
Using the table 4.3.1 above as the basis for the analysis, an attempt is made
to find out whether there is a relationship between top management support
for quality and prospects of TQM, the response in the table shows that most
respondents that is 72.12% of the PHCN staff.
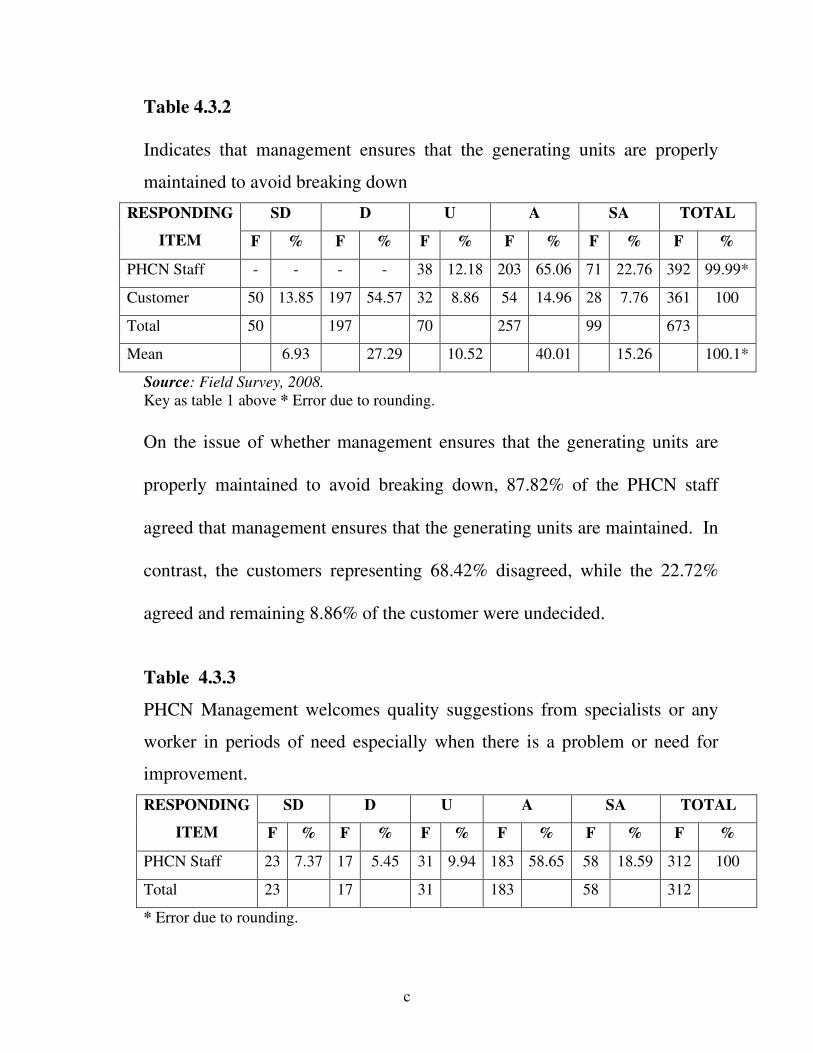
c
Table 4.3.2
Indicates that management ensures that the generating units are properly
maintained to avoid breaking down
RESPONDING
ITEM
SD D U A SA TOTAL
F % F % F % F % F % F %
PHCN Staff - - - - 38 12.18 203 65.06 71 22.76 392 99.99*
Customer 50 13.85 197 54.57 32 8.86 54 14.96 28 7.76 361 100
Total 50 197 70 257 99 673
Mean 6.93 27.29 10.52 40.01 15.26 100.1*
Source: Field Survey, 2008.
Key as table 1 above * Error due to rounding.
On the issue of whether management ensures that the generating units are
properly maintained to avoid breaking down, 87.82% of the PHCN staff
agreed that management ensures that the generating units are maintained. In
contrast, the customers representing 68.42% disagreed, while the 22.72%
agreed and remaining 8.86% of the customer were undecided.
Table 4.3.3
PHCN Management welcomes quality suggestions from specialists or any
worker in periods of need especially when there is a problem or need for
improvement.
RESPONDING
ITEM
SD D U A SA TOTAL
F % F % F % F % F % F %
PHCN Staff 23 7.37 17 5.45 31 9.94 183 58.65 58 18.59 312 100
Total 23 17 31 183 58 312
* Error due to rounding.
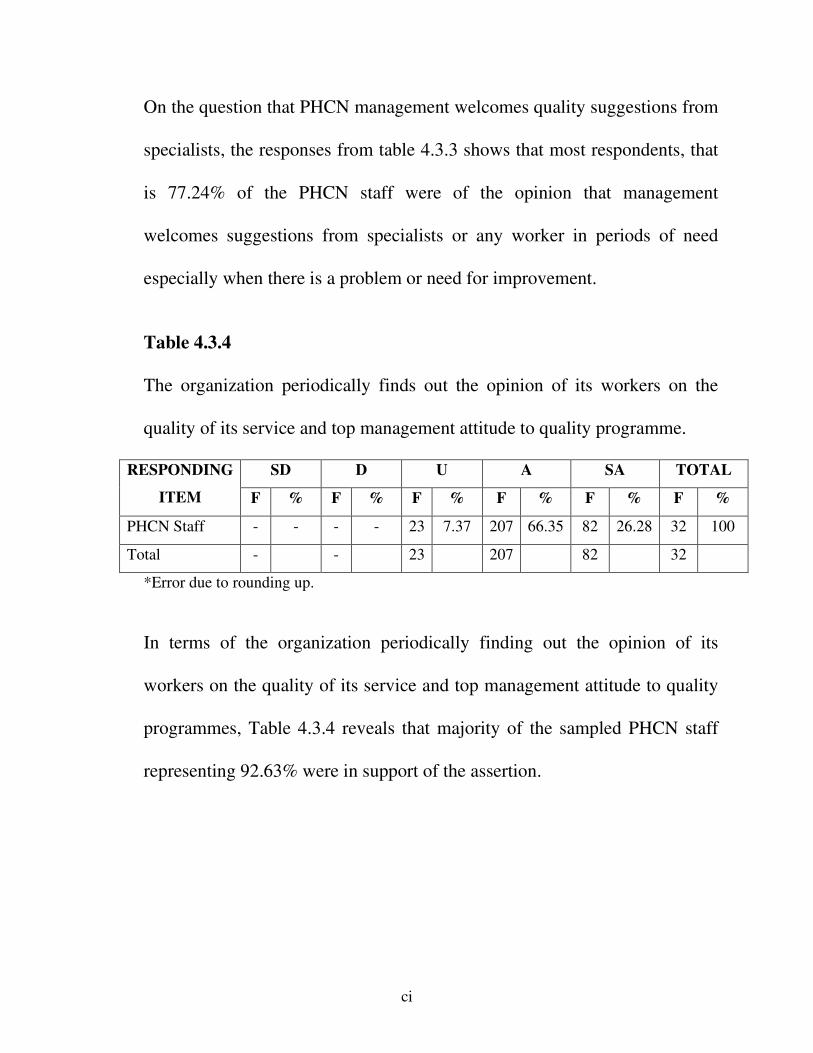
ci
On the question that PHCN management welcomes quality suggestions from
specialists, the responses from table 4.3.3 shows that most respondents, that
is 77.24% of the PHCN staff were of the opinion that management
welcomes suggestions from specialists or any worker in periods of need
especially when there is a problem or need for improvement.
Table 4.3.4
The organization periodically finds out the opinion of its workers on the
quality of its service and top management attitude to quality programme.
RESPONDING
ITEM
SD D U A SA TOTAL
F % F % F % F % F % F %
PHCN Staff - - - - 23 7.37 207 66.35 82 26.28 32 100
Total - - 23 207 82 32
*Error due to rounding up.
In terms of the organization periodically finding out the opinion of its
workers on the quality of its service and top management attitude to quality
programmes, Table 4.3.4 reveals that majority of the sampled PHCN staff
representing 92.63% were in support of the assertion.
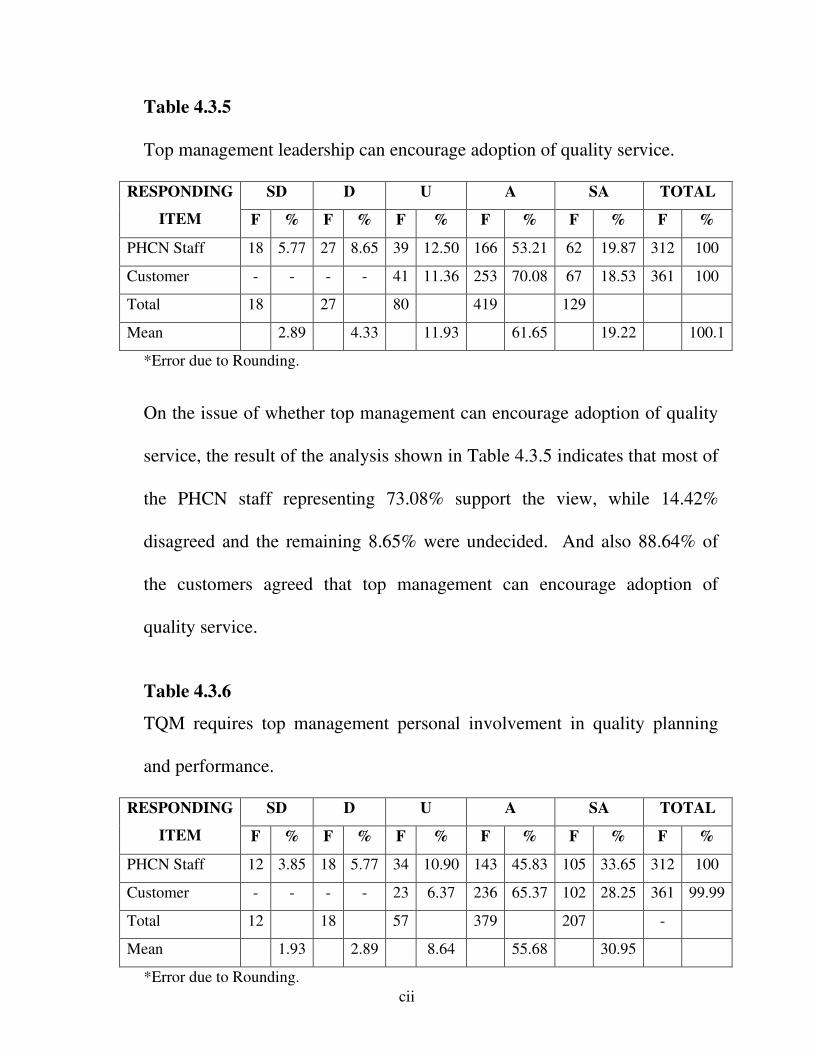
cii
Table 4.3.5
Top management leadership can encourage adoption of quality service.
RESPONDING
ITEM
SD D U A SA TOTAL
F % F % F % F % F % F %
PHCN Staff 18 5.77 27 8.65 39 12.50 166 53.21 62 19.87 312 100
Customer - - - - 41 11.36 253 70.08 67 18.53 361 100
Total 18 27 80 419 129
Mean 2.89 4.33 11.93 61.65 19.22 100.1
*Error due to Rounding.
On the issue of whether top management can encourage adoption of quality
service, the result of the analysis shown in Table 4.3.5 indicates that most of
the PHCN staff representing 73.08% support the view, while 14.42%
disagreed and the remaining 8.65% were undecided. And also 88.64% of
the customers agreed that top management can encourage adoption of
quality service.
Table 4.3.6
TQM requires top management personal involvement in quality planning
and performance.
RESPONDING
ITEM
SD D U A SA TOTAL
F % F % F % F % F % F %
PHCN Staff 12 3.85 18 5.77 34 10.90 143 45.83 105 33.65 312 100
Customer - - - - 23 6.37 236 65.37 102 28.25 361 99.99
Total 12 18 57 379 207 -
Mean 1.93 2.89 8.64 55.68 30.95
*Error due to Rounding.
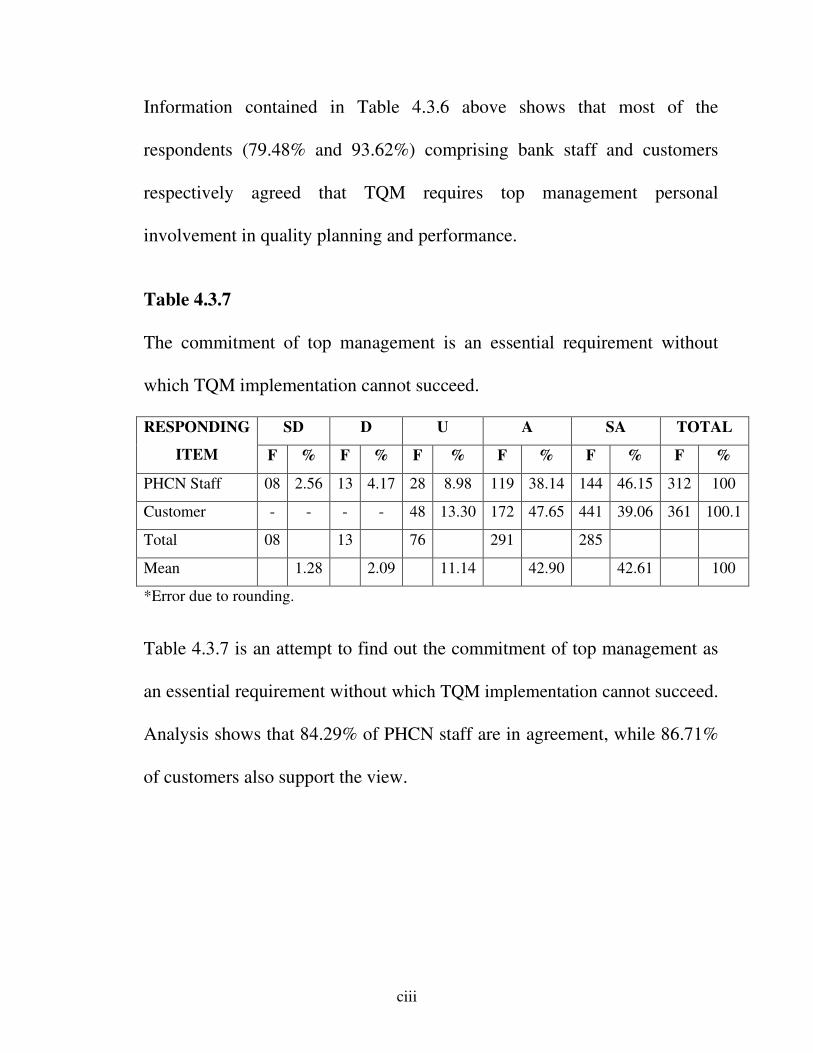
ciii
Information contained in Table 4.3.6 above shows that most of the
respondents (79.48% and 93.62%) comprising bank staff and customers
respectively agreed that TQM requires top management personal
involvement in quality planning and performance.
Table 4.3.7
The commitment of top management is an essential requirement without
which TQM implementation cannot succeed.
RESPONDING
ITEM
SD D U A SA TOTAL
F % F % F % F % F % F %
PHCN Staff 08 2.56 13 4.17 28 8.98 119 38.14 144 46.15 312 100
Customer - - - - 48 13.30 172 47.65 441 39.06 361 100.1
Total 08 13 76 291 285
Mean 1.28 2.09 11.14 42.90 42.61 100
*Error due to rounding.
Table 4.3.7 is an attempt to find out the commitment of top management as
an essential requirement without which TQM implementation cannot succeed.
Analysis shows that 84.29% of PHCN staff are in agreement, while 86.71%
of customers also support the view.
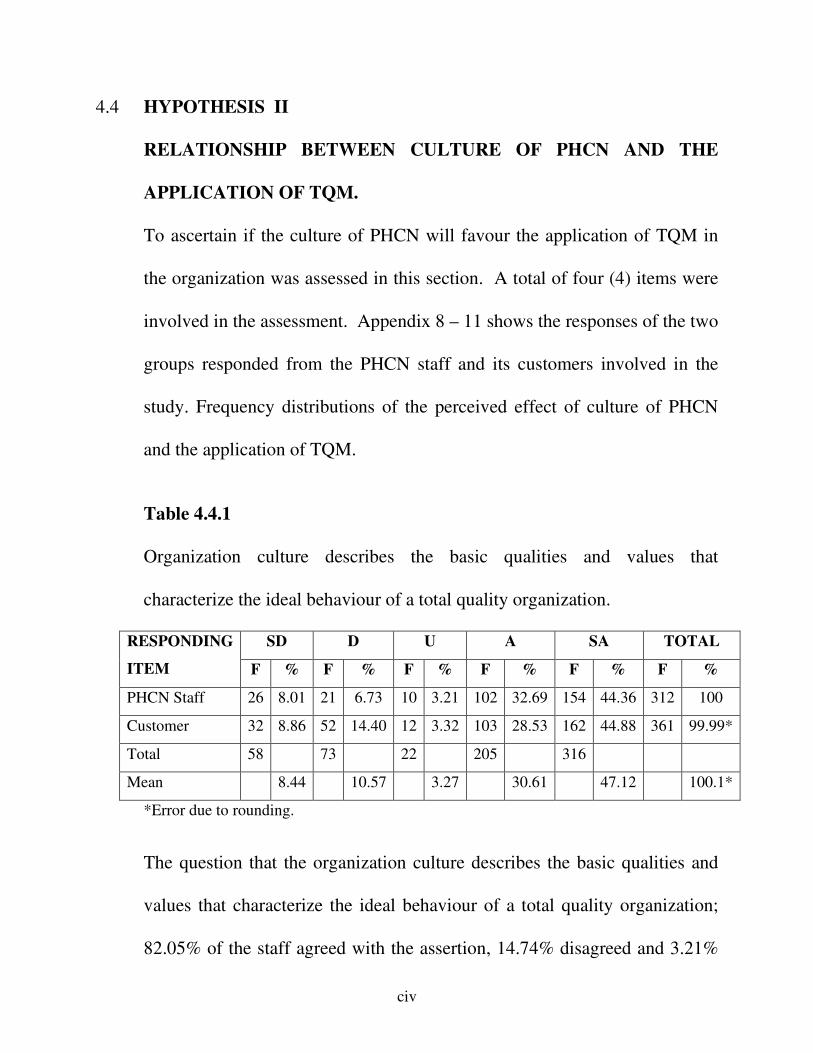
civ
4.4 HYPOTHESIS II
RELATIONSHIP BETWEEN CULTURE OF PHCN AND THE
APPLICATION OF TQM.
To ascertain if the culture of PHCN will favour the application of TQM in
the organization was assessed in this section. A total of four (4) items were
involved in the assessment. Appendix 8 – 11 shows the responses of the two
groups responded from the PHCN staff and its customers involved in the
study. Frequency distributions of the perceived effect of culture of PHCN
and the application of TQM.
Table 4.4.1
Organization culture describes the basic qualities and values that
characterize the ideal behaviour of a total quality organization.
RESPONDING
ITEM
SD D U A SA TOTAL
F % F % F % F % F % F %
PHCN Staff 26 8.01 21 6.73 10 3.21 102 32.69 154 44.36 312 100
Customer 32 8.86 52 14.40 12 3.32 103 28.53 162 44.88 361 99.99*
Total 58 73 22 205 316
Mean 8.44 10.57 3.27 30.61 47.12 100.1*
*Error due to rounding.
The question that the organization culture describes the basic qualities and
values that characterize the ideal behaviour of a total quality organization;
82.05% of the staff agreed with the assertion, 14.74% disagreed and 3.21%
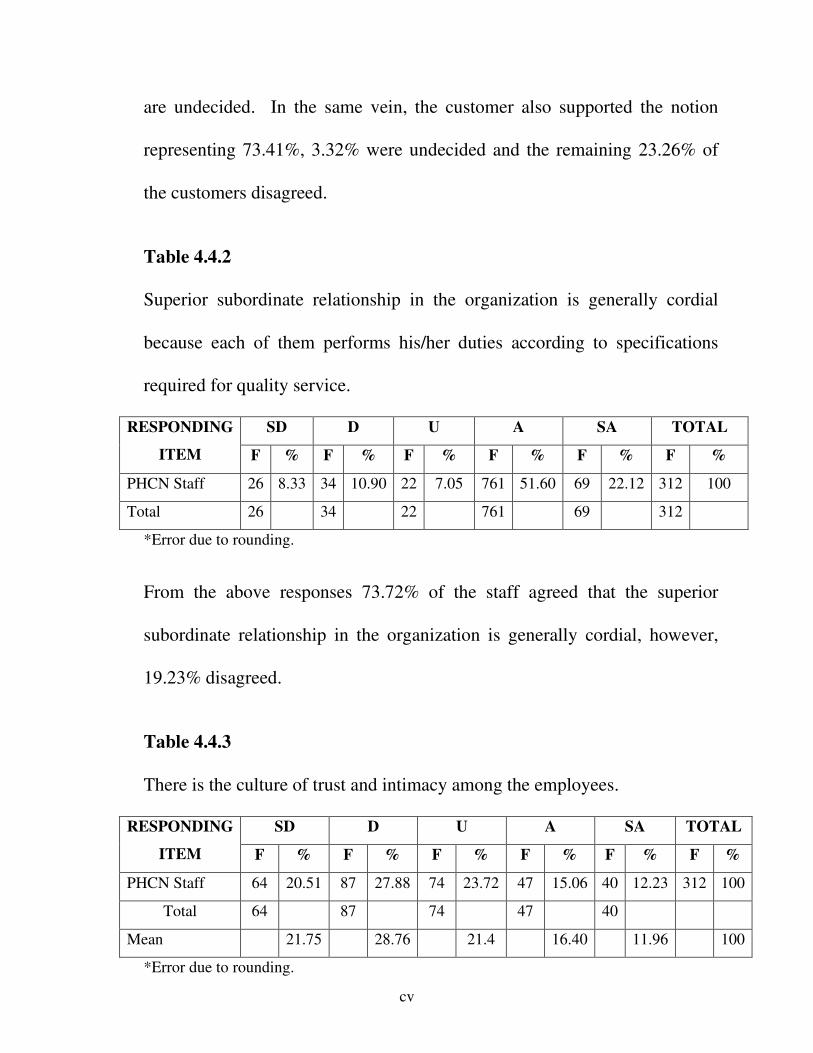
cv
are undecided. In the same vein, the customer also supported the notion
representing 73.41%, 3.32% were undecided and the remaining 23.26% of
the customers disagreed.
Table 4.4.2
Superior subordinate relationship in the organization is generally cordial
because each of them performs his/her duties according to specifications
required for quality service.
RESPONDING
ITEM
SD D U A SA TOTAL
F % F % F % F % F % F %
PHCN Staff 26 8.33 34 10.90 22 7.05 761 51.60 69 22.12 312 100
Total 26 34 22 761 69 312
*Error due to rounding.
From the above responses 73.72% of the staff agreed that the superior
subordinate relationship in the organization is generally cordial, however,
19.23% disagreed.
Table 4.4.3
There is the culture of trust and intimacy among the employees.
RESPONDING
ITEM
SD D U A SA TOTAL
F % F % F % F % F % F %
PHCN Staff 64 20.51 87 27.88 74 23.72 47 15.06 40 12.23 312 100
Total 64 87 74 47 40
Mean 21.75 28.76 21.4 16.40 11.96 100
*Error due to rounding.
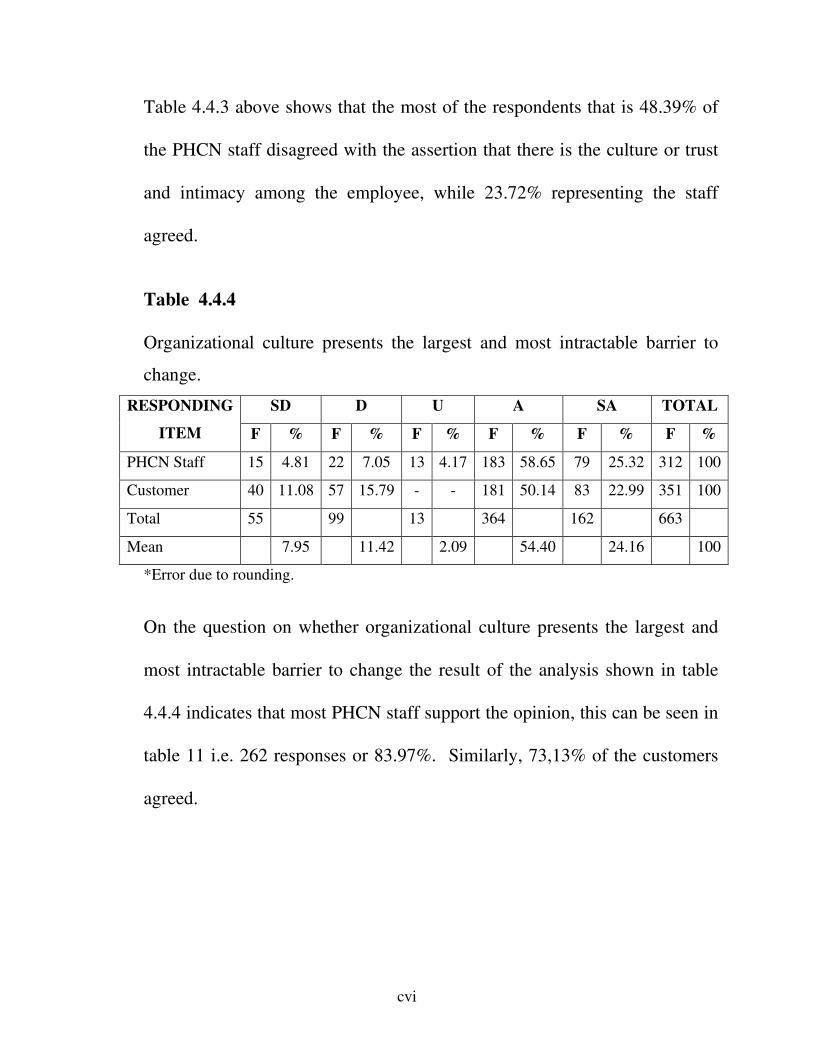
cvi
Table 4.4.3 above shows that the most of the respondents that is 48.39% of
the PHCN staff disagreed with the assertion that there is the culture or trust
and intimacy among the employee, while 23.72% representing the staff
agreed.
Table 4.4.4
Organizational culture presents the largest and most intractable barrier to
change.
RESPONDING
ITEM
SD D U A SA TOTAL
F % F % F % F % F % F %
PHCN Staff 15 4.81 22 7.05 13 4.17 183 58.65 79 25.32 312 100
Customer 40 11.08 57 15.79 - - 181 50.14 83 22.99 351 100
Total 55 99 13 364 162 663
Mean 7.95 11.42 2.09 54.40 24.16 100
*Error due to rounding.
On the question on whether organizational culture presents the largest and
most intractable barrier to change the result of the analysis shown in table
4.4.4 indicates that most PHCN staff support the opinion, this can be seen in
table 11 i.e. 262 responses or 83.97%. Similarly, 73,13% of the customers
agreed.
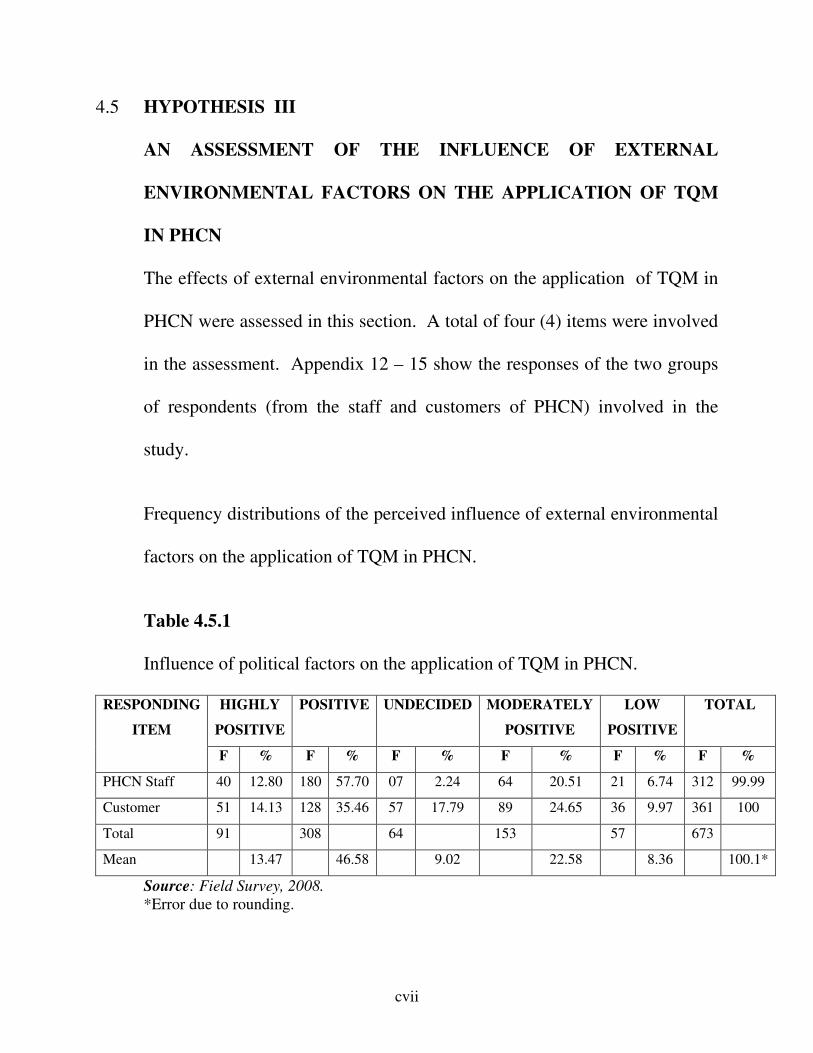
cvii
4.5 HYPOTHESIS III
AN ASSESSMENT OF THE INFLUENCE OF EXTERNAL
ENVIRONMENTAL FACTORS ON THE APPLICATION OF TQM
IN PHCN
The effects of external environmental factors on the application of TQM in
PHCN were assessed in this section. A total of four (4) items were involved
in the assessment. Appendix 12 – 15 show the responses of the two groups
of respondents (from the staff and customers of PHCN) involved in the
study.
Frequency distributions of the perceived influence of external environmental
factors on the application of TQM in PHCN.
Table 4.5.1
Influence of political factors on the application of TQM in PHCN.
RESPONDING
ITEM
HIGHLY
POSITIVE
POSITIVE UNDECIDED MODERATELY
POSITIVE
LOW
POSITIVE
TOTAL
F % F % F % F % F % F %
PHCN Staff 40 12.80 180 57.70 07 2.24 64 20.51 21 6.74 312 99.99
Customer 51 14.13 128 35.46 57 17.79 89 24.65 36 9.97 361 100
Total 91 308 64 153 57 673
Mean 13.47 46.58 9.02 22.58 8.36 100.1*
Source: Field Survey, 2008.
*Error due to rounding.
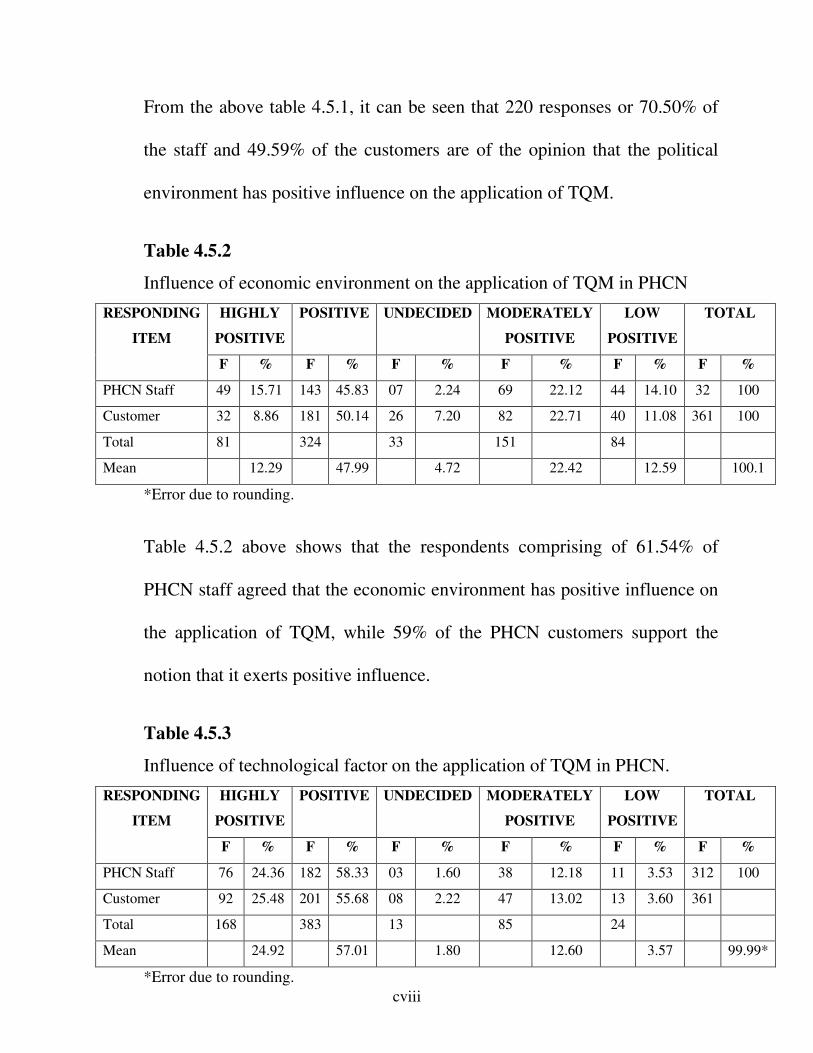
cviii
From the above table 4.5.1, it can be seen that 220 responses or 70.50% of
the staff and 49.59% of the customers are of the opinion that the political
environment has positive influence on the application of TQM.
Table 4.5.2
Influence of economic environment on the application of TQM in PHCN
RESPONDING
ITEM
HIGHLY
POSITIVE
POSITIVE UNDECIDED MODERATELY
POSITIVE
LOW
POSITIVE
TOTAL
F % F % F % F % F % F %
PHCN Staff 49 15.71 143 45.83 07 2.24 69 22.12 44 14.10 32 100
Customer 32 8.86 181 50.14 26 7.20 82 22.71 40 11.08 361 100
Total 81 324 33 151 84
Mean 12.29 47.99 4.72 22.42 12.59 100.1
*Error due to rounding.
Table 4.5.2 above shows that the respondents comprising of 61.54% of
PHCN staff agreed that the economic environment has positive influence on
the application of TQM, while 59% of the PHCN customers support the
notion that it exerts positive influence.
Table 4.5.3
Influence of technological factor on the application of TQM in PHCN.
RESPONDING
ITEM
HIGHLY
POSITIVE
POSITIVE UNDECIDED MODERATELY
POSITIVE
LOW
POSITIVE
TOTAL
F % F % F % F % F % F %
PHCN Staff 76 24.36 182 58.33 03 1.60 38 12.18 11 3.53 312 100
Customer 92 25.48 201 55.68 08 2.22 47 13.02 13 3.60 361
Total 168 383 13 85 24
Mean 24.92 57.01 1.80 12.60 3.57 99.99*
*Error due to rounding.
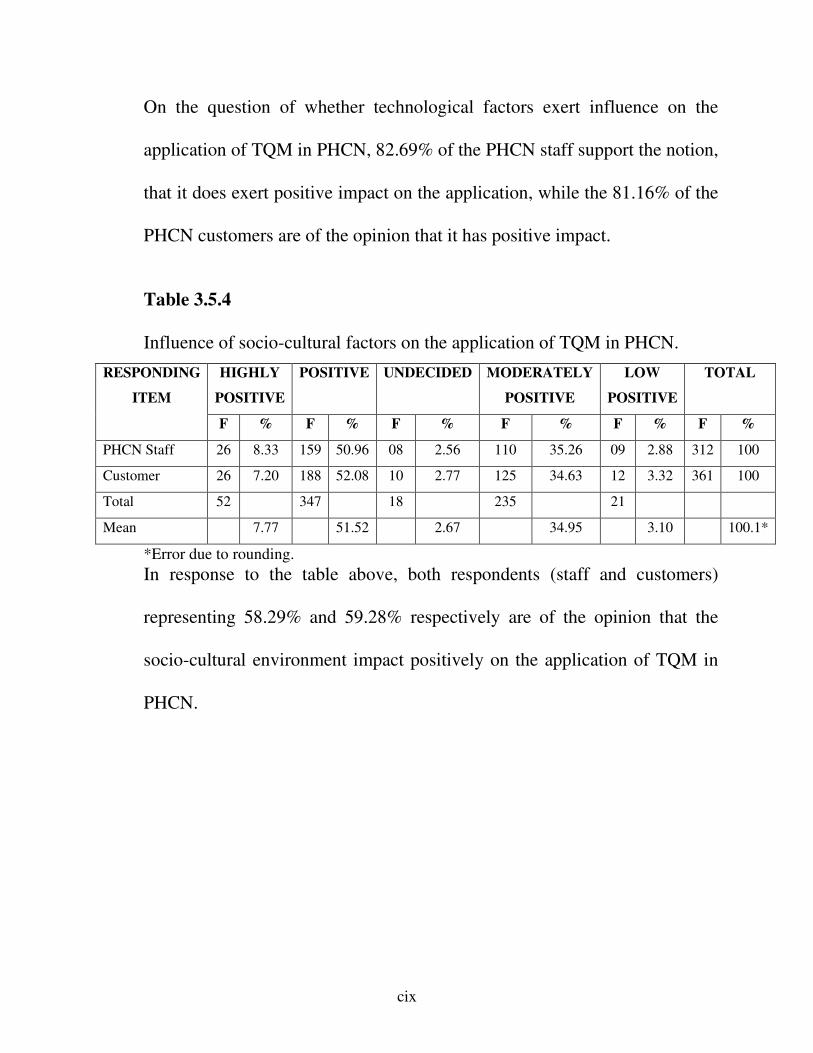
cix
On the question of whether technological factors exert influence on the
application of TQM in PHCN, 82.69% of the PHCN staff support the notion,
that it does exert positive impact on the application, while the 81.16% of the
PHCN customers are of the opinion that it has positive impact.
Table 3.5.4
Influence of socio-cultural factors on the application of TQM in PHCN.
RESPONDING
ITEM
HIGHLY
POSITIVE
POSITIVE UNDECIDED MODERATELY
POSITIVE
LOW
POSITIVE
TOTAL
F % F % F % F % F % F %
PHCN Staff 26 8.33 159 50.96 08 2.56 110 35.26 09 2.88 312 100
Customer 26 7.20 188 52.08 10 2.77 125 34.63 12 3.32 361 100
Total 52 347 18 235 21
Mean 7.77 51.52 2.67 34.95 3.10 100.1*
*Error due to rounding.
In response to the table above, both respondents (staff and customers)
representing 58.29% and 59.28% respectively are of the opinion that the
socio-cultural environment impact positively on the application of TQM in
PHCN.
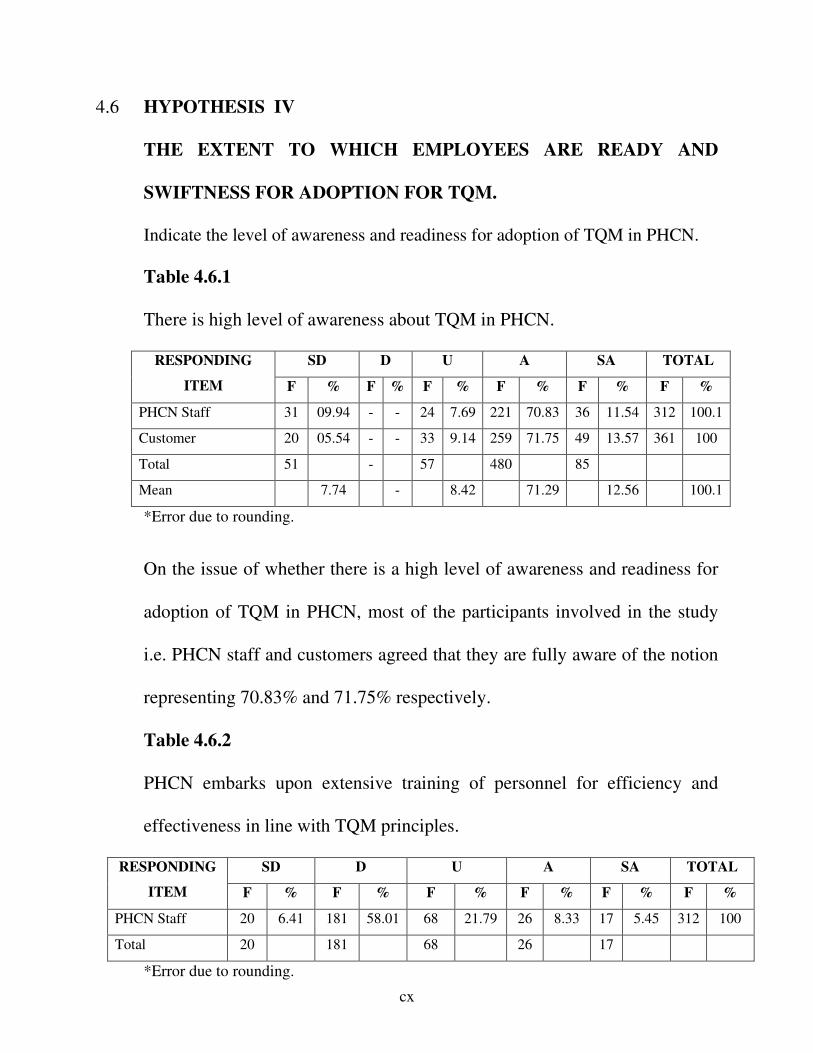
cx
4.6 HYPOTHESIS IV
THE EXTENT TO WHICH EMPLOYEES ARE READY AND
SWIFTNESS FOR ADOPTION FOR TQM.
Indicate the level of awareness and readiness for adoption of TQM in PHCN.
Table 4.6.1
There is high level of awareness about TQM in PHCN.
RESPONDING
ITEM
SD D U A SA TOTAL
F % F % F % F % F % F %
PHCN Staff 31 09.94 - - 24 7.69 221 70.83 36 11.54 312 100.1
Customer 20 05.54 - - 33 9.14 259 71.75 49 13.57 361 100
Total 51 - 57 480 85
Mean 7.74 - 8.42 71.29 12.56 100.1
*Error due to rounding.
On the issue of whether there is a high level of awareness and readiness for
adoption of TQM in PHCN, most of the participants involved in the study
i.e. PHCN staff and customers agreed that they are fully aware of the notion
representing 70.83% and 71.75% respectively.
Table 4.6.2
PHCN embarks upon extensive training of personnel for efficiency and
effectiveness in line with TQM principles.
RESPONDING
ITEM
SD D U A SA TOTAL
F % F % F % F % F % F %
PHCN Staff 20 6.41 181 58.01 68 21.79 26 8.33 17 5.45 312 100
Total 20 181 68 26 17
*Error due to rounding.
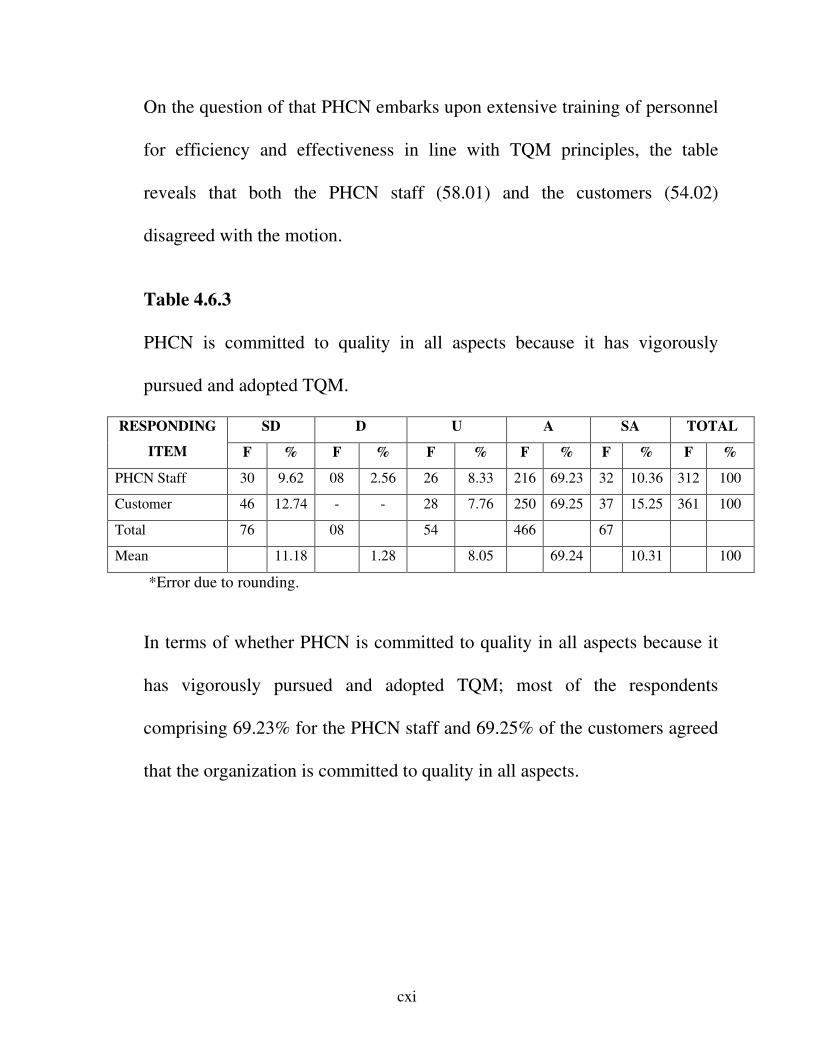
cxi
On the question of that PHCN embarks upon extensive training of personnel
for efficiency and effectiveness in line with TQM principles, the table
reveals that both the PHCN staff (58.01) and the customers (54.02)
disagreed with the motion.
Table 4.6.3
PHCN is committed to quality in all aspects because it has vigorously
pursued and adopted TQM.
RESPONDING
ITEM
SD D U A SA TOTAL
F % F % F % F % F % F %
PHCN Staff 30 9.62 08 2.56 26 8.33 216 69.23 32 10.36 312 100
Customer 46 12.74 - - 28 7.76 250 69.25 37 15.25 361 100
Total 76 08 54 466 67
Mean 11.18 1.28 8.05 69.24 10.31 100
*Error due to rounding.
In terms of whether PHCN is committed to quality in all aspects because it
has vigorously pursued and adopted TQM; most of the respondents
comprising 69.23% for the PHCN staff and 69.25% of the customers agreed
that the organization is committed to quality in all aspects.
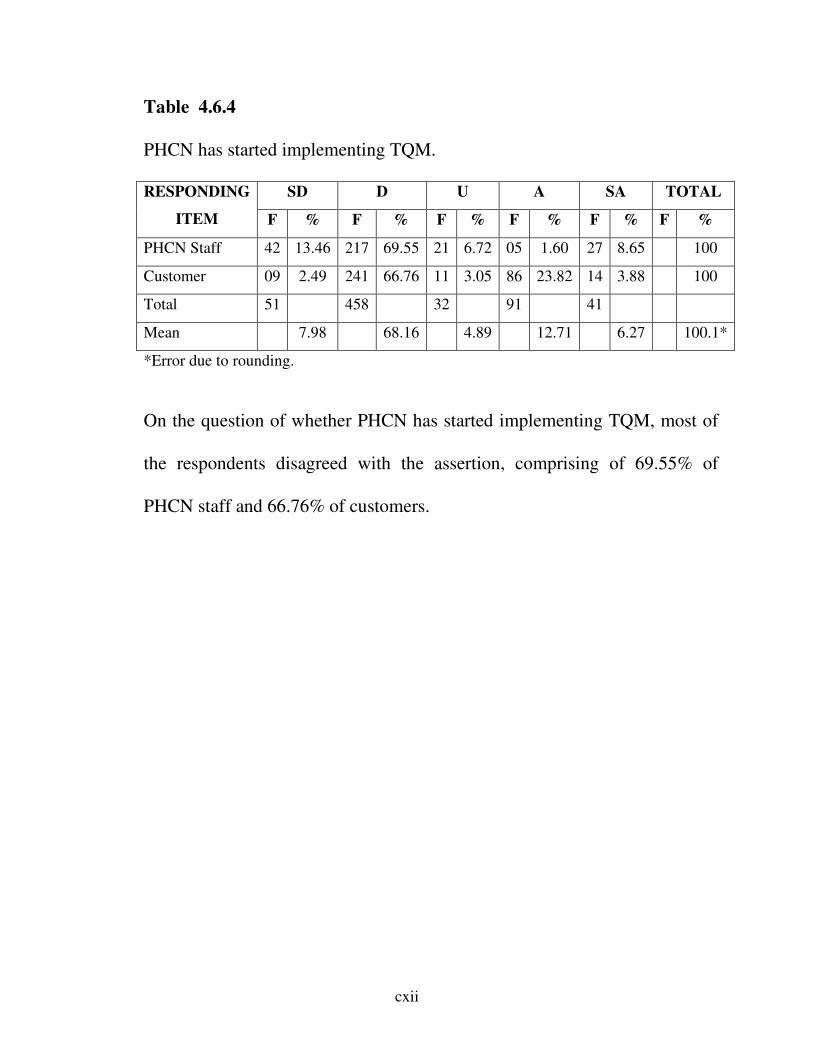
cxii
Table 4.6.4
PHCN has started implementing TQM.
RESPONDING
ITEM
SD D U A SA TOTAL
F % F % F % F % F % F %
PHCN Staff 42 13.46 217 69.55 21 6.72 05 1.60 27 8.65 100
Customer 09 2.49 241 66.76 11 3.05 86 23.82 14 3.88 100
Total 51 458 32 91 41
Mean 7.98 68.16 4.89 12.71 6.27 100.1*
*Error due to rounding.
On the question of whether PHCN has started implementing TQM, most of
the respondents disagreed with the assertion, comprising of 69.55% of
PHCN staff and 66.76% of customers.
cxiii
4.7 TEST OF HYPOTHESIS
The hypotheses raised in the study are tested in part of the chapter.
HYPOTHESIS I:
There is a positive relationship between top management support for quality
and prospects of TQM in PHCN.
Level of Significance
α = 0.05
Test Statistic
Kari – Pearson’s product – moment correlation coefficient using the
Statistical Package for Social Sciences (SPSS).
Decision Criterion
Reject Ho if the calculated value of the test statistic exceeds the tabulated of
if the p-value is less than the level of significance.
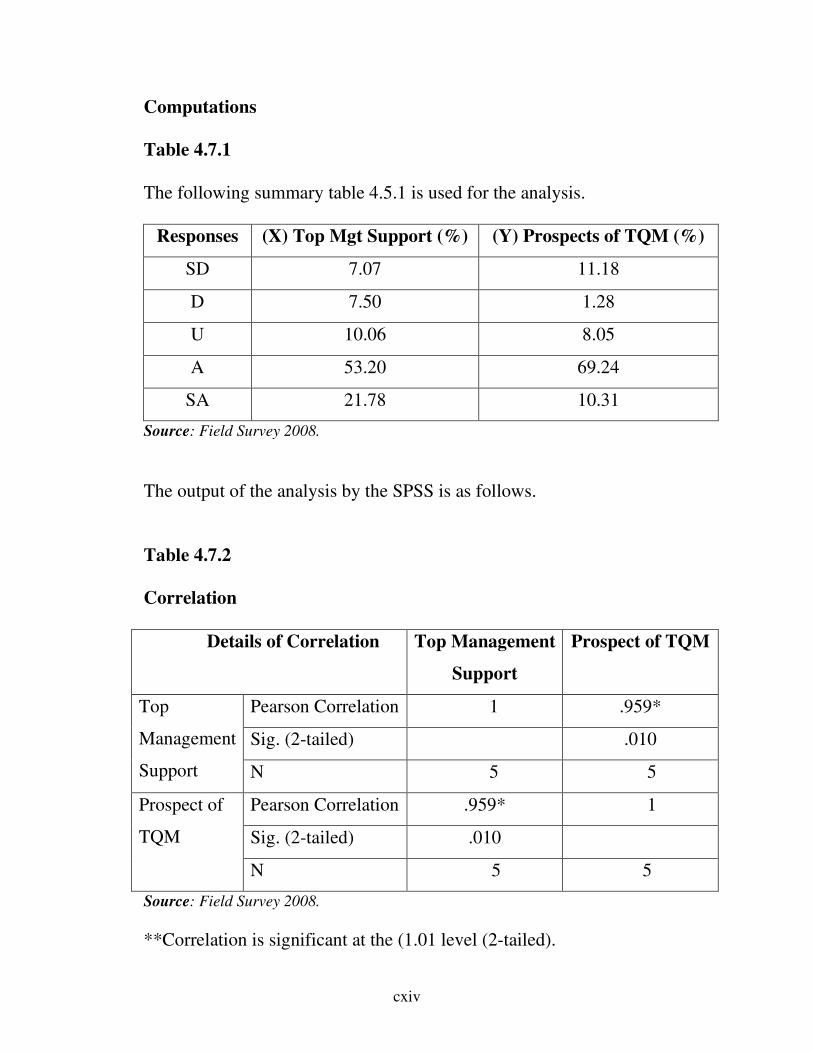
cxiv
Computations
Table 4.7.1
The following summary table 4.5.1 is used for the analysis.
Responses (X) Top Mgt Support (%) (Y) Prospects of TQM (%)
SD 7.07 11.18
D 7.50 1.28
U 10.06 8.05
A 53.20 69.24
SA 21.78 10.31
Source: Field Survey 2008.
The output of the analysis by the SPSS is as follows.
Table 4.7.2
Correlation
Details of Correlation Top Management
Support
Prospect of TQM
Top
Management
Support
Pearson Correlation 1 .959*
Sig. (2-tailed) .010
N 5 5
Prospect of
TQM
Pearson Correlation .959* 1
Sig. (2-tailed) .010
N 5 5
Source: Field Survey 2008.
**Correlation is significant at the (1.01 level (2-tailed).
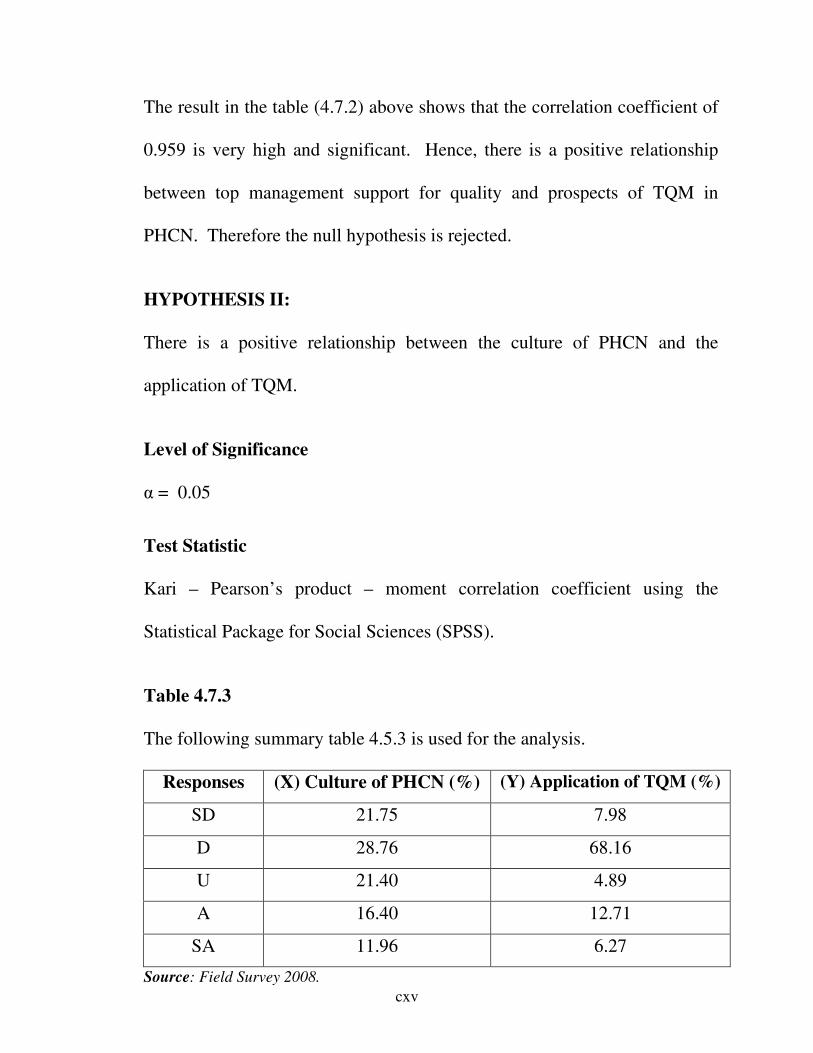
cxv
The result in the table (4.7.2) above shows that the correlation coefficient of
0.959 is very high and significant. Hence, there is a positive relationship
between top management support for quality and prospects of TQM in
PHCN. Therefore the null hypothesis is rejected.
HYPOTHESIS II:
There is a positive relationship between the culture of PHCN and the
application of TQM.
Level of Significance
α = 0.05
Test Statistic
Kari – Pearson’s product – moment correlation coefficient using the
Statistical Package for Social Sciences (SPSS).
Table 4.7.3
The following summary table 4.5.3 is used for the analysis.
Responses (X) Culture of PHCN (%) (Y) Application of TQM (%)
SD 21.75 7.98
D 28.76 68.16
U 21.40 4.89
A 16.40 12.71
SA 11.96 6.27
Source: Field Survey 2008.
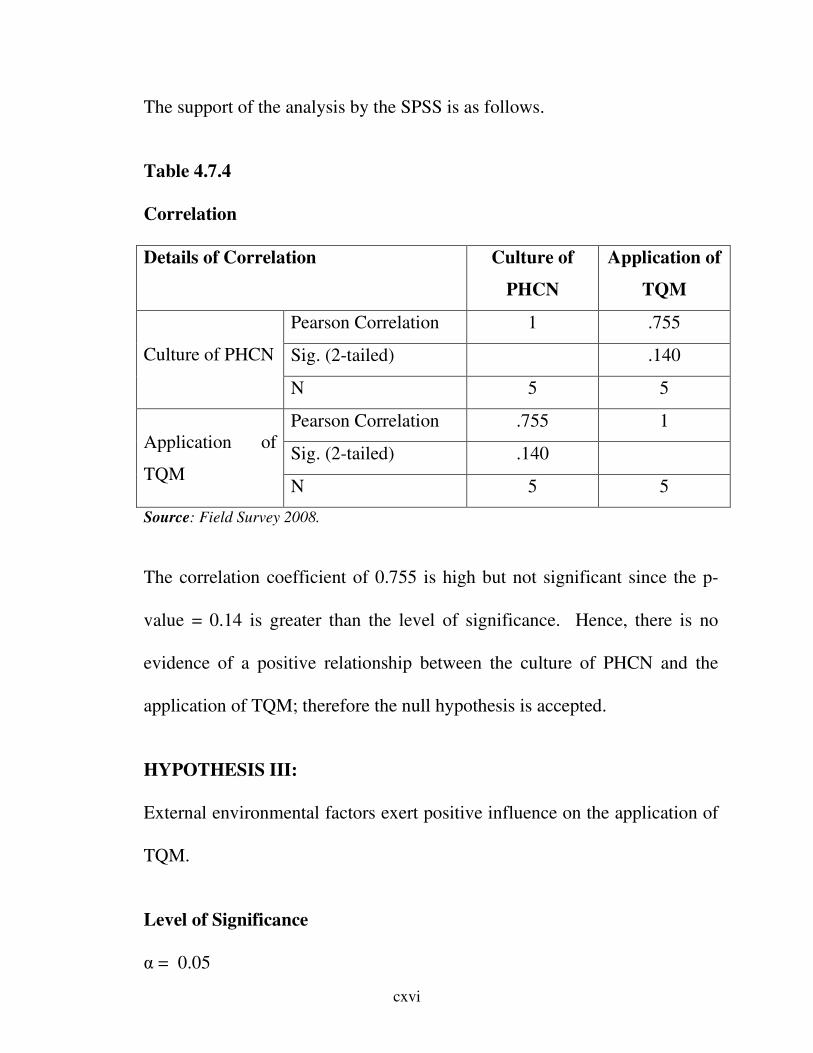
cxvi
The support of the analysis by the SPSS is as follows.
Table 4.7.4
Correlation
Details of Correlation Culture of
PHCN
Application of
TQM
Culture of PHCN
Pearson Correlation 1 .755
Sig. (2-tailed) .140
N 5 5
Application of
TQM
Pearson Correlation .755 1
Sig. (2-tailed) .140
N 5 5
Source: Field Survey 2008.
The correlation coefficient of 0.755 is high but not significant since the p-
value = 0.14 is greater than the level of significance. Hence, there is no
evidence of a positive relationship between the culture of PHCN and the
application of TQM; therefore the null hypothesis is accepted.
HYPOTHESIS III:
External environmental factors exert positive influence on the application of
TQM.
Level of Significance
α = 0.05
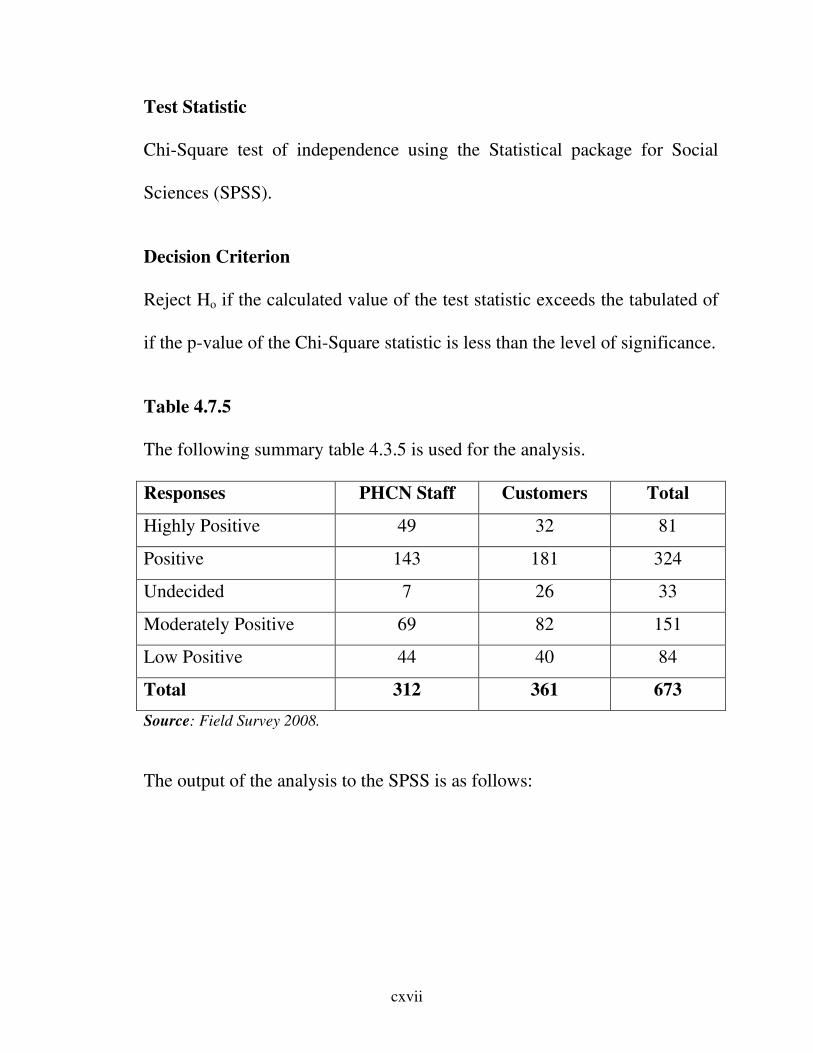
cxvii
Test Statistic
Chi-Square test of independence using the Statistical package for Social
Sciences (SPSS).
Decision Criterion
Reject Ho if the calculated value of the test statistic exceeds the tabulated of
if the p-value of the Chi-Square statistic is less than the level of significance.
Table 4.7.5
The following summary table 4.3.5 is used for the analysis.
Responses PHCN Staff Customers Total
Highly Positive 49 32 81
Positive 143 181 324
Undecided 7 26 33
Moderately Positive 69 82 151
Low Positive 44 40 84
Total 312 361 673
Source: Field Survey 2008.
The output of the analysis to the SPSS is as follows:
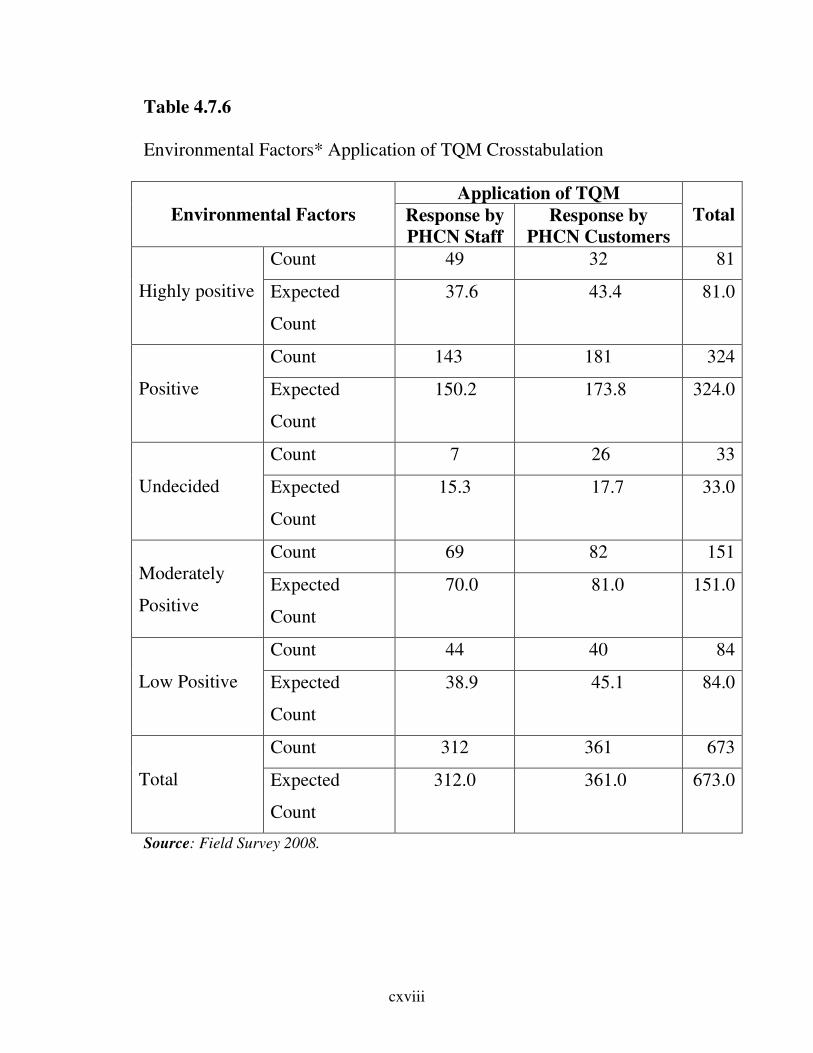
cxviii
Table 4.7.6
Environmental Factors* Application of TQM Crosstabulation
Environmental Factors
Application of TQM
Total Response by
PHCN Staff
Response by
PHCN Customers
Highly positive
Count 49 32 81
Expected
Count
37.6 43.4 81.0
Positive
Count 143 181 324
Expected
Count
150.2 173.8 324.0
Undecided
Count 7 26 33
Expected
Count
15.3 17.7 33.0
Moderately
Positive
Count 69 82 151
Expected
Count
70.0 81.0 151.0
Low Positive
Count 44 40 84
Expected
Count
38.9 45.1 84.0
Total
Count 312 361 673
Expected
Count
312.0 361.0 673.0
Source: Field Survey 2008.
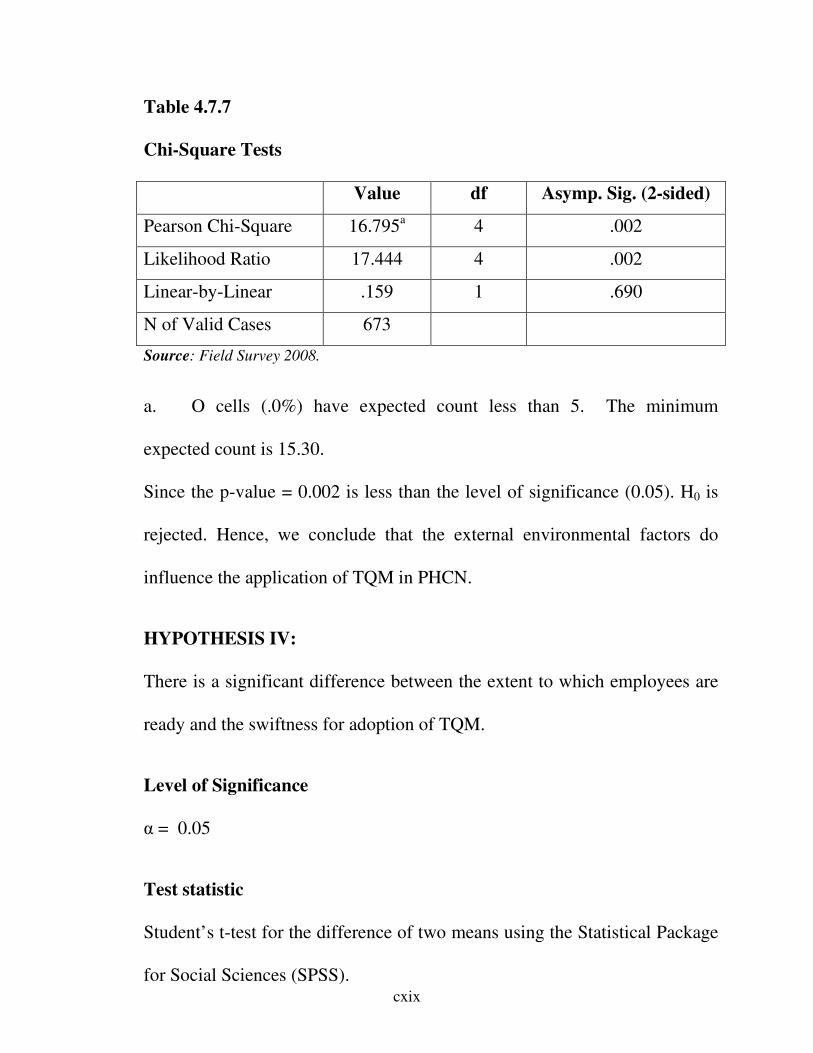
cxix
Table 4.7.7
Chi-Square Tests
Value df Asymp. Sig. (2-sided)
Pearson Chi-Square 16.795a 4 .002
Likelihood Ratio 17.444 4 .002
Linear-by-Linear .159 1 .690
N of Valid Cases 673
Source: Field Survey 2008.
a. O cells (.0%) have expected count less than 5. The minimum
expected count is 15.30.
Since the p-value = 0.002 is less than the level of significance (0.05). H0 is
rejected. Hence, we conclude that the external environmental factors do
influence the application of TQM in PHCN.
HYPOTHESIS IV:
There is a significant difference between the extent to which employees are
ready and the swiftness for adoption of TQM.
Level of Significance
α = 0.05
Test statistic
Student’s t-test for the difference of two means using the Statistical Package
for Social Sciences (SPSS).
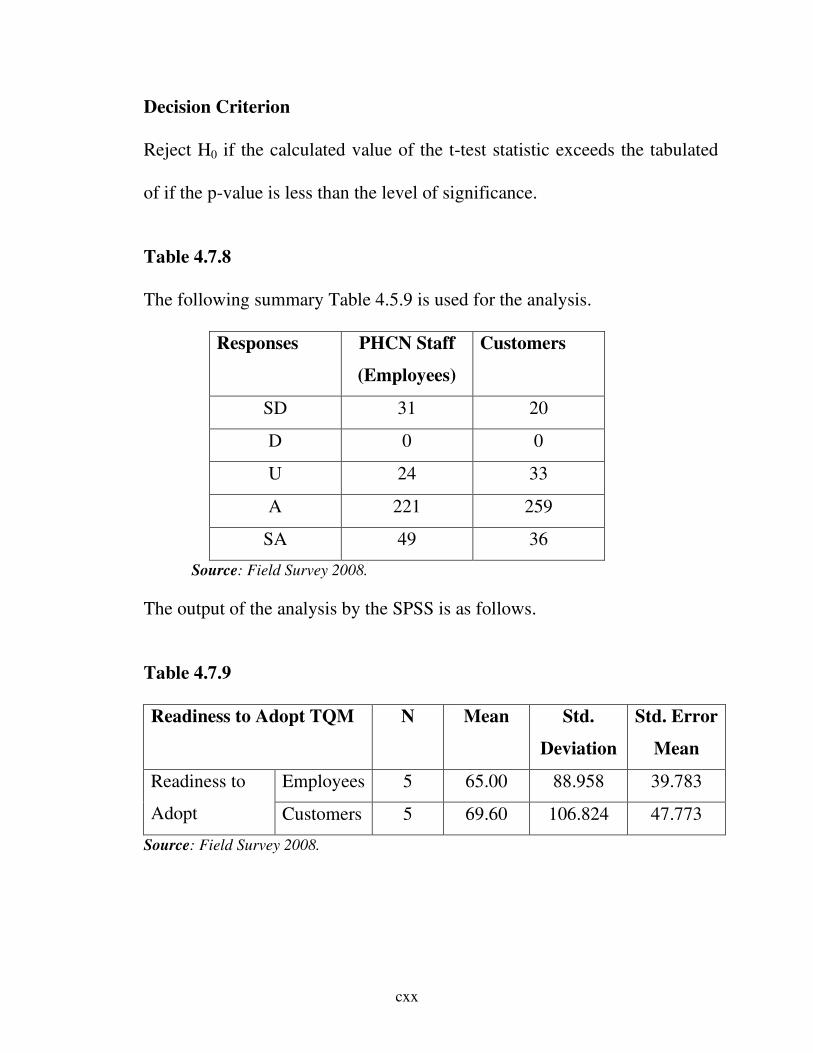
cxx
Decision Criterion
Reject H0 if the calculated value of the t-test statistic exceeds the tabulated
of if the p-value is less than the level of significance.
Table 4.7.8
The following summary Table 4.5.9 is used for the analysis.
Responses PHCN Staff
(Employees)
Customers
SD 31 20
D 0 0
U 24 33
A 221 259
SA 49 36
Source: Field Survey 2008.
The output of the analysis by the SPSS is as follows.
Table 4.7.9
Readiness to Adopt TQM N Mean Std.
Deviation
Std. Error
Mean
Readiness to
Adopt
Employees 5 65.00 88.958 39.783
Customers 5 69.60 106.824 47.773
Source: Field Survey 2008.
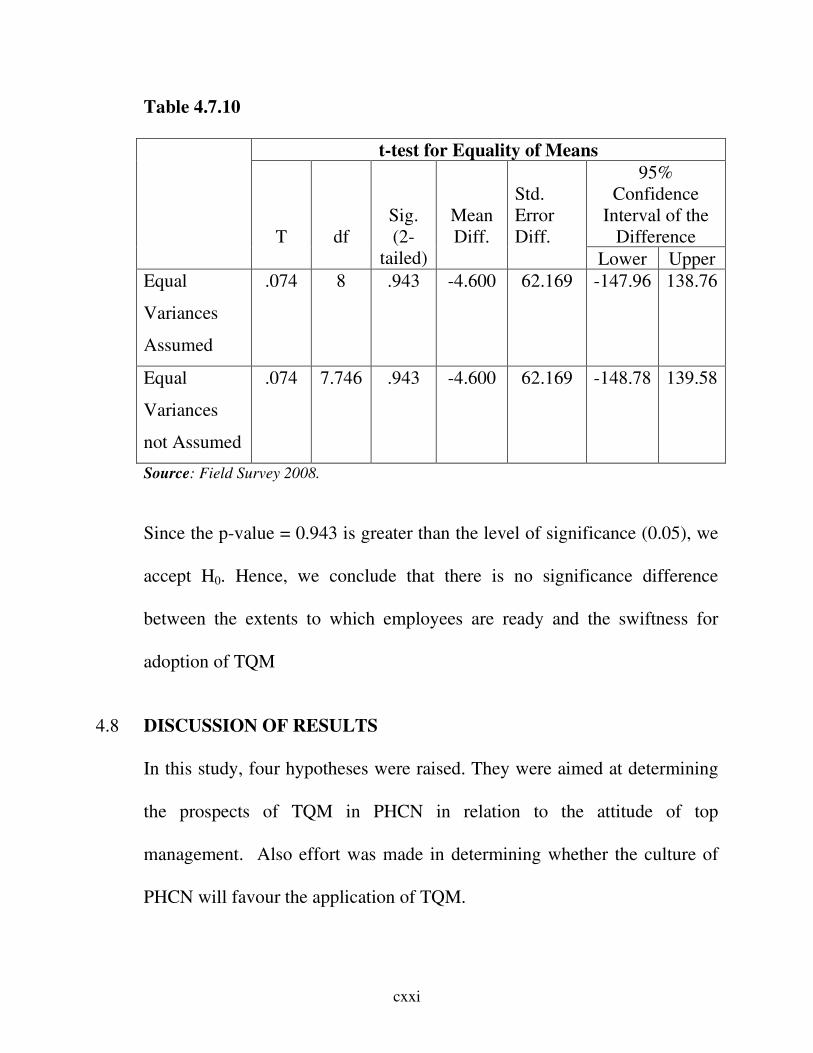
cxxi
Table 4.7.10
t-test for Equality of Means
T
df
Sig.
(2-
tailed)
Mean
Diff.
Std.
Error
Diff.
95%
Confidence
Interval of the
Difference
Lower Upper
Equal
Variances
Assumed
.074 8 .943 -4.600 62.169 -147.96 138.76
Equal
Variances
not Assumed
.074 7.746 .943 -4.600 62.169 -148.78 139.58
Source: Field Survey 2008.
Since the p-value = 0.943 is greater than the level of significance (0.05), we
accept H0. Hence, we conclude that there is no significance difference
between the extents to which employees are ready and the swiftness for
adoption of TQM
4.8 DISCUSSION OF RESULTS
In this study, four hypotheses were raised. They were aimed at determining
the prospects of TQM in PHCN in relation to the attitude of top
management. Also effort was made in determining whether the culture of
PHCN will favour the application of TQM.
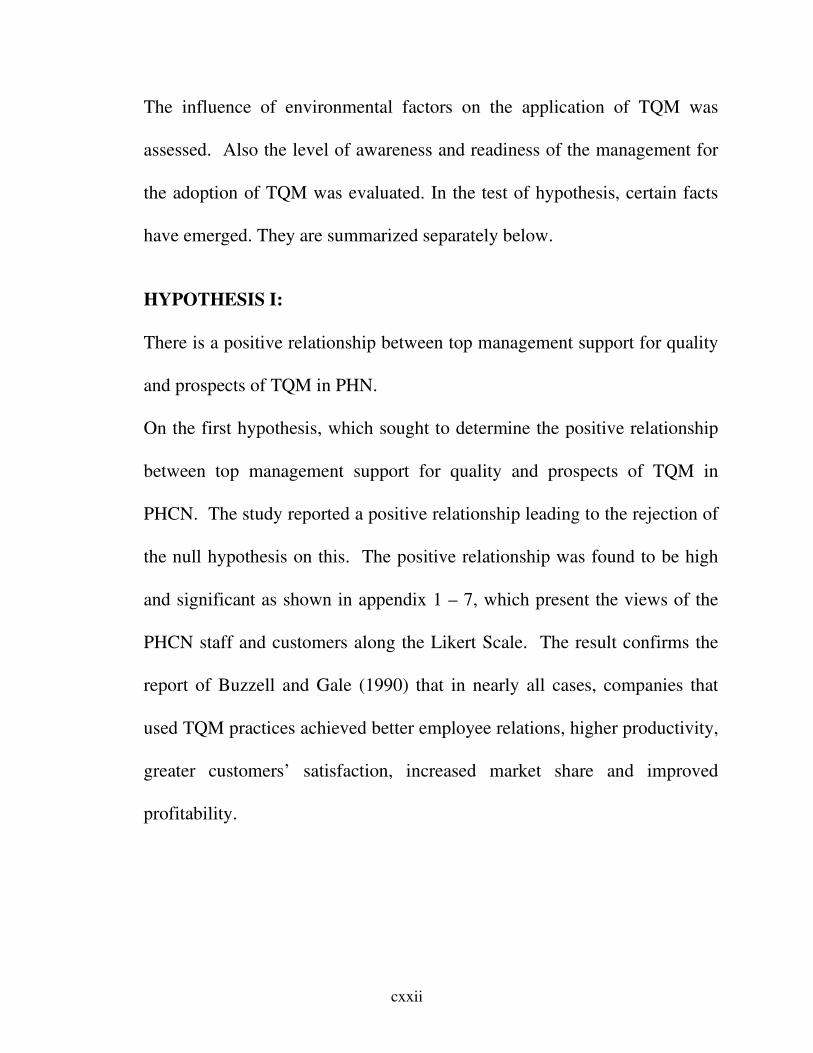
cxxii
The influence of environmental factors on the application of TQM was
assessed. Also the level of awareness and readiness of the management for
the adoption of TQM was evaluated. In the test of hypothesis, certain facts
have emerged. They are summarized separately below.
HYPOTHESIS I:
There is a positive relationship between top management support for quality
and prospects of TQM in PHN.
On the first hypothesis, which sought to determine the positive relationship
between top management support for quality and prospects of TQM in
PHCN. The study reported a positive relationship leading to the rejection of
the null hypothesis on this. The positive relationship was found to be high
and significant as shown in appendix 1 – 7, which present the views of the
PHCN staff and customers along the Likert Scale. The result confirms the
report of Buzzell and Gale (1990) that in nearly all cases, companies that
used TQM practices achieved better employee relations, higher productivity,
greater customers’ satisfaction, increased market share and improved
profitability.
cxxiii
HYPOTHESIS II:
There is positive relationship between the culture of PHCN and the
application of TQM.
The hypothesis tested the extent of the relationship between the culture of
PHCN and the application of TQM in the test of the hypothesis as shown in
appendix 8 – 11 the correlation coefficient of 0.755 is high but not
significant, since the p value – 0.14 is greater than the level of significance,
hence, the null hypothesis is accepted, which concludes that there is no
evidence of a positive relationship between the culture of PHCN and the
application of TQM. This result aligns with Wilkins (1994:60) who
maintains that a culture cannot be forced into existence by policy, but it can
be effectively steered and evolved through the resolve application of
appropriate employee education and training. Further evidence is provided
by Atkinson (1990:256-261) that the effect of TQM on organizational
culture should not be estimated, as it radically influences an organization’s
strategy and is geared to changing culture in a long term.
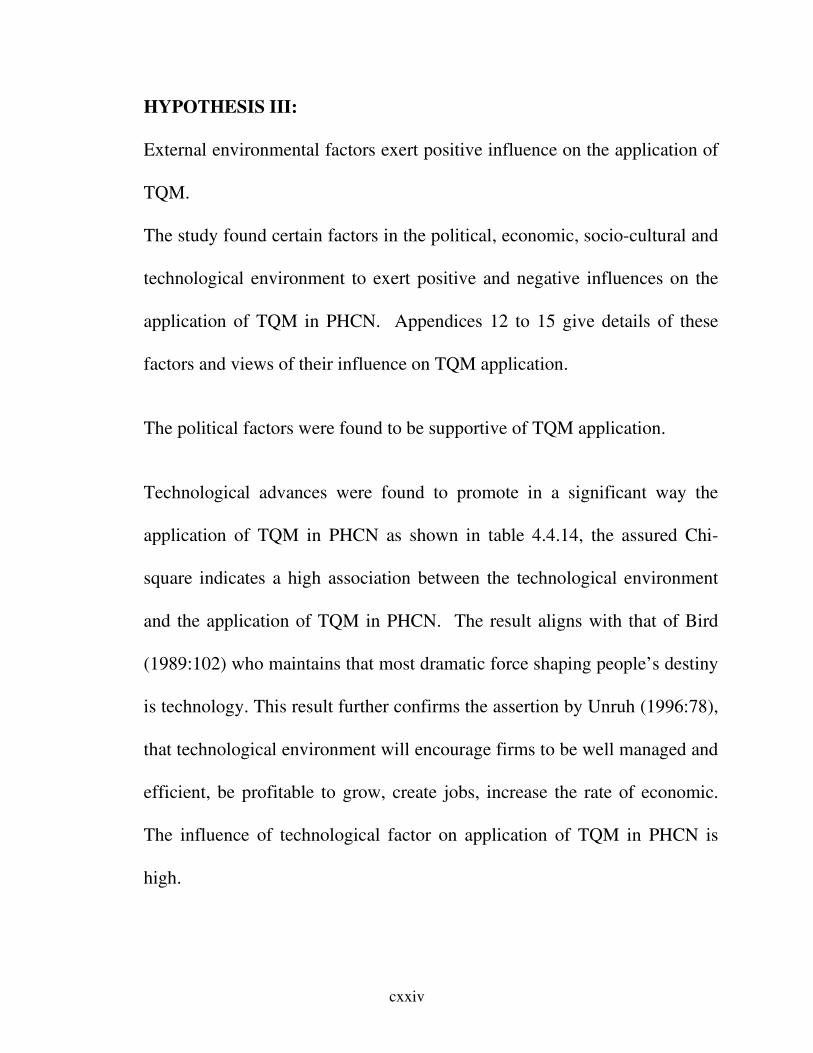
cxxiv
HYPOTHESIS III:
External environmental factors exert positive influence on the application of
TQM.
The study found certain factors in the political, economic, socio-cultural and
technological environment to exert positive and negative influences on the
application of TQM in PHCN. Appendices 12 to 15 give details of these
factors and views of their influence on TQM application.
The political factors were found to be supportive of TQM application.
Technological advances were found to promote in a significant way the
application of TQM in PHCN as shown in table 4.4.14, the assured Chi-
square indicates a high association between the technological environment
and the application of TQM in PHCN. The result aligns with that of Bird
(1989:102) who maintains that most dramatic force shaping people’s destiny
is technology. This result further confirms the assertion by Unruh (1996:78),
that technological environment will encourage firms to be well managed and
efficient, be profitable to grow, create jobs, increase the rate of economic.
The influence of technological factor on application of TQM in PHCN is
high.
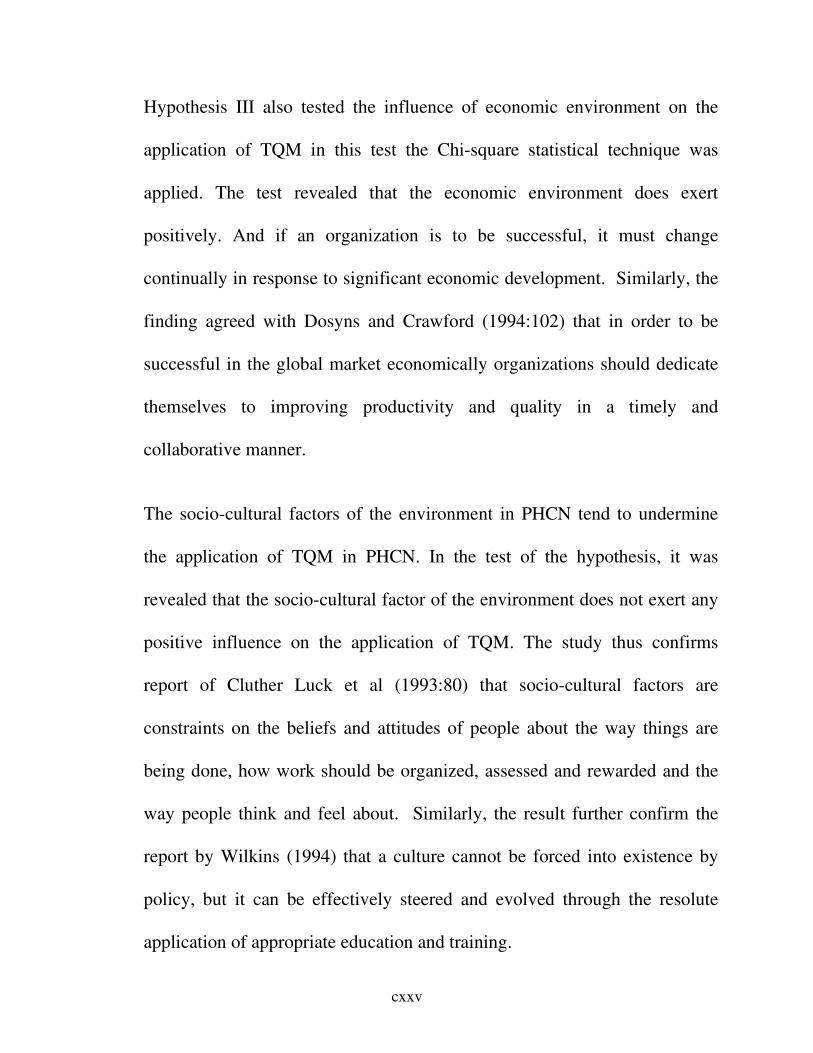
cxxv
Hypothesis III also tested the influence of economic environment on the
application of TQM in this test the Chi-square statistical technique was
applied. The test revealed that the economic environment does exert
positively. And if an organization is to be successful, it must change
continually in response to significant economic development. Similarly, the
finding agreed with Dosyns and Crawford (1994:102) that in order to be
successful in the global market economically organizations should dedicate
themselves to improving productivity and quality in a timely and
collaborative manner.
The socio-cultural factors of the environment in PHCN tend to undermine
the application of TQM in PHCN. In the test of the hypothesis, it was
revealed that the socio-cultural factor of the environment does not exert any
positive influence on the application of TQM. The study thus confirms
report of Cluther Luck et al (1993:80) that socio-cultural factors are
constraints on the beliefs and attitudes of people about the way things are
being done, how work should be organized, assessed and rewarded and the
way people think and feel about. Similarly, the result further confirm the
report by Wilkins (1994) that a culture cannot be forced into existence by
policy, but it can be effectively steered and evolved through the resolute
application of appropriate education and training.
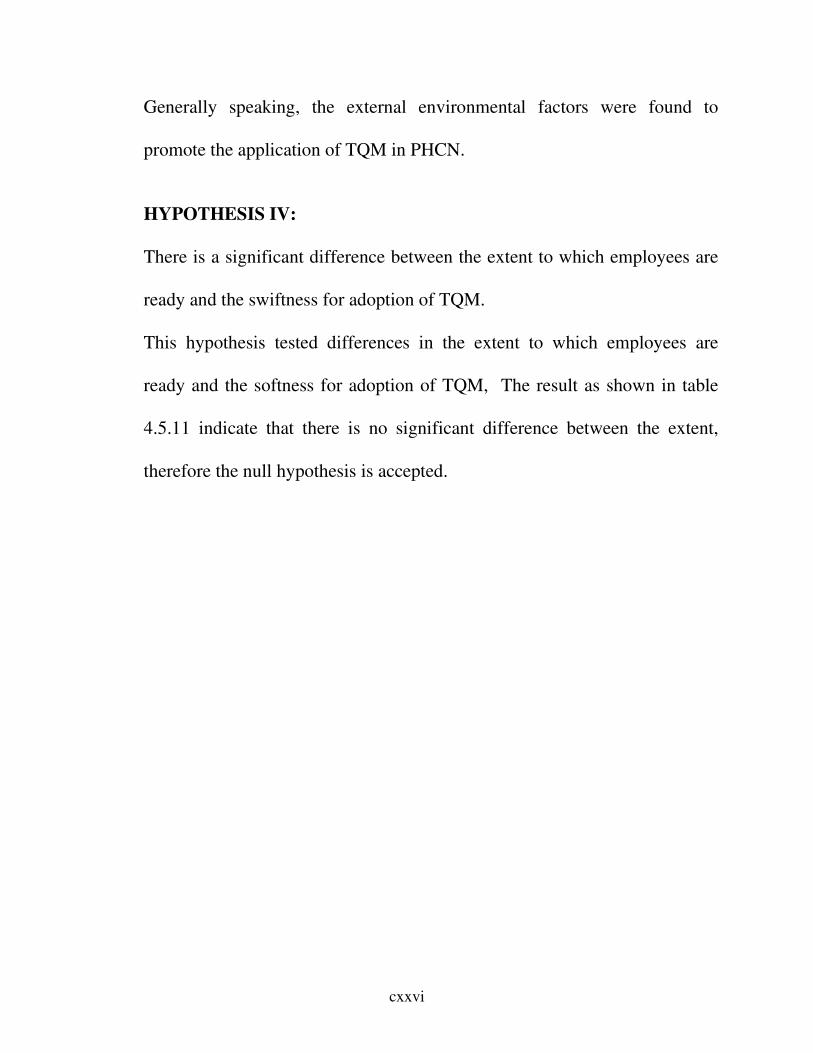
cxxvi
Generally speaking, the external environmental factors were found to
promote the application of TQM in PHCN.
HYPOTHESIS IV:
There is a significant difference between the extent to which employees are
ready and the swiftness for adoption of TQM.
This hypothesis tested differences in the extent to which employees are
ready and the softness for adoption of TQM, The result as shown in table
4.5.11 indicate that there is no significant difference between the extent,
therefore the null hypothesis is accepted.
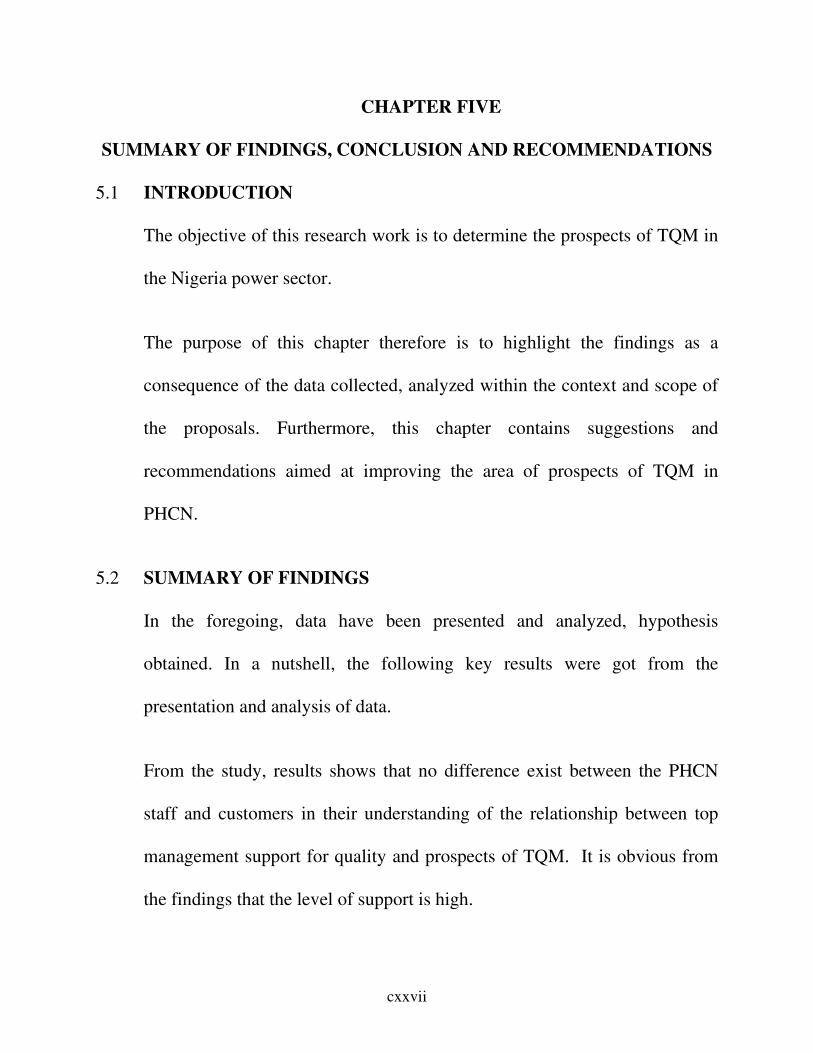
cxxvii
CHAPTER FIVE
SUMMARY OF FINDINGS, CONCLUSION AND RECOMMENDATIONS
5.1 INTRODUCTION
The objective of this research work is to determine the prospects of TQM in
the Nigeria power sector.
The purpose of this chapter therefore is to highlight the findings as a
consequence of the data collected, analyzed within the context and scope of
the proposals. Furthermore, this chapter contains suggestions and
recommendations aimed at improving the area of prospects of TQM in
PHCN.
5.2 SUMMARY OF FINDINGS
In the foregoing, data have been presented and analyzed, hypothesis
obtained. In a nutshell, the following key results were got from the
presentation and analysis of data.
From the study, results shows that no difference exist between the PHCN
staff and customers in their understanding of the relationship between top
management support for quality and prospects of TQM. It is obvious from
the findings that the level of support is high.
cxxviii
The study found out that the culture of PHCN does not favour the
application of TQM. It was also discovered that certain factors in the
political, economic, technological and socio-cultural environment that all of
them exert influences on the application of TQM.
The study reported no significant difference in the degree of readiness and
swiftness to adoption of TQM in PHCN.
5.3 CONCLUSION
The main thrust of this study was focused on the prospects of TQM in the
Nigeria power sector, a study of PHCN, Kaduna distribution office. Based
on the findings of the study, it is concluded that although top management
support for quality and prospects of TQM in PHCN is high but the extent of
application is low.
The culture of PHCN exerts negative pull on the application of TQM.
Environmental factors have positive influence on the application of TQM in
PHCN. However, the extent to which the staff are ready and swiftness for
action is low.
5.4 IMPLICATIONS OF THE STUDY
There is strong evidence that the prospects of TQM in PHCN is high. In this
vein, Buzzel and Gale (1990) stressed that in nearly all cases, companies that
cxxix
used TQM practices achieved better employee relations higher productivity,
greater customer satisfaction, increased market share and improved
profitability.
The bottom-line from the study is that effective TQM application and
implementations significantly improve financial performance, it does pay off
handsomely.
Also effective implementation means that the key principles of TQM such as
focus on customer satisfaction, employees, involvement and continuous
improvement are accepted, practiced and deployed within PHCN.
The evidence from the study shows that environmental factors exert
influence on the application of TQM in PHCN, for especially as shown by
both the PHCN staff and customers.
Therefore, there is the need for PHCN to be friendly with its environment,
this enable it to compete globally with firms in the power sector.
The evidence that the culture of PHCN exert no positive impact on the
application of TQM, therefore, firm that wants to implement TQM
effectively must have patience. It is widely accepted as stated by Heller
(1995) that TQM takes a long time to implement as it requires organizational
cxxx
changes in culture and employee mindset, hence, the prospects will be
realized in the long run. He emphasized that even after effective application
it still takes a couple of years before financial performance starts to improve.
5.5 SPECIFIC RECOMMENDATIONS
On the basis of the summary highlighted above the following suggestions
are recommended to strengthen the achievement of the prospect of TQM in
the Nigeria power sector. There is no gainsaying the fact that the prospect of
TQM has positive influence on its application in the Nigeria power sectors.
To fully reap the prospects of TQM the following are recommended for the
Nigeria power sector.
a. The Nigeria power sector with particular reference to PHCN should
initiate a company wide awareness of TQM through seminar and
workshop.
b. The PHCN staff should be adequately trained, and the content of
training of the staff should be such that will enhance the
implementation of the TQM.
c. For TQM to succeed or even transcends the expected or targeted
point, the top management has got to be committed to their role and
carry its people along. The entire workforce has to be indulged to
take ownership of the processes. Every PHCN staff should be
cxxxi
allowed and encouraged to contribute reasonably to quality
improvement and satisfaction of customers needs.
d. Organization, restructuring to suit the demands of TQM should be
undertaken to ensure complete customer satisfaction at every stage.
This will lead to not only zero defects but also getting it right first
time, this will pave the way for the organization to compete globally.
e. PHCN staff’s quality awareness and involvement through well
developed programme should be given wide publicity.
GENERAL RECOMMENDATIONS
a. Top management should be involved in continuous monitoring of the
progress of TQM at different units of the organization.
b. Government should create a conducive environment for TQM to
thrive, whereby quality improvement strategy should be evolved to
cover all the aspects of the organization.
c. International quality standard like the ISO 9000 could be invented to
judge the acceptability of the service of the power sector.
d. Review procedures should be established.
e. External consultants can be employed on the criteria to be used for the
international standard for measuring the quality of service of the
power sector.
cxxxii
f. There is also need for prudential arrangements, adequate supervision
and consistent maintenance of the structures put in place.
g. There is the need for cooperation between the regulators and the
operations, such that the rate of the regulatory authorities must be
such that creates an enabling environment for the power sector to
operate.
5.6 SUGGESTION FOR FURTHER READING
Having undertaken the research on the prospects of TQM in the Nigeria
power sector consulting, a wide range of validated texts I would recommend
that, future researchers on the same topic should adopt other instruments like
interview and observation or comparative analysis with a wider coverage of
literacy texts to confirm or disapprove the findings in the study.
Also a study should be replicated in other part of the country in order to
confirm or disapprove the finding of the study.
cxxxiii
BIBLIOGRAPHY
Almaraz, Y. (1994), “Quality Management and the Process of Change”, Journal of
Organisational Change Management 2, No. 1.
Atkinson, P.E. (1990), Creating Cultural Change: The Key to Successful Total
Quality Management. London: International Press Limited.
Badiru, A. and Ayeni, B. (1999), Think About Quality Advances in Management.
Vol. 18, No. 2.
Benson, P.G. and Savaph, J.V. (1990), “The Effects of Organisation Context on
Total Quality Management: An Empirical Investigation; Management
Sciences”, 37, No. 9.
Bulmer, M. (1986), Social Research in Developing Countries: Surveys and
Censuses in Third World. 3rd
edition, Chichester: John Wiley and Sons
Limited.
Buzzell, R.D. and Gale, B.T. (1990), The PIMS Principles; Linking Strategy to
Performance. New York: The Free Press.
Christopher, M. (1994), Customer Service and Logistic Strategy. 3rd
edition:
Torrent, Heinemann.
Clampa, D. (1992), Total Quality: A Uder’s Reference Guide for Implementation.
New Jersey: Addison Wesley Publishing Co.
Clutter Buck, David, et al (1993), Inspired Customer Service: Strategies for
Service Quality. London: Kogan Page Ltd.
Cole, R.E. (1999), Managing Quality Fads. Oxford: Oxford University Press.
Creech, B. (1994), The Five Pillars of Total Quality Management, New York
Truma Tailley Books.
Croning, E. and Taylor, R.L. (1994), “Don’t Count Total Quality Management
(TQM) Out” Quality Process.
cxxxiv
Dahlgaard, J.; Kristensen; Kai, K. & Gopal, K. (1998), Fundamentals of Total
Quality Management. London: Chapman and Hall.
Dean, J.W. & Bowan, D.E. (1994), “Management Theory and Total Quality:
improving Research and Practice Theory Development”. Academy of
Management Review, 19(3).
Deming, E. (1986), Out of the Crisis. Cambridge, MA: MIT Centre for Advanced
Engineering.
Depew, D. (1994), “Implementing Total Quality Management in Higher
Education”. ATEA Journal.
Dobyns, B. & Crawford, J. (1994), Organisational Changes and Development: A
System View. California: Good Year Publishing Company.
Easton, G.S & Jarell, S.L. (1998), “The Effects of Total Quality Management on
Corporate Performance: An Empirical Investigation”, Journal of Business
Vol. 71, No. 2.
Edward, E. & Lawlex Gerald, E.L. (1995), “Creating High Performance
Organisation”. Practices and Results of Employee Employment in Total
Quality Management. San Francisco, Jossey-Bais Publishers.
Eke, A.O. (2001), “SWOT Analysis and Managing Change”, in Ewurum UJT (ed),
Managing Service Quality in the Nigerian Public Sector. Enugu: Smart Link
Publishers.
Feiganbaum, A.V. (1961), Total Quality Engineering and Management. New
Delhi: McGraw Hill Book Company Inc.
Garvin, A.D. (1988), Managing Quality. New York: Free Press.
George, S. (2002), “Bull or Bear?” The Q-100 Proves That If You Have Quality
You will Beat The Market. Quality Progress Journal Vol. 8.
Gilbert, J. (1992), A Slice to Slice Guide to Total Quality Management. New Delhi:
Tudor Business Publishing.
Hedges, B. (1996), Sampling Survey Research Practice. London: Heinemann.
cxxxv
Heller, B. (1995), Quality Costing. 3rd
edition, London: Chapman and Heul.
Henderick, K.B. & Singhal, V.R. (2001), “Does Implementing and Effective Total
Quality Management Programme Actually Improve Operating Performance”.
Management Service, Vol. 43, No. 9.
Horovits, E.B. & Panak, G. (2002), “Is Quality Dead?”, 11E Solution. Heinemann:
Retrieved from www.isixsingma.com.
Iornum, D. (1998), How to be a Good Manager in 10 Minutes and Other Essay.
Kaduna: JVC Press.
Ismaila, H. (2004), An Introduction to the Study of Total Quality Management.
University Press, Zaria.
Jablonski, J.R. (1992), Implementing Total Quality Management. 2nd
edition,
Technical Management Consortium Inc.
Kilman, H.R.; SDaxton, J.M.; & Serpa, R. (1986), Understanding and Changing
Culture. California: Management Review, Winter.
MacDonald, J. (1993), Understanding Total Quality Management in a Week,
Corby: Institute of Management Foundation.
Management Practices: “US Companies Improves Performance through Quality”.
United States General Accounting Office (GAO/NSIAD), 1994.
Martin, L. (1993), “Total Quality Management in the Public Sector”. National
Productivity.
Meekyaa, U.J. (1992), The Preparation and Presentation of Research Projects: An
Electric Guide. Jos, Nigeria: Planning Research Publication.
Myoung, et al. (2002), Total Quality Management. New Jersey: Prentice Hall, Inc.
Nwosu, I.E. (2001), “Service Quality and Customer Expectations”, in Ewurum
UJF (ed) Managing Service Quality in the Nigerian Public Sector. Enugu:
Smart Link Publishers.
Oakland, J. (1995), Total Quality Management: Text with Cases, Oxford Butterworth
Heinemann.
cxxxvi
Omanchonu, V.K. & Ross, J.E. (1994), Principles of Total Quality. Florida: St.
Lucie Press.
Osuala, E.C. (1991), Introduction to Research Methodology. Enugu: Africana-FEP
Publishers Limited.
Ranpsey, J. & Roberts, H. (1992), Perspectives on Total Quality: Proceedings of
Total Quality Forum IV. Cincinnati, Ohio.
Roass, E.J. (1995), “Total Quality Management”. Text Cases and Readings,
Florida: St Lucie Press.
Robson, J. (2002), Adapting Quality Management: Public Administration Review.
Ryan, F.R. (1998), “The Proverbs of Total Quality Management: Recharting the
Path”, Public Productivity and Management Review, 16(1).
Stahl, J.M. (1995), Management: Total Quality in a Global Environment. Oxford:
Blackwell Publishers Ltd.
Teck, D.C. & Tobia, P.M. (2000), Moving Organisational Mountains. New Delhi:
Quality Press.
Unruh, A.J. (1996), “Customers Mean Business”. Six Steps to Building
Relationships that Last Reading. Addison-Wesley Publishing Co.
Wakhilu, N. (1995), Total Quality Management: Quality in Manufacturing. Vol.
18, No. 2.
Walpole, R.E. (1984), Introduction to Statistics. 2nd
edition, New York: Macmillan
Publishing Co. Inc.
Weihrich, Heinz and Koontz (1994), Management: A Global Perspective Lothed,
New York: McGraw-Hill.
Wilkins, H.R. (1994), The Quality Empowered Business. New Jersey: Prentice
Hall.
Wilkinson, Adrain, Redman, TOM (1998), Managing With Total Quality
Management: Theory and Practice. London: Macmillan Business.
cxxxvii
APPENDIX I
LETTER OF INTRODUCTION
Department of Management,
Faculty of Business Administration,
University of Nigeria,
Enugu Campus.
31st March, 2008.
The Chief Operating Officer,
_______________________
_______________________
_______________________
QUESTIONNAIRE ON THE PROSPECTS OF TOTAL QUALITY
MANAGEMENT IN THE NIGERIA POWER SECTOR (A STUDY OF POWER
HOLDING COMPANY OF NIGERIA, KADUNA DISTRIBUTION OFFICE)
I am a postgraduate student of Management of the University of Nigeria, Enugu Campus
and presently conducting a research work in respect of the above mentioned title in
partial fulfilment for the award of MSc. Management.
Consequently, I am requesting for your kind approval to distribute the Attached
questionnaire to PHCN staff and customers as your organisation is one selected for the
study.
It is envisaged that this study will help the Power Sector in adopting strategies that will
ensure effective application and proper implementation of the TQM in the sector. This
will create effectiveness and enhance the quality of service.
Thanks for your cooperation.
Yours faithfully,
Umar, Talatu Raiya

cxxxviii
APPENDIX II
LETTER OF INTRODUCTION
Department of Management,
Faculty of Business Administration,
University of Nigeria,
Enugu Campus.
31st March, 2008.
Dear Sir/Madam,
QUESTIONNAIRE ON THE PROSPECTS OF TOTAL QUALITY
MANAGEMENT IN THE NIGERIA POWER SECTOR (A STUDY OF
POWER HOLDING COMPANY OF NIGERIA, KADUNA DISTRIBUTION
OFFICE)
The questionnaire is defined for the collection of data that would enable the
researcher, an MSc. Management student of the above stated University, to carry
out the study on the above underlined subject matter. You are please required to
provide answers to the items on the questionnaire.
All responses to the questionnaire shall be treated in confidence and shall be used
strictly for academic purpose.
Thank you for your cooperation.
Yours faithfully,
Umar, Talatu Raiya
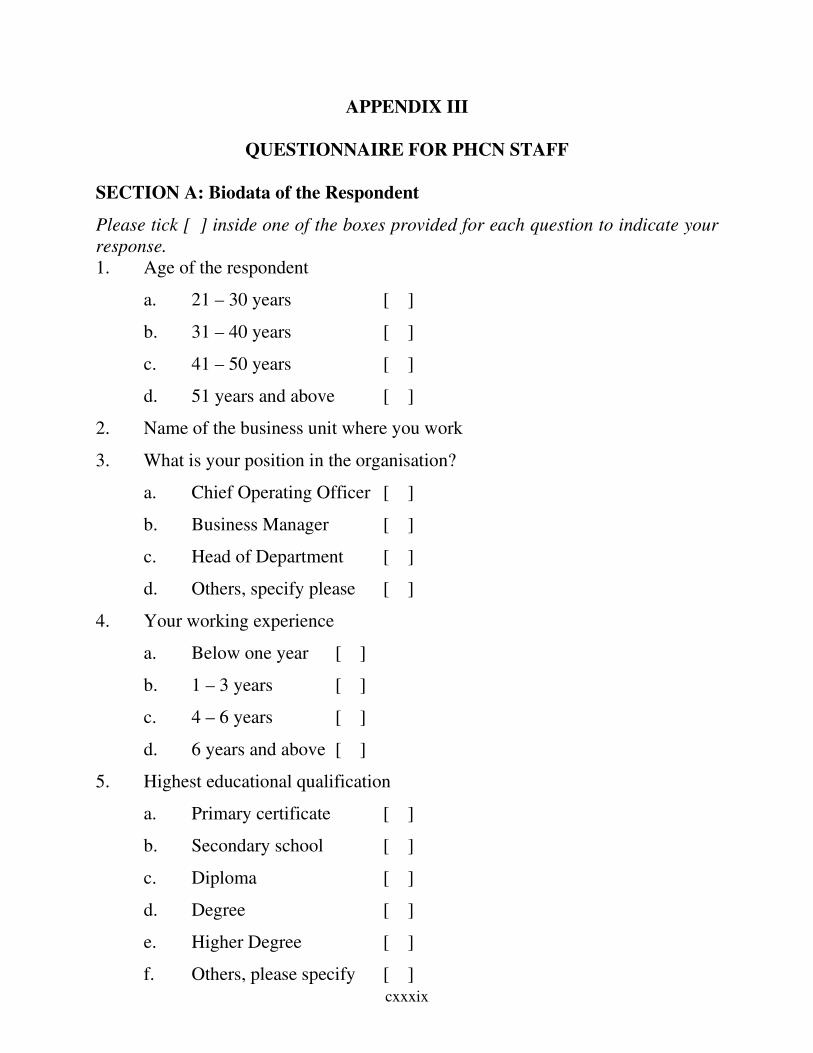
cxxxix
APPENDIX III
QUESTIONNAIRE FOR PHCN STAFF
SECTION A: Biodata of the Respondent
Please tick [] inside one of the boxes provided for each question to indicate your
response.
1. Age of the respondent
a. 21 – 30 years [ ]
b. 31 – 40 years [ ]
c. 41 – 50 years [ ]
d. 51 years and above [ ]
2. Name of the business unit where you work
3. What is your position in the organisation?
a. Chief Operating Officer [ ]
b. Business Manager [ ]
c. Head of Department [ ]
d. Others, specify please [ ]
4. Your working experience
a. Below one year [ ]
b. 1 – 3 years [ ]
c. 4 – 6 years [ ]
d. 6 years and above [ ]
5. Highest educational qualification
a. Primary certificate [ ]
b. Secondary school [ ]
c. Diploma [ ]
d. Degree [ ]
e. Higher Degree [ ]
f. Others, please specify [ ]
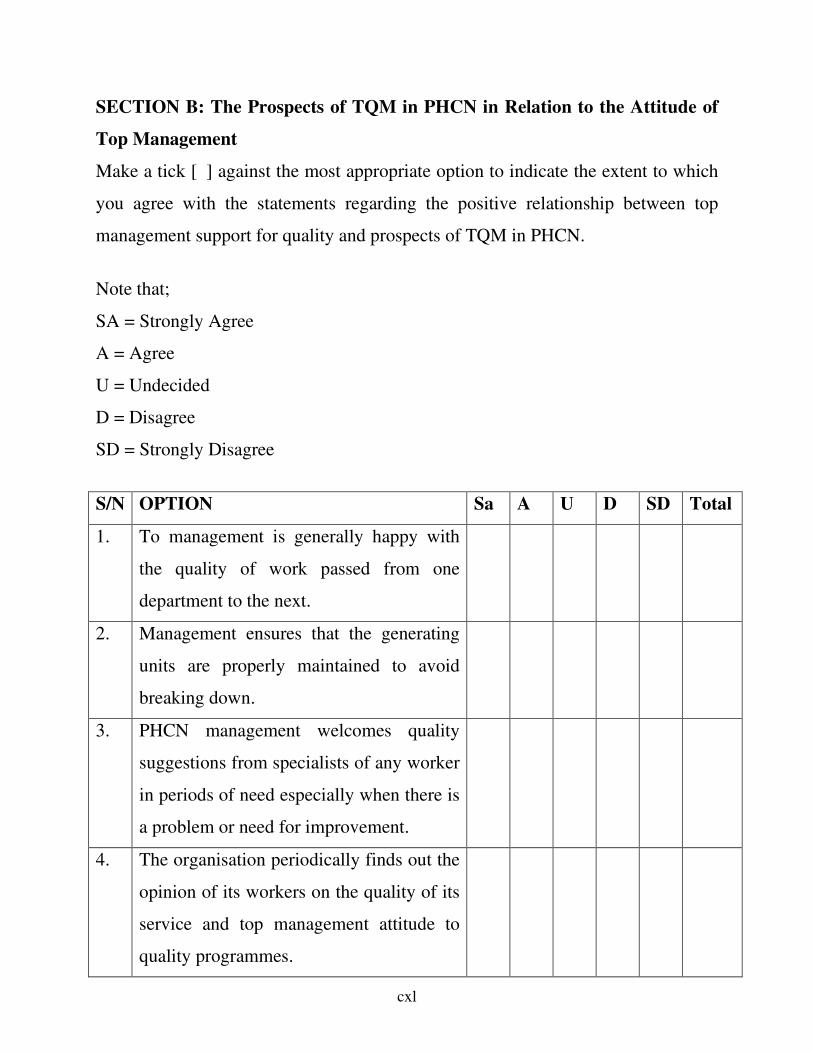
cxl
SECTION B: The Prospects of TQM in PHCN in Relation to the Attitude of
Top Management
Make a tick [] against the most appropriate option to indicate the extent to which
you agree with the statements regarding the positive relationship between top
management support for quality and prospects of TQM in PHCN.
Note that;
SA = Strongly Agree
A = Agree
U = Undecided
D = Disagree
SD = Strongly Disagree
S/N OPTION Sa A U D SD Total
1. To management is generally happy with
the quality of work passed from one
department to the next.
2. Management ensures that the generating
units are properly maintained to avoid
breaking down.
3. PHCN management welcomes quality
suggestions from specialists of any worker
in periods of need especially when there is
a problem or need for improvement.
4. The organisation periodically finds out the
opinion of its workers on the quality of its
service and top management attitude to
quality programmes.
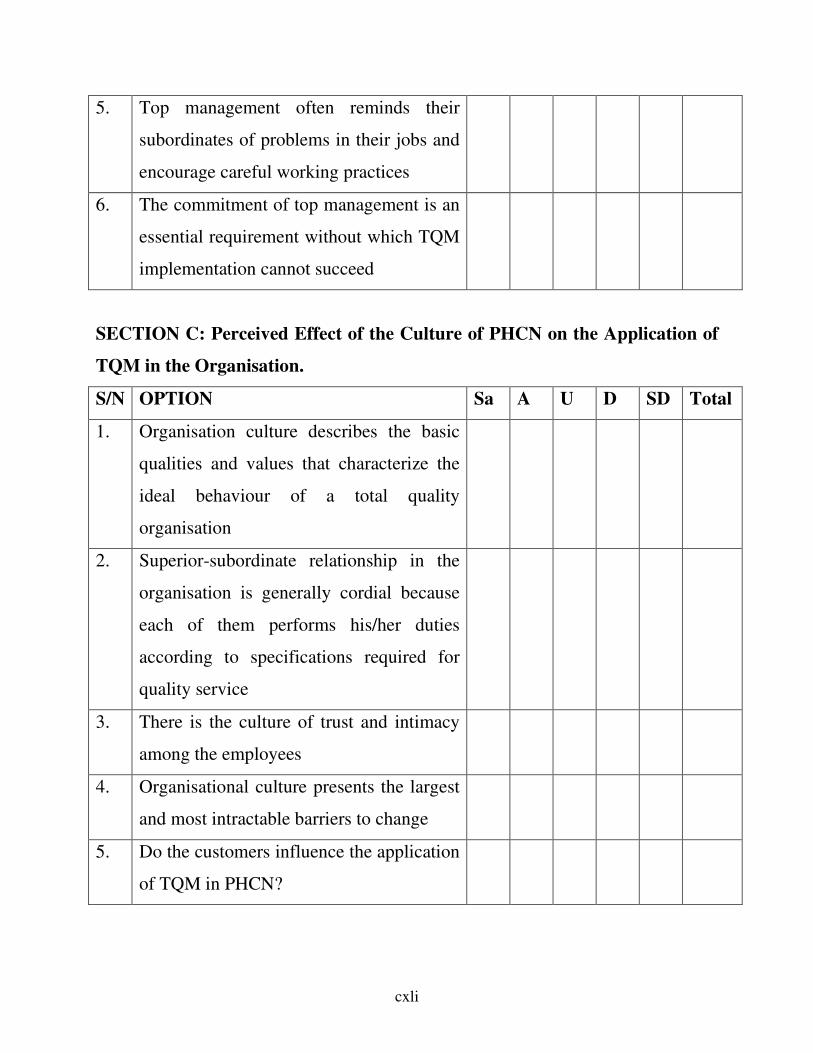
cxli
5. Top management often reminds their
subordinates of problems in their jobs and
encourage careful working practices
6. The commitment of top management is an
essential requirement without which TQM
implementation cannot succeed
SECTION C: Perceived Effect of the Culture of PHCN on the Application of
TQM in the Organisation.
S/N OPTION Sa A U D SD Total
1. Organisation culture describes the basic
qualities and values that characterize the
ideal behaviour of a total quality
organisation
2. Superior-subordinate relationship in the
organisation is generally cordial because
each of them performs his/her duties
according to specifications required for
quality service
3. There is the culture of trust and intimacy
among the employees
4. Organisational culture presents the largest
and most intractable barriers to change
5. Do the customers influence the application
of TQM in PHCN?
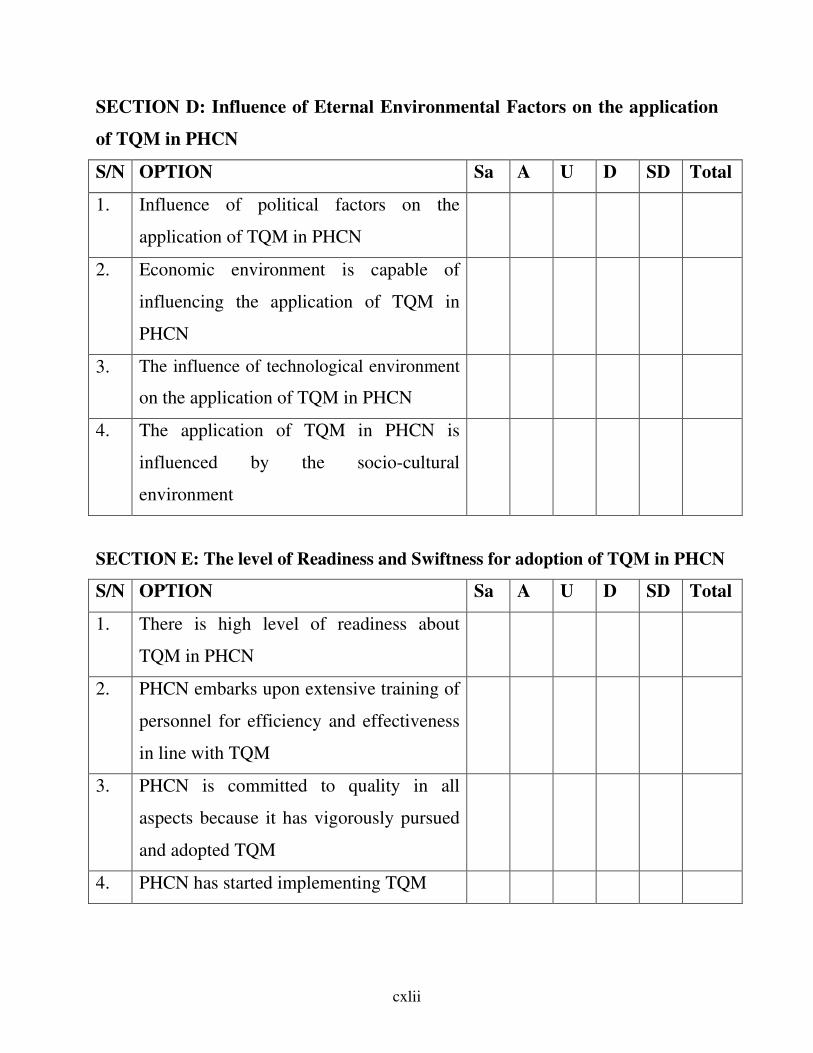
cxlii
SECTION D: Influence of Eternal Environmental Factors on the application
of TQM in PHCN
S/N OPTION Sa A U D SD Total
1. Influence of political factors on the
application of TQM in PHCN
2. Economic environment is capable of
influencing the application of TQM in
PHCN
3. The influence of technological environment
on the application of TQM in PHCN
4. The application of TQM in PHCN is
influenced by the socio-cultural
environment
SECTION E: The level of Readiness and Swiftness for adoption of TQM in PHCN
S/N OPTION Sa A U D SD Total
1. There is high level of readiness about
TQM in PHCN
2. PHCN embarks upon extensive training of
personnel for efficiency and effectiveness
in line with TQM
3. PHCN is committed to quality in all
aspects because it has vigorously pursued
and adopted TQM
4. PHCN has started implementing TQM
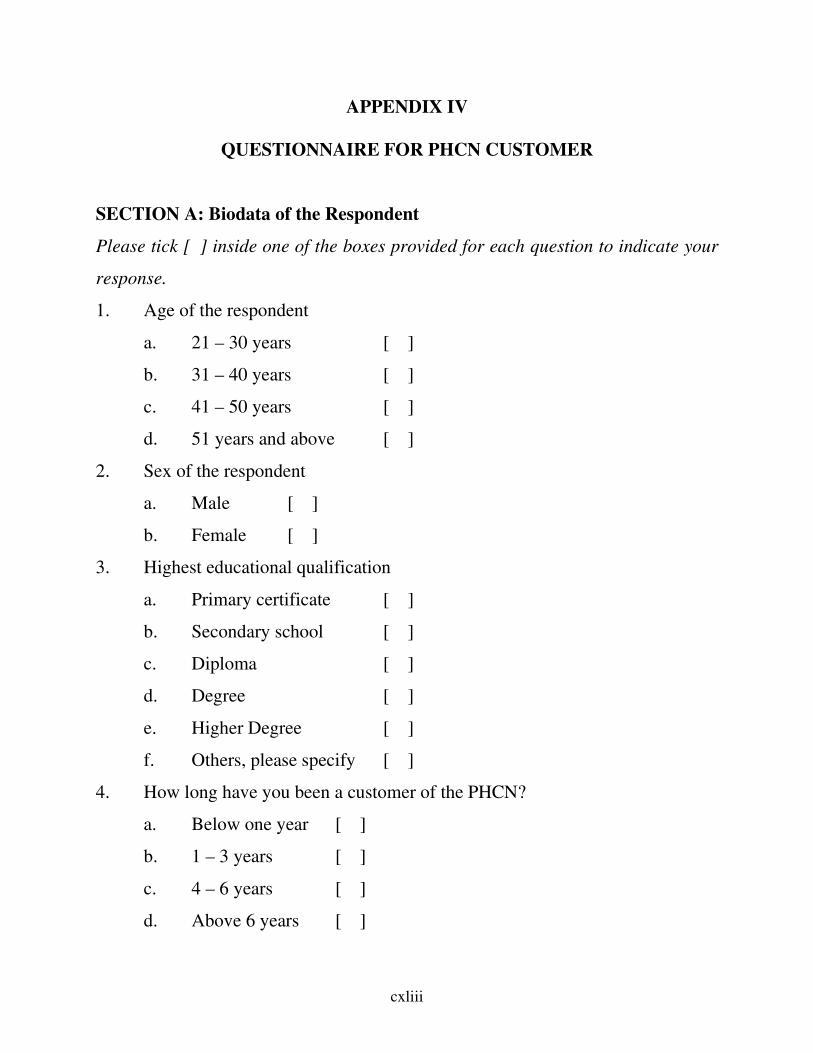
cxliii
APPENDIX IV
QUESTIONNAIRE FOR PHCN CUSTOMER
SECTION A: Biodata of the Respondent
Please tick [] inside one of the boxes provided for each question to indicate your
response.
1. Age of the respondent
a. 21 – 30 years [ ]
b. 31 – 40 years [ ]
c. 41 – 50 years [ ]
d. 51 years and above [ ]
2. Sex of the respondent
a. Male [ ]
b. Female [ ]
3. Highest educational qualification
a. Primary certificate [ ]
b. Secondary school [ ]
c. Diploma [ ]
d. Degree [ ]
e. Higher Degree [ ]
f. Others, please specify [ ]
4. How long have you been a customer of the PHCN?
a. Below one year [ ]
b. 1 – 3 years [ ]
c. 4 – 6 years [ ]
d. Above 6 years [ ]
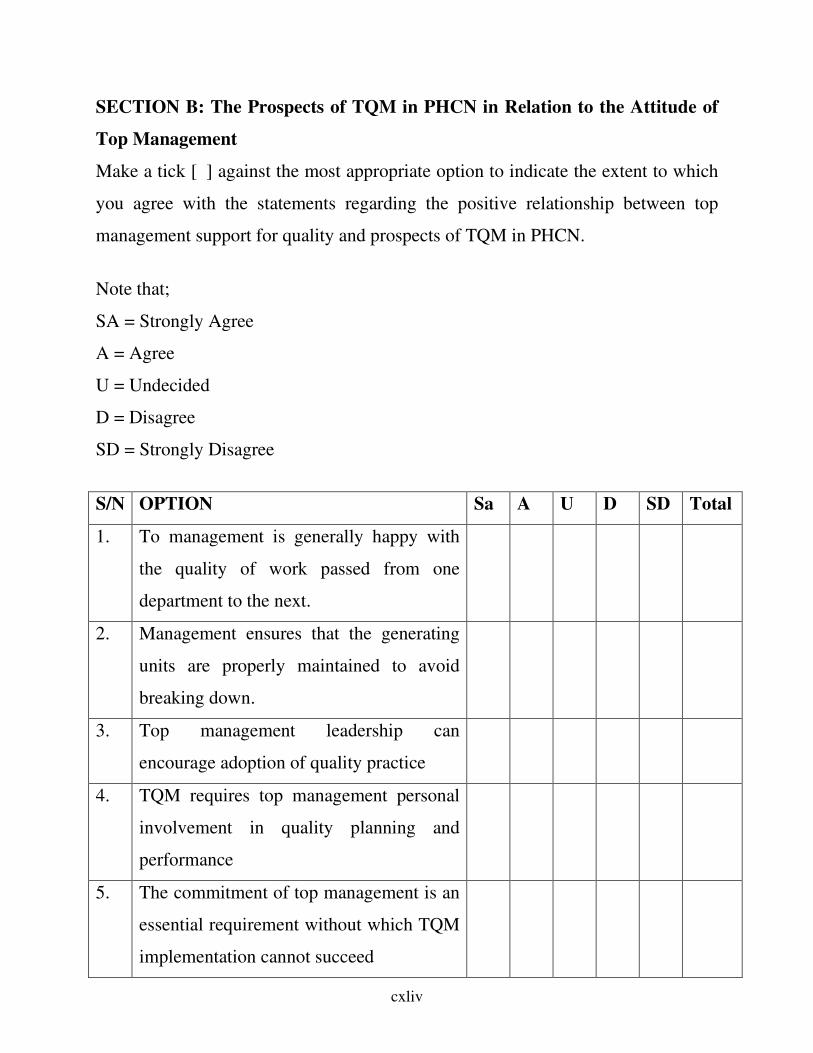
cxliv
SECTION B: The Prospects of TQM in PHCN in Relation to the Attitude of
Top Management
Make a tick [] against the most appropriate option to indicate the extent to which
you agree with the statements regarding the positive relationship between top
management support for quality and prospects of TQM in PHCN.
Note that;
SA = Strongly Agree
A = Agree
U = Undecided
D = Disagree
SD = Strongly Disagree
S/N OPTION Sa A U D SD Total
1. To management is generally happy with
the quality of work passed from one
department to the next.
2. Management ensures that the generating
units are properly maintained to avoid
breaking down.
3. Top management leadership can
encourage adoption of quality practice
4. TQM requires top management personal
involvement in quality planning and
performance
5. The commitment of top management is an
essential requirement without which TQM
implementation cannot succeed
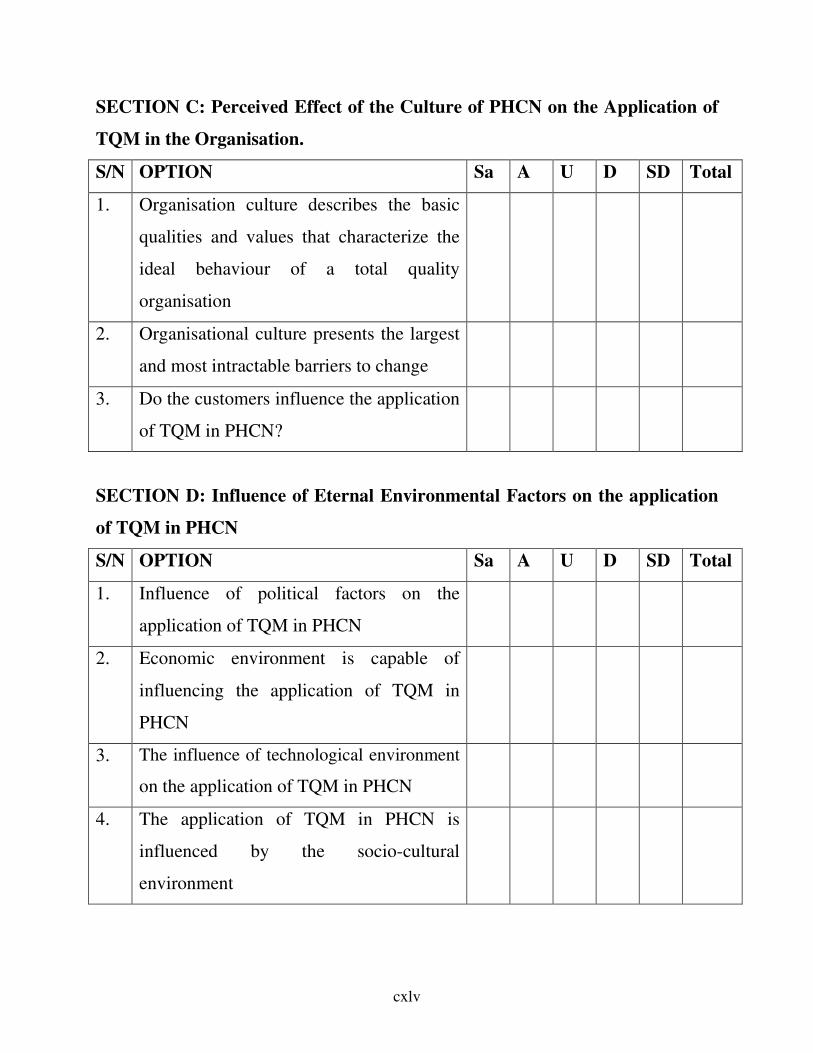
cxlv
SECTION C: Perceived Effect of the Culture of PHCN on the Application of
TQM in the Organisation.
S/N OPTION Sa A U D SD Total
1. Organisation culture describes the basic
qualities and values that characterize the
ideal behaviour of a total quality
organisation
2. Organisational culture presents the largest
and most intractable barriers to change
3. Do the customers influence the application
of TQM in PHCN?
SECTION D: Influence of Eternal Environmental Factors on the application
of TQM in PHCN
S/N OPTION Sa A U D SD Total
1. Influence of political factors on the
application of TQM in PHCN
2. Economic environment is capable of
influencing the application of TQM in
PHCN
3. The influence of technological environment
on the application of TQM in PHCN
4. The application of TQM in PHCN is
influenced by the socio-cultural
environment
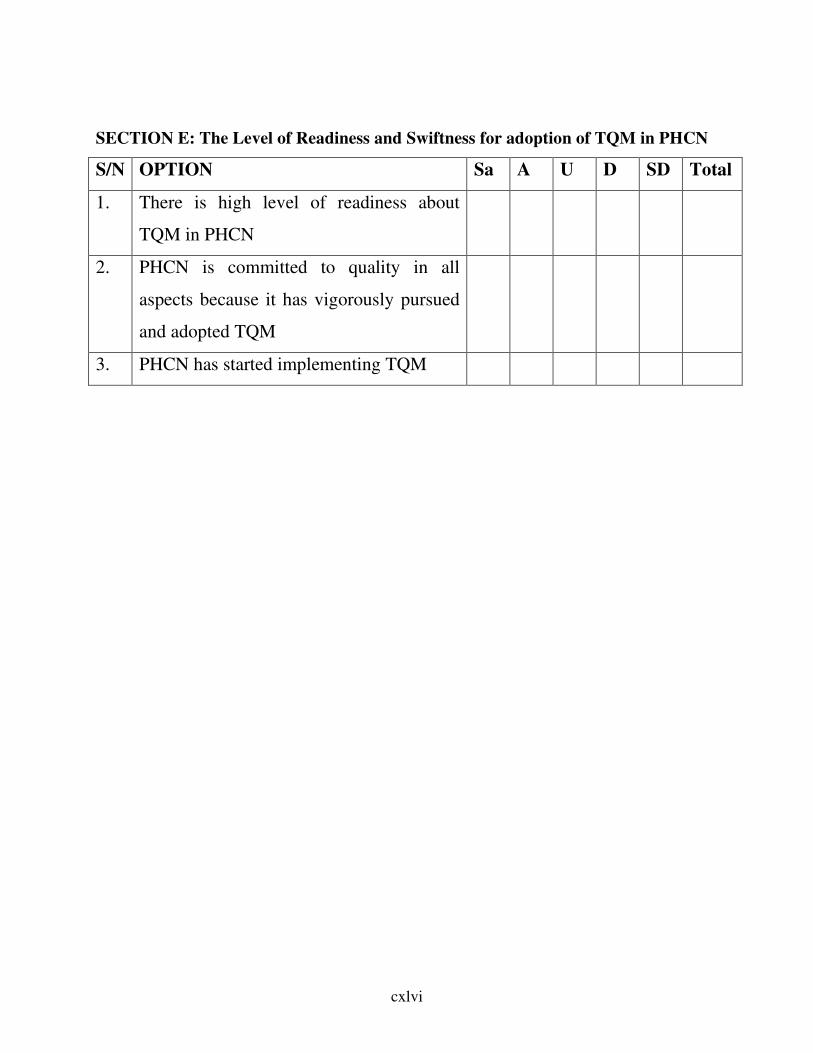
cxlvi
SECTION E: The Level of Readiness and Swiftness for adoption of TQM in PHCN
S/N OPTION Sa A U D SD Total
1. There is high level of readiness about
TQM in PHCN
2. PHCN is committed to quality in all
aspects because it has vigorously pursued
and adopted TQM
3. PHCN has started implementing TQM