Embed Size (px)
Citation preview
8/3/2019 Tour d’horizon des systèmes bancaires
http://slidepdf.com/reader/full/tour-dhorizon-des-systemes-bancaires 1/38
Cercle des Economistes Arabes our or zon es sys mes anca res
au Moyen-Orient
nouar assoune
Moody’s I nvestors Service
nouar assoune
Moody’s I nvestors Service
28 septembre 2009
8/3/2019 Tour d’horizon des systèmes bancaires
http://slidepdf.com/reader/full/tour-dhorizon-des-systemes-bancaires 2/38
. ,the Gulf
. Africa
3. Banking opportunities in the Levant
4. I slamic banking: resilient to crisis… but howfar?
2
8/3/2019 Tour d’horizon des systèmes bancaires
http://slidepdf.com/reader/full/tour-dhorizon-des-systemes-bancaires 3/38
1. Li uidit creditgrow th and asset
3
8/3/2019 Tour d’horizon des systèmes bancaires
http://slidepdf.com/reader/full/tour-dhorizon-des-systemes-bancaires 4/38
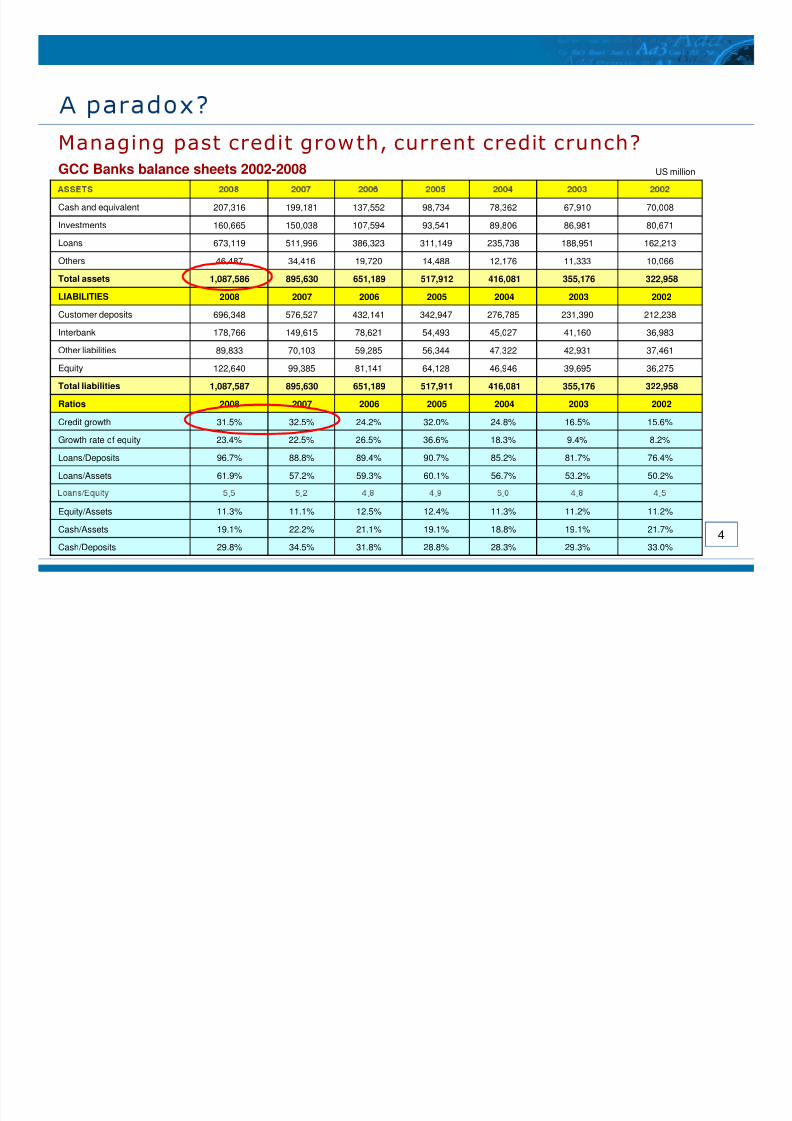
Managing past credit grow th, current credit crunch?GCC Banks balance sheets 2002-2008 US million
Cash and equivalent 207,316 199,181 137,552 98,734 78,362 67,910 70,008
Investments 160,665 150,038 107,594 93,541 89,806 86,981 80,671
Loans 673,119 511,996 386,323 311,149 235,738 188,951 162,213
Others 46,487 34,416 19,720 14,488 12,176 11,333 10,066
Total assets 1,087,586 895,630 651,189 517,912 416,081 355,176 322,958
LIABILITIES 2008 2007 2006 2005 2004 2003 2002
Customer deposits 696,348 576,527 432,141 342,947 276,785 231,390 212,238
Interbank 178,766 149,615 78,621 54,493 45,027 41,160 36,983
Other liabilities 89,833 70,103 59,285 56,344 47,322 42,931 37,461
Equity 122,640 99,385 81,141 64,128 46,946 39,695 36,275
Total liabilities 1,087,587 895,630 651,189 517,911 416,081 355,176 322,958
Ratios 2008 2007 2006 2005 2004 2003 2002
Credit growth 31.5% 32.5% 24.2% 32.0% 24.8% 16.5% 15.6%
Growth rate of equity 23.4% 22.5% 26.5% 36.6% 18.3% 9.4% 8.2%
Loans/Deposits 96.7% 88.8% 89.4% 90.7% 85.2% 81.7% 76.4%
Loans/Assets 61.9% 57.2% 59.3% 60.1% 56.7% 53.2% 50.2%
4
. . . . . . .
Equity/Assets 11.3% 11.1% 12.5% 12.4% 11.3% 11.2% 11.2%
Cash/Assets 19.1% 22.2% 21.1% 19.1% 18.8% 19.1% 21.7%Cash/Deposits 29.8% 34.5% 31.8% 28.8% 28.3% 29.3% 33.0%
8/3/2019 Tour d’horizon des systèmes bancaires
http://slidepdf.com/reader/full/tour-dhorizon-des-systemes-bancaires 5/38
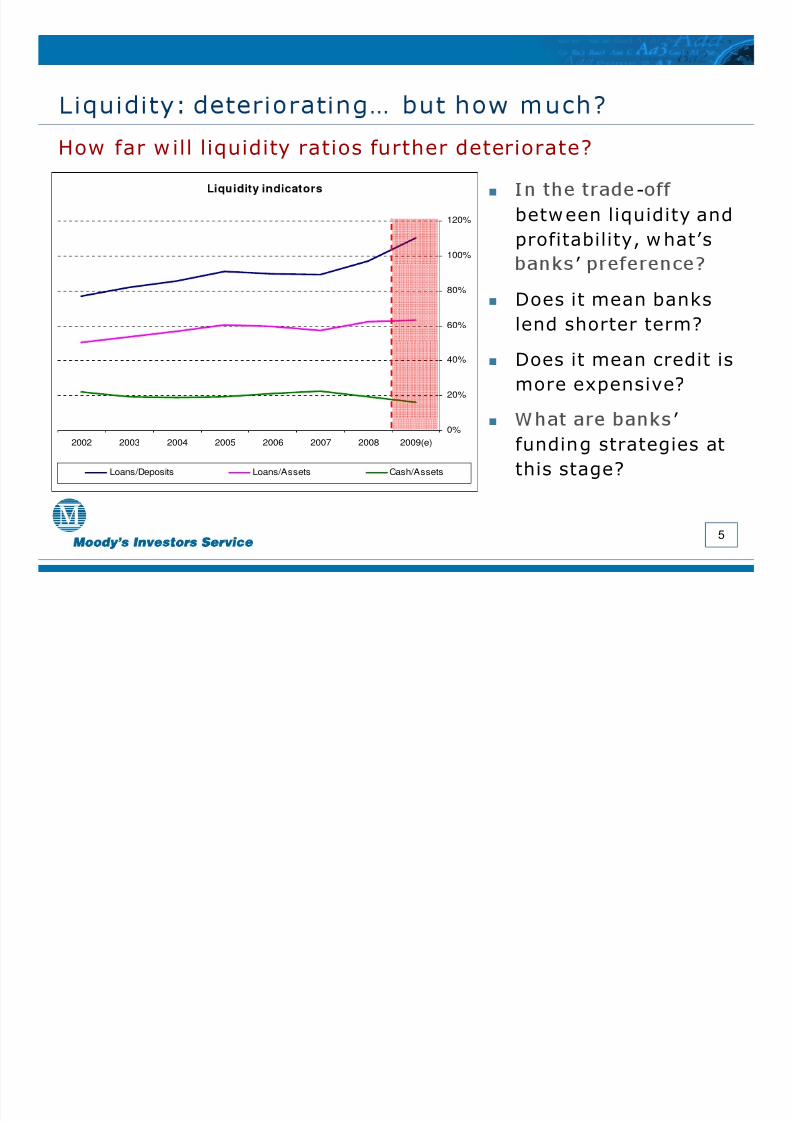
How far w ill liquidity ratios further deteriorate?
100%
120%
-
betw een liquidity andprofitability, w hat’s
’
60%
80%
Does it mean banks
lend shorter term?
20%
40% Does it mean credit ismore expensive?
’ 0%2009(e)2008200720062005200420032002
Loans/Deposits Loans/Assets Cash/Assets
funding strategies atthis stage?
5
8/3/2019 Tour d’horizon des systèmes bancaires
http://slidepdf.com/reader/full/tour-dhorizon-des-systemes-bancaires 6/38
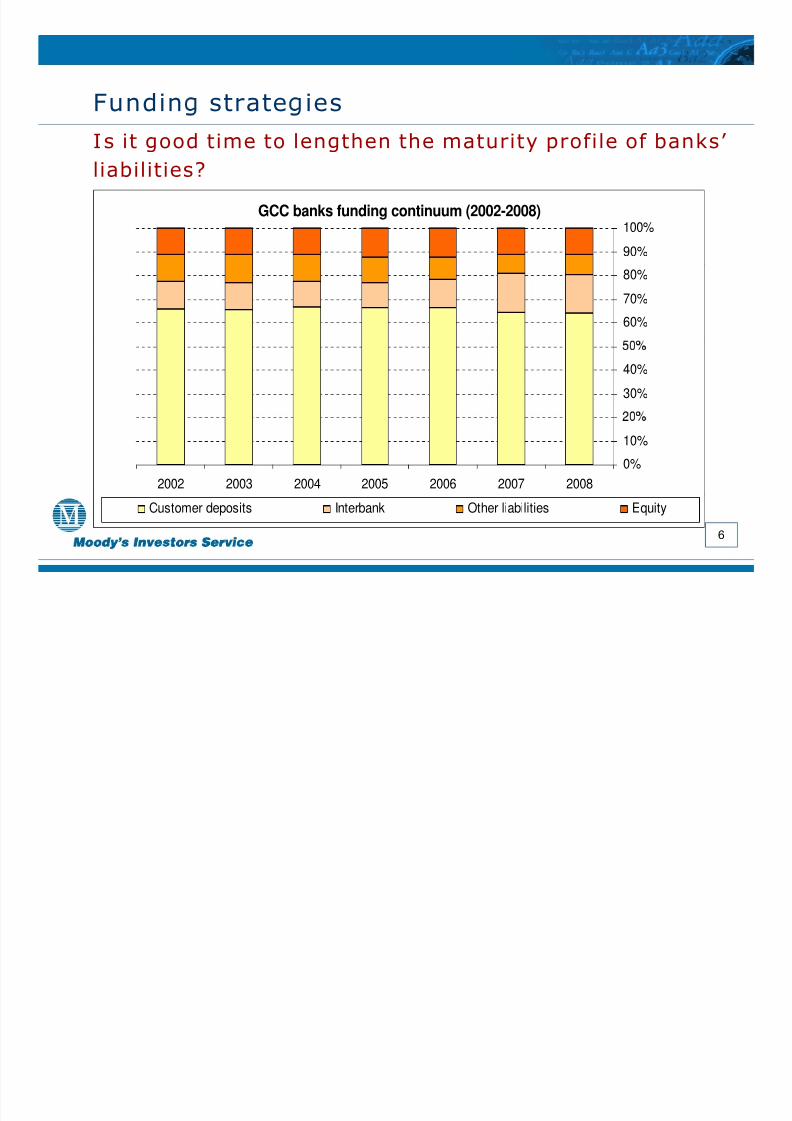
Fundin strate iesI s it good time to lengthen the maturity profile of banks’ liabilities?
GCC banks funding continuum (2002-2008)
90%
100%
60%
70%
80%
30%
40%
0%
10%
2008200720062005200420032002
6
Customer deposits Interbank Other liabilities Equity
8/3/2019 Tour d’horizon des systèmes bancaires
http://slidepdf.com/reader/full/tour-dhorizon-des-systemes-bancaires 7/38
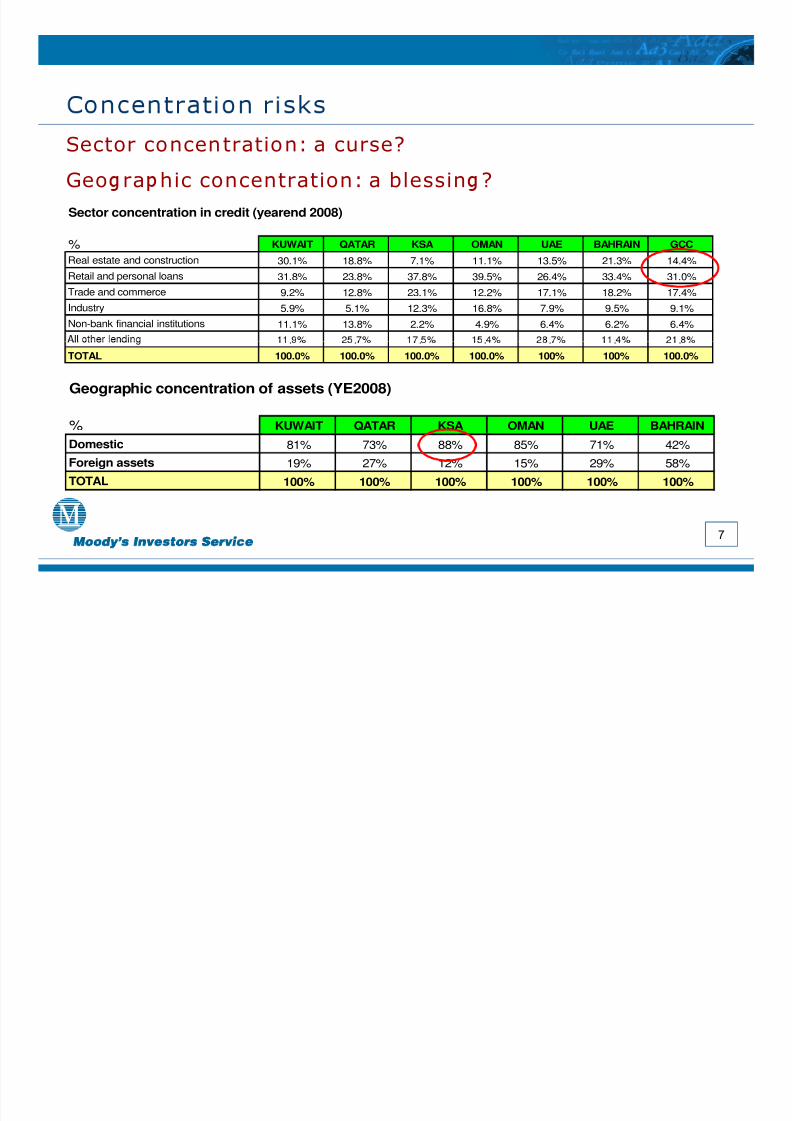
Sector concen tration: a curse?
Geo ra hic concentration: a blessin ?
Sector concentration in credit (yearend 2008)
% KUWAIT QATAR KSA OMAN UAE BAHRAIN GCC
Real estate and construction 30.1% 18.8% 7.1% 11.1% 13.5% 21.3% 14.4%Retail and personal loans 31.8% 23.8% 37.8% 39.5% 26.4% 33.4% 31.0%Trade and commerce 9.2% 12.8% 23.1% 12.2% 17.1% 18.2% 17.4%Industry 5.9% 5.1% 12.3% 16.8% 7.9% 9.5% 9.1%
Non-bank financial institutions 11.1% 13.8% 2.2% 4.9% 6.4% 6.2% 6.4%
Geographic concentration of assets (YE2008)
. . . . . . .
TOTAL 100.0% 100.0% 100.0% 100.0% 100% 100% 100.0%
% KUWAIT QATAR KSA OMAN UAE BAHRAINDomestic 81% 73% 88% 85% 71% 42%Foreign assets 19% 27% 12% 15% 29% 58%TOTAL 100% 100% 100% 100% 100% 100%
7
8/3/2019 Tour d’horizon des systèmes bancaires
http://slidepdf.com/reader/full/tour-dhorizon-des-systemes-bancaires 8/38
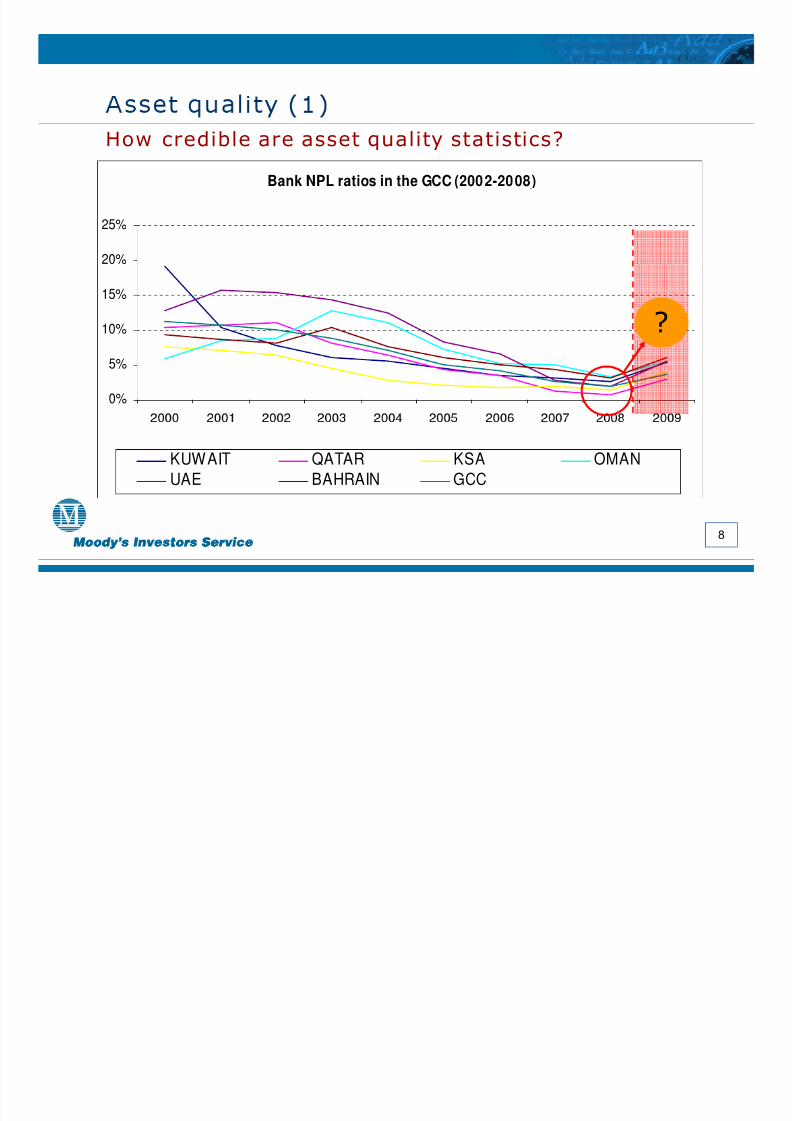
How credible are asset quality statistics?
Bank NPL ratios in the GCC (2002-2008)
20%
25%
10%
15%
?
0%
5%
KUWAIT QATAR KSA OMANUAE BAHRAIN GCC
8
8/3/2019 Tour d’horizon des systèmes bancaires
http://slidepdf.com/reader/full/tour-dhorizon-des-systemes-bancaires 9/38
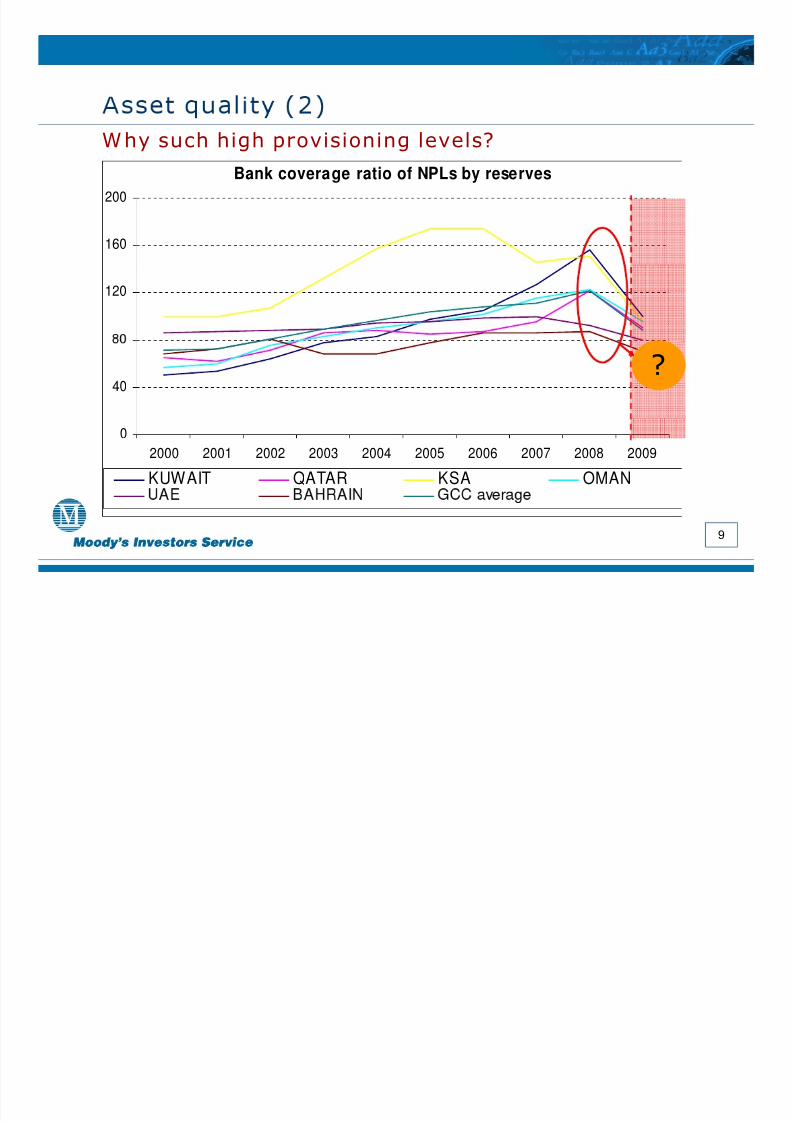
W hy such high provisioning levels?
Bank coverage ratio of NPLs by reserves
160
200
120
40?
02000 2001 2002 2003 2004 2005 2006 2007 2008 2009
KUWAIT QATAR KSA OMAN
9
8/3/2019 Tour d’horizon des systèmes bancaires
http://slidepdf.com/reader/full/tour-dhorizon-des-systemes-bancaires 10/38
Strate & tacticsW hat should w e expect?
W ill GCC banks…
… grow more slow ly?
… continue to curb lending?
… focus on the short term only?
… reduce their risk appetite?
… explore new asset classes?
… activate new business lines?
1 0

8/3/2019 Tour d’horizon des systèmes bancaires
http://slidepdf.com/reader/full/tour-dhorizon-des-systemes-bancaires 11/38
2. Bankin reformgoing unabated in
1 1
8/3/2019 Tour d’horizon des systèmes bancaires
http://slidepdf.com/reader/full/tour-dhorizon-des-systemes-bancaires 12/38
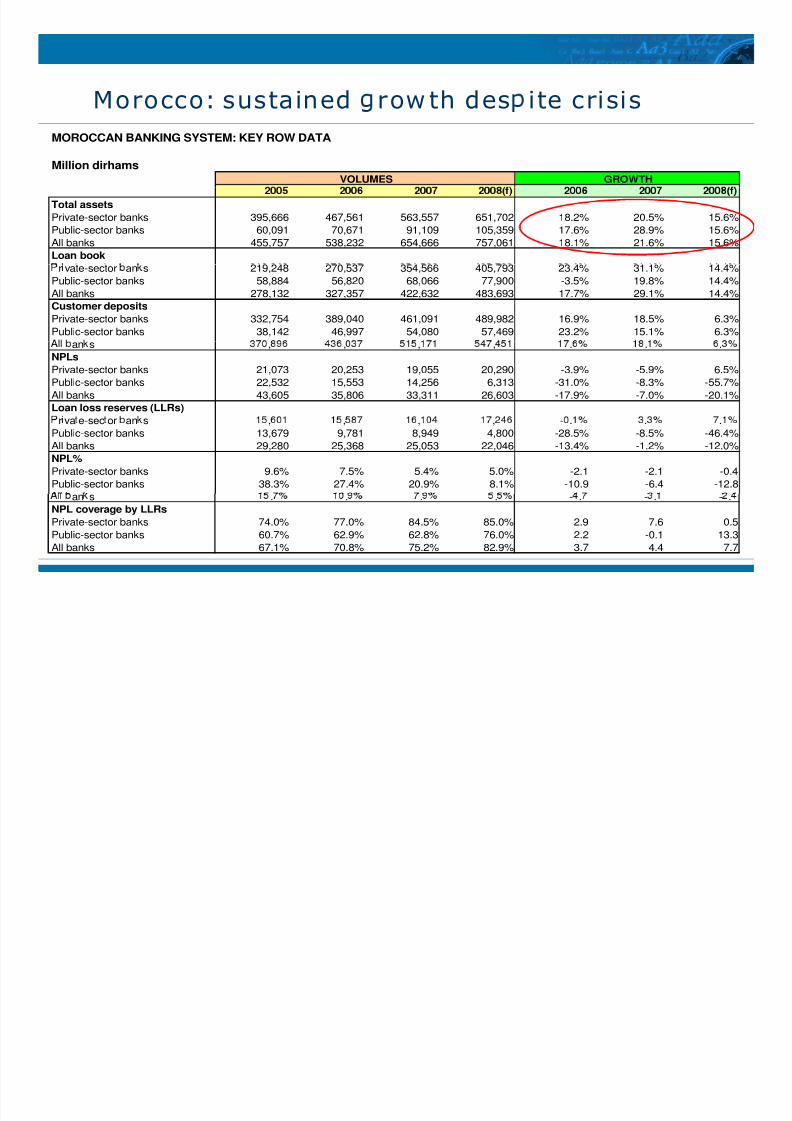
Morocco: sustained row th des i te crisisMOROCCAN BANKING SYSTEM: KEY ROW DATA
Million dirhamsVOLUMES GROWTH
Total assetsPrivate-sector banks 395,666 467,561 563,557 651,702 18.2% 20.5% 15.6%Public-sector banks 60,091 70,671 91,109 105,359 17.6% 28.9% 15.6%All banks 455,757 538,232 654,666 757,061 18.1% 21.6% 15.6%Loan book
r vate-sector an s 219,248 270,537 354,566 405,793 23.4% 31.1% 14.4%Public-sector banks 58,884 56,820 68,066 77,900 -3.5% 19.8% 14.4%All banks 278,132 327,357 422,632 483,693 17.7% 29.1% 14.4%Customer deposits
Private-sector banks 332,754 389,040 461,091 489,982 16.9% 18.5% 6.3%Public-sector banks 38,142 46,997 54,080 57,469 23.2% 15.1% 6.3%an s , , , , . . .
NPLsPrivate-sector banks 21,073 20,253 19,055 20,290 -3.9% -5.9% 6.5%Public-sector banks 22,532 15,553 14,256 6,313 -31.0% -8.3% -55.7%All banks 43,605 35,806 33,311 26,603 -17.9% -7.0% -20.1%Loan loss reserves (LLRs)
r va e-sec or an s , , , , - . . .Public-sector banks 13,679 9,781 8,949 4,800 -28.5% -8.5% -46.4%All banks 29,280 25,368 25,053 22,046 -13.4% -1.2% -12.0%NPL%Private-sector banks 9.6% 7.5% 5.4% 5.0% -2.1 -2.1 -0.4Public-sector banks 38.3% 27.4% 20.9% 8.1% -10.9 -6.4 -12.8
1 2
an s . . . . - . - . - .NPL coverage by LLRsPrivate-sector banks 74.0% 77.0% 84.5% 85.0% 2.9 7.6 0.5
Public-sector banks 60.7% 62.9% 62.8% 76.0% 2.2 -0.1 13.3All banks 67.1% 70.8% 75.2% 82.9% 3.7 4.4 7.7
8/3/2019 Tour d’horizon des systèmes bancaires
http://slidepdf.com/reader/full/tour-dhorizon-des-systemes-bancaires 13/38
8/3/2019 Tour d’horizon des systèmes bancaires
http://slidepdf.com/reader/full/tour-dhorizon-des-systemes-bancaires 14/38
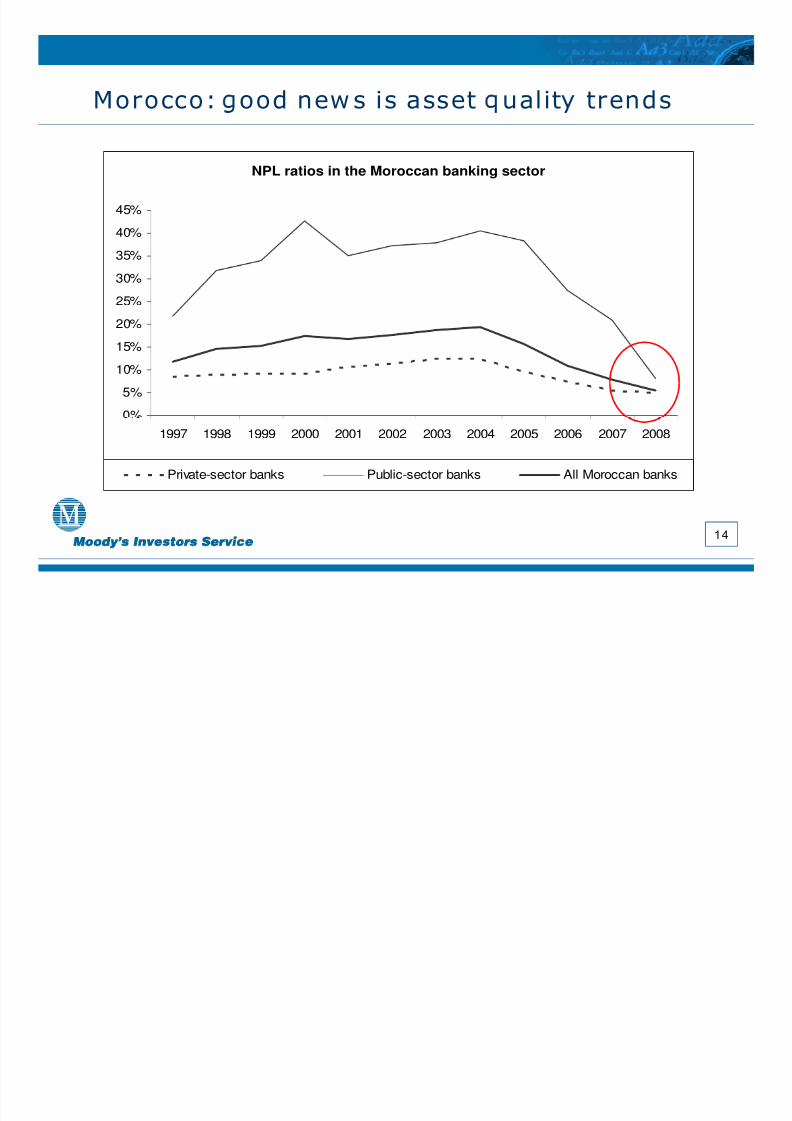
Morocco: ood new s is asset ualit trends
NPL ratios in the Moroccan banking sector
35%
40%45%
20%
25%
30%
0%
5%
10%
15%
1997 1998 1999 2000 2001 2002 2003 2004 2005 2006 2007 2008
Private-sector banks Public-sector banks All Moroccan banks
1 4
8/3/2019 Tour d’horizon des systèmes bancaires
http://slidepdf.com/reader/full/tour-dhorizon-des-systemes-bancaires 15/38
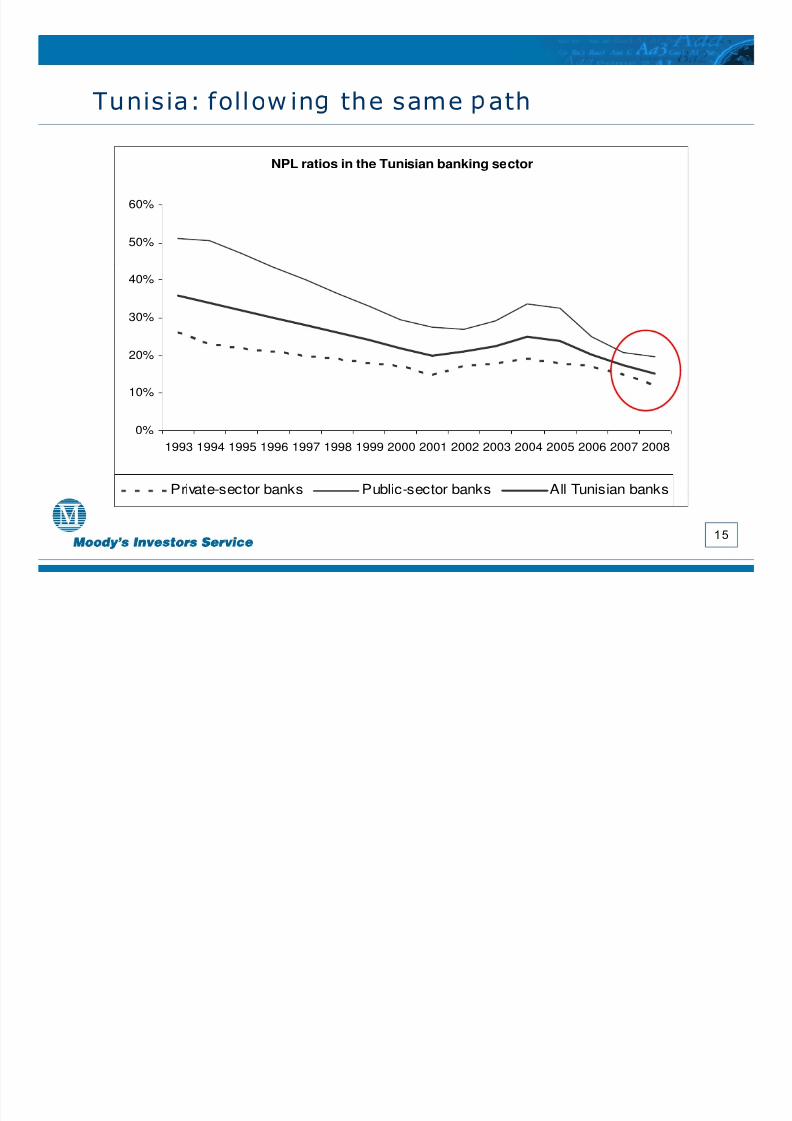
Tunis ia: follow in the same ath
NPL ratios in the Tunisian banking sector
50%
60%
30%
40%
10%
20%
0%1993 1994 1995 1996 1997 1998 1999 2000 2001 2002 2003 2004 2005 2006 2007 2008
Private-sector banks Public-sector banks All Tunisian banks
1 5
8/3/2019 Tour d’horizon des systèmes bancaires
http://slidepdf.com/reader/full/tour-dhorizon-des-systemes-bancaires 16/38
Tunisia: ke issues
Banking reform taken seriously
Banking system clean-up higher on governmentagenda
Privatization of « development banks »
P ublic-sector banks back on trackP rivate-sector banks improving financialperformance
Emergence of a sustainable retail platform
More foreign entrants allow ed in
1 6
8/3/2019 Tour d’horizon des systèmes bancaires
http://slidepdf.com/reader/full/tour-dhorizon-des-systemes-bancaires 17/38
Egypt: Moody’s RatingsMoody’s rates five Egyptian banks (National bank of Egypt, BanqueMisr, Banque du Caire, Bank o f Alexandria and CommercialInternational Bank) w hich account for around of 50% of total bankingsystem assets.
Their BFSR vary from D- to C- (all w ith stable outlook) w hile theirLocal Currency (LC) deposi t ratings are in the Baa category (RUR) and
outlook).
In July 2009, the five Egyptian banks LC deposit ratings w ere placedunder review for possible dow ngrade in light of Moody’s global review
.
In august 2009, the FC deposit ratings’ outlook of the five Egyptianbanks w as changed to stable from negative follow ing Moody’ssovereign team recent change in Egypt FC deposit ceilings ou tlook to
stable from negative. This action came in response to the easing of inflation levels and the bank ing sector resiliency in the face of theglobal financial crisis.
E t’s bankin s stem outlook for the comin 12 months is s table .
1 7
All sovereign ratings carry also a stable outlook.
8/3/2019 Tour d’horizon des systèmes bancaires
http://slidepdf.com/reader/full/tour-dhorizon-des-systemes-bancaires 18/38
Egyptian Banking System: Main Rating DriversFunding remains largely deposit-based w ith minimal exposuresto capital market funding.
Underbanked market w ith significant opportunities in retail,mortgage and SME sectors.
Strong systemic support factored in the banks’ deposit ratings.
High level of NP Ls remains a major i ssue facing the Egyptianbanking system, in particular at the state-ow ned banks.
Significant single-name borrow er concentration levels constraint’ .
Enhanced regulatory and supervisory practices , though in needof further development.
.
Challenging operating environment, characterised by a low GDPper capita level, high unem ployment rate and w eakening macro-economic conditions due to the global economic turmoil.
1 8
8/3/2019 Tour d’horizon des systèmes bancaires
http://slidepdf.com/reader/full/tour-dhorizon-des-systemes-bancaires 19/38
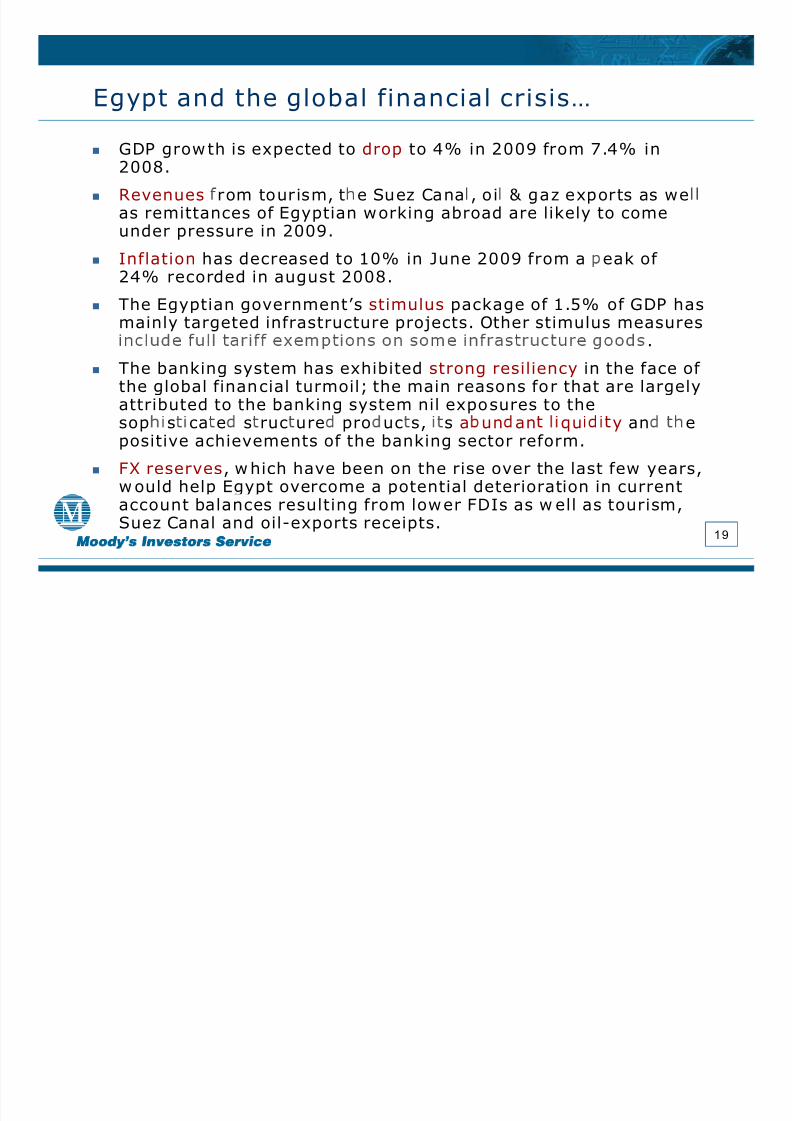
Egypt and the global financial crisis…
GDP grow th is expected to drop to 4% in 2009 from 7.4% in2008.
Revenues rom tour ism, t e Suez Cana , o i & gaz expor ts as we
as remittances of Egyptian w orking abroad are likely to comeunder pressure in 2009.
Inflation has decreased to 10% in June 2009 from a eak of 24% recorded in august 2008.
The Egyptian government’s stimulus package of 1.5% of GDP has
mainly targeted infrastructure projects. Other stimulus measures .
The banking system has exhibited strong resiliency in the face of the global financial turmoil; the main reasons fo r that are largelyattributed to the banking system nil exposures to the
sop s ca e s ruc ure pro uc s, s a un an qu y an epositive achievements of the banking sector reform.
FX reserves , w hich have been on the rise over the last few years,w ould help Egypt overcome a potential deterioration in current
1 9
account balances resulting from low er FDIs as w ell as tourism,Suez Canal and oil-exports receipts.
8/3/2019 Tour d’horizon des systèmes bancaires
http://slidepdf.com/reader/full/tour-dhorizon-des-systemes-bancaires 20/38
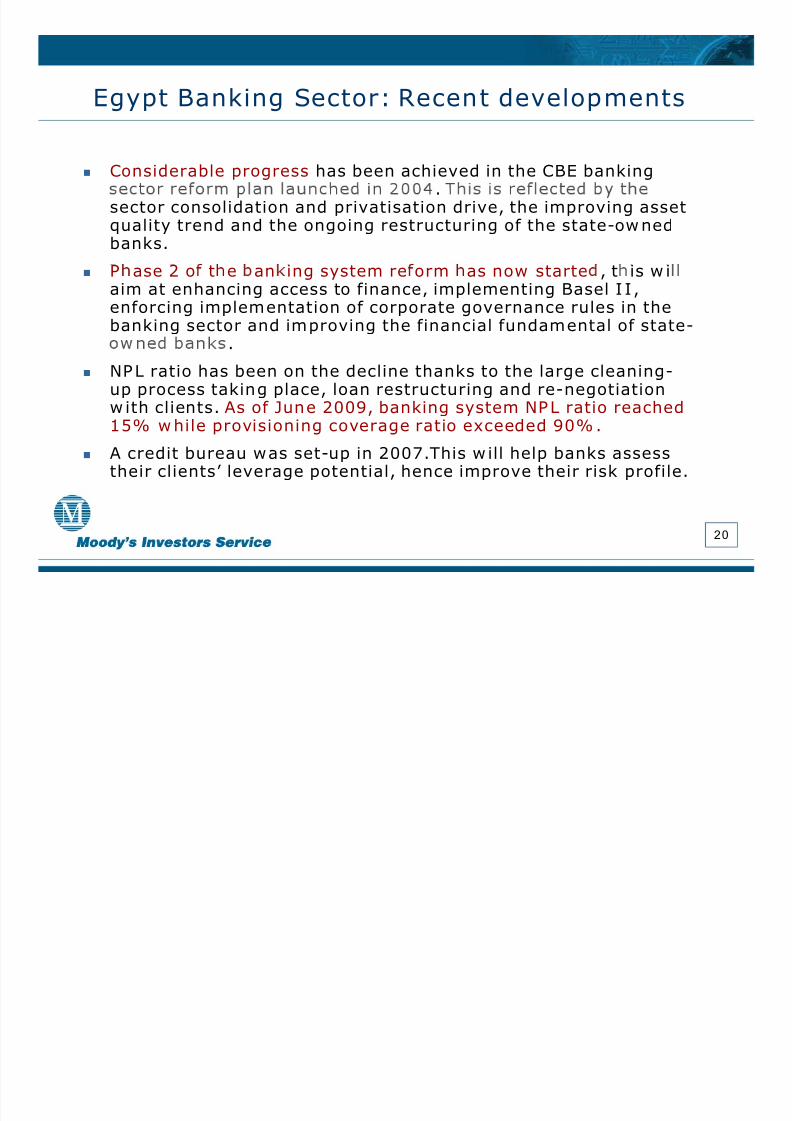
Egypt Banking Sector: Recent developments
Considerable progress has been achieved in the CBE banking.
sector consolidation and privatisation drive, the improving assetquality trend and the ongoing restructuring of the state-ow nedbanks.
P ase 2 o t e an ing system re orm as now starte , t is w iaim at enhancing access to finance, implementing Basel I I ,enforcing implementation of corporate governance rules in thebanking sector and improving the financial fundamental of state-
.
NP L ratio has been on the decline thanks to the large cleaning-up process taking place, loan restructuring and re-negotiationw ith clients. As of June 2009, banking system NP L ratio reached
15% w hile provisioning coverage ratio exceeded 90% .A credit bureau w as set-up in 2007.This w ill help banks assesstheir clients’ leverage potential, hence improve their risk profile.
2 0

8/3/2019 Tour d’horizon des systèmes bancaires
http://slidepdf.com/reader/full/tour-dhorizon-des-systemes-bancaires 21/38
3. Bankinopportunities in the
2 1
8/3/2019 Tour d’horizon des systèmes bancaires
http://slidepdf.com/reader/full/tour-dhorizon-des-systemes-bancaires 22/38
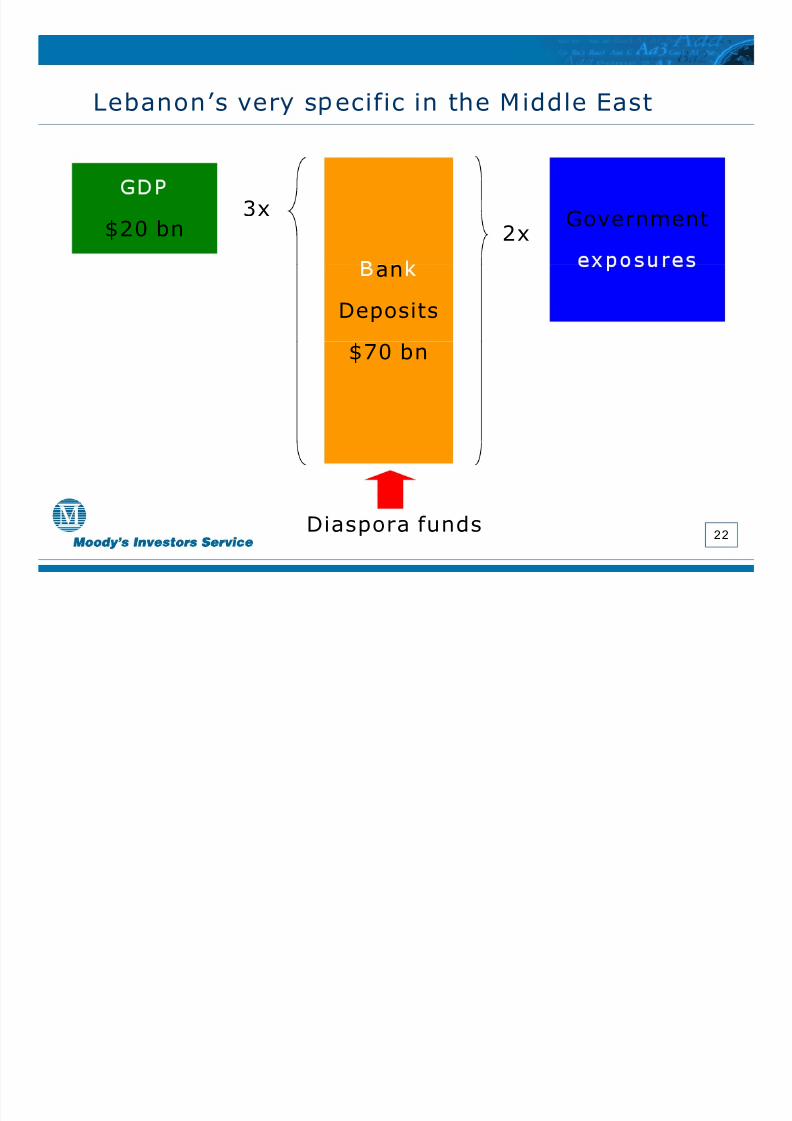
Lebanon’s ver s ecific in the Middle East
$20 bn 3x Government2x
an
Deposits
$70 bn
2 2Diaspora funds
8/3/2019 Tour d’horizon des systèmes bancaires
http://slidepdf.com/reader/full/tour-dhorizon-des-systemes-bancaires 23/38
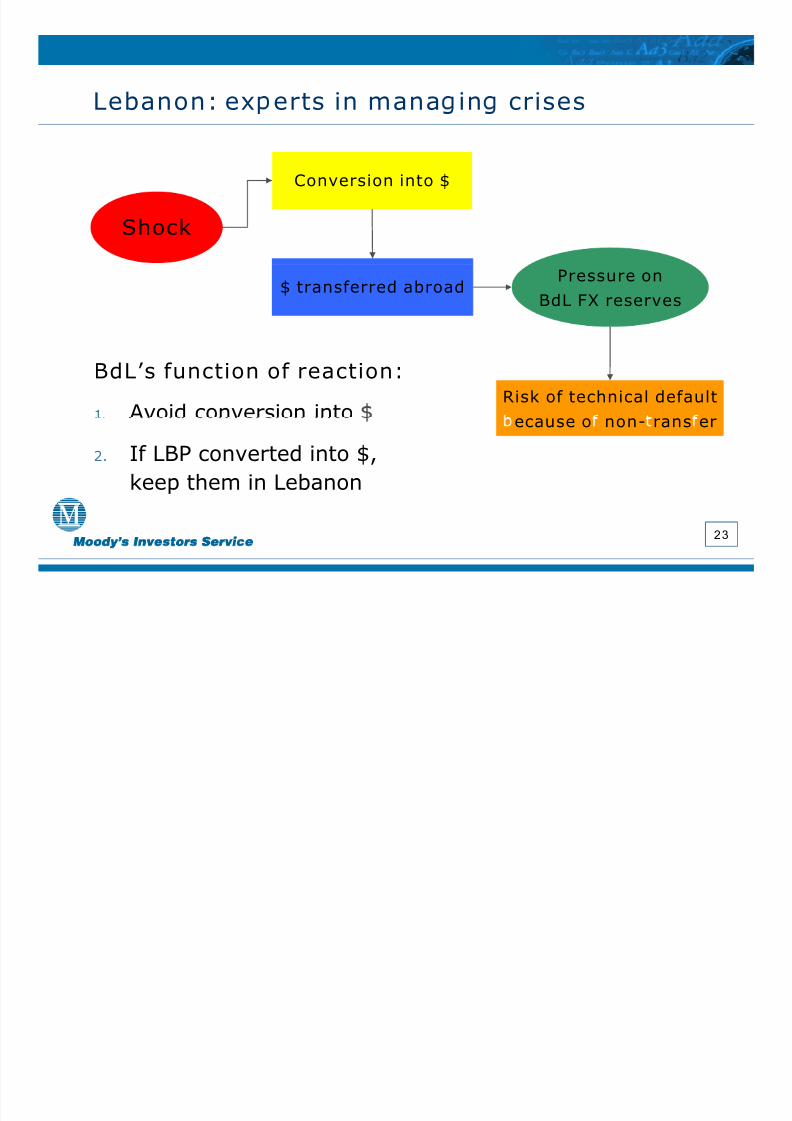
Lebanon: ex erts in mana in crises
Conversion into $
Shock
$ transferred abroadPressure on
BdL FX reserves
Risk of technical default
BdL’s function of reaction:
1. Avoid conversion into ecause o non- rans er
2. If LBP converted into $,keep them in Lebanon
2 3
8/3/2019 Tour d’horizon des systèmes bancaires
http://slidepdf.com/reader/full/tour-dhorizon-des-systemes-bancaires 24/38
Lebanon: for banks few w a s out…
W hat can Lebanese banks do in such a context?
1. Keep on receiving Diaspora's deposits2. Kee on fundin the ublic sector’s needs
3. Use balance sheet size to expand in neighboring
countries4. Syria: Islamic banking
5. Jordan E t Turke : retail and cor orate bankin
6. GCC: investment and merchant banking
2 4
8/3/2019 Tour d’horizon des systèmes bancaires
http://slidepdf.com/reader/full/tour-dhorizon-des-systemes-bancaires 25/38
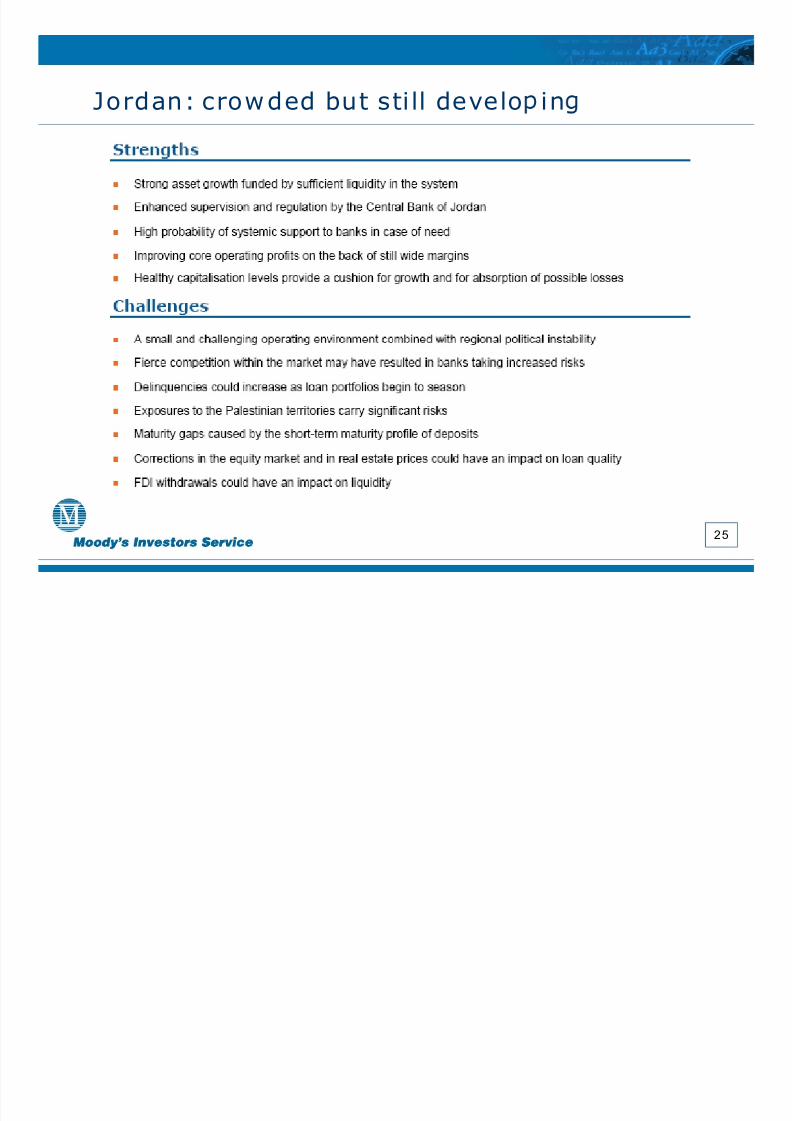
Jordan: crow ded but s ti ll develo in
2 5
8/3/2019 Tour d’horizon des systèmes bancaires
http://slidepdf.com/reader/full/tour-dhorizon-des-systemes-bancaires 26/38
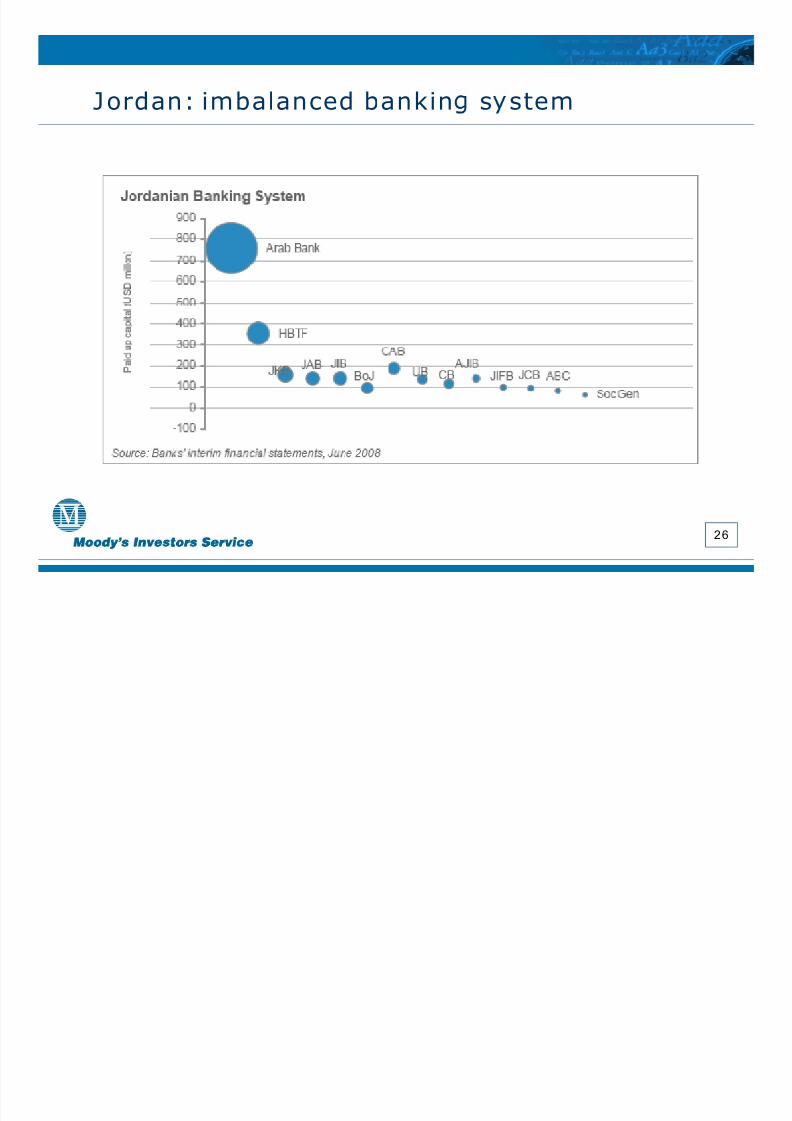
Jordan: imbalanced bankin s stem
2 6
8/3/2019 Tour d’horizon des systèmes bancaires
http://slidepdf.com/reader/full/tour-dhorizon-des-systemes-bancaires 27/38
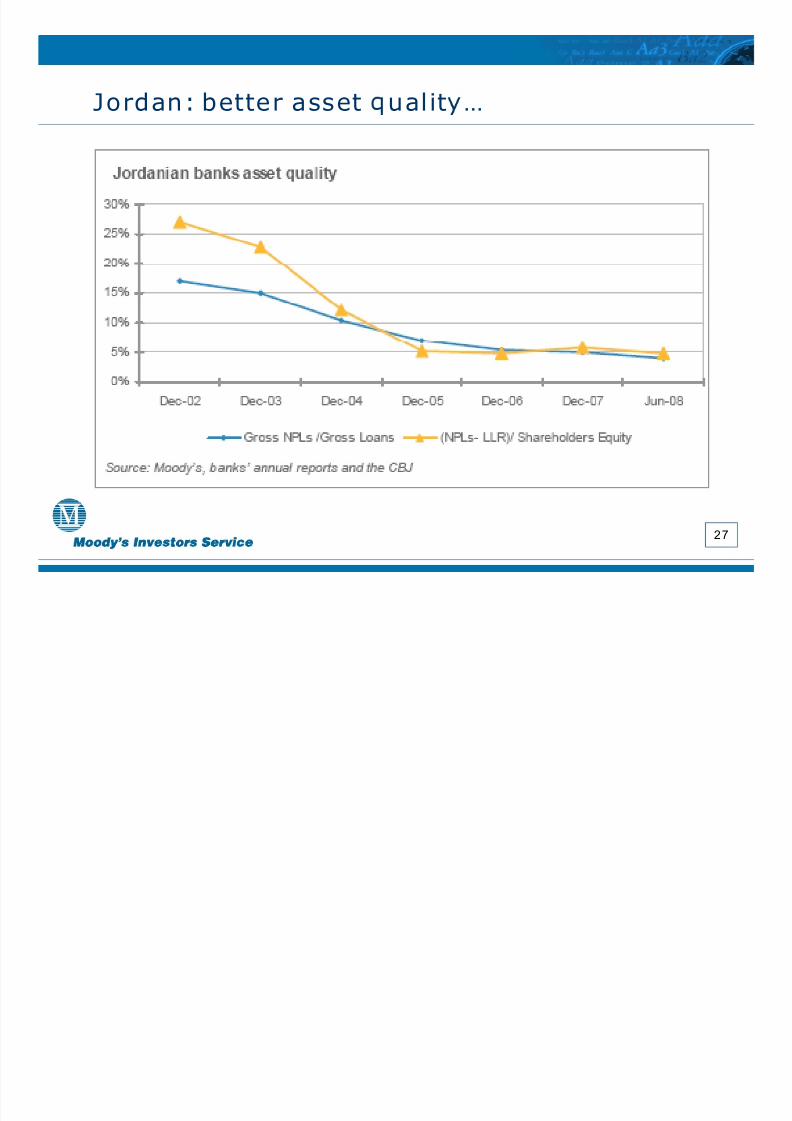
Jordan: better asset ual it …
2 7
8/3/2019 Tour d’horizon des systèmes bancaires
http://slidepdf.com/reader/full/tour-dhorizon-des-systemes-bancaires 28/38
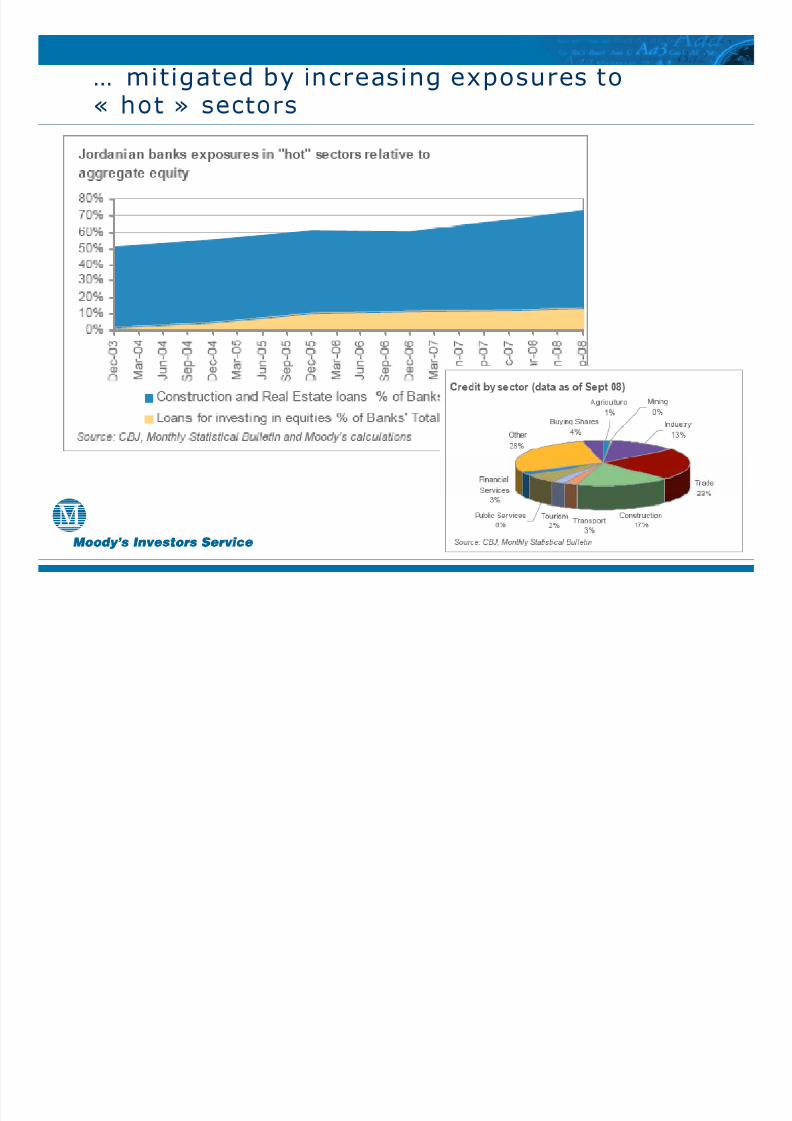
… mitigated by increasing exposures to
« »
2 8

8/3/2019 Tour d’horizon des systèmes bancaires
http://slidepdf.com/reader/full/tour-dhorizon-des-systemes-bancaires 29/38
4. I slamic financeresilient to crisis…
2 9
8/3/2019 Tour d’horizon des systèmes bancaires
http://slidepdf.com/reader/full/tour-dhorizon-des-systemes-bancaires 30/38
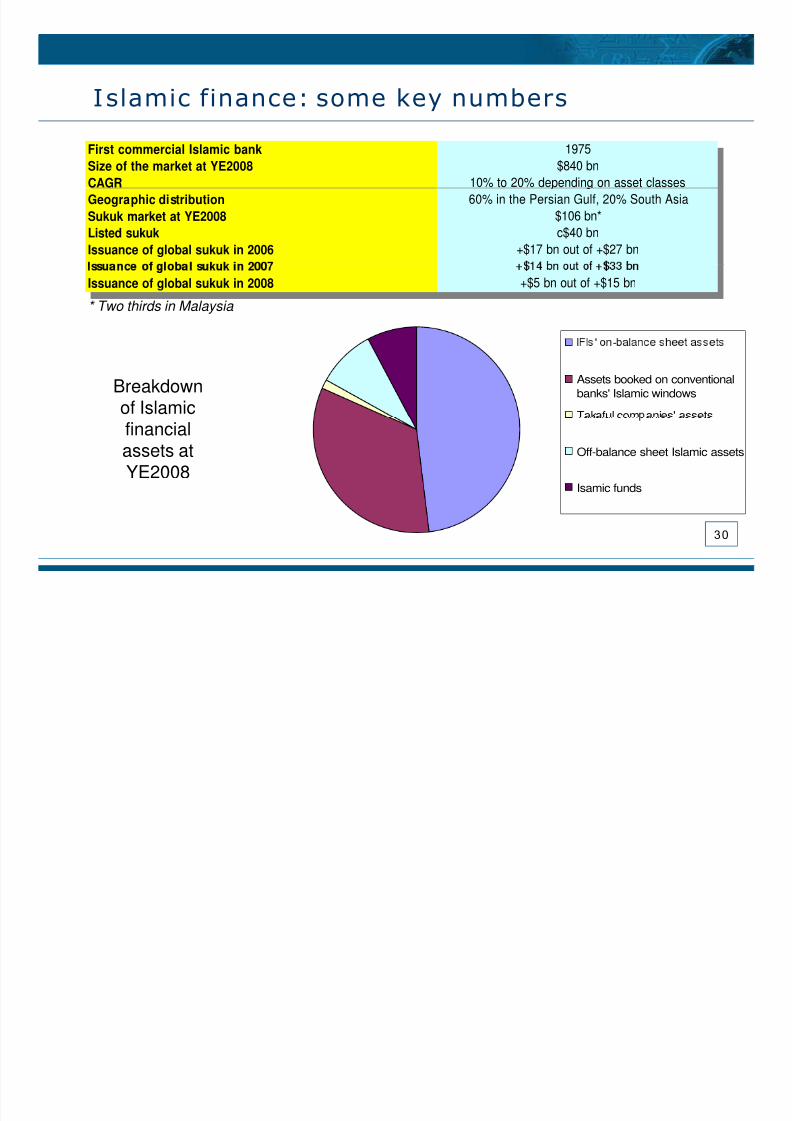
I slamic finance: some key numbers
First commercial Islamic bank 1975Size of the market at YE2008 $840 bnCAGR 10% to 20% depending on asset classesGeographic distribution 60% in the Persian Gulf, 20% South Asia
Sukuk market at YE2008 $106 bn*Listed sukuk c$40 bnIssuance of global sukuk in 2006 +$17 bn out of +$27 bn
Issuance of global sukuk in 2008 +$5 bn out of +$15 bn
* Two thirds in Malaysia
'
Breakdownof Islamic
-
Assets booked on conventionalbanks' Islamic windows
Takaful com anies' assets
financialassets atYE2008
Off-balance sheet Islamic assets
Isamic funds
3 0
8/3/2019 Tour d’horizon des systèmes bancaires
http://slidepdf.com/reader/full/tour-dhorizon-des-systemes-bancaires 31/38
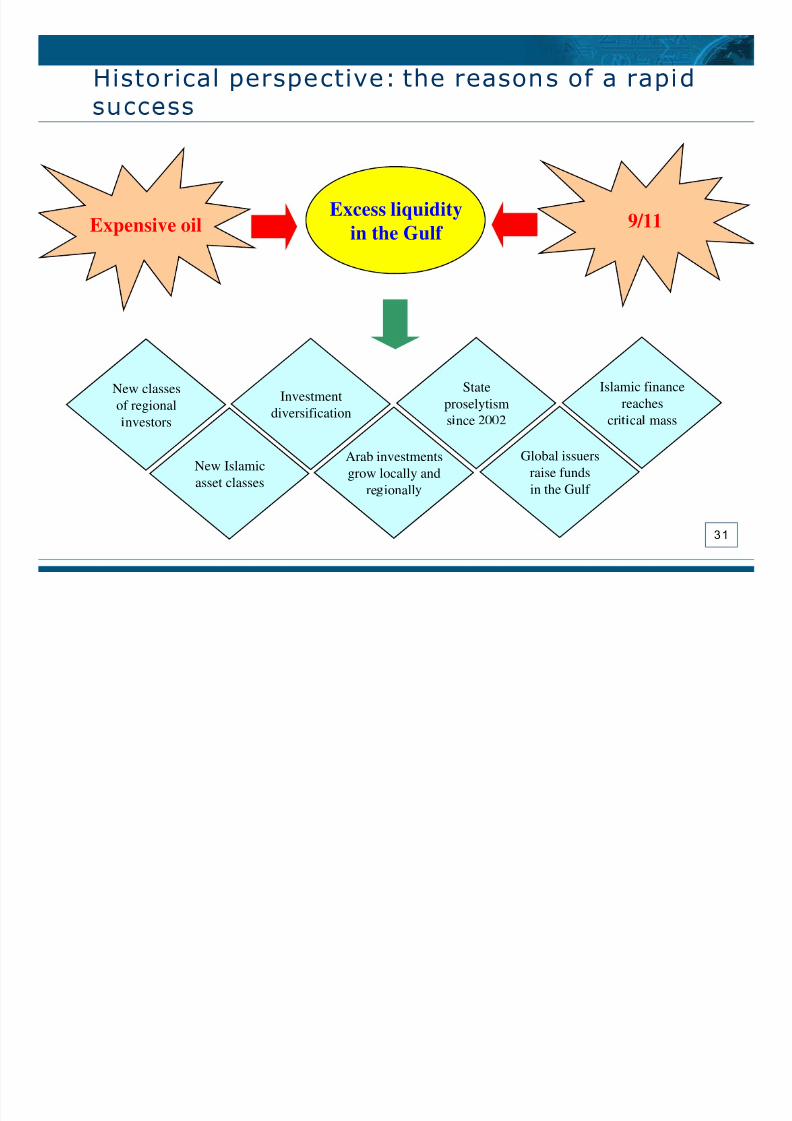
Historical perspective: the reasons of a rapid
Expensive oil 9/11Excess liquidity
in the Gulf
StateproselytismInvestment
diversification
Islamic financereaches
New classesof regional
s nce
Arab investmentsgrow locally and
re ionall
Global issuersraise fundsin the Gulf
New Islamicasset classes
cr ca massnvestors
3 1
8/3/2019 Tour d’horizon des systèmes bancaires
http://slidepdf.com/reader/full/tour-dhorizon-des-systemes-bancaires 32/38
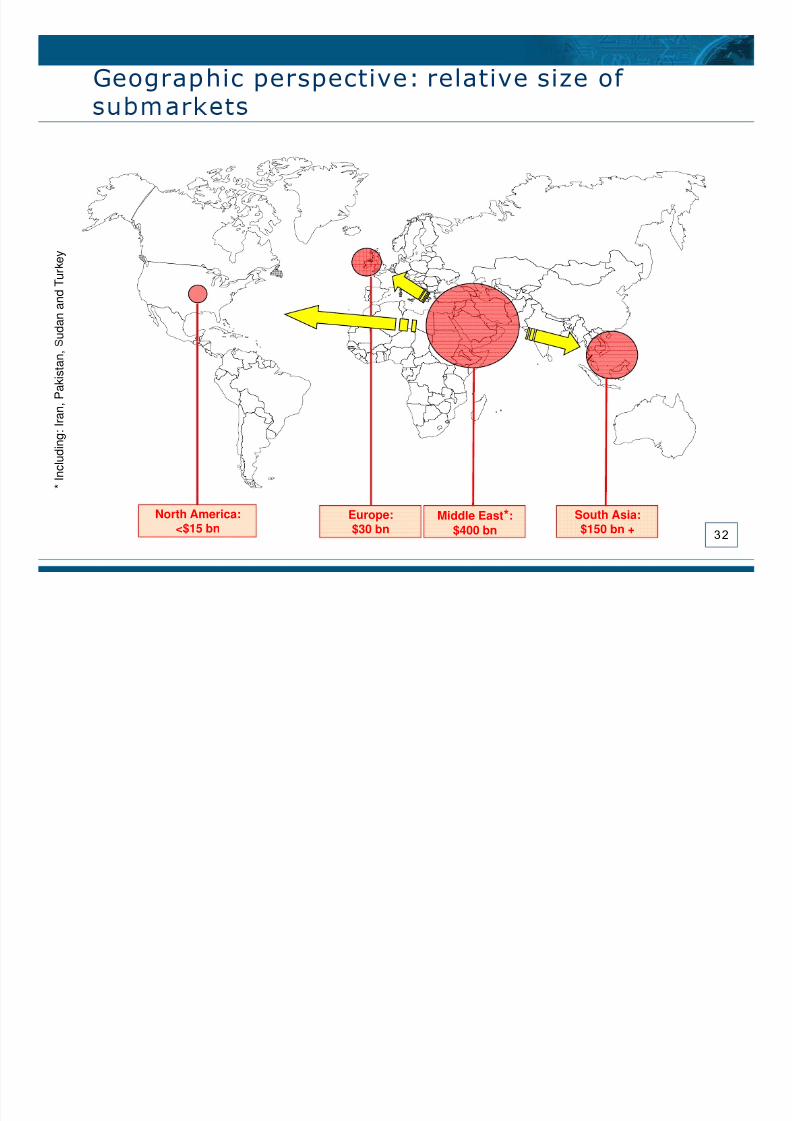
Geographic perspective: relative size of
e y
u d a n a n
d T u r
a n ,
P a
k i s t a n ,
* I n c
l u d i n g :
I r
3 2
Middle East *:$400 bn
Europe:$30 bn
South Asia:$150 bn +
North America:<$15 bn
8/3/2019 Tour d’horizon des systèmes bancaires
http://slidepdf.com/reader/full/tour-dhorizon-des-systemes-bancaires 33/38
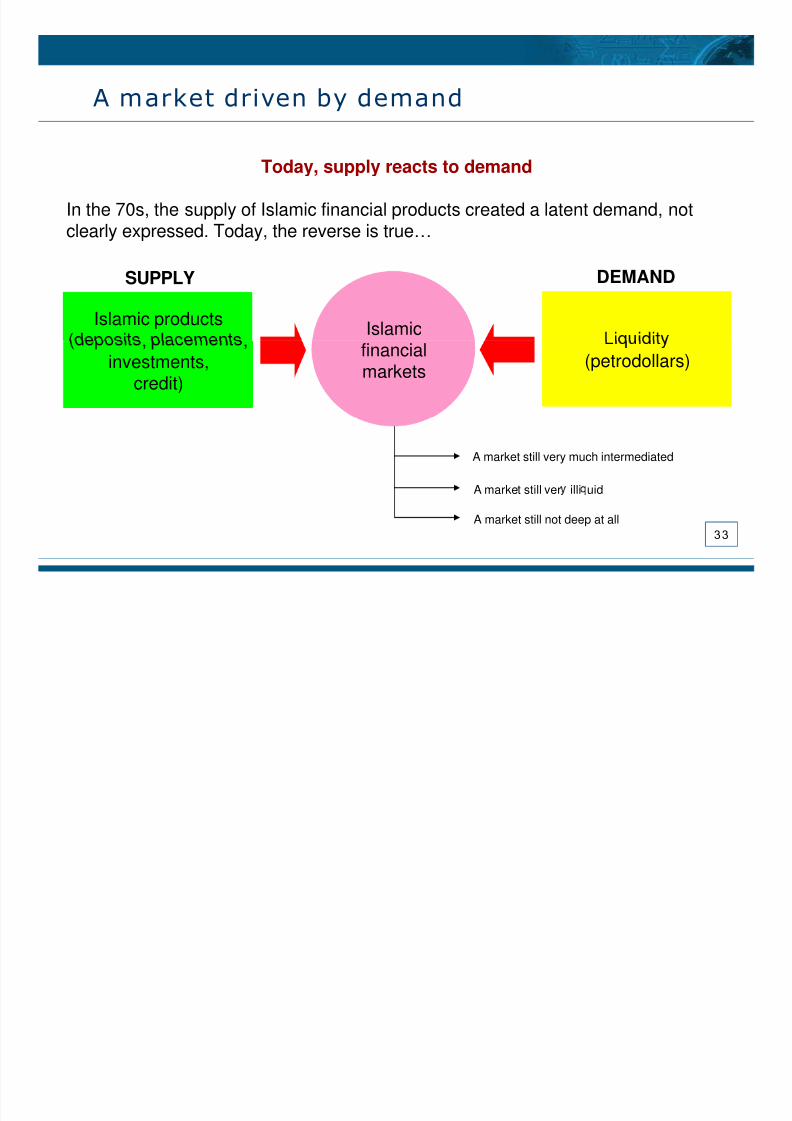
A market driven by demand
Today, supply reacts to demand
In the 70s, the supply of Islamic financial products created a latent demand, notclearly expressed. Today, the reverse is true…
Islamic productsIslamic products IslamicIslamic
SUPPLY DEMAND
(petrodollars)(petrodollars), ,
investments,credit)
, ,investments,
credit)
financialmarketsfinancialmarkets
A market still very much intermediated
A market still ver illi uid
3 3A market still not deep at all
8/3/2019 Tour d’horizon des systèmes bancaires
http://slidepdf.com/reader/full/tour-dhorizon-des-systemes-bancaires 34/38
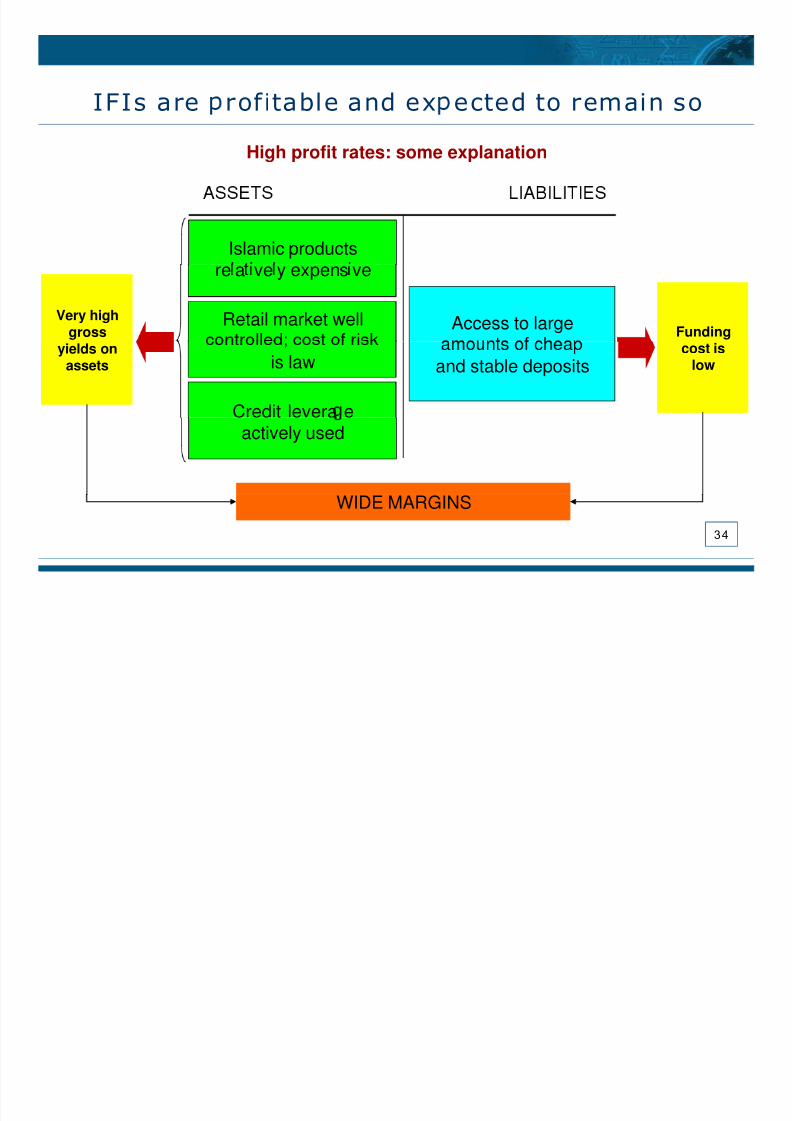
IFIs are rof itable and ex ected to remain soHigh profit rates: some explanation
Islamic products
Access to large FundingFunding
re a ve y expens ve
Retail market wellVery high
grossVery high
gross
and stable depositscost is
lowcost is
low
is law
Credit levera e
yields onassets
yields onassets
actively used
3 4
WIDE MARGINSWIDE MARGINS
8/3/2019 Tour d’horizon des systèmes bancaires
http://slidepdf.com/reader/full/tour-dhorizon-des-systemes-bancaires 35/38
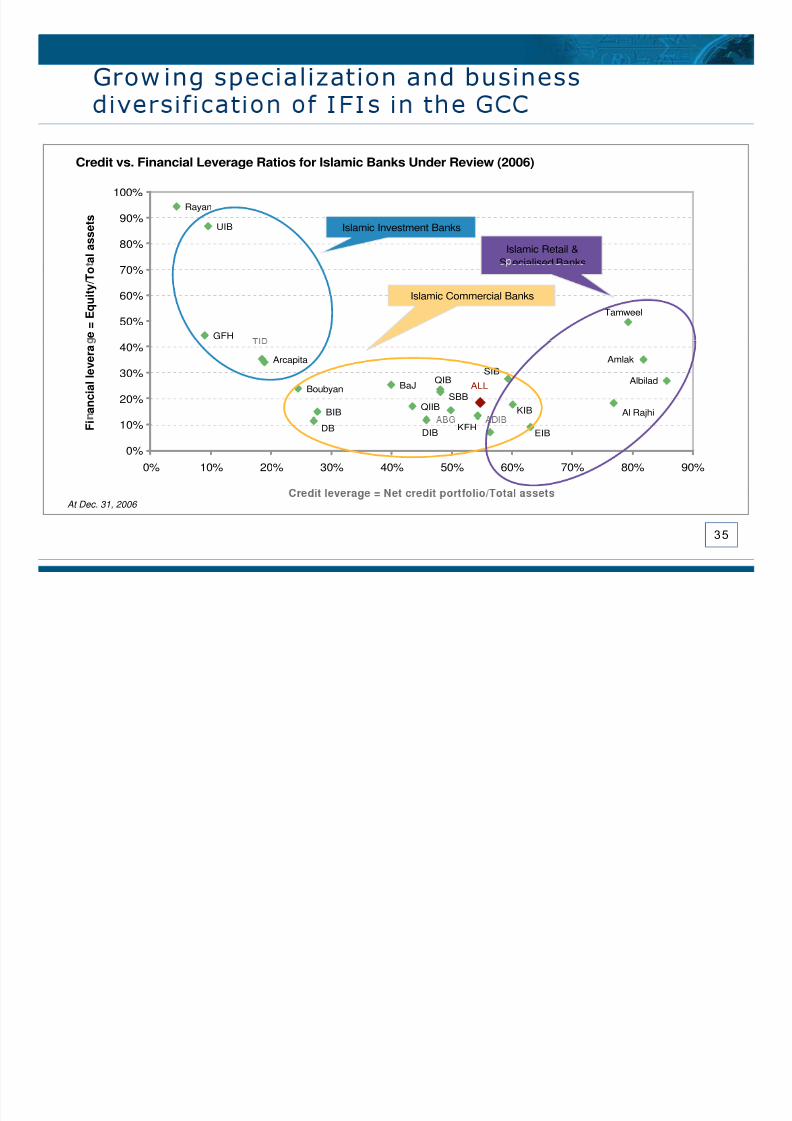
Grow ing specialization and business
Credit vs. Financial Leverage Ratios for Islamic Banks Under Review (2006)
UIB
Rayan
80%
90%
100%
a l a s s e t s
Islamic Retail &S ecialised Banks
Islamic Investment Banks
Tamweel
GFH50%
60%
70%
e =
E q u
i t y / T o
Islamic Commercial Banks
ALL
KIB
Amlak
Albilad
Al Rajhi
SIBQIB
SBBQIIB
BaJ
BIB
Boubyan
Arcapita
20%
30%
40%
a n c
i a l l e v e r a
KFHEIBDIB
DB
0%
10%
0% 10% 20% 30% 40% 50% 60% 70% 80% 90%
F i
3 5
At Dec. 31, 2006
8/3/2019 Tour d’horizon des systèmes bancaires
http://slidepdf.com/reader/full/tour-dhorizon-des-systemes-bancaires 36/38
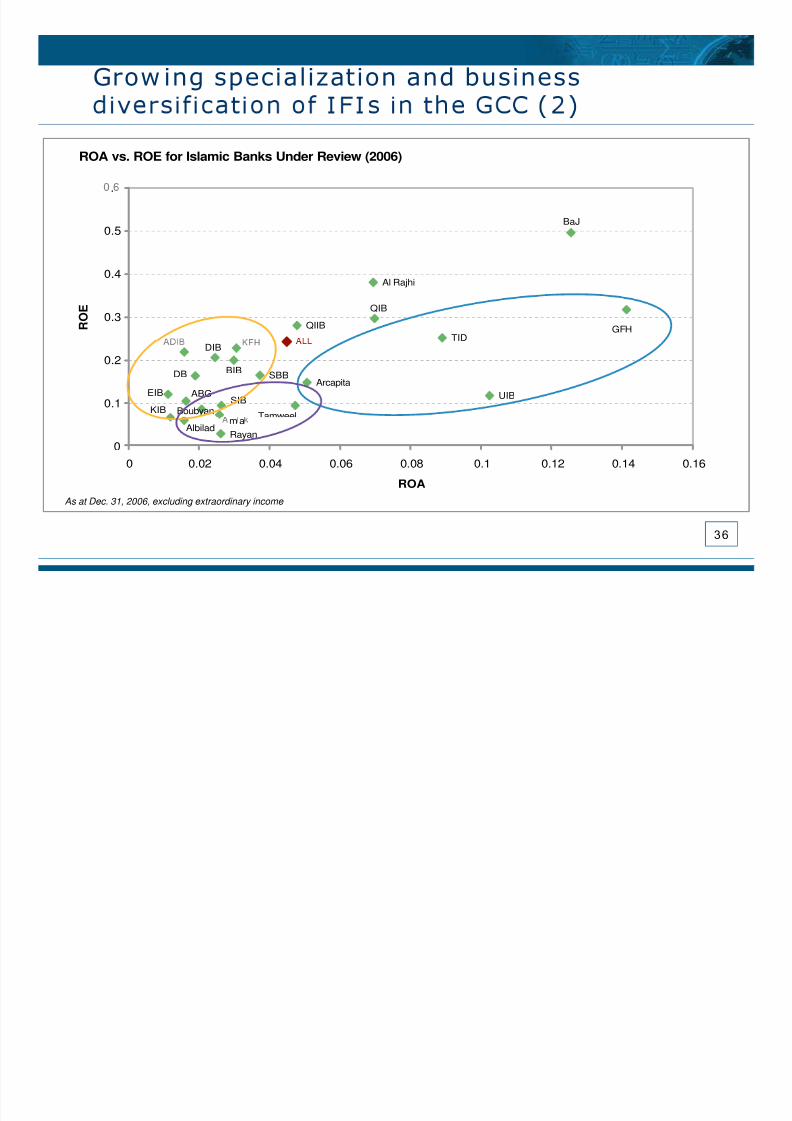
Grow ing specialization and business
ROA vs. ROE for Islamic Banks Under Review (2006)
BaJ0.5
.
QIIB
QIB
Al Rajhi
TID GFH
0.3
0.4
R
O E
SIBBoubyanKIB
ABGEIB
DB BIB
DIB
SBB
Tamweel
ArcapitaUIB
0.1
0.2
m aAlbilad
Rayan0
0 0.02 0.04 0.06 0.08 0.1 0.12 0.14 0.16
ROA
3 6
As at Dec. 31, 2006, excluding extraordinary income
8/3/2019 Tour d’horizon des systèmes bancaires
http://slidepdf.com/reader/full/tour-dhorizon-des-systemes-bancaires 37/38
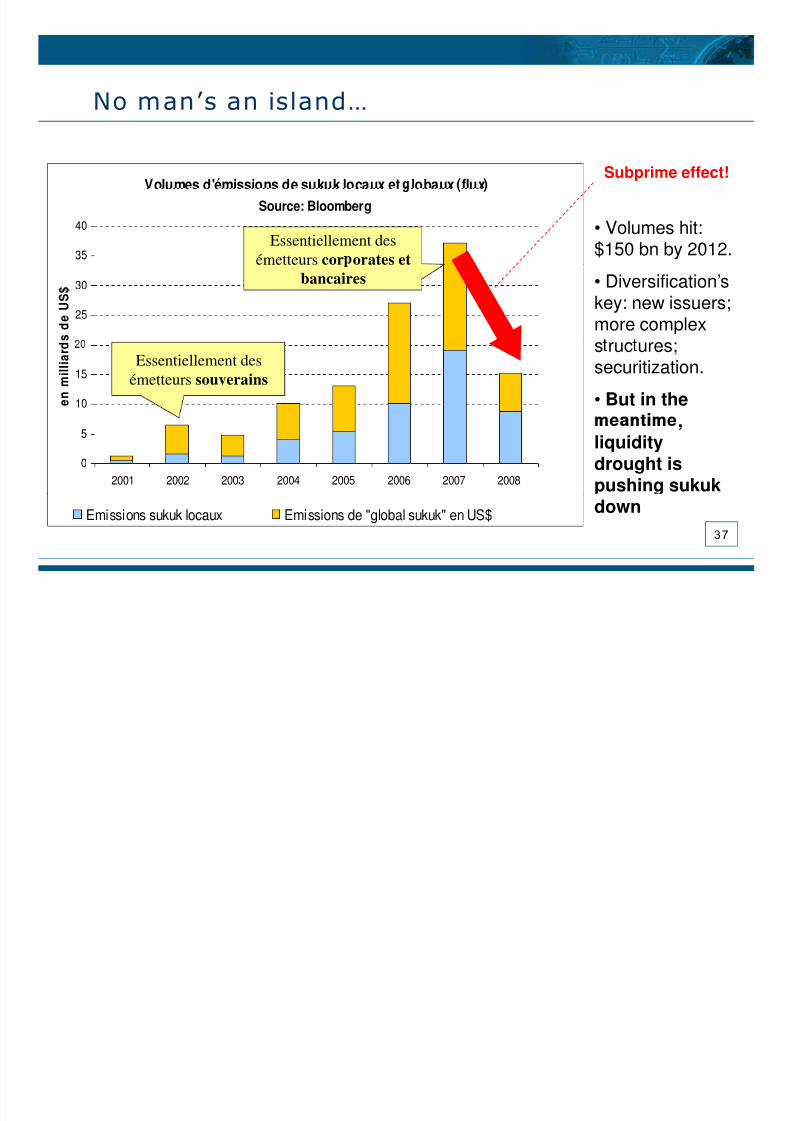
No man’s an island…
Volumes d'émissions de sukuk locaux et lobaux fluxSubprime effect!
35
40
Source: Bloomberg
Essentiellement desémetteurs cor orates et
• Volumes hit:$150 bn by 2012.
25
30
s d
e U S $
bancaires • Diversification’skey: new issuers;
more complex
10
15
e n m i l l i a r d
Essentiellement desémetteurs souverains
s ruc ures;securitization.
• But in the
0
5
2001 2002 2003 2004 2005 2006 2007 2008
,liquiditydrought ispushing sukuk
3 7
Emissions sukuk locaux Emissions de "global sukuk" en US$ down
8/3/2019 Tour d’horizon des systèmes bancaires
http://slidepdf.com/reader/full/tour-dhorizon-des-systemes-bancaires 38/38
Where there an defau lts?
Y es indeed, although relatively few er.
Global Investment House (Kuw ait)The I nvestment Dar Kuw ait
East Cameron Gas Co. (Canada)
More to come?
Shari’ah-complian t investment banking model:illiquid and concentrated assets + w holesale,
concentrated funding base = higher defaultprobabilities
3 8