Embed Size (px)
Citation preview
UNIVERSITÉ DU QUÉBEC À TROIS - RIVIÈRES.
RÉSUMÉ SUBSTANTIEL DE MÉMOIRE EN MAÎTRISE DES
SCIENCES DE L'ENVIRONNEMENT
PAR
JOHN NJIKE NYEANGO
INFLUENCE DE LA COMPOSITION SALINE SUR LA
BIOVALORISATION DE L'EFFLUENT DE FROMAGERIE.
AVRIL 1996.
Université du Québec à Trois-Rivières
Service de la bibliothèque
Avertissement
L’auteur de ce mémoire ou de cette thèse a autorisé l’Université du Québec à Trois-Rivières à diffuser, à des fins non lucratives, une copie de son mémoire ou de sa thèse.
Cette diffusion n’entraîne pas une renonciation de la part de l’auteur à ses droits de propriété intellectuelle, incluant le droit d’auteur, sur ce mémoire ou cette thèse. Notamment, la reproduction ou la publication de la totalité ou d’une partie importante de ce mémoire ou de cette thèse requiert son autorisation.
TABLEAU DE MATIÈRE
Page
Introduction ... .... .. .... ... ..... ...... ........... .............. .. .. ..... .... .... ........ ....... ... .. 1
Il Problématique .... ....... ..... ........ ..... ...... .. ...... .. ....... ... .... .. ............ ... .. .. ..... 3
III Objectif ...... ............... .... ..... .. ....... .......... .... ........... ... ...... .................. ..... 5
IV Méthodologie .... .. ...... ... ....... ... ...... ......... ..... ..... ... .. ... .. ........ ... .............. . 6
Méthode d'immobilisation ......... ........ ............ ..... ..... ... ... .... ... ..... 6
Études cinétiques avec lactose ... ..... ..... ....... ..... ... .. ....... ......... .. 7
Études cinétiques en présence des cations ...... .. ....... .... ....... ... 7
L'Hydrolyse des effluents de fromagerie en bioréacteurs .. .. .... 8
Étude spectroscopique par FT - 1R. .... .. .. .. ...... ... ......... .... .. ....... 8
V Résultats et Discussion ...... ....... ....... ................ ....... ... ... .... ... ... ..... ...... 1 0
Résultats d'immobilisation ..... ......... .... .. .. .... ..... .... .... .. ... .. ... .... .. 10
Études cinétiques .. .. ..... ...... .............. .. ... .... ... ..... ... .. .. ... .. ........ .. 1 0
Sans cations ...... .. ........ ..... ............ .... ......................... ...... ...... .. 1 0
Effet de la température ..... ....... .. ....... .... ..... ......... .... ....... 1 0
Effet de la concentration initial du lactose ... .... ... .. .. .... .. . 11
Avec Cations .. ..... ..... ...... ... ........ ... ..... .... .... ..... .... .. ..... ..... . -.. ...... . 12
Cations individuels .. .. ..... ... .... .... ... ..... ... .... .. .... .... ..... .. .... 12
Cations combinés ..... .. ... .. .................... ..... ...... ..... ... ....... 13
Étude spectroscopique .................... ... ............... .. .. ..... ........ ...... 13
L'hydrolyse de l'effluent de fromagerie en bioréacteurs .... .... ... 14
V Conclusion ........ ...... .... ... ...... ............ .. .................... ....... .. .. ........ .... ...... 16
INTRODUCTION
La production du fromage au Québec et au Canada est en croissance régulière,
elle a atteint 159.5 tonnes métrique (TM) et 370.2 TM en 1994 respectivement. On
a estimé que 2,203 TM du lactosérum (petit lait) furent produits au Canada en
1994(1) . Le lait entier est utilisé pour la production du fromage naturel tel que le
cheddar et le sous - produit résultant est appelé lactosérum doux, ayant un pH de
5 - 7. Le lactosérum est aussi le sous - produit de fromage lorsque les matières
grasses et la caséine sont enlevées. Il est généré dans une proportion de 9 kg de
lactosérum pour chaque kg du fromage fabriqué. Le fromage cottage, fabriqué
avec lait écrémé, produit un lactosérum acide, pH de 3.5 - 5 dans une proportion
d'environ 6 kg de lactosérum pour chaque kg du fromage fabriqué. Cette baisse
de pH est due aux acides produits et / ou utilisés pour la coagulation. Le
lactosérum est très riche en minéraux: Calcium, Sodium, Potassium, cuivre et fer.
Ces minéraux ont une qualité digestive supérieure. Le lactosérum est également
une source potentielle de complexes de vitamine B, de la riboflavine et d'autres
vitamines.
L'utilisation du lactosérurtl est limitée à cause du lactose, son composant
principal qui se cristallise facilement. La biovalorisation des effluents de
fromagerie (lactosérum) et la récupération des sous-produits de biotransformation
offrent des potentiels d'applications innombrables. Ces techniques pourraient
1
résoudre les problèmes de l'intolérance au lactose, de la cristallisation du lactose,
et les problèmes environnementaux (pollution) associés au lactosérum.
Beaucoup de recherches ont été effectuées pendant les deux dernières
décennies dans le domaine de valorisation du lactose, surtout la biotechnologie.
Plusieurs chercheurs<2,3,4) ont mis l'accent sur l'hydrolyse du lactose par l'enzyme p
- galactosidase. Quelques uns ont montré que les sels ou ions métalliques
(cations) jouent un rôle important sur l'activité et la stabilité de la l'enzyme p -
galactosidase pendant l'hydrolyse du lactose. Ces cations sont impliqués dans
certains contrôles physiologiques, ils déclenchent les mécanismes d'activation
enzymatique, gardent les structures et contrôlent les fonctions de parois
cellulaires. II a été constaté que le manque de cations était responsable de la
perte d'activité de certaines lactases (enzymes) de p - galactosidase.
2
II. PROBLÉMATIQUE.
Il ressort de l'historique bibliographique la problématique suivante :-
- Le lactosérum rejeté comme déchet constitue une charge polluante
considérable. Le lactosérum contenant environ 6% (w/w) de solides représente
une demande biochimique en oxygène (0805) de l'ordre de 30,000 ppm - 50,000
ppm. Les différents voies de valorisation posent certains problèmes. Par exemple,
l'ultrafiltration nous permet de concentrer et séparer des protéines du lactosérum
et du perméat; mais la présence de lactose (4 - 5% w/v) dans le perméat et sa
forte charge en 0805 pose un problème de pollution.
- La biovalorisation du lactose par la dégradation anaérobie est une
alternative attrayante, due au faible coût d'opération et le recouvrement du
méthane, réutilisable comme combustible dans l'usine. Puisque le lactose se
dégrade facilement en acides(lactique, propanoique , etc), la concentration élevée
du lactose dans le lactosérum résulte souvent en un digesteur acidifié dans lequel
-les bactéries acétogéniques et méthanogéniques ne peuvent bien fonctionner.
L'immobilisation de micro-organismes (bactéries) anaérobies sur les parois des
bioréacteurs en utilisant leur capacité à s'attacher sur les parois "biofilm" ou à se
regrouper" bioflock" peut occasionner des difficultés pour le transfert du substrat
.ft.
3
dans les agrégats microbiens. L'usine de traitement ou d'épuration d'effluent de la
compagnie d'Agropur du Notre - Dame du Bon Conseil, Québec, Canada, offre un
bel exemple où les agrégats microbiens arrêtent le fonctionnement d'un
bioréacteur anaérobique.
- Le lactose représente le constituant principal du lactosérum à valoriser à
cause de sa charge polluante élevée. L'utilisation directe du lactose est limitée par
son faible pouvoir sucrant et certaines personnes présentent des problèmes
d'intolérance au lactose. De plus, le lactose cristallin est peu soluble. L'hydrolyse
de lactose en glucose et galactose est une alternative potentielle pour surmonter
ces handicaps.
- L'hydrolyse du lactose par les systèmes d'enzymes immobilisées a donné
de bons espoirs aux industries laitières, de pouvoir mieux valoriser leurs sous
produits; mais malheureusement dans la plupart des installations, la demi-vie des
catalyseurs biologiques ne sont que de quelques semaines, voire quelques
heures. La recherche d'un modèle de vitesse englobant le plus d'influences
possible devient nécessaire. Le. comportement de l'activité vis-à-vis certains sels
ou cations, observé sur les enzymes solubles peuvent être appliqués aux
enzymes ou cellules sur supports, mais les essais en réacteurs sont nécessaires
pour confirmer leur stabilité.
4
III. OBJECTIF
Le but principal de ceUe étude était de proposer une voie de biovalorisation de
l'effluent de fromagerie en fonction de sa composition saline. CeUe recherche
permet:
1. d'évaluer des paramètres cinétiques en fonction de la concentration en sels
du substrat lors l'hydrolyse du lactose.
2. de faire une étude de l'interaction cation-lactose par spectroscopie.
3. d'étudier la biovalorisation du lactosérum en bioréacteurs, réacteur
tubulaire (PFTR) et réacteur à réservoir agité (CSTR).
4. de proposer une usine pilote type de biovalorisation des effluents de
fromagerie.
-5. de faire une étude d'analyse économique de l'usine pilote.
5
IV. MÉTHODOLOGIE.
4.1. Méthode d'immobilisation.
La méthode d'immobilisation inventée par Chiang, J.P. et Lantero, O.J. Jr,
1990, publiée dans le bureau des Brevets Européen était modifiée et adaptée à
cette recherche. Cette méthode consiste à immobiliser le lactase, Aspergillus
oryzae avec l'activité initiale de 4.4 unités/mg solide avec lactose ou 4.5 unité/mg
solide avec 2-Nitrophenyl-~-D-galactopyranoside(ONPG) à 30 oC et pH 4.5 sur un
support enzymatique (granular diatomaceous earth). L'efficacité d'immobilisation a
été calculée en utilisant l'expression:
[E -E J Efficacité d'immobilisation, a = 0 E 0 1 * 1 00
où Eo = activité initiale d'enzyme.
E1 = activité de la solution résiduelle d'immobilisation.
Après l'immobilisation un test de stabilité thermique d'enzyme immobilisée et un
autre pour la stabilité mécanique d'enzyme immobilisée ont été effectués .
.c..
6
4.2. Études cinétiques avec du lactose pur.
4.2.1. Sans cations.
4.2.1.1 Effet de la température.
L'influence de la température sur les paramètres cinétiques était effectuée avec
2% (w/v) de lactose tout en faisant varier la température de 30 oC à 60 oC.
4.2.1.2. Effet de la concentration initiale du lactose.
L'influence de la concentration initiale du lactose a été mesurée à une
température optimale de 50 oC tout en variant la concentration initiale de 0,5% à
5% (w/v) .
4.2.2. Étude cinétique en présence des cations.
4.2.2.1. Le cas de cation individuels.
Cette étude a été effectuée sur 2% (w/v) de lactose en présence de 4 cations
individuels avec les concentrations suivantes: 0.1 M NaCI, 0.1 M KCI , 2mM CaS04,
et 2mM MgCI2.
7
4.2.2.2. Le cas de cations combinés
Cette étude a été effectuée sur 2% (w/v) du lactose en présence des
combinaisons de 3 cations: K+, Na+, Ca++ selon les gammes suivantes:
NaCI
KCI
CaCI2
O.05M - O.1M
O.05M - O.1M
O.5mM -2mM
4.3. Étude spectroscopique par FT - IR.
Elle a été effectuée avec le lactose libre et ensuite avec le complexe de cation
(Na, K, Ca) - lactose.
4.4. Hydrolyse des effluents de fromagerie en bioréacteurs
Les substrats utilisés dans cette étude étaient l'effluent de fromagerie (lactosérum)
et l'effluent de l'usine d'épuration d'AGROPUR de Notre - Dame du Bon Conseil.
4.4.1. Unité d'ultrafiltration (UF).
L'unité d'ultrafiltration était nécessaire pour séparer l'effluent en concentrés
protéines de lactosérum et de perméat . Dans ce système la plupart des sels ou
cations étaient enlevés lors de ce procédé.
8
4.4.2. Hydrolyse de l'effluent de fromagerie en bioréacteurs.
Le perméat de lactosérum et celui de l'effluent de l'usine d'épuration ont été
pompés dans les bioréacteurs; le réacteur à réservoir agité (CSTR) et le réacteur
tubulaire (PFTR). À la sortie de réacteur, les produits sont analysés pour la
présence de glucose, galactose, lactose, et les oligosaccharides.
Le degré d'hydrolyse, X (%) était calculé en utilisant l'expression :
x = [ Cglu cose + Cgalactose ]100 C lactose + C glu cos e + C galactose
ou C est les concentrations des composés trouvées dans les produits obtenus.
4.5. Demande biologique et chimique en oxygène.
La 0805 et DCO des échantillons et les effluents hydrolysés dans les réacteurs
ont été mesurées en utilisant le "Dissolve Oxygen Meter" au Centre. de recherche
en pâte et papier (CRPP).
9
v. RÉSULTATS ET DISCUSSIONS.
5.1. Résultats d'immobilisation.
5.1.1. Efficacité d'immobilisation.
À partir des résultats d'immobilisation obtenus, l'efficacité d'immobilisation
d'Aspergillus oryzae sur le support, GDE, était 98.4 % et la vitesse optimum
d'agitation du bain d'immobilisation était 150 rpm.
5.1.2. Stabilité thermique d'enzyme immobilisée.
L'Aspergillus oryzae immobilisée était plus stable à 50 oC
5.1.3. Stabilité mécanique d'enzyme immobilisée.
L'Aspergillus oryzae immobilisée était mécaniquement stable à une vitesse
d'agitation optimum du réacteur réservoir agité (CSTR) de 120 rpm.
5.2. Études cinétiques.
L'objectifs des études cinétiques étaient de déterminer les paramètres cinétiques,
V max. and Km. app. et étudier les ef!ets des cations sur les paramètres cinétiques.
5.2.1. Études cinétiques sans cations.
Les effets suivants ont été observés en augmentant la température sur les
paramètres cinétiques :
.c..
10
5.2.1.1
-la vitesse maximum de la réaction, Vmax. , augmente mais elle était limitée
aux températures élevées.
- la degré de transformation maximum augmente. Cependant une chute
graduelle était remarquée aux températures plus de 55 oC.
- les valeurs de Km app. obtenues sont plus faibles que celles trouvées dans
certaines revues scientifiques( 5,6) en utilisant l'équation de Michealis -
Menten avec une inhibition compétitive de produit.
Effets de la concentration initiale du lactose sur les
paramètres cinétiques
À partir des paramètres cinétiques obtenus, on remarque que lorsque la
concentration du lactose augmente :
- la vitesse maximum de réaction augmente mais elle était limitée aux
concentrations élevées.
- la conversion diminue, indiquant que le lactose et le galactose sont
impliqués dans la formation des oligosaccharides.
- dans la plupart des milieux de réaction la concentration du galactose était
inférieure à celle du glucose.
Bien qu'il ait été démontré que les oligosaccharides sont formés pendant
l'hydrolyse du lactose, ils étaient négligés dans les modèles de vitesse de réaction
proposées. En effet une étude réalisée par S.T. Yang (1980) avait montré que la
11
formation des oligosaccharides peut être négligée dans la modélisation de la
vitesse de l'hydrolyse surtout quand la concentration initiale du lactose est faible
et la température de réaction d'environ 50 oC.
5.2.2. Études cinétiques en présence des cations.
L'objectif était de démontrer l'influence des cations sur les paramètres cinétiques
et aussi de montrer qu'une déminéralisation au complet de l'effluent de fromagerie
n'est plus nécessaire avant l'hydrolyse.
5.2.2.1. Effets des cations individuels sur les paramètres cinétiques.
À partir des paramètres cinétiques obtenus, on remarque que les paramètres
cinétiques sont influencés par la présence des cations. Les cations bivalents en
particulier jouent une rôle significatif sur . l'activité enzymatique. Ces cations
augmentent la vitesse maximale de réaction, Vmax. de l'ordre de 20% à 60 %. Les
paramètres cinétiques étaient très élevés pour Ca++ et Mg++ par rapport au 1< et
Na + ou en absence de cations. On a noté aussi que les paramètres cinétiques
pour les cations monovalents ' étaient moins élevés que ceux en absence de
cations. Les taux de transformation étaient plus élevés chez les cations bivalents
que les monovalents.
12
5.2.2.2. L'influence de cations combinés.
Les résultats obtenus en variant les concentrations des cations combinés étaient
compliqués et parfois difficiles à interpréter parce que les paramètres cinétiques
n'étaient pas uniformes. Cependant, la vitesse maximum de réaction la plus
élevée était 6.63 mmoI.L-1.min-1.g-1IME et la valeur Km.app. était 72.69 mmol.lL. Ces
paramètres cinétiques ont été observés à une concentration optimum de 3 cations,
Na : K: Ca dans le rapport 7SmM : 7SmM : O. SmM respectivement. Les valeurs
de Km.app. obtenues en présence des cations étaient faibles, indiquant ainsi, une
grande affinité d'enzyme pour lactose. Par conséquent, l'attachement de l'enzyme
au complexe de cation - lactose est très forte.
5.3. Études spectroscopique avec le FT-IR.
L'étude spectroscopie était l'une de nouveauté de ce projet de recherche.
Aucune étude sur l'interaction de lactose - cations n'a été réalisé jusqu'à présent.
Les résultats des spectres obtenus dans la marge de 1800-1000 cm-1 sont
analysés dans cette étude. Un seul groupe de bande d'absorption a été observé à
16S0 cm-1 . La bande d'absorption a montré un changement d'intensité
considérable en complexant le lactose avec les cations. La variation de l'intensité
observée avec une concentration de O.SM de cation monovalent (Na+ et ~ ) a
montré que l'absorption était plus forte pour Na+ que pour le ~ . Cette
dissimilarité est due au rayon ionique de Na+ qui est petit par rapport à celui de ~.
13
Pour le complexe de Ca ++ - lactose, on a observé une absorption remarquable et
distincte à 1650 cm-1 , mais aux concentrations de 0.5 - 1 M CaCb la bande
d'absorption est déplacée à une fréquence inférieure de 1637 cm-1.
L'ordre d'intensité d'absorption est Ca > Na > K. Ceci montre que l'interaction
entre le calcium et lactose est plus forte que celles observées entre Na+ ou 1\,
indiquant que le complexe cations bivalents (Ca2+, Mg2+ ) a beaucoup d'affinité
pour l'enzyme que les cations monovalents (Na+, 1\ ). Ceci explique la valeur
élevée de vitesse maximum,vmax., et un degré élevé de l'hydrolyse par rapport aux
cations monovalents. Cela peut être confirmé par le fait que les valeurs de la
constante de Michealis - Menten, Km.app. obtenues dans cette étude était plus faible
pour les cations bivalents que les cations monovalents. Plus que Km.app. est petit,
plus l'affinité d'enzyme pour le substrat est forte.
5.4. Hydrolyse de l'effluent fromagerie dans les bioréacteurs .
Le degré de l'hydrolyse était 30% plus élevé dans réacteur tubulaire (PFTR) que
le réacteur réservoir agité (CSTR). Pour atteindre le même dégrée de conversion,
le CSTR demandera plus d'enzymes immobilisées que le PFTR. La demi-vie
d'enzyme immobilisé était 17 jours. Friends and Shahani (7) en utilisant le même
enzyme et les mêmes conditions opérationnelles à une température, 50 oC ont
trouvé une demi-vie de 13 jours. Le désactivation d'enzymes était influencée par
14
la température d'opération, le pH, la nature de substrat et la contamination
microbienne.
5.5. Étude d'analyse économique.
L'objectif de l'étude économique était de démontrer la faisabilité industrielle de ce
projet et de déterminer si l'usine sera installée en parallèle ou en série avec
l'usine d'épuration existant à l'usine de fromage d'AGROPUR de Notre -Dame du
Bon Conseil , Québec, Canada.
L'usine pilote devra traiter 48 m3 or 50 tonnes par jour. Les prix des équipements
étaient obtenus soit chez les manufacturiers, soit chez les distributeurs soit à
partir des graphiques et mis à jour en utilisant le "Chemical Engineering plant cost
Index" pour faire le rapport des coûts pour l'année 1995.
Le fonds de roulement est le capital nécessaire pour le fonctionnement du
procédé. Le fonds de roulement varie entre 1 0 - 20 % de capital fixe dépendant de
la complexité de l'usine et du coût de matière première. Le capital total qui est la
somme total à investir par les investisseurs a été estimé à 3,695,538 $. Le coût
total du produit comprend les cOûts de fabrication et les dépenses générales. Le
coût total du produit dans cette étude était estimé à 1.4 millions $. Les revenus
étaient de 1.6 millions $. Ce qui a donné un profit net après impôt de 100,000$
15
VI. CONCLUSION.
Cette recherche a bien démontré que les cations jouent une rôle significatif sur
l'activité et la stabilité du lactase, Aspergillus oryzae. Une analyse de l'effet des
spectres de FT -IR des cations sur la cinétique de l'hydrolyse du lactose a
confirmé qu'ils réagissent en augmentant l'affinité du complexe cation - lactose de
l'enzyme et l'activité maximum de l'enzyme.
Le Ca ++ et Mg ++ étaient activateurs, alors que les cations monovalents ( K +, Na +
) étaient stabilisateurs pour la lactase, Aspergillus oryzae. Cependant, ces cations
peuvent devenir inhibiteurs lorsque leurs concentrations dépassent certaines
limites. Par conséquent, il est très important de contrôler les concentrations
cationiques dans le milieu réactionnel.
À partir des caractéristiques spectroscopiques du lactose étudiés ici, on peut tirer
les conclusions suivantes :
- La forte liaison d'hydrogène du lactose libre est maintenue après le
complexation;
- Il y a quelques interactions entre cations et les groupes OH, aussi que
C - 0 du lactose anion.
16
Le réacteur tubulaire est plus performant, plus efficace, et plus économique que le
réacteur en agitation continu pour l'hydrolyse du lactosérum.
Le DBOs était réduit de 33,3000 mg/L pour l'effluent fromagerie (lactosérum) à 300
mg/L pour l'effluent hydrolysé tandis que l'effluent de l'usine d'épuration existante
était réduit de 2,300 ppm à 84 ppm donc un niveau plus bas que la limite de 1,000
mg/L stipulée par le Ministère de l'Environnement pour les industries laitières.
À partir d'étude d'analyse économique on peut conclure que l'usine pilote sera
rentable si elle est installée en parallèle à l'usine d'épuration existante dans la
fromagerie de Notre-Dame du Bon Conseil.
17
REFERENCES.
1. Statistic Canada, The Dairy Review, Catalogue No. 23-001, vol.56 NO.7 July 1995.
2. Khalid . A Rahim and Byong H. Lee, Production and characteristization of B - galactosidase from Psychrotrophic Bacillus subtilis KL88, Biotechnology and Applied Biochemistry, vol.13 pp 246 - 256 (1991).
3. Mehaia,M. A, Jose Alvarez & Munir Cheryan, " Hydrolysis of Whey Permeate in a Continuous Stirred Tank Membrane Reactor", Int. Dairy Journal 3, p179 - 192 (1993)
4. Shang-Tian Yang, An Investigation of the Performance of Lactose Hydrolysis Catalyzed by ~-galactosidase, M.Sc. Thesis, Purdue University, August 1980.
5. A Illanes, et aL, Immobilization of lactase for the continuous hydrolysis of whey permeate, Bioprocess Engineering 5 257 - 262 (1990).
6. Klaus Mosbach, Methods in Enzymology, Vol. 136, Immobilized Enzymes and Cells, Part C. 1987 Edition.
7. Friends, B. A, and Shahani,K. M., Biotech. and Bioeng., 24,P329(1982).
8. Greenberg, N.A and R.R. Mahoney, Production and Characterization of BGalactosidase from Streptococcus thermophilus, J of Food Sc., vol.47, (1982)
....
UNVERSITÉ DU QUÉBEC
THESIS SUBMITTED TO
THE UNVERSITÉ DU QUÉBEC À TROIS - RIVIÈRES
IN PARTIAL FULFILLMENT OF THE REQUIREMENTS FOR THE DEGREE
OF MASTER OF SCIENCE IN ENVIRONMENTAL SCIENCES
BY
NYEANGO JOHN NJIKE
THE VALORIZATION AND THE INFLUENCE OF WHEY CATIONS ON THE
BIOTRANSFORMATION OF CHEESE INDUSTRIAL EFFLUENT.
APRIL 1996
RÉSUMÉ.
La valorisation de l'effluent de fromagerie par l'hydrolyse avec les enzymes
immobilisées sur supports en sirop de glucose et galactose constitue une
double solution pour la gestion des effluents de fromagerie. Elle permet de
satisfaire les attentes économiques de l'industrie fromagère et de répon~re
aux exigences environnementales de la société. Dans cette optique, nous
avons conçu deux types de réacteurs, un réacteur tubulaire (PFR) et un
réacteur en agitation continue (CSTR). Chacun de ces réacteurs était rempli
d'une quantité d'enzyme immobilisée sur diatomée (GDE) en fonction du
volume réactionnel.
Des essais préliminaires de l'hydrolyse de lactose pur par différentes 8-
galactosidase ont permis de retenir l'enzyme Aspergillus oryzae. Des essais
d'optimisation des conditions d'immobilisation d'enzyme immobilisée ont
conduit au choix d'une vitesse d'agitation optimum de bain d'immobilisation
de 150 rpm qui a donnée une efficacité d'immobilisation plus de 98% et une
stabilité thermique de 50 oC. Des tests d'optimisation des conditions
d'opération d'enzyme immobilisée ont conduit au choix d'une stabilité
mécanique à 120 rpm pour le CSTR, un débit de 40 ml/min pour le PFR, et un
pH 4,5 pour le milieu réactionnel.· L'hydrolyse de lactose en présence et en
absence de cations a démontré que les cations bivalents (Mg2+, Ca2+)
influencent beaucoup la vitesse de réaction de l'hydrolyse et par la suite
augmentent l'activité d'Aspergillus oryzae.
11
Les expériences dans les bioréacteurs ont prouvé que le réacteur tubulaire est
plus efficace que le CSTR pour l'hydrolyse du lactose et ont donné un
rendement de conversion de plus de 85 % pour les effluents fromagerie.
De plus une étude économique de l'usine pilote proposée à partir de ce projet
recherche permet d'avancer que l'application industrielle de ce type de
procédé pourrait être rentable.
Finalement une étude spectroscopie par FT-IR, nous a permis de faire une
tentative pour expliquer le mécanisme de l'interaction cation - lactose qui n'a
jamais été réalisé, cependant d'autres études seraient nécessaires pour
valider cette théorie avancée. Les cations bivalents ont augmenté la vitesse
de réaction maximum, Vmax. de l'hydrolyse du lactose par 4 à 600/0.
III
ABSTRACT.
Lactose in reconstituted whey permeate was hydrolyzed using immobilized p
galactosidase from Aspergillus oryzae. The effect of single as weil as a
combination of three whey cations (Na, K, and Ca) at different concentrations
on the hydrolysis of lactose were studied. Divalent cations significantly
increased the rate of lactose hydrolysis. The maximum rate of reaction, Vmax,
was increased by 60% in the presence of Mg2+. A FT-IR spectroscopic study
also confirmed the important role played by divalent 'cations on the kinetics of
lactose hydrolysis. When a combination of these three cations were utilized, a
maximum rate of hydrolysis, Vmax, of 6.63 mmol/L.min.gIME and Km.app. of 72.69
mmol/L. was obtained at a concentration of 75 mM, 75 mM and 0.5 mM for
Na, K, and Ca respectively. High conversion (850/0) of lactose was achieved in
less than 1 hr. residence time at 50 oC and pH 4.5 in a plug flow tubular
reactor. The biological oxygen demand(BODs) of the substrate was reduced
from 35,000 ppm to about 300 ppm .
. f,
iv
This thesis is dedicated to my parents Mr. and Mrs. Nyeango,
and to my son Nyeango Jimmy Liu whose support contributed
to the completion of this work.
1 thank them sincerely and dearly for their encouragement and
stimulation which was helpful to me throughout this project.
.f,'
v
ACKNOWLEDGEMENTS.
1 would like to express my profound gratitude to my research director, Dr.
James T. Agbebavi for his contribution, encouragement, guidance and support
throughout this research work. Besides his scientific competence, 1 sincerely
thank him for his good sense of humour and human qualities. His availability
and encouragement greatly inspired me to overcome the difficulties
encountered in this research project thereby enabling me to complete this
research.
1 would like to express my appreciation and acknowledgment to NSERC for
financing this research project as weil as Université du Québec à Trois
Rivières for the scholarship awarded to me throughout my entire stay at the
University. Special thanks also goes to Louis Lamontagne and Serge Deblois;
laboratory technicians in the department of Chemistry - Biology and Chemical
Engineering laboratory, respectively.
Finally, thanks is greatly deserved by my spouse, Mrs. Nyeango Liu Qi, for her
advice, inspiration and understan9ing; without her this work wouldn't have
been completed.
VI
TABLE OF CONTENTS Page
RESUME ....... ......... ........ ....... .. ...... ...... ..... .... .... ..... .... .... ....... ........ ... ... ... .. ....... .. ... ...... ..... iii
ABSTRACT .... ... ...... ..... ...... ... ... ...... .... .... ...... ....... ..... .... ... .. ..... ..... .... ..... ..... .... ......... ... ..... iv
ACKNOWLEDGEMENTS ..... ...... ... ...... .... .. .. ... ........ .. ... ...... ..... .. .... .. ..... .... ......... .. ........... vi
LIST OF TABLES .. .. .... .... ....... ... ........ .... ...... .. ..... ... ...... ..... .... ... .. .. ........ ·· ..... ...... ·. ·.···· ... .. xii
LIST OF FIGURES .... ... ... .................. ..... ...... ..... ... ............ ... .. .... .... ... .......... .... .... ......... xiv
1. INTRODUCTION AND PROBLEM DEFINITION .. ........... ... ... .. ......... ..... ........... ..... ... .. 1
1.1. Introduction .. .... .... .... ...... ... .. ........ .... .... .. ....... .... ....... ... ...... ... ........... .. ............ .... .. .. . 1
1.2. Problem definition ... .. ........ ......... .. .... .. .. .. ... .... ... ... .. ... ......... ................. .............. .... 4
1.3. Objective ... .. ... .... ...... ...... .... ....... .. ...... .... .. ............ ..... ........ .... ....... ... .... .. ... ...... ...... .. 6
II. LlTERATURE REVIEW ... ..... .... ............ .... .. .. ...... .... .... ..... .. ... .. ..... ....... .......... ....... ....... 7
2.1 . Definition of cheese industrial effluent.. .. .... .... ... .... .... ... ... .. ......... ........... ... ... .. .... ... 7
2.2.Methods of valorizing cheese industrial effluenL ... ... ... .. ............ ........ ..... .. .. ... ....... 9
2.2.1. Physico - chemical processes .. ......... .. .. ... .... ... .. ... .. ... .. ... ... .... .... .... .......... ...... .. 9
2.2.2. Biotechnological processes ..... ..... ... ... .. .... ... .... .... ... ... ....... ... ...... ... .... ........... . 11
2.3.The case j3-galactosidase and the influence of cations ........... .... .. ........... .. ... .. .. .. 14
2.4. Action of j3-galactosidase ....... ... ... .. .... ............ ....... ......... .... ...... ..... ....... .. .... ......... 16
2.5. Properties and application of j3-galactosidase .. .... .. .. .. .. .... ..... ... ... .... ... ............... . 20
2.6. Immobilization of 13 - galactosidase .. ............. ..... ... .... ...... ............. .......... ..... ... . .21
2.6.1. Method of immobilization ..... .... ... .. .. .. .... .... .... ... .. ..... .. .. ... ... ............... .... .. ....... 21
2.6.2. Enzyme carriers or support .... . : ..... ...... .. ..... .... ... ......... .. .. ... ....... ...... ... ..... .... .. .22
2.7. Enzyme reactor ........ .. ... ... ....... ... ...... ........... ....... ....... ... .. .... .... ........................... .. 24
2.8. Theory ........ .. .... ... .. .... ... .... .... .. ....... .... ...... .... .. ...... ...... ... ... .. ... .. ......... ............ ........ 26
2.8.1 . Kinetics of lactose hydrolysis by 13 - galactosidase ... .. .................. .......... ..... . 26
2.9. Kinetics of ideal enzyme reactor systems .. .... ......... ............. .. ....... .... .... .... .. ...... .. 28
2.9.1. Design equation of a plug flow reactor (PFR) ... .. ..... .... ........... .. .. ..... ............. 28
vii
...................... . ............................................................ . .................... Page
2.9.2. Product inhibition design equation for plug flow reactor ..... ..... .. ... .. .. ............ 30
2.9.3. Design equation for a continuous stirred tank reactor(CSTR) ..... ........ ..... .... 30
2.9.4. Design equation for product inhibition in a CSTR. .... .. .. ... ..... ...... .. ....... .... .... 31
2.10. Thermal deactivation of immobilized enzyme ................... .. .......... .. ... .. .... ... .. ................. 31
III. MATERIAL AND METHODS .... ... ......... ...... ...... .................. .. ........ ... .. ................... .. 33
3.1. MATERIALS ... .. .... ... ...... ..... .. ... ....... ...... .. .............. ... ........ ..... .......... ...... .. .. .. .. ..... .. 33
3.1.1.Experimental equipment ., .. ... ...... ............ ...... .. ... ....... ............... .. ... ... ..... ..... ..... 33 3.1.2. Analytical equipment.. ..... ... ...... ...... .. ... ................... ...... ... ........................... .. 34 3.1.3. Chemicals ....... ... .. ... ..... ....... .. ........ .. ..... ......... ... .......... ... .. ...... ..... .. .... .. .... .. ..... 35
111.2. EXPERIMENTAL PROCEDURE ... .......... ..... ....... .. ...... .. ... .... ...... .. .. ... .. ................ . 36
3.2.1. Immobilization method ......... .. ........ ... .......................... ...... .. ........ .. ........ ..... ..... 36
3.2.1.1. Enzyme ....... .. ... .. ....... ..................... .... ............ ........ .. .... .. ........ ..... ..... .. ..... ... 36
3.2.1.2. Lactase ........................................................ .. .. ....... .. .................. ..... .... ... ... 36
3.2.1.3. Determination of initial enzyme activity in ONPG units ... .... ............. .......... 37
3.2.1.4. Immobilization .... .. ........ .. ....... ...... ...... . ' ............ ... ........ .............. .. .. ... ....... ..... 37
3.2.1.4.1. Treatment of enzyme support ........ ......... ........ .. ............ ... ..... ............... 37
3.2.1.4.2. Immobilization of enzymes .. .......... .... ................ ............. ... ... .. ......... ..... 38
3.2.1 .5. Residual enzyme activity .......... ........ ..... .. .................. .. .. ... ... ... .. ....... .... ..... 39
3.2.1.6. Determination of immobilized enzyme thermal stability ....... ..... ... , .... .. .. .... 39
3.2.1.7. Determination of immobilized enzyme mechanical stability ................. .. .... 39
3.2.2. Kinetic studies .. .. .... .. .... ..... ....... ........ .. ......... .. ... .... .......... ... .......... ..................... 40
3.2.2.1 . Kinetic studies without cations ....................... ..... .... ......... ... ...... ... .... .. ...... .40
3.2.2.1 .1. Effect of temperature .. ............................................. .......... ...... ...... .... . .40
3.2.2.1.2. Effect of various initial lactose concentration ........ ..... ..... ... .... .... .... ... .. .41
3.2.2.2. Kinetic studies in the presence of cations .... ...... ... ..... ... .... ... ..... ..... ...... .. .. . .42
3.2.2.2.1. The case of single cation .... .. .... ..... .... ... ........ ... ... ... ... .. ............. ........... .42
3.2.2.2.2. The case of a combination of three cations .. ...... .. ... .. .. .. ........ ....... ..... .42
3.2.3. Experimental circuit .. .... .. .. .... ............................... .... ...................... ......... ........ .42
viii
Page
3.2.3.1. Ultrafiltration (UF) unit .. .. ...................................... ... ...... .. ........... ....... ....... .42
3.2.3.2. Hydrolysis of cheese industrial effluent in bioreactors ...... ... .............. ... .... .43
3.2.4. Biochemical and chemical oxygen demand analysis .. .... ........ .... ........ ..... .. .. ... .48
3.2.5. Spectroscopie study of lactose - cation complex . ................ .. .. ......... .... .......... .48
IV. RESUL TS ......... ....... ......... ...... .... ... ... ....... .. ... ....... .. ....... .. ... ..... ... ... .... .. ..... .... ..... .... .. 49
4.1 . Immobilization results .... ............... .. .. ... .... .. ..... .... ..... ....... ....... ... ..... ...... .. ... ..... ... .49
4.1 .1. Immobilization efficiency ............. ... ... ..... ...... ..... ........... .... ... ... .. .. ....... ..... .... .. .49
4.1.2. Enzyme support .. .......................................................................................... 49
4.1.3. Initial activity ..... .... ... ...... .. ......... .... .. .. .. ...... ... ... ... ... ........................................ 49
4.1.4. Thermal stability of immobilized enzyme .................. ... ........ ... .... ............ ...... 52
4.1.5. Mechanical stability of immobilized enzyme ..... .... ... .... ....................... .......... 52
4.2. Kinetic results ... ........ ... ..................... ... .. .. ... ........ ............... .. .... .. .................... ..... 52
4.2.1. Kinetic of lactose hydrolysis without cations .. ...................... ... .... ... .... .... .. .... 52
4.2.1.1. Temperature influences . ... ..... ................... ............. .............. ......... .......... 52
4.2.1.2. The effect of initial lactose concentration .... .................. ... ... ... .. ....... ... .... 56
4.2.2. Kinetic of lactose hydrolysis in the presence of cations .... ... ... ...... .... ........ ... 60
4.2.2.1. The case single cations .... ... ........ ..... .. .. ... ............... .... ... .... ............. ........ 60
4.2.2.2. The case of a combination of three (3) cations .............. ..................... .... 60
4.3. FT-IR spectroscopie studies on lactose-cation complex ... .. .. .. ....... .. ............... .... 64
4.4. Hydrolysis of cheese industrial effluent in bioreactor .... .. .. ... ... ...... ... ............. ... . 64
4.5. The results of the biological and chemical oxygen demand ............ ........... .... ... . 65
V. DiSCUSSiONS .. ........................................ ......................... .... .. .. ... ...... .... ... .... .. ...... .. 73
5.1 . Immobilization results ....................... .................................... ... ................ ..... .... . 73
5.1.1. Enzyme support ....... .. ...... ....... ... ... ......................... ........ .. .. ....... .. .. ....... ... ...... 73
5.1.2. Effect of agitating speed on immobilization efficiency ......................... ........ 74
5.1.3. Residual activity .................. ... ... ........... .... .. ... .... .... .. ... .. ... .. .. .......... .. ............. 74
5.1.4. Th~rmal stability of immobilized enzyme . .... .... ....... ... ...... ... ... .... ................... 76
IX
Page
5.1.5. Mechanical stability of immobilized enzyme .... .... ... ... ... ..... .. .... ... ... .. ... ........ .. 76
5.2. Discussion of kinetic results ..... .. ... .... ... ....... ............. .. ........ ... .... ..... ... ... ..... ........ . 76
5.2.1 . Kinetic studies without cations ..... .. ................... .... ... ....... .. ... ...... ... ... ........ ..... 76
5.2.1.1 . Effect of temperature on the kinetic parameters .... .. ... ....... ........... .......... . 76
5.2.1.2. Effect of initial lactose concentration on the kinetic parameters ...... ....... 79
5.2.2. Kinetic studies in the presence of cations ....... ... .... .... .. ... ... .. .. .. ..................... 81
5.2.2.1. Effect of single cations on the kinetic parameters . ... ..... ..... ....... .. .......... 81
5.2.2.2.The effect of combined cations on the kinetic parameters .... ............. ..... . 84
5.3. Tentative explanation of the cation-lactose complex mechanism ... .. .. .. ..... ..... ... 92
5.4. Hydrolysis of cheese industrial effluent in bioreactor .... .... .. .... ......... .. ............. .. 95
5.5. Immobilized enzyme deactivation and half - life estimation ...... ... .... ... .. ... .. .... ... .. 98
VI. ECONOMIC ANAL YSIS OF THE PILOT PLANT. .. .... .......... .... ... ........... ......... ....... 1 03
6.1. Introduction and objective ... ..... ... .... ..... .. ......... ......... ... .. ...... .. .. .. .. .. ... .... .. .......... 1 03
6.2. Equipment specifications . ...... ..... .. ...... .............. ............ ... .. .. ... ....... .. ... .. ...... ...... 1 06
6.3. Estimation of equipment cost or fixed capital. ..... .. ..... ....... ....... ... ... ... .... .... ... ..... 1 06
6.4. Capital cost estimation ..... .. ............ .... .......... ....... ...... ........... .. ... .......... .. ...... .... . 1 09
6.4.1. Installation factor, FSM . ... .... .... ... ... ... ... .................. ... .. ... .... .... .. ...... .. ... ........ .. 11 0
6.4.2. Direct labor and materials, COLM ... ................................. ............ .. ..... ...... ..... 110
6.4.3. Indirect cost. .. ... .. ... .... ..... .............. .............. ............. .............. ...... .. ... ~ ......... 11 0
6.4.4. Auxiliary facilities . ....... ....... ... .... .. .. .......................... .. ... ...... ..... .. .. .... ... ........ . 112
6.4.5. Estimation of working capital and total capital. ... .. ..... ......... ....... ............ ....... 113
6.4.6. Estimation of the total product cost. ............................ ...... .... ... .. .. ... ...... ... ...... 116
6.4.6.1. Manufacturing cost estimation .... .................... .. ........ ..... ....... ... ... .... ......... 116
6.4.6.2. Direct production co st. ...... ...... ..... .. ............ ...... .............. ......... .. ............... 116
6.4.6.3. Indirect manufacturing expenses .. .... ......... ........ ....................... ... ........ .... 120
6.4.6.4. General expenses .... .. ... ..... .. ... .. .. ... .. ............. .. ............. ... .... ........... .......... 122
6.4.6.5. Revenue from sales . ... ....... ..... .. ................. ......... .. ...... .. .......... ....... .......... 123 ....
x
6.4.7. Profitability .......... .... ... ... .. ..... ....... ..... ... .... .... ... ....... ..... ........ .. .... ...................... 124
Page
6.4.7.2. Caleulation of rate of return . .... .. ...... ........ ............................................... 127
6.4.7.3. Unit sales priee of hydrolyzed syrup ... .................. ............ ...... ............. 127
6.4.7.4. Paybaek period ............................................................ ........................ ... 127
VII. CONCLUSiON ....... ............ ............ ... .. .. ....... ... .. .... .... .... ..... .. ..... ....... ..... .... ............ 128
VIII. RECOMMENDATIONS ... ..... ... .... ... ... ...... ....... .. ............. ...... .... ... .......... ... ..... ........ 131
REFERENCES ............ ...... .. .............. .. .......................... .. ..... ... ..... .... .... ................. .. .. .. 132
,f;'
Xl
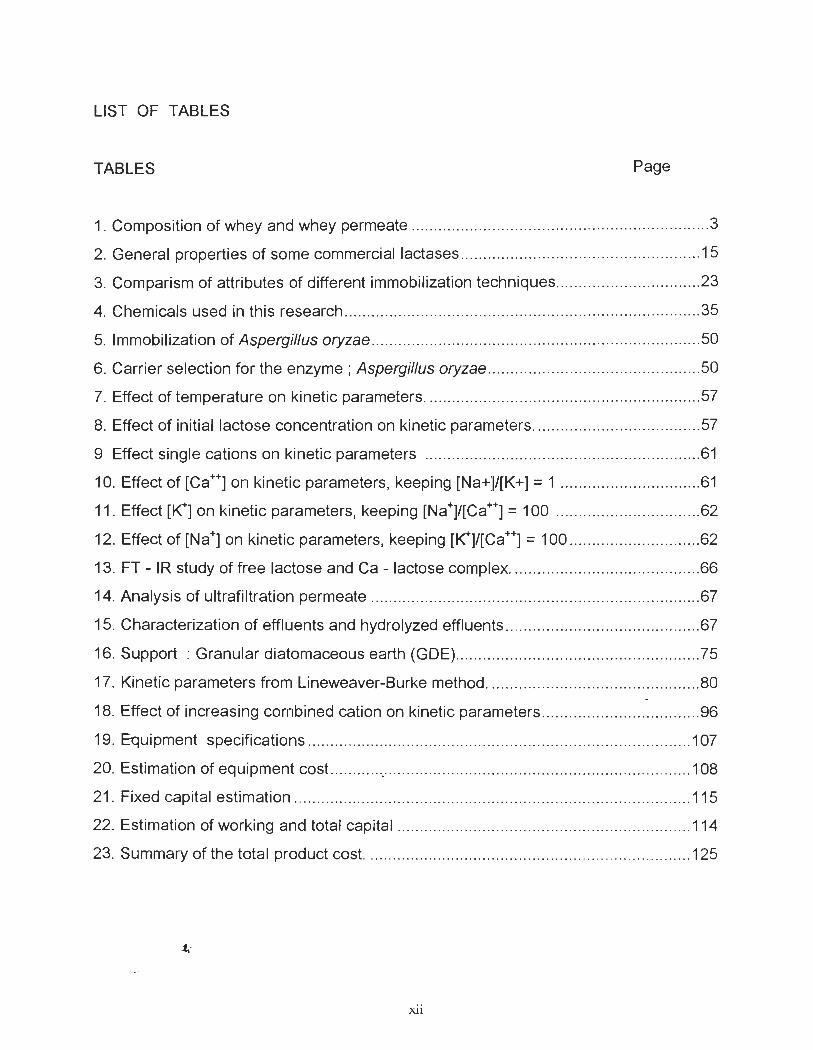
LIST OF TABLES
TABLES Page
1. Composition of whey and whey permeate .................. .......... ...... .. ... .......... ........... .... .. 3
2. General properties of some commercial lactases .... ... .. .. .......... ........ ... .... ... .. ..... ..... .. 15
3. Comparism of aUributes of different immobilization techniques ........ ... ............... ... .. . 23
4. Chemicals used in this research ............ .... ........ ... .... .. .. .............. .... ....... ...... .. .. .... ..... 35
5. Immobilization of Aspergillus oryzae ........ .. ...... ........... ........ .... .. ... .... ..... ....... .. ........ .. . 50
6. Carrier selection for the enzyme; Aspergillus oryzae ... ... ... ....... .. .. .... .. .. .......... .. .. .. ... 50
7. Effect of temperature on kinetic parameters ................. .... ..... .... ....... ..... ....... ... ...... .. . 57
8. Effect of initial lactose concentration on kinetic parameters . .. ... .. .............. .. ............. 57
9 Effect single cations on kinetic parameters ................ ....... ..... .. .. .. .. .. .. .... .... .. ... ... ..... 61
10. Effect of [Ca++] on kinetic parameters, keeping [Na+]/[K+] = 1 .... ...... ............... ... ... 61
11. Effect [~] on kinetic parameters, keeping [Na+]/[Ca++] = 100 ... ....... .... ..... .... .... ..... 62
12. Effect of [Na+] on kinetic parameters, keeping [~]/[Ca++] = 100 .... ... .. ... ... ... ........... 62
13. FT - IR study of free lactose and Ca - lactose complex . .. .. ....... ................ ..... ... ...... 66
14. Analysis of ultrafiltration permeate .... .... .. ... .............. ......... .. .... .. .. ..... .. .... .... ... .... ..... 67
15. Characterization of effluents and hydrolyzed effluents .............. .. .... .. .. .... ......... ... ... 67
16. Support: Granular diatomaceous earth (GDE) .. ....... ......... ... ....... ...... ..... .......... ..... 75
17. Kinetic parameters from Lineweaver-Burke method ... .. ... ... ... .... .. ....... .. .. ... ....... ... .. . 80 -
18. Effect of increasing combined cation on kinetic parameters .... ... ........ .......... ... .... ... 96
19. Equipment specifications ........... .. ..... ... ............................. .. .. .. ... .... ................ ... ... 1 07
20. Estimation of equipment cost.. ............. .... ................. ... .............. ........................... . 1 08
21. Fixed capital estimation .............................. ....... ...... ... ... ... ............ ... ........ ... .. .. .. .... 115
22. Estimation of working and total capital ....................... .. ................. .. ..... ... ............. 114
23. Summary of the total product cost. ........... .... ...... .. ....... .. ...... .. ........ ... ............ ........ 125
xii
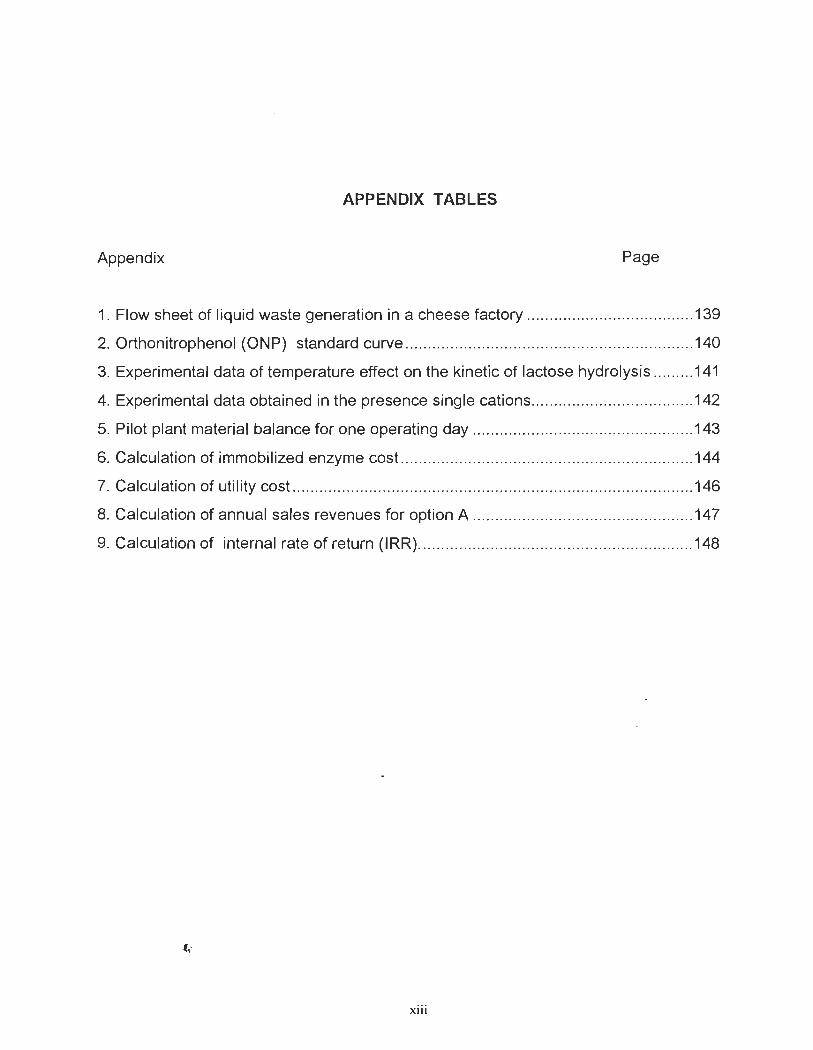
APPENDIX TABLES
Appendix Page
1. Flow sheet of liquid waste generation in a cheese factory ....... ... .... ... ... ................. 139
2. Orthonitrophenol (ONP) standard curve ... ......... .. .... ... ..... ..... ....... ... ...... ... .......... .... 140
3. Experimental data of temperature effect on the kinetic of lactose hydrolysis ....... .. 141
4. Experimental data obtained in the presence single cations .......... ............ ... .... ....... 142
5. Pilot plant material balance for one operating day ... ...... .... ..... .......... .......... .......... . 143
6. Calculation of immobilized enzyme cost .. ... .. ..... ... .... ..... .. .. .. ...... ... ... ... ... .. ... ............ 144
7. Calculation of utility cost ... ...... ... .................... .......... .......... ... ......... .... .... .. ... ......... ... 146
8. Calculation of annual sales revenues for option A .......... ... ... .......... ..... .................. 147
9. Calculation of internai rate of return (IRR) .. ....... ... ... ... .... ... .. .... .. ...... .... .. ... .... ....... .. 148
xiii
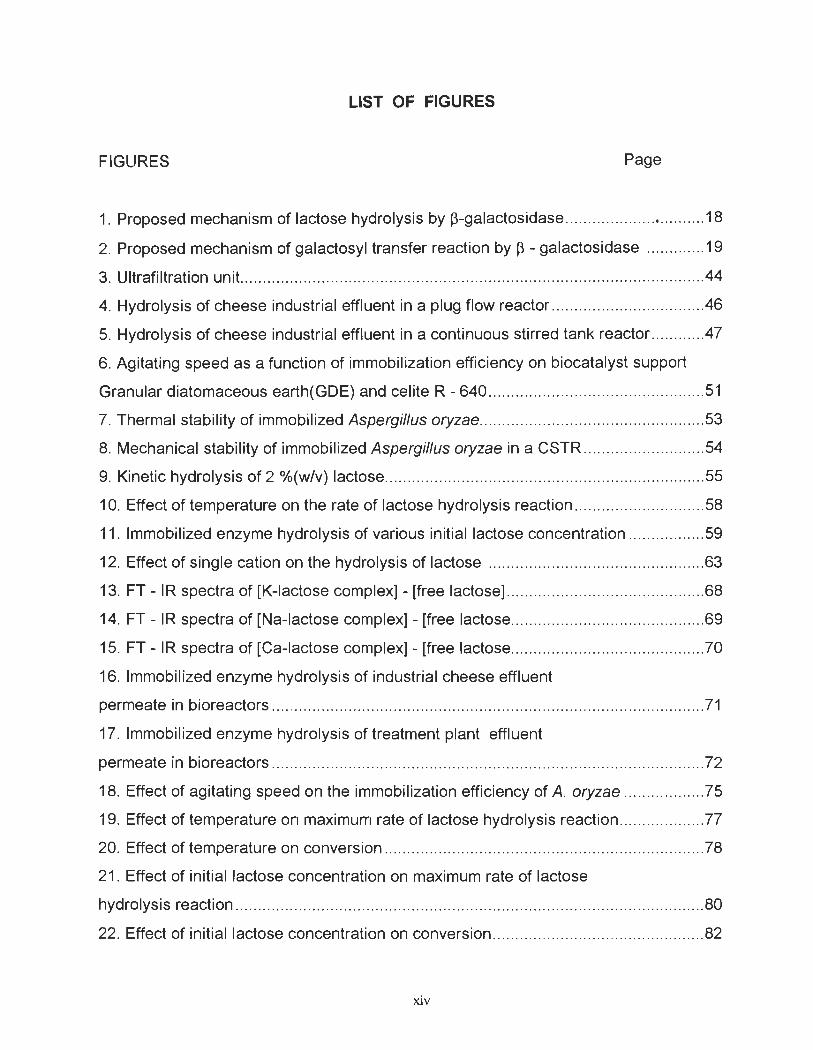
LIST OF FIGURES
FIGURES Page
1. Proposed mechanism of lactose hydrolysis by ~-galactosidase .. .. .. ... .. ..... .. ..•.. .... ... . 18
2. Proposed mechanism of galactosyl transfer reaction by ~ - galactosidase .... ... ...... 19
3. Ultrafiltration unit. ... .... ..... .. .... ........ .... ..... ...... .............. .... .. .... ... .......... .. .... .. .. ........ ..... .44
4. Hydrolysis of cheese industrial effluent in a plug flow reactor .. ... ..... .. .. ... .... ....... ..... .46
5. Hydrolysis of cheese industrial effluent in a continuous stirred tank reactor ...... ..... .47
6. Agitating speed as a function of immobilization efficiency on biocatalyst support
Granular diatomaceous earth(GDE) and celite R - 640 ...... .. ................. .................. ..... 51
7. Thermal stability of immobilized Aspergillus oryzae ........ ............ .. .. .... .. ................. ... 53
8. Mechanical stability of immobilized Aspergillus oryzae in a CSTR .... .. ....... ... .......... . 54
9. Kinetic hydrolysis of 2 %(w/v) lactose ..... ... ....... .... ... .... .. ..................... .. .. ...... .. ......... . 55
10. Effect of temperature on the rate of lactose hydrolysis reaction .. ....... ...... ......... ..... 58
11 . Immobilized enzyme hydrolysis of various initial lactose concentration ... ........ ... ... 59
12. Effect of single cation on the hydrolysis of lactose ...... ... .......... .. ............ .......... ..... 63
13. FT - IR spectra of [K-Iactose complex] - [free lactose] .. .... .... ..... ................ .......... ... 68
14. FT _ IR spectra of [Na-lactose complex] _ [free lactose .... ..... .... .. ... .. ........ ........ ..... .. 69
15. FT - IR spectra of [Ca-lactose complex] - [free lactose ................... ...... ..... ........ ... .. 70
16. Immobilized enzyme hydrolysis of industrial cheese effluent
permeate in bioreactors ..... ............. ............ ......................................................... .. ..... " .. 71
17. Immobilized enzyme hydrolysis of treatment plant effluent
permeate in bioreactors .... ......................... ................ ... ................. ......... .................. .. .. 72
18. Effect of agitating speed on the immobilization efficiency of A. oryzae .................. 75
19. Effect of temperature on maximum rate of lactose hydrolysis reaction ... ...... .... ...... 77
20. Effect of temperature on conversion .............. ......................... .. ..... ... ...... .... ... ..... .... 78
21. Effect of initial lactose concentration on maximum rate of lactose
hydrolysis reaction ................. ........ .. ............... .... ... ... ......... ...................... .. .... .. ... .. ... ... .. 80
22. Effect of initial lactose concentration on conversion ...................................... .. ....... 82
xiv
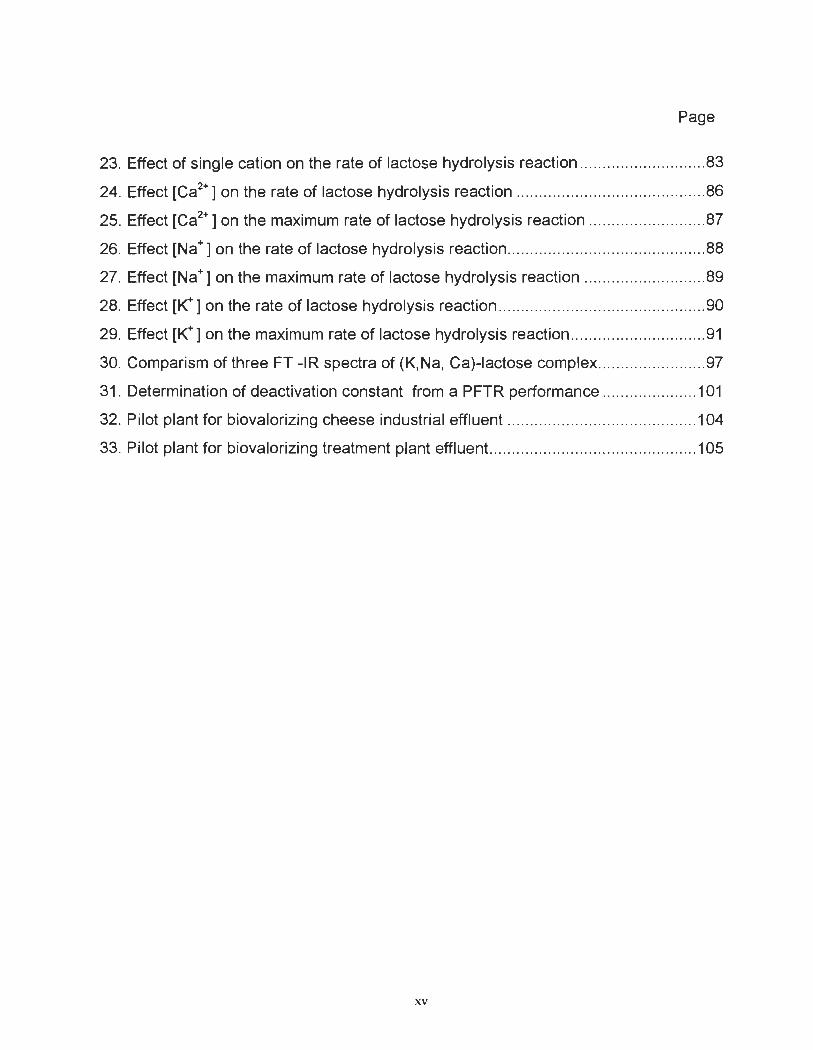
Page
23. Effect of single cation on the rate of lactose hydrolysis reaction .. ....... ......... ..... .... . 83
24. Effect [Ca2+] on the rate of lactose hydrolysis reaction .. ... ... ... ....... ... ...... ..... ...... .... 86
25. Effect [Ca2+ ] on the maximum rate of lactose hydrolysis reaction .. ........ .. ... .. ......... 87
26. Effect [Na+] on the rate of lactose hydrolysis reaction ...... .......... .. .. ... .. .. ........ ......... 88
27. Effect [Na+] on the maximum rate of lactose hydrolysis reaction .. .. .... ... .... ...... ...... 89
28. Effect [~] on the rate of lactose hydrolysis reaction ... ... ....................................... . 90
29. Effect [~] on the maximum rate of lactose hydrolysis reaction ..... ... .... ......... ... ..... . 91
30. Comparism of three FT -IR spectra of (K,Na, Ca)-Iactose complex ..... ...... ....... .... .. 97
31 . Determination of deactivation constant from a PFTR performance .. ..... ......... .. ... 1 01
32. Pilot plant for biovalorizing cheese industrial effluent ....... ... .... .......... ... ........... .. .. 1 04
33. Pilot plant for biovalorizing treatment plant effluent. ... ... ... ............................. ....... 1 05
xv
1. INTRODUCTION AND PROBLEM DEFINITION.
1.1. INTRODUCTION
The production of cheese in Québec and Canada has been increasing steadily
and according to Statistic Canada (1) it aUained 159.5 * 103 tons and 307.2 * 103
tons respectively in 1994. Cheese manufacturing is accompanied by the
production of large quantities of high strength liquid effluent (whey) that
constitutes a major disposai problem. It is estimated that 2.203 million tons of
cheese whey was produced in Canada in 1994.
Historically, cheese industrial effluent was considered as waste, and
was either given to animais as feed, spread on land, farms, or discharged into
rivers and municipals sewage systems. Due to stringent environmental
regulations, coupled with the high cost of using municipal treatment systems;
cheese manufacturers have increasingly been viewing cheese industrial effluent
as a rich and cheap source of raw material from which valuable by-products
could be obtained. Cheese industrial effluent contains lactose, protein, minerai
salts, fats, lactic acid and water, [Table 1]. Whey is a very rich source of minerai
salts such as Calcium, Copper, Iron, Phosphorus, Potassium and Sodium. It is
also a potential source of vitamin of the B-complex, riboflavin and other vitamins.
Whey contain a 6% (w/v) total solid of which the principal constituent is
.t-
1
lactose(70% (w/w)). In 1990, KeIl er(2) proposed that whey could be disposed
according to four "Fs" in order of hierarchy ;
Food human consumption as whey protein (WPC), glucose, or vitamin.
Feed for animal (pigs and chicken) consumption.
Fuel fermented to methane or ethanol
Fertilizer: land spreading because it contains nitrogen, phosphorus and potassium
The challenge of finding a solution to the problems caused by
cheese industrial effluent has attracted the attention of researchers, government
and the dairy industry because of nutritional (lactose intolerance), technological
(crystallisation), and environmental (pollution) problems associated with it (3,4,5).
For the past two decades, most researchers have put greater emphasis on the
hydrolysis of lactose by the enzyme f3 - galactosidase. The immobilization of this
enzymes offers the advantage of repetitive use and application in continuous
systems thereby reducing the processing cost as weil as eliminating enzyme
contamination problem. Although a few researchers have investigated and
shown that metal ions or cations play a crucial role on the activity and the
stability of some of these enzymes during the hydrolysis of lactose (6,7,8) ,
published information on the modification of lactose hydrolysis kinetic
parameters caused by whey cations are limited. Moreover, no phenomenological
explanations of these modifications or the interactions of cations - enzyme-
substrate complex has been reported in literature . ....
2
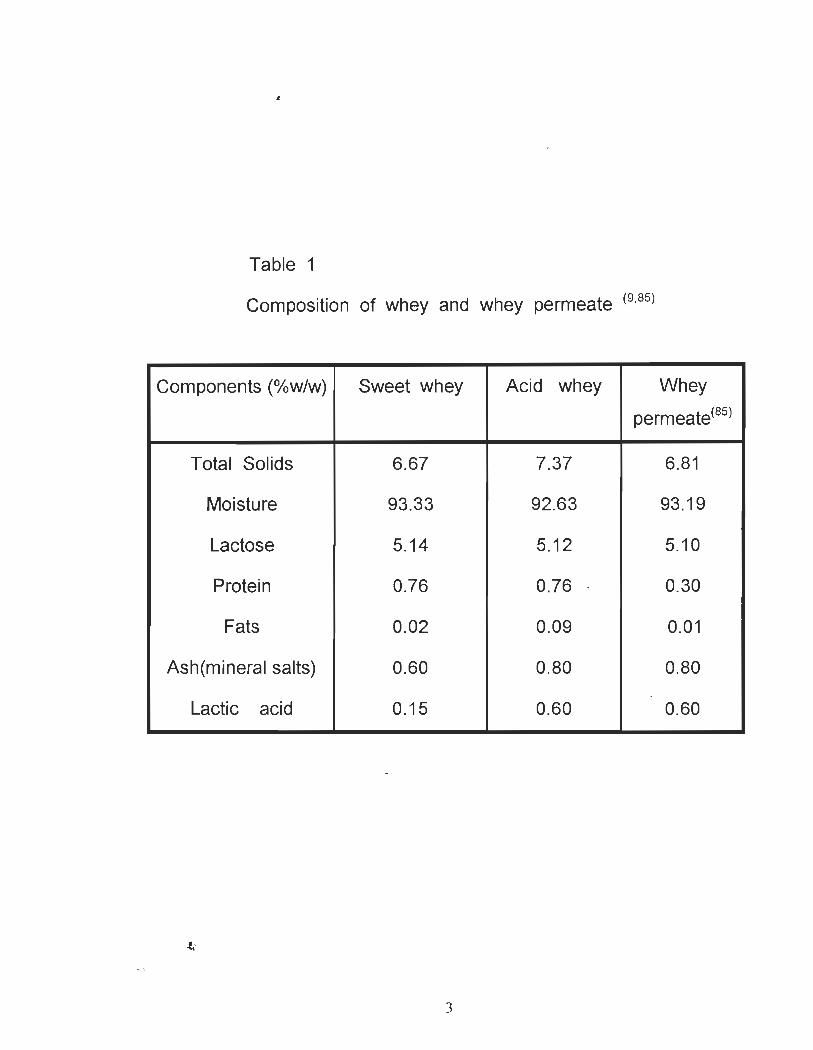
Table 1
Composition of whey and whey permeate (9,85)
Components (%w/w) Sweet whey Acid whey Whey
permeate(85)
Total Solids 6.67 7.37 6.81
Moisture 93.33 92.63 93.19
Lactose 5.14 5.12 5.10
Protein 0.76 0.76 0.30
Fats 0.02 0.09 0.01
Ash(mineral salts) 0.60 0.80 0.80
Lactic acid 0.15 0.60 0.60
3
1.2. PROBLEM DEFINITION.
A thorough review of the dairy industry especially chee se manufacturing factories
has led to the following problems concerning its effluent:
- Cheese industrial effluent discarded as waste creates severe pollution
problem. Cheese industrial effluent and its permeate each with a total solid
content of about 6% (w/v) represents a biochemical oxygen demand (BOOS) of
30.000 ppm to 50.000 ppm (9,10) . The different methods of valorization present
certain problems; for example ultrafiltration which has emerged as one of the best
ways of valorizing cheese industrial effluent to obtained a protein-rich ingredient
generates large quantities of permeate containing 4% to 5% (w/v) of lactose with a
BOO of more than 30,000 ppm. This indicates that ultrafiltration is not the best.
- The biovalorization of lactose by anaerobic degradation is an
attractive alternative due to the cheap operational cost as weil as the recovery of
methane gas which can be reutilized in the cheese factory as heating fuel.
However, lactose is decomposed easily into acid, and the high concentration of
lactose in cheese industrial effluent often leads to a sour digester in which the
acetogenic and methanogenic bacteria can't operate properly (11,12,13) .
,f.'
4
The immobilization of anaerobic bacteria on the wall of the bioreactor or fermentor
as weil as the regrouping of these microbes together (bioflock) can lead to
difficulties of the substrate transfer in the microbial aggregate.
- Lactose is the main constituent in cheese industrial effluent to be
valorized due to its high pollution strength. Direct utilization of lactose is limited
due to its low sweetness and the problem of lactose intolerance shown by certain
persons, in addition to the low solubility of lactose(14). The hydrolysis of lactose to
glucose and galactose is a potential alternative to overcome these handicaps.
- The hydrolysis of lactose by immobilized enzymes have given good
hopes to dairy industries, to beUer valorize their by-products, but unfortunately in
most of the installations, the half - life of the biocatalyst is just a few weeks, some
even a few hours. The need to test a reaction model that will englobe most of the
influencing factors becomes a necessity. The effect of enzyme activity with respect
to certain salts or cations, observed in soluble enzymes could be applied to
enzymes or cells on supports .or carriers. However, assays in bioreactors are
necessary to confirm their stability. Finally, there is the economics problem.
Immobilized enzymes can be recycled and reused leading to low operational cost
for immobilized systems as compared to using soluble enzymes.
5
1.3. OBJECTIVES
The principal objective of this research is to propose a method for the
biotransformation of cheese industrial effluent as a function of its saline (cation)
composition. This study would enable us to :
1 . Evaluate the kinetic parameters as a function of the concentration of
metal ions present in cheese factory effluent.
2. Investigate the biovalorization of cheese factory effluent in bioreactors;
• the plug flow reactor and the continuous stirred tank reactor (CSTR).
3. Propose a pilot plant for the biotransformation of cheese industrial
effluent and the separation of the resulting by - products, the whey
protein concentrates (WPC35%) and the hydrolyzed syrup .
4. Make a technico - economic evaluation (total capital estimation, product
estimation and profitability) of the pilot plant.
5. Propose a tentative explanation for the mechanism of cation - lactose
complex interaction.
,t.
6
II. LITERATURE REVIEW
2.1. Definition of cheese industrial effluent.
Cheese industrial includes whey, waste water, detergents and disinfectants used
for cleaning and disinfecting cheese manufacturing equipment. Whey is a
greenish - yellow fluid obtained by separating fats and casein from whole or skim
milk. Whole milk is used for the production of natural cheese such as cheddar
and the resulting by-product is known as sweet whey. It has a pH greater than
5.0. Sweet whey is generated at a proportion of nine (9) kg for every kg of
cheese manufactured. Acid whey is derived from the manufactured of cottage
cheese, lactic casein or minerai acid casein from skim milk. It has a pH less than
5.0. Acid whey is generated at the rate of six (6) kg for every kg of cottage
cheese produced. This low pH value is due to the acid produced mainly lactic
acid and 1 or used for coagulation.
ln Québec the normal process of cheese manufacturing leads to a spi liage loss
which represents between 1 and 12 % of the milk received. The average is
situated at about 5% (15) . This variation depends on three important factors:
7
- the age of the cheese factory;
- the way the piping system was installed;
- the environmental conscience of the factory.
Annex 1 presents a flow sheet of the liquid waste generated in a cheese factory.
Waste water including chemicals (detergent and disinfectants) used for cleaning
and disinfecting equipment in dairy industries constitutes an important source of
waste generation in cheese industries. Other pollutants generated from the
cheese factory include lubricants from salts of fatty acids.
Lactose is the main constituent of cheese factory effluent. Discharging this
effluent in water or spreading on agricultural farmland without appropriate pre
treatment would favour the development a filamentous bacterial population which
are incapable of utilizing the amino acids present as a source of nitrogen. The
large size of the protein molecules are unable to pass through the bacterial cell
wall, consequently the excess of nitrogen can increased the level or
concentration of nitrate in water thereby modifying its pH. The amount of whey
that can be spread on land as fertilizer is limited to 45 - 90 tonnes per acre (16).
Exceeding these limits poses a threat to environmental pollution from run - off
and off - odour production. The discharge of cheese industrial effluent can cause
special problems in relation to treatment plants due to variation in volume and
strength, temperature, pH value, nutrient levels, fat and curds levels(17) .
.c..
8
2.2. Methods of valorizing cheese industrial effluent.
The valorization of whey can be classified into two processes namely :
Physico- chemical process and the biotechnological process.
2.2.1 Physico-chemical process
This include ultrafiltration, reverse osmosis, evaporation and drying, ion
exchange or electrodialysis. These techniques permit the separation,
modification, and recombination of whey constituents to obtain several products
used in numerous sectors of the food industries. Evaporation and drying is the
most widely used method to produce whey powder which is used in bakery, other
food preparation and animal feed. This process is economical for large cheese
plants with output of more than 150.000 litres of whey per day, but it is
unprofitable for small and medium size cheese plants. About 60 % of whey
generated in Québec is dried or given to hogs as feed. Statistics show that about
70 % of Québec's cheese manufacturing plants produce less than 50,000 litres of
whey per day, representing thus, the principal source of whey in Québec.
Scattered in far location and small quantities of whey produced, accompanied by
inadequate storage conditions are the main obstacles facing small size cheese
,t-
9
plants with output of less than 50,000 L of whey per day. However, in small size
cheese plants whey may be transformed to fermented ammoniated concentrated
whey (FACW) used as animal feed or spread as fertilizers on farms (9) .
Ultrafiltration offers an alternative way of treating cheese industrial effluent by
separating it into a much more valuable whey protein concentrate (WPC) and a
lactose stream. The WPC has a significant sale value and the North American
market for WPC (35 % - 75 %) attained about 150 million U.S. dollars in 1995 (5) .
The 35 % WPC is as a substitute for skim milk powder and the 75 % WPC can
replace egg white in baking(18). The main disadvantage of UF is the high water
content (about 93%) in the UF permeate , coupled with the presence of lactose
(4 - 5 %) and posing a disposai problem, besides being a perishable product.
Reverse Osmosis permits the concentration of of lactose in the permeate but its
high energy consumption makes this process costly. Modler (19 ) stJggested that
reverse osmosis should be used in medium size chee se plants with a daily output
of about 50.000 to 150.000 L of whey.
10
2.2.2 Biotechnological process.
This process enable the transformation of lactose into a variety of products. It
includes hydrolysis and fermentation. Their products are designated mostly to
non-food markets namely; pharmaceuticals, chemicals, or cosmetics.
The hydrolysis of lactose generates in theory an isomolecular mixture of two (2)
sugars; glucose and galactose. But , in reality oligosaccharides are also generated
by the polymerization of galactose or a reaction between galactose and lactose
(20,21) . These oligosaccharides are undesirable products. The quantity of
oligosaccharide produced can be minimized by : using a fungal enzyme; keeping
initial lactose concentration to a minimum; using immobilized enzymes because of
high mass transfer effect.
The hydrolyzed lactose enable us to obtain by-products with increased solubility
and sweetness, as weil as producing syrups which are microbiological stable,
thereby avoiding the process of drying. These products can be consumed by
people suffering from lactose intolerance. Lactose intolerance or malabsorption
is a problem that arises when there is insufficient enzyme in the intestine to
hydrolyzed ail the lactose ingested. Consequently, the unhydrolyzed lactose is
not absorbed and move to the large intestine where bacterial actions and osmotic
.t-
11
effects often cause abdominal discomfort, bloating and flatulence. Lactose can
be hydrolyzed by two methods : Acid hydrolysis and enzymatic hydrolysis.
Acid hydrolysis can be carried out by either a homogenous reaction in which the
acid is free in solution or by a heterogenous reaction catalyzed by hydrogen ions.
This method is simple and gives a high degree of conversion in a shorter time
compared to enzymatic hydrolysis of lactose. However, it can't be applied to milk
hydrolysis and protein containing lactose solution (cheese factory effluent)
because of protein denaturation and coagulation at high temperature and low pH
(22.23)
Enzymatic hydrolysis of lactose is carried out by soluble (free) enzymes or
enzymes immobilised on biocatalyst carriers. The method by enzymes
immobilized on carriers is preferred because :
immobilized enzyme can be recycled and reused, thus improving
enzyme utilization and the overall productivity;
immobilized enzymes can be used in a continuous system;
immobilized enzymes system give products of high purity and yield ;
low cost of operation for immobilized enzymes systems;
12
immobilized enzymes are more resistant to thermal deactivation
than soluble enzymes.
The rate model of reaction for lactose hydrolysis into glucose and galactose is
often represented by the apparent constant of Michealis-Menten, Km.app. and the
apparent maximum rate of reaction, Vmax.app .. The numerous enzymes - carrier
systems studied have been characterized by parameters such as pH, temperature,
substrate concentration, enzyme concentration, residence time, stirring and mixing
conditions, thereby defining the optimal operating conditions.
The utilization of whole cells can avoid the costly and crucial process of
extraction and purification of enzymes before immobilization on supports (24).
Despite the enormous quantity of f3 - galactosidase - carrier systems developed,
very few have been exploited in pilot plants or at industrial level. Most probably
because of the following reasons :
- problems of microbial contamination in continuous systems;
- los ses in enzyme activity as result of immobilization;
- immobilized enzymes could suffer from steric hindrance effects;
13
- thermal degradation of enzymes as weil as enzyme inhibition by
hydrolyzed praducts; galactose, oligosaccharides, or accumulated
substrate (20) .
- harmful effects of salts or cations on the enzyme system.
A preliminary step of partial demineralization of the substrate by ultrafiltration or by
membrane process can resolved the harmful effect of cations on the enzyme
system.
2.3. The Case of J3 - galactosidase and the influence of cations.
J3 - galactosidase is the trivial name for the enzyme lactase (
E.C.3.2.1.23). Typical J3 - galactosidase has a multi - subunit structure. Metal ions
play a crucial raie on the activity and stability of a typical J3-galactosidase. Sorne
lactases require metal ions for their activation, others for their stability and sorne
for both activation and stability. Table 2 summarizes sorne lactase enzymes and
the type of cations that influences their activity and 1 or stability. The J3-
galactosidase fram E. coli and K. lactis are activated by Na+ and K+ but don't need
monovalent or divalent cations for their stability. The J3-galactosidase from
Kluyveromyces fragilis specifically requires K+ for its stability . West et aL, (25 )
investigated J3-galactosidase fram yeast, Trichosporon cutaneum and concluded
14
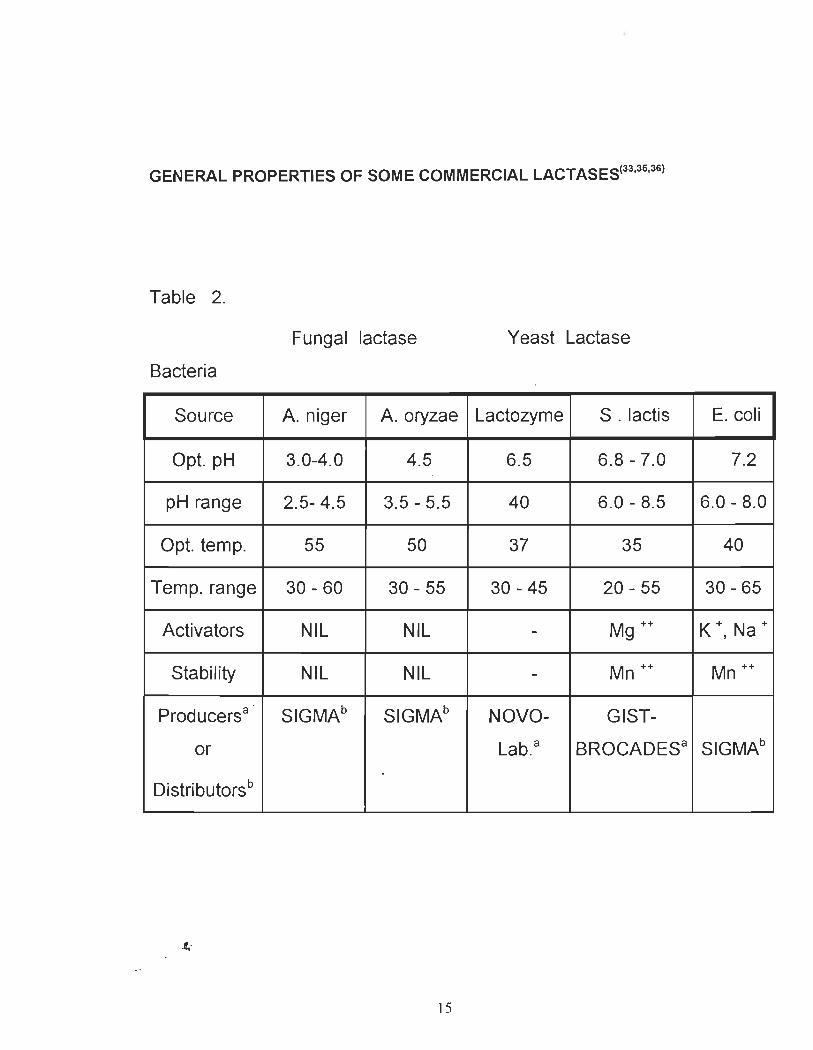
GENERAL PROPERTIES OF SOME COMMERCIAL LACTASES(33,36,36)
Table 2.
Fungal lactase Yeast Lactase
Bacteria
Source A. niger A.oryzae Lactozyme S . lactis E. coli
Opt. pH 3.0-4.0 4.5 6.5 6.8 - 7.0 7.2
pH range 2.5- 4.5 3.5 - 5.5 40 6.0 - 8.5 6.0 - 8.0
Opt. tempo 55 50 37 35 40
Temp. range 30 - 60 30 - 55 30 - 45 20 - 55 30 - 65
Activators NIL NIL - Mg ++ K + Na + ,
Stability NIL NIL - Mn ++ Mn ++
Producersa SIGMAb SIGMAb NOVO- GIST-
or Lab. a BROCADESa SIGMAb
. Distributorsb
.fi
15
that, this enzyme needed K+ and Rb+ for its activity and stability. However,
diva lent cations like Mg++ and Mn++ stimulated its activity to a lesser extend. A
study by Chang et aL, (26) on factors affecting the thermostability of p -
galactosidase from streptococcus salivarius in milk showed that K+, Mg++ and
Ca++ had a major contribution on its stability. It was observed that the absence
of Mg++ or Ca++ in the saline composition of milk led to a drop in stability by 62
% and 50 % respectively, while the complete absence of these two cations
resulted in a drop in the stability by 85 %.
. One of the areas that remains unexploited is the variation of the rate
model of hydrolysis as a function of cheese whey cations. The analysis of whey
by 8. Menten et aL, (27) showed the presence of cations such as Ca++, Mg++,
K+, and Na+. The choice of an appropriate p-galactosidase that would require
these cations for their activation and stability could give different results for Vmax
and Km or simply modify the rate of hydrolysis.
2.4. Action of p - gala-ctosidase.
The enzyme, p ~ galactosidase typically catalyzes the hydrolysis of p-O
galactosides (lactose, ONPG) and a-L-arabinoside (28). The active site of p -
,t.-
16
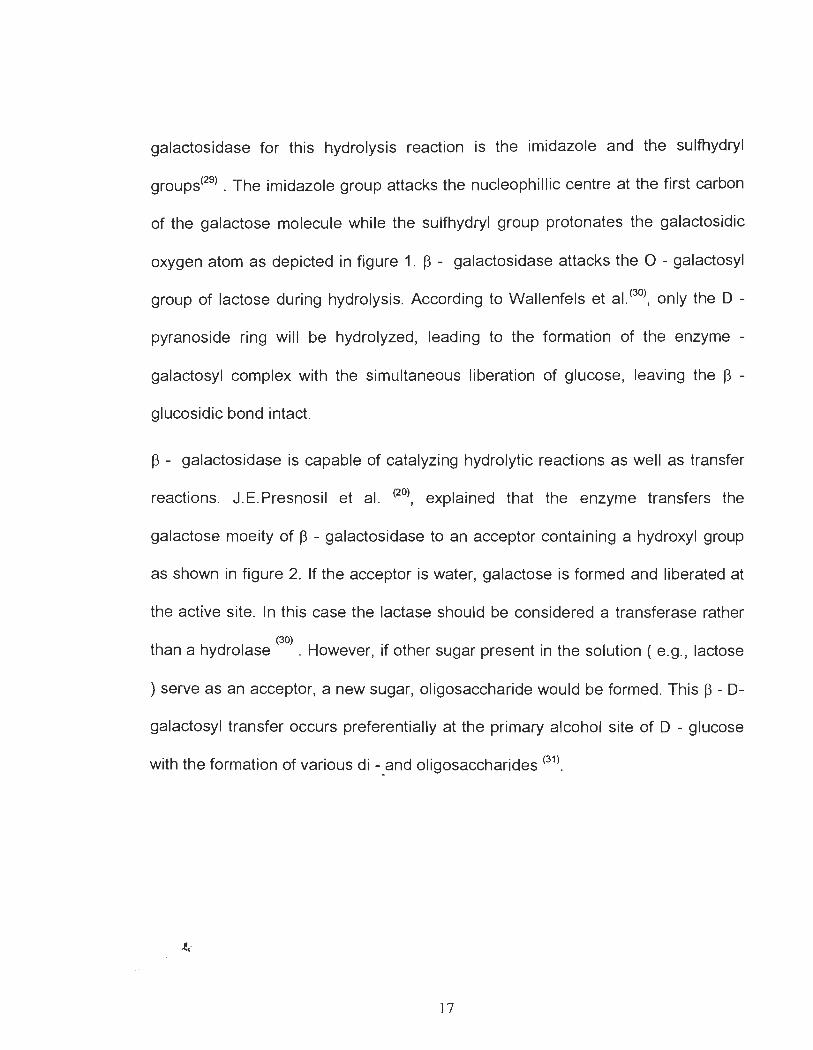
galactosidase for this hydrolysis reaction is the imidazole and the sulfhydryl
groups(29) . The imidazole group attacks the nucleophillic centre at the first carbon
of the galactose molecule while the sulfhydryl group protonates the galactosidic
oxygen atom as depicted in figure 1. /3 - galactosidase attacks the 0 - galactosyl
group of lactose during hydrolysis. According to Wallenfels et al. (30), only the 0 -
pyranoside ring will be hydrolyzed, leading to the formation of the enzyme -
galactosyl complex with the simultaneous liberation of glucose, leaving the /3 -
glucosidic bond intact.
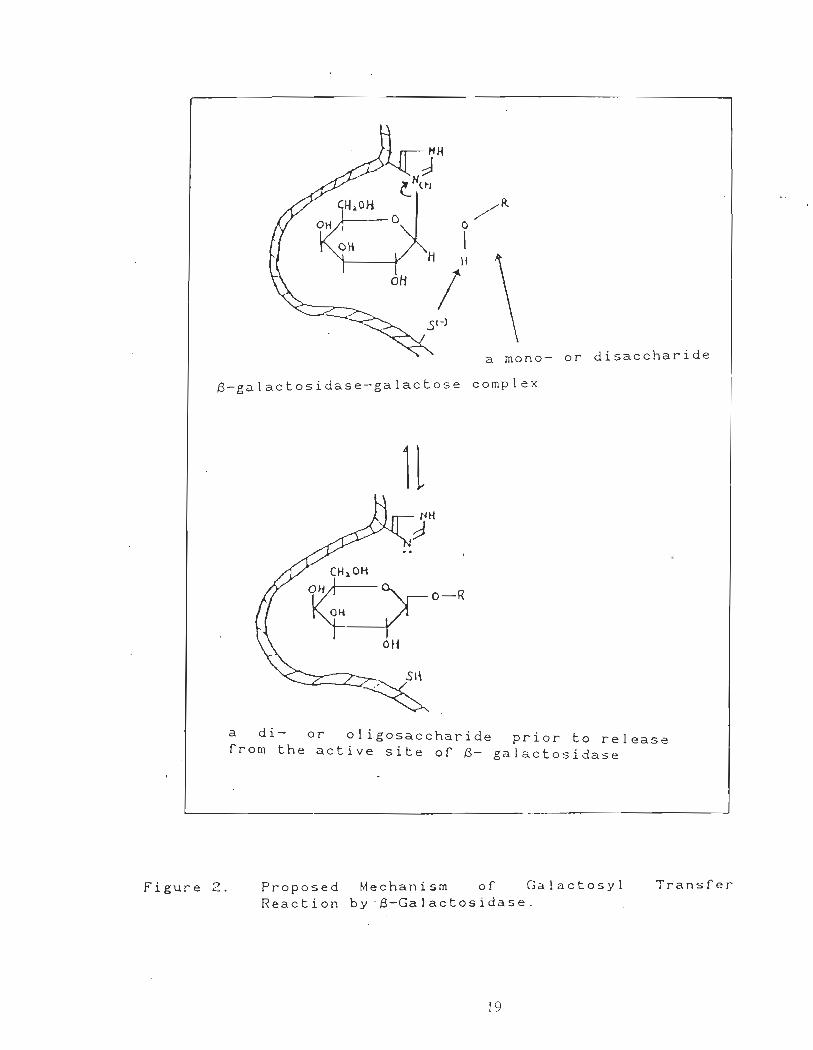
/3 - galactosidase is capable of catalyzing hydrolytic reactions as weil as transfer
reactions. J.E.Presnosil et al. (20), explained that the enzyme transfers the
galactose moeity of /3 - galactosidase to an acceptor containing a hydroxyl group
as shown in figure 2. If the acceptor is water, galactose is formed and liberated at
the active site. In this case the lactase should be considered a transferase rather
than a hydrolase (30) . However, if other sugar present in the solution ( e.g., lactose
) serve as an acceptor, a new sugar, oligosaccharide would be form~d. This /3 - 0-
galactosyl transfer occurs preferentially at the primary alcohol site of 0 - glucose
with the formation of various di -.and oligosaccharides (31).
17
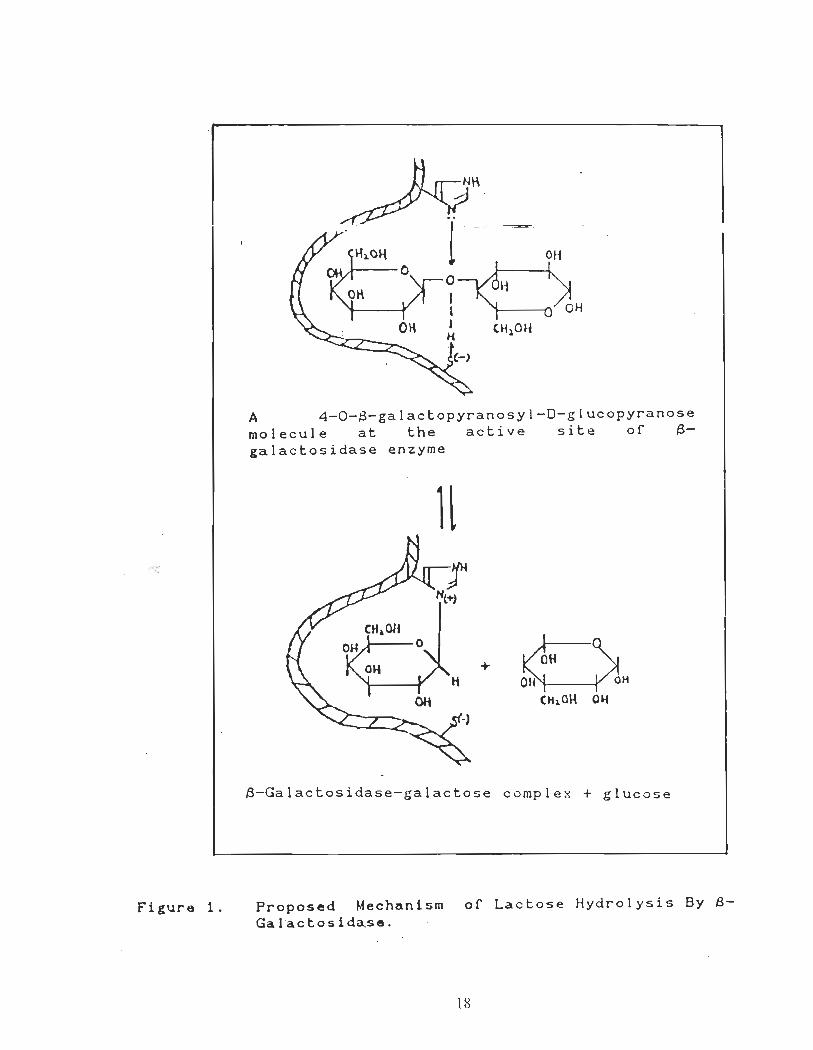
Figure 1.
A 4-0-~-galactopyranosyl-D-glucopyranose
molecule at the active site of Bgalactosidase enzyme
1l
B-Galactosidase-galactose complex + glucose
?roposed Mechanism of Lactose Hydrolysis By 8-Galactosidase.
18
a mono- or disaccharide
B-galactosidase-galactose complex
Figure 2.
1l
a di- or oligosaccharide prior to release from the active site of B- galactosidase
Proposed Mechanism of Galactosyl Transfer
Reaction by ' B-Galactosidase.
19
2.5. Properties and application of J3 - galactosidase . .
The properties of each enzyme depends on the source of the enzyme.
The catalytic activity of an enzyme is affected by pH, temperature, ionic strength,
inhibitors and substrate concentration (32) . The immobilization of enzyme and the
type of carrier used influences the optimal pH and temperature of the enzyme.
Properties, cost, availability and safety of ~ - galactosidase are important factors
to be consider for any full - scale enzymatic process for lactose hydrolysis. Fungal
enzymes, Aspergillus niger and Aspergillus oryzae with optimum pH 4.0 - 5.0 are
ideally suitable for acid whey (pH 4 - 5) hydrolysis while yeast; K/uveromyces
fragi/is, Sacchromyces /aclis with optimum pH 6.5 - 7.0 and bacterial (E.co/i, pH
6.5 - 7.5) lactases are suitable for milk ( pH 6.6) and sweet whey (pH 6.1) . Table
2 gives general characteristics of some commercial lactases. Fungal lactase is
more thermostable than yeast and bacterial lactases, retaining their activities at a
temperature of 55 oC for prolonged periods. This gives them two main advantages
: higher conversion or shorter residence time for a given conversion rate
compared to other lactases and-Iess prone to microbial contamination.
~ - glactosidase preparations from fungi ( A. niger & A. oryzae) and
from Yeast ( K. fragi/is and S. /aelis ) are generally recognized as safe (GRAS)
.f.:
20
because these sources have a long history of safe used in food processing and
have been subjected to numerous test (33). Lactase (E. Coll) from bacteria is not
considered safe in food processing because it gives toxicity problems with crude
extracts of coliforms (34) and it is expensive. Based on these properties, p -
galactosidase from Aspergillus oryzae was chosen for the hydrolysis of cheese
industrial effluent with pH 4.9, used in this study.
2.6. IMMOBILIZATION OF P - GALACTOSIDASE
Method of immobilization.
Immobilized enzymes are enzymes that are physically confined or
localized in a microenvironment with retention of their catalytic activities and can
be used repeatedly and continuously. The art of enzyme immobilization is a
rapidly expanding and advancing field. During the past two decades numerous
techniques have been developed and used for the immobilization of p -
galactosidase in lactose hydrolysis. These techniques can be classified as
Intramolecular Cross - Linking, Covalent Binding, physical Adsorption, lonic
Binding, Metal Binding, and Entrapment.
21
The first two are generally classified as chemical method because they
form covalent bonds between the enzyme and the carrier (support), while the other
are physical methods. A comparative characteristics of the different immobilization
technique is given in table 3.
2.6.2. Enzyme carriers or supports.
Many enzyme carriers have been successfully developed and used to
immobilized f3-galactosidase (33,38,39) . Selecting a carrier involves defining the
properties which are most important in the carrier. It is important to consider the
following factors before choosing an enzyme support :
- suitable particle size and pore diameter to maintain excellent
diffusion properties in reactors and high production rate.
- suitable pore size to provide large surface area and to avoid steric
hindrance for both enzyme and substrate.
- structural stability over a wide range of temperature, pH, pressure
and solvent composition.
- posses functional groups which is required for covalently bound
immobilized enzymes and can be activated or modified without
harming the carrier structure.
22
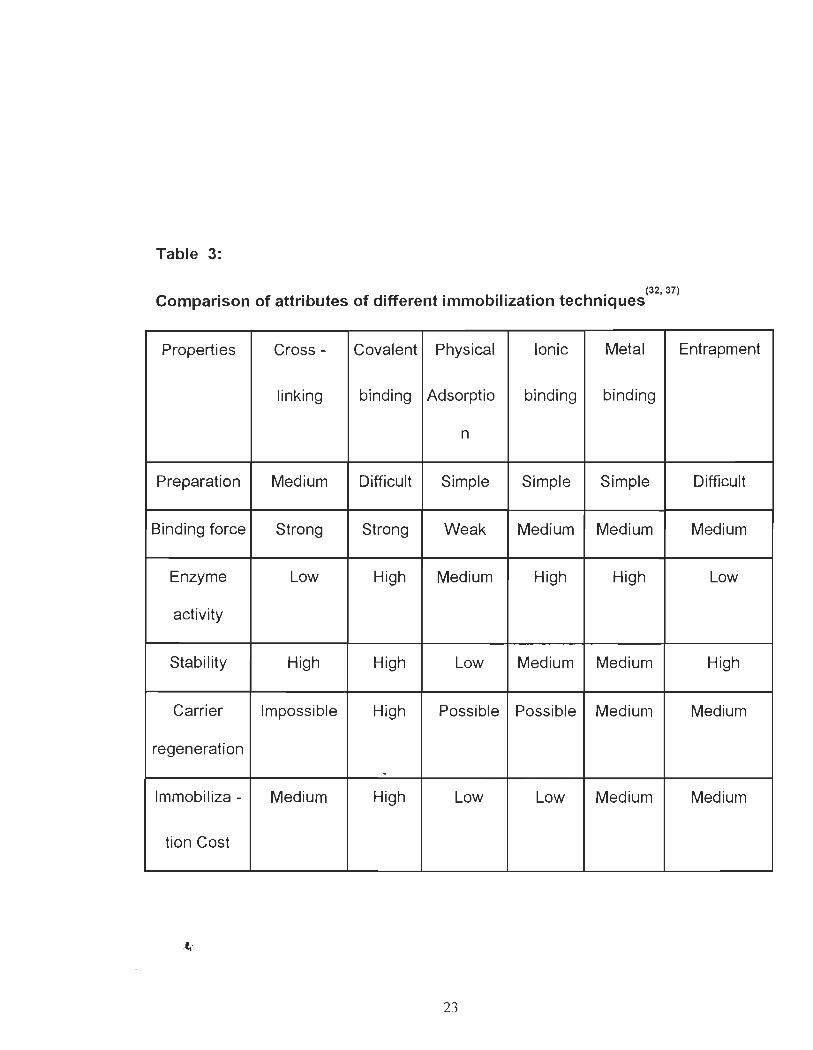
Table 3:
Comparison of attributes of different immobilization techniques(32, 37)
Properties Cross - Covalent Physical Ionie Metal Entrapment
linking binding Adsorptio binding binding
n
Preparation Medium Diffieult Simple Simple Simple Diffieult
Binding force Strong Strong Weak Medium Medium Medium
Enzyme Low High Medium High High Low
aetivity
Stability High High Low Medium Medium High
Carrier Impossible High Possible Possible Medium Medium
regeneration .
Immobiliza - Medium High Low Low Medium Medium
tion Cost
23
- physical durability for long- run operations and chemical inertness to
microbial attack.
- good regeneration capacity and low cost
- insoluble supports can be used in several industries; for example:
food and dairy industries.
8ased on these criteria, silica and silicates base materials; celite, granular
. diatomaceous earth(GDE), glass, and ceramics appears to be better than others for
the hydrolysis of cheese effluent. They are compatible with a very wide range of
aqueous and organic environments. They are presently being used for
pharmaceuticals, beverages, petrochemicals, wastewater treatment systems and
drug filtration. It can be concluded from literature (40, 41) that diatomite(GDE and
celite) are the most suitable carriers for the preparation of adsorption type
immobilized enzymes.
2.7. Enzyme reactor.
Different types of reactors have been used with enzymes in their free or immobilized
forms. These reactors can be classified according to their mode of operation and
24
reactor flow patterns. The flow patterns ranges from the well-mixed continuous - flow
stirred tank reactor (CSTR) to the" ideal" plug flow (PFR) or tubular reactor.
The plug flow is kinetically more efficient than the continuous stirred tank
reactor systems on the basis of product formed per unit time per unit enzyme
activity. The weil - mixed continuous stirred tank reactors have the following
characteristics (42) : Low co st and relatively simple, flexibility in use and stability for
many processes, excellent mixing and control conditions as weil as low reactivity per
unit volume. Recycled loops may be used with the stirred tanks to allowed
separation of the immobilized enzyme from the product stream. This necessitates
either the retention of the enzyme in the reactor or its recovery from the product
stream. The choice of a reactor system must take into consideration the following
(37) factors :
- reactor utilization and cost: continuous operation offer several
advantages, for example diminished labour costs, the facilitation of
automatic control, greater constancy in reaction conditions, a more
reliable product and enzyme reuse.
- operational requirements : easily control in a well-mixed system, fresh
immobilized enzyme can be added without interrupting the process for a
CSTR but for many other systems the reactor must be shut down.
25
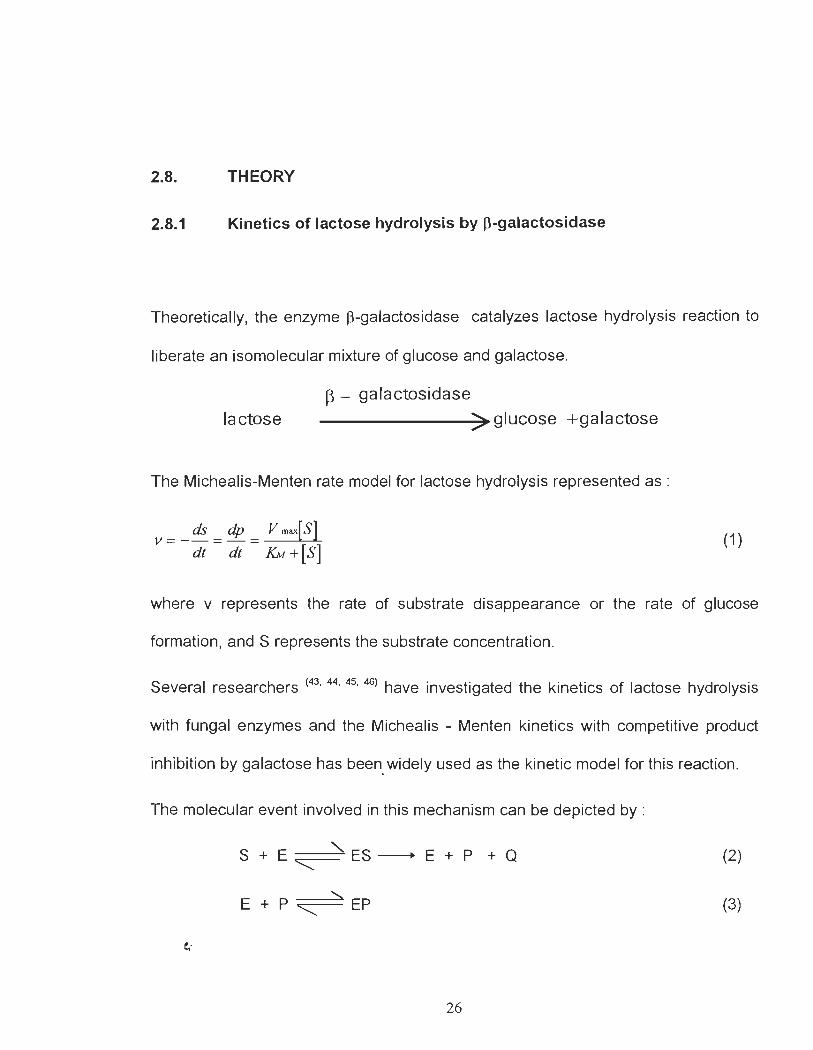
2.8. THEORY
2.8.1 Kinetics of lactose hydrolysis by p-galactosidase
Theoretically, the enzyme p-galactosidase catalyzes lactose hydrolysis reaction to
liberate an isomolecular mixture of glucose and galactose.
lactose J3 - galactosidase -------->~glucose +galactose
The Michealis-Menten rate model for lactose hydrolysis represented as :
v = _ ds = dp = V max[ S] dt dt KM +[S]
(1 )
where v represents the rate of substrate disappearance or the rate of glucose
formation, and S represents the substrate concentration.
Several researchers (43, 44, 45, 46) have investigated the kinetics of las;tose hydrolysis
with fungal enzymes and the Michealis - Menten kinetics with competitive product
inhibition by galactose has been. widely used as the kinetic model for this reaction.
The molecular event involved in this mechanism can be depicted by :
S + E " ES -. E + P + Q
"'" (2)
E + P "'" '- EP (3)
26
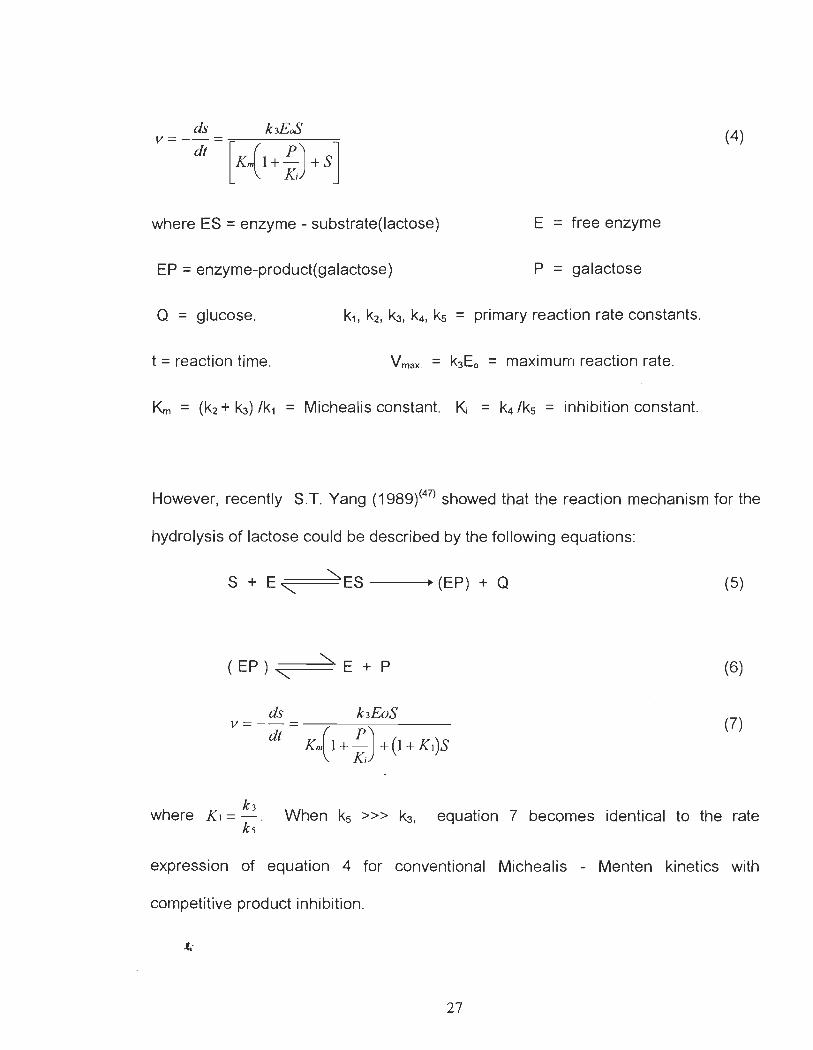
(4)
where ES = enzyme - substrate(lactose) E = free enzyme
EP = enzyme-product(galactose) P = galactose
Q = glucose. k1, k2 , ~, k.t, ks = primary reaction rate constants.
t = reaction time. V max. = k3Eo = maximum reaction rate.
Km = (k2 + ~) Ik1 = Michealis constant. K = k.t Iks = inhibition constant.
However, recently S.T. Yang (1989)<47) showed that the reaction mechanism for the
hydrolysis of lactose could be described by the following equations:
S + E ~,,==""=ES ----+~ (EP) + Q (5)
( E P ) ~",====""=- E + P (6)
(7)
where KI = kJ . k s
When ks »> ~ "3, equation 7 becomes identical to the rate
expression of equation 4 for conventional Michealis - Menten kinetics with
competitive product inhibition.
27
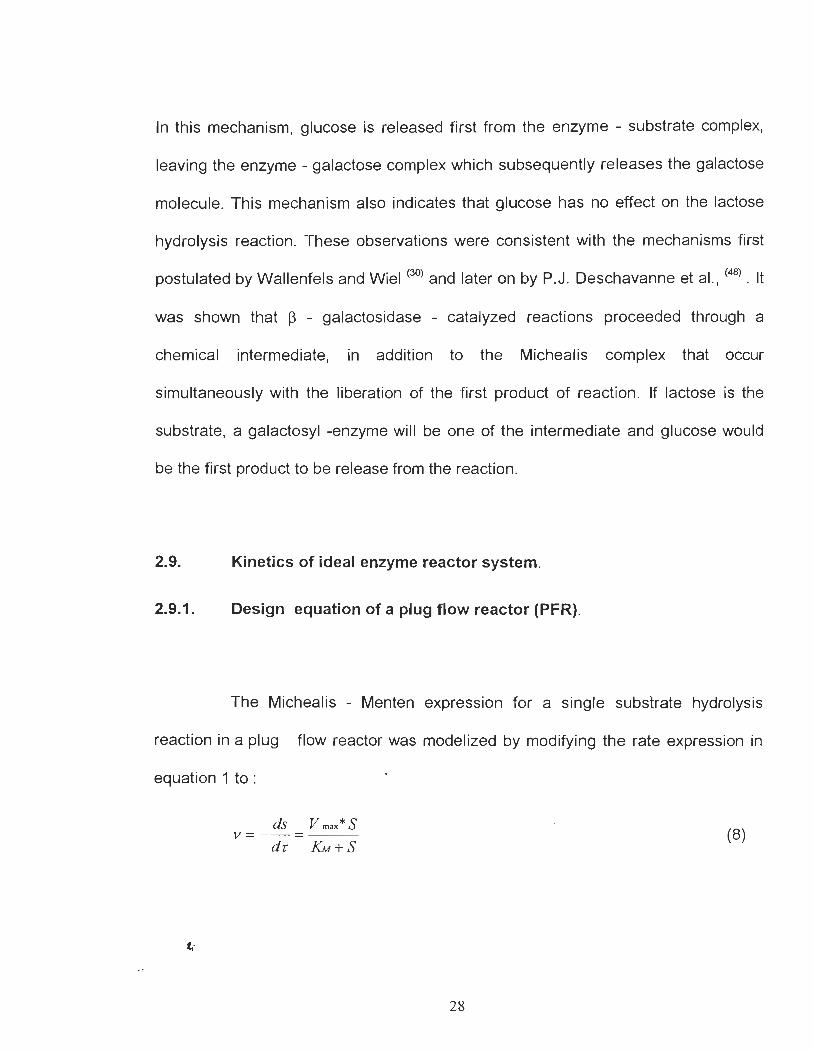
ln this mechanism, glucose is released first from the enzyme - substrate complex,
leaving the enzyme - galactose complex which subsequently releases the galactose
molecule. This mechanism also indicates that glucose has no effect on the lactose
hydrolysis reaction. These observations were consistent with the mechanisms first
postulated by Wallenfels and Wiel (30) and later on by P.J. Deschavanne et al. , (48) . It
was shown that ~ - galactosidase - catalyzed reactions proceeded through a
chemical intermediate, in addition to the Michealis complex that occur
simultaneously with the liberation of the first product of reaction . If lactose is the
substrate, a galactosyl -enzyme will be one of the intermediate and glucose would
be the first product to be release from the reaction.
2.9. Kinetics of ideal enzyme reactor system.
2.9.1. Design equation of a plug flow reactor (PFR).
The Michealis - Menten expression for a single substrate hydrolysis
reaction in a plug flow reactor was modelized by modifying the rate expression in
equation 1 to :
....
ds V max* S v=--=---
dT KM+S (8)
28
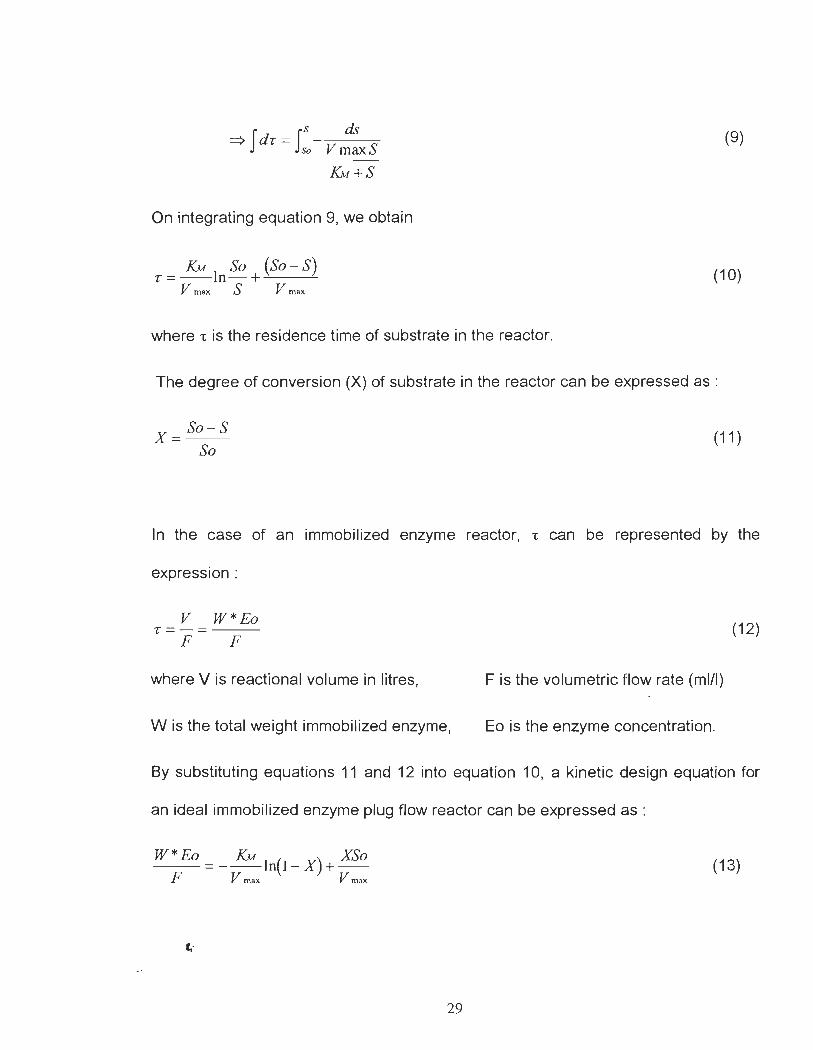
=>fdr = f~ vr!s (9)
KM+S
On integrating equation 9, we obtain
r = KM ln So + (So-S) V max S V max
(10)
where "C is the residence time of substrate in the reactor.
The degree of conversion (X) of substrate in the reactor can be expressed as :
X=_So_-_S So
(11 )
ln the case of an immobilized enzyme reactor, "C can be represented by the
expression:
V W*Eo r=-=---
F F (12)
where V is reactional volume in litres, F is the volumetrie flow rate (ml/l)
W is the total weight immobilized enzyme, Eo is the enzyme concentration.
By substituting equations 11 and 12 into equation 10, a kinetic design equation for
an ideal immobilized enzyme plug flow reactor can be expressed as :
W* Eo = _ KM In(l- X) + XSo F V max V max
(13)
.t.
29
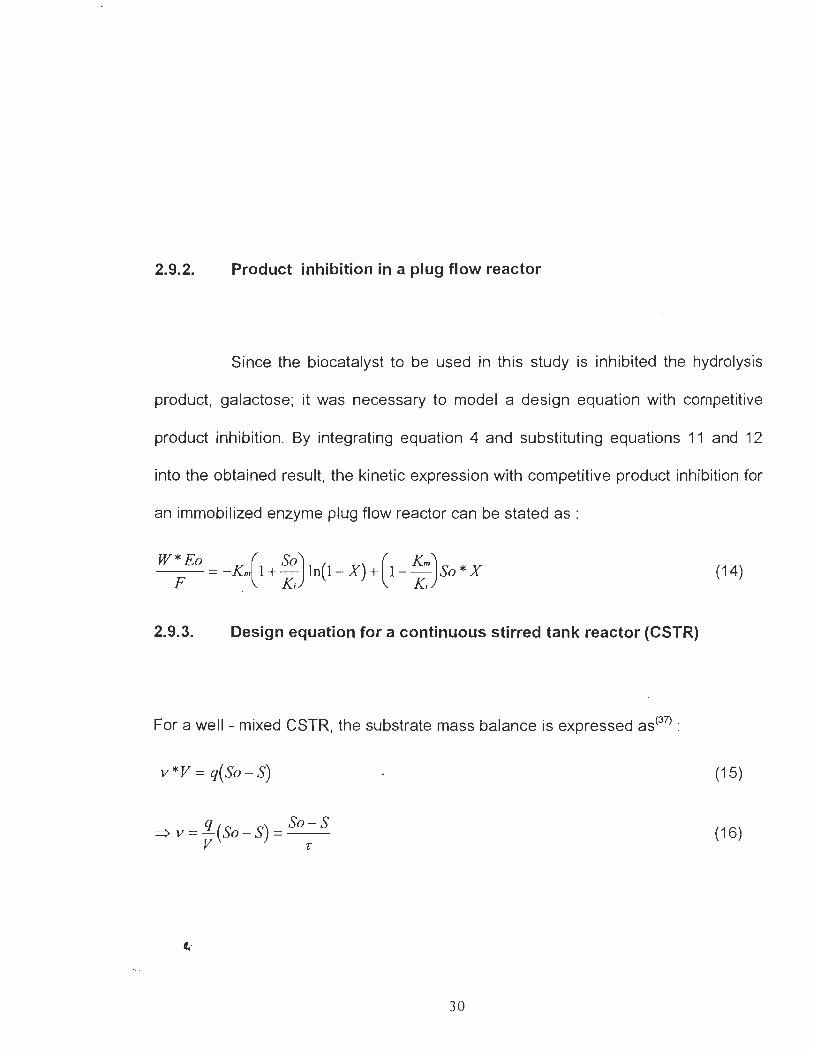
2.9.2. Product inhibition in a plug flow reactor
Since the biocatalyst to be used in this study is inhibited the hydrolysis
product, galactose; it was necessary to model a design equation with competitive
product inhibition. By integrating equation 4 and substituting equations 11 and 12
into the obtained result, the kinetic expression with competitive product inhibition for
an immobilized enzyme plug flow reactor can be stated as :
_W_*_E_o = _ Km(l + _so) In( 1 _ X) + (1- _Km) So * X F Ki Ki
(14)
2.9.3. Design equation for a continuous stirred tank reactor (CSTR)
For a weil - mixed CSTR, the substrate mass balance is expressed as(37) :
v * V = q( So - S) (15)
~ v = i.(So-S) = _So_-_S V r
(16)
30
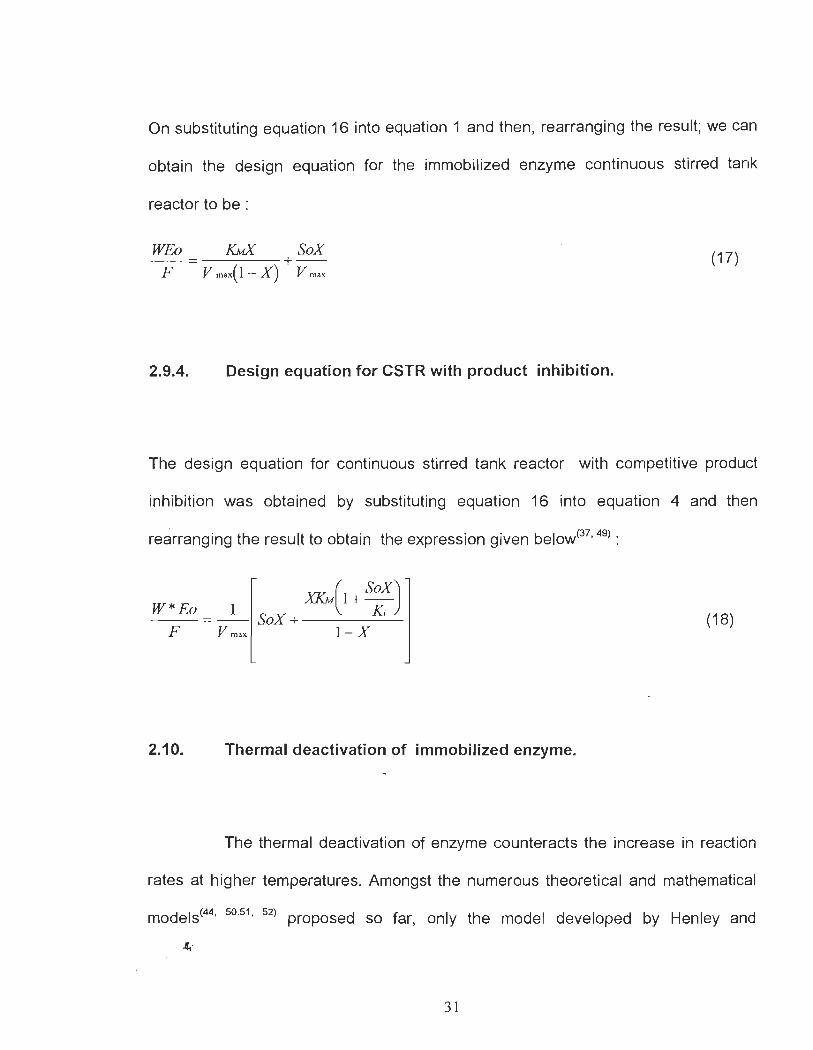
On substituting equation 16 into equation 1 and then, rearranging the result; we can
obtain the design equation for the immobilized enzyme continuous stirred tank
reactor to be :
WEo KMX SaX --= +--
F Vmax(I-X) Vmax
(17)
2.9.4. Design equation for CSTR with product inhibition.
The design equation for continuous stirred tank reactor with competitive product
inhibition was obtained by substituting equation 16 into equation 4 and th en
rearranging the result to obtain the expression given bel OW(37 , 49) :
vv __ ( Sax) .IU.U1 1 +--
W * Ea = _ 1_ SaX + Ki F V max 1- X
(18)
2.10. Thermal deactivation of immobilized enzyme.
The thermal deactivation of enzyme counteracts the increase in reaction
rates at higher temperatures. Amongst the numerous theoretical and mathematical
models(44, 50.51, 52) proposed so far, only the model developed by Henley and
;ft-
31
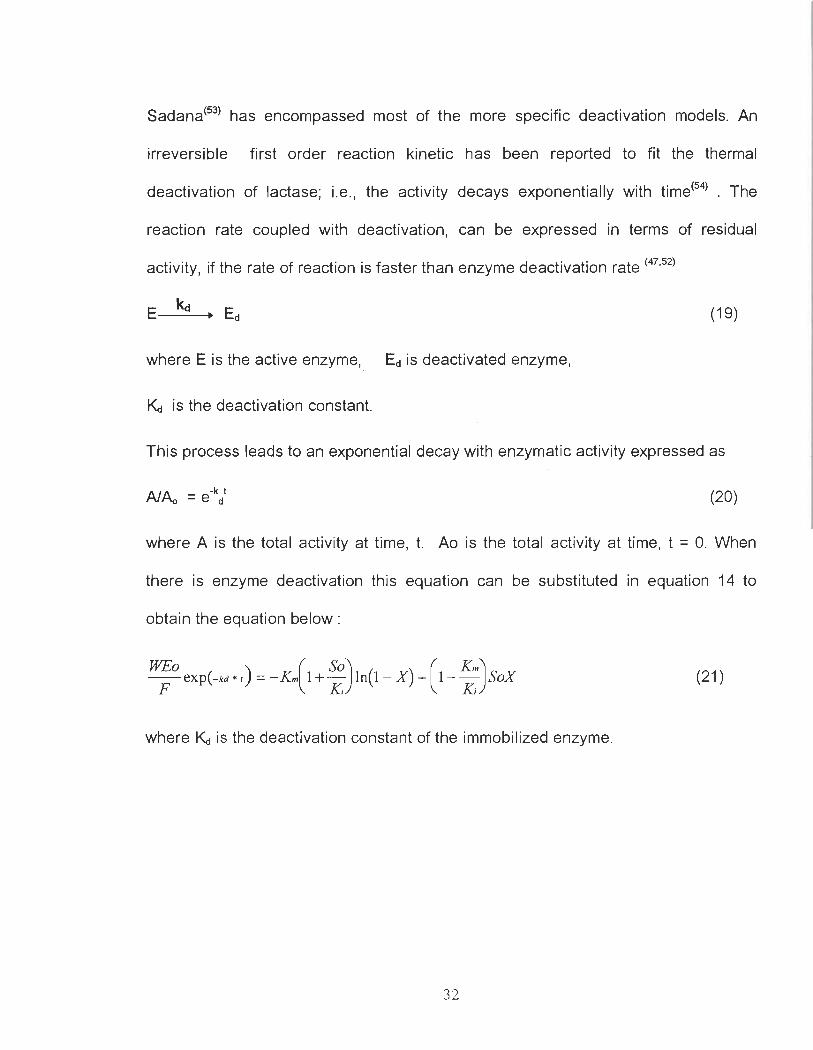
Sadana(53) has encompassed most of the more specifie deactivation models. An
irreversible first order reaction kinetic has been reported to fit the thermal
deactivation of lactase; i.e., the activity decays exponentially with time(54) . The
reaction rate coupled with deactivation, can be expressed in terms of residual
activity, if the rate of reaction is faster than enzyme deactivation rate (47,52)
(19)
where E is the active enzyme, Ed is deactivated enzyme,
I<c! is the deactivation constant.
This process leads to an exponential decay with enzymatic activity expressed as
(20)
where A is the total activity at time, t. Ao is the total activity at time, t = O. When
there is enzyme deactivation this equation can be substituted in equation 14 to
obtain the equation below :
WEo ) (so) (Km) --exp(-kdOt = -Km 1+- In(l - X)+ 1- - SoX F ~ ~
(21 )
where I<c! is the deactivation constant of the immobilized enzyme.
32
III. MATERIALS AND METHODS.
3.1. MATERIALS.
3.1.1 Experimental equipments
- Two reactors; a continuous stirred tank reactor and a plug flow reactor, both
made of plexiglass were inserted into the experimental circuit.
- A peristaltic pump used for pumping the substrate into the reactors.
- A Constant temperature bath on which an immersion heater is attached.
- Flow meter to regulate the substrate feeding rate of substrate into
the CSTR
- A basket - type stirrer for the CSTR.
- Five (5) temperature probes connected to a temperature recorder
- A tubular polysulfone membrane obtained from Osmonics Ine., was
inserted into the UF unit.
33
3.1.2. Equipment for analyzing samples and products.
- High Performance Liquid Chromatography was used to analyzed sugars (lactose,
galactose, and glucose). This HPLC had a Gilson refractive index detector, model
132, a Gilson automatic sample in je ct or, model 231 and a Gilson dilutor, model 401 .
The pump utilized was a waters associate pump, model 6000A. Water was employed
as the eluent at a flow rate of 1 ml/min. The column heating apparatus was from
Man-Tech Inc., model 7980 and the analyzing column was a Bio-Rad, Aminex HPX-
87C Column.This column was excellent in separating a variety of carbohydrates
(sugars). The operating temperature of the column was 80°C. The quantity of
sample utilized each time was 20 IJ.l.
- VARIAN Instrument, model AA - 1275 series, Atomic Absorption spectrophotometer
was used to analyzed cations concentration in the substrate (Cheese industrial
effluent).
- A Nicolet 510 P, FT - IR Spectrometer was used to record -and study the
interactions between the sugar-cation complexes.
- The Hewlett Packard Diode - Array Spectrophotometer, model HP 8452A, with an
operating software, HP 89531A MS-DOS(R), UVNIS, was used to analyzed ONPG
and ONP concentration required for determining the initial activity of the enzyme as
weil as the operating conditions of the immobilized enzymes.
34
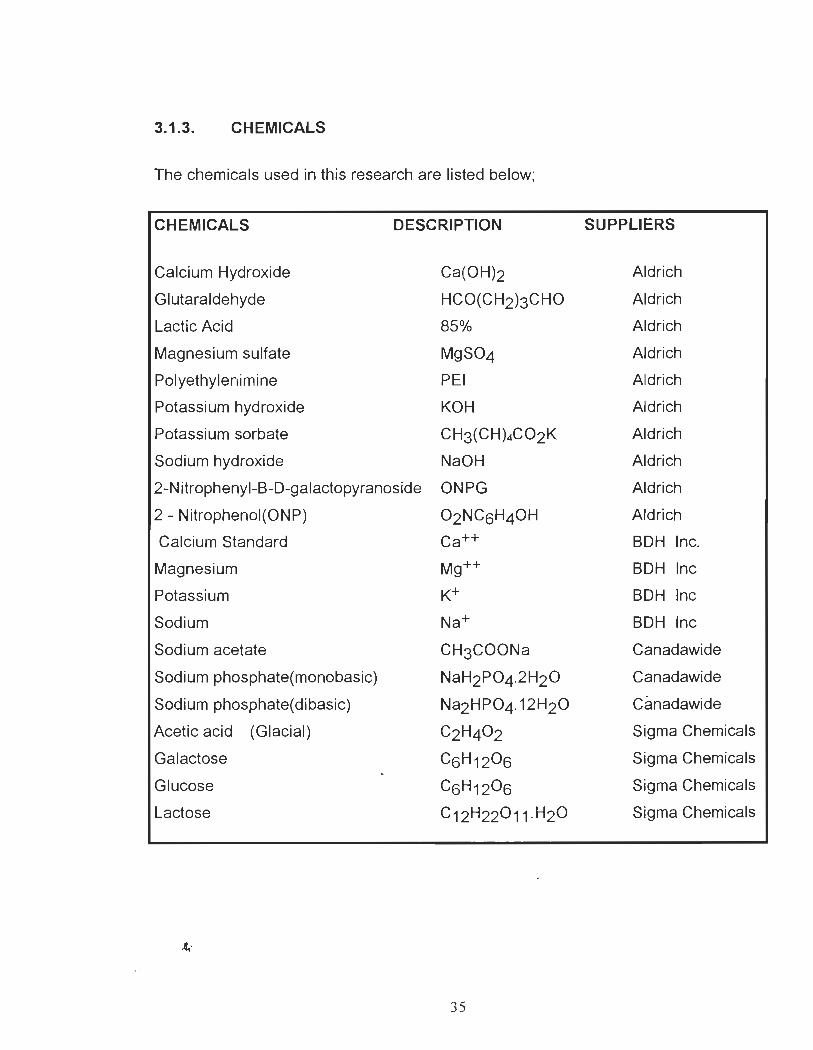
3.1.3. CHEMICALS
The chemicals used in this research are listed below;
CHEMICALS DESCRIPTION
Calcium Hydroxide
Glutaraldehyde
Lactic Acid
Magnesium sulfate
Polyethylenimine
Potassium hydroxide
Potassium sorbate
Sodium hydroxide
2-Nitrophenyl-B-D-galactopyranoside
2 - Nitrophenol(ONP)
Calcium Standard
Magnesium
Potassium
Sodium
Sodium acetate
Sodium phosphate(monobasic)
Sodium phosphate(dibasic)
Acetic acid (Glacial)
Galactose
Glucose
Lactose
Ca(OH)2
HCO(CH2)3CHO
85%
MgS04
PEI
KOH
CH3(CH)4C02K
NaOH
ONPG
02NC6H40H
Ca++
Mg++
K+
Na+
CH3COONa
NaH2P04·2H20
Na2HP04·12H20
C2H40 2
C6H120 6
C6H120 6
C12H220 11 ·H20
35
SUPPLIERS
Aldrich
Aldrich
Aldrich
Aldrich
Aldrich
Aldrich
Aldrich
Aldrich
Aldrich
Aldrich
BDH Inc.
BDH Inc
BDH Inc
BDH Inc
Canadawide
Canadawide
Canadawide
Sigma Chemicals
Sigma Chemicals
Sigma Chemicals
Sigma Chemicals
111.2
3.2.1.
3.2.1.1.
EXPERIMENTAL PROCEDURE.
Immobilization method.
Enzyme support
Two types of biocatalyst carriers were used in this research. The granular
diatomaceous earth (GDE) was obtained fram Eagle Pitcher Minerais Inc.
Michigan, U.S.A. This poraus GDE has good mechanical strength, and stability on
exposure to heat and to acid or basic solutions. The particle diameter was
between 0.74 - 0.85 mm and the pore size was 22 mesh size U.S. standard. The
other bio-catalyst carrier, Celite R - 640 was obtained fram Celite Corporation P.O.
Box 519 Lompoc, CA 93438-0519, U.S.A. The celite R-640 carrier was made of
rigid inorganic materials and was in pellet form. This carrier had a very good
chemical and thermal stability. The mean pore diameter was 0.03 J..lm and the
surface area was 61 m2/g. In order to select which biocatalyst carrier was to be
used in this research , immobilisation efficiency, enzyme loading per gram of dry
weight support, mechanical and thermal stability were investigated.
3.2.1.2. Lactase
Two kinds of enzymes were tested; ~ - galactosidase ( EC 3.2.1.23) fram
Aspergillus oryzae was purchased fram Sigma Chemicals and had an initial
activity of 4.4 units/mg sol id with lactose or 4.5 units/mg solid with ONPG at 30
oC and pH 4.5. The other enzyme, Lactozyme 3000 L, type HP obtained fram the
36
Nova Industries, CT, U.S.A. had an initial activity of 3000 LU (lactose unit) at 37 oC
and pH 6.5.
3.2.1.3. Determination of initial enzyme activity in ONPG units.
ln arder ta determine the initial activity of these enzymes, a standard curve for
orthonitrophenol (ONP) was made from various initial concentration of ONP [see
Appendix 2]. Equal amounts of soluble enzymes were placed in five test tubes
containing different concentrations of ortonitrophenyl-J3-galactopyranoside
(ONPG), a colourless substrate which is hydrolyzed by lactase into galactose and
the yellow-coloured ortonitrophenol (ONP). The reaction was stopped after 2
minutes by adding 1 ml of 1 M Na2C03 to each test tube.
3.2.1.4 Immobilization
The immobilization method used in this research was invented by Chiang , J. P.
and Lantero, O. J. Jr (41) and published in the European patent office.
1. Treatment of enzyme support.
39 9 GDE was washed thoroughly with distilled water or di-ionized water until the
supernatant was clear. After the GDE had settled, the supernatant liquid was
decanted. The diatomaceous earth was suction deaerated and the residual water
decanted.
37
2. Immobilization of enzymes.
500ml of 0.2% w/v aqueous solution polyethylenimine (PEI) with pH 9.8 was
added to the carrier in a 1 L Erlenmeyer flask and the flask was placed in a
microprocessor bath. It was agitated gently at a speed of 150 rpm for 4 hours.
Excess PEI was decanted and the treated carrier washed thoroughly with water.
The pendant amine groups of the polymer attached to the carrier was derivatized
byadding 500ml of 0.5% w/v glutaraldehyde made up 0.05M NaHC03, in pH 8.2.
The flask was agitated gently for 2 hours at room temperature. The excess
glutaraldehyde was decanted and the treated carrier washed with di-ionized water
to remove unreacted glutaraldehyde. The result was a carrier comprising
diatomaceous earth, polyethylenimine, and glutaraldehyde. One gram of lactase
from Aspergillius oryzae was dissolved in 500 ml of 0.02 M phosphate buffer
adjusted to pH 7.0 and then, added to the derivatized support. It was then agitated
gently for 4 hours at room temperature.
The residual buffer solution was decanted and stored in order to determine the
residual solution activity. The IME was washed with copious amount of de-ionized
water. The washed IME was stored in Potassium Sorbate solution and kept in a
freezer until utilisation was required.
38
3.2.1.5 Residual enzyme activity
The residual immobilization solution was reacted with ONPG and the activity, E1
in ONPG Units was obtained. The immobilization efficiency was calculated by
using the formula :
1 b'i" Eff" [EO -El] mmo Ilzatlon IClency, a = Eo *100 (22)
where Eo = Initial enzyme activity and E1 = residual enzyme activity
3.2.1.6 Determination of immobilized enzyme thermal stability.
Two (2) 9 of A. oryzae immobilized on GDE was placed in 5 ml 2mM ONPG and
adjusted to a pH 4.5 with acetate buffer. 1 ml of solution was removed each time
and placed in 1 ml 0.12N NaOH to stop the enzymatic reaction. The amount of
ONP formed was measured at 420 nm. This was repeated for other
temperatures(40, 50, 55 OC).
3.2.1.7 Determination of immobilized enzyme mechanical stability.
6 9 of IME (A.oryzae on GDE) was placed in the CSTR containing 50 ml of water.
The stirring speed (<p) was varieèj from 1 rps -3 rps. After every 15 minutes, 1 ml of
solution was removed and reacted with 1 ml of ONPG adjusted to pH 4.5 with an
acetate buffer. This reaction was stopped after 2 minutes with NaOH . The
amount of ONP formed was measured at 420 nm.
39
3.2.2. KINETIC STUDIES.
Kinetic studies were performed on pure lactose without cations and then, in the
presence of cations. The kinetic studies in the presence of cations were carried
out with individual cations as weil as a combination of the three principal cations
found in cheese industrial effluent.
3.2.2.1 Kinetic studies without cations.
3.2.2.1.1 Effect of temperature.
The effect of temperature on lactose hydrolysis kinetics was performed with a 2 %
(w/v) lactose solution in a temperature range of 30 oC - 60 oC. 6 9 of immobilized
enzymes was placed in a 100 ml flask containing 25 ml lactose solution whose pH
has been adjusted to 4.5 with an acetate buffer. The flask was placed in a
constant temperature microprocessor bath and allowed to shake gently. The
reaction was left to continue in a stirred batch reactor (flask) for 180 minutes
during which samples were taken every 15 minutes for analysis.
The samples were filtered with 0.45 Jlm nylon 66 membrane filter and immediately
heat-treated in about 80 oC hot water bath to stop the enzymatic reaction. An
HPLC was used to analyzed the galactose, glucose, lactose, and oligosaccharide
;t.
40
present in the sample. The degree of hydrolysis or conversion (X ) was calculated
using the equation below:
x = [ C ghJ cos e + CgaJac/ose ]*100
C lac/ose + C glu cos e + C galactose (23)
where C is the concentration of lactose, glucose and galactose present in the
analyzed sample.
3.2.2.1.2 Effect of various initial lactose concentration.
The influence of various initial lactose concentration on the rate of lactose
hydrolysis by immobilized enzymes was investigated experimentally at a constant
temperature of 50 oC . An acetate buffer was used to stabilized the pH at 4.5. An
appropriate amount of IME with an enzyme loading of 26,3 mgl 9 dry wt. support
were placed in 100 ml flask containing 25 ml of different concentrations of lactose
solutions. These flasks were placed in a constant temperature microprocessor
bath and allowed to shake gently. The concentration of lactose varie.d from 0.5 %
(w/v) to 5 % (w/v) . The reaction was performed in a stirred batch reactor for 180
minutes and samples were takeo every 15 minutes for analysis. The samples were
filtered with 0.45 Ilm nylon 66 membrane filter and immediately heat-treated in
about 80 oC hot water bath to stop the enzymatic reaction. An HPLC was used to
analyzed the galactose, glucose. lactose and oligosaccharide present in the
sample. The degree of conversion (X ) was calculated using equation 23.
;t-
41
3.2.2.2. Kinetic studies in the presence of cations.
3.2.2.2.1. The case of single cation
A similar experiment as in 3.2.2.1.1 above was performed with 2% (w/v) lactose in
the presence four individual cations namely, 0.1 M NaCI, 0.1 M KCI, 2 mM CaS04,
and 2 mM MgCb.
3.2.2.2.2. The case of a combination of three cations.
A similar experiment as in 3.2.2.1.1 above was performed in the presence of a
combination of three cations namely; ~ , Na+, Ca++. Their concentration ranges
were as follows :
NaCI
KCI
CaS04
3.2.3.
3.2.3.1
0.05 M - 0.1 M
0.05 M - 0.1 M
0.5 mM - 2 mM
Experimental circuit.
Ultrafiltration (UF) unit
Cheese effluent obtained fram the cheese plant was placed in a 20 liters plastic
container and a 1 hp pump was used to pump the substrate through a catridge filter
to remove extremely large particles before sending it to the UF unit. A tubular
membrane obtained fram Osmonics Inc., U.S.A. was used to separate the effluent
into whey pratein concentrate (retentate) and whey permeate. Most the salts or
.t.
42
cations were also removed during this process The feeding rate was about 70 ml/s
and the pressure applied was about 350 kpa. The ultrafiltrate ( permeate) was
stored in a freezer and ready to be used in the bioreactors. Figure 3 illustrate the
diagram of the ultrafiltration unit.
3.2.3.2 Hydrolysis of cheese industrial effluent in bioreactors.
The experimental circuits as shown in figure 4 and figure 5 were thoroughly
flushed with dionized water containing a few drops of 5.25 % sodium hypochlorite
solution to desinfect the system from any microbial contamination prior to
performing the experiments.The continuous stirred tank reactor (CSTR) and the
plug flow tubular reactor (PFTR) were constructed of plexiglass. A proportionate
amount of immobilized enzymes depending on the reaction volume of each reactor
was placed in the CSTR and PFTR. A variable speed peristaltic pump was used to
pump the 4 oC whey permeate through a spiral stainless steel tube-type heat
exchanger, placed in a constant temperature bath. Here, the feed was warmed to
the required operating temperature. The feed was then pumped at a-constant flow
rate of 15 ml/min or 40 ml/min into the CSTR or the PFTR respectively. The
reactors were maintained at is6thermal condition of 50 oC as the substrate by a
continuous stream of hot water circulating through the jacket of the reactor and the
constant temperature water bath. Medical grade tygon tubing and stainless steel
piping were employed in the experimental circuit. A polyethylene filter with a mesh
43
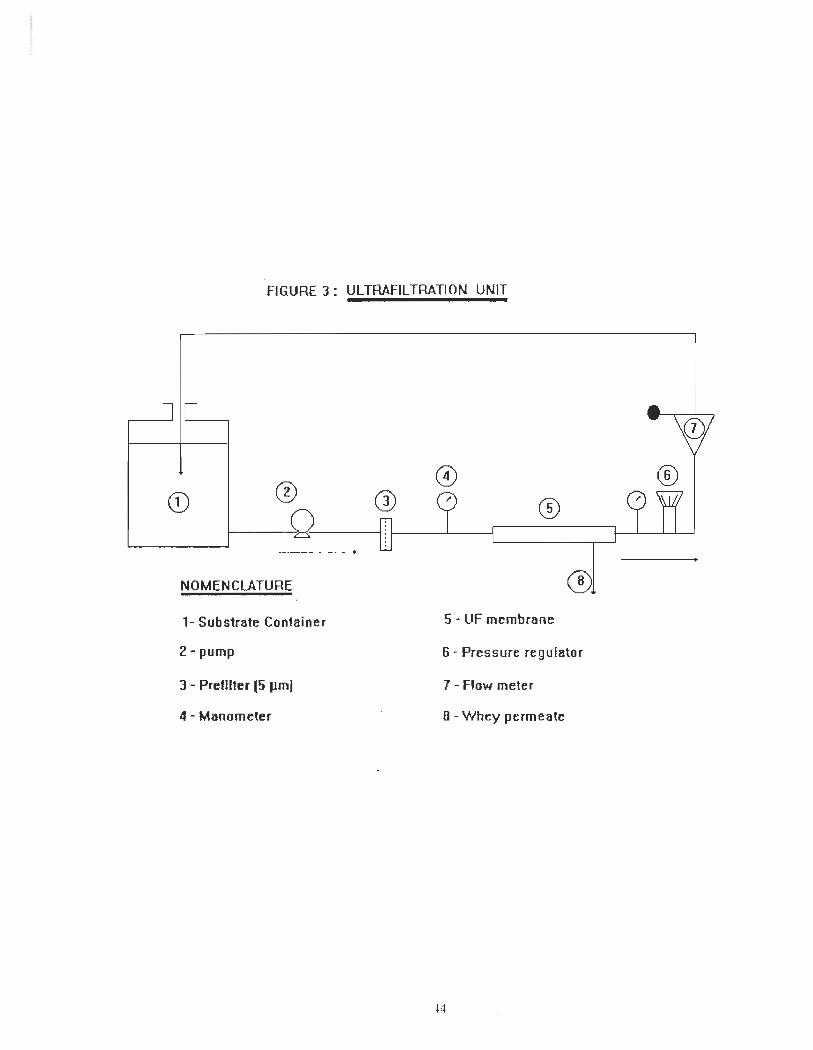
FIGURE 3: ULTRAFILTRATION UNIT
®
NOMENCLATURE
1- Substrate Container 5 - UF membrane
2-pump 6 - Pressure regulator
3 - Prefilter (5 Ilm) 7 - Flow meter
4 - Manometer 8 - Whey permeate
44
size of 408 J..I.m was used to support the immobilized enzymes bed in the plug flow
tubular reactor. A similar type of screen was placed at the exit of the continuous
stirred tank reactor to prevent immobilized enzymes fram going into the product
stream. A high flow rate of feed solution was used to eliminate diffusion
limitation.The outlet stream of the reactors were collected and tested for the
presence of glucose, galactose, lactose, and oligosaccharides.The degree of
hydrolysis, X (%) was calculated using the expression in equation 23, where C is
the concentration in the hydrolyzed permeate collected at the reactor's exit.
45
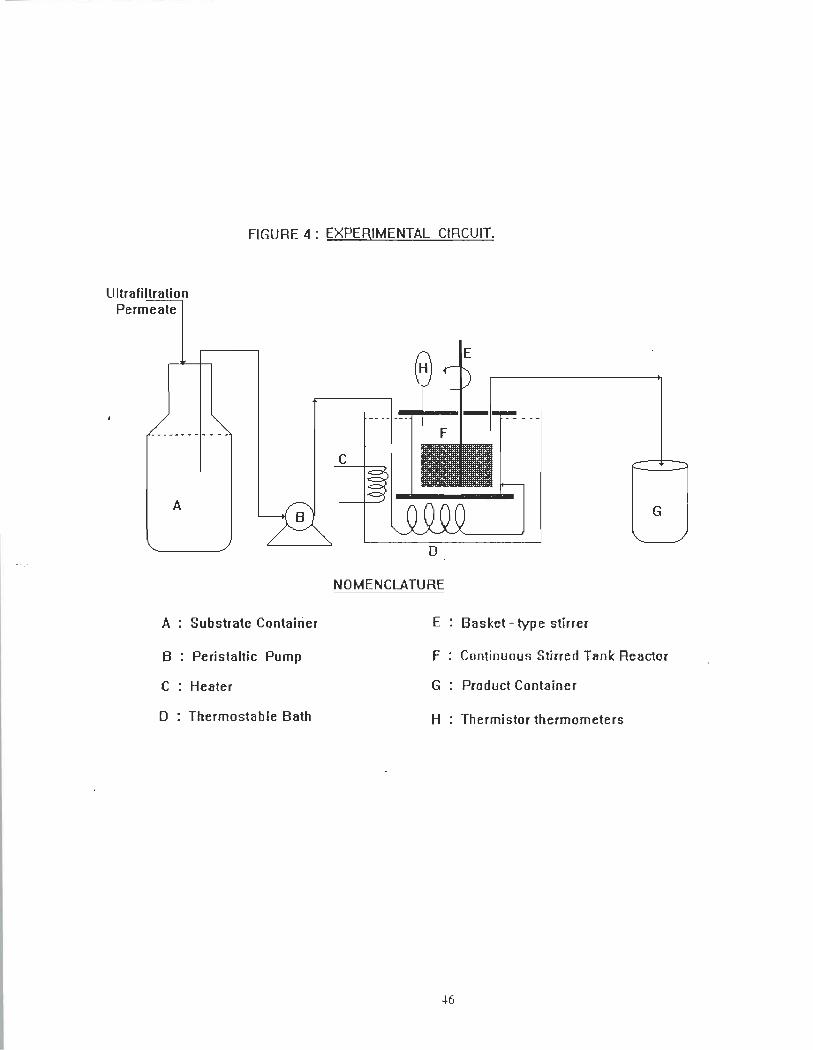
FIGURE 4 : EXPERIMENTAL CIRCUIT.
U Itrafiltrati 0 n Permeate
A
A : Substrate Container
B : Peristaltic Pump
C : Heater
o : Thermostable Bath
G
NOMENCLATURE
E : Basket - type stirrer
F : Continuous Stirred Tank Reacfor
G Product Container
H Thermistor thermometers
46
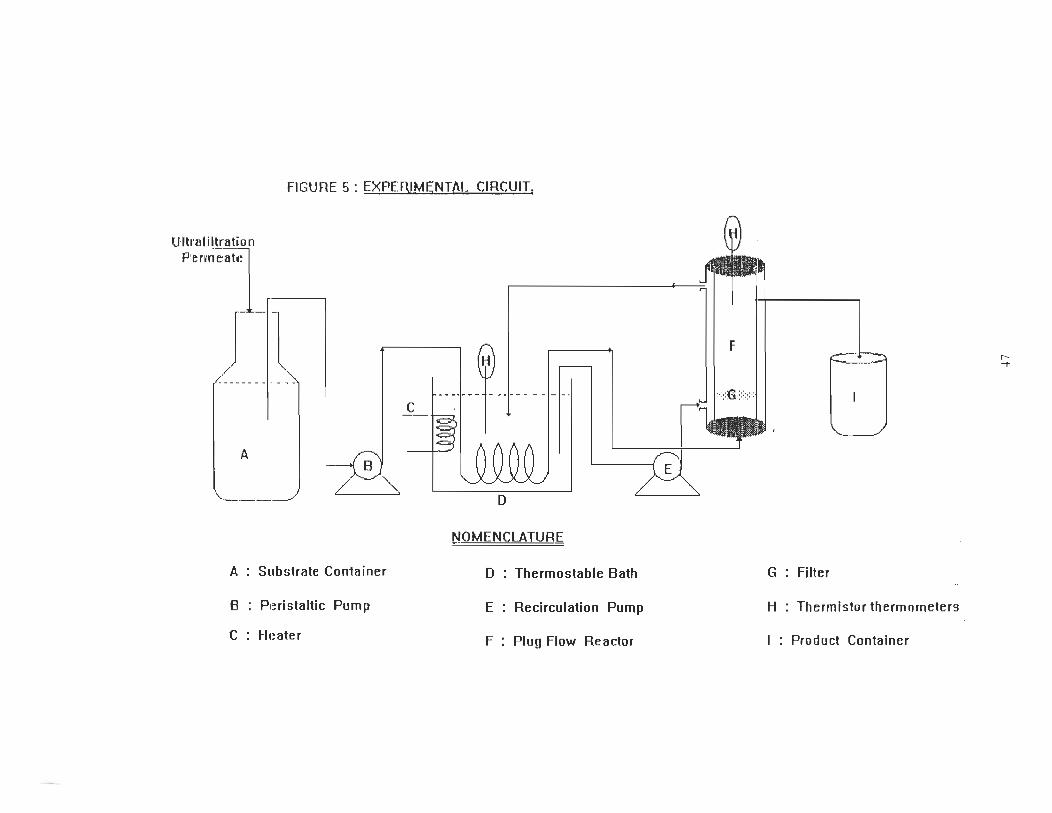
FIGURE 5 : EXPERIMENTAL CIRCUIT.
Ultl'lIt i P',ermeate
A
A Substrate Container
B PI!ristaltic Pump
C Ht!ater
D
NOMENCLATURE
o Thermostable Bath
E Recirculation Pump
F Plug Flow Reactor
F
G : FlUer
H Thermistor thermometers
Product Container
r-T
3.2.4. Biochemical and chemical oxygen demand analysis.
The Biochemical oxygen demand (BOD5) and chemical oxygen demand (COD) of
the sampled effluents and the hydrolyzed effluents were measured using the
dissolve oxygen meter at the pulp and paper research center (CRPP) of Université
du Québec à Trois - Rivières.
3.2.5. Spectroscopie study of lactose - cation complexes.
The D - lactose - metal ion complexes were prepared by mixing separately 1 ml of
0.1 M of hydrated metal halides (KCI, NaCI, and CaCb) in water to 1 ml solution
of 0.1 M D - lactose in water. The mixture was heated for 10 minutes at 70 oC and
then cooled to room temperature. Four drops of each mixture were placed on a
CaF2 window and allow to evaporate at room temperature and low pressure to
obtain a uniform film of the complex precipitate on the calI. This precipitate was an
adduct of the type M(D-lactose)X.nH20, where M represents the cations K or Na,
and X represents the anion (CI). In the case of calcium chloride, the adduct was of
the type, Ca(D-lactose)Cb.nH20. It should be mentioned here· that ail the
chemicals were reagent grade and were used without further purification. A Nicolet
type FT-IR spectrophotometer 'was used to record the infrared spectra. This
procedure was repeated for different concentrations( 0.1 M, 0.5M and 1 M) of metal
ions. Infrared spectra were recorded in the range of 1800 cm·1 to 1000 cm·1 were
studied.
48
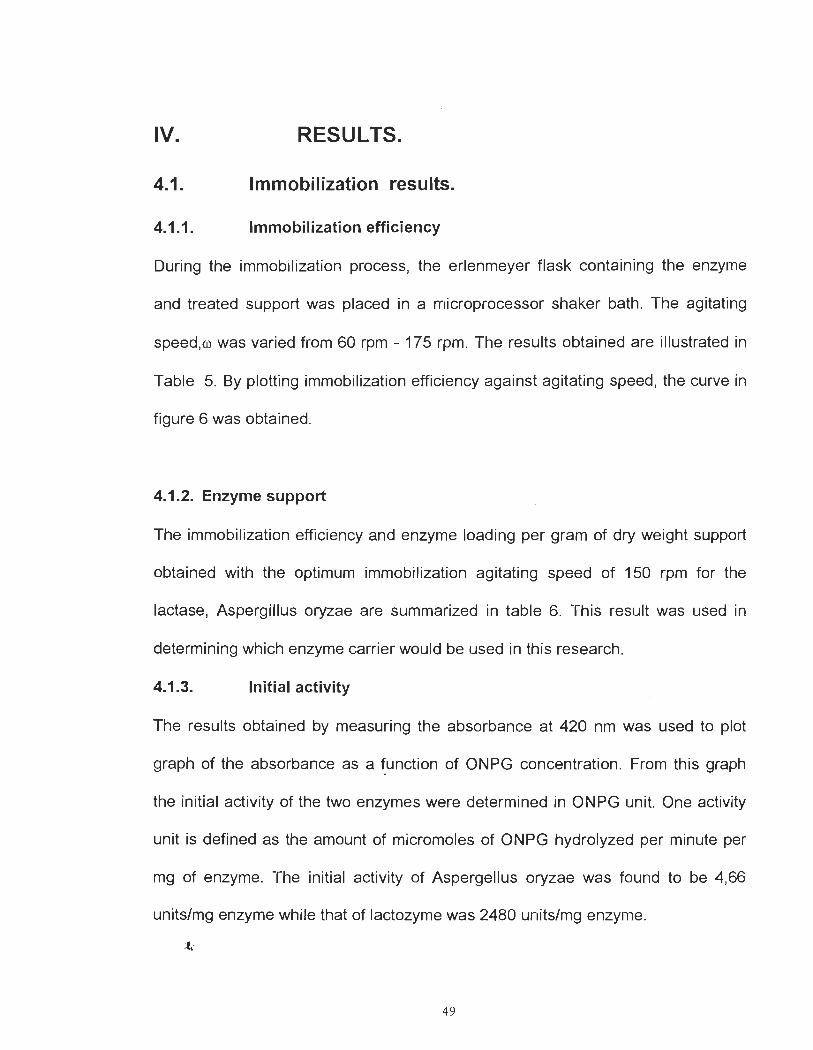
RESULTS. IV.
4.1.
4.1.1.
Immobilization results.
Immobilization efficiency
During the immobilization process, the erlenmeyer flask containing the enzyme
and treated support was placed in a microprocessor shaker bath. The agitating
speed,ro was varied from 60 rpm - 175 rpm. The results obtained are illustrated in
Table 5. By plotting immobilization efficiency against agitating speed, the curve in
figure 6 was obtained.
4.1.2. Enzyme support
The immobilization efficiency and enzyme loading per gram of dry weight support
obtained with the optimumimmobilization agitating speed of 150 rpm for the
lactase, Aspergillus oryzae are summarized in table 6. This result was used in
determining which enzyme carrier would be used in this research.
4.1.3. Initial activity
The results obtained by measuring the absorbance at 420 nm was used to plot
graph of the absorbance as a ~unction of ONPG concentration. From this graph
the initial activity of the two enzymes were determined in ONPG unit. One activity
unit is defined as the amount of micromoles of ONPG hydrolyzed per minute per
mg of enzyme. The initial activity of Aspergellus oryzae was found to be 4,66
units/mg enzyme while that of lactozyme was 2480 units/mg enzyme .
.t:
49
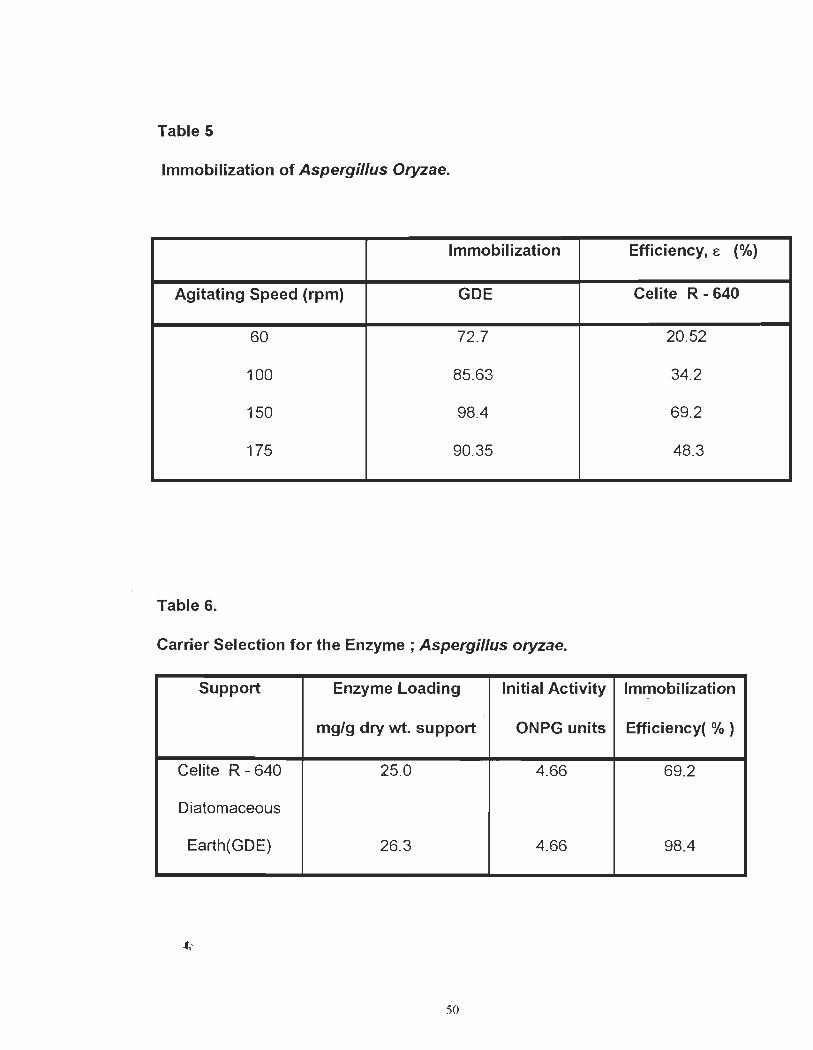
Table 5
Immobilization of Aspergillus Oryzae.
Immobilization Efficiency, E (%)
Agitating Speed (rpm) GDE Celite R - 640
60 72.7 20.52
100 85.63 34.2
150 98.4 69.2
175 90.35 48.3
Table 6.
Carrier Selection for the Enzyme; Aspergillus oryzae.
Support Enzyme Loading Initial Activity Immobilization -
mg/g dry wt. support ONPG units Efficiency( % }
Celite R - 640 25.0 4.66 69.2
Diatomaceous
Earth(GDE) 26.3 4.66 98.4
50
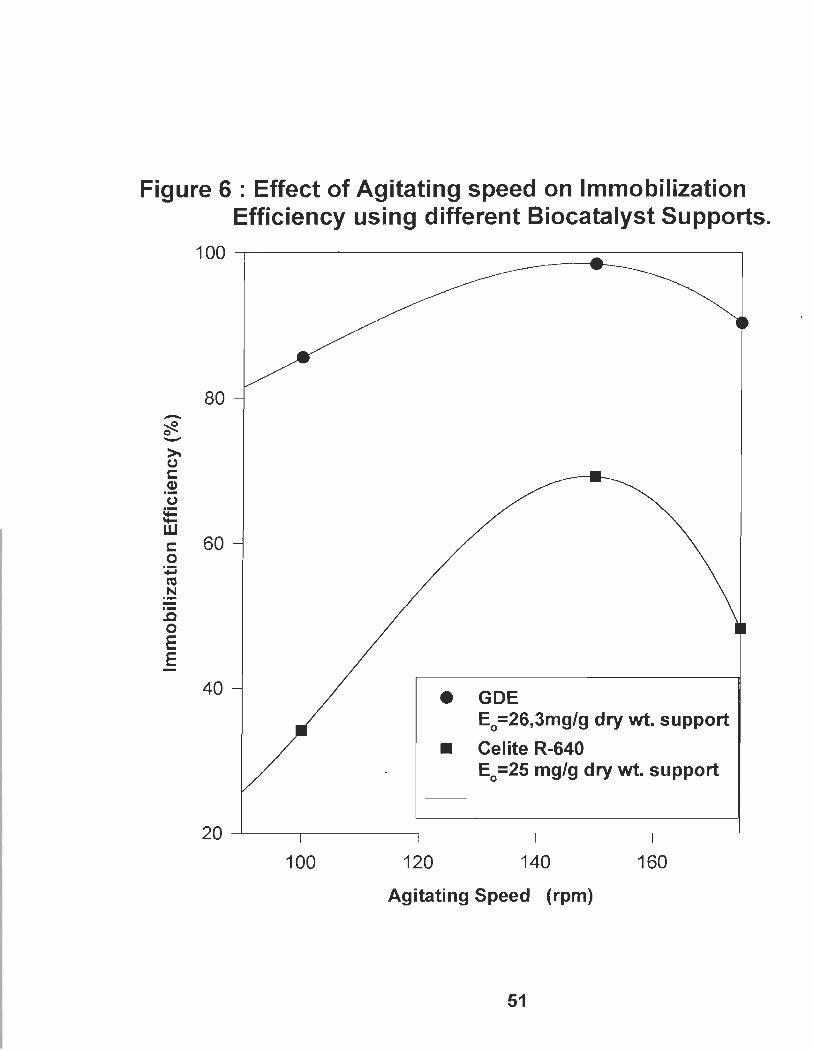
Figure 6 : Effect of Agitating speed on Immobilization Efficiency using different Biocatalyst Supports.
100 ~----------------------------------~
80 -~ c -~ (,) c Cl) .-(,)
!E w c 60 0 ~ cu .!:::! -.c 0 E E -
40 • GDE Eo =26,3mg/g dry wt. support
• Celite R-640 Eo =25 mg/g dry wt. support
20 ~--~------~~------~------~----~
100 120 140 160
Agitating Speed (rpm)
51
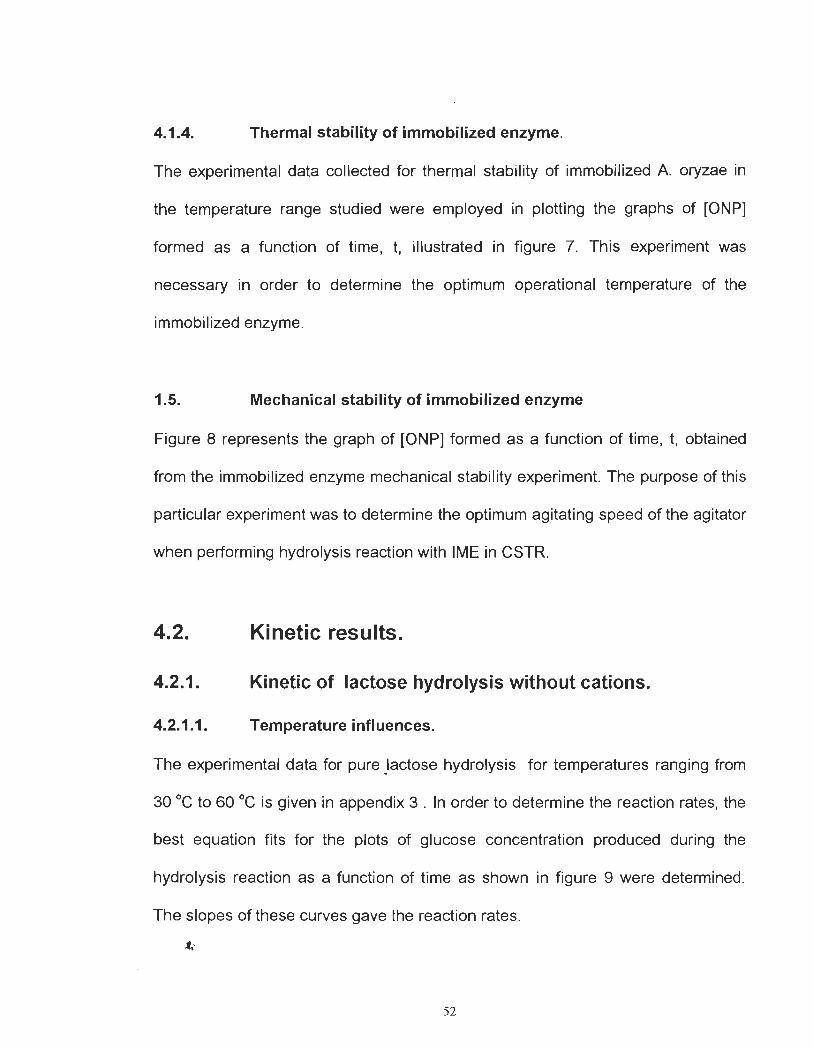
4.1.4. Thermal stability of immobilized enzyme.
The experimental data collected for thermal stability of immobilized A. oryzae in
the temperature range studied were employed in plotting the graphs of [ONP]
formed as a function of time, t, illustrated in figure 7. This experiment was
necessary in order to determine the optimum operational temperature of the
immobilized enzyme.
1.5. Mechanical stability of immobilized enzyme
Figure 8 represents the graph of [ONP] formed as a function of time, t, obtained
from the immobilized enzyme mechanical stability experiment. The purpose of this
particular experiment was to determine the optimum agitating speed of the agitator
when performing hydrolysis reaction with IME in CSTR.
4.2.
4.2.1.
4.2.1.1.
Kinetic results.
Kinetic of lactose hydrolysis without cations.
Temperature influences.
The experimental data for pure .Iactose hydrolysis for temperatures ranging from
30 oC to 60 Oc is given in appendix 3 . In order to determine the reaction rates, the
best equation fits for the plots of glucose concentration produced during the
hydrolysis reaction as a function of time as shown in figure 9 were determined.
The si opes of these curves gave the reaction rates .
.ft:
52
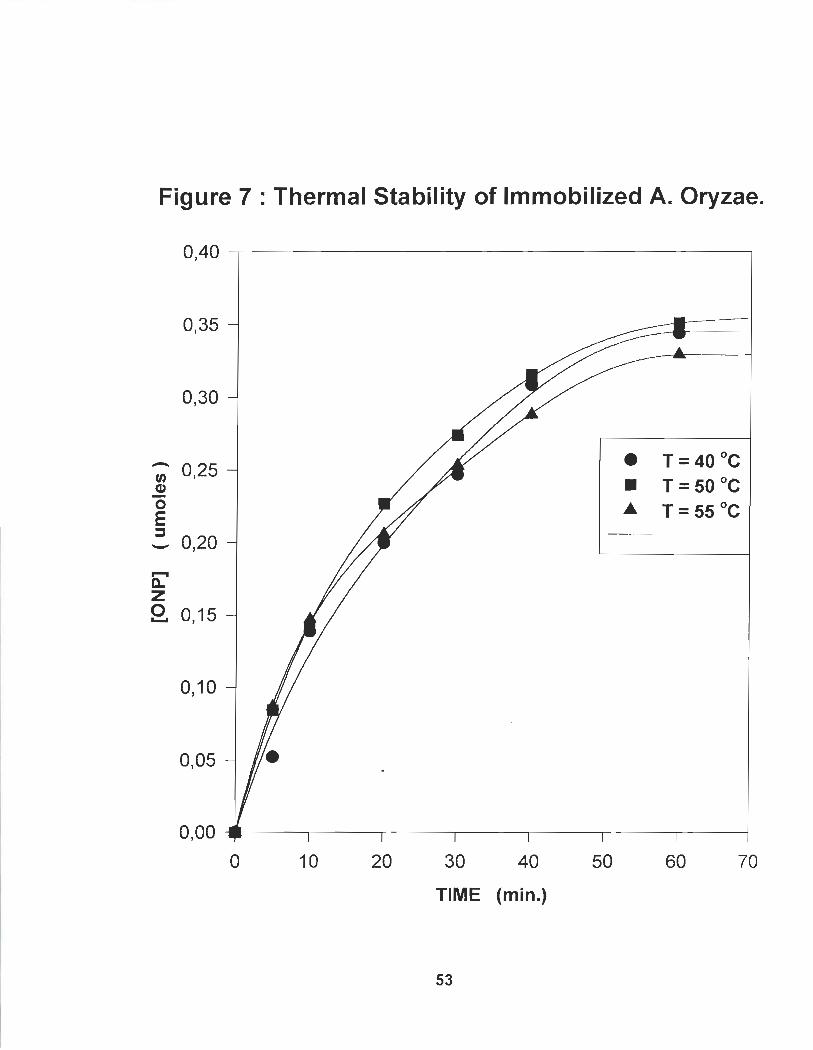
Figure 7 : Thermal Stability of Immobilized A. Oryzae.
0,40 -,----------------------,
0,35
0,30
-; 0,25 ..! o E ::J _ 0,20
~ z Q. 0,15
0,10
0,05
• T = 40 Oc • T = 50 oc .. T = 55 Oc
0,00 ___ ---r----,----,-----,--------,---,------1
o 10 20 30 40 50 60 70
TIME (min.)
53
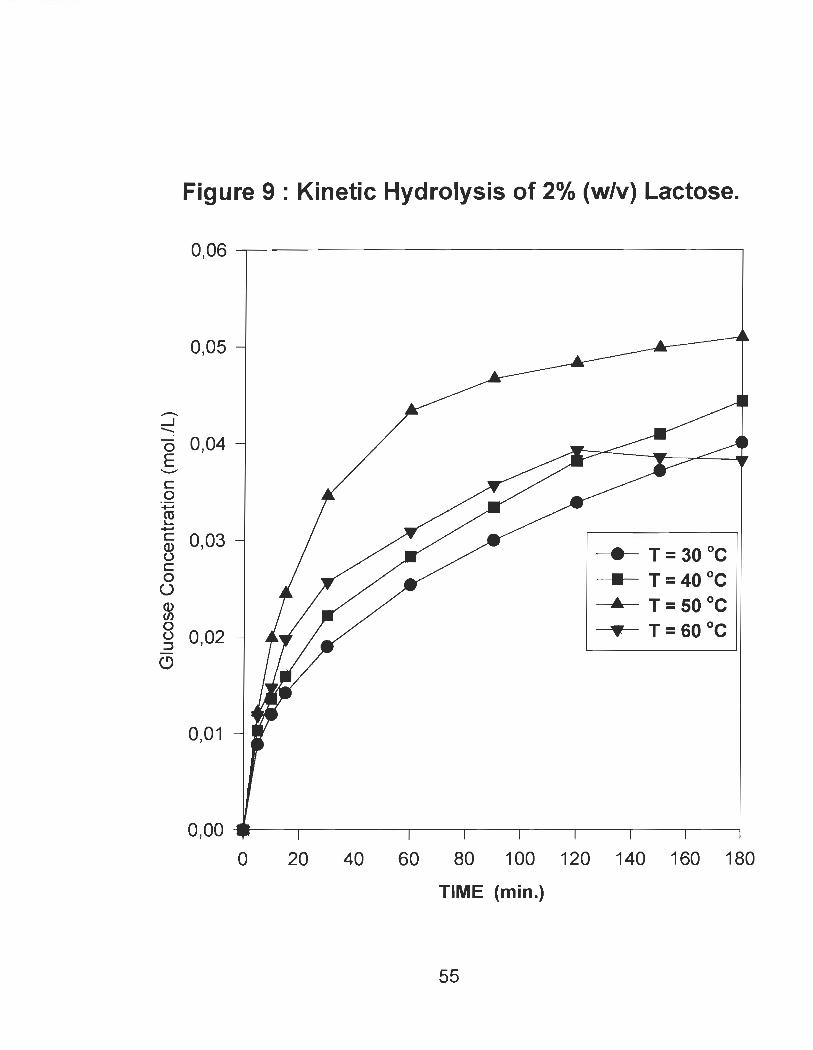
Figure 9 : Kinetic Hydrolysis of 2% (w/v) Lactose.
0,06 ----r---------------------,
0,05
..-
.....J -" 0,04 E c o
:.;:::; ro ~ +-'
55 0,03 () c o Ü Q) (/)
§ 0,02 (9
0,01
• T = 30 Oc • T = 40 Oc ... T = 50 Oc • T = 60 Oc
0,00 ___ ----.--------.----r----r--------r--------r-------r-------r---4
o 20 40 60 80 100 120 140 160 180
TIME (min.)
55
By plotting the obtained reaction rates , v, as a function of the initial lactose
concentration, [S], as shown figure 10 and applying a non - linear computer
regression method to the Michealis - Menten type kinetic with competitive product
inhibition represented by equation 4, the kinetic parameters (apparent maximum
rate of reaction, Vmax.app, and the apparent Michealis-menten kinetic constant,
Km.app. ) were obtained. The results are summarized in table 7.
4.2.1.2 The effect of initial lactose concentration.
The experimental data obtained were used to make the plots of initial lactose
concentration as a function of time shown in figure 11. Initial rates of reaction, R,
were obtained by doing the first derivative of the best equation fit of each of the
curves in figure 11. The values of the reaction rates obtained were plotted against
lactose concentration to obtained the kinetic parameters as indicated in equation
4. These kinetic parameters are represented as V m.app. and Km.app .. The kinetic
parameters obtained are summarized in table 8.
56
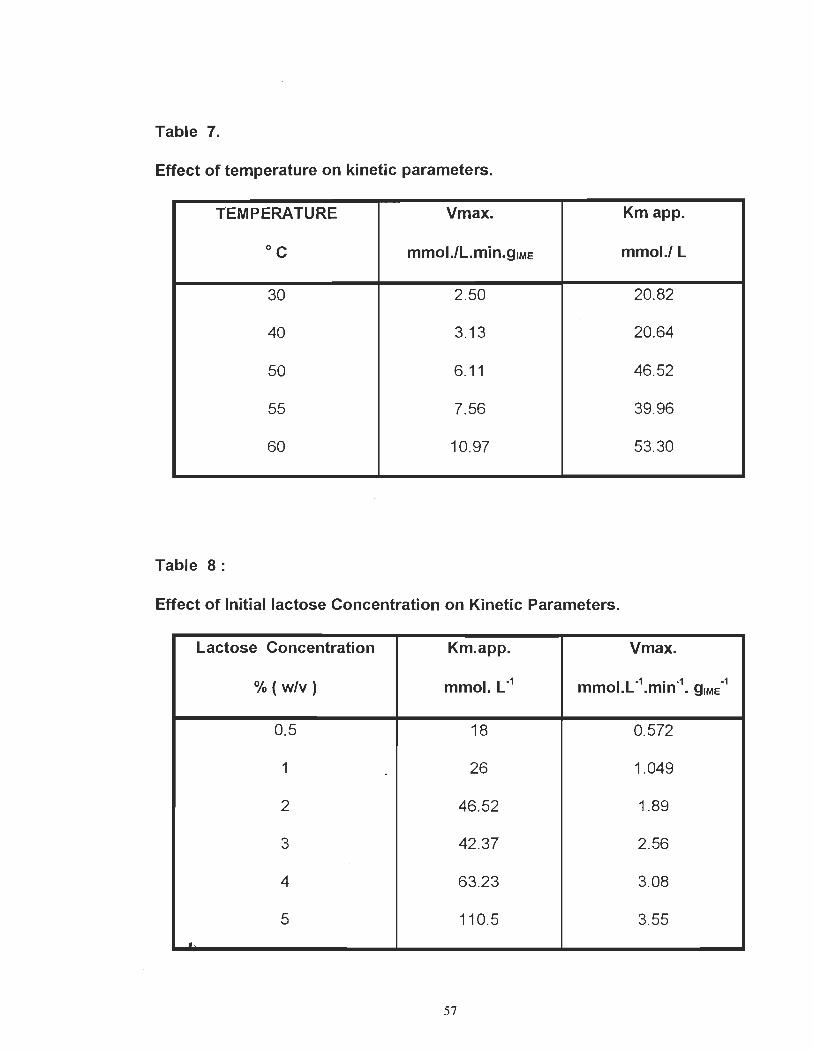
Table 7.
Effect of temperature on kinetic parameters.
TEMPERATURE Vmax. Km app.
oC mmol.lL.min.QIME mmol.l L
30 2.50 20.82
40 3.13 20.64
50 6.11 46.52
55 7.56 39.96
60 10.97 53.30
Table 8:
Effect of Initial lactose Concentration on Kinetic Parameters.
Lactose Concentration Km.app. Vmax.
% (w/v) mmol. L-1 1 L-1 • -1 -1 mmo . .~m. QIME
0.5 18 0.572
1 - 26 1.049
2 46.52 1.89
3 42.37 2.56
4 63.23 3.08
5 110.5 3.55 ..
57
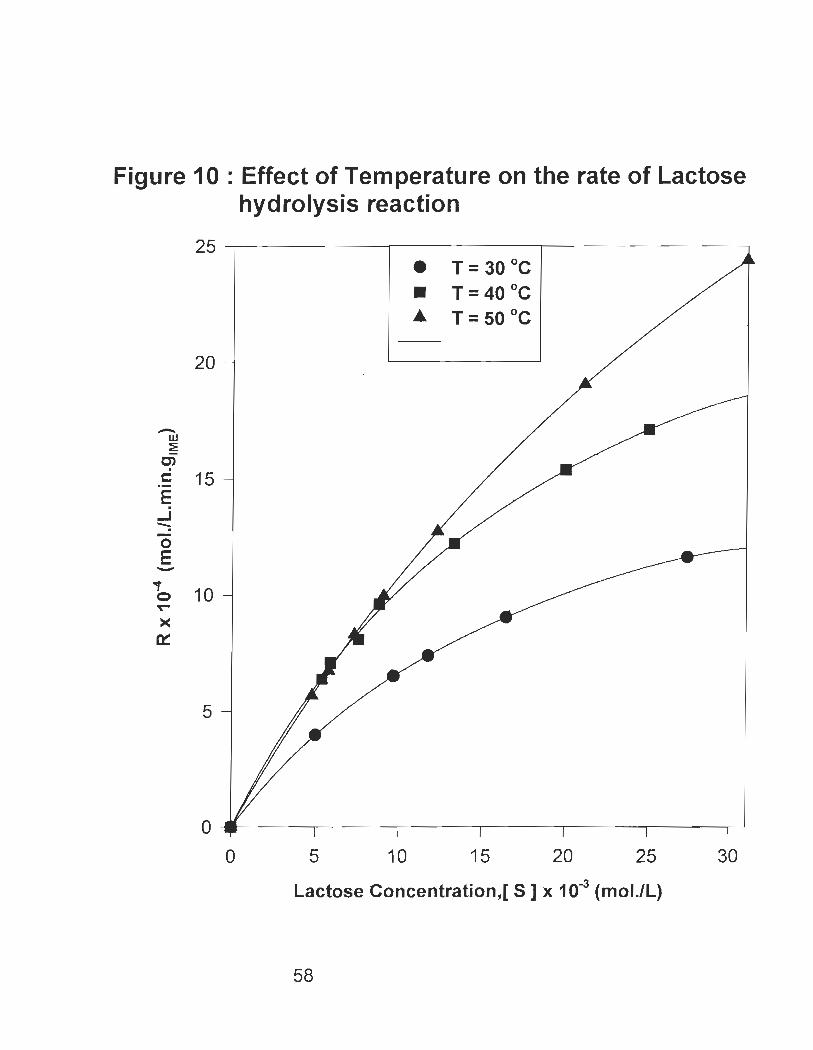
Figure 10 : Effect of Temperature on the rate of Lactose hydrolysis reaction
-w :i:
C)
c .-E . ..J ~
0 E -
'«t 0 -r-
>< ~
25~----------~----------~------------~
20
15
10
5
• T = 30 Oc • T=40 Oc .. T = 50 Oc
o ~----~----~----~------~----~----~ o 5 10 15 20 25 30
Lactose Concentration,[ S 1 x 10⁻³ (moI.lL)
58
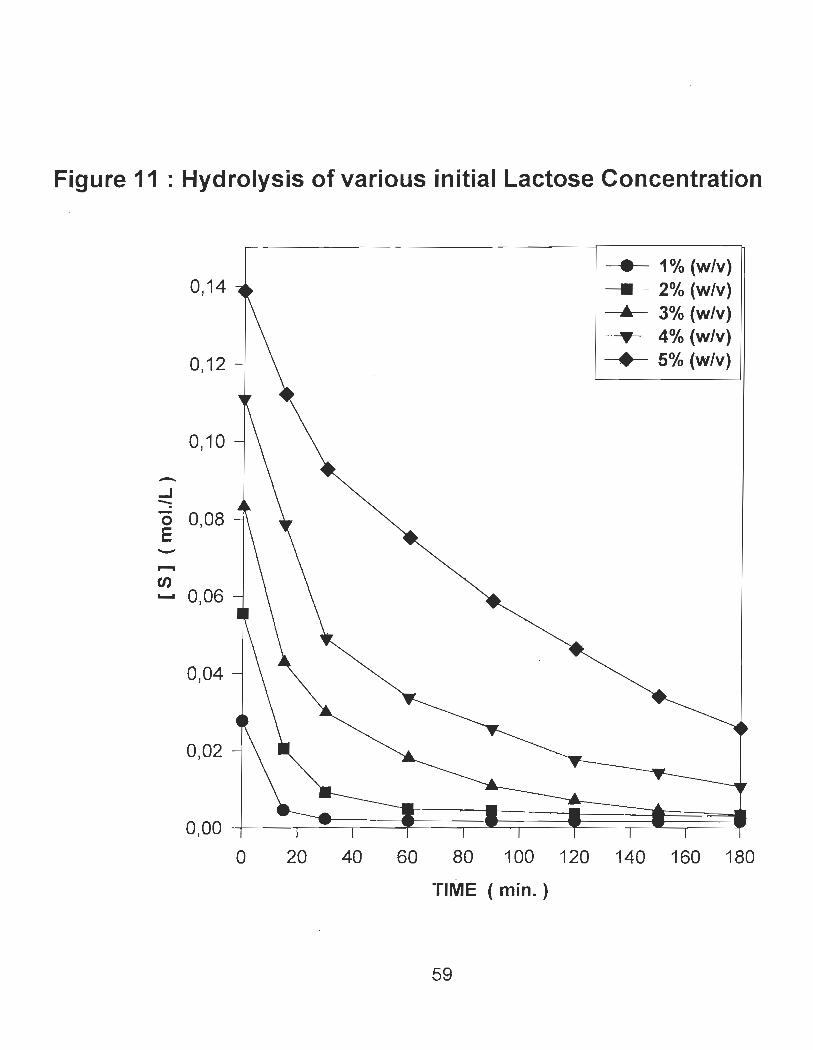
Figure 11 : Hydrolysis of various initial Lactose Concentration
-..J -=
0,14
0,12
0,10
"0 0,08 E -......
CI) ....... 006 ,
0,04
0,02
• 1% (w/v)
• 2% (w/v) .. 3% (w/v) ... 4% (w/v)
• 5% (w/v)
o 20 40 60 80 100 120 140 160 180
TIME (min.)
59
4.2.2.
4.2.2.1.
Kinetic of lactose hydrolysis in the presence of cations
The case single cation.
The experimental data obtained from the hydrolysis of lactose in the presence of
single cations at a temperature of 50 oC are listed in Appendix 4.
Cations were tested individually to investigate the effect of each individual cation
on the kinetic parameters. The obtained results were compared to those obtained
from a real cheese factory effluent hydrolyzed in the bioreactors.as weil as those
obtained from the enzymatic hydrolysis of lactose in the absence of cations. The
Michealis - Menten rate model in equation 4 was used to obtained the kinetic
parameters given in table 9 for each individual cation. The results obtained from
the degree of conversion as a function of time, t, are shown in figure 12.
4.2.2.2. The case of a combination of three (3) cations.
The results obtained from a combination of the three principal cations present in
cheese industrial effluent are reported here. By maintaining the concentration of
[Na + ] 1 [~ ] = 1 and varying the concentration of Ca 2+ , the result -of the kinetic
parameters obtained are given in table 10. Similarly, by keeping the concentration
of [Na+] 1 [Ca2+ ] = 100 and vaÏying the concentration of ~ the results obtained
for the kinetic parameters are represented in table 11 .
Finally, the results of the kinetic parameters obtained by varying the
concentration of Na+ while maintaining [~] 1 [Ca 2+ ] = 100 are shown in table 12.
60
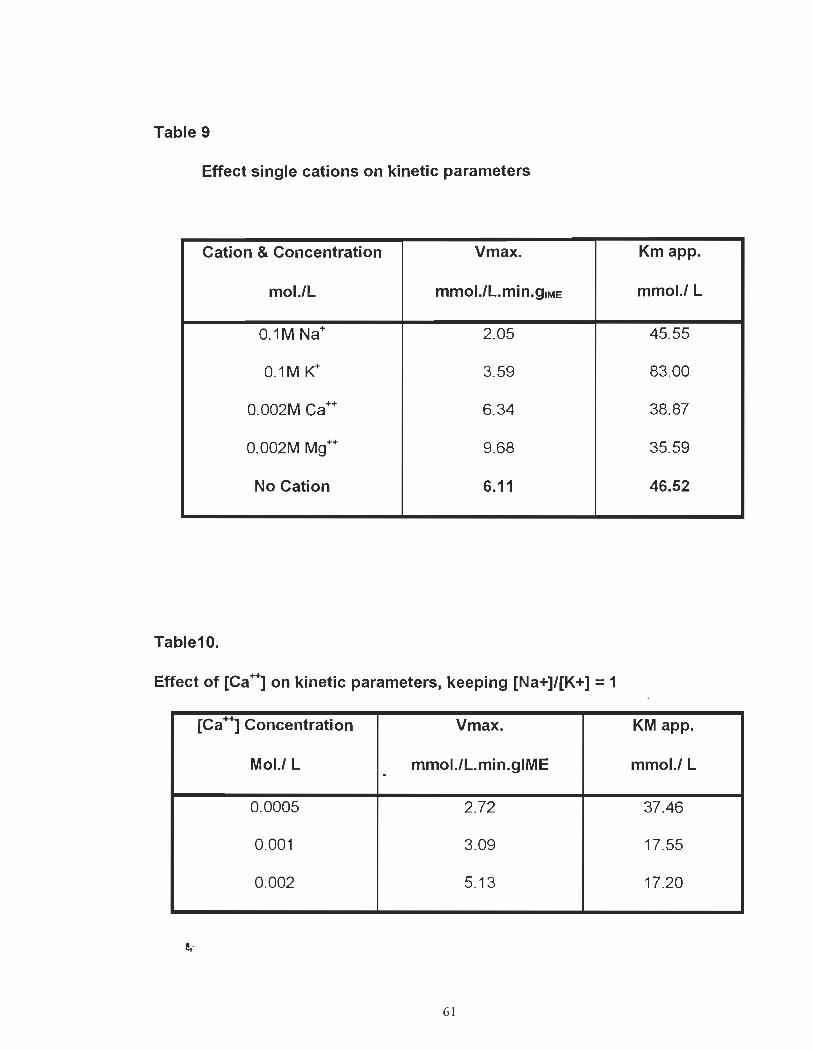
Table 9
Effect single cations on kinetic parameters
Cation & Concentration Vmax. Km app.
mol.!L mmol./L.min.gIME mmol.! L
0.1M Na+ 2.05 45.55
0.1M K" 3.59 83.00
0.002M Ca++ 6.34 38.87
0.002M Mg++ 9.68 35.59
No Cation 6.11 46.52
Table10.
Effect of [CaJ on kinetic parameters, keeping [Na+]/[K+] = 1
[Ca J Concentration Vmax. KM app.
Mol.! L mmol.!L.min.gIME mmol.! L -
0.0005 2.72 37.46
0.001 3.09 17.55
0.002 5.13 17.20
61
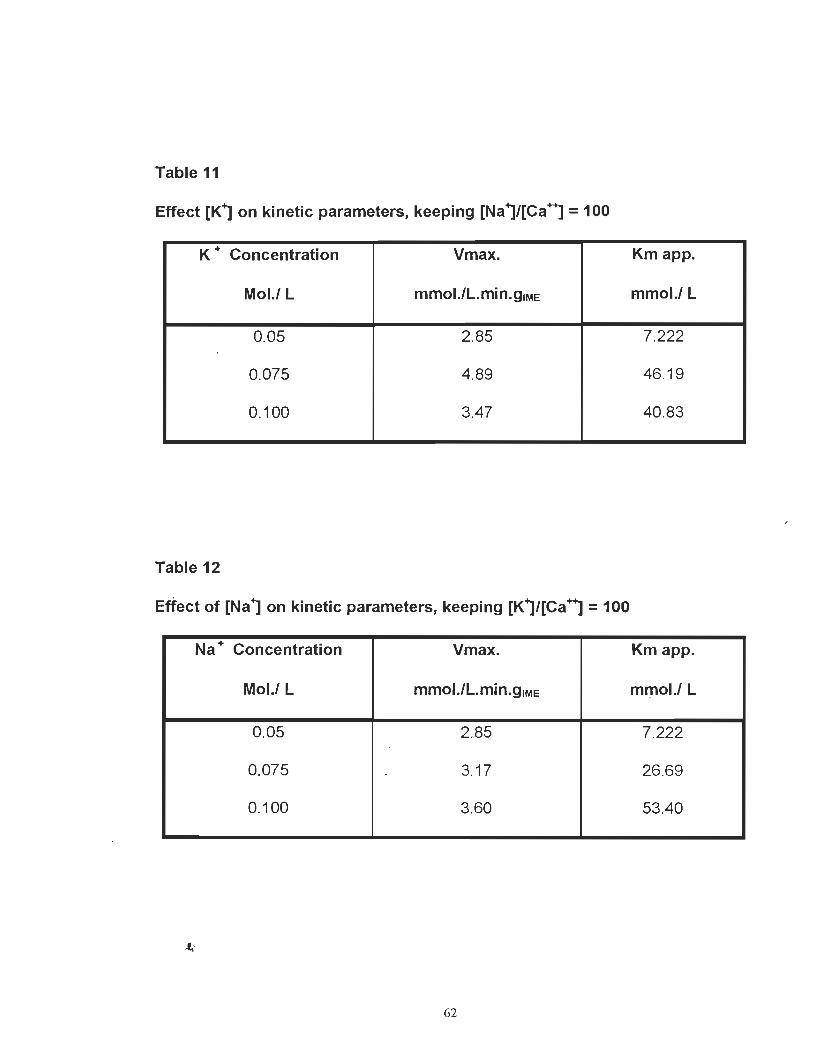
Table 11
Effect [K1 on kinetic parameters, keeping [Na 1/[Ca J = 100
K + Concentration Vmax. Km app.
Mol.! L mmol.!L.min.gIME mmol.! L
0.05 2.85 7.222
0.075 4.89 46.19
0.100 3.47 40.83
Table 12
Effect of [Na 1 on kinetic parameters, keeping [K1/[Ca J = 100
Na + Concentration Vmax. Km app.
Mol./ L mmol.!L.min.gIME mmol./ L
0.05 2.85 7.222
0.075 . 3.17 26.69
0.100 3.60 53.40
;f,
62
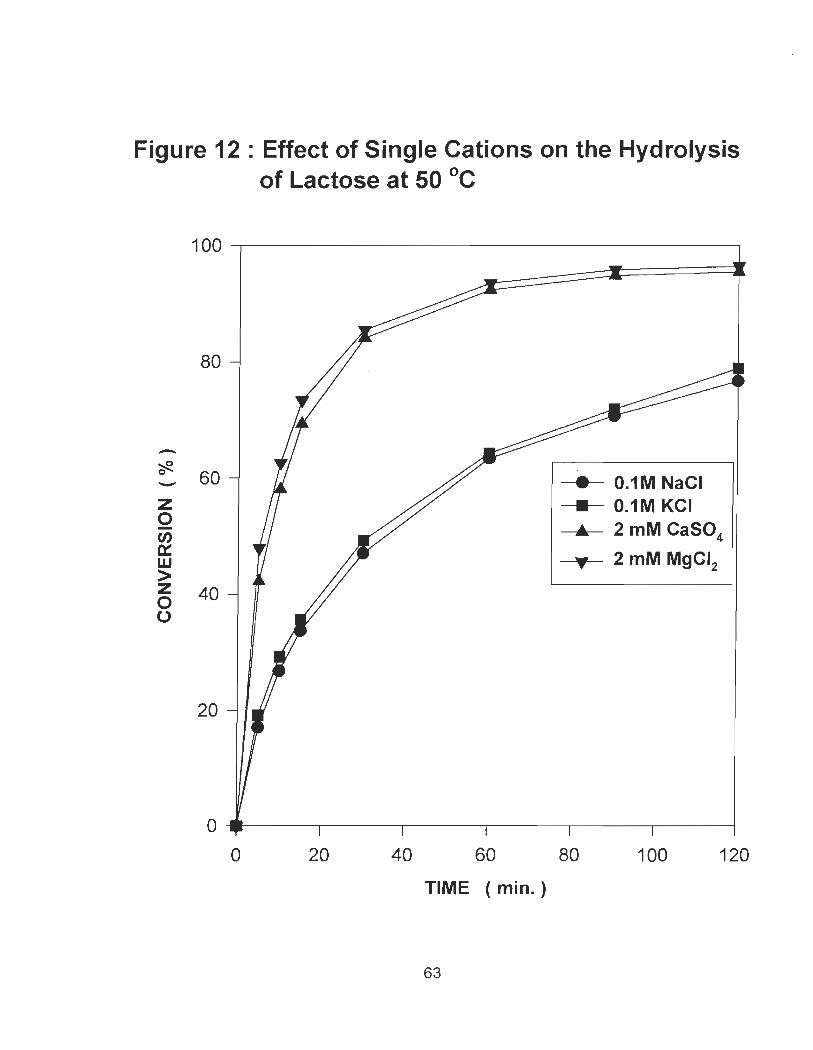
Figure 12 : Effect of Single Cations on the Hydrolysis of Lactose at 50 Oc
100~----------------------------------~
80
-~ 1 0 60 - • O.1M NaCI z • O.1M KCI 0
 2 mM CaS04 -en 0:: 2 mM MgCI2 w y > z 40 0 0
20
O~----~----~----~----~----~----~
o 20 40 60 80 100 120
TIME (min.)
63
4.3. FT-IR spectroscopie studies on lactose-cation complexes.
The results of infrared spectra obtained for various concentrations of the
chlorides of potassium, sodium and calcium upon complexation with D-Iactose are
shown in figures 13, 14, and 15 respectively. The absorbance obtained at 1650
cm-1 where a strong and broad regularly increasing absorption bands were
observed in the region studied in this research as weil as the calculated coefficient
of absorption for the free D-Iactose and Ca(D-lactose)Cb.nH20 complexes are
presented in table 13.
4.4. Hydrolysis of cheese Industrial effluent in bioreactors .
The samples obtained from Agropur's cheese factory at Notre-Dame du Bon
Conseil were tested in the two types of bioreactors; CSTR and PFTR. Sample A
was cheese production plant effluent or the wastewater treatment plant affluent
while Sample B Waste water treatment plant effluent.
An analysis of the ultrafiltration permeate of these samples is given in table14. In
order to compare the two reactors, the same residence time of substrate was
applied to both reactors. A plot of the degree of hydrolysis Vs time, t, is shown in
figures 16 and 17 for samples A and B respectively.
64
4.5. The results of the biological and chemical oxygen demande
The results given in table 15 were obtained by measuring the biochemical and
chemical oxygen demand of the sampled effluents and the hydrolyzed effluents
using the dissolve oxygen meter at pulp and paper research centre of the
university of Queébec at Trois - Rivières.
65
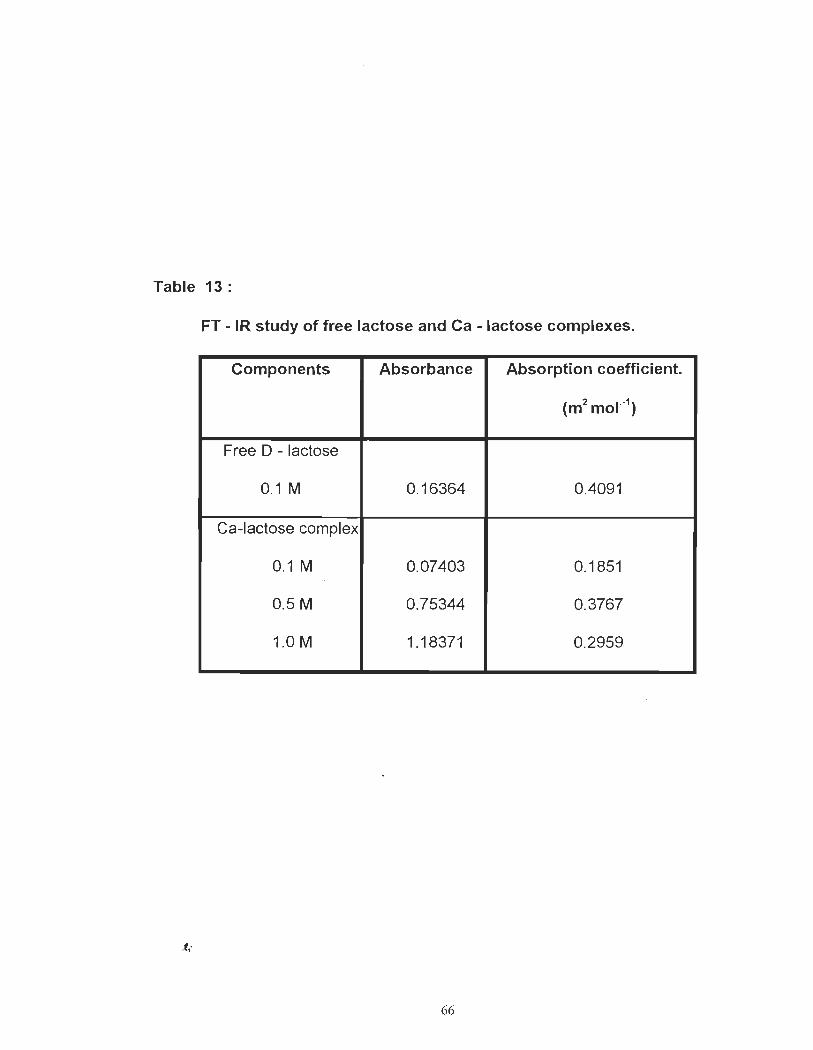
Table 13:
FT - IR study of free lactose and Ca - lactose complexes.
Components Absorbance Absorption coefficient.
(m2 mol.-1 )
Free 0 - lactose
0.1 M 0.16364 0.4091
Ca-lactose complex
0.1 M 0.07403 0.1851
0.5 M 0.75344 0.3767
1.0 M 1.18371 0.2959
66
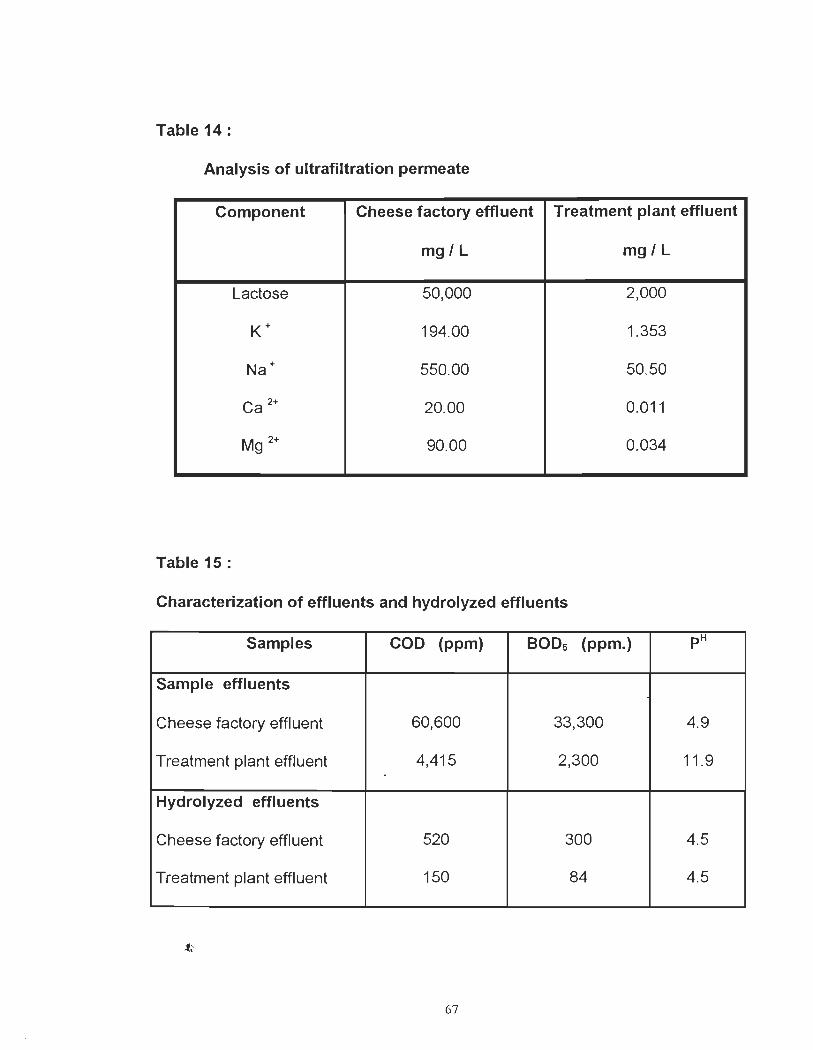
Table 14:
Analysis of ultrafiltration permeate
Component Cheese factory effluent Treatment plant effluent
mg/L mg/L
Lactose 50,000 2,000
K+ 194.00 1.353
Na+ 550.00 50.50
Ca 2+ 20.00 0.011
Mg 2+ 90.00 0.034
Table 15 :
Characterization of effluents and hydrolyzed effluents
Samples COD (ppm) 8005 (ppm.) pH
Sample effluents
Cheese factory effluent 60,600 33,300 4.9
Treatment plant effluent 4,415 2,300 11 .9 .
Hydrolyzed effluents
Cheese factory effluent 520 300 4.5
Treatment plant effluent 150 84 4.5
67
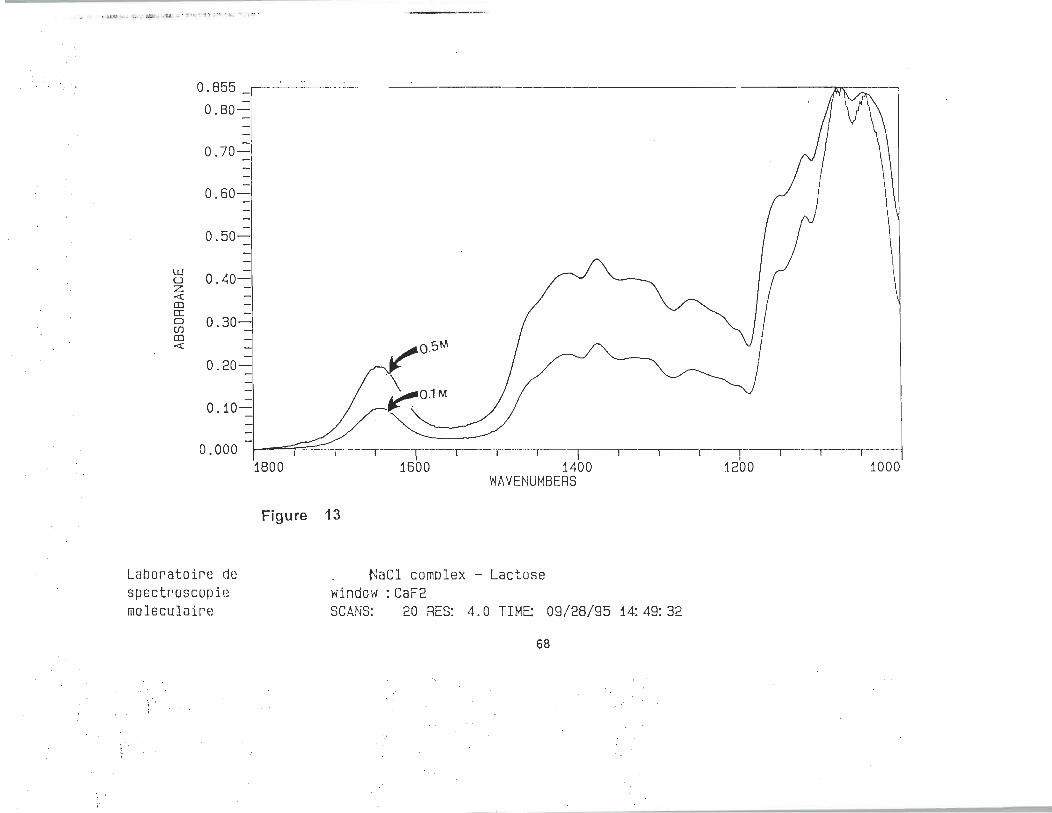
.' .!.I.l:.<J ~ .... "~.'.' ~~ •• ,U '';' • ' '': 'Y": "f t;~ :"H
, "
0.855
0.80-
0.70-,
-0.60-'
0.50-
LU 0.40-u
z -« en a:
0.30-a U) en «
0.20-
0.10-
0.000
Laboratoire de spectroscopie moleculaire
(,
r'
r ,--'--r- T-'--y---T--- ---T 1 I~ ----,--,
1800
Figure
1600 1400 1200 1000 WAVENUMBERS
13
NaCl complex - Lactose window : CaF2 SCANS: 20 RES: 4.0 TIM~ 09/28/95 i4: 49: 32
68
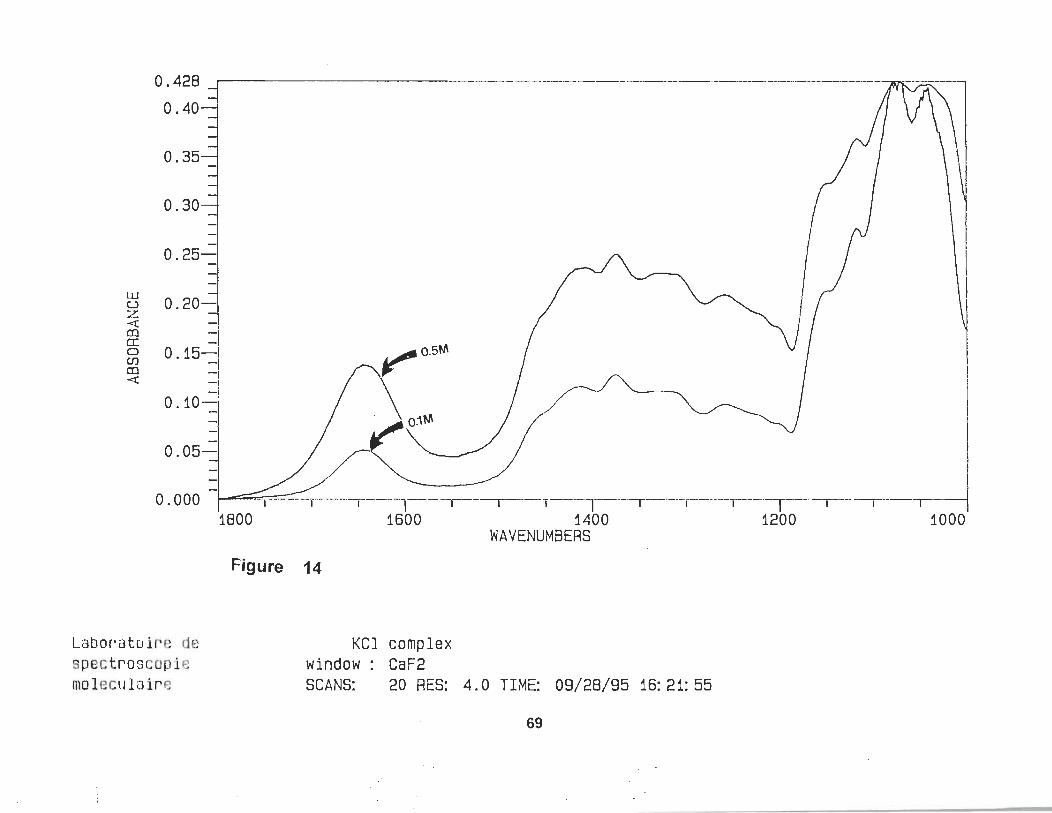
w u z <t en CI: 0 en en <t
0.428
0.40
0.35
0.30
0.25-
0.20-
0.15-:
0.10
0.05-'
0.000
Labor'atoire de spectroscopie moleculaire
='l~' -T----"--, 1800 1600
Figure 14
KCl complex window: CaF2
T----·~---,
1400 WAVENUMBERS
- 1- --'-
SCANS: 20 RES: 4.0 TIME: 09/28/95 16: 21: 55
69
/fV\\l
! ' 1 '-'---1-- 1 1200 1000
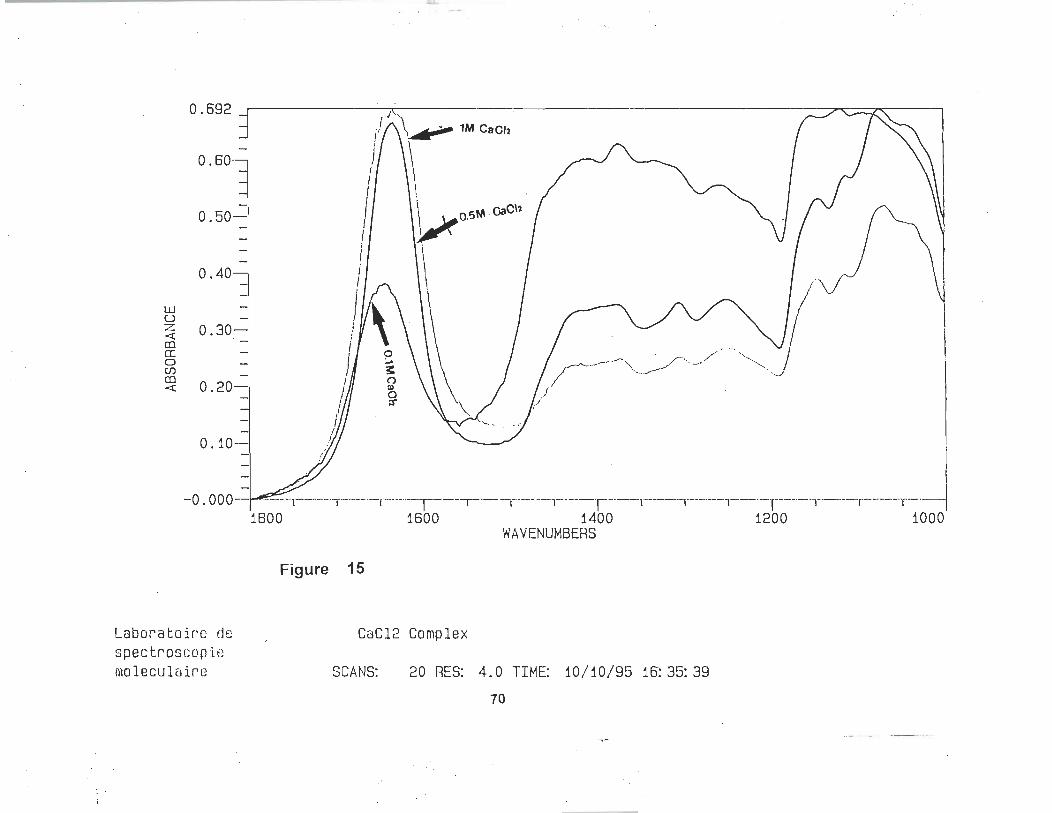
0.692
0.60
0.50
0.40-
w u z 0.30-<t: en cr: 0 Cf) en
0.20-<t:
1
1 1 1 , / 1
J f 1 1 1
~ f 1 1
~~~ . /'" /' .-... .......... ~ . ~ - ' / -. -,
-0 ~ O::~l- Y~ ---,-- 1 ,--T---,-.--,.-'--.T----,--.--T-.--.l-.-.. -r---T-~ 1800 1600 1400 1200 1000
WAVENUMBERS
Figure 15
Laboratoire de CaC12 Complex spectroscopie moleculaire SCANS: 20 RES: 4.0 TIM~ 10/10/95 1~35:39
70
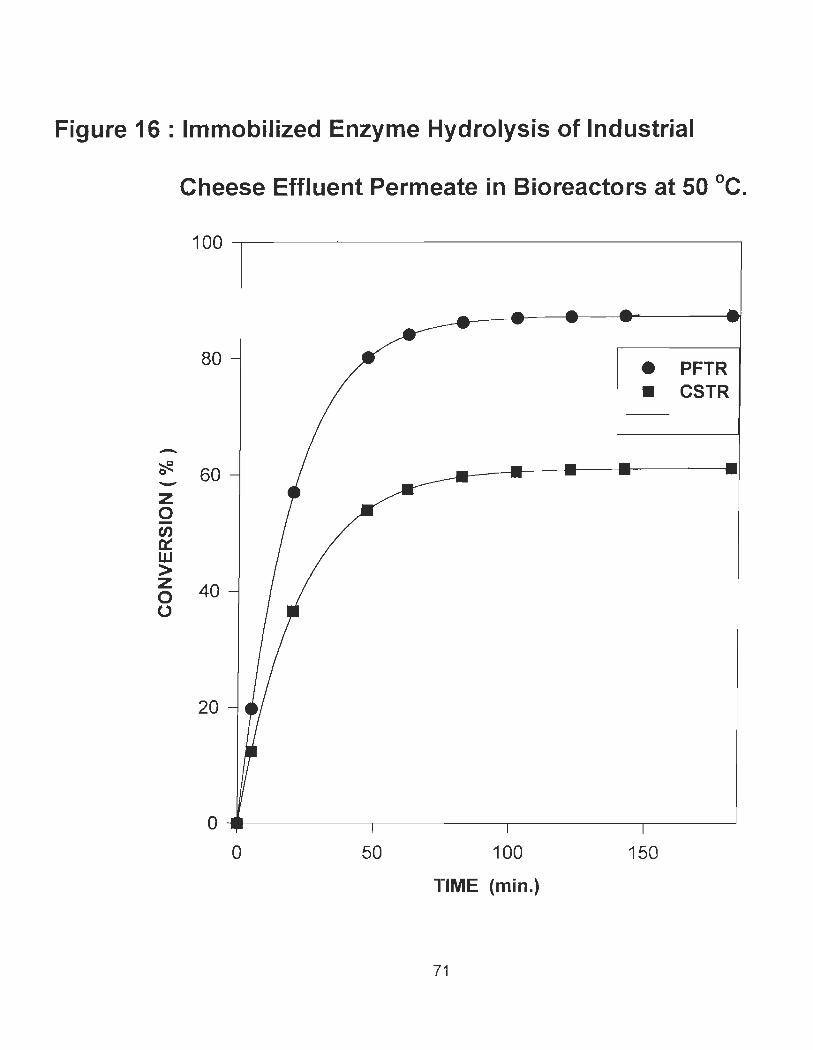
Figure 16 : Immobilized Enzyme Hydrolysis of Industrial
-~ -z 0 -CI)
0::: W > z 0 0
Cheese Effluent Permeate in Bioreactors at 50 oC.
100 ~--------------------------------~
80 • PFTR • CSTR
60
40
20
O~--------~--------~------~----~
o 50 100
TIME (min.)
71
150
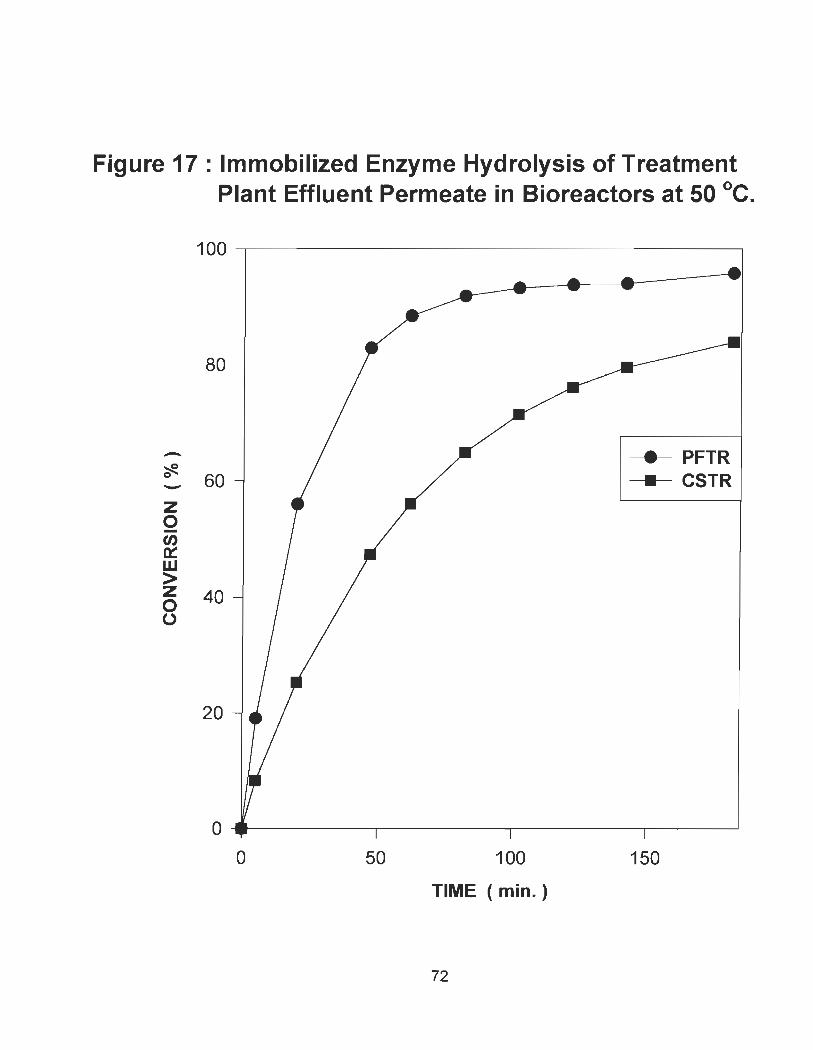
Figure 17 : Immobilized Enzyme Hydrolysis of Treatment Plant Effluent Permeate in Bioreactors at 50 oC.
-~ 0 -z 0 -tn 0::: w > z 0 0
100 ~--------------------------------~
80
• PFTR 60 • CSTR
40
20
O~--------~------~~------~----~
o 50 100
TIME (min. )
72
150
v. DISCUSSIONS.
5.1. Immobilization results
5.1.1 Enzyme support
From the experimental results obtained, celite R-640 provided the lowest
enzymes loading of 25 mg of enzyme per gm of dry support, but was mechanically
unstable in the continuous stirred tank reactor. This was due to its pellet shape.
The celite R-640 became fragmented after repeated used. Further more the
immobilization efficiency was by far lower than those obtained with GDE
biocatalyst carrier as can be seen from table 6. Despite these disadvantages, it
seems to be a good biocatalyst carrier in a plug flow reactor.
The GDE biocatalyst carrier had an enzyme loading of 26,3 mg! 9 dry
(GDE) support. The immobilization efficiency stood at 98,4 %, in addition to its
excellent mechanical and thermal stability in both continuous stirred tank reactor
and the plug flow reactor. Granular diatomaceous earth support was reused
repeatedly for immobilization after regeneration with a simple process involving
base-acid wash. This eliminates any disposai problem and provides a potential
economic savings as weil. These advantages led to the selection of GDE
biocatalyst carrier as the principal enzyme support used in this research.
73
5.1.2 Effect of agitating speed on immobilization efficiency.
It can be seen from figure 18, that the agitating speed greatly influenced the
immobilization efficiency. An optimum immobilization efficiency greater than 98
percent was obtained at an agitating speed of about 150 rpm for the lactase, A.
oryzae using GDE as the support [Table 5]. An optimum agitating speed is
required to enable the pendant amine reactive moiety left unreacted when the
treated biocatalyst was contacted with glutaraldehyde to sufficiently come in
contact with the enzyme. The amine group of the enzyme reacts with the
unreacted amine reactive moiety forming a covalent bond thereby immobilizing the
enzyme.
5.1.3 Residual activity.
It can be observed from the results obtained on immobilization that the
immobilization efficiency of both enzymes at an agitation speed of 150 rpm was
above 98 percent [see table 16]. Experimental data obtained from hydrolyzing
ONPG indicated a higher conversion rate for A. oryzae as compared to lactozyme.
Moreover, scientific literatures<20. 52) indicates that lactase of the laêtozyme group
produced more oligosaccharides during lactose hydrolysis reaction than fungal
lactase such as Aspergillus oryzae. The cheese industrial effluent used in this
research had a pH 4.9 and immobilized Aspergillus oryzae reacts best at a pH
4.5. Consequently, Aspergillus oryzae was chosen as the biocatalyst for this
research. Lactozyme , with pH 6.5 is most suitable for hydrolyzing sweet whey
which has a pH of 6.0.
74
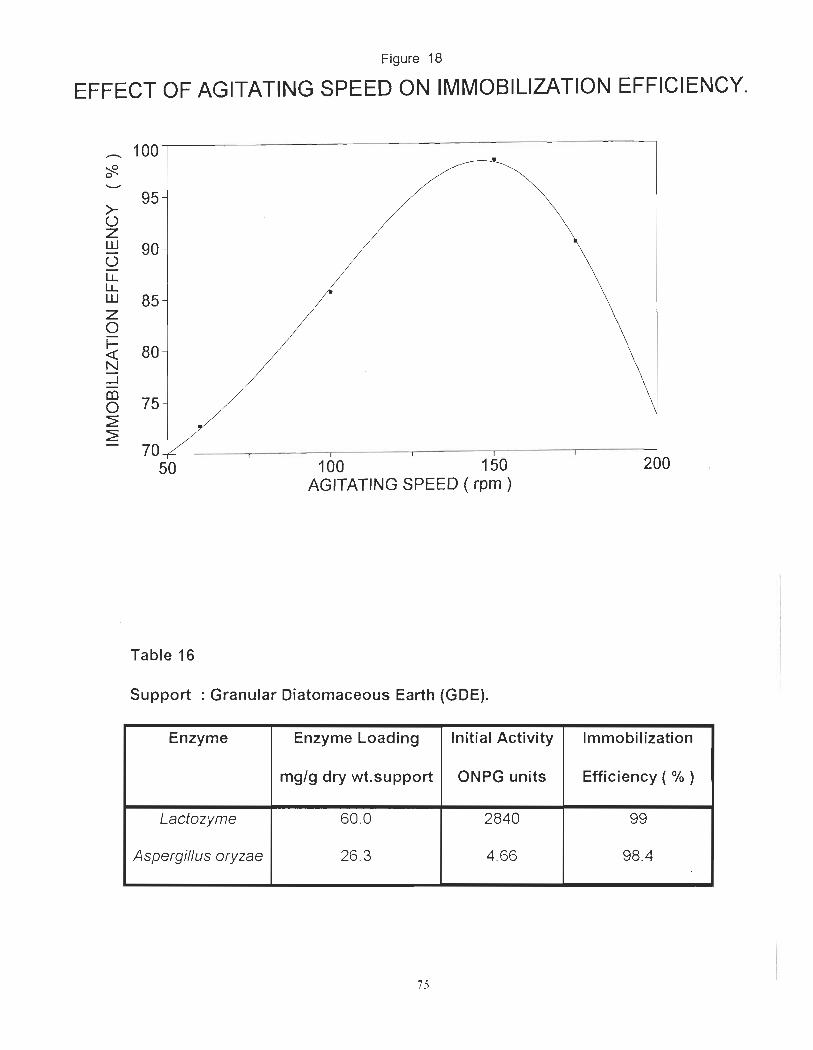
Figure 18
EFFECT OF AGITATING SPEED ON IMMOBILIZATION EFFICIENCY.
.--. 100 ::R 0 ......."
95 >-0 z w 90 0 u.. u.. w 85 z 0
~ 80 N -l Cl)
75 0 ~ ~
70 50 100 150 200
AGITA TING SPEED ( rpm )
Table 16
Support : Granular Diatomaceous Earth (GDE).
Enzyme Enzyme Loading Initial Activity Immobilization
mg/g dry wt.support ONPG units Efficiency ( % )
Lactozyme 60.0 2840 99
Aspergillus oryzae 26.3 4.66 98.4
75
5.1.4 Thermal stability of immobilized enzyme.
It can be observed from figure 7 that immobilized Aspergillus oryzae was most
stable at a temperature of 50 oC. Similar results were obtained by other
researchers (41, 55, 56) using different biocatalyst carriers as weil as different
immobilization methods.
5.1.5 Mechanical stability of immobilized enzyme.
From the experimental data obtained, it can be seen that the optimum mechanical
stability was observed at an agitation speed of 120 rpm in the continuous stirred
tank reactor [see figure 8 ].
5.2. Discussion of kinetic results.
5.2.1.
5.2.1.1.
Kinetic studies without Cations.
Effect of temperature on the kinetic parameters.
The rate of reaction was found to increased with increasing temperature from the
experimental results obtained, but became limiting at high temperatures as
indicated in figure 19. It is also observed from figure 20 that the maximum
conversion increased with increasing temperature, but decreased steadily at
temperatures above 55 oC. The values of the Michealis - Menten constant, Km,
obtained in this research were smaller than those reported in some papers (56,58)
using Michealis - Menten type kinetic with competitive product inhibition.
76
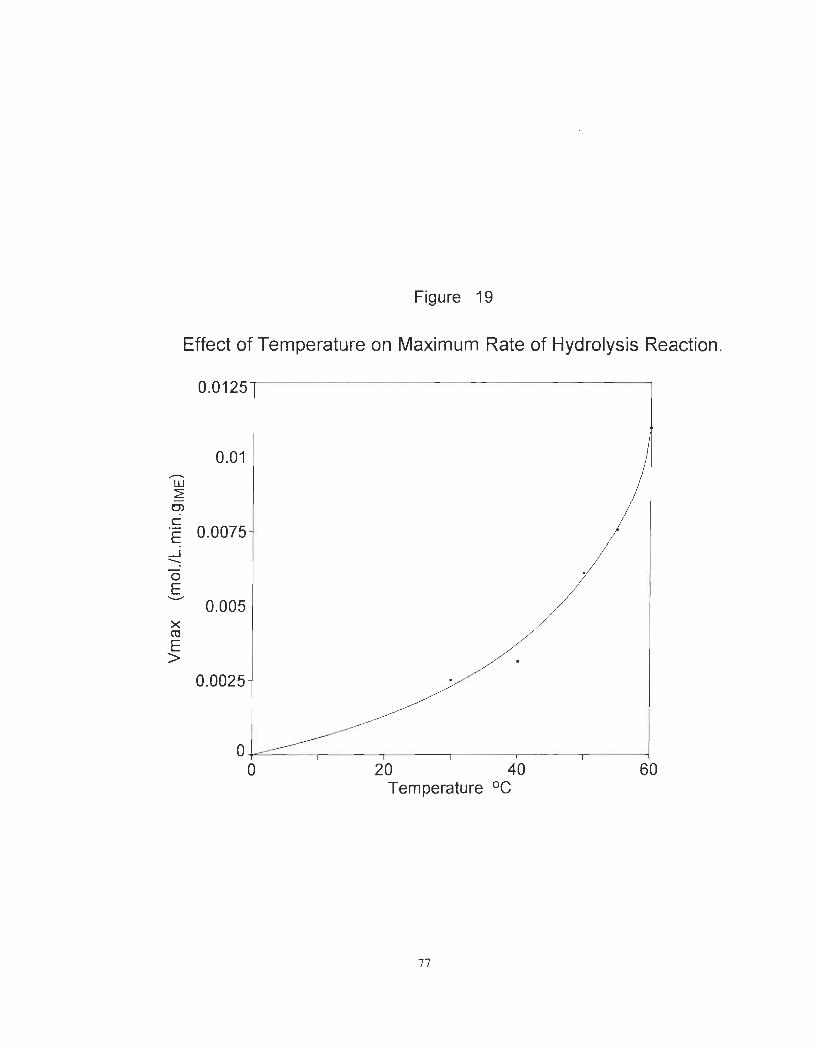
Figure 19
Effect of Temperature on Maximum Rate of Hydrolysis Reaction .
0.0125
0.01 ...--.. w :::2: C> c E 0.0075 .-J -0 E -- 0.005 >< ca
$ 0.0025
o+=~--~----~----~----~----~--~ o 20 40 60
Temperature oC
77
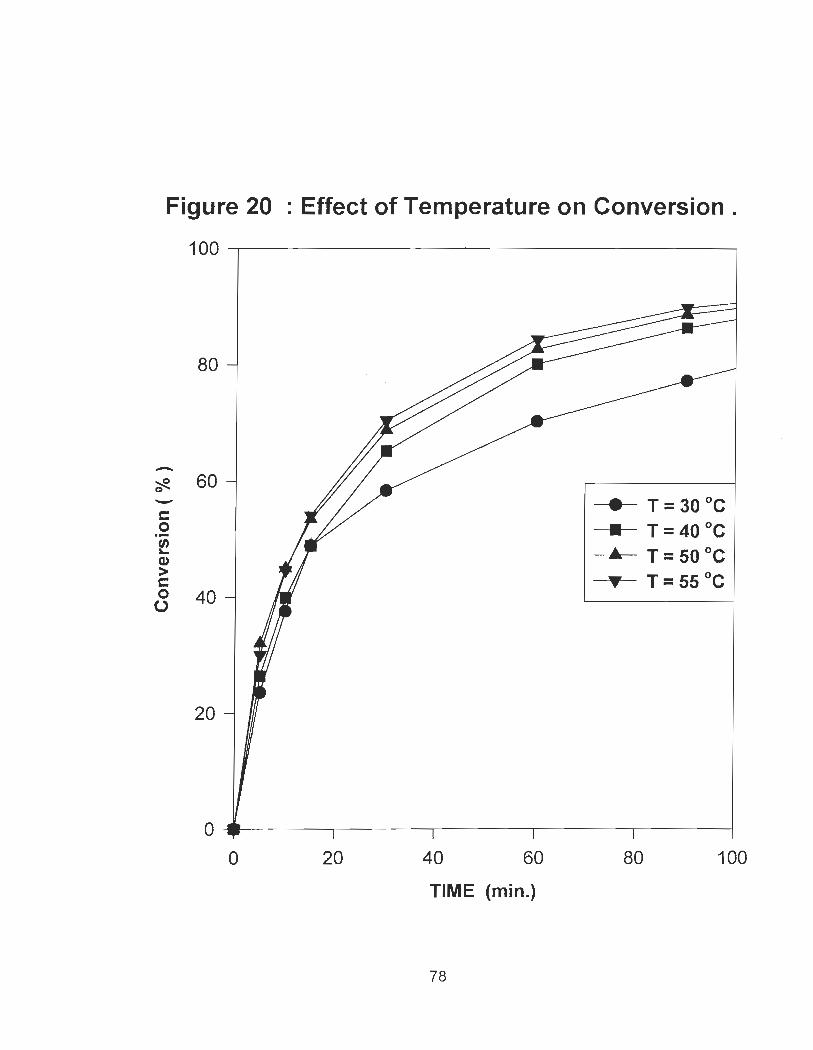
Figure 20 : Effect of Temperature on Conversion.
100~------------------------------------~
80
-~ 60 0 - • T = 30 Oc c 0 . - • T = 40 Oc ~ .... T = 50 Oc Q)
> ... T = 55 Oc c 0 40 ()
20
o ~------~------~----~------~------~ o 20 40 60 80 100
TIME (min.)
78
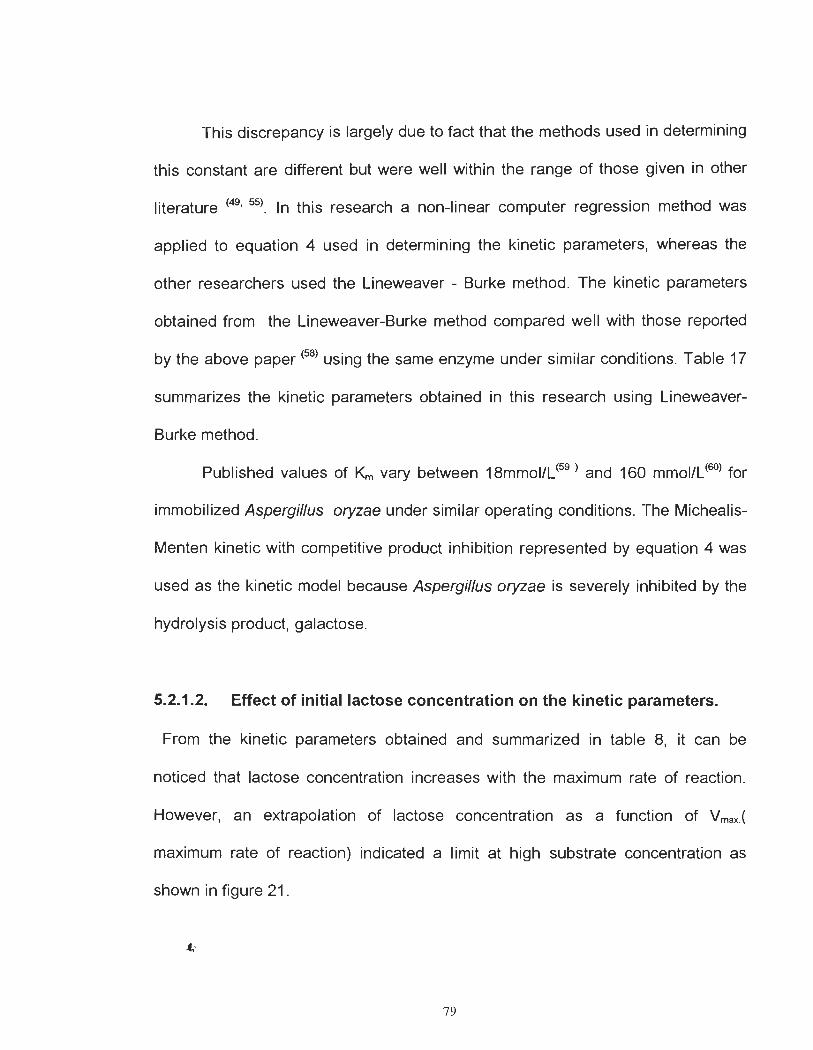
This discrepancy is largely due to fact that the methods used in determining
this constant are different but were weil within the range of those given in other
literature (49, 55). In this research a non-linear computer regression method was
applied to equation 4 used in determining the kinetic parameters, whereas the
other researchers used the Lineweaver - Burke method. The kinetic parameters
obtained from the Lineweaver-Burke method compared weil with those reported
by the above paper (58) using the same enzyme under similar conditions. Table 17
summarizes the kinetic parameters obtained in this research using Lineweaver
Burke method.
Published values of Km vary between 18mmol/L (59) and 160 mmol/L (GO) for
immobilized Aspergillus oryzae under similar operating conditions. The Michealis
Menten kinetic with competitive product inhibition represented by equation 4 was
used as the kinetic model because Aspergillus oryzae is severely inhibited by the
hydrolysis product, galactose.
5.2.1.2. Effect of initial lactose concentration on the kinetic parameters.
From the kinetic parameters obtained and summarized in table 8, it can be
noticed that lactose concentration increases with the maximum rate of reaction.
However, an extrapolation of lactose concentration as a function of Vmax.(
maximum rate of reaction) indicated a limit at high substrate concentration as
shown in figure 21 .
79
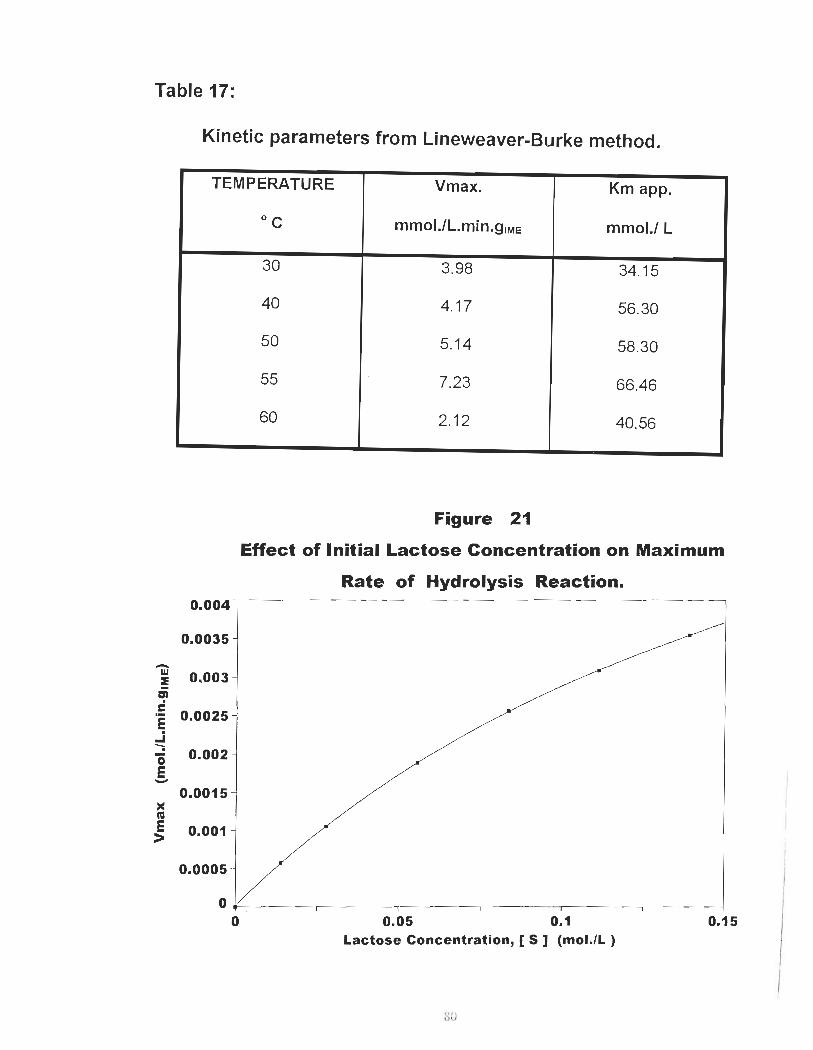
Table 17:
-w ! ~ c ·ë ..i -. '0 E -)( cu E >
Kinetic parameters trom Lineweaver-Burke method.
TEMPERATURE Vmax. Km app.
0.004
0.0035
0.003
0.0025
0.002
0.0015
0.001
0.0005
0
oC mmol.lL.min.gIME mmol.l L
30 3.98 34.15
40 4.17 56.30
50 5.14 58.30
55 7.23 66.46
60 2.12 40.56
Figure 21
Effect of Initial Lactose Concentration on Maximum
Rate of Hydrolysis Reaction.
0 0.05 0.1 0.15
Lactose Concentration, [ S 1 (mol./L)
80
It was also noted from the degree of hydrolysis curve that maximum conversion
was affected by lactose concentration. It can be observed fram figure 22 that
conversion decreased as lactose concentration increased, indicating that lactose
and galactose may be involved in oligosaccharides formation reactions. Fungal
lactase have long been reported by several researchers(20, 47,57) to transform
transgalatosyl reactions to oligosaccharides . This explains why galactose was
lower than glucose in most of the reaction medium. Even though it has been
demonstrated that oligosaccharides are formed during the hydralysis of lactose, it
was neglected in the praposed rate of reaction model. This is because one study
proved that oligosaccharides formation could be neglected in the modeling of
lactose hydralysis reaction when initial lactose concentration is low and the
reaction temperature is about 50 oC (21).
5.2.2. Kinetic studies in the presence of cations.
5.2.2.1 Effect of single cations on the kinetic parameters.
The rate of lactose hydralysis is greatly influenced by the presence of
cations as can be se en fram figure 23. On comparing the values of the kinetic
constants obtained in the presence of cations to those in the absence of cations,
as represent.ed in table 9, it was observed that the presence of divalent cations
played a significant raie on the activity of the enzyme. Interestingly, the kinetic
parameters were higher for Ca++ and Mg++ as compared to those of 1< and Na+ as
81
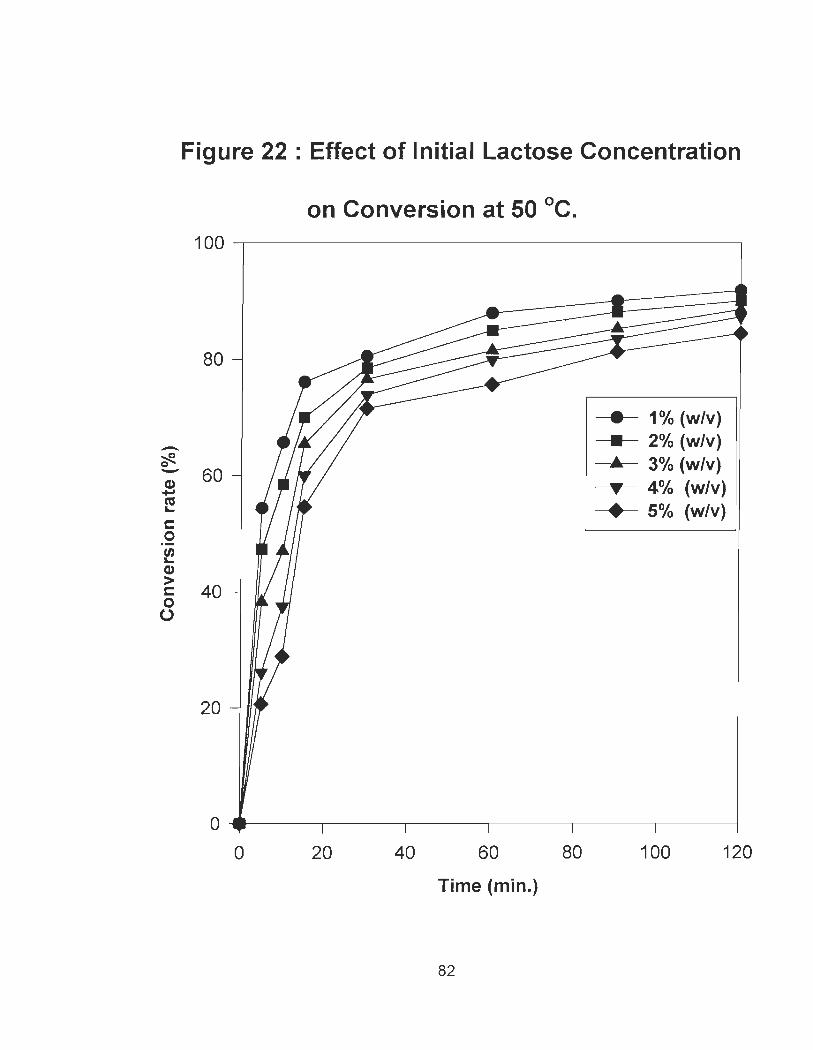
-~ 0 -Cl) .., cu L.
c 0
~ Cl)
> c 0 0
Figure 22 : Effect of Initial Lactose Concentration
on Conversion at 50 oC. 100~----------------------------------~
80
• 1% (w/v)
• 2% (w/v) Â 3% (w/v)
60 ... 4% (w/v)
• 5% (w/v)
40
20
o ~----~--~~----~----~----~----~ o 20 40 60
Time (min.)
82
80 100 120
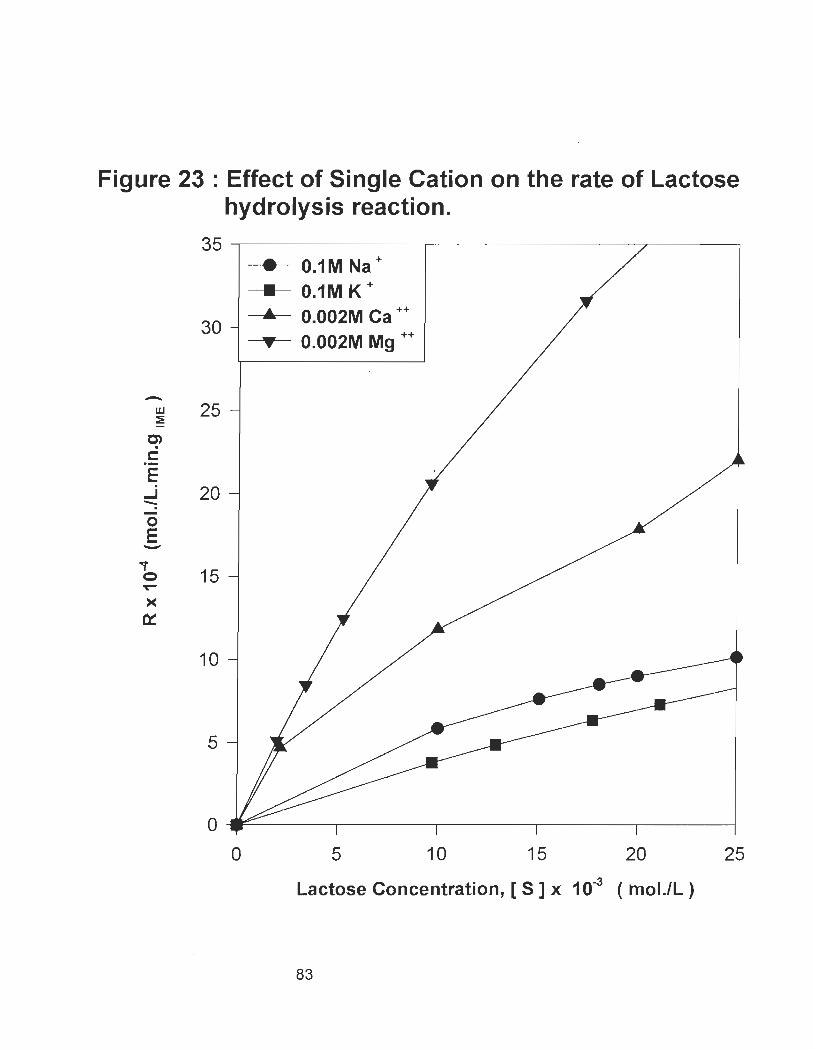
Figure 23 : Effect of Single Cation on the rate of Lactose hydrolysis reaction.
-w :!!
en . c .-E .
...J -= 0 E -..,
0 T'"
>< Ct:
35 ~------------~--------------~----~
30
25
20
15
10
5
• 0.1M Na+ • 0.1M K +
.... 0.002M Ca ++ ~ 0.002M Mg ++
o~------~----~------~------~----~
o 5 10 15 20 25
Lactose Concentration, [ 5 ] x 10-3 (mol./L)
83
weil as those obtained in the absence of cations. Surprisingly, the kinetic
parameters obtained in the presence of monovalent cations were slightly lower
than those obtained in the absence cations. As expected, higher maximum
conversion rates were obtained in the presence of divalent cations than in the
presence of monovalent cations as shown in figure 12.
5.2.2.2. The effect of combined cations on the kinetic parameters.
When the three most abundant cations found in cheese industrial effluent
were combined in the concentration ranges mentioned in the experimental section,
complex results were obtained. Keeping the ~ and Na + concentration constant
at 75mM : 75mM and varying Ca++ concentration from 0.5 mM - 2 mM, the results
represented in figure 24 were obtained. It indicated that the rate of lactose
hydrolysis reaction increased with increasing Ca ++ concentration as shown in
table 10. However, a graph of the effect of increasing Ca ++ concentration on
maximum rate of reaction obtained in this research indicates that this increased in
the maximum reaction rate is limited as can be seen in figure 25. AR extrapolation
of this curve indicates that Vmax is limited.
Similarly, while keeping ~ and Ca++ concentration constant at 50mM :
0.5mM respectively , and varying Na+ concentration between 50mM - 100 mM, the
maximum reaction rate was noted to be increasing. This increased was limited at
;fi:
84
high Na+ concentration. Figure 26 represent the variation of Na+ concentration with
reaction rate, while figure 27 shows the effect of Na+. concentration on Vmax. An
optimum Na+ concentration can be obtained from figure 27 byextrapolation.
It was observed from figure 28 that the concentration of ~ increased with
increasing reaction rates but at concentration above 0.08 M, it decreased steadily
as can be seen in figure 29 .
. f.-
85
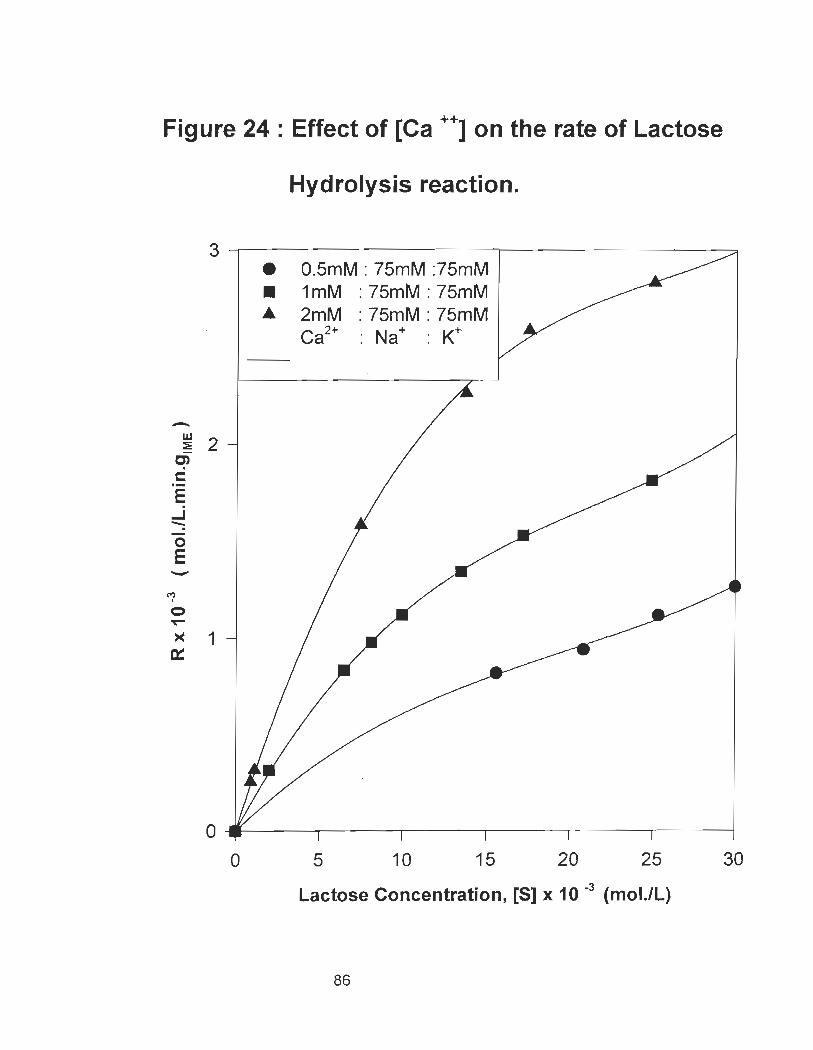
Figure 24 : Effect of [Ca ++] on the rate of Lactose
-w :E
Cl . C .-E . ...J """": 0 E -
M 1
0 oor-
>< rx:
Hydrolysis reaction.
3 ~------------------~----------------~
2
1
• 0.5mM : 75mM :75mM • 1mM : 75mM : 75mM .. 2mM : 75mM : 75mM
Ca2+ : Na+ : K+
o ~----~----~----~------~----~----~
o 5 10 15 20 25 30
. Lactose Concentration, [5] x 10 -3 (moI.lL)
86
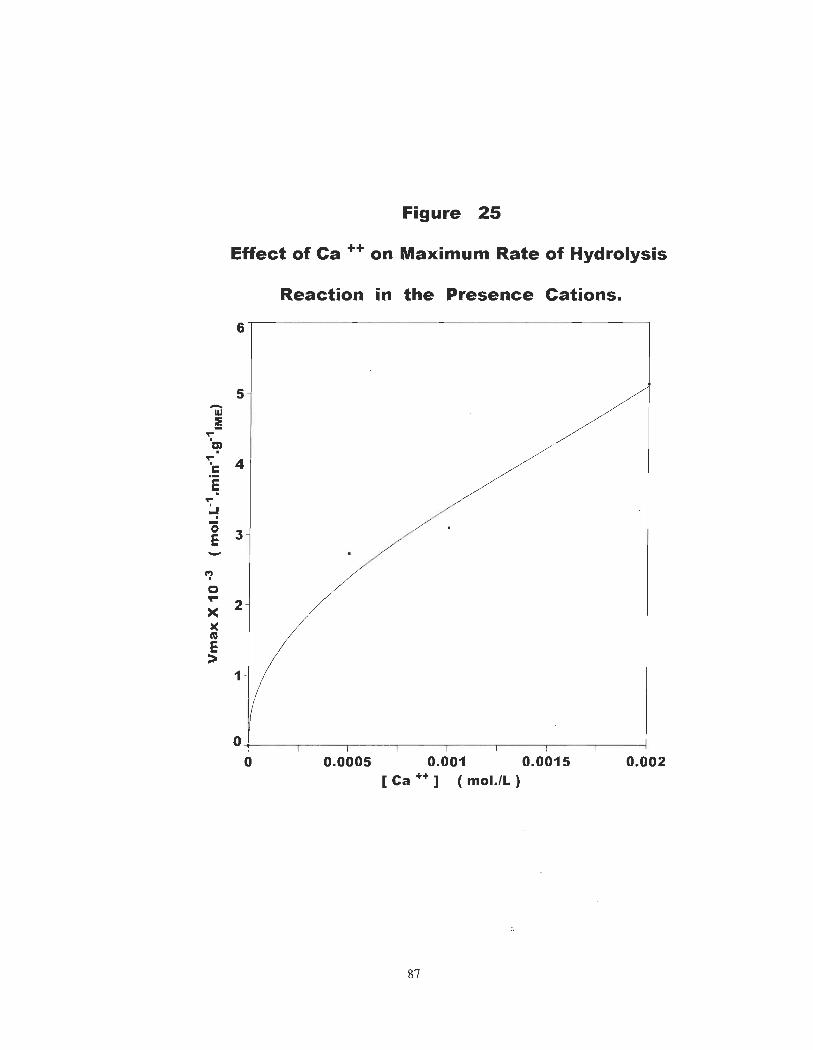
Figure 25
Effect of Ca ++ on Maximum Rate of Hydrolysis
Reaction in the Presence Cations.
6
5 -w ! .. 'C!' ..
4 :: E . .. ~ . '0 3 E -
"? CI ~
2 >< >C iO E >
1
o+-__ ~ ____ ~ __ ~ __ ~ ____ ~ __ ~ ____ ~ __ ~ o 0.0005 0.001 0.0015 0.002
[ Ca + .. ] ( mol./L )
87
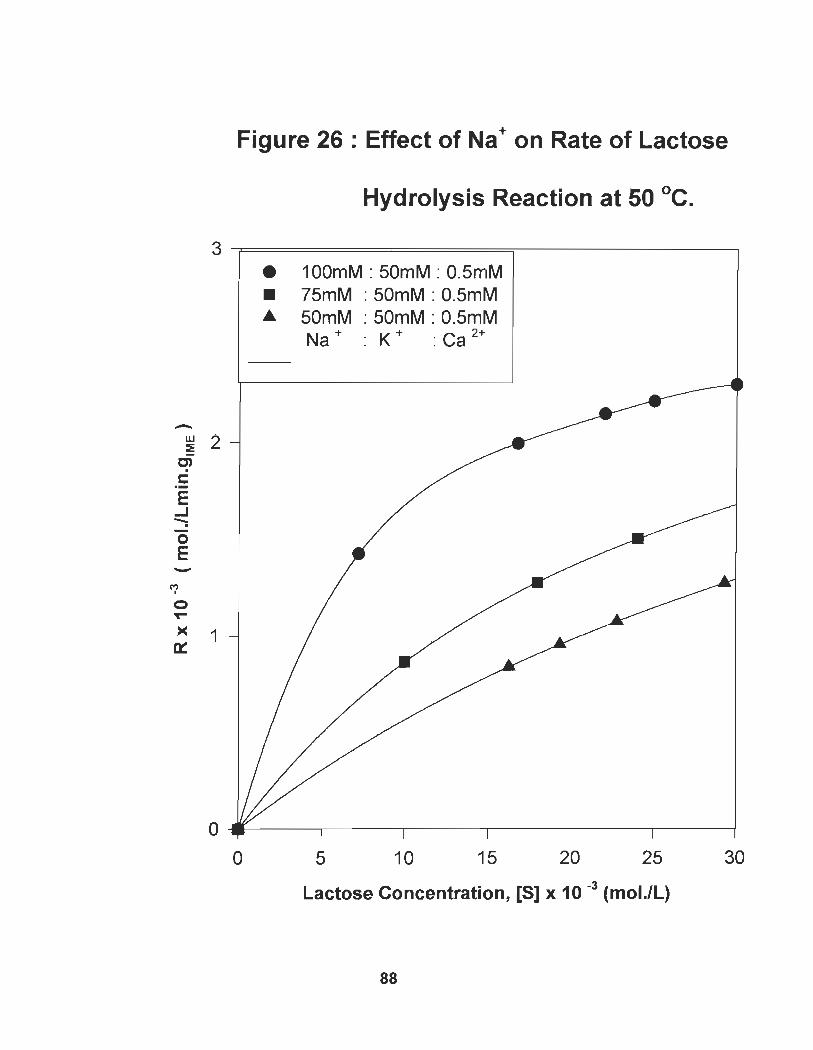
Figure 26 : Effect of Na+ on Rate of Lactose
Hydrolysis Reaction at 50 oC.
3 r===================~--------------~ • 100mM: 50mM : 0.5mM • 75mM: 50mM : 0.5mM • 50mM: 50mM : 0.5mM
Na + : K + : Ca 2+
-w 2 :lE C) . c .-E
...J '"'"': -0 E -
C'? , 0 ~
>< 1 0::
o ~----~----~----~------~----~--~ o 5 10 15 20 25 30
Lactose Concentration, [S] x 10 -3 (moI.lL)
88
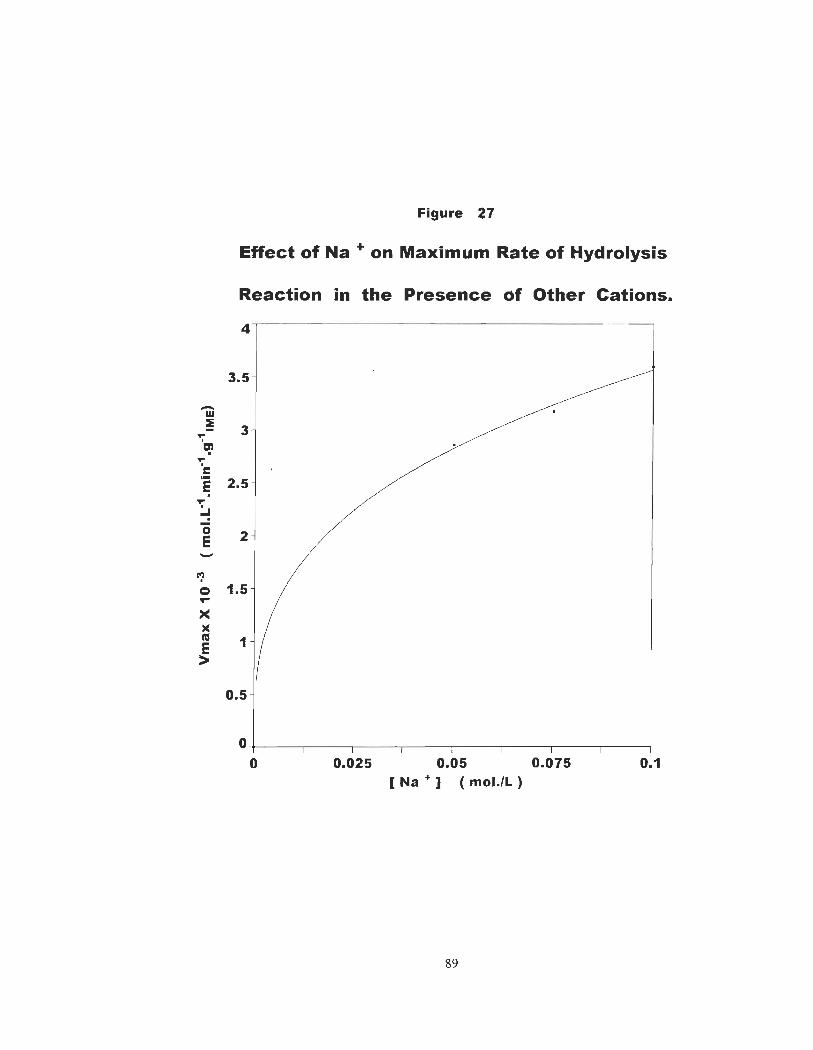
Figure 27
Effect of Na + on Maximum Rate of Hydrolysis
Reaction in the Presence of Other Cations.
4
3.5
-w ! 3 .... '~
.... 'c 'E 2.5 . .... ~ . '0 2 E -
C'}
0 1.5 "1'"'
>< )( tG 1 E >
0.5
o+-__ ~ ____ .-__ ~ ____ .-__ -, ____ ,-__ -, __ ~ o 0.025 0.05 0.075 0.1
[ Na + ] (mol./L)
89
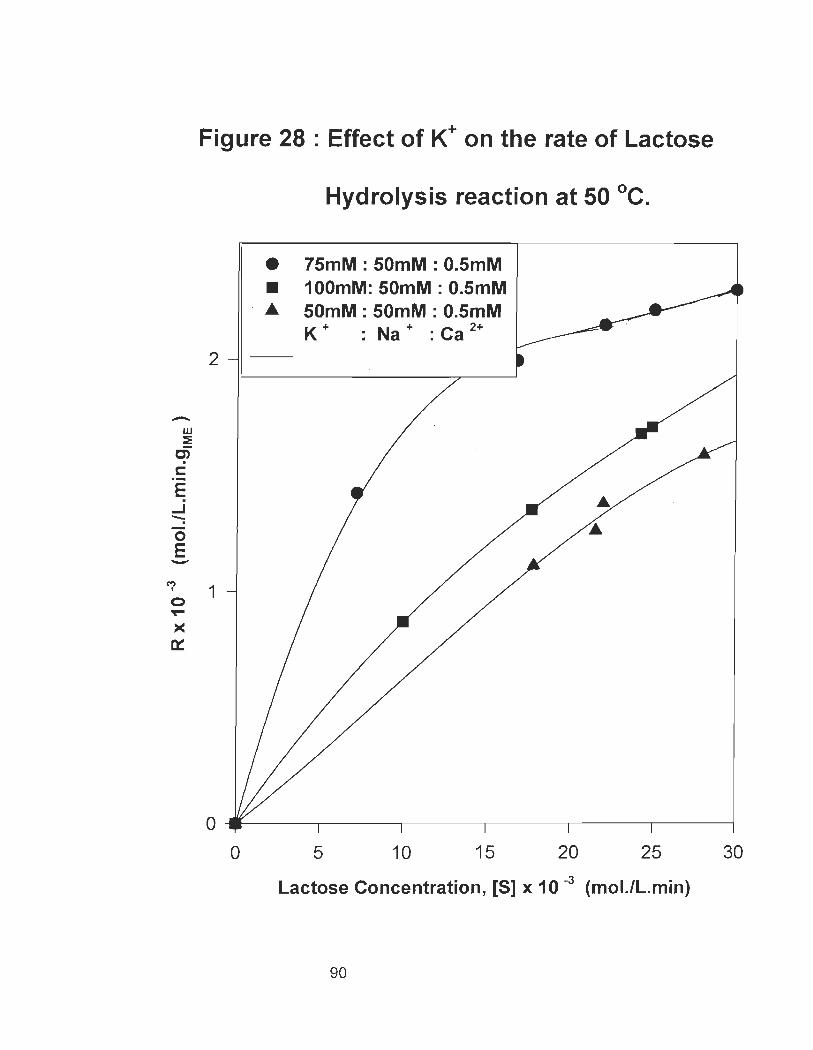
-w ~
C) . c: .-E
..J -= -0 E -
M , 0 T""
>< Il::
Figure 28 : Effect of K+ on the rate of Lactose
2
1
Hydrolysis reaction at 50 oC.
• 75mM : 50mM : O.5mM • 100mM: 50mM : O.5mM
- .. 50mM: 50mM : O.5mM K + : Na + : Ca 2+
o ~----~----~----~------~----~----~ o 5 10 15 20 25 30
Lactose Concentration, [5] x 10 -3 (mol.lL.min)
90
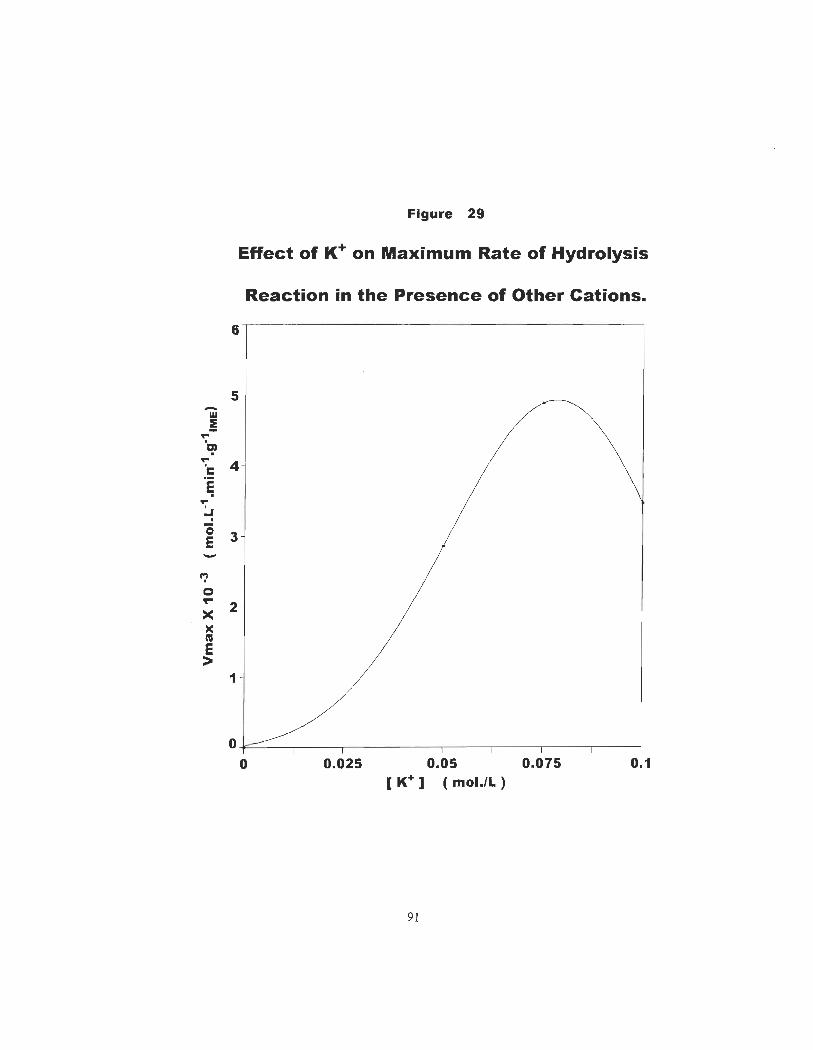
Figure 29
Effect of K+ on Maximum Rate of Hydrolysis
Reaction in the Presence of Other Cations.
6
5 -11,1 ~ ... '~ ...
4 'c E . ... ~ . "0 3 E -
f7 0 't""
2 >< >< cu E >
1
o~ __ ~ ____ ~ __ ~ __ ~ ____ ,-__ -, ____ ,-__ ~ o 0.025 0.05 0.075 0.1
[ K+ ] (mol./L )
91
Finally, the effect of increasing the concentrations of combined cations on
the kinetic parameters is given in table 18. From this table, the highest maximum
rate of reaction of 6.63 mmoLL-1.min-1.g-1IME and a Km.app. value of 72.69 mmol.lL
was observed for a combination of three cations at a concentration of Na : K : Ca
being 100 : 100 : 1 respectively.
Experimental data suggest that the effects and interactions observed fram
the combined (Na+, ~, Ca2+ ) cations were quite complicated and differ
significantly from individual cations. The highest maximum activity (Vmax = 9.68
mmoLL-1.min-1.g-\ME ) was given by Mg++ whereas, the highest activity fram the
combined cations, 6.63 mmoLL-1.min-1.g-\ME was barely above the Vmax (6.11
mmoLL-1.min-1.g-\ME) obtained in the absence of cations. The ~ values obtained in
the presence cations were smaller, indicating a greater affinity of the enzyme for
lactose(61). Consequently, the binding of cations to the enzyme - lactose complex is
much stranger.
5.3. Tentative explanation of the cation - lactose complex mechanism.
Although sugars interaction with alkali and alkaline earth metal ions are weil
known (62, 63), there has been no report on lactose - metal ion interaction in
literature so far. In this study, infrared spectra of lactose - cations complexes and
free lactose were recorded in the region of 1800-1000 cm-1 and the results of the
92
spectral analysis is described. In this region only one group of absorption band
was observed at approximately 1650 cm-1 . This group of strong and broad
absorption band can be assigned to the OH groups of the water molecule. The
band at 1650 cm-1 in the spectrum of free sugar appeared as a sharp absorption
band, but it showed considerable intensity changes upon lactose metalation with
0.1 M of hydrated metal halide ions. Further variation of KCI ions concentrations
showed no significant changes in the absorption band whereas NaCI ions
concentration showed no significant changes in the absorption band only after 0.5
M. However, the intensity change observed at 0.5M for monovalent metal ions
indicated a greater absorption for Na + as compared to ~ complexes [figure 30].
This dissimilarity is due to the smaller ionic raduis of Na+ with respect to ~.
Spectroscopie evidence indicated that K(D-lactose)CI. nH20 and Na(D-lactose)CI.
nH20 were isomorphous in term of coordinate ion geometriesand had similar
binding-sites (64) . The interaction between the potassium or sodium atom and the
oxygen molecule in 0 - lactose ring is largely electrostatic (65) and it is mainly
through cation hydration shell.
The band at 1650 cm-1 iA the spectrum of Ca(D-lactose)Cb. nH20 complex
showed distinct intensity changes and shifted towards a lower absorption
frequency of 1637 cm-1 as the Ca ++ concentration was increased from 0.1 M to
0.5M, then to 1 M CaCb [figure 15]. It is worth noting that the skeletal vibrations,
93
C-C and C-O-C of the lactose ring around 1500 - 1000 cm-1 showed changes upon
metalation [Figure 15]. The spectral changes observed for these vibrations are
due the involvement of the lactose donor atoms in the metal-ligand bonding, as
weil as the rearrangement of the strong hydrogen bonding network of the free
lactose on the complex formation, thereby causing a large perturbation to the ring
system where the vibrations are mostly localized and finally bringing a distortion to
the ring system. The lactose OH and C-O groups, as weil as the water molecules
are involved in the cation - lactose bonding.
Even though X-ray and NMR spectroscopy have often been used to
characterized the nature of metal - carbohydrate interaction [68.69701, FT-IR study
could lead to a reliable correlation between the missing structural information and
the spectroscopie properties for sugars. Metalation of the sugar moiety can be a
useful probe in order to develop our understanding about lactose - cations
interaction and vibrational frequencies and to relate them to the kinetics of
enzymatic hydrolysis of cheese industrial effluent and other sugar containing
substrates. The strong interaction between calcium ions and the lactose molecule
as compared to sodium or potassium ions observed in this spectroscopie study
indicates that the lactose - enzyme complex has a greater affinity for divalent
cations (Ca2+ , Mg2+ ) than for monovalent cations (Na+, ~ ). Consequently, the
binding of divalent cations to the enzyme - lactose complex is much stronger and
94
resulting to a higher maximum rate of reaction as weil as a higher degree of
hydrolysis as compared to monovalent cations or the absence of cations i. e.
demineralized cheese effluent. This can be confirmed by the fact that the Km.app.
values obtained in this research [table 9] were much smaller for diva lent cations as
compared to monovalent cations. The smaller the Km.app. value, the stronger the
affinity of enzyme for the substrate.
5.4. Hydrolysis of cheese industrial effluent in bioreactor .
From figure 16 and figure 17, it can be seen that the rate of conversion of
lactose into glucose and galactose is higher in the plug flow tubular reactor
(PFTR) than in the continuous stirred tank reactor (CSTR). This confirmed earlier
studies by Ander Axelsson and Guido Zacchi (55) in 1990. The percentage
conversion of substrate to product decreased initially with time before settling to a
ste ad y conversion rate. Similar observation had been reported in literature (70,71)
stating that deactivation of enzyme was more important initially and slow down
after a few days. This decreased was due to enzyme deactivation.
95
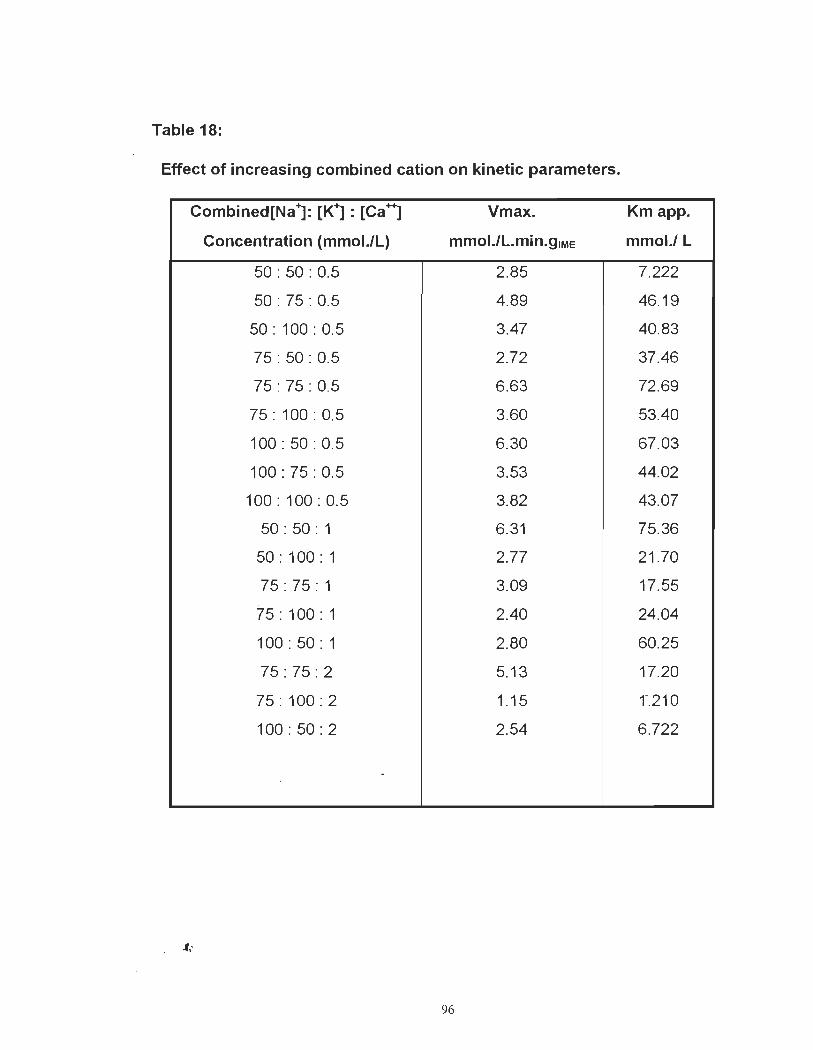
Table 18:
Effect of increasing combined cation on kinetic parameters.
Combined[Na1: [K1 : [Ca*] Vmax. Km app.
Concentration (mmoI.lL) mmol.ll.min.gIME mmol./ L
50 : 50 : 0.5 2.85 7.222
50 : 75 : 0.5 4.89 46.19
50 : 100 : 0.5 3.47 40.83
75 : 50 : 0.5 2.72 37.46
75 : 75 : 0.5 6.63 72.69
75 : 100 : 0.5 3.60 53.40
100:50 : 0.5 6.30 67.03
100 : 75 : 0.5 3.53 44.02
100 : 100 : 0.5 3.82 43.07
50: 50 : 1 6.31 75.36
50 : 100 : 1 2.77 21.70
75 : 75 : 1 3.09 17.55
75 : 100 : 1 2.40 24.04
100 : 50 : 1 2.80 60.25
75: 75 : 2 5.13 17.20
75 : 100 : 2 1.15 r .210
100 : 50 : 2 2.54 6.722
.
.f ' . ,
96
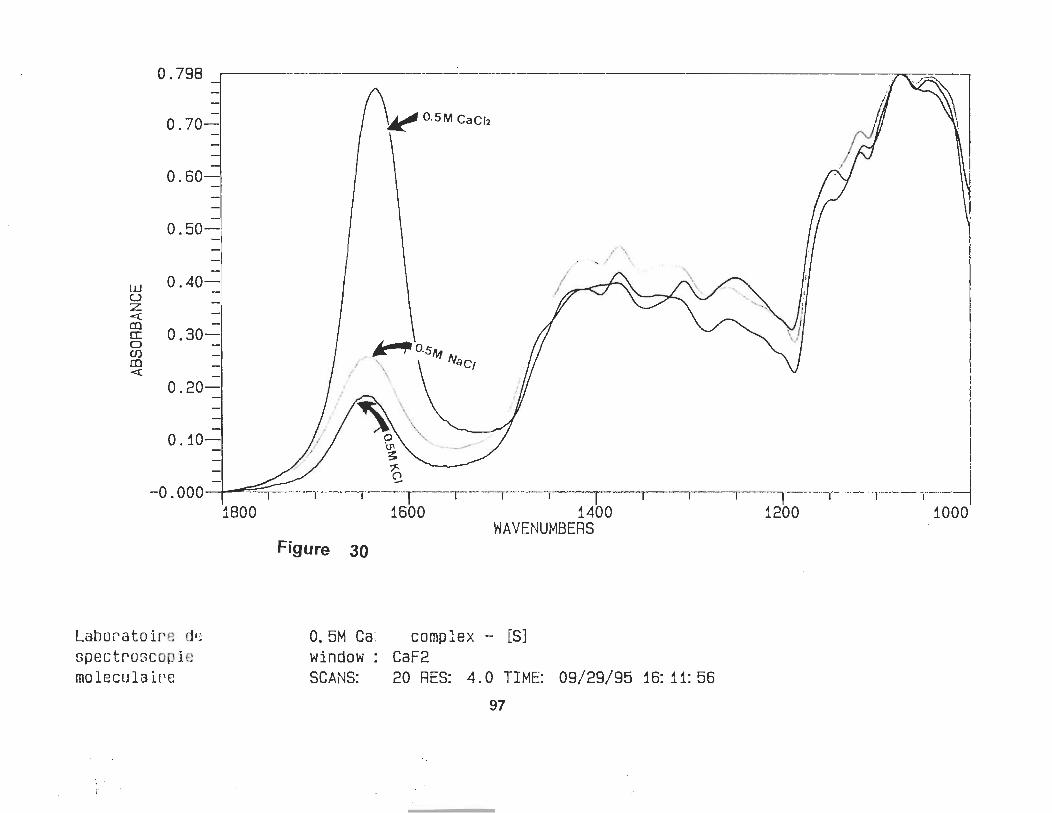
0.798 -1 -1 , - ,
0.70-, ~ a.SM CaCI2 -
0.60 --
0.50-=! -1
UJ 0.40-=' u z « en -CI: 0.30-0 Cl) en « -,
~O.SM No /" ~ r \ ac,
1 \ / \ ' ,
0.20-· \
\ 0.10-' 0\ '" .~ ________ f
-0.000 1 ~-'--T-----I 1800
\ '--ï·----I----I----r-· ··I·----r---T---ï··----r·---T--~ 1600 1400 1200 1000
Laborato ire (je spectroscopie moleculair'e
..
WAVENW·1BERS Figure 30
0.5M Ca:, complex - [S] window: CaF2 SCANS: 20 RES: 4.0 TIME: 09/29/95 16: 11:56
97
There are three possibilities by which a constant prqduction and conversion rate
can be maintained by
- Raising the temperature to compensate for activity loss (47,55,71 ) .
- Performing reaction at isothermal conditions using multiple-reactors system(51 , 55)
- Reducing flow of substrate and by so doing the residence time is increased (21) .
5.5. Immobilized enzyme deactivation and hait - lite estimation.
ln order to determined the deactivation of an immobilized enzyme, the reactor
performance at constant temperature and flow rate was monitored for a long
operating time. Experimental data on lactose conversion were collected and used
in evaluating the deactivation constant and then , the half-life. In order to evaluate
the deactivation kinetics, the experimental data obtained from the plug flow tubular
reactor was used. The proposed equation 21 for an ideal plug flow reactor was
used. This equation could be rearranged to give the expression:
W -Eo* exp( -kd * t) = - A{l- X) + EX F
~ In[~o ] - Kd * t = In[-Aln{l- X) + EX]
(24)
(25)
On performing the linear plot of Ln [-Aln(1-X) + B*X] as a function of time, t, a
straight line graph is obtained as shown in figure 31 with the slope equal to - KI;
the deactivation constant.
98
The observed deactivation constant was best described by a first order
reaction mechanism, reported to fit the thermal deactivation of lactase and it was
in accordance to earlier reports by sorne researchers under similar conditions(21. 54 )
The residual activity or the exponential decay of an immobilized enzyme is
represented by equation 20. By substituting the deactivation constant obtained in
equation 25 into equation 20 , the half - life of the immobilized enzyme can be
determined.
The half-life, t1l2, is described as the time the initial activity of the IME drop by 50
percent; i.e. when E = Eo , and can be calculated by substituting into equation 20 2
to obtain
1 1 -= e- K d*l -2 2
1 In2 =>1 - =-
2 K d
(26)
(27)
The estimated value for the deactivation constant, ~, was 17 days. Under the
actual operating conditions, one - half of the initial activity was lost after 17 days.
For comparison, Friends and Shahani (60) using the enzyme, A. oryzae and at
same temperature, 50 oC observed a half-life (first order) of 13 days. The
deactivation of enzymes are mainly influenced by the operating temperature, pH ,
nature of the feed, and microbial contamination. From the batch process it was
observed that at lower temperatures , example at 30 oC, more galactose was
99
present in the analyzed products than glucose. At this tempe rature the half-life
was reported to be longer than at a temperature of 50 oC by S.T. Yang (21) and he
reported that galactose in fact offered a protective effect on the activity of enzyme
while the effect of glucose was the contrary. However, at lower temperatures more
oligosaccharides (undesirable products) are formed thereby lowering the degree
of conversion of lactose to glucose and galactose.
100
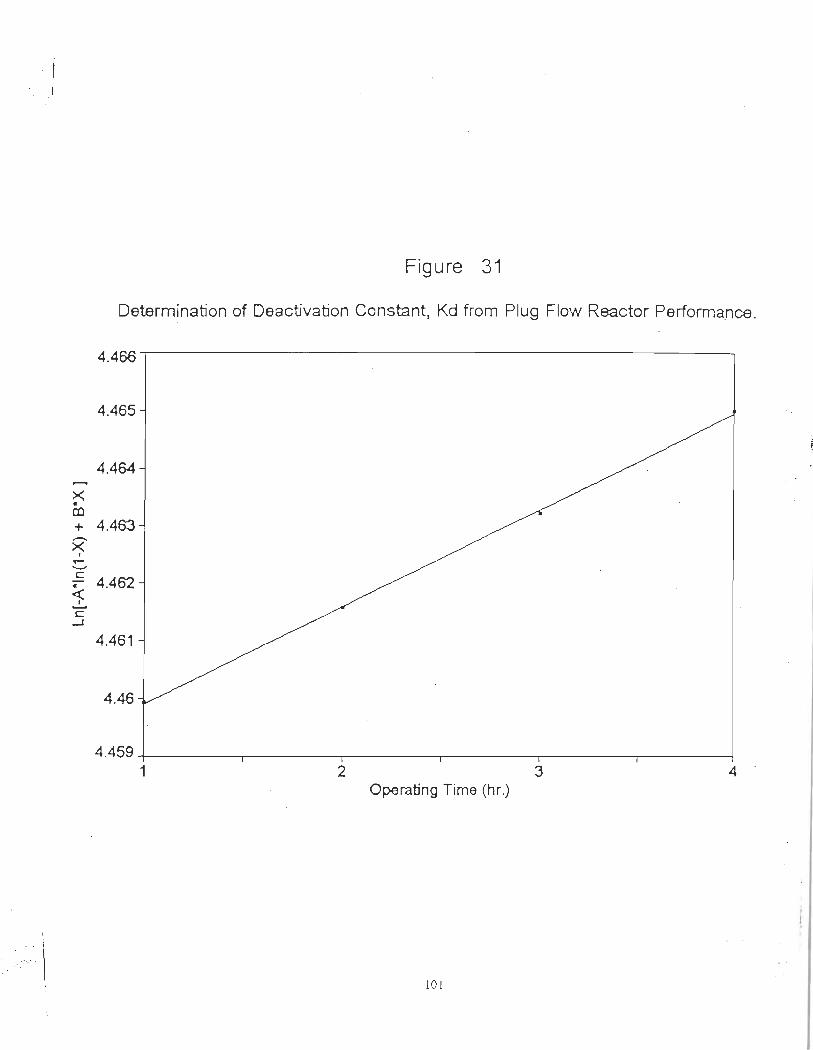
Figure 31
Determination of Oeactivation Constant, Kd from Plug Flow Reactor Performance.
4.466
4.465
4.464
>< • c:o + 4.463
>? .,.... '-" c « 4.462 i c
-1
4.461
4.46
4.459+-------~--------_.--------~--------._------_.------__4 1 2 3 4 .
Operating Time Chr.)
101
VI. ECONOMIC ANAL YSIS OF THE PILOT PLANT.
6.1. Introduction and objective.
The main objective of this economic analysis was to determine whether this pilot
plant should be installed in parallel or in series with the existing wastewater
treatment plant at the Agrapur's cheese factory in Notre Dame du Bon Conseil,
Québec, Canada. Two options were considered in this study ;
Option A.
This involve an economic analysis of the pilot plant installed in parallel to the
existing treatment plant. The sa me raw material ( effluent fram the cheese plant)
was used in both the pilot plant and the existing treatment plant.
Option B.
ln case B, an economic analysis of the pilot plant installed in series with the
existing treatment plant was studied. In this option, the raw materiaï for the pilot
plant was the effluent fram the existing treatment plant.
The process flow diagrams for option A and option B are presented in figure 32
and figure 33 respectively.
102
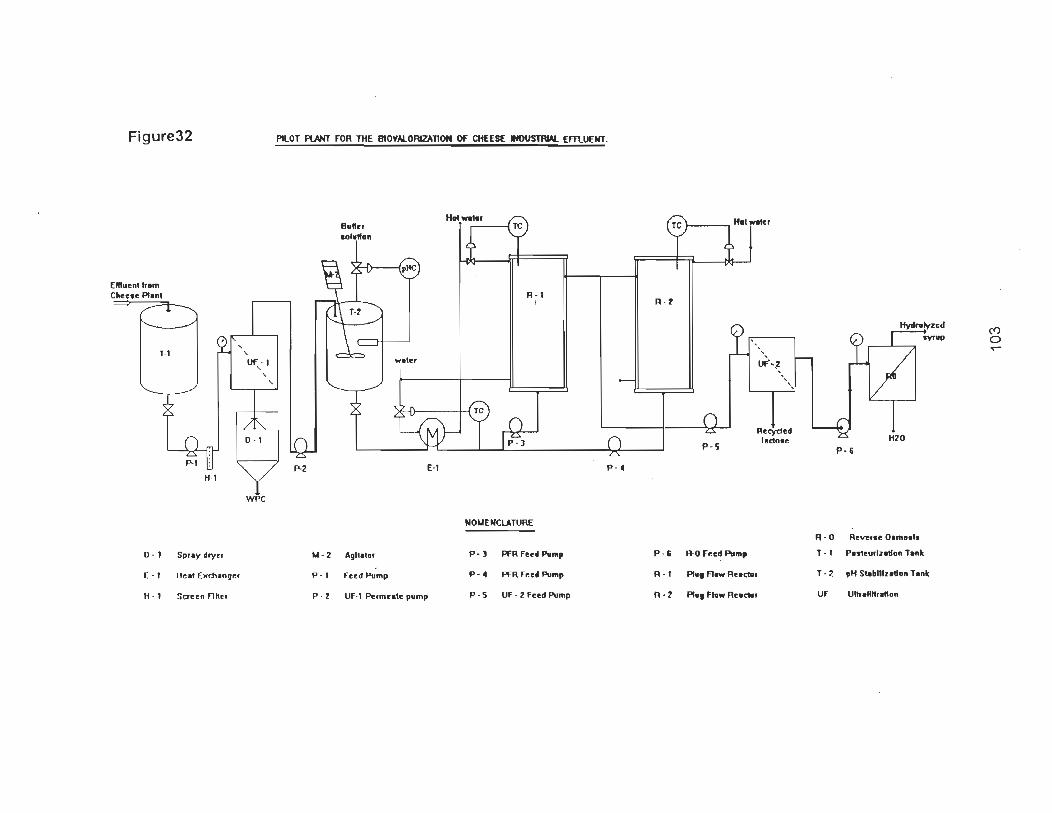
Figure32
Ellluenl tr.m Cheen PI.nl
1-'
0 - 1
H-'
Sp'.y dry ..
, , OF -, , , ,
WPC
E - , liell Exmlnge,
H - 1 Sac on Flne.
PILOT PUHT FOR THE BlOYAlORIZAnON OF CHEES( INOUsmIAl EfflUENT.
P-2
1.1 - 2
p-, P - Z
B"IIe, ... I.tI.n
AgII.lo,
E-'
flOod Pump
UF-' ""',mcole pump
p - 4
NOI.IENCLATURE
pol PFR Feed Pu""
P - 4 PFR Fe" Pump
P - 5 UF - 2 FlOod Pump
R - t
P - 5
P O' R-O Feed PlI""
R - ' PI.,R_Reoc:lll'
R - Z Plu, Rlw Rnc:lll,
,
uf-"\ "
RecVdd I.etuoe
R - O
T- 1
T - 2
Uf
lfvdnt!Yzed
P O'
Reve,oe 00"'0.1.
Pesleu,lzodon Tonie
pH SIobl1lzodon Ton1c
UllYo"","'on
Ct) o ..-
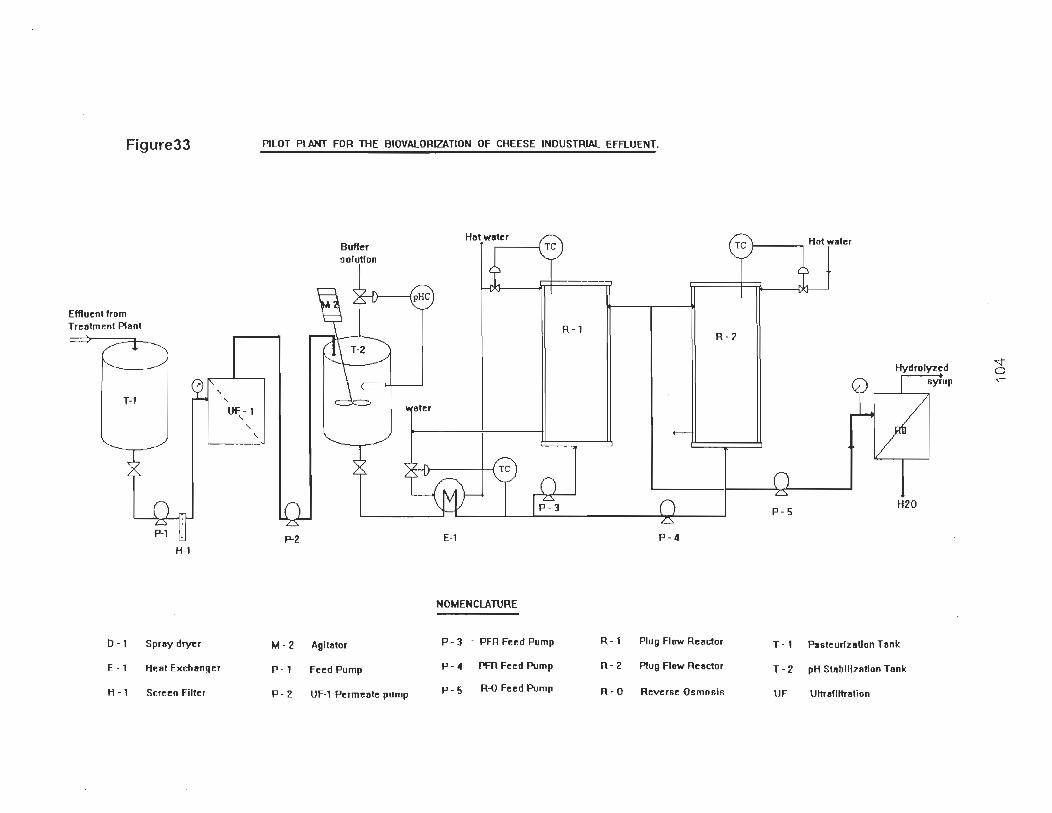
Figure33
Effluent trom Trelltment Plant
T-1
D - 1
E - 1
H - 1
~ ,
H-1
Spray dryer
Hellt Excf1l1nger
Sereen Filter
, UF-l , , ,
PILOT PLANT FOR TliE 810VAlORIZATION OF (HEESE INOUSTRIAL EFflUENT.
P-2
M - 2
P - 1
P - 2
Buffer solution
Agltlltor
Feed Pump
UF-l Permellte pump
E-1
NOMENCLATURE
P - 3 - PFR Feed Pump
P - 4 l'fR Feed Pump
P - 5 R-O Feed Pump
R -1 R - 2
P-4
R -1 Plug Flow Reador
R - 2 Plug Flow Reactor
R - O Reverse Osmosis
P- 5
T - 1
T - 2
UF
H20
Pasteurlzatlon Tank
pH Stllblllzlltlon Tllnk
Ultrllflltrlltion
~ o ~
6.2. Equipment specifications.
Table 19 illustrate the principal charateristics of the equipments employed in this
pilot project. The identification numbers are identical to those on the process flow
diagrams.
6.3. Estimation of equipment cost or fixed capital.
The process flow diagrams in figure 32 and figure 33 were used to estimate the
capital cost of equipment or fixed capital, CFC. The capacity or size specification
actually served as basis to determine the cost priee of each major flow sheet
equipment items from charts, suppliers, references, or from chemical engineering
literature (72, 73, 74, 75) . The cost priee of equipments obtained from charts were
updated using the appropriate chemical engineering plant cost indices[76] uptil
April, 1995.
The cost priee of each equipment, and the total grass root capital or fixed capital
for each option is summarized in table 20.
105
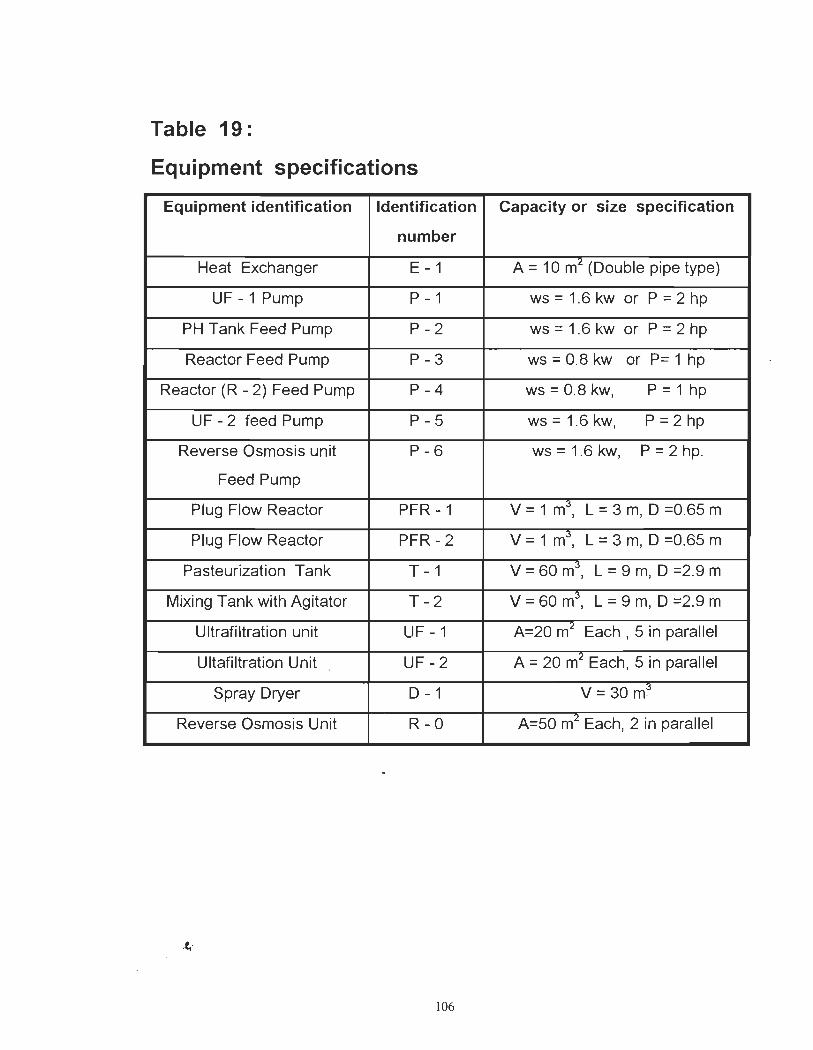
Table 19:
Equipment specifications
Equipment identification Identification Capacity or size specification
number
Heat Exchanger E - 1 A = 10 m2 (Double pipe type)
UF -1 Pump P - 1 ws = 1.6 kw or P = 2 hp
PH Tank Feed Pump P-2 ws = 1.6 kw or P = 2 hp
Reactor Feed Pump P-3 ws = 0.8 kw or P= 1 hp
Reactor (R - 2) Feed Pump P-4 ws = 0.8 kw, P = 1 hp
UF - 2 feed Pump P-5 ws = 1.6 kw, P = 2 hp
Reverse Osmosis unit P-6 ws = 1.6 kw, P = 2 hp.
Feed Pump
Plug Flow Reactor PFR -1 V= 1 m;j , L = 3 m, D =0.65 m
Plug Flow Reactor PFR-2 V= 1 m3 , L = 3 m, D =0.65 m
Pasteurization Tank T -1 V = 60 m3 , L = 9 m, D =2.9 m
Mixing Tank with Agitator T-2 V = 60 m3 , L = 9 m, D =2.9 m
Ultrafiltration unit UF-1 A=20 m2 Each, 5 in parallel
Ultafiltration Unit UF-2 A = 20 m2 Each, 5 in parallel
Spray Dryer D -1 V = 30 m~
Reverse Osmosis Unit R-O A=50 m2 Each, 2 in parallel
106
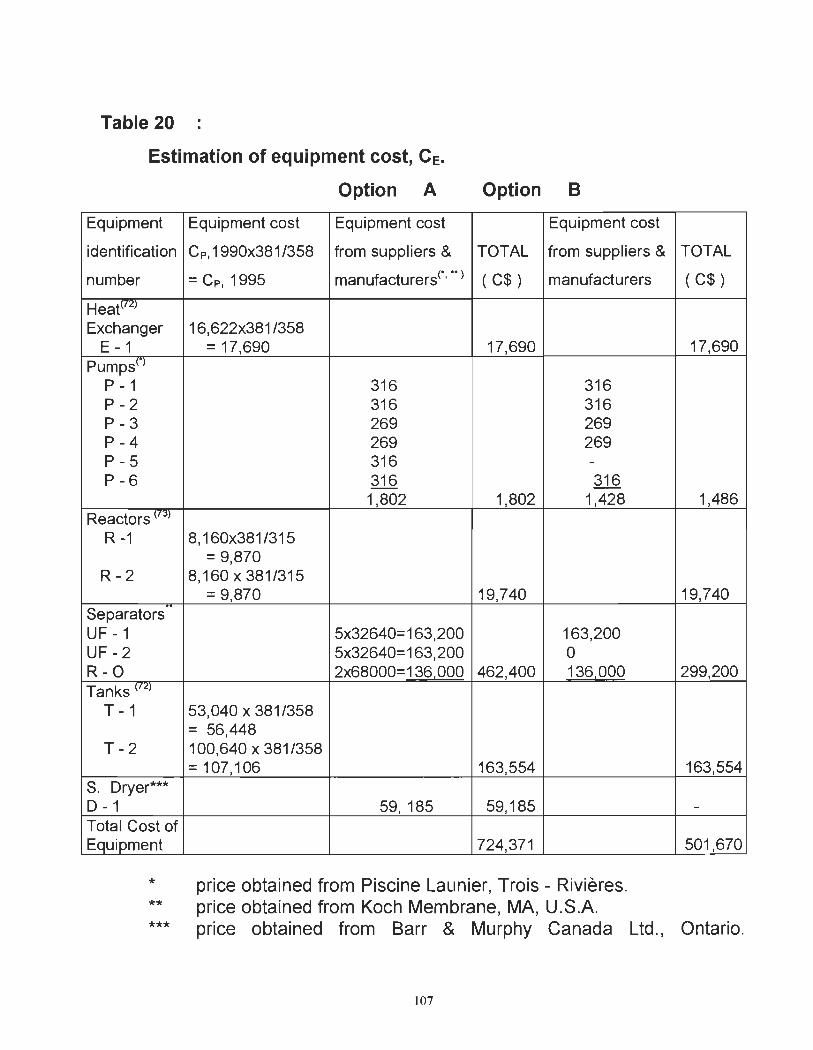
Table 20
Estimation of equipment cost, CE"
Option A Option B
Equipment
identification
number
Heatlf<!)
Exchanger E - 1
pumpsn P - 1 P-2 P-3 P-4 P-5 P-6
Reactors (73)
R -1
R-2
Separators UF-1 UF-2 R-O Tanks (72)
T -1
T-2
S. Dryer*** D - 1 Total Cost of Equipment
* **
Equipment co st Equipment co st Equipment cost
Cp,1990x381/358 from suppliers & TOTAL from suppliers &
= Cp, 1995 manufacturers("' "" ) ( C$ ) manufacturers
16,622x381/358 = 17,690 17,690
316 316 316 316 269 269 269 269 316 -316 316 1,802 1,802 1,428
8,160x381/315 = 9,870
8,160 x 381/315 = 9,870 19,740
5x32640=163,200 163,200 5x32640=163,200 0 2x68000= 136 000 462,400 136000
53,040 x 381/358 = 56,448 100,640 x 381/358 = 107,106 163,554
59, 185 59,185
724,371
priee obtained from Piscine Launier, Trois - Rivières. priee obtained from Koch Membrane, MA, U.S.A.
TOTAL
( C$ )
17,690
1,486
19,740
299,200
163,554
-
501,670
*** priee obtained from Barr & Murphy Canada Ltd., Ontario.
107
6.4. Capital cost estimation.
Fixed capital or Capaital cost is the sum of direct project expense, indirect project
expenses contingency and fee, start up expenses and cost of auxiliary facilities.
The module factor method proposed by Gutherie (74) , is advocated, illustrated and
employed in this project. This technique is accurate, direct, and relatively easy to
employed. The procedure is as follows :
- Determine cost price of each major flow sheet equipment item shown
in table 20.
- Update the price using appropriate cost indices up to the year that the
estimate is required.
- multiply each updated cost price by the installation factor to determine
the base bare module contribution of each equipment
- Sum bare module prices to obtain total bare module capital
- Since this pilot plant is to be attached to an already existing plant,
multiply the total bare module capital by 1.18 to account for contingency
and fee yielding the tot~1 module capital which is also the fixed capital.
This is the fixed capital required for purchasing equipments, building that houses
the plant, and installation of equipments.
108
6.4.1. Installation factor, FSM.
Installation involves direct materials and labor, indirect expenses, contingency
and fee allowance, and capital for auxiliary facilities.
6.4.2. Direct labor and materials, COLM.
This includes the price of purchasing equipment, CE, materials used for
installation (piping, steel instruments, electrical materials, insulation and paints ),
and direct labor used the installations. According to Gutherie this can be
calculated as follows :
Cost of purchasing equipments = CE·
Cost of materials = 0.71 CE
Cost of labor used for installation = 0.63 CE.
Total cost direct labor and materials = 2.34 CE
6.4.3. Indirect cost.
Indirect costs involves freight, insurance and sales taxes on purchased
equipment, construction overhead and contractor engineering expenses.
6.4.3.1. Construction overhead, Co,
This refer to labor, fringe benefits for workers (health insurance, holidays and
vacation pay, retirement benefits etc.), mandatory fees such as social security,
109
unemployment insurance, salaries, fees for supervisory and advisory personnel. It
also includes miscellaneous items such as job side clean up and security
services, warehousing, temporary buildings, roads, parking areas and other
facilities required only during the construction period. Construction overhead is a
function of direct labor used during installation, amounting to approximately 70
percent of the direct labor cost, CL . Therefore Overhead cost, Co is equal to 0.7
CL.
6.4.3.2. Engineering cost, CEe.
This comprises salaries for project and process engineers, designers, and
associated overhead. It depends on the complexity of the design and is
proportional to the materials. Since this pilot plant is a simple plant, the
engineering cost is estimated to be about 15 percent of direct installation cost.
Thus, Engineering Cost, CEC. is taken as 0.15 COLM.
6.4.3.3. Contingency and tee
ln order to compensate for unpredictable events, such as storms, floods, strikes,
priee changes, small design changes, error in estimation, and other unforeseen
expenses, a contingency factor is added. For this project , a contingency factor of
10 percent of direct and indirect plant cost was chosen. Therefore, Contingency
cost, Cc is taken as 0.1 (COLM + C'O ). Contractor fee varies for different situations,
:Ct-
110
but an average estimate of 3 percent of direct project and indirect project cost is
acceptable. Thus, Contractor's Fee, CCF, is taken as 0.03 (COLM + CID) which is
also equal to 0.03 CSM.
6.4.3.4. Start up expense
These are expenses incurred for changes made after the completion of a plant
construction, in order to enable the plant operate at maximum design operations.
These changes involved expenses for materials and equipment as weil as losses
in income endure while the plant is shot down or is operating at partial capacity.
An allowance of 8 percent of the fixed capital is acceptable. Thus , Start-up
Expenses, CSE, is equal to 0.08 CFC.
6.4.4. Auxiliary facilities.
Auxiliary facilities incorporates site development, auxiliary buildings and off site
facilities.
6.4.4.1. Site development
. This include location of land and survey, civil engineering evaluation and site
design, drainage, construction of roads, parking lots, walkways, water lines, site
fencing, and sewer. Site development cost is estimated at an average value of 5
percent of the total module cost.
ill
The Cost of Site Development, CSD, is taken as 0.05 CTM or 0.19 CE.
6.4.4.2. Auxiliary building
This comprises administrative offices, laboratory, garage, maintenance shop,
recreational rooms, warehouses as weil as service buildings. The cost of auxiliary
building represent approximately 4 percent of the total module cost .
6.4.4.3. Off site facilities
Off site facilities are necessary to supply utilities and for convenience, safety, and
pollution control. Examples include electrical power generators, raw material and
final storage tanks, warehouses, fire protection utilities, yard lighting,
communication networks, etc. Since this plant is to attached to an already
existing plant an average value of 21 percent of the total bare module is
acceptable as off site facilities cost.
Thus, Cost of Off site Facilities, COF, is equal to 0.21 CTM .
Table 21 summarizes the cost capital estimation of this pilot plant.
6.4.5. Estimation of working capital and total capital.
Working capital consist of the total amount of money invested before there is a
product to sail. This include money invested in raw materials and supplies carried
.c..
112
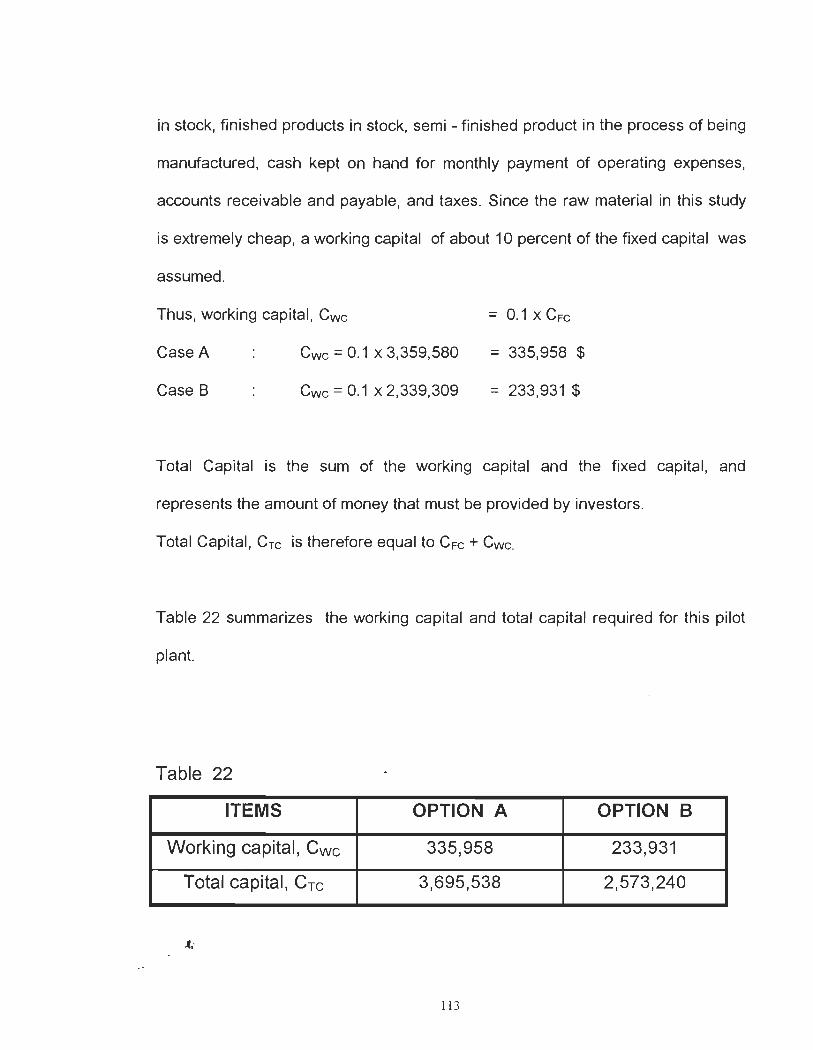
in stock, finished products in stock, semi - finished product in the process of being
manufactured, cash kept on hand for monthly payment of operating expenses,
accounts receivable and payable, and taxes. Since the raw material in this study
is extremely cheap, a working capital of about 10 percent of the fixed capital was
assumed.
Thus, working capital, Cwc
Case A
Case B
CWC = 0.1 x 3,359,580
Cwc = 0.1 x 2,339,309
= 0.1 X CFC
= 335,958 $
= 233,931 $
Total Capital is the sum of the working capital and the fixed capital, and
represents the amount of money that must be provided by investors.
Total Capital, Crc is therefore equal to CFC + Cwc.
Table 22 summarizes the working capital and total capital required for this pilot
plant.
Table 22
ITEMS OPTION A OPTION B
Working capital, Cwc 335,958 233,931
Total capital, CTC 3,695,538 2,573,240
....
113

Table 21. Fixed Capital Estimation.
ITEMS OPTION A COST (C$) OPTION B COST (C$)
Direct Project Expenses
Direct Materials
Cost of Equipments, CE. 724,371 501,670
Installation Material , CM = 0.71 CE. 514,303 356,186
Direct Labor, CL = 0.63 CE 456,354 316,052
Total Direct labor &material Cost, CDLM 1,695,028 1,173,908
Indirect Project Expenses
Freight, Insurance & Taxes, C1T=0.07(CE+CM)
Construction Overhead,Co = 0.7 CL 86,707 68,628
Contractor Engineering Expense, 319,448 221,236
0.15(CE+CM)
Total Indirect Project Cost, C1PC 185,801 128,678
591,956 418,542
Bare Module Capital, CSM = (CDLM+CIPC) 2,286,984 1,592,450
Contigency, fee and Start-up Expenses
Contigency, Cc = 0.10 CSM 228,698 159,245
Fee, CF = 0.03 CSM 68,610 47,774
Total Contigency & Fee, CCF 297,308 207,019
Total Module Capital, CTM = (CSM + CCF) 2,584,292 1,799,469
Auxiliary Facilities
Site Development, CSD = 0.05 CTM . 129,215 89,973
Auxiliary Buildings, CAS = 0.04 CTM 103,372 71,979
Offsite Facilities, COF = 0.21 CTM 542,701 377,888
Total Auxiliary Cost, CTAC 775,288 539,840
Total Grass-Root or Fixed Capital, CFC. 3,359,580 2,339,309
1 1 L1
6.4.6. ESTIMATION OF TOTAL PRODUCT COST.
This is divided into two categories; manufacturing cost and general expenses. In
this project the annual cost basis method was used for the estimation of the total
product cost. Table 5 represent a summary of the total product cost.
6.4.6.1 Manufacturing cost estimation.
Manufacturing costs are ail expenses directly connected to the manufacturing
operation. These expenses are divided into three groups :
- direct production
- fixed charges
- plant - overhead cost.
6.4.6.2 Direct production cost.
Direct production cost, Copc, involves expenditures for raw materials, cost of
immobilized enzymes, direct operating labor, plant maintenance and repairs, and
utilities. An operating factor, fo, of 90 percent was used in this project to convert
from a one-day to a one-year basis, as weil as to acknowledge that no plant can
operate continuously without interruption. The operating factor represents the
fraction of time that this plant is in equivalent full-scale production. This
interruption time, which sums to about 16.8 hrs/week, is the time required to c1ean
and disinfect the process equipments, changing of biocatalyst, and maintenance.
115
It is important to clean and disinfect processing line because microbial attack can
lead to deactivation of the biocatalyst.
6.4.6.2.1 Raw material
The raw material employed in this project was the effluent fram cheese
manufacturing industries. Due to stringent enviranmental regulations, small
cheese manufacturers either pay pracessors to collect and dispose their cheese
effluent or sell them to farmers as animal feed at 3.6$/m3. Assuming that the cost
of raw material is 3.6 $ / m3, then the annual cost for raw material is 48 m3/day
x365 days/yr x 0.9 x 3.6 $/m3 which equal to 56,765 $/yr.
6.4.6.2.2 Operating labor
Since this plant was to be attached to an existing treatment plant, the equipment
is assumed to require only one third (1/3) of the attention of an operator.
Considering the operation is continuous, 24 hrs/day, the number of persons
employed on an annual basis for this task would be 4x1/3 = 1.3 persons. Thus,
annual operating labor cost, Aoc is 4/3 x 45,OOO$/yr(77) x 381/358 which is equal to
63,855 $/yr.
116
6.4.6.2.3 Cost of immobilized enzymes
The cost of immobilized enzymes was calculated from three principal items :
- cost of enzyme - Aspergelluis oryzae.
- cost biocatalyst carrier ( granular diatomaceous earth).
- cost chemicals utilized during the immobilization process.
The total an nuai cost of immobilized enzymes was calculated as indicated in
Appendix 1 . Therefore, Total annual cost of IME; CIME is 91,366 $
6.4.6~2.4 Cost of acetate butter
Acetate buffer is used to maintain the pH of the ultrafiltration permeate at 4.5.
Annual co st of acetate buffer at 0.186 $/L
= 233Uday x 0.186 $/L x 365 days/yr x 0.9 = 14,237 $/yr
6.4.6.2.5 Supervisory and clerical labor
Direct supervisory and clerical labor is always required for manufacturing
operation. It is closely related to the total amount of operating labor, complexity of
the operation and the production quality standard. This cost averages about 15
percent of the operating labor cost in a project like this.
Thus, supervisory and clerical labor cost, CS&CI = 0.15 COL or 9,578 $
117
6.4.6.2.6 Utilities
Typical utilities cost include electricity, process steam, hot water, compressed air,
and refrigeration used in the plant. Utility cost for ordinary chemical processes is
estimated between 10 - 20 percent of the total production cost (72). However, it can
also be calculated as shown in Appendix 2. The total annual cost for utilities was
calculated to be 11,485$ .
6 .. 6.2.7 Maintenance and repairs.
This expense is necessary for the maintenance and repairs in order to keep the
plant in efficient operating conditions. It include the cost for labor, materials, and
supervision. Since this plant is relatively a simple process, the annual
maintenance and repair cost was estimated at 6 percent of the fixed capital.
Annual maintenance and repair cost, CM&R is taken as 0.06 C FC.
6.4.2.6.7 Operating supplies
Many miscellaneous supplies are needed to keep the process functioning
properly. This include items such as instrument charts, lubricants, cleaning
chemicals and disinfectants, 'custodial supplies, and any other items not
considered as part of regular maintenance. The annual cost of operating supplies
is about 15 percent of the maintenance and repair cost.
Annual operating supplies cost, Cos is taken as 0.15 CM&R
118
6.4.6.2.8 Laboratory expense
This cost result from quality control testing and chemical or physical analysis
necessary to certify product purity and viability. The annual cost for laboratory test
was estimated at 15 percent of the operating labor cost.
The annual laboratory cost, CL is 0.15 COL or 9,578 $
6.4.6.2.9 Patent and royalties.
They are accrued in many processes that are licensed from another firm. This
cost is estimated in this project to be approximately 3 percent of the total product
co st.
Annual patent and royalty costs , CP&R is taken as 0.03 ATE
6.4.6.3 Indirect manufacturing expenses.
These expenses are also known as fixed cost because they are invariant with the
amount of production. These include costs for local property tax, insurance,
depreciation, plant overhead and other miscellaneous expenses .
. 6.4.6.3.1 Plant overhead and other miscellaneous cost.
Overhead and other miscellaneous form an important component of indirect
manufacturing expenses. Prominent in this category are social security,
unemployment insurance, fringe benefits, packaging, warehouses, general
,ft.
119
engineering, salaries, etc. Plant overhead cost are based on the sum of operating
labor, supervision and maintenance. About 60 percent of this sum would
adequately represent the plant overhead cost in this project.
Thus annual plant overhead costs , Cpoc is equal to 0.6 (COL + Cs + CM&R)
6.4.6.3.2 Local taxes
Since this plant is located in a less populated area, the local property tax
was estimated at 1.5 percent of the fixed capital. Therefore, annual local taxes
Cost is taken as 0.015 CFC.
6.4.6.3.3 Insurance
This is necessary to insure the plant against accidents such as fire, thief,
vandalism, flood, strong winds, etc. The cost of insu rance is relatively low and is
estimated at 0.5 percent of the fixed capital.
6.4.6.3.4 Depreciation
Depreciation is the decrease in value of an asset (physical properties) with the
passage of time. Holland et al. (79) present four chemical engineering definition for
depreciation:
- A tax allowance.
- A cost of operation .
. c.
120
- A means of building fund to finance plant replacement.
- A measure of falling value.
The straight-line method is normally used to determine the rate of depreciation in
engineering projects. In this method, the difference between the initial cost and
salvage value is divided by the total years of useful life to give the annual
depreciation. The chemical industry has a useful life of 10 years. The salvage
value is generally negligible, and the annual straight-line depreciation over a 10
years period is approximately 10 percent of the fixed capital.
Thus, the annual depreciation cost, Coc is 0.1 X CFC
6.4.6.4 General expenses.
Besides the direct and indirect manufacturing expenses, a certain portion of
corporate management cost, sales expenses, and research effort must be
financed from plant revenue. Administrative costs incorporate salaries and wages
for administrators, secretaries, accountants, typists, cost for office supplies and
equipment, and other overhead items related to administrative activities. In this
project, administrative expenses was estimated to be 25 percent of overhead
cost. Therefore the annual administrative costs, CAC is equal to 0.25x Co
121
6.4.64.1 Research and development
ln chemical and enviranmental industries, new praducts and methods are
constantly being developed. Research and development cost include salaries and
wages for ail personnel directly concern with research and development, fixed
and operating expenses for ail equipments involved, cost for materials and
supplies, direct overhead expenses and miscellaneous costs. Research and
development cost amounts to about 5 percent of the total praduct cost, ATE . Thus,
the annual cost for Research & Development is equal to 0.05 ATE.
6.4.6.4.2 Distribution and marketing cost
This is usually based product value. Praminent items in this group include cost for
sales offices, salesmen expenses, shipping, advertisements, technical services,
and salaries for personnel connected to this type of work. Since this praduct
would be sold in small quantities to large numbers of customers, 10 percent of the
total expense was chosen for the cost of distribution and marketing.
Annual distribution and marketing costs, COMe = 0.1 ATE
6.4.6.5 Revenue trom sales
Option A: The two marketable products obtained fram option A are whey
pratein concentrate(WPC 35%), which is the retentate fram the UF - 1 unit and
the syrup of glucose and galactose obtained fram the reverse osmosis unit. An
122
elaborate calculation of the annual sales revenue is shown in Appendix 3. The
annual sales revenue for option A, AsR1 is 1,610,037 $ .
Option B: Here the permeate contained approximately 0.2 % (w/v) of lactose
and was hydrolyzed at about 99% in the bioreactors. No WPC was found in the
retentate since they were almost completely fermented the anaerobic reactors of
the treatment plant to produced methane. Annual revenue from the hydrolyzed
syrup is (0.2 + 0.7)/100 x 47 m3/d x 365 d/yr x 0.9 x 1000 Llm3 x 1.4 $/L =
58,361.3 $/yr.
6.4.7. P rofitability
The minimum attractive rate of return (MARR) is an interest rate chosen to
minimized the economic well-being of a company. The criteria for estimating this
interest rate is based on four factors :
- Money available for investment, source and co st of fund ( equity,
borrow funds )
- Number of good projects available for investment and their purposed.
123
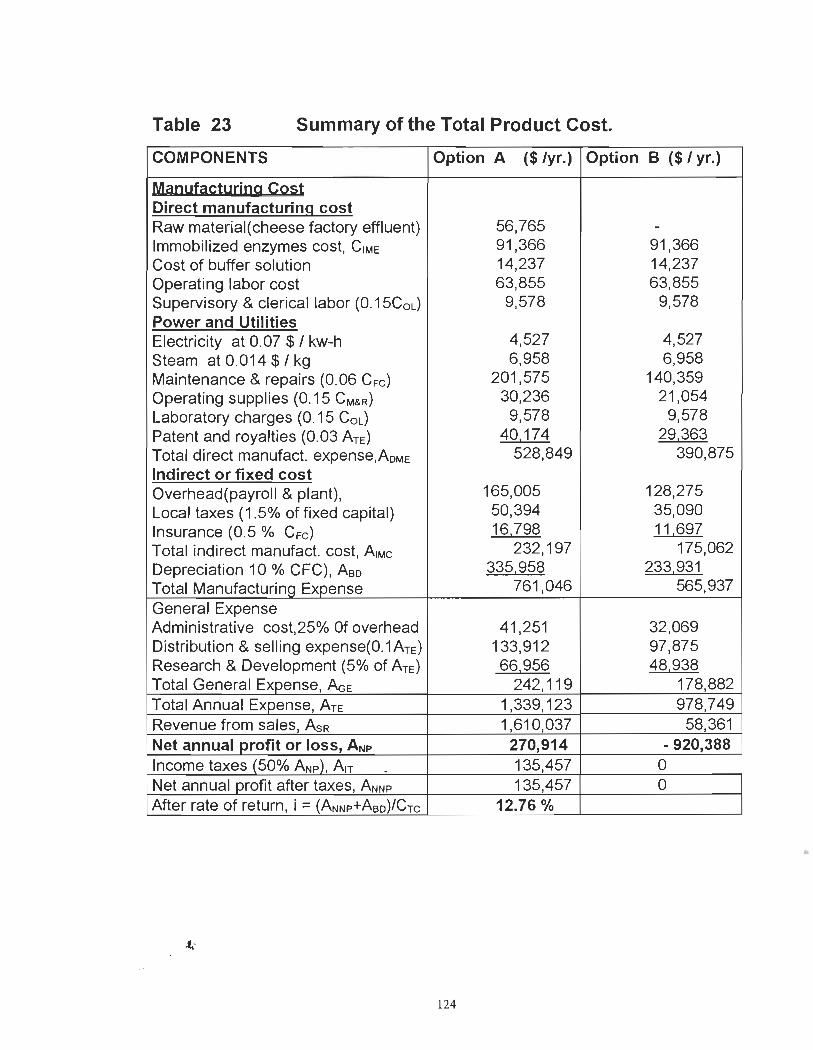
Table 23 Summary of the Total Product Cost.
COMPONENTS Option A ($/yr.) Option 8 ($1 yr.)
Milouf,u,lutiOg ~s;;uii Direct manufacturing cost Raw material( cheese factory effluent) 56,765 -Immobilized enzymes cost, CIME 91,366 91 ,366 Cost of buffer solution 14,237 14,237 Operating labor cost 63,855 63,855 Supervisory & clerical labor (0.15Cod 9,578 9,578 Power and Utilities Electricity at 0.07 $1 kw-h 4,527 4,527 Steam at 0.014 $ 1 kg 6,958 6,958 Maintenance & repairs (0.06 CFC) 201,575 140,359 Operating supplies (0.15 CM&R) 30,236 21 ,054 Laboratory charges (0.15 Cod 9,578 9,578 Patent and royalties (0.03 ATE) 40,174 29,363 Total direct manufact. expense,ADME 528,849 390,875 Indirect or fixed cost Overhead(payroll & plant), 165,005 128,275 Local taxes (1.5% of fixed capital) 50,394 35,090 Insurance (0.5 % CFC) 16,798 11 ,697 Total indirect manufact. cost, AIMC 232,197 175,062 Depreciation 10 % CFC), ABD 335,958 233,931 Total Manufacturing Expense 761,046 565,937
General Expense Administrative cost,25% Of overhead 41 ,251 32,069 Distribution & selling expense(0.1ATE) 133,912 97,875 Research & Development (5% of ATE) 66,956 48,938 Total General Expense, ~E 242,119 178,882 Total Annual Expense, ATE 1,339,123 978,749 Revenue from sales, AsR 1,610,037 58,361 Net annual profit or loss, ANP 270,914 - 920,388 Income taxes (50% ANP), AIT . 135,457 0 Net annual profit after taxes, ANNP 135,457 0 After rate of return, i = (ANNP+ABD)/CTC 12.76 %
•
124
- Amount of perceived risk associated with investment opportunities
available to the firm.
- Type of organization involved; government, public utility or competitive
industry.
The MARR for this project was estimated at 10 %.
The most widely used rate of return method for performing engineering economic
analysis is the internai rate of return (IRR) method. It solves the interest rate that
equates the equivalent worth of an alternative cash inflows ( receipts or savings)
to the equivalent worth of cash outflows (expenditure, including investments). It is
calculated by using the present worth formulation.
L Rk(P/F, i%, k) = L Ek(P/F, i%, k)
where RK = net revenue; Ek =. net expenditure; N = project life
Once i% is calculated, it is compared with MARR to assess whether the
alternative is acceptable. If i% > MARR, the alternative is acceptable; otherwise it
is not(83) .
Using the above equation i was found to be 10.2 % [Appendix 4]
Since IRR is 10.2 percent and is greater than the MARR, which is 10 percent.
This project is acceptable and profitable from the engineering economic analysis.
125
6.4.7.2 Caleulation of rate of retum.
The rate of return is also calculated by using the formula:
i = ((ANNP + ABD) / CTC) x 100
where ANNP = net profit after taxes, ABD = annual depreciation
CTC = total capital investment
i = ((135,457 + 339,580) /3,695,538) x 100 = 12.8 %
Here depreciation is considered as repayment on loan. The principal would
decline with time and the net profit after taxes would represent the interest
payment.
6.4.7.3 Unit sales priee of hydrolyzed syrup
The unit sales price for the hydrolyzed glucose and galactose syrup was obtained
by making a division of the annual sales income by the annual capacity yields.
Therefore, Unit Sales Price =1,098,586 $/yr /13,601,542.5L1yr = 0.081 $/L
6.4.7.4 Paybaek period.
The payback period is the minimum length of time theoretically necessary to
recover the original capital investment in form of cash from the project
Payback period, PT ,
....
= Total capital/ Net an nuai revenue
= 3,695,538/606,872 ~ 6 yrs .
126
VII. CONCLUSION.
ln this research it has been shown that cations play a significant role on the
activity and stability of the lactase, Aspergillus oryzae. This contradicts the null
effect on the activity of fungal lactase by cations as reported in literature (16,17) .
However, nowhere in literature has any an experimental investigation been
performed to demonstrate the null effect of cations on fungal enzymes.
Divalent cations significantly influenced the the rate of lactose hydrolysis reaction.
A FT -IR spectral analysis of the effect of cations on the kinetics of lactose
hydrolysis showed that they acted by increasing the binding of lactose to the
enzyme as weil as by increasing the maximum activity.
Ca ++ and Mg ++ were activators while monovalent cations ( K +, Na + ) were
stabilizers for Aspergillus oryzae. However, these cations may become toxic when
their concentration are beyond certain limits. Consequently, it is very important to
control cation concentrations in the reaction medium. An optimum concentration of
-75mM NaCI : 75mM KCI : O.5mM CaCb was observed for the combined cations
studied in this research, corresponding to an optimum maximum rate of reaction of •
6.63 mmoI.L-1.min-1.g-1IME and a Km.app. value of 72.69 mmol.lL
.t,.
127
From the spectroscopie properties of D-Iactose with alkali and alkaline earth
metals studied here, the following conclusion may be reached :
- The strong hydrogen bonding system of the free D - lactose is
preserved upon metalation;
- There is some interaction between the metal ions and the OH, as
weil as the C - a groups of the D - lactose anion.
The Plug flow tubular reactor performed better and was more economical than the
continuous stirred tank reactor for hydrolyzing cheese industrial effluent.
A wide range of applications are available to the hydrolyzed lactose syrup in
toffee, ice cream, soft fruit drinks, yogurts, bakery and dairy desserts due of their
sweetness and special protein value(72) .
It can be concluded from the economic analysis made in this study that the pilot
plant proposed to be installed in parallel to the existing treatment-plant at the
cheese factory in Notre-Dame du Bon Conseil, Québec, Canada was profitable.
This profitability was due to the tact that two valuable by-products were obtained
from this option namely whey protein concentrates ( WPC 35% ) and the
hydrolyzed whey syrup of glucose and gaiactose.
128
The second option which was to install the pilot in series with the existing
treatment plant wasn't profitable according to my economic evaluation. This was
due to the fact that only one by-product (glucose and galactose syrup) was
obtained in this option. Moreover, the permeate had a low lactose content (0.2%
or 2 mg/L). This was evident since most of organic matter in the effluent had
undergone anaerobic fermentation in the existing treatment plant to produced
methane gas.
Both options had one common advantage that they were environmentally safe
projects. The Biochemical Oxygen Oemand ( BOOs) was reduced from 35,000
mg/L for cheese industrial effluent to 300 mg/L for the hydrolyzed effluent while
that of the existing treatment plant was reduced from 2,300 ppm to 84 ppm weil
below the limit of 1,000 mg/L stipulated by Environment Canada for dairy
industries.
129
VI. RECOMMENDATIONS.
1. The highest maximum rate of reaction , Vmax., in the presence of single
cations was obtained with Mg++. It would be interesting to further investigate the
combine effect of Mg++ and the other three cations tested in research on the
kinetic parameters of lactose hydrolysis reaction. This wasn't done in this study
because of the amount of experiments involved.
2. Further interest should include more FT-IR studies on the interactions of
metal ions with sugar (lactose) and if possible the mechanism proposed in this
study should be confirmed by conductivity, x - ray diffraction as weil as NMR
studies.
3. 1 strongly recommend that the UF permeate; 5% (w/v) lactose should be
concentrated in a reverse osmosis system to about 15 or 20% (w/v) lactose .
before sending it to the reactor. This would reduced a substantial amount of waste
water that would have been otherwise pumped into the reactor thereby making the
system more efficient and most important more profitable .
....
130
REFERENCES.
1. Statistic Canada, The Dairy Review, Catalogue No. 23-001, vol.56 No.7 July 1995.
2. Keller A. K., Permeate utilization. APDI/CDR, Dairy Products Technical Conference, Chicago, April 25 - 26 , Pp 101 - 107 (1990).
3. Khalid . A. Rahim and Byong H. Lee, Production and characterization of B - galactosidase from Psychrotrophic Bacillus subtilis KL88, Biotechnology and Applied Biochemistry, vol.13 pp 246 - 256 (1991).
4. Jones, H. R, Pollution Control in the Dairy Industry. Noyes Data Corporation, New Jerssey, 274pp (1974).
5. Rajesh D. Tyagi, Évaluation de Déchets de Produits Laitiers comme Substrat pour Bioconversion, INRS-Eau Université de Québec (1985)
6. Agbebavi ,J.T., Denis Rouleau and RC. Mayer, " The Effects of Whey Cation on the Kinetic Parameters of a Model for Enzymatic Hydrolysis of Lactose" J. Chem. Tech. & Biotechnol., 37, pp 153 - 168 (1987).
7. Smart John and Barry Richardson, Molecular properties and sensitivity to Cations of B-Galactosidase from Streptococcus thermophilus with four enzyme substrates,Applied Microbiol. Biotechnol. 26 : pp177 -185 (1987)
8. Greenberg, N.A. and RR Mahoney, Production and Characterization of BGalactosidase from Streptococcus thermophilus, J of Food Sc., vol.47, (1982)
9. Lefebvre, J. et R Masella. Opportunité de valorisation de trois sousproduits de transformation de l'industrie laitière. Les presses de l'université Laval (1990).
10. Byeong-seon Chang and RR Mahoney, Factors affecting the thermostability of B-galactosidase (Streptococcus salivarius subsp. thermophilus) in milk : a quantitative study, J. of Dairy Research, 56, pp785 - 792 (1989).
11. Jian Yu and Kenneth L. Pinder, Intrinsic Fermentation Kinetics of Lactose in Acetogenic Biofilms, Biotech. & Bioengineering, vol. 41 pp 479 - 488 (1993).
131
12. Barford J.P. et aL, Anaerobic Digestion Of high Strength Cheese Whey Utilizing Semi-Continuous Digesters and Chemical Flocculation Addition, Biotechnology & Bioengineering, vo1.28, pp1601-1607, (1986)
13. Kisaalita, W.S., K.L.Pinder and K.V.Lo, "Acidogenic Fermentation of Lactose", Biotechnology & Bioengineering, vo1.30, pp88-95 (1987).
14. Mehaia,M. A., Jose Alvarez & Munir Cheryan, " Hydrolysis of Whey Permeate in a Continuous Stirred Tank Membrane Reactor", Int. Dairy Journal 3, p179 - 192 (1993)
15. Filon, J. Les technologies propres au Québec : puisque jamais, Fiche 1: Secteur agro-alimentaire, technologie propre, production fromagère (1988).
16. Zadow, J. G., Whey and Lactose Processing, Elsevier Applied Science, London (1992).
17 Hemming M. L. " Treatment of Dairy Wastes" in Food Industry Wastes: Disposai and Recovery by A. Herzka and R. G. Booth. Applied Science publishers Ltd., 1981
18 Pepper D., " Recovery of Materials from Effluents by Membrane . Systems" in Food Industry Wastes: Disposai and Recovery. Applied
Science publishers Ltd. , 1981
19 Modler, H. W. Canadian whey research programs. Proc. Whey Products Conference. US. Department of Agriculture & Whey Product Institute, Chicago, Illinois, USA (1982).
20. Presnosil, J.E., E. Stuker, and J. R. Bourne, Formation of Oligosaccharides during enzymatic lactose hydrolysis : Part 1 : State of Art; Biotechnology and Bioengineering, vo1.30, No. 9, pp1019 -1025,1987.
21 . Shang-Tian Yang, An Investigation of the Performance of Lactose Hydrolysis Catalyzed by j3-galactosidase, M. Sc. Thesis, Purdue University, August 1980.
22 Demaimay, M., Le Henaff, Y., and Printemps, P., Hydrolysis of Lactose on Catalytic Resin, Process Biochemistry, April 1978.
132
23. Lopez - Leiva Miguel and Vassilis Gekas, A Crossflow Immobilized Enzyme Reactor For The Hydrolysis of Whey, Process Biochem., p 27- 29 Feb., 1986,
24. M. Oeclerie et al., Hydrolysis of whey by whole cells of Kluyveromyces bulgaricus immobilized in calcium alginate gels and in hen egg white, Applied Microbiology Biotechnology, vol. 22 : 438 -441 (1985)
25. Mark West, G.W.Emerson and P.A.Sullivan, Purification and properties of two lactose hydrolases from Trichoporon cutaneum,J. of General Microb., vol. 136, pp1483- 1490 (1990).
26. Mahoney ,RR and John R Whitaker, Stability and Enzymatic Properties of B-Galactosidase from Kluyveromyces fragilis, J. of Food Biochem., 1, pp327- 350 (1977).
27. B. Mertens and A. Huyghebaert, "Lactose hydrolysis in an enzymatic membrane reactor" Milchwissenschaft 42 (10), pp 640 - 645 (1987).
28. Whitaker, J. R, The glycoside hydrolases, Pp 462-465 in Principles of Enzymology for the Food Sciences. Marcell Oekker, Inc., New York(1972).
29. Shukla, T. P. B-galactosidase technology: A Solution to the Lactose Problem. CRC.Critical Review, Food Technol. 5 : 325 (1975).
30. Wallenfels, K,and R Weil, B-galactosidase, Pp 616-663, The Enzyme, Vol. VII, P.O. Boyer, ed. Academic Press, New York. (1972)
31 Kulp, K Carbohydrates, Enzyme in Food Processing, Pp 92-97, G. Reed, Academic Press, New York (1975).
32. Kennedy J.F., E.H.M .. Melo, and K Jumel. "Immobilized Enzymes and Cells." Chemical Engineering Progress, pp81 - 89, July 1990.
33. Gekas Vassilis and Miguel Lopez - Leiva, Hydrolysis of Lactose : A Literature Review, Process Biochemistry, pp. 2 - 12, February 1985.
34. Greenberg N.A. and RR Mahoney. Process Biochemistry, VoI.16,p2(1981)
35. Finocchiaro Terry, Norman F. Oison, and Thomas Richardson, "Use of Immobilized Lactase in Milk Systems." Advances in Biochemical Engineering,VoI.15, P71-87 (1980) .
.c,.
133
36. Enzymes at work, Brochure of the Enzyme Process Division, Bioindustrial Group, Novo Nordisk AIS, Denmark.
37. Wang ,O. 1. C., C. L.Cooney, AL.Demain, P.Dunill, AE.Humphrey and M.D. Lilly, "Fermentation and Enzyme Technology" John Wiley & Sons Inc., 311 - 367 (1979).
38. Falb RD., "Review of recent Enzyme Immobilization Techniques", Enzymes Engineering, Plenum press, New York, Vol.2, pp. 67-
76(1974).
39. "Biocatalyseurs Immobilisés" Savoir - faire, Hoechst High Chemical Magazine, 12/ 1992
40. Durham D. R , Marshall L. C., Miller J. G., and Chmurny A B, Characterization of Inorganic Biocarriers that Moderate System Upsets during Fixed - Film Biotreatment Process, Applied and Environmental Microbiology, Vol.60, No. 9, Pp. 3329 - 3335, Sept. 1994.
41 . Chiang, John Paichun and Lantero, Oreste John, Jr., Immobilization of Biocatalysts on Granular Diatomaceous Earth, European Patent Application, Publ. No. : 0 216 272 A3
42. Lilly, M.D., D.L.Regean and P.Dunili " Weil - mixed Immobilized Enzyme Reactors" Enzymes Engineering, Plenum press, New York, Vol. 2, pp245-251 (1974).
43. Shang - Tian Yang and Martin R Okos, A New Graphical Method for Determining Parameters in Michealis - Menten - Type Kinetics for Enzymatics Lactose Hydrolysis, Biotechnology and Bioengineering, vol. 34, pp 763-773 (1989)
44. Peterson, RS. and C.G. Hill,Jr. & C.H. Amundson, Effect of Temperature on the Hydrolysis of Lactose by Immobilized B-Galactosidase in a Capillary Bed Reactor, Biotechnology and Bioengineering, vo1.34,pp429-437 (1989).
45. Pitcher, W. H., Jr., "Immobilized Lactase for Whey Hydrolysis : Stability and Operating Strategy." Enzymes Engineering, Vol. 4,Pp.67 -75(1978).
46. Hung Ma, P. Monsan, R. Mayer et D. Rouleau, "Etude Cinétique de l'Hydrolyse du Lactose." The Canadian Journal of Chemical
Engineering, Vol. 61 , 75 - 79 Feb. 1983.
134
47. Yang S. T. and M. R. Okos, Effect of Temperature on Lactose Hydrolysis by Immobilized B-Galactosidase in Plug - Flow Reactor, Biotechnologyand Bioengineering, vol.33, pp 873 - 885 (1989).
48. Deschavanne, P. J., Viratelle O. M., and J. M. Yon, J. Biol. Chem. 253, 833(1978).
49 Baret, J.L. , Large-Scale Production and Application of Immobilized Lactase, Methods in Enzymology, Vol. 136, Pp 411-423
50. Levenspiel, O., Chemical Reaction Engineering (Wiley, New York, 1972)
51 Fogler, H. Scott. Element of Chemical Reaction Engineering, published by Prentice-Hall International Inc., 1986
52. Bakken A P., Hill C. G., Jr. and Amundson C. H., Hydrolysis of Lactose in Skim Milk by Immobilized B-Galactosidase in a Spiral Flow Reactor, Biotechnology and Bioengineering, vol. 33, pp 1249 - 1257 (1989).
53. Henley J. P. and A Sadana, Biotechnol. and Bioeng. ,Vol .28,1277(1986)
54. Gianfreda,L., M. Modafferi, and G. Greco, Jr., Enzyme and Micro. Tech.,7, 78(1985)
55. Anders Axelsson and Guido Zacchi, "Economic Evaluation of the Hydrolysis of Lactose Using Immobilized B-Galactosidase, Applied Biochemistry and Biotechnology vol. 24/25, pp 679 - 693 (1990).
56. A Illanes, et aL , Immobilization of lactase for the continuous hydrolysis of whey permeate, Bioprocess Engineering 5257 - 262 (1990).
57. AC.Olson and W.L.Stanley. Immobilization of enzymes on phenol -formaldehyde resins, Enzymes Engineering, 1974 Plenum press, New York, Vol. 2 pp 91 - 96.
58 Klaus Mosbach, Methods in Enzymology, Vol. 136, Immobilized Enzymes and Cells, Part C. 1987 Edition.
59. Tanaka,Y., Kagamishi, A , Kuichi , A,and Horiuchi,T. J., Journal of Biochemistry, Vol. 77 p241 (1975)
60. Friends, B. A , and Shahani,K. M., Biotech. and Bioeng., 24,P329(1982).
135
61 . Gavrilovic, M., Maginot, M. J., Schwartz-Garvrilovic, C., et Wallach, J., Manipulations d'analyse Biochimique, Nouvelle édition, 1992.
62. Rrendlman J. AJr.,Advances in Carbohydrate Chemistry,21, P209(1966)
63. D. M. Whitfield, S. Stojkovski, and B. Sarkar," Metal Coordination to Carbohydrates. Structure and Function".Coordination Chemistry Reviews, 122 171-225 (1993).
64. Tersis, A , Crystal Structure Communication, Vol. 7, (1978), 95 - 99.
65 Tajmir - Riahi H. A, Sugar Interaction with Magnesium Ion, Sythesis, Spectroscopic, and Structural Properties of Mg - Sugar Complexes containing L - Arabinose, Journal of Inorganic Biochemistry, 22, pp 55- 61 (1984)
66. Nakamoto K., Infrared Spectra of Inorganic and Coordination Compounds. Wiley, New York, 1963
67. Tajmir - Riahi H. A, "Interaction of D-Glucose with alkaline earth metal ions". Synthesis, Spectroscopic, and Structural Characterization of Mg(lI) and Ca(II)- D-Glucose Adducts and the Effect of Metal - Ions Binding on Anomeric Configuration of the Sugar, Carbohydrate Research, 183, Pp 35 - 46 (1988).
68. Cook, W. J. and Bugg, C. E., Metal-Ligand Interactions in Organic Chemistry and Biochemistry, Vol. 2, Reidel, Dordrecht, Holland, Pp231-256 (1977).
69. Kalman Burger and Laslo Nagy, Metal Complexes of Carbohydrates and Sugar-type Ligands, pp236-267, Dept. of Inorganic and Analytic Chemistry, A Jozsef University, 6701 Szeged, Hungary.
70. Deesle D. W. and Munir Cheryan, A CSTR-Hollow Fibre System for Continuous Hydrolysis of Protein. Factors affecting long term stability of the reactor. Biotech. and Bioeng., vol.24, p 69 - 82 (1982) .
71. Samejima, M. and K. Kimura, Immobilized Enzymes using Resinous Carriers, Enzyme Engineering, Plenum press, New York, Vol 2 pp131-135 (1974).
72. Max S. Peters, and Klaus D. Timmerhaus. Plant Design and Economics for Chemical Engineers, 4th Edition, McGraw-Hill, Montréal, 1991 .
.t,.
136
73. Gael D. Ulrich. A Guide to Chemical Engineering Process Design and Economies, John Wiley & Sons, 1984
74. Guthrie K. M., Data and Techniques for preliminary Capital Cost Estimation, Chem. Eng., pp. 114-142, vol. 3, March 1969.
75. Perry R. H., and D. W. Green. Perry Chemical Engineer's Handbook, 6th Edition, McGraw-Hill, 1985
76. Journal of Chemical Engineering, Vol. 102, # 7, July 1995, CE Plant Cost Index
77. Donald Gagnon, Projet fin d'étude; Etude Technico - Economique de la Gestion et de la Lixiviation Bacteriologique Simultanées des Boues Municipales, Section Génie Chimique, UQT-R, Avril 1992
78. Erik Tremblay, Projet de fin d'étude : Ingénierie d'Extraction de la Miraculine, Section Génie Chimique, UQT-R, 1995
79. Holland F.A , Watson F.A, and Wilkinson J.K., Profitability of Invested Capital, Chem. Eng., pp139-144, August 20,1973.
80. Philip A Schweitzer, Handbook of Separation Techniques for Chemical Engineers
81. Morris Zief and Robert Speights, Ultrapurity Methods and Techniques.
82 Degarmo E. P., Sullivan W. G. and Bontadelli J. A, Engineering Economy, 9th Edition, Macmillan Publishing Company, 1993.
83. Bernd F. Pritzwald-Stegmann, Lactose and some of derivatives, J. of the Society of Dairy Technology, vol. 39, NO. 3, pp 91 - 97, July 1986.
84 Richmond M.L., Gray J.1. and Stine C.M., "B-galactosidase : Reviewof Recent Research Related to Technological Application, Nutritional Concerns, and Immobilization" J. Dairy Science ,vol. 64, No. 9, pp1759 - 1771 (1981)
85. Jacques Danielle, Valorisation des sous - produits de l'industrie de transformation du lait. Centre de Valorisation de la Biomasse Québec (1993).
137
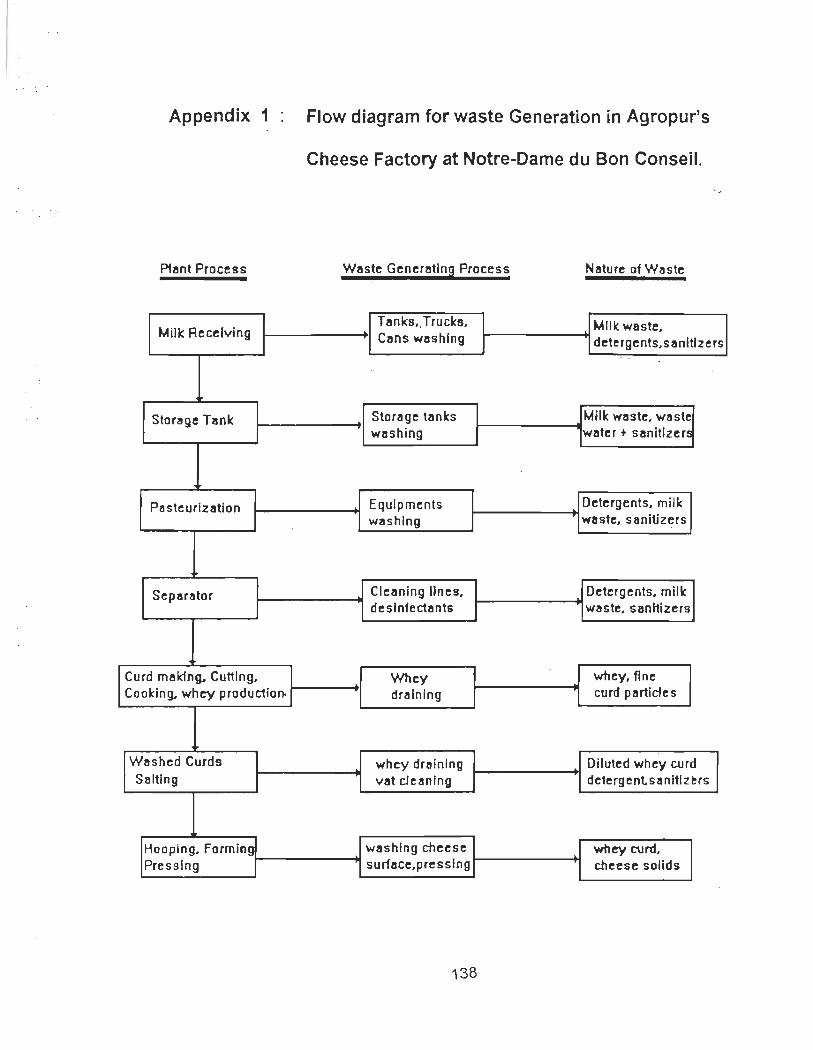
Appendix 1 Flow diagram for waste Generation in Agropur's
Cheese Factory at Notre-Dame du Bon Conseil.
Phmt Process Waste Generzrtlng Process Nature of Waste
Milk Recelving TlInks"Trucks, Mil" w8ste, Cans wlIshlng detergents,sanltlz e rs
, ,
Storage Tank Storllge tanks Milk waste, waste washing 'WlIter t sanitizers
1
PasteurizlItion Equlpments Detergents, mille: washlng waste, sanitizers
Separator Clellning Unes, Detergents. milk deslnfectants \fIaste. sanltizers
1
Curd mllldng. Cutting.
1
Whey
1 ~ whey,ftne Cookin!}. whey production. dralnlng curd partldes
Washed Curds whey drainlng Diluted whey curd Saltlng vat cJeanlng detergenlsanltlz ers
Hooplng. Forming washlng cheese whey eurd. Pressing surface,presslng cheese solids
138
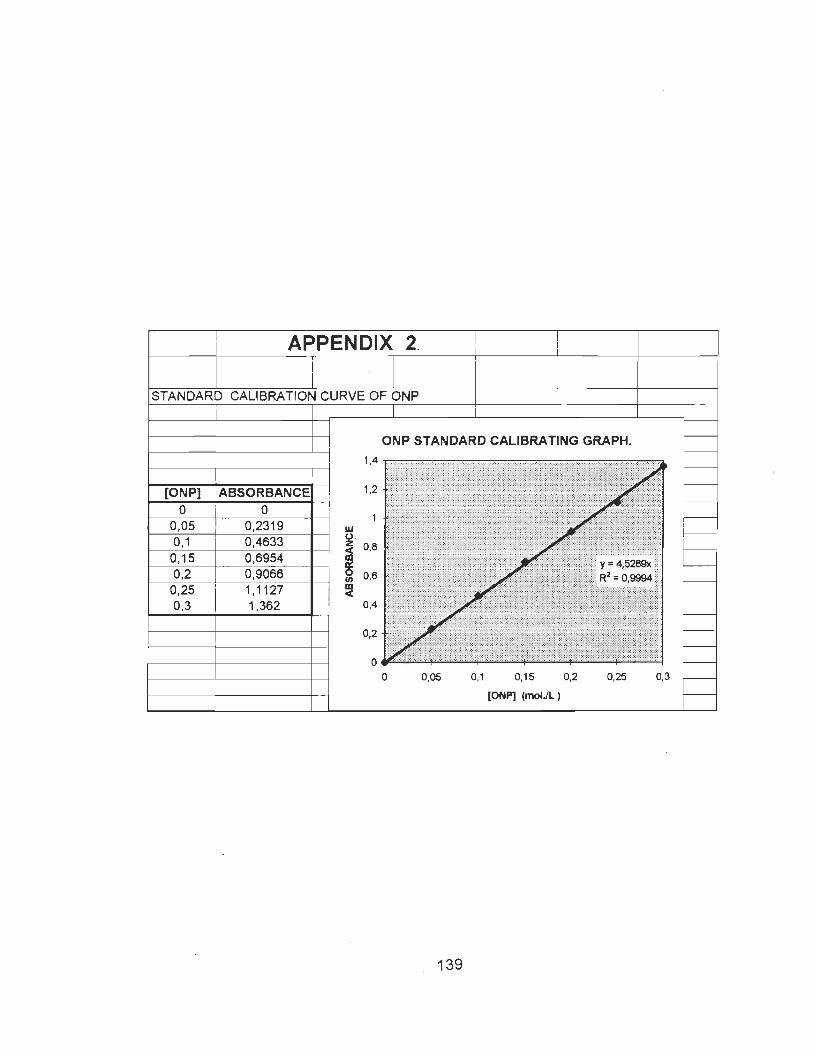
APPENDIX 2.
STANDARD CALIBRATION CURVE OF ONP
ONP STANDARD CALIBRATING GRAPH.
1,4 ==============~
[ONP] : ABSORBANCE 1,2
° ° 0,05 0,2319 1 w 0,1 0,4633 o . z
0,15 0,6954 1 0,2 0,9066 en
0,8
0,6
0,25 1,1127 m 0(
0,3 1,362 0,4
0,2
0,05 0,1 0,15 0,2 0,25 0,3
(ONP] (moIJl)
139
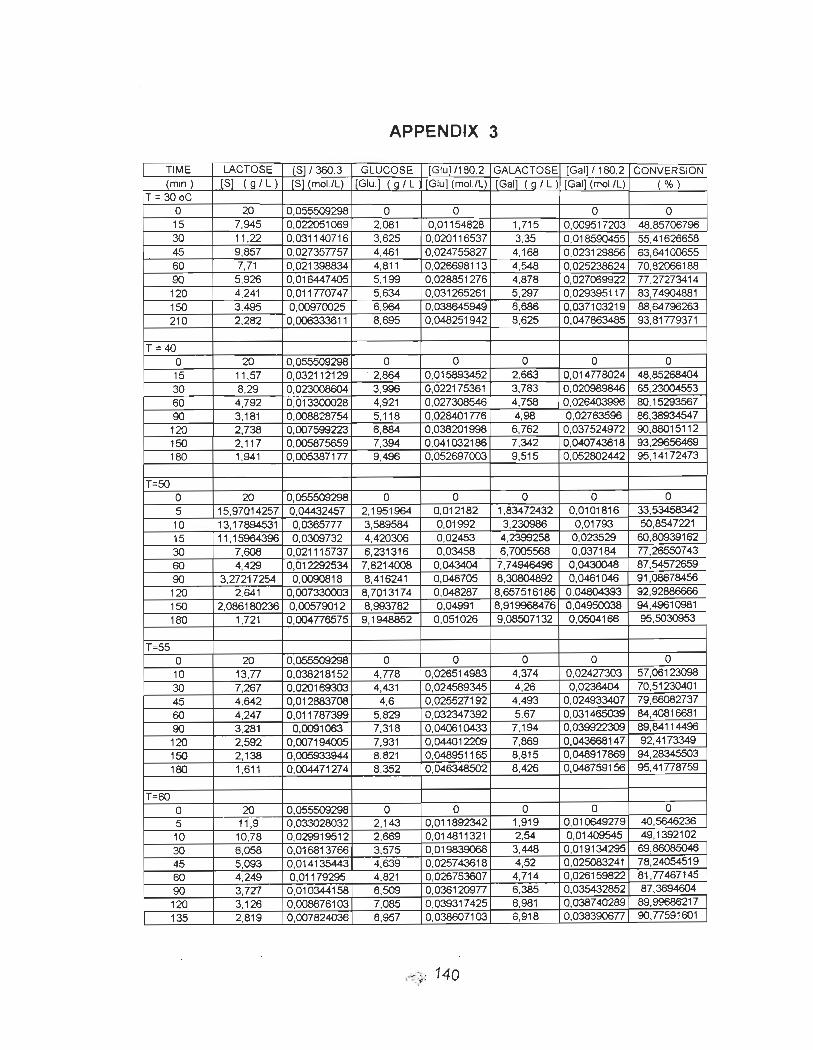
APPENDIX 3
TIME LACTOSE [5]/360.3 GLUCOSE [Glu]/180.2 GALACTOSE [Gal]/180.2 CONVERSION (min.) [5] (g / L) (51 (moI.lL) ! [Glu.] (g / L [Glu] (moI.lL) [Gal] (g / L) [Gal] (moI.lL) ("M)
T = 30 oC 0 20 0,055509298 0 0 0 0 15 7,945 0,022051069 2,081 0,01154828 1,715 0,009517203 48,85706796 30 11 ,22 0,031140716 3,625 0,020116537 3,35 0,018590455 55,41626658 45 9,857 0,027357757 4,461 0,024755827 4.168 0.023129856 63,64100655 60 7,71 0,021398834 4,811 0.026698113 4,548 0.025238624 70.82066188 90 5.926 0,016447405 5,199 0,028851276 4,878 0.027069922 77,27273414 120 4.241 0,011770747 5,634 0.031265261 5,297 0.029395117 83,74904881 150 3,495 0,00970025 6.964 0.038645949 6,686 0,037103219 88.64796263 210 2,282 0,006333611 8,695 0,048251942 8,625 0,047863485 93.81779371
T = 40 0 20 0,055509298 0 0 0 0 0 15 11 ,57 0,032112129 . 2,864 0,015893452 2.663 0,014778024 48,85268404 30 8,29 0,023008604 3,996 0,022175361 3,783 0,020989846 65,23004553 60 4,792 0,013300028 4,921 0,027308546 4,758 0,026403996 BO,15293567 90 3,181 0,008828754 5,118 0,028401776 4,98 0,02763596 86,38934547 120 2,738 0,007599223 6,884 0,038201998 6,762 0,037524972 90,88015112 150 2,117 0,005875659 7.394 0,041032186 7,342 0.040743618 93,29656469 180 1,941 0,005387177 9.496 0,052697003 9,515 0.052802442 95,14172473
T=5O 0 20 0,055509298 0 0 0 0 0 5 15,97014257 0,04432457 2,1951964 0.012182 1.83472432 0,0101816 33,53458342 10 13,17894531 0,0365777 3,589584 0,01992 3,230986 0,01793 50,8547221 15 11,15964396 0,0309732 4,420306 0,02453 4,2399258 0.023529 60,80939162 30 7,608 0,021115737 6,231316 0,03458 6,7005568 0,037184 77,26550743 60 4,429 0,012292534 7,8214008 0,043404 7,74946496 0,0430048 87,54572659 90 3,27217254 0,0090818 8,416241 0,046705 8,30804892 0,0461046 91,08678456 120 2,641 0,007330003 8,7013174 0,048287 8,657516186 0,04804393 92,92886666 150 2,086180236 0,00579012 8,993782 0,04991 8,919968476 0,04950038 94,49610981 180 1,721 0,004776575 9,1948852 0,051026 9,08507132 0,0504166 95,5030953
T=55 0 20 0,055509298 0 0 0 0 0 10 13.77 0,038218152 4,778 0,026514983 4,374 0,02427303 57,06123098 30 7,267 0,020169303 4,431 0,024589345 4,26 0,0236404 70,51230401 45 4,642 0,012883708 4,6 0,025527192 4,493 0,024933407 79,66082737
60 4,247 0,011787399 5,829 0,032347392 5,67 0,031465039 84,40816681 90 3,281 0,0091063 7.318 0,040610433 7.194 0,039922309 89,84114496 120 2,592 0,007194005 7,931 0,044012209 7,869 0,043668147 92,4173349 150 2,138 0,005933944 8,821 0,048951165 8,815 0,048917869 94,28345503 180 1,611 0,004471274 8,352 0,046348502 8,426 0,046759156 95,41778759
T=60 0 20 0,055509298 0 0 0 0 0 5 11 ,9 0,033028032 2,143 0,011892342 1,919 0,010649279 40,5646236 10 10,78 0,029919512 2,669 0,014811321 2.54 0,01409545 49,1392102
30 6,058 0,016813766 3,575 0,019839068 3,448 0,019134295 69,86085046 45 5,093 0,014135443 4,639 0.025743618 4,52 0,025083241 78,24054519 60 4,249 0,01179295 4,821 0,026753607 4,714 0,026159822 81 ,77467145 90 3,727 0,010344158 6,509 0,036120977 6,385 0,035432852 87,3694604
120 3,126 0,008876103 7,085 0,039317425 6,981 0,038740289 89,99686217
135 2,819 0,007824036 6,957 0,038607103 6,918 0,038390677 90,77591601
140
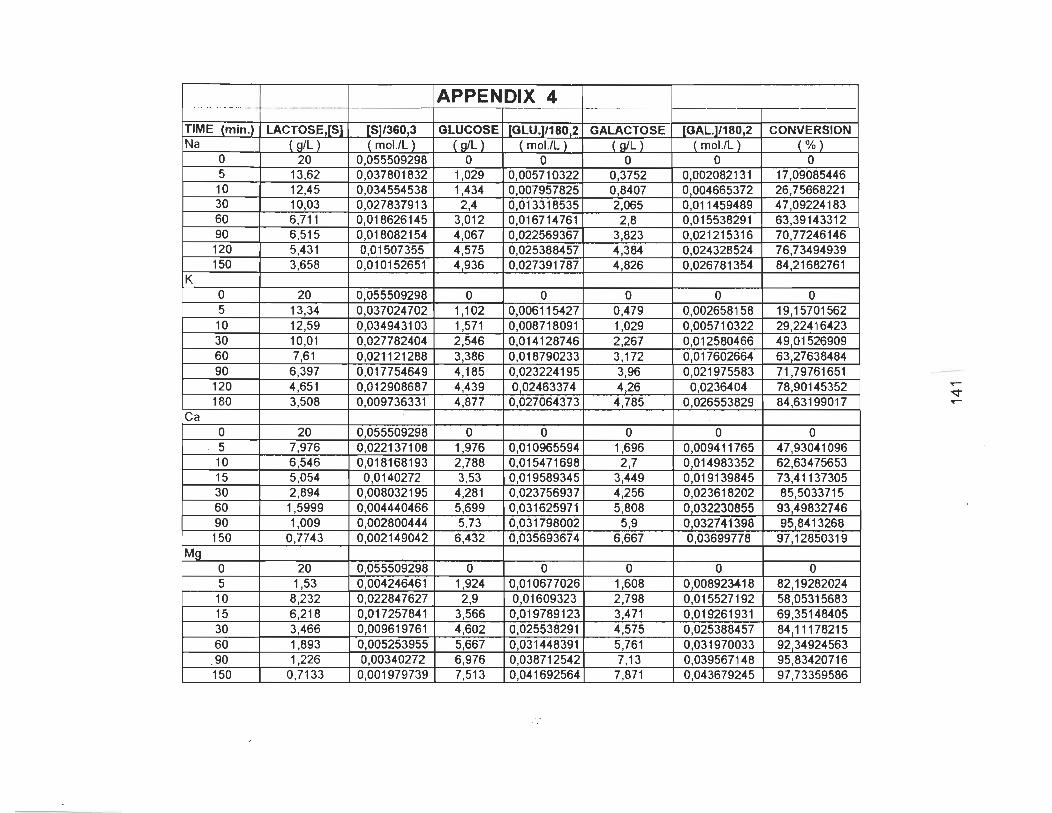
APPENDIX 4 .... ... -.. ... - .... _- - _ .. . .. __ ._~._------ -
TIME (min.) LACTOSE,[S] [S]/360,3 GLUCOSE [GLU.)J180 2 GALACTOSE [GAL.]/180,2 CONVERSION Na ( g/L) (mol.IL ) (glL) (mol.IL ) (g1L) (mol.IL ) (% )
0 20 0,055509298 0 0 0 0 0 5 13,62 0,037801832 1 029 0,005710322 0,3752 0,002082131 1709085446 10 12,45 0,034554538 1 434 0,007957825 08407 0004665372 26,75668221 30 10,03 0,027837913 2,4 0,013318535 2,065 0,011459489 47,09224183 60 6,711 0,018626145 3,012 0,016714761 2,8 0,015538291 63,39143312 90 6,515 0,018082154 4,067 0,022569367 3,823 0,021215316 70,77246146 120 5,431 0,01507355 4,575 0,025388457 4,384 0,024328524 76,73494939 150 3,658 0,010152651 4,936 0,027391787 4,826 0,026781354 8421682761
K 0 20 0,055509298 0 0 0 0 0 5 13,34 0,037024702 1,102 0,006115427 0,479 0,002658158 19,15701562 10 12,59 0,034943103 1,571 0,008718091 1,029 0,005710322 29,22416423 30 10,01 0,027782404 2,546 0,014128746 2,267 0,012580466 49,01526909 60 7,61 0,021121288 3,386 0,018790233 3,172 0,017602664 6327638484 90 6,397 0,017754649 4,185 0,023224195 3,96 0,021975583 71,79761651 120 4,651 0,012908687 4,439 002463374 4,26 0,0236404 78,90145352 ...-
~ 180 3,508 0,009736331 4,877 0,027064373 4,785 0,026553829 84,63199017 ...-
Ca
° 20 0,055509298 0 0 0 0 0 5 7,976 0,022137108 1,976 0010965594 1,696 0,009411765 4793041096 10 6,546 0,018168193 2,788 0,015471698 2,7 0014983352 62,63475653 15 5,054 0,0140272 3,53 0019589345 3,449 0019139845 73,41137305 30 2,894 0,008032195 4,281 0,023756937 4,256 0,023618202 855033715 60 1,5999 0,004440466 5,699 0,031625971 5,808 0032230855 9349832746 90 1,009 0,002800444 5,73 0,031798002 5,9 0032741398 958413268 150 0,7743 0,002149042 6,432 0,035693674 6,667 0,03699778 97,12850319
Mg 0 20 0,055509298 0 0 0 0 0 5 1,53 0,004246461 1,924 0,010677026 1,608 0008923418 8219282024 10 8,232 0,022847627 2,9 001609323 2,798 0,015527192 5805315683 15 6,218 0,017257841 3566 0,019789123 3,471 0,019261931 69,35148405 30 3,466 0,009619761 4,602 0,025538291 4,575 0,025388457 8411178215 60 1,893 0,005253955 5,667 0,031448391 5,761 0,031970033 9234924563
.90 1,226 0,00340272 6,976 0,038712542 7,13 0,039567148 95,83420716 150 0,7133 0,001979~39_ _7,513 0,0416925Ji-t 7,871
- ----0,043679245 97,73359586
--
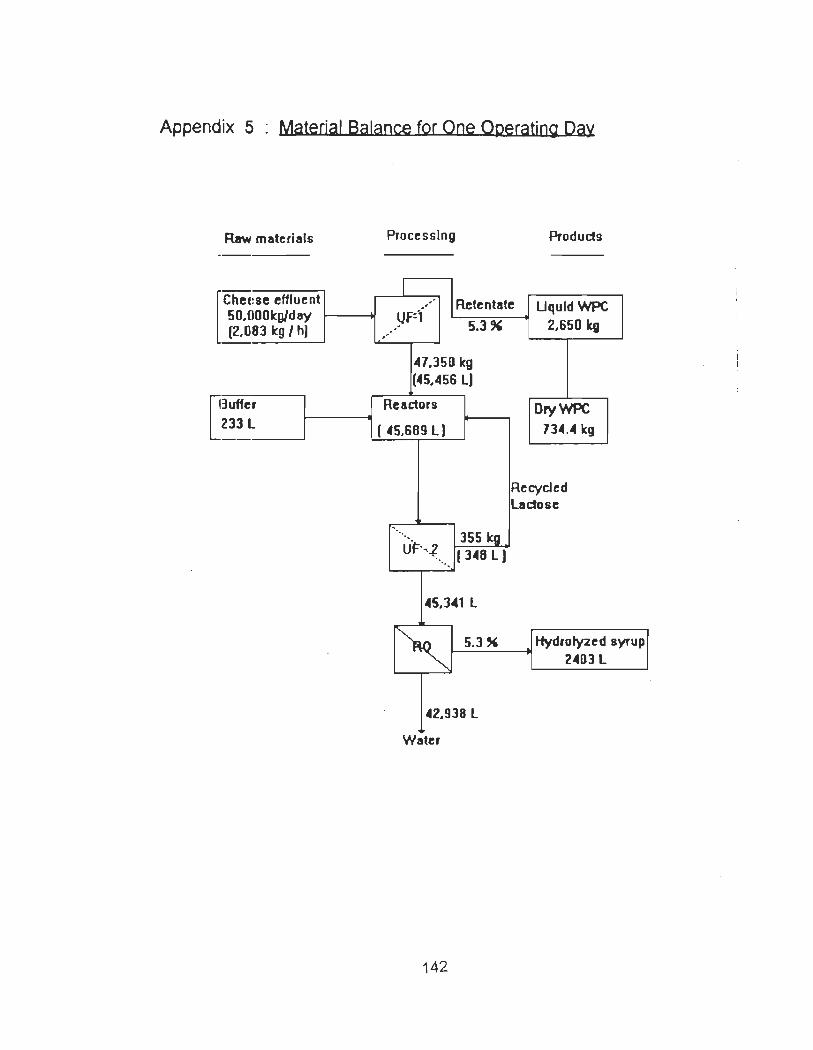
Appendix 5 Matedal Balance for One Operatjng Day
Raw matcrials
[
Chef!Se effluent 50.0001cg/d ay (2.083 kg / hl
L3uffer
233l ----
Processlng Products
r Retentate UquldWPC L....-.5-.3-"-~ 2.650 kg /~f::(
~7.350 kg (45.456l)
Readors
( 45,689 li
355 kg Ùf='",~ ( 3~8 l)
"
45,341 l
~ 5.3"
42.938 l
Water
142
DryWPC 734.4 \cg
RecycJed lactose
Hydrofyzed syrup 2401l
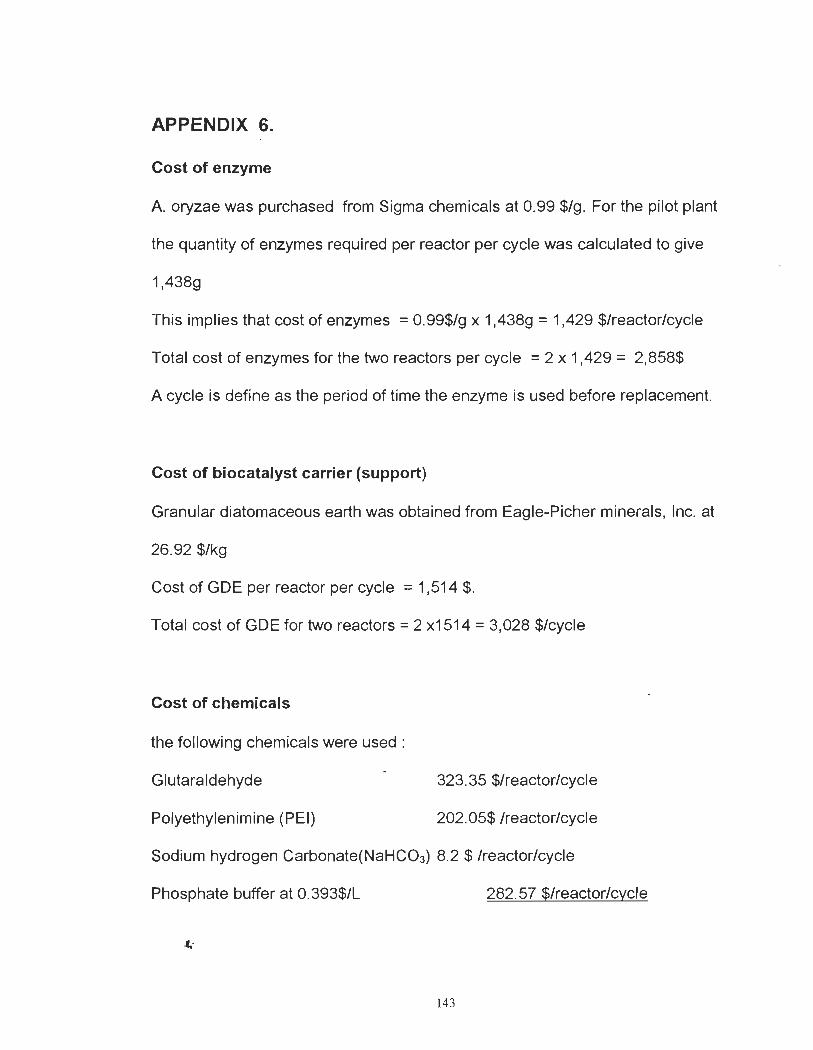
APPENDIX 6.
Cost of enzyme
A. oryzae was purchased fram Sigma chemicals at 0.99 $/g . For the pilot plant
the quantity of enzymes required per reactor per cycle was calculated to give
1,438g
This implies that cost of enzymes = 0.99$/g x 1,438g = 1,429 $/reactor/cycle
Total cost of enzymes for the two reactors per cycle = 2 x 1,429 = 2,858$
A cycle is define as the period of time the enzyme is used before replacement.
Cost of biocatalyst carrier (support)
Granular diatomaceous earth was obtained fram Eagle-Picher minerais, Inc. at
26.92 $/kg
Cost of GDE per reactor per cycle = 1,514 $.
Total cost of GDE for two reactors = 2 x1514 = 3,028 $/cycle
Cost of chemicals
the following chemicals were used :
Glutaraldehyde
Polyethylenimine (PEI)
323.35 $/reactor/cycle
202.05$ Ireactor/cycle
Sodium hydragen Carbonate(NaHC03 ) 8.2 $ Ireactor/cycle
Phosphate buffer at 0.393$/L 282.57 $/reactor/cycle
.fi
143
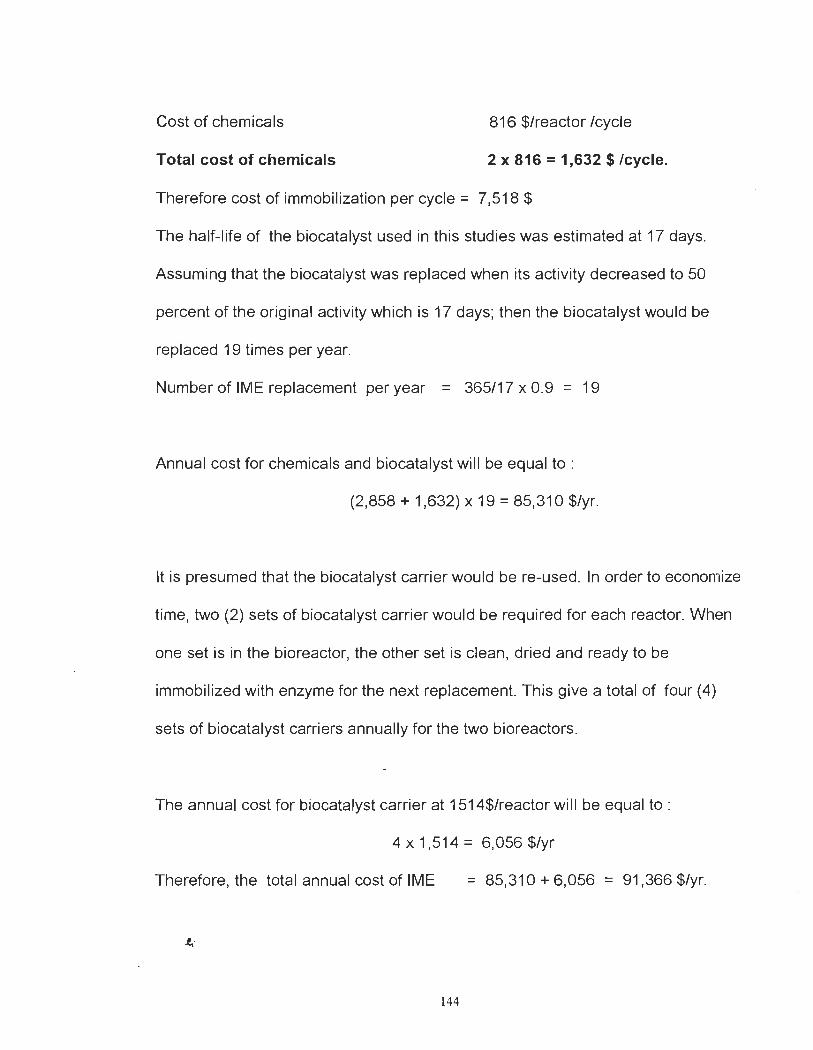
Cost of chemicals 816 $/reactor /cycle
Total cost of chemicals 2 x 816 = 1,632 $/cycle.
Therefore cost of immobilization per cycle = 7,518 $
The half-life of the biocatalyst used in this studies was estimated at 17 days.
Assuming that the biocatalyst was replaced when its activity decreased to 50
percent of the original activity which is 17 days; then the biocatalyst would be
replaced 19 times per year.
Number of IME replacement per year = 365/17 x 0.9 = 19
Annual cost for chemicals and biocatalyst will be equal to :
(2,858 + 1,632) x 19 = 85,310 $/yr.
It is presumed that the biocatalyst carrier would be re-used. In order to economize
time, two (2) sets of biocatalyst carrier would be required for each reactor. When
one set is in the bioreactor, the other set is clean, dried and ready to be
immobilized with enzyme for the next replacement. This give a total of four (4)
sets of biocatalyst carriers annually for the two bioreactors.
The annual cost for biocatalyst carrier at 1514$/reactor will be equal to :
4 x 1,514 = 6,056 $/yr
Therefore, the total annual cost of IME = 85,310 + 6,056 = 91 ,366 $/yr.
.t.
144

Appendix 7 : Calculation of utility cost.
Electricity
The projected cost for electricity (industrial) obtained from Hydro- Québec is 0.07
$/kw-h.
Electricity is consumed mostly by the pumps and the heating system.
Cost of power consumption by ail the 2 hp pumps (P-1, P-2, P-5, and P-6)
= 4pumps x 2hp/pump x 0.7457 kw/hp x 8760 h/yr x 0.07 $/kw-h x 0 .9
= 3,292 $/yr
Cost of power consumption by ail the 1 hp pumps(P-3, and P-4) and the agitator
is equal to 3 x 1 hp x 0.7457 kw/hp x 8760 h/yr x 0.07 $/kw-h x 0.9
= 1,235 $/yr
Co st of steam
Q = mh x Cp,h x Th = me x Cp,c x Tc
= mh X 4180j/kg-k x 73°k = 0.0171 kg/s x 1,251j/g-k x 25 ok
= mh = 53,480.5 / 305,148 kg/s = 0.1753 kg/s
Annual steam cost, As = 0.1753kg/s x (3.15 x 10⁶ s/yr) x 0.9 x 0.014 $/kg (78)
= 6,958 $/yr
The total annual cost for utilities = 3,292 + 1,235 + 6,958 = 11,485 $/yr.
145
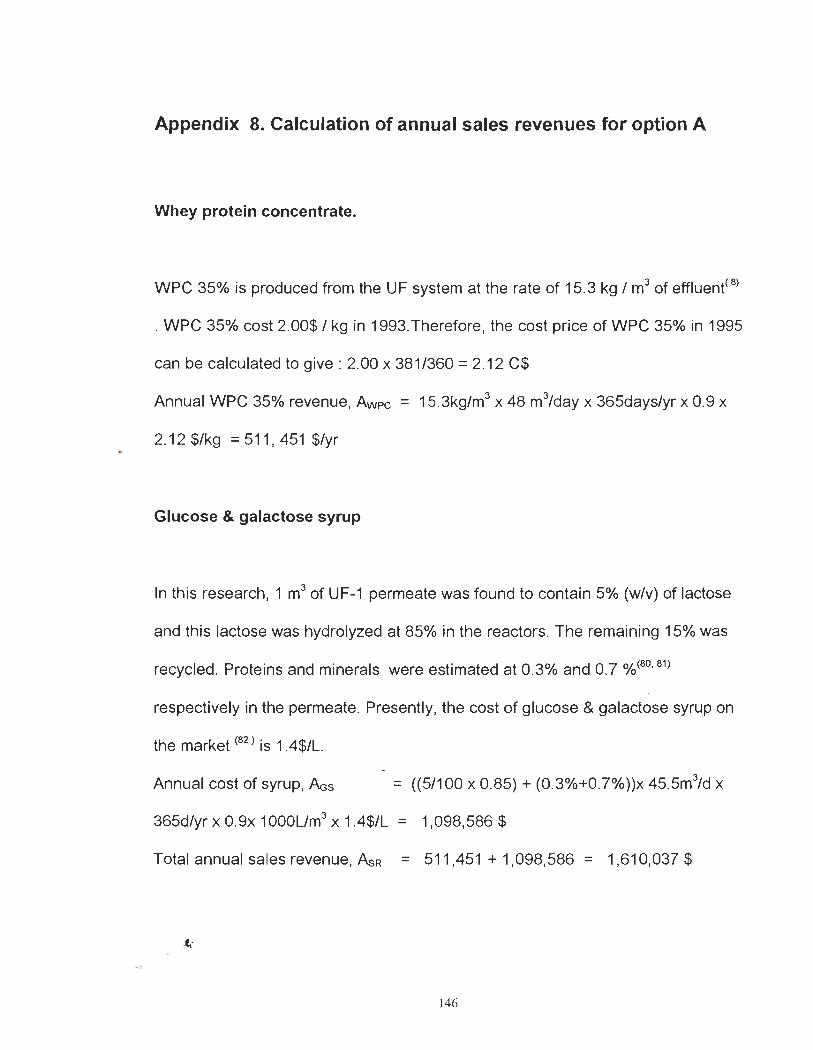
Appendix 8. Calculation of annual sales revenues for option A
Whey protein concentrate.
WPC 35% is produced from the UF system at the rate of 15.3 kg / m3 of effluent< 8)
. WPC 35% cost 2.00$ / kg in 1993. Therefore, the cost priee of WPC 35% in 1995
can be calculated to give: 2.00 x 381/360 = 2.12 C$
Annual WPC 35% revenue, Awpc = 15.3kg/m3 x 48 m3/day x 365days/yr x 0.9 x
2.12 $/kg = 511,451 $/yr
Glucose & galactose syrup
ln this research, 1 m3 of UF-1 permeate was found to contain 5% (w/v) of lactose
and this lactose was hydrolyzed at 85% in the reactors. The remaining 15% was
recycled. Proteins and minerais were estimated at 0.3% and 0.7 %<80.81)
respectively in the permeate. Presently, the cost of glucose & galactose syrup on
the market (82) is 1 A$/L.
Annual cost of syrup, ~s = ((5/100 x 0.85) + (0.3%+0.7%))x 45.5m3/d x
365d/yr x 0.9x 1 000Llm3 x 1A$/L = 1,098,586 $
Total annual sales revenue, AsR = 511,451 + 1,098,586 = 1,610,037 $
146
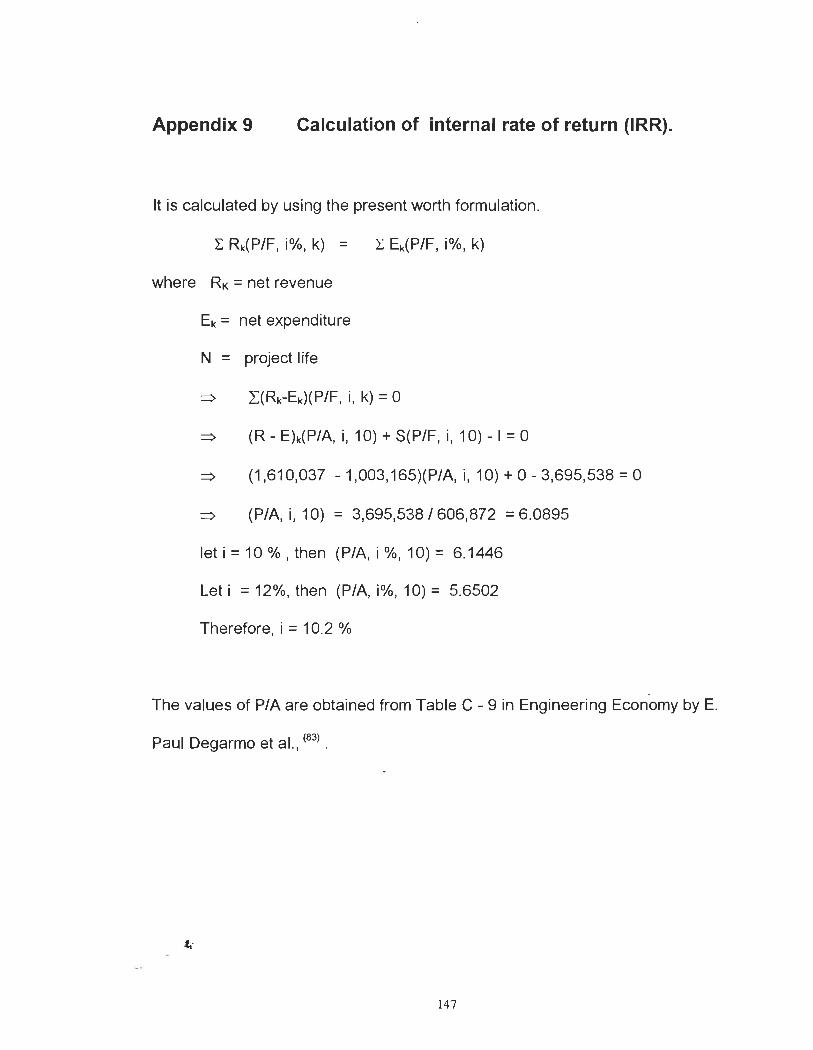
Appendix 9 Calculation of internai rate of return (IRR).
It is calculated by using the present worth formulation.
where RK = net revenue
Ek = net expenditure
N = praject life
(R - EMP/A, i, 10) + S(P/F, i, 10) -1 = 0
(1,610,037 - 1 ,003, 165)(P/A, i, 10) + 0 - 3,695,538 = 0
~ (PIA, i, 10) = 3,695,538/606,872 = 6.0895
leti=10%,then (P/A,i%, 10)= 6.1446
Let i = 12%, then (PIA, i%, 10) = 5.6502
Therefore, i = 10.2 %
.
The values of PIA are obtained fram Table C - 9 in Engineering Economy by E.
Paul Degarmo et aL, (83) .
147