Embed Size (px)
Citation preview
UNIVERSITÉ DU QUÉBEC
VARIA TIONS SPATIALES ET TEMPORELLES DE LA SÉDIMENTATION SOUS LA
ZONE EUPHOTIQUE DANS LE SECTEUR CANADIEN DE LA MER DE BEAUFORT
THÈSE
PRÉSENTÉE À
L'UNIVERSITÉ DU QUÉBEC À RIMOUSKI
comme exigence partielle
du programme de doctorat en océanographie
PAR
THOMAS JUUL-PEDERSEN
Décembre 2007
UNIVERSITÉ DU QUÉBEC À RIMOUSKI Service de la bibliothèque
Avertissement
La diffusion de ce mémoire ou de cette thèse se fait dans le respect des droits de son auteur, qui a signé le formulaire « Autorisation de reproduire et de diffuser un rapport, un mémoire ou une thèse ». En signant ce formulaire, l’auteur concède à l’Université du Québec à Rimouski une licence non exclusive d’utilisation et de publication de la totalité ou d’une partie importante de son travail de recherche pour des fins pédagogiques et non commerciales. Plus précisément, l’auteur autorise l’Université du Québec à Rimouski à reproduire, diffuser, prêter, distribuer ou vendre des copies de son travail de recherche à des fins non commerciales sur quelque support que ce soit, y compris l’Internet. Cette licence et cette autorisation n’entraînent pas une renonciation de la part de l’auteur à ses droits moraux ni à ses droits de propriété intellectuelle. Sauf entente contraire, l’auteur conserve la liberté de diffuser et de commercialiser ou non ce travail dont il possède un exemplaire.
UNIVERSITÉ DU QUÉBEC
SPATIAL AND TEMPORAL PATTERNS OF SEDIMENTATION BELOW THE
EUPHOTIC ZONE IN THE CANADIAN BEAUFORT SEA
THESIS
PRESENTED TO
L'UNIVERSITÉ DU QUÉBEC À RIMOUSKI
in partial fulfillment of the requirements of the
Doctorate Program in Oceanography
BY
THOMAS JUUL-PEDERSEN
December 2007
AVANT-PROPOS
"So throw off the bowl ines, sai 1 away from the safe harbor. Catch the trade winds in
your sails. Explore. Dream. Discover" (Mark Twain). What started a few years ago with a
flight across the Atlantic Ocean soon became a voyage of exploration and learning. 1 will
forever be indebted to my parents, Marian and Holger Juul-Pedersen, and my brother,
Lars-Henrik Thorngreen, for al ways encouraging me to explore new horizons, while
providing a profound sense of stability and unwavering support - always a safe harbor. A
warrnhearted thanks to my new-found Canadian friends for making me feel so welcome.
My Arctic journey started in Greenland where, during my second visit, 1 had the
privilege ofworking with Dr. Christine Michel, as arranged by my Master of Science
supervisor Dr. Torkel Gissel Nielsen. This meeting facilitated my involvement in a field
project in Resolute Passage, Canadian Arctic, and led to a Ph.D. collaboration with Drs.
Christine Michel and Michel Gosselin. 1 will always remain grateful to Christine and
Michel for accepting me as their student. Christine and Michel contributed greatly to this
thesis and 1 would like to acknowledge ail their guidance and hard work. Christine, thank
you for always taking time to discuss the thesis and instilling a strong scientific
professionalism. 1 really appreciate our friendship. Michel, 1 would like thank you for your
always insightful and constructive input. 1 have enjoyed ail the good times we spent in the
field, at meetings and during my stay in Rimouski.
This project has greatly benefited from the support and assistance of numerous
collaborators. To our team, C. Michel , M. Gosselin, A. Niemi, B. LeBlanc, M. Rozanska
and M . Poulin 1 send a special thanks for your invaluable efforts and friendship. 1 am also
grateful for the support of our collaborators, S. Brugel, K. Lacoste, M. Lizotte, W. Moskal,
L. Seuthe, A. Tatarek, J . Wiktor, M. Zajaczkowski and man y more. 1 would like to
acknowledge the assistance provided by K. Proteau, K. Wilson, K. Cherewyk, D. Bérubé,
M. Simard and J. Ferland in the processing of samples. This project was part of the
Canadian Arctic Shelf Exchange Study (CASES) and 1 would like to convey my gratitude
to the CASES project organizers and the coast guard officers and crew onboard the CCGS
Amundsen, for making this research possible.
1 wish to thank Dr. A. Rochon (Université du Québec à Rimouski , UQAR) for being
part of my thesis and evaluation committees and Dr. J .-É. Tremblay (Université Laval) for
being part ofmy thesis committee. 1 am also very grateful that Dr. P. Wassmann
(Norwegian College ofFishery Science, University of Troms0) agreed to be the extemal
member of my evaluation committee. Finally my gratitude goes to the students and staff at
the Institut des sciences de la mer de Rimouski (lSMER) and UQAR who assisted in
maintaining my long-distance study from Winnipeg.
II
III
This project was supported by grants from the Natural Sciences and Engineering
Research Council (NSERC) of Canada and from the Department of Fisheries and Oceans
Canada (DFO). Funding was also provided by the International Joint Ventures Fund of the
Canada Foundation for Innovation and the Fonds québécois de la recherche sur la nature et
les technologies (FQRNT). My involvement in this Ph.D. program was made possible by
post-graduate scholarships from ISMER and UQAR (Exemptions des frais majorés pour
étudiants étrangers).
This research is a contribution to the research programs of CASES, the Freshwater
Institute (Fisheries and Oceans Canada), ISMER and Québec-Océan. The results presented
in this thesis have been presented at the CASES general meetings in Montréal , QC
(October 2004) and Winnipeg, MB (February 2006), the Gordon Research Conference on
Polar Marine Science in Ventura, CA (March 2005), the American Society of Limnology
and Oceanography (ASLO) summer meeting in Victoria, BC (June 2006) and the Arctic
Science Conference in Fairbanks, AK (October 2006). The three main chapters ofthis
thesis will be published in scientific joumals. The first chapter is currently in press in
Marine Ecology Progress Series, the second chapter has been submitted to the CASES
special issue in Journal of Marine Systems and the third chapter will be submitted to an
international journal.
IV
RÉSUMÉ
La sédimentation de la matière particulaire a été étudiée sous couvert de glace de première année et en eau libre dans le secteur canadien de la mer de Beaufort. Les patrons saisonniers d'exportation verticale de la matière particulaire ont été étudiés pendant toute la période de production des algues de glace, de la fin de l'hiver à la fonte printanière, en ciblant la couche de surface près de la base de la glace Gusqu'à une profondeur de 25 m). En eau libre, les variations spatiales de l'exportation verticale de la matière particulaire sous la zone euphotique ont été étudiées en fonction des caractéristiques particulières de cette région, i.e. , l'influence du panache du fleuve Mackenzie et de la polynie du Cap Bathurst.
L ' étude réalisée sous la glace de première année de la baie de Franklin a montré une étroite relation entre l'augmentation de la biomasse des algues de glace et la sédimentation du matériel algal au printemps, avant la fonte de la glace. De plus, nous avons observé une importante contribution de matériel non-algal à l'exportation verticale du matériel. Cette étude a mis en évidence une transformation significative du matériel algal qui sédimente, dans les 25 premiers mètres de la colonne d'eau. La fonte printanière a mis fin à la période de production des algues de glace, tel que montré par une augmentation importante de la sédimentation du matériel organique associée avec la libération de la biomasse présente dans la glace. Il est généralement considéré que la sédimentation de matériel provenant de l'interface glace-eau est liée à la fonte de la glace. Nos résultats remettent ce principe en question , bien que le maximum de sédimentation ait été observé pendant la période de fonte.
L' étude spatiale en eau libre a montré que l'étendue saisonnière des taux de sédimentation du matériel organique particulaire était comparable dans la région influencée par le fleuve Mackenzie et dans la polynie du Cap Bathurst. Nous avons observé une diminution saisonnière de la sédimentation du matériel organique particulaire de l'été à l' automne, dans toute la région d'étude. Cette étude a aussi montré qu'une succession d'espèces phytoplantoniques, à même le matériel qui sédimente, prévaut dans le secteur canadien de la mer de Beaufort, malgré les différences spatiales et interannuelles entre les stations d'échantillonnage. Une étude comparative de l' exportation verticale du matériel à une station de glace de rive, en présence de couvert de glace et en période libre de glace, a mis en évidence l' importance de l'exportation verticale de la matière organique particulaire sous la glace, notamment au cours de la période de fonte.
v
ABSTRACT
The sedimentation of particulate material was assessed under first-year sea ice and in open waters in the Canadian Beaufort Sea. Seasonal patterns of particulate material sinking export were studied throughout the ice algal productive period, from late winter to spring melt, targeting the upper water column near the bottom surface of the sea ice (down to 25 m). ln open waters, spatial patterns in the sinking export of particulate material from the euphotic zone were related to key features of this region, i.e. the intluence of Mackenzie River and the Cape Bathurst Polynya.
The underice component of this study showed a close coupling between the increasing ice algal biomass and the sedimentation of algal material in spring, prior to the onset of ice melt. ln addition, we observed a large contribution of non-algal material to the sinking tlux of material. This research also showed significant transformation of the sedimenting al gal material in the upper 25 m of the water column. Spring melt induced the termination of the ice algal productive period, as shown by a strong increase in the sedimentation of organic material associated with the release of ice biomass. Passive sinking export of material across the ice-water interface is generally considered to be related to ice melt. Our results challenge this view, even if the spring melt period showed maximum sedimentation.
The spatial investigation during ice-free conditions revealed comparable seasonal ranges of sinking export of particulate organic material between the region intluenced by the Mackenzie River and the Cape Bathurst polynya. A general seasonal decrease in the sinking export of particulate organic material was observed from summer to fall throughout this study. This research also found that a strong seasonal phytoplankton species succession prevailed in the Canadian Beaufort Sea, regardless of the spatial and interannual differences between sampling stations. A comparison of the sinking export of particulate organic material at a landfast station, during the ice covered period and subsequent ice-free conditions, emphasized the importance of underice sinking export of particulate organic material, particularly during spring melt.
VI
TABLE DES MATIÈRES
AVANT-PROPOS ... .. ................................ ....... ..... .. ... ... ............. ... ... .... ... ...................... ... ...... i
RÉSUMÉ ....... .... ...... .. ........ .... ...... ..... ... ... .. ..... ....... .... ............ ................................................ iv
ABSTRACT ..... .. ........................... ..... ... .. .. ... ......... ... ............ ......... ... ............ .... ....... ................ v
TABLE DES MATIÈRES .................................................................................................... vi
LISTE DES TABLEAUX ...... ... ......................... .. ... ........................ .... .... ..... .. ....... .... ........... ix
LISTE DES FIGURES ......................................................................................................... xi
INTRODUCTION GÉNÉRALE ............................................................................................ l
The Arctic Ocean ................................................................................................................ l
Arctic continental shelves ..... ..... ......... .... ........... .. ...... ... ...... .......... ....... ...... ....... ...... ............ 3
Seasonal primary production and sinking export ................................................................ 5
Pelagic-benthic coupling ................................................ ....................................... ............ .. 9
Research objectives ... .... ... ..... .... .. ................. ....... ... ........ ......... ... ... .. ..... .... ... .... ......... .... ..... 12
CHAPITRE 1
SEASONAL CHANGES IN THE SINKlNG EXPORT OF PARTICULATE
MATERlAL, UNDER FIRST-YEAR SEA ICE ON THE MACKENZIE SHELF
(WESTERN CANADIAN ARCTIC)
RÉSUMÉ .................................................... ... ... ....... ............... .. ..... .... ........... ... .......... ........... 15
ABSTRACT ...................... .............. ... ............ ........ ............... .. ................. ............... .. ..... ....... 16
Vll
1.1 Introduction ... ...... ..... ..... ...... ...... ....... ..... .... .. ... ..... .... .... .... ..... ... ..... ..... .. ....... ...... ...... ... . 17
1.2 Materials and methods .... ...... ... ...... ... ...... .... ...... ........ .... ....... .. ........ .... .. ......... .... ... ... .... 20 1.2.1 Sampling ...... ......... .. ........ ... ...... ........... .............. .... .. ... .... .... ...... ....... ...... .. .. ........... 20 1.2.2 Analyses ... .... ......... ....... ............ ..... ....... .......... ............ ..... .... .. ...... .... ... ... .. ........ ..... 23 1.2.3 Calculations and statistical analyses ..... ........ .. ..... ...... ...................... .................... 25
1.3 Results ... ....... .. ...... .. ................ ............ ...................... ............ ........ .. ..... ..... ........... ... ..... 26
1.4 Discussion .. ....... ....... ..... .... ... ........... ..... .... .. ... ...... ......... ......... .. ....... ...... .. ............ ...... ... 36 1.4.1 Seasonal variations in underice sinking fluxes ...... .. ....... .................. ...... ........... .. 36 J .4.2 Depth-related changes in the composition of the sinking material.. .. ..... ............ .42 1.4.3 Loss of biomass through sinking export ........... ......... ......... .......... ..... ............ ... ... 46
1.5 Conclusion .. ..... .. ... ... ......... .. ................................................. ............ ...... .... ....... ...... .... 47
CHAPITRE 2
INFLUENCE OF THE MACKENZIE RIVER PLUME ON THE SINKING
EXPORT OF PARTTCULATE MATERIAL ON TH E SHELF
RÉSUMÉ ... ...... ...... .... .... ......... ............ ....... ....... ... .. ...... ......... .... ... ... .... .. ......... ........ .... .. ...... ... 49
ABSTRACT ........ .. ... .... .. .. ... .... .. ... .... ... .......... ... ......... ....... .... .. ... .. .......... ... ... .............. ............ 50
2.1 Introduction .......... ...... .... ... ............ ................... ... .... ... .... .... ........... .. .. ...... ... ... ...... .. ...... 51
2.2 Materials and Inethods .... ... ...... .... .. ... ......... ..... .... .. .... .. ... ...... ... .... ...... .. ... ....... .. ........... . 54 2.2.1 Study are a ....... .... .... .... ... ....... .. ... ... ......... ..... .. .... ... .. .. ............... ... .............. .. .......... 54 2.2.2 Sampling ......... ...... ... .... ... ....... .... ..... ..... ....... .. ....... ... ....... ... .. ........................ .. ....... 56 2.2.3 Analyses .. .......... ................................................... ..... .... ... .. ... ... ..... .......... .. ...... ..... 59 2.2.4 Calculations and statistical analyses ... .... ........ .... .. ... ......... ...... .. ..... .. ..... ........ ... .... 61
2.3 Results ... ... ...... ....... .. .. ....... .. ... ...... ............ .............. ............... .... ...... ............... ..... .... ..... 62
2.4 Discussion ........ .... .. ..... .. .... .... .... ...... ..... .. .. .. .... ..... ... .. .. ..... .......................... ........... ...... . 72 2.4.1 Effect of the ri ver plume on the magnitude of sinking fluxes .. ........ .. ..... ....... ..... 73 2.4.2 Effect of the river plume on the composition of the sinking material ................. 76 2.4.3 Pelagic export and transformation of sinking material ...... ....... ... ........ .... .... ...... .. 82 2.4.4 Species composition of the sinking assemblage .... ...... ... ..... ... ..... .. .. ............. ....... 86
2.5 Conclusion ..................... ..... ..... ....... ...... ..... ....... ............ .... .. ... ... ........ .... ...................... 88
VIII
CHAPITRE 3
SrNKING EXPORT OF PARTICULATE ORGANIC MATERIAL FROM THE
EUPHOTIC ZONE IN THE EASTERN BEAUFORT SEA
RÉSUMÉ .................. ......... ......... ........ ..... ... ............ .... ... ... ..................... ... ... ......... ... .. ........... 90
ABSTRACT ..... .... ................. ........ ......... ........... ... ... ... ... .......... .................. ...... ............ ..... ..... 91
3.1 Introduction .. ........ ........................ ...... ........ ... ....... ..... ...... ......... .......... .. .... ... ..... ... ........ 92
3.2 Materials and methods ......... .. .... ........... ... .... ...... ......... ... ......... ... .......... .... ........ .... ....... 95 3.2.] Study area ............................... ......... ... .. .. .... ... .. ................. .... .. ... ....... ......... ... ....... 95 3.2.2 Salnpling .............................................................................................................. 96 3.2.3 Analyses ............................................................................................................... 99 3.2.4 Calculations and statistical analyses .................................................................. 102
3.3 Results .................................................... ......... ... ... ............... ... ........... ............ ........... 103
3.4 Discussion ................................................................................................................. 114 3.4.1 Sinking export in the eastem Beaufort Sea.. ...................................................... 114 3.4.2 Seasona1 and regional sinking export ....... .. .................... ... ... .... .... .............. ....... 116 3.4.3 Species composition of the sinking material ................ ..... ..................... ..... ...... 119 3.4.4 A landfast sea ice perspective ............................................................................ 121
3.5 Conclusion ........ ..... .......... ....... .... ..... ... ... ... ............. ...... .. ....... ........ ............... ... ..... .. ... 123
CONCLUSION GÉNÉRALE ....... .... ..... .... ......... ....... .. .... ........... ... ..... .. .......... .......... .......... 125
RÉFÉRENCES ................................................................................................................... 131
IX
LISTE DES TABLEAUX
CHAPITRE 1:
SEASONAL CHANGES IN THE SINKING EXPORT OF PARTICULATE
MATERIAL, UNDER FIRST-YEAR SEA [CE ON THE MACKENZIE SHELF
(WESTERN CANADIAN ARCTIC)
Table 1. Sampling periods, dates of deployment and recovery, and duration of the underice deployments ofparticle interceptor traps in Franklin Bay, western Canadian Arctic, in 2004 ...................................................................................................... 23
Table 2. Summary of sinking fluxes and composition ratios of the sinking material in particle interceptor traps at l , 15 and 25 m during three sampling periods. POC sinking fluxes from 23 February to 27 March were estimated from the linear regression between POC and TPC sinking fluxes (Fig. 4). ChI a and phaeopigment sinking fluxes at 1 mon 20 June are missing. Median and range of values are given. Number of deployments for each period (n) is shown ....... ... .. . ........ ... ................ ........ ................ . ..... . ..... . . 30
CHAPITRE 2:
INFLUENCE OF THE MACKENZIE RIVER PLUME ON THE SINKING
EXPORT OF PARTICULA TE MA TERIAL ON THE SHELF
Table 1. Characteristics of free-driftin g particle interceptor trap deployments during fall 2002 and summer 2004 .. ..... ..... .. ..... .. ...... . ......................... . ..... . .. ...... . ...... . ... 58
Table 2. Percent contribution of phytoplankton taxonomie groups and dominant taxa in the sinking material collected at 50 m (25 m at St. 65) during fall 2002 and summer 2004. A dominant taxon is defined as the species or genus representing a minimum of 15 % total phytoplankton abundance at one station .. .... . .. .. . .. .. .... ........... ...... . .. . . ... . ...... . . ..... . 71
x
CHAPITRE 3:
SINKING EXPORT OF PARTICULA TE ORGANIC MA TERIAL FROM THE
EUPHOTIC ZONE IN THE EASTERN BEAUFORT SEA
Table 1. Characteristics offree-drifting particle interceptor trap deployments during 2002, 2003 and 2004 ....................................................... ....... . .... ....... .......... ... .... 97
Table 2. Sinking fluxes and daily loss rates of chlorophyll a (chi a) , particulate organic carbon (POC), and export-ratio at 50 m (25 m at stations 83 and 65 and 75 mat station 106) during open water periods, in eastern Beaufort Sea. The seasonal grouping of stations in the Cape Bathurst Polynya and on the Mackenzie shelf and slope is based on the c1uster analysis (see Fig. 3). Averages and ranges of values are presented when applicable. NIA: not available ................................................................. .... ..... ... .. .. ......... ] Il
Table 3. Sinking fluxes of fecal pellet based carbon (FPC) and contribution of FPC to total particulate organic carbon (POC) sinking flux at 50 m (25 m at stations 83 and 65 and 75 m at station 106) during open water periods, in eastern Beaufort Sea. The seasonal grouping of stations in the Cape Bathurst Polynya and on the Mackenzie shelf and slope is based on the cluster analysis (see Fig. 3). Averages and ranges of values are presented when applicable ............................................................................................. 113
XI
LISTE DES FIGURES
INTRODUCTION GÉNÉRALE
Figure 1. The Arctic Ocean with its shelves and basins. The black arrows indicate places and strength for the inflows of Atlantic and Pacific Waters and the grey arrows indicate the outflows of Arctic Water (redrawn after Carrnack & Wassmann 2006) ...... ...... .... ........ .4
CHAPITRE 1:
SEASONAL CHANGES IN THE SINKlNG EXPORT OF PARTICULATE
MA TERIAL, UNDER FIRST -YEAR SEA ICE ON THE MACKENZIE SHELF
(WESTERN CANADIAN ARCTIC)
Figure 1. Location of the sampling station (indicated by star) in Franklin Bayon the Mackenzie Shelf, western Canadian Arctic. For comparison, the positions of sediment trap moorings CA-04 and CA-07 of Forest et al. (2007) and SS-1 of O'Brien et al. (2006) are shown. Water depth is in meter. ............. ................ ...... . .................. ............... 22
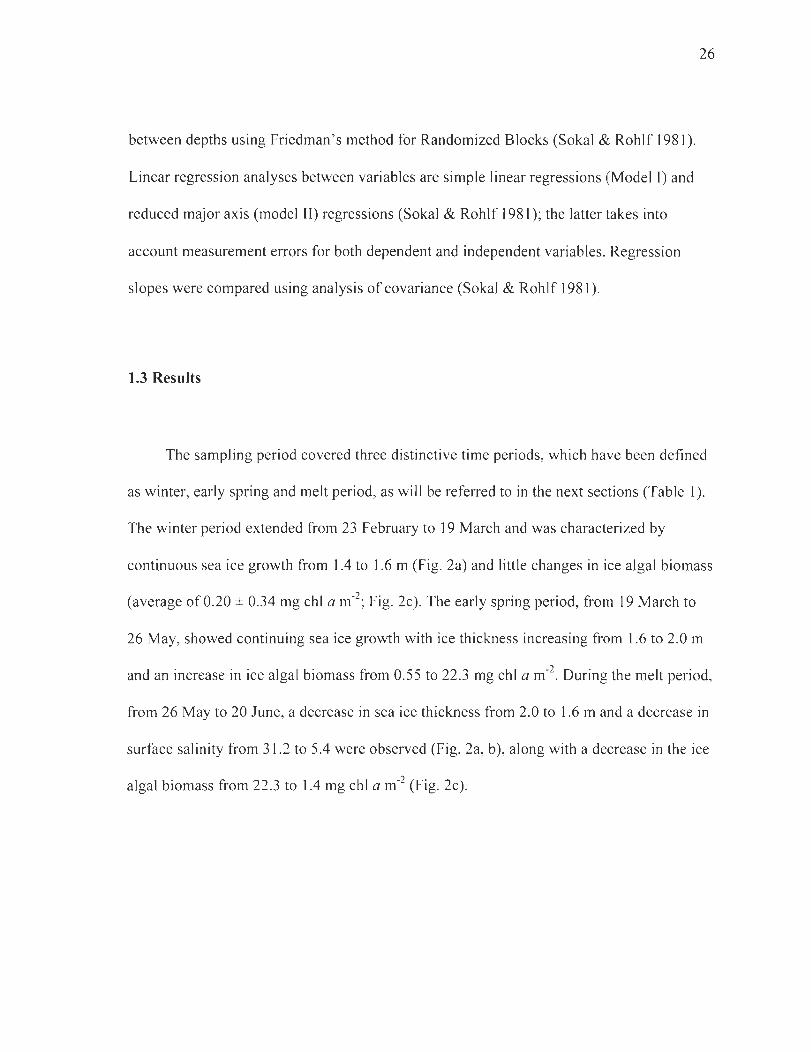
Figure 2. Seasonal changes in (a) sea ice thickness, (b) surface salinity and (c) sea ice chlorophyll a (chI a) concentrations, from 23 February to 20 June 2004. In (a) and (c), values were averaged from sites with high and low snow cover during deployment periods of particle interceptor traps. Error bars represent standard deviations. Vertical dashed lines represent reference periods as described in Table 1 ............................................... 27
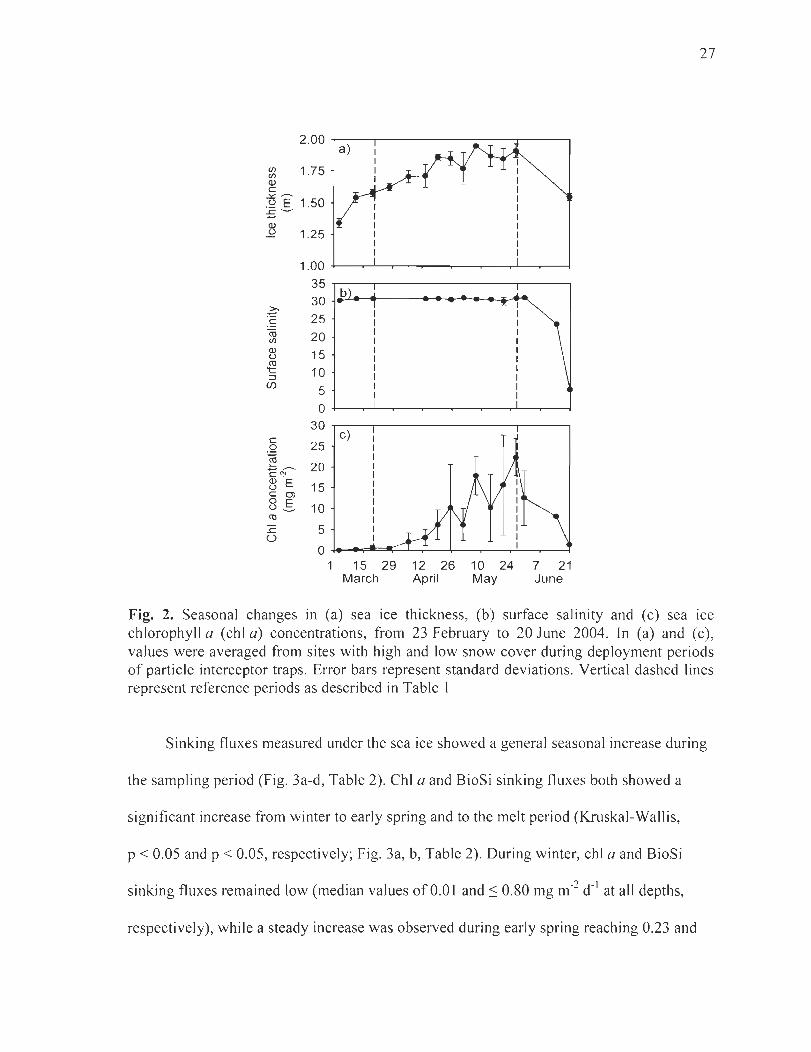
Figure 3. Seasonal changes in sinking fluxes of (a) chlorophyll a (chI a), (b) biogenic silica (BioSi), (c) total particulate carbon (TPC) and (d) particulate organic carbon (POC) at l , 15 and 25 m under the sea ice, from 23 February to 20 June 2004. Data points represent particle interceptor trap recovery dates. The open data points in (d) are POC values estimated from the linear relationship between POC and TPC. Vertical dashed lines represent reference periods as described in Table 1 ....... ..... .. ......... ........... . .. .......... 29
XII
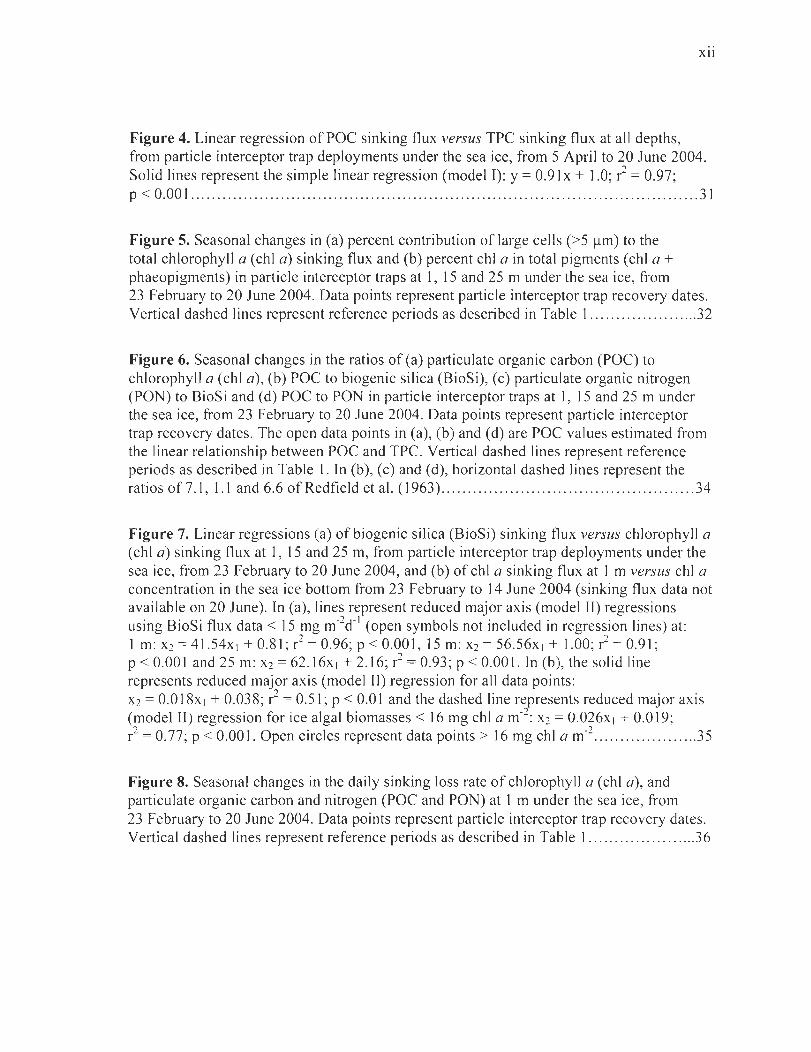
Figure 4. Linear regression ofPOC sinking flux versus TPC sinking flux at ail depths, from particle interceptor trap deployments under the sea ice, from 5 April to 20 June 2004. Solid lines represent the simple linear regression (model T): y = 0.91 X + 1.0; r2
= 0.97; p < 0.001 .. . ............................ . ..... .. ................... ...... .......... ... . ............ .... .. 31
Figure 5. Seasonal changes in (a) percent contribution oflarge cells (>5 f.lm) to the total chlorophyll a (chI a) sinking flux and (b) percent chI a in total pigments (chI a + phaeopigments) in partic1e interceptor traps at 1, 15 and 25 m under the sea ice, from 23 February to 20 June 2004. Data points represent partic1e interceptor trap recovery dates. Vertical dashed lines represent reference periods as described in Table 1 ..................... 32
Figure 6. Seasonal changes in the ratios of (a) particulate organic carbon (POC) to chlorophyll a (chI a), (b) POC to biogenic silica (BioSi), (c) particulate organic nitrogen (PON) to BioSi and (d) POC to PON in partic1e interceptor traps at 1, 15 and 25 m under the sea ice, from 23 February to 20 June 2004. Data points represent parti cie interceptor trap recovery dates. The open data points in (a), (b) and (d) are POC values estimated from the linear relationship between POC and TPC. Vertical dashed lines represent reference periods as described in Table 1. In (b), (c) and (d), horizontal dashed lines represent the ratios of7.1 , l.1 and 6.6 of Redfield et al. (1963) ................................................ 34
Figure 7. Linear regressions (a) ofbiogenic silica (BioSi) sinking flux versus chlorophyll a (chI a) sinking flux at l , 15 and 25 m, from particle interceptor trap deployments under the sea ice, from 23 February to 20 June 2004, and (b) of chI a sinking flux at 1 m versus chI a concentration in the sea ice bottom from 23 February to 14 June 2004 (sinking flux data not available on 20 June). ln (a), lines represent reduced major axis (model II) regressions using BioSi flux data < 15 mg m-2d- 1 (open symbols not inc1uded in regression lines) at:
2 2 1 m: X2 = 41.54x I + 0.81; r = 0.96; p < 0.001 , 15 m: X2 = 56.56x I + 1.00; r = 0.91; p < 0.001 and 25 m: X2 = 62.16xI + 2.16; r2 = 0.93; p < 0.001. ln (b), the solid line represents reduced major axis (model II) regression for ail data points: X2 = 0.018xI + 0.038; r2 = 0.51 ; p < 0.01 and the dashed line represents reduced major axis (model fI) regression for ice algal biomasses < 16 mg chI a m-2
: X2 = 0.026xI + 0.019; r2 = 0.77; P < 0.001. Open circles represent data points > 16 mg chI a m-2
............ . . ...... 35
Figure 8. Seasonal changes in the daily sinking loss rate of chlorophyll a (chI a), and particulate organic carbon and nitrogen (POC and PON) at 1 m un der the sea ice, from 23 February to 20 June 2004. Data points represent partic1e interceptor trap recovery dates. Vertical dashed lines represent reference periods as described in Table 1 .. . .. . ............... 36
CHAPITRE 2:
INFLUENCE OF THE MACKENZIE RIVER PLUME ON THE SINKING
EXPORT OF PARTICULATE MATERIAL ON THE SHELF
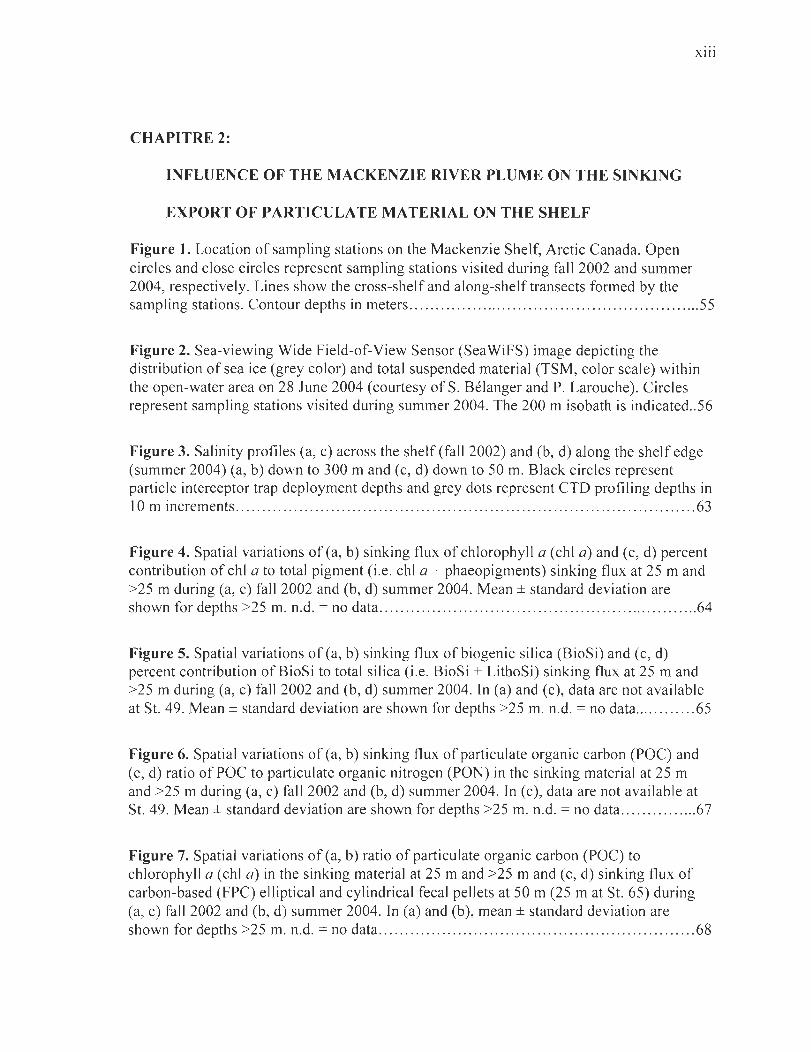
Figure 1. Location of sampling stations on the Mackenzie Shelf, Arctic Canada. Open circles and close circles represent sampling stations visited during fall 2002 and summer 2004, respectively. Lines show the cross-shelf and along-shelf transects formed by the
XIII
sampling stations. Contour depths in meters ........................................................ 55
Figure 2. Sea-viewing Wide Field-of-View Sensor (Sea WiFS) image depicting the di stribution of sea ice (grey color) and total suspended material (TSM, color scale) within the open-water area on 28 June 2004 (courtesy of S. Bélanger and P. Larouche). Circles represent sampling stations visited during summer 2004. The 200 m isobath is indicated .. 56
Figure 3. Salinity profiles (a, c) across the shelf(faIl2002) and (b, d) along the shelfedge (summer 2004) (a, b) down to 300 m and (c, d) down to 50 m. Black circles represent particle interceptor trap deployment depths and grey dots represent CTO profiling depths in 10 m increments ....... ... ...... . ......... ... ... .... ......... .. ...... ......... ......... ..... .. ......... 63
Figure 4. Spatial variations of(a, b) sinking flux ofchlorophyll a (chi a) and (c, d) percent contribution of chi a to total pigment (i.e. chi a + phaeopigments) sinking flux at 25 m and >25 m during (a, c) fall 2002 and (b, d) summer 2004. Mean ± standard deviation are shown for depths >25 m. n.d. = no data . . ... .. . ... .... ........ .... . .. .... .. .... . ............ . ....... 64
Figure 5. Spatial variations of(a, b) sinking flux ofbiogenic silica (BioSi) and (c, d) percent contribution of BioSi to total silica (i.e. BioSi + LithoSi) sinking flux at 25 m and >25 m during (a, c) fall 2002 and (b, d) summer 2004. In (a) and (c), data are not available at St. 49. Mean ± standard deviation are shown for depths >25 m. n.d. = no data ....... ... .. 65
Figure 6. Spatial variations of (a, b) sinking flux of particulate organic carbon (POC) and (c, d) ratio of POC to particulate organic nitrogen (PON) in the sinking material at 25 m and >25 m during (a, c) fall 2002 and (b, d) summer 2004. In (c), data are not available at St. 49. Mean ± standard deviation are shown for depths >25 m. n.d. = no data . ......... .. ... 67
Figure 7. Spatial variations of (a, b) ratio of particulate organic carbon (POC) to chlorophyll a (chi a) in the sinking material at 25 m and >25 m and (c, d) sinking flux of carbon-based (FPC) elliptical and cylindrical fecal pellets at 50 m (25 mat St. 65) during (a, c) fall 2002 and (b, d) summer 2004. ]n (a) and (b), mean ± standard deviation are shown for depths >25 m. n.d. = no data ........... . ......... ... . .. . .. . ... ............ . .......... . .. 68
XIV
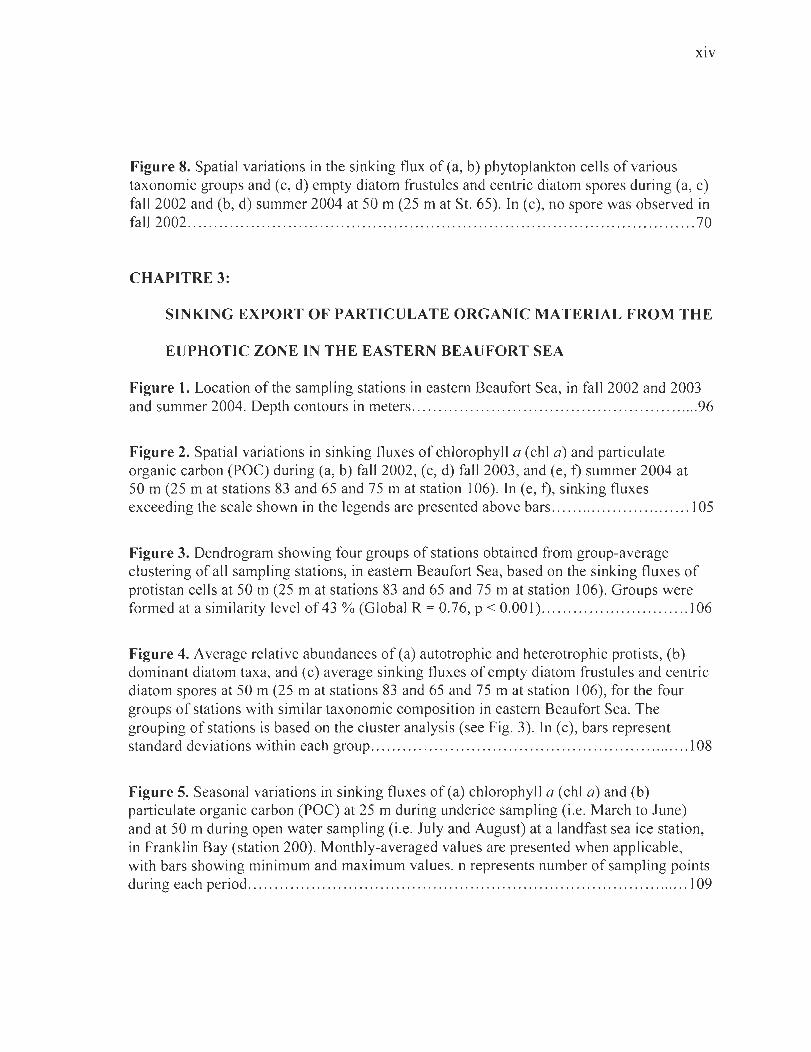
Figure 8. Spatial variations in the sinking flux of (a, b) phytoplankton cells of various taxonomie groups and (c, d) empty diatom frustules and centric diatom spores during (a, c) fall 2002 and (b, d) summer 2004 at 50 m (25 m at St. 65). In (c), no spore was observed in fall 2002 ................................................................................................ 70
CHAPITRE 3:
SINKING EXPORT OF PARTICULA TE ORGANIC MA TERIAL FROM THE
EUPHOTIC ZONE IN THE EASTERN BEAUFORT SEA
Figure 1. Location of the sampling stations in eastem Beaufort Sea, in fall 2002 and 2003 and summer 2004. Depth contours in meters ... .... ...... .............. . ......... .. . . .... .. ..... ... 96
Figure 2. Spatial variations in sinking fluxes of chlorophyll a (chI a) and particulate organic carbon (POC) during (a, b) fall 2002, (c, d) fall 2003, and (e, f) summer 2004 at 50 m (25 m at stations 83 and 65 and 75 m at station 106). ln (e, f), sinking fluxes exceeding the scale shown in the legends are presented above bars ........................... 105
Figure 3. Dendrogram showing four groups of stations obtained from group-average clustering of ail sampling stations, in eastem Beaufort Sea, based on the sinking fluxes of protistan cells at 50 m (25 m at stations 83 and 65 and 75 m at station 106). Groups were formed at a similarity level of 43 % (Global R = 0.76, P < 0.001) . .. ............ .. ........... 1 06
Figure 4. Average relative abundances of (a) autotrophic and heterotrophic protists, (b) dominant diatom taxa, and (c) average sinking fluxes of empty diatom frustules and centric diatom spores at 50 m (25 mat stations 83 and 65 and 75 mat station 106), for the four groups of stations with similar taxonomie composition in eastem Beaufort Sea. The grouping of stations is based on the c1uster analysis (see Fig. 3). In (c), bars represent standard deviations within each group ............................................................. ] 08
Figure 5. Seasonal variations in sinking fluxes of(a) chlorophyll a (chI a) and (b) particulate organic carbon (POC) at 25 m during underice sampling (i.e. March to June) and at 50 m during open water sampling (i.e. July and August) at a landfast sea ice station, in Franklin Bay (station 200). Monthly-averaged values are presented when applicable, with bars showing minimum and maximum values. n represents number ofsampling points during each period .................................................................................... 109
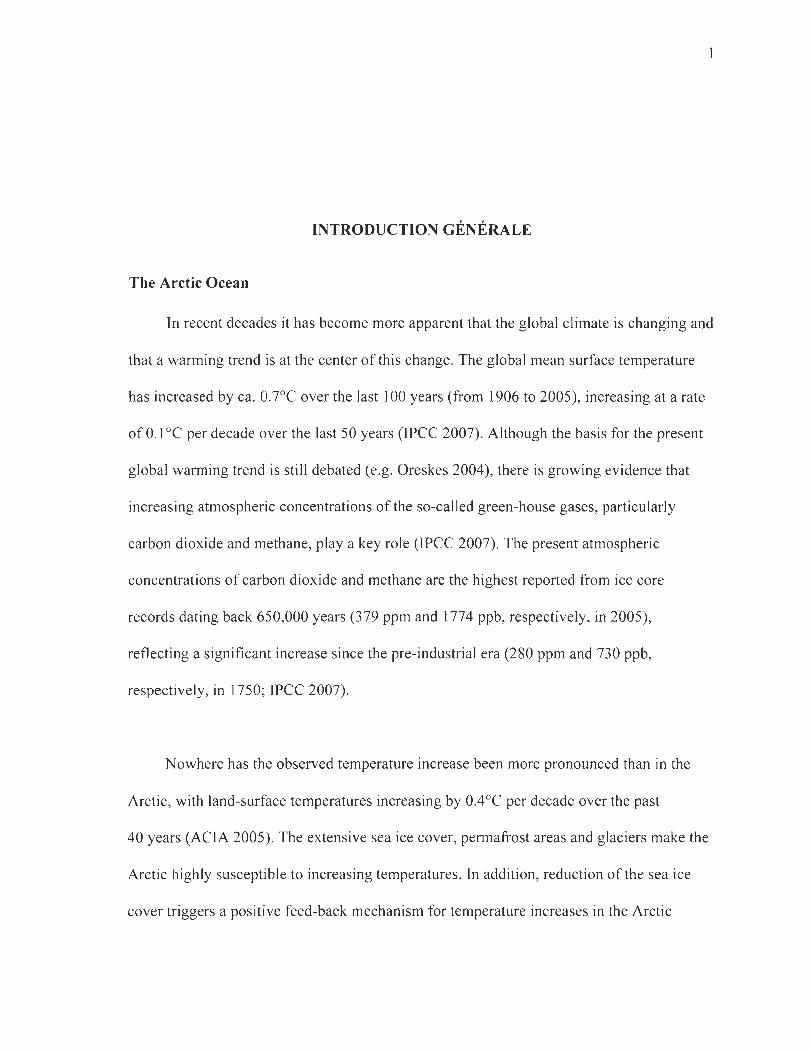
INTRODUCTION GÉNÉRALE
The Arctic Ocean
In recent decades it has become more apparent that the global climate is changing and
that a warming trend is at the center ofthis change. The global mean surface temperature
has increased by ca. 0.7°e over the last 100 years (from 1906 to 2005), increasing at a rate
of 0.1 oC per decade over the last 50 years (Ipee 2007). Although the basis for the present
global warming trend is still debated (e.g. Oreskes 2004), there is growing evidence that
increasing atmospheric concentrations of the so-called green-house gases, particularly
carbon dioxide and methane, play a key role (Jpee 2007). The present atmospheric
concentrations of carbon dioxide and methane are the highest reported from ice core
records dating back 650,000 years (379 ppm and 1774 ppb, respectively, in 2005),
reflecting a significant increase since the pre-industrial era (280 ppm and 730 ppb,
respectively, in 1750; IPee 2007).
Nowhere has the observed temperature increase been more pronounced than in the
Arctic, with land-surface temperatures increasing by OAoe per decade over the pa st
40 years (AeIA 2005). The extensive sea ice co ver, pennafrost areas and glaciers make the
Arctic highly susceptible to increasing temperatures. In addition, reduction of the sea ice
co ver triggers a positive feed-back mechanism for temperature increases in the Arctic
(Johannessen et al. 2004), due to the reduction in surface albedo associated with a shift
from sea ice to open water conditions (ca. 80 and 20 % of incident solar radiation ,
respectively; Kerr 1999). Altogether, the Arctic is considered an early indicator of climate
change, particularly increasing temperatures (ACIA 2005 , IPCC 2007).
2
Sea ice in the Arctic Ocean is already showing signs of the ongoing warming trend,
as the annual average sea ice extent has decreased by ca. 3 % per decade between 1978 and
2005 (IPCC 2007). The summer minimum sea ice cover, i.e. the multi-year sea ice
concentrated mainly in the central Arctic Ocean, is showing the highest rate of decrease, at
ca. 7 % per decade between 1978 and 2005 (IPCC 2007). The reason for the different loss
rates is that multi-year sea ice is being replaced by first-year sea ice in sorne areas, thus
increasing the seasonal ice zone (Comiso 2002). In addition, the seasonal first-year sea ice
coyer in the Arctic Ocean is predicted to show earlier ice break-up in spring, delayed
refreezing in fall and larger and more widespread flaw lead systems and polynyas (ACTA
2005 , Lukovich & Barber 2005). Consequently, areas of permanently and seasonally
ice-free conditions are projected to expand in size and duration, particularly on the
continental shelves of the Arctic Ocean (ACIA 2005, IPCC 2007).
lncreasing precipitation is another projected consequence of the warming trend in the
Arctic, with a projected increase in the freshwater runoffto the Arctic Ocean by up to ca.
15 % at the end ofthis century (ACIA 2005). The Arctic Ocean already receives the highest
freshwater runoff of any ocean relative to its size, since it receives Il % of the global
3
runoffbut represents only 1 % of the world ocean water (Shiklomanov 1998). Arctic rivers
generally display a high discharge of organic material (Dittmar & Kattner 2003), which is
likely to increase with the projected increasing runoff and meIting permafrost (ACIA
2005). The already strong riverine discharge offreshwater and material (Gordeev &
Rachold 2004), may therefore extend further onto and beyond the Arctic shelves.
Arctic continental shelves
The continental shelves are key regions of the Arctic Ocean, comprising more than
half of its total surface area (53 %; Jakobsson 2002) and displaying the highest annual
primary production (between ca. 170 and 323 Mt Cil; Sakshaug 2004, Michel et al.
2006). ln two recent reviews, the Arctic shelves were categorized in terms of their
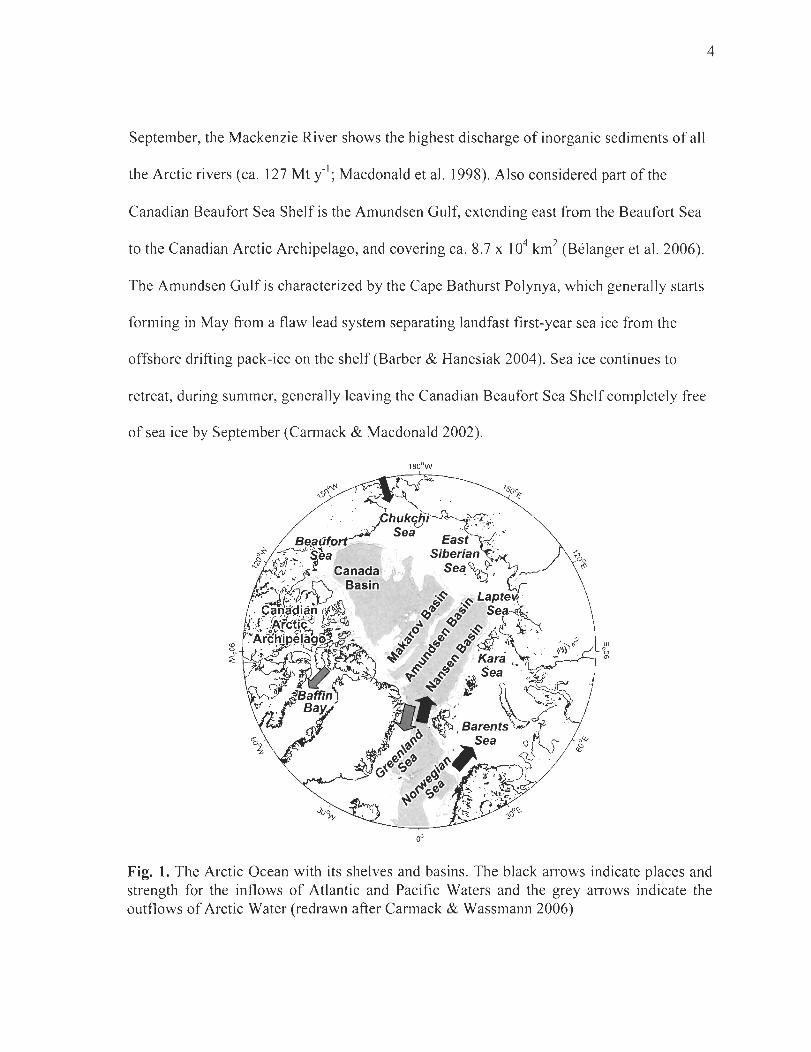
exchange of water with the Atlantic or Pacific oceans (Fig. 1); as inflow, outflow or interior
shelves (Carmack & Wassmann 2006, Carmack et al. 2006).
This study focuses on the Canadian sector of the Beaufort Sea Shelf (Fig. 1),
categorized as a narrow interior shelf(Carmack & Wassmann 2006). This region includes a
shelf plateau bordering the Canada Basin in the Arctic Ocean, covering ca. 530 km
alongshore and ca. 120 km offshore (ca. 6.0 x 10⁴ km2; Carmack et al. 2004). This shelf
receives freshwater from the Mackenzie River, which is the fourth largest river entering the
Arctic Ocean in terms of annual freshwater discharge (from 249 to 333 km3; Dittmar &
Kattner 2003). Along with the high freshwater discharge, occurring mostly between May to
4
September, the Mackenzie River shows the highest discharge of inorganic sediments of ail
the Arctic ri vers (ca. 127 Mt il; Macdonald et al. 1998). Also considered part of the
Canadian Beaufort Sea Shelf is the Amundsen Gulf, extending east from the Beaufort Sea
to the Canadian Arctic Archipelago, and covering ca. 8.7 x 10⁴ km2 (Bélanger et al. 2006).
The Amundsen Gulf is characterized by the Cape Bathurst Polynya, which generally starts
forming in May from a flaw lead system separating landfast first-year sea ice from the
offshore drifting pack-ice on the shelf (Barber & Hanesiak 2004). Sea ice continues to
retreat, during summer, generally leaving the Canadian Beaufort Sea Shelf completely free
of sea ice by September (Carmack & Macdonald 2002).
Fig. 1. The Arctic Ocean with its shelves and basins. The black arrows indicate places and strength for the inflows of Atlantic and Pacific Waters and the grey arrows indicate the outflows of Arctic Water (redrawn after Carmack & Wassmann 2006)
Most Arctic shelves show a strong seasonal freshwater influence from melting
first-year sea ice and terrestrial runoff, in spring and summer (Koberle & Gerdes 2007,
Dickson et al. 2007). The resulting stratification of the water column influences the
seasonal pelagic primary production on these shelves; initially promoting phytoplankton
production above the haloc1ine, while later limiting the replenishment ofnutrients to the
phytoplankton community, as described later. Still, pelagic phytoplankton production
dominates the total annual primary production on Arctic shelves, comprising an estimated
ca. 75 to >97 % of the integrated ice algal and phytoplankton production (Subba Rao &
Platt 1984, Legendre et al. 1992, Gosselin et al. 1997).
Seasonal primary production and sin king export
Primary production in the Arctic Ocean is governed by the extreme annual cycle of
sunlight and the low angle of the sun above the horizon, at high latitudes; along with the
reduced light penetration in the water column during the sea ice covered period (Carmack
et al. 2004, 2006, Sakshaug 2004, Hill & Cota 2005). Yet, algal cells, mainly pennate
diatoms (Michel et al. 1996, Gosselin et al. 1997, Gradinger 1999, von Quillfeldt et al.
2003), entrained in the newly formed ice at the time of its formation (Garrison et al. 1989,
Gradinger & Ikavalko 1998, Riedel et al. 2007), initiate an ice algal bloom during early
spring (Michel et al. 2006). Variable ice thickness and snow coyer on top of first-year sea
ice produce spatial patchiness in ice algal biomass on Arctic shelves (Gosselin et al. 1986,
Mundy et al. 2005). Ice algae in first-year sea ice are considered a seasonally important
5
food source for sorne pelagie copepods (Runge & Ingram 1988, Conover & Siferd 1993,
Michel et al. 1996, Hattori & Saito 1997) and amphipods (Werner 2000), and also support
sympagic micro- and meiofauna (Nozais et al. 2001, Michel et al. 2002).
6
Ice algal blooms are usually terminated during ice melt in spring, often resulting in an
abrupt export of ice bound material to the underlying water column (Tremblay et al. 1989,
Michel et al. 1996,2002, Fortier et al. 2002, Lalande et al. 2007). Since the timing of the
ice melt and break-up may vary significantly between years (e.g. Barber & Hanesiak 2004),
the sinking export of ice algal material may not parallel the annual cycle of pelagie
herbivorous zooplankton (i.e. "mismatch" scenario; Wassmann 1998), notably calanoid
copepods in Arctic waters (Dawson 1978, Hirche & Mumm 1992, Richter 1995, Hirche
1997, Madsen et al. 2001). Under such a scenario, the sinking export of ice algae may
represent a seasonally important input of organic material to the benthic communities
(Carey 1987, Renaud et al. 2007b).
Unimpeded light penetration to the water column after the ice break-up, a stratified
water column formed by melt water and high nutrient concentrations following winter
mixing, generally promote a pelagic diatom bloom in spring, i.e. ice edge bloom (Sakshaug
& Skjoldal 1989, Strass & Nothig 1996, Head et al. 2000, Rat'kova & Wassmann 2002).
This intense primary production event often leads to nitrate or silicic acid depletion in the
surface mixed layer on Arctic shelves (Tremblay et al. 2002a, 2006a, Carmack et al. 2004,
Hill & Cota 2005), accompanied by increased sinking export of primary-produced material
7
(Wassmann et al. 2004 and references therein). Yet, herbivorous grazing activity may be
considerable during spring phytoplankton blooms reducing the sinking export of
primary-produced material (Andreassen & Wassmann 1998, Olli et al. 2002, Juul-Pedersen
et al. 2006, Tremblay et al. 2006b).
Phytoplankton production in summer on Arctic shelves generally remains limited by
nitrate and silicic acid, following the spring diatom bloom (Tremblay et al. 2002b, Carmack
et al. 2004, Hill & Cota 2005). Nutrient depletion in the surface mixed layer often leads to a
seasonal phytoplankton succession, from a diatom dominated spring bloom to a dominance
of flagellates, which have no requirement for silicic acid and higher nutrient affinity than
diatoms, during summer and fall on Arctic shelves (Bursa 1963 , Heiskanen & Keck 1995,
Booth & Smith 1997, Rat'kova et al. 1998, Lovejoy et al. 2002, Hill et al. 2005).
Calanoid copepods are abundant during summer on Arctic shelves and shelf-slopes
(Madsen et al. 2001, Pasternak et al. 2002, Ringuette et al. 2002, Hirche & Kosobokova
2003 , Riser et al. 2007), while copepod nauplii and protozooplankton may become
dominant towards the fall. At that time, various species of adult copepods descend to depth
to overwinter, as seen in Disko Bay, Greenland (Madsen et al. 200]). Zooplankton may
therefore utilize much of the phytoplankton biomass in summer. A phytoplankton bloom
may occur in the fall due to vertical mixing with deeper nutrient-rich waters during
increased wind activity (e.g. Klein et al. 2002, Arrigo & Dijken 2004). According to
predicted climate-change scenarios, a retreating multi-year sea ice coyer may expose the
shelf-break to seasonally ice-free conditions and increased wind effect, thus promoting
upwelling ofnutrient-rich waters from the central Arctic basins onto the Arctic shelves
(Carmack & Chapman 2003).
Ice algae initiate the primary production season in response to increasing Iight levels,
after winter, on the Canadian Beaufort Sea Shelf (Carmack & Macdonald 2002). Homer &
Schrader (1982) reported an increase in ice algal production and biomass from March until
the onset of ice melt in early-June 1979 (reaching ca. 63 mg C m-2 d- I and
8
>26 mg chlorophyll a m-2, respectively), with ice algal production comprising about two-
thirds of the total primary production (i.e. ice algal, phytoplankton and benthic microalgae).
An increase in the sinking export of particulate organic carbon (POC) during ice melt in
May and June was observed during two separate studies in 1987 and 2004 (O'Brien et al.
2006, Forest et al. 2007). Phytoplankton production, after the ice break-up, was reported to
increase until late-July (reaching ca. 200 mg C m-2 d- I) , when nitrogen became limited in
the surface mixed layer (Cannack et al. 2004). Subsequent summer phytoplankton
production (between ca. 40 to 100 mg C m -2 d- I) was concentrated deeper (20 to 40 m),
where nutrient concentrations were higher (Carmack et al. 2004). The presence of the
Mackenzie River plume, in summer, has been shown to induce higher sinking export of
POC near the river outlet (ca. 80 mg C m-2 d- I at 213 m; O 'Brien et al. 2006). Satellite
images of the Cape Bathurst Polynya, in the Amundsen Gulfregion, showed occurrence of
two distinct phytoplankton blooms (Arrigo & Dijken 2004). A spring bloom followed the
sea ice retreat, while a later and often stronger phytoplankton bloom was reported in fall,
though timing and intensity of the blooms varied interannually (Arrigo & Dijken 2004).
Pelagic-benthic coupling
9
Gravitational vertical export, i.e. sinking export, of organic material is the principal
transport pathway linking pelagic primary production with the benthos. Yet, a multitude of
biogeochemical transformational processes affect the organic material during its transport,
heterotrophic degradation generally being the most pronounced (Boyd & Trull 2007). As
such, sinking algal cells may be subjected to bacterial degradation (Smith et al. 1995,
Grossart & Simon 2007) and viral cell lysis (Suttle 2005) but, often more importantly, to
zooplankton grazing (Turner 2002 and references therein). Transformation ofthe sinking
organic material during sinking generally follows a non-linear trend with depth, often
explained by a power law function (Buesseler et al. 2007), as first described by Martin et al.
(1987). High abundance and activity of zooplankton and bacteria in the surface and
subsurface layer, along with differential solubilisation of organic material (Smith et al.
1992, Hoppe et al. 1993), are considered the main reasons for the exponential attenuation in
sinking export of organic material with depth (Boyd & Trull 2007 and references therein).
The residence time of the sinking material within the pelagos determines the time
available for transformational pro cesses to affect the material in transit (Schnack-Shiel &
Isla 2005 , Riser et al. 2007). Aggregation of ice algal (Riebesell et al. 1991) and
phytoplankton (Ki0rboe et al. 1996) cells is a key process that may increase their sinking
velocity, and is often enhanced during high cell concentrations and in the presence of
transparent exopolymeric partic1es (TEP) (En gel 2003, Grossart et al. 2006). Yet, these
aggregates may at the same time improve the availability of organic material to
mesozooplankton, by increasing the size of food partic1es (Ki0rboe 2001).
10
The copepod dominated mesozooplankton community, in Arctic waters, generally
congregates within the euphotic zone where the phytoplankton cell concentrations are
highest during spring and summer (Richter 1995, Madsen et al. 200 l, Pasternak et al. 2002,
Astthorsson & Gislason 2003, Hirche & Kosobokova 2003, Riser et al. 2007). Fecal pellets
may at times comprise a significant fraction of the organic material sinking from the
euphotic zone towards the benthos in Arctic waters (Gonzâlez et al. 1994, Riebesell et al.
1995, Urban-Rich et al. 1999, Riser et al. 2002, Sampei et al. 2004, Juul-Pedersen et al.
2006). Although fecal pellets represent the waste product of zooplankton grazing activity
they may have a high organic content, particularly during periods ofhigh food availability
(Penry & Frost 1991, Turner 2002). Still, herbivorous grazing translates into a loss of
primary-produced organic material to assimilation (Conover 1966, Landry et al. 1984,
M011er et al. 2003) and leaking of dissolved organic material to the surrounding water
(Strom et al. 1997, M011er & Nielsen 200 l, M01ler et al. 2003). In spite of the generally
high sinking velocity of fecal pellets, i.e. a short residence time in the pelagos (Turner
2002), their ingestion (coprophagy) and/or fragmentation (coprohexy) may be effective in
reintroducing egested material into the pelagic food web (Sampei et al. 2004, Riser et al.
2007 and references therein).
Il
Advective processes may disrupt the pelagic-benthic coupling in a particular area, by
horizontally exporting or importing material. As such, benthic and intermediate nepheloid
layers, i.e. partic1e-rich layers, are important in transporting resuspended and sinking
material from the continental shelves onto the continental sI opes (McPhee-Shaw 2006 and
references therein). Cross-shelftransport has been reported during long-term studies of
sinking export on the Canadian Beaufort Sea Shelf (O'Brien et al. 2006, Forest et al. 2007).
While these advective processes for the most part occur below the stratum studied in this
study, they are part of the pelagic-benthic coupling and will influence the sequestration of
material. Nevertheless, the sediments on the Canadian Beaufort Sea Shelf still retain a c1ear
signal of input trom the Mackenzie River (Macdonald et al. 1998, Carmack & Macdonald
2002). Moreover, a tight pelagic-benthic coupling was suggested during a study of the
benthic carbon demand on the Canadian Beaufort Sea shelf/slope, indicating that the carbon
demand of the sediment communities accounted ca. 60 % of the annual new primary
production, i.e. primary production based on allochthonous nutrients, in this region
(Renaud et al. 2007a).
12
Research objectives
Due to the challenges posed by ongoing climate change and the need to understand
the sequestration of organic material in the ocean, much effort has gone into studying
long-term time series of sinking export at depth. Consequently, processes affecting the
sinking export of particulate material in the mesopelagic zone are not as weIl understood
nor quantified (e.g. Boyd & Tru Il 2007). Yet, sinking export in this part of the water
column will most likely be strongly affected by the predicted increase in pelagic primary
production due to climate change. lt is therefore imperative to obtain a better understanding
of the biogeochemical processes affecting the organic material in transit through the
mesopelagic zone towards the benthos.
As part of the Canadian Arctic Shelf Exchange Study (CASES), "an international
effort under Canadian leadership to understand the biogeochemical and ecological
consequences of sea ice variability and change on the Mackenzie Shelf'
(http: //www.cases.quebec-ocean.ulaval.ca). the main objective ofthis study was to assess
the sinking export of particulate material from the euphotic zone in the Canadian Beaufort
Sea. This has only been investigated once before in this area, using short-term deployments
(5 d) of particle interceptor traps moored just above the bottom (at ca. 10 m) on the Alaskan
Beaufort Sea Shelf (Carey 1987). The only other sedimentation studies in this are a have
focused on long-term sinking export of particulate material at depth on the Canadian
Beaufort Sea shelf and slope (O'Brien et al. 2006, Forest et al. 2007).
13
The first chapter focuses on seasonal changes in the sinking export of particulate
organic material under first-year sea ice, throughout the productive season of ice algae,
from Iate winter to spring melt. The objectives of this chapter were three-fold. Our first
objective was to estimate the sinking export of particulate material under first-year sea ice,
at a Iandfast station, prior to ice algal production (Iate winter), for the duration of the
productive season (early spring) and during spring ice melt. Our second objective was to
evaluate changes in the magnitude of the sinking export and in the composition of the
sinking organic material , after its release from the ice and during descent to depth. Our
third objective was to quantify the daily loss of the standing biomass in the bottom sea ice
and upper part of the water column through sinking. It was hypothesized that the sinking
export of organic material would increase during spring melt and that ice algal material
would dominate the organic material exported from the sea ice.
In the second chapter, the influence of the Mackenzie River on the sinking export of
particulate material and on the composition ofthis material on the adjacent shelfwas
evaluated. In order to tackle the influence of the Mackenzie River on the sinking export of
particulate material , we studied the layer immediately under the surface halocline as weil as
the sedimentation signal recorded at deeper depths (down to 150 m) along two separate
transects under the influence of the river plume. lt was hypothesized that the river plume
would induce higher sinking export of particulate organic material and would affect the
composition of the sinking material.
14
The third chapter examines the sinking export of organic material from the euphotic
zone in the Canadian Beaufort Sea. The objectives of this chapter were to assess spatial
variations in the magnitude of the sinking export of particulate organic material in this area.
A second objective was to characterize any patterns in the cell composition of the collected
sinking material. The third objective was to make a comparison between the magnitude of
sinking export of particulate organic material during the sea ice covered and subsequent
ice-free periods at a landfast sea ice station. Tt was hypothesized that the Canadian Beaufort
Sea would display spatial and seasonal differences in the sinking export ofparticulate
organic material. Tt was also hypothesized that the comparative assessment at the landfast
sea ice station would show higher sinking export of particulate organic material during
ice-free conditions, when phytoplankton material may be exported from the euphotic zone.
15
CHAPITRE 1
SEASONAL CHANGES IN THE SINKING EXPORT OF PARTICULATE
MATERIAL, UNDER FIRST-YEAR SEA ICE ON THE MACKENZIE SHELF
(WESTERN CANADIAN ARCTIC)
RÉSUMÉ
La sédimentation du matériel particulaire a été étudiée sous couvert de glace de première année, de la fin de la période hivernale à la fonte printanière, sur le plateau du Mackenzie, dans l'Arctique canadien. Des pièges à particules à court terme ont été déployés à l, 15 et 25 m sous la glace, à 16 occasions consécuti ves entre le 23 février et le 20 juin 2004. Des analyses de chlorophylle a (chI a), phaeopigments, carbone particulaire total (TPC), carbone et azote organique particulaire (POC et PON) et silice biogénique (BioSi) ont été effectuées sur le matériel collecté dans les pièges. Les flux verticaux de chI a et de BioSi ont augmenté de façon consistante entre le ] 9 mars et le début de la fonte printanière (26 mai). Par la suite, ces flux ont augmenté considérablement (maxima de 2.0 et 90.4 mg m-2 d- J
, respectivement). La contribution des cellules de grande taille (>5 )lm) à la sédimentation de la chI a totale a aussi augmenté après le 19 mars (passant d ' environ 60 % à 90 %), reflétant une augmentation de la contribution des diatomées à l'exportation verticale du matériel algaJ. En accord avec ce résultat, une relation linéaire significative entre le taux de sédimentation de la chI a à 1 m et la biomasse chlorophyllienne dans la glace, a été observée. En moyenne, près de la moitié (46 %) de la chI a exportée à 1 m a été perdue dans les 25 premiers mètres de la colonne d'eau. Le POC constituait la composante principale des flux de TPC (91 %) pendant toute la durée de l'étude. Les fl ux de POC, relativement stables jusqu'au début de la fonte printanière (valeurs médianes de 21.0 et 24.6 mg m-2 d- J à 1 m), ont par la suite augmenté considérablement (maximum de 522 mg m-2 d- J
). Les rapports POC:chl a étaient élevés (étendue de 75.8 à 3474 g:g à 1 m), indiquant une contribution significative de matériel non-algal aux flux verticaux de POc. Les taux quotidiens de perte par sédimentation de la chI a, du POC et du PON, présents dans la glace et à l'interface glace-eau (premier mètre de la colonne d'eau), ont varié de façon saisonnière et étaient plus élevés pendant la période hivernale. Au cours de la période de quatre mois couverte par cette étude, les flux verticaux de chI a, POC et PON , mesurés à 1 m sous la glace, étaient de 31.3 mg m-2
, 7.2 mg C m-2, et 1.3 mg N m-2
, respectivement. Les résultats de cette étude montrent que la matière organique est exportée de façon continue de la glace de première année, de l'hiver jusqu'à la fin du printemps.
16
ABSTRACT
The sinking export ofparticulate material under landfast first-year sea ice was studied from the winter period to spring melt on the Mackenzie Shelf, western Canadian Arctic. Short-term partic\e interceptor traps were deployed at 1, 15 and 25 m under the ice on 16 consecutive occasions from 23 February to 20 June 2004. The sinking material was analysed for chlorophyll a (chI a), phaeopigments, total particulate carbon (TPC), particulate organic carbon and nitrogen (POC and PON) and for biogenic silica (BioSi). The sinking fluxes of chI a and BioSi increased steadily after 19 March and until the onset of spring melt (26 May), after which these sinking fluxes increased considerably (maxima of 2.0 and 90.4 mg m-2 d- I, respectively). The contribution of large algae (>5 )lm) to the total chI a sinking flux also increased after 19 March (from ca. 60 % to 90 %), reflecting an increasing contribution of diatoms to the sinking export of algal material. Accordingly, chI a sinking fluxes at 1 m showed a significant linear relationship with bottom ice chI a biomass. On average, almost half (46 %) of the chI a exported at ] m was lost in the upper 25 m. POC was the main component of the TPC sinking fluxes (91 %) throughout the study. POC sinking fluxes remained fairly stable until the onset of spring melt (median values of 21.0 and 24.6 mg m-2 d-I at 1 m), after which a considerable increase was observed (maximum of 522 mg m-2 d-I). High POC:chl a ratios (ranging from 75.8 to 3474 g:g at 1 m) indicated a significant contribution of non-al gal material to the sinking POc. The daily sin king loss rates of ch] a, POC and PON from the sea ice and interfacial layer (top 1 m of the water column) varied seasonally and were highest during the winter period. Over the 4-month duration of this study, underice sinking fluxes of chI a, POC and PON at 1 m were 31.3 mg m-2, 7.2 g C m-2 and 1.2 g N m-2, respectively. These results illustrate the continuous downward sinking export of organic material under landfast ice, from winter throughout late spring.
17
1.1 Introduction
The sinking export of organic material at the termination of phytoplankton blooms is
a key process by which primary-produced material from surface waters is transferred to the
benthos (e.g. Turner 2002). ln ice-covered seas, where sea ice primary production precedes
the phytoplankton bloom, the sinking of organic material from the sea ice may provide an
early source of material for benthic communities (e.g. McMahon et al. 2006). ln the Arctic
Ocean, most sea ice primary production takes place in first-year sea ice, which is primarily
found on shelf areas. Arctic continental shelves make up more than half (53 %; Jakobsson
2002) of the total are a of the Arctic Ocean and adjacent seas. On these shallow shelves,
higher annual primary production (phytoplankton and ice algal production) is found
compared to the central Arctic Ocean (e.g. Gosselin et al. ] 997). lce algal chlorophyll a
(chI a) biomass in the bottom layer of Arctic first-year sea ice may vary considerably
between areas, and may reach concentrations of 250 mg m-2 (Smith et al. 1990). Although
light and nutrient conditions have been observed to limit ice algal production (e.g. Gosselin
et al. 1990), the production period of ice algae typically extends until they are released from
the sea ice at the time of spring ice melt (e.g. Michel et al. 1996).
Ice algal communities in the Arctic have been shown to be directly grazed upon by
pelagic copepods and amphipods (e.g. Werner 2000, Fortier et al. 2002) and, to a lesser
extent, by sympagic fauna (Nozais et al. 200], Michel et al. 2002). Still, the bulk of the ice
algal biomass is mainly released into the water column at the time of spring ice melt
(Tremblay et al. ] 989, Michel et al. 1996,2002, Fortier et al. 2002). Melnikov (1998) did,
however, suggest an export of material from the sea ice during ice growth, as a result of
episodic brine drainage. Based on this study, Lavoie et al. (2005) applied a continuous
export of ice algae from the sea ice throughout the period of ice algal development, when
modelling ice algal growth and decline in Arctic first-year sea ice.
18
Primary-produced particulate organic material (POM) may either sink directly as
intact algal cells or be diverted to the pelagic heterotrophic food web (e.g. Wassmann 1998,
Turner 2002), which affects the composition of the sinking material. The sinking of intact
algal cells may result in better preservation of the sinking POM (e.g. Turner 2002), though
sorne loss usually occurs during sinking (e.g. release of dissolved material and dissolution).
Algal cells released from the sea ice may either sink as intact cells or form aggregates,
which may increase their sinking velocities and therefore decrease their residence time in
the pelagic zone (e.g. Wassmann 1998). The other export pathway, through the
heterotrophic food web, affects both the quantity and composition of the sinking particulate
organic materia1 (e.g. Turner 2002), and a considerably reduced amount of the ingested
carbon may be reintroduced to the water column as fecal material (e.g. M011er et al. 2003).
The efficiency of the heterotrophic food web in utilizing the sinking material is thought to
depend largely on the timing and rate of release of the material from the sea ice in relation
to the seasonal presence of grazers (e.g. Michel et al. 1996, F ortier et al. 2002). In northern
Baffin Bay, ca. 75 % of the bottom first-year sea ice carbon biomass was observed sinking
as intact algal cells (at 1 m un der the sea ice; Michel et al. 2002), whiJe ca. 60 % of the ice
algal production was estimated to be channelled through pelagic herbivores in Resolute
]9
Passage, Canada (Michel et al. ] 996). Sinking ice algae are believed to provide a seasonally
important food source for the pelagic (e.g. Michel et al. 1996, Werner 2000, Fortier et al.
2002) and benthic (e.g. McMahon et al. 2006) communities.
The Mackenzie shelf in the western Canadian Arctic co vers an area of ca.
60 x ] 03 km2 (defined by the 200 01 isobath) and generally experiences a landfast inshore
first-year sea ice cover from December to May-June and drifting pack ice on the outer-shelf
during winter (Carmack & Macdonald 2002). Primary production on the Mackenzie shelf
has been estimated at 12 to 16 g C 01-2 il (Carmack et al. 2004), and ice algae are
estimated to account for < 15 % of the annual primary production (Homer & Schrader
1982, Macdonald et al. 1998). Tce algae have been observed forming dense mats on the
under-surface of the sea ice on the Mackenzie Shelf, which were later dislodged from the
sea ice during spring melt and sea ice break-up (Macdonald et al. 1998). These events could
result in a large proportion of organic material reaching the benthos unutilized, if exceeding
the grazing capacity of the pelagic heterotrophic food web. Tndeed, Seuthe et al. (2007)
showed that the underice copepods in Franklin Bayon the Mackenzie Shelf increased their
grazing activity from March to May 2004. Studies of sinking fluxes under the sea ice on the
Mackenzie Shelf are from long-term sediment trap moorings (O'Brien et al. 2006, Forest et
al. 2007). From these studies, the annual particulate organic carbon (POC) sinking flux was
estimated to vary between 1.7 - 5.8 g C 01-2/ (deployment depths ranging [rom
118 - 21301; O'Brien et al. 2006) and 1.0 - 1.7 g C 01-2 il (depth of200 01 ; Forest et al.
2007) on the Mackenzie Shelf.
20
The present study investigated the seasonal changes in the sinking flux of particulate
material under first-year sea ice on the Mackenzie Shelf during late winter and spring 2004.
Our first objective was to estimate underice sinking fluxes of particulate material during the
period of ice growth and prior to the period of ice algal production, in contrast to the later
productive season and the period of ice melt. The duration of this study ensured that the
entire productive season of ice algae was covered, and that a complete seasonal time-series
of underice sedimentation, from late winter to spring melt was obtained. Our second
objective was to evaluate depth-related changes in underice sinking fluxes of organic
material and in the composition of the sinking material , after its release from the ice into
the water column. Our third objective was to quantify sinking export processes with respect
to the standing biomass of chI a, POC and particulate organic nitrogen (PON) in the bottom
sea ice and the upper part of the water column.
1.2 Materials and methods
1.2.1 Sampling
Underice sampling was conducted at a landfast first-year sea ice station (ca. 250 !TI
water depth) in Franklin Bay, western Canadian Arctic (Fig. 1). This study was carried out
onboard the Canadian research ice-breaker CCGS Amundsen during the overwintering
period of the Canadian Arctic ShelfExchange Study (CASES). From 23 February to
20 June 2004, sinking fluxes of particulate material from the sea ice were studied using
parti cIe interceptor traps deployed at l, 15 and 25 m from the under-surface of the ice. Two
21
identical particle interceptor trap arrays, fixed to a tripod on the sea ice, where deployed in
relatively close proximity (ca. 50 m) on 16 consecutive occasions (Table 1). The ice holes
through which the sediment traps were deployed were covered by wooden plates and snow
to prevent increased Iight penetration. During the initial part of the study, from 23 February
to 13 April, the deployment time was, on average, 7.8 ± 0.8 days (n = 6). From 13 April to
20 June, the deployment time was reduced to an average of 6.2 ± 0.4 days (n = 8), in
response to higher sinking fluxes, except for two deployments of 4.0 and 15.2 days on
26 May and 30 May, respectively. The particle interceptor traps were constructed of PVC
(Polyvinyl Chloride) cylinders closed at one end, with an internai diameter of 10 cm and an
aspect ratio (height:diameter) of7. The sampling with particle interceptor traps was carried
out in accordance with JGOFS protocols (Knap et al. 1996) and recommendations by
Gardner (2000). Prior to deployment, the particle interceptor traps were filled with 0.22 flm
filtered seawater previously col!ected at 200 m, to ensure that the higher density parti cIe
free water would remain within the traps during deployment. No preservative or poison was
added to the filtered seawater prior to deployment. Upon recovery, the entire sample
volume of the particle interceptor traps was transported back to the laboratory onboard the
CCGS Amundsen for chI a, phaeopigments, total particulate carbon (TPC), POC, PON, and
biogenic silica (BioSi) analyses.
22
Banks Island -
o 50 100
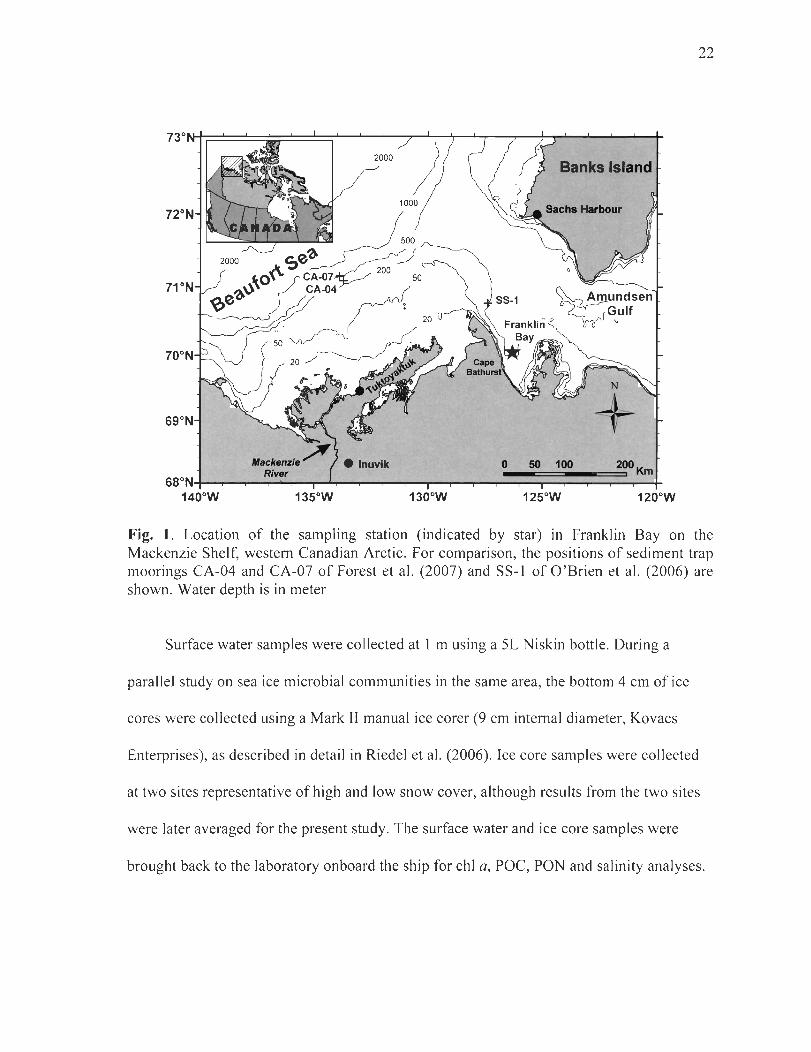
Fig. 1. Location of the sampling station (indicated by star) in Franklin Bayon the Mackenzie Shelf, western Canadian Arctic. For comparison, the positions of sediment trap moorings CA-04 and CA-07 of Forest et al. (2007) and SS-l of O'Brien et al. (2006) are shown. Water depth is in meter
Surface water sampI es were collected at 1 m using a SL Niskin bottle. During a
parallel study on sea ice microbial communities in the same area, the bottom 4 cm of ice
cores were collected using a Mark Il manual ice corer (9 cm internaI diameter, Kovacs
Enterprises), as described in detail in Riedel et al. (2006). lee core samples were collected
at two sites representative of high and low snow coyer, although results from the two sites
were later averaged for the present study. The surface water and ice core samples were
brought back to the laboratory on board the ship for chI a, POC, PON and salinity analyses.
23
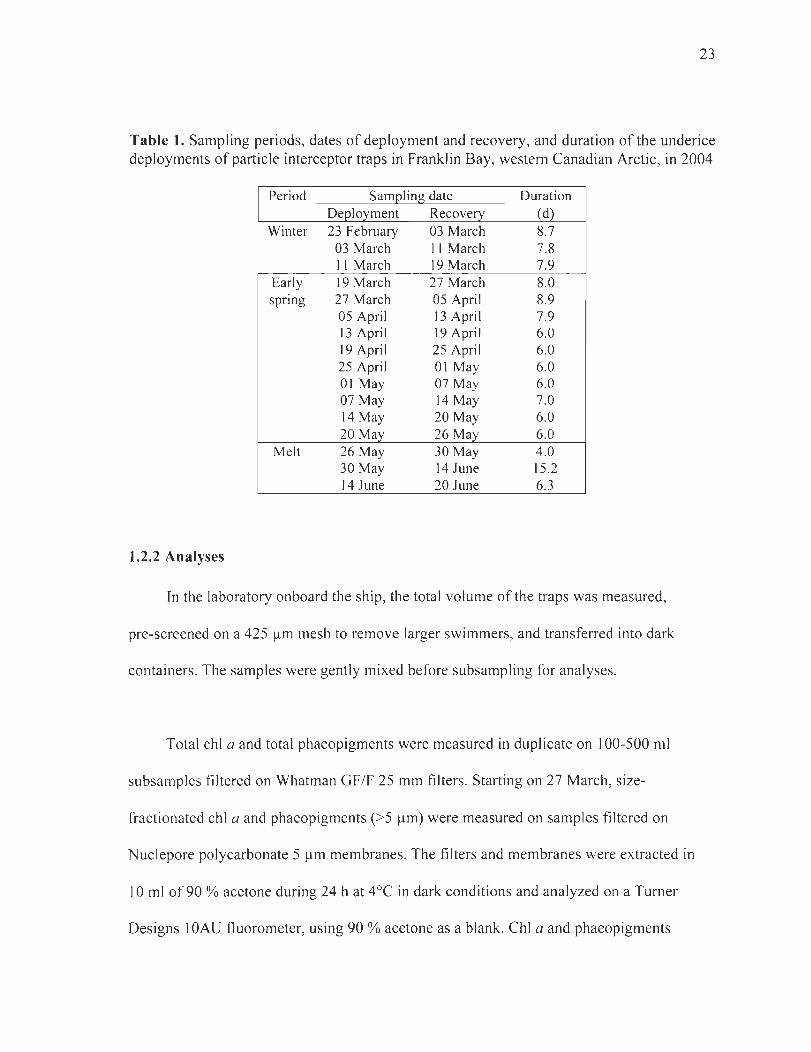
Table 1. Sampling periods, dates of deployment and recovery, and duration of the underice deployments of particle interceptor traps in Franklin Bay, western Canadian Arctic, in 2004
Period Saml2ling date Duration Deployment Recovery (d)
Winter 23 February 03 March 8.7 03 March Il March 7.8 11 March 19 March 7.9
Early 19 March 27 March 8.0 spnng 27 March 05 April 8.9
05 April 13 April 7.9 13 April 19 April 6.0 19 April 25 April 6.0 25 April 01 May 6.0 01 May 07 May 6.0 07 May 14 May 7.0 14 May 20 May 6.0 20 May 26 May 6.0
Melt 26 May 30 May 4.0 30May 14 June 15.2 14 June 20 June 6.3
1.2.2 Analyses
In the laboratory onboard the ship, the total volume of the traps was measured,
pre-screened on a 425 )lm mesh to remove larger swimmers, and transferred into dark
containers. The samples were gently mixed before subsampling for analyses.
Total chi a and total phaeopigments were measured in duplicate on 100-500 ml
subsamples filtered on Whatman GF/F 25 mm filters. Starting on 27 March, size-
fractionated chi a and phaeopigments (>5 )lm) were measured on sampi es filtered on
Nuclepore polycarbonate 5 )lm membranes. The filters and membranes were extracted in
10 ml of90 % acetone during 24 h at 4°C in dark conditions and analyzed on a Turner
Designs 10AU fluorometer, using 90 % acetone as a blank. Chi a and phaeopigments
concentrations were estimated according to Parsons et al. (1984). The fluorometer was
calibrated before and after the expedition, using a pure chI a extract (from
Anacystis nidulans; Sigma Chemicals).
24
TPC, POC and PON were measured in duplicate on 100-1000 ml subsamples which
were filtered on pre-combusted (450°C during 24 h) Whatman GF/F 21 mm filters. The
filters were dried at 60°C during 24 h, pelletized and stored until later analysis on a Perkin-
Elmer Model 2400 CHN Analyzer. POC was obtained by acidifying filters in a dessicator
saturated with HCI fumes during 24 h, thereby removing any inorganic carbon, before
analysis on the CHN Analyzer. POC was sampled from 5 April onwards. Analysis ofnon-
acidified filters produced values ofTPC and PON.
BioSi was measured in duplicate on 100-500 ml subsamples. The subsamples were
filtered on 0.6 /-tm Nuclepore polycarbonate membranes using an ali-plastic filtration
system, and were dried at 60°C for 24 h. BioSi was measured by extraction in 0.2 M NaOH
at 95°C for 45 min. Extracted subsamples were then analyzed using a colorimetric reaction
involving the formation of a silicomolybdate complex, which was spectrophotometrically
determined at 810 nm (Varian Inc. CARY 100 BIO) (adapted from Ragueneau & Tréguer
1994 and Conley 1998).
The same methods as described above were used to determine chI a, POC and PON
concentrations from surface water samples and meIted ice cores. Surface water salinity was
determined using a Guildline Model 8400B Autosal salinometer. Before filtration, the
bottom sea ice samples were processed as described in Riedel et al. (2006).
1.2.3 Calculations and statistical analyses
Sinking fluxes were calculated using the following equation:
Sinking flux (mg m-2 d- I) = (Ctrap * Ytrap) / (Atrap * Tdep) (1)
where Ctrap is the concentration of the measured variable in the particle interceptor trap
25
(mg m-3) , Ytrap is the volume of the particle interceptor trap sample (m\ Atrap is the particle
interceptor trap surface area (m2) and Tdep is the deployment time (d).
The daily loss rate of suspended material due to sinking export at 1 m was estimated
using the following equation:
Daily loss rate (% d- I) = Sinking flux / Cn! * 100 (2)
where sinking flux at 1 m is from equation (1) and Cnt is the integrated concentration of the
variable considered (mg m-2) in the bottom sea ice and water column above the particle
interceptor trap depth. Because of the missing chI a sinking flux at ] mon 20 June, the
chI a daily loss rate on that day was estimated using the chI a sinking flux measured at
15 m.
The seasonal time-series of sinking flux data was tested for significant differences
between selected reference periods using Kruskal- Wallis tests (Sokal & Rohlf 198]), and
between depths using Friedman's method for Randomized Blocks (Sokal & Rohlf 1981).
Linear regression analyses between variables are simple linear regressions (Model J) and
reduced major axis (model II) regressions (Sokal & Rohlf 1981); the latter takes into
account measurement errors for both dependent and independent variables. Regression
slopes were compared using analysis of covariance (Sokal & Rohlf 1981).
1.3 Results
26
The sampling period covered three distinctive time periods, which have been defined
as winter, early spring and melt period, as wi Il be referred to in the next sections (Table 1).
The winter period extended from 23 February to 19 March and was characterized by
continuous sea ice growth from 1.4 to 1.6 m (Fig. 2a) and little changes in ice al gal biomass
(average of 0.20 ± 0.34 mg chI a m-2; Fig. 2c). The early spring period, from 19 March to
26 May, showed continuing sea ice growth with ice thickness increasing from 1.6 to 2.0 m
and an increase in ice algal biomass from 0.55 to 22.3 mg chI a m-2. During the melt period,
from 26 May to 20 June, a decrease in sea ice thickness from 2.0 to 1.6 m and a decrease in
surface salinity from 31.2 to 5.4 were observed (Fig. 2a, b), along with a decrease in the ice
algal biomass from 22.3 to 1.4 mg chI a m-2 (Fig. 2c).
27
2.00 a)
Cf) 1.75 Cf) <l) c ~~
.S2 E 1.50 -5~
<l)
.S2 1.25
1.00 35 30 b
.~ 25 c eu 20 Cf)
<l) 15 <..l eu 't: 10 :::J Cf) 5
0 30
c c) 0 25 ~ 20 -~ c ,,:, ~ E 15 c Ol o E 10 <..l_ eu ::c 5 0
0 1 15 29 12 26 10 24 7 21
March April May June
Fig. 2. Seasonal changes in (a) sea ice thickness, (b) surface salini ty and (c) sea ice ch lorophyll a (chi a) concentrations, from 23 February to 20 June 2004. ln (a) and (c), values were averaged from sites with high and low snow cover during deployment periods of parti cie interceptor traps. Error bars represent standard deviations. Vertical dashed lines represent reference periods as described in Table 1
Sinking fluxes measured under the sea ice showed a general seasonal increase during
the sampling period (Fig. 3a-d, Table 2). Chi a and BioSi sinking fluxes both showed a
significant increase [rom winter to early spring and to the melt period (Kruska l-Walli s,
p < 0.05 and p < 0.05, respectively; Fig. 3a, b, Table 2) . During winter, chi a and BioSi
sinking fluxes remained low (median values of 0.01 and:s 0.80 mg m-2 d-I at ail depths,
respectively), whi le a steady increase was observed during early spring reaching 0.23 and
28
5.8 mg m-2 d- I at 1 mon 26 May, respectively. During the fo11owing melt period, chI a
sinking fluxes increased 7 to 9-fold, reaching 2.0 and 0.97 mg m-2 d- I at 15 and 25 m,
respectively (unfortunately data are not available at 1 mon 20 June). BioSi sinking fluxes
increased 7 to 13-fold at a11 depths during the melt period, reaching 37.9, 90.4 and
72 .0 mg m-2 d-I at 1, 15 and 25 m, respectively, on 20 June. Throughout the study chI a
sinking fluxes decreased significantly with depth, on average, by 46.2 ± 18.5 % from 1 to
25 m (Friedman ' s method, p < 0.001), while BioSi sinking fluxes remained stable with
depth (Friedman 's method, p > 0.05 ; Table 2). Sinking fluxes of phaeopigments increased
significantly with depth throughout the study (Friedman ' s method, p < 0.05; Table 2) .
TPC and POC showed para11el seasonal sinking flux patterns throughout the study
(Fig. 3c, d, Table 2), which differed from chi a and BioSi. Missing POC data points from
23 February to 27 March were extrapolated from the strong linear correlation between the
measured sinking fluxes ofTPC and POC (Fig. 4), using the measured TPC sinking flux
values. Sinking fluxes ofTPC and POC remained rather stable during the winter (median
values of27 .0 and 24.6 mg m-2 d- I at 1 m, respectively) and early spring (median values of
24.4 and 21.0 mg m -2 d- I at 1 m, respectively) periods. During the melt period, TPC sinking
fluxes increased 9 to 18-fold (maximum values of 539.9, 312.8 and 185.5 mg m-2 d- I at l ,
15 and 25 m, respectively, on 20 June) and POC increased 7 to 21-fold (maximum values
of 521.7, 214.5 and 188.6 mg m-2 d- I at l, 15 and 25 m, respectively, on 20 June). TPC and
POC sinking fluxes did not show any significant change with depth during the study period
(Friedman's method, p > 0.05 and p > 0.05 , respectively; Table 2). Throughout our study,
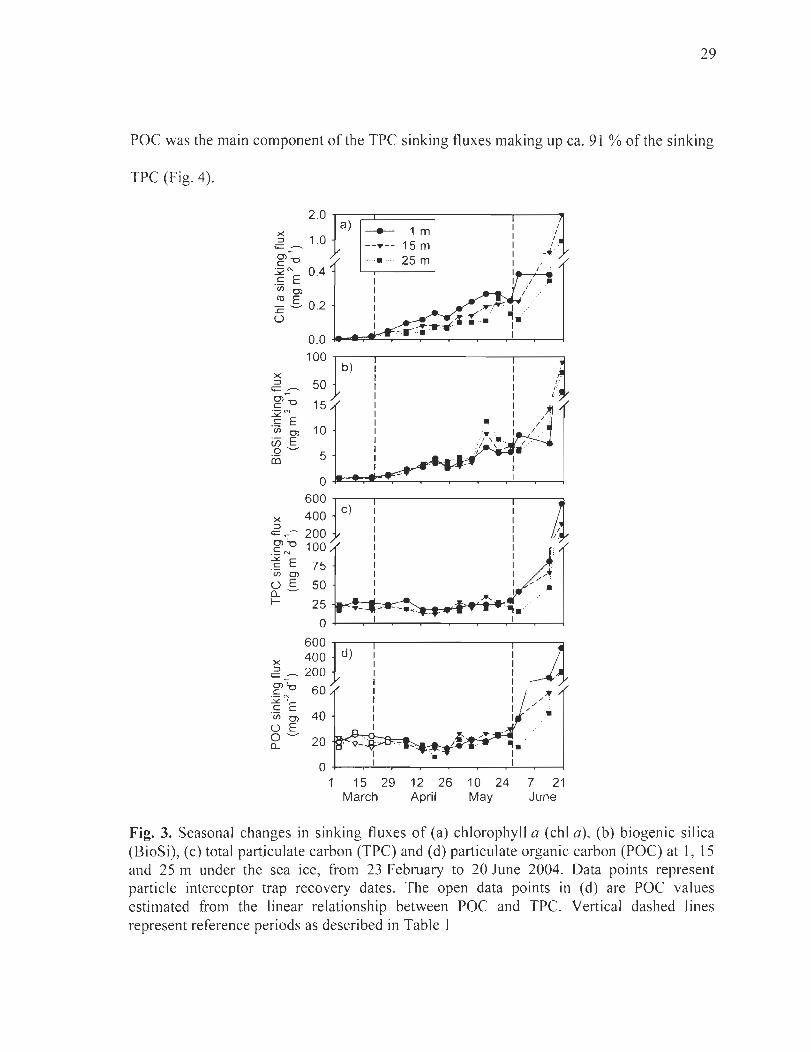
29
POC was the main component of the TPC sinking fluxes making up ca. 91 % of the sinking
TPC (Fig. 4).
2 .0 ~-;::::c::====:;----r--fI a) -.- 1 m
~ 1.0 Ci:: ........ 0)'7 c:::"O ~ 'l'E 0.4 "Ci5 0)
co E ::ë: - 0 .2 Ü
--... - - 15 m . ..• .. 25 m
x-. . ..-: .. 1 ....• ~ II1II ' -/.r. .•... 1Ii • _ -"';:11'.,. 1
O. 0 .... ..e:;::a:.:-=.-·· :--=· .:....· · ..,.· ··_~_~--,,....!I_..---~
><
100
1 ~ ........ 50 0)'7 c:::"O 15 ~ ~ c::: E '00 0) 10 .- E 'g-ëO 5
b)
..
15 29 12 26 10 24 7 21 March April May June
Fig. 3. Seasonal changes in sinking fluxes of (a) chlorophyll a (chI a), (b) biogenic silica (BioSi), (c) total particulate carbon (TPC) and (d) particulate organic carbon (POC) at 1, 15 and 25 III under the sea ice, from 23 February to 20 June 2004. Data points represent particle interceptor trap recovery dates. The open data points in (d) are POC values estimated from the linear relationship between POC and TPC. Vertical dashed lines represent reference periods as described in Table 1
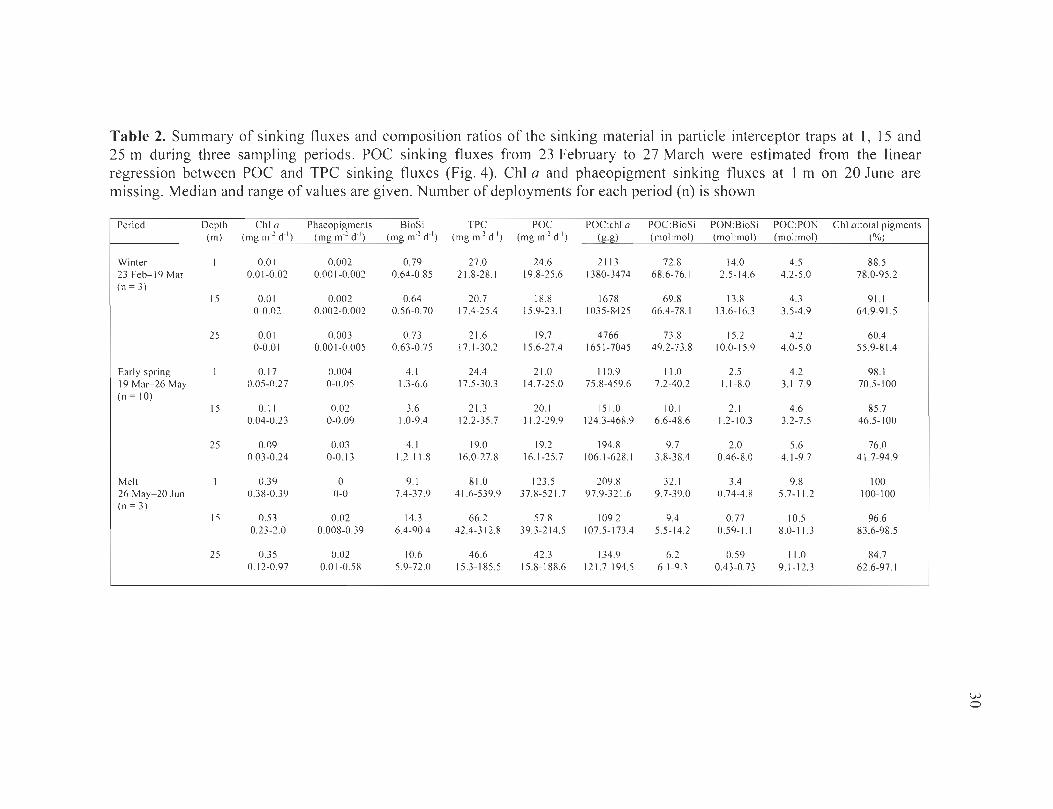
Table 2. Summary of sinking flu xes and composition ratios of the sinking material in partic\e interceptor traps at 1, 15 and 25 m during three sampling periods. POC sinking fluxes from 23 February to 27 March were estimated from the linear regression between POC and TPC sinking fluxes (Fig. 4). ChI a and phaeopigment sinking fluxes at 1 m on 20 June are missing. Median and range of values are given. Number of deployments for each period (n) is shown
Period Depth Chi a Phaeopigments BioSi TpC l'OC pOC:chl a POC:BioS i pON:BioSi pOC:pON Chi a:total pigments (m) (mg m·2 d" ) (mg m·2 d" ) (mg m" d" ) (mg m" d" ) (mg m" d" ) (g:g) (mol:mol) (mol: mol) (mol:mol) (%)
Winter 0.0 1 0.002 0.79 27.0 24.6 2 11 3 72.8 14.0 4.5 88.5 23 Feb- 19 Mar 0.01-0.02 0.001-0.002 0.64-0.85 2 \. 8-28 .1 19.8-25.6 1380-3474 68.6-76.1 12 .5 -14.6 4.2-5.0 78.0-95 .2 (n = 3)
15 0.0 1 0.002 0.64 20.7 18.8 1678 69.8 13.8 4.3 9\.1 0-0.02 0.002-0.002 0.56-0.70 17.4-25.4 15.9-23. 1 1035-8425 66.4-78.1 13.6-16.3 3.5-4.9 64.9-9 1.5
25 0.0 1 0.003 0.73 2 \.6 19.7 4766 73.8 15.2 4.2 60.4 0-0.0 1 0.00 1-0.005 0.63-0.75 17.1-30.2 15.6-27.4 1651-7045 49.2-73.8 10.0- 15.9 4.0-5.0 55 .9-8 1.4
Ear1y spring 0. 17 0.004 4. 1 24.4 2 \.0 11 0.9 1 \.0 2.5 4.2 98. 1 19 Mar- 26 May 0.05-0 .27 0-0.05 1.3-6.6 17.5-30.3 14.7-25.0 75.8-459.6 7.2-40.2 1. 1-8.0 3. 1-7.9 70.5- 100 (n = 10)
15 0. 11 0.02 3.6 21.3 20. 1 15 \.0 10.1 2. 1 4.6 85 .7 0.04-0.23 0-0.09 1.0-9.4 12.2-35.7 11.2-29.9 124.3-468.9 6.6-48.6 1.2- 10.3 3.2-7.5 46.5 -1 00
25 0.09 0.03 4.1 19.0 19.2 194.8 9.7 2.0 5.6 76.0 0.03-0.24 0-0. 13 1.2- 11 .8 16.0-27.8 16.1 -25.7 106. 1-628 .1 3.8-3 8.4 0.46-8.0 4. 1-9.7 41.7-94.9
Melt 0.39 0 9 .1 8 \.0 123.5 209.8 32 .1 3.4 9.8 100 26 May- 20 Jun 0.38-0.39 0-0 7.4-37.9 4 \.6-539.9 37.8-521.7 97.9-32 \.6 9.7-39.0 0.74-4.8 5.7- 11.2 100-100 (n = 3)
15 0.53 0.02 14.3 66.2 57.8 109.2 9.4 0.77 10.5 96.6 0.23-2.0 0.008-0.39 6.4-90.4 42.4-312.8 39.3-2 14.5 107.5- 173.4 5.5- 14.2 0.59- 1.1 8.0- 11 .3 83.6-98.5
25 0.35 0.02 10.6 46.6 42.3 134.9 6.2 0.59 1 \.0 84.7 0.12-0.97 0.0 1-0.58 5.9-72.0 15.3-1 85.5 15.8-188.6 121.7- 194.5 6. 1-9.3 0.43-0.73 9.1- 12.3 62.6-97. 1
w o
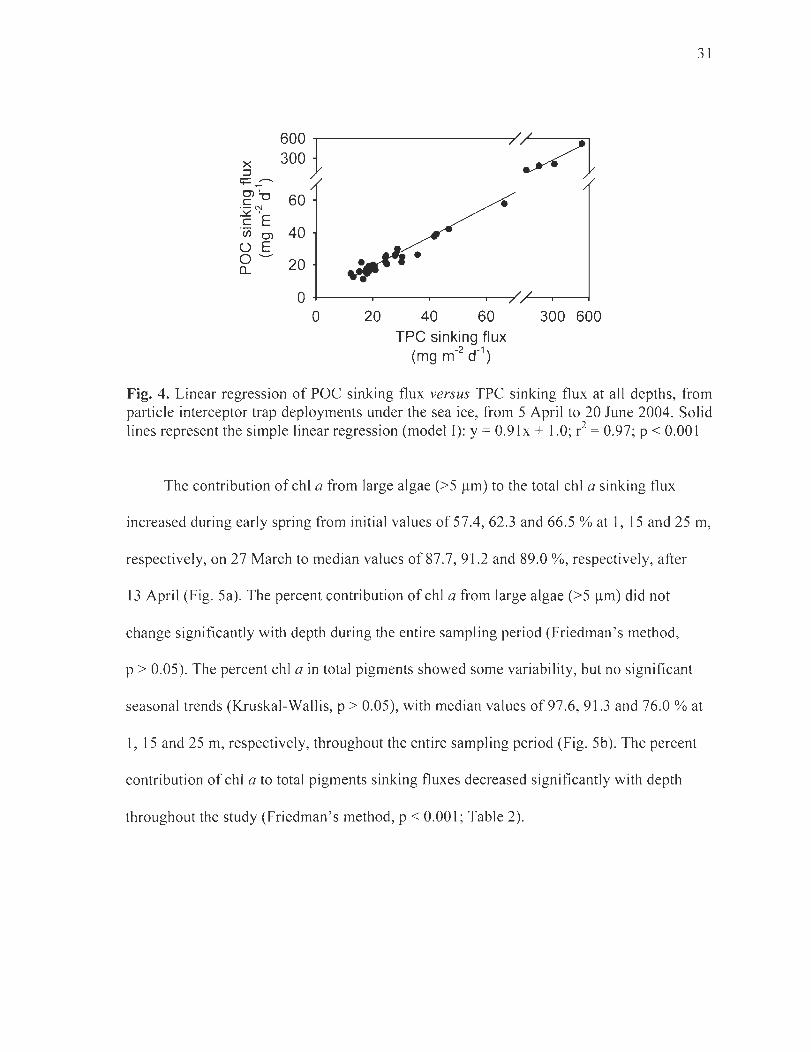
x 600 J 300
~
t+=~ 0) ' 60 c"O ·- N ~ , c E "ii5 0) 40 ü E 0"--' 20 0...
0 0 20
•
40 60 TPC sinking flux
(mg m-2 d-1)
31
//}
300 600
Fig. 4. Linear regression of POC sinking flux versus TPC sinking flux at a il depths, from particle interceptor trap deployments under the sea ice, from 5 April to 20 June 2004. Solid lines represent the simple linear regression (model 1): y = 0.91x + 1.0; r2 = 0.97; p < 0.001
The contribution of chI a from large algae (>5 ).lm) to the total chi a sinking flux
increased during early spring from initial values of 57.4,62.3 and 66.5 % at 1, 15 and 25 m,
respectively, on 27 March to median values of87.7, 91.2 and 89.0 %, respectively, after
13 April (Fig. 5a). The percent contribution of chI a from large algae (>5 ).lm) did not
change significantly with depth during the entire sampling period (Friedman 's method,
p > 0.05). The percent chI a in total pigments showed sorne variabi lity, but no significant
seasonal trends (Kruskal -Walli s, p > 0.05), with median values of97 .6, 91 .3 and 76.0 % at
1, 15 and 25 m, respectively, throughout the entire sampling period (Fig. 5b). The percent
contribution of ch i a to total pigments sinking fluxes decreased significantly with depth
throughout the study (Friedman ' s method, p < 0.001; Table 2).
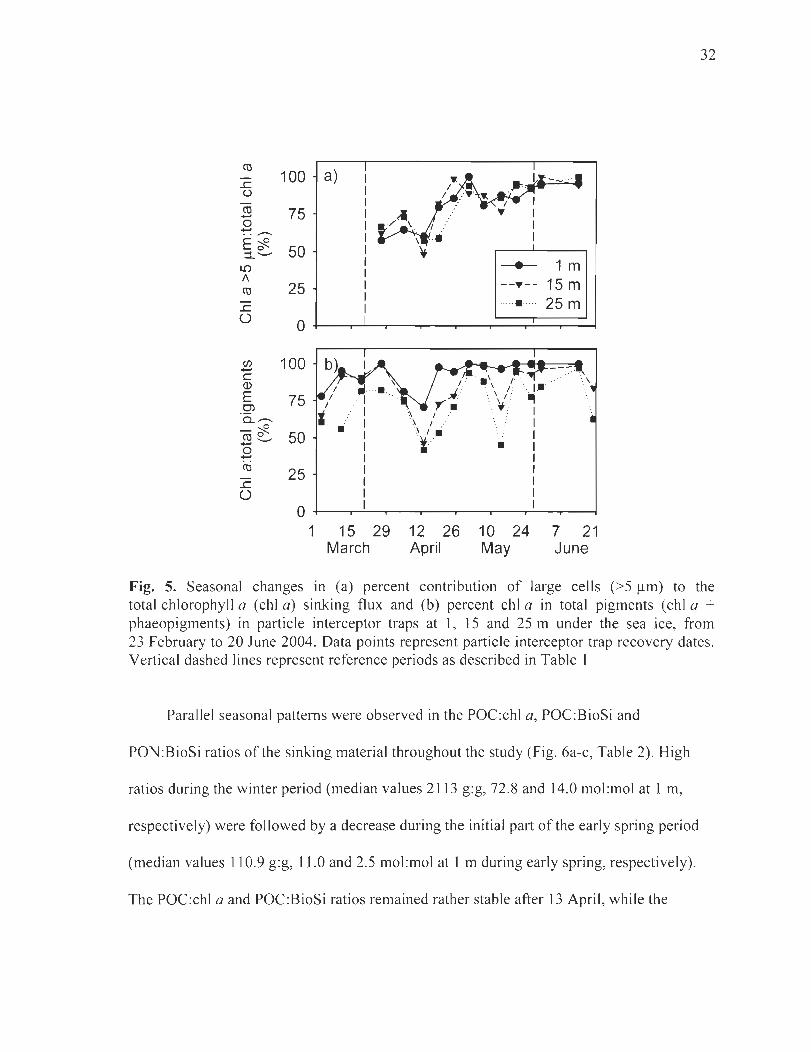
..c ü
cu -+-' o -+-' .. ..-
100
75
E;ft ::t -- 50
LO 1\ co
..c o 25
2 100 c ID
E 75 en 0...--~ ~~ 50 o .......
25 ..c o
a)
".
----- 1 m --~-- 15 m ... • .. 25 m
ii
"· 1.·' ~
1 1 1 1 1 1 1 1
o +---~~~~--~---r--~I~~~ 1 15 29
March 12 26 April
10 24 May
7 21 June
32
Fig. 5. Seasonal changes in (a) percent contribution of large cells (>5 !lm) to the total chlorophyll a (chi a) sinking flux and (b) percent chi a in total pigments (chi a + phaeopigments) in particle interceptor traps at l, 15 and 25 m under the sea ice, from 23 February to 20 June 2004. Data points represent particle interceptor trap recovery dates. Vertical dashed lines represent reference periods as described in Table 1
Parallel seasonal patterns were observed in the POC:chl a, POC:BioSi and
PON:BioSi ratios of the sinking material throughout the study (Fig. 6a-c, Table 2). High
ratios during the winter period (median values 2113 g:g, 72.8 and 14.0 mol:mol at 1 m,
respectively) were followed by a decrease during the initial part of the early spring period
(median values 110.9 g:g, 11.0 and 2.5 mol:mol at 1 m during early spring, respectively).
The POC:chl a and POC:BioSi ratios remained rather stable after 13 April, while the
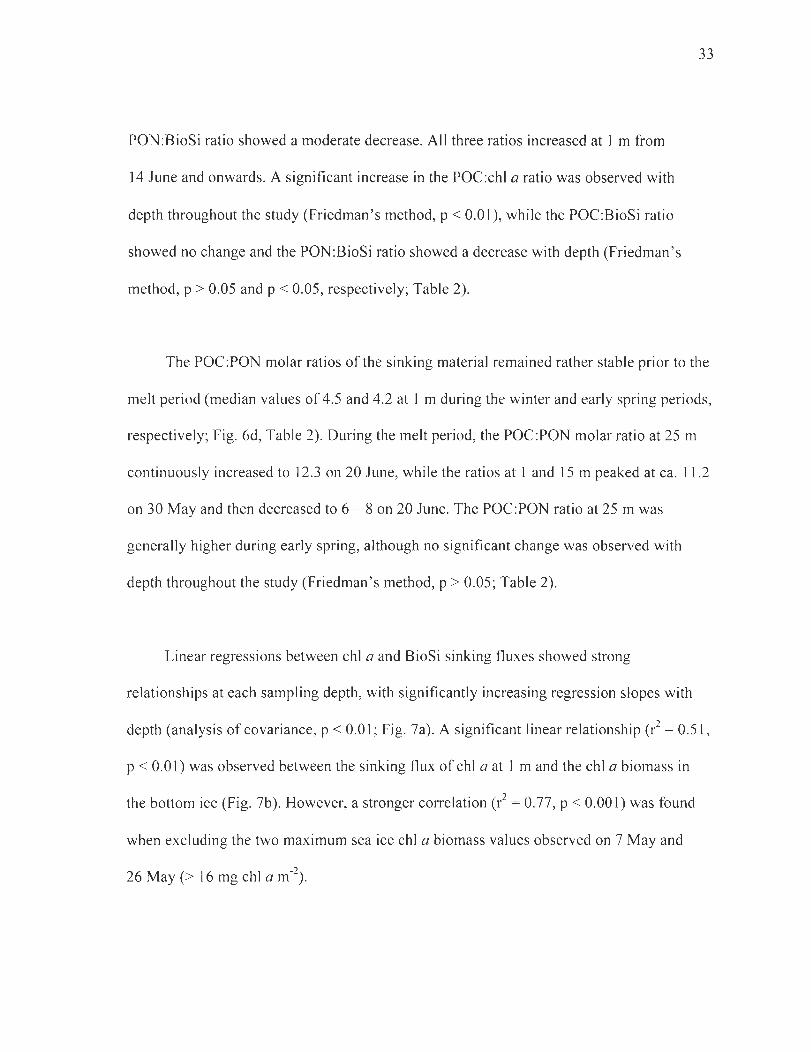
PON:BioSi ratio showed a moderate decrease. Ali three ratios increased at 1 m from
14 June and onwards. A significant increase in the POC:chl a ratio was observed with
depth throughout the study (Friedman 's method, p < 0.01), while the POC:BioSi ratio
showed no change and the PON:BioSi ratio showed a decrease with depth (Friedman's
method, p > 0.05 and p < 0.05, respectively; Table 2).
33
The POC:PON molar ratios of the sinking material remained rather stable prior to the
melt period (median values of 4.5 and 4.2 at 1 m during the winter and early spring periods,
respectively; Fig. 6d, Table 2). During the melt period, the POC:PON molar ratio at 25 m
continuously increased to 12.3 on 20 June, while the ratios at 1 and 15 m peaked at ca. 1 1.2
on 30 May and then decreased to 6 - 8 on 20 June. The POC:PON ratio at 25 m was
generally higher during early spring, although no significant change was observed with
depth throughout the study (Friedman's method, p > 0.05; Table 2).
Linear regressions between chI a and BioSi sinking fluxes showed strong
relationships at each sampling depth, with significantly increasing regression sI opes with
depth (analysis of covariance, p < 0.01; Fig. 7a). A significant linear relationship (r2 = 0.51 ,
P < 0.01) was observed between the sinking flux of chI a at 1 m and the chI a biomass in
the bottom ice (Fig. 7b). However, a stronger correlation (r2 = 0.77, P < 0.001) was found
wh en excIuding the two maximum sea ice chI a biomass values observed on 7 May and
26 May (> 16 mg chI a m-2).
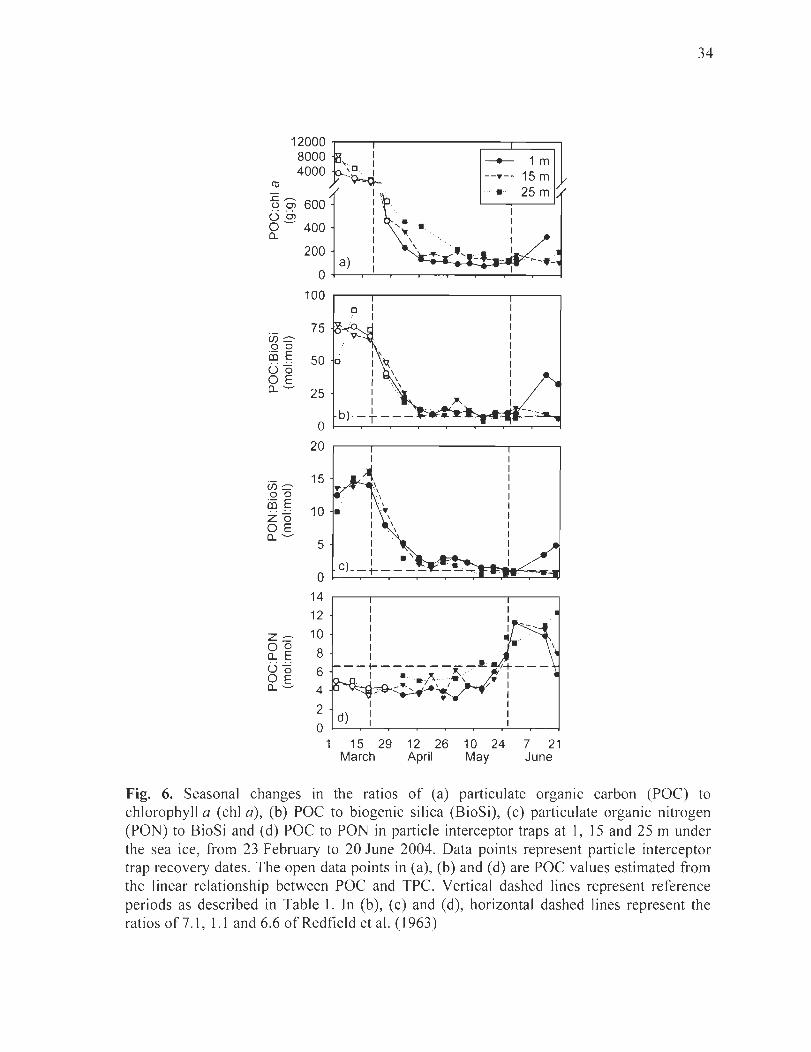
12000
t1l
.!: -UOl 0ëJ 0-a.
ü5::::-o 0 ai~ 00 OE 0.-
ü5::::-00
8000 4000
600 400
200
0 100
75
50
25
0 20
15
- 1m --"'-- 15 m
l, : .... . . 25 m 1 1 1 , ' ... 1 ~ 1 \
1 \
a) 1 1
0 1 1
1 1 1 1 1 1
b) --+---
ai~ Zo OE
10 • 1 1 1 1 1
0.-5
0 14 12
z::::- 10 00 o.E 8 00 6 OE a. - 4
2 0
1 .• ' W'>-.____ ......... c) __ ~----
1 1 1 1 1 1
--+--------....,..!!.: 1 • ~ ~ ....
.'-I.:'-~D... ; ... ~ ... ~ .. "···ïfe \
d)
15 29 12 26 10 24 7 21 March April May June
34
Fig. 6. Seasonal changes in the ratios of (a) particulate organic carbon (POC) to chlorophyll a (chI a), (b) POC to biogenic silica (BioSi), (c) particulate organic nitrogen (PON) to BioSi and (d) POC to PON in particle interceptor traps at l, 15 and 25 m under the sea ice, from 23 February to 20 June 2004. Data points represent particle interceptor trap recovery dates. The open data points in (a), (b) and (d) are POC values estimated from the Iinear relationship between POC and TPC. Vertical dashed lines represent reference periods as described in Table 1. In (b), (c) and (d), horizontal dashed lines represent the ratios of 7.1, 1.1 and 6.6 of Redfield et al. (1963)
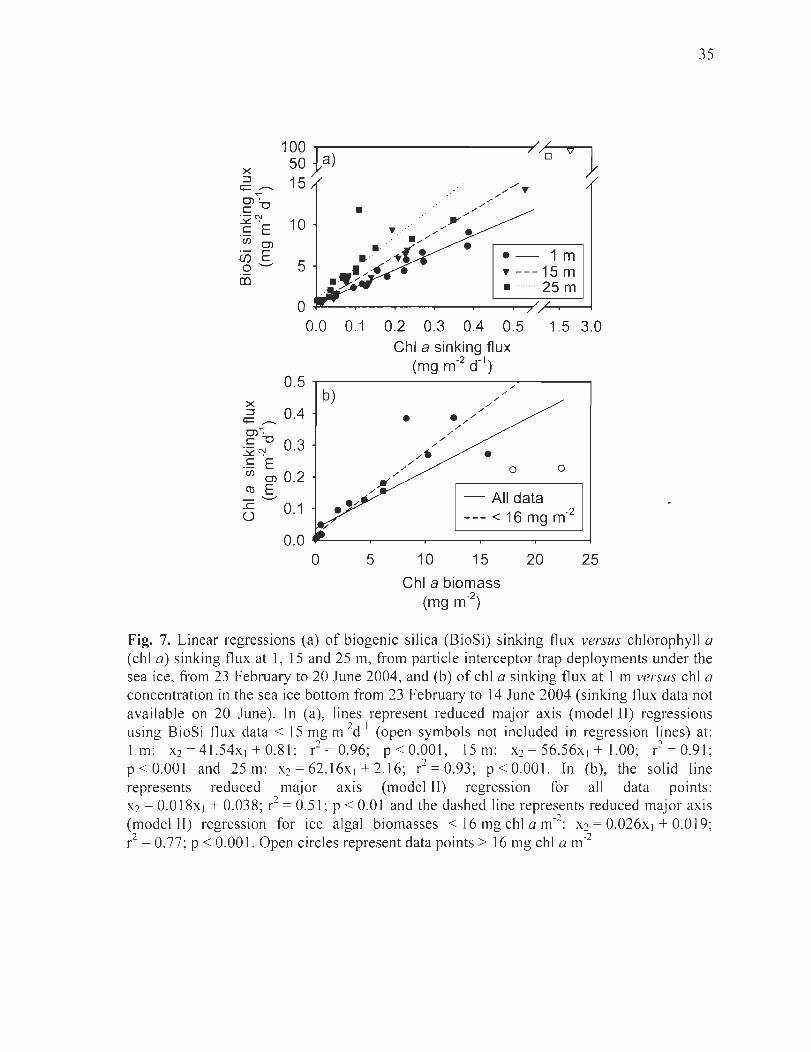
100
x 50 ~a) ::::l 15
/~ 7 0 ,Y
t;::-0)'7 c:"O
·-N ~ . .~ E CI) 0)
i:ï5 E 0-
i:O
10
5
•
.- 1 m ~ ---15 m . ········· 25 m
0.0 0.1 0.2 0.3 0.4 0 .5 1.5 3.0
Chi a sinking flux (mg m-2 d-1)
0.5 ,..------------:-/'-----, b) / x
~ _ 0.4 0)'7
~~"O 0.3 . ~ E CI) 0) 0.2 C\j E --cS 0.1
v
K' /'
•
/' /'
/'
/' /' /'-
/' /' . /'/'
/' /'
• o o
- Ali data --- < 16 mg m-2
0.0 .-:----,~-____r--_,_---r--___4 o 5 10 15
Chi a biomass (mg m-2)
20 25
35
Fig. 7. Linear regressions (a) of biogenic silica (BioSi) sinking flux versus chlorophyll a (chI a) sinking flux at 1, 15 and 25 m, from particle interceptor trap deployments under the sea ice, from 23 February to 20 June 2004, and (b) of chI a sinking flux at 1 m versus chI a concentration in the sea ice bottom from 23 February to 14 June 2004 (sinking flux data not available on 20 June). ln (a), lines represent reduced major axis (modellI) regressions using BioSi flux data < 15 mg m-2d-) (open symbols not inc\uded in regression lines) at:
2 2 1 m: x2= 41.54x) + 0.81; r = 0.96; p < O.OOl , 15m: x2= 56.56x ) + 1.00; r = 0.91 ; p < O.OOl and 25m: x2= 62.16x) + 2.16; r2 = 0.93; p < O.OOl. In (b), the sol id line represents reduced major axis (modellI) regression for ail data points: X2 = 0.018x) + 0.038; r2 = 0.51; P < 0.01 and the dashed line represents reduced major axi s (modelll) regression for ice algal biomasses < 16 mg chI a m-2: X2 = 0.026x) + 0.019; r2 = 0.77; P < 0.001. Open circles represent data points > 16 mg chi a m-2
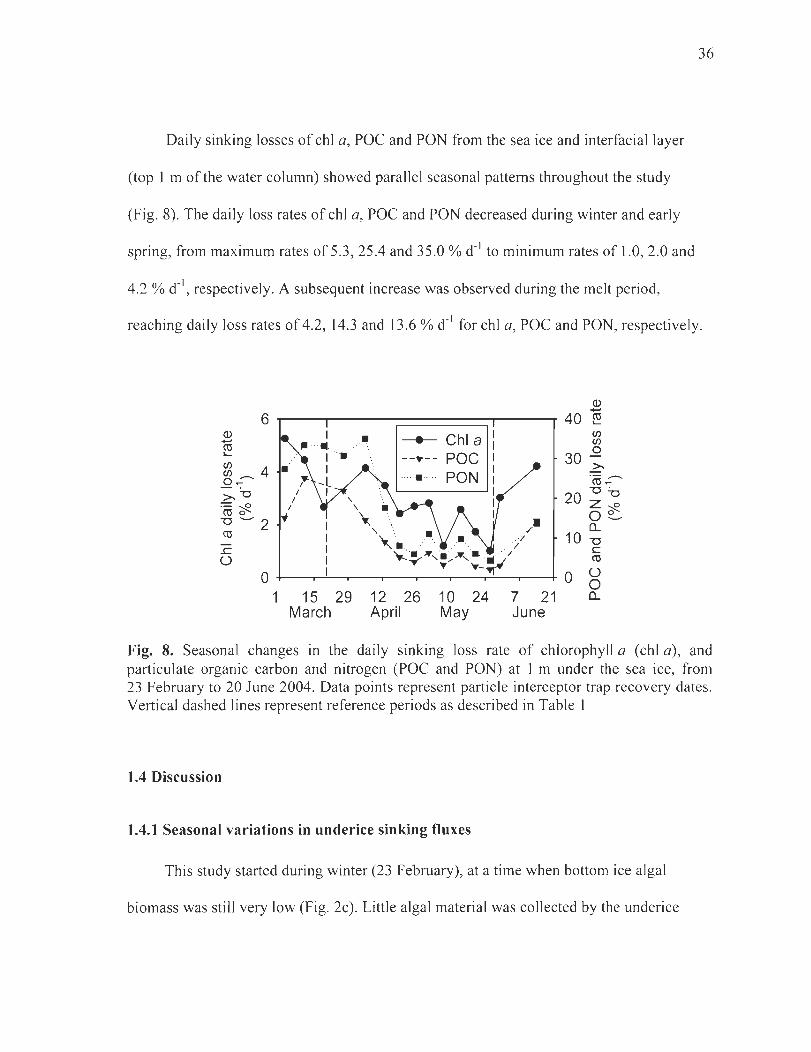
36
Daily sinking losses of chI a, POC and PON from the sea ice and interfaciallayer
(top 1 m of the water column) showed parallel seasonal patterns throughout the study
(Fig. 8). The daily loss rates of chi a, POC and PON decreased during winter and early
spring, from maximum rates of 5.3,25.4 and 35.0 % d- I to minimum rates of 1.0,2.0 and
4.2 % d- I, respectively. A subsequent increase was observed during the melt period,
reaching daily loss rates of 4.2, 14.3 and 13.6 % d- I for chi a, POC and PON, respectively.
1 15 29 March
-----'1'--
12 26 April
10 24 May
Cl) -40 cu '-Cf) CI)
30 0 >-
7 21 June
Fig. 8. Seasonal changes in the daily sinking loss rate of chlorophyll a (chI a), and particulate organic carbon and nitrogen (POC and PON) at 1 m under the sea ice, from 23 February to 20 June 2004. Data points represent particle interceptor trap recovery dates. Vertical da shed lines represent reference periods as described in Table 1
1.4 Discussion
1.4.1 Seasonal variations in underice sinking fluxes
This study started during winter (23 February), at a time when bottom ice algal
biomass was still very low (Fig. 2c). Little algal material was collected by the underice
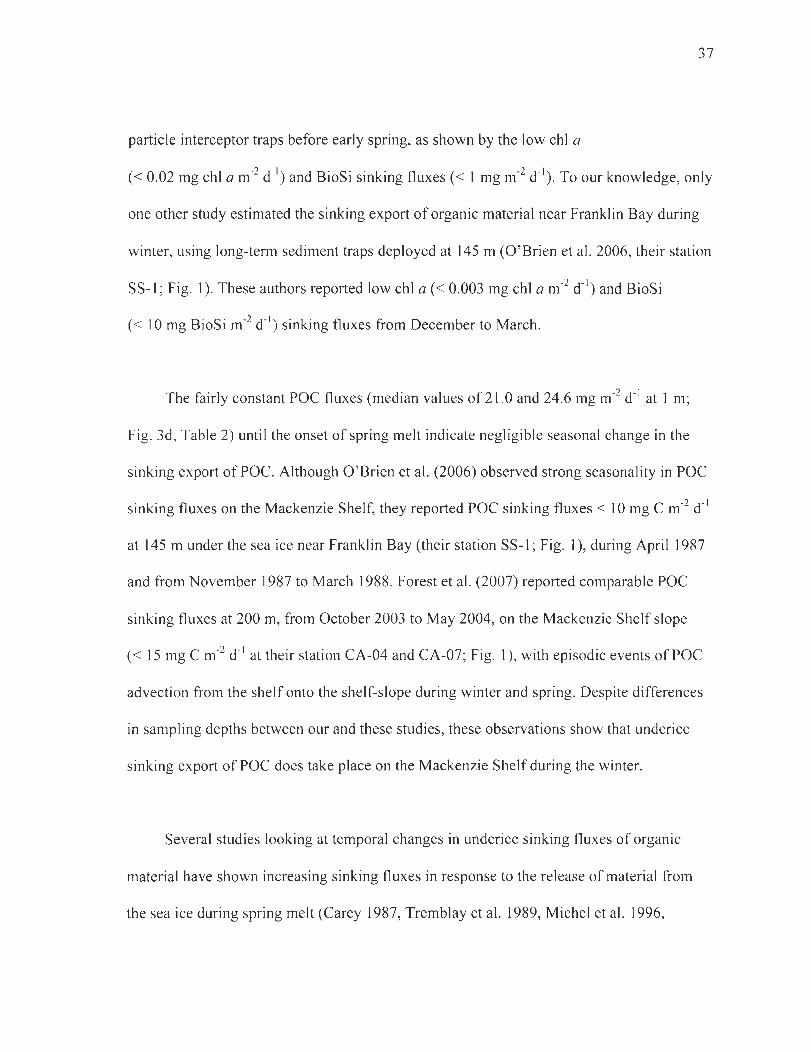
37
particle interceptor traps before early spring, as shown by the low chi a
« 0.02 mg chi a m-2 d-I) and BioSi sinking fluxes « 1 mg m-2 d-I). To our knowledge, only
one other study estimated the sinking export of organic material near Franklin Bay during
winter, using long-term sediment traps deployed at 145 m (O'Brien et al. 2006, their station
SS-I; Fig. 1). These authors reported low chi a « 0.003 mg chi a m-2 d-I) and BioSi
« 1 0 mg BioSi m-2 d- I) sinking fluxes from December to March.
The fairly constant POC fluxes (median values of 21.0 and 24.6 mg m-2 d-I at 1 m;
Fig. 3d, Table 2) until the onset of spring melt indicate negligible seasonal change in the
sinking export ofPOC. Although O'Brien et al. (2006) observed strong seasonality in POC
sinking fluxes on the Mackenzie Shelf, they reported POC sinking fluxes < 10 mg C m-2 d-I
at 145 m under the sea ice near Franklin Bay (their station SS-I; Fig. 1), during April 1987
and From November 1987 to March 1988. Forest et al. (2007) reported comparable POC
sinking fluxes at 200 m, From October 2003 to May 2004, on the Mackenzie Shelf slope
« 15 mg C m-2 d-I at their station CA-04 and CA-07; Fig. 1), with episodic events ofPOC
advection From the shelf onto the shelf-slope during winter and spring. Despite differences
in sampling depths between our and these studies, these observations show that underice
sinking export of POC does take place on the Mackenzie Shelf during the winter.
Several studies looking at temporal changes in underice sinking fluxes of organic
material have shown increasing sinking fluxes in response to the release of material From
the sea ice during spring melt (Carey 1987, Tremblay et al. 1989, Michel et al. 1996,
Fortier et al. 2002). Melnikov (1998) suggested that ice algae are released From the ice
during winter through brine drainage during ice growth, in the western Weddell Sea.
Furthermore, Carey (1987) suggested that the carbon sinking flux measured near the
38
bottom in the vicinity ofNarwhal Island (southwestern Beaufort Sea), from mid-April to
end-May, primarily originated From the productive ice communities prior to ice melt.
During the present study, ice thickness continuously increased until the onset of spring ice
melt, indicating that any release of organic material from the ice during that period would
be linked to brine drainage rather than melt processes. An early coupling between ice
communities and the underlying water column, prior to spring ice melt, could be of
seasonal importance for pelagic herbivores, as suggested by Melnikov (1998), as weil as for
the benthic community as suggested by Renaud et al. (2007b).
The increasing pelagic grazing activity of copepods observed by Seuthe et al. (2007)
during the winter-spring transition in Franklin Bay, although linked to pelagic primary
production, may have been supplemented with sinking ice algal material. Indeed,
microscopie observations of fecal pellets in sediment traps showed that they contained
frustules ofpennate diatoms (L. Seuthe unpubl. data), the most abundant algal group in the
bottom surface of the ice in April-May (M. R6zaIlska pers. comm.). During our study,
bottom ice algal concentrations were, on average, more than 2 orders of magnitude higher
than phytoplankton concentrations at 1 m, indicating that any phytoplankton contribution to
sinking algae would be minimal.
39
Assuming that the POC sinking flux measured during the winter period in the present
study would have been the same throughout the preceding winter months, we can estimate
that ca. 3.5 g C m-2 would have been exported through sinking from November to the end
ofMarch. This POC sinking flux estimate for the winter period is almost one order of
magnitude higher than that reported by O'Brien et al. (2006) near Franklin Bay for
November to March « 0.5 g C m-2 at 145 mat their station SS-l), and compares with their
annual POC sin king flux estimate (ca. 4 g C m-2) . The discrepancy between our results and
those obtained from by O'Brien et al. (2006) is likely explained by transformation and loss
processes affecting the organic material during its descent to deep waters. This aspect will
be discussed in more details in the next section. In addition, the different methods and
interannual and spatial differences between the two studies probably also contributed to the
observed discrepancy.
The fairly constant POC sinking fluxes prior to spring meIt compared to the observed
changes in chI a and BioSi fluxes suggests a non-algal origin of the sinking POC during
winter. This indeed is supported by the high POC:chl a ratios and the POC:BioSi and
PON:BioSi molar ratios which were considerably higher than Redfield ratios (7.1 and 1.1,
respectively; Redfield et al. 1963), during the winter period (Fig. 6a-c). The POC sinking
fluxes during the winter period did not appear to be related to the sinking of senescent algae
or herbivorous fecal material , as evidenced by negligible sinking fluxes of phaeopigments
(:S 0.002 mg m-2 d- I; Table 2) and low POC:PON molar ratios compared to those reported
for copepod fecal pellets (33.2; Daly et al. 1999). Qualitative microscopie analysis of the
40
sin king material collected during winter revealed large amounts of gelatinous material to
which detritus were attached, possibly transparent exopolymeric partic\es (TEP). TEP
produced by diatoms have been show to have high C:N molar ratios (26; Engel & Passow
2001). This, in combination with the low abundance of sea ice diatoms during winter does
not support that the TEP in the sinking material would have originated from diatoms.
Bhaskar et al. (2005) report low C:N molar ratios (2.4) in bacterial exopolymeric
substances (EPS). The transparent Coomassie Stained Particles (CSP), first described by
Long & Azam (1996), can be produced by marine bacterioplankton and Iikely have a high
nitrogen content due to their protein composition (Radié et al. 2006). Bacteria also have
low C:N ratios (3 .2; Lee & Fuhrman 1987). We thus surmise that bacteria-mediated sinking
fluxes contributed significantly to the export of organic material during winter.
The initial increase in underice chI a and BioSi sinking fluxes coincided with the
increasing bottom ice chI a biomass, suggesting a coupling between sinking fluxes under
the sea ice and ice algal biomass. Indeed, a significant relationship between sinking fluxes
and ice algal biomass was observed during the present study (Fig. 7b). This relationship
was found to be stronger at lower ice algal biomass concentrations. The higher and more
variable data points in the regression plot represent measurements obtained towards the
onset of spring melt, indicating a stronger relationship between sinking fluxes and ice algal
biomass during winter and in early spring.
The POC:chl a ratios during early spring (median value of 110.9 g:g; Table 2) were
higher than the ratio typically considered for healthy algal cells (40 g:g; Lorenzen 1968),
but were within the range reported for ice algae (ca. 15 - 180 g:g; Gosselin et al. ] 990).
When using the POC:chl a ratio for the bottom ice algae during our study (44 g:g;
41
A. Riedel pers. comm.), then the estimated sinking export ofPOC explained by al gal cells
would, on average, be 7.5 mg C m-2 d- I or 37.8 % of the observed POC sin king flux during
early spring. This indicates that a significant part of the POC sinking flux was explained by
algal cells during early spring. Diatoms appeared to become a seasonally increasing
fraction of the algal sinking flux, as supported by the increase in the contribution of chI a
>5 flm to the total chI a sinking flux, the increasing BioSi sinking flux and the decreasing
POC:BioSi and PON:BioSi ratios during early spring. Indeed, increasing sinking fluxes of
algal cells, dominated by the pennate diatoms Nitzschiafrigida and Navicula spp., were
observed from March to May (from 3.2 to 118.0 x 10⁶ cells m-2 d- I at 1 m; A. Tatarak pers.
comm.). These two species were also dominant in the ice assemblage (M. Rozanska pers.
comm.).
Analyses of vertical sections of ice cores showed that, on average, 95 % ofthe total
chI a biomass in complete ice cores was found in the bottom 4 cm (A. Riedel pers. comm.).
Therefore, the initial melting of the bottom section of the sea ice would presumably result
in a higher release of organic material as compared to later melt further up in the vertical
ice profile . During the spring melt period, sinking fluxes of organic material increased
significantly in response to the onset of spring ice melt after 26 May. This initial and rapid
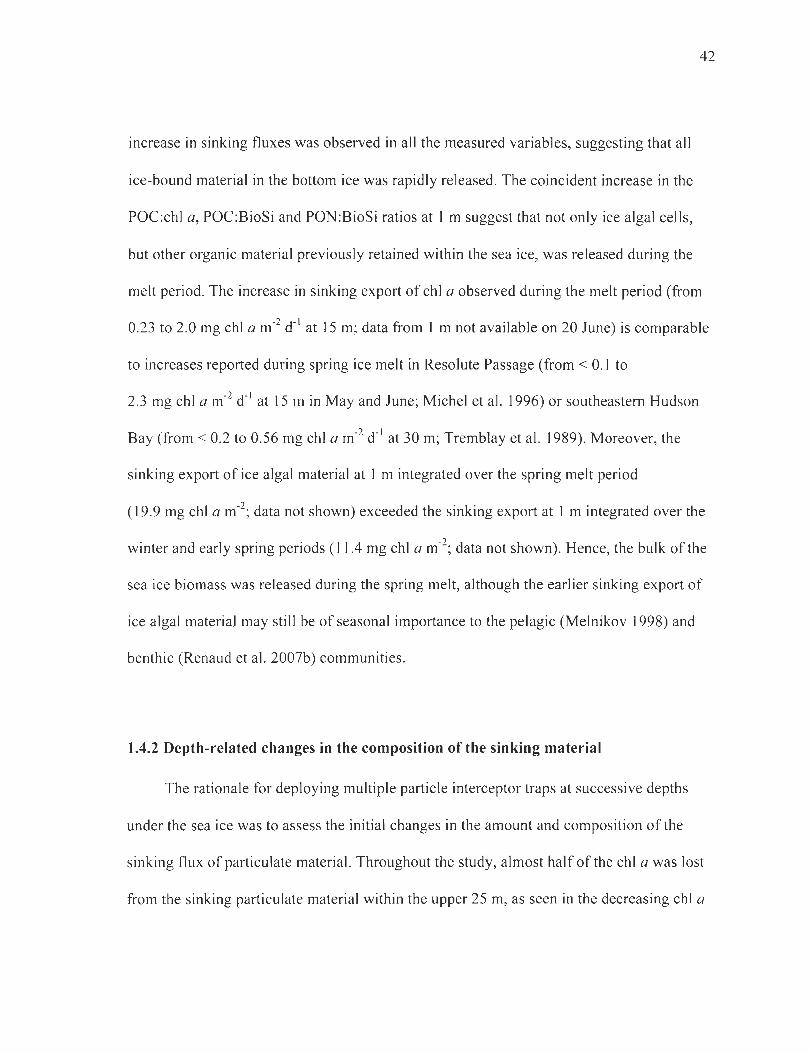
42
increase in sinking fluxes was observed in ail the measured variables, suggesting that ail
ice-bound material in the bottom ice was rapidly released. The coincident increase in the
POC:chl a, POC:BioSi and PON:BioSi ratios at 1 m suggest that not only ice algal cells,
but other organic material previously retained within the sea ice, was released during the
melt period. The increase in sinking export of chI a observed during the melt period (from
0.23 to 2.0 mg chI a mo2 dol at 15 m; data from 1 m not available on 20 June) is comparable
to increases reported during spring ice melt in Resolute Passage (from < 0.1 to
2.3 mg chI a mo2 dol at 15 m in May and June; Michel et al. 1996) or southeastem Hudson
Bay (from < 0.2 to 0.56 mg chI a mo2 dol at 30 m; Tremblay et al. 1989). Moreover, the
sinking export of ice algal material at 1 m integrated over the spring melt period
(19.9 mg chI a mo2; data not shown) exceeded the sinking export at 1 m integrated over the
winter and early spring periods (11.4 mg chI a mo2; data not shown). Hence, the bulk of the
sea ice biomass was released during the spring melt, although the earlier sinking export of
ice algal material may still be of seasonal importance to the pelagic (Melnikov 1998) and
benthic (Renaud et al. 2007b) communities.
1.4.2 Depth-related changes in the composition ofthe sinking material
The rationale for deploying multiple particle interceptor traps at successive depths
under the sea ice was to assess the initial changes in the amount and composition of the
sinking flux of particulate material. Throughout the study, almost half of the chI a was lost
from the sinking particulate material within the upper 25 m, as seen in the decreasing chI a
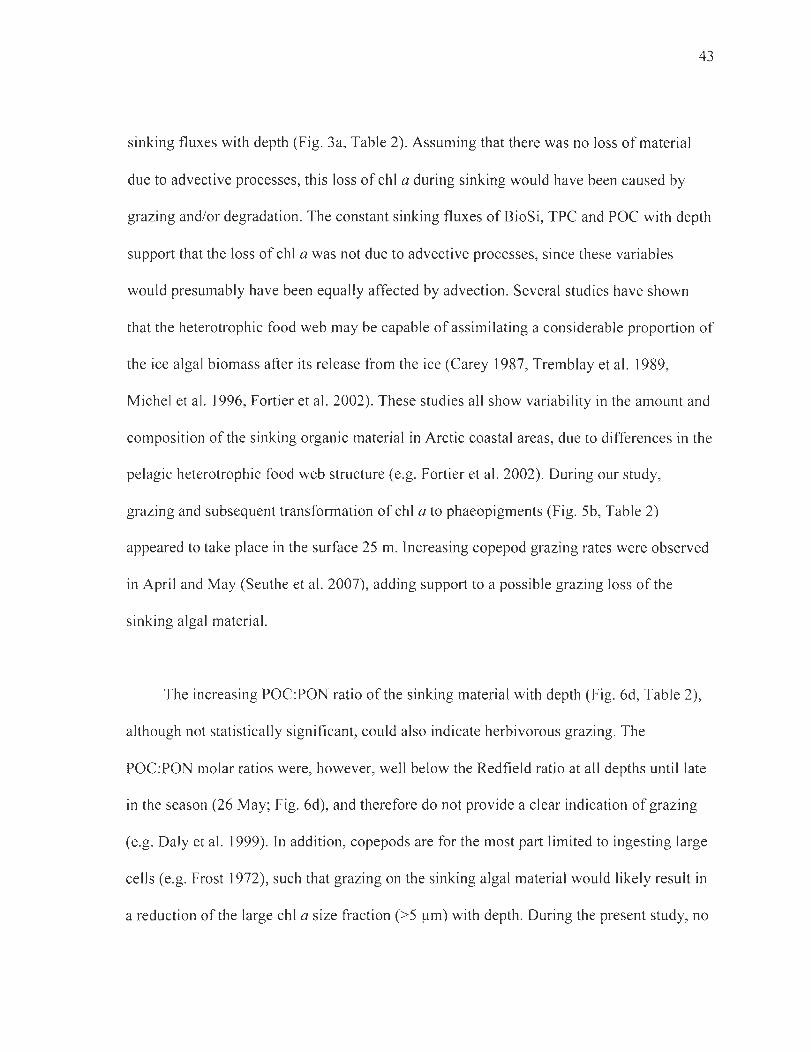
43
sinking fluxes with depth (Fig. 3a, Table 2). Assuming that there was no loss of material
due to advective processes, this loss of chi a during sinking would have been caused by
grazing and/or degradation. The constant sinking fluxes of BioSi, TPC and POC with depth
support that the loss of chI a was not due to advective processes, since these variables
would presumably have been equally affected by advection. Several studies have shown
that the heterotrophic food web may be capable of assimilating a considerable proportion of
the ice algal biomass after its release from the ice (Carey 1987, Tremblay et al. 1989,
Michel et al. 1996, Fortier et al. 2002). These studies ail show variability in the amount and
composition of the sinking organic material in Arctic coastal areas, due to differences in the
pelagic heterotrophic food web structure (e.g. Fortier et al. 2002). During our study,
grazing and subsequent transformation of chi a to phaeopigments (Fig. Sb, Table 2)
appeared to take place in the surface 25 m. Increasing copepod grazing rates were observed
in April and May (Seuthe et al. 2007), adding support to a possible grazing loss of the
sinking algal material.
The increasing POC:PON ratio of the sinking material with depth (Fig. 6d, Table 2),
although not statistically significant, could also indicate herbivorous grazing. The
POC:PON molar ratios were, however, weil below the Redfield ratio at ail depths until late
in the season (26 May; Fig. 6d), and therefore do not provide a c1ear indication of grazing
(e.g. Daly et al. 1999). ln addition, copepods are for the most part limited to ingesting large
cells (e.g. Frost 1972), such that grazing on the sinking algal material would likely result in
a reduction of the large chI a size fraction (>5 /lm) with depth. During the present study, no
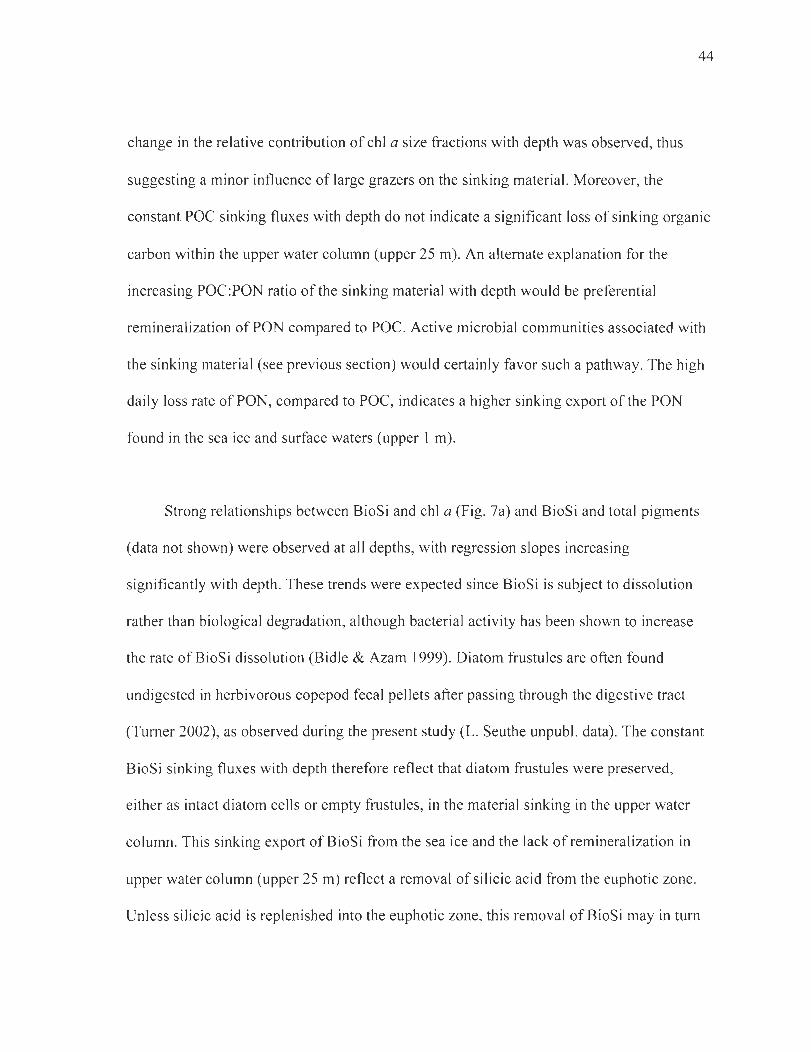
44
change in the relative contribution of chI a size fractions with depth was observed, thus
suggesting a minor influence of large grazers on the sinking material. Moreover, the
constant POC sinking fluxes with depth do not indicate a significant loss of sinking organic
carbon within the upper water column (upper 25 m). An alternate explanation for the
increasing POC:PON ratio of the sinking material with depth would be preferential
remineralization ofPON compared to POCo Active microbial communities associated with
the sinking material (see previous section) would certainly favor such a pathway. The high
daily loss rate ofPON, compared to POC, indicates a higher sinking export of the PON
found in the sea ice and surface waters (upper 1 m).
Strong relationships between BioSi and chI a (Fig. 7a) and BioSi and total pigments
(data not shown) were observed at ail depths, with regression slopes increasing
significantly with depth . These trends were expected since BioSi is subject to dissolution
rather than biological degradation, although bacterial activity has been shown to increase
the rate ofBioSi dissolution (Bidle & Azam 1999). Diatom frustules are often found
undigested in herbivorous copepod fecal pellets after passing through the digestive tract
(Turner 2002), as observed during the present study (L. Seuthe unpubl. data). The constant
BioSi sinking fluxes with depth therefore reflect that diatom frustules were preserved,
either as intact diatom cells or empty frustules, in the material sinking in the upper water
column. This sinking export of BioSi from the sea ice and the lack ofremineralization in
upper water column (upper 25 m) reflect a removal of silicic acid from the euphotic zone.
Unless silicic acid is replenished into the euphotic zone, this removal of BioSi may in tum
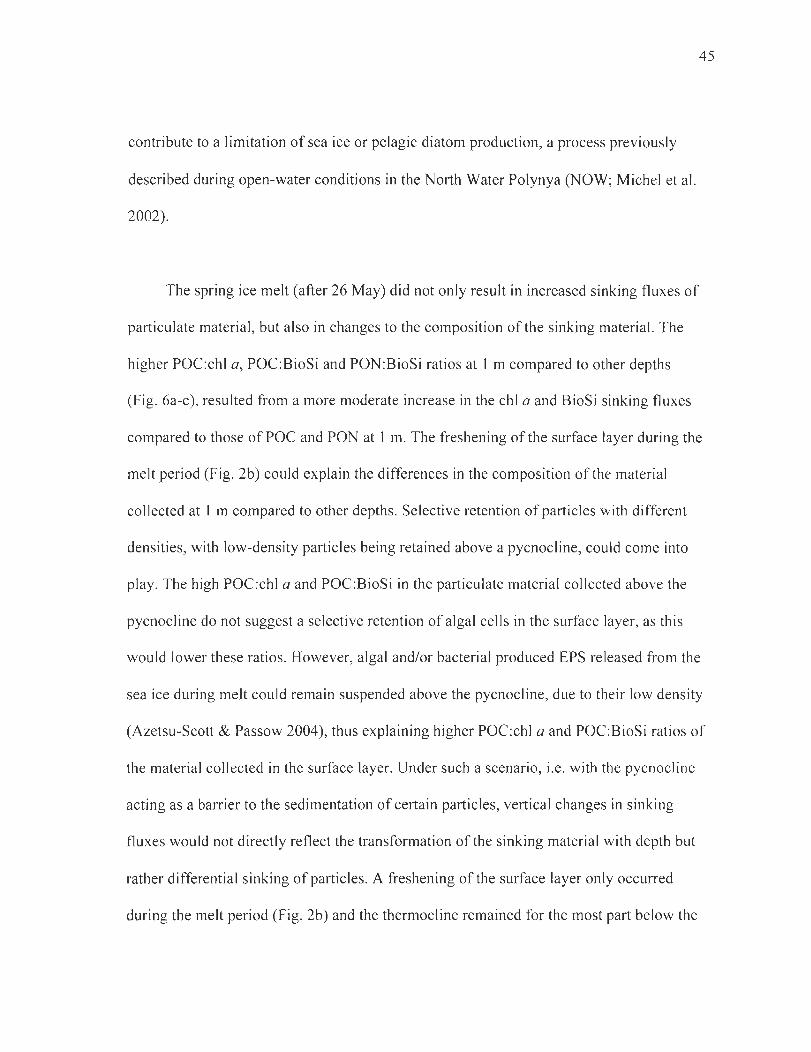
contribute to a limitation of sea ice or pelagic diatom production, a process previously
described during open-water conditions in the North Water Polynya (NOW; Michel et al.
2002).
The spring ice melt (after 26 May) did not only result in increased sinking fluxes of
particulate material , but also in changes to the composition of the sinking material. The
higher POC:chl a, POC:BioSi and PON:BioSi ratios at 1 m compared to other depths
45
(Fig. 6a-c), resulted from a more moderate increase in the chi a and BioSi sinking fluxes
compared to those ofPOC and PON at 1 m. The freshening of the surface layer during the
melt period (Fig. 2b) could explain the differences in the composition of the material
collected at 1 m compared to other depths. Selective retenti on ofparticles with different
densities, with low-density particles being retained above a pycnocline, could come into
play. The high POC:chl a and POC:BioSi in the particulate material collected above the
pycnocline do not suggest a selective retenti on of algal cells in the surface layer, as this
would lower the se ratios. However, algal and/or bacterial produced EPS released from the
sea ice during melt could remain suspended above the pycnocline, due to their low density
(Azetsu-Scott & Passow 2004), thus explaining higher POC:chl a and POC:BioSi ratios of
the material collected in the surface layer. Under such a scenario, i.e . with the pycnocline
acting as a barrier to the sedimentation of certain particles, vertical changes in sinking
fluxes would not directly reflect the transformation of the sinking material with depth but
rather differential sinking of particles. A freshening of the surface layer only occurred
during the melt period (Fig. 2b) and the thermocline remained for the most part below the
46
deployment depths (Forest et al. 2007), which suggests that vertical changes in sinking
fluxes observed during winter and early spring were linked to depth-related transformation
of the sinking material.
1.4.3 Loss of biomass through sin king export
The overall decreasing trend in the daily loss of chi a until the spring ice melt
(Fig. 8), indicates that the seasonal increase in sea ice chI a biomass was not matched
equally by the increasing chI a sinking export. The parallel seasonal patterns in the sinking
loss of chi a, POC and PON suggests that these variables were c10sely linked and Iikely
reflected the sinking export of algal material. Michel et al. (2002) observed comparable
daily sinking loss rates of chI a (up to 10 % d- I) and POC (5 to 22 % d- I
) at 1 m under
first-year sea ice in northern Baffin Bay during April and May. During the present study,
between 1.0 and 5.3 % of the chI a biomass, 2.0 and 25.4 % of the POC biomass and 4.2
and 35.0 % of the PON biomass was exported daily from the sea ice and interfaciallayer
through sinking. In the course ofthis 4-month study, an estimated 31.3 mg chI a m-2,
7.2 g C m-2 (POC) and 1.2 g N m-2 (PaN) was exported through sinking at 1 m under the
first-year sea ice in Franklin Bay. In comparison, the underice sinking export of poe
during a 54 d spring study in Resolute Passage was 11 - 12 g C m-2 at 15 m, ofwhich most
(8 - Il g C m-2) remained suspended during the period of study (Michel et al. 1996). These
poe sinking export values are considerably higher than the estimate reported by O'Brien et
al. (2006) from April to May (ca. 0.5 g C m-2 at 145 m; their SS-I station), which may be
47
related to a high degradation of the organic material during sinking to depth. A benthic
study on the Mackenzie Shelf reports an annual benthic carbon demand of ca. 12.1 g C m-2
(ca. 231 m water depth ; Renaud et al. 2007a), which falls in the same range as our estimate
of carbon sinking export.
1.5 Conclusion
This study showed a tight coupling between the sinking export of algal material and
the biomass ofice algae, especially during winter and at the beginning of the early spring
period. The observed coupling between ice biomass and sinking export suggests that ice
algae can provide a potential food source for the pelagic and benthic communities weil
before the onset of spring melt. The decreasing sinking fluxes of chI a with depth (46 %
from 1 to 25 m), showed a considerable loss ofpigmented biomass from the sinking
particulate organic material after its release from the ice. Diatoms comprised a seasonally
increasing fraction of the sinking algal material during early spring, as indicated by the
increasing fraction of large chi a (>5 )lm) and BioSi sinking fluxes. In contrast with the
seasonally increasing sinking fluxes of chi a and BioSi , POC sinking fluxes remained
rather stable until the onset of spring melt. A large part of the sinking POC appeared to be
non-algae related, as suggested by the high POC:chl a ratios. The onset of spring melt
resulted in a considerable increase in sinking fluxes of pigmented and non-pigmented
material, indicating a non-selective release of particulate organic material from the sea ice.
However, our results also suggest retention of sorne of the released particulate material

48
within the low sali nit y surface layer (between 1 and 15 m) formed at the time of ice melt.
Our daily loss rate estimates showed that highest sinking losses ofbiomass occurred during
late winter.
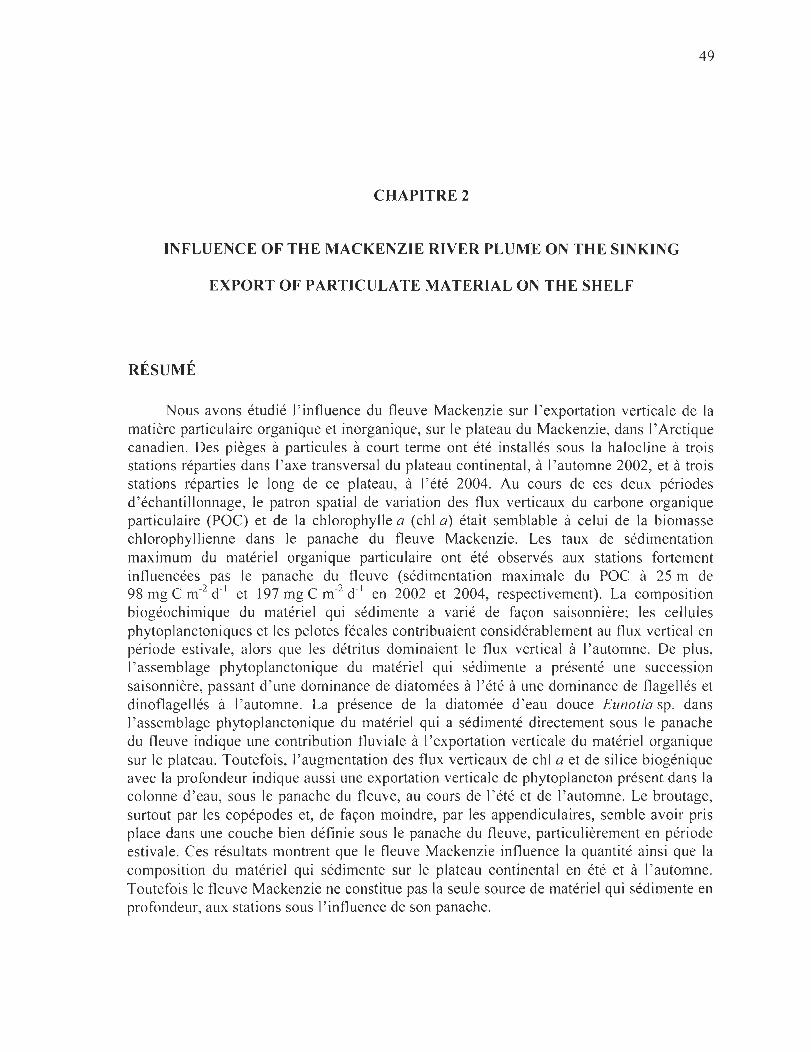
49
CHAPITRE 2
INFLUENCE OF THE MACKENZIE RIVER PLUME ON THE SIN KING
EXPORT OF PARTICULATE MATERIAL ON THE SHELF
RÉSUMÉ
Nous avons étudié l' influence du fleuve Mackenzie sur l'exportation verticale de la matière particulaire organique et inorganique, sur le plateau du Mackenzie, dans l'Arctique canadien. Des pièges à particules à court terme ont été installés sous la halocline à trois stations réparties dans l'axe transversal du plateau continental, à l'automne 2002, et à trois stations réparties le long de ce plateau, à l 'été 2004. Au cours de ces deux périodes d'échantillonnage, le patron spatial de variation des flux verticaux du carbone organique particulaire (POC) et de la chlorophylle a (chI a) était semblable à celui de la biomasse chlorophyllienne dans le panache du fleuve Mackenzie. Les taux de sédimentation maximum du matériel organique particulaire ont été observés aux stations fortement influencées pas le panache du fleuve (sédimentation maximale du POC à 25 m de 98 mg C m-2 d-I et 197 mg C m-2 d- I en 2002 et 2004, respectivement). La composition biogéochimique du matériel qui sédimente a varié de façon saisonnière; les cellules phytoplanctoniques et les pelotes fécales contribuaient considérablement au flux vertical en période estivale, alors que les détritus dominaient le flux vertical à l'automne. De plus, l' assemblage phytoplanctonique du matériel qui sédimente a présenté une succession saisonnière, passant d ' une dominance de diatomées à l'été à une dominance de flagellés et dinoflagellés à l'automne. La présence de la diatomée d'eau douce Eunotia sp. dans l'assemblage phytoplanctonique du matériel qui a sédimenté directement sous le panache du fleuve indique une contribution fluviale à l'exportation verticale du matériel organique sur le plateau. Toutefois, l'augmentation des flux verticaux de chi a et de silice biogénique avec la profondeur indique aussi une exportation verticale de phytoplancton présent dans la colonne d'eau, sous le panache du fleuve, au cours de l'été et de l'automne. Le broutage, surtout par les copépodes et, de façon moindre, par les appendiculaires, semble avoir pris place dans une couche bien définie sous le panache du fleuve, particulièrement en période estivale. Ces résultats montrent que le fleuve Mackenzie influence la quantité ainsi que la composition du matériel qui sédimente sur le plateau continental en été et à l'automne. Toutefois le fleuve Mackenzie ne constitue pas la seule source de matériel qui sédimente en profondeur, aux stations sous l' influence de son panache.
50
ABSTRACT
We examined the influence of the Mackenzie River plume on sinking fluxes of particulate organic and inorganic material on the Mackenzie Shelf, Canadian Arctic. Short-term particle interceptor traps were deployed under the halocline at 3 stations across the shelf during fall 2002 and at 3 stations along the shelf edge during summer 2004. During the two sampling periods, the horizontal pattern in sinking fluxes of particulate organic carbon (POC) and chlorophyll a (chI a) paralleled that in chI a biomass within the plume. Highest sinking fluxes of particulate organic material occurred at stations strongly influenced by the river plume (maximum POC sinking fluxes at 25 m of 98 mg C m-2 d- I
and 197 mg C m-2 d-I in 2002 and 2004, respectively). The biogeochemical composition of the sinking material varied seasonally with phytoplankton and fecal pellets contributing considerably to the sinking flux in summer, while amorphous detritus dominated in the fall. AIso, the sinking phytoplankton assemblage showed a seasonal succession from a dominance of diatoms in summer to flagellates and dinoflagellates in the fall. The presence of the freshwater diatom Eunotia sp. in the sinking assemblage directly underneath the river plume indicates the contribution of a phytoplankton community carried by the plume to the sinking export of organic material. Yet, increasing chI a and biogenic silica (BioSi) sinking fluxes with depth indicated an export of phytoplankton from the water column below the river plume during summer and fall. Grazing activity, mostly by copepods, and to a lesser extent by appendicularians, appeared to occur in a well-defined stratum underneath the river plume, particularly during summer. These results show that the Mackenzie River influences the amount and the composition of the sinking material on the shelf in summer and fa 11 , but does not constitute the only source of material sinking to depth at stations influenced by the river plume.
•
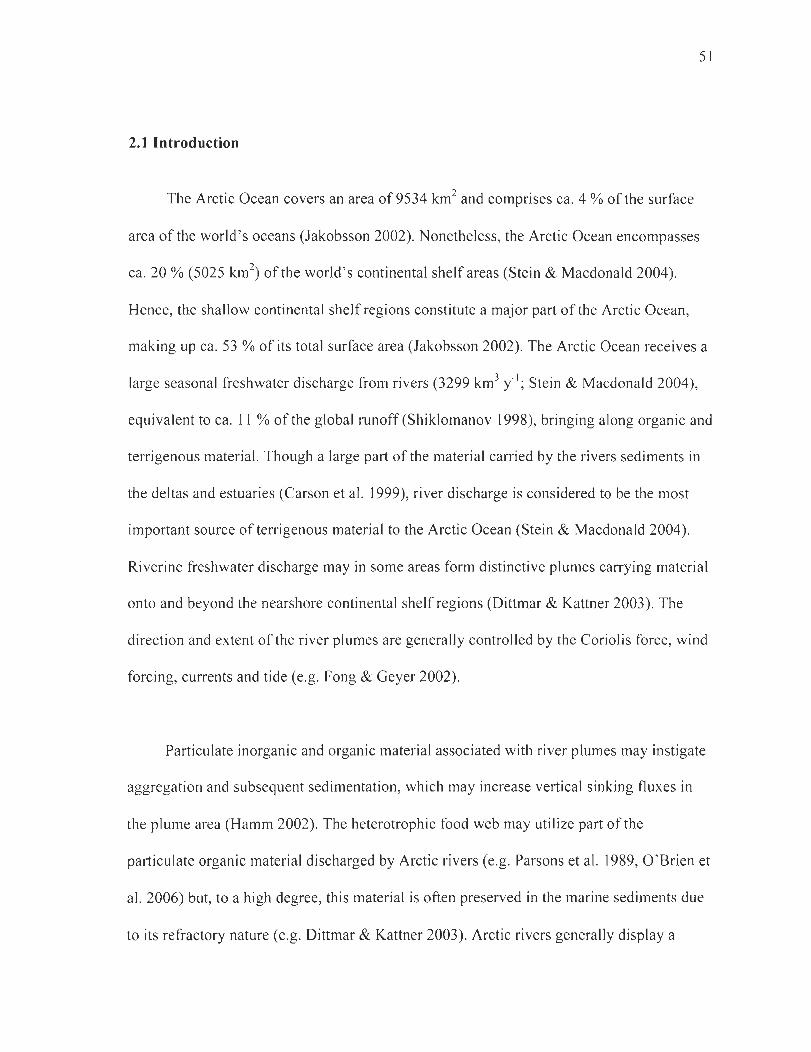
51
2.1 Introduction
The Arctic Ocean covers an are a of9534 km2 and comprises ca. 4 % of the surface
area of the worId's oceans (Jakobsson 2002). Nonetheless, the Arctic Ocean en compasses
ca. 20 % (5025 km2) of the world ' s continental shelfareas (Stein & Macdonald 2004).
Hence, the shallow continental shelfregions constitute a major part of the Arctic Ocean,
making up ca. 53 % of its total surface are a (Jakobsson 2002). The Arctic Ocean receives a
large seasonal freshwater discharge from rivers (3299 km3 il; Stein & Macdonald 2004),
equivalent to ca. II % of the global runoff (Shiklomanov 1998), bringing along organic and
terrigenous material. Though a large part of the material carried by the ri vers sediments in
the deltas and estuaries (Carson et al. 1999), river discharge is considered to be the most
important source ofterrigenous material to the Arctic Ocean (Stein & Macdonald 2004).
Riverine freshwater discharge may in sorne areas form distinctive plumes carrying material
onto and beyond the nearshore continental shelfregions (Dittmar & Kattner 2003). The
direction and extent of the river plumes are generally controlled by the Coriolis force, wind
forcing, currents and tide (e.g. Fong & Geyer 2002).
Particulate inorganic and organic material associated with river plumes may instigate
aggregation and subsequent sedimentation, which may increase vertical sinking fluxes in
the plume area (Hamm 2002). The heterotrophic food web may utilize part of the
particulate organic material discharged by Arctic rivers (e.g. Parsons et al. 1989, O 'Brien et
al. 2006) but, to a high degree, this material is often preserved in the marine sediments due
to its refractory nature Ce.g. Dittmar & Kattner 2003). Arctic ri vers generally display a
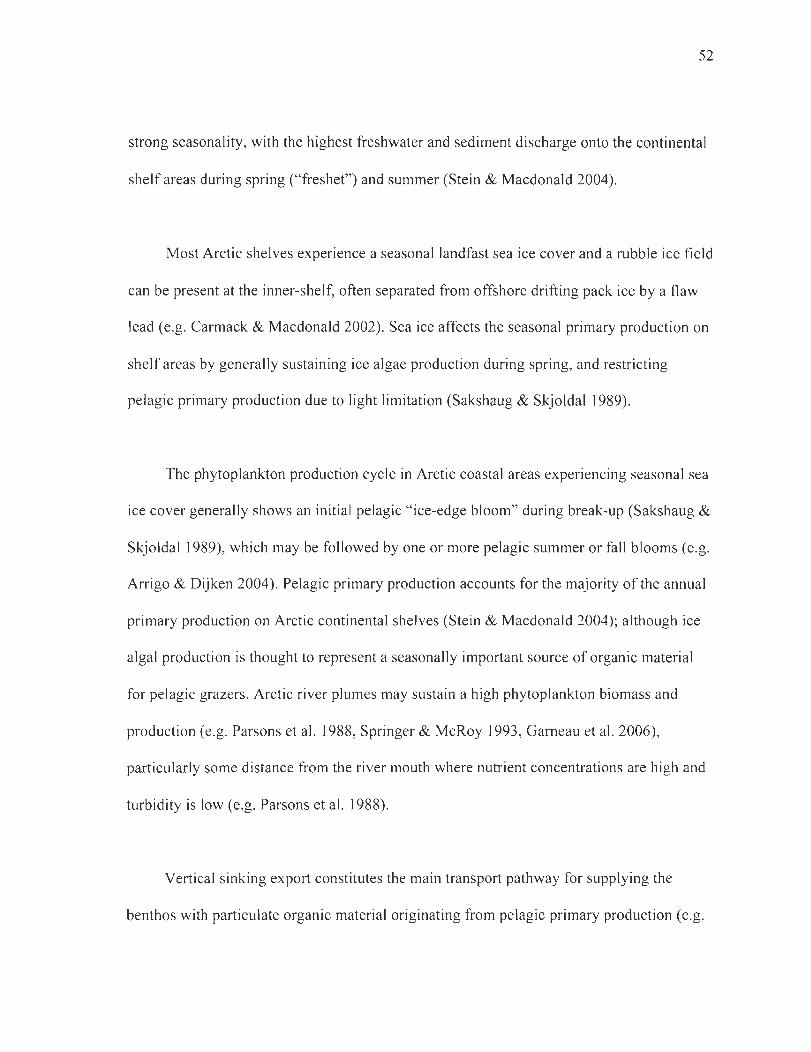
52
strong seasonality, with the highest freshwater and sediment discharge onto the continental
shelf areas during spring ("freshet") and summer (Stein & Macdonald 2004).
Most Arctic shelves experience a seasonallandfast sea ice cover and a rubble ice field
can be present at the inner-shelf, often separated from offshore drifting pack ice by a flaw
lead (e.g. Carmack & Macdonald 2002). Sea ice affects the seasonal primary production on
shelf areas by generally sustaining ice algae production during spring, and restricting
pelagic primary production due to light limitation (Sakshaug & Skjoldal 1989).
The phytoplankton production cycle in Arctic coastal are as experiencing seasonal sea
ice cover generally shows an initial pelagic "ice-edge bloom" during break-up (Sakshaug &
Skjoldal 1989), which may be followed by one or more pelagic summer or fall blooms (e.g.
Arrigo & Dijken 2004). Pelagic primary production accounts for the majority of the annual
primary production on Arctic continental shelves (Stein & Macdonald 2004); although ice
algal production is thought to represent a seasonally important source of organic material
for pelagic grazers. Arctic river plumes may sustain a high phytoplankton biomass and
production (e.g. Parsons et al. 1988, Springer & McRoy 1993, Garneau et al. 2006),
particularly some distance trom the river mouth where nutrient concentrations are high and
turbidity is low (e.g. Parsons et al. 1988).
Vertical sinking export constitutes the main transport pathway for supplying the
benthos with particulate organic material originating from pelagic primary production (e.g.
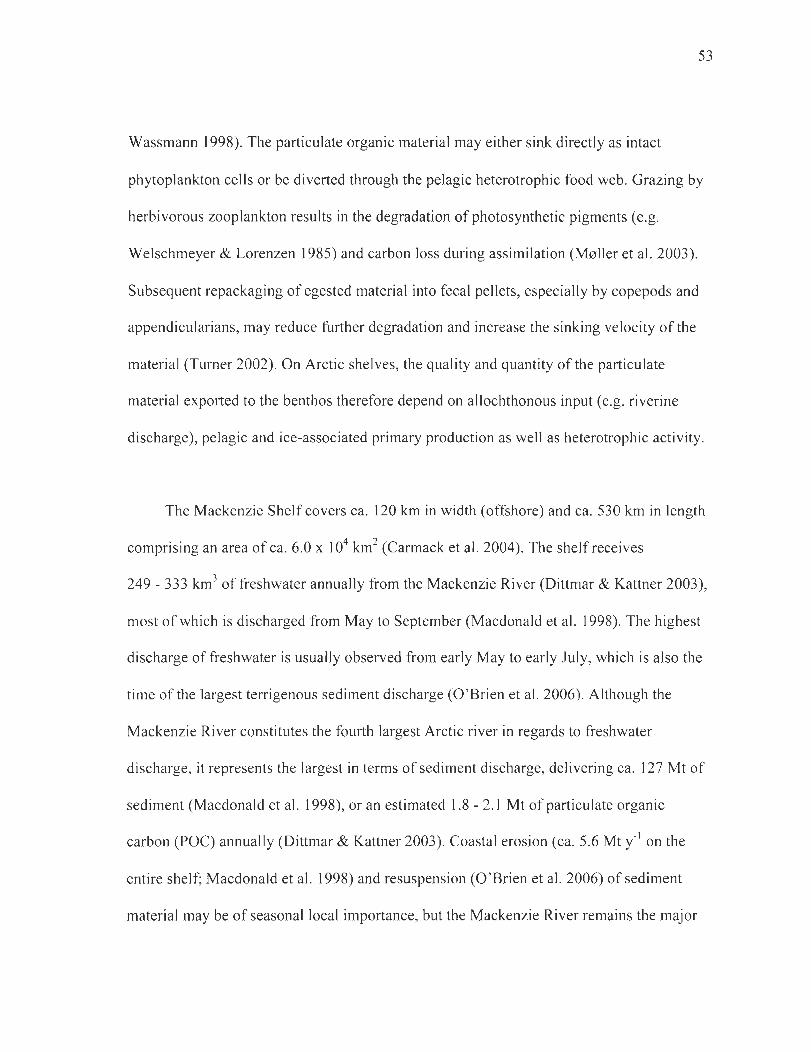
53
Wassmann 1998). The particulate organic material may either sink directly as intact
phytoplankton cells or be diverted through the pelagic heterotrophic food web. Grazing by
herbivorous zooplankton resuIts in the degradation of photosynthetic pigments (e.g.
Welschmeyer & Lorenzen 1985) and carbon loss during assimilation (M0ller et al. 2003).
Subsequent repackaging of egested material into fecal pellets, especially by copepods and
appendicularians, may reduce further degradation and increase the sinking velocity of the
material (Turner 2002). On Arctic shelves, the quality and quantity of the particulate
material exported to the benthos therefore depend on allochthonous input (e.g. riverine
di scharge), pelagic and ice-associated primary production as weil as heterotrophic activity.
The Mackenzie Shelf co vers ca. 120 km in width (offshore) and ca. 530 km in length
comprising an area of ca. 6.0 x 10⁴ km2 (Carmack et al. 2004). The shelf receives
249 - 333 km3 of freshwater annually from the Mackenzie River (Dittmar & Kattner 2003),
most ofwhich is discharged from May to September (Macdonald et al. 1998). The highest
discharge of freshwater is usually observed from early May to early July, which is also the
time of the largest terrigenous sediment discharge (O'Brien et al. 2006). Although the
Mackenzie River constitutes the fourth largest Arctic river in regards to freshwater
discharge, it represents the largest in terms of sediment discharge, delivering ca. 127 Mt of
sediment (Macdonald et al. 1998), or an estimated 1.8 - 2.1 Mt of particulate organic
carbon (POC) annually (Dittmar & Kattner 2003). Coastal erosion (ca. 5.6 Mt il on the
entire shelf; Macdonald et al. 1998) and resuspension (O'Brien et al. 2006) of sediment
material may be of seasonal local importance, but the Mackenzie River remains the major
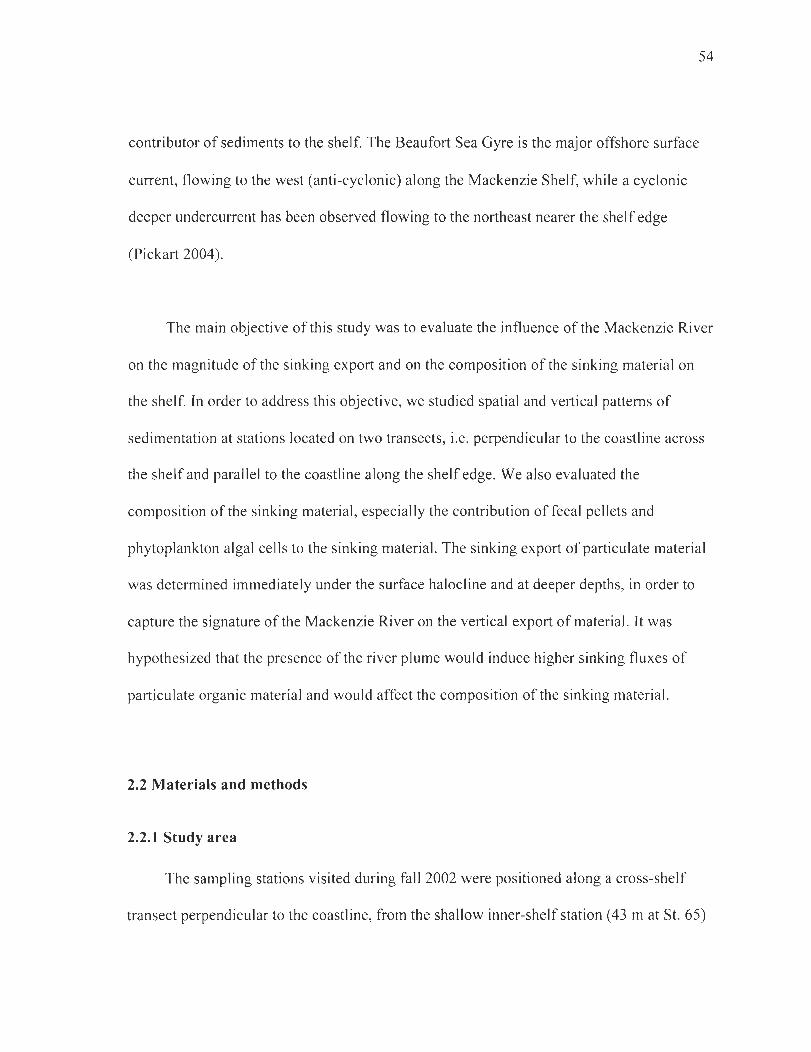
contributor of sediments to the shelf. The Beaufort Sea Gyre is the major offshore surface
cUITent, flowing to the west (anti-cyclonic) along the Mackenzie Shelf, while a cyclonic
deeper undercuITent has been observed flowing to the northeast nearer the shelf edge
(Pickart 2004).
54
The main objective ofthis study was to evaluate the influence of the Mackenzie River
on the magnitude of the sinking export and on the composition of the sinking material on
the shelf. In order to address this objective, we studied spatial and vertical patterns of
sedimentation at stations located on two transects, i.e. perpendicular to the coastline across
the shelf and parallel to the coastline along the shelf edge. We also evaluated the
composition of the sinking material, especially the contribution of fecal pellets and
phytoplankton algal cells to the sinking material. The sinking export of particulate material
was determined immediately under the surface halocline and at deeper depths, in order to
capture the signature of the Mackenzie Ri ver on the vertical export of material. It was
hypothesized that the presence of the river plume would induce higher sinking fluxes of
particulate organic material and would affect the composition of the sinking material.
2.2 Materials and methods
2.2.1 Study area
The sampling stations visited during fall 2002 were positioned along a cross-shelf
transect perpendicular to the coastline, from the shallow inner-shelf station (43 mat St. 65)
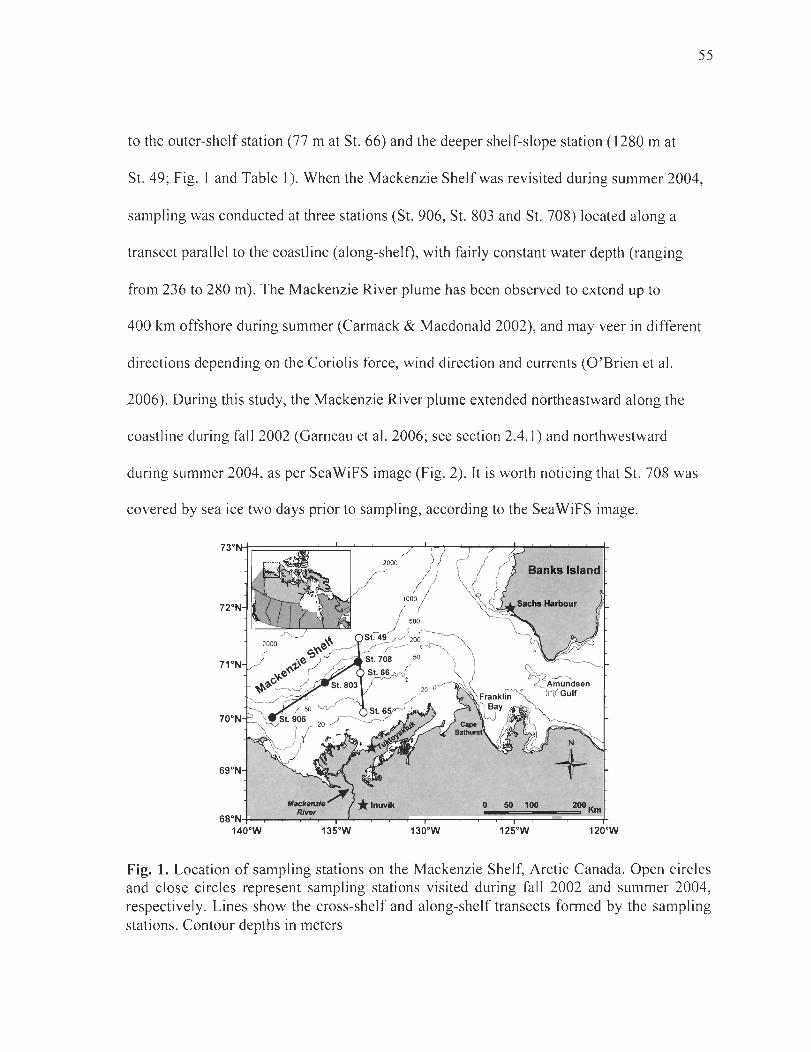
55
to the outer-shelf station (77 m at St. 66) and the deeper shelf-slope station (1280 m at
St. 49; Fig. 1 and Table 1). When the Mackenzie Shelfwas revisited during summer 2004,
sampling was conducted at three stations (St. 906, St. 803 and St. 708) located along a
transect parallel to the coastline (along-shelf), with fairly constant water depth (ranging
from 236 to 280 m) . The Mackenzie River plume has been observed to extend up to
400 km offshore during summer (Carmack & Macdonald 2002), and may veer in different
directions depending on the Coriolis force, wind direction and currents (O ' Brien et al.
2006) . During this study, the Mackenzie River plume extended northeastward along the
coastl ine during fall 2002 (Garneau et al. 2006; see section 2.4.1) and northwestward
during summer 2004, as per SeaWiFS image (Fig. 2). It is worth noticing that St. 708 was
covered by sea ice two da ys prior to sampling, according to the SeaWiFS image.
72°N
71 °N
~An:;;;;wsen • »<f Gult
70 0 N
69°N
135°W 1300 W 125°W 120' W
Fig. 1. Location of sampling stations on the Mackenzie Shelf, Arctic Canada. Open circles and close circles represent sampling stations visited during fall 2002 and summer 2004, respectively. Lines show the cross-shelf and along-shelf transects formed by the sampling stations. Contour depths in meters
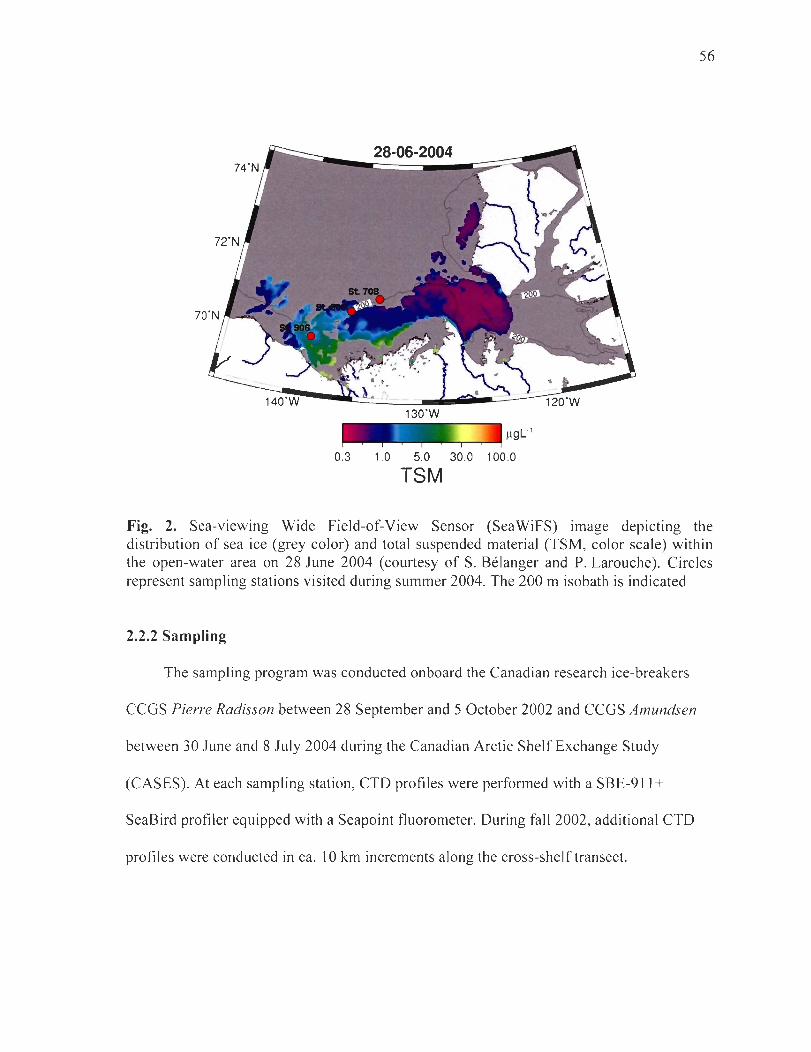
56
0.3 1.0 5.0 30.0 100.0
TSM
Fig. 2. Sea-viewing Wide Field-of-View Sensor (SeaWiFS) image depicting the distribution of sea ice (grey color) and total suspended material (TSM, color scale) within the open-water are a on 28 June 2004 (courtesy of S. Bélanger and P. Larouche). Circles represent sampling stations visited during summer 2004. The 200 m isobath is indicated
2.2.2 Sampling
The sampling program was conducted onboard the Canadian research ice-breakers
CCGS Pierre Radisson between 28 September and 5 October 2002 and CCGS Amundsen
between 30 June and 8 July 2004 during the Canadian Arctic Shelf Exchange Study
(CASES). At each sampling station, CTO profiles were performed with a SBE-911 +
SeaBird profiler equipped with a Seapoint fluorometer. During fall 2002, additional CTD
profiles were conducted in ca. 10 km increments along the cross-shelftransect.
57
Sinking fluxes ofparticulate material were measured using free-drifting partic\e
interceptor traps deployed at multiple depths ranging from 25 to 150 m, depending on water
depth (Table] and Fig. 3). Consequently, due to the shallow water depth at the shelf
stations (43 and 77 m at St. 65 and St. 66, respectively), no data are available at depths
>25 mat St. 65 and only two deployment depths (25 and 50 m) are available at St. 66
(Table 1).
Duplicate partic\e interceptor traps were deployed at each depth to ensure that enough
particulate material was collected for analyses. The free-drifting trap array was equipped
with a wave dampening device made of a series of 7 buoys of which 3 were submerged.
Partic\e interceptor traps were constructed ofPVC (Polyvinyl Chloride) cylinders c\osed at
one end, with an internai diameter of 10 cm and an aspect ratio (height:diameter) of 7. The
free-drifting trap array was fitted with a CAST ARGOS Drifter (Sei mac Smart Cat
PTT/GPS transmitter) for long-range satellite tracking and a Novatech Designs Ltd. RF-
700C 1 radio beacon for short-range positioning.
The partic\e interceptor trap sampling was carried out in accordance with JGOFS
protocols (Knap et al. 1996) and recommendations by Gardner (2000). Filtered (0.22 !lm)
seawater, collected weil below the deployment depths, was added to the partic\e interceptor
traps prior to deployment to ensure that the higher density partic\e-free water remained
inside the traps.
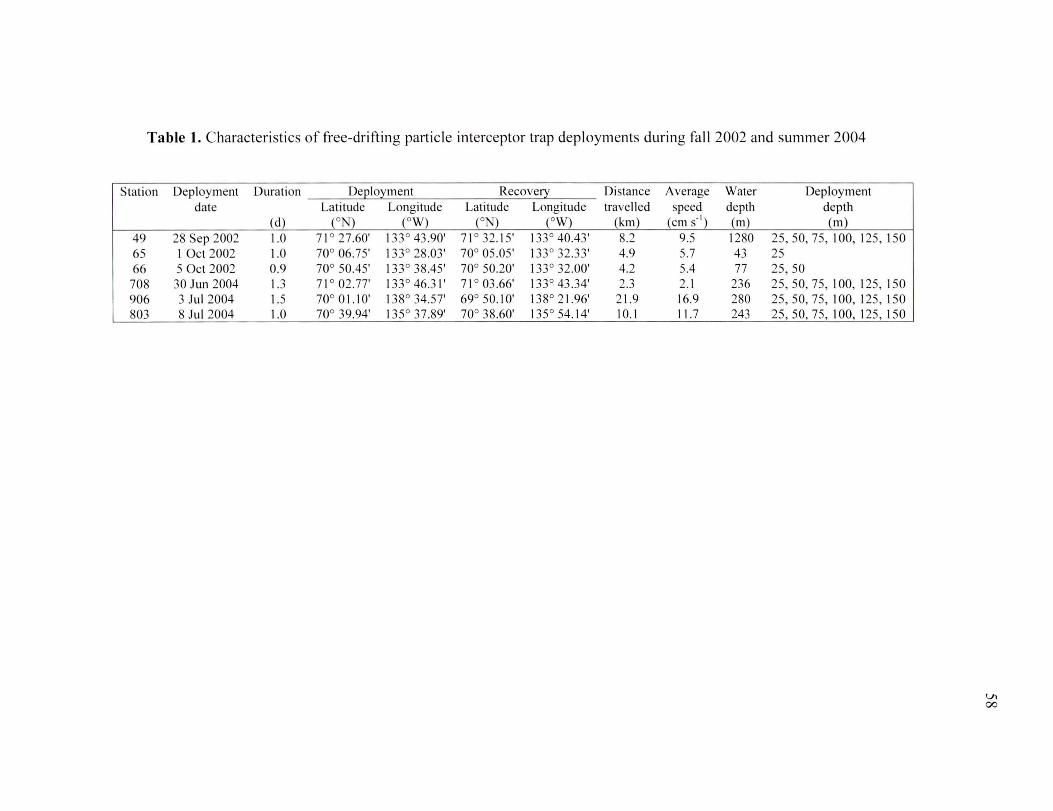
o
0 0 0
'r
vï
trr tri tri' C
si
Ô Ô
Ô
O 0 0 0
vî tri
nr-r 1n
h h h
0" 0
ce O
Ci'
tn
te) ts1
kr-)
V'1 (1-1
v-r tri tri tri'
SS
NS
;.. cu --
-o
s. e °0
0 r-n
r—
r °
en
r..,)
CT
te) •
• O
i tri tri rj 1:;•
Dot S
O N
r1 . .
••zt:
'ZD rn
rn
o.;
ON
N r•-;
•o o
oo
M e
n
C-1 C
,1 0
0
In
rn
inrnE
DZ
obb
N
Ntr; O
cn 0
oe,
M O
tr› cn
O00000
—eO
d
cD
S S
S S
n0
h
b e
n in
0.; O
en v
7
•
oo
M
oci ce ‘.15 •
N
O00000
MM
M 0
0
tr)
c-ntn
rntn
tnrn
Ôb
tO h
d" h
C
rt o.;
(-4
•
O
kr1 C
D O
rn
O000
0 0 0 0
hhhhhh
OC
> en ts1
—
2, d
Do, tt1
t/D °°
rn
0 0 0
30 Jun 2004
N O O
N
13' o
d- d
- 0 0
0 0
rg
M 0
0
-0
.003
O
O
Chi
O
-0 z
O
-o CL
O
•-
58
Table 1. Characteristics of free-drifting particle interceptor trap deployments during fail 2002 and summer 2004 Table 1. Characteristics of free-drifting partic\e interceptor trap deployments during fa11 2002 and summer 2004
Station Deployment Duration De2lo~ment Recove!}' Distance Average Water Deployment date Latitude Longitude Latitude Longitude travell ed speed depth depth
(d) (ON) (OW) (ON) (OW) (km) (cm S' I) (m) m) 49 28 Sep 2002 1.0 7 1 ° 27.60' 133° 43.90' 71 ° 32. 15' 133° 40.43' 8.2 9.5 1280 25,50,75, 100, 125, 150 65 1 Oct 2002 1.0 70° 06.75' 133° 28.03' 70° 05.05' 133° 32.33' 4.9 5.7 43 25 66 5 Oct 2002 0.9 70° 50.45' 133° 38.45' 70° 50.20' 133° 32.00' 4.2 5.4 77 25,50 708 30 Jun 2004 1.3 71 ° 02.77' 133° 46.31' 71 ° 03.66' 133° 43 .34' 2.3 2. 1 236 25, 50, 75, 100, 125, 150 906 3 Ju l 2004 1.5 70° 01.10' 138° 34.57' 69° 50. 10' 138° 21.96' 2 1.9 16.9 280 25,50, 75, 100, 125, 150 803 8 Jul 2004 1.0 70° 39.94' 135° 37.89' 70° 38.60' 135° 54. 14' 10. 1 11.7 243 25, 50, 75, 100, 125, 150
VI 00
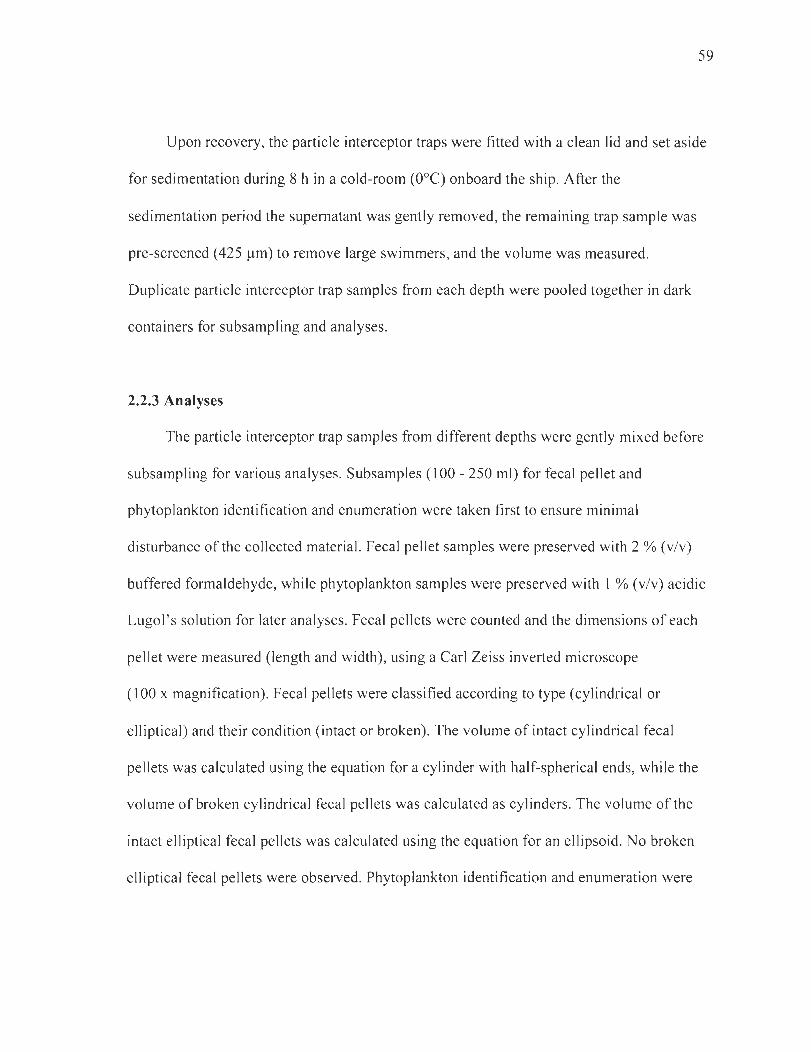
59
Upon recovery, the particle interceptor traps were fitted with a c\ean lid and set aside
for sedimentation during 8 h in a cold-room (O°C) onboard the ship. After the
sedimentation period the supernatant was gently removed, the remaining trap sample was
pre-screened (425 )lm) to remove large swimmers, and the volume was measured.
Duplicate partic\e interceptor trap sampi es from each depth were pooled together in dark
containers for subsampling and analyses.
2.2.3 Analyses
The particle interceptor trap samples from different depths were gently mixed before
subsampling for various analyses. Subsamples (100 - 250 ml) for fecal pellet and
phytoplankton identification and enumeration were taken first to ensure minimal
disturbance of the collected material. Fecal pellet sampi es were preserved with 2 % (v/v)
buffered formaldehyde, while phytoplankton sampi es were preserved with 1 % (v/v) acidic
Lugol 's solution for later analyses. Fecal pellets were counted and the dimensions of each
pellet were measured (Iength and width), using a Carl Zeiss inverted microscope
(100 x magnification). Fecal pellets were classified according to type (cylindrical or
elliptical) and their condition (intact or broken). The volume of intact cylindrical fecal
pellets was calculated using the equation for a cylinder with half-spherical ends, while the
volume ofbroken cylindrical fecal pellets was calculated as cylinders. The volume of the
intact elliptical fecal pellets was calculated using the equation for an ellipsoid. No broken
elliptical fecal pellets were observed. Phytoplankton identification and enumeration were
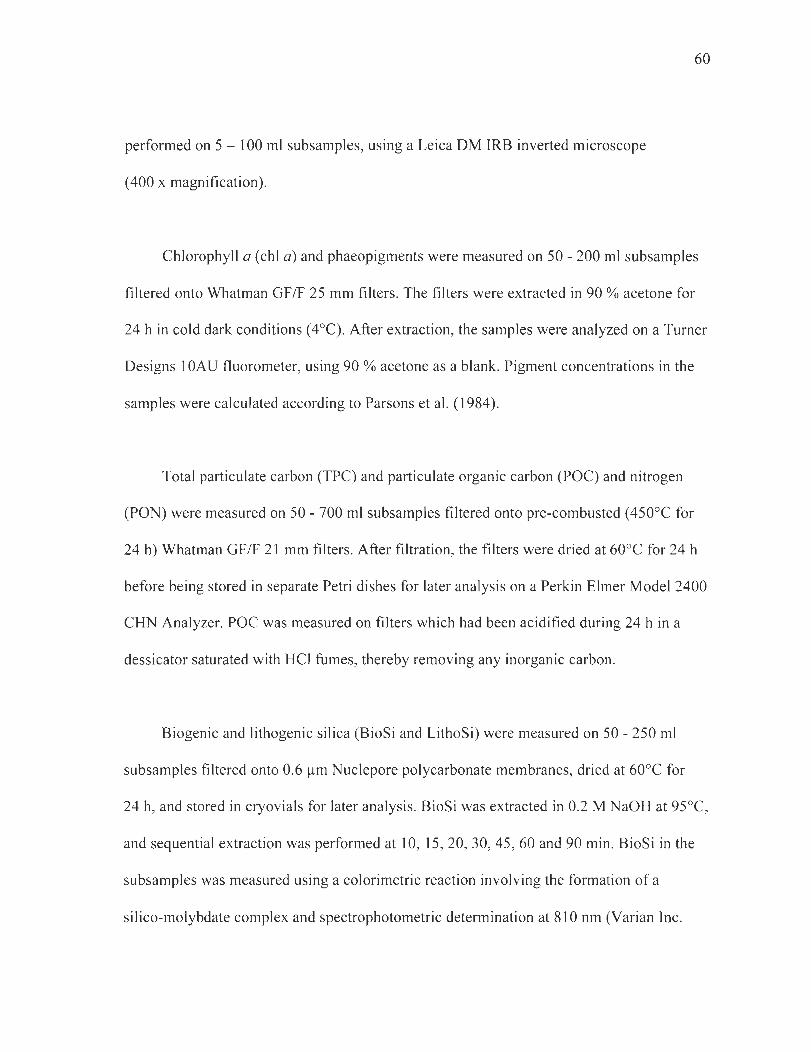
performed on 5 - 100 ml subsamples, using a Leica DM IRB inverted microscope
(400 x magnification).
60
Chlorophyll a (chI a) and phaeopigments were measured on 50 - 200 ml subsamples
filtered onto Whatman GF/F 25 mm filters. The filters were extracted in 90 % acetone for
24 h in cold dark conditions (4°C). After extraction, the samples were analyzed on a Turner
Designs 10AU fluorometer, using 90 % acetone as a blank. Pigment concentrations in the
samples were calculated according to Parsons et al. (1984).
Total particulate carbon (TPC) and particulate organic carbon (POC) and nitrogen
(PON) were measured on 50 - 700 ml subsamples filtered onto pre-combusted (450°C for
24 h) Whatman GF/F 21 mm filters. After filtration, the filters were dried at 60°C for 24 h
before being stored in separate Petri dishes for later analysis on a Perkin Elmer Model 2400
CHN Analyzer. POC was measured on filters which had been acidified during 24 h in a
dessicator saturated with HCI fumes, thereby removing any inorganic carbon.
Biogenic and lithogenic silica (BioSi and LithoSi) were measured on 50 - 250 ml
subsamples filtered onto 0.6 flm Nuc\epore polycarbonate membranes, dried at 60°C for
24 h, and stored in cryovials for later analysis. BioSi was extracted in 0.2 M NaOH at 95°C,
and sequential extraction was performed at 10, 15,20,30,45,60 and 90 min. BioSi in the
subsamples was measured using a colorimetric reaction involving the formation of a
silico-molybdate complex and spectrophotometric determination at 810 nm (Varian lnc.
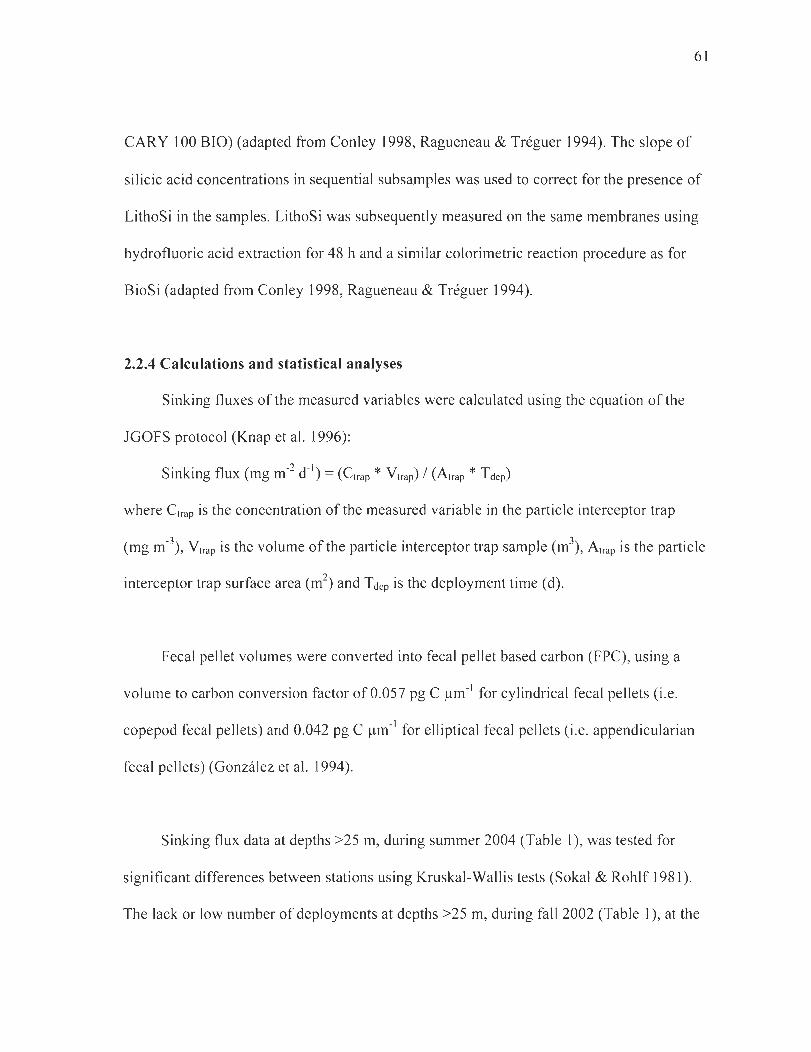
61
CARY 100 BIO) (adapted from Conley 1998, Ragueneau & Tréguer 1994). The slope of
silicic acid concentrations in sequential subsamples was used to correct for the presence of
LithoSi in the samples. LithoSi was subsequently measured on the same membranes using
hydrofluoric acid extraction for 48 h and a similar colorimetrie reaction procedure as for
BioSi (adapted from Conley 1998, Ragueneau & Tréguer 1994).
2.2.4 Calculations and statistical analyses
Sinking fluxes of the measured variables were ca\culated using the equation of the
JGOFS protocol (Knap et al. 1996):
Sinking flux (mg m-2 d- I) = (Ctrap * Ytrap) / (Atrap * Tdep)
where Ctrap is the concentration of the measured variable in the particle interceptor trap
(mg m-3) , Ytrap is the volume of the particle interceptor trap sample (m\ Atrap is the particle
interceptor trap surface are a (m2) and Tdep is the deployment time (d).
Fecal pellet volumes were converted into fecal pellet based carbon (FPC), using a
volume to carbon conversion factor of 0.057 pg C )lm- I for cylindrical fecal pellets (i.e.
copepod fecal pellets) and 0.042 pg C )lm- I for elliptical fecal pellets (i.e. appendicularian
fecal pellets) (Gonzâlez et al. 1994).
Sinking flux data at depths >25 m, during summer 2004 (Table 1), was tested for
significant differences between stations using Kruskal-Wallis tests (Sokal & Rohlf 1981).
The lack or low number of deployments at depths >25 m, during fall 2002 (Table 1), at the
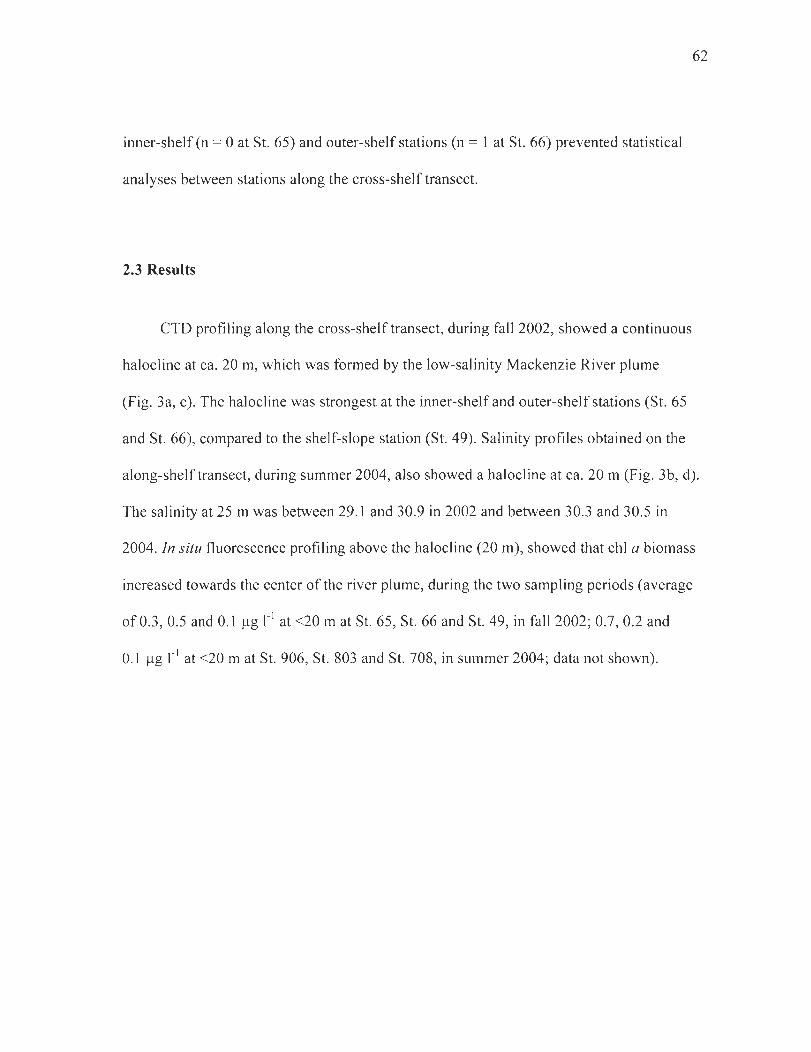
inner-shelf (n = 0 at St. 65) and outer-shelf stations (n = 1 at St. 66) prevented statistical
analyses between stations along the cross-shelf transect.
2.3 Results
CTD profiling along the cross-shelftransect, during fall 2002, showed a continuous
halocline at ca. 20 m, which was formed by the low-salinity Mackenzie River plume
62
(Fig. 3a, c). The halocline was strongest at the inner-shelf and outer-shelf stations (St. 65
and St. 66), compared to the shelf-slope station (St. 49). Salinity profiles obtained on the
along-shelftransect, during summer 2004, also showed a halocline at ca. 20 m (Fig. 3b, d).
The salinity at 25 m was between 29.1 and 30.9 in 2002 and between 30.3 and 30.5 in
2004. In situ fluorescence profiling above the halocline (20 m), showed that chI a biomass
increased towards the center of the river plume, during the two sampling periods (average
of 0.3 , 0.5 and 0.1 fJg rI at <20 mat St. 65, St. 66 and St. 49, in fall 2002 ; 0.7, 0.2 and
0.1 fJg rI at <20 m at St. 906, St. 803 and St. 708, in summer 2004; data not shown).
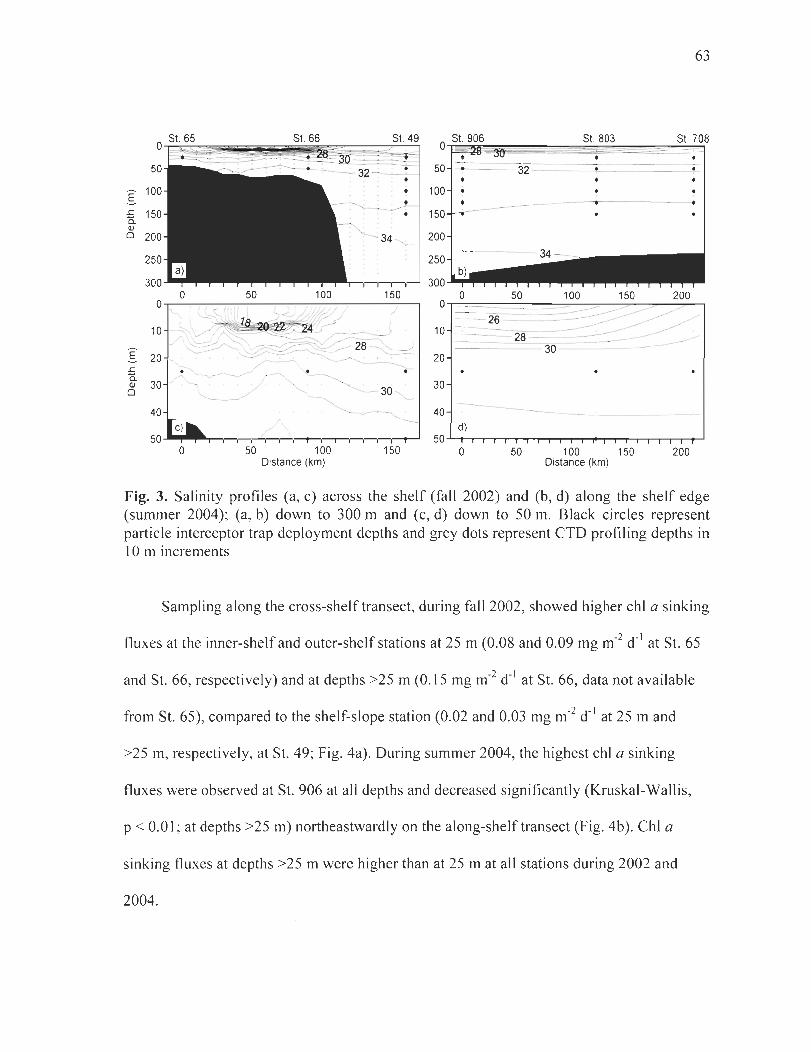
Ê 1
E 1 a. Ol o
2
st. 65 St. 66
40
63
St. 49
30 --40 -----d)
50~~~~~~~-r~'~~i -ri~i~i-~ 50~-r~~~~~~-r~~~~~~
o 50 100 150 o 50 100 150 200 Distance (km) Distance (km)
Fig. 3. Salinity profiles (a, c) across the shelf (fal1 2002) and (b, d) along the shelf edge (summer 2004); (a, b) down to 300 m and (c, d) down to 50 m. Black circles represent particle interceptor trap deployment depths and grey dots represent CTD profiling depths in 10 m increments
Sampling along the cross-shelftransect, during fal1 2002, showed higher chI a sinking
fluxes at the inner-shelf and outer-shelf stations at 25 m (0.08 and 0.09 mg m-2 d- I at St. 65
and St. 66, respectively) and at depths >25 m (0.15 mg m-2 d- I at St. 66, data not available
from St. 65), compared to the shelf-slope station (0.02 and 0.03 mg m-2 d- I at 25 m and
>25 m, respectively, at St. 49; Fig. 4a). During summer 2004, the highest chI a sinking
fluxes were observed at St. 906 at al1 depths and decreased significantly (Kruskal-Wallis,
p < 0.01 ; at depths >25 m) northeastwardly on the along-shelftransect (Fig. 4b). ChI a
sinking fluxes at depths >25 m were higher than at 25 m at al1 stations during 2002 and
2004.
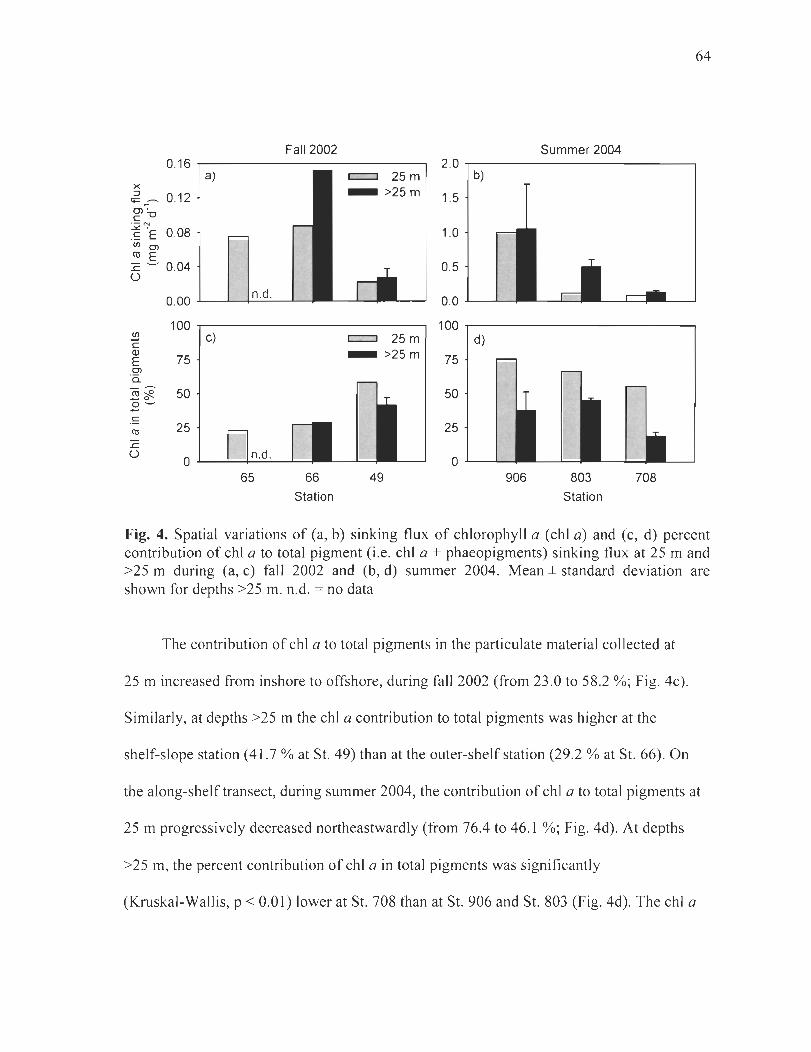
Fall 2002 0.16 -r----------------,
x ~ _ 0.12 0)"';" c"O
~~ 0.08 <Il 0)
tU E :c '-' 0.04 Ü
a)
0.00 -L---L.----j..:n..:.;.. d::";"_L--
c::::::J 25m - >25m
100 ~-----------~ <Il
ë Cl> E 0)
'0..
2~ .8'-' c tU
.r:::. Ü
75 c)
65 66 Station
c::::::J 25m - >25m
49
64
Summer 2004 2.0 ,---------------,
b)
1.5
1.0
0.5
o . 0 ""------'--
100.------------, d)
75
906 803 Station
708
Fig. 4. Spatial variations of (a, b) sinking flux of chlorophyll a (chI a) and (c, d) percent contribution of chI a to total pigment (i.e. chI a + phaeopigments) sinking flux at 25 m and >25 m during (a, c) fall 2002 and (b, d) summer 2004. Mean ± standard deviation are shown for depths >25 m. n.d. = no data
The contribution of chI a to total pigments in the particulate material collected at
25 m increased from inshore to offshore, during fall 2002 (from 23.0 to 58.2 %; Fig. 4c).
SimiIarIy, at depths >25 m the chI a contribution to total pigments was higher at the
shelf-slope station (41. 7 % at St. 49) than at the outer-shelf station (29.2 % at St. 66). On
the along-shelftransect, during summer 2004, the contribution of chI a to total pigments at
25 m progressively decreased northeastwardly (from 76.4 to 46.1 %; Fig. 4d). At depths
>25 m, the percent contribution of chI a in total pigments was significantly
(Kruskal-Wallis, p < 0.01) lower at St. 708 than at St. 906 and St. 803 (Fig. 4d). The chI a
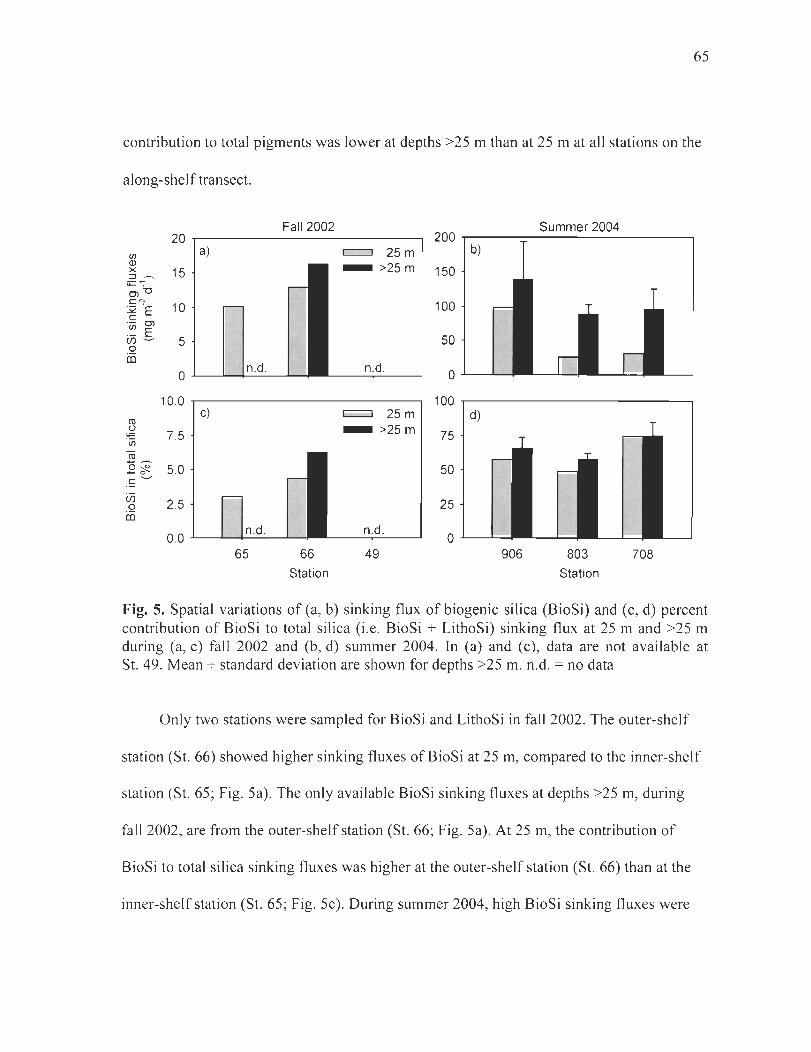
65
contribution to total pigments was lower at depths >25 m than at 25 m at all stations on the
along-shelf transect.
Fall2002 Summer 2004 20 200
CIl a) c::::::J 25 m b)
Q) _ >25m x 15 150 :::l ~ '+- • Cl "0 c C)'
10 100 ~ E ' iJj Cl .- E
50 CI)~ 5 0 ëë
n.d. n.d. 0 0
10.0 100 c) c::::::J 25 m d)
CIl ()
7.5 - >25m 75 'iJj
CIl
§ ~ 5.0 50 c~
CI) 2.5 25 0
ffi
0.0 n.d. n.d.
0 65 66 49 906 803 708
Station Station
Fig. s. Spatial variations of (a, b) sinking flux of biogenic silica (BioSi) and (c, d) percent contribution of BioSi to total silica (i.e. BioSi + LithoSi) sinking flux at 25 m and >25 m during (a, c) fall 2002 and (b, d) summer 2004. ln (a) and (c), data are not available at St. 49. Mean ± standard deviation are shown for depths >25 m. n.d. = no data
Only two stations were sampled for BioSi and LithoSi in fall 2002. The outer-shelf
station (St. 66) showed higher sinking fluxes of BioSi at 25 m, compared to the inner-shelf
station (St. 65; Fig. 5a). The only available BioSi sinking fluxes at depths >25 m, during
fall 2002, are from the outer-shelf station (St. 66; Fig. 5a). At 25 m, the contribution of
BioSi to total silica sinking fluxes was higher at the outer-shelf station (St. 66) than at the
inner-shelf station (St. 65; Fig. 5c). During summer 2004, high BioSi sinking fluxes were
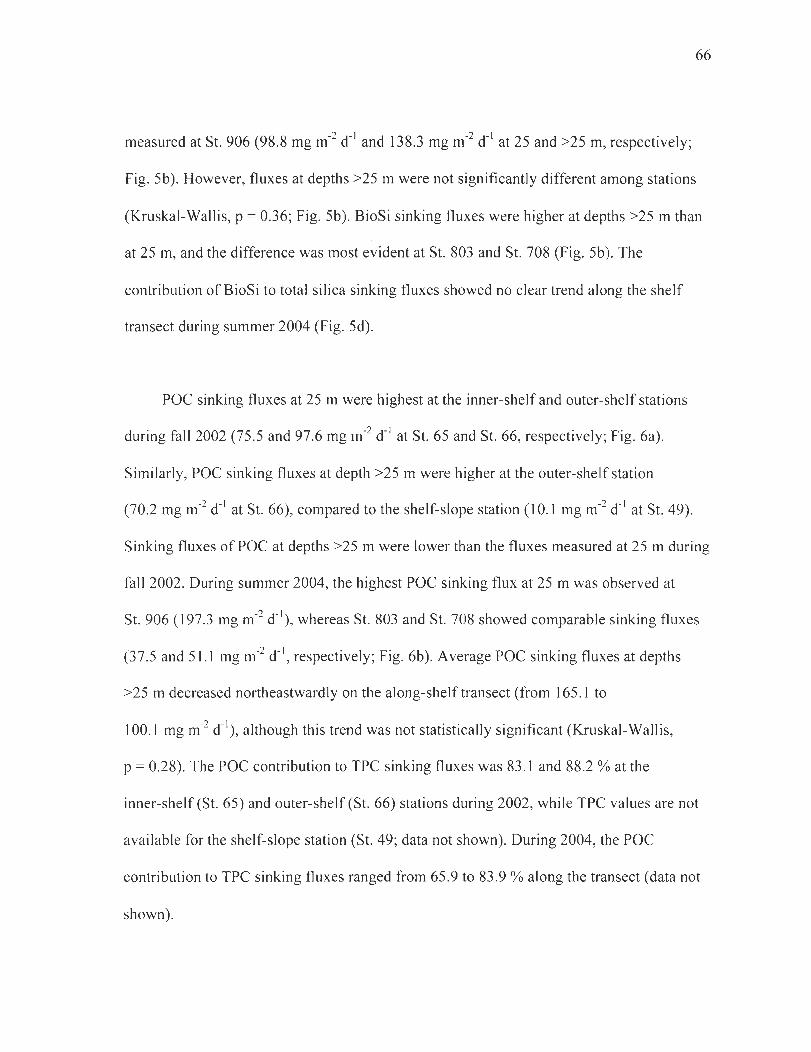
66
measured at St. 906 (98.8 mg m-2 d- I and 138.3 mg m-2 d- I at 25 and >25 m, respectively;
Fig. 5b). However, fluxes at depths >25 m were not significantly different among stations
(Kruskal-Wallis, p = 0.36; Fig. 5b). BioSi sinking fluxes were higher at depths >25 m than
at 25 m, and the difference was most evident at St. 803 and St. 708 (Fig. 5b). The
contribution of BioSi to total silica sinking fluxes showed no clear trend along the shelf
transect during summer 2004 (Fig. 5d).
poe sinking fluxes at 25 m were highest at the inner-shelf and outer-shelf stations
during fall 2002 (75.5 and 97.6 mg m-2 d- I at St. 65 and St. 66, respectively; Fig. 6a).
Similarly, poe sinking fluxes at depth >25 m were higher at the outer-shelf station
(70.2 mg m-2 d- I at St. 66), compared to the shelf-slope station (10.1 mg m-2 d- I at St. 49).
Sinking fluxes of poe at depths >25 m were lower than the fluxes measured at 25 m during
fall 2002. During summer 2004, the highest poe sinking flux at 25 m was observed at
St. 906 (197.3 mg m-2 d- I), whereas St. 803 and St. 708 showed comparable sinking fluxes
(37.5 and 51.1 mg m-2 d- I, respectively; Fig. 6b). Average poe sinking fluxes at depths
>25 m decreased northeastwardly on the along-shelftransect (from 165.1 to
100.1 mg m-2 d- I), although this trend was not statistically significant (Kruskal-Wallis,
p = 0.28). The poe contribution to TPC sinking fluxes was 83.] and 88.2 % at the
inner-shelf (St. 65) and outer-shelf (St. 66) stations during 2002, while TPC values are not
available for the shelf-slope station (St. 49; data not shown). During 2004, the poe
contribution to TPC sinking fluxes ranged from 65.9 to 83.9 % along the transect (data not
shown) .
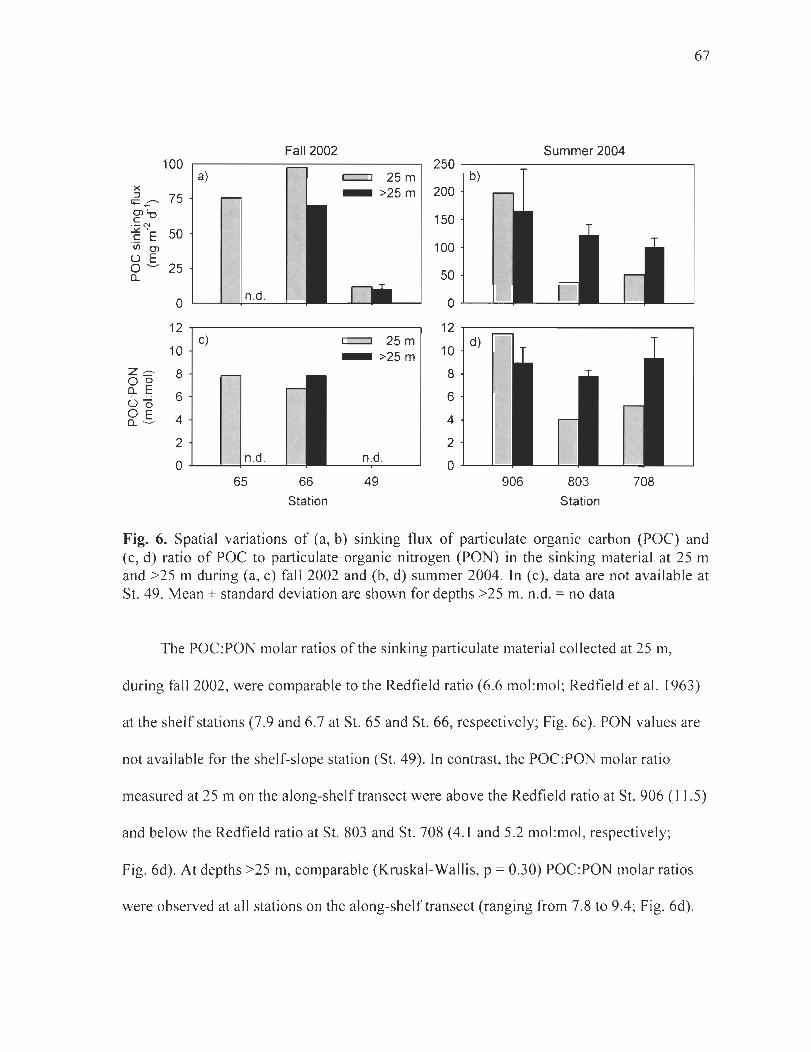
67
Fall 2002 Summer 2004 100 250 ,---------------,
x ~ _''' 75 g''o
' - N
~ 'E 50 rJl 0> U E o ~ 25 0...
o
a) c::::::J 25 m b) _ >25m 200
150
100
50
n.d. o "----'--12 .-------------~ 12 r------------~
z '" 0 0 o...E uo o E o... ~
10
8
6
4
2
c)
o .l....----L---I-.;..;n.:..::. d~. --'-65 66
Station
c::::::J 25 m ->25m
n.d .
49
10 d)
8
6
4
2
o "----'--906 803
Station
708
Fig. 6. Spatial variations of (a, b) sinking flux of particulate organic carbon (POC) and (c, d) ratio of POC to particulate organic nitrogen (PON) in the sinking material at 25 m and >25 m during (a, c) fall 2002 and (b, d) summer 2004. ln (c), data are not available at St. 49. Mean ± standard deviation are shown for depths >25 m. n.d. = no data
The POC:PON molar ratios of the sinking particulate material collected at 25 m,
during fall 2002, were comparable to the Redfield ratio (6.6 mol:mol; Redfield et al. 1963)
at the shelf stations (7.9 and 6.7 at St. 65 and St. 66, respectively; Fig. 6c). PON values are
not available for the shelf-slope station (St. 49). ln contrast, the POC:PON molar ratio
measured at 25 m on the along-shelftransect were above the Redfield ratio at St. 906 (11.5)
and below the Redfield ratio at St. 803 and St. 708 (4.1 and 5.2 mol:mol , respectively;
Fig. 6d). At depths >25 m, comparable (Kruskal-Wallis, p = 0.30) POC:PON molar ratios
were observed at ail stations on the along-shelftransect (ranging from 7.8 to 9.4; Fig. 6d).
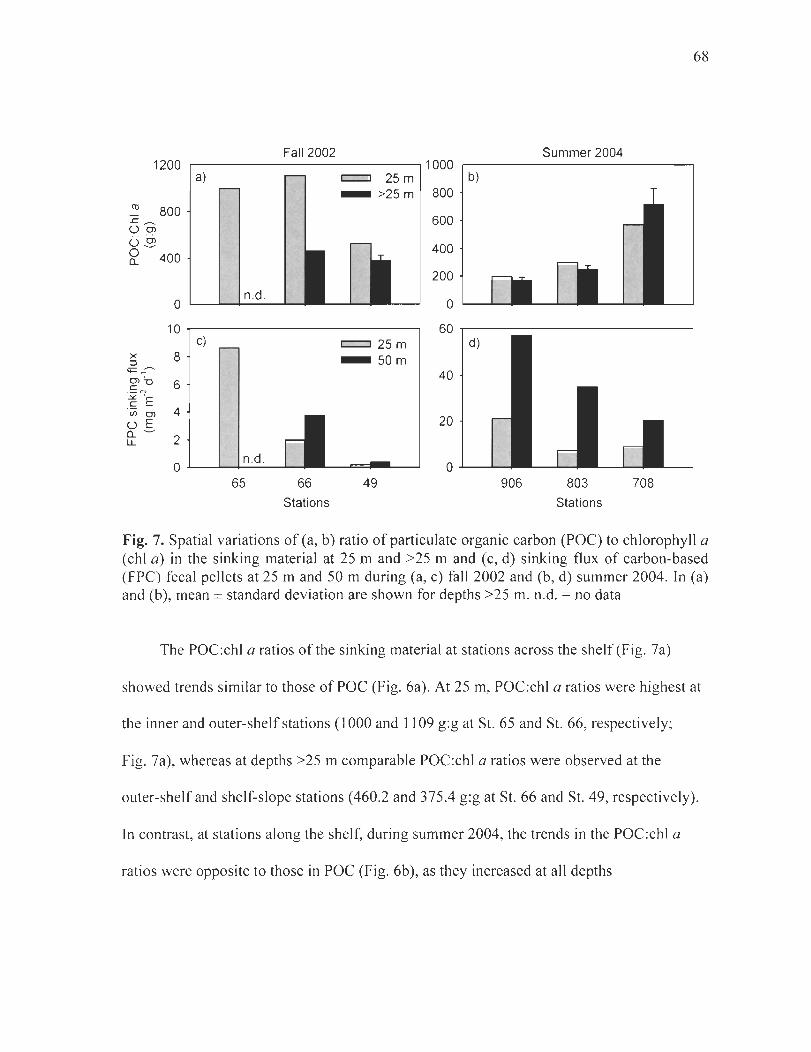
68
Fall2002 Summer 2004 1200 ,--- ------------, 1000
a) c:::::::J 25 m b) _ >25m 800
800 600
400 400
200 n.d. o L---'----+-_----''--
10~-----------~
o 60~-----------~
c)
~ 8 <;:: ~~
.~N'o 6 ~ , .S:: E VI Cl 4 u E a.. ~
ll.. 2 n.d. o .1....----"----4----'--
65 66 Stations
c:::::::J 25 m -50m
49
d)
40
20
o ..L....----'-_
906 803 Stations
708
Fig. 7. Spatial variations of (a, b) ratio of particulate organic carbon (POC) to chlorophyll a (chI a) in the sinking material at 25 m and >25 m and (c, d) sinking flux of carbon-based (FPC) fecal pellets at 25 m and 50 m during (a, c) fall 2002 and (b, d) summer 2004. ln (a) and (b), mean ± standard deviation are shown for depths >25 m. n.d. = no data
The POC:chl a ratios of the sinking material at stations across the shelf (Fig. 7a)
showed trends similar to those ofPOC (Fig. 6a). At 25 m, POC:chl a ratios were highest at
the inner and outer-shelf stations (1000 and 1109 g:g at St. 65 and St. 66, respectively;
Fig. 7a), whereas at depths >25 m comparable POC:chl a ratios were observed at the
outer-shelfand shelf-slope stations (460.2 and 375.4 g:g at St. 66 and St. 49, respectively).
In contrast, at stations along the shelf, during summer 2004, the trends in the POC:chl a
ratios were opposite to those in POC (Fig. 6b), as they increased at ail depths
69
northeastwardly along the transect (from 184.0 to 801.2 and from 167.0 to 717.8 g:g at 25
and >25 m, respectively; Fig. 7b).
Sinking fluxes ofFPC at 25 m decreased from 8.6 to 0.17 mg m-2 d- I along the
transect during fa1l2002 (Fig. 7c), and from 21.1 mg m-2 d- I at St. 906 to 7.4 and
9.1 mg m-2 d- I at St. 803 and St. 708, respectively, during summer 2004 (Fig. 7d). FPC
sinking fluxes at 50 m were 2 times higher than at 25 m during fall 2002 (ranging from 3.8
to 0.36 mg m-2 d- I) and 2-5 times higher during summer 2004 (ranging from 20.5 to
57.0 mg m-2 d- I). Cylindrical fecal pellets were the main contributors to FPC at all stations
and depths during fall 2002 (ranging from 75.6 to 100.0 %; data not shown) and summer
2004 (ranging from 71.9 to 99.2 %; data not shown).
Sampling along the cross-shelftransect, during fall 2002, showed the highest sinking
fluxes ofphytoplankton cells at the inner-shelfstation (325.7, 7.7 and
27.2 x 10⁶ cells m-2 d- I at St. 65, St. 66 and St. 49, respectively; Fig. 8a). Flagellates,
especially flagellates <5 /lm, were the most abundant phytoplankton cells collected along
the cross-shelftransect (ranging from 74.4 to 93.7 %), although dinoflagellates, primarily
Gymnodinium and Gyrodinium spp., contributed increasingly to the sinking assemblage
across the shelf(from 5.1 to 19.9 %; Table 2). Diatoms comprised a minor fraction of the
phytoplankton sinking flux along the cross-shelftransect (ranging from l.2 to 9.4 %;
Table 2). The freshwater diatom, Eunotia sp., was found in the material collected at 25 m at
the inner-shelf station (St. 65) in fall 2002. During summer 2004, a strong decrease in
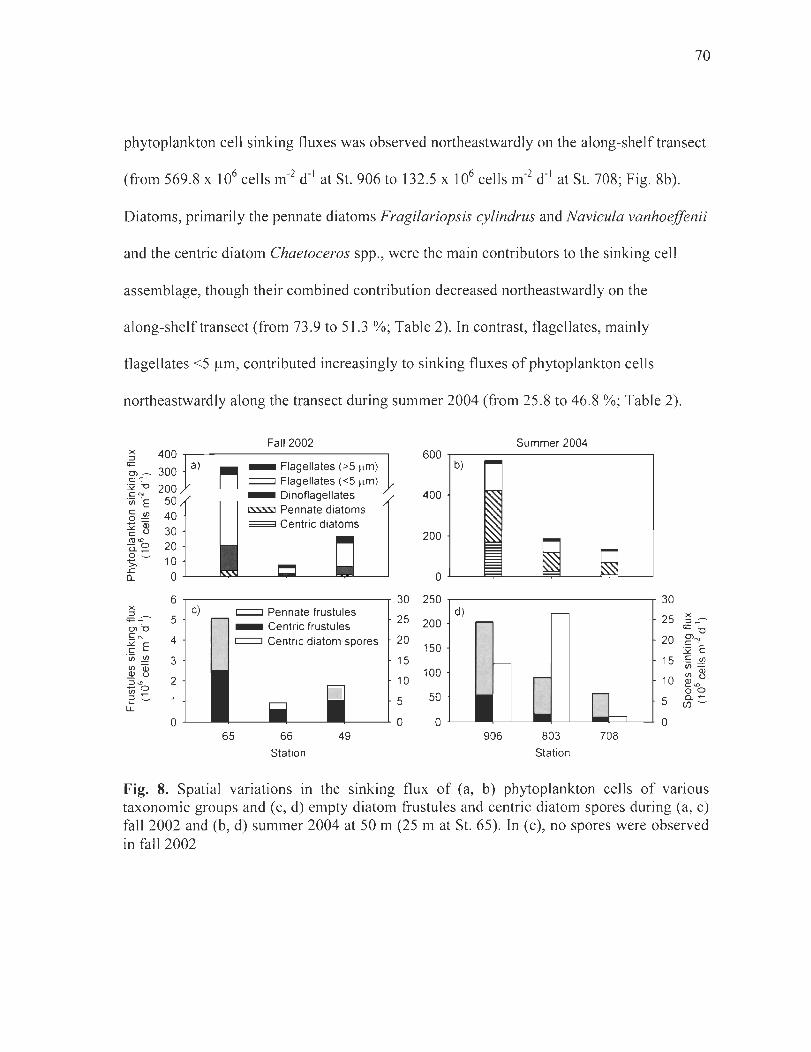
70
phytoplankton cell sinking fl uxes was observed northeastwardly on the along-shelftransect
(from 569.8 x 10⁶ cell s m-2 d- I at St. 906 to 132.5 x 10⁶ cells m-2 d- ' at St. 708; Fig. 8b).
D iatoms, primarily the pennate diatoms Fragilariopsis cylindrus and Navicula vanhoeffenii
and the centric diatom Chaetoceros spp., were the main contributors to the sin king cell
assemblage, though their combined contribution decreased northeastwardly on the
along-shelftransect (from 73 .9 to 51.3 %; Table 2). In contrast, flage llates, mainly
flage llates <5 /lm, contributed increasingly to sinking fluxes of phytoplankton cells
northeastwardly along the transect during summer 2004 (from 25.8 to 46.8 %; Table 2).
Fall2002 Summer 2004 x 400 600 ::J
c;:: a) r-, _ Flagellates (>5 ~Im) b) O> ~ 300 c ,";" C=:J Flagellates « 5 ~Im) ~ N-o 200 ïii 'E 50 - Dinoflagellates 400
C VI 40 ~ Pennate dia toms
0-~ Centric diatoms ~~ 30
<1) <0 200 -0 20 a.~ o ~
10 >-.r. 0 0 a..
6 30 250 30 x c) C=:J Pennate frustules d) ::J 25 25 ~.--:;::: :- 5 _ Centric frustules 200 0>'0 '= u
C N 4 C=:J Centric diatom spores 20 20 O>N ~ 'E 150
C · 32 E
"en .:!2 3 15 15 .S: 00 VlQ) 00= .s! u 100 VI Q)
::J <o 2 la 10 Q) U -0 ~ <O
VI ~ 50 00
2 ~ 5 5 0. "-U.
(/') ~
0 a 0 0 65 66 49 906 803 708
Station Station
Fig. 8. Spatial variations in the sinking flux of (a, b) phytoplankton cell s of various taxonomie groups and (c, d) empty diatom frustules and centric diatom spores during (a, c) fall 2002 and (b, d) summer 2004 at 50 m (25 m at St. 65). ln (c), no spores were observed in fa ll 2002
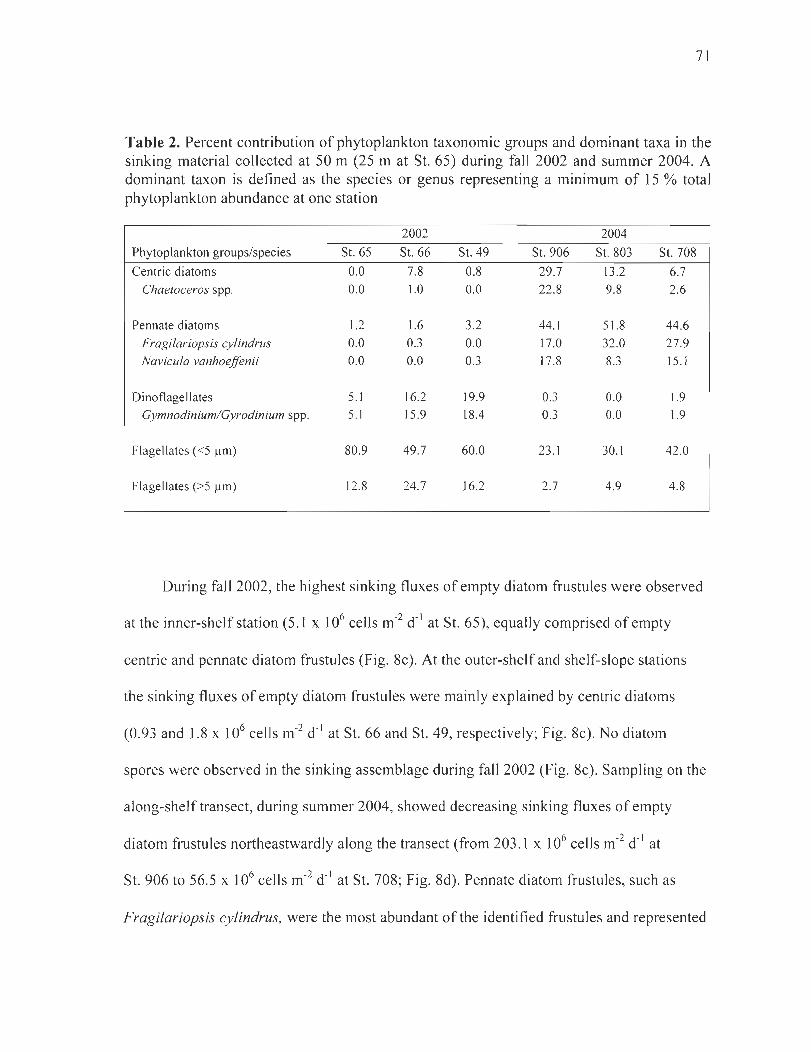
71
Table 2. Percent contribution of phytoplankton taxonomic groups and dominant taxa in the sinking material coIlected at 50 m (25 m at St. 65) during faH 2002 and summer 2004. A dominant taxon is defined as the species or genus representing a minimum of 15 % total phytoplankton abundance at one station
2002 2004 Phytoplankton groups/species St. 65 St. 66 St. 49 St. 906 St. 803 St. 708 Centric diatoms 0.0 7.8 0.8 29.7 13 .2 6.7
Chaetoceros spp. 0.0 1.0 0.0 22.8 9.8 2.6
Pennate diatoms 1.2 1.6 3.2 44.1 51.8 44.6 Fragilariopsis cylindrus 0.0 0.3 0.0 17.0 32.0 27.9 Navicula vanhoeffenii 0.0 0.0 0.3 17.8 8.3 15.1
Dinoflagellates 5.1 16.2 19.9 0.3 0.0 1.9 Gymnodinium/Gyrodinium spp. 5.1 15.9 18.4 0.3 0.0 1.9
Flagellates «5 /lm) 80.9 49.7 60.0 23 .1 30.1 42.0
Flagellates (>5 /lm) 12.8 24.7 16.2 2.7 4.9 4.8
During fa Il 2002, the highest sinking fluxes of empty diatom frustu les were observed
at the inner-shelf station (5.1 x 10⁶ cells m -2 d- I at St. 65), equally comprised of empty
centric and pennate diatom frustu les (Fig. 8c). At the outer-shelf and shelf-slope stations
the sinking fluxes of empty diatom frustu les were mainly explained by centric diatoms
(0.93 and 1.8 x 10⁶ cells m-2 d- I at St. 66 and St. 49, respectively; Fig. 8c). No diatom
spores were observed in the sinking assemblage during faIl 2002 (Fig. 8c). Sampling on the
along-shelftransect, during summer 2004, showed decreasing sinking fluxes of empty
diatom frustules northeastwardly along the transect (from 203.1 x 10⁶ ceIls 111 -2 d- I at
St. 906 to 56.5 x 10⁶ cells m-2 d- I at St. 708; Fig. 8d). Pennate diatom frustules, such as
Fragilariopsis cylindrus, were the most abundant of the identified frustules and represented
the majority of the empty diatom frustules (> 73 %), at ail stations on the along-shelf
transect. Centric diatom spores were present in the collected material at ail stations on the
along-shelftransect, with a maximum sinking flux observed at St. 803 (Fig. 8d).
2.4 Discussion
72
Predicted consequences of global warming in Arctic continental shelfregions include
increased river runoff as a result of increasing precipitation on land (e.g. Peterson et al.
2002). The Mackenzie River already discharges more suspended material than any other
river flowing into the Arctic Ocean (Stein & Macdonald 2004), and previous studies have
established the major influence ofthis river on sediment and carbon fluxes on the adjacent
shelf (e.g. Macdonald et al. 1998, O'Brien et al. 2006). This study provides new insights
into the influence of the Mackenzie River on the sinking fluxes and composition of
particulate material sedimenting on the shelf during the ice-free period.
Although the sampling was carried out in two different years and during different
seasons (fall of2002, summer of2004), the study was designed such that the transects
would intercept at the shelf-slope (near the 200 m isobath; Fig. 1), thus aiming for potential
comparisons between transects. While it is not our intent to rule out interannual variability
in sinking fluxes of particulate material (see sections 2.4.1 and 2.4.2), results from the two
sampling periods will be brought together to discuss seasonal changes in the composition of
the material exported vertically on the shelf(see sections 2.4.2 and 2.4.4).
In this study, cylindrical parti cIe interceptor traps with a high aspect ratio (7) were
used to assess sinking fluxes in the study area, as trap aspect ratios >3 are recommended
(Gardner 1980, Hargrave & Burns 1979, Taguchi et al. 1993, BaIe 1998), in particular in
dynamic environments (e.g. current velocities up to 20 cm S-I; White 1990). Estimated
sinking fluxes ofPOC, using similar free-drifting particle trap arrays in the North Water
Polynya (NOW), were in very good agreement with POC sinking flux estimates using the
234Thp38U disequilibrium method (Tremblay et al. 2006b).
2.4.1 Effeet of the river plume on the magnitude of sinking fluxes
73
The river plume observed during fall 2002 likely originated further to the southwest
and extended along the coastline into the sampling area, as suggested by Garneau et al.
(2006). The sampling transect therefore covered a cross-section of the river plume, with a
decreasing influence of the river wh en progressing offshore along the transect (Fig. 3a, c).
Similarly, the along shelftransect sampled during summer 2004 covered a partial
cross-section of the northwestwardly extending river plume, with a decreasing influence of
the river plume from St. 906 to St. 708 (Fig. 2 and 3b, d). The shallowest particle
interceptor trap deployments (25 m) were in close proximity to the halocline along the two
transects, with the intent of collecting particulate material exported from the river plume.
lndeed, the freshwater pennate diatom Eunotia sp. found in the sinking material collected at
the inner-shelf station (at 25 mat St. 65), clearly indicated phytoplankton that had been
transported onto the shelfby the river plume and subsequently exported to the underlying
water column.
74
The presence of a phytoplankton community carried by the river plume was
supported by the high chI a biomass in surface waters, particularly at the stations strongly
influenced by the plume (St. 65 and St. 66 during 2002, St. 906 during 2004). The spatial
trend observed in fall 2002, with a high river plume chI a biomass at the shelf stations,
agrees with the spatial trend reported during two parallel studies focussing on surface water
sampI es collected along the cross-shelftransect during the same period. During these
studies, higher POC (Wells et al. 2006) and chI a (Garneau et al. 2006) concentrations in
the surface waters, i.e. above the halocline, were found at the stations strongly influenced
by the river plume (St. 65 and St. 66) compared to the shelf-slope station (St. 49). In
addition, Wells et al. (2006) established, based on similarity ofbiochemical variables, that
the surface water on the cross-shelftransect corresponded to Mackenzie River water.
The presence of the river plume influenced the magnitude of the sinking flux of
particulate organic material during both fall 2002 and summer 2004, as reflected by higher
fluxes of chI a and POC at 25 m at the stations strongly influenced by the plume
(Figs. 4a, band 6a, b). The chI a biomass within the river plume therefore appeared to be
coupled with the magnitude of sinking fluxes ofparticulate organic material to the
underlying water column during both sampling periods. River plumes are usually
associated with high concentrations of particulate organic material (e.g. Dittmar & Kattner
75
2003, Dagg et al. 2004), but mixing with sUITounding seawater may dilute the biomass
along the extent of the river plume (e.g. Dagg et al. 2004). During our sampling, dilution
effects on the river plume biomass Iikely explain the lower suspended chI a concentrations
(St. 49 during 2002, St. 708 during 2004) and lower sinking fluxes ofparticulate organic
material towards the periphery of the river plume (Figs. 4a, band 6a, b). In addition, our
results show that the direct sinking of algal biomass from the surface layer to deeper waters
in nearshore areas is likely to contribute to the removal ofbiomass from the river plume as
it extends offshore.
While there was overall similarity in the spatial trends of particulate organic material
sinking fluxes along the two transects (i.e. higher sinking fluxes ofPOC and chI a at
stations strongly influenced by the river plume), a seasonal difference in the magnitude of
fluxes was observed at the stations strongly influenced by the river plume. A previous study
in one of the major channels in the Mackenzie Delta, the East Channel, showed increasing
chI a concentrations from June to August (from ca. 2 to 5 ~g rI) followed by a decrease in
September (to ca. 1 ~g rI ; Anema et al. 1990), which agrees with the higher chI a biomass
observed in the river plume in summer than in the fall during our study. As a corollary, the
higher sinking fluxes ofparticulate organic material from the halocline during summer (at
St. 906) compared to fall (St. 65 and St. 66), can be linked to seasonal changes in river
plume biomass.
76
The influence of the Mackenzie River plume on sinking fluxes on the shelftherefore
depends on seasonal differences in the concentration of particulate organic material in the
discharged river water and how strongly a particular are a is influenced by the plume.
Moreover, the seasonal magnitude offreshwater discharge may influence the extent of the
Mackenzie River plume (Carmack & Macdonald 2002).
2.4.2 Effect of the river plume on the composition of the sinking material
In the next section, we will discuss the influence of the Mackenzie River plume on
the biogeochemical composition of the material exported from surface waters. While the
presence of the river plume appeared to induce higher sinking fluxes of chi a and POC
during the two sampling years and seasons, the effect of the plume on the composition of
the exported material varied between sampling years. For this reason, the following
discussion will address processes influencing the biogeochemical composition of the
material for each sampling period separately.
Fall of2002
During faH 2002, the particulate material exported from surface waters (25 m) at the
shelf stations strongly influenced by the river plume showed a high particulate organic
content, as POC dominated the TPC sinking export (83.1 and 88.2 % at St. 65 and St. 66,
respectively; data not shown). This is in contrast with the very high (> 95 %; Fig. Sc)
contribution ofLithoSi to the total particulate silica in the sinking material collected
undemeath the river plume at those stations. This high LithoSi contribution to the exported
material along the cross-shelftransect can be explained by a combination oflow BioSi
sinking fluxes « 15 mg m-2 d-I; Fig. Sa) and high LithoSi fluxes (320.7 and
77
282.4 mg m-2 d-I at St. 65 and St. 66, respectively; data not shown). The measured BioSi
sinking fluxes were lower than fluxes reported during spring and summer in the NOW
using similar short-term parti cie interceptor traps (ca. 50 - 800 mg m-2 d-I at 50 m; Michel
et al. 2002), while they compared with sinking fluxes reported during fall of 1987 on the
Mackenzie Shelf edge using long-term moorings (ca. 5 - 30 mg m-2 d-I at 128 and 145 m;
O ' Brien et al. 2006). The LithoSi contribution to the total silica sinking fluxes measured in
the present study compare with those (> 90 %) reported by O'Brien et al. (2006) at the
Mackenzie shelf edge in fall of 1987. Low sinking fluxes of intact diatom cells, empty
diatom frustules and the lack ofhighly silicified diatom spores (Hargraves & French 1983)
during fall 2002 (Fig. 8a, c) explain the low BioSi fluxes. LithoSi usually originates from
terrestrial soils and sediments, and as a consequence may be abundant in river plumes
containing a high terrestrial sediment load (e.g. Dagg et al. 2004). To our knowledge,
particulate LithoSi has not been documented for the Mackenzie River, however, O'Brien et
al. (2006) reported an increased contribution ofLithoSi , i.e. decreased contribution of
BioSi to total silica, resulting from the influence of the Mackenzie River plume and during
episodes of resuspension or coastal erosion. While no indication of resuspended material
was apparent at our deployment depths, it is possible that, during the fall, resuspended
material was introduced into the river plume closer to the river. The similarity between the
POC :PON and POC:chl a ratios measured in the material sinking from the river plume
during our fall sampling (POC:PON ranging from 6.7 - 7.9 mol:mol , POC:chl a ranging
78
from 527.3 to 1109 g:g; Fig. 6c and 7a) and those reported by Wells et al. (2006) in the
river plume (POC:PON ranging from 5.4 to 6.8 mol:mol, POC:chl a ranging from 312.5 to
1250 g:g) lends further support to a close coupling between the river plume and the
material sinking undemeath the halocline.
The river plume had a distinct signature reflected in the biogeochemical composition
of the material sinking out of surface waters, with high POC:chl a ratios and a low percent
contribution « 30 %; Fig. 4c) of chI a to total sinking pigments during fall. Accordingly,
estimates of the percent contribution of algal-based carbon to the total POC sinking fluxes,
using a POC:chl a ratio of 40 g:g (Lorenzen 1968) at the shelf stations give values :s 4 %,
thus reflecting a minor contribution of algae to the sinking flux of organic material from the
river plume in fall. In contrast, at the shelf-slope station (St. 49), the percent contribution of
algal-based carbon to total POC sinking fluxes estimated using the same carbon conversion
factor, was somewhat higher (7.6 %). These values are conservative estimates, as
POC:chl a ratios may vary considerably depending on the physiological condition of the
phytoplankton cells (e.g. up to 221 g:g in nutrient deficient cells; Stramski et al. 2002). In
addition, zooplankton fecal pellets contributed only a small fraction of the POC sinking
flux from surface waters (25 m) at the shelf stations (11.4 and 2.3 % at St. 65 and St. 66;
data not shown). Therefore, neither algal-based material nor fecal pellets were major
contributors to the POC sinking out of surface plume waters during fall.
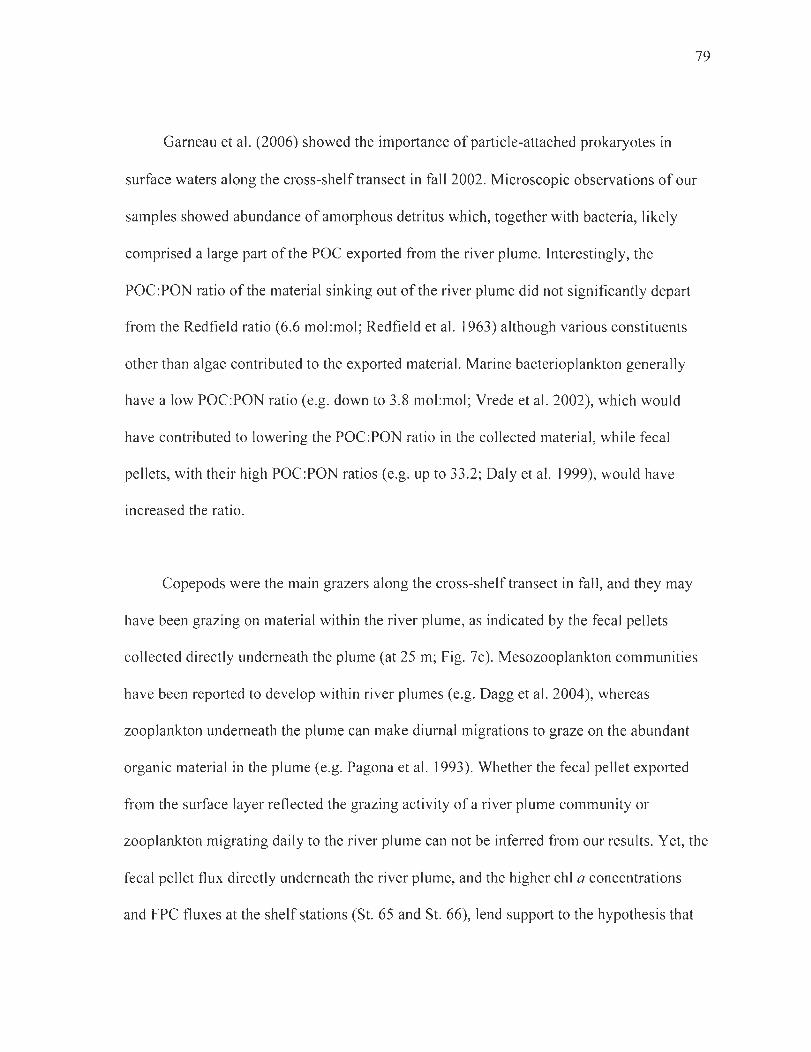
79
Garneau et al. (2006) showed the importance of partic1e-attached prokaryotes in
surface waters along the cross-shelftransect in faH 2002. Microscopie observations of our
sampI es showed abundance of amorphous detritus which, together with bacteria, likely
comprised a large part of the POC exported from the river plume. Interestingly, the
POC:PON ratio of the material sinking out of the river plume did not significantly depart
from the Redfield ratio (6.6 mol:mol; Redfield et al. 1963) although various constituents
other than algae contributed to the exported material. Marine bacterioplankton generaHy
have a low POC:PON ratio (e.g. down to 3.8 mol:mol; Vrede et al. 2002), which would
have contributed to lowering the POC:PON ratio in the collected material, while fecal
peHets, with their high POC:PON ratios (e.g. up to 33.2; Daly et al. 1999), would have
increased the ratio.
Copepods were the main grazers along the cross-shelftransect in fall, and they may
have been grazing on material within the river plume, as indicated by the fecal pellets
collected directly underneath the plume (at 25 m; Fig. 7c). Mesozooplankton communities
have been reported to develop within river plumes (e.g. Dagg et al. 2004), whereas
zooplankton underneath the plume can make diurnal migrations to graze on the abundant
organic material in the plume (e.g. Pagona et al. 1993). Whether the fecal pellet exported
from the surface layer reflected the grazing activity of a river plume community or
zooplankton migrating daily to the river plume can not be inferred from our results. Yet, the
fecal pellet flux directly underneath the river plume, and the higher chI a concentrations
and FPC fluxes at the shelf stations (St. 65 and St. 66), lend support to the hypothesis that
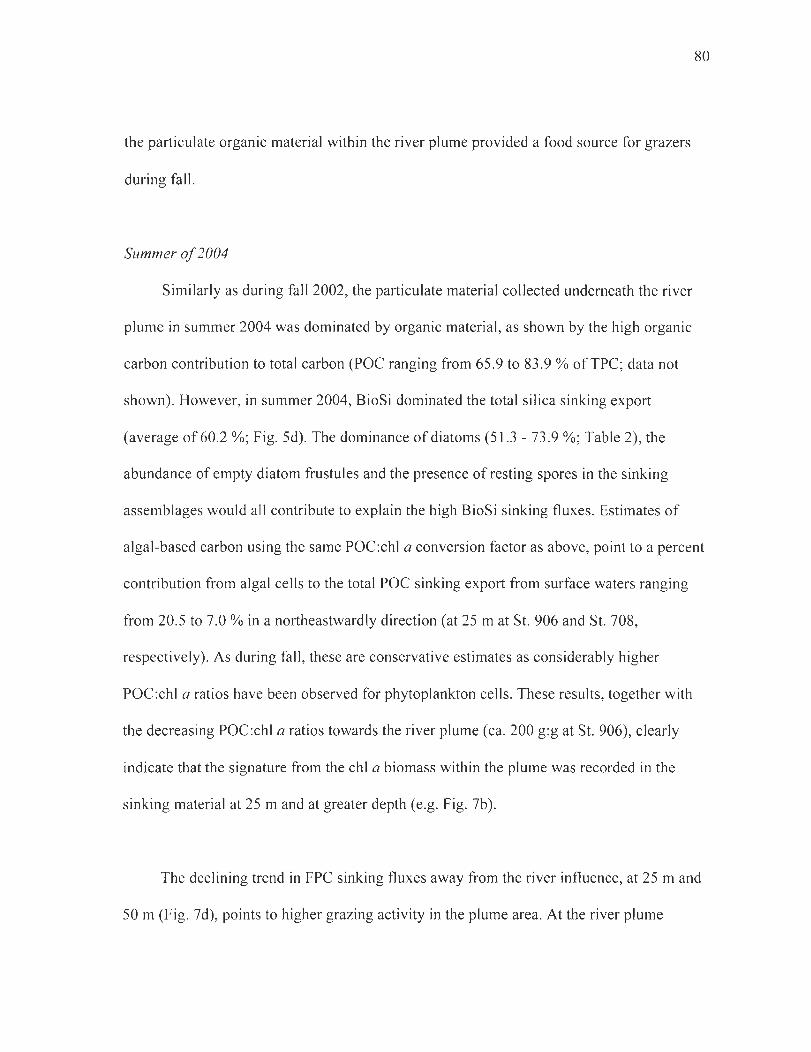
the particulate organic material within the river plume provided a food source for grazers
during fall.
Summer of 2004
80
Similarly as during faH 2002, the particulate material coHected underneath the river
plume in summer 2004 was dominated by organic material , as shown by the high organic
carbon contribution to total carbon (POC ranging from 65.9 to 83.9 % ofTPC; data not
shown). However, in summer 2004, BioSi dominated the total silica sinking export
(average of 60.2 %; Fig. 5d). The dominance of diatoms (51.3 - 73.9 %; Table 2), the
abundance of empty diatom frustules and the presence of resting spores in the sinking
assemblages would ail contribute to explain the high BioSi sinking fluxes. Estimates of
algal-based carbon using the same POC:chl a conversion factor as above, point to a percent
contribution from algal cells to the total POC sinking export from surface waters ranging
from 20.5 to 7.0 % in a northeastwardly direction (at 25 mat St. 906 and St. 708,
respectively). As during fall, these are conservative estimates as considerably higher
POC:chl a ratios have been observed for phytoplankton cel1s. These results, together with
the decreasing POC:chl a ratios towards the river plume (ca. 200 g:g at St. 906), clearly
indicate that the signature from the chI a biomass within the plume was recorded in the
sinking material at 25 m and at greater depth (e.g. Fig. 7b).
The declining trend in FPC sinking fluxes away from the river influence, at 25 m and
50 m (Fig. 7d), points to higher grazing activity in the plume area. At the river plume
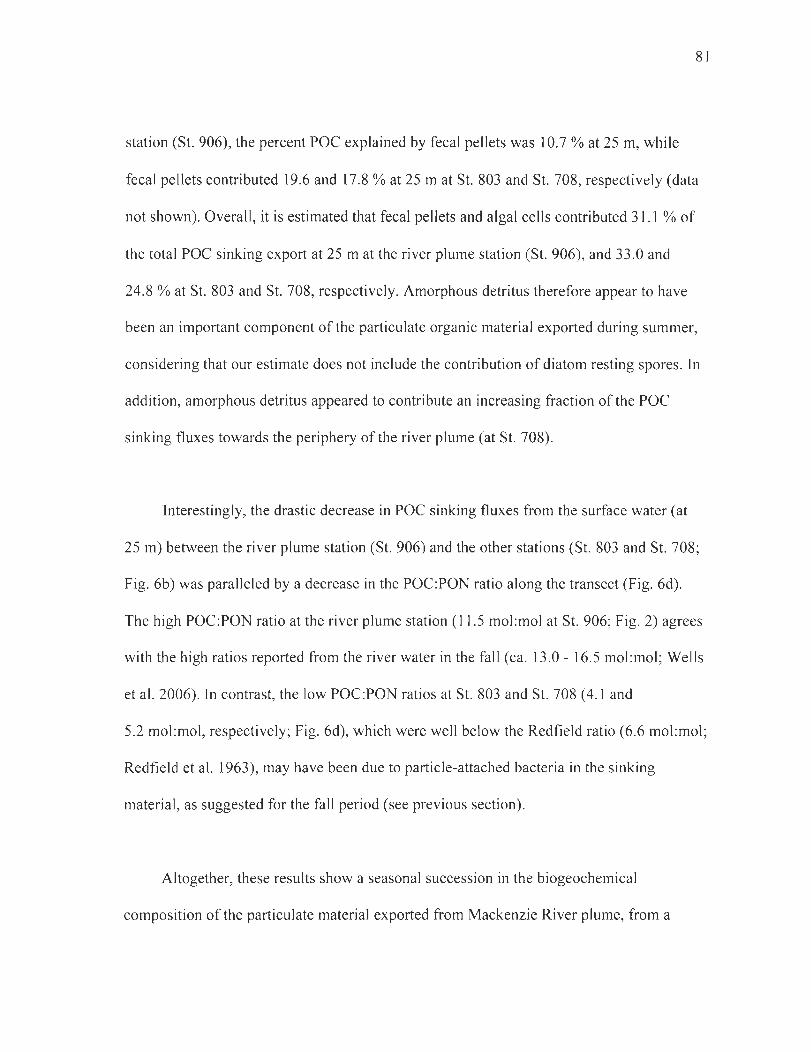
81
station (St. 906), the percent POC explained by fecal pellets was 10.7 % at 25 m, while
fecal pellets contributed 19.6 and 17.8 % at 25 m at St. 803 and St. 708, respectively (data
not shown). Overall, it is estimated that fecal pellets and algal cells contributed 31.1 % of
the total POC sinking export at 25 mat the river plume station (St. 906), and 33.0 and
24.8 % at St. 803 and St. 708, respectively. Amorphous detritus therefore appear to have
been an important component of the particulate organic material exported during summer,
considering that our estimate does not include the contribution of diatom resting spores. In
addition, amorphous detritus appeared to contribute an increasing fraction of the POC
sinking fluxes towards the periphery of the river plume (at St. 708).
Interestingly, the drastic decrease in POC sinking fluxes from the surface water (at
25 m) between the river plume station (St. 906) and the other stations (St. 803 and St. 708;
Fig. 6b) was paralleled by a decrease in the POC:PON ratio along the transect (Fig. 6d).
The high POC:PON ratio at the river plume station (11.5 mol:mol at St. 906; Fig. 2) agrees
with the high ratios reported from the river water in the fall (ca. 13.0 - 16.5 mo1:mol ; Wells
et al. 2006). In contrast, the low POC:PON ratios at St. 803 and St. 708 (4.1 and
5.2 mol:mol, respectively; Fig. 6d), which were weil below the Redfield ratio (6.6 mol:mol;
Redfield et al. 1963), may have been due to particle-attached bacteria in the sinking
material, as suggested for the fall period (see previous section).
AItogether, these results show a seasonal succession in the biogeochemical
composition of the particulate material exported from Mackenzie River plume, from a
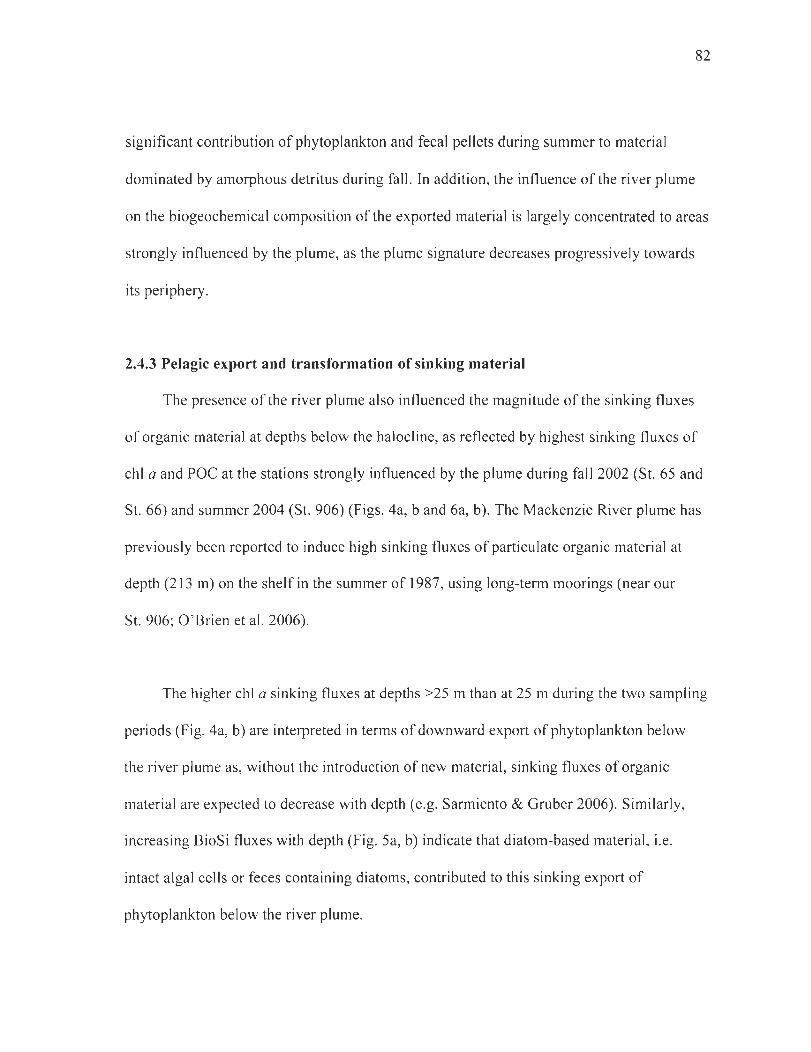
82
significant contribution of phytoplankton and fecal pellets during summer to material
dominated by amorphous detritus during fall. In addition, the influence of the river plume
on the biogeochemical composition of the exported material is largely concentrated to areas
strongly influenced by the plume, as the plume signature decreases progressively towards
its periphery.
2.4.3 Pelagie export and transformation of sinking material
The presence of the river plume also influenced the magnitude of the sinking fluxes
of organic material at depths below the halocline, as reflected by highest sinking fluxes of
chi a and POC at the stations strongly influenced by the plume during fall 2002 (St. 65 and
St. 66) and summer 2004 (St. 906) (Figs. 4a, band 6a, b). The Mackenzie River plume has
previously been reported to induce high sinking fluxes of particulate organic material at
depth (213 m) on the shelfin the summer of 1987, using long-term moorings (near our
St. 906; O'Brien et al. 2006).
The higher chI a sinking fluxes at depths >25 m than at 25 m during the two sampling
periods (Fig. 4a, b) are interpreted in terms of downward export of phytoplankton below
the river plume as, without the introduction of new material , sinking fluxes of organic
material are expected to decrease with depth (e.g. Sarmiento & Gruber 2006). Similarly,
increasing BioSi fluxes with depth (Fig. Sa, b) indicate that diatom-based material , i.e.
intact algal cells or feces containing diatoms, contributed to this sinking export of
phytoplankton below the river plume.
83
Zooplankton was grazing on particulate organic material below the river plume in
summer and faH , as reflected by the higher FPC sinking fluxes at 50 m, than at 25 m, in fal1
and summer (Fig. 7c, d). Stil1, the contribution offecal pel1ets from zooplankton located
below the river plume was higher during summer, compared to in fal1, as seen by the more
pronounced increase in FPC sinking fluxes from 25 m to 50 m in summer. Copepods were
the main grazers in summer and faH, as FPC sinking fluxes were predominantly comprised
of cylindrical fecal pel1ets. This grazing on the sinking particulate organic material below
the river plume was also reflected in the increasing proportion ofphaeopigments with depth
occurring at most stations (Fig. 4c, d) and the decreasing POC sinking fluxes with depth
during fall (Fig. 6a). This shift took place within a wel1-defined depth stratum at each
station (from 25 to 50 m at St. 49, St. 803 and St. 708, and from 25 to 100 m at St. 906;
data not shown), indicating production of fecal pel1ets in these depth strata. The grazing
activity below the river plume (from 25 to 50 m) could also explain the increasing
POC:PON ratios with depth (except for St. 906; Fig. 6c, d) , as herbivorous fecal pel1ets
have a high POC:PON ratio (e.g. Daly et al. 1999).
The FPC contribution to POC sinking fluxes at 50 m at St. 708 on 30 June 2004
(24.4 %; data not shown), corresponds with results (ca. 20 %) reported during July 2004 in
a paral1el study using long-term sediment trap moorings at 200 m at a nearby station on the
upper-slope of the Mackenzie Shelf (Forest et al. 2007). FPC sinking fluxes during summer
(20.5 - 55.9 mg C m-2 d- I; Fig. 7d) were comparable to fluxes reported during June and July
in the NOW (ca. 25 - 75 mg C m-2 d-I; Caron et al. 2004), but considerably higher than
fluxes reported at the deeper nearby station in July 2004 (ca. 2 mg m-2 d- I; Forest et al.
2007). In contrast, during fall 2002 the measured FPC fluxes (0.17 - 8.6 mg C m-2 d- I at
84
25 m and 50 m; Fig. 7c) were comparable to those reported by Forest et al. (2007) in
October 2003 (ca. 2 mg m-2 d- ' , similar to their July 2004 value), but were considerably
lower than the values reported in August and September in the NOW (ca. 100 mg C m-2 d-' ;
Caron et al. 2004). The high fecal pellet sinking fluxes in the NOW relates to a high
primary production and a high transfer rate of primary-produced material through the
herbivorous food web in this area during spring and summer (Mei et al. 2003).
The size range of cylindrical fecal pellets collected during summer and fall (width
ranging from ca. 20 - 100 !lm ; data not shown) indicates the presence of small copepods as
weil as of large Calanus spp. (Riser et al. 2002). This corresponds with the species
composition observed by Forest et al. (2007) on the Mackenzie Shelf, where Oithona
similes, Microcalanus pygmaeus and Cyclopina sp. showed the highest abundance, whereas
the larger Calanus hyperboreus and C. glacialis comprised the highest biomass during
October 2003 and June 2004.
Although appendicularian feces contributed much less to FPC fluxes on the shelfthan
copepods (0.83 - 28.1 and 0 - 24.4 % during summer and fall, respectively; Fig. 7c, d) , their
presence in the sinking biomass reflects a utilization of particles smaller than those
effectively grazed by copepods (Urban et al. 1992). Our results thus reflect two distinct
pathways of export of organic material to pelagie grazers, i.e. large cells being grazed by
copepods and small «5 !lm) cells, which were particularly abundant in the material
collected during fall (Table 2), being transferred to appendicularians.
85
The observed FPC sinking fluxes (at 50 m) represent a higher POC ingestion by
grazers, as only a small fraction of the POC removed from suspension by the grazers is
reintroduced into the water column as FPC (ca. 15 % ofPOC for Calan us spp.; M011er et
al. 2003). These authors, found high DOC production, due to sloppy-feeding (49 % ofPOC
removed from suspension) and leakage from fecal pellets (6 % ofPOC removed from
suspension) using 14C-labeled phytoplankton as tracers, which may have been
underestimated in other studies. Using the value from M011er et al. (2003), it is estimated
that 136.5 - 372.4 mg m-2 d- I ofalgal-based POC was removed from suspension by grazers
in summer and 3.0 - 57.5 mg m-2 d- I in the fall. These grazing estimates are equivalent to
5.4 - 86.0 % and 0.8 - 7.0 % of the integrated algal-based POC biomass above 50 m (25 m
at St. 65) in summer and fall , respectively, based on in situ fluorescence and a POC:chl a
ratio of 40 g:g for algae (Lorenzen 1968). Although these grazing estimates are subject to
change if using a different percent removal from suspension by grazing and/or different
POC:chl a values, the relative values clearly indicate higher grazing pressure in summer
than in fall. The dominance of smaller phytoplankton cells «5 !lm) in the fall and/or the
fact that large arctic copepods of the genus Ca/anus descend to deeper waters late in the
season in preparation for their diapause (Hirche 1998), would explain the lower grazing
activity in fall. In contrast, smaller copepods may remain active during the entire or part of
86
the win ter period, and have been reported to graze on the early ice algae production during
the winter-spring transition (e.g. Runge & Ingram 1988).
2.4.4 Species composition of the sinking assemblage
The comparable sinking fluxes of particulate organic material from the surface
waters, i.e. chI a, BioSi and POC fluxes at 25 m (Figs. 4a, b; 5a, band 6a, b), towards the
periphery of the river plume during fall 2002 (St. 49) and summer 2004 (St. 803 and
St. 708), together with the community succession observed in the trap material, lend
support to discuss the datasets in terms of seasonal trends.
In addition to the seasonally higher sinking fluxes ofparticulate organic material at
the station strongly influenced by the river plume in summer (St. 906) than in fall (St. 65
and St. 66; see section 2.4.1), there was also a transition from a higher contribution of
algal-based material in summer towards a higher contribution of amorphous detritus and
degraded material in the faU. Microscopic analyses of the coUected particulate material
reflected comparable ranges of phytoplankton cell sinking fluxes in faU 2002 (ranging from
7 to 326 x 106 cells m-2 d- I; Fig. 8a) and summer 2004 (ranging from 133 to
569 x 106 cells m-2 d- I; Fig. 8b). The low phytoplankton cell sinking flux at the outer-shelf
station (St. 66) where the river plume influence was strong, in the fall, may reflect an
underestimation of cell numbers due to the high degree of aggregation of the collected
material. The sinking fluxes of phytoplankton cell numbers observed during our study are
comparable to values reported during open-water conditions in Frobisher Bay
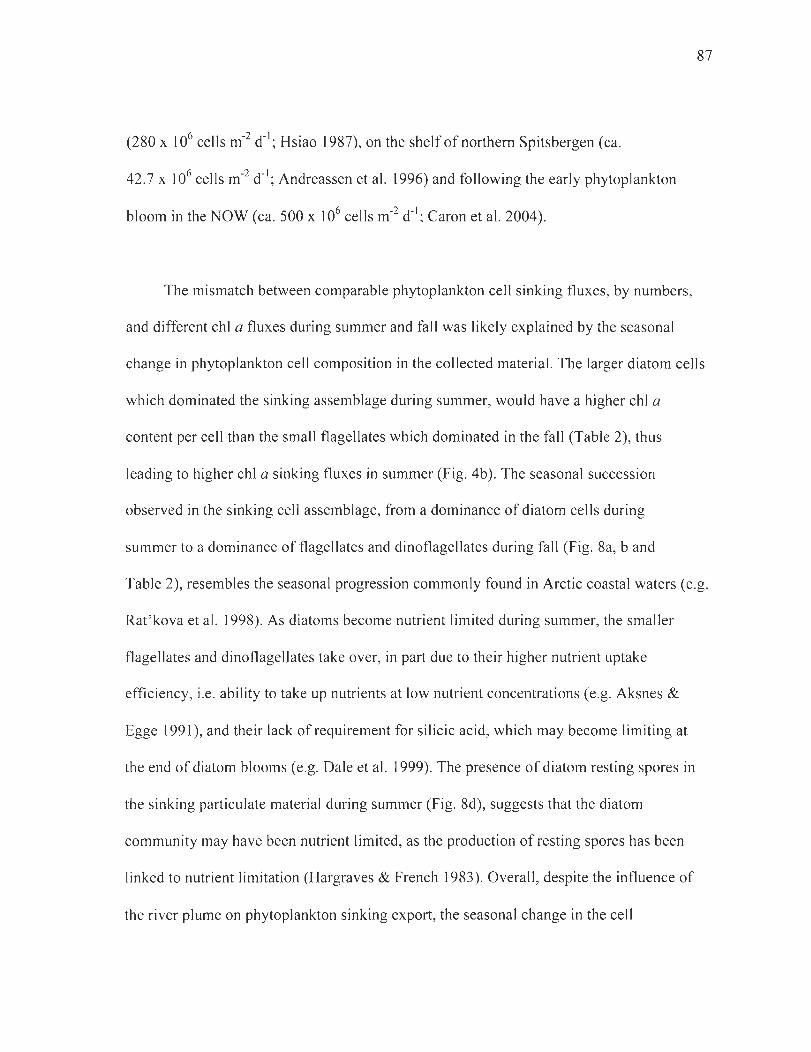
(280 X 106 cells m-2 d- 1; Hsiao 1987), on the shelfofnorthern Spitsbergen (ca.
42.7 x 10⁶ ceIls m -2 d- 1; Andreassen et al. 1996) and foIlowing the early phytoplankton
bloom in the NOW (ca. 500 x 106 ceIls m-2 d- 1; Caron et al. 2004).
87
The mismatch between comparable phytoplankton cell sinking fluxes, by numbers,
and different chI a fluxes during summer and fall was likely explained by the seasonal
change in phytoplankton ceIl composition in the collected material. The larger diatom cells
which dominated the sinking assemblage during summer, would have a higher chI a
content per cell than the small flagellates which dominated in the fall (Table 2), thus
leading to higher chI a sinking fluxes in summer (Fig. 4b). The seasonal succession
observed in the sinking cell assemblage, from a dominance of diatom cells during
summer to a dominance of flagellates and dinoflagellates during fall (Fig. 8a, band
Table 2), resembles the seasonal progression commonly found in Arctic coastal waters (e.g.
Rat'kova et al. 1998). As diatoms become nutrient limited during summer, the smaller
flagellates and dinoflagellates take over, in part due to their higher nutrient uptake
efficiency, i.e. ability to take up nutrients at low nutrient concentrations (e.g. Aksnes &
Egge 1991), and their lack of requirement for silicic acid, which may become limiting at
the end of diatom blooms (e.g. Dale et al. 1999). The presence of diatom resting spores in
the sinking particulate material during summer (Fig. 8d), suggests that the diatom
community may have been nutrient limited, as the production of resting spores has been
linked to nutrient limitation (Hargraves & French 1983). Overall, despite the influence of
the river plume on phytoplankton sinking export, the seasonal change in the cell
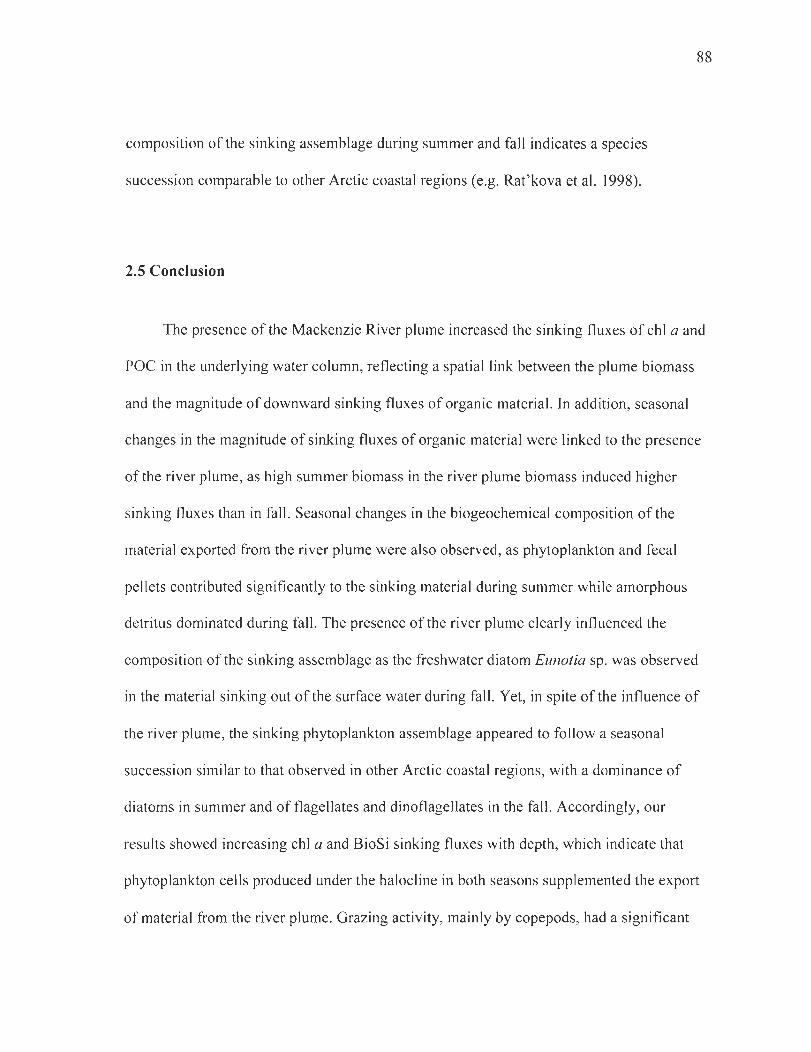
composition of the sinking assemblage during summer and fall indicates a species
succession comparable to other Arctic coastal regions (e.g. Rat'kova et al. 1998).
2.5 Conclusion
88
The presence of the Mackenzie River plume increased the sinking fluxes of chI a and
POC in the underlying water column, reflecting a spatiallink between the plume biomass
and the magnitude of downward sinking fluxes of organic material. In addition, seasonal
changes in the magnitude of sinking fluxes of organic material were Iinked to the presence
of the river plume, as high summer biomass in the river plume biomass induced higher
sinking fluxes than in fall. Seasonal changes in the biogeochemical composition of the
material exported from the river plume were also observed, as phytoplankton and fecal
pellets contributed significantly to the sinking material during summer while amorphous
detritus dominated during fall. The presence of the river plume clearly influenced the
composition of the sinking assemblage as the freshwater diatom Eunotia sp. was observed
in the material sinking out of the surface water during fall. Yet, in spite of the influence of
the river plume, the sinking phytoplankton assemblage appeared to follow a seasonal
succession similar to that observed in other Arctic coastal regions, with a dominance of
diatoms in summer and offlagellates and dinoflagellates in the fall. Accordingly, our
results showed increasing chI a and BioSi sinking fluxes with depth, which indicate that
phytoplankton cells produced under the halocline in both seasons supplemented the export
of material from the river plume. Grazing activity, mainly by copepods, had a significant
89
impact on the biogeochemical composition of the sinking material , in particular during
summer. Overall, these results provide valuable information on the effects of a river plume
on the magnitude and biogeochemical composition of sinking fluxes on an Arctic shelf.
This study emphasizes that various processes, including the presence of river plumes
together with production and grazing in the water column, determine the sinking export of
organic material on Arctic shelves.
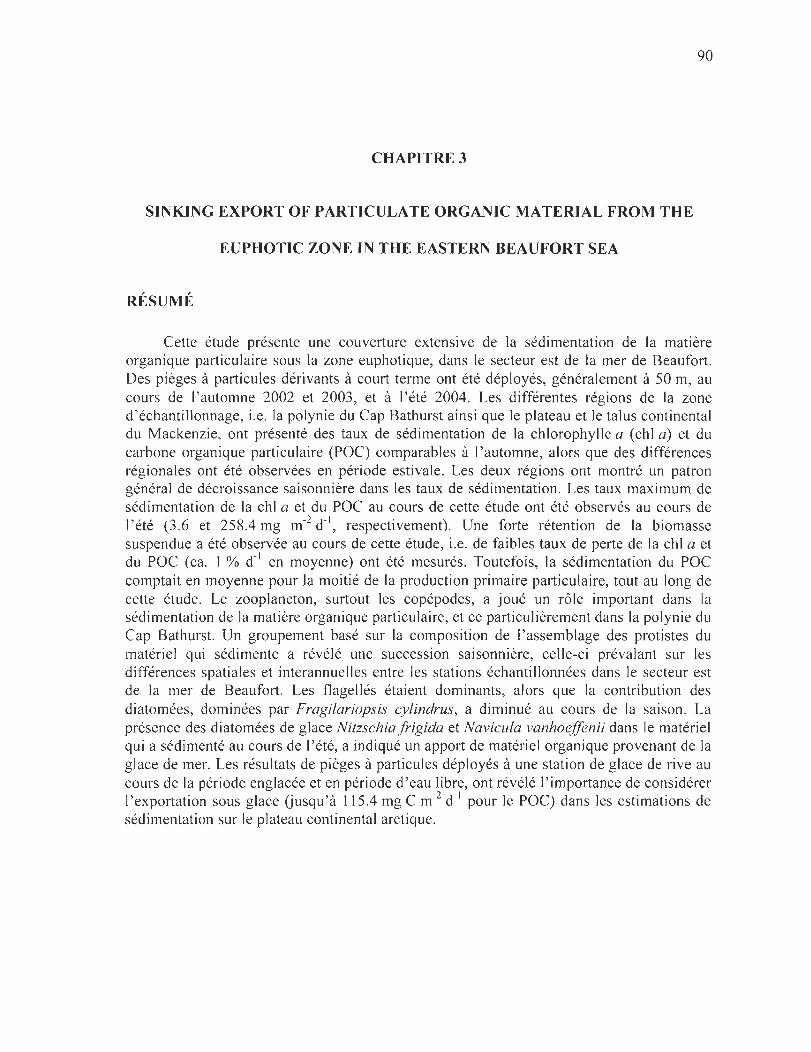
90
CHAPITRE 3
SINKING EXPORT OF PARTI CULA TE ORGANIC MA TERIAL FROM THE
EUPHOTIC ZONE IN THE EASTERN BEAUFORT SEA
RÉSUMÉ
Cette étude présente une couverture extensive de la sédimentation de la matière organique particulaire sous la zone euphotique, dans le secteur est de la mer de Beaufort. Des pièges à particules dérivants à court terme ont été déployés, généralement à 50 m, au cours de l'automne 2002 et 2003, et à l'été 2004. Les différentes régions de la zone d'échantillonnage, i.e. la polynie du Cap Bathurst ainsi que le plateau et le talus continental du Mackenzie, ont présenté des taux de sédimentation de la chlorophylle a (chi a) et du carbone organique particulaire (POC) comparables à l' automne, alors que des différences régionales ont été observées en période estivale. Les deux régions ont montré un patron général de décroissance saisonnière dans les taux de sédimentation. Les taux maximum de sédimentation de la chI a et du POC au cours de cette étude ont été observés au cours de l'été (3.6 et 258.4 mg m-2 d-I, respectivement). Une forte rétention de la biomasse suspendue a été observée au cours de cette étude, i.e. de faibles taux de perte de la chI a et du POC (ca. 1 % d-I en moyenne) ont été mesurés. Toutefois, la sédimentation du POC comptait en moyenne pour la moitié de la production primaire particulaire, tout au long de cette étude. Le zooplancton, surtout les copépodes, a joué un rôle important dans la sédimentation de la matière organique particulaire, et ce particulièrement dans la polynie du Cap Bathurst. Un groupement basé sur la composition de l'assemblage des protistes du matériel qui sédimente a révélé une succession saisonnière, celle-ci prévalant sur les différences spatiales et interannuelles entre les stations échantillonnées dans le secteur est de la mer de Beaufort. Les flagellés étaient dominants, alors que la contribution des diatomées, dominées par Fragilariopsis cy lindrus, a diminué au cours de la saison. La présence des diatomées de glace Nitzschia frigida et Navicula vanhoefJenü dans le matériel qui a sédimenté au cours de l'été, a indiqué un apport de matériel organique provenant de la glace de mer. Les résultats de pièges à particules déployés à une station de glace de rive au cours de la période englacée et en période d'eau libre, ont révélé l'importance de considérer l' exportation sous glace Uusqu ' à 115.4 mg C m-2 d-I pour le POC) dans les estimations de sédimentation sur le plateau continental arctique.
91
ABSTRACT
This study presents an extensive spatial and seasonal coverage of the sinking export of particulate organic material below the euphotic zone in the eastem Beaufort Sea. Free-drifting short-term particle interceptor traps were deployed, generally at 50 m, during fall 2002 and 2003 and summer 2004. The different regions of the sampling area, i.e. the Cape Bathurst Polynya and the Mackenzie shelf and sI ope, showed comparable ranges in the sinking export of chlorophyll a (chI a) and particulate organic carbon (POC) in fall , while regional differences were observed in summer. The two regions showed a general decreasing trend in sinking fluxes towards fall. The highest chI a and POC sinking fluxes during this study were therefore recorded during summer (3.6 and 258.4 mg m-2 d- I, respectively). A high retention of suspended biomass was observed throughout this study, i.e. low daily loss rates of suspended chI a and POC (both averaging ca. 1 % d-I) were observed. Still , the POC sinking export accounted for, on average, half of the particulate primary production throughout this study. Zooplankton, primarily copepods, played an important role in the sinking export of particulate organic material, particularly in the Cape Bathurst Polynya. A c1uster-based analysis of the sinking protist cell assemblage revealed a seasonal succession that prevailed over spatial and interannual differences between the stations sampled in the eastem Beaufort Sea. Flagellates dominated throughout the study area, while diatoms, dominated by Fragilariopsis cylindrus, showed a decreasing contribution to the sinking protist cell assemblage towards fall. The presence of the sea ice related pennate diatoms Nitzschia frigida and Navicula vanhoeffenii in the material collected during summer reflected an input of organic material from the sea ice. Results from particJe interceptor traps deployed at a landfast sea ice station during ice-covered and ice-free conditions showed the importance of taking into account underice sinking fluxes (up to ] 15.4 mg C m-2 d-I for POC) for sinking export estimates on Arctic shelves.
92
3.1 Introduction
The extent and thickness of the sea ice co ver have changed in the Northem
Hemisphere during the last three decades; these changes are thought to be a consequence of
the ongoing global warrning trend (IPCC 2007). The extent of multi-year sea ice, primarily
found in the central Arctic Ocean, has been decreasing by ca. 7 % per decade since 1978
(IPCC 2007), as multi-year sea ice is being replaced by seasonal first-year sea ice in many
areas (e.g. Belchansky et al. 2005). Moreover, the number and size of sea ice flaw leads and
polynyas in the Arctic Ocean is expected to increase if the climate change trend continues
(ACiA 2005). Consequently, the duration and extent of seasonally ice-free areas is
expected to increase in the Arctic Ocean, in particular in the coastal regions (ACIA 2005,
IPCC 2007).
Changes in sea ice dynamics may have impacts on marine productivity and
ecosystem structure, especially on Arctic continental shelves (e.g. Grebmeier et al. 2006)
which comprise a large part of the Arctic Ocean (i.e. 53 % of the total surface area;
Jakobsson 2002). An increase in the duration and extent of ice-free areas is likely to
improve conditions for phytoplankton production in the Arctic Ocean, due to increased
light availability in the upper water column (ACIA 2005). Phytoplankton production
already contributes ca. 75 to >97 % of the total annual primary production (i.e. ice algal and
phytoplankton production) on Arctic shelves (Subba Rao & Platt 1984, Legendre et al.
1992, Gosselin et al. 1997).
93
Spring phytoplankton production on Arctic shelves, which is often dominated by
diatoms, is generally associated with the moving ice edge during spring melt, as the upper
water column is stabilized via the halocline formed by released melt water (e.g. Sakshaug
& Skjoldal 1989, Carmack et al. 2006). Ice edge blooms or spring blooms in polynyas are
often terminated by nutrient limitation within the surface mixed layer (e.g. Sakshaug &
Skjoldal 1989, Carmack et al. 2006, Tremblay et al. 2006a). Nutrient limitation often
induces a succession in phytoplankton species, from diatoms to flagellates and
dinoflagellates (e.g. Rat'kova et al. 1998, Dale et al. 1999, Hill et al. 2005). Flagellates and
dinoflagellates generally have higher uptake efficiency for nitrate and phosphate than
diatoms (e.g. Dale et al. 1999). In addition, they are not dependent on the availability of
silicic acid which may limit diatom production during summer (e.g. Dale et al. 1999). A
phytoplankton bloom can occur during fall in Arctic areas, as wind mixing can reintroduce
nutrients into the surface mixed layer (e.g. Klein et al. 2002, Arrigo & Dijken 2004,
Carmack et al. 2006).
Primary-produced organic material may be vertically exported to the benthos as intact
algal cells, or it may be diverted through the pelagie heterotrophic food web (e.g. Turner
2002, Wassmann et al. 2006). Sinking of intact algal cells generally conveys organic
material of a high quality to the benthos, while algal material diverted through the
heterotrophic food web results in a reduced sinking export of organic material of usually
lesser quality (e.g. Turner 2002). Herbivorous grazers, particularly copepods, may at times
effectively graze on suspended algal material in sorne Arctic areas (e.g. Michel et al. 1996,
94
Fortier et al. 2002, Forest et al. 2007). Fecal pellets from herbivorous grazers may therefore
at times represent an important component of the vertically exported organic material (e.g.
up to ca. 60 % ofPOC sinking fluxes; Juul-Pedersen et al. 2006). A potential increase in
the annual primary production in the Arctic Ocean associated with climate changes (ACIA
2005), accompanied by changes in the pelagic heterotrophic food web (Grebmeier et al.
2006), will likely result in changes to the pelagic-benthic coupling on the Arctic continental
shelves.
This study investigates spatial and temporal variability in the sinking export of
organic material from the euphotic zone in the eastem Beaufort Sea. The objectives ofthis
study were to (1) asses spatial variations in the magnitude of sinking export of organic
material from the euphotic zone in the eastem Beaufort Sea, (2) characterize any patterns in
the composition of the sinking material within the sampling area, especially with respect to
protist cell assemblages, and (3) make a comparison between the magnitudes of sinking
export of particulate organic material during sea ice covered and subsequent ice-free
conditions at a land fast sea ice station. A first hypothesis was that the eastem Beaufort Sea
would display spatial and seasonal differences, from spring to faIl , in the magnitude of
sinking ofparticulate organic material. Tt was also hypothesized that higher sinking fluxes
of organic material would be observed during ice-free conditions, than during landfast ice
coyer, as phytoplankton may be exported from the euphotic zone.
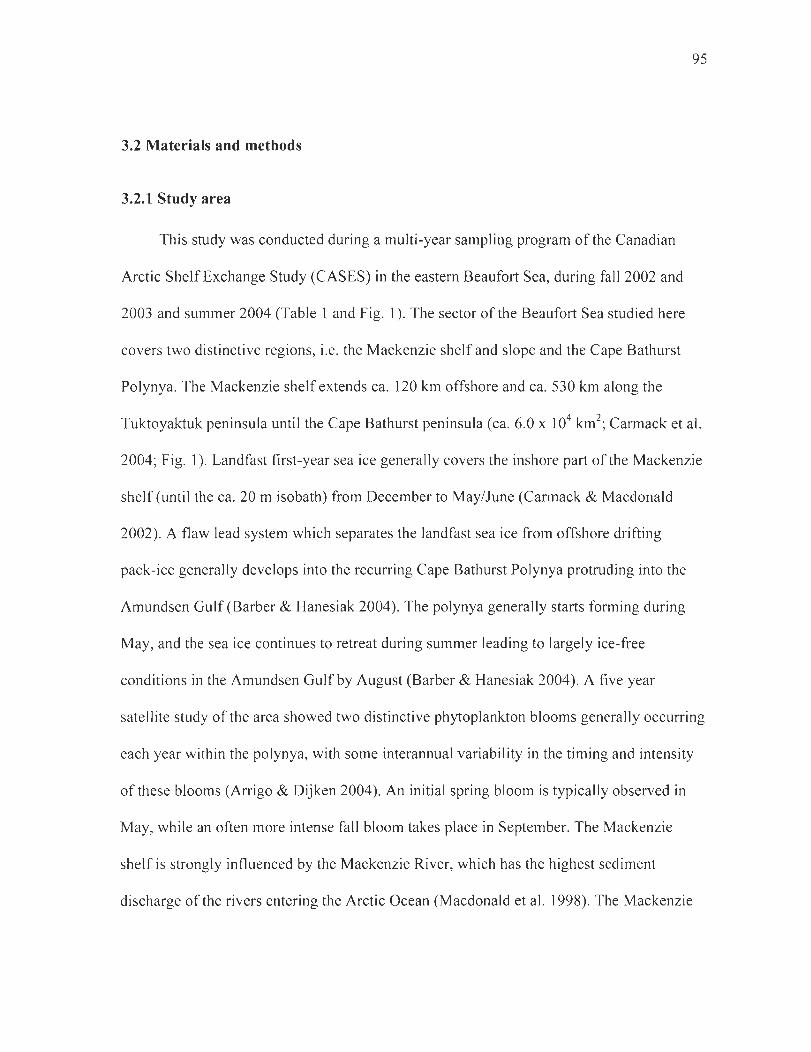
3.2 Materials and methods
3.2.1 Study area
This study was conducted during a multi-year sampling program of the Canadian
Arctic ShelfExchange Study (CASES) in the eastern Beaufort Sea, during fall 2002 and
2003 and summer 2004 (Table 1 and Fig. 1). The sector of the Beaufort Sea studied here
95
co vers two distinctive regions, i.e. the Mackenzie shelf and slope and the Cape Bathurst
Polynya. The Mackenzie shelf extends ca. 120 km offshore and ca. 530 km along the
Tuktoyaktuk peninsula until the Cape Bathurst peninsula (ca. 6.0 x 10⁴ km2; Carmack et al.
2004; Fig. 1). Landfast first-year sea ice generally covers the inshore part of the Mackenzie
shelf (until the ca. 20 m isobath) from December to May/June (Canllack & Macdonald
2002). A flaw lead system which separates the landfast sea ice from offshore drifting
pack-ice generally develops into the recurring Cape Bathurst Polynya protruding into the
Amundsen Gulf(Barber & Hanesiak 2004). The polynya generally starts forming during
May, and the sea ice continues to retreat during summer leading to largely ice-free
conditions in the Amundsen Gulfby August (Barber & Hanesiak 2004). A five year
satellite study of the area showed two distinctive phytoplankton blooms generally occurring
each year within the polynya, with sorne interannual variability in the timing and intensity
ofthese blooms (Arrigo & Dijken 2004). An initial spring bloom is typically observed in
May, while an often more intense fall bloom takes place in September. The Mackenzie
shelf is strongly influenced by the Mackenzie River, which has the highest sediment
discharge of the ri vers entering the Arctic Ocean (Macdonald et al. 1998). The Mackenzie
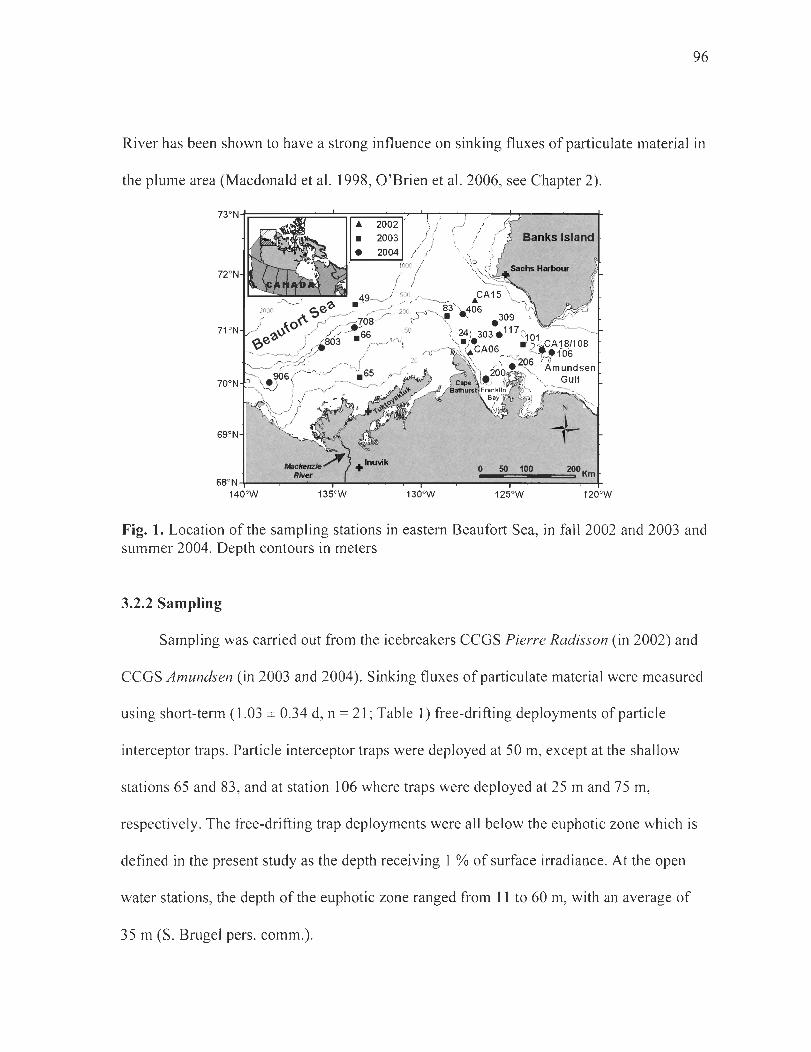
96
River has been shown to have a strong influence on sinking fluxes ofparticulate material in
the plume are a (Macdonald et al. 1998, O'Brien et al. 2006, see Chapter 2).
Fig. 1. Location of the sampling stations in eastern Beaufort Sea, in fall 2002 and 2003 and summer 2004. Depth contours in meters
3.2.2 Sampling
Sampling was carried out from the icebreakers CCGS Pierre Radisson (in 2002) and
CCGS Amundsen (in 2003 and 2004). Sinking fluxes ofparticulate material were measured
using short-term (1.03 ± 0.34 d, n = 21; Table 1) free-drifting deployments of particle
interceptor traps. Partic1e interceptor traps were deployed at 50 m, except at the shallow
stations 65 and 83 , and at station 106 where traps were deployed at 25 m and 75 m,
respectively. The free-drifting trap deployments were ail below the euphotic zone which is
defined in the present study as the depth receiving 1 % of surface irradiance. At the open
water stations, the depth of the euphotic zone ranged from Il to 60 m, with an average of
35 m (S. Brugel pers. comm.).
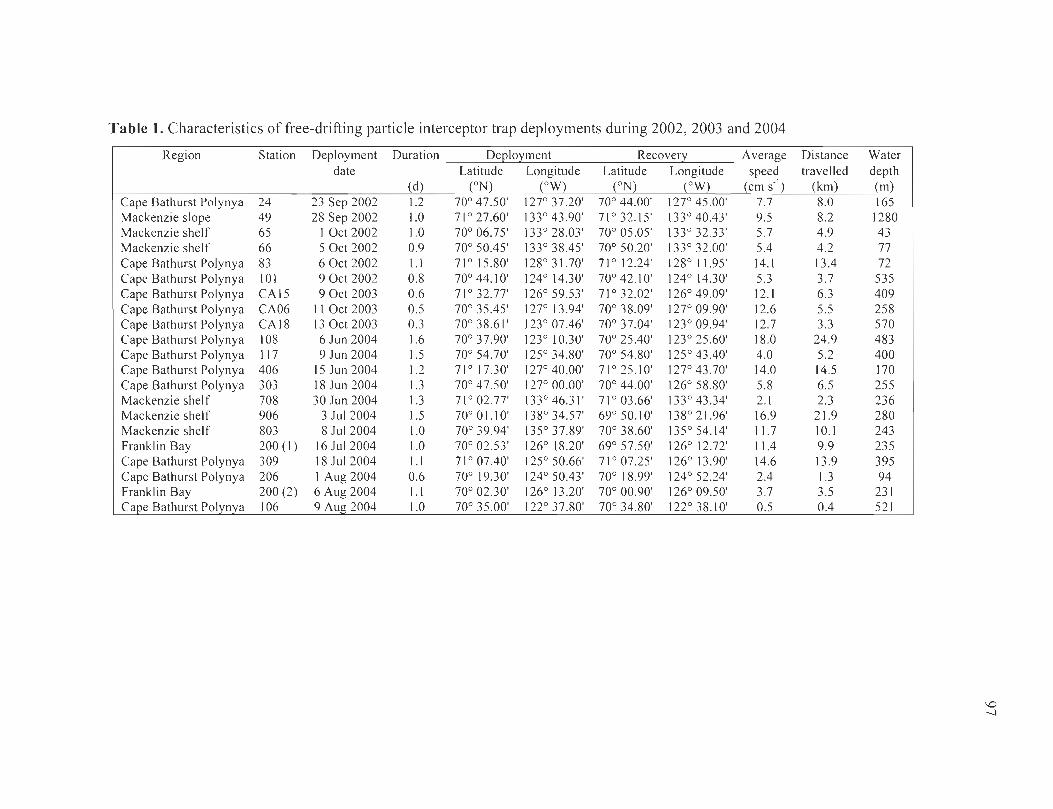
Table 1. Characteristics of free-drifting particle interceptor trap deployments during 2002, 2003 and 2004
Region Station Deployment Duration DeElo~ment Recover~ Average date Latitude Longitude Latitude Longitude speed
(d) (ON) (OW) (ON) (OW) (cm S- I)
Cape Bathurst Polynya 24 23 Sep 2002 1.2 70° 47.50' 12r 37.20' 70° 44.00' 127° 45.00' 7.7 Mackenzie slope 49 28 Sep 2002 1.0 71 ° 27.60' 133° 43.90' 71 ° 32.15' 133° 40.43' 9.5 Mackenzie she lf 65 1 Oct 2002 1.0 70° 06.75' 133° 28.03' 70° 05 .05' 133° 32 .33' 5.7 Mackenzie shelf 66 5 Oct 2002 0.9 70° 50.45' 133° 38.45' 70° 50.20' 133° 32 .00' 5.4 Cape Bathurst Polynya 83 6 Oct 2002 1.1 71 ° 15.80' 128° 31.70' 71 ° 12.24' 128° 11 .95' 14.1 Cape Bathurst Polynya 101 9 Oct 2002 0.8 70° 44.10' 124° 14.30' 70° 42 .10' 124° 14.30' 5.3 Cape Bathurst Polynya CA I5 9 Oct 2003 0.6 71 ° 32.77' 126° 59.53' 71 ° 32.02' 126° 49.09' 12.1 Cape Bathurst Polynya CA06 Il Oct 2003 0.5 70° 35.45' 127° 13.94' 70° 38.09' 127° 09.90' 12.6 Cape Bathurst Polynya CA 18 13 Oct 2003 0.3 70° 38.6 1' 123° 07.46' 70° 37.04' 123° 09.94' 12.7 Cape Bathurst Polynya 108 6 Jun 2004 1.6 70° 37.90' 123 ° 10.30' 70° 25.40' 123° 25.60' 18.0 Cape Bathurst Polynya 117 9 Jun 2004 1.5 70° 54.70' 125° 34.80' 70° 54.80' 125° 43.40' 4.0 Cape Bathurst Polynya 406 15 Jun 2004 1.2 71 ° 17.30' 127° 40.00' 71 ° 25 .10' 127° 43 .70' 14.0 Cape Bathurst Polynya 303 18 Jun 2004 1.3 70° 47.50' 127° 00.00' 70° 44.00' 126° 58 .80' 5.8 Mackenzie shelf 708 30 Jun 2004 1.3 71 ° 02.77' 133° 46.3 1' 71 ° 03.66' 133° 43.34' 2. 1 Mackenzie shelf 906 3 .lui 2004 1.5 70° 01. 10' 138° 34.57' 69° 50. 10' 138° 2 1.96' 16.9 Mackenzie shelf 803 8 .lui 2004 1.0 70° 39.94' 135° 37.89' 70° 38.60' 135° 54. 14' 11.7 Frankl in Bay 200 (1) 16 lu i 2004 1.0 70° 02.53' 126° 18.20' 69° 57.50' 126° 12.72' I l.4 Cape Bathurst Polynya 309 18 l ui 2004 1.1 71 ° 07.40' 125° 50.66' 71 ° 07.25' 126° 13.90' 14.6 Cape Bathurst Polynya 206 1 Aug 2004 0.6 70° 19.30' 124° 50.43' 70° 18.99' 124° 52.24' 2.4 Frankli n Bay 200 (2) 6 Aug 2004 1. 1 70° 02 .30' 126° 13.20' 70° 00.90' 126° 09.50' 3.7 Cape Bathurst Polynya 106 9 Aug 2004 1.0 70° 35 .00' 122° 37.80' 70° 34.80' 122° 38.10' 0.5
Distance travelled
(km) 8.0 8.2 4.9 4 .2 13.4 3.7 6.3 5.5 3.3
24.9 5.2 14.5 6.5 2.3
21.9 10.1 9.9 13.9 1.3 3.5 0.4
Water depth (m) 165
1280 43 77 72
535 409 258 570 483 400 170 255 236 280 243 235 395 94
23 1 521
\0 --l
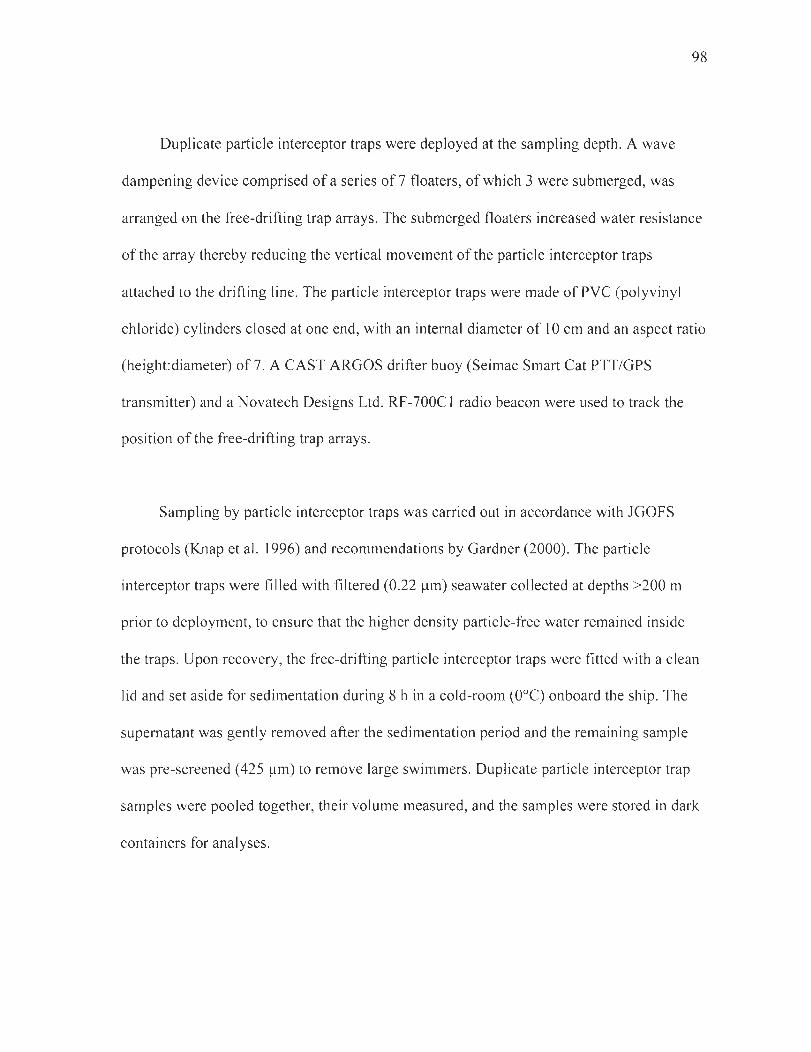
98
Duplicate partic\e interceptor traps were deployed at the sampling depth. A wave
dampening device comprised of a series of 7 floaters, of which 3 were submerged, was
arranged on the free-drifting trap arrays. The submerged floaters increased water resistance
of the array thereby reducing the vertical movement of the partic\e interceptor traps
attached to the drifting line. The particle interceptor traps were made of PVC (polyvinyl
chloride) cylinders closed at one end, with an internaI diameter of 10 cm and an aspect ratio
(height:diameter) of7. A CAST ARGOS drifter buoy (Seimac Smart Cat PTT/GPS
transmitter) and a Novatech Designs Ltd. RF-700Cl radio beacon were used to track the
position of the free-drifting trap arrays.
Sampling by partic\e interceptor traps was carried out in accordance with JGOFS
protocols (Knap et al. 1996) and recommendations by Gardner (2000). The partic\e
interceptor traps were filled with filtered (0.22 )lm) seawater collected at depths >200 m
prior to deployment, to ensure that the higher density partic\e-free water remained inside
the traps. Upon recovery, the free-drifting partic\e interceptor traps were fitted with a c\ean
lid and set aside for sedimentation during 8 h in a cold-room (ODC) onboard the ship. The
supernatant was gently removed after the sedimentation period and the remaining sample
was pre-screened (425 )lm) to remove large swimmers. Dupl icate particle interceptor trap
sampI es were pooled together, their volume measured, and the samples were stored in dark
containers for analyses.
99
Particle interceptor traps were also deployed at a landfast first-year sea ice station in
Franklin Bay (station 200; Fig. 1) on 16 consecutive occasions from 23 February to 20 June
2004. The trap array was fixed to the sea ice with traps deployed at 25 m under the sea ice
during, on average, 7.8 ± 0.8 days (n = 6) from 23 February to 13 April and 6.2 ± 0.4 days
(n = 8) from 13 April to 20 June, except for two deployments of 4.0 and 15.2 days on
26 May and 30 May, respectively. Upon recovery, the entire volume of the underice
parti cIe interceptor traps were pre-screened (425 !lm) to remove large swimmers and
measured, and was stored in black containers for analyses (see Chapter 2 for further
details).
Sampling of the suspended material was carried out at each station with a rosette
sampler equipped with 12 L bottles (OceanTest Equipment) deployed at 3-8 depths within
the upper 50 m.
3.2.3 Analyses
Trap sampI es were gently mixed prior to subsampling. To ensure minimal
disturbance of the collected material , samples for microscopic examination were taken first.
Subsamples for fecal pellet (100-250 ml) and protist (100-250 ml) analyses were preserved
with 2 % (v/v) buffe red formaldehyde and 1 % (v/v) acidic Lugol's solution, respectively.
Enumeration and measurement (Iength and width) of fecal pellet dimensions were later
conducted using a Carl Zeiss inverted microscope (100 x magnification). Fecal pellets were
c1assified according to type (i.e. cyl indri cal or elliptical) and condition (i.e. intact or
100
broken). The volume of intact and broken cylindrical fecal pellets was calculated using the
equation for a cylinder with half-spherical ends and for a cylinder, respectively. The
volume of intact elliptical fecal pellets was calculated using the equation for an ellipsoid;
no broken elliptical fecal pellets were observed during the present study. Fecal pellet based
carbon (FPC) was estimated using a volume to carbon conversion factor of 0.057 pg C Ilm-I
for cylindrical fecal pellets (i.e. copepod fecal pellets) and 0.042 pg C Ilm-I for elliptical
fecal pellets (i.e. appendicularian fecal pellets) (Gonzalez et al. 1994). Identification and
enumeration ofphytoplankton and other protists were conducted using a Leica DM IRB
inverted microscope (400 x magnification), according to the method of Lund et al. (1958).
For each sample, a minimum of 300 cells were counted.
Chlorophyll a (chi a) and phaeopigments were measured on subsamples (50-200 ml)
filtered onto Whatman GF/F 25 mm glass fiber filters. Pigments were extracted in 90 %
acetone for 24 h in cold dark conditions (4°C). Samples were then analyzed on a Turner
Designs 10AU fluorometer, using 90 % acetone as a blank. The pigment concentration in
the samples was calculated in accordance with Parsons et al. (1984).
Total particulate carbon (TPC) and particulate organic carbon (POC) were measured
on subsamples (50-900 ml) filtered onto precombusted (450°C for 24 h) Whatman GFIF
21 mm filters. The filters were dried at 60°C for 24 h and stored in separate Petri dishes.
Filters for POC determination were acidified during 24 h in a dessicator saturated with HCI
fumes, thereby removing any inorganic carbon. Analyses were conducted on a Perkin-
101
Elmer Model 2400 CHN Analyzer. POC analysis could not be conducted at several stations
in the Cape Bathurst Polynya during the study because of insufficient collection of material
in the short-term particle interceptor traps (stations CA 15 and CA 18 during fall 2003;
stations 108, 117 and 303 during summer 2004). Missing POC data at these stations were
extrapolated from the measured TPC sinking fluxes , using the strong linear regression
between sinking fluxes ofPOC and TPC at other stations (y = 0.84x + 1.69; r2 = 0.87;
P < 0.001). Unfortunately TPC and POC data are missing from station 406.
The water samples for suspended material were analysed for chi a and POC, although
different sample volumes were used (S. Brugel pers. comm.).
During the trap deployment period, particulate phytoplankton production was
measured at 5 optical depths (100,50,25, 10 and 1 % of surface irradiance) with the 14C
uptake method in accordance with JGOFS protocols (Knap et al. 1996) (S. Brugel pers.
comm.). After 24 h on-deck in-situ simulated incubation, samples were filtered onto
Whatman GFIF filters. The filters were placed in borosilicate scintillation vials and
acidified ovemight with 0.5 N HCI , in order to remove 14C that was not incorporated (Lean
& Bumison 1979). Scintillation cocktail was then added to the vials . The vials were stored
in the dark for 24 h before being counted on a Packard Tri-Carb 2900 TR Liquid
Scintillation Analyzer. Particulate primary production corrected for dark uptake was
calculated according to Knap et al. (1996).
3.2.4 Calculations and statistical analyses
The sinking flux of the measured variables was calculated using the following
equation:
Sinking flux (mg m-2 d- 1) = (Ctrap * Vtrap) / (Atrap * Tdep) (1)
102
where Ctrap (mg m-3) is the concentration of the measured variable in the particle interceptor
trap, Vtrap (m3) is the volume of the particle interceptor trap sample, Atrap (m2) is the particle
interceptor trap surface area and Tdep (d) is the deployment time.
The daily loss rate of suspended chi a and POC biomass in a given depth stratum due
to sinking export was estimated using the following equation:
Daily loss rate (% d- 1) = Sinking flux / ent * 100 (2)
where sinking flux is from equation (1), at 50 m generally and C int is integrated biomass of
chI a and POC in the upper 50 m generally, estimated using chi a and POC concentrations
measured at 3-8 depths in the 0 to 50 m stratum. The export-ratio was ca\culated as the
ratio of the POC sinking flux at a given depth (at 50 m, except for stations 65 , 83 and 106)
to the particulate phytoplankton production integrated over the euphotic zone depth. This
ratio is dimensionless.
A group-average linkage cluster analysis was performed to determine similarities in
the sinking protist cell assemblage (including empty diatom frustules and diatom spores)
between stations, based on a Bray-Curtis similarity matrix computed on the logarithmic
transformed (Log (x + 1)) sinking cell numbers (Field et al. 1982, Legendre & Legendre
103
1998). The difference between groups of sampling stations, at an arbitrarily level of
similarity selected to obtain four groups, was tested using Analysis of Similarities (one-way
ANOSIM; Legendre & Legendre 1998). The Global R value obtained provided an absolute
measure ofhow separated the groups were on a scale of 0 (indistinguishable) to 1 (aH
similarities within groups are greater than similarities between groups) (Clarke & Gorley
2001). The cluster analysis and ANOSIM were performed using the PRIMER software
package (Clarke & Gorley 2001).
Differences between two or more average values of sinking fluxes in groups, of
varying sample sizes, were analysed using a one-way ANOY A (Sokal & Rohlf 1981).
3.3 Results
Figure 2 shows the chI a and POC sinking fluxes measured in the two sampling
regions, i.e. the Cape Bathurst Polynya and the Mackenzie shelf and slope, in the eastem
Beaufort Sea, during faH 2002 and 2003 and summer 2004. The sinking fluxes of chI a and
POC were comparable in both regions during faH 2002 and 2003 (Fig. 2a-d and Table 2).
The sinking fluxes ofboth chI a and POC were higher during summer 2004 (Fig. 2e, fand
Table 2) than during faH 2002 and 2003 (Fig. 2a-d and Table 2). ln addition, the sinking
fluxes ofPOC in summer 2004 were generaHy higher on the Mackenzie shelf and slope
than in the Cape Bathurst Polynya region (Fig. 2e, f and Table 2). The highest chI a and
POC sinking fluxes recorded throughout this study were respectively measured at
104
station 303 in the Cape Bathurst Polynya and at station 906 on the Mackenzie shelf during
summer 2004.
Cluster analysis of the sinking assemblage of autotrophic and heterotrophic protists
(inc1uding empty diatom frustules and resting spores), at each sampling station, showed
significant (one-way ANOSIM, similarity level = 43 %, Global R = 0.76, P < 0.001)
similarity between the stations sampled in the eastem Beaufort Sea (Fig. 3). Based on the
species composition of the sinking assemblage, four groups of stations were obtained. One
group comprised stations visited during June 2004 (Group 1: stations 108, 117,406 and
303), while the stations sampled from July to August 2004 formed another distinctive
group (Group II: stations 708, 906, 803, 309, 106 and 206). The stations sampled in
September and October 2002 and 2003 formed another group (Group III: stations CA 15,
CA18, CA06, 83 , 24, 101,49 and 66), except for station 65 (October 2002) which
constituted a separate group (Group IV).
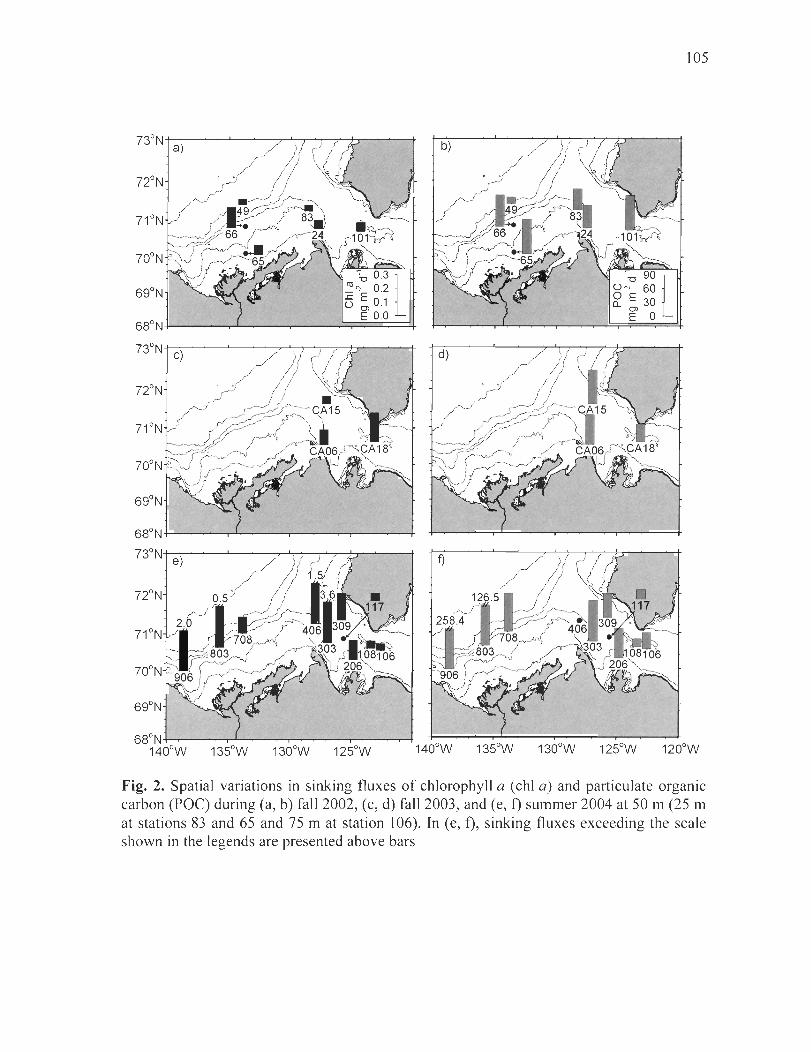
105
6S0N
73°N d)
72°N
71 °N
700N
69°N
6SoN
73°N e) f)
72°N 12 ,",J -
Fig. 2. Spatial variations in sinking fluxes of chlorophyll a (chI a) and particulate organic carbon (POC) during (a, b) fa Il 2002, (c, d) fa1I2003, and (e, f) summer 2004 at 50 m (25 m at stations 83 and 65 and 75 m at station 106). In (e, f), sinking fluxes exceeding the scale shown in the legends are presented above bars
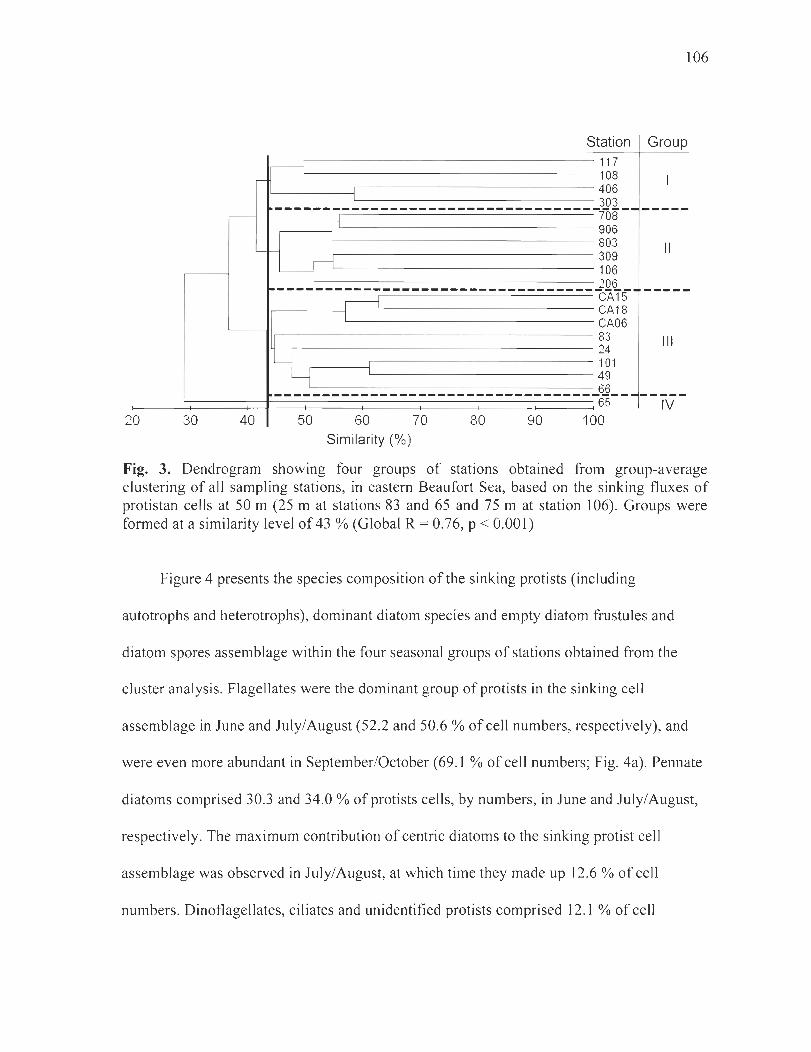
106
,-----------j
Station Group 117
-
,-----
-
2 0 30 40
---------------------------------1
-
y--t
108 406 303
-io8'-906 803 309 106 206 --------------------------------- -cATs
1
4 CA1 8 CA06 83 24 101 49 66 --------------------------------- -65--
50 60 70 80 90 10 o Similarity (%)
Il
III
IV
Fig. 3. Dendrogram showing four groups of stations obtained from group-average clustering of aIl sampling stations, in eastern Beaufort Sea, based on the sinking fluxes of protistan œIls at 50 m (25 m at stations 83 and 65 and 75 m at station 106). Groups were formed at a similarity level of 43 % (Global R = 0.76, p < 0.001)
Figure 4 presents the species composition of the sinking protists (including
autotrophs and heterotrophs), dominant diatom species and empty diatom frustules and
diatom spores assemblage within the four seasonal groups of stations obtained from the
cluster analysis. Flagellates were the dominant group of protists in the sinking œil
assemblage in June and July/ August (52.2 and 50.6 % of œIl numbers, respectively), and
were even more abundant in September/October (69.1 % of cell numbers; Fig. 4a). Pennate
diatoms comprised 30.3 and 34.0 % of protists cells, by numbers, in June and July/ August,
respectively. The maximum contribution of œntric diatoms to the sinking protist cell
assemblage was observed in July/ August, at which time they made up 12.6 % of œil
numbers. DinoflageIlates, ciliates and unidentified protists comprised 12.1 % of œil
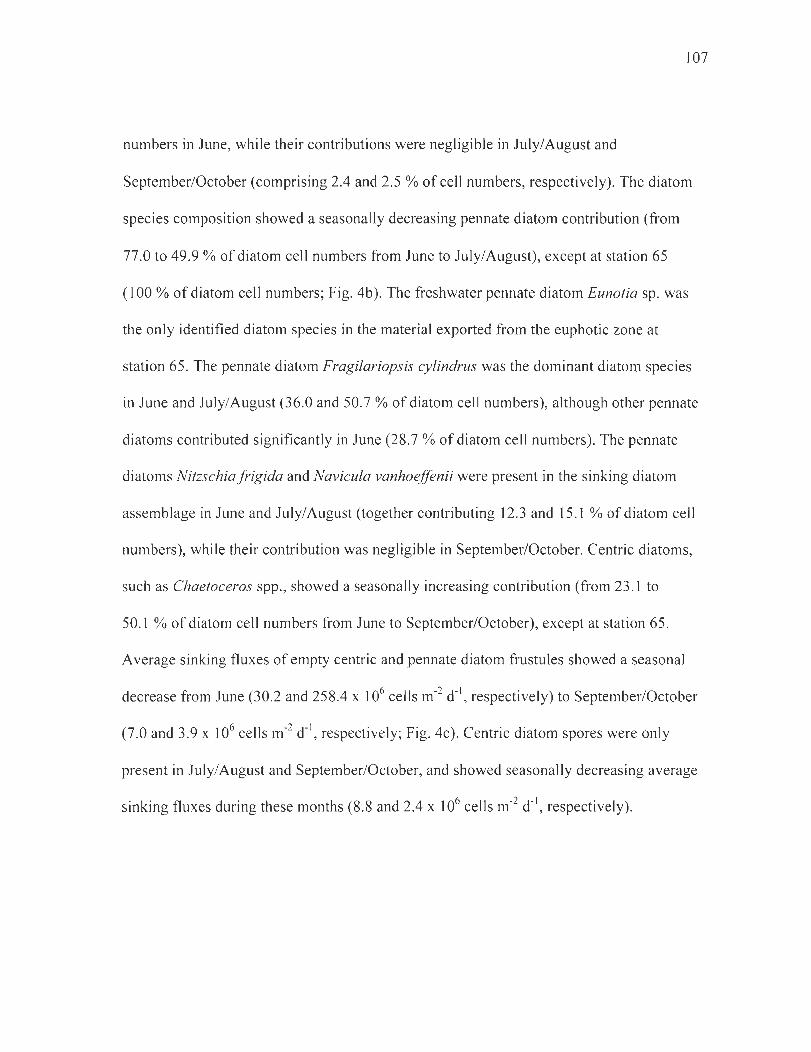
107
numbers in June, while their contributions were negligible in July/August and
September/October (comprising 2.4 and 2.5 % of cell numbers, respectively). The diatom
species composition showed a seasonally decreasing pennate diatom contribution (from
77.0 to 49.9 % of diatom cell numbers from June to July/August), except at station 65
(100 % of diatom cell numbers; Fig. 4b). The freshwater pennate diatom Eunotia sp. was
the only identified diatom species in the material exported from the euphotic zone at
station 65. The pennate diatom Fragilariopsis cylindrus was the dominant diatom species
in June and July/ August (36.0 and 50.7 % of diatom cell numbers), although other pennate
diatoms contributed significantly in June (28.7 % of diatom cell numbers). The pennate
diatoms Nitzschia frigida and Navicula vanhoeffenii were present in the sinking diatom
assemblage in June and July/August (together contributing 12.3 and 15.1 % of diatom cell
numbers), while their contribution was negligible in September/October. Centric diatoms,
such as Chaetoceros spp., showed a seasonally increasing contribution (from 23.1 to
50.1 % of diatom cell numbers from June to September/October), except at station 65.
Average sinking fluxes of empty centric and pennate diatom frustules showed a seasonal
decrease from June (30.2 and 258.4 x 10⁶ cells m-2 d- I, respectively) to September/October
(7 .0 and 3.9 x 10⁶ cells m-2 d-I, respectively; Fig. 4c). Centric diatom spores were only
present in July/ August and September/October, and showed seasonally decreasing average
sinking fluxes during these months (8.8 and 2.4 x 10⁶ cells m-2 d- I, respectively).
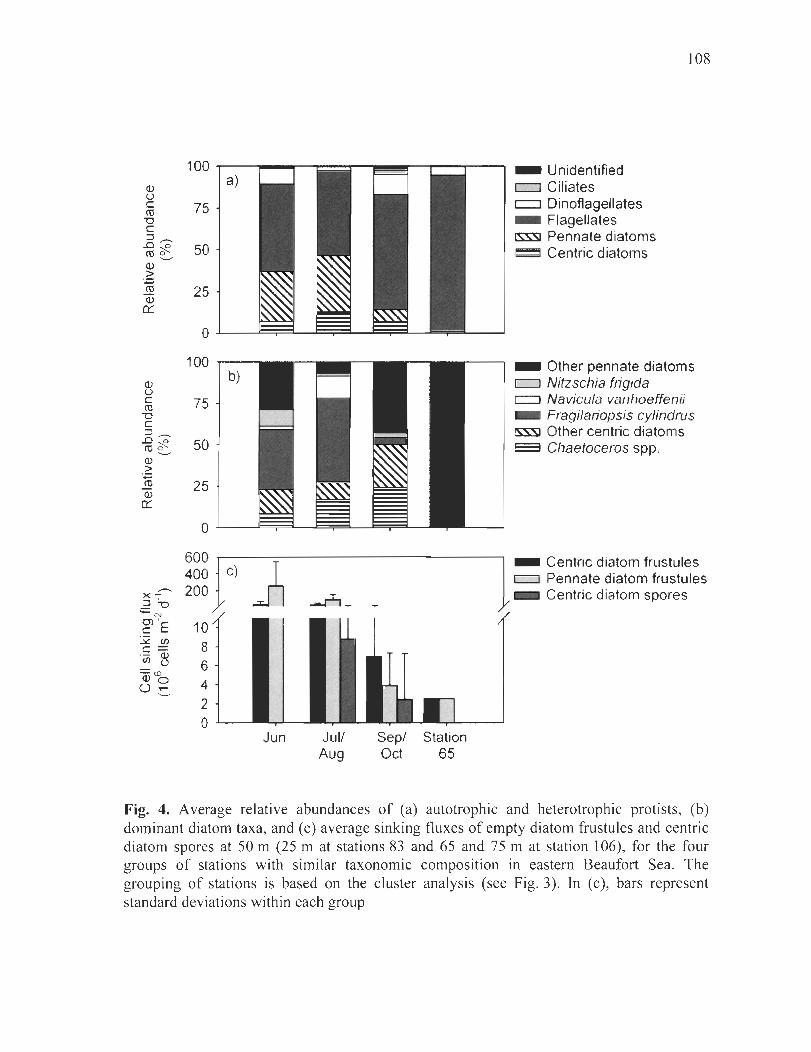
Q.) u c: (\)
"C c: :::l,-..
...à ;:i? (\) 0
'--' Q:l > :.::; cu (])
0::
Q:l u c: cu "0 c: :::l_ .D ;:i? cu~ Q:l > :.;:: l'tl
Q3 0::
-. )(-:::l ' <;:;"0 ... 0) ' c: E ~ CI)
c:= <n ~ = r.D Va ü .....
'-'
100 a.)
75
50
25
0
100 b)
75
50
25
0
600 400 i c) 200
10 8 6 4 2 0
J
Jun Juil Aug
Sep! Oct
Station 65
_ Unidentified c=J Ci/iates c::::J Dinoflagellates - Flagellates ~ Pennate diatoms ~ Centric diatoms
108
- Other pennate diatoms c=J Nitzschia frigida c::::J Navicula vanhoeffenù - Fragifariopsis cylindrus lSSSl Other centric dîatoms f==:J Chaefoceros spp.
1-. c. entric diatom frustules c:::J Penna te diatom frustules _ Cenlric dialom spores
Fig. 4. Average relative abundances of (a) autotrophic and heterotrophic protists, (b) dominant diatom taxa, and (c) average sinking fluxes of empty diatom frustules and centric diatom spores at 50 m (25 m at stations 83 and 65 and 75 m at station 106), for the four groups of stations with similar taxonomic composition in eastem Beaufort Sea. The grouping of stations is based on the cluster analysis (see Fig. 3). In (c), bars represent standard deviations within each group
109
Figure 5 presents monthly-averaged sinking fluxes of organic material, from March
to August, at 25 m at the landfast sea ice station in Franklin Bay (station 200). Monthly-
averaged sinking fluxes of chI a increased significantly from March to June (one-way
ANOVA, P < 0.01) and consistently decreased thereafter (Fig. Sa). Sinking fluxes ofPOC
under the sea ice did not vary significantly from March to May, but increased rapidly in
June (Fig. Sb). During the ice-free period (Ju ly and August), POC sinking fluxes remained
high in July and decreased in August.
x
12
1 0.8 a)
~ 04 <+= -0) ':' cU '- N .::L ' 02 c E en 0) co E :i:: - 0.1 0
0.0
200 lb) ~ 100 ~ -r--
g'o ~ "'E 30 <n 0) o E 20 0 -0... 10
o
/
n=6
n = 1
n=4 n = 1
- n = 1 n=4 -
n=6
n=2 ,.--
Mar Apr May Jun Jul Aug
l
l /
Fig. 5. Seasonal variations in sinking fluxes of (a) ch lorophyll a (chi a) and (b) particulate organic carbon (POC) at 25 m during underice sampling (i .e. March to June) and at 50 m during open water sampling (i.e. July and August) at a landfast sea ice station, in Franklin Bay (station 200). Monthly-averaged va lues are presented wh en applicable, with bars showing minimum and maximum values. n represents number of sampling points during each period
110
Table 2 summarizes the sinking fluxes and daily loss rates of chI a and POC together
with the export-ratios, for each region, and according to the seasonal grouping obtained
from the cluster analysis. For comparative purposes, this Table also reports observations at
the landfast first-year ice station in Franklin Bay during the open water period. Seasonally
decreasing trends in the average chI a sinking fluxes were observed in each region,
although these trends were not statistically significant. Average sinking fluxes ofPOC did
not show any clear seasonal trend in the Cape Bathurst Polynya, while a decreasing trend
was observed on the Mackenzie shelf and sI ope. In Franklin Bay, sinking fluxes of chI a
and POC decreased from July to August. A seasonally decreasing trend was also observed
in the daily loss rate of chI a in the Cape Bathurst Polynya and in the daily loss rate of chI a
and POC on the Mackenzie shelf and slope, although neither of these trends were
statistically significant. The average daily loss rates ofPOC in the Cape Bathurst Polynya
showed a significant (one-way ANOVA, p < 0.001) increase from June to July/August.
Franklin Bay showed a seasonal decrease in the daily loss rates of suspended chI a and
POC from July to August. The average export-ratios increased significantly (one-way
ANOVA, p < 0.01) throughout the open water period (i.e. from June to September/October)
in the Cape Bathurst Polynya, while the export-ratio decreased from July to August in
Franklin Bay. Primary production was unfortunately not measured on the Mackenzie shelf
and slope.
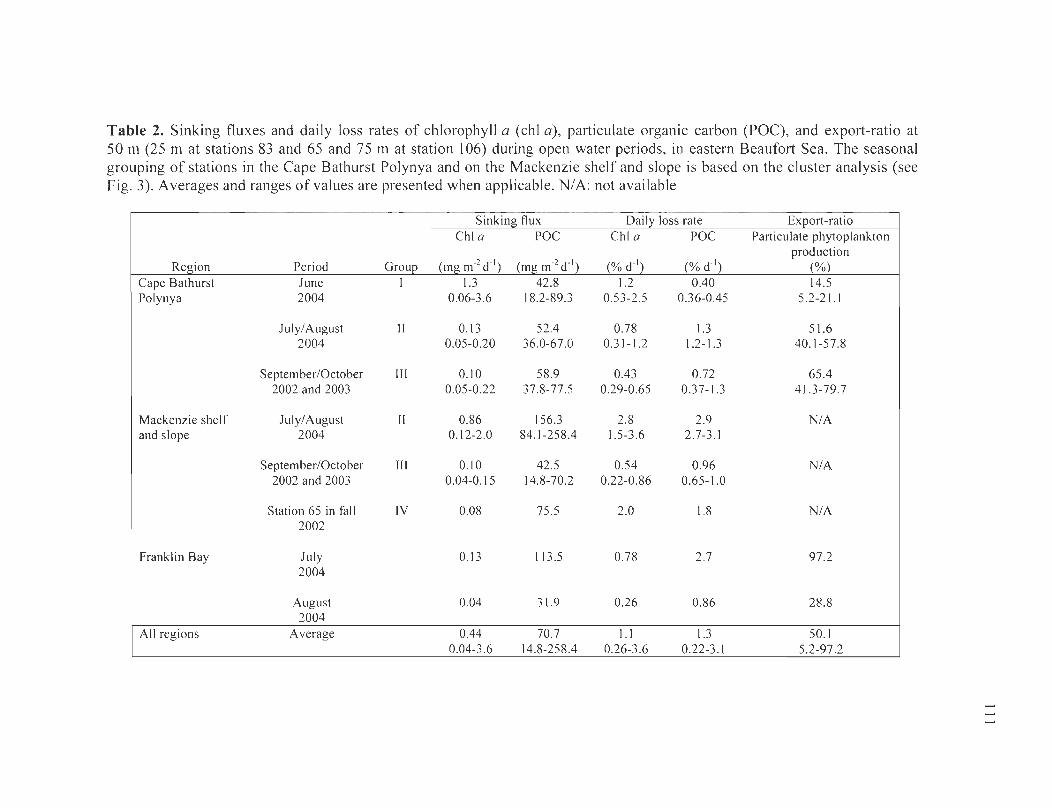
Table 2. Sinking fluxes and dai ly loss rates of ch lorophyll a (ch I a), particu late organic carbon (POC), and export-ratio at 50 m (25 m at stations 83 and 65 and 75 m at station 106) during open water periods, in eastem Beaufort Sea. The seasonal grouping of stations in the Cape Bathurst Polynya and on the Mackenzie shelf and slope is based on the cluster analys is (see Fig. 3). A verages and ranges of va lues are presented wh en app licable. NIA: not avai lable
Sinking flux Dai l;:: loss rate Ex~ort- ratio
Chi a POC Chi a POC Particulate phytop lankton production
Re ion Period Grou % Cape Bathurst June 1 42.8 14.5 Polynya 2004 18.2-89.3 5.2-21. 1
Julyl August II 0.13 52.4 0.78 1.3 51.6 2004 0.05-0.20 36.0-67.0 0.31 - 1.2 1.2- 1.3 40.1-57.8
September/October lI1 0. 10 58.9 0.43 0.72 65.4 2002 and 2003 0.05-0.22 37.8-77.5 0.29-0.65 0.37-1.3 4 1.3-79.7
Mackenzie shelf Ju lyl August II 0.86 156.3 2.8 2.9 NIA and slope 2004 0.12-2 .0 84.1-258.4 1.5-3.6 2.7-3. 1
September/October III 0. 10 42.5 0.54 0.96 NIA 2002 and 2003 0.04-0. 15 14.8-70.2 0.22-0.86 0.65-1.0
Station 65 in fa ll IV 0.08 75.5 2.0 1.8 NIA 2002
Franklin Bay Ju ly 0.13 113.5 0.78 2.7 97 .2 2004
August 0.04 31.9 0.26 0.86 28.8 2004
Ali regions Average 0.44 70.7 l.l 1.3 50.1 0.04-3.6 14.8-258.4 0.26-3.6 0.22-3.1 5.2-97.2
--------- ----
........
112
Table 3 presents a summary of sinking fluxes of FPC and their contribution to total
POC sinking fluxes according to the sa me grouping of stations as that of Table 2.
Cylindrical fecal pellets were the main contributors to total FPC sinking fluxes in the
eastem Beaufort Sea throughout the study (averaging 91.4 % of total FPC at ail stations).
Average sinking fluxes of cylindrical FPC and total FPC showed seasonally decreasing
trends in the Cape Bathurst Polynya and on the Mackenzie shelf and slope, although these
trends were not statistical significant. Similarly, the average contribution ofFPC to total
POC sinking fluxes showed seasonally decreasing trends in the two regions. In Franklin
Bay, the sinking fluxes ofcylindrical FPC and total FPC, as weil as the contribution ofFPC
to total POC sinking fluxes, also decreased from July to August.
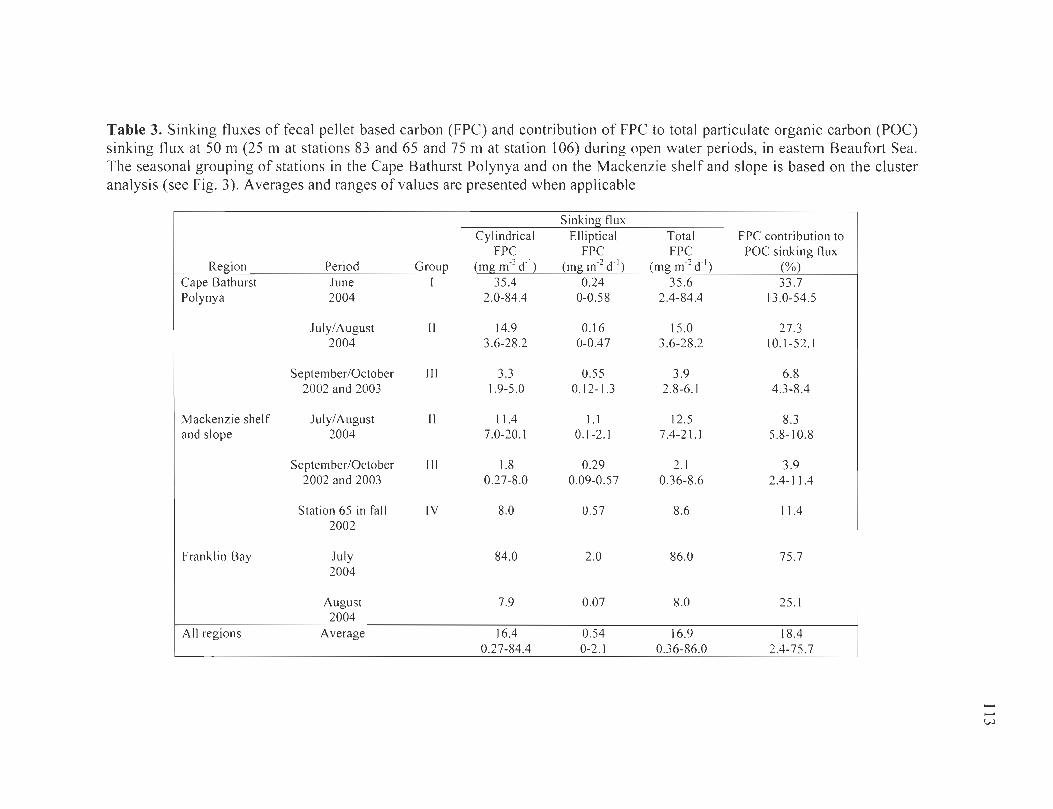
Table 3. Sinking fluxes of fecal pellet based carbon (FPC) and contribution of FPC to total particulate organic carbon (POC) sinking flux at 50 m (25 m at stations 83 and 65 and 75 m at station 106) during open water periods, in eastem Beaufort Sea. The seasonal grouping of stations in the Cape Bathurst Polynya and on the Mackenzie shelf and slope is based on the c1uster analysis (see Fig. 3). Averages and ranges ofvalues are presented when app licable
Sinking flux Cylindrica l Elliptical Total FPC contribution to
FPC FPC FPC POC sinking flux Region Period Group (mg m'2 d' l) (mgm'2 d' l) (mg m'2 d' l) (%)
Cape Bathurst June 1 35.4 0.24 35 .6 33 .7 Polynya 2004 2.0-84.4 0-0.58 2.4-84.4 13.0-54.5
luly/August Il 14.9 0.16 15.0 27 .3 2004 3.6-28.2 0-0.47 3.6-28 .2 10.1-52 .1
September/October III 3.3 0.55 3.9 6.8 2002 and 2003 1.9-5.0 0.12-1.3 2.8-6.1 4.3-8.4
Mackenzie shelf Ju ly/ August Il 11.4 1.1 12.5 8.3 and slope 2004 7.0-20.1 0.1 -2.1 7.4-2 1.1 5.8- 10.8
September/October III 1.8 0.29 2.1 3.9 2002 and 2003 0.27-8.0 0.09-0.57 0.36-8.6 2.4-11 .4
Station 65 in fa ll IV 8.0 0.57 8.6 Il.4 2002
Franklin Bay July 84.0 2.0 86.0 75.7 2004
August 7.9 0.07 8,0 25.1 2004
Ali regions Average 16.4 0.54 16.9 18.4 0.27-84.4 0-2 .1 0.36-86.0 2.4-75 .7
w
114
3.4 Discussion
3.4.1 Sin king export in the eastern Beaufort Sea
This multi-year study provides extensive spatial coverage of the sinking export of
chI a and POC below the euphotic zone in the eastem Beaufort Sea. This sampling program
covered most of the ice-free season in this area, which generally begins with initial sea ice
break-up in late-April and lasts until freeze-up commences in late-October (e.g. Carmack &
Macdonald 2002, Barber & Hanesiak 2004). The two first sampling periods, i.e.
SeptemberiOctober of 2002 and 2003, indicated that rather stable conditions of sinking
export of particulate organic material prevailed in the fall, during this study, as comparable
chI a and POC sinking fluxes were observed in the eastem Beaufort Sea (Fig. 2 and
Table 2). These similarities also tend to support interannual comparisons within the present
dataset. The subsequent sampling period, in summer 2004, showed that the highest sinking
fluxes of chI a and POC occur early during the ice-free period, i.e. June and July/August, in
the eastem Beaufort Sea. It has previously been shown that two key features, i.e. the Cape
Bathurst Polynya and the Mackenzie River, which characterize this part of the Beaufort Sea
(e.g. Carmack & Macdonald 2002), may induce high sinking fluxes ofparticulate organic
material during spring and summer in this area (O'Brien et al. 2006, see Chapter 2). The
same has been reported for other Arctic regions, where high sinking fluxes of particulate
organic material have been Iinked to spring phytoplankton production in polynyas (e.g.
North Water Polynya (NOW); Amiel et al. 2002, Michel et al. 2002, Caron et al. 2004) and
increased river discharge during freshet in spring and summer (Dittmar & Kattner 2003 ,
115
Stein & Macdonald 2004 and references therein, Carrnack & Wassmann 2006). The highest
POC sinking export recorded in the eastem Beaufort Sea (station 906; Fig. 2t), during this
study, was linked to a high sinking export of particulate organic material from the
Mackenzie River plume in summer (2004), as described in details in a companion study
(see Chapter 2).
The POC sinking export values observed throughout our multi-year sampling in
eastem Beaufort Sea (ranging from 18.2 to 258.4 mg C m-2 d- I; Table 2) were persistently
higher than previously reported values from the same shelfslope area « 20 mg C m-2 d- I at
200 m; Forest et al. 2007) and, for the most part, exceeded values previously reported
across the same shelf area « 80 mg C m-2 d- I at 118 to 213 m; O'Brien et al. 2006). Both of
these studies used long-term sediment trap moorings deployed weil below the euphotic
zone, and their lower values, compared to the present study, may have been due to a loss of
sinking POC with depth (i.e. vertical flux attenuation) and/or methodological differences
(i.e. short-terrn versus long-term deployments). However, a study of the benthic carbon
demand in the eastem Beaufort Sea suggested a tight pelagic-benthic coupling and an
annual benthic carbon demand of ca. 12.1 g C m-2 on the shelf (Renaud et al. 2007a); this
estimate exceeds the annual carbon sinking export values from the other two studies on the
shelf (ca. 1.7 to 5.8 g C m-2; O'Brien et al. 2006) and shelf slope (ca. 1 g C m-2
; Forest et al.
2007). From a pan-Arctic perspective, the Beaufort Sea shelf showed a lower POC sinking
export than reported below the euphotic zone on the extensively studied shelf of the central
Barents Sea in spring and summer (range: ca. 250 to 850 mg C m-2 d- I, between 40 and
116
60 m; Wassmann 1989, Wassmann et al. 1990, Olli et al. 2002). Yet, the sinking export
values in the present study are between values reported from a short-term sediment trap
study during summer on the Chukchi Sea shelf (depths averages: 129 and 442 mg C m-2 d-I,
between 30 and 100 m; Lalande et al. 2007), and are generally higher than those reported
from the Kara Sea shelfand slope in fall (range: 0.5 to 185 mg C m-2 d-I, between 9 and
360 m; Wassmann et al. 2004), using sediment traps deployed for periods of 1 to 10 days.
3.4.2 Seasonal and regional sinking export
A general decrease in the sinking export of chI a was observed in the eastem Beaufort
Sea towards fall, i.e. from June to September/October (Table 2), indicating a seasonal
decrease in the export of phytoplankton material from euphotic zone. This seasonal
decrease occurred mainly during spring in the Cape Bathurst Polynya, as average chI a
sinking fluxes decreased by one order of magnitude from June to July/ August. The
seasonally decreasing chI a sinking fluxes also reflected a declining contribution of algal
cells to POC sinking fluxes (from 121.5 to 6.8 % in June and September/October; data not
shown), using a POC:chl a ratio of 40 g:g from healthy algal cells (Lorenzen 1968) and the
average chI a and POC sinking fluxes in this region (Table 2). This agrees with the
termination of a phytoplankton bloom during July in this region, as suggested by Simpson
et al. (ms), based on decreasing integrated surface nitrate concentrations and phytoplankton
biomass. The significantly lower export-ratio in June, compared to the following months
(Table 2), is consistent with the biomass build-up during a phytoplankton bloom.
Unfortunately no sampling was carried out on the Mackenzie shelf and sI ope in June, so
117
that we can not conclude on the seasonal trend of the chI a sinking export at that time.
However, the seasonal decrease in chI a sinking fluxes in this region, from July/ August to
September/October, was Iinked to a lower sinking export induced by decreased input by the
river plume in fall compared summer (see Chapter 2). This seasonal decreasing sinking
export of algal material also represented a halving of the algal contribution to sinking POC
from luly/August (22.0 %; data not shown) to September/October (9.4 %; data not shown),
estimated using the same POC:chl a ratio as above and the regional average chi a and POC
sinking fluxes (Table 2). Thus, the overall seasonal decrease in sinking export of chI a and
POC in the Cape Bathurst polynya and the Mackenzie shelf appears to have been largely
driven by different regional processes, i.e. the termination of the phytoplankton bloom and
the decreasing input From the river.
The seasonal decrease in chI a sinking fluxes was also paralleled by an increasing
retenti on of phytoplankton material within the euphotic zone, as evidenced from the
seasonal decrease in daily loss rates of chi a through sinking (Table 2). Yet, the retention of
phytoplankton material within the euphotic zone was generally high throughout this study,
as the daily loss rates of chi a remained low at ail stations « 4.0 % d- I; Table 2). High
retenti on within the euphotic zone was also observed for POC (daily loss rates < 3.5 d-I;
Table 2). These daily loss rates of POC were generally below those reported in Disko Bay,
Greenland in spring (from ca. 18 to 3 % d-1at 15 and 100 m; Juul-Pedersen et al. 2006),
while they compare with values reported in the marginal ice zone in the Barents Sea during
summer « 4 % d- I at 50 m; Olli et al. 2002). Still , the POC sinking export accounted for a
118
high proportion of the phytoplankton production, in the Cape Bathurst Polynya, in summer
and fall (> 50 %; Table 2). These results indicate that a negligible fraction of the biomass
accumulated in the euphotic zone was sinking to the benthos, but that little additional
biomass accumulation was taking place as more than half of the phytoplankton production
was exported through sinking. A high transfer of organic material to the pelagie food web
reduces the sinking export, due to assimilation and remineralization, thus resulting in low
daily 10ss rates of organic material, as observed in this region. The high fecal pellet sinking
export in summer supports the strong influence of mesozooplankton on the suspended
biomass. Grazing or destruction of fecal pellets by mesozooplankton (i.e. coprophagy and
coprorhexy, respectively) may have further elevated the retention and remineralization of
organic material in the pelagos, as reported trom the Barents Sea (e.g. Olli et al. 2002, Ri ser
et al. 2007).
Concomitant with the seasonal decrease in the sinking export of phytoplankton
material (chI a), in the eastern Beaufort Sea, zooplankton mediated sinking export, i.e. total
FPC sinking flux , also decreased (Table 3). A seasonal decrease in the fecal pellet
contribution to total POC sinking fluxes was also observed towards fall (i.e. from
Jul y/ August to September/October), suggesting a lower grazing activity later in the season.
The generally higher FPC contribution to total POC sinking fluxes in the Cape Bathurst
Polynya, compared to the Mackenzie shelf and slope (Table 3), suggests a higher
zooplankton grazing activity in this region. However, the landfast sea ice station in Franklin
Bay showed the highest fecal pellet contribution to total POC sinking fluxes observed
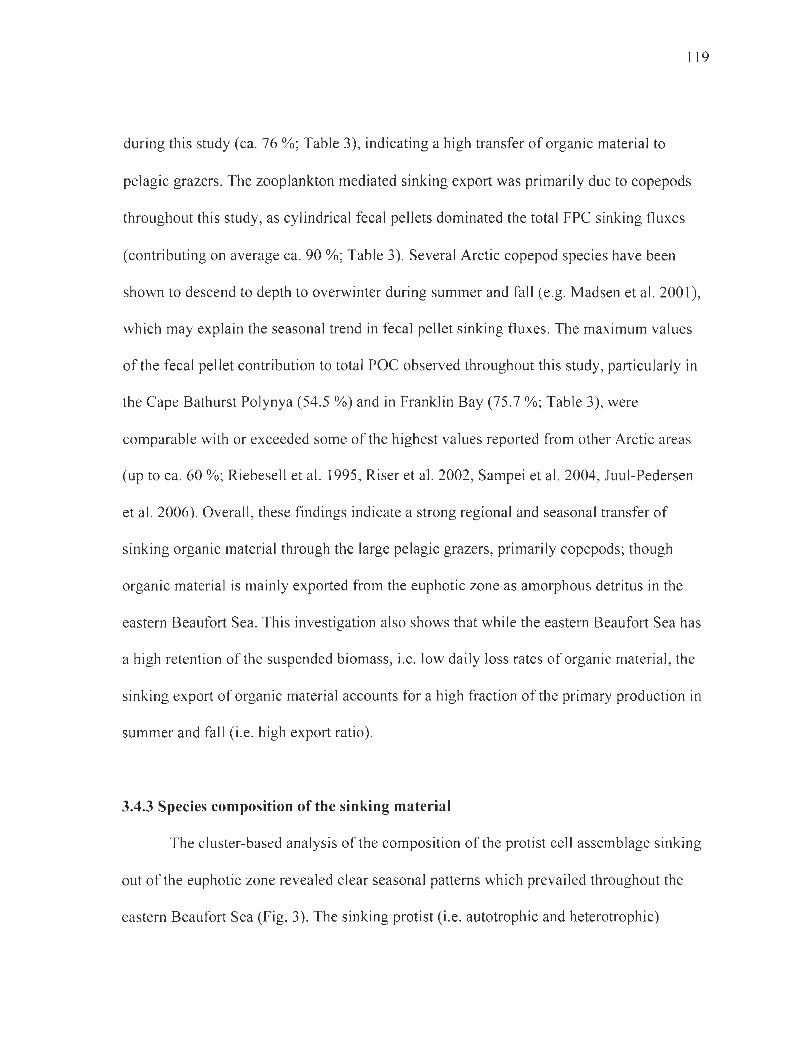
119
during this study (ca. 76 %; Table 3), indicating a high transfer of organic material to
pelagie grazers. The zooplankton mediated sinking export was primarily due to copepods
throughout this study, as cylindrical fecal pellets dominated the total FPC sinking fluxes
(contributing on average ca. 90 %; Table 3). Several Arctic copepod species have been
shown to descend to depth to overwinter during summer and fall (e.g. Madsen et al. 2001),
which may explain the seasonal trend in fecal pellet sinking fluxes . The maximum values
of the fecal pellet contribution to total POC observed throughout this study, particularly in
the Cape Bathurst Polynya (54.5 %) and in Franklin Bay (75.7 %; Table 3), were
comparable with or exceeded sorne of the highest values reported from other Arctic areas
(up to ca. 60 %; Riebesell et al. 1995, Riser et al. 2002, Sampei et al. 2004, Juul-Pedersen
et al. 2006). OveraIl, these findings indicate a strong regional and seasonal transfer of
sinking organic material through the large pelagie grazers, primarily copepods; though
organic material is mainly exported from the euphotic zone as amorphous detritus in the
eastern Beaufort Sea. This investigation also shows that while the eastern Beaufort Sea has
a high retention of the suspended biomass, i.e. low daily loss rates of organic material, the
sinking export of organic material accounts for a high fraction of the primary production in
summer and fall (i.e. high export ratio).
3.4.3 Species composition of the sin king material
The c1uster-based analysis of the composition of the protist cell assemblage sinking
out of the euphotic zone revealed clear seasonal patterns which prevailed throughout the
eastem Beaufort Sea (Fig. 3). The sinking protist (i.e. autotrophic and heterotrophic)
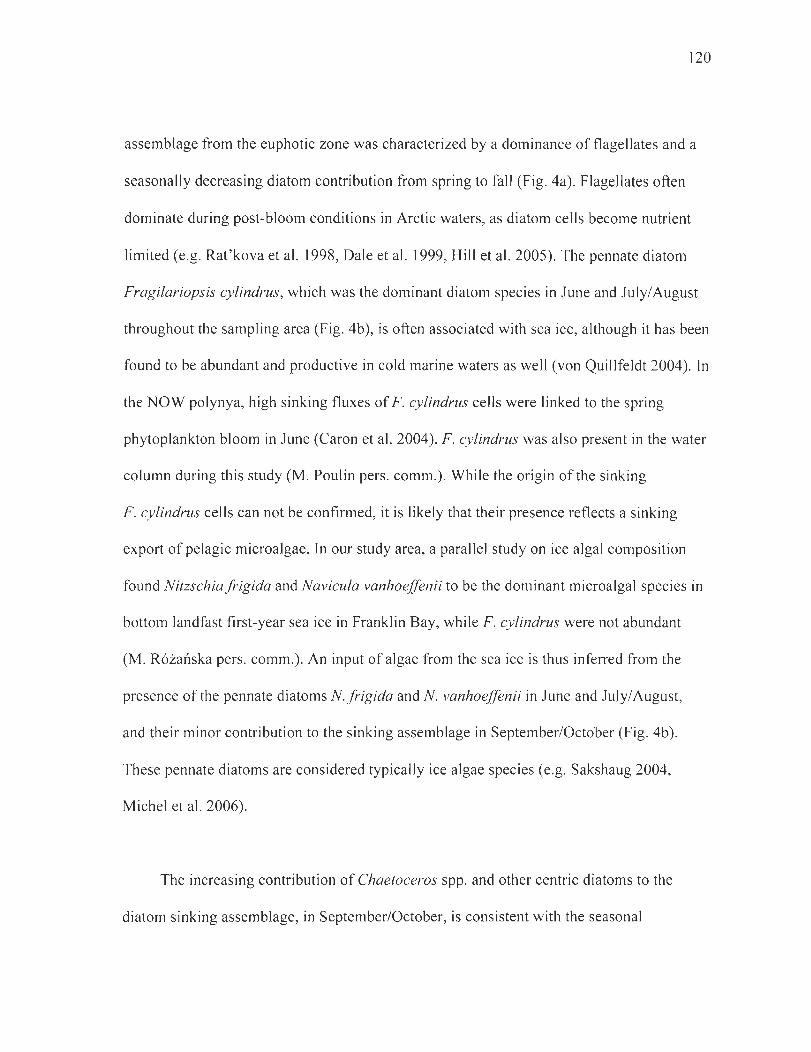
120
assemblage from the euphotic zone was characterized by a dominance of flagellates and a
seasonally decreasing diatom contribution from spring to fall (Fig. 4a). Flagellates often
dominate during post-bloom conditions in Arctic waters, as diatom cells become nutrient
limited (e.g. Rat'kova et al. 1998, Dale et al. 1999, Hill et al. 2005). The pennate diatom
Fragilariopsis cylindrus, which was the dominant diatom species in June and July/August
throughout the sampling area (Fig. 4b), is often associated with sea ice, aIthough it has been
found to be abundant and productive in cold marine waters as weil (von Quillfeldt 2004). In
the NOW polynya, high sinking fluxes of F. cylindrus cells were linked to the spring
phytoplankton bloom in June (Caron et al. 2004). F. cylindrus was also present in the water
column during this study (M. Poulin pers. comm.). While the origin of the sinking
F. cylindrus cells can not be confirmed, it is likely that their presence reflects a sinking
export of pelagic microalgae. In our study area, a parallel study on ice algal composition
found Nitzschiafrigida and Navicula vanhoeffenii to be the dominant microalgal species in
bottom landfast first-year sea ice in Franklin Bay, while F. cylindrus were not abundant
(M. Rozanska pers. comm.). An input of algae from the sea ice is thus inferred from the
presence of the pennate diatoms N.frigida and N. vanhoeffenü in June and July/August,
and their minor contribution to the sinking assemblage in September/October (Fig. 4b).
These pennate diatoms are considered typically ice algae species (e.g. Sakshaug 2004,
Michel et al. 2006).
The increasing contribution of Chaetoceros spp. and other centric diatoms to the
diatom sinking assemblage, in September/October, is consistent with the seasonal
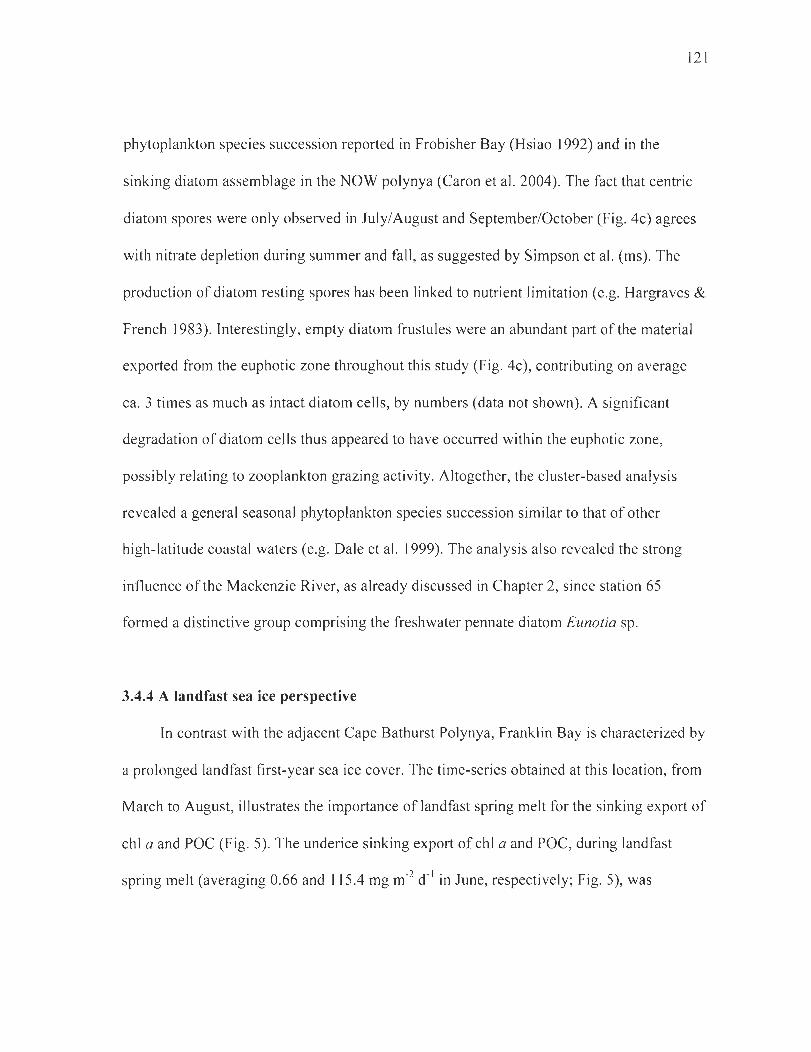
121
phytoplankton species succession reported in Frobisher Bay (Hsiao 1992) and in the
sinking diatom assemblage in the NOW polynya (Caron et al. 2004). The fact that centric
diatom spores were only observed in July/August and September/October (Fig. 4c) agrees
with nitrate depletion during summer and fall, as suggested by Simpson et al. (ms). The
production of diatom resting spores has been linked to nutrient limitation (e.g. Hargraves &
French 1983). Interestingly, empty diatom frustules were an abundant part of the material
exported from the euphotic zone throughout this study (Fig. 4c), contributing on average
ca. 3 times as much as intact diatom cells, by numbers (data not shown). A significant
degradation of diatom cells thus appeared to have occurred within the euphotic zone,
possibly relating to zooplankton grazing activity. Altogether, the cluster-based analysis
revealed a general seasonal phytoplankton species succession similar to that of other
high-Iatitude coastal waters (e.g. Dale et al. 1999). The analysis also revealed the strong
influence of the Mackenzie River, as already discussed in Chapter 2, since station 65
formed a distinctive group comprising the freshwater pennate diatom Eunotia sp.
3.4.4 A landfast sea ice perspective
In contrast with the adjacent Cape Bathurst Polynya, Franklin Bay is characterized by
a prolonged landfast first-year sea ice cover. The time-series obtained at this location, from
March to August, illustrates the importance of landfast spring melt for the sinking export of
chI a and POC (Fig. 5). The underice sinking export of chI a and POC, during landfast
spring melt (averaging 0.66 and 115.4 mg m-2 d-I in June, respectively; Fig. 5), was
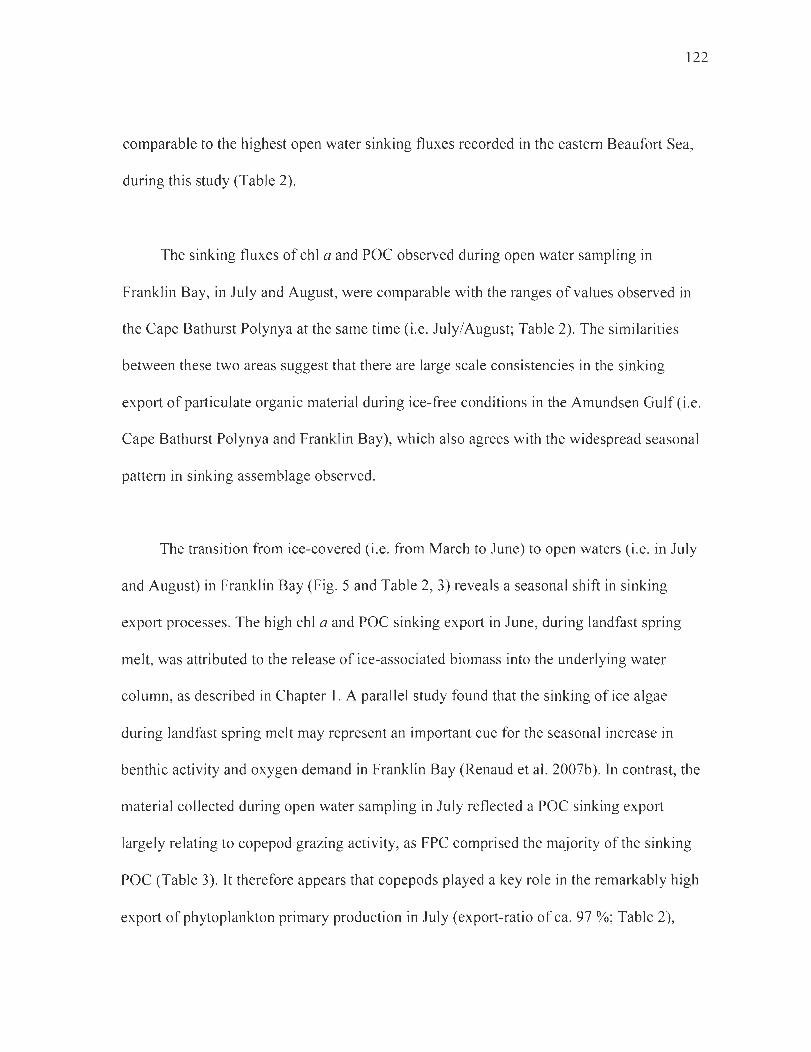
122
comparable to the highest open water sinking fluxes recorded in the eastem Beaufort Sea,
during this study (Table 2).
The sinking fluxes of chI a and POC observed during open water sampling in
Franklin Bay, in July and August, were comparable with the ranges ofvalues observed in
the Cape Bathurst Polynya at the same time (i.e. July/August; Table 2). The similarities
between these two areas suggest that there are large scale consistencies in the sinking
export of particulate organic material during ice-free conditions in the Amundsen Gulf (i.e.
Cape Bathurst Polynya and Franklin Bay), which also agrees with the widespread seasonal
pattern in sinking assemblage observed.
The transition from ice-covered (i.e. from March to June) to open waters (i.e. in July
and August) in Franklin Bay (Fig. 5 and Table 2, 3) reveals a seasonal shift in sinking
export processes. The high chi a and POC sinking export in June, during landfast spring
melt, was attributed to the release of ice-associated biomass into the underlying water
column, as described in Chapter 1. A parallel study found that the sinking of ice algae
during landfast spring melt may represent an important cue for the seasonal increase in
benthic activity and oxygen demand in Franklin Bay (Renaud et al. 2007b). In contrast, the
material collected during open water sampling in July reflected a POC sinking export
largely relating to copepod grazing activity, as FPC comprised the majority of the sinking
POC (Table 3). It therefore appears that copepods played a key role in the remarkably high
export ofphytoplankton primary production in July (export-ratio of ca. 97 %; Table 2),
123
diverting most of the primary-produced organic material through the pelagic heterotrophic
food web. Copepod grazing activity and sinking export ofphytoplankton primary
production, as reflected by FPC sinking fluxes and the export-ratio (Tables 2 and 3),
decreased substantially from July to August. Overall, the high sinking ex port of released ice
material during landfast spring melt therefore appeared to have been followed soon after by
a peak in copepod grazing activity.
3.5 Conclusion
The extensive spatial and seasonal study of the sinking export of particulate organic
material from the euphotic zone, showed comparable chi a and POC sinking fluxes
throughout the eastem Beaufort Sea in fall. In summer, higher sinking fluxes of POC were
observed on the Mackenzie shelf and slope than in the Cape Bathurst Polynya. Overall , a
seasonal decrease was observed in the sinking eXPort of chI a and POC, from spring to fall.
Daily loss rates of chi a and POC were low throughout this study « 4 % d-'), while the
Cape Bathurst Polynya showed a high export-ratio ofparticulate phytoplankton production
during summer (ca. 50 %). Zooplankton played an important, but seasonally decreasing,
role in the sinking export ofparticulate organic material , particularly in the Cape Bathurst
Polynya. The cluster-based analysis of the sinking protist cell assemblage revealed seasonal
groups that prevailed over spatial and interannual differences amongst sampling stations. A
seasonal succession of microalgal species in the sinking assemblage was observed
throughout the sampling area. A considerable diatom contribution, dominated by the
124
pennate diatom F. cylindrus, in summer was followed by a dominance offlagellated cells
towards fall. Still, input from sea ice at the stations visited in summer, was related to the ice
diatoms N.frigida and N. vanhoeffenii which were present in the collected material in June
and July. The high chi a and POC sinking fluxes measured during landfast spring melt
illustrate the importance of inc1uding the spring melt period when studying seasonal
sinking export in Arctic regions.
125
CONCLUSION GÉNÉRALE
This study shows patterns of sinking export in the upper water column in different
environments of the Canadian Beaufort Sea. The seasonal patterns in sinking export
described under landfast sea ice are likely applicable to other Arctic regions experiencing
landfast sea ice and relevant to areas of first-year sea ice in general. The strong seasonal
patterns in the sinking export of particulate material in the Canadian Beaufort Sea and the
insights into the influence of the Mackenzie River plume are believed to be relevant to
other Arctic shelves.
In chapter l, our results showed that the sinking export of organic material was low
under landfast first-year sea ice during winter. This research provides new information on
shallow sinking ex port of particulate material during winter, a long period extending from
freeze-up typically around October/November (e.g. Carmack et al. 2006) to March on
Arctic shelves, and which remains unstudied using shallow short-term particJe interceptor
traps. These results also showed a strong coupling between the sinking export of algal
material underneath landfast sea ice and ice algal biomass was observed during the ice algal
productive period in spring, thus substantiating the hypothesis of ice-water coupling taking
place prior to spring ice melt, as proposed in other studies (Carey 1987, Melnikov 1998).
126
These results challenge the view that there is very little export of ice material prior to ice
melt. The evidence of an early coupling between ice algal biomass and sinking export of
algal material therefore urges future studies of shallow sinking export to inc1ude the ice
algal growth period.
This research also showed an abrupt increase in sinking export of organic material
during spring ice melt, as reported during previous studies of under-ice sinking export
(Tremblay et al. 1989, Michel et al. 1996,2002, Fortier et al. 2002). The onset of spring
melt also reflected a release of material with a different biochemical composition, than
prior to ice melt. This annual ev en t, i.e. ice melt, is thought to represent an important
trigger for increased benthic activity during early spring in the Canadian Beaufort Sea (e.g.
Renaud et al. 2007b). Furthermore, the abrupt release and sinking export of organic
material , during spring ice melt, exceeded the sinking export of organic material during
subsequent ice-free condition, as described in Chapter 3. This study therefore connects
shallow sinking export of organic material across the transition from first-year sea ice coyer
to ice-free conditions, a transition which may be temporally and spatially displaced on
Arctic shelves by future climate re1ated changes (e.g. ACrA 2005).
While sinking ex port of algal material , i.e. chlorophyll a (chI a), biogenic silica
(BioSi) and algal cells, showed a seasonal increase during the developing ice algal bloom,
sinking export of particulate organic carbon (POC) remained rather stable prior to the onset
of spring ice melt. A significant non-algal component sustained the stable POC sinking
127
export. This research also showed that almost half(46 %) of the sinking chI a was lost in
the first 25 meters, due in part to the degradation of chI a to phaeopigments predominantly
by herbivorous copepods. These results evidence a significant transformation of the sinking
pigmented material in the upper most part of the water column under landfast sea ice.
Chapter 2 showed the strong influence of the Mackenzie River plume on the sinking
export of particulate material on the shelf and slope. Two sampling transects provided a
synoptic view of separate sections of the river plume during summer and fall. Seasonal and
spatial differences in the sinking export of chI a and POC were linked to the chi a biomass
carried by the river plume, such that the highest sinking export occurred in summer and at
stations most influenced by the river plume. In addition to the effect of the river plume, our
results showed that phytoplankton and zooplankton located undemeath the plume
contributed to the sinking export of organic material at depth.
This research also showed a strong seasonal ity in the composition of the sinking
material in the area of the river plume. Aigai based material and fecal pellets contributed
much in summer, while amorphous detritus dominated in fall. The sinking phytoplankton
assemblage followed a seasonal species succession, from a dominance of diatoms in
summer to mainly flagellates and dinoflagellates in fall, similar to the succession observed
in most high-Iatitude waters.
128
The regional freshwater influence on sorne Arctic shelves in spring and summer, due
to terrestrial riverine runoff, may increase due to climate related changes (e.g. ACIA 2005 ,
IPCC 2007). While the riverine processes affecting sinking export of particulate material is
weil understood, regional information on the riverine influence on Arctic shelves is
incomplete Ce.g. Dittmar & Kattner 2003). This research provides not only regional
information on the influence of Mackenzie River plume on the sinking export of particulate
material , but also shows sinking export from the river plume and the water column below.
These components are inevitably integrated in deeper studies of sinking export. As
described in Chapter 2, seasonal differences appear not only in the influence of the
Mackenzie River plume on sinking export of particulate material , but also in the
contribution from the pelagie food web below the river plume, which may apply to other
Arctic shelves influenced by river plumes.
The extensive dataset presented in chapter 3 showed comparable sinking fluxes of
chI a and POC below the euphotic zone throughout the Canadian Beaufort Sea in fall . The
seasonally high riverine influence on the sinking export of organic material in summer, as
shown in chapter 2, induced higher POC sinking fluxes on the Mackenzie shelf and slope
than in the Cape Bathurst Polynya at that time. An overall seasonal decrease in sinking
fluxes of chi a and POC below the euphotic zone, from spring to fall, persisted throughout
the Canadian Beaufort Sea.
129
Regardless of spatial and interannual variability between sampling stations, a strong
seasonal signature in the species composition of the sinking protist assemblage emerged for
the study area. These results showed that the phytoplankton species succession generally
observed in the high-Iatitude waters, from a high diatom contribution in summer towards
mainly flagellates in fall, prevailed in the sinking material throughout the Canadian
Beaufort Sea.
The large scale perspective of sinking export of particulate organic material presented
in Chapter 3 connects the different environments in Canadian Beaufort Sea, i.e. the
Mackenzie River plume and the Cape Bathurst Polynya. This chapter shows that while
these environments may have a strong regional and seasonal impact, large scale
consistencies may prevail in both the sinking export of particulate organic material and the
composition of the exported material. Prevailing consistencies may aid in the linkage
between regional sinking export studies in the Arctic, if similar consistencies can be found
on other Arctic shelves.
For future studies, a general aim should be to achieve a better understanding of the
sinking export and transformation of the sinking material within the mesopelagic zone, as
stressed in a recent review by Boyd & Trull (2007). In continuation with the present
findings of a coupling between ice algal biomass and sinking export of algal material prior
to ice melt, an investigation of the processes driving the ice-water export of algal material ,
e.g. brine drainage, would be valuable. Also, future studies oriented towards determining an
130
early sinking export of organic material from first-year sea ice are needed to corroborate
and assess this in other Arctic regions. The observed increase in the proportion of seasonal
first-year sea ice in the Arctic Ocean, due to climate related changes, compels to more
widespread studies of the sinking export prior to and during ice melt, as weil as during the
sea ice break-up. In addition, further regional studies of the riverine influence on sinking
export ofparticulate material on Arctic shelves are needed (e.g. Dittmar & Kattner 2003),
and may become more important with the predicted increases in terrestrial riverine runoff
due to climate related changes (e.g. ACIA 2005).
131
RÉFÉRENCES
ACIA (2005) Arctic climate impact assessment. Cambridge University Press, Cambridge
Aksnes DL, Egge JK (1991) A theoretical model for nutrient uptake in phytoplankton . Mar Ecol Prog Ser 70:65-72
Amiel D, Cochran JK, Hirschberg DJ (2002) 234Thp38U disequilibrium as an indicator for the seasonal export flux ofparticulate organic carbon in the North Water. Deep-Sea Res 1149:5191- 5209
Andreassen IJ, Wassmann P (1998) Vertical flux ofphytoplankton and particulate biogenic matter in the marginal ice zone of the Barents Sea in May 1993. Mar Ecol Prog Ser 170:1-14
Andreassen IJ , Nothig E-M, Wassmann P (1996) Vertical particle flux on the shelfoff northem Spitsbergen, Norway. Mar Ecol Prog Ser 137:215-228
Anema C, Hecky RE, Fee EJ, Nemberg D, Guildford SJ (1990) Water chemistry of sorne lakes and channels in the Mackenzie Delta and on the Tuktoyaktuk Peninsula, N.W.T., 1985. Can Data Rep Fish Aquat Sci 726
Arrigo KR, Dijken GL V (2004) Annual cycles of sea ice and phytoplankton in Cape Bathurst polynya, southeastem Beaufort Sea, Canadian Arctic. Geophys Res Lett 31, L08304, doi: 10.1 029/2003GLO 18978
Astthorsson OS, Gislason A (2003) Seasonal variations in abundance, development and vertical distribution of Calanus finmarchicus, C. hyperboreus and C. glacialis in the East lcelandic Current. J Plankton Res 25:843-854
Azetsu-Scott K, Passow U (2004) Ascending marine particles: Significance of transparent exopolymer particles (TEP) in the upper ocean. Limnol Oceanogr 49:741-748
BaIe Al (1998) Sediment trap perfonnance in tidal waters: comparison of cylindrical and conical collectors. Cont ShelfRes 18:1401-1418
Barber DG, Hanesiak JM (2004) Meteorological forcing of sea ice concentration in the southem Beaufort Sea over the period 1979 to 2000. J Geophys Res 109, C0614, doi: 10.1 029/2003JC0022027
132
Bélanger S, Xie H, Krotkov N, Larouche P, Vincent WF, Babin M (2006) Photomineralization ofterrigenous dissolved organic matter in Arctic coastal waters from 1979 to 2003: 1nterannual variabi lity and implications of climate change. Global Biogeochem Cycles, 20, GB4005, doi: 10.1 029/2006GB002708
Belchansky G1, Douglas OC, Eremeev VA, Platonov NG (2005) Variations in the Arctic ' s multiyear sea ice coyer: a neural network analysis of SMMR-SSM/1 data, 1979-2004. Geophys Res Lett 32, L09605 , doi: 1 0.1 029/2005GL022395
Bhaskar PV, Grossart H-P, Bhosle NB, Simon M (2005) Production ofmacroaggregates from dissolved exopolymeric substances (EPS) ofbacterial and diatom origin. FEMS Microbiol Ecol 53:255-264
Bidle KD, Azam F (1999) Accelerated dissolution of diatom silica by marine bacterial assemblages. Nature 397:508-512
Booth BC, Smith WO Jr (1997) Autotrophic flagellates and diatoms in the Northeast Water Polynya, Greenland: summer 1993. J Mar Syst 10:241-261
Boyd PW, Trull TW (2007) Understanding the export ofbiogenic particles in oceanic waters: 1s there consensus? Prog Oceanogr 72:276-312
Buesseler KO, Lamborg CH, Boyd PW, Lam PJ, Trull TW, Bidigare RR, Bishop JK, Casciotti KL, Dehairs F, Elskens M, Honda M, Karl DM, Siegel DA, Silver MW, Steinberg DK, Val des J, Mooy BV, Wilson S (2007) Revisiting carbon flux through the ocean's twilight zone. Science 316:567-570
Bursa A (1963) Phytoplankton in coastal waters of the Arctic Ocean at Point Barrow, Alaska. Arctic 16:239-262
Carey AG (1987) Particle flux beneath fast ice in the shallow southwestern Beaufort Sea, Arctic Ocean. Mar Ecol Prog Ser 40:247-257
Carmack EC, Chapman DC (2003) Wind-driven shelf/basin exchange on an Arctic shelf: the joint roles of ice coyer extent and shelf-break bathymetry. Geophys Res Lett 30, 1778, doi: 10.1 029/2003GLO 1752
Carmack EC, Macdonald RW (2002) Oceanography of the Canadian Shelf of the Beaufort Sea: A setting for marine life. Arctic 55:29-45
133
Carmack E, Wassmann P (2006) Food webs and physical- biological coupling on pan-Arctic shelves: Unifying concepts and comprehensive perspectives. Prog Oceanogr 71 :446-477
Carmack EC, Macdonald RW, Jasper S (2004) Phytoplankton productivity on the Canadian Shelf of the Beaufort Sea. Mar Ecol Prog Ser 277:37-50
Carmack E, Barber D, Christensen J, Macdonald R, Rudels B, Sakshaug E (2006) Climate variability and physical forcing of the food webs and the carbon budget on panarctic shelves. Prog Oceanogr 71: 145-181
Caron G, Michel C, Gosselin M (2004) Seasonal contributions ofphytoplankton and fecal pellets to the organic carbon sinking flux in the North Water (northem Baffin Bay). Mar Ecol Prog Ser 283: 1-13
Carson MA, Conly FM, Jasper JN (1999) Riverine sediment balance of the Mackenzie Delta, Northwest Territories, Canada. Hydrol Process l3 :2499-2518
Clarke KR, Gor1ey RN (2001) PRIMER v5 User manual/tutorial. PRIMER-E, Plymouth
Comiso JC (2002) A rapidly dec1ining perennial sea ice coyer in the Arctic. Geophys Res Lett 29,1956, doi:10.1029/2002GL015650
Conley DJ (1998) An interlaboratory comparison for the measurement ofbiogenic silica in sediments. Mar Chem 63 :39-48
Conover RJ (1966) Assimilation of organic matter by zooplankton. Limnol Oceanogr 11:338-345
Conover RJ, Siferd TD (1993) Dark-season survival strategies of coastal zone zooplankton in the Canadian Arctic. Arctic 46 :303-311
Dagg M, Benner R, Lohrenz S, Lawrence 0 (2004) Transformation of dissolved and particulate materials on continental shelves influenced by large rivers: plume processes. Co nt ShelfRes 24:833-858
Dale T, Rey F, Heimdal BR (1999) Seasonal development ofphytoplankton at a high latitude oceanic site. Sarsia 84:419-435
Daly KL, Wallace DWR, Smith WO, Skoog A, Lara R, Gosselin M, Falck E, Yager PL (1999) Non-Redfield carbon and nitrogen cycling in the Arctic: effects of ecosystem structure and dynamics. J Geophys Res 104:3185-3199
Dawson JK (1978) Vertical distribution of Ca/anus hyperboreus in the central Arctic Ocean. Limnol Oceanogr 23:950-957
134
Dickson R, Rudels B, Dye S, Karcher M, Meincke J, Yashayaev 1 (2007) Current estimates of freshwater flux through Arctic and subarctic seas. Prog Oceanogr 73 :21 0-230
Dittmar T, Kattner G (2003) The biogeochemistry of the river and shelf ecosystem of the Arctic Ocean: a review. Mar Chem 83:103-120
Engel A (2003) Distribution of transparent exopolymer particles (TEP) in the northeast Atlantic Ocean and their potential significance for aggregation processes. Deep-Sea Res 1 51:83-92
Engel A, Passow U (2001) Carbon and nitrogen content of transparent exopolymer particles (TEP) in relation to their AIcian Blue adsorption. Mar Ecol Prog Ser 219:1-10
Field JG , Clarke KR, Warwick RM (1982) A practical strategy for analysing multispecies distribution patterns. Mar Ecol Prog Ser 8:37-52
Fong DA, Geyer WR (2002) The alongshore transport of freshwater in a surface-trapped river plume. J Phys Oceanogr 32:957-972
Forest A, Sampei M, Hattori H, Makabe R, Sasaki H, Fukuchi M, Wassmann P, Fortier L (2007) Particulate organic carbon fluxes on the slope of the Mackenzie Shelf (Beaufort Sea): Physical and biological forcing of shelf-basin exchanges. J Mar Sys 68:39-54
Fortier M, Fortier L, Michel C, Legendre L (2002) Climatic and biological forcing of the vertical flux ofbiogenic particles under seasonal Arctic sea ice. Mar Ecol Prog Ser 225:1-16
Frost B W (1972) Effects of size and concentrations of food particles on the feeding behavior of the marine planktonic copepod Ca/anus pacificus. Limnol Oceanogr 17:805-815
Gardner WD (1980) Field assessment of sediment traps. J Mar Res 38:41-52
Gardner WD (2000) Sediment trap sampling in surface waters: issues and recommendations. ln: Hanson RB, Ducklow HW, Field JG (eds) The changing ocean carbon cycle: a midterm synthesis of the Joint Global Ocean Flux Study. Cambridge University Press, Cambridge, p 240-281
135
Garneau M-È, Vincent WF, Alonso-Saez L, Gratton Y, Lovejoy C (2006) Prokaryotic community structure and heterotrophic production in a river-influenced coastal arctic ecosystem. Aquat Microb Ecol 42:27-40
Garrison DL, Close AR, Reimnitz E (1989) Algae concentrated by frazil ice: evidence from laboratory experiments and field measurements. Antarct Sci 1 :313-316
Gonzalez HE, Gonzalez SR, Brummer G-JA (1994) Short-term sedimentation pattern of zooplankton, faeces and microplankton at a permanent station in the Bj0rnafjorden (Norway) during April-May 1992. Mar Ecol Prog Ser 105:31-45
Gordeev VV, Rachold V (2004) River input. In : Stein R, Macdonald RW (eds) The organic carbon cycle in the Arctic Ocean. Springer, Berlin, p 33-41
Gosselin M, Legendre L, Therriault JC, Demers S, Rochet M (1986) Physical control of the horizontal patchiness of sea-ice microalgae. Mar Ecol Prog Ser 29:289-298
Gosselin M, Legendre L, Therriault J-C, Demers S (1990) Light and nutrient limitation of sea-ice microalgae (Hudson Bay, Canadian Arctic). J Phycol 26:220-232
Gosselin M, Levasseur M, Wheeler PA, Homer RA, Booth BC (1997) New measurements of phytoplankton and ice algae production in the Arctic Ocean. Deep-Sea Res II 44: 1623-1644
Gradinger R (1999) Vertical fine structure of the biomass and composition of algal communities in Arctic pack ice. Mar Biol 133:745-754
Gradinger R, lkavalko J (1998) Organism incorporation into newly forming Arctic sea in the Greenland Sea. J Plankton Res 20:871-886
Grebmeier JM , Cooper LW, Feder HM , Sirenko BI (2006) Ecosystem dynamics of the Pacific-influenced Northern Bering and Chukchi Seas in the Amerasian Arctic. Prog Oceanogr 71 :331-361
Grossart H-P, Simon M (2007) Interactions ofplanktonic algae and bacteria: effects on algal growth and organic matter dynamics. Aquat Microb Ecol 47: 163-176
Grossart H-P, Ki0rboe T, Tang KW, AlIgaier M, Yam EM, Ploug H (2006) Interactions between marine snow and heterotrophic bacteria: aggregate formation and microbial dynamics. Aquat Microb Ecol 42: 19-26
Hamm CE (2002) Interactive aggregation and sedimentation of diatoms and clay-sized lithogenic material. Limnol Oceanogr 47: 1790-1795
136
Hargrave BT, Burns NM (1979) Assessment of sediment trap collection efficiency. Limnol Oceanogr 24: 1124-1136
Hargraves PE, French FW (1983) Diatom resting spores: Significance and strategies. ln: Fryxell , G.A. (ed) Survival strategies of the algae. Cambridge University Press, New York, p 49-68
Hattori H, Saito H (1997) Diel changes in vertical distribution and feeding activity of copepods in ice-covered Resolute Passage, Canadian Arctic, in spring 1992. J Mar Syst Il :205-219
Head EJH, Harris LR, Campbell RW (2000) Investigations on the ecology of Calanus spp. in the Labrador Sea. 1. Relationship between the phytoplankton bloom and reproduction and development of Calanus finmarchicus in spring. Mar Ecol Prog Ser 193 :53-73
Heiskanen A-S, Keck A (1995) Distribution and sinking rates of phytoplankton, detritus, and particulate biogenic silica in the Laptev Sea and Lena River (Arctic Siberia). Mar Chem 53:229-245
Hill V, Cota G (2005) Spatial patterns ofprimary production on the shelf, slope and basin of the Western Arctic in 2002. Deep-Sea Res IJ 52:3344-3354
Hill V, Cota G, Stockwell D (2005) Spring and summer phytoplankton communities in the Chukchi and Eastern Beaufort Seas. Deep-Sea Res II 52:3369-3385
Hirche H-J (1997) Life cycle of the copepod Calanus hyperboreus in the Greenland Sea. Mar Biol 128:607-618
Hirche H-J (1998) Donnancy in three Calanus species (Cfinmarchicus, C glacialis and C hyperboreus) from the North Atlantic. Arch Hydrobiol Spec Issues Advanc Limnol 52:359-369
Hirche H-J, Kosobokova K (2003) EarIy reproduction and development of dominant calanoid copepods in the sea ice zone of the Barents Sea - need for a change of paradigms? Mar Biol 143 :769-781
Hirche H-J, Mumm N (1992) Distribution of dominant copepods in the Nansen basin, Arctic Ocean, in summer. Deep-Sea Res l 39:485-505
Hoppe H-G , Ducklow H, Karrasch B (1993) Evidence for dependency of bacterial growth on enzymatic hydrolysis of particulate organic matter in the mesopelagic ocean. Mar Ecol Prog Ser 93:277-283
137
Homer R, Schrader GC (1982) Relative contributions of ice algae, phytoplankton and benthic microalgae to primary production in nearshore regions of the Beaufort Sea. Arctic 35:485-503
Hsiao SIC (1987) Sedimentation in Arctic Canada: Species composition and biomass of phytoplankton contributed to the marine sediments in Frobisher Bay. Polar Biol 7:245-251
Hsiao SIC (1992) Dynamics ofice algae and phytoplankton in Frobisher Bay. Polar Biol 12:645-651
IPCC (2007) Climate change 2007: The physical science basis. Contribution of Working Group 1 to the Fourth Assessment Report of the Intergovernmental Panel on Climate Change. Cambridge University Press, Cambridge and New York
Jakobsson M (2002) Hypsometry and volume of the Arctic Ocean and its constituent seas. Geochem Geophys Geosyst 3, 1028, doi: 1 0.1 029/2001 GC000302
Johannessen OM, Bengtsson L, Miles MW, Kuzmina SI, Semenov VA, Alekseev GV, Nagurnyi AP, Zakharov VF, Bobylev LP, Pettersson LH, Hasselmann K, Cattle HP (2004) Arctic climate change: observed and modelled temperature and sea-ice variability. Tellus 56:328-341
Juul-Pedersen T, Nielsen TG, Michel C, M011er EF, Tiselius P, Thor P, Olesen M, Selander E, Gooding S (2006) Sedimentation following the spring bloom in Disko Bay, West Greenland, with special emphasis on the role of copepods. Mar Ecol Prog Ser 314:239-255
Kerr RA (1999) Will the Arctic Ocean lose all its ice? Science 286: 1828
Ki0rboe T (2001) Formation and fate of marine snow: small-scale processes with large-scale implications. Sci Mar 65:57-71
Ki0rboe T, Hansen JLS, Allredge AL, Jackson GA, Passow U, Dam HG, Drapeau DT, Waite A, Garcia CM (1996) Sedimentation ofphytoplankton during a diatom bloom: Rates and mechanisms. J Mar Res 54: 1123-1148
Klein B, LeBlanc B, Mei ZP, Beret R, Michaud J, Mundy C-J, von Quillfeldt CH, Garneau M-È, Roy S, Gratton Y, Cochran JK, Bélanger S, Larouche P, Pakulski JO, Rivkin RB, Legendre L (2002) Phytoplankton biomass, production and potential export in the North Water. Deep-Sea Res II 49:4983-5002
Knap A, Michaels A, Close A, Ducklow H, Dickson A (1996) Protocols for the Joint Global Ocean Flux Study (JGOFS) Core Measurements JGOFS Report Nr. 19. Reprint of the IOC Manuals and Guides No. 29, UNESCO, Bergen
138
Koberle C, Gerdes R (2007) Simulated variability of the Arctic Ocean freshwater balance 1948-2001. J Phys Oceanogr 37: 1628-1644
Lalande C, Grebmeier JM, Wassmann P, Cooper LW, Flint MY, Sergeeva VM (2007) Export fluxes of biogenic matter in the presence and absence of seasonal sea ice coyer in the Chukchi Sea. Cont Shelf Res 27:2051-2065
Landry MR, Hassett RP, Fagemess Y, Downs J, Lorenzen CJ (1984) Effect of food acclimation on assimilation efficiency of Ca/anus pacificus. Limnol Oceanogr 29:361-364
Lavoie D, Denman K, Michel C (2005) Modelling ice algal growth and decJine in a seasonally ice-covered region of the Arctic (Resolute Passage, Canadian Archipelago). J Geophys Res 110, Cll009, doi:10.102912005JC002922
Lee S, Fuhrman JA (1987) Relationships between biovolume and biomass ofnaturally derived marine bacterioplankton. Appl Environ Microbiol 53: 1298-1303
Lean DRS, Bumison BK (I979) An evaluation of errors in the 14C method of primary measurement. Limnol Oceanogr 24:917-928
Legendre P, Legendre L (1998) Numerical ecology, 2nd edn. Elsevier Science BY, Amsterdam
Legendre L, Ackley SF, Dieckmann GS, Gulliksen B, Homer R, Hoshiai T, Melnikov lA, Reeburgh WS, Spindler M, Sullivan CW (1992) Ecology of sea ice biota. 2 Global significance. Polar Biol 12:429-444
Lorenzen CJ (1968) Carbon/chlorophyll relationships in an upwelling area. Limnol Oceanogr 13:202-204
Long RA, Azam F (1996) Abundant protein-containing particJes in the sea. Aquat Microb Ecol 10:213-221
Lovejoy C, Legendre L, Martineau M-J, Bâcle J, von Quillfeldt CH (2002) Distribution of phytoplankton and other protists in the North Water. Deep-Sea Res II 49:5027-5047
Lukovich JV, Barber DG (2005) On sea ice concentration anomaly coherence in the southem Beaufort Sea. Geophys Res Lett 32, L10705 , doi:lO.1029/2005GL022737
139
Lund JWG, Kipling C, Le Cren ED (1958) The inverted microscope method of estimating algal numbers and the statistical analysis of estimations by counting. Hydrobiologia 11:143-170
Macdonald R W, Solomon SM, Cranston RE, WeJch HE, Yunker MB, Gobeil C (1998) A sediment and organic carbon budget for the Canadian Beaufort Sea. Mar Geol 144:255-273
Madsen SD, Nielsen TG, Hansen BW (2001) Annual population development and production by Calanus finmarchicus , C. glacialis and C. hyperboreus in Disko Bay, western Greenland. Mar Biol 139:75-93
Martin JH, Knauer GA, Karl DM, Broenkow WW (1987) VERTEX: carbon cycling in the northeastern Pacific. Deep-Sea Res 34:267-285
McMahon KW, Ambrose WG Jr, Johnson BJ, Sun M-Y, Lopez GR, Clough LM, Carroll ML (2006) Benthic community response to ice algae and phytoplankton in Ny Âlesund, Svalbard. Mar Ecol Prog Ser 310: 1-14
McPhee-Shaw E (2006) Boundary-interior exchange: Reviewing the idea that internal-wave mixing enhances lateral dispersal near continental margins. Deep-Sea Res II 53:42-59
Mei Z-P, Legendre L, Gratton Y, Tremblay J-É, LeBlanc B, Klein B, Gosselin M (2003) Phytoplankton production in the North Water Polynya: size- fractions and carbon fluxes, April to July ] 998. Mar Ecol Prog Ser 256: 13-27
Melnikov lA (1998) Winter production of sea ice algae in the western Weddell Sea. J Mar Syst 17: 195-205
Michel C, Legendre L, Ingram RG, Gosselin M, Levasseur M (1996) Carbon budget of sea-ice algae in spring: Evidence of a significant transfer to zooplankton grazers. J Geophys Res 101: 18345-18360
Michel C, Legendre L, Demers S, Therriault J-C (1998) Photoadaptation of sea-ice microalgae in springtime: photosynthesis and carboxylating enzymes. Mar Ecol Prog Ser 50:177-185
Michel C, Gosselin M, Nozais C (2002) Preferential sinking export ofbiogenic silica during the spring and summer in the North Water Polynya (northern Baffin Bay): Temperature or biological control? J Geophys Res 107, C7, doi: 1 0.1 029/2002JC000408
140
Michel C, Nielsen TG, Nozais C, Gosselin M (2002) Significance of sedimentation and grazing by ice micro- and meiofauna for carbon cycling in annual sea ice (northern Baffin Bay). Aquat Microb Ecol 30:57-68
Michel C, Ingram RG, Harris LR (2006) Variability in oceanographic and ecological processes in the Canadian Arctic Archipelago. Prog Oceanogr 71:379-401
Mundy CJ, Barber DG, Michel C (2005) Variability of snow and ice thermal, physical and optical properties pertinent to sea ice algae biomass during spring. J Mar Syst 58: 1 07-120
M011er EF, Nielsen TG (2001) Production ofbacterial substrate by marine copepods: Effects of phytop1ankton biomass and cell size. J Plankton Res 23 :527-536
M011er EF, Thor P, Nielsen TG (2003) Production of DOC by Calanusfinmarchicus, C. glacialis and C. hyperboreus through sI oppy feeding and leakage from faecal pellets. Mar Ecol Prog Ser 262: 185-191
Nozais C, Gosselin M, Michel C, Tita G (2001) Abundance, biomass, composition and grazing impact of the sea-ice meiofauna in the North Water, northern Baffin Bay. Mar Ecol Prog Ser 217:235-250
O'Brien MC, Macdonald RW, Melling H, Iseki K (2006) Partic1e fluxes and geochemistry on the Canadian Beaufort Shelf: Implications for sediment transport and deposition. Cont Shelf Res 26:41-81
Olli K, Riser CW, Wassmann P, Rat'kova T, Arashkevich E, Pasternak A (2002) Seasonal variation in vertical flux of biogenic matter in the marginal ice zone and the central Barents Sea. J Mar Syst 38:189-204
Oreskes N (2004) Beyond the ivory tower: The scientific consensus on c1imate change. Science 306: 1686
Pagona M, Gaudy R, Thibault D, Lochet F (1993) Vertical migrations and feeding rhythms ofmesozooplanktonic organisms in the Rhone River plume area (North-west Mediterranean Sea). Est Coast Shelf Sci 37:251-269
Parsons TR, Maita Y, Lalli CM (1984) A manual of chemical and biological methods for seawater analysis. Pergamon Press, Toronto
Parsons TR, Webb DG, Dovey H, Haigh R, Lawrence M, Hopky GE (1988) Production studies in the Mackenzie River - Beaufort Sea Estuary. Polar Biol 8:235-239
Parsons TR, Webb DG, Rokeby BE, Lawrence M, Hopky GE, Chiperzak DB (1989) Autotrophic and heterotrophic production in the Mackenzie River/Beaufort Sea Estuary. Polar Biol 9:261-266
Pasternak A, Riser CW, Arashkevich E, Rat'kova T, Wassmann P (2002) Calanus spp. grazing affects egg production and vertical carbon flux (the marginal ice zone and open Barents Sea). J Mar Syst 38:147-164
141
Penry DL, Frost BW (1991) Chlorophyll a degradation by Ca/anus pacificus: Dependence on ingestion rate and digestive acclimation to food resources. Limnol Oceangr 36:147-159
Peterson BJ, Holmes RM, McClelland JW, Vorosmarty CJ, Lammers RB, Shiklomanov AI , Shiklomanov lA, Rahmstorf S (2002) lncreasing river discharge to the Arctic Ocean. Science 298:2171-2] 73
Pickart RS (2004) Shelfbreak circulation in the Alaskan- Beaufort Sea: Mean structure and variability. J Geophys Res 109, C04024, doi:l0.102912003JCOOI912
Radié T, Ivancié I, Fuks D, Radié J (2006) Marine bacterioplankton production of polysaccharide and proteinaceous particles under different nutrient regimes. FEMS Microbiol Ecol 58:333-342
Ragueneau 0 , Tréguer P (1994) Determination ofbiogenic silica in coastal waters: applicability and limits of the alkaline digestion method. Mar Chem 45:43-5]
Rat ' kova TN, Wassmann P (2002) Seasonal variation and spatial distribution of phyto- and protozooplankton in the central Barents Sea. J Mar Syst 38:47-75
Rat'kova TN, Wassmann P, Verity P, Andreassen IJ (1998) Abundance and biomass of pico-, nano-, and microplankton on a transect across Nordvestbanken, north Norwegian shelf, in 1994. Sarsia 84:213-225
Redfield AC, Ketchum BH, Richards FA (1963) The influence of organisms on the composition ofsea water. In: Hill MN (ed) The sea. Wiley, New York, p 26-77
Renaud PE, Morata N, Ambrose WG Jr, Bowie]J, Chiuchiolo A (2007a) Carbon cycling by seatloor communities on the eastern Beaufort Sea shelf. J Exp Mar Biol Ecol 349:248-260
Renaud PE, Riedel A, Michel C, Morata N, Gosselin M, Juul-Pedersen T, Chiuchiolo A (2007b) Seasonal variation in benthic community oxygen demand: A response to an ice algal bloom in the Beaufort Sea, Canadian Arctic? J Mar Syst 67: 1-12
142
Richter C (1995) Seasonal changes in the vertical distribution of mesozooplankton in the Greenland Sea Gyre (75°N): distribution strategies of calanoid copepods. ICES J Mar Sci 52:533-539
Riebesell U, Schloss I, Smetacek V (1991) Aggregation of algae released from melting sea ice: implications for seeding and sedimentation. Polar Biol Il :239-248
Riebesell U, Reigstad M, Wassmann P, Noji T, Passow U (1995) On the trophic fate of Phaeocystis pouchetii (Hariot): VI. Significance of Phaeocystis-derived mucus for vertical flux. Neth 1 Sea Res 33:193-203
Riedel A, Michel C, Gosselin M (2006) Seasonal study of sea-ice exopolymeric substances (EPS) on the Mackenzie Shelf: Implications for the transport of sea-ice bacteria and algae. Aquat Microb Eco145: 195-206
Riedel A, Michel C, Gosselin M, LeBlanc B (2007) Enrichment ofnutrients, exopolymeric substances and microorganisms in newly formed sea ice on the Mackenzie shelf. Mar Ecol Prog Ser 342:55-67
Ringuette M, Fortier L, Fortier M, Runge lA, Bélanger S, Larouche P, Weslawski J-M, Kwasniewski S (2002) Advanced recruitment and accelerated population development in Arctic calanoid copepods of the North Water. Deep-Sea Res II 49:5081-5099
Riser CW, Wassmann P, Olli K, Pasternak A, Arashkevich E (2002) Seasonal variation in production, retenti on and export of zooplankton faecal pellets in the marginal ice zone and central Barents Sea. J Mar Syst 38:175-188
Riser CW, Reigstad M, Wassmann P, Arashkevich E, Falk-Petersen S (2007) Export or retenti on? Copepod abundance, faecal pellet production and vertical flux in the marginal ice zone through snap shots from the northern Barents Sea. Polar Biol 30:719-730
Runge lA , Ingram RG (1988) Underice grazing by planktonic, calanoid copepods in relation to a bloom of ice microalgae in southeastern Hudson Bay. Limnol Oceanogr 33:280-286
Sakshaug E (2004) Primary and secondary production in the Arctic Seas. In : Stein R, Macdonald RW (eds) The organic carbon cycle in the Arctic Ocean. Springer, Berlin, p 57-82
Sakshaug E, Skjoldal HR (1989) Life at the ice edge. Ambio 18:60-67
143
Sampei M, Sasaki H, Hattori H, Fukuchi M, Hargrave BT (2004) Fate of sinking particles, especially fecal pellets, within the epipelagic zone in the North Water (NOW) polynya of northern Baffin Bay. Mar Ecol Prog Ser 278: 17-25
Sarmiento JL, Gruber N (2006) Ocean biogeochemical dynamics. Princeton University Press, New Jersey
Schnack-Shiel SB, Isla E (2005) The role of zooplankton in the pelagic-benthic coupling of the Southern Ocean . Sci Mar 69:39-55
Seuthe L, Oanis G, Riser CW, Wassmann P, Fortier L (2007) Winter-spring feeding and metabolism of Arctic copepods: insights from faecal pellet production and respiration measurements in the southeastern Beaufort Sea. Polar Biol 30:427-436
Shiklomanov lA (1998) Comprehensive assessment of the freshwater resources of the world: Assessment ofwater resources and water availability in the world. Stockholm Environment Institute, Stockholm
Simpson KG, Tremblay J-É, Gratton Y, Price NM (ms) An annual study on nutrient distribution in the south-eastern Beaufort Sea, Mackenzie Shelf and Amundsen Gulf
Smith DC, Simon M, Alldredge AL, Azam F (1992) Intense hydrolytic enzyme activity on marine aggregates and implications for rapid particle dissolution. Nature 359: 139-142
Smith DC, Steward GF, Long RA, Azam F (1995) Bacterial mediation of carbon fluxes during a diatom bloom in a mesocosm. Deep-Sea Res Il 42:75-79
Smith REH, Harrison WG, Harris LR, Herman A W (1990) Vertical fine structure of particulate matter and nutrients in sea ice of the high Arctic . Can J Fish Aquat Sci 47:1348-1355
Sokal RR, RohlfFJ (1981) Biometry: the principles and practice ofstatistics in biological research, 2nd edn. WH Freeman, San Francisco
Springer AM, McRoy CP (1993) The paradox ofpelagic food webs in the northern Bering Sea. 3. Patterns ofprimary production. Cont ShelfRes 13:575-599
Stein R, Macdonald RW (2004) The organic carbon cycle in the Arctic Ocean. Springer-Verlag, New York
Stramski D, Sciandra A, Claustre H (2002) Effects oftemperature, nitrogen , and light limitation on the optical properties of the marine diatom Thalassiosira pseudo nana. Limnol Oceanogr 47:392-403
Strass VH, Nothig E-M (1996) Seasonal shifts in ice edge phytoplankton blooms in the Barents Sea related to the water column stability. Polar Biol 16:409-422
Strom SL, Benner R, Ziegler S, Dagg Ml (1997) Planktonic grazers are a potentially important source of marine dissolved organic carbon. Limnol Oceanogr 42:1364-1374
]44
Subba Rao DY, Platt T (1984) Primary production of Arctic waters. Polar Biol 3:191-201
Suttle CA (2005) Viruses in the sea. Nature 437:356-361
Taguchi S, Saito H, Kasai H (1993) Effect of shape of sediment trap on measurement of vertical flux of particles: Preliminary results. Proc NIPR Symp Polar Biol 6:]-5
Tremblay C, Runge JA, Legendre L (1989) Grazing and sedimentation of ice algae during and immediately after a bloom at the ice-water interface. Mar Ecol Prog Ser 56:291-300
Tremblay J-É, Gratton Y, Carmack EC, Payne CD, Price NM (2002a) Impact of the large-scale Arctic circulation and the North Water Polynya on nutrient inventories in Baffin Bay. J Geophys Res 107, C8, 31] 2, doi: 1 0.1 029/2000JC000595
Tremblay J-É, Gratton Y, Fauchot J, Price NM (2002b) Climatic and oceanic forcing of new, net, and diatom production in the North Water. Deep-Sea Res II 49:4927-4946
Tremblay J-É, Hattori H, Michel C, Ringuette M, Mei Z-P, Lovejoy C, Fortier L, Hobson KA, Amiel D, Cochran K (2006a) Trophic structure and pathways ofbiogenic carbon flow in the eastem North Water Polynya. Prog Oceanogr 71 :402-425
Tremblay l-É, Michel C, Hobson KA, Gosselin M, Price NM (2006b) Bloom dynamics in early opening waters of the Arctic Ocean. Limnol Oceanogr 5] :900-912
Turner JT (2002) Zooplankton fecal pellets, marine snow and sinking phytoplankton blooms. Aquat Microb EcoI27:57-102
Urban JL, McKenzie CH, Deibel D (1992) Seasonal differences in the content of Oikopleura vanhoefJeni and Calanusfinmarchicus faecal pellets: illustrations of zooplankton food web shifts in coastal Newfoundland waters . Mar Ecol Prog Ser 84:255-264
Urban-Rich J, Nordby E, Andreassen Il, Wassmann P (1999) Contribution by mesozooplankton fecal pellets to the carbon flux on Nordvestbanken north Norwegian shelf in 1994. Sarsia 84:253-264
von Quillfeldt CH (2004) The diatom Fragilariopsis cylindrus and its potential as an indicator species for cold water rather than for sea ice. Vie Milieu 54: 137 -143
145
von Quillfeldt CH, Ambrose WG Jr, Clough LM (2003) High number of diatom species in first-year ice from the Chukchi Sea. Polar Biol 26:806-818
Vrede K, Heldal M, Norland S, Bratbak G (2002) Elemental composition (C, N, P) and cell volume of exponentially growing and nutrient-limited bacterioplankton. Appl Environ Microbiol 68:2965-2971
Wassmann P (1989) Sedimentation of organic matter and silicate from the euphotic zone of the Barents Sea. Rapp P-v Réun Cons Int Explor Mer 188:108-114
Wassmann P (1998) Retention versus export food chains: processes controlling sinking loss from marine pelagic systems. Hydrobiologia 363:29-57
Wassmann P, Vernet M, Mitchell BG, Rey F (1990) Mass sedimentation of Phaeocystis pouchetii in the Barents Sea. Mar Ecol Prog Ser 66: 183-195
Wassmann P, Bauerfeind E, Fortier M, Fukuchi M, Hargrave B, Moran B, Noji T, Nothig E-M, Olli K, Peinert R, Sasaki H, Shevchenko V (2004) Particulate organic carbon tlux to the Arctic Ocean sea tloor. In: Stein R, Macdonald RW (eds) The organic carbon cycle in the Arctic Ocean. Springer, Berlin, p 101-138
Wassmann P, Reigstad M, Haug T, Rudels B, Carroll ML, Hop H, Gabrielsen GW, Falk-Petersen S, Denisenko SG, Arashkevich E, Slagstad D, Pavlova 0 (2006) Food webs and carbon tlux in the Barents Sea. Prog Oceanogr 71 :232-287
Wells LE, Cordray M, Bowerman S, Miller LA, Warwick FV, Deming JW (2006) Archaea in particle-rich waters of the Beaufort Shelf and Franklin Bay, Canadian Arctic: Clues to an allochthonous origin? Limnol Oceanogr 51 :47-59
Welschmeyer NA, Lorenzen CJ (1985) Chlorophyll budgets: Zooplankton grazing and phytoplankton growth in a temperate fjord and the Central Pacific Gyres. Limnol Oceanogr 30: 1-21
Werner 1 (2000) Faecal pellet production by Arctic under-ice amphipods - transfer of organic matter through the ice/water interface. Hydrobiologia 426:89-96
White J (1990) The use of sediment traps in high-energy environments. Mar Geophys Res 12:145-152