Xavier Maldague
http://mivim.gel.ulaval.ca
Infrared thermography for NDT:
Applications and more
Chaire de recherche du CanadaTitulaire : Xavier Maldague
Xavier Maldague
November 2013
Mor
e In
fo a
t Ope
n A
cces
s D
atab
ase
ww
w.n
dt.n
et/?
id=
1516
9
2
Outline
1. Infrared vision;
2. Non-Thermal infrared NDT;
3. Thermal infrared NDT: Passive thermography;
4. Thermal infrared NDT : Active thermography;
5. Thermal infrared NDT : More Applications;
6. Conclusions.

3
1. Infrared vision1. Infrared vision
4
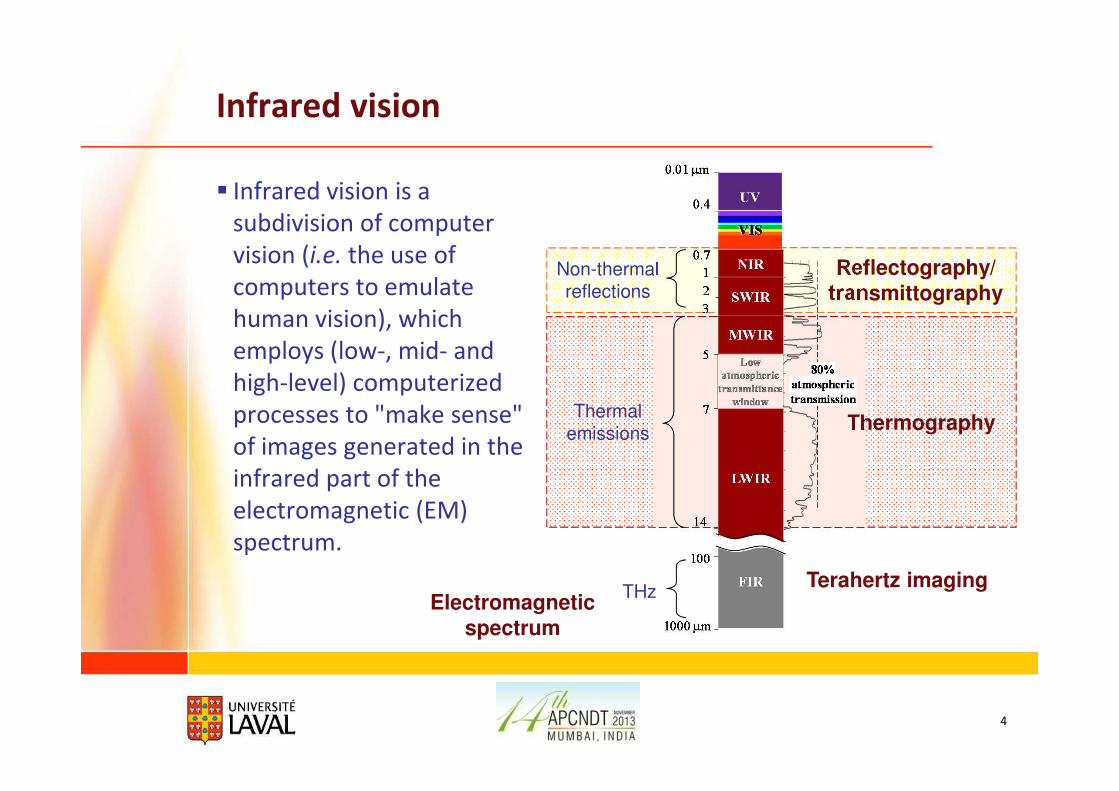
Infrared vision
� Infrared vision is a
subdivision of computer
vision (i.e. the use of
computers to emulate
human vision), which
employs (low-, mid- and
high-level) computerized
processes to "make sense"
of images generated in the
infrared part of the
electromagnetic (EM)
spectrum.
Thermal emissions
Non-thermal reflections
Reflectography/
transmittography
Thermography
THzTerahertz imaging
Electromagnetic
spectrum
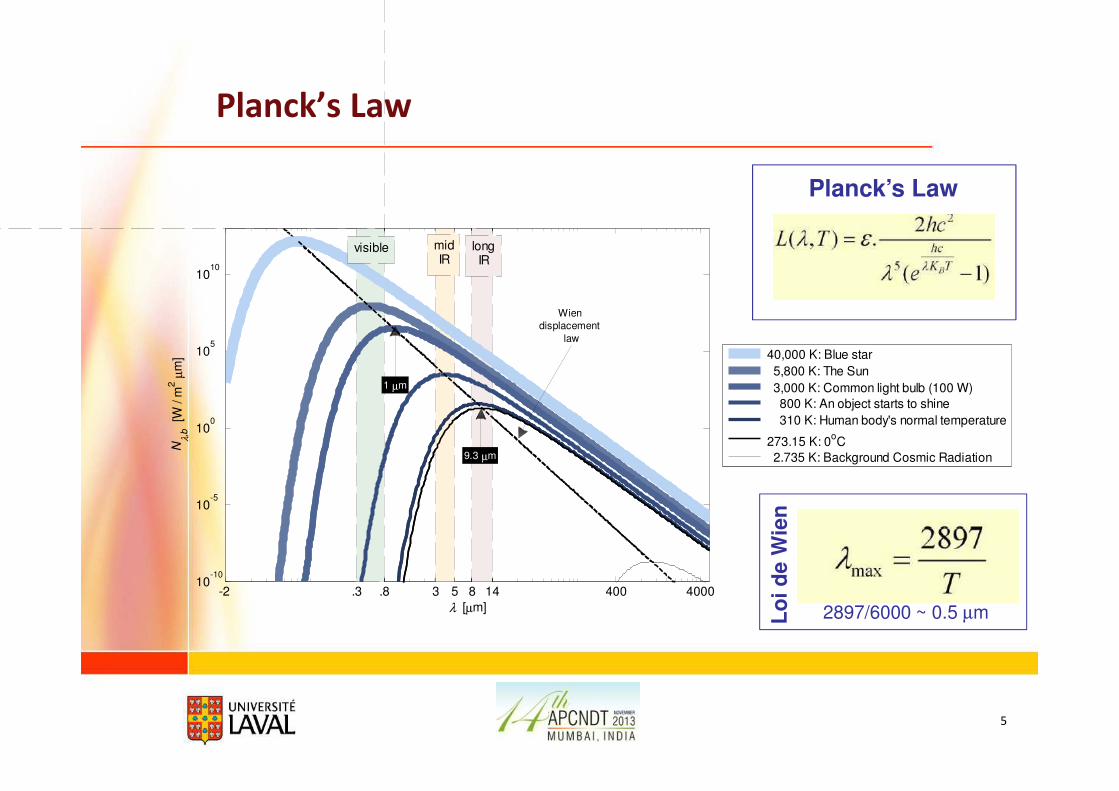
Planck’s Law
5
Planck’s Law
-2 .3 .8 3 5 8 14 400 400010
-10
10-5
100
105
1010
λ [µm]
Nλ,
b [W
/ m
2 µ
m]
40,000 K: Blue star
5,800 K: The Sun
3,000 K: Common light bulb (100 W)
800 K: An object starts to shine
310 K: Human body's normal temperature
273.15 K: 0oC
2.735 K: Background Cosmic Radiation9.3 µm
visible midIR
longIR
Wien
displacement
law
1 µm
Lo
i d
e W
ien
2897/6000 ~ 0.5 µm
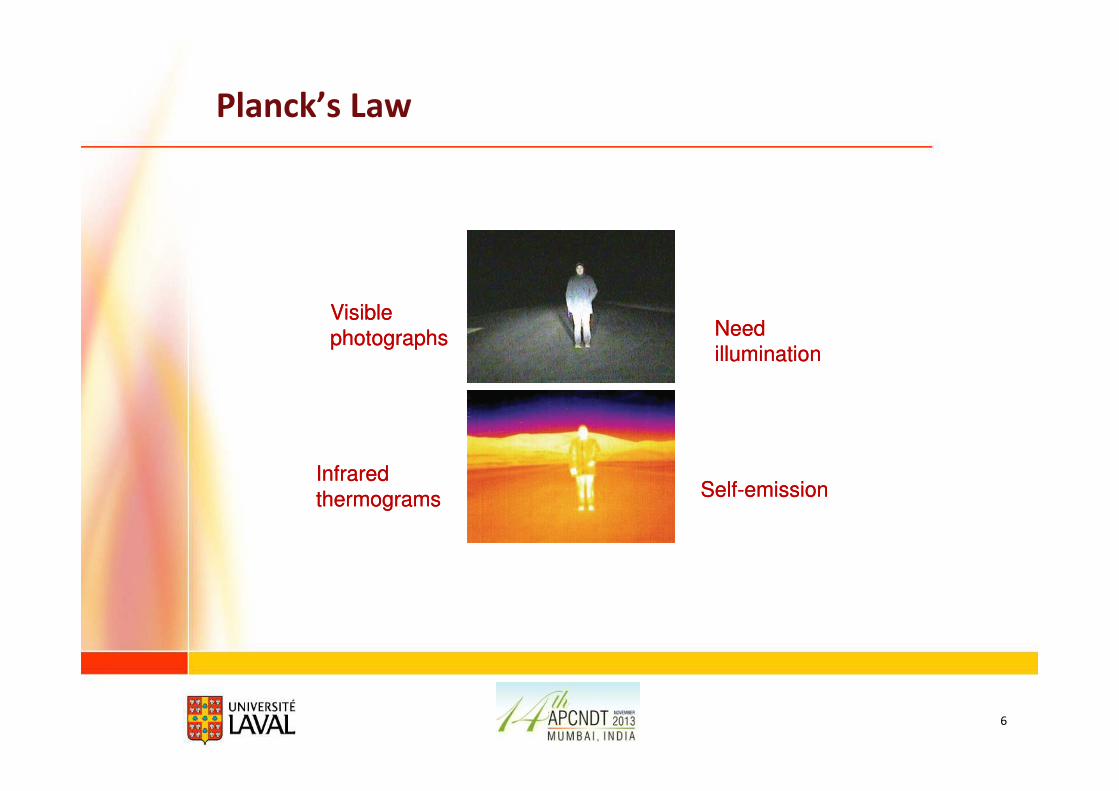
6
Infrared
thermograms
Infrared
thermograms
Visible
photographs
Visible
photographs
Planck’s Law
Self-emissionSelf-emission
Need
illumination
Need
illumination
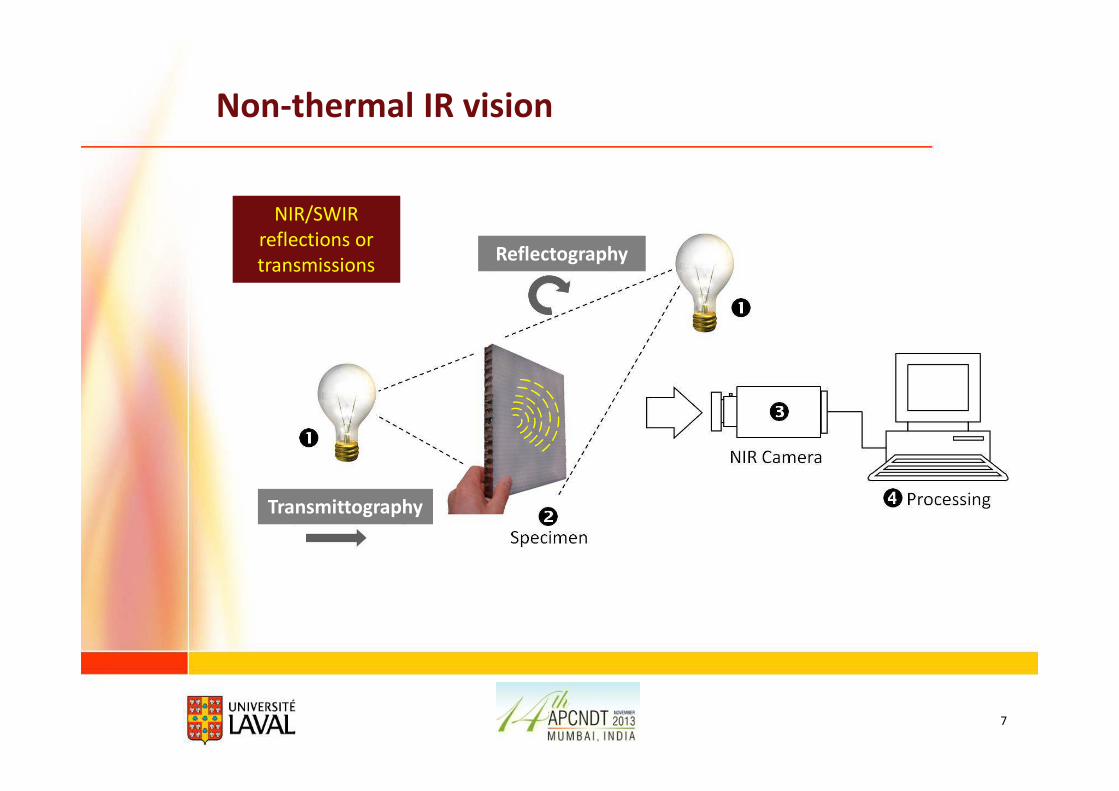
Non-thermal IR vision
7
NIR/SWIR
reflections or
transmissionsReflectography
Transmittography
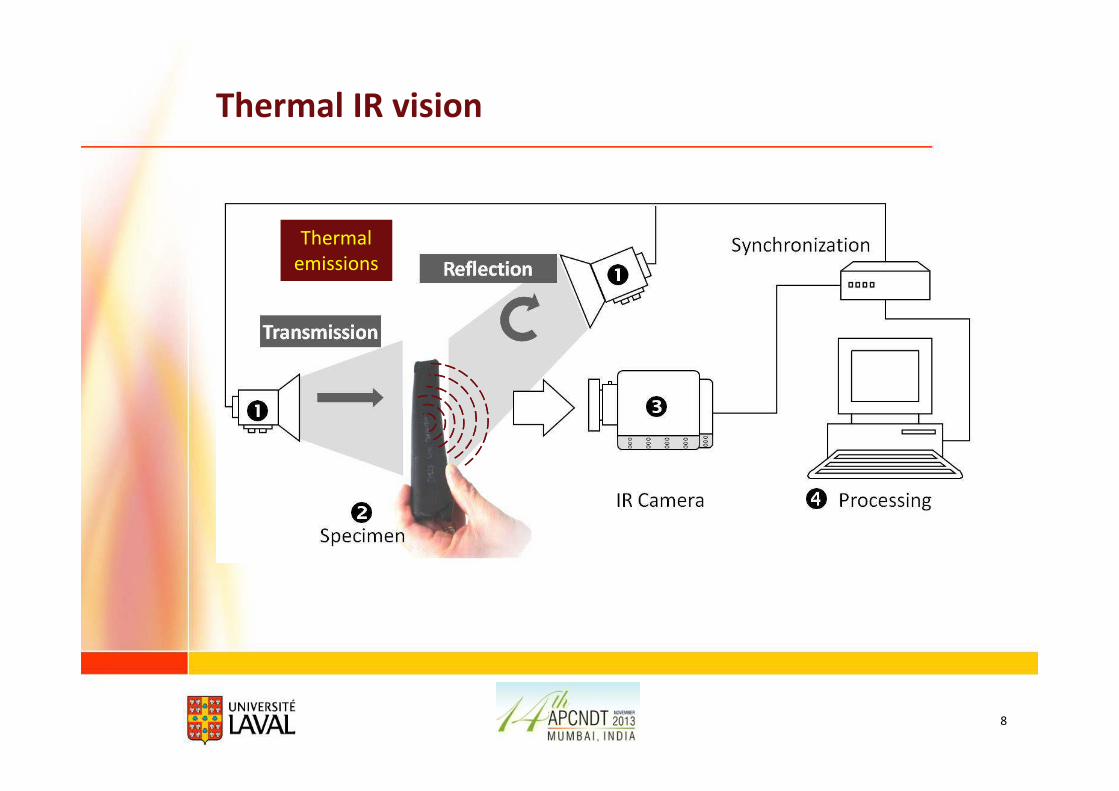
8
Thermal IR vision
Thermal
emissions
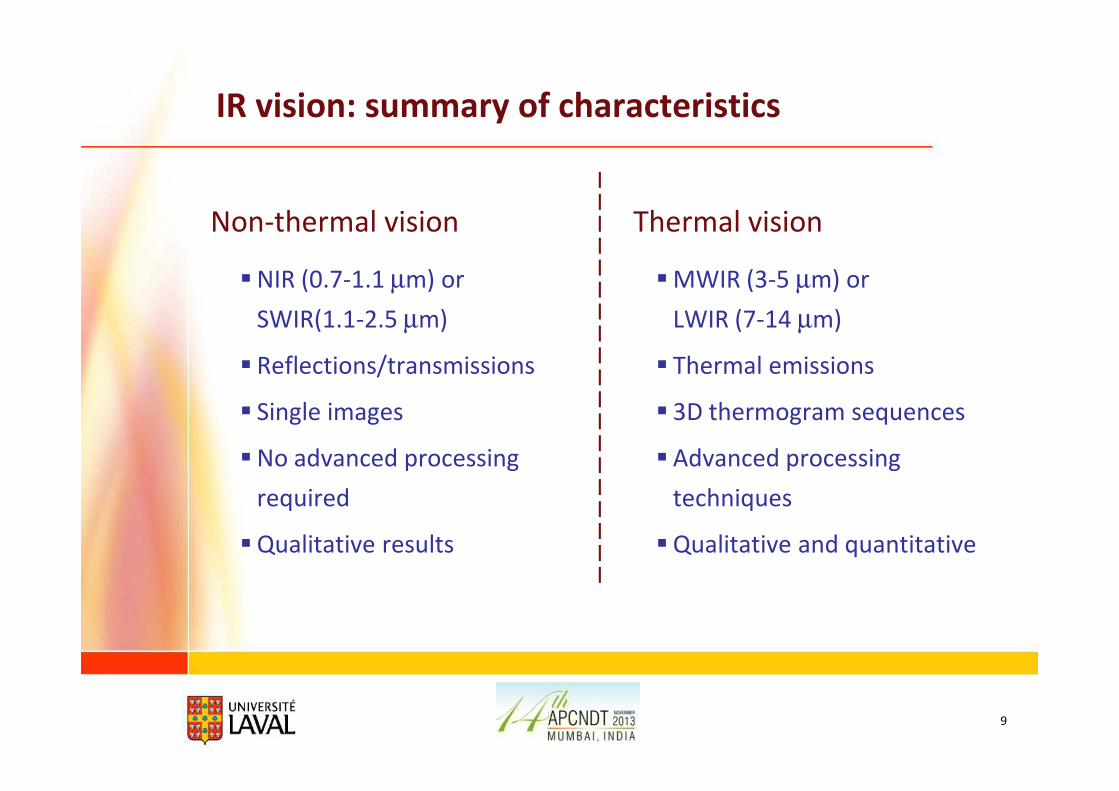
IR vision: summary of characteristics
�NIR (0.7-1.1 µm) or
SWIR(1.1-2.5 µm)
� Reflections/transmissions
� Single images
�No advanced processing
required
�Qualitative results
�MWIR (3-5 µm) or
LWIR (7-14 µm)
� Thermal emissions
� 3D thermogram sequences
� Advanced processing
techniques
�Qualitative and quantitative
9
Non-thermal vision Thermal vision
10
2. Non-thermal Infrared NDT2. Non-thermal Infrared NDT
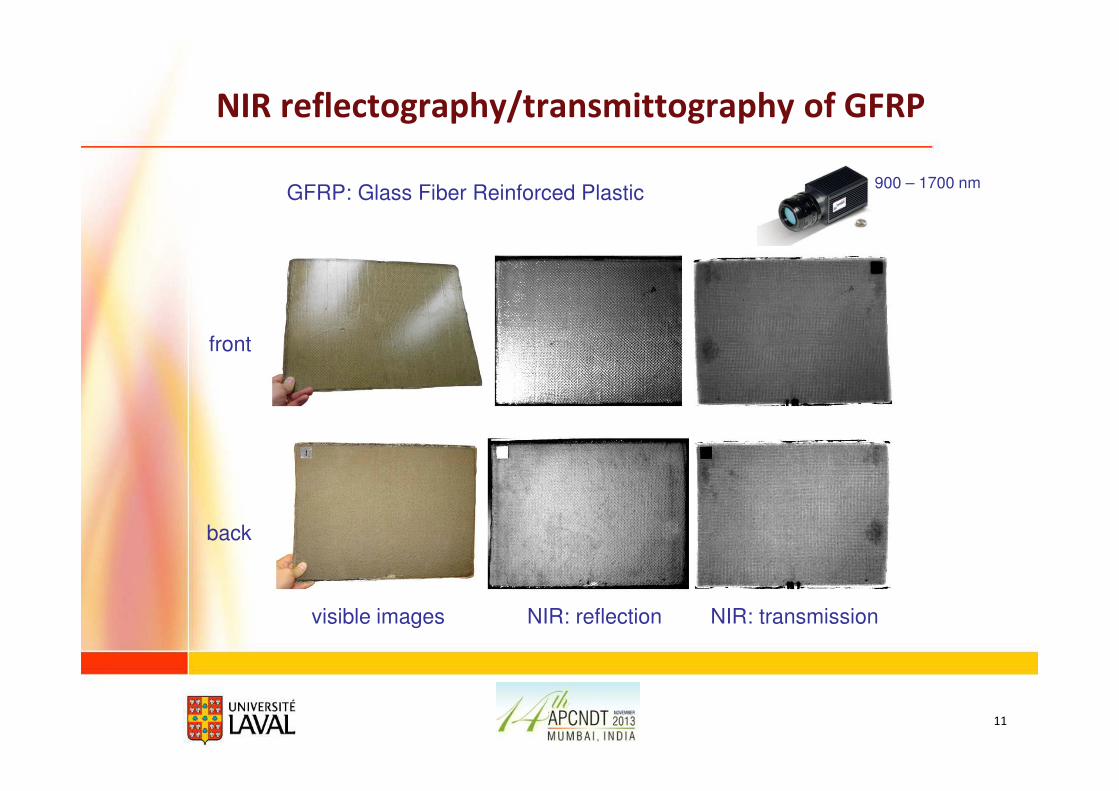
NIR reflectography/transmittography of GFRP
11
900 – 1700 nm
NIR: reflection NIR: transmissionvisible images
GFRP: Glass Fiber Reinforced Plastic
front
back
12
3. Thermal Infrared NDT: Passive Thermography3. Thermal Infrared NDT: Passive Thermography
13
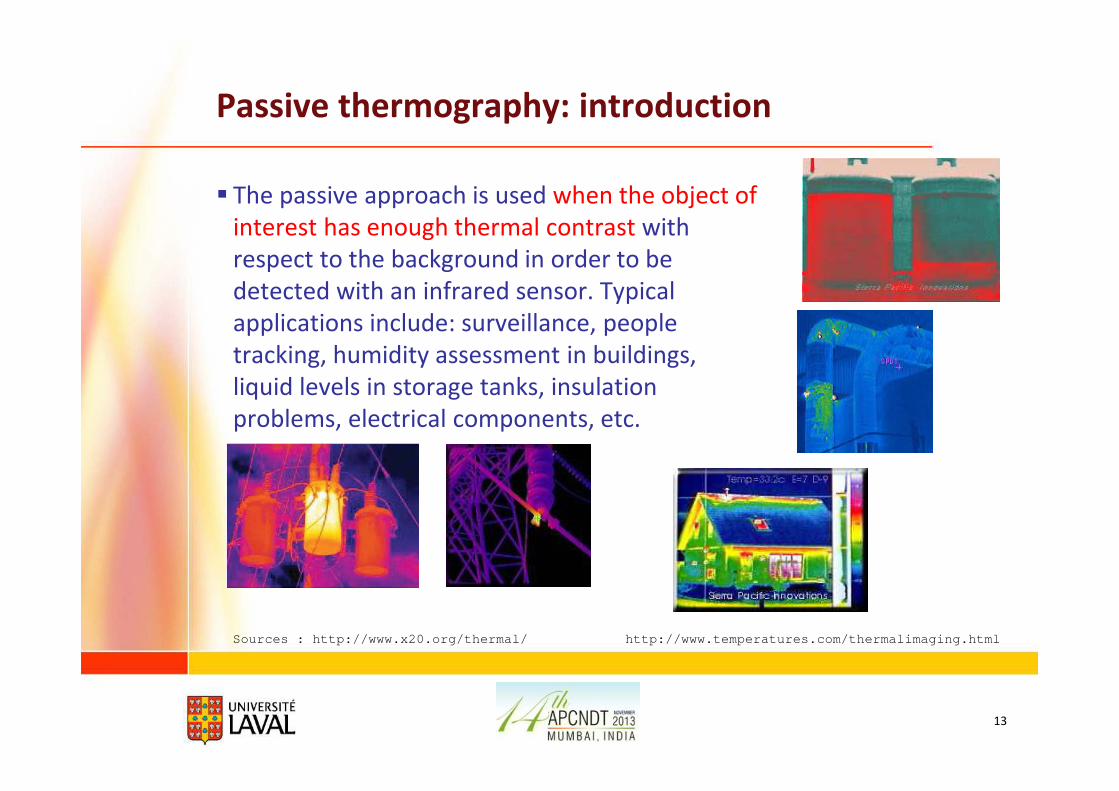
Passive thermography: introduction
� The passive approach is used when the object of
interest has enough thermal contrast with
respect to the background in order to be
detected with an infrared sensor. Typical
applications include: surveillance, people
tracking, humidity assessment in buildings,
liquid levels in storage tanks, insulation
problems, electrical components, etc.
Sources : http://www.x20.org/thermal/ http://www.temperatures.com/thermalimaging.html
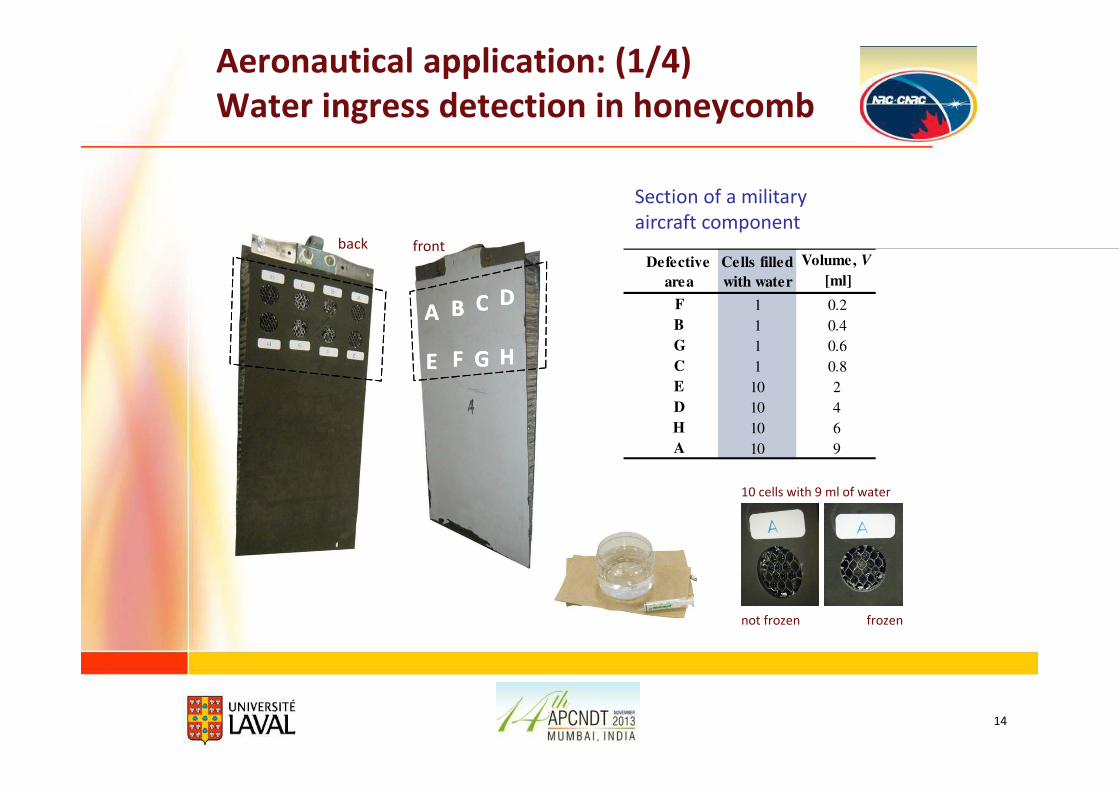
Aeronautical application: (1/4)
Water ingress detection in honeycomb
14
AA BB CC DD
EE FF GG HH
frontbackVolume, V
[ml]
F 1 0.2
B 1 0.4
G 1 0.6
C 1 0.8
E 10 2
D 10 4
H 10 6
A 10 9
Cells filled
with water
Defective
area
Section of a military
aircraft component
10 cells with 9 ml of water
not frozen frozen
Aeronautical application: (2/4)
Water ingress detection in honeycomb
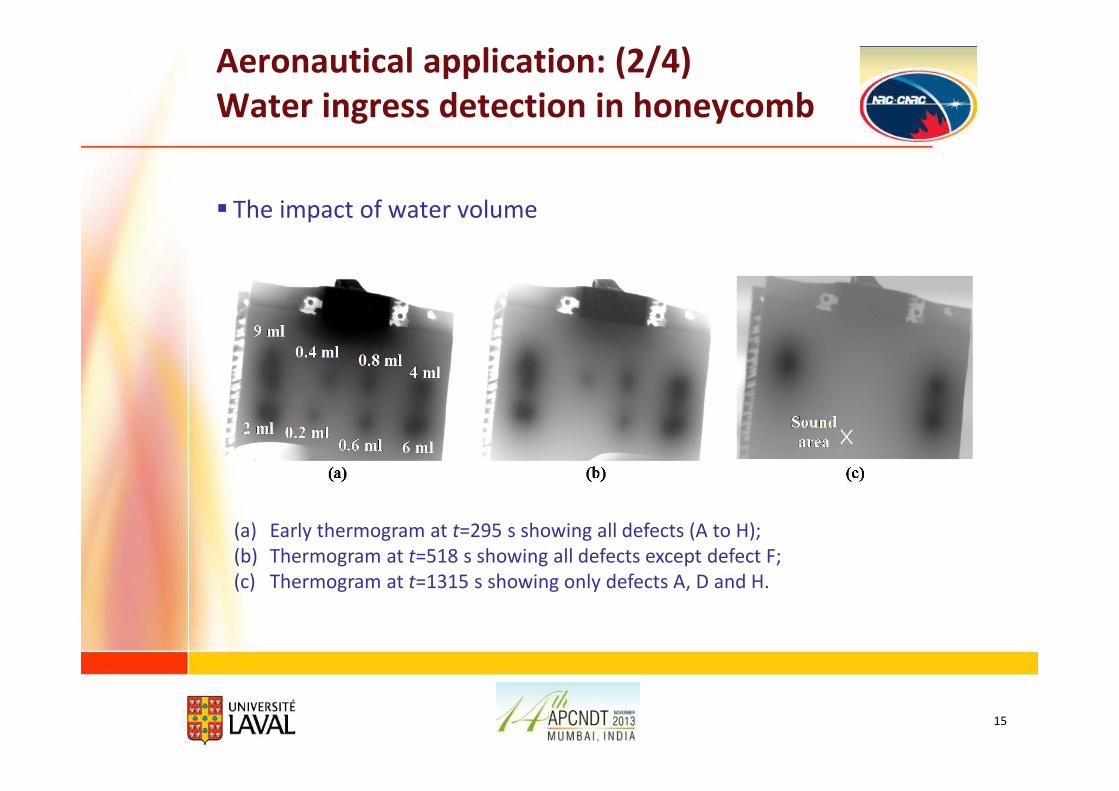
� The impact of water volume
15
(a) Early thermogram at t=295 s showing all defects (A to H);
(b) Thermogram at t=518 s showing all defects except defect F;
(c) Thermogram at t=1315 s showing only defects A, D and H.
Aeronautical application: (3/4)
Water ingress detection in honeycomb
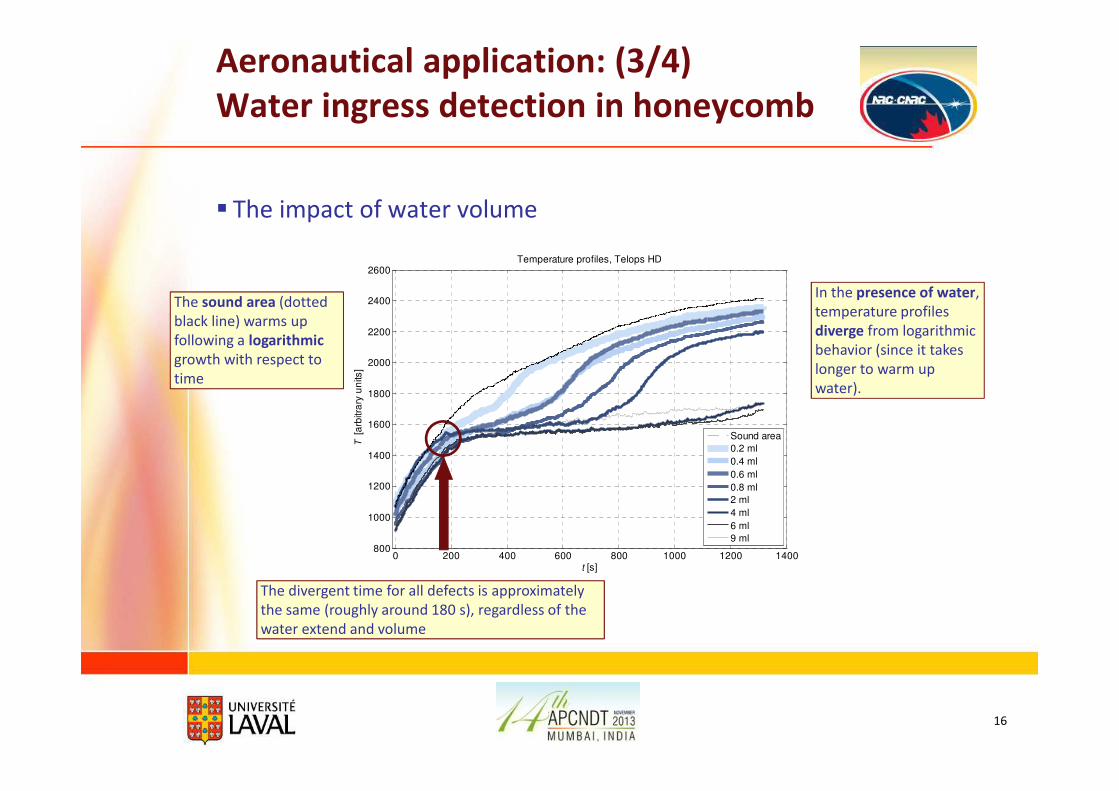
� The impact of water volume
16
The sound area (dotted
black line) warms up
following a logarithmic
growth with respect to
time
In the presence of water,
temperature profiles
diverge from logarithmic
behavior (since it takes
longer to warm up
water).
The divergent time for all defects is approximately
the same (roughly around 180 s), regardless of the
water extend and volume
0 200 400 600 800 1000 1200 1400800
1000
1200
1400
1600
1800
2000
2200
2400
2600Temperature profiles, Telops HD
t [s]
T [a
rbitra
ry u
nits
]
Sound area
0.2 ml
0.4 ml
0.6 ml
0.8 ml
2 ml
4 ml
6 ml
9 ml
Aeronautical application: (4/4)
Water ingress detection in honeycomb
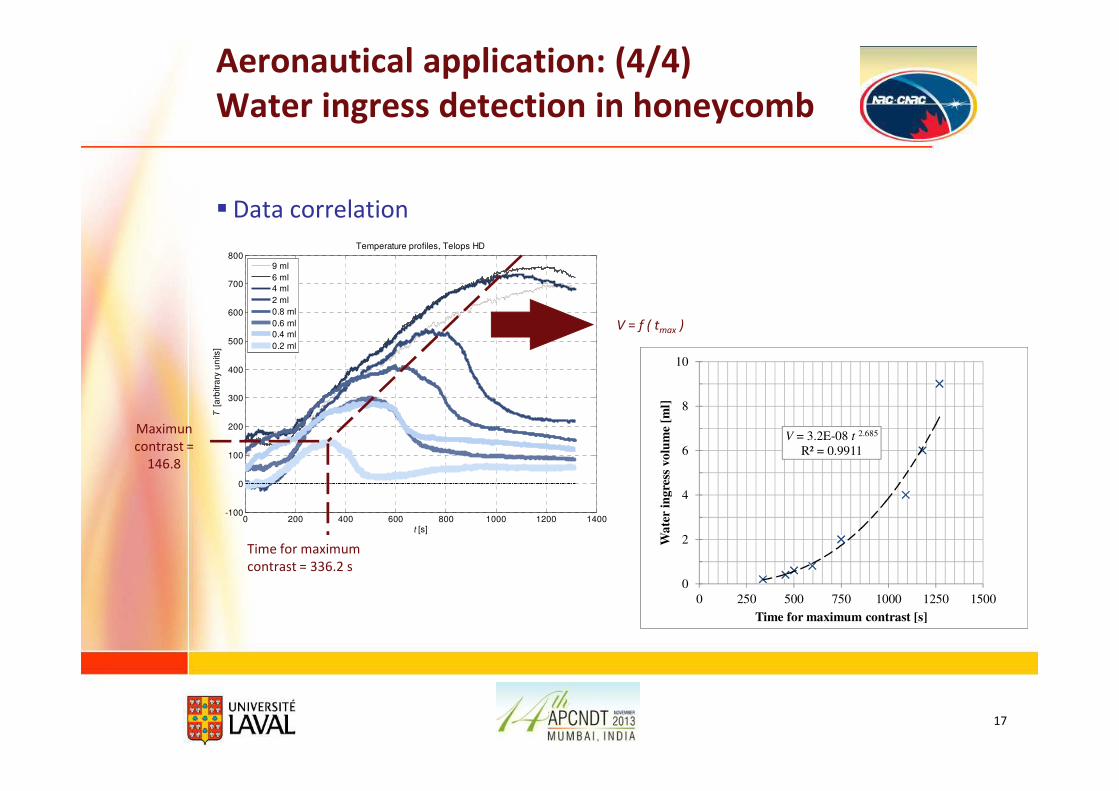
�Data correlation
17
0 200 400 600 800 1000 1200 1400-100
0
100
200
300
400
500
600
700
800Temperature profiles, Telops HD
t [s]
T [a
rbitr
ary
un
its]
9 ml
6 ml
4 ml
2 ml
0.8 ml
0.6 ml
0.4 ml
0.2 ml
Time for maximum
contrast = 336.2 s
V = f ( tmax )
Maximun
contrast =
146.8
V = 3.2E-08 t 2.685
R² = 0.9911
0
2
4
6
8
10
0 250 500 750 1000 1250 1500
Wa
ter
ingre
ss v
olu
me
[ml]
Time for maximum contrast [s]
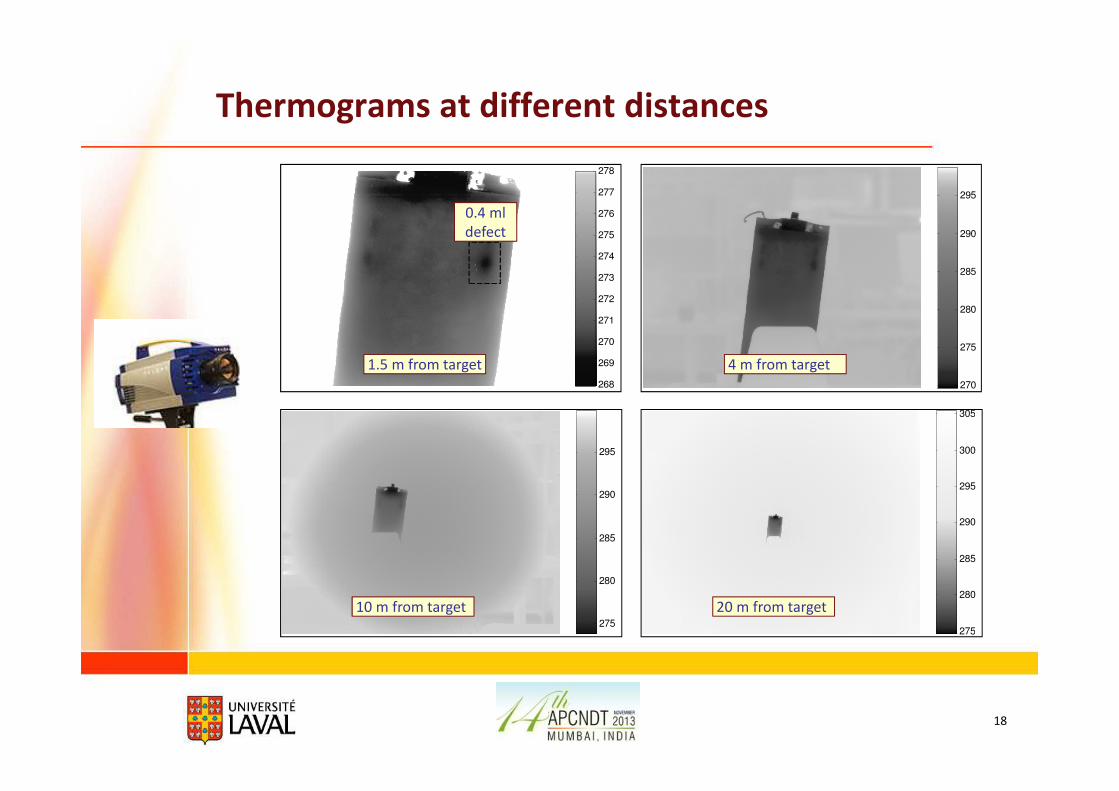
Thermograms at different distances
18
268
269
270
271
272
273
274
275
276
277
278
270
275
280
285
290
295
275
280
285
290
295
275
280
285
290
295
300
305
1.5 m from target 4 m from target
10 m from target 20 m from target
0.4 ml
defect
19
4. Thermal Infrared NDT: Active Thermography4. Thermal Infrared NDT: Active Thermography
20
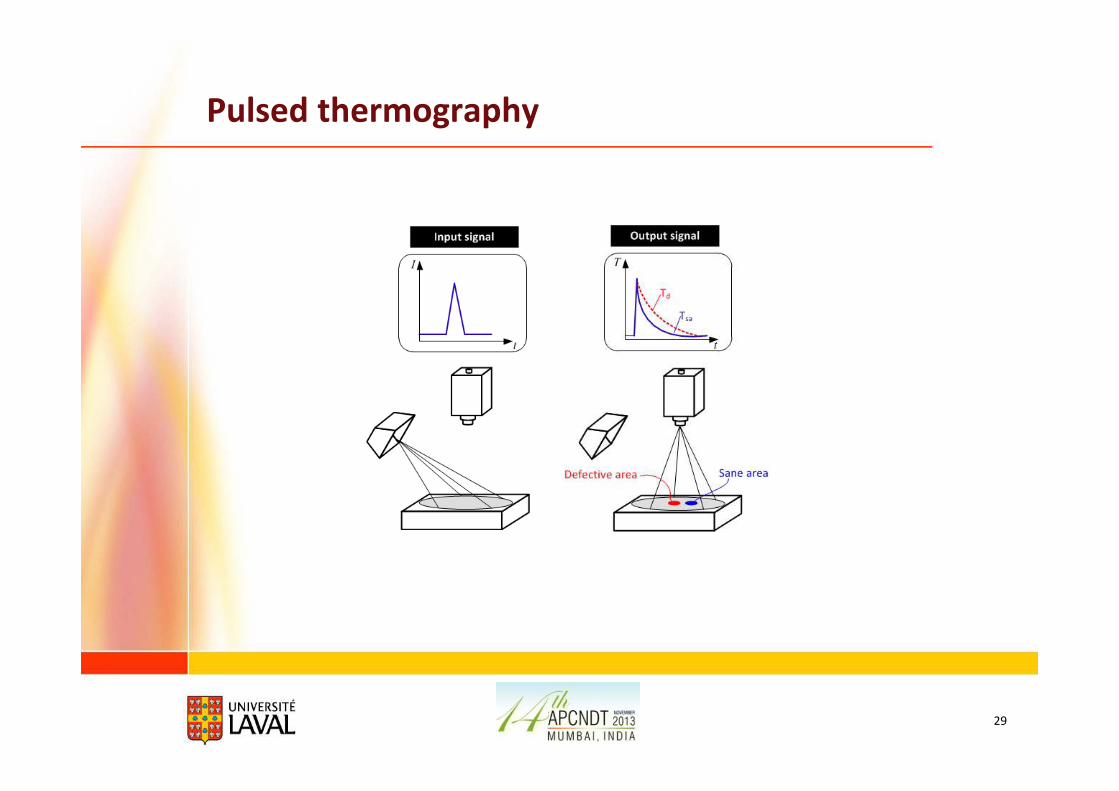
Active thermography for NDT
� Active thermography for NDT is based on the detection and
recording by an infrared camera of thermal radiations emitted by
object surface.
� To detect defects, it is sometimes necessary to destabilize the
object thermal state through heating or cooling (→ active
thermography ).
� The presence of an internal defect reveals itself on surface as a
temperature perturbation above this defect.
Active thermography for NDT
Main advantages:
� Possibility to perform one-sided inspection (in reflection configuration);
� Carried out in real-time;
� Appropriate on most composites materials and multi-layer structures,
including porous materials and industrial lines;
� Relatively unaffected by the object’s geometry, and well adapted for
the inspection of large surfaces.
21
Active thermography for NDT
Main problems:
� Sensible to heating sources (type, duration, location);
� Response time (very fast for metals => need for fast acquisition rates);
� Affected by the object’s surface condition and thickness;
22
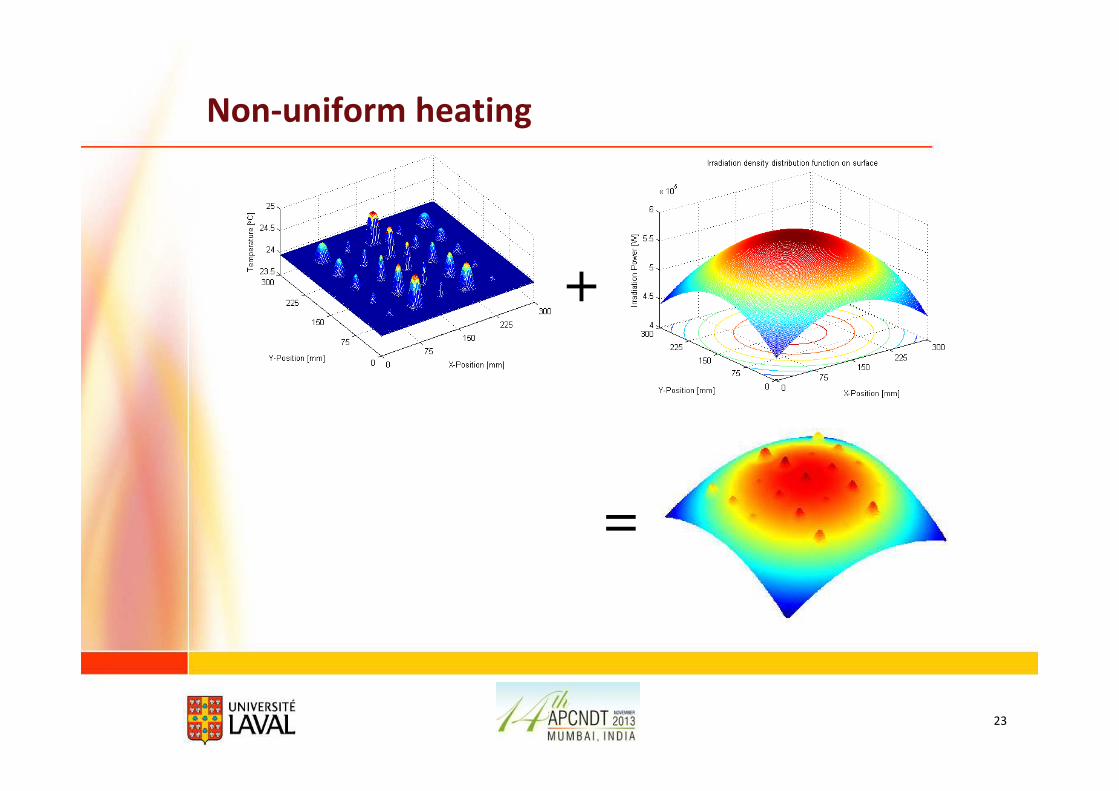
23
Non-uniform heating
+
=
24
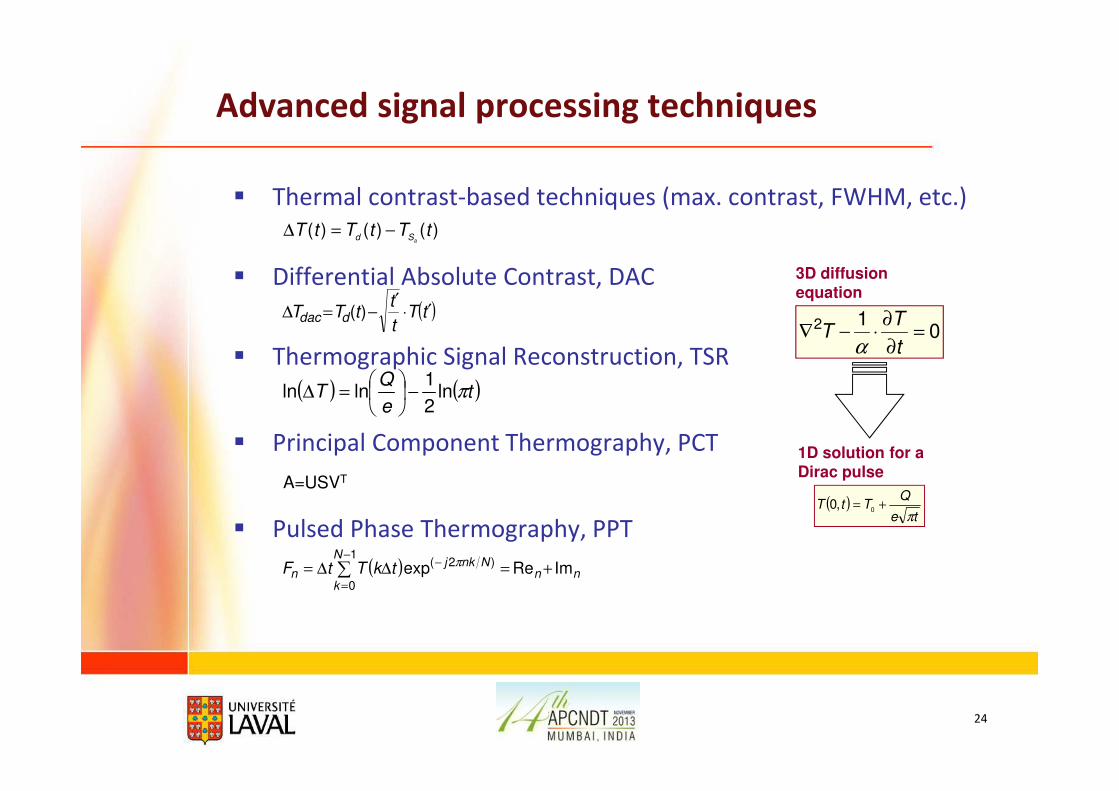
Advanced signal processing techniques
� Thermal contrast-based techniques (max. contrast, FWHM, etc.)
� Differential Absolute Contrast, DAC
� Thermographic Signal Reconstruction, TSR
� Principal Component Thermography, PCT
� Pulsed Phase Thermography, PPT
( ) ( )te
QT πln
2
1lnln −
=∆
A=USVT
)()()( tTtTtTaSd
−=∆
( ) nn
N
k
Nnkjn tkTtF ImReexp
1
0
)2( +=∆∆= ∑−
=
− π
( )tTt
ttTT ddac ′⋅
′−=∆ )(
012 =
∂
∂⋅−∇
t
TT
α
( )te
QTtT
π+=
0,0
3D diffusion equation
1D solution for a Dirac pulse
25
defect
Sa1
Sa2
Sa3
Sa4
0 1 2 3 4 5 6 -0.2 0 0.2 0.4 0.6
.01 .1 1 6.3
-4
-3
-2
-1
0
1
t [s]
∆T
[o
C]
Sa1
Sa2
Sa3
Sa4
.01 .1 1 6.3
-1.2
-1
-0.8
-0.6
-0.4
-0.2
0
0.2
t [s]
∆T
[o
C]
Sa1
Sa2
Sa3
Sa4
(a) (b)
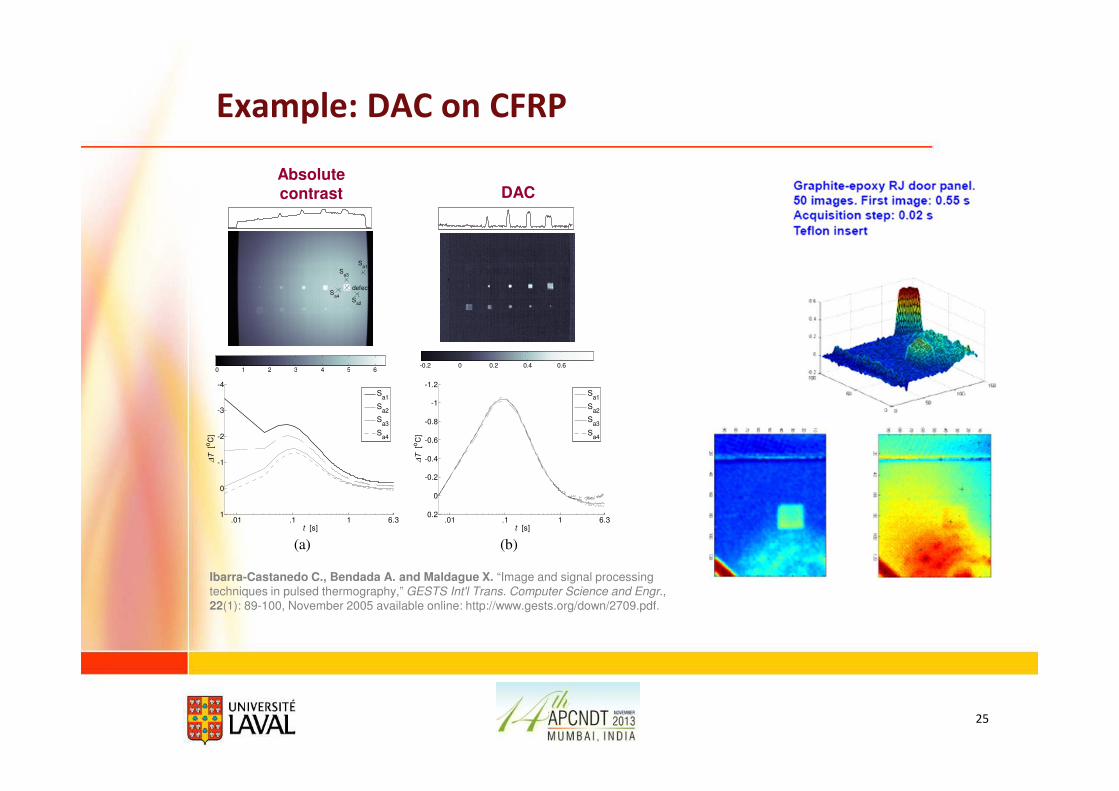
Absolute contrast DAC
Ibarra-Castanedo C., Bendada A. and Maldague X. “Image and signal processing
techniques in pulsed thermography,” GESTS Int'l Trans. Computer Science and Engr.,
22(1): 89-100, November 2005 available online: http://www.gests.org/down/2709.pdf.
Example: DAC on CFRP
26
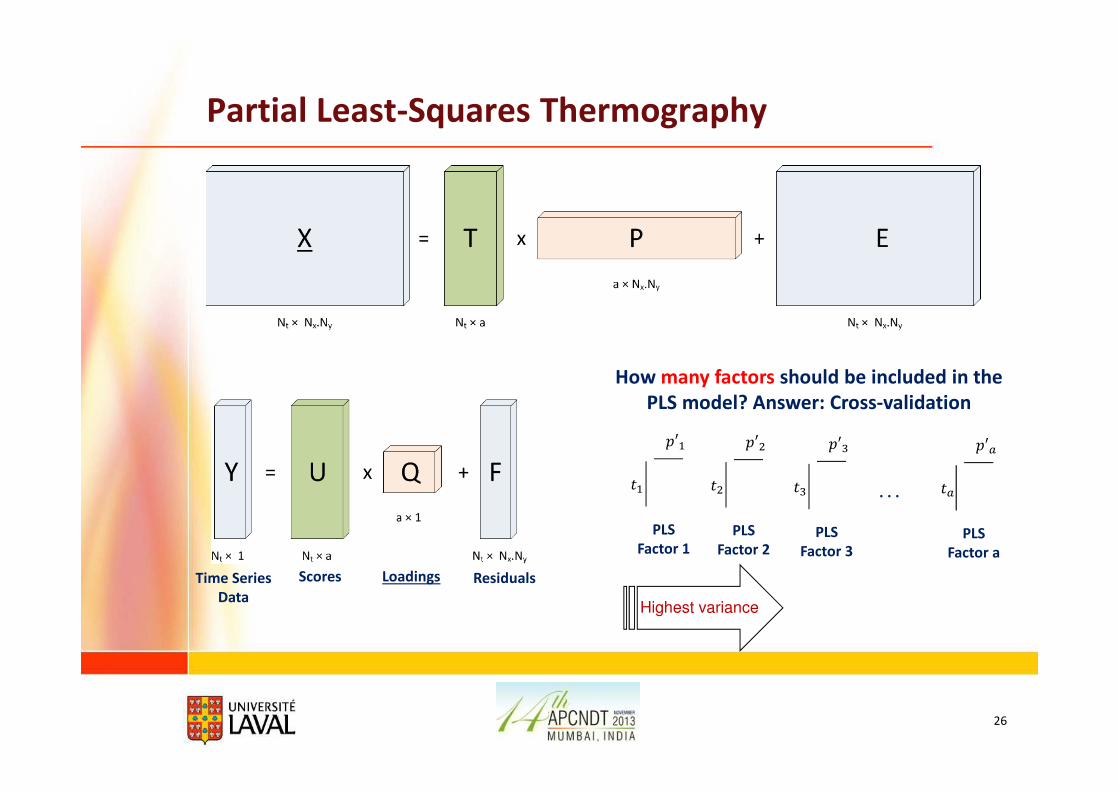
Partial Least-Squares Thermography
Time Series
Data
Scores
Highest variance
Loadings Residuals
PLS
Factor 1
��
�′�
PLS
Factor 2
��
�′�
PLS
Factor 3
��
�′�
PLS
Factor a
��
�′�
. . .
How many factors should be included in the
PLS model? Answer: Cross-validation
27
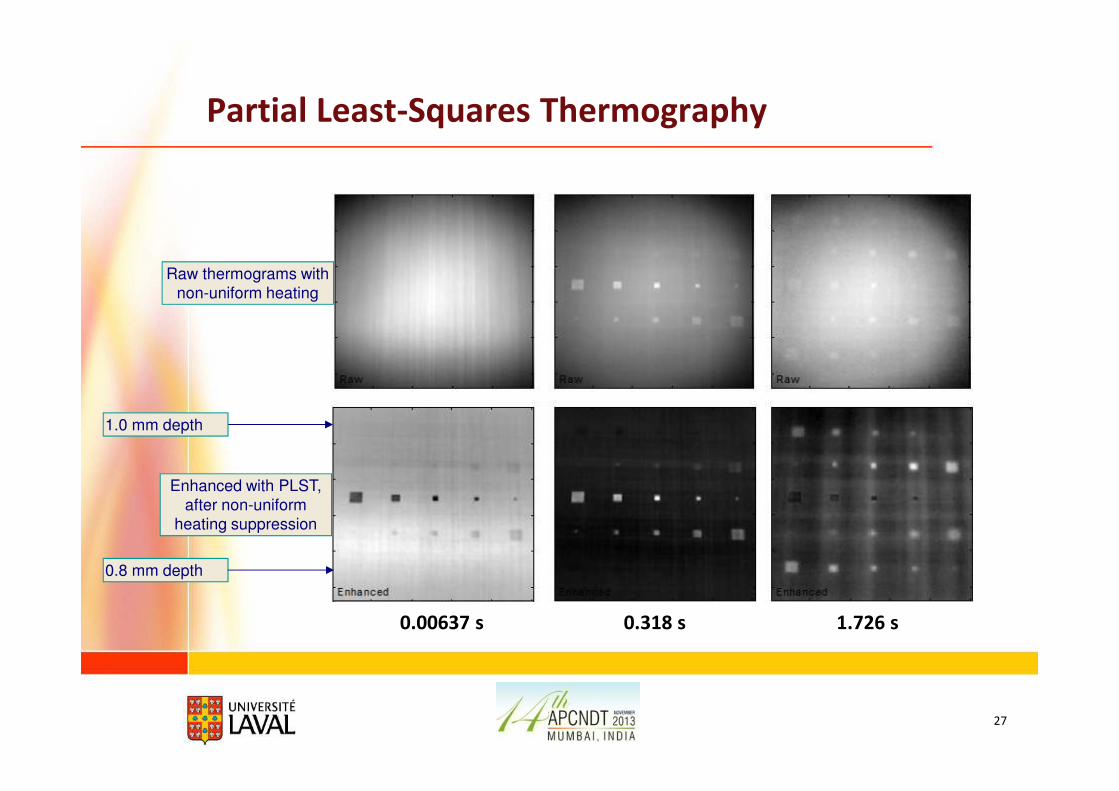
Partial Least-Squares Thermography
0.00637 s 0.318 s 1.726 s
0.8 mm depth
1.0 mm depth
Raw thermograms with
non-uniform heating
Enhanced with PLST,
after non-uniform
heating suppression

28
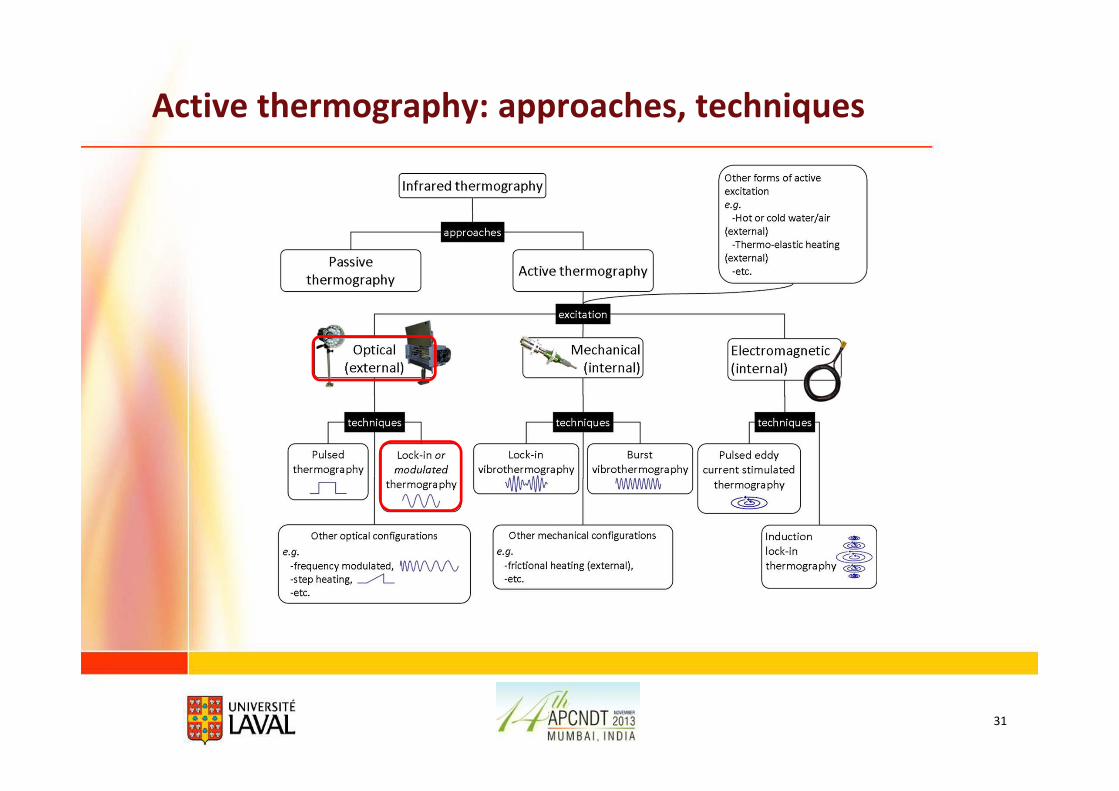
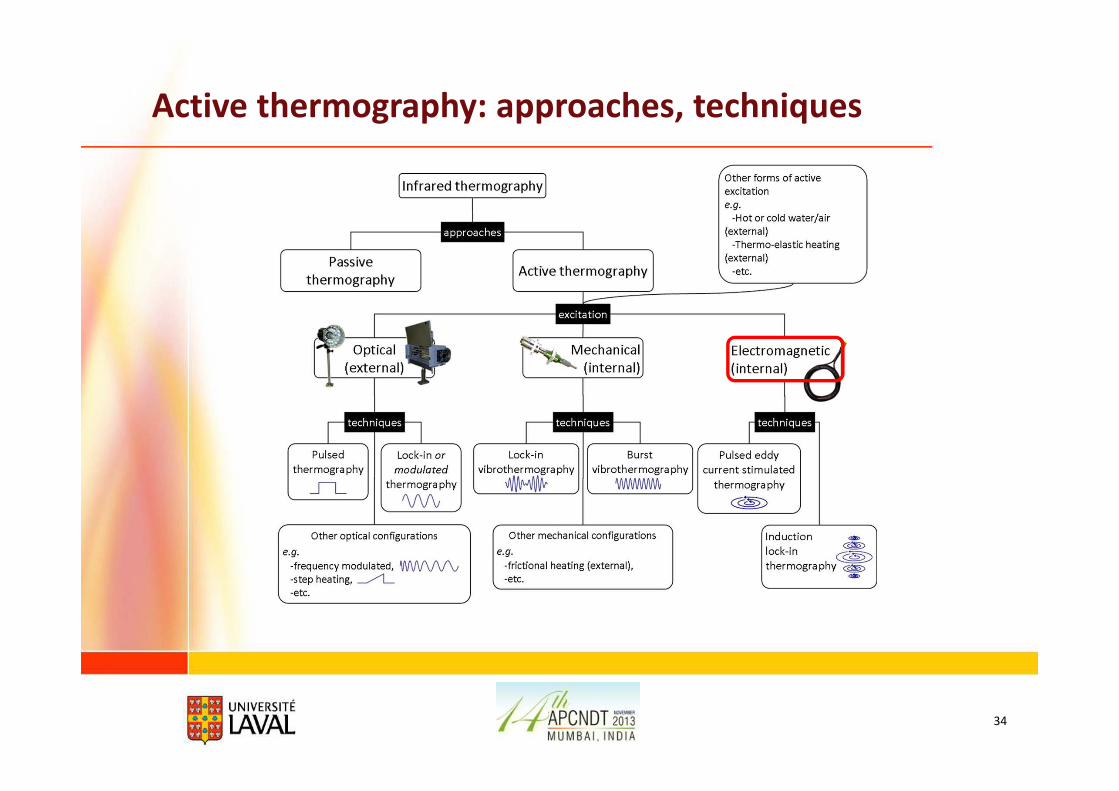
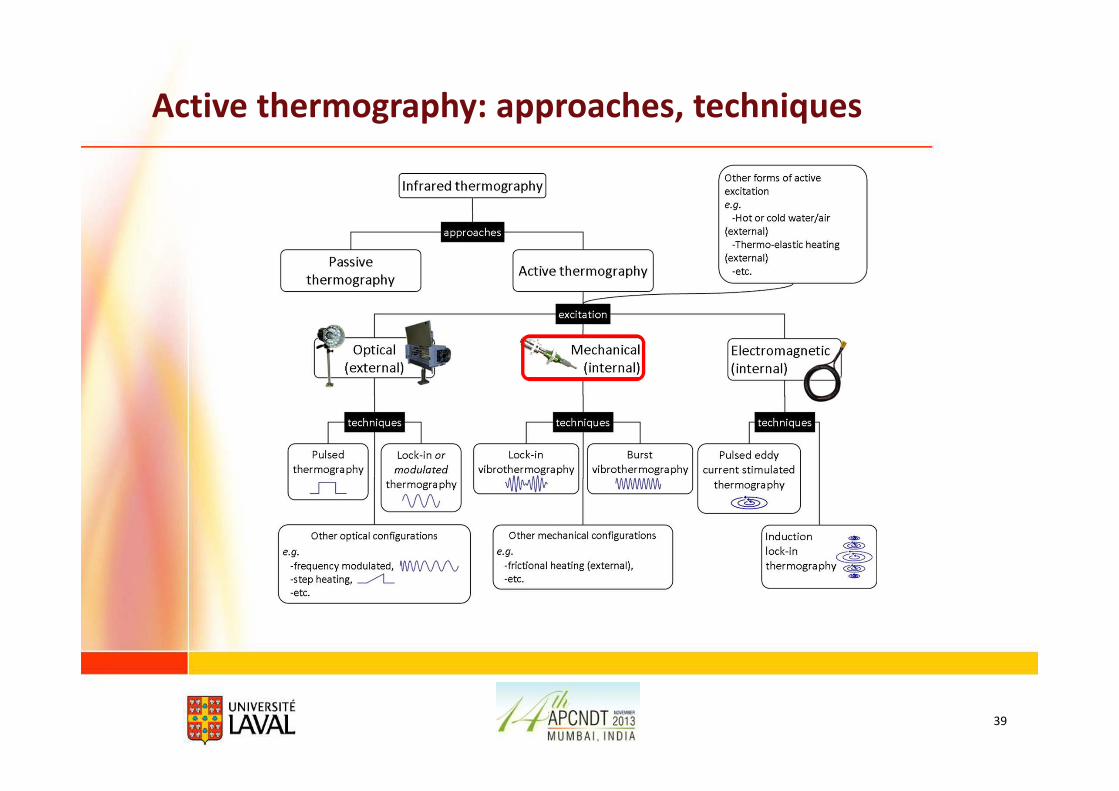
Active thermography: approaches, techniques
29
Pulsed thermography
30
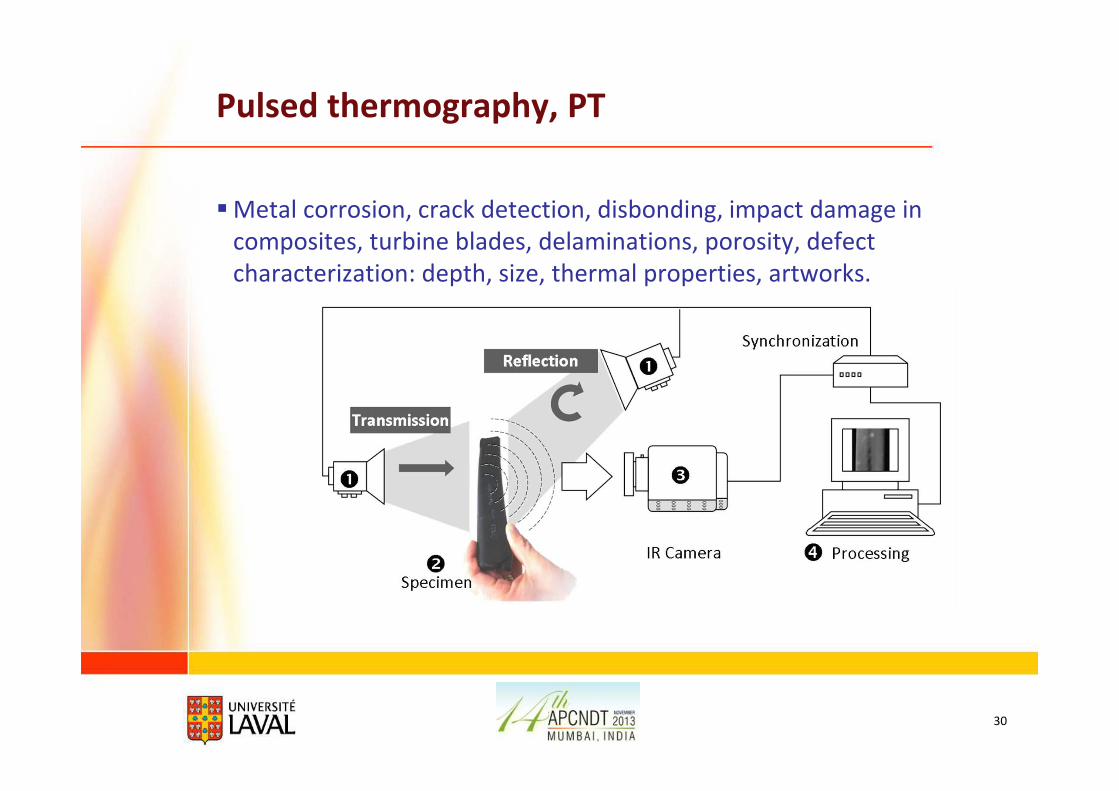
Pulsed thermography, PT
�Metal corrosion, crack detection, disbonding, impact damage in
composites, turbine blades, delaminations, porosity, defect
characterization: depth, size, thermal properties, artworks.
31
Active thermography: approaches, techniques
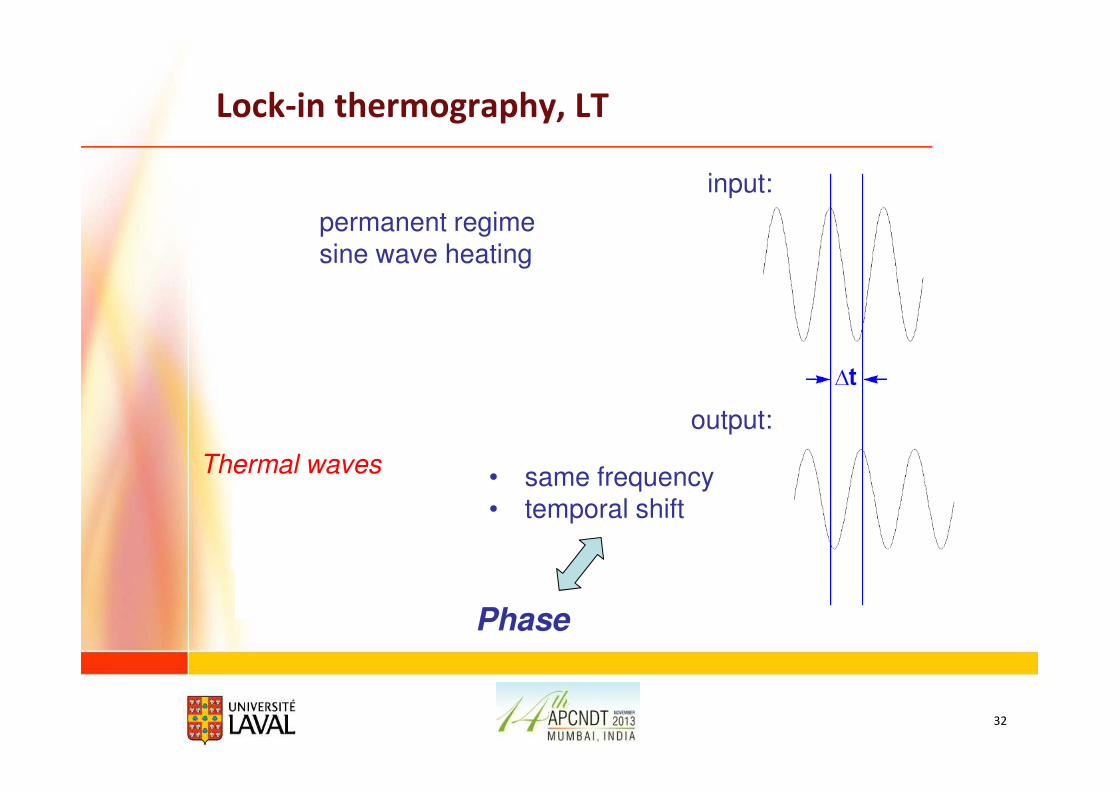
Lock-in thermography, LT
32
Phase
permanent regimesine wave heating
• same frequency• temporal shift
Thermal waves
input:
output:
33
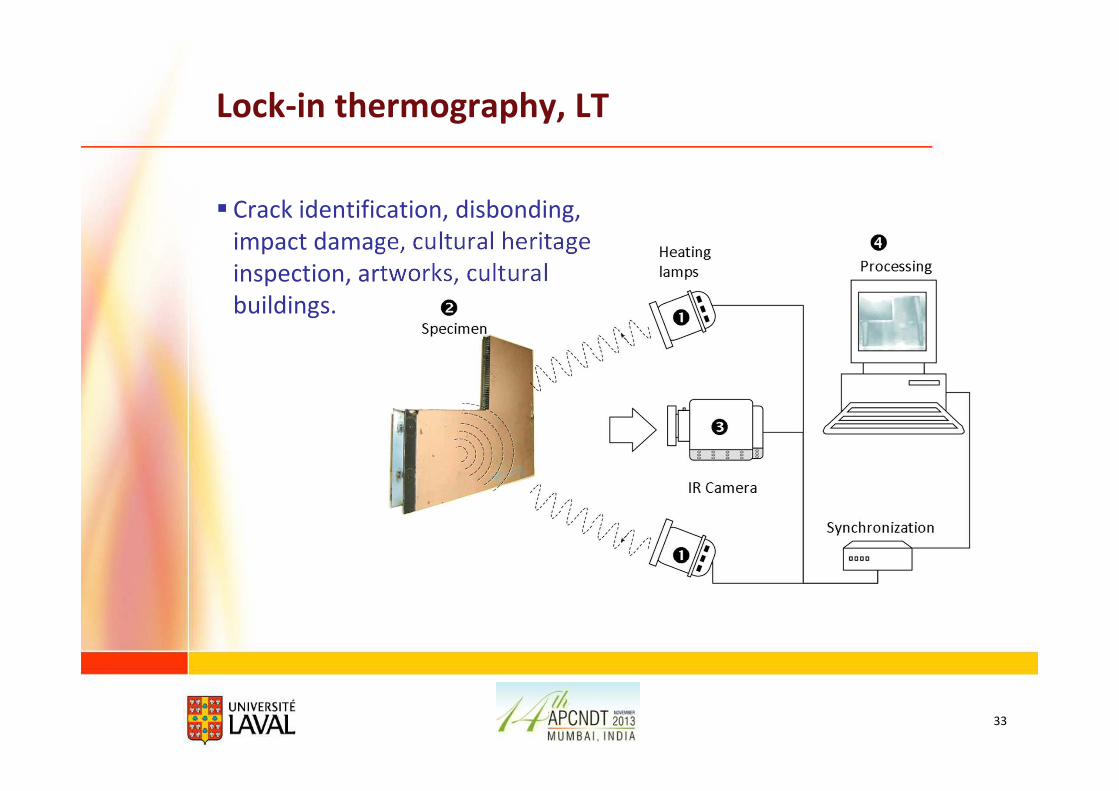
Lock-in thermography, LT
� Crack identification, disbonding,
impact damage, cultural heritage
inspection, artworks, cultural
buildings.
34
Active thermography: approaches, techniques
35
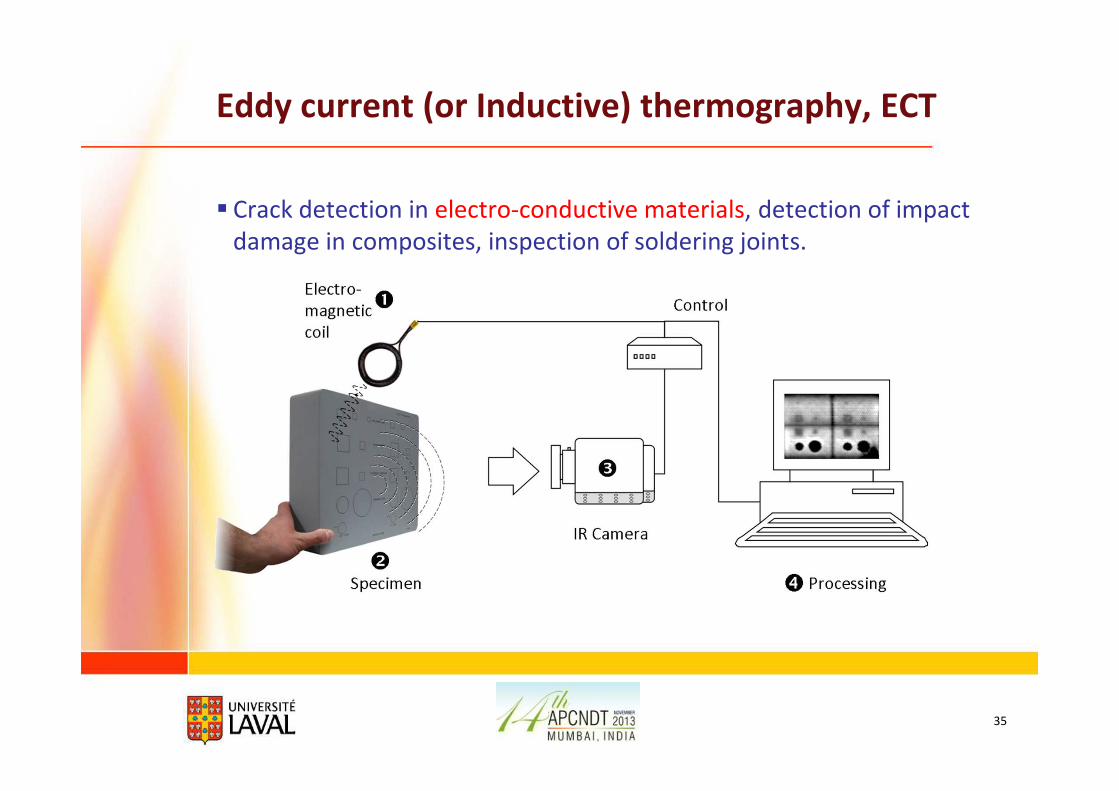
Eddy current (or Inductive) thermography, ECT
� Crack detection in electro-conductive materials, detection of impact
damage in composites, inspection of soldering joints.
36
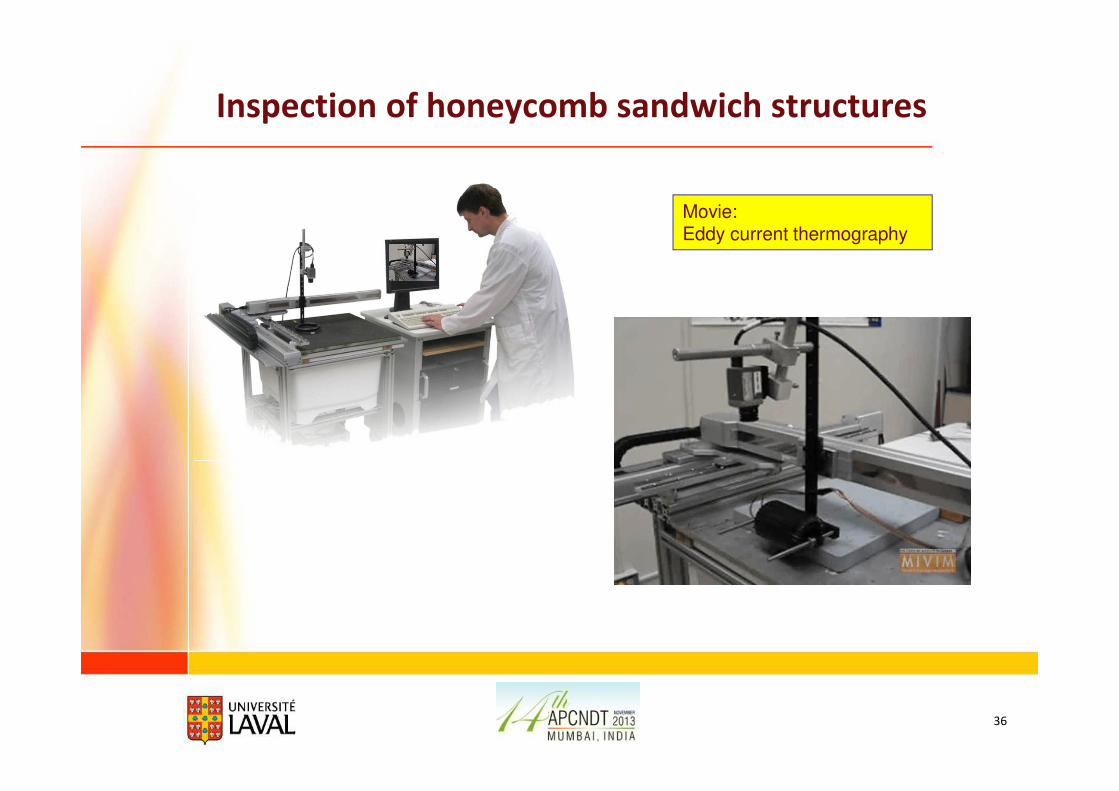
Inspection of honeycomb sandwich structures
Movie: Eddy current thermography
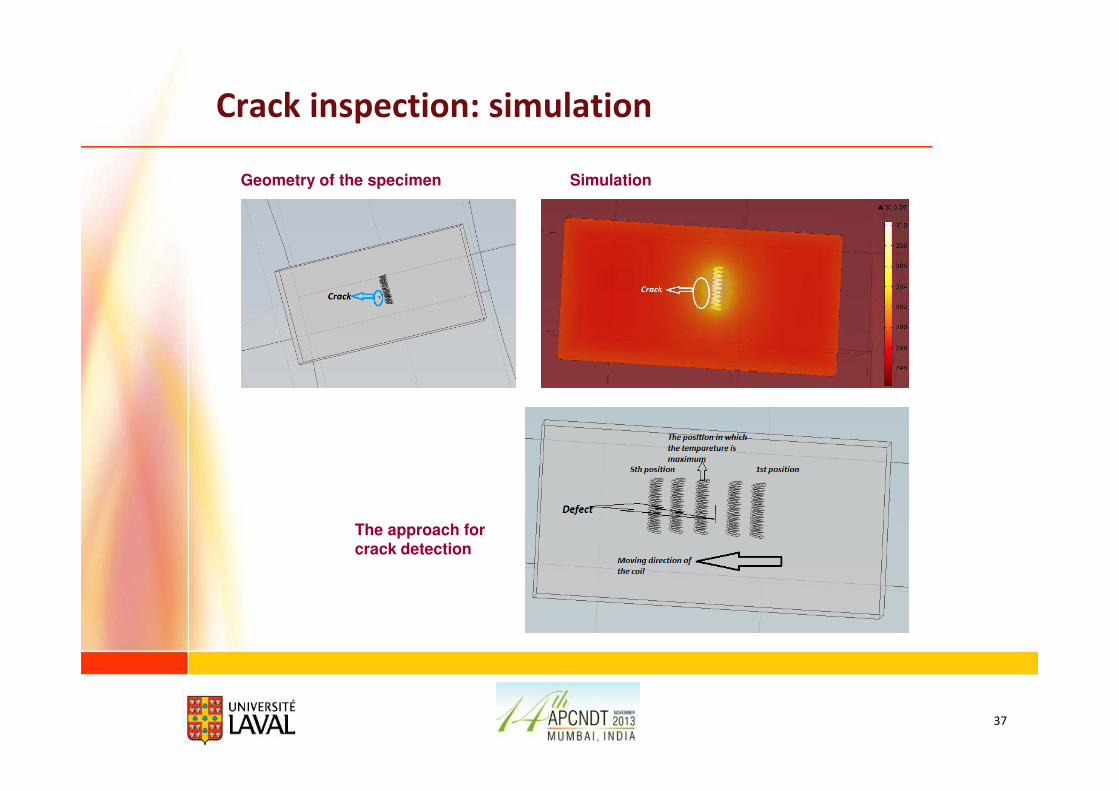
Crack inspection: simulation
37
The approach for crack detection
SimulationGeometry of the specimen
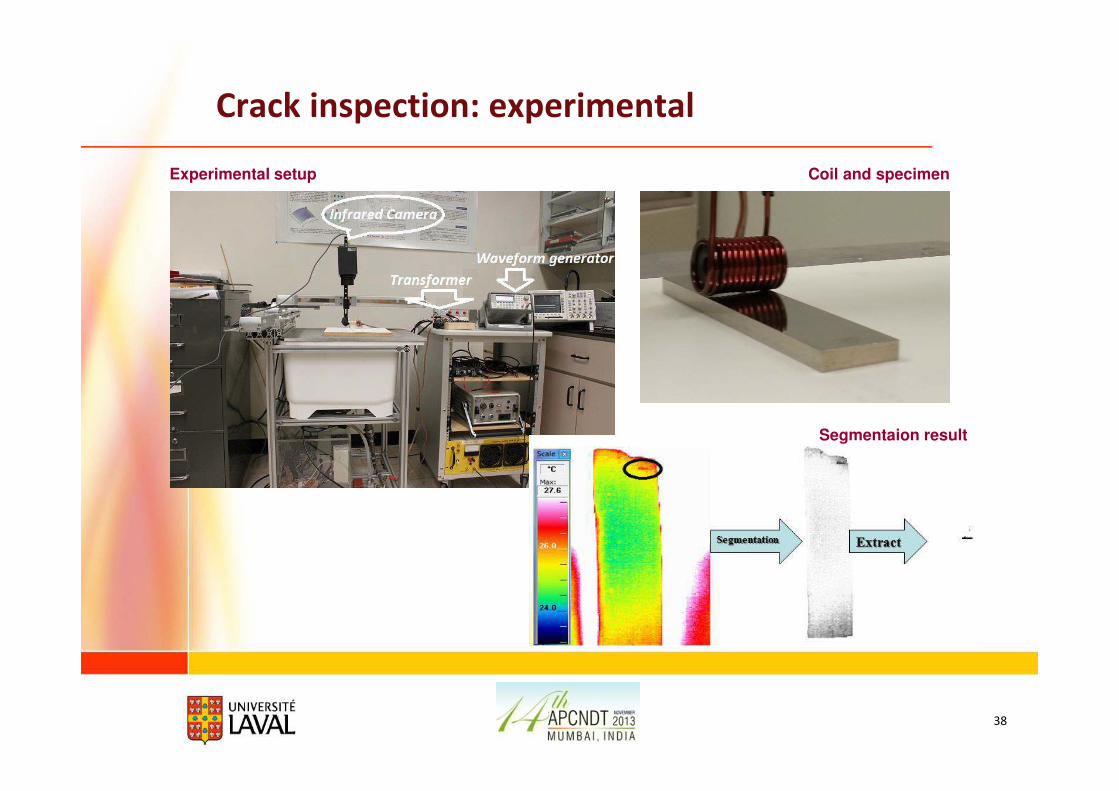
Crack inspection: experimental
38
Experimental setup Coil and specimen
Segmentaion result
39
Active thermography: approaches, techniques
40
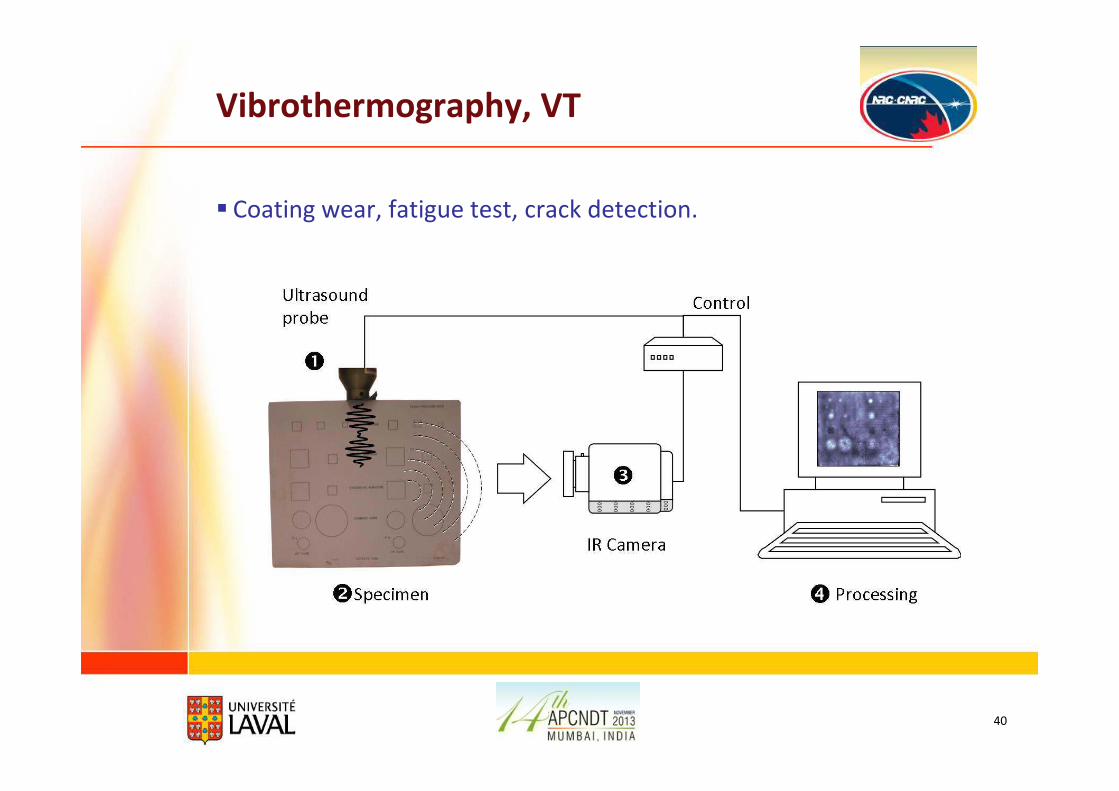
Vibrothermography, VT
� Coating wear, fatigue test, crack detection.
41
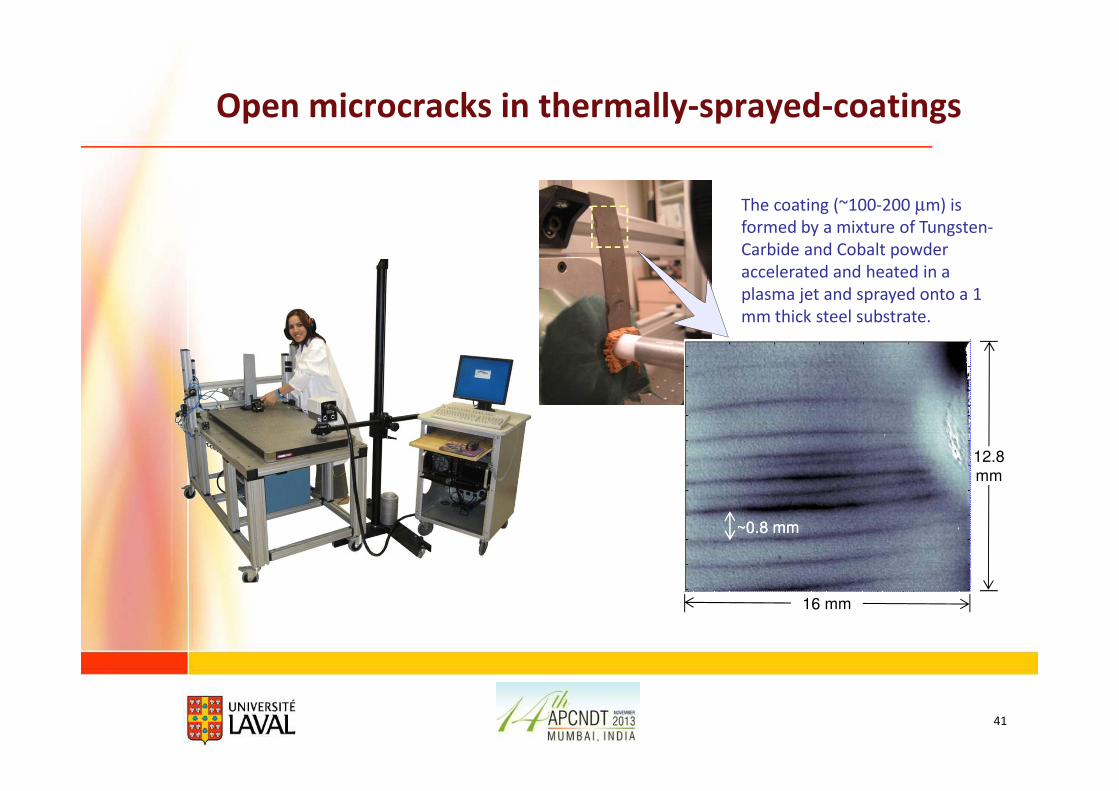
Open microcracks in thermally-sprayed-coatings
The coating (~100-200 µm) is
formed by a mixture of Tungsten-
Carbide and Cobalt powder
accelerated and heated in a
plasma jet and sprayed onto a 1
mm thick steel substrate.
12.8
mm
16 mm
~0.8 mm ~0.8 mm
42
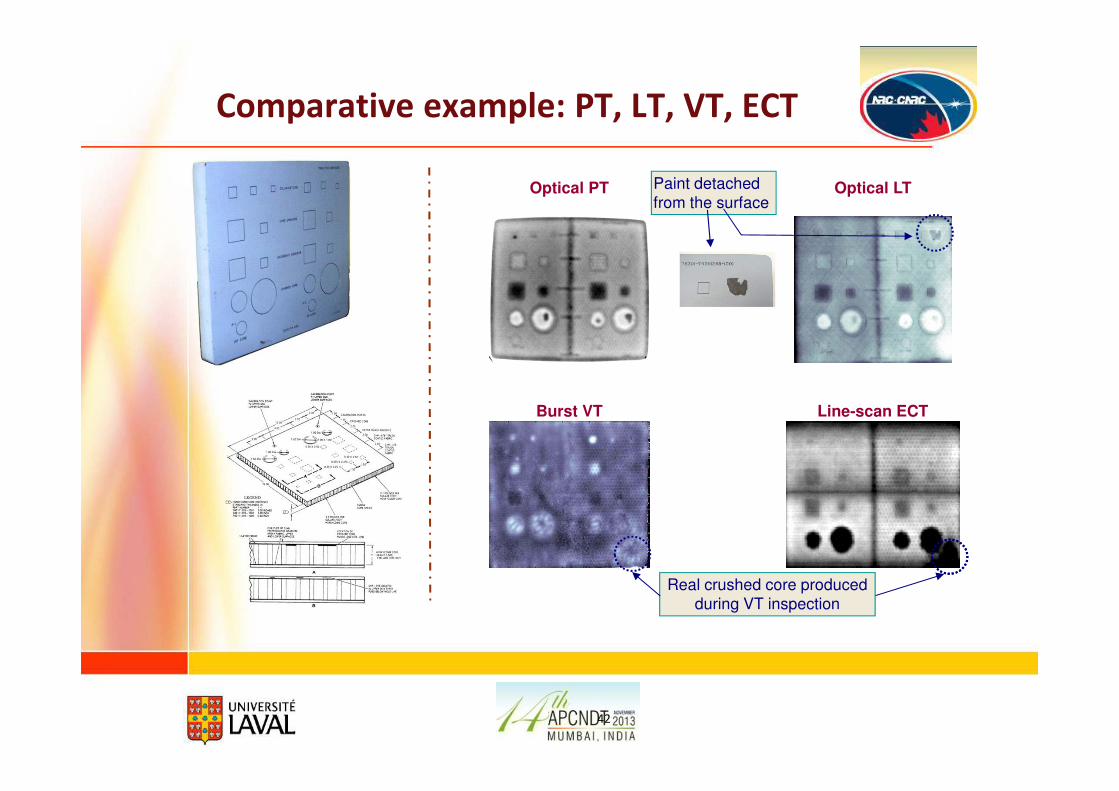
Optical PT Optical LT
Burst VT Line-scan ECT
Real crushed core produced
during VT inspection
Paint detached
from the surface
Comparative example: PT, LT, VT, ECT
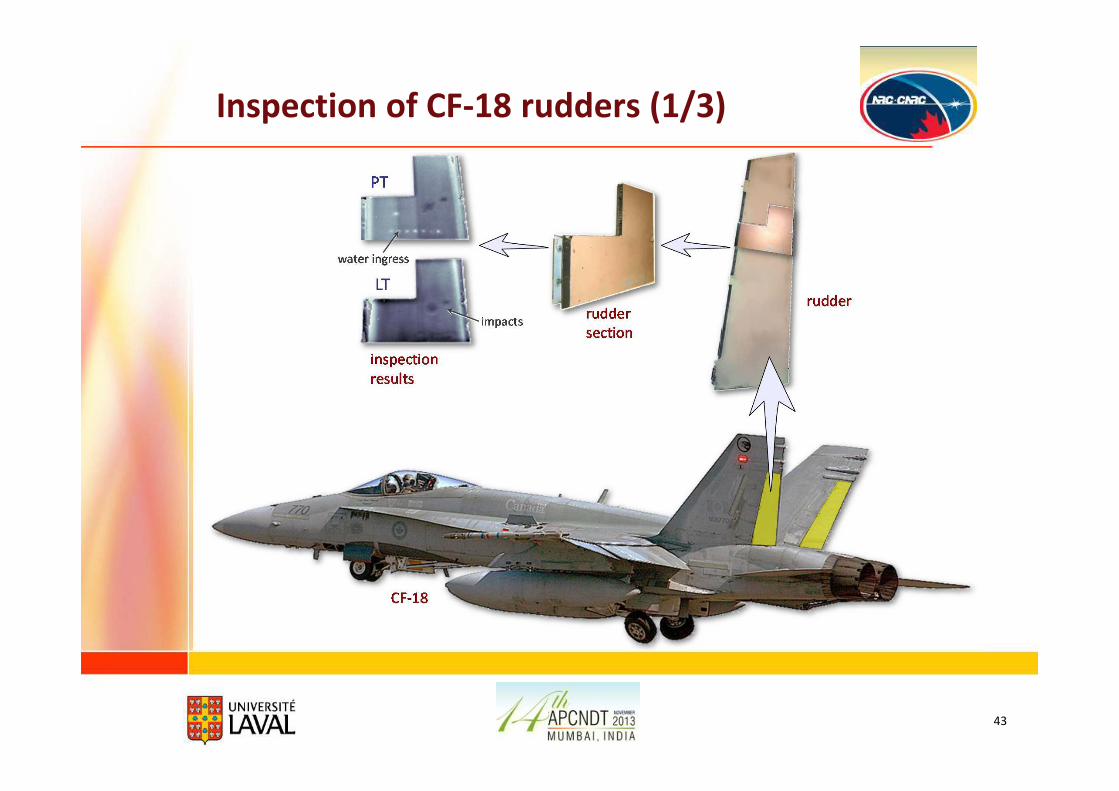
Inspection of CF-18 rudders (1/3)
43

Inspection of CF-18 rudders (2/3)
� Impact of de-noising with synthetic data
f=0.015 Hz f=0.04 Hz f=1.2 Hz
PPT from raw
pulsed data
PPT from
synthetic
pulsed data
44
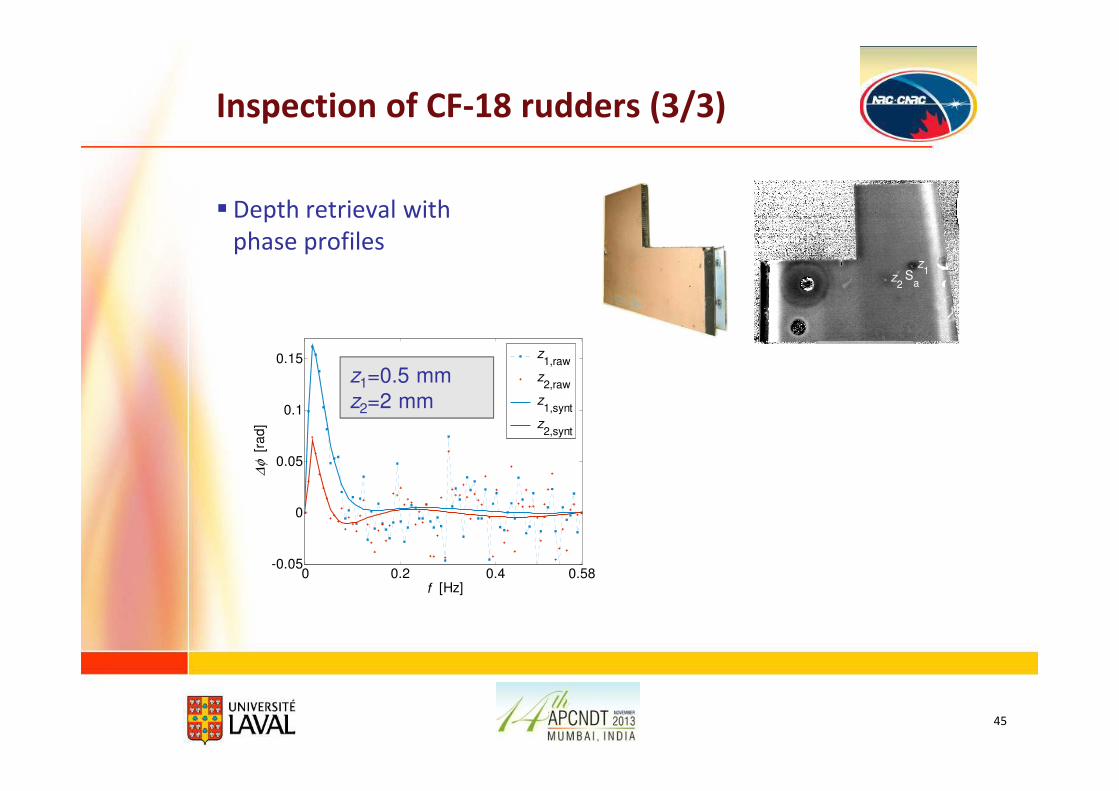
Inspection of CF-18 rudders (3/3)
�Depth retrieval with
phase profiles
0 0.2 0.4 0.58-0.05
0
0.05
0.1
0.15
f [Hz]
∆φ
[ra
d]
z1,raw
z2,raw
z1,synt
z2,synt
z1=0.5 mm
z2=2 mm
Sa
z1
z2
45
46
5. Thermal Infrared NDT: More Applications5. Thermal Infrared NDT: More Applications
47
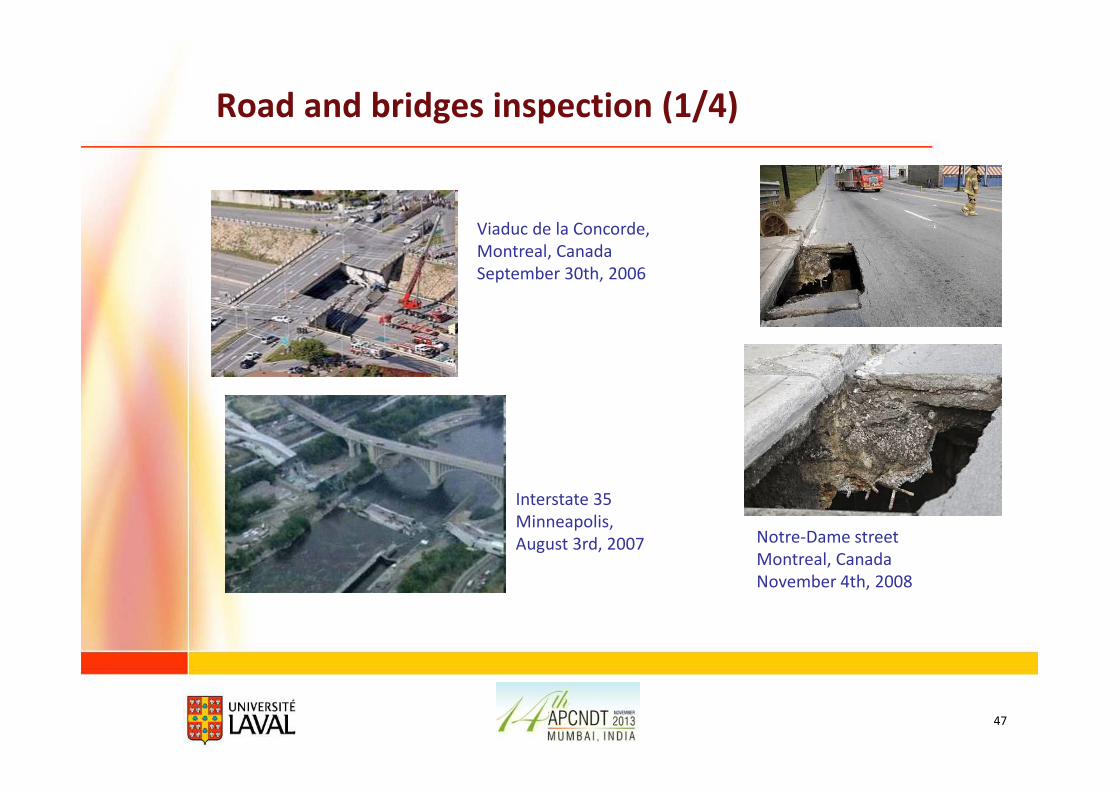
Road and bridges inspection (1/4)
Notre-Dame street
Montreal, Canada
November 4th, 2008
Interstate 35
Minneapolis,
August 3rd, 2007
Viaduc de la Concorde,
Montreal, Canada
September 30th, 2006
48
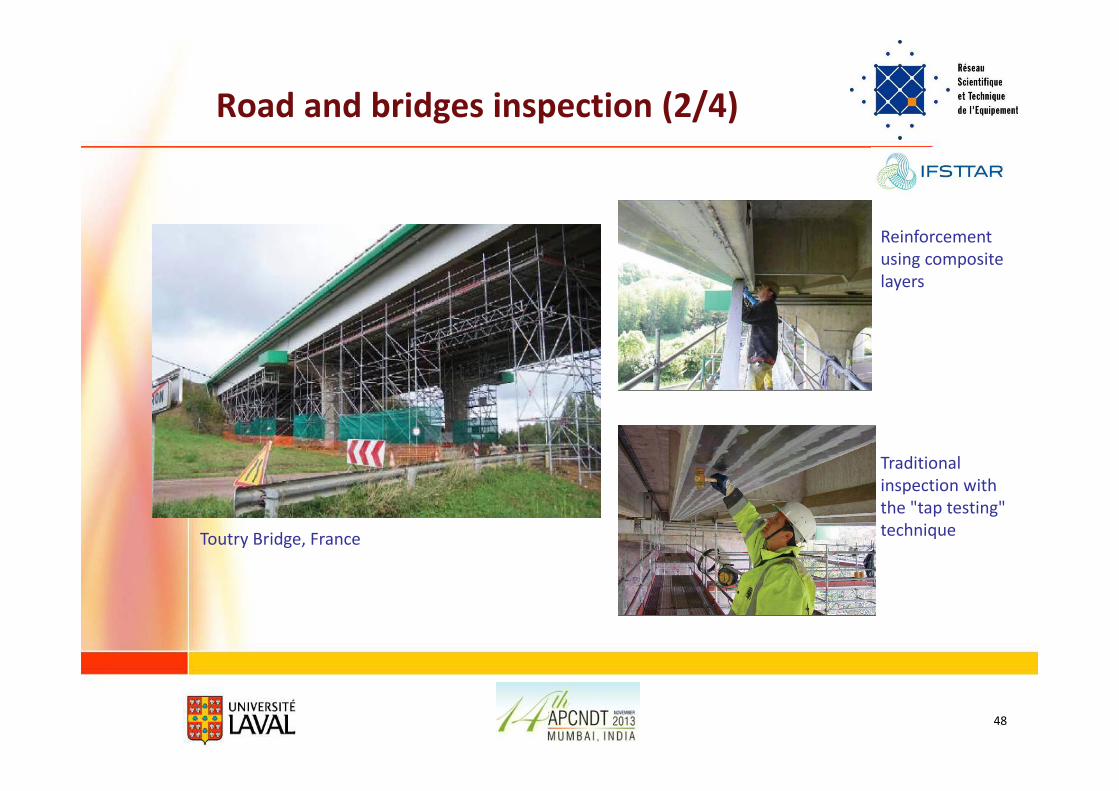
Road and bridges inspection (2/4)
Reinforcement
using composite
layers
Traditional
inspection with
the "tap testing"
techniqueToutry Bridge, France
49
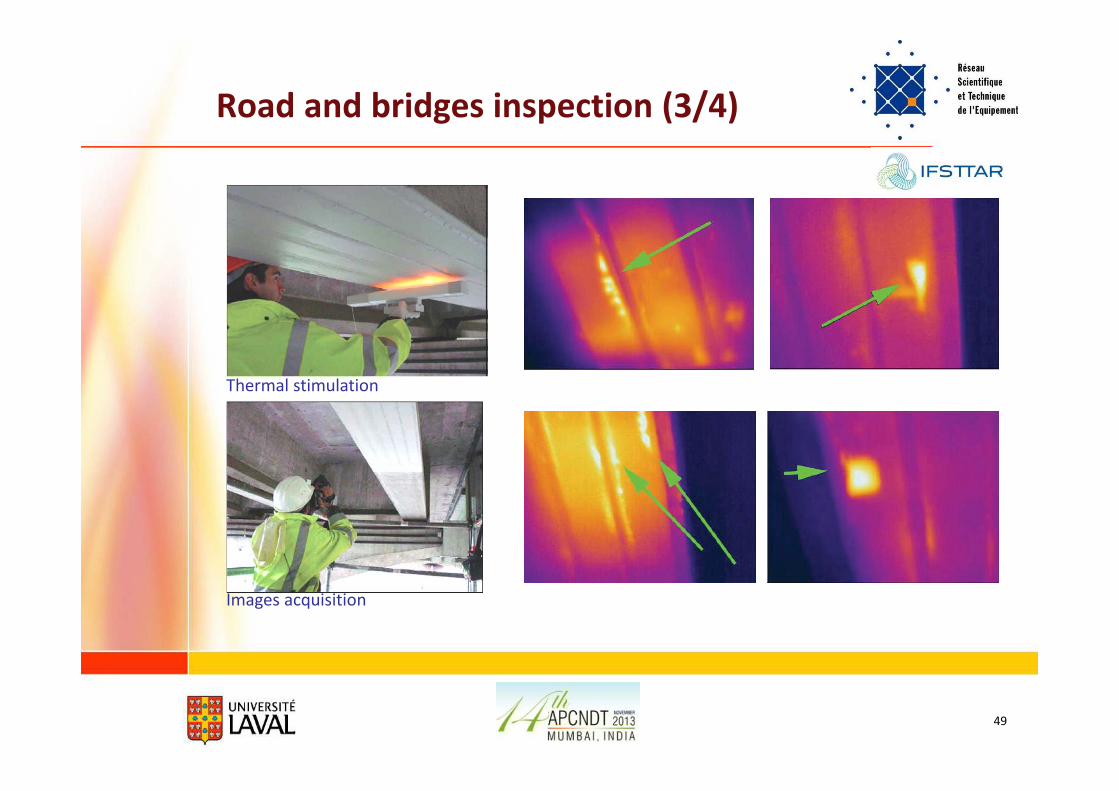
Road and bridges inspection (3/4)
Thermal stimulation
Images acquisition
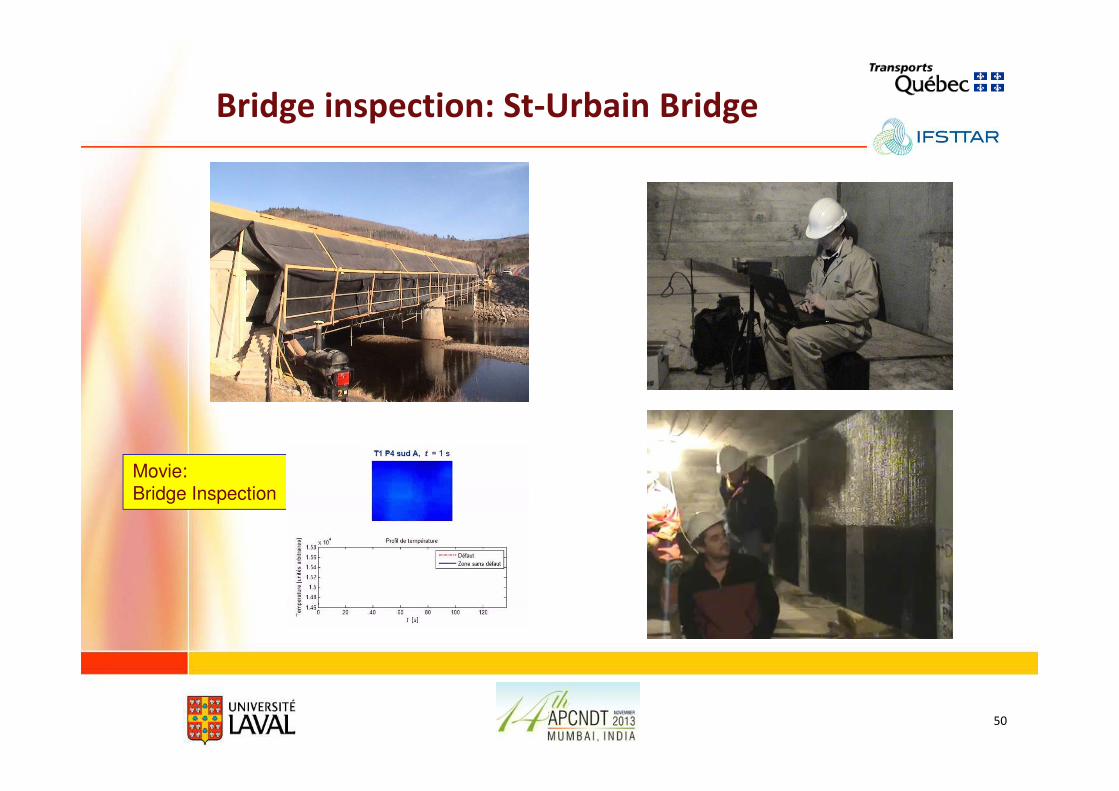
Bridge inspection: St-Urbain Bridge
50
Movie: Bridge Inspection
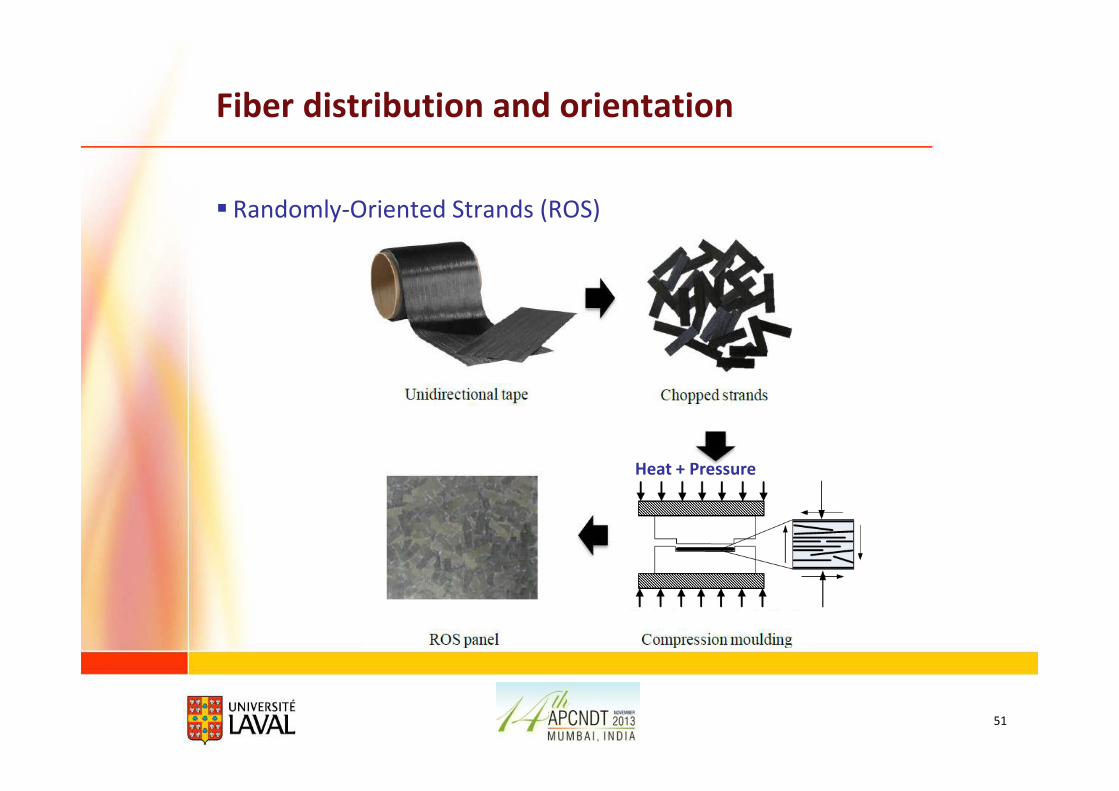
Fiber distribution and orientation
� Randomly-Oriented Strands (ROS)
51
Heat + Pressure
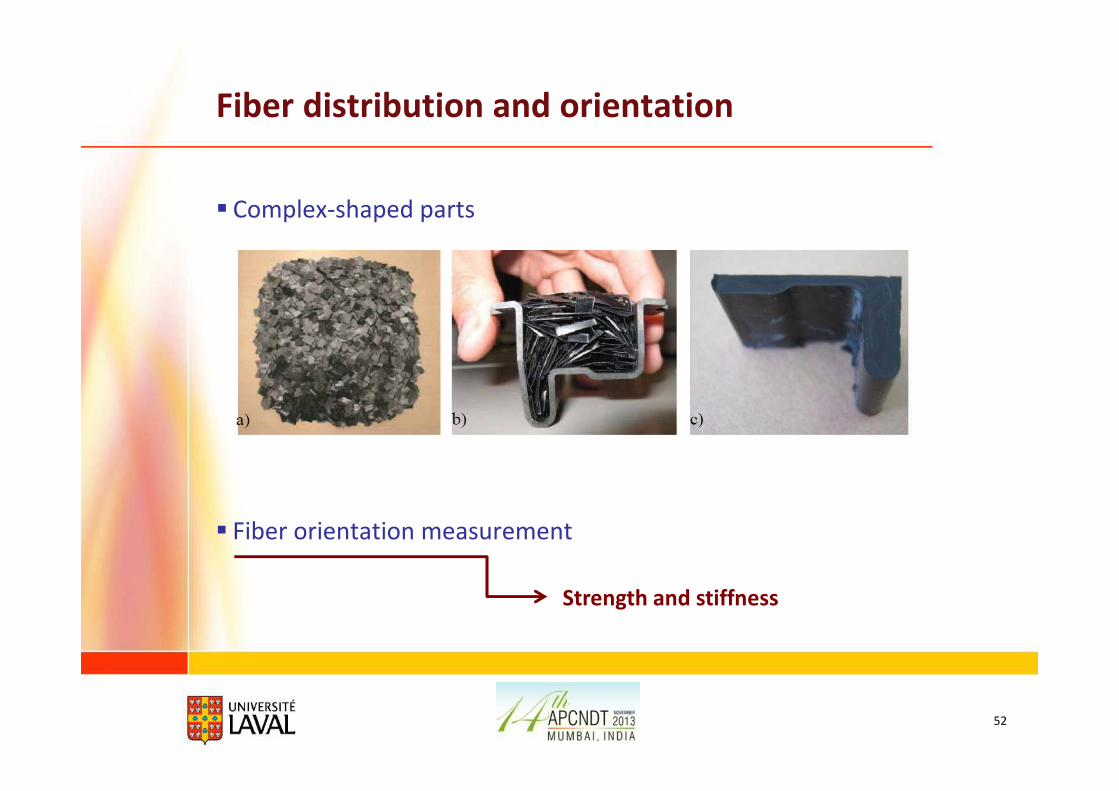
Fiber distribution and orientation
� Complex-shaped parts
52
� Fiber orientation measurement
Strength and stiffness
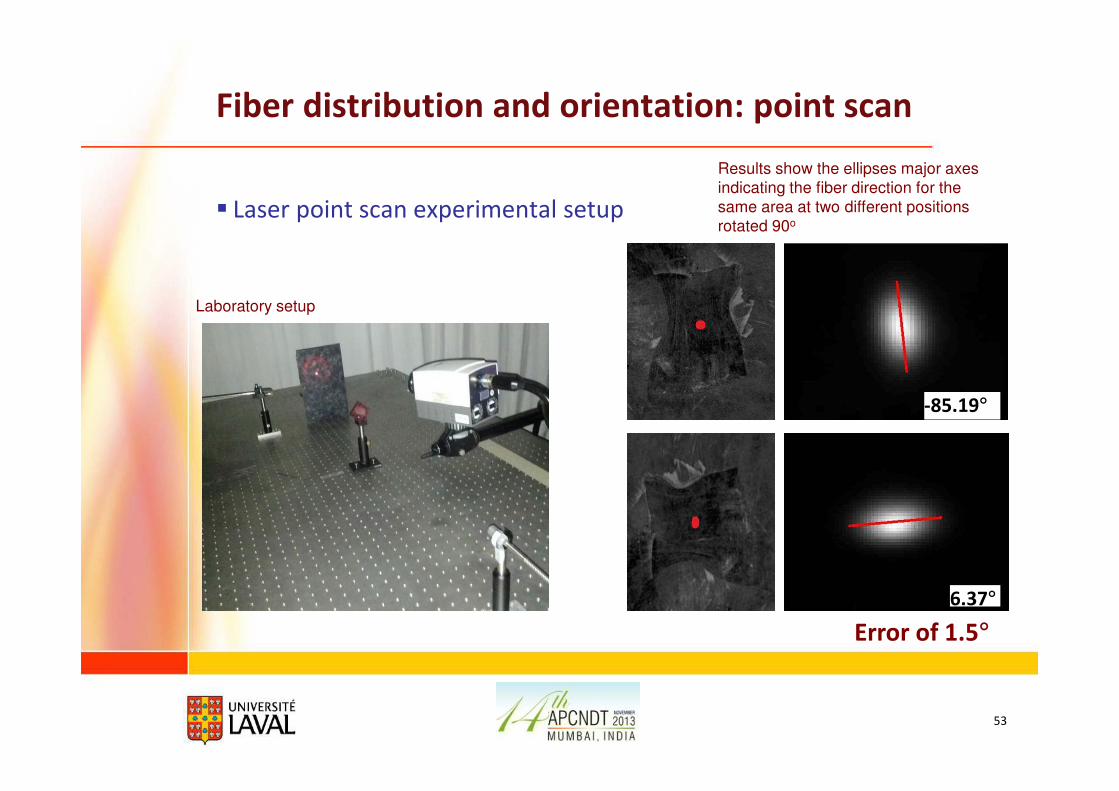
Fiber distribution and orientation: point scan
� Laser point scan experimental setup
53
Laboratory setup
Results show the ellipses major axes
indicating the fiber direction for the
same area at two different positions
rotated 90o
6.37°
-85.19°
Error of 1.5°
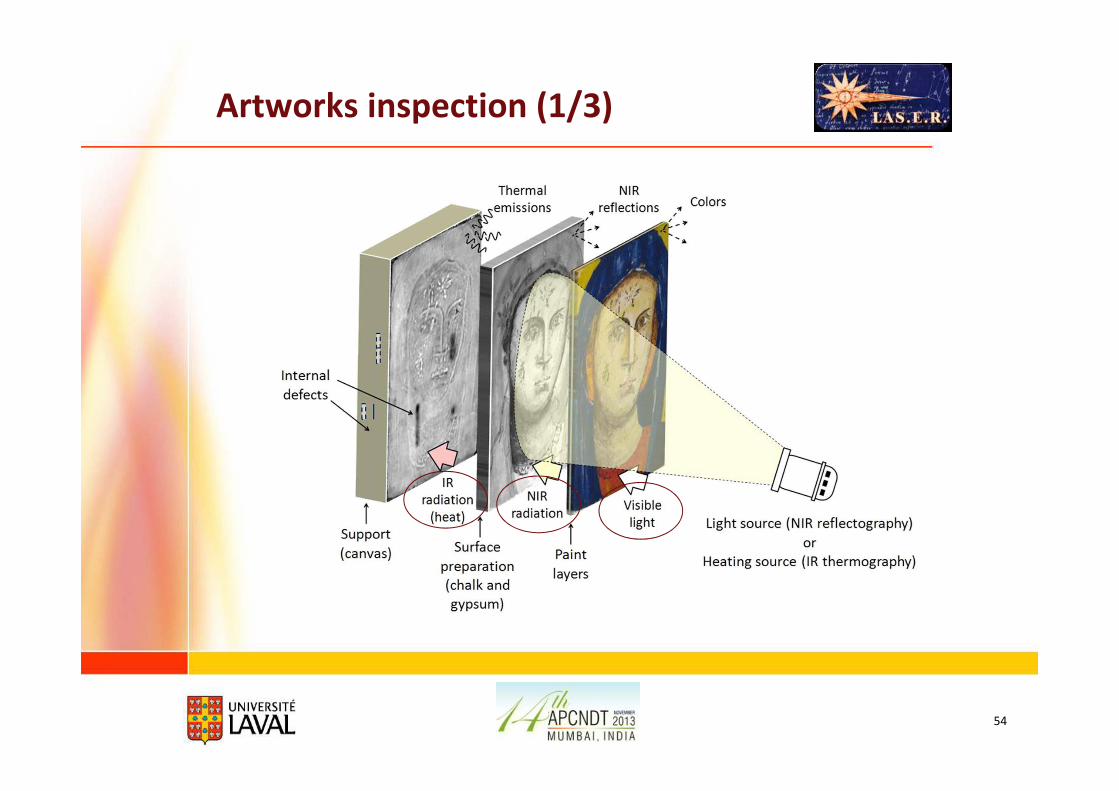
Artworks inspection (1/3)
54
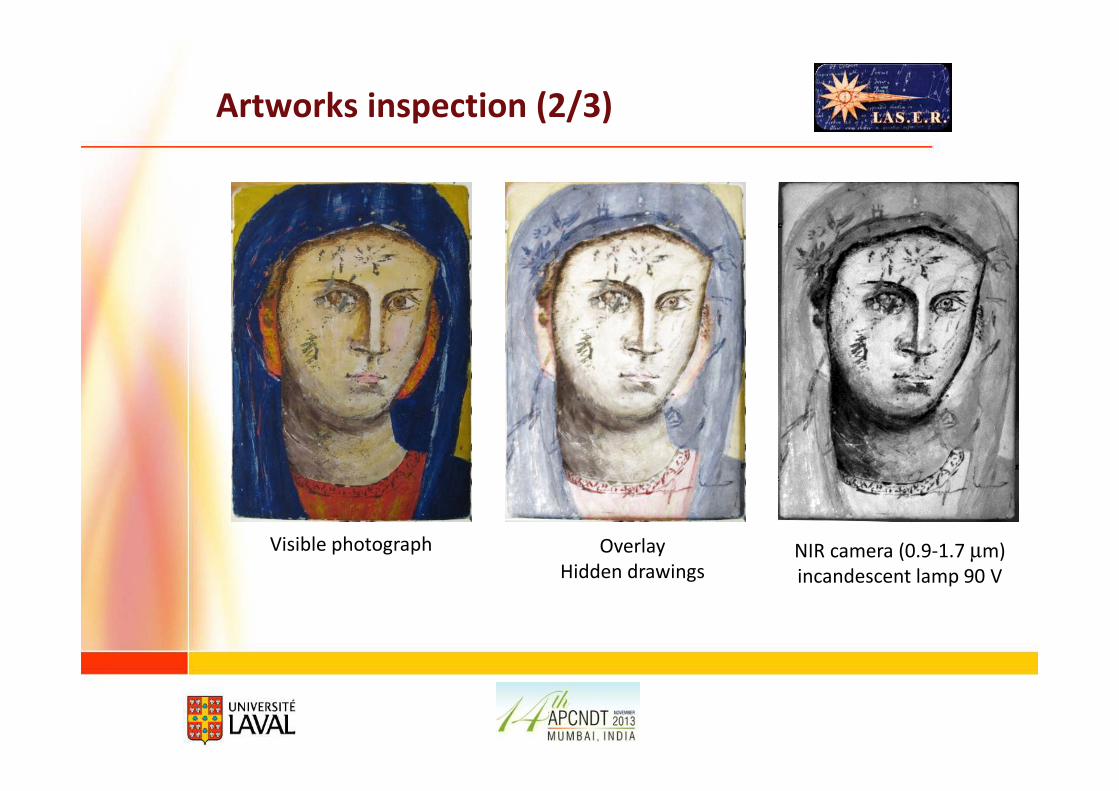
Artworks inspection (2/3)
Overlay
Hidden drawingsNIR camera (0.9-1.7 µm)
incandescent lamp 90 V
Visible photograph
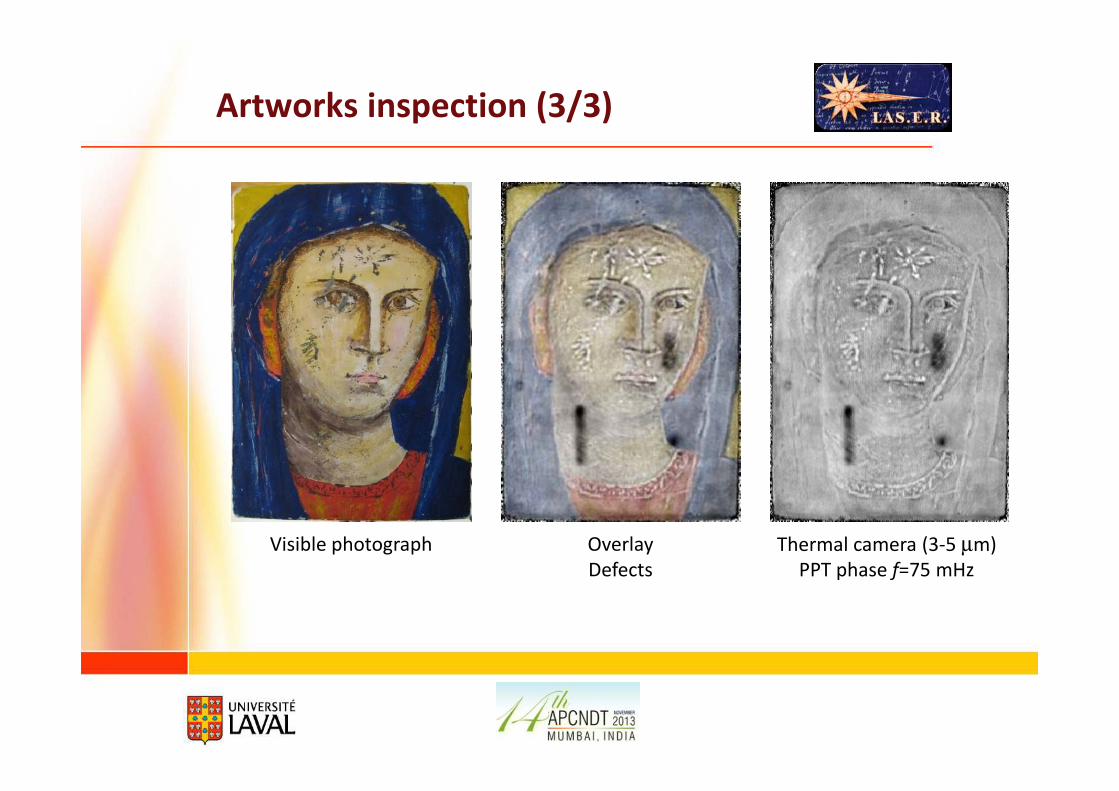
Artworks inspection (3/3)
Overlay
Defects
Thermal camera (3-5 µm)
PPT phase f=75 mHz
Visible photograph
57
6. Conclusions6. Conclusions
58
Conclusions
� Infrared reflectography and transmittography employ the non-
thermal part of the infrared spectrum, where the
opacity/transparency of materials, subjected to a specific infrared
radiation, are exploited to detect internal anomalies in materials.
� Infrared thermography works in the thermal part of the infrared
spectrum under the principle that dissimilar materials provide
different thermal signatures, useful for surface/subsurface defect
detection.
� Passive thermography is typically used in the field of security and
surveillance, biological applications, the inspection of electrical and
electronic components, and buildings among others.
59
Conclusions (cont.)
� Active thermography is widely used in aerospace and automobile
industries and is finding new applications such as the inspection of
bridges and roads and the assessment of artworks and cultural
heritage.
� Data processing techniques are required to enhance contrast, to
improve the spatial resolution and to increase the signal-to-noise ratio
of the infrared signal.
� Continual technological progress in commercial infrared cameras and
computers , as well as the constant development of new processing
techniques, have promoted the appearance of new and innovative
applications for infrared vision.
�� �
60
Thank you for your attention !
Recommended