Embed Size (px)
Citation preview
1111
1,11
11
Hun
,.'"'
unnu
unuu
nuu'
uuuu
uuuu
u111
1111
11!1
'quu
muu
muu
l
,111
1111
1111
1111
1111
1111
111
1111
1111
111
F2tA 'aft Ee-tk
Til:P010
4-f 44-
_
-Tfa_ TA-1'0 ra p-tr;:s'E -Tt qgmifkiirfro -D'i ftír íi iii 11az_ Nvif_ifitl- -foj
TTiT1CL 1LTITE it1-1'; -741 [1:Ci7:0 iOlIfTff I frEflitpr-Ap. ,-01r ra:1
JprflTbr Ji uï ib L11bi)-4;p="ex2 rifem,a.eilfrExel 11176:1 :1-91.1:11-SEr. )11FQ-ii,
if; 1:frOT TrT.T_T4-'7r_rr) CVITD r_5111):Ta_tir1i [dal) r,-TO:1)
.09 ro ji)jr».*11j1?,:fl i'Llt_12 [-WAD 17,1,1157 IN1)-1:IVECi1CFArá Dr;i7 '0"ta re®-Alf
(§)-f Aff:Cekir (sIjrp 'DJ fOdffe_d1
-royi fitec-J-il (6)161 rcliq aálTarr_a_g -
FDA)jpitrAitittYtzs figit_4_(=fs c0,31 dh. /ID+ ;-)TIT
1-P5rdh:D.701; LIFO:PVII5Y.,K3 FOVICT 161311I Wy<:»> (s_-_Fr_tiiCliff
Ti_v_qtti,w-dyt 41,5 qi.1:1-rt'n-R-0,15 fk.;' fp:-e-oD-ftfcyti'rDII -141-1-51-)fi fri2
fxvi-i6)--,--it_c0Tryi-, F14.3 [kJ riti-Tr?Virro-,t7D- (-6-11:1 cow:055107EG,
Cfftiii (iffg, (111:Th_a rip:TIble*--,11.ffì Sy ,:rilijY1 froAL,C. Ic a:s'Ic5:4:16.T.cirfaffE I íThfli rfc_na-41-11;:_i-JT. ib40:6'_tifiLff-W, ik7C4Ift(?:;_b_TIafiTnn ATITJT_O.kjiu 'Ç Ofl
wIf?Aff...3_ r rff 015 W7,ntr:0,-_,0,-paill 1_76)-±§1g, rjA.,ll ITAC)
_royt 41V-;,c5 qtruilar:ClahW,- Lai-WM' cfYIK Jrf3:01 rib_Tmlft rP_ tfAe
44.71-11I-OfFS WifkaWX.01W -12! lb:6j LP. rj:ki-VDZA14)-.
Ji /i_.AfEak-T:fiTO 174_1(0 rpirrw)rEdy1a-5 of.orcft &,c,o(5f011_ iff:?:s-g110:4-§N.-:
-1):0116A\s. _j7G. CO) WC1h.14-7G _
ifv3 TroaTf_QRT-DT,ic c írfIm jï- ItifrKe -s,7
6)7 Tí Lfe'VJJ),70: oij _n_65", f:01EVITIVA.7- FIC*5 riki_rcgs, (5.-2
TP.11 FPJ'_40,DT_O-D-AYA_ ?Di) Ibl=fV,Vlailiq..011:'
P.40 E!.;) 41PIFY: ,1-1IGVitial_eTATTACLt rJh
_ -9.51jj 'alkiwilzrcfri*, lb 11.W cG----DITtriejj cp,CjEitLiy;:cctrAelcK5 Jïtïf
qtA t,it IIiI,,ro7.-zá-L,_:q,:?..(
4_Ted: ,ot iiIiOIlI iiit r -itiotot
FAO Forestry SeriesNo. 33FAO Statistics SeriesNo. 155
Collection FAO:Forets N 33Collection FAO:Statistiques N 155
Colección FAO:Montes N 33Colección FAO:
t ad is tic a N 155
tt/tca
2000 Ti
FOODAND AGRICULTUREORGANIZATIONOF THEUNITED NATIONSRome, 2000
ORGANISATIONDES NATIONS UNIESPOURL'ALIMENTATIONET L'AGRICULTURERome, 2000
ORGANIZACIÓNDE LASNACIONES UNIDASPARALA AGRICULTURAY LA ALIMENTACIÓNRoma, 2000
Pr ittS7tizTa
1995-1999
ts
43-
.ffl .0;33
155 tL
AA -1$
t if1Fyearbook14 nuaire-mario
aEuctresta
*1,1,"A Ffl .)"-; SAZ., * fl 1gjiji.
r1<i wo,r w -rAq'T.t.i./JY_K 5-7; frf R-
The designations employed and the presentation of material in this publication do not imply the expression of any opinionwhatsoever on the part of the Food and Agriculture Organization of the United Nations concerning the legal status of anycountry, territory, city or area or of its authorities, or concerning the delimitation of its frontiers or boundaries.
Les appellations employées dans cette publication et la présentation des données qui y figurent n'impliquent de la part defOrganisation des Nations Unies pour l'alimentation et fiagriculture aucune prise de position quant au statut juridique despays. territoires, villes ou zones, ou de leurs autorités, ni quant au tracé de leurs frontières ou limites.
Las denominaciones empleadas en esta publicación y la forma en que aparecen presentados los datos que contiene noimplican. de parte de la Organización de las Naciones Unidas para la Agricultura y la Alimentación. juicio alguno sobre lacondición jurídica de países, territorios, ciudades o zonas o de sus autoridades, ni respecto de la delimitación de susfronteras o límites.
1,1", t LIA ti[~ I ffl , 1P A5.1,1 Vi1C ".6 Off PINZ ffi fr,i o
Chief, Publishing and Multimedia -Service, Information Division, FAO, Viale delle Terme di Caracalla,00100 Rome, Italy.
The data contained in this publication may be quoted provided that reference is made to the source. Two copies of the textindicating the data used should be sent to the Chief, Publishing and Multimedia Service, Information Division, FAO,Viale delle Terme di Caracalla, 00100 Rome, Italy.
Les données contenues dans cette publication peuvent étre reproduites à condition d'en indiquer la source. Prière d'envoyerdeux exemplaires de toute représentation ou reproduction au Chef du Service des publications et du multimedia,Division de l'information, FAO, Viale delle Terme di Caracalla, 00100 Rome, !talle.
Pueden citarse los datos contenidos en esta publicación, siempre que se ndique la fuente. Se ruega enviar dos copias deltexto en que aparecen los datos utilizados al Jefe del Servicio de Publicaciones y Multimedia, Dirección deInformación, FAO, Viale delle Terme di Caracalla, 00100 Roma, Italia.
© FAO 2001
I NTER N ET t4 0-19L ISBN 92-5-004407-0FAO agricultura! statistics are available at ISSN 0084-3768Les statistigues agricoles de la FAO sont disponibles sur
Las estadísticas agrícolas de la FAO se pueden consultar enwww.fao.org
Ak eiM )3t WC:if`4 :
FliR : FO-Registry @fao.org
.-"A+39 06 57055137
FAO, Viale delle Terme di Caracalla00100 Rome, Italy
Prepared by the statistics and economic analysis staff of the Forestry Department, FAO. Inquines about the technicalcontent should be addressed to:
Forestry Planning and Statistics Branch E-mail: [email protected] Policy and Planning Division Fax: +39 06 57055137FAO, Viale del le Terme di Caracalla00100 Rome, Italy
Preparé par le personnel des statistiques et de l'analyse économique du Dépadement des forêts de la FAO.La correspondance d'ordre technique au sujet de cette publication doit etre adressée
Sous-Division des données de base, Division de la statistique Mél.: [email protected] des politiques et de la planification forestières Télécopie: +3906 57055137FAO, Viale delle Terme di Caracalla00100 Rome, ltalie
Preparado por el personal de estadística y análisis económico del Departamento de Montes, FAO. La correspondenciarelativa al contenido técnico de esta publicación debe ser dirigida a:
Subdirección de Planificación y Estadísticas Forestales Correo electrónico: [email protected]ón de Políticas y Planificación Forestales Fax: +39 06 57055137FAO, Viale delle Terme di Caracalla00100 Roma. Italia
rovi
, iiszf%J3Ezts4 vi
vr6tvAxi
96 *16-1ALA.AfEl%E'Plig-tifil3tMR47-R)Itxii
tafEIXV1'_0_,V xiiiRgARN xv5C. A-1
A-3 **, Azis-44-40*1 4740
1998 *FR RE^Ei't A-4
62Ark., 3EL1fft 64
J 7F HIFiru_':, 1111=I1 652
3)in2,1Lpfh 5 al.Liv. ialifh. 661111=12. IL; 1-1fiti: 7 ili n I., W n tii. 67
fR; (-H-F) 4IA-tM-I 9 F"'l 'ii 4 i4' 2 68
f9 (1rt-F0±) 1 1=1'0:. a p fA. 7011 LE 111# di LI ffi 71
ffi0,44, g,ItV*7..,Tru.'-. MI1 14 IN *1-ADO. J.IL:HA 17
It DV:. Ill 1=1 18 tEffiMV-t, fre2t-- Jrz*?: (tc-h) itr,7ff., Atki.Ti 74
19 31t Ill'a. AL ri (A. 77
ffiP,M-t, 'nit*- (tfat) th QM, Iii nfA 80,i,, gr 20 TE7i ( V-01- )
iiifIJE - )i0.1+1 =11., ;411 -1 8222 a p a. a D fili: 85
Milt, 1=11`.4 25 Hil1-1., WA 87
du=i1A, Ilirmfb: 27 . ig41 (1FMt)TilfOrg - )J1Uil (V-0-1-) T'-4., 'rtl*It 89
29 ilipas ItLifili: 92
ALLit, Jal=1, -ft 31 li n1 , ffi LAM 94
SIS lit., ffi W.-ft 33
ilkfflf5 - /J11.1+1 (*Ot) J.It 4&,ir--2, MI q 35
A I-14, A n1t 38 AB&[Liplil.ffiWA 40 ?-11.., A#.A 98
.11HkitrAME9 - )]111*1 (lEt--H-h) AiLi.R. ADM: 101
ilt(ig, Jai=iti: 42 ffi iii X, HI i Ili- 104irbiiiIV:. 1-1-ii,ifA 43 t.A t&
III,IPAZ,f9 - )11I (1EW-F) i''r-f8.-. r'gMM 106A n V:, Aril :44 i41 Fi M: , aliftt 108Lis H -1, di i:4114- 46 ill Lit, di WA 110
VP11gfa &F N-8-&-,,,,,, i s.': 47!6':, '-#A 111
tiE41-IR*MCM"* (V-[+) Iliiii-1., iltpft. 1147a. 49 1-ink, tli Litt 116
t)gp-p-, KV&fg (-0+)
III
A
54161iff0)1X (1-Fifh)
55JAE,TAL fg
56Ift- ,I.1!FIU9 (Mt)
P'r 58#2TALFIJIM (1-0t)
59
TAOKr 51
118ffiFt(lt)At 3.41=1:1,DÍ 120
53122
1513ifili)0A
iv
It&.74..ìIj 123 A.442 At 4a
iL D-q [I fir 125
UHi ±u1A 127
EJMfftiltR, * 128
Ann 130
± iThE 132
EP .-TgfPR133
DÇI 135
Ili [IV., VI 137
gt&MA'S- 138
140
Ili Litt, iflDfj 142
*S. 4ti lekitx
144
ALI 31tt.rfA 146
WLI Hi fri 148
149
Ant, awn. 150
III: 151
152a, a 153
1H-I ffi W-11 154
155
At. 157dLJal 159
160Li f-FA 161
Wnt, ffinfg. 162
RÉ.EaM83.163
1W4., Mu% 164I I fti: 165
166I fh: 167
168
41PV. 169Air! fel 171
Ili 173
174175
r=1 176
14'8_Tgtr;I": tit 177L1=1-R. 11 178di riff, HFIí 179
!MaAt,t-At 180
Ingi, 182flW tli 184
L1
tlfrittl&186
341nM, n 189
ID LUI{ 192
194
ADM. 196
1.1;11-ff, rifti- 198
Pk. 199201203
14'-'etEEKMm4tr-1. 204
206
;Un fb. 208
210
jE. -a-. 2J-F1 I 212
ffluI±-. ffi 1=1 t 213
214
3L1-1.R.iûL 216
111711 TL1 218
.D1.1)IMNaffigatgM*-1 219
V.. fri. 221
1=1 fft 223
rc t%
¡Limn. ir_H=1 226
9i R, ral
I.!12.Pf5 - (-E0+) 230
(4-t-H+) 231
TIL2FPX2',E- (r-Fo-h) 232233
t)61/ (0i) 234(-0-t-) 235
236
fl38tR 237.W.f4tK 238..ffgfV& 239
240241
PgVIVEI)..011,n.kflhaIK 242IS 243
Air
53 141 '0[14VA.M4,0'IN,lii-10:L .4K (
1995-1999 f37, ft ffl RgtA IJ.19984l 1999 *WA' A o FTid
f. 11)k 1961 .:111,401,J.rh -(1 .Yetit (
...41 ?.3E VLATUUrfi f Yt)yijig:44http:/Iapps.faoorg.forestry ii t5 1' UT 11:1+1
ffi, T 3-71.1H fril: IT* [email protected], , 1:-)q P61
http://apps.fao.org/products.htmo
110-,..a* (sfr.W) 84J M.4-L o T +;.-Llift*As
)4; kr ffl/t-fit-MtzfritJliF4-4S- 'V . 11tVar-.7tr.
.,MPETII.A-fiÉr308111cc
k'sJ AftIgUftJ a lit T ì *4
rE'Llf1N-H14T, fg
- -A *AMr-ils tAit'A k6., A 1999 fft,JJt - ìfrk 1998
fnj.13., A. 1997
lift f K Nik 413 , We6ti 0. a 4k. !A AY; PI* Vf. .t fu
- 11X fr VE 07-ff ITEI
T Aii1847A itif5 iTtE 113i t #1*';f2-f-L. rt' If8',J-9.1i-)R4TLff:84i IT
TVI-i-1)1111. Mix 14;t1. AVA tli
tZ. rri -
5-1' --%3-1-tM": .7- 1999
4--g-ti*7Y-irri1f5. qrt-AintA-h-tf.-.A 084.1i8Y.ei$1- o .:i153-041i1N14/NIII*"4814fti'&11(.1-i''Rkfl-P.V AV Os 3t M,gfiD.41-ir
AMt1995-1999 frf VAtcE
ifq**-f- , Jit Li RR nE fkE1riJiJ Y:4 =4A:it t, Trff
--- )4k- LI.i*ntV>-2_111)vAtt.fr6d1V c
1E --o
MATA:-.A#U T 5'3 A .4,4q' Fl frh,fici-''
l'fllireJ 15 tif',,t1r; -Wu 25 1- fez it a Li 14 ITAI o 11,18i
!4 $4 Rai W.f. 84i IV kt ,6113111 Ala -rt t,5rr-Mfltjjfiuffi i4It)Jt 1gi48<.1
*E0>1*6k iE14 ?11:1.TV& ffl.1.45.1A it P51* L, rt-T-
o
Mh,ns 1VF"f fili 8`,riii , 4:1=.
- -11.1 , ,f4cr" t*.0 -114--1147"'
rim ) tir #1.1. 8163. L3-4t ( $14
V?rtC, 1982 ,!-ffl -(1*.[Vi
rAfCr7-(11- n-414''Al!,
ry n Titk 7. Ye, Pr AL di 1k
- ri<ixt ff -'4, -I--
lit Ts Vt -4-41J).604;51[.. 2A Tilt LI; ri
ir+f ffq -NI 'A' -11`*1-, #1J [+14;'191 VII- M
SIC) gA .41..tf;-; t)1, iA
ÍIIIg H s ticr- ti4 o
)11T i-la4RiT'.
Fiq PluEt,
hS 3-Mrg -)N--ktP113i1J1-1-1T
tivtilliv rrbuiti
17,1Uk LAI < YIJ , *PA
AtWAVAirta.i P'¡;,' t ri V:1,s,WAA Vs *A;tftIN-IMO ti;f114.-L*V,
iklIiL,:(.-ETJAIA,.,k. ZrAfgeilltY,I, fiM OA,
iJJ » r$,I E .
frsi;).quTi n7F -6] *NA& of4y) ,
tAlk n tPfli ìM1lJ - N 1-h ;
Mt/L Pfr 114i 0 411-.V.A-1341qT.M13.11L-t.t:
t`Fdi.1 AN ',a *10P.M1,:),DfliOVil frr-
("K 1-HE tqW :Y11 rri -t-
fiss- f tiT4*M"',114 it* ffi PAE,-;1:1P11,1 (
it , ,), 1 000 )..1e, Amffim
1"A fflf.,t.,41: .a.. E1.+A.ft(.1 -0?M-#1),it)
;t.'LPh'1`17'rl`di #4[1W .-1`JA*4tftL>_.<-?,,R(iri
rtfra7qt Y. Ti .0/ EA AZ( 500 -t-V-{ii.
1.1.0. tan T 500 t*4 1--frqt.lit,
VEN*J11 #11Cti
fflff, ( F ) YiLirrIZ.*M(Jrah ").
rri Xstrilj(sP:M ( F ) ,f11 (*) !LE
f"' ,gfn*AV1711.13.i.o.Vf
T &.3/12.16c rf ,
n'A*Ts m a A-li IJ 5K ui ri
.h , 1r1-6-*& , ii4.LJ114.A gU); ff-tg .41 ff;A5,-
IV& '4 111.84JVC , R- 11 n J=VJ
fu P.PM n AMR n L l f-Ufi
Titrf-MITV tz 410, fit A-4s: OF-13-1 Oft A J7-iXE
gnom Planing and Statistics Branch, FAO ForestryDepartment, Vials delle TerMe di Caracalia, 00100 Rome,
Italy. 1&.; +39-06-5705.5514 a +39-06-5705.5137:
IiiTI: 7: tT. [email protected],[email protected], .K:T.V.t A
--eva.borzillo@fao,org; YB20T4V.41*P.V-i-I-**)*[email protected]
vi
.a6
1# 11 o M'& ! ;'1-rt
TftUFJ 17-.0 AtA: "3:Lintitir
#0JH iLs: tit tfr LI] l'.11141.4,frti-
0-:--.7s111-104J 4: [II o t4: -TA
n .;,!, TgT6: "I_K*11-1-1"51-11Zat, Mr43.MAZA*!Nil'4,,
rPtaff
fh LOP. 4.Z,e 1:1; n tift* 9J M.1114+
intvctint, -3' tti Ja ;i;
4-11L'i-ram.Vk.
*lc Niklt ft*TI .Vg
fi.70. Mt: N 1+1 1,1Q`'
g o II. 11--- Li i- tLqtzffinn 1*-Ut 13 ,
T Pfi 747' ,g.ft Stu fli1 LE* 0 'hi
(t+0+)
tc(rt-ho+)
fU rifi UP 4;jc
--1-14 ))51=PA FJ-Z****IV,
If4.*411)Ta#AW.+1110014)*#0 t,4t:244nm:1444r, 47tif-ft4Limx. tA).60)-b,11cA-4
( 1911iii. ,f4 , *Ili t4i. 46i. ) coTxt o**VAs 174s1Viff?, 1-i.VIIMYi
.7KiRtPi4 tjAÀlk. 11: Wf4J1-*fri*N;11::*; $1V.7KM,rtTli);fl-liA4)i; 1:7,_LAYJI.7N- MARi--FU TAkl=fl7K *1111:1-:)KV';
VAP , o ( RIITtu
YullifA!kto .*:itttlW,L!.AMXlti,:k1)14,(1)14-, 11AN
*EOM,. g.,. -tV*1
10,it*A- (Mt)(t--h0±)
ILL; ft (n1-]J ifz *CV a 4.07 fi<J
'9,4% : 140 l4141.0 af)Y. .*;t4
;Rini kfM4P)IJTJA:6141.1
rri**to6.0 rr:JAttrh'14]*&E.'.V-00.P.
(14) * * ( )7 ;$: )0
4ÌL) 4u1k: ./k o
variiimEnoqn-CUM
MT
tt Pt
NC IFt
jj,
19FAVIRZSZ.
4,z ("( '/) iifF1114) - -faltiff
-YraiTn4trit.x. PAPJ Iv:LT (tfq'g7105±-Ti , .1,3Y , 1982 rrg .1,041
501: T i)td Aft ri]
16t*W11-,f
fet It 1- " THA 0.1 " Of *. fq Pfr -ff
M' , Tifih it4 , rFLK; , +
(ioLt101 gft n ')
4k-ffilf
ILIA lt *3-1- " " 1104 lk N. 0 Tifi
W1ta4-63ikA,16 JO, tr,i: 44irk ,I7t, (7IctA- tI3
f141 tAt ).
< DA P,..14A 4'4 (1994gt E VP..K Tr i143 1EUP:
R44 *f<fiiNft60*
PTAkflittlit,%-0K.
I* rtri As-;S: it! 'ft Ft
Ill :i-- y11 1 fft )1h AK o
Ai , 'L lOttl 17t-L f)Z, V.V, 4 ALr_IZ A11,144 itc ( NOR.% )
, --4'4 d,1 0 :4,1 4A 0 X- ,
(":11.1 PA401)iiik iJJ0. W'-4111A-It.1419I40tet7-Ktra
4,4fArl
A* it L iqf t0j4u c.
.i'T. Oet (.T1',Fifttk) tinVq,&ittr
tj1114:0 ifg F
(.01741-f:11-AuP.iit4iJuirk) ri:rrikk.JTA-Ft?'-.4v2,-tkin
*r"ki. XTJP, , gt
M31:411M)'-:61',911J11,10uV-1,4t.
TUL; )J11IP`IUL )J0.1+1 (-11±)
*tHi*.,q W1-0.1
:ktiri*# (*ital.)/44 t. it ( 144 fHle *2-4: F-V,( ) rf<1
' a411: g*MVOPI- 0.3,HYPWjj?EIR-H-41ILV1ZI-4fih )01111'11k 7K; KAM' , -X
TAUIJ rrni-HuiÇtrft nt ( nt A-41:11,4A ,tr,, v-111. ,
1).0_17.7* ( HP
tg f0*-NT/1-9
(
*&Ç (1-0t)rq, Wi$11(t1.1 ) 1: t V; Jil
1' r. }_a 1-41n ) n<J)v../N.
Ì9 J1tZ *TTECF]--f.
-1.41-1M A:1*; )(V P,1.*-R Ful] T bri
5k;f.* VO-R* ). ( HP tiAto0-4- 4=
g +1, 13 ff f0
fC1W,It (
N%Cl.tRsA-)
Otki_a-Vf if4 11I
1Ì Uri(3 1-,MIF ;0'1 9=F +4 D1-41- hi* WWII_ L *rilLfE 'trf a
HP Ti_WIzI )
.141)_frig
IBL q1-1+)
4'2I!JILJEN (t-h-l]t)
fff CZ-0.K*,
.0=c titti=i tt7K, 7r4_WALLYti*-4,1:;0. cA (&))**, 4441-4v *I 4,02)
gr.Hot3A p,uAvmg us'3 ig
114 M401 fri .0041-,tMRIV,T.1441:1-0.I.-14-0**0 ff,ti.J,./4--Vri./k*ff-.
A-fHqt31
r-Eu'ill:'L*-14)2-'11f6d4-1:dAtri .1.zJ 4it_11 1.1
' NJ 441R;f0LH.ft-..1 FtifFt.10314Z-I.r.--LT113N43101-,,
*"0,4%.: ft4 VA41),J.) 9,1 01[1_11hI*Pr- PL. .Ts.
I/4 A) X la t-k- Wit 7h:44 17P56n-A:
vii
441J-;t14,2
.4 AI it Jfi 411 ( HP
ft ))1-1 T:wmko trI_L,14,*). l'i<M:7hz# f;1,,
4Rtg*1rl1 Fat4, ,
fr.vp.6. .t4,4,6: 1,k ).:;:
,Kalt ( HP AL: )
t 1- filf0'14A.H. ).
IA 4d"
*tEt1 ( t1-0
TE*4
14111 n 1-1 ìtJ fil 1 1-,11
ri<171,T)iri_L 5 t ) fi(JJJfl1,J {1.11)1. (DJ 'i ±M S fbLJ
V ±R.+kr i30./1- Arrip:tz.'J' Lc4 144
Ma fr-,10.1*-11_7 4P-0
J.5t.xetg
.10VEUL- T'cttn f-A-CtOMV.TA4101
iii 1995*1 1)?- i1OF fk flat. a tr4 M. 1995
If] QV] 010i THIT)7 BJ rri oft-.
}p431-:g
t4t: 11111,1111.1itioJiiircfrKm*N-0
tg
ln-i=z-N-01441-fgVi* -,111.1Y3t1 ,3*.V. ntofIL Ifi rr.M*tk &VI JP-NZ g Wit ii5c riffk
ik * t4 Pi. Mil AZ -±A- NJTVJQLt-414M-1* 1-,1 I:
N, N glc - t'k E fri ;
( rol,1¡;. --e4- LE It 6 , Er] #flfi A
:91k. 4.21-&OZ*-11,.. 1),')Z, - 61, Illii4J4.:itfArtf aitcvt.,wri/gAi*6); mo.E
(.--ftzvivu2;ri:?o;-164*-6 o,m.,in*tv-mmu.i<74;'qMJHU14
W,V1411-01 *Pc Diç htt 41141111: ,
14Ltt, (-1* )- JT1 frtqf
01.1M.LnJT1MI. -2Wt 4 ; gill N AY.
1=i-VJC la 7K`'., tgA ItZTIMtko
ffatKTO . K1. fTIL4VE *LI ffilt *I- 'RDA
Vrtiw)J100,[i*MR/aZW/inIn1). T.,IT4Rkiel1if.T'Itiltaf-C-FttNIAT/Lrfflgtrifill: fkg:ff
LI-,',e0V-TAK:
RIMffWR
Rgiff.4.fRtiTe#,IE31 0.80 P../3Z.1,T.ITA. A. 1995
*2.6, faiAffflitkPE/ii.M.MfM-T'Uirtlin--"N)151`,11.E.L. 1994iffni,2/1-4tralitiAltiattz4g. TtM: PI*
*1',141-rL*J1gTAW:#41-4WiAti-i.1-VJCV,Zrt1-2,1'5;4;1 1-i1(:
0-4VhXff o
EIA7r3T.ePR
+Wt.tfliftKAVVrrf 0.5 -02:ialt01,4.*Lj 0.8 A/
,!.1-jr2)Q.1111c, 1995 *2.015, I=P VA.11.-4&1131A0i4f.
Ill 1`0Z3-}.JJJt 1994 4.f.). cUlii.r6t i ,'NF
t.ggtK
ffiactz0vTzT;t6I 0.5 ALLAJUK:.. 1995AMIRX-F1F-EtitTfl.
*S.412 CI
fOnhaftP44-i147$1.1h1ZA.MP#4,4,
7'nrillAzilNkftifitc:(JIATA-AM**-it: 4,10)0M *V; 'f-t1-.*V;**V.. P.),-.21TCIT-1.1 (L110%4)
*T-L1431:
dat.$1.1V**ta41.1,-*ItrffIMZ.ff-W.,710;-4TIOVM)-,-0,40'9*.V. 3104i*Villm-10*V*RIti4t*v, t4t: ftq't1LMAQITrI4A:filKAKV. IIV-(T- Vt. (RP 109401-)/k4ffo
ii(.Vtajki_14:-4taffgflAWaRkt,t0q4. Z:1)Aril*.V, P.)4J,1=trilin -41,k0P.-hA
Tir1).lilalraiMZ*A1.00< t#&: *; "lc**. 1K.V; cZfMbuirEil
0.1z.:FRLLATES". (RP 10%
t*IPt. 40
ktf=i1.1V,104. WKI-14+1.1#4Pn:44f
tor.ti3M14.i*V. MM: 4;ttifPg*: iCA*R:TITUkfflI[ Il*tTN:
( RP 10%4()) o
iTgIVA T Y1.1 PP flti Vi<A6-it : *isrimwilt] ; Il varogx:
A.V.
MI JMHTIg agM[9]:Ea ag
/KA., nt4T),Z
FAKilli--ftrif2t3TOEKAMAAEMfutOi
! 74: ( RP
10%)10;) MrigMr1110 411V.VIV3-,f.lito
37,n119Tigi-..a3{
31-ÉlEINMag
i f4':*Vi.t;flitRAAJ:r12-AVIV.2k#, *Pc, Wtil-04(40,1H,t*V)
VA,4,EMRait-MM41*AkAA (rytf&A.V.)pkitAXIfd4033ZnoflTWCUp 10%
-1') XSztIS3.}-003Pk: (ftM=-443::11
36-twgfltV310h,-I*,191$1Jaarift* (Mig
)K.VOZ.COMAV),1;44;ar+Wft4R?&'iciLi1490%1-'),.11)<
1.0,:/rtffil#J-1131biETIAZITM. gfMtD4. 1L. 11q/1..T-IE: (UP 10%/1(3t)
Yj
g*tit f44144.1J0aM.MfAt ,;NZ P.CM , fuR gflf1R. o tf6dit14, 117-.
M.t3;46*414ttl,110E, 4..alAFtimibacitour,ivon.ti-c9,--xm (RP 109,64(;¡-) YuP14-1-)).. V.
11W
fEclivifIvE,41in.t-ouysAR i2)1T*1113 riliKtfti
At*/ itt4M
EVOWN
.4EfRitM1,1fNAkt ?9tP5Yiattetit:§1A-Fr4&[141.1K. +3"=. M, A.8.4k11fiet>to
-kititigbii`k(,IkkEA- 16 1.411 (P)036C4. 48.13fU 48.19 IN OA 36 NA) alfoi
ì2Aìt 36M.*. i-LbtOilt 15 PRI:nrtiffil4.11.(J5):
Ts..RWiriMMKT, KV. 44LlifE.-?;;4.-;','Aw1=41,
r MEE
**WM, *isitV TOM, T.. -.A60%nil1,**1K (upt-Hfi.th ff33-1;t100:), iaSt-17-- -*R3MiftT/-T.40 gtAqE:11 60 A,Dili -1,-1:,)11k*U o
itstrum. vilvEpom. giciimozg. U1MKFP41.4k. )1:Mg. A4M, 1,4gt1.,
SgeA, E46.1.4t.,
9i '4 444-K 4'6 TIM fr
gR, , 1VEk, , *51)41'..7,
IN M 0,1z. 11 IToUf../z.
gErc,
RiLkA, .*:NZ4019gKillAV.,
'grafigffIfOT
a*ig,-r$ 426** (1rIitIiflp<JVtA rt<iN $1.% PR 7.1(g
: 1I1t1 PM,
tAfri -;,:`KttitigtM
t.3,SN'n,4gERtKJTY- , $1.13.VEM fKaK
16: 1611t-*A4k-4(4'47,04-É.FIRWMa, fad47.t.*Itaff,511Jr,flfPit/YA'AhVc,07,11;#.0itt, Ay:SON', 141-4-A.',
*141.k. 1R ( ./S#Étf
ORCtf#-TRO''s4-'4::.011-CalKK-ig-ifflio.sqynfoiRwAI); VitC-PACKAWlfetetfe,
hf h 1) 44:4) ;
JJjfJ t..1-147VRA-Wik4YZO/E-PItE'g/P/ag771
hf): IfiRriAtk (A11-1;11Z..gebffg.,--/KK);
P.1/\4E11)7FfIWM
.F11 11, 144 Slif-14 fL11VE N1.1t V-L
itk,frikKfk. AiYi-PW, 0*. Eff,ealt, rg2 *
V4 i14.1 E.5/..*NA 'IL: fiq
#4.11C, iJj ÌfE011.)Wif*); it A/1J V::M,E,Q 0,4%').F. f4-8-1P.5tirgf117.17Y1,112f. itEhlitCkfl,
efeAt US:4N -
*E#4tjA%if,4-8-1g-VAtffiorlttrifVEi-21,1)1470-OWP/$0-1, 41,744PAR: -FA-4-ff<FE. al, a/c, ,ry`. A; .72-AbigIV
1-t f,#.. 07,9 IV Pt Ile t ItA4f-filM9k-trig,OME1'S.1
ix
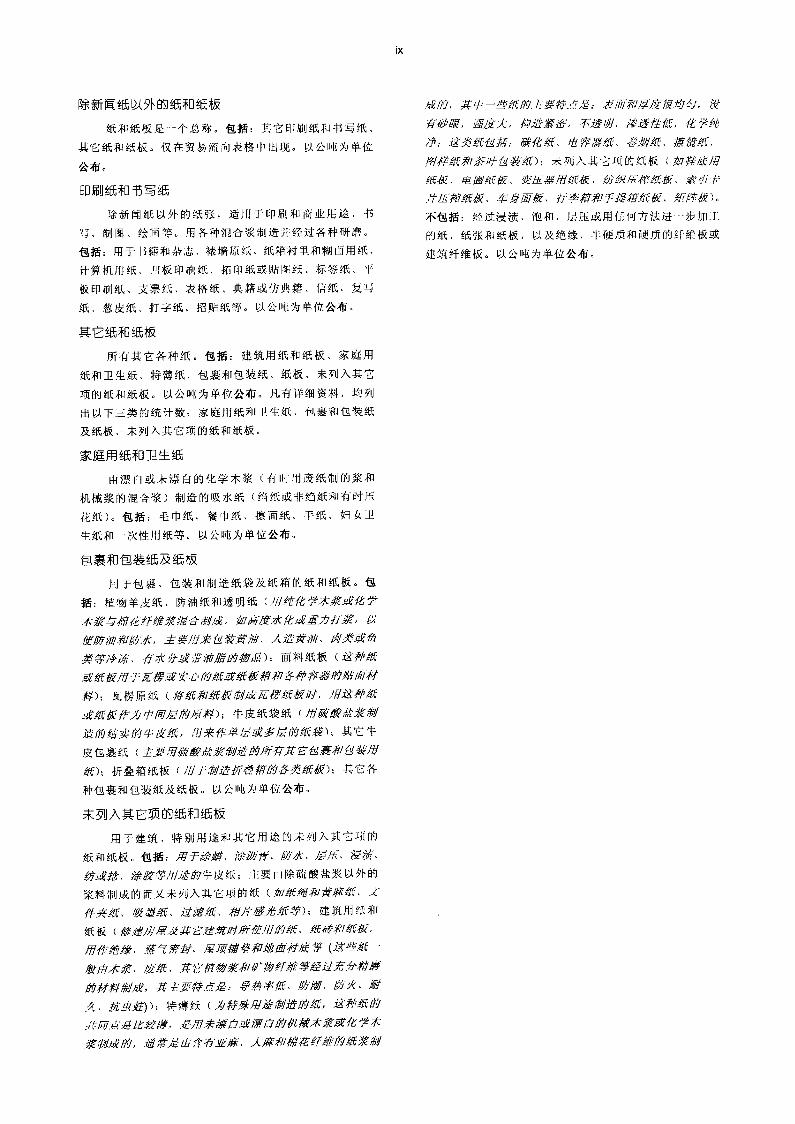
R tIfffg(e)..k9HINEfOft± AV/LP --LTKO. 177411glI. f#1.9
Aft' itUP2M-..--
4=1:'LKfLiff,itio iVf.V1
tA: .1::-LPI1Jgtk4:11=5ft
.-14-111113%.
-O4,12 12/.S:0,71 ;3:111.AI UÀJkfe, ( OP/47-#
t6Mt0 1'3
r4iift itM*0)V-VS
"r; , ftJ, PA
ittl1T-E11.9.1f1-11141:Cit,
A- fiff
4/4 It I /CC: t
1-HAP:Of& ,
4k, kMK
177 it( IT: RE .*: I ./.."
ii4414-1-177RIKK,it.1 4ì, f111.114 - :F.
uagm. trortfrasuliwrwiRt 16: '15 IA *11 WZ:, glk**1- W4{101 [flit ilk.,
1).k o
;(1:F441*Inir.i!itiNe:Rri'MAW'Rift*V-I-MJIM:*4M.44-111M.Flz,T.
Ak. VA:* rri E'r,1 411'il
ii 1988 14, AtP,frflitbLI-12-: J'Air-&- -1107-nYjitC)
41. fik R4.1t, 30E g id" Mi tRP IA, ri'Vk ti ;VA. Itt:5-)- l,4*."41.-:
;JP. f4- 11.1 Vr.;(S ITC Rev.3) WY: 11:1M.4 , iVLA.5t1 W.). 401i 4titP-M
T , :LA.k , Vitig *41a 1:L1KJ,r;OK.
VA411 Lq-*Ilt 41.0. E*I
k- j',9, kitt 4A' IL4.1-LM-44
AMMIRP g*: t± ) 4i11111 M.1. TT-. IX
.18 fe,4fH lit Y Ste11-4.1 YLIUI
t,46.71}M
IliIIS-114 1)AiffVbM fL I :40A o lz 'fif lit
t:14.z1 tt -01j 4g. )t-) 61}1,
tz4f40 TE
AIM
- *ULM 1_11 1.75:
V- o NI fit nti .T 3Wtati.i:;114 rflifv1F.3-Vtifltc.
fff tfk
.11 F<.3i
Aiii0,1,111UT {R 4.:7(1W- fR t'A
fit nfiliRF, 3-J` M #1.! id -'6-JVI-.11k)'"' <
5atarni
41i ME 111 0,4 #11-
M:Mg A- r tt Plitk fiM51I-1 RY,3-
lI Jr.,: a 5 M J4- 4 VA $1..A o
tiP11:41. WETON- , WIE1-1-M
-exrrl, &VP-FL efi-E,Aan I.E.gri411 ;np- gal it: 1). ilt Li *I ri(J414
'LfMill Lit rE* 11, Ell.FIR 1R-g.1 17Eil.)76
M W P. LK. !MY T4114 T .*a , R,t,AMA- C*SA, t...
o
111-VP-eL
Vgffir*tl'i-OliMIRIAJekTc. -(11:M.A4,-17.1-4114-1 tz , )(,) }L-Toif
.2-V:415_1 *a 7.M.03; it it f& 51,ZR t 1kt
VA.V=145-F, Val-11111Vt'4,f-4 37 l'iNtrti , I -fz 1)111 ii.a
¼1t W Jo
FlkM41.4k1 Ruld
teAltiv.
)""*.fP1R8t*-i-Fil " FLfilt1,1--ra" ri3 o
-R fi"e,L, fa8*Y.0141-1E3cEfF4:1114m
IEVM 1 000 ,K4,-; 2.36,r.7'5*1117qAf-ti)010. 1 000 4k)V-P.V.`44.tachl-fl
9,YAVAi
P'r- 1'4 :T.14 t 7'z o Mii, ,
1$1 dIr11.1-1111 /OE 4,1-41;MAR.0-,f-MMTiV4t1)1441.:L±)': 5,:f4-3i0 3 VI1FFit T- ft- Fit )31Z +I MT, 'ILJjtz Et, t4
27%. 1995 -f-V.:L) ",- -,f1.1qfr ALA Cili=441k T"=4.:fd,X
4-`1.21-,7f4t,?-EtU,,
*IX
T'A
.gf1
040
ÌI (P
)41-
i-0'1
.034
4 (p
) P
IFfir
t/V91
.6.td
akl
#1ili
pit (
I) 4
-f-iW
_F41
,A (
i) E
riffi3
riXia
ult.a
4il
tftdd
riiit
(E)
(e)
reffh
PA
-411
0-1C
atu.
g*M
iti (
C)
Rli?
419.
1TiA
.M(I
hMli
(P)
An*
(I)
ffith
rAk
(E)
(rIZ
IFZ
E1-
ttit/r
.ifi
rtit
(c)
A:M
EA
N T
WV
9t (
p) ,
ALA
I (i)
trou
t (o)
fejle
jttgz
Alg
its,
Ana
l (I)
1,11
1=1.
8(11
(E)
tl-FI
E&
151#
.1)1
4.M
hiar
=iti
l(i)
nít.
(e)
Efig
141.g
JR*
61 *
01,1
)E
*(1
1.19
1)
*ME
W4,
1M*T
ral
MA
UI*
-*E
IT*I
tJ_
UllE
i*-
'Ma
T2K
#3(1
1-m
t)
1411
3kik
*
- "k
te_E
*14
(4m
.h)
iiPM
*In
r**1
4
NE
VI.
1111
5ia
att
A 'i
.',
MV
P)
tiF*
X t4
Am
*,f4
t1*
Eft
It
* X
ER
IC&
?ME
Ea
444'
8111
CU
MC
UM
CU
MC
UM
CU
MC
UM
CU
MC
UM
CU
MC
UM
CU
MC
UM
CU
MM
TM
TM
TM
TU
S$
ecA
rIA
/P,
I,E
,CP
PP1
01,C
,P,
I,M
,CP,
I,B
,CP,
I,E
,CP
PP
P,I,
E,C
P,I
,N,C
P,/,
11,C
P,I
,2,0
P,I
,E,C
P,I,
E,C
P.I
,E,C
I,E
*MO
M. I
MA
*Wl4
CU
Mi.e
p p p P p p p p
i.e le i.e
P P P P
P P P P
i.eP P
P P e P P Pi.e i.e i.e
e P P
i.e
P P P
i.e i.e
P P
P
1'r.. p,
1,e,
cP,
i,e,c
p,i,e
,cp,
1,e,
cP,
1,e
, c13
, i,e
,cp,
i,e,c
p,i,e
,c
p,i,e
,cp,
1,e,
cp,
i,e,c
P,i,e
,cp,
i,e,c
p,1,
e,c
p,i,e
,cp,
i,e,c
p,i,e
,cp,
i,e,c
p,1,
e,c
p,i,e
,cp,
i,e,c
p,i,e
,c
p,i,e
,cP,
i,e,c
P,i,e
,cP,
1,e,
cp,
1,e,
c
P,1,
e,c
p,i,e
,cp,
i,e,c
i.e*m
tv. %
***4
-4 (
tilit)
CU
M
(40*
,110
4 (4
04)
CU
M
044*
*NA
M**
(40
00C
UM
Wi4
1140
viR
IN.X
* (4
ttpt)
CU
M
.lif
eW*1
)t. (
vtPF
)C
UM
AIR
, IliW
ukkt
t (44
1.P1
-)C
UM
A'è
:T46
1}51
* M
gt)
CU
M
It e
,I.,M
itá*
(1{-
11-1
4)C
UM
TO
ilift
**A
-r*4
51 (
11-p
f)C
UM
i.eT
Akf
lifili
tailc
Iii4
(#1
1-nt
)C
UM
jeIG
IIL
EC
C1E
7ic*
Era
tl (4
40,)
CU
Mle
*t#4
6M
Ti,e
*11-
#0*I
iC
UM
i.e**
MN
**C
UM
i.etI
tt (4
1-lit
)C
UM
1,e
41*
(44H
-At)
CU
Mi.e
111
litcu
mje
Reè
tiC
UM
1,e
tif$4
1kC
UM
i.e¡R
OH
M.
CU
Mi.e
.Pita
ffili
kC
UM
i.e*X
*cu
m-i
.e00
4!..4
,fM
T1
ein
bilt*
tM
Ti.e
*R.I
*SM
Ti,e
*X ti
DA
PPU
XM
Ti.e
aing
Nun
kif
An-
i,e*t
it ri
XIM
XM
Ti.e
Mil
tiRtS
MT
i.eX
tiffi
tXM
Ti.e
bitr
Ak
MT
i,egm
lleM
Ti.e
EE
PRIK
4414
VgX
MT
i.e31
(Xfi
ltEfe
ltilt
MT
i.eM
U'ri
qlvi
tste
tiM
Ti.e
*I.A
xtar
ritat
ei6i
iM
Ti.e
xii
11111 ileo i'=411240. 1%
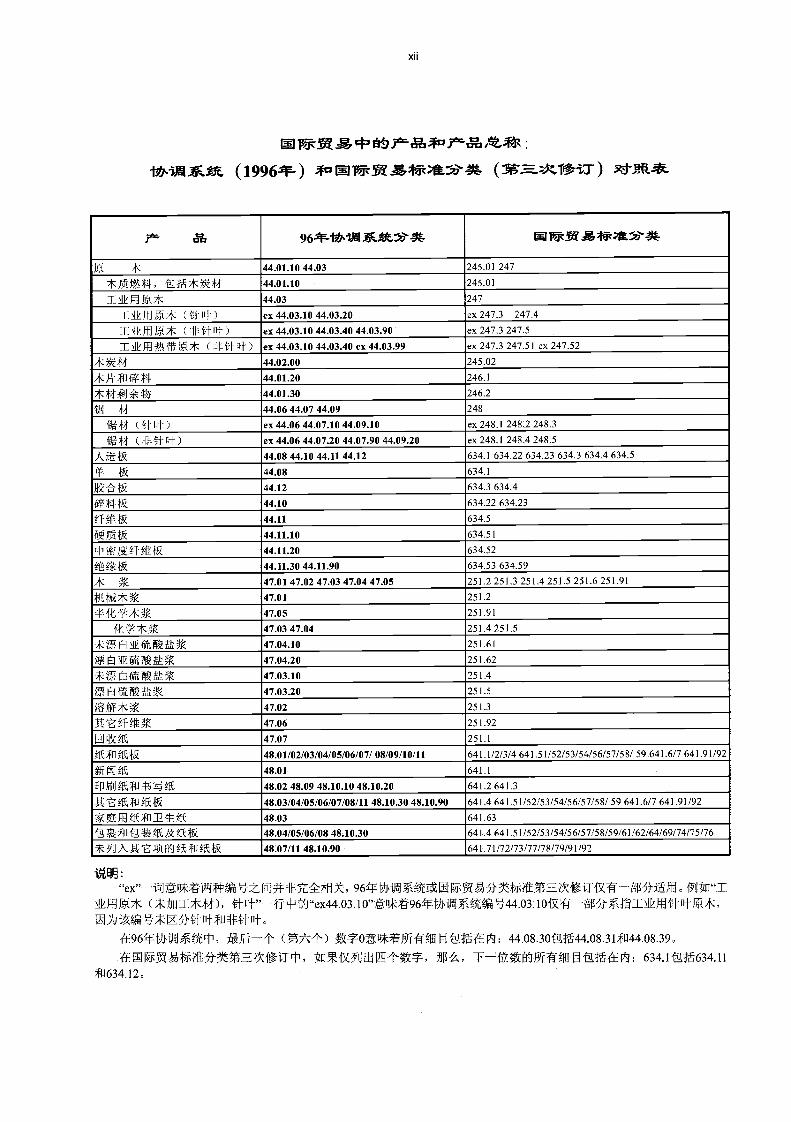
tb./A 0...ft (1996)1F- n15/ Z4i17<4.-)34t-
iABA:"ex"- ii:iltAt-Wifq:1417ili ff1J4-tir5E-t[IX--, 96LOZR-IPilMNI33-/V4i'litZERXIO-0.43M--q110-}iLftic
(ÁW31111104), -ii-41N"ex44.03.10"gri*V96!Tits-MA?Af9y=i-44.03.101R4--filii-1- 141:1kV-141:4:*,MVA ritt111VV^nt o
4.961fdAVAJV011, jî (M)\1') tY-0I5**Pfr-fOli 44.08.30VAt44.08.31*H44.08.39.
41111WRMUnf3'/-J-ME-031iT , tcr-l-R--f)0fiti Vil T 411 /a4fiA : 634.Pa#634.11R634. 12c
1372 96.31F-WIJN AA:zi* 1Z1~44r-,7;*.573-41
44.01.10 44.03 245.01 247
*A1104, tIlt 2.4)1 44.01.10 245.01
I Ak 1E11 1* 44.03 247
-1-.i.knn;q * ( qui- ) ex 44.03.10 44.03.20 ex 247.3 247.4
1141,..)fl 19.* (:HI" lit ) ex 44.03.10 44.03.40 44.03.90 ' ex 247.3 247.5I A fli l'41,. 'ilfr. JA * ( ir 11- ) ex 44.03.10 44.03.40 ex 44.03.99 ex 247.3 247.51 ex 247.52
***M. 44.02.00 245.02
*Pi lfl W 14 44.01.20 246.1
MI A A': 44.01.30 246.2
iig 44 44.06 44.07 44.09 248
ig44 ( qui- ) ex 44.06 44.07.10 44.09.10 ex 248.1 248.2 248.3
4F ( Hlr-q1± ) ex 44.06 44.07.20 44.07.90 44.09.20 ex 248.1 248.4 248.5
Al tk 44.08 44.10 44.11 44.12 634.1 634.22 634.23 634.3 634.4 634.5
-1 K 44.08 634.1
iKe i' ..,1k 44.12 634.3 634.4
47 g tk 44.10 634.22 634.23
Mfttl 44.11 634.5
R1111 44.11.10 634.51
'114; 1 g:,T-* if( 44.11.20 634.52
?t %+k 44.11.3044.11.90 634.53 634.59
* .V 47.01 47.02 47.03 47.04 47.05 251.2 251.3 251.4 251.5 251.6 251.91
tilotlii V 47.01 251.2
47.05 251.91
47.03 47.04 251.4 251.5
-;Kmolkombit 47.04.10 251.61
19011.KAILILV 47.04.20 251.62
1: r=r4ii i'l 47.03.10 251.4
715,H5V&P,43 47.03.20 251.5
WIlf 7 47.02 251.3
It i',-7 gf *V 47.06 251.92
IA 1V,K 47.07 251.1
1 trl.11a 48.01/02103104/05/06/07/ 08/09/10/11 641.1/2/3/4 641.5132153/54/56157/58/ 59 641.6/7 641.91/92
gfi 11,17,1 1, 48.01 641.1
EP IJLi'ti a 48.02 48.09 48.10.10 48.10.20 641.2 641.3
It-L'af MIK 48.03/04/05/06/07/08/11 48.10.30 48.10.90 641.4 641.51/52/53/54/56/57/58/ 59 641.6/7 641.91/92
*X1J-TMAITA:15., 48.03 641.63
.4,11,40.KRAIR 48.04/05/06/08 48.10.30 641.4 641.51/52/53/54/56/57/58/59/61/62/64/69/74/75/76
YO AA -L JCV.1 IMII g fk 48.07/11 48.10.90 641.71/72/73/77/78/79/91/92
ii*411,41a1(3R6- 013 5T -1:1-M1ASAtiT- cri
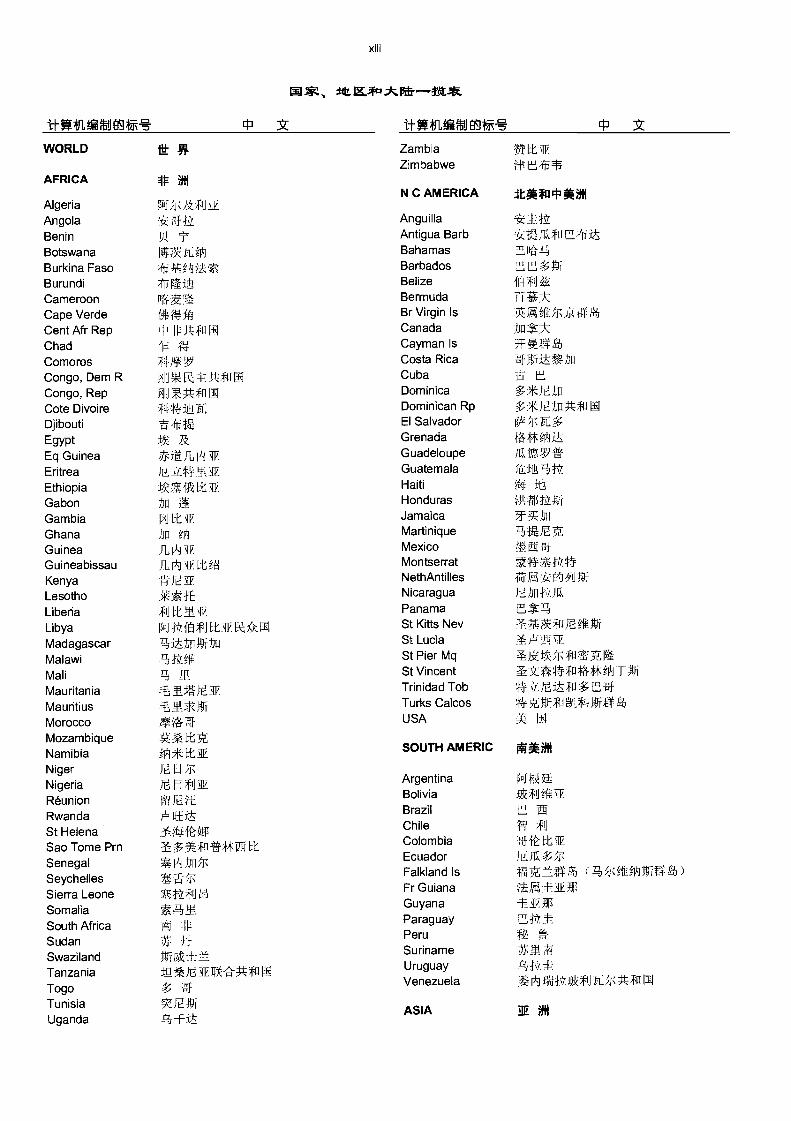
WORLD R- Zambia MUG.Zimbabwe
AFRICA 1P MIN C AMERICA 4tAN NM
Algeria 51.1%)..btfih21
Angola 'i,:.gflA Anguilla
Benin 911-- Antigua Barb 'ill4lIalrl nijtBotswana A ...'./k1 RIM Bahamas L'21}, 4
Burkina Faso -,rts*giW4 Barbados
Burundi ri. Rift Belize fr-1 11
Cameroon [11!.-Bermuda
Cape Verde 1044 frJ Br Virgin Is lq A. '4 %.1- ),I-: VT A
Cent Afr Rep '+' -IM,fu Pi Canada ta-tChad 1z. 14 Cayman Is 3T .14 AComoros 3-1-1 IV Costa Rica .t.-4HVit VA
Congo, Dem R lx.BRN,17.AflIN Cuba i_1=1" ECongo, Rep fld ;:fn iin Dominica
Cote Divoire -q-t,'-i,A.-[1:: Dominican Rp :'ÌKÌé, hr A 11 Ill
Djibouti r .1,1ZEl Salvador IPV,-,kE
Egypt tY:: a Grenada 4.4*(40iL;
Eq GuineaFLI,),J .4 V.Guadeloupe alt =,33*
Eritrea GuatemalaGuatemala ift fill lizi /A
Ethiopia J,-OXIR LL .ilk Haiti We, ItGabon til A Honduras A 4illIrrGambia IA LE A Jamaica T TanGhana ,1.111 k_Pi
Martinique P.:1)f_.1 A,
Guinea IL, 1),1 W. Mexico 4-'1N of
Guineabissau _FM 4 LEM Montserrat re44:7IP.*.-
Kenya .4 J- AF. NethAntilles QIi.Vg#1.1Wr
Lesotho t'A'K Nicaragua )1.-uinvoa
Liberia f 11 Lt. INIV. Panama 12.-11:-.
Libya PlkfAfIJI:EWKAM: St Kitts Nev
Madagascar/JOE ti St Lucia 47 AF A ff.
Malawi-.ii, W.f. St Pier Mq -1(d3MM-I-1 t'A 14
Mali -q ,-L_11.St Vincent :1-.-scAt44.fillq*m-rvi
Mauritania -T; -I/ it AR Trinidad Tob Vis-- A tat fil
Mauritius -- -,4',.*Ali Turks Caicos *A Itfiff-i9j4ItS# AMorocco *A -Ttf USA X LF.1
Mozambique .A. 1 bL ANamibia MI: LL.A.
SOUTH AMERIC Mg011
Niger V, IdNigeria t,' H fli A. Argentina P.1.
Réunion ffire,h-:Bolivia 5-ViRitU
Rwanda , ffif it. Brazil
LSt Helena -,*% OFChile TR -ifri
Sao Tome Pm n -. *.fr[*-4*N ft. Colombia I-1f % LLE
Senegala:1),i tri %.T Ecuador JEig %71<
Seychelles".&. t Falkland Is itAA.-1.`--Mqv4 (...q %.1itikillitT A )
Sierra Leone Uft.. 1.111"3Fr Guiana MN+. .±1.VAI
Somalia'.k- - 1 Guyana ±.-, AL:43
South Africa A dk Paraguay EliY.:::
Sudan -?):1-, LI-Peru f,,r6 ..f1-
Swazilandit Ha If: - -.Suriname 3* M
TanzaniatiA )E.',HE-Afil IA Uruguay A ISLI
Togo ' ,. 4 Venezuela Ph iiiP glififti:%10=M11
Tunisia 'A7: fi2. A ASIA RE MIUganda -03 =Fit
3Z
xiv
-1.-F*411,0VJaS1*-- CID
Faeroe Is Vf
Afghanistan 51,754 Finland
ArmeniaAzerbaijan
AA V,1Z ft
FranceGermany 11:
Bahrain E 4 Gibraltar A--Ai Vé:
Bangladesh )31-i Ft PI Greece Jig
Bhutan Hungary `41-,f1J
Brunei Darsm L.t.m Iceland ,r3.)
Cambodia Vril IrelandChina rt1 1:51 ItalyCyprus Latvia f-AKeEGeorgia 11- r1. Lithuania )Y-14
India Ep MacedoniaIndonesia iJJFk MaltaIran 011P-IIR. ii ;41.-7 Moldova RepIraq tk NetherlandsIsrael PJ.t.N NorwayJapan PolandJordan M Portugal 161Q
Kazakhstan PftP Mtn Romania #4)2E.Korea D P Rp 0.1iP-TKTh7U.AKYM151 Russian Fed 1:14,VYtli1h41
Korea Rep taRiT1 SlovakiaKuwait SloveniaKyrgyzstan %,T,' SpainLaos SwedenLebanon EA SwitzerlandMalaysia UKMaldives 45Mt* UkraineMongoliaMyanmar fig
Yugoslavia MIA 151
Nepal )2 'di %.1< OCEANIAOmanPakistan 41[011. Amer Samoa
Philippines *0 Australia fIJ
Qatar Cook Is 1- 0] ffSaudi Arabia t-M-f"kf0 Fiji T-,='gFigA4VHEN
Singapore ffrhu¡A Fr Polynesia
Sri Lanka Sitt Guam
Syria 131TP.in fiJ.E.)1;11M1 Kiribati A.V LI*Tajikistan Nauru A 'P-Thailand 15 Newcaledonia EA*.Turkey New Zealand tELi.
Turkmenistan ±.1t-- Ni if! Niue 11 i
Untd Arab Em 15-14tfilk-g-nt Papua N Guin EX5E.V)LAEUzbekistan 'Jill Samoa
Viet Nam t Solomon Is *.vrirtghYemen Tokelau K3-tch
Tonga J fui
EUROPE FA Tuvalu [L41
VanuatuAlbania GFIJ EfEr Wallis Fut I ET[111Xfl-raIRMfft6AndorraAustria -0,1-.111*L1
Belarus .f YItfr
Bel-LuxBosnia Herzg
ELM
a Al A fo N Ht JiBulgaria NI:Alf!! +IV:
CroatiaCzech Rep I PA F.Denmark )1.Estonia
kI.,*4M314i
*7' AltIniEU*S
XV
4Plq'ai)11*
filAh* Ah-Aui4:4
WA. *tilt *31 Out Vfilit
*TRIAVI. i2.11.q0AV 725 625 750 1.38 1.60 1.33
YX- 167
Jih*41-11P-Irk** 730 1.37
'NI 700 800 1.43 1.25
Ig)-fRiA4);) 675 650 750 1.48 1.54 1.33
TrAil\1k11.1.C9:* 750 700 800 1.33 1.43 1.25
550 700 1.82 1.43
750 1.33
tn-ti 650 1.54
650 1.54
950 1.053
rt3 IV-TitHR 2
itOtk 250 4
7'4414141.41 AVI: Ah'%g 1 000 VAR 6**-481,
If :*1 4Z VEAFFAPA'R5'4-Tuff171.A.7.iRM 1 [ILL
1 M741.:ti ;q
0.036051.80272.833.625
1.27363.66
100
1281-11)q 1 1 35.3151 17: 6.1164 216
Vi4.672 165 1.98 1
1 000 f,E,M-',/irA-R 2 2.36 83.33 1 0.50550 . IF:.WJ 11111 1.416 50 0.6 0.303
Alak1 000 -7F 1 35.315 0.42381 000 11--tr (1/8*t:4) 0.295 10.417 0.125
?tienSlikiR AVK AhAR
Igt4)***1-1Ri'i-KV-000
IbiltPriWK
MJ4-1./7.41,
4.53 160
PL.-til( 0.72 25.4
tlq 2.55 90
1-L7-j)K 0.65 23
tlq- 2.12 74.9
1 0003 18.41 650
R A Akflq-MM tib***AXAM
Aft R 1.1VIt
1 N.: 4 = 25.41 'MAX = 0.0929 T.1,-*.1 )?-1JAR = 0.02832 ',".ji;
= 0.9072 Ibt
= 1.016 4

INTRODUCTION xixSYMBOLS USED IN THE TABLES XX
PRODUCT NAMES AND DEFINITIONS XX
NOTES ON THE TABLES >ociv
COMPOSITION OF PRODUCT AGGREGATES xxvCROSS-REFERENCES TO HS 96 AND SITC REV./ xxvi
LIST OF COUNTRIES. ZONES ANO CONTINENTS xxvii
STANDARD CONVERSION FACTORS xxixEXCHANGE RATES A-1
ASSUMED PRODUCTION PER CAPUT A-3FIVE LEADING COUNTRIES IN 1998 A-4
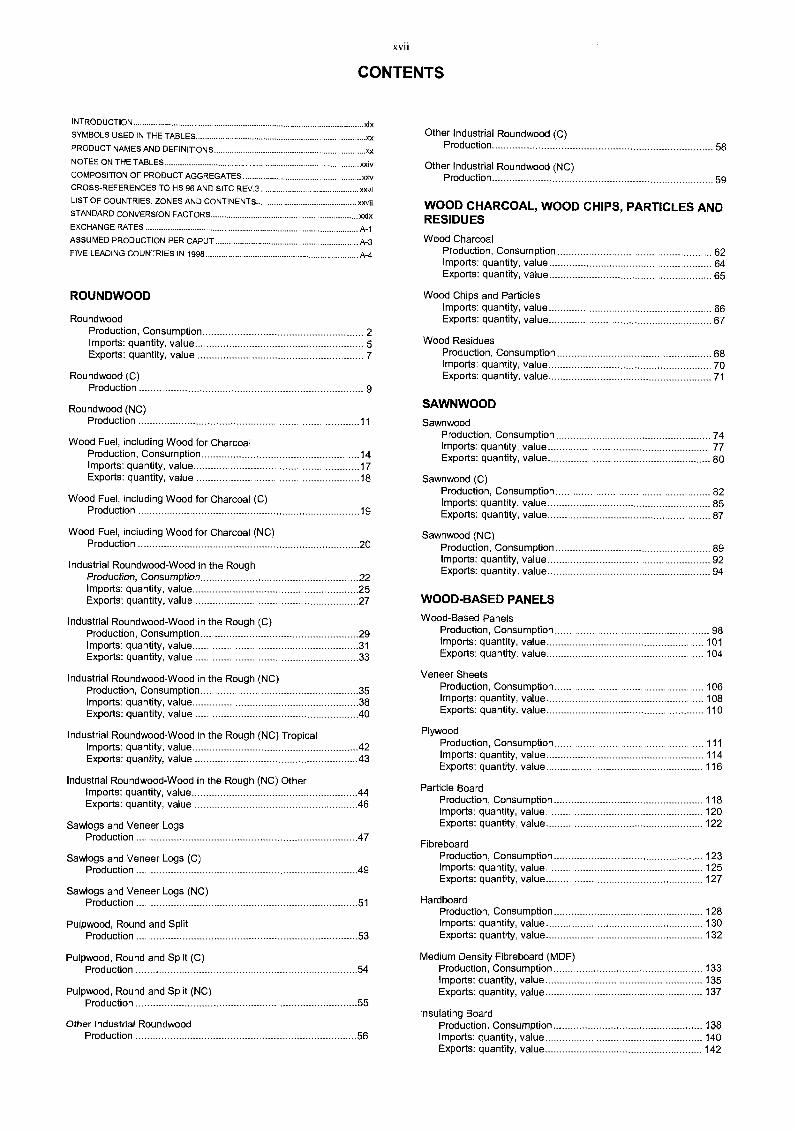
ROUNDWOOD
RoundwoodProduction, Consumption 2Imports: quantity, value 5Exports: quantity, value 7
Roundwood (C)Production 9
Roundwood (NC)Production 11
Wood Fuel, including Wood for CharcoalProduction, Consumption 14Imports: quantity, value 17Exports: quantity, value 18
Wood Fuel, including Wood for Charcoal (C)Production 19
Wood Fuel, including Wood for Charcoal (NC)Production 20
Industrial Roundwood-Wood in the RoughProduction, Consumption 22Imports: quantity, value 25Exports: quantity, value 27
Industrial Roundwood-Wood in the Rough (C)Production, Consumption 29Imports: quantity, value 31
Exports: quantity, value 33
Industrial Roundwood-Wood in the Rough (NC)Production, Consumption 35Imports: quantity, value 38Exports: quantity, value 40
Industrial Roundwood-Wood in the Rough (NC) TropicalImports: quantity, value 42Exports: quantity, value 43
Industrial Roundwood-Wood in the Rough (NC) OtherImports: quantity, value 44Exports: quantity, value 46
Sawlogs and Veneer LogsProduction 47
Sawlogs and Veneer Logs (C)Production 49
Sawlogs and Veneer Logs (NC)Production 51
Pulpwood, Round and SplitProduction 53
Pulpwood, Round and Split (C)Production 54
Pulpwood, Round and Split (NC)Production 55
Other Industrial RoundwoodProduction 56
xvii
CONTENTS
Other Industrial Roundwoold (C)Production 58
Other Industrial Roundwood (NC)Production 59
WOOD CHARCOAL, WOOD CHIPS, PARTICLES ANDRESIDUES
Wood CharcoalProduction, Consumption 62Imports: quantity, value 64Exports: quantity, value 65
VVood Chips and ParticlesImports: quantity, value 66Exports: quantity, value 67
Wood ResiduesProduction, Consumption 68Imports: quantity, value 70Exports: quantity, value 71
SAWNWOOD
SawnwoodProduction, Consumption 74Imports: quantity, value 77Exports: quantity, value 80
Sawnwood (C)Production, Consumption 82Imports: quantity. value 85Exports: quantity, value 87
Sawnwood (NC)Production, Consumption 89Imports: quantity, value 92Exports: quantity, value 94
WOOD-BASED PANELS
Wood-Based PanelsProduction, Consumption 98Imports: quantity, value 101Exports: quantity, value 104
Veneer SheetsProduction, Consumption 106Imports: quantity, value 108Exports: quantity. value 110
PlywoodProduction, Consumption 111Imports: quantity, value 114Exports: quantity. value 116
Particle BoardProduction, Consumption 118Imports: quantity, value 120Exports: quantity. value 122
FibreboardProduction, Consumption 123Imports: quantity, value 125Exports: quantity, value 127
HardboardProduction, Consumption 128Imports: quantity, value 130Exports: quantity. value 132
Medium Density Fibreboard (MDF)Production, Consumption 133Imports: quantity, value 135Exports: quantity, value 137
Insulating BoardProduction, Consumption 138Imports: quantity, value 140Exports: quantity, value 142
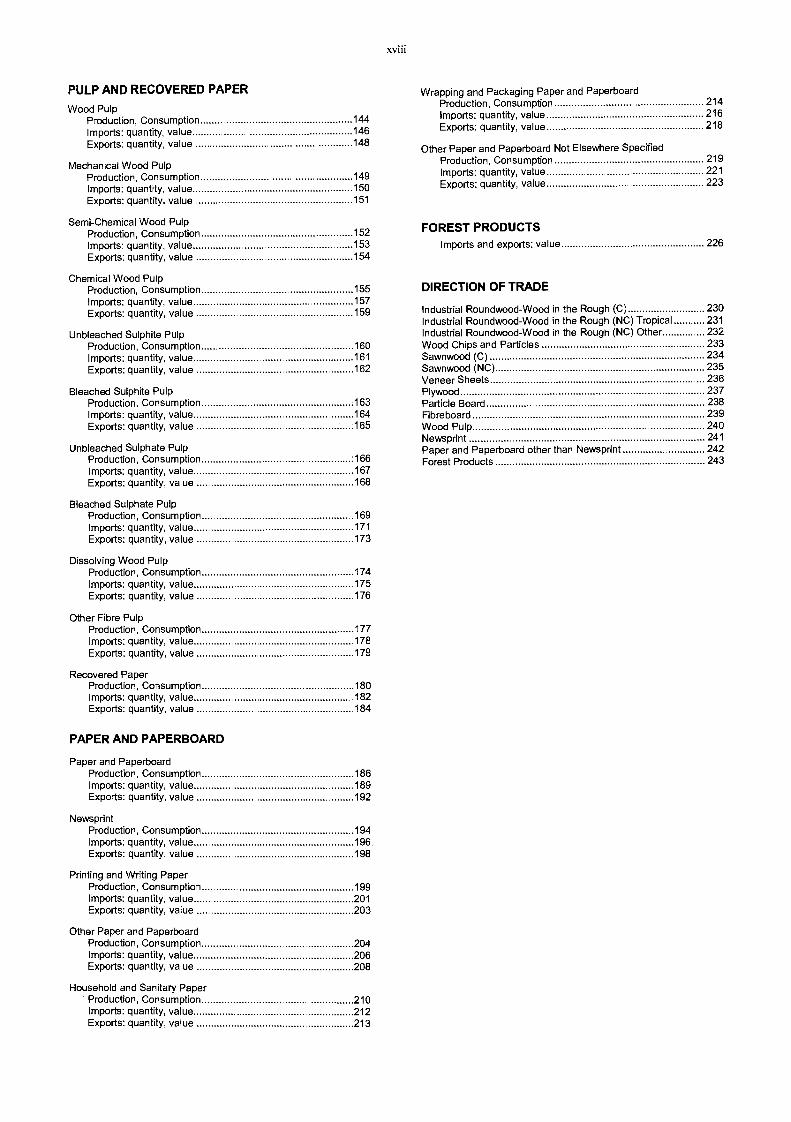
PULP AND RECOVERED PAPER
Wood PulpProduction, Consumption 144Imports: quantity, value 146Exports: quantity, value 148
Mechanical Wood PulpProduction, Consumption 149Imports: quantity, value 150Exports: quantity, value 151
Semi-Chemical Wood PulpProduction, Consumption 152
Imports: quantity, value 153Exports: quantity, value 154
Chemical Wood PulpProduction, Consumption 155
Imports: quantity, value 157
Exports: quantity, value 159
Unbleached Sulphite PulpProduction, Consumption 160Imports: quantity, value 161
Exports: quantity, value 162
Bleached Sulphite PulpProduction, Consumption 163Imports: quantity, value 164Exports: quantity, value 165
Unbleached Sulphate PulpProduction, Consumption 166Imports: quantity, value 167Exports: quantity, value 168
Bleached Sulphate PulpProduction, Consumption 169Imports: quantity, value 171
Exports: quantity, value 173
Dissolving Wood PulpProduction, Consumption 174Imports: quantity, value 175Exports: quantity, value 176
Other Fibre PulpProduction, Consumption 177Imports: quantity, value 178Exports: quantity, value 179
Recovered PaperProduction, Consumption 180Imports: quantity, value 182Exports: quantity, value 184
PAPER AND PAPERBOARD
Paper and PaperboardProduction, Consumption 186Imports: quantity, value 189Exports: quantity, value 192
NewsprintProduction, Consumption 194Imports: quantity, value 196Exports: quantity, value 198
Printing and Writing PaperProduction, Consumption 199Imports: quantity, value 201Exports: quantity, value 203
Other Paper and PaperboardProduction, Consumption 204Imports: quantity, value 206Exports: quantity, value 208
Household and Sanitary PaperProduction, Consumption 210Imports: quantity, value 212Exports: quantity, value 213
xviii
VVrapping and Packaging Paper and PaperboardProduction, Consumption . 214
Imports: quantity, value 216Exports: quantity, value 218
Other Paper and Paperboard Not Elsewhere SpecifiedProduction, Consumption 219Imports: quantity, value 221
Exports: quantity, value 223
FOREST PRODUCTSImports and exports: value 226
DIRECTION OF TRADE
Industrial Roundwood-Wood in the Rough (C) 230Industrial Roundwood-Wood in the Rough (NC) Tropical 231Industrial Roundwood-Wood in the Rough (NC) Other 232Wood Chips and Particles 233Sawnwood (C) 234Sawnwood (NC) 235Veneer Sheets 236Plywood 237Particle Board 238Fibreboard 239Wood Pulp 240Newsprint 241Paper and Paperboard other than Newsprint 242Forest Products 243
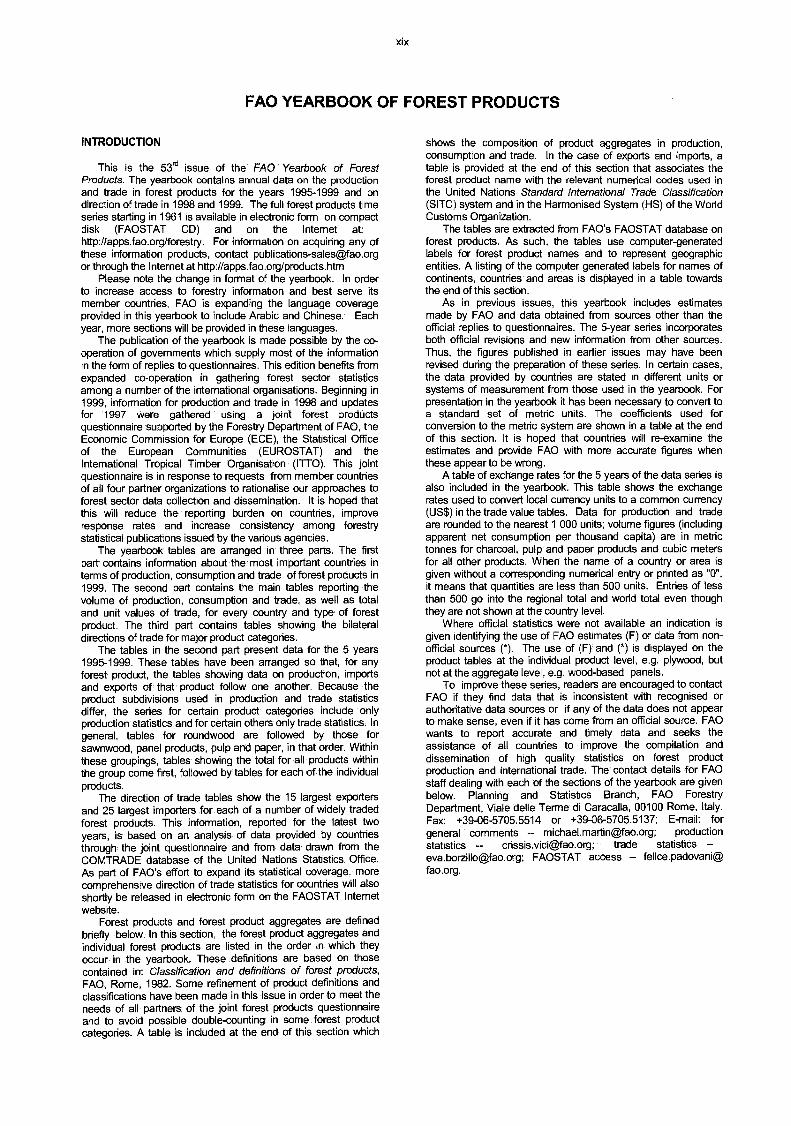
INTRODUCTION
This is the 53m1 issue of the FAO Yearbook of ForestProducts. The yearbook contains annual data on the productionand trade in forest products for the years 1995-1999 and ondirection of trade in 1998 and 1999. The full forest products timeseries starting in 1961 is available in electronic form on compactdisk (FAOSTAT CD) and on the Internet at:http://apps.fao.org/forestry. For information on acquiring any ofthese information products, contact [email protected] through the Internet at http://apps.fao.org/products.htm
Please note the change in format of the yearbook. In orderto increase access to forestry information and best serve itsmember countries, FAO is expanding the language coverageprovided in this yearbook to include Arabic and Chinese. Eachyear, more sections will be provided in these languages.
The publication of the yearbook is made possible by the co-operation of governments which supply most of the informationin the form of replies to questionnaires. This edition benefits fromexpanded co-operation in gathering forest sector statisticsamong a number of the intemational organisations. Beginning in1999, information for production and trade in 1998 and updatesfor 1997 were gathered using a joint forest productsquestionnaire supported by the Forestry Department of FAO, theEconomic Commission for Europe (ECE), the Statistical Officeof the European Communities (EUROSTAT) and theInternational Tropical Timber Organisation (ITTO). This jointquestionnaire is in response to requests from member countriesof all four partner organizations to rationalise our approaches toforest sector data collection and dissemination. It is hoped thatthis will reduce the reporting burden on countries, improveresponse rates and increase consistency among forestrystatistical publications issued by the various agencies.
The yearbook tables are arranged in three parts. The firstpart contains information about the most important countries interms of production, consumption and trade of forest products in1999. The second part contains the main tables reporting thevolume of production, consumption and trade, as well as totaland unit values of trade, for every country and type of forestproduct. The third part contains tables showing the bilateraldirections of trade for major product categories.
The tables in the second part present data for the 5 years1995-1999. These tables have been arranged so that, for anyforest product, the tables showing data on production, importsand exports of that product follow one another. Because theproduct subdivisions used in production and trade statisticsdiffer, the series for certain product categories include onlyproduction statistics and for certain others only trade statistics. Ingeneral, tables for roundwood are followed by those forsawnwood, panel products, pulp and paper, in that order. Withinthese groupings, tables showing the total for all products withinthe group come first, followed by tables for each of the individualproducts.
The direction of trade tables show the 15 largest exportersand 25 largest importers for each of a number of widely tradedforest products. This information, reported for the latest twoyears, is based on an analysis of data provided by countriesthrough the joint questionnaire and from data drawn fronn theCOMTRADE database of the United Nations Statistics Office.As part of FAO's effort to expand its statistical coverage, morecomprehensive direction of trade statistics for countries will alsoshortly be released in electronic form on the FAOSTAT Internetwebsite.
Forest products and forest product aggregates are definedbriefly below. In this section, the forest product aggregates andindividual forest products are listed in the order in which theyoccur in the yearbook. These definitions are based on thosecontained in: Classification and definitions of forest products,FAO, Rome, 1982. Some refinement of product definitions andclassifications have been made in this issue in order to meet theneeds of all partners of the joint forest products questionnaireand to avoid possible double-counting in some forest productcategories. A table is included at the end of this section which
xix
FAO YEARBOOK OF FOREST PRODUCTS
shows the composition of product aggregates in production,consumption and trade. In the case of exports and imports, atable is provided at the end of this section that associates theforest product name with the relevant numerical codes used inthe United Nations Standard international Trade Classification(SITC) system and in the Harmonised System (HS) of the WorldCustoms Organization.
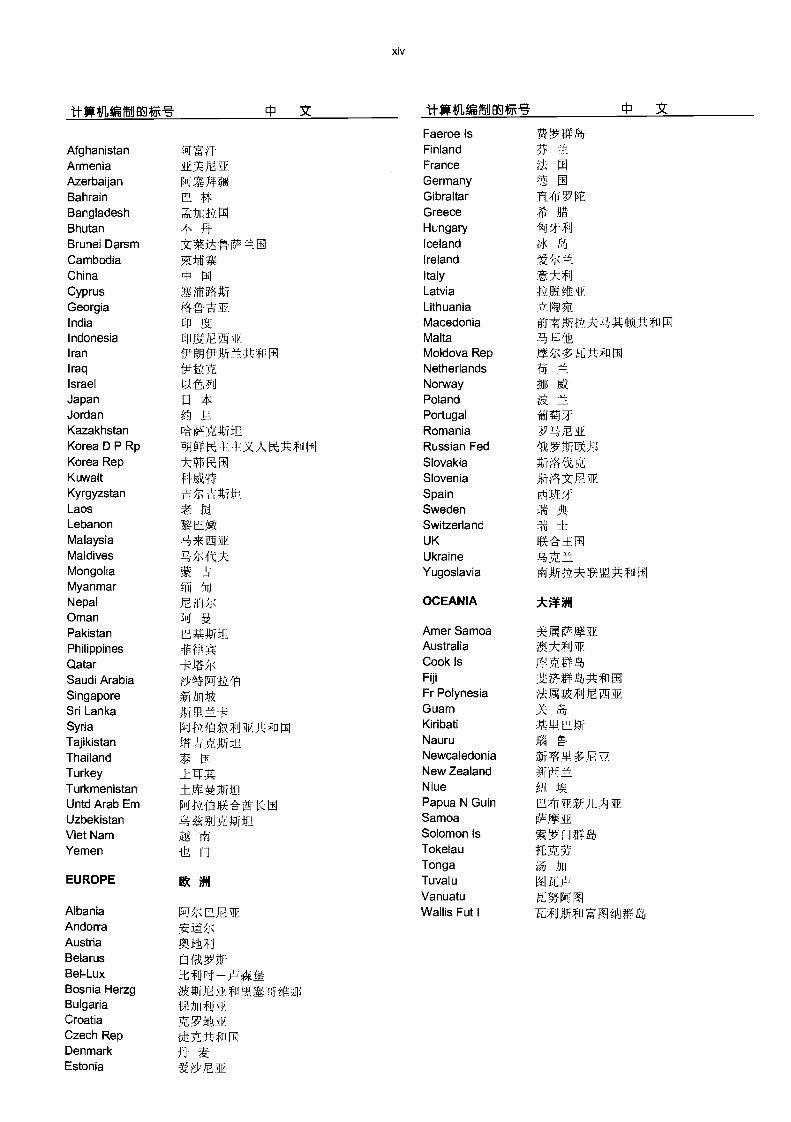
The tables are extracted from FAO's FAOSTAT database onforest products. As such, the tables use computer-generatedlabels for forest product names and to represent geographicentities. A listing of the computer generated labels for names ofcontinents, countries and areas is displayed in a table towardsthe end of this section.
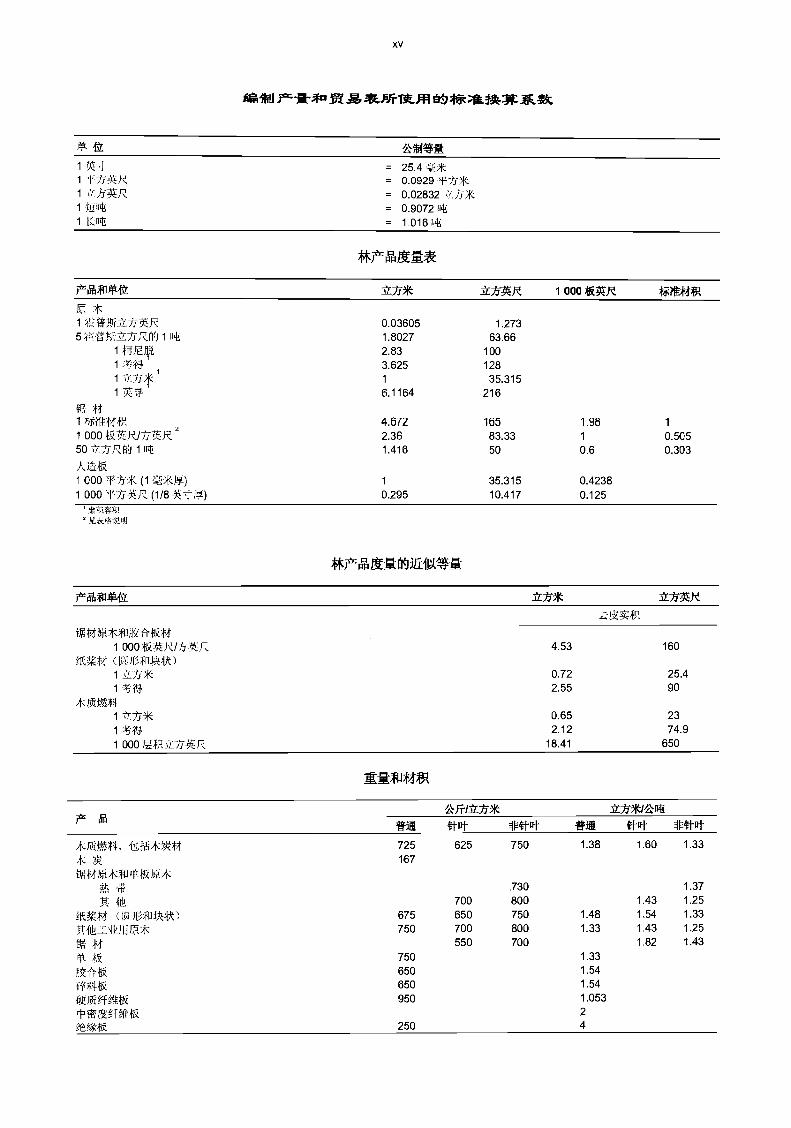
As in previous issues, this yearbook includes estimatesmade by FAO and data obtained from sources other than theofficial replies to questionnaires. The 5-year series incorporatesboth official revisions and new information from other sources.Thus, the figures published in earlier issues may have beenrevised during the preparation of these series. In certain cases,the data provided by countries are stated in different units orsystems of measurement from those used in the yearbook. Forpresentation in the yearbook it has been necessary to convert toa standard set of metric units. The coefficients used forconversion to the metric system are shown in a table at the endof this section. It is hoped that countries will re-examine theestimates and provide FAO with more accurate figures whenthese appear to be wrong.
A table of exchange rates for the 5 years of the data series isalso included in the yearbook. This table shows the exchangerates used to convert local currency units to a common currency(US$) in the trade value tables. Data for production and tradeare rounded to the nearest 1 000 units; volume figures (includingapparent net consumption per thousand capita) are in metrictonnes for charcoal, pulp and paper products and cubic metersfor all other products. When the name of a country or area isgiven without a =responding numerical entry or printed as "0",it means that quantities are less than 500 units. Entries of lessthan 500 go into the regional total and world total even thoughthey are not shown at the country level.
Where official statistics were not available an indication isgiven identifying the use of FAO estimates (F) or data from non-official sources (*). The use of (F) and (") is displayed on theproduct tables at the individual product level, e.g. plywood, butnot at the aggregate level, e.g. wood-based panels.
To improve these series, readers are encouraged to contactFAO if they find data that is inconsistent with recognised orauthoritative data sources or if any of the data does not appearto make sense, even if it has come from an official source. FAOwants to report accurate and timely data and seeks theassistance of all countries to improve the compilation anddissemination of high quality statistics on forest productproduction and intemational trade. The contact details for FAOstaff dealing with each of the sections of the yearbook are givenbelow. Planning and Statistics Branch, FAO ForestryDepartment, Viale delle Terme di Caracalla, 00100 Rome, Italy.Fax: +39-06-5705.5514 or +39-06-5705.5137; E-mail: forgeneral comments [email protected]; productionstatistics [email protected]; trade [email protected]; FAOSTAT access [email protected].
XX
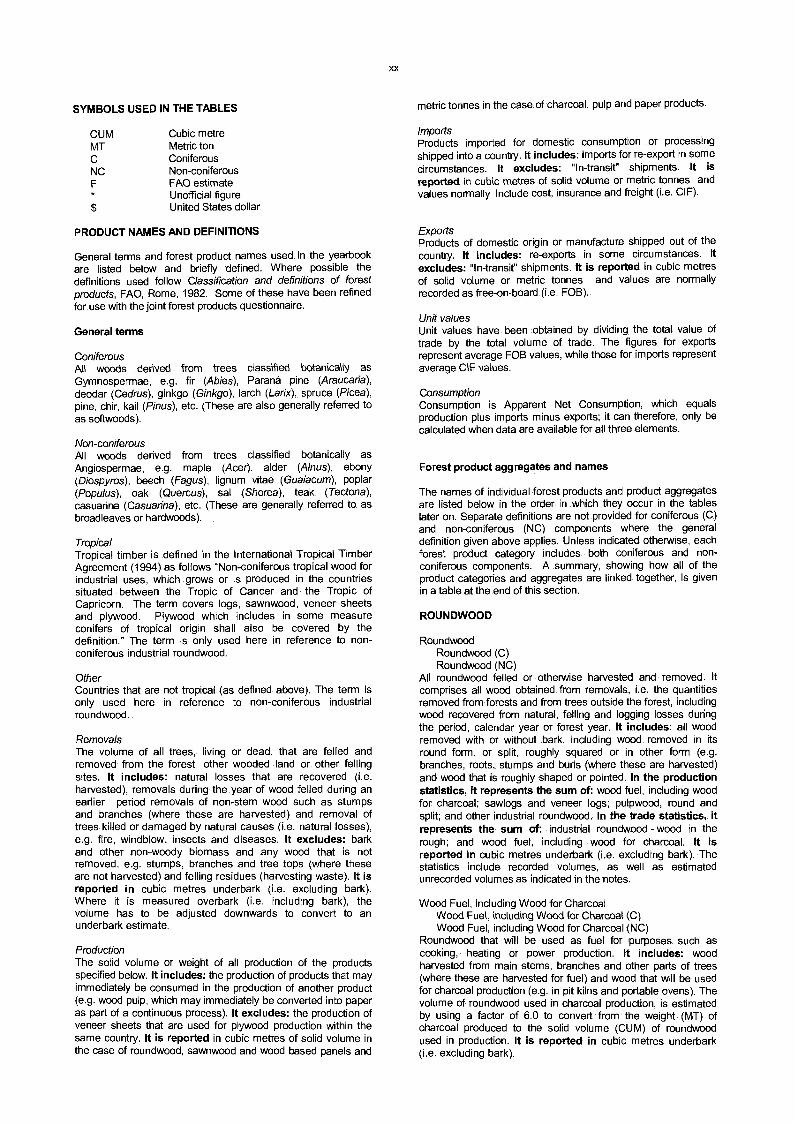
SYMBOLS USED IN THE TABLES metric tonnes in the case of charcoal, pulp and paper products.
/tripodsProducts imported for domestic consumption or processingshipped into a country. It includes: imports for re-export in somecircumstances. It excludes: "In-transit" shipments. It isreported in cubic metres of solid volume or metric tonnes andvalues normally include cost, insurance and freight (i.e. CIF).
ExportsProducts of domestic origin or manufacture shipped out of thecountry. It includes: re-exports in some circumstances. It
excludes: "In-transit" shipments. It is reported in cubic metresof solid volume or metric tonnes and values are normallyrecorded as free-on-board (i.e. FOB).
Unit valuesUnit values have been obtained by dividing the total value oftrade by the total volume of trade. The figures for exportsrepresent average FOB values, while those for imports representaverage CIF values.
ConsumptionConsumption is Apparent Net Consumption, which equalsproduction plus imports minus exports; it can therefore, only becalculated when data are available for all three elements.
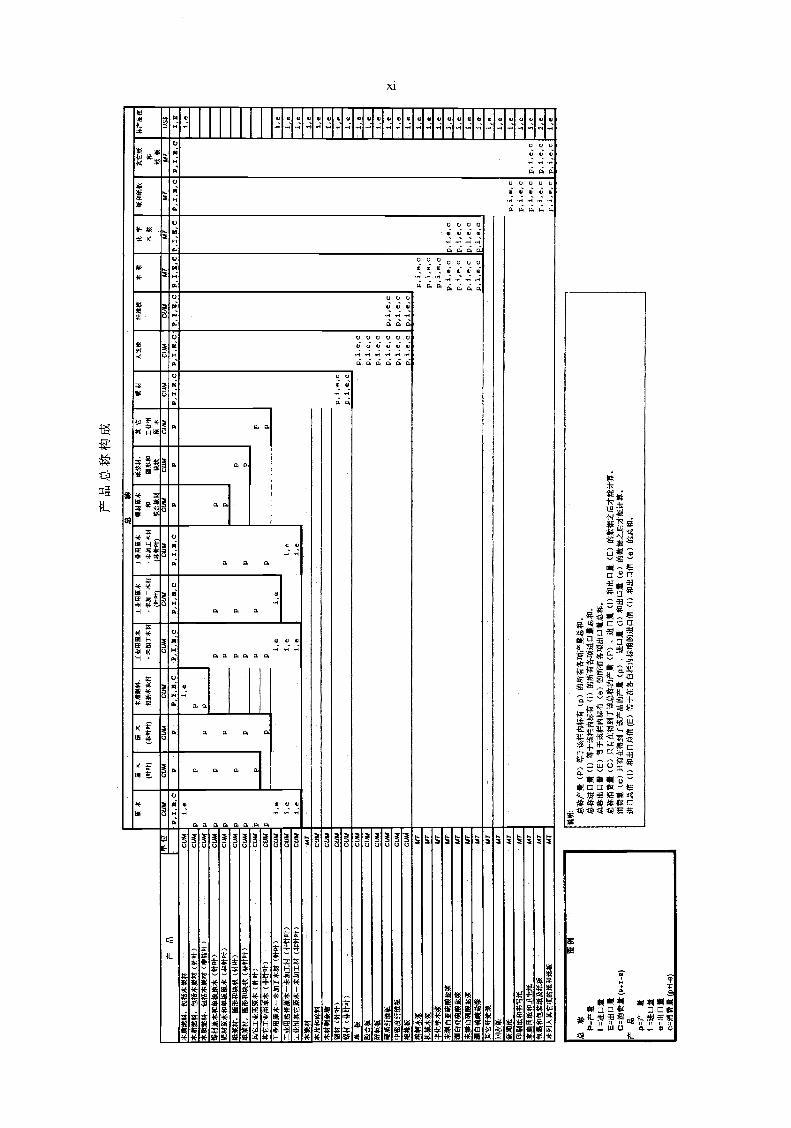
Forest product aggregates and names
The names of individual forest products and product aggregatesare listed below in the order in which they occur in the tableslater on. Separate definitions are not provided for coniferous (C)and non-coniferous (NC) components where the generaldefinition given above applies. Unless indicated otherwise, eachforest product category includes both coniferous and non-coniferous components. A summary, showing how all of theproduct categories and aggregates are linked together, is givenin a table at the end of this section.
ROUNDWOOD
RoundwoodRoundwood (C)Roundwood (NC)
All roundwood felled or otherwise harvested and removed. Itcomprises all wood obtained from removals, i.e. the quantitiesremoved from forests and from trees outside the forest, includingwood recovered from natural, felling and logging losses duringthe period, calendar year or forest year. It includes: all woodremoved with or without bark, including wood removed in itsround form, or split, roughly squared or in other form (e.g.branches, roots, stumps and burls (where these are harvested)and wood that is roughly shaped or pointed. In the productionstatistics, it represents the sum of: wood fuel, including woodfor charcoal; sawlogs and veneer logs; pulpwood, round andsplit; and other industrial roundwood. In the trade statistics, itrepresents the sum of: industrial roundwood - wood in therough; and wood fuel, including wood for charcoal. It isreported in cubic metres underbark (i.e. excluding bark). Thestatistics include recorded volumes, as well as estirnatedunrecorded volumes as indicated in the notes.
Wood Fuel, including INood for CharcoalWood Fuel, including Wood for Charcoal (C)Wood Fuel, including Wood for Charcoal (NC)
Roundwood that will be used as fuel for purposes such ascooking, heating or power production. It includes: woodharvested from main stems, branches and other parts of trees(where these are harvested for fuel) and wood that will be usedfor charcoal production (e.g. in pit kilns and portable ovens). Thevolume of roundwood used in charcoal production, is estimatedby using a factor of 6.0 to convert from the weight (MT) ofcharcoal produced to the solid volume (CUM) of roundwoodused in production. It is reported in cubic metres underbark(i.e. excluding bark).
CUM Cubic metreMT Metric ton
ConiferousNC Non-coniferous
FAO estimateUnofficial figureUnited States dollar
PRODUCT NAMES AND DEFINITIONS
General terms and forest product names used in the yearbookare listed below and briefly defined. Where possible thedefinitions used follow Classification and definitions of forestproducts, FAO, Rome, 1982. Some of these have been refinedfor use with the joint forest products questionnaire.
General terms
ConiferousAll woods derived from trees classified botanically asGymnospermae, e.g. fir (Abies), Paraná pine (Araucaria),deodar (Cedrus), ginkgo (Ginkgo), larch (Larix), spruce (Picea),pine, chir, kail (Pinus), etc. (These are also generally referred toas softwoods).
Non-coniferousAll woods derived from trees classified botanically as
Angiospermae, e.g. maple (Acer), alder (Alnus), ebony(Diospyros), beech (Fagus), lignum vitae (Guaiacum), poplar(Populus), oak (Quercus), sal (Shorea), teak (Tectona),casuarina (Casuarina), etc. (These are generally referred to asbroadleaves or hardwoods).
TropicalTropical timber is defined in the International Tropical TimberAgreement (1994) as follows "Non-coniferous tropical wood forindustrial uses, which grows or is produced in the countriessituated between the Tropic of Cancer and the Tropic ofCapricorn. The term covers logs, sawnwood, veneer sheetsand plywood. Plywood which includes in some measureconifers of tropical origin shall also be covered by thedefinition." The term is only used here in reference to non-coniferous industrial roundwood.
OtherCountries that are not tropical (as defined above). The term isonly used here in reference to non-coniferous industrialroundwood.
RemovalsThe volume of all trees, living or dead, that are felled andremoved from the forest, other wooded land or other fellingsites. It includes: natural losses that are recovered (i.e.harvested), removals during the year of wood felled during anearlier period removals of non-stem wood such as stumpsand branches (where these are harvested) and removal oftrees killed or damaged by natural causes (i.e. natural losses),e.g. fire, windblow. insects and diseases. It excludes: barkand other non-woody biomass and any wood that is notremoved, e.g. stumps, branches and tree tops (where theseare not harvested) and felling residues (harvesting waste). It isreported in cubic metres underbark (i.e. excluding bark).Where it is measured overbark (i.e. including bark), thevolume has to be adjusted downwards to convert to anunderbark estimate.
ProductionThe solid volume or weight of all production of the productsspecified below. It includes: the production of products that mayimmediately be consumed in the production of another product(e.g. wood pulp, which may immediately be converted into paperas part of a continuous process). It excludes: the production ofveneer sheets that are used for plywood production within thesame country. It is reported in cubic metres of solid volume inthe case of roundwood, sawnwood and wood based panels and
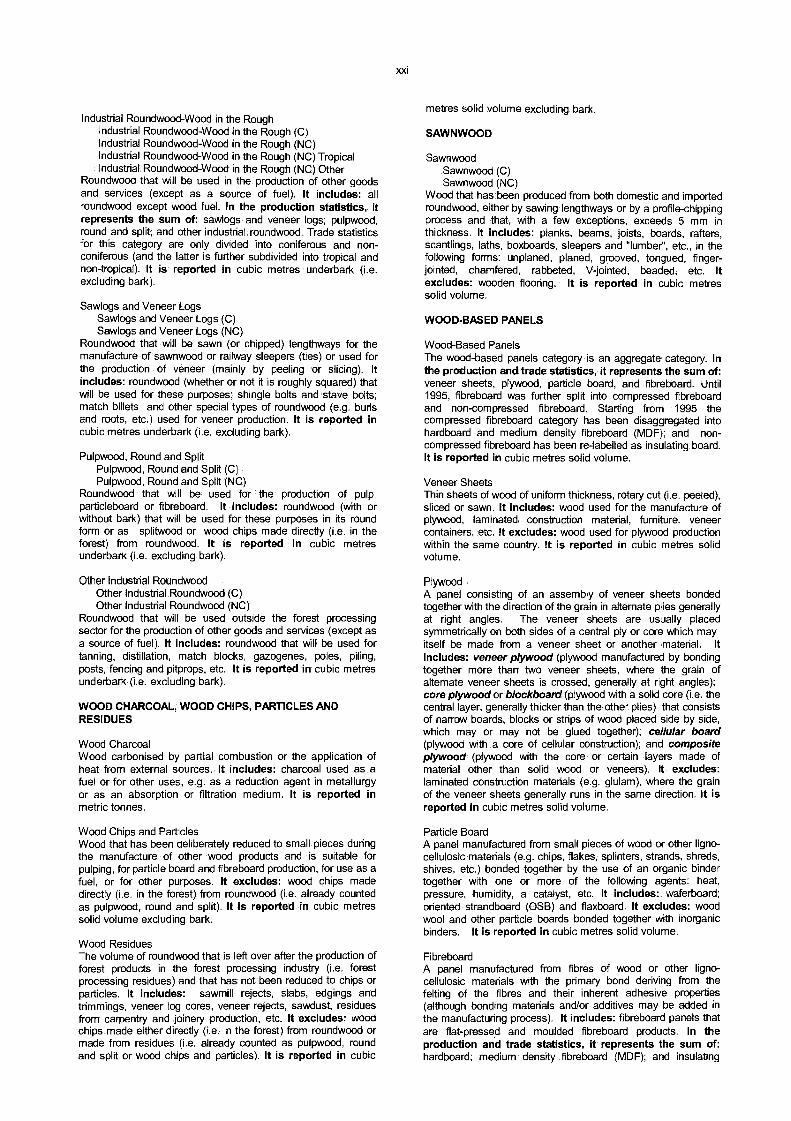
Industrial Roundwood-Wood in the RoughIndustrial Roundwood-Wood in the Rough (C)Industrial Roundwood-Wood in the Rough (NC)Industrial Roundwood-Wood in the Rough (NC) TropicalIndustrial Roundwood-Wood in the Rough (NC) Other
Roundwood that will be used in the production of other goodsand services (except as a source of fuel). It includes: allroundwood except wood fuel. In the production statistics, itrepresents the sum of: sawlogs and veneer logs; pulpwood,round and split; and other industrial roundwood. Trade statisticsfor this category are only divided into coniferous and non-coniferous (and the latter is further subdivided into tropical andnon-tropical). It is reported in cubic metres underbark (i.e.excluding bark).
Sawlogs and Veneer LogsSawlogs and Veneer Logs (C)Sawlogs and Veneer Logs (NC)
Roundwood that will be sawn (or chipped) lengthways for themanufacture of sawnwood or railway sleepers (ties) or used forthe production of veneer (mainly by peeling or slicing). Itincludes: roundwced (whether or not it is roughly squared) thatwill be used for these purposes; shingle bolts and stave bolts;match billets and other special types of roundwood (e.g. burlsand roots, etc.) used for veneer production. It is reported incubic metres underbark (i.e. excluding bark).
Pulpwood, Round and SplitPulpwood, Round and Split (C)Pulpwood, Round and Split (NC)
Roundwood that will be used for the production of pulp,particleboard or fibreboard. It includes: roundwood (with orwithout bark) that will be used for these purposes in its roundform or as splitwood or wood chips made directly (i.e. in theforest) from roundwood. It is reported in cubic metresunderbark (i.e. excluding bark).
Other Industrial RoundwoodOther Industrial Roundwood (C)Other Industrial Roundwood (NC)
Roundwood that will be used outside the forest processingsector for the production of other goods and services (except asa source of fuel). Ft includes: roundwood that will be used fortanning, distillation, match blocks, gazogenes, poles, piling,posts, fencing and pitprops, etc. It is reported in cubic metresunderbark (i.e. excluding bark).
WOOD CHARCOAL, WOOD CHIPS, PARTICLES ANDRESIDUES
Wood CharcoalWood carbonised by partial combustion or the application ofheat from external sources. It includes: charcoal used as afuel or for other uses, e.g. as a reduction agent in metallurgyor as an absorption or fittration medium. It is reported inmetric tonnes.
Wood Chips and ParticlesWood that has been deliberately reduced to small pieces duringthe manufacture of other wood products and is suitable forpulping, for particle board and fibreboard production, for use as afuel, or for other purposes. It excludes: wood chips madedirectly (i.e. in the forest) from roundwood (i.e. already countedas pulpwood, round and split). It is reported in cubic metressolid volume excluding bark.
Wood ResiduesThe volume of roundwood that is left over after the production offorest products in the forest processing industry (i.e. forestprocessing residues) and that has not been reduced to chips orparticles. It includes: sawmill rejects, slabs, edgings andtrimmings, veneer log cores, veneer rejects, sawdust, residuesfrom carpentry and joinery production, etc. It excludes: woodchips made either directly (i.e. in the forest) from roundwood ormade from residues (i.e. already counted as pulpwood, roundand split or wood chips and particles). It is reported in cubic
xxi
metres solid volume excluding bark.
SAVVNWOOD
SawnwoodSawnwood (C)Sawnwood (NC)
Wood that has been produced from both domestic and importedroundwood, either by sawing lengthways or by a profile-chippingprocess and that, with a few exceptions, exceeds 5 mm inthickness. It includes: planks, beams, joists, boards, rafters,scantlings, laths, boxboards, sleepers and "lumber, etc., in thefollowing forms: unplaned, planed, grooved, tongued, finger-jointed, chamfered, rabbeted, V-jointed, beaded, etc. Itexcludes: wooden flooring. It is reported in cubic metressolid volume.
WOOD-BASED PANELS
Wood-Based PanelsThe wood-based panels category is an aggregate category. Inthe production and trade statistics, it represents the sum of:veneer sheets, plywood, particle board, and fibreboard. Until1995, fibreboard was further split into compressed fibreboardand non-compressed fibreboard. Starting from 1995 thecompressed fibreboard category has been disaggregated intohardboard and medium density fibreboard (MDF); and non-compressed fibreboard has been re-labelled as insulating board.It is reported in cubic metres solid volume.
Veneer SheetsThin sheets of wood of unifomi thickness, rotary cut (i.e. peeled),sliced or sawn. It includes: wood used for the manufacture ofplywood, laminated construction material, furniture, veneercontainers, etc. It excludes: wood used for plywood productionwithin the same country. It is reported in cubic metres solidvolume.
PlywoodA panel consisting of an assembly of veneer sheets bondedtogether with the direction of the grain in alternate plies generallyat right angles. The veneer sheets are usually placedsymmetrically on both sides of a central ply or core which mayitself be made from a veneer sheet or another material. Itincludes: veneer plywood (plywood manufactured by bondingtogether more than two veneer sheets, where the grain ofaltemate veneer sheets is crossed, generally at right angles);core plywood or blockboard (piywood with a solid core (i.e. thecentral layer, generally thicker than the other plies) that consistsof narrow boards, blocks or strips of wood placed side by side,which may or may not be glued together); cellular board(plywood with a core of cellular construction); and compositeplywood (plywood with the core or certain layers made ofmaterial other than solid wood or veneers). It excludes:laminated construction materials (e.g. glulam), where the grainof the veneer sheets generally runs in the same direction. It isreported in cubic metres solid volume.
Particle BoardA panel manufactured from small pieces of wood or other ligno-cellulosic materials (e.g. chips, flakes, splinters, strands, shreds,shives, etc.) bonded together by the use of an organic bindertogether with one or more of the following agents: heat,pressure, humidity, a catalyst, etc. It includes: waferboard;oriented strandboard (OSB) and flaxboard. It excludes: woodwool and other particle boards bonded together with inorganicbinders. It is reported in cubic metres solid volume.
FibreboardA panel manufactured from fibres of wood or other ligno-cellulosic materials with the primary bond deriving from thefelting of the fibres and their inherent adhesive properties(although bonding materials and/or additives may be added inthe manufacturing process). It includes: fibreboard panels thatare flat-pressed and moulded fibreboard products. In theproduction and trade statistics, it represents the sum of:hardboard; medium density fibreboard (MDF); and insulating
board. It is reported in cubic nnetres solid volume.
HardboardFibreboard with a density exceeding 0.80 g/cm3. Before 1995,this product was a component of the compressed fibreboardproduct category, so data for this product is not available for1994 and earlier years. R excludes: similar products made frompieces of wood, wood flour or other ligno-cellulosic materialwhere additional binders are required to make the panel; andpanels made of gypsum or other mineral material. It isreported in cubic metres solid volume.
Medium Density Fibreboard (MDF)Fibreboard of a density exceeding 0.5 g/cm3 but not exceeding0.8 9/cm3. Before 1995, this product was a component of thecompressed fibreboard product category, so data for this productis not available for 1994 and earlier years. It is reported incubic metres solid volume.
Insulating BoardFibreboard of a density not exceeding 0.5 9/cm3. Before 1995,this product was referred to as non-compressed fibreboard. It isreported in cubic metres solid volume.
PULP AND RECOVERED PAPER
Wood PulpFibrous material prepared from pulpwood, wood chips,particles, residues or recovered paper by mechanical and/orchemical process for further manufacture into paper,paperboard, fibreboard or other cellulose products. In theproduction and trade statistics, it represents the sum of:mechanical wood pulp; semi-chemical wood pulp; chemicalwood pulp; and dissolving wood pulp. It is reported in metrictonnes air-dry weight (i.e. with a 10% moisture content).
Mechanical Wood PulpWood pulp obtained by grinding or milling pulpwood or residuesinto fibres, or through refining chips or particles. Also calledground wood pulp and refiner pulp, it may be bleached orunbleached. It includes: chemi-mechanical and thermo-mechanical pulp. It excludes: exploded and defibrillated pulp. Itis reported in metric tonnes air-dry weight (i.e. with a 10%moisture content).
Semi-Chemical Wood PulpWood pulp obtained by subjecting pulpwood, wood chips,particles or residues to a series of mechanical and chemicaltreatments, none of which alone is sufficient to make the fibresseparate readily. It may be bleached or unbleached. It includes:semi-chennical wood pulp; chemi-ground wood pulp; and chemi-mechanical wood pulp etc.(named in the order and importanceof the treatment during the manufacturing process). It isreported in metric tonnes air-dry weight (i.e. with a 10%moisture content).
Chemical Wood PulpWood pulp obtained by subjecting pulpwood, wood chips,particles or residues to a series of chemical treatments. Itincludes: sulphate (kraft) wood pulp; soda wood pulp; andsulphite wood pulp. It may be bleached, semi-bleached orunbleached. It excludes dissolving grades of wood pulp. It isreported in metric tonnes air-dry weight (i.e. with a 10%moisture content). Where detail is available, statistics for thefollowing four component pulps are also given: unbleachedsulphite pulp; bleached sulphite pulp; unbleached sulphate pulp;and bleached sulphate pulp.
Unbleached Sulphite PulpBleached Sulphite PulpWood pulp obtained by mechanically reducing pulpwood, woodchips, particles or residues to small pieces that aresubsequently cooked in a pressure vessel in the presence of abisulphite cooking liquor. Bisulphites such as ammonium,calcium, magnesium and sodium are commonly used in thisprocess. It excludes dissolving grades of wood pulp. It isreported in metric tonnes air-dry weight (i.e. with a 10%
moisture content) and data for two classes: bleached (includingsemi-bleached); and unbleached, are reported separately.
Unbleached Sulphate PulpBleached Sulphate PulpWood pulp obtained by mechanically reducing pulpwood, woodchips, particles or residues to small pieces that aresubsequently cooked in a pressure vessel in the presence ofsodium hydroxide cooking liquor (soda pulp) or a mixture ofsodium hydroxide and sodium sulphite cooking liquor (sulphatepulp). It excludes dissolving grades of wood pulp. It isreported in metric tonnes air-dry weight (i.e. with a 10%moisture content) and data for two classes: bleached (includingsemi-bleached); and unbleached, are reported separately.
Dissolving Wood PulpChemical pulp (sulphate, soda or sulphite) made from wood ofspecial quality, with a very high alpha-cellulose content (usually90 percent and over). This type of pulp is always bleached and isreadily adaptable for uses other than paper-making. It is usedprincipally as a source of cellulose in the manufacture ofproducts such as synthetic fibres, cellulose plastic materials,lacquers and explosives. It is reported in metric tonnes air-dry weight (i.e. with a 10% moisture content).
Other Fibre PulpPulp manufactured from fibrous vegetable materials other thanwood and used for the manufacture of paper, paperboard andfibreboard. It includes pulps made from: straw; bamboo;bagasse; esparto; other reeds or grasses; cotton fibres: flax;hemp; rags; and other textile wastes. It excludes pulp madefrom recovered paper. it is reported in metric tonnes air-dryweight (i.e. with a 10% moisture content).
Recovered PaperWaste and scraps of paper or paperboard that have beencollected for re-use as a raw material for the manufacture ofpaper and paperboard. It includes: paper and paperboard thathas been used for its original purpose and residues from paperand paperboard production. It is reported in metric tonnes.
PAPER AND PAPERBOARD
Paper and Paperboard
The paper and paperboard category is an aggregate category. Inthe production and trade statistics, it represents the sum of:newsprint; printing and writing paper; and other paper andpaperboard. Products in this category are generallymanufactured in strips or rolls of a width exceeding 15 cm (36cm for HS 48.13 and 48.19) or in rectangular sheets with oneside exceeding 36 cm and the other exceeding 15 cm in theunfolded state. It excludes manufactured paper products suchas boxes, cartons, books and magazines, etc. It is reported inmetric tonnes.
NewsprintUncoated paper, unsized (or only slightly sized), containing atleast 60 percent mechanical wood pulp (percentage of fibrouscontent), usually weighing not less that 40 g/m2 and generallynot more than 60 g/m4, of the type used mainly for the printing ofnewspapers. It is reported in metric tonnes.
Paper and Paperboard other than NewsprintThe paper and paperboard category is an aggregate category. Itcomprises: other printing and writing paper; and other paperand paperboard. It only appears in tables showing direction oftrade. It is reported in metric tonnes.
Printing and Writing PaperPaper, except newsprint, suitable for printing and businesspurposes, writing, sketching, drawing, etc. Made from a varietyof pulp blends and with various finishes. It includes: papersused for books and magazines; wallpaper base stock; box liningand covering; calculator paper; rotonews; duplicating tablet orblock; labels; lithograph paper; banknotes; tabulating card stock;bible or imitation bible paper; stationery; manifold paper;
onionskin; typewriter paper; and poster paper, etc. It isreported in metric tonnes.
Other Paper and PaperboardAll other types of paper. It includes: construction paper andpaperboard; household and sanitary paper, special thin paper;wrapping and packaging paper and paperboard; and other paperand paperboard not elsewhere specified. It is reported inmetric tonnes. Where detail is available, statistics for thefollowing three components are also given: household andsanitary paper; wrapping and packaging paper and paperboard;and other papar and paperboard not elsewhere specified.
Household and Sanitary PaperAbsorbent paper (creped or uncreped and sometimesembossed) nnade from bleached or unbleached chemical woodpulp, sometimes with a mixture of pulp from waste paper andmechanical pulp. It includes: towelling; napkins; facial tissue;toilet tissue; wadding; and disposable tissues, etc. It isreported in metric tonnes.
Wrapping and Packaging Papar and PaperboardPaper or paperboard used for wrapping, packaging and themanufacture of sacks and boxes. It includes: vegetableparchment, greaseproof paper and glassine paper (made frompure chemical wood pulp or from a mixture of chemical woodpulp, cotton fibre pulp, tnaated (e.g. highly hydrated or hard-beaten) to render the resulting paper resistant to oil, grease andwater and used primarily for packaging fmzen, moist or greasymaterials such as butter, margarine, meat or fish); linerboard(paper or paperboard used as facing material on corrugated orsolid paper or paperboarci boxes and containers); fluting medium(paper or paperboard used as medium when combining paperand paperboard for conversion into a corrugated board); sackkraft paper (strong paper made from sulphate pulp and used inthe manufacture of single or multiwall sacks); other kraftwrapping paper (all other wrapping and packaging papers madeprincipally from sulphate pulp); folding boxboard (all types ofpaperboard used in the manufacture of folding boxes); and otherwrapping and packaging paper and paperboard. It is reportedin metric tonnes.
Other Paper and Paperboard Not Elsewhere SpecifiedPaper and paper board used for construction, special purposesand other uses not elsewhere specified. It includes: kraftpapers used for waxing, asphalting, waterproofing, laminating,impregnating, spinning or twisting, gumming, etc.; papersmanufactured principally from furnishes other than sulphate pulpand not elsewhere specified (such as rope and jute paper, folderstock, blotting paper, filter paper, photographic sensitising paper,etc.); construction paper and paperboard (papers, paper feltsand paperboards used in the construction of buildings and otherstructures for insulation, vapour seal, roofing and flooringunderlay, etc. (these papers are generally made from fullyrefined material such as wood pulp, waste paper, othervegetable pulp and mineral fibre and their principlecharacteristics are low thermal conductivity, moistura resistance,fire resistance, permanency and insect and vermin resistance));special thin paper (papers made for special purposes, theircommon characteristics being their relative thinness, thesepapers may be made from mechanical or chemical wood pulps,bleached or unbleached. but frequently from pulps containingflax, hemp or cotton fibre and the principal characteristics ofsome of these papers are: uniformity of surface and calliper,freedom from pinholes, strength, close formation, opacity, lowpermeability, chemical purity, examples of this type of paperincludes: carbonising tissue, condenser and capacitor paper,cigarette paper, lens tissue, pattern tissue, and tea-bag paper);and paperboards not elsewhere specified (such as shoe board,gasket board, transfomier board, press textile board, indexpressboard, panel board (car), trunk and suitcase board andmatrix board). It excludes: papers, felts or boards that areimpregnated, saturated, laminated or further manufactured inany way and fibreboard or fibre building-board, in the fccm ofinsulating board, medium hardboard and hardboard. It isreported in metric tonnes.
NOTES ON THE TABLES
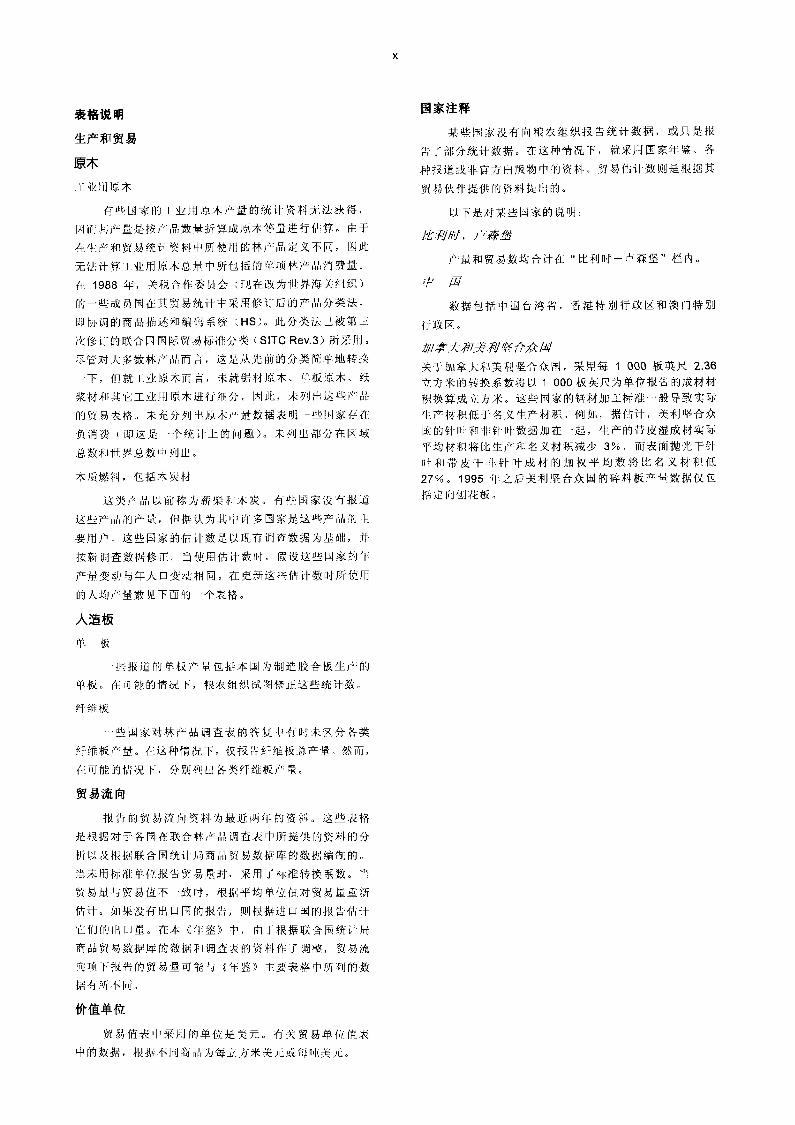
Production and trade
ROUNDWOOD
Industrial RoundwoodData on industrial roundwood production are not available for anumber of countries and have been estimated by converting thevolume of products produced in the country to the volume ofroundwood required to produce that volume (the roundwoodequivalent). Consumption of individual forest products includedin total industrial roundwood cannot be calculated due to thedifferent definitions of forest products used in the production andtrade statistics. In 1988 a number of countries that weremembers of the Customs Co-operation Council (now named theWorld Customs Organisation) introduced a revised classificationof products in their trade statistics, the Harmonized CommodityDescription and Coding System (HS). This has also beenadopted by the United Nations in Revision 3 of the Standardinternational trade classification (SIC Rev. 3). Although formost forest products this is a straightforward transforrnation fromthe previous classification, in the case of industrial roundwoodthe subdivisions between sawlogs and veneer logs, pulpwoodand other industrial roundwood are not included. Thus tables fortrade in these products are discontinued. The incompletedeclaration of roundwood production data explains the presenceof negative consumption in some countries (i.e. this is a
statistical problem). These inaccuracies are included in theregional and world totals.
Wood Fuel. including Wood for CharcoalThis product category was formerly known as fuelwood andcharcoal. Data on the production of this product is not reportedfor a number of countries, many of which are believed to beimportant users of this product. Estimates for these countries arebased on available survey data and are revised as new surveysbecome available. Where estimates are used, the annualchange in production is assumed to be the same as the annualchange in population in these countries. The per capitaproduction figures used in the process of updating theseestimates are displayed in a table below.
WOOD-BASED PANELS
Veneer SheetsFor some countries, the reported volume of production of veneersheets includes veneer sheets produced for plywoodmanufacture within the same country. FAO has attempted tocorrect these statistics wherever possible.
FibreboardThe production volumes of the various types of fibreboard aresometimes not distinguished in country replies to the forestproducts questionnaire. In these cases only total fibreboardproduction is reported. However, fibreboard production isseparated into its individual components wherever possible.
Direction of trade
Information on the direction of trade is reported for the latest twoyears. These tables are based on an analysis of informationprovided by countries on the joint forest products questionnaireand from data drawn from the COMTRADE database of theUnited Nations Statistics Office. Where volumes have not beenreported in standard units, standard conversion factors havebeen applied. Where reported volumes have been inconsistentwith value, volumes have been re-estimated on the basis ofaverage unit values. In the absence of exporting country reports,estimates of their exports have been constructed from importers'reports. In this edition, volumes reported under direction of trademay differ somewhat from data shown in the main yearbooktables due to adjustments made on the basis of bothCOMTRADE and questionnaire information.
xxiv
Value units
The unit used in tables on the value of trade is US dollars. In thetables on unit value of trade, it is US dollars per cubic metre orper metric ton, according to the commodity.
Country notes
Certain countries either have not reported statistrcs to FAO orhave reported only partially. In such cases, information has beentaken from national yearbooks, from reports or from unofficialpublications. Estimates of trade have been based on informationprovided by reports of trading partners.
The following notes apply to particular countries:
Belgium, LuxembourgProduction and trade are merged under BEL-LUX.
ChinaData include those for Taiwan Province of China, Hong KongSpecial Administrative Region and Macau Special AdministrativeRegion.
Canada and the United States of AmericaFor Canada and the United States of America, the volume ofsawnwood reported in 1 000 board feet is converted to cubicmetres using a conversion factor of 2.36 m3 per 1 000 bd ft.Sawing conventions in these countries generally result in thetrue volume of production being less than the nominal volume ofproduction. For example, it is estimated that, for the UnitedStates of America. taking coniferous and non-coniferous datatogether, the actual average volume of rough green sawnwoodproduced would be 3 percent less than the nominal volumeproduced, while the weighted average for surface dry coniferousand rough dry non-coniferous sawnwood would be 27 percentless than the nominal volume. Data for particle board productionin the United States of America only includes OSB (orientedstrand board) from 1995.
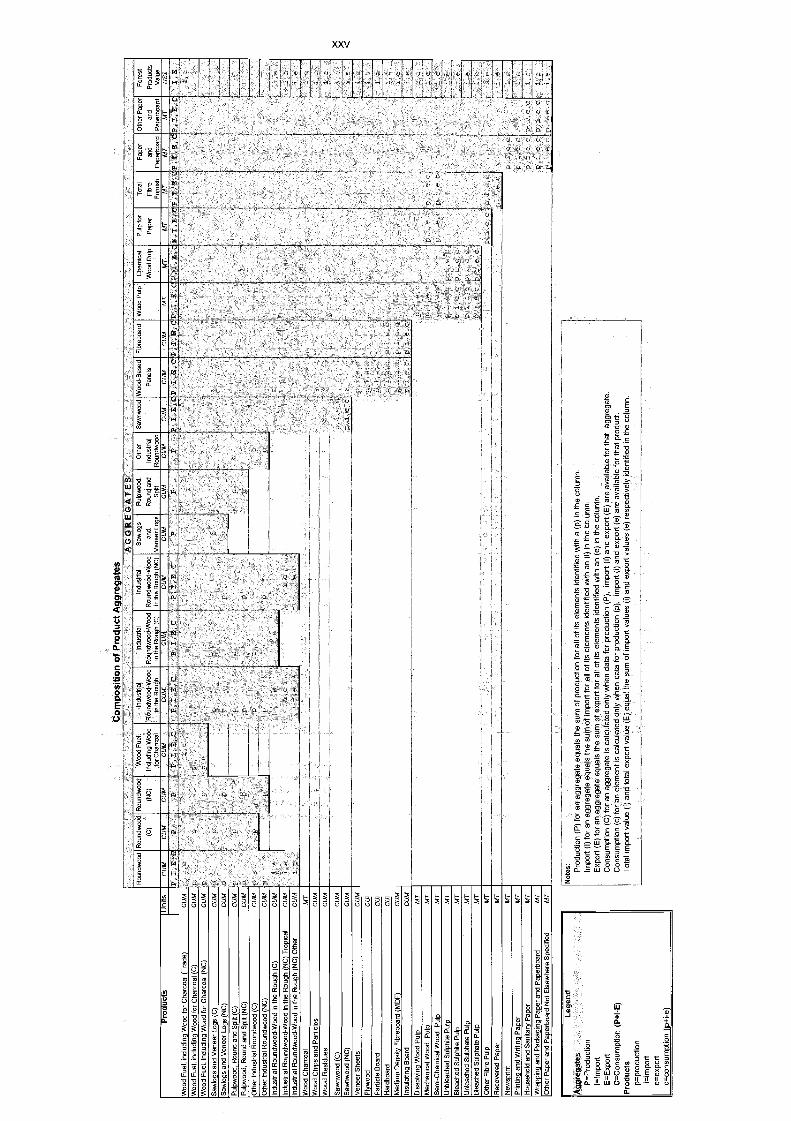
Pro
duct
s
Woo
d F
uel,
incl
udin
g W
ood
for
Cha
rcoa
l (T
rade
)
Woo
d F
uel,
incl
udin
g W
ood
for
Cha
rcoa
l (C
)W
ood
Fue
l, in
clud
ing
Woo
d fo
r C
harc
oal (
NC
)
Saw
logs
and
Ven
eer
Logs
(C
)
Uni
ts
CU
M
CU
M
CU
M
CU
M
Saw
logs
and
Ven
eer
Logs
(N
C)
CU
M
Pul
pwoo
d, R
ound
and
Spl
it (C
)C
UM
Pul
pwoo
d, R
ound
and
Spl
it (N
C)
CU
M
Oth
er In
dust
rial R
ound
woo
d (C
)C
UM
Oth
er In
dust
rial R
ound
woo
d (N
C)
Ply
woo
d
Par
ticle
Boa
rd
Har
dboa
rd
Med
ium
Den
sity
Fib
rebo
ard
(MD
F)
CU
M r
Indu
stria
l Rou
ndw
ood-
Woo
d in
the
Rou
gh (
C)
CU
M
Indu
stria
l Rou
ndw
ood-
Woo
d in
the
Rou
gh (
NC
) T
ropi
cal
CU
M
Indu
stria
l Rou
ndw
ood-
Woo
d in
the
Rou
gh (
NC
) O
ther
CU
M
Woo
d C
harc
oal
MT
Woo
d C
hips
and
Par
ticle
sC
UM
Woo
d R
esid
ues
CU
M
Saw
nwoo
d (C
)C
UM
Saw
nwoo
d (N
C)
CU
M
Ven
eer
She
ets
CU
M
CU
I
CU
CU
I
CU
M
Insu
latin
g B
oard
CU
M
Dis
solv
ing
Woo
d P
ulp
MT
Mec
hani
cal W
ood
Pul
pM
T
Sem
i-Che
mic
al W
ood
Pul
pM
T
Unb
leac
hed
Sul
phite
Pul
pM
T
Ble
ache
d S
ulph
ite P
ulp
MT
Unl
each
ed S
ulph
ate
Pul
pM
T
Ble
ache
d S
ulph
ate
Pul
pM
T
Oth
er F
ibre
Pul
pM
T
Rec
over
ed P
aper
MT
New
sprin
tM
T
Prin
ting
and
Writ
ing
Pap
erM
T
Hou
seho
ld a
nd S
anita
ry P
aper
MT
Wra
ppin
g an
d P
acka
ging
Pap
er a
nd P
aper
boar
dM
T
Oth
er P
aper
and
Pap
erbo
ard
Not
Els
ewhe
re S
peci
fied
MT
CU
MC
UM
P,I,
E,C
P
e
Lege
ndA
ggre
gate
sP
=P
rodu
ctio
nI=
Impo
rtE
=E
xpor
tC
=C
onsu
mpt
ion
(P+
I-E
)P
rodu
cts
p=pr
oduc
tion
i=im
port
e=ex
port
c=co
nsum
ptio
n (p
+i-e
)
Rou
ndw
ood
Rou
ndw
ood
Rou
ndw
ood
(C)
(NC
)
CU
M
e
Not
es:
Pro
duct
ion
(P)
for
an a
ggre
gate
equ
als
the
sum
of p
rodu
ctio
n fo
r al
l of i
ts e
lem
ents
iden
tifie
d w
ith a
(p)
in th
e co
lum
n.Im
port
(I)
for
an a
ggre
gate
equ
als
the
sum
of i
mpo
rt fo
r al
l of i
ts e
lem
ents
iden
tifie
d w
ith a
n (i)
in th
e co
lum
n.E
xpor
t (E
) fo
r an
agg
rega
te e
qual
s th
e su
m u
f exp
ort f
or a
ll of
its
elem
ents
iden
tifie
d w
ith a
n (e
) in
the
colu
mn.
Con
sum
ptio
n (C
) fo
r an
agg
rega
te is
cal
cula
ted
only
whe
n da
ta fo
r pr
oduc
tion
(P),
impo
rt (
I) a
nd e
xpor
t (E
) ar
e av
aila
ble
for
that
agg
rega
te.
Con
sum
ptio
n (c
) fo
r an
ele
men
t is
calc
ulat
ed o
nly
whe
n da
ta fo
r pr
oduc
tion
(p),
impo
rt (
i) an
d ex
port
(e)
are
ava
ilabl
e fo
r th
at p
rodu
ct.
Tot
al im
port
val
ue (
I) a
nd to
tal e
xpor
t val
ue (
E)
equa
l the
sum
of i
mpo
rt v
alue
s (i)
and
exp
ort v
alue
s (e
) re
spec
tivel
y id
entif
ied
in th
e co
lum
n.
r 1,
e
p,e
e,c
p,e
e c
e e e
Com
posi
tion
of P
rodu
ct A
ggre
gate
sA
GG
RE
GA
TE
SW
ood
Fue
l
Incl
udin
g W
ood
Indu
stria
l
Rou
ndw
ood-
Woo
d
Indu
stna
l
Rou
ndw
ood-
Woo
d
lndu
stna
l
Rou
ndw
ood
Woo
d
Saw
logs
and
Pul
pwoo
d,
Rou
nd a
nd
Oth
er
Indu
stna
l
Saw
nwoo
d W
ood-
Bas
ed
Pan
els
Fib
rebo
ard
Woo
d P
ulp
Che
mic
al
Woo
d P
ulp
Pul
p fo
r
Pap
er
Tot
al
Fib
re
Pap
er
and
Oth
er P
aper
and
For
est
Pro
duct
sfo
r C
harc
oal
in th
e R
ough
in th
e R
oo h
Cin
the
Rou
gh (
NC
Ven
eer
Logs
S li
tR
ound
woo
dF
urni
shrf
psrg
nard
Pa
erbo
ard
Val
ueC
UM
CU
MC
UM
CU
MC
UM
CU
MC
UM
CU
MC
UM
CU
MM
TM
TM
TM
TM
TM
TU
S$
P,I,
E,C
P,I,
E,C
P,I,
E,C
P,I,
E,C
CP
,I,E
, P,/,
EP
,/,E
,5,
1,5,
p e.
e c
P
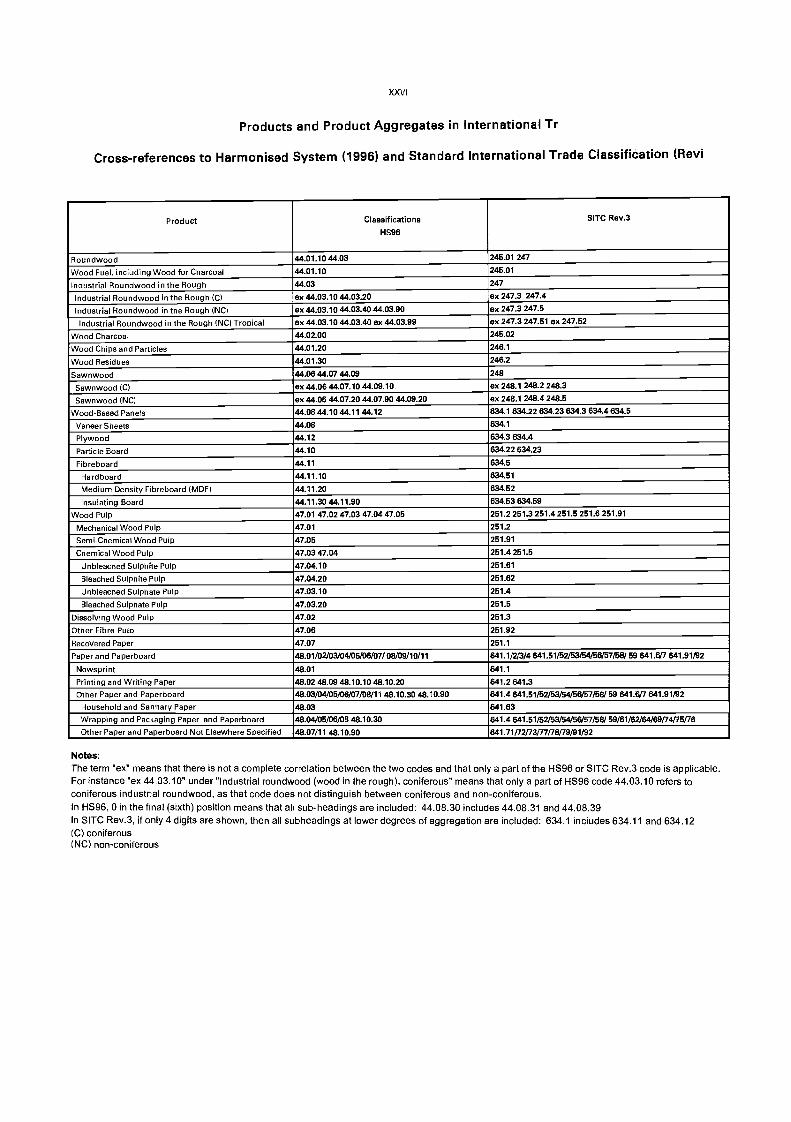
XXVI
Products and Product Aggregates in International Tr
Cross-references to Harmonised System (1996) and Standard International Trade Classification (Revi
Notes:The term "ex means that there is not a complete correlation between the two codes and that only a part of the HS96 or SITCRev.3 code is applicable.For instance "ex 44,03.10" under "Industrial roundwood (wood in the rough), coniferous" means that only a part of HS96 code 44.03.10 refers toconiferous industrial roundwood, as that code does not distinguish between coniferous and non-coniferous.In HS96, 0 in the final (sixth) position means that all sub-headings are included: 44.08.30 includes 44.08.31 and 44.08.39In SITC Rev.3, if only 4 digits are shown, then all subheadings at lower degrees of aggregation are included: 634.1 includes 634.11 and 634.12(C) coniferous(NC) non-coniferous
Product ClassificationsHS96
SITO Rev.3
Roundwood 44.01.10 44.03 245.01 247
Wood Fuel. including Wood for Charcoal 44.01.10 245.01
Industrial Roundwood in the Rough 44.03 247
Industrial Roundwood in the Rough (Cl ex 44.03.10 44.03.20 ex 247.3 247.4
Industrial Roundwood in the Rough (NC) ex 44.03.10 44.03.4044.03.90 ex 247.3 247.5
Industrial Roundwood in the Rough (NC) Tropical ex 44.03.10 44.03.40 ex 44.03.99 ex 247.3 247.51 ex 247.52
Wood Charcoal 44.02.00 245.02
Wood Chips and Particles 44.01.20 246.1
Wood Residues 44.01.30 246.2
Sawnwood 44.0644.07 44.09 248
Sawnwood (C) ex 44.06 44.07.10 44.09.10 ex 248.1 248.2 248.3
Sawnwood (NC) ex 44.06 44.07.20 44.07.90 44.09.20 ex 248.1 248.4 248.5
Wood-Based Panels 44.08 44.10 44.11 44.12 834.1 634.22 634.23 634.3 634.4 634.5
Veneer Sheets 44.08 634.1
Plywood 44.12 634.3 634.4
Particle Board 44.10 634.22 634.23
Fibreboard 44.11 634.5
Hardboard 44.11.10 634.51
Medium Density Fibreboard (MDF) 44.11.20 634.52
Insulating Board 44.11.3044.11.90 634.53 634.59
Wood Pulp 47.01 47.02 47.03 47.04 47.05 251.2 251.3 251.4 251.5 251.6 251.91
Mechanical Wood Pulp 47.01 251.2
Semi-Chemical Wood Pulp 47.05 251.91
Chemical Wood Pulp 47.03 47.04 251.4 251.5
Unbleacned Sulphite Pulp 47.04.10 251,61
Bleached Sulphite Pulp 47.04.20 251.62
Unbleached Sulphate Pulp 47.03.10 251.4
Bleached Sulphate Pulp 47.03.20 251.5
Dissolving Wood Pulp 47.02 251.3
Other Fibre Pule 47.06 251.92
Recovered Paper 47.07 251.1
Paper and Paperboard 48.01/02/03104/05/06/07/ 08/09/10/11 641.1/213/4 641.51/52/53/54/56/57/58/ 59 641.6/7 641.91/92
Newsprint 48.01 641.1
Printing and Writing Paper 48.02 48.09 48,10.1046.10.20 641.2 641.3
Other Paper and Paperboard 48.03/04/08/06/07/08/11 48.10.30 48.10.90 641.4 641.51/52/53/54/56/57/58/ 59 641.6/7 641.91/92
Household and Sanitary Paper 48.03 641.63
Wrapping and Packaging Paper and Paperboard 48.04/05/06/08 48.10.30 641.4 641.51/52/53/54156/57/68/ 59/61/62/64/69/74/75/76
Other Paper and Paperboard Not Elsewhere Specified 48.07111 48.10.90 641.71/72/73/77/78/79/91/92
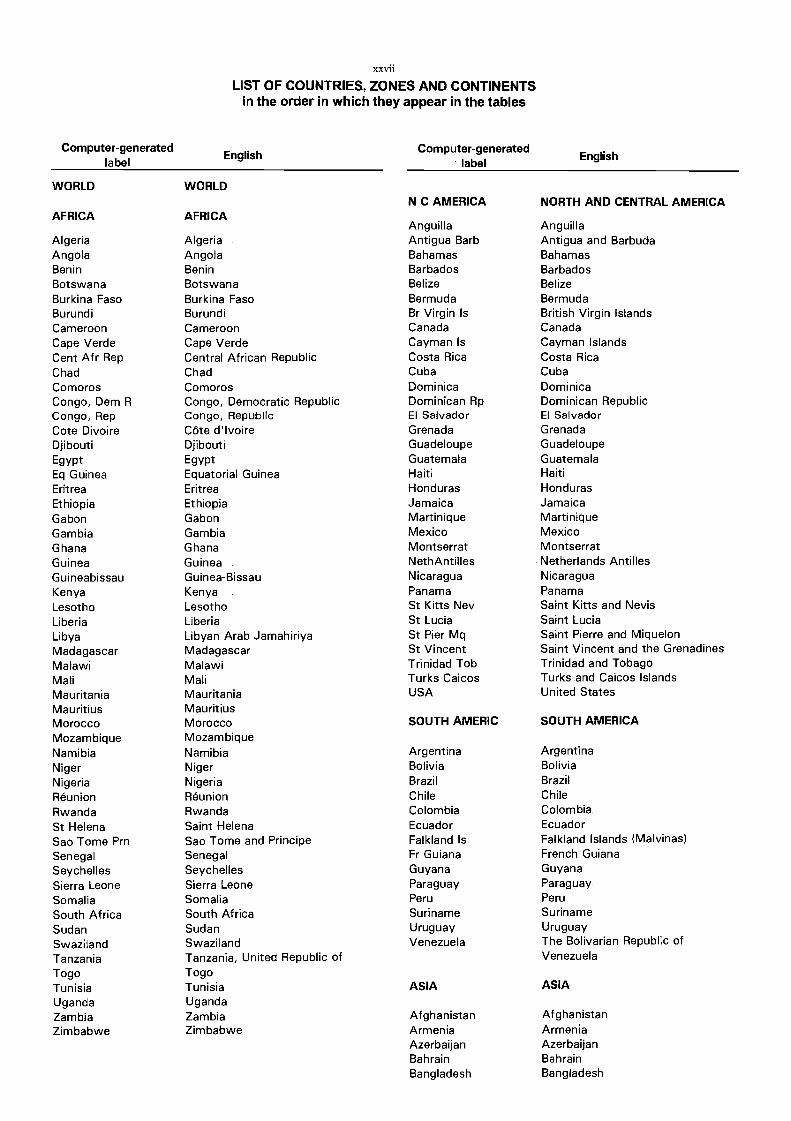
xxvii
LIST OF COUNTRIES, ZONES AND CONTINENTSin the order in which they appear in the tables
Computer-generatedlabel
EnglishComputer-generated
labelEnglish
WORLD WORLDN C AMERICA NORTH AND CENTRAL AMERICA
AFRICA AFRICAAnguilla Anguilla
Algeria Algeria Antigua Barb Antigua and BarbudaAngola Angola Bahamas BahamasBenin Benin Barbados BarbadosBotswana Botswana Belize BelizeBurkina Faso Burkina Faso Bermuda BermudaBurundi Burundi Br Virgin Is British Virgin IslandsCameroon Cameroon Canada CanadaCape Verde Cape Verde Cayman Is Cayman IslandsCent Afr Rep Central African Republic Costa Rica Costa RicaChad Chad Cuba CubaComoros Comoros Dominica DominicaCongo, Dem R Congo, Democratic Republic Dominican Rp Dominican RepublicCongo, Rep Congo, Republic El Salvador El SalvadorCote Divoire Côte d'Ivoire Grenada GrenadaDjibouti Djibouti Guadeloupe GuadeloupeEgypt Egypt Guatemala GuatemalaEq Guinea Equatorial Guinea Haiti Haiti
Eritrea Eritrea Honduras HondurasEthiopia Ethiopia Jamaica JamaicaGabon Gabon Martinique MartiniqueGambia Gambia Mexico MexicoGhana Ghana Montserrat MontserratGuinea Guinea NethAntilles Netherlands AntillesGuineabissau Guinea-Bissau Nicaragua NicaraguaKenya Kenya Panama Panama
Lesotho Lesotho St Kitts Nev Saint Kitts and NevisLiberia Liberia St Lucia Saint LuciaLibya Libyan Arab Jamahiriya St Pier Mq Saint Pierre and MiquelonMadagascar Madagascar St Vincent Saint Vincent and the GrenadinesMalawi Malawi Trinidad Tob Trinidad and TobagoMali Mali Turks Caicos Turks and Caicos IslandsMauritania Mauritania USA United StatesMauritius MauritiusMorocco Morocco SOUTH AMERIC SOUTH AMERICA
Mozambique MozambiqueNamibia Namibia Argentina ArgentinaNiger Niger Bolivia Bolivia
Nigeria Nigeria Brazil Brazil
Reunion Reunion Chile Chile
Rwanda Rwanda Colombia Colombia
St Helena Saint Helena Ecuador Ecuador
Sao Tome Pmn Sao Tome and Principe Falkland Is Falkland Islands (Malvinas)Senegal Senegal Fr Guiana French Guiana
Seychelles Seychelles Guyana Guyana
Sierra Leone Sierra Leone Paraguay Paraguay
Somalia Somalia Peru Peru
South Africa South Africa Suriname Suriname
Sudan Sudan Uruguay UruguaySwaziland Swaziland Venezuela The Bolivarian Republic of
Tanzania Tanzania, United Republic of Venezuela
Togo TogoTunisia Tunisia ASIA ASIA
Uganda UgandaZambia Zambia Afghanistan AfghanistanZimbabwe Zimbabwe Armenia Armenia
Azerbaijan AzerbaijanBahrain BahrainBangladesh Bangladesh
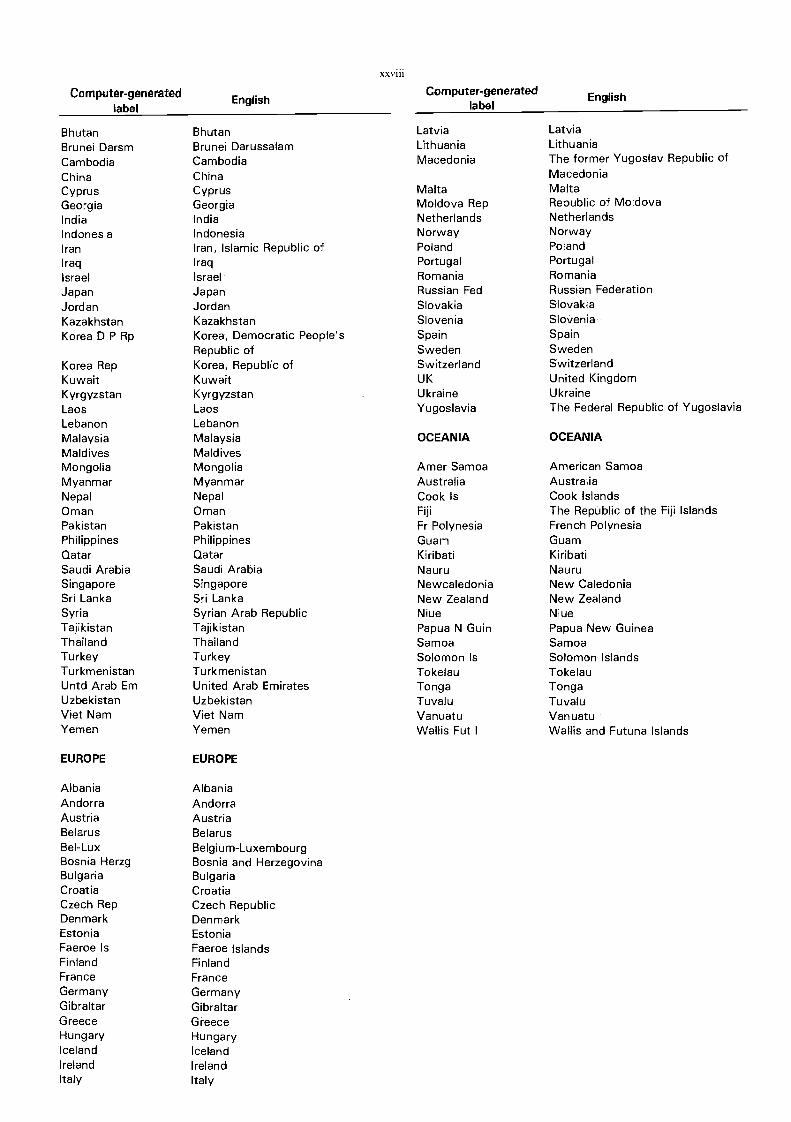
Computer-generatedlabel
BhutanBrunei DarsmCambodiaChinaCyprusGeorgiaIndiaIndonesiaIranIraqIsraelJapanJordanKazakhstanKorea D P Rp
Korea RepKuwaitKyrgyzstanLaosLebanonMalaysiaMaldivesMongoliaMyanmarNepalOmanPakistanPhilippinesQatarSaudi ArabiaSingaporeSri LankaSyriaTajikistanThailandTurkeyTurkmenistanUntd Arab EmUzbekistanViet NamYemen
EUROPE
AlbaniaAndorraAustriaBelarusBel-LuxBosnia HerzgBulgariaCroatiaCzech RepDenmarkEstoniaFaeroe IsFinlandFranceGermanyGibraltarGreeceHungaryIcelandIrelandItaly
BhutanBrunei DarussalamCambodiaChinaCyprusGeorgiaIndiaIndonesiaIran, Islamic Republic ofIraqIsraelJapanJordanKazakhstanKorea, Democratic People'sRepublic ofKorea, Republic ofKuwaitKyrgyzstanLaosLebanonMalaysiaMaldivesMongoliaMyannnarNepalOmanPakistanPhilippinesQatarSaudi ArabiaSingaporeSri LankaSyrian Arab RepublicTajikistanThailandTurkeyTurkmenistanUnited Arab EmiratesUzbekistanViet NamYemen
EUROPE
AlbaniaAndorraAustriaBelarusBelgium-LuxembourgBosnia and HerzegovinaBulgariaCroatiaCzech RepublicDenmarkEstoniaFaeroe IslandsFinlandFranceGermanyGibraltarGreeceHungaryIcelandIrelandItaly
EnglishComputer-generated
label
LatviaLithuaniaMacedonia
MaltaMoldova RepNetherlandsNorwayPolandPortugalRomaniaRussian FedSlovakiaSloveniaSpainSwedenSwitzerlandUKUkraineYugoslavia
OCEANIA
Amer SamoaAustraliaCook IsFijiFr PolynesiaGuamKiribatiNauruNewcaledoniaNew ZealandNiuePapua N GuinSamoaSolomon IsTokelauTongaTuvaluVanuatuWallis Fut I
English
LatviaLithuaniaThe former Yugoslav Republic ofMacedoniaMaltaRepublic of MoldovaNetherlandsNorwayPolandPortugalRomaniaRussian FederationSlovakiaSloveniaSpainSwedenSwitzerlandUnited KingdomUkraineThe Federal Republic of Yugoslavia
OCEANIA
American SamoaAustraliaCook IslandsThe Republic of the Fiji IslandsFrench PolynesiaGuamKiribatiNauruNew CaledoniaNew ZealandNiuePapua New GuineaSamoaSolomon IslandsTokelauTongaTuvaluVanuatuWallis and Futuna Islands
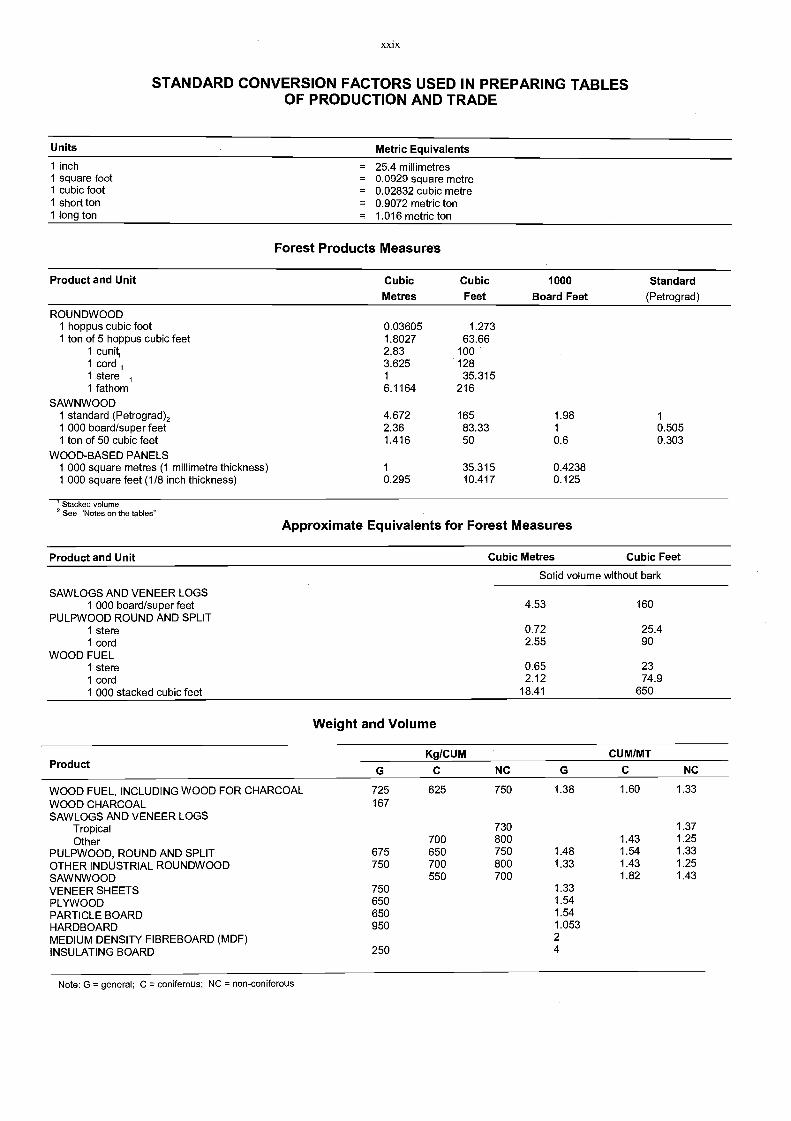
STANDARD CONVERSION FACTORS USED IN PREPARING TABLESOF PRODUCTION AND TRADE
Forest Products Measures
Stacked volume2 See "Notes on the tables"
Approximate Equivalents for Forest Measures
Note: G = general; C = coniferous; NC = non-coniferous
Weight and Volume
Solid volume without bark
SAWLOGS AND VENEER LOGS1 000 board/super feet 4.53 160
PULPWOOD ROUND AND SPLIT1 stere 0.72 25.41 cord 2.55 90
WOOD FUEL1 stere 0.65 231 cord 2.12 74.91 000 stacked cubic feet 18.41 650
Kg/CUM CUM/MTProduct
NC G C NC
WOOD FUEL, INCLUDING WOOD FOR CHARCOAL 725 625 750 1.38 1.60 1.33
WOOD CHARCOAL 167SAWLOGS AND VENEER LOGS
Tropical 730 1.37
Other 700 800 1.43 1.25
PULPWOOD, ROUND AND SPLIT 675 650 750 1.48 1.54 1.33
OTHER INDUSTRIAL ROUNDWOOD 750 700 800 1.33 1.43 1.25
SAWNWOOD 550 700 1.82 1.43
VENEER SHEETS 750 1.33
PLYWOOD 650 1.54
PARTICLE BOARD 650 1.54
HARDBOARD 950 1.053MEDIUM DENSITY FIBREBOARD (MDF) 2
INSULATING BOARD 250 4
Product and Unit CubicMetres
CubicFeet
1000
Board FeetStandard
(Petrograd)
ROUNDWOOD1 hoppus cubic foot1 ton of 5 hoppus cubic feet
0.036051.8027
1.27363.66
1 cunit,1 cord
2.833.625
100128
1 stere 1 1 35.3151 fathom 6.1164 216
SAWNWOOD1 standard (Petrograd)2 4.672 165 1.98 1
1 000 board/super feet 2.36 83.33 1 0.5051 ton of 50 cubic feet 1.416 50 0.6 0.303
WOOD-BASED PANELS1 000 square metres (1 millimetre thickness) 1 35.315 0.42381 000 square feet (1/8 inch thickness) 0.295 10.417 0.125
Product and Unit Cubic Metres Cubic Feet
Units Metric Equivalents1 inch = 25.4 millimetres1 square foot = 0.0929 square metre1 cubic foot = 0.02832 cubic metre1 short ton = 0.9072 metric ton1 long ton = 1.016 metric ton

INTRODUCTION =diSIGNES CONVENTIONNELS UTILISES DANS LES TABLEAUX xxxiv
NOMS ET DEFINITIONS DES PRODUITS xxxtv
NOTES SUR LES TABLEAUX xxxviii
COMPOSITION DES AGGREGATS DE PRODUITS xxxix
RENVOIS AU SH 96 ET A LA CTCI REV.3 xl
LISTE DES PAYS, ZONES ET CONTINENTS xli
COEFFICIENTS DE CONVERSION TYPES xliii
TAUX DE CHANGE A-1
PRODUCTION ESTIMEE PAR HABITANT A-3
CINQ PREMIERS PAYS EN 1998 A-4
BOIS ROND
Bois rondProduction, consommation 2Importations: quantité, valeur 5Exportations: quantité, valeur 7
Bois rond (C)Production 9
Bois rond (NC)Production 11
Bois de chauffage, y compris charbon de boisProduction, consommation 14Importations: quantité, valeur 17Exportations: quantité, valeur 18
Bois de chauffage, y compris charbon de bois (C)Production 19
Bois de chauffage, y compris charbon de bois (NC)Production 20
Bois rond industriel-Bois brutProduction, con som mation 22Importations: quantité, valeur 25Exportations: quantité, valeur 27
Bois rond industriel-Bois brut (C)Production, consommation 29Importations: quantité, valeur 31
Exportations: quantité, valeur 33
Bois rond industriel-Bois brut (NC)Production, consommation 35Importations: quantité, valeur 38Exportations: quantité, valeur 40
Bois rond industriel-Bois brut (NC) tropicalImportations: quantité, valeur 42Exportations: quantité, valeur 43
Bois rond industriel-Bois brut (NC) autreImportations: quantité, valeur 44Exportations: quantité, valeur 46
Grumes, sciage et placageProduction 47
Grumes, sciage et placage (C)Production 49
Grumes, sciage et placage (NC)Production 51
Bois de trituration, en rondins ou fenduProduction 53
Bois de trituration, en rondins ou fendu (C)Production 54
Bois de trituration, en rondins ou fendu (NC)Production 55
Autre bois rond indusbielProduction 56
TABLE DES MATIERES
Autre bois rond industriel (C)Production 58
Autre bois rond industriel (NC)Production 59
CHARBON DE BOIS, PLAQUETTES ET PARTICULESET RESIDUS DE BOIS
Charbon de boisProduction, consommation 62Importations: quantité, valeur 64Exportations: quantité, valeur 65
Piaquettes et particulesImportations: quantité, valeur 66Exportations: quantité, valeur 67
Résidus de boisProduction, consommation 68Importations: quantité, valeur 70Exportations: quantité, valeur 71
SCIAGES
SciagesProduction, consommation 74Importations: quantité, valeur 77Exportations: quantité, valeur 80
Sciages (C)Production, consommation 82Importations: quantité, valeur 85Exportations: quantité, valeur 87
Sciages (NC)Production, consommation 89Importations: quantité, valeur 92Exportations: quantité, valeur 94
PANNEAUX A BASE DE BOIS
Panneaux à base de boisProduction, consommation 98Importations: quantité, valeur 101Exportations: quantité, valeur 104
Feuilles de placageProduction, consommation 106Importations: quantité, valeur 108Exportations: quantité, valeur 110
ContreplaquésProduction, consommation 111Importations: quantité, valeur 114Exportations: quantité, valeur 116
Panneaux de particulesProduction, consommation 118Importations: quantité, valeur 120Exportations: quantité, valeur 122
Panneaux de fibresProduction, consommation 123Importations: quantité, valeur 125Exportations: quantité, valeur 127
OursProduction, consommation 128Importations: quantité. valeur 130Exportations: quantité, valeur 132
Panneaux de fibres a densité moyenne (MDF)Production, consommation 133Importations: quantité, valeur 135Exportations: quantité, valeur 137
Panneaux fibres. isolantsProduction, consommation 138Importations: quantité, valeur 140Exportations: quantité, valeur 142
PATE ET VIEUX PAPIERS
Pale de boisProduction, consommation 144Importations: quantité, valeur 146Exportations: quantité, valeur 148
Pate de bois, mécaniqueProduction, consommation 149Importations: quantité, valeur 150Exportations: quantité, valeur 151
ate de bois, mi-chimiqueProduction, consommation 152Importations: quantité, valeur 153Exportations: quantité, valeur 154
Pate de bois, chimiqueProduction, consommation 155Importations: quantité, valeur 157Exportations: quantité, valeur 159
Pate écrue au bisulfiteProduction, consommation 160
Importations: quantité, valeur 161
Exportations: quanta, valeur 162
Pate blanchie, bisulfiteProduction, consommation 163Importations: quantité, valeur 164
Exportations: quantité, valeur 165
Pate écrue, sulfate et soudeProduction, consommation 166Importations: quanta, valeur 167Exportations: quantité, valeur 168
ate blanchie, sulfate et soudeProduction, consommation 169Importations: quanta, valeur 171Exportations: quantité, valeur 173
ate de bois A dissoudreProduction, consommation 174Importations: want& valeur 175Exportations: quantité, valeur 176
ate, autres fibresProduction, consommation 177Importations: quanta, valeur 178Exportations: quantité, valeur 179
Vieux papiersProduction, consommation 180Importations: quantité, valeur 182Exportations: quantité, valeur 184
PAPIER ET CARTON
Papiers et cartonsProduction, consommation 186Importations: quantité, valeur 189Exportations: quantité, valeur 192
Papier journalProduction, co nsommation 194Importations: quanta, valeur 196Exportations: quanta, valeur 198
Papier, impression et écritureProduction, consommation 199importations: quantité, valeur 201Exportations: want& valeur 203
Autres papiers et cartonsProduction, consommation 204Importations: quantité, valeur 206Exportations: quanta, valeur 208
Papiers domestiques et hygiéniquesProduction, consommation 210Importations: quanta, valeur 212Exportations: quanta, vaieur 213
=di
Papiers et cartons d'empaquetage et d'emballageProduction, consommation 214Importations: quanta, valeur 216Exportations: quanta& valeur 218
Autres papiers et cartons non décrits ailleursProduction, consommation 219Importations: quanta. valeur 221
Exportations: quantité, valeur 223
PRODUITS FORESTIERSImportations et exportations: valeur 226
DIRECTION DU COMMERCE
Bois rond-industriel-Bois brut (C) 230Bois rond industriel-Bois brut (NC) Tropical 231Bois rond industriel-Bois brut (NC) Autre 232Plaquettes et particules 233Sciages (C) 234Sciages (NC) 235Feuilles de placage 236Contreplaqués 237Panneaux de particules 238Panneaux de fibres 239Päte de bois 240Papier joumal 241
Papiers et cartons autres que le papier joumal 242Produits forestiers 243
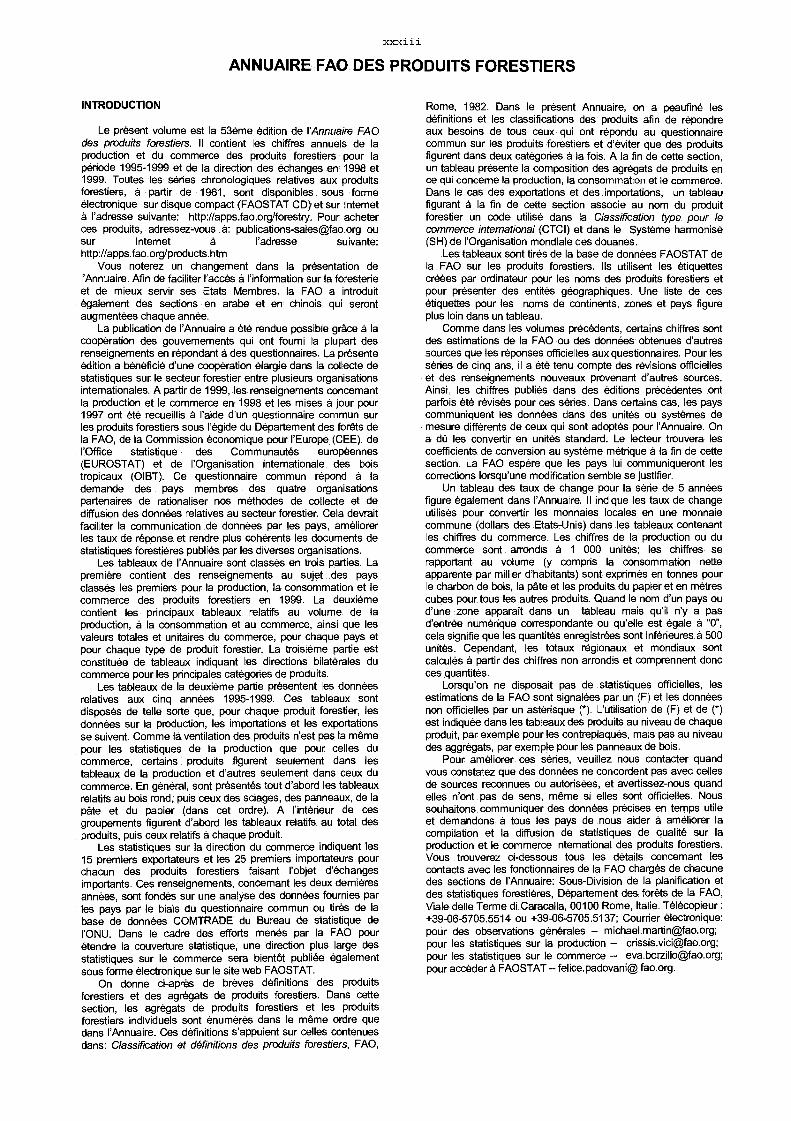
INTRODUCTION
Le present volume est la 53eme edition de l'Annuaire FAOdes produits forestiers. II contient les chiffres annuels de laproduction et du commerce des produits forestiers pour lapériode 1995-1999 et de la direction des &changes en 1998 et1999. Toutes !es series chronologiques relatives aux produitsforestiers, à partir de 1961, sont disponibles sous formeélectronique sur disque compact (FAOSTAT CD) et sur Internet
l'adresse suivante: http://apps.fao.org/forestry. Pour acheterces produits, adressez-vous A: [email protected] ousur Internet à l'adresse suivante:http://apps.fao.org/products.htm
Vous noterez un changement dans la presentation del'Annuaire. Afin de faciliter recces à ['information sur la foresterieet de mieux servir ses Etats Membres. la FAO a introduitegalement des sections en arabe et en chinois qui serontaugmentées cheque année.
La publication de l'Annuaire a été rendue possible grace à lacooperation des gouvemements qui ont foumi la plupart desrenseignements en répondant â des questionnaires. La présenteedition a bénéficié d'une cooperation élargie dans la collecte destatistiques sur le secteur forestier entre plusieurs organisationsintemationales. A partir de 1999, les renseignements concemantla production et le commerce en. 1998 et les mises à jour pour1997 ont été recueillis à l'aide d'un questionnaire commun surles produits forestiers sous l'égide du Département des forests dela FAO, de la Commission économique pour l'Europe (CEE), del'Office statistique des Connmunautés européennes(EUROSTAT) et de l'Organisation intemationale des boistropicaux (0IBT). Ce questionnaire comnnun répond à lademande des pays membres des quatre organisationspartenaires de rationaliser nos méthodes de collecte et dediffusion des donnees relatives au secteur forestier. Cela devraitfaciliter la communication de données par les pays, améliorerles taux de réponse et rendre plus cohérents les documents destatistiques forestières publiés par les diverses organisations.
Les tableaux de l'Annuaire sont classes en trois parties. Lapremière contient des renseignements au sujet des paysclasses les premiers pour la production, la consommation et lecommerce des produits forestiers en 1999. La deuxièmecontient les principaux tableaux relatifs au volume de laproduction, à la consommation et au commerce, ainsi que lesvaleurs totales et unitaires du commerce, pour cheque pays etpour cheque type de produit forestier. La troisième partie estconstituée de tableaux indiquant les directions bilatérales ducommerce pour les principales categories de produits.
Les tableaux de la deuxième partie présentent les donnéesrelatives aux cinq années 1995-1999. Ces tableaux sontdisposes de telle sorte que, pour cheque produit forestier, lesdonnées sur la production, les importations et les exportationsse suivent. Comme la ventilation des produits n'est pas la mérnepour les statistiques de la production que pour celles ducommerce, certains produits figurent seulement dans lestableaux de la production et d'autres seulement dans ceux ducommerce. En general, sont présentés tout d'abord les tableauxrelatifs au bois rond, puis ceux des sciages, des panneaux, de lapale et du papier (dans cet ordre). A l'intérieur de cesgroupements figurent d'abord les tableaux relatifs au total desproduits, puis ceux relatifs a. cheque produit.
Les statistiques sur la direction du commerce indiquent les15 premiers exportateurs et les 25 premiers importateurs pourchacun des produits forestiers faisant l'objet d'échangesimportants. Ces renseignements, concemant les deux demièresannées, sont fondes sur une analyse des données fournies parles pays par le biais du questionnaire commun ou tires de labase de données COM-TRADE du Bureau de statistique del'ONU. Dens le cadre des efforts merles par la FAO pourétendre la couverture statistique, une direction plus large desstatistiques sur le commerce sera bientr5t publiée égalementsous forme électronique sur le site web FAOSTAT.
On donne ci-après de breves definitions des produitsforestiers et des agrégats de produits forestiers. Dans cettesection, les agrégats de produits forestiers et les produitsforestiers individuels sont énumérés dans le méme ordre quedans l'Annuaire. Ces definitions s'appuient sur celles contenuesdans: Classification et définitions des produits forestiers, FAO,
ANNUAIRE FAO DES PRODUITS FORESTIERS
Rome, 1982. Dans le present Annuaire, on a peaufiné lesdefinitions et les classifications des produits afin de répondreaux besoins de tous ceux qui ont répondu au questionnairecommun sur les produits forestiers et d'éviter que des produitsfigurent dans deux categories a. la fois. A la fin de cette section,un tableau présente la composition des agrégats de produits ence qui conceme la production, la consommation et le commerce.Dans le cas des exportations et des importations, un tableaufigurant à la fin de cette section associe au nom du produitforestier un code utilise dans la Classification type pour lecommerce international (CTCI) et dans le Système harmonise(SH) de l'Organisation mondiale des douanes.
Les tableaux sont tires de la base de données FAOSTAT dela FAO sur les produits forestiers. Ils utilisent les étiquettescréées par ordinateur pour les noms des produits forestiers etpour presenter des entités géographiques. Une liste de cesétiquettes pour les noms de continents, zones et pays figureplus loin dans un tableau.
Comme dans les volumes precedents, certains chiffres sontdes estimations de la FAO ou des données obtenues d'autressources que les réponses officielles aux questionnaires. Pour lesseries de cinq ans, il a été tenu compte des revisions officielleset des renseignements nouveaux provenant d'autres sources.Ainsi, les chiffres publiés dans des editions précédentes ontparfois été revises pour ces series. Dans certains cas, les payscommuniquent les données dans des unit& ou systèmes demesure différents de ceux qui sont adoptés pour l'Annuaire. Ona dO les convertir en unites standard. Le lecteur trouvera lescoefficients de conversion au système métrique à la fin de cettesection. La FAO espère que les pays lui communiqueront lescorrections lorsqu'une modification semble se justifier.
Un tableau des taux de change pour la série de 5 annéesfigure également dans l'Annuaire. II indique les taux de changeutilises pour convertir les monnaies locales en une monnaiecommune (dollars des Etats-Unis) dans les tableaux contenantles chiffres du commerce. Les chiffres de la production ou ducommerce sont arrondis a. 1 000 unites; les chiffres serapportant au volume (y compris la consommation netteapparente par millier d'habitants) sont exprimés en tonnes pourle charbon de bois, la pate et les produits du papier et en metrescubes pour tous les autres produits. Quand le nom d'un pays oud'une zone apparet dans un tableau mais qu'il n'y a pasd'entrée numérique correspondante ou qu'elle est égale a "0",cela signifie que les quantités enregistrées sont inférieures a 500unites. Cependant, les totaux régionaux et mondiaux sontcalculés à partir des chiffres non arrondis et comprennent doncces quantités.
Lorsqu'on ne disposait pas de statistiques officielles, lesestimations de la FAO sont signalées par un (F) et les donnéesnon officielles par un astérisque (*) L'utilisation de (F) et de (1est indiquée dans les tableaux des produits au niveau de chequeproduit, par exemple pour les contreplaqués, mais pas au niveaudes aggrégats, par exemple pour les panneaux de bois.
Pour améliorer ces series, veuillez nous contacter quandvous constatez que des données ne concordent pas avec cellesde sources reconnues ou autorisées, et avertissez-nous quandelles n'ont pas de sens, méme si elles sont officielles. Noussouhaitons communiquer des données precises en temps utileet demandons à tous les pays de nous aider à améliorer lacompilation et la diffusion de statistiques de qualité sur laproduction et le commerce intemational des produits forestiers.Vous trouverez ci-dessous tous les details concemant lescontacts avec les fonctionnaires de la FAO charges de chacunedes sections de l'Annuaire: Sous-Division de la planification etdes statistiques forestières, Département des forets de la FAO,Viale delle Terme di Caracalla, 00100 Rome, Italie. Télécopieur :+39-06-5705.5514 ou +39-06-5705.5137; Courier électronique:pour des observations generales [email protected];pour les statistiques sur la production [email protected];pour les statistiques sur le oommerce [email protected];pour acceder à FAOSTAT felice.padovani@ fao.org.
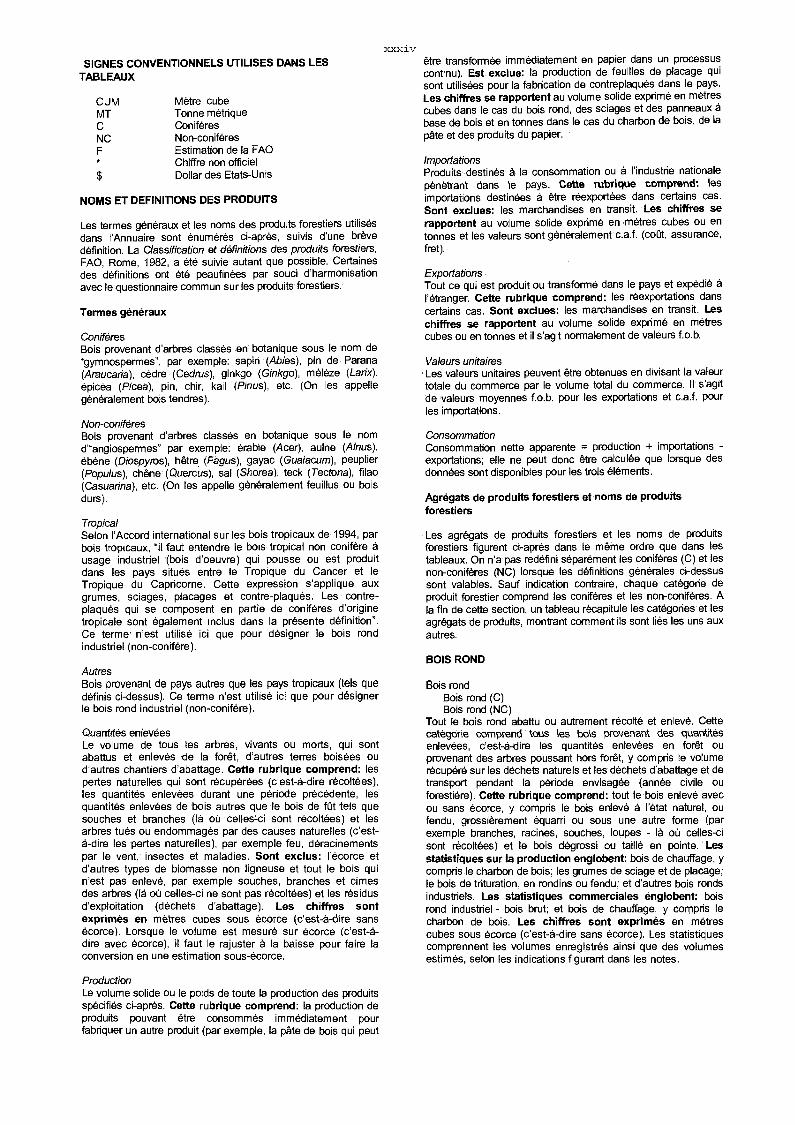
SIGNES CONVENTIONNELS UTILISES DANS LESTABLEAUX
CUM Metre cubeMT Tonne métrique
ConifèresNC Non-conifer-es
Estimation de la FAOChiffre non officielDollar des Etats-Unis
NOMS ET DEFINITIONS DES PRODUITS
Les termes généraux et !es noms des produits forestiers utilisesdens l'Annuaire sont énumérés ci-après, suivis d'une brevedefinition. La Classification et définitions des produits forestiers,FAO, Rome, 1982, a été suivie autant que possible. Certainesdes definitions ont été peaufinees par souci d'harmonisationavec le questionnaire comnnun sur les produits forestiers.
Termes généraux
ConifèresBois provenant d'arbres classes en botanique sous le nom de"gymnospermes, par exemple: sapin (Abies), pin de Parana(Araucaria), cèdre (Cedrus), ginkgo (Ginkgo), mélèze (Larix),épicéa (Picea), pin, chir, kail (Pous), etc. (On les appellegénéralement bois tendres).
Non-conifèresBois provenant d'arbres classes en botanique sous le nomd'angiospermes" par exemple: &able (Acer), aulne (Alnus),elpène (Diospyros), hétre (Fagus), gayac (Guaiacum), peuplier(Populus), chene (Quercus), sal (Shorea), teck (Tectona), filao(Casuarina), etc. (On les appelle généralement feuillus ou boisdurs).
TropicalSeIon l'Accord international sur les bois tropicaux de 1994, parbois tropicaux, "il faut entendre le loots tropical non conifereusage industriel (bois d'oeuvre) qui pousse ou est produitdans les pays situés entre le Tropique du Cancer et leTropique du Capricorne. Cette expression s'applique auxgrumes, sciages, placages et contre-plaqués. Les contre-plaques qui se composent en partie de conifères d'originetropicale sont également Indus dans la présenteCe terme- n'est utilise ici que pour designer le bois rondindustriel (non-conifère).
AutresBois provenant de pays autres que les pays tropicaux (tels queMinis ci-dessus). Ce terme n'est utilise ici que pour designerle bois rond industriel (non-conifère).
Quantités enlevéesLe volume de tous les arbres, vivants ou morts, qui sontabattus et enlevés de la foret, d'autres terres boisées oud'autres chantiers d'abattage. Cette rubrique comprend: lespertes naturelles qui sont recupérées (c'est-à-dire récoltées),les quantités enlevées durant une 'Anode précédente, lesquantités enlevées de bois autres que le bois de Kit tels quesouches et branches (le où celles-ci sont récoltées) et lesarbres tires ou endommagés par des causes naturelles (c'est-6-dire les pertes naturelles), par exemple feu, déracinementspar le vent, insectes et maladies. Sont exclus: l'écorce etd'autres types de biomasse non ligneuse et tout le bois quin'est pas enlevé, par exemple souches, branches et cinnesdes arbres (lb où celles-ci ne sont pas récoltées) et les résidusd'exploitation (déchets d'abattage). Les chiffres sontexprimés en metres cubes sous écorce (c'est-e-dire sansécorce). Lorsque le volume est mesuré sur écorce (c'est-à-dire avec écorce), il taut le rajuster à la baisse pour faire laconversion en une estimation sous-écorce.
ProductionLe volume solide ou le poids de toute la production des produitsspecifies ci-après. Cette rubrique comprend: la production deproduits pouvant étre consommés immédiatement pourfabriquer un autre produit (par exemple, la pete de bois qui peut
étre transforrnée imnnédiatement en papier dans un processuscontinu). Est exclue: la production de feuilles de placage quisont utilistes pour la fabrication de contreplaqués dans le pays.Les chiffres se rapportent au volume solide exprime en metrescubos dans le cas du bois rond, des sciages et des panneauxbase de bois et en tonnes dans le cas du charbon de bois, de lapale et des produits du papier.
ImportationsProduits destines à la consommation ou â l'industrie nationalepenetrant dans le pays. Cette rubrique comprenti: lesimportations destinées à étre réexportées dans certains cas.Sont exdues: les marchandises en transit. Les chiffres serapportent au volume solide exprimé en metres cubes ou entonnes et les valeurs sont généralement c.a.f. (coil, assurance,fret).
ExportationsTout ce qui est produit ou transformé dans le pays et expéclié el'étranger. Cefte rubrique comprend: les réexportations danscertains cas. Sont exclues: les merchandises en transit. Leschiffres se rapportent au volume solide exprimé en metrescubes ou en tonnes et il s'agit norrnalement de valeurs f.o.b.
Valeurs unitairesLes valeurs unitaires peuvent étre obtenues en divisant la valeurtotale du commerce par le volume total du commerce. II s'agitde valeurs nnoyennes f.o.b. pour les exportations et c.a.f. pourles importations.
ConsommationConsommation nette apparente = production + importations -exportations; elle ne peut donc etre calculée que lorsque desdonnees sont disponibles pour les trois elements.
Agrégats de produits forestlers et noms de produitsforestiers
Les agrégats de produits forestiers et les noms de produitsforestiers figurent ci-après dans le meme ordre que dans lestableaux. On n'a pas redéfini separément les conifères (C) et lesnon-conifer-es (NC) lorsque les definitions générales ci-dessussont valables. Sauf indication contraire, cheque catégorie deproduit forestier comprend les conifères et les non-coniféres. Ala fin de cette section, un tableau récapitule les categories et lesagrégats de produits, montrant cornment ils sont lies les uns auxautres.
BOIS ROND
Bois rondBois rond (C)Bois rond (NC)
Tout le bois rond abattu ou autrement récolté et enlevé. Cettecatégorle comprend tous les bols brovenant des quantitésenlevées, c'est-e-dire les quantités enlevées en foret ouprovenant des arbres poussant hors forét, y compris le volumerécupéré sur les déchets naturels et les déchets d'abattage et detransport pendant la période envisagée (année civile ouforestière). Cette rubrique comprend: tout le bois enlevé avecou sans écorce, y compris le bois enlevé à l'état nature!, oufendu, grossièrennent équarri ou sous une autre forme (parexennple branches, racines, souches, loupes - le où celles-cisont récoltées) et le bois dégrossi ou taillé en pointe. Lesstatistiques sur la production englobent: bois de chauffage, ycompris le charbon de bois: les grumes de sciage et de placage;le bois de trituration, en rondins ou fendu; et d'autres bois rondsindustriels. Les statistiques commerciales englobent: boisrond industriel - bois brut; et bois de chauffage, y compris lecharbon de bois. Les chiffres sont exprimés en metrescubes sous écorce (c'est-à-dire sans écorce). Les statistiquescomprennent les volumes enregistrés ainsi que des volumesestimés, selon les indications figurant dans les notes.
Bois de chauffage, y compris charbon de boisBois de chauffage, y compris charbon de bois (C)Bois de chauffage. y compris charbon de bois (NC)
Bois rond destine A servir de combustible pour la cuisine, lechauffage, la production d'énergie, etc. Cette rubriquecomprend: bois récolté sur les tiges principales, les branches etd'autres parties de l'arbre (le où celles-ci sont récoltées pour lechauffage) et le bois qui sert à la production de charbon de bois(par exemple dans fours souterrains et fours mobiles). Onestime le volume de bois rond utilise pour la production decharbon de bois en appliquant un coefficient de 6,0 pourconvertir les unites de poids (tonnes) de charbon de bois produiten unites de volume solide (metres cubes) de bois rond utilisepour la production. Les chiffres sont exprimés en metrescubes sous écorce (c'est-A-dire sans écorce).
Bois rond industriel-Bois brutBois rond industriel-Bois brut (C)Bois rand industriel-Bois brut (NC)Bois rand industriel-bois brut (NC) TropicalBois rond industriel-Bois brut (NC) Autre
Bois rond qui sert à produire d'autres biens et services (saufcomme source de combustible). Cette rubrique comprend:tous les bois rands sauf le bois de chauffage. Les statistiquessur la production englobent: grunnes de sciage et de placage;bois de trituration, en rondins ou fendu, et d'autres bois rondsindustriels. Les statistiques sur le commerce pour cettecatégorie sont divisées seulement en conifères et non-ccxliferes(eux-rnémes divisés en tropicaux et non tropicaux). Les chiffressont exprimes en metres cubes sous ecorce (c'est-A-diresans &come).
Grumes, sciage et placageGrimes, sciage et placage (C)Grumes, sciage et placage (NC)
Bois rond qui sera scie (ou fendu) longitudinalennent pour lafabrication de sciages ou de traverses de chemins de fer ouutilise pour la production de placages (essentiellement pardéroulage ou tranchage). Cette rubrique comprend: bois rond(grossièrement équarri ou non) qui servira A ces fins; billots pourbardeaux et douves; !Aches pour la fabrication des allumettes etd'autres types spéciaux de bois rand (par exemple loupes,racines, etc.) utilises dans la fabrication des placages. Leschiffres sont exprimés en metres cubes sous écorce (c'est-6-dire sans écorce).
Bois de trituration, en rondins ou fenduBois de trituration, en nondins ou fendu (C)Bois de trituration, en rondins ou fendu (NC)
Bois rond destine A la fabrication de pAte, de panneaux departicules ou de panneaux de fibres. Cette rubrique comprend:bois rond (écorcé ou non) qui servira A ces fins sous forme derondins, de bois fendus ou de plaquettes élaborées directement(c'est-A-dire dans la fork) du bois rond. Les chiffres sontexprimés en metres cubes sous écorce (c'est-à-dire sansécorce).
Autre bois rond industrialAutre bois rond induStriel (C)Autre bois rond industriel (NC)
f3ois rond utilise hors du secteur de l'industrie forestière pour laproduction d'autres bier's et services (sauf comme source decombustible). Cette rubrique comprend: bois ronds utilisespour la tannerie, la distillation, les tiges d'allumettes, bois pourgazogènes, poteaux, pilotis et piquets, cleitures et 'Reis de mine,etc. Les chiffres sont exprimés en metres cubes sousécorce (c'est-A-dire sans écorce).
CHARBON DE BOIS, PLAQUETTES ET PARTICULES ETRESIDUS DE BOIS
Charbon de boisBois carbonise par combustion partielle ou par l'application dechaleur foumie par des sources extemes. Celle rubriquecomprend: charbon de bois utilise comme combustible oudestine à d'autres usages, par exempla comme agentréducteur en métallurgie ou comnne milieu d'absorption ou defiltrage. Les chiffres sont exprimes en tonnes.
Plaquettes et particulesBois transformé délibérément en petits fragments pour lafabrication d'autres produits tels que pate, panneaux departicules et panneaux de fibres, pour l'utilisation commecombustible ou à d'autres fins. Sont exclues: les plaquettes debois provenant directement (c'est-A-dire dans la forét) de boisrond (qui sont donc déjà comptées comme bois de trituration, enrondins ou fendu). Les chiffres se rapportent au volumesolide exprimé en metres cubes, ecorce non comprise.
Résidus de boisVolume de bois rond restant Bpi-6s la production de produitsforestiers dans l'industrie de transformation (par exemple résidusde la transformation en forét) et qui n'ont pas été réduits enparticules ou en plaquettes. Cette rubrique comprend: déchetsde scierie, dosses, délignures et déchets d'ébranchage, noyauxde déroulage et déchets de placages, sciure, déchets decharpenterie et de menuiserie, etc. Sont exclues: les plaquettesfaites soit directement (c'est-A-dire dans la forét) du bois rondsoit a partir de résidus (qui sont donc déja comptées comnnebois de trituration, en rondins et fendus ou plaquettes etparticules). Les chiffres se rapportent au volume solideexprimé en metres cubes, écorce non comprise.
SCIAGES
SciagesSciages (C)Sciages (NC)
Bois produits A partir de bois rond national ou importé, soit soresdans le sens de la longueur, soit obtenus A l'aide d'un procédéde profilage par enlevement de copeaux et qui, à quelquesexceptions ores, ont plus de 5 mm d'épaisseur. Cette rubriquecomprend: madriers, poutres, solives, planches, chevrons,voliges, lattes, planches de caisserie, bois d'oeuvre, etc. sousles formes suivantes: non rabotés, rabotés, mines, languetés,joints digitiformes, chanfreinés, à feuillures, à joints en V,rebords, etc. Sont exclus: les elements de parquet en bois. Leschiffres se rapportent au volume solide exprime en metrescubes.
PANNEAUX A BASE DE BOIS
Panneaux a base de boisII s'agit d'un agregat de produits. Les statistiques sur laproduction et le commerce englobent: feuilles de placage,contreolaqués, panneaux de particules et de fibres. Jusqu'en1995, les panneaux de fibres étaient divises en panneauxconnprimés et panneaux non comprimés. A partir de 1995, lespanneaux de fibres comprimés ont été decomposes enpanneaux durs et panneaux à densité moyenne (MDF) et lespanneaux de fibres non comprimés sont appelés maintenantpanneaux isolants. Les chiffres se rapportent au volumesolide exprimé en metres cubes.
Feuilles de placageMinces couches ou feuilles de bois d'épaisseur uniforme,obtenues par déroulage (c'est-A-dire placage à coupe rotative),tranchage ou sciage. Cette rubrique comprend: bois utilisepour la fabrication des contreplaqués, des structures lamellées,du mobilier, des emballages, etc. Sont exclus: les bois utilisespour la fabrication de contreplaqués dans le pays. Les chiffresse rapportent au volume solide exprimé en metres cubes.
ContreplaquésPanneaux fabriqués en collant plusieurs feuilles de placagedisposées A fils croisés, généralement à angles droits. Lesfeuilles de placage sont toujours placées symetriquement desdeux cotes d'une couche ou Ame centrale qui peut elle-nrièmeétre faite d'une feuille de placage ou d'un autre materiau. Cetterubrique comprend: le contreplaqué à plis (contreplaquéfabriqué en collant plus de deux feuilles de placage, où lescouches sont disposées à fils croisés, généralement à anglesdroits); le contpaplaqué à dale ou panneau lane (contreplaquédont l'Ame, c'est-A-dire la couche centrale, généralement plusépaisse que !es autres couches. est en bois plein et se composede planchettes, de lattes ou de lamelles de bors placées c6tecéte, qui peuvent étre collées ou non); les contreplaquésalvéolaires (contreplaqués dont l'Ame consiste en une structure
cellulaire); et les contreplaqués composites (contreplaquésdont l'ame ou certaines couches sont fakes de nnatériaux autresque le bois plein ou les placages). Sont exclus: les matériauxde construction laminés (par exemple le glulam), où les feuillesde placage sont généralement dans le sens de la longueur. Leschiffres se rapportent au volume solide exprimé en metrescubes.
Panneaux de particulesPanneaux fabriqués avec des particules de bois ou autresmatières ligno-cellulosiques (par exemple plaquettes, flocons,éclats, copeaux longs, debris d'anas de lin, etc.) agglornéréespar un liant organique â l'arde d'un ou de plusieurs des agentssuivants: chaleur, pression, humidité, catalyse, etc. Cetterubrique comprend: panneaux de grandes particules,panneaux de particules orientées (PPO) et panneaux de lin.Sont exclus: les panneaux de laine de bois et autres panneauxde particules agglornérés dens des liants minéraux. Les chiffressont exprimés en metres cubes de volume solide.
Panneaux de fibresPanneaux faits de fibres de bois ou d'autres substances ligno-cellulosiques agglomérées essentiellement grace au feutragedes fibres et à leurs propriétés adhesives naturelles (bien quedes liants et/ou des additifs puissent &Ire ajoutes durant lafabrication). Cette rubrique comprend: panneaux de fibrespresses à plat et moulés. Les statistiques sur la production etle commerce englobent: panneaux durs, panneaux à densitémoyenne (MDF) et panneaux isolants. Les chiffres serapportent au volume solide exprinné en metres cubes.
Panneaux dursPanneaux de fibres dont la densité est supérieure à 0,80 g/cm3.Avant 1995, ce produit faisait partie de la catégorie despanneaux de fibres comprimés; on ne dispose donc pas dedonnées pour ce produit pour 1994 et les années précedentes.Sont exclus: les produits analogues fabnqués à partir demorceaux de bois, de farine de bois ou d'autres matériaux ligno-cellulosiques avec adjonction de liants, et panneaux de gypse oud'autre matériau mineral. Les chiffres se rapportent auvolume solide exprimé en metres cubes.
Panneaux de fibres A densité moyenne (MDF)Panneaux de fibres dont la densité est comprise entre 0,5g/cm3 et 0,8 g/cm3. Avant 1995, ce produit faisait partie de lacategorie des panneaux de fibres comprimés; on ne disposedonc pas de données pour 1994 et les années précédentes.Les chiffres se rapportent au volume solide exprime enmetres cubes.
Panneaux fibres, isolantsPanneaux de fibres dont la densité ne dépasse pas 0,5 g/cm3.Avant 1995, ce produit &aft appelé panneau de fibre noncomprimé. Les chiffres se rapportent au volume solideexprimé en metres cubes.
PATE ET VIEUX PAPIERS
Pate de boisLa matière fibreuse préparée à partir de bois de trituration, deplaquettes, de particules, de résidus ou de vieux papiers parun processus mécanique et/ou chimique pour une nouvelletransformation en papier, carton, panneaux de fibres ou autresproduits cellulosiques. Les statistiques sur la production etle commerce englobent: pate de bois mécanique; pate de boismi-chimrque; pate de bois chimique et pate de bois à dissoudre.Les chiffres se rapportent au poids sec à l'air (c'est-A-direavec une teneur en humidite de 10%) exprimé en tonnes.
Pate de bois, mécaniquePates de bois obtenues par le broyage ou le rApage de bois detrituration ou de résidus de bois en fibres, ou par le raffinage deplaquettes ou de particules. Appelées également patemécanique de défibreur et pate mécanique raffinée, ellespeuvent étre blanchies ou non. Cette rubrique comprend: patechimico-mécanique et pate thermo-mecanique. Sont exdues:pate éclatese et pate défibrée. Les chiffres se rapportent aupoids sec à l'air (c'est-A-dire avec une teneur en humidité de10%) exprimé en tonnes.
xxxvi
Pate de bois, mi-chimiquePates de bois obtenues en soumettant du bois de trituration, desplaquettes et particules de bois ou des résidus de bois à uneserie de traitements mécaniques et chimiques dont aucun n'estsuffisant seul pour que les fibres se séparent aisement. Ellespeuvent Ate bianchies ou non. Cette rubrique comprend: patede bois mi-chimique; pate de bois chimico-mécanique dedéfibreur et pate de bois chimico-mécanique, etc. (suivant l'ordreet l'importance des traitements subis durant la fabrication). Leschiffres se rapportent au poids sec à rail* (c'est-a-dire avecune teneur en hunnidité de 10%) exprimé en tonnes.
Pate de bois, chimiquePates de bois obtenues en soumettant du bois de trituration. desplaquettes et particules de bois ou des résidus de bois A unesérie de traitements chimiques. Cette rubrique comprend:pate de bois au sulfate (kraft), A la soude et au bisulfite. Ellespeuvent &Ire blanchies, mi-blanchies ou écrues. Sont exclues:les pates de bois à dissoudre. Les chiffres se rapportent aupoids sec A Fair (c'est-A-dire avec une teneur en humidité de10 %) exprimé en tonnes. Lorsque les details sont disponibles,les statistiques sont ventilées entre les quatre categoriessuivantes: pate écrue au bisulfite, pate au bisutfite blanchie, pateécrue au sulfate et pate au sulfate blanchie.
Pate écrue, bisuffitePate blanchie, bisulfitePate de bois obtenue en réduisant mécaniquement du bois detrituration, des plaquettes et particules de bois ou des résidus debois en petits fragments et en les cuisant sous pression avecune lessive de cuisson au bisuffite. Les bisulfites les pluscommunément utilises sont ceux d'ammonium, de calcium, demagnesium et de sodium. Sont exclues: les pates de boisdissoudre. Les chiffres se rapportent au poids sec A l'air(c'est-à-dire avec une teneur en humiclité de 10%) exprimé entonnes et deux sous-categories sont prévues: les patesblanchies (y compris les pates mi-blanchies) et les pates &rues.
Pate écrue, sulfatePate blanchie, sulfatePate de bois obtenue en réduisant mécan?quernent du bois detrituration, des plaquettes de bois, des particules ou résidus enpetits fragments et en les cuisant sous pression avec unelessive de cuisson à base de soude caustique (pour les pates Ala soude) ou d'un melange de soude caustique et de sulfate desodium (pour les pates au sulfate). Sont exclues: les pates debois à dissoudre. Les chiffres se rapportent au poids secl'air (c'est-A-dire avec une teneur en humidité de 10%) et deuxsous-categories sont prévues: les pates blanchies (y comprisles pates mi-blanchies) et les pates écrues.
Pate de bois A dissoudrePate chimique (au sulfate, à la soude ou au bisulfrte) de boisd'une qualité spéciale, ayant une très forte teneur en alpha-cellulose (en general 90 pour cent ou plus). Ce type de pate esttoujours blanchi et se préte aisément à des utifisations autresque la fabrication du papier. Ces pates sont principalementutilisées comme matières cellulosiques dans la fabrication deproduits tels que fibres artificielles, metieres plastiquescellulosiques, laques et explosifs. Les chiffres se rapportentau poids sec â l'air (c'est-e-dire avec une teneur en humiditéde 10%) exprimé en tonnes.
Pate, autres fibresPate obtenue à l'aide de matière végétale fibreuse autres que lebois et utilisée pour la fabrication de papier, de carton et depanneaux de fibres. Cette rubrique comprend: pates obtenues
partir de: paille, bambous, bagasse. alpha, divers roseaux ouplantes herbacées: linters de coton; lin; chanvre, chiffons etautres déchets textiles. Est exclue: la pate obtenue à partir devieux papiers. Les chiffres se rapportent au poids sec A l'air(c'est-A-dire avec une teneur en humidité de 10%) exprimé entonnes.
Vieux papiersPapiers et cartons de rebut qui ont été ramasses en vue d'uneréutilisation comme matière première pour la fabrication depapier et de carton. Cette rubrique comprend: papiers et
cartons qui ont éte utilises pour leur destination première etrésidus de la transformation du papier. Les chiffres sentexprimés en tonnes.
PAPIERS ET CARTONS
Papiers et cartons
II s'agit d'un agrégat de produits. Les statistiques sur laproduction et le commerce englobent: papier joumal, papierd'impression et d'écriture, et autres papiers et cartons. Lesproduits de cette catégorie sont généralement fabnqués enbandes ou en rouleaux dépassant 15 cm de large (36 cm pourSH 48.13 et 48.19) ou en feuilles rectangulaires dont un côtédépasse 36 cm et l'autre 15 cm lorsqu'elles sont dépliées. Sontexclus: les produits du papier tels que boites, cartons, livres etrevues, etc. Les chiffres sont exprimés en tonnes.
Papier journalPapier non couché, non mile (ou tits légèrement collé),contenant au moins 60 pour cent de pate mécanique(pourcentage en matieres fibreuses), dont le poids n'estgénéralement pas inférieur à 40 g/m2, ni supérieur e 60 g/m2,utilise principalement pour l'impression des journaux. Leschiffres sont exprimes en tonnes.
Papiers et cartons autres que le papier joumalII s'agit d'un agrégat de produits. Cette catégorie comprend:autres papiers d'impression et d'écriture et les autres papiers etcartons. Ils ne figurent que dans les tableaux sur la direction ducommerce. Les chiffres sont exprimés en tonnes.
Papier, impression et écriturePapiers autres que le papier joumal, utifises pour l'impression,les besoins commerciaux, l'écriture, les croquis, le dessin, etc.Faits avec divers mélanges de päte et soumis à divers procédésde finissage. Cette catégorie comprend: papiers pour livres etrevues; supports de tenture (papiers peints); papiers pourgamissage et habillage de boites; papier pour machines acalculer; papier pour impression sur rotatives, papier pourreproduction ou duplicateur; papier pour bloc-notes; papiers pourétiquettes; papiers pour lithographie; papier pour billets debanque; papier pour cartes mecanographiques; papier bibleveritable ou imitation; papier é lettres; papier pour manifold;papier pelure surglacé; papier machine; papier pour affiches,etc. Les chiffres sont exprimés en tonnes.
Autres papiers et cartonsAutres papiers et cartons. Cette catégorie comprend: papierset cartons de construction; papiers de ménage et papiershygiéniques; papiers minces spéciaux; papiers et cartonsd'empaquetage et d'emballage et les autres papiers et cartonsnon décrits ailleurs. Les chiffres sont exprimés en tonnes.Lorsque les details sont disponibles, les données sontventilées dans les trois categories suivantes: papiersdomestiques et papiers hygieniques, papiers et cartonsd'empaquetage et d'emballage, et les autres papiers et cartonsnon elects ailleurs.
Papiers domestiques et hygiéniquesPapiers absorbants (crepes ou non, parfois gaufres) faits avecde la pate de bois chimique, blanchie ou écrue, parfoismélangée à de la pate de vieux papiers et de la pate mécanique.Cette catégorie comprend: essuie-mains et serviettes; papiers
démaquiller; papiers hygiéniques; ouate de cellulose; articlesen papier à jeter, etc. Les chiffres sont exprimés en tonnes.
Papiers et cartons d'empaquetage et d'emballagePapiers et cartons utilises pour l'empaquetage, l'emballage et lafabrication de sacs et de bones. Cate catégorie comprend:papiers sulfurisés et similisulfurisés, papier cristal (ls sont faitsavec des pates de bois chimique pures ou mélangées ou despates de fibres de coton, traitées - c'est-6-dire fortementhydratées ou soumises 6 un raffinage poussé - pour que lepapier obtenu spit resistant à l'huile, 6 la graisse et 6 reau. Ilssont utilises principalement pour l'emballage des produitsalimentaires congeles, humides ou gras, tels que beurre,margarine, viande ou poisson); papiers et cartons ondulés(papiers et cartons utilises pour couvrir des bones et conteneurs
de papier ou de carton ondulé ou compact); papiers et cartonspour cannelures (papiers au cartons utilises comme Ame dansles assemblages de papier et carton transformes en cartonondule); papier kraft pour grands sacs (papier fort, fait avec de lapate au sulfate et utilise dans la fabrication des sacsd'emballage et d'empaquetage 6 une ou plusieurs épaisseurs);autres papiers kraft d'emballage (tous les attires papiersdemballage et dempaquetage faits principalement avec de lapate au sulfate); cartons pour boftes pliantes (cartons de toustypes servant 6 la fabrication de boites pliantes); et autrescartons et papiers d'empaquetage et d'emballage. Les chiffressont exprimés en tonnes.
Autres papiers et cartons non décrits ailleursPapiers et cartons de construction, à des fins spéciales et autresusages non décrits ailleurs. Cette rubrique comprend: lespapiers kraft destines â étre paraffines, asphaltés,imperméabilises, famines, impregnes, files ou tordus, gommés,etc.; les papiers faits principalement avec des matièrespremières autres que la pate au sulfate et non décrits ailleurs(tels que les papiers de chanyre et de jute, le papier pourdossier, le papier buvard, le papier filtre, le papier supportphotographique, etc.); les papiers et cartons de construction(papiers, feutres et cartons utilises dans /a constructiond'immeubles et autres structures comme isolant, jointsdetancheite aux gaz, sous-couches de plafonds ou deplanchers, etc. (ils sont généralement faits avec des matierescompletement raffinees, telles que pate de bois, vieux papiers,autres pates vegetales et fibres minerales et leurs principalescaracteristiques sont la faible conductivité thermique, laresistance 6 l'humidité, au feu, 6 la vermine et aux insectes); lespapiers minces spéciaux (papiers destines 6 des usagesparticuliers, et taus relativement fins, ils sont faits parfois avecdes pates de bois mecaniques ou chimiques, blanchies ouecrues, souvent avec des pates contenant du lin, du chanvre oude la fibre de coton. Leurs principales caracteristiques sont:uniformite de la surface et du calibre, absence de perforation,resistance, texture serrée, opacité, faible permeabilite, puretéchimique. Font partie, notamment, de cette categorie les papierssuivants: papier pelure pour carbone, papier pour condensateur,papier 6 cigarette, papier mousseline pour essuyage de !entitlesoptiques, papier pour patrons et papier pour sachets de the.); etcartons non décrits ailleurs (tels que les cartons pour l'industriede la chaussure, les cartons pour joints, les cartons pourtransformateurs, les cartons pour appréts textiles, les cartonspour classeurs, les cartons pour carrossene automobile, lescartons pour valises et malles, les cartons pour flans declicherie). Sont exclus: les papiers, feutres et cartonsimprégnés, imprégnés à coeur, a plusieurs épaisseurs, outraités de toute autre nnanière, ainsi que les panneaux de fibresdurs, mi-durs et isolants. Les chiffres sont exprimés entonnes.
NOTES SUR LES TABLEAUX
Production et commerce
BOIS ROND
Bois rond industrielLes données sur la production de bois rond industriel ne sontpas disponibles pour un certain nombre de pays. On a proposeune estimation en convertissant le volume de produits defabrication nationale en volume de bois rond requis pourproduire ce volume (requivalent bois rond). La consommation detous les produits forestiers inclus dans la catégorie "Bois rondindustriel" ne peut étre calculée en raison des différentesdefinitions des produits forestiers entre la production et le
commerce. En 1988, plusieurs pays membres du Conseil decooperation douanière (appelé maintenant Organisationmondiale des douanes) ont adopté un nouveau système declassification des produits pour leurs statistiques du commerceextérieur: le Système harmonise de designation et decodific,ation de marchandises (SH). Ce système a également étéadopté par les Nations Unies pour la troisième revision de laClassification type pour le commerce intemational (CTCI, Rev.3). Pour la 'Apart des produits forestiers, la nouvelleclassification est calquée sur la précédente, mais dans le cas dubois rond industriel, il n'y a plus de ventilation entre grumes desciage et grumes de placage, bois de trituration et les autresbois ronds industriels. En consequence, les tableaux sur lecommerce de ces produits ont été supprimés. La presentationincomplete de données concernant le bois rond explique lapresence d'une consommation negative dens certains pays (ils'agit d'un probleme statistique). On a tenu compte de cesinexactitudes dans les totaux regionaux et mondiaux.
Bois de chauffage, y compris le charbon de boisCette catégorie de produits était dénommée précédemment boisde chauffage et charbon de bois. Un certain nombre de pays necommuniquent pas leurs chiffies de production de ces produits,mais on sait que ceux-ci représentent une part importante de laconsommation totale de bois. Les estimations relatives à cespays se fondent sur les résultats disponibles des enquétes etsont révisées au fur et à mesure que de nouvelles enquetes sonteffectuées. On a admis que revolution de la production de cespays d'une année sur l'autre est proportionnelle à revolutiondemographique. Les chiffres de la production par habitantutilises pour la mise à jour de ces estimations figurent plus loindans un tableau.
PANNEAUX A BASE DE BOIS
Feuilles de placagePour certains pays, le volume de la production de feuilles deplacage communiqué comprend les feuilles de placagedestinées à la fabrication de contreplaqué à rinterieur du pays.La FAO a tenté de corriger ces statistiques cheque fois quepossible.
Panneaux de fibresLes volumes de la production des divers types de panneaux defibres ne sont pas toujours distingués dans les réponses despays au questionnaire sur les produits foresters. Dans de telscas, seule la production totale de panneaux de fibres estindiquée. Toutefois, cheque composante de la production depanneaux de fibres est décrite cheque fois que possible.
Direction du commerce
Les informations sur la direction du commerce concernent lesdeux demières années. Les tableaux sont fondés sur uneanalyse des données foumies par les pays dans lequestionnaire commun sur les produits forestiers et desrenseignements foumis par la base de données COMTRADE duBureau de statistique de l'ONU. Lorsque les volumes ne sontpas communiqués en unites standard, des coefficients deconversion leur sont appliqués. Lorsque les volumes signalés necorrespondent pas à la valeur, les volumes sont réestimés sur labase des valeurs unitaires moyennes. En l'absence de donnéesprovenant des pays exportateurs, on a estimé leurs exportationsa partir des données communiquées par les pays importateurs.
xxxviiiDans la présente edition, il se peut que les volumes indiquésdans la rubrique direction du commerce different quelque peudes chiffres présentés dans les principaux tableaux del'Annuaire, en raison des corrrections apportées d'après lesrenseignements foumis par la base de données COMTRADE etpar les réponses aux questionnaires.
Unites de valeur
L'unité utilisée dans les tableaux concemant la valeur ducommerce est le dollar des Etats-Unis. Dans les tableauxconcemant les valeurs unitaires du commerce, runité utilisée estle dollar des Etats-Unis par metre cubo (CUM) ou par tonne(MT), suivant le produit.
Notes sur les pays
Certains pays ont communiqué à la FAO des statistiquesincomplètes ou n'ont pas répondu. Dans ces cas, lesinformations pertinentes ont été trees des annuaires nationaux,de rapports ou de publications non officielles. Pour le
commerce, des estimations ont été faites d'après lesrenseignements communiqués par les reprises des partenairescommerciaux.
Les indications ci-dessous portent sur certains pays:
Belgique, LuxembourgLes données se rapportent a la Belgique et au Luxembourg.
ChineLes données relatives a la Chine comprennent celles de TaYwanProvince de Chine, celles de la Region administrative spécialede Hong Kong et celle de la Region administrative spéciale deMacao.
Canada et Etats-Unis dAmériqueEn ce qui conceme le Canada et les Etats-Unis d'Amérique, ona utilise, pour convertir en metres cubes le volume de sciagesexprime en milliers de pieds planches, le facteur de conversion2,36 m3 par 1 000 pieds planches. Selon les conventions sur lessciages en vigueur dans ces pays. /e volume est généraiementinférieur au volume nominal. Aux Etats-Unis d'Amérique, parexemple, le volume moyen effectif - pour les conifer-es et lesnon-conifères pris ensemble - des sciages verts bruts serait de 3pour cent inférieur au volume nominal, tandis que le volumemoyen pondere pour les sciages de coniferes secs surfaces etles sciages bruts secs de non-coniferes serait de 27 pour centinférieur au volume nominal. Les données relatives a laproduction américaine de panneaux de particules comprennentles PPO (panneaux de particules orientées) à partir de1995seulement.
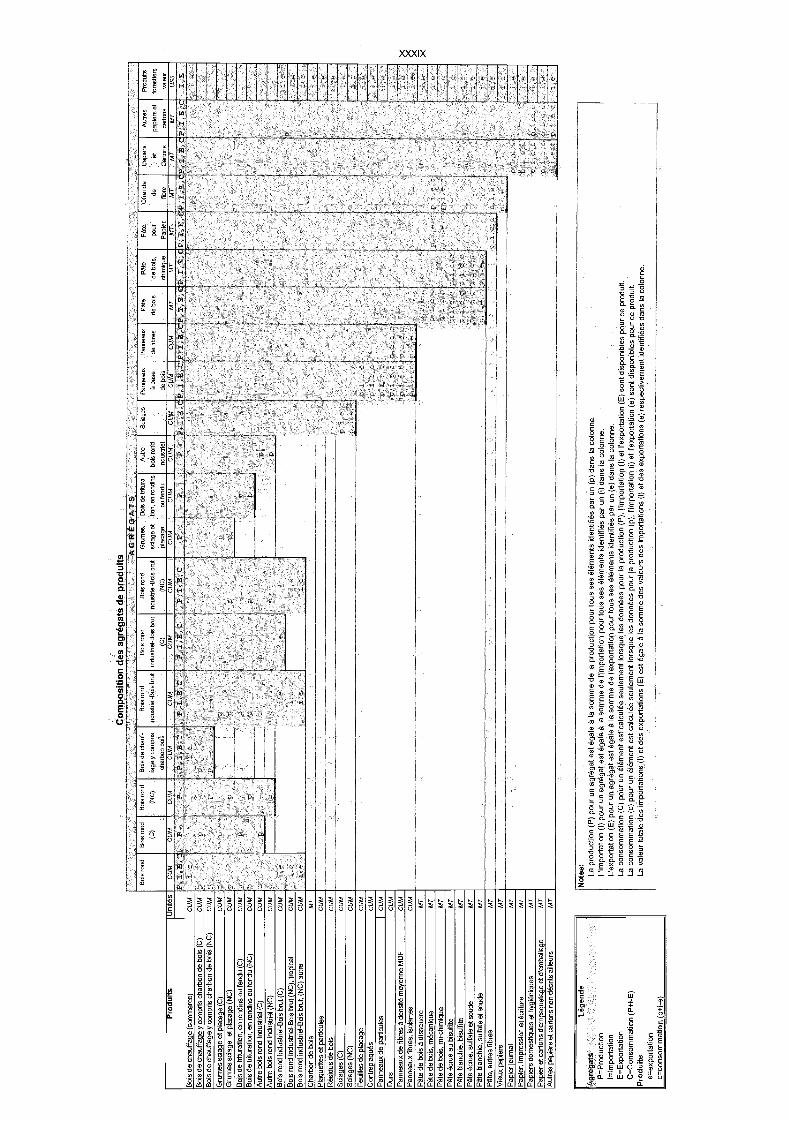
Boi
s ro
nd
Pro
du ts
Boi
s de
cha
uffa
ge (
com
mer
ce)
Boi
s de
cha
uffa
ge y
com
pris
cha
rbon
de
bois
(C
)B
ois
de c
hauf
fage
y c
ompr
is c
harb
on d
e bo
is (
NC
)
Boi
s ro
nd in
dust
riel-B
ois
brut
(N
C),
trop
ical
CU
M
Con
trep
laqu
ésC
UM
Pan
neau
x de
par
ticul
esD
urs
Pan
neau
x de
fibr
es a
den
sité
moy
enne
MD
FP
anne
aux
fibre
s, is
olan
tes
Pat
e de
boi
sdi
ssou
dre
Pat
e de
boi
s, m
écan
ique
Pat
e de
boi
s, m
i-chi
miq
ueP
ate
écru
e au
bis
ulfit
eP
ate
blan
chie
, bis
ulfit
e
Pat
e éc
rue,
sul
fate
et s
oude
Pat
e bl
anch
ie, s
ulfa
te e
t sou
de
Pat
e, a
utre
s fib
res
Vie
ux p
apie
rs
Pap
ier
joum
al
Pap
ier,
impr
essi
on e
l écr
iture
Pap
iers
dom
estiq
ues
et h
ygié
niqu
esP
apie
r et
car
tons
d'e
mpa
quet
age
et d
'em
balla
geA
utre
s pa
pier
s et
can
ons
non
décr
its a
illeu
rs
Lege
nds
Agr
egat
sP
=P
rodu
ctio
nI=
Impo
rtat
ion
E=
Exp
orta
tion
C=
Con
som
mat
ion
(P+
I-E
)P
rodu
itse=
expo
rtat
ion
c=co
nsom
mat
ion
(p+
i-e)
Com
posi
tion
des
agré
gats
de
prod
uits
AG
RE
GA
TS
e
r
Not
es:
La p
rodu
ctio
n (P
) po
ur u
n ag
réga
t est
éga
le a
la s
omm
e de
la p
rodu
ctio
n po
ur to
us s
es e
lem
ents
iden
tifie
s pa
r un
(p)
dan
s la
col
onne
.L'
impo
rtat
ion
(I)
pour
un
agré
gat e
st é
gate
a la
som
me
de (
'impo
rtat
ion
pour
tous
ses
ele
men
ts id
entif
ies
par
un (
i) da
ns la
co)
onne
.L'
expo
rtat
ion
(E)
pour
un
agré
gat e
st &
gale
a la
som
me
de P
expo
rtat
ion
pour
tous
ses
ele
men
ts id
entif
ies
par
un (
e) d
ans
la c
olon
ne.
La c
onso
mm
atio
n (C
) po
ur u
n el
emen
t est
cal
culé
e se
ulem
ent l
orsq
ue le
s do
nnée
s po
ur la
pro
duct
ion
(P),
['im
port
atio
n (I
) et
rex
port
atio
n (E
) so
nt d
ispo
nibl
es p
our
cepr
odui
t.La
con
som
mat
ion
(c)
pour
un
elem
ent e
st c
alcu
lée
seul
emen
t lor
sque
les
donn
ées
pour
la p
rodu
ctio
n (p
), r
impo
rtat
ion
(i) e
t rex
port
atio
n (e
) so
nt d
ispo
nibl
es p
our
cepr
odui
t.La
val
eur
tota
le d
es im
port
atio
ns (
I) e
t des
exp
orta
tions
(E
) es
t éga
le a
la s
omm
e de
s va
leur
s de
s im
port
atio
ns (
i) et
des
exp
orta
fions
(e)
res
pect
ivem
ent i
dent
ifiée
s da
ns la
col
onne
.
Boi
s ro
ndB
ois
rond
Gru
mes
BO
IS d
e tr
itura
-A
utre
Scl
ages
Pan
neau
xP
anne
aux
Pat
eP
ate
PA
teO
fren
daP
aper
sA
utre
sP
rodu
itsin
dust
nel-B
ois
brut
(C)
CU
M
indu
stne
l-Boi
s br
ut
(NC
)
=ag
e et
plac
age
CU
m
ton,
en
rond
os
ou fe
ndu
CU
M
bois
ron
d
indu
stne
lC
UM
CU
M
a ba
se
de lu
zde
fibr
es
CU
M
de b
ois
MT
de b
ras,
chim
ique
MT
pour
Pap
erM
T
de fibre
MT
et
Car
tons
MT
pape
rs e
t
cart
ons
MT
fore
ster
s
vale
urC
UM
C S
P,I,
E,C
P,I,
E,C
PC
P, I
,E,
P,I,
E,
P,I,
E, P
,I,E
, 5,1
,5, 5
,1,5
,
Icu
me C
:`r
cum
Cum
CU
M
MT
MT
-M
T
MT
MT
MT
MT
1 ,
MT
,e,-
MT
pIth
MT
MT
MT
MT
, -M
T
Boi
s ro
ndB
ois
rond
Boi
s de
cha
uf-
Boi
s ro
nd
(C)
(NC
)fa
gey
com
psch
arbo
n bo
is
indu
stne
l-Boi
s br
ut
CU
MC
:J.
CU
MC
UM
PP
,I,E
,CP
,I,E
,C
Aut
re b
ois
rond
indu
strie
) (C
)C
UM
Aut
re b
ois
rond
indu
strie
) (N
C)
Cum
c
Boi
s ro
nd in
dust
riel-B
ois
brut
(C
)C
UM
Boi
s ro
nd in
dust
riel-B
ois
brut
, (N
C)
autr
eC
UM
Cha
rbon
de
bois
MT
Pla
quet
tes
et p
artic
ules
CU
M
Rés
idus
de
bois
CU
m
Sci
ages
(C
)C
UM
Sci
ages
(N
C)
CU
M
Feu
illes
de
plac
age
CU
M
Gru
mes
sci
age
et p
laca
ge (
C)
cum
rG
rum
es s
ciag
e et
pla
cage
(N
C)
cum
Boi
s de
tritu
ratio
n, e
n ro
ndin
s ou
fend
u (C
)cu
m p
Boi
s de
tritu
ratio
n, e
n ro
ndin
s ou
fend
u (N
C)
CU
MI.
ni e
sru
m
CU
m1'
eC
UM
I,C
UM
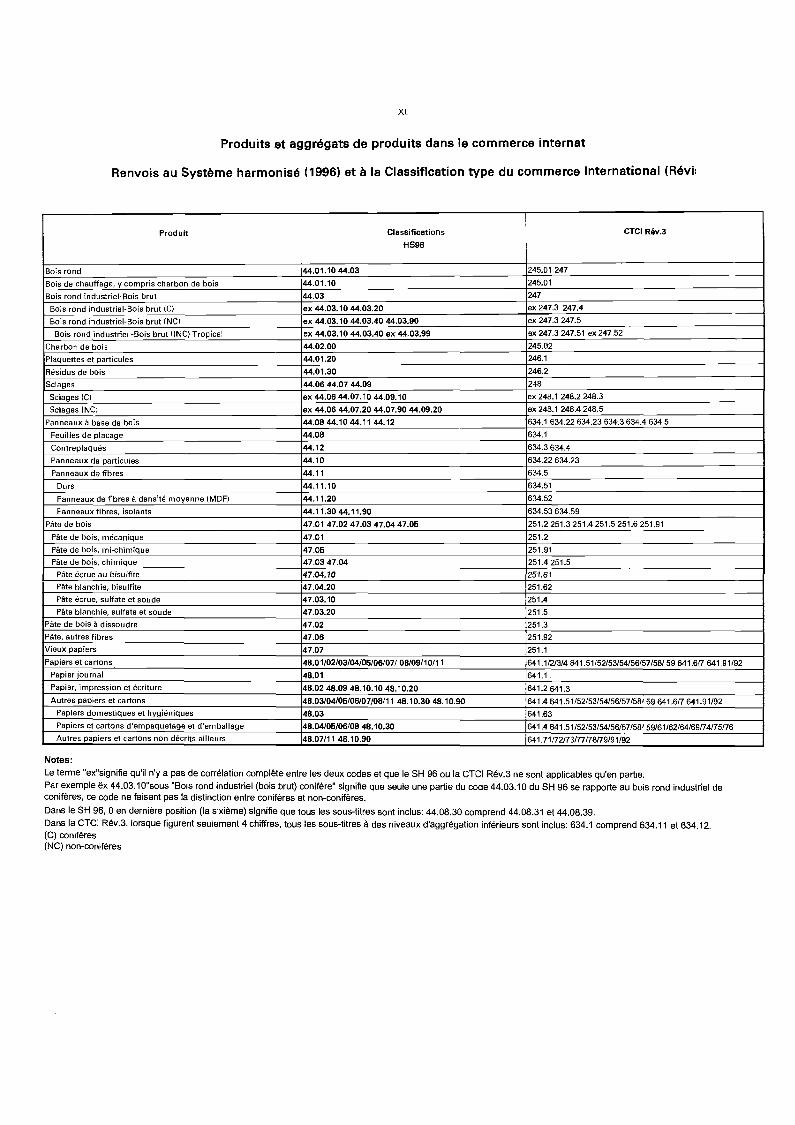
XL
Produits et aggrégats de produits dans le commerce internat
Renvois au Système harmonisé (1996) et à la Classification type du commerce international (Révi!
Notes:
Le terme "ex"signifie qu'il ny a pas de correlation complete entre les deux codes et que le SH 96 ou la CTCI Rév.3 ne sont applicables qu'en partie.Par exemple ex 44.03.10sous "Bois rond industriel (bois brut) conifère" signifie que seule une partie du code 44.03.10 du SH 96 se rapporte au bois rond industrielconiferes, ce code ne faisant pas la distinction entre conifères et non-conifères.
Dans le SH 96, 0 en dernière position (la sixième) signifie que tous les sous-titres sont inclus: 44.08.30 comprend 44.08.31 et 44.08.39.Dans la CTCI Rév.3, iorsque figurent seulement 4 chiffres, tous les sous-titres à des niveaux d'aggrégation inférieurs sont inclus: 634.1 comprend 634.11 et 634.12.(C) coniferes(NC) non-conifères
Prod uitI
ClassificationsHS96
CTCI Rév.3
Bo:s rond 44.01.10 44.03 245.01 247
Bois de chauffage, y compris charbon de bois 44.01.10 245.01
Bois rond industriel-Bois brut 44.03 247
Bois rond industriel-Bois brut (C) ex 44.03.10 44.03.20 ex 247.3 247.4
Bois rond industriel-Bois brut (NC) ex 44.03.10 44.03.40 44.03.90 ex 247.3 247.5
Bois rend industriel -Bois brut (INC) Tropical ex 44.03.1044.03.40 ex 44.03.99 ex 247.3 247.51 ex 247.52
Charbon de bois 44.02.00 245.02
Plaquettes et particules 44.01.20 246.1
Résidus de bois 44.01.30 246.2
Sciages 44.06 44.07 44.09 248
Sciages (C) ex 44.06 44.07.1044.09.10 ex 248.1 248.2 248.3
Sciages INC) ex 44.06 44.07.20 44.07.90 44.09.20 ex 248.1 248.4 248.5
Panneaux 6 base de bois 44.08 44.10 44.11 44.12 634.1 634.22 634.23 634.3 634.4 634.5
Feuilies de placage 44.08 634.1
Contreplaqués 44.12 634.3 634.4
Panneaux de particules 44.10 634.22 634.23
Panneaux de fibres 44.11 634.5
Durs 44.11.10 634.51
Panneaux de f:bres a densité moyenne (MDF) 44.11.20 634.52
Panneaux fibres, isolants 44.11.3044.11.90 634.53 634.59
Pate de bois 47.01 47.02 47.03 47.04 47.05 251.2 251.3 251.4 251.5 251.6 251.91
Pate de bois, mécanique 47.01 251.2
Pate de bois, mi-chimique 47.05 251.91
Pate de bois, chimique 47.03 47.04 251.4 251.5
Pate écrue ad bisulffte 47.04.10 251.61
Pate blanchie, bisuifite 47.04.20 251.62
Pate écrue, sulfate et soude 47.03.10 251.4
Pate blanchie, sulfate et soude 47.03.20 251.5
Pate de bois a dissoudre 47.02 251.3
Pate, autres fibres 47.06 251.92
Vieux papiers 47.07 251.1
Papiers et cartons. 48.01/02/03/04/05/06/07/ 08/09/10/11 641.1/2/3/4 641.51/52/53/54/56/S7/58/59 641.6/7 641.91192
Papier journal 48.01 641.1
Papier, impression et écriture 48.02 48.09 48.10.10 48.10.20 641.2 641.3
Autres paoiers el cartons 48.03/04/05/06/07/08/11 48.10.30 48.10.90 641.4 641.51152/53/54/56/57/58(59 641.6/7 641.91/92Papiers domestiques et hygiéniques 48.03 641.63
Papiers et cartons d'empaquetage el d'emballage 48.04/05/06/08 48.10.30 641.4 6.41.51152/53/54/56/57/58! 59/61162/64/69/74/75/76Autres papiers et cartons non décrits ailleurs 48.07/11 48.10.90 641.71/72[73/77/78/79/91/92
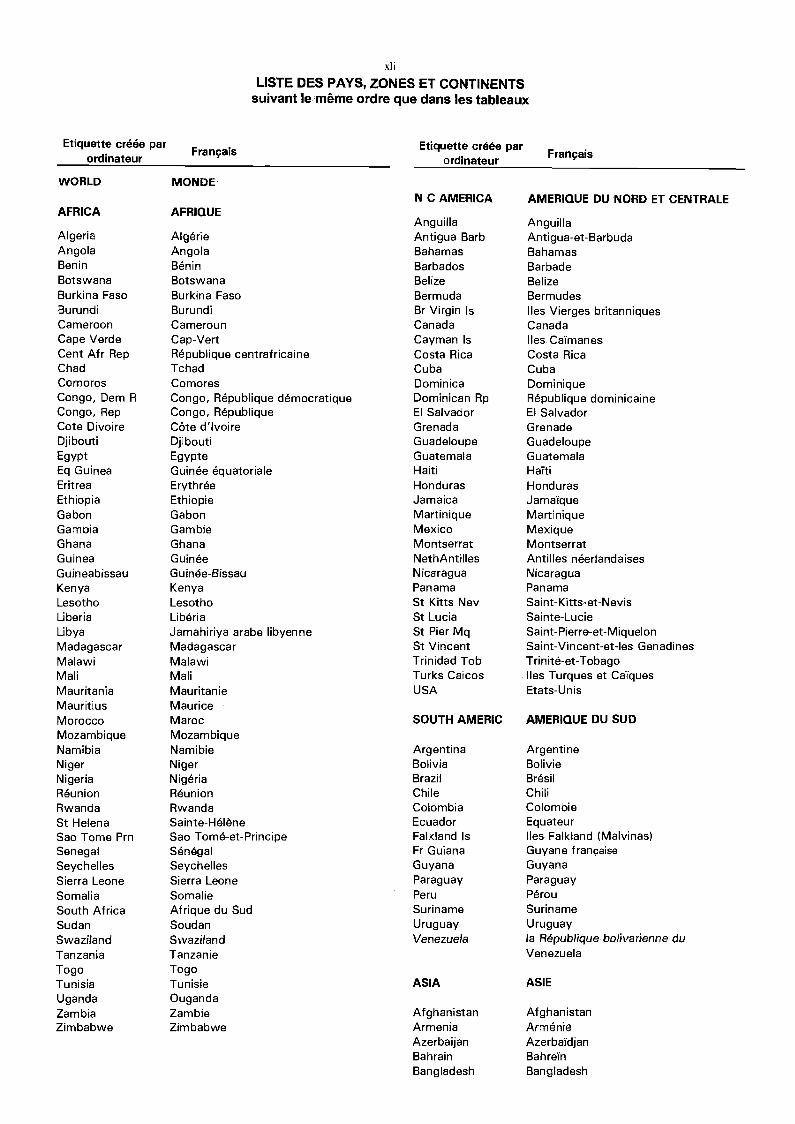
LISTE DES PAYS, ZONES ET CONTINENTSsuivant le métne ordre que dans les tableaux
Etiquette créée parordinateur Français Etiquette credo par
ordinateur Fran9ais
WORLD MONDEN C AMERICA AMERIQUE DU NORD ET CENTRALE
AFRICA AFRIQUEAnguilla Anguilla
Algeria Algeria Antigua Barb Antigua-et-BarbudaAngola Angola Bahamas BahamasBenin Benin Barbados BarbadeBotswana Botswana Belize BelizeBurkina Faso Burkina Faso Bermuda BermudesBurundi Burundi Br Virgin Is Iles Vierges britanniquesCameroon Cameroun Canada CanadaCape Verde Cap-Vert Cayman Is Iles CaimanesCent Afr Rep Republique centrafricaine Costa Rica Costa RicaChad Tchad Cuba CubaComoros Comores Dominica DominiqueCongo, Dem R Congo, Republique démocratique Dominican Rp Republique dominicaineCongo, Rep Congo, Republique El Salvador El SalvadorCote Divoire Cöte d'Ivoire Grenada GrenadeDjibouti Djibouti Guadeloupe GuadeloupeEgypt Egypte Guatemala GuatemalaEq Guinea Guinea équatoriale Haiti HaitiEritrea Erythrée Honduras HondurasEthiopia Ethiopia Jamaica JamaiqueGabon Gabon Martinique MartiniqueGambia Gambie Mexico MexiqueGhana Ghana Montserrat MontserratGuinea Guinea NethAntilles Antilles néerlandaisesGuineabissau Guinée-Bissau Nicaragua NicaraguaKenya Kenya Panama PanamaLesotho Lesotho St Kitts Nev Saint-Kitts-et-NevisLiberia Liberia St Lucia Sainte-LucieLibya Jamahiriya arabe libyerme St Pier Mq Saint-Pierre-et-MiquelonMadagascar Madagascar St Vincent Saint-Vincent-et-les GenadinesMalawi Malawi Trinidad Tob Trinité-et-TobagoMali Mali Turks Caicos Iles Turques et CaiquesMauritania Mauritanie USA Etats-UnisMauritius MauriceMorocco Maroc SOUTH AMERIC AMERIQUE DU SUDMozambique MozambiqueNamibia Namibie Argentina ArgentineNiger Niger Bolivia BoliviaNigeria Nigeria Brazil BrasilReunion Reunion Chile ChiliRwanda Rwanda Colombia ColombiaSt Helena Sainte-Helene Ecuador EquateurSao Tome Pm n Sao Tome-et-Principe Falkland Is Iles Falkland (Malvinas)Senegal Senegal Fr Guiana Guyane franpaiseSeychelles Seychelles Guyana GuyanaSierra Leone Sierra Leone Paraguay ParaguaySomalia Somalia Peru Perou
South Africa Afrique du Sud Suriname SurinameSudan Soudan Uruguay UruguaySwaziland Swaziland Venezuela la Republique bolivarienne duTanzania Tanzanie VenezuelaTogo TogoTunisia Tunisie ASIA ASIE
Uganda OugandaZambia Zambie Afghanistan AfghanistanZimbabwe Zimbabwe Armenia Armenia
Azerbaijan AzerbakljanBahrain BahreinBangladesh Bangladesh
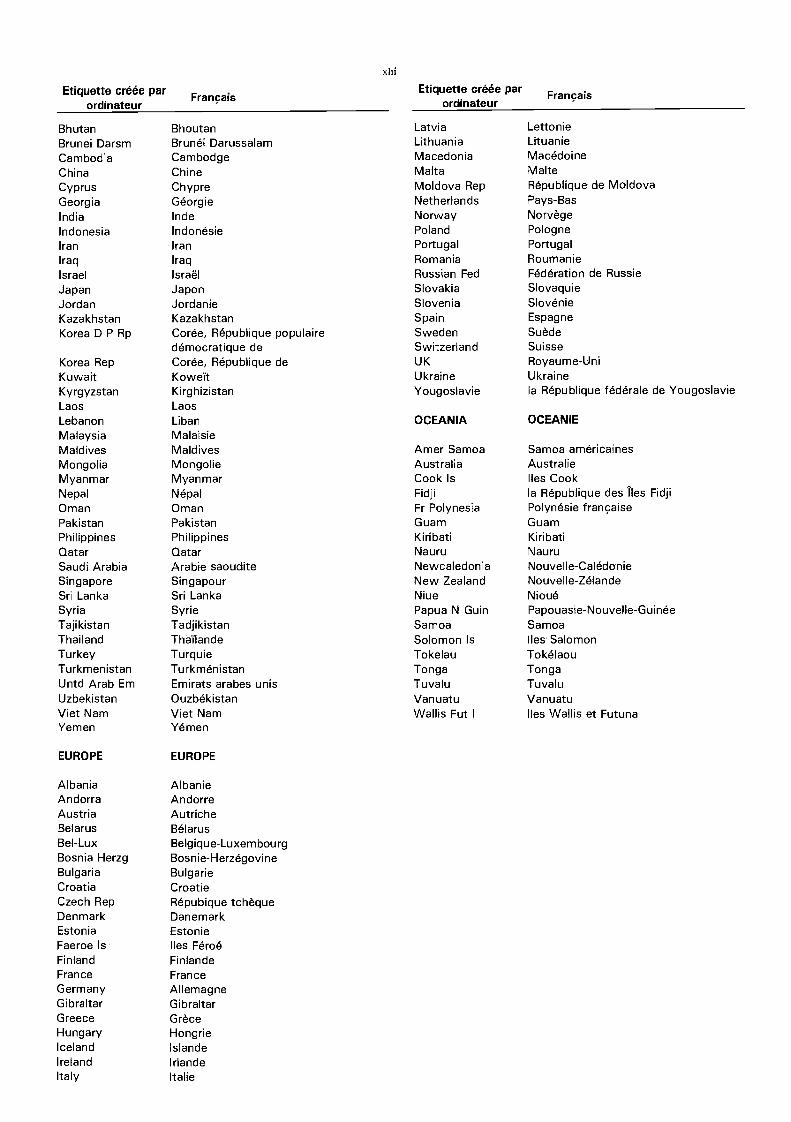
BhutanBrunei DarsmCambodiaChinaCyprusGeorgiaIndiaIndonesiaIranIraqIsraelJapanJordanKazakhstanKorea D P Rp
Korea RepKuwaitKyrgyzstanLaosLebanonMalaysiaMaldivesMongoliaMyanmarNepalOmanPakistanPhilippinesQatarSaudi ArabiaSingaporeSri LankaSyriaTajikistanThailandTurkeyTurkmenistanUntd Arab EmUzbekistanViet NamYemen
EUROPE
AlbaniaAndorraAustriaBelarusBel-LuxBosnia HerzgBulgariaCroatiaCzech RepDenmarkEstoniaFaeroe IsFinlandFranceGermanyGibraltarGreeceHungaryIcelandIrelandItaly
Français
BhoutanBrunei DarussalamCambodgeChineChypreGéorgielndeIndonésieIranIraqIsraelJaponJordanieKazakhstanCorée, Republique populairedémocratique deCorée, Republique deK oweitKirghizistanLaosLibanMalaisieMaldivesMongolieMyannnarNepalOmanPakistanPhilippinesQatarArable saouditeSingapourSri LankaSyrieTadjikistanThaTlandeTurquieTurkmenistanEmirats arabes unisOuzbékistanViet NamYemen
EUROPE
AlbanieAndorreAutricheBélarusBelgique-LuxembourgBosnie-HerzégovineBulgarieCroatieRépubique tchèqueDanemarkEstonieIles FéroéFinlandeFranceAllennagneGibraltarGreceHongrieIslandeI rlandeItalie
Etiquette créée parEtiquette créée paro ordinateurrdinateur
LatviaLithuaniaMacedoniaMaltaMoldova RepNetherlandsNorwayPolandPortugalRomaniaRussian FedSlovakiaSloveniaSpainSwedenSwitzerlandUKUkraineYougoslavie
OCEANIA
Amer SamoaAustraliaCook IsFidjiFr PolynesiaGuamKiribatiNauruNewcaledoniaNew ZealandNiuePapua N GuinSamoaSolomon IsTokelauTongaTuvaluVanuatuWallis Fut I
Français
LettonieLituanieMacedoineMalteRepublique de MoldovaPays-BasNorvègePolognePortugalRoumanieFederation de RussieSlovaquieSlovénieEspagneSuedeSuisseRoyaunne-UniUkrainela Republique fédérale de Yougoslavie
OCEANIE
Samoa américainesAustralieIles Cookla Republique des Iles FidjiPolynésie franpaiseGuamKiribatiNauruNouvelle-CalédonieNouvelle-ZélandeNiouéPapouasie-Nouvelle-GuinéeSamoaIles Salo monTokélaouTongaTuvaluVanuatuIles Wallis et Futuna
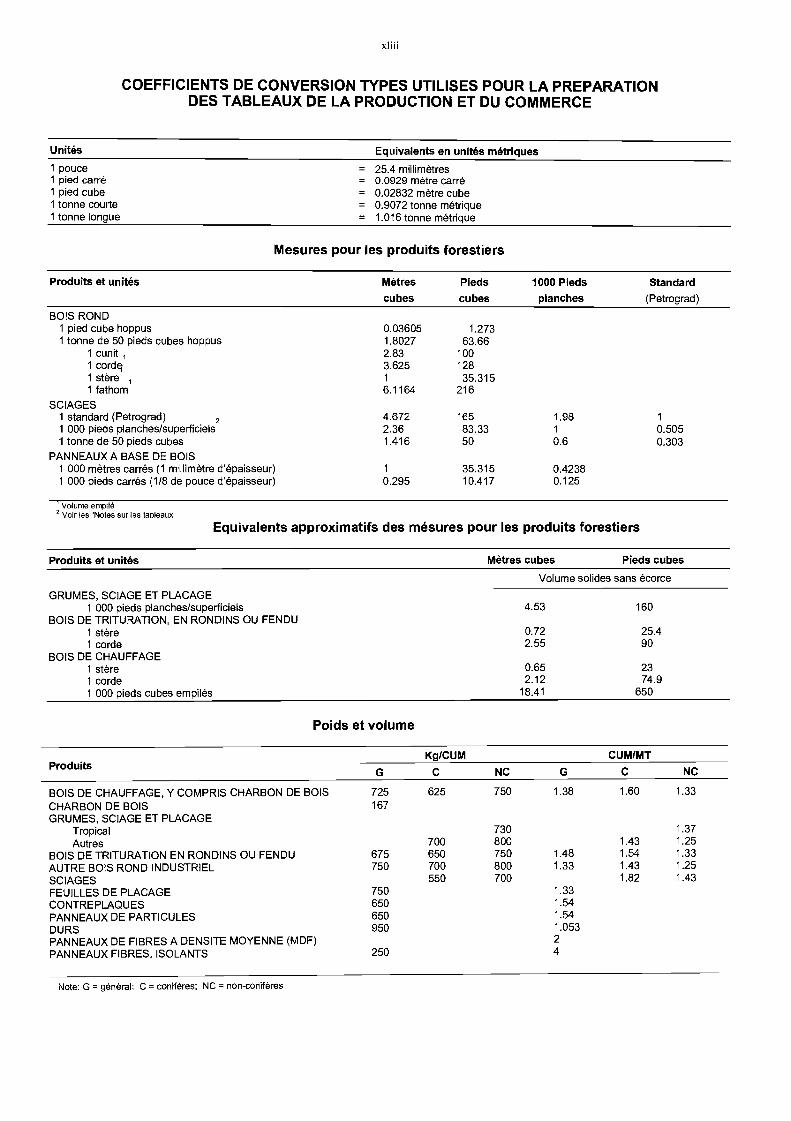
Unites Equivalents en unites métriques
Volume empilé2 Voir les "Notes sur les taoleaux
Equivalents approximatifs des mésures pour les produits forestiers
COEFFICIENTS DE CONVERSION TYPES UTILISES POUR LA PREPARATIONDES TABLEAUX DE LA PRODUCTION ET DU COMMERCE
Note: G = general; C = conifères; NC = non-conifères
Mesures pour les produits forestiers
BOIS ROND
Poids et volume
Volume solides sans écorce
GRUMES, SCIAGE ET PLACAGE1 000 pieds planches/superficiels 4.53 160
BOIS DE TRITURATION, EN RONDINS OU FENDU1 stere 0.72 25.41 corde 2.55 90
BOIS DE CHAUFFAGE1 stem 0.65 231 corde 2.12 74.91 000 pieds cubes empilés 18.41 650
Kg/CUM CUM/MTProduits
NC G C NC
BOIS DE CHAUFFAGE, Y COMPRIS CHARBON DE BOIS 725 625 750 1.38 1.60 1.33
CHARBON DE BOIS 167GRUMES, SCIAGE ET PLACAGE
Tropical 730 1.37
Autres 700 800 1.43 1.25
BOIS DE TRITURATION EN RONDINS OU FENDU 675 650 750 1.48 1.54 1.33
AUTRE BOIS ROND INDUSTRIEL 750 700 800 1.33 1.43 1.25
SCIAGES 550 700 1.82 1.43
FEUILLES DE PLACAGE 750 1.33
CONTREPLAQUES 650 1.54
PANNEAUX DE PARTICULES 650 1.54
DURS 950 1.053
PANNEAUX DE FIBRES A DENSITE MOYENNE (MDF) 2
PANNEAUX FIBRES, ISOLANTS 250 4
1 pied cube hoppus1 tonne de 50 pieds cubes hoppus
0.036051.8027
1.27363.66
1 cunit 1 2.83 1001 corde 3.625 1281 stère ,
1 fathom1
6.116435.315
216
SCIAGES1 standard (Petrograd) 2 4.672 165 1.98 1
1 000 pieds planches/superficiels 2.36 83.33 1 0.5051 tonne de 50 pieds cubes 1.416 50 0.6 0.303
PANNEAUX A BASE DE BOIS1 000 metres carrés (1 millimetre d'épaisseur) 1 35.315 0.42381 000 pieds cants (1/8 de pouce d'épaisseur) 0.295 10.417 0.125
Produits et unites Metres Pieds 1000 Pieds Standardcubes cubes planches (Petrograd)
Produits et unites Metres cubes Pieds cubes
1 pouce = 25.4 millimetres1 pied carré = 0.0929 metre came1 pied cube = 0.02832 metre cube1 tonne courte = 0.9072 tonne métrique1 tonne longue = 1.016 tonne métrique

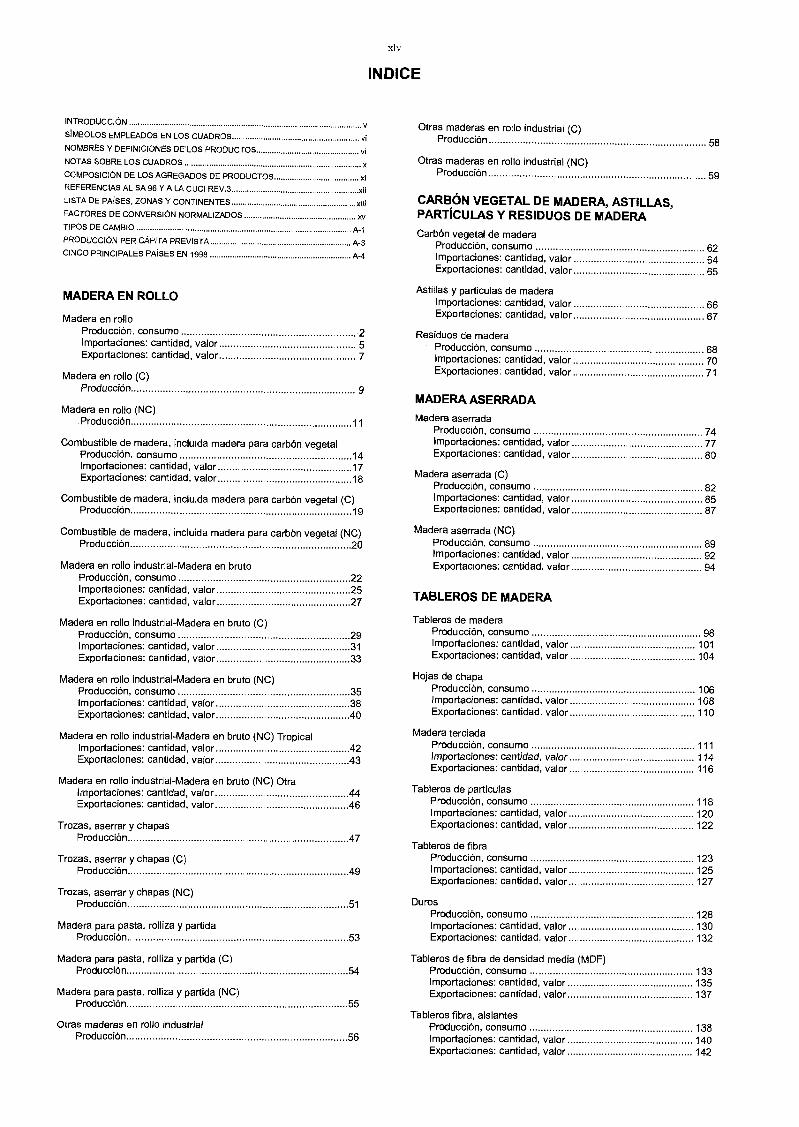
INTRODUCCÓN
SÍMBOLOS EMPLEADOS EN LOS CUADROS vi
NOMBRES Y DEFINICIONES DE LOS PRODUCTOS vi
NOTAS SOBRE LOS CUADROS
COMPOSICIÓN DE LOS AGREGADOS DE PRODUCTOS xi
REFERENCIAS AL SA 96 YA LA CUCI REV.3 xiiLISTA DE PAÍSES, ZONAS Y CONTINENTES ?di
FACTORES DE CONVERSIÓN NORMALIZADOS xv
TIPOS DE CAMBIO A-1
PRODUCCIÓN PER CAPITA PREVISTA A-3
CINCO PRINCIPALES PAÍSES EN 1998 A-4
MADERA EN ROLLO
Madera en rolloProducción, consumo 2Importaciones: cantidad, valor 5Exportaciones: cantidad, valor 7
Madera en rollo (C)Producción 9
Madera en rollo (NC)Producción 11
Combustible de madera, incluida madera para carbón vegetalProducción. consumo 14Importaciones: cantidad, valor 17Exportaciones: cantidad, valor 18
Combustible de madera, incluida madera para carbón vegetal (C)Producción 19
Combustible de madera, incluida madera para carbón vegetal (NC)Producción 20
Madera en rollo industrial-Madera en brutoProducción, consumo 22Importaciones: cantidad, valor 25Exportaciones: cantidad, valor 27
Madera en rollo industrial-Madera en bruto (C)Producción, consumo 29Importaciones: cantidad, valor 31Exportaciones: cantidad, valor 33
Madera en rollo industrial-Madera en bruto (NC)Producción, consumo 35Importaciones: cantidad, valor 38Exportaciones: cantidad, valor 40
Madera en rollo industrial-Madera en bruto (NC) TropicalImportaciones: cantidad, valor 42Exportaciones: cantidad, valor 43
Madera en rollo industrial-Madera en bruto (NC) OtraImportaciones: cantidad, valor 44Exportaciones: cantidad, valor 46
Trozas, aserrar y chapasProducción 47
Trozas, aserrar y chapas (C)Producción 49
Trozas, aserrar y chapas (NC)Producción 51
Madera para pasta, rolliza y partidaProducción 53
Madera para pasta, rolliza y partida (C)Producción 54
Madera para pasta. rolliza y partida (NC)Producción 55
Otras maderas en rollo industrialProducción 56
xlv
INDICE
Otras maderas en rollo industrial (C)Producción 58
Otras maderas en rollo industrial (NC)Producción 59
CARBÓN VEGETAL DE MADERA, ASTILLAS,PARTÍCULAS Y RESIDUOS DE MADERA
Carbón vegetal de maderaProducción, consumo 62Importaciones: cantidad, valor 64Exportaciones: cantidad, valor 65
Astillas y particulas de maderaImportaciones: cantidad, valor 66Exportaciones: cantidad, valor 67
Residuos de maderaProducción, consumo 68Importaciones: cantidad, valor 70Exportaciones: cantidad, valor 71
MADERA ASERRADA
Madera aserradaProducción, consumo 74Importaciones: cantidad, valor 77Exportaciones: cantidad, valor 80
Madera aserrada (C)Producción, consumo 82Importaciones: cantidad, valor 85Exportaciones: cantidad, valor 87
Madera aserrada (NC)Producción, consumo 89Importaciones: cantidad, valor 92Exportaciones: cantidad, valor 94
TABLEROS DE MADERA
Tableros de maderaProducción, consumo 98Importaciones: cantidad, valor 101Exportaciones: cantidad, valor 104
Hojas de chapaProducción, consumo 106Importaciones: cantidad, valor 108Exportaciones: cantidad. valor 110
Madera terciadaProducción, consumo 111Importaciones: cantidad, valor 114Exportaciones: cantidad, valor 116
Tableros de particulasProducción, consumo 118Importaciones: cantidad, valor 120Exportaciones: cantidad, valor 122
Tableros de fibraProducción, consumo 123Importaciones: cantidad, valor 125Exportaciones: cantidad, valor 127
DurosProducción, consumo 128Importaciones: cantidad, valor 130Exportaciones: cantidad. valor 132
Tableros de fibra de densidad media (MDF)Producción, consumo 133Importaciones: cantidad, valor 135Exportaciones: cantidad, valor 137
Tableros fibra, aislantesProducción, consumo 138Importaciones: cantidad, valor 140Exportaciones: cantidad, valor 142
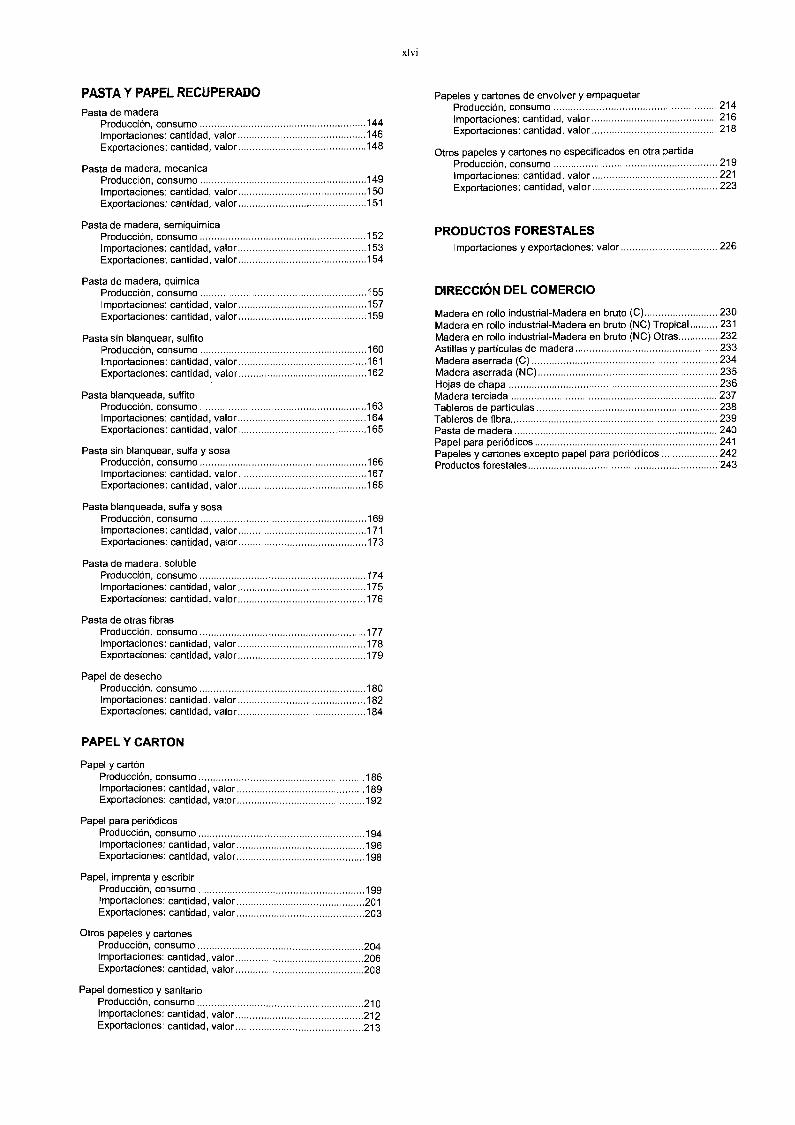
PASTA Y PAPEL RECUPERADO
Pasta de maderaProducción, consumo 144Importaciones: cantidad, valor 146Exportaciones: cantidad. valor 148
Pasta de madera, mecanicaProducción, consumo 149Importaciones: cantidad. valor 150Exportaciones: cantidad, valor 151
Pasta de madera, semiquimicaProducción, consumo 152
Importaciones: cantidad, valor 153Exportaciones: cantidad, valor 154
Pasta de madera, quimicaProducción, consumo 155Importaciones: cantidad, valor 157Exportaciones: cantidad, valor 159
Pasta sin blanquear, sulfitoProducción, consumo 160Importaciones: cantidad, valor 161
Exportaciones: cantidad, valor 162
Pasta blanqueada, sulfitoProducción, consumo 163Importaciones: cantidad, valor 164Exportaciones: cantidad, valor 165
Pasta sin blanquear, sulfa y sosaProducción, consumo 166Importaciones: cantidad, valor 167Exportaciones: cantidad, valor 168
Pasta blanqueada, sulfa y sosaProducción, consumo 169Importaciones: cantidad, valor 171Exportaciones: cantidad, valor 173
Pasta de madera, solubleProducción, consumo 174Importaciones: cantidad, valor 175Exportaciones: cantidad, valor 176
Pasta de otras fibrasProducción, consumo 177Importaciones: cantidad, valor 178Exportaciones: cantidad, valor 179
Papel de desechoProducción. consumo 180Importaciones: cantidad, valor 182Exportaciones: cantidad, valor 184
PAPEL Y CARTON
Papel y cartónProducción, consumo 186Importaciones: cantidad, valor 189Exportaciones: cantidad, valor 192
Papel para periódicosProducción, consumo 194Importaciones: cantidad, valor 196Exportaciones: cantidad, valor 198
Papel, imprenta y escribirProducción, consumo 199Importaciones: cantidad, valor 201Exportaciones: cantidad, valor 203
Otros papeles y cartonesProducción, consumo 204Importaciones: cantidad, valor 206Exportaciones: cantidad, valor 208
Papel domestico y sanitarioProducción, consumoImportaciones: cantidad, valorExportaciones: cantidad, valor
210212213
xlvi
Papeles y cartones de envolver y empaquetarProducción, consumo 214Importaciones: cantidad, valor 216Exportaciones: cantidad, valor 218
Otros papeles y cartones no especificados en otra partidaProducción, consumo 219Importaciones: cantidad, valor 221
Exportaciones: cantidad, valor 223
PRODUCTOS FORESTALESImportaciones y exportaciones: valor 226
DIRECCIÓN DEL COMERCIO
Madera en rollo industrial-Madera en bruto (C) 230Madera en rollo industrial-Madera en bruto (NC) Tropical 231
Madera en rollo industrial-Madera en bruto (NC) Otras 232Astillas y partículas de madera 233Madera aserrada (C) 234Madera aserrada (NC) 235Hojas de chapa 236Madera terciada 237Tableros de partículas 238Tableros de fibra 239Pasta de madera 240Papel para periódicos 241Papeles y cartones excepto papel para periódicos 242Productos forestales 243
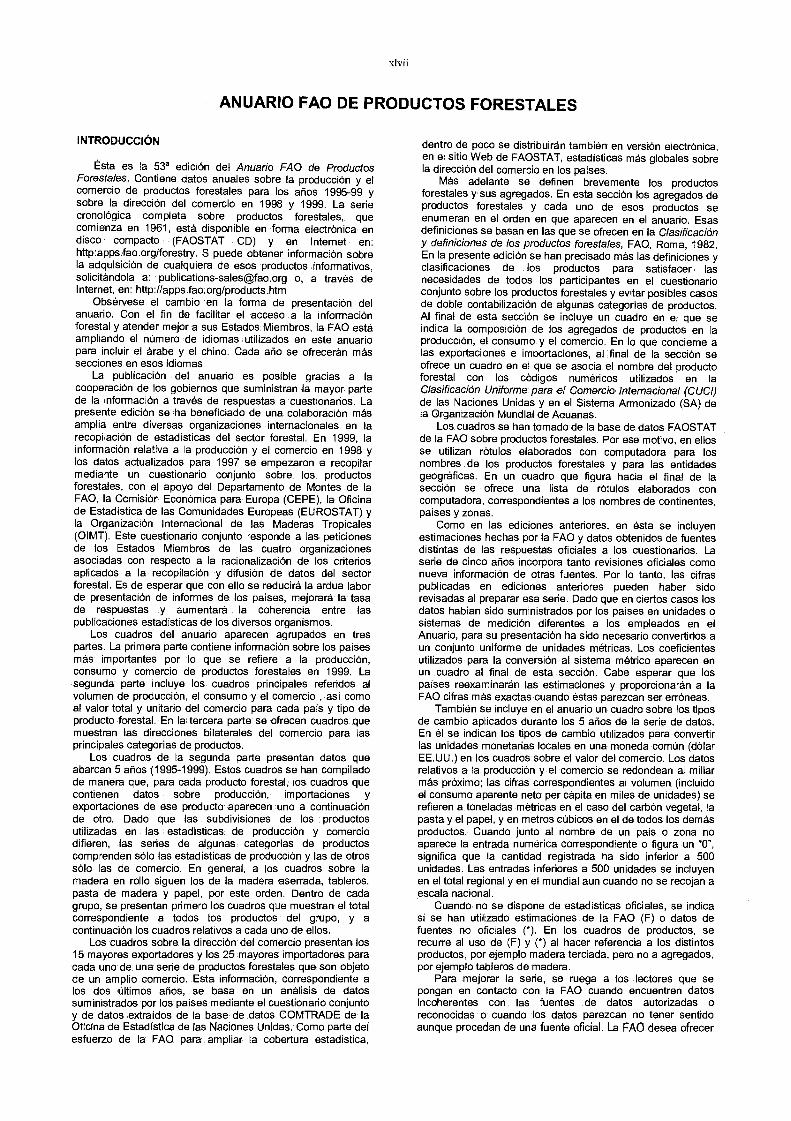
INTRODUCCIÓN
Ésta es la 538 edición del Anuario FAO de ProductosForestales. Contiene datos anuales sobre la producción y elcomercio de productos forestales para los años 1995-99 ysobre la dirección del comercio en 1998 y 1999. La seriecronológica completa sobre productos forestales, quecomienza en 1961, está disponible en forma electrónica endisco compacto (FAOSTAT CD) y en Internet en:http:apps.fao.org/forestry. S puede obtener información sobrela adquisición de cualquiera de esos productos informativos,solicitándola a: [email protected] o, a través deI nternet, en: http://apps.fao.org/products.htm
Obsérvese el cambio en la forma de presentación delanuario. Con el fin de facilitar el acceso a la informaciónforestal y atender mejor a sus Estados Miembros, la FAO estáampliando el número de idiomas utilizados en este anuariopara incluir el árabe y el chino. Cada año se ofrecerán massecciones en esos idiomas.
La publicación del anuario es posible gracias a lacooperación de los gobiernos que suministran la mayor partede la información a través de respuestas a cuestionarios. Lapresente edición se ha beneficiado de una colaboración másamplia entre diversas organizaciones internacionales en larecopilación de estadisticas del sector forestal, En 1999, lainformación relativa a la producción y el comercio en 1998 ylos datos actualizados para 1997 se empezaron a recopilarmediante un cuestionario conjunto sobre los productosforestales, con el apoyo del Departamento de Montes de laFAO, la Comisión Económica para Europa (CEPE), la Oficinade Estadística de las Comunidades Europeas (EUROSTAT) yla Organización Internacional de las Maderas Tropicales(OIMT). Este cuestionario conjunto responde a las peticionesde los Estados Miembros de las cuatro organizacionesasociadas con respecto a la racionalización de los criteriosaplicados a la recopilación y difusión de datos del sectorforestal. Es de esperar que con ello se reducirá la ardua laborde presentación de informes de los países, mejorará la tasade respuestas y aumentará la coherencia entre laspublicaciones estadísticas de los diversos organismos.
Los cuadros del anuario aparecen agrupados en trespartes. La primera parte contiene información sobre los paísesmás importantes por lo que se refiere a la producción,consumo y comercio de productos forestales en 1999. Lasegunda parte incluye los cuadros principales referidos alvolumen de producción, el consumo y el comercio, así comoal valor total y unitario del comercio para cada pais y tipo deproducto forestal. En la tercera parte se ofrecen cuadros quemuestran las direcciones bilaterales del comercio para lasprincipales categorías de productos.
Los cuadros de la segunda parte presentan datos queabarcan 5 años (1995-1999). Estos cuadros se han compiladode manera que, para cada producto forestal, los cuadros quecontienen datos sobre producción, importaciones yexportaciones de ese producto aparecen uno a continuaciónde otro. Dado que las subdivisiones de los productosutilizadas en las estadísticas de producción y comerciodifieren, las series de algunas categorías de productoscomprenden sólo las estadísticas de producción y las de otrossólo las de comercio. En general, a los cuadros sobre lamadera en rollo siguen los de la madera aserrada, tableros,pasta de madera y papel, por este orden. Dentro de cadagrupo, se presentan primero los cuadros que muestran el totalcorrespondiente a todos los productos del grupo, y acontinuación los cuadros relativos a cada uno de ellos.
Los cuadros sobre la dirección del comercio presentan los15 mayores exportadores y los 25 mayores importadores paracada uno de una serie de productos forestales que son objetode un amplio comercio. Esta información, correspondiente alos dos últimos años, se basa en un análisis de datossuministrados por los países mediante el cuestionario conjuntoy de datos extraídos de la base de datos COMTRADE de laOficina de Estadística de las Naciones Unidas. Como parte delesfuerzo de la FAO para ampliar la cobertura estadística,
ANUARIO FAO DE PRODUCTOS FORESTALES
xlvii
dentro de poco se distribuirán también en versión electrónica,en el sitio Web de FAOSTAT, estadísticas más globales sobrela dirección del comercio en los países.
Mas adelante se definen brevemente los productosforestales y sus agregados. En esta sección los agregados deproductos forestales y cada uno de esos productos seenumeran en el orden en que aparecen en el anuario. Esasdefiniciones se basan en las que se ofrecen en la Clasificacióny definiciones de los productos forestales, FAO, Roma, 1982.En la presente edición se han precisado más las definiciones yclasificaciones de los productos para satisfacer lasnecesidades de todos los participantes en el cuestionarioconjunto sobre los productos forestales y evitar posibles casosde doble contabilización de algunas categorías de productos.Al final de esta sección se incluye un cuadro en el que seindica la composición de los agregados de productos en laproducción, el consumo y el comercio. En lo que concierne alas exportaciones e importaciones, al final de la sección seofrece un cuadro en el que se asocia el nombre del productoforestal con los códigos numéricos utilizados en laClasificación Uniforme para el Comercio Internacional (CUCOde las Naciones Unidas y en el Sistema Armonizado (SA) dela Organización Mundial de Aduanas.
Los cuadros se han tomado de la base de datos FAOSTATde la FAO sobre productos forestales. Por ese motivo, en ellosse utilizan rótulos elaborados con computadora para losnombres de los productos forestales y para las entidadesgeográficas. En un cuadro que figura hacia el final de lasección se ofrece una lista de rótulos elaborados concomputadora, correspondientes a los nombres de continentes,países y zonas.
Como en las ediciones anteriores. en ésta se incluyenestimaciones hechas por la FAO y datos obtenidos de fuentesdistintas de las respuestas oficiales a los cuestionarios. Laserie de cinco años incorpora tanto revisiones oficiales comonueva información de otras fuentes. Por lo tanto, las cifraspublicadas en ediciones anteriores pueden haber sidorevisadas al preparar esa serie. Dado que en ciertos casos losdatos hablan sido suministrados por los países en unidades osistemas de medición diferentes a los empleados en elAnuario, para su presentación ha sido necesario convertirlos aun conjunto uniforme de unidades métricas. Los coeficientesutilizados para la conversión al sistema métrico aparecen enun cuadro al final de esta sección. Cabe esperar que lospaises reexaminarán las estimaciones y proporcionarán a laFAO cifras más exactas cuando éstas parezcan ser erróneas.
También se incluye en el anuario un cuadro sobre los tiposde cambio aplicados durante los 5 años de la serie de datos.En él se indican los tipos de cambio utilizados para convertirlas unidades monetarias locales en una moneda común (dólarEE.UU.) en los cuadros sobre el valor del comercio. Los datosrelativos a la producción y el comercio se redondean al millarmás próximo; las cifras correspondientes al volumen (incluidoel consumo aparente neto per capita en miles de unidades) serefieren a toneladas métricas en el caso del carbón vegetal, lapasta y el papel, y en metros cúbicos en el de todos los demásproductos. Cuando junto al nombre de un país o zona noaparece la entrada numérica correspondiente o figura un "0",significa que la cantidad registrada ha sido inferior a 500unidades. Las entradas inferiores a 500 unidades se incluyenen el total regional y en el mundial aun cuando no se recojan aescala nacional.
Cuando no se dispone de estadísticas oficiales, se indicasi se han utilizado estimaciones de la FAO (F) o datos defuentes no oficiales (*). En los cuadros de productos, serecurre al uso de (F) y (") al hacer referencia a los distintosproductos, por ejemplo madera terciada, pero no a agregados,por ejemplo tableros de madera.
Para mejorar la serie, se ruega a los lectores que sepongan en contacto con la FAO cuando encuentren datosincoherentes con las fuentes de datos autorizadas oreconocidas o cuando los datos parezcan no tener sentidoaunque procedan de una fuente oficial. La FAO desea ofrecer
datos precisos y puntuales y solicita la ayuda de todos lospaíses para mejorar la recopilación y difusión de estadísticasde alta calidad sobre producción y comercio internacional deproductos forestales. A continuación se ofrecen datosdetallados para ponerse en contacto con los funcionarios de laFAO encargados de las distintas secciones del anuario.Subdirección de Planificación y Estadísticas, Departamento deMontes de la FAO, Viale delle Terrne di Caracalla, 00100Roma, Italia. Fax: +39-06-5705.5514 ô +39-06-5705.5137;correo electrónico: para observaciones [email protected]; estadísticas de producció[email protected]; estadísticas de [email protected]; acceso a FAOSTATfe I ice.padovan [email protected].
SÍMBOLOS EMPLEADOS EN LOS CUADROS
CUM Metro cúbicoMT Tonelada métrica
ConíferasNC No coníferas
Estimación de la FAOCifra no oficialDólar EE.UU.
NOMBRES Y DEFINICIONES DE LOS PRODUCTOS
A continuación se presenta una lista de los términos generalesy de los nombres de productos forestales empleados en elanuario, con una breve definición. En la medida de lo posible,las definiciones empleadas se ajustan a la Clasificación ydefiniciones de los productos forestales, FAO, Roma, 1982.Algunas de ellas han sido retocadas con miras a su empleo enel cuestionario conjunto sobre los productos forestales.
Términos generales
ConíferasTodas las maderas procedentes de árboles clasificadosbotánicamente como Gymnospermae; por ejemplo, abeto(Abies), pino de Paraná (Araucaria), cedro (Cedrus), ginkgo(Ginkgo), alerce (Larix), picea (Picea), pino (Pinus) incluso elllorón del Himalaya y el longifolio. (Suelen denominarsetambién maderas blandas).
No coníferasTodas las maderas procedentes de árboles clasificadosbotánicamente como Angiospermae; por ejemplo, arce (Acer),ébano (Diospyros), haya (Fagus), guayacán (Guaiacum),chopo (Populus), roble (Cluercus), sal (Shorea), teca(Tectona), casuarina (Casuarina). etc. (Suelen denominarsefrondosas o maderas duras).
TropicalesEn el Acuerdo Internacional sobre las Maderas Tropicales(1994) la madera tropical se define como sigue: "Maderatropical de no coníferas para usos industriales, que crece o seproduce en los países situados entre el Trópico de Cáncer y elTrópico de Capricornio. El término comprende las trozas, lamadera aserrada, las hojas de chapa y la madera terciada. Ladefinición se aplicará también a la madera terciada queincluye en parte madera de coníferas de origen tropical". En elanuario, el término sólo se aplica a la madera en rolloindustrial de especies no coníferas.
OtrosPaíses que no son tropicales (con arreglo a la definiciónsusodicha). En el anuario, el término sólo se aplica a lamadera en rollo industrial de especies no coníferas.
ExtraccionesVolumen de todos los árboles, vivos o muertos, que se cortany extraen del bosque, de otros terrenos boscosos o de otroslugares de corta. Se incluyen las pérdidas naturales que serecuperan (es decir, se aprovechan), las extracciones duranteel año de la madera cortada en un período anterior, lasextracciones de madera no proveniente del tronco, como porejemplo tocones y ramas (cuando se aprovechan), y lasextracciones de arboles muertos o dañados por causas
xlviii
naturales (es decir pérdidas naturales), por ej. incendios,vendavales, insectos y enfermedades. Se excluyen la cortezay otra biomasa no leñosa, así como toda la madera que no seextrae, por ej. tocones, ramas y copas de árboles (cuando nose aprovechan) y residuos de la corta (desechos delaprovechamiento). Los datos se expresan en metros cúbicossin corteza. Cuando el volumen se calcula con inclusión de lacorteza, ha de ajustarse a la baja para convertido en unaestimación sin corteza.
ProducciónVolumen o peso real de toda la producción de los productosque se especifican más adelante. Se incluye la producción deproductos que pueden consumirse inmediatamente en laproducción de otro producto (por ej. pasta de madera, quepuede convertirse inmediatamente en papel como parte de unproceso continuo). Se excluye la producción de hojas dechapa que se utilizan para la producción de madera terciadadentro del mismo país. Los datos se expresan en metroscúbicos de volumen real en el caso de la madera en rollo, lamadera aserrada y los tableros de madera y en toneladasmétricas en el caso del carbón vegetal, la pasta y el papel.
ImportacionesProductos importados para el consumo interno o para sertransformados en el país. Se incluyen las importaciones parala reexportación en ciertas circunstancias. Se excluyen losenvíos "en tránsito". Los datos se expresan en metros cúbicosde volumen real o en toneladas métricas, y los valores suelenincluir el costo, seguro y flete (c.i.f).
ExportacionesProductos de origen o fabricación nacional enviados fuera delpaís. Se incluyen las reexportaciones en ciertascircunstancias. Se excluyen los envíos "en tránsito". Los datosse expresan en metros cúbicos de volumen real o entoneladas métricas y los valores suelen registrarse comofranco a bordo (f.o.b.).
Valores unitariosLos valores unitarios se han obtenido dividiendo el valor totaldel comercio por su volumen total. Las cifras de lasexportaciones corresponden a los valores medios f.o.b.,mientras que las de las importaciones corresponden a losvalores medios c.i.f.
ConsumoEl consumo es el consumo aparente neto, que es igual a laproducción más las importaciones menos las exportaciones,por lo que sólo puede calcularse cuando se dispone de datosrelativos a esos tres elementos.
Agregados y nombres de productos forestales
Los nombres de los distintos productos forestales y de susagregados se ofrecen a continuación en el orden en queaparecen en los cuadros. No se dan definiciones por separadode los componentes de las coníferas (C) y de las no coníferas(NC) cuando se aplica la definición general. Salvo indicaciónen contrario, cada categoría de productos forestales incluyecomponentes tanto de coníferas como de no coníferas. En uncuadro al final de esta sección se ofrece un resumen en el quese indica cómo se relacionan entre sí todas las categorías deproductos y los agregados.
MADERA EN ROLLO
Madera en rolloMadera en rollo (C)Madera en rollo (NC)
Toda la madera en rollo cortada o aprovechada y extraída decualquier otro modo. Comprende toda la madera obtenida delas extracciones, es decir las cantidades extraídas de losbosques y de árboles situados fuera de ellos, incluida lamadera recuperada de pérdidas naturales, de la corta y de lasoperaciones de explotación durante el período (año civil oejercicio forestal). Se incluye toda la madera extraída con osin corteza, incluida la madera extraída en forma de rollo, opartida, simplemente escuadrada o en otra forma (por ej.
ramas, raíces, tocones y excrecencias (cuando seaprovechan) y la madera simplemente desbastada o afilada.En las estadísticas de producción, representa la suma delcombustible de madera, incluida la madera para carbónvegetal; las trozas para aserrar y para chapa; la madera parapasta, rolliza y partida; y otras maderas en rollo industriales.En las estadísticas de comercio, representa la suma de lamadera en rollo industrial (madera en bruto); y el combustiblede madera, incluida la madera para carbón vegetal. Los datosse expresan en metros cúbicos sin corteza. Las estadísticascomprenden tanto el volumen registrado como estimacionesdel volumen no registrado, según se indica en las notas.
Combustible de madera, incluida madera para carbón vegetalCombustible de madera, incluida madera para carbón
vegetal (C)Combustible de madera, incluida madera para carbón
vegetal (NC)Toda la madera en rollo destinada a ser utilizada comocombustible para cocinar, calentar o generar energía. Seincluye la madera que se aprovecha de los principalestocones, ramas y otras partes de los árboles (cuando seaprovechan como combustible) y la madera destinada a laproducción de carbón vegetal (por ej., en homos subterráneoso portátiles). Para estimar el volumen de la madera en rolloempleada en la producción de carbón vegetal se aplica unfactor de 6,0 a fin de convertir el peso (MT) del carbón vegetalproducido en volumen real (CUM) de la madera en rolloempleada en su producción. Los datos se expresan enmetros cúbicos sin corteza.
Madera en rollo industrial-Madera en brutoMadera en rollo industrial-Madera en bruto (C)Madera en rollo industrial-Madera en bruto (NC)Madera en rollo industrial-Madera en bruto (NC) TropicalMadera en rollo industrial-Madera en bruto (NC) Otras
Madera en rollo destinada a ser utilizada en la producción deotros bienes y servicios (excepto como fuente decombustible). Se incluye toda la madera en rollo conexcepción de la leña. En las estadísticas de producción,representa la suma de trozas para aserrar y para chapas;madera para pasta, rolliza y partida; y otras maderas en rolloindustriales, Las estadísticas de comercio para esta categoríasólo se dividen en coníferas y no coníferas (subdividiéndoseéstas últimas a su vez tropicales y no tropicales). Los datos seexpresan en metros cúbicos sin corteza.
Trozas para aserrar y para chapasTrozas para aserrar y para chapas (C)Trozas para aserrar y para chapas (NC)
Madera en rollo destinada a ser aserrada (o astillada)longitudinalmente para la fabricación de madera aserrada o dedurmientes de ferrocarril (traviesas) o empleada en laproducción de chapas (principalmente mediante desenrollo orebanado). Se incluyen la madera en rollo (esté o nosimplemente escuadrada) destinada a ser utilizada con esosfines; los cachones o rollizos para tejamaniles y duelas; losrollizos para cerillas y otros tipos especiales de madera enrollo (por ej. excrecencias y raíces) empleados para laproducción de chapas. Los datos se expresan en metroscúbicos sin corteza
Madera para pasta, rolliza y partidaMadera para pasta, rolliza y partida (C)Madera para pasta, rolliza y partida (NC)
Madera en rollo destinada a ser utilizada en la producción depasta y de tableros de partículas o de fibra. Se incluye lamadera en rollo (con o sin corteza) destinada a ser utilizadacon esos fines en forma de rollo, como madera partida o comoastillas obtenidas directamente (es decir, en el bosque) demadera en rollo. Los datos se expresan en metros cúbicos sincorteza.
Otras maderas en rollo industrialesOtras maderas en rollo industriales (C)Otras maderas en rollo industriales (NC)
Madera en rollo destinada a ser utilizada fuera del sector de laelaboración forestal para la producción de otros bienes yservicios (excepto como fuente de combustible). Se incluye la
madera en rollo destinada a ser utilizada para curtido,destilación, cerillas, gasógenos, postes, pilotes, vallas ypuntales para minas, etc. Los datos se expresan en metroscúbicos sin corteza.
CARBÓN VEGETAL DE MADERA, ASTILLAS,PARTÍCULAS Y RESIDUOS DE MADERA
Carbón vegetal de maderaMadera carbonizada mediante la combustión parcial o laaplicación de calor de fuentes externas. Se incluye el carbónvegetal utilizado como combustible o con otros fines, por ej.como agente reductor en la metalurgia o como materialabsorbente o filtrante. Los datos se expresan en toneladasmétricas.
Astillas y partículas de maderaMadera que ha sido reducida deliberadamente a trozospequeños durante la manufactura de otros productosmadereros y que es idónea para la elaboración de pasta, parala fabricación de tableros de partículas y de fibra, para suutilización como combustible y para otros fines. Se excluyenlas astillas de madera obtenidas directamente (es decir en elbosque) de la madera en rollo (es decir, ya contabilizadascomo madera para pasta, rolliza y partida). Los datos seexpresan en metros cúbicos de volumen real con exclusiónde la corteza.
Residuos de maderaMadera en rollo que queda después de la producción deproductos forestales en la industria de elaboración forestal (esdecir, residuos de la elaboración forestal) y que no ha sidoreducida a astillas o a partículas. Se incluyen los desechosde aserradero, tapas, despuntes, recortes, duramen de trozaspara chapas, desechos de chapa, aserrín, corteza, residuosde carpintería y de ebanistería, etc. Se excluyen las astillasde madera obtenidas directamente (es decir, en el bosque) dela madera en rollo o de residuos (es decir, ya contabilizadascomo madera para pasta, rolliza y partida, o astillas ypartículas de madera). Los datos se expresan en metroscúbicos de volumen real, con exclusión de la corteza.
MADERA ASERRADA
Madera aserradaMadera aserrada (C)Madera aserrada (NC)
Madera que se ha producido a partir de madera en rollo tantonacional como importada, ya sea aserrándolalongitudinalmente o por medio de un proceso de labrado yque, salvo escasas excepciones, tiene más de 5 mm deespesor. Se incluyen los tablones, vigas, viguetas, tablas,tablijas, cabríos, cuartones, listones, listones de cielo raso,tablas para cajones, durmientes, etc. en las siguientes formas:sin cepillas, cepillada, ranurada, nnachihembrada, rebajada,achaflanada, moldeada, con juntas en V, rebordeada, etc. Seexcluyen las tablas para pisos. Los datos se expresan enmetros cúbicos de volumen real.
TABLEROS DE MADERA
Tableros de maderaLa categoría de los tableros de madera constituye unagregado. En las estadísticas de producción y comercio,representa la suma de hojas de chapa, madera terciada ytableros de partículas y de fibra. Hasta 1995, los tableros defibra se dividían a su vez en tableros de fibra prensados ytableros de fibra no prensados. A partir de 1995 la categoríade los tableros de fibra prensados se ha desglosado entableros duros y tableros de fibra de densidad media (MDF),mientras que los tableros de fibra no prensados se denominanahora tableros aislantes. Los datos se expresan en metroscúbicos de volumen real.
Hojas de chapaHojas delgadas de madera de espesor uniforme, obtenidasmediante corte rotatorio (es decir, desenrollo), rebanado oaserrado. Se incluye la madera empleada en la manufacturade madera terciada, material de construcción laminado,
muebles, envases de chapa, etc. Se excluye la maderaempleada en la producción de madera terciada dentro delmismo país. Los datos se expresan en metros cúbicos devolumen real.
Madera terciadaTablero que consiste en un conjunto de hojas de chapaencoladas, con la dirección del hilo en capas alternasgeneralmente en ángulo recto. Las chapas suelen colocarsesimétricamente a ambos lados de una capa o núcleo centralde hoja de chapa o de otro material. Se incluyen la maderaterciada de chapa (madera terciada que se fabrica encolandomás de dos chapas, con las fibras de las hojas de chapaalternas atravesadas generalmente en ángulo recto); lostableros con alma (madera terciada con un alma maciza (esdecir, una capa central, generalmente más gruesa que lasotras), que consiste en tablas angostas, bloques o listones demadera yuxtapuestos, encolados o no); los tableros celulares(madera terciada con un alma de construcción celular); y lostableros compuestos (madera terciada que tiene un alma oalgunas capas de un material que no consiste ni en chapas nien madera maciza). Se excluyen los materiales deconstrucción laminados (por ejemplo, la madera laminada), enlos que las fibras de las hojas de chapa van por lo general enla misma dirección. Los datos se expresan en metros cúbicosde volumen real.
Tableros de partículasTableros fabricados con trozos pequeños de madera u otrasmaterias lignocelulósicas (por ej., astillas, hojuelas, virutas,etc.) aglomeradas por medio de un aglutinante orgánico y unoo más de los agentes que se mencionan a continuación: calor,presión, humedad, catalizador, etc. Se incluyen los tablerosde obleas, los tableros de virutas largas orientadas (OSB) ylos tableros de lino. Se excluyen los tableros de lana demadera y otros tableros de particulas con aglutinantesinorgánicos. Los datos se expresan en metros cúbicos devolumen real.
Tableros de fibraTableros fabricados con fibras de madera u otros materialeslignocelulósicos utilizando como ligazón primaria las fibrasafieltradas y sus propiedades de cohesión inherentes (aunqueen el proceso de fabricación pueden añadirse aglutinantes yaditivos). Se incluyen los tableros de fibra prensados conprensa lisa y moldeados. En las estadísticas de produccióny comercio, representan la suma de los tableros duros, lostableros de fibra de densidad media (MDF) y los tablerosaislantes. Los datos se expresan en metros cúbicos devolumen real.
Tableros durosTableros de fibra de densidad superior a 0,80 g/cm3. Antes de1995, este producto formaba parte de la categoría de lostableros de fibra prensados, por lo que no se dispone de datospara este producto relativos a 1994 y años anteriores. Seexcluyen los productos similares fabricados con partículas demadera, polvo de madera u otros materiales lignocelulósicosque requieren otros aglutinantes para fabricar el tablero, asícomo los tableros de yeso o de cualquier otra materia primade origen mineral. Los datos se expresan en metros cúbicosde volumen real.
Tableros de fibra de densidad media (MDF)Tableros de fibra de densidad comprendida entre 0,5 9/cm3 y0,8 g/cm3. Antes de 1995, este producto formaba parte de lacategoría de los tableros de fibra prensados, por lo que no sedispone de datos para este producto relativos a 1994 y añosanteriores. Los datos se expresan en metros cúbicos devolumen real.Tableros aislantesTableros de fibra de densidad no superior a 0,5 g/cm3. Antesde 1995, este producto se incluía entre los tableros de fibra noprensados. Los datos se expresan en metros cúbicos devolumen real.
PASTA Y PAPEL RECUPERADO
Pasta de maderaMaterial fibroso preparado a partir de madera para pasta,astillas, partículas y residuos de madera o papel recuperado,mediante procesos mecánicos o químicos, para su ulteriortransformación en papel, cartón, tableros de fibra u otrosproductos celulósicos. En las estadísticas de producción ycomercio, representa la suma de la pasta de maderamecánica, pasta de madera semiquírinica, pasta de maderaquímica y pasta de madera soluble. Los datos se expresan entoneladas métricas de peso seco al aire (es decir, con un 10por ciento de humedad).
Pasta de madera mecánicaPasta de madera obtenida triturando o desfibrando maderapara pasta o residuos , o refinando astillas o partículas. Sedenomina también pasta mecánica de madera triturada ypasta de refino. Puede ser blanqueada o no. Se incluyen lapasta de madera semimecanica, la pasta de madera química-mecánica y la temlomecanica. Se excluyen la pasta de fibrasdesintegradas. Los datos se expresan en toneladas métricasde peso seco al aire (es decir, con un 10 por ciento dehumedad).
Pasta de madera semiquímicaPasta de madera obtenida sometiendo pasta de madera,astillas, partículas o residuos de madera a una serie detratamientos mecánicos y químicos, ninguno de los cuales porseparado es suficiente para hacer que las fibras se separencon facilidad. Puede ser blanqueada o no. Se incluyen lapasta de madera semiquímica, la pasta química de maderatriturada, la pasta química-mecánica, etc. (se citan en ordende importancia del tratamiento durante el proceso defabricación). Los datos se expresan en toneladas métricas depeso seco al aire (es decir, con un 10 por ciento de humedad).
Pasta de madera químicaPasta de madera obtenida sometiendo pasta de madera.astillas, partículas o residuos de madera a una serie detratamientos químicos. Se incluyen la pasta de madera alsulfato (kraft), a la sosa y al sulfito. Puede ser blanqueada,semiblanqueada o sin blanquear. Se excluyen las calidadessolubles de pasta de madera. Los datos se expresan entoneladas métricas de peso seco al aire (es decir, con un 10por ciento de humedad). Cuando se dispone de informacióndetallada, se dan también estadísticas para los cuatrocomponentes siguientes: pasta al sulfito sin blanquear, pastaal sulfito blanqueada, pasta al sulfato sin blanquear y pasta alsulfato blanqueada.
Pasta al sulfito sin blanquearPasta al sulfito blanqueadaPasta de madera obtenida reduciendo mecánicamente pastade madera, astillas, partículas o residuos de madera a trozospequeños que se cuecen después en autoclave en presenciade licor de cocción al bisulfito. En este proceso suelenemplearse bisulfitos como los de amonio, calcio, magnesio y'sodio. Se excluyen las calidades solubles de pasta demadera. Los datos se expresan en toneladas métricas depeso seco al aire (es decir, con un 10 por ciento de humedad)y se dan por separado para dos clases: blanqueada (incluidala semiblanqueada) y sin blanquear.
Pasta al sulfato sin blanquearPasta al sulfato blanqueadaPasta de madera obtenida reduciendo mecánicamente pastade madera, astillas, partículas o residuos de madera a trozospequeños que se cuecen después en autoclave en presenciade licor de cocción al hidróxido de sodio (pasta a la sosa) o deun licor de cocción consistente en una mezcla de hidróxido desodio y sulfito de sodio (pasta al sulfato). Se excluyen lascalidades solubles de pasta de madera. Los datos seexpresan en toneladas métricas de peso seco al aire (esdecir, con un 10 por ciento de humedad) y se dan porseparado para dos clases: blanqueada (incluida lasemiblanqueada) y sin blanquear.
Pasta de madera solublePasta química (al sulfato, a la sosa o al sulfito) hecha demadera de calidad especial, con un contenido muy alto de alfacelulosa (por lo general el 90 por ciento o más). Este tipo depasta se blanquea siempre y es fácilmente adaptable aaplicaciones distintas de la fabricación de papel. Se empleaprincipalmente como fuente de celulosa en la fabricación deproductos tales como fibras artificiales, materiales plásticoscelulósicos, laces y explosivos. Los datos se expresan entoneladas métricas de peso seco al aire (es decir, con un 10por ciento de humedad).
Pasta de otras fibrasPasta de materiales vegetales fibrosos distintos de la maderaque se emplea en la fabricación de papel, cartón y tableros defibra. Se incluyen las pastas de paja, bambú, bagazo,esparto, otras cañas o gramineas, borra de algodón, lino,cáñamo, trapos y otros desechos textiles. Se excluye la pastade papel recuperado. Los datos se expresan en toneladasmétricas de peso seco al aire (es decir, con un 10 por cientode humedad).
Papel recuperadoDesechos y pedazos de papel o cartón que se han recogidopara su reutilización como materia prima para la fabricación depapel y cartón. Se incluyen los papeles y cartones que hasido utilizados para su fin original y los residuos de laproducción de papel y cartón. Los datos se expresan entoneladas métricas.
PAPEL Y CARTÓN
Papel y cartón
La categoría del papel y el carbón constituye un agregado. Enlas estadísticas de producción y comercio, representa lasuma de papel para periódicos, papel de imprenta y deescribir, y otros papeles y cartones. Los productos de estacategoría se suelen fabricar en tiras o rollos de una anchurasuperior a 15 cm (36 cm en el caso de las partidas 48.13 y48.19 del SA) o en hojas rectangulares que sin plegar midenmás de 36 cm x 15 cm de lado. Se excluyen los productos depapel manufacturados tales como cajas, envases, libros yrevistas, etc. Los datos se expresan en toneladas métricas.
Papel para periódicosPapel sin estuco, sin apresto (o con muy poco apresto) quecontiene como mínimo un 60 por ciento de pasta mecánica demadera (porcentaje de fibras) y pesa no menos de 40 g/m2 ypor lo general no más de 60 g/m2, del tipo empleadoprincipalmente para la impresión de periódicos. Los datos seexpresan en toneladas métricas.
Papeles y cartones distintos del papel para periódicosLa categoría del papel y el carbón constituye un agregado.Comprende otros papeles de imprenta y de escribir y otrospapeles y cartones. Aparece solamente en los cuadros en losque se indica la dirección del comercio. Los datos seexpresan en toneladas métricas.
Papel de imprenta y de escribirPapeles. con la excepción del papel para periódicos, idóneospara la impresión y para fines comerciales, escritura, grabado,dibujo, etc., hechos con diversas mezclas de pastas y diversosacabados. Se incluyen los papeles empleados para libros yrevistas, base de papel mural, forro interior y exterior de cajas,papel de calculadora, papel de rotativa, papel de copia,etiquetas, papel litográfico, papel moneda, papel de tarjetas detabulación, papel biblia o imitación biblia, papel de carta, papelde copia para máquina de escribir, papel cebolla, papel paramáquina de escribir, papel para carteles, etc. Los datos seexpresan en toneladas métricas.Otros papeles y cartonesTodos lo demás tipos de papel. Se incluyen los papeles ycartones de construcción, el papel de uso doméstico ysanitario, el papel especial fino, el papel y cartón de envolver yempaquetar, y otros papeles y cartones no especificados enotra partida. Los datos se expresan en toneladas métricas.Cuando se dispone de información detallada, se ofrecen
li
también estadísticas para los tres componentes siguientes:papel doméstico y sanitario, papel y cartón de envolver yempaquetar, y otros papeles y cartones no especificados enotra partida.
Papel doméstico y sanitarioPapel absorbente (crepé o no y a veces gofrado) hecho depasta química de madera, blanqueada o no, a veces conmezcla de pasta de papel viejo y de pasta mecánica. Seincluyen las toallas, servilletas, papel facial, papel higiénico,guata y pañuelos desechables, etc. Los datos se expresan entoneladas métricas.
Papel y cartón de envolver y empaquetarPapel o cartón empleado para envolver, para empaquetar ypara la fabricación de bolsas y cajas. Se incluyen elpergamino vegetal, el papel impermeable a las grasas y elpapel cristal (hechos de pasta química de madera pura o deuna mezcla de pasta química de madera, pastas de fibra dealgodón, tratadas (por ej. altamente hidratadas o bataneadasenérgicamente) para que el papel obtenido sea resistente alaceite, a la grasa y al agua, empleados principalmente paraenvasar productos congelados, húmedos o grasosos talescomo mantequilla, margarina, carne o pescado); el cartón decapa o cara (papel o cartón empleado como cara de cajas yenvases de papel o cartón sólido u ondulado); el medio paraacanalar (pape/ o cartón empleado como inedia cuando secombinan papel y cartón para fabricar cartón ondulado); elpapel kraft para bolsas (papel resistente de pasta al sulfatoempleado en la fabricación de bolsas simples o múltiple s);otros papeles kraft de envolver (todos los demás papeles deenvolver y empaquetar hechos principalmente de pasta alsulfato); el cartón para cajas plegables (todos los tipos decartón empleados en la fabricación de cajas plegables): yotros papeles y cartones de envolver y empaquetar. Los datosse expresan en toneladas métricas.
Otros papeles y cartones no especificados en otra partidaPapeles y cartones empleados en la construcción, para usosespeciales y para otros fines no especificados en otra partida.Se incluyen los papeles kraft empleados para encerar,asfaltar, impermeabilizar, laminar, impregnar, hilar o torcer,engomar, etc.; los papeles hechos especialmente con mezclasde pasta, con excepción de la pasta al sulfato, que no seespecifican en otra partida (como por ejemplo, papel decordeles y de yute, papel de carpeta, papel secante, papelfiltro, papel sensible fotográfico, etc.); los papeles y cartonespara la construcción (papeles, fieltros de papel y cartonesempleados en la construcción de edificios y otras estructuraspara aislar y sellar contra emanaciones, para colocar debajode los techos y pisos, etc. (estos papeles se hacen por logeneral de material totalmente refinado, como por ejemplo,pasta de madera, papel viejo, pasta de otros vegetales y fibramineral y sus características básicas son poca conductividadtérmica, resistencia a la humedad, resistencia al fuego,permanencia y resistencia a los insectos y otros animalesdañinos)); el papel especial fino (papeles elaborados parafines especiales, cuya característica común es su delgadezrelativa, y que pueden estar hechos de pastas mecánicas oquímicas de madera, blanqueadas o no, pero quefrecuentemente se hacen de pastas que contienen fibras delino, cáñamo o algodón, siendo las características principalesde algunos de esos papeles la uniformidad de sus superficie yespesor, ausencia de poros, resistencia, densidad, opacidad,escasa permeabilidad y pureza química; pueden citarse comoejemplos de este tipo de papel el papel carbón, papel paracondensador, papel para cigarrillos, pañuelos para lentes,papel para estarcidos y papel para bolsitas de té); y loscartones no especificados en otra partida (como por ejemplocartón de zapatos, carón de empaquetadora, cartón detransformador, cartón prensado textil, cartón prensado paraindices, cartón panel (automóviles), cartón de baúles ymaletas y cartón de matrices). Se excluyen los papeles,fieltros o cartones impregnados, saturados, laminados oelaborados ulteriormente de cualquier modo, y los tableros defibra o los tableros de fibra para la construcción, en forma detableros aislantes, tableros semiduros y tableros duros. Losdatos se expresan en toneladas métricas.
NOTAS SOBRE LOS CUADROS
Producción y comercio
MADERA EN ROLLO
Madera en rollo industrialDado que no se dispone de datos sobre la producción demadera en rollo industrial para varios países, ésta se haestimado convirtiendo el volumen de los productos producidosen el país al volumen de madera en rollo necesario paraproducirlo (equivalente de madera en rollo). No se puedecalcular el consumo de los distintos productos forestalesincluidos en el total de la madera en rollo industrial, debido alas diferencias en las definiciones de los productos forestalesutilizadas en las estadísticas de producción y comercio. En1988, varios países miembros del Consejo de CooperaciónAduanera (actualmente denominado Organización Mundial deAduanas) introdujeron una clasificación revisada de losproductos en sus estadísticas comerciales: el SistemaArmonizado de Designación y Codificación de Mercancías(SA). Este sistema ha sido adoptado también por las NacionesUnidas en la Revisión 3 de la Clasificación Uniforme para elComercio Internacional (CUCI Rev. 3). Aunque para lamayoría de los productos forestales esto supone una simpletransformación con respecto a la clasificación anterior, en loque respecta a la madera en rollo industrial no se incluyen lassubdivisiones entre trozas para aserrar y para chapas, maderapara pasta y otras maderas en rollo industriales. Por ello sehan dejado de preparar los cuadros relativos al comercio deesos productos. El carácter incompleto de la declaración dedatos sobre producción de madera en rollo explica lapresencia de un consumo negativo en algunos países (esdecir, se trata de un problema estadista)). Estas inexactitudesse recogen en los totales regionales y mundiales.
Combustible de madera, incluida madera para carbón vegetalEsta categoria de productos se denominaba anteriormenteleña y carbón vegetal. Varios países no suministran datossobre la producción de estos productos, aunque se sabe quemuchos de ellos son consumidores importantes. Lasestimaciones correspondientes a esos países se basan en losdatos de las encuestas disponibles y se revisan a medida quese dispone de nuevas encuestas. Cuando se utilizanestimaciones, se supone que las variaciones anuales de laproducción de esos países son análogas a las variacionesanuales de la población. En un cuadro que figura másadelante se ofrecen las cifras correspondientes a laproducción por habitante que se han utilizado para actualizaresas estimaciones.
TABLEROS DE MADERA
Hojas de chapaEn algunos países, el volumen declarado de la producción dehojas de chapa incluye las hojas de chapa destinadas a lafabricación de madera terciada en el mismo país. La FAO haintentado corregir esas estadísticas siempre que ha sidoposible.
Tableros de fibraA veces, en las respuestas de los países al cuestionario sobrelos productos forestales no se distinguen los volúmenes deproducción de los diversos tipos de tableros de fibra. En talescasos, sólo se indica la producción total de tableros de fibra.Sin embargo, la producción de tableros de fibra se hadesglosado en sus distintos componentes siempre que ha sidoposible.
Dirección del comercio
Se ofrece información sobre la dirección del comerciocorrespondiente a los dos últimos años. Los cuadros alrespecto se basan en un análisis de la informaciónsuministrada por los países mediante el cuestionario conjuntosobre los productos forestales y de datos extraídos de la basede datos COMTRADE de la Oficina de Estadística de lasNaciones Unidas. Cuando el volumen no estaba expresado enunidades estándar, se han aplicado coeficientes de conversión
lii
normalizados. Cuando el volumen notificado no era coherentecon el valor, se ha procedido a estimado de nuevo sobre labase del promedio de los valores unitarios. En ausencia deinformes de los países exportadores, se han elaboradoestimaciones de sus exportaciones a partir de informes de losimportadores. En la presente edición, los volúmenes indicadosen relación con la dirección del comercio pueden variar enalguna medida con respecto a los datos que aparecen en loscuadros principales del anuario, debido a los ajustes hechosen función de la información obtenida de COMTRADE y de loscuestionarios.
Unidades de valor
La unidad empleada en los cuadros relativos al valor delcomercio es el dólar EE.UU, y en los relativos al valor unitariodel comercio, el dólar EE.UU. por metro cúbico o por toneladamétrica, según el producto.
Notas sobre los paises
Algunos países no han suministrado estadísticas a la FAO ohan proporcionado sólo datos parciales. En tales casos, se hatomado información de anuarios nacionales, informes ypublicaciones no oficiales. Las estimaciones del comercio sehan basado en datos proporcionados por informes de losinterlocutores comerciales.
A continuación se hacen algunas observaciones sobredeterminados países:
Bélgica. Luxemburgo.La producción y el comercio se han fusionado en BEL-LUX.
ChinaLos datos incluyen los relativos a Taiwán, Provincia de China,a la Región Administrativa Especial de Hong Kong y a laRegión Administrativa Especiale de Macao.
Canadá y Estados Unidos de AméricaPara Canadá y los Estados Unidos de América, el volumen dela madera aserrada, expresado en miles de pies tablares, seha convertido a metros cúbicos mediante un factor deconversión de 2,36 m3 por 1 000 pies tablares. Las normasrelativas al aserrado en esos países hacen que por lo generalel volumen real de producción sea inferior al volumen nominal.Por ejemplo, se estima que, en el caso de los Estados Unidosde América, tomando en conjunto las coníferas y las noconíferas, el volumen medio efectivo de la madera aserradaverde sin cepillar seria inferior en un 3 por ciento al volumennominal producido, mientras que el volumen medio ponderadode la madera aserrada seca cepillada de coníferas y de lamadera aserrada seca sin cepillar de especies no coníferassería inferior en un 27 por ciento. A partir de 1995, los datosrelativos a la producción de tableros de partículas en losEstados Unidos de América sólo comprenden los tableros devirutas largas orientadas (OSB).
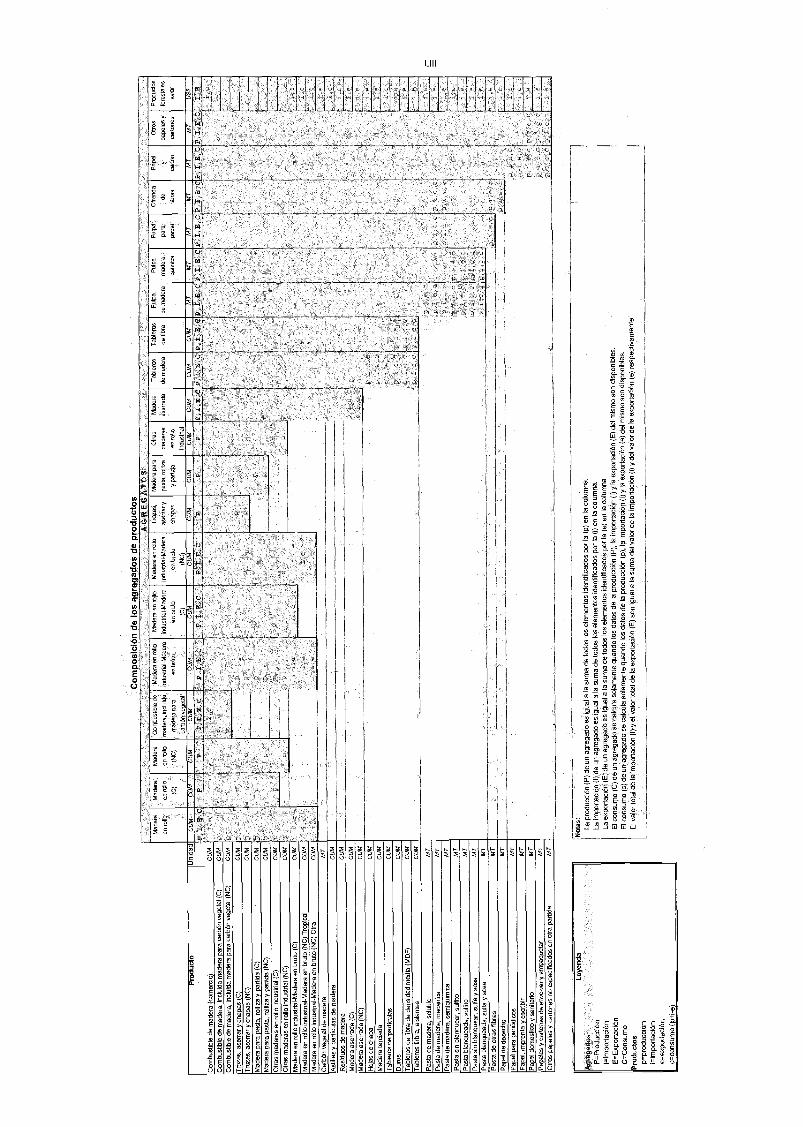
lrodu
cto
Uni
dad
Tro
zas
aser
rar
y ch
apas
(C
)T
roza
s, a
serr
ar y
cha
pas
(NC
)
Mad
era
para
pas
ta, r
olliz
a y
part
id(C
)C
UM
Mad
era
para
pas
ta, r
olliz
a y
part
ida
(NC
)C
U
Otr
as m
ader
as e
n ro
llo in
dust
rial (
C)
CU
M
Otr
as m
ader
as e
n ro
llo in
dust
rial (
NC
)C
UM
Mad
era
en r
ollo
indu
stria
l-Mad
era
en b
ruto
(C
)C
UM
Mad
era
en r
ollo
indu
stria
l-Mad
era
en b
ruto
(N
C)
Tro
pica
lC
UM
Mad
era
en r
ollo
indu
stria
l-Mad
era
en b
ruto
(N
C)
Otr
aC
UM
Car
bón
vege
tal d
e m
ader
a
Ast
illas
y p
artíc
ulas
de
mad
era
Res
iduo
s de
mad
era
Mad
era
aser
rada
(C
)
Mad
era
aser
rada
(N
C)
Hoj
as d
e ch
apa
Mad
era
terc
iada
Tab
lero
s de
par
ticul
asD
uros
Tab
lero
s de
fibr
a de
den
sida
d m
edia
(M
DF
)T
able
ros
firbr
a, a
isla
ntes
Pas
ta d
emud
are,
sol
uble
Pas
tada
mad
era,
mec
anm
a
Pas
ta d
e m
ader
a, s
emiq
uim
ica
Pas
ta s
in b
lanq
uear
, sul
fito
Pas
ta s
in b
lanq
uear
, sul
a y
sos
aP
asta
bla
nque
ada,
sul
f o
Pas
ta b
lanq
uead
a, s
ulfa
y s
osa
Pas
tada
otr
as fi
bras
Pap
el d
e de
sech
o
Pap
elpa
ra p
erió
dico
s
Pap
el, i
mpr
enta
y e
scrib
irP
apel
dom
estic
o y
sani
tario
Pap
eles
y c
arto
nes
de e
nvol
ver
y em
paqu
eO
tros
pap
eles
y c
arto
nes
no e
spec
ifica
dos
en o
tra
part
ida
Agr
egad
osP
=P
rodu
ccio
nI=
Impo
rtac
ión
E=
Exp
orta
ción
C=
Con
sum
oP
rodu
ctos
p=pr
oduc
ción
i=im
port
ació
ne=
expo
rtac
ióri
c=co
nsum
o (p
si-e
)
Leye
nda
Com
posi
ción
de
los
agre
gado
s de
pro
duct
osA
GR
EG
AT
OS
CU
M
CU
Mh
Mad
era
Mad
era
Mad
era
Com
bust
ible
de
Mad
era
en r
olb
Mad
era
en r
ollo
en r
ollo
en r
ollo
mad
era
oclu
ida
indu
stria
l-Mad
erai
ndus
tria
l-Mad
era
(C)
(NC
)m
ader
a pa
raen
Mut
óen
bru
to
carb
ón v
eget
al(C
)
CU
MC
UM
CU
MC
UM
Plik
tC
UM
CP
PF
,I,LC
_C
P,I,
E,C
1e
Mad
era
cam
ilo
indu
stna
l Mad
era
en b
ruto
(NC
)C
UM E
, C
Tro
z
aser
rar
y
chap
as
Mad
era
para
past
a ro
lliza
y pa
rtid
a
Otr
as
mad
eras
en r
ollo
indu
stria
lC
UM
Mad
era
Tab
la o
s
de m
ader
a
CU
MC
UM
/,E,C
P,I,
E,C
Tab
lero
s
de fi
bra
Not
as:
La p
rodu
cció
n (P
) de
un
agre
gado
es
igua
l a la
sum
ada
todo
s lo
s el
emen
tos
iden
tific
ados
por
ta (
p) e
n la
col
umna
.La
Impo
rtac
ión
(l) d
e un
agr
egad
o es
igua
l a la
sum
a de
todo
s lo
s el
emen
tos
iden
tific
ados
por
ta (
i) en
la c
olum
na.
La e
xpor
taci
ón (
E)
de u
n ag
rega
do e
s ig
ual a
la s
umad
a to
dos
los
elem
ento
s id
entif
icad
os p
or la
(e)
en
la c
olum
naE
l con
sum
o (C
) de
un
agre
gado
se
calc
ula
sola
men
te g
uand
o lo
s da
tos
de la
pro
ducc
ión
(P)
a im
port
ació
n (I
) y
la e
xpor
taci
ón (
E)
del m
ism
oso
n di
spon
ible
s.E
l con
sum
o (c
) de
un
agre
gado
se
calc
ula
sola
men
te g
uand
o lo
s da
tos
dala
pro
ducc
ión
(p),
la im
port
ació
n (i)
y la
exp
orta
ción
(e)
del
mis
mo
son
disp
onib
les.
El v
alor
tota
l del
e im
port
ació
n (t
) y
el v
alor
tota
l dat
a ex
port
ació
n (E
) so
n ig
ual a
la s
uma
del v
alor
de
la im
port
ació
n (i)
yde
l val
or d
e la
exp
orta
cien
(e)
res
pect
ivam
ente
.
-
e
1
a
Cum
CU
M
CU
M
cum
CU
M
CU
MF
CU
M
CU
ME
-1
CU
M
CU
M
MT
MT
MT
MT
MT
MT
MT
MT
MT
MT
MT
MT
MT
MT
Pul
paP
ulpa
Pol
paO
fren
daP
orci
Otr
osP
rodu
ctos
de m
ader
am
ader
apa
rade
pape
les
yfo
rest
ales
quim
ica
pape
lfi
bras
carlY
ónca
nora
sva
lor
MT
MT
MT
MT
MT
MT
u54
P, I
, E, C
'E.G
P,I,
E,C
,/,E
,C1,
E,C
P,I,
E,C
L E
CU
M
CU
M
Com
bust
ible
de
mad
era
(com
erci
o)C
UM
Com
bust
ible
de
mad
era,
incl
uida
mad
era
para
ca
bon
vege
tal (
C)
Com
bust
ible
de
mad
era,
incl
uida
mad
era
para
car
bón
vege
tal (
NC
)
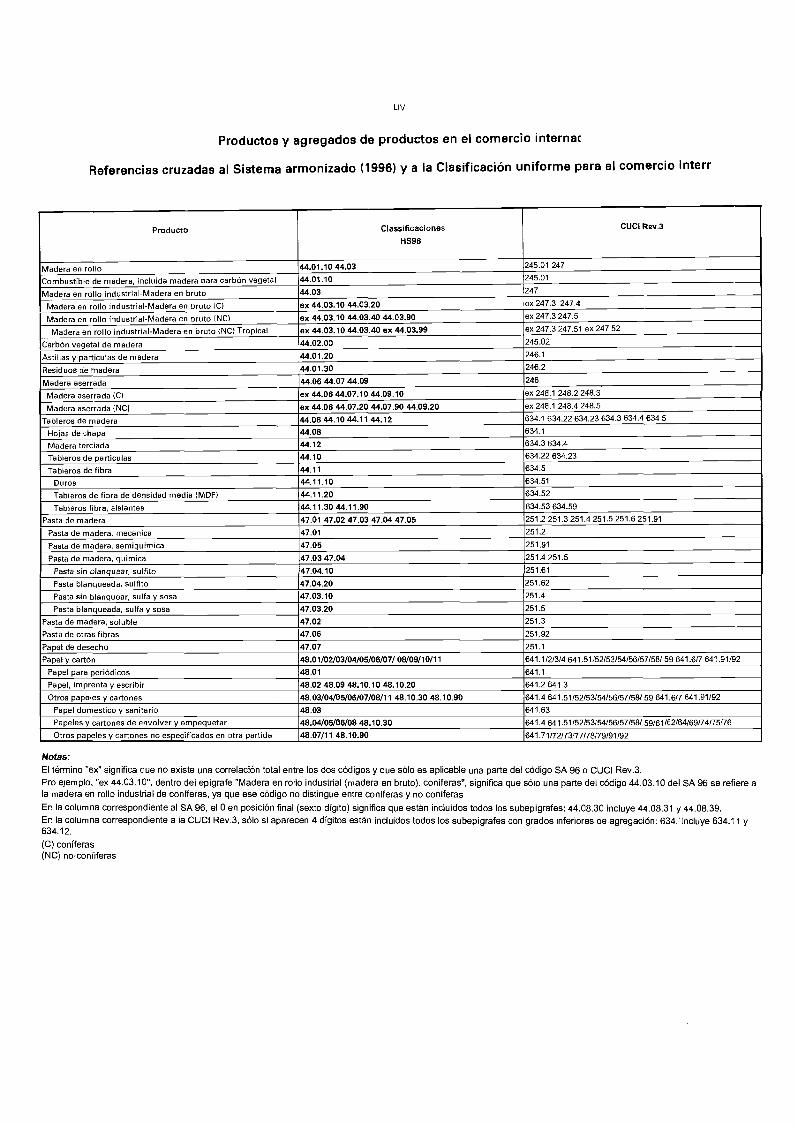
LIV
Productos y agregados de productos en el comercio interna(
Referencias cruzadas al Sistema armonizado (1996) y a la Clasificación uniforme para el comercio interr
Natas:El término "ex" significa que no existe una correlación total entre los cos códigos y que sólo es aplicable una parte del código SA 96 o CUCI Rev.3.Pro ejemplo. "ex 44.03.10, dentro del epigrafe "Madera en rollo industrial (madera en bruto), coníferas", significa que sólo una parte del código 44.03.10 del SA96 se refiere ala madera en rollo industrial de coníferas, ya que ese código no distingue entre coníferas y no coníferas
En la columna correspondiente al SA 96, el 0 en posición final (sexto dígito) significa que están incluidos todos los subepígrafes: 44.08.30 incluye 44.08.31 y 44.08.39.En la columna correspondiente a la CUCI Rev.3, sólo si aparecen 4 dígitos están incluidos todos los subepígrafes con grados inferiores de agregación: 634.' incluye 634.11 y634.12.
(C) coníferas(NC) no-coniiferas
Producto ClassificacionesHS96
CUCI Rev.3
Madera en rollo 44.01.10 44.03 245.01 247
Combustible de madera, incluida madera tiara carbón vegetal 44.01.10 245.01
Madera en rollo industrial-Madera en bruto 44.03 247
Madera en rollo industrial-Madera en bruto (C) ex 44.03.10 44.03.20 ex 247.3 247.4
Madera en rollo industrial-Madera en oruto INC) ex 44.03.10 44.03.40 44.03.90 ex 247.3 247.5
Madera en rollo industrial-Madera en bruto (NC) Tropical ex 4.4.03.10 44.03.40 ex 44.03.99 ex 247.3 247.51 ex 247.52
Carbón vegetal de madera 44.02.00 245.02
Astillas y particulas de madera 14.4.01.20 246.1
Residuos de madera 144.01.30 246.2
Madera aserrada 44.06 44.07 44.09 248
Madera aserrada (CI ex 44.06 44.07.10 44.09.10 ex 248.1 248.2 248.3
Madera aserrada (NC) ex 44.06 44.07.20 44.07.90 44.09.20 ex 248.1 248.4 248.5
Tableros de madera 44.08 44.10 44.11 44.12 634.1 634.22 634.23 634.3 634.4 634.5
Hojas de chapa 44.08 634.1
Madera terciada 44.12 634.3 634.4
Tableros de particulas 44.10 634.22 634.23
Tableros de fibra 44.11 634.5
Duros 44.11.10 634.51
Tableros de fibra de densidad media (MDF) 44.11.20 634.52
Tableros fibra, aislantes 44.11.3044.11.90 634.53 634.59
Pasta de madera 47.01 47.02 47.03 47.04 47.05 251.2 251.3 251.4 251.5 251.6 251.91
Pasta de madera, mecanica 47.01 251.2
Pasta de madera, semiquimica 47.05 251.91
Pastado madera, quimica 47.03 47.04 251.4 251.5
Pasta sin blanquear, sulfite 47.04.10 251.61
Pasta blanqueada. sulfito 47.04.20 251.62
Pasta sin blanquear, sulfa y sosa 47.03.10 251.4
Pasta blanqueada, sulfa y sosa 47.03.20 251.5
Pasta de madera, soluble 47.02 251.3
Pasta de otras fibras 47.06 251.92
Papel de desecho 47.07 251.1
Papel y cartón 48.01/02/03/04/05/06/07/ 08/09/10/11 641.1/2/3/4 641.51/52/53/54/56/57/58/ 59 641.6/7 641.91/92
Papel para periódicos 48.01 641.1
Papel, imprenta y escribir 48.02 48.09 48.10.10 48.10.20 641.2 641.3
Otros papeles y cartones 48.03/04/05/06/07/08/11 48.10.30 48.10.90 641.4 641.51/52/53/54/56/57/58/ 59 641.6/7 641.91/92
Papel domestico y sanitario 48.03 641.63
Papeles y cartones de envolver y empaquetar 48.04/05/06/08 48.10.30 641.4 641.51/52/53/54/56/57/58/ 59)61/62/64/69/74/75;76
Otros papeles y cartones no especificados en otra partida 48.07/11 48.10.90 641.71/72/73/77/78/79/91/92
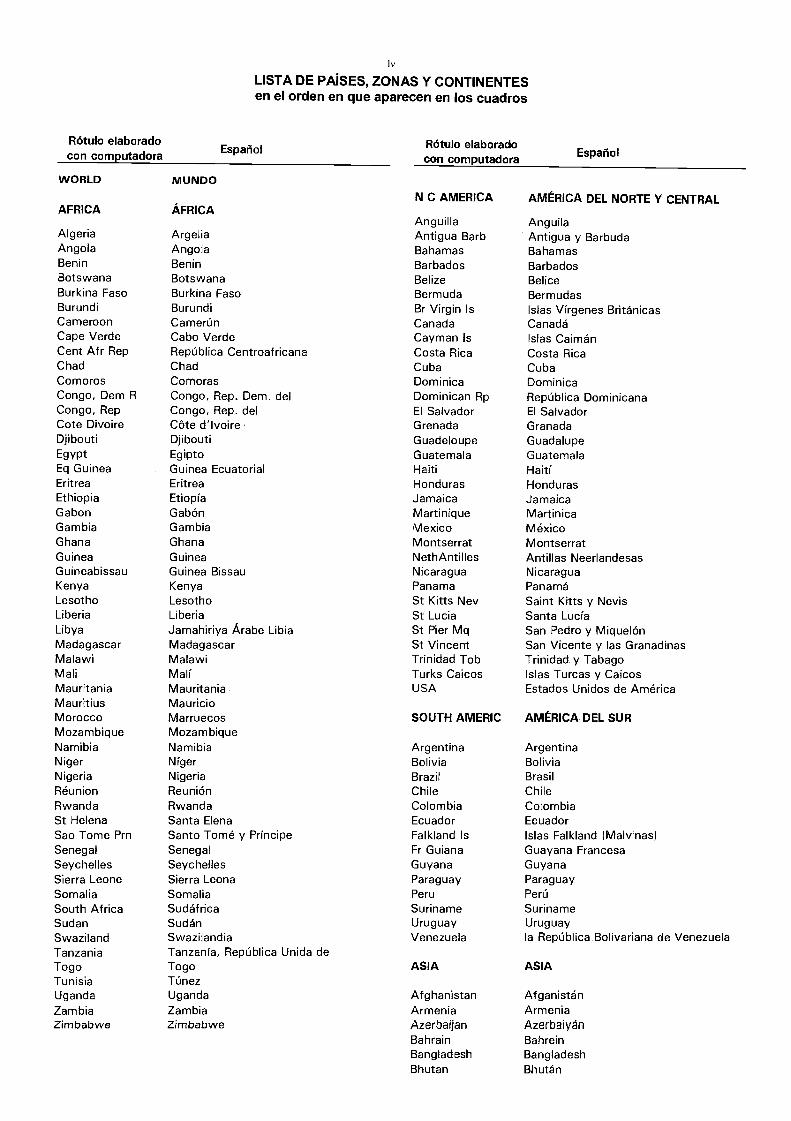
iv
LISTA DE PAISES, ZONAS Y CONTINENTESen el orden en que aparecen en los cuadros
Rótulo elaboradocon computadora Español Rótulo elaborado
con computadora Español
WORLD MUNDON C AMERICA AMÉRICA DEL NORTE Y CENTRAL
AFRICA ÁFRICAAnguilla Anguila
Algeria Argelia Antigua Barb Antigua y BarbudaAngola Angola Bahamas BahamasBenin Benin Barbados BarbadosBotswana Botswana Belize BeliceBurkina Faso Burkina Faso Bermuda BermudasBurundi Burundi Br Virgin Is Islas Vírgenes BritánicasCameroon Camerún Canada CanadáCape Verde Cabo Verde Cayman Is Islas CaimánCent Af r Rep República Centroafricana Costa Rica Costa RicaChad Chad Cuba CubaComoros Comoras Dominica DominicaCongo, Dem Congo, Rep. Dem. del Dominican Rp República DominicanaCongo, Rep Congo, Rep. del El Salvador El SalvadorCote Divoire Côte d'Ivoire Grenada GranadaDjibouti Djibouti Guadeloupe GuadalupeEgypt Egipto Guatemala GuatemalaEq Guinea Guinea Ecuatorial Haiti HaitíEritrea Eritrea Honduras HondurasEthiopia Etiopía Jamaica JamaicaGabon Gabón Martinique MartinicaGambia Gambia Mexico MéxicoGhana Ghana Montserrat MontserratGuinea Guinea NethAntilles Antillas NeerlandesasGuineabissau Guinea Bissau Nicaragua NicaraguaKenya Kenya Pananna PanamáLesotho Lesotho St Kitts Nev Saint Kitts y NevisLiberia Liberia St Lucia Santa LucíaLibya Jamahiriya Árabe Libia St Pier Mq San Pedro y Miguel&Madagascar Madagascar St Vincent San Vicente y las GranadinasMalawi Malawi Trinidad Tob Trinidad y TabagoMali Malí Turks Calcos Islas Turcas y CaicosMauritania Mauritania USA Estados Unidos de AméricaMauritius MauricioMorocco Marruecos SOUTH AMERIC AMÉRICA DEL SURMozambique MozambiqueNamibia Namibia Argentina ArgentinaNiger Níger Bolivia BoliviaNigeria Nigeria Brazil BrasilRéunion Reunión Chile ChileRwanda Rwanda Colombia ColombiaSt Helena Santa Elena Ecuador EcuadorSao Tome Pm n Santo Tomé y Príncipe Falkland Is Islas Falkland (Malvinas)Senegal Senegal Fr Guiana Guayana FrancesaSeychelles Seychelles Guyana GuyanaSierra Leone Sierra Leona Paraguay ParaguaySomalia Somalia Peru PerúSouth Africa Sudáfrica Suriname SurinameSudan Sudan Uruguay UruguaySwaziland Swazilandia Venezuela la República Bolivariana de VenezuelaTanzania Tanzania, República Unida deTogo Togo ASIA ASIATunisia TúnezUganda Uganda Afghanistan AfganistánZambia Zambia Armenia ArmeniaZimbabwe Zimbabwe Azerbaijan AzerbaiyAn
Bahrain BahreinBangladesh BangladeshBhutan Bhután
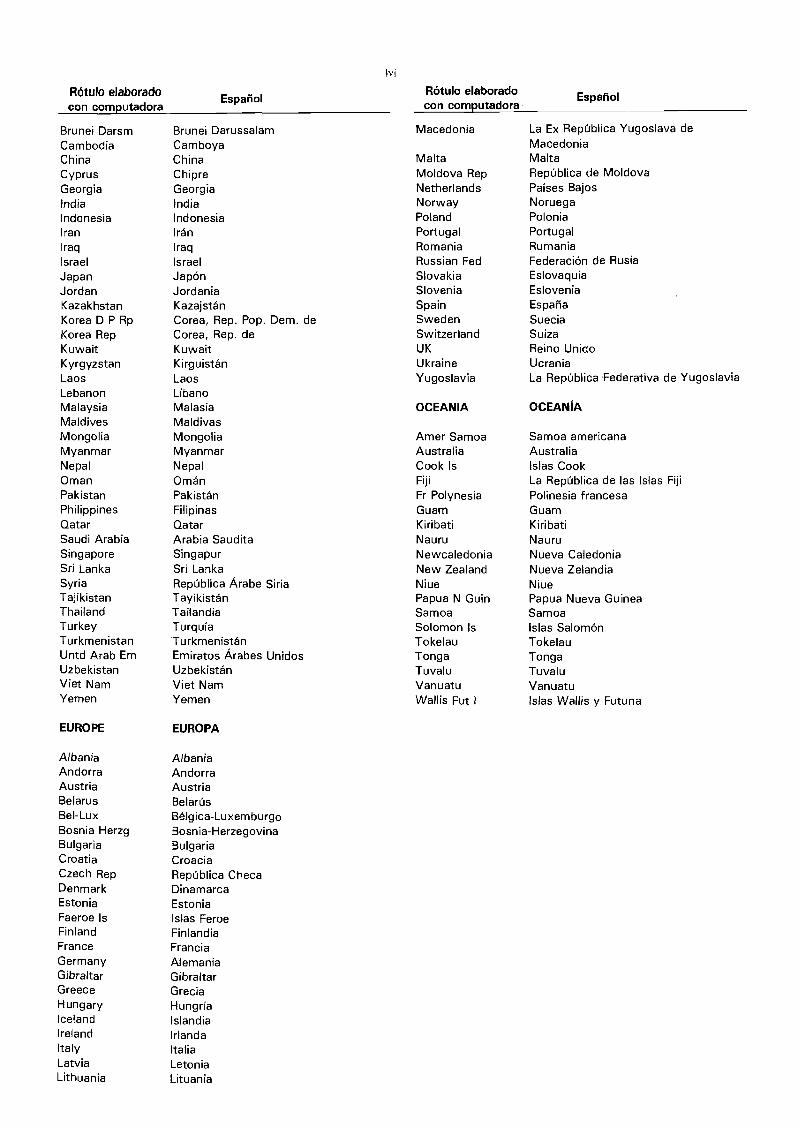
Rótulo elaboradocon computadora
Brunei DarsmCambodiaChinaCyprusGeorgiaIndiaIndonesiaIranIraqIsraelJapanJordanKazakhstanKorea D P RpKorea RepKuwaitKyrgyzstanLaosLebanonMalaysiaMaldivesMongoliaMyanmarNepalOmanPakistanPhilippinesQatarSaudi ArabiaSingaporeSri LankaSyriaTajikistanThailandTurkeyTurkmenistanUntd Arab EmUzbekistanViet NamYemen
Español
Brunei DarussalamCamboyaChinaChipreGeorgiaIndiaIndonesiaIránIraqIsraelJapónJordaniaKazajstánCorea, Rep. Pop. Denn. deCorea, Rep. deKuwaitKirguistánLaosLíbanoMalasiaMaldivasMongoliaMyannnarNepalOmánPakistánFilipinasQatarArabia SauditaSingapurSri LankaRepública Árabe SiriaTayikistánTailandiaTurquíaTurkmenistánEmiratos Árabes UnidosUzbekistánViet NamYemen
lvi
Rótulo elaboradocon computadora
Macedonia
MaltaMoldova RepNetherlandsNorwayPolandPortugalRomaniaRussian FedSlovakiaSloveniaSpainSwedenSwitzerlandUKUkraineYugoslavia
OCEANIA
Amer SamoaAustraliaCook IsFijiFr PolynesiaGuamKiribatiNauruNewcaledoniaNew ZealandNiuePapua N GuinSamoaSolomon IsTokelauTongaTuvaluVanuatuWallis Fut t
Español
La Ex República Yugoslava deMacedoniaMaltaRepública de MoldovaPaises BajosNoruegaPoloniaPortugalRumaniaFederación de RusiaEslovaquiaEsloveniaEspañaSueciaSuizaReino UnidoUcraniaLa República Federativa de Yugoslavia
OCEANÍA
Samoa americanaAustraliaIslas CookLa República de las Islas FijiPolinesia francesaGuamKiribatiNauruNueva CaledoniaNueva ZelandiaNiuePapua Nueva GuineaSamoaIslas SalornónTokelauTongaTuvaluVanuatuIslas Wallis y Futuna
EUROPE EUROPA
Albania AlbaniaAndorra AndorraAustria AustriaBelarus BelarúsBel-Lux Bélgica-LuxemburgoBosnia Herzg Bosnia-HerzegovinaBulgaria BulgariaCroatia CroaciaCzech Rep República ChecaDenmark DinamarcaEstonia EstoniaFaeroe Is Islas FeroeFinland FinlandiaFrance FranciaGermany AlemaniaGibraltar GibraltarGreece GreciaHungary HungríaIceland IslandiaIreland IrlandaItaly ItaliaLatvia LetoniaLithuania Lituania
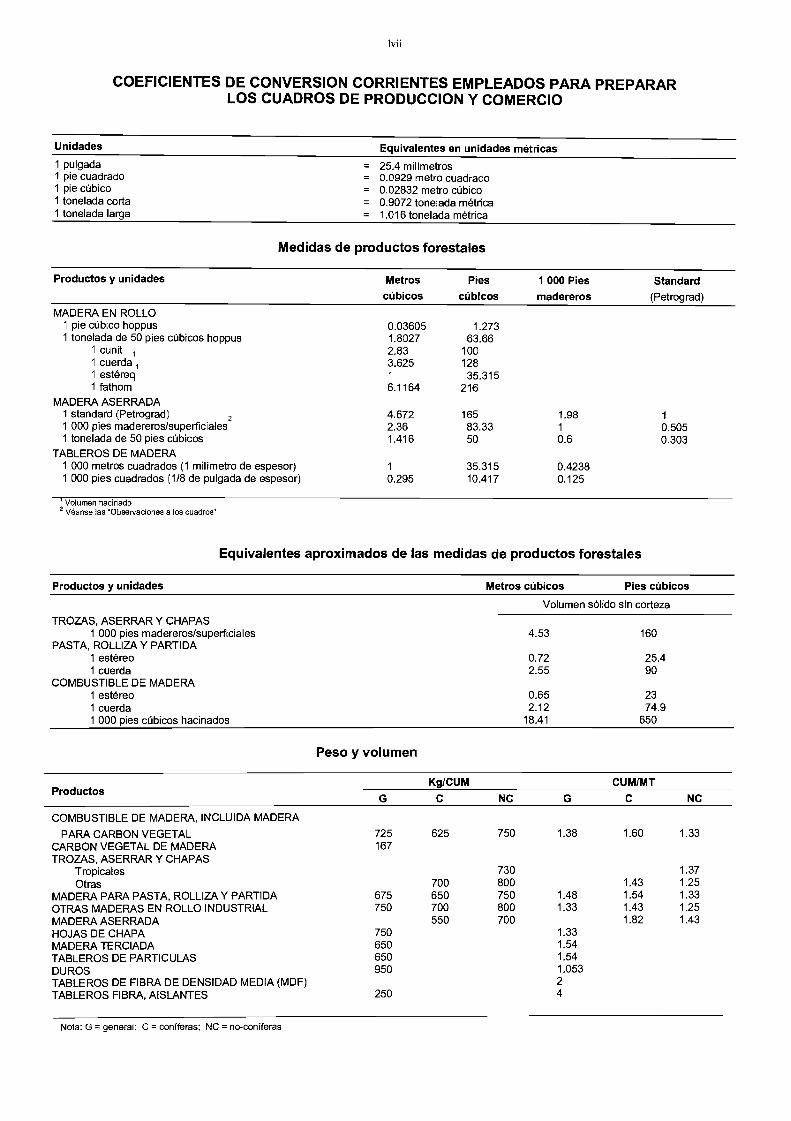
Unidades Equivalentes en unidades métricas
Volumen hacinadoVéanse las `Observaciones a los cuadros'
Equivalentes aproximados de las medidas de productos forestales
Productos
COEFICIENTES DE CONVERSION CORRIENTES EMPLEADOS PARA PREPARARLOS CUADROS DE PRODUCCION Y COMERCIO
Nota: G = general: C = coníferas; NC = no-coníferas
lvii
Medidas de productos forestales
MADERA EN ROLLO
TROZAS, ASERRAR Y CHAPAS1 000 pies madereros/superficiales 4.53 160
PASTA, ROLLIZA Y PARTIDA1 estéreo 0.72 25.41 cuerda 2.55 90
COMBUSTIBLE DE MADERA1 estéreo 0.65 231 cuerda 2.12 74.91 000 pies cúbicos hacinados 18.41 650
Peso y volumen
Volumen sólido sin corteza
Kg/CUM CUM/MT
NC G C NC
COMBUSTIBLE DE MADERA, INCLUIDA MADERA
PARA CARBON VEGETAL 725 625 750 1.38 1.60 1.33CARBON VEGETAL DE MADERA 167TROZAS, ASERRAR Y CHAPAS
Tropicales 730 1.37Otras 700 800 1.43 1.25
MADERA PARA PASTA, ROLLIZA Y PARTIDA 675 650 750 1.48 1.54 1.33OTRAS MADERAS EN ROLLO INDUSTRIAL 750 700 800 1.33 1.43 1.25
MADERA ASERRADA 550 700 1.82 1.43HOJAS DE CHAPA 750 1.33
MADERA TERCIADA 650 1.54TABLEROS DE PARTICULAS 650 1.54
DUROS 950 1.053TABLEROS DE FIBRA DE DENSIDAD MEDIA (MDF) 2TABLEROS FIBRA, AISLANTES 250 4
1 pie cúbico hoppus1 tonelada de 50 pies cúbicos hoppus
0.036051.8027
1.27363.66
1 cunit ,
1 cuerda 12.833.625
100128
1 estéreo 1 35.3151 fathom 6.1164 216
MADERA ASERRADA1 standard (Petrograd) 2 4.672 165 1.98 1
1 000 pies madereros/superficiales 2.36 83.33 1 0.5051 tonelada de 50 pies cúbicos 1.416 50 0.6 0.303
TABLEROS DE MADERA1 000 metros cuadrados (1 milímetro de espesor) 1 35.315 0.42381 000 pies cuadrados (1/8 de pulgada de espesor) 0.295 10.417 0.125
Productos y unidades Metros Pies 1 000 Pies Standardcúbicos cúbicos madereros (Petrograd)
Productos y unidades Metros cúbicos Pies cúbicos
1 pulgada = 25.4 milímetros1 pie cuadrado = 0.0929 metro cuadrado1 pie cúbico = 0.02832 metro cúbico1 tonelada corta = 0.9072 tonelada métrica1 tonelada larga = 1.016 tonelada métrica

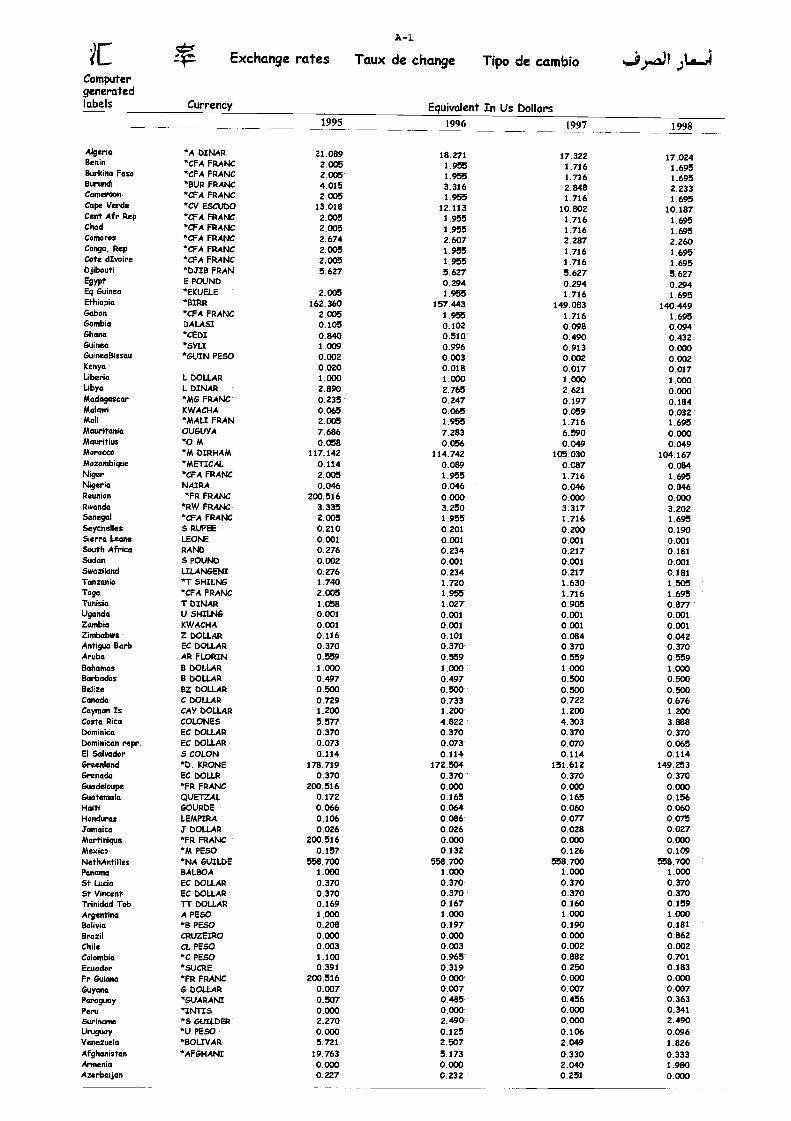
A- 1
Computergeneratedlabels
Exchange rates Taux de change Tipo de cambio
Currency Equivalent In Us Dollars
j.rman )6.)
1995 1996 1997 1998
Algeria *A DINAR 21.089 18.271 17.322 17.024Benin *CFA FRANC 2.005 1955 1.716 1.695Burkina Faso *FA FRANC 2.005 1955. 1.716 1_695Burundi *BUR FRANC 4.015 3.316 2.848 2.233Cameroon *FA FRANC 2.005 1.955 1.716 1.695Cape Verde *CV ESCUDO 13.018 12.113 10.802 10.187Cent Afr Rep *ØA FRANC 2008. 1.955 1.716 1.695Chad *A FRANC 2.005 1.955 1.716 1.695Comoros *CFA FRANC 2.674 2.607 2.287 2.260Congo, Rep *CFA FRANC 2.005 1.955 1.716 1.695Cote dIvoire *CFA FRANC 2.005 1.955 1.716 1.695Djibouti *DJIB FRAN 5.627 5.627 5.627 5.627Egypt E POUND 0.294 0.294 0.294Eq Guinea *EKUELE 2.005 1.955 1.716 1.695Ethiopia *BIRR 162.360 157.443 149.083 140.449Gabon *CFA FRANC 2.005 1.955 1.716 1.695Gambia DALASI 0.105 0.102 0.098 0.094Ghana *CEDI 0.840 0.510 0.490 0.432Guinea *SYLI 1.009 0.996 0.913 0.000GuineaBissau *GUIN PESO 0.002 0.003 0.002 0.002Kenya 0.020 0.018 0.017 0.017Liberia L DOLLAR 1.000 1.000 1.000 1.000Libya L DINAR 2.890 2.765 2.621 0.000Madagascar *MG FRANC 0.235 0.247 0.197 0.184Malawi KWACHA 0.065 0.065 0.059 0.032Mali *MALI FRAN 2.005 1.955 1.716 1.695Mauritania OUGUYA 7.686 7.283 6.590 0.000Mauritius "0 M 0.058 0.056 0.049 0.049Morocco *M DIRHAM 117.142 114.742 105.030 104.167Mozambique *METICAL 0.114 0.089 0.087 0.084Niger *CF A FRANC 2.005 1.955 1.716 1.695Nigeria NAIRA 0.044 0.046 0.046 0.046Reunion *FR FRANC 200.516 0.000 0.000 0.000Rwanda *RW FRANC 3.335 3.250 3.317 3.202Senegal *CFA FRANC 2.005 1.955 1.716 1.695Seychelles S RUPEE 0.210 0.201 0.200 0.190Sierra Leone LEONE 0.001 0.001 0.001 0.001South Africa RANO 0.276 0.234 0.217 0.181Sudan 5 POUND 0.002 0.001 0.001 0.001Swaziland LILANGENI 0.276 0.234 0.217 0.181Tanzania *T SHILNG 1.740 1.720 1.630 1.505Togo *CFA FRANC 2.005 1.955 1.716 1.695Tunisia T DINAR 1.058 1.027 0.905 0.877Uganda U SHILNG 0.001 0.001 0.001 0.001Zambia KWACHA 0.001 0.001 0.001 0.001Zimbabwe Z DOLLAR 0.116 0.101 0.084 0.042Antigua Barb EC DOLLAR 0.370 0.370 0.370 0.370Aruba AR FLORIN 0.559 0.559 0.559 0.559Bahamas B DOLLAR 1.000 1.000 1.000 1.000Barbados B DOLLAR 0.497 0.497 0.500 0.500Belize BZ DOLLAR 0.500 0.500 0.500 0.500Canada C DOLLAR 0.729 0.733 0.722 0.676Cayman Is CAY DOLLAR 1.200 1.200 1.200 1.200Costa Rica COLDNES 5.577 4.822 4.303 3.888Dominica EC DOLLAR 0.370 0.370 0.370 0.370Dominican repr. EC DOLLAR 0.073 0.073 0.070 0.065El Salvador S COLON 0.114 0.114 0.114 0.114Greenland 'b. KRONE 178.719 172.504 151.612 149.253Grenada EC DOLLR 0.370 0.370 0.370 0.370Guadeloupe *FR FRANC 200.516 0.000 0.000 0.000Guatemala QUETZAL 0.172 0.165 0.165 0.156Haiti GOURDE 0.066 0.064 0.060 0.060Honduras LEMPIRA 0.106 0.086 0.077 0.075Jamaica a DOLLAR 0.026 0.026 0.028 0.027Martinique *FR FRANC 200.516 0.000 0.000 0.000Mexico 'M PESO 0.157 0.132 0.126 0.109NethAntilles *NA GUILDE 558.700 558.700 558.700 558.700Panama BALBOA 1.000 1.000 1.000 1.000St Lucia EC DOLLAR 0.370 0.370 0.370 0.370St Vincent EC DOLLAR 0.370 0.370 0.370 0.370Trinidad Tob TT DOLLAR 0.169 0.167 0.160 0.159Argentina A PESO 1.000 1,000 1.000 1.000Bolivia *B PESO 0.208 0.197 0.190 0.181Brazil CRUZEIRO 0.000 0.000 0.000 0.862Chile CL PESO 0.003 0.003 0.002 0.002Colombia *C PESO 1.100 0.965 0.882 0.701Ecuador *SUCRE 0.391 0.319 0.250 0.183Fr Guiana *FR FRANC 200.516 0.000 0.000 0.000Guyana G DOLLAR 0.007 0.007 0.007 0.007Paraguay *GUARANI 0.507 0.485 0.456 0.363Peru *INTIS 0.000 0.000 0.000 0.341Suriname *5 GUILDER 2.270 2.490 0.000 2.490Uruguay .0 PESO 0.000 0.125 0.106 0.096Venezuela *BOLIVAR 5.721 2.507 2.049 1.826Afghanistan *AFGHANI 19.763 5.173 0.330 0.333Armenia 0.000 0.000 2.040 1.980Azerbaijan 0.227 0.232 0.251 0.000
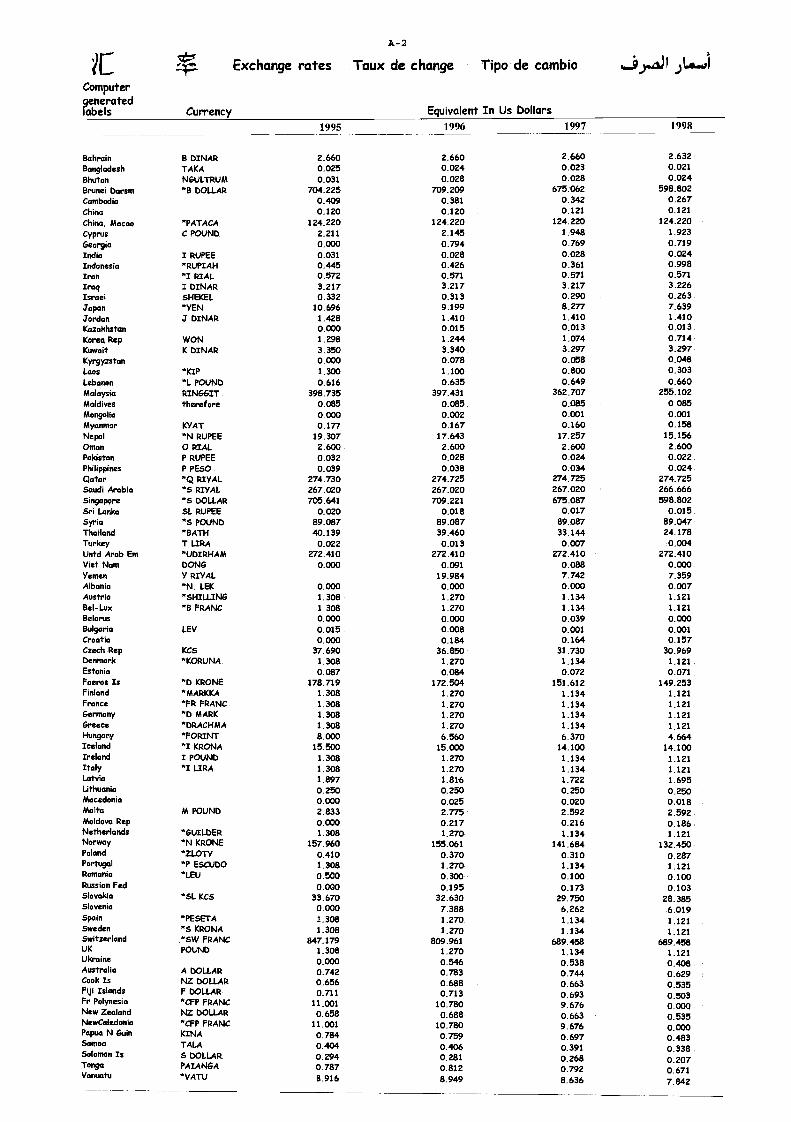
A-2
.V Exchange rates Taux de change Tipo de cambio j)..a)1 )6jComputergeneratedlabels Currency Equivalent In Us Dollars
1995 1996 1997 1998
Bahrain B DINAR 2.660 2.660 2.660 2.632Bangladesh TAKA 0.025 0.024 0.023 0.021
Bhutan NGL/LTRUM 0.031 0.028 0.028 0.024Brunei Darsm *B DOLLAR 704.225 709.209 675.062 598.802Cambodia 0.409 0.381 0.342 0.267China 0.120 0.120 0.121 0.121China, Macao *PATACA 124.220 124.220 124.220 124.220Cyprus C POVND 2.211 2.145 1.948 1.923
Georgia 0.000 0.794 0.769 0.719India I RUPEE 0.031 0.028 0.028 0.024Indonesia *RUPIAH 0.445 0.426 0.361 0.998Iran *I RIAL 0.572 0.571 0.571 0.571Iraq I DINAR 3.217 3.217 3.217 3.226Israel SHEKEL 0.332 0.313 0.290 0.263Japan *YEN 10.696 9.199 8.277 7.639Jordan J DINAR 1.428 1.410 1.410 1.410Kazakhstan 0.000 0.015 0.013 0.013Korea Rep WON 1.298 1.244 1.074 0.714Kuwait K DINAR 3.350 3.340 3.297 3.297Kyrgyzstan 0.000 0.078 0.058 0.048Laos *KIP 1.300 1.100 0.800 0.303Lebanon *L POUND 0.616 0.635 0.649 0.660Malaysia RINGGI 398.735 397.431 362.707 255.102Maldives therefore 0.085 0.085 0.0135 0.085Mongolia 0.000 0.002 0.001 0.001Myanmar KYAT 0.177 0.167 0.160 0.158Nepal *N RUPEE 19.307 17.643 17.257 15.156Ornan 0 RIAL 2.600 2.600 2.600 2.600Pakistan P RUPEE 0.032 0.028 0.024 0.022Philippines P PESO 0.039 0.038 0.034 0.024Qatar *Q RIVAL 274.730 274.725 274.725 274.725Saudi Arabia *5 RIVAL 267.020 267.020 267.020 266.666
Sin9aPore *S DOU.AR 705.641 709.221 675.087 598.802Sri Lanka SL RUPEE 0.020 0.018 0.017 0.015Syria *5 POUND 89.087 89.087 89.087 89.047Thailand *BATH 40.139 39.460 33.144 24.178Turkey T LIRA 0.022 0.013 0.007 0.004Untd Arab Em *UDIRHAM 272.410 272.410 272.410 272.410Viet Nato DONG 0.000 0.091 0.088 0.000Yemen Y RIVAL 19.984 7.742 7.359Albania *N. LEK 0.000 0.000 0.000 0.007Austria *SHILLING 1.308 1.270 1.134 1.121Bel-Lux *B FRANC 1.308 1.270 1.134 1.121Belarus 0,000 0.000 0.039 0.000Bulgaria LEV 0.015 0.008 0.001 0.001Croatia 0.000 0.184 0.164 0.157Czech Rep KCS 37.690 36.850 31.730 30.969Denmark *KORUNA 1.308 1.270 1.134 1.121Estonia 0.087 0.084 0.072 0.071Faeroe Is *D KRONE 178.719 172.504 151.612 149.253Finland *MARKKA 1.308 1.270 1.134 1.121France *FR FRANC 1.308 1.270 1.134 1.121Germany *D MARK 1.308 1.270 1.134 1.121Greece *DRACHMA 1.308 1.270 1.134 1,121Hum3417 *FORINT 8.000 6.560 6.370 4.664Iceland *1 KRONA 15.500 15.000 14.100 14.100Ireland I POUND 1.308 1.270 1.134 1.121Italy *I LIRA 1.308 1.270 1.134 1.121Latvia 1.897 1.816 1.722 1.695Lithuania 0.250 0.250 0.250 0.250Macedonia 0.000 0.025 0.020 0,018Malta M POUND 2.833 2.775 2.592 2.592Moldova Rep 0.000 0.217 0.216 0.186Netherlands *GUILDER 1.308 1.270 1.134 1.121Norway *N KRONE 157.960 155.061 141.684 132.450Poland *ZLOTY 0.410 0.370 0.310 0.287Portugal *P ESCUDO 1.308 1.270 1,134 1.121Romania *LEU 0.500 0.300 0.100 0.100Russian Fed 0.000 0.195 0.173 0.103Slovakia *SL KCS 33.670 32.630 29.750 28.385Slovenia 0.000 7.388 6.262 6.019Spain *PESETA 1.308 1.270 1.134 1.121Sweden *S KRONA 1.308 1.270 1.134 1.121Switzerland *SW FRANC 847.179 809.961 689.458 689.458VK POUND 1.308 1.270 1.134 1.121Ukraine 0.000 0.546 0.538 0.408Australia A DOUAR 0.742 0.783 0.744 0.629Cook Is NZ DOLLAR 0.656 0.688 0.663 0.535Fiji Islands F DOLL4R 0.711 0.713 0.693 0.503Fr Polynesia .CFP FRANC 11.001 10.780 9.676 0.000New Zealand NZ DOLLAR 0.658 0.688 0.663 0.535NewCaledonia *CFI' FRANC 11.001 10.780 9.676 0.000Papua N Guin KINA 0.784 0.759 0.697 0.483Samoa TALA 0.404 0.406 0.391 0.338Solomon Is S DOLLAR 0.294 0.281 0.268 0207.Tonga PAIANGA 0.787 0.812 0.792 0.671Vanuatu *VATU 8.916 8.949 8.636 7.842
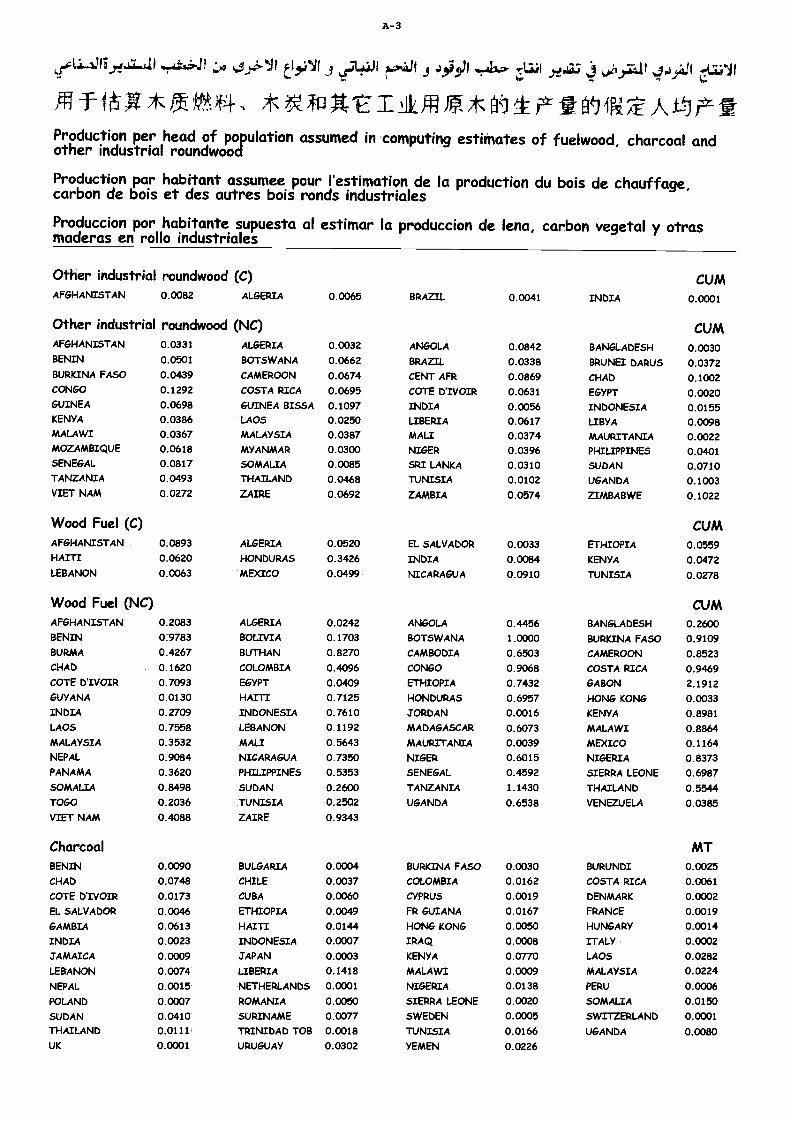
I.
Production per head of population assumed in computing estimates of fuelwood, charcoal andother industrial roundwood
Production par habitant assutnee pour l'estimation de la production du bois de chauffage,carbon de bois et des nutres bois ronds industriales
Produccion por habitante supuesta al estimar la produccion de lena, carbon vegetal y otrasmaderas en rollo industriales
A-3
aal..411 4411 J.' I aj ob.11.1 I 4.),ail
Other industrial roundwood (C) CUMAFGHANISTAN 0.0082 ALGERIA 0.0065 BRAZIL 0.0041 INDIA 0.0001
Other industrial roundwood (NC) CUMAFGHANISTAN 0.0331 ALGERIA 0.0032 ANGOLA 0.0842 BANGLADESH 0.0030BENIN 0.0501 BOTSWANA 0.0662 BRAZIL 0.0338 BRUNEI DARUS 0.0372BURKINA FASO 0.0439 CAMEROON 0.0674 CENT AFR 0.0869 CHAD 0.1002CONGO 0.1292 COSTA RICA 0.0695 COTE D'IVOIR 0.0631 EGYPT 0.0020GUINEA 0.0698 GUINEA BISSA 0.1097 INDIA 0.0056 INDONESIA 0.0155KENYA 0.0386 LAOS 0.0250 LIBERIA 0.0617 LIBYA 0.0098MALAWI 0.0367 MALAYSIA 0.0387 MALI 0.0374 MAURITANIA 0.0022MOZAMBIQUE 0.0618 MYANMAR 0.0300 NIGER 0.0396 PHILIPPINES 0.0401SENEGAL 0.0817 SOMALIA 0.0085 SRI LANKA 0.0310 SUDAN 0.0710TANZANIA 0.0493 THAILAND 0.0468 TUNISIA 0.0102 UGANDA 0.1003VIET NAM 0.0272 ZAIRE 0.0692 ZAMBIA 0.0574 ZIMBABWE 0.1022
Wood Fuel (C) CUMAFGHANISTAN 0.0893 ALGERIA 0.0520 EL SALVADOR 0.0033 ETHIOPIA 0.0559HAITI 0.0620 HONDURAS 0.3426 INDIA 0.0084 KENYA 0.0472LEBANON 0.0063 MEXICO 0.0499 NICARAGUA 0.0910 TUNISIA 0.0278
Wood Fuel (NC) CUMAFGHANISTAN 0.2083 ALGERIA 0.0242 ANGOLA 0.4456 BANGLADESH 0.2600BENIN 0.9783 BOLIVIA 0.1703 BOTSWANA 1.0000 BURIaNA FASO 0.9109BURMA 0.4267 BUTFIAN 0.8270 CAMBODIA 0.6503 CAMEROON 0.8523CHAD 0.1620 COLOMBIA 0.4096 CONGO 0.9068 COSTA RICA 0.9469COTE D'IVOIR 0.7093 EGYPT 0.0409 ETHIOP/A 0.7432 GABON 2.1912GUYANA 0.0130 HAITI 0.7125 HONDURAS 0.6957 HONG KONG 0.0033INDIA 0.2709 INDONESIA 0.7610 .TORDAN 0.0016 KENYA 0.8981LAOS 0.7558 LEBANON 0.1192 MADAGASCAR 0.6073 MALAWI 0.8864MALAYSIA 0.3532 MALI 0.5643 MAURITANIA 0.0039 MEXICO 0.1164NEPAL 0.9084 NICARAGUA 0.7350 NIGER 0.6015 NIGERIA 0.8373PANAMA 0.3620 PHILIPPINES O. 5353 SENEGAL 0.4592 SIERRA LEONE 0.6987SOMALIA 0.8498 SUDAN 0.2600 TANZANIA 1.1430 THAILAND 0.5544TOGO 0.2036 TUNISIA 0.2502 UGANDA 0.6538 VENEZUELA 0.0385VIET NAM 0.4088 ZAIRE 0.9343
Charcoal MTBENIN 0.0090 BULGARIA 0.0004 BURKINA FASO 0.0030 BURUNDI 0.0025
CHAD 0.0748 CHILE 0.0037 COLOMBIA 0.0162 COSTA RICA 0.0061COTE D'IVOIR 0.0173 CUBA 0.0060 CYPRUS 0.0019 DENMARK 0.0002
EL SALVADOR 0.0046 ETHIOPIA 0.0049 FR GUIANA 0.0167 FRANCE 0.0019
GAMBIA 0.0613 HAITI 0.0144 HONG KONG 0.0050 HUNGARY 0.0014
INDIA 0.0023 INDONESIA 0.0007 IRAQ 0.0008 ITALY 0.0002
JAMAICA 0.0009 TAPAN 0.0003 KENYA 0.0770 LAOS 0.0282
LEBANON 0.0074 LIBERIA 0.1418 MALAWI 0.0009 MALAYSIA 0.0224
NEPAL 0.0015 NETHERLANDS 0.0001 NIGERIA 0.0138 PERU 0.0006
POLAND 0.0007 ROMANIA 0.0050 SIERRA LEONE 0.0020 SOMALIA 0.0150
SUDAN 0.0410 SURINAME 0.0077 SWEDEN 0.0005 SWITZERLAND 0.0001.
THAILAND 0.0111 TRINIDAD TOB 0.0018 TUNISIA 0.0166 UGANDA 0.0080UK 0.0001 URUGUAY 0.0302 YEMEN 0.0226
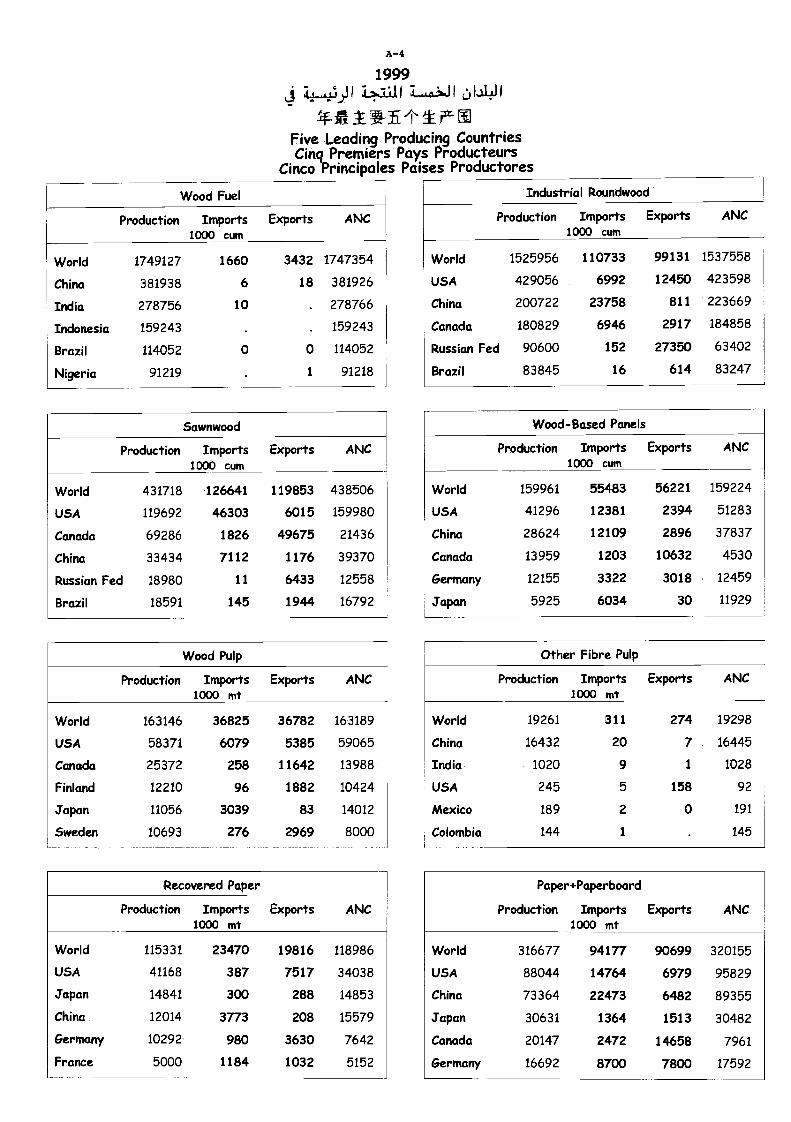
Sawnwood
A-4
1999j 44)1 )141
Five Leading Producing CountriesCinq Premiers Pays Producteurs
Cinco Principales Paises Productores
Industrial Roundwood
1000 mt
Wood Pulp
Production Imports1000 mt
Exports ANC
World 163146 36825 36782 163189
USA 58371 6079 5385 59065
Canada 25372 258 11642 13988
Finland 12210 96 1882 10424
Japan 11056 3039 83 14012
Sweden 10693 276 2969 8000- - -
Recovered Paper
Production Imports Exports ANC1000 mt
World 115331 23470 19816 118986
USA 41168 387 7517 34038
Japan 14841 300 288 14853
China 12014 3773 208 15579
Germany 10292 980 3630 7642
France 5000 1184 1032 5152
Production Imports1000 cum
Exports ANC
World 1525956 110733 99131 1537558
USA 429056 6992 12450 423598
China 200722 23758 811 223669
Canada 180829 6946 2917 184858
Russian Fed 90600 152 27350 63402
Brazil 83845 16 614 83247
Wood-Based Panels
Production Imports Exports ANC1000 cum
World 159961 55483 56221 159224
USA 41296 12381 2394 51283
China 28624 12109 2896 37837
Canada 13959 1203 10632 4530
Gertnany 12155 3322 3018 12459
, Japan 5925 6034 30 11929
Other Fibre Pulp
Production Imports Exports ANC1000 mt
World 19261 311 274 19298
China 16432 20 7 16445
India 1020 9 1 1028
USA 245 5 158 92
Mexico 189 2 0 191
Colombia 144 1 145
Paper+Paperboard
Production Imports Exports ANC
World 316677 94177 90699 320155
USA 88044 14764 6979 95829
China 73364 22473 6482 89355
Japan 30631 1364 1513 30482
Canada 20147 2472 14658 7961
Germany 16692 8700 7800 17592
Wood Fuel
Production Imports Exports ANC1000 cum
World 1749127 1660 3432 1747354
China 381938 6 18 381926
India 278756 10 278766
Indonesia 159243 159243
Brazil 114052 0 0 114052
Nigeria 91219 1 91218
Production Imports Exports ANC1000 cum
World 431718 126641 119853 438506
USA 119692 46303 6015 159980
Canada 69286 1826 49675 21436
China 33434 7112 1176 39370
Russian Fed 18980 11 6433 12558
Brazil 18591 145 1944 16792
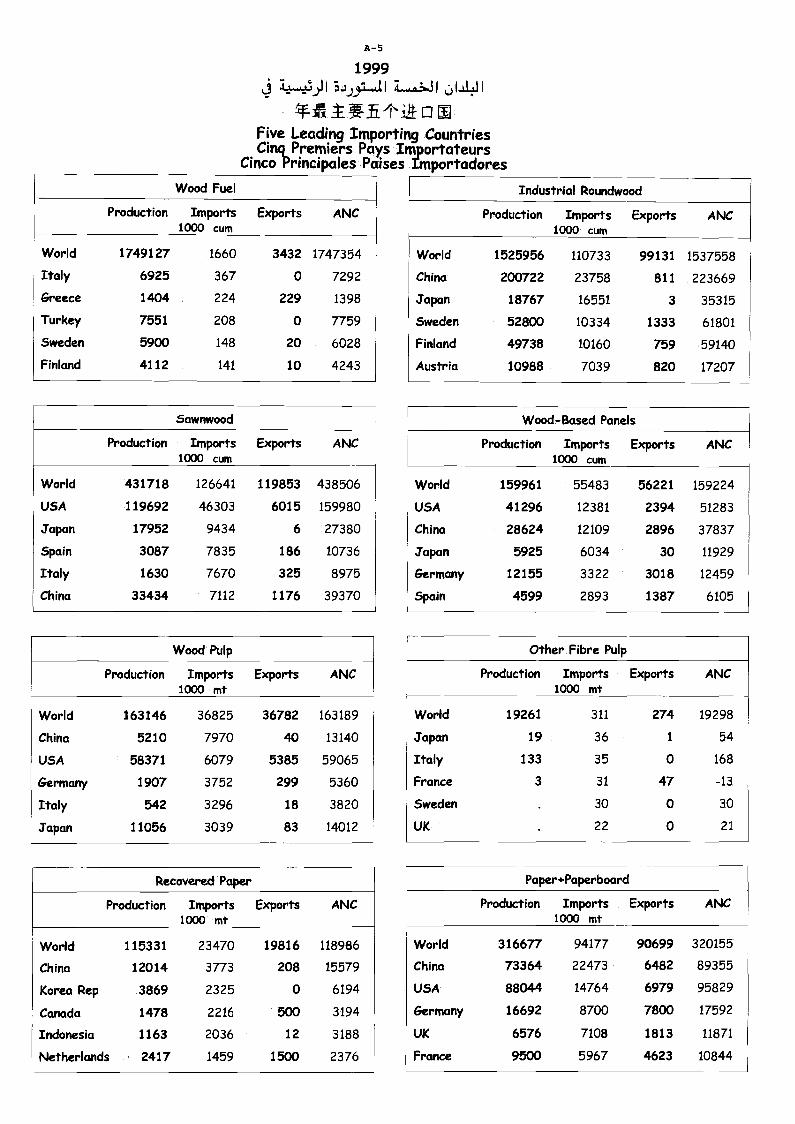
World 1749127 1660 3432 1747354
1000 mt
A-5
1999I JI 7t...4.:,J I 1.4 I
*fx.t.E.'hiA Lt
Five Leading Importing CountriesCinq_ Premiers Pays Itn_portateurs
Cinco Principales Paises Importadores
Wood Fuel Industrial Roundwood
Wood-Based Panels
Lrcuy OVCD SO/ U /LYC
Greece 1404 224 229 1398
Turkey 7551 208 0 7759
Sweden 5900 148 20 6028
Finland 4112 141 10 4243
Sawnwood
Production Imports Exports ANC1000 cum
World 431718 126641 119853 438506
USA 119692 46303 6015 159980
Japan 17952 9434 6 27380
Spain 3087 7835 186 10736
Italy 1630 7670 325 8975
China 33434 7112 1176 39370
Production Imports1000 cum
Exports ANC
World 159961 55483 56221 159224
USA 41296 12381 2394 51283
China 28624 12109 2896 37837
Japan 5925 6034 30 11929
Germany 12155 3322 3018 12459
Spain 4599 2893 1387 6105
Other Fibre Pulp
Production Imports Exports ANC1000 tnt
World 19261 311 274 19298
Japan 19 36 1 54
Italy 133 35 0 168
France 3 31 47 -13
Sweden 30 0 30
UK 22 0 21
Paper+Paperboard
Production Imports Exports ANC1000 mt
World 316677 94177 90699 320155
China 73364 22473 6482 89355
USA 88044 14764 6979 95829
Germany 16692 8700 7800 17592
UK 6576 7108 1813 11871
France 9500 5967 4623 10844
Wood Pulp
Production Imports1000 mt
Exports ANC
World 163146 36825 36782 163189
China 5210 7970 40 13140
USA 58371 6079 5385 59065
Germany 1907 3752 299 5360
Italy 542 3296 18 3820
Japan 11056 3039 83 14012
Recovered Paper
Production Imports Exports ANC
Production Imports1000 cum
Exports ANC
World 1525956 110733 99131 1537558
China 200722 23758 811 223669
Japan 18767 16551 3 35315
Sweden 52800 10334 1333 61801
Finland 49738 10160 759 59140
Austria 10988 7039 820 17207
World 115331 23470 19816 118986
China 12014 3773 208 15579
Korea Rep 3869 2325 0 6194
Canada 1478 2216 500 3194
Indonesia 1163 2036 12 3188
Netherlands 2417 1459 1500 2376
Production Imports1000 cum
ANCExports
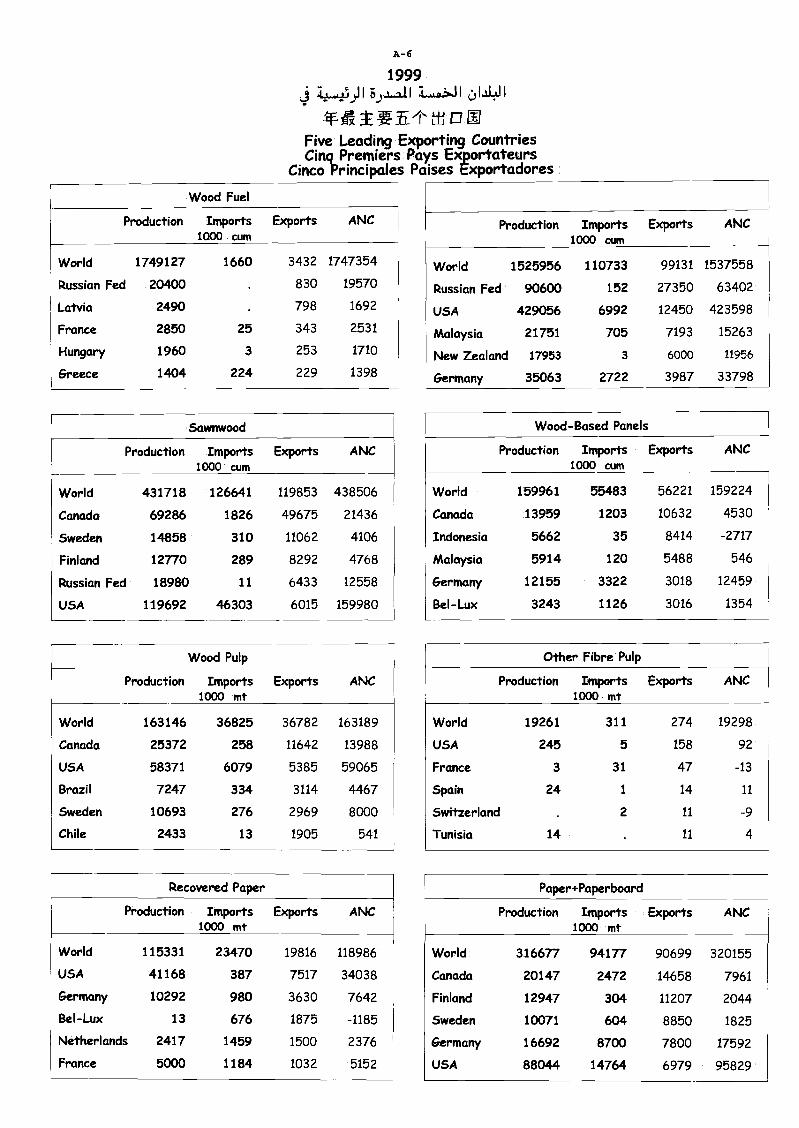
r-Wood Fuel
A-6
1999j 3ia.AII-0.>11 (..1141
*AftFive Leading Exporting CountriesCinq_ Premiers Pays Exportateurs
Cinco Principales Paises Exportadores
Production Imports1000 cum
Exports ANC Production Itnports1000 cum
Exports ANC
World 1749127 1660 3432 1747354 World 1525956 110733 99131 1537558
Russian Fed 20400 830 19570 Russian Fed 90600 152 27350 63402
Latvia 2490 798 1692 USA 429056 6992 12450 423598
France 2850 25 343 2531 Malaysia 21751 705 7193 15263
Hungary 1960 3 253 1710 New Zealand 17953 3 6000 11956
Greece 1404 224 229 1398 Germany 35063 2722 3987 33798
Sawnwood Wood-Based Panels
Production Imports Exports ANC Production Imports Exports ANC1000 cum 1000 cum
World 431718 126641 119853 438506 World 159961 55483 56221 159224
Canada 69286 1826 49675 21436 Canada 13959 1203 10632 4530
Sweden 14858 310 11062 4106 Indonesia 5662 35 8414 -2717
Finland 12770 289 8292 4768 Malaysia 5914 120 5488 546
Russian Fed 18980 11 6433 12558 Germany 12155 3322 3018 12459
USA 119692 46303 6015 159980 Bel-Lux 3243 1126 3016 1354
Wood Pulp Other Fibre Pulp
Production Imports Exports ANC Production Imports Exports ANC1000 mt 1000 mt
World 163146 36825 36782 163189 World 19261 311 274 19298
Canada 25372 258 11642 13988 USA 245 5 158 92
USA 58371 6079 5385 59065 France 3 31 47 -13
Brazil 7247 334 3114 4467 Spain 24 1 14 11
Sweden 10693 276 2969 8000 Switzerland 2 11 -9
Chile 2433 13 1905 541 Tunisia 14 11 4
Recovered Paper Paper+Paperboard
Production Imports Exports ANC Production Imports Exports ANC1000 mt 1000 mt
World 115331 23470 19816 118986 World 316677 94177 90699 320155
USA 41168 387 7517 34038 Canada 20147 2472 14658 7961
Germany 10292 980 3630 7642 Finland 12947 304 11207 2044
Bel-Lux 13 676 1875 -1185 Sweden 10071 604 8850 1825
Netherlands 2417 1459 1500 2376 Germany 16692 8700 7800 17592
France 5000 1184 1032 5152 USA 88044 14764 6979 95829
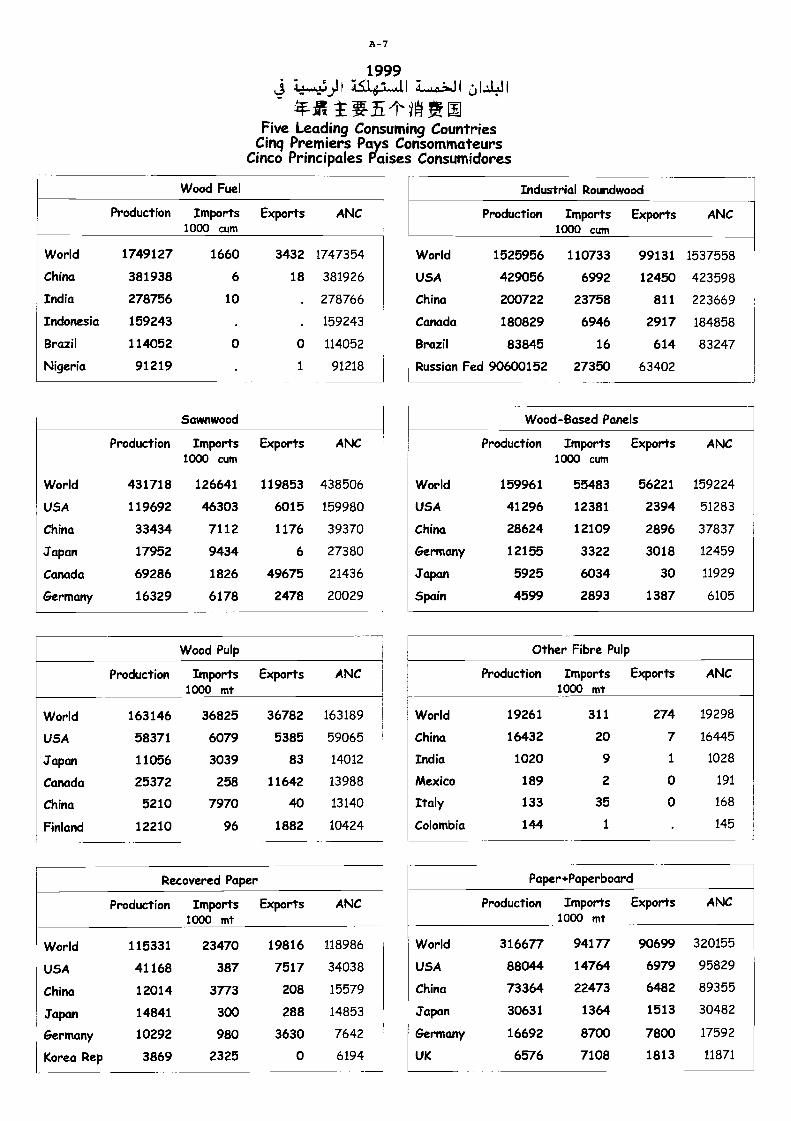
A-7
19991514.1-.11 I UJI
*Ai [11
Five Leading Consuming CountriesCing Premiers Pays Consornmateurs
Cinco Principales Paises Consumidores
Wood Fuel Industrial Roundwood
Production Imports Exports ANC Production Imports Exports ANC1000 cum 1000 cum
World 1749127 1660 3432 1747354 World 1525956 110733 99131 1537558
China 381938 6 18 381926 USA 429056 6992 12450 423598
India 278756 10 278766 China 200722 23758 811 223669
Indonesia 159243 159243 Canada 180829 6946 2917 184858
Brazil 114052 0 0 114052 Brazil 83845 16 614 83247
Nigeria 91219 1 91218 Russian Fed 90600152 27350 63402
Sawnwood Wood-Based Panels
Production Imports Exports ANC Production Imports Exports ANC1000 cum 1000 cum
World 431718 126641 119853 438506 World 159961 55483 56221 159224
USA 119692 46303 6015 159980 USA 41296 12381 2394 51283
China 33434 7112 1176 39370 China 28624 12109 2896 37837
Japan 17952 9434 6 27380 Germany 12155 3322 3018 12459
Canada 69286 1826 49675 21436 Japan 5925 6034 30 11929
Germany 16329 6178 2478 20029 Spain 4599 2893 1387 6105
Wood Pulp Other Fibre Pulp
Production Imports Exports ANC Production Itnports Exports ANC1000 mt 1000 mt
World 163146 36825 36782 163189 World 19261 311 274 19298
USA 58371 6079 5385 59065 China 16432 20 7 16445
Japan 11056 3039 83 14012 India 1020 9 1 1028
Canada 25372 258 11642 13988 Mexico 189 2 0 191
China 5210 7970 40 13140 Italy 133 35 0 168
Finland 12210 96 1882 10424 Colombia 144 1 145
Recovered Paper Paper+Paperboard
Production Imports Exports ANC Production Imports Exports ANC
1000 mt 1000 mt
World 115331 23470 19816 118986 World 316677 94177 90699 320155
USA 41168 387 7517 34038 USA 88044 14764 6979 95829
China 12014 3773 208 15579 China 73364 22473 6482 89355
Japan 14841 300 288 14853 japan 30631 1364 1513 30482
Germany 10292 980 3630 7642 Germany 16692 8700 7800 17592
Korea Rep 3869 2325 0 6194 UK 6576 7108 1813 11871

ROUNDWOOD
BOIS ROND
MADERA EN ROLLO
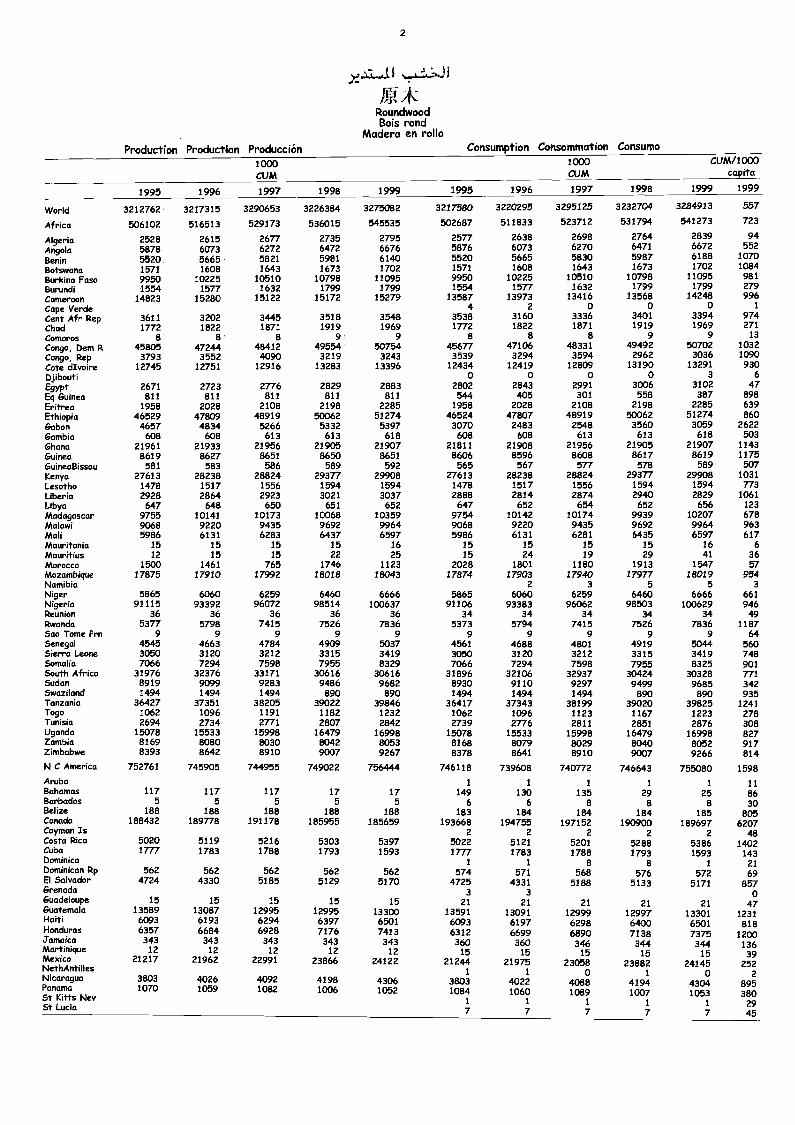
2
.11...4.1 I 4*
RoundwoodBois rond
Madera en rollo
Production Production Producción Consumption Consommation Consumo
1000CUM
1000CUM
CUM/1000capita
1995 1996 1997 1998 1999 1995 1996 1997 1998 1999 1999
World 3212762 3217315 3290653 3226384 3275082 3217580 3220295 3295125 3232704 3284913 557
Africa 506102 516513 529173 536015 545535 502687 511833 523712 531794 541273 723
Algeria 2528 2615 2677 2735 2795 2577 2638 2698 2764 2839 94
Angola 5878 6073 6272 6472 6676 5876 6073 6270 6471 6672 552
Benin 5520 5665 5821 5981 6140 5520 5665 5830 5987 6188 1070
Botswana 1571 1608 1643 1673 1702 1571 1608 1643 1673 1702 1084
Burkina Faso 9950 10225 10510 10798 11095 9950 10225 10510 10798 11095 981
Burundi 1554 1577 1632 1799 1799 1554 1577 1632 1799 1799 279
Cameroon 14823 15280 15122 15172 15279 13587 13973 13416 13568 14248 996Cape Verde 4 2 0 0 o 1
Cent Afr Rep 3611 3202 3445 3518 3548 3538 3160 3336 3401 3394 974Chad 1772 1822 1871 1919 1969 1772 1822 1871 1919 1969 271
Comoros 8 8 8 9 9 8 8 8 9 9 13
Congo, Dem R 45805 47244 48412 49554 50754 45677 47106 48331 49492 50702 1032Congo, Rep 3793 3552 4090 3219 3243 3539 3294 3594 2962 3036 1090C.ote dIvoire 12745 12751 12916 13283 13396 12434 12419 12809 13190 13291 930Djibouti o o o o 3 6
Egypt 2671 2723 2776 2829 2883 2802 2843 2991 3006 3102 47Eq Guinea 811 811 811 811 811 544 405 301 558 387 898Eritrea 1958 2028 2108 2198 2285 1958 2028 2108 2198 2285 639Ethiopia 46529 47809 48919 50062 51274 46524 47807 48919 50062 51274 860Gabon 4657 4834 5266 5332 5397 3070 2483 2548 3560 3059 2622Gambia 608 608 613 613 618 608 608 613 613 618 503Ghana 21961 21933 21956 21905 21907 21811 21908 21956 21905 21907 1143Guinea 8619 8627 8651 8650 8651 8606 8596 8608 8617 8619 1175GuineaBissau 581 583 586 589 592 565 567 577 578 589 507Kenya 27613 28238 28824 29377 29908 27613 28238 28824 29377 29908 1031Lesotho 1478 1517 1556 1594 1594 1478 1517 1556 1594 1594 773Liberia 2928 2864 2923 3021 3037 2888 2814 2874 2940 2829 1061Libya 647 648 650 651 652 647 652 654 652 656 123Madagascar 9755 10141 10173 10068 10359 9754 10142 10174 9939 10207 678Malawi 9068 9220 9435 9692 9964 9068 9220 9435 9692 9964 963Mali 5986 6131 6283 6437 6597 5986 6131 6281 6435 6597 617Mauritania 15 15 15 15 16 15 15 15 15 16 6Mauritius 12 15 15 22 25 15 24 19 29 41 36Morocco 1500 1461 765 1746 1123 2028 1801 1180 1913 1547 57Mozambique 17875 17910 17992 18018 18043 17874 17903 17940 17977 18019 954Namibia 2 3 5 5 3Niger 5865 6060 6259 6460 6666 5865 6060 6259 6460 6666 661Nigeria 91115 93392 96072 98514 100637 91106 93383 96062 98503 100629 946Reunion 36 36 36 36 36 34 34 34 34 34 49Rwanda 5377 5798 7415 7526 7836 5373 5794 7415 7526 7836 1187Sao Tome Frn 9 9 9 9 9 9 9 9 9 9 64Senegal 4545 4663 4784 4909 5037 4561 4688 4801 4919 5044 560Sierra Leone 3050 3120 3212 3315 3419 3050 3120 3212 3315 3419 748Somalia 7066 7294 7598 7955 8329 7066 7294 7598 7955 8325 901South Africa 31976 32376 33171 30616 30616 31896 32106 32937 30424 30328 rnSudan 8919 9099 9283 9486 9682 8930 9110 9297 9499 9685 342Swaziland 1494 1494 1494 890 890 1494 1494 1494 890 890 935Tanzania 36427 37351 38205 39022 39846 36417 37343 38199 39020 39825 1241Togo 1062 1096 1191 1182 1232 1062 1096 1123 1167 1223 278Tunisia 2694 2734 2771 2807 2842 2739 2776 2811 2851 2876 308Uganda 15078 15533 15998 16479 16998 15078 15533 15998 16479 16998 827Zambia 8169 8080 8030 8042 8053 8168 8079 8029 8040 8052 917Zimbabwe 8393 8642 8910 9007 9267 8378 8641 8910 9007 9266 814N C America 752761 745905 744955 749022 756444 746118 739608 740772 746643 755080 1598Aruba 1 1. 1 1 1 11Bahamas 117 117 117 17 17 149 130 135 29 25 86Barbados 5 5 5 5 5 6 6 8 8 8 30BelizeCanada
188188432
188189778
188191178
188185955
188185659
183193668
184194755
184197152
184190900 181896975 86207
Cayman Is 2 2 2 2 2 48Costa Rica 5020 5119 5216 5303 5397 5022 5121 5201 5288 5386 1402Cuba 1777 1783 1788 1793 1593 1777 1783 1788 1793 1593 143Dominica 1 1 8 8 1 21Dominican Rp 562 562 562 562 562 574 571 568 576 572 69El Salvador 4724 4330 5185 5129 5170 4725 4331 5188 5133 5171 857Grenada 3 3 oGuadeloupe 15 15 15 15 15 21 21 21 21GuatemalaHaiti
135896093
130876193
129956294
129956397
133006501
135916093
130916197
129996298
129976400
173632111
11822431871
Honduras 6357 6684 6928 7176 7413 6312 6699 6890 7138Jamaica 343 343 343 343 343 360 360 346 344 344 136Martinique 12 12 12 12 12 15 15 15 15 15 39MexicoNethAntilles
21217 21962 22991 23866 24122 212441
219751
23058o
238821
241450
2522Nicaragua 3803 4026 4092 4198 4306 3803 4022 4088 4194 4304 895Panama
St Kitts Nev1070 1059 1082 1006 1052 1084
1
1060 1089 1007 1053 380
St Lucia 71
71
71
71
72945
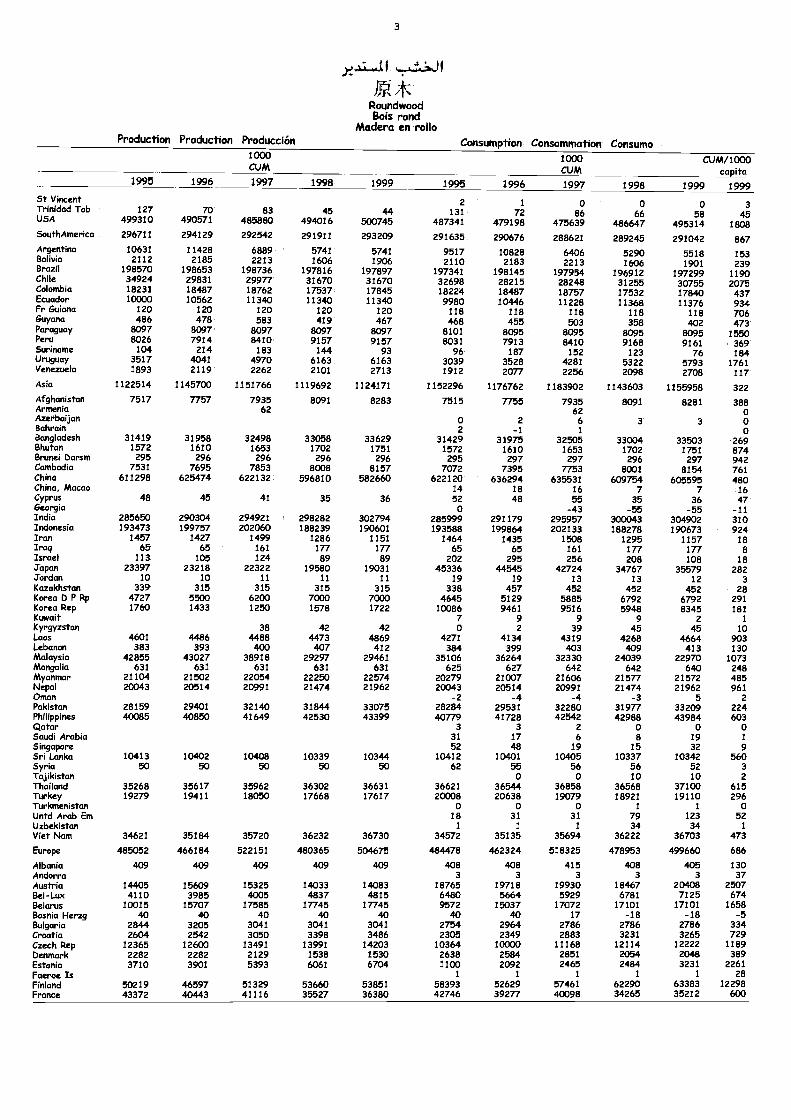
3
x..,17.4 1
%tRoundwoodBois rond
Madera en rolloProduction Production Producción Consumption Consornmation Consumo
1000CUM
1000CUM
CUM/1000
1995 1996 1997 1998 1999 1995 1996 1997 1998 1999 1999St Vincent 2 1 o o 0 3TrinkMdTob 127 70 83 45 44 131 72 86 66 58 45USA 499310 490571 485880 494016 500745 487341 479198 475639 486647 495314 1808SouthAmerica 296711 294129 292542 291911 293209 291635 290676 288621 289245 291042 867Argentina 10631 11428 6889 5741 5741 9517 10828 6406 5290 5518 153Bolivia 2112 2185 2213 1606 1906 2110 2183 2213 1606 1901 239Brazil 198570 198653 198736 197816 197897 197341 198145 197954 196912 197299 1190Chile 34924 29831 29977 31670 31670 32698 28215 28246 31255 30755 2075Colombia 18231 18487 18762 17537 17845 18224 18487 18757 17532 17840 437Ecuador 10000 10562 11340 11340 11340 9980 10446 11228 11368 11376 934Fr Guiana 120 120 120 120 120 118 118 118 118 118 706Guyana 486 478 583 419 467 468 455 503 358 402 473Paraguay 8097 8097 8097 8097 8097 8101 8095 8095 8095 8095 1550Peru 8026 7914 8410 9157 9157 8031 7913 8410 9168 9161 369Suriname 104 214 183 144 93 96 187 152 123 76 184Uruguay 3517 4041 4970 6163 6163 3039 3528 4281 5322 5793 1761Venezuela 1893 2119 2262 2101 2713 1912 2077 2256 2098 2708 117Asia 1122514 1145700 1151766 1119692 1124171 1152296 1176762 1183902 1143603 1155958 322Afghanistan 7517 7757 7935 8091 8283 7515 7755 7935 8091 8281 388Armada 62 62 0Azerbaijan o 2 6 3 3 0Bahrain 2 -1 1 0Bangladesh 31419 31958 32498 33058 33629 31429 31975 32505 33004 33503 269Bhutan 1572 1610 1653 1702 1751 1572 1610 1653 1702 1751 874Bmmeibarsm 295 296 296 296 296 295 297 297 296 297 942Cambodia 7531 7695 7853 8008 8157 7072 7395 7753 8001 8154 761China 611298 625474 622132 596810 582660 622120 636294 635531 609754 605595 480China, Macao 14 18 16 7 7 16Cyprus 48 45 41 35 36 52 48 55 35 36 47Georgia o -43 -55 -55 -11India 285650 290304 294921 298282 302794 285999 291179 295957 300043 304902 310Indonesia 193473 199757 202060 188239 190601 193588 199864 202133 188278 190673 924Irim 1457 1427 1499 1286 1151 1464 1435 1508 1295 1157 18Iraq 65 65 161 177 177 65 65 161 177 177 8Israel 113 105 124 89 89 202 295 256 208 108 18Japan 23397 23218 22322 19580 19031 45336 44545 42724 34767 35579 282Jordan 10 10 11 11 11 19 19 13 13 12 3Kazakhrftm 339 315 315 315 315 338 457 452 452 452 28Korea 13 P Rp 4727 5500 6200 7000 7000 4645 5129 5885 6792 6792 291Korea Rep 1760 1433 1250 1578 1722 10086 9461 9516 5948 8345 181Kuwait 7 9 9 9 2 1
Kyrgyzstan 38 42 42 0 2 39 45 45 10Laos 4601 4486 4488 4473 4869 4271 4134 4319 4268 4664 903Lexmon 383 393 400 407 412 384 399 403 409 413 130Malaysia 42855 43027 38918 29297 29461 35106 36264 32330 24039 22970 1073Mongolia 631 631 631 631 631 625 627 642 642 640 248Myanmar 21104 21502 22054 22250 22574 20279 21007 21606 21577 21572 485Nepal 20043 20514 20991 21474 21962 20043 20514 20991 21474 21962 961Ornan -2 -4 -4 -3 5 2Pakistan 28159 29401 32140 31844 33075 28284 29531 32280 31977 33209 224Philippines 40085 40850 41649 42530 43399 40779 41728 42542 42988 43984 603Clcaar 3 3 2 0 0 0Saudi Arabia 31 17 6 8 19 1
Singapore 52 48 19 15 32 9Sri Lanka 10413 10402 10408 10339 10344 10412 10401 10405 10337 10342 560Syria 50 50 50 50 50 62 55 56 56 52 3Tajikistan o o 10 10 2Thafland 35268 35617 35962 36302 36631 36621 36544 36858 36568 37100 615Turkey 19279 19411 18050 17668 17617 20008 20638 19079 18921 19110 296Turkmenistan 0 0 0 1 1 0Untd Arab Em 18 31 31 79 123 52Uzbekistan 1 1 1 34 34 1
Viet Nam 34621 35184 35720 36232 36730 34572 35135 35694 36222 36703 473
Europe 485052 466184 522151 480365 504675 484478 462324 518325 478953 499660 686
Albania 409 409 409 409 409 408 408 415 408 405 130Andorra 3 3 3 3 3 37Austin 14405 15609 15325 14033 14083 18765 19718 19930 18467 20408 2507Bel-Lux 4110 3985 4005 4837 4815 6480 5664 5929 6781 7125 674&dorm 10015 15707 17585 17745 17745 9572 15037 17072 17101 17101 1658Bosnia Herzg 40 40 40 40 40 40 40 17 -18 -18 -5Bulgaria 2844 3205 3041 3041 3041 2754 2964 2786 2786 2786 334Croatia 2604 2542 3050 3398 3486 2305 2349 2883 3231 3265 729Czech Rep 12365 12600 13491 13991 14203 10364 10000 11168 12114 12222 1189Denmark 2282 2282 2129 1538 1530 2638 2584 2851 2054 2048 389Estonia 3710 3901 5393 6061 6704 1100 2092 2465 2484 3231 2261Faeroe Is 1 1 1 1 1 28Finland 50219 46597 51329 53660 53851 58393 52629 57461 62290 IN:11 12298France 43372 40443 41116 35527 36380 42746 39277 40098 34265
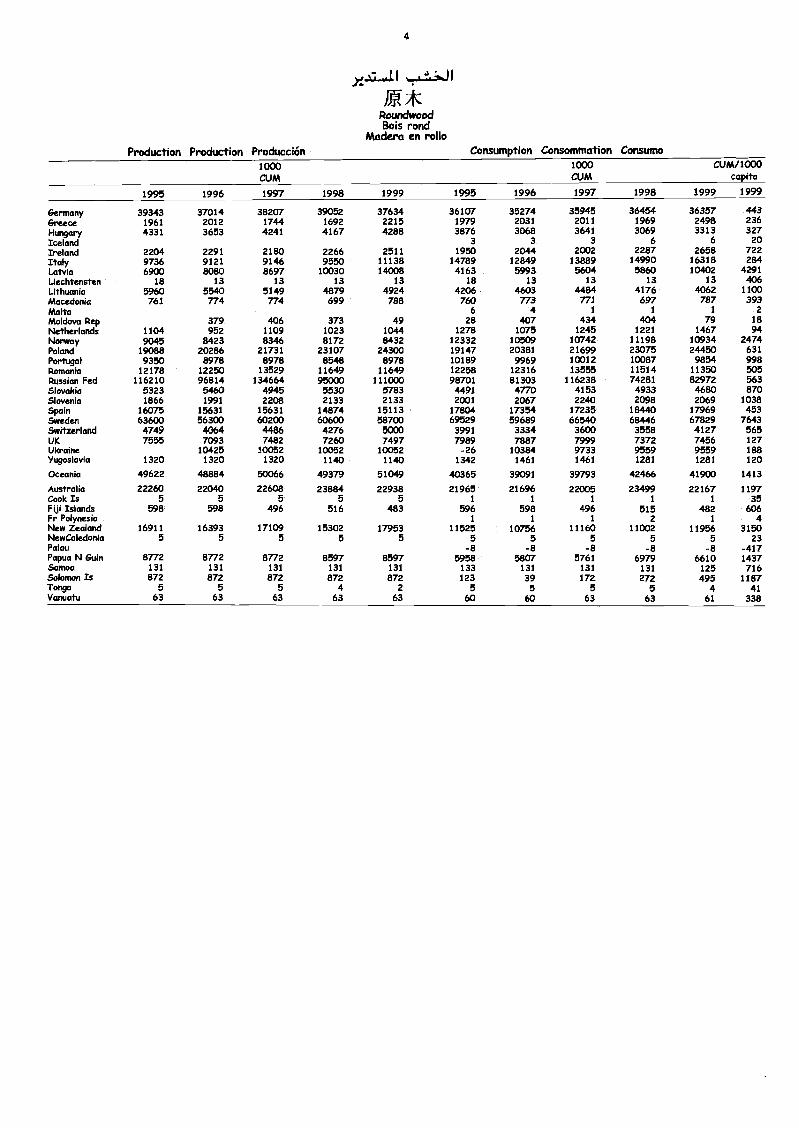
4
I I
.71C
Round woodBois rond
Madero en rolloProduction Production Producción Consumption Consommation Consumo
1000CUM
1000CUM
CUM/1000capita
1995 1996 1997 1998 1999 1995 1996 1997 1998 1999 1999
Germany 39343 37014 38207 39052 37634 36107 35274 35945 36454 36357 443Greece 1961 2012 1744 1692 2215 1979 2031 2011 1969 2498 236Hungary 4331 3653 4241 4167 4288 3876 3068 3641 3069 3313 327Iceland 3 3 3 6 6 20Ireland 2204 2291 2180 2266 2511 1950 2044 2002 2287 2658 722Italy 9736 9121 9146 9550 11138 14789 12849 13889 14990 16318 284Latvia 6900 8080 8697 10030 14008 4163 5993 5604 5860 10402 4291Uechtensten 18 13 13 13 13 18 13 13 13 13 406Lithuania 5960 5540 5149 4879 4924 4206 4603 4484 4176 4062 1100Macedonia 761 774 774 699 788 760 773 771 697 787 393Malta 6 4 1 1 1 2
Moldova Rep 379 406 373 49 28 407 434 404 79 18Netherlands 1104 952 1109 1023 1044 1278 1075 1245 1221 1467 94Norway 9045 8423 8346 8172 8432 12332 10509 10742 11198 10934 2474Poland 19088 20286 21731 23107 24300 19147 20381 21699 23075 24450 631Portugal 9350 8978 8978 8548 8978 10189 9969 10012 10087 9854 998Romania 12178 12250 13529 11649 11649 12258 12316 13555 11514 11350 505Russian Fed 116210 96814 134664 95000 111000 98701 81303 116238 74281 82972 563Slovakia 5323 5460 4945 5530 5783 4491 4770 4153 4933 4680 870Slovenia 1866 1991 2208 2133 2133 2001 2067 2240 2098 2069 1038Spain 16075 15631 15631 14874 15113 17804 17354 17235 18440 17969 453Sweden 63600 56300 60200 60600 58700 69529 59689 66540 68446 67829 7643Switzerland 4749 4064 4486 4276 5000 3991 3334 3600 3558 4127 565UK 7555 7093 7482 7260 7497 7989 7887 7999 7372 7456 127Ukraine 10425 10052 10052 10052 -26 10384 9733 9559 9559 188Yugoslavia 1320 1320 1320 1140 1140 1342 1461 1461 1281 1281 120
Oceania 49622 48884 50066 49379 51049 40365 39091 39793 42466 41900 1413
Australia 22260 22040 22608 23884 22938 21965 21696 22005 23499 22167 1197Cook Is 5 5 5 5 5 1 1 1 1 1 35Fiji Islands 598 598 496 516 483 596 598 496 515 482 606Fr Polynesia 1 1 1 2 1 4New Zealand 16911 16393 17109 15302 17953 11525 10756 11160 11002 11956 3150NewCaledonia 5 5 5 5 5 5 5 5 5 5 23Palau -8 -8 -8 -8 -8 -417Papua N Guin 8772 8772 8772 8597 8597 5958 5807 5761 6979 6610 1437Samoa 131 131 131 131 131 133 131 131 131 125 716Solomon Is 872 872 872 872 872 123 39 172 272 495 1187Tonga 5 5 5 4 2 5 5 5 5 4 41Vanuatu 63 63 63 63 63 60 60 63 63 61 338
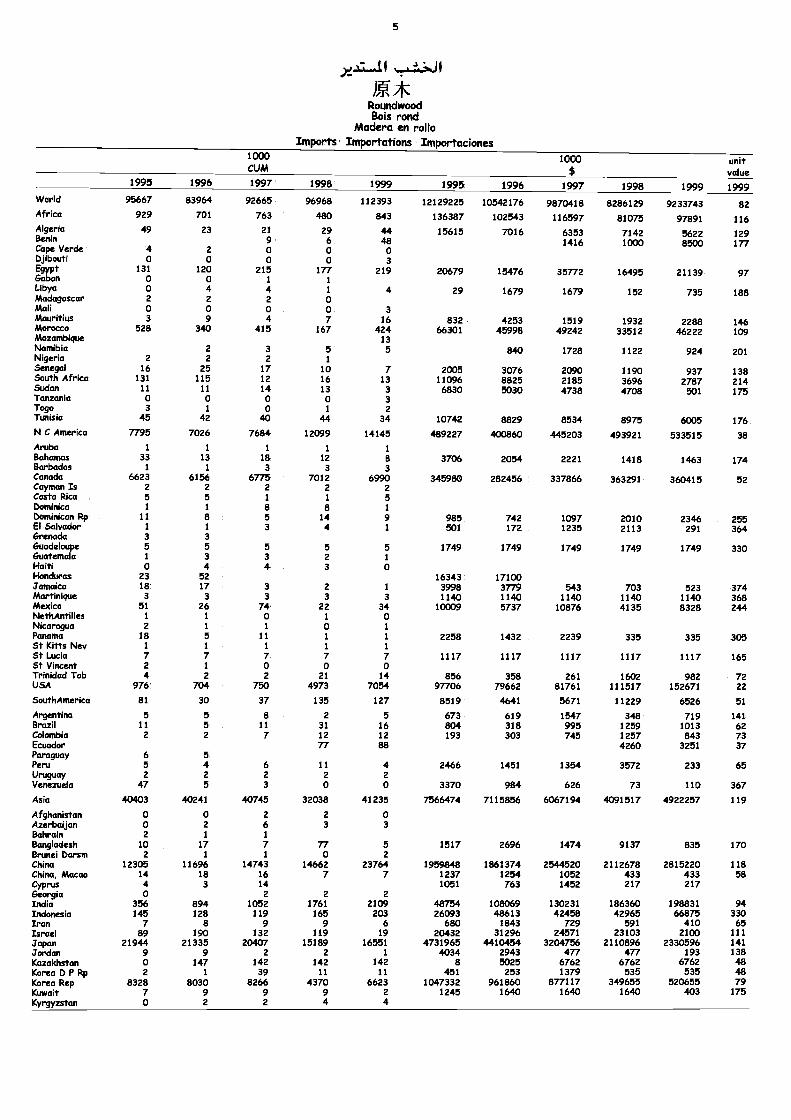
5
);,..4.4.
EY; *RoundwoodBois rond
Madera en rolloLnports Importations Importaciones
1000CUM
1000$
unitvalue
1995 1996 1997 1998 1999 1995 1996 1997 1998 1999 1999World 95667 83964 92665 96968 112393 12129225 10542176 9870418 8286129 9233743 82Africa 929 701 763 480 843 136387 102543 116597 81075 97891 116Algeria 49 23 21 29 44 15615 7016 6353 7142 5622 129BeninCape Verde 4 2
90
6o
480
1416 1000 8500 177
Djibouti o o o o 3EgyptGabon
1310
1200
2151
1771
219 20679 15476 35772 16495 21139 97LibyaMadagascar
02
42
42
1
04 29 1679 1679 152 735 188
Mali 0 0 0 0 3Mauritius 3 9 4 7 16 832 4253 1519 1932 2288 146Morocco 528 340 415 167 424 66301 45998 49242 33512 46222 109Mozambique 13Namibia 2 3 5 5 840 1728 1122 924 201Nigeria 2 2 2 1Senegal 16 25 17 10 7 2005 3076 2090 1190 937 138South Africa 131 115 12 16 13 11096 8825 2185 3696 2787 214Sudan 11 11 14 13 3 6830 5030 4738 4708 501 175Tanzania o o o 0 3Togo 3 1 0 1 2Ttmisia 45 42 40 44 34 10742 8829 8534 8975 6005 176N C America 7795 7026 7684 12099 14145 489227 400860 445203 493921 533515 38Aruba 1 1 1 1 1Bahamas 33 13 18 12 8 3706 2054 2221 1418 1463 174Barbados 1 1 3 3 3Canada 6623 6156 6775 7012 6990 345980 282456 337866 363291 360415 52Cayman Is 2 2 2 2 2Costa Rica 5 5 1 1 5Dominica 1 1 8 8 1
Dominican Rp 11 8 5 14 9 985 742 /097 2010 2346 255El Salvador 1 1 3 4 i 501 172 1235 2113 291 364Grenada 3 3Guadeloupe 5 5 5 5 5 1749 1749 1749 1749 1749 330Guatemala 1 3 3 2 1
Haiti 0 4 4 3 oHonduras 23 52 16343 17100Jamaica 18 17 3 2 1 3998 3779 543 703 523 374Martinique 3 3 3 3 3 1140 1140 1140 1140 1140 368Mexico 51 26 74 22 34 10009 5737 10876 4135 8328 244NethAntilles 1 1 0 1 0Nicaragua 2 1 1 0 1Panama 18 5 11 1 1 2258 1432 2239 335 335 305St Kitts Neil 1 1 1 1 1St Lucia 7 7 7 7 7 1117 1117 1117 1117 1117 165St Vincent 2 1 0 0 0Trinidad Tob 4 2 2 21 14 856 358 261 1602 982 72USA 976 704 750 4973 7054 97706 79662 81761 111517 152671 22
SouthAmerica 81 30 37 135 127 8519 4641 5671 11229 6526 51
Argentina 5 5 8 2 5 673 619 1547 348 719 141Brazil 11 5 11 31 16 804 318 995 1259 1013 62Colombia 2 2 7 12 12 193 303 745 1257 843 73Ecuador 77 88 4260 3251 37Paraguay 6 5Peru 5 4 6 11 4 2466 1451 1354 3572 233 65Uruguay 2 2 2 2 2Venezuela 47 5 3 0 0 3370 984 626 73 110 367Asia 40403 40241 40745 32038 41235 7566474 7115856 6067194 4091517 4922257 119
Afghanistan o 0 2 2 0Azerbaijan 0 2 6 3 3Bahrain 2 1 1
Bangladesh 10 17 7 77 5 1517 2696 1474 9137 835 170Brunei barsm 2 1 1 0 2China 12305 11696 14743 14662 23764 1959848 1861374 2544520 2112678 2815220 118China, Macao 14 18 16 7 7 1237 1254 1052 433 433 58Cyprus 4 3 14 1051 763 1452 217 217Georgia o 2 2 2India 356 894 1052 1761 2109 48754 108069 130231 186360 198831 94Indonesia 145 128 119 165 203 26093 48613 42458 42965 66875 330Iran 7 8 9 9 6 680 1843 729 591 410 65Israel 89 190 132 119 19 20432 31296 24571 23103 2100 111
TaPan 21944 21335 20407 15189 16551 4731965 4410454 3204756 2110896 2330596 141J'ordan 9 9 2 2 1 4034 2943 477 477 193 138Kazakhstan 0 147 142 142 142 8 5025 6762 6762 6762 48Korea D P Rp 2 1 39 11 11 451 253 1379 535 535 48Korea Rep 8328 8030 8266 4370 6623 1047332 961860 877117 349655 520655 79Kuwait 7 9 9 9 2 1245 1640 1640 1640 403 175Kyrgyzstan 0 2 2 4 4
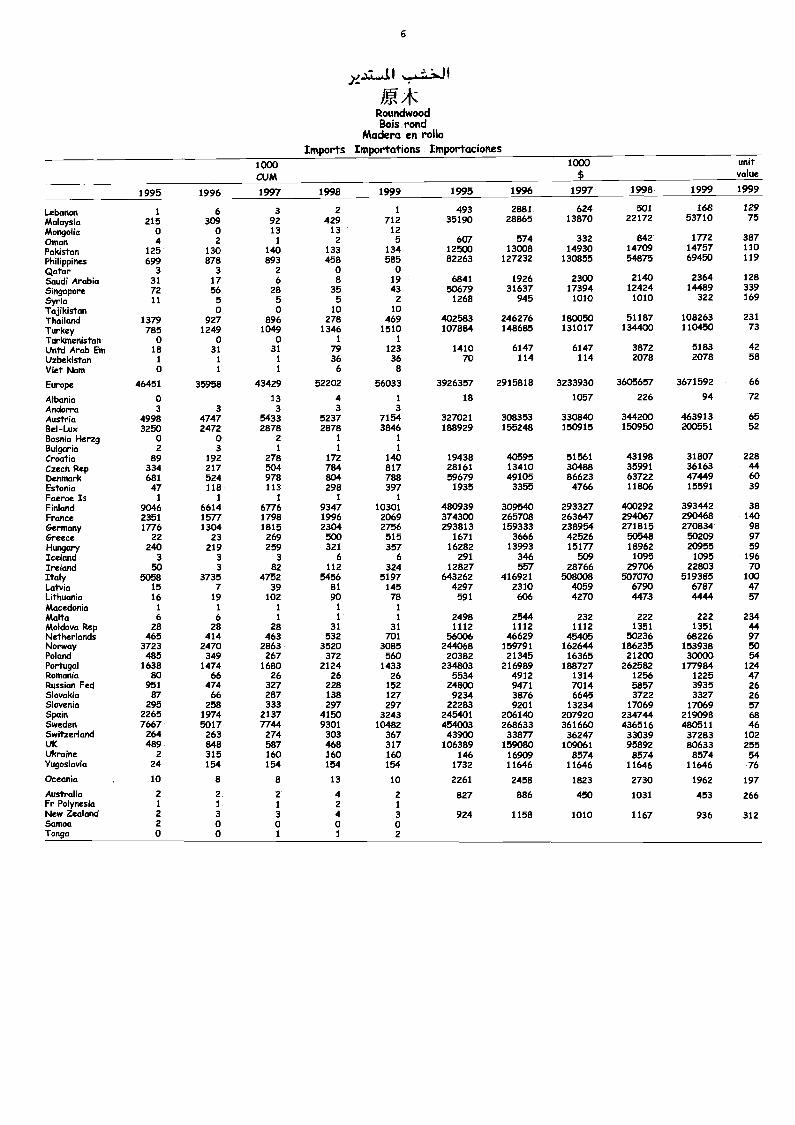
6
RoundwoodBois rond
Madera en rolloImports Importations importaciones
1000CUM
1000$
unitvalue
1995 1996 1997 1998 1999 1995 1996 1997 1998 1999 1999
Lebanon 1 6 3 2 1 493 2881 624 501 168 129
Malaysia 215 309 92 429 712 35190 28865 13870 22172 53710 75
Mongolia o o 13 13 12Oman 4 2 1 2 5 607 574 332 842 1772 387
Pakistan 125 130 140 133 134 12500 13008 14930 14709 14757 110
Philippines 699 878 893 458 585 82263 127232 130855 54875 69450 119
Qatar 3 3 2 0 0Saudi Arabia 31 17 6 8 19 6841 1926 2300 2140 2364 128
Singapore 72 56 28 35 43 50679 31637 17394 12424 14489 339
Syria 11 5 5 5 2 1268 945 1010 1010 322 169
Tajikistan 0 o 10 10Thailand 1379 927 896 278 469 402583 246276 180050 51187 108263 231
Turkey 785 1249 1049 1346 1510 107884 148685 131017 134400 110450 73
Turkmenistan 0 0 o I 1
Untd Arab Em 18 31 31 79 123 1410 6147 6147 3872 5183 42
Uzbekistan 1 1 1 36 36 70 114 114 2078 2078 58Viet Nam 0 1 1 6 8
Europe 46451 35958 43429 52202 56033 3926357 2915818 3233930 3605657 3671592 66
Albania 0 13 4 1 18 1057 226 94 72Andorra 3 3 3 3 3
Austria 4998 4747 5433 5237 7154 327021 308353 330840 344200 463913 65Bel-Lux 3250 2472 2878 2878 3846 188929 155248 150915 150950 200551 52Bosnia Herzg o o 2 1 1
Bulgaria 2 3 1 1 1
Croatia 89 192 278 172 140 19438 40595 51561 43198 31807 228Czech Rep 334 217 504 784 817 28161 13410 30488 35991 36163 44Denmark 681 524 978 804 788 59679 49105 86623 63722 47449 60Estonia 47 118 113 298 397 1935 3355 4766 11806 15591 39Faeroe Is 1 1 1 1 1
Finland 9046 6614 6776 9347 10301 480939 309540 293327 400292 393442 38France 2351 1577 1798 1996 2069 374300 265708 263647 294067 290468 140Germany 1776 1304 1815 2304 2756 293813 159333 238954 271815 270834 98Greece 22 23 269 500 515 1671 3666 42526 50548 50209 97Hungary 240 219 259 321 357 16282 13993 15177 18962 20955 59Iceland 3 3 3 6 6 291 346 509 1095 1095 196Ireland 50 3 82 112 324 12827 557 28766 29706 22803 70Italy 5058 3735 4752 5456 5197 643262 416921 508008 507070 519385 100Latvia 15 7 39 81 145 4297 2310 4059 6790 6787 47Lithuania 16 19 102 90 78 591 606 4270 4473 4444 57Macedonia 1 1 1 1 1
Malta 6 6 1 1 1 2498 2544 232 222 222 234Moldova Rep 28 28 28 31 31 1112 1112 1112 1351 1351 44Netherlands 465 414 463 532 701 56006 46629 45405 50236 68226 97Norway 3723 2470 2863 3520 3085 244068 159791 162644 186235 153938 50Poland 485 349 267 372 560 20382 21345 16365 21200 30000 54Portugal 1638 1474 1680 2124 1433 234803 216989 188727 262582 177984 124Romania 80 66 26 26 26 5534 4912 1314 1256 1225 47Russian Fed 951 474 327 228 152 24800 9471 7014 5857 3935 26Slovakia 87 66 287 138 127 9234 3876 6645 3722 3327 26Slovenia 295 258 333 297 297 22283 9201 13234 17069 17069 57Spain 2265 1974 2137 4150 3243 245401 206140 207920 234744 219098 68Sweden 7667 5017 7744 9301 10482 454003 268633 361660 436516 480511 46Switzerland 264 263 274 303 367 43900 33877 36247 33039 37283 102UK 489 848 587 468 317 106389 159080 109061 95892 80633 255Ukraine 2 315 160 160 160 146 16909 8574 8574 8574 54Yugoslavia 24 154 154 154 154 1732 11646 11646 11646 11646 76Oceania 10 8 8 13 10 2261 2458 1823 2730 1962 197Australia 2 2 2 4 2 827 886 450 1031 453 266Fr Polynesia 1 1 1 2 1
New Zealand 2 3 3 4 3 924 1158 1010 1167 936 312Samoa 2 0 0 o 0Tonga 0 0 1 1 2
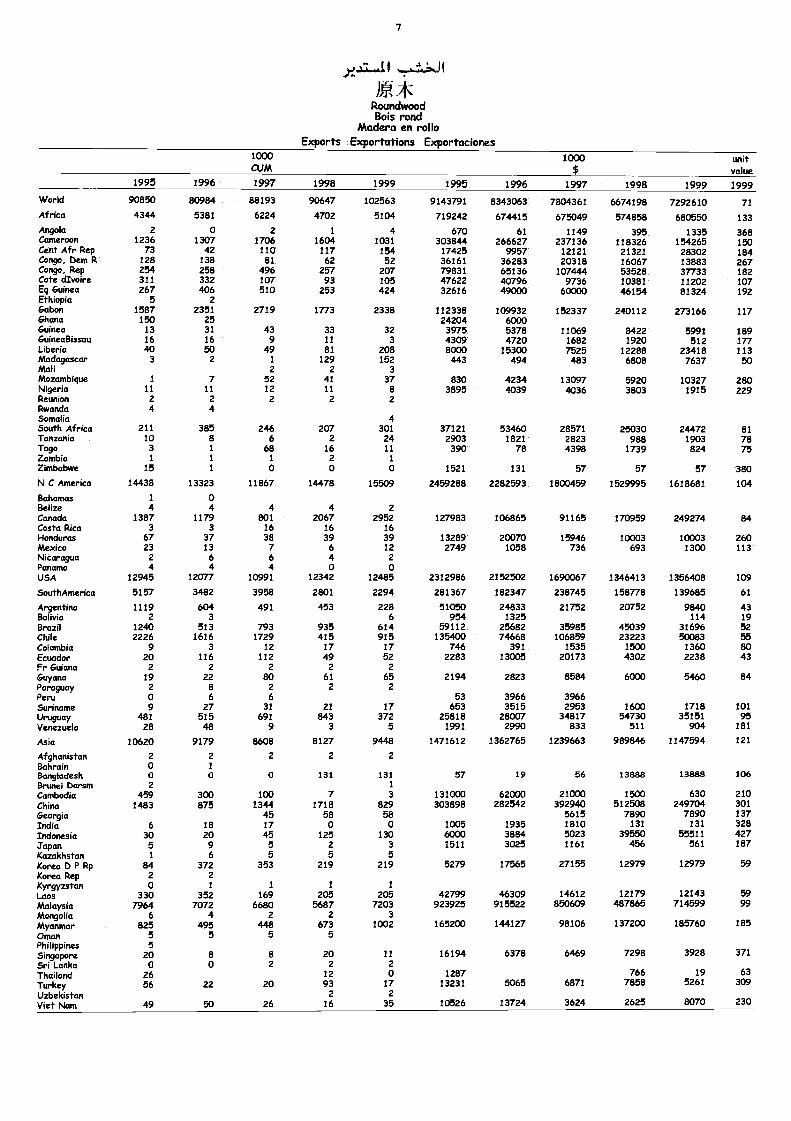
7
F.*RoundwoodBois rond
Madera en rolloExports Exportations Exportaciones
1000CUM
1000$
unitvalue
1995 1996 1997 1998 1999 1995 1996 1997 1998 1999 1999
World 90850 80984 88193 90647 102563 9143791 8343063 780436/ 6674198 7292610 71Africa 4344 5381 6224 4702 5104 719242 674415 675049 574858 680550 133Angola 2 o 2 1 4 670 61 1149 395 1335 368Cameroon 1236 1307 1706 1604 1031 303844 266627 237136 118326 154265 150Cent Afr Rep 73 42 110 117 154 17425 9957 12121 21321 28302 184Congo, Om R 128 138 81 62 52 36161 36283 20318 16067 13883 267Congo, Rep 254 258 496 257 207 79831 65136 107444 53528 37733 182Cote dIvoire 311 332 107 93 105 47622 40796 9736 10381 11202 107Eq Guinea 267 406 510 253 424 32616 49000 60000 46154 81324 192Ethiopia 5 2Gabon 1587 2351 2719 1773 2338 112338 109932 152337 240112 273166 117Ghana 150 25 24204 6000Guinea 13 31 43 33 32 3975 5378 11069 8422 5991 189GuineaBissau 16 16 9 11 3 4309 4720 1682 1920 512 177Liberia 40 50 49 81 208 8000 15300 7525 12288 23418 113Madagascar 3 2 1 129 152 443 494 483 6808 7637 50Mali 2 2 3Mozambique 1 7 52 41 37 830 4234 13097 5920 10327 280Nigeria 11 11 12 11 8 3895 4039 4036 3803 1915 229Reunion 2 2 2 2 2Rwanda 4 4Somalia 4South Africa 211 385 246 207 301 37121 53460 28571 25030 24472 81Tanzania 10 8 6 2 24 2903 1821 2823 988 1903 78Togo 3 1 68 16 11 390 78 4398 1739 824 75Zambia 1 1 1 2 1
Zimbabwe 15 1 o 0 o 1521 131 57 57 57 380
N C America 14438 13323 11867 14478 15509 2459288 2282593 1800459 1529995 1618681 104
Bahamas 1 oBelize 4 4 4 4 2Canada 1387 1179 801 2067 2952 127983 106865 91165 170959 249274 84Costa Rica 3 3 16 16 16Honduras 67 37 38 39 39 13289 20070 15946 10003 10003 260Mexico 23 13 7 6 12 2749 1058 736 693 1300 113Nicaragua 2 6 6 4 2Panama 4 4 4 o oUSA 12945 12077 10991 12342 12485 2312986 2152502 1690067 1346413 1356408 109
SouthAmerica 5157 3482 3958 2801 2294 281367 182347 238745 158778 139685 61
Argentina 1119 604 491 453 228 51050 24833 21752 20752 9840 43Bolivia 2 3 6 954 1325 114 19Brazil 1240 513 793 935 614 59112 25682 35985 45039 31696 52Chile 2226 1616 1729 415 915 135400 74668 106859 23223 50083 55Colombia 9 3 12 17 17 746 391 1535 1500 1360 80Ecuador 20 116 112 49 52 2283 13005 20173 4302 2238 43Fr Guiana 2 2 2 2 2Guyana 19 22 80 61 65 2194 2823 8584 6000 5460 84Paraguay 2 a 2 2 2Peru 0 6 6 53 3966 3966Suriname 9 27 31 21 17 653 3515 2953 1600 1718 101Uruguay 481 515 691 843 372 25818 28007 34817 54730 35151 95Venezuela 28 48 9 3 5 1991 2990 833 511 904 181
Asia 10620 9179 8608 8127 9448 1471612 1362765 1239663 989846 1147594 121
Afghanistan 2 2 2 2 2Bahrain o 1
Bangladesh o o o 131 131 57 19 56 13888 13888 106Brunei barsm 2 1
Cambodia 459 300 100 7 3 131000 62000 21000 1500 630 210China 1483 875 1344 1718 829 303898 282542 392940 512508 249704 301
Georgia 45 58 58 5615 7890 7890 137India 6 18 17 o 0 1005 1935 1810 131 131 328Indonesia 30 20 45 125 130 6000 3884 5023 39550 55511 427Japan 5 9 5 2 3 1511 3025 1161 456 561 187Kazakhstan 1 6 5 5 5Korea b P Rp 84 372 353 219 219 5279 17565 27155 12979 12979 59Korea Rep 2 2Kyrgyzstan o 1 1 1 1
Laos 330 352 169 205 205 42799 46309 14612 12179 12143 59Malaysia 7964 7072 6680 5687 7203 923925 915522 850609 487865 714599 99Mongolia 6 4 2 2 3Myanmar 825 495 448 673 1002 165200 144127 98106 137200 185760 185
Oman 5 5 5 5Philippines 5Singapore 20 8 8 20 11 16194 6378 6469 7298 3928 371
Sri Lanka 0 0 2 2 2Thailand 26 12 0 1287 766 19 63Turkey 56 22 20 93 17 13231 5065 6871 7858 5261 309
Uzbekistan 2 2
Viet Nam 49 50 26 16 35 10526 13724 3624 2625 8070 230
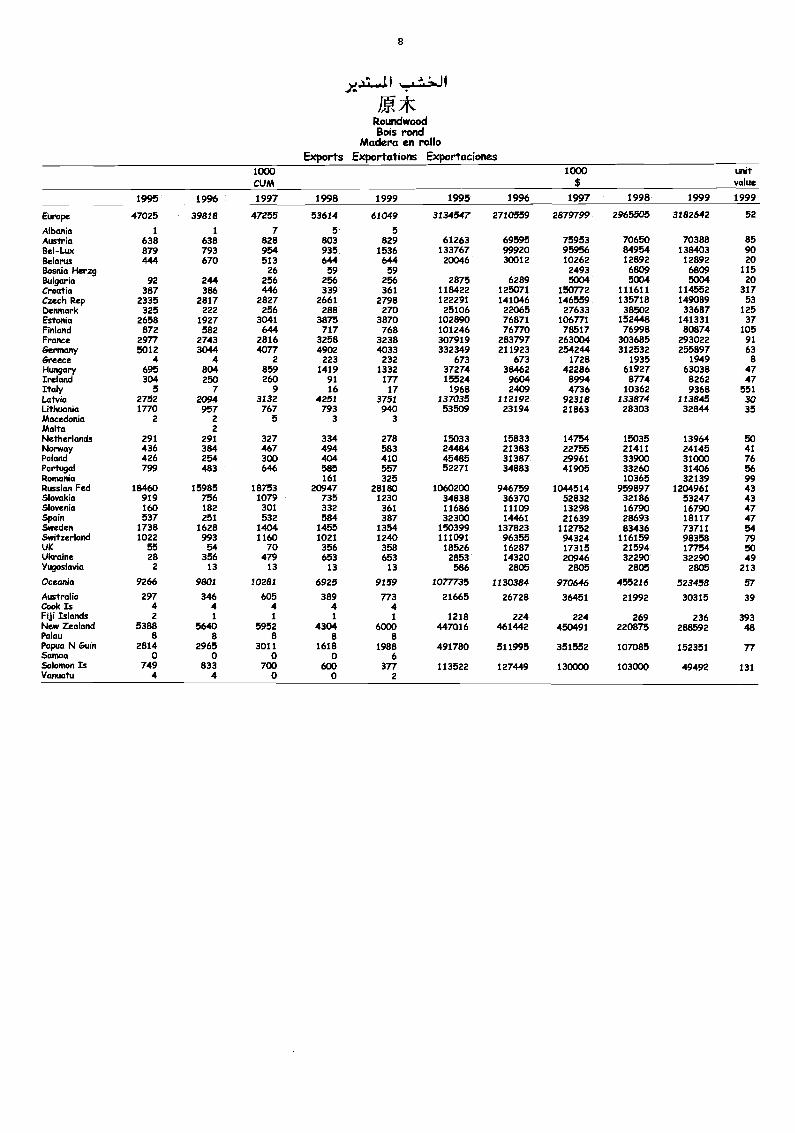
8
'J1
JP:RoundwoodBois rond
Madera en rolloExports Exportations Exportaciones
1000CUM
1000$
unitvalue
1995 1996 1997 1998 1999 1995 1996 1997 1998 1999 1999
Europe 47025 39818 47255 53614 61049 3134547 2710559 2879799 2965505 3182642 52
Albania 1 1 7 5 5Austria 638 638 828 803 829 61263 69595 75953 70650 70388 85Bel-Lux 879 793 954 935 1536 133767 99920 95956 84954 138403 90Belarus 444 670 513 644 644 20046 30012 10262 12892 12892 20Bosnia Hang 26 59 59 2493 6809 6809 115Bulgaria 92 244 256 256 256 2875 6289 5004 5004 5004 20Croatia 387 386 446 339 361 118422 125071 150772 111611 114552 317Czech Rep 2335 2817 2827 2661 2798 122291 141046 146559 135718 149089 53Denmark 325 222 256 288 270 25106 22065 27633 38502 33687 125Estonia 2658 1927 3041 3875 3870 102890 76871 106771 152448 141331 37Finland 872 582 644 717 768 101246 76770 78517 76998 80874 105France 2977 2743 2816 3258 3238 307919 283797 263004 303685 293022 91Germany 5012 3044 4077 4902 4033 332349 211923 254244 312532 255897 63Greece 4 4 2 223 232 673 673 1728 1935 1949 8Hungary 695 804 859 1419 1332 37274 38462 42286 61927 63038 47Ireland 304 250 260 91 177 15524 9604 8994 8774 8262 47Italy 5 7 9 16 17 1968 2409 4736 10362 9368 551Latvia 2752 2094 3132 4251 3751 137035 112192 92318 133874 113845 30Lithuania 1770 957 767 793 940 53509 23194 21863 28303 32844 35Macedonia 2 2 5 3 3Malta 2Netherlands 291 291 327 334 278 15033 15833 14754 15035 13964 50Norway 436 384 467 494 583 24484 21383 22755 21411 24145 41Poland 426 254 300 404 410 45485 31387 29961 33900 31000 76Portugal 799 483 646 585 557 52271 34883 41905 33260 31406 56Romania 161 325 10365 32139 99Russian Fed 18460 15985 18753 20947 28180 1060200 946759 1044514 959897 1204961 43Slovakia 919 756 1079 735 1230 34838 36370 52832 32186 53247 43Slovenia 160 182 301 332 361 11686 11109 13298 16790 16790 47Spain 537 251 532 584 387 32300 14461 21639 28693 18117 47Sweden 1738 1628 1404 1455 1354 150399 137823 112752 83436 73711 54Switzerland 1022 993 1160 1021 1240 111091 96355 94324 116159 98358 79UK 55 54 70 356 358 18526 16287 17315 21594 17754 50Ukraine 28 356 479 653 653 2853 14320 20946 32290 32290 49Yugoslavia 2 13 13 13 13 586 2805 2805 2805 2805 213Oceania 9266 9801 10281 6925 9159 1077735 1130384 970646 455216 523458 57Australia 297 346 605 389 773 21665 26728 36451 21992 30315 39Cook Is 4 4 4 4 4Fkli Islands 2 1 1 1 1 1218 224 224 269 236 393New Zealand 5388 5640 5952 4304 6000 447016 461442 450491 220875 288592 asPalau 8 8 8 8 8Papua N Guin 2814 2965 3011 1618 1988 491780 511995 351552 107085 152351 77Samoa 0 0 0 0 6Solomon Is 749 833 700 600 377 113522 127449 130000 103000 49492 131Vanuatu 4 4 0 0 2
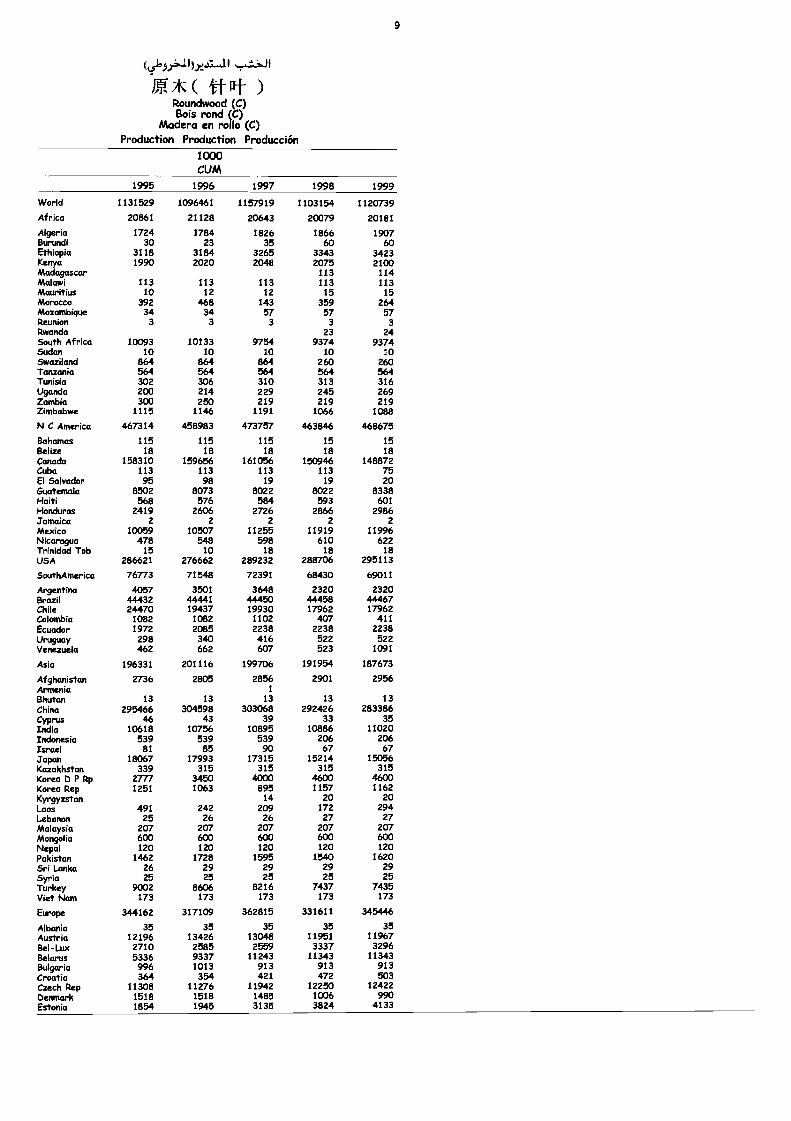
E21( )Roundwood (C)Bois rond (C)
Madera en rollo (C)Production Production Producción
1000CUM
9
1995 1996 1997 1998 1999
World 1131529 1096461 1157919 1103154 1120739
Africa 20861 21128 20643 20079 20181
Algeria 1724 1784 1826 1866 1907Burundi 30 23 35 60 60Ethiopia 3118 3184 3265 3343 3423Kenya 1990 2020 2048 2075 2100Madagascar 113 114Malawi 113 113 113 113 113Mauritius 10 12 12 15 15Morocco 392 468 143 359 264Mozambique 34 34 57 57 57Reunion 3 3 3 3 3Rwanda 23 24South Africa 10093 10133 9754 9374 9374Sudan 10 10 10 10 10Swaziland 864 864 864 260 260Tanzania 564 564 564 564 564Tunisia 302 306 310 313 316Uganda 200 214 229 245 269Zambia 300 250 219 219 219Zimbabwe 1115 1146 1191 1066 1088
N C America 467314 458983 473757 463846 468675
Bahamas 115 115 115 15 15Belize 18 18 18 18 18Canada 158310 159656 161056 150946 148872Cuba 113 113 113 113 75El Salvador 95 98 19 19 20Guatemala 8502 8073 8022 8022 8338Haiti 568 576 584 593 601Honduras 2419 2606 2726 2866 2986Jamaica 2 2 2 2 2Mexico 10059 10507 11255 11919 11996Nicaragua 478 548 598 610 622Trinidad Tob 15 10 18 18 18USA 286621 276662 289232 288706 295113
SouthAmerica 76773 71548 72391 68430 69011
Argentina 4057 3501 3648 2320 2320Brazil 44432 44441 44450 44458 44467Chile 24470 19437 19930 17962 17962Colombia 1082 1082 1102 407 411Ecuador 1972 2085 2238 2238 2238Uruguay 298 340 416 522 522Venezuela 462 662 607 523 1091
Asia 196331 201116 199706 191954 187673
Afghanistan 2736 2805 2856 2901 2956Armenia 1
Bhutan 13 13 13 13 13China 295466 304598 303068 292426 283386Cyprus 46 43 39 33 35India 10618 10756 10895 10886 11020Indonesia 539 539 539 206 206Israel 81 85 90 67 67Japan 18067 17993 17315 15214 15056Kazakhstan 339 315 315 315 315Korea b P Rp 2777 3450 4000 4600 4600Korea Rep 1251 1063 895 1157 1162Kyrgyzstan 14 20 20Laos 491 242 209 172 294Lebanon 25 26 26 27 27Malaysia 207 207 207 207 207Mongolia 600 600 600 600 600Nepal 120 120 120 120 120Pakislan 1462 1728 1595 1540 1620Sri Lanka 26 29 29 29 29Syria 25 25 25 25 25Turkey 9002 8606 8216 7437 7435Viet Nam 173 173 173 173 173
Europe 344162 317109 362815 331611 345446
Albania 35 35 35 35 35Austria 12196 13426 13048 11951 11967Bel-Lux 2710 2585 2559 3337 3296Belams 5336 9337 11243 11343 11343Bulgaria 996 1013 913 913 913Croatia 364 354 421 472 503Czech Rep 11308 11276 11942 12250 12422beninark 1518 1518 1485 1006 990Estonia 1854 1945 3135 3824 4133
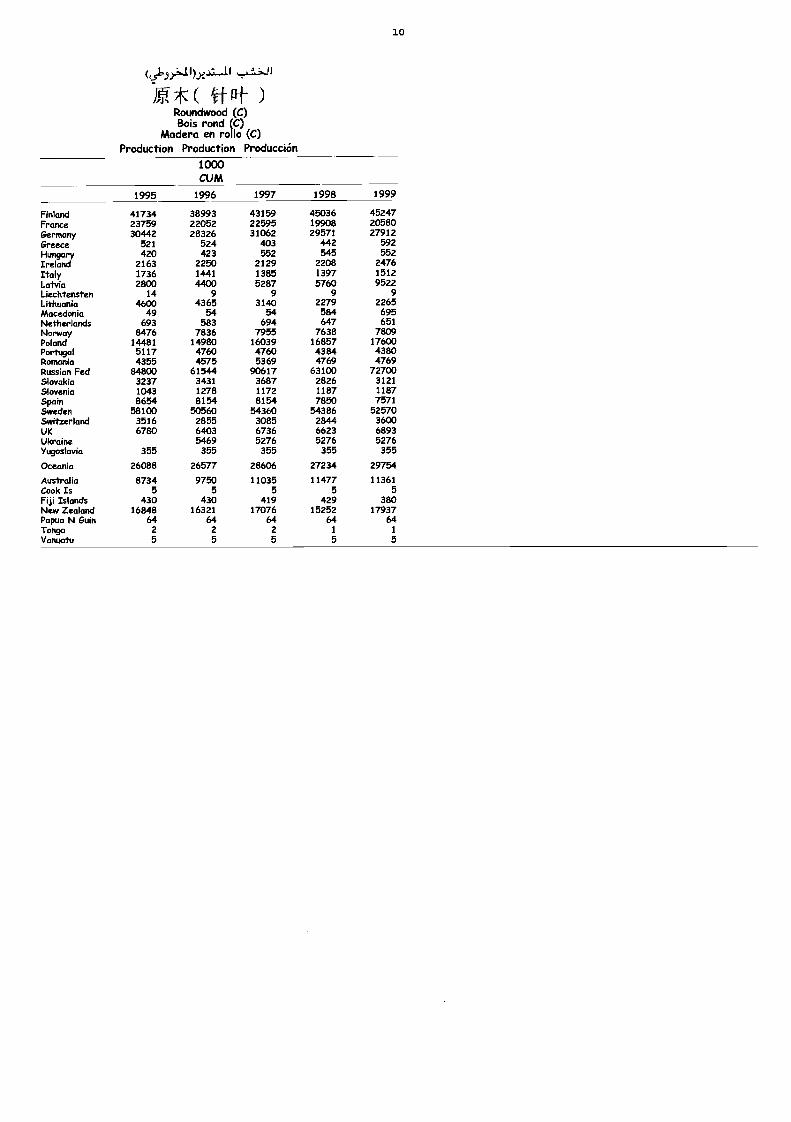
Roundwood (C)Bois rond (C)
Madera en rollo (C)Production Production Producción
1000CUM
10
1995 1996 1997 1998 1999
Finland 41734 38993 43159 45036 45247France 23759 22052 22595 19908 20580Germany 30442 28326 31062 29571 27912Greece 521 524 403 442 592Hungary 420 423 552 545 552Ireland 2163 2250 2129 2208 2476Italy 1736 1441 1385 1397 1512Latvia 2800 4400 5287 5760 9522Liechtensten 14 9 9 9 9Lithuania 4600 4365 3140 2279 2265Macedonia 49 54 54 584 695Netherlands 693 583 694 647 651Norway 8476 7836 7955 7638 7809Poland 14481 14980 16039 16857 17600Portugal 5117 4760 4760 4384 4380Romania 4355 4575 5369 4769 4769Russian Fed 84800 61544 90617 63100 72700Slovakia 3237 3431 3687 2826 3121Slovenia 1043 1278 1172 1187 1187SPoin 8654 8154 8154 7850 7571Sweden 58100 50560 54360 54386 52570Switzerland 3516 2855 3085 2844 3600UK 6780 6403 6736 6623 6893Ukraine 5469 5276 5276 5276Yugoslavia 355 355 355 355 355
Oceania 26088 26577 28606 27234 29754
Australia 8734 9750 11035 11477 11361Cook Is 5 5 5 5 5Fiji Islands 430 430 419 429 380New Zealand 16848 16321 17076 15252 17937Papua N Guin 64 64 64 64 64Tonga 2 2 2 1 1
Vanuatu 5 5 5 5 5
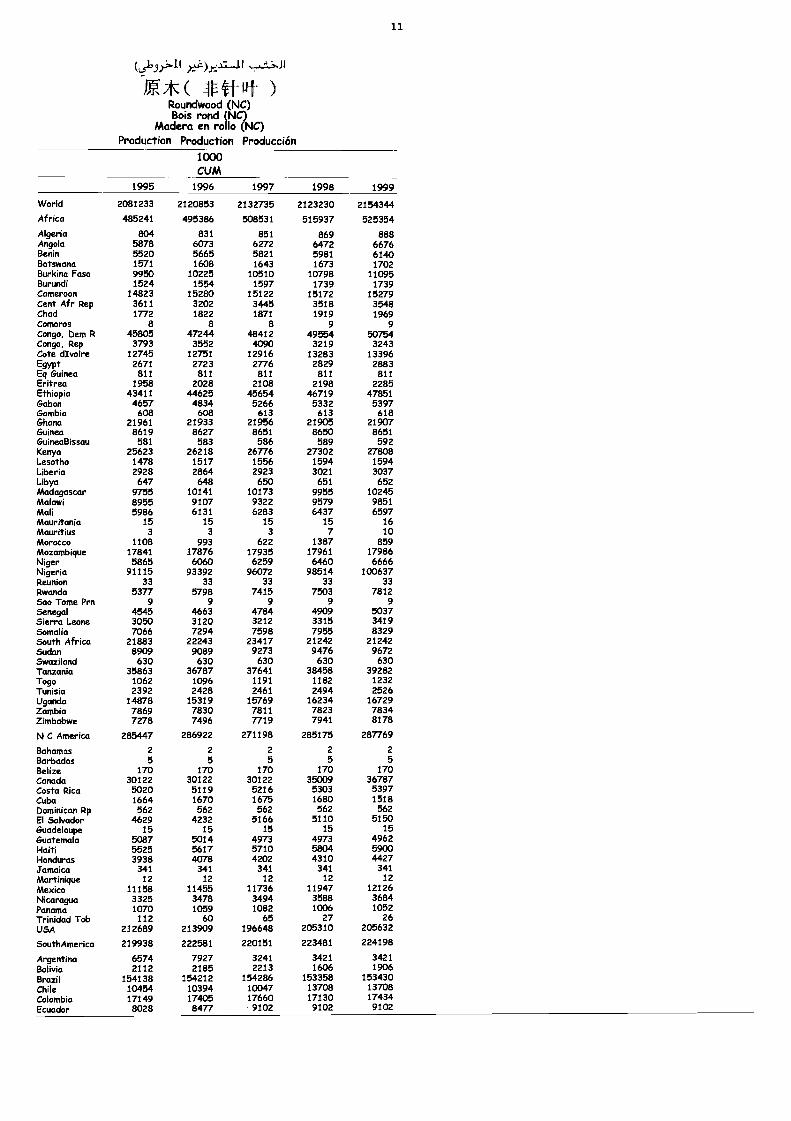
(L513).41 );.....e.b.4.a....11 i.JI
E*( 1M-Ift )Roundwood (NC)Bois rond (NC)
Madera en rollo (NC)Production Production Producción
1000CUM
11
1995 1996 1997 1998 1999
World 2081233 2120853 2132735 2123230 2154344
Africa 485241 495386 508531 515937 525354
Algeria 804 831 851 869 888Angola 5878 6073 6272 6472 6676Benin 5520 5665 5821 5981 6140Botswana 1571 1608 1643 1673 1702Burkina Faso 9950 10225 10510 10798 11095Burundi 1524 1554 1597 1739 1739Cameroon 14823 15280 15122 15172 15279Cent Afr Rep 3611 3202 3445 3518 3548Chad 1772 1822 1871 1919 1969Camoros 8 8 8 9 9Congo, Dem R 45805 47244 48412 49554 50754Congo, Rep 3793 3552 4090 3219 3243Cote dIvoire 12745 12751 12916 13283 13396Egypt 2671 2723 2776 2829 2883Eq Guinea 811 811 811 811 811Eritrea 1958 2028 2108 2198 2285EtMopia 43411 44625 45654 46719 47851Gabon 4657 4834 5266 5332 5397Gambia 608 608 613 613 618Ghana 21961 21933 21956 21905 21907Guinea 8619 8627 8651 8650 8651GuMeaBissau 581 583 586 589 592Kenya 25623 26218 26776 27302 27808Lesotho 1478 1517 1556 1594 1594Liberia 2928 2864 2923 3021 3037Libya 647 648 650 651 652Madagascar 9755 10141 10173 9955 10245Malawi 8955 9107 9322 9579 9851Mali 5986 6131 6283 6437 6597Mauritania 15 15 15 15 16Mauritius 3 3 3 7 10Morocco 1108 993 622 1387 859Mozambique 17841 17876 17935 17961 17986Niger 5865 6060 6259 6460 6666Nigeria 91115 93392 96072 98514 100637Reunkm 33 33 33 33 33Rwanda 5377 5798 7415 7503 7812Sao Tome Prn 9 9 9 9 9Senegal 4545 4663 4784 4909 5037Sierra Leone 3050 3120 3212 3315 3419Somalia 7066 7294 7598 7955 8329South Africa 21883 22243 23417 21242 21242Sudan 8909 9089 9273 9476 9672Swazfland 630 630 630 630 630Tanzania 35863 36787 37641 38458 39282Togo 1062 1096 1191 1182 1232Tunisia 2392 2428 2461 2494 2526Uganda 14878 15319 15769 16234 16729Zambia 7869 7830 7811 7823 7834Zimbabwe 7278 7496 7719 7941 8178
NC America 285447 286922 271198 285175 287769
Bahamas 2 2 2 2 2Barbados 5 5 5 5 5Befize 170 170 170 170 170Canada 30122 30122 30122 35009 36787Costa Rica 5020 5119 5216 5303 5397Cuba 1664 1670 1675 1680 1518Dominican Rp 562 562 562 562 562ElSahmdor 4629 4232 5166 5110 5150Guaddoupe 15 15 15 15 15Guatemala 5087 5014 4973 4973 4962Haiti 5525 5617 5710 5804 5900Honduras 3938 4078 4202 4310 4427Jamaica 341 341 341 341 341Minlinkrue 12 12 12 12 12Mexico 11158 11455 11736 11947 12126Nicaragua 3325 3478 3494 3588 3684Panama 1070 1059 1082 1006 1052Trinidad Tob 112 60 65 27 26USA 212689 213909 196648 205310 205632
SouthAmerica 219938 222581 220151 223481 224198
Argentina 6574 7927 3241 3421 3421Bolivia 2112 2185 2213 1606 1906Brazil 154138 154212 154286 153358 153430Chile 10454 10394 10047 13708 13708Colombia 17149 17405 17660 17130 17434Ecuador 8028 8477 9102 9102 9102
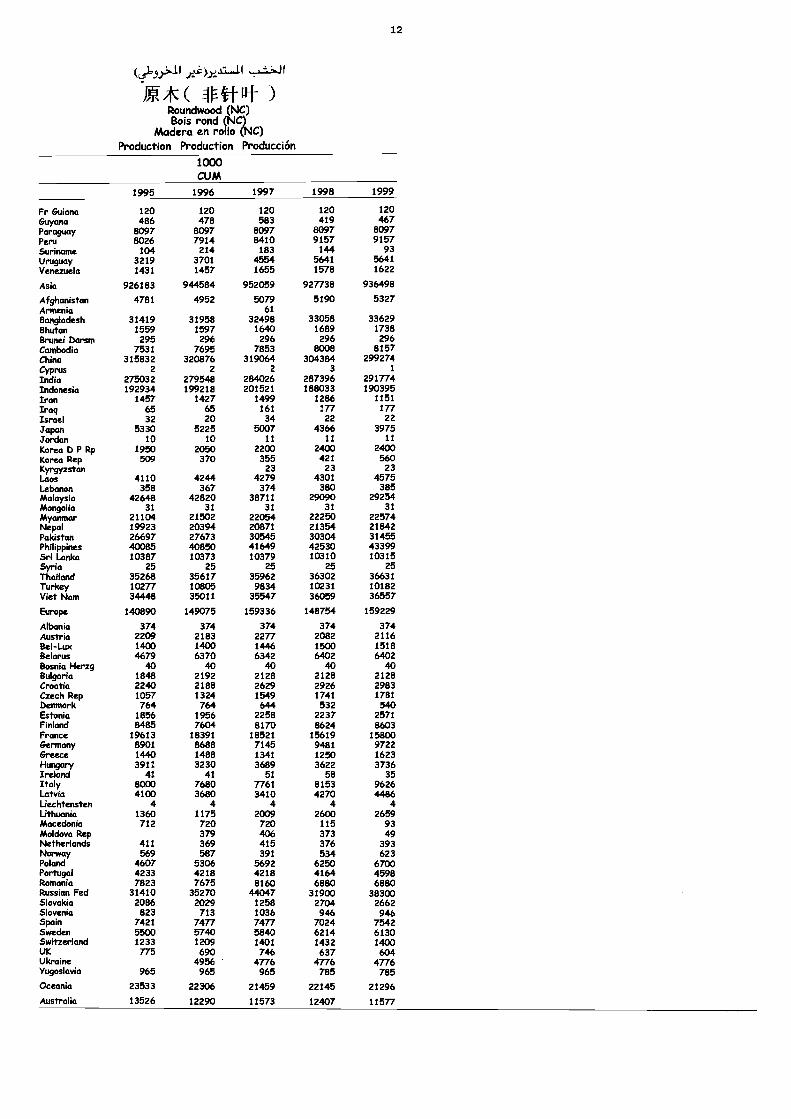
Jp--*( [FFRoundwood (NC)Bois rond (NC)
Madera en rollo (NC)Production Production Producción
1000CUM
12
1995 1996 1997 1998 1999
Fr Guiana 120 120 120 120 120Guyana 486 478 583 419 467Paraguay 8097 8097 8097 8097 8097Peru 8026 7914 8410 9157 9157Suriname 104 214 183 144 93Uruguay 3219 3701 4554 5641 5641Venezuela 1431 1457 1655 1578 1622
Asia 926183 944584 952059 927738 936498
Afghanistan 4781 4952 5079 5190 5327Armenia 61Bangladesh 31419 31958 32498 33058 33629Bhutan 1559 1597 1640 1689 1738Brunei Darsm 295 296 296 296 296Cambodia 7531 7695 7853 8008 8157China 315832 320876 319064 304384 299274Cyprus 2 2 2 3 1
India 275032 279548 284026 287396 291774Indonesia 192934 199218 201521 188033 190395Iran 1457 1427 1499 1286 1151Iraq 65 65 161 177 177Israel 32 20 34 22 22
JaPan 5330 5225 5007 4366 3975Jordan 10 10 11 11 11
Korea D P Rp 1950 2050 2200 2400 2400Korea Rep 509 370 355 421 560Kyrgyzstan 23 23 23Laos 4110 4244 4279 4301 4575Lebanon 358 367 374 380 385Malaysia 42648 42820 38711 29090 29254Mongolia 31 31 31 31 31Myanmar 21104 21502 22054 22250 22574Nepal 19923 20394 20871 21354 21842Pakistan 26697 27673 30545 30304 31455Philippines 40085 40850 41649 42530 43399Sri Lanka 10387 10373 10379 10310 10315Syria 25 25 25 25 25Thailand 35268 35617 35962 36302 36631Turkey 10277 10805 9834 10231 10182Viet Nam 34448 35011 35547 36059 36557
Europe 140890 149075 159336 148754 159229
Albania 374 374 374 374 374Austria 2209 2183 2277 2082 2116Bel-Lux 1400 1400 1446 1500 1518Belarus 4679 6370 6342 6402 6402Bosnia Herzg 40 40 40 40 40Bulgaria 1848 2192 2128 2128 2128Croatia 2240 2188 2629 2926 2983Czech Rep 1057 1324 1549 1741 1781Demaark 764 764 644 532 540Estonia 1856 1956 2258 2237 2571Finland 8485 7604 8170 8624 8603France 19613 18391 18521 15619 15800Germany 8901 8688 7145 9481 9722Greece 1440 1488 1341 1250 1623Hun9arY 3911 3230 3689 3622 3736Ireland 41 41 51 58 35Italy 8000 7680 7761 8153 9626Latvia 4100 3680 3410 4270 4486Liechtensten 4 4 4 4 4Lithuania 1360 1175 2009 2600 2659Macedonia 712 720 720 115 93Moldova Rep 379 406 373 49Netherlands 411 369 415 376 393Norway 569 587 391 534 623Poland 4607 5306 5692 6250 6700Portugal 4233 4218 4218 4164 4598Romania 7823 7675 8160 6880 6880Russian Fed 31410 35270 44047 31900 38300Slovakia 2086 2029 1258 2704 2662Slovenia 823 713 1036 946 946Spain 7421 7477 7477 7024 7542Sweden 5500 5740 5840 6214 6130Switzerland 1233 1209 1401 1432 1400UK 775 690 746 637 604Ukraine 4956 4776 4776 4776Yugoslavia 965 965 965 785 785Oceania 23533 22306 21459 22145 21296Australia 13526 12290 11573 12407 11577
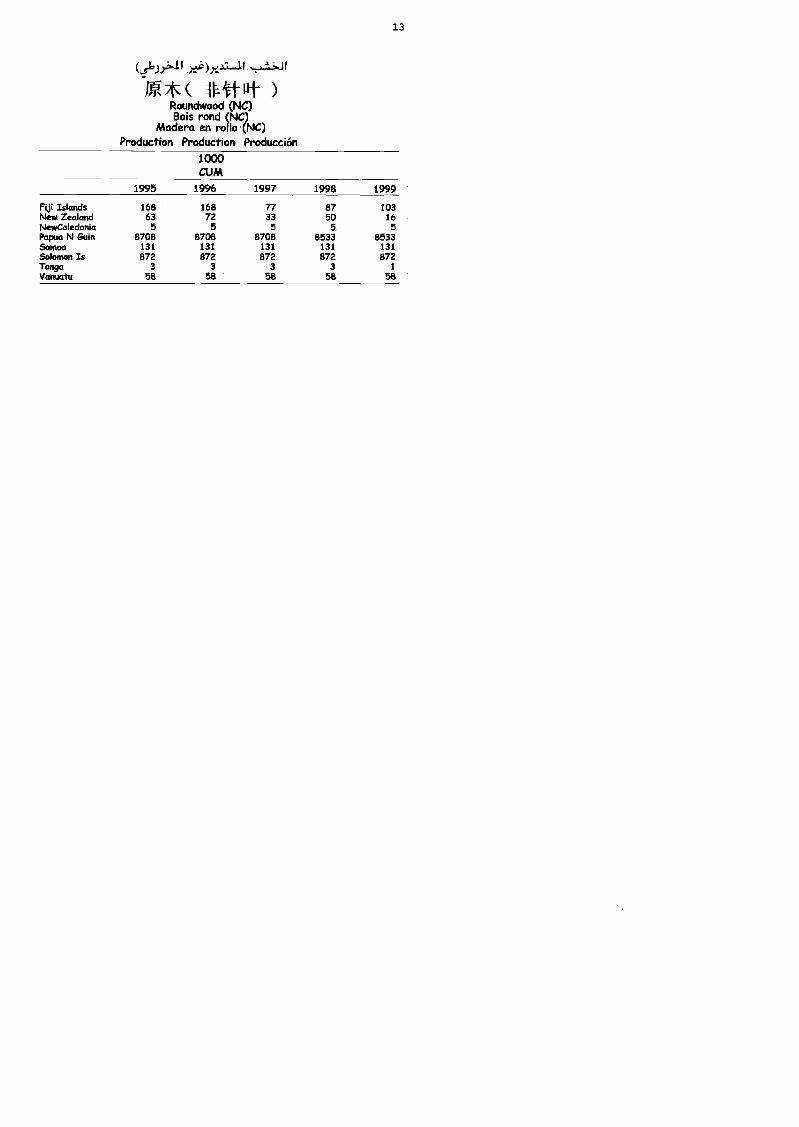
N-N*( -1t )Roundwood (NC)Bois rond (NC)
Madera en rollo (NC)Production Production Producción
1000CUM
13
1995 1996 1997 1998 1999
Fip Islands 168 168 77 87 103New Zealand 63 72 33 50 16NewCaledonia 5 5 5 5 5Papua N Guin 8708 8708 8708 8533 8533Samoa 131 131 131 131 131Solomon Is 872 872 872 872 872Tonga 3 3 3 3 1
Vanuatu 58 58 58 58 58
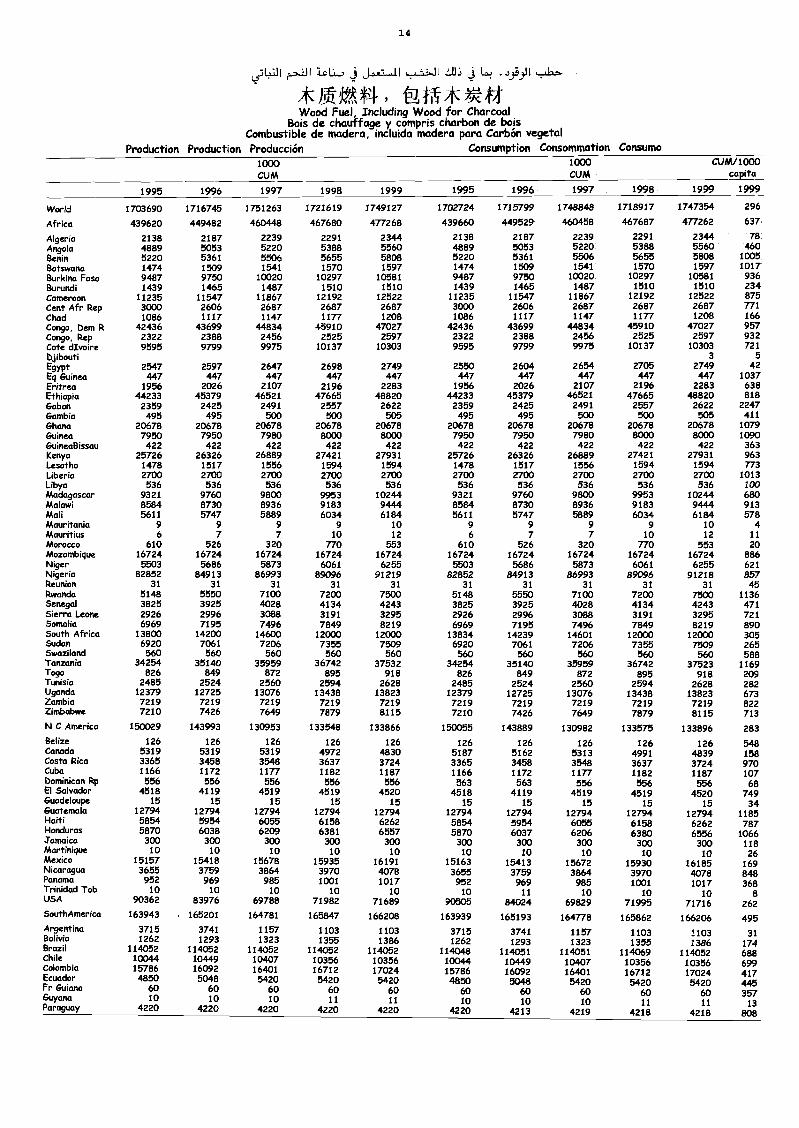
14
0.3111 ic1, j JAA.5..11 ;IL) j L..iJI
M* 44Wood Fuel, Including Wood for Charcoal
Bois de chauffage y compris charbon de boisCombustible de madera, incluida madera para Carbón vegetal
Production Production Producción Consumption Consommation Consumo1000CUM
1000CUM
CUM/1000capita
1995 1996 1997 1998 1999 1995 1996 1997 1998 1999 1999
World 1703690 1716745 1751263 1721619 1749127 1702724 1715799 1748848 1718917 1747354 296
Africa 439620 449482 460448 467680 477268 439660 449529 460458 467687 477262 637
Algeria 2138 2187 2239 2291 2344 2138 2187 2239 2291 2344 78Angola 4889 5053 5220 5388 5560 4889 5053 5220 5388 5560 460Benin 5220 5361 5506 5655 5808 5220 5361 5506 5655 5808 1005Botswana 1474 1509 1541 1570 1597 1474 1509 1541 1570 1597 1017Burkina Faso 9487 9750 10020 10297 10581 9487 9750 10020 10297 10581 936Burundi 1439 1465 1487 1510 1510 1439 1465 1487 1510 1510 234Cameroon 11235 11547 11867 12192 12522 11235 11547 11867 12192 12522 875Cent Afr Ftep 3000 2606 2687 2687 2687 3000 2606 2687 2687 2687 771Chad 1086 1117 1147 1177 1208 1086 1117 1147 1177 1208 166Congo, Dem R 42436 43699 44834 45910 47027 42436 43699 44834 45910 47027 957Congo, Rep 2322 2388 2456 2525 2597 2322 2388 2456 2525 2597 932Cote dIvoire 9595 9799 9975 10137 10303 9595 9799 9975 10137 10303 721Djibouti 3 5Egypt 2547 2597 2647 2698 2749 2550 2604 2654 2705 2749 42Eq Guinea 447 447 447 447 447 447 447 447 447 447 1037Eritrea 1956 2026 2107 2196 2283 1956 2026 2107 2196 2283 638Ethiopia 44233 45379 46521 47665 48820 44233 45379 46521 47665 48820 818Gabon 2359 2425 2491 2557 2622 2359 2425 2491 2557 2622 2247Gambia 495 495 500 500 505 495 495 500 500 505 411Ghana 20678 20678 20678 20678 20678 20678 20678 20678 20678 20678 1079Guinea 7950 7950 7980 8000 8000 7950 7950 7980 8000 8000 1090GuineaBissau 422 422 422 422 422 422 422 422 422 422 363Kenya 25726 26326 26889 27421 27931 25726 26326 26889 27421 27931 963Lesotho 1478 1517 1556 1594 1594 1478 1517 1556 1594 1594 773Liberia 2700 2700 2700 2700 2700 2700 2700 2700 2700 2700 1013Libya 536 536 536 536 536 536 536 536 536 536 100Madagascar 9321 9760 9800 9953 10244 9321 9760 9800 9953 10244 680Malawi 8584 8730 8936 9183 9444 8584 8730 8936 9183 9444 913Mali 5611 5747 5889 6034 6184 5611 5747 5889 6034 6184 578Mauritania 9 9 9 9 10 9 9 9 9 10 4Mauritius 6 7 7 10 12 6 7 7 10 12 11Ahorocco 610 526 320 770 553 610 526 320 770 553 20Mozambique 16724 16724 16724 16724 16724 16724 16724 16724 16724 16724 886Niger 5503 5686 5873 6061 6255 5503 5686 5873 6061 6255 621Nigeria 82852 84913 86993 89096 91219 82852 84913 86993 89096 91218 857Reunion 31 31 31 31 31 31 31 31 31 31 45Rwanda 5148 5550 7100 7200 7500 5148 5550 7100 7200 7500 1136Senegal 3825 3925 4028 4134 4243 3825 3925 4028 4134 4243 471Sierra Leone 2926 2996 3088 3191 3295 2926 2996 3088 3191 3295 721Somalia 6969 7195 7496 7849 8219 6969 7195 7496 7849 8219 890South Africa 13800 14200 14600 12000 12000 13834 14239 14601 12000 12000 305Sudan 6920 7061 7206 7355 7509 6920 7061 7206 7355 7509 265Swaziland 560 560 560 560 560 560 560 560 560 560 588Tanzania 34254 35140 35959 36742 37532 34254 35140 35959 36742 37523 11691-090 826 849 872 895 918 826 849 872 895 918 209Tunisia 2485 2524 2560 2594 2628 2485 2524 2560 2594 2628 282Uganda 12379 12725 13076 13438 13823 12379 12725 13076 13438 13823 673Zambia 7219 7219 7219 7219 7219 7219 7219 7219 7219 7219 822Zimbabwe 7210 7426 7649 7879 8115 7210 7426 7649 7879 8115 713N C America 150029 143993 130953 133548 133866 150055 143889 130982 133575 133896 283Belize 126 126 126 126 126 126 126 126 126 126 548Canada 5319 5319 5319 4972 4830 5187 5162 5313 4991 4839 158Costa Rica 3365 3458 3548 3637 3724 3365 3458 3548 3637 3724 970Cuba 1166 1172 1177 1182 1187 1166 1172 1177 1182 1187 107Dominican Rp 556 556 556 556 556 563 563 556 556 556 68El Salvador 4518 4119 4519 4519 4520 4518 4119 4519 4519 4520 749Guadeloupe 15 15 15 15 15 15 15 15 15 15 34Guatemala 12794 12794 12794 12794 12794 12794 12794 12794 12794 12794 1185Haiti 5854 5954 6055 6158 6262 5854 5954 6055 6158 6262 787Honduras 5870 6038 6209 6381 6557 5870 6037 6206 6380 6556 1066Jamaica 300 300 300 300 300 300 300 300 303 300 118Martinique 10 10 10 10 10 10 10 10 10 10 26Mexico 15157 15418 15678 15935 16191 15163 15413 15672 15930 16185 169Nicaragua 3655 3759 3864 3970 4078 3655 3759 3864 3970 4078 848Panama 952 969 985 1001 1017 952 969 985 1001 1017 368Trinidad Tob 10 10 10 10 10 10 11 10 10 10 8USA 90362 83976 69788 71982 71689 90505 84024 69829 71995 71716 262SouthAmerica 163943 165201 164781 165847 166208 163939 165193 164778 165862 166206 495Argentina 3715 3741 1157 1103 1103 3715 3741 1157 1103 1103 31Bolivia 1262 1293 1323 1355 1386 1262 1293 1323 1355 1386 174Brazil 114052 114052 114052 114052 114052 114048 114051 114051 114069 114052 688Chile 10044 10449 10407 10356 10356 10044 10449 10407 10356 10356 699Colombia 15786 16092 16401 16712 17024 15786 16092 16401 16712 17024 417Ecuador 4850 5048 5420 5420 5420 4850 5048 5420 5420 5420 445Fr Guiana 60 60 60 60 60 60 60 60 60 60 357Guyana 10 10 10 11 11 10 10 10 11 11 13Paraguay 4220 4220 4220 4220 4220 4220 4213 4219 4218 4218 808
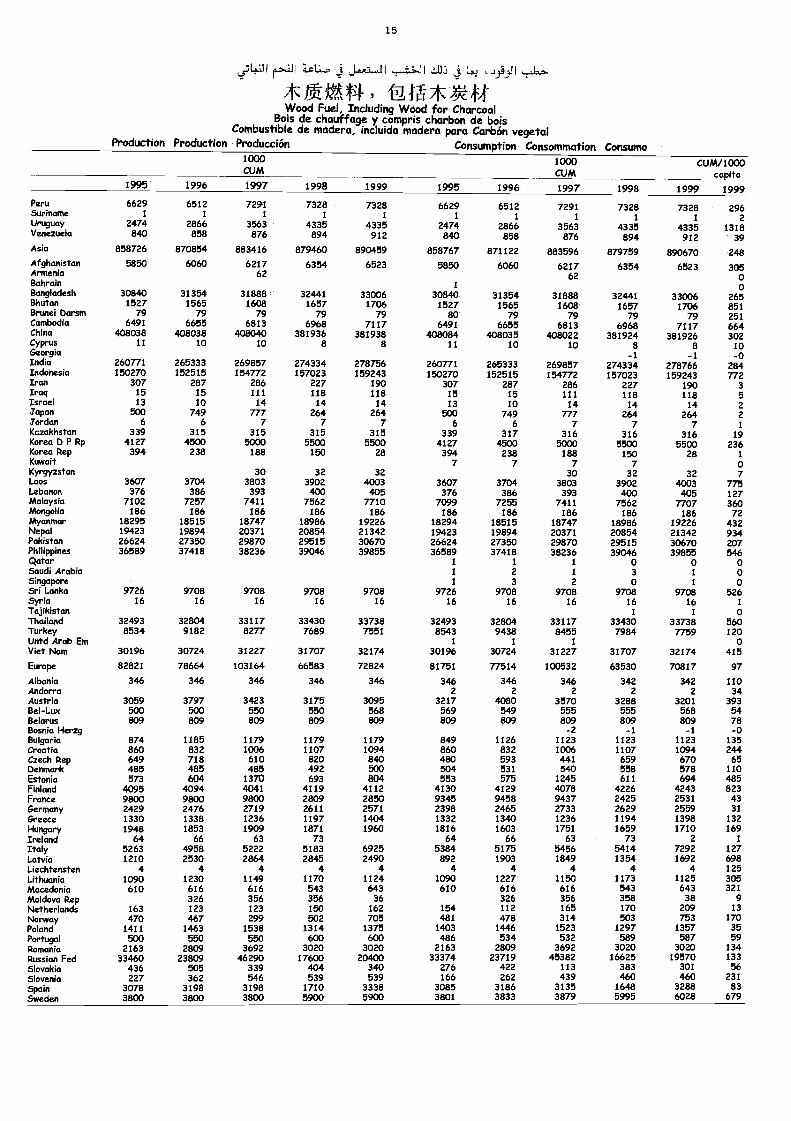
15
L55141 rN.1.31 LaLi_.= J....5-11 4 L:q
**JA , 'N,I&*X441-Wood Fuel, Including Wood for Charcoal
Bois de chauffage y compris charbon de boisCombustible de madera, incluida madera para Carbón vegetal
Production Production Producción Consumption Consommation Consumo1000Cum
1000cum
cum/1000capita
19991995 1996 1997 1998 1999 1995 1996 1997 1998 1999Peru 6629 6512 7291 7328 7328 6629 6512 7291 7328 7328 296Suriname 1 1 1 1 1 1 1 1 1 1 2Uruguay 2474 2866 3563 4335 4335 2474 2866 3563 4335 4335 1318Venezuela 840 858 876 894 912 840 858 876 894 912 39Asia 858726 870854 883416 879460 890459 858767 871122 883596 879759 890670 248Afghanistan 5850 6060 6217 6354 6523 5850 6060 6217 6354 6523 305Armenia 62 62 0Bahrain 1 0Bangladesh 30840 31354 31888 32441 33006 30840 31354 31888 32441 33006 265Bhutan 1527 1565 1608 1657 1706 1527 1565 1608 1657 1706 851Brunei Darsm 79 79 79 79 79 80 79 79 79 79 251Cambodia 6491 6655 6813 6968 7117 6491 6655 6813 6968 7117 664China 408038 408038 408040 381936 381938 408084 408035 408022 381924 381926 302Cyprus 11 10 10 8 8 11 10 10 8 8 10Georgia -1 -I -0India 260771 265333 269857 274334 278756 260771 265333 269857 274334 278766 284Indonesia 150270 152515 154772 157023 159243 150270 152515 154772 157023 159243 772Iran 307 287 286 227 190 307 287 286 227 190 3Iraq 15 15 111 118 118 15 15 111 118 118 5Israel 13 10 14 14 14 13 10 14 14 14 2Japan 500 749 777 264 264 500 749 777 264 264 2Jordan 6 6 7 7 7 6 6 7 7 7 1Kazakhstan 339 315 315 315 315 339 317 316 316 316 19Korea D P Rp 4127 4500 5000 5500 5500 4127 4500 5000 5500 5500 236Korea Rep 394 238 188 150 28 394 238 188 150 28 1Kuwait 7 7 7 7 0Kyrgyzstan 30 32 32 30 32 32 7Laos 3607 3704 3803 3902 4003 3607 3704 3803 3902 4003 775Lebanon 376 386 393 400 405 376 386 393 400 405 127Malaysia 7102 7257 7411 7562 7710 7099 7255 7411 7562 7707 360Mongolia 186 186 186 186 186 186 186 186 186 186 72Myanmar 18295 18515 18747 18986 19226 18294 18515 18747 18986 19226 432Nepal 19423 19894 20371 20854 21342 19423 19894 20371 20854 21342 934Pakistan 26624 27350 29870 29515 30670 26624 27350 29870 29515 30670 207Philippines 36589 37418 38236 39046 39855 36589 37418 38236 39046 39855 546Qatar 1 1 1 0 0 0Saudi Arabia 1 2 1 3 1 0Singapore . 1 3 2 0 1 0Sri Lanka 9726 9708 9708 9708 9708 9726 9708 9708 9708 9708 526Syria 16 16 16 16 16 16 16 16 16 16 1
Tajikistan 1 1 0Thailand 32493 32804 33117 33430 33738 32493 32804 33117 33430 33738 560Turkey 8534 9182 8277 7689 7551 8543 9438 8455 7984 7759 120Untd Arab Em 1 1 1 0Viet Nam 30196 30724 31227 31707 32174 30196 30724 31227 31707 32174 415Europe 82821 78664 103164 66583 72824 81751 77514 100532 63530 70817 97
Albania 346 346 346 346 346 346 346 346 342 342 110Andorra 2 2 2 2 2 34Austria 3059 3797 3423 3175 3095 3217 4080 3570 3288 3201 393Bel-Lux 500 500 550 550 568 569 549 555 555 568 54Belarus 809 809 809 809 809 809 809 809 809 809 78Bosnia Herzg -2 -1 -1 -0Bulgaria 874 1185 1179 1179 1179 849 1126 1123 1123 1123 135Croatia 860 832 1006 1107 1094 860 832 1006 1107 1094 244Czech Rep 649 718 610 820 840 480 593 441 659 670 65Denmark 485 485 485 492 500 504 531 540 558 578 110Estonia 573 604 1370 693 804 553 575 1245 611 694 485Finland 4095 4094 4041 4119 4112 4130 4129 4078 4226 4243 823France 9800 9800 9800 2809 2850 9345 9458 9437 2425 2531 43Germany 2429 2476 2719 2611 2571 2398 2465 2733 2629 2559 31Greece 1330 1338 1236 1197 1404 1332 1340 1236 1194 1398 132Hungary 1948 1853 1909 1871 1960 1816 1603 1751 1659 1710 169Ireland 64 66 63 73 64 66 63 73 2 1
Italy 5263 4958 5222 5183 6925 5384 5175 5456 5414 7292 127Latvia 1210 2530 2864 2845 2490 892 1903 1849 1354 1692 698Liechtensten 4 4 4 4 4 4 4 4 4 4 125Lithuania 1090 1230 1149 1170 1124 1090 1227 1150 1173 1125 305Macedonia 610 616 616 543 643 610 616 616 543 643 321Moldova Rep 326 356 356 36 326 356 358 38 9Netherlands 163 123 123 150 162 154 112 165 170 209 13Norway 470 467 299 502 705 481 478 314 503 753 170Poland 1411 1463 1538 1314 1375 1403 1446 1523 1297 1357 35Portugal 500 550 550 600 600 486 534 532 589 587 59Romania 2163 2809 3692 3020 3020 2163 2809 3692 3020 3020 134Russian Fed 33460 23809 46290 17600 20400 33374 23719 45382 16625 19570 133Slovakia 436 505 339 404 340 276 422 113 383 301 56Slovenia 227 362 546 539 539 166 262 439 460 460 231Spain 3078 3198 3198 1710 3338 3085 3186 3135 1648 3288 83Sweden 3800 3800 3800 5900 5900 3801 3833 3879 5995 6028 679
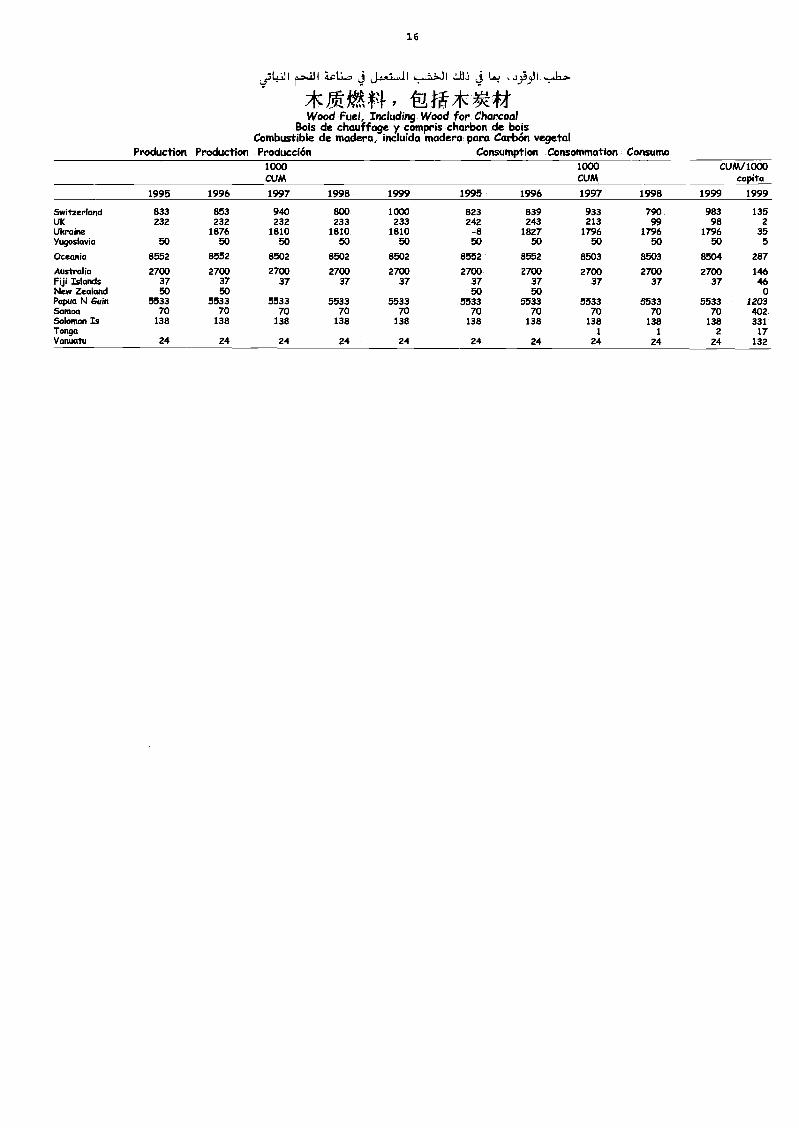
16
,531.1.111 Lct:.-0 j,-'; .11 ,r,j...:>J1 .3,3)1
*AWN., 'NM*Vf-tWood Fuel, Including Wood for Charcoal
Bois de chauffage y compris charbon de boisCombustible de madera, incluida madera para Carbón vegetal
Production Production Producción Consumption Consommation Consume1000CUM
1000CUM
CUM/1000capita
1995 1996 1997 1998 1999 1995 1996 1997 1998 1999 1999
Switzerland 833 853 940 800 1000 823 839 933 790 983 135UK 232 232 232 233 233 242 243 213 99 98 2Ukraine 1876 1810 1810 1810 -8 1827 1796 1796 1796 35Yugoslavia 50 50 50 50 50 50 50 50 50 50 5
Oceania 8552 8552 8502 8502 8502 8552 8552 8503 8503 8504 287
Australia 2700 2700 2700 2700 2700 2700 2700 2700 2700 2700 146Fiji Islands 37 37 37 37 37 37 37 37 37 37 46New Zealand 50 50 50 50 0Papua N Gain 5533 5533 5533 5533 5533 5533 5533 5533 5533 5533 1203Samoa 70 70 70 70 70 70 70 70 70 70 402Solomon Is 138 138 138 138 138 138 138 138 138 138 331Tonga 1 1 2 17Vanuatu 24 24 24 24 24 24 24 24 24 24 132
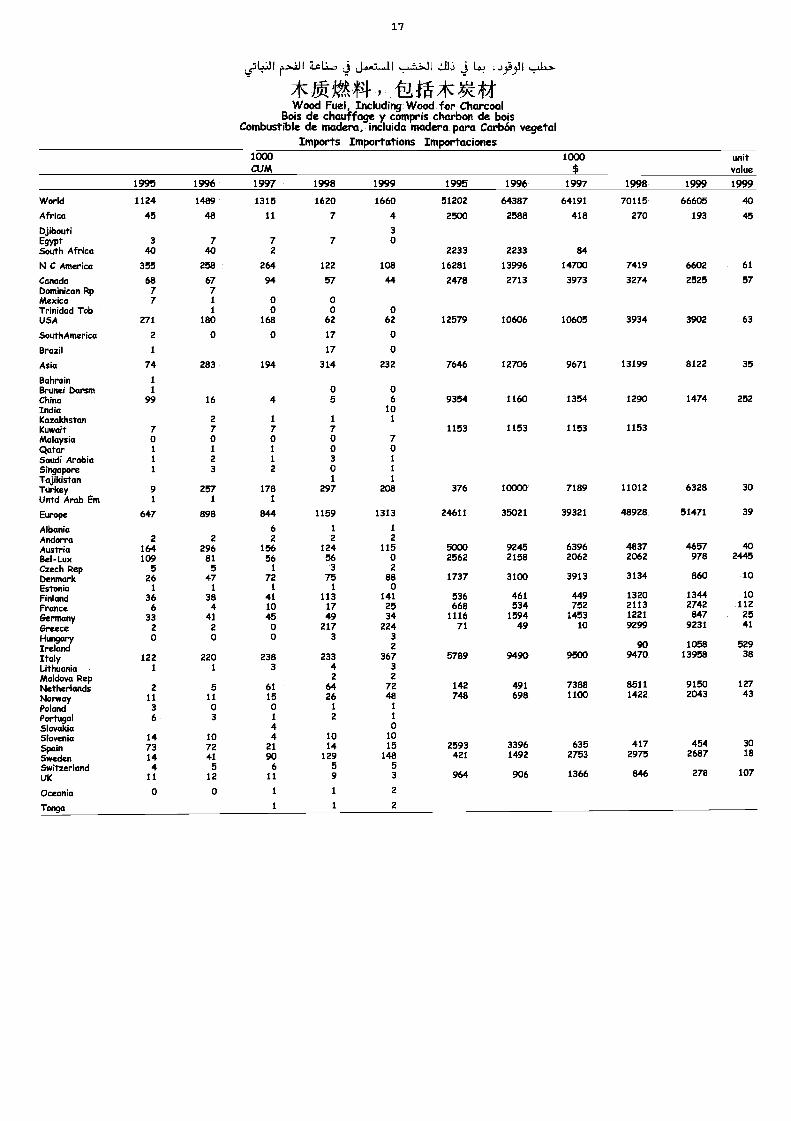
17
a31÷111 Hz)! j J,. U ii JJ j J9793.11
* J*0 'Nit* Vt-Wood Fuel, Including Wood for Charcoal
Bois de chauffage y compris charbon de boisCombustible de madera, incluida madera para Carbón vegetal
Imports Importations Importaciones1000CUM
1000$
unitvalue
1995 1996 1997 1998 1999 1995 1996 1997 1998 1999 1999
World 1124 1489 1315 1620 1660 51202 64387 64191 70115 66605 40
Africa 45 48 11 7 4 2500 2588 418 270 193 45
Djibouti 3Egypt 3 7 7 7 0South Africa 40 40 2 2233 2233 84
N C America 355 258 264 122 108 16281 13996 14700 7419 6602 61
Cculada 68 67 94 57 44 2478 2713 3973 3274 2525 57Dominican Rp 7 7Mexico 7 i o oTrinidad Tob i o o oUSA 271 180 168 62 62 12579 10606 10605 3934 3902 63
SouthAmerica 2 0 0 17 0
Brazil I 17 o
Asia 74 283 194 314 232 7646 12706 9671 13199 8122 35
Bahrain 1
Brunei barsm 1 0 oChina 99 16 4 5 6 9354 1160 1354 1290 1474 252India 10Kazakhstan 2 1 1 1
Kuwait 7 7 7 7 1153 1153 1153 1153Malaysia 0 0 0 0 7Qatar 1 1 1 0 0Saudi Arabia 1 2 i 3 1
Singapore 1 3 2 0 1
Tajikistan 1 1
Ttrkey 9 257 178 297 208 376 10000 7189 11012 6328 30Untd Arab Etn 1 1 I
Europe 647 898 844 1159 1313 24611 35021 39321 48928 51471 39
Albania 6 1 1
Andorra 2 2 2 2 2
Austria 164 296 156 124 115 5000 9245 6396 4837 4657 aoBel-Lux 109 81 56 56 o 2562 2158 2062 2062 978 2445
Czech Rep 5 5 1 3 2
Denmark 26 47 72 75 88 1737 3100 3913 3134 860 10Estonia 1 1 1 1 oFinland 36 38 41 113 141 536 461 449 1320 1344 10
france 6 4 10 17 25 668 534 752 2113 2742 112
Gertnany 33 41 45 49 34 1116 1594 1453 1221 847 25
Greece 2 2 0 217 224 71 49 10 9299 9231 41
Hungary 0 0 0 3 3
Ireland 2 90 1058 529
Italy 122 220 238 233 367 5789 9490 9500 9470 13958 38
Lithuania 1 1 3 4 3
Moldova Ftep 2 2
Netherlands 2 5 61 64 72 142 491 7388 8511 9150 127
Norway 11 11 15 26 48 748 698 1100 1422 2043 43
Poland 3 0 0 I 1
Portugal 6 3 1 2 1
Slovakia 4 0Slovenia 14 10 4 10 10
Spain 73 72 21 14 15 2593 3396 635 417 454 30
Sweden 14 41 90 129 148 421 1492 2753 2975 2687 18
Switzerland 4 5 6 5 5UK 11 12 11 9 3 964 906 1366 846 278 107
Oceania 0 o 1 1 2
Tonga 1 1 2
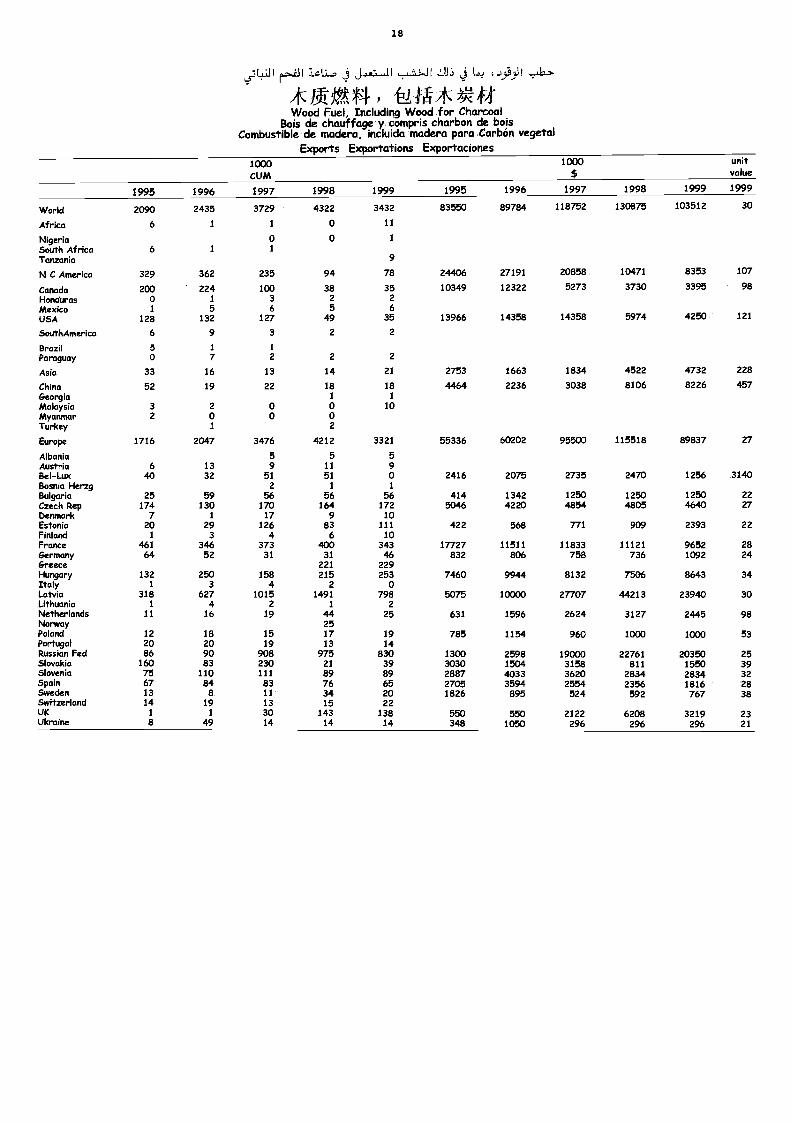
18
j5 (4) 3I c1i j j.1I Jl .2.13 j 1 J1*!4 , fl IN* RiftWood Fuel, Including Wood for Charcoal
Bois de chauffage y cotnpris charbon de boisCombustible de madera, incluida madera para Carbón vegetal
Exports Exportations Exportaciones1000cuM
1000 unitvalue
1995 1996 1997 1998 1999 1995 1996 1997 1998 1999 1999
World 2090 2435 3729 4322 3432 83550 89784 118752 130875 103512 30
Africa 6 1 1 0 11
Nigeria 0 0 1
South Africa 6 1 1
Tanzania 9
N C America 329 362 235 94 78 24406 27191 20858 10471 8353 107
Canada 200 224 100 38 35 10349 12322 5273 3730 3395 98Honduras 0 1 3 2 2Mexico 1 5 6 5 6USA 128 132 127 49 35 13966 14358 14358 5974 4250 121
SouthAmerica 6 9 3 2 2
Brazil 5 1 1
Paraguay 0 7 2 2 2
Asia 33 16 13 14 21 2753 1663 1834 4522 4732 228
China 52 19 22 18 18 4464 2236 3038 8106 8226 457Georgia 1 1
Malaysia 3 2 o o 10Myanmar 2 0 0 0Turkey 1 2
Europe 1716 2047 3476 4212 3321 55336 60202 95500 115518 89837 27
Albania 5 5 5Austria 6 13 9 11 9Bel-Lux 40 32 51 51 0 2416 2075 2735 2470 1256 3140Bosnia Herzg 2 1 1
Bulgaria 25 59 56 56 56 414 1342 1250 1250 1250 22Czech Rep 174 130 170 164 172 5046 4220 4854 4805 4640 27Denmark 7 1 17 9 10Estonia 20 29 126 83 111 422 568 771 909 2393 22Finland 1 3 4 6 10France 461 346 373 400 343 17727 11511 11833 11121 9652 28Germany 64 52 31 31 46 832 806 758 736 1092 24Greece 221 229Himgary 132 250 158 215 253 7460 9944 8132 7506 8643 34Italy 1 3 4 2 0Latvia 318 627 1015 1491 798 5075 10000 27707 44213 23940 30Lithuania 1 4 2 1 2Netherlands 11 16 19 44 25 631 1596 2624 3127 2445 98Norway 25Poland 12 18 15 17 19 785 1154 960 1000 1000 53Portugal 20 20 19 13 14Russian Fed 86 90 908 975 830 1300 2598 19000 22761 20350 25Slovakia 160 83 230 21 39 3030 1504 3158 811 1550 39Slovenia 75 110 111 89 89 2887 4033 3620 2834 2834 32Spain 67 84 83 76 65 2705 3594 2554 2356 1816 28Sweden 13 a 11 34 20 1826 895 524 592 767 38Switzerland 14 19 13 15 22UK 1 1 30 143 138 550 550 2122 6208 3219 23Ukraine 8 49 14 14 14 348 1050 296 296 296 21
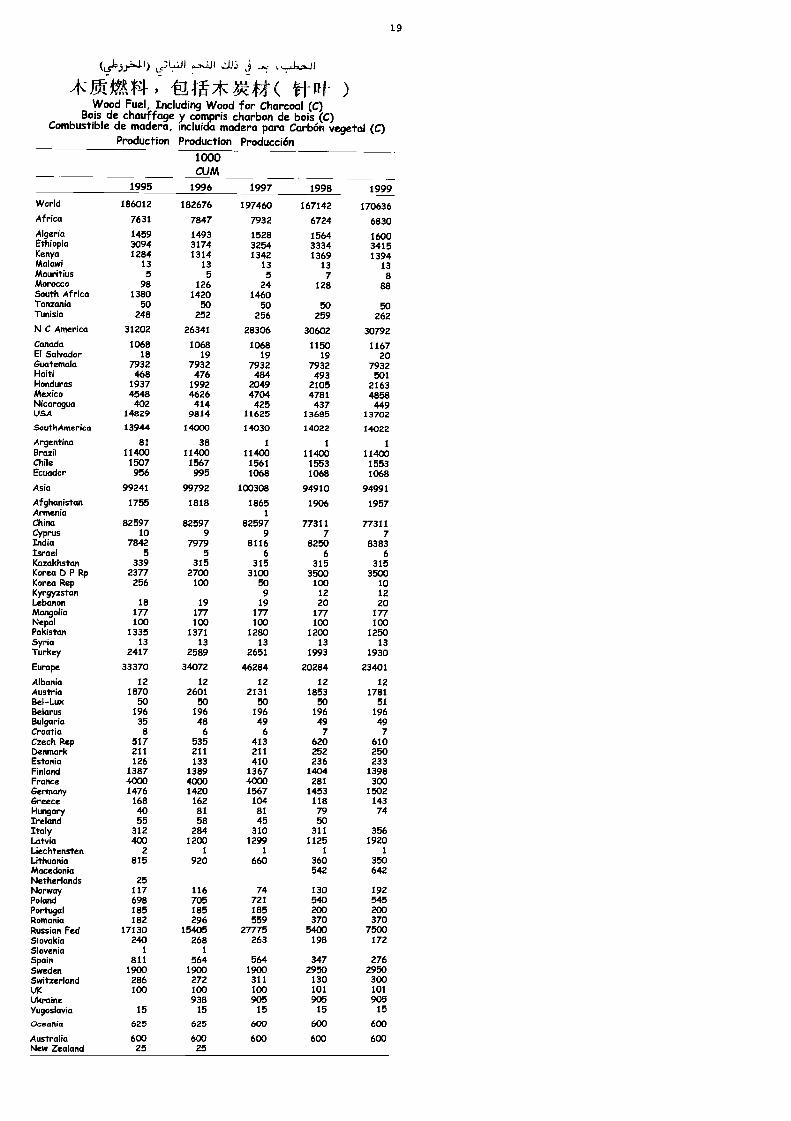
(L1,5).6.11)1JI,,.1,J1 L,.,,
AJtU4Via*V44( )Wood Fuel, Including Wood for Charcoal (C)
Bois de chauffage y compris charbon de bois (C)Combustible de madera, incluida madera para Carbón vegetal (C)
Production Production Producción1000CUM
19
1995 1996 1997 1998 1999
World 186012 182676 197460 167142 170636Africa 7631 7847 7932 6724 6830Algeria 1459 1493 1528 1564 1600Ethiopia 3094 3174 3254 3334 3415Kenya 1284 1314 1342 1369 1394Malawi 13 13 13 13 13Mauritius 5 5 5 7 8Morocco 98 126 24 128 88South Africa 1380 1420 1460Tanzania 50 50 50 50 50Tunisia 248 252 256 259 262
N C America 31202 26341 28306 30602 30792Canada 1068 1068 1068 1150 1167El Salvador 18 19 19 19 20Guatemala 7932 7932 7932 7932 7932Haiti 468 476 484 493 501Honduras 1937 1992 2049 2105 2163Mexico 4548 4626 4704 4781 4858Nicaragua 402 414 425 437 449USA 14829 9814 11625 13685 13702
SouthAmerica 13944 14000 14030 14022 14022
Argentina 82 38 1 1 1
Brazil 11400 11400 11400 11400 11400Chile 1507 1567 1561 1553 1553Ecuador 956 995 1068 1068 1068
Asia 99241 99792 100308 94910 94991
Afghanistan 1755 1818 1865 1906 1957Armenia 1
China 82597 82597 82597 77311 77311Cyprus 10 9 9 7 7India 7842 7979 8116 8250 8383Israel 5 5 6 6 6Kazakhstan 339 315 315 315 315Korea D P Rp 2377 2700 3100 3500 3500Korea Rep 256 100 50 100 10Kyrgyzstan 9 12 12Lebanon 18 19 19 20 20Mongolia 177 177 177 177 177Nepal 100 100 WO 100 100Pakistan 1335 1371 1280 1200 1250Syria 13 13 13 13 13Turkey 2417 2589 2651 1993 1930
Europe 33370 34072 46284 20284 23401
Albania 12 12 12 12 12Austria 1870 2601 2131 1853 1781Bel-Lux 50 50 50 50 51Belarus 196 196 196 196 196Bulgaria 35 48 49 49 49Croatia 8 6 6 7 7Czech Rep 517 535 413 620 610Denmark 211 211 211 252 250Estonia 126 133 410 236 233Finland 1387 1389 1367 1404 1398France 4000 4000 4000 281 300Germany 1476 1420 1567 1453 1502Greece 168 162 104 118 143Hungary 40 81 81 79 74Ireland 55 58 45 50Italy 312 284 310 311 356Latvia 400 1200 1299 1125 1920Liechtensten 2 1 1 1 1
Lithuania 815 920 660 360 350Macedonia 542 642Netherlands 25Norway 117 116 74 130 192Poland 698 705 721 540 545Portugal 185 185 185 200 200Romania 182 296 559 370 370Russian Fed 17130 15405 27775 5400 7500Slovakia 240 268 263 198 172Slovenia 1 1
Spain 811 564 564 347 276Sweden 1900 1900 1900 2950 2950Switzerland 286 272 311 130 300UK 100 100 100 101 101Ukraine 938 905 905 905Yugoslavia 15 15 15 15 15
Oceania 625 625 600 600 600
Australia 600 600 600 600 600New Zealand 25 25
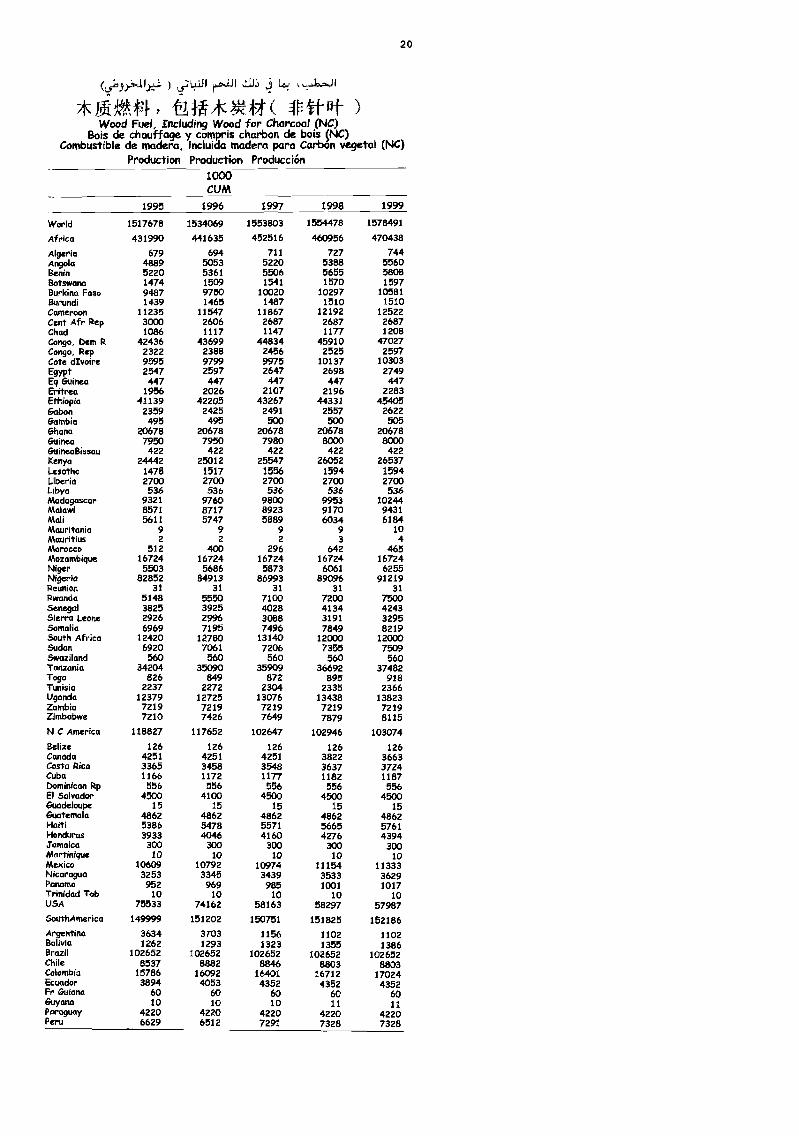
) JI JI 1 kIl4rittvt- )
Wood Fuel, Including Wood for Charcoa/ (NC)Bois de chauffage y compris charbon de bois (NC)
Combustible de madera, incluida madera para Carbon vegetal (NC)Production Production Producción
1000CUM
20
1995 1996 1997 1998 1999
World 1517678 1534069 1553803 1554478 1578491
Africa 431990 441635 452516 460956 470438
Algeria 679 694 711 727 744Angola 4889 5053 5220 5388 5560Benin 5220 5361 5506 5655 5808Botswana 1474 1509 1541 1570 1597Burkina Faso 9487 9750 10020 10297 10581Burundi 1439 1465 1487 1510 1510Cameroon 11235 11547 11867 12192 12522Cent Afr Rep 3000 2606 2687 2687 2687Chad 1086 1117 1147 1177 1208Congo, Dem R 42436 43699 44834 45910 47027Congo, Rep 2322 2388 2456 2525 2597Cote Moire 9595 9799 9975 10137 10303Egypt 2547 2597 2647 2698 2749Eq Guinea 447 447 447 447 447Eritrea 1956 2026 2107 2196 2283Ethiopia 42139 42205 43267 44331 45405Gabon 2359 2425 2491 2557 2622Gambia 495 495 500 500 505Ghana 20678 20678 20678 20678 20678Guinea 7950 7950 7980 8000 8000GuineaBissau 422 422 422 422 422Kenya 24442 25012 25547 26052 26537Lesotho 1478 1517 1556 1594 1594Liberia 2700 2700 2700 2700 2700Libya 536 536 536 536 536Madagascar 9321 9760 9800 9953 10244Malawi 8571 8717 8923 9170 9431Mali 5611 5747 5889 6034 6184Mauritania 9 9 9 9 10Mauritius 2 2 2 3 4Morocco 512 400 296 642 465Mozambique 16724 16724 16724 16724 16724Niger 5503 5686 5873 6061 6255Nigeria 82852 84913 86993 89096 91219Reunion 31 31 31 31 31Rwanda 5148 5550 7100 7200 7500Senegal 3825 3925 4028 4134 4243Sierra Leone 2926 2996 3088 3191 3295Somalia 6969 7195 7496 7849 8219South Africa 12420 12780 13140 12000 12000Sudan 6920 7061 7206 7355 7509Swaziland 560 560 560 560 560Tanzania 34204 35090 35909 36692 37482Togo 826 849 872 895 918Tunisia 2237 2272 2304 2335 2366Uganda 12379 12725 13076 13438 13823Zambia 7219 7219 7219 7219 7219Zimbabwe 7210 7426 7649 7879 8115
N C America 118827 117652 102647 102946 103074
Belize 126 126 126 126 126Canada 4251 4251 4251 3822 3663Costa Rica 3365 3458 3548 3637 3724Cuba 1166 1172 1177 1182 1187Dominican iztp 556 556 556 556 556El Salvador 4500 4100 4500 4500 4500Guadeloupe 15 15 15 15 15Guatemala 4862 4862 4862 4862 4862Haiti 5386 5478 5571 5665 57611-londuras 3933 4046 4160 4276 4394Jamaica 300 300 300 300 300Martinique 10 10 10 10 10Mexico 10609 10792 10974 11154 11333Nicaragua 3253 3345 3439 3533 3629Panama 952 969 985 1001 1017Trinidad Tob 10 10 10 10 10USA 75533 74162 58163 58297 57987SouthAmerica 149999 151202 150751 151825 152186Argentina 3634 3703 1156 1102 1102Bolivia 1262 1293 1323 1355 1386Brazil 102652 102652 102652 102652 102652Chile 8537 8882 8846 8803 8803Colombia 15786 16092 16401 16712 17024Ecuador 3894 4053 4352 4352 4352Fr Guiana 60 60 60 60 60Guyana 10 10 10 11 11Paraguay 4220 4220 4220 4220 4220Peru 6629 6512 7291 7328 7328
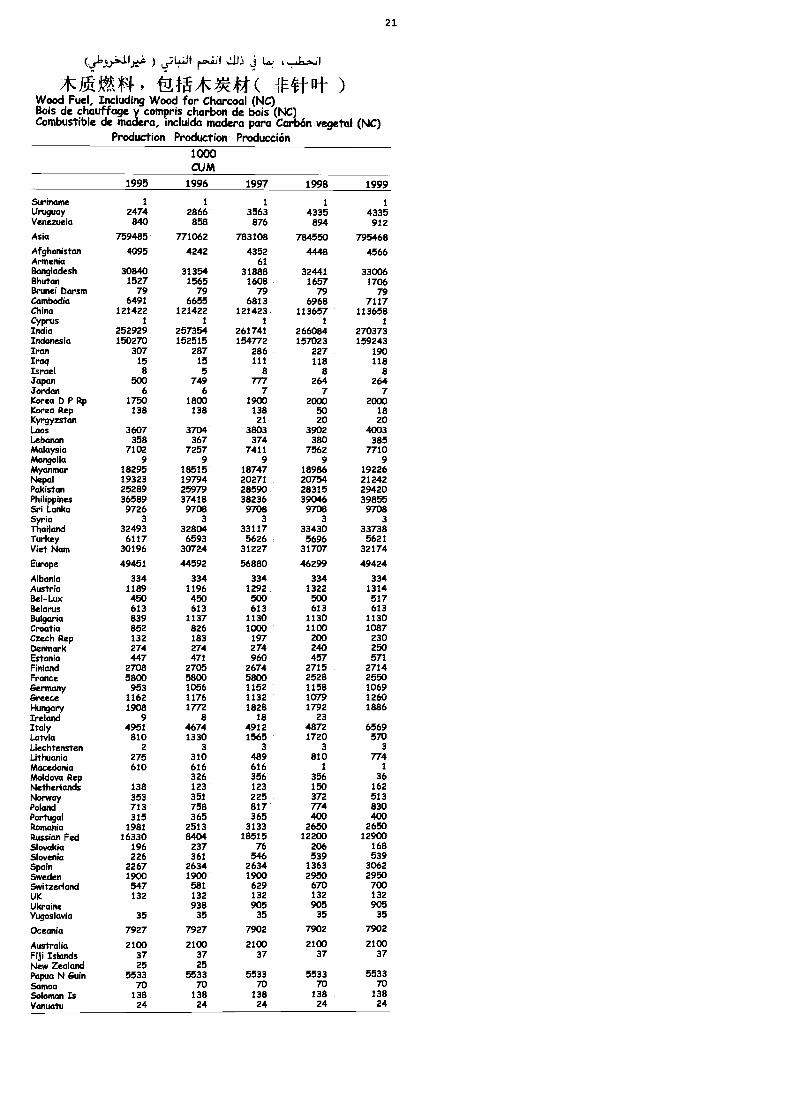
) 1.0.11 JE) 1.4.;JI*LkW1-, '0,M*/-4( ft1)
Wood Fuel, Including Wood for Charcoal (NC)Bois de chauffage y compris charbon de bois (NC)Combustible de modero, incluida madero para Carbón vegetal (NC)
Production Production Producción1000CUM
21
1995 1996 1997 1998 1999
Suriname 1 1 1 1 1
Uruguay 2474 2866 3563 4335 4335Venezuela 840 858 876 894 912
Asia 759485 771062 783108 784550 795468
Afghanistan 4095 4242 4352 4448 4566Armenia 61Bangladesh 30840 31354 31888 32441 33006Bhutan 1527 1565 1608 1657 1706Brunei Darsm 79 79 79 79 79Cainbodia 6491 6655 6813 6968 7117China 121422 121422 121423 113657 113658Cyprus 1 1 1 1 1
India 252929 257354 261741 266084 270373Indonesia 150270 152515 154772 157023 159243Iran 307 287 286 227 190Iraq 15 15 111 118 118Israel 8 5 8 8 8japan 500 749 777 264 264jordan 6 6 7 7 7Korea D P Rp 1750 1800 1900 2000 2000Korea Rep 138 138 138 50 18Kyrgyzstan 21 20 20Laos 3607 3704 3803 3902 4003Lebanon 358 367 374 380 385Malaysia 7102 7257 7411 7562 7710Mongolia 9 9 9 9 9Myanmar 18295 18515 18747 18986 19226Nepal 19323 19794 20271 20754 21242Pakistan 25289 25979 28590 28315 29420Philippines 36589 37418 38236 39046 39855Sri Lanka 9726 9708 9708 9708 9708Syria 3 3 3 3 3Thailand 32493 32804 33117 33430 33738Turkey 6117 6593 5626 5696 5621Viet Nam 30196 30724 31227 31707 32174
Europe 49451 44592 56880 46299 49424
Albania 334 334 334 334 334Austria 1189 1196 1292 1322 1314Bel-Lux 450 450 500 500 517Belarus 613 613 613 613 613Bulgaria 839 1137 1130 1130 1130Croatia 852 826 1000 1100 1087Czech Rep 132 183 197 200 230Denmark 274 274 274 240 250Estonia 447 471 960 457 571Finland 2708 2705 2674 2715 2714France 5800 5800 5800 2528 2550Germany 953 1056 1152 1158 1069Greece 1162 1176 1132 1079 1260Hungary 1908 1772 1828 1792 1886Ireland 9 a 18 23Italy 4951 4674 4912 4872 6569Latvia 810 1330 1565 1720 570Liechtensten 2 3 3 3 3Lithuania 275 310 489 810 774Macedonia 610 616 616 1 1
Moldova Rep 326 356 356 36Netherlands 138 123 123 150 162Norway 353 351 225 372 513Poland 713 758 817 774 830Portugal 315 365 365 400 400Romania 1981 2513 3133 2650 2650Russian Fed 16330 8404 18515 12200 12900Slovakia 196 237 76 206 168Slovenia 226 361 546 539 539Spain 2267 2634 2634 1363 3062Sweden 1900 1900 1900 2950 2950Switzerland 547 581 629 670 700UK 132 132 132 132 132Ukraine 938 905 905 905Yugoslavia 35 35 35 35 35
Oceania 7927 7927 7902 7902 7902
Australia 2100 2100 2100 2100 2100Fiji Islands 37 37 37 37 37New Zealcind 25 25Papua N Gula 5533 5533 5533 5533 5533Samoa 70 70 70 70 70Soloman Is 138 138 138 138 138Vanuatu 24 24 24 24 24
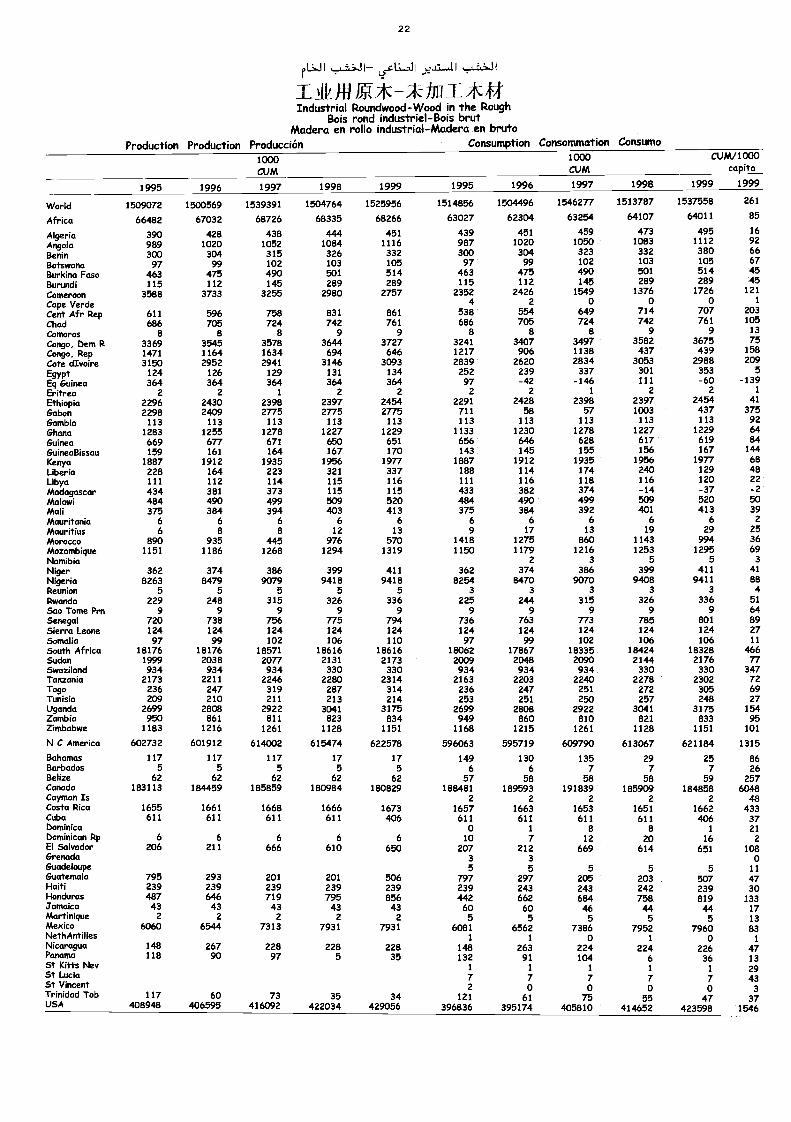
22
Lvel*. -11 ,),?..11,11
141-11/41*AchiLli2i0/Industrial Roundwood-Wood in the Rough
Bois rond industriel-Bois brutMadera en rollo industrial-Madera en bruto
Production Production Producción Consumption Consommation Consumo
1000CUM
1000CUM
CUM/1000capita
1995 1996 1997 1998 1999 1995 1996 1997 1998 1999 1999
World 1509072 1500569 1539391 1504764 1525956 1514856 1504496 1546277 1513787 1537558 261
Africa 66482 67032 68726 68335 68266 63027 62304 63254 64107 64011 85
Algeria 390 428 438 444 451 439 451 459 473 495 16
Angola 989 1020 1052 1084 1116 987 1020 1050 1083 1112 92
Benin 300 304 315 326 332 300 304 323 332 380 66
Botswana 97 99 102 103 105 97 99 102 103 105 67
Burkina Faso 463 475 490 501 514 463 475 490 501 514 45
Burundi 115 112 145 289 289 115 112 145 289 289 45
Cameroon 3588 3733 3255 2980 2757 2352 2426 1549 1376 1726 121
Cape Verde 4 2 0 0 0 1
Cent Afr Rep 611 596 758 831 861 538 554 649 714 707 203
Chad 686 705 724 742 761 686 705 724 742 761 105
Comoros 8 8 8 9 9 8 8 8 9 9 13
Congo, Dem R 3369 3545 3578 3644 3727 3241 3407 3497 3582 3675 75Congo, Rep 1471 1164 1634 694 646 1217 906 1138 437 439 158
Cote dIvoire 3150 2952 2941 3146 3093 2839 2620 2834 3053 2988 209
Egypt 124 126 129 131 134 252 239 337 301 353 5
Eq Guinea 364 364 364 364 364 97 -42 -146 111 -60 -139Eritrea 2 2 1 2 2 2 2 1 2 2 1
Ethiopia 2296 2430 2398 2397 2454 2291 2428 2398 2397 2454 41
Gabon 2298 2409 2775 2775 2775 711 58 57 1003 437 375Gambia 113 113 113 113 113 113 113 113 113 113 92Ghana 1283 1255 1278 1227 1229 1133 1230 1278 1227 1229 64Guinea 669 677 671 650 651 656 646 628 617 619 84GuineaBissau 159 161 164 167 170 143 145 155 156 167 144
Kenya 1887 1912 1935 1956 1977 1887 1912 1935 1956 1977 68Liberia 228 164 223 321 337 188 114 174 240 129 48Libya 111 112 114 115 116 111 116 118 116 120 22Madagascar 434 381 373 115 115 433 382 374 -14 -37 -2Malawi 484 490 499 509 520 484 490 499 509 520 50Mali 375 384 394 403 413 375 384 392 401 413 39Mauritania 6 6 6 6 6 6 6 6 6 6 2
Mauritius 6 8 8 12 13 9 17 13 19 29 25Morocco 890 935 445 976 570 1418 1275 860 1143 994 36Mozambique 1151 1186 1268 1294 1319 1150 1179 1216 1253 1295 69Namibia 2 3 5 5 3Niger 362 374 386 399 411 362 374 386 399 411 41Nigeria 8263 8479 9079 9418 9418 8254 8470 9070 9408 9411 88Reunion 5 5 5 5 5 3 3 3 3 3 4Rwanda 229 248 315 326 336 225 244 315 326 336 51Sao Tome Prn 9 9 9 9 9 9 9 9 9 9 64Senegal 720 738 756 775 794 736 763 773 785 801 89Sierra Leone 124 124 124 124 124 124 124 124 124 124 27Somalia 97 99 102 106 110 97 99 102 106 106 11
South Africa 18176 18176 18571 18616 18616 18062 17867 18335 18424 18328 466Sudan 1999 2038 2077 2131 2173 2009 2048 2090 2144 2176 nSwaziland 934 934 934 330 330 934 934 934 330 330 347Tanzania 2173 2211 2246 2280 2314 2163 2203 2240 2278 2302 72Togo 236 247 319 287 314 236 247 251 272 305 69Tunisia 209 210 211 213 214 253 251 250 257 248 27Uganda 2699 2808 2922 3041 3175 2699 2808 2922 3041 3175 154Zambia 950 861 811 823 834 949 860 810 821 833 95Zimbabwe 1183 1216 1261 1128 1151 1168 1215 1261 1128 1151 101
N C America 602732 601912 614002 615474 622578 596063 595719 609790 613067 621184 1315
Bahamas 117 117 117 17 17 149 130 135 29 25 86Barbados 5 5 5 5 5 6 6 7 7 7 26Belize 62 62 62 62 62 57 58 58 58 59 257Canada 183113 184459 185859 180984 180829 188481 189593 191839 185909 184858 6048Cayman Is 2 2 2 2 2 48Costa Rica 1655 1661 1668 1666 1673 1657 1663 1653 1651 1662 433Cuba 611 611 611 611 406 611 611 611 611 406 37Dominica 0 I 8 8 1 21Dominican Rp 6 6 6 6 6 10 7 12 20 16 2El Salvador 206 211 666 610 650 207 212 669 614 651 108Grenada 3 3 0Guadeloupe 5 5 5 5 5 11Guatemala 795 293 201 201 506 797 297 205 203 507 47Haiti 239 239 239 239 239 239 243 243 242 239 30Honduras 487 646 719 795 856 442 662 684 758 819 133Jamaica 43 43 43 43 43 60 60 46 44 44 17Martinique 2 2 2 2 2 5 5 5 5 5 13Mexico 6060 6544 7313 7931 7931 6081 6562 7386 7952 7960 83NethAntilles 1 1 0 1 0 1Nicaragua 148 267 228 228 228 148 263 224 224 226 47Panama 118 90 97 5 35 132 91 104 6 36 13St Kitts Nev 1 1 1 1 1 29St Lucia 7 7 7 7 7 43St Vincent 2 0 o o 0 3Trinidad Tob 117 60 73 35 34 121 61 75 55
47USA 408948 406595 416092 422034 429056 396836 395174 405810 414652 423598 15467
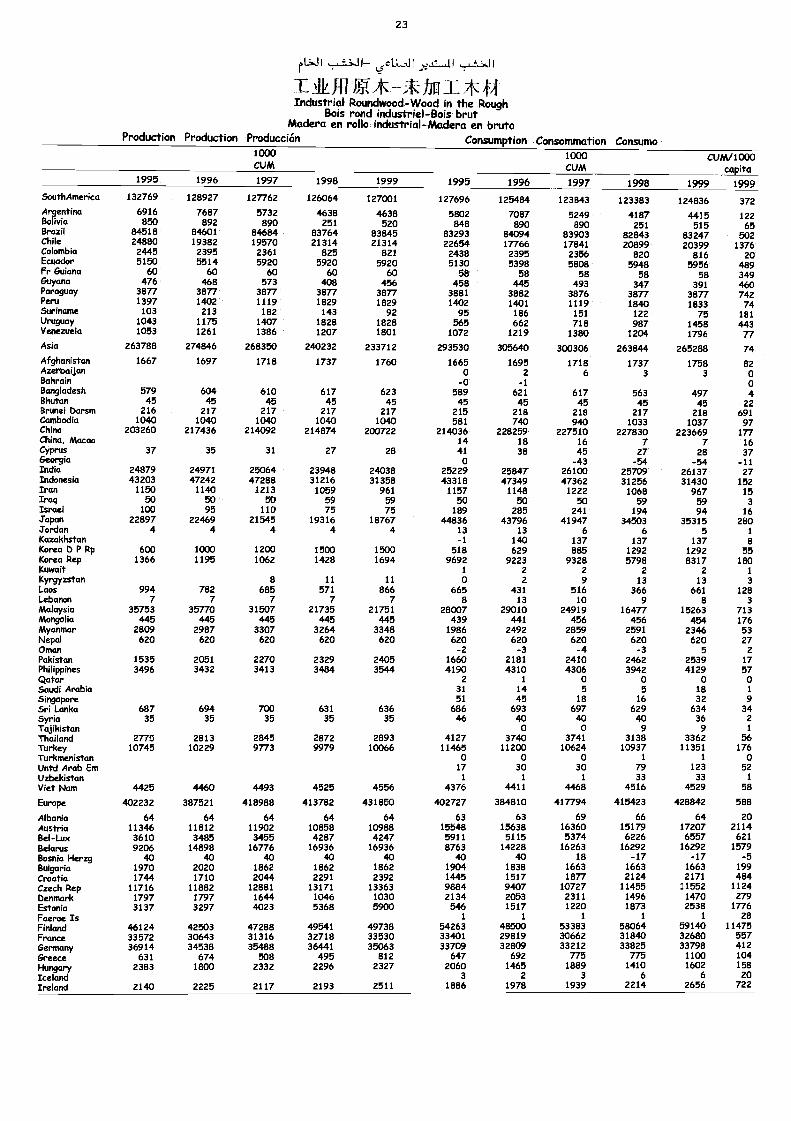
23
H I , k 4.11 jatLal I ...,;;A:L41 I
TAUIndustrial Roundwood-Wood in the Rough
Bois rond industriel-Bois brtitMadera en rollo industrial-Madera en bruto
Production Production Producción Consumption Consommation Consumo1000CUM
1000CUM
cum/1000capita
19991995 1996 1997 1998 1999 1995 1996 1997 1998 1999SouthAmerica 132769 128927 127762 126064 127001 127696 125484 123843 123383 124836 372Argentina 6916 7687 5732 4638 4638 5802 7087 5249 4187 4415 122Bolivia 850 892 890 251 520 848 890 890 251 515 65Brazil 84518 84601 84684 83764 83845 83293 84094 83903 82843 83247 502Chile 24880 19382 19570 21314 21314 22654 17766 17841 20899 20399 1376Colombia 2445 2395 2361 825 821 2438 2395 2356 820 816 20Ecuador 5150 5514 5920 5920 5920 5130 5398 5808 5948 5956 489Fr Guiana 60 60 60 60 60 58 58 58 58 58 349Guyana 476 468 573 408 456 458 445 493 347 391 460Paraguay 3877 3877 3877 3877 3877 3881 3882 3876 3877 3877 742Peru 1397 1402 1119 1829 1829 1402 1401 1119 1840 1833 74Suriname 103 213 182 143 92 95 186 151 122 75 181Uruguay 1043 1175 1407 1828 1828 565 662 718 987 1458 443Venezuela 1053 1261 1386 1207 1801 1072 1219 1380 1204 1796 77Asia 263788 274846 268350 240232 233712 293530 305640 300306 263844 265288 74Afghanistan 1667 1697 1718 1737 1760 1665 1695 1718 1737 1758 82Azerbaijan o a 6 3 3 0Bahrain -o -1 0Bangladesh 579 604 610 617 623 589 621 617 563 497 4Bhutan 45 45 45 45 45 45 45 45 45 45 22Brunei Darsm 216 217 217 217 217 215 218 218 217 218 691Cambodia 1040 1040 1040 1040 1040 581 740 940 1033 1037 97China 203260 217436 214092 214874 200722 214036 228259 227510 227830 223669 177China, Macao 14 18 16 7 7 16Cyprus 37 35 31 27 28 41 38 45 27 28 37Georgia 0 -43 -54 -54 -11India 24879 24971 25064 23948 24038 25229 25847 26100 25709 26137 27Indonesia 43203 47242 47288 31216 31358 43318 47349 47362 31256 31430 152Iran 1150 1140 1213 1059 961 1157 1148 1222 1068 967 15Iraq 50 50 50 59 59 50 50 50 59 59 3Israel 100 95 110 75 75 189 285 241 194 94 16japan 22897 22469 21545 19316 18767 44836 43796 41947 34503 35315 280Jordan 4 4 4 4 4 13 13 6 6 5 1
Kazakhstan -1 140 137 137 137 8Korea D P Rp 600 1000 1200 1500 1500 518 629 885 1292 1292 55Korea Rep 1366 1195 1062 1428 1694 9692 9223 9328 5798 8317 180Kuwait 1 2 2 2 2 1
Kyrgyzstan 8 11 11 0 2 9 13 13 3Laos 994 782 685 571 866 665 431 516 366 661 128Lebanon 7 7 7 7 7 8 13 10 9 8 3Malaysia 35753 35770 31507 21735 21751 28007 29010 24919 16477 15263 713Mongolia 445 445 445 445 445 439 441 456 456 454 176Myanmar 2809 2987 3307 3264 3348 1986 2492 2859 2591 2346 53Nepal 620 620 620 620 620 620 620 620 620 620 27Oman -2 -3 -4 -3 5 2Pakistan 1535 2051 2270 2329 2405 1660 2181 2410 2462 2539 17Philippines 3496 3432 3413 3484 3544 4190 4310 4306 3942 4129 57Qatar 2 1 o o o oSaudi Arabia 31 14 5 5 18 1
Singapore 51 45 18 16 32 9Sri Lanka 687 694 700 631 636 686 693 697 629 634 34Syria 35 35 35 35 35 46 40 40 40 36 2Tajikistan o 0 9 9 1
Thailand 2775 2813 2845 2872 2893 4127 3740 3741 3138 3362 56Turkey 10745 10229 9773 9979 10066 11465 11200 10624 10937 11351 176Turkmenistan o o o 1 1 oUntd Arab Em 17 30 30 79 123 52Uzbekistan 1 1 1 33 33 1
Viet Nam 4425 4460 4493 4525 4556 4376 4411 4468 4516 4529 58
Europe 402232 387521 418988 413782 431850 402727 384810 417794 415423 428842 588
Albania 64 64 64 64 64 63 63 69 66 64 20Austria 11346 11812 11902 10858 10988 15548 15638 16360 15179 17207 2114Bel-Lux 3610 3485 3455 4287 4247 5911 5115 5374 6226 6557 621Belarus 9206 14898 16776 16936 16936 8763 14228 16263 16292 16292 1579Bosnia Herzg ao 40 40 40 ao ao 40 18 -17 -17 -5Bulgaria 1970 2020 1862 1862 1862 1904 1838 1663 1663 1663 199Croatia 1744 1710 2044 2291 2392 1445 1517 1877 2124 2171 484Czech Rep 11716 11882 12881 13171 13363 9884 9407 10727 11455 11552 1124Denmark 1797 1797 1644 1046 1030 2134 2053 2311 1496 1470 279Estonia 3137 3297 4023 5368 5900 546 1517 1220 1873 2538 1776Faeroe Is 1 1 1 1 1 28Finland 46124 42503 47288 49541 49738 54263 48500 53383 58064 59140 11475France 33572 30643 31316 32718 33530 33401 29819 30662 31840 32680 5576ertnany 36914 34538 35488 36441 35063 33709 32809 33212 33825 33798 4126reece 631 674 508 495 812 647 692 775 775 1100 104
Hun9arYIceland
2383 1800 2332 2296 2327 20603
14652
18893
14106
16026
15820
Ireland 2140 2225 2117 2193 2511 1886 1978 1939 2214 2656 722
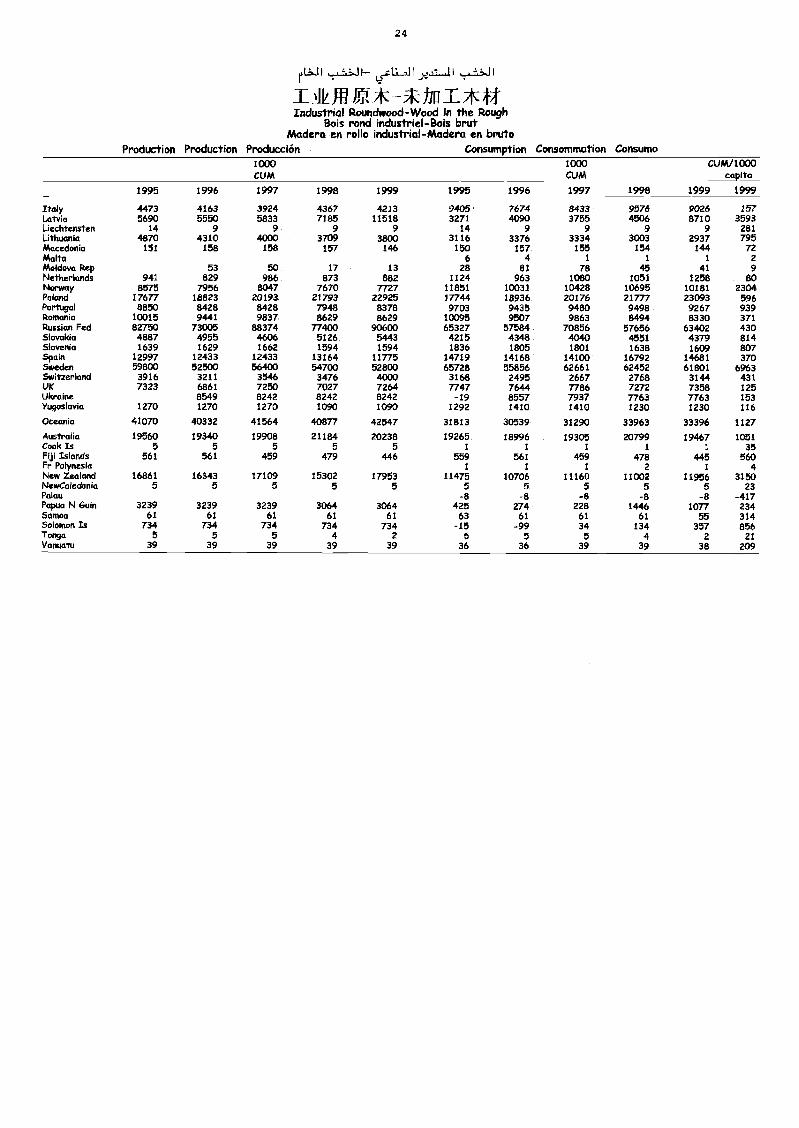
24
I
1_01111#*-Industrial Roundwood-Wood in the Rough
Bois rond industriel-Bois brutMadera en rollo industrial-Madera en bruto
Production Production Producción Consumption Consommation Consumo1000CUM
1000CUM
CUM/1000capita
1995 1996 1997 1998 1999 1995 1996 1997 1998 1999 1999
Itaiy 4473 4163 3924 4367 4213 9405 7674 8433 9576 9026 257Latvia 5690 5550 5833 7185 11518 3271 4090 3755 4506 13710 3593Liechtensten 14 9 9 9 9 14 9 9 9 9 281Lithuania 4870 4310 4000 3709 3800 3116 3376 3334 3003 2937 795Macedonia 151 158 158 157 146 150 157 155 154 144 72Malta 6 4 1 1 1 2Moldova Rep 53 50 17 13 28 81 78 45 41 9Netherlands 941 829 986 873 882 1124 963 1080 1051 1258 80Norway 8575 7956 8047 7670 7727 11851 10031 10428 10695 10181 2304Poland 17677 18823 20193 21793 22925 27744 18936 20176 21777 23093 596Portugal 8850 8428 8428 7948 8378 9703 9435 9480 9498 9267 939Romania 10015 9441 9837 8629 8629 10095 9507 9863 8494 8330 371Russian Fed 82750 73005 88374 77400 90600 65327 57584 70856 57656 63402 430Slovakia 4887 4955 4606 5126 5443 4215 4348 4040 4551 4379 814Slovenia 1639 1629 1662 1594 1594 1836 1805 1801 1638 1609 807SPain 12997 12433 12433 13164 11775 14719 14168 14100 16792 14681 370Sweden 59800 52500 56400 54700 52800 65728 55856 62661 62452 611301 6963Switzerland 3916 3211 3546 3476 4000 3168 2495 2667 2768 3144 431UK 7323 6861 7250 7027 7264 7747 7644 7786 7272 7358 125Ukraine 8549 8242 8242 8242 -19 8557 7937 7763 7763 153Yugoslavia 1270 1270 1270 1090 1090 1292 1410 1410 1230 1230 116
Oceania 41070 40332 41564 40877 42547 31813 30539 31290 33963 33396 1127
Australia 19560 19340 19908 21184 20238 19265 18996 19305 20799 19467 1051Cook Is 5 5 5 5 5 1 1 1 1 1 35Fiji Islands 561 561 459 479 446 559 561 459 478 445 560Fr Polynesia 1 1 1 2 1 4New Zealand 16861 16343 17109 15302 17953 11475 10706 11160 11002 11956 3150NewCaledania 5 5 5 5 5 5 5 5 5 5 23Palau -8 -8 -8 -8 -8 -417Papua N Guin 3239 3239 3239 3064 3064 425 274 228 1446 1077 234Samoa 61 61 61 61 61 63 61 61 61 55 314Solomon Is 734 734 734 734 734 -15 -99 34 134 357 856Tonga 5 5 5 4 2 5 5 5 4 2 21Vanuatu 39 39 39 39 39 36 36 39 39 38 209
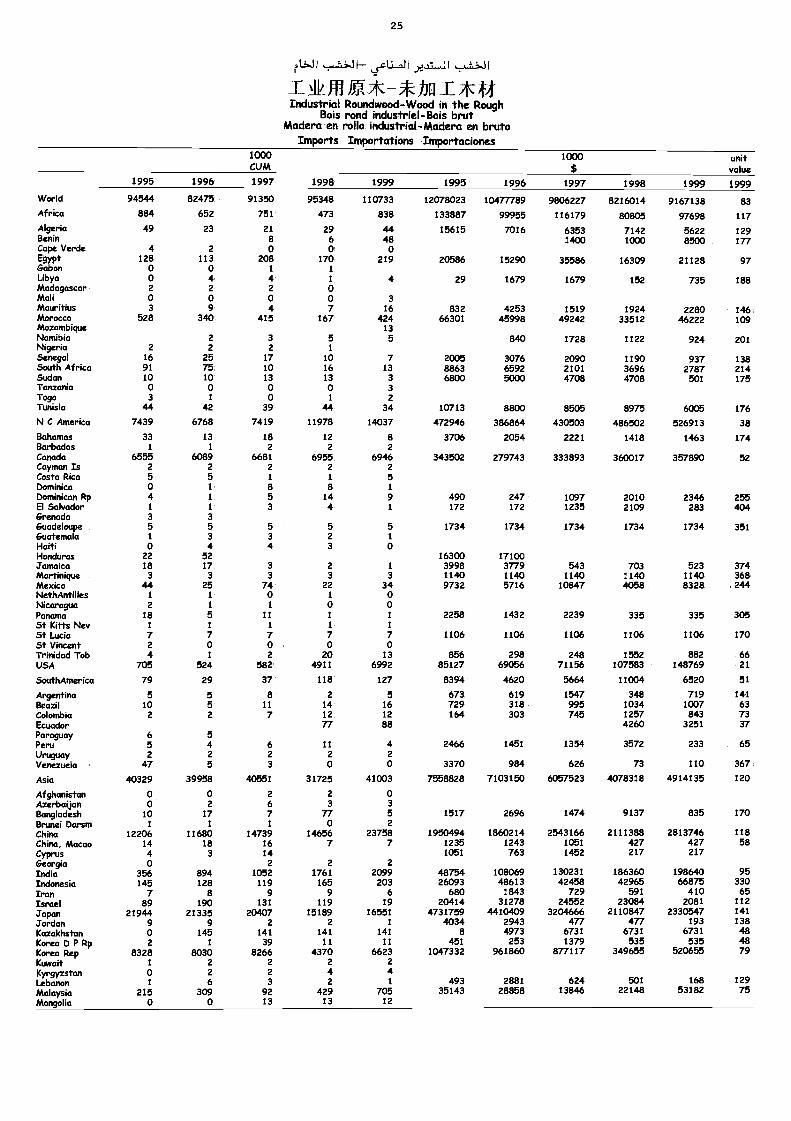
2 5
--r-IlkMg*h11-1[*ffIndustrial Roundwood-Wood in the Rough
Bois rond industriel-Bois brutMadera en rollo industrial-Madera en bruto
Imports Importations Importaciones1000CUM
1000$
uMtvakm
1995 1996 1997 1998 1999 1995 1996 1997 1998 1999 1999
VlokMd 94544 82475 91350 95348 110733 12078023 10477789 9806227 8216014 9167138 83Africa 884 652 751 473 838 133887 99955 116179 80805 97698 117Algeria 49 23 21 29 44 15615 7016 6353 7142 5622 129Benin 8 6 48 1400 1000 8500 177Cape Verde 4 2 0 0 0Egypt 128 113 208 170 219 20586 15290 35586 16309 21128 97Gabon 0 0 1 1
Libya 0 4 4 1 4 29 1679 1679 152 735 188Madagascar 2 2 2 0Mali 0 0 0 0 3Mcmritius 3 9 4 7 16 832 4253 1519 1924 2280 146Morocco 528 340 415 167 424 66301 45998 49242 33512 46222 109Mozambique 13Namibia 2 3 5 5 840 1728 1122 924 201Nigeria 2 2 2 1
Senegal 16 25 17 10 7 2005 3076 2090 1190 937 138South AfMca 91 75 10 16 13 8863 6592 2101 3696 2787 214Sudan 10 10 13 13 3 6800 5000 4708 4708 501 175Tanzania 0 0 0 0 3Togo 3 1 0 1 2TuniMa 44 42 39 44 34 10713 8800 8505 8975 6005 176N C Ammrka 7439 6768 7419 11978 14037 472946 386864 430503 486502 526913 38
Bahamas 33 13 18 12 8 3706 2054 2221 1418 1463 174Barbados 1 1 2 2 2Canada 6555 6089 6681 6955 6946 343502 279743 333893 360017 357890 52Carnanrs 2 2 2 2 2Costa Rica 5 5 1 1 5Dominica 0 1 8 8 1
Dominican Rp 4 1 5 14 9 490 247 1097 2010 2346 255El Salvador 1 1 3 4 1 172 172 1235 2109 283 404Grenada 3 3Guadeloupe 5 5 5 5 5 1734 1734 1734 1734 1734 351Guatemala 1 3 3 2 1
HMti 0 4 4 3 0Honduras 22 52 16300 17100Jamaica 18 17 3 2 1 3998 3779 543 703 523 374Martinkme 3 3 3 3 3 1140 1140 1140 1140 1140 368Mmxico 44 25 74 22 34 9732 5716 10847 4058 8328 244NkthAntilles 1 1 0 1 0Nicaragua 2 1 1 0 0Panama 18 5 11 1 1 2258 1432 2239 335 335 305St Kifts Nev 1 1 1 1 1
St Uxia 7 7 7 7 7 1106 1106 1106 1106 1106 170St Vincent 2 0 0 0 0Trinidad Tob 4 1 2 20 13 856 298 248 1552 882 66USA 705 524 582 4911 6992 85127 69056 71156 107583 148769 21
SouthAmerica 79 29 37 118 127 8394 4620 5664 11004 6520 51
Argentina 5 5 8 2 5 673 619 1547 348 719 141Brazil 10 5 11 14 16 729 318 995 1034 1007 63Colombia 2 2 7 12 12 164 303 745 1257 843 73Ecuador 77 88 4260 3251 37Paraguay 6 5Peru 5 4 6 11 4 2466 1451 1354 3572 233 65Uruguay 2 2 2 2 2Venezuela 47 5 3 0 0 3370 984 626 73 110 367
Asia 40329 39958 40551 31725 41003 7558828 7103150 6057523 4078318 4914135 120
AfghanMtan 0 0 2 2 0Azerbaijan 0 2 6 3 3Bangladesh 10 17 7 77 5 1517 2696 1474 9137 835 170Brunei Dorsm 1 i 1 0 2China 12206 11680 14739 14656 23758 1950494 1860214 2543166 2111388 2813746 118China. Macao 14 18 16 7 7 1235 1243 1051 427 427 58Cylays 4 3 14 1051 763 1452 217 217Georgia 0 2 2 2India 356 894 1052 1761 2099 48754 108069 130231 186360 198640 95Indonesia 145 128 119 165 203 26093 48613 42458 42965 66875 330Iran 7 8 9 9 6 680 1843 729 591 410 65Israel 89 190 131 119 19 20414 31278 24552 23084 2081 112
Japan 21944 21335 20407 15189 16551 4731759 4410409 3204666 2110847 2330547 141
Jordan 9 9 2 2 1 4034 2943 477 477 193 138
Kazakhstan 0 145 141 141 141 8 4973 6731 6731 6731 48Korea bPRp 2 1 39 11 11 451 253 1379 535 535 48Korea Rep 8328 8030 8266 4370 6623 1047332 961860 877117 349655 520655 79Kuwait 1 2 2 2 2
Kyrgyzstan 0 2 2 4 4Lebanon 1 6 3 2 1 493 2881 624 501 168 129
Malaysia 215 309 92 429 705 35143 28858 13846 22148 53182 75Mongolia 0 0 13 13 12
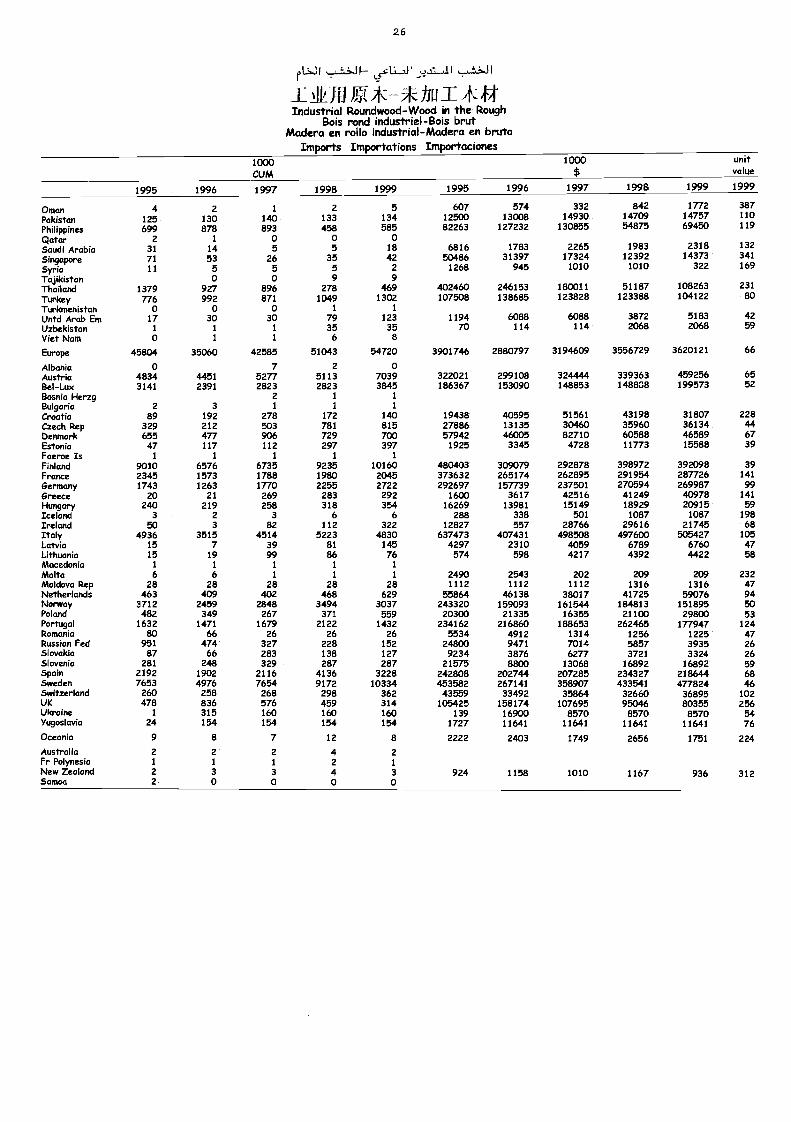
2 6
rWl U
ill -Industrial Roundwood-Wood in the Rough
Bois rond industriel-Bois brutMadera en rollo industrial-Madera en bruto
Imports Importations Importaciones1000CUM
1000 unitvalue
1995 1996 1997 1998 1999 1995 1996 1997 1998 1999 1999
OmanPakistanPhilippines
4125699
2130878
1
140893
2133458
5134585
607125082263
57400813127232
33214930
13085525409147
5487514177725769450
387110119
QatarSaudi Arabia
231
1
1405
05
018 6816 1783 2265 1983 2318 132
SingaporeSyria
7111
535
265
355
422 5°4586126
31397945
173241010
123921010
14373322
341169
Tajikistan 0 0 9 9Thailand 1379 927 896 278 469 402460 246153 180011 51187 108263 231
Turkey 776 992 871 1049 1302 107508 138685 123828 123388 104122 80Turkmenistan 0 o o 1 1
Untd Arab Em 17 30 30 79 123 1194 6088 6088 3872 5183 42
Uzbekistan 1 1 1 35 35 70 114 114 2068 2068 59Viet Nam o 1 1 6 8
Europe 45804 35060 42585 51043 54720 3901746 2880797 3194609 3556729 3620121 66
Albania o 7 2 oAustria 4834 4451 5277 5113 7039 322021 299108
314244448853
339363 459256 65Bel-Lux 3141 2391 2823 2823 3845 186367 153090 148868 199573 52Bosnia Herzg 2 1 1
Bulgaria 2 3 1 1 1
CroatiaCzech Rep
89329
192212
278503
172781
140815
1943827886
4059513135
5156130460
4319835960
31807
43618394
22844
DenmarkEstonia
65547
477117
906112
729297
700397
579421925
460053345
827104728
6058811773
6515588
6739
Faeroe Is 1 1 1 1 1
Finland 9010 6576 6735 9235 10160 480403 309079 292878 398972 392098 39FranceGermanyGreeceHungary
23451743
20240
15731263
21219
17881770
269258
19802255
283318
20452722
292354
373632292697
160016269
265174157739
361713981
2628952375014251615149
2919542705944124918929
2877262699874097820915
14199
14159
IcendlaIreland
350
2
33
826
1126
322288
12827338557 5°661287
108729616
108721745
19868
ItalyLatvia
493615
35157
451439
522381
4830145
6374734297
4074312310
498508 49765009 5054276760
10547
Lithuania 15 19 99 86 76 574 598 44°25917 4392 4422 58Macedonia 1 1 1 1 1
MaltaMoldova RepNetherlands
628
463
628
409
1
28402
1
28468
1
28629
24901112
5586421543112
46138
2021112
380172°91613
41725
209
59076
2324794
Norway 3712 2459 2848 3494 3037 243320 159093 161544 184813 151895 50Polculd 482 349 267 371 559 20300 21335 16355 21100 29800 53PortugalRoniamaRussian FedSlovakiaSlovenia
163280
95187
281
147166
47466
248
167926
327283329
212226
228138287
143226
152127287
234162
245851331
2915234
2168604912
39847761
8800
188653131470146277
13068
26212465
5857
163879221
17794275
3935163539242
12447265296
SpainSwedenSwitzerland
21927653
260
19024976
258
21167654
268
41369172
298
322810334
362
242808453582
43559
202744267141
33492
207285358907
35864
234327433541
32660
218644
43776859254
6846
102UK 478 836 576 459 314 105425 158174 107695 95046 80355 256Ukraine 1 315 160 160 160 16900 8570 8570 570 54Yugoslavia 24 154 154 154 154 1237917 11641 11641 11641
18164176
Oceania 9 8 7 12 8 2222 2403 1749 2656 1751 224Australia 2 2 2 4 2Fr Polynesia 1 1 1 2 1
New Zealand 2 3 3 4 3 924 1158 1010 1167 936 312Samoa 2 o 0 o o
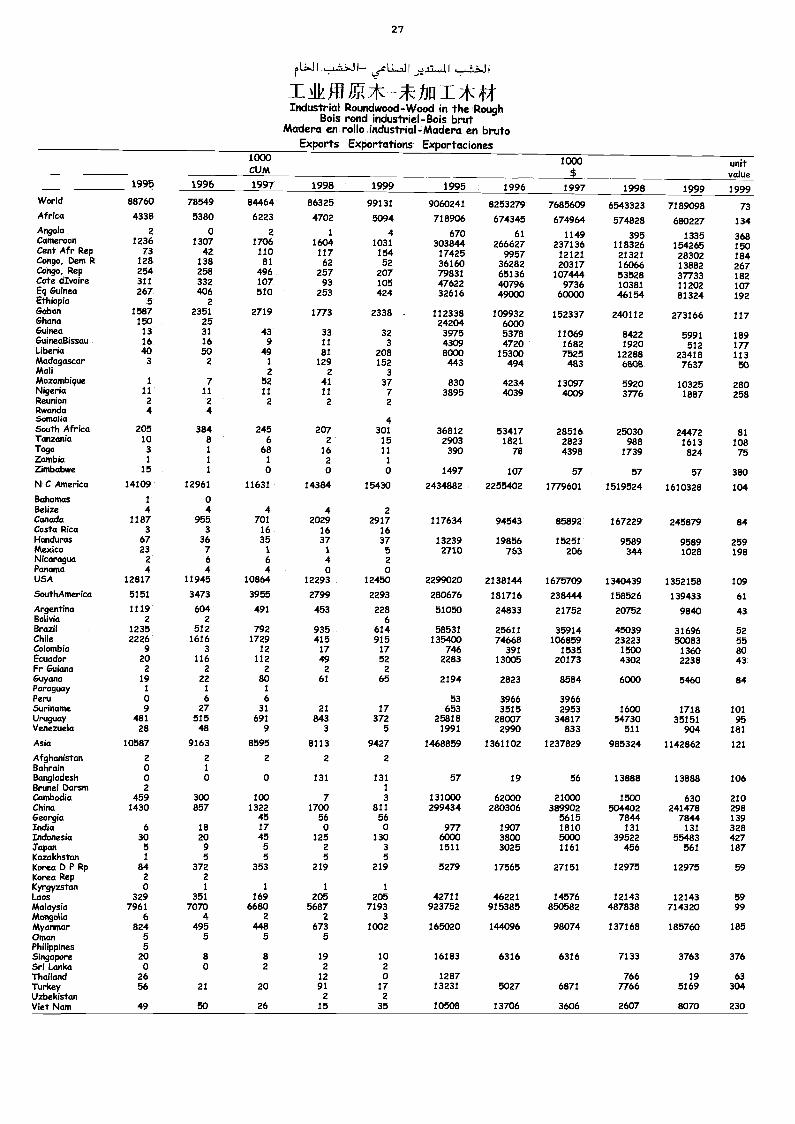
2 7
.t1
)_11/A hnIndustrial Roundwood-Wood in the Rough
Bois rond industriel-Bois brutMadera en rollo industrial-Madera en bruto
Exports Exportations Exportaciones1000CUM
1000$
unitvalue
1995 1996 1997 1998 1999 1995 1996 1997 1998 1999 1999World 88760 78549 84464 86325 99131 9060241 8253279 7685609 6543323 7189098 73Africa 4338 5380 6223 4702 5094 718906 674345 674964 574828 680227 134Angola 2 0 2 1 4 670 61 1149 395 1335 368Cameroon 1236 1307 1706 1604 1031 303844 266627 237136 118326 154265 150Ce.nt Afr Rep 73 42 110 117 154 17425 9957 12121 21321 28302 184Congo, Dem R 128 138 81 62 52 36160 36282 20317 16066 13882 267Congo, Rep 254 258 496 257 207 79831 65136 107444 53528 37733 182Cote dIvoire 311 332 107 93 105 47622 40796 9736 10381 11202 107Eq GuineaEthiopia
2675
4062
510 253 424 32616 49000 60000 46154 81324 192
Gabon 1587 2351 2719 1773 2338 112338 109932 152337 240112 273166 117Ghana 150 25 24204 6000Guinea 13 31 43 33 32 3975 5378 11069 8422 5991 189GuineaBissau 16 16 9 11 3 4309 4720 1682 1920 512 177Liberia 40 50 49 81 208 8000 15300 7525 12288 23418 113Madagascar 3 2 1 129 152 443 494 483 6808 7637 50Mali 2 2 3Mozambique 1 7 52 41 37 830 4234 13097 5920 10325 280Nigeria 11 11 11 11 7 3895 4039 4009 3776 1887 258Reunion 2 2 2 2 2Rwanda 4 4Somalia 4South Africa 205 384 245 207 301 36812 53417 28516 25030 24472 81Tanzania 10 8 6 2 15 2903 1821 2823 988 1613 108Togo 3 1 68 16 11 390 78 4398 1739 824 75Zambia 1 1 1 2 1
Zimbabwe 15 1 0 0 0 1497 107 57 57 57 380N C America 14109 12961 11631 14384 15430 2434882 2255402 1779601 1519524 1610328 104Bahamas 1 0Belize 4 4 4 4 2Canada 1187 955 701 2029 2917 117634 94543 85892 167229 245879 84Costa Rica 3 3 16 16 16Honduras 67 36 35 37 37 13239 19856 15251 9589 9589 259Mexico 23 7 1 1 5 2710 763 206 344 1028 198Nicaragua 2 6 6 4 2Panama 4 4 4 0 0USA 12817 11945 10864 12293 12450 2299020 2138144 1675709 1340439 1352158 109SouthAmerica 5151 3473 3955 2799 2293 280676 181716 238444 158526 139433 61
Argentina 1119 604 491 453 228 51050 24833 21752 20752 9840 43Bolivia 2 2 6Brazil 1235 512 792 935 614 58531 25611 35914 45039 31696 52Chile 2226 1616 1729 415 915 135400 74668 106859 23223 50083 55Colombia 9 3 12 17 17 746 391 1535 1500 1360 80Ecuador 20 116 112 49 52 2283 13005 20173 4302 2238 43Fr Guiana 2 2 2 2 2Guyana 19 22 80 61 65 2194 2823 8584 6000 5460 84Paraguay 1 1 1
Peru 0 6 6 53 3966 3966Suriname 9 27 31 21 17 653 3515 2953 1600 1718 101Uruguay 481 515 691 843 372 25818 28007 34817 54730 35151 95Venezuela 28 48 9 3 5 1991 2990 833 511 904 181
Asia 10587 9163 8595 8113 9427 1468859 1361102 1237829 985324 1142862 121
Afghanistan 2 2 2 2 2Bahrain 0 IBangladesh 0 0 0 131 131 57 19 56 13888 13888 106Brunei Darsm 2 1Cambodia 459 300 100 7 3 131000 62000 21000 1500 630 210China 1430 857 1322 1700 811 299434 280306 389902 504402 241478 298Georgia 45 56 56 5615 7844 7844 139India 6 18 17 0 0 977 1907 1810 131 131 328Indonesia 30 20 45 125 130 6000 3800 5000 39522 55483 427Japan 5 9 5 2 3 1511 3025 1161 456 561 187Kazakhstan 1 5 5 5 5Korea D P Rp 84 372 353 219 219 5279 17565 27151 12975 12975 59Korea Rep 2 2Kyrgyzstan 0 1 1 1 /Laos 329 351 169 205 205 42711 46221 14576 12143 12143 59Malaysia 7961 7070 6680 5687 7193 923752 915385 850582 487838 714320 99Mongolia 6 4 2 2 3Myaninar 824 495 448 673 1002 165020 144096 98074 137168 185760 185Ornan 5 5 5 5Philippines 5Singapore 20 8 8 19 10 16183 6316 6316 7133 3763 376Sri Lanka 0 0 2 2 2Thailand 26 12 0 1287 766 19 63Turkey 56 21 20 91 17 13231 5027 6871 7766 5169 304Uzbekistan 2 2
Viet Nam 49 50 26 15 35 10508 13706 3606 2607 8070 230
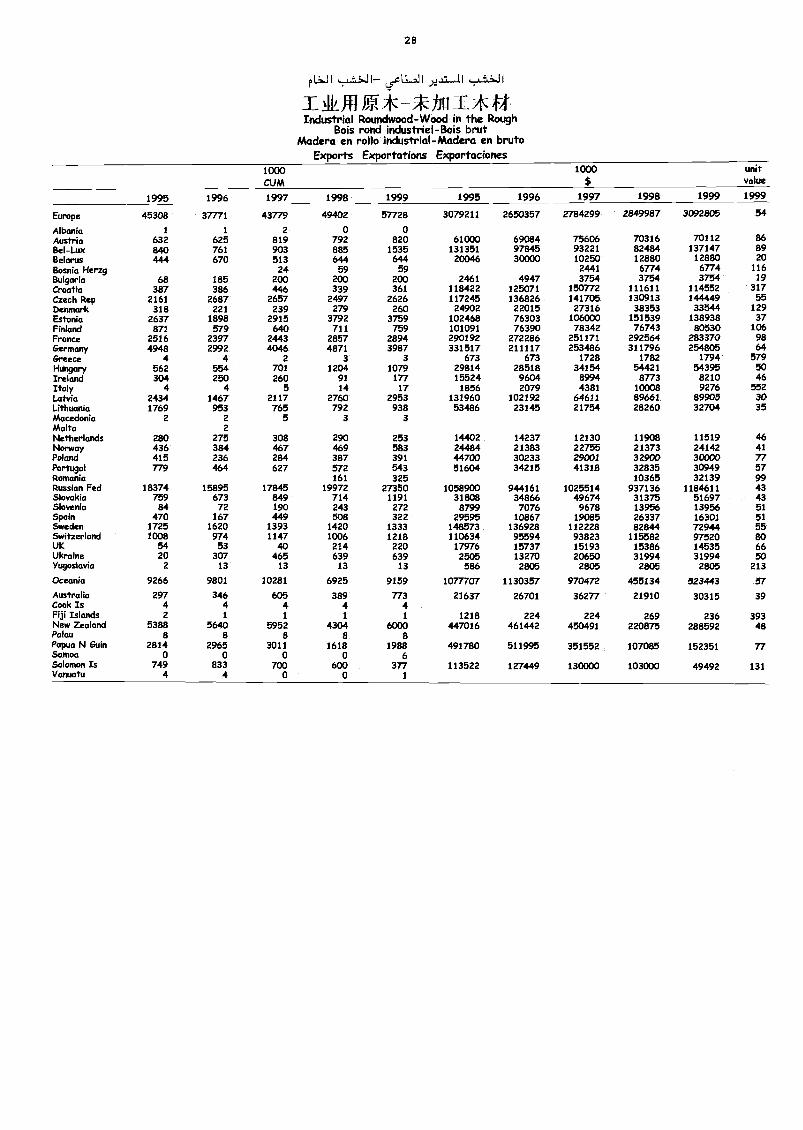
2 8
H I I cUU )4 I
Thin L1-7rrii-**1-Industrial Roundwood-Wood in the Rough
Bois rand industriel-Sois brutMadera en rollo industrial-Madera en bruto
Exports Exportaiions Exportaciones1000CUM
1000$
unitvalue
1995 1996 1997 1998 1999 1995 1996 1997 1998 1999 1999
Europe 45308 37771 43779 49402 57728 3079211 2650357 2784299 2849987 3092805 54
Albania I 1 2 o 0Austria 632 625 819 792 820 61000 69084 75606 70316 70112 86Bel-Lux 840 761 903 885 1535 131351 97845 93221 82484 137147 89Belarus 4.44 670 513 644 644 20046 30000 10250 12880 12880 20Bosnia Herzg 24 59 59 2441 6774 6774 116Bulgaria 68 185 200 200 200 2461 4947 3754 3754 3754 19Croatia 387 386 446 339 361 118422 125071 150772 111611 114552 317Czech Rep 2161 2687 2657 2497 2626 117245 136826 141705 130913 144449 55Denmark 318 221 239 279 260 24902 22015 27316 38353 33544 129Estonia 2637 1898 2915 3792 3759 102468 76303 106000 151539 138938 37Finland 871 579 640 711 759 101091 76390 78342 76743 80530 106France 2516 2397 2443 2857 2894 290192 272286 251171 292564 283370 98Germany 4948 2992 4046 4871 3987 331517 211117 253486 311796 254805 64Greece 4 4 2 3 3 673 673 1728 1782 1794 579Hungary 562 554 701 1204 1079 29814 28518 34154 54421 54395 50Ireland 304 250 260 91 177 15524 9604 8994 8773 8210 46Italy 4 4 5 14 17 1856 2079 4381 10008 9276 552Latvia 2434 1467 2117 2760 2953 131960 102192 64611 89661 89905 30Lithuania 1769 953 765 792 938 53486 23145 21754 28260 32704 35Macedonia 2 2 5 3 3Malta 2Netherlands 280 275 308 290 253 14402 14237 12130 11908 11519 46Norway 436 384 467 469 583 24484 21383 22755 21373 24142 41Poland 415 236 284 387 391 44700 30233 29001 32900 30000 77Portugal 779 464 627 572 543 51604 34215 41318 32835 30949 57Romania 161 325 10365 32139 99Russian Fed 18374 15895 17845 19972 27350 1058900 944161 1025514 937136 1184611 43Slovakia 759 673 849 714 1191 31808 34866 49674 31375 51697 43Slovenia 84 72 190 243 272 8799 7076 9678 13956 13956 51Spain 470 167 449 508 322 29595 10867 19085 26337 16301 51Sweden 1725 1620 1393 1420 1333 148573 136928 112228 82844 72944 55Switzerland 1008 974 1147 1006 1218 110634 95594 93823 115582 97520 80UK 54 53 40 214 220 17976 15737 15193 15386 14535 66Ukraine 20 307 465 639 639 2505 13270 20650 31994 31994 50Yugoslavia 2 13 13 13 13 586 2805 2805 2805 2805 213
Oceania 9266 9801 10281 6925 9159 1077707 1130357 970472 455134 523443 57Australia 297 346 605 389 773 21637 26701 36277 21910 30315 39Cook Is 4 4 4 4 4Fiji Islands 2 1 1 1 1 1218 224 224 269 236 393New Zealand 5388 5640 5952 4304 6000 447016 461442 450491 220875 288592 48Palau 8 8 8 a 8Papua N Guin 2814 2965 3011 1618 1988 491780 511995 351552 107085 152351 77Samoa 0 0 o 0 6Solomon Is 749 833 700 600 377 113522 127449 130000 103000 49492 131Vanuatu 4 4 0 0 1
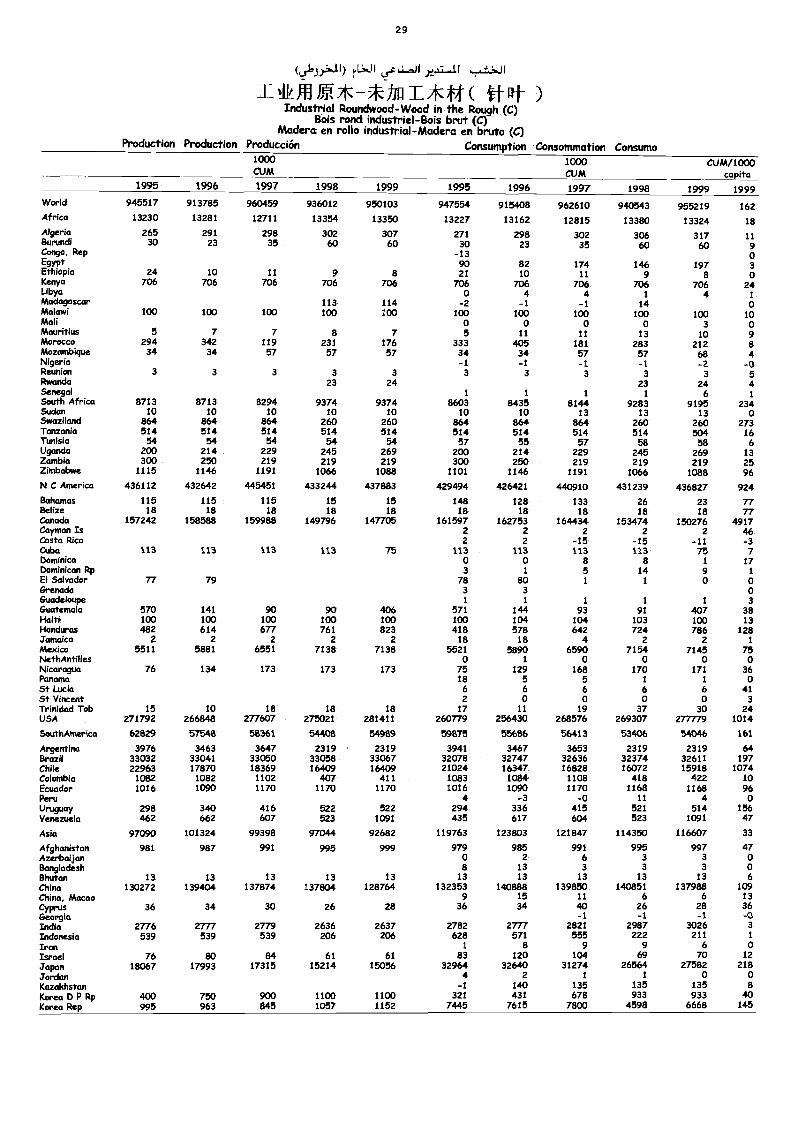
2 9
iseLL0.11
tf-q- )Industrial Roundwood-Wood in the Rough (C)
Bois rand industriel-Bois brut (C)Madera en rollo industrial-Madera en bruto (C)
Production Production Producción Consumption Consommation Consumo1000CUM
1000CUM
CUM/1000capita
1999 19991995 1996 1997 1998 19 99 1995 1996 1997 1998World 945517 913785 960459 936012 950103 947554 915408 962610 940543 955219 162Africa 13230 13281 12711 13354 13350 13227 13162 12815 13380 13324 18Algeria 265 291 298 302 307 271 298 302 306 317 11Burundi 30 23 35 60 60 30 23 35 60 60 9Congo, Rep -13 0EgYPt 90 82 174 146 197 3Ethiopia 24 10 11 9 8 21 10 11 9 8 0Kenya 706 706 706 706 706 706 706 706 706 706 24Libya o 4 4 1 4 1Madagascar 113 114 -2 -1 -1 14 0Malawi 100 100 100 100 100 100 100 100 100 100 10Mali o o o o 3 0Mauritius 5 7 7 8 7 5 11 11 13 10 9Morocco 294 342 119 231 176 333 405 181 283 212 8Mozambique 34 34 57 57 57 34 34 57 57 68 4Nigeria -1 -1 -1 -1 -2 -0Reunion 3 3 3 3 3 3 3 3 3 3 5Rwanda 23 24 23 24 4Senegal 1 1 1 1 6 1South Africa 8713 8713 8294 9374 9374 8603 8435 8144 9283 91 95 234Sudan 10 10 10 10 10 10 10 13 13 13 oSwaziland 864 864 864 260 260 864 864 864 260 260 273Tanzania 514 514 514 514 514 514 514 514 514 504 16Tunisia 54 54 54 54 54 57 55 57 58 58 6Uganda 200 214 229 245 269 200 214 229 245 269 13Zambia 300 250 219 219 219 300 250 219 219 219 25Zimbabwe 1115 1146 1191 1066 1088 1101 1146 1191 1066 1088 96N C Americo 436112 432642 445451 433244 437883 429494 426421 440910 431239 436827 924Bahamas 115 115 115 15 15 148 128 133 26 23 77Belize 18 18 18 18 18 18 18 18 18 18 77Canada 157242 158588 159988 149796 147705 161597 162753 164434 153474 150276 4917Cayman Is 2 2 2 2 2 46Costa Rica 2 2 -15 -15 -11 -3Cuba 113 113 113 113 75 113 113 113 113 75 7Dominica 0 0 8 8 1 17Dominican Rp 3 1 5 14 9 1
El Salvador 77 79 78 80 1 1 0 0Grenada 3 3 0Guadeloupe 1 1 1 I 1 3Guatemala 570 141 90 90 406 571 144 93 91 407 38Haiti 100 100 100 100 100 100 104 104 103 100 13Honduras 482 614 677 761 823 418 578 642 724 786 128Jamaica 2 2 2 2 2 18 18 4 2 2 1
Mexico 5511 5881 6551 7138 7138 5521 5890 6590 7154 7145 75NethAntilles 0 1 o o 0 oNicaragua 76 134 173 173 173 75 129 168 170 171 36Panama 18 5 5 1 1 0St Lucia 6 6 6 6 6 41St Vincent 2 0 o o 0 3Trinidad Tob 15 10 18 18 18 17 11 19 37 30 24USA 271792 266848 277607 275021 281411 260779 256430 268576 269307 277779 1014
SouthArnerica 62829 57548 58361 54408 54989 59875 55686 56413 53406 54046 161
Argentina 3976 3463 3647 2319 2319 3941 3467 3653 2319 2319 64Brazil 33032 33041 33050 33058 33067 32078 32747 32636 32374 32611 197Chile 22963 17870 18369 16409 16409 21024 16347 16828 16072 15918 1074Colombia 1082 1082 1102 407 411 1083 1084 1108 418 422 10Ecuador 1016 1090 1170 1170 1170 1016 1090 1170 1168 1168 96Peru 4 -3 -0 11 4 0Uruguay 298 340 416 522 522 294 336 415 521 514 156Venezuela 462 662 607 523 1091 435 617 604 523 1091 47
Asia 97090 101324 99398 97044 92682 119763 123803 121847 114350 116607 33
Afghanistan 981 987 991 995 999 979 985 991 995 997 47Azerbaijan o 2 6 3 3 0Bangladesh 8 13 3 3 3 0Bhutan 13 13 13 13 13 13 13 13 13 13 6China 130272 139404 137874 137804 128764 132353 140888 139850 140851 137988 109China, Macao 9 15 11 6 6 13Cyprus 36 34 30 26 28 36 34 40 26 28 36Georgia -I -1 -1 -aIndia 2776 2777 2779 2636 2637 2782 2777 2821 2987 3026 3
Indonesia 539 539 539 206 206 628 571 555 222 211 1
Iran I 8 9 9 6 0Israel 76 80 84 61 61 83 120 104 69 70 12
J'apan 18067 17993 17315 15214 15056 32964 32640 31274 26564 27582 218Jordan 4 2 1 1 0 0Kazakhstan -1 140 135 135 135 8Korea D P Rp 400 750 900 1100 1100 321 431 678 933 933 40Korea Rep 995 963 845 1057 1152 7445 7615 7800 4598 6668 145
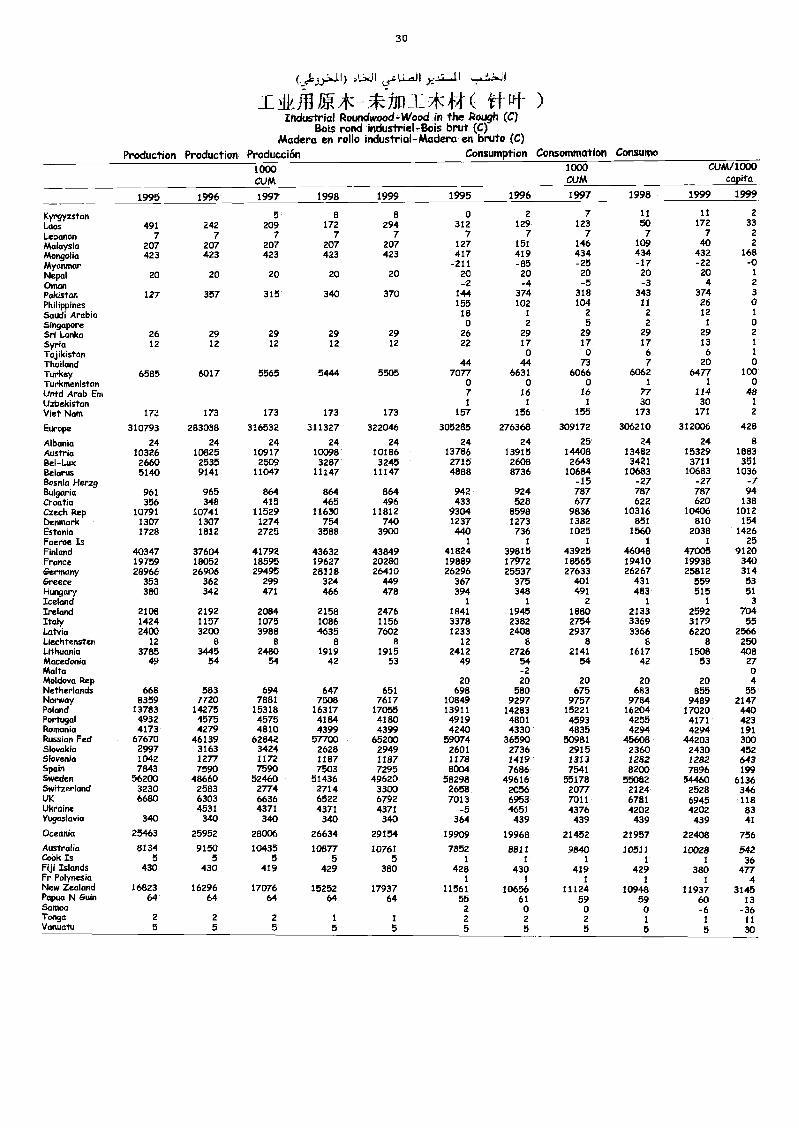
30
TOM VAL:11*ff ( ¡IA )Industrial Round wood-Wood in the Rough (C)
Bois rand industriel-Bois brut (C)Madera en rollo industrial-Madera en bruto (C)
Production Production Producción Consumption Consommation Consumo
1000CUM
1000CUM
CUM/1000capita
1995 1996 1997 1998 1999 1995 1996 1997 1998 1999 1999
Kyrgyzstan 5 a 8 o 2 7 11 11 2
Laos 491 242 209 172 294 312 129 123 50 172 33
Lebanon 7 7 7 7 7 7 7 7 7 7 2
Malaysia 207 207 207 207 207 127 151 146 109 40 2
Mongolia 423 423 423 423 423 417 419 434 434 432 168Myanmar -211 -85 -25 -17 -22 -0Nepal 20 20 20 20 20 20 20 20 20 20 1
Oman -2 -4 -5 -3 4 2
Pakistan 127 357 315 340 370 144 374 318 343 374 3
Philippines 155 102 104 11 26 0Saudi Arabia 18 1 2 2 12 1
Singapore o 2 5 2 1 0Sri Lanka 26 29 29 29 29 26 29 29 29 29 2Syria 12 12 12 12 12 22 17 17 17 13 1
Tajikistan 0 0 6 6 1
Thailand 44 44 73 7 20 0Turkey 6585 6017 5565 5444 5505 7077 6631 6066 6062 6477 100Turkmenistan 0 0 0 1 1 0Untd Arab Em 7 16 16 77 114 48Uzbekistan 1 1 1 30 30 1
Viet Nam 17a 173 173 173 173 157 156 155 173 171 2
Europe 310793 283038 316532 311327 322046 305285 276368 309172 306210 312006 428
Albania 24 24 24 24 24 24 24 25 24 24 8Austria 10326 10825 10917 10098 10186 13786 13915 14408 13482 15329 1883Bel-Lux 2660 2535 2509 3287 3245 2715 2608 2643 3421 3711 351Belarus 5140 9141 11047 11147 11147 4888 8736 10684 10683 10683 1036Bosnia Herzg -15 -27 -27 -7Bulgaria 961 965 864 864 864 942 924 787 787 787 94Croatia 356 348 415 465 496 433 528 677 622 620 138Czech Rep 10791 10741 11529 11630 11812 9304 8598 9836 10316 10406 1012Denmark 1307 1307 1274 754 740 1237 1273 1382 851 810 154Estonia 1728 1812 2725 3588 3900 440 736 1025 1560 2038 1426Faeroe Is 1 1 1 1 1 25Finland 40347 37604 41792 43632 43849 41824 39815 43925 46048 47005 9120France 19759 18052 18595 19627 20280 19889 17972 18565 19410 19938 340Germany 28966 26906 29495 28118 264W 26296 25537 27633 26267 25812 314Greece 353 362 299 324 449 367 375 401 431 559 53Hungary 380 342 471 466 478 394 348 491 483 515 51Iceland 1 1 2 1 1 3Ireland 2108 2192 2084 2158 2476 1841 1945 1880 2133 2592 704Italy 1424 1157 1075 1086 1156 3378 2382 2754 3369 3179 55Latvia 2400 3200 3988 4635 7602 1233 2408 2937 3366 6220 2566Liechtensten 12 a 8 8 a 12 8 8 8 8 250Lithuania 3785 3445 2480 1919 1915 2412 2726 2141 1617 1508 408Macedonia 49 54 54 42 53 49 54 54 42 53 27Malta -2 0Moldova Rep 20 20 20 20 20 4Netherlands 668 583 694 647 651 698 580 675 683 855 55Norway 8359 7720 7881 7508 7617 10849 9297 9757 9784 9489 2147Poland 13783 14275 15318 16317 17055 13911 14283 15221 16204 17020 440Portugal 4932 4575 4575 4184 41110 4919 4801 4593 4255 4171 423Romania 4173 4279 4810 4399 4399 4240 4330 4835 4294 4294 191Russian Fed 67670 46139 62842 57700 65200 59074 36590 50981 45608 44203 300Slovakia 2997 3163 3424 2628 2949 2601 2736 2915 2360 2430 452Slovenia 1042 1277 1172 1187 1187 1178 1419 1313 1282 1282 643Spain 7843 7590 7590 7503 7295 8004 7686 7541 8200 7896 199Sweden 56200 48660 52460 51436 49620 58298 49616 55178 55082 54460 6136Switzerland 3230 2583 2774 2714 3300 2658 2056 2077 2124 2528 346UK 6680 6303 6636 6522 6792 7013 6953 7011 6781 6945 118Ukraine 4531 4371 4371 4371 -5 4651 4376 4202 4202 83Yugoslavia 340 340 340 340 340 364 439 439 439 439 41
Oceania 25463 25952 28006 26634 29154 19909 19968 21452 21957 22408 756Australia 8134 9150 10435 10877 10761 7852 8811 9840 10511 10028 542Cook Is 5 5 5 5 5 1
11 1 1 36
Fiji Islands 430 430 419 429 380 428 430 419 429 380 477Fr Polynesia 1 1 1 1 1 4New Zealand 16823 16296 17076 15252 17937 11561 10656 11124 10948 11937 3145Papua N Guin 64 64 64 64 64 55 61 59 59 60 13Samoa 2 0 0 0 -6 -36Tonga 2 2 2 1 1 2 2 2 1 i 11Vanuatu 5 5 5 5 5 5 5 5 5 5 30
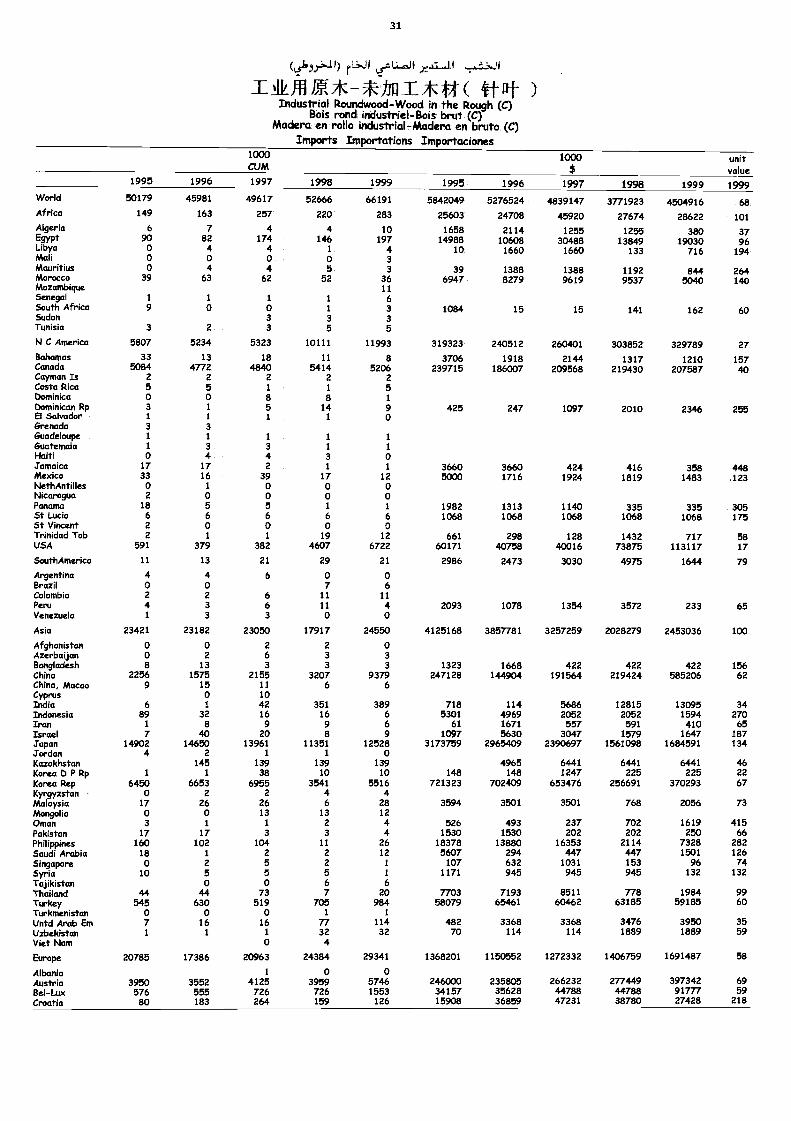
31
(selL.A.11JLITJ-hI*ff(itrut )Industrial Roundwood-Wood in the Rough (C)
Bois rond indusiriel-Bois brut (C)Madera en rollo industrial-Madera en bruto (C)
Imports Itnportations Importaciones1000CUM
1000$
unitvalue
1995 1996 1997 1998 1999 1995 1996 1997 1998 1999 1999World 50179 45981 49617 52666 66191 5842049 5276524 4839147 3771923 4504916 68Africa 149 163 257 220 283 25603 24708 45920 27674 28622 101Algeria 6 7 4 4 10 1658 2114 1255 1255 380 37Egypt 90 82 174 146 197 14988 10608 30488 13849 19030 96Libya o 4 4 1 4 10 1660 1660 133 716 194Mali o o o o 3Mauritius o 4 4 5 3 39 1388 1388 1192 844 264Morocco 39 63 62 52 36 6947 8279 9619 9537 5040 140Mozambique 11Senegal 1 1 1 1 6South Africa 9 0 o 1 3 1084 15 15 141 162 60Sudan 3 3 3Tunisia 3 2 3 5 5
N C America 5807 5234 5323 10111 11993 319323 240512 260401 303852 329789 27Bahamas 33 13 18 11 8 3706 1918 2144 1317 1210 157Canada 5084 4772 4840 5414 5206 239715 186007 209568 219430 207587 aoCayman Is 2 2 2 2 2Costa Rica 5 5 1 1 5Dominica o o 8 8 1
Dominican Rp 3 1 5 14 9 425 247 1097 2010 2346 255El Salvador 1 1 1 1 0Grenada 3 3Guadeloupe 1 1 1 1 1
Guatemala 1 3 3 1 1
1-laiti o 4 4 3 oJamaica 17 17 2 1 1 3660 3660 424 416 358 448Mexico 33 16 39 17 12 5000 1716 1924 1819 1483 123NethAntilles o 1 o o oNicaragua 2 o o o oPancuna 18 5 5 1 1 1982 1313 1140 335 335 305St Lucia 6 6 6 6 6 1068 1068 1068 1068 1068 175St Vincent 2 o o o 0Trinidad Tob 2 1 1 19 12 661 298 128 1432 717 58USA 591 379 382 4607 6722 60171 40758 40016 73875 113117 17
SouthAmerica 11 13 21 29 21 2986 2473 3030 4975 1644 79Argentina 4 4 6 o oBrazil o 0 7 6Colombia 2 2 6 11 11Peru 4 3 6 11 4 2093 1078 1354 3572 233 65Venezuela 1 3 3 0 o
Asia 23421 23182 23050 17917 24550 4125168 3857781 3257259 2028279 2453036 100
Afghanistan o o 2 2 oAzerbaijan o 2 6 3 3Bangladesh 8 13 3 3 3 1323 1668 422 422 422 156China 2256 1575 2155 3207 9379 247128 144904 191564 219424 585206 62China, Macao 9 15 11 6 6Cyprus o 10India 6 1 42 351 389 718 114 5686 12815 13095 34Indonesia 89 32 16 16 6 5301 4969 2052 2052 1594 270Iran 1 8 9 9 6 61 1671 557 591 410 65Israel 7 ao 20 8 9 1097 5630 3047 1579 1647 187Japan 14902 14650 13961 11351 12528 3173759 2965409 2390697 1561098 1684591 134Jordan 4 2 1 1 0Kazakhstan 145 139 139 139 4965 6441 6441 6441 46Korea D P Rp 1 1 38 10 10 148 148 1247 225 225 22Korea Rep 6450 6653 6955 3541 5516 721323 702409 653476 256691 370293 67Kyrgyzstan . 0 2 2 4 4Malaysia 17 26 26 6 28 3594 3501 3501 768 2056 73Mongolia o 0 13 13 12Oman 3 1 1 2 4 526 493 237 702 1619 415Pakistan 17 17 3 3 4 1530 1530 202 202 250 66Philippines 160 102 104 11 26 18378 13880 16353 2114 7328 282Saudi Arabia 18 1 2 2 12 5607 294 447 447 1501 126Singapore o 2 5 2 1 107 632 1031 153 96 74Syria 10 5 5 5 1 1171 945 945 945 132 132Tajikistan o 0 6 6Thailand 44 44 73 7 20 7703 7193 8511 778 1984 99Turkey 545 630 519 705 984 58079 65461 60462 63185 59185 60Turkmenistan 0 o o 1 1
Untd Arab Eon 7 16 16 77 114 482 3368 3368 3476 3950 35Uzbekistan 1 1 1 32 32 70 114 114 1889 1889 59Viet Nam 0 4
Europe 20785 17386 20963 24384 29341 1368201 1150552 1272332 1406759 1691487 58
Albania 1 o oAustria 3950 3552 4125 3959 5746 246000 235805 266232 277449 397342 69Bel-Lux 576 555 726 726 1553 34157 35628 44788 44788 91777 59Croatia 80 183 264 159 126 15908 36859 47231 38780 27428 218
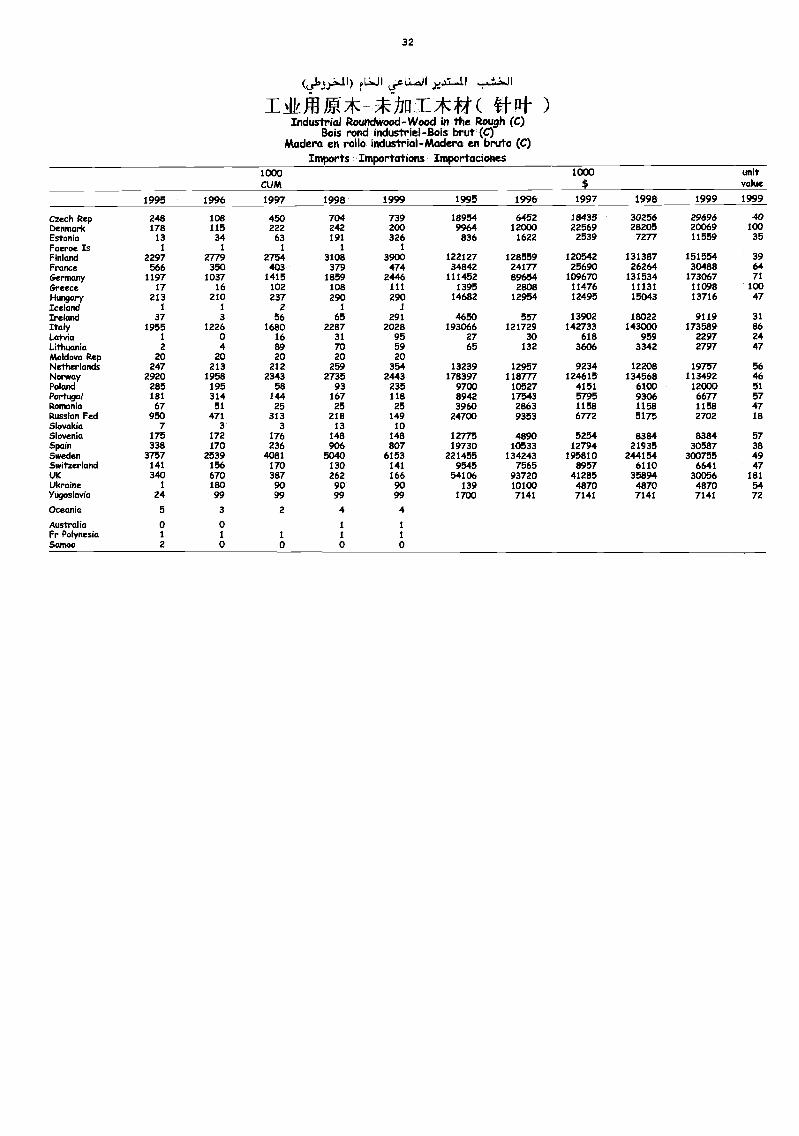
32
(0.1.».41)
Thilit*-VnI*44-( )Industrial Roundwood-Wood in the Rough (C)
Bois rand industriel-Bois brut (C)Madera en rollo industrial-Madera en bruto (C)
Imports Importations Importaciones1000CUM
1000 unitvalue
1995 1996 1997 1998 1999 1995 1996 1997 1998 1999 1999
Czech Rep 248 108 450 704 739 18954 6452 18435 30256 29696 40Denmark 178 115 222 242 200 9964 12000 22569 28205 20069 100Estonia 13 34 63 191 326 836 1622 2539 7277 11559 35Faeroe Is 1 I 1 1 1
Finland 2297 2779 2754 3108 3900 122127 128559 120542 131387 151554 39France 566 350 403 379 474 34842 24177 25690 26264 30488 64Germany 1197 1037 1415 1859 2446 111452 89654 109670 131534 173067 71Greece 17 16 102 108 111 1395 2808 11476 11131 11098 100Hungary 213 210 237 290 290 14682 12954 12495 15043 13716 47Iceland 1 1 2 1 1
Ireland 37 3 56 65 291 4650 557 13902 18022 9119 31Italy 1955 1226 1680 2287 2028 193066 121729 142733 143000 173589 86Latvia 1 0 16 31 95 27 30 618 959 2297 24Lithuania 2 4 89 70 59 65 132 3606 3342 2797 47Moldova Rep 20 20 20 20 20Netherlands 247 213 212 259 354 13239 12957 9234 12208 19757 56Norway 2920 1958 2343 2735 2443 178397 118777 124615 134568 113492 46Poland 285 195 58 93 235 9700 10527 4151 6100 12000 51Portugal 181 314 144 167 118 8942 17543 5795 9306 6677 57Romankt 67 51 25 25 25 3960 2863 1158 1158 1158 47Russian Fed 950 471 313 218 149 24700 9353 6772 5175 2702 18Slovakia 7 3 3 13 10Slovenia 175 172 176 148 148 12775 4890 5254 8384 8384 57Spain 338 170 236 906 807 19730 10533 12794 21935 30587 38Sweden 3757 2539 4081 5040 6153 221455 134243 195810 244154 300755 49Switzerland 141 156 170 130 141 9545 7565 8957 6110 6641 47VIC 340 670 387 262 166 54106 93720 41285 35894 30056 181Ukraine 1 180 90 90 90 139 10100 4870 4870 4870 54Yugoslavia 24 99 99 99 99 1700 7141 7141 7141 7141 72
Oceania 5 3 2 4 4
Australia 0 0 1 1
Fr Polynesia 1 1 1 1 1
Samoa 2 0 0 0 0
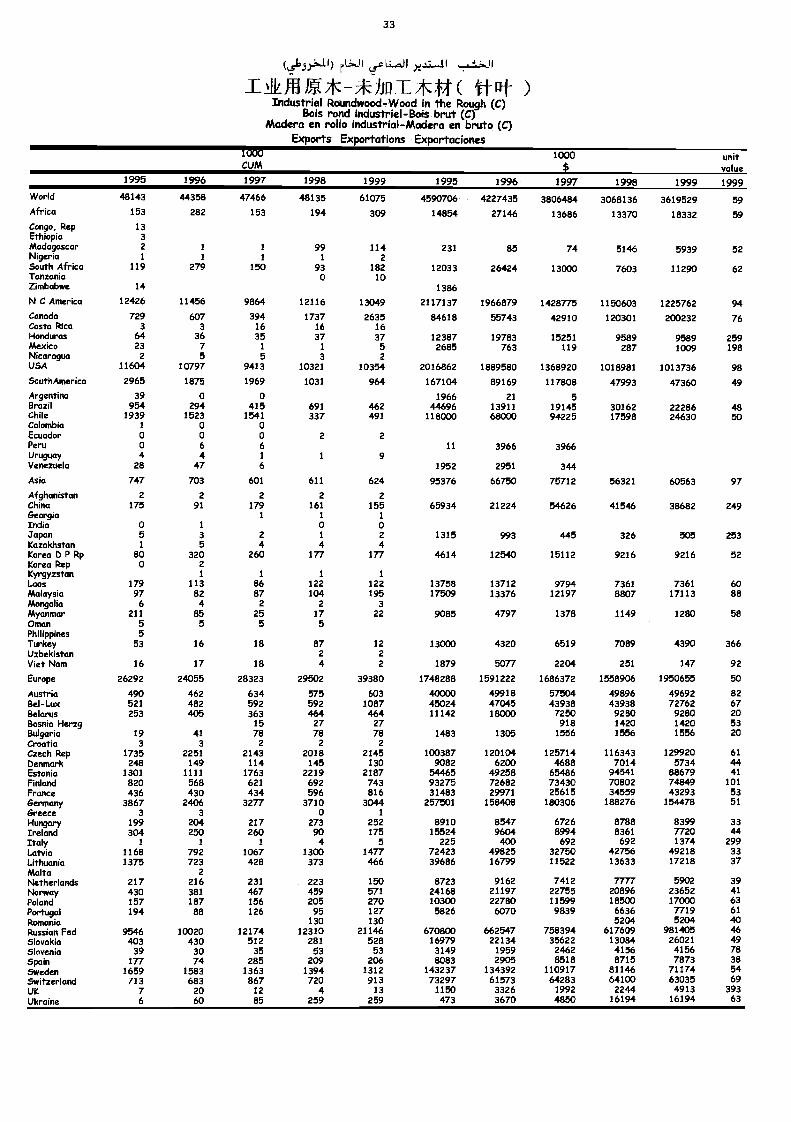
33
L5.6 rLáNJI 5,s L.Lan)JIf JI
rikffig*-hrt*4.4 )Industrial Roundwood-Wood in the Rough (C)
Bois rond industriel-Bois brut (C)Madera en rollo industrial-Madera en bruto (C)
Exports Exportations Exportaciones1000CUM
1000 unitvalue
1995 1996 1997 1998 1999 1995 1996 1997 1998 1999 1999World 48143 44358 47466 48135 61075 4590706 4227435 3806484 3068136 3619529 59Africa 153 282 153 194 309 14854 27146 13686 13370 18332 59Congo, Rep 13Ethiopia 3Madagascar 2 1 1 99 114 231 85 74 5146 5939 52Nigeria 1 1 1 1 2South Africa 119 279 150 93 182 12033 26424 13000 7603 11290 62Tanzania 0 10Zimbabwe 14 1386
N C America 12426 11456 9864 12116 13049 2117137 1966879 1428775 1150603 1225762 94Canada 729 607 394 1737 2635 84618 55743 42910 120301 200232 76Costo Pica 3 3 16 16 16Honduras 64 36 35 37 37 12387 19783 15251 9589 9589 259Mexico 23 7 1 1 5 2685 763 119 287 1009 198Nicaragua 2 5 5 3 2USA 11604 10797 9413 10321 10354 2016862 1889580 1368920 1018981 1013736 98SouthAmerica 2965 1875 1969 1031 964 167104 89169 117808 47993 47360 49Argentina 39 0 0 1966 21 5Brazil 954 294 415 691 462 44696 13911 19145 30162 22286 48Chile 1939 1523 1541 337 491 118000 68000 94225 17598 24630 50Colombia 1 0 0Ecuador 0 0 0 2 2Peru 0 6 6 11 3966 3966Uruguay 4 4 1 1 9Venezuela 28 47 6 1952 2951 344
Asia 747 703 601 611 624 95376 66750 75712 56321 60563 97
Afghanistan 2 2 2 2 2Chino 175 91 179 161 155 65934 21224 54626 41546 38682 249Georgia 1 / 1
India 0 1 0 0Japan 5 3 2 1 2 1315 993 445 326 505 253Kazakhstan 1 5 4 4 4Korea OP Rp 80 320 260 177 177 4614 12540 15112 9216 9216 52Korea Rep 0 2Kyrgyzstan 1 1 1 1
Laos 179 113 86 122 122 13758 13712 9794 7361 7361 60Malaysia 97 82 87 104 195 17509 13376 12197 8807 17113 88Mongolia 6 4 2 2 3Myanmar 211 85 25 17 22 9085 4797 1378 1149 1280 58Oman 5 5 5 5Philippines 5Turkey 53 16 18 87 12 13000 4320 6519 7089 4390 366Uzbekistan 2 2Viet Nam 16 17 18 4 2 1879 5077 2204 251 147 92
Eurype 26292 24055 28323 29502 39380 1748288 1591222 1686372 1558906 1950655 50
Austria 490 462 634 575 603 40000 49918 57504 49896 49692 82Bel-Lux 521 482 592 592 1087 45024 47045 43938 43938 72762 67Bekmus 253 405 363 464 464 11142 18000 7250 9280 9280 20Bosnia Herzg 15 27 27 918 1420 1420 53Bulgaria 19 41 78 78 78 1483 1305 1556 1556 1556 20Croatia 3 3 2 2 2Czech Rep 1735 2251 2143 2018 2145 100387 120104 125714 116343 129920 61Denmark 248 149 114 145 130 9082 6200 4688 7014 5734 44Estonia 1301 1111 1763 2219 2187 54465 49258 65486 94541 88679 41FMkmd 820 568 621 692 743 93275 72682 73430 70802 74849 101Fratme 436 430 434 596 816 31483 29971 25615 34559 43293 53Germany 3867 2406 3277 3710 3044 257501 158408 180306 188276 154478 51Greece 3 3 0 1
Hungary 199 204 217 273 252 8910 8547 6726 8788 8399 33Irdand 304 250 260 90 175 15524 9604 8994 8361 7720 44Italy 1 1 1 4 5 225 400 692 692 1374 299Latvia 1168 792 1067 1300 1477 72423 49825 32750 42756 49218 33Lithuania 1375 723 428 373 466 39686 16799 11522 13633 17218 37Malta 2Netherlands 217 216 231 223 150 8723 9162 7412 7777 5902 39Norway 430 381 467 459 571 24168 21197 22755 20896 23652 41Pdand 157 187 156 205 270 10300 22780 11599 18500 17000 63Portugal 194 88 126 95 127 5826 6070 9839 6636 7719 61Ramada 130 130 5204 5204 40RusManFed 9546 10020 12174 12310 21146 670800 662547 758394 617609 981405 46SlovaMa 403 430 512 281 528 16979 22134 35622 13084 26021 49Skived° 39 30 35 53 53 3149 1959 2462 4156 4156 78SpaM 177 74 285 209 206 8083 2905 8518 8715 7873 38Sweden 1659 1583 1363 1394 1312 143237 134392 110917 81146 71174 54Swfterland 713 683 867 720 913 73297 61573 64283 64100 63035 69UK 7 20 12 4 13 1150 3326 1992 2244 4913 393UkraMe 6 60 85 259 259 473 3670 4850 16194 16194 63
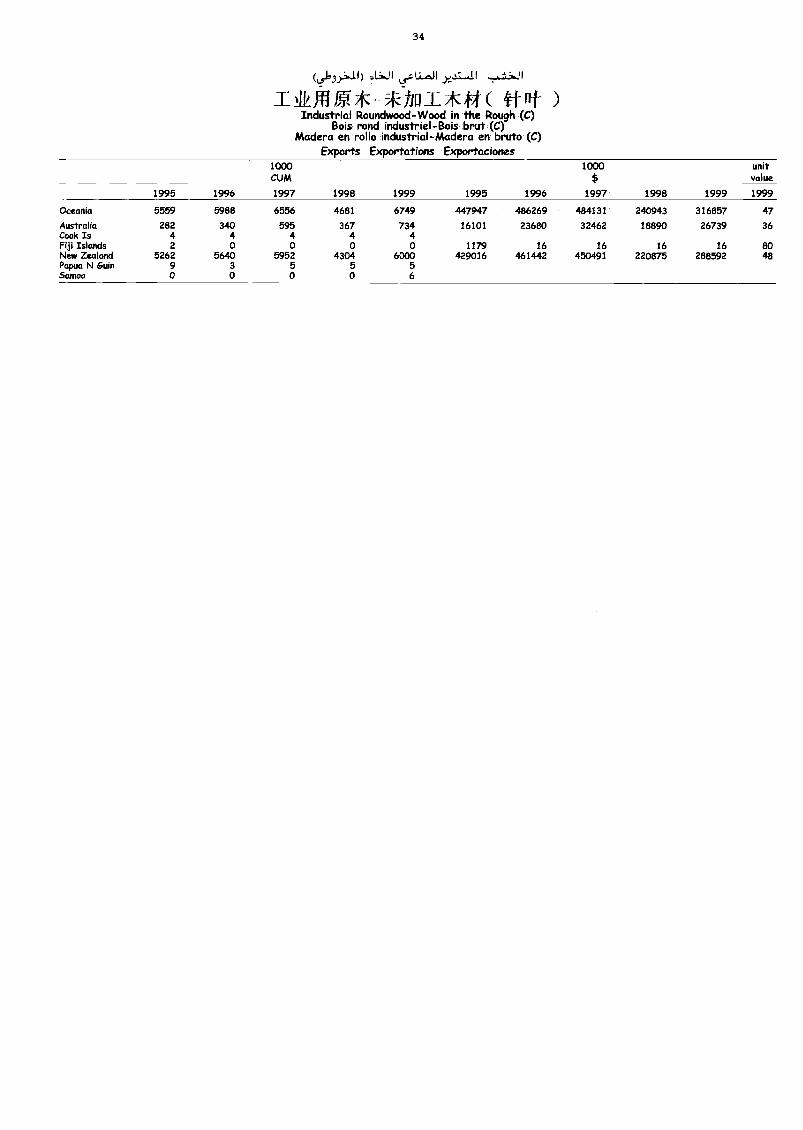
34
)Industrial Roundwood-Wood in the Rough (C)
Bois rond industriel-Bois brut (C)Madera en rollo industrial-Madera en bruto (C)
Exports Exportations Exportaciones1000CUM
1000$
unitvalue
1995 1996 1997 1998 1999 1995 1996 1997 1998 1999 1999
Oceania 5559 5988 6556 4681 6749 447947 486269 484131 240943 316857 47
Australia 282 340 595 367 734 16101 23680 32462 18890 26739 36Cook Is 4 4 4 4 4Fiji Islands 2 0 0 0 0 1179 16 16 16 16 80New Zealand 5262 5640 5952 4304 6000 429016 461442 450491 220875 288592 48Papua N Gain 9 3 5 5 5Samoa 0 0 0 0 6
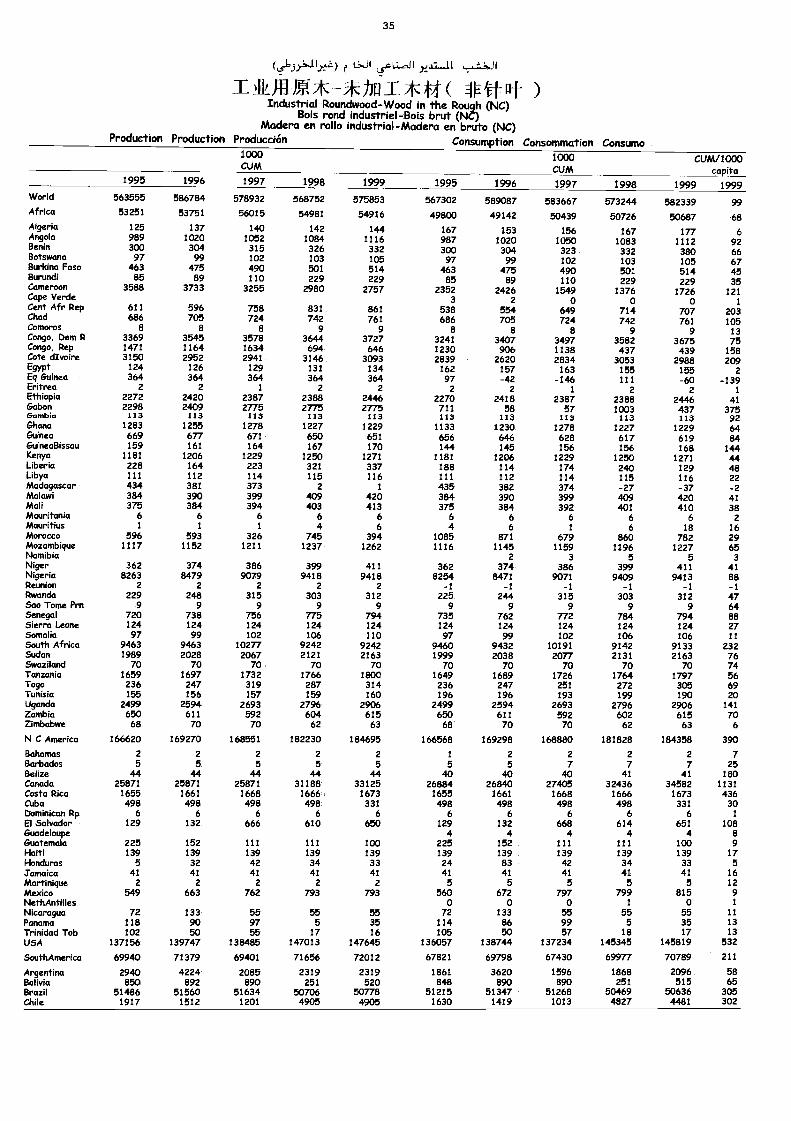
35
(015).) r C-0 c.L11
14.111 fk:* - *MT -7K+21 ( itf- ilf- )Industrial Roundwood-Wood in the Rough (NC)
Bois rond industriel-Bois brut (NC)Madera en rollo industrial-Madera en bruto (NC)
Production Production Producción Consumption Consommation Consumo1000CUM
1000CUM
CUM/1000capita
1995 1996 1997 1998 1999 1995 1996 1997 1998 1999 1999World 563555 586784 578932 568752 575853 567302 589087 583667 573244 582339 99Africa 53251 53751 56015 54981 54916 49800 49142 50439 50726 50687 68Algeria 125 137 140 142 144 167 153 156 167 177 6Angola 989 1020 1052 1084 1116 987 1020 1050 1083 1112 92Benin 300 304 315 326 332 300 304 323 332 380 66Botswana 97 99 102 103 105 97 99 102 103 105 67Burkina Faso 463 475 490 501 514 463 475 490 501 514 45Burundi 85 89 110 229 229 85 89 110 229 229 35Cameroon 3588 3733 3255 2980 2757 2352 2426 1549 1376 1726 121Cape Verde 3 2 0 o 0 1Cent Afr Rep 611 596 758 831 861 538 554 649 714 707 203Chad 686 705 724 742 761 686 705 724 742 761 105Comoros 8 e e 9 9 8 8 8 9 9 13Congo, Oem R 3369 3545 3578 3644 3727 3241 3407 3497 3582 3675 75Congo, Rep 1471 1164 1634 694 646 1230 906 1138 437 439 158Cote dIvoire 3150 2952 2941 3146 3093 2839 2620 2834 3053 2988 209Egypt 124 126 129 131 134 162 157 163 155 155 2Eq Guinea 364 364 364 364 364 97 -42 -146 111 -60 -139Eritrea 2 2 1 2 2 2 2 1 2 2 1Ethiopia 2272 2420 2387 2388 2446 2270 2418 2387 2388 2446 41Gabon 2298 2409 2775 2775 2775 711 58 57 1003 437 375Gambia 113 113 113 113 113 113 113 113 11$ 113 92Ghana 1283 1255 1278 1227 1229 1133 1230 1278 1227 1229 64Guinea 669 677 671 650 651 656 646 628 617 619 84GuineaBissau 159 161 164 167 170 144 145 156 156 168 144Kenya 1181 1206 1229 1250 1271 1181 1206 1229 1250 1271 44Liberia 228 164 223 321 337 188 114 174 240 129 48Libya 111 112 114 115 116 111 112 114 115 116 22Madagascar 434 381 373 2 1 435 382 374 -27 -37 -2Malawi 384 390 399 409 420 384 390 399 409 420 41Mali 375 384 394 403 413 375 384 392 401 410 38Mauritania 6 6 6 6 6 6 6 6 6 6 2Mauritius 1 1 1 4 6 4 6 1 6 18 16Morocco 596 593 326 745 394 1085 871 679 860 782 29Mozambique 1117 1152 1211 1237 1262 1116 1145 1159 1196 1227 65Namibia 2 3 5 5 3Niger 362 374 386 399 411 362 374 386 399 411 41Nigeria 8263 8479 9079 9418 9418 8254 8471 9071 9409 9413 88Reunion 2 2 2 2 2 -1 -1 -1 -1 -1 -1Rwanda 229 248 315 303 312 225 244 315 303 312 47Sao Tome Prn 9 9 9 9 9 9 9 9 9 9 64Senegal 720 738 756 775 794 735 762 772 784 794 88Sierra Leone 124 124 124 124 124 124 124 124 124 124 27Somalia 97 99 102 106 110 97 99 102 106 106 11South Africa 9463 9463 10277 9242 9242 9460 9432 10191 9142 9133 232Sudan 1989 2028 2067 2121 2163 1999 2038 2077 2131 2163 76Swaziland 70 70 70 70 70 70 70 70 70 70 74Tanzania 1659 1697 1732 1766 1800 1649 1689 1726 1764 1797 56Togo 236 247 319 287 314 236 247 251 272 305 69Tunisia 155 156 157 159 160 196 196 193 199 190 20Uganda 2499 2594 2693 2796 2906 2499 2594 2693 2796 2906 141Zambia 650 611 592 604 615 650 611 592 602 615 70Zimbabwe 68 70 70 62 63 68 70 70 62 63 6
N C America 166620 169270 168551 182230 184695 166568 169298 168880 181828 184358 390
Bahamas 2 2 2 2 2 1 2 2 2 2 7Barbados 5 5 5 5 5 5 5 7 7 7 25Belize 44 44 44 44 44 40 40 40 41 41 180Canada 25871 25871 25871 31188 33125 26884 26840 27405 32436 34582 1131Costa Rica 1655 1661 1668 1666 1673 1655 1661 1668 1666 1673 436Cuba 498 498 498 498 331 498 498 498 498 331 30Dominican Rp 6 6 6 6 6 6 6 6 6 6 1
El Salvador 129 132 666 610 650 129 132 668 614 651 108Guadeloupe 4 4 4 4 4 8Guatemala 225 152 111 111 100 225 152 111 111 100 9Haiti 139 139 139 139 139 139 139 139 139 139 17Honduras 5 32 42 34 33 24 83 42 34 33 5Jamaica 41 41 41 41 41 41 41 41 41 41 16Martinique 2 2 2 2 2 5 5 5 5 5 12Mexico 549 663 762 793 793 560 672 797 799 815 9NethAntilles 0 0 0 1 0 1
Nicaragua 72 133 55 55 55 72 133 55 55 55 11Panama 118 90 97 5 35 114 86 99 5 35 13Trinidad Tob 102 50 55 17 16 105 50 57 18 17 13USA 137156 139747 138485 147013 147645 136057 138744 137234 145345 145819 532
SouthAmerica 69940 71379 69401 71656 72012 67821 69798 67430 69977 70789 211
Argentina 2940 4224 2085 2319 2319 1861 3620 1596 1868 2096 58Bolivia 850 892 890 251 520 848 890 890 251 515 65Brazil 51486 51560 51634 50706 50778 51215 51347 51268 50469 50636 305Chile 1917 1512 1201 4905 4905 1630 1419 1013 4827 4481 302
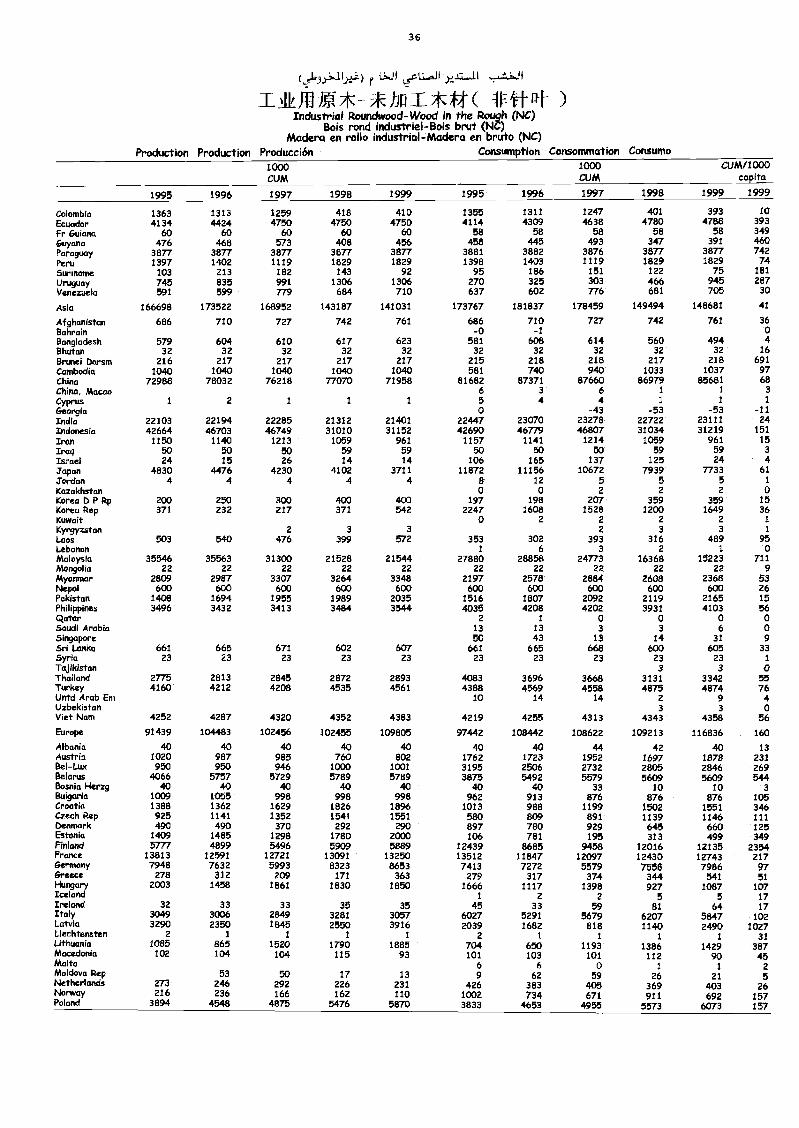
36
r
TAkiiibli*-Adirtil*W )Industrial Roundwood-Wood in the Rough (NC)
Bois rond industriel-Bois brut (NC)Madera en rollo industrial-Madera en bruto (NC)
Production Production Producción Consumption Consommation Consumo
1000CUM
1000CUM
CUM/1000capita
1995 2996 1997 1998 1999 1995 1996 1997 1998 1999 1999
Colombia 1363 1313 1259 418 410 1355 1311 1247 401 393 10
Ecuador 4134 4424 4750 4750 4750 4114 4309 4638 4780 4788 393Fr Guiana 60 60 60 60 60 58 58 58 58 58 349Guyana 476 468 573 408 456 458 445 493 347 391 460Paraguay 3877 3877 3877 3877 3877 3881 3882 3876 3877 3877 742Peru 1397 1402 1119 1829 1829 1398 1403 1119 1829 1829 74Suriname 103 213 182 143 92 95 186 151 122 75 181
Uruguay 745 835 991 1306 1306 270 325 303 466 945 287Venezuela 591 599 779 684 710 637 602 776 681 705 30
Asia 166698 173522 168952 143187 141031 173767 181837 178459 149494 148681 41
Afghanistan 686 710 727 742 761 686 710 727 742 761 36Bahrain -0 -1 0Bangladesh 579 604 610 617 623 581 608 614 560 494 4Bhutan 32 32 32 32 32 32 32 32 32 32 16Brunei Darsm 216 217 217 217 217 215 218 218 217 218 691C.ambodia 1040 1040 1040 1040 1040 581 740 940 1033 1037 97China 72988 78032 76218 77070 71958 81682 87371 87660 86979 85681 68China, Macao 6 3 6 1 1 3Cyprus 1 2 1 1 1 5 4 4 1 1 1
Georgia 0 -43 -53 -53 -11India 22103 22194 22285 21312 21401 22447 23070 23278 22722 23111 24Indonesia 42664 46703 46749 31010 31152 42690 46779 46807 31034 31219 151
Iran 1150 1140 1213 1059 961 1157 1141 1214 1059 961 15Iraq 50 50 50 59 59 50 50 50 59 59 3
Israel 24 15 26 14 14 106 165 137 125 24 4japan 4830 4476 4230 4102 3711 11872 11156 10672 7939 7733 61
'Torsion 4 4 4 4 4 8 12 5 5 5 1
Kazakhstan o 0 2 2 2 0Korea D P Rp 200 250 300 400 400 197 198 207 359 359 15Korea Rep 371 232 217 371 542 2247 1608 1528 1200 1649 36Kuwait o 2 2 2 2 1
Kyrgyzstan 2 3 3 2 3 3 1
Laos 503 540 476 399 572 353 302 393 316 489 95Lebanon I 6 3 2 1 oMalaysia 35546 35563 31300 21528 21544 27880 28858 24773 16368 15223 711Mongolia 22 22 22 22 22 22 22 22 22 22 9Myaroaar 2809 2987 3307 3264 3348 2197 2578 2884 2608 2368 53Nepal 600 600 600 600 600 600 600 600 600 600 26Pakistan 1408 1694 1955 1989 2035 1516 1807 2092 2119 2165 15Philippines 3496 3432 3413 3484 3544 4035 4208 4202 3931 4103 56Qatar 2 1 0 0 0 0Saudi Arabia 13 13 3 3 6 0Singapore 50 43 13 14 31 9Sri Lanka 661 665 671 602 607 661 665 668 600 605 33Syria 23 23 23 23 23 23 23 23 23 23 1
Tajikistan 3 3 0Thailand 2775 2813 2845 2872 2893 4083 3696 3668 3131 3342 55Turkey 4160 4212 4208 4535 4561 4388 4569 4558 4875 4874 76Untd Arab Em 10 14 14 2 9 4Uzbekistan 3 3 0Viet Nam 4252 4287 4320 4352 4383 4219 4255 4313 4343 4358 56
Europe 91439 104483 102456 102455 109805 97442 108442 108622 109213 116836 160
Albania 40 40 40 40 40 40 40 44 42 40 13Austria 1020 987 985 760 802 1762 1723 1952 1697 1878 231Bel-Lux 950 950 946 1000 1001 3195 2506 2732 2805 2846 269Belarus 4066 5757 5729 5789 5789 3875 5492 5579 5609 5609 544Bosnia Herzg 40 40 40 ao 40 40 40 33 10 10 3Bulgaria 1009 1055 998 998 998 962 913 876 876 876 105Croatia 1388 1362 1629 1826 1896 1013 988 1199 1502 1551 346Czech Rep 925 1141 1352 1541 1551 580 809 891 1139 1146 111Denmark 490 490 370 292 290 897 780 929 645 660 125Estonia 1409 1485 1298 1780 2000 106 781 195 313 499 349Finland 5777 4899 5496 5909 5889 12439 8685 9458 12016 12135 2354France 13813 12591 12721 13091 13250 13512 11847 12097 12430 12743 217Germany 7948 7632 5993 8323 8.653 7413 7272 5579 7558 7986 97Greece 278 312 209 171 363 279 317 374 344 541 51Hungary 2003 1458 1861 1830 1850 1666 1117 1398 927 1087 107Iceland i 2 2 5 5 17Ireland 32 33 33 35 35 45 33 59 81 64 17Italy 3049 3006 2849 3281 3057 6027 5291 5679 6207 5847 102Latvia 3290 2350 1845 2550 3916 2039 1682 818 1140 2490 1027Liechtensten 2 1 1 1 1 2 1 1 1 1 31Lithuania 1085 865 1520 1790 1885 704 650 1193 1386 1429 387Macedonia 102 104 104 115 93 101 103 101 112 90 45Malta 6 6 0 1 1 2Moldova Rep 53 50 17 13 9 62 59 26 21 5Netherlands 273 246 292 226 231 426 383 405 369 403 26Norway 216 236 166 162 110 1002 734 671 911 692 157Poland 3894 4548 4875 5476 5870 3833 4653 4955 5573 6073 157
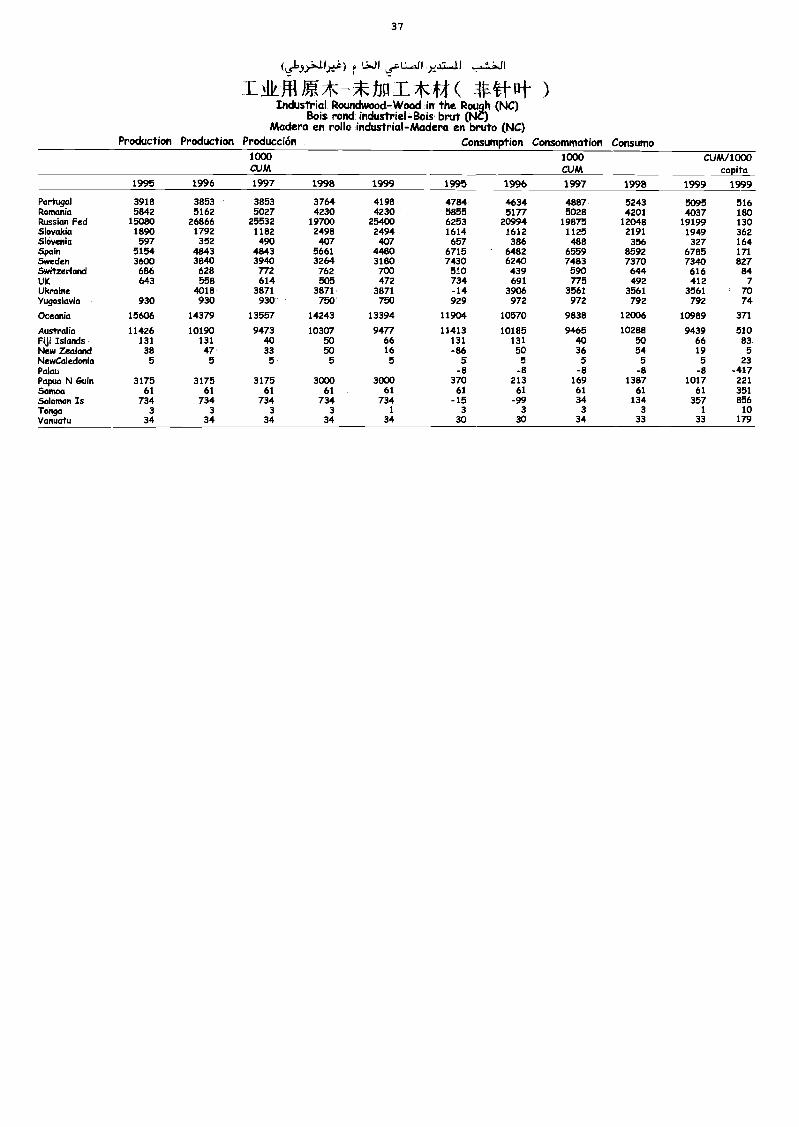
37
r LI,J1çaLil yUI ail E - /0Jui_ * ( 14t I-)Industrial Rounchvood-Wood in the Rough (NC)
Bois rond industriel-Bois brut (NC)Madera en rollo industrial-Madera en bruto (NC)
Production Production Producción Consumption Consommation Consumo1000CUM
1000CUM
CUM/1000capita
1995 1996 1997 1998 1999 1995 1996 1997 1998 1999 1999
Portugal 3918 3853 3853 3764 4198 4784 4634 4887 5243 5095 516Romania 5842 5162 5027 4230 4230 5855 5177 5028 4201 4037 180Russian Fed 15080 26866 25532 19700 25400 6253 20994 19875 12048 19199 130Slovakia 1890 1792 1182 2498 2494 1614 1612 1125 2191 1949 362Slovenia 597 352 490 407 407 657 386 488 356 327 164Spain 5154 4843 4843 5661 4480 6715 6482 6559 8592 6785 171Sweden 3600 3840 3940 3264 3180 7430 6240 7483 7370 7340 827Switzerland 686 628 772 762 700 510 439 590 644 616 84UK 643 558 614 505 472 734 691 775 492 412 7Ukraine 4018 3871 3871 3871 -14 3906 3561 3561 3561 70Yugoslavia 930 930 930 750 750 929 972 972 792 792 74
Oceania 15606 14379 13557 14243 13394 11904 10570 9838 12006 10989 371
Australia 11426 10190 9473 10307 9477 11413 10185 9465 10288 9439 510Fiji Islands 131 131 40 50 66 131 131 40 50 66 83New Zealand 38 47 33 50 16 -86 50 36 54 19 5NewCaledonia 5 5 5 5 5 5 5 5 5 5 23Palau -a -8 -8 -a -8 -417Papua N Guin 3175 3175 3175 3000 3000 370 213 169 1387 1017 221Samoa 61 61 61 61 61 61 61 61 61 61 351Solomon Is 734 734 734 734 734 -15 -99 34 134 357 856Tonga 3 3 3 3 1 3 3 3 3 1 10Vanuatu 34 34 34 34 34 30 30 34 33 33 179
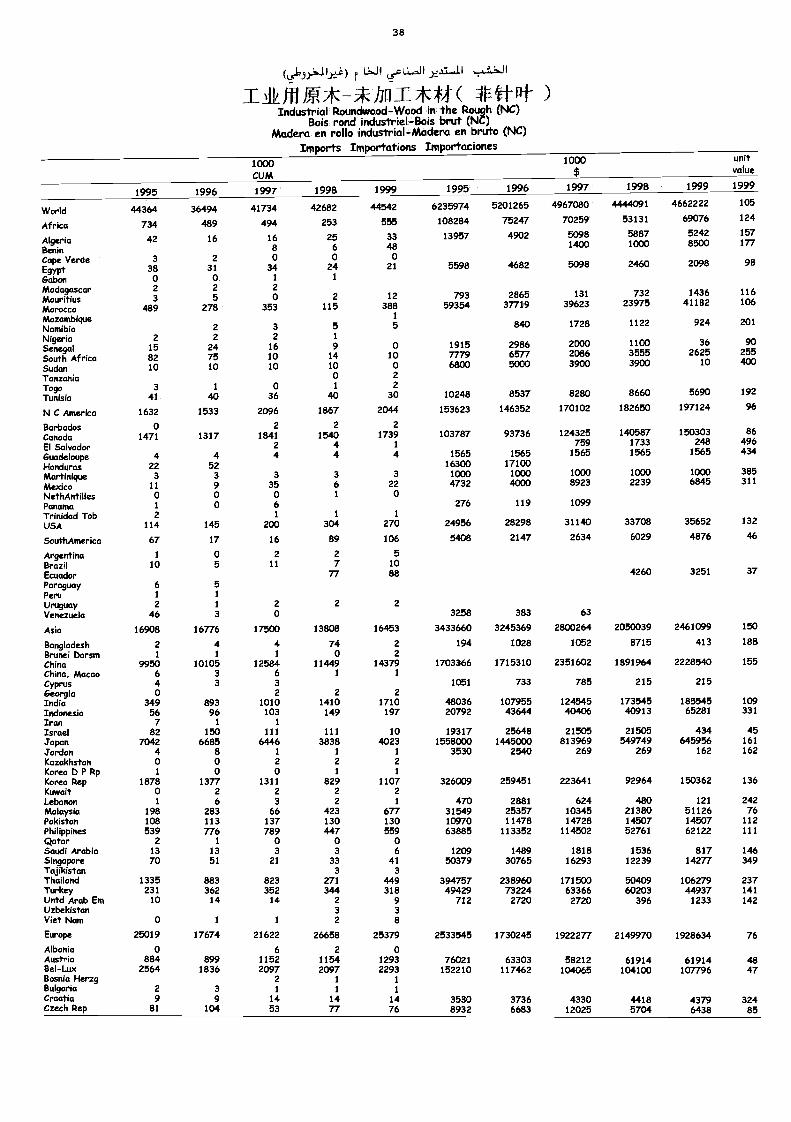
38
(5)o-u..)*=) r L6,11 Lek.;....li )...,C,-,11 ..,,.2.6JI
1.4k1111#-**-hnI*44( --#41rit )Industrial Rounckvood-Wood in the Rough (NC)
Bois rond industriel-Bois brut (NC)Madera en rollo industrial-Madera en bruto (NC)
Imports Importations Importaciones1000CUM
1000$ vuotiliute
Worid
1995
44364
1996
36494
1997
41734
1998
42682
1999
44542
1995
6235974
1996
5201265
1997
4967080
1998
4444091
1999
4662222
1999
105
Africa 734 489 494 253 555 108284 75247 70259 53131 69076 124
AlgeriaBenin
42 16
2
1680
2560
33480
13957 4902 50981400
88751000 5552,01.02 157177
Cape VerdeEgypt
338 31 34 24 21 5598 4682 5098 2460 2098 98
Gabon 0 0 1 1
MadagascarMauritiusMoroccoMozambiqueNamibia
23
489
25
278
2
2o
353
3
2115
5
12388
1
5
79359354
286537719
840
13139 62283 22373597
1122
143641182
924
116106
201
NigeriaSenegalSouth Africa
21582
22475
21610
1
914
010
19157779
29866577
20002086
11003555
362625
90255
Sudan 10 10 10 10 0 6800 5000 3900 3900 10 400
Tanzania 0 2
TogoTunisia
N C America
341
1632
1
40
1533
036
2096
1
40
1867
230
2044
10248
153623
8537
146352
8280
170102
8660
182650
5690
197124
192
96
Barbados o 2 22Canada 1471 1317 1841 1540 1739 103787 93736 124325 140587 150303 86
El Salvador 2 4 1 759 1733 248 496
GuadeloupeHondurasMartiniqueMexico
422
311
452
39
4
335
4
36
4
322
156516300
10004732
156517100
10004000
1565
10008923
1565
10002239
1565
10006845
434
385311
NethAntilles 0 o o I 0Pancuna 1 o 6 276 119 1099
Trinidad TobUSA
SouthAmerica
2114
67
145
17
1
200
16
1
304
89
1
270
106
24956
5408
28298
2147
31140
2634
33708
6029 534867562
132
46
Argentina 1 o 2 2 5
Brazil 10 5 11 7 10
Ecuador n 88 4260 3251 37
Paraguay 6 5Peru 1 1
Uruguay 2 1 2 2 2
Venezuela 46 3 0 3258 383 63
Asia 16908 16776 17500 13808 16453 3433660 3245369 2800264 2050039 2461099 150
Bangladesh 2 4 4 74 2 194 1028 1052 8715 413 188
Brunei Darsm 1 1 1 o 2
China 9950 10105 12584 11449 14379 1703366 1715310 2351602 1891964 2228540 155China, Macao 6 3 6 1 1
Cyprus 4 3 3 1051 733 785 215 215Georgia 0 2 2 2India 349 893 1010 1410 1710 48036 107955 124545 173545 185545 109Indonesia 56 96 103 149 197 20792 43644 40406 40913 65281 331
Iran 7 1 1
Israel 82 150 111 111 10 19317 25648 21505 21505 434 45japan 7042 6685 6446 3838 4023 1558000 1445000 813969 549749 645956 161Jordan 4 8 1 1 1 3530 2540 269 269 162 162Kazakhstan o o 2 2 2Korea D P Rp 1 o o 1
1Korea Rep 1878 1377 1311 829 1107 326009 259451 223641 92964 150362 136Kuwait 0 2 2 2 2LebanonMalaysiaPakistan
1
198108
6283113
366
137
2423130
1
677130
31454709
1097025238815711478
6241034514728
480
2 141538°075112614507
121 24276
112Philippines 539 776 789 447 559 63885 113352 114502 52761 62122 111Qatar 2 1 0 0 0Saudi Arabia 13 13 3 3 6 1209 1489 1818 1536 817 146Singapore 70 51 21 33 41 50379 30765 16293 12239 14277 349Tajikistan 3 3Thailand 1335 883 823 271 449 394757 238960 171500 50409 106279 237Turkey 231 362 352 344 318 49429 73224 63366 60203 44937 141Untd Arab Em 10 14 14 2 9 712 2720 2720 396 1233 142Uzbekistan 3 3Viet Nam 0 1 1 2 8
Europe 25019 17674 21622 26658 25379 2533545 1730245 1922277 2149970 1928634 76
Albania 0 6 2 oAustria 884 899 1152 1154 1293 76021 63303 58212 48Bel-Lux 2564 1836 2097 2097 2293 152210 117462 104065
1"61914649914610 47
Bosnia Herzg 2 1 1
Bulgaria 2 3 1 1 1
CroatiaCzech Rep
981
9104
1453
1477
1476
35308932
37366683
433012025
44185704
43796438
32485
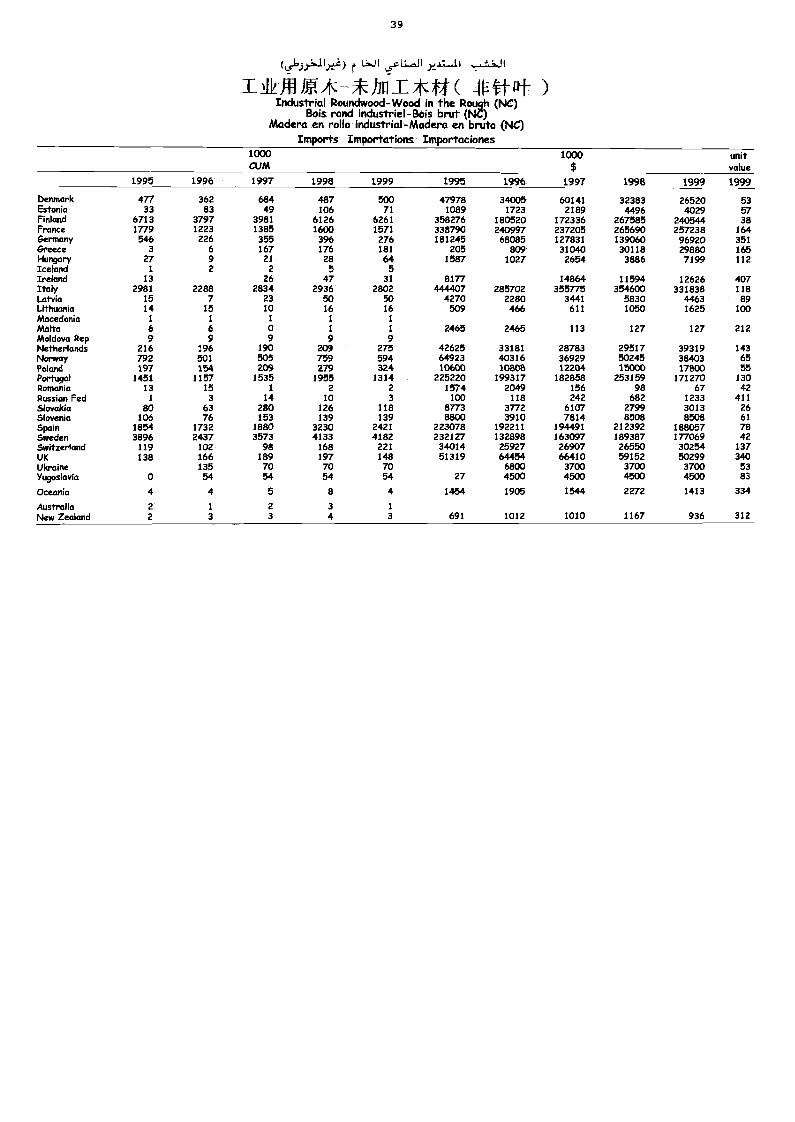
3 9
r
)Industrial Roundwood-Wood in the Ro h (NC)
Bois rond industriel-Bois brut (tsX)Madera en rollo industrial-Madera en bruto (NC)
Imports Importations Importaciones1000CUM
1000$
unitvalue
1995 1996 1997 1998 1999 1995 1996 1997 1998 1999 1999
Dot/nark 477 362 684 487 500 47978 34005 60141 32383 26520 53Estonia 33 83 49 106 71 1089 1723 2189 4496 4029 57Finland 6713 3797 3981 6126 6261 358276 180520 172336 267585 240544 38France 1779 1223 1385 1600 1571 338790 240997 237205 265690 257238 164Germany 546 226 355 396 276 181245 68085 127831 139060 96920 351Greece 3 6 167 176 181 205 809 31040 30118 29880 165liun9orY 27 9 21 28 64 1587 1027 2654 3886 7199 112Iceland I 2 2 5 5Ireland 13 26 47 31 8177 14864 11594 12626 407Italy 2981 2288 2834 2936 2802 444407 285702 355775 354600 331838 118Latvia 15 7 23 50 50 4270 2280 3441 5830 4463 89Lithuania 14 15 10 16 16 509 466 611 1050 1625 100Macedonia 1 1 1 1 1
Malta 6 6 0 1 1 2465 2465 113 127 127 212Moldova Rep 9 9 9 9 9Netherlands 216 196 190 209 275 42625 33181 28783 29517 39319 143Nomvay 792 501 505 759 594 64923 40316 36929 50245 38403 65Poland 197 154 209 279 324 10600 10808 12204 15000 17800 55Portugal 1451 1157 1535 1955 1314 225220 199317 182858 253159 171270 130Romania 13 15 1 2 2 1574 2049 156 98 67 42Russian Fed 1 3 14 10 3 100 118 242 682 1233 411Slovakia 80 63 280 126 118 8773 3772 6107 2799 3013 26Slovenia 106 76 153 139 139 8800 3910 7814 8508 8508 61Spain 1854 1732 1880 3230 2421 223078 192211 194491 212392 188057 78Sweden 3896 2437 3573 4133 4182 232127 132898 163097 189387 177069 42Switzerland 119 102 98 168 221 34014 25927 26907 26550 30254 137UK 138 166 189 197 148 51319 64454 66410 59152 50299 340Ukraine 135 70 70 70 6800 3700 3700 3700 53Yugoslavia 0 54 54 54 54 27 4500 4500 4500 4500 83
Oceania 4 4 6 8 4 1454 1905 1544 2272 1413 334
Australia 2 1 2 3 1
New Zealand 2 3 3 4 3 691 1012 1010 1167 936 312
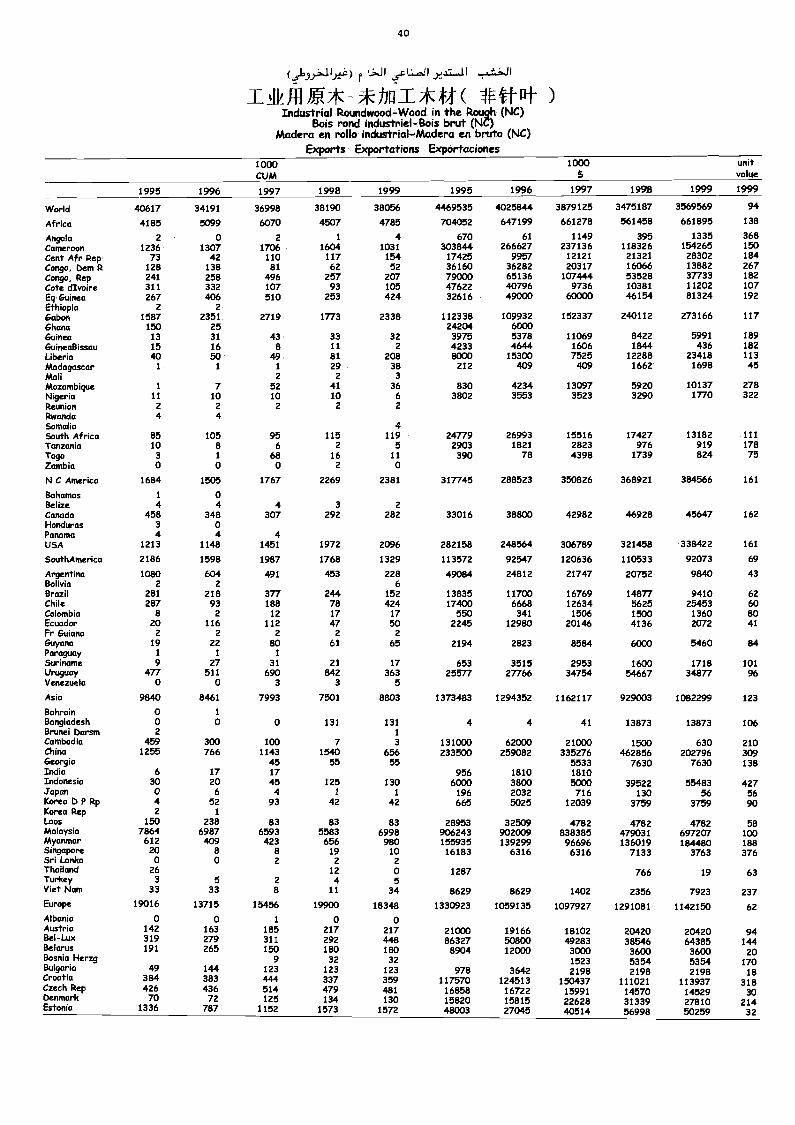
40
r c..J1
TAM Lq*- -*hni)Kft( Arttfri- )Industrial Roundwood-Wood in the Rough (NC)
Bois rond industriel-lkis brut (NC)Madera en rollo industrial-Madera en bruto (NC)
Exports Exportations Exportaciones1000CUM
1000$
unitvalue
1995 1996 1997 1998 1999 1995 1996 1997 1998 1999 1999
World 40617 34191 36998 38190 38056 4469535 4025844 3879125 3475187 3569569 94
Africa 4185 5099 6070 4507 4785 704052 647199 66127B 561458 661895 138
Angola 2 o 2 1 4 670 61 1149 395 1335 368Cameroon 1236 1307 1706 1604 1031 303844 266627 237136 118326 154265 150Cent Afr Rep 73 42 110 117 154 17425 9957 12121 21321 28302 184Congo, Um R 128 138 81 62 52 36160 36282 20317 16066 13882 267Congo, Rep 241 258 496 257 207 79000 65136 107444 53528 37733 182Cote dIvoire 311 332 107 93 105 47622 40796 9736 10381 11202 107Eq Guinea 267 406 510 253 424 32616 49000 60000 46154 81324 192Ethiopia 2 2Gabon 1587 2351 2719 1773 2338 112338 109932 152337 240112 273166 117Ghana 150 25 24204 6000Guinea 13 31 43 33 32 3975 5378 11069 8422 5991 189GuineaBissau 15 16 8 11 2 4233 4644 1606 1844 436 182Liberia ao 50 49 81 208 8000 15300 7525 12288 23418 113Madagascar 1 1 1 29 38 212 409 409 1662 1698 45Mali 2 2 3
Mozambique 1 7 52 41 36 830 4234 13097 5920 10137 278Nigeria 11 10 10 10 6 3802 3553 3523 3290 1770 322Retmion 2 2 2 2 2Rwanda 4 4Somalia 4South Africa 85 105 95 115 119 24779 26993 15516 17427 13182 111Tanzania 10 s 6 2 5 2903 1821 2823 976 919 178Togo 3 1 68 16 11 390 78 4398 1739 824 75Zambia 0 o o 2 0
N C America 1684 1505 1767 2269 2381 317745 288523 350826 368921 384566 161
Bahamas 1 0Belize 4 4 4 3 2Canada 458 348 307 292 282 33016 38800 42982 46928 45647 162Honduras 3 oPanama 4 4 4USA 1213 1148 1451 1972 2096 282158 248564 306789 321458 338422 161
SouthAmerica 2186 1598 1987 1768 1329 113572 92547 120636 110533 92073 69
Argentina 1080 604 491 453 228 49084 24812 21747 20752 9840 43Bolivia 2 2 6Brazil 281 218 377 244 152 13835 11703 16769 14877 9410 62Chile 287 93 188 78 424 17400 6668 12634 5625 25453 60Colombia 8 2 12 17 17 550 341 1506 1500 1360 80Ecuador 20 116 112 47 50 2245 12980 20146 4136 2072 41Fr Guiana 2 2 2 2 2Guyana 19 22 80 61 65 2194 2823 8584 6000 5460 84Paraguay 1 1 1
Suriname 9 27 31 21 17 653 3515 2953 1600 1718 101Uruguay 477 511 690 842 363 25577 27766 34754 54667 34877 96Venezuela 0 0 3 3 5
Asia 9840 8461 7993 7501 8803 1373483 1294352 1162117 929003 1082299 123
Bahrain 0 1
Bangladesh o o o 131 131 4 4 41 13873 13873 106Brunei Darsm 2 1
Cambodia 459 300 100 7 3 131000 62000 21000 1500 630 210China 1255 766 1143 1540 656 233500 259082 335276 462856 202796 309Georgia 45 55 55 5533 7630 7630 138India 6 17 17 956 1810 1810Indonesia 30 20 45 125 130 6000 3803 5000 39522 55483 427Japan 0 6 4 1 1 196 2032 716 130 56 56Korea D P Rp 4 52 93 42 42 665 5025 12039 3759 3759 90Korea Rep 2 1
Laos 150 238 83 83 83 28953 32509 4782 4782 4782 58Malaysia 7864 6987 6593 5583 6998 906243 902009 838385 479031 697207 100Myarunar 612 409 423 656 980 155935 139299 96696 136019 1134480 188Singapore 20 8 8 19 10 16183 6316 6316 7133 3763 376Sri Lanka 0 o 2 2 2Thailand 26 12 o 1287 766 19 63Turkey 3 5 2 4 5Viet Nam 33 33 8 11 34 8629 8629 1402 2356 7923 237Europe 19016 13715 15456 19900 18348 1330923 1059135 1097927 1291081 1142150 62Albania 0 o 1 o oAustria 142 163 185 217 217 21000 19166 18102 20420 20420 94Bel-Lux 319 279 311 292 448 86327 50800 49283 38546 64385 144Belarus 191 265 150 180 180 8904 12000 3000 3600 3600 20Bosnia Herzg 9 32 32 1523 5354 5354 170Bulgaria 49 144 123 123 123 978 3642 2198 2198 2198 18Croatia 384 383 444 337 359 117570 124513 150437 111021 113937 318Czech Rep 426 436 514 479 481 16858 16722 15991 14570 14529 30Denmark 70 72 125 134 130 15820 15815 22628 31339 27810 214Estonia 1336 787 1152 1573 1572 48003 27045 40514 56998 50259 32
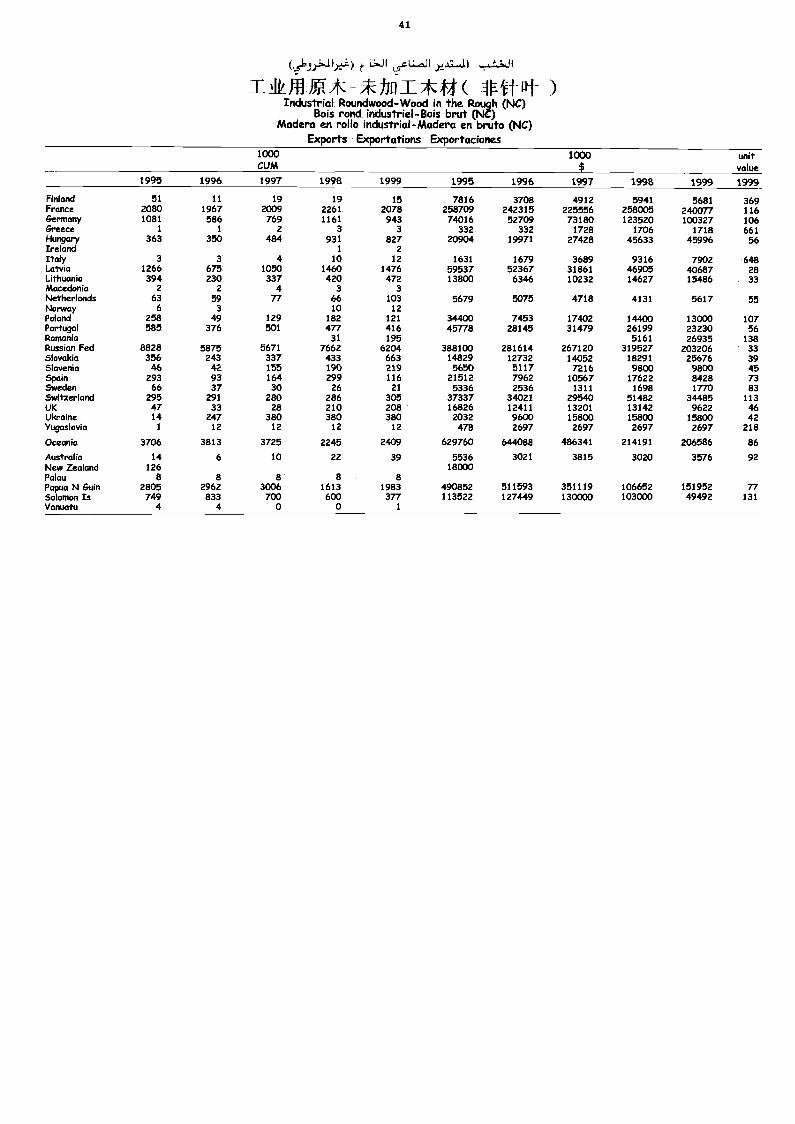
41
(,..5111.:%11».e) C.J1
TAUTIMAK,Oini.*#( Vir )Industrial Roundwood-Wood in the Rough (NC)
Bois rond industriel-Bois brut (NC)Madera en rollo industrial-Madera en bruto (NC)
Exports Exportations Exportaciones1000CUM
1000 unitvalue
1995 1996 1997 1998 1999 1995 1996 1997 1998 1999 1999
Finland 51 11 19 19 15 7816 3708 4912 5941 5681 369France 2080 1967 2009 2261 2078 258709 242315 225556 258005 240077 116Germany 1081 586 769 1161 943 74016 52709 73180 123520 100327 106Greece 1 1 2 3 3 332 332 1728 1706 1718 661Hungary 363 350 484 931 827 20904 19971 27428 45633 45996 56Ireland 1 2Italy 3 3 4 10 12 1631 1679 3689 9316 7902 648Latvia 1266 675 1050 1460 1476 59537 52367 31861 46905 40687 28Lithuania 394 230 337 420 472 13800 6346 10232 14627 15486 33Macedonia 2 2 4 3 3Netherlands 63 59 77 66 103 5679 5075 4718 4131 5617 55Norway 6 3 10 12Poland 258 49 129 182 121 34400 7453 17402 14400 13000 107Portugal 585 376 501 477 416 45778 28145 31479 26199 23230 56Romania 31 195 5161 26935 138Russian Fed 8828 5875 5671 7662 6204 388100 281614 267120 319527 203206 33Slovakia 356 243 337 433 663 14829 12732 14052 18291 25676 39Slovenia 46 42 155 190 219 5650 5117 7216 9800 9800 45SPain 293 93 164 299 116 21512 7962 10567 17622 8428 73Sweden 66 37 30 26 21 5336 2536 1311 1698 1770 83Switzerland 295 291 280 286 305 37337 34021 29540 51482 34485 113UK 47 33 28 210 208 16826 12411 13201 13142 9622 46Ukraine 14 247 380 380 380 2032 9600 15800 15800 15800 42Yugoslavia 1 12 12 12 12 478 2697 2697 2697 2697 218
Oceania 3706 3813 3725 2245 2409 629760 644088 486341 214191 206586 86
Australia 14 6 10 22 39 5536 3021 3815 3020 3576 92New Zealand 126 18000Palau 8 8 8 8 8Papua N &tin 2805 2962 3006 1613 1983 490852 511593 351119 106652 151952 77Solomon Is 749 833 700 600 377 113522 127449 130000 103000 49492 131Vanuatu 4 4 0 0 1
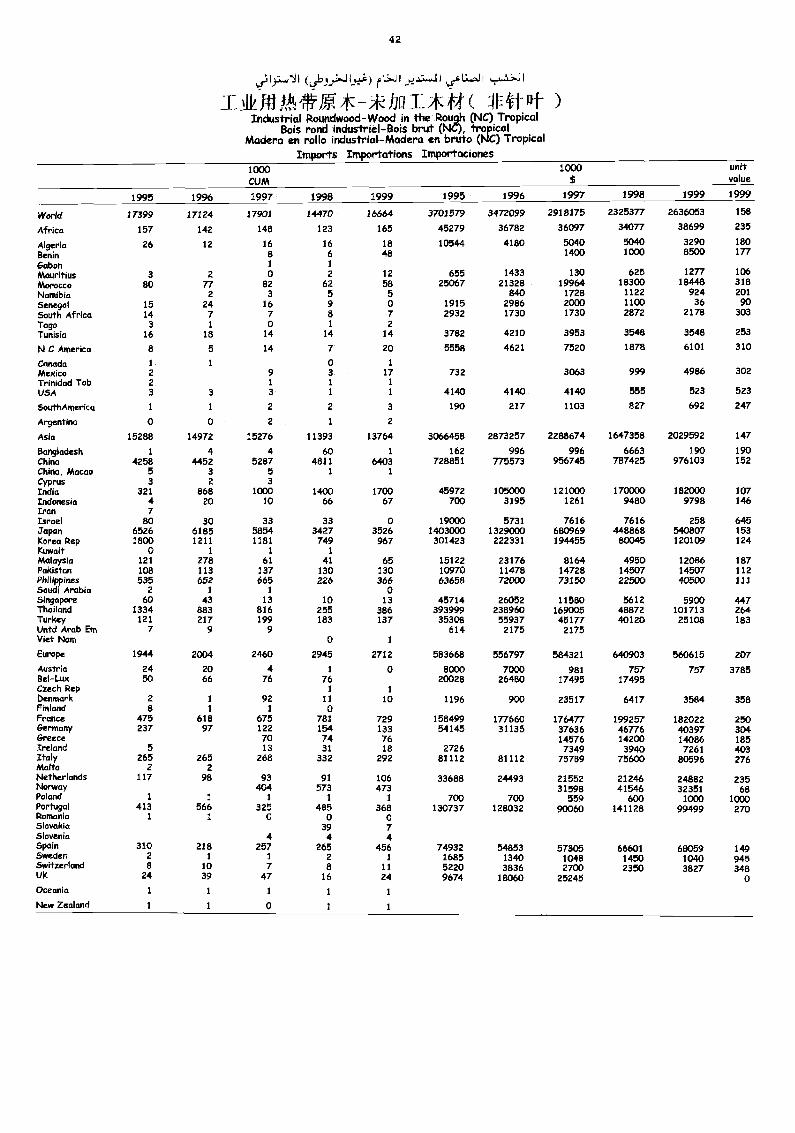
42
4/#* :_L*;14 n(7 )Industrial Roundwood-Wood in the Rough (NC) Tropical
Bois rond indusiriel-Bois brut (NC), tropicalMadera en rollo industrial-Madera en bruto (NC) Tropical
Imports Importations Importaciones1000CUM
1000 unitvalue
1995 1996 1997 1998 1999 1995 1996 1997 1998 1999 1999
World 17399 17124 17901 14470 16664 3701579 3472099 2918175 2325377 2636053 158
Africa 157 142 148 123 165 45279 36782 36097 34077 38699 235
Algeria 26 12 16 16 18 10544 4180 5040 5040 3290 180Benin 8 6 48 1400 1000 8500 177Gabon 1 1
MauMtius 3 2 0 2 12 655 1433 130 625 1277 106
Morocco 80 77 82 62 58 25067 21328 19964 18300 18448 318Namibia 2 3 5 5 840 1728 1122 924 201
Senegal 15 24 16 9 0 1915 2986 2000 1100 36 90South Africa 14 7 7 8 7 2932 1730 1730 2872 2178 303Togo 3 1 0 1 2Tunisia 16 18 14 14 14 3782 4210 3953 3548 3548 253
NC America 8 5 14 7 20 5558 4621 7520 1878 6101 310
Canada 1 I o 1
Mexico 2 9 3 17 732 3063 999 4986 302Trinidad Tob 2 1 1 1
USA 3 3 3 I 1 4140 4140 4140 555 523 523
SouthAmerica 1 1 2 2 3 190 217 1103 827 692 247
Argentina 0 0 2 1 2
Asia 15288 14972 15276 11393 13764 3066458 2873257 2288674 1647358 2029592 147
Bangladesh 1 4 4 60 1 162 996 996 6663 190 190China 4258 4452 5287 4811 6403 728851 775573 956745 787425 976103 152China, Macao 5 3 5 1 1
Cyprus 3 2 3India 321 868 1000 1400 1700 45972 105000 121000 170000 182000 107Indonesia 4 20 10 66 67 700 3195 1261 9480 9798 146Irm 7Israel 80 30 33 33 0 19000 5731 7616 7616 258 645Japan 6526 6185 5854 3427 3526 1403000 1329000 680969 448868 540807 153Korea Rep 1800 1211 1181 749 967 301423 222331 194455 80045 120109 124Kuwait 0 1 1 1
Malaysia 121 278 61 41 65 15122 23176 8164 4950 12086 187Pakirftm 108 113 137 130 130 10970 11478 14728 14507 14507 112PhilippMes 535 652 665 226 366 63658 72000 73150 22500 40500 inSaudi Arabia 2 i 1 0Singopixs 60 43 13 10 13 45714 26052 11580 5612 5900 447Thailand 1334 883 816 255 386 393999 238960 169005 48872 101713 264Turkey 121 217 199 183 137 35308 55937 45177 40120 25108 183Untd Arab Em 7 9 9 614 2175 2175Viet Nam 0 1
Euroim 1944 2004 2460 2945 2712 583668 556797 584321 640903 560615 207
Austria 24 20 4 1 0 8000 7000 981 757 757 378586-1.mx 50 66 76 76 20028 26480 17495 17495Czech Rep I 1
Denmark 2 1 92 11 10 1196 900 23517 6417 3584 358FiMand 8 1 1 0France 475 618 675 781 729 158499 177660 176477 199257 182022 250Gemnany 237 97 122 154 133 54145 31135 37636 46776 40397 304Greece 70 74 76 14576 14200 14086 185Ireland 5 13 31 18 2726 7349 3940 7261 403Italy 265 265 268 332 292 81112 81112 75759 75600 80596 276Malta 2 2Netherkmds 117 98 93 91 106 33688 24493 21552 21246 24882 235hMrway 404 573 473 31598 41546 32351 68Poland 1 / 1 1 1 700 700 559 600 1000 1000Portugal 413 566 325 485 368 130737 128032 90060 141128 99499 270RomaMa 1 1 0 0 0Skotakie 39 7SkweMa 4 4 4SpMn 310 218 257 265 456 74932 54853 57305 66601 68059 149Sweden 2 1 1 2 1 1685 1340 1048 1450 1040 945Swfteriond 8 10 7 8 11 5220 3836 2700 2350 3827 348UK 24 39 47 16 24 9674 18060 25245 0OceaMa 1 1 1 1 1
New Zealand 1 1 0 I I
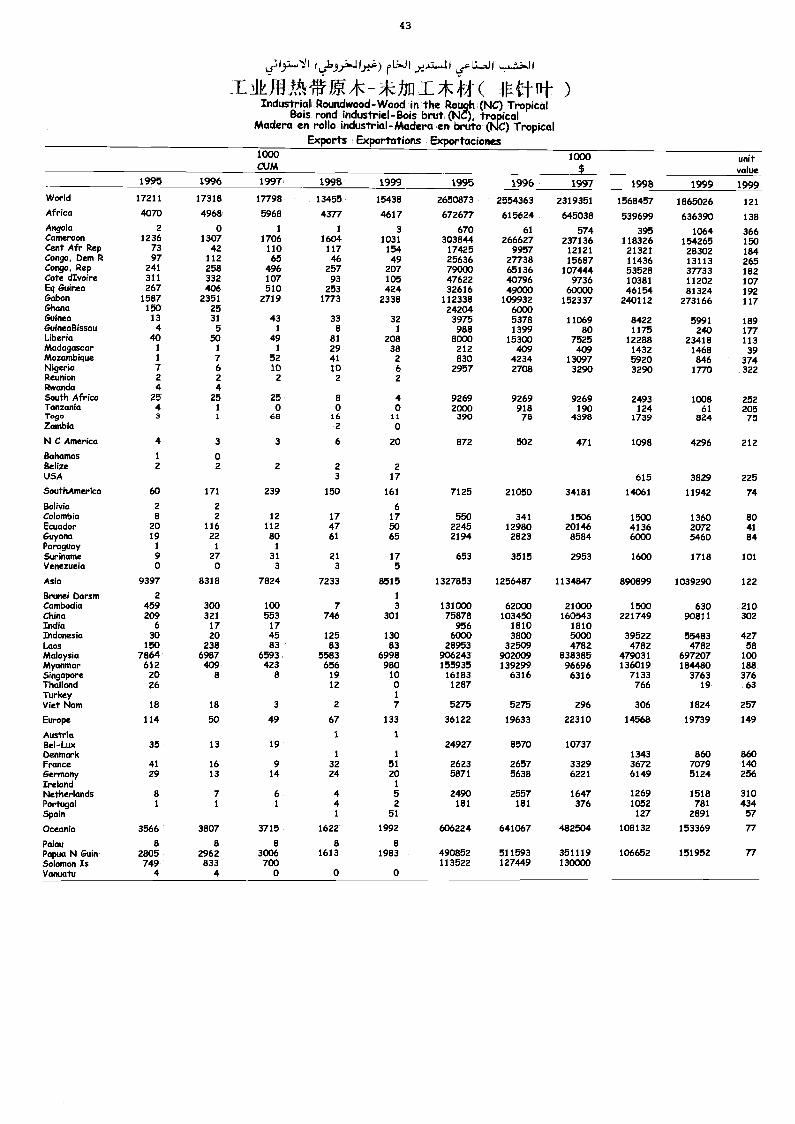
43
r L.J I ).,..4.;-11 LJ1
tiff+ )Industrial Roundwood-Wood in the Rough (NC) Tropical
Bois rond industriel-13ois brut (NC), tropicalMadera en rollo industrial-Madera en bruto (NC) Tropical
Exports Exportations Exportaciones1000CUM
1000$
unitvalue
1995 1996 1997 1998 1999 1995 1996 1997 1998 1999 1999World 17211 17318 17798 13455 15438 2650873 2554363 2319351 1568457 1865026 121Africa 4070 4968 5968 4377 4617 672677 615624 645038 539699 636390 138Angola 2 o 1 1 3 670 61 574 395 1064 366Cameroon 1236 1307 1706 1604 1031 303844 266627 237136 118326 154265 150Cent Afr Rep 73 42 110 117 154 17425 9957 12121 21321 28302 184Congo, Dem R 97 112 65 46 49 25636 27738 15687 11436 13113 265Congo, Rep 241 258 496 257 207 79000 65136 107444 53528 37733 182Cote dIvoire 311 332 107 93 105 47622 40796 9736 10381 11202 107Eq Guinea 267 406 510 253 424 32616 49000 60000 46154 81324 192Gabon 1587 2351 2719 1773 2338 112338 109932 152337 240112 273166 117Ghana 150 25 24204 6000Guinea 13 31 43 33 32 3975 5378 11069 8422 5991 189GuineaBissau 4 5 1 8 1 988 1399 80 1175 240 177Liberia 40 50 49 81 208 8000 15300 7525 12288 23418 113Madagascar 1 1 1 29 38 212 409 409 1432 1468 39Mozambique 1 7 52 41 2 830 4234 13097 5920 846 374Nigeria 7 6 10 10 6 2957 2708 3290 3290 1770 322Reunion 2 2 2 2 2Rwanda 4 4South Africa 25 25 25 8 4 9269 9269 9269 2493 1008 252Tanzania 4 1 o o o 2000 918 190 124 61 205Togo 3 1 68 16 11 390 78 4398 1739 824 75Zambia 2 o
N C America 4 3 3 6 20 872 502 471 1098 4296 212Bahamas 1 0Belize 2 2 2 2 2USA 3 17 615 3829 225SouthAmerica 60 171 239 150 161 7125 21050 34181 14061 11942 74Bolivia 2 2 6Colombia 8 2 12 17 17 550 341 1506 1500 1360 80Ecuador 20 116 112 47 50 2245 12980 20146 4136 2072 41Guyana 19 22 80 61 65 2194 2823 8584 6000 5460 84Paraguay 1 1 1
Suriname 9 27 31 21 17 653 3515 2953 1600 1718 101Venezuela o 0 3 3 5
Asia 9397 8318 7824 7233 8515 1327853 1256487 1134847 890899 1039290 122
Brunei barsm 2 1
Cambodia 459 300 100 7 3 131000 62000 21000 1500 630 210China 209 321 553 746 301 75878 103450 160543 221749 90811 302India 6 17 17 956 1810 1810Indonesia 30 20 45 125 130 6000 3800 5000 39522 55483 427Laos 150 238 83 83 83 28953 32509 4782 4782 4782 58Malaysia 7864 6987 6593 5583 6998 906243 902009 838385 479031 697207 100Myanmar 612 409 423 656 980 155935 139299 96696 136019 184480 188Singapore 20 8 8 19 10 16183 6316 6316 7133 3763 376Thailand 26 12 0 1287 766 19 63Turkey 1
Viet Nam 18 18 3 2 7 5275 5275 296 306 1824 257
Europe 114 50 49 67 133 36122 19633 22310 14568 19739 149
Austria 1 1
Bel-Lux 35 13 19 24927 8570 10737Denmark 1 1 1343 860 860France 41 16 9 32 51 2623 2657 3329 3672 7079 140Germany 29 13 14 24 20 5871 5638 6221 6149 5124 256Ireland 1
Netherlands 8 7 6 4 5 2490 2557 1647 1269 1518 310Portugal 1 1 1 4 2 181 181 376 1052 781 434Spain 1 51 127 2891 57
Oceania 3566 3807 3715 1622 1992 606224 641067 482504 108132 153369 77
Palau a 8 8 8 8Papua N Guin 2805 2962 3006 1613 1983 490852 511593 351119 106652 151952 77Solomon Is 749 833 700 113522 127449 130000Vanuatu 4 4 0 0 0
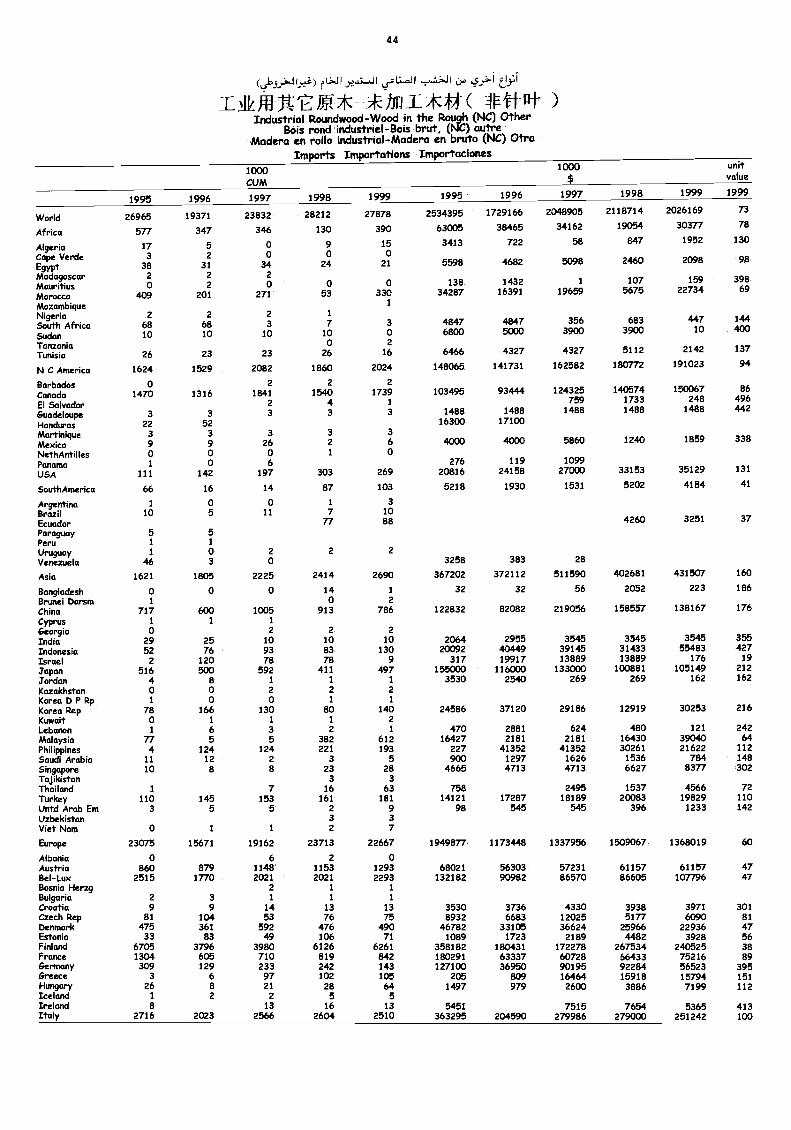
44
IAA ili_AKU( 4J11 )Industrial Roundwood-Woocl in the Rough (NC) Other
Bois rond industriel-Bois brut, (t4C) autreMadera en rollo industrial-Madera en bruto (NC) Otra
Imports Importations Importaciones1000CUM
1000$
unitvalue
1995 1996 1997 1998 1999 1995 1996 1997 1998 1999 1999
World 26965 19371 23832 28212 27878 2534395 1729166 2048905 2118714 2026169 73
Africa 577 347 346 130 390 63005 38465 34162 19054 30377 78
Algeria 17 5 0 9 15 3413 722 58 847 1952 130
Cape Verde 3 2 o o o2098 98
Egypt 38 31 34 24 21 5598 4682 5098 2460
Madagascar 2 2 2398
Matwitius 0 2 o 0 o 138 1432 1 107 15969
Morocco 409 201 271 53 330 34287 16391 19659 5675 22734
Mozambique 1
Nigeria 2 2 2 1144
South Africa 68 68 3 7 3 4847 4847 356 683 447400
Sudan 10 10 10 10 0 6800 5000 3900 3900 10
Tanzania 0 2
Tunisia 26 23 23 26 16 6466 4327 4327 5112 2142 137
N C America 1624 1529 2082 1860 2024 148065 141731 162582 180772 191023 94
Barbados 0 2 2 2
Canada 1470 1316 1841 1540 1739 103495 93444 124325 140574 150067 86
El Salvador 2 4 1 759 1733 248 496
Guadeloupe 3 3 3 3 3 1488 1488 1488 1488 1488 442
Honduras 22 52 16300 17100
Martinique 3 3 3 3 3
Mexico 9 9 26 2 6 4000 4000 5860 1240 1859 338
NethAntilles 0 0 0 i 0Panama 1 0 6 276 119 1099
USA 111 142 197 303 269 20816 24158 27000 33153 35129 131
SouthAmerica 66 16 14 87 103 5218 1930 1531 5202 4184 41
Argentina 1 o o 1 3Brazil 10 5 11 7 10Ecuador 77 88 4260 3251 37
Paraguay 5 5Peru 1 1
Uruguay 1 o 2 2 2
Venezuela 46 3 o 3258 383 28
Asia 1621 1805 2225 2414 2690 367202 372112 511590 402681 431507 160
Bangladesh 0 o 0 14 1 32 32 56 2052 223 186
Brunei Darsm 1 o 2China 717 600 1005 913 786 122832 82082 219056 158557 138167 176
Cyprus 1 1 1
Georgia 0 2 2 2
India 29 25 10 10 10 2064 2955 3545 3545 3545 355
Indonesia 52 76 93 83 130 20092 40449 39145 31433 55483 427Israel 2 120 78 78 9 317 19917 13889 13889 176 19
japan 516 500 592 411 497 155000 116000 133000 100881 105149 212
Jordan 4 s 1 1 1 3530 2540 269 269 162 162Kazakhstan 0 o 2 2 2Korea D P Rp 1 o o 1 1
Korea Rep 78 166 130 BO 140 24586 37120 29186 12919 30253 216Kuwait 0 1 1 1 2Lebanon 1 6 3 2 1 470 2881 624 480 121 242Malaysia 77 5 5 382 612 16427 2181 2181 16430 39040 64Philippines 4 124 124 221 193 227 41352 41352 30261 21622 112Saudi Arabia 11 12 2 3 5 900 1297 1626 1536 784 148Singapore 10 8 8 23 28 4665 4713 4713 6627 8377 302Tajikistan 3 3Thailand 1 7 16 63 758 2495 1537 4566 72Turkey 110 145 153 161 181 14121 17287 18189 20083 19829 110Untd Arab Em 3 5 5 2 9 98 545 545 396 1233 142Uzbekistan 3 3Viet Nam o 1 1 2 7
Europe 23075 15671 19162 23713 22667 1949877 1173448 1337956 1509067 1368019 60
Albania 0 6 2 oAustria 860 879 1148 1153 1293 68021 56303 57231 61157 61157 47Bel-Lux 2515 1770 2021 2021 2293 132182 90982 86570 86605 107796 47Bosnia Herzg 2 1 1
Bulgaria 2 3 1 1 1
Croatia 9 9 14 13 13 3530 3736 4330 3938 3971 301Czech Rep 81 104 53 76 75 8932 6683 12025 5177 6090 81Denmark 475 361 592 476 490 46782 33105 36624 25966 22936 47Estonia 33 83 49 106 71 1089 1723 2189 4482 3928 56Finland 6705 3796 3980 6126 6261 358182 180431 172278 267534 240525 38France 1304 605 710 819 842 180291 63337 60728 66433 75216 89Germany 309 129 233 242 143 127100 36950 90195 92284 56523 395Greece 3 6 97 102 105 205 809 16464 15918 15794 151Hungary 26 8 21 28 64 1497 979 2600 3886 7199 112Iceland 1 2 2 5 5Ireland 8 13 16 13 5451 7515 7654 5365 413Italy 2716 2023 2566 2604 2510 363295 204590 279986 279000 251242 100
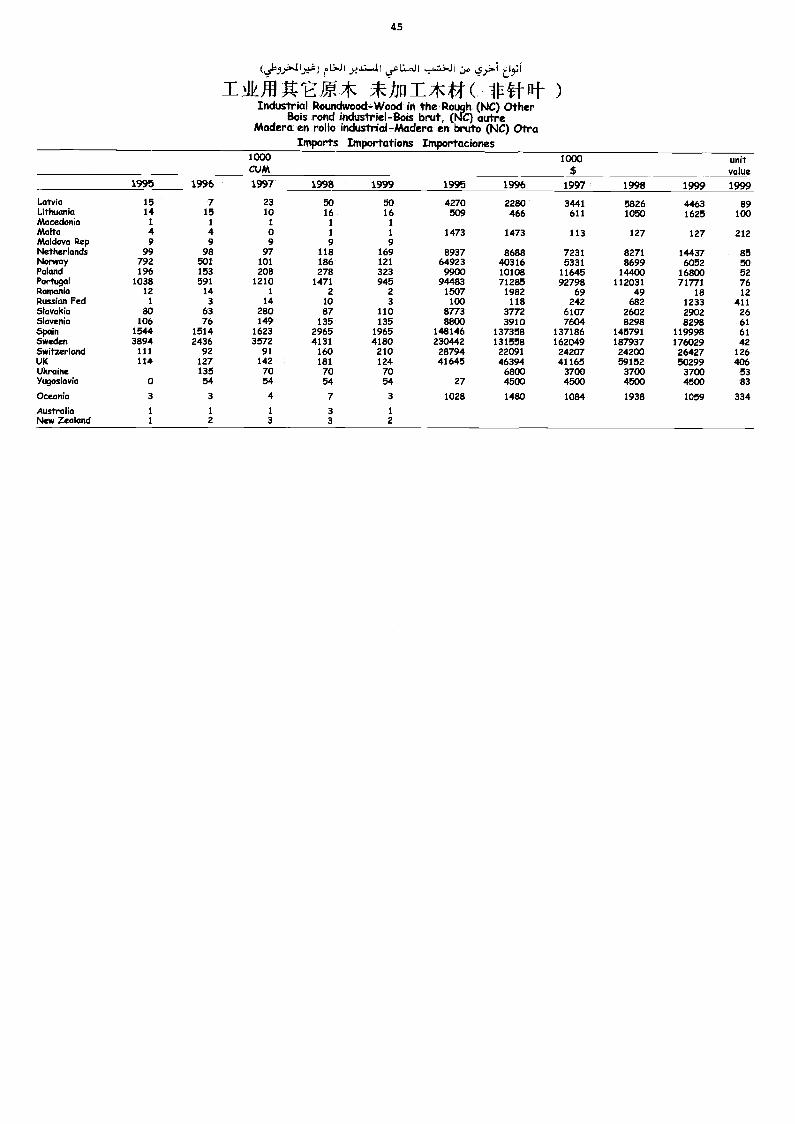
45
(461):141,,..1) rL.Ji 4r0.,c1.1.4.1 I cj.o t1,7,1
TAUTiArE/#* *hni.*ff( lr-ttr[f-- )Industrial Roundwood-Wood in the Rough (NC) Other
Bois rond industriel-Bois brut, (MC) autreMadera en rollo industrial-Madera en bruto (NC) Otra
Imports Importations Importaciones1000CUM
1000 unitvalue
1995 1996 1997 1998 1999 1995 1996 1997 1998 1999 1999
Latvia 15 7 23 50 50 4270 2280 3441 5826 4463 89Lithuania 14 15 10 16 16 509 466 611 1050 1625 100Macedonia 1 1 I 1 1Malta 4 4 0 1 1 1473 1473 113 127 127 212Moldova Rep 9 9 9 9 9Netherlands 99 98 97 118 169 8937 8688 7231 8271 14437 85Norway 792 501 101 186 121 64923 40316 5331 8699 6052 50Polculd 196 153 208 278 323 9900 10108 11645 14400 16800 52Portugal 1038 591 1210 1471 945 94483 71285 92798 112031 71771 76Romania 12 14 1 2 2 1507 1982 69 49 18 12Russian Fed 1 3 14 10 3 100 118 242 682 1233 411Slovakia 80 63 280 87 110 8773 3772 6107 2602 2902 26Slovenia 106 76 149 135 135 8800 3910 7604 8298 8298 61Spain 1544 1514 1623 2965 1965 148146 137358 137186 145791 119998 61Sweden 3894 2436 3572 4131 4180 230442 131558 162049 187937 176029 42Switzerland 111 92 91 160 210 28794 22091 24207 24200 26427 126UK 114 127 142 181 124 41645 46394 41165 59152 50299 406Ukraine 135 70 70 70 6800 3700 3700 3700 53Yugoslavia o 54 54 54 54 27 4500 4500 4500 4500 83
Oceania 3 3 4 7 3 1028 1480 1084 1938 1059 334
Australia 1 I 1 3 1
New Zealand 1 2 3 3 2
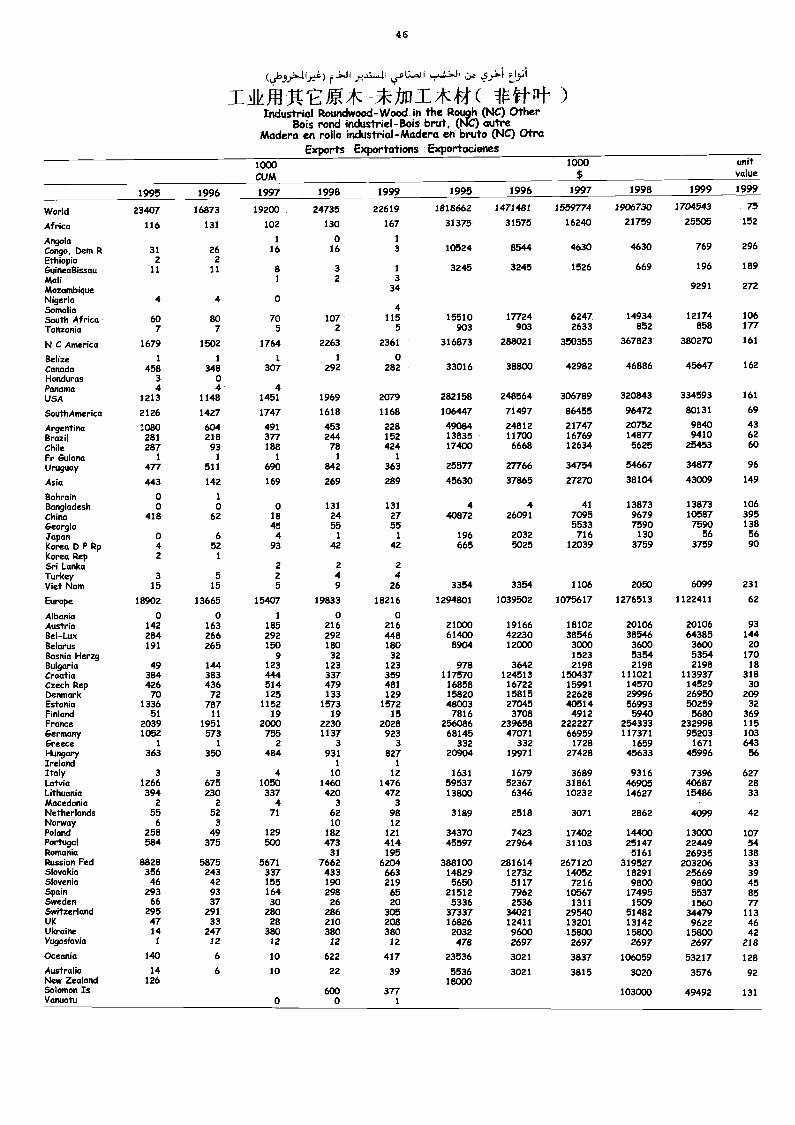
46
t.:.J Iy1Ll.a.1 I Lyi
*Jini*,fit( 1f-)Industrial Roundwood-Wood in the Rough (NC) Other
Bois rond industriel-Bois brut, (NC) autreMadera en rollo industrial-Madera en bruto (NC) Otra
Exports Exportations Exportaciones1000CUM
1000 unitvalue
1995 1996 1997 1998 1999 1995 1996 1997 1998 1999 1999
World 23407 16873 19200 24735 22619 1818662 1471481 /559774 1906730 1704543 75
Africa 116 131 102 130 167 31375 31575 16240 21759 25505 152
Angola 1 0 1
Congo, Dem R 31 26 16 16 3 10524 8544 4630 4630 769 296
Ethiopia 2 2GuineaBissau 11 11 8 3 1 3245 3245 1526 669 196 189
Mali 1 2 3Mozambique 34 9291 272
Nigeria 4 4 0Somalia 4South Africa 60 80 70 107 115 15510 17724 6247 14934 12174 106
Tanzania 7 7 5 2 5 903 903 2633 852 858 177
N C America 1679 1502 1764 2263 2361 316873 288021 350355 367823 380270 161
Belize 1 1 1 1 0Canada 458 348 307 292 282 33016 38800 42982 46886 45647 162
Honduras 3 0Panama 4 4 4USA 1213 1148 1451 1969 2079 282158 248564 306789 320843 334593 161
SouthAmerica 2126 1427 1747 1618 1168 106447 71497 86455 96472 80131 69
Argentina 1080 604 491 453 228 49084 24812 21747 20752 9840 43
Brazil 281 218 377 244 152 13835 11700 16769 14877 9410 62
Chile 287 93 188 78 424 17400 6668 12634 5625 25453 60Fr Guiana 1 1 1 1 1
Uruguay 477 511 690 842 363 25577 27766 34754 54667 34877 96
Asia 443 142 169 269 289 45630 37865 27270 38104 43009 149
Bahrain 0 1
Bangladesh o o 0 131 131 4 4 41 13873 13873 106China 418 62 18 24 27 40872 26091 7095 9679 10587 395Georgia 45 55 55 5533 7590 7590 138
Japan o 6 4 1 1 196 2032 716 130 56 56Korea D P Rp 4 52 93 42 42 665 5025 12039 3759 3759 90Korea Rep 2 1
Sri Lanka 2 2 2
Turkey 3 5 2 4 4Viet Nam 15 15 5 9 26 3354 3354 1106 2050 6099 231
Europe 18902 13665 15407 19833 18216 1294801 1039502 1075617 1276513 1122411 62
Albania 0 o 1 0 0Austria 142 163 185 216 216 21000 19166 18102 20106 20106 93Bel-Lux 284 266 292 292 448 61400 42230 38546 38546 64385 144Belarus 191 265 150 180 180 8904 12000 3000 3600 3600 20Bosnia Herzg 9 32 32 1523 5354 5354 170Bulgaria 49 144 123 123 123 978 3642 2198 2198 2198 18Croatia 384 383 444 337 359 117570 124513 150437 111021 113937 318Czech Rep 426 436 514 479 481 16858 16722 15991 14570 14529 30Denmark 70 72 125 133 129 15820 15815 22628 29996 26950 209Estonia 1336 787 1152 1573 1572 48003 27045 40514 56993 50259 32Finland 61 11 19 19 15 7816 3708 4912 5940 5680 369France 2039 1951 2000 2230 2028 256086 239658 222227 254333 232998 115Germany 1052 573 755 1137 923 68145 47071 66959 117371 95203 103Greece 1 1 2 3 3 332 332 1728 1659 1671 643Hungary 363 350 484 931 827 20904 19971 27428 45633 45996 56Ireland 1 1
Italy 3 3 4 10 12 1631 1679 3689 9316 7396 627Latvia 1266 675 1050 1460 1476 59537 52367 31861 46905 40687 28Lithuania 394 230 337 420 472 13800 6346 10232 14627 15486 33Macedonia 2 2 4 3 3Netherlands 55 52 71 62 98 3189 2518 3071 2862 4099 42Norway 6 3 10 12Poland 258 49 129 182 121 34370 7423 17402 14400 13000 107Portugal 584 375 500 473 414 45597 27964 31103 25147 22449 54Romania 31 195 5161 26935 138Russian Fed 8828 5875 5671 7662 6204 388100 281614 267120 319527 203206 33Slovakia 356 243 337 433 663 14829 12732 14052 18291 25669 39Slovenia 46 42 155 190 219 5650 5117 7216 9800 9800 45Spain 293 93 164 298 65 21512 7962 10567 17495 5537 85Sweden 66 37 30 26 20 5336 2536 1311 1509 1560 77Switzerland 295 291 280 286 305 37337 34021 29540 51482 34479 113UK 47 33 28 210 208 16826 12411 13201 13142 9622 46Ukraine 14 247 380 380 380 2032 9600 15803 15800 15800 42Yugoslavia 1 12 12 12 12 478 2697 2697 2697 2697 218Oceania 140 6 10 622 417 23536 3021 3837 106059 53217 128
Australia 14 6 10 22 39 5536 3021 3815 3020 3576 92New Zealand 126 18000Solomon Is 600 377 103000 49492 131Vanuatu 0 o 1
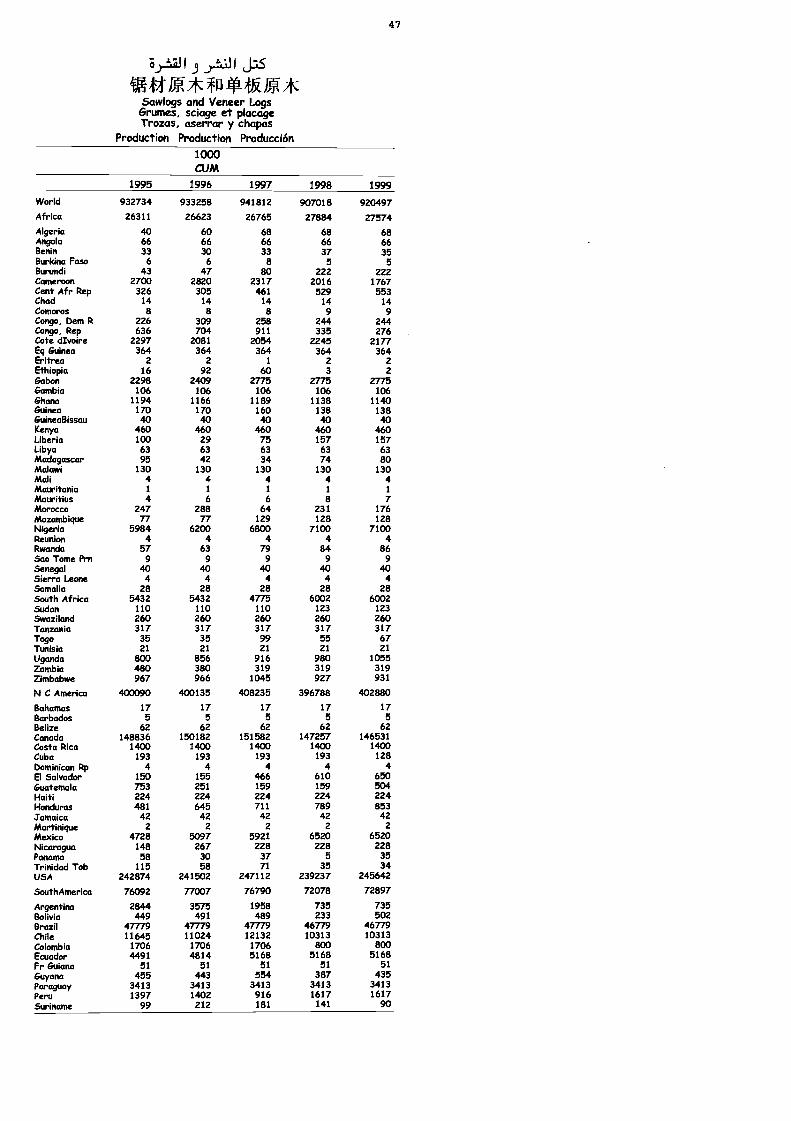
3j-tal I j.L.If I ja5
Vffig*fri-**);9:*Sawlogs and Veneer Logs
Grumes, sciage et placageTrozas, aserrar y chapas
Production Production Producción1000CUM
47
1995 1996 1997 1998 1999
World 932734 933258 941812 907018 920497Africa 26311 26623 26765 27884 27574
Algeria 40 60 68 68 68Angola 66 66 66 66 66Benin 33 30 33 37 35Burkina Faso 6 6 8 5 5Burundi 43 47 80 222 222Cameroon 2700 2820 2317 2016 1767Cent Afr Rep 326 305 461 529 553Chad 14 14 14 14 14Cantoras 8 8 8 9 9Congo, bem R 226 309 258 244 244Congo, Rep 636 704 911 335 276Cote dIvoire 2297 2081 2054 2245 2177Eq Guinea 364 364 364 364 364Eritrea 2 2 1 2 2Ethiopia 16 92 60 3 2Gabon 2298 2409 2775 2775 2775Gambia 106 106 106 106 106Ghana 1194 1166 1189 1138 1140Guinea 170 170 160 138 138GuineaBissau 40 ao 40 40 40Kenya 460 460 460 460 460Uberia 100 29 75 157 157Libya 63 63 63 63 63Madagascar 95 42 34 74 80Malawi 130 130 130 130 130Mali 4 4 4 4 4Mauritania 1 1 1 1 1
Mauritius 4 6 6 8 7Morocco 247 288 64 231 176Mozambique 77 77 129 128 128Nigeria 5984 6200 6800 7100 7100Reunion 4 4 4 4 4Rwanda 57 63 79 84 86Sao Tome Prn 9 9 9 9 9Senegal 40 40 40 40 40Sierra Leone 4 4 4 4 4Somalia 28 28 28 28 28South Africa 5432 5432 4775 6002 6002Sudan 110 110 110 123 123Swaziland 260 260 260 260 260Tanzania 317 317 317 317 317Togo 35 35 99 55 67Tunisia 21 21 21 21 21Uganda 800 856 916 980 1055Zambia 480 380 319 319 319Zimbabwe 967 966 1045 927 931
N C America 400090 400135 408235 396788 402880
Bahamas 17 17 17 17 17Barbados 5 5 5 5 5Belize 62 62 62 62 62Canada 148836 150182 151582 147257 146531Costa Rica 1400 1400 1400 1400 1400Cuba 193 193 193 193 128Dominican Rp 4 4 4 4 4El Salvador 150 155 466 610 650Guatemala 753 251 159 159 504Haiti 224 224 224 224 224Honduras 481 645 711 789 853Jamaica 42 42 42 42 42Martinique 2 2 2 2 2Mexico 4728 5097 5921 6520 6520Nicaragua 148 267 228 228 228Panama 58 30 37 5 35Trinidad Tob 115 58 71 35 34USA 242874 241502 247112 239237 245642
SouthAmerica 76092 77007 76790 72078 72897
Argentina 2844 3575 1958 735 735Bolivia 449 491 489 233 502Brazil 47779 47779 47779 46779 46779Chile 11645 11024 12132 10313 10313Colombia 1706 1706 1706 800 800Ecuador 4491 4814 5168 5168 5168Fr Guiana 51 51 51 51 51Guyana 455 443 554 387 435Paraguay 3413 3413 3413 3413 3413Peru 1397 1402 916 1617 1617Suriname 99 212 181 141 90
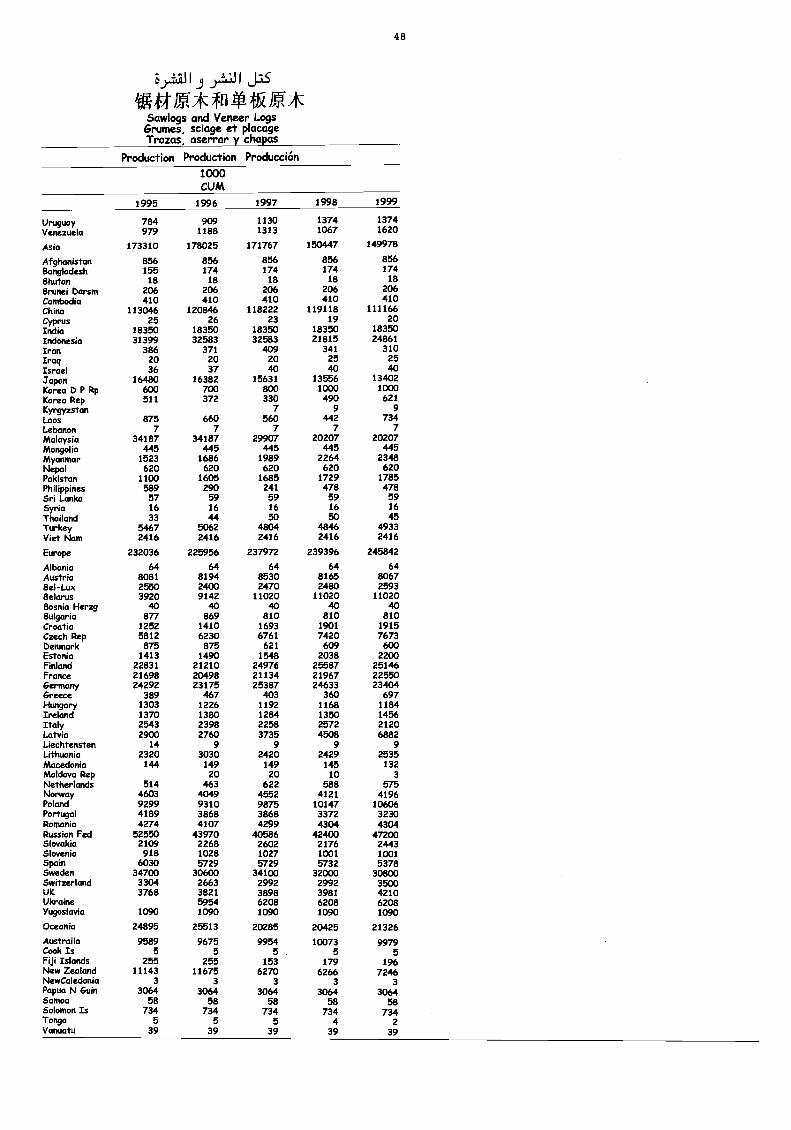
yJJjyJIJs
VIM.* fil**/#*Sawlogs and Veneer LogsGrurnes, sciage et piacageTrozas, aserrar y chapas
Production Production Producción1000CUM
48
1995 1996 1997 1998 1999
Uruguay 784 909 1130 1374 1374Venezuela 979 1188 1313 1067 1620
Asia 173310 178025 171767 150447 149978
Afghanistan 856 856 856 856 856Bangladesh 155 174 174 174 174Bhutcm 18 18 18 18 18
Brunei Damn 206 206 206 206 206Cambodia 410 410 410 410 410China 113046 120846 118222 119118 111166Cyprus 25 26 23 19 20India 18350 18350 18350 18350 18350Indonesia 31399 32583 32583 21815 24861Iran 386 371 409 341 310Iraq 20 20 20 25 25Israel 36 37 40 40 40yapan 16480 16382 15631 13556 13402Korea D P Rp 600 700 800 1000 1000Korea Rep 511 372 330 490 621Kyrgyzstan 7 9 9Laos 875 660 560 442 734Lebcmon 7 7 7 7 7Malaysia 34187 34187 29907 20207 20207Mongolia 445 445 445 445 445/Armor 1523 1686 1989 2264 2348Nepal 620 620 620 620 620Pakistan 1100 1605 1685 1729 1785Philippines 589 290 241 478 478Sri Lanka 57 59 59 59 59Syria 16 16 16 16 16Thafland 33 44 50 50 45Turkey 5467 5062 4804 4846 4933Viet Nam 2416 2416 2416 2416 2416
Europe 232036 225956 237972 239396 245842
Albania 64 64 64 64 64Austria 8081 8194 8530 8165 8067BO-Lux 2550 2400 2470 2480 2593Belarus 3920 9142 11020 11020 11020BosMa Herzg 40 40 40 40 40Bulgaria 877 869 810 810 810Croatia 1252 1410 1693 1901 1915Czech Rep 5812 6230 6761 7420 7673Demnark 875 875 621 609 600Estonia 1413 1490 1548 2038 2200Finland 22831 21210 24976 25587 25146France 21698 20498 21134 21967 22550Germany 24292 23175 25387 24633 23404Greece 389 467 403 360 697Hungary 1303 1226 1192 1168 1184Irdand 1370 1380 1284 1350 1456Italy 2543 2398 2258 2572 2120Latvia 2900 2760 3735 4508 6882LiechtenstrA 14 9 9 9 9Lithuada 2320 3030 2420 2429 2535Macedonia 144 149 149 145 132Mokkrect Rep 20 20 10 3Netherkmds 514 463 622 588 575Norway 4603 4049 4552 4121 4196Poland 9299 9310 9875 10147 10606Portugal 4189 3868 3868 3372 3230RomaMa 4274 4107 4299 4304 4304Russian Fed 52550 43970 40586 42400 47200Slovakia 2109 2268 2602 2176 2443SkweMa 918 1028 1027 1001 1001Spain 6030 5729 5729 5732 5378Sweden 34700 30600 34100 32000 30800SwitzeHand 3304 2663 2992 2992 3500UK 3768 3821 3898 3981 4210UkraMe 5954 6208 6208 6208Yugoslavia 1090 1090 1090 1090 1090
Oceada 24895 25513 20285 20425 21326Australia 9589 9675 9954 10073 9979Cook7s 5 5 5 5 5Fiji IMands 255 255 153 179 196NkviZeakmd 11143 11675 6270 6266 7246NewCaledonia 3 3 3 3 3Papua NI &yin 3064 3064 3064 3064 3064Samoa 58 58 58 58 58SMomonIs 734 734 734 734 734Tonga 5 5 5 4 2Vanuatu 39 39 39 39 39
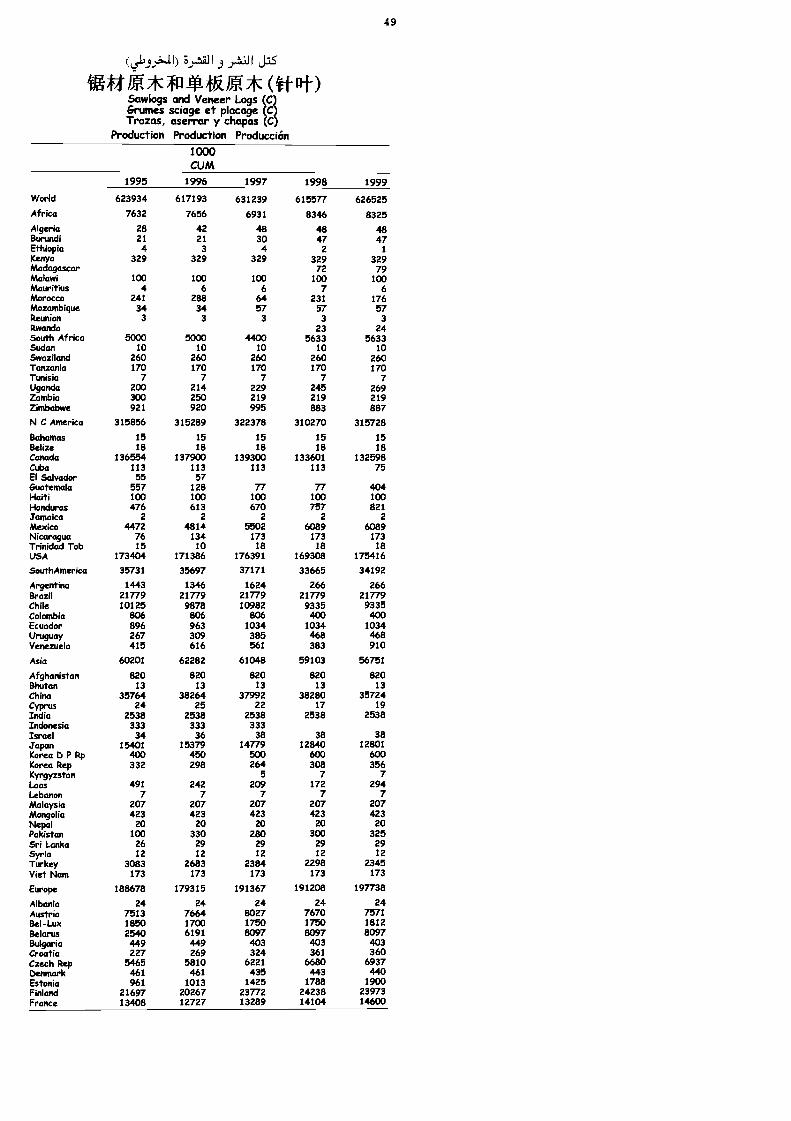
I) S..11iJ I .3 ).....tZJ I J.15
11-04k19:*Sawlogs and Veneer LogsGrumes sciage et placage CTrozas, aserrar y chapas C
Production Production Producción1000CUM
49
1995 1996 1997 1998 1999
World 623934 617193 631239 615577 626525Africa 7632 7656 6931 8346 8325Algeria 28 42 48 48 48Burundi 21 21 30 47 47Ethiopia 4 3 4 2 1
Kenya 329 329 329 329 329Madagascar 72 79Malawi 100 100 100 100 100Mauritius 4 6 6 7 6Morocco 241 288 64 231 176Mozambique 34 34 57 57 57Reunion 3 3 3 3 3Rwanda 23 24South Africa 5000 5000 4400 5633 5633Sudan 10 10 10 10 10Swaziland 260 260 260 260 260Tanzania 170 170 170 170 170Tunisia 7 7 7 7 7Uganda 200 214 229 245 269Zambia 300 250 219 219 219Zimbabwe 921 920 995 883 887N C America 315856 315289 322378 310270 315728
Bahamas 15 15 15 15 15Belize 18 18 18 18 18Canada 136554 137900 139300 133601 132598Cuba 113 113 113 113 75El Salvador 55 57Guatemala 557 128 77 77 404Haiti MO 100 /00 100 100Honduras 476 613 670 757 821Jamaica 2 2 2 2 2Mexico 4472 4814 5502 6089 6089Nicaragua 76 134 173 173 173Trinidad Tob 15 10 18 18 18USA 173404 171386 176391 169308 175416
SouthAmerica 35731 35697 37171 33665 34192
Argentina 1443 1346 1624 266 266Brazil 21779 21779 21779 21779 21779Chile 10125 9878 10982 9335 9335Colombia 806 806 806 400 400Ecuador 896 963 1034 1034 1034Uruguay 267 309 385 468 468Venezuela 415 616 561 383 910
Asia 60201 62282 61048 59103 56751
Afghanistan 820 820 820 820 820Bhirran 13 13 13 13 13China 35764 38264 37992 38280 35724Cyprus 24 25 22 17 19India 2538 2538 2538 2538 2538Indonesia 333 333 333Israel 34 36 38 38 38j(lPGP 15401 15379 14779 12840 12801Korea Ci P Rp 400 450 500 600 600Korea Rep 332 298 264 308 356Kyrgyzstan 5 7 7Laos 491 242 209 172 294Lebanon 7 7 7 7 7Malaysia 207 207 207 207 207Mongolia 423 423 423 423 423Nepal 20 20 20 20 20Pakistan 100 330 280 300 325Sri Lanka 26 29 29 29 29Syria 12 12 12 12 12Turkey 3083 2683 2384 2298 2345Viet Nam 173 173 173 173 173
Europe 188678 179315 191367 191208 197738
Albania 24 24 24 24 24Austria 7513 7664 8027 7670 7571Bel-Lux 1850 1700 1750 1750 1812Belarus 2540 6191 8097 8097 8097Bulgaria 449 449 403 403 403Croatia 227 269 324 361 360Czech Rep 5465 5810 6221 6680 6937Dounark 461 461 435 443 440Estonia 961 1013 1425 1788 1900Finland 21697 20267 23772 24238 23973France 13408 12727 13289 14104 14600
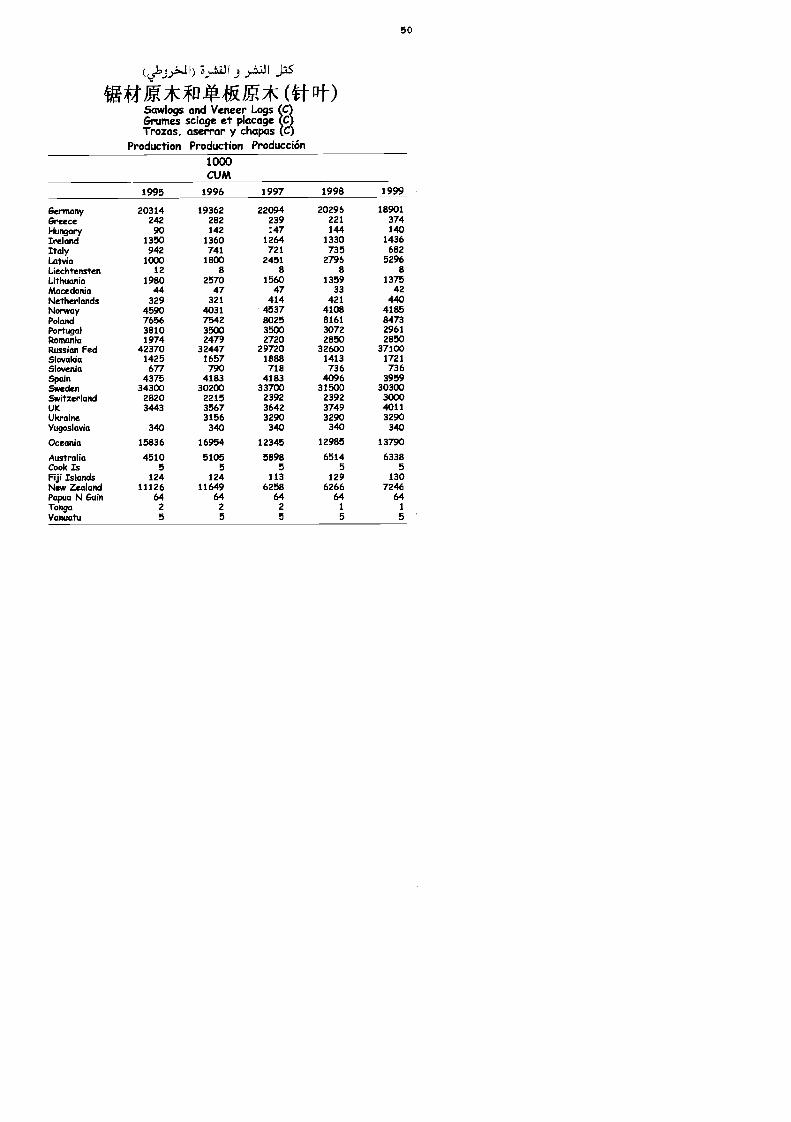
(L56-9):'11) 9 "It.:JI J:1-5
iihil***11-0-*IP:* (tilt)Sawlogs and Veneer Logs CGrumes sciage et placage CTrozas, aserrar y chapas C
Production Production Producción1000CUM
50
1995 1996 1997 1998 1999
Germany 20314 19362 22094 20296 18901Greece 242 282 239 221 374
Hun9arY 90 142 147 144 140Ireland 1350 1360 1264 1330 1436Italy 942 741 721 735 682Latvia 1000 1800 2451 2796 5296Liechtensten 12 a 8 8 a
Lithuania 1980 2570 1560 1359 1375Macedonia 44 47 47 33 42Netherlands 329 321 414 421 440Norway 4590 4031 4537 4108 4185Poland 7656 7542 8025 8161 8473Portugal 3810 3500 3500 3072 2961Ronumia 1974 2479 2720 2850 2850Russian Fed 42370 32447 29720 32600 37100Slovakia 1425 1657 1888 1413 1721Slovenia 677 790 718 736 736Spain 4375 4183 4183 4096 3959Sweden 34300 30200 33700 31500 30300Switzerland 2820 2215 2392 2392 3000UK 3443 3567 3642 3749 4011illumine 3156 3290 3290 3290Yugoslavia 340 340 340 340 340
Oceania 15836 16954 12345 12985 13790
Australia 4510 5105 5898 6514 6338Cook Is 5 5 5 5 5Fiji Islands 124 124 113 129 130New Zealand 11126 11649 6258 6266 7246Papua N Guin 64 64 64 64 64Tonga 2 2 2 1 1
Vanuatu 5 5 5 5 5
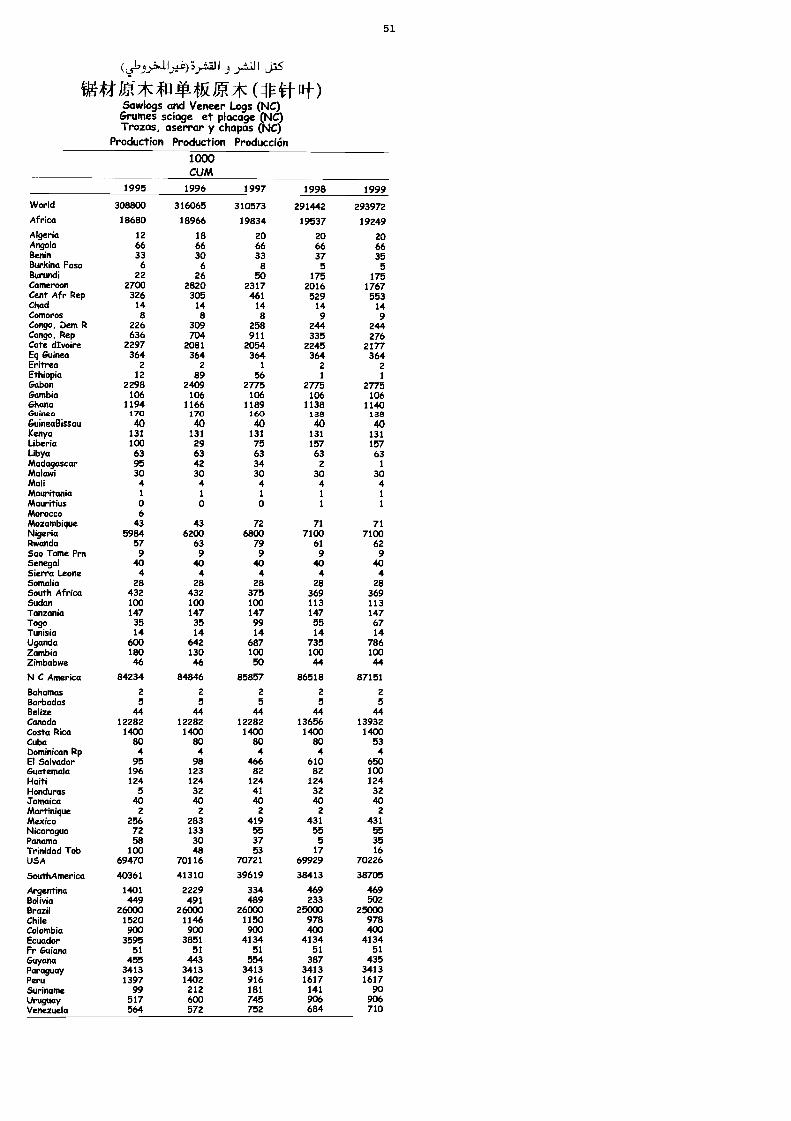
I js$
fn ik JP: ( k )Sawlogs and Veneer Logs (NC)Grumes sciage et placage (NC)Trozas, aserrar y chapas (NC)
Production Production Producción1000CUM
51
1995 1996 1997 1998 1999
World 308800 316065 310573 291442 293972Africa 18680 18966 19834 19537 19249Algeria 12 18 20 20 20Angola 66 66 66 66 66Benin 33 30 33 37 35Burkina Fasa 6 6 8 5 5Burundi 22 26 50 175 175Cameroon 2700 2820 2317 2016 1767Cent Afr Rep 326 305 461 529 553Chad 14 14 14 14 14Comoros 8 8 a 9 9Congo, Dem R 226 309 258 244 244Congo, Rep 636 704 911 335 276Cote dIvoire 2297 2081 2054 2245 2177Eq Guinea 364 364 364 364 364Eritrea 2 2 1 2 2Ethiopia 12 89 56 1 1
Gabon 2298 2409 2775 2775 2775Gambia 106 106 106 106 106Ghana 1194 1166 1189 1138 1140Guinea 170 170 160 138 138Guinectilissau 40 40 40 40 ItoKenya 131 131 131 131 131Liberia 100 29 75 157 157Ubya 63 63 63 63 63Madagascar 95 42 34 2 1
Malawi 30 30 30 30 30Mali 4 4 4 4 4Mauritania 1 1 1 1 1
Mauritius 0 0 0 1 1
Morocco 6Mozambique 43 43 72 71 71Nigeria 5984 6200 6800 7100 7100Rwanda 57 63 79 61 62Sao Tome Prn 9 9 9 9 9Senegal 40 40 40 40 40Sierra Leone 4 4 4 4 4Somalia 28 28 28 28 28South Africa 432 432 375 369 369Sudan 100 100 100 113 113Tanzania 147 147 147 147 147Togo 35 35 99 55 67Tunisia 14 14 14 14 14Uganda 600 642 687 735 786Zambia 180 130 100 100 100Zimbabwe 46 46 50 44 44
N C America 84234 84846 85857 86518 87151
Bahamas 2 2 2 2 2Barbados 5 5 5 5 5Belize 44 44 44 44 44Canada 12282 12282 12282 13656 13932Costa Rica 1400 1400 1400 1400 1400Cuba 80 80 80 80 53Dominican Rp 4 4 4 4 4El Salvador 95 98 466 610 650Guatemala 196 123 82 82 100Haiti 124 124 124 124 124Honduras 5 32 41 32 32Jamaica 40 40 40 40 40Martinique 2 2 2 2 2
Mexico 256 283 419 431 431Nicaragua 72 133 55 55 55Panama 58 30 37 5 35Trinidad Tob WO 48 53 17 16USA 69470 70116 70721 69929 70226
SouthAmerica 40361 41310 39619 38413 38705
Argentina 1401 2229 334 469 469Bolivia 449 491 489 233 502Brazil 26000 26000 26000 25000 25000Chile 1520 1146 1150 978 978Colombia 900 900 900 400 400Ecuador 3595 3851 4134 4134 4134Fr Guiana 51 51 51 51 51Guyana 455 443 554 387 435Paraguay 3413 3413 3413 3413 3413Peru 1397 1402 916 1617 1617Suriname 99 212 181 141 90Uruguay 517 600 745 906 906Venezuela 564 572 752 684 710
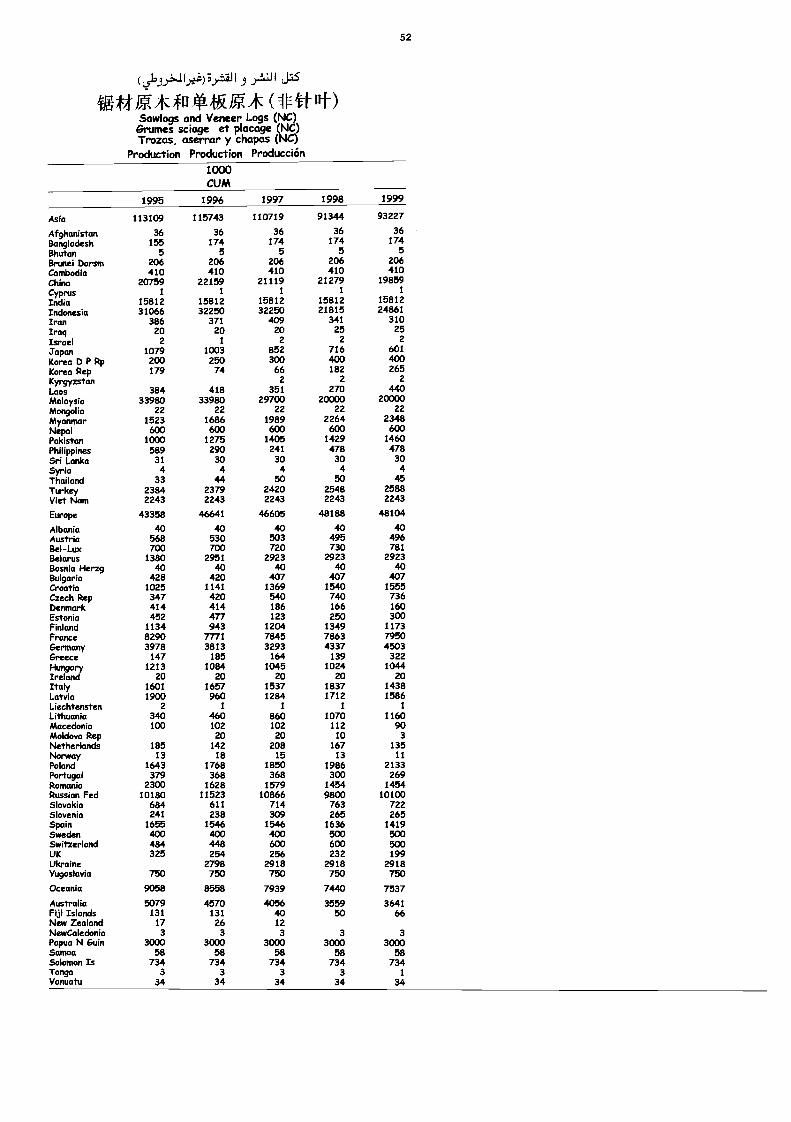
(1.Y=j)6.T4111 .r.4.111
igftiff*#1-0-*Ig* (Sawlogs and Veneer Logs (NC)
&rums sciage et placage (NC)Trozas, aserrar y chapas (NC)
Production Production Producción1000CUM
52
1995 1996 1997 1998 1999
Asia 113109 115743 110719 91344 93227
Afghanistan 36 36 36 36 36
Bangladesh 155 174 174 174 174
Bhutan 5 5 5 5 5
Brunei Darstn 206 206 206 206 206
Cambodia 410 410 410 410 410China 20759 22159 21119 21279 19859Cyprus 1 1 1 1 1
India 15812 15812 15812 15812 15812Indonesia 31066 32250 32250 21815 24861Iran 386 371 409 341 310Iraq 20 20 20 25 25Israel 2 1 2 2 2
Japan 1079 1003 852 716 601Korea D P Rp 200 250 300 400 400Korea Rep 179 74 66 182 265Kyrgyzstan 2 2 2
Laos 384 418 351 270 440Malaysia 33980 33980 29700 20000 20000Mongolia 22 22 22 22 22
Myanmar 1523 1686 1989 2264 2348Nepal 600 600 600 600 600Pakistan 1000 1275 1405 1429 1460Philippines 589 290 241 478 478Sri Lanka 31 30 30 30 30
Sria 4 4 4 4 4Thailand 33 44 50 50 45Turkey 2384 2379 2420 2548 2588Viet Nam 2243 2243 2243 2243 2243
Europe 43358 46641 46605 48188 48104
Albania 40 40 40 40 40Austria 568 530 503 495 496Bel-Lux 700 700 720 730 781Belarus 1380 2951 2923 2923 2923Bosnia Herzg 40 40 40 40 40Bulgaria 428 420 407 407 407Croatia 1025 1141 1369 1540 1555Czech Rep 347 420 540 740 736Denmark 414 414 186 166 160Estonia 452 477 123 250 300Finland 1134 943 1204 1349 1173France 8290 7771 7845 7863 7950Germany 3978 3813 3293 4337 4503Greece 147 185 164 139 322
HurigarY 1213 1084 1045 1024 1044Ireland 20 20 20 20 20Italy 1601 1657 1537 1837 1438Latvia 1900 960 1284 1712 1586Liechtensten 2 1 1 1 1
Lithuania 340 460 860 1070 1160Macedonia 100 102 102 112 90Moldova Rep 20 20 10 3
Netherlands 185 142 208 167 135Norway 13 18 15 13 11Poland 1643 1768 1850 1986 2133Portugal 379 368 368 300 269Rotnania 2300 1628 1579 1454 1454Russian Fed 10180 11523 10866 9800 10100Slovakia 684 611 714 763 722Slovenia 241 238 309 265 265Spain 1655 1546 1546 1636 1419Sweden 400 400 400 500 500Switzerland 484 448 600 600 500UK 325 254 256 232 199Ulcraine 2798 2918 2918 2918Yugoslavia 750 750 750 750 750
Oceania 9058 8558 7939 7440 7537
Australia 5079 4570 4056 3559 3641Fiji Islands 131 131 40 50 66New Zealand 17 26 12NewCaledonia 3 3 3 3 3Papua N &fin 3000 3000 3000 3000 3000Samoa 58 58 58 58 5850101T10/1 Is 734 734 734 734 734Tonga 3 3 3 3 1
Vanuatu 34 34 34 34 34
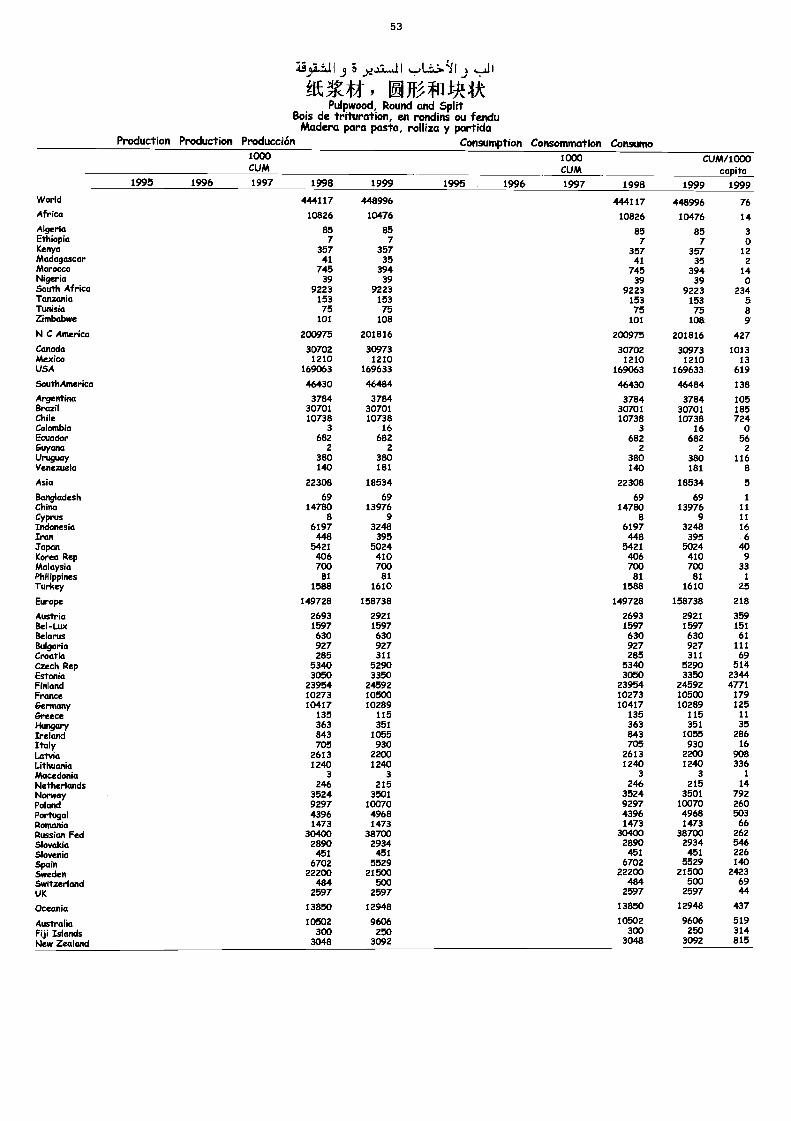
53
ZiSi.±41 j E, ).2.4.11 ,..l..t..1.111 i ,....411
. it V *I- ) El Jf4r1 ¡A litPulpwood, Round and Split
Bois de trituration, en rondins ou fenduMadera para pasta, rolliza y partida
Production Production Producción Consumption Consommation Consumo1000CUM
1000CUM
cum/1000capita
1995 1996 1997 1998 1999 1995 1996 1997 1998 1999 1999World 444117 448996 444117 448996 76Africa 10826 10476 10826 10476 14Algeria 85 85 85 85 3Ethiopia 7 7 7 7 0Kenya 357 357 357 357 12Madagascar 41 35 41 35 2Morocco 745 394 745 394 14Nigeria 39 39 39 39 oSouth Africa 9223 9223 9223 9223 234Tanzania 153 153 153 153 5Tunisia 75 75 75 75 8Zimbabwe 101 108 101 108 9
N C America 200975 201816 200975 201816 427Canada 30702 30973 30702 30973 1013Mexico 1210 1210 1210 1210 13USA 169063 169633 169063 169633 619
SouthAmerica 46430 46484 46430 46484 138
Argentina 3784 3784 3784 3784 105Brazil 30701 30701 30701 30701 185Chile 10738 10738 10738 10738 724Colombia 3 16 3 16 oEcuador 682 682 682 682 56Guyana 2 2 2 2 2Uruguay 380 380 380 380 116Venezuela 140 181 140 181 8
Asia 22308 18534 22308 18534 5
Bangladesh 69 69 69 69 1
China 14780 13976 14780 13976 11Cyprus 8 9 8 9 11Indonesia 6197 3248 6197 3248 16Iran 448 395 448 395 6Japan 5421 5024 5421 5024 40Kama Rep 406 410 406 410 9Malaysia 700 700 700 700 33Philippines 81 81 81 81 1
Turkey 1588 1610 1588 1610 25
Europe 149728 158738 149728 158738 218
Austria 2693 2921 2693 2921 359Bel-Lux 1597 1597 1597 1597 151Belarus 630 630 630 630 61Bulgaria 927 927 927 927 111Croatia 285 311 285 311 69Czech Rep 5340 5290 5340 5290 514Estonia 3050 3350 3050 3350 2344Finland 23954 24592 23954 24592 4771France 10273 10500 10273 10500 179Germany 10417 10289 10417 10289 125Greece 135 115 135 115 11
Hun9arY 363 351 363 351 35Ireland 843 1055 843 1055 286Italy 705 930 705 930 16Latvia 2613 2200 2613 2200 908Lithuania 1240 1240 1240 1240 336Macedonia 3 3 3 3 1
Netherlands 246 215 246 215 14Norway 3524 3501 3524 3501 792Poland 9297 10070 9297 10070 260Portugal 4396 4968 4396 4968 503Romania 1473 1473 1473 1473 66Russian Fed 30400 38700 30400 38700 262Slovakia 2890 2934 2890 2934 546Slovenia 451 451 451 451 226Spain 6702 5529 6702 5529 140Sweden 22200 21500 22200 21503 2423Switzerland 484 500 484 500 69UK 2597 2597 2597 2597 44
Oceania 13850 12948 13850 12948 437
Australia 10502 9606 10502 9606 519Fiji Islands 300 250 300 250 314New Zealand 3048 3092 3048 3092 815
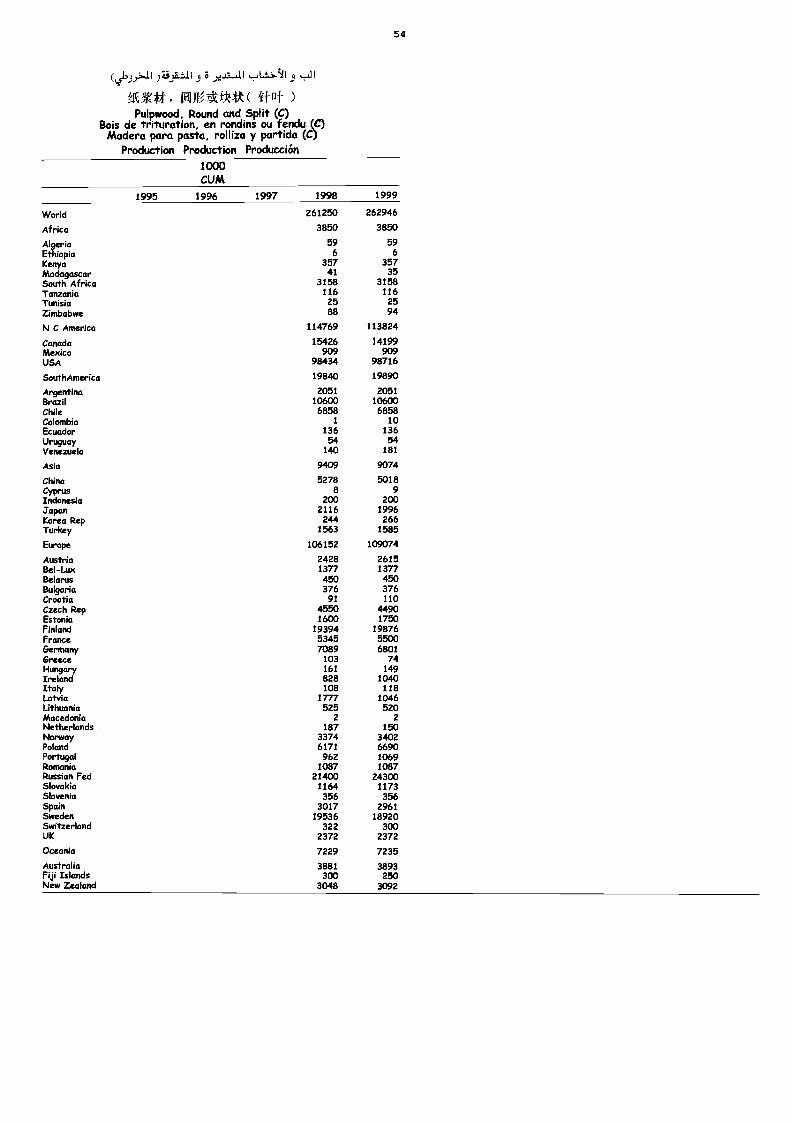
).4..iSi-tal 3 "61,.4$3
NEyliAR(Pulpwood, Round and Split (C)
Bois de trituration, en rondins ou fendu (C)Madera para pasta, rolliza y partida (C)
Production Production Producción1000CUM
54
1995 1996 1997 1998 1999
World 261250 262946
Africa 3850 3850
Algeria 59 59Ethiopia 6 6
Kenya 357 357Madagascar 41 35South Africa 3158 3158Tanzania 116 116Tunisia 25 25Zimbabwe 88 94
N C America 114769 113824
Canada 15426 14199Mexico 909 909USA 98434 98716
SouthAmerica 19840 19890
Argentina 2051 2051Brazil 10600 10600Chile 6858 6858Colombia 1 10Ecuador 136 136Uruguay 54 54Venezuela 140 181
Asia 9409 9074
China 5278 5018Cyprus 8 9Indonesia 200 200Japan 2116 1996Korea Rep 244 266Turkey 1563 1585
Europe 106152 109074
Austria 2428 2615Bel-Lux 1377 1377Belarus 450 450Bulgaria 376 376Croatia 91 110Czech Rzp 4550 4490Estonia 1600 1750Finland 19394 19876France 5345 5500Germany 7089 6801Greece 103 74Hungary 161 149Ireland 828 1040Italy 108 118Latvia 1777 1046Lithuania 525 520Macedonia 2 2Netherlands 187 150Norway 3374 3402Poland 6171 6690Portugal 962 1069Romania 1087 1087Russian Fed 21400 24300Slovakia 1164 1173Slovenia 356 356Spain 3017 2961Sweden 19536 18920Switzerland 322 300UK 2372 2372
Oceania 7229 7235
Australia 3881 3893Fiji Islands 300 250New Zealand 3048 3092
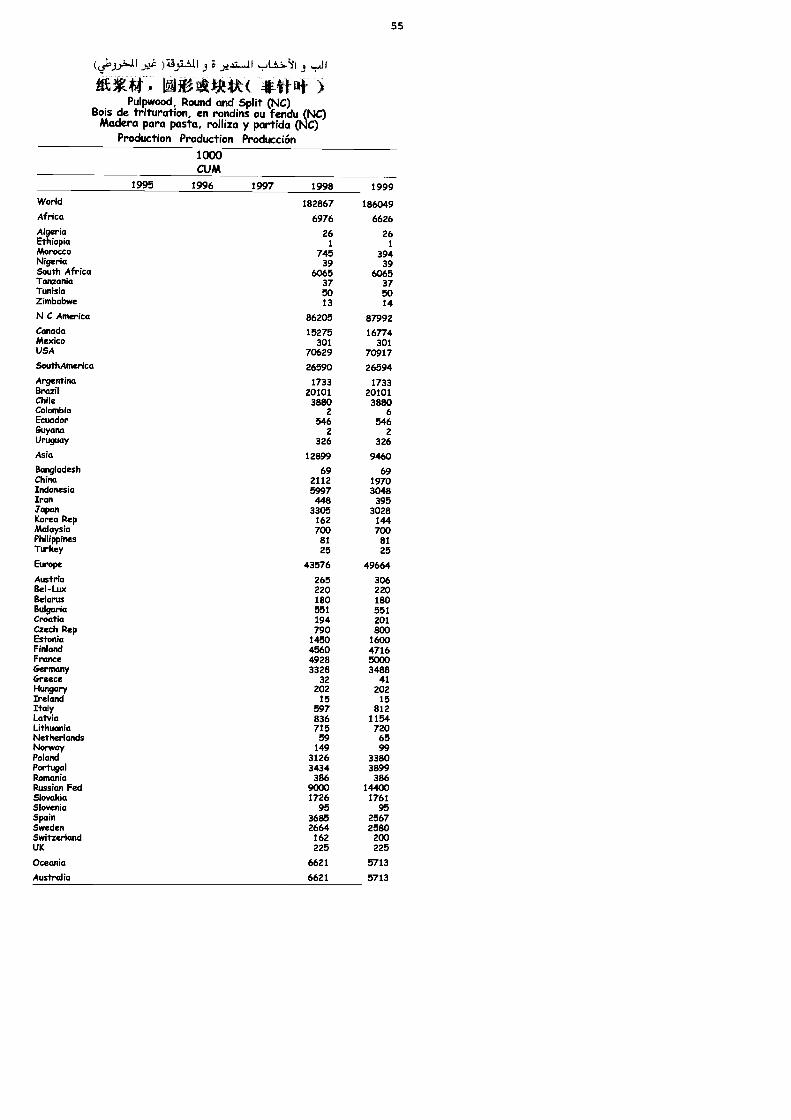
)76,WIJ 3 ,11
htt# LIZA/AU( *ttlit )Pulpwood, Round and Split (NC)
Bois de trituration, en rondins ou fendu (NC)Madera para pasta, rolliza y partida (NC)
Production Production Producción1000CUM
55
1995 1996 1997 1998 1999
World 182867 186049Africa 6976 6626Algeria 26 26Ethiopia 1 IMorocco 745 394Nigeria 39 39South Africa 6065 6065Tanzania 37 37Tunisia 50 50Zimbabwe 13 14
N C America 86205 87992Canada 15275 16774Mexico 301 301USA 70629 70917SouthAmerica 26590 26594Argentina 1733 1733Brazil 20101 20101Chile 3880 3880Colombia 2 6Ecuador 546 546Guyana 2 2Uruguay 326 326
Asia 12899 9460Bangladesh 69 69China 2112 1970Indonesia 5997 3048Iran 448 395yapan 3305 3028Korea Rep 162 144Malaysia 700 700Philippines 81 81Turkey 25 25
EuroPe 43576 49664
Austria 265 306Bel-Lux 220 220Betorus 180 180Bulgaria 551 551Croatia 194 201Czech Rep 790 800Estonia 1450 1600Finland 4560 4716France 4928 5000Germany 3328 3488Greece 32 41Hungary 202 202Ireland 15 15Italy 597 812Latvia 836 1154Lithuania 715 720Netherlands 59 65Norway 149 99Poland 3126 3380Portugal 3434 3899Romania 386 386Russian Fed 9000 14400Slovakia 1726 1761Slovenia 95 95Spain 3685 2567Sweden 2664 2580Switzerland 162 200UK 225 225
Oceania 6621 5713
Australia 6621 5713
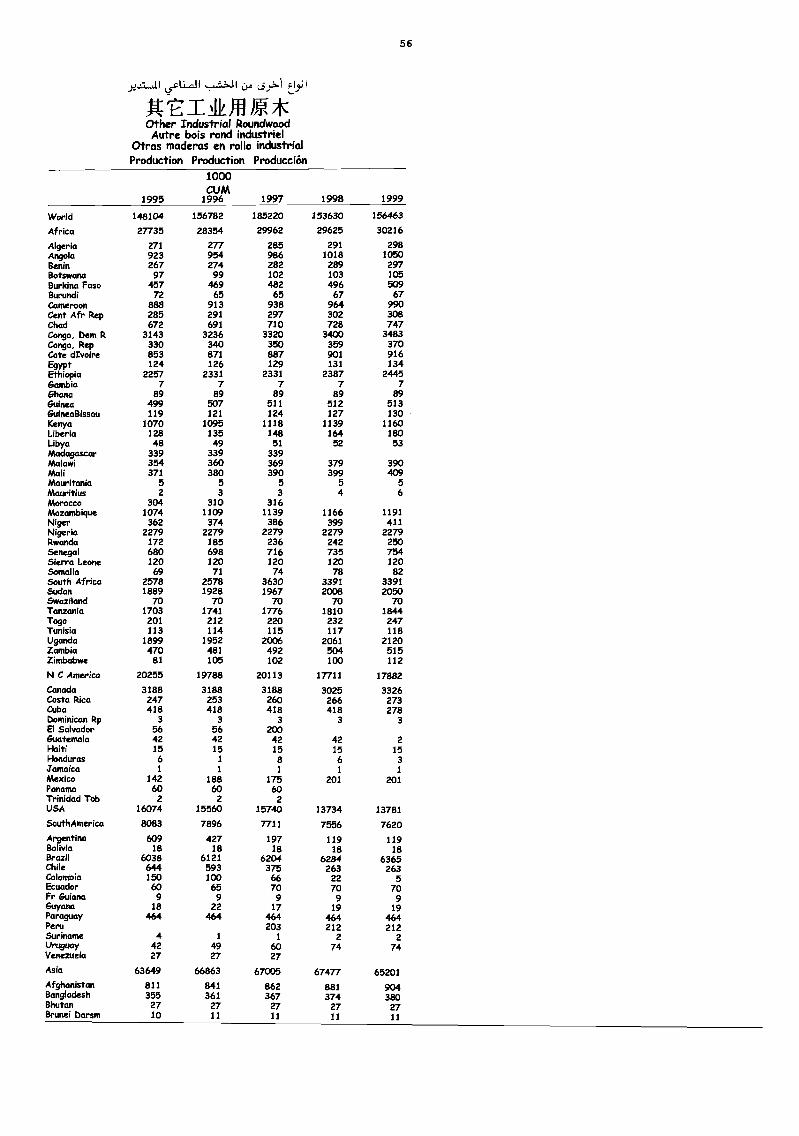
La! I67.....1:.+-11 c).0 L5).:1.1 p 1.9.; I
1-E-' I h. fll JP:*Other Industrial RoundwoodAutre bois rond industriel
Otras maderas en rollo industrialProduction Production Producción
1000CUM
56
1995 1996 1997 1998 1999
World 148104 156782 185220 153630 156463
Africa 27735 28354 29962 29625 30216
Algeria 271 277 285 291 298Angola 923 954 986 1018 1050Benin 267 274 282 289 297Botswana 97 99 102 103 105Burkina Faso 457 469 482 496 509Burundi 72 65 65 67 67Cameroon 888 913 938 964 990Cent Afr Rep 285 291 297 302 308Chad 672 691 710 728 747Congo, Dem R 3143 3236 3320 3400 3483Congo, Rep 330 340 350 359 370Cote dIvoire 853 871 887 901 916Egypt 124 126 129 131 134Ethiopia 2257 2331 2331 2387 2445Gambia 7 7 7 7 7Ghana 89 89 89 89 89Guinea 499 507 511 512 513GuineaBissau 119 121 124 127 130Kenya 1070 1095 1118 1139 1160Liberia 128 135 148 164 180Libya 48 49 51 52 53Madagascar 339 339 339Malawi 354 360 369 379 390Mali 371 380 390 399 409Mauritania 5 5 5 5 5Mauritius 2 3 3 4 6Morocco 304 310 316Mozambique 1074 1109 1139 1166 1191Niger 362 374 386 399 411Nigeria 2279 2279 2279 2279 2279Rwanda 172 185 236 242 250Senegal 680 698 716 735 754Sierra Leone 120 120 120 120 120Somalia 69 71 74 78 82South Africa 2578 2578 3630 3391 3391Sudan 1889 1928 1967 2008 2050Swazilcind 70 70 70 70 70Tanzania 1703 1741 1776 1810 1844Togo 201 212 220 232 247Tunisia 113 114 115 117 118Uganda 1899 1952 2006 2061 2120Zambia 470 481 492 504 515Zimbabwe 81 105 102 100 112
N C America 20255 19788 20113 17711 17882
Canada 3188 3188 3188 3025 3326Costa Rica 247 253 260 266 273Cuba 418 418 418 418 278Dominican Rp 3 3 3 3 3El Salvador 56 56 200Guatemala 42 42 42 42 21-laiti 15 15 15 15 15Honduras 6 1 8 6 3Jamaica 1 1 1 1 1
Mexico 142 188 175 201 201Panama 60 60 60Trinidad Tob 2 2 2USA 16074 15560 15740 13734 13781
SouthAmerica 8083 7896 7711 7556 7620Argentina 609 427 197 119 119Bolivia 18 18 18 18 18Brazil 6038 6121 6204 6284 6365Chile 644 593 375 263 263Colombia 150 100 66 22 5Ecuador 60 65 70 70 70Fr Guiana 9 9 9 9 9Guyana 18 22 17 19 19Paraguay 464 464 464 464 464Peru 203 212 212Suriname 4 1 1 2 2Uruguay 42 49 60 74 74Venezuela 27 27 27
Asia 63649 66863 67005 67477 65201Afghanistan 811 841 862 881 904Bangladesh 355 361 367 374 380Bhutan 27 27 27 27 27Brunei barsm 10 11 11 11 11
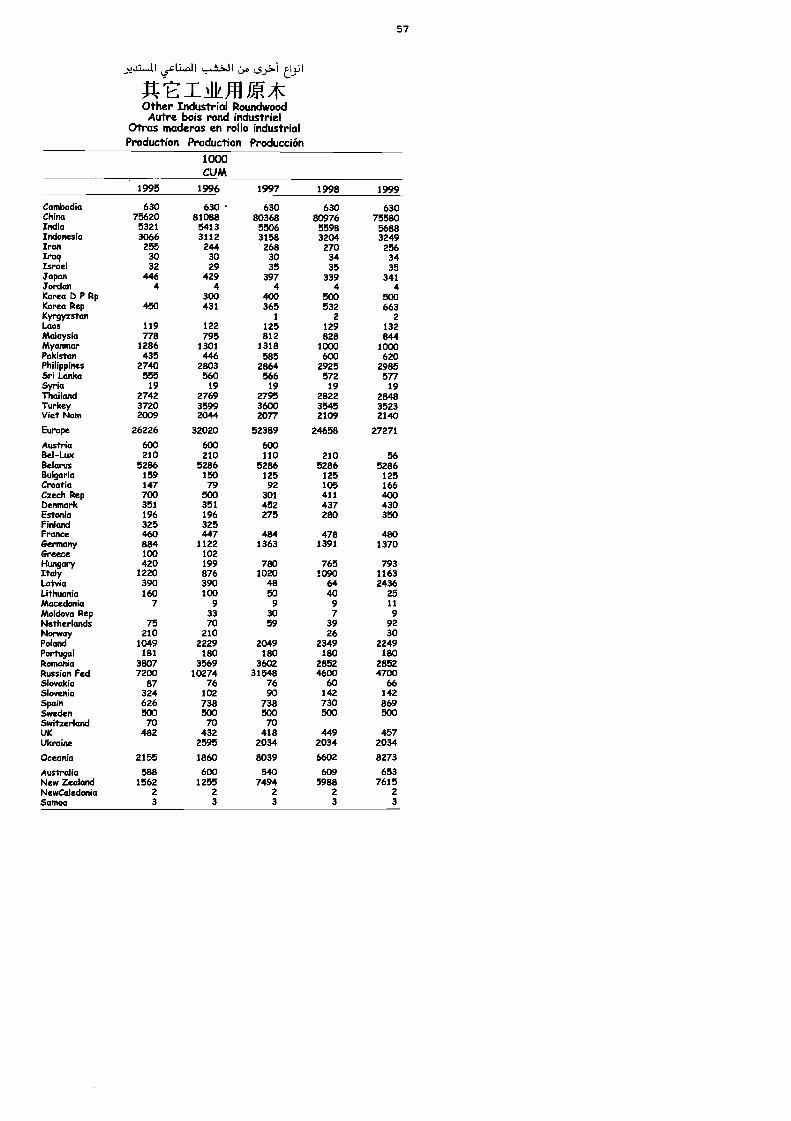
yez-1.1
TAUTM*Other Industrial RoundwoodAutre bois rond industriel
Otras maderas en rollo industrialProduction Production Producción
1000CUM
57
1995 1996 1997 1998 1999
Cambodia 630 630 630 630 630China 75620 81088 80368 80976 75580India 5321 5413 5506 5598 5688Indonesia 3066 3112 3158 3204 3249Iran 255 244 268 270 256Iraq 30 30 30 34 34Israel 32 29 35 35 35Japan 446 429 397 339 341Jordan 4 4 4 4 4Korea 0 P Rp 300 400 500 500Korea Rep 450 431 365 532 663Kyrgyzstan 1 2 2Laos 119 122 125 129 132Malaysia 778 795 812 828 844Myamnar 1286 1301 1318 1000 1000Pakistan 435 446 585 600 620Philippines 2740 2803 2864 2925 2985Sri Lanka 555 560 566 572 577Syria 19 19 19 19 19Thailand 2742 2769 2795 2822 2848Turkey 3720 3599 3600 3545 3523Viet Nam 2009 2044 2077 2109 2140
Europe 26226 32020 52389 24658 27271
Austria 600 600 600Bel-Lux 210 210 110 210 56Belarus 5286 5286 5286 5286 5286Bulgaria 159 150 125 125 125Croatia 147 79 92 105 166Czech Rep 700 500 301 411 400Denmark 351 351 452 437 430Estonia 196 196 275 280 350Finland 325 325France 460 447 484 478 480Germany 884 1122 1363 1391 1370Greece 100 102Hungary 420 199 780 765 793Italy 1220 876 1020 2090 1163Latvia 390 390 ao 64 2436Lithuania 160 100 50 ao 25Macedonia 7 9 9 9 11Moldova Rep 33 30 7 9hktherlands 75 70 59 39 92Nonvay 210 210 26 30Poland 1049 2229 2049 2349 2249Portugal 181 180 180 180 180Romania 3807 3569 3602 2852 2852Russian Fed 7200 10274 31548 4600 4700Slovakia 87 76 76 60 66Slovenia 324 102 90 142 142SPain 626 738 738 730 869Sweden 500 500 500 500 500Switzerland 70 70 70UK 482 432 418 449 457Ukraine 2595 2034 2034 2034
Oceania 2155 1860 8039 6602 8273
Australia 588 600 540 609 653New Zealand 1562 1255 7494 5988 7615NewCaledmia 2 2 2 2 2Samoa 3 3 3 3 3
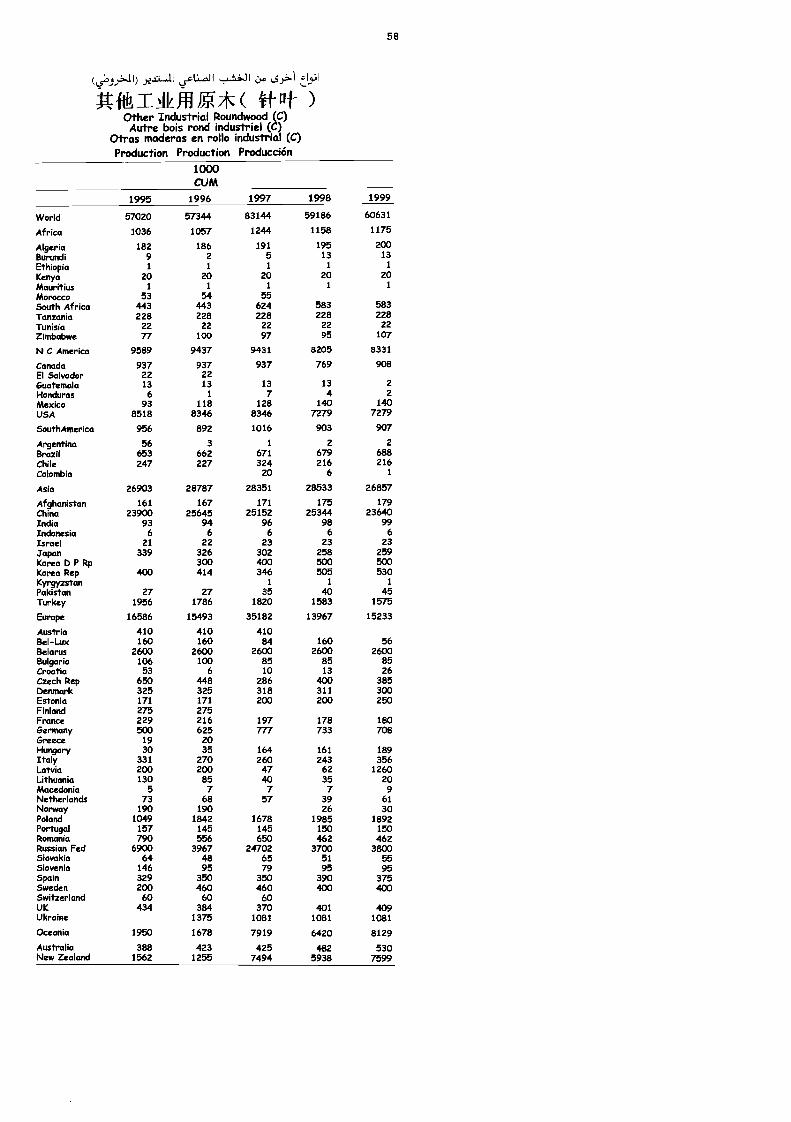
(01.3;,...1f) .11 agt....all
RIP.ICILM*( )Other Industrial Roundwood (C)Autre bois rond industriel (C)
Otras maderas en rollo industrial (C)Production Production Producción
1000CUM
58
1995 1996 1997 1998 1999
World 57020 57344 83144 59186 60631
Africa 1036 1057 1244 1158 1175
Algeria 182 186 191 195 200Burundi 9 2 5 13 13
Ethiopia 1 1 1 1 1
Kenya 20 20 20 20 20Mauritius 1 1 1 1 1
Morocco 53 54 55South Africa 443 443 624 583 583Tanzania 228 228 228 228 228Tunisia 22 22 22 22 22Zimbabwe 77 100 97 95 107
N C America 9589 9437 9431 8205 8331
Canada 937 937 937 769 908El Salvador 22 22Guatemala 13 13 13 13 2Honduras 6 1 7 4 2Mexico 93 118 128 140 140USA 8518 8346 8346 7279 7279
SouthAmerica 956 892 1016 903 907
Argentina 56 3 1 2 2Brazil 653 662 671 679 688Chile 247 227 324 216 216Colombia 20 6 1
Asia 26903 28787 28351 28533 26857
Afghanistan 161 167 171 175 179China 23900 25645 25152 25344 23640India 93 94 96 98 99Indonesia 6 6 6 6 6Israel 21 22 23 23 23Jai= 339 326 302 258 259Korea C. P Rp 300 400 500 500Korea Rep 400 414 346 505 530Kyrgyzstan 1 1 1
Pakistan 27 27 35 40 45Turkey 1956 1786 1820 1583 1575
Europe 16586 15493 35182 13967 15233
Austria 410 410 410Bel-Lux 160 160 84 160 56Betarus 2600 2600 2600 2600 2600Bulgaria 106 100 85 85 85Croatia 53 6 10 13 26Czech Rep 650 448 286 400 385Denmark 325 325 318 311 300Estonia 171 171 203 200 250Finland 275 275France 229 216 197 178 180Germany 500 625 777 733 708Greece 19 20HungarY 30 35 164 161 189Italy 331 270 260 243 356Latvia 200 200 47 62 1260Lithuania 130 85 40 35 20Macedonia 5 7 7 7 9Netherlands 73 68 57 39 61Norway 190 190 26 30Poland 1049 1842 1678 1985 1892Portugal 157 145 145 150 150Romania 790 556 650 462 462Russian Fed 6900 3967 24702 3700 3800Slovakia 64 48 65 51 55Slovenia 146 95 79 95 95Spain 329 350 350 390 375Sweden 200 460 460 400 400Switzerland 60 60 60UK 434 384 370 401 409Ukraine 1375 1081 1081 1081
Oceania 1950 1678 7919 6420 8129Australia 388 423 425 482 530New Zealand 1562 1255 7494 5938 7599
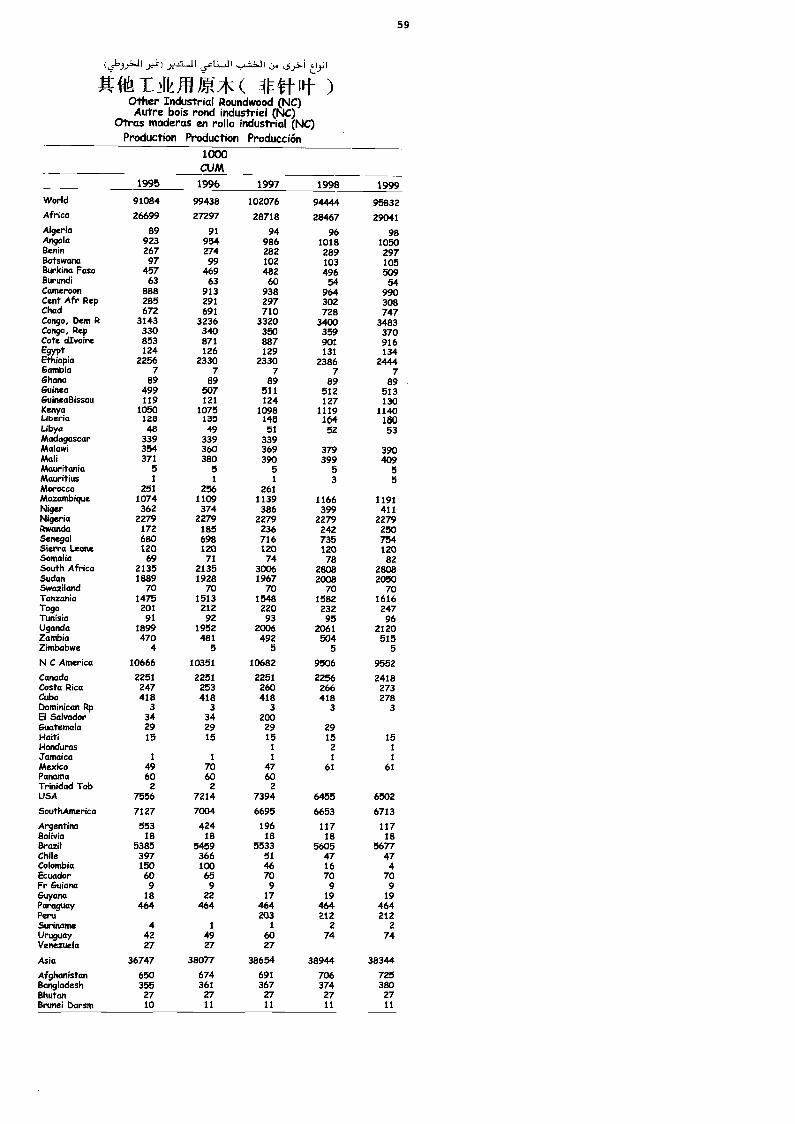
(13.11 )2.11-11 usliJ1
Ai-61A " LY*( :t-9t)Other Industrial Roundwood (NC)Autre bois rond industriel (NC)
Otras maderas en rollo industrial (NC)Production Production Producción
1000CUM
59
1995 1996 1997 1998 1999
World 91084 99438 102076 94444 95832Africa 26699 27297 28718 28467 29041Algeria 89 91 94 96 98Angola 923 954 986 1018 1050Benin 267 274 282 289 297Botswana 97 99 102 103 105Burkina Faso 457 469 482 496 509Burundi 63 63 60 54 54Cameroon 888 913 938 964 990Cent Afr Rep 285 291 297 302 308Chad 672 691 710 728 747Congo, Dem R 3143 3236 3320 3400 3483Congo, Rep 330 340 350 359 370Cote divoire 853 871 887 901 916Egypt 124 126 129 131 134Ethiopia 2256 2330 2330 2386 2444Gambia 7 7 7 7 7Ghana 89 89 89 89 89Guinea 499 507 511 512 513GuineaBissau 119 121 124 127 130Kenya 1050 1075 1098 1119 1140Liberia 1213 130 146 164 180Libya 48 49 51 52 53Madagascar 339 339 339Malawi 354 360 369 379 390Mali 371 380 390 399 409Mauritania 5 5 5 5 5Mauritius 1 1 1 3 5MoroccoMozambique
2511074
2561109
1213691
1166 1191NigerNigeria
3622279
3742279 6223789
3992279 2427191
Rwanda 172 185 236 242 250Senegal 680 698 716 735 754Sierra Leone 120 120 120 120 120Somalia 69 71 74 78 82South Africa 2135 2135 3006 2808 2808Sudan 1889 1928 1967 2008 2050Swaziland 70 70 70 70Tanzania 1475 1513 1548 1582 167160Togo 201 212 220 232 247Tunisia 91 92 93 95 96Uganda 1899 1952 2006 2061 2120Zambia 470 481 492 504 515Zimbabwe 4 5 5 5 5
N C America 10666 10351 10682 9506 9552
Canada 2251 2251 2251 2256 2418Costa Rica 247 253 260 266 273Cuba 418 418 418 418 278Dominican Rp 3 3 3 3 3El Salvador 34 34 200Guatemala 29 29 29 29Haiti 15 15 15 15 15Honduras 1 2 1
Jamaica 1 1 1 1 1
Mexico 49 70 47 61 61Panama 60 60 60Trinidad Tob 2 2 2USA 7556 7214 7394 6455 6502
SouthAmerica 7127 7004 6695 6653 6713
Argentina 553 424 196 117 117Bolivia 18 18 18 18 18Brazil 5385 5459 5533 5605 5677Chile 397 366 51 47 47Colombia 150 100 46 16 4Ecuador 60 65 70 70 70Fr Guiana 9 9 9 9 9Guyana 18 22 17 19 19Paraguay 464 464 464 464 464Peru 203 212 212Suriname 4 1 1 2 2
Uruguay 42 49 60 74 74Venezuela 27 27 27
Asia 36747 38077 38654 38944 38344
Afghanistan 650 674 691 706 725Bangladesh 355 361 367 374 380Bhutan 27 27 27 27 27Brunei Dar= 10 11 11 11 11
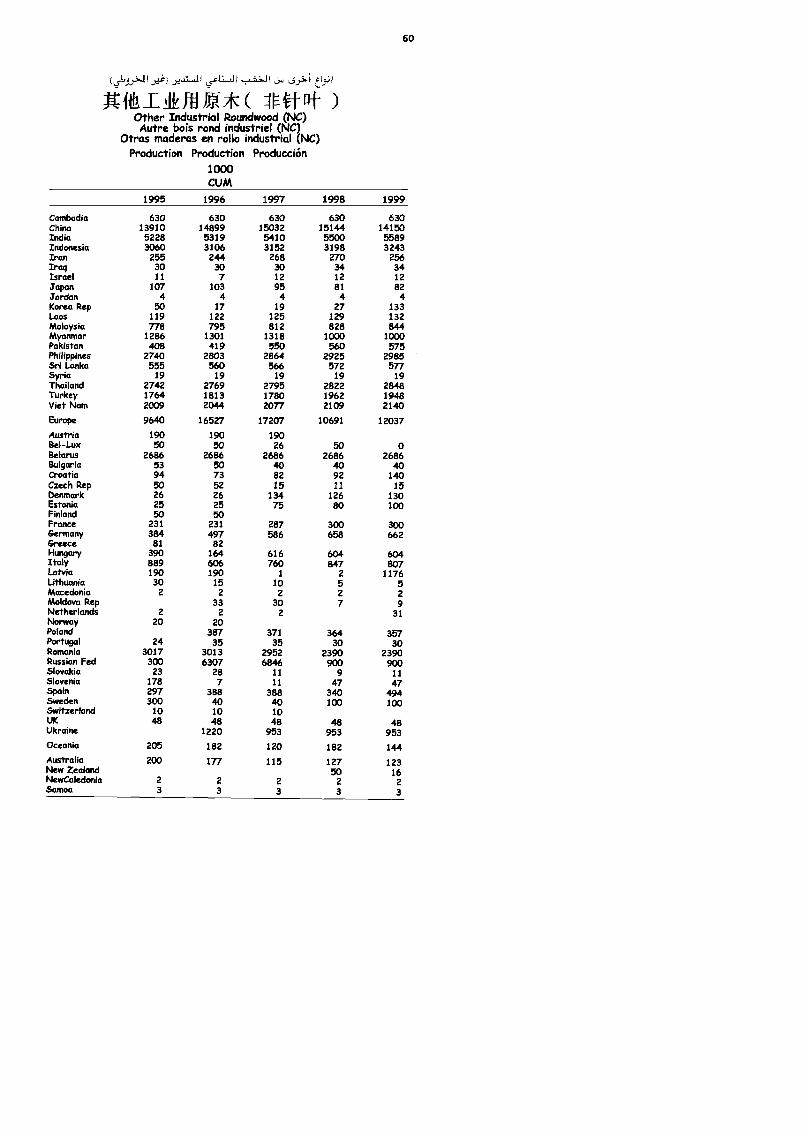
Rft.14J111,7K( 14ttit )Other Industrial Roundwood (NC)Autre bois rond industriel (NC)
Otras maderas en rollo industrial (NC)Production Production Producción
1000CUM
60
1995 1996 1997 1998 1999
Cambodia 630 630 630 630 630China 13910 14899 15032 15144 14150India 5228 5319 5410 5500 5589Indonesia 3060 3106 3152 3198 3243Iran 255 244 268 270 256Iraq 30 30 30 34 34Israel 11 7 12 12 12yapan 107 103 95 81 82Jordan 4 4 4 4 4Korea Rep 50 17 19 27 133Laos 119 122 125 129 132Malaysia 778 795 812 828 844Myanmar 1286 1301 1318 1000 1000Pakistan 408 419 550 560 575Philippines 2740 2803 2864 2925 2985Sri Lanka 555 560 566 572 577Syria 19 19 19 19 19Thailand 2742 2769 2795 2822 2848Turkey 1764 1813 1780 1962 1948Viet Nam 2009 2044 2077 2109 2140
Europe 9640 16527 17207 10691 12037
Austria 190 190 190Bel-Lux 50 50 26 50 0Betorus 2686 2686 2686 2686 2686Bulgaria 53 50 40 40 40Croatia 94 73 82 92 140Czech Rep 50 52 15 11 15benmark 26 26 134 126 130Estonia 25 25 75 80 100Finland 50 50France 231 231 287 300 300Germany 384 497 586 658 662Greece 81 82Hungary 390 164 616 604 604Italy 889 606 760 847 1307Latvia 190 190 1 2 1176Lithuania 30 15 10 5 5Macedonia 2 2 2 2 2Moldova Rep 33 30 7 9Netherlands 2 2 2 31Norway 20 20Poland 387 371 364 357Portugal 24 35 35 30 30Romania 3017 3013 2952 2390 2390Russian Fed 300 6307 6848 900 900Slovakia 23 28 11 9 11Slovenia 178 7 11 47 47Spain 297 388 388 340 494Sweden 300 40 40 100 100Switzerland 10 10 10UK 48 48 48 48 48Ukraine 1220 953 953 953Oceania 205 182 120 182 144
Australia 200 177 115 127 123New Zealand 50 16NewCaledonia 2 2 2 2 2Samoa 3 3 3 3 3
1LJ I L 1.1:1-±J L5.514 I ix..".1.1 I
*g.WOOD CHARCOAL, WOOD CHIPS, PARTICLES AND
RESIDUES
CHARBON DE BOIS, PLAQUETTES ET PARTICULESET RESIDUS DE BOIS
CARBÓN V,EGETAL DE MADERA, ASTILLAS,PARTICULAS Y RESIDUOS DE MADERA
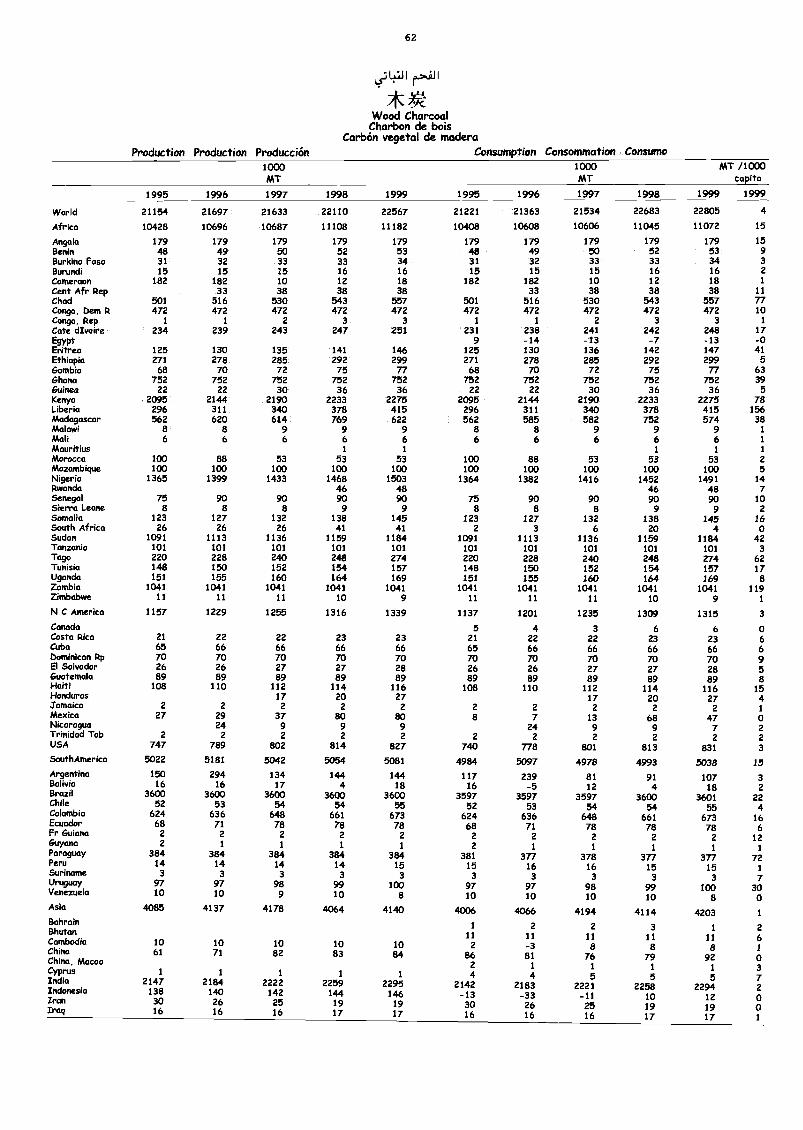
62
0:'it1/1 r"""111
*Wood Charcoal
Charbon de boisCarbón vegetal de madera
Production Production Producción Consumption Consommation Consumo1000MT
1000MT
MT /1000capita
1995 1996 1997 1998 1999 1995 1996 1997 1998 1999 1999
World 21154 21697 21633 22110 22567 21221 21363 21534 22683 22805 4
Africa 10428 10696 10687 11108 11182 10408 10608 10606 11045 11072 15
Angola 179 179 179 179 179 179 179 179 179 179 15Benin 48 49 50 52 53 48 49 50 52 53 9Burkina Faso 31 32 33 33 34 31 32 33 33 34 3Burundi 15 15 15 16 16 15 15 15 16 16 2Cameroon 182 182 10 12 18 182 182 10 12 18 1
Cent Afr Rep 33 38 38 38 33 38 38 38 11Chad 501 516 530 543 557 501 516 530 543 557 77Congo, bern R 472 472 472 472 472 472 472 472 472 472 10Congo, Rep 1 1 2 3 3 1 1 2 3 3 1
Cote dIvaire 234 239 243 247 251 231 238 241 242 248 17Egypt 9 -14 -13 -7 -13 -0Eritrea 125 130 135 141 146 125 130 136 142 147 41Ethiopia 271 278 285 292 299 271 278 285 292 299 5Gambia 68 70 72 75 77 68 70 72 75 77 63Ghana 752 752 752 752 752 752 752 752 752 752 39Guinea 22 22 30 36 36 22 22 30 36 36 5Kenya 2095 2144 2190 2233 2275 2095 2144 2190 2233 2275 78Liberia 296 311 340 378 415 296 311 340 378 415 156Madagascar 562 620 614 769 622 562 585 582 752 574 38Malawi 8 s 9 9 9 8 8 9 9 9 1
Mali 6 6 6 6 6 6 6 6 6 6 1
Mauritius 1 1 1 1 1
Morocco 100 88 53 53 53 100 88 53 53 53 2Mozambique 100 100 100 100 100 100 100 100 100 100 5Nigeria 1365 1399 1433 1468 1503 1364 1382 1416 1452 1491 14Rwanda 46 48 46 48 7Senegal 75 90 90 90 90 75 90 90 90 90 10Sierra Leone 8 8 8 9 9 8 8 8 9 9 2Somalia 123 127 132 138 145 123 127 132 138 145 16South Africa 26 26 26 41 41 2 3 6 20 4 0Sudan 1091 1113 1136 1159 1184 1091 1113 1136 1159 1184 42Tanzania 101 101 101 101 101 101 101 101 101 101 3Togo 220 228 240 248 274 220 228 240 248 274 62Tunisia 148 150 152 154 157 148 150 152 154 157 17Uganda 151 155 160 164 169 151 155 160 164 169 8Zambia 1041 1041 1041 1041 1041 1041 1041 1041 1041 1041 119Zimbabwe 11 11 11 10 9 11 11 11 10 9 1
N C America 1157 1229 1255 1316 1339 1137 1201 1235 1309 1315 3
Canada 5 4 3 6 6 0Costa Rica 21 22 22 23 23 21 22 22 23 23 6Cuba 65 66 66 66 66 65 66 66 66 66 6bominican Rp 70 70 70 70 70 70 70 70 70 70 9El Salvador 26 26 27 27 28 26 26 27 27 28 5Guatemala 89 89 89 89 89 89 89 89 89 89 8Haiti 108 110 112 114 116 108 110 112 114 116 15Honduras 17 20 27 17 20 27 4Jamaica 2 2 2 2 2 2 2 2 2 2 1Mexico 27 29 37 80 80 8 7 13 68 47 0Nicaragua 24 9 9 9 24 9 9 7 2Trinidad Tob 2 2 2 2 2 2 2 2 2 2 2USA 747 789 802 814 827 740 778 801 813 831 3SouthAmerica 5022 5181 5042 5054 5081 4984 5097 4978 4993 5038 15Argentina 150 294 134 144 144 117 239 81 91 107 3Bolivia 16 16 17 4 18 16 -5 12 4 18 2Brazil 3600 3600 3600 3600 3600 3597 3597 3597 3600 3601 22Chile 52 53 54 54 55 52 53 54 54 55 4Colombia 624 636 648 661 673 624 636 648 661 673 16Ecuador 68 71 78 78 78 68 71 78 78 78 6Fr Guiana 2 2 2 2 2 2 2 2 2 2 12Guyana 2 1 1 I 1 2 1 1 1 1 1Paraguay 384 384 384 384 384 381 377 378 377 377 72Peru 14 14 14 14 15 15 16 16 15 15 1Suriname 3 3 3 3 3 3 3 3 3 3 7Uruguay 97 97 98 99 100 97 97 98 99 100 30Venezuela 10 10 9 10 8 10 10 10 10 8 0Asia 4085 4137 4178 4064 4140 4006 4066 4194 4114 4203 1
Bahrain1 2 2 3 1 2Bhutan 11 11 11 11 11 6Cambodia 10 10 10 10 10 2 -3 8 8 8 1China 61 71 82 83 84 86 81 76 79 92 0China, Macao 2 1 1 1 1 3Cyprus
India1 1 1 1 1 4 4 5 5 5 72147 2184 2222 2259 2295 2142 2183 2221 2258 2294 2Indonesia
Iran138 140 142 144 146 -13 -33 -11 10 12 0
Iraq3016
2616
2516
1917
1917
3016
2616
2516
1917
1917
01
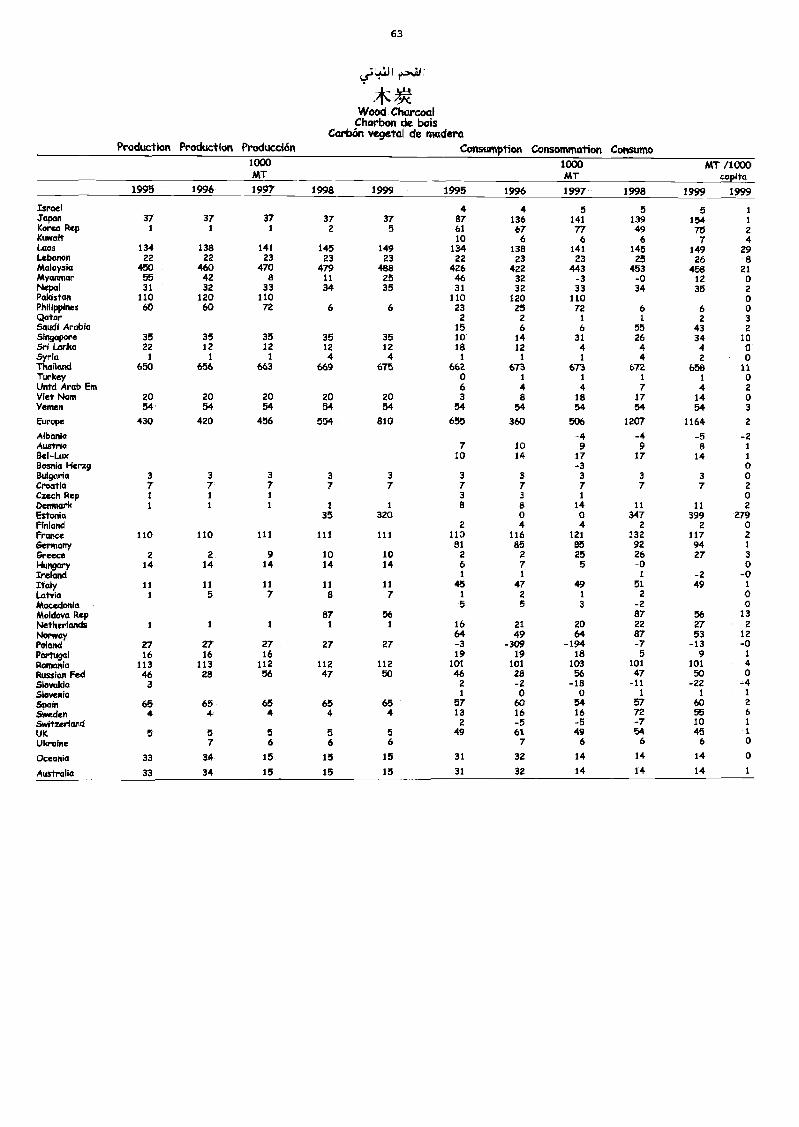
63
0_1.411 r.."..111
*V(Wood CharcoalCharbon de bois
Carbón vegetal de maderaProduction Production Producción Consumption Consommation Consumo
1000MT
1999 1995 1996
1000MT
1997 1998
MT /1000capita
1999 19991995 1996 1997 1998
Israel 4 4 5 5 5 1
Japan 37 37 37 37 37 87 136 141 139 154 1
Korea Rep I 1 1 2 5 61 67 77 49 75 2Kuwait 10 6 6 6 7 4Laos 134 138 141 145 149 134 138 141 145 149 29Lebanon 22 22 23 23 23 22 23 23 25 26 8Malaysia 450 460 470 479 488 426 422 443 453 458 21Myanmar 55 42 a 11 25 46 32 -3 -o 12 oNepal 31 32 33 34 35 31 32 33 34 35 2Pakistan 110 120 110 110 120 110 0Philippines 60 60 72 6 6 23 25 72 6 6 0Qatar 2 2 1 1 2 3Saudi Arabia 15 6 6 55 43 2Singapore 35 35 35 35 35 10 14 31 26 34 10Sri Lanka 22 12 12 12 12 18 12 4 4 4 0Sria 1 1 1 4 4 1 1 1 4 2 0Thailand 650 656 663 669 675 662 673 673 672 658 11Turkey o 1 1 1 1 oUntd Arab Em 6 4 4 7 4 2Viet Nam 20 20 20 20 20 3 8 18 17 14 0Yemen 54 54 54 54 54 54 54 54 54 54 3
Europe 430 420 456 554 810 655 360 506 1207 1164 2
Albania -4 -4 -5 -2Austria 7 10 9 9 s 1
Bel-Lux 10 14 17 17 14 1
BOSI/lia Herzg -3 0Bulgaria 3 3 3 a 3 3 3 3 3 3 oCroatia 7 7 7 7 7 7 7 7 7 7 2Czech Rep 1 1 1 3 3 1 0Demnork 1 1 1 I 1 8 8 14 11 11 2Estonia 35 320 o o 347 399 279Finland 2 4 4 2 2 oFrance 110 110 111 111 111 110 116 121 132 117 2Germany 81 85 85 92 94 IGreece 2 2 9 10 10 2 2 25 26 27 3
14,019arY 14 14 14 14 14 6 7 5 -0 0Ireland 1 1 I -2 -0Italy 11 11 11 11 11 45 47 49 51 49 1
Laivia 1 5 7 8 7 I 2 I 2 oMacedonia 5 5 3 -2 oMoldova Rep 87 56 87 56 13
Netherlands 1 1 1 I 1 16 21 20 22 27 2
Norway 64 49 64 87 53 12Poland 27 27 27 27 27 -3 -309 -194 -7 -13 -0Portugal 16 16 16 19 19 18 5 9 1
Romania 113 113 112 112 112 101 101 103 101 101 4Russian Fed 46 28 56 47 50 46 28 56 47 50 oSlovakia 3 2 -2 -18 -11 -22 -4Slovenia 1 o o i 1 ISpain 65 65 65 65 65 57 60 54 57 60 2
S*eden 4 4 4 4 4 13 16 16 72 55 6
Switzerland 2 -5 -5 -7 10 IUK 5 5 5 5 5 49 61 49 54 45 1
Ukraine 7 6 6 6 7 6 6 6 0
Oceania 33 34 15 15 15 31 32 14 14 14 0
Australia 33 34 15 15 15 31 32 14 14 14
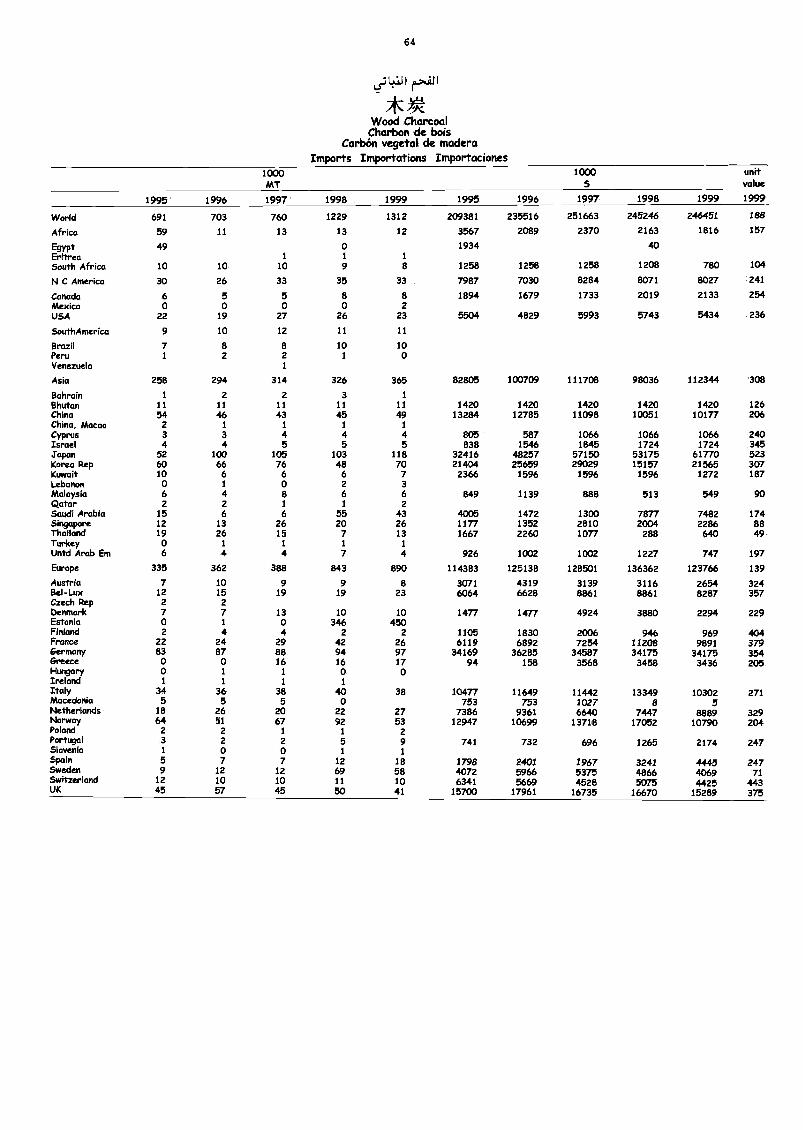
64
0.51÷1J1
*g.Wood Charcoal
Charbon de boisCarbón vegetal de madera
Imports Importations Importaciones1000MT
1000 unitvalue
1995 1996 1997 1998 1999 1995 1996 1997 1998 1999 1999
World 691 703 760 1229 1312 209381 235516 251663 245246 246451 188
Africa 59 11 13 13 12 3567 2089 2370 2163 1816 157
Egypt 49 0 1934 40Eritrea 1 1 1
South Africa 10 10 10 9 8 1258 1258 1258 1208 780 104
N C America 30 26 33 35 33 7987 7030 8284 8071 8027 241
Canada 6 5 5 8 8 1894 1679 1733 2019 2133 254Mexico 0 0 0 0 2USA 22 19 27 26 23 5504 4829 5993 5743 5434 236
SouthAmerica 9 10 12 11 11
Brazil 7 8 8 10 10Peru 1 2 2 1 0Venezuela 1
Asia 258 294 314 326 365 82805 100709 111708 98036 112344 308
Bahrain 1 2 2 3 1
Bhutan 11 11 11 11 11 1420 1420 1420 1420 1420 126China 54 46 43 45 49 13284 12785 11098 10051 10177 206China, Macao 2 1 1 1 1
Cyprus 3 3 4 4 4 805 587 1066 1066 1066 240Israel 4 4 5 5 5 838 1546 1845 1724 1724 345Japan 52 100 105 103 118 32416 48257 57150 53175 61770 523Korea Rep 60 66 76 48 70 21404 25659 29029 15157 21565 307Kuwait 10 6 6 6 7 2366 1596 1596 1596 1272 187Lebanon 0 1 0 2 3Malaysia 6 4 8 6 6 849 1139 888 513 549 90Qatar 2 2 1 1 2Saudi Arabia 15 6 6 55 43 4005 1472 1300 7877 7482 174SingclPore 12 13 26 20 26 1177 1352 2810 2004 2286 88Thailand 19 26 15 7 13 1667 2260 1077 288 640 49Turkey 0 1 I 1 1Untd Arab Em 6 4 4 7 4 926 1002 1002 1227 747 197Europe 335 362 388 843 890 114383 125138 128501 136362 123766 139
Austria 7 10 9 9 a 3071 4319 3139 3116 2654 324Bel-Lux 12 15 19 19 23 6064 6628 8861 8861 8287 357Czech Rep 2 2Denmark 7 7 13 10 10 1477 1477 4924 3880 2294 229Estonia 0 1 0 346 450Finland 2 4 4 2 2 1105 1830 2006 946 969 404France 22 24 29 42 26 6119 6892 7254 11208 9891 379Germany 83 87 88 94 97 34169 36285 34587 34175 34175 354Greece 0 0 16 16 17 94 158 3568 3458 3436 205Hungary 0 1 1 0 0Ireland 1 1 1 1
Italy 34 36 38 40 38 10477 11649 11442 13349 10302 271Macedonia 5 5 5 0 753 753 1027 8 5Netherlands 18 26 20 22 27 7386 9361 6640 7447 8889 329Norway 64 51 67 92 53 12947 10699 13718 17052 10790 204Poland 2 2 1 1 2Portugal 3 2 2 5 9 741 732 696 1265 2174 247Slovenia 1 0 0 1 1Spain 5 7 7 12 18 1798 2401 1967 3241 4445 247Sweden 9 12 12 69 58 4072 5966 5375 4866 4069 71Switzerland 12 10 10 11 10 6341 5669 4528 5075 4425 443UK 45 57 45 50 41 15700 17961 16735 16670 15289 375
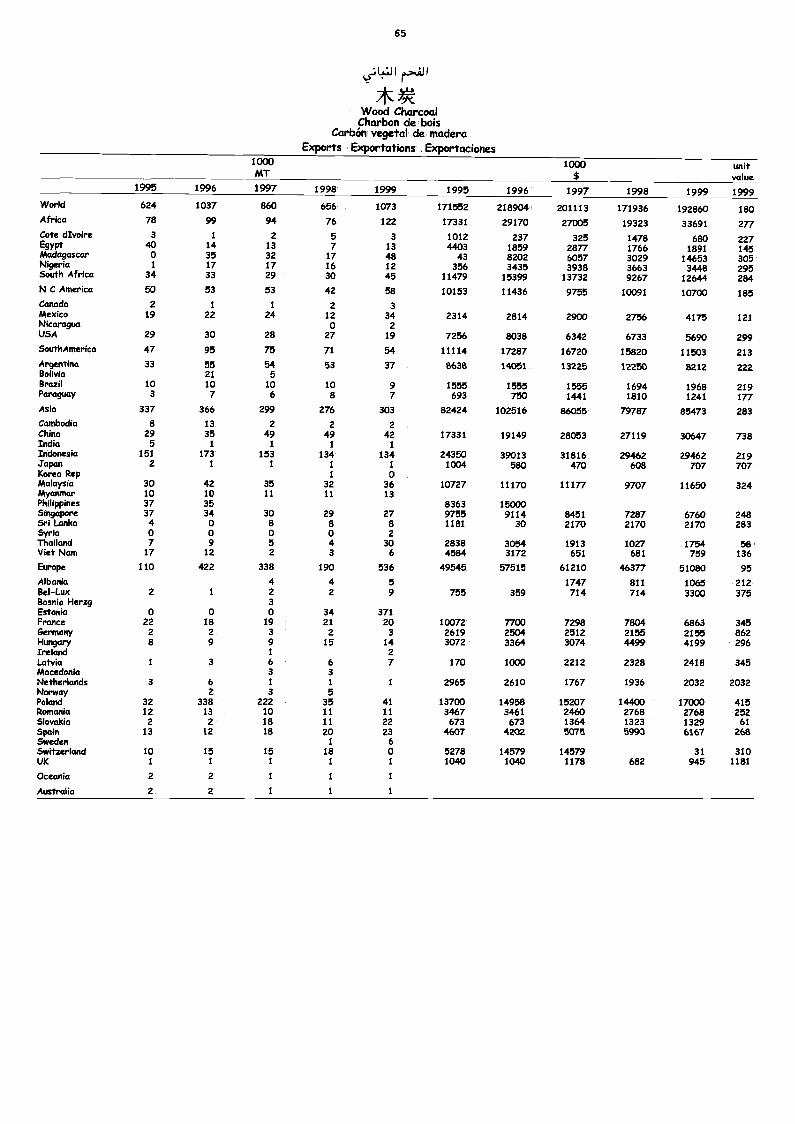
65
s'-71÷1/1
*Wood Charcoal
Charbon de boisCarbón vegetal de madera
Exports Exportations Exportaciones1000MT
1000$
unitvalue
1995 1996 1997 1998 1999 1995 1996 1997 1998 1999 1999World 624 1037 860 656 1073 171552 218904 201113 171936 192860 180Africa 78 99 94 76 122 17331 29170 27005 19323 33691 277Cote dIvoire 3 1 2 5 3 1012 237 325 1478 680 227Egypt ao 14 13 7 13 4403 1859 2877 1766 1891 145Madagascar o 35 32 17 48 43 8202 6057 3029 14653 305Nigeria 1 17 17 16 12 356 3435 3938 3663 3448 295South Africa 34 33 29 30 45 11479 15399 13732 9267 12644 284N C America 50 53 53 42 58 10153 11436 9755 10091 10700 185Canada 2 1 1 2 3Mexico 19 22 24 12 34 2314 2814 2900 2756 4175 121Nicaragua o 2USA 29 30 28 27 19 7256 8038 6342 6733 5690 299SouthAmerica 47 95 75 71 54 11114 17287 16720 15820 11503 213Argentina 33 55 54 53 37 8638 14051 13225 12250 8212 222Bolivia 21 5Brazil 10 10 10 10 9 1555 1555 1555 1694 1968 219Paraguay 3 7 6 8 7 693 750 1441 1810 1241 177Asia 337 366 299 276 303 82424 102516 86055 79787 85473 283Cambodia 8 13 2 2 2China 29 35 49 49 42 17331 19149 28053 27119 30647 738India 5 1 1 1 1
Indonesia 151 173 153 134 134 24350 39013 31816 29462 29462 219Japan 2 1 1 1 1 1004 580 470 608 707 707Korea Rep 1 oMalaysia 30 42 35 32 36 10727 11170 11177 9707 11650 324Myanmar 10 10 11 11 13Philippines 37 35 8363 15000Singapore 37 34 30 29 27 9755 9114 8451 7287 6760 248Sri Lanka 4 0 8 8 8 1181 30 2170 2170 2170 283Syria o o o 0 2Thailand 7 9 5 4 30 2838 3054 1913 1027 1754 58Viet Nam 17 12 2 3 6 4584 3172 651 681 759 136
Europe 110 422 338 190 536 49545 57515 61210 46377 51080 95Albania 4 4 5 1747 811 1065 212Bel-Lux 2 1 2 2 9 755 359 714 714 3300 375Bosnia Herzg 3Estonia o o o 34 371France 22 18 19 21 20 10072 7700 7298 7804 6863 345Germany 2 2 3 2 3 2619 2504 2512 2155 2155 862Hungary 8 9 9 15 14 3072 3364 3074 4499 4199 296Ireland 1 2Latvia 1 3 6 6 7 170 1000 2212 2328 2418 345Macedonia 3 3Netherlands 3 6 1 1 1 2965 2610 1767 1936 2032 2032Norway 2 3 5Poland 32 338 222 35 41 13700 14958 15207 14400 17000 415Romania 12 13 10 11 11 3467 3461 2460 2768 2768 252Slovakia 2 2 18 11 22 673 673 1364 1323 1329 61SPain 13 12 18 20 23 4607 4202 5075 5993 6167 268Sweden 1 6Switzerland 10 15 15 18 0 5278 14579 14579 31 310UK 1 1 1 1 1 1040 1040 1178 682 945 1181
Oceania 2 2 1 1 1
Australia 2 2 1 1 1
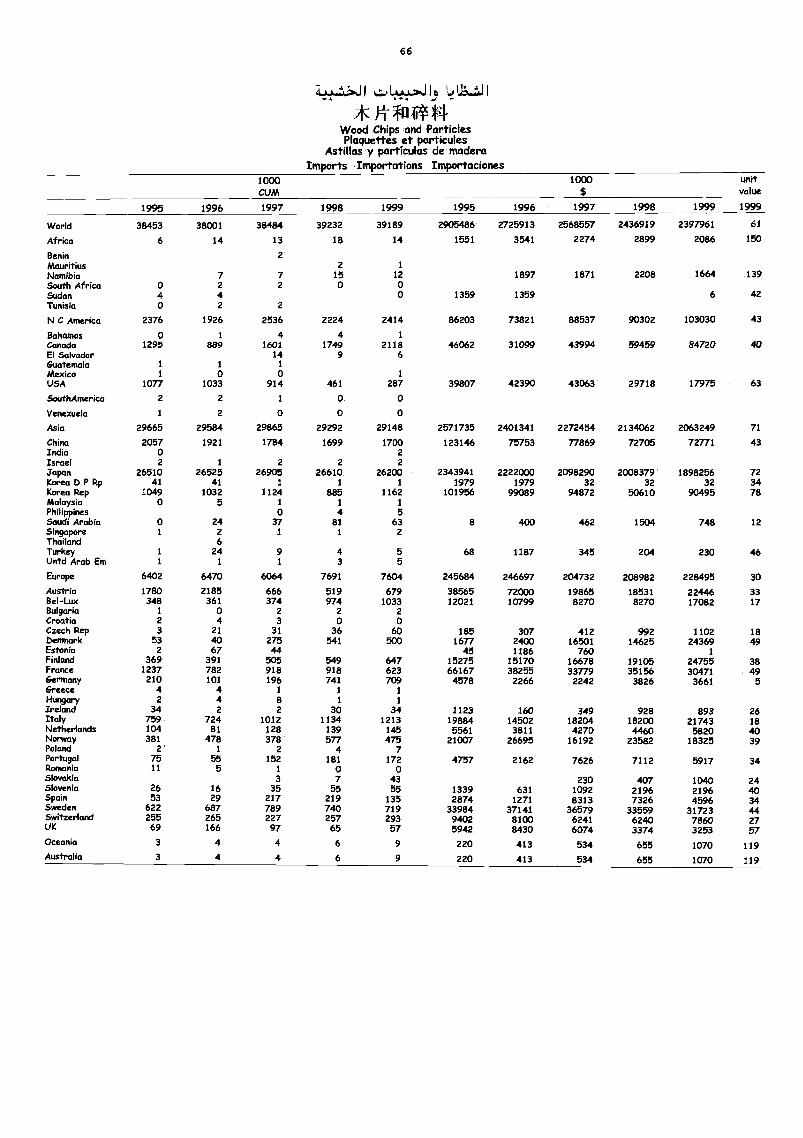
66
4. 1,.J 1 N.--)1.4.14,...1.J 1341
Wood Chips and ParticlesPlaquettes et particules
Astillas y partículas de maderaImports Importations Importaciones
1000CUM
1000 unitvalue
1995 1996 1997 1998 1999 1995 1996 1997 1998 1999 1999
World 38453 38001 38484 39232 39189 2905486 2725913 2568557 2436919 2397961 61
Africa 6 14 13 18 14 1551 3541 2274 2899 2086 150
Benin 2tAauritius 2 1
Namibia 7 7 15 12 1897 1871 2208 1664 139South Africa 0 2 2 o oSudan 4 4 0 1359 1359 6 42Tunisia 0 2 2
N C America 2376 1926 2536 2224 2414 86203 73821 88537 90302 103030 43
Bahamas o 1 4 4 1
Canada 1295 889 1601 1749 2118 46062 31099 43994 59459 84720 40El Salvador 14 9 6Guatemala 1 1 1
Mexico 1 0 o 1
USA 1077 1033 914 461 287 39807 42390 43063 29718 17975 63
SouthAmerica 2 2 1 0 0
Venezuela 1 2 o o 0
Asia 29665 29584 29865 29292 29148 2571735 2401341 2272454 2134062 2063249 71
China 2057 1921 1784 1699 1700 123146 75753 77869 72705 72771 43India 0 2Israel 2 1 2 2 2J'apon 26510 26525 26905 26610 26200 2343941 2222000 2098290 2008379 1898256 72Kama b P P43 41 41 1 1 1 1979 1979 32 32 32 34Korea Rep 1049 1032 1124 885 1162 101956 99089 94872 50610 90495 78Malaysia 0 5 1 1 1
Philippines 0 4 5Saudi Arabia o 24 37 81 63 8 400 462 1504 748 12Singapore 1 2 1 1 2Thailand 6Turkey 1 24 9 4 5 68 1187 345 204 230 46Untd Arab Em 1 1 1 3 5
Europe 6402 6470 6064 7691 7604 245684 246697 204732 208982 228495 30
Austria 1780 2185 666 519 679 38565 72000 19865 18531 22446 33Bel-Lux 348 361 374 974 1033 12021 10799 8270 8270 17082 17Bulgaria 1 0 2 2 2Croatia 2 4 3 0 oCzech Rep 3 21 31 36 60 185 307 412 992 1102 18bemnark 53 ao 275 541 500 1677 2400 16501 14625 24369 49Estonia 2 67 44 45 1186 760 1Finland 369 391 505 549 647 15275 15170 16678 19105 24755 38France 1237 782 918 918 623 66167 38255 33779 35156 30471 49Germany 210 101 196 741 709 4578 2266 2242 3826 3661 5Greece 4 4 1 1 1
Hungary 2 4 8 1 1
Ireland 34 2 2 30 34 1123 160 349 928 893 26Italy 759 724 1012 1134 1213 19884 14502 18204 18200 21743 18Netherlands 104 81 128 139 145 5561 3811 4270 4460 5820 40Norway 381 478 378 577 475 21007 26695 16192 23582 18325 39Poland 2 1 2 4 7Portugal 75 55 152 181 172 4757 2162 7626 7112 5917 34Romania 11 5 1 o 0Slovakia 3 7 43 230 407 1040 24Slovenia 26 16 35 55 55 1339 631 1092 2196 2196 40Spain 53 29 217 219 135 2874 1271 8313 7326 4596 34Sweden 622 687 789 740 719 33984 37141 36579 33559 31723 44Switzerland 255 265 227 257 293 9402 8100 6241 6240 7860 27UK 69 166 97 65 57 5942 8430 6074 3374 3253 57Oceania 3 4 4 6 9 220 413 534 655 1070 119Australia 3 4 4 6 9 220 413 534 655 1070 119
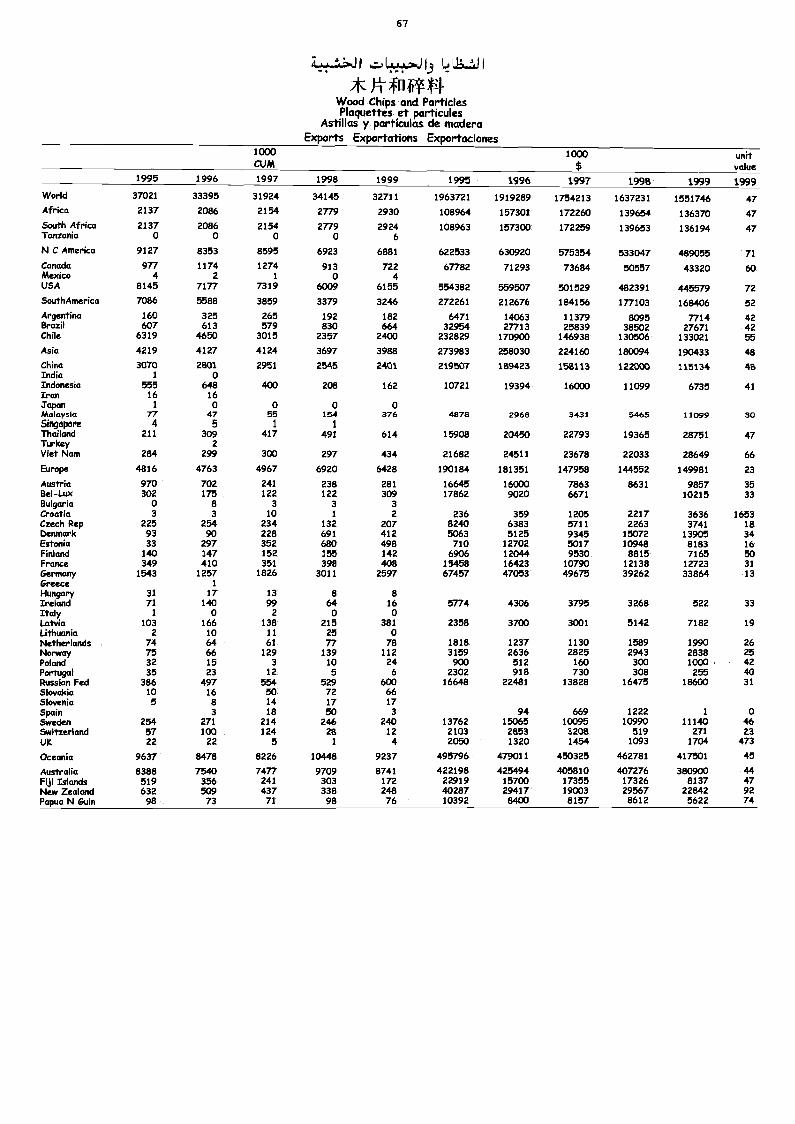
67
1.6..J I
Wood Chips and ParticlesPlaquettes et particules
Astillas y partículas de maderaExports Exportations Exportaciones
1000CUM
1000$
unitvalue
1995 1996 1997 1998 1999 1995 1996 1997 1998 1999 1999World 37021 33395 31924 34145 32711 1963721 1919289 1754213 1637231 1551746 47Africa 2137 2086 2154 2779 2930 108964 157301 172260 139654 136370 47South Africa 2137 2086 2154 2779 2924 108963 157300 172259 139653 136194 47Tanzania 0 o o 0 6
N C America 9127 8353 8595 6923 6881 622533 630920 575354 533047 489055 71Canada 977 1174 1274 913 722 67782 71293 73684 50557 43320 60Mexico 4 2 1 0 4USA 8145 7177 7319 6009 6155 554382 559507 501529 482391 445579 72SouthAmerica 7086 5588 3859 3379 3246 272261 212676 184156 177103 168406 52Argentina 160 325 265 192 182 6471 14063 11379 8095 7714 42Brazil 607 613 579 830 664 32954 27713 25839 38502 27671 42Chile 6319 4650 3015 2357 2400 232829 170900 146938 130506 133021 55Asia 4219 4127 4124 3697 3988 273983 258030 224160 180094 190433 48China 3070 2801 2951 2545 2401 219507 189423 158113 122000 115134 48India 1 0Indonesia 555 648 400 208 162 10721 19394 16000 11099 6735 41Iran 16 16Japan 1 0 0 0 0Malaysia 77 47 55 154 376 4878 2968 3431 5465 11099 30Singapore 4 5 1 1
Thailand 211 309 417 49/ 614 15908 20450 22793 19365 28751 47Ttrkey 2Viet Nam 284 299 300 297 434 21682 24511 23678 22033 28649 66
Europe 4816 4763 4967 6920 6428 190184 181351 147958 144552 149981 23
Austria 970 702 241 238 281 16645 16003 7863 8631 9857 35Bel-Lux 302 175 122 122 309 17862 9020 6671 10215 33Bulgaria 0 8 3 3 3Croatia 3 3 10 1 2 236 359 1205 2217 3636 1653Czech Rep 225 254 234 132 207 8240 6383 5711 2263 3741 18Denmark 93 90 228 691 412 5063 5125 9345 15072 13905 34Estonia 33 297 352 680 498 710 12702 5017 10948 8183 16Finland 140 147 152 155 142 6906 12044 9530 8815 7165 50France 349 410 351 398 408 15458 16423 10790 12138 12723 31Germany 1543 1257 1826 3011 2597 67457 47053 49675 39262 33864 13Greece 1
Hungary 31 17 13 8 8Ireland 71 140 99 64 16 5774 4306 3795 3268 522 33Italy 1 0 2 0 oLatvia 103 166 138 215 381 2358 3700 3001 5142 7182 19Lithuania 2 10 11 25 0Netherlands 74 64 61 77 78 1818 1237 1130 1589 1990 26Norway 75 66 129 139 112 3159 2636 2825 2943 2838 25Poland 32 15 3 10 24 900 512 160 300 1000 42Portugal 35 23 12 5 6 2302 918 730 308 255 40Russictn Fed 386 497 554 529 600 16648 22481 13828 16475 18600 31Slovakia 10 16 50 72 66Slovenia 5 8 14 17 17Spain 3 18 50 3 94 669 1222 1 oSweden 254 271 214 246 240 13762 15065 10095 10990 11140 46Switzerland 57 100 124 28 12 2103 2853 3208 519 271 23UK 22 22 5 1 4 2050 1320 1454 1093 1704 473
Oceania 9637 8478 8226 10448 9237 495796 479011 450325 462781 417501 45
Australia 8388 7540 7477 9709 8741 422198 425494 405810 407276 380900 44Fiji Islands 519 356 241 303 172 22919 15700 17355 17326 8137 47New Zealand 632 509 437 338 248 40287 29417 19003 29567 22842 92Papua N &tin 98 73 71 98 76 10392 8400 8157 8612 5622 74
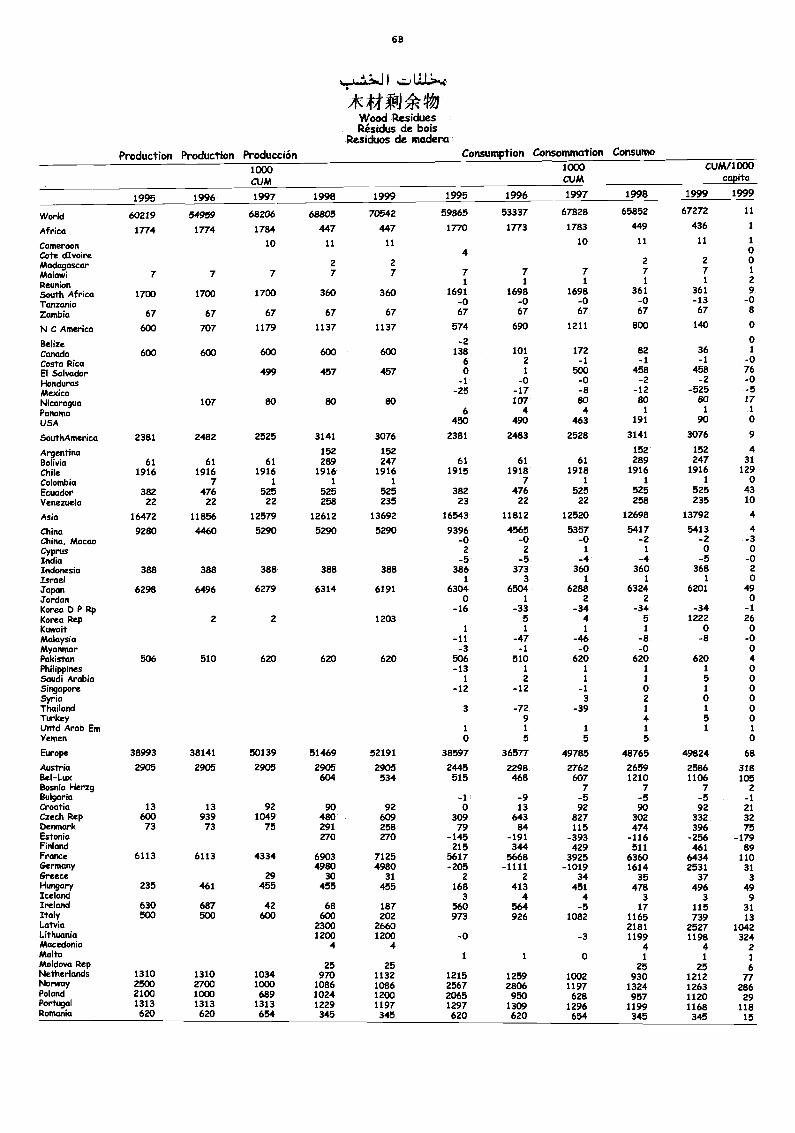
68
;-.1 I LLL
* 0.1 tWood ResiduesRésidus de bois
Residuos de madera
Production Production Producción Consumption Consonunation Consumo
1000CUM
1000CUM
CUM/1000capita
1995 1996 1997 1998 1999 1995 1996 1997 1998 1999 1999
World 60219 54959 68206 68805 70542 59865 53337 67828 65852 67272 11
Africa 1774 1774 1784 447 447 1770 1773 1783 449 436 1
Cameroon 10 11 11 10 11 11 1
Cote dIvoire 4 0Madagascar 2 2 2 2 0Malawi 7 7 7 7 7 7 7 7 7 7 1
Reunion 1 1 1 1 1 2
South Africa 1700 1700 1700 360 360 1691 1698 1698 361 361 9
Tanzania -0 -0 -0 -0 -13 -0Zambia 67 67 67 67 67 67 67 67 67 67 8
N C America 600 707 1179 1137 1137 574 690 1211 800 140 0
Belize -2 0
Canada 600 600 600 600 600 138 101 172 82 36 1
Costa Rica 6 2 -1 -1 -1 -0El Salvador 499 457 457 0 I 500 458 458 76
Honduras -1 -0 -o -2 -2 -0Mexico -25 -17 -8 -12 -525 -5Nicaragua 107 80 80 80 107 80 80 80 17
Panama 6 4 4 1 1 1
USA 450 490 463 191 90 0
SotrthAmerica 2381 2482 2525 3141 3076 2381 2483 2528 3141 3076 9
Argentina 152 152 152 152 4Bolivia 61 61 61 289 247 61 61 61 289 247 31
Chile 1916 1916 1916 1916 1916 1915 1918 1918 1916 1916 129
Colombia 7 1 1 1 7 1 1 1 0Ecuador 382 476 525 525 525 382 476 525 525 525 43
Venezuela 22 22 22 258 235 23 22 22 258 235 10
Asia 16472 11856 12579 12612 13692 16543 11812 12520 12698 13792 4
China 9280 4460 5290 5290 5290 9396 4565 5357 5417 5413 4China, Macao -o -0 -o -2 -2 -3Cyprus 2 2 1 1 o 0India -5 -5 -4 -4 -5 -0Indonesia 388 388 388 388 388 386 373 360 360 368 2
Israel 1 3 1 1 1 ojapan 6298 6496 6279 6314 6191 6304 6504 6288 6324 6201 49Jordan o 1 2 2 oKorea D P Rp -16 -33 -34 -34 -34 -1Korea Rep 2 2 1203 5 4 5 1222 2Kuwait 1 1 I 1 0Malaysia -11 -47 -46 -8 -8Myanmar -3 -1 -0 -0Pakistan 506 510 620 620 620 506 510 620 620 620Philippines -13 1 1 1 1
Saudi Arabia 1 2 1 1 5Singapore -12 -12 -1 0 1
Syria 3 2 oThailand 3 -72 -39 1 1
Turkey 9 4 5lintd Arab Em 1 1 1 1 1 1
Yemen 0 5 5 5 0
Europe 38993 38141 50139 51469 52191 38597 36577 49785 48765 49824 68
Austria 2905 2905 2905 2905 2905 2445 2298 2762 2659 2586 318Bel-Lux 604 534 515 468 607 1210 1106 105Bosnia Herzg 7 7 7 2Bulgaria -1 -9 -5 -5 -5 -1Croatia 13 13 92 90 92 0 13 92 90 92 21Czech Rep 600 939 1049 480 609 309 643 827 302 332 32Denmark 73 73 75 291 258 79 84 115 474 396 75Estonia 270 270 -145 -191 -393 -116 -256 -179Finland 215 344 429 511 461 89France 6113 6113 4334 6903 7125 5617 5668 3925 6360 6434 110Germany 4980 4980 -205 -1111 -1019 1614 2531 31Greece 29 30 31 2 2 34 35 37 3Hungary 235 461 455 455 455 168 413 451 478 496 49Iceland 3 4 4 3 3 9Ireland 630 687 42 68 187 560 564 -5 17 115 31Italy 500 500 600 600 202 973 926 1082 1165 739 13Latvia 2300 2660 2181 2527 1042Lithuania 1200 1200 -0 -3 1199 1198 324Macedonia 4 4 4 4 2Malta 1 1 0 1 1 1Moldova Rep 25 25 25 25 6Netherlands 1310 1310 1034 970 1132 1215 1259 1002 930 1212 77Norway 2500 2700 1000 1086 1086 2567 2806 1197 1324 1263 286Poland 2100 1000 689 1024 1200 2065 950 628 957 1120 29Portugal 1313 1313 1313 1229 1197 1297 1309 1296 1199 1168 118Romania 620 620 654 345 345 620 620 654 345 345 15
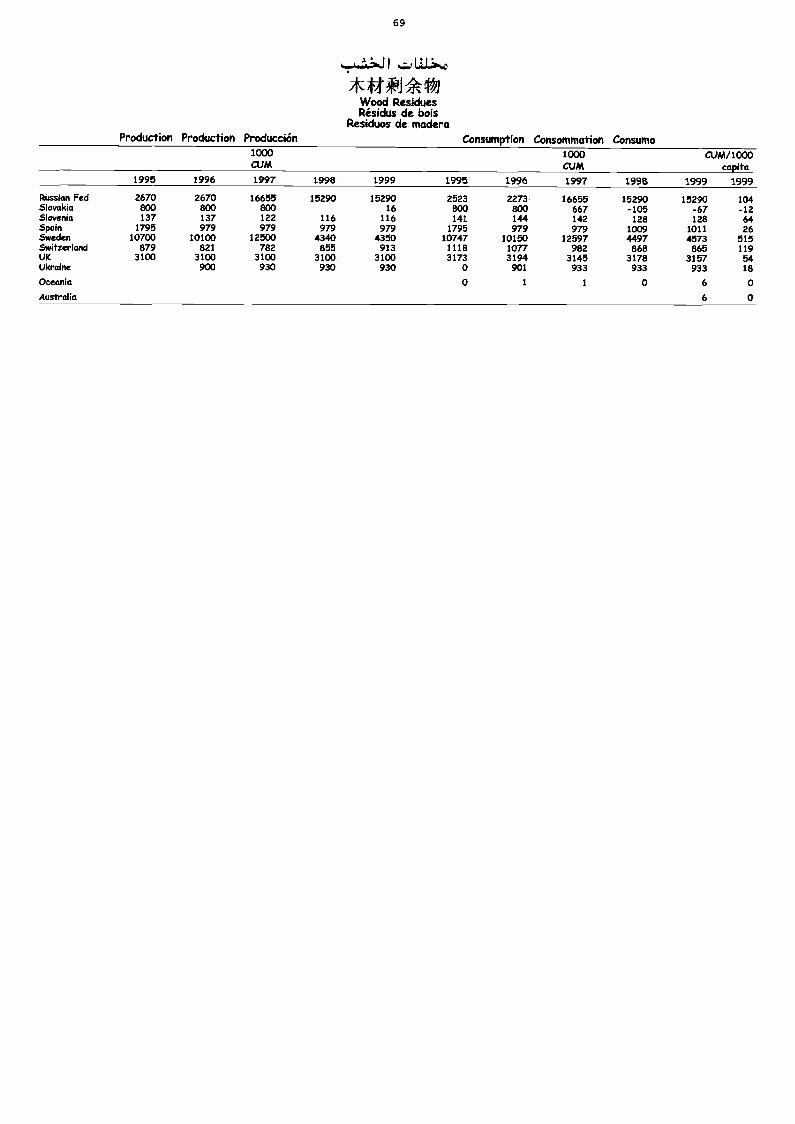
69
*ff#1.1 4tWood ResiduesRésidus de bois
Residuos de maderaProduction Production Producción Consumption Consommation Consumo
1000CUM
1000CUM
C1JM/1000capita
1995 1996 1997 1998 1999 1995 1996 1997 1998 1999 1999
Russian Fed 2670 2670 16655 15290 15290 2523 2273 16655 15290 15290 104Slovakia 800 800 800 16 800 800 667 -105 -67 -12Slovenia 137 137 122 116 116 141 144 142 128 128 64Spain 1795 979 979 979 979 1795 979 979 1009 1011 26Sweden 10700 10100 12500 4340 4350 10747 10150 12597 4497 4573 515Switzerland 879 821 782 855 913 1118 1077 982 868 865 119UK 3100 3100 3100 3100 3100 3173 3194 3145 3178 3157 54Ukraine 900 930 930 930 0 901 933 933 933 18
Oceania 0 1 1 0 6 0
Australia 6 0
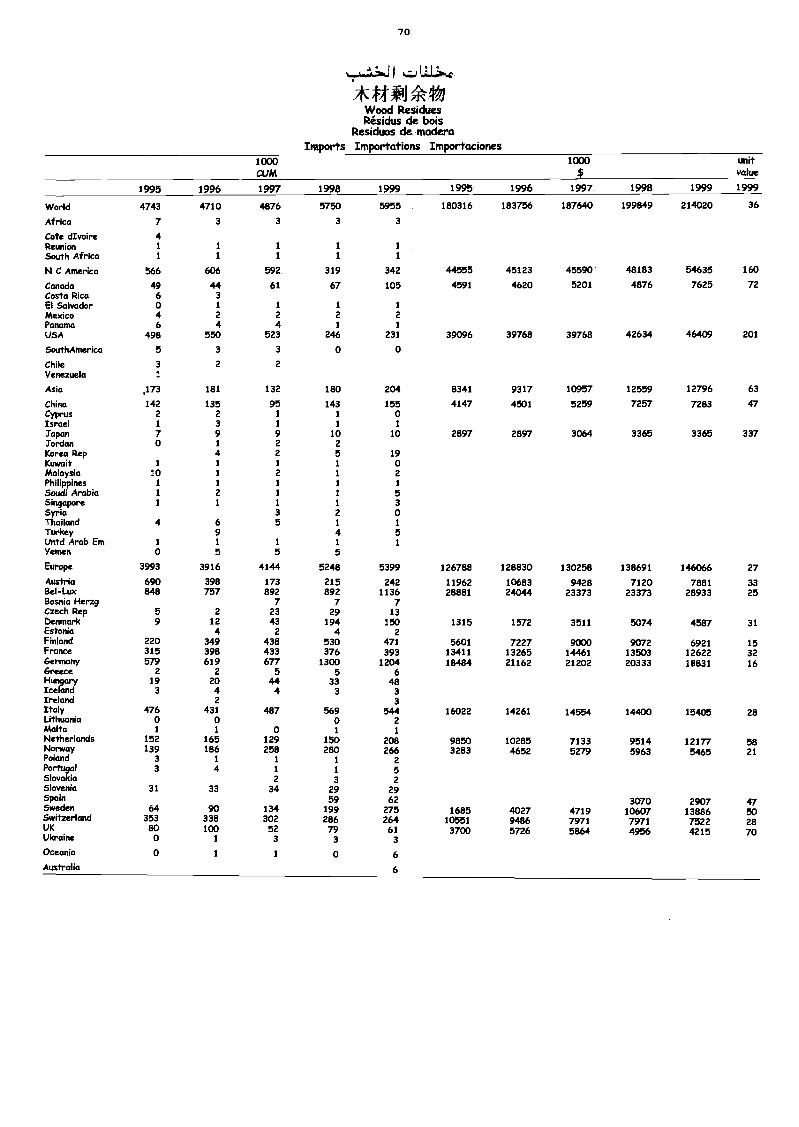
70
ft#41-triAWood ResiduesRésidtu de bois
Residuos de maderaImports Importations Importaciones
1000CUM
1000$
unitvalue
1995 1996 1997 1998 1999 1995 1996 1997 1998 1999 1999
World 4743 4710 4876 5750 5955 180316 183756 187640 199849 214020 36
Africa 7 3 3 3 3
Cote dIvoire 4Reunion 1 1 1 1 1
South Africa 1 1 1 1 1
N C America 566 606 592 319 342 44555 45123 45590 48183 54635 160
Canada 49 44 61 67 105 4591 4620 5201 4876 7625 72Costa Rica 6 3El Salvador o 1 1 1 1
Mexico 4 2 2 2 2Panama 6 4 4 1 1
VSA 498 550 523 246 231 39096 39768 39768 42634 46409 201
SouthAmerica 5 3 3 o o
Chile 3 2 2Venezuela
Asia .173 181 132 180 204 8341 9317 10957 12559 12796 63
China 142 135 95 143 155 4147 4501 5259 7257 7283 47Cyprus 2 2 1 1 0Israel 1 3 1 1 1
Japan 7 9 9 10 10 2897 2897 3064 3365 3365 337Jordan 0 1 2 2Korea Rep 4 2 5 19Kuwait 1 1 1 1 oMalaysia 10 1 2 1 2Philippines 1 i 1 I iSaudi Arabia 1 2 1 1 5Singapore 1 1 1 i 3Syria 3 2 0Thailand 4 6 5 1 1
Turkey 9 4 5Untd Arab Em 1 1 i 1 1
Yemen o 5 5 5
Europe 3993 3916 4144 5248 5399 126788 128830 130258 138691 146066 27Austria 690 398 173 215 242 11962 10683 9428 7120 7881 33Bel-Lux 848 757 892 892 1136 28881 24044 23373 23373 28933 25Bosnia Herzg 7 7 7Czech Rep 5 2 23 29 13Denmark 9 12 43 194 150 1315 1572 3511 5074 4587 31Estonia 4 2 4 2Finland 220 349 438 530 471 5601 7227 9000 9072 6921 15France 315 398 433 376 393 13411 13265 14461 13503 12622 32Germany 579 619 677 1300 1204 18484 21162 21202 20333 18831 16Greece 2 2 5 5 6Hungary 19 20 44 33 aIceland 3 4 4 3 3Ireland 2 3Italy 476 431 487 569 544 16022 14261 14554 14400 15405 28Uthuania o o o 2Malta 1 1 o 1 1
Netherlands 152 165 129 150 208 9850 10285 7133 9514 12177 58Norway 139 186 258 280 266 3283 4652 5279 5963 5465 21Poland 3 1 1 1 2Portugal 3 4 1 1 5Slovakia 2 3 2Slovenia 31 33 34 29 29Spain 59 62 3070 2907 47Sweden 64 90 134 199 275 1685 4027 4719 10607 13886 50Switzerland 353 338 302 286 264 10551 9486 7971 7971 7522 28UK 80 100 52 79 61 3700 5726 5864 4956 4215 70Ukraine o 1 3 3 3
Oceania 0 1 1 0 6
Australia 6
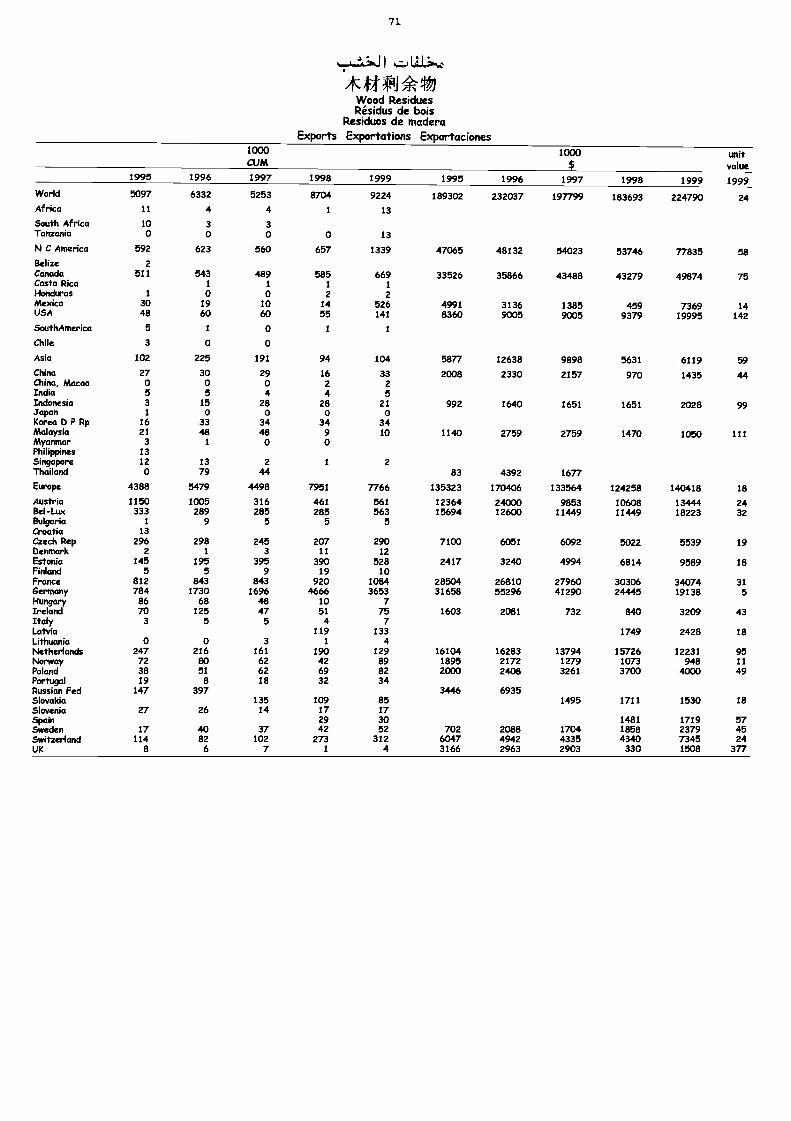
71
Wood ResiduesRésidus de bois
Residuos de maderaExports Exportations Exportaciones
1000CUM
1000$
unitvalue
1995 1996 1997 1998 1999 1995 1996 1997 1998 1999 1999World 5097 6332 5253 8704 9224 189302 232037 197799 183693 224790 24Africa 11 4 4 1 13
South Africa 10 3 3Tanzania 0 0 0 0 13
N C America 592 623 560 657 1339 47065 48132 54023 53746 77835 58Belize 2Canada 511 543 489 585 669 33526 35866 43488 43279 49874 75Costa Rica 1 1 1 1
Hondtras 1 0 o 2 2Mexico 30 19 10 14 526 4991 3136 1385 459 7369 14USA 48 60 60 55 141 8360 9005 9005 9379 19995 142ScuthAmerica 5 1 0 1 IChile 3 o 0
Asia 102 225 191 94 104 5877 12638 9898 5631 6119 59China 27 30 29 16 33 2008 2330 2157 970 1435 44China, Macao 0 0 0 2 2India 5 5 4 4 5Indonesia 3 15 28 28 21 992 1640 1651 1651 2028 99Japan 1 o o o oKorea D P Rp 16 33 34 34 34Malaysia 21 as 48 9 10 1140 2759 2759 1470 1050 111Myanmar 3 1 0 0Philippines 13
Sin9aPore 12 13 2 1 2Thailand 0 79 44 83 4392 1677
Europe 4388 5479 4498 7951 7766 135323 170406 133564 124258 140418 18
Austria 1150 1005 316 461 561 12364 24000 9853 10608 13444 24Bel-Lux 333 289 285 285 563 15694 12600 11449 11449 18223 32Bulgaria 1 9 5 5 5Croatia 13Czech Rep 296 298 245 207 290 7100 6051 6092 5022 5539 19Denmark 2 I 3 11 12Estonia 145 195 395 390 528 2417 3240 4994 6814 9589 18Finland 5 5 9 19 10France 812 843 843 920 1084 28504 26810 27960 30306 34074 31Germany 784 1730 1696 4666 3653 31658 55296 41290 24445 19138 5Hungary 86 68 48 10 7Ireland 70 125 47 51 75 1603 2081 732 840 3209 43Italy 3 5 5 4 7Latvia 119 133 1749 2428 18Lithuania 0 0 3 1 4Netherlands 247 216 161 190 129 16104 16283 13794 15726 12231 95Norway 72 ao 62 42 89 1895 2172 1279 1073 948 11Poland 38 51 62 69 82 2000 2408 3261 3700 4000 49Portugal 19 8 18 32 34Russian Fed 147 397 3446 6935Slovakia 135 109 85 1495 1711 1530 18Slovenia 27 26 14 17 17Spain 29 30 1481 1719 57Sweden 17 40 37 42 52 702 2088 1704 1858 2379 45Switzerland 114 82 102 273 312 6047 4942 4335 4340 7345 24UK 8 6 7 1 4 3166 2963 2903 330 1508 377

Vg
SAWNW000
SCIAGES
MADERA ASERRADA
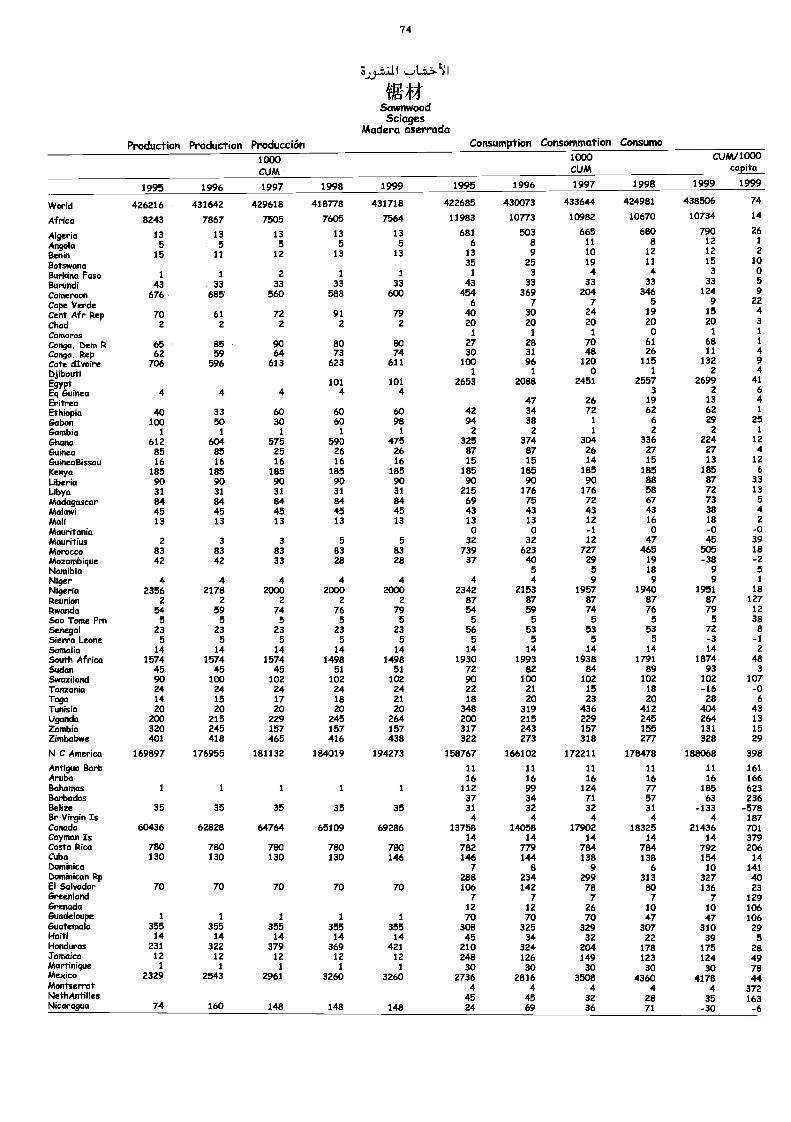
74
ii».1111 I
tg-44SaynnvoodSciages
Madera aserradaProduction Production Producción Consumption Consommation Consumo
1000CUM
1000CUM
CUM/1000capita
1995 1996 1997 1998 1999 1995 1996 1997 1998 1999 1999
World 426216 431642 429618 418778 431718 422685 430073 433644 424981 438506 74
Africa 8243 7867 7505 7605 7564 11983 10773 10982 10670 10734 14
Algeria 13 13 13 13 13 681 503 665 680 790 26
Angola 5 5 5 5 5 6 8 11 8 12 1
Benin 15 11 12 13 13 13 9 10 12 12 2
Botswana 35 25 19 11 15 10
Burkina Faso 1 1 2 1 1 1 3 4 4 3 o
Burundi 43 33 33 33 33 43 33 33 33 33 5
Cameroon 676 685 560 588 600 454 369 204 346 124 9
Cape Verde 6 7 7 5 9 22
Cent Afr Rep 70 61 72 91 79 40 30 24 19 15 4
Chad 2 2 2 2 2 20 20 20 20 20 3
Comoros 1 1 1 0 1 1
Congo, Dem R 65 85 90 80 ao 27 28 70 61 68 1
Congo, Rep 62 59 64 73 74 30 31 48 26 11 4
Cote dIvoire 706 596 613 623 611 100 96 120 115 132 9
Djibouti i 1 o 1 2 4
Egypt 101 101 2653 2088 2451 2557 2699 41
Eq Guinea 4 4 4 4 4 3 2 6
Eritrea 47 26 19 13 4
Ethiopia 40 33 60 60 60 42 34 72 62 62 i
Gabon 100 50 30 60 98 94 38 1 6 29 25
Gambia i 1 1 1 1 2 2 1 2 2 1
Ghana 612 604 575 590 475 325 374 304 336 224 12
Guinea 85 85 25 26 26 87 87 26 27 27 4
GuineaBissau 16 16 16 16 16 15 15 14 15 13 12
Kenya 185 185 185 185 185 185 185 185 185 185 6
Liberia 90 90 90 90 90 90 90 90 88 87 33
Libya 31 31 31 31 31 215 176 176 58 72 13
Madagascar 84 84 84 84 84 69 75 72 67 73 5
Malawi 45 45 45 45 45 43 43 43 43 38 4Mali 13 13 13 13 13 13 13 12 16 18 2
Mauritania 0 o -1 o -o -0Mauritius 2 3 3 5 5 32 32 12 47 45 39Morocco 83 83 83 83 83 739 623 727 465 505 18
Mozambique 42 42 33 28 28 37 40 29 19 -38 -2Namibia 5 5 18 9 5Niger 4 4 4 4 4 4 4 9 9 9 i
Nigeria 2356 2178 2000 2000 2000 2342 2153 1957 1940 1951 18
Reunion 2 2 2 2 2 87 87 87 87 87 127Rwanda 54 59 74 76 79 54 59 74 76 79 12
Sao Tome Prn 5 5 5 5 5 5 5 5 5 5 38Senegal 23 23 23 23 23 56 53 53 53 72 8Sierra Leone 5 5 5 5 5 5 5 5 5 -3 -1Somalia 14 14 14 14 14 14 14 14 14 14 2South Africa 1574 1574 1574 1498 1498 1930 1993 1938 1791 1874 48Sudan 45 45 45 51 51 72 82 84 89 93 3Swaziland 90 100 102 102 102 90 100 102 102 102 107Tanzania 24 24 24 24 24 22 21 15 18 -16 -0Togo 14 15 17 18 21 18 20 23 20 28 6Tunisia 20 20 20 20 20 348 319 436 412 404 43Uganda 200 215 229 245 264 200 215 229 245 264 13Zambia 320 245 157 157 157 317 243 157 155 131 15Zimbabwe 401 418 465 416 438 322 273 318 277 328 29
N C America 169897 176955 181132 184019 194273 158767 166102 172211 178478 188068 398
Antigua Barb 11 11 11 11 11 161Aruba 16 16 16 16 16 166Bahamas 1 1 1 1 1 112 99 124 77 185 623Barbados 37 34 71 57 63 236Belize 35 35 35 35 35 31 32 32 31 -133 -578Br Virgin Is 4 4 4 4 4 187Canada 60436 62828 64764 65109 69286 13758 14058 17902 18325 21436 701Cayman Is 14 14 14 14 14 379Costa Rica 780 780 780 780 780 782 779 784 784 792 206Cuba 130 130 130 130 146 146 144 138 138 154 14Dominica 7 8 9 6 10 141Dominican Rp 288 234 299 313 327 40El Salvador 70 70 70 70 70 106 142 78 80 136 23Greenland 7 7 7 7 7 129Grenada 12 12 26 10 10 106Guadeloupe 1 1 1 1 1 70 70 70 47 47 106Guatemala 355 355 355 355 355 308 325 329 307 310 29Haiti 14 14 14 14 14 45 34 32 22 39 5Honduras 231 322 379 369 421 210 324 204 178 175 28Jamaica 12 12 12 12 12 248 126 149 123 124 49Martinique 1 1 1 1 1 30 30 30 30 30 78Mexico 2329 2543 2961 3260 3260 2736 2816 3508 4360 4178 44Montserrat 4 4 4 4 4 372NethAntilles 45 45 32 28 35 163Nicaragua 74 160 148 148 148 24 69 36 71 -30 -6
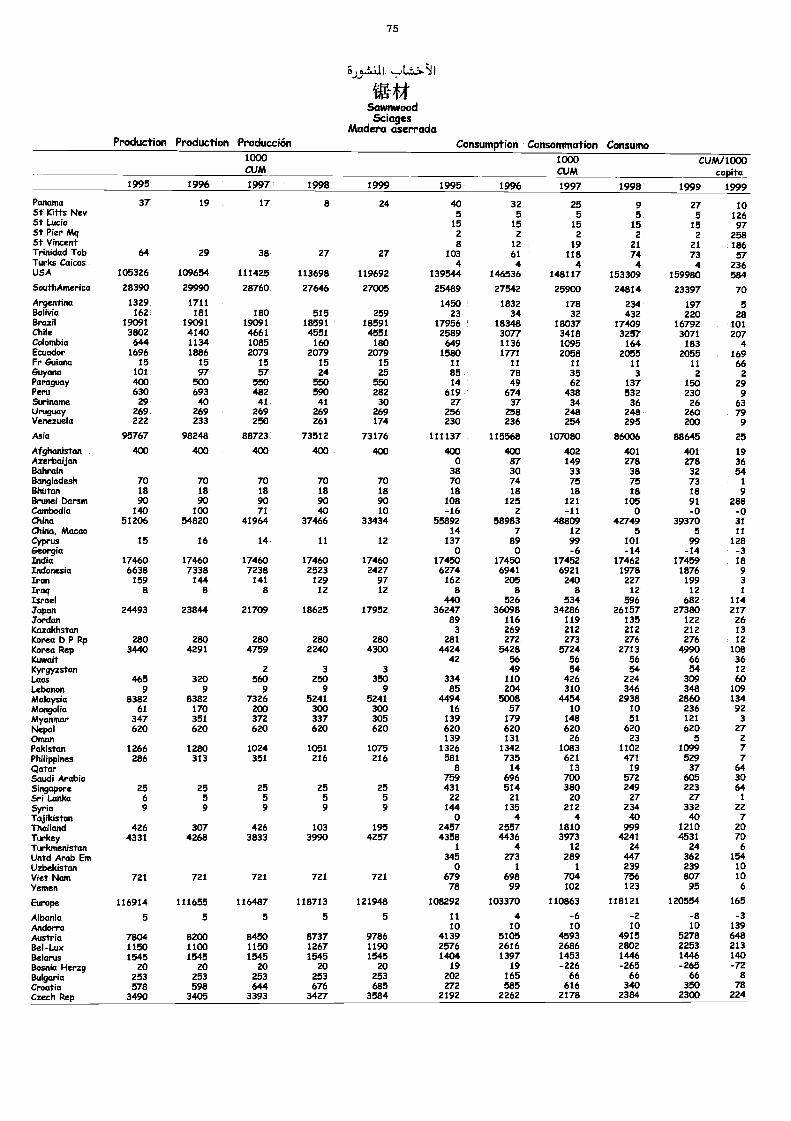
75
WitSavmwoodSciages
Madera aserradaProduction Production Producción Consumption Consommation Consumo
1000CUM
1000CUM
CUM/1000capita
19991995 1996 1997 1998 1999 1995 1996 1997 1998 1999
Panama 37 19 17 8 24 40 32 25 9 27 10St Kitts Nev 5 5 5 5 5 126St Lucia 15 15 15 15 15 97St Pier Mq 2 2 2 2 2 258St Vincent 8 12 19 21 21 186Trinidad Tob 64 29 38 27 27 103 61 118 74 73 57Turks Caicos 4 4 4 4 4 236USA 105326 109654 111425 113698 119692 139544 146536 148117 153309 159980 584SouthAmerica 28390 29990 28760 27646 27005 25489 27542 25900 24814 23397 70Argentina 1329 1711 1450 1832 178 234 197 5Bolivia 162 181 180 515 259 23 34 32 432 220 28Brazil 19091 19091 19091 18591 18591 17956 18348 18037 17409 16792 101Chile 3802 4140 4661 4551 4551 2589 3077 3418 3257 3071 207Colombia 644 1134 1085 160 180 649 1136 1095 164 183 4Ecuador 1696 1886 2079 2079 2079 1580 1771 2058 2055 2055 169Fr Guiana 15 15 15 15 15 11 11 11 11 11 66Guyana 101 97 57 24 25 85 78 35 3 2 2Paraguay 400 500 550 550 550 14 49 62 137 150 29Peru 630 693 482 590 282 619 674 438 532 230 9Suriname 29 40 41 41 30 27 37 34 36 26 63Uruguay 269 269 269 269 269 256 258 248 248 260 79Venezuela 222 233 250 261 174 230 236 254 295 200 9
Asia 95767 98248 88723 73512 73176 111137 115568 107080 86006 88645 25
Afghanistan 400 400 400 400 400 400 400 402 401 401 19Azerbaijan 0 87 149 278 278 36Bahrain 38 30 33 38 32 54Bangladesh 70 70 70 70 70 70 74 75 75 73 1
Bhutan 18 18 18 18 18 18 18 18 18 18 9Brunei Damn 90 90 90 90 90 108 125 121 105 91 288Cambodia 140 100 71 40 10 -16 2 -11 0 -0 -0China 51206 54820 41964 37466 33434 55892 58983 48809 42749 39370 31China, Macao 14 7 12 5 5 11Cyprus 15 16 14 11 12 137 89 99 101 99 128Georgia o o -6 -14 -14 -3India 17460 17460 17460 17460 17460 17450 17450 17452 17462 17459 18Indonesia 6638 7338 7238 2523 2427 6274 6941 6921 1978 1876 9Iran 159 144 141 129 97 162 205 240 227 199 3Iraq a 8 8 12 12 8 s 8 12 12 IIsrael 440 526 534 596 682 114japan 24493 23844 21709 18625 17952 36247 36098 34286 26157 27380 217Tordan 89 116 119 135 122 26Kazakhstan 3 269 212 212 212 13Korea 0 P Rp 280 280 280 280 280 281 272 273 276 276 12Korea RepKuwait
3440 4291 4759 2240 4300 442442
542856
572456
271356 466 13°86
Kyrgyzstan 2 3 3 49 54 54 54 12Laos 465 320 560 250 350 334 110 426 224 309 60Lebanon 9 9 9 9 9 85 204 310 346 348 109Malaysia 8382 8382 7326 5241 5241 4494 5008 4454 2938 2860 134Mongolia 61 170 200 300 300 16 57 10 10 236 92Myanmar 347 351 372 337 305 139 179 148 51 121 3
Nepal 620 620 620 620 620 620 620 620 620 620 27Ornan 139 131 26 23 5 2
Pakistan 1266 1280 1024 1051 1075 1326 1342 1083 1102 1099 7Philippines 286 313 351 216 216 581 735 621 471 529 7Qatar 8 14 13 19 37 64Saudi Arabia 759 696 700 572 605 30Singapore 25 25 25 25 25 431 514 380 249 223 64Sri Lanka 6 5 5 5 5 22 21 20 27 27 1
Syria 9 9 9 9 9 144 135 212 234 332 22Tajikistan 0 4 4 40 40 7Thailand 426 307 426 103 195 2457 2557 1810 999 1210 20Turkey 4331 4268 3833 3990 4257 4358 4436 3973 4241 4531 70Turlumenistan 1 4 12 24 24 6
Untd Arab Em 345 273 289 447 362 154Uzbekistan 0 1 1 239 239 10Viet Nam 721 721 721 721 721 679 698 704 756 807 10Yemen 78 99 102 123 95 6
Europe 116914 111655 116487 118713 121948 108292 103370 110863 118121 120554 165
Albania 5 5 5 5 5 11 4 -6 -2 -8 -3Andorra 10 10 /0 10 10 139Austria 7804 8200 8450 8737 9786 4139 5105 4593 4915 5278 648Bel-Lux 1150 1100 1150 1267 1190 2576 2616 2686 2802 2253 213Belarus 1545 1545 1545 1545 1545 1404 1397 1453 1446 1446 140Bosnia Herzg 20 20 20 20 20 19 19 -226 -265 -265 -72Bulgaria 253 253 253 253 253 202 165 66 66 66 8
Croatia 578 598 644 676 685 272 585 616 340 350 78Czech Rep 3490 3405 3393 3427 3584 2192 2262 2178 2384 2300 224
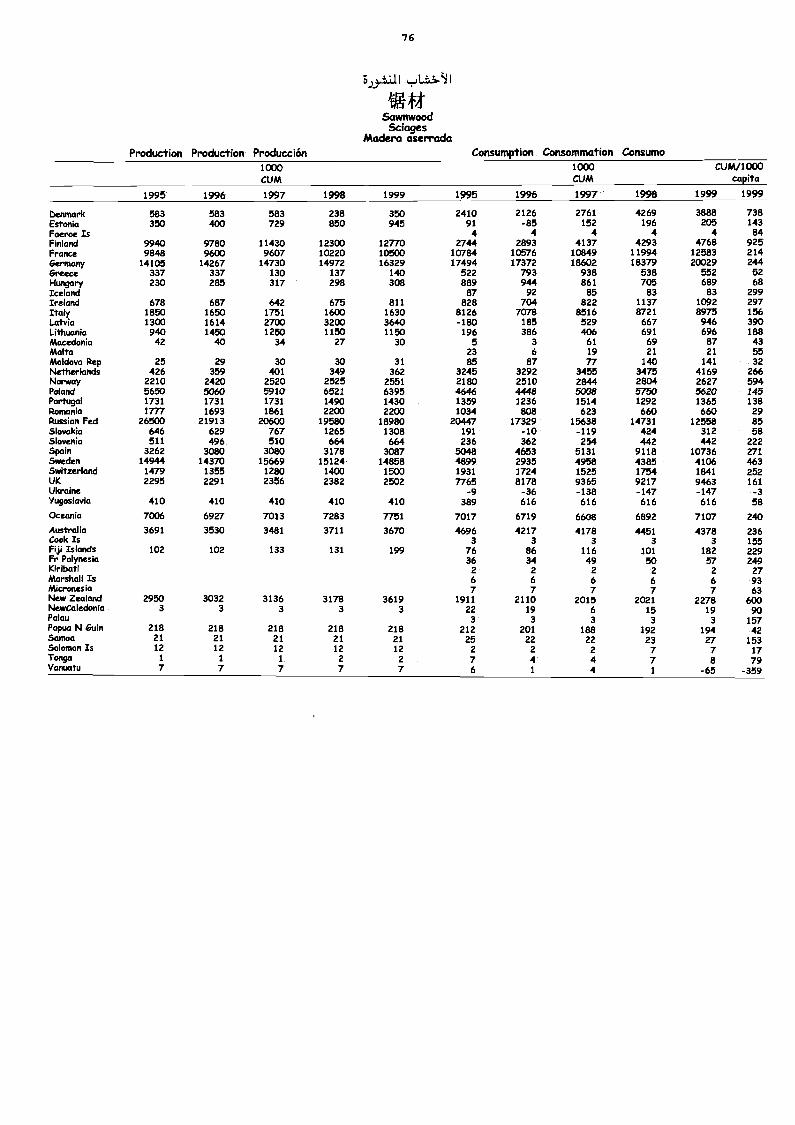
7 6
5j. .1.111
ith#Sawnwood
SciagesMadera aserrada
Production Production Producción Consumption Consornmation Consumo1000CUM
1000CUM
CUW1000capita
1995 1996 1997 1998 1999 1995 1996 1997 1998 1999 1999
berunark 583 583 583 238 350 2410 2126 2761 4269 3888 738Estonia 350 400 729 850 945 91 -85 152 196 205 143Faeroe Is 4 4 4 4 4 84Finland 9940 9780 11430 12300 12770 2744 2893 4137 4293 4768 925France 9848 9600 9607 10220 10500 10784 10576 10849 11994 12583 214Germany 14105 14267 14730 14972 16329 17494 17372 18602 18379 20029 244Greece 337 337 130 137 140 522 793 938 538 552 52Hungary 230 285 317 298 308 889 944 861 705 689 68Iceland 87 92 85 83 83 299Ireland 678 687 642 675 811 828 704 822 1137 1092 297Italy 1850 1650 1751 1600 1630 8126 7078 8516 8721 8975 156Latvia 1300 1614 2700 3200 3640 -180 185 529 667 946 390UthuaMa 940 1450 1250 1150 1150 196 386 406 691 696 188Macedonia 42 40 34 27 30 5 3 61 69 87 43Malta 23 6 19 21 21 55Moldova Rep 25 29 30 30 31 85 87 77 140 141 32NetherkvWs 426 359 401 349 362 3245 3292 3455 3475 4169 266Norway 2210 2420 2520 2525 2551 2180 2510 2844 2804 2627 594Poland 5650 5060 5910 6521 6395 4646 4448 5008 5750 5620 145PmIligM 1731 1731 1731 1490 1430 1359 1236 1514 1292 1365 138RomaMa 1777 1693 1861 2200 2200 1034 808 623 660 660 29RussianFed 26500 21913 20600 19580 18980 20447 17329 15638 14731 12558 55SlovaMa 646 629 767 1265 1308 191 -10 -119 424 312 58Slovenia 511 496 510 664 664 236 362 254 442 442 222SPain 3262 3080 3080 3178 3087 5048 4653 5131 9118 10736 271Sweden 14944 14370 15669 15124 14858 4899 2935 4958 4385 4106 463Switzerland 1479 1355 1280 1400 1500 1931 1724 1525 1754 1841 252UK 2295 2291 2356 2382 2532 7765 8178 9365 9217 9463 161Ukraine -9 -36 -138 -147 -147 -3Yugoslavia 410 410 410 410 410 389 616 616 616 616 58
OceaMa 7006 6927 7013 7283 7751 7017 6719 6608 6892 7107 240Australia 3691 3530 3481 3711 3670 4696 4217 4178 4451 4378 236Cook Is 3 3 3 3 3 155Fiji Islands 102 102 133 131 199 76 86 116 101 182 229FrPolyneMa 36 34 49 50 57 249Kiribati 2 2 2 2 2 27MarshallIs 6 6 6 6 6 93Micmmesia 7 7 7 7 7 63New Zeakmd 2950 3032 3136 3178 3619 1911 2110 2015 2021 2278 600NewCaledoMa 3 3 3 3 3 22 19 6 15 19 90Palau 3 3 3 3 3 157PapuaNemM 218 218 218 218 218 212 201 188 192 194 42Samoa 21 21 21 21 21 25 22 22 23 27 153Solomon's 12 12 12 12 12 2 2 2 7 7 17Tongo 1 1 1 2 2 7 4 4 7 8 79Vanuatu 7 7 7 7 7 6 1 4 1 -65 -359
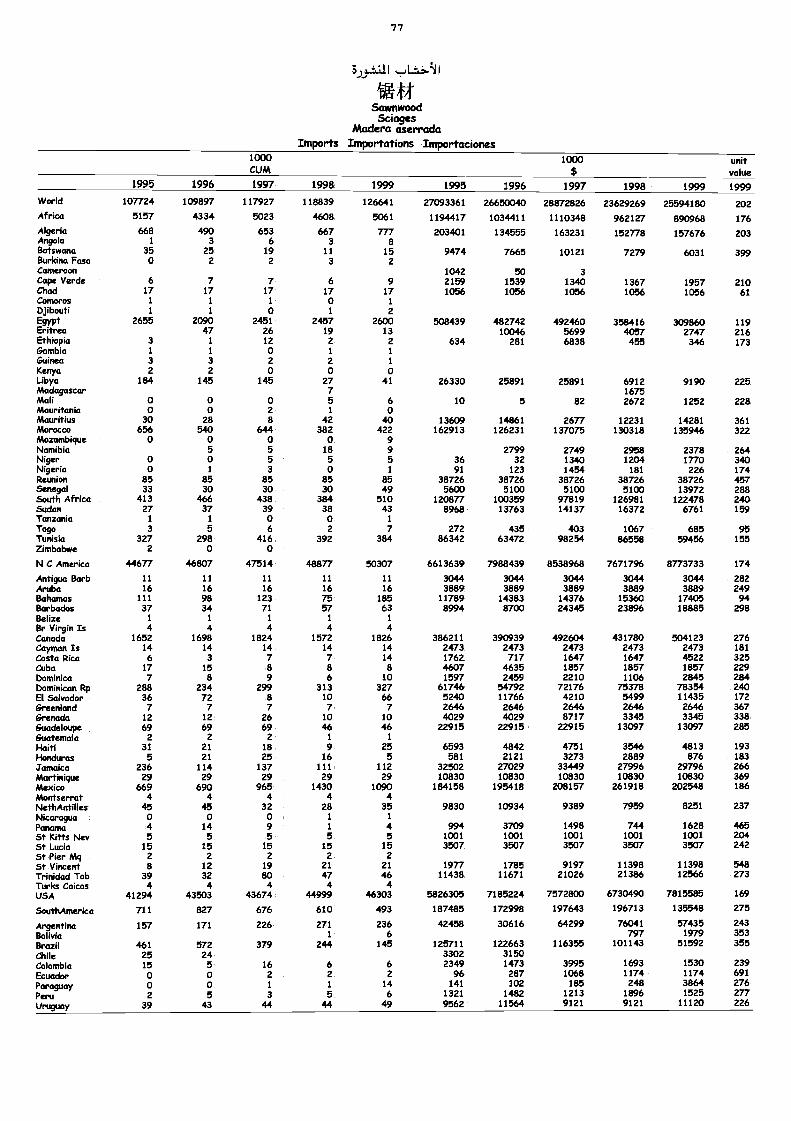
77
j j.t.L1 I 1
SawnwoodSciages
Madera aserradaImports Lnportations Importaciones
1000cUM
1000$
unitvalue
1995 1996 1997 1998 1999 1995 1996 1997 1998 1999 1999World 107724 109897 117927 118839 126641 27093361 26650040 28872826 23629269 25594180 202Africa 5157 4334 5023 4608 5061 1194417 1034411 1110348 962127 890968 176Algeria 668 490 653 667 777 203401 134555 163231 152778 157676 203Angola 1 3 6 3 8Botswana 35 25 19 11 15 9474 7665 10121 7279 6031 399Burkina Faso 0 2 2 3 2Cameroon 1042 50 3Cape Verde 6 7 7 6 9 2159 1539 1340 1367 1957 210Chad 17 17 17 17 17 1056 1056 1056 1056 1056 61Comoros 1 1 1 0 1
Djibouti 1 1 0 1 2Egypt 2655 2090 2451 2457 2600 508439 482742 492460 358416 309860 119Eritrea 47 26 19 13 10046 5699 4057 2747 216Ethiopia 3 1 12 2 2 634 281 6838 455 346 173Gambia 1 1 0 1 1
Guinea 3 3 2 2 1
Kenya 2 2 0 0 0Ubya 184 145 145 27 41 26330 25891 25891 6912 9190 225Madagascar 7 1675Mali o 0 0 5 6 10 5 82 2672 1252 228Mauritania o o 2 1 oMauritius 30 28 8 42 40 13609 14861 2677 12231 14281 361Morocco 656 540 644 382 422 162913 126231 137075 130318 135946 322Mozambique 0 0 0 0 9Namibia 5 5 18 9 2799 2749 2958 2378 264Niger o 0 5 5 5 36 32 1340 1204 1770 340Nigeria 0 1 3 0 1 91 123 1454 181 226 174Reunion 85 85 85 85 85 38726 38726 38726 38726 38726 457Senegal 33 30 30 30 49 5600 5100 5100 5100 13972 288South Africa 413 466 438 384 510 120877 100359 97819 126981 122478 240Sudan 27 37 39 38 43 8968 13763 14137 16372 6761 159Tanzania 1 1 0 0 1
Togo 3 5 6 2 7 272 435 403 1067 685 95Tunisia 327 298 416 392 384 86342 63472 98254 86558 59456 155Zimbabwe 2 0 0
N C America 44677 46807 47514 48877 50307 6613639 7988439 8538968 7671796 8773733 174
Antigua Barb 11 11 11 11 11 3044 3044 3044 3044 3044 282Aruba 16 16 16 16 16 3889 3889 3889 3889 3889 249Bahamas 111 98 123 75 185 11789 14383 14376 15360 17405 94Barbados 37 34 71 57 63 8994 8700 24345 23896 18885 298Belize 1 1 1 1 1
Br Virgin Is 4 4 4 4 4Canada 1652 1698 1824 1572 1826 386211 390939 492604 431780 504123 276Cayman Is 14 14 14 14 14 2473 2473 2473 2473 2473 181Costa Rica 6 3 7 7 14 1762 717 1647 1647 4522 325Cuba 17 15 8 8 8 4607 4635 1857 1857 1857 229Dominica 7 8 9 6 10 1597 2459 2210 1106 2845 284Dominican Rp 288 234 299 313 327 61746 54792 72176 75378 78354 2408 Salvador 36 72 8 10 66 5240 11766 4210 5499 11435 172Greenland 7 7 7 7 7 2646 2646 2646 2646 2646 367Grenada 12 12 26 10 10 4029 4029 8717 3345 3345 338Guadeloupe 69 69 69 46 46 22915 22915 22915 13097 13097 285Guatemala 2 2 2 1 1
Haiti 31 21 18 9 25 6593 4842 4751 3546 4813 193Honduras 5 21 25 16 5 581 2121 3273 2889 876 183Jamaica 236 114 137 111 112 32502 27029 33449 27996 29796 266Martinique 29 29 29 29 29 10830 10830 10830 10830 10830 369Mexico 669 690 965 1430 1090 184158 195418 208157 261918 202548 186Montserrat 4 4 4 4 4NethAntilles 45 45 32 28 35 9830 10934 9389 7959 8251 237Nicaragua 0 0 0 1 1
Panama 4 14 9 1 4 994 3709 1498 744 1628 465St Kitts Nev 5 5 5 5 5 1001 1001 1001 1001 1001 204St Lucia 15 15 15 15 15 3507 3507 3507 3507 3507 242St Pier Mq 2 2 2 2 2St Vincent 8 12 19 21 21 1977 1785 9197 11398 11398 548Trinidad Tob 39 32 so 47 46 11438 11671 21026 21386 12566 273Turks Caicos 4 4 4 4 4USA 41294 43503 43674 44999 46303 5826305 7185224 7572803 6730490 7815585 169
SouthArnerica 711 827 676 610 493 187485 172998 197643 196713 135548 275
ArgentinaBolivia
157 171 226 2711
2366
42458 30616 64299 76041797
571947395 234533
Brazil 461 572 379 244 145 125711 122663 116355 101143 51592 355Chile 25 24 3302 3150Colombia 15 5 16 6 6 2349 1473 3995 1693 1530 239
Ecuador 0 0 2 2 2 96 287 1068 1174 1174 691
Paraguay 0 o 1 1 14 141 102 185 248 3864 276
Peru 2 5 3 5 6 1321 1482 1213 1896 1525 277Uruguay 39 43 44 44 49 9562 11564 9121 9121 11120 226
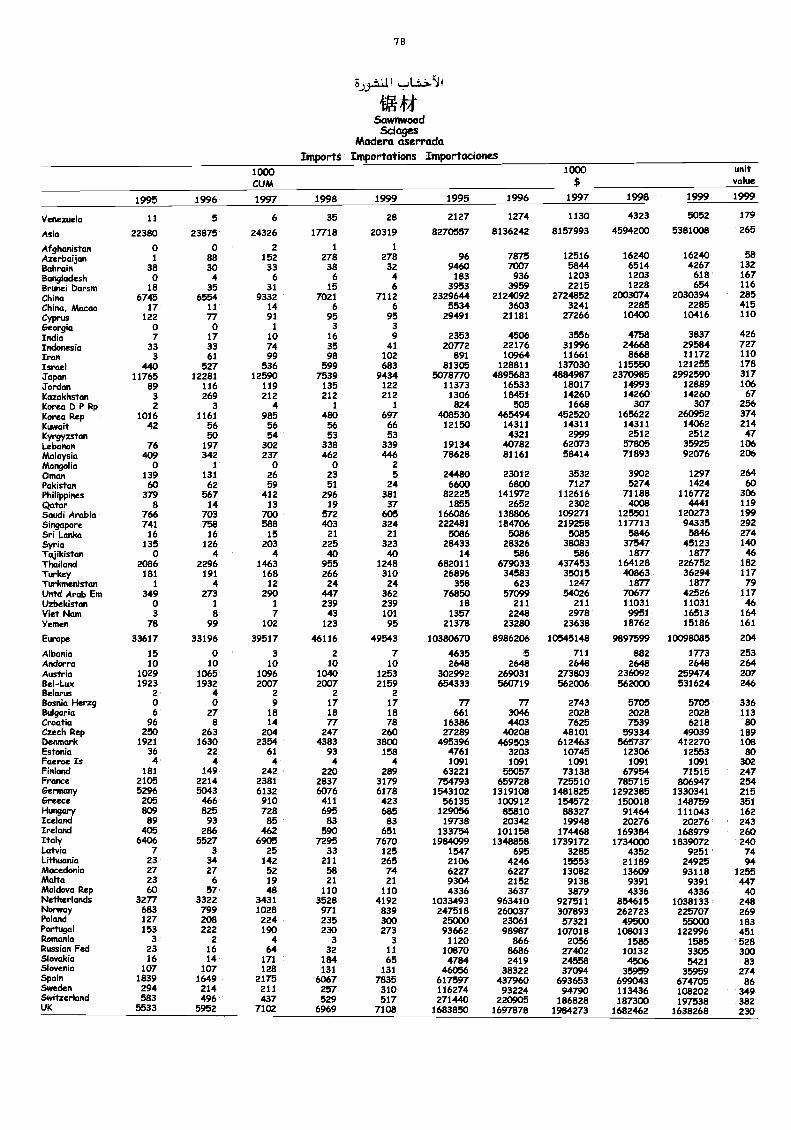
7B
5.026)111 ....11:1:s!li
unitvalue
1999 1999
5052 179
5381008 265
16240 584267 132
618 167654 116
2030394 2852285 415
10416 110
3837 42629584 72711172 110
121255 1782992590 317
12889 10614260 67
307 256260952 374
14062 2142512 47
35925 10692076 206
1297 2641424 60
116772 3064441 119
120273 19994335 292
5846 27445123 140
1877 46226752 182
36294 1171877 79
42526 11711031 4616513 16415186 161
10098085 204
1773 2532648 264
259474 207531624 246
5705 3362028 1136218 80
49039 189412270 108
12553 801091 302
71515 247806947 254
1330341 215148759 351111043 162
20276 243168979 260
1839072 2409251 74
24925 9493118 1255
9391 4474336 40
1038133 248225707 26955000 183
121::g 1:313
3305 3005421 83
Iii9ii 23ii197538 382
1638268 230
ith f4.Sawmvood
SciagesMadera aserrada
Imports Importations Importaciones1000CUM
1000
1995 1996 1997 1998 1999 1995 1996 1997 1998
Venezuela 11 5 6 35 28 2127 1274 1130 4323
Asia 22380 23875 24326 17718 20319 8270557 8136242 8157993 4594200
Afghanistan o 0 2 1 1
Azerbaijan I 88 152 278 278 96 7875 12516 16240Bahrain 38 30 33 38 32 9460 7007 5844 6514Bangladesh o 4 6 6 4 183 936 1203 1203Brunei Darsm 18 35 31 15 6 3953 3959 2215 1228China 6745 6554 9332 7021 7112 2329644 2124092 2724852 2003074China. Macao 17 11 14 6 6 5534 3603 3241 2285Cyprus 122 77 91 95 95 29491 21181 27266 10400Georgia 0 0 1 3 3
India 7 17 10 16 9 2353 4506 3556 4758Indonesia 33 33 74 35 41 20772 22176 31996 24668Lan 3 61 99 98 102 891 10964 11661 8668Israel 440 527 536 599 683 81305 128811 137030 115550Japan 11765 12281 12590 7539 9434 5078770 4895683 4884987 2370985Jordan 89 116 119 135 122 11373 16533 18017 14993Kazakhstan 3 269 212 212 212 1306 18451 14260 14260Kmva CI P Rp 2 3 4 1 1 824 505 1668 307Korea Rep 1016 1161 985 480 697 408530 465494 452520 165622Kuwait 42 56 56 56 66 12150 14311 14311 14311Krgyzstan 50 54 53 53 4321 2999 2512Lebmkm 76 197 302 338 339 19134 40782 62073 57805Malaysia 409 342 237 462 446 78628 81161 58414 71893Mongolia 0 1 0 0 2
Onum 139 131 26 23 5 24480 23012 3532 3902Pakistan 60 62 59 51 24 6600 6800 7127 5274PhilippMes 379 567 412 296 381 82225 141972 112616 71188Qatar 8 14 13 19 37 1855 2652 2302 4008Saudi Arabia 766 703 700 572 605 166086 138806 109271 125501Singapore 741 758 588 403 324 222481 184706 219258 117713Sri Lanka 16 16 15 21 21 5086 5086 5085 5846Syria 135 126 203 225 323 28433 28326 38083 37547Nikistan 0 4 4 40 40 14 586 586 1877Thailand 2086 2296 1443 955 1248 682011 679033 437453 164128Turkey 181 191 168 266 310 26896 34583 35015 40863Turkmenistan 1 4 12 24 24 358 623 1247 1877Lkdd Arab Em 349 273 290 447 362 76850 57099 54026 70677Uzbekistan o 1 1 239 239 18 211 211 11031Viet Nam 3 8 7 43 101 1357 2248 2978 9951Yemen 78 99 102 123 95 21378 23280 23638 18762
Europe 33617 33196 39517 46116 49543 10380670 8986206 10545148 9897599
Albania 15 0 3 2 7 4635 5 711 882Andorra 10 10 10 10 10 2648 2648 2648 2648Austria 1029 1065 1096 1040 1253 302992 269031 273803 236092Bel-Lux 1923 1932 2007 2007 2159 654333 560719 562006 562000Beams 2 4 2 2 2Bosnia Herzg o o 9 17 17 77 77 2743 5705Bulgaria 6 27 18 18 18 661 3046 2028 2028Croatia 96 8 14 77 78 16386 4403 7625 7539Czech Rep 250 263 204 247 260 27289 40208 48101 59334Denmark 1921 1630 2354 4383 3800 495396 469503 612463 565737Estonia 36 22 61 93 158 4761 3203 10745 12306Faeroe Is 4 4 4 4 4 1091 1091 1091 1091Finland 181 149 242 220 289 63221 55057 73138 67954France 2105 2214 2381 2837 3179 754793 659728 725510 785715Germany 5296 5043 6132 6076 6178 1543102 1319108 1481825 1292385Greece 205 466 910 411 423 56135 100912 154572 150018Hungary 809 825 728 695 685 129056 85810 88327 91464Iceland 89 93 85 83 83 19738 20342 19948 20276Ireland 405 286 462 590 651 133754 101158 174468 169384ItMy 6406 5527 6905 7295 7670 1984099 1348858 1739172 1734000Latvia 7 3 25 33 125 1547 695 3285 4352Lithuania 23 34 142 211 265 2106 4246 15553 21189Macedonia 27 27 52 58 74 6227 6227 13082 13609Malta 23 6 19 21 21 9304 2152 9138 9391MoklomzRep 60 57 48 110 110 4336 3637 3879 4336Nedurlands 3277 3322 3431 3528 4192 1033493 963410 927511 854615Norway 683 799 1028 971 839 247518 260037 307893 262723Pokmd 127 208 224 235 300 25000 23061 57321 49500Portugal 153 222 190 230 273 93662 98987 107018 108013Ramada 3 2 4 3 3 1120 866 2056 1585Russian Fed 23 16 64 32 11 10870 8686 27402 10132Slovakia 16 14 171 184 65 4784 2419 24558 4506!Moved° 107 107 128 131 131 46056 38322 37094 35959SpaM 1839 1649 2175 6067 7835 617597 437960 693653 699043Sweden 294 214 211 257 310 116274 93224 94790 113436Switzerland 583 496 437 529 517 271440 220905 186828 187300UK 5533 5952 7102 6969 7108 1683850 1697878 1984273 1682462
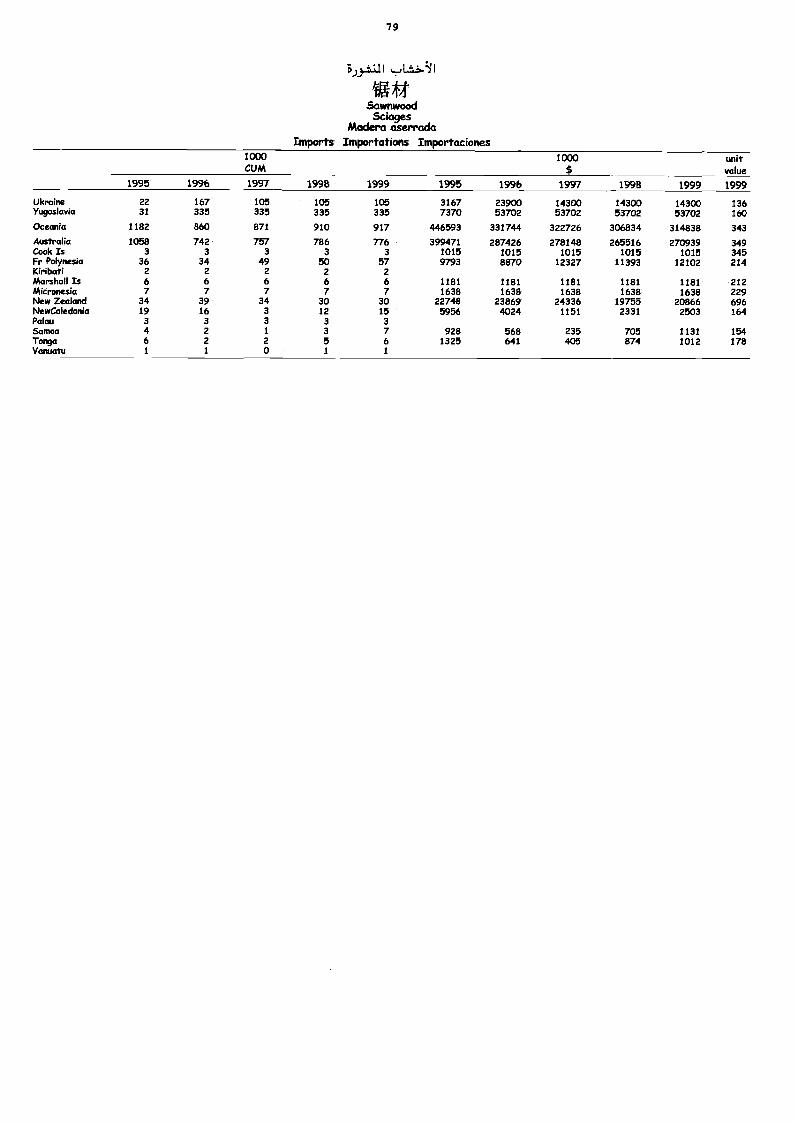
7 9
3 »III 1 I
WM.5avmwood
SciagesMadera aserrada
Imports Importations Importaciones1000CUM
1000$
unitvalue
1995 1996 1997 1998 1999 1995 1996 1997 1998 1999 1999
Ukraine 22 167 105 105 105 3167 23900 14300 14300 14300 136Yugoslavia 31 335 335 335 335 7370 53702 53702 53702 53702 160Oceania 1182 860 871 910 917 446593 331744 322726 306834 314838 343Australia 1058 742 757 786 776 399471 287426 278148 265516 270939 349Cook Is 3 3 3 3 3 1015 1015 1015 1015 1015 345Fr Polynesia 36 34 49 50 57 9793 8870 12327 11393 12102 214Kiribati 2 2 2 2 2Marshall Is 6 6 6 6 6 1181 1181 1181 1181 1181 212Micronesia 7 7 7 7 7 1638 1638 1638 1638 1638 229New Zealand 34 39 34 30 30 22748 23869 24336 19755 20866 696NewCaledania 19 16 3 12 15 5956 4024 1151 2331 2503 164Palau 3 3 3 3 3Samoa 4 2 1 3 7 928 568 235 705 1131 154Tonga 6 2 2 5 6 1325 641 405 874 1012 178Vanuatu 1 1 0 1 1
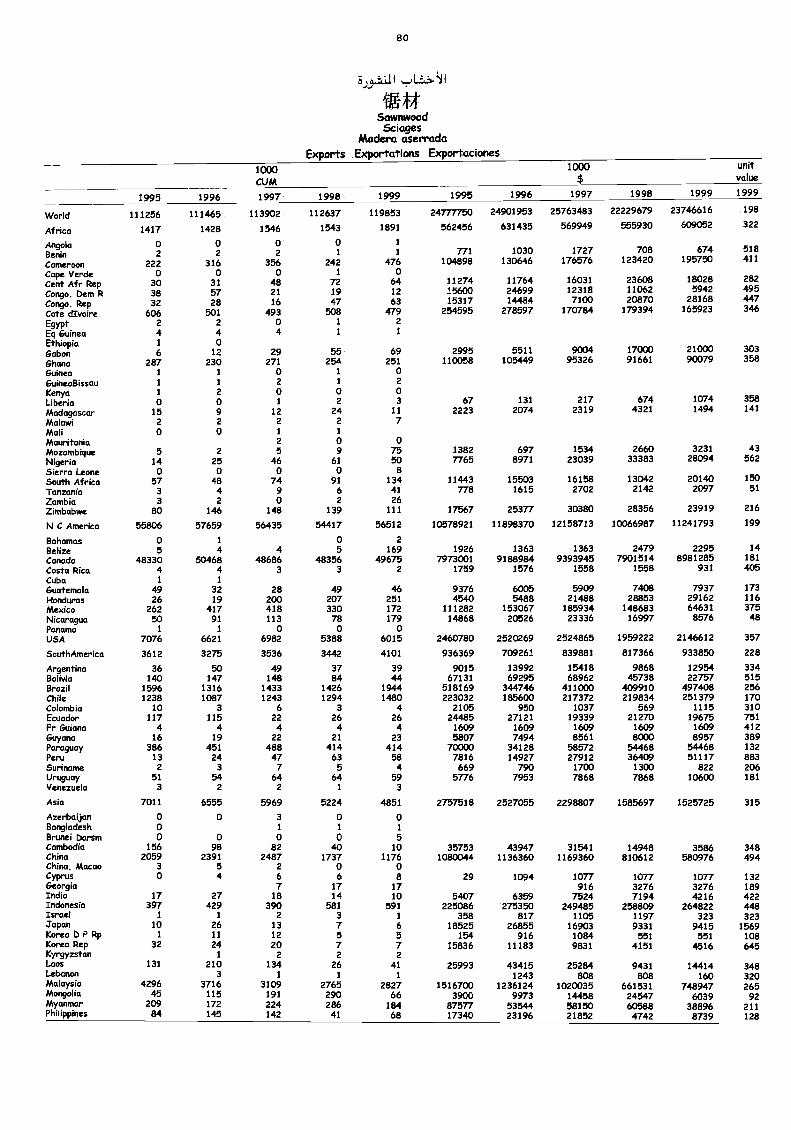
80
5)31111
WhttSawnwood
SciagesMadera aserrada
Exports Exportations Exportaciones1000cum1997 1998 1999 1995 1996
1000
1997 1998 1999
vuanli:e
19991995 1996
World 111256 111465 113902 112637 119853 24777750 24901953 25763483 22229679 23746616 198
Africa 1417 1428 1546 1543 1891 562456 631435 569949 555930 609052 322
Angola o o o o 1
Benin 2 z 2 1 1 771 1030 1727 708 674 518
Cameroon 222 316 356 242 476 104898 130646 176576 123420 195750 411
Cape Verde o o o 1 oCent Afr Rep 30 31 48 72 64 11274 11764 16031 23608 18028 282
Congo, Oem R 38 57 21 19 12 15600 24699 12318 11062 5942 495
Congo, Rep 32 28 16 47 63 15317 14484 7100 20870 28168 447
Cote dIvoire 606 501 493 508 479 254595 278597 1707M 179394 165923 346
Egypt 2 2 0 1 2
Eq Guinea 4 4 4 1 1
Ethiopia 1 oGabon 6 12 29 55 69 2995 5511 9004 17000 21000 303
Ghana 287 230 271 254 251 110058 105449 95326 91661 90079 358
Guinea 1 1 0 1 0GuineaBissau 1 1 2 1 2
Kenya 1 2 0 0 0Liberia 0 o 1 2 3 67 131 217 674 1074 358
Madagascar 15 9 12 24 11 2223 2074 2319 4321 1494 141
Malawi 2 2 2 2 7Mali 0 o 1 1
Mauritania 2 o oMozambique 5 2 5 9 75 1382 697 1534 2660 3231 43
Nigeria 14 25 46 61 50 7765 8971 23039 33383 28094 562
Sierra Leone 0 0 o o 8South Africa 57 48 74 91 134 11443 15503 16158 13042 20140 150
Tanzania 3 4 9 6 41 778 1615 2702 2142 2097 51
Zambia 3 2 o 2 26Zimbabwe 80 146 148 139 111 17567 25377 30380 28356 23919 216
N C America 55806 57659 56435 54417 56512 10578921 11898370 12158713 10066987 11241793 199
Bahamas 0 1 0 2
Belize 5 4 4 5 169 1926 1363 1363 2479 2295 14
Canada 48330 50468 48686 48356 49675 7973001 9188984 9393945 7901514 8981285 181
Costa Rica 4 4 3 3 2 1759 1576 1558 1558 931 405Cuba 1 1
Guatemala 49 32 28 49 46 9376 6005 5909 7408 7937 173Honduras 26 19 200 207 251 4540 5488 21488 28853 29162 116Mexico 262 417 418 330 172 111282 153067 185934 148683 64631 375Nicaragua 50 91 113 78 179 14868 20526 23336 16997 8576 48Panama 1 / o o oUSA 7076 6621 6982 5388 6015 2460780 2520269 2524865 1959222 2146612 357
SouthAmerica 3612 3275 3536 3442 4101 936369 709261 839881 817366 933850 228
Argentina 36 50 49 37 39 9015 13992 15418 9868 12954 334Bolivia 140 147 148 84 44 67131 69295 68962 45738 22757 515Brazil 1596 1316 1433 1426 1944 518169 344746 411000 409910 497408 256Chile 1238 1087 1243 1294 1480 223032 185600 217372 219834 251379 170Colombia 10 3 6 3 4 2105 950 1037 569 1115 310Ecuador 117 115 22 26 26 24485 27121 19339 21270 19675 751Fr Guiana 4 4 4 4 4 1609 1609 1609 1609 1609 412Guyana 16 19 22 21 23 5807 7494 8561 8000 8957 389Paraguay 386 451 488 414 414 70000 34128 58572 54468 54468 132Peru 13 24 47 63 58 7816 14927 27912 36409 51117 883Suriname 2 3 7 5 4 669 790 1700 1300 822 206Uruguay 51 54 64 64 59 5776 7953 7868 7868 10600 181Venezuela 3 2 2 1 3
Asia 7011 6555 5969 5224 4851 2757518 2527055 2298807 1585697 1525725 315
Azerbaijan 0 o 3 0 0Bangladesh 0 1 1 1
Brunei 0arsm o o o 0 5Cambodia 156 98 82 40 10 35753 43947 31541 14948 3586 348China 2059 2391 2487 1737 1176 1080044 1136360 1169360 810612 580976 494China, Macao 3 5 2 0 oCyprus 0 4 6 6 8 29 1094 1077 1077 1077 132Georgia 7 17 17 916 3276 3276 189India 17 27 18 14 10 5407 6359 7524 7194 4216 422Indonesia 397 429 390 581 591 225086 275350 249485 258809 264822 448IsraelJapan
1
101
262
1337
1
6358
18525817
268551105
1690311979331 3294135 3152693
Korea b P Rp 1 11 12 5 5 154 916 1084 551 551 108Korea Rep 32 24 20 7 7 15836 11183 9831 4151 4516 645Kyrgyzstan 1 2 2 2Laos 131 210 134 26 41 25993 43415 25284 9431 14414 348Lebanon 3 1 1 1 1243 808 808 160 320Malaysia 4296 3716 3109 2765 2827 1516700 1236124 1020035 661531 748947 265Mongolia 45 115 191 290 66 3900 9973 14458 24547 6039 92Myanmar 209 172 224 286 184 87577 53544 58150 60588 38896 211Philippines 84 145 142 41 68 17340 23196 21852 4742 8739 128
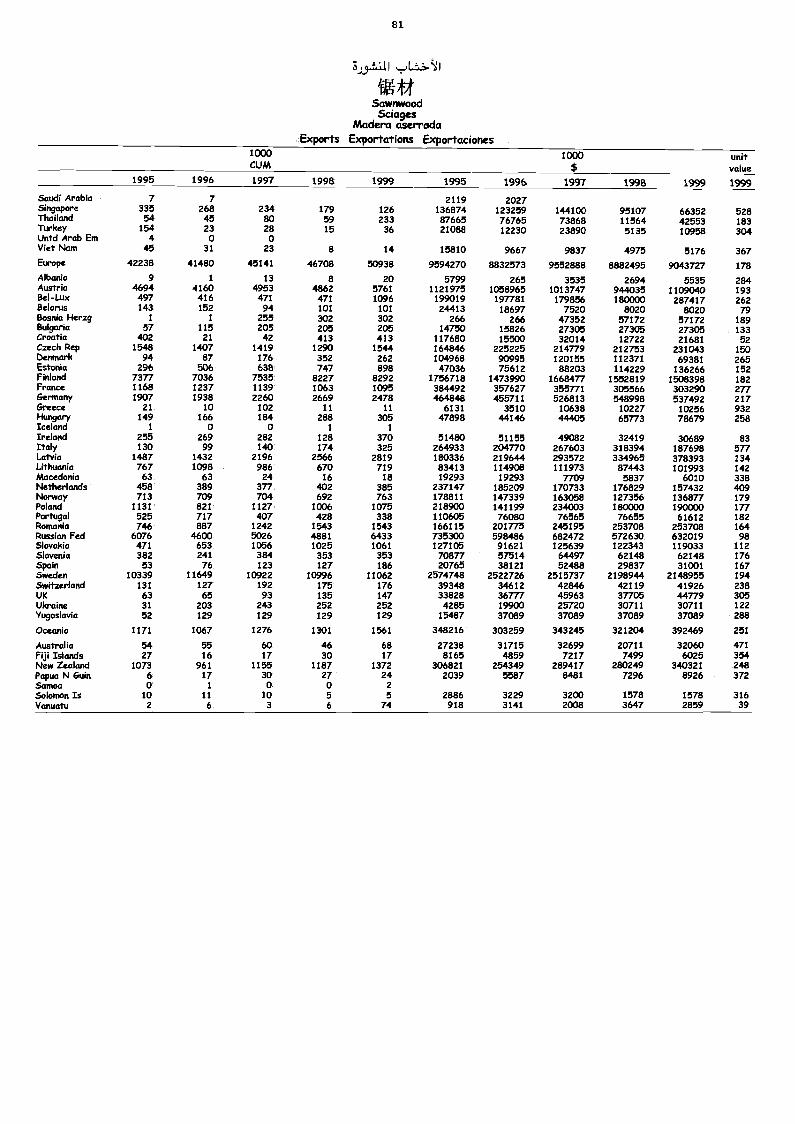
81
5»,±,111
SawnwoodSciages
Madera aserradaExports Exportations Exportaciones
1000cuM
1000 unitvalue
1995 1996 1997 1998 1999 1995 1996 1997 1998 1999 1999
Saudí Arabia 7 7 2119 2027Singapcme 335 268 234 179 126 136874 123259 144100 95107 66352 528Thailand 54 45 80 59 233 87665 76765 73868 11564 42553 183Turkey 154 23 28 15 36 21088 12230 23890 5135 10958 304Untd Arab Em 4 0 0Viet Nam 45 31 23 8 14 15810 9667 9837 4975 5176 367Europe 42238 41480 45141 46708 50938 9594270 8832573 9552888 8882495 9043727 178Albania 9 1 13 8 20 5799 265 3535 2694 5535 284Austria 4694 4160 4953 4862 5761 1121975 1058965 1013747 944035 1109040 193Bel-Lux 497 416 471 471 1096 199019 197781 179856 180000 287417 262Bekmus 143 152 94 101 101 24413 18697 7520 8020 8020 79Bosnia Herzg 1 1 255 302 302 266 266 47352 57172 57172 189Bulgaria 57 115 205 205 205 14750 15826 27305 27305 27305 133Croatia 402 21 42 413 413 117680 15500 32014 12722 21681 52Czech Rep 1548 1407 1419 1290 1544 164846 225225 214779 212753 231043 150Demnark 94 87 176 352 262 104968 90995 120155 112371 69381 265Estonio 296 506 638 747 898 47036 75612 88203 114229 136266 152Finland 7377 7036 7535 8227 8292 1756718 1473990 1668477 1552819 1508398 182France 1168 1237 1139 1063 1095 384492 357627 355771 305566 303290 277Germany 1907 1938 2260 2669 2478 464848 455711 526813 548998 537492 217Greece 21 10 102 11 11 6131 3510 10638 10227 10256 932Hungary 149 166 184 288 305 47898 44146 44405 65773 78679 258Iceland 1 0 0 1 1
Imdand 255 269 282 128 370 51480 51155 49082 32419 30689 83Italy 130 99 140 174 325 264933 204770 267603 318394 187698 577Latvia 1487 1432 2196 2566 2819 180336 219644 293572 334965 378393 134Lfthuania 767 1098 986 670 719 83413 114908 111973 87443 101993 142Macedonia 63 63 24 16 18 19293 19293 7709 5837 6010 338Netherlands 458 389 377 402 385 237147 185269 170733 176829 157432 409Norway 713 709 704 692 763 178811 147339 163058 127356 136877 179Pokmd 1131 821 1127 1006 1075 218900 141199 234003 180000 190000 177Portugal 525 717 407 428 338 110605 76080 76565 76655 61612 182RomaMa 746 887 1242 1543 1543 166115 201775 245195 253708 253708 164Russian Fed 6076 4600 9326 4881 6433 735300 598486 682472 572630 632019 98Skwakia 471 653 1056 1025 1061 127105 91621 125639 122343 119033 112Skwerlia 382 241 384 353 353 70877 57514 64497 62148 62148 1765Pain 53 76 123 127 186 20765 38121 52488 29837 31001 167Sweden 10339 11649 10922 10996 11062 2574748 2522726 2515737 2198944 2148955 194SwitzeHand 131 127 192 175 176 39348 34612 42846 42119 41926 238UK 63 65 93 135 147 33828 36777 45963 37705 44779 305Womirm 31 203 243 252 252 4285 19900 25720 30711 30711 122Yugoslavia 52 129 129 129 129 15487 37089 37089 37089 37089 288
CteaMa 1171 1067 1276 1301 1561 348216 303259 343245 321204 392469 251
Australia 54 55 60 46 68 27238 31715 32699 20711 32060 471FijiIskmds 27 16 17 30 17 8165 4859 7217 7499 6025 354Ntw Zealand 1073 961 1155 1187 1372 306821 254349 289417 280249 340321 248PapaNGuM 6 17 30 27 24 2039 5587 8481 7296 8926 372Samoa 0 1 0 0 2SolopmnIs 10 11 10 5 5 2886 3229 3200 1578 1578 316Vanuatu 2 6 3 6 74 918 3141 2008 3647 2859 39
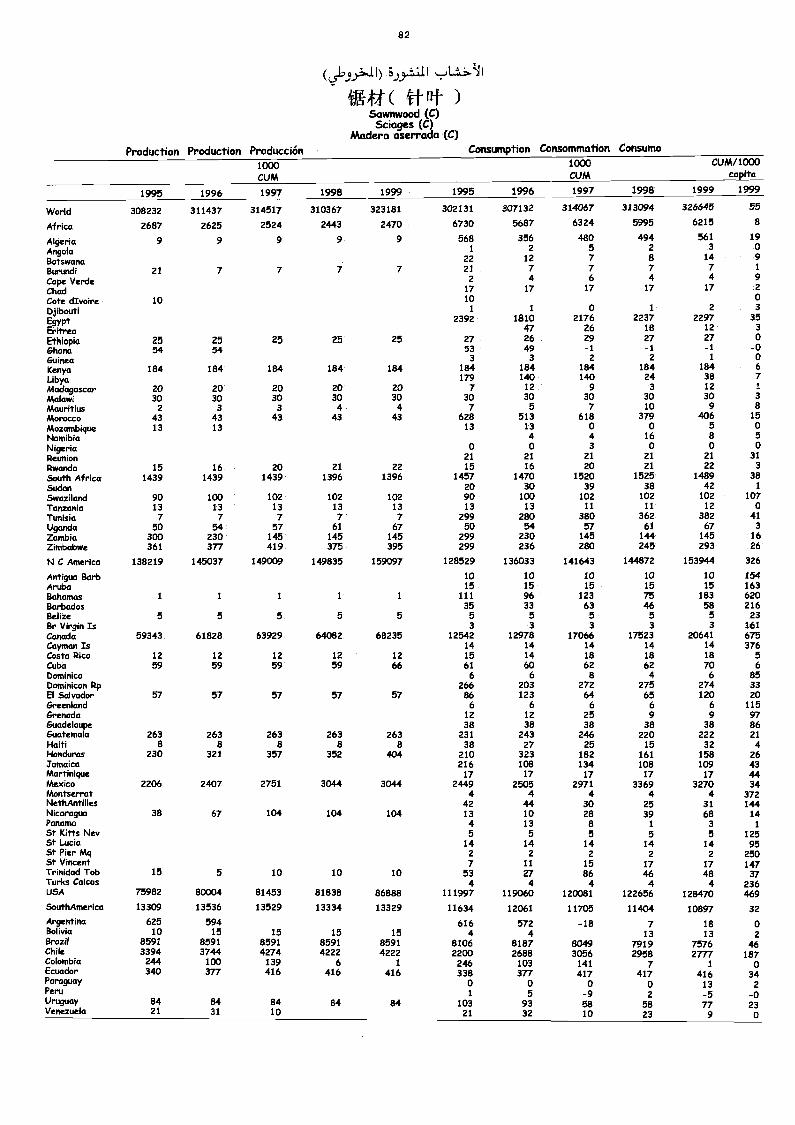
82
(»).".4.1 I) L I L...,121.;)11
WV. ( Fit )Savmwood (C)Sciages (C)
Madera aserrada (C)Production Production Producción Consutnption Consomtnation Consumo
1000CUM
1000CUM
CUM/1000capita
1995 1996 1997 1998 1999 1995 1996 1997 1998 1999 1999
World 308232 311437 314517 310367 323181 302131 307132 314067 313094 326645 55
Africa 2687 2625 2524 2443 2470 6730 5687 6324 5995 6215 8
Algeria 9 9 9 9 9 568 356 480 494 561 19
Angola 1 2 5 2 3 0
Botswana 22 12 7 8 14 9
Burundi 21 7 7 7 7 21 7 7 7 7 1
Cape Verde 2 4 6 4 4 9
Chad 17 17 17 17 17 2
Cote dIvoire 10 10 0
Djibouti 1 1 0 1 2 3
Egypt 2392 1810 2176 2237 2297 35
Eritrea 47 26 18 12 3
Ethiopia 25 25 25 25 25 27 26 29 27 27 o
Ghana 54 54 53 49 -1 -1 -1 -oGuinea 3 3 2 2 1 0Kenya 184 184 184 184 184 184 184 184 184 184 6
Libya 179 140 140 24 38 7Madagascar 20 20 20 20 20 7 12 9 3 12
Malawi 30 30 30 30 30 30 30 30 30 30 3
Mauritius 2 3 3 4 4 7 5 7 10 9 8Morocco 43 43 43 43 43 628 513 618 379 406 15
Mozambique 13 13 13 13 0 0 5 0NamibiaNigeria o
40
43
160
80
5o
Reunion 21 21 21 21 21 31
Rwanda 15 16 20 21 22 15 16 20 21 22 3
South Africa 1439 1439 1439 1396 1396 1457 1470 1520 1525 1489 38Sudan 20 30 39 38 42 1
Swaziland 90 100 102 102 102 90 100 102 102 102 107Tanzania 13 13 13 13 13 13 13 11 11 12 0Tunisia 7 7 7 7 7 299 280 380 362 382 41Uganda 50 54 57 61 67 50 54 57 61 67 3Zambia 300 230 145 145 145 299 230 145 144 145 16Zimbabwe 361 377 419 375 395 299 236 280 245 293 26
N C America 138219 145037 149009 149835 159097 128529 136033 141643 144872 153944 326
Antigua Barb 10 10 10 10 10 154Aruba 15 15 15 15 15 163Bahamas 1 1 1 1 1 111 96 123 75 183 620Barbados 35 33 63 46 58 216Belize 5 5 5 5 5 5 5 5 5 5 23Br Virgin IsCanadaCaytnan Is
59343 61828 63929 64082 682353
1254214
312978
14
317066
14
317523
1431206414 616i
Costa Rica 12 12 12 12 12 15 14 18 18 18 5Cuba 59 59 59 59 66 61 60 62 62 70 6Dominica 6 6 8 4 6 85Dominican Itp 266 203 272 275 274 33El Salvador 57 57 57 57 57 86 123 64 65 120 20Greenland 6 6 6 6 6 115Grenada 12 12 25 9 9 97Guadeloupe 38 38 38 38 38 86Guatemala 263 263 263 263 263 231 243 246 220 222 21Haiti 8 8 8 8 8 38 27 25 15 32 4Honduras 230 321 357 352 404 210 323 182 161 158 26Jamaica 216 108 134 108 109 43Martinique 17 17 17 17 17 44Mexico 2206 2407 2751 3044 3044 2449 2505 2971 3369 3270 34Montserrat 4 4 4 4 4 372NethAntilles 42 44 30 25 31 144Nicaragua 38 67 104 104 104 13 10 28 39 68 14Panama 4 13 8 1 3 1St Kitts Nev 5 5 5 5 5 125St Lucia 14 14 14 14 14 95St Pier Mq 2 2 2 2 2 250St Vincent 7 11 15 17 17 147Trinidad Tob 15 5 10 10 10 53 27 86 46 48 37Turks Calcos 4 4 4 4 4 236USA 75982 80004 81453 81838 86888 111997 119060 120081 122656 128470 469SouthAmerica 13309 13536 13529 13334 13329 11634 12061 11705 11404 10897 32
Argentina 625 594 616 572 -18 7 18 0Bolivia 10 15 15 15 15 4 4 13 13 2Brazil 8592 8591 8591 8591 8591 8106 8187 8049 7919 7576 46Chile 3394 3744 4274 4222 4222 2200 2688 3056 2958 2777 187Colombia 244 100 139 6 1 246 103 141 7 1 0Ecuador 340 377 416 416 416 338 377 417 417 416 34Paraguay 0 o o o 13 2Peru 1 5 -9 2 -5 -0Uruguay 84 84 84 84 84 103 93 58 58 77 23Venezuela 21 31 10 21 32 10 23 9 0
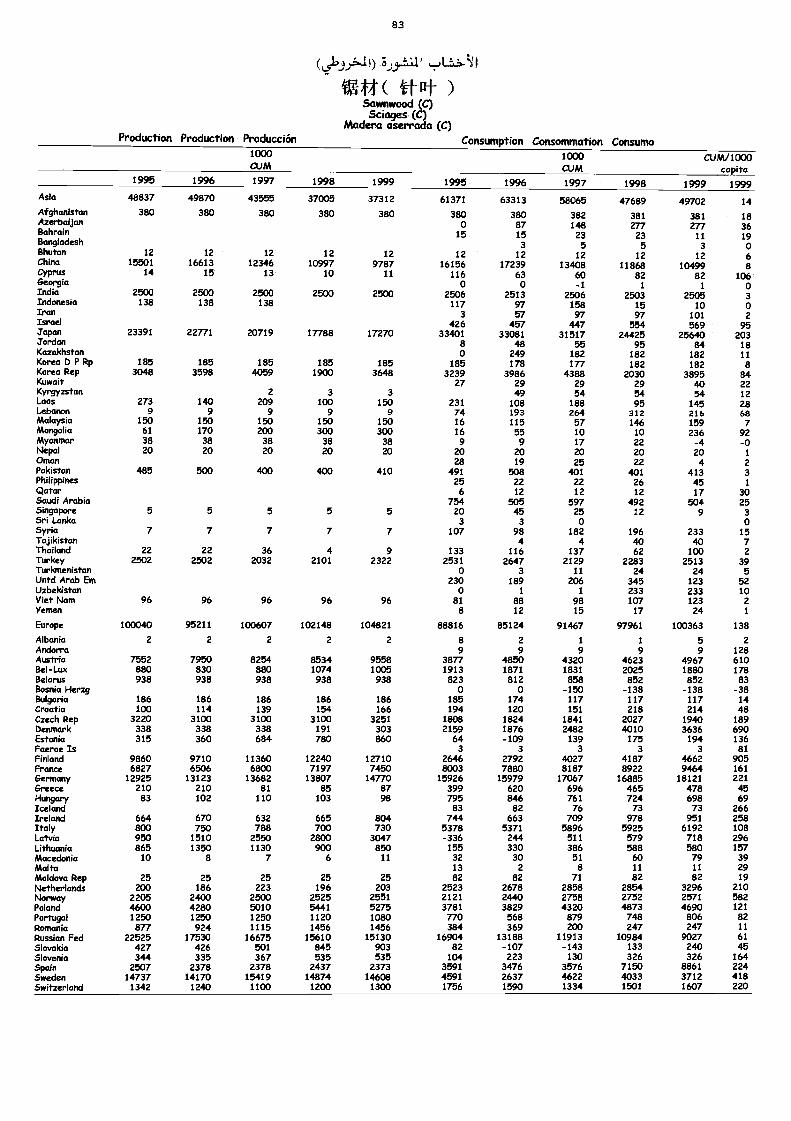
83
I) 3).4;1 f
'tt 1t)Sawnwood (C)&loges (C)
Madera aserrada (C)Production Production Producción Consumption Consommation Consumo
1000CUM
1000CUM
1998
CUM/1000capita
1999 19991995 1996 1997 1998 1999 1995 1996 1997Asia 48837 49870 43555 37005 37312 61371 63313 58065 47689 49702 14Afghanistan 380 380 380 380 380 380 380 382 381 381 18Azerbaijan 0 87 148 277 277 36Bahrain 15 15 23 23 11 19Bangladesh 3 5 5 3 0Bhutan 12 12 12 12 12 12 12 12 12 12 6China 15501 16613 12346 10997 9787 16156 17239 13408 11868 10499 8Cyprus 14 15 13 10 11 116 63 60 82 82 106Georgia 0 0 -1 1 1 0India 2500 2500 2500 2500 2500 2506 2513 2506 2503 2505 3Indonesia 138 138 138 117 97 158 15 10 0Iran 3 57 97 97 101 2Israel 426 457 447 554 569 95yapan 23391 22771 20719 17788 17270 33401 33081 31517 24425 25640 203Jordan 8 48 55 95 84 18Kazakhstan o 249 182 182 182 11Korea b P Rp 185 185 185 185 185 185 178 177 182 182 8Korea Rep 3048 3598 4059 1900 3648 3239 3986 4388 2030 3895 84Kuwait 27 29 29 29 40 22Kyrgyzstan 2 3 3 49 54 54 54 12Laos 273 140 209 100 150 231 108 188 95 145 28Lebanon 9 9 9 9 9 74 193 264 312 216 68Malaysia 150 150 150 150 150 16 115 57 146 159 7Mongolia 61 170 200 300 300 16 55 10 10 236 92Myanmar 38 38 38 38 38 9 9 17 22 -4 -0Nepal 20 20 20 20 20 20 20 20 20 20 1Oman 28 19 25 22 4 2Pakistan 485 500 400 400 410 491 508 401 401 413 3Philippines 25 22 22 26 45 1
Qatar 6 12 12 12 17 30Saudi Arabia 754 505 597 492 504 25Singapore 5 5 5 5 5 20 45 25 12 9 3Sri Lanka 3 3 o 0Syria 7 7 7 7 7 107 98 182 196 233 15Tajikistan 4 4 40 40 7Thailand 22 22 36 4 9 133 116 137 62 100 2Turkey 2502 2502 2032 2101 2322 2531 2647 2129 2283 2513 39Ttrkmenistan 0 3 11 24 24 5Untd Arab Em 230 189 206 345 123 52Uzbekistan 0 1 1 233 233 10Viet Nam 96 96 96 96 96 81 88 98 107 123 2Yemen 8 12 15 17 24 1
Europe 100040 95211 100607 102148 104821 88816 85124 91467 97961 100363 138
Albania 2 2 2 2 2 8 2 1 I 5 2Andorra 9 9 9 9 9 128Austria 7552 7950 8254 8534 9558 3877 4850 4320 4623 4967 610Bel-Lux 880 830 880 1074 1005 1913 1871 1831 2025 1880 178Belarus 938 938 938 938 938 823 812 858 852 852 83Bosnia Herzg 0 0 -150 -138 -138 -38Bulgaria 186 186 186 186 186 185 174 117 117 117 14Croatia 100 114 139 154 166 194 120 151 218 214 48Czech Rep 3220 3100 3100 3100 3251 1808 1824 1841 2027 1940 189Denmark 338 338 338 191 303 2159 1876 2482 4010 3636 690Estonia 315 360 684 780 860 64 -109 139 173 194 136Faeroe Is 3 3 3 3 3 81Finland 9860 9710 11360 12240 12710 2646 2792 4027 4187 4662 905France 6827 6506 6800 7197 7450 8003 7880 8187 8922 9464 161Germany 12925 13123 13682 13807 14770 15926 15979 17067 16885 18121 221Greece 210 210 81 85 87 399 620 696 465 478 45Hungary 83 102 110 103 98 795 846 761 724 698 69Iceland 83 82 76 73 73 266Ireland 664 670 632 665 804 744 663 709 978 951 258Italy 800 750 788 700 730 5378 5371 5896 5925 6192 108Latvia 950 1510 2550 2800 3047 -336 244 511 579 718 296Lithuania 865 1350 1130 900 850 155 330 386 588 580 157Macedonia 10 8 7 6 11 32 30 51 60 79 39Malta 13 2 8 11 11 29Moldova Rep 25 25 25 25 25 82 82 71 82 82 19Netherlands 200 186 223 196 203 2523 2678 2858 2854 3296 210Norway 2205 2400 2500 2525 2551 2121 2440 2758 2752 2571 582Poland 4600 4280 5010 5441 5275 3781 3829 4320 4873 4690 121Portugal 1250 1250 1250 1120 1080 770 568 879 748 806 82Romania 877 924 1115 1456 1456 384 369 200 247 247 11Russian Fed 22525 17530 16675 15610 15130 16904 13188 11913 10984 9027 61Slovakia 427 426 501 845 903 82 -107 -143 133 240 45Slovenia 344 335 367 535 535 104 223 130 326 326 164
SPain 2507 2378 2378 2437 2373 3591 3476 3576 7150 8861 224Sweden 14737 14170 15419 14874 14608 4591 2637 4622 4033 3712 418Switzerland 1342 1240 1100 1200 1300 1756 1590 1334 1501 1607 220
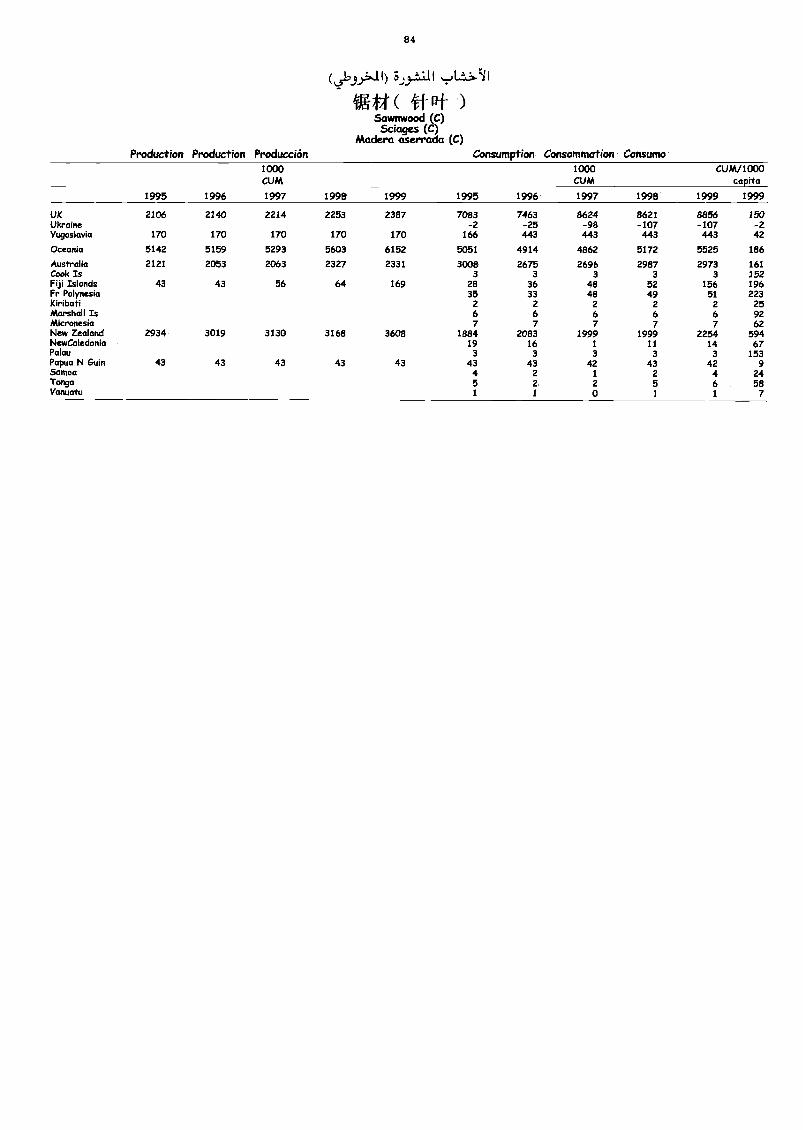
84
5»..t.:111
)Sawnwood (C)
Sciages (C)Madera aserrada (C)
Production Production Producción Consumption Consommation Consumo1000CUM
1000CUM
CUM/1000capita
1995 1996 1997 1998 1999 1995 1996 1997 1998 1999 1999
UK 2106 2140 2214 2253 2387 7083 7463 8624 8621 8856 150Ukraine -2 -25 -98 -107 -107 -2Yugoslavia 170 170 170 170 170 166 443 443 443 443 42
Oceania 5142 5159 5293 5603 6152 5051 4914 4862 5172 5525 186
Australia 2121 2053 2063 2327 2331 3008 2675 2696 2987 2973 161Cook Is 3 3 3 a 3 152Fiji Islands 43 43 56 64 169 28 36 48 52 156 196Fr Polynesia 35 33 48 49 51 223Kiribati 2 a 2 2 2 25Marshall Is 6 6 6 6 6 92Micronesia 7 7 7 7 7 62New Zealand 2934 3019 3130 3168 3608 1884 2083 1999 1999 2254 594NewCaledonia 19 16 I 11 14 67Palau 3 3 3 3 3 153Papua N Ginn 43 43 43 43 43 43 43 42 43 42 9Samoa 4 2 1 2 4 24Tonga 5 2 2 5 6 58Vanuatu 1 1 0 1 1 7
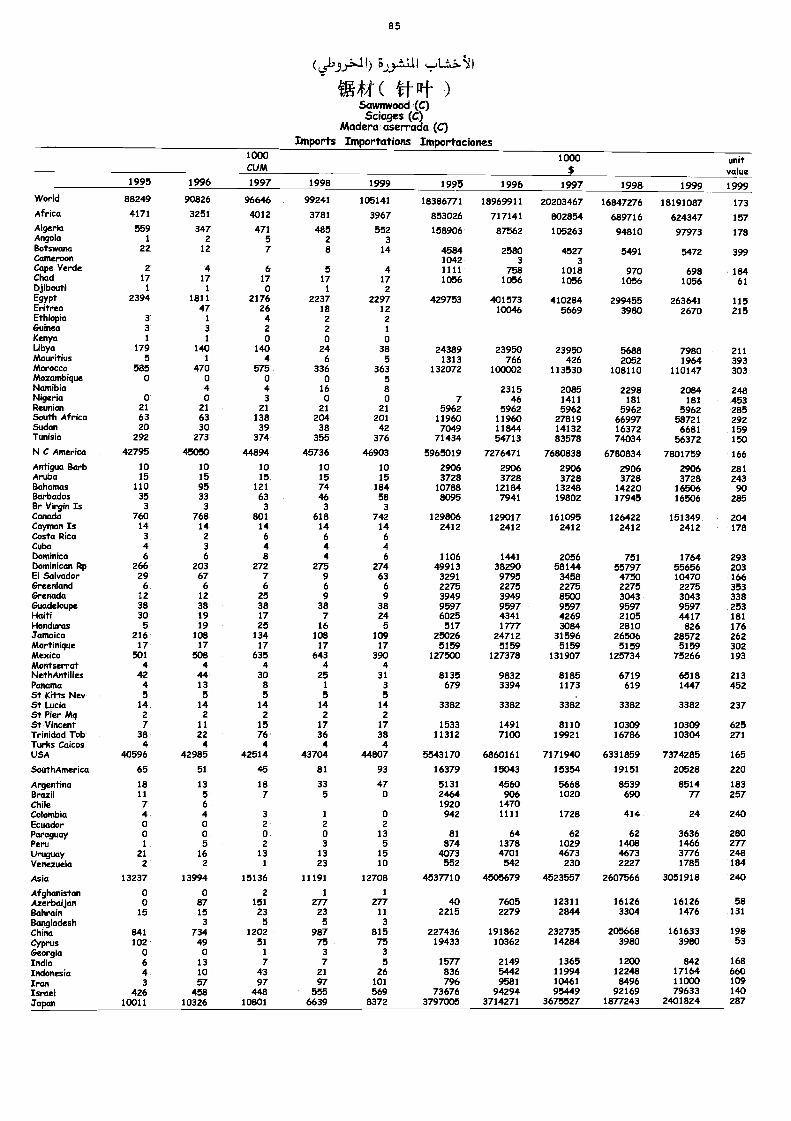
85
4.(Sawnwood (C)Sciages (C)
Madera aserrada (C)Imports Importations Importaciones
1003CUM
1000 unitvalue
1995 1996 1997 1998 1999 1995 1996 1997 1998 1999 1999World 88249 90826 96646 99241 105141 18386771 18969911 20203467 16847276 18191087 173Africa 4171 3251 4012 3781 3967 853026 717141 802854 689716 624347 157Algeria 559 347 471 485 552 158906 87562 105263 94810 97973 178Angola 1 2 5 2 3Botswana 22 12 7 8 14 4584 2580 4527 5491 5472 399Cameroon 1042 3 3Cape Verde 2 4 6 5 4 1111 758 1018 970 698 184Chad 17 17 17 17 17 1056 1056 1056 1056 1056 61Djibouti 1 1 0 1 2Egypt 2394 1811 2176 2237 2297 429753 401573 410284 299455 263641 115Eritrea 47 26 18 12 10046 5669 3980 2670 215Ethiopia 3 1 4 2 2Guinea 3 3 2 2 1
Kenya 1 1 0 o 0Libya 179 140 140 24 38 24389 23950 23950 5688 7980 211Mauritius 5 1 4 6 5 1313 766 426 2052 1964 393Morocco 585 470 575 336 363 132072 100002 113530 108110 110147 303Mozambique 0 0 o o 5Namibia 4 4 16 s 2315 2085 2298 2084 248Nigeria o o 3 0 0 7 46 1411 181 181 453Reunion 21 21 21 21 21 5962 5962 5962 5962 5962 285South Africa 63 63 138 204 201 11960 11960 27819 66997 58721 292Sudan 20 30 39 38 42 7049 11844 14132 16372 6681 159Tunisia 292 273 374 355 376 71434 54713 83578 74034 56372 150N C America 42795 45050 44894 45736 46903 5965019 7276471 7680838 6780834 7801759 166Antigua Barb 10 10 10 10 10 2906 2906 2906 2906 2906 281Aruba 15 15 15 15 15 3728 3728 3728 3728 3728 243Bahamas 110 95 121 74 184 10788 12184 13248 14220 16506 90Barbados 35 33 63 46 58 8095 7941 19802 17945 16506 285Br Virgin Is 3 3 3 3 3Canada 760 768 801 618 742 129806 129017 161095 126422 151349 204Cayman Is 14 14 14 14 14 2412 2412 2412 2412 2412 178Costa Rica 3 2 6 6 6Cuba 4 3 4 4 4Dominica 6 6 8 4 6 1106 1441 2056 751 1764 293Dominican Rp 266 203 272 275 274 49913 38290 58144 55797 55656 203El Salvador 29 67 7 9 63 3291 9795 3458 4750 10470 166Greenland 6 6 6 6 6 2275 2275 2275 2275 2275 353Grenada 12 12 25 9 9 3949 3949 8500 3043 3043 338Guadeloupe 38 38 38 38 38 9597 9597 9597 9597 9597 253Haiti 30 19 17 7 24 6025 4341 4269 2105 4417 181Honduras 5 19 25 16 5 517 1777 3084 2810 826 176Jamaica 216 108 134 108 109 25026 24712 31596 26506 28572 262Martinique 17 17 17 17 17 5159 5159 5159 5159 5159 302Mexico 501 508 635 643 390 127500 127378 131907 125734 75266 193Montserrat 4 4 4 4 4NethAntilles 42 44 30 25 31 8135 9832 8185 6719 6518 213Panama 4 13 8 1 3 679 3394 1173 619 1447 452St Kitts Nev 5 5 5 5 5St Lucia 14 14 14 14 14 3382 3382 3382 3382 3382 237St Pier Mq 2 2 2 2 2St Vincent 7 11 15 17 17 1533 1491 8110 10309 10309 625Trinidad Tob 38 22 76 36 38 11312 7100 19921 16786 10304 271Turks Caicos 4 4 4 4 4USA 40596 42985 42514 43704 44807 5543170 6860161 7171940 6331859 7374285 165
SouthAtnerica 65 51 45 81 93 16379 15043 15354 19151 20528 220
Argentina 18 13 18 33 47 5131 4560 5668 8539 8514 183Brazil 11 5 7 5 0 2464 906 1020 690 77 257Chile 7 6 1920 1470Colombia 4 4 3 1 0 942 1111 1728 414 24 240Ecuador o 0 2 2 2Paraguay 0 0 0 o 13 81 64 62 62 3636 280Peru 1 5 2 3 5 874 1378 1029 1408 1466 277Uruguay 21 16 13 13 15 4073 4701 4673 4673 3776 248Venezuela 2 2 1 23 10 552 542 230 2227 1785 184
Asia 13237 13994 15136 11191 12708 4537710 4505679 4523557 2607566 3051918 240
Afghanis-tan o o 2 1 1
Azerbaijan 0 87 151 277 277 40 7605 12311 16126 16126 58Bahrain 15 15 23 23 11 2215 2279 2844 3304 1476 131Bangladesh 3 5 5 3
China 841 734 1202 987 815 227436 191862 232735 205668 161633 198Cyprus 102 49 51 75 75 19433 10362 14284 3980 3980 53Georgia 0 o 1 3 3
India 6 13 7 7 5 1577 2149 1365 1200 842 168Indonesia 4 10 43 21 26 836 5442 11994 12248 17164 660Iran 3 57 97 97 101 796 9581 10461 8496 11000 109Israel 426 458 448 555 569 73676 94294 95449 92169 79633 140Japan 10011 10326 10801 6639 8372 3797005 3714271 3675527 1877243 2401824 287
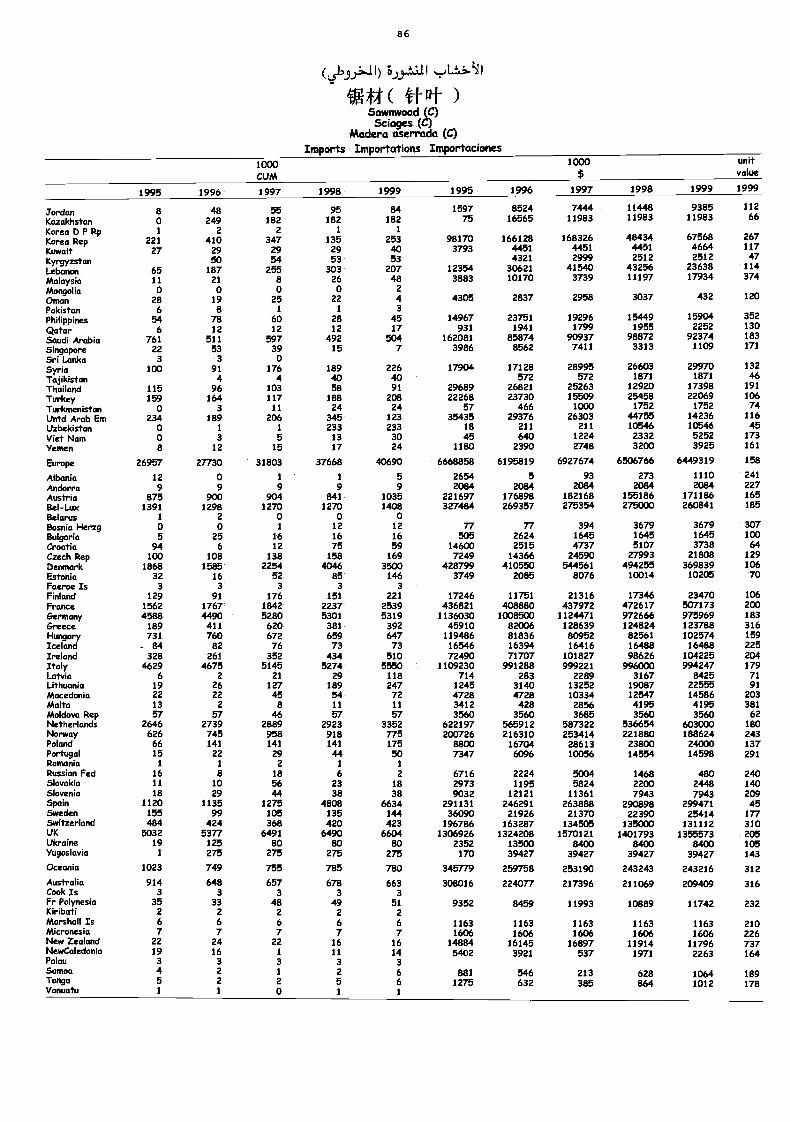
86
I) 3.).g.1111
ig 44( itSawmvood (C)
Sciages (C)Madera aserrada (C)
Imports Importations Importaciones1000CUM
1000 unitvalue
1995 1996 1997 1998 1999 1995 1996 1997 1998 1999 1999
Jordan 8 48 55 95 84 1597 8524 7444 11448 9385 112
Kazakhstan 0 249 182 182 182 75 16565 11983 11983 11983 66
Korea ID P Rp 1 2 2 1 1
Korea Rep 221 410 347 135 253 98170 166128 168326 48434 67568 267
Kuwait 27 29 29 29 40 3793 4451 4451 4451 4664 117
Kyrgyzstan 50 54 53 53 4321 2999 2512 2512 47
Lebanon 65 187 255 303 207 12354 30621 41540 43256 23638 114
Malaysia 11 21 a 26 48 3883 10170 3739 11197 17934 374
Mongolia 0 0 0 0 2
Oman 28 19 25 22 4 4305 2837 2958 3037 432 120
Pakistan 6 8 1 1 3
Philippines 54 78 60 28 45 14967 23751 19296 15449 15904 352
Qatar 6 12 12 12 17 931 1941 1799 1955 2252 130
Saudi Arabia 761 511 597 492 504 162081 85874 90937 98872 92374 183
Singapore 22 53 39 15 7 3986 8562 7411 3313 1109 171
Sri Lanka 3 3 oSyria 100 91 176 189 226 17904 17128 28995 26603 29970 132
Tajikistan 4 4 40 40 572 572 1871 1871 46
Thailand 115 96 103 58 91 29689 26821 25263 12920 17398 191
Turkey 159 164 117 188 208 22268 23730 15509 25458 22069 106
Turkmenistan 0 3 11 24 24 57 466 1000 1752 1752 74Untd Arab Em 234 189 206 345 123 35435 29376 26303 44755 14236 116Uzbekistan o 1 1 233 233 18 211 211 10546 10546 45Viet Nam 0 3 5 13 30 45 640 1224 2332 5252 173Yemen 8 12 15 17 24 1180 2390 2748 3200 3925 161
Europe 26957 27730 31803 37668 40690 6668858 6195819 6927674 6506766 6449319 158
Albania 12 o 1 1 5 2654 5 93 273 1110 241
Andorra 9 9 9 9 9 2084 2084 2084 2084 2084 227Austria 875 900 904 841 1035 221697 176898 182168 155186 171186 165Bel-Lux 1391 1298 1270 1270 1408 327484 269357 275354 275000 260841 185Belarus 1 2 0 0 0Bosnia Herzg 0 o 1 12 12 77 77 394 3679 3679 307Bulgaria 5 25 16 16 16 505 2624 1645 1645 1645 100Croatia 94 6 12 75 59 14600 2515 4737 5107 3738 64Czech Rep 100 108 138 158 169 7249 14366 24590 27993 21808 129Denmark 1868 1585 2254 4046 3500 428799 410550 544561 494255 369839 106Estonia 32 16 52 85 146 3749 2085 8076 10014 10205 70Faeroe Is 3 3 3 3 3Finland 129 91 176 151 221 17246 11751 21316 17346 23470 106France 1562 1767 1842 2237 2539 436821 408880 437972 472617 507173 200Germany 4588 4490 5280 5301 5319 1136030 1008500 1124471 972666 975969 183Greece 189 411 620 381 392 45910 82006 128639 124824 123788 316Hungary 731 760 672 659 647 119486 81836 80952 82561 102574 159Iceland - 84 82 76 73 73 16546 16394 16416 16488 16488 225Ireland 328 261 352 434 510 72490 71707 101827 98626 104225 204Italy 4629 4675 5145 5274 5550 1109230 991288 999221 996000 994247 179Latvia 6 2 21 29 118 714 283 2289 3167 8425 71Lithuania 19 26 127 189 247 1245 3140 13252 19087 22555 91Macedonia 22 22 45 54 72 4728 4728 10334 12547 14586 203Malta 13 2 a 11 11 3412 428 2856 4195 4195 381Moldova Rep 57 57 46 57 57 3560 3560 3685 3560 3560 62Netherlands 2646 2739 2889 2923 3352 622197 565912 587322 536654 603000 180Norway 626 745 958 918 775 200726 216310 253414 221860 168624 243Poland 66 141 141 141 175 8800 16704 28613 23800 24000 137Portugal 15 22 29 44 50 7347 6096 10056 14554 14598 291Romania 1 1 2 1 1
Russian Fed 16 8 18 6 2 6716 2224 5004 1468 480 240Slovakia 11 10 56 23 18 2973 1195 5824 2200 2448 140Slovenia 18 29 44 38 38 9032 12121 11361 7943 7943 209SPain 1120 1135 1275 4808 6634 291131 246291 263888 290898 299471 45Sweden 155 99 105 135 144 36090 21926 21370 22390 25414 177Switzerland 484 424 368 420 423 196786 163287 134505 135000 131112 310UK 5032 5377 6491 6490 6604 1306926 1324208 1570121 1401793 1355573 205Ukraine 19 125 80 80 80 2352 13500 8400 8400 8400 105Yugoslavia 1 275 275 275 275 170 39427 39427 39427 39427 143Oceania 1023 749 755 785 780 345779 259758 253190 243243 243216 312Australia 914 648 657 678 663 308016 224077 217396 211069 209409 316Cook Is 3 3 3 3 3Fr Polynesia 35 33 48 49 51 9352 8459 11993 10889 11742 232Kiribati 2 2 2 2 2Marshall Is 6 6 6 6 6 1163 1163 1163 1163 1163 210Micronesia 7 7 7 7 7 1606 1606 1606 1606 1606 226New Zealand 22 24 22 16 16 14884 16145 16897 11914 11796 737NewCaledonia 19 16 1 11 14 5402 3921 537 1971 2263 164Palau 3 3 3 3 3Samoa 4 2 1 2 6 881 546 213 628 1064 189Tonga 5 2 2 5 6 1275 632 385 864 1012 178Vanuatu 1 1 0 1 1
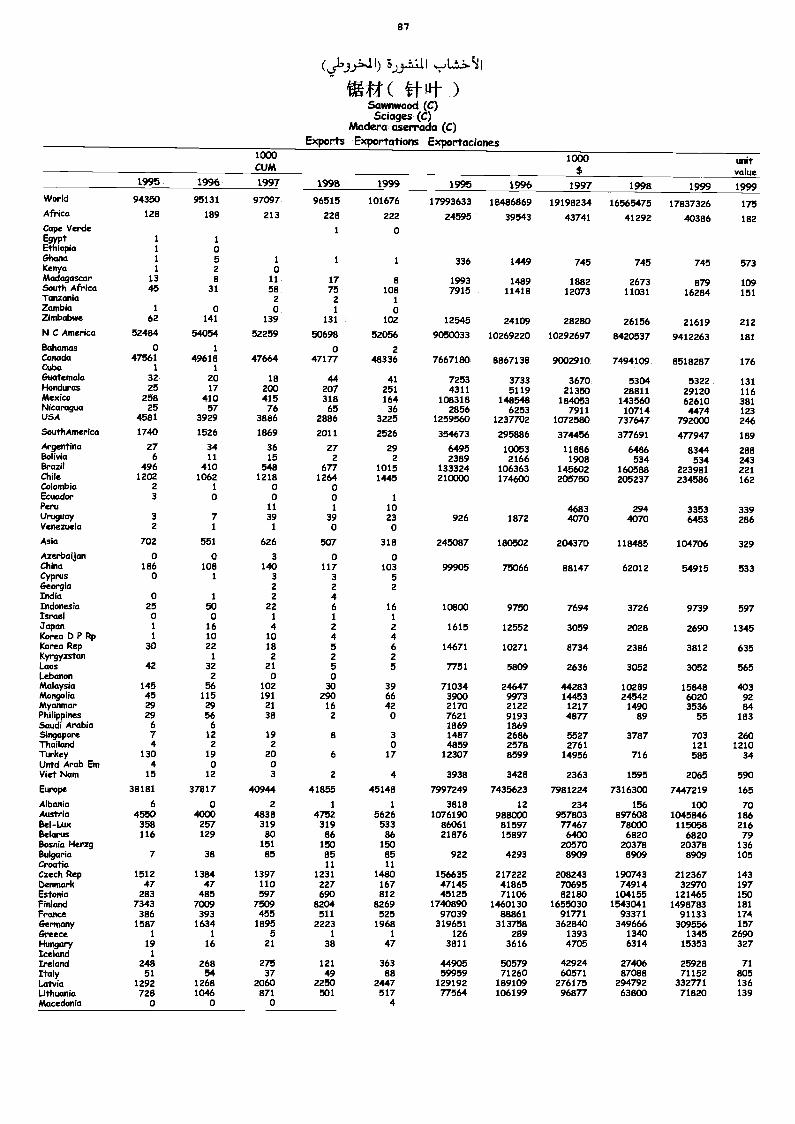
8 7
(46-Lbr ( Fit )
Sawnwaod (C)Sciages (C)
Madera aserrada (C)Exports Exportations Exportaciones
1000CUM
1000$
unitvalue
1995 1996 1997 1998 1999 1995 1996 1997 1998 1999 1999World 94350 95131 97097 96515 101676 17993633 18486869 19198234 16565475 17837326 175Africa 128 189 213 228 222 24595 39543 43741 41292 40386 182Cape Verde 1 0Egypt 1 1
Ethiopia 1 0GhanaKenya
1
152
1
01 1 336 1449 745 745 745 573
Madagascar 13 8 11 17 8 1993 1489 1882 2673 879 109South AfricaTanzania
45 31 582
752
1081
7915 11418 12073 11031 16284 151
Zambia 1 0 0 1 0Zimbabwe 62 141 139 131 102 12545 24109 28280 26156 21619 212N C America 52484 54054 52259 50698 52056 9050033 10269220 10292697 8420537 9412263 181Bahamas 0 I o 2CanadaCuba
475611
496181
47664 47177 48336 7667180 8867138 9002910 7494109 8518287 176
Guatemala 32 20 18 44 41 7253 3733 3670 5304 5322 131Honduras 25 17 200 207 251 4311 5119 21350 28811 29120 116Mexico 258 410 415 318 164 108318 148548 184053 143560 62610 381Nicaragua 25 57 76 65 36 2856 6253 7911 10714 4474 123USA 4581 3929 3886 2886 3225 1259560 1237702 1072580 737647 792000 2465outhAmerica 1740 1526 1869 2011 2526 354673 295886 374456 377691 477947 189Argentina 27 34 36 27 29 6495 10053 11886 6486 8344 288Bolivia 6 11 15 2 2 2389 2166 1908 534 534 243Brazil 496 410 548 677 1015 133324 106363 145602 160588 223981 221Chile 1202 1062 1218 1264 1445 210000 174600 205750 205237 234586 162Colombia 2 1 0 0Ecuador 3 0 0 0 1
Peru 11 1 10 4683 294 3353 339Uruguay 3 7 39 39 23 926 1872 4070 4070 6453 286Venezuela 2 1 1 0 0
Asia 702 551 626 507 318 245087 180502 204370 118485 104706 329Azerbaijan 0 0 3 0 0China 186 108 140 117 103 99905 75066 88147 62012 54925 533Cyprus 0 1 3 3 5Georgia 2 z 2India 0 1 2 4Indonesia 25 50 22 6 16 10800 9750 7694 3726 9739 597Israel 0 0 1 I 1
Japan 1 16 4 2 2 1615 12552 3059 2028 2690 1345Korea to P Ftp 1 10 10 4 4Korea Rep 30 22 18 5 6 14671 10271 8734 2386 3812 635Kyrgyzstan 1 2 2 2Laos 42 32 21 5 5 7751 5809 2636 3052 3052 565Lebanon 2 0 0Malaysia 145 56 102 30 39 71034 24647 44283 10289 15848 403Mongolia 45 115 191 290 66 3900 9973 14453 24542 6020 92Myanmar 29 29 21 16 42 2170 2122 1217 1490 3536 84Philippines 29 56 38 2 0 7621 9193 4877 89 55 183Saudi Arabia 6 6 1869 1869Singapore 7 12 19 8 3 1487 2686 5527 3787 703 260Thailand 4 2 2 0 4859 2578 2761 121 1210Turkey 130 19 20 6 17 12307 8599 14956 716 585 34Untd Arab Em 4 0 0Viet Nam 15 12 3 2 4 3938 3428 2363 1595 2065 590
Europe 38181 37817 40944 41855 45148 7997249 7435623 7981224 7316300 7447219 165
Albania 6 0 2 1 1 3818 12 234 156 100 70Austria 4550 4000 4838 4752 5626 1076190 988000 957803 897608 1045846 186Bel-Lux 358 257 319 319 533 86061 81597 77467 78000 115058 216Belarus 116 129 80 86 86 21876 15897 6400 6820 6820 79Bosnia Herzg 151 150 150 20570 20378 20378 136Bulgaria 7 38 85 85 85 922 4293 8909 8909 8909 105Croatia 11 11Czech Rep 1512 1384 1397 1231 1480 156635 217222 208243 190743 212367 143Denmark 47 47 110 227 167 47145 41865 70695 74914 32970 197Estonia 283 485 597 690 812 45125 71106 82180 104155 121465 150Finland 7343 7009 7509 8204 8269 1740890 1460130 1655030 1543041 1498783 181France 386 393 455 511 525 97039 88861 91771 93371 91133 174Germany 1587 1634 1895 2223 1968 319651 313758 362840 349666 309556 157Greece 1 1 5 1 1 126 289 1393 1340 1345 2690H1.111901"/ 19 16 21 38 47 3811 3616 4705 6314 15353 327Iceland 1
Ireland 248 268 275 121 363 44905 50579 42924 27406 25928 71Italy 51 54 37 49 88 59959 71260 60571 87088 71152 805Latvia 1292 1268 2060 2250 2447 129192 189109 276175 294792 332771 136Lithuania 728 1046 871 501 517 77564 106199 96877 63800 71820 139Macedonia 0 0 0 4
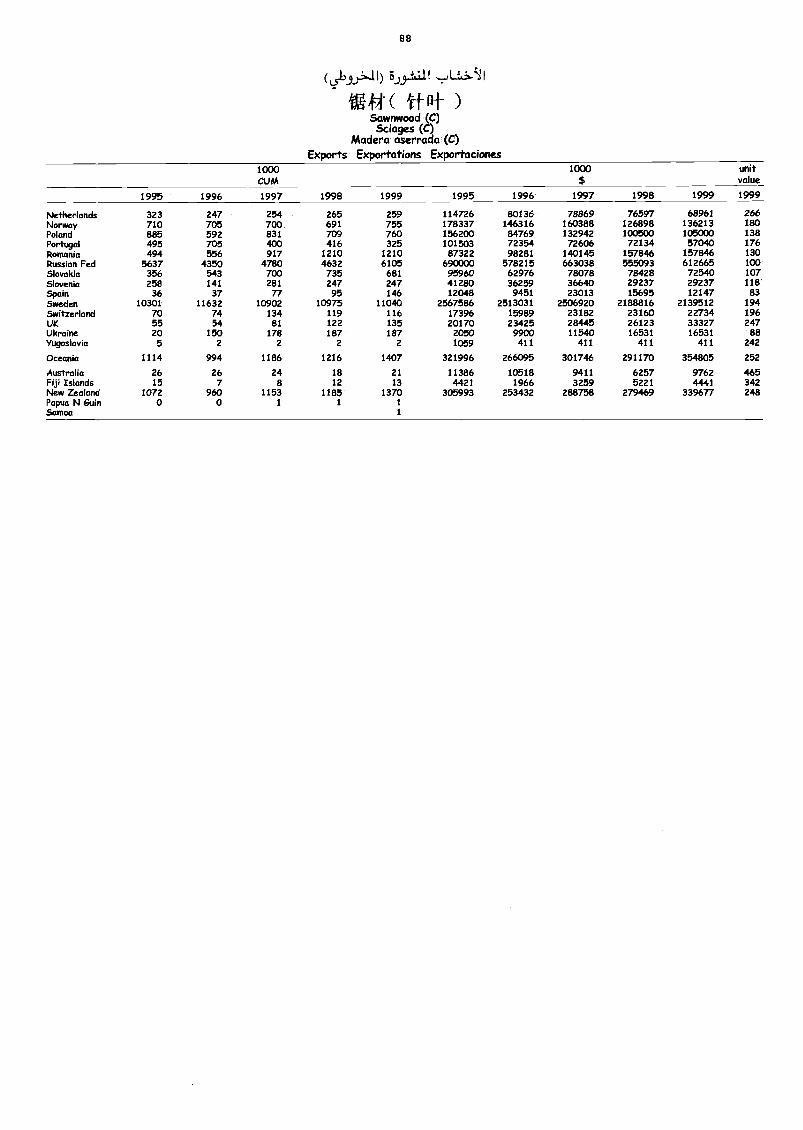
88
(443,...11) 3,J4111
( af-Sawnnood (C)Sciages (C)
Madera aserrada (C)Exports Exportations Exportaciones
1000CUM
1000$
tmitvalue
1995 1996 1997 1998 1999 1995 1996 1997 1998 1999 1999
hktherlands 323 247 254 265 259 114726 80136 78869 76597 68961 266Norway 710 705 700 691 755 178337 146316 160388 126898 136213 180Poland 885 592 831 709 760 156200 84769 132942 100500 105000 138Portugal 495 705 400 416 325 101503 72354 72606 72134 57040 176RomaMa 494 556 917 1210 1210 87322 98281 140145 157846 157846 130RusManFed 5637 4350 4780 4632 6105 690000 578215 663038 555093 612665 100Skwakia 356 543 700 735 681 95960 62976 78078 78428 72540 107SkweMa 258 141 281 247 247 41280 36259 36640 29237 29237 118SpaM 36 37 77 95 146 12048 9451 23013 15695 12147 83Sweden 10301 11632 10902 10975 11040 2567586 2513031 2506920 2188816 2139512 194Switzerland 70 74 134 119 116 17396 15989 23182 23160 22734 196UK 55 54 81 122 135 20170 23425 28445 26123 33327 247Ukrairm 20 150 178 187 187 2050 9900 11540 16531 16531 88Yugoslavia 5 2 2 2 2 1059 411 411 411 411 242
CocemMa 1114 994 1186 1216 1407 321996 266095 301746 291170 354805 252
Australia 26 26 24 18 21 11386 10518 9411 6257 9762 465FijilMands 15 7 8 12 13 4421 1966 3259 5221 4441 342New Zeakmd 1072 960 1153 1185 1370 305993 253432 288758 279469 339677 248PommONIGuin o o 1 1 1
Samoa 1
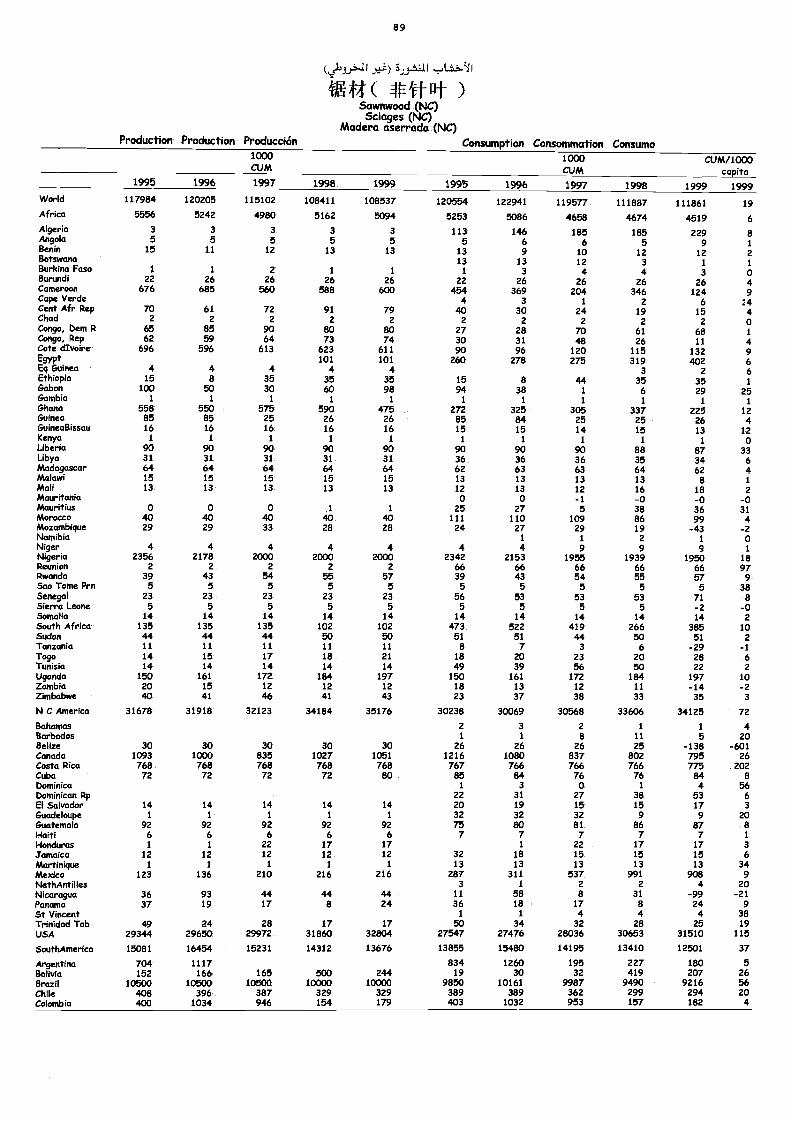
89
;U)Sawnwood (NC)
Sciages (NC)Madera aserrada (NC)
Production Production Producción Consumption Consommation Consumo1000CUM
1000CUM
CUM/1000capita
1995 1996 1997 1998 1999 1995 1996 1997 1998 1999 1999World 117984 120205 115102 108411 108537 120554 122941 119577 111887 111861 19Africa 5556 5242 4980 5162 5094 5253 5086 4658 4674 4519 6Algeria 3 3 3 3 3 113 146 185 185 229 8Angola 5 5 5 5 5 5 6 6 5 9 1Benin 15 11 12 13 13 13 9 10 12 12 2Botswana 13 13 12 3 1 1Burkina Faso 1 1 2 1 1 1 3 4 4 3 0Burundi 22 26 26 26 26 22 26 26 26 26 4Cameroon 676 685 560 588 600 454 369 204 346 124 9Cape Verde 4 3 1 2 6 14Cent Afr Rep 70 61 72 91 79 40 30 24 19 15 4Chad 2 2 2 2 2 2 2 2 2 2 0Congo, Dem R 65 85 90 80 80 27 28 70 61 68 1Congo, Rep 62 59 64 73 74 30 31 48 26 11 4Cote dlvoire 696 596 613 623 611 90 96 120 115 132 9Egypt 101 101 260 278 275 319 402 6Eq Guinea 4 4 4 4 4 3 2 6Ethiopia 15 8 35 35 35 15 8 44 35 35 1Gabon 100 50 30 60 98 94 38 1 6 29 25Gambia 1 1 1 1 1 1 1 1 1 1 1Ghana 558 550 575 590 475 272 325 305 337 225 12Guinea 85 85 25 26 26 85 84 25 25 26 4GuineaBissau 16 16 16 16 16 15 15 14 15 13 12Kenya 1 1 1 1 1 1 1 1 1 1 0Liberia 90 90 90 90 90 90 90 90 88 87 33Ubya 31 31 31 31 31 36 36 36 35 34 6Madagascar 64 64 64 64 64 62 63 63 64 62 4Malawi 15 15 15 15 15 13 13 13 13 8 1Mali 13 13 13 13 13 12 13 12 16 18 2Mauritania 0 0 -1 -0 -0 -0Mauritius 0 0 0 1 1 25 27 5 38 36 31Morocco 40 40 40 40 40 111 110 109 86 99 4Mozambique 29 29 33 28 28 24 27 29 19 -43 -2Namibia 1 1 2 1 0Niger 4 4 4 4 4 4 4 9 9 9 1Nigeria 2356 2178 2000 2000 2000 2342 2153 1955 1939 1950 18Reunion 2 2 2 2 2 66 66 66 66 66 97Rwanda 39 43 54 55 57 39 43 54 55 57 9Sao Tome Prn 5 5 5 5 5 5 5 5 5 5 38Senegal 23 23 23 23 23 56 53 53 53 71 8Sierra Leone 5 5 5 5 5 5 5 5 5 -2 -0Somalia 14 14 14 14 14 14 14 14 14 14 2South Africa 135 135 135 102 102 473 522 419 266 385 10Sudan 44 44 44 50 50 51 51 44 50 51 2Tanzania 11 11 11 11 11 8 7 3 6 -29 -1Togo 14 15 17 18 21 18 20 23 20 28 6Tunisia 14 14 14 14 14 49 39 56 50 22 2Uganda 150 161 172 184 197 150 161 172 184 197 10Zambia 20 15 12 12 12 18 13 12 11 -14 -2Zimbabwe 40 41 46 41 43 23 37 38 33 35 3
N C America 31678 31918 32123 34184 35176 30238 30069 30568 33606 34125 72
Bahamas 2 3 2 1 1 4Barbados I 1 8 11 5 20Belize 30 30 30 30 30 26 26 26 25 -138 -601Canada 1093 1000 835 1027 1051 1216 1080 837 802 795 26Costa Rica 768 768 768 768 768 767 766 766 766 775 202Cuba 72 72 72 72 80 85 84 76 76 84 8Dominica 1 3 0 1 4 56Dominican Rp 22 31 27 38 53 6El Salvador 14 14 14 14 14 20 19 15 15 17 3Guadeloupe 1 1 1 1 1 32 32 32 9 9 20Guatemala 92 92 92 92 92 75 ao 81 86 87 8Haiti 6 6 6 6 6 7 7 7 7 7 1
Honduras 1 1 22 17 17 1 22 17 17 3Jamaica 12 12 12 12 12 32 18 15 15 15 6Martinique 1 1 1 1 1 13 13 13 13 13 34Mexico 123 136 210 216 216 287 311 537 991 908 9NethAntilles 3 1 2 2 4 20Nicaragua 36 93 44 44 44 11 58 8 31 -99 -21Panama 37 19 17 5 24 36 18 17 8 24 9St Vincent 1 1 4 4 4 38Trinidad Tob 49 24 28 17 17 50 34 32 28 25 19USA 29344 29650 29972 31860 32804 27547 27476 28036 30653 31510 115
SouthAmerica 15081 16454 15231 14312 13676 13855 15480 14195 13410 12501 37
Argentina 704 1117 834 1260 195 227 180 5Bolivia 152 166 165 500 244 19 30 32 419 207 26Brazil 10500 10500 10500 10000 10000 9850 10161 9987 9490 9216 56Chile 408 396 387 329 329 389 389 362 299 21942 20Colombia 400 1034 946 154 179 403 1032 953 157
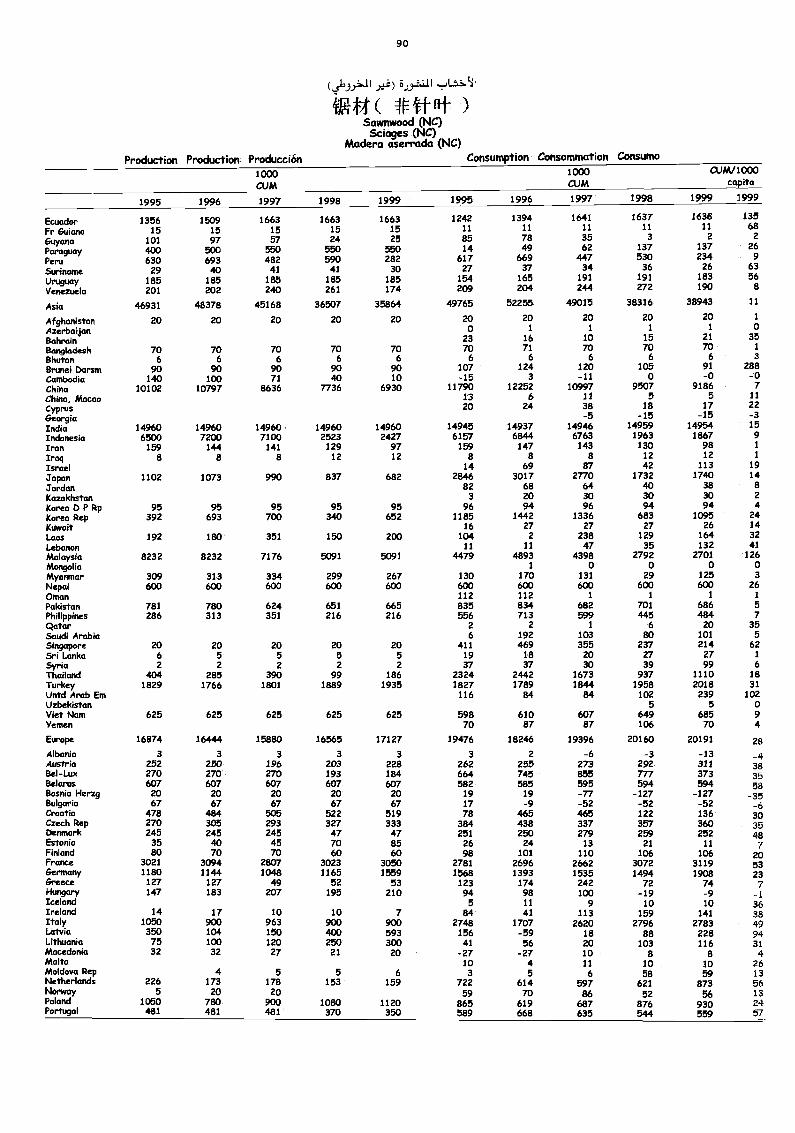
90
(46.3)"^11
CV'( 4fi tf.Sawnwood (NC)
Sciages (NC)Madera aserrada (NC)
Production Production Producción Consumption C.onsommcrtion Consumo
1000CUM
1000CUM
CUM/1000capita
1995 1996 1997 1998 1999 1995 1996 1997 1998 1999 1999
Ecuador 1356 1509 1663 1663 1663 1242 1394 1641 1637 1638 135
Fr Guiana 15 15 15 15 15 11 11 11. 11 11 68
Guyana 101 97 57 24 25 85 78 35 3 2 2
Paraguay 400 500 550 550 550 14 49 62 137 137 26
Peru 630 693 482 590 282 617 669 447 530 234 9
Suriname 29 40 41 41 30 27 37 34 36 26 63
Uruguay 185 185 185 185 185 154 165 191 191 183 56
Venezuela 201 202 240 261 174 209 204 244 272 190 8
Asia 46931 48378 45168 36507 35864 49765 52255 49015 38316 38943 11
Afghanistan 20 20 20 20 20 20 20 20 20 20 1
Azerbaijan o 1 1 1 1 0
Bahrain 23 16 10 15 21 35
Bangladesh 70 70 70 70 70 70 71 70 70 70 1
Bhutan 6 6 6 6 6 6 6 6 6 6 3
Brunei Darsm 90 90 90 90 90 107 124 120 105 91 288
Cambodia 140 100 71 40 10 -15 3 -11 0 -0 -.0
China 10102 10797 8636 7736 6930 11790 12252 10997 9507 9186 7China, Macao 13 6 11 5 5 11
CyprusGeorgia
20 24 38-5
18-15
17-15
22-3
India 14960 14960 14960 14960 14960 14945 14937 14946 14959 14954 15
Indonesia 6500 7200 7100 2523 2427 6157 6844 6763 1963 1867 9Iran 159 144 141 129 97 159 147 143 130 98 1
Iraq 8 8 8 12 12 8 8 8 12 12 iIsrael 14 69 87 42 113 19
japan 1102 1073 990 837 682 2846 3017 2770 1732 1740 14
Jordan 82 68 64 40 38 8
Kazakhstan 3 20 30 30 30 2
Korea 0 P Ftp 95 95 95 95 95 96 94 96 94 94 4Korea Rep 392 693 700 340 652 1185 1442 1336 683 1095 24Kuwait 16 27 27 27 26 14Laos 192 180 351 150 200 104 2 238 129 164 32Lebanon 11 11 47 35 132 41Malaysia 8232 8232 7176 5091 5091 4479 4893 4398 2792 2701 126Mongolia 1 0 0 0 0Myanmar 309 313 334 299 267 130 170 131 29 125 3
Nepal 600 600 600 600 600 600 600 600 600 600 26Oman 112 112 1 1 1 1
Pakistan 781 780 624 651 665 835 834 682 701 686 5Philippines 286 313 351 216 216 556 713 599 445 484 7Qatar 2 2 1 6 20 35Saudi Arabia 6 192 103 80 101 5Singapore 20 20 20 20 20 411 469 355 237 214 62Sri Lanka 6 5 5 5 5 19 18 20 27 27 1
Syria 2 2 2 2 2 37 37 30 39 99 6Thailand 404 285 390 99 186 2324 2442 1673 937 1110 18Turkey 1829 1766 1801 1889 1935 1827 1789 1844 1958 2018 31Untd Arab Em 116 84 84 102 239 102Uzbekistan 5 5 0Viet Nlam 625 625 625 625 625 598 610 607 649 685 9Yemen 70 87 87 106 70 4
Etrope 16874 16444 15880 16565 17127 19476 18246 19396 20160 20191 28Albania 3 3 3 3 3 3 2 -6 -3 -13 -4Austria 252 250 196 203 228 262 255 273 292 311 38Bel-Lux 270 270 270 193 184 664 745 855 777 373 35Belarus 607 607 607 607 607 582 585 595 594 594 58Bosnia Herzg 20 20 20 20 20 19 19 -77 -127 -127 -35Bulgaria 67 67 67 67 67 17 -9 -52 -52 -52 -6Croatia 478 484 505 522 519 78 465 465 122 136 30Czech Rep 270 305 293 327 333 384 438 337 357 360 35Denmark 245 245 245 47 47 251 250 279 259 252 48Estonia 35 40 45 70 85 26 24 13 21 11 7Finland 80 70 70 60 60 98 101 110 106 106 20France 3021 3094 2807 3023 3050 2781 2696 2662 3072 3119 53Germany 1180 1144 1048 1165 1559 1568 1393 1535 1494 1908 23Greece 127 127 49 52 53 123 174 242 72 74 7Hungary 147 183 207 195 210 94 98 100 -19 -9 -1Iceland 5 11 9 10 10 36Ireland 14 17 10 10 7 84 41 113 159 141 38Italy 1050 900 963 900 900 2748 1707 2620 2796 2783 49Latvia 350 104 150 400 593 156 -59 18 88 228 94Lithuania 75 100 120 250 300 41 56 20 103 116 31Macedonia 32 32 27 21 20 -27 -27 10 8 8 4Malta 10 4 11 10 10 26Moldova Rep 4 5 5 6 3 5 6 58 59 13Netherlands 226 173 178 153 159 722 614 597 621 873 56Norway 5 20 20 59 70 86 52 56 13Poland 1050 780 900 1080 1120 865 619 687 876 930 24Portugal 481 481 481 370 350 589 668 635 544 559 57
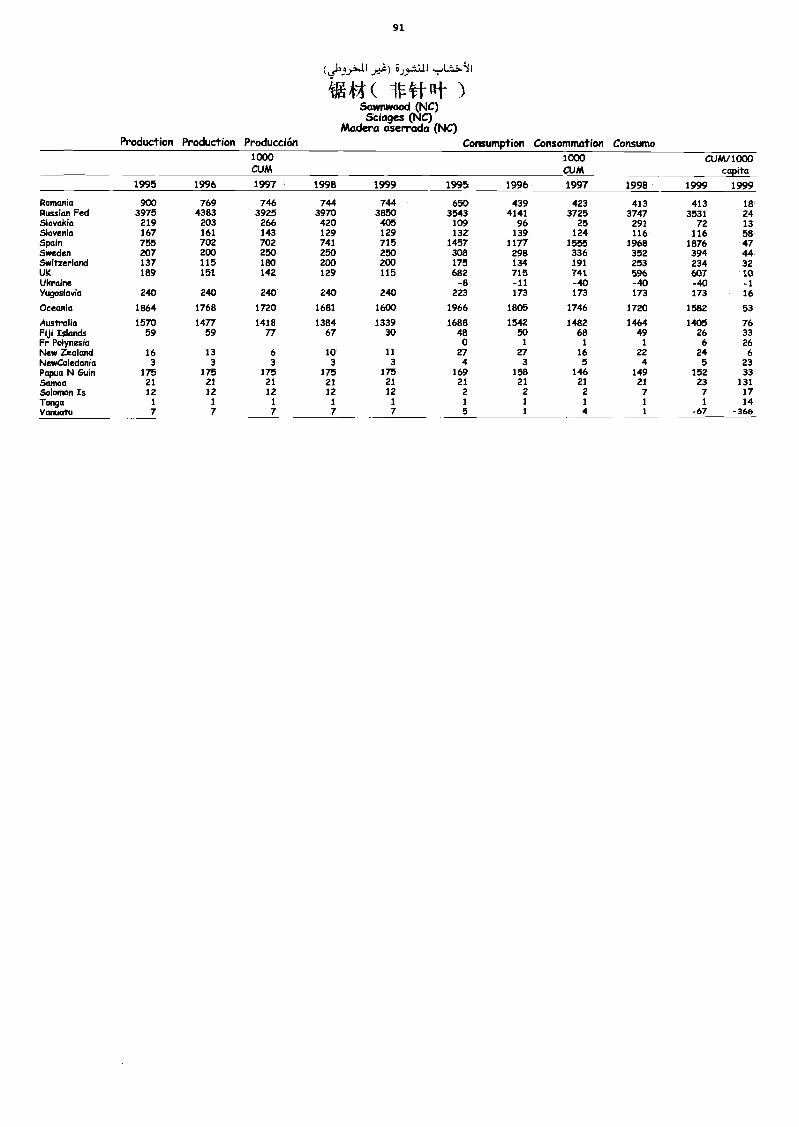
91
4g44( 1V4tFtsSawnwood (NC)
Sciages (NC)Madera aserrada (NC)
Production Production Producción Consumption Consommation Consumo1000CUM
1000CUM
CUW1000capita
1995 1996 1997 1998 1999 1995 1996 1997 1998 1999 1999
Rommlia 900 769 746 744 744 650 439 423 413 413 18Russian Fed 3975 4383 3925 3970 3850 3543 4141 3725 3747 3531 24Slovakia 219 203 266 420 405 109 96 25 291 72 13Slovenia 167 161 143 129 129 132 139 124 116 116 58Spain 755 702 702 741 715 1457 1177 1555 1968 1876 47Sweden 207 200 250 250 250 308 298 336 352 394 44Switzerland 137 115 180 200 200 175 134 191 253 234 32UK 189 151 142 129 115 682 715 741 596 607 10Ukraine -8 -11 -40 -40 -40 -1Yugoslavia 240 240 240 240 240 223 173 173 173 173 16
Oceania 1864 1768 1720 1681 1600 1966 1805 1746 1720 1582 53
Australia 1570 1477 1418 1384 1339 1688 1542 1482 1464 1405 76Fiji Islands 59 59 77 67 30 48 50 68 49 26 33Fr Polynesia 0 1 1 1 6 26New Zealand 16 13 6 10 11 27 27 16 22 24 6NewCaleckinia 3 3 3 3 3 4 3 5 4 5 23Papua N buin 175 175 175 175 175 169 158 146 149 152 33Samoa 21 21 21 21 21 21 21 21 21 23 131Solomon Is 12 12 12 12 12 2 2 2 7 7 17Tonga I 1 1 1 1 1 1 1 1 1 14Vanuatu 7 7 7 7 7 5 1 4 1 -67 -366
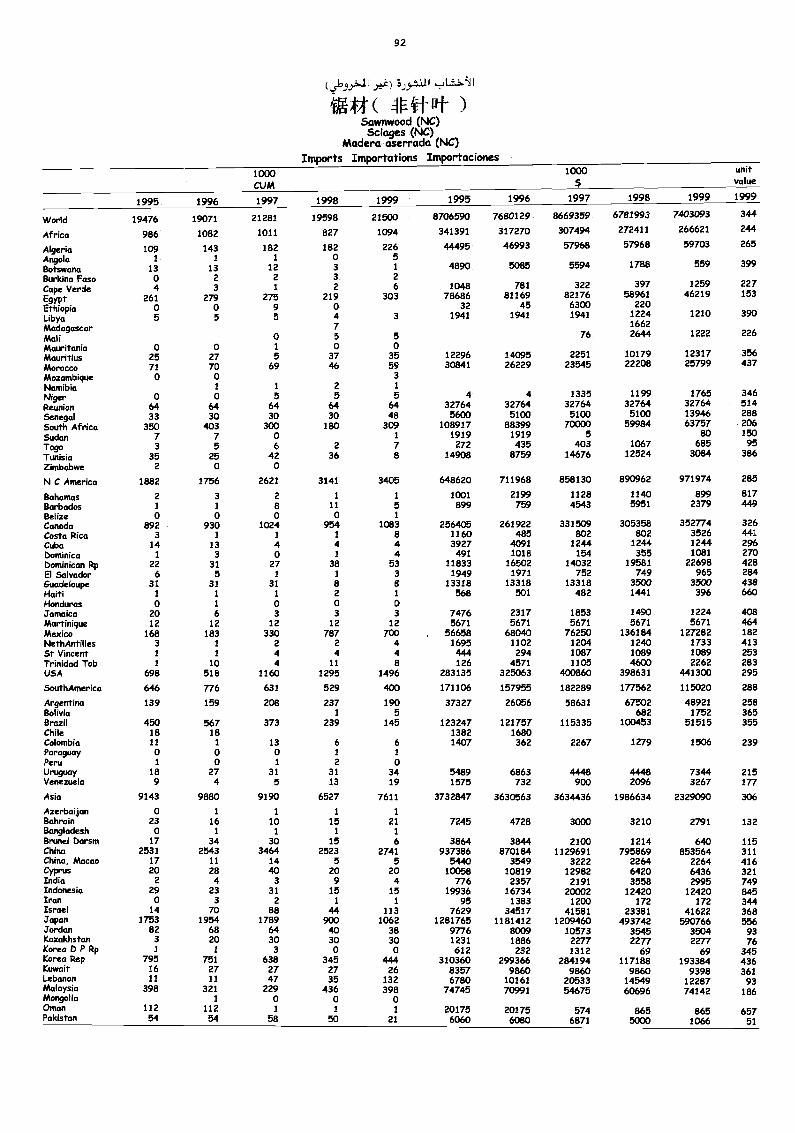
92
(41'..9 -11.x'-) .8)9.4-'111
4E44( )Sawnwood (NC)&loges (NC)
Madera aserrada (NC)Imports Importations Importaciones
1000CUM
1000 unitvalue
1995 1996 1997 1998 1999 1995 1996 1997 1998 1999 1999
World 19476 19071 21281 19598 21500 8706590 7680129 8669359 6781993 7403093 344
Africa 986 1082 1011 827 1094 341391 317270 307494 272411 266621 244
Algeria 109 143 182 182 226 44495 46993 57968 57968 59703 265
Angola 1 1 1 0 5
Botswana 13 13 12 3 1 4890 5085 5594 1788 559 399
Burkina Faso 0 2 2 3 2
Cape Verde 4 3 1 2 6 1048 781 322 397 1259 227
EgyptEthiopia
261o
279o
2759
2190
303 7868632
8116945
821766300
58961220
46219 153
Libya 5 5 5 4 3 1941 1941 1941 1224 1210 390
Madagascar 7 1662
Mali o 5 5 76 2644 1222 226
Mauritania 0 0 1 0 0Mauritius 25 27 5 37 35 12296 14095 2251 10179 12317 356
Morocco 71 70 69 46 59 30841 26229 23545 22208 25799 437
Mozambique o o 3
Namibia I 1 2 1
Niger o 0 5 5 5 4 4 1335 1199 1765 346
Reunion 64 64 64 64 64 32764 32764 32764 32764 32764 514
Senegal 33 30 30 30 48 5600 5100 5100 5100 13946 288
South Africa 350 403 300 180 309 108917 88399 70000 59984 63757 206
Sudan 7 7 o 1 1919 1919 5 80 150
Togo 3 5 6 2 7 272 435 403 1067 685 95Tunisia 35 25 42 36 8 14908 8759 14676 12524 3084 386Zimbabwe 2 o o
N C America 1882 1756 2621 3141 3405 648620 711968 858130 890962 971974 285
Bahamas 2 3 2 1 1 1001 2199 1128 1140 899 817Barbados 1 1 8 11 5 899 759 4543 5951 2379 449Belize o o o o 1
Canada 892 930 1024 954 1083 256405 261922 331509 305358 352774 326Costa Rica 3 1 1 1 8 1160 485 802 802 3526 441Cuba 14 13 4 4 4 3927 4091 1244 1244 1244 296Dominica 1 3 0 i 4 491 1018 154 355 1081 270Dominican Rp 22 31 27 38 53 11833 16502 14032 19581 22698 428El Salvador 6 5 1 1 3 1949 1971 752 749 965 284Guadeloupe 31 31 31 8 8 13318 13318 13318 3500 3500 438Haiti 1 1 1 2 1 568 501 482 1441 396 660Honduras o i o o 0Jamaica 20 6 3 3 3 7476 2317 1853 1490 1224 408Martinique 12 12 12 12 12 5671 5671 5671 5671 5671 464Mexico 168 183 330 787 700 56658 68040 76250 136184 127282 182NethAntilles 3 1 2 2 4 1695 1102 1204 1240 1733 413St Vincent 1 1 4 4 4 444 294 1087 1089 1089 253Trinidad Tob 1 10 4 11 8 126 4571 1105 4600 2262 283USA 698 518 1160 1295 1496 283135 325063 400860 398631 441300 295
SouthAmerica 646 776 631 529 400 171106 157955 182289 177562 115020 288
Argentina 139 159 208 237 190 37327 26056 58631 67502 48921 258Bolivia 1 5 682 1752 365Brazil 450 567 373 239 145 123247 121757 115335 100453 51515 355Chile 18 18 1382 1680Colombia 11 1 13 6 6 1407 362 2267 1279 1506 239Paraguay o o o 1 1
Peru 1 o 3 2 0Uruguay 18 27 31 31 34 5489 6863 4448 4448 7344 215Venezuela 9 4 5 13 19 1575 732 900 2096 3267 177
Asia 9143 9880 9190 6527 7611 3732847 3630563 3634436 1986634 2329090 306
Azerbaijan 0 1 1 1 1
Bahrain 23 16 10 15 21 7245 4728 3000 3210 2791 132Bangladesh o I I I 1
Brunei Darsm 17 34 30 15 6 3864 3844 2100 1214 640 115China 2531 2543 3464 2523 2741 937386 870184 1129691 795869 853564 311China, Macao 17 11 14 5 5 54.40 3549 3222 2264 2264 416Cyprus 20 28 40 20 20 10058 10819 12982 6420 6436 321India 2 4 3 9 4 776 2357 2191 3558 2995 749Indonesia 29 23 31 15 15 19936 16734 20002 12420 12420 845Iran o 3 2 1 1 95 1383 1200 172 172 344Israel 14 70 88 44 113 7629 34517 41581 23381 41622 368Japan 1753 1954 1789 900 1062 1281765 1181412 1209460 493742 590766 556Jordan 82 68 64 40 38 9776 8009 10573 3545 3504 93Kazaldistan 3 20 30 30 30 1231 1886 2277 2277 2277 76Korea D P Rp I 1 3 0 0 612 232 1312 69 69 345Korea Rep 795 751 638 345 444 310360 299366 284194 117188 193384 436Kuwait 16 27 27 27 26 8357 9860 9860 9860 9398 361Lebanon 11 11 47 35 132 6780 10161 20533 14549 12287 93Malaysia 398 321 229 436 398 74745 70991 54675 60696 74142 186Mongolia 1 o o oOrnan 112 112 1 1 1 20175 20175 574 865 865 657Pakistan 54 54 58 50 21 6060 6080 6871 5000 1066 51
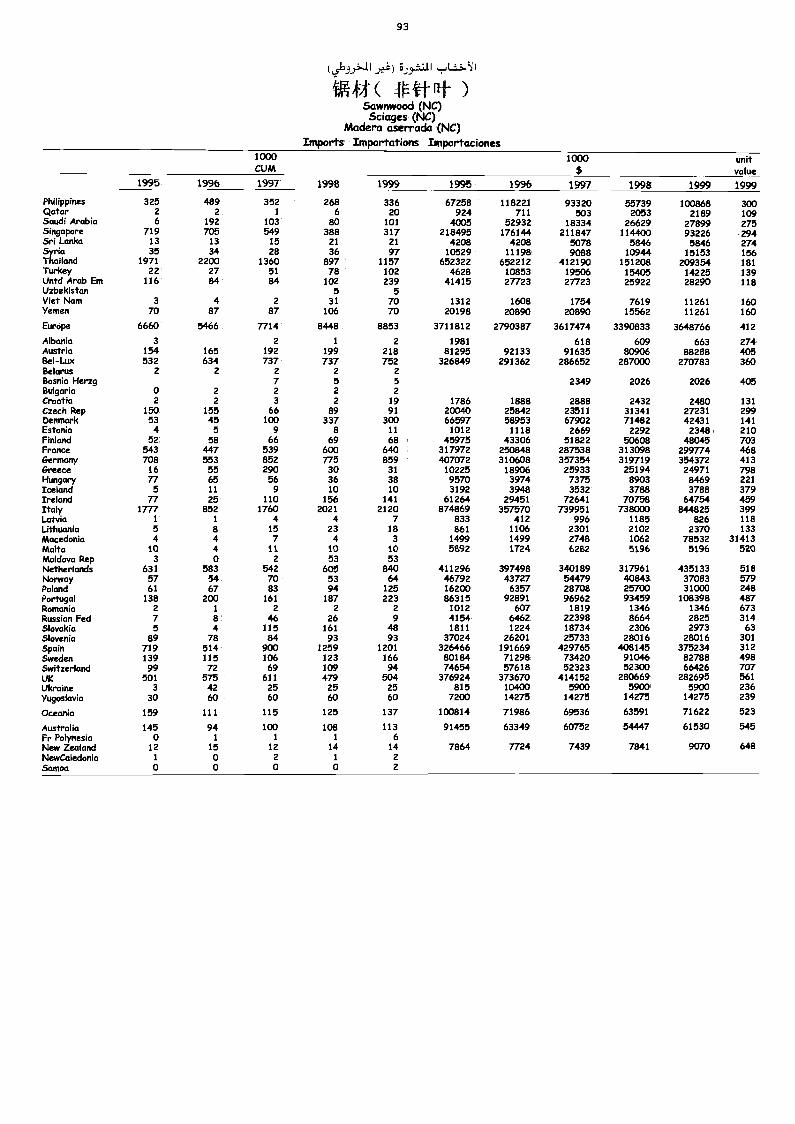
93
(4.6»:'"-11):7)
)Sawnwood (NC)Sciages (NC)
Madera aserrada (NC)Imports Importations Importaciones
1000CUM
1000$
unitvalue
1995 1996 1997 19913 1999 1995 1996 1997 1998 1999 1999
Philippines 325 489 352 268 336 67258 118221 93320 55739 100868 300Qatar 2 2 1 6 20 924 711 503 2053 2189 109Saudi Arabia 6 192 103 80 101 4005 52932 18334 26629 27899 275Singapore 719 705 549 388 317 218495 176144 211847 114400 93226 294Sri Lanka 13 13 15 21 21 4208 4208 5078 5846 5846 274Syria 35 34 28 36 97 10529 11198 9088 10944 15153 156Thailand 1971 2200 1360 897 1157 652322 652212 412190 151208 209354 181Turkey 22 27 51 78 102 4628 10853 19506 15405 14225 139Untd Arab Em 116 84 84 102 239 41415 27723 27723 25922 28290 118Uzbekistan 5 5Viet Nam 3 4 2 31 70 1312 1608 1754 7619 11261 160Yemen 70 87 87 106 70 20198 20890 20890 15562 11261 160
Europe 6660 5466 7714 8448 8853 3711812 2790387 3617474 3390833 3648766 412
Albania 3 2 1 2 1981 618 609 663 274Austria 154 165 192 199 218 81295 92133 91635 80906 88288 405Bel-Lux 532 634 737 737 752 326849 291362 286652 287000 270783 360Belarus 2 2 2 2 2Bosnia Herzg 7 5 5 2349 2026 2026 405Bulgaria 0 2 2 2 2
Croatia 2 2 3 2 19 1786 1888 2888 2432 2480 131Czech Rep 150 155 66 89 91 20040 25842 23511 31341 27231 299Denmark 53 45 100 337 300 66597 58953 67902 71482 42431 141Estonia 4 5 9 8 11 1012 1118 2669 2292 2348 210Finland 52 58 66 69 68 45975 43306 51822 50608 48045 703France 543 447 539 600 640 317972 250848 287538 313098 299774 468Germany 708 553 852 775 859 407072 310608 357354 319719 354372 413Greece 16 55 290 30 31 10225 18906 25933 25194 24971 798Hungary 77 65 56 36 38 9570 3974 7375 8903 8469 221Iceland 5 11 9 10 10 3192 3948 3532 3788 3788 379Ireland 77 25 110 156 141 61264 29451 72641 70758 64754 459Italy 1777 852 1760 2021 2120 874869 357570 739951 738000 844825 399Latvia 1 1 4 4 7 833 412 996 1185 826 118Lithuania 5 8 15 23 18 861 1106 2301 2102 2370 133Macedonia 4 4 7 4 3 1499 1499 2748 1062 78532 31413Malta 10 4 11 10 10 5892 1724 6282 5196 5196 520Moldova Rep 3 0 2 53 53Netherlands 631 583 542 605 840 411296 397498 340189 317961 435133 518Norway 57 54 70 53 64 46792 43727 54479 40843 37083 579Poland 61 67 83 94 125 16200 6357 28708 25700 31000 248Portugal 138 200 161 187 223 86315 92891 96962 93459 108398 487Romania 2 1 2 2 2 1012 607 1819 1346 1346 673Russian Fed 7 8 46 26 9 4154 6462 22398 8664 2825 314Slovakia 5 4 115 161 48 1811 1224 18734 2306 2973 63Slovenia 89 78 84 93 93 37024 26201 25733 28016 28016 301Spain 719 514 900 1259 1201 326466 191669 429765 408145 375234 312Sweden 139 115 106 123 166 80184 71298 73420 91046 82788 498Switzerland 99 72 69 109 94 74654 57618 52323 52300 66426 707UK 501 575 611 479 504 376924 373670 414152 280669 282695 561Ukraine 3 42 25 25 25 815 10400 5900 5900 5900 236Yugoslavia 30 60 60 60 60 7200 14275 14275 14275 14275 239
Oceania 159 111 115 125 137 100814 71986 69536 63591 71622 523
Australia 145 94 100 108 113 91455 63349 60752 54447 61530 545Fr Polynesia o 1 1 1 6New Zealand 12 15 12 14 14 7864 7724 7439 7841 9070 648NewCaledonia 1 0 2 1 2Samoa 0 o 0 0 2
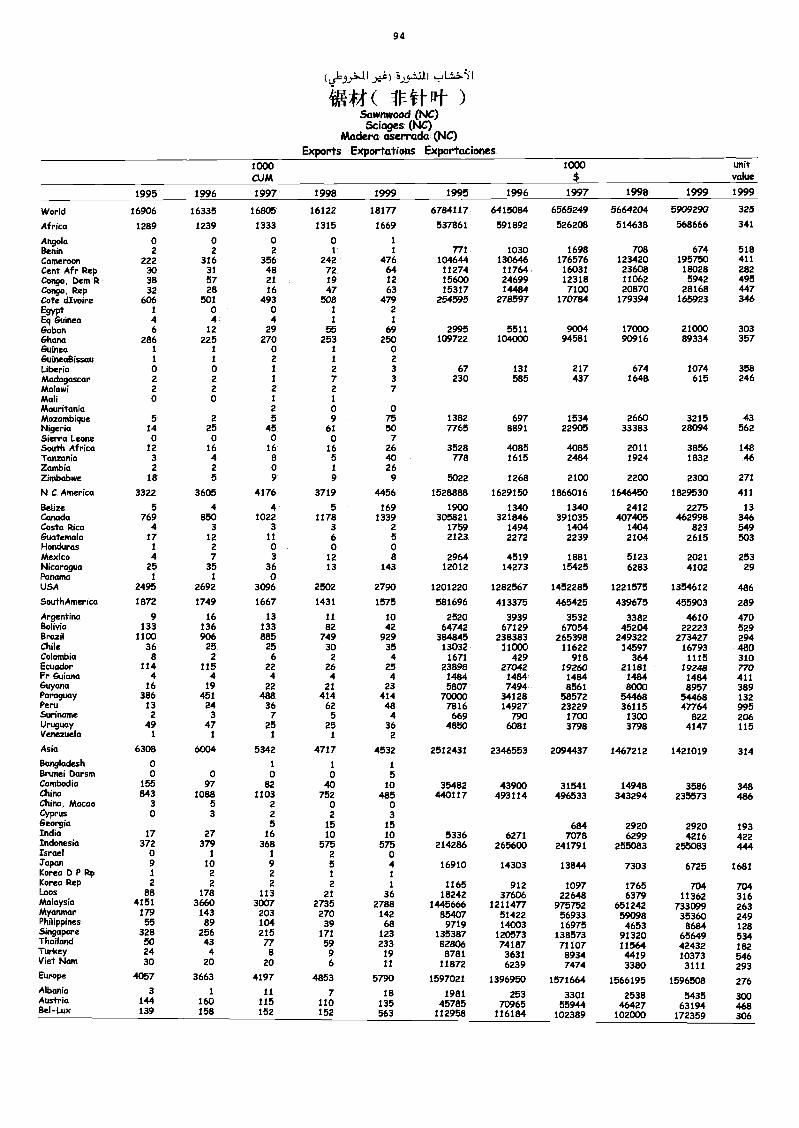
94
I
Vh44( 1V4fritSawmvood (NC)&loges (NC)
Madera aserrada (NC)Exports Exportations Exportaciones
1000CUM
1000$
unitvalue
1995 1996 1997 1998 1999 1995 1996 1997 1998 1999 1999
World 16906 16335 16805 16122 18177 67841/7 6415084 6565249 5664204 5909290 325
Africa 1289 1239 1333 1315 1669 537861 591892 526208 514638 568666 341
Angola 0 0 0 0 1
Benin 2 2 2 1 1 771 1030 1698 708 674 518Cameroon 222 316 356 242 476 104644 130646 176576 123420 195750 411Cent Afr Rep 30 31 48 72 64 11274 11764 16031 23608 18028 282Congo, Dam 12 38 57 21 19 12 15600 24699 12318 11062 5942 495Congo, Rep 32 28 16 47 63 15317 14484 7100 20870 28168 447Cote divoire 606 501 493 508 479 254595 278597 1 70784 179394 165923 346E9YPt 1 0 0 1 2Eq Guinea 4 4 4 1 1
Gabon 6 12 29 55 69 2995 5511 9004 17000 21000 303Ghana 286 225 270 253 250 109722 104000 94581 90916 89334 357Guinea 1 1 0 1 06uinea8issau 1 1 2 1 2Liberia 0 0 i 2 3 67 131 217 674 1074 358Madagascar 2 2 i 7 3 230 585 437 1648 615 246Malawi 2 2 2 2 7Mali 0 0 1 1
Mauritania 2 0 0Mozambique 5 2 5 9 75 1382 697 1534 2660 3215 43Nigeria 14 25 45 61 50 7765 8891 22905 33383 28094 562Sierra Leone 0 0 0 0 7South Africa 12 16 16 16 26 3528 4085 4085 2011 3856 148Tanzania 3 4 8 5 40 778 1615 2484 1924 1832 46Zambia 2 2 0 1 26Zimbabwe 18 5 9 9 9 5022 1268 2100 2200 2300 271
N C America 3322 3605 4176 3719 4456 1528888 1629150 1866016 1646450 1829530 411
Belize 5 4 4 5 169 1900 1340 1340 2412 2275 13Canada 769 850 1022 1178 1339 305821 321846 391035 407405 462998 346Costa Rica 4 3 3 3 2 1759 1494 1404 1404 823 549Guatemala 17 12 11 6 5 2123 2272 2239 2104 2615 503Honduras 1 2 0 0 0Mexico 4 7 3 12 8 2964 4519 1881 5123 2021 253Nicaragua 25 35 36 13 143 12012 14273 15425 6283 4102 29Panama 1 / OUSA 2495 2692 3096 2502 2790 1201220 1282567 1452285 1221575 1354612 486
SouthAmerica 1872 1749 1667 1431 1575 581696 413375 465425 439675 455903 289
Argentina 9 16 13 11 10 2520 3939 3532 3382 4610 470Bolivia 133 136 133 82 42 64742 67129 67054 45204 22223 529Brazil 1100 906 885 749 929 384845 238383 265398 249322 273427 294Chile 36 25 25 30 35 13032 11000 11622 14597 16793 480Colombia 8 2 6 2 4 1671 429 918 364 1115 310Ecuador 114 115 22 26 25 23898 27042 19260 21181 19248 770Fr Guiana 4 4 4 4 4 1484 1484 1484 1484 1484 411Guyana 16 19 22 21 23 5807 7494 8561 8000 8957 389Paraguay 386 451 488 414 414 70000 34128 58572 54468 54468 132Peru 13 24 36 62 48 7816 14927 23229 36115 47764 995Suriname 2 3 7 5 4 669 790 1700 1300 822 206Uruguay 49 47 25 25 36 4850 6081 3798 3798 4147 115Venezuela 1 1 1 1 2
Asia 6308 6004 5342 4717 4532 2512431 2346553 2094437 1467212 1421019 314Bangladesh 0 I 1 1Brunei barsm 0 0 0 0 5Cambodia 155 97 82 40 10 35482 43900 31541 14948 3586 348China 843 1088 1103 752 485 440117 493114 496533 343294 235573 486China, Macao 3 5 2 0 0Cyprus 0 3 2 2 3Georgia 5 15 15 684 2920 2920 193India 17 27 16 10 10 5336 6271 7078 6299 4216 422Indonesia 372 379 368 575 575 214286 265600 241791 255083 255083 444Israel o i 1 2 0Japan 9 10 9 5 4 16910 14303 13844 7303 6725 1681Korea b P Rp 1 2 2 1 1Korea Rep 2 2 2 2 1 1165 912 1097 1765 704 704Laos 88 178 113 21 36 18242 37606 22648 6379 11362 316Malaysia 4151 3660 3007 2735 2788 1445666 1211477 975752 651242 733099 263Myanmar 179 143 203 270 142 85407 51422 56933 59098 35360 249Philippines 55 89 104 39 68 9719 14003 16975 4653 8684 128Singapore 328 256 215 171 123 135387 120573 138573 91320 65649 534Thailand 50 43 77 59 233 82806 74187 71107 11564 42432 182Turkey 24 4 8 9 19 8781 3631 8934 4419 10373 546Viet Nam 30 20 20 6 11 11872 6239 7474 3380 3111 293Europe 4057 3663 4197 4853 5790 1597021 1396950 1571664 1566195 1596508 276Albania 3 1 11 7 18 1981 253 3301 2538 5435 300Austria 144 160 115 110 135 45785 70965 55944 46427 63194 468Bel-Lux 139 158 152 152 563 112958 116154 102389 102000 172359 306
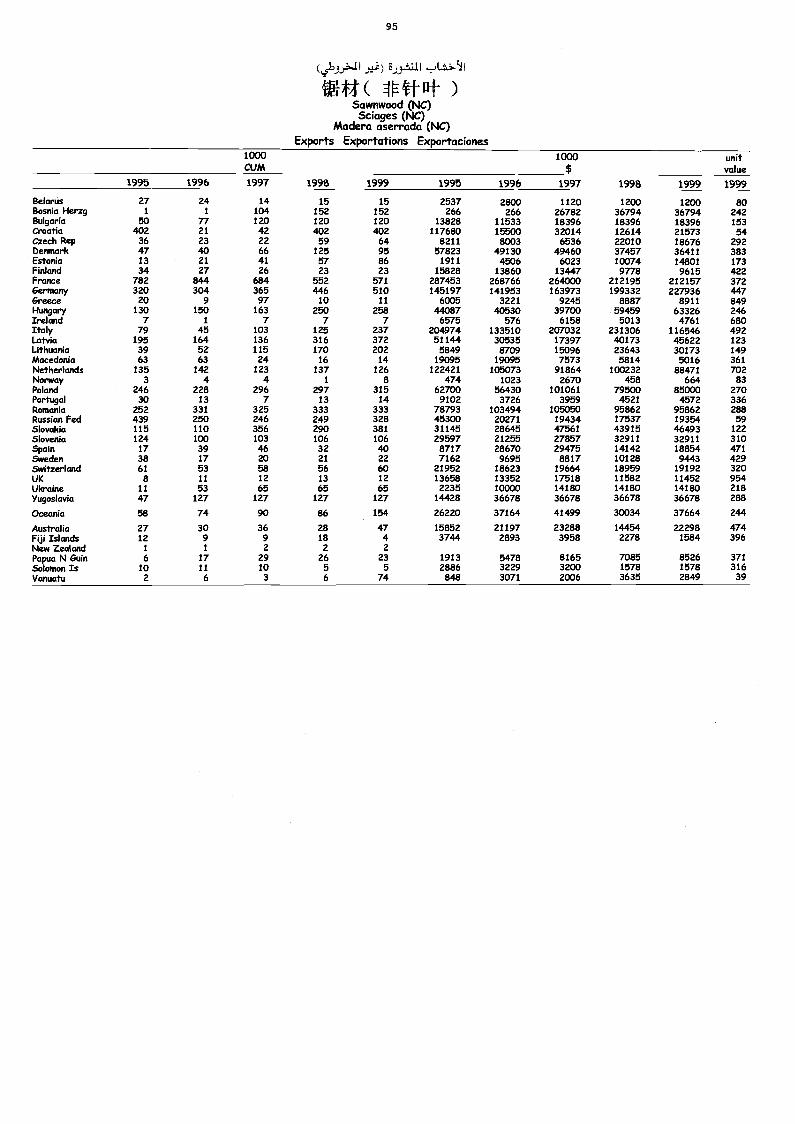
95
i.J..9-±11
WU( AV )Sawnwood (NC)Sciages (NC)
Madera aserrada (NC)Exports Exportations Exportaciones
1000CUM
1000$
unitvalue
1995 1996 1997 1995 1999 1995 1996 1997 1998 1999 1959
Belarus 27 24 14 15 15 2537 2800 1120 1200 1200 80Bosnia Herzg 1 1 104 152 152 266 266 26782 36794 36794 242Bulgaria 50 77 120 120 120 13828 11533 18396 18396 18396 153Croatia 402 21 42 402 402 117680 15500 32014 12614 21573 54Czech Rep 36 23 22 59 64 8211 8003 6536 22010 18676 292Denmark 47 40 66 125 95 57823 49130 49460 37457 36411 383Estonia 13 21 41 57 86 1911 4506 6023 10074 14801 173Finkmd 34 27 26 23 23 15828 13860 13447 9778 9615 422Frame 782 844 684 552 571 287453 268766 264000 212195 212157 372Gernmny 320 304 365 446 510 145197 141953 163973 199332 227936 447Greece 20 9 97 10 11 6005 3221 9245 8887 8911 849Hungary 130 150 163 250 258 44087 40530 39700 59459 63326 246Irdand 7 1 7 7 7 6575 576 6158 5013 4761 680Italy 79 45 103 125 237 204974 133510 207032 231306 116546 492Wyk 195 164 136 316 372 51144 30535 17397 40173 45622 123Lithuania 39 52 115 170 202 5849 8709 15096 23643 30173 149Macedonia 63 63 24 16 14 19095 19095 7573 5814 5016 361Netherlands 135 142 123 137 126 122421 105073 91864 100232 88471 702Norway 3 4 4 1 8 474 1023 2670 458 664 83Poland 246 228 296 297 315 62700 56430 101061 79500 85000 270Portugal 30 13 7 13 14 9102 3726 3959 4521 4572 336RonmMa 252 331 325 333 333 78793 103494 105050 95862 95862 288RussianFed 439 250 246 249 328 45300 20271 19434 17537 19354 59SlovaMa 115 110 356 290 381 31145 28645 47561 43915 46493 122Slaved° 124 100 103 106 106 29597 21255 27857 32911 32911 310Spain 17 39 46 32 40 8717 28670 29475 14142 18854 471Sweden 38 17 20 21 22 7162 9695 8817 10128 9443 429Switzerland 61 53 58 56 60 21952 18623 19664 18959 19192 320UK 8 11 12 13 12 13658 13352 17518 11582 11452 954Ukmine 11 53 65 65 65 2235 10000 14180 14180 14180 218Yugoslavia 47 127 127 127 127 14428 36678 36678 36678 36678 288
CceaMa 58 74 90 86 154 26220 37164 41499 30034 37664 244
Australia 27 30 36 28 47 15852 21197 23288 14454 22298 474Fiji IMands 12 9 9 18 4 3744 2893 3958 2278 1584 396New Zeakmd 1 1 2 2 2Papua N Guin 6 17 29 26 23 1913 5478 8165 7085 8526 371Solomon Is 10 11 10 5 5 2886 3229 3200 1578 1578 316Vanuatu 2 6 3 6 74 848 3071 2006 3635 2849 39

c_.15B1
A. ¡A*WOOD-BASED PANELS
PANNEAUX A BASE DE BOIS
TABLEROS DE MADERA
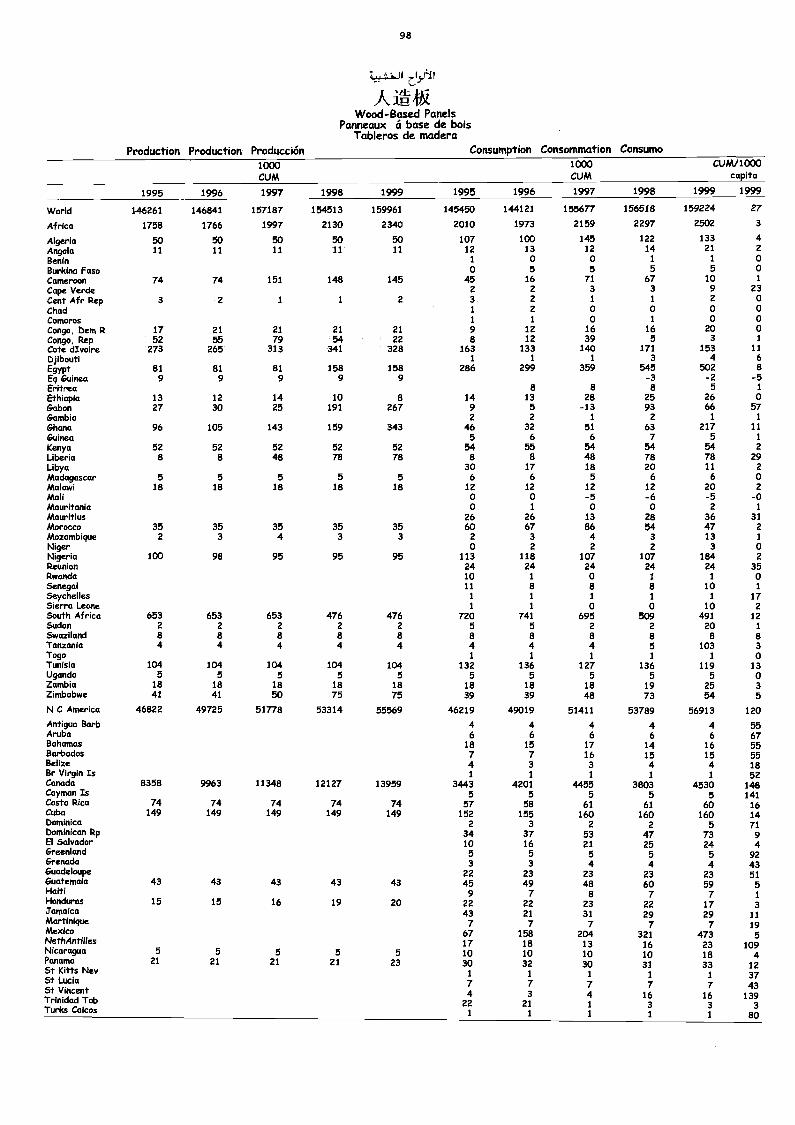
98
1.9.111,C.
lEls&A.Wood-Based Panels
Panneaux á base de boisTableros de modero
Production Production Producción Consumption Consomation Consumo1000CUM
1000CUM
CUW1000capita
1995 1996 1997 1998 1999 1995 1996 1997 1998 1999 1999
World 146261 146841 157187 154513 159961 145450 144121 155677 156518 159224 27
Africa 1758 1766 1997 2130 2340 2010 1973 2159 2297 2502 3
Algeria 50 50 50 50 50 107 100 145 122 133 4Angola 11 11 11 11 11 12 13 12 14 21 2
Benin 1 0 0 1 1 0Burkina Faso 0 5 5 5 5 0Cameroon 74 74 151 148 145 45 16 71 67 10 1
Cape Verde 2 2 3 3 9 23Cent Afr Rep 3 2 1 1 2 3 2 1 1 2 0Chad 1 2 0 0 0 0Comoros 1 1 0 1 0 0Congo, Dem R 17 21 21 21 21 9 12 16 16 20 0Congo, Rep 52 55 79 54 22 6 12 39 5 3 1
Cote dIvoire 273 265 313 341 328 163 133 140 171 153 11
Djibouti 1 1 1 3 4 6Egypt 81 81 81 158 158 286 299 359 545 502 8Eq Guinea 9 9 9 9 9 -3 -2 -5Eritrea 8 8 8 5 1
Ethiopia 13 12 14 10 8 14 13 28 25 26 0Gabon 27 30 25 191 267 9 5 -13 93 66 57Gambia 2 2 1 2 1 1
Ghana 96 105 143 159 343 46 32 51 63 217 11
Guinea 5 6 6 7 5 1
Kenya 52 52 52 52 52 54 55 54 54 54 2
Liberia 8 8 48 78 78 8 8 48 78 78 29Libya 30 17 18 20 11 2Madagascar 5 5 5 5 5 6 6 5 6 6 0Malawi 18 18 18 18 18 12 12 12 12 20 2Mali 0 0 -5 -6 -5 -0Mauritania 0 1 0 0 2 1
Mauritius 26 26 13 28 36 31Morocco 35 35 35 35 35 60 67 86 54 47 2Mozambique 2 3 4 3 3 2 3 4 3 13 1
Niger 0 2 2 2 3 0Nigeria 100 98 95 95 95 113 118 107 107 184 2Reunion 24 24 24 24 24 35Rwanda 10 1 0 1 1 0Senegal 11 8 8 8 10 1
Seychelles 1 1 1 1 1 17Sierra Leone 1 1 0 0 10 2South Africa 653 653 653 476 476 720 741 695 509 491 12Sudan 2 2 2 2 2 5 5 2 2 20 1
Swaziland 8 8 8 8 8 8 8 8 8 8 8Tanzania 4 4 4 4 4 4 4 4 5 103 3Togo 1 1 1 1 1 0Tunisia 104 104 104 104 104 132 136 127 136 119 13Uganda 5 5 5 5 5 5 5 5 5 5 0Zambia 18 18 18 18 18 18 18 18 19 25 3Zimbabwe 41 41 50 75 75 39 39 48 73 54 5
N C America 46822 49725 51778 53314 55569 46219 49019 51411 53789 56913 120
Antigua Barb 4 4 4 4 4 55Aruba 6 6 6 6 6 67Bahamas 18 15 17 14 16 55Barbados 7 7 16 15 15 55Bel ize 4 3 3 4 4 18Br Virgin Is 1 1 1 1 1 52Canada 8358 9963 11348 12127 13959 3443 4201 4455 3803 4530 148Cayman Is 5 5 5 5 5 141Costa Rica 74 74 74 74 74 57 58 61 61 60 16Cuba 149 149 149 149 149 152 155 160 160 160 14Dominica 2 3 2 2 5 71Dominican Rp 34 37 53 47 73 9El Salvador 10 16 21 25 24 4Greenland 5 5 5 5 5 92Grenada 3 3 4 4 4 43Guadeloupe 22 23 23 23 23 51Guatemala 43 43 43 43 43 45 49 48 60 59 5Haiti 9 7 8 7 7 1Honduras 15 15 16 19 20 22 22 23 22 17 3Jamaica 43 21 31 29 29 11MartiniqueMexicoNethAntillesNicaraguaPanamaSt Kitts NevSt LuciaSt VincentTrinidad TobTurks Caicos
521
521
521
521
523
767171030
1
74
221
7158181032
1
73
211
7204
131030
1
741
1
7321
161031
1
716
31
7473
231833
1
716
31
195
1094
123743
1393
80
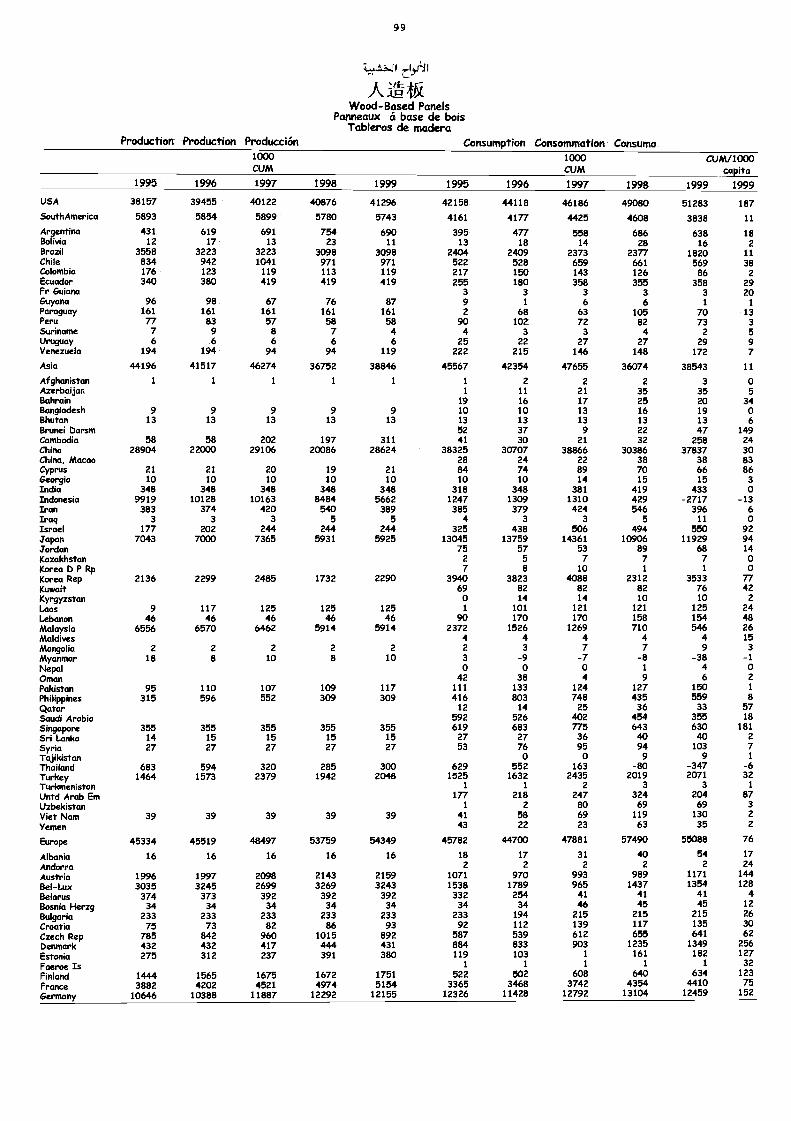
9 9
' I I
AWood-Based Panels
Panneaux á base de boisTableros de madera
Production Production Producción Consumption Consommation Consumo1000CUM
1000CUM
CUM/1000_c_41 i1p .1 1
19991995 1996 1997 1998 1999 1995 1996 1997 1998 1999
USA 38157 39455 40122 40876 41296 42158 44118 46186 49080 51283 187
SouthAmerica 5893 N54 5899 5780 5743 4161 4177 4425 4608 3838 11
Argentina 431 619 691 754 690 395 477 558 686 638 18Bolivia 12 17 13 23 11 13 18 14 28 16 2Brazil 3558 3223 3223 3098 3098 2404 2409 2373 2377 1820 11Chile 834 942 1041 971 971 522 528 659 661 569 38Colombia 176 123 119 113 119 217 150 143 126 86 2Ecuador 340 380 419 419 419 255 180 358 355 358 29Fr Guiana 3 3 3 3 3 20Guyana 96 98 67 76 87 9 1 6 6 1 1
Paraguay 161 161 161 161 161 2 68 63 105 70 13Peru 77 83 57 58 58 90 102 72 82 73 3Suriname 7 9 8 7 4 4 3 3 4 2 5Uruguay 6 6 6 6 6 25 22 27 27 29 9Venezuela 194 194 94 94 119 222 215 146 148 172 7Asia 44196 41517 46274 36752 38846 45567 42354 47655 36074 38543 11
Afghanistan 1 1 1 1 1 1 2 2 2 3 0Azerbai jan I 11 21 35 35 5Bahrain 19 16 17 25 20 34Bangladesh 9 9 9 9 9 10 10 13 16 19 oBhutan 13 13 13 13 13 13 13 13 13 13 6Brunei Darsm 52 37 9 22 47 149Cambodia 58 58 202 197 311 41 30 21 32 258 24China 28904 22000 29106 20086 28624 38325 30707 38866 30386 37837 30China, Macao 28 24 22 38 38 83Cyprus 21 21 20 19 21 84 74 89 70 66 86Georgia 10 10 10 10 10 10 10 14 15 15 3India 348 348 348 348 348 318 348 381 419 433 oIndonesia 9919 10128 10163 8484 5662 1247 1309 1310 429 -2717 -13Iran 383 374 420 540 389 385 379 424 546 396 6Iraq 3 3 3 5 5 4 3 3 5 11 0Israel 177 202 244 244 244 325 438 506 494 550 92.Tapan 7043 7000 7365 5931 5925 13045 13759 14361 10906 11929 94.Tordan 75 57 53 89 68 14Kazakhstan 2 5 7 7 7 oKorea D P Rp 7 8 10 1 1 0Korea Rep 2136 2299 2485 1732 2290 3940 3823 4088 2312 3533 77Kuwait 69 82 82 82 76 42Kyrgyzstan 0 14 14 10 10 2Laos 9 117 125 125 125 1 101 121 121 125 24Lebanon 46 46 46 46 46 90 170 170 158 154 48Malaysia 6556 6570 6462 5914 5914 2372 1526 1269 710 546 26Maldives 4 4 4 4 4 15Mongolia 2 2 2 2 2 2 3 7 7 9 3Myanmar 18 8 10 8 10 3 -9 -7 -8 -38 -INepal 0 o o 1 4 0Oman 42 38 4 9 6 2
Pakistan 95 110 107 109 117 111 133 124 127 150 IPhilippines 315 596 552 309 309 416 803 748 435 559 8
Qatar 12 14 25 36 33 57Saudi Arabia 592 526 402 454 355 18
Singapore 355 355 355 355 355 619 683 775 643 630 181Sri Lanka 14 15 15 15 15 27 27 36 40 40 2
Syria 27 27 27 27 27 53 76 95 94 103 7Tajikistan 0 o 9 9 1
Thailand 683 594 320 285 300 629 552 163 -80 -347 -6Turkey 1464 1573 2379 1942 2048 1525 1632 2435 2019 2071 32Turkmenistan 1 1 2 3 3 1
Untd Arab En 177 218 247 324 204 87Uzbekistan 1 2 80 69 69 3
Viet Nam 39 39 39 39 39 41 58 69 119 130 2
Yemen 43 22 23 63 35 2
Europe 45334 45519 48497 53759 54349 45782 44700 47881 57490 55088 76
Albania 16 16 16 16 16 18 17 31 40 54 17
Andorra 2 2 2 2 2 24Austria 1996 1997 2098 2143 2159 1071 970 993 989 1171 144Bel-Lux 3035 3245 2699 3269 3243 1538 1789 965 1437 1354 128
Beiarus 374 373 392 392 392 332 254 41 41 41 4Bosnia Herzg 34 34 34 34 34 34 34 46 45 45 12
Bulgaria 233 233 233 233 233 233 194 215 215 215 26
Croatia 75 73 82 86 93 92 112 139 117 135 30Czech Rep 785 842 960 1015 892 587 539 612 655 641 62Denmark 432 432 417 444 431 884 833 903 1235 1349 256Estonia 275 312 237 391 380 119 103 1 161 182 127
Faeroe Is 1 1 1 1 1 32
Finland 1444 1565 1675 1672 1751 522 502 608 640 634 123
France 3882 4202 4521 4974 5154 3365 3468 3742 4354 4410 75
Germany 10646 10388 11887 12292 12155 12326 11428 12792 13104 12459 152
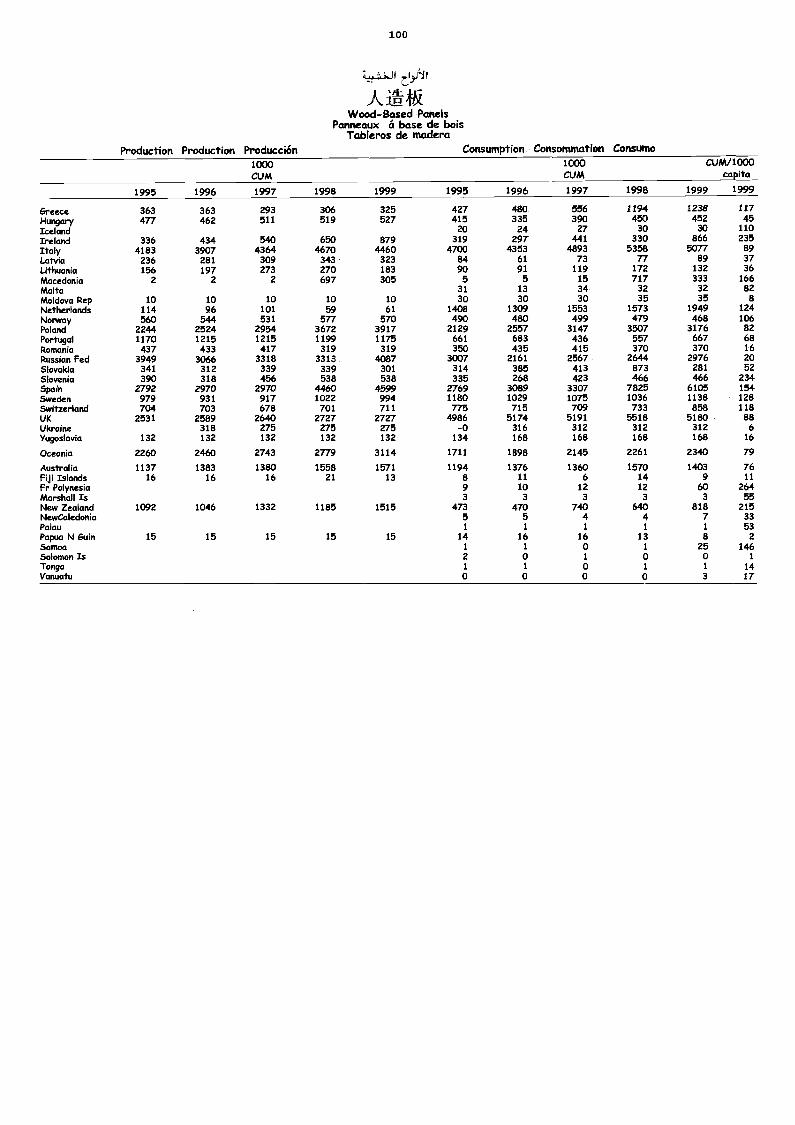
100
iFIAWood-Based Panels
Panneaux 6 base de boisTableros de madera
Production Production Producción Consumption Consommation Consumo1000CUM
1000CUM
CUM/1000capita
1995 1996 1997 1998 1999 1995 1996 1997 1998 1999 1999
Greece 363 363 293 306 325 427 480 556 1194 1238 117Hungary 477 462 511 519 527 415 335 390 450 452 45Iceland 20 24 27 30 30 110Ireland 336 434 540 650 879 319 297 441 330 866 235Italy 4183 3907 4364 4670 4460 4700 4353 4893 5358 5077 89Latvia 236 281 309 343 323 84 61 73 77 89 37Lithuada 156 197 273 270 183 90 91 119 172 132 36Macedonia 2 2 2 697 305 5 5 15 717 333 166Malta 31 13 34 32 32 82MaldovaRep 10 10 10 10 10 30 30 30 35 35 8Netherlands 114 96 101 59 61 1408 1309 1553 1573 1949 124Norway 560 544 531 577 570 490 480 499 479 468 106Pdand 2244 2524 2954 3672 3917 2129 2557 3147 3507 3176 82Portugal 1170 1215 1215 1199 1175 661 683 436 557 667 68Romania 437 433 417 319 319 350 435 415 370 370 16Russian Fed 3949 3066 3318 3313 4087 3007 2161 2567 2644 2976 20ShwoMa 341 312 339 339 301 314 385 413 873 281 52ShAeMa 390 318 456 538 538 335 268 423 466 466 234Spain 2792 2970 2970 4460 4599 2769 3089 3307 7825 6105 154Sweden 979 931 917 1022 994 1180 1029 1075 1036 1138 128Switzerland 704 703 678 701 711 775 715 709 733 858 118UK 2531 2589 2640 2727 2727 4986 5174 5191 5518 5180 88Ukraine 318 275 275 275 -0 316 312 312 312 6Yugoslavia 132 132 132 132 132 134 168 168 168 168 16
OceaMa 2260 2460 2743 2779 3114 1711 1898 2145 2261 2340 79
Australia 1137 1383 1380 1558 1571 1194 1376 1360 1570 1403 76Fiji IMands 16 16 16 21 13 8 11 6 14 9 11
FrPolynesia 9 10 12 12 60 264Marshals 3 3 3 3 3 55New Zealand 1092 1046 1332 1185 1515 473 470 740 640 818 215NewCakdonia 5 5 4 4 7 33Palau 1 1 1 1 1 53Papua N Gain 15 15 15 15 15 14 16 16 13 8 2StlITM 1 1 0 1 25 146Solomon Is 2 0 1 0 0 1
Tonga 1 1 0 1 1 14Vanuatu 0 0 0 0 3 17
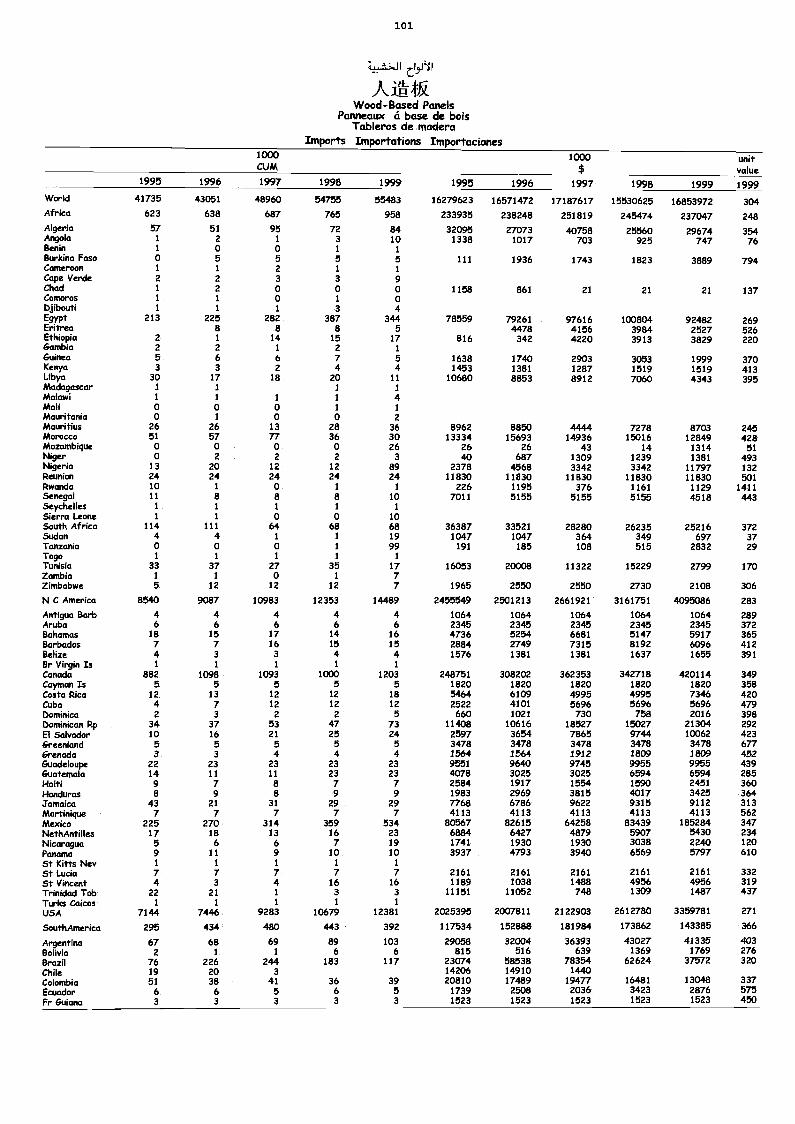
101
A I fk.Wood-Based Panels
Panneaux á base de boisTableros de madera
Imports Itnportations Importaciones1000CUM
1000$
unitvalue
1995 1996 1997 1998 1999 1995 1996 1997 1998 1999 1999World 41735 43051 48960 54755 55483 16279623 16571472 17187617 15530625 16853972 304Africa 623 638 687 765 958 233935 238248 251819 245474 237047 248Algeria 57 51 95 72 84 32095 27073 40758 25560 29674 354Angola 1 2 1 3 10 1338 1017 703 925 747 76Benin 1 0 0 1 1
Burkina Faso 0 5 5 5 5 111 1936 1743 1823 3889 794Cameroon 1 1 2 1 1
Cape Verde 2 2 3 3 9Chad 1 2 0 0 0 1158 861 21 21 21 137Comoros 1 1 0 1 0Djibouti 1 1 1 3 4Egypt 213 225 282 387 344 78559 79261 97616 100804 92482 269Eritrea 8 8 8 5 4478 4156 3984 2527 526Ethiopia 2 1 14 15 17 816 342 4220 3913 3829 220Gambia 2 2 1 2 1Guinea 5 6 6 7 5 1638 1740 2903 3053 1999 370Kenya 3 3 2 4 4 1453 1381 1287 1519 1519 413Libya 30 17 18 20 11 10680 8853 8912 7060 4343 395Madagascar 1 1 1 1
Malawi 1 1 1 1 4Mali 0 0 0 1 1Mauritania 0 1 0 0 2Mauritius 26 26 13 28 36 8962 8850 4444 7278 8703 245Morocco Si 57 77 36 30 13334 15693 14936 15016 12849 428Mozambique 0 0 0 0 26 26 26 43 14 1314 SiNiger 0 2 2 2 3 40 687 1309 1239 1381 493Nigeria 13 20 12 12 89 2378 4568 3342 3342 11797 132Reunion 24 24 24 24 24 11830 11830 11830 11830 11830 501Rwanda 10 1 0 1 1 226 1195 376 1161 1129 1411Senegal 11 8 8 8 10 7011 5155 5155 5155 4518 443Seychelles 1 1 1 1 1
Sierra Leone 1 1 0 0 10South Africa 114 111 64 68 68 36387 33521 28280 26235 25216 372Sudan 4 4 1 1 19 1047 1047 364 349 697 37Tanzania 0 0 0 1 99 191 185 108 515 2832 29Togo 1 1 1 1 1
Tunisia 33 37 27 35 17 16053 20008 11322 15229 2799 170Zambia 1 1 0 1 7Zimbabwe 5 12 12 12 7 1965 2550 2550 2730 2108 306
N C America 8540 9087 10983 12353 14489 2455549 2501213 2661921 3161751 4095086 283
Antigua Barb 4 4 4 4 4 1064 1064 1064 1064 1064 289Aruba 6 6 6 6 6 2345 2345 2345 2345 2345 372Bahamas 18 15 17 14 16 4736 5254 6681 5147 5917 365Barbados 7 7 16 15 15 2884 2749 7315 8192 6096 412Belize 4 3 3 4 4 1576 1381 1381 1637 1655 391Br Virgin Is 1 1 1 1 1
Canada 882 1098 1093 1000 1203 248751 308202 362353 342718 420114 349Caytnan Is 5 5 5 5 5 1820 1820 1820 1820 1820 358Costa Rica 12 13 12 12 18 5464 6109 4995 4995 7346 420Cuba 4 7 12 12 12 2522 4101 5696 5696 5696 479Dominica 2 3 2 2 5 660 1021 730 758 2016 398Dominican Rp 34 37 53 47 73 11408 10616 18527 15027 21304 292El Salvador 10 16 21 25 24 2597 3654 7865 9744 10062 423Greenland 5 5 5 5 5 3478 3478 3478 3478 3478 677Grenada 3 3 4 4 4 1564 1564 1912 1809 1809 452Guadeloupe 22 23 23 23 23 9551 9640 9745 9955 9955 439Guatemala 14 11 11 23 23 4078 3025 3025 6594 6594 285Haiti 9 7 8 7 7 2584 1917 1554 1590 2451 360Honduras 8 9 8 9 9 1983 2969 3815 4017 3425 364Jamaica 43 21 31 29 29 7768 6786 9622 9315 9112 313Martinique 7 7 7 7 7 4113 4113 4113 4113 4113 562Mexico 225 270 314 359 534 80567 82615 64258 83439 185284 347NethAntilles 17 18 13 16 23 6884 6427 4879 5907 5430 234Nicaragua 5 6 6 7 19 1741 1930 1930 3038 2240 120Panama 9 11 9 10 10 3937 4793 3940 6569 5797 610St Kitts Nev 1 1 1 1 1
St Lucia 7 7 7 7 7 2161 2161 2161 2161 2161 332St Vincent 4 3 4 16 16 1189 1038 1488 4956 4956 319Trinidad Tob 22 21 1 3 3 11151 11052 748 1309 1487 437Turks Caicos 1 1 1 1 1
USA 7144 7446 9283 10679 12381 2025395 2007811 2122903 2612780 3359781 271
SouthAmerica 295 434 480 443 392 117534 152888 181984 173862 143385 366
Argentina 67 68 69 89 103 29058 32004 36393 43027 41335 403Bolivia 2 1 1 6 6 815 516 639 1369 1769 276Brazil 76 226 244 183 117 23074 58538 78354 62624 37572 320Chile 19 20 3 14206 14910 1440Colombia 51 38 41 36 39 20810 17489 19477 16481 13048 337Ecuador 6 6 5 6 5 1739 2508 2036 3423 2876 575Fr Guiana 3 3 3 3 3 1523 1523 1523 1523 1523 450
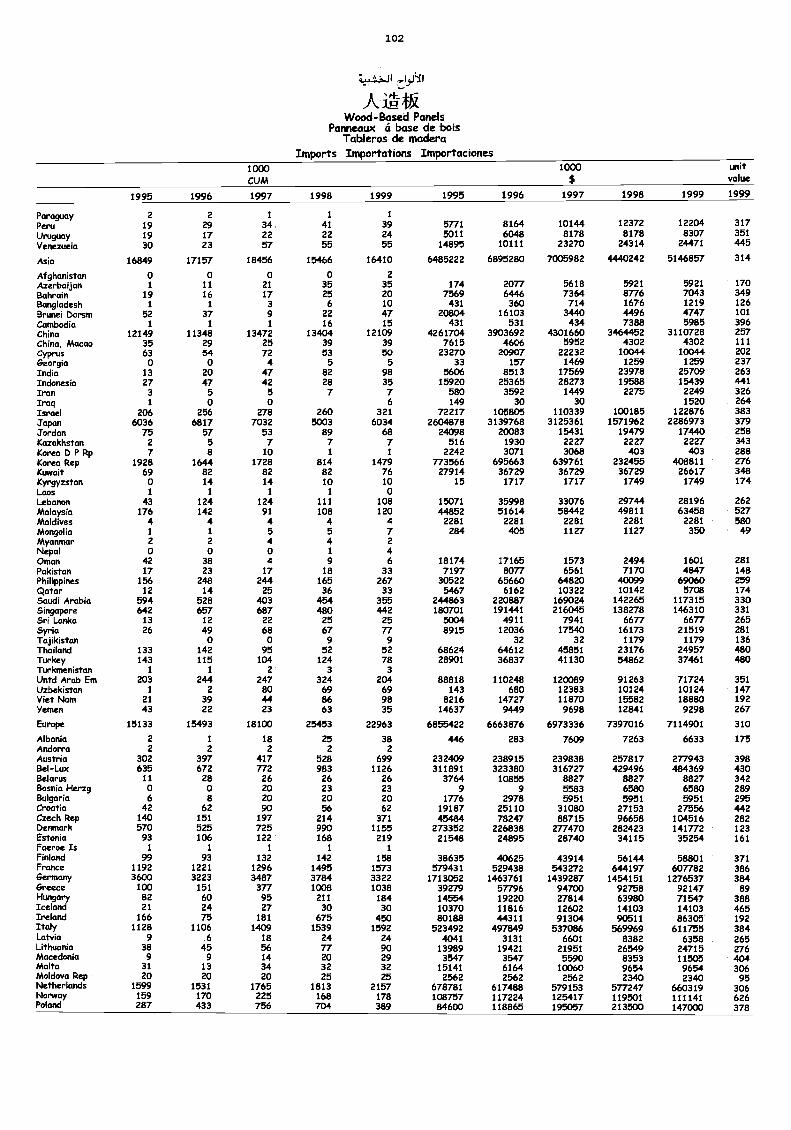
102
AZ-14Wood-Based Panels
Panneaux á base de boisTableros de madera
Imports Importations Importaciones1000CUM
1000$
unitvalue
1995 1996 1997 1998 1999 1995 1996 1997 1998 1999 1999
Paraguay 2 2 1 1 1
Peru 19 29 34 41 39 5771 8164 10144 12372 12204 317Uruguay 19 17 22 22 24 5011 6048 8178 8178 8307 351
Venezuela 30 23 57 55 55 14895 10111 23270 24314 24471 445
Asia 16849 17157 18456 15466 16410 6485222 6895280 7005982 4440242 5146857 314
Afghanistan 0 0 0 0 2Azerbaijan 1 11 21 35 35 174 2077 5618 5921 5921 170Bahrain 19 16 17 25 20 7569 6446 7364 8776 7043 349Bangladesh 1 1 3 6 10 431 360 714 1676 1219 126Brunei barsm 52 37 9 22 47 20804 16103 3440 4496 4747 101Cambodia 1 1 1 16 15 431 531 434 7388 5985 396China 12149 11348 13472 13404 12109 4261704 3903692 4301660 3464452 3110728 257China, Macao 35 29 25 39 39 7615 4606 5952 4302 4302 111Cyprus 63 54 72 53 50 23270 20907 22232 10044 10044 202Georgia 0 0 4 5 5 33 157 1469 1259 1259 237India 13 20 47 82 98 5606 8513 17569 23978 25709 263Indonesia 27 47 42 28 35 15920 25365 28273 19588 15439 441Iran 3 5 5 7 7 580 3592 1449 2275 2249 326Iraq 1 0 0 6 149 30 30 1520 264Israel 206 256 278 260 321 72217 105805 110339 100185 122876 383Japan 6036 6817 7032 5003 6034 2604878 3139768 3125361 1571962 2286973 379Jordan 75 57 53 89 68 24098 20083 15431 19479 17440 258Kazakhstan 2 5 7 7 7 516 1930 2227 2227 2227 343Korea 0 P Rp 7 8 10 1 1 2242 3071 3068 403 403 288Korea Rep 1928 1644 1728 814 1479 773566 695663 639761 232455 408811 276Kuwait 69 82 82 82 76 27914 36729 36729 36729 26617 348Kyrgyzstan 0 14 14 10 10 15 1717 1717 1749 1749 174Laos 1 1 1 1 0Lebanon 43 124 124 111 108 15071 35998 33076 29744 28196 262Malaysia 176 142 91 108 120 44852 51614 58442 49811 63458 527Maldives 4 4 4 4 4 2281 2281 2281 2281 2281 580Mongolia 1 1 5 5 7 284 405 1127 1127 350 49Myanmar 2 2 4 4 2Nepal 0 0 0 1 4Oman 42 38 4 9 6 18174 17165 1573 2494 1601 281Pakistan 17 23 17 18 33 7197 8077 6561 7170 4847 148Philippines 156 248 244 165 267 30522 65660 64820 40099 69060 259Qatar 12 14 25 36 33 5467 6162 10322 10142 5708 174Saudi Arabia 594 528 403 454 355 244863 220887 169024 142265 117315 330Singapore 642 657 687 480 442 180701 191441 216045 138278 146310 331Sri Lanka 13 12 22 25 25 5004 4911 7941 6677 6677 265Syria 26 49 68 67 77 8915 12036 17540 16173 21519 281Tajikistan 0 0 9 9 32 32 1179 1179 136Thailand 133 142 95 52 52 68624 64612 45851 23176 24957 480Turkey 143 115 104 124 78 28901 36837 41130 54862 37461 480Turkmenistan 1 1 2 3 3Untd Arab Em 203 244 247 324 204 88818 110248 120089 91263 71724 351Uzbekistan 1 2 80 69 69 143 680 12383 10124 10124 147Viet Nam 21 39 44 86 98 8216 14727 11870 15582 18880 192Yemen 43 22 23 63 35 14637 9449 9698 12841 9298 267
Europe 15133 15493 18100 25453 22963 6855422 6663876 6973336 7397016 7114901 310Albania 2 1 18 25 38 446 283 7609 7263 6633 175Andorra 2 2 2 2 2Austria 302 397 417 528 699 232409 238915 239838 257817 277943 398Bel-Lux 635 672 772 983 1126 311891 323380 316727 429496 484369 430Belarus 11 28 26 26 26 3764 10855 8827 8827 8827 342Bosnia Herzg 0 0 20 23 23 9 9 5583 6580 6580 289Bulgaria 6 8 20 20 20 1776 2978 5951 5951 5951 295Croatia 42 62 90 56 62 19187 25110 31080 27153 27556 442Czech Rep 140 151 197 214 371 45484 78247 88715 96658 104516 282tienmark 570 525 725 990 1155 273352 226838 277470 282423 141772 123Estonia 93 106 122 168 219 21548 24895 28740 34113 35254 161Faeroe Is 1 1 1 1 1
Finland 99 93 132 142 158 38635 40625 43914 56144 58801 371France 1192 1221 1296 1495 1573 579431 529438 543272 644197 607782 386Germany 3600 3223 3487 3784 3322 1713052 1463761 1439287 1454151 1276537 384Greece 100 151 377 1008 1038 39279 57796 94700 92758 92147 89Hungary 82 60 95 211 184 14554 19220 27814 63980 71547 388Iceland 21 24 27 30 30 10370 11816 12602 14103 14103 465Ireland 166 75 181 675 450 80188 44311 91304 90511 86305 192Italy 1128 1106 1409 1539 1592 523492 497849 537086 569969 611755 384Latvia 9 6 18 24 24 4041 3131 6601 8382 6358 265Lithuania 38 45 56 77 90 13989 19422 21951 26549 24715 276Macedonia 9 9 14 20 29 3547 3547 5590 8353 11505 404Malta 31 13 34 32 32 15141 6164 10060 9654 9654 306Moldova Rep 20 20 20 25 25 2562 2562 2562 2340 2340 95Netherlands 1599 1531 1765 1813 2157 678781 617488 579153 577247 660319 306Nonvay 159 170 225 168 178 108757 117224 125417 119501 111141 626Poland 287 433 756 704 389 84600 118865 195057 213500 147000 378
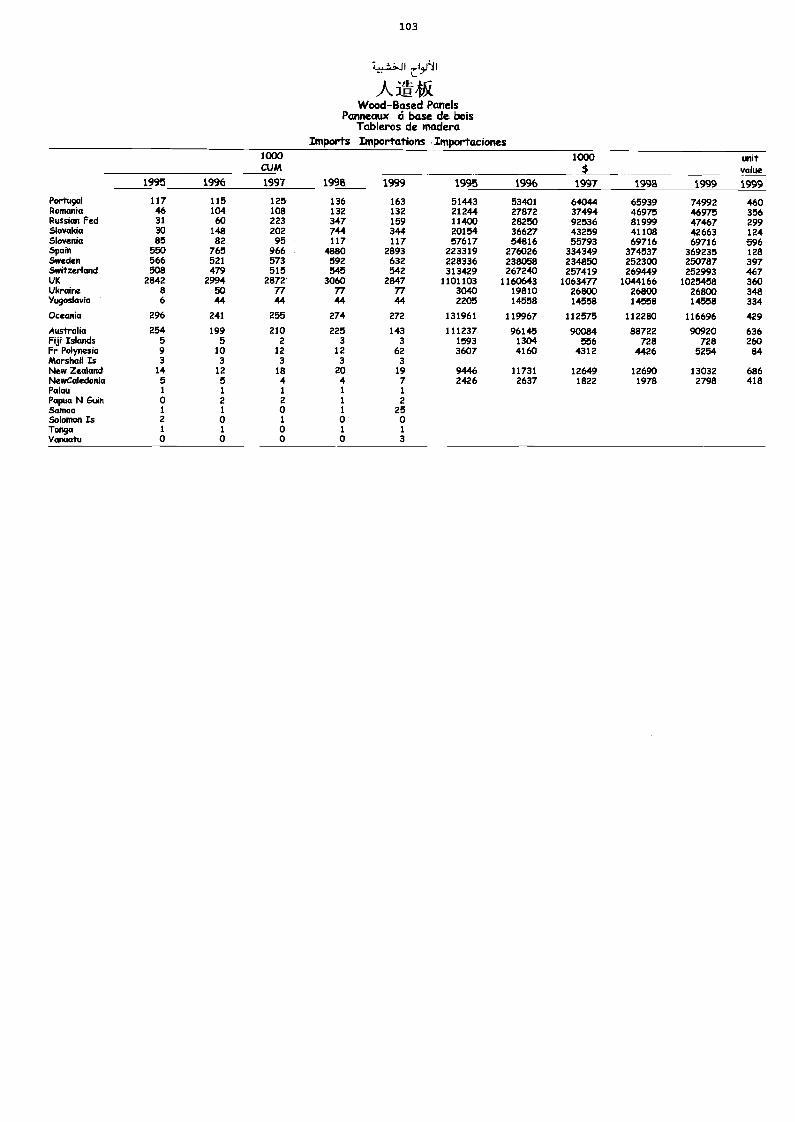
1 0 3
"Wood-Based Panels
Panneaux ci base de boisTableros de madera
Imports Importations Importaciones1000CUM
1000$
unitvalue
1995 1996 1997 1998 1999 1995 1996 1997 1998 1999 1999
Portugal 117 115 125 136 163 51443 53401 64044 65939 74992 460Romania 46 104 108 132 132 21244 27872 37494 46975 46975 356Russian Fed 31 60 223 347 159 11400 28250 92536 81999 47467 299Skwakia 30 148 202 744 344 20154 36627 43259 41108 42663 124SkweMa 85 82 95 117 117 57617 54816 55793 69716 69716 596Spain 550 765 966 4880 2893 223319 276026 334349 374537 369235 128Sweden 566 521 573 592 632 228336 238058 234850 252300 250787 397Switzerland 508 479 515 545 542 313429 267240 257419 269449 252993 467UK 2842 2994 2872 3060 2847 1101103 1160643 1063477 1044166 1025458 360Ukraine 8 50 77 77 77 3040 19810 26800 26800 26800 348Yugoslavia 6 44 44 44 44 2205 14558 14558 14558 14558 334
OceaMa 296 241 255 274 272 131961 119967 112575 112280 116696 429
Australia 254 199 210 225 143 111237 96145 90084 88722 90920 636FijiIMands 5 5 2 3 3 1593 1304 556 728 728 260FrPolynesia 9 10 12 12 62 3607 4160 4312 4426 5254 84Marshals 3 3 3 3 3NiemiZeakmd 14 12 18 20 19 9446 11731 12649 12690 13032 686NWwCaksionia 5 5 4 4 7 2426 2637 1822 1978 2798 418Palau 1 1 1 1 1
Papua N Guin 0 2 2 1 2Samoa 1 1 0 1 25SoloMon Is 2 0 1 0 0Tanga 1 1 0 1 1
Vanuatu 0 0 0 0 3
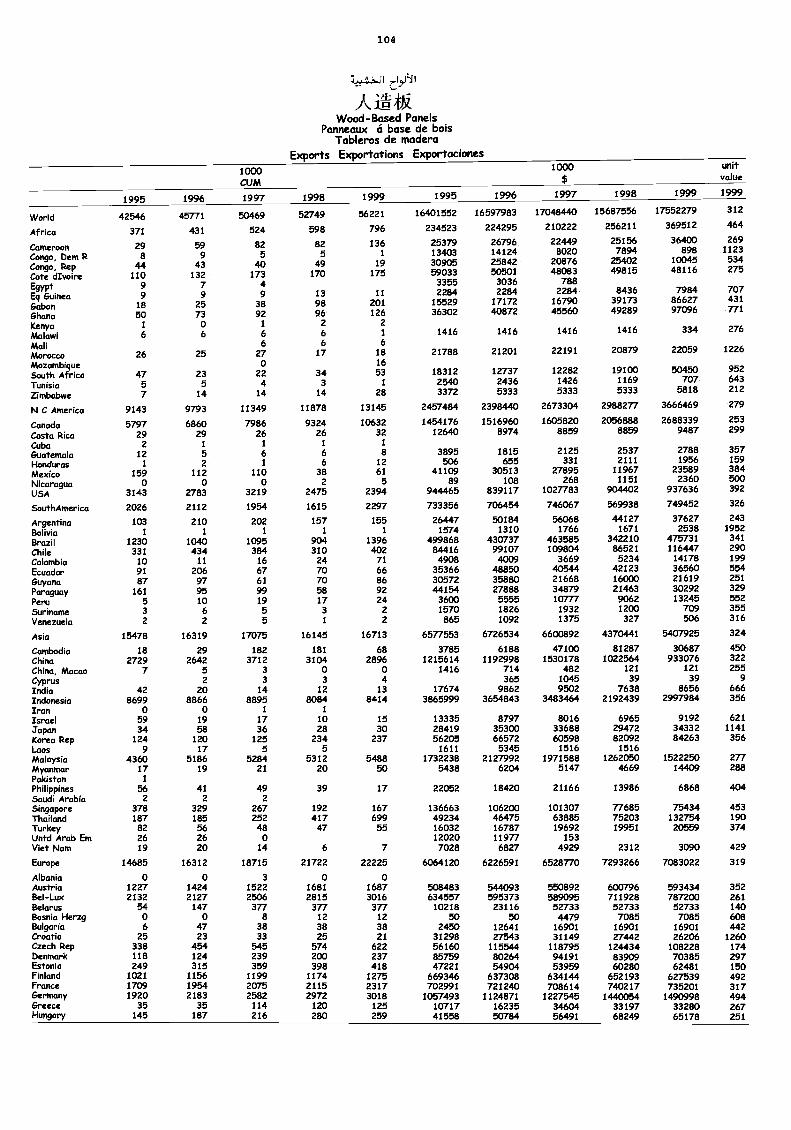
109
c..01
A itit.Wood-Based Panels
Panneaux et base de boisTableros de madera
Exports Exportations Exportaciones1000 1000 unit
valueCUM
1995 1996 1997 1998 1999 1995 1996 1997 1998 1999 1999
World 42546 45771 50469 52749 56221 16401552 16597983 170484-40 15687556 17552279 312
Africa 371 431 524 598 796 234523 224295 210222 256211 369512 464
CameroonCongo, Dem R
298
599
825
825
1361
2537913403
2679614124
224498020
251567894
36400898
2691123534
Congo, Rep 44 43 40 49 19 30905 25842 20876 25402 10045275
Cote dIvoire 110 132 173 170 175 59033 50501 48083 49815 48116
EgyptEq Guinea
99
7'9
49 13 11
33552284
30362284
7882284 8436 7984 707
431Gabon 18 25 38 98 201 15529 17172 16790 39173 86627
Ghana 50 73 92 96 126 36302 40872 45560 49289 97096 771
Kenya 1 0 1 2 2
Malawi 6 6 6 6 1 1416 1416 1416 1416 334 276
Mali 6 6 6
Morocco 26 25 27 17 18 21788 21201 22191 20879 22059 1226
Mozambique 0 16
South Africa 47 23 22 34 53 18312 12737 12282 19100 50450 952
Tunisia 5 5 4 3 1 2540 2436 1426 1169 707 643
Zimbabwe 7 14 14 14 28 3372 5333 5333 5333 5818 212
N C America 9143 9793 11349 11878 13145 2457484 2398440 2673304 2988277 3666469 279
Canada 5797 6860 7986 9324 10632 1454176 1516960 1605820 2056888 2688339 253
Costa Rica 29 29 26 26 32 12640 8974 8859 8859 9487 299
Cuba 2 1 1 1 1
Guatemala 12 5 6 6 8 3895 1815 2125 2537 2788 357
Honduras 1 2 1 6 12 506 655 331 2111 1956 159
Mexico 159 112 110 38 61 41109 30513 27895 11967 23589 384
Nicaragua 0 o o 2 5 89 108 268 1151 2360 500
USA 3143 2783 3219 2475 2394 944465 839117 1027783 904402 937636 392
SouthAmerica 2026 2112 1954 1615 2297 733356 706454 746067 569938 749452 326
Argentina 103 210 202 157 155 26447 50184 56068 44127 37627 243
Bolivia 1 1 1 1 1 1574 1310 1766 1671 2538 1952
Brazil 1230 1040 1095 904 1396 499868 430737 463585 342210 475731 341
Chile 331 434 384 310 402 84416 99107 109804 86521 116447 290
Colombia 10 11 16 24 71 4908 4009 3669 5234 14178 199
Ecuador 91 206 67 70 66 35366 48850 40544 42123 36560 554
Guyana 87 97 61 70 86 30572 35880 21668 16000 21619 251
Paraguay 161 95 99 58 92 44154 27888 34879 21463 30292 329
Peru 5 10 19 17 24 3600 5555 10777 9062 13245 552
Suriname 3 6 5 3 2 1570 1826 1932 1200 709 355
Venezuela 2 2 5 1 2 865 1092 1375 327 506 316
Asia 15478 16319 17075 16145 16713 6577553 6726534 6600892 4370441 5407925 324
Cambodia 18 29 182 181 68 3785 6188 47100 81287 30687 450China 2729 2642 3712 3104 2896 1215614 1192998 1530178 1022564 933076 322China, Macao 7 5 3 0 0 1416 714 482 121 121 255Cyprus 2 3 3 4 365 1045 39 39 9India 42 20 14 12 13 17674 9862 9502 7638 8656 666Indonesia 8699 8866 8895 8084 8414 3865999 3654843 3483464 2192439 2997984 356Iran 0 0 1 1
Israel 59 19 17 10 15 13335 8797 8016 6965 9192 621
Japan 34 58 36 28 30 28419 35300 33688 29472 34332 1141Korea Rep 124 120 125 234 237 56205 66572 60598 82092 84263 356Laos 9 17 5 5 1611 5345 1516 1516Malaysia 4360 5186 5284 5312 5488 1732238 2127992 1971588 1262050 1522250 277Myanmar 17 19 21 20 50 5438 6204 5147 4669 14409 288Pakistan 1
Philippines 56 41 49 39 17 22052 18420 21166 13986 6868 404Saudi Arabia 2 2 zSingapore 378 329 267 192 167 136663 106200 101307 77685 75434 453Thailand 187 185 252 417 699 49234 46475 63885 75203 132754 190Turkey 82 56 48 47 55 16032 16787 19692 19951 20559 374Untd Arab Em 26 26 0 12020 11977 153Viet Nam 19 20 14 6 7 7028 6827 4929 2312 3090 429
Europe 14685 16312 18715 21722 22225 6064120 6226591 6528770 7293266 7083022 319
Albania o o 3 o oAustria 1227 1424 1522 1681 1687 508483 544093 550892 600796 593434 352Bel-Lux 2132 2127 2506 2815 3016 634557 595373 589095 711928 787200 261Belarus 54 147 377 377 377 10218 23116 52733 52733 52733 140Bosnia Herzg o 0 8 12 12 50 50 4479 7085 7085 608Bulgaria 6 47 38 38 38 2450 12641 16901 16901 16901 442Croatia 25 23 33 25 21 31298 27543 31149 27442 26206 1260Czech Rep 338 454 545 574 622 56160 115544 118795 124434 108228 174Denmark 118 124 239 200 237 85759 80264 94191 83909 70385 297Estonia 249 315 359 398 418 47221 54904 53959 60280 62481 150Finland 1021 1156 1199 1174 1275 669346 637308 634144 652193 627539 492France 1709 1954 2075 2115 2317 702991 721240 708614 740217 735201 317Germany 1920 2183 2582 2972 3018 1057493 1124871 1227545 1440054 1490998 494Greece 35 35 114 120 125 10717 16235 34604 33197 33280 267Hungary 145 187 216 280 259 41558 50784 56491 68249 65178 251
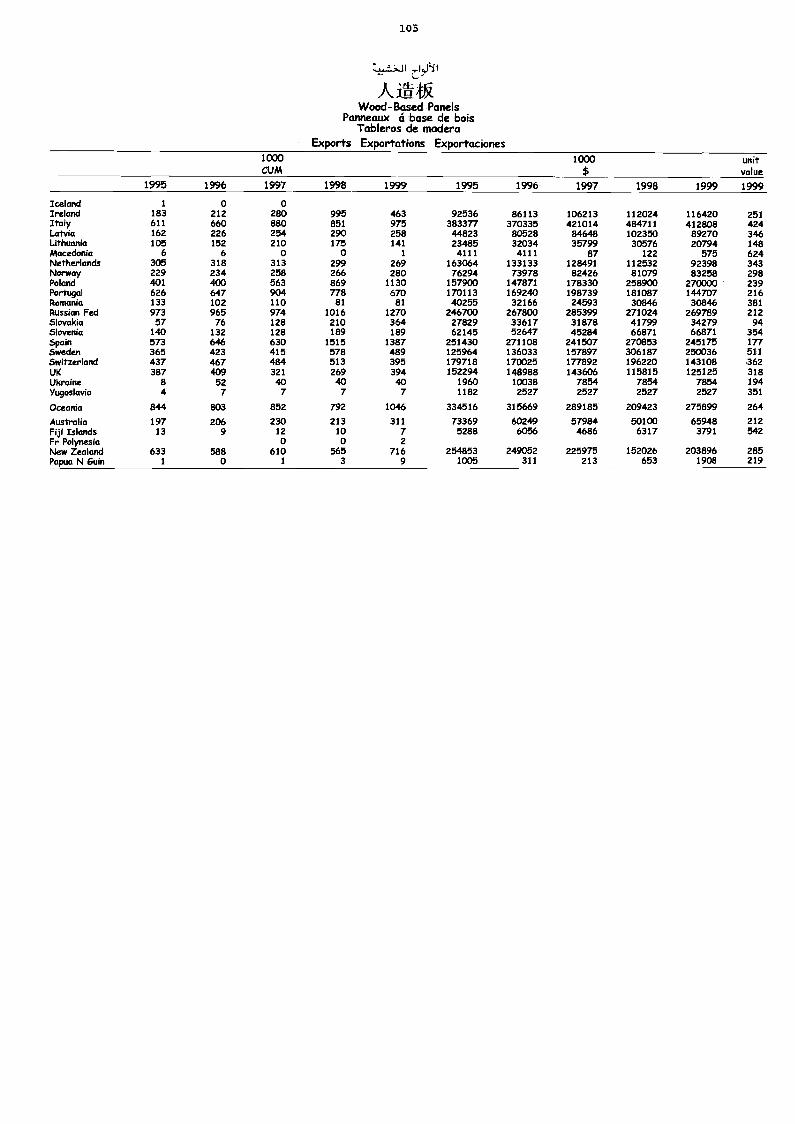
105
ALIPI*Wood-Based Panels
Panneaux et base de boisTableros de madera
Exports Exportations Exportaciones1000CUM
1000 unitvalue
1995 1996 1997 1998 1999 1995 1996 1997 1998 1999 1999
Iceland / 0 0Ireload 183 212 280 995 463 92536 86113 106213 112024 116420 251Italy 611 660 880 851 975 383377 370335 421014 484711 412808 424Latvia 162 226 254 290 258 44823 80528 84648 102350 89270 346Lithuania 105 152 210 175 141 23485 32034 35799 30576 20794 148Mooed:mkt 6 6 0 0 1 4111 4111 87 122 575 624Netherlands 305 318 313 299 269 163064 133133 128491 112532 92398 343Norway 229 234 258 266 280 76294 73978 82426 81079 83258 298PoMnd 401 400 563 869 1130 157900 147871 178330 258900 270000 239Portugal 626 647 904 778 670 170113 169240 198739 181087 144707 216RomoMa 133 102 110 81 81 40255 32166 24593 30846 30846 381RussianFed 973 965 974 1016 1270 246700 267800 285399 271024 269789 212SlovaMa 57 76 128 210 364 27829 33617 31878 41799 34279 94SloveMa 140 132 128 189 189 62145 52647 45284 66871 66871 354SpaM 573 646 630 1515 1387 251430 271108 241507 270853 245175 177Sweden 365 423 415 578 489 125964 136033 157897 106187 250036 511Switzerland 437 467 484 513 395 179718 170025 177892 196220 143108 362UK 387 409 321 269 394 152294 148988 143606 115815 125125 318UkraMe 8 52 40 40 40 1960 10038 7854 7854 7854 194Yugoslavia 4 7 7 7 7 1182 2527 2527 2527 2527 351
Oceania 844 803 852 792 1046 334516 315669 289185 209423 275899 264
Australia 197 206 230 213 311 73369 60249 57984 50100 65948 212Fiji Islands 13 9 12 10 7 5288 6056 4686 6317 3791 542FrPMyneMa 0 0 2New Zealand 633 588 610 565 716 254853 249052 225975 152026 203896 285Papua N Guin 1 0 1 3 9 1005 311 213 653 1908 219
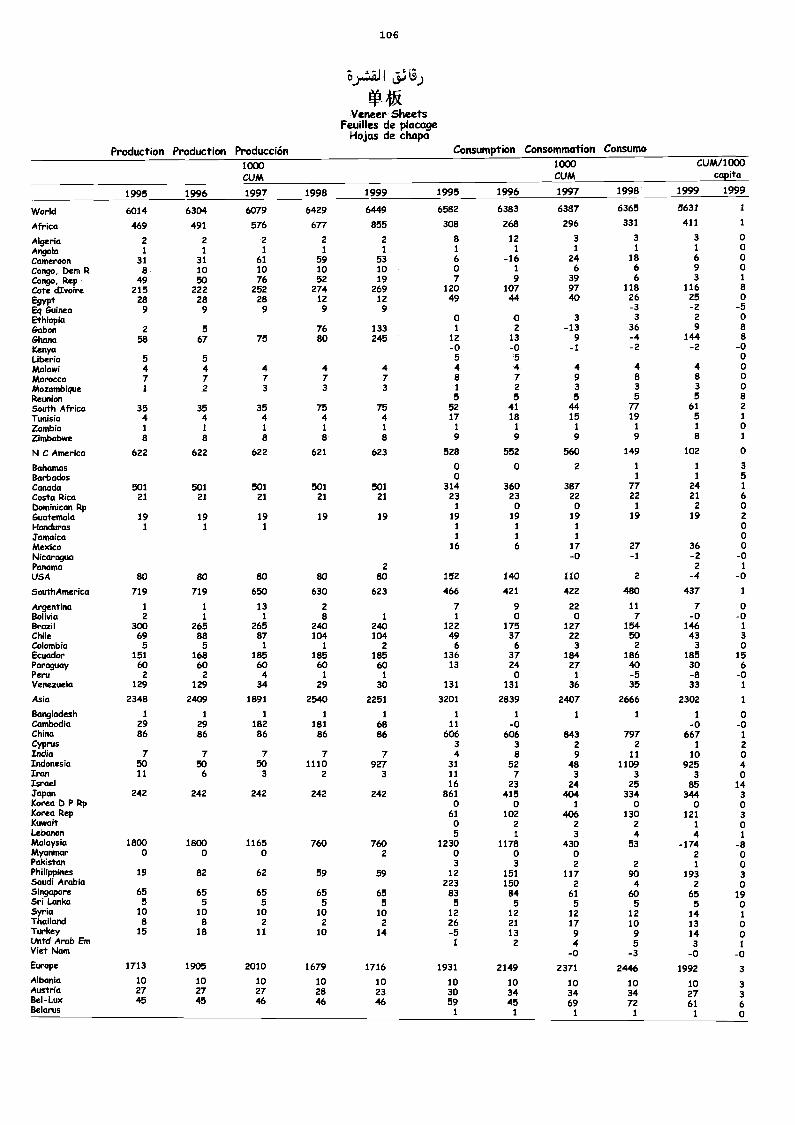
106
"ci P.B.)
Veneer SheetsFeuilles de placage
Hojas de chapaProduction Production Producción Consumption Consomrnation Consumo
1000CUM
1000CUM
CUM/1000capita
1995 1996 1997 1998 1999 1995 1996 1997 1998 1999 1999
World 6014 6304 6079 6429 6449 6582 6383 6387 6365 5631 1
Africa 469 491 576 677 855 308 268 296 331 411 1
Algeria 2 2 2 2 2 8 12 3 3 3 oAngola 1 1 1 1 1 1 1 1 1 1 oCameroon 31 31 61 59 53 6 -16 24 18 6 oCongo, Dem R 8 10 10 10 10 0 1 6 6 9 oCongo, Rep 49 50 76 52 19 7 9 39 6 3 1
Cote dIvoire 215 222 252 274 269 120 107 97 118 116 aEgypt 28 28 28 12 12 49 44 40 26 25 0Eq Guinea 9 9 9 9 9 -3 -2 -5Ethiopia 0 o 3 3 2 0
Gabon 2 5 76 133 1 2 -13 36 9 8Ghana 58 67 75 80 245 12 13 9 -4 144 8Kenya -o -0 -1 -2 -2 -oUberia 5 5 5 5 oMalawi 4 4 4 4 4 4 4 4 4 4 o1Viorocco 7 7 7 7 7 8 7 9 8 8 oMozambique 1 2 3 3 3 1 2 3 3 3 0Reunion 5 5 5 5 5 8
South Africa 35 35 35 75 75 52 41 44 77 61 2
Tunisia 4 4 4 4 4 17 18 15 19 5 1
Zambia 1 1 1 1 1 1 1 1 1 1 0Zimbabwe 8 8 a 8 8 9 9 9 9 8 1
N C America 622 622 622 621 623 528 552 560 149 102 o
Bahamas o 0 2 1 1 3Barbados 0 1 1 5Canada 501 501 501 501 501 314 360 387 77 24 1
Costa Rica 21 21 21 21 21 23 23 22 22 21 6Dominican Rp 1 o o 1 2 oGuatemala 19 19 19 19 19 19 19 19 19 19 2Honduras 1 1 1 1 1 1 oJamaica 1 1 1 oMexico 16 6 17 27 36 oNicaragua -0 -1 -2 -oPanama 2 2 1
USA 80 so ao 80 so 152 140 110 2 -4 -oSouthAmerica 719 719 650 630 623 466 421 422 480 437 1
Argentina 1 1 13 2 7 9 22 11 7 0Bolivia 2 1 1 8 1 1 0 0 7 -0 -0Brazil 300 265 265 240 240 122 175 127 154 146 1
Chile 69 88 87 104 104 49 37 22 50 43 3Colombia 5 5 1 1 2 6 6 3 2 3 0Ecuador 151 168 185 185 185 136 37 184 186 185 15Paraguay 60 60 60 so 60 13 24 27 40 30 6Peru 2 2 4 1 1 0 1 -5 -8 -0Venezuela 129 129 34 29 30 131 131 36 35 33 1
Asia 2348 2409 1891 2540 2251 3201 2839 2407 2666 2302 1
Bangladesh 1 1 1 1 1 1 1 1 1 1 oCambodia 29 29 182 181 68 11 -o -o -oChina 86 86 86 86 86 606 606 843 797 667 1
Cyprus 3 3 2 2 1 2India 7 7 7 7 7 4 8 9 11 10 oIndonesia 50 50 50 1110 927 31 52 48 1109 925 4Iran 11 6 3 2 3 11 7 3 3 3 oIsrael 16 23 24 25 85 14japan 242 242 242 242 242 861 415 404 334 344 3Korea D P Rp o 0 1 o o oKorea Rep 61 102 406 130 121 3Kuwait o 2 2 2 1 oLebanon 5 I 3 4 4 1
Malaysia 1800 1800 1165 760 760 1230 1178 430 53 -174 -8Myanmar o o o 2 o o 0 2 0Pakistan 3 3 2 2 1 oPhilippines 19 82 62 59 59 12 151 117 90 193 3Saudi Arabia 223 150 2 4 2 oSingapore 65 65 65 65 65 83 54 61 60 65 19Sri Lanka 5 5 5 5 5 5 5 5 5 5 oSyria 10 10 10 10 10 12 12 12 12 14 1Thailand 8 8 2 2 2 26 21 17 10 13 oTurkey 15 18 11 10 14 -5 13 9 9 14 oUnto, Arab Em 1 2 4 5 3 1
Viet Nam -0 -3 -o -oEurope 1713 1905 2010 1679 1716 1931 2149 2371 2446 1992 3Albania 10 10 10 10 10 10 10 10 10 10 3Austria 27 27 27 28 23 30 34 34 34 27 3Bel-Lux 45 45 46 46 as 59 45 69 72 61 6Belarus 1 1 1 1 1 0
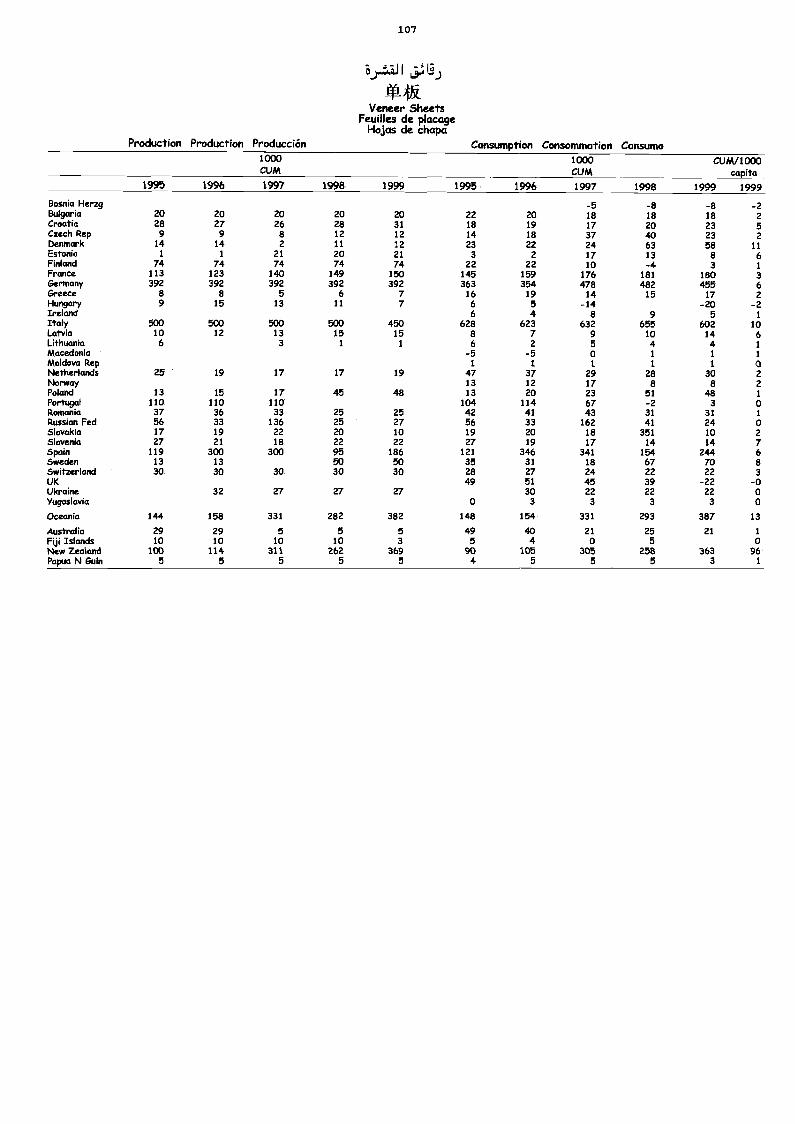
107
B)-tal 1 L)0 4k.
Veneer SheetsFeuilles de placage
Hojas de chapaProduction Production Producción Consumption Consornmation Consumo
1000CUM
1000CUM
cUM/1000capita
1999 19991995 1996 1997 1998 1999 1995 1996 1997 1998
Bosnia Herzg -5 -a -8 -2Bulgaria 20 20 20 20 20 22 20 18 18 18 2Croatia 28 27 26 28 31 18 19 17 20 23 5Czech Rep 9 9 s 12 12 14 18 37 40 23 21>etuttark 14 14 2 11 12 23 22 24 63 58 11Estonia 1 1 21 20 21 3 2 17 13 8 6Finland 74 74 74 74 74 22 22 10 -4 3 1France 113 123 140 149 150 145 159 176 181 180 3Germany 392 392 392 392 392 363 354 478 482 455 6Greece 8 8 5 6 7 16 19 14 15 17 2Hungary 9 15 13 11 7 6 5 -14 -20 -2Ireland 6 4 8 9 5 1
Italy 500 500 500 500 450 628 623 632 655 602 10Latvia 10 12 13 15 15 8 7 9 10 14 6Lithuania 6 3 1 1 6 2 5 4 4 1
Macedonia -5 -5 o 1 1 1
Moldova Rep 1 1 1 1 1 oNetherlands 25 19 17 17 19 47 37 29 28 30 2Norway 13 12 17 8 8 2Poland 13 15 17 45 48 13 20 23 51 48 1
Portugal 110 110 110 104 114 67 -2 3 0Romania 37 36 33 25 25 42 41 43 31 31 1
Russian Fed 56 33 136 25 27 56 33 162 41 24 oSlovakia 17 19 22 20 10 19 20 18 351 10 2Slovenia 27 21 18 22 22 27 19 17 14 14 7Spain 119 300 300 95 186 121 346 341 154 244 6Sweden 13 13 50 50 35 31 18 67 70 8Switzerland 30 30 30 30 30 28 27 24 22 22 3UK 49 51 45 39 -22 -0Ukraine 32 27 27 27 30 22 22 22 0Yugoslavia o 3 3 3 3 0
Oceania 144 158 331 282 382 148 154 331 293 387 13
Australia 29 29 5 5 5 49 ao 21 25 21 1
Fiji Islands 10 10 10 10 3 5 4 0 5 0New Zealand 100 114 311 262 369 90 105 305 258 363 96Papua N Guin 5 5 5 5 5 4 5 5 5 3 1
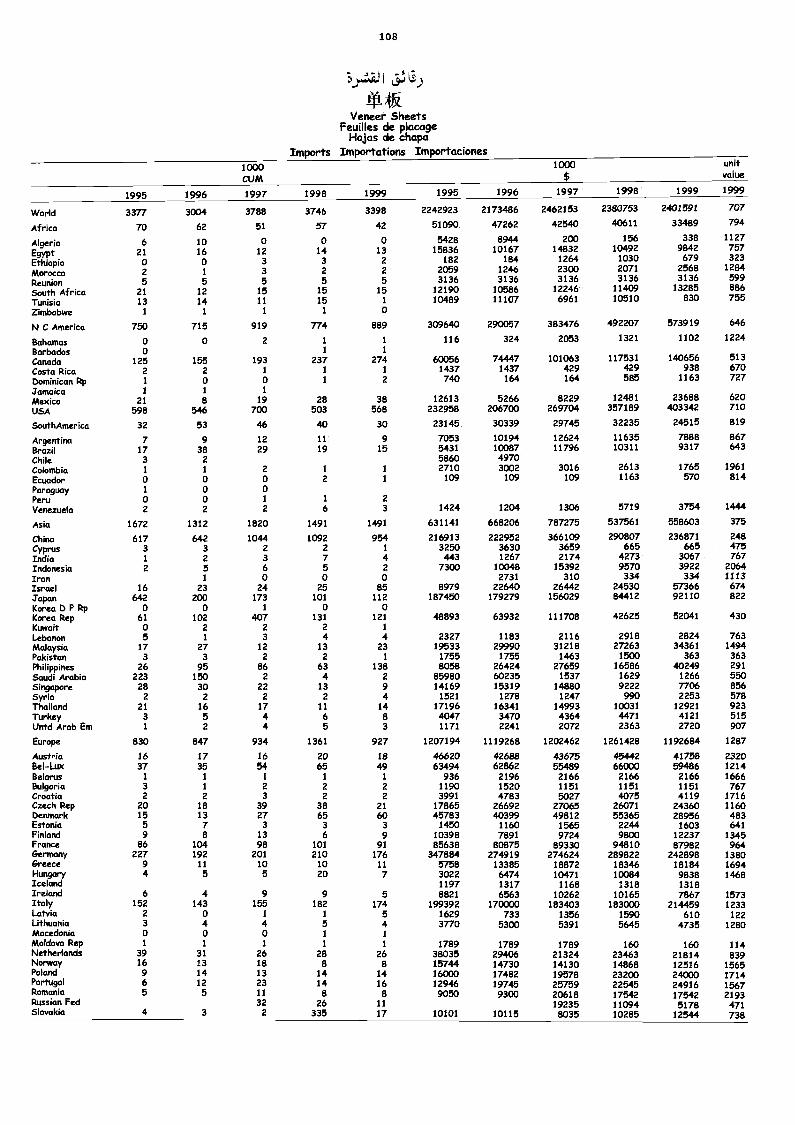
108
j...;\111
Veneer SheetsFeuilles de placage
Hojas de chapaImports Importations Importaciones
1000CUM
1000 univalue
1995 1996 1997 1998 1999 1995 1996 1997 1998 1999 1999
World 3377 3004 3788 3746 3398 2242923 2173486 2462153 2380753 2401591 707
Africa 70 62 51 57 42 51090 47262 42540 40611 33489 794
Algeria 6 10 0 0 o 5428 8944 200 156 338 1127
EgyptEthiopia
210
160
123
143
132
15836182
10167184
148321264
104921030
9842679
757323
Morocco 2 1 3 2 2 2059 1246 2300 2071 2568 1284
Reunion 5 5 5 5 5 3136 3136 3136 3136 3136 599
South Africa 21 12 15 15 15 12190 10586 12246 11409 13285 886
Tunisia 13 14 11 15 1 10489 11107 6961 10510 830 755
Zimbabwe 1 1 1 1 0
N C America 750 715 919 774 889 309640 290057 383476 492207 573919 646
Bahamas o 0 2 1 1 116 324 2053 1321 1102 1224
Barbados o I 1
Canada 125 155 193 237 274 60056 74447 101063 117531 140656 513
Costa Rica 2 2 1 1 1 1437 1437 429 429 938 670
Dominican Rp 1 0 0 1 2 740 164 164 585 1163 727
Jamaica I I 1
Mexico 21 8 19 28 38 12613 5266 8229 12481 23688 620
USA 598 546 700 503 568 232958 206700 269704 357189 403342 710
SouthAmerica 32 53 46 40 30 23145 30339 29745 32235 24515 819
Argentina 7 9 12 11 9 7053 10194 12624 11635 7888 867Brazil 17 38 29 19 15 5431 10087 11796 10311 9317 643
Chile 3 2 5860 4970Colombia 1 1 2 1 1 2710 3002 3016 2613 1765 1961
Ecuador 0 0 o 2 1 109 109 109 1163 570 814Paraguay 1 0 0Peru o o I I 2
Venezuela 2 2 2 6 3 1424 1204 1306 5719 3754 1444
Asia 1672 1312 1820 1491 1491 631141 668206 787275 537561 558603 375
China 617 642 1044 1092 954 216913 222952 366109 290807 236871 248Cyprus 3 3 2 2 1 3250 3630 3659 665 665 475India 1 2 3 7 4 443 1267 2174 4273 3067 767Indonesia 2 5 6 5 2 7300 10048 15392 9570 3922 2064Iran 1 0 o 0 2731 310 334 334 1113Israel 16 23 24 25 85 8979 22640 26442 24530 57366 674Japan 642 200 173 101 112 187450 179279 156029 84412 92110 822Korea D P Rp 0 0 1 o oKorea Rep 61 102 407 131 121 48893 63932 111708 42625 52041 430Kuwait 0 2 2 2 1
Lebanon 5 1 3 4 4 2327 1183 2116 2918 2824 763Malaysia 17 27 12 13 23 19533 29990 31218 27263 34361 1494Pakistan 3 3 2 2 1 1755 1755 1463 1500 363 363Philippines 26 95 86 63 138 8058 26424 27659 16586 40249 291Saudi Arabia 223 150 2 4 2 85980 60235 1537 1629 1266 550Singapore 28 30 22 13 9 14169 15319 14880 9222 7706 856Syria 2 2 2 2 4 1521 1278 1247 990 2253 578Thailand 21 16 17 11 14 17196 16341 14993 10031 12921 923Turkey 3 5 4 6 8 4047 3470 4364 4471 4121 515Untd Arab Em 1 2 4 5 3 1171 2241 2072 2363 2720 907
Europe 830 847 934 1361 927 1207194 1119268 1202462 1261428 1192684 1287
Austria 16 17 16 20 18 46620 42688 43675 45942 41758 2320Bel-Lux 37 35 54 65 49 63494 62862 55489 66000 59486 1214Belarus 1 1 1 1 1 936 2196 2166 2166 2166 1666Bulgaria 3 1 2 2 2 1190 1520 1151 1151 1151 767Croatia 2 2 3 2 2 3991 4783 5027 4075 4119 1716Czech Rep 20 18 39 38 21 17865 26692 27065 26071 24360 1160Denmark 15 13 27 65 60 45783 40399 49812 55365 28956 483Estonia 5 7 3 3 3 1450 1160 1565 2244 1603 641Finland 9 a 13 6 9 10398 7891 9724 9800 12237 1345France 86 104 98 101 91 85638 80875 89330 94810 87982 964Germany 227 192 201 210 176 347884 274919 274624 289822 242898 1380Greece 9 11 10 10 11 5758 13385 18872 18346 18184 1694Hungary 4 5 5 20 7 3022 6474 10471 10084 9838 1468Iceland 1197 1317 1168 1318 1318Ireland 6 4 9 9 5 8821 6563 10262 10165 7867 1573Italy 152 143 155 182 174 199392 170000 183403 183000 214459 1233Latvia 2 o 1 1 5 1629 733 1356 1590 610 122Lithuania 3 4 4 5 4 3770 5300 5391 5645 4735 1280Macedonia o o o 1 1
Moldova Rep 1 1 1 1 1 1789 1789 1789 160 160 114Netherlands 39 31 26 28 26 38035 29406 21324 23463 21814 839Norway 16 13 18 8 8 15744 14730 14130 14868 12516 1565Poland 9 14 13 14 14 16000 17482 19578 23200 24000 1714Portugal 6 12 23 14 16 12946 19745 25759 22545 24916 1567Romania 5 5 11 8 8 9050 9300 20618 17542 17542 2193Russian Fed 32 26 11 19235 11094 5178 471Slovakia 4 3 2 335 17 10101 10115 8035 10285 12544 738
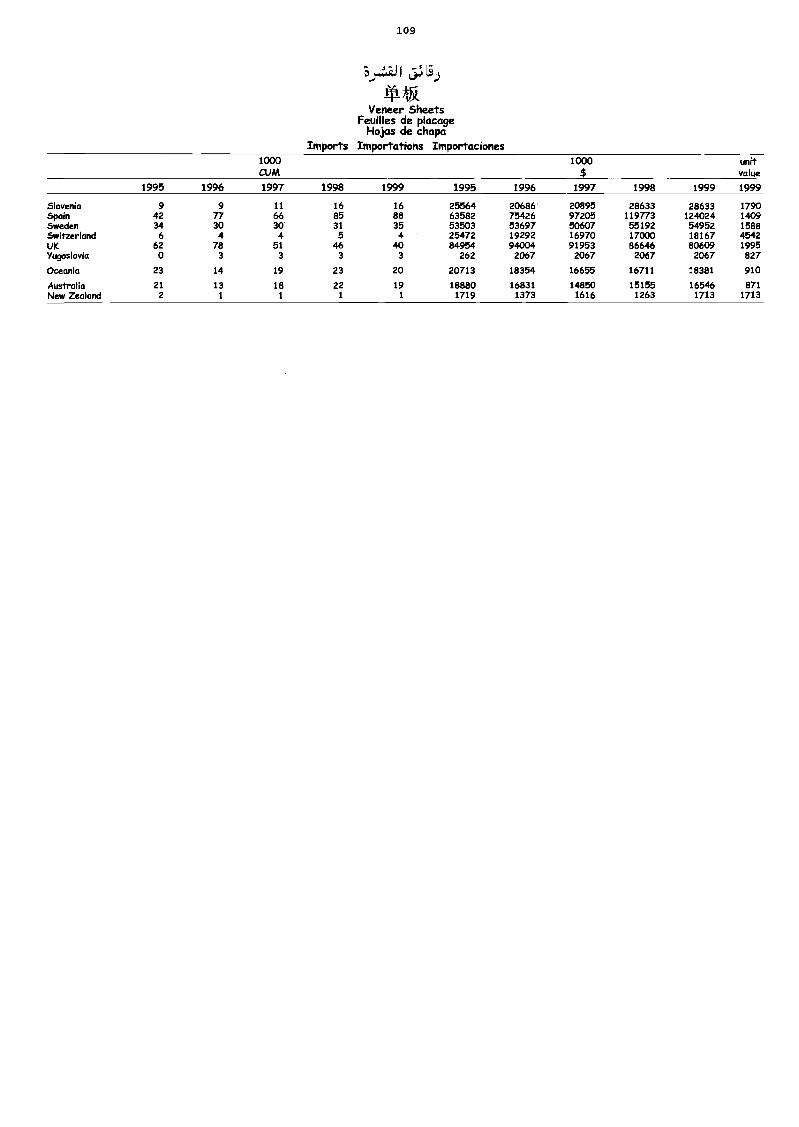
109
Veneer SheetsFeuilles de placage
Hojas de chapaImports Importations Importaciones
1000CUM
1000$
unitvalue
1995 1996 1997 1998 1999 1995 1996 1997 1998 1999 1999
Slovenia 9 9 11 16 16 25564 20686 20895 28633 28633 1790Spain 42 77 66 85 88 63582 75426 97205 119773 124024 1409Sweden 34 30 30 31 35 53503 53697 50607 55192 54952 1588Switzerland 6 4 4 5 4 25472 19292 16970 17000 18167 4542UK 62 78 51 46 40 84954 94004 91953 86646 80609 1995Yugoslavia 0 3 3 3 3 262 2067 2067 2067 2067 827
Oceania 23 14 19 23 20 20713 18354 16655 16711 18381 910
Australia 21 13 18 22 19 18880 16831 14850 15155 16546 871New Zealand 2 1 1 1 1 1719 1373 1616 1263 1713 1713
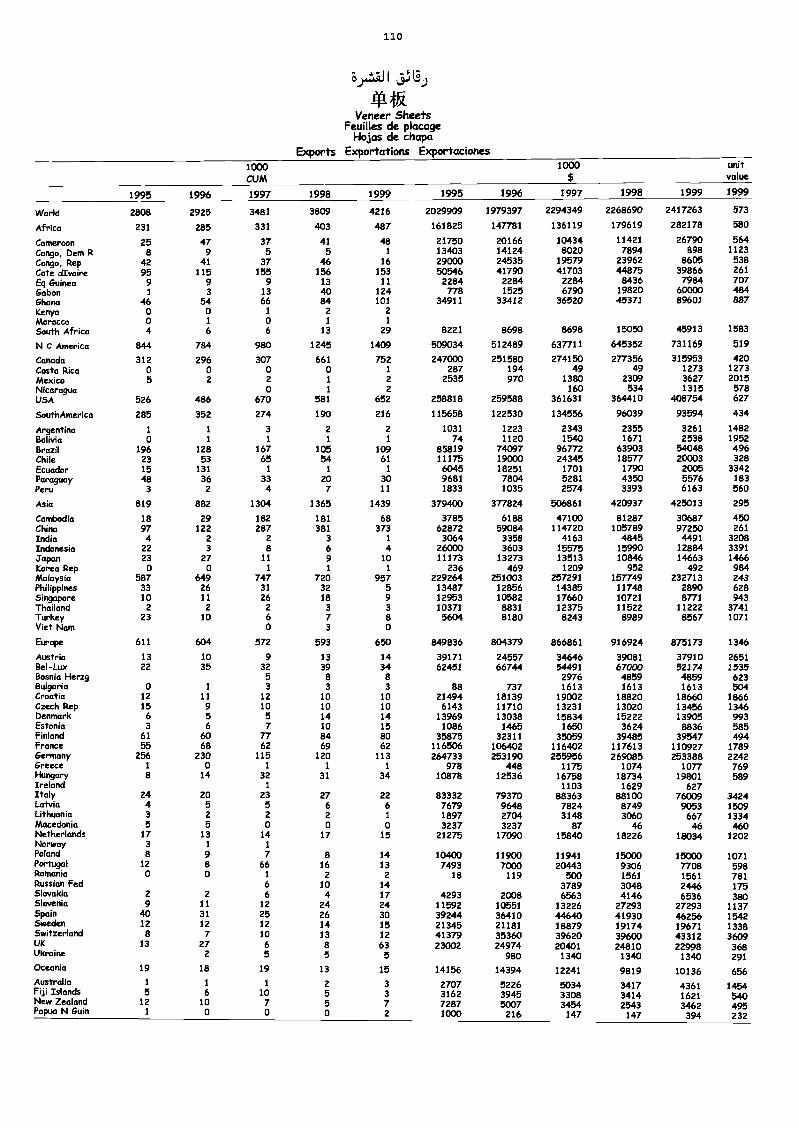
110
k1 5:+13)
Veneer SheetsFeuilles de placage
Hojas de chapaExports Exportations Exportaciones
1000CUM
1000$
unitvalue
1995 1996 1997 1998 1999 1995 1996 1997 1998 1999 1999
World 2808 2925 3481 3809 4216 2029909 1979397 2294349 2268690 2417263 573
Africa 231 285 331 403 487 161825 147781 136119 179619 282178 580
Cameroon 25 47 37 41 48 21750 20166 10434 11421 26790 564Congo, Dam R 8 9 5 5 1 13403 14124 8020 7894 898 1123
Congo, Rep 42 41 37 46 16 29000 24535 19579 23962 8605 538Cote dIvoire 95 115 155 156 153 50546 41790 41703 44875 39866 261
Ea Guinea 9 9 9 13 11 2284 2284 2284 8436 7984 707Gabon 1 3 13 40 124 na 1525 6790 19820 60000 484Ghana 46 54 66 84 101 34911 33412 36520 45371 89601 887Kenya o o 1 2 2Morocco 0 1 0 1 1
South Africa 4 6 6 13 29 8221 8698 8698 15050 45913 1583
N C America 844 784 980 1245 1409 509034 512489 637711 645352 731169 519
Canada 312 296 307 661 752 247000 251580 274150 277356 315953 420Costa Rica 0 0 0 o 1 287 194 49 49 1273 1273Mexico 5 2 2 1 2 2535 970 1380 2309 3627 2015Nicaragua o 1 2 160 534 1315 578USA 526 486 670 581 652 258818 259588 361631 364410 408754 627
SouthAmerica 285 352 274 190 216 115658 122530 134556 96039 93594 434
Argentina 1 1 3 2 2 1031 1223 2343 2355 3261 1482Bolivia 0 1 1 I 1 74 1120 1540 1671 2538 1952Brazil 196 128 167 105 109 85819 74097 96772 63903 54048 496Chile 23 53 65 54 61 11175 19000 24345 18577 20003 328Ecuador 15 131 1 1 1 6045 18251 1701 1790 2005 3342Paraguay 48 36 33 20 30 9681 7804 5281 4350 5576 183Peru 3 2 4 7 11 1833 1035 2574 3393 6163 560
Asia 819 882 1304 1365 1439 379400 377824 506861 420937 425013 295
Cambodia 18 29 182 181 68 3785 6188 47100 81287 30687 450China 97 122 287 381 373 62872 59084 114720 105789 97250 261India 4 2 2 3 1 3064 3358 4163 4845 4491 3208Indonesia 22 3 8 6 4 26000 3603 15575 15990 12884 3391
jaParl 23 27 11 9 10 11173 13273 13513 10846 14663 1466Korea Rep 0 o 1 1 1 236 469 1209 952 492 984Malaysia 587 649 747 720 957 229264 251003 257291 157749 232713 243Philippines 33 26 31 32 5 13487 12856 14385 11748 2890 628Singapore 10 11 26 18 9 12953 10582 17660 10721 8771 943Thailand 2 2 2 3 3 10371 8831 12375 11522 11222 3741Turkey 23 10 6 7 s 5604 8180 8243 8989 8567 1071Viet Nam 0 3 0
Europe 611 604 572 593 650 849836 804379 866861 916924 875173 1346
Austria 13 10 9 13 14 39171 24557 34646 39081 37910 2651Bel-Lux 22 35 32 39 34 62451 66744 54491 67000 52174 1535Bosnia Herzg 5 8 8 2976 4859 4859 623Bulgaria o 1 3 3 3 88 737 1613 1613 1613 504Croatia 12 11 12 10 10 21494 18139 19002 18820 18660 1866Czech Rep 15 9 10 10 10 6143 11710 13231 13020 13456 1346Denmark 6 5 5 14 14 13969 13038 15834 15222 13905 993Estonia 3 6 7 10 15 1086 1465 1650 3624 8836 585Finland 61 60 77 84 80 35875 32311 35059 39485 39547 494France 55 68 62 69 62 116506 106402 116402 117613 110927 1789Germany 256 230 115 120 113 264733 253190 255956 269085 253388 2242Greece 1 0 1 1 1 978 448 1175 1074 1077 769HungorY 8 14 32 31 34 10878 12536 16758 18734 19801 589Ireland 1 1103 1629 627Italy 24 20 23 27 22 83332 79370 88363 88100 76009 3424Latvia 4 5 5 6 6 7679 9648 7824 8749 9053 1509Lithuania 3 2 2 2 1 1897 2704 3148 3060 667 1334Macedonia 5 5 0 0 0 3237 3237 87 46 46 460Netherlculds 17 13 14 17 15 21275 17090 15840 18226 18034 1202Norway 3 I 1
Poland 8 9 7 8 14 10400 11900 11941 15000 15000 1071Portugal 12 8 66 16 13 7493 7000 20443 9306 ma 598Romania 0 0 1 2 2 18 119 500 1561 1561 781Russian Fed 6 10 14 3789 3048 2446 175Slovakia 2 2 6 4 17 4293 2008 6563 4146 6536 380Slovenia 9 11 12 24 24 11592 10551 13226 27293 27293 1137Spain 40 31 25 26 30 39244 36410 44640 41930 46256 1542Sweden 12 12 12 14 15 21345 21181 18879 19174 19671 1338Switzerland 8 7 10 13 12 41379 35360 39620 39600 43312 3609UK 13 27 6 s 63 23002 24974 20401 24810 22998 368Ukraine 2 5 5 5 980 1340 1340 1340 291Oceania 19 18 19 13 15 14156 14394 12241 9819 10136 656Australia 1 1 1 2 3 2707 5226 5034 3417 4361 1454Fiji Islands 5 6 10 5 3 3162 3945 3308 3414 1621 540New Zealand 12 10 7 5 7 7287 5007 3454 2543 3462 495Papua N Guin 1 0 0 0 2 1000 216 147 147 394 232
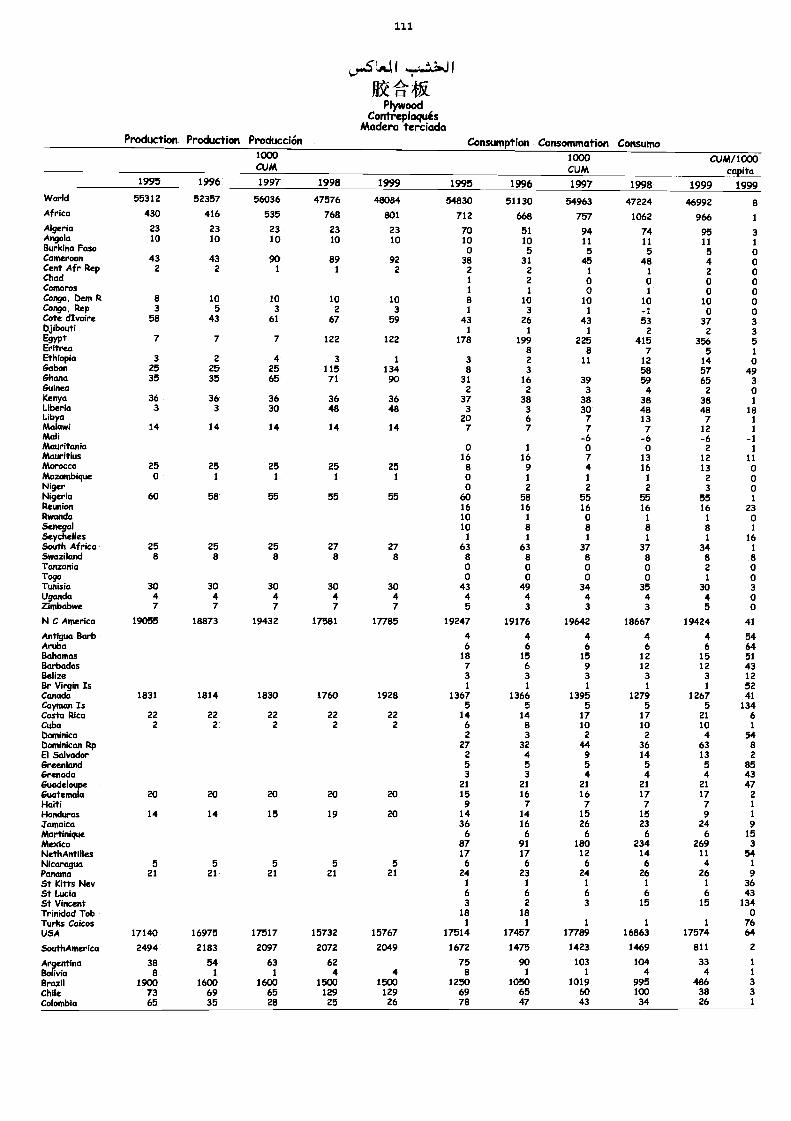
111
...p.,..5Lpuli 4.. ..L,..20%.11
Wt. 1=1 TXPlywood
ContreplaquisMadera terciada
Production Production Producción Consumption Consommation Consumo1000CUM
1000CUM
cuM/1000capita
19991995 1996 1997 1998 1999 1995 1996 1997 1998 1999World 55312 52357 56036 47576 48084 54830 51130 54963 47224 46992 8Africa 430 416 535 768 801 712 668 757 1062 966 1
Algeria 23 23 23 23 23 70 51 94 74 95 3Angola 10 10 10 10 10 10 10 11 11 11 1Burkina Foso 0 5 5 5 5 oCameroon 43 43 90 89 92 38 31 45 48 4 oCent Afr Rep 2 2 1 1 2 2 2 1 1 2 oChad 1 2 0 0 o oComoros 1 1 0 1 0 0Congo, Dem R 8 10 10 10 10 8 10 10 10 10 0Congo, Rep 3 5 3 2 3 1 3 1 -1 0 0Cote divoire 58 43 61 67 59 43 26 43 53 37 3Djibouti 1 1 1 2 2 3Egypt 7 7 7 122 122 178 199 225 415 356 5Eritrea 8 8 7 5 1Ethiopia 3 2 4 3 1 3 2 11 12 14 oGabon 25 25 25 115 134 8 3 58 57 49Ghana 35 35 65 71 90 31 16 39 59 65 3Guinea 2 2 3 4 2 0Kenya 36 36 36 36 36 37 38 38 38 38 1Liberia 3 3 30 48 48 3 3 30 48 48 18Libya 20 6 7 13 7 1Malawi 14 14 14 14 14 7 7 7 7 12 1Mali -6 -6 -6 -1Mauritania 0 1 0 o 2 1Mauritius 16 16 7 13 12 11Morocco 25 25 25 25 25 8 9 4 16 13 0Mozambique 0 1 1 1 1 0 1 1 1 2 0Niger 0 2 2 2 3 0Nigeria 60 58 55 55 55 60 58 55 55 55 1Reunion 16 16 16 16 16 23Rwanda 10 1 0 1 1 oSenegal 10 8 8 8 8 1
Seychelles 1 1 1 1 1 16South Africa 25 25 25 27 27 63 63 37 37 34 1
Swaziland 8 8 8 8 8 8 8 8 8 8 8Tanzania o o 0 0 2 0Togo 0 0 0 0 1 0Tunisia 30 30 30 30 30 43 49 34 35 30 3Uganda 4 4 4 4 4 4 4 4 4 4 oZimbabwe 7 7 7 7 7 5 3 3 3 5 0
N C America 19055 18873 19432 17581 17785 19247 19176 19642 18667 19424 41
Antigua Barb 4 4 4 4 4 54Aruba 6 6 6 6 6 64Bahamas 18 15 15 12 15 51Barbados 7 6 9 12 12 43Belize 3 3 3 3 3 12Br Virgin Is 1 1 1 1 1 52Canada 1831 1814 1830 1760 1928 1367 1366 1395 1279 1267 41Cayman Is 5 5 5 5 5 134Costa Rica 22 22 22 22 22 14 14 17 17 21 6Cuba 2 2 2 2 2 6 8 10 10 10 1
Dominica 2 3 2 2 4 54Dominican Ftp 27 32 44 36 63 8El Salvador 2 4 9 14 13 2Greenland 5 5 5 5 5 85Grenada 3 3 4 4 4 43Guadeloupe 21 21 21 21 21 47Guatemala 20 20 20 20 20 15 16 16 17 17 2Haiti 9 7 7 7 7 1
Honduras 14 14 15 19 20 14 14 15 15 9 1
Jamaica 36 16 26 23 24 9Martinique 6 6 6 6 6 15Mexico 87 91 180 234 269 3
NethAntilles 17 17 12 14 11 54Nicaragua 5 5 5 5 5 6 6 6 6 4 1
Panama 21 21 21 21 21 24 23 24 26 26 9St Kitts Nev 1 1 1 1 1 36St Lucia 6 6 6 6 6 43St Vincent 3 2 3 15 15 134Trinidad Tob 18 18 0Turlcs Calcos 1 1 1 1 1 76USA 17140 16975 17517 15732 15767 17514 17457 17789 16863 17574 64
SouthAmerica 2494 2183 2097 2072 2049 1672 1475 1423 1469 811 2
Argentina 38 54 63 62 75 90 103 104 33 1
Bolivia 8 1 1 4 4 8 1 1 4 4 1
Brazil 1900 1600 1600 1500 1500 1250 1050 1019 995 486 3
Chile 73 69 65 129 129 69 65 60 100 38 3
Colombia 65 35 28 25 26 78 47 43 34 26 1
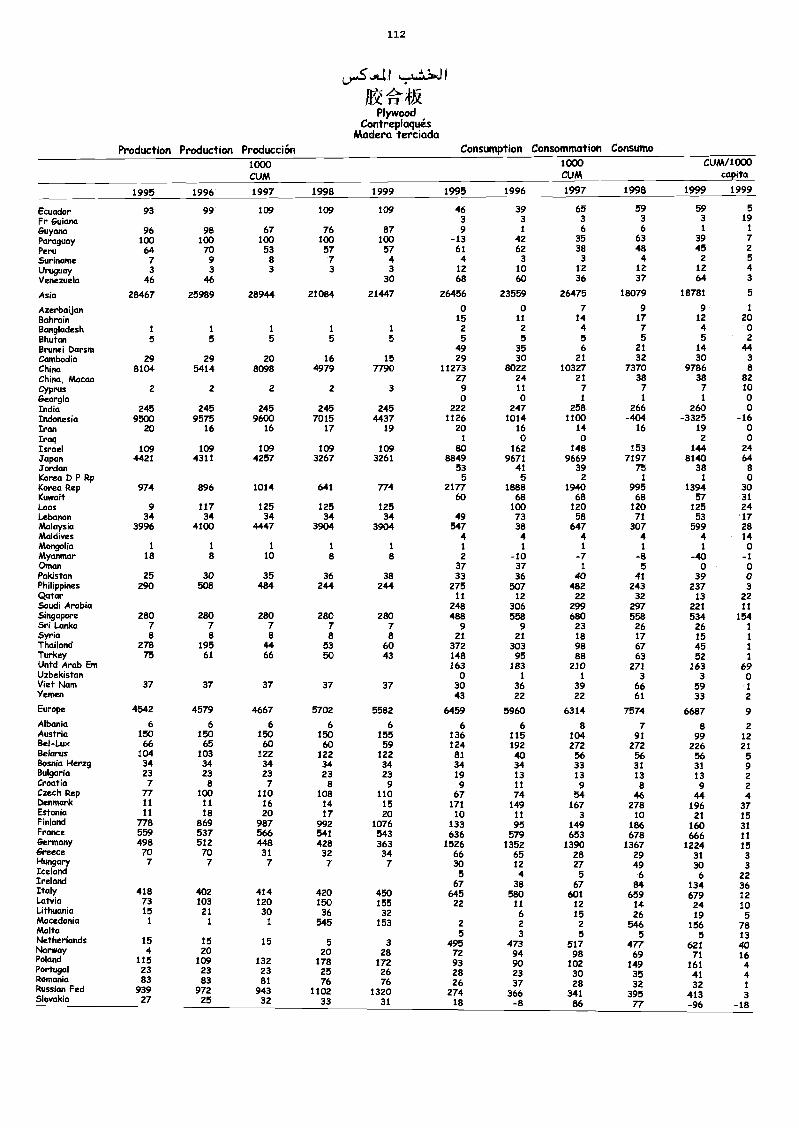
112
L)05lAll
V.**Plywood
ContreplaquésMadera terciada
Production Production Producción Consumption Consommation Consumo1000CuM
1000CUM
cuM/1000capita
1995 1996 1997 1998 1999 1995 1996 1997 1998 1999 1999
Ecuador 93 99 109 109 109 46 39 65 59 59 5Fr Guiana 3 3 3 3 3 19
Guyana 96 98 67 76 87 9 1 6 6 1 1
Paraguay 100 100 100 100 100 -13 42 35 63 39 7Peru 64 70 53 57 57 61 62 38 48 45 2
Suriname 7 9 8 7 4 4 3 3 4 2 5Uruguay 3 3 3 3 3 12 10 12 12 12 4Venezuela 46 46 30 68 60 36 37 64 3
Asia 28467 25989 28944 21084 21447 26456 23559 26475 18079 18781 5
Azerbaijan o 0 7 9 9 1
Bahrain 15 11 14 17 12 20Bangladesh 1 1 1 1 1 2 2 4 7 4 0Bhutan 5 5 5 5 5 5 5 5 5 5 2Brunei barsm 49 35 6 21 14 44Cambodia 29 29 20 16 15 29 30 21 32 30 3China 8104 5414 8098 4979 7790 11273 8022 10327 7370 9786 8China, Macao 27 24 21 38 38 82Cyprus 2 2 2 2 3 9 11 7 7 7 10Georgia o o 1 1 1 0India 245 245 245 245 245 222 247 258 266 260 0Indonesia 9500 9575 9600 7015 4437 1126 1014 1100 -404 -3325 -16Iran 20 16 16 17 19 20 16 14 16 19 0Iraq 1 0 0 2 0Israel 109 109 109 109 109 80 162 148 153 144 24Japan 4421 4311 4257 3267 3261 8849 9671 9669 7197 8140 64Jordan 53 41 39 75 38 8Korea D P Rp 5 5 2 1 1 oKorea Rep 974 896 1014 641 774 2177 1888 1940 995 1394 30Kuwait 60 68 68 68 57 31Laos 9 117 125 125 125 100 120 120 125 24Lebanon 34 34 34 34 34 49 73 58 71 53 17Malaysia 3996 4100 4447 3904 3904 547 38 647 307 599 28Maldives 4 4 4 4 4 14Mongolia 1 1 1 1 1 1 1 i 1 1 0Myamnar 18 8 10 8 8 2 -10 -7 -8 -40 -1Oman 37 37 1 5 0 0Pakistan 25 30 35 36 38 33 36 40 41 39 0Philippines 290 508 484 244 244 275 507 482 243 237 3Qatar 11 12 22 32 13 22Saudi Arabia 248 306 299 297 221 11Singapore 280 280 280 280 280 488 558 680 558 534 154Sri Lanka 7 7 7 7 7 9 9 23 26 26 1Syria 8 8 8 8 8 21 21 18 17 15 1Thailand 278 195 44 53 60 372 303 98 67 45 1Turkey 75 61 66 50 43 148 95 88 63 52 1Untd Arab Em 163 183 210 271 163 69Uzbekistan 0 1 1 3 3 0Viet Nam 37 37 37 37 37 30 36 39 66 59 1Yemen 43 22 22 61 33 2
Europe 4542 4579 4667 5702 5582 6459 5960 6314 7574 6687 9Albania 6 6 6 6 6 6 6 8 7 8 2Austria 150 150 150 150 155 136 115 104 91 99 12Bel-Lux 66 65 60 60 59 124 192 272 272 226 21Belarus 104 103 122 122 122 81 40 56 56 56 5Bosnia Herzg 34 34 34 34 34 34 34 33 31 31 9Bulgaria 23 23 23 23 23 19 13 13 13 13 2Croatia 7 8 7 8 9 9 11 9 8 9 2Czech Rep 77 100 110 108 110 67 74 54 46 44 4Denmark 11 11 16 14 15 171 149 167 278 196 37Estonia 11 18 20 17 20 10 11 3 10 21 15Finland 778 869 987 992 1076 133 95 149 186 160 31France 559 537 566 541 543 636 579 653 678 666 11Germany 498 512 448 428 363 1526 1352 1390 1367 1224 15Greece 70 70 31 32 34 66 65 28 29 31 3Hungary 7 7 7 7 7 30 12 27 49 30 3Iceland 5 4 5 6 6 22Ireland 67 38 67 84 134 36Italy 418 402 414 420 450 645 580 601 659 679 12Latvia 73 103 120 150 155 22 11 12 14 24 10Lithuania 15 21 30 36 32 6 15 26 19 5Macedonia i 1 1 545 153 2 2 2 546 156 78Malta 5 3 5 5 5 13Netherlands 15 15 15 5 3 495 473 517 477 621 40Norway 4 20 20 28 72 94 98 69 71 16Poland 115 109 132 178 172 93 90 102 149 161 4Portugal 23 23 23 25 26 28 23 30 35 41 4Romania 83 83 81 76 76 26 37 28 32 32 1Ptussian Fed 939 972 943 1102 1320 274 366 341 395 413 3Slovakia 27 25 32 33 31 18 -8 86 77 -96 -18
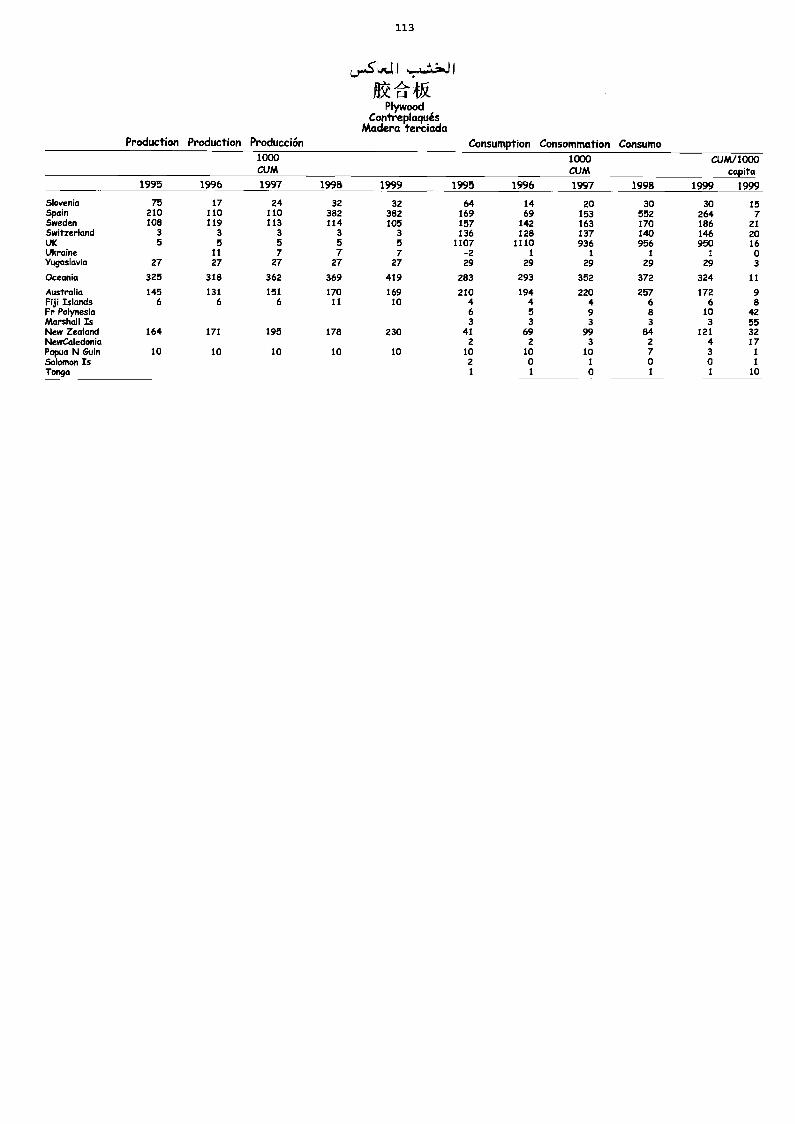
113
L)...SA,11 JI
jr-1 itgPlywood
ContreplaquisMadera terciada
Production Production Producción Consurnption Consommation Consumo1000CUM
1000CUM
CUM/ 1000capita
1999 19991995 1996 1997 1998 1999 1995 1996 1997 1998
Slovenia 75 17 24 32 32 64 14 20 30 30 15Spain 210 110 110 382 382 169 69 153 552 264 7Sweden 108 119 113 114 105 157 142 163 170 186 21Switzerland 3 3 3 3 3 136 128 137 140 146 20UK 5 5 5 5 5 1107 1110 936 956 950 16Ukraine 11 7 7 7 -2 1 1 1 1 oYugoslavia 27 27 27 27 27 29 29 29 29 29 3
Oceania 325 318 362 369 419 283 293 352 372 324 11
Australia 145 131 151 170 169 210 194 220 257 172 9Fiji Islands 6 6 6 11 10 4 4 4 6 6 8Fr Polynesia 6 5 9 8 10 42Marshall Is 3 3 3 3 3 55New Zealand 164 171 195 178 230 41 69 99 84 121 32NewCaledonia 2 2 3 2 4 17Papua N Guin 10 10 10 10 10 10 10 10 7 3 1
Solomon Is 2 o 1 0 o iTonga 1 1 0 1 1 10
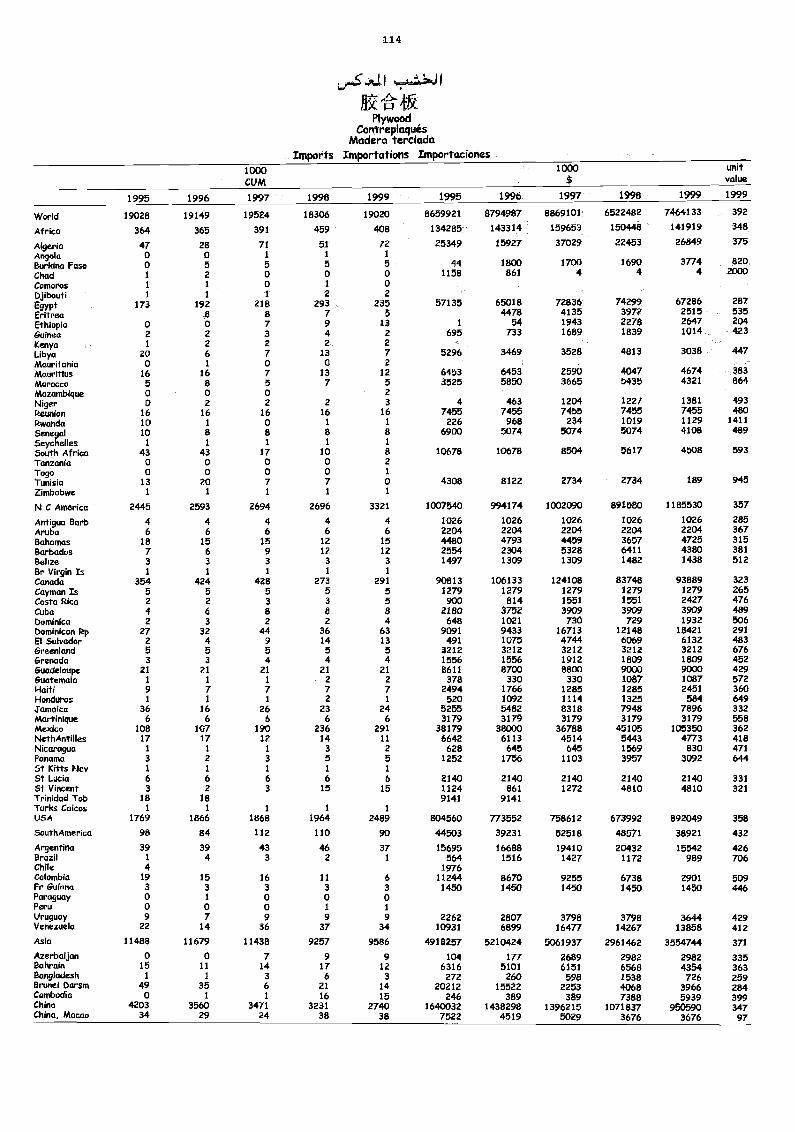
114
75604.1i
itkPlywood
ContreplaquisMadera terciada
Imports Importations Importaciones1000CUM
1000 unitvalue
1995 1996 1997 1998 1999 1995 1996 1997 1998 1999 1999
World 19028 19149 19524 18306 19020 8659921 8794987 8869101 6522482 7464133 392
Africa 364 365 391 459 408 134285 143314 159653 150448 141919 348
Algeria 4T 28 71 51 72 25349 15927 37029 22453 26849 375
Angola 0 0 1 1 1
Burkina Faso 0 5 5 5 5 44 1800 1700 1690 3774 820
Chad 1 2 0 o o 1158 861 4 4 4 2000
Comoros 1 1 o 1 oDjibouti 1 1 1 2 2
E9YPtEritrea
173 1928
2188
2937
2355
57135 650184478
728364135
74299397?
672862515
287535
Ethiopia 0 o 7 9 13 1 54 1943 2278 2647 204
Guinea 2 2 3 4 2 695 733 1689 1839 1014 423
Kenya 1 2 2 2 2
Libya 20 6 7 13 7 5296 3469 3528 4813 3038 447Mauritania 0 1 o o 2Mauritius 16 16 7 13 12 6453 6453 2590 4047 4674 383
Morocco 5 8 5 7 5 3525 5850 3665 5435 4321 864
Mozambique 0 o 0 2
Niger 0 2 2 2 3 4 463 1204 1227 1381 493Reunion 16 16 16 16 16 7455 7455 7455 7455 7455 480Rwanda 10 1 0 1 1 226 968 234 1019 1129 1411
Senegal 10 a 8 8 a 6900 5074 5074 5074 4108 489
Seychelles 1 1 1 1 1
South Africa 43 43 17 10 8 10678 10678 8504 5617 4508 593Tanzania 0 0 o o 2
Togo 0 0 0 o 1
Tunisia 13 20 7 7 0 4308 8122 2734 2734 189 945Zimbabwe I 1 1 1 1
N C America 2445 2593 2694 2696 3321 1007540 994174 1002090 891580 1185530 357
Antigua Barb 4 4 4 4 4 1026 1026 1026 1026 1026 285Aruba 6 6 6 6 6 2204 2204 2204 2204 2204 367Bahamas 18 15 15 12 15 4480 4793 4459 3657 4725 315Barbados 7 6 9 12 12 2554 2304 5328 6411 4380 381Belize 3 3 3 3 3 1497 1309 1309 1482 1438 512Br Virgin Is 1 1 1 1 1
Canada 354 424 428 273 291 90813 106133 124108 83748 93889 323Cayman Is 5 5 5 5 5 1279 1279 1279 1279 1279 265Costa Rica 2 2 3 3 5 900 814 1551 1551 2427 476Cuba 4 6 8 a a 2180 3752 3909 3909 3909 489Dominica 2 3 2 2 4 648 1021 730 729 1932 506Dominican Rp 27 32 44 36 63 9091 9433 16713 12148 18421 291El Salvador 2 4 9 14 13 491 1075 4744 6069 6132 483Greenland 5 5 5 5 5 3212 3212 3212 3212 3212 676Grenada 3 3 4 4 4 1556 1556 1912 1809 1809 452Guadeloupe 21 21 21 21 21 8611 8700 8800 9000 9000 429Guatemala 1 1 1 2 2 378 330 330 1087 1087 572Haiti 9 7 7 7 7 2494 1766 1285 1285 2451 360Honduras 1 1 1 2 1 520 1092 1114 1325 584 649Jamaica 36 16 26 23 24 5255 5482 8318 7948 7896 332Martinique 6 6 6 6 6 3179 3179 3179 3179 3179 558Mexico 108 107 190 236 291 38179 38000 36788 45105 105350 362NethAntilles 17 17 12 14 11 6642 6113 4514 5443 4773 418Nicaragua 1 1 1 3 2 628 645 645 1569 830 471Panama 3 2 3 5 5 1252 1756 1103 3957 3092 644St Kitts Nev 1 1 1 1 1
St Lucia 6 6 6 6 6 2140 2140 2140 2140 2140 331St Vincent 3 2 3 15 15 1124 861 1272 4810 4810 321Trinidad Tob 18 18 9141 9141Turks Calcos 1 1 1 1 1
USA 1769 1866 1868 1964 2489 804560 773552 758612 673992 892049 358
SouthAmerica 98 84 112 110 90 44503 39231 52518 48571 38921 432
Argentina 39 39 43 46 37 15695 16688 19410 20432 15542 426Brazil 1 4 3 2 1 564 1516 1427 1172 989 706Chile 4 1976Colombia 19 15 16 11 6 11244 8670 9255 6738 2901
509Fr Guiana 3 3 3 3 3 1450 1450 1450 1450 1450 446Paraguay 0 1 0 0 0Peru o o o I 1
Uruguay 9 7 9 9 9 2262 2807 3798 3798 3644 429Venezuela 22 14 36 37 34 10931 6899 16477 14267 13858 412Asia 11488 11679 11438 9257 9586 4918257 5210424 5061937 2961462 3554744 371
Azerbaijan o 0 7 9 9 104 177 2689 2982 2982 335Bahrain 15 11 14 17 12 6316 5101 6151 6568 4354 363Bangladesh 1 1 3 6 3 272 260 598 1538 726 259Brunei Darsm 49 35 6 21 14 20212 15522 2253 4068 3966 284Cambodia 0 1 1 16 15 246 389 389 7388 5939 399China 4203 3560 3471 3231 2740 1640032 1438298 1396215 1071837 950590 347China, Macao 34 29 24 38 38 7522 4519 5029 3676 3676 97
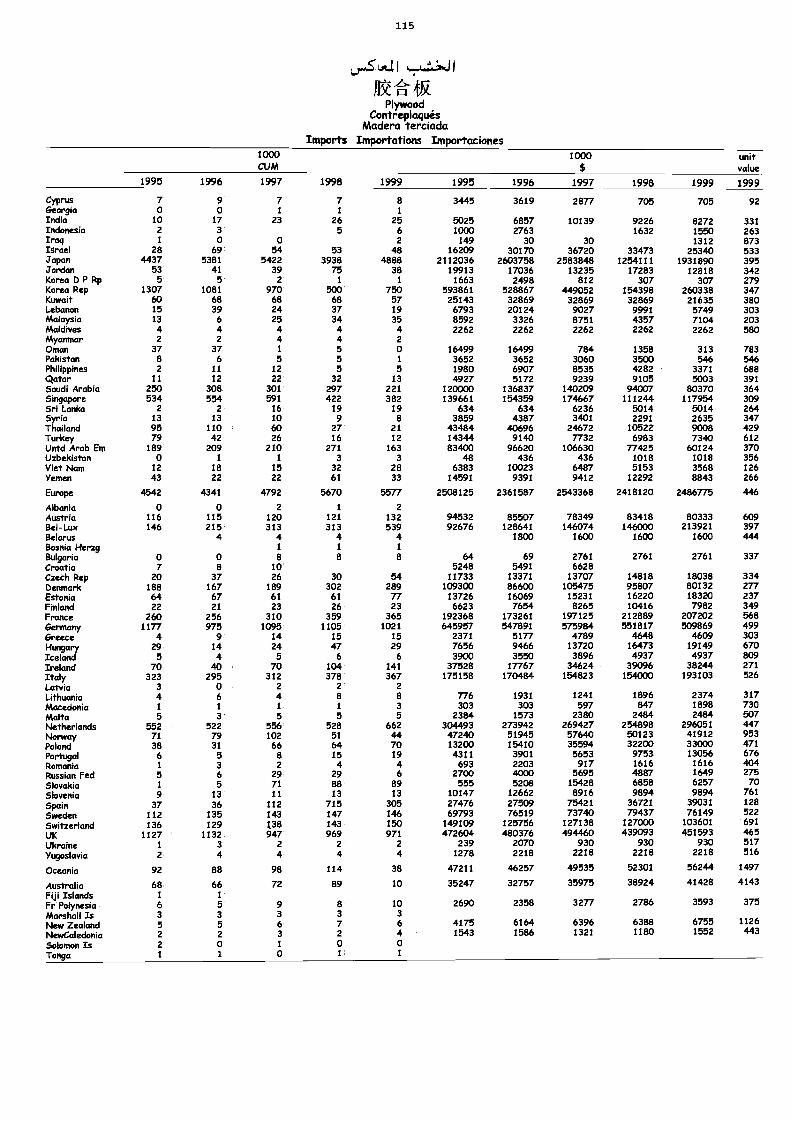
115
1
f11)'"4gPlywood
ContreplaquésMadera terciada
Imports Importations Importaciones1000CUM
1000 unitvalue
1995 1996 1997 1998 1999 1995 1996 1997 1998 1999 1999
Cyprus 7 9 7 7 8 3445 3619 2877 705 705 92Georgia o o 1 1 1
India 10 17 23 26 25 5025 6857 10139 9226 8272 331Indonesia 2 3 5 6 1000 2763 1632 1550 263Iraq 1 0 0 2 149 30 30 1312 873Israel 28 69 54 53 48 16209 30170 36720 33473 25340 533Japan 4437 5381 5422 3938 4888 2112036 2603758 2583848 1254111 1931890 395Jordan 53 41 39 75 38 19913 17036 13235 17283 12818 342Korea D P Rp 5 5 2 1 1 1663 2498 812 307 307 279Korea Rep 1307 1081 970 500 750 593861 528867 449052 154398 260338 347Kuwait 60 68 68 68 57 25143 32869 32869 32869 21635 380Lebanon 15 39 24 37 19 6793 20124 9027 9991 5749 303Malaysia 13 6 25 34 35 8592 3326 8751 4357 7104 203Maldives 4 4 4 4 4 2262 2262 2262 2262 2262 580Myanmar 2 2 4 4 2Oman 37 37 1 5 o 16499 16499 784 1358 313 783Pakistan 8 6 5 5 1 3652 3652 3060 3500 546 546Philippines 2 11 12 5 5 1980 6907 8535 4282 3371 688Qatar 11 12 22 32 13 4927 5172 9239 9105 5003 391Saudi Arabia 250 308 301 297 221 120000 136837 140209 94007 80370 364Singapore 534 554 591 422 382 139661 154359 174667 111244 117954 309Sri Lanka 2 2 16 19 19 634 634 6236 5014 5014 264Syria 13 13 10 9 8 3859 4387 3401 2291 2635 347Thailand 95 110 60 27 21 43484 40696 24672 10522 9008 429Turkey 79 42 26 16 12 14344 9140 7732 6983 7340 612Untd Arab Em 189 209 210 271 163 83400 96620 106630 77425 60124 370Uzbekistan 0 1 1 3 3 48 436 436 1018 1018 356Viet Nam 12 18 15 32 28 6383 10023 6487 5153 3568 126Yemen 43 22 22 61 33 14591 9391 9412 12292 8843 266
Europe 4542 4341 4792 5670 5577 2508125 2361587 2543368 2418120 2486775 446
Albania 0 0 2 1 2Austria 116 115 120 121 132 94532 85507 78349 83418 80333 609Bel-Lux 146 215 313 313 539 92676 128641 146074 146000 213921 397Belarus 4 4 4 4 1800 1600 1600 1600 444Bosnia Herzg 1 1 1
Bulgaria 0 o a 8 8 64 69 2761 2761 2761 337Croatia 7 8 10 5248 5491 6628Czech Rep 20 37 26 30 54 11733 13371 13707 14818 18038 334Denmark 188 167 189 302 289 109300 86600 105475 95807 80132 277Estonia 64 67 61 61 77 13726 16069 15231 16220 18320 237Finland 22 21 23 26 23 6623 7654 8265 10416 7982 349France 260 256 310 359 365 192368 173261 197125 212889 207202 568Germany 1177 975 1095 1105 1021 645957 547891 575984 551817 509869 499Greece 4 9 14 15 15 2371 5177 4789 4648 4609 303Hungary 29 14 24 47 29 7656 9466 13720 16473 19149 670Iceland 5 4 5 6 6 3900 3550 3896 4937 4937 809Ireland 70 ao 70 104 141 37528 17767 34624 39096 38244 271Italy 323 295 312 378 367 175158 170484 154823 154000 193103 526Latvia 3 0 2 2 2
Lithuania 4 6 4 a 8 776 1931 1241 1896 2374 317Macedonia 1 1 1 1 3 303 303 597 847 1898 730Malta 5 3 5 5 5 2384 1573 2380 2484 2484 507Netherlands 552 522 556 528 662 304493 273942 269427 254898 296051 447Norway 71 79 102 51 44 47240 51945 57640 50123 41912 953Poland 38 31 66 64 70 13200 15410 35594 32200 33000 471Portugal 6 5 8 15 19 4311 3901 5653 9753 13056 676Romania 1 3 2 4 4 693 2203 917 1616 1616 404Russian Fed 5 6 29 29 6 2700 4000 5695 4887 1649 275
Slovakia 1 5 71 es 89 555 5208 15428 6858 6257 70
Slovenia 9 13 11 13 13 10147 12662 8916 9894 9894 761
Spain 37 36 112 715 305 27476 27509 75421 36721 39031 128
Sweden 112 135 143 147 146 69793 76519 73740 79437 76149 522
Switzerland 136 129 1,38 143 150 149109 125756 127138 127000 103601 691
UK 1127 1132 947 969 971 472604 480376 494460 439093 451593 465Ukraine 1 3 2 2 2 239 2070 930 930 930 517
Yugoslavia 2 4 4 4 4 1278 2218 2218 2218 2218 516
Oceania 92 88 98 114 38 47211 46257 49535 52301 56244 1497
Australia 68 66 72 89 10 35247 32757 35975 38924 41428 4143
Fiji Islands 1 1
Fr Polynesia 6 5 9 8 10 2690 2358 3277 2786 3593 375
Marshall Es 3 3 3 3 3New Zealand 5 5 6 7 6 4175 6164 6396 6388 6755 1126
NewCaledonia 2 2 3 2 4 1543 1586 1321 1180 1552 443
Solomon Is 2 o 1 o 0Tonga 1 1 0 1 1
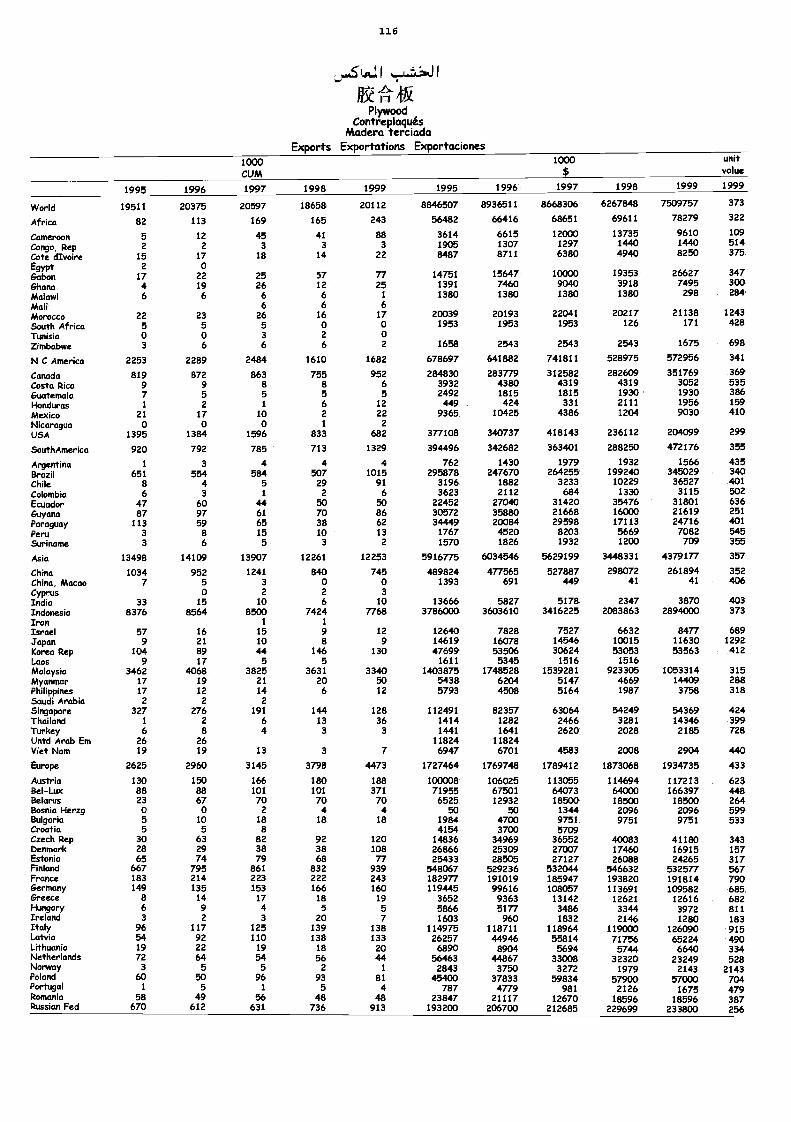
116
LAI I I
re It*Plywood
ContreplaquésMadera terciada
Exports Exportations Exportaciones1000CUM
1000 unitvalue
1995 1996 1997 1998 1999 1995 1996 1997 1998 1999 1999
World 19511 20375 20597 18658 20112 8846507 8936511 8668306 6267848 7509757 373
Africa 82 113 169 165 243 56482 66416 68651 69611 78279 322
Cammmmn 5 12 45 41 88 3614 6615 12000 13735 9610 109
Congo, Rep 2 2 3 3 3 1905 1307 1297 1440 1440 514
Cote dIvoire 15 17 18 14 22 8487 8711 6380 4940 8250 375
E9YPtGabon
217
022 25 57 77 14751 15647 10000 19353 26627 347
Ghana 4 19 26 12 25 1391 7460 9040 3918 7495 300
Malawi 6 6 6 6 1 1380 1380 1380 1380 298 284
Mcdi 6 6 6Morocco 22 23 26 16 17 20039 20193 22041 20217 21138 1243
South Africa 5 5 5 0 0 1953 1953 1953 126 171 428TuMda 0 0 3 2 0Zimbabwe 3 6 6 6 2 1658 2543 2543 2543 1675 698
N C America 2253 2289 2484 1610 1682 678697 641882 741811 528975 572956 341
Canada 819 872 863 755 952 284830 283779 312582 282609 351769 369CostaRko 9 9 8 8 6 3932 4380 4319 4319 3052 535Guatemala 7 5 5 5 5 2492 1815 1815 1930 1930 386Honduras 1 2 1 6 12 449 424 331 2111 1956 159
Mexico 21 17 10 2 22 9365 10425 4386 1204 9030 410
Nicaragua 0 0 0 1 2
USA 1395 1384 1596 833 682 377108 340737 418143 236112 204099 299
SouthAmerica 920 792 785 713 1329 394496 342682 363401 288250 472176 355
Argentina 1 3 4 4 4 762 1430 1979 1932 1566 435Brazil 651 554 584 507 1015 295878 247670 264255 199240 345029 340Chile 8 4 5 29 91 3196 1882 3233 10229 36527 401
Colombia 6 3 1 2 6 3623 2112 684 1330 3115 502Ecuador 47 60 44 50 50 22452 27040 31420 35476 31801 636Guyana 87 97 61 70 86 30572 35880 21668 16000 21619 251
Paraguay 113 59 65 38 62 34449 20084 29598 17113 24716 401
Peru 3 8 15 10 13 1767 4520 8203 5669 7082 545Suriname 3 6 5 3 2 1570 1826 1932 1200 709 355
Asia 13498 14109 13907 12261 12253 5916775 6034546 5629199 3448331 4379177 357
China 1034 952 1241 840 745 489824 477565 527887 298072 261894 352China, Macao 7 5 3 0 0 1393 691 449 41 41 406Cyprus 0 2 2 3India 33 15 10 6 10 13666 5827 5178 2347 3870 403Indonesia 8376 8564 8500 7424 7768 3786000 3603610 3416225 2083863 2894000 373Iran 1 1
Israel 57 16 15 9 12 12640 7828 7527 6632 8477 689Japan 9 21 10 8 9 14619 16078 14546 10015 11630 1292Korea Rep 104 89 44 146 130 47699 53506 30624 53053 53563 412Laos 9 17 5 5 1611 5345 1516 1516Malaysia 3462 4068 3825 3631 3340 1403875 1748528 1539281 923305 1053314 315Wiyamnar 17 19 21 20 50 5438 6204 5147 4669 14409 288PhilOpMes 17 12 14 6 12 5793 4508 5164 1987 3758 318Saudi Arabia 2 2 2SMgapore 327 276 191 144 128 112491 82357 63064 54249 54369 424Thailand 1 2 6 13 36 1414 1282 2466 3281 14346 399Turkey 6 8 4 3 3 1441 1641 2620 2028 2185 728Untd Arab Em 26 26 11824 11824Viet Nam 19 19 13 3 7 6947 6701 4583 2008 2904 440
Europe 2625 2960 3145 3798 4473 1727464 1769748 1789412 1873068 1934735 433
Austria 130 150 166 180 188 100008 106025 113055 114694 117213 623Bel-Lux 88 88 101 101 371 71955 67501 64073 64030 166397 448Belaros 23 67 70 70 70 6525 12932 18500 18500 18500 264BosMa Herzg 0 0 2 4 4 50 50 1344 2096 2096 599Bulgaria 5 10 18 18 18 1984 4700 9751 9751 9751 533Croatia 5 5 8 4154 3700 5709Czech Rep 30 63 82 92 120 14836 34969 36552 40083 41180 343Cennmrk 28 29 38 38 108 26866 25309 27007 17460 16915 157Estonia 65 74 79 68 77 25433 28505 27127 26088 24265 317Finland 667 795 861 832 939 548067 529236 532044 546632 532577 567France 183 214 223 222 243 182977 191019 185947 193820 191814 790Germany 149 135 153 166 160 119445 99616 108057 113691Greece 8 14 17 18 19 3652 9363 13142 12621 1(1)::(11: :::Humpy 6 9 4 5 5 5866 5177 3486 3344 3972 811Ireland 3 2 3 20 7 1603 960 1832 2146Italy 96 117 125 139 138 114975 118711 118964 119000 126= t7;Latvia 54 92 110 138 133 26257 44946 55814 71756 65224 490LithuaMa 19 22 19 18 20 6890 8904 5694 5744 6640 334Nktherlands 72 64 54 56 44 56463 44867 33008 32320 23249 528Norway 3 5 5 2 1 2843 3750 3272 1979 2143 2143Poland 60 50 96 93 81 45400 37833 59834 57900 57000 704Portugal 1 5 1 5 4 787 4779 981 2126 1675 479RomaMa 58 49 56 48 48 23847 21117 12670 18596 18596 387Russian Fed 670 612 631 736 913 193200 206700 212685 229699 233800 256
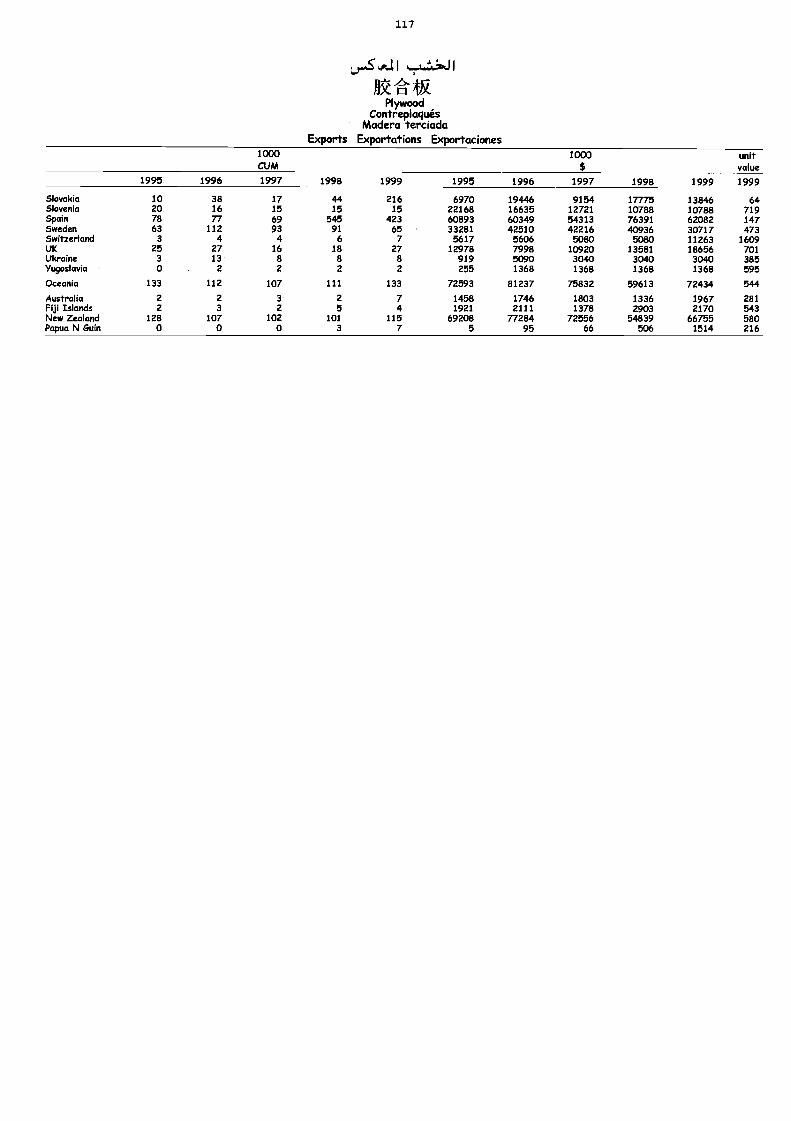
117
44 I I
kg.Plywood
ContreplaquésMadera terciada
Exports Exportations Exportaciones1000CUM
1000$
unitvalue
1995 1996 1997 1998 1999 1995 1996 1997 1998 1999 1999
Slovakia 10 38 17 44 216 6970 19446 9154 17775 13846 64Slovenia 20 16 15 15 15 22168 16635 12721 10788 10788 719Spain 78 77 69 545 423 60893 60349 54313 76391 62082 147Sweden 63 112 93 91 65 33281 42510 42216 40936 30717 473Switzerland 3 4 4 6 7 5617 5606 5080 5080 11263 1609UK 25 27 16 18 27 12978 7998 10920 13581 18656 701Ukraine 3 13 8 8 8 919 5090 3040 3040 3040 385Yugoslavia 0 2 2 2 2 255 1368 1368 1368 1368 595
Oceania 133 112 107 111 133 72593 81237 75832 59613 72434 544
Australia 2 2 3 2 7 1458 1746 1803 1336 1967 281Fiji Islands 2 3 2 5 4 1921 2111 1378 2903 2170 543New Zealand 128 107 102 101 115 69208 77284 72556 54839 66755 580Papua N Guin 0 0 0 3 7 5 95 66 506 1514 216
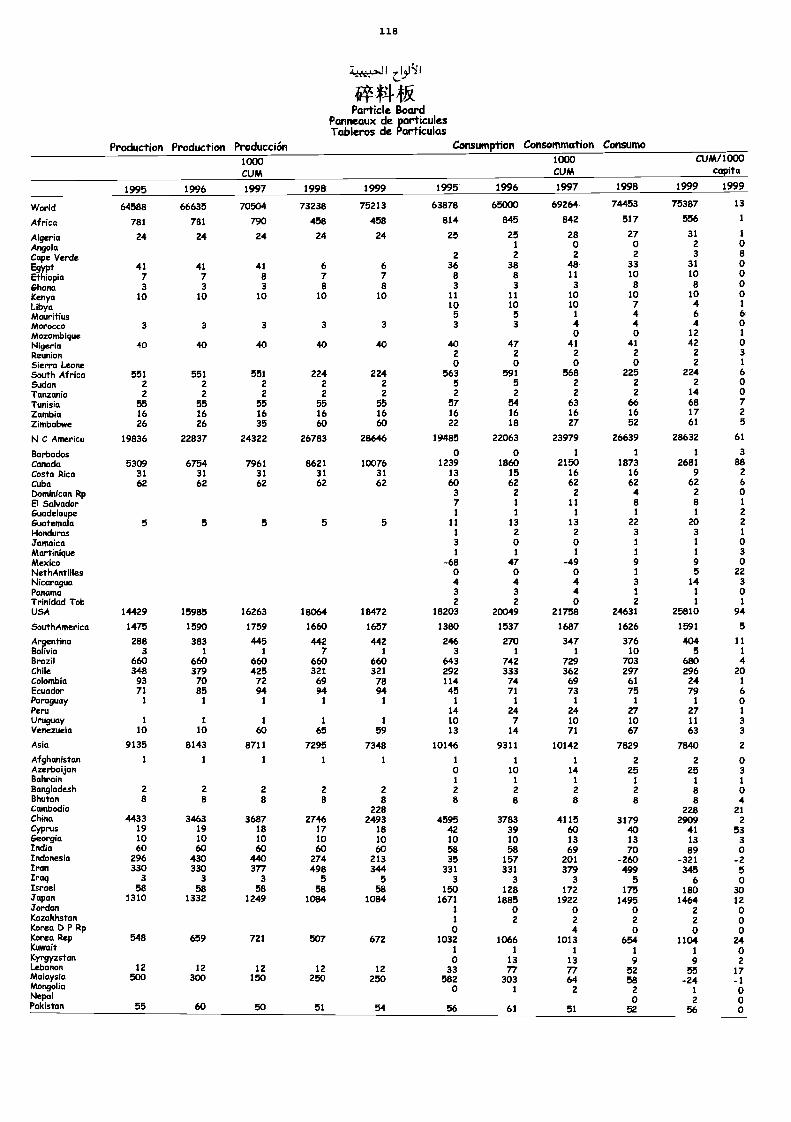
118
4.14*Particle Board
Panneaux de particulesTableros de Partículas
Production Production Producción Consumption Consommation Consumo
1000CUM
1000CUM
CUM/1000capita
1995 1996 1997 1998 1999 1995 1996 1997 1998 1999 1999
World 64588 66635 70504 73238 75213 63878 65000 69264 74453 75387 13
Africa 781 781 790 458 458 814 845 842 517 556 1
Algeria 24 24 24 24 24 25 25 28 27 31 1
Angola 1 0 0 2 0
Cape Verde 2 2 2 2 3 8
Egypt 41 41 41 6 6 36 38 48 33 31 0
Ethiopia 7 7 8 7 7 8 8 11 10 10 0
Ghana 3 3 3 8 8 3 3 3 8 8 o
Kenya 10 10 10 10 10 11 11 10 10 10 0
Libya 10 10 10 7 4 1
Mauritius 5 5 1 4 6 6
Morocco 3 3 3 3 3 3 3 4 4 4 0Mozambique 0 0 12 1
Nigeria 40 40 40 40 40 40 47 41 41 42 0Reunion 2 2 2 2 2 3
Sierra Leone 0 0 0 0 2 1
South Africa 551 551 551 224 224 563 591 568 225 224 6Sudan 2 2 2 2 2 5 5 2 2 2 0Tanzania 2 2 2 2 2 2 2 2 2 14 0Tunisia 55 55 55 55 55 57 54 63 66 68 7Zambia 16 16 16 16 16 16 16 16 16 17 2
Zimbabwe 26 26 35 60 60 22 18 27 52 61 5
N C America 19836 22837 24322 26783 28646 19485 22063 23979 26639 28632 61
Barbados 0 0 1 1 1 3
Canada 5309 6754 7961 8621 10076 1239 1860 2150 1873 2681 88Costa Rica 31 31 31 31 31 13 15 16 16 9 2
Cuba 62 62 62 62 62 60 62 62 62 62 6Dominican Rp 3 2 2 4 2 0El Salvador 7 1 11 8 8 1
Guadeloupe 1 1 1 1 1 2
Guatemala 5 5 5 5 5 11 13 13 22 20 2
Honduras 1 2 2 3 3 1
Jamaica 3 0 0 1 1 0Martinique 1 1 1 1 1 3
Mexico -68 47 -49 9 9 0NethAntilles 0 0 0 1 5 22Nicaragua 4 4 4 3 14 3
Panama 3 3 4 1 1 0Trinidad Tob 2 2 0 2 1 1
USA 14429 15985 16263 18064 18472 18203 20049 21758 24631 25810 94
SouthAmerica 1475 1590 1759 1660 1657 1380 1537 1687 1626 1591 5
Argentina 288 383 445 442 442 246 270 347 376 404 11Bolivia 3 1 1 7 1 a 1 1 10 5 1
Brazil 660 660 660 660 660 643 742 729 703 680 4Chile 348 379 425 321 321 292 333 362 297 296 20Colombia 93 70 72 69 78 114 74 69 61 24 1
Ecuador 71 85 94 94 94 45 71 73 75 79 6Paraguay 1 1 1 1 1 1 1 1 1 1 0Peru 14 24 24 27 27 1
Uruguay 1 1 1 1 1 10 7 10 10 11 3Venezuela 10 10 60 65 59 13 14 71 67 63 3
Asia 9135 8143 8711 7295 7348 10146 9311 10142 7829 7840 2
Afghanistan 1 1 1 1 1 1 1 1 2 2 0Azerbaijan 0 10 14 25 25 3Bahrain 1 1 1 1 1 1
Bangladesh 2 2 2 2 2 2 2 2 2 8 0Bhutan 8 8 8 9 8 a 8 8 a 8 4Cambodia 228 228 21China 4433 3463 3687 2746 2493 4595 3783 4115 3179 2909 2Cyprus 19 19 18 17 18 42 39 60 40 41 53Georgia 10 10 10 10 10 10 10 13 13 13 3India 60 60 60 60 60 58 58 69 70 89 0Indonesia 296 430 440 274 213 35 157 201 -260 -321 -2Iran 330 330 377 498 344 331 331 379 499 345 5Iraq 3 3 3 5 5 3 3 3 5 6 0Israel 58 58 58 58 58 150 128 172 175 180 30Japan 1310 1332 1249 1084 1084 1671 1885 1922 1495 1464 12Jordan 1 0 0 0 2 0Kazakhstan 1 2 2 2 2 0Korea D P Rp 0 4 0 0 0Korea Rep 548 659 721 507 672 1032 1066 1013 654 1104 24Kuwait 1 1 I 1 1 OKrgyzstan 0 13 13 9 9 2Lebanon 12 12 12 12 12 33 77 77 52 55 17Malaysia 500 300 150 250 250 582 303 64 58 -24 -1MongoliaNepal
0 1 2 20
1
200Pakistan 55 60 50 51 54 56 61 51 52 56 0
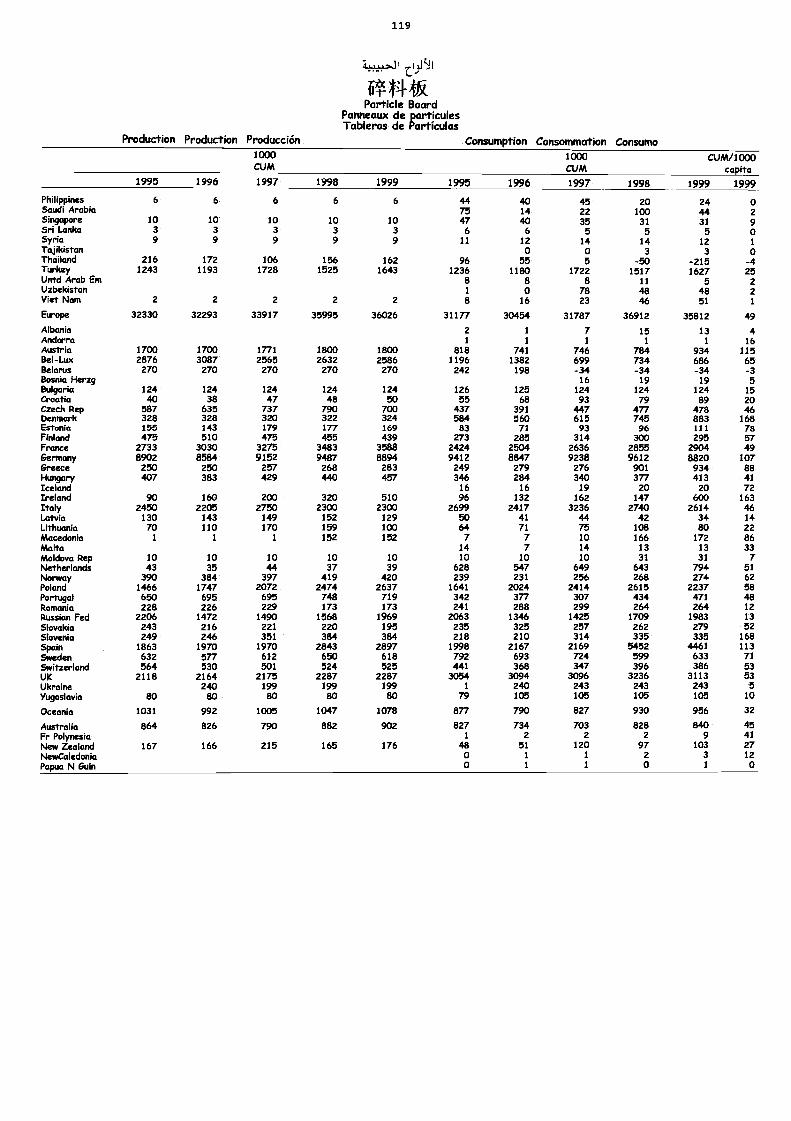
119
Particle BoardPanneaux de particulesTableros de Partículas
Production Production Producción Consumption Consommation Consumo1000CUM
1000CUM
CUM/1000capita
1995 1996 1997 1998 1999 1995 1996 1997 1998 1999 1999Philippines 6 6 6 6 6 44 40 45 20 24 oSaudi Arabia 75 14 22 100 44 2Singapore 10 10 10 10 10 47 40 35 31 31 9Sri Lanka 3 3 3 3 3 6 6 5 5 5 oSyria 9 9 9 9 9 11 12 14 14 12 1Tajikistan 0 0 3 3 oThailand 216 172 106 156 162 96 55 5 -50 -215 -4Turkey 1243 1193 1728 1525 1643 1236 1180 1722 1517 1627 25Untd Arab Em 8 8 8 11 5 2Uzbekistan 1 o 78 48 48 2Viet Nam 2 2 2 2 2 8 16 23 46 51 1
Europe 32330 32293 33917 35995 36026 31177 30454 31787 36912 35812 49Albania 2 1 7 15 13 4Andorra 1 1 1 1 1 16Austria 1700 1700 1771 1800 1800 818 741 746 784 934 115Bel-Lux 2876 3087 2565 2632 2586 1196 1382 699 734 686 65Belarus 270 270 270 270 270 242 198 -34 -34 -34 -3Bosnia Herzg 16 19 19 5Bulgaria 124 124 124 124 124 126 125 124 124 124 15Croatia ao 38 47 48 50 55 68 93 79 89 20Czech Rep 587 635 737 790 700 437 391 447 477 478 46Denmark 328 328 320 322 324 584 560 615 745 883 168Estonia 155 143 179 177 169 83 71 93 96 111 78Finland 475 510 475 455 439 273 285 314 300 295 57France 2733 3030 3275 3483 3588 2424 2504 2636 2855 2904 49GerMany 8902 8584 9152 9487 8894 9412 8847 9238 9612 8820 107Greece 250 250 257 268 283 249 279 276 901 934 88Hull9GrY 407 383 429 440 457 346 284 340 377 413 41Iceland 16 16 19 20 20 72Ireland 90 160 200 320 510 96 132 162 147 600 163Italy 2450 2205 2750 2300 2300 2699 2417 3236 2740 2614 46Latvia 130 143 149 152 129 50 41 44 42 34 14Uthuania 70 110 170 159 100 64 71 75 108 80 22Macedonia 1 1 1 152 152 7 7 10 166 172 86Malta 14 7 14 13 13 33Moldova Rep 10 10 10 10 10 10 10 10 31 31 7Netherlands 43 35 44 37 39 628 547 649 643 794 51Norway 390 384 397 419 420 239 231 256 268 274 62Poland 1466 1747 2072 2474 2637 1641 2024 2414 2615 2237 58Portugal 650 695 695 748 719 342 377 307 434 471 48Romania 228 226 229 173 173 241 288 299 264 264 12Russian Fed 2206 1472 1490 1568 1969 2063 1346 1425 1709 1983 13Slovakia 243 216 221 220 195 235 325 257 262 279 52Slovenia 249 246 351 384 384 218 210 314 335 335 168Spain 1863 1970 1970 2843 2897 1998 2167 2169 5452 4461 113Sweden 632 577 612 650 618 792 693 724 599 633 71Switzerland 564 530 501 524 525 441 368 347 396 386 53UK 2118 2164 2175 2287 2287 3054 3094 3096 3236 3113 53Ukraine 240 199 199 199 1 240 243 243 243 5Yugoslavia 80 80 80 so 80 79 105 105 105 105 10
Oceania 1031 992 1005 1047 1078 877 790 827 930 956 32
Australia 864 826 790 882 902 827 734 703 828 840 45Fr Polynesia 1 2 2 2 9 41New Zealand 167 166 215 165 176 as 51 120 97 103 27NewCaledonia o 1 1 2 3 12Papua N Guin 0 1 1 0 1 0
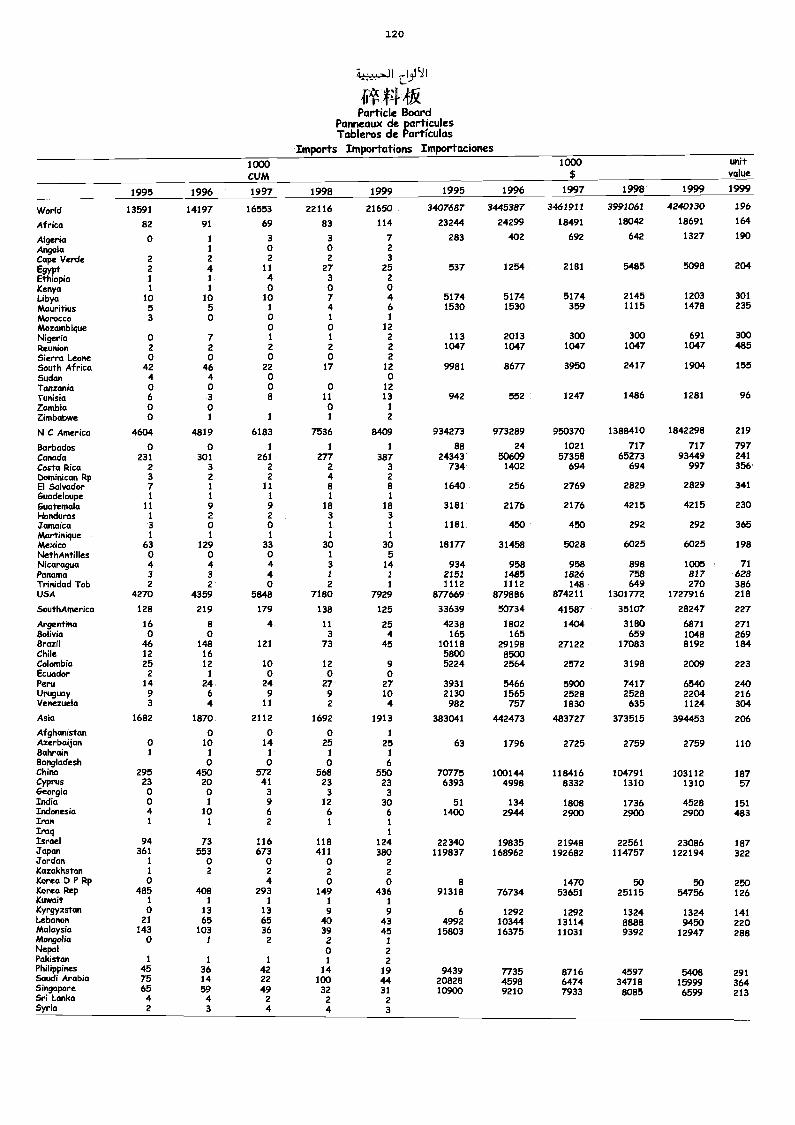
120
dpiiist-14kParticle Board
Panneaux de particulesTableros de Partículas
Imports Importations Importaciones1000CUM
1000 unitvalue
1995 1996 1997 1998 1999 1995 1996 1997 1998 1999 1999
World 13591 14197 16553 22116 21650 3407687 3445387 3461911 3991061 4240130 196
Africa 82 91 69 83 114 23244 24299 18491 18042 18691 164
Algeria 0 1 3 3 7 283 402 692 642 1327 190
Angola 1 0 0 2Cape Verde 2 2 2 2 3
Egypt 2 4 11 27 25 537 1254 2181 5485 5098 204Ethiopia 1 1 4 3 2
Kenya 1 1 0 0 0Libya 10 10 10 7 4 5174 5174 5174 2145 1203 301
Mauritius 5 5 1 4 6 1530 1530 359 1115 1478 235Morocco 3 0 0 1 1
Mozambique 0 0 12Nigeria 0 7 1 1 2 113 2013 300 300 691 300Reunion 2 2 2 2 2 1047 1047 1047 1047 1047 485Sierra Leone 0 0 0 0 2South Africa 42 46 22 17 12 9981 8677 3950 2417 1904 155
Sudan 4 4 0 0Tanzania 0 0 0 0 12Tunisia 6 3 8 11 13 942 552 1247 1486 1281 96Zambia 0 0 0 1
Zimbabwe 0 1 1 1 2
N C America 4604 4819 6183 7536 8409 934273 973289 950370 1388410 1842298 219
Barbados 0 0 1 1 1 88 24 1021 717 717 797Canada 231 301 261 277 387 24343 50609 57358 65273 93449 241Costa Rica 2 3 2 2 3 734 1402 694 694 997 356bominican Rp 3 2 2 4 2
El Salvador 7 1 11 8 8 1640 256 2769 2829 2829 341Guadeloupe 1 1 1 1 1
Guatemala 11 9 9 18 18 3181 2176 2176 4215 4215 230Honduras 1 2 2 3 3Jamaica 3 0 0 1 1 1181 450 450 292 292 365Martinique 1 1 1 1 1
Mexico 63 129 33 30 30 18177 31458 5028 6025 6025 198NethAntilles 0 0 0 1 5Nicaragua 4 4 4 3 14 934 958 958 898 1005 71Panama 3 3 4 1 1 2151 1485 1826 758 817 628Trinidad Tob 2 2 0 2 1 1112 1112 148 649 270 386USA 4270 4359 5848 7180 7929 877669 879886 874211 1301772 1727916 218
SouthAtnerica 128 219 179 138 125 33639 50734 41587 35107 28247 227
Argentina 16 8 4 11 25 4238 1802 1404 3180 6871 271Bolivia 0 0 3 4 165 165 659 1048 269Brazil 46 148 121 73 45 10118 29198 27122 17083 8192 184Chile 12 16 5800 8500Colombia 25 12 10 12 9 5224 2564 2572 3198 2009 223Ecuador 2 1 0 0 0Peru 14 24 24 27 27 3931 5466 5900 7417 6540 240Uruguay 9 6 9 9 10 2130 1565 2528 2528 2204 216Venezuela 3 4 11 2 4 982 757 1830 635 1124 304
Asia 1682 1870 2112 1692 1913 383041 442473 483727 373515 394453 206
Afghanistcm 0 0 0 1
Azerbaijan 0 10 14 25 25 63 1796 2725 2759 2759 110Bahrain 1 1 1 1 1
Bangladesh 0 0 0 6China 295 450 572 568 550 70775 100144 118416 104791 103112 187Cyprus 23 20 41 23 23 6393 4998 8332 1310 1310 57Georgia 0 0 3 3 3India 0 1 9 12 30 51 134 1808 1736 4528 151Indonesia 4 10 6 6 6 1400 2944 2900 2900 2900 483Iran 1 1 2 1 1
Iraq 1
Israel 94 73 116 118 124 22340 19835 21948 22561 23086 187Japan 361 553 673 411 380 119837 168962 192682 114757 122194 322Jordan 1 0 0 0 2Kazakhstan 1 2 2 2 2Korea D P Rp 0 4 0 0 8 1470 50 50 250Korea Rep 485 408 293 149 436 91318 76734 53651 25115 54756 126Kuwait 1 1 1 1 1Kyrgyzstan 0 13 13 9 9 6 1292 1292 1324 1324 141Lebanon 21 65 65 40 43 4992 10344 13114 8888 9450 220Malaysia 143 103 36 39 45 15803 16375 11031 9392 12947 288Mongolia 0 1 2 2 /Nepal 0 2Pakistan 1 1 1 1 2Philippines 45 36 42 14 19 9439 7735 8716 4597 5408 291Saudi Arabia 75 14 22 WO 44 20828 4598 6474 34718 15999 364SingaporeSri Lanka
654
594
492
322
312
10900 9210 7933 8085 6599 213
Syria 2 3 4 4 3
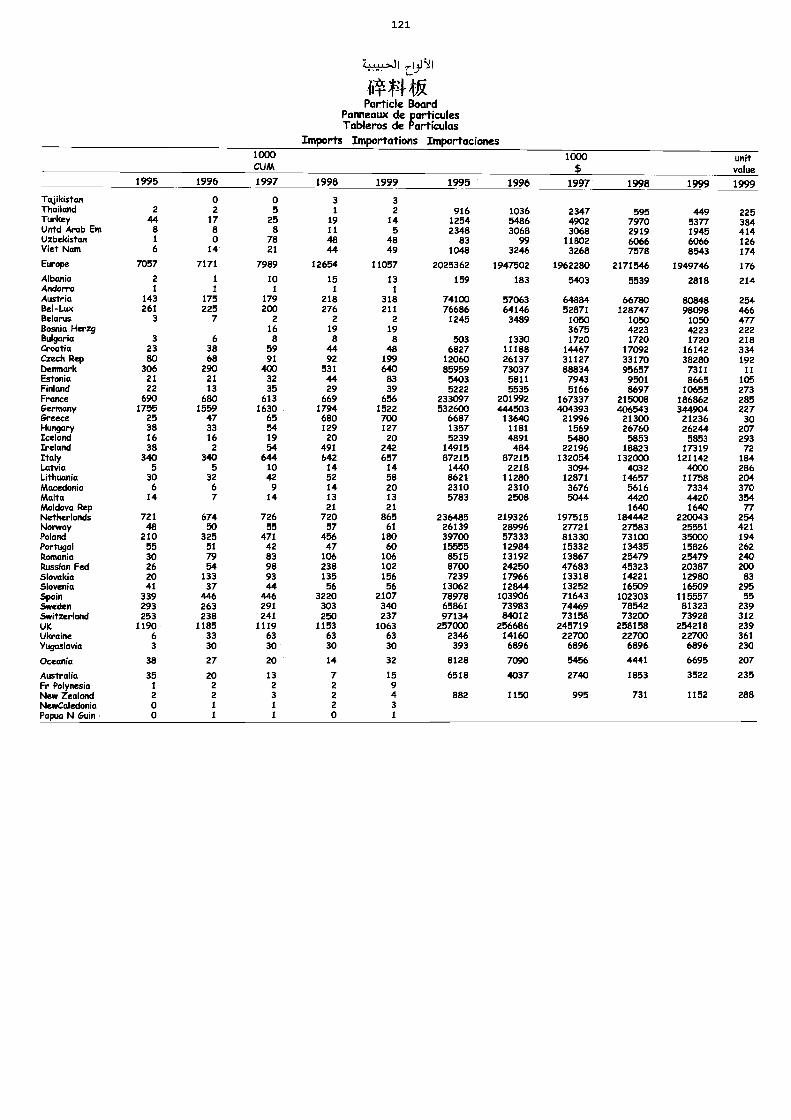
121
'
41'4 tl"Particle Board
Panneaux de particulesTableros de Partículas
Imports Importations Importaciones1000CUM
1000$
unitvalue
1995 1996 1997 1998 1999 1995 1996 1997 1998 1999 1999
Tajikistan 0 0 3 3Thailand 2 2 5 1 2 916 1036 2347 595 449 225Turkey 44 17 25 19 14 1254 5486 4902 7970 5377 384Untd Arab Em 8 8 8 11 5 2348 3068 3068 2919 1945 414Uzbekistan 1 0 78 48 48 83 99 11802 6066 6066 126Viet Nam 6 14 21 44 49 1048 3246 3268 7578 8543 174
Europe 7057 7171 7989 12654 11057 2025362 1947502 1962280 2171546 1949746 176Albania 2 1 10 15 13 159 183 5403 5539 2818 214Andorra 1 1 1 1 1
Austria 143 175 179 218 318 74100 57063 64884 66780 80848 254Bel-Lux 261 225 200 276 211 76686 64146 52871 128747 98098 466Belarus 3 7 2 2 2 1245 3489 1050 1050 1050 477Bosnia Herzg 16 19 19 3675 4223 4223 222Bulgaria 3 6 8 8 8 503 1330 1720 1720 1720 218Croatia 23 38 59 44 48 6827 11188 14467 17092 16142 334Czech Rep 80 68 91 92 199 12060 26137 31127 33170 38280 192Denmark 306 290 400 531 640 85959 73037 88834 95657 7311 11Estonia 21 21 32 44 83 5403 5811 7943 9501 8665 105Finland 22 13 35 29 39 5222 5535 5166 8697 10655 273France 690 680 613 669 656 233097 201992 167337 215008 186862 285Germany 1755 1559 1630 1794 1522 532600 444503 404393 406543 344904 227Greece 25 47 65 680 700 6687 13640 21996 21300 21236 30Hun9arY 38 33 54 129 127 1357 1181 1569 26760 26244 207Iceland 16 16 19 20 20 5239 4891 5480 5853 5853 293Ireland 38 2 54 491 242 14915 484 22196 18823 17319 72Italy 340 340 644 642 657 87215 87215 132054 132000 121142 184Latvia 5 5 10 14 14 1440 2218 3094 4032 4000 286Lithuania 30 32 42 52 58 8621 11280 12871 14657 11758 204Macedonia 6 6 9 14 20 2310 2310 3676 5616 7334 370Malta 14 7 14 13 13 5783 2508 5044 4420 4420 354Moldova Rep 21 21 1640 1640 77Netherlands 721 674 726 720 865 236485 219326 197515 184442 220043 254Norway 48 50 55 57 61 26139 28996 27721 27583 25551 421Poland 210 325 471 456 180 39700 57333 81330 73100 35000 194Portugal 55 51 42 47 60 15555 12984 15332 13435 15826 262Romania 30 79 83 106 106 8515 13192 13867 25479 25479 240Russian Fed 26 54 98 238 102 8700 24250 47683 45323 20387 200Slovakia 20 133 93 135 156 7239 17966 13318 14221 12980 83Slovenia 41 37 44 56 56 13062 12844 13252 16509 16509 295Spain 339 446 446 3220 2107 78978 103906 71643 102303 115557 55Sweden 293 263 291 303 340 65861 73983 74469 78542 81323 239Switzerland 253 238 241 250 237 97134 84012 73158 73200 73928 312UK 1190 1185 1119 1153 1063 257000 256686 245719 258158 254218 239Ukraine 6 33 63 63 63 2346 14160 22700 22700 22700 361Yugoslavia 3 30 30 30 30 393 6896 6896 6896 6896 230
Oceania 38 27 20 14 32 8128 7090 5456 4441 6695 207
Australia 35 20 13 7 15 6518 4037 2740 1853 3522 235Fr Polynesia 1 2 2 2 9New Zealand 2 2 3 2 4 882 1150 995 731 1152 288NewCaledonia 0 1 1 2 3Papua N Guin 0 1 1 0 1
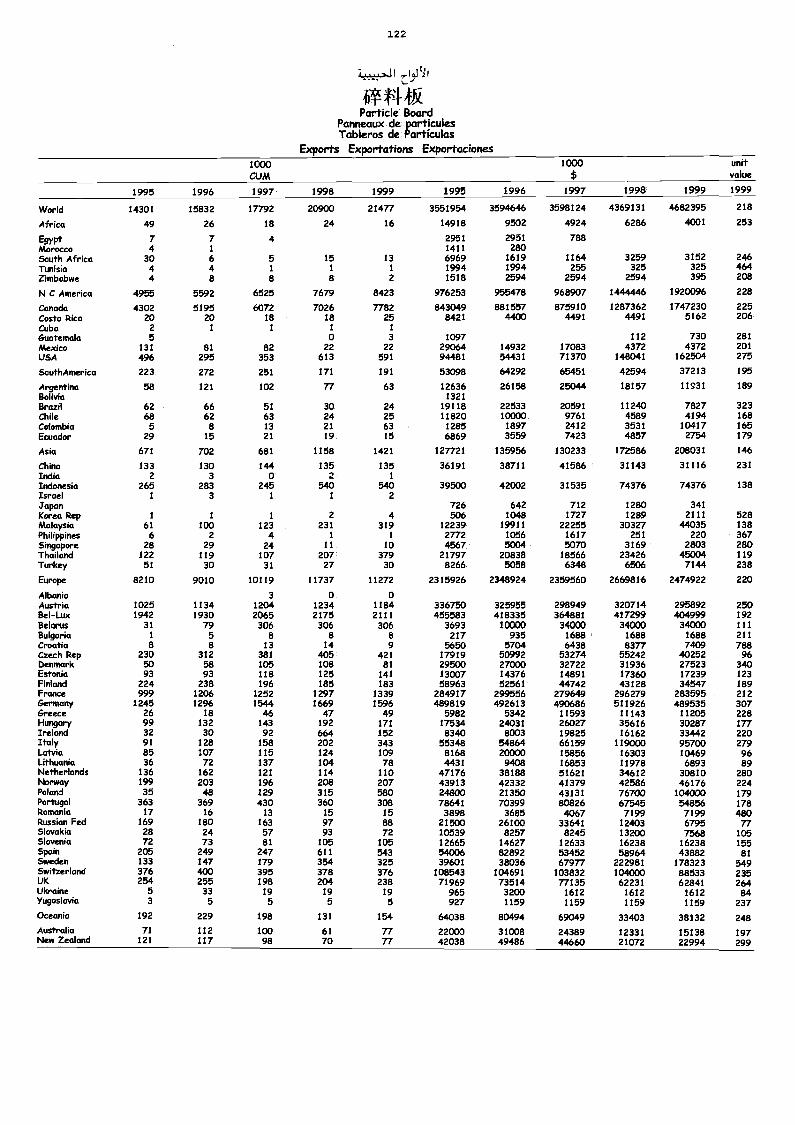
122
Particle BoardPanneaux de particulesTableros de Partículas
Exports Exportations Exportaciones1000CUM
1000$
unitvalue
1995 1996 1997 1998 1999 1995 1996 1997 1998 1999 1999
World 14301 15832 17792 20900 21477 3551954 3594646 3598124 4369131 4682395 218
Africa 49 26 18 24 16 14918 9502 4924 6286 4001 253
Egypt 7 7 4 2951 2951 788Morocco 4 1 1411 280South Africa 30 6 5 15 13 6969 1619 1164 3259 3152 246Tunisia 4 4 1 1 1 1994 1994 255 325 325 464Zimbabwe 4 8 8 8 2 1518 2594 2594 2594 395 208
N C America 4955 5592 6525 7679 8423 976253 955478 968907 1444446 1920096 228
Canada 4302 5195 6072 7026 7782 843049 881557 875910 1287362 1747230 225Costa Rica 20 20 18 18 25 8421 4400 4491 4491 5162 206Cuba 2 1 1 1 1
Guatemala 5 0 3 1097 112 730 281Mexico 131 81 82 22 22 29064 14932 17083 4372 4372 201USA 496 295 353 613 591 94481 54431 71370 148041 162504 275
SouthAmerica 223 272 251 171 191 53098 64292 65451 42594 37213 195
Argentina 58 121 102 77 63 12636 26158 25044 18157 11931 189Bolivia 1321Brazil 62 66 51 30 24 19118 22533 20591 11240 7827 323Chile 68 62 63 24 25 11820 10000 9761 4589 4194 168Colombia 5 8 13 21 63 1285 1897 2412 3531 10417 165Ecuador 29 15 21 19 15 6869 3559 7423 4857 2754 179
Asia 671 702 681 1158 1421 127721 135956 130233 172586 208031 146
China 133 130 144 135 135 36191 38711 41586 31143 31116 231India 2 3 0 2 1
Indonesia 265 283 245 540 540 39500 42002 31535 74376 74376 138Israel 1 3 1 1 2Japan 726 642 712 1280 341Korea Rep / 1 1 2 4 506 1048 1727 1289 2111 528Malaysia 61 100 123 231 319 12239 19911 22255 30327 44035 138Philippines 6 2 4 1 1 2772 1056 1617 251 220 367Singapore 28 29 24 11 10 4567 5004 5070 3169 2803 280Thailand 122 119 107 207 379 21797 20838 18566 23426 45004 119Turkey 51 30 31 27 30 8266 5058 6348 6506 7144 238
Europe 8210 9010 10119 11737 11272 2315926 2348924 2359560 2669816 2474922 220
Albania 3 0 0Austria 1025 1134 1204 1234 1184 336750 325955 298949 320714 295892 250Bel-Lux 1942 1930 2065 2175 2111 455583 418335 364881 417299 404999 192Belarus 31 79 306 306 306 3693 10000 34000 34000 34030 111Bulgaria 1 5 8 8 8 217 935 1688 1688 1688 211Croatia 8 8 13 14 9 5650 5704 6438 8377 7409 788Czech Rep 230 312 381 405 421 17919 50992 53274 55242 40252 96Denmark 50 58 105 108 81 29500 27000 32722 31936 27523 340Estonia 93 93 118 125 141 13007 14376 14891 17360 17239 123Finland 224 238 196 185 183 58963 52561 44742 43128 34547 189France 999 1206 1252 1297 1339 284917 299556 279649 296279 283595 212Germany 1245 1296 1544 1669 1596 489819 492613 490686 511926 489535 307Greece 26 18 4.6 47 49 5982 5342 11593 11143 11205 228Hungary 99 132 143 192 171 17534 24031 26027 35616 30287 177Ireland 32 30 92 664 152 8340 8003 19825 16162 33442 220Italy 91 128 158 202 343 55348 54864 66159 119000 95700 279Latvia 85 107 115 124 109 8168 20000 15856 16303 10469 96Lithuania 36 72 137 104 78 4431 9408 16853 11978 6893 89Netherlands 136 162 121 114 110 47176 38188 51621 34612 30810 280Norway 199 203 196 208 207 43913 42332 41379 42586 46176 224Poland 35 48 129 315 580 24800 21350 43131 76700 104000 179Portugal 363 369 430 360 308 78641 70399 80826 67545 54856 178Romania 17 16 13 15 15 3898 3685 4067 7199 7199 480Russian Fed 169 180 163 97 88 21500 26100 33641 12403 6795 77Slovakia 28 24 57 93 72 10539 8257 8245 13200 7568 105Slovenia 72 73 81 105 105 12665 14627 12633 16238 16238 155Spain 205 249 247 611 543 54006 82892 53452 58964 43882 81Sweden 133 147 179 354 325 39601 38036 67977 222981 178323 549Switzerland 376 400 395 378 376 108543 104691 103832 104000 88533 235UK 254 255 198 204 238 71969 73514 77135 62231 62841 264Ukraine 5 33 19 19 19 965 3200 1612 1612 1612 84Yugoslavia 3 5 5 5 5 927 1159 1159 1159 1159 237Oceania 192 229 198 131 154 64038 80494 69049 33403 38132 248Australia 71 112 100 61 77 22000 31008 24389 12331 15138 197New Zealand 121 117 98 70 77 42038 49486 44660 21072 22994 299
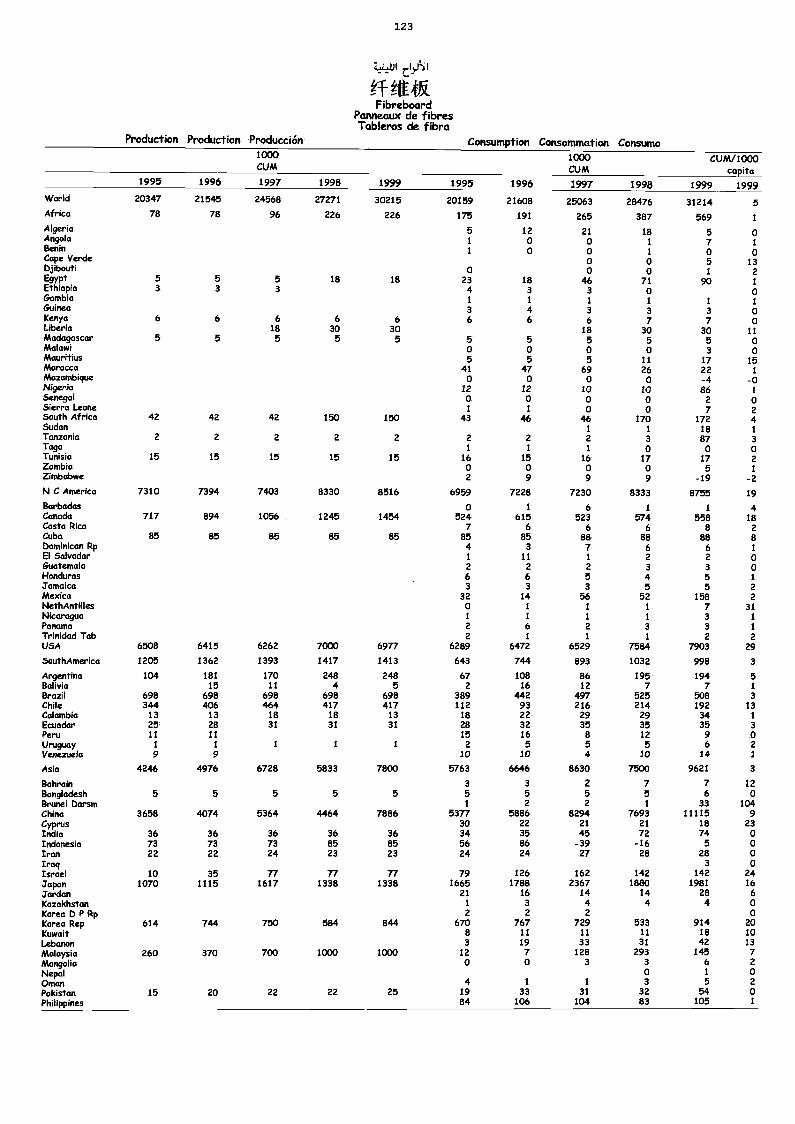
12 3
Zt41
?TM*Fibreboard
Panneaux de fibresTableros de fibra
Production Production Producción Consumption Consommation Consumo1000CUM
1000CuM
cuM/1000capita
1995 1996 1997 1998 1999 1995 1996 1997 1998 1999 1999World 20347 21545 24568 27271 30215 20159 21608 25063 28476 31214 5Africa 78 78 96 226 226 175 191 265 387 569 1
Algeria 5 12 21 18 5 0Angola 1 0 0 1 7 1
Benin 1 0 0 1 0 0Cape Verde 0 0 5 13Djibouti 0 0 0 1 2Egypt 5 5 5 18 18 23 18 46 71 90 1
Ethiopia 3 3 3 4 3 3 0 0Gambia 1 1 1 1 1 1
Guinea 3 4 3 3 3 0Kenya 6 6 6 6 6 6 6 6 7 7 0Liberia 18 30 30 18 30 30 11Madagascar 5 5 5 5 5 5 5 5 5 5 0Malawi 0 0 0 0 3 0Mauritius 5 5 5 11 17 15Morocco 41 47 69 26 22 1
Mozambique 0 0 0 0 -4 -0Nigeria 12 12 10 10 86 1Senegal 0 0 0 0 2 0Sierra Leone 1 1 0 0 7 2South Africa 42 42 42 150 150 43 46 46 170 172 4Sudan 1 1 18 1Tanzania 2 2 2 2 2 2 2 2 3 87 3Togo 1 1 1 0 0 0Tunisia 15 15 15 15 15 16 15 16 17 17 2Zambia O 0 0 0 5 1Zimbabwe 2 9 9 9 -19 -2N C America 7310 7394 7403 8330 8516 6959 7228 7230 8333 8755 19
Barbados 0 1 6 1 1 4Canada 717 894 1056 1245 1454 524 615 523 574 558 18Costa Rica 7 6 6 6 8 2Cuba 85 85 85 85 85 85 85 88 88 88 8Dominican Rp 4 3 7 6 6 1El Salvador 1 11 1 2 2 0Guatemala 2 2 2 3 3 0Honduras 6 6 5 4 5 1
Jamaica 3 3 3 5 5 2Mexico 32 14 56 52 158 2NethAntilles 0 1 1 1 7 31Nicaragua 1 1 1 1 3 1
Panama 2 6 2 3 3 1
Trinidad Tob 2 1 1 1 2 2USA 6508 6415 6262 7000 6977 6289 6472 6529 7584 7903 29
SouthAmerica 1205 1362 1393 1417 1413 643 744 893 1032 998 3
Argentina 104 181 170 248 248 67 108 86 195 194 5Bolivia 15 11 4 5 2 16 12 7 7 1
Brazil 698 698 698 698 698 389 442 497 525 508 3Chile 344 406 464 417 417 112 93 216 214 192 13Colombia 13 13 18 18 13 18 22 29 29 34 1
Ecuador 25 28 31 31 31 28 32 35 35 35 3Peru 11 11 15 16 8 12 9 0Uruguay 1 1 1 1 1 2 5 5 5 6 2Venezuela 9 9 10 10 4 10 14 1
Asia 4246 4976 6728 5833 7800 5763 6646 8630 7500 9621 3
Bahrain 3 3 2 7 7 12Bangladesh 5 5 5 5 5 5 5 5 5 6 0Brunei Darsm 1 2 2 1 33 104China 3658 4074 5364 4464 7886 5377 5886 8294 7693 11115 9Cyprus 30 22 21 21 18 23India 36 36 36 36 36 34 35 45 72 74 0Indonesia 73 73 73 85 85 56 86 -39 -16 5 0Iran 22 22 24 23 23 24 24 27 28 28 0Iraq 3 0Israel 10 35 77 77 77 79 126 162 142 142 24Japan 1070 1115 1617 1338 1338 1665 1788 2367 1880 1981 16Jordan 21 16 14 14 28 6Kazakhstan 1 3 4 4 4 0Korea D P Rp 2 2 2 0Korea Rep 614 744 750 584 844 670 767 729 533 914 20Kuwait 8 11 11 11 18 10Lebanon 3 19 33 31 42 13
Malaysia 260 370 700 1000 1000 12 7 128 293 145 7Mongolia 0 0 3 3 6 2
Nepal 0 1 0Ornan 4 1 1 3 5 2
Pakistan 15 20 22 22 25 19 33 31 32 54 0Philippines 84 106 104 83 105 1
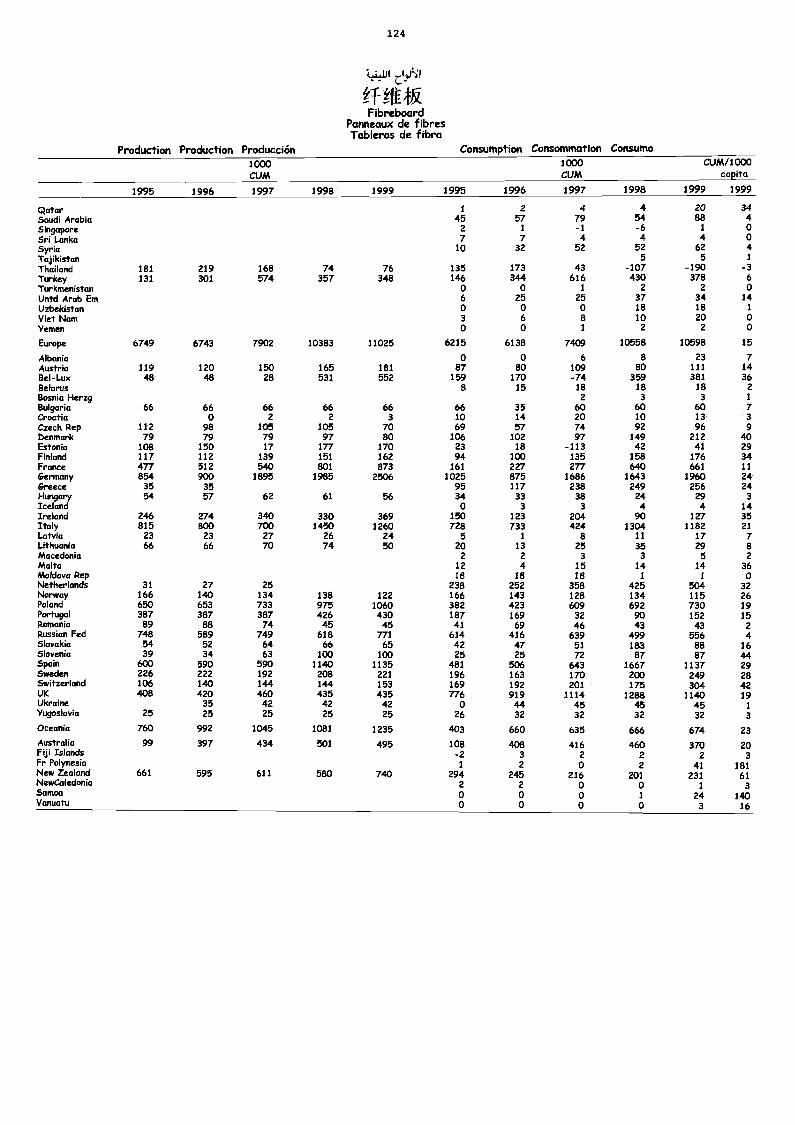
124
71.,41 clytlî I
gitFibreboard
Panneaux de fibresTableros de fibra
Production Procktction Producción Consumption Consommation Consumo1000CUM
1000CUM
CUM/1000capita
1995 1996 1997 1998 1999 1995 1996 1997 1998 1999 1999
Qatar 1 2 4 4 ao 34Saudi Arabia 45 57 79 54 88 4Singapore 2 1 -1 -6 1 0Sri Lanka 7 7 4 4 4 0Syria 10 32 52 52 62 4Tajikistan 5 5 1
Thailand 181 219 168 74 76 135 173 43 -107 -190 -3Ttrkey 131 301 574 357 348 146 344 616 430 378 6Turkmenistan 0 0 1 2 2 0Untd Arab Em 6 25 25 37 34 14Uzbekistan 0 0 0 18 18 1
Viet Nam 3 6 8 10 20 0Yemen 0 0 1 2 2 0
Europe 6749 6743 7902 10383 11025 6215 6138 7409 10558 10598 15
Albania 0 0 6 8 23 7Austria 119 120 150 165 181 87 BO 109 80 111 14Bel-Lux 48 48 28 531 552 159 170 -74 359 381 36Belarta 8 15 18 18 18 2Bosnia Herzg 2 3 3 1
Bulgaria 66 66 66 66 66 66 35 60 60 60 7Croatia 0 2 2 3 10 14 20 10 13 3Czech Rep 112 98 105 105 70 69 57 74 92 96 9Denmark 79 79 79 97 80 106 102 97 149 212 40Estonia 108 150 17 177 170 23 18 -113 42 41 29Finland 117 112 139 151 162 94 100 135 158 176 34France 477 512 540 801 873 161 227 277 640 661 11Germany 854 900 1895 1985 2506 1025 875 1686 1643 1960 24Greece 35 35 95 117 238 249 256 24Hungary 54 57 62 61 56 34 33 38 24 29 3Iceland 0 3 3 4 4 14Ireland 246 274 340 330 369 150 123 204 90 127 35Italy 815 BOO 703 1450 1260 728 733 424 1304 1182 21Latvia 23 23 27 26 24 5 1 8 11 17 7Lithuania 66 66 70 74 50 20 13 25 35 29 8Macedonia 2 2 3 3 5 2Malta 12 4 15 14 14 36Mo/dova Rep 18 18 18 1 1 0Netherlands 31 27 25 238 252 358 425 504 32Norway 166 140 134 138 122 166 143 128 134 115 26Poland 650 653 733 975 1060 382 423 609 692 730 19Portugal 387 387 387 426 430 187 169 32 90 152 15Romania 89 88 74 45 45 41 69 46 43 43 2Russian Fed 748 589 749 618 771 614 416 639 499 556 4Slovakia 54 52 64 66 65 42 47 51 183 88 16Slovenia 39 34 63 100 100 25 25 72 87 87 44Spain 600 590 590 1140 1135 481 506 643 1667 1137 29Sweden 226 222 192 208 221 196 163 170 200 249 28Switzerland 106 140 144 144 153 169 192 201 175 304 42UK 408 420 460 435 435 776 919 1114 1288 1140 19Ukraine 35 42 42 42 0 44 45 45 45 1
Yugoslavia 25 25 25 25 25 26 32 32 32 32 3Oceania 760 992 1045 1081 1235 403 660 635 666 674 23Australia 99 397 434 501 495 108 408 416 460 370 20Fiji Islands -2 3 2 2 2 3Fr Polynesia 1 2 0 2 41 181New Zealand 661 595 611 580 740 294 245 216 201 231 61NewCaledonia 2 2 0 0 1 3Samoa 0 0 0 1 24 140Vanuatu 0 0 0 0 3 16
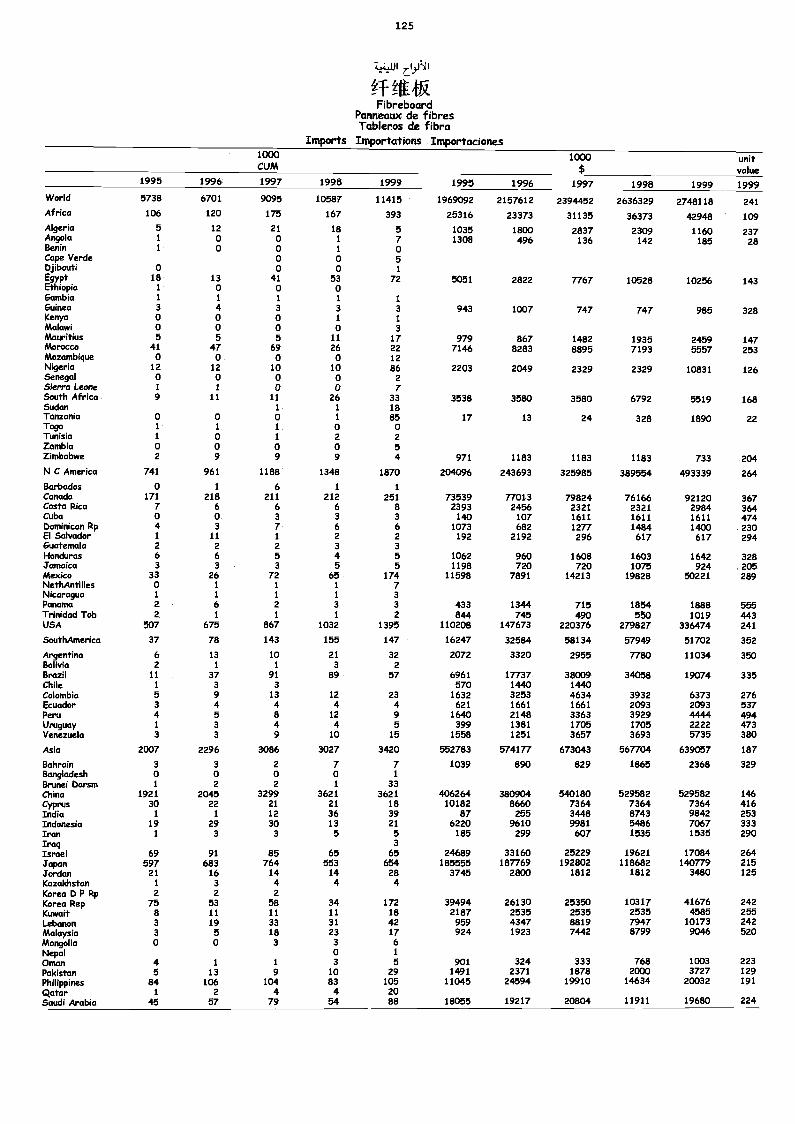
125
FibreboardPanneaux de fibresTableros de fibra
Imports Importations Importaciones1000CUM
1000$
unitvalue
1995 1996 1997 1998 1999 1995 1996 1997 1998 1999 1999World 5738 6701 9095 10587 11415 1969092 2157612 2394452 2636329 2748118 241Africa 106 120 175 167 393 25316 23373 31135 36373 42948 109Algeria 5 12 21 18 5 1035 1800 2837 2309 1160 237Angola 1 0 o 1 7 1308 496 136 142 185 28Benin 1 0 o 1 0Cape Verde 0 0 5Djibouti 0 0 o 1
Egypt 18 13 41 53 72 5051 2822 7767 10528 10256 143Ethiopia 1 0 0 0Gambia 1 1 1 I 1GuineaKenya
3o
4o
3o
31
31
943 1007 747 747 985 328
Malawi o o o 0 3Mauritius 5 5 5 11 17 979 867 1482 1935 2459 147Morocco 41 47 69 26 22 7146 8283 8895 7193 5557 253Mozambique 0 0 0 0 12Nigeria 12 12 10 10 86 2203 2049 2329 2329 10831 126Senegal o o o 0 2Sierra Leone I I o 0 7South Africa 9 11 11 26 33 3538 3580 3580 6792 5519 168Sudan 1 1 18Tanzania o o o 1 85 17 13 24 328 1890 22Togo 1 1 1 0 0Tunisia 1 0 1 2 2Zambia 0 0 0 0 5Zimbabwe 2 9 9 9 4 971 1183 1183 1183 733 204N C America 741 961 1188 1348 1870 204096 243693 325985 389554 493339 264Barbados 0 1 6 1 1
Canada 171 218 211 212 251 73539 77013 79824 76166 92120 367Costa Rica 7 6 6 6 a 2393 2456 2321 2321 2984 364Cuba 0 0 3 3 3 140 107 1611 1611 1611 474Dominican Rp 4 3 7 6 6 1073 682 1277 1484 1400 230El Salvador 1 11 1 2 2 192 2192 296 617 617 294Guatemala 2 2 2 3 3Honduras 6 6 5 4 5 1062 960 1608 1603 1642 328Jamaica 3 3 3 5 5 1198 720 720 1075 924 205Mexico 33 26 72 65 174 11598 7891 14213 19828 50221 289NethAntilles o 1 1 1 7Nicaragua 1 1 1 1 3Panama 2 6 2 3 3 433 1344 715 1854 1888 555Trinidad Tob 2 1 1 1 2 844 745 490 550 1019 443USA 507 675 867 1032 1395 110208 147673 220376 279827 336474 241
SouthAmerica 37 78 143 155 147 16247 32584 58134 57949 51702 352
Argentina 6 13 10 21 32 2072 3320 2955 7780 11034 350Bolivia 2 1 1 3 2Brazil 11 37 91 89 57 6961 17737 38009 34058 19074 335Chile 1 3 3 570 1440 1440Colombia 5 9 13 12 23 1632 3253 4634 3932 6373 276Ecuador 3 4 4 4 4 621 1661 1661 2093 2093 537Peru 4 5 8 12 9 1640 2148 3363 3929 4444 494Uruguay 1 3 4 4 5 399 1381 1705 1705 2222 473Venezuela 3 3 9 10 15 1558 1251 3657 3693 5735 380
Asia 2007 2296 3086 3027 3420 552783 574177 673043 567704 639057 187
Bahrain 3 3 2 7 7 1039 890 829 1865 2368 329Bangladesh o o o o 1
Brunei Dorm 1 2 2 1 33China 1921 2045 3299 3621 3621 406264 380904 540180 529582 529582 146Cyprus 30 22 21 21 18 10182 8660 7364 7364 7364 416India 1 1 12 36 39 87 255 3448 8743 9842 253Indonesia 19 29 30 13 21 6220 9610 9981 5486 7067 333Iran 1 3 3 5 5 185 299 607 1535 1535 290Iraq 3Israel 69 91 85 65 65 24689 33160 25229 19621 17084 264Japan 597 683 764 553 654 185555 187769 192802 118682 140779 215Jordan 21 16 14 14 28 3745 2800 1812 1812 3480 125Kazakhstan 1 3 4 4 4Korea D P Rp 2 2 2Korea Rep 75 53 58 34 172 39494 26130 25350 10317 41676 242Kuwait 8 11 11 11 18 2187 2535 2535 2535 4585 255Lebanon 3 19 33 31 42 959 4347 8819 7947 10173 242Malaysia 3 5 18 23 17 924 1923 7442 8799 9046 520Mongolia o o 3 3 6Nepal 0 1
Oman 4 1 1 3 5 901 324 333 768 1003 223Pakistan 5 13 9 10 29 1491 2371 1878 2000 3727 129Philippines 84 106 104 83 105 11045 24594 19910 14634 20032 191
Qatar 1 2 4 4 20Saudi Arabia 45 57 79 84 88 18055 19217 20804 11911 19680 224
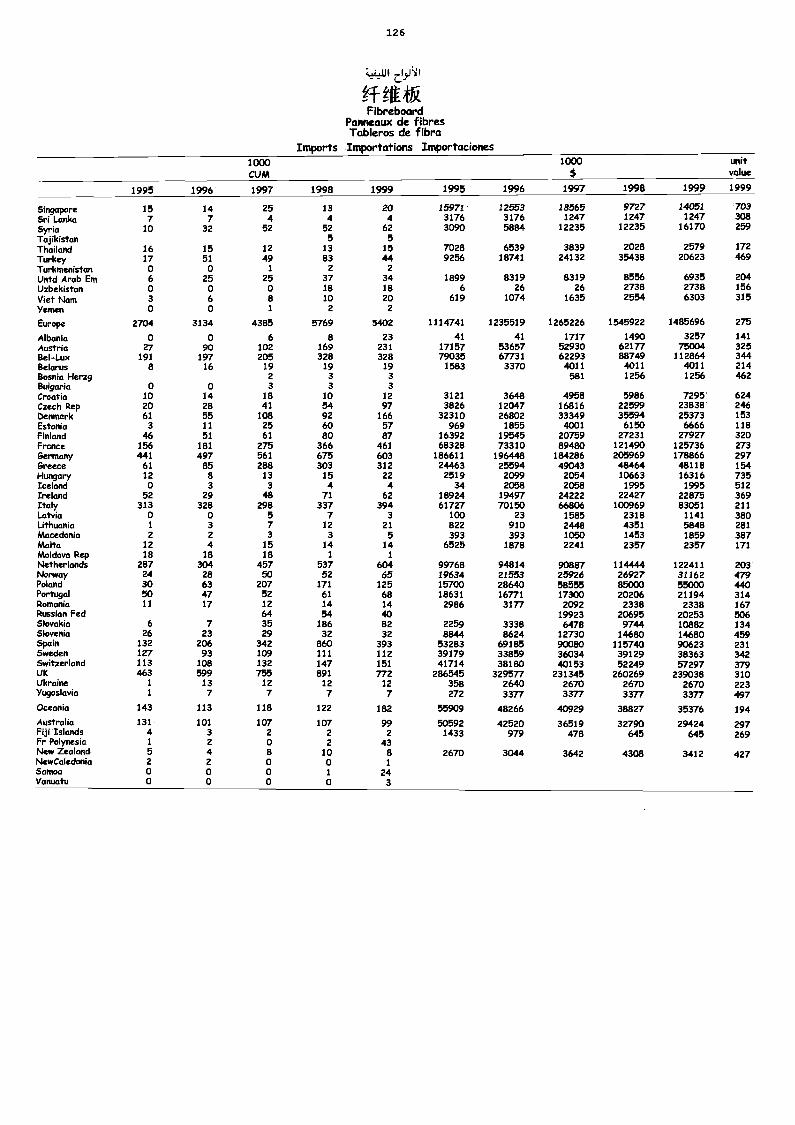
126
Ul &'P
g+gliFibreboard
Panneaux de fibresTableros de fibra
Imports Importations Importaciones1000CUM
1000$
unitvalue
1995 1996 1997 1998 1999 1995 1996 1997 1998 1999 1999
Singapore 15 14 25 13 20 15971 12553 18565 9727 14051 703Sri Lanka 7 7 4 4 4 3176 3176 1247 1247 1247 308Syria 10 32 52 52 62 3090 5884 12235 12235 16170 259Tajikistan 5 5Thailand 16 15 12 13 15 7028 6539 3839 2028 2579 172Turkey 17 51 49 83 44 9256 18741 24132 35438 20623 469Turkmenistan 0 0 1 2 2Untd Arab Em 6 25 25 37 34 1899 8319 8319 8556 6935 204Uzbekistan 0 0 0 18 18 6 26 26 2738 2738 156Viet Nam 3 6 8 10 20 619 1074 1635 2554 6303 315Yemen 0 0 1 2 2
Europe 2704 3134 4385 5769 5402 1114741 1235519 1265226 1545922 1485696 275
Albania 0 0 6 8 23 41 41 1717 1490 3257 141Austria 27 90 102 169 231 17157 53657 52930 62177 75004 325Bel-Lux 191 197 205 328 328 79035 67731 62293 88749 112864 344Belarus 8 16 19 19 19 1583 3370 4011 4011 4011 214Bosnia Herzg 2 3 3 581 1256 1256 462Bulgaria 0 0 3 3 3Croatia 10 14 18 10 12 3121 3648 4958 5986 7295 624Czech Rep 20 28 41 54 97 3826 12047 16816 22599 23838 246Denmark 61 55 108 92 166 32310 26802 33349 35594 25373 153Estonia 3 11 25 60 57 969 1855 4001 6150 6666 118Finland 46 51 61 80 87 16392 19545 20759 27231 27927 320France 156 181 275 366 461 68328 73310 89480 121490 125736 273Germany 441 497 561 675 603 186611 196448 184286 205969 178866 297Greece 61 85 288 303 312 24463 25594 49043 48464 48118 154Hungary 12 8 13 15 22 2519 2099 2054 10663 16316 735Iceland 0 3 3 4 4 34 2058 2058 1995 1995 512Ireland 52 29 48 71 62 18924 19497 24222 22427 22875 369Italy 313 328 298 337 394 61727 70150 66806 100969 83051 211Latvia 0 0 5 7 3 100 23 1585 2318 1141 380Lithuania 1 3 7 12 21 822 910 2448 4351 5848 281Macedonia 2 2 3 3 5 393 393 1050 1453 1859 387Malta 12 4 15 14 14 6525 1878 2241 2357 2357 171Moldova Rep 18 18 18 1 1
Netherlands 287 304 457 537 604 99768 94814 90887 114444 122411 203Norway 24 28 50 52 65 19634 21553 25926 26927 31162 479Poland 30 63 207 171 125 15700 28640 58555 85000 55000 440Portugal 50 47 52 61 68 18631 16771 17300 20206 21194 314Romania 11 17 12 14 14 2986 3177 2092 2338 2338 167Russian Fed 64 54 40 19923 20695 20253 506Slovakia 6 7 35 186 82 2259 3338 6478 9744 10882 134Slovenia 26 23 29 32 32 8844 8624 12730 14680 14680 459Spain 132 206 342 860 393 53283 69185 90080 115740 90623 231Sweden 127 93 109 111 112 39179 33859 36034 39129 38363 342Switzerland 113 108 132 147 151 41714 38180 40153 52249 57297 379UK 463 599 755 891 772 286545 329577 231345 260269 239038 310Ukraine 1 13 12 12 12 358 2640 2670 2670 2670 223Yugoslavia 1 7 7 7 7 272 3377 3377 3377 3377 497Oceania 143 113 118 122 182 55909 48266 40929 38827 35376 194Australia 131 101 107 107 99 50592 42520 36519 32790 29424 297Fiji Islands 4 3 2 2 2 1433 979 478 645 645 269Fr Polynesia 1 2 0 2 43New Zealand 5 4 8 10 8 2670 3044 3642 4308 3412 427NewCaledonia 2 2 0 0 1Samoa 0 0 0 1 24Vanuatu 0 0 0 0 3
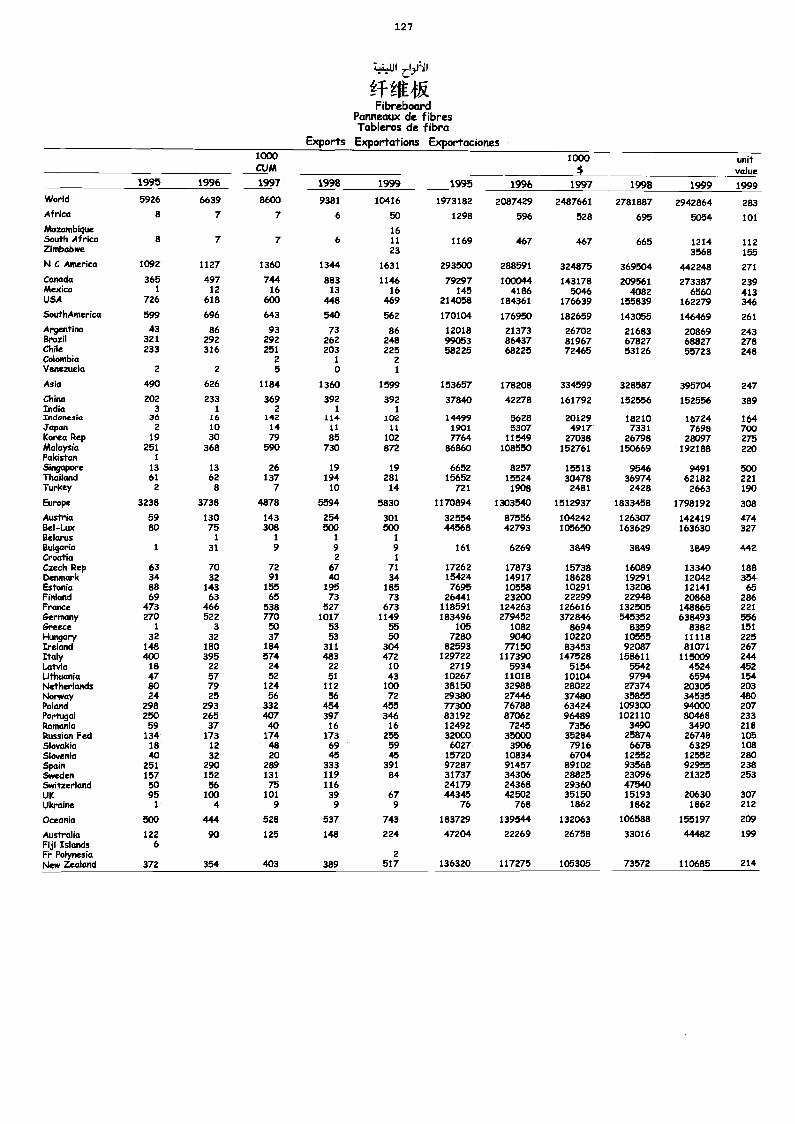
127
cy'D
FibreboardPanneaux de fibresTableros de fibra
Exports Exportations Exportaciones1000CUM
1000$
unitvalue
1995 19% 1997 1998 1999 1995 1996 1997 1998 1999 1999World 5926 6639 8600 9381 10416 1973182 2087429 2487661 2781887 2942864 283Africa 8 7 7 6 50 1298 596 528 695 5054 101Mozambique 16South Africa 8 7 7 6 11 1169 467 467 665 1214 112Zimbabwe 23 3568 155N C America 1092 1127 1360 1344 1631 293500 288591 324875 369504 442248 271Canada 365 497 744 883 1146 79297 100044 143178 209561 273387 239Mexico 1 12 16 13 16 145 4186 5046 4082 6560 413USA 726 618 600 448 469 214058 184361 176639 155839 162279 3465outhAmerica 599 696 643 540 562 170104 176950 182659 143055 146469 261Argentina 43 86 93 73 86 12018 21373 26702 21683 20869 243Brazil 321 292 292 262 248 99053 86437 81967 67827 68827 278Chile 233 316 251 203 225 58225 68225 72465 53126 55723 248Colombia 2 1 2Venezuela 2 2 5 0 1
Asia 490 626 1184 1360 1599 153657 178208 334599 328587 395704 247China 202 233 369 392 392 37840 42278 161792 152556 152556 389India 3 1 2 1 1Indonesia 36 16 142 114 102 14499 5628 20129 18210 16724 164Japan 2 10 14 11 11 1901 5307 4917 7331 7698 700Korea Rep 19 30 79 85 102 7764 11549 27038 26798 28097 275Malaysia 251 368 590 730 872 86860 108550 152761 150669 192188 220Pakistan 1
Singapore 13 13 26 19 19 6652 8257 15513 9546 9491 500Thailand 61 62 137 194 281 15652 15524 30478 36974 62182 221Turkey 2 8 7 10 14 721 1908 2481 2428 2663 190
Europe 3238 3738 4878 5594 5830 1170894 1303540 1512937 1833458 1798192 308
Austria 59 130 143 254 301 32554 87556 104242 126307 142419 474Bel-Lux 80 75 308 500 500 44568 42793 105650 163629 163630 327Belarus 1 1 1 1
Bulgaria 1 31 9 9 9 161 6269 3849 3849 3849 442Croatia 2 1
Czech Rep 63 70 72 67 71 17262 17873 15738 16089 13340 188Denmark 34 32 91 40 34 15424 14917 18628 19291 12042 354Estonia 88 143 155 195 185 7695 10558 10291 13208 12141 65Finland 69 63 65 73 73 26441 23200 22299 22948 20868 286France 473 466 538 527 673 118591 124263 126616 132505 148865 221Germany 270 522 770 1017 1149 183496 279452 372846 545352 638493 556Greece 1 3 50 53 55 105 1082 8694 8359 8382 151Hungary 32 32 37 53 50 7280 9040 10220 10555 11118 225Ireland 148 180 184 311 304 82593 77150 83453 92087 81071 267Italy 400 395 574 483 472 129722 117390 147528 158611 115009 244Latvia 18 22 24 22 10 2719 5934 5154 5542 4524 452Uthuania 47 57 52 51 43 10267 11018 10104 9794 6594 154Netherlands 80 79 124 112 100 38150 32988 28022 27374 20305 203Norway 24 25 56 56 72 29380 27446 37480 35855 34535 480Poland 298 293 332 454 455 77300 76788 63424 109300 94000 207Portugal 250 265 407 397 346 83192 87062 96489 102110 80468 233Romania 59 37 40 16 16 12492 7245 7356 3490 3490 218Russian Fed 134 173 174 173 255 32000 35000 35284 25874 26748 105Slovakia 18 12 48 69 59 6027 3906 7916 6678 6329 108Slovenia 40 32 20 45 45 15720 10834 6704 12552 12552 280Spain 251 290 289 333 391 97287 91457 89102 93568 92955 238Sweden 157 152 131 119 84 31737 34306 28825 23096 21325 253Switzerland 50 56 75 116 24179 24368 29360 47540UK 95 100 101 39 67 44345 42502 35150 15193 20630 307Ukraine 1 4 9 9 9 76 768 1862 1862 1862 212
Oceania 500 444 528 537 743 183729 139544 132063 106588 155197 209
Australia 122 90 125 148 224 47204 22269 26758 33016 44482 199Fiji Islands 6Fr Polynesia 2New Zealand 372 354 403 389 517 136320 117275 105305 73572 110685 214
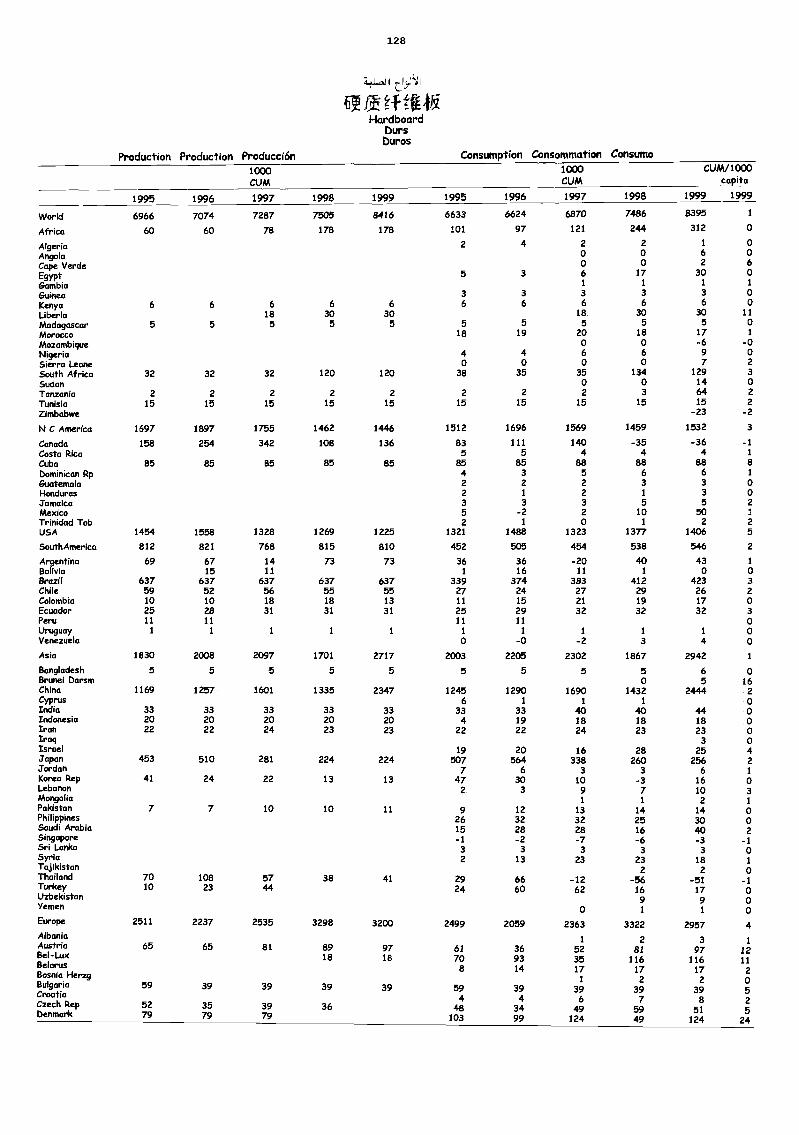
128
41.,2.1 I z.:>11: 1
FlatftfitHardboard
bursDuros
Production Production Producción Consumption Consommation Consumo1000CUM
1000CUM
CUM/1000capita
1995 1996 1997 1998 1999 1995 1996 1997 1998 1999 1999
World 6966 7074 7287 7505 8416 6633 6624 6870 7486 8395 1
Africa 60 60 78 178 178 101 97 121 244 312 0
Algeria 2 4 2 2 1 0Angola o o 6 0Cape Verde o o 2 6
Egypt 5 3 6 17 30 oGambia 1 1 1 1
Guinea 3 3 3 3 3 oKenya 6 6 6 6 6 6 6 6 6 6 oLiberia 18 30 30 18 30 30 11
Madagascar 5 5 5 5 5 5 5 5 5 5 oMorocco 18 19 20 18 17 1
Mozambique o o -6 -oNigeria 4 4 6 6 9 oSierra Leone 0 o o 0 7 2
South AfricaSudan
32 32 32 120 120 38 35 35o
1340
12914
3o
Tanzania 2 2 2 2 2 2 2 2 3 64 2
Tunisia 15 15 15 15 15 15 15 15 15 15 2
Zimbabwe -23 -2
N C America 1697 1897 1755 1462 1446 1512 1696 1569 1459 1532 3
Canada 158 254 342 108 136 83 111 140 -35 -36 -1Costa Rica 5 5 4 4 4 1
Cuba 85 85 85 85 85 85 85 88 88 88 8Dominican Rp 4 3 5 6 6 1
Guatemala 2 2 2 3 3 oHonduras 2 1 2 1 3 oJamaica 3 3 3 5 5 2Mexico 5 -2 2 10 50 1
Trinidad Tob 2 1 0 1 2 2USA 1454 1558 1328 1269 1225 1321 1488 1323 1377 1406 5
SouthAmerica 812 821 768 815 810 452 505 454 538 546 2
Argentina 69 67 14 73 73 36 36 -20 ao 43 1
Bolivia 15 11 1 16 11 1 0 o&Wit 637 637 637 637 637 339 374 383 412 423 3Chile 59 52 56 55 55 27 24 27 29 26 2Colombia 10 10 18 18 13 11 15 21 19 17 oEcuador 25 28 31 31 31 25 29 32 32 32 3Peru 11 11 11 11 oUruguay 1 1 1 1 1 1 1 1 1 1 oVenezuela o -o -2 3 4 oAsia 1830 2008 2097 1701 2717 2003 2205 2302 1867 2942 1
Bangladesh 5 5 5 5 5 5 5 5 5 6 oBrunei Darsm o 5 16China 1169 1257 1601 1335 2347 1245 1290 1690 1432 2444 2Cyprus 6 1 1 1 oIndia 33 33 33 33 33 33 33 ao 40 44 oIndonesia 20 20 20 20 20 4 19 18 18 18 oIran 22 22 24 23 23 22 22 24 23 23 0Iraq 3 oIsrael 19 20 16 28 25 4Japan 453 510 281 224 224 507 564 338 260 256 2Jordan 7 6 3 3 6 1
Korea Rep 41 24 22 13 13 47 30 10 -3 16 oLebanon 2 3 9 7 10 3Mongolia
1 1 2 1
Pakistan 7 7 10 10 11 9 12 13 14 14 oPhilippines 26 32 32 25 30 0Saudi Arabia 15 28 28 16 40 2Singapore -1 -2 -7 -6 -3 -1Sri Lanka 3 3 3 3 3 oSyria 2 13 23 23 18 1TajikistanThailand 70 108 57 38 41 29 66 -12
2-56
2-51
o-1
Turkey 10 23 44 24 60 62 16 17 oUzbekistanYemen o
91
91
o0
Europe 2511 2237 2535 3298 3200 2499 2059 2363 3322 2957 4Albania
1 2 3 1Austria 65 65 81 89 97 61 36 52 81 97 12Bel-LuxBelarusBosnia HerzgBulgariaCroatiaCzech Rep
59
52
39
35
39
39
18
39
36
18
39
708
594
48
9314
394
34
3517
1
396
49
116172
397
59
11617
239
851
112o525Denmark 79 79 79 103 99 124 49 124 24
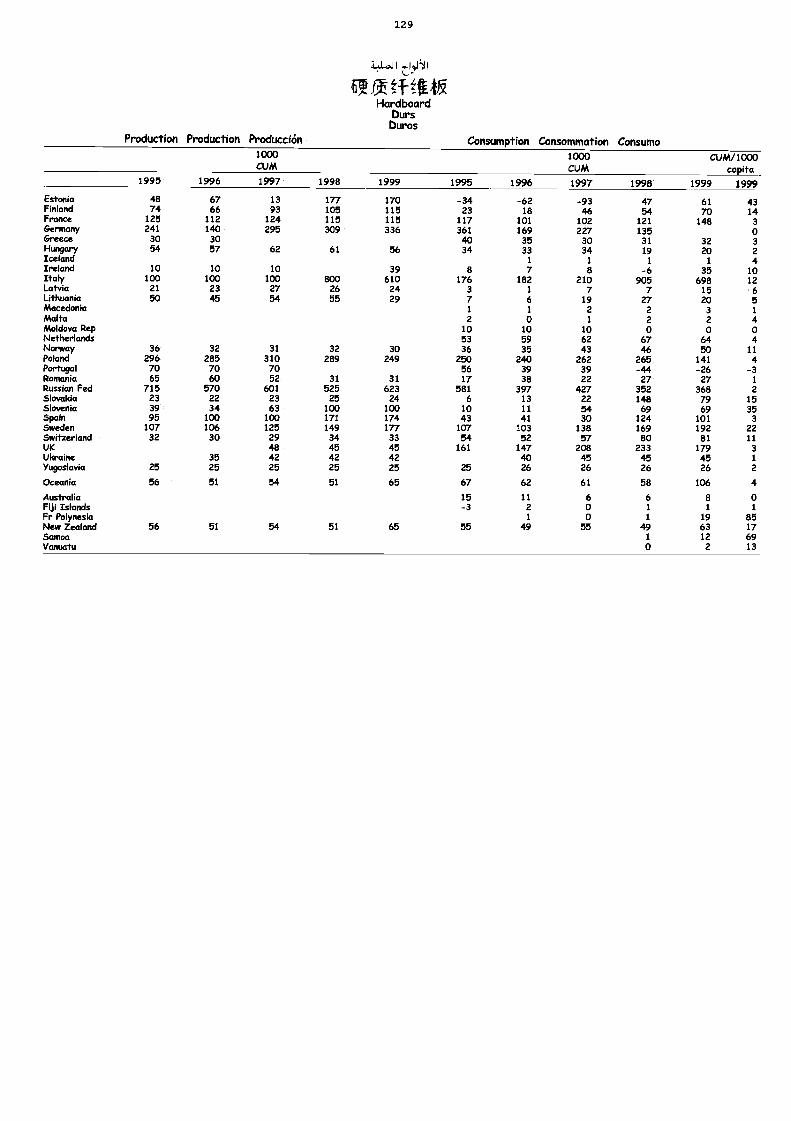
129
RatfttigHardboard
bursburos
Production Production Producción Consumption Consommation Consumo1000CUM
1000CUM
CUM/1000capita
1995 1996 1997 1998 1999 1995 1996 1997 1998 1999 1999
Estonia 48 67 13 177 170 -34 -62 -93 47 61 43Finland 74 66 93 105 115 23 18 46 54 70 14France 125 112 124 115 115 117 101 102 121 148 3Germany 241 140 295 309 336 361 169 227 135 0Greece 30 30 40 35 30 31 32 3Hungary 54 57 62 61 56 34 33 34 19 20 2Iceland 1 1 1 1 4Ireland 10 10 10 39 8 7 8 -6 35 10Italy 100 100 100 800 610 176 182 210 905 698 12Latvia 21 23 27 26 24 3 1 7 7 15 6Lithuania 50 45 54 55 29 7 6 19 27 20 5Macedonia 1 1 2 2 3 1
Malta 2 0 1 2 2 4Moldova Rep 10 10 10 0 0 0Netherlands 53 59 62 67 64 4Norway 36 32 31 32 30 36 35 43 46 50 11Poland 296 285 310 289 249 250 240 262 265 141 4Portugal 70 70 70 56 39 39 -44 -26 -3Romania 65 60 52 31 31 17 38 22 27 27 1
Russian Fed 715 570 601 525 623 581 397 427 352 368 2Slovakia 23 22 23 25 24 6 13 22 148 79 15Slovenia 39 34 63 100 100 10 11 54 69 69 35Spain 95 100 100 171 174 43 41 30 124 101 3Sweden 107 106 125 149 177 107 103 138 169 192 22Switzerland 32 30 29 34 33 54 52 57 80 81 11UK 48 45 45 161 147 208 233 179 3Ukraine 35 42 42 42 40 45 45 45 1
Yugoslavia 25 25 25 25 25 25 26 26 26 26 2
Oceania 56 51 54 51 65 67 62 61 58 106 4
Australia 15 11 6 6 8 oFiji Islands -3 2 0 1 1 1
Fr Polynesia 1 0 1 19 85New Zealand 56 51 54 51 65 55 49 55 49 63 17Samoa 1 12 69Vanuatu o 2 13
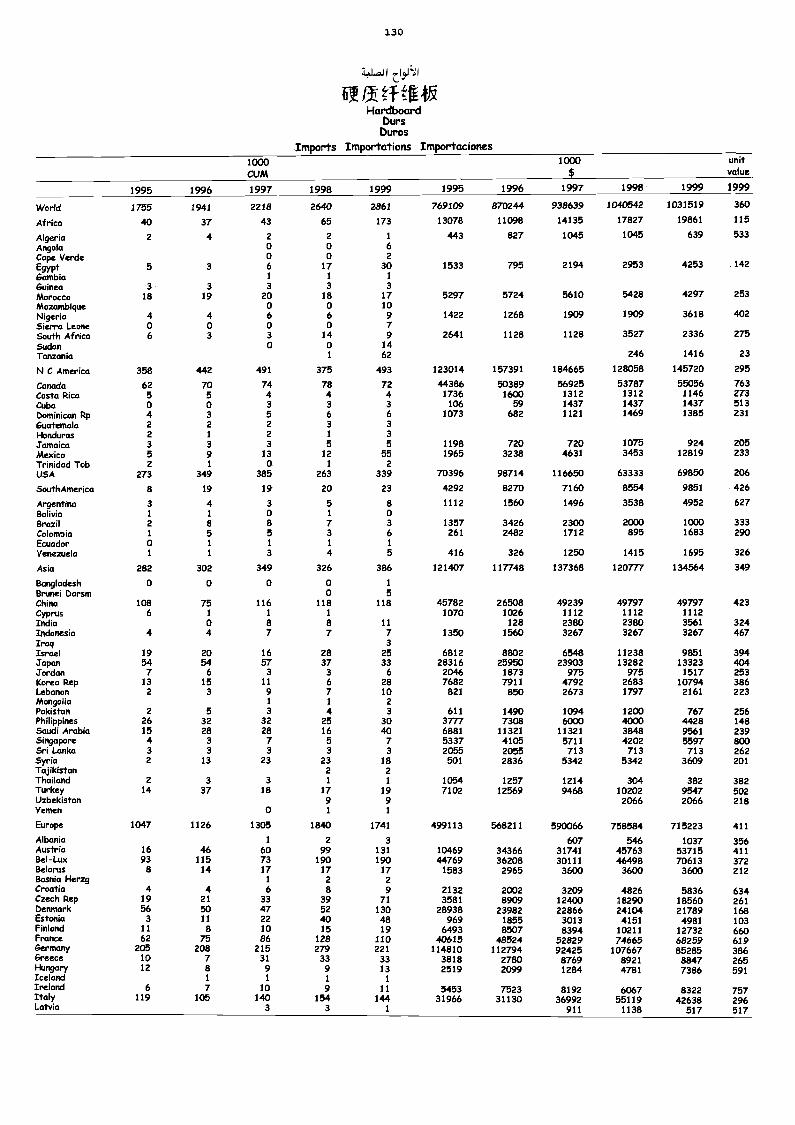
130
:L1..41.11
tftfi4gHardboard
bursDuros
Imports Importations Importaciones1000CUM
1000 unitvalue
1995 1996 1997 1998 1999 1995 1996 1997 1998 1999 1999
World 1755 1941 2218 2640 2861 769109 870244 938639 1040542 1031519 360
Africa 40 37 43 65 173 13078 11098 14135 17827 19861 115
Algeria 2 4 2 2 1 443 827 1045 1045 639 533Angola 0 0 6
Cope Verde 0 0 2
Egypt 5 3 6 17 30 1533 795 2194 2953 4253 142
Gambia 1 1 1
Guinea 3 3 3 3 3Morocco 18 19 20 18 17 5297 5724 5610 5428 4297 253Mozambique 0 0 10Nigeria 4 4 6 6 9 1422 1268 1909 1909 3618 402Sierra Leone 0 0 0 0 7South Africa 6 3 3 14 9 2641 1128 1128 3527 2336 275Sudan 0 0 14Tanzania 1 62 246 1416 23
N C America 358 442 491 375 493 123014 157391 184665 128058 145720 295
Canada 62 70 74 78 72 44386 50389 56925 53787 55056 763Costa Rica 5 5 4 4 4 1736 1600 1312 1312 1146 273Cuba 0 0 3 3 3 106 59 1437 1437 1437 513Dominican Rp 4 3 5 6 6 1073 682 1121 1469 1385 231Guatemala 2 2 2 3 31-londuras 2 1 2 1 3Jamaica 3 3 3 5 5 1198 720 720 1075 924 205Mexico 5 9 13 12 55 1965 3238 4631 3453 12819 233Trinidad Tob 2 1 0 1 2USA 273 349 385 263 339 70396 98714 116650 63333 69850 206
SouthAmerica 8 19 19 20 23 4292 8270 7160 8554 9851 426
Argentina 3 4 3 5 8 1112 1560 1496 3538 4952 627Bolivia 1 1 0 1 0Brazil 2 8 8 7 3 1357 3426 2300 2000 1000 333Colombia 1 5 5 3 6 261 2482 1712 895 1683 290Ecuador 0 1 1 1 1
Venezuela 1 1 3 4 5 416 326 1250 1415 1695 326
Asia 282 302 349 326 386 121407 117748 137368 120777 134564 349
Bangladesh 0 0 0 0 1
Brunei Darsm 0 5China 108 75 116 118 118 45782 26508 49239 49797 49797 423Cyprus 6 1 1 1 1070 1026 1112 1112 1112India 0 8 8 11 128 2380 2380 3561 324Indonesia 4 4 7 7 7 1350 1560 3267 3267 3267 467Iraq 3Israel 19 20 16 28 25 6812 8802 6548 11238 9851 394Japan 54 54 57 37 33 28316 25950 23903 13282 13323 404Jordan 7 6 3 3 6 2046 1873 975 975 1517 253Korea Rep 13 15 11 6 28 7682 7911 4792 2683 10794 386Lebanon 2 3 9 7 10 821 850 2673 1797 2161 223Mongolia 1 1 2Pakistan 2 5 3 4 3 611 1490 1094 1200 767 256Philippines 26 32 32 25 30 3777 7308 6000 4000 4428 148Saudi Arabia 15 28 28 16 40 6881 11321 11321 3848 9561 239Singapore 4 3 7 5 7 5337 4105 5711 4202 5597 800Sri Lanka 3 3 3 3 3 2055 2055 713 713 713 262Syria 2 13 23 23 18 501 2836 5342 5342 3609 201Tajikistan 2 2Thailand 2 3 3 1 1 1054 1257 1214 304 382 382Turkey 14 37 18 17 19 7102 12569 9468 10202 9547 502Uzbekistan 9 9 2066 2066 218Yemen 0 1 1
Europe 1047 1126 1305 1840 1741 499113 568211 590066 758584 715223 411
Albania 1 2 3 607 546 1037 356Austria 16 46 60 99 131 10469 34366 31741 45763 53715 411Bel-Lux 93 115 73 190 190 44769 36208 30111 46498 70613 372Belarus a 14 17 17 17 1583 2965 3600 3600 3600 212Bosnia Herzg 1 2 2Croatia 4 4 6 8 9 2132 2002 3209 4826 5836 634Czech Rep 19 21 33 39 71 3581 8909 12400 18290 18560 261Denmark 56 50 47 52 130 28938 23982 22866 24104 21789 168Estonia 3 11 22 40 48 969 1855 3013 4151 4981 103Finland 11 8 10 15 19 6493 8507 8394 10211 12732 660France 62 75 86 128 110 40615 48524 52829 74665 68259 619Germany 205 208 215 279 221 114810 112794 92425 107667 85285 386Greece 10 7 31 33 33 3818 2780 8769 8921 8847 265Hungary 12 8 9 9 13 2519 2099 1284 4781 7386 591Iceland 1 1 1 1Ireland 6 7 10 9 11 5453 7523 8192 6067 8322 757Italy 119 105 140 154 144 31966 31130 36992 55119 42638 296Latvia 3 3 1 911 1138 517 517
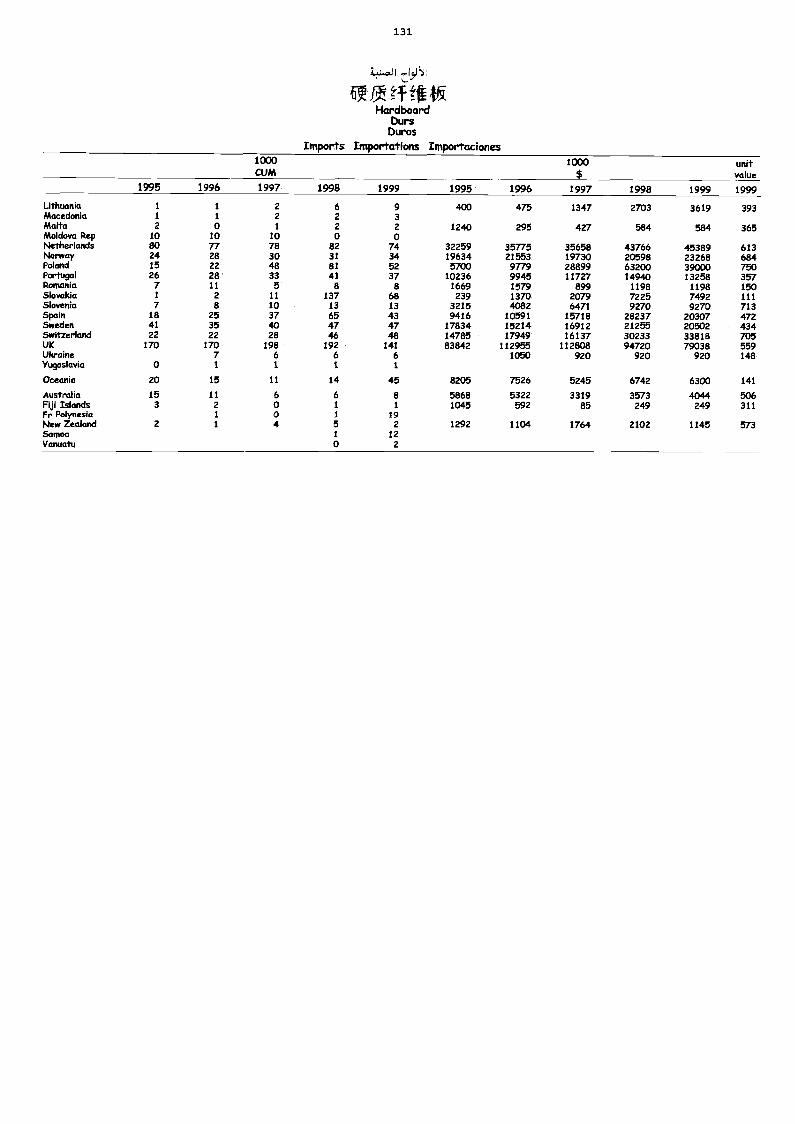
131
1.4...11
ua,tt 115Hardboard
bursDuros
Imports Importations Importaciones1000CUM
1000$
unitvalue
1995 1996 1997 1998 1999 1995 1996 1997 1998 1999 1999
Lithuania 1 1 2 6 9 400 475 1347 2703 3619 393Macedonia 1 1 2 2 3Malta 2 0 1 2 2 1240 295 427 584 584 365Moldova Rep 10 10 10 0 0Netherlands 80 77 78 82 74 32259 35775 35658 43766 45389 613Norway 24 28 30 31 34 19634 21553 19730 20598 23268 684Poland 15 22 48 81 52 5700 9779 28899 63200 39000 750Portugal 26 28 33 41 37 10236 9945 11727 14940 13258 357Romania 7 11 5 8 8 1669 1579 899 1198 1198 150Slovakia 1 2 11 137 68 239 1370 2079 7225 7492 111Slovenia 7 a 10 13 13 3215 4082 6471 9270 9270 713Spain 18 25 37 65 43 9416 10591 15718 28237 20307 472Sweden 41 35 40 47 47 17834 15214 16912 21255 20502 434Switzerland 22 22 28 46 48 14785 17949 16137 30233 33818 705UK 170 170 198 192 141 83842 112955 112808 94720 79038 559Ukraine 7 6 6 6 1050 920 920 920 148Yugoslavia 0 1 1 1 1
Oceania 20 15 11 14 45 8205 7526 5245 6742 6303 141
Australia 15 11 6 6 8 5868 5322 3319 3573 4044 506Fiji Islands 3 2 0 1 1 1045 592 85 249 249 311Fr Polynesia 1 0 1 19New Zealand 2 1 4 5 2 1292 1104 1764 2102 1145 573Samoa 1 12Vanuatu 0 2
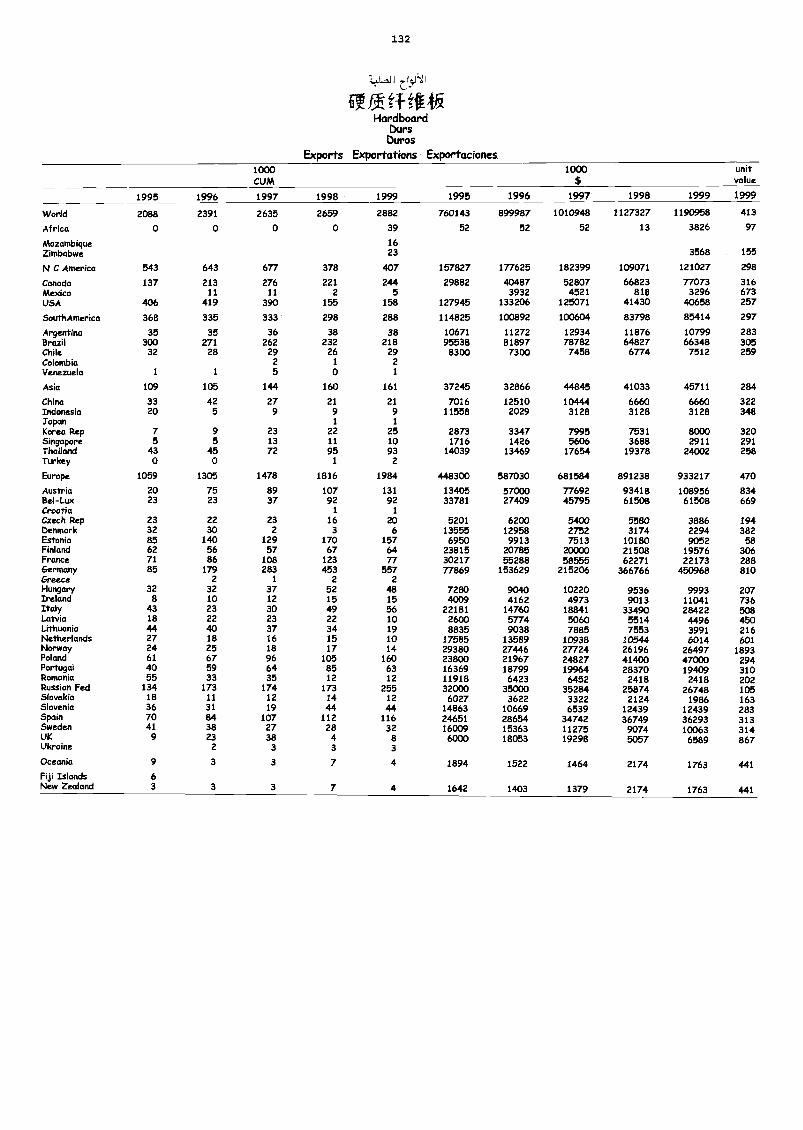
132
RamtfigHardboard
bursDuros
Exports Exportations Exportaciones1000CUM
1000 Unitvalue
1995 1996 1997 1998 1999 1995 1996 1997 1998 1999 1999
World 2088 2391 2635 2659 2882 760143 899987 1010948 1127327 1190958 413
Africa o 0 0 o 39 52 52 52 13 3826 97
Mozambique 16Zimbabwe 23 3568 155
N C Americo 543 643 677 378 407 157827 177625 182399 109071 121027 298
Canada 137 213 276 221 244 29882 40487 52807 66823 77073 316Mexico 11 11 2 5 3932 4521 818 3296 673USA 406 419 390 155 158 127945 133206 125071 41430 40658 257
SouthAmerica 368 335 333 298 288 114825 100892 100604 83798 85414 297
Argentina 35 35 36 38 38 10671 11272 12934 11876 10799 283Brazil 300 271 262 232 218 95538 81897 78782 64827 66348 305Chile 32 28 29 26 29 8300 7300 7458 6774 7512 259Colombia 2 1 2Venezuela 1 1 5 o 1
Asia 109 105 144 160 161 37245 32866 44845 41033 45711 284
China 33 42 27 21 21 7016 12510 10444 6660 6660 322Indonesia 20 5 9 9 9 11558 2029 3128 3128 3128 348japan 1 1
Korea Rep 7 9 23 22 25 2873 3347 7995 7531 8000 320Singapore 5 5 13 11 10 1716 1426 5606 3688 2911 291Thailand 43 45 72 95 93 14039 13469 17654 19378 24002 258Turkey 0 0 1 2
Europe 1059 1305 1478 1816 1984 448300 587030 681584 891238 933217 470
Austria 20 75 89 107 131 13405 57000 77692 93418 108956 834Bel-Lux 23 23 37 92 92 33781 27409 45795 61508 61508 669Croatia 1 1
Czech Rep 23 22 23 16 20 5201 6200 5400 5580 3886 194Denmark 32 30 2 3 6 13555 12958 2752 3174 2294 382Estonia 85 140 129 170 157 6950 9913 7513 10180 9052 58Finland 62 56 57 67 64 23815 20785 20030 21508 19576 306France 71 86 108 123 77 30217 55288 58555 62271 22173 288Germany 85 179 283 453 557 77869 153629 215206 366766 450968 810Greece 2 1 2 2Hungary 32 32 37 52 48 7280 9040 10220 9536 9993 207Ireland 8 10 12 15 15 4009 4162 4973 9013 11041 736Italy 43 23 30 49 56 22181 14760 18841 33490 28422 508Latvia 18 22 23 22 10 2600 5774 5060 5514 4496 450Lithuania 44 40 37 34 19 8835 9038 7885 7553 3991 216Netherlands 27 18 16 15 10 17585 13589 10938 10544 6014 601Norway 24 25 18 17 14 29380 27446 27724 26196 26497 1893Poland 61 67 96 105 160 23800 21967 24827 41400 47000 294Portugal 40 59 64 85 63 16369 18799 19964 28370 19409 310Rontania 55 33 35 12 12 11918 6423 6452 2418 2418 202Russian Fed 134 173 174 173 255 32000 35000 35284 25874 26748 105Slovakia 18 11 12 14 12 6027 3622 3322 2124 1986 163Slovenia 36 31 19 44 44 14863 10669 6539 12439 12439 283Spain 70 84 107 112 116 24651 28654 34742 36749 36293 313Sweden 41 38 27 28 32 16009 15363 11275 9074 10063 314UK 9 23 38 4 8 6000 18053 19298 5057 6589 867Ukraine 2 3 3 3
Oceania 9 3 3 7 4 1894 1522 1464 2174 1763 441Fiji Islands 6New Zealand 3 3 3 7 4 1642 1403 1379 2174 1763 441
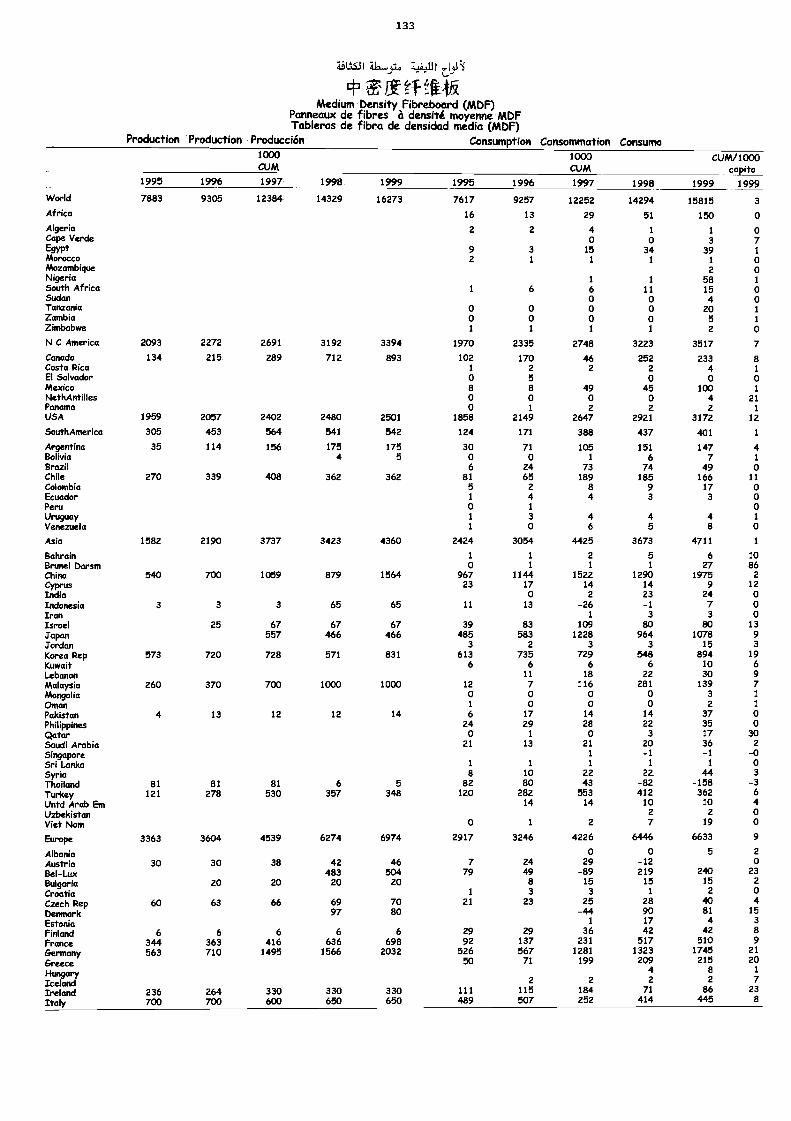
133
IASJ 11,....):4 74,14 I
c13 tflOMedium Density Fibreboard (MDF)
Panneaux de fibres ii densité moyenne MDFTableros de fibra de densidad media (MDF)
Production Production Producción Consumption Consommation Consuma1000CUM
1000CUM
CUM/1000capita
1995 1996 1997 1998 1999 1995 1996 1997 1998 1999 1999World 7883 9305 12384 14329 16273 7617 9257 12252 14294 15815 3
Africa 16 13 29 51 150 oAlgeria 2 2 4 1 1 oCape Verde o o 3 7Egypt 9 3 15 34 39 1Morocco 2 1 1 1 1 oMozambique 2 0Nigeria 1 1 58 1South Africa 1 6 6 11 15 0Sudan 0 0 4 0Tanzania o o o o 20 1Zambia o 0 o o 5 1
Zimbabwe 1 1 1 1 2 oN C America 2093 2272 2691 3192 3394 1970 2335 2748 3223 3517 7
Canada 134 215 289 712 893 102 170 46 252 233 aCosta Rica 1 2 2 2 4 1
El Salvador o 5 o o oMexico 8 8 49 45 100 1
NethAntilles o o o o 4 21Panama o i 2 2 2 1USA 1959 2057 2402 2480 2501 1858 2149 2647 2921 3172 12
SouthAmerica 305 453 564 541 542 124 171 388 437 401 1
Argentina 35 114 156 175 175 30 71 105 151 147 4Bolivia 4 5 0 o 1 6 7 1
Brazil 6 24 73 74 49 0Chile 270 339 408 362 362 81 65 189 185 166 11Colombia 5 2 8 9 17 oEcuador 1 4 4 3 3 0Peru 0 1 0Uruguay I 3 4 4 4 1
Venezuela 1 0 6 5 8 0
Asia 1582 2190 3737 3423 4360 2424 3054 4425 3673 4711 1
Bahrain 1 1 2 5 6 10Brunei barsm 0 1 1 1 27 86China 540 700 1059 879 1564 967 1144 1522 1290 1975 2Cyprus 23 17 14 14 9 12India 0 2 23 24 0Indonesia 3 3 3 65 65 11 13 -26 -1 7 0Iran 1 3 3 0Israel 25 67 67 67 39 83 109 80 ao 13.Tapan 557 466 466 485 583 1228 964 1078 9Jordan 3 2 3 3 15 3
Korea Rep 573 720 728 571 831 613 735 729 548 894 19Kuwait 6 6 6 6 10 6Lebanon 11 18 22 30 9Malaysia 260 370 700 1000 1000 12 7 116 281 139 7Mongolia 0 0 o 0 3 1
Oman 1 0 0 o 2 1
Pakistan 4 13 12 12 14 6 17 14 14 37 oPhilippines 24 29 28 22 35 0Qatar 0 1 o 3 17 30Saudi Arabia 21 13 21 20 36 2
Singapore 1 -1 -1 -0Sri Lanka 1 1 1 1 1 0Syria 8 10 22 22 44 3
Thailand 81 81 81 6 5 82 80 43 -82 -158 -3Turkey 121 278 530 357 348 120 282 553 412 362 6Untd Arab Em 14 14 10 10 4
Uzbekistan 2 2 0Viet Nam o 1 2 7 19 0
Europe 3363 3604 4539 6274 6974 2917 3246 4226 6446 6633 9
Albania o o 5 2
Austria 30 30 38 42 46 7 24 29 -12 o
Bel-Lux 483 504 79 49 -89 219 240 23
Bulgaria 20 20 20 20 8 15 15 15 2
Croatia 1 3 3 1 2 o
Czech Rep 60 63 66 69 70 21 23 25 28 40 4
Denmark 97 80 -44 90 81 15
Estonia 1 17 4 3
Finland 6 6 6 6 6 29 29 36 42 42 a
France 344 363 416 636 698 92 137 231 517 510 9
Germany 563 710 1495 1566 2032 526 567 1281 1323 1745 21
Greece 50 71 199 209 215 20
1-111n9orY4 8 1
Iceland 2 2 2 2 7
Ireland 236 264 330 330 330 111 115 184 71 86 23
Italy 700 700 600 650 650 489 507 252 414 445 a
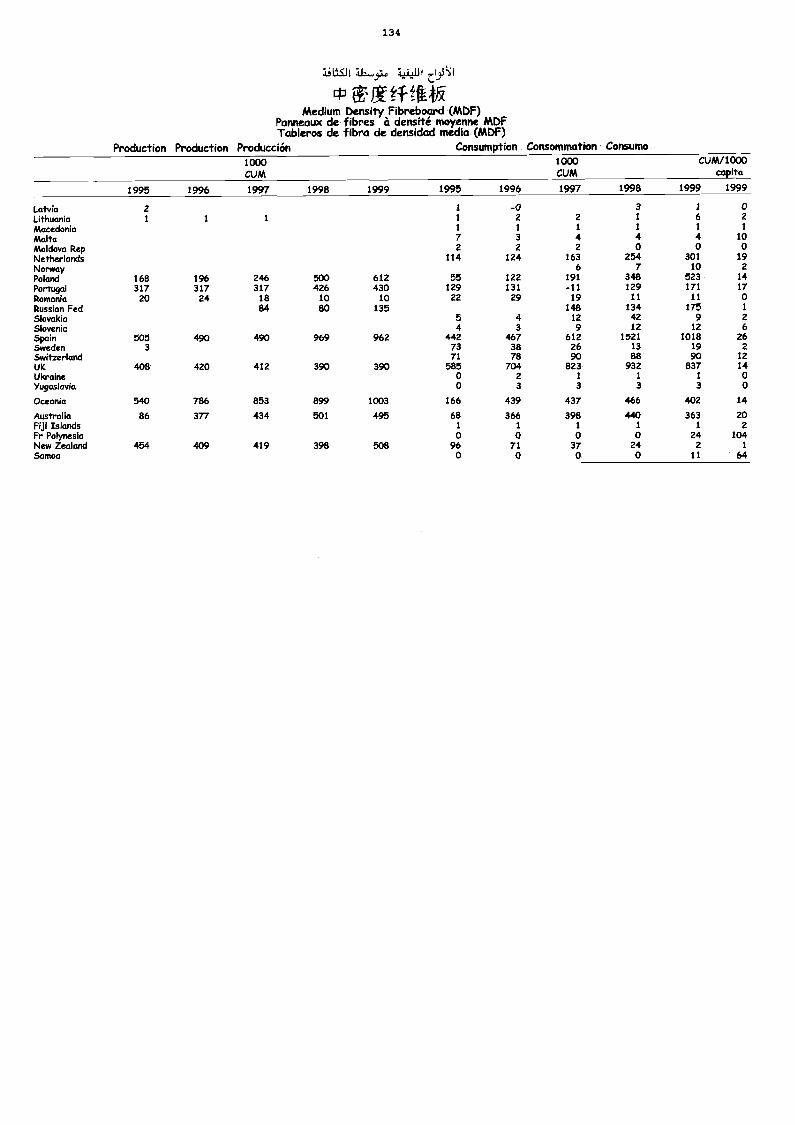
134
:LiLW! iL41,.+1.1f
- -CO &lqMedium Density Fibreboard (MDF)
Panneaux de fibres 21 densité moyenne MDFTableros de fibra de densidad media (MDF)
Production Production Producción Consumption Consommation Consumo1000CUM
1000CUM
CUM/1000capita
1995 1996 1997 1998 1999 1995 1996 1997 1998 1999 1999
Latvia 2 1 -0 3 1 0Lithuania 1 1 1 1 2 2 1 6 2
Macedonia 1 I 1 1 1 1
Malta 7 3 4 4 4 10Moldova Rep 2 2 2 0 0 0Netherlands 114 124 163 254 301 19
Norway 6 7 10 2Poland 168 196 246 500 612 55 122 191 348 523 14Portugal 317 317 317 426 430 129 131 -11 129 171 17Romania 20 24 18 10 10 22 29 19 11 11 0Russian Fed 84 80 135 148 134 175 1
Slovakia 5 4 12 42 9 2
Slovenia 4 3 9 12 12 6
Slmin 505 490 490 969 962 442 467 612 1521 1018 26Sweden 3 73 38 26 13 19 2Switzerland 71 78 90 88 90 12UK 408 420 412 390 390 585 704 823 932 837 14Ukraine 0 2 i 1 1 oYugoslavia 0 3 3 3 3 0
Oceania 540 786 853 899 1003 166 439 437 466 402 14
Australia 86 377 434 501 495 68 366 398 440 363 20Fiji Islands 1 1 1 1 1 2
Fr Polynesia 0 0 0 0 24 104New Zealand 454 409 419 398 508 96 71 37 24 2 1
Samoa 0 0 0 0 11 64
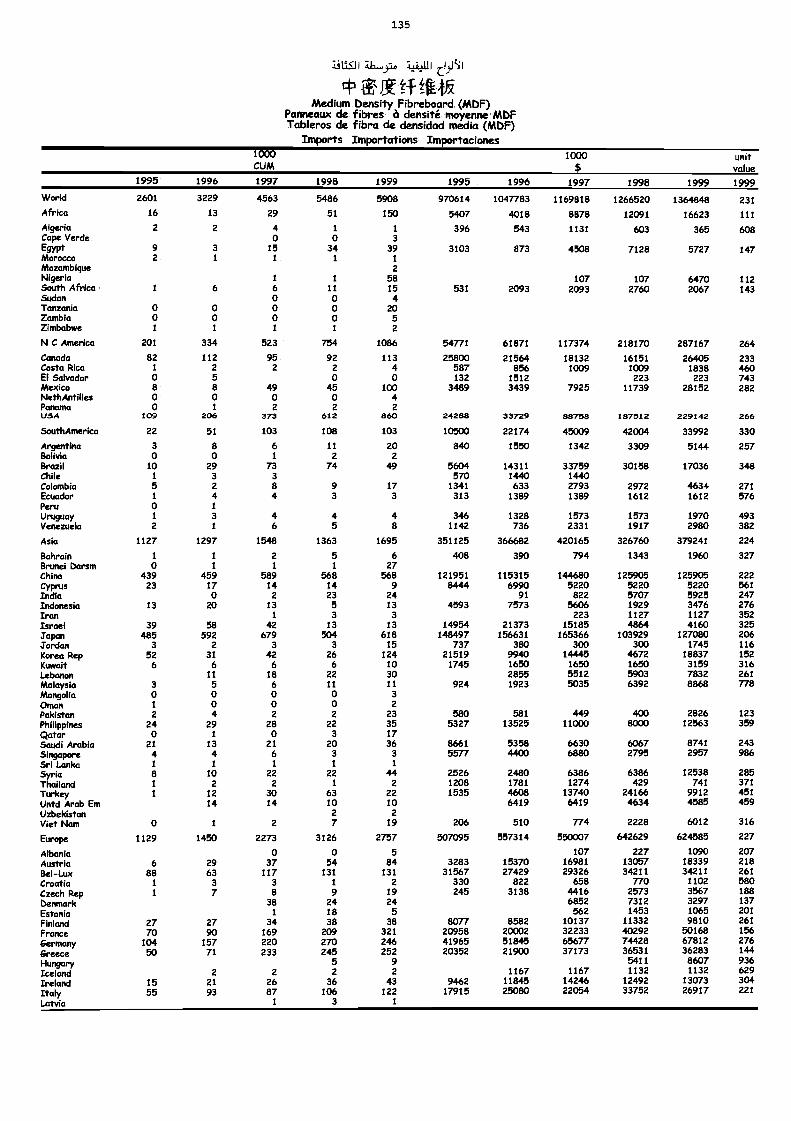
135
:6114.11 11.y... c1,44)1
VYMti&Medium Density Fibreboard (MDF)
Panneaux de fibres à densité moyenne MDFTableros de fibra de densidad media (MDF)
Imports Importations Importaciones1000CUM
1000$
unitvalue
1995 1996 1997 1998 1999 1995 1996 1997 1998 1999 1999
World 2601 3229 4563 5486 5908 970614 1047783 1169818 1266520 1364848 231
Africa 16 13 29 51 150 5407 4018 8878 12091 16623 111
Algeria 2 2 4 1 1 396 543 1131 603 365 608Cape Verde 0 0 3Egypt 9 3 15 34 39 3103 873 4508 7128 5727 147Morocco 2 1 1 1 1
Mozambique 2
Nigeria 1 1 58 107 107 6470 112South Africa 1 6 6 11 15 531 2093 2093 2760 2067 143Sudan 0 0 4Tanzania 0 0 0 0 20Zambia 0 0 0 0 5Zimbabwe 1 1 1 1 2
N C America 201 334 523 754 1086 54771 61871 117374 218170 287167 264
Canada 82 112 95 92 113 25800 21564 18132 16151 26405 233Costa Rica 1 2 2 2 4 587 856 1009 1009 1838 460El Salvador 0 5 0 0 132 1512 223 223 743Mexico 8 8 49 45 100 3489 3439 7925 11739 28152 282NethAntilles 0 0 0 0 4Panama 0 1 2 2 2USA 109 206 373 612 860 242138 33729 88758 187512 229142 266
SouthAmerica 22 51 103 108 103 10503 22174 45009 42004 33992 330
Argentina 3 8 6 11 20 840 1550 1342 3309 5144 257Bolivia 0 0 1 2 2Brazil 10 29 73 74 49 5604 14311 33759 30158 17036 348Chile 1 3 3 570 1440 1440Colombia 5 2 8 9 17 1341 633 2793 2972 4634 271Ecuador 1 4 4 3 3 313 1389 1389 1612 1612 576Peru 0 1
Uruguay 1 3 4 4 4 346 1328 1573 1573 1970 493Venezuela 2 1 6 5 8 1142 736 2331 1917 2980 382
Asia 1127 1297 1548 1363 1695 351125 366682 420165 326760 379241 224
Bahrain 1 1 2 5 6 408 390 794 1343 1960 327Brunei Darsm 0 1 1 1 27China 439 459 589 568 568 121951 115315 144680 125905 125905 222Cyprus 23 17 14 14 9 8444 6990 5220 5220 5220 561India 0 2 23 24 91 822 5707 5925 247Indonesia 13 20 13 5 13 4593 7573 5606 1929 3476 276Iran 1 3 3 223 1127 1127 352Israel 39 58 42 13 13 14954 21373 15185 4864 4160 325japan 485 592 679 504 618 148497 156631 165366 103929 127080 206Jordan 3 2 3 3 15 737 380 300 300 1745 116Korea Rep 52 31 42 26 124 21519 9940 14445 4672 18837 152Kuwait 6 6 6 6 10 1745 1650 1650 1650 3159 316Lebanon 11 18 22 30 2855 5512 5903 7832 261Malaysia 3 5 6 11 11 924 1923 5035 6392 8868 778Mongolia 0 0 0 0 3Oman 1 0 0 0 2Pakistan 2 4 2 2 23 580 581 449 400 2826 123Philippines 24 29 28 22 35 5327 13525 11000 8000 12563 359Qatar 0 1 0 3 17Saudi Arabia 21 13 21 20 36 8661 5358 6630 6067 8741 243
Singapore 4 4 6 3 3 5577 4400 6880 2795 2957 986Sri Lanka 1 1 1 1 1
Syria 8 10 22 22 44 2526 2480 6386 6386 12538 285Thailand 1 2 2 1 2 1208 1781 1274 429 741 371Turkey 1 12 30 63 22 1535 4608 13740 24166 9912 451Untd Arab Em 14 14 10 10 6419 6419 4634 4585 459Uzbekistan 2 2Viet Nam 0 1 2 7 19 206 510 774 2228 6012 316
Europe 1129 1450 2273 3126 2757 507095 557314 550007 642629 624585 227
Albania 0 0 5 107 227 1090 207Austria 6 29 37 54 84 3283 15370 16981 13057 18339 218Bel-Lux 88 63 117 131 131 31567 27429 29326 34211 34211 261
Croatia 1 3 3 1 2 330 822 658 770 1102 580Czech Rep 1 7 8 9 19 245 3138 4416 2573 3567 188
Denmark 38 24 24 6852 7312 3297 137
Estonia 1 18 5 562 1453 1065 201
Finland 27 27 34 38 38 8077 8582 10137 11332 9810 261
France 70 90 169 209 321 20958 20002 32233 40292 50168 156
Germany 104 157 220 270 246 41965 51845 65677 74428 67812 276
Greece 50 71 233 245 252 20352 21900 37173 36531 36283 144
Hunclat,Iceland 2 2
52
92 1167 1167
54111132
86071132
936629
Ireland 15 21 26 36 43 9462 11845 14246 12492 13073 304Italy 55 93 87 106 122 17915 25080 22054 33752 26917 221
Latvia 1 3 1
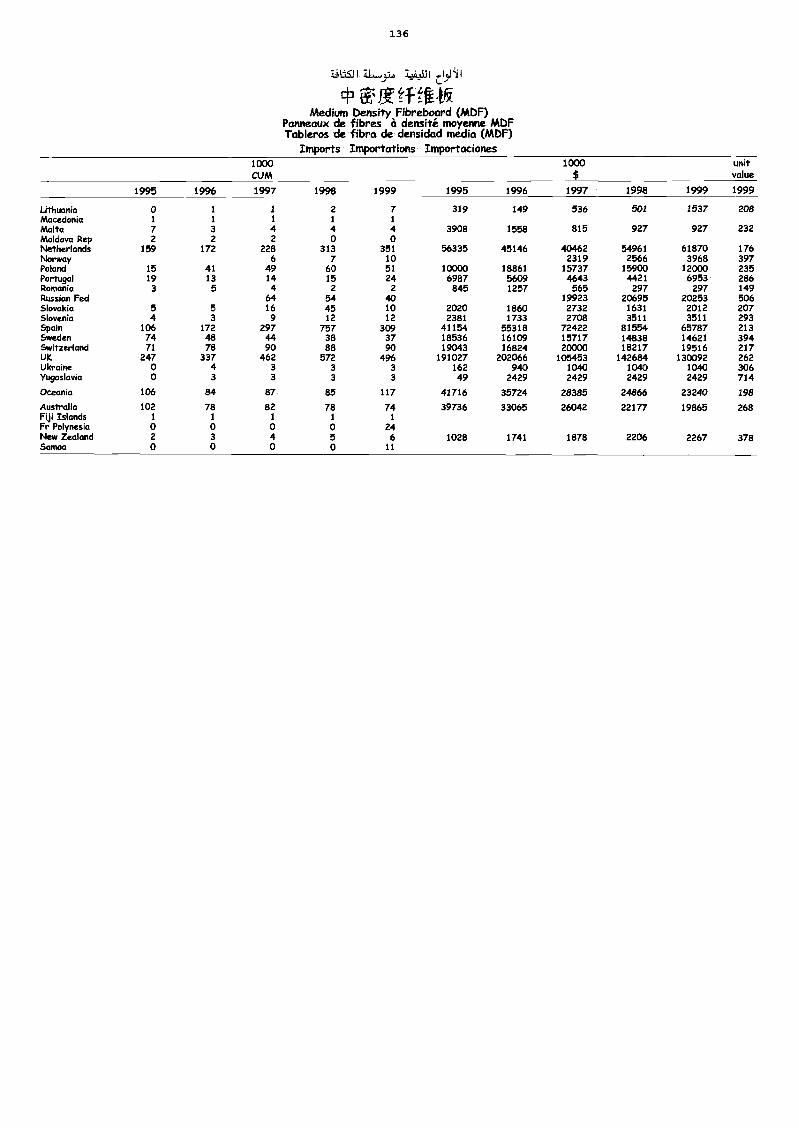
136
ItSJI 101
03 tfligMedium Density Fibreboard (MDF)
Panneaux de fibres it densité moyenne MDFTableros de fibra de densidad media (MDF)
Imports Importatioos Importaciones1000CVM
1000$
uMtvalue
1995 1996 1997 1998 1999 1995 1996 1997 1998 1999 1999
Lithuania 0 1 1 2 7 319 149 536 501 1537 208Macedonia 1 1 1 1 1
Malta 7 3 4 4 4 3908 1558 815 927 927 232Moldova Rep 2 2 2 0 0Netherlands 159 172 228 313 351 56335 45146 40462 54961 61870 176Norway 6 7 10 2319 2566 3968 397Poland 15 41 49 60 51 10000 18861 15737 15900 12000 235Portugal 19 13 14 15 24 6987 5609 4643 4421 6953 286Romania 3 5 4 2 2 845 1257 565 297 297 149Russian Fed 64 54 40 19923 20695 20253 506Slovakia 5 5 16 45 10 2020 1860 2732 1631 2012 207Slovenia 4 3 9 12 12 2381 1733 2708 3511 3511 293Spain 106 172 297 757 309 41154 55318 72422 81554 65787 213Sweden 74 48 44 38 37 18536 16109 15717 14838 14621 394Switzerland 71 78 90 88 90 19043 16824 20000 18217 19516 217UK 247 337 462 572 496 191027 202066 105453 142684 130092 262Ukraine 0 4 3 3 3 162 940 1040 1040 1040 306Yugoslavia 0 3 3 3 3 49 2429 2429 2429 2429 714
Oceania 106 84 87 85 117 41716 35724 28385 24866 23240 298
Australia 102 78 82 78 74 39736 33065 26042 22177 19865 268Fiji Islands 1 1 1 1 1
Fr Polynesia 0 0 0 0 24New Zealand 2 3 4 5 6 1028 1741 1878 2206 2267 378Samoa 0 0 0 0 11
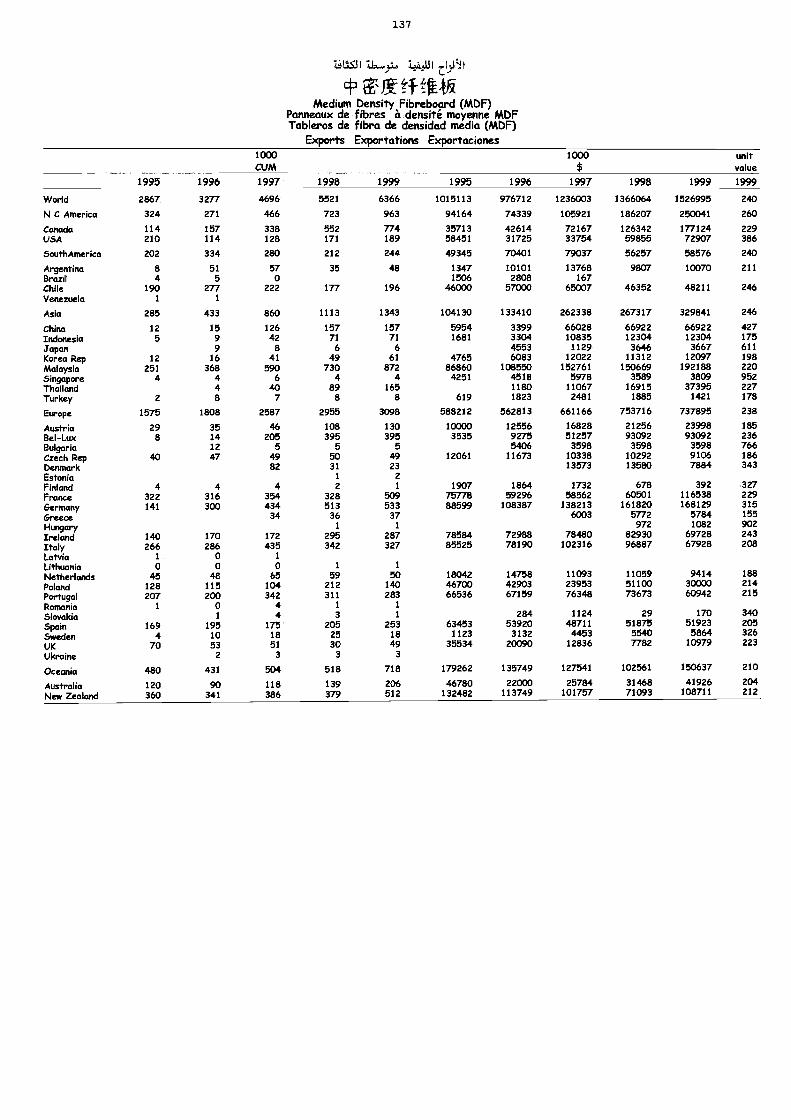
137
(13Medium Density Fibreboard (MOP)
Panneaux de fibres sit densité moyenne MDFTableros de fibra de densidad media (MDF)
Exports Exportations Exportaciones1000CUM
1999
1000$
unitvalue
1995 1996 1997 1998 1995 1996 1997 1998 1999 1999
World 2867 3277 4696 5521 6366 1015113 976712 1236003 1366064 1526995 240
N C America 324 271 466 723 963 94164 74339 105921 186207 250041 260
Canada 114 157 338 552 774 35713 42614 72167 126342 177124 229USA 210 114 128 171 189 58451 31725 33754 59855 72907 386
SouthAmerica 202 334 280 212 244 49345 70401 79037 56257 58576 240
Argentina 8 51 57 35 48 1347 10101 13768 9807 10070 211Brazil 4 5 0 1506 2808 167Chile 190 277 222 177 196 46000 57000 65007 46352 48211 246Venezuela 1 1
Asia 285 433 860 1113 1343 104130 133410 262338 267317 329841 246
China 12 15 126 157 157 5954 3399 66028 66922 66922 427Indonesia 5 9 42 71 71 1681 3304 10835 12304 12304 175Japan 9 8 6 6 4553 1129 3646 3667 611Korea Rep 12 16 41 49 61 4765 6083 12022 11312 12097 198Malaysia 251 368 590 730 872 86860 108550 152761 150669 192188 220Singapore 4 4 6 4 4 4251 4518 5978 3589 3809 952Thailand 4 40 89 165 1180 11067 16915 37395 227Turkey 2 8 7 8 8 619 1823 2481 1885 1421 178
Europe 1575 1808 2587 2955 3098 588212 562813 661166 753716 737895 238
Austria 29 35 46 108 130 10000 12556 16828 21256 23998 185Bel-Lux 8 14 205 395 395 3535 9275 51257 93092 93092 236Bulgaria 12 5 5 5 5406 3598 3598 3598 766Czech Rep 40 47 49 50 49 12061 11673 10338 10292 9106 186
Denmark 82 31 23 13573 13580 7884 343Estonia 1 2Finland 4 4 4 2 1 1907 1864 1732 678 392 327Frimce 322 316 354 328 509 75778 59296 58562 60501 116538 229Germmny 141 300 434 513 533 88599 108387 138213 161820 168129 315Greece 34 36 37 6003 5772 5784 155
Numymy 1 1 972 1082 902Ireland 140 170 172 295 287 78584 72988 78480 82930 69728 243
Italy 266 286 435 342 327 85525 78190 102316 96887 67928 208
LatWa 1 0 1
LithuaMa 0 0 0 1 1
NMtherlands 45 48 65 59 50 18042 14758 11093 11059 9414 188
Pokmd 128 115 104 212 140 46700 42903 23953 51100 30000 214
Portugal 207 200 342 311 283 66536 67159 76348 73673 60942 215
Pommnia 1 0 4 1 1
SMvaMa 1 4 3 1 284 1124 29 170 340
Spain 169 195 175 205 253 63453 53920 48711 51875 51923 205
Sweden 4 10 18 25 18 1123 3132 4453 5540 5864 326
UK 70 53 51 30 49 35534 20090 12836 7782 10979 223
UkrMne 2 3 3 3
CMeaMa 480 431 504 518 718 179262 135749 127541 102561 150637 210
Australia 120 90 118 139 206 46780 22000 25784 31468 41926 204
New ZeMand 360 341 386 379 512 132482 113749 101757 71093 108711 212
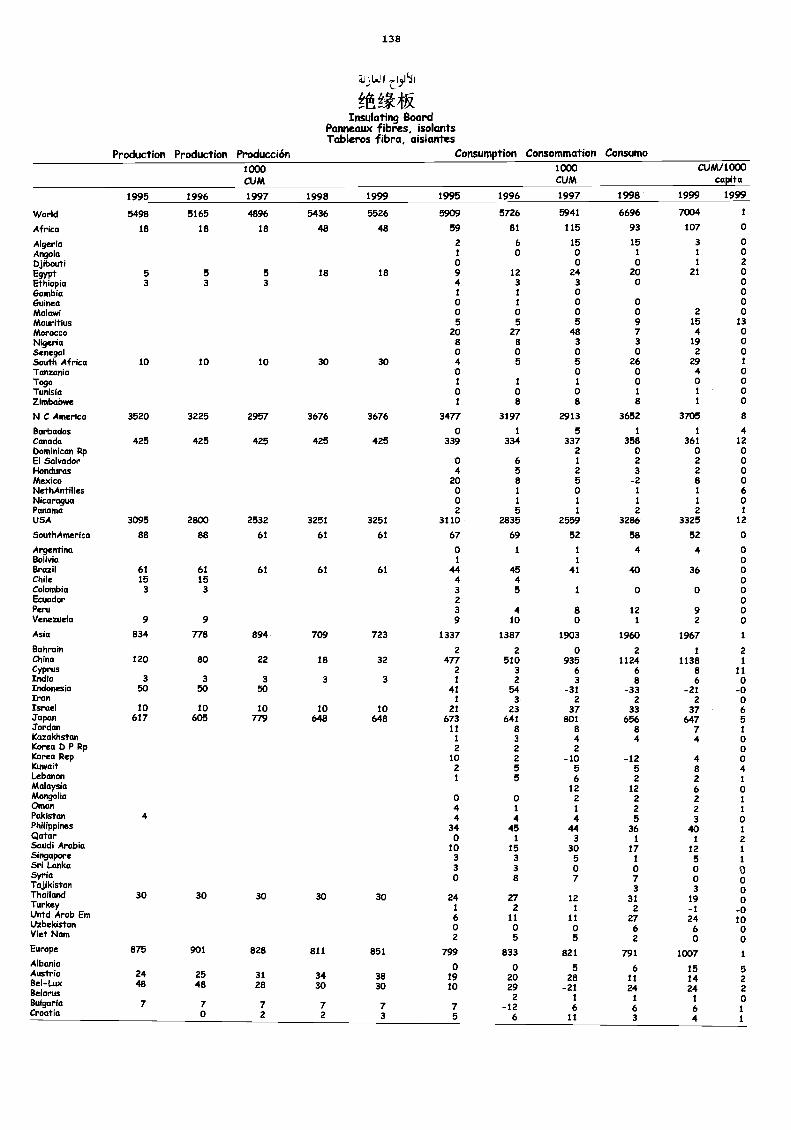
138
=sJ3L.1/411 ,15J411
Insulating BoardPanneaux fibres, isolantsTableros fibra, aislantes
Production Production Producción Consumption Consommation Consumo1000CuM
1000cum
CuM/1000capita
1995 1996 1997 1998 1999 1995 1996 1997 1998 1999 1999
World 5498 5165 4896 5436 5526 5909 5726 5941 6696 7004 1
Africa 18 18 18 48 48 59 81 115 93 107 0
Algeria 2 6 15 15 3 0Angola 1 0 0 1 1 0Djibouti 0 0 0 1 2
Egypt 5 5 5 18 18 9 12 24 20 21 0Ethiopia 3 3 3 4 3 3 0 0Gambia 1 1 0 0Guinea 0 1 0 0 0Malawi 0 0 0 0 2 0Matwitius 5 5 5 9 15 13Morocco 20 27 48 7 4 0Nigeria 8 s 3 3 19 0Senegal 0 0 0 0 2 0South Africa 10 10 10 30 30 4 5 5 26 29 1
Tanzania 0 0 0 4 0Togo 1 1 1 0 0 0Tunisia 0 0 0 1 1 0Zimbabwe 1 8 8 8 1 0
N C Ainerica 3520 3225 2957 3676 3676 3477 3197 2913 3652 3705 8
Barbadas 0 1 5 1 1 4Canada 425 425 425 425 425 339 334 337 358 361 12Dominican Rp 2 0 0 0El Salvador 0 6 1 2 2 0Honduras 4 5 2 3 2 0Mexico 20 8 5 -2 8 0NethAntilles 0 1 0 1 1 6Nicaragua 0 1 1 1 1 0Panama 2 5 1 2 2 1
USA 3095 2800 2532 3251 3251 3110 2835 2559 3286 3325 12
SouthAmerica 88 88 61 61 61 67 69 52 58 52 0
Argentina 0 1 1 4 4Bolivia 1 1
Brazil 61 61 61 61 61 44 45 41 40 36Chile 15 15 4 4Colombia 3 3 3 5 1 0 0Ecuador 2Peru 3 4 8 12 9Venezuela 9 9 9 10 0 1 2
Asia 834 778 894 709 723 1337 1387 1903 1960 1967 1
Bahrain 2 2 0 2 1 2China 120 80 22 18 32 477 510 935 1124 1138 1
Cyprus 2 3 6 6 8 11India 3 3 3 3 3 1 2 3 8 6 0Indonesia 50 50 50 41 54 -31 -33 -21 -0Iran 1 3 2 2 2 0Israel 10 10 10 10 10 21 23 37 33 37 6Japan 617 605 779 648 648 673 641 801 656 647 5Jordan 11 8 8 13 7 1Kazakhstan 1 3 4 4 4 0Korea D P Rp 2 2 2 0Korea Rep 10 2 -10 -12 4 0Kuwait 2 5 5 5 8 4Lebanon 1 5 6 2 2 1Malaysia 12 12 6 0Mongolia 0 0 2 2 2 1Oman 4 1 1 2 2 1Pakistan 4 4 4 4 5 3 0Philippines 34 45 44 36 40 1Qatar 0 1 3 1 1 2Saudi Arabia 10 15 30 17 12 1Singapore 3 3 5 1 5 1Sri Lanka 3 3 0 0 0 0SyriaTajikistanThaila nd 30 30 30 30 30
0
24
8
27
7
12
73
3/
03
19
000Turkey 1 2 1 2 -1 -0Untd Arab Em 6 11 11 27 24 10Uzbekistan 0 0 0 6 6 0Viet Nam 2 5 5 2 0 0
Europe 875 901 828 811 851 799 833 821 791 1007 1
AlbaniaAustria 24 25 31 34 38
019
020
528
611
1514
52Bel-Lux
BelarusBulgariaCroatia
48
7
48
70
28
72
30
72
30
73
10
75
292
-126
-211
611
241
63
241
64
201
1
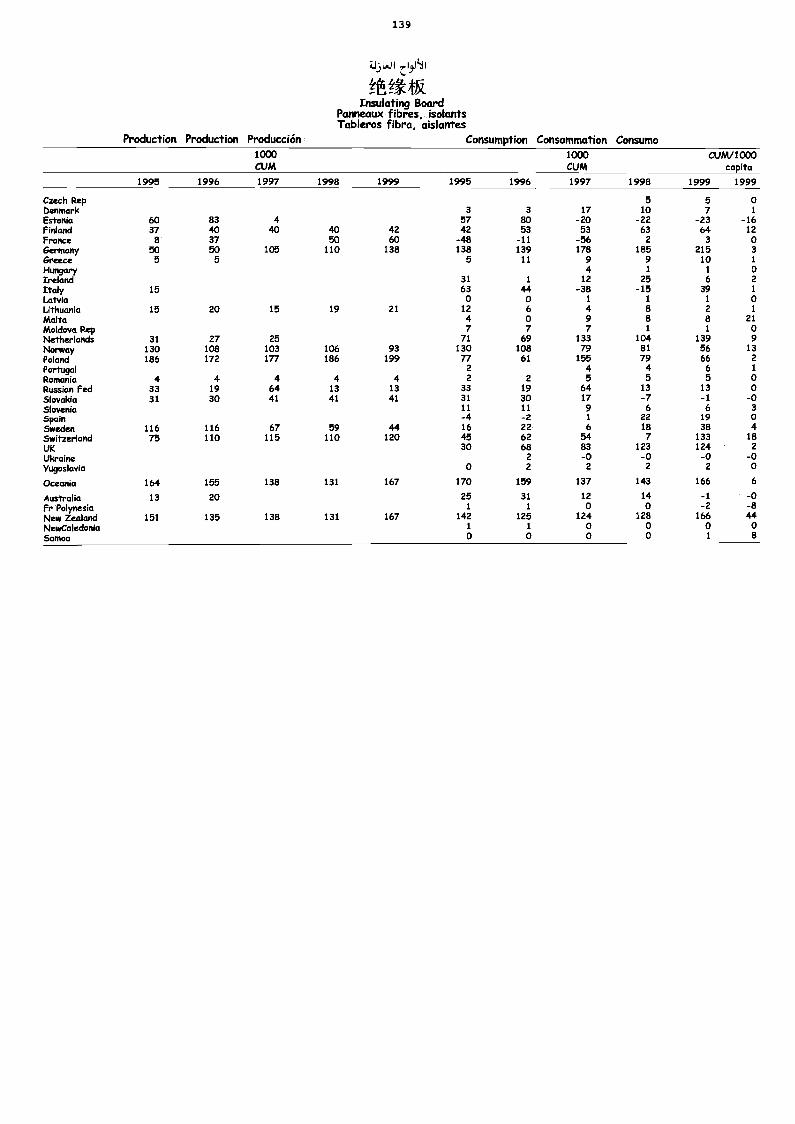
13 9
Ma*Insulating Board
Panneaux fibres, isolantsTableros fibra, aislantes
Production Production Producción Consumption Consommation Consumo1000CUM
1000CUM
CUM/1000capita
1995 1996 1997 1998 1999 1995 1996 1997 1998 1999 1999
Czech Rep 5 5 0Denmark 3 3 17 10 7 1
Estonia 60 83 4 57 80 -20 -22 -23 -16Finland 37 40 40 40 42 42 53 53 63 64 12France 8 37 50 60 -48 -11 -56 2 3 0Germany 50 50 105 110 138 138 139 178 185 215 3
Greece 5 5 5 11 9 9 10 1
Hungary 4 1 1 Cc
Ireland 31 1 12 25 6 2
Italy 15 63 44 -38 -15 39 1
Latvia 0 0 1 1 1 0Lithuania 15 20 15 19 21 12 6 4 8 2 1
Malta 4 0 9 8 8 21Moldova Rep 7 7 7 1 1 0Netherlands 31 27 25 71 69 133 104 139 9Norway 130 108 103 106 93 130 108 79 81 56 13Poland 186 172 177 186 199 77 61 155 79 66 2
Portugal 2 4 4 6 1
Romania 4 4 4 4 4 2 2 5 5 5 0Russian Fed 33 19 64 13 13 33 19 64 13 13 0Slovakia 31 30 41 41 41 31 30 17 -7 -1 -0Slovenia 11 11 9 6 6 3Spain -4 -2 1 22 19 0Sweden 116 116 67 59 44 16 22 6 18 38 4Switzerland 75 110 115 110 120 45 62 54 7 133 18
UK 30 68 83 123 124 2
Ulcraine 2 -0 -0 -0 -0Yugoslavia 0 2 2 2 2 0
Oceania 164 155 138 131 167 170 159 137 143 166 6
Australia 13 20 25 31 12 14 -1 -0Fr Polynesia 1 1 0 0 -2 -8New Zealand 151 135 138 131 167 142 125 124 128 166 44NewCaledonia 1 1 0 0 0 0Samoa 0 0 0 0 1 8
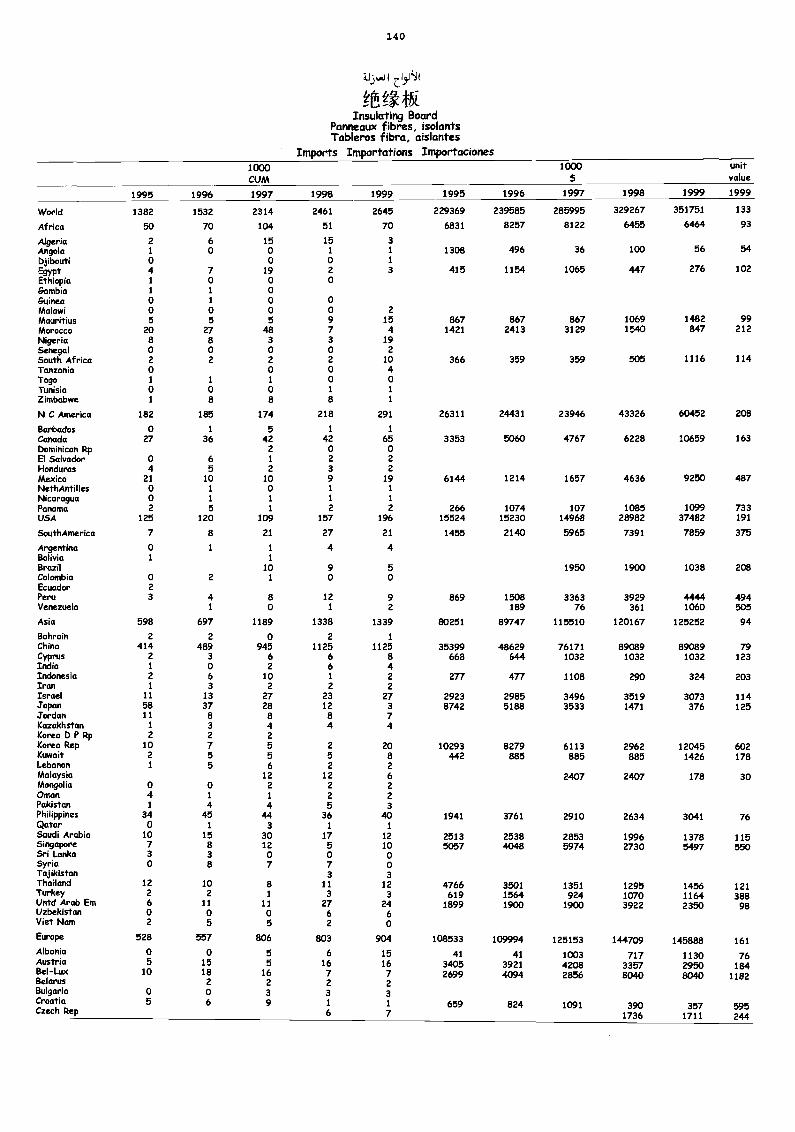
140
JL1Ji ..c.131'11
Mgt fkInsulating Board
Panneaux fibres, isolantsTableros fibra, aislantes
Imports Importations Importaciones1000CUM
1000$
unitvalue
1995 1996 1997 1998 1999 1995 1996 1997 1998 1999 1999
World 1382 1532 2314 2461 2645 229369 239585 285995 329267 351751 133
Africa 50 70 104 51 70 6831 8257 8122 6455 6464 93
Algeria 2 6 15 15 3Angola 1 0 0 1 1 1308 496 36 100 56 54Djibouti 0 0 0 1
Egypt 4 7 19 2 3 415 1154 1065 447 276 102Ethiopia 1 0 0 0Gambia 1 1 0Guinea 0 1 0 0Malawi 0 0 0 0 2Mauritius 5 5 5 9 15 867 867 867 1069 1482 99Morocco 20 27 48 7 4 1421 2413 3129 1540 847 212Nigeria 8 8 3 3 19Senegal 0 0 0 0 2South Africa 2 2 2 2 10 366 359 359 505 1116 114Tanzania 0 0 0 4Togo 1 1 1 0 0Tunisia 0 0 0 1 1
Zimbabwe 1 8 8 8 1
N C America 182 185 174 218 291 26311 24431 23946 43326 60452 208
Barbados 0 1 5 1 ICanada 27 36 42 42 65 3353 5060 4767 6228 10659 163Dominican Rp 2 0 0El Salvador 0 6 1 2 2Honduras 4 5 2 3 2Mexico 21 10 10 9 19 6144 1214 1657 4636 9250 487NethAntilles 0 1 0 1 1
Nicaragua 0 1 1 1 1
Panama 2 5 1 2 2 266 1074 107 1085 1099 733USA 125 120 109 157 196 15524 15230 14968 28982 37482 191
SouthAtnerica 7 8 21 27 21 1455 2140 5965 7391 7859 375
Argentina 0 1 1 4 4Bolivia 1 1
Brazil 10 9 5 1950 1900 1038 208Colombia 0 2 1 0 0Ecuador 2
Peru 3 4 8 12 9 869 1508 3363 3929 4444 494Venezuela 1 0 1 2 189 76 361 1060 505
Asia 598 697 1189 1338 1339 80251 89747 115510 120167 125252 94
Bahrain 2 2 0 2 1
China 414 489 945 1125 1125 35399 48629 76171 89089 89089 79Cyprus 2 3 6 6 8 668 644 1032 1032 1032 123India 1 0 2 6 4Indonesia 2 6 10 1 2 277 477 1108 290 324 203Iran 1 3 2 2 2Israel 11 13 27 23 27 2923 2985 3496 3519 3073 114.Topan 58 37 28 12 3 8742 5188 3533 1471 376 125jordan 11 8 8 8 7Kazakhstan 1 3 4 4 4Korea D P Rp 2 2 2Korea Rep 10 7 5 2 20 10293 8279 6113 2962 12045 602Kuwait 2 5 5 5 8 442 885 885 885 1426 178Lebanon 1 5 6 2 2Malaysia 12 12 6 2407 2407 178 30Mongolia 0 0 2 2 2Oman 4 1 1 2 2Pakistan 1 4 4 5 3Philippines 34 45 44 36 40 1941 3761 2910 2634 3041 76Qatar 0 1 3 1 1
Saudi Arabia 10 15 30 17 12 2513 2538 2853 1996 1378 115Singapore 7 8 12 5 10 5057 4048 5974 2730 5497 550Sri Lanka 3 3 0 0 0Syria 0 8 7 7 0Tajikistan 3 3Thailand 12 10 8 11 12 4766 3501 1351 1295 1456 121Turkey 2 2 1 3 3 619 1564 924 1070 1164 388Untd Arab Em 6 11 11 27 24 1899 1900 1900 3922 2350 98Uzbekistan 0 0 0 6 6Viet Nam 2 5 5 2 0Europe 528 557 806 803 904 108533 109994 125153 144709 145888 161Albania 0 0 5 6 15 41 41 1003 717 1130 76Austria 5 15 5 16 16 3405 3921 4208 3357 2950 184Bel-LuxBelarus
10 182
162
72
72
2699 4094 2856 8040 8040 1182
Bulgaria 0 0 3 3 3Croatia 5 6 9 1 1 659 824 1091 390 357 595Czech Rep 6 7 1736 1711 244
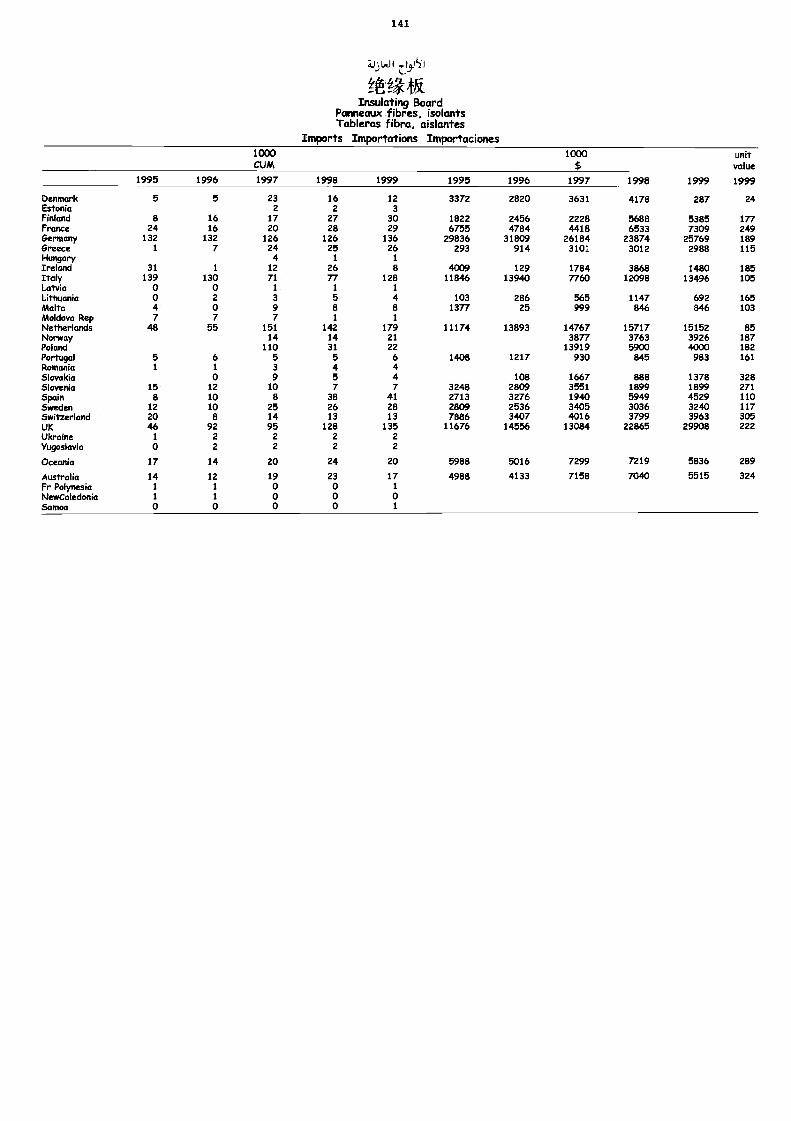
141
Lei 1 z:13J111
tEaInsulating Board
Panneaux fibres, isolantsTableros fibra, aislantes
Imports Importations Importaciones1000CUM
1000$
unitvalue
1995 1996 1997 1998 1999 1995 1996 1997 1998 1999 1999
Denmark 5 5 23 16 12 3372 2820 3631 4178 287 24Estonia 2 2 3Finland 8 16 17 27 30 1822 2456 2228 5688 5385 177France 24 16 20 28 29 6755 4784 4418 6533 7309 249Germany 132 132 126 126 136 29836 31809 26184 23874 25769 189Greece 1 7 24 25 26 293 914 3101 3012 2988 115Hungary 4 1 1
Ireland 31 1 12 26 8 4009 129 1784 3868 1480 185Italy 139 130 71 77 128 11846 13940 7760 12098 13496 105Latvia 0 0 1 1 1
Lithuania 0 2 3 5 4 103 286 565 1147 692 165Malta 4 0 9 a a 1377 25 999 846 846 103Moldova Rep 7 7 7 1 1
Netherlands 48 55 151 142 179 11174 13893 14767 15717 15152 85Norway 14 14 21 3877 3763 3926 187Poland 110 31 22 13919 5900 4000 182Portugal 5 6 5 5 6 1408 1217 930 845 983 161Romcmia 1 1 3 4 4Slovakia 0 9 5 4 108 1667 888 1378 328Slovenia 15 12 10 7 7 3248 2809 3551 1899 1899 271Spain 8 10 8 38 41 2713 3276 1940 5949 4529 110Sweden 12 10 25 26 28 2809 2536 3405 3036 3240 117Switzerland 20 8 14 13 13 7886 3407 4016 3799 3963 305UK 46 92 95 128 135 11676 14556 13084 22865 29908 222Ukraine 1 2 2 2 2
Yugoslavia 0 2 2 2 2
Oceania 17 14 20 24 20 5988 5016 7299 7219 5836 289
Australia 14 12 19 23 17 4988 4133 7158 7040 5515 324Fr Polynesia 1 1 0 0 1
NewCaledonia 1 1 o o oSamoa 0 0 0 0 1
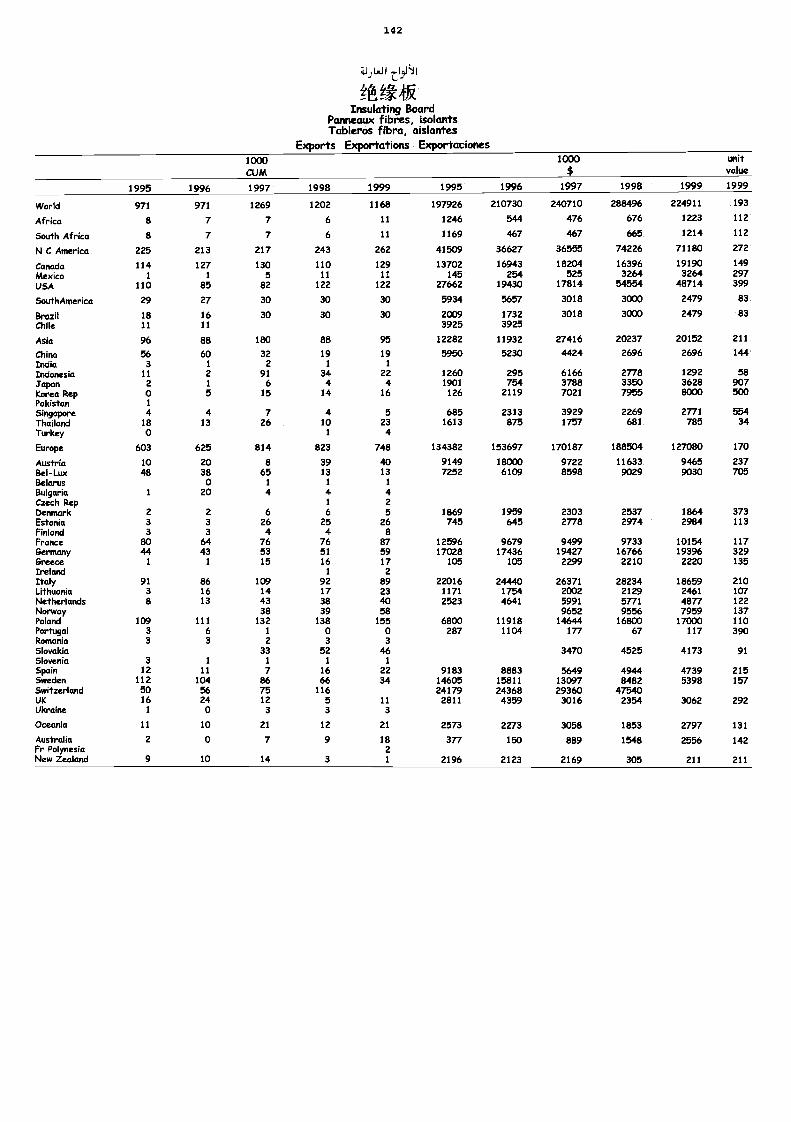
142
Mkt*Insulating Board
Panneaux fibres, isolantsTableros fibra, aislantes
Exports Exportations Exportaciones1000CUM
1000$
unitvalue
1995 1996 1997 1998 1999 1995 1996 1997 1998 1999 1999
World 971 971 1269 1202 1168 197926 210730 240710 288496 224911 193
Africa 8 7 7 6 11 1246 544 476 676 1223 112
South Africa 8 7 7 6 11 1169 467 467 665 1214 112
N C America 225 213 217 243 262 41509 36627 36555 74226 71180 272
Canada 114 127 130 110 129 13702 16943 18204 16396 19190 149
Mexico 1 1 5 11 11 145 254 525 3264 3264 297
USA 110 85 62 122 122 27662 19430 17814 54554 48714 399
SouthAmerica 29 27 30 30 30 5934 5657 3018 3000 2479 83
BM il 18 16 30 30 30 2009 1732 3018 3000 2479 83Chile 11 11 3925 3925
Asia 96 88 180 88 95 12282 11932 27416 20237 20152 211
China 56 60 32 19 19 5950 5230 4424 2696 2696 144India 3 1 2 1 1
Indonesia 11 2 91 34 22 1260 295 6166 2778 1292 58Japan 2 1 6 4 4 1901 754 3788 3350 3628 907Korea Rep 0 5 15 14 16 126 2119 7021 7955 8000 500Pakistan 1
Singapore 4 4 7 4 5 685 2313 3929 2269 2771 554Thailand 18 13 26 10 23 1613 875 1757 681 785 34Turkey 0 1 4
Europe 603 625 814 823 748 134382 153697 170187 188504 127080 170
Austria 10 20 8 39 40 9149 18000 9722 11633 9465 237Bel-Lux 48 38 65 13 13 7252 6109 8598 9029 9030 705Belarus 0 1 1 1
Bulgaria 1 20 4 4 4Czech Rep 1 2Denmark 2 2 6 6 5 1869 1959 2303 2537 1864 373Estonia 3 3 26 25 26 745 645 2778 2974 2984 113Finland 3 3 4 4 8France 80 64 76 76 87 12596 9679 9499 9733 10154 1176emnany 44 43 53 51 59 17028 17436 19427 16766 19396 329Greece 1 1 15 16 17 105 105 2299 2210 2220 135Ireland 1 2Italy 91 86 109 92 89 22016 24440 26371 28234 18659 210Lithuania 3 16 14 17 23 1171 1754 2002 2129 2461 107Netherlands 8 13 43 38 40 2523 4641 5991 5771 4877 122Norway 38 39 58 9652 9556 7959 137Poland 109 111 132 138 155 6800 11918 14644 16800 17000 110Portugal 3 6 1 0 0 287 1104 177 67 117 390Romania 3 3 2 3 3Slovakia 33 52 46 3470 4525 4173 91Slovenia 3 1 1 1 1
Spain 12 11 7 16 22 9183 8883 5649 4944 4739 215Sweden 112 104 86 66 34 14605 15811 13097 8482 5398 157Switzerland 50 56 75 116 24179 24368 29360 47540UK 16 24 12 5 11 2811 4359 3016 2354 3062 292Ulcraine 1 0 3 3 3
Oceania 11 10 21 12 21 2573 2273 3058 1853 2797 131
Australia 2 0 7 9 18 377 150 889 1548 2556 142Fr Polynesia 2New Zealand 9 10 14 3 1 2196 2123 2169 305 211 211
*;M:1113tkfkPULP AND RECOVERED PAPER
PATE ET VIEUX PAPIERS
PASTA Y PAPEL RECUPERADO
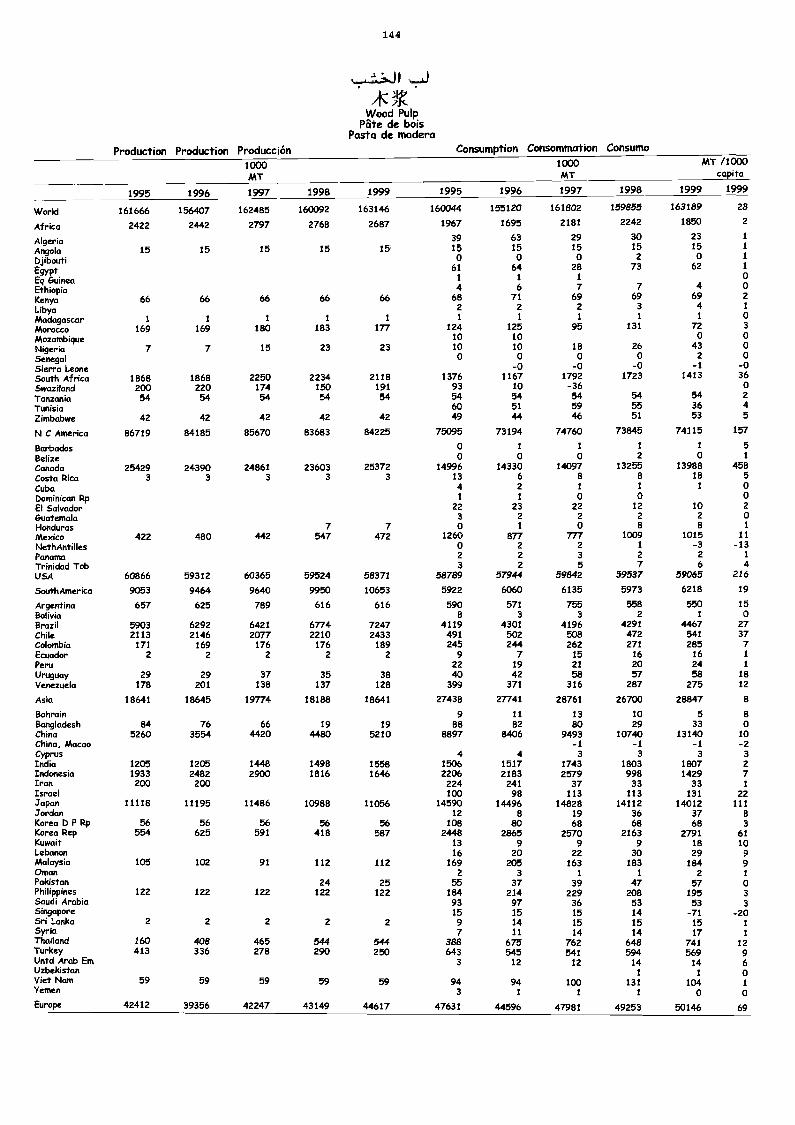
144
Wood PulpPate de bois
Pasta de modemProduction Production Producción Consumption Consommation Consumo
1000MT
1000MT
MT /1000capita
1995 1996 1997 1998 1999 1995 1996 1997 1998 1999 1999
World 161666 156407 162485 160092 163146 160044 155120 161802 159855 163189 28
Africa 2422 2442 2797 2768 2687 1967 1695 2181 2242 1850 2
Algeria 39 63 29 30 23 1
Angola 15 15 15 15 15 15 15 15 15 15 1
Djibouti 0 0 0 2 0 1
Egypt 61 64 28 73 62 1
Eq Guinea 1 1 1 0
Ethiopia 4 6 7 7 4 0
Kenya 66 66 66 66 66 68 71 69 69 69 2
Libya 2 2 2 3 4 1
Madagascar 1 1 1 1 1 1 1 1 1 1 0
Morocco 169 169 180 183 177 124 125 95 131 72 3
Mozambique 10 10 0 0
Nigeria 7 7 15 23 23 10 10 18 26 43 0
Senegal 0 0 0 0 2 0
Sierra Leone -0 -0 -0 -1 -0South Africa 1868 1868 2250 2234 2118 1376 1167 1792 1723 1413 36
Swaziland 200 220 174 150 191 93 10 -36 0Tanzania 54 54 54 54 54 54 54 54 54 54 2
Tunisia 60 51 59 55 36 4Zimbabwe 42 42 42 42 42 49 44 46 51 53 5
N C America 86719 84185 85670 83683 84225 75095 73194 74760 73845 74115 157
Barbados 0 1 1 1 1 5Belize 0 0 0 2 0 1
Canada 25429 24390 24861 23603 25372 14996 14330 14097 13255 13988 458Costa Rica 3 3 3 3 3 13 6 8 8 18 5
Cuba 4 2 1 1 1 0Dominican Rp 1 1 0 0 0El Salvador 22 23 22 12 10 2
Guatemala 3 2 2 2 2 0Honduras 7 7 0 1 0 8 8 1
Mexico 422 480 442 547 472 1260 877 777 1009 1015 11
NethAntilles 0 2 2 1 -3 -13Panama 2 2 3 2 2 1
Trinidad Tob 3 2 5 7 6 4USA 60866 59312 60365 59524 58371 58789 57944 59842 59537 59065 216
SouthAmerica 9053 9464 9640 9950 10653 5922 6060 6135 5973 6218 19
Argentina 657 625 789 616 616 590 571 755 558 550 15Bolivia 8 3 3 2 1 0Brazil 5903 6292 6421 6774 7247 4119 4301 4196 4291 4467 27Chile 2113 2146 2077 2210 2433 491 502 508 472 541 37Colombia 171 169 176 176 189 245 244 262 271 285 7Ecuador 2 2 2 2 2 9 7 15 16 16 1
Peru 22 19 21 20 24 1
Uruguay 29 29 37 35 38 40 42 58 57 58 18Venezuela 178 201 138 137 128 399 371 316 287 275 12
Asia 18641 18645 19774 18188 18641 27438 27741 28761 26700 28847 8
Bahrain 9 11 13 10 5 8Bangladesh 84 76 66 19 19 88 82 80 29 33 0China 5260 3554 4420 4480 5210 8897 8406 9493 10740 13140 10China, Macao -1 -1 -1 -2Cyprus 4 4 3 3 3 3India 1205 1205 1448 1498 1558 1506 1517 1743 1803 1807 2
Indonesia 1933 2482 2900 1816 1646 2206 2183 2579 998 1429 7Iran 200 200 224 241 37 33 33 1
Israel 103 98 113 113 131 22Japan 11118 11195 11486 10988 11056 14590 14496 14828 14112 14012 111Jordan 12 8 19 36 37 8Korea D P Rp 56 56 56 56 56 108 80 68 68 68 3Korea Rep 554 625 591 418 587 2448 2865 2570 2163 2791 61Kuwait 13 9 9 9 18 10Lebanon 16 20 22 30 29 9Malaysia 105 102 91 112 112 169 205 163 183 184 9Ornan 2 3 1 1 2 1Pakistan 24 25 55 37 39 47 57 0Philippines 122 122 122 122 122 184 214 229 208 195 3Saudi Arabia 93 97 36 53 53 3Singapore 15 15 15 14 -71 -20Sri Lanka 2 2 2 2 2 9 14 15 15 15 1Syria 7 11 14 14 17 1Thailand 160 408 465 544 544 388 675 762 648 741 12Turkey 413 336 278 290 250 643 545 541 594 569 9Untd Arab Em 3 12 12 14 14 6Uzbekistan 1 1
Viet Nam 59 59 59 59 59 94 94 100 13 1 10401
Yemen 3 1 1 1 0 0Europe 42412 39356 42247 43149 44617 47631 44596 47981 49253 50146 69
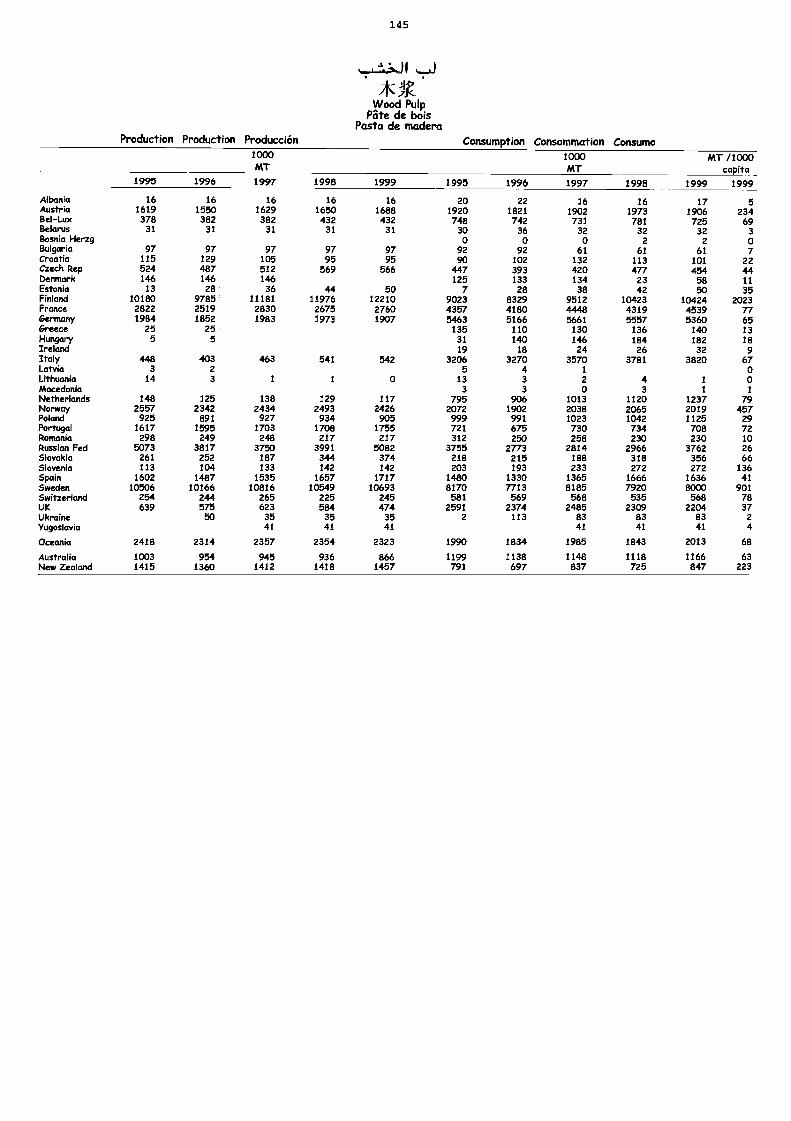
145
,
*Wood Pulp
Pate de boisPasta de madero
Production Production Producción Consumption Consommation Consumo1000MT
1997 1998 1999 1995 1996
1000MT
1997 1998
MT /1000capita
1999 19991995 1996
Albania 16 16 16 16 16 20 22 16 16 17 5Austria 1619 1550 1629 1650 1688 1920 1821 1902 1973 1906 234Bel-Lux 378 382 382 432 432 748 742 731 781 725 69Belarus 31 31 31 31 31 30 36 32 32 32 3BosMaHMrzg 0 0 0 2 2 0Bulgaria 97 97 97 97 97 92 92 61 61 61 7Croafia 115 129 105 95 95 90 102 132 113 101 22CzechRep 524 487 512 569 566 447 393 420 477 454 44Denmark 146 146 146 125 133 134 23 58 11Estonia 13 28 36 44 50 7 28 38 42 50 35Finland 10180 9785 11181 11976 12210 9023 8329 9512 10423 10424 2023France 2822 2519 2830 2675 2760 4357 4180 4448 4319 4539 77Germany 1984 1852 1983 1973 1907 5463 5166 5661 5557 5360 65Greece 25 25 135 110 130 136 140 13Hungary 5 5 31 140 146 184 182 18Ireland 19 18 24 26 32 9ItMy 448 403 463 541 542 3206 3270 3570 3781 3820 67Latvia 3 2 5 4 1 0Lithuania 14 3 1 1 0 13 3 2 4 1 0Macedonia 3 3 0 3 1 1
Netherlands 148 125 138 129 117 795 906 1013 1120 1237 79Norway 2557 2342 2434 2493 2426 2072 1902 2038 2065 2019 457Poland 925 891 927 934 905 999 991 1023 1042 1125 29Portugal 1617 1595 1703 1708 1755 721 675 730 734 708 72RomaMa 298 249 248 217 217 312 250 258 230 230 10Russian Fed 5073 3817 3750 3991 5082 3755 2773 2814 2966 3762 26SkwaMa 261 252 187 344 374 218 215 188 318 356 66Slovenia 113 104 133 142 142 203 193 233 272 272 136Spain 1602 1487 1535 1657 1717 1480 1330 1365 1666 1636 41Sweden 10506 10166 10816 10549 10693 8170 7713 8185 7920 8000 901SwitzerlaW 254 244 265 225 245 581 569 568 535 568 78UK 639 575 623 584 474 2591 2374 2485 2309 2204 37Ukmfine 50 35 35 35 2 113 83 83 83 2Yugoslavia 41 41 41 41 41 41 4
OteaMa 2418 2314 2357 2354 2323 1990 1834 1985 1843 2013 68
Australia 1003 954 945 936 866 1199 1138 1148 1118 1166 63New Zeakmul 1415 1360 1412 1418 1457 791 697 837 725 847 223
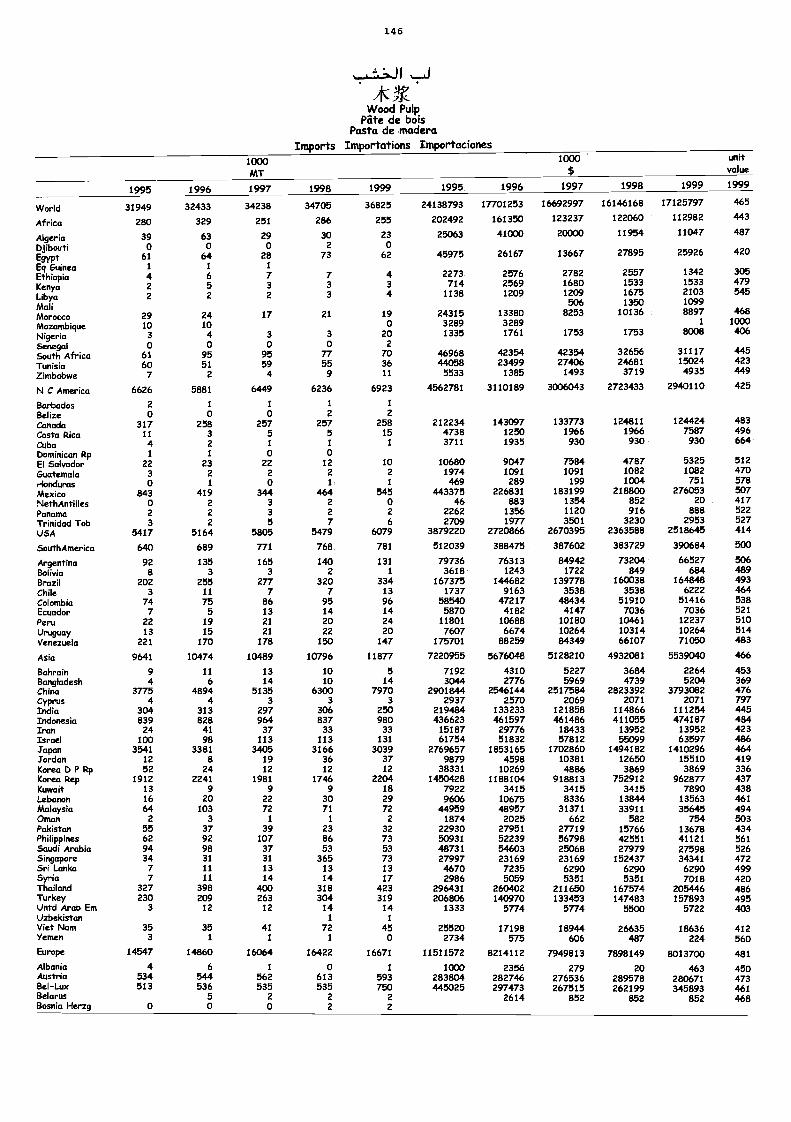
14 6
, i .:1.. :2.J I ,_.J
* VWood Pulp
Pate de boisPasta de madera
Imports Importations Importaciones1000MT
1000$
unitvalue
1995 1996 1997 1998 1999 1995 1996 1997 1998 1999 1999
World 31949 32433 34238 34705 36825 24138793 17701253 16692997 16146168 17125797 465
Africa 280 329 251 286 255 202492 161350 123237 122060 112982 443
Algeria 39 63 29 30 23 25063 41000 20000 11954 11047 487
Djibouti 0 0 0 2 0420
Egypt 61 64 28 73 62 45975 26167 13667 27895 25926
Eq Guinea i 1 1
Ethiopia 4 6 7 7 4 2273 2576 2782 2557 1342 305
Kenya 2 5 3 3 3 714 2569 1680 1533 1533 479
Libya 2 2 2 3 4 1138 1209 1209 1675 2103 545
Mali 506 1350 1099
Morocco 29 24 17 21 19 24315 13380 8253 10136 8897 468
Mozambique 10 10 0 3289 3289 1 1000
Nigeria 3 4 3 3 20 1335 1761 1753 1753 8008 406
Senegal o o o 0 2South Africa 61 95 95 77 70 46968 42354 42354 32656 31117 445
Tunisia 60 51 59 55 36 44058 23499 27406 24681 15024 423
Zimbabwe 7 2 4 9 11 5533 1385 1493 3719 4935 449
N C America 6626 5881 6449 6236 6923 4562781 3110189 3006043 2723433 2940110 425
Barbados 2 1 1 1 1
Belize o o 0 2 2
Canada 317 258 257 257 258 212234 143097 133773 124811 124424 483
Costa Rica 11 3 5 5 15 4738 1250 1966 1966 7587 496
Cuba 4 2 1 1 1 3711 1935 930 930 930 664
Dominican Ftp 1 1 0 0El Salvador 22 23 22 12 10 10680 9047 7584 4787 5325 512
Guatemala 3 2 2 2 2 1974 1091 1091 1082 1082 470
l-londuras o 1 o 1 1 469 289 199 1004 751 578
Mexico 843 419 344 464 545 443375 226831 183199 218800 276053 507
NethAntilles o 2 3 2 o 46 883 1354 852 20 417Panama 2 2 3 2 2 2262 1356 1120 916 888 522
Trinidad Tob 3 2 5 7 6 2709 1977 3501 3230 2953 527USA 5417 5164 5805 5479 6079 3879220 2720866 2670395 2363588 2518645 414
SouthAmerica 640 689 771 768 781 512039 388475 387602 383729 390684 500
Argentina 92 135 165 140 131 79736 76313 84942 73204 66527 506Bolivia 8 3 3 2 1 3618 1243 1722 849 684 489Brazil 202 255 277 320 334 167375 144682 139778 160038 164848 493Chile 3 11 7 7 13 1737 9163 3538 3538 6222 464Colombia 74 75 86 95 96 58540 47217 48434 51910 51416 538Ecuador 7 5 13 14 14 5870 4182 4147 7036 7036 521Peru 22 19 21 20 24 11801 10688 10180 10461 12237 510Uruguay 13 15 21 22 20 7607 6674 10264 10314 10264 514Venezuela 221 170 178 150 147 175701 88259 84349 66107 71050 483
Asia 9641 10474 10489 10796 11877 7220955 5676048 5128210 4932081 5539040 466
Bahrain 9 11 13 10 5 7192 4310 5227 3684 2264 453Bangladesh 4 6 14 10 14 3044 2776 5969 4739 5204 369China 3775 4894 5135 6300 7970 2901844 2546144 2517584 2823392 3793082 476Cyprus 4 4 3 3 3 2937 2570 2069 2071 2071 797India 304 313 297 306 250 219484 133233 121858 114866 111254 445Indonesia 839 828 964 837 980 436623 461597 461486 411055 474187 484Iran 24 41 37 33 33 15187 29776 18433 13952 13952 423Israel 100 98 113 113 131 61754 51832 57812 55099 63597 486Japan 3541 3381 3405 3166 3039 2769657 1853165 1702860 1494182 1410296 464jordan 12 8 19 36 37 9879 4598 10381 12650 15510 419Korea D P Rp 52 24 12 12 12 38331 10269 4886 3869 3869 336Korea Rep 1912 2241 1981 1746 2204 1450428 1188104 918813 752912 962877 437Kuwait 13 9 9 9 18 7922 3415 3415 3415 7890 438Lebanon 16 20 22 30 29 9606 10675 8336 13844 13563 461Malaysia 64 103 72 71 72 44959 48957 31371 33911 35645 494Oman 2 3 1 1 2 1874 2025 662 582 754 503Pakistan 55 37 39 23 32 22930 27951 27719 15766 13678 434Philippines 62 92 107 86 73 50931 52239 56798 42551 41121 561Saudi Arabia 94 98 37 53 53 48731 54603 25068 27979 27598 526Singapore 34 31 31 365 73 27997 23169 23169 152437 34341 472Sri Lanka 7 11 13 13 13 4670 7235 6290 6290 6290 499Syria 7 11 14 14 17 2986 5059 5351 5351 7018 420Thailand 327 398 400 318 423 296431 260402 211650 167574 205446 486Turkey 230 209 263 304 319 206806 140970 133453 147483 157893 495Untd Arab Em 3 12 12 14 14 1333 5774 5774 5500 5722 403Uzbekistan 1 1
Viet Nam 35 35 41 72 45 25520 17198 18944 26635 18636 412Yemen 3 1 1 1 o 2734 575 606 487 224 560Europe 14547 14860 16064 16422 16671 11511572 8214112 7949813 7898149 8013700 481
Albania 4 6 1 0 1 1000 2356 279 20 463 450Austria 534 544 562 613 593 283804 282746 276536 289578 280671 473Bel-Lux 513 536 535 535 750 445025 297473 267515 262199 345893 461Belarus 5 2 2 2 2614 852 852 852 468Bosnia Herzg 0 0 o 2 2
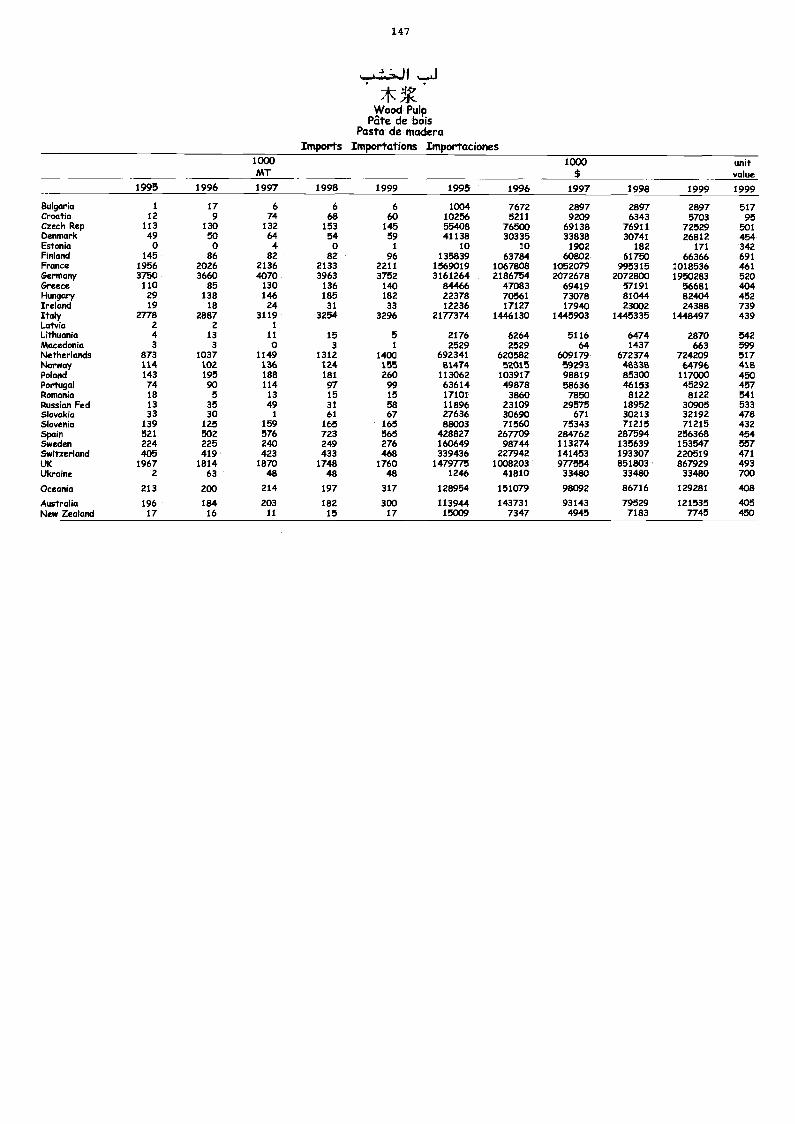
147
JIPulp
Pate de boisPasta de madera
Imports Importations ImportacionesIMOMT
1000$
unitvalue
1995 1996 1997 1998 1999 1995 1996 1997 1998 1999 1999
Bulgaria 1 17 6 6 6 1004 7672 2897 2897 2897 517Croatia 12 9 74 68 60 10256 5211 9209 6343 5703 95Czech Rep 113 130 132 153 145 55408 76500 69138 76911 72529 501Denmark 49 50 64 54 59 41138 30335 33838 30741 26812 454Estonia 0 0 4 0 1 10 10 1902 182 171 342Finland 145 86 82 82 96 135839 63784 60802 61750 66366 691France 1956 2026 2136 2133 2211 1569019 1067808 1052079 995315 1018536 461Germany 3750 3660 4070 3963 3752 3161264 2186754 2072678 2072800 1950283 520Greece 110 85 130 136 140 84466 47083 69419 57191 56681 404Hungary 29 138 146 185 182 22378 70561 73078 81044 82404 452Ireland 19 18 24 31 33 12236 17127 17940 23002 24388 739Italy 2778 2887 3119 3254 3296 2177374 1446130 1445903 1445335 1448497 439Latvia 2 2 1
Lithuania 4 13 11 15 5 2176 6264 5116 6474 2870 542Macedonia 3 3 0 3 1 2529 2529 64 1437 663 599Netherlands 873 1037 1149 1312 1400 692341 620582 609179 672374 724209 517Norway 114 102 136 124 155 81474 52015 59293 48338 647% 418Poland 143 195 188 181 260 113062 103917 98819 85300 117000 450Portugal 74 90 114 97 99 63614 49878 58636 46153 45292 457Romania 18 5 13 15 15 17101 3860 7850 8122 8122 541Russian Fed 13 35 49 31 58 11896 23109 29575 18952 30905 533Slovakia 33 30 1 61 67 27636 30690 671 30213 32192 478Slovenia 139 125 159 165 165 88003 71560 75343 71215 71215 432Spain 521 502 576 723 565 428827 267709 284762 287594 256368 454Sweden 224 225 240 249 276 160649 98744 113274 135639 153547 557Switzerland 405 419 423 433 468 339436 227942 141453 193307 220519 471UK 1967 1814 1870 1748 1760 1479775 1008203 977554 851803 867929 493Ukraine 2 63 48 48 48 1246 41810 33480 33480 33480 700
Oceania 213 200 214 197 317 128954 151079 98092 86716 129281 408
Australia 196 184 203 182 300 113944 143731 93143 79529 121535 405New Zealand 17 16 11 15 17 15009 7347 4945 7183 7745 450
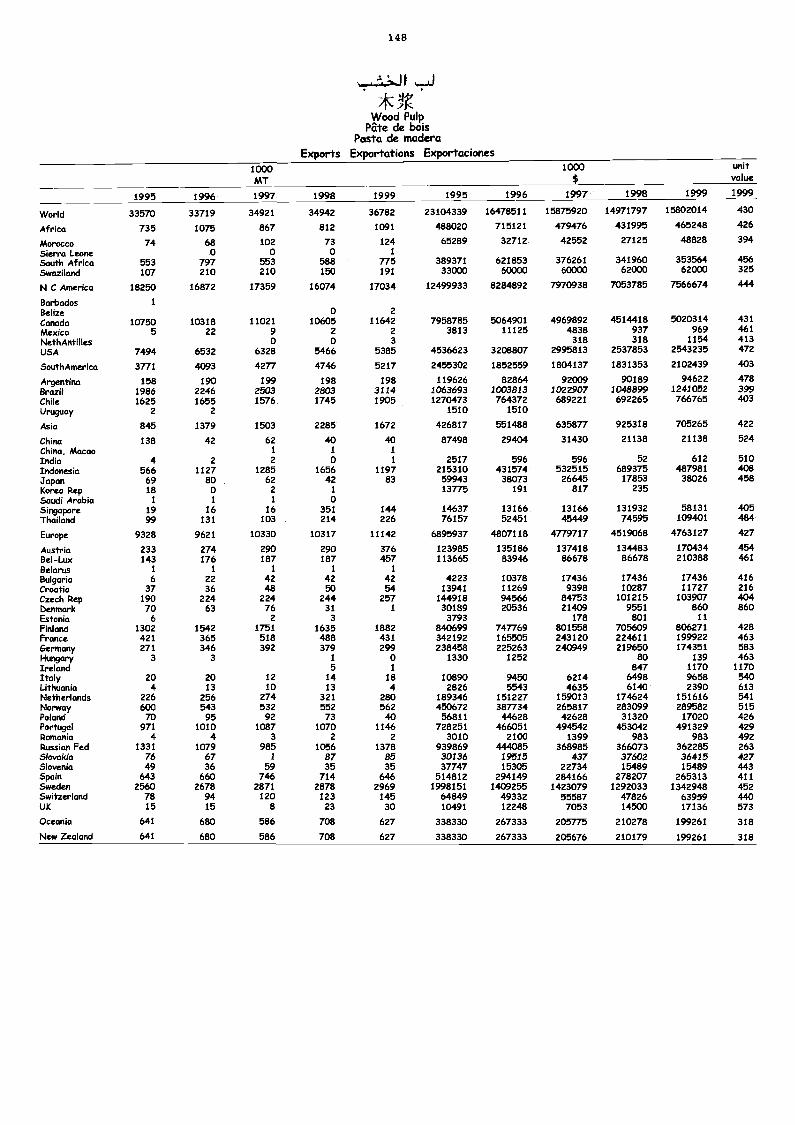
14 8
O. 4. :-..J 1 ,....ii
* VWood Pulp
Pate de boisPasta de madera
Exports Exportations Exportaciones1000MT
1000$
unitvalue
1995 1996 1997 1998 1999 1995 1996 1997 1998 1999 1999
World 33570 33719 34921 34942 36782 23104339 16478511 15875920 14971797 15802014 430
Africa 735 1075 867 812 1091 488020 715121 479476 431995 465248 426
Morocco 74 68 102 73 124 65289 32712 42552 27125 48828 394Sierra Leone 0 0 0 1
South Africa 553 797 553 588 775 389371 621853 376261 341960 353564 456Swaziland 107 210 210 150 191 33000 60000 60000 62000 62000 325
N C America 18250 16872 17359 16074 17034 12499933 8284892 7970938 7053785 7566674 444
Barbados 1Belize 0 2Canada 10750 10318 11021 10605 11642 7958785 5064901 4969892 4514418 5020314 431Mexico 5 22 9 2 2 3813 11125 4838 937 969 461NethAntilles 0 0 3 318 318 1154 413USA 7494 6532 6328 5466 5385 4536623 3208807 2995813 2537853 2543235 472
SouthAmerica 3771 4093 4277 4746 5217 2455302 1852559 1804137 1831353 2102439 403
Argentina 158 190 199 198 198 119626 82864 92009 90189 94622 478Brazil 1986 2246 2503 2803 3114 1063693 1003813 1022907 1048899 1241052 399Chile 1625 1655 1576 1745 1905 1270473 764372 689221 692265 766765 403Uruguay 2 2 1510 1510
Asia 845 1379 1503 2285 1672 426817 551488 635877 925318 705265 422
China 138 42 62 40 40 87498 29404 31430 21138 21138 524China, Macao 1 1 1
India 4 2 2 0 1 2517 596 596 52 612 510Indonesia 566 1127 1285 1656 1197 215310 431574 532515 689375 487981 408Japan 69 80 62 42 83 59943 38073 26645 17853 38026 458Korea Rep 18 0 2 1 13775 191 817 235Saudi Arabia 1 1 1 0Singapore 19 16 16 351 144 14637 13166 13166 131932 58131 405Thailand 99 131 103 214 226 76157 52451 45449 74595 109401 484
Europe 9328 9621 10330 10317 11142 6895937 4807118 4779717 4519068 4763127 427
Austria 233 274 290 290 376 123985 135186 137418 134483 170434 454Bel-Lux 143 176 187 187 457 113665 83946 86678 86678 210388 461Belarus 1 1 1 1 1
Bulgaria 6 22 42 42 42 4223 10378 17436 17436 17436 416Croatia 37 36 48 50 54 13941 11269 9398 10287 11727 216Czech Rep 190 224 224 244 257 144918 94566 84753 101215 103907 404Denmark 70 63 76 31 1 30189 20536 21409 9551 860 860Estonia 6 2 3 3793 178 801 11
Finland 1302 1542 1751 1635 1882 840699 747769 801558 705609 806271 428France 421 365 518 488 431 342192 165505 243120 224611 199922 4636ermany 271 346 392 379 299 238458 225263 240949 219650 174351 583Hungary 3 3 1 0 1330 1252 80 139 463Ireland 5 1 847 1170 1170Italy 20 20 12 14 18 10890 9450 6214 6498 9658 540Lithuania 4 13 10 13 4 2826 5543 4635 6140 2390 613Netherlands 226 256 274 321 280 189346 151227 159013 174624 151616 541Norway 600 543 532 552 562 450672 387734 265817 283099 289582 515Poland 70 95 92 73 40 56811 44628 42628 31320 17020 426Portugal 971 1010 1087 1070 1146 728251 466051 494542 453042 491329 429Romania 4 4 3 2 2 3010 2100 1399 983 983 492Russian Fed 1331 1079 985 1056 1378 939869 444085 368985 366073 362285 263Slovakia 76 67 1 87 85 30136 19515 437 37602 36415 427Slovenia 49 36 59 35 35 37747 15305 22734 15489 15489 443Spain 643 660 746 714 646 514812 294149 284166 278207 265313 411Sweden 2560 2678 2871 2878 2969 1998151 1409255 1423079 1292033 1342948 452Switzerland 78 94 120 123 145 64849 49332 55587 47826 63959 440UK 15 15 8 23 30 10491 12248 7053 14500 17136 573
Oceania 641 680 586 708 627 338330 267333 205775 210278 199261 318New Zealand 641 680 586 708 627 338330 267333 205676 210179 199261 318
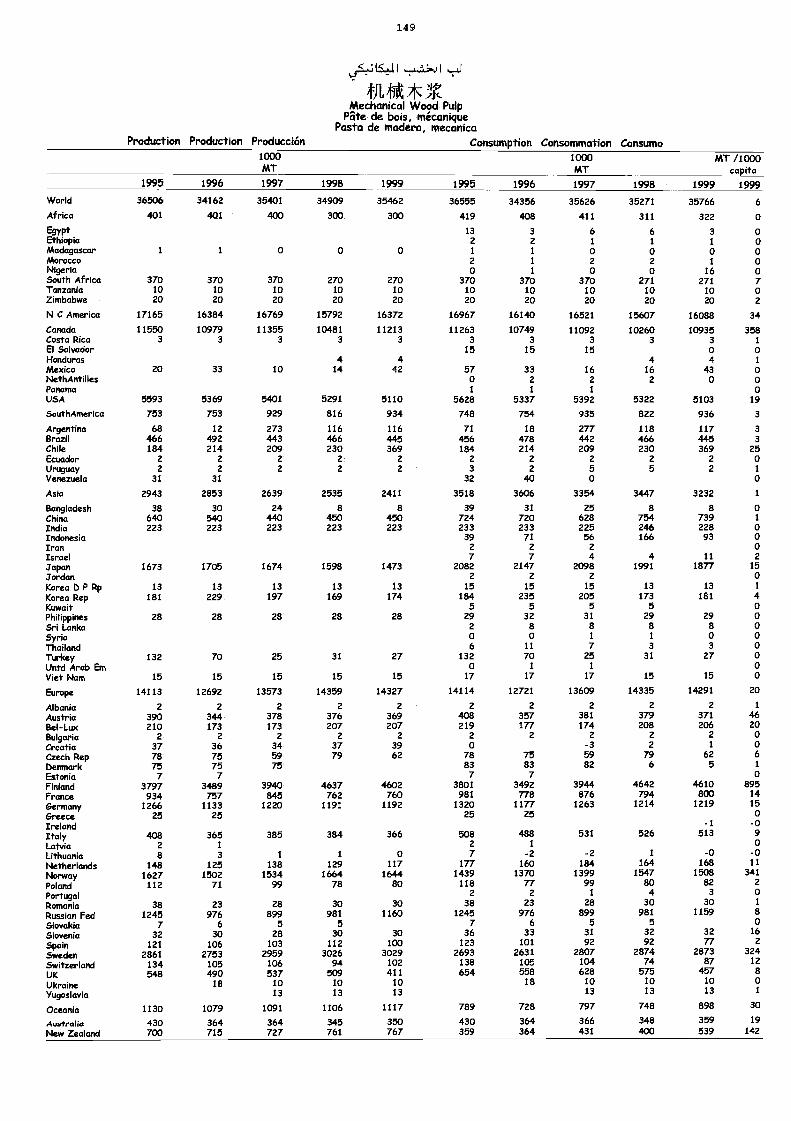
149
fit**Mechanical Wood Pulp
Pate de bois, micaniquePasta de modem, mecanica
Production Production Producción Consumption Consommation Consumo1000MT
1000PAT
MT /1000capita
1999 19991995 1996 1997 1998 1999 1995 1996 1997 1998
World 36506 34162 35401 34909 35462 36555 34356 35626 35271 35766 6
Africa 401 401 400 300 300 419 408 411 311 322 0
Egypt 13 3 6 6 3 0Ethiopia 2 2 1 1 1 0Madagascar 1 1 0 0 0 1 1 0 0 0 0Morocco 2 1 2 2 1 0Nigeria 0 1 0 0 16 0South Africa 370 370 370 270 270 370 370 370 271 271 7Tanzania 10 10 10 10 10 10 10 10 10 10 0Zimbabwe 20 20 20 20 20 20 20 20 20 20 2
N C America 17165 16384 16769 15792 16372 16967 16140 16521 15607 16088 34
Canada 11550 10979 11355 10481 11213 11263 10749 11092 10260 10935 358Costa Rica 3 3 3 3 3 3 3 3 3 3 1
El Salvador 15 15 15 0 0Honduras 4 4 4 4 1
Mexico 20 33 10 14 42 57 33 16 16 43 0NethAntilles 0 2 2 2 0 0Panama 1 1 1 0USA 5593 5369 5401 5291 5110 5628 5337 5392 5322 5103 19
SouthAmerica 753 753 929 816 934 748 754 935 822 936 3
Argentina 68 12 273 116 116 71 18 277 118 117 3Brazil 466 492 443 466 445 456 478 442 466 445 3Chile 184 214 209 230 369 184 214 209 230 369 25Ecuador 2 2 2 2 2 2 2 2 2 2 0Uruguay 2 2 2 2 2 3 2 5 5 2 1
Venezuela 31 31 32 40 0 0
Asia 2943 2853 2639 2535 2411 3518 3606 3354 3447 3232 1
Bangladesh 38 30 24 8 8 39 31 25 8 8 0China 640 540 440 450 450 724 720 628 754 739 1
India 223 223 223 223 223 233 233 225 246 228 0Indonesia 39 71 56 166 93 0Iran 2 2 2 0Israel 7 7 4 4 11 2
Japan 1673 1705 1674 1598 1473 2082 2147 2098 1991 1877 15
Jordan 2 2 2 0Korea II) P Rp 13 13 13 13 13 15 15 15 13 13 1
Korea Rep 181 229 197 169 174 184 235 205 173 181
Kuwait 5 5 5 5
Philippines 28 28 28 28 28 29 32 31 29 29Sri Lanka 2 8 8 8 8
Syria 0 0 1 1 0Thailand 6 11 7 3 3
Turkey 132 70 25 31 27 132 70 25 31 27Untd Arab Ern 0 1 1
Viet Nam 15 15 15 15 15 17 17 17 15 15
Europe 14113 12692 13573 14359 14327 14114 12721 13609 14335 14291 20
Albania 2 2 2 2 2 2 2 2 2 2 1
Austria 390 344 378 376 369 408 357 381 379 371 46Bel-Lux 210 173 173 207 207 219 177 174 208 206 20Bulgaria 2 2 2 2 2 2 2 2 2 2 0Croatia 37 36 34 37 39 0 -3 2 1 0Czech Rep 78 75 59 79 62 78 75 59 79 62 6
bemnark 75 75 75 83 83 82 6 5 1
Estonia 7 7 7 7 0Finland 3797 3489 3940 4637 4602 3801 3492 3944 4642 4610 895France 934 757 845 762 760 981 778 876 794 800 14
Germany 1266 1133 1220 1191 1192 1320 1177 1263 1214 1219 15
Greece 25 25 25 25 0Ireland -1 -0Italy 408 365 385 384 366 508 488 531 526 513 9
Latvia 2 1 2 1 0Lithuania 8 3 1 1 0 7 -2 -2 1 -0 -0Netherlands 148 125 138 129 117 177 160 184 164 168 11
Norway 1627 1502 1534 1664 1644 1439 1370 1399 1547 1508 341
Poland 112 71 99 78 80 118 n 99 80 82 2
Portugal 2 2 1 4 3 0
Romania 38 23 28 30 30 38 23 28 30 30 1
Russian Fed 1245 976 899 981 1160 1245 976 899 981 1159 8
Slovakia 7 6 5 5 7 6 5 5 0
Slovenia 32 30 28 30 30 36 33 31 32 32 16
SPain 121 106 103 112 100 123 101 92 92 77 2
Sweden 2861 2753 2959 3026 3029 2693 2631 2807 2874 2873 324
Switzerland 134 105 106 94 102 138 105 104 74 87 12
UK 548 490 537 509 411 654 558 628 575 457 8
Ukraine 18 10 10 10 18 10 10 10 0
Yugoslavia 13 13 13 13 13 13 1
Oceania 1130 1079 1091 1106 1117 789 728 797 748 898 30
Australia 430 364 364 345 350 430 364 366 348 359 19
New Zealand 700 715 727 761 767 359 364 431 400 539 142
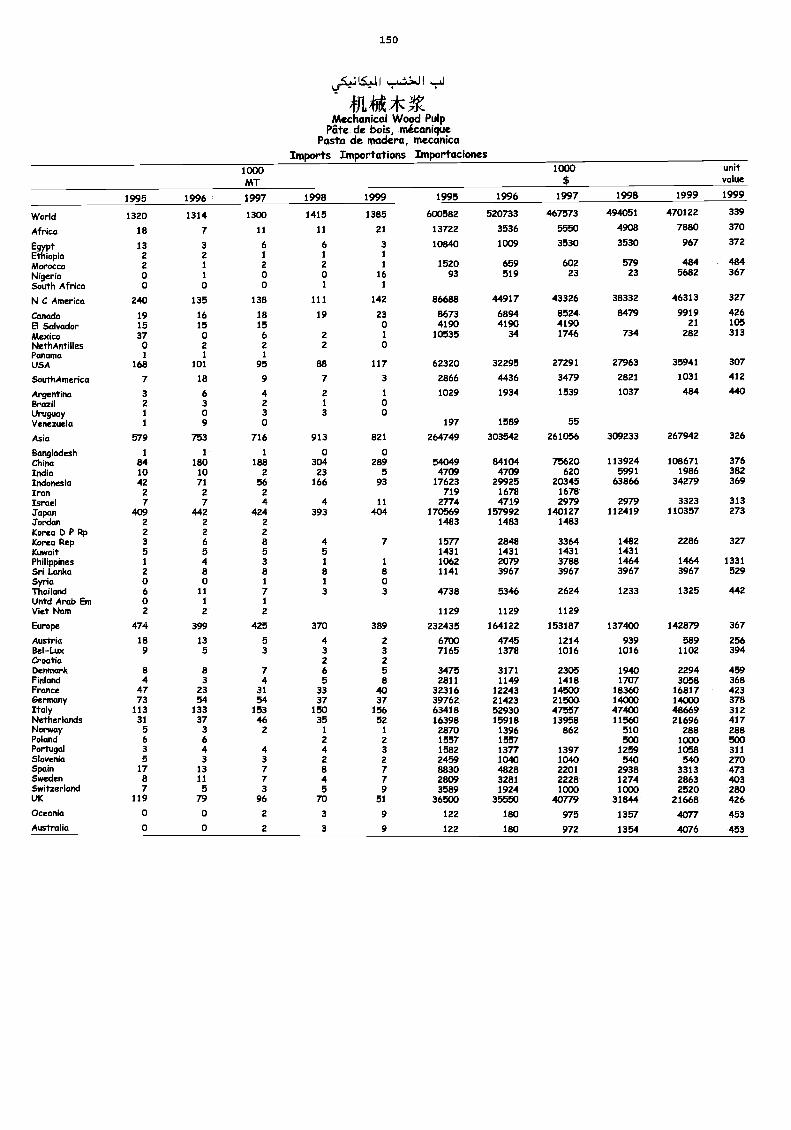
150
I
fit* AZ V.Mechanical Wood Pulp
Pate de bois, micaniquePosta de madera, mecanica
Imports Importations Importaciones1000MT
1000 unitvalue
1995 1996 1997 1998 1999 1995 1996 1997 1998 1999 1999
World 1320 1314 1300 1415 1385 600582 520733 467573 494051 470122 339
Africa 18 7 11 11 21 13722 3536 5550 4908 7880 370
Egypt 13 3 6 6 3 10840 1009 3530 3530 967 372
Ethiopia 2 2 1 1 1
Morocco 2 1 2 2 1 1520 659 602 579 484 484
Nigeria o 1 o o 16 93 519 23 23 5682 367
South Africa 0 0 0 1 1
N C America 240 135 138 111 142 86688 44917 43326 38332 46313 327
Canada 19 16 18 19 23 8673 6894 8524 8479 9919 426
El Salvador 15 15 15 0 4190 4190 4190 21 105
Mexico 37 0 6 2 1 10535 34 1746 734 282 313
NethAntilles 0 2 2 2 0Panama 1 1 1
USA 168 101 95 88 117 62320 32295 27291 27963 35941 307
SouthAmerica 7 18 9 7 3 2866 4436 3479 2821 1031 412
Argentina 3 6 4 2 1 1029 1934 1539 1037 484 440Brazil 2 3 2 1 0Uruguay 1 0 3 3 oVenezuela 1 9 o 197 1589 55
Asia 579 753 716 913 821 264749 303542 261056 309233 267942 326
Bangladesh 1 1 1 0 0China sa 180 188 304 289 54049 84104 75620 113924 108671 376India 10 10 2 23 5 4709 4709 620 5991 1986 382Indonesia 42 71 56 166 93 17623 29925 20345 63866 34279 369Iran 2 2 2 719 1678 1678Israel 7 7 4 4 11 2774 4719 2979 2979 3323 313Japan 409 442 424 393 404 170569 157992 140127 112419 110357 273Jordan 2 2 2 1483 1483 1483Korea D P Rp 2 2 2Korea Rep 3 6 8 4 7 1577 2848 3364 1482 2286 327Kuwait 5 5 5 5 1431 1431 1431 1431Philippines 1 4 3 1 1 1062 2079 3788 1464 1464 1331Sri Lanka 2 8 8 8 8 1141 3967 3967 3967 3967 529Syria 0 0 1 1 0Thailand 6 11 7 3 3 4738 5346 2624 1233 1325 442Untd Arab Em o I 1
Viet Nam 2 2 2 1129 1129 1129
Europe 474 399 425 370 389 232435 164122 153187 137400 142879 367
Austria 18 13 5 4 2 6700 4745 1214 939 589 256Bel-Lux 9 5 3 3 3 7165 1378 1016 1016 1102 394Croatia 2 2Denmark s a 7 6 5 3475 3171 2305 1940 2294 459Finland 4 3 4 5 8 2811 1149 1418 1707 3058 368France 47 23 31 33 40 32316 12243 14503 18360 16817 423Germany 73 54 54 37 37 39762 21423 21500 14000 14000 378Italy 113 133 153 150 156 63418 52930 47557 47400 48669 312Netherlands 31 37 46 35 52 16398 15918 13958 11560 21696 417Norway 5 3 2 1 1 2870 1396 862 510 288 288Poland 6 6 2 2 1557 1557 500 1000 500Portugal 3 4 4 4 3 1582 1377 1397 1259 1058 311Slovenia 5 3 3 2 2 2459 1040 1040 540 540 270Spain 17 13 7 8 7 8830 4828 2201 2938 3313 473Sweden 8 11 7 4 7 2809 3281 2228 1274 2863 403Switzerland 7 5 3 5 9 3589 1924 1000 1000 2520 280UK 119 79 96 70 51 36500 35550 40779 31844 21668 426Oceania 0 o 2 3 9 122 180 975 1357 4077 453Australia 0 0 2 3 9 122 180 972 1354 4076 453
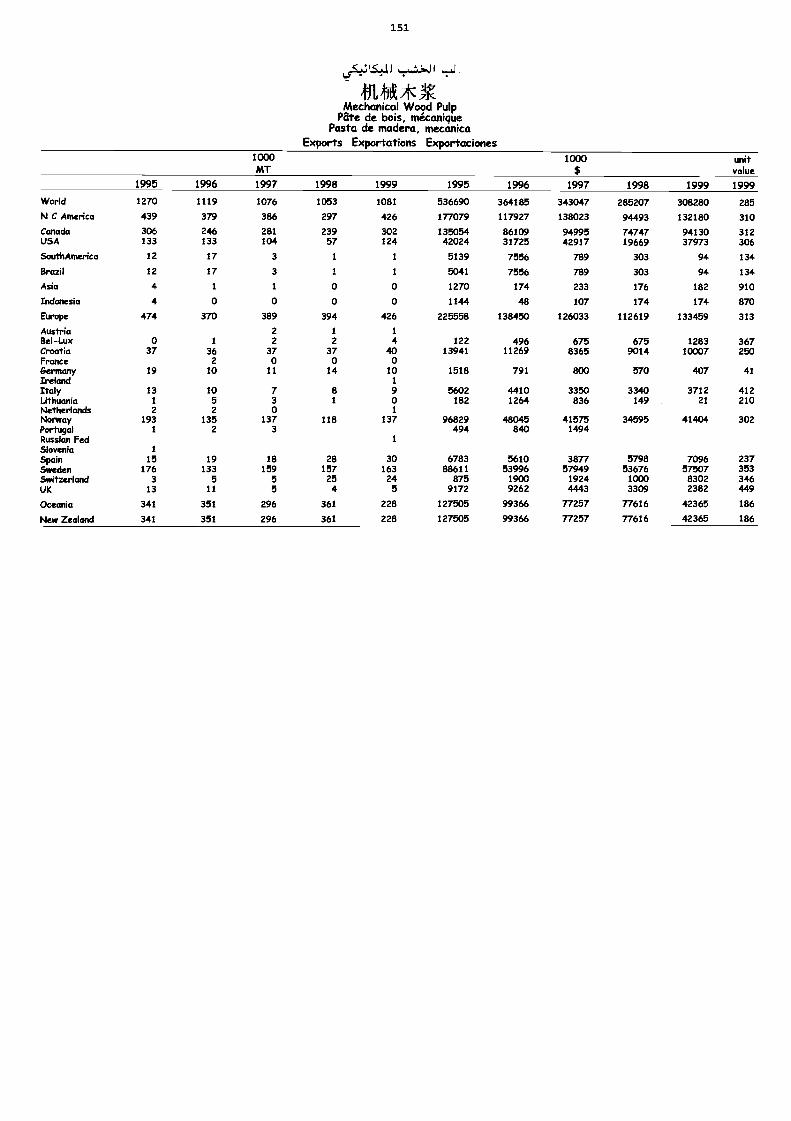
151
0.5.2.11.5÷11 .:_J
tis* AOPMechanical Wood Pulp
Pate de bois, micaniquePasta de madera, tnecanica
Exports Exportations Exportaciones1000MT
1000$
unitvalue
1995 1996 1997 1998 1999 1995 1996 1997 1998 1999 1999
World 1270 1119 1076 1053 1081 536690 364185 343047 285207 308280 285N C America 439 379 386 297 426 177079 117927 138023 94493 132180 310
Canada 306 246 281 239 302 135054 86109 94995 74747 94130 312USA 133 133 104 57 124 42024 31725 42917 19669 37973 306
SouthAmerica 12 17 3 1 1 5139 7556 789 303 94 134
Brazil 12 17 3 1 1 5041 7556 789 303 94 134
Asia 4 1 1 0 0 1270 174 233 176 182 910
Indonesia 4 0 0 0 0 1144 48 107 174 174 870
Europe 474 370 389 394 426 225558 138450 126033 112619 133459 313
Austria 2 1 1
Bel-Lux o 1 2 2 4 122 496 675 675 1283 367Croatia 37 36 37 37 40 13941 11269 8365 9014 10007 250France 2 0 0 0Germany 19 10 11 14 10 1518 791 800 570 407 41Ireland 1
Italy 13 10 7 8 9 5602 4410 3350 3340 3712 412Lithuania 1 5 3 1 0 182 1264 836 149 21 210Netherlands 2 2 o 1
Norway 193 135 137 118 137 96829 48045 41575 34595 41404 302Portugal 1 2 3 494 840 1494Russian Fed 1
Slovenia 1
Spain 15 19 18 28 30 6783 5610 3877 5798 7096 237Sweden 176 133 159 157 163 88611 53996 57949 53676 57507 353Switzerland 3 5 5 25 24 875 1900 1924 1000 8302 346UK 13 11 5 4 5 9172 9262 4443 3309 2382 449
Oceania 341 351 296 361 228 127505 99366 77257 77616 42365 186
New Zealand 341 351 296 361 228 127505 99366 77257 77616 42365 186
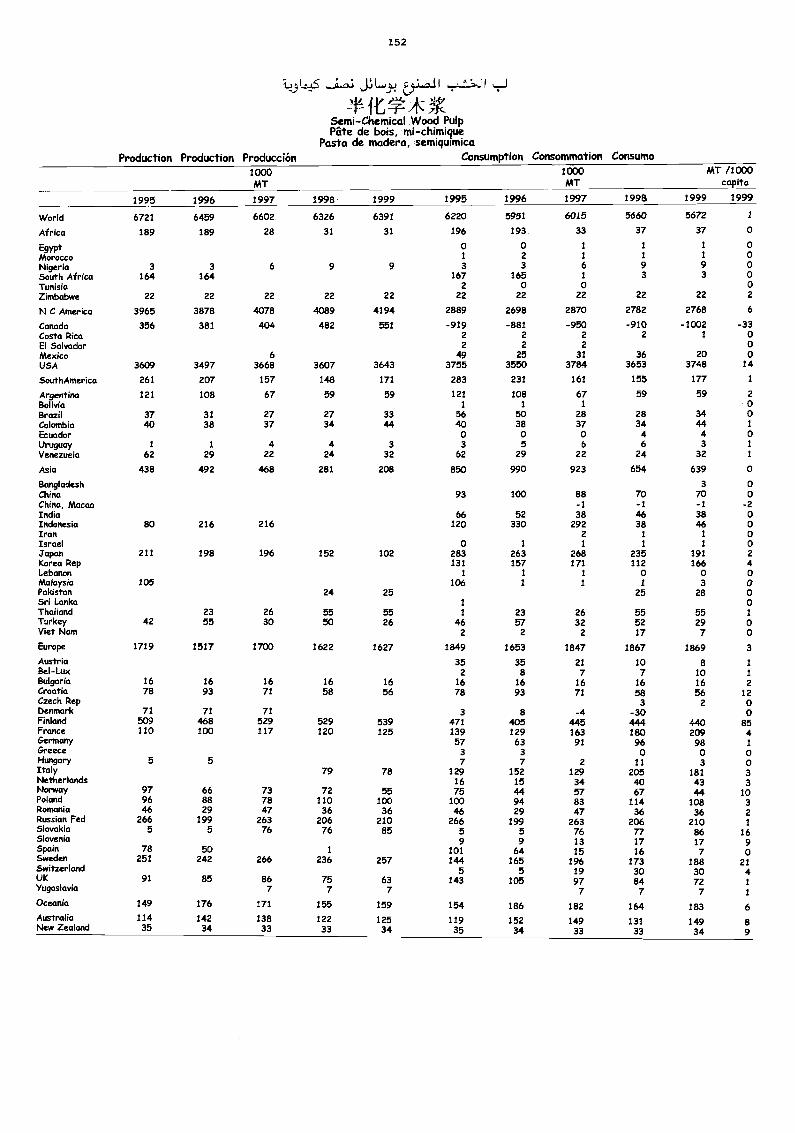
152
la.,..5 .....iax; J.:o L.,.5.;
t ft*I:* VSemi-Chemical Wood PulpPate de bois, mi-chimique
Pasta de madera, serniquimicaProduction Production Producción Consumption Consommation Consumo
1000MT
1000MT
MT /1000capita
1995 1996 1997 1998 1999 1995 1996 1997 1998 1999 1999
World 6721 6459 6602 6326 6391 6220 5951 6015 5660 5672 1
Africa 189 189 28 31 31 196 193 33 37 37 0
Egypt 0 0 1 1 1 0Morocco 1 2 1 1 1 0Nigeria 3 3 6 9 9 3 3 6 9 9 0South Africa 164 164 167 165 1 3 3 0Tunisia 2 0 0 0Zimbabwe 22 22 22 22 22 22 22 22 22 22 2
N C America 3965 3878 4078 4089 4194 2889 2698 2870 2782 2768 6
Canada 356 381 404 482 551 -919 -881 -950 -910 -1002 -33Costa Rica 2 2 2 2 1 0El Salvador 2 2 2 0Mexico 6 49 25 31 36 20 0USA 3609 3497 3668 3607 3643 3755 3550 3784 3653 3748 14
SouthAmerica 261 207 157 148 171 283 231 161 155 177 1
Argentina 121 108 67 59 59 121 108 67 59 59 2
Bolivia 1 1 1 0Brazil 37 31 27 27 33 56 50 28 28 34 0Colombia 40 38 37 34 44 40 38 37 34 44 1
Ecuador 0 0 0 4 4 0Uruguay 1 1 4 4 3 3 5 6 6 3 1
Venezuela 62 29 22 24 32 62 29 22 24 32 1
Asia 438 492 468 281 208 850 990 923 654 639 0
Bangladesh 3 0China 93 100 88 70 70 0China, Macao -1 -1 -1 -2India 66 52 38 46 38 0Indonesia 80 216 216 120 330 292 38 46 0Iran 2 1 1 0Israel 0 1 1 1 1 0japan 211 198 196 152 102 283 263 268 235 191 2Korea Rep 131 157 171 112 166 4Lebanon 1 1 1 0 0 0Malaysia 105 106 1 1 1 3 0Pakistan 24 25 25 28 0Sri Lanka 1 0Thailand 23 26 55 55 1 23 26 55 55 1Turkey 42 55 30 50 26 46 57 32 52 29 0Viet Nam 2 2 2 17 7 0
Europe 1719 1517 1700 1622 1627 1849 1653 1847 1867 1869 3
Austria 35 35 21 10 8 1
Bel-Lux 2 8 7 7 10 1
Bulgaria 16 16 16 16 16 16 16 16 16 16 2Croatia 78 93 71 58 56 78 93 71 58 56 12Czech Rep 3 2 0Denmark 71 71 71 3 8 -4 -30 0Finland 509 468 529 529 539 471 405 445 444 440 85France 110 100 117 120 125 139 129 163 180 209 4Germany 57 63 91 96 98 1Greece 3 3 0 0 0Hungary 5 5 7 7 2 11 3 0Italy 79 78 129 152 129 205 181 3Netherlands 16 15 34 40 43 3Norway 97 66 73 72 55 75 44 57 67 44 10Poland 96 88 78 110 100 100 94 83 114 108 3Romania 46 29 47 36 36 46 29 47 36 36 2Russian Fed 266 199 263 206 210 266 199 263 206 210 1Slovakia 5 5 76 76 85 5 5 76 n 86 16Slovenia 9 9 13 17 17 9Spain 78 50 1 101 64 15 16 7 0Sweden 251 242 266 236 257 144 165 196 173 188 21Switzerland 5 5 19 30 30 4UK 91 85 86 75 63 143 105 97 84 72 1Yugoslavia 7 7 7 7 7 7 1
Oceania 149 176 171 155 159 154 186 182 164 183 6Australia 114 142 138 122 125 119 152 149 131 149 8New Zealand 35 34 33 33 34 35 34 33 33 34 9
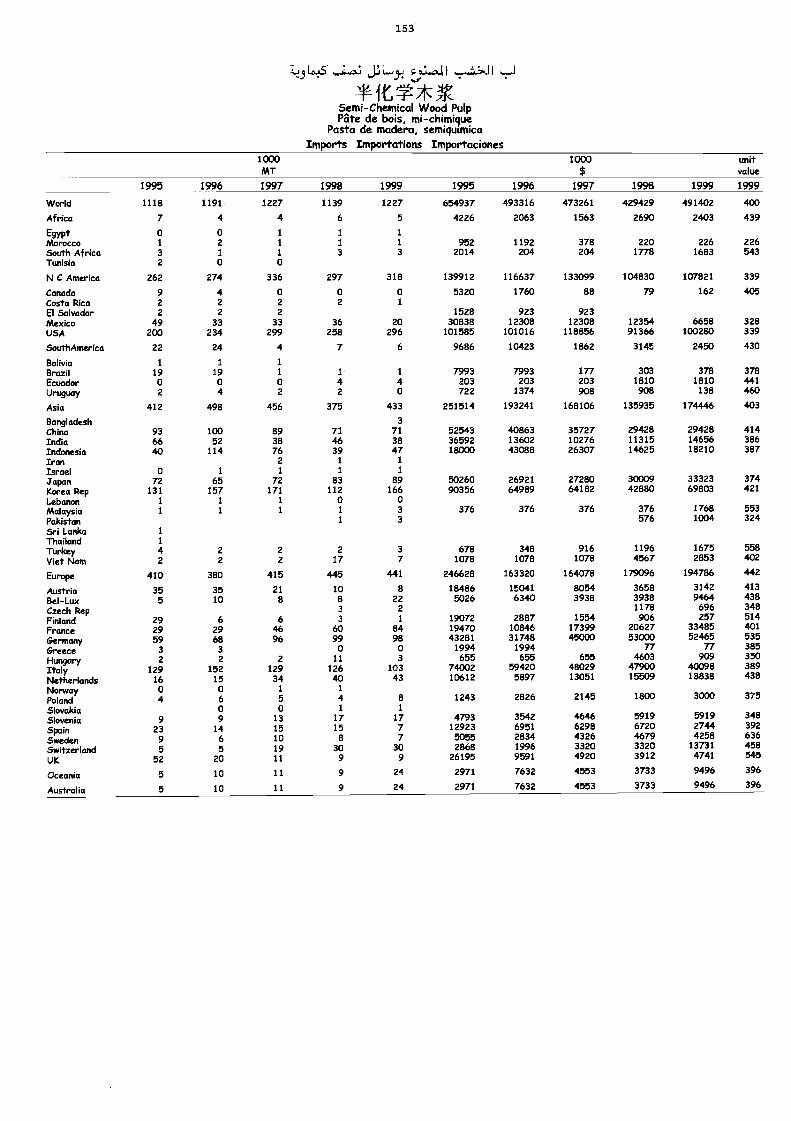
153
Lo-S j:# L-1./ tv".1.44 I
11-1t1:7KtSemi-Chemical Wood PulpPate de bois, mi-chimique
Pasta de madera, semiqutmicaImports Importations Importaciones
1000MT
1000$
unitvalue
1995 1996 1997 1998 1999 1995 1996 1997 1998 1999 1999
World 1118 1191 1227 1139 1227 654937 493316 473261 429429 491402 400
Africa 7 4 4 6 5 4226 2063 1563 2690 2403 439
Egypt 0 0 1 1 1
Morocco 1 2 1 1 1 952 1192 378 220 226 226South Africa 3 1 1 3 3 2014 204 204 1778 1683 543Tunisia 2 0 0
N C America 262 274 336 297 318 139912 116637 133099 104830 107821 339
Canada 9 4 0 0 0 5320 1760 88 79 162 405Costa Rica 2 2 2 2 1
El Salvador 2 2 2 1528 923 923Mexico 49 33 33 36 20 30838 12308 12308 12354 6658 328USA 200 234 299 258 296 101585 101016 118856 91366 100280 339
SouthAmerica 22 24 4 7 6 9686 10423 1862 3145 2450 430
Bolivia 1 1 1
Brazil 19 19 1 1 1 7993 7993 177 303 378 378Ecuador 0 0 0 4 4 203 203 203 1810 1810 441
Uruguay 2 4 2 2 0 722 1374 908 908 138 460
Asia 412 498 456 375 433 251514 193241 168106 135935 174446 403
Bangladesh 3China 93 100 89 71 71 52543 40863 35727 29428 29428 414India 66 52 38 46 38 36592 13602 10276 11315 14656 386Indonesia 40 114 76 39 47 18000 43088 26307 14625 18210 387Iran 2 1 1
Israel 0 1 1 1 1
Japan 72 65 72 83 89 50260 26921 27280 30009 33323 374Korea Rep 131 157 171 112 166 90356 64989 64182 42880 69803 421
Lebanon 1 1 1 0 0Malaysia 1 1 1 1 3 376 376 376 376 1768 553
Pakistan 1 3 576 1004 324Sri Lanka 1
Thailand 1
Turkey 4 2 2 2 3 678 348 916 1196 1675 558
Viet Nam 2 2 2 17 7 1078 1078 1078 4567 2853 402
Europe 410 380 415 445 441 246628 163320 164078 179096 194786 442
Austria 35 35 21 10 8 18486 15041 8054 3658 3142 413
Bel-Lux 5 10 8 8 22 5026 6340 3938 3938 9464 438
Czech Rep 3 2 1178 696 348
Finland 29 6 6 3 1 19072 2887 1554 906 257 514
France 29 29 46 60 84 19470 10846 17399 20627 33485 401
Germany 59 68 96 99 98 43281 31748 45000 53000 52465 535
Greece 3 3 0 D 1994 1994 77 77 385
Hungary 2 2 2 11 3 655 655 655 4603 909 350
Italy 129 152 129 126 103 74002 59420 48029 47900 40098 389
Netherlands 16 15 34 40 43 10612 5897 13051 15509 18838 438
Norway 0 0 1 1
Poland 4 6 5 4 8 1243 2826 2145 1800 3000 375
Slovakia 0 0 1 1
Slovenia 9 9 13 17 17 4793 3542 4646 5919 5919 348
Spain 23 14 15 15 7 12923 6951 6298 6720 2744 392
Sweden 9 6 10 8 7 5055 2834 4326 4679 4258 636
Switzerland 5 5 19 30 30 2868 1996 3320 3320 13731 458
UK 52 20 11 9 9 26195 9591 4920 3912 4741 545
Oceania 5 10 11 9 24 2971 7632 4553 3733 9496 396
Australia 5 10 11 9 24 2971 7632 4553 3733 9496 396
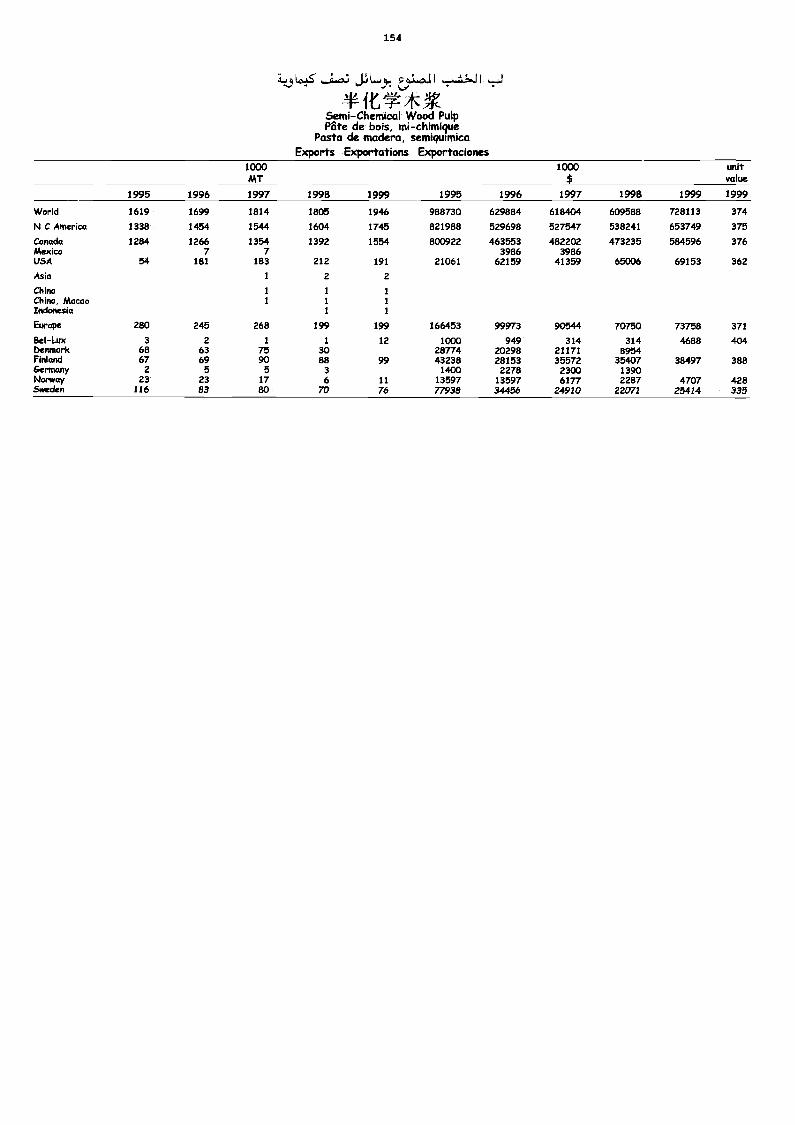
154
lc÷5 ,r61
ft* *VSemi-Chemical Wood PulpPate de bois, mi-chimique
Pasta de madera, semiqunnicaExports Exportations Exportaciones
1000AiT
1000$
unitvalue
1995 1996 1997 1998 1999 1995 1996 1997 1998 1999 1999
World 1619 1699 1814 1805 1946 988730 629884 618404 609588 728113 374
N C America 1338 1454 1544 1604 1745 821988 529698 527547 538241 653749 375
Canada 1284 1266 1354 1392 1554 800922 463553 482202 473235 584596 376Mexico 7 7 3986 3986USA 54 181 183 212 191 21061 62159 41359 65006 69153 362
Asia 1 2 2
China 1 1 1
China, Macao 1 I 1Indonesia 1 1
Europe 280 245 268 199 199 166453 99973 90544 70750 73758 371
Bel-Lux 3 2 1 1 12 1000 949 314 314 4688 404Cierunark 68 63 75 30 28774 20298 21171 8954Finland 67 69 90 88 99 43238 28153 35572 35407 38497 388Germany 2 5 5 3 1400 2278 2300 1390Norway 23 23 17 6 11 13597 13597 6177 2287 4707 428Sweden 116 83 80 70 76 77938 34456 24910 22071 25424 333
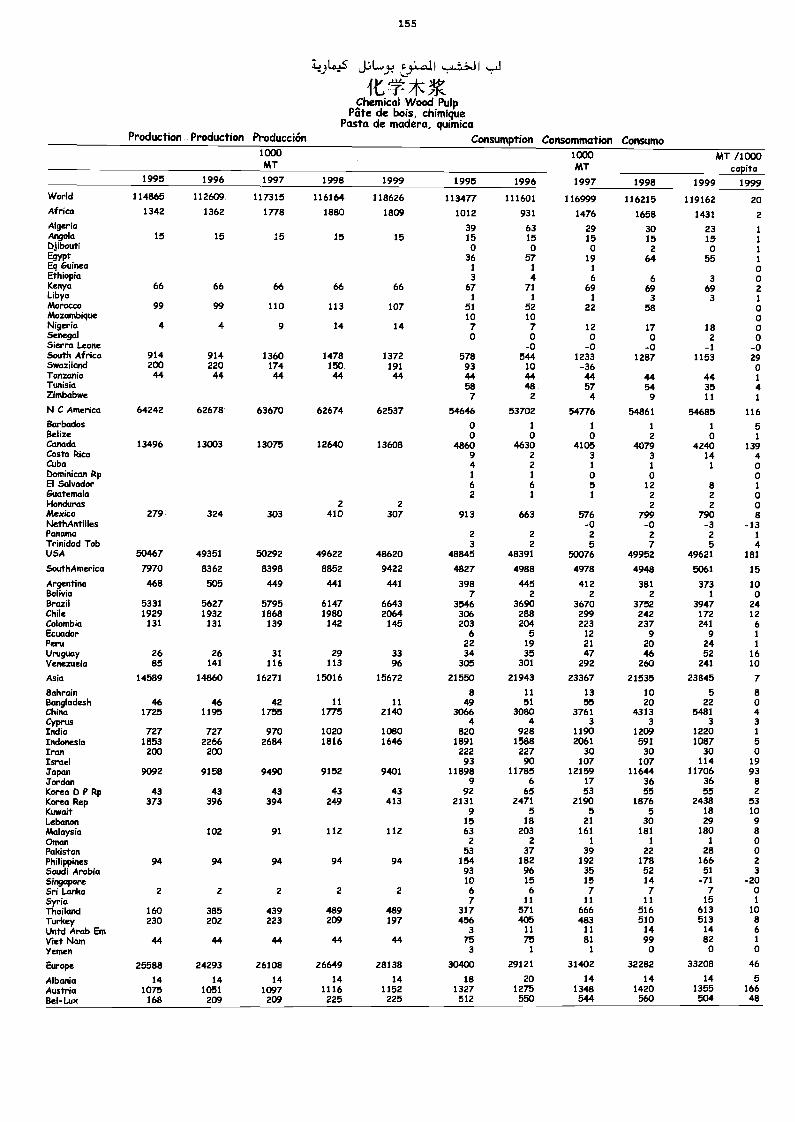
155
JLty;-..ai
Production Production Producción
Chemical Wood PulpPate de bois, chimique
Pasta de madera, quimicaConsumption Consommation Consumo
1000MT
1000MT
MT /1000capita
1995 1996 1997 1998 1999 1995 1996 1997 1998 1999 1999World 114865 112609 117315 116164 118626 113477 111601 116999 116215 119162 20Africa 1342 1362 1778 1880 1809 1012 931 1476 1658 1431 2Algeria 39 63 29 30 23 1Angola 15 15 15 15 15 15 15 15 15 15 /Djibouti 0 o 0 2 0 1Egypt 36 57 19 64 55 1Eq Guinea 1 1 1 oEthiopia 3 4 6 6 3 0Kenya 66 66 66 66 66 67 71 69 69 69 2Libya 1 1 1 3 3 1Morocco 99 99 110 113 107 51 52 22 58 0Mozambique 10 10 0NigeriaSenegalSierra Leone
4 4 9 14 14 7o
7o
-o
12o
-o
170
-o
182
-1
0o
-oSouth Africa 914 914 1360 1478 1372 578 544 1233 1287 1153 29Swaziland 200 220 174 150 191 93 10 -36 oTanzania 44 44 44 44 44 44 44 44 44 44 1Tunisia 58 48 57 54 35 4Zimbabwe 7 2 4 9 11 1
N C America 64242 62678 63670 62674 62537 54646 53702 54776 54861 54685 116Barbados 0 I 1 1 1 5Belize o o o 2 0 1Canada 13496 13003 13075 12640 13608 4860 4630 4105 4079 4240 139Costa Rica 9 2 3 3 14 4Cuba 4 2 1 1 1 oDominican Rp 1 1 o o oEl Salvador 6 6 5 12 8 1Guatemala 2 1 1 2 2 0Honduras 2 2 2 2 0Mexico 279 324 303 410 307 913 663 576 799 790 8NethAntilles -0 -0 -3 -13Pancuna 2 2 2 2 2 1
Trinidad Tob 3 2 5 7 5 4USA 50467 49351 50292 49622 48620 48845 48391 50076 49952 49621 181
ScuthAmerica 7970 8362 8398 8852 9422 4827 4988 4978 4948 5061 15
Argentina 468 505 449 441 441 398 445 412 381 373 10Bolivia 7 2 2 2 1 oBrazil 5331 5627 5795 6147 6643 3546 3690 3670 3752 3947 24Chile 1929 1932 1868 1980 2064 306 288 299 242 172 12Colombia 131 131 139 142 145 203 204 223 237 241 6Ecuador 6 5 12 9 9 1
Peru 22 19 21 20 24 1
Uruguay 26 26 31 29 33 34 35 47 46 52 16Venezuela 85 141 116 113 96 305 301 292 260 241 10
Asia 14589 14860 16271 15016 15672 21550 21943 23367 21535 23845 7
Bahrain 8 11 13 10 5 8Bangladesh 46 46 42 11 11 49 51 55 20 22 oChina 1725 1195 1755 1775 2140 3066 3080 3761 4313 5481 4Cyprus 4 4 3 3 3 3India 727 727 970 1020 1080 820 928 1190 1209 1220 1
Indonesia 1853 2266 2684 1816 1646 1891 1588 2061 591 1087 5Iran 200 200 222 227 30 30 30 0Israel 93 90 107 107 114 19Japan 9092 9158 9490 9152 9401 11898 11785 12159 11644 11706 93Jordan 9 6 17 36 36 8Korea D P Rp 43 43 43 43 43 92 65 53 55 55 2Komi Rep 373 396 394 249 413 2131 2471 2190 1876 2438 53Kuwait 9 5 5 5 18 10Lebanon 15 18 21 30 29 9Malaysia 102 91 112 112 63 203 161 181 180 8Onicui 2 2 1 1 1 oPakistan 53 37 39 22 28 0Philippines 94 94 94 94 94 154 182 192 178 166 2Saudi Arabia 93 96 35 52 51 3Singapore 10 15 15 14 -71 -20Sri Lanka 2 2 2 2 2 6 6 7 7 7 oSyria 7 11 11 11 15 1
Thailand 160 385 439 489 489 317 571 666 516 613 10Turkey 230 202 223 209 197 456 405 483 510 513 8Untd Arab Em 3 11 11 14 14 6Viet Nam 44 44 44 44 44 75 75 81 99 82 1
Yemen 3 1 1 0 0 o
Europe 25588 24293 26108 26649 28138 30400 29121 31402 32282 33208 46
Albania 14 14 14 14 14 18 20 14 14 14 5Austria 1075 1051 1097 1116 1152 1327 1275 1348 1420 1355 166Bel-Lux 168 209 209 225 225 512 550 544 560 504 48
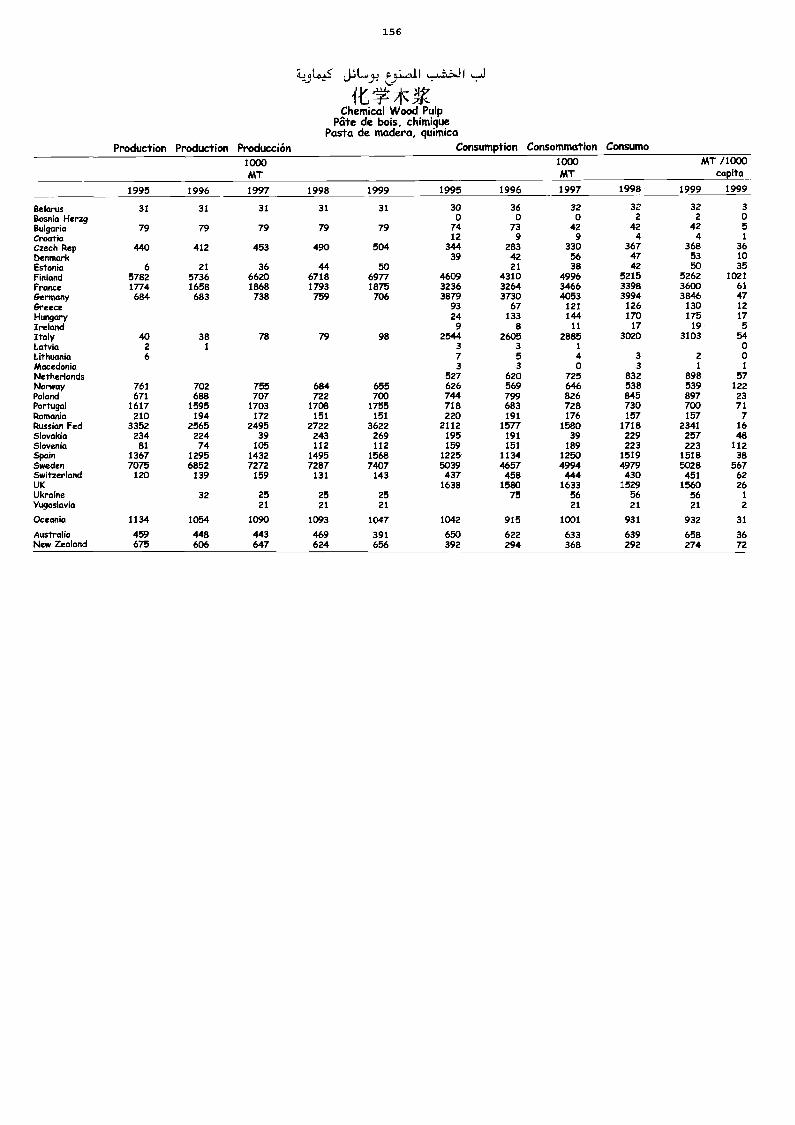
156
ty1 1-1 I ,..J
Chemical Wood PulpPate de bois, chimique
Pasta de madera, quimicaProduction Production Producción Consumption Consommation Consumo
1000MT
1000MT
MT /1000capita
1995 1996 1997 1998 1999 1995 1996 1997 1998 1999 1999
Belarus 31 31 31 31 31 30 36 32 32 32 3Bosnia Herzg 0 0 0 2 2 oBulgaria 79 79 79 79 79 74 73 42 42 42 5Croatia 12 9 9 4 4 1
Czech Rep 440 412 453 490 504 344 283 330 367 368 36Denmark 39 42 56 47 53 10Estonia 6 21 36 44 50 21 38 42 50 35Finland 5782 5736 6620 6718 6977 4609 4310 4996 5215 5262 1021France 1774 1658 1868 1793 1875 3236 3264 3466 3398 3600 61Germany 684 683 738 759 706 3879 3730 4053 3994 3846 47Greece 93 67 12! 126 130 12Hungary 24 133 144 170 175 17Ireland 9 8 11 17 19 5Italy 40 38 78 79 98 2544 2605 2885 3020 3103 54Latvia 2 1 3 3 1 oLithuania 6 7 5 4 3 2 0Macedonia 3 3 0 3 1 1
Netherlands 527 620 725 832 898 57Norway 761 702 755 684 655 626 569 646 538 539 122Poland 671 688 707 722 700 744 799 826 845 897 23Portugal 1617 1595 1703 1708 1755 718 683 728 730 700 71Romania 210 194 172 151 151 220 191 176 157 157 7Russian Fed 3352 2565 2495 2722 3622 2112 1577 1580 1718 2341 16Slovakia 234 224 39 243 269 195 191 39 229 257 48Slovenia 81 74 105 112 112 159 151 189 223 223 112Spain 1367 1295 1432 1495 1568 1225 1134 1250 1519 1518 38Sweden 7075 6852 7272 7287 7407 5039 4657 4994 4979 5028 567Switzerland 120 139 159 131 143 437 458 444 430 451 62UK 1638 1580 1633 1529 1560 26Ukraine 32 25 25 25 75 56 56 56 1
Yugoslavia 21 21 21 21 21 21 2
Oceania 1134 1054 1090 1093 1047 1042 915 1001 931 932 31
Australia 459 448 443 469 391 650 622 633 639 658 36New Zealand 675 606 647 624 656 392 294 368 292 274 72
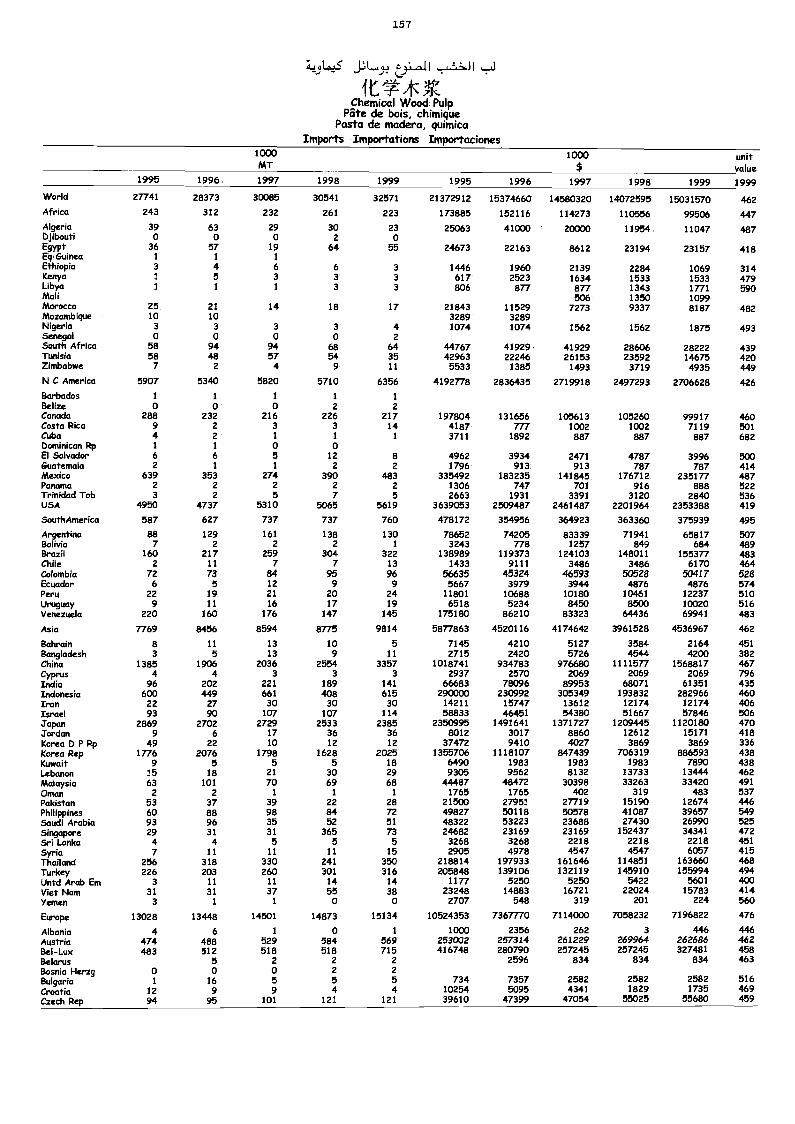
157
.1
- 1711Chemical Wood Pulp
Pate de bois, chimiquePasta de madera, quimica
Imports Importations Importaciones1000MT
1000 unitvalue
1995 1996 1997 1998 1999 1995 1996 1997 1998 1999 1999World 27741 28373 30085 30541 32571 21372912 15374660 14580320 14072595 15031570 462Africa 243 312 232 261 223 173885 152116 114273 110556 99506 447Algeria 39 63 29 30 23 25063 41000 20000 11954 11047 487Djibouti 0 0 0 2 oEgypt 36 57 19 64 55 24673 22163 8612 23194 23157 418Eq Guinea 1 1 1Ethiopia 3 4 6 6 3 1446 1960 2139 2284 1069 314Kenya 1 5 3 3 3 617 2523 1634 1533 1533 479Libya 1 1 1 3 3 806 877 877 1343 1771 590Mali 506 1350 1099Morocco 25 21 14 18 17 21843 11529 7273 9337 8187 482Mozambique 10 10 3289 3289Nigeria 3 3 3 3 4 1074 1074 1562 1562 1875 493Senegal 0 0 0 0 2South Africa 58 94 94 68 64 44767 41929 41929 28606 28222 439Tunisia 58 48 57 54 35 42963 22246 26153 23592 14675 420Zimbabwe 7 2 4 9 11 5533 1385 1493 3719 4935 449N C America 5907 5340 5820 5710 6356 4192778 2836435 2719918 2497293 2706628 426Barbados 1 1 1 1 1
Belize 0 0 0 2 2Canada 288 232 216 226 217 197804 131656 105613 105260 99917 460Costa Rica 9 2 3 3 14 4187 777 1002 1002 7119 501Cuba 4 2 1 1 1 3711 1892 887 887 887 682Dominican Rp i 1 o 0El Salvador 6 6 5 12 8 4962 3934 2471 4787 3996 500Guatemala 2 1 1 2 2 1796 913 913 787 787 414Mexico 639 353 274 390 483 335492 183235 141845 176712 235177 487Panama 2 2 2 2 2 1306 747 701 916 888 522Trinidad Tob 3 2 5 7 5 2663 1931 3391 3120 2840 536USA 4950 4737 5310 5065 5619 3639053 2509487 2461487 2201964 2353388 419
SouthAmerica 587 627 737 737 760 478172 354956 364923 363360 375939 495
Argentina 88 129 161 138 130 78652 74205 83339 71941 65817 507Bolivia 7 2 2 2 1 3243 778 1257 849 684 489Brazil 160 217 259 304 322 138989 119373 124103 148011 155377 483Chile 2 11 7 7 13 1433 9111 3486 3486 6170 464Colombia 72 73 84 95 96 56635 45324 46593 50528 50417 528Ecuador 6 5 12 9 9 5667 3979 3944 4876 4876 574Peru 22 19 21 20 24 11801 10688 10180 10461 12237 510Uruguay 9 11 16 17 19 6518 5234 8450 8500 10020 516Venezuela 220 160 176 147 145 175180 86210 83323 64436 69941 483
Asia 7769 8456 8594 8775 9814 5877863 4520116 4174642 3961528 4536967 462
Bahrain 8 11 13 10 5 7145 4210 5127 3584 2164 451BangladeshChina
31385
51906
132036
92554
113357
27151018741
2420934783
5726 544415 42001568817
382467
Cyprus 4 4 3 3 3 2937 2570 2069 2069 2069 796India 96 202 221 189 141 66683 78096 89953 68071 61351 435Indonesia 600 449 661 408 615 290000 230992 305349 193832 282966 460Iran 22 27 30 30 30 14211 15747 13612 12174 12174 406Israel 93 90 107 107 114 58833 46451 54380 51667 57846 506Japan 2869 2702 2729 2533 2385 2350995 1491641 1371727 1209445 1120180 470Jordan 9 6 17 36 36 8012 3017 8860 12612 15171 418Korea D P Rp 49 22 10 12 12 37472 9410 4027 3869 3869 336Korea Rep 1776 2076 1798 1628 2025 1355706 1118107 847439 706319 886593 438Kuwait 9 5 5 5 18 6490 1983 1983 1983 7890 438Lebanon 15 18 21 30 29 9305 9562 8132 13733 13444 462Malaysia 63 101 70 69 68 44487 48472 30398 33263 33420 491Oman 2 2 1 1 1 1765 1765 402 319 483 537Pakistan 53 37 39 22 28 21500 27951 27719 15190 12674 446Philippines 60 88 98 84 72 49827 50118 50578 41087 39657 549Saudi Arabia 93 96 35 52 51 48322 53223 23688 27430 26990 525Singapore 29 31 31 365 73 24682 23169 23169 152437 34341 472Sri Lanka 4 4 5 5 5 3268 3268 2218 2218 2218 451Syria 7 11 11 11 15 2905 4978 4547 4547 6057 415Thailand 256 318 330 241 350 218814 197933 161646 114851 163660 468Turkey 226 203 260 301 316 205848 139106 132119 145910 155994 494Untd Arab Em 3 11 11 14 14 1177 5250 5250 5422 5601 400Viet Nam 31 31 37 55 38 23248 14883 16721 22024 15783 414Yemen 3 1 1 o 0 2707 548 319 201 224 560
Europe 13028 13448 14501 14873 15134 10524353 7367770 7114000 7058232 7196822 476
Albania 4 6 1 0 1 1000 2356 262 3 446 446Austria 474 488 529 584 569 253002 257314 261229 269964 262686 462Bel-Lux 483 512 518 518 715 416748 280790 257245 257245 327481 458Belarus 5 2 2 2 2596 834 834 834 463Bosnia Herzg 0 o 0 2 2Bulgaria 1 16 5 5 5 734 7357 2582 2582 2582 516Croatia 12 9 9 4 4 10254 5095 4341 1829 1735 469Czech Rep 94 95 101 121 121 39610 47399 47054 55025 55680 459
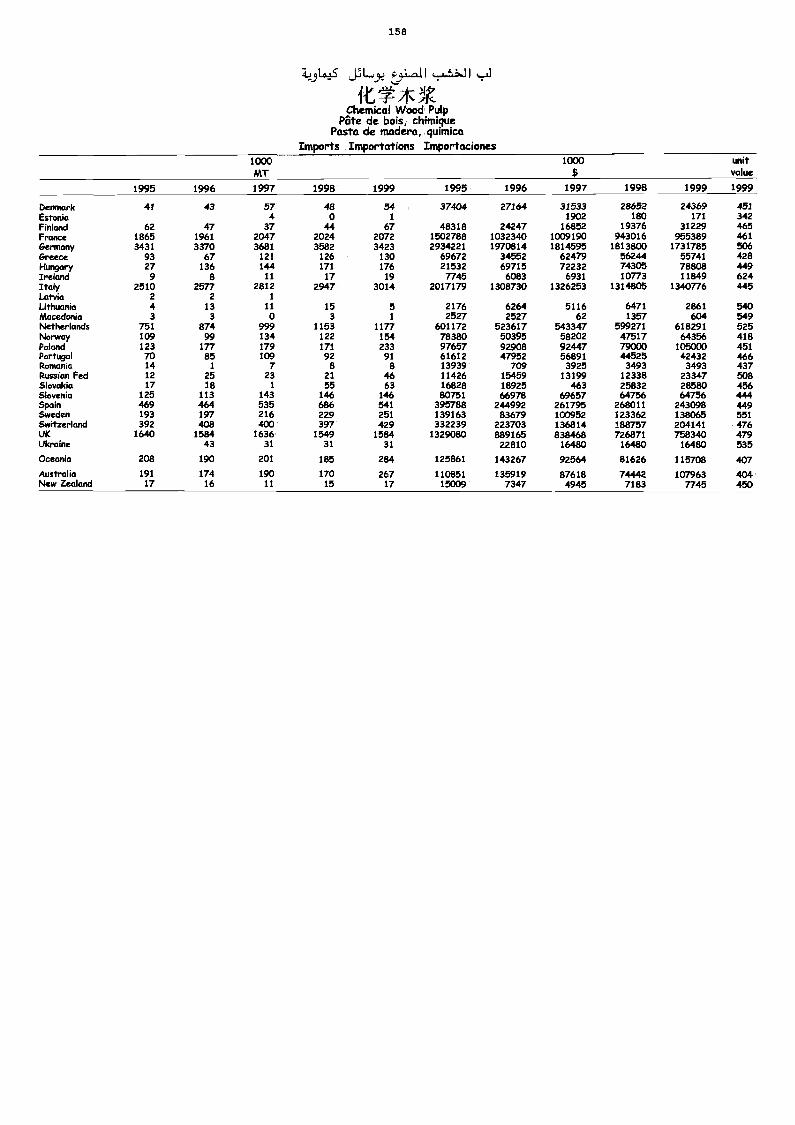
158
4.1.5 L.4y stii.al I I
Chemical Wood PulpPate de bois, chimique
Pasta de madera, químicoImports Importations Importaciones
1000MT
1000$
unitvalue
1995 1996 1997 1998 1999 1995 1996 1997 1998 1999 1999
Denmark 41 43 57 48 54 37404 27164 31533 28652 24369 451Estonia 4 0 1 1902 180 171 342Finland 62 47 37 44 67 48318 24247 16852 19376 31229 465France 1865 1961 2047 2024 2072 1502788 1032340 1009190 943016 955389 461Germany 3431 3370 3681 3582 3423 2934221 1970814 1814595 1813800 1731785 506Greece 93 67 121 126 130 69672 34552 62479 56244 55741 428Hungary 27 136 144 171 176 21532 69715 72232 74305 78808 449Ireland 9 8 11 17 19 7745 6083 6931 10773 11849 624Italy 2510 2577 2812 2947 3014 2017179 1308730 1326253 1314805 1340776 445Latvia 2 2 1
Lithuania 4 13 11 15 5 2176 6264 5116 6471 2861 540Macedonia 3 3 o 3 1 2527 2527 62 1357 604 549Netherlands 751 874 999 1153 1177 601172 523617 543347 599271 618291 525Norway 109 99 134 122 154 78380 50395 58202 47517 64356 418Poland 123 177 179 171 233 97657 92908 92447 79000 105000 451Portugal 70 85 109 92 91 61612 47952 56891 44525 42432 466Romania 14 1 7 8 8 13939 709 3925 3493 3493 437Russian Fed 12 25 23 21 46 11426 15459 13199 12338 23347 508Slovakia 17 18 1 55 63 16828 18925 463 25832 28580 456Slovenia 125 113 143 146 146 80751 66978 69657 64756 64756 444Spain 469 464 535 686 541 395788 244992 261795 268011 243098 449Sweden 193 197 216 229 251 139163 83679 100952 123362 138065 551Switzerland 392 408 400 397 429 332239 223703 136814 188757 204141 476UK 1640 1584 1636 1549 1584 1329080 889165 838468 726871 758340 479Ulcraine 43 31 31 31 22810 16480 16480 16480 535Oceania 208 190 201 185 284 125861 143267 92564 81626 115708 407Australia 191 174 190 170 267 110851 135919 87618 74442 107963 404New Zealand 17 16 11 15 17 15009 7347 4945 7183 7745 450
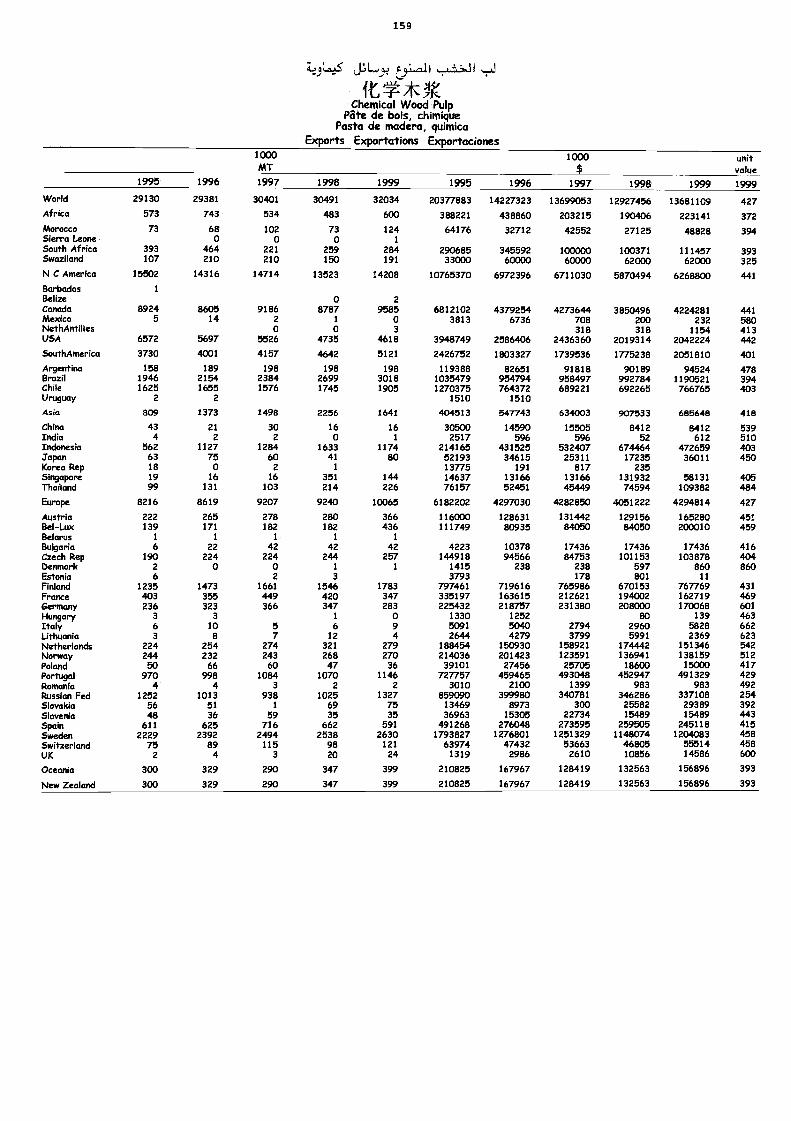
15 9
14314.2.5 SLy 1
it *Chemical Wood Pulp
Pate de bois, chimiquePasta de madera, quimica
Exports Exportations Exportaciones1000MT
1000$
unitvalue
1995 1996 1997 1998 1999 1995 1996 1997 1998 1999 1999World 29130 29381 30401 30491 32034 20377883 14227323 13699053 12927456 13681109 427Africa 573 743 534 483 600 388221 438860 203215 190406 223141 372Morocco 73 68 102 73 124 64176 32712 42552 27125 48828 394Sierra Leone o o o 1
South Africa 393 464 221 259 284 290685 345592 100000 100371 111457 393Swaziland 107 210 210 150 191 33000 60000 60000 62000 62000 325N C America 15502 14316 14714 13523 14208 10765370 6972396 6711030 5870494 6268800 441
Barbados 1
Belize 0 2Canada 8924 8605 9186 8787 9585 6812102 4379254 4273644 3850496 4224281 441Mexico 5 14 2 1 0 3813 6736 708 200 232 580NethAntilles 0 o 3 318 318 1154 413115A 6572 5697 5526 4735 4618 3948749 2586406 2436360 2019314 2042224 442
SouthAmerica 3730 4001 4157 4642 5121 2426752 1803327 1739536 1775238 2051810 401
Argentina 158 189 198 198 198 119388 82651 91818 90189 94524 478Brazil 1946 2154 2384 2699 3018 1035479 954794 958497 992784 1190521 394Chile 1625 1655 1576 1745 1905 1270375 764372 689221 692265 766765 403Uruguay 2 2 1510 1510
Asia 809 1373 1498 2256 1641 404513 547743 634003 907533 685648 418
China 43 21 30 16 16 30500 14590 15505 8412 8412 539India 4 2 2 0 1 2517 596 596 52 612 510Indonesia 562 1127 1284 1633 1174 214165 431525 532407 674464 472659 403Japan 63 75 60 41 80 52193 34615 25311 17235 36011 450Korea Rep 18 0 2 1 13775 191 817 235Singapore 19 16 16 351 144 14637 13166 13166 131932 58131 405Thailand 99 131 103 214 226 76157 52451 45449 74594 109382 484
Europe 8216 8619 9207 9240 10065 6182202 4297030 4282850 4051222 4294814 427
Austria 222 265 278 280 366 116000 128631 131442 129156 165280 451Bel-Lux 139 171 182 182 436 111749 80935 84050 84050 200010 459Belarus 1 1 1 1 1
Bulgaria 6 22 42 42 42 4223 10378 17436 17436 17436 416Czech Rep 190 224 224 244 257 144918 94566 84753 101153 103878 404Denmark 2 0 0 1 1 1415 238 238 597 860 860Estonia 6 2 3 3793 178 801 11Finland 1235 1473 1661 1546 1783 797461 719616 765986 670153 767769 431France 403 355 449 420 347 335197 163615 212621 194002 162719 469Germany 236 323 366 347 283 225432 218757 231380 208000 170068 60114ungary 3 3 1 0 1330 1252 80 139 463Italy 6 10 5 6 9 5091 5040 2794 2960 5828 662Lithuania 3 8 7 12 4 2644 4279 3799 5991 2369 623Netherlands 224 254 274 321 279 188454 150930 158921 174442 151346 542Norway 244 232 243 268 270 214036 201423 123591 136941 138159 512Poland 50 66 60 47 36 39101 27456 25705 18600 15000 417Portugal 970 998 1084 1070 1146 727757 459465 493048 452947 491329 429Romania 4 4 3 2 2 3010 2100 1399 983 983 492Russian Fed 1252 1013 938 1025 1327 859090 399980 340781 346286 337108 254Slovakia 56 51 1 69 75 13469 8973 300 25582 29389 392Slcotenia 48 36 59 35 35 36963 15305 22734 15489 15489 443Spain 611 625 716 662 591 491268 276048 273595 259505 245118 415Sweden 2229 2392 2494 2538 2630 1793827 1276801 1251329 1148074 1204083 458Switzerland 75 89 115 98 121 63974 47432 53663 46805 55514 458UK 2 4 3 20 24 1319 2986 2610 10856 14586 600
Oceania 300 329 290 347 399 210825 167967 128419 132563 156896 393
New Zealand 300 329 290 347 399 210825 167967 128419 132563 156896 393
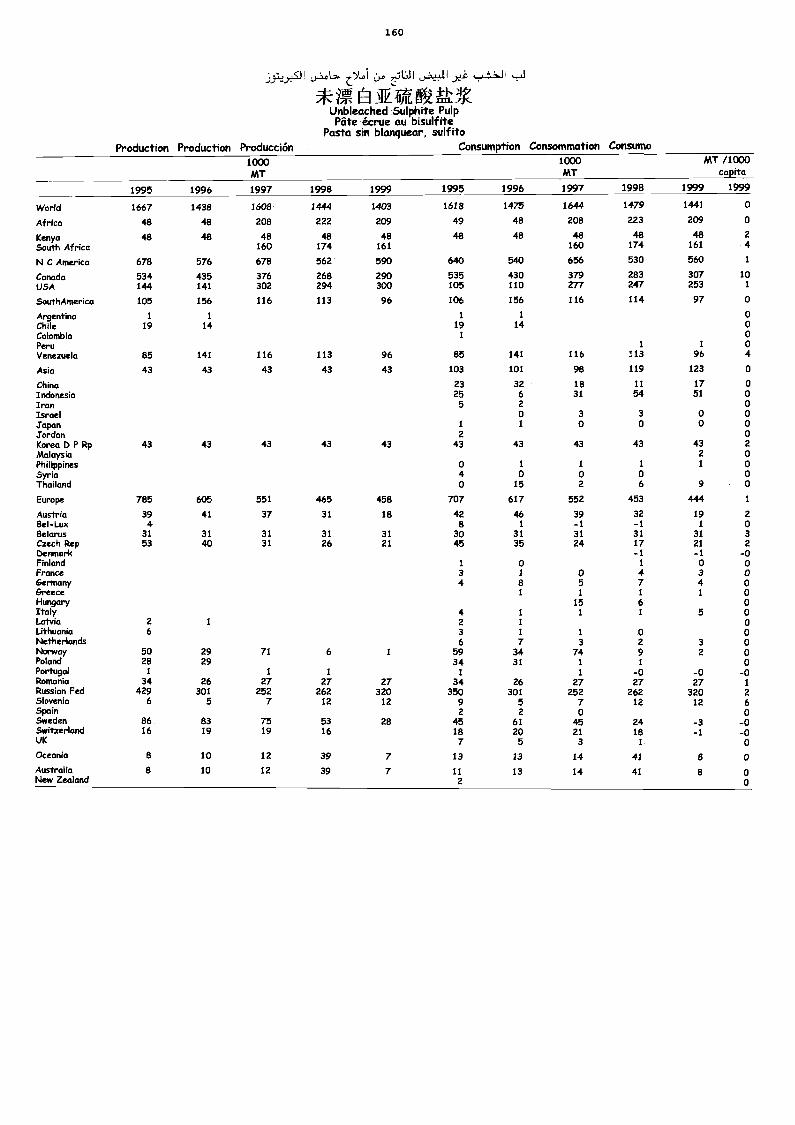
160
Production Production Producción
Unbleached Sulphite PulpPate écrue au bisulfite
Pasta sin blanquear, sulfitoConsumption Consommation Consumo
1000MT
1000MT
MT /1000capita
1995 1996 1997 1998 1999 1995 1996 1997 1998 1999 1999
World 1667 1438 1608 1444 1403 1618 1475 1644 1479 1441 o
Africa 48 48 208 222 209 49 48 208 223 209 o
Kenya 48 48 48 48 48 48 48 48 48 48 2
South Africa 160 174 161 160 174 161 4
N C America 678 576 678 562 590 640 540 656 530 560 1
Canada 534 435 376 268 290 535 430 379 283 307 10USA 144 141 302 294 300 105 110 277 247 253 1
SouthAmer ica 105 156 116 113 96 106 156 116 114 97 o
Argentina 1 1 1 1 oChileColombiaPeru
19 14 191
14
1 1
oo
Venezuela 85 141 116 113 96 85 141 116 113 96 4
Asia 43 43 43 43 43 103 101 98 119 123 o
China 23 32 18 11 17Indonesia 25 6 31 54 51IranIsraelJapan
5
1
2
o1
3o
3o
oo
Jordan 2Korea DP Rp 43 43 43 43 43 43 43 43 43 43Malaysia 2
PhilippinesSyria
04
1
o1
01
o1
Thailand 0 15 2 6 9
Europe 785 605 551 465 458 707 617 552 453 444
Austria 39 41 37 31 18 42 46 39 32 19Bel-Lux 4 a 1 -1 -1 1
Belarus 31 31 31 31 31 30 31 31 31 31Czech Rep 53 40 31 26 21 45 35 24 17 21DenmarkFinland 1 o
-.1
1
-1.o
France 3 1 0 4 3Germany 4 8 5 7 4Greece 1 1 1 1
Hungary 15 6Italy 4 1 1 1 5Latvia 2 1 2 1
Lithuania 6 3 1 1 oNetherlands 6 7 3 2 3Norway 50 29 71 6 1 59 34 74 9 2Poland 28 29 34 31 1 1Portugal 1 1 1 / 1 -o -o -Romania 34 26 27 27 27 34 26 27 27 27 1
Russian Fed 429 301 252 262 320 350 301 252 262 320 2Slovenia 6 5 7 12 12 9 5 7 12 12 6Spain 2 2 0 oSweden 86 83 75 53 28 45 61 45 24 -3 -0Switzerland 16 19 19 16 18 20 21 18 -1 -0UK 7 5 3 1 o
Oceania a 10 12 39 7 13 13 14 41 a 0Australia 8 10 12 39 7 11 13 14 41 8 oNew Zealand 2 0
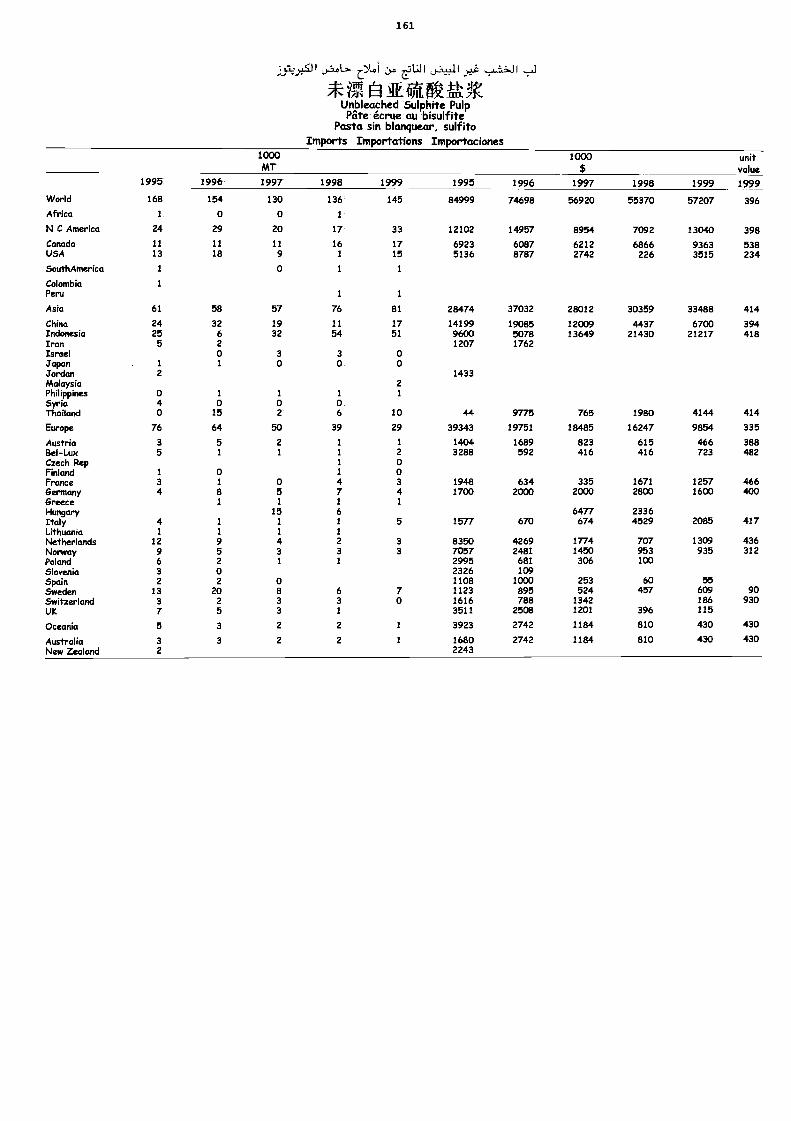
1 61
et:JI il
it! fititUnbleached Sulphite PulpPate écrue au bisulfite
Pasta sin blanquear, sulfitoImports Importations Importaciones
1000MT
1000$
unitvalue
1995 1996 1997 1998 1999 1995 1996 1997 1998 1999 1999
World 168 154 130 136 145 84999 74698 56920 55370 57207 396Africa 1 o o 1
N C America 24 29 20 17 33 12102 14957 8954 7092 13040 398
Canada 11 11 II 16 17 6923 6087 6212 6866 9363 538USA 13 18 9 1 15 5136 8787 2742 226 3515 234
SouthAmerica I 0 1 1
Colombia 1
Peru 1 i
Asia 61 58 57 76 81 28474 37032 28012 30359 33488 414
China 24 32 19 11 17 14199 19085 12009 4437 6700 394Indonesia 25 6 32 54 51 9600 5078 13649 21430 21217 418Iran 5 2 1207 1762Israel 0 3 3 oJapan 1 I 0 o oJordan 2 1433Malaysia 2Philippines 0 1 1 1 1
Syria 4 o o oThailand o 15 2 6 10 44 9775 765 1980 4144 414
Europe 76 64 50 39 29 39343 19751 18485 16247 9854 335
Austria 3 5 2 1 1 1404 1689 823 615 466 388Bel-Lux 5 1 1 1 2 3288 592 416 416 723 482Czech Rep 1 0Finland 1 o 1 0France 3 1 0 4 3 1948 634 335 1671 1257 466Germany 4 8 5 7 4 1700 2000 2000 2800 1600 400Greece 1 1 i 1
Hungary 15 6 6477 2336Italy 4 1 1 1 5 1577 670 674 4529 2085 417Lithuania 1 1 1 1
Netherlands 12 9 4 2 3 8350 4269 1774 707 1309 436Norway 9 5 3 3 3 7057 2481 1450 953 935 312Poland 6 2 1 1 2995 681 306 100Slovenia 3 0 2326 109Spain 2 2 0 1108 1000 253 60 55Sweden 13 20 8 6 7 1123 895 524 457 609 90Switzerland 3 2 3 3 0 1616 788 1342 186 930UK 7 5 3 1 3511 2508 1201 396 115
Oceania 5 3 2 2 1 3923 2742 1184 810 430 430
Australia 3 3 2 2 i 1680 2742 1184 810 430 430New Zealand 2 2243
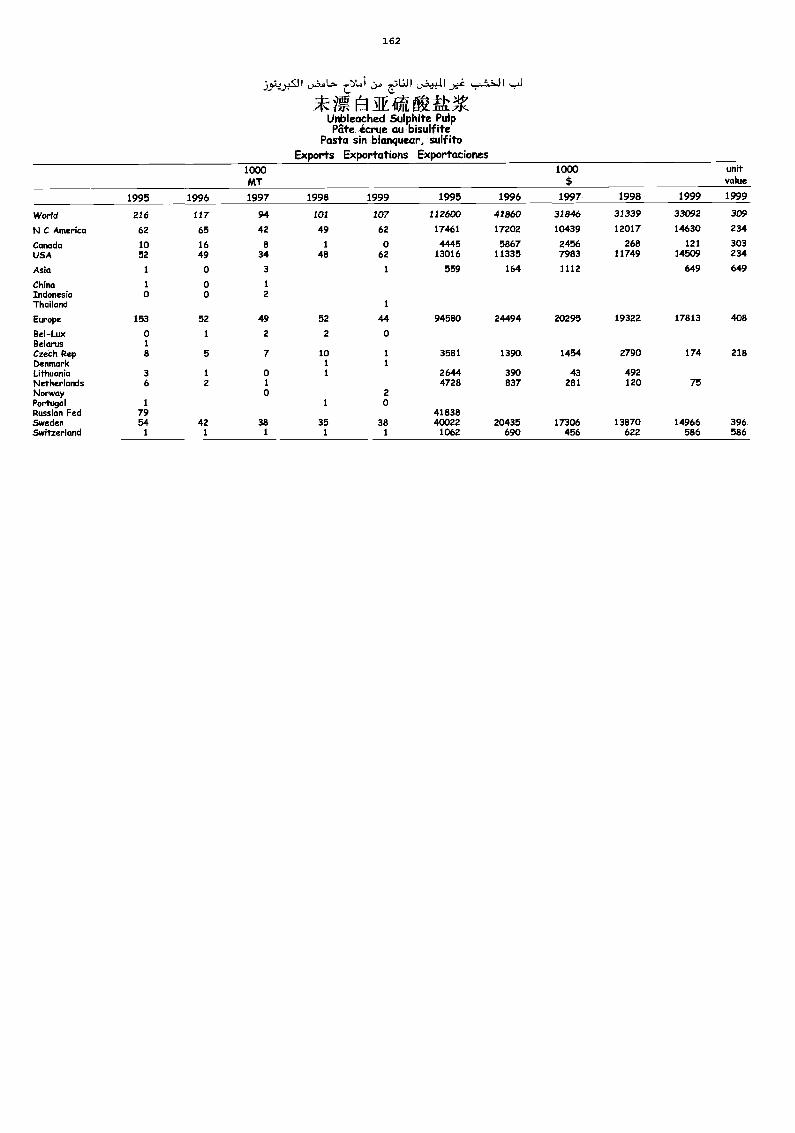
162
eun
Unbleached Sulphite PuipPate icrue au bisulfite
Pasta sin blanquear, sulfitoExports Exportations Exportaciones
1000MT
1000$
unitvalue
1995 1996 1997 1998 1999 1995 1996 1997 1998 1999 1999
World 216 117 94 101 107 112600 41860 31846 31339 33092 309
N C America 62 65 42 49 62 17461 17202 10439 12017 14630 234
Canada 10 16 8 1 0 4445 5867 2456 268 121 303USA 52 49 34 48 62 13016 11335 7983 11749 14509 234
Asia 1 o 3 1 559 164 1112 649 649
China 1 0 1
Indonesia 0 0 2Thailand 1
Europe 153 52 49 52 44 94580 24494 20295 19322 17813 408
Bel-Lux o 1 2 2 0Belarus 1
Czech Rep 8 5 7 10 i 3581 1390 1454 2790 174 218Denmark 1 1
Lithuania 3 1 0 1 2644 390 43 492Netherlands 6 2 1 4728 837 281 120 75Norway o 2Portugal 1 1 0Russian Fed 79 41838Sweden 54 42 38 35 38 40022 20435 17306 13870 14966 396Switzerland 1 1 1 1 1 1062 690 456 622 586 586
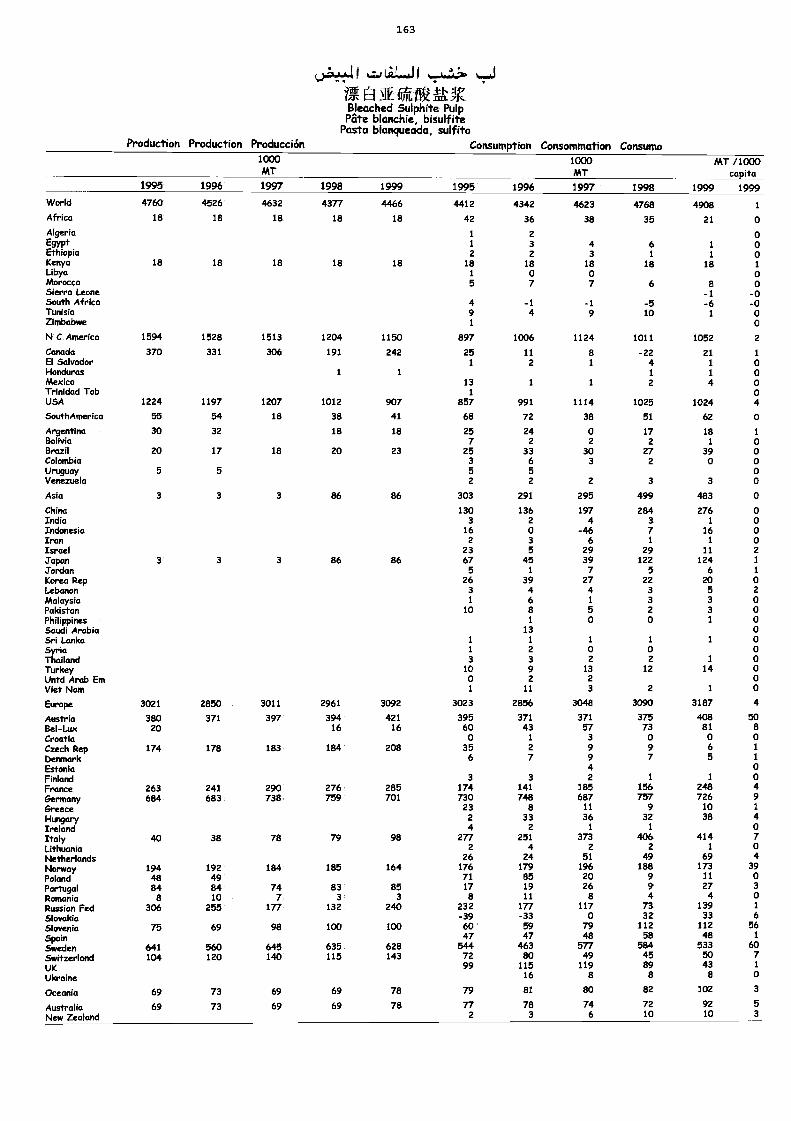
1 63
t.)::%044 1 6;./ ItilLwkil kttr6:br?. vt...J
7?Y, [IA .51. Ok :Us_ ;!.g_Bleached Sulphite PulpPate blanchie, bisulfite
Pasta blanqueada, sulfitoProduction Production Producción Consumption Consommation Consumo
1000MT
1000MT
MT /1000capita
1995 1996 1997 1998 1999 1995 1996 1997 1998 1999 1999
World 4760 4526 4632 4377 4466 4412 4342 4623 4768 4908 1
Africa 18 18 18 18 18 42 36 38 35 21 0Algeria 1 2 oEgypt 1 3 4 6 1 0Ethiopia 2 2 3 1 1 oKenya 18 18 18 18 18 18 18 18 18 18 1
Libya 1 0 0 0Morocco 5 7 7 6 8 oSierra Leone -1 -0South Africa 4 -1 -1 -5 -6 -0Tunisia 9 4 9 10 1 0Zimbabwe 1 o
N C America 1594 1528 1513 1204 1150 897 1006 1124 1011 1052 2
Canada 370 331 306 191 242 25 11 8 -22 21 iEl Salvador 1 2 1 4 1 0Honduras 1 1 1 1 0Mexico 13 1 1 2 4 0Trinidad Tob 1 0USA 1224 1197 1207 1012 907 857 991 1114 1025 1024 4
SouthAmerica 55 54 18 38 41 68 72 38 51 62 o
Argentina 30 32 18 18 25 24 o 17 18 1Bolivia 7 2 2 2 1 0Brazil 20 17 18 20 23 25 33 30 27 39 0Colombia 3 6 3 2 o oUruguay 5 5 5 5 0Venezuela 2 2 2 3 3 0
Asia 3 3 3 86 86 303 291 295 499 483 0
China 130 136 197 284 276 0India 3 2 4 3 1 oIndonesia 16 0 -46 7 16 o/ran 2 3 6 1 1 oIsrael 23 5 29 29 11 2japan 3 3 3 86 86 67 45 39 122 124 1
Jordan 5 1 7 5 6 1
Korea Rep 26 39 27 22 20 0Lebanon 3 4 4 3 5 2Malaysia 1 6 i 3 3 oPakistan 10 8 5 2 3 oPhilippines 1 0 0 1 0Saudi Arabia 13 0Sri Lanka 1 1 1 1 1 oSyria 1 2 0 o 0Thailand 3 3 2 2 1 oTurkey 10 9 13 12 14 oUntd Arab Em 0 2 2 oViet Nam 1 11 3 2 1 o
Etrope 3021 2850 3011 2961 3092 3023 2856 3048 3090 3187 4
Austria 380 371 397 394 421 395 371 371 375 408 50Bel-Lux 20 16 16 60 43 57 73 81 8Croatia 0 1 3 0 o 0Czech Rep 174 178 183 184 208 35 2 9 9 6 1
Denmark 6 7 9 7 5 1
Estonia 4 0Finland 3 3 2 1 1 0France 263 241 290 276 285 174 141 185 156 248 4Germany 684 683 738 759 701 730 748 687 757 726 9Greece 23 8 11 9 10 1
Hungary 2 33 36 32 38 4Ireland 4 2 1 1 0Italy 40 38 78 79 98 277 251 373 406 414 7Lithuania 2 4 2 2 1 0Netherlands 26 24 51 49 69 4Norway 194 192 184 185 164 176 179 196 188 173 39Poland 48 49 71 85 20 9 11 0Portugal 84 84 74 83 85 17 19 26 9 27 3
Romania 8 10 7 3 3 8 11 8 4 4 0Russian Fed 306 255 177 132 240 232 177 117 73 139 1
Slovakia -39 -33 0 32 33 6
Slovenia 75 69 98 100 100 60 59 79 112 112 56
Spain 47 47 46 58 48 1
Sweden 641 560 645 635 628 544 463 577 584 533 60
Switzerland 104 120 140 115 143 72 80 49 45 50 7UK 99 115 119 89 43 1
Ukraine 16 8 8 8 0
Oceania 69 73 69 69 78 79 81 80 82 102 3
Australia 69 73 69 69 78 77 78 74 72 92 5
New Zealand 2 3 6 10 10 3
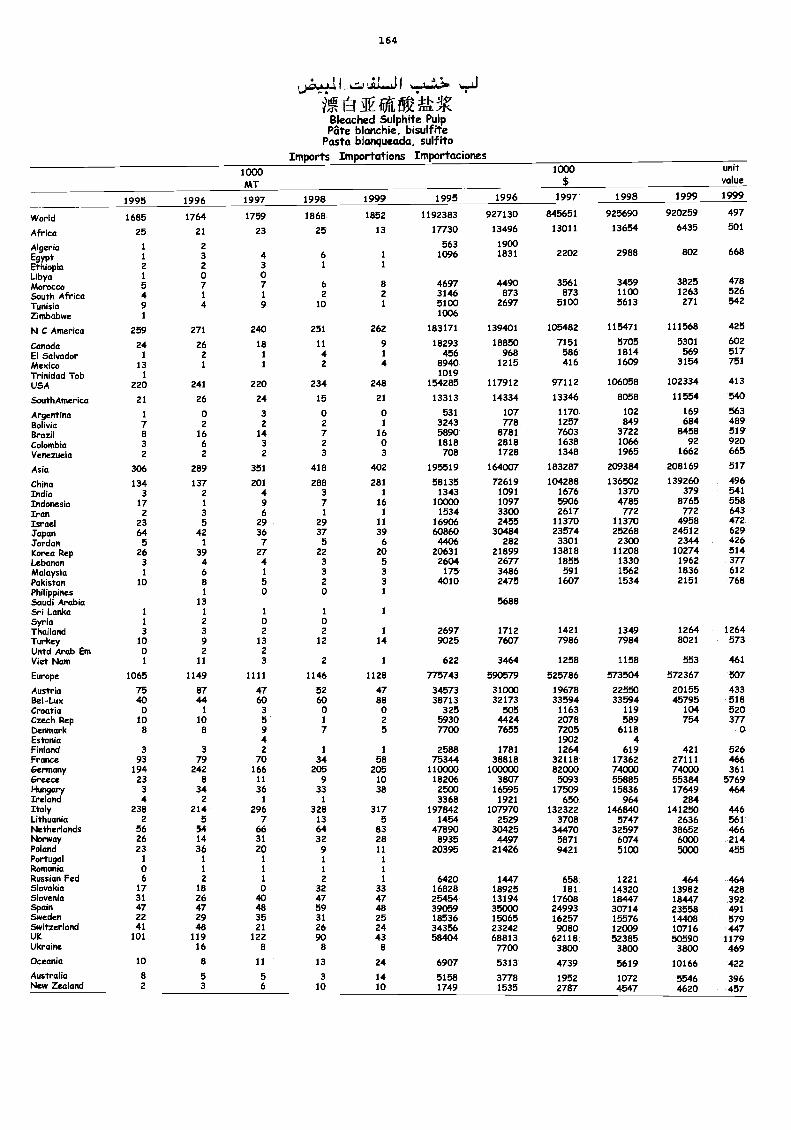
1 64
L)....,-,...11 ,,:..= jti...k.11 .....1.:. '....10 .....4.1..
Bleached Sulphite PuipPate blanchie, bisulfite
Posta blanqueada, sulfitoImports Importations Importaciones
1000MT
1000$
unitvalue
1995 1996 1997 1998 1999 1995 1996 1997 1998 1999 1999
World 1685 1764 1759 1868 1852 1192383 927130 845651 925690 920259 497
Africa 25 21 23 25 13 17730 13496 13011 13654 6435 501
Algeria 1 2 563 1900
Egypt 1 3 4 6 1 1096 1831 2202 2988 802 668
Ethiopia 2 2 3 1 1
Libya 1 0 oMorocco 5 7 7 6 8 4697 4490 3561 3459 3825 478
South Africa 4 1 1 2 2 3146 873 873 1100 1263 526
Tunisia 9 4 9 10 1 5100 2697 5100 5613 271 542
Zimbabwe 1 1006
N C America 259 271 240 251 262 183171 139401 105482 115471 111568 425
Canada 24 26 18 11 9 18293 18850 7151 5705 5301 602
El Salvador 1 2 1 4 1 456 968 586 1814 569 517
Mexico 13 1 1 2 4 8940 1215 416 1609 3154 751
Trinidad Tob 1 1019USA 220 241 220 234 248 154285 117912 97112 106058 102334 413
SouthAtnerica 21 26 24 15 21 13313 14334 13346 8058 11554 540
Argentina 1 0 3 o 0 531 107 1170 102 169 563
Bolivia 7 2 2 2 1 3243 778 1257 849 684 489
Brazil 8 16 14 7 16 5890 8781 7603 3722 8458 519
Colombia 3 6 3 2 o 1818 2818 1638 1066 92 920
Venezuela 2 2 2 3 3 708 1728 1348 1965 1662 665
Asia 306 289 351 418 402 195519 164007 183287 209384 208169 517
China 134 137 201 288 281 58135 72619 104288 136502 139260 496India 3 2 4 3 1 1343 1091 1676 1370 379 541
Indonesia 17 1 9 7 16 10000 1097 5906 4785 8765 558Iran 2 3 6 1 1 1534 3300 2617 772 772 643
Israel 23 5 29 29 11 16906 2455 11370 11370 4958 472Japan 64 42 36 37 39 60860 30484 23574 25268 24512 629Jordan 5 1 7 5 6 4406 282 3301 2300 2344 426Korea Rep 26 39 27 22 20 20631 21899 13818 11208 10274 514Lebanon 3 4 4 3 5 2604 2677 1855 1330 1962 377Malaysia 1 6 1 3 3 175 3486 591 1562 1836 612Pakistan 10 8 5 2 3 4010 2475 1607 1534 2151 768Philippines 1 o o 1
Saudi Arabia 13 5688Sri Lanka 1 1 1 1 1
Syria 1 2 o oThailand 3 3 2 2 1 2697 1712 1421 1349 1264 1264Turkey 10 9 13 12 14 9025 7607 7986 7984 8021 573Untd Arab Em o 2 2Viet Nam 1 11 3 2 1 622 3464 1258 1158 553 461
Europe 1065 1149 1111 1146 1128 775743 590579 525786 573504 572367 507
Austria 75 87 47 52 47 34573 31000 19678 22550 20155 433Bel-Lux 40 44 60 60 88 38713 32173 33594 33594 45795 518Croatia 0 I 3 0 0 325 505 1163 119 104 520Czech Rep 10 10 5 1 2 5930 4424 2078 589 754 377Denmark 8 8 9 7 5 7700 7655 7205 6118 oEstonia 4 1902 4Finland 3 3 2 1 1 2588 1781 1264 619 421 526France 93 79 70 34 58 75344 38818 32118 17362 27111 466Germany 194 242 166 205 205 110000 100000 82000 74000 74000 361Greece 23 8 11 9 10 18206 3807 5093 55885 55384 5769Htin9GrY 3 34 36 33 38 2500 16595 17509 15836 17649 464Ireland 4 2 1 1 3368 1921 650 964 284Italy 238 214 296 328 317 197842 107970 132322 146840 141250 446Lithuania 2 5 7 13 5 1454 2529 3708 5747 2636 561Netherlands 56 54 66 64 83 47890 30425 34470 32597 38652 466Norway 26 14 31 32 28 8935 4497 5871 6074 6000 214Poland 23 36 20 9 11 20395 21426 9421 5100 5000 455Portugal 1 1 1 1 1
Romania 0 1 1 1 1
Russian Fed 6 2 1 2 1 6420 1447 658 1221 464 464Slovakia 17 18 0 32 33 16828 18925 181 14320 13982 428Slovenia 31 26 40 47 47 25454 13194 17608 18447 18447 392Spain 47 47 48 59 48 39059 35000 24993 30714 23558 491Sweden 22 29 35 31 25 18536 15065 16257 15576 14408 579Switzerland 41 48 21 26 24 34356 23242 9080 12009 10716 447UK 101 119 122 90 43 58404 68813 62118 52385 50590 1179Ukraine 16 8 8 8 7700 3800 3800 3800 469Oceania 10 8 11 13 24 6907 5313 4739 5619 10166 422Australia 8 5 5 3 14 5158 3778 1952 1072 5546 396New Zealand 2 3 6 10 10 1749 1535 2787 4547 4620 467
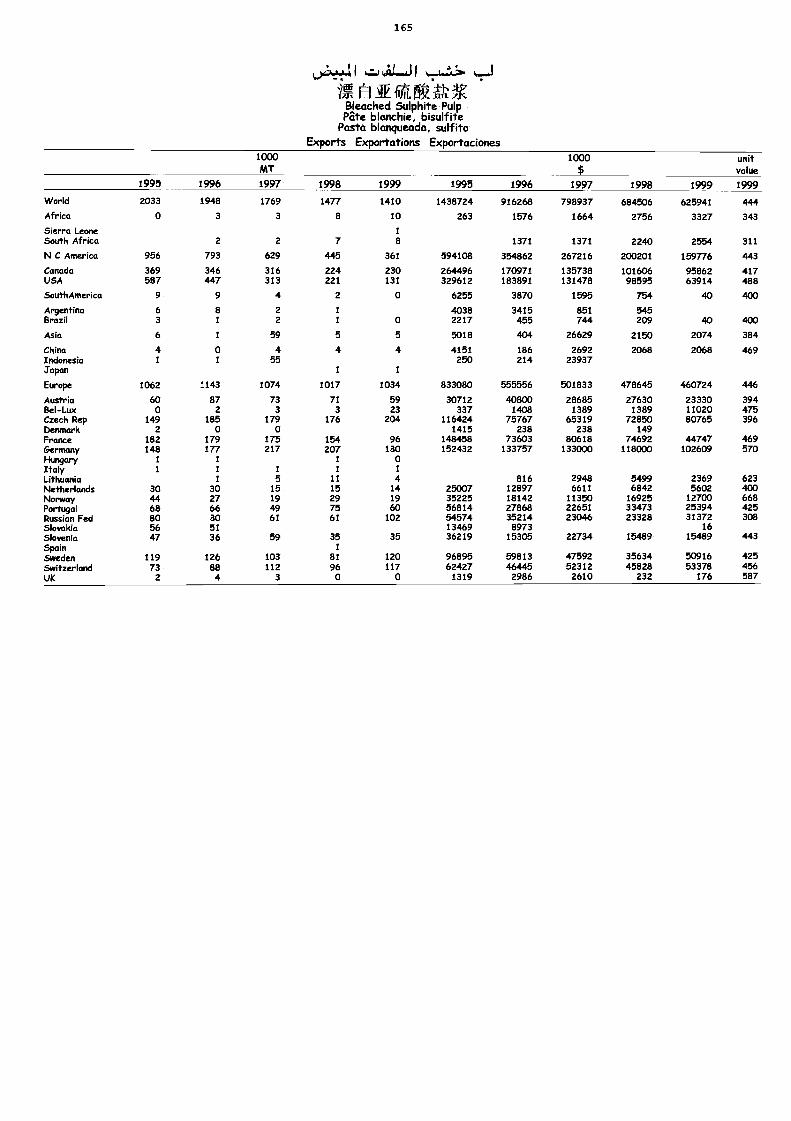
1 65
hza
igniWARVilgBleached Sulphite PulpPate blanchie, bisulfite
Pasta blanqueada, sulfitoExports Exportations Exportaciones
1000MT
1000$
unitvalue
1995 1996 1997 1998 1999 1995 1996 1997 1998 1999 1999
World 2033 1948 1769 1477 1410 1438724 916268 798937 684506 625941 444Africa 0 3 3 8 10 263 1576 1664 2756 3327 343
Sierra Leone 1
South Africa 2 2 7 8 1371 1371 2240 2554 311
N C America 956 793 629 445 361 594108 354862 267216 200201 159776 443
Canada 369 346 316 224 230 264496 170971 135738 101606 95862 417USA 587 447 313 221 131 329612 183891 131478 98595 63914 488
SouthAmerica 9 9 4 2 0 6255 3870 1595 754 40 400
Argentina 6 8 2 1 4038 3415 851 545Brazil 3 1 2 1 0 2217 455 744 209 40 400
Asia 6 1 59 5 5 5018 404 26629 2150 2074 384
China 4 0 4 4 4 4151 186 2692 2068 2068 469Indonesia 1 1 55 250 214 23937Japan 1 1
Europe 1062 1143 1074 1017 1034 833080 555556 501833 478645 460724 446
Austria 60 87 73 71 59 30712 40800 28685 27630 23330 394Bel-Lux 0 2 3 3 23 337 1408 1389 1389 11020 475Czech Rep 149 185 179 176 204 116424 75767 65319 72850 80765 396Denmark 2 0 0 1415 238 238 149France 182 179 175 154 96 148458 73603 80618 74692 44747 469Germany 148 177 217 207 180 152432 133757 133000 118000 102609 570Hungary 1 1 1 0Italy 1 1 1 1 1
Lithuania 1 5 11 4 816 2948 5499 2369 623Netherlands 30 30 15 15 14 25007 12897 6611 6842 5602 400Norway 44 27 19 29 19 35225 18142 11350 16925 12700 668Portugal 68 66 49 75 60 56814 27868 22651 33473 25394 425Russian Fed 80 80 61 61 102 54574 35214 23046 23328 31372 308Slovakia 56 51 13469 8973 16Slovenia 47 36 59 35 35 36219 15305 22734 15489 15489 443Spain 1
Sweden 119 126 103 81 120 96895 59813 47592 35634 50916 425Switzerland 73 88 112 96 117 62427 46445 52312 45828 53378 456UK 2 4 3 0 0 1319 2986 2610 232 176 587
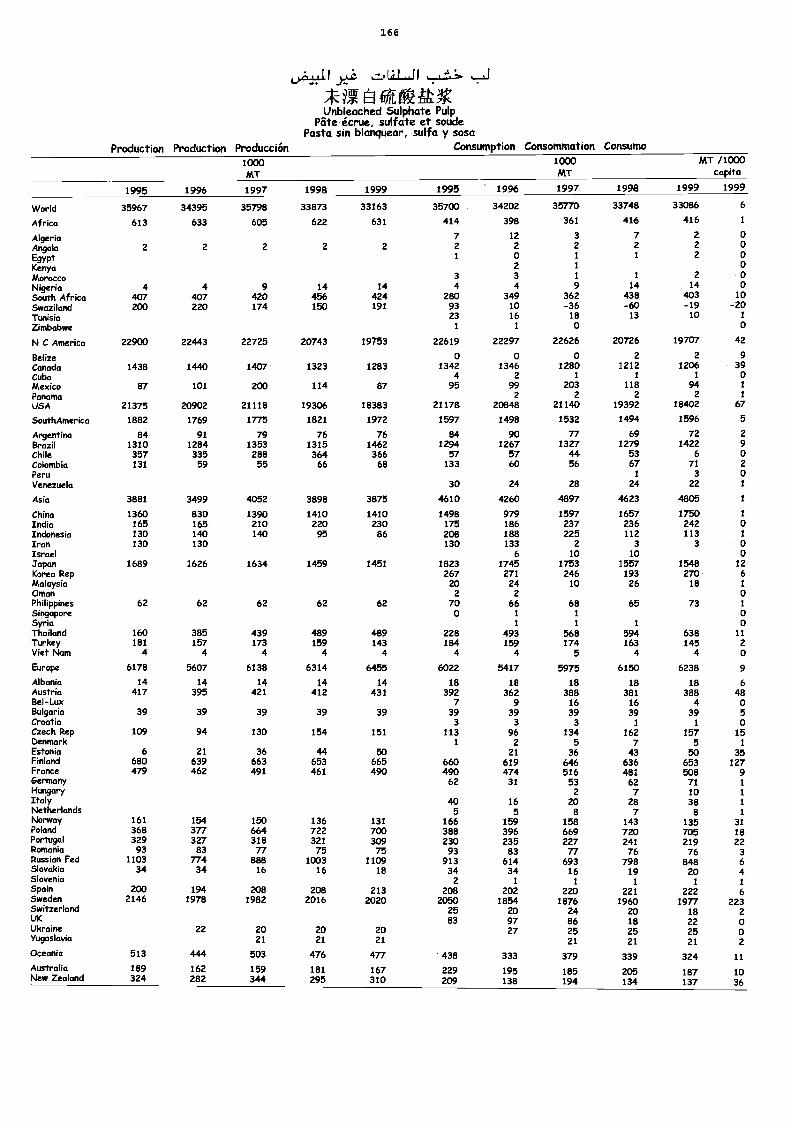
1 66
40,P-MVUnbleached Sulphate Pulp
Pate écrue, sulfate et soudePasta sin blanquear, sulfa y sosa
Production Production Producción Consumption Consommation Consumo1000MT
1000MT
MT /1000capita
1995 1996 1997 1998 1999 1995 1996 1997 1998 1999 1999
World 35967 34395 35798 33873 33163 35700 34202 35770 33748 33086 6
Africa 613 633 605 622 631 414 398 361 416 416 1
Algeria 7 12 3 7 2 0Angola 2 2 2 2 2 2 2 2 2 2 0
Egypt 1 0 1 1 2 0Kenya 2 1 0Morocco 3 3 1 1 2 0Nigeria 4 4 9 14 14 4 4 9 14 14 0
South Africa 407 407 420 456 424 280 349 362 438 403 10Swaziland 200 220 174 150 191 93 10 -36 -60 -19 -20Tunisia 23 16 18 13 10 1
Zimbabwe 1 1 0 0
N C America 22900 22443 22725 20743 19753 22619 22297 22626 20726 19707 42
Belize 0 0 0 2 2 9Canada 1438 1440 1407 1323 1283 1342 1346 1280 1212 1206 39Cuba 4 2 1 1 1 0Mexico 87 101 200 114 87 95 99 203 118 94 1
Panama 2 2 2 2 1
USA 21375 20902 21118 19306 18383 21178 20848 21140 19392 18402 67
SouthAmerica 1882 1769 1775 1821 1972 1597 1498 1532 1494 1596 5
Argentina 84 91 79 76 76 84 90 77 69 72 2Brazil 1310 1284 1353 1315 1462 1294 1267 1327 1279 1422 9Chile 357 335 288 364 366 57 57 44 53 6 0Colombia 131 59 55 66 68 133 60 56 67 71 2Peru 1 3 0Venezuela 30 24 28 24 22 1
Asia 3881 3499 4052 3898 3875 4610 4260 4897 4623 4805 1
Chino 1360 830 1390 1410 1410 1498 979 1597 1657 1750 1
India 165 165 210 220 230 175 186 237 236 242 0Indonesia 130 140 140 95 86 208 188 225 112 113 1
Iran 130 130 130 133 2 3 3 0Israel 6 10 10 0japan 1689 1626 1634 1459 1451 1823 1745 1753 1557 1548 12Korea Rep 267 271 246 193 270 6Malaysia 20 24 10 26 18 1
Ornan 2 2 0Philippines 62 62 62 62 62 70 66 68 65 73 1
Singapore 0 1 1 0Syria 1 1 1 0Thailand 160 385 439 489 489 228 493 568 594 638 11Turkey 181 157 173 159 143 184 159 174 163 145 2Viet Nam 4 4 4 4 4 4 4 5 4 4 0Europe 6178 5607 6138 6314 6455 6022 5417 5975 6150 6238 9
Albania 14 14 14 14 14 18 18 18 18 18 6Austria 417 395 421 412 431 392 362 388 381 388 48Bel-Lux 7 9 16 16 4 0Bulgaria 39 39 39 39 39 39 39 39 39 39 5Croatia 3 3 3 1 1 0Czech Rep 109 94 130 154 151 113 96 134 162 157 15Denmark 1 2 5 7 5 1
Estonia 6 21 36 44 50 21 36 43 50 35Finland 680 639 663 653 665 660 619 646 636 653 127France 479 462 491 461 490 490 474 516 481 508 9Germany 62 31 53 62 71 1Hungary 2 7 10 1Italy 40 16 20 28 38 1Netherlands 5 5 8 7 8 1Norway 161 154 150 136 131 166 159 158 143 135 31Poland 368 377 664 722 700 388 396 669 720 705 18Portugal 329 327 318 321 309 230 235 227 241 219 22Romania 93 83 77 75 75 93 83 77 76 76 3Russian Fed 1103 774 888 1003 1109 913 614 693 798 848 6Slovakia 34 34 16 16 18 34 34 16 19 20 4Slovenia 2 1 1 1 1 1Spain 200 194 208 208 213 208 202 220 221 222 6Sweden 2146 1978 1982 2016 2020 2050 1854 1876 1960 1977 223Switzerland 25 20 24 20 18 2UK 83 97 86 18 22 0Ukraine 22 20 20 20 27 25 25 25 0Yugoslavia 21 21 21 21 21 21 2Oceania 513 444 503 476 477 438 333 379 339 324 11Australia 189 162 159 181 167 229 195 185 205 187 10New Zealand 324 282 344 295 310 209 138 194 134 137 36
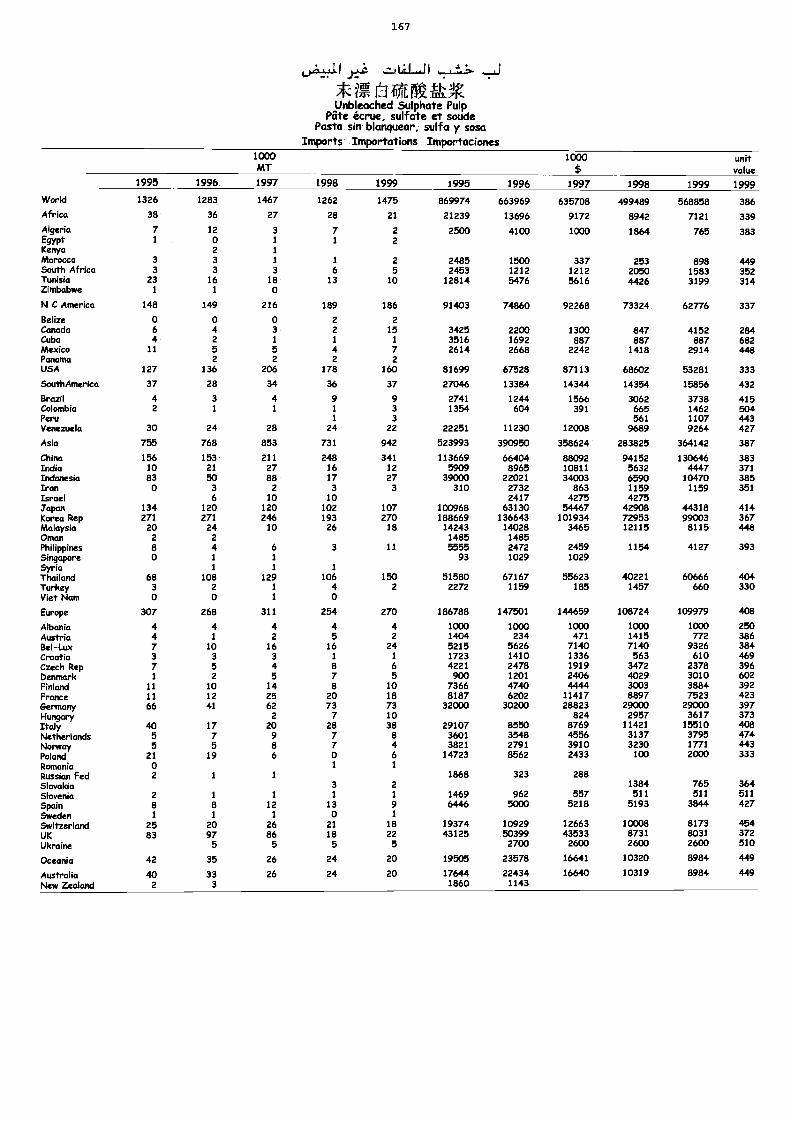
167
-II LILJI -L1
M &V.Unbleached Sulphate Pulp
Kite écrue, sulfate et soudePasta sin blanquear, sulfa y sosa
Imports Importations Importaciones1000MT
1000 unitvalue
1995 1996 1997 1998 1999 1995 1996 1997 1998 1999 1999
World 1326 1283 1467 1262 1475 869974 663969 635708 499489 568858 386Africa 38 36 27 28 21 21239 13696 9172 8942 7121 339Algeria 7 12 3 7 2 2500 4100 1000 1864 765 383Egypt 1 0 1 1 2Kenya 2 1
Morocco 3 3 1 1 2 2485 1500 337 253 898 449South Africa 3 3 3 6 5 2453 1212 1212 2050 1583 352Tunisia 23 16 18 13 10 12814 5476 5616 4426 3199 314Zimbabwe 1 1 0
N C America 148 149 216 189 186 91403 74860 92268 73324 62776 337Belize 0 0 0 2 2Canada 6 4 3 2 15 3425 2200 1300 847 4152 284Cuba 4 2 1 1 1 3516 1692 887 887 887 682Mexico 11 5 5 4 7 2614 2668 2242 1418 2914 448Panama 2 2 2 2USA 127 136 206 178 160 81699 67528 87113 68602 53281 333
SouthAmerica 37 28 34 36 37 27046 13384 14344 14354 15856 432
Brazil 4 3 4 9 9 2741 1244 1566 3062 3738 415Colombia 2 1 1 1 3 1354 604 391 665 1462 504Peru 1 3 561 1107 443Venezuela 30 24 28 24 22 22251 11230 12008 9689 9264 427
Asia 755 768 853 731 942 523993 390950 358624 283825 364142 387
China 156 153 211 248 341 113669 66404 88092 94152 130646 383India 10 21 27 16 12 5909 8965 10811 5632 4447 371Indonesia 83 50 88 17 27 39000 22021 34003 6590 10470 385Iran 0 3 2 3 3 310 2732 863 1159 1159 351Israel 6 10 10 2417 4275 4275Japan 134 120 120 102 107 100968 63130 54467 42908 44318 414Korea Rep 271 271 246 193 270 188669 136643 101934 72953 99003 367Malaysia 20 24 10 26 18 14243 14028 3465 12115 8115 448Oman 2 2 1485 1485Philippines 8 4 6 3 11 5555 2472 2459 1154 4127 393Singapore 0 1 1 93 1029 1029SYria 1 1 1
Thailand 68 108 129 106 150 51580 67167 55623 40221 60666 404Turkey 3 2 1 4 2 2272 1159 185 1457 660 330Viet Ncon 0 0 1 0
Europe 307 268 311 254 270 186788 147501 144659 108724 109979 408
Albania 4 4 4 4 4 1000 1000 1000 1000 1000 250Austria 4 1 2 5 2 1404 234 471 1415 772 386Bel-Lux 7 10 16 16 24 5215 5626 7140 7140 9326 384Croatia 3 3 3 1 1 1723 1410 1336 563 610 469Czech Rep 7 5 4 8 6 4221 2478 1919 3472 2378 396Denmark 1 2 5 7 5 900 1201 2406 4029 3010 602Finland 11 10 14 8 10 7366 4740 4444 3003 3884 392France 11 12 25 20 18 8187 6202 11417 8897 7523 423Germany 66 41 62 73 73 32000 30200 28823 29000 29000 397Hungary 2 7 10 824 2957 3617 373Italy 40 17 20 28 38 29107 8550 8769 11421 15510 408Netherlands 5 7 9 7 8 3602 3548 4556 3137 3795 474Nonvay 5 5 8 7 4 3821 2791 3910 3230 1771 443Poland 21 19 6 0 6 14723 8562 2433 100 2000 333Romania 0 1 1
Russian Fed 2 1 1 1868 323 288Slovakia 3 2 1384 765 364Slovenia 2 1 1 1 1 1469 962 557 511 511 511
Spain 8 8 12 13 9 6446 5000 5218 5193 3844 427Sweden 1 1 1 0 1
Switzerland 25 20 26 21 18 19374 10929 12663 10008 8173 454UK 83 97 86 18 22 43125 50399 43533 8731 8031 372
Ukraine 5 5 5 5 2700 2600 2600 2600 510
Oceania 42 35 26 24 20 19505 23578 16641 10320 8984 449
Australia 40 33 26 24 20 17644 22434 16640 10319 8984 449New Zealand 2 3 1860 1143
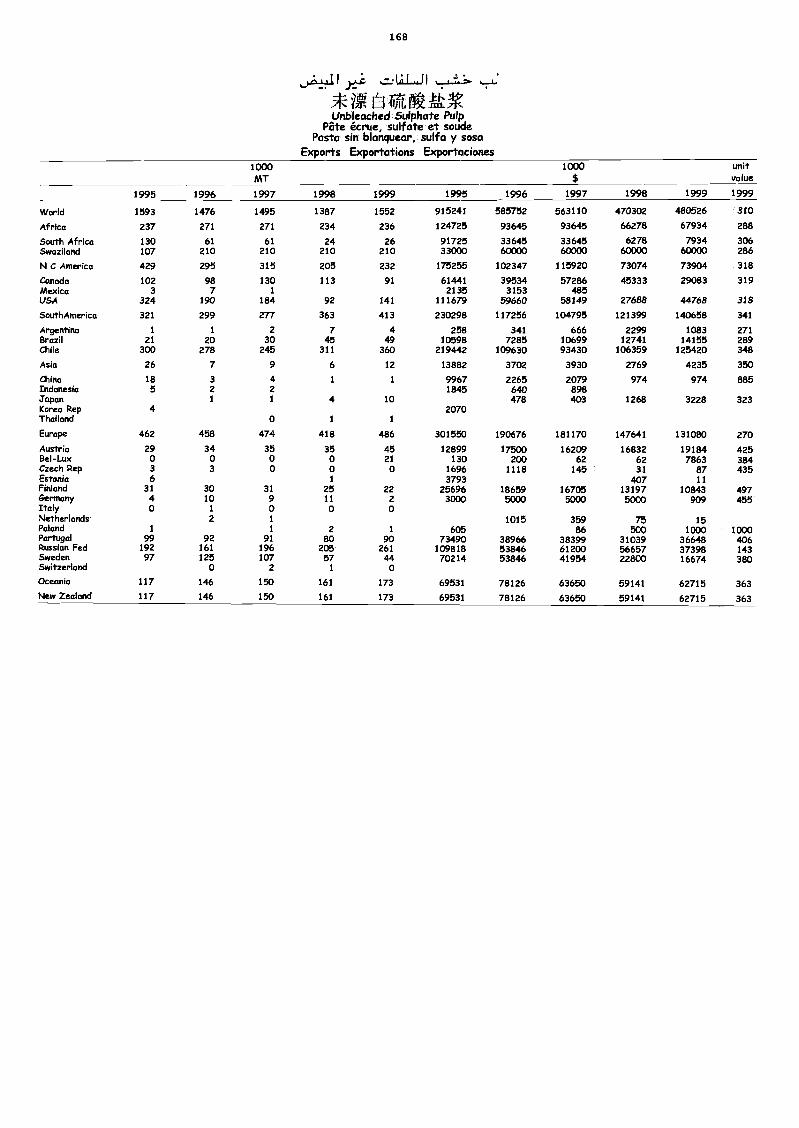
168
,;_j
4-ig IfidaftliVUnbleached Sulphate Pulp
Pate &rue, sulfate et soudePasta sin blanquear, sulfa y sosa
Exports Exportations Exportaciones1000MT
1000$
unitvalue
1995 1996 1997 1998 1999 1995 1996 1997 1998 1999 1999
World 1593 1476 1495 1387 1552 915241 585752 563110 470302 480526 310
Africa 237 271 271 234 236 124725 93645 93645 66278 67934 288
South Africa 130 61 61 24 26 91725 33645 33645 6278 7934 306Swaziland 107 210 210 210 210 33000 60000 60000 60000 60000 286
N C America 429 295 315 205 232 175255 102347 115920 73074 73904 318
Canada 102 98 130 113 91 61441 39534 57286 45333 29083 319Mexico 3 7 1 2135 3153 485USA 324 190 184 92 141 111679 59660 58149 27688 44768 318
SouthAmerica 321 299 277 363 413 230298 117256 104795 121399 140658 341
Argentina 1 1 2 7 4 258 341 666 2299 1083 271Brazil 21 20 30 45 49 10598 7285 10699 12741 14155 289Chile 300 278 245 311 360 219442 109630 93430 106359 125420 348
Asia 26 7 9 6 12 13882 3702 3930 2769 4235 350
China 18 3 4 1 1 9967 2265 2079 974 974 885Indonesia 5 2 2 1845 640 898yapan 1 1 4 10 478 403 1268 3228 323Korea Rep 4 2070Thailand 0 1 1
Europe 462 458 474 418 486 301550 190676 181170 147641 131080 270
Austria 29 34 35 35 45 12899 17500 16209 16832 19184 425Bel-Lux o o o 0 21 130 200 62 62 7863 384Czech Rep 3 3 0 0 0 1696 1118 145 31 87 435Estonia 6 1 3793 407 11Finland 31 30 31 25 22 25696 18659 16705 13197 10843 497emrmany 4 10 9 11 2 3000 5000 5000 5000 909 455Italy 0 1 0 0 0Netherlands 2 1 1015 359 75 15Poland 1 1 2 1 605 86 500 1000 1000Portugal 99 92 91 ao 90 73490 38966 38399 31039 36648 406Russian Fed 192 161 196 205 261 109818 53846 61200 56657 37398 143Sweden 97 125 107 57 44 70214 53846 41954 22800 16674 380Switzerland 0 2 1 oOceania 117 146 150 161 173 69531 78126 63650 59141 62715 363New Zealand 117 146 150 161 173 69531 78126 63650 59141 62715 363
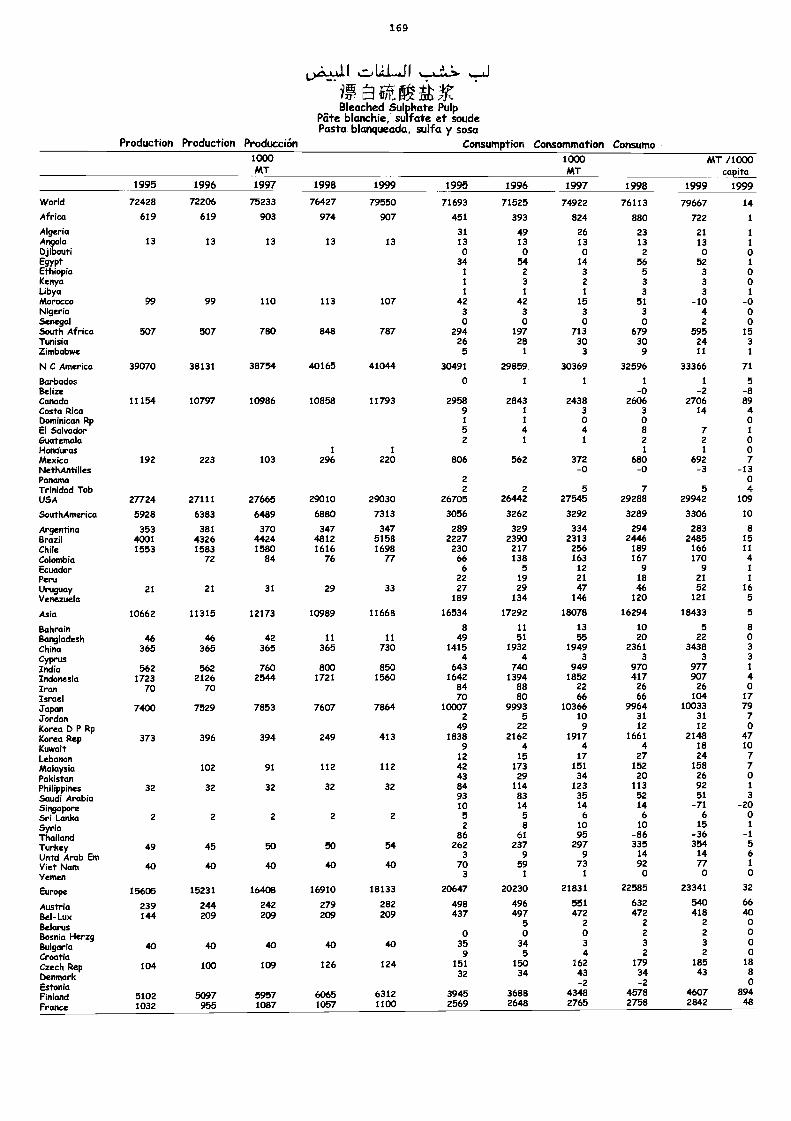
1 69
1),AA.J. I f I
jug
Production Production Producción
Bleached Sulphate PulpPate blanchie, sulfate et soudePasta blanqueada, sulfa y sosa
Consumption Consommation Consumo1000FAT
1000MT
MT /1000capita
1995 1996 1997 1998 1999 1995 1996 1997 1998 1999 1999
World 72428 72206 75233 76427 79550 71693 71525 74922 76113 79667 14
Africa 619 619 903 974 907 451 393 824 880 722 1
Algeria 31 49 26 23 21 1
Angola 13 13 13 13 13 13 13 13 13 13 1
Djibouti o o o 2 o oEgypt 34 54 14 56 52 1
Ethiopia 1 2 3 5 3 oKenya 1 3 2 3 3 oUbya 1 1 1 3 3 1
Morocco 99 99 110 113 107 42 42 15 51 -10 -0Nigeria 3 3 3 3 4 oSenegal 0 0 0 0 2 oSouth Africa 507 507 780 848 787 294 197 713 679 595 15Tunisia 26 28 30 30 24 3Zimbabwe 5 1 3 9 11 1
N C America 39070 38131 38754 40165 41044 30491 29859 30369 32596 33366 71
Barbados o 1 1 1 1 5Belize -0 -2 -8Canada 11154 10797 10986 10858 11793 2958 2843 2438 2606 2706 89Costa Rica 9 1 3 3 14 4Dominican lap 1 1 0 0 0El Salvador 5 4 4 8 7 1
Guatemala 2 1 1 2 2 0Honduras 1 1 1 1 0Mexico 192 223 103 296 220 806 562 372 680 692 7NethAntilles -0 -0 -3 -13Panama 2 0Trinidad Tob 2 2 5 7 5 4USA 27724 27111 27665 29010 29030 26705 26442 27545 29288 29942 109
SouthAmerica 5928 6383 6489 6880 7313 3056 3262 3292 3289 3306 10
Argentina 353 381 370 347 347 289 329 334 294 283 8Brazil 4001 4326 4424 4812 5158 2227 2390 2313 2446 2485 15Chile 1553 1583 1580 1616 1698 230 217 256 189 166 11
Colombia 72 84 76 77 66 138 163 167 170 4Ecuador 6 5 12 9 9 1
Peru 22 19 21 18 21 1
Uruguay 21 21 31 29 33 27 29 47 46 52 16Venezuela 189 134 146 120 121 5
Asia 10662 11315 12173 10989 11668 16534 17292 18078 16294 18433 5
Bahrain 8 11 13 10 5 8Bangladesh 46 46 42 11 11 49 51 55 20 22 oChina 365 365 365 365 730 1415 1932 1949 2361 3438 3
Cyprus 4 4 3 3 3 3
India 562 562 760 800 850 643 740 949 970 977 1
Indonesia 1723 2126 2544 1721 1560 1642 1394 1852 417 907 4Iran 70 70 84 88 22 26 26 0Israel 70 80 66 66 104 17
Japan 7400 7529 7853 7607 7864 10007 9993 10366 9964 10033 79Jordan 2 5 10 31 31 7
Korea D P Rp 49 22 9 12 12 o
Korea Rep 373 396 394 249 413 1838 2162 1917 1661 2145 47Kuwait 9 4 4 4 18 10
Lebanon 12 15 17 27 24 7
Malaysia 102 91 112 112 42 173 151 152 158 7
Pakistan 43 29 34 20 26 0
Philippines 32 32 32 32 32 84 114 123 113 92 1
Saudi Arabia 93 83 35 52 51 3
Singapore 10 14 14 14 -71 -20Sri Lanka 2 2 2 2 2 5 5 6 6 6 0
Syria 2 8 10 10 15 1
Thailand 86 61 95 -86 -36 -1Turkey 49 45 50 50 54 262 237 297 335 354 5
Untd Arab Em 3 9 9 14 14 6
Viet Nam 40 40 40 40 40 70 59 73 92 77 1
Yemen 3 1 1 0 0 0
Europe 15605 15231 16408 16910 18133 20647 20230 21831 22585 23341 32
Austria 239 244 242 279 282 498 496 551 632 540 66
Bel-Lux 144 209 209 209 209 437 497 472 472 418 40
Belarus 5 2 2 2
Bosnia Herzg 0 0 0 2 2
Bulgaria 40 40 40 ao 40 35 34 3 3 3
Croatia 9 5 4 2 2
Czech Rep 104 100 109 126 124 151 150 162 179 185 1
DenmarkEstonia
32 34 43-2
34-2
43
Finland 5102 5097 5957 6065 6312 3945 3688 4348 4578 4607 89
France 1032 955 1087 1057 1100 2569 2648 2765 2758 2842 48
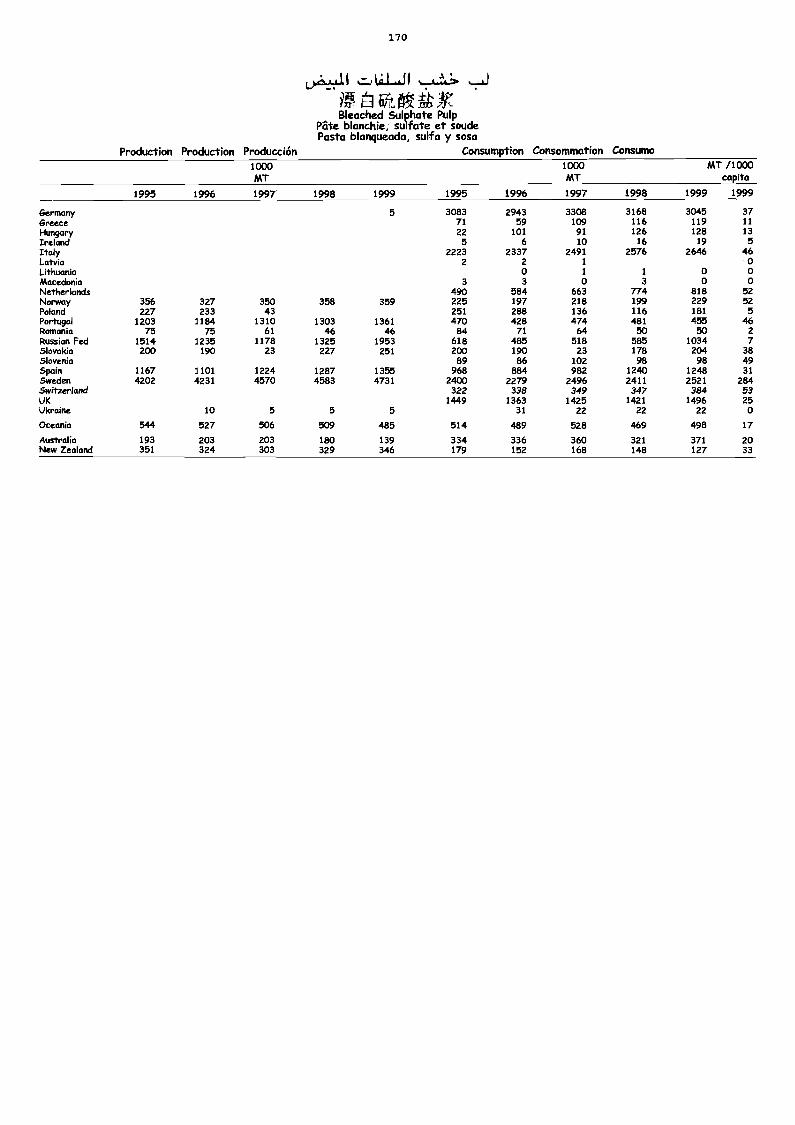
170
Bleached Sulphate PulpPate blanchie, sulfate et soudePasto blanqueada, sulfa y sosa
Production Production Producción Consumption Consommation Consumo1000MT
1000MT
MT /1000capita
1995 1996 1997 1998 1999 1995 1996 1997 1998 1999 1999
Germany 5 3083 2943 3308 3168 3045 37Greece 71 59 109 116 119 11
HunciarY 22 101 91 126 128 13Ireland 5 6 10 16 19 5Italy 2223 2337 2491 2576 2646 46Latvia 2 2 1 0Lithuania 0 1 1 0 0Macedonia 3 3 0 3 0 0Netherlands 490 584 663 774 818 52Norway 356 327 350 358 359 225 197 218 199 229 52Poland 227 233 43 251 288 136 116 181 5Portugal 1203 1184 1310 1303 1361 470 428 474 481 455 46Romania 75 75 61 46 46 84 71 64 50 50 2Russian Fed 1514 1235 1178 1325 1953 618 485 518 585 1034 7Slovakia 200 190 23 227 251 200 190 23 178 204 38Slovenia 89 86 102 98 98 49SPain 1167 1101 1224 1287 1355 968 884 982 1240 1248 31Sweden 4202 4231 4570 4583 4731 2400 2279 2496 2411 2521 284Switzerland 322 338 349 347 384 53UK 1449 1363 1425 1421 1496 25Ukraine 10 5 5 5 31 22 22 22 0
Oceania 544 527 506 509 485 514 489 528 469 498 17
Australia 193 203 203 180 139 334 336 360 321 371 20New Zealand 351 324 303 329 346 179 152 168 148 127 33
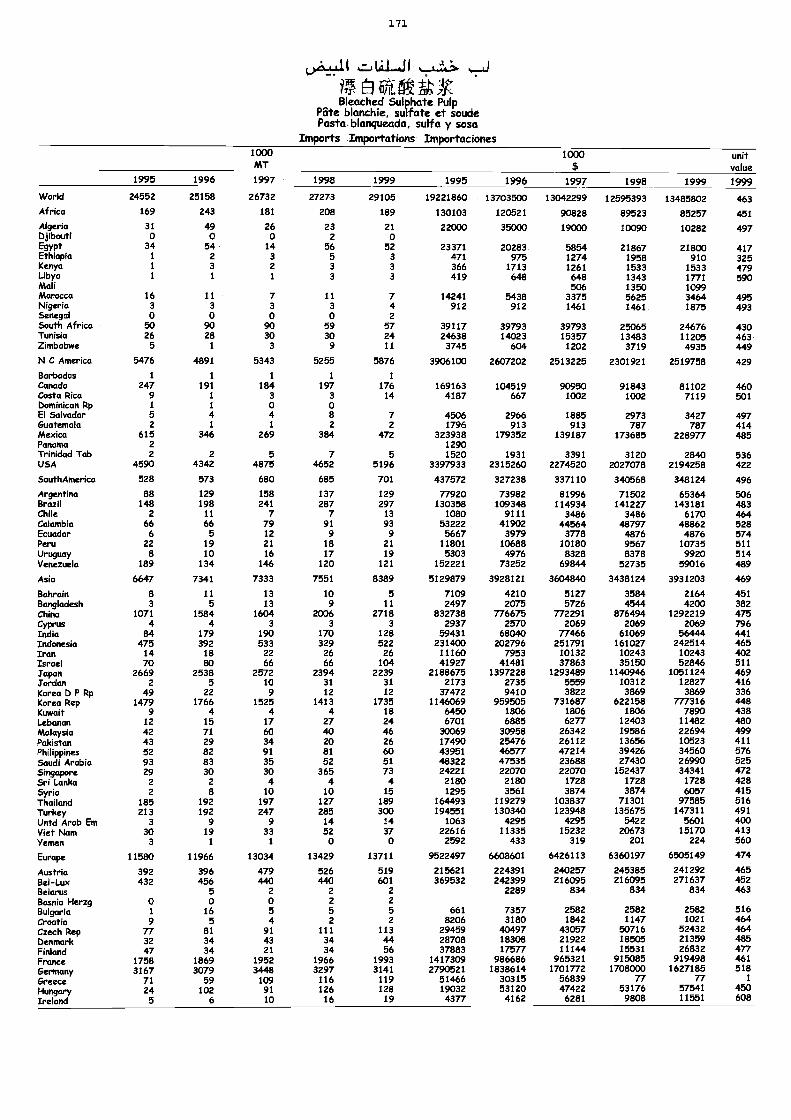
1 7 1
6;irotBleached Sulphate Pulp
Pate blanchie, sulfate et soudePasta blanqueada, sulfa y sosa
Imports Importations Importaciones1000MT
1000 unitvalue
1995 1996 1997 1998 1999 1995 1996 1997 1998 1999 1999World 24552 25158 26732 27273 29105 19221860 13703500 13042299 12595393 13485802 463Africa 169 243 181 208 189 133103 120521 90828 89523 85257 451Algeria 31 49 26 23 21 22000 35000 19000 10090 10282 497Dybouti 0 0 0 2 0Egypt 34 54 14 56 52 23371 20283 5854 21867 21800 417Ethiopia I 2 3 5 3 471 975 1274 1958 910 325Kenya 1 3 2 3 3 366 1713 1261 1533 1533 479Ubya 1 1 1 3 3 419 648 648 1343 1771 590Mali 506 1350 1099MOMICCO 16 11 7 11 7 14241 5438 3375 5625 3464 495Nigeria 3 3 3 3 4 912 912 1461 1461 1875 4935enegM 0 0 0 0 2South Africa 50 90 90 59 57 39117 39793 39793 25065 24676 430Tunisia 26 28 30 30 24 24638 14023 15357 13483 11205 463Zimbabwe 5 1 3 9 11 3745 604 1202 3719 4935 449N C Ammrka 5476 4891 5343 5255 5876 3906100 2607202 2513225 2301921 2519758 429
Barbados 1 1 1 1 ICanada 247 191 184 197 176 169163 104519 90950 91843 81102 460Costa Rica 9 I 3 3 14 4187 667 1002 1002 7119 501Dominkxm Rp 1 I 0 0El Salvador 5 4 4 a 7 4506 2966 1885 2973 3427 497Guatemala 2 1 1 2 2 1796 913 913 787 787 414Maxko 615 346 269 384 472 323938 179352 139187 173685 228977 485Panama 2 1290Trinidad Tob 2 2 5 7 5 1520 1931 3391 3120 2840 536USA 4590 4342 4875 4652 5196 3397933 2315260 2274520 2027078 2194258 422
5outhAmerica 528 573 680 685 701 437572 327238 337110 340568 348124 496
Argentino 88 129 158 137 129 77920 73982 81996 71502 65364 506Brazil 148 198 241 287 297 130358 109348 114934 141227 143181 483Chile 2 11 7 7 13 1080 9111 3486 3486 6170 464Colombia 66 66 79 91 93 53222 41902 44564 48797 48862 528Ecuador 6 5 12 9 9 5667 3979 3778 4876 4876 574Peru 22 19 21 18 21 11801 10688 10180 9567 10735 511Uruguay 8 10 16 17 19 5303 4976 8328 8378 9920 514Venezuela 189 134 146 120 121 152221 73252 69844 52735 59016 489
Asia 6647 7341 7333 7551 8389 5129879 3928121 3604840 3438124 3931203 469
Bahrain 8 11 13 10 5 7109 4210 5127 3584 2164 451Bangladesh 3 5 13 9 11 2497 2075 5726 4544 4200 382Chita 1071 1584 1604 2006 2718 832738 776675 772291 876494 1292219 475Cyprus 4 4 3 3 3 2937 2570 2069 2069 2069 796India 84 179 190 170 128 59431 68040 77466 61069 56444 441Indonesia 475 392 533 329 522 231400 202796 251791 161027 242514 465Iran 14 18 22 26 26 11160 7953 10132 10243 10243 402Israel 70 80 66 66 104 41927 41481 37863 35150 52846 511Japan 2669 2538 2572 2394 2239 2188675 1397228 1293489 1140946 1051124 469Jordan 2 5 10 31 31 2173 2735 5559 10312 12827 416Korea DP Rp 49 22 9 12 12 37472 9410 3822 3869 3869 336Korea Rep 1479 1766 1525 1413 1735 1146069 959505 731687 622158 777316 448Kuwait 9 4 4 4 18 6450 1806 1806 1806 7890 438Lebanon 12 15 17 27 24 6701 6885 6277 12403 11482 480Malaysia 42 71 60 40 46 30069 30958 26342 19586 22694 499Pakistan 43 29 34 20 26 17490 25476 26112 13656 10523 411Philippines 52 82 91 81 60 43951 46577 47214 39426 34560 5765audiArabia 93 83 35 52 51 48322 47535 23688 27430 26990 5255ingapcme 29 30 30 365 73 24221 22070 22070 152437 34341 472Sri Lanka 2 2 4 4 4 2180 2180 1728 1728 1728 428Syria 2 8 10 10 15 1295 3561 3874 3874 6057 415Thafland 185 192 197 127 189 164493 119279 103837 71301 97585 516Turkey 213 192 247 285 300 194551 130340 123948 135675 147311 491Untd Arab Em 3 9 9 14 14 1063 4295 4295 5422 5601 400Viet Nam 30 19 33 52 37 22616 11335 15232 20673 15170 413Yemen 3 1 1 o 0 2592 433 319 201 224 560
Europe 11580 11966 13034 13429 13711 9522497 6608601 6426113 6360197 6505149 474
Austria 392 396 479 526 519 215621 224391 240257 245385 241292 465Bel-Lux 432 456 440 440 601 369532 242399 216095 216095 271637 452Belarus 5 2 2 2 2289 834 834 834 463BosMa Herzg 0 0 0 2 2
Bulgaria 1 16 5 5 5 661 7357 2582 2582 2582 516Croatia 9 5 4 2 2 8206 3180 1842 1147 1021 464Czech Rep 77 81 91 111 113 29459 40497 43057 50716 52432 464Denmark 32 34 43 34 44 28708 18308 21922 18505 21359 485FMkmd 47 34 21 34 56 37883 17577 11144 15531 26832 477Frcuum 1758 1869 1952 1966 1993 1417309 986686 965321 915085 919498 461
Gemnany 3167 3079 3448 3297 3141 2790521 1838614 1701772 1708000 1627185 518Greece 71 59 109 116 119 51466 30315 56839 77 77 1
Hungary 24 102 91 126 128 19032 53120 47422 53176 57541 450Indand 5 6 10 16 19 4377 4162 6281 9808 11551 608
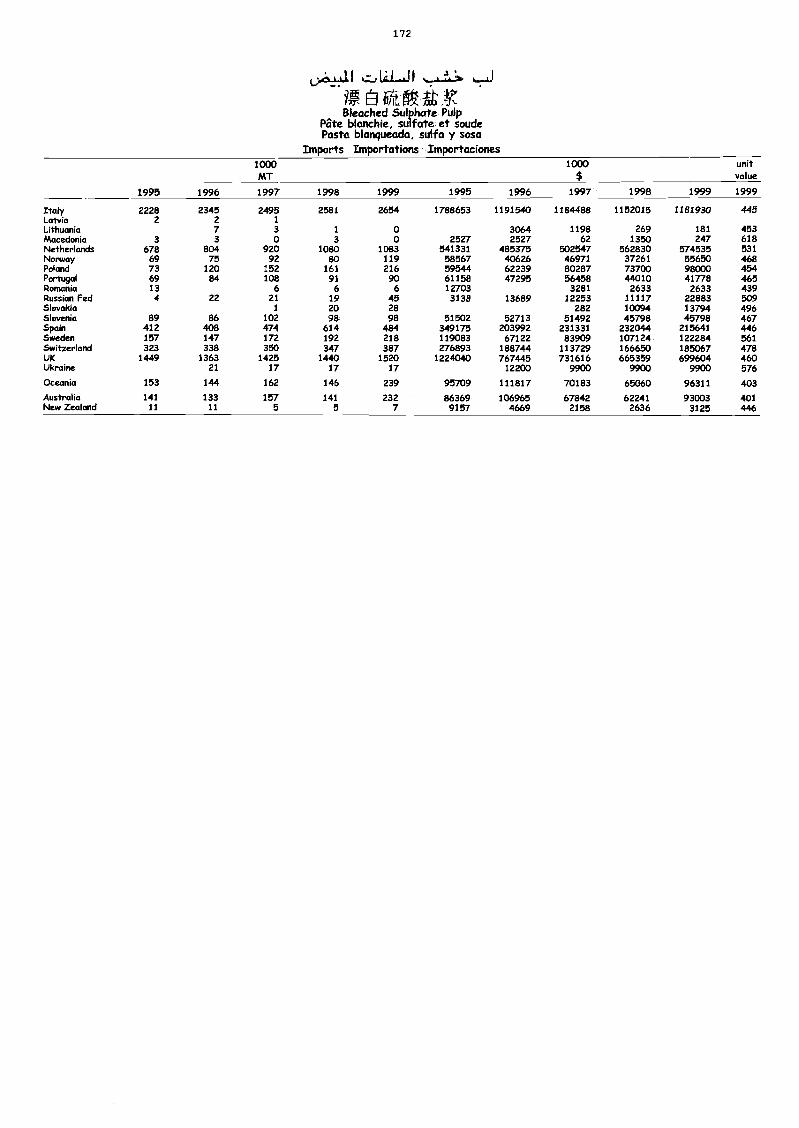
172
L)A....d I
o gBleached Sulphate Pulp
Pate blanchie, sulfate et soudePasta blanqueada, sulfa y sosa
Imports Importations Importaciones1000MT
1000$
unitvalue
1995 1996 1997 1998 1999 1995 1996 1997 1998 1999 1999
Italy 2228 2345 2495 2581 2654 1788653 1191540 1164488 1152015 1181930 445Latvia 2 2 1
Lithuania 7 3 1 0 3064 1198 269 181 453Macedonia 3 3 0 3 0 2527 2527 62 1350 247 618Netherlands 678 804 920 1080 1083 541331 485375 502547 562830 574535 531Norway 69 75 92 80 119 58567 40626 46971 37261 55650 468Poland 73 120 152 161 216 59544 62239 80287 73700 98000 454Portugal 69 84 108 91 90 61158 47295 56458 44010 41778 465Romania 13 6 6 6 12703 3281 2633 2633 439Russian Fed 4 22 21 19 45 3138 13689 12253 11117 22883 509Slovakia 1 20 28 282 10094 13794 496Slovenia 89 86 102 98 98 51502 52713 51492 45798 45798 467Spain 412 408 474 614 484 349175 203992 231331 232044 215641 446Sweden 157 147 172 192 218 119083 67122 83909 107124 122284 561Switzerland 323 338 350 347 387 276893 188744 113729 166650 185067 478UK 1449 1363 1425 1440 1520 1224040 767445 731616 665359 699604 460Ukraine 21 17 17 17 12200 9900 9900 9900 576
Oceania 153 144 162 146 239 95709 111817 70183 65060 96311 403
Australia 141 133 157 141 232 86369 106965 67842 62241 93003 401New Zealand 11 11 5 5 7 9157 4669 2158 2636 3125 446
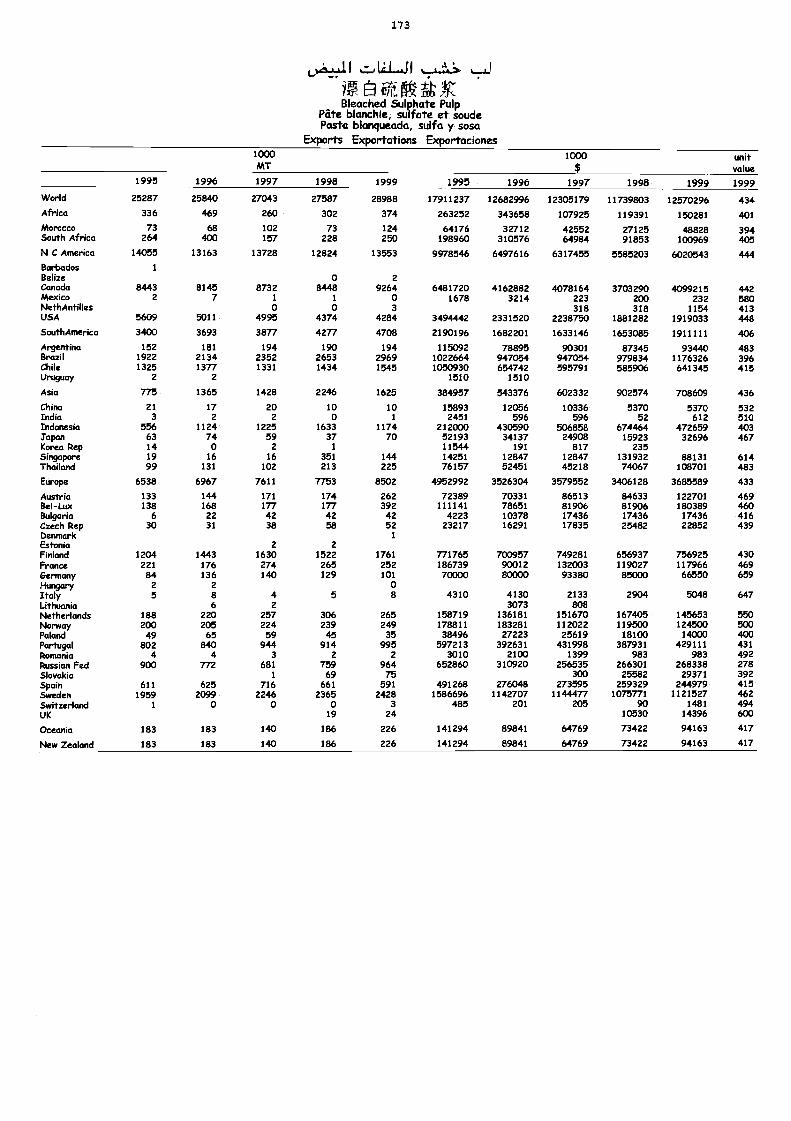
173
fik.r0 '7.1:Bleached Sulphate Pulp
Pate blanchie, sulfate et soudePasta blanqueada, sulfa y sosa
Exports Exportations Exportaciones1000MT
1000 unitvalue
1995 1996 1997 1998 1999 1995 1996 1997 1998 1999 1999
World 25287 25840 27043 27587 28988 17911237 12682996 12305179 11739803 12570296 434Africa 336 469 260 302 374 263252 343658 107925 119391 150281 401
Morocco 73 68 102 73 124 64176 32712 42552 27125 48828 394South Africa 264 400 157 228 250 198960 310576 64984 91853 100969 405N C America 14055 13163 13728 12824 13553 9978546 6497616 6317455 5585203 6020543 444Barbados 1
Belize 0 2Canada 8443 8145 8732 8448 9264 6481720 4162882 4078164 3703290 4099215 442PAexico 2 7 1 1 0 1678 3214 223 200 232 580NethAntilles 0 0 3 318 318 1154 413USA 5609 5011 4995 4374 4284 3494442 2331520 2238750 1881282 1919033 448SouthAmerica 3400 3693 3877 4277 4708 2190196 1682201 1633146 1653085 1911111 406Argentina 152 181 194 190 194 115092 78895 90301 87345 93440 483Brazil 1922 2134 2352 2653 2969 1022664 947054 947054 979834 1176326 396Chile 1325 1377 1331 1434 1545 1050930 654742 595791 585906 641345 415Uruguay 2 2 1510 1510
Asia 775 1365 1428 2246 1625 384957 543376 602332 902574 708609 436
China 21 17 20 10 10 15893 12056 10336 5370 5370 532India 3 2 2 0 1 2451 596 596 52 612 510Indonesia 556 1124 1225 1633 1174 212000 430590 506858 674464 472659 403Japan 63 74 59 37 70 52193 34137 24908 15923 32696 467Korea Rep 14 0 2 1 11544 191 817 235Singapore 19 16 16 351 144 14251 12847 12847 131932 88131 614Thailand 99 131 102 213 225 76157 52451 45218 74067 108701 483
Europe 6538 6967 7611 7753 8502 4952992 3526304 3579552 3406128 3685589 433
Austria 133 144 171 174 262 72389 70331 86513 84633 122701 469Bel-Lux 138 168 177 177 392 111141 78651 81906 81906 180389 460Bulgaria 6 22 42 42 42 4223 10378 17436 17436 17436 416Czech Rep 30 31 38 58 52 23217 16291 17835 25482 22852 439Denmark 1
Estonia 2 2
Finland 1204 1443 1630 1522 1761 771765 700957 749281 656937 756925 430France 221 176 274 265 252 186739 90012 132003 119027 117966 469Germany 84 136 140 129 101 70000 80000 93380 85000 66550 659Hungary 2 2 0Italy 5 8 4 5 8 4310 4130 2133 2904 5048 647Lithuania 6 2 3073 808Netherlands 188 220 257 306 265 158719 136181 151670 167405 145653 550Norway 200 205 224 239 249 178811 183281 112022 119500 124500 500Poland 49 65 59 45 35 38496 27223 25619 18100 14000 400Portugal 802 840 944 914 995 597213 392631 431998 387931 429111 431Romania 4 4 3 2 2 3010 2100 1399 983 983 492Russian Fed 900 772 681 759 964 652860 310920 256535 266301 268338 278Slovakia 1 69 75 300 25582 29371 392Spain 611 625 716 661 591 491268 276048 273595 259329 244979 415Sweden 1959 2099 2246 2365 2428 1586696 1142707 1144477 1075771 1121527 462Switzerland 1 0 0 0 3 485 201 205 90 1481 494UK 19 24 10530 14396 600
Oceania 183 183 140 186 226 141294 89841 64769 73422 94163 417
New Zealand 183 183 140 186 226 141294 89841 64769 73422 94163 417
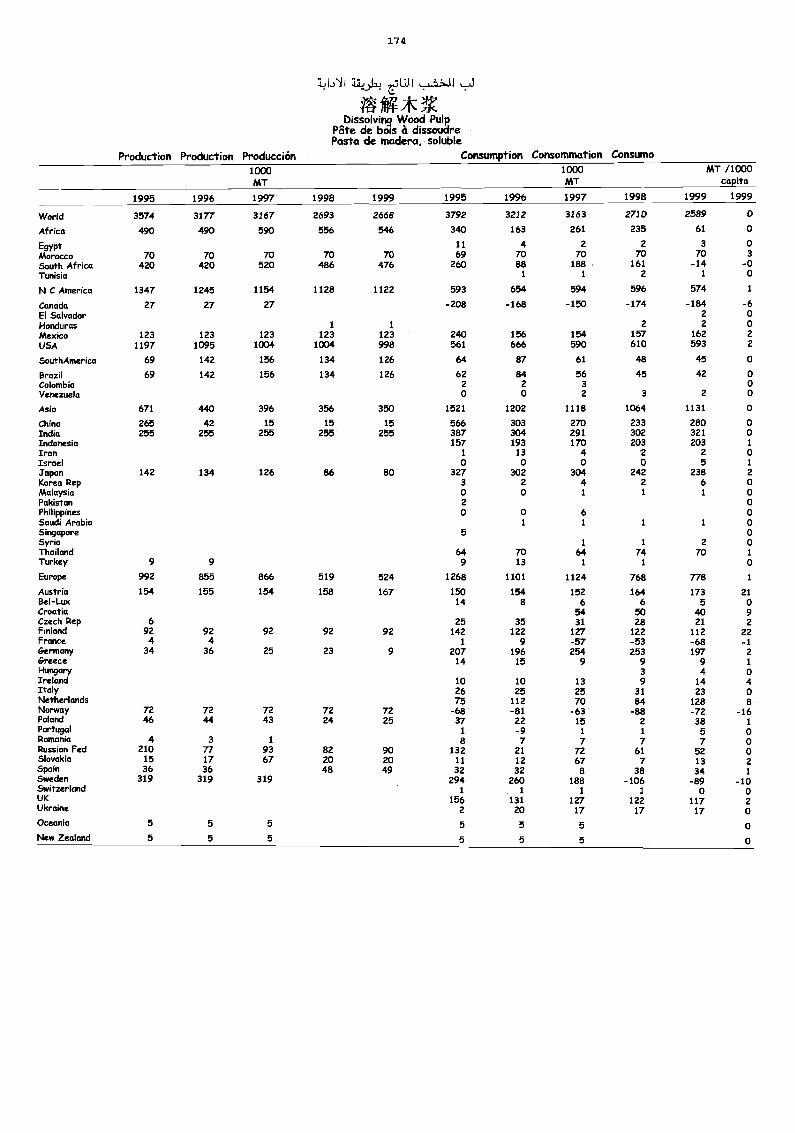
17 4
'41A rize_,L,,, 7,11111 ,,:... .
Dissolving Wood PulpPate de bois el dissoudrePasta de madera, soluble
Production Production Producción Consumption Consommation Consumo1000MT
1000MT
MT /1000capita
1995 1996 1997 1998 1999 1995 1996 1997 1998 1999 1999
World 3574 3177 3167 2693 2668 3792 3222 3163 2710 2589 0
Africa 490 490 590 556 546 340 163 261 235 61 0
Egypt 11 4 2 2 3 0Morocco 70 70 70 70 70 69 70 70 70 70 3
South Africa 420 420 520 486 476 260 88 188 161 -14 -0Tunisia 1 1 2 1 0
N C America 1347 1245 1154 1128 1122 593 654 594 596 574 1
Canada 27 27 27 -208 -168 -150 -174 -184 -6El Salvador 2 0Honduras 1 1 2 2 0Mexico 123 123 123 123 123 240 156 154 157 162 2
USA 1197 1095 1004 1004 998 561 666 590 610 593 2
SouthAmerica 69 142 156 134 126 64 87 61 48 45 0
Brazil 69 142 156 134 126 62 84 56 45 42 0Colombia 2 2 3 0Venezuela 0 0 2 3 2 0
Asia 671 440 396 356 350 1521 1202 1118 1064 1131 0
China 265 42 15 15 15 566 303 270 233 280 0India 255 255 255 255 255 387 304 291 302 321 0Indonesia 157 193 170 203 203 1
Iran 1 13 4 2 2 0Israel 0 0 0 0 5 1
&Van 142 134 126 86 80 327 302 304 242 238 2Korea Rep 3 2 4 2 6 0Malaysia 0 0 1 1 1 0Pakistan 2 0Philippines 0 0 6 0Saudi Arabia 1 1 1 1 0Singapore 5 0Syria 1 1 2 0Thailand 64 70 64 74 70 1
Turkey 9 9 9 13 1 1 0Europe 992 855 866 519 524 1268 1101 1124 768 778 1
Austria 154 155 154 158 167 150 154 152 164 173 21Bel-Lux 14 8 6 6 5 0Croatia 54 50 40 9Czech Rep 6 25 35 31 28 21 2Finland 92 92 92 92 92 142 122 127 122 112 22France 4 4 1 9 -57 -53 -68 -1Germany 34 36 25 23 9 207 196 254 253 197 2Greece 14 15 9 9 9 1
HungarY 3 4 0Ireland 10 10 13 9 14 4Italy 26 25 25 31 23 0Netherlands 75 112 70 84 128 8Norway 72 72 72 72 72 -68 -81 -63 -88 -72 -16Poland 46 44 43 24 25 37 22 15 2 38 1Portugal 1 -9 1 1 5 0Romania 4 3 1 8 7 7 7 7 0Russian Fed 210 77 93 82 90 132 21 72 61 52 0Slovakia 15 17 67 20 20 11 12 67 7 13 2Spain 36 36 48 49 32 32 8 38 34 1Sweden 319 319 319 294 260 188 -106 -89 -10Switzerland 1 1 1 1 0 0UK 156 131 127 122 117 2Ukraine 2 20 17 17 17 0Oceania 5 5 5 5 5 5 0New Zealand 5 5 5 5 5 5 0
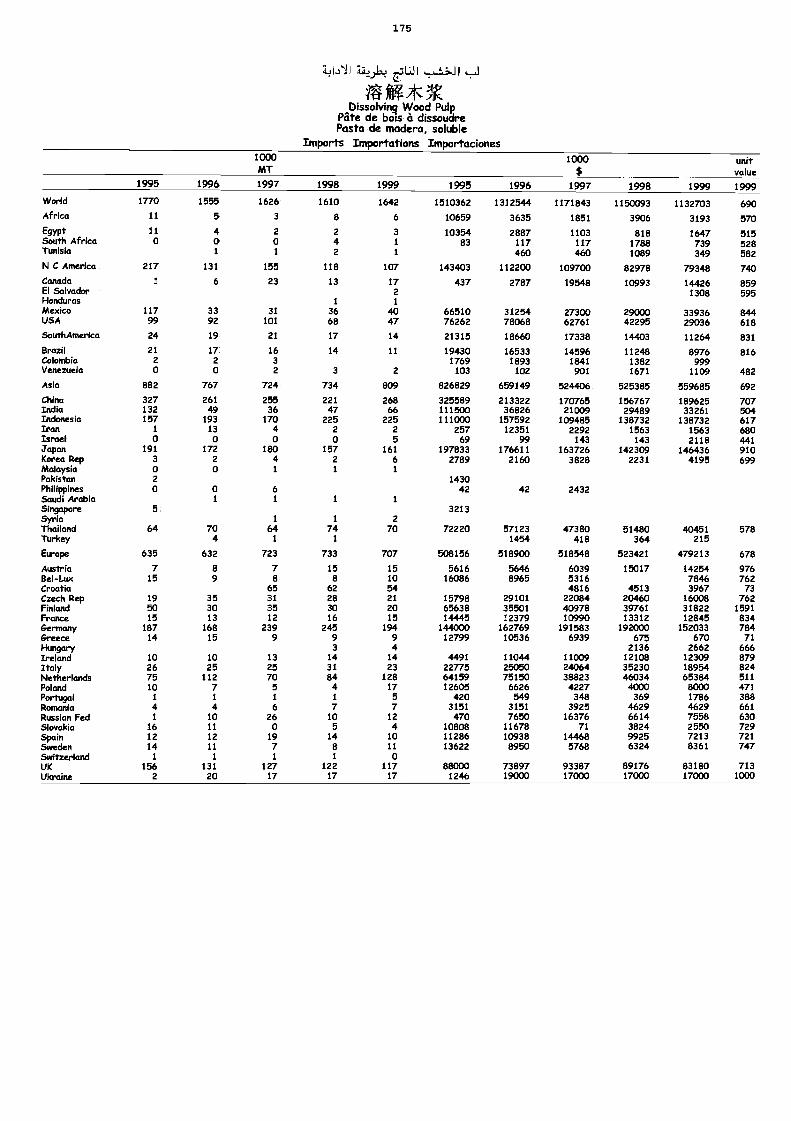
175
Ij1J1.12A eusi
VAT*V.bissolvinti Wood Pulp
Pate de bois ò dissoudrePasta de madera, soluble
Imports Importations Importaciones1000MT
1000 unitvalue
1995 1996 1997 1998 1999 1995 1996 1997 1998 1999 1999World 1770 1555 1626 1610 1642 1510362 1312544 1171843 1150093 1132703 690Africa 11 5 3 8 6 10659 3635 1851 3906 3193 570Egypt 11 4 2 2 3 10354 2887 1103 818 1647 515South Africa o o 0 4 1 83 117 117 1788 739 528Tunisia 1 1 2 1 460 460 1089 349 582N C America 217 131 155 118 107 143403 112200 109700 82978 79348 740Canada 1 6 23 13 17 437 2787 19548 10993 14426 859El Salvador 2 1308 595Honduras 1 1
Mexico 117 33 31 36 ao 66510 31254 27300 29000 33936 844USA 99 92 101 68 47 76262 78068 62761 42295 29036 618SouthAmerica 24 19 21 17 14 21315 18660 17338 14403 11264 831Brazil 21 17 16 14 11 19430 16533 14596 11248 8976 816Colombia 2 2 3 1769 1893 1841 1382 999Venezuela 0 o 2 3 2 103 102 901 1671 1109 482Asia 882 767 724 734 809 826829 659149 524406 525385 559685 692China 327 261 255 221 268 325589 213322 170765 156767 189625 707India 132 49 36 47 66 111500 36826 21009 29489 33261 504Indonesia 157 193 170 225 225 111000 157592 109485 138732 138732 617Iran 1 13 4 2 2 257 12351 2292 1563 1563 680Israel 0 0 0 0 5 69 99 143 143 2118 441Japan 191 172 180 157 161 197833 176611 163726 142309 146436 910Korea Rep 3 2 4 2 6 2789 2160 3828 2231 4195 699Malaysia 0 0 1 1 1
Pakistan 2 1430Philippines 0 o 6 42 42 2432Saudi Arabia 1 1 1 1
Singapore 5 3213Syria 1 1 2Thailand 64 70 64 74 70 72220 57123 47380 51480 40451 578Turkey 4 1 1 1454 418 364 215
Europe 635 632 723 733 707 508156 518900 518548 523421 479213 678
Austria 7 8 7 15 15 5616 5646 6039 15017 14254 976Bel-Lux 15 9 8 a 10 16086 8965 5316 7846 762Croatia 65 62 54 4816 4513 3967 73Czech Rep 19 35 31 28 21 15798 29101 22084 20460 16008 762Finland 50 30 35 30 20 65638 35501 40978 39761 31822 1591France 15 13 12 16 15 14445 12379 10990 13312 12845 834Germany 187 168 239 245 194 144000 162769 191583 192000 152033 784Greece 14 15 9 9 9 12799 10536 6939 675 670 71Hungary 3 4 2136 2662 666Ireland 10 10 13 14 14 4491 11044 11009 12108 12309 879Italy 26 25 25 31 23 22775 25050 24064 35230 18954 824Netherlands 75 112 70 84 128 64159 75150 38823 46034 65384 511Poland 10 7 5 4 17 12605 6626 4227 4000 8000 471Portugal 1 1 1 1 5 420 549 348 369 1786 388Romania 4 4 6 7 7 3151 3151 3925 4629 4629 661Russian Fed 1 10 26 10 12 470 7650 16376 6614 7558 630Slovakia 16 11 0 5 4 10808 11678 71 3824 2550 729Spain 12 12 19 14 10 11286 10938 14468 9925 7213 721Sweden 14 11 7 8 11 13622 8950 5768 6324 8361 747Switzerland 1 1 1 1 0UK 156 131 127 122 117 88000 73897 93387 89176 83180 713Ulwaine 2 20 17 17 17 1246 19000 17000 17000 17000 1000
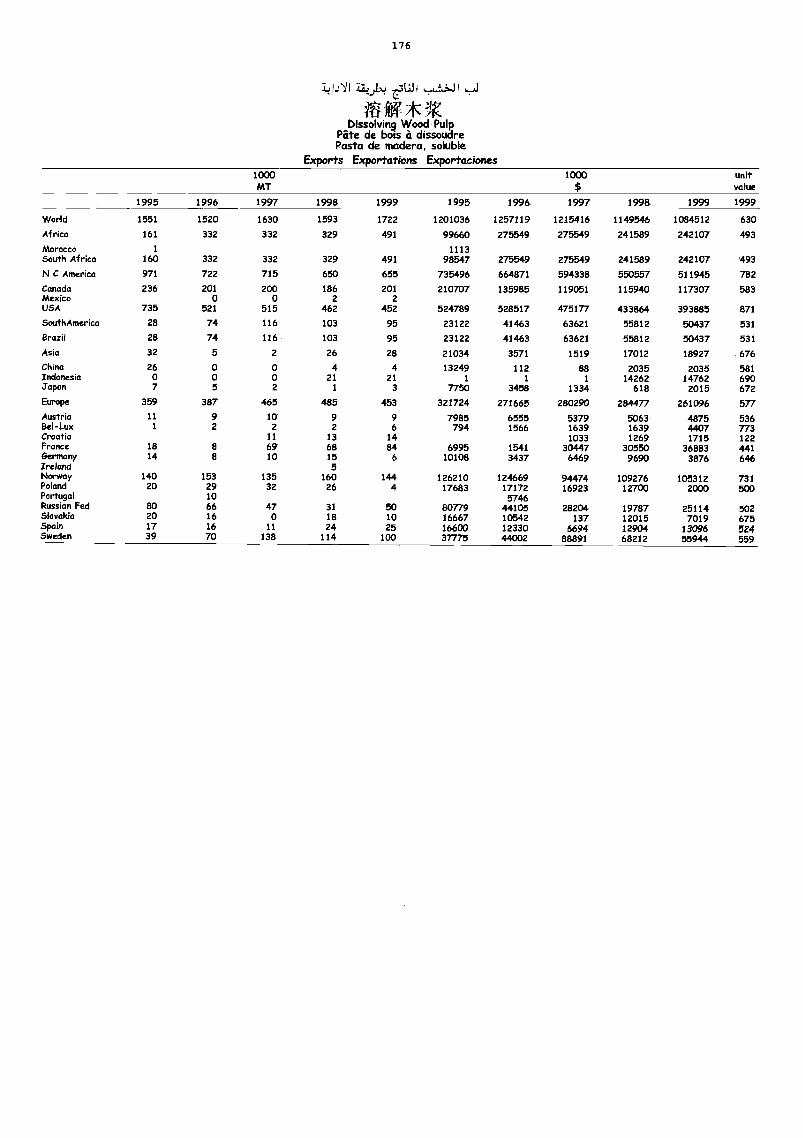
176
ltg*Dissolving Wood Pulp
Pate de bots 2t dissoudrePasta de madera, soluble
Exports Exportations Exportaciones1000mT
1000$
unitvalue
1995 1996 1997 1998 1999 1995 1996 1997 1998 1999 1999
World 1551 1520 1630 1593 1722 1201036 1257119 1215416 1149546 1084512 630
Africa 161 332 332 329 491 99660 275549 275549 241589 242107 493
Morocco 1 1113South Africa 160 332 332 329 491 98547 275549 275549 241589 242107 493
N C America 971 722 715 650 655 735496 664871 594338 550557 511945 782
Canada 236 201 200 186 201 210707 135985 119051 115940 117307 583Mexico 0 0 2 2USA 735 521 515 462 452 524789 528517 475177 433864 393885 871
SouthAmerica 28 74 116 103 95 23122 41463 63621 55812 50437 531
Brazil 28 74 116 103 95 23122 41463 63621 55812 50437 531
Asia 32 5 2 26 28 21034 3571 1519 17012 18927 676China 26 o 0 4 4 13249 112 88 2035 2035 581Indonesia 0 0 0 21 21 1 1 I 14262 14762 690Japan 7 5 2 1 3 7750 3458 1334 618 2015 672Europe 359 387 465 485 453 321724 271665 280290 284477 261096 577Austria 11 9 10 9 9 7985 6555 5379 5063 4875 536Bel-Lux 1 2 2 2 6 794 1566 1639 1639 4407 773Croatia 11 13 14 1033 1269 1715 122France 18 e 69 68 84 6995 1541 30447 30550 36883 441Germany 14 8 10 15 6 10108 3437 6469 9690 3876 646Ireland 5Norway 140 153 135 160 144 126210 124669 94474 109276 105312 731Poland 20 29 32 26 4 17683 17172 16923 12700 2000 500Portugal 10 5746Russian Fed 80 66 47 31 50 80779 44105 28204 19787 25114 502Slovakia 20 16 0 18 10 16667 10542 137 12015 7019 675Sfain 17 16 11 24 25 16600 12330 6694 12904 13096 524Sweden 39 70 138 114 100 37775 44002 88891 68212 55944 559
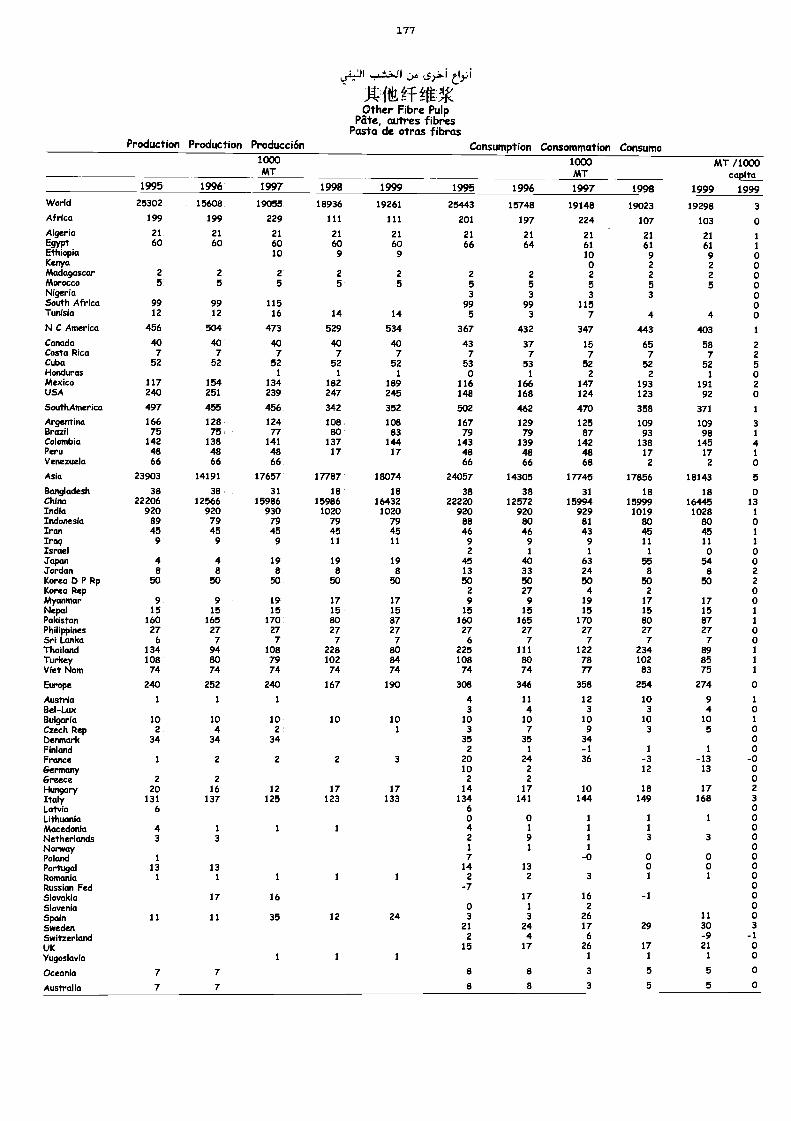
177
I
ft It VOther Fibre Pulp
Pate, autres fibresPasta de otras fibras
Production Production Producción Consumption Consommation Consumo1000MT
1000MT
MT /1000capita
1995 1996 1997 1998 1999 1995 1996 1997 1998 1999 1999World 25302 15608 19055 18936 19261 25443 15748 19148 19023 19298 3Africa 199 199 229 111 111 201 197 224 107 103 oAlgeria 21 21 21 21 21 21 21 21 21 21 1Egypt 60 60 60 60 60 66 64 61 61 61 1EthiopiaKenya
10 9 9 10o
92
92
0o
Madagascar 2 2 2 2 2 2 2 2 2 2 oMorocco 5 5 5 5 5 5 5 5 5 5 0Nigeria 3 3 3 3 0South Africa 99 99 115 99 99 115 0Tunisia 12 12 16 14 14 5 3 7 4 4 0N C America 456 504 473 529 534 367 432 347 443 403 1
Canada 40 40 40 40 40 43 37 15 65 58 2Costa Rica 7 7 7 7 7 7 7 7 7 7 2Cuba 52 52 52 52 52 53 53 52 52 52 5Honduras 1 1 1 0 1 2 2 1 0Mexico 117 154 134 182 189 116 166 147 193 191 2USA 240 251 239 247 245 148 168 124 123 92 0SouthAmerica 497 455 456 342 352 502 462 470 358 371 1
Argentina 166 128 124 108 108 167 129 125 109 109 3Brazil 75 75 77 80 83 79 79 87 93 98 1Colombia 142 138 141 137 144 143 139 142 138 145 4Peru 48 48 48 17 17 48 48 48 17 17 1
Venezuela 66 66 66 66 66 68 2 2 o
Asia 23903 14191 17657 17787 18074 24057 14305 17745 17856 18143 5
Bangladesh 38 38 31 18 18 38 38 31 18 18 0China 22206 12566 15986 15986 16432 22220 12572 15994 15999 16445 13India 920 920 930 1020 1020 920 920 929 1019 1028 1
Indonesia 89 79 79 79 79 88 ao 81 80 80 oIran 45 45 45 45 45 46 46 43 45 45 1
Iraq 9 9 9 11 11 9 9 9 11 11 1
Israel 2 1 1 1 0 oJapan 4 4 19 19 19 45 40 63 55 54 0Jordan 8 8 8 8 8 13 33 24 8 8 2Korea 0 P Rp 50 50 50 50 50 50 50 50 50 50 2Korea Rep 2 27 4 2 0Myanmar 9 9 19 17 17 9 9 19 17 17 oNepal 15 15 15 15 15 15 15 15 15 15 1
Pakistan 160 165 170 80 87 160 165 170 80 87 1
Philippines 27 27 27 27 27 27 27 27 27 27 0Sri Lanka 6 7 7 7 7 6 7 7 7 7 0Thailand 134 94 108 228 80 225 111 122 234 89 1
Turkey 108 80 79 102 84 108 80 78 102 85 1
Viet Nam 74 74 74 74 74 74 74 77 83 75 1
Europe 240 252 240 167 190 308 346 358 254 274 0
Austria 1 1 1 4 11 12 10 9 1
Bel-Lux 3 4 3 3 4 oBulgaria 10 10 10 10 10 10 10 10 10 10 1
Czech Rep 2 4 2 1 3 7 9 3 5 0Denmark 34 34 34 35 35 34 0Finland 2 1 -1 1 1 0France 1 2 2 2 3 20 24 36 -3 -13 -oGermcmy 10 2 12 13 0Greece 2 2 2 2 0Hungary 20 16 12 17 17 14 17 10 18 17 2Italy 131 137 125 123 133 134 141 144 149 168 3
Latvia 6 6 oLithuania o 0 1 1 1 oMacedonia 4 1 1 1 4 1 1 1 oNetherlands 3 3 2 9 1 3 3 oNorway 1 1 1 oPoland 1 7 -o o o oPortugal 13 13 14 13 o o oRomania 1 1 1 1 1 2 2 3 1 1 oRussian Fed -7 oSlovakia 17 16 17 16 -1 0Slovenia o 1 2 oSpain 11 11 35 12 24 3 3 26 11 oSweden 21 24 17 29 30 3
Switzerland 2 4 6 -9 -1
UK 15 17 26 17 21 0Yugoslavia 1 1 1 1 1 1 0
Oceania 7 7 8 8 3 5 5 0
Australia 7 7 8 8 3 5 5 o
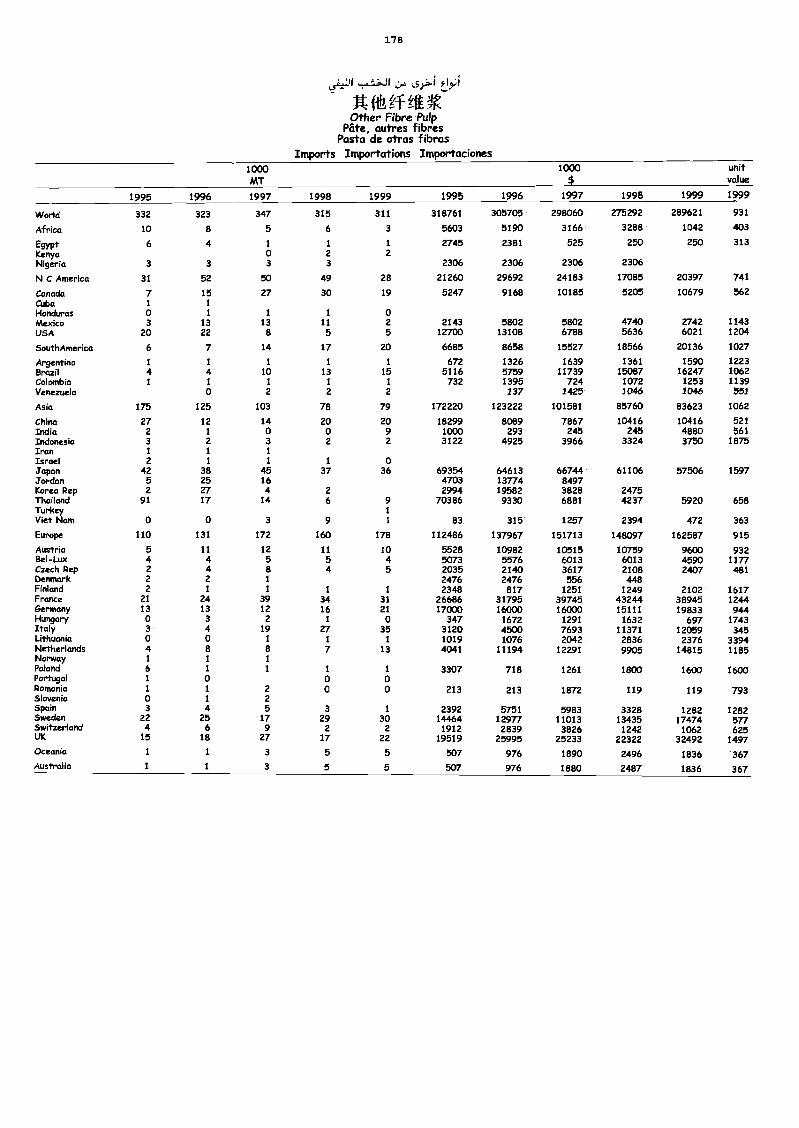
178
L5).:1.1 p13.;1,
JfttMa.Other Fibre Pulp
Pate, autres fibresPasta de otras fibras
Imports Importations Importaciones1000MT
1000$
unitvalue
1995 1996 1997 1998 1999 1995 1996 1997 1998 1999 1999
World 332 323 347 315 311 318761 305705 298060 275292 289621 931
Africa 10 8 5 6 3 5603 5190 3166 3288 1042 403
Egypt 6 4 1 1 1 2745 2381 525 250 250 313Kenya 0 2 2
Nigeria 3 3 3 3 2306 2306 2306 2306
N C America 31 52 50 49 28 21260 29692 24183 17085 20397 741
Canada 7 15 27 30 19 5247 9168 10185 5205 10679 562Cuba 1 1
Honduras o I 1 1 0Mexico 3 13 13 11 2 2143 5802 5802 4740 2742 1143USA 20 22 8 5 5 12700 13108 6788 5636 6021 1204
SouthAmerica 6 7 14 17 20 6685 8658 15527 18566 20136 1027
Argentina 1 1 1 1 1 672 1326 1639 1361 1590 1223Brazil 4 4 10 13 15 5116 5759 11739 15087 16247 1062Colombia 1 1 1 1 1 732 1395 724 1072 1253 1139Venezuela 0 2 2 2 137 1425 1046 1046 551
Asia 175 125 103 78 79 172220 123222 101581 85760 83623 1062
China 27 12 14 20 20 18299 8089 7867 10416 10416 521India 2 1 0 0 9 1000 293 245 245 4880 561Indonesia 3 2 3 2 2 3122 4925 3966 3324 3750 1875Iran 1 1 1
Israel 2 1 1 1 0Japan 42 38 45 37 36 69354 64613 66744 61106 57506 1597Jordan 5 25 16 4703 13774 8497Korea Rep 2 27 4 2 2994 19582 3828 2475'Thailand 91 17 14 6 9 70386 9330 6881 4237 5920 658Turkey 1
Viet Nam 0 0 3 9 1 83 315 1257 2394 472 363
Europe 110 131 172 160 178 112486 137967 151713 148097 162587 915
Austria 5 11 12 11 10 5528 10982 10515 10759 9600 932Bel-Lux 4 4 5 5 4 5073 5576 6013 6013 4590 1177Czech Rep 2 4 8 4 5 2035 2140 3617 2108 2407 481Denmark 2 2 1 2476 2476 556 448Finland 2 1 1 1 1 2348 817 1251 1249 2102 1617France 21 24 39 34 31 26686 31795 39745 43244 38945 1244Germany 13 13 12 16 21 17000 16000 16000 15111 19833 944Hungary o 3 2 1 0 347 1672 1291 1632 697 1743Italy 3 4 19 27 35 3120 4500 7693 11371 12059 345Lithuania 0 0 1 1 1 1019 1076 2042 2836 2376 3394Netherlands 4 8 8 7 13 4041 11194 12291 9905 14815 1185Norway 1 1 1
Poland 6 / 1 1 1 3307 718 1261 1800 1600 1600Portugal 1 0 o oRomania 1 1 2 0 0 213 213 1872 119 119 793Slovenia 0 1 2Spain 3 4 5 3 1 2392 5751 5983 3328 1282 1282Sweden 22 25 17 29 30 14464 12977 11013 13435 17474 577Switzerland 4 6 9 2 2 1912 2839 3826 1242 1062 625UK 15 18 27 17 22 19519 25995 25233 22322 32492 1497Oceania 1 1 3 5 5 507 976 1890 2496 1836 367Australia 1 1 3 5 5 507 976 1880 2487 1836 367
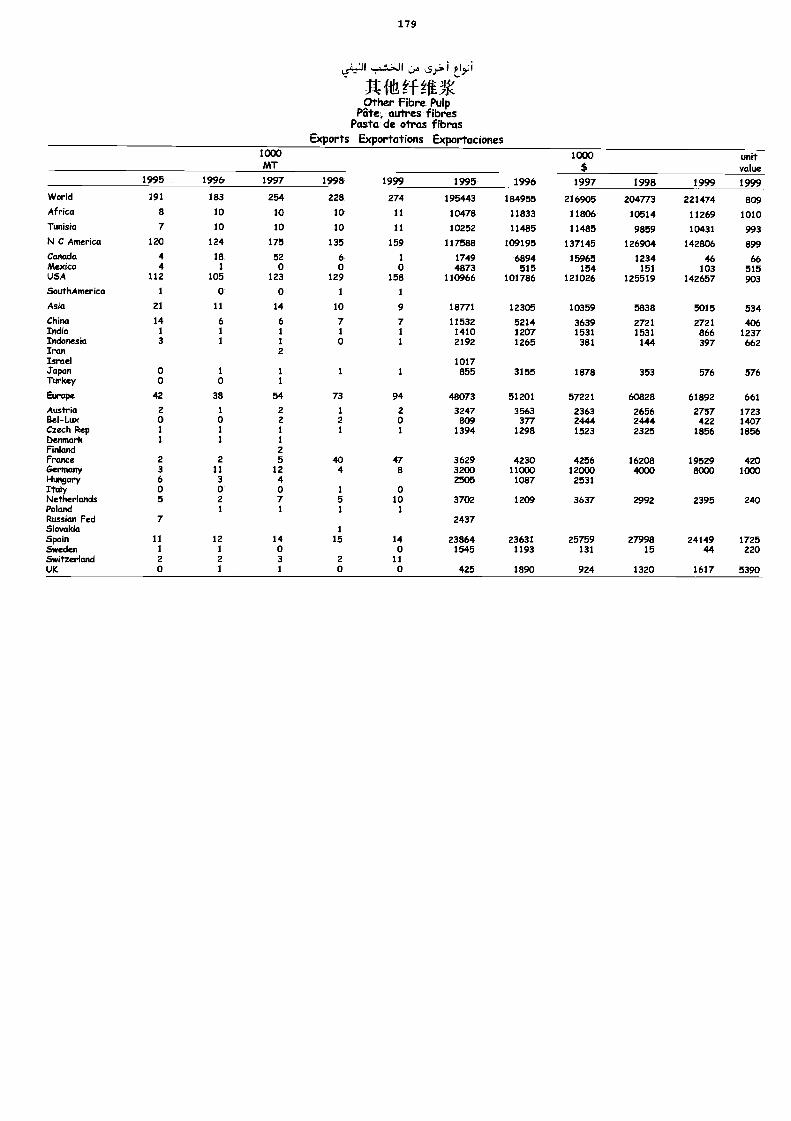
179
Lei7J: I
A ft ?-f titOther Fibre Pulp
Pate, autres fibresPasta de otras fibras
Exports Exportations Exportaciones1000MT
1000
$unitvalue
1995 1996 1997 1998 1999 1995 1996 1997 1998 1999 1999World 191 183 254 228 274 195443 184955 216905 204773 221474 809Africa 8 10 10 10 11 10478 11833 11806 10514 11269 1010Tunisia 7 10 10 10 11 10252 11485 11485 9859 10431 993N C America 120 124 175 135 159 117588 109195 137145 126904 142806 899Cartada 4 18 52 6 1 1749 6894 15965 1234 46 66Mexico 4 1 0 0 o 4873 515 154 151 103 515USA 112 105 123 129 158 110966 101786 121026 125519 142657 903SouthAmerica 1 o o 1 1
Asia 21 11 14 10 9 18771 12305 10359 5838 5015 534China 14 6 6 7 7 11532 5214 3639 2721 2721 406India 1 1 1 1 1 1410 1207 1531 1531 866 1237Indonesia 3 1 1 0 / 2192 1265 381 144 397 662Iran 2Israel 1017Japan 0 1 1 1 1 855 3155 1878 353 576 576Turkey 0 0 1
Europe 42 38 54 73 94 48073 51201 57221 60828 61892 661Austria 2 1 2 1 2 3247 3563 2363 2656 2757 1723Rel-Lux 0 0 2 2 0 809 377 2444 2444 422 1407Czech Rep 1 1 1 1 1 1394 1298 1523 2325 1856 1856Denmark 1 1 1
Finland 2France 2 2 5 40 47 3629 4230 4256 16208 19529 420Germany 3 11 12 4 8 3200 11000 12000 4000 8000 1000Hungary 6 3 4 2505 1087 2531Italy 0 0 O 1 0Netherlands 5 2 7 5 10 3702 1209 3637 2992 2395 240Poland 1 1 1 1
RUSSiCIII Fed 7 2437Slovakia 1
Spain 11 12 14 15 14 23864 23631 25759 27998 24149 1725Sweden 1 1 o 0 1545 1193 131 15 44 220Switzerland 2 2 3 2 11UK 0 1 1 0 0 425 1890 924 1320 1617 5390
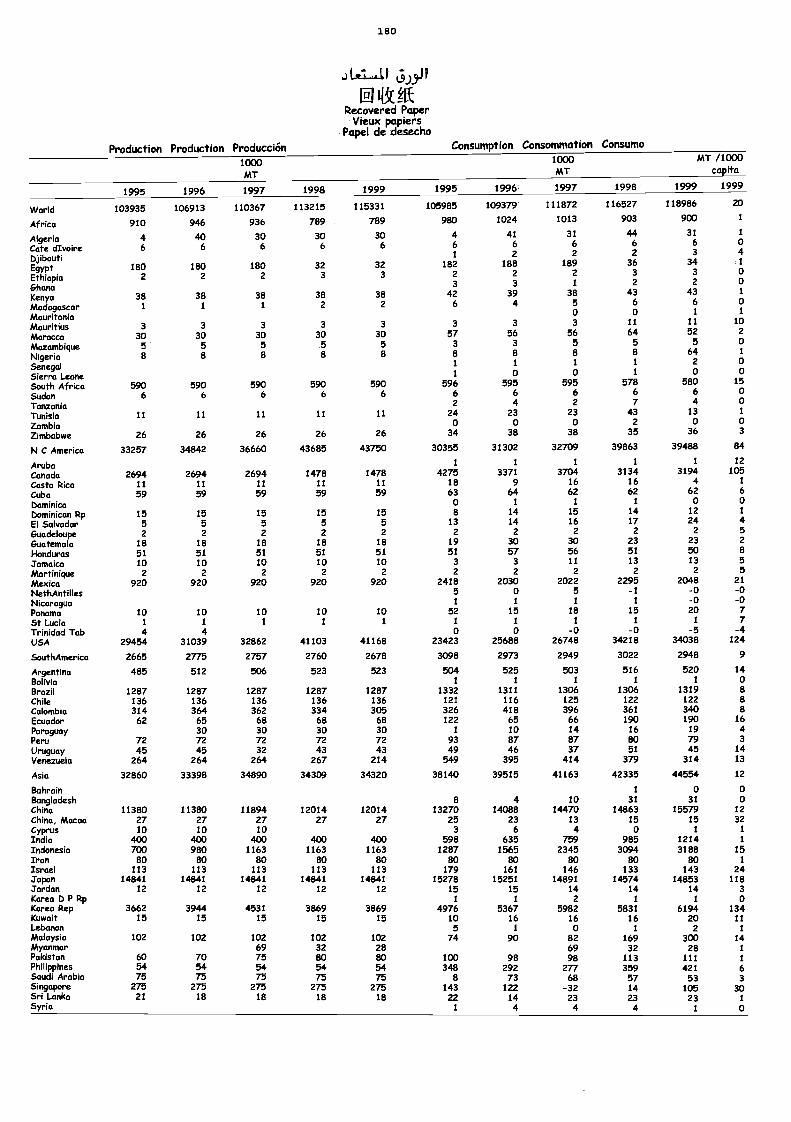
180
..A.4 5)5.11
13 ilk tUkRecovered Paper
Vieux papiersPapel de desecho
Production Production Producción Consumption Consommation Consumo
1000MT
1000MT
MT /1000copita
1995 1996 1997 1998 1999 1995 1996 1997 1998 1999 1999
World 103935 106913 110367 113215 115331 105985 109379 111872 116527 118986 20
Africa 910 946 936 789 789 980 1024 1013 903 900 1
Algeria 4 40 30 30 30 4 41 31 44 31 1
Cote dIvoire 6 6 6 6 6 6 6 6 6 6 o4
Djibouti 1 2 2 2 31
EgyptEthiopia
1802
1802
1802
323
323
1822
1882
1892
363
343 o
Ghana 3 3 1 2 2 o
Kenya 38 38 38 38 38 42 39 38 43 43 1
Madagascar 1 1 1 2 2 6 4 5 6 6 o
Mauritania o o 1 1
Mauritius 3 3 3 3 3 3 3 3 11 11 10
Morocco 30 30 30 30 30 57 56 56 64 52 2
Mozambique 5 5 5 5 5 3 3 5 5 5 0
Nigeria a 8 a 8 8 8 s a 8 64 1
Senegal 1 1 1 1 2 o
Sierra Leone 1 o o 1 o o
South Africa 590 590 590 590 590 596 595 595 578 580 15
Sudan 6 6 6 6 6 6 6 6 6 6 o
Tanzania 2 4 2 7 4 o
TunisiaZambia
11 11 11 11 11 24o
230
23o
432
13o
1
o
Zimbabwe 26 26 26 26 26 34 38 38 35 36 3
N C America 33257 34842 36660 43685 43750 30355 31302 32709 39863 39488 84
Aruba 1 1 1 1 1 12
Canada 2694 2694 2694 1478 1478 4275 3371 3704 3134 3194 105
Costa Rica 11 11 11 11 11 18 9 16 16 4 1
CubaDominica
59 59 59 59 59 63o
641
621
621
62o
6o
Dominican Rp 15 15 15 15 15 8 14 15 14 12 1
El Salvador 5 5 5 5 5 13 14 16 17 24 4
Guadeloupe 2 2 2 2 2 2 2 2 2 2 5
Guatemala 18 18 18 18 18 19 30 30 23 23 2
Honduras 51 51 51 51 51 51 57 56 51 50 8
Jamaica 10 10 10 10 10 3 3 11 13 13 5
Martinique 2 2 2 2 2 2 2 2 2 2 5
Mexico 920 920 920 920 920 2418 2030 2022 2295 2048 21
NethAntilles 5 o 5 -1 -o -oNicaragua 1 1 1 1 -o -oPanama 10 10 10 10 10 52 15 18 15 20 7
St Lucia 1 1 1 1 1 1 1 1 1 1 7Trinidad Tob 4 4 o o -o -o -5 -4USA 29454 31039 32862 41103 41168 23423 25688 26748 34218 34038 124
SouthAmerica 2665 2775 2757 2760 2678 3098 2973 2949 3022 2948 9
Argentina 485 512 506 523 523 504 525 503 516 520 14
Bolivia 1 1 1 1 1 oBrazil 1287 1287 1287 1287 1287 1332 1311 1306 1306 1319 8Chile 136 136 136 136 136 121 116 125 122 122 8Colombia 314 364 362 334 305 326 418 396 361 340 8
Ecuador 62 65 68 68 68 122 65 66 190 190 16Paraguay 30 30 30 30 1 10 14 16 19 4Peru 72 72 72 72 72 93 87 87 so 79 3Uruguay 45 45 32 43 43 49 46 37 51 45 14Venezuela 264 264 264 267 214 549 395 414 379 314 13
Asia 32860 33398 34890 34309 34320 38140 39515 41163 42335 44554 12
Bahrain 1 o oBangladesh 8 4 10 31 31 oChina 11380 11380 11894 12014 12014 13270 14088 14470 14863 15579 12China, Macao 27 27 27 27 27 25 23 13 15 15 32Cyprus 10 10 10 3 6 4 o 1 1
India 400 400 400 400 400 598 635 759 985 1214 1
Indonesia 700 980 1163 1163 1163 1287 1565 2345 3094 3188 15Iran 80 so 80 so 80 80 80 so 80 so 1
Israel 113 113 113 113 113 179 161 146 133 143 24Japan 14841 14841 14841 14841 14841 15278 15251 14891 14574 14853 118Jordan 12 12 12 12 12 15 15 14 14 14 3Korea D P Rp 1 1 2 1 1 oKorea Rep 3662 3944 4531 3869 3869 4976 5367 5982 5831 6194 134Kuwait 15 15 15 15 15 10 16 16 16 20 11Lebanon 5 1 o 1 2 1
Malaysia 102 102 102 102 102 74 90 82 169 300 14Mycuunar 69 32 28 69 32 28 1
Pakistan 60 70 75 so 80 100 98 98 113 111 1
Philippines 54 54 54 54 54 348 292 277 359 421 6Saudi Arabia 75 75 75 75 75 s 73 68 57 53 3Singapore 275 275 275 275 275 143 122 -32 14 105 30Sri Lanka 21 18 18 18 18 22 14 23 23 23 1Syria 1 4 4 4 1 o
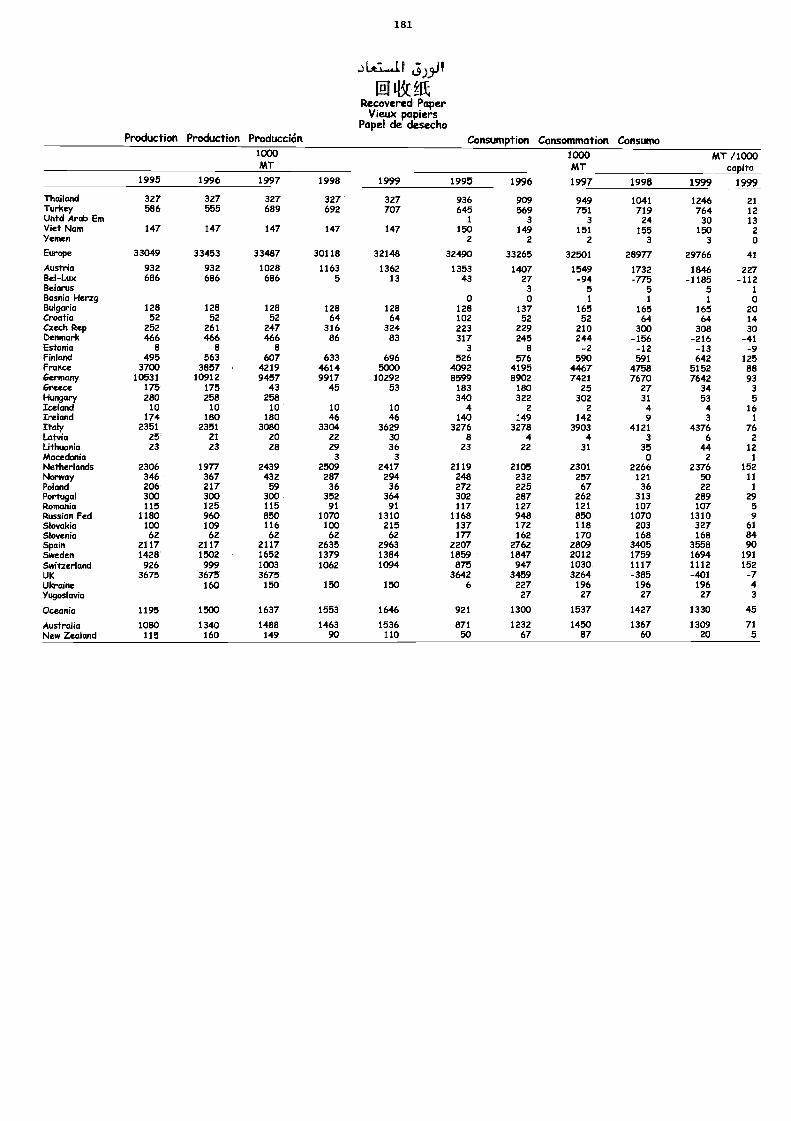
181
.) L1dP ).3.1
LI IBC fRRecovered Paper
Vieux papiersPapel de desecho
Production Production Producción Consumption Consommation Consumo1000MT
1000MT
MT /1000capita
1999 19991995 1996 1997 1998 1999 1995 1996 1997 1998
Thailand 327 327 327 327 327 936 909 949 1041 1246 21Turkey 586 555 689 692 707 645 569 751 719 764 12Untd Arab Em I 3 3 24 30 13Viet Nam 147 147 147 147 147 150 149 151 155 150 2Yemen 2 2 2 3 3 0
Europe 33049 33453 33487 30118 32148 32490 33265 32501 28977 29766 41
Austria 932 932 1028 1163 1362 1353 1407 1549 1732 1846 227Bel-Lux 686 686 686 5 13 43 27 -94 -775 -1185 -112Belarus 3 5 5 5 1
Bosnia Herzg 0 0 1 1 1 0Bulgaria 128 128 128 128 128 128 137 165 165 165 20Croatia 52 52 52 64 64 102 52 52 64 64 14Czech Rep 252 261 247 316 324 223 229 210 300 308 30Denmark 466 466 466 86 83 317 245 244 -156 -216 -41Estonia 8 8 8 3 8 -2 -12 -13 -9Finland 495 563 607 633 696 526 576 590 591 642 125France 3700 3857 4219 4614 5000 4092 4195 4467 4758 5152 88Germany 10531 10912 9457 9917 10292 8599 8902 7421 7670 7642 93Greece 175 175 43 45 53 183 180 25 27 34 3Hungary 280 258 258 340 322 302 31 53 5Iceland 10 10 10 10 10 4 2 2 4 4 16Ireland 174 180 180 46 46 140 149 142 9 3 1
Italy 2351 2351 3080 3304 3629 3276 3278 3903 4121 4376 76Latvia 25 ZI 20 22 30 8 4 4 3 6 2Lithuania 23 23 28 29 36 23 22 31 35 44 12Macedonia 3 3 0 2 1
Netherlands 2306 1977 2439 2509 2417 2119 2105 2301 2266 2376 152Norway 346 367 432 287 294 248 232 257 121 50 11Poland 206 217 59 36 36 272 225 67 36 22 1
Portugal 300 300 300 352 364 302 287 262 313 289 29Romania 115 125 115 91 91 117 127 121 107 107 5Russian Fed 1180 960 850 1070 1310 1168 948 850 1070 1310 9Slovakia 100 109 116 100 215 137 172 118 203 327 61Slovenia 62 62 62 62 62 177 162 170 168 168 84Spain 2117 2117 2117 2635 2963 2207 2762 2809 3405 3558 90Sweden 1428 1502 1652 1379 1384 1859 1847 2012 1759 1694 191Switzerland 926 999 1003 1062 1094 875 947 1030 1117 1112 152UK 3675 3675 3675 3642 3459 3264 -385 -401 -7Ukraine 160 150 150 150 6 227 196 196 196 4Yugoslavia 27 27 27 27 3
Oceania 1195 1500 1637 1553 1646 921 1300 1537 1427 1330 45
Australia 1080 1340 1488 1463 1536 871 1232 1450 1367 1309 71New Zealand 115 160 149 90 110 50 67 87 60 20 5
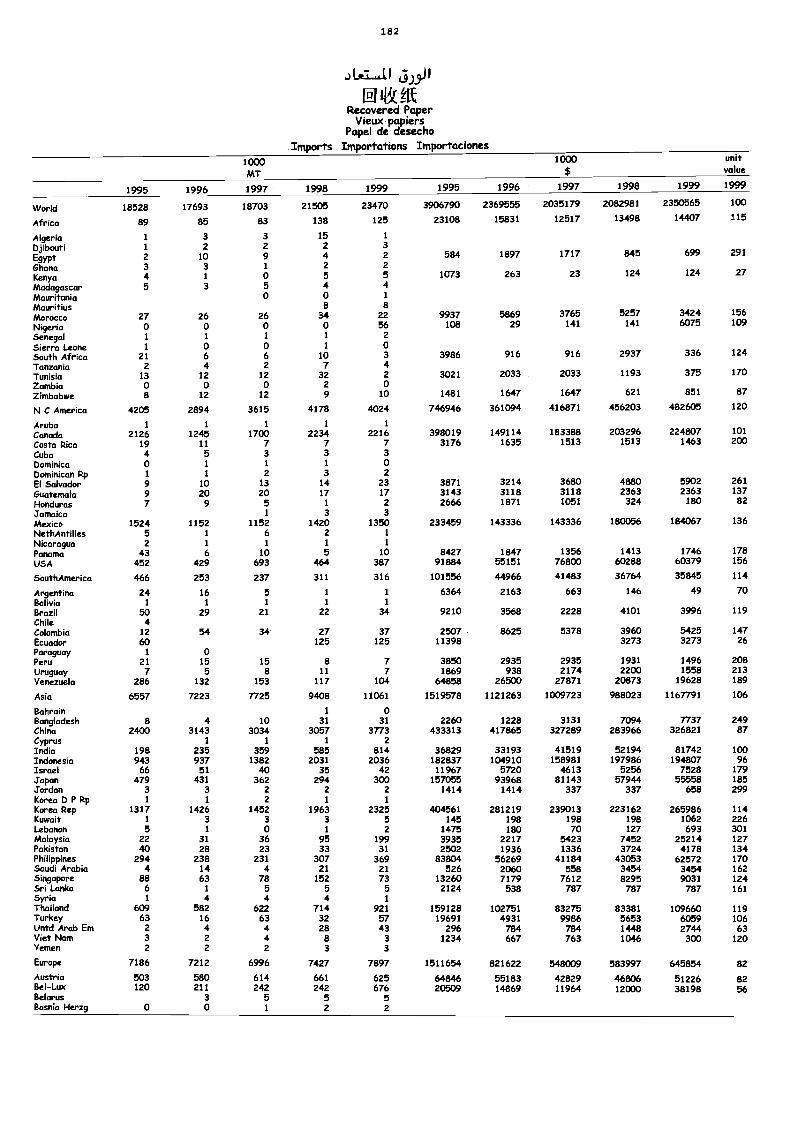
182
J LdIB(±ft
Recovered PaperVieux papiers
Papel de desechoImports Importations Importaciones
1000MT
1000$
unitvalue
1995 1996 1997 1998 1999 1995 1996 1997 1998 1999 1999
World 18528 17693 18703 21505 23470 3906790 2369555 2035179 2082981 2350565 100
Africa 89 85 83 138 125 23108 15831 12517 13498 14407 115
Algeria 1 3 3 15 1
Djibouti 1 2 2 2 3
Egypt 2 10 9 4 2 584 1897 1717 845 699 291
Ghana 3 3 1 2 2
Kenya 4 1 0 5 5 1073 263 23 124 124 27
Madagascar 5 3 5 4 4Mauritania 0 0 1
Mauritius 8 8Ntorocco 27 26 26 34 22 9937 5869 3765 5257 3424 156
Nigeria 0 0 0 0 56 108 29 141 141 6075 109
Senegal 1 1 1 1 2
Sierra Leone 1 o 0 1 0South Africa 21 6 6 10 3 3986 916 916 2937 336 124
Tanzania 2 4 2 7 4Tunisia 13 12 12 32 2 3021 2033 2033 1193 375 170
Zambia o o 0 2 oZimbabwe 8 12 12 9 10 1481 1647 1647 621 851 87
N C America 4205 2894 3615 4178 4024 746946 361094 416871 456203 482605 120
Aruba 1 1 1 1 1
Canada 2126 1245 1700 2234 2216 398019 149114 183388 203296 224807 101
Costa Rica 19 11 7 7 7 3176 1635 1513 1513 1463 200Cuba 4 5 3 3 3
Dominica 0 1 1 i 0Dominican Rp 1 1 2 3 2
El Salvador 9 10 13 14 23 3871 3214 3680 4880 5902 261
Guatemala 9 20 20 17 17 3143 3118 3118 2363 2363 137
Honduras 7 9 5 1 2 2666 1871 1051 324 180 82
Jamaica 1 3 3
Mexico 1524 1152 1152 1420 1350 233459 143336 143336 180056 184067 136
NethAntilles 5 1 6 2 1
Nicaragua 2 1 1 1 1
Panama 43 6 10 5 10 8427 1847 1356 1413 1746 178
USA 452 429 693 464 387 91884 55151 76803 60288 60379 156
SouthAmerica 466 253 237 311 316 101556 44966 41483 36764 35845 114
Argentina 24 16 5 1 1 6364 2163 663 146 49 70Bolivia 1 1 1 1 1
Brazil 50 29 21 22 34 9210 3568 2228 4101 3996 119Chile 4Colombia 12 54 34 27 37 2507 8625 5378 3960 5425 147Ecuador 60 125 125 11398 3273 3273 26Paraguay 1 oPeru 21 15 15 a 7 3850 2935 2935 1931 1496 208Uruguay 7 5 8 11 7 1869 938 2174 2200 1558 213Venezuela 286 132 153 117 104 64858 26500 27871 20873 19628 189
Asia 6557 7223 7725 9408 11061 1519578 1121263 1009723 988023 1167791 106
Bahrain 1 0Bangladesh 8 4 10 31 31 2260 1228 3131 7094 7737 249China 2400 3143 3034 3057 3773 433313 417865 327289 283966 326821 87Cyprus 1 1 1 2India 198 235 359 585 814 36829 33193 41519 52194 81742 100Indonesia 943 937 1382 2031 2036 182837 104910 158981 197986 194807 96Israel 66 51 40 35 42 11967 5720 4613 5256 7528 179Japan 479 431 362 294 300 157055 93968 81143 57944 55558 185Jordan 3 3 2 2 2 1414 1414 337 337 658 299Korea D P Rp 1 1 2 1 1
Korea Rep 1317 1426 1452 1963 2325 404561 281219 239013 223162 265986 114Kuwait 1 3 3 3 5 145 198 198 198 1062 226Lebanon 5 1 o 1 2 1475 180 70 127 693 301Malaysia 22 31 36 95 199 3935 2217 5423 7452 25214 127Pakistan 40 28 23 33 31 2502 1936 1336 3724 4178 134Philippines 294 238 231 307 369 83804 56269 41184 43053 62572 170Saudi Arabia 4 14 4 21 21 526 2060 558 3454 3454 162Singapore 88 63 78 152 73 13260 7179 7612 8295 9031 124Sri Lanka 6 1 5 5 5 2124 538 787 787 787 161Syria 1 4 4 4 1
Thailand 609 582 622 714 921 159128 102751 83275 83381 109660 119Turkey 63 16 63 32 57 19691 4931 9986 5653 6059 106Untd Arab Em 2 4 4 28 43 296 784 784 1448 2744 63Viet Nam 3 2 4 8 3 1234 667 763 1046 300 120Yemen 2 2 2 3 3
Europe 7186 7212 6996 7427 7897 1511654 821622 548009 583997 645854 82Austria 503 580 614 661 625 64846 55183 42829 46806 51226 82Bel-Lux 120 211 242 242 676 20509 14869 11964 12000 38198 56Belarus 3 5 5 5Bosnia Herzg 0 0 1 2 2
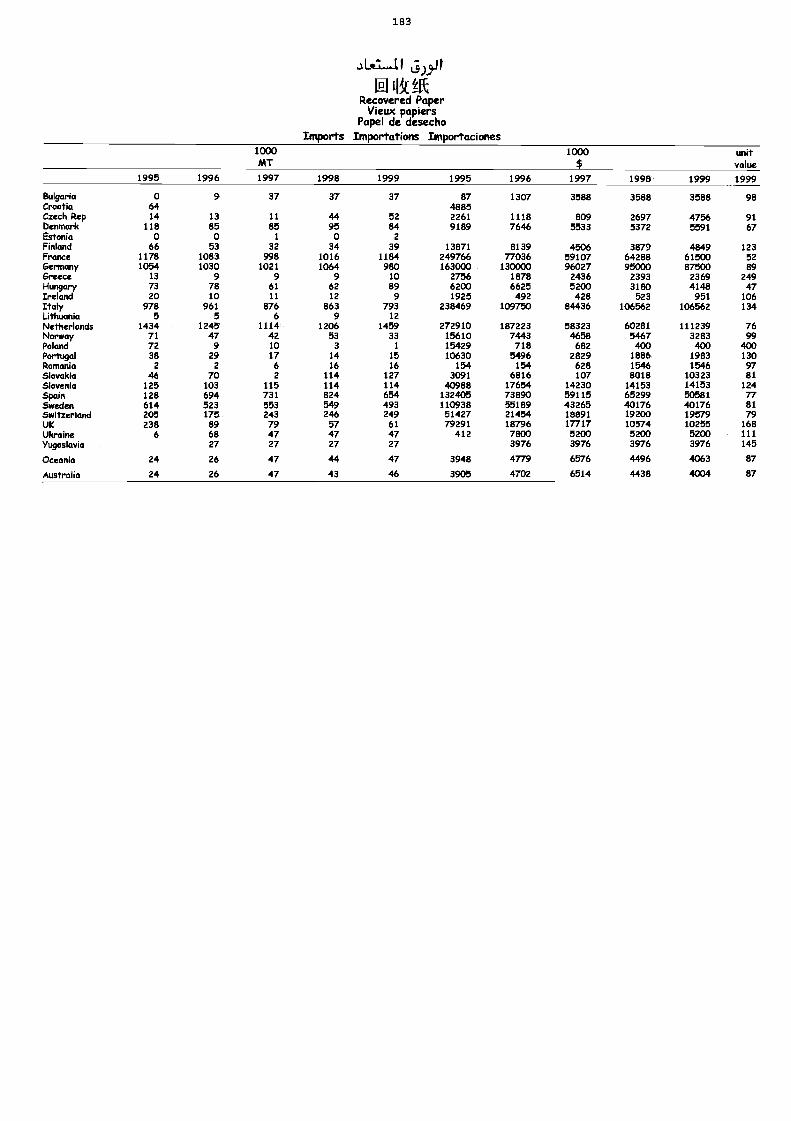
183
'61.11 5)90
1111MRecovered Paper
Vieux papiersPapel de desecho
Imports Importations Importaciones1000MT
1000$
unitvalue
1995 1996 1997 1998 1999 1995 1996 1997 1998 1999 1999
Bulgaria 0 9 37 37 37 87 1307 3588 3588 3588 98Croatia 64 4885Czech Rep 14 13 11 44 52 2261 1118 809 2697 4756 91Denmark 118 85 85 95 84 9189 7646 5533 5372 5591 67Estonia 0 0 1 0 2Finlcmd 66 53 32 34 39 13871 8139 4506 3879 4849 123France 1178 1083 998 1016 1184 249766 77036 59107 64288 61500 52Germany 1054 1030 1021 1064 980 163000 130000 96027 95000 87500 89Greece 13 9 9 9 10 2756 1878 2436 2393 2369 249Hungary 73 78 61 62 89 6200 6625 5200 3180 4148 47Ireland 20 10 11 12 9 1925 492 428 523 951 106Italy 978 961 876 863 793 238469 109750 84436 106562 106562 134Lithuania 5 5 6 9 12Netherlands 1434 1245 1114 1206 1459 272910 187223 58323 60281 111239 76Norway 71 47 42 53 33 15610 7443 4658 5467 3283 99Poland 72 9 10 3 1 15429 718 682 400 400 400Portugal 38 29 17 14 15 10630 5496 2829 1886 1983 130Romania 2 2 6 16 16 154 154 628 1546 1546 97Slovakia 46 70 2 114 127 3091 6816 107 8018 10323 81Slovenia 125 103 115 114 114 40988 17654 14230 14153 14153 124Spain 128 694 731 824 654 132405 73890 59115 65299 50581 77Sweden 614 523 553 549 493 110938 55189 43265 40176 40176 81Switzerland 205 175 243 246 249 51427 21454 18891 19200 19579 79UK 238 89 79 57 61 79291 18796 17717 10574 10255 168Ukraine 6 68 47 47 47 412 7800 5200 5200 5200 111Yugoslavia 27 27 27 27 3976 3976 3976 3976 145
Oceania 24 26 47 44 47 3948 4779 6576 4496 4063 87
Australia 24 26 47 43 46 3905 4702 6514 4438 4004 87
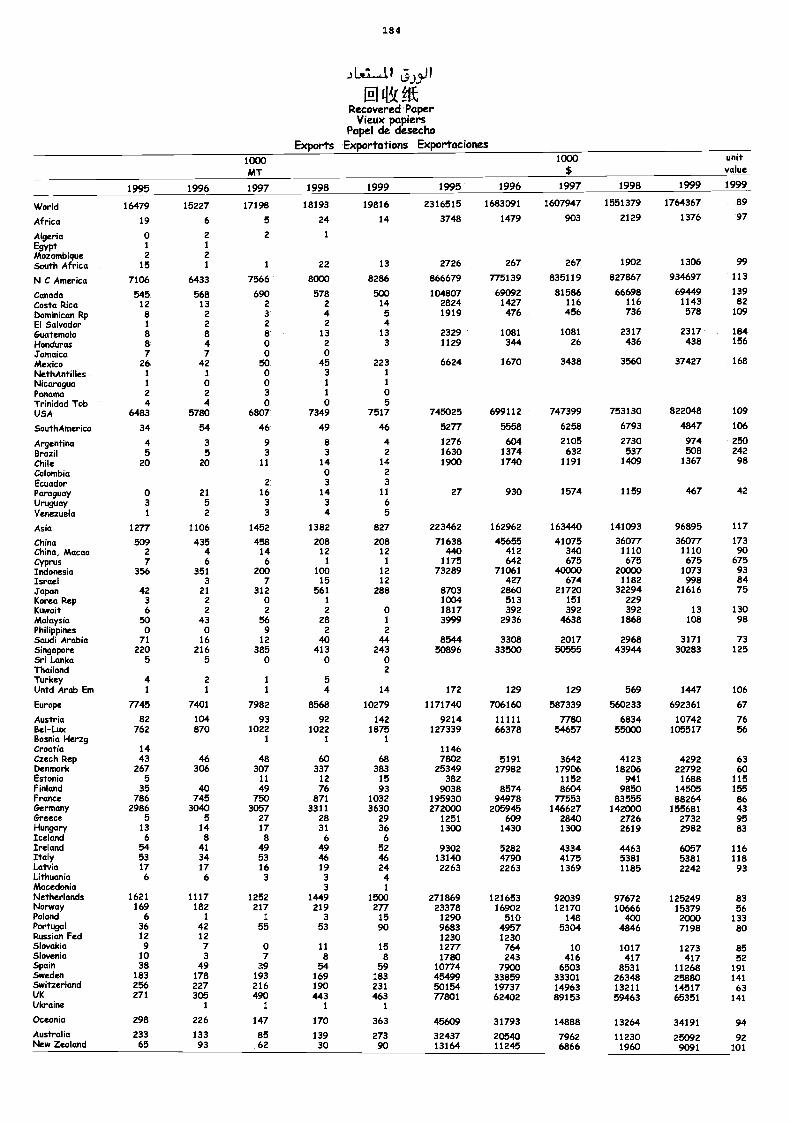
184
JP.C.1-adl
11 let AtRecovered Paper
Vieux papiersPapel de desecho
Exports Exportations Exportaciones1000MT
1000 unitvalue
1995 1996 1997 1998 1999 1995 1996 1997 1998 1999 1999
World 16479 15227 17198 18193 19816 2316515 1683091 1607947 1551379 1764367 89
Africa 19 6 5 24 14 3748 1479 903 2129 1376 97
Algeria 0 2 2 1
Egypt 1 1
Mozambique 2 2South Africa 15 1 1 22 13 2726 267 267 1902 1306 99
N C Americo 7106 6433 7566 8000 8286 866679 775139 835119 827867 934697 113
Canada 545 568 690 578 500 104807 69092 81586 66698 69449 139
Costa Rica 12 13 2 2 14 2824 1427 116 116 1143 82
Dominican Rp 8 2 3 4 5 1919 476 456 736 578 109
El Salvador 1 2 2 2 4Guatemala 8 8 8 13 13 2329 1081 1081 2317 2317 184
Honduras 8 4 0 2 3 1129 344 26 436 438 156
Jamaica 7 7 0 0Mexico 26 42 50 45 223 6624 1670 3438 3560 37427 168
NethAntilles 1 1 0 3 1
Nicaragua 1 0 0 1 1
Panama 2 2 3 1 0Trinidad Tob 4 4 0 0 5USA 6483 5780 6807 7349 7517 745025 699112 747399 753130 822048 109
SoirthAmerica 34 54 46 49 46 5277 5558 6258 6793 4847 106
Argentina 4 3 9 8 4 1276 604 2105 2730 974 250Brazil 5 5 3 3 2 1630 1374 632 537 508 242Chile 20 20 11 14 14 1900 1740 1191 1409 1367 98Colombia 0 2Ecuador 2 3 3
Paraguay 0 21 16 14 11 27 930 1574 1159 467 42Uruguay 3 5 3 3 6Venezuela 1 2 3 4 5
Asia 1277 1106 1452 1382 827 223462 162962 163440 141093 96895 117
China 509 435 458 208 208 71638 45655 41075 36077 36077 173China, Macao 2 4 14 12 12 440 412 340 1110 1110 90Cyprus 7 6 6 1 1 1175 642 675 675 675 675Indonesia 356 351 200 100 12 73289 71061 40000 20000 1073 93Israel 3 7 15 12 427 674 1182 998 84Japan 42 21 312 561 288 8703 2860 21720 32294 21616 75Korea Rep 3 2 0 1 1004 513 151 229Kuwait 6 2 2 2 0 1817 392 392 392 13 130Malaysia 50 43 56 28 1 3999 2936 4638 1868 108 98Philippines 0 0 9 2 2Saudi Arabia 71 16 12 40 44 8544 3308 2017 2968 3171 73Singapore 220 216 385 413 243 50896 33500 50555 43944 30283 125Sri Lanka 5 5 0 0 0Thailand 2Turkey 4 2 1 5Untd Arab Em 1 1 1 4 14 172 129 129 569 1447 106
Europe 7745 7401 7982 8568 10279 1171740 706160 587339 560233 692361 67
Austria 82 104 93 92 142 9214 11111 7780 6834 10742 76Bel-Lux 762 870 1022 1022 1875 127339 66378 54657 55000 105517 56Bosnia Herzg 1 1 1
Croatia 14 1146Czech Rep 43 46 48 60 68 7802 5191 3642 4123 4292 63Denmark 267 306 307 337 383 25349 27982 17906 18206 22792 60Estonia 5 11 12 15 382 1152 941 1688 115Finland 35 40 49 76 93 9038 8574 8604 9850 14505 155France 786 745 750 871 1032 195930 94978 77553 83555 88264 86Germany 2986 3040 3057 3311 3630 272000 205945 146627 142000 155681 43Greece 5 5 27 28 29 1251 609 2840 2726 2732 95Hungary 13 14 17 31 36 1300 1430 1300 2619 2982 83Iceland 6 8 8 6 6Ireland 54 41 49 49 52 9302 5282 4334 4463 6057 116Italy 53 34 53 46 46 13140 4790 4175 5381 5381 118Latvia 17 17 16 19 24 2263 2263 1369 1185 2242 93Lithuania 6 6 3 3 4Macedonia 3 1
Netherlands 1621 1117 1252 1449 1500 271869 121653 92039 97672 125249 83Norway 169 182 217 219 277 23378 16902 12170 10666 15379 56Poland 6 1 1 3 15 1290 510 148 400 2000 133Portugal 36 42 55 53 90 9683 4957 5304 4846 7198 80Russian Fed 12 12 1230 1230Slovakia 9 7 0 11 15 1277 764 10 1017 1273 85Slovenia 10 3 7 8 8 1780 243 416 417 417 52Spain 38 49 39 54 59 10774 7900 6503 8531 11268 191Sweden 183 178 193 169 183 45499 33859 33301 26348 25880 141Switzerland 256 227 216 190 231 50154 19737 14963 13211 14517 63UK 271 305 490 443 463 77801 62402 89153 59463 65351 141Ukraine 1 1 1 1
Oceania 298 226 147 170 363 45609 31793 14888 13264 34191 94Australia 233 133 85 139 273 32437 20540 7962 11230 25092 92New Zealand 65 93 , 62 30 90 13164 11245 6866 1960 9091 101
j»." 5 j).,-11
fft fn kLURPAPER AND PAPERBOARD
PAPIER ET CARTON
PAPEL Y CARTÓN
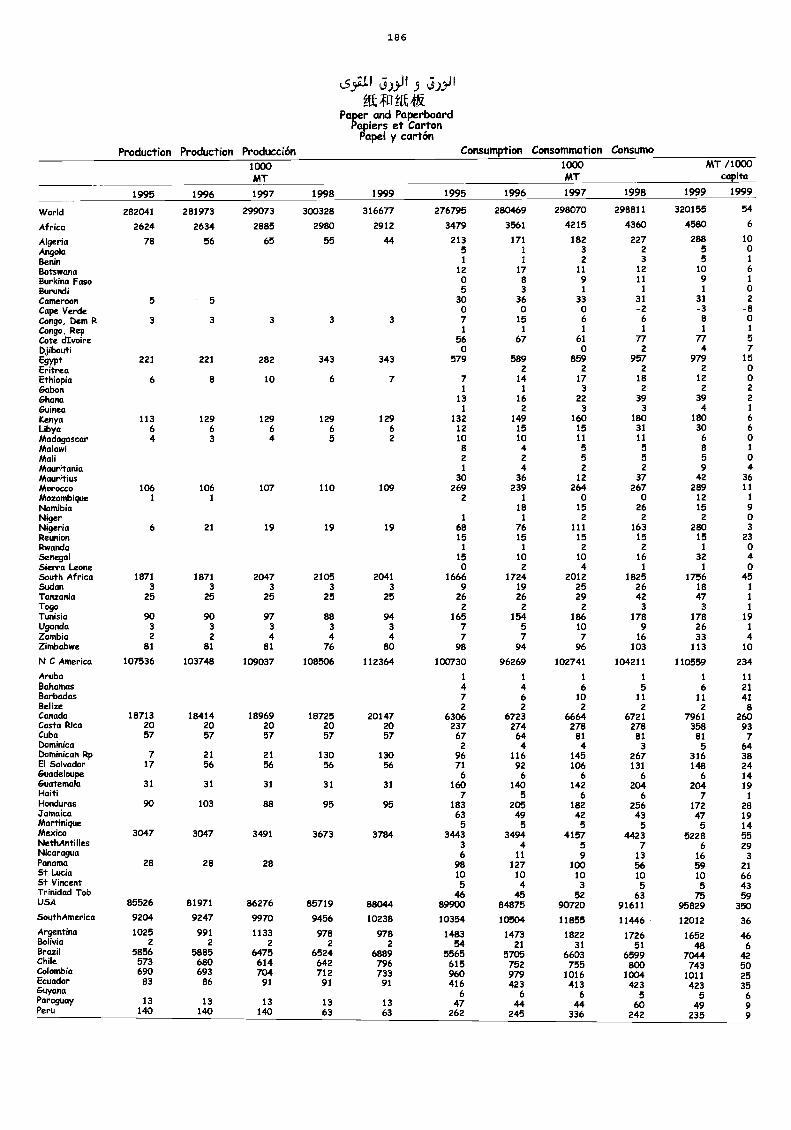
186
FltRÌKPaper and Paperboard
Papiers et CartonPapel y cartón
Production Production Producción Consumption Consommation Consumo1000MT
1000MT
MT /1000capita
1995 1996 1997 1998 1999 1995 1996 1997 1998 1999 1999
World 282041 281973 299073 300328 316677 276795 280469 298070 298811 320155 54
Africa 2624 2634 2885 2980 2912 3479 3561 4215 4360 4580 6
Algeria 78 56 65 55 44 213 171 182 227 288 10
Angola 5 1 3 2 5 0Benin 1 1 2 3 5 1
Botswana 12 17 11 12 10 6Burkina Faso 0 8 9 11 9 1
Burundi 5 3 1 1 1 oCameroon 5 5 30 36 33 31 31 2
Cape Verde 0 0 0 -2 -3 -8Congo, Um R 3 3 3 3 3 7 15 6 6 8 0Congo, Rep 1 1 1 1 1 1
Cote cilvoire 56 67 61 77 77 5Djibouti o o 2 4 7Egypt 221 221 282 343 343 579 589 859 957 979 15Eritrea 2 2 2 2 0Ethiopia 6 8 10 6 7 7 14 17 18 12 0Gabon 1 1 3 2 2 2
Ghana 13 16 22 39 39 2
Guinea 1 2 3 3 4 1
Kenya 113 129 129 129 129 132 149 160 180 180 6Libya 6 6 6 6 6 12 15 15 31 30 6Madagascar 4 3 4 5 2 10 10 11 11 6 0Malawi 8 4 5 5 8 1
Mali 2 2 5 5 5 oMauritania 1 4 2 2 9 4Mauritius 30 36 12 37 42 36Morocco 106 106 107 110 109 269 239 264 267 289 11
Mozambique 1 1 2 1 0 0 12 1
Namibia 18 15 26 15 9Niger 1 1 2 2 2 0Nigeria 6 21 19 19 19 68 76 111 163 280 3Reunion 15 15 15 15 15 23Rwanda 1 1 2 2 1 0Senegal 15 10 10 16 32 4Sierra Leone 0 2 4 1 1 0South Africa 1871 1871 2047 2105 2041 1666 1724 2012 1825 1756 45Sudan 3 3 3 3 3 9 19 25 26 18 1
Tanzania 25 25 25 25 25 26 26 29 42 47 1
Togo 2 2 2 3 3 1
Tunisia 90 90 97 88 94 165 154 186 178 178 19Uganda 3 3 3 3 3 7 5 10 9 26 1
Zambia 2 2 4 4 4 7 7 7 16 33 4Zimbabwe 81 81 81 76 80 98 94 96 103 113 10
N C America 107536 103748 109037 108506 112364 100730 96269 102741 104211 110559 234
Aruba i 1 1 1 1 11Bahamas 4 4 6 5 6 21Barbados 7 6 10 11 11 41Belize 2 2 2 2 2 8Canada 18713 18414 18969 18725 20147 6306 6723 6664 6721 7961 260Costa Rica 20 20 20 20 20 237 274 278 278 358 93Cuba 57 57 57 57 57 67 64 81 81 81 7Dominica 2 4 4 3 5 64Dominican Rp 7 21 21 130 130 96 116 145 267 316 38El Salvador 17 56 56 56 56 71 92 106 131 148 24Guadeloupe 6 6 6 6 6 14Guatemala 31 31 31 31 31 160 140 142 204 204 19Haiti 7 5 6 6 7 1Honduras 90 103 88 95 95 183 205 182 256 172 28Jamaica 63 49 42 43 47 19Martinique 5 5 5 5 5 14Mexico 3047 3047 3491 3673 3784 3443 3494 4157 4423 5228 55NethAntilles 3 4 5 7 6 29Nicaragua 6 11 9 13 16 3Panama 28 28 28 98 127 100 56 59 21St Lucia 10 10 10 10 10 66St Vincent 5 4 3 5 5 43Trinidad Tob 46 45 52 63 75 59USA 85526 81971 86276 85719 88044 89900 84875 90720 91611 95829 350SouthAmerica 9204 9247 9970 9456 10238 10354 10504 11855 11446 12012 36Argentina 1025 991 1133 978 978 1483 1473 1822 1726 1652 46Bolivia 2 2 2 2 2 54 21 31 51 48 6Brazil 5856 5885 6475 6524 6889 5565 5705 6603 6599 7044 42Chile 573 680 614 642 796 615 752 755 800 743 50Colombia 690 693 704 712 733 960 979 1016 1004 1011 25EcuadorGuyanaParaguayPeru
83
13140
86
13140
91
13140
91
1363
91
1363
4166
47262
4236
44245
4136
44336
4235
60242
4235
49235
35699
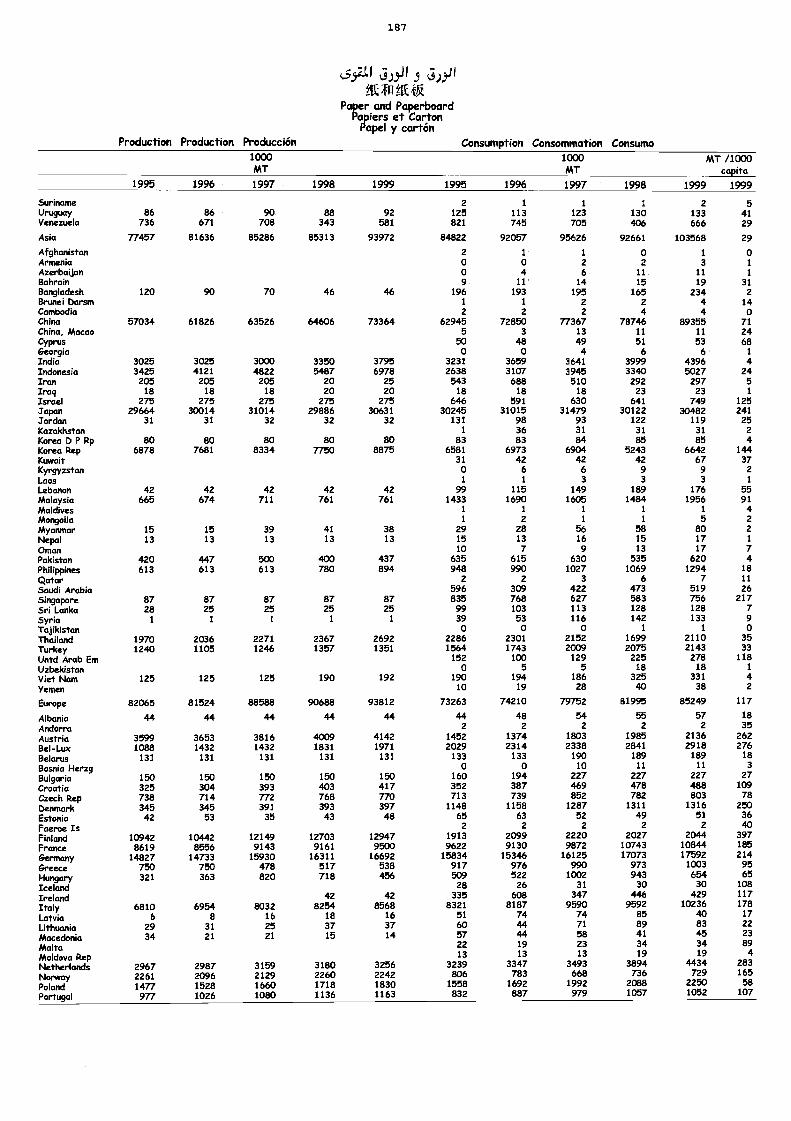
187
L5P j)5-11 5).9-11
MfiltKitgPaper and Paperboard
Papiers et CartonPapel y cartón
Production Production Producción Consumption Consoinmation Consumo1000MT
1000MT
MT /1000capita
1995 1996 1997 1998 1999 1995 1996 1997 1998 1999 1999
Suriname 2 1 1 1 2 5Uruguay 86 86 90 88 92 125 113 123 130 133 41Venezuela 736 671 708 343 581 821 745 705 406 666 29
Asia 77457 81636 85286 85313 93972 84822 92057 95626 92661 103568 29
Afghanistan 2 1 1 0 1 oArmenia o o 2 2 3 1
Azerbaijan 0 4 6 11 11 1
Bahrain 9 11 14 15 19 31Bangladesh 120 90 70 46 46 196 193 195 165 234 2Brunei Doran 1 1 2 2 4 14Cambodia 2 2 2 4 4 oChina 57034 61826 63526 64606 73364 62945 72850 77367 78746 89355 71China, Macao 5 3 13 11 11 24Cyprus 50 48 49 51 53 68Georgia 0 o 4 6 6 1
India 3025 3025 3000 3350 3795 323/ 3659 3641 3999 4396 4Indonesia 3425 4121 4822 5487 6978 2638 3107 3945 3340 5027 24Iran 205 205 205 20 25 543 688 510 292 297 5Iraq 18 18 18 20 20 18 18 18 23 23 1
Israel 275 275 275 275 275 646 591 630 641 749 125Japan 29664 30014 31014 29886 30631 30245 31015 31479 30122 30482 241Jordan 31 31 32 32 32 131 98 93 122 119 25Kazakhstan 1 36 31 31 31 2
Korea I) P Rp 80 80 80 80 80 83 83 84 85 85 4Korea Rep 6878 7681 8334 7750 8875 6581 6973 6904 5243 6642 144Kuwait 31 42 42 42 67 37Kyrgyzstan o 6 6 9 9 2
Laos 1 1 3 3 3 1
Lebanon 42 42 42 42 42 99 115 149 189 176 55Malaysia 665 674 711 761 761 1433 1690 1605 1484 1956 91Maldives 1 1 1 1 1 4Mongolia i 2 1 1 5 2
Myanmar 15 15 39 41 38 29 28 56 58 80 2
Nepal 13 13 13 13 13 15 13 16 15 17 1
Oman 10 7 9 13 17 7Pakistan 420 447 500 400 437 635 615 630 535 620 4Philippines 613 613 613 780 894 948 990 1027 1069 1294 18
Qatar 2 2 3 6 7 11
Saudi Arabia 596 309 422 473 519 26Singapore 87 87 87 87 87 835 768 627 583 756 217Sri Lanka 28 25 25 25 25 99 103 113 128 128 7Syria 1 1 1 1 i 39 53 116 142 133 9Tajikistan o o o 1 1 oThailand 1970 2036 2271 2367 2692 2286 2301 2152 1699 2110 35Turkey 1240 1105 1246 1357 1351 1564 1743 2009 2075 2143 33Untd Arab Em 152 100 129 225 278 118Uzbekistan 0 5 5 18 18 1
Viet Nam 125 125 125 190 192 190 194 186 325 331 4Yemen 10 19 28 40 38 2
Europe 82065 81524 88588 90688 93812 73263 74210 79752 81995 85249 117
Albania 44 44 44 44 44 44 48 54 55 57 18
Andorra 2 2 z 2 2 35
Austria 3599 3653 3816 4009 4142 1452 1374 1803 1985 2136 262
Bel-Lux 1088 1432 1432 1831 1971 2029 2314 2338 2841 2918 276
Belarus 131 131 131 131 131 133 133 190 189 189 18
Bosnia Herzg 0 0 10 11 11 3
Bulgaria 150 150 150 150 150 160 194 227 227 227 27Croatia 325 304 393 403 417 352 387 469 478 488 109
Czech Rep 738 714 772 768 770 713 739 852 782 803 78
Denmark 345 345 391 393 397 1148 1158 1287 1311 1316 250Estonia 42 53 35 43 48 65 63 52 49 51 36
Faeroe Is 2 2 2 2 2 40Finland 10942 10442 12149 12703 12947 1913 2099 2220 2027 2044 397
France 8619 8556 9143 9161 9500 9622 9130 9872 10743 10844 185
Germany 14827 14733 15930 16311 16692 15834 15346 16125 17073 17592 214
Greece 750 750 478 517 538 917 976 990 973 1003 95
Hungary 321 363 820 718 456 509 522 1002 943 654 65
Iceland 28 26 31 30 30 108
Ireland 42 42 335 608 347 446 429 117
Italy 6810 6954 8032 8254 8568 8321 8187 9590 9592 10236 178
Latvia 6 8 16 18 16 51 74 74 85 ao 17
Lithuania 29 31 25 37 37 60 44 71 89 83 22
Macedonia 34 21 21 15 14 57 44 58 41 45 23
Malta 22 19 23 34 34 89
Moldova Rep 13 13 13 19 19 4
Netherlands 2967 2987 3159 3180 3256 3239 3347 3493 3894 4434 283
Norway 2261 2096 2129 2260 2242 806 783 668 736 729 165
Poland 1477 1528 1660 1718 1830 1558 1692 1992 2088 2250 58
Portugal 977 1026 1080 1136 1163 832 887 979 1057 1052 107
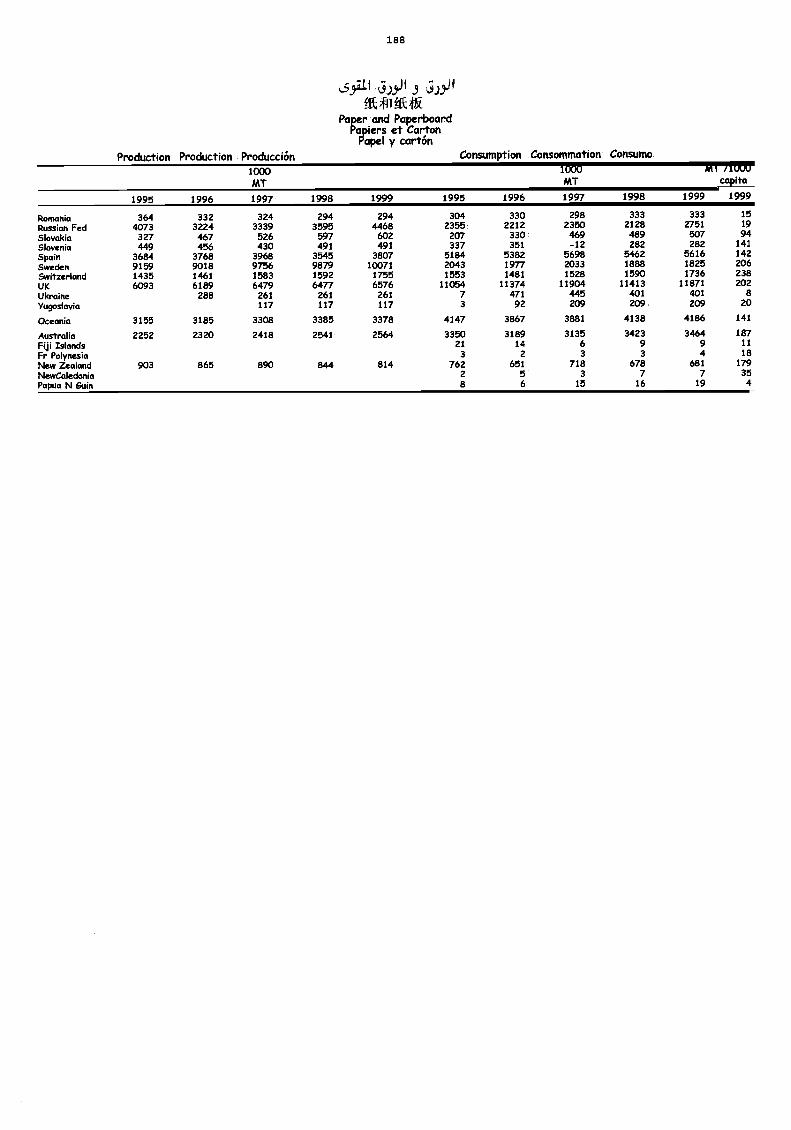
188
L5fik "fnifi*
Paper and PaperboardPapiers et Carton
Papel y cartónProduction Production Producción Consumption Consommation Consumo
1000MT
1000MT
MI nuuucapita
1995 1996 1997 1998 1999 1995 1996 1997 1998 1999 1999
Romania 364 332 324 294 294 304 330 298 333 333 15
Russian Fed 4073 3224 3339 3595 4468 2355 2212 2350 2128 2751 19
Slovakia 327 467 526 597 602 207 330 469 489 507 94Slovenia 449 456 430 491 491 337 351 -12 282 282 141
Spain 3684 3768 3968 3545 3807 5184 5382 5698 5462 5616 142
Sweden 9159 9018 9756 9879 10071 2043 1977 2033 1888 1825 206
Switzerland 1435 1461 1583 1592 1755 1553 1481 1528 1590 1736 238
UK 6093 6189 6479 6477 6576 11054 11374 11904 11413 11871 202
Ukraine 288 261 261 261 7 471 445 401 401 8
Yugoslavia 117 117 117 3 92 209 209 209 20
Oceania 3155 3185 3308 3385 3378 4147 3867 3881 4138 4186 141
Australia 2252 2320 2418 2541 2564 3350 3189 3135 3423 3464 187Fiji Islands 21 14 6 9 9 11
Fr Polynesia 3 2 3 3 4 18New Zealand 903 865 890 844 814 762 651 718 678 681 179NewCaledortia 2 5 3 7 7 35Papua N Guin 8 6 15 16 19 4
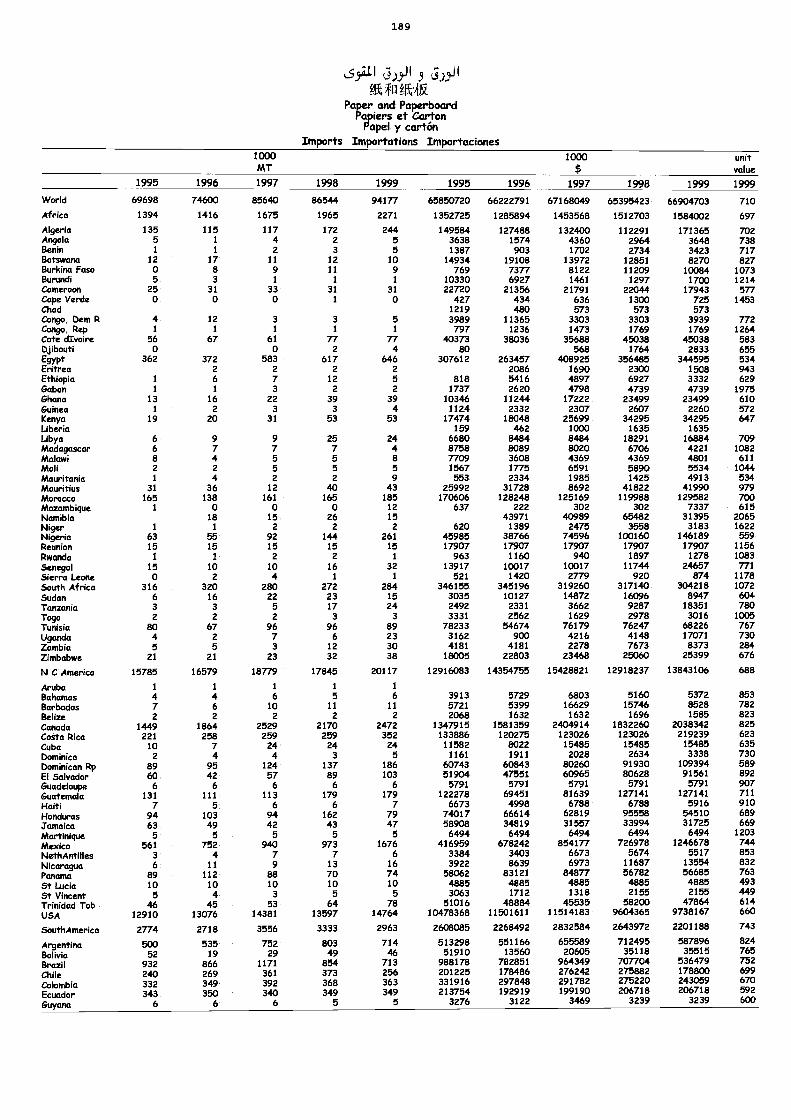
189
.t4 4aPaper and Paperboard
Papiers et CartonPapel y cart6n
Imports Importations Importaciones1000MT
1000 unitvalue
1995 1996 1997 1998 1999 1995 1996 1997 1998 1999 1999
Work 69698 74600 85640 86544 94177 65850720 66222791 67168049 65395423 66904703 710Africa 1394 1416 1675 1965 2271 1352725 1285894 1453568 1512703 1584002 697Again 135 115 117 172 244 149584 127488 132400 112291 171365 702Angola 5 1 4 2 5 3638 1574 4360 2964 3648 738Befall 1 1 2 3 5 1387 903 1702 2734 3423 717&Alumna 12 17 11 12 10 14934 19108 13972 12851 8270 827Burkina Faso 0 8 9 11 9 769 7377 8122 11209 10084 1073Burundi 5 3 1 1 1 10330 6927 1461 1297 1700 1214Cameroon 25 31 33 31 31 22720 21356 21791 22044 17943 577Cape Verde 0 0 0 I 0 427 434 636 1300 725 1453Chad 1219 480 573 573 573Congo, Dem R 4 12 3 3 5 3989 11365 3303 3303 3939 772Con9o, Re p 1 1 1 1 1 797 1236 1473 1769 1769 1264Cote dIvoire 56 67 61 77 77 40373 38036 35688 45038 45038 583Djibouti 0 0 2 4 80 568 1764 2833 655Egrt 362 372 583 617 646 307612 263457 408925 356485 344595 534Eritrea 2 2 2 2 2086 1690 2300 1508 943Ethiopia 1 6 7 12 5 818 5416 4897 6927 3332 629Gabon 1 1 3 2 2 1737 2620 4798 4739 4739 1975Ghana 13 16 22 39 39 10346 11244 17222 23499 23499 610Guirka 1 2 3 3 4 1124 2332 2307 2607 2260 572Kenya 19 20 31 53 53 17474 18048 25699 34295 34295 647Liberia 159 462 1000 1635 1635Libya 6 9 9 25 24 6680 8484 8484 18291 16884 709Madagascar 6 7 7 7 4 8758 8089 8020 6706 4221 1082Malawi 8 4 5 5 8 7709 3608 4369 4369 4801 611Mali 2 2 5 5 5 1567 1775 6591 5890 5534 1044Mauritania 1 4 2 2 9 553 2334 1985 1425 4913 534bkwritius 31 36 12 40 43 25992 31728 8692 41822 41990 979Momkco 165 138 161 165 185 170606 128248 125169 119988 129582 700Mozambique 1 0 0 0 12 637 222 302 302 7337 615Namibia 18 15 26 15 43971 40989 65482 31395 2065Niger 1 1 2 2 2 620 1389 2475 3558 3183 1622Nigeria 63 55 92 144 261 45985 38766 74596 100160 146189 559Reunkn 15 15 15 15 15 17907 17907 17907 17907 17907 1156Rwanda 1 1 2 2 1 963 1160 940 1897 1278 1083Senegal 15 10 10 16 32 13917 10017 10017 11744 24657 771Sierra Leone 0 2 4 1 1 521 1420 2779 920 874 1178South Africa 316 320 280 272 284 346155 345196 319260 317140 304218 1072Sudan 6 16 22 23 15 3035 10127 14872 16096 8947 604Tanzania 3 3 5 17 24 2492 2331 3662 9287 18351 780Togo 2 2 2 3 3 3331 2562 1629 2978 3016 1005Tunisia 80 67 96 96 89 78233 54674 76179 76247 68226 767Uganda 4 2 7 6 23 3162 900 4216 4148 17071 730Zambia 5 5 3 12 30 4181 4181 2278 7673 8373 284Zimbabwe 21 21 23 32 38 18005 22803 23468 25060 25399 676
NC Amerka 15785 16579 18779 17845 20117 12916083 14354755 15428821 12918237 13843106 688
Aruba 1 1 1 1 1
Bahamas 4 4 6 5 6 3913 5729 6803 5160 5372 853Barbados 7 6 10 11 11 5721 5399 16629 15746 8528 782Belize 2 2 2 2 2 2068 1632 1632 1696 1585 823Canada 1449 1864 2529 2170 2472 1347915 1581359 2404914 1832260 2038342 825Costa Rica 221 258 259 259 352 133886 120275 123026 123026 219239 623
Cuba 10 7 24 24 24 11582 8022 15485 15485 15485 635Dominica 2 4 4 3 5 1161 1911 2028 2634 3338 730DongMcariRp 89 95 124 137 186 60743 60843 80260 91930 109394 589
El Salvador 60 42 57 89 103 51904 47551 60965 80628 91561 892
Guadeloupe 6 6 6 6 6 5791 5791 5791 5791 5791 907Guatemala 131 111 113 179 179 122278 69451 81639 127141 127141 711
Haiti 7 5 6 6 7 6673 4998 6788 6788 5916 910Honduras 94 103 94 162 79 74017 66614 62819 95558 54510 689
Jamaica 63 49 42 43 47 58908 34819 31557 33994 31725 669
Marfinkme 5 5 5 5 5 6494 6494 6494 6494 6494 1203
Mexko 561 752 940 973 1676 416959 678242 854177 726978 1246678 744
NethAntilles 3 4 7 7 6 3384 3403 6673 5674 5517 853
Nicaragua 6 11 9 13 16 3922 8639 6973 11687 13554 832
Panama 89 112 as 70 74 58062 83121 84877 56782 56685 763
StLuda 10 10 10 10 10 4885 4885 4885 4885 4885 493
St Vincent 5 4 3 5 5 3063 1712 1318 2155 2155 449
TrinkkulTob 46 45 53 64 78 51016 48884 45535 58200 47864 614
USA 12910 13076 14381 13597 14764 10478368 11501611 11514183 9604365 9738167 660
SouthAmerka 2774 2718 3556 3333 2963 2608085 2268492 2832584 2643972 2201188 743
Argentina 500 535 752 803 714 513298 551166 655589 712495 587896 824
Bolivia 52 19 29 49 46 51910 13560 20605 35118 35515 765
Brazil 932 866 1171 854 713 988178 782851 964349 707704 536479 752
Chile 240 269 361 373 256 201225 178486 276242 275882 178800 699
Colombia 332 349 392 368 363 331916 297848 291782 275220 243059 670
Ecuador 343 350 340 349 349 213754 192919 199190 206718 206718 592
Guyana 6 6 6 5 5 3276 3122 3469 3239 3239 600
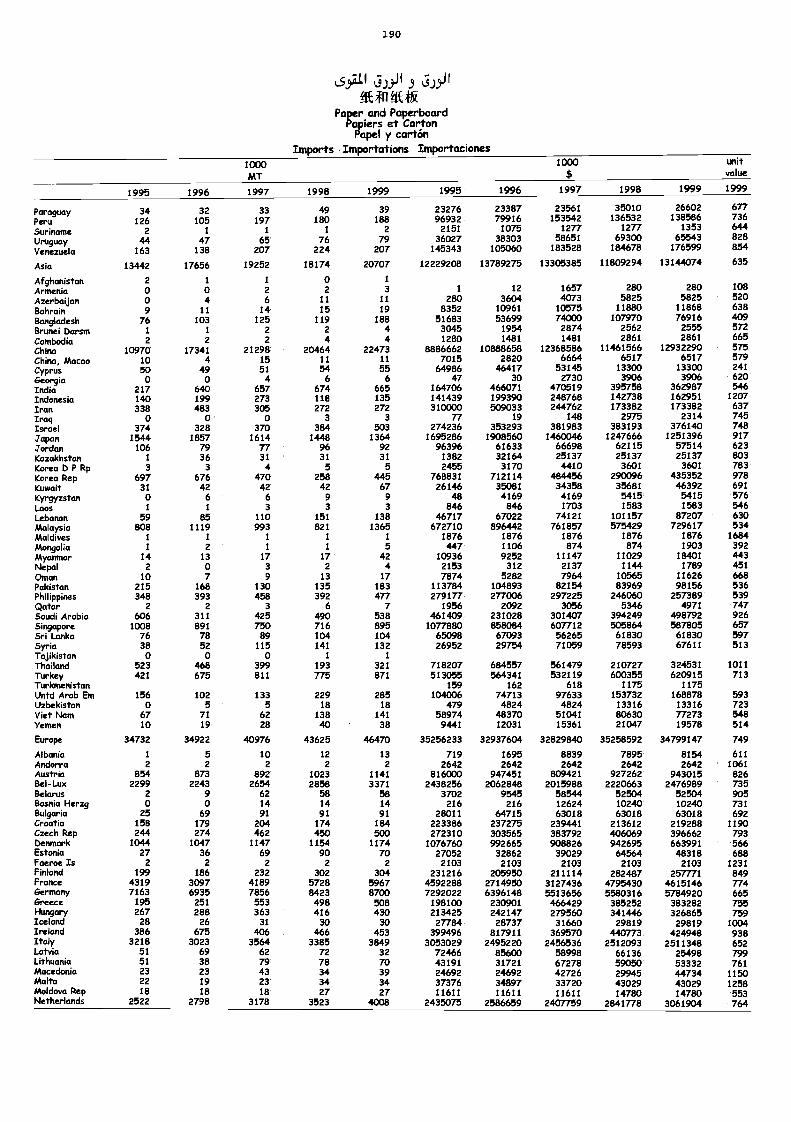
190
L5,3;11 J.)yil 3
ffE411.fiEfk.Paper and Paperboard
Papiers et CartonPapel y cartón
Imports Importations Importaciones1000MT
1000 unitvalue
1995 1996 1997 1998 1999 1995 1996 1997 1998 1999 1999
Paraguay 34 32 33 49 39 23276 23387 23561 35010 26602 677
Peru 126 105 197 180 188 96932 79916 153542 136532 138586 736
Suriname 2 1 1 1 2 2151 1075 1277 1277 1353 644
Uruguay 44 47 65 76 79 36027 38303 58651 69300 65543 828
Venezuela 163 138 207 224 207 145343 105060 183528 184678 176599 854
Asia 13442 17656 19252 18174 20707 12229208 13789275 13305385 11809294 13144074 635
Afghanistan 2 1 1 0 1
Armenia 0 0 2 2 3 1 12 1657 280 280 108
Azerbaijan o 4 6 11 11 250 3604 4073 5825 5825 520
Bahrain 9 11 14 15 19 8352 10961 10575 11880 11868 638
Bangladesh 76 103 125 119 188 51683 53699 74000 107970 76916 409
Brunei Darsm 1 1 2 2 4 3045 1954 2874 2562 2555 572
Cambodia 2 2 2 4 4 1280 1481 1481 2861 2861 665
China 10970 17341 21298 20464 22473 8886662 10888658 12368586 11461566 12932290 575
China, Macao 10 4 15 11 11 7015 2820 6664 6517 6517 579
CyprusGeorgia
50o
490
514
546
556
6498647
4641730
531452730
133003906
133003906
241620
India 217 640 657 674 665 164706 466071 470519 395758 362987 546Indonesia 140 199 273 118 135 141439 199390 248768 142738 162951 1207
Iran 338 483 305 272 272 310000 509033 244762 173382 173382 637
Iraq o o o 3 3 77 19 148 2975 2314 745Israel 374 328 370 384 533 274236 353293 381983 383193 376140 748Japan 1544 1857 1614 1448 1364 1695286 1908560 1460046 1247666 1251396 917Jordan 106 79 77 96 92 96396 61633 66698 62115 57514 623
Kazakhstan 1 36 31 31 31 1382 32164 25137 25137 25137 803Korea DP Rp 3 3 4 5 5 2455 3170 4410 3601 3601 783Korea Rep 697 676 470 258 445 768831 712114 484456 290096 435352 978Kuwait 31 42 42 42 67 26146 35081 34358 35681 46392 691Kyrgyzstan 0 6 6 9 9 48 4169 4169 5415 5415 576Laos 1 I 3 3 3 846 846 170e 1583 1583 546Liebman 59 85 110 151 138 46717 67022 74121 101157 87207 630Malaysia 808 1119 993 821 1365 672710 896442 761857 575429 729617 534Maldhms / 1 1 1 1 1876 1876 1876 1876 1876 1684Mongolia 1 2 1 1 5 447 1106 874 874 1903 392Myanmar 14 13 17 17 42 10936 9252 11147 11029 18401 443Nepal 2 0 3 2 4 2153 312 2137 1144 1789 451Onwm 10 7 9 13 17 7874 5282 7964 10565 11626 668Pakistan 215 168 130 135 183 113784 104893 82154 83969 98156 536Philippines 348 393 458 392 477 279177 277006 297225 246060 257389 539Qatar 2 2 3 6 7 1956 2092 3056 5346 4971 747Saudí Arabia 606 311 425 490 538 461409 231028 301407 394249 498792 926Singapore 1008 891 750 716 895 1077880 858084 607712 505864 587805 657Sri Lanka 76 78 89 104 104 65098 67093 56265 61830 61830 597Syria 38 52 115 141 132 26952 29754 71059 78593 67611 513Tajikistan o o 0 1 1
Thailand 523 468 399 193 321 718207 684557 561479 210727 324531 1011Turlmy 421 675 811 775 871 513055 564341 532119 600355 620915 713Turkmenistan 159 162 618 1175 1175Vntd Arab Em 156 102 133 229 285 104006 74713 97633 153732 168878 593Uzbekistan 0 5 5 18 18 479 4824 4824 13316 13316 723Viet Nam 67 71 62 138 141 58974 48370 51041 80630 77273 548Yemen 10 19 28 40 38 9441 12031 15361 21047 19578 514
Europe 34732 34922 40976 43625 46470 35256233 32937604 32829840 35258592 34799147 749
Albania 1 5 10 12 13 719 1695 8839 7895 8154 611Andorra 2 2 2 2 2 2642 2642 2642 2642 2642 1061Austria 854 873 892 1023 1141 816000 947451 809421 927262 943015 826Bel-Lux 2299 2243 2654 2858 3371 2438256 2062848 2015988 2220663 2476989 735Bekrus 2 9 62 58 58 3702 9545 58544 52504 52504 905Bosnia Herzg 0 o 14 14 14 216 216 12624 10240 10240 731Bulgaria 25 69 91 91 91 28011 64715 63018 63018 63018 692Croatia 158 179 204 174 184 223386 237275 239441 213612 219288 1190Czech Rep 244 274 462 450 500 272310 303565 383792 406069 396662 793Denmark 1044 1047 1147 1154 1174 1076760 992665 908826 942695 663991 566Estonia 27 36 69 90 70 27052 32862 39029 64564 48318 688Faeroe Is 2 2 2 2 2 2103 2103 2103 2103 2103 1231FMland 199 186 232 302 304 231216 205950 211114 282487 257771 849France 4319 3097 4189 5728 5967 4592288 2714950 3127436 4795430 4615146 774Germany 7163 6935 7856 8423 8700 7292022 6396148 5513656 5580316 5784920 665Greece 195 251 553 498 508 198100 230901 466429 385252 383282 755Hungary 267 288 363 416 430 215425 242147 279560 341446 326865 759IceMnd 28 26 31 30 30 27784 28737 31660 29819 29819 1004Irekmd 386 675 406 466 453 399496 817911 369570 440773 424948 938Italy 3218 3023 3564 3385 3849 3053029 2495220 2456536 2512093 2511348 652Latvia 51 69 62 72 32 72466 85600 58998 66136 25498 799Lithuania 51 38 79 78 70 43191 31721 67278 59050 53332 761Macedonia 23 23 43 34 39 24692 24692 42726 29945 44734 1150Malta 22 19 23 34 34 37376 34897 33720 43029 43029 1258Moldova Rep 18 18 18 27 27 11611 11611 11611 14780 14780 553Netherlands 2522 2798 3178 3523 4008 2435075 2586659 2407759 2841778 3061904 764
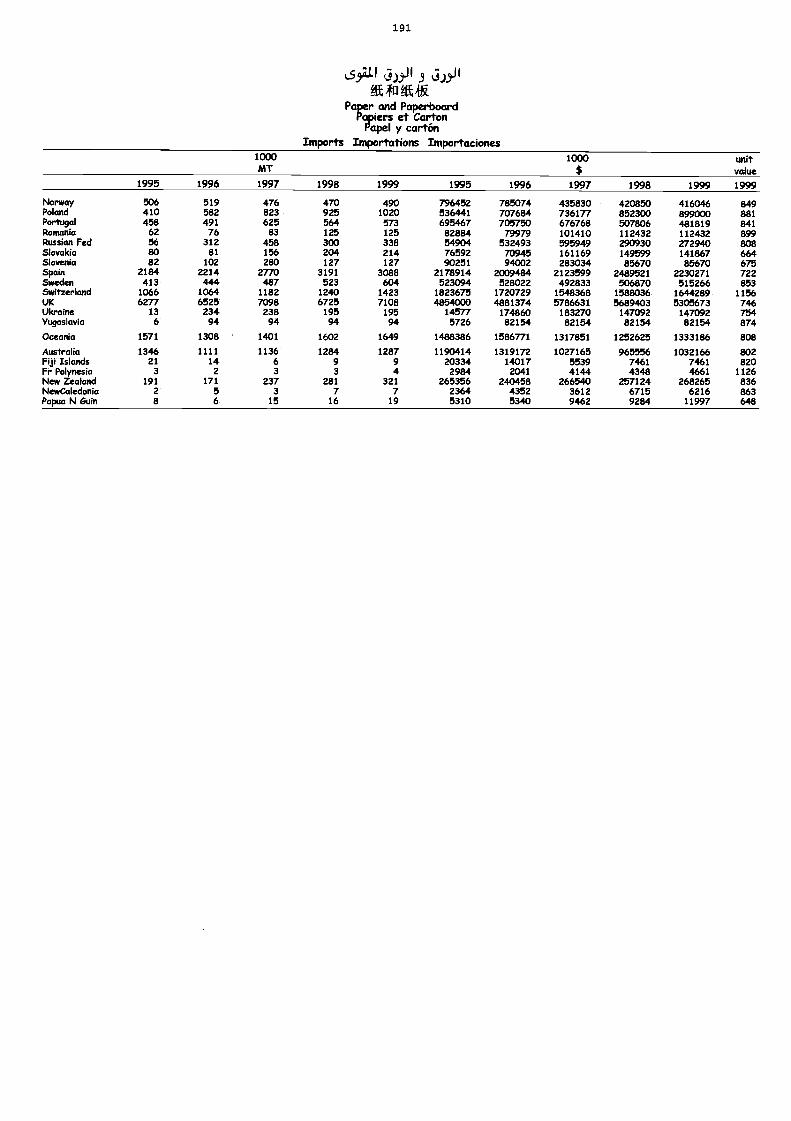
191
j).01 9flkfria*
Paper and PaperboardPapiers et Carton
Papel y cartónImports Importations Importaciones
1000MT
1000$
unitvalue
1995 1996 1997 1998 1999 1995 1996 1997 1998 1999 1999
Norway 506 519 476 470 490 796452 785074 435830 420850 416046 849Poland 410 582 823 925 1020 536441 707684 736177 852300 899000 881Portugal 458 491 625 564 573 695467 705750 676768 507806 481819 841Romania 62 76 83 125 125 82884 79979 101410 112432 112432 899Russian Fed 56 312 458 300 338 54904 532493 595949 290930 272940 808Slovakia 80 81 156 204 214 76592 70945 161169 149599 141867 664Slovenia 82 102 280 127 127 90251 94002 283034 85670 85670 675Spain 2184 2214 2770 3191 3088 2178914 2009484 2123599 2489521 2230271 722Sweden 413 444 487 523 604 523094 528022 492833 506870 515266 853Switzerland 1066 1064 1182 1240 1423 1823675 1720729 1548368 1588036 1644289 1156UK 6277 6525 7098 6725 7108 4854000 4881374 5786631 5689403 5305673 746Ukraine 13 234 238 195 195 14577 174860 183270 147092 147092 754Yugoslavia 6 94 94 94 94 5726 82154 82154 82154 82154 874
Oceania 1571 1308 1401 1602 1649 1488386 1586771 1317851 1252625 1333186 808
Australia 1346 1111 1136 1284 1287 1190414 1319172 1027165 965556 1032166 802Fiji Islands 21 14 6 9 9 20334 14017 5539 7461 7461 820Fr Polynesia 3 2 3 3 4 2984 2041 4144 4348 4661 1126New Zealand 191 171 237 281 321 265356 240458 266540 257124 268265 836NewCaledonia 2 5 3 7 7 2364 4352 3612 6715 6216 863Papua N Guin 8 6 15 16 19 5310 5340 9462 9284 11997 648
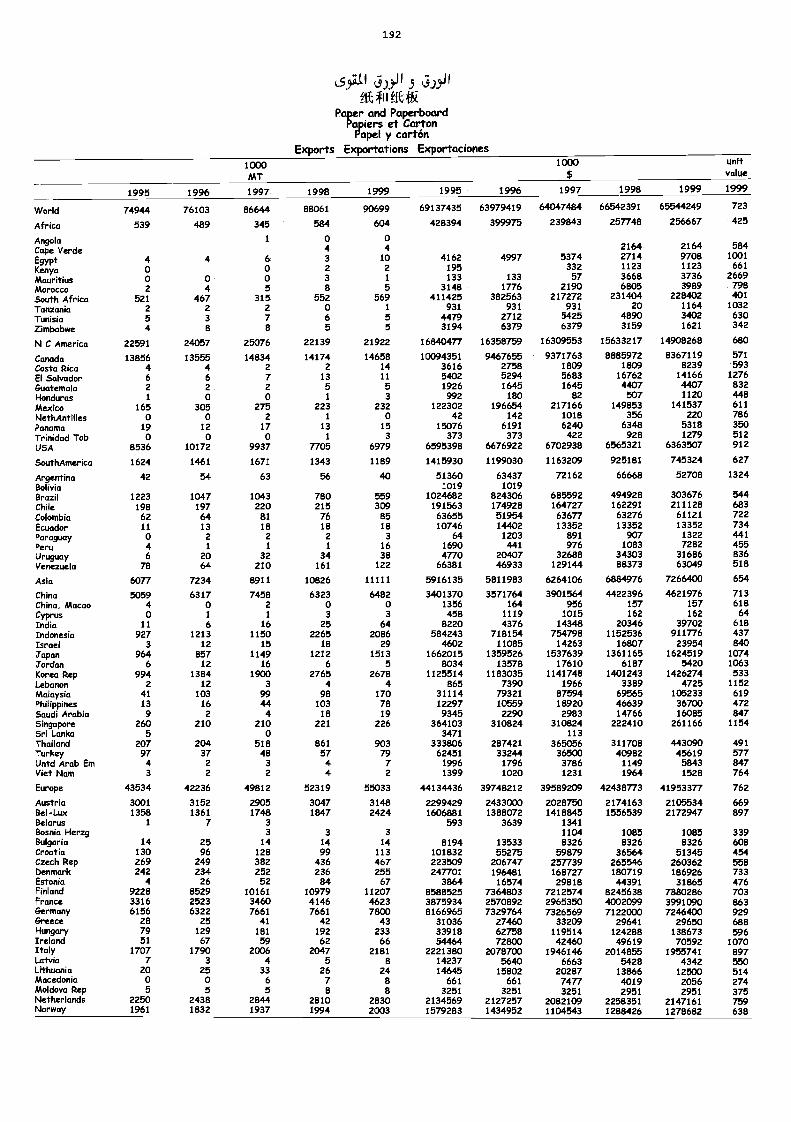
192
L5jg, j)5,11 5 a)5Mig,ftlfft
Paper and PaperboardPápiers et Carton
Papel y cartónExports Exportations Exportaciones
1000/i4T
1000 unitvalue
1995 1996 1997 1998 1999 1995 1996 1997 1998 1999 1999
World 74944 76103 86644 88061 90699 69137435 63979419 64047484 66542391 65544249 723
Africa 539 489 345 584 604 428394 399975 239843 257748 256667 425
Angola O
Cape Verde 4 4 2164 2164 584
EgyptKenya
40
4 60
32
102
4162195
4997 5374332
27141123
97081123
1001661
Mauritius 0 0 0 3 1 133 133 57 3668 3736 2669
Morocco 2 4 5 8 5 3148 1776 2190 6805 3989 798
South Afrka 521 467 315 552 569 411425 382563 217272 231404 228402 401
Tanzania 2 2 2 0 1 931 931 931 20 1164 1032
Tunisia 5 3 7 6 5 4479 2712 5425 4890 3402 630
Zimbabwe 4 8 8 5 5 3194 6379 6379 3159 1621 342
N C America 22591 24057 25076 22139 21922 16840477 16358759 16309553 15633217 14908268 680
Canada 13856 13555 14834 14174 14658 10094351 9467655 9371763 8885972 8367119 571
Costo Rica 4 4 2 2 14 3616 2758 1809 1809 8239 593
El Salvador 6 6 7 13 11 5402 5294 5683 16762 14166 1276
Guatemala 2 2 2 5 5 1926 1645 1645 4407 4407 832Honduras 1 0 0 1 3 992 180 82 507 1120 448
Mexico 165 305 275 223 232 122302 196654 217166 149853 141537 611
NethAntHles 0 0 2 1 0 42 142 1018 356 220 786Panana 19 12 17 13 15 15076 6191 6240 6348 5318 350
Trinidad Tob 0 0 o 1 3 373 373 422 928 1279 512
USA 8536 10172 9937 7705 6979 6595398 6676922 6702938 6565321 6363507 912
SouthAmerica 1624 1461 1671 1343 1189 1415930 1199030 1163209 925181 745324 627
Argentina 42 54 63 56 40 51360 63437 72162 66668 52708 1324
Bolivia 1019 1019Brazil 1223 1047 1043 780 559 1024682 824306 685592 494928 303676 544Chile 198 197 220 215 309 191563 174928 164727 162291 211128 683
Colombia 62 64 81 76 85 63655 51954 63677 63276 61121 722
Ecuador 11 13 18 18 18 10746 14402 13352 13352 13352 734Paraguay 0 2 2 2 3 64 1203 891 907 1322 441Peru 4 1 1 1 16 1690 441 976 1083 7282 455Uruguay 6 20 32 34 38 4770 20407 32688 34303 31686 836Venezuela 78 64 210 161 122 66381 46933 129144 88373 63049 518
Asia 6077 7234 8911 10826 11111 5916135 5811983 6264106 6884976 7266400 654
China 5059 6317 7458 6323 6482 3401370 3571764 3901564 4422396 4621976 713ChMa, Macao 4 0 2 0 0 1356 164 956 157 157 618Cyprus 0 1 I 3 3 458 1119 1015 162 162 64India 11 6 16 25 64 8220 4376 14348 20346 39702 618Indonesia 927 1213 1150 2265 2086 584243 718154 754798 1152536 911776 437Israel 3 12 15 18 29 4602 11085 14263 16807 23954 840Japan 964 857 1149 1212 1513 1662015 1359526 1537639 1361165 1624519 1074Jordan 6 12 16 6 5 8034 13578 17610 6187 5420 1063Korea Rep 994 1384 1900 2765 2678 1125514 1183035 1141748 1401243 1426274 533Lebanon 2 12 3 4 4 865 7390 1966 3389 4725 1152Malaysia 41 103 99 98 170 31114 79321 87594 69565 105233 619Philippines 13 16 44 103 78 12297 10559 18920 46639 36700 472Saudi Arabia 9 2 4 18 19 9345 2290 2983 14766 16085 847Singapore 260 210 210 221 226 364103 310824 310824 222410 261166 1154Sri Lanka 5 0 3471 113Thailand 207 204 518 861 903 333806 287421 365056 311708 443090 491Turkey 97 37 48 57 79 62451 33244 36500 40982 45619 577Untd Arab Em 4 2 3 4 7 1996 1796 3786 1149 5843 847Viet Nam 3 2 2 4 2 1399 1020 1231 1964 1528 764
Europe 43534 42236 49812 52319 55033 44134436 39748212 39589209 42438773 41953377 762
Austria 3001 3152 2905 3047 3148 2299429 2433000 2028750 2174163 2105534 669Bel-Lux 1358 1361 1748 1847 2424 1606881 1388072 1418845 1556539 2172947 897Bdarus 1 7 3 593 3639 1341BosnM Herzg 3 3 3 1104 1085 1085 339Bulgaria 14 25 14 14 14 8194 13533 8326 8326 8326 608Croafla 130 96 128 99 113 101832 55275 59879 36564 51345 454Czech Rep 269 249 382 436 467 223509 206747 257739 265546 260362 558Denmark 242 234 252 236 255 247701 196481 168727 180719 186926 733Estonia 4 26 52 84 67 3864 16574 29818 44391 31865 476Finland 9228 8529 10161 10979 11207 8588525 7364803 7212574 8245638 7880286 703France 3316 2523 3460 4146 4623 3875934 2570892 2965350 4002099 3991090 863Germany 6156 6322 7661 7661 7800 8166965 7329764 7326569 7122000 7246400 929Greece 28 25 41 42 43 31036 27460 33209 29641 29650 688Hungam/ 79 129 181 192 233 33918 62758 119514 124288 138673 596Irdand 51 67 59 62 66 54464 72800 42460 49619 70592 1070ItMy 1707 1790 2006 2047 2181 2221380 2078700 1946146 2014855 1955741 897Latvia 7 3 4 5 s 14237 5640 6663 5428 4342 550LithuaMa 20 25 33 26 24 14645 15802 20287 13866 12500 514Macedonia 0 0 6 7 8 661 661 7477 4019 2056 274MoldmmRep 5 5 5 8 El 3251 3251 3251 2951 2951 375Netherkmds 2250 2438 2844 2810 2830 2134569 2127257 2082109 2258351 2147161 759Norway 1961 1832 1937 1994 2003 1579283 1434952 1104543 1288426 1278682 638
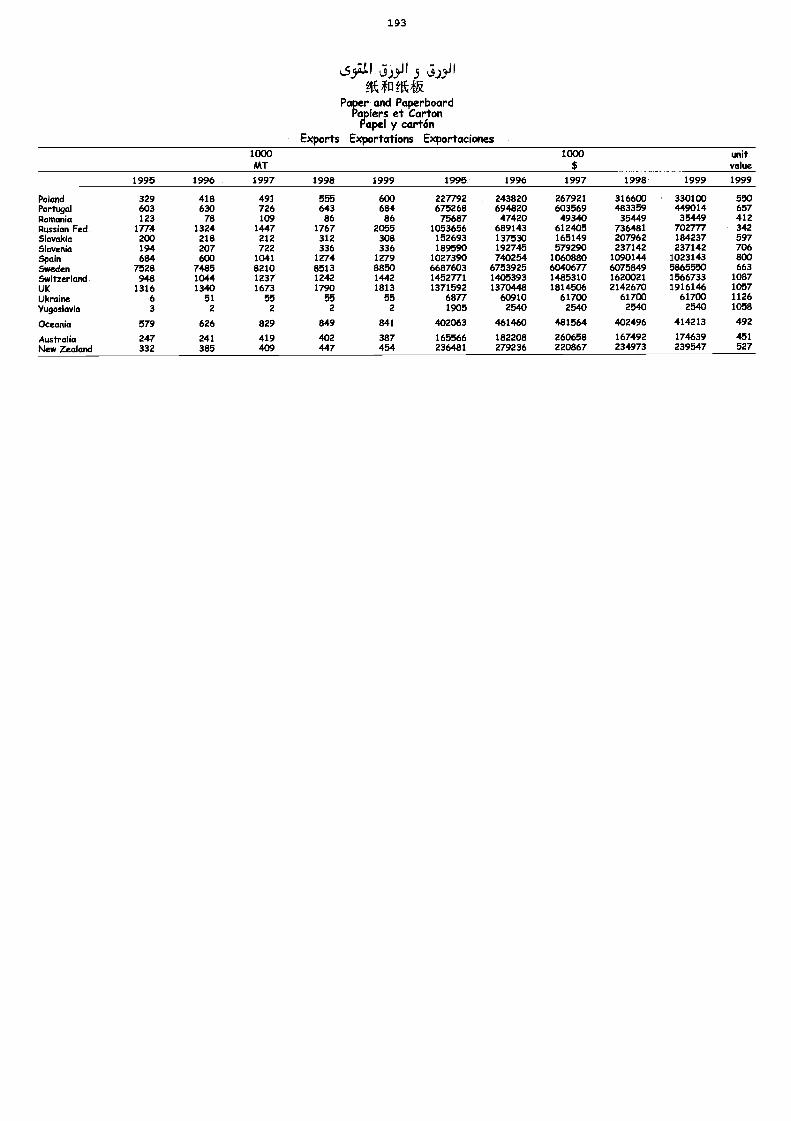
193
L53.4. j).0 IftkPtttlk
Paper and PaperboardPapiers et Carton
Papel y cartónExports Exportations Exportaciones
1000MT
1000$
unitvalue
1995 1996 1997 1998 1999 1995 1996 1997 1998 1999 1999
Poland 329 418 491 555 600 227792 243820 267921 316600 330100 550Portugal 603 630 726 643 684 675268 694820 603569 483359 449014 657Romania 123 78 109 86 86 75687 47420 49340 35449 35449 412Russian Fed 1774 1324 1447 1767 2055 1053656 689143 612405 736481 702777 342Slovakia 200 218 212 312 308 152693 137530 165149 207962 184237 597Slovenia 194 207 722 336 336 189590 192745 579290 237142 237142 706Spain 684 600 1041 1274 1279 1027390 740254 1060880 1090144 1023143 800Sweden 7528 7485 8210 8513 8850 6687603 6753925 6040677 6075849 5865550 663Sviitzerland 948 1044 1237 1242 1442 1452771 1405393 1485310 1620021 1566733 1087UK 1316 1340 1673 1790 1813 1371592 1370448 1814506 2142670 1916146 1057Ukraine 6 51 55 55 55 6877 60910 61700 61700 61700 1126Yugoslavia 3 2 2 2 2 1905 2540 2540 2540 2540 1058
Oceania 579 626 829 849 841 402063 461460 481564 402496 414213 492
Australia 247 241 419 402 387 165566 182208 260658 167492 174639 451New Zealand 332 385 409 447 454 236481 279236 220867 234973 239547 527
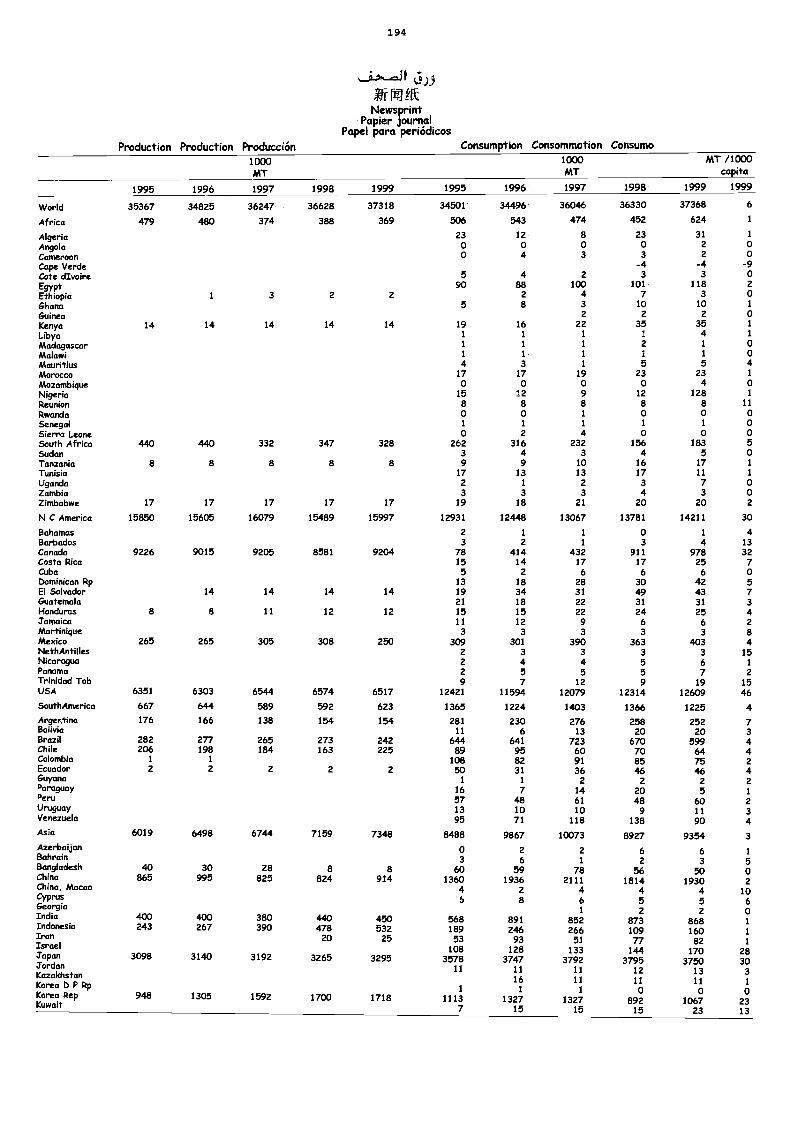
1 94
k RP fitNewsprint
Papier journalPapel para periódicos
Production Production Producción Consumption Consommation Consumo
1000MT
1000MT
MT /1000capita
1995 1996 1997 1998 1999 1995 1996 1997 1998 1999 1999
World 35367 34825 36247 36628 37318 34501 34496 36046 36330 37368 6
Africa 479 480 374 388 369 506 543 474 452 624 1
Algeria 23 12 8 23 31 1
Angola 0 0 0 0 2 0Cameroon 0 4 3 3 2 0Cape Verde -4 -4 -9Cote dIvoire 5 4 2 3 3 0Egypt 90 an 100 101 118 2
Ethiopia I 3 2 2 2 4 7 3 0Ghana 5 8 3 10 10 1
Guinea 2 2 2 0Kenya 14 14 14 14 14 19 16 22 35 35 1
Libya 1 1 1 1 4 1
Madagascar 1 1 1 2 1 0Malawi 1 1 1 1 1 0Mauritius 4 3 1 5 5 4Morocco 17 17 19 23 23 1
Mozambique 0 0 0 0 4 0Nigeria 15 12 9 12 128 1
Reunion 8 8 8 8 8 11
Rwanda 0 0 1 0 0 0Senegal 1 1 1 1 1 0Sierra Leone 0 2 4 0 0 0South Africa 440 440 332 347 328 262 316 232 156 183 5Sudan 3 4 3 4 5 0Tanzania 8 8 8 8 8 9 9 10 16 17 1
Tunisia 17 13 13 17 11 1
Uganda 2 1 2 3 7 0Zambia 3 3 3 4 3 0Zimbabwe 17 17 17 17 17 19 18 21 20 20 2
N C America 15850 15605 16079 15489 15997 12931 12448 13067 13781 14211 30
Bahamas 2 1 1 0 1 4Barbados 3 2 1 3 4 13Canada 9226 9015 9205 8581 9204 78 414 432 911 978 32Costa Rica 15 14 17 17 25 7Cuba 5 2 6 6 6 0Dominican Rp 13 18 28 30 42 5El Salvador 14 14 14 14 19 34 31 49 43 7Guatemala 21 18 22 31 31 3Honduras 8 8 11 12 12 15 15 22 24 25 4Jamaica 11 12 9 6 6 2Martinique 3 3 3 3 3 8Mexico 265 265 305 308 250 309 301 390 363 403 4NethAntilles 2 3 3 3 3 15Nicaragua 2 4 4 5 6 1
Panama 2 5 5 5 7 2Trinidad Tob 9 7 12 9 19 15USA 6351 6303 6544 6574 6517 12421 11594 12079 12314 12609 46SouthAmerica 667 644 589 592 623 1365 1224 1403 1366 1225 4Argentina 176 166 138 154 154 281 230 276 258 252 7Bolivia 11 6 13 20 20 3Brazil 282 277 265 273 242 644 641 723 670 599 4Chile 206 198 184 163 225 89 95 60 70 64 4Colombia 1 1 108 82 91 85 75 2Ecuador 2 2 2 2 2 50 31 36 46 46 4Guyana 1 1 2 2 2 2Paraguay 16 7 14 20 5 1Peru 57 48 61 48 60 2Uruguay 13 10 10 9 11 3Venezuela 95 71 118 138 90 4Asia 6019 6498 6744 7159 7348 8488 9867 10073 8927 9354 3AzerbaijanBahrainBangladeshChinaChina, Macao
40865
30995
28825
8824
8914
03
601360
4
26
591936
2
21
782111
4
62
561814
4
63
501930
4
1
502
10CyprusGeorgiaIndiaIndonesiaIranIsraelJ'apanJordanKazakhstanKorea b P RpKorea RepKuwait
400243
3098
948
400267
3140
1305
380390
3192
1592
440478
20
3265
1700
450532
25
3295
1718
6
568189
53108
357811
1
11137
8
891246
93128
374711
16/
132715
61
852266
51133
37921111
1
132715
52
87310977
1443795
1211
0892
15
52
86816082
1703750
13110
106723
601
1
1
2830
31
02313
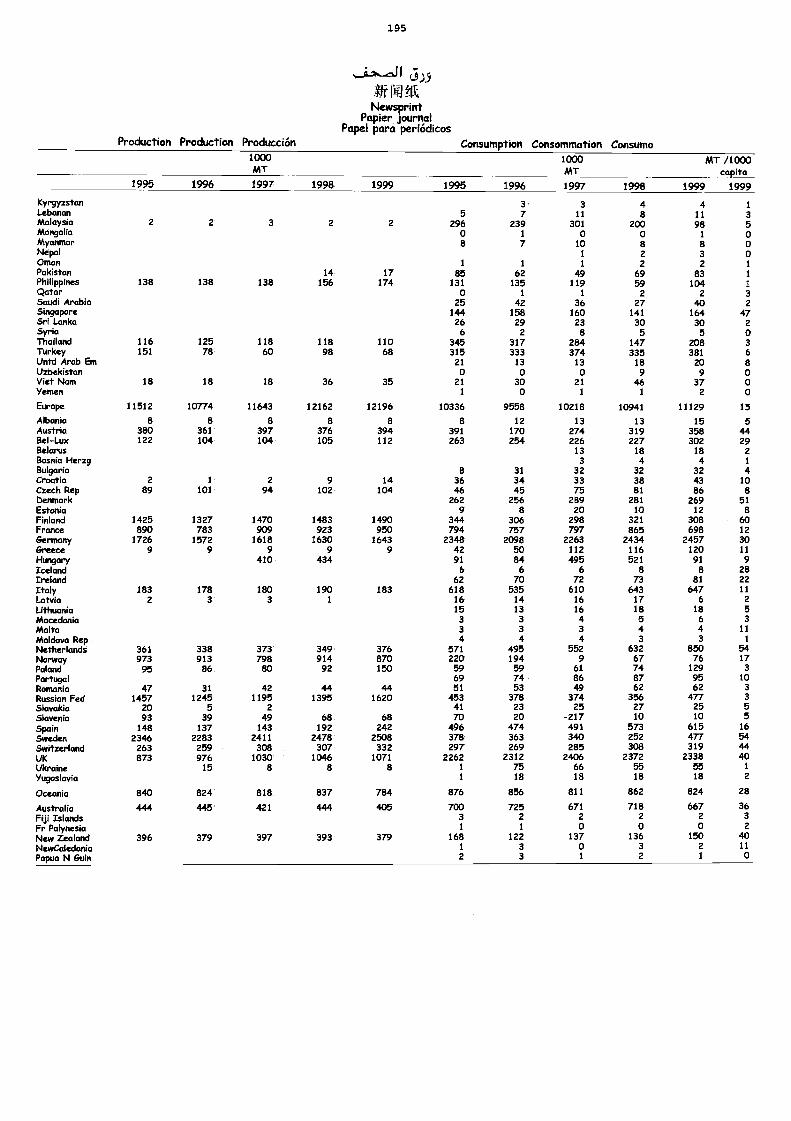
195
NewsprintPapier journal
Papel para periódicosProduction Production Producción Consumption Consommation Consumo
1000MT
1000MT
MT /1000capita
1995 1996 1997 1998 1999 1995 1996 1997 1998 1999 1999
Kyrgyzstan 3 3 4 4 1Lebanon 5 7 11 8 11 3Malaysia 2 2 3 2 2 296 239 301 200 98 5Mongolia 0 1 O 0 1 0Myanmar 8 7 10 8 8 0Nepal 1 2 3 0Oman 1 1 1 2 2 1Pakistan 14 17 85 62 49 69 83 1Philippines 138 138 138 156 174 131 135 119 59 104 1Qatar 0 1 1 2 2 3Saudi Arabia 25 42 36 27 40 2Singapore 144 158 160 141 164 47Sri Lanka 26 29 23 30 30 2Syria 6 2 8 5 5 0Thailand 116 125 118 118 110 345 317 284 147 208 3Turkey 151 78 60 98 68 315 333 374 335 381 6Untd Arab Em 21 13 13 18 20 8Uzbekistan 0 0 0 9 9 0Viet Nam 18 18 18 36 35 21 30 21 46 37 0Yemen 1 0 1 1 2 0Europe 11512 10774 11643 12162 12196 10336 9558 10218 10941 11129 15
Albania 8 8 8 8 8 8 12 13 13 15 5Austria 380 361 397 376 394 391 170 274 319 .358 44Bel-Lux 122 104 104 105 112 263 254 226 227 302 29Belams 13 18 18 2Bosnia Herzg 3 4 4 1
Bulgaria 8 31 32 32 32 4Croatia a 1 2 9 14 36 34 33 38 43 10Czech Rep 89 101 94 102 104 46 45 75 81 86 8Denmark 262 256 289 281 269 51Estonia 9 8 20 10 12 8Finland 1425 1327 1470 1483 1490 344 306 298 321 308 60France 890 783 909 923 950 794 757 797 865 698 12Gervnany 1726 1572 1618 1630 1643 2348 2098 2263 2434 2457 30Greece 9 9 9 9 9 42 50 112 116 120 11Hungary 410 434 91 84 495 521 91 9Iceland 6 6 6 8 8 28Ireland 62 70 72 73 81 22Italy 183 178 180 190 183 618 535 610 643 647 11Latvia 2 3 3 1 16 14 16 17 6 2Uthuania 15 13 16 18 18 5Macedonia 3 3 4 5 6 3Malta 3 3 3 4 4 11Moldova Rep 4 4 4 3 3 1
Netherlands 361 338 373 349 376 571 495 552 632 850 54Norway 973 913 798 914 870 220 194 9 67 76 17Poland 95 86 80 92 150 59 59 61 74 129 3Portugal 69 74 86 87 95 10Romania 47 31 42 44 44 51 53 49 62 62 3Russian Fed 1457 1245 1195 1395 1620 453 378 374 356 477 3Slovakia 20 5 2 41 23 25 27 25 5Slovenia 93 39 49 68 68 70 20 -217 10 10 5Spain 148 137 143 192 242 496 474 491 573 615 16Sweden 2346 2283 2411 2478 2508 378 363 340 252 477 54Switzerland 263 259 308 307 332 297 269 285 308 319 44UK 873 976 1030 1046 1071 2262 2312 2406 2372 2338 40Ukraine 15 8 8 8 1 75 66 55 55 1
Yugoslavia 1 18 18 18 18 2
Oceania 840 824 818 837 784 876 856 811 862 824 28
Australia 444 445 421 444 405 700 725 671 718 667 36Fiji Islands 3 2 2 2 2 3Fr Polynesia 1 1 0 0 0 2
New Zealand 396 379 397 393 379 168 122 137 136 150 40NewCaledonia 1 3 0 3 2 11
Papua N Guin 2 3 1 2 1 0
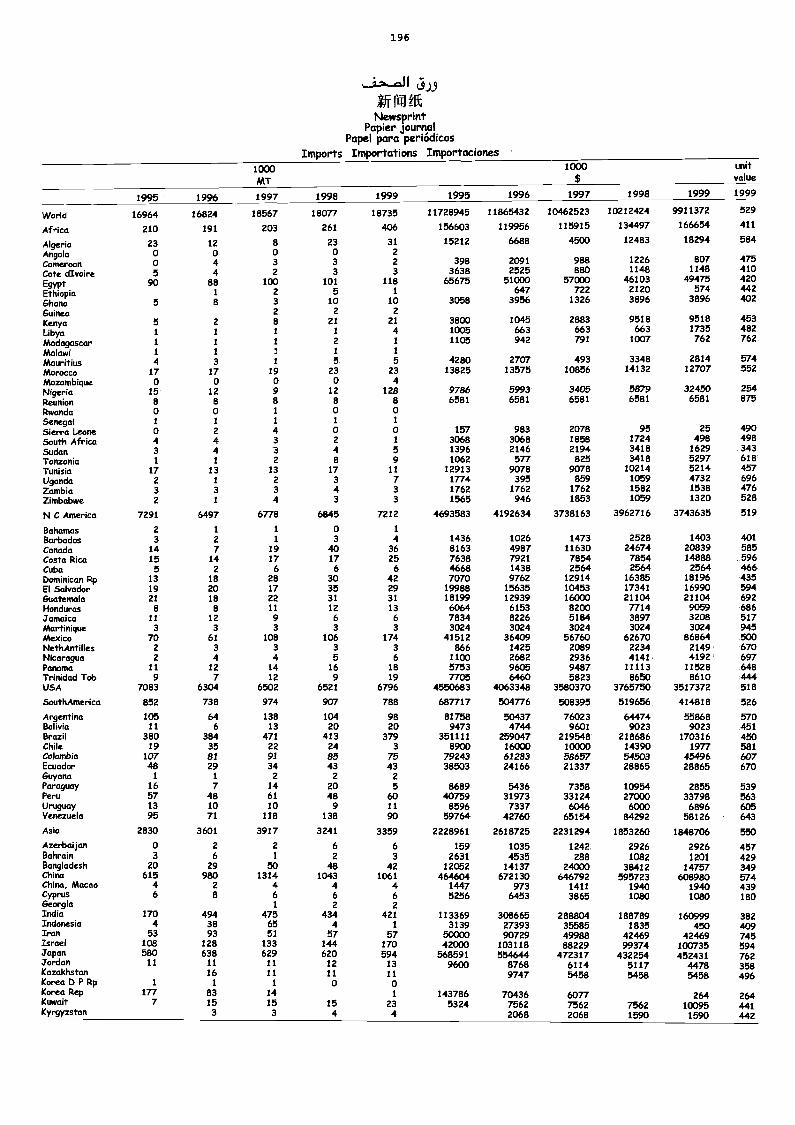
1 96
619
ifr 141 itkNewsprint
Papier journalPapel para periódicos
Imports Importations Importaciones1000MT
1000 unitvalue
1995 1996 1997 1998 1999 1995 1996 1997 1998 1999 1999
World 16964 16824 18567 18077 18735 11728945 11865432 104.62523 10212424 9911372 529
Africa 210 191 203 261 406 156603 119956 115915 134497 166654 411
Algeria 23 12 8 23 31 15212 6688 4500 12483 18294 584
Angola o o o o 2
Cameroon o 4 3 3 2 398 2091 988 1226 807 475
Cote dIvoire 5 4 2 3 3 3638 2525 880 1148 1148 410
EgyptEthiopia
90 881
1002
1015
1181
65675 51000647
57000722
461032120
49475574
420442
Ghana 5 8 3 10 10 3058 3956 1326 3896 3896 402
Guinea 2 2 2
Kenya 5 2 8 21 21 3800 1045 2883 9518 9518 453
Libya 1 1 1 i 4 1005 663 663 663 1735 482
Madagascar 1 1 1 2 1 1105 942 791 1007 762 762
Malawi 1 1 1 1 1
Mauritius 4 3 1 5 5 4280 2707 493 3348 2814 574
Morocco 17 17 19 23 23 13825 13575 10856 14132 12707 552
Mozambique 0 o o 0 4Nigeria 15 12 9 12 128 9786 5993 3405 5879 32450 254Reunion 8 8 8 8 8 6581 6581 6581 6581 6581 875
Rwanda o 0 1 o oSenegal 1 1 1 1 iSierra Leone o 2 4 0 0 157 983 2078 95 25 490South Africa 4 4 3 2 1 3068 3068 1858 1724 498 498
Sudan 3 4 3 4 5 1396 2146 2194 3418 1629 343
Tanzania 1 1 2 8 9 1062 577 825 3418 5297 618Tunisia 17 13 13 17 11 12913 9078 9078 10214 5214 457Uganda 2 1 2 3 7 1774 395 859 1059 4732 696Zambia 3 3 3 4 3 1762 1762 1762 1582 1538 476Zimbabwe 2 1 4 3 3 1565 946 1853 1059 1320 528
N C America 7291 6497 6778 6845 7212 4693583 4192634 3738163 3962716 3743635 519
Bahamas 2 1 1 o 1
Barbados 3 2 1 3 4 1436 1026 1473 2528 1403 401Canada 14 7 19 40 36 8163 4987 11630 24674 20839 585Costa Rica 15 14 17 17 25 7638 7921 7854 7854 14888 596Cuba 5 2 6 6 6 4668 1438 2564 2564 2564 466Dominican Rp 13 18 28 30 42 7070 9762 12914 16385 18196 435El Salvador 19 20 17 35 29 19988 15635 10453 17341 16990 594Guatemala 21 18 22 31 31 18199 12939 16000 21104 21104 692Honduras 8 8 11 12 13 6064 6153 8200 7714 9059 686Jamaica 11 12 9 6 6 7834 8226 5184 3897 3208 517Martinique 3 3 3 3 3 3024 3024 3024 3024 3024 945Mexico 70 61 108 106 174 41512 36409 56760 62670 86864NethAntilles 2 3 3 3 3 866 1425 2089 2234 2149 670Nicaragua 2 4 4 5 6 1100 2682 2936 4141 4192 697Panama 11 12 14 16 18 5753 9605 9487 11113 11528 648Trinidad Tob 9 7 12 9 19 7705 6460 5823 8650 8610 444USA 7083 6304 6502 6521 6796 4550683 4063348 3580370 3765750 3517372 518
SouthAmerica 852 738 974 907 788 687717 504776 508395 519656 414818 526
Argentina 105 64 138 104 98 81758 50437 76023 64474 55868 570Bolivia 11 6 13 20 20 9473 4744 9601 9023 9023 451Brazil 380 384 471 413 379 351111 259047 219548 218686 170316 450Chile 19 35 22 24 3 8900 16000 10000 14390 1977 581Colombia 107 81 91 85 75 79243 61283 58657 54503 45496 607Ecuador 48 29 34 43 43 38503 24166 21337 28865 28865 670Guyana 1 1 2 2 2Paraguay 16 7 14 20 5 8689 5436 7358 10954 2855 539Peru 57 48 61 48 60 40759 31973 33124 27000 33798 563Uruguay 13 10 10 9 11 8596 7337 6046 6000 6896 605Venezuela 95 71 118 138 90 59764 42760 65154 84292 58126 643
Asia 2830 3601 3917 3241 3359 2228961 2618725 2231294 1853260 1848706 550Azerbaijan o 2 2 6 6 159 1035 1242 2926 2926 457Bahrain 3 6 1 2 3 2631 4535 288 1082 1201 429BangladeshChina
20615
29980
501314
481043
421061
12052464604
14137672130
24000646792
8459357212 75601489807 349574
China, Macao 4 2 4 4 4 1447 973 1411 1940 1940 439Cyprus 6 8 6 6 6 5256 6453 3865 1080 1080 180Georgia 1 2 2India 170 494 475 434 421 113369 308665 288804 188789 160999 382Indonesia 4 38 65 4 1 3139 27393 35585 1835 450 409Iran 53 93 51 57 57 50000 90729 49988 42469 42469 745Israel 108 128 133 144 170 42000 103118 88229 99374 100735 594Japan 580 638 629 620 594 568591 554644 472317 432254 452431 762Jordan 11 11 11 12 13 9600 8768 6114 5117 4478 358Kazakhstan 16 11 11 11 9747 5458 5458 5458 496Korea D P Rp 1 I 1 0 0Korea Rep 177 83 14 1 143786 70436 6077 264 264Kuwait 7 15 15 15 23 5324 7562 7562 7562 10095 441Kyrgyzstan 3 3 4 4 2068 2068 1590 1590 442
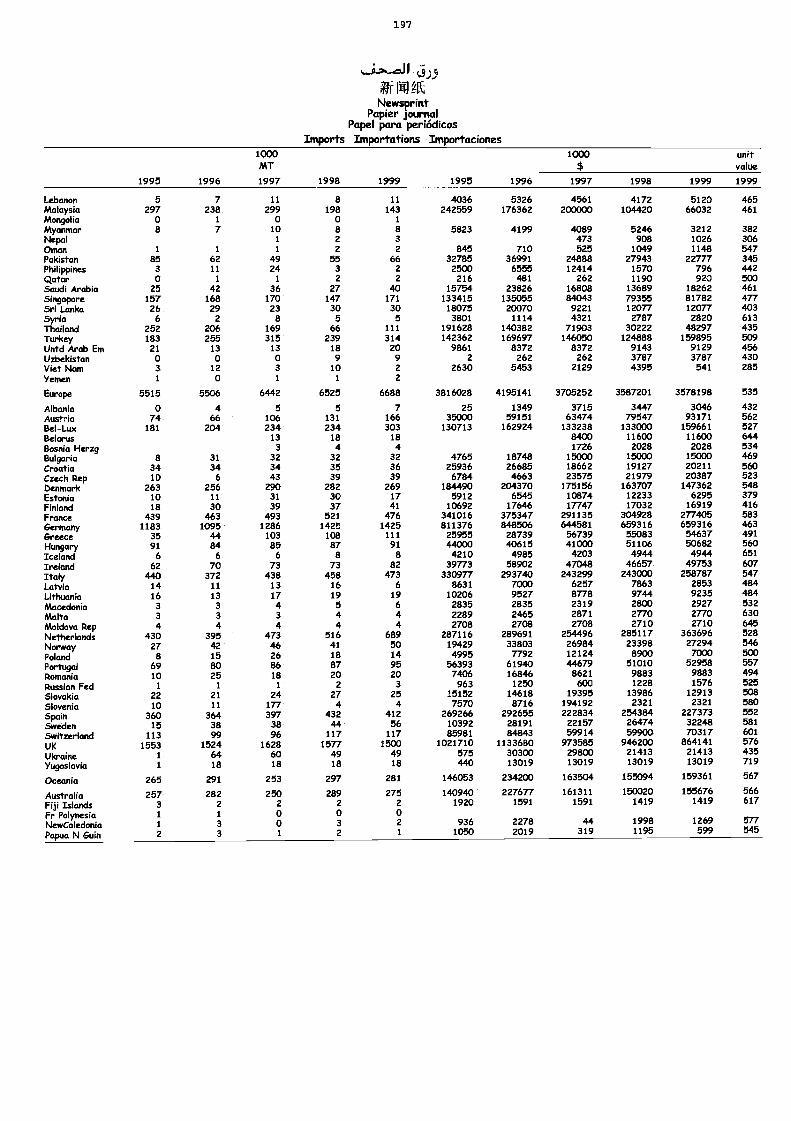
1 97
5),1:fr 141 gttNewsprint
Papier journalPapel para periódicos
Imports Importations Importaciones1000MT
1000$
unitvalue
1995 1996 1997 1998 1999 1995 1996 1997 1998 1999 1999
Lebanon 5 7 11 8 11 4036 5326 4561 4172 5120 465Malaysia 297 238 299 198 143 242559 176362 200000 104420 66032 461Mongolia 0 1 0 0 1
MManmar 8 7 10 8 8 5823 4199 4089 5246 3212 382Nepal 1 2 3 473 908 1026 306Oman 1 1 1 2 2 845 710 525 1049 1148 547Pakistan 85 62 49 55 66 32785 36991 24888 27943 22777 345Philippirms 3 11 24 3 2 2500 6555 12414 1570 796 442Qatar 0 1 1 2 2 216 481 262 1190 920 500Saudi Arabia 25 42 36 27 40 15754 23826 16808 13689 18262 461Singapore 157 168 170 147 171 133415 135055 84043 79355 81782 477Sri Lanka 26 29 23 30 30 18075 20070 9221 12077 12077 403Syria 6 2 8 5 5 3801 1114 4321 2787 2820 613Thailand 252 206 169 66 111 191628 140382 71903 30222 48297 435Turkey 183 255 315 239 314 142362 169697 146050 124888 159895 509Untd Arab Em 21 13 13 18 20 9861 8372 8372 9143 9129 456Uzbekistan 0 0 0 9 9 2 262 262 3787 3787 430Viet Nam 3 12 3 10 2 2630 5453 2129 4395 541 285Yemen 1 0 1 1 2
Europe 5515 5506 6442 6525 6688 3816028 4195141 3705252 3587201 3578198 535
Albania 0 4 5 5 7 25 1349 3715 3447 3046 432Austria 74 66 106 131 166 35000 59151 63474 79547 93171 562Bel-Lux 181 204 234 234 303 130713 162924 133238 133000 159661 527Bekirus 13 18 18 8400 11600 11600 644Bodia Herzg 3 4 4 1726 2028 2028 534Bulgaria 8 31 32 32 32 4765 18748 15000 15000 15000 469Croatia 34 34 34 35 36 25936 26685 18662 19127 20211 560Czech Rep 10 6 43 39 39 6784 4663 23575 21979 20387 523
Denmark 263 256 290 282 269 184490 204370 175156 163707 147362 548Estonia 10 11 31 30 17 5912 6545 10874 12233 6295 379
Finland 18 30 39 37 41 10692 17646 17747 17032 16919 416France 439 463 493 521 476 341016 375347 291135 304928 277405 583Germany 1183 1095 1286 1425 1425 811376 848506 644581 659316 659316 463Greece 35 44 103 108 111 25955 28739 56739 55083 54637 491
Hungary 91 84 85 87 91 44000 40615 41000 51106 53682 560
Iceland 6 6 6 8 s 4210 4985 4203 4944 4944 651
IreMnd 62 70 73 73 82 39773 58902 47048 46657 49753 607
Italy 440 372 438 458 473 330977 293740 243299 243000 258787 547
Latvia 14 11 13 16 6 8631 7000 6257 7863 2853 484Lithuada 16 13 17 19 19 10206 9527 8778 9744 9235 484Macedonia 3 3 4 5 6 2835 2835 2319 2800 2927 532
Malta 3 3 3 4 4 2289 2465 2871 2770 2770 630
Moldova Rep 4 4 4 4 4 2708 2708 2708 2710 2710 645
Netherlands 430 395 473 516 689 287116 289691 254496 285117 363696 528
Norway 27 42 46 41 50 19429 33803 26984 23398 27294 546
Poland 8 15 26 18 14 4995 7792 12124 8900 7000 500
Portugal 69 80 86 87 95 56393 61940 44679 51010 52958 557
Ramada 10 25 18 20 20 7406 16846 8621 9883 9883 494
Russian Fed 1 1 1 2 3 963 1250 600 1228 1576 525
SkmaMa 22 21 24 27 25 15152 14618 19395 13986 12913 508
Skmenia 10 11 177 4 4 7570 8716 194192 2321 2321 580
SpaM 360 364 397 432 412 269266 292655 222834 254384 227373 552
Sweden 15 38 38 44 56 10392 28191 22157 26474 32248 581
Swfterland 113 99 96 117 117 85981 84843 59914 59900 70317 601
UK 1553 1524 1628 1577 1500 1021710 1133680 973585 946200 864141 576
UkraMe 1 64 60 49 49 575 30300 29800 21413 21413 435
Yugoslavia 1 18 18 18 18 440 13019 13019 13019 13019 719
Oceada 265 291 253 297 281 146053 234200 163504 155094 159361 567
Australia 257 282 250 289 275 140940 227677 161311 150020 155676 566
Fiji Islands 3 2 2 2 2 1920 1591 1591 1419 1419 617
FrPolyneda 1 1 0 0 0
NewCaledonia 1 3 0 3 2 936 2278 44 1998 1269 577
Papua N GuM 2 3 1 2 1 1050 2019 319 1195 599 545
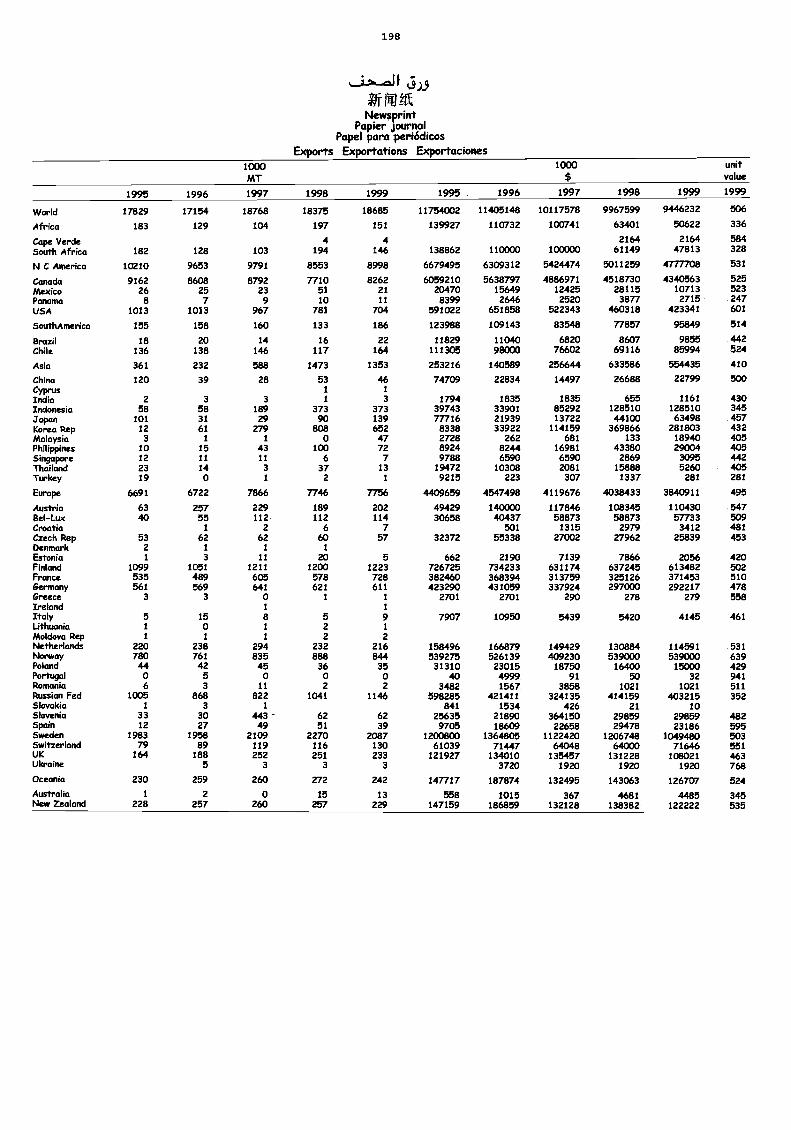
1 98
a AV
NewsprintPapier journal
Papel para periódicosExports Exportations Exportaciones
1000MT
1000$
unitvalue
1995 1996 1997 1998 1999 1995 1996 1997 1998 1999 1999
World 17829 17154 18768 18375 18685 11754002 11405148 10117578 9967599 9446232 506
Africa 183 129 104 197 151 139927 110732 100741 63401 50622 336
Cape Verde 4 4 2164 2164 584South Africa 182 128 103 194 146 138862 110000 100000 61149 47813 328
N C America 10210 9653 9791 8553 8998 6679495 6309312 5424474 5011259 4777708 531
Canada 9162 8608 8792 7710 8262 6059210 5638797 4886971 4518730 4340563 525Mexico 26 25 23 51 21 20470 15649 12425 28115 10713 523Panama 8 7 9 10 11 8399 2646 2520 3877 2715 247USA 1013 1013 967 781 704 591022 651858 522343 460318 423341 601
SouthAmerica 155 158 160 133 186 123988 109143 83548 77857 95849 514
Brazil 18 20 14 16 22 11829 11040 6820 8607 9855 442Chile 136 138 146 117 164 111305 98000 76602 69116 85994 524
Asia 361 232 588 1473 1353 253216 140589 256644 633586 554435 410
China 120 39 28 53 46 74709 22834 14497 26688 22799 500Cyprus 1 1
India 2 3 3 1 3 1794 1835 1835 655 1161 430Indonesia 58 58 189 373 373 39743 33901 85292 128510 128510 345Japan 101 31 29 90 139 77716 21939 13722 44100 63498 457Korea Rep 12 61 279 808 652 8338 33922 114159 369866 281803 432Malaysia 3 1 1 0 47 2728 262 681 133 18940 405Philippines 10 15 43 100 72 8924 8244 16981 43380 29004 405Singapore 12 11 11 6 7 9788 6590 6590 2869 3095 442Thailand 23 14 3 37 13 19472 10308 2081 15888 5260 405Turkey 19 0 1 2 1 9215 223 307 1337 281 281
Europe 6691 6722 7866 7746 7756 4409659 4547498 4119676 4038433 3840911 495
Austria 63 257 229 189 202 49429 140000 117846 108345 110430 547Bel-Lux 40 55 112 112 114 30658 40437 58873 58873 57733 509Croatia 1 2 6 7 501 1315 2979 3412 481Czech Rep 53 62 62 60 57 32372 55338 27002 27962 25839 453Denmark 2 1 1 1
Estonia 1 3 11 20 5 662 2190 7139 7866 2056 420Finland 1099 1051 1211 1200 1223 726725 734233 631174 637245 613482 502France 535 489 605 578 728 382460 368394 313759 325126 371453 510Germany 561 569 641 621 611 423290 431059 337924 297000 292217 478Greece 3 3 0 1 1 2701 2701 290 278 279 558Ireland 1 1
Italy 5 15 8 5 9 7907 10950 5439 5420 4145 461Lithuania 1 0 1 2 1
Mokkwa Rep 1 1 1 2 2Netherlands 220 238 294 232 216 158496 166879 149429 130884 114591 531Norway 780 761 835 888 844 539275 526139 409230 539000 539000 639Poland 44 42 45 36 35 31310 23015 18750 16400 15000 429Portugal o 5 o o 0 40 4999 91 50 32 941Romania 6 3 11 2 2 3482 1567 3858 1021 1021 511Russian Fed 1005 868 822 1041 1146 598285 421411 324135 414159 403215 352Slovakia 1 3 1 841 1534 426 21 10Slovenia 33 30 443 - 62 62 25635 21890 364150 29859 29859 482Spain 12 27 49 51 39 9705 18609 22658 29478 23186 595Sweden 1983 1958 2109 2270 2087 1200800 1364805 1122420 1206748 1049480 503Switzerland 79 89 119 116 130 61039 71447 64048 64000 71646 551UK 164 188 252 251 233 121927 134010 135457 131228 108021 463Ukraine 5 3 3 3 3720 1920 1920 1920 768Oceania 230 259 260 272 242 147717 187874 132495 143063 126707 524Australia 1 2 o 15 13 558 1015 367 4681 4485 345New Zealand 228 257 260 257 229 147159 186859 132128 138382 122222 535
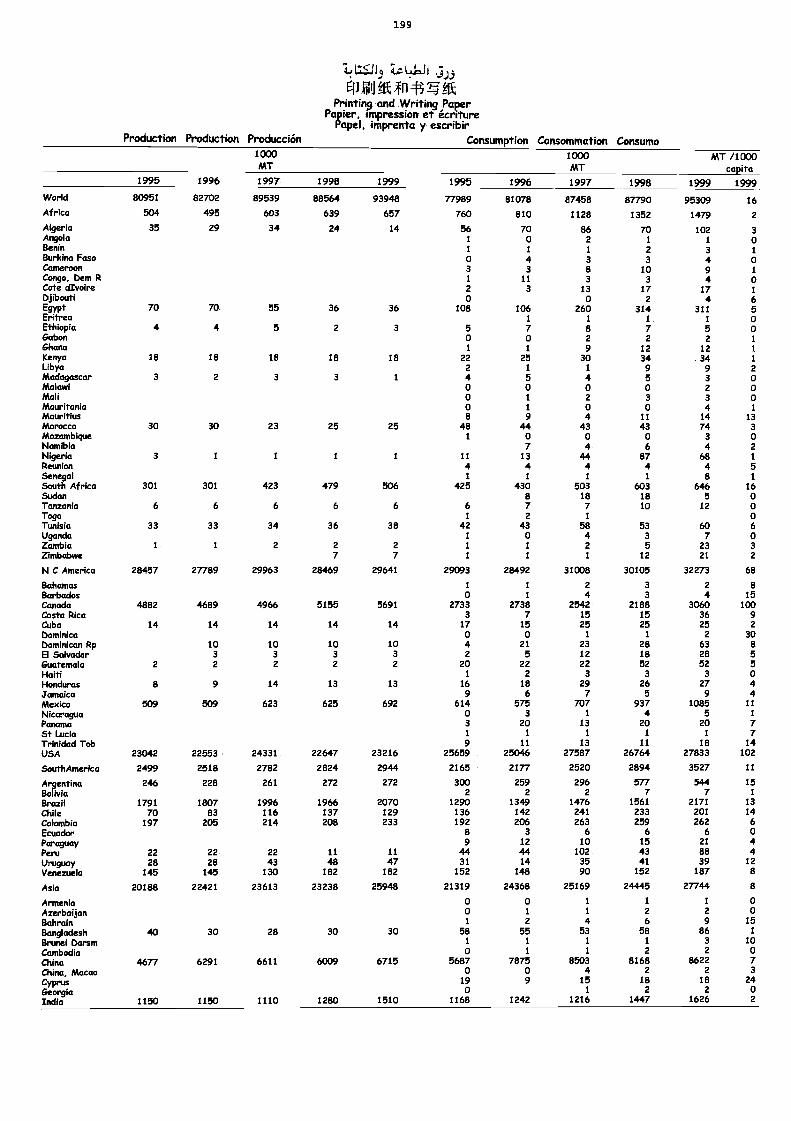
199
74.f =13 411.6..o
CPNOEfll1 -WtikPrinting and Writing Paper
Papier, Impression et écnturePapel, imprenta y escribir
Production Production Producción Consumption Consommation Consumo1000MT
1000MT
MT /1000capita
19991995 1996 1997 1998 1999 1995 1996 1997 1998 1999
World 80951 82702 89539 88564 93948 77989 81078 87458 87790 95309 16Africa 504 495 603 639 657 760 810 1128 1352 1479 2
Algeria 35 29 34 24 14 56 70 86 70 102 3Angola 1 0 2 1 1 0Benin 1 1 1 2 3 1
Burkina Paso 0 4 3 3 4 0Cameroon 3 3 8 10 9 1Congo, Dam R 1 11 3 3 4 0Cote dIvoire 2 3 13 17 17 1Djibouti 0 0 2 4 6Egypt 70 70 55 36 36 108 106 260 314 311 5Eritrea 1 1 1 1 0Ethiopia 4 4 5 2 3 5 7 8 7 5 0Gabon 0 0 2 2 2 1Ghana 1 1 9 12 12 1Kenya 18 18 18 18 18 22 25 30 34 34 1
Libya 2 1 1 9 9 2Madagascar 3 2 3 3 1 4 5 4 5 3 0Malawi 0 0 0 0 2 0Mali 0 1 2 3 3 0Mauritania 0 1 0 0 4 1
Mauritius 8 9 4 11 14 13Morocco 30 30 23 25 25 48 44 43 43 74 3Mozambique 1 0 0 0 3 0Namibia 7 4 6 4 2Nigeria 3 1 1 1 1 11 13 44 87 68 1
Reunion 4 4 4 4 4 5Senegal 1 1 1 1 8 1
South Africa 301 301 423 479 506 425 430 503 603 646 16Sudan 8 18 18 5 0Tanzania 6 6 6 6 6 6 7 7 10 12 0Togo 1 2 1 0Tunisia 33 33 34 36 38 42 43 58 53 60 6Uganda 1 0 4 3 7 0Zambia 1 1 2 2 2 1 1 2 5 23 3Zimbabwe 7 7 1 1 1 12 21 2
N C Amarka 28457 27789 29963 28469 29641 29093 28492 31008 30105 32273 68
Bahamas 1 1 2 3 2 8Barbados 0 1 4 3 4 15Canada 4882 4689 4966 5155 5691 2733 2738 2542 2188 3060 100Costa Rica 3 7 15 15 36 9Cuba 14 14 14 14 14 17 15 25 25 25 2Dominica 0 0 1 1 2 30Dominican Rp 10 10 10 10 4 21 23 28 63 8El Salvador 3 3 3 3 2 5 12 18 28 5Guatemala 2 2 2 2 2 20 22 22 52 52 5Haiti 1 2 3 3 3 0Honduras 8 9 14 13 13 16 18 29 26 27 4Jamaica 9 6 7 5 9 4Mexico 509 509 623 625 692 614 575 707 937 1085 11
Nicaragua 0 3 1 4 5 1
Panama 3 20 13 20 20 7St Lucia 1 1 1 1 1 7Trinidad Tob 9 11 13 11 18 14USA 23042 22553 24331 22647 23216 25659 25046 27587 26764 27833 102
SouthAmerica 2499 2518 2782 2824 2944 2165 2177 2520 2894 3527 11
Argentina 246 228 261 272 272 300 259 296 577 544 15Bolivia 2 2 2 7 7 1
Brazil 1791 1807 1996 1966 2070 1290 1349 1476 1561 2171 13Chile 70 83 116 137 129 136 142 241 233 201 14Colombia 197 205 214 208 233 192 206 263 259 262 6Ecuador 8 3 6 6 6 0Paraguay 9 12 10 15 21 4Peru 22 22 22 11 11 44 44 102 43 88 4Uruguay 28 28 43 48 47 31 14 35 41 39 12Venezuela 145 145 130 182 182 152 148 90 152 187 8
Asia 20188 22421 23613 23238 25948 21319 24368 25169 24445 27744 8
Armenia 0 0 1 1 1 0Azerbaijan 0 1 1 2 2 0Bahrain 1 2 4 6 9 15Bangladesh 40 30 28 30 30 58 55 53 58 86 1
Brunei Darsm 1 1 1 1 3 10Cambodia 0 1 1 2 2 0China 4677 6291 6611 6009 6715 5687 7875 8503 8168 8622 7China, Macao 0 0 4 2 2 3
Cyprus 19 9 15 18 18 24Georgia 0 1 2 2 0India 1150 1150 1110 1280 1510 1168 1242 1216 1447 1626 2
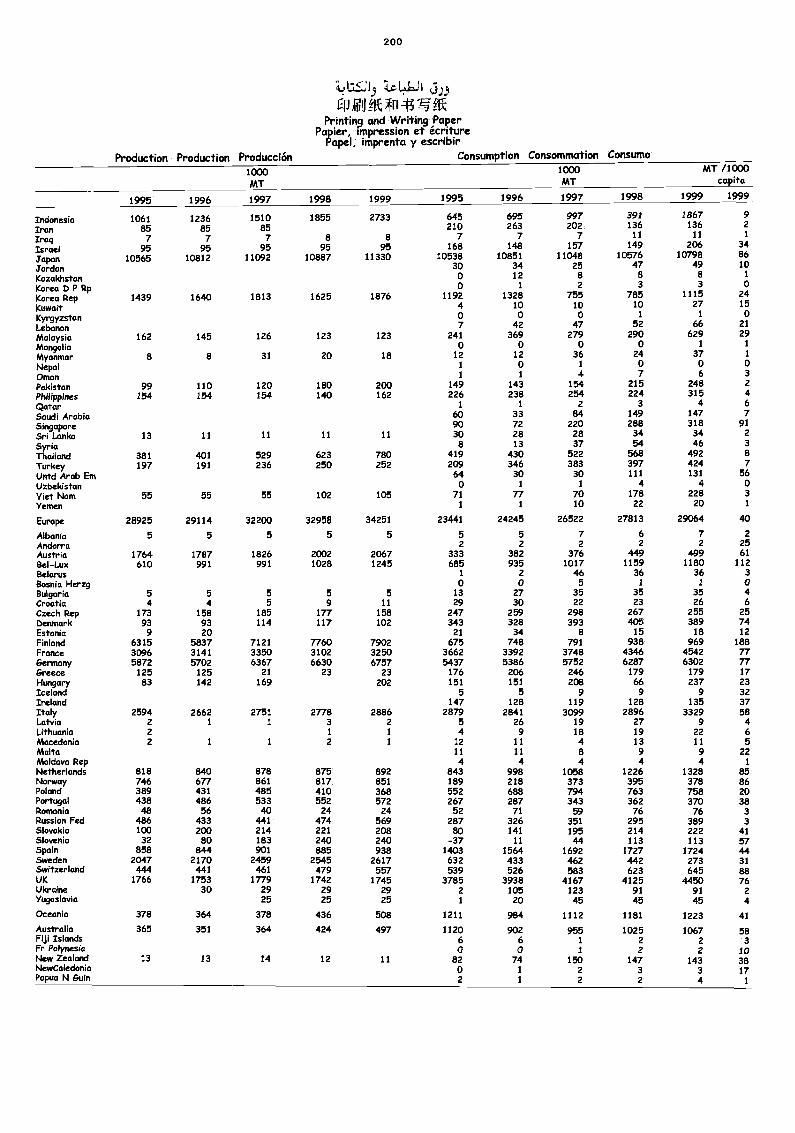
200
I 4 t,..krCp Vitffk
Production Production Producción
Printing and Writing PaperPapier, impression et écriture
Papel, imprenta y escribirConsumption Consommation Consumo
1000MT
1000MT
MT /1000capita
1995 1996 1997 1998 1999 1995 1996 1997 1998 1999 1999
Indonesia 1061 1236 1510 1855 2733 645 695 997 391 1867 9
Iran 85 85 85 210 263 202 136 136 2
Iraq 7 7 7 8 8 7 7 7 11 11 1
Israel 95 95 95 95 95 168 148 157 149 206 34
Japan 10565 10812 11092 10887 11330 10538 10851 11048 10576 10798 86
Jordan 30 34 25 47 49 10
Kazakhstan o 12 8 8 8 1
Korea D P Rp o 1 2 3 3 0
Korea Rep 1439 1640 1813 1625 1876 1192 1328 755 785 1115 24
Kuwait 4 10 10 10 27 15
Kyrgyzstan 0 0 0 1 1 0
Lebanon 7 42 47 52 66 21
Malaysia 162 145 126 123 123 241 369 279 290 629 29
Mongolia 0 0 0 0 1 1
Myanmar 8 8 31 20 18 12 12 36 24 37 1
Nepal 1 0 1 0 0 0
Ornan 1 1 4 7 6 3
Pakistan 99 110 120 180 200 149 143 154 215 248 2
Philippines 154 154 154 140 162 226 238 254 224 315 4Qatar 1 1 2 3 4 6
Saudi Arabia 60 33 84 149 147 7
Singapore 90 72 220 288 318 91
Sri Lanka 13 11 11 11 11 30 28 28 34 34 2
Syria 8 13 37 54 46 3
Thailand 381 401 529 623 780 419 430 522 568 492 8
Turkey 197 191 236 250 252 209 346 383 397 424 7
Untd Arab Em 64 30 30 111 131 56
Uzbekistan 0 1 1 4 4 o
Viet Nam 55 55 55 102 105 71 77 70 178 228 3
Yemen 1 1 10 22 20 I
Europe 28925 29114 32200 32958 34251 23441 24245 26522 27813 29064 40
Albania 5 5 5 5 5 5 5 7 6 7 2
Andorra 2 2 2 2 2 25Austria 1764 1787 1826 2002 2067 333 382 376 449 499 61Bel-Lux 610 991 991 1028 1245 685 935 1017 1159 1180 112Belarus 1 2 46 36 36 3
Bosnia Herzg 0 0 5 / / 0Bulgaria 5 5 5 5 5 13 27 35 35 35 4Croatia 4 4 5 9 11 29 30 22 23 26 6Czech Rep 173 158 185 177 158 247 259 298 267 255 25Denmark 93 93 114 117 102 343 328 393 405 389 74Estonia 9 20 21 34 8 15 18 12Finland 6315 5837 7121 7760 7902 675 748 791 938 969 188France 3096 3141 3350 3102 3250 3662 3392 3748 4346 4542 77Germany 5872 5702 6367 6630 6757 5437 5386 5752 6287 6302 77Greece 125 125 21 23 23 176 206 246 179 179 17Hungary 83 142 169 202 151 151 208 66 237 23Iceland 5 5 9 9 9 32Ireland 147 128 119 128 135 37Italy 2594 2662 2751 2778 2886 2879 2841 3099 2896 3329 58Latvia 2 1 1 3 2 5 26 19 27 9 4Lithuania 2 1 1 4 9 18 19 22 6Macedonia 2 1 1 2 1 12 11 4 13 11 5Malta 11 11 8 9 9 22Moldova Rep 4 4 4 4 4 1
Netherlands 818 840 878 875 892 843 998 1058 1226 1328 85Norway 746 677 861 817 851 189 218 373 395 378 86Poland 389 431 485 410 368 552 688 794 763 758 20Portugal 438 486 533 552 572 267 287 343 362 370 38Romania 48 56 40 24 24 52 71 59 76 76 3Russian Fed 486 433 441 474 569 287 326 351 295 389 3Slovakia 100 200 214 221 208 80 141 195 214 222 41Slovenia 32 80 183 240 240 -37 11 44 113 113 57Spain 858 844 901 885 938 1403 1564 1692 1727 1724 44Sweden 2047 2170 2459 2545 2617 632 433 462 442 273 31Switzerland 444 441 461 479 557 539 526 583 623 645 88UK 1766 1753 1779 1742 1745 3785 3938 4167 4125 4450 76Ukraine 30 29 29 29 2 105 123 91 91 2Yugoslavia 25 25 25 1 20 45 45 45 4
Oceania 378 364 378 436 508 1211 984 1112 1181 1223 41Australia 365 351 364 424 497 1120 902 955 1025 1067 58Fiji Islands 6 6 1 2 2 3Fr Polynesia 0 0 1 2 z 10New Zealand 13 13 14 12 11 82 74 150 147 143 38NewCaledonia 0 1 2 3 3 17Papua N Guin 2 1 2 2 4 1
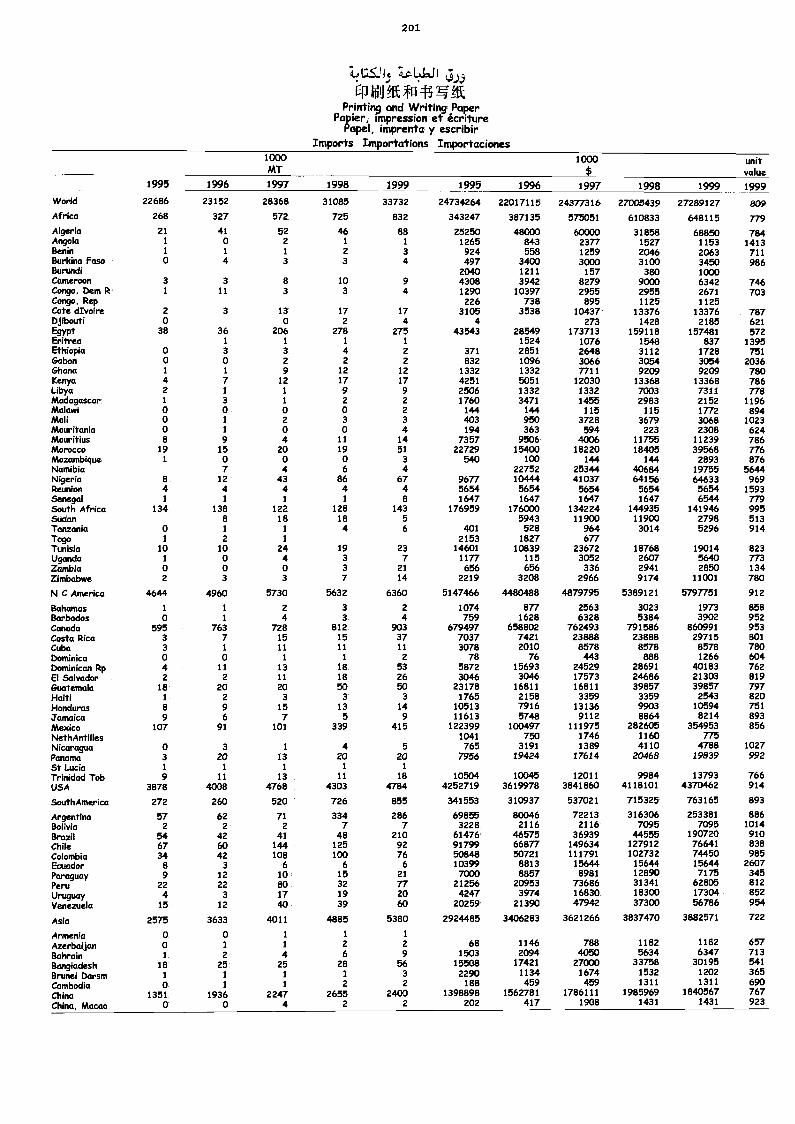
201
(.1.5../13 Lfl,5).3'jand Writing Paper
Papier, impression et écriturePapel, imprenta y escribir
Imports Importations Importaciones1000MT
1000 unitvalue
1995 1996 1997 1998 1999 1995 1996 1997 1998 1999 1999
World 22686 23152 28368 31085 33732 24734264 22017115 24377316 27005439 27289127 809Africa 268 327 572 725 832 343247 387135 575051 610833 648115 779Algeria 21 41 52 46 88 25250 48000 60000 31858 68850 784Angola 1 0 2 1 1 1265 843 2377 1527 1153 1413Benin 1 1 1 2 3 924 558 1259 2046 2063 711Burkina Faso 0 4 3 3 4 497 3400 3000 3100 3450 986Burundi 2040 1211 157 380 1000Cameroon 3 3 8 10 9 4308 3942 8279 9000 6342 746Congo, Dem R 1 11 3 3 4 1290 10397 2955 2955 2671 703Congo, Rep 226 738 895 1125 1125Cote dIvoire 2 3 13 17 17 3105 3538 10437 13376 13376 787Djibouti 0 0 2 4 4 273 1428 2185 621Egypt 38 36 206 278 275 43543 28549 173713 159118 157481 572Eritrea 1 1 1 1 1524 1076 1548 837 1395Ethiopia 0 3 3 4 2 371 2851 2648 3112 1728 751Gabon 0 0 2 2 2 832 1096 3066 3054 3054 2036Ghana 1 1 9 12 12 1332 1332 7711 9209 9209 780Kenya 4 7 12 17 17 4251 5051 12030 13368 13368 786Libya 2 1 1 9 9 2506 1332 1332 7003 7311 778Madagascar 1 3 1 2 2 1760 3471 1455 2983 2152 1196Malawi o o o o 2 144 144 115 115 1772 894Mali o 1 a 3 3 403 950 3728 3679 3068 1023Mauritania 0 1 o 0 4 194 363 594 223 2308 624Mauritius 8 9 4 11 14 7357 9506 4006 11755 11239 786Morocco 19 15 20 19 51 22729 15400 18220 18405 39568 776Mozambique 1 o o 0 3 540 100 144 144 2893 876Namibia 7 4 6 4 22752 25344 40684 19755 5644Nigeria 8 12 43 86 67 9677 10444 41037 64156 64633 969Reunion 4 4 4 4 4 5654 5654 5654 5654 5654 1593Senegal I 1 1 1 8 1647 1647 1647 1647 6544 779South Africa 134 138 122 128 143 176959 176000 134224 144935 141946 995Sudan 8 18 18 5 5943 11900 11900 2798 513Tanzania 0 1 1 4 6 401 528 964 3014 5296 914Togo 1 2 I 2153 1827 677Tunisia 10 10 24 19 23 14601 10839 23672 18768 19014 823Uganda 1 o 4 3 7 1177 115 3052 2607 5640 773Zambia 0 0 0 3 21 656 656 336 2941 2850 134Zimbabwe 2 3 3 7 14 2219 3208 2966 9174 11001 780
N C America 4644 4960 5730 5632 6360 5147466 4480488 4879795 5389121 5797751 912
Bahamas 1 1 2 3 2 1074 877 2563 3023 1973 858Barbados 0 1 4 3 4 759 1628 6328 5384 3902 952Canada 595 763 728 812 903 679497 658802 762493 791586 860991 953Costa Rica 3 7 15 15 37 7037 7421 23888 23888 29715 801Cuba 3 1 11 11 11 3078 2010 8578 8578 8578 780Dominica 0 0 1 1 2 78 76 443 888 1266 604Dominican Rp 4 11 13 18 53 5872 15693 24529 28691 40183 762El Salvador 2 2 11 18 26 3046 3046 17573 24686 21303 819Guatemala 18 20 20 50 50 23178 16811 16811 39857 39857 797Haiti 1 2 3 3 3 1765 2158 3359 3359 2543 820Honduras 8 9 15 13 14 10513 7916 13136 9903 10594 751Jamaica 9 6 7 5 9 11613 5748 9112 8864 8214 893Mexico 107 91 101 339 415 122399 100497 111975 282605 354953 856NethAntilles 1041 750 1746 1160 775Nicaragua 0 3 1 4 5 765 3191 1389 4110 4788 1027Panama 3 20 13 20 20 7956 19424 17614 20468 19839 992St Lucia 1 1 1 1 1
Trinidad Tob 9 11 13 11 18 10504 10045 12011 9984 13793 766USA 3878 4008 4768 4303 4784 4252719 3619978 3841860 4118101 4370462 914
SouthAmerica 272 260 520 726 855 341553 310937 537021 715325 763165 893
Argentina 57 62 71 334 286 69855 80046 72213 316306 253381 886Bolivia 2 2 2 7 7 3228 2116 2116 7095 7095 1014
Brazil 54 42 41 48 210 61476 46575 36939 44555 190720 910Chile 67 60 144 125 92 91799 66877 149634 127912 76641 838
Colombia 34 42 108 100 76 50848 50721 111791 102732 74450 985Ecuador 8 3 6 6 6 10399 8813 15644 15644 15644 2607Paraguay 9 12 10 15 21 7000 8857 8981 12890 7175 345Peru 22 22 80 32 77 21256 20953 73686 31341 62805 812
Uruguay 4 3 17 19 20 4247 3974 16830 18300 17304 852
Venezuela 15 12 40 39 60 20259 21390 47942 37300 56786 954
Asia 2575 3633 4011 4885 5380 2924485 3406283 3621266 3837470 3882571 722
Armenia 0 0 1 1 1
Azerbaijan o 1 1 2 2 68 1146 788 1182 1182 657Bahrain 1 2 4 6 9 1503 2094 4050 5634 6347 713
Bangladesh 18 25 25 28 56 15508 17421 27000 33758 30195 541
Brunei Darsm 1 1 1 1 3 2290 1134 1674 1532 1202 365
Cainbodia 0 1 1 2 2 188 459 459 1311 1311 690
China 1351 1936 2247 2655 2400 1398898 1562781 1786111 1985969 1840567 767
China, Macao 0 0 4 2 2 202 417 1908 1431 1431 923
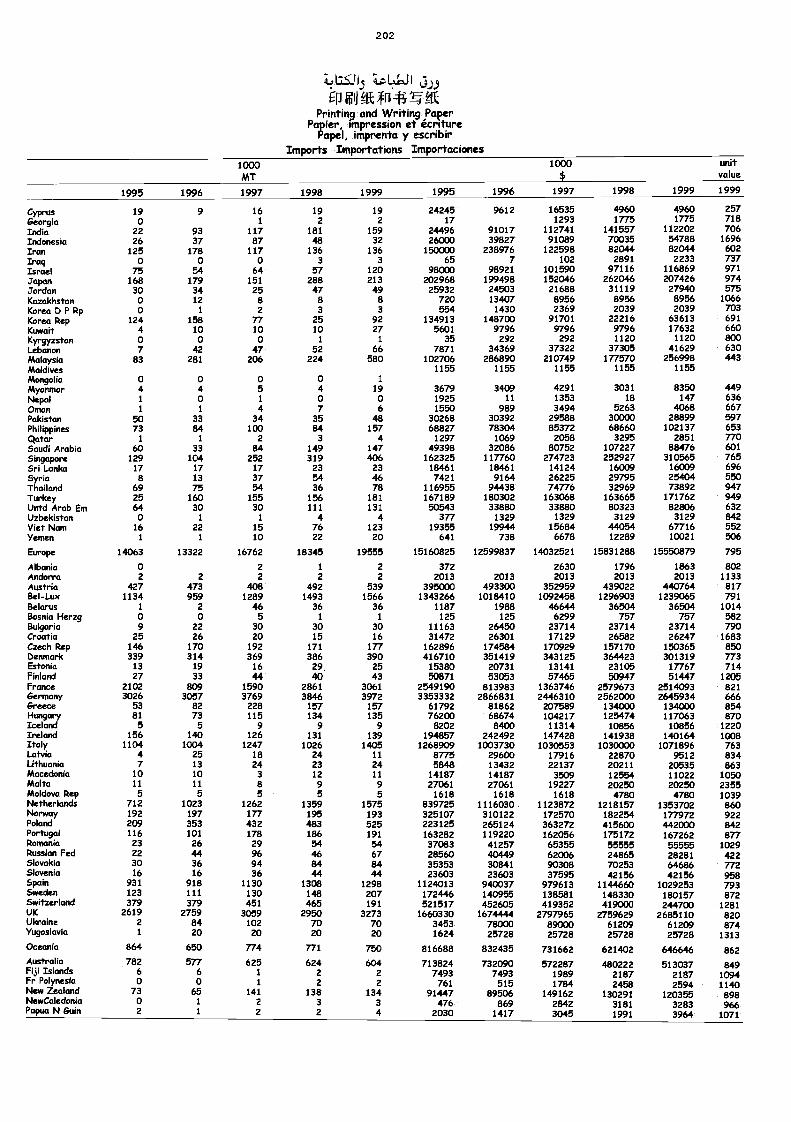
202
Li5.115 lisL,L6J1
EtJ ION 3n14=-q.iikPrinting and Writing Paper
Papier, impression et icriturePapel, imprenta y escribir
Imports Importations Importaciones1000MT
1000$
unitvalue
1995 1996 1997 1998 1999 1995 1996 1997 1998 1999 1999
Cyprus 19 9 16 19 19 24245 9612 16535 4960 4960 257
Georgia 0 1 2 2 17 1293 1775 1775 718India 22 93 117 181 159 24496 91017 112741 141557 112202 706Indonesia 26 37 87 48 32 26000 39827 91089 70035 54788 1696Iran 125 178 117 136 136 150000 238976 122598 82044 82044 602Iraq 0 0 0 3 3 65 7 102 2891 2233 737Israel 75 54 64 57 120 98000 98921 101590 97116 116869 971
yapan 168 179 151 288 213 202968 199498 152046 262046 207426 974Jordan 30 34 25 47 49 25932 24503 21688 31119 27940 575Kazakhstan o 12 8 8 8 720 13407 8956 8956 8956 1066Korea b PRp 0 1 2 3 3 554 1430 2369 2039 2039 703Korea Rep 124 158 77 25 92 134913 148700 91701 22216 63613 691
Kuwait 4 10 10 10 27 5601 9796 9796 9796 17632 660Kyrgyzstan o o o 1 1 35 292 292 1120 1120 800Lebcmon 7 42 47 52 66 7871 34369 37322 37305 41629 630Malaysia 83 281 206 224 580 102706 286890 210749 177570 256998 443MaldWes 1155 1155 1155 1155 1155Mongolia 0 0 0 0 1
Myamnar 4 4 5 4 19 3679 3409 4291 3031 8350 449Nlepal 1 0 1 0 0 1925 11 1353 18 147 636Gomm 1 1 4 7 6 1553 989 3494 5263 4068 667Pakistan 50 33 34 35 48 30268 30392 29588 30000 28899 597PhMppines 73 84 100 84 157 68827 78304 85372 68660 102137 653Qatar 1 1 2 3 4 1297 1069 2058 3295 2851 770Saudi Arabia 60 33 84 149 147 49398 32086 80752 107227 88476 601
Sin9aPPre 129 104 252 319 406 162325 117760 274723 252927 310565 765Sri Umka 17 17 17 23 23 18461 18461 14124 16009 16009 696Syria 8 13 37 54 46 7421 9164 26225 29795 25404 550Thaikmd 69 75 54 36 78 116955 94438 74776 32969 73892 947Turkey 25 160 155 156 181 167189 180302 163068 163665 171762 949Untd Arab Em 64 30 30 111 131 50543 33880 33880 80323 82806 632Uzbekistan 0 1 1 4 4 377 1329 1329 3129 3129 842Viet Nam 16 22 15 76 123 19355 19944 15684 44054 67716 552Yemen 1 1 10 22 20 641 738 6678 12289 10021 506
Emmpe 14063 13322 16762 18345 19555 15160825 12599837 14032521 15831288 15550879 795
Albania o 2 1 2 372 2630 1796 1863 802Andorra 2 2 2 2 2 2013 2013 2013 2013 2013 1133Austria 427 473 408 492 539 395000 493300 352959 439022 440764 817Bel-Lux 1134 959 1289 1493 1566 1343266 1018410 1092458 1296903 1239065 791Bdoms 1 2 46 36 36 1187 1988 46644 36504 36504 1014Bosda Herzg 0 0 5 1 1 125 125 6299 757 757 582Bulgaria 9 22 30 30 30 11163 26450 23714 23714 23714 790Croatia 25 26 20 15 16 31472 26301 17129 26582 26247 1683Czech Rep 146 170 192 171 177 162896 174584 170929 157170 150365 850Demnark 339 314 369 386 390 416710 351419 343125 364423 301319 773Estonia 13 19 16 29, 25 15380 20731 13141 23105 17767 714Finland 27 33 44 40 43 50871 53053 57465 50947 51447 1205France 2102 809 1590 2861 3061 2549190 813983 1363746 2579673 2514093 821Germany 3026 3057 3769 3846 3972 3353332 2866831 2446310 2562000 2645934 666Greece 53 82 228 157 157 61792 81862 207589 134000 134000 854Hungary 81 73 115 134 135 76200 68674 104217 125474 117063 870IcMand 5 5 9 9 9 8202 8400 11314 10856 10856 1220Ireland 156 140 126 131 139 194857 242492 147428 141938 140164 1008Italy 1104 1004 1247 1026 1405 1268909 1003730 1030553 1030000 1071896 763Latvia 4 25 18 24 11 8775 29600 17916 22870 9512 834Lithuada 7 13 24 23 24 5848 13432 22137 20211 20535 863Macedonia 10 10 3 12 11 14187 14187 3509 12554 11022 1050Malta 11 11 8 9 9 27061 27061 19227 20250 20250 2355MoldovaRep 5 5 5 5 5 1618 1618 1618 4780 4780 1039Netherkmds 712 1023 1262 1359 1575 839725 1116030 1123872 1218157 1353702 860Norway 192 197 177 195 193 325107 310122 172570 182254 177972 922Pdand 209 353 432 483 525 223125 265124 363272 415600 442000 842Portugal 116 101 178 186 191 163282 119220 162056 175172 167262 877Romania 23 26 29 54 54 37083 41257 65355 55555 55555 1029Russian Fed 22 44 96 46 67 28560 40449 62006 24865 28281 422Sbyakia 30 36 94 84 84 35353 30841 90308 70253 64686 772Skwenb 16 16 36 44 44 23603 23603 37595 42156 42156 958Spain 931 918 1130 1308 1298 1124013 940037 979613 1144660 1029253 793Sweden 123 111 130 148 207 172446 140955 138581 148330 180157 872SwitzeHand 379 379 451 465 191 521517 452605 419352 419000 244700 1281UK 2619 2759 3059 2950 3273 1660330 1674444 2797965 2759629 2685110 820Ukrdne 2 84 102 70 70 3453 78000 89000 61209 61209 874Yugoslavia 1 20 20 20 20 1624 25728 25728 25728 25728 1313Oteada 864 650 774 771 750 816688 832435 731662 621402 646646 862Australia
FijiIMands 6782 577
6625
1
6242
6042
7138247493
7320907493
5722871989
4802222187 51:?:; 1011:
Fr Polynesia 0 0 1 2 2 761 515 1784 2458 2594 1140NlemoZealond 73 65 141 138 134 91447 89506 149162 130291 120355 898NewCaleddlici 0 1 2 3 3 476 869 2842 3181 3283 966Papua N Guin 2 1 2 2 4 2030 1417 3045 1991 3964 1071
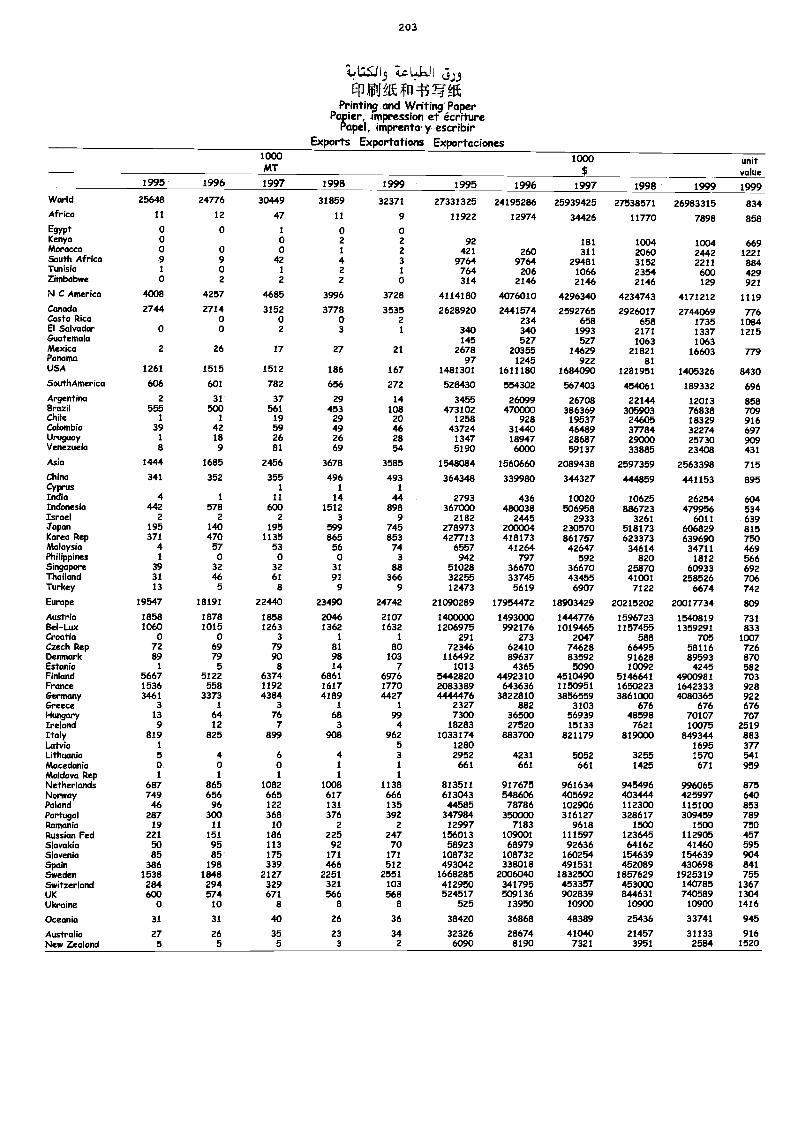
2 03
1...,=13 Le.kur j.9
EP tEPrinting and Writing Paper
Papier, impression et écrrturePape!, imprenta y escribir
Exports Exportations Exportaciones1000MT
1000$
unitvalue
1995 1996 1997 1998 1999 1995 1996 1997 1998 1999 1999World 25648 24776 30449 31859 32371 27331325 24195266 25939425 27538571 26983315 834Africa 11 12 47 11 9 11922 12974 34426 11770 7898 858Egypt 0 0 1 0 0Kenya 0 0 2 2 92 181 1004 1004 669Morocco 0 0 0 1 2 421 260 311 2060 2442 1221South Africa 9 9 42 4 3 9764 9764 29481 3152 2211 884TuniMa 1 0 1 2 1 764 206 1066 2354 600 429Zimbabwe 0 2 2 2 0 314 2146 2146 2146 129 921NC Amerka 4008 4257 4685 3996 3728 4114180 4076010 4296340 4234743 4171212 1119Cmmda 2744 2714 3152 3778 3535 2628920 2441574 2592765 2926017 2744069 776Costa Rica 0 0 0 2 234 658 658 1735 1084El Salvador 0 0 2 3 1 340 340 1993 2171 1337 1215Guatemala 145 527 527 1063 1063Mexico 2 26 17 27 21 2678 20355 14629 21821 16603 779Panama 97 1245 922 81USA 1261 1515 1512 186 167 1481301 1611180 1684090 1281951 1405326 8430SouthAmeHca 606 601 782 656 272 528430 554302 567403 454061 189332 696Argentina 2 31 37 29 14 3455 26099 26708 22144 12013 858Brazil 555 500 561 453 108 473102 470000 386369 305903 76838 709Chile I 1 19 29 20 1258 928 19537 24605 18329 916Colombia 39 42 59 49 46 43724 31440 46489 37784 32274 697Uruguay 1 18 26 26 28 1347 18947 28687 29000 25730 909Venezuela 8 9 81 69 54 5190 6000 59137 33885 23408 431Asia 1444 1685 2456 3678 3585 1548084 1560660 2089438 2597359 2563398 715China 341 352 355 496 493 364348 339980 344327 444859 441153 895Cyprus 1 1 1
India 4 1 11 14 44 2793 436 10020 10625 26254 604Indonesia 442 578 600 1512 898 367000 480038 506958 886723 479956 534Israel 2 2 2 3 9 2182 2445 2933 3261 6011 639Japan 195 140 195 599 745 278973 200004 230570 518173 606829 815Korea Rep 371 470 1135 865 853 427713 418173 861757 623373 639690 750AUilayMa 4 57 53 56 74 6557 41264 42647 34614 34711 469Philippines 1 0 0 0 3 942 797 592 820 1812 566Singapore 39 32 32 31 88 51028 36670 36670 25870 60933 692Thailand 31 46 61 91 366 32255 33745 43455 41001 258526 706Turkey 13 5 8 9 9 12473 5619 6907 7122 6674 742
Europe 19547 18191 22440 23490 24742 21090289 17954472 18903429 20215202 20017734 809
Austria 1858 1878 1858 2046 2107 1400000 1493000 1444776 1596723 1540819 731Bel-Lux 1060 1015 1263 1362 1632 1206975 992176 1019465 1157455 1359291 833Croatia 0 o 3 1 1 291 273 2047 588 705 1007Czech Rep 72 69 79 81 80 72346 62410 74628 66495 58116 726Demnark 89 79 90 98 103 116492 89637 83592 91628 89593 870Estonia 1 5 8 14 7 1013 4365 5090 10092 4245 582Finkmd 5667 5122 6374 6861 6976 5442820 4492310 4510490 5146641 4900981 703France 1536 558 1192 1617 1770 2083389 643636 1150951 1650223 1642333 928Gelmany 3461 3373 4384 4189 4427 4444476 3822810 3856559 3861000 4080365 922Greece 3 1 3 1 1 2327 882 3103 676 676 676Hungary 13 64 76 68 99 7300 36500 56939 48598 70107 707Irekmd 9 12 7 3 4 18283 27520 15133 7621 10075 2519ItMy 819 825 899 908 962 1033174 883700 821179 819000 849344 883Latvia 1 5 1280 1695 377Lithuania 5 4 6 4 3 2952 4231 5052 3255 1570 541Macedonia 0 0 0 1 1 661 661 661 1425 671 959Moldova Rep 1 1 1 1 1
NetheHands 687 865 1082 1008 1138 813511 917675 961634 945496 996065 875Norway 749 656 665 617 666 613043 548606 405692 403444 425997 640Poland 46 96 122 131 135 44585 78786 102906 112300 115100 853Portugal 287 300 368 376 392 347984 350000 316127 328617 309459 789Rommlia 19 11 10 2 2 12997 7183 9618 1500 1500 750Ruakm Fed 221 151 186 225 247 156013 109001 111597 123645 112905 457Slovakia 50 95 113 92 70 58923 68979 92636 64162 41460 595Slovenia 85 85 175 171 171 108732 108732 160254 154639 154639 904Spain 386 198 339 466 512 493042 338018 491531 452089 430698 841Sweden 1538 1848 2127 2251 2551 1668285 2006040 1832500 1857629 1925319 755Switzerland 284 294 329 321 103 412950 341795 453357 453000 140785 1367UK 600 574 671 566 568 524517 509136 902839 844631 740589 1304Ukraine 0 10 8 8 8 525 13950 10900 10900 10900 1416
Oceania 31 31 40 26 36 38420 36868 48389 25436 33741 945
Australia 27 26 35 23 34 32326 28674 41040 21457 31133 916NkurZealand 5 5 5 3 2 6090 8190 7321 3951 2584 1520
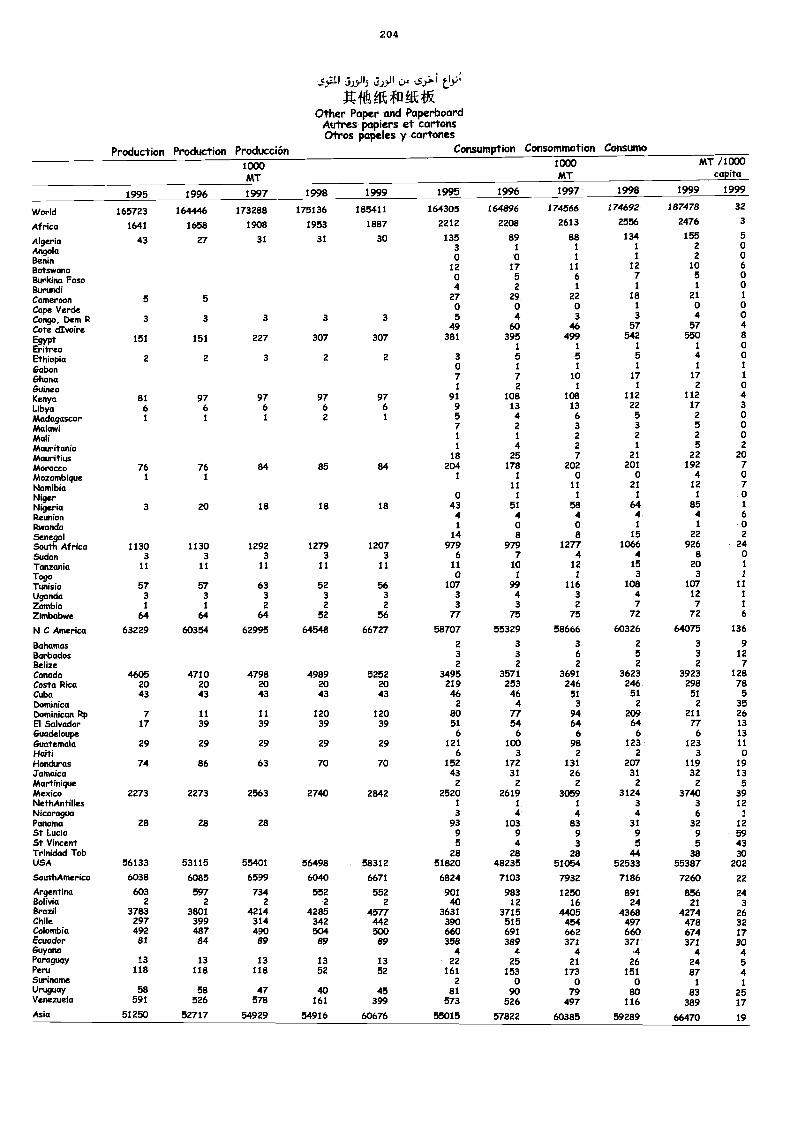
204
310.9 3»111:+' t_19;
fft tik o NI*Other Paper and Paperboard
Attires papiers et cartonsOtros papeles y cartones
Production Production Producción Consumption Consomtnation Consumo
1000MT
1000MT
MT /1000capita
1995 1996 1997 1998 1999 1995 1996 1997 1998 1999 1999
World 165723 164446 173288 175136 185411 164305 164896 174566 174692 187478 32
Africa 1641 1658 1908 1953 1887 2212 2208 2613 2556 2476 3
Algeria 43 27 31 31 30 135 89 88 134 155 5
Angola 3 1 1 1 2 0
Benin 0 0 1 1 2 0
Botswana 12 17 11 12 10 6
Burkina Faso 0 5 6 7 5 0
Burundi 4 2 1 1 1 0
Cameroon 5 5 27 29 22 18 21 1
Cape Verde 0 0 0 1 0 0
Congo, Dam 12 3 3 3 3 3 5 4 3 3 4 0
Cote dIvoire 49 60 46 57 57 4
EgyptEritrea
151 151 227 307 307 381 3951
4991
5421
5501
80
Ethiopia 2 2 3 2 2 3 5 5 5 4 0
Gabon 0 1 1 1 1 1
Ghana 7 7 10 17 17 1
Guinea 1 2 1 1 2 0
Kenya 81 97 97 97 97 91 108 108 112 112 4
Libya 6 6 6 6 6 9 13 13 22 17 3
Madagascar 1 1 1 2 1 5 4 6 5 2 0
Malawi 7 2 3 3 5 0
Mali 1 1 2 2 2 0
Mauritania 1 4 2 1 5 2
Mauritius 18 25 7 21 22 20
Morocco 76 76 84 85 84 204 178 202 201 192 7
Mozambique 1 1 1 1 0 0 4 0
Namibia 11 11 21 12 7
Niger 0 1 1 1 1 0
Nigeria 3 20 18 18 18 43 51 58 64 85 1
Reunion 4 4 4 4 4 6
Rwanda 1 0 0 1 1 0Senegal 14 8 8 15 22 2
South Africa 1130 1130 1292 1279 1207 979 979 1277 1066 926 24Sudan 3 3 3 3 3 6 7 4 4 8 0Tanzania 11 11 11 11 11 11 10 12 15 20 1
Togo 0 I 1 3 3 /Tunisia 57 57 63 52 56 107 99 116 108 107 11
Uganda 3 3 3 3 3 3 4 3 4 12 1
Zambia 1 1 2 2 2 3 3 2 7 7 1
Zimbabwe 64 64 64 52 56 77 75 75 72 72 6
N C America 63229 60354 62995 64548 66727 58707 55329 58666 60326 64075 136
Bahamas 2 3 3 2 3 9Barbados 3 3 6 5 3 12Belize 2 2 2 2 2 7Cortada 4605 4710 4798 4989 5252 3495 3571 3691 3623 3923 128Costa Rica 20 20 20 20 20 219 253 246 246 298 78Cuba 43 43 43 43 43 46 46 51 51 51 5Dominica 2 4 3 2 2 35Dominican Rp 7 11 11 120 120 80 77 94 209 211 26El Salvador 17 39 39 39 39 51 54 64 64 77 13Guadeloupe 6 6 6 6 6 13Guatemala 29 29 29 29 29 121 100 98 123 123 11Haiti 6 3 2 2 3 0Honduras 74 86 63 70 70 152 172 131 207 119 19Jamaica 43 31 26 31 32 13Martinique 2 2 2 2 2 5Mexico 2273 2273 2563 2740 2842 2520 2619 3059 3124 3740 39MethAntilles 1 1 1 3 3 12Nicaragua 3 4 4 4 6 1
Panama 28 28 28 93 103 83 31 32 12St Lucia 9 9 9 9 9 59St Vincent 5 4 3 5 5 43Trinidad Tob 28 28 28 44 38 30USA 56133 53115 55401 56498 58312 51820 48235 51054 52533 55387 202
southAmerica 6038 6085 6599 6040 6671 6824 7103 7932 7186 7260 22
Argentina 603 597 734 552 552 901 983 1250 891 856 24Bolivia 2 2 2 2 2 40 12 16 24 21 3Brazil 3783 3801 4214 4285 4577 3631 3715 4405 4368 4274 26Chile 297 399 314 342 442 390 515 454 497 478 32Colombia 492 487 490 504 500 660 691 662 660 674 17Ecuador 81 84 69 89 89 358 389 371 371 371 30Guyana 4 4 4 4 4 4Paraguay 13 13 13 13 13 22 25 21 26 24 5Peru 118 118 118 52 52 161 153 173 151 87 4Suriname 2 0 0 0 1 1Uruguay 58 58 47 40 45 81 90 79 80 83 25Venezuela 591 526 578 161 399 573 526 497 116 389 17Asia 51250 52717 54929 54916 60676 55015 57822 60385 59289 66470 19
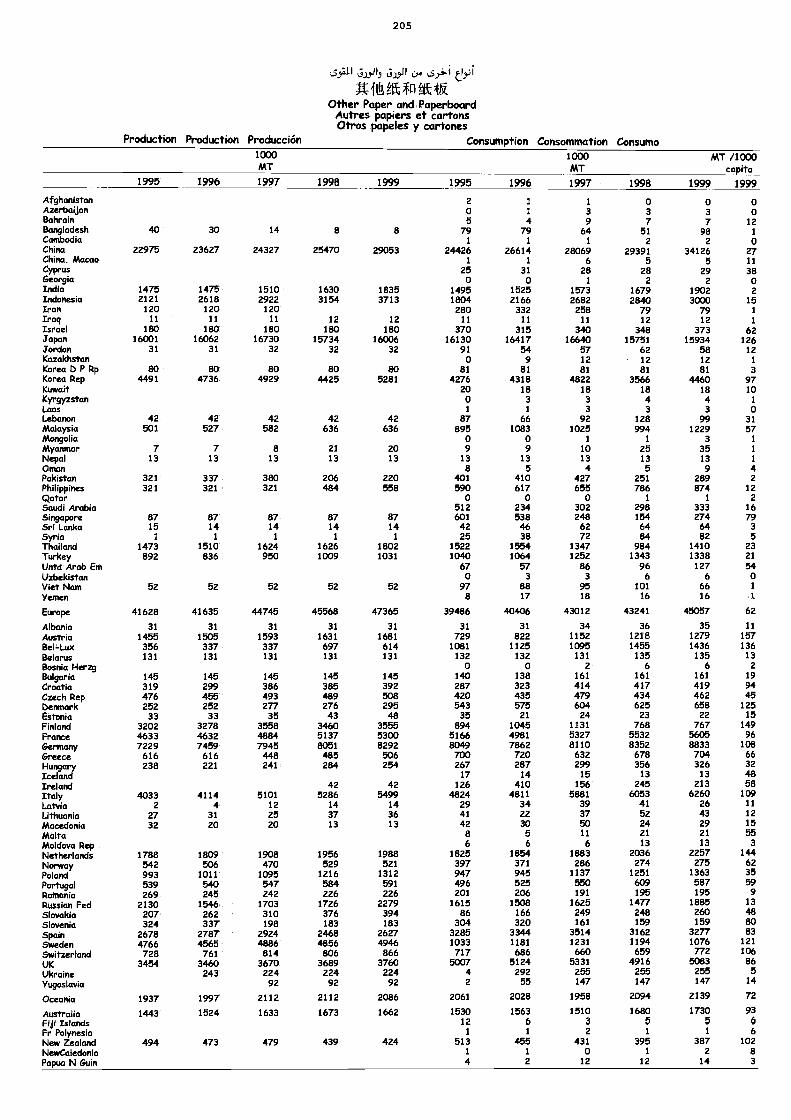
205
Jlo, J.49,[1c.0
ttitA*Fi4k4K
Production Production Producción
Other Paper and PaperboardAutres papiers et cartonsOtros papeles y cartones
Consumption Consommation Consumo1000MT
1000MT
1998
MT/1000capita
1999 19991995 1996 1997 1998 1999 1995 1996 1997
Afghanistan 2 1 1 0 0 0Azerbaijan 0 1 3 3 3 0Bahrain 5 4 9 7 7 12Bangladesh 40 30 14 8 8 79 79 64 51 98 1
Cambodia 1 1 1 2 2 0China 22975 23627 24327 25470 29053 24426 26614 28069 29391 34126 27China, Macao 1 1 6 5 5 11Cyprus 25 31 28 28 29 38Georgia 0 0 1 2 2 0India 1475 1475 1510 1630 1835 1495 1525 1573 1679 1902 2Lekeeda 2121 2618 2922 3154 3713 1804 2166 2682 2840 3000 15Iran 120 120 120 280 332 258 79 79 1
Iraq 11 11 11 12 12 11 11 11 12 12 1Israel 180 180 180 180 180 370 315 340 348 373 62Japan 16001 16062 16730 15734 16006 16130 16417 16640 15751 15934 126Jordan 31 31 32 32 32 91 54 57 62 58 12Kazakhstan 0 9 12 12 12 1
Korea DPRp 80 80 80 80 80 81 81 81 81 81 3Korea Rep 4491 4736 4929 4425 5281 4276 4318 4822 3566 4460 97Kuwait 20 18 18 18 18 10Kyrgyzstan 0 3 3 4 4 1
Laos 1 1 3 3 3 0Leixmon 42 42 42 42 42 87 66 92 128 99 31Malaysia 501 527 582 636 636 895 1083 1025 994 1229 57Mongolia 0 0 1 1 3 1
Ngmnnwr 7 7 8 21 20 9 9 10 25 35 1
Nepal 13 13 13 13 13 13 13 13 13 13 1
Onum 8 5 4 5 9 4Pakktan 321 337 380 206 220 401 410 427 251 289 2Mdlippires 321 321 321 484 558 590 617 655 786 874 12Ckftar 0 0 0 1 1 2Sawd Arabia 512 234 302 298 333 16Singemore 87 87 87 87 87 601 538 248 154 274 79SdLanko 15 14 14 14 14 42 46 62 64 64 3Syria 1 1 1 1 1 25 38 72 84 82 5Thailand 1473 1510 1624 1626 1802 1522 1554 1347 984 1410 23Turkey 892 836 950 1009 1031 1040 1064 1252 1343 1338 21
Vida Arab Em 67 57 86 96 127 54Uzbekistan 0 3 3 6 6 0Viet Nam 52 52 52 52 52 97 88 95 101 66 1
Yemen 8 17 18 16 16 1
Europe 41628 41635 44745 45568 47365 39486 40406 43012 43241 45057 62
Albania 31 31 31 31 31 31 31 34 36 35 11
Austria 1455 1505 1593 1631 1681 729 822 1152 1218 1279 157Bel-Lux 356 337 337 697 614 1081 1125 1095 1455 1436 136Bekmus 131 131 131 131 131 132 132 131 135 135 13Bomda. Herzg 0 0 2 6 6 2
Bulgaria 145 145 145 145 145 140 138 161 161 161 19CroaMa 319 299 386 385 392 287 323 414 417 419 94Czech Rep 476 455 493 489 508 420 435 479 434 462 45Denrrmrk 252 252 277 276 295 543 575 604 625 658 125Estonia 33 33 35 43 48 35 21 24 23 22 15FMhmd 3202 3278 3558 3460 3555 894 1045 1131 768 767 149France 4633 4632 4884 5137 5300 5166 4981 5327 5532 5605 96Germany 7229 7459 7945 8051 8292 8049 7862 8110 8352 8833 108Greece 616 616 448 485 506 700 720 632 678 704 66Hungary 238 221 241 284 254 267 287 299 356 326 32Icekmd 17 14 15 13 13 48Imdand 42 42 126 410 156 245 213 58Itdy 4033 4114 5101 5286 5499 4824 4811 5881 6053 6260 109Latha 2 4 12 14 14 29 34 39 41 26 11
LithuaMa 27 31 25 37 36 41 22 37 52 43 12
Macedonia 32 20 20 13 13 42 30 50 24 29 15
Malta 8 5 11 21 21 55Moldova Rep 6 6 6 13 13 3
Netherkmds 1788 1809 1908 1956 1988 1825 1854 1883 2036 2257 144
Norway 542 506 470 529 521 397 371 286 274 275 62Pdand 993 1011 1095 1216 1312 947 945 1137 1251 1363 35Portugal 539 540 547 584 591 496 525 550 609 587 59
Romania 269 245 242 226 226 201 206 191 195 195 9
Russhm Fed 2130 1546 1703 1726 2279 1615 1508 1625 1477 1885 13
SlovaMa 207 262 310 376 394 86 166 249 248 260 48
SMvede 324 337 198 183 183 304 320 161 159 159 soSpaM 2678 2787 2924 2468 2627 3285 3344 3514 3162 3277 83
Sweden 4766 4565 4886 4856 4946 1033 1181 1231 1194 1076 121
Switzerland 728 761 814 836 866 717 686 660 659 772 106
UK 3454 3460 3670 3689 3760 5007 5124 5331 4916 5083 86
UkraMe 243 224 224 224 4 292 255 255 255 5
Yugoslavia 92 92 92 2 55 147 147 147 14
CMeada 1937 1997 2112 2112 2086 2061 2028 1958 2094 2139 72
Australia 1443 1524 1633 1673 1662 1530 1563 1510 1680 1730 93Fiji Islands 12 6 a 5 5 6Fr Polynesia 1 1 2 1 1 6New Zealand 494 473 479 439 424 513 455 431 395 387 102NewCaledonia 1 1 0 1 2 8Papua N Guin 4 2 12 12 14 3
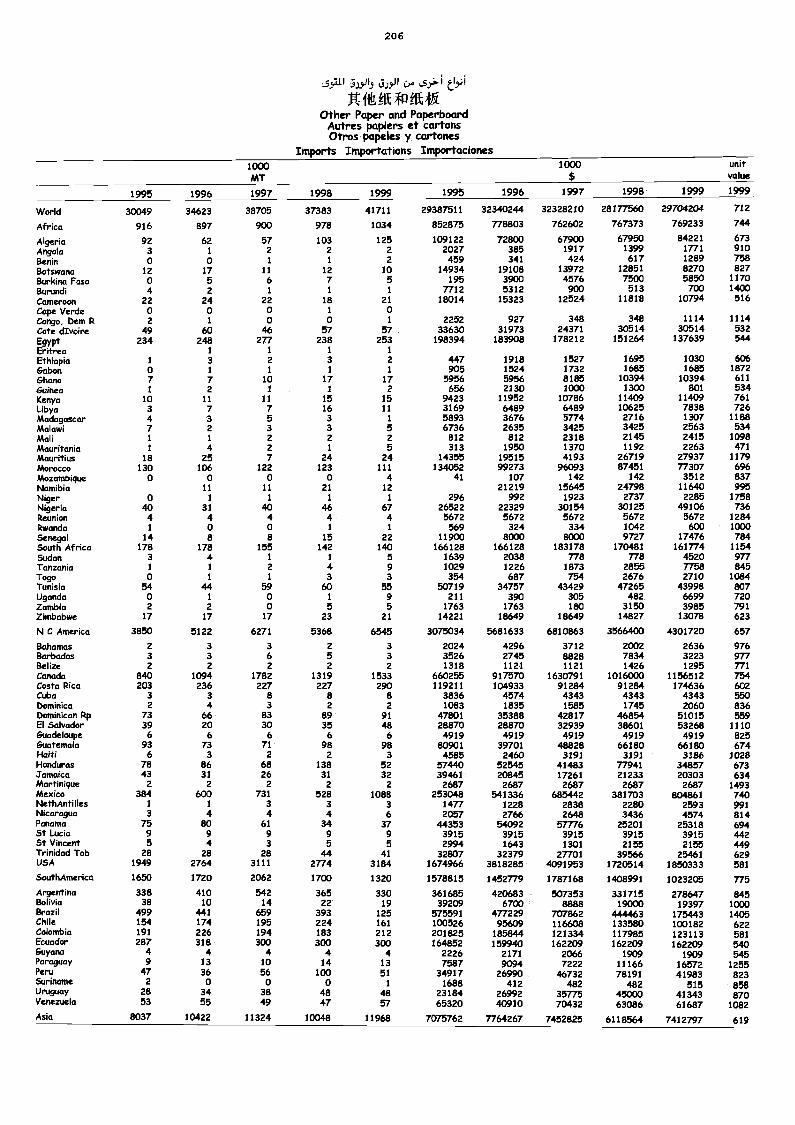
20 6
:syai c_r, Ls» tiyA
ft±ft ffiffE4N.Other Paper and Paperboard
Atrtres papiers et cartonsOtros papeles y cartones
Imports Importations Importaciones1000MT
1000$
unitvalue
1995 1996 1997 1998 1999 1995 1996 1997 1998 1999 1999
World 30049 34623 38705 37383 41711 29387511 32340244 32328210 28177560 29704204 712
Africa 916 897 900 978 1034 852875 778803 762602 767373 769233 744
Algeria 92 62 57 103 125 109122 72800 67900 67950 84221 673
Angola 3 1 2 2 2 2027 385 1917 1399 1771 910Benin 0 0 1 1 2 459 341 424 617 1289 758Botswana 12 17 11 12 10 14934 19108 13972 12851 8270 827Barkina Faso 0 5 6 7 5 195 3900 4576 7500 5850 1170
Burundi 4 2 1 1 1 7712 5312 900 513 700 1400
Cameroon 22 24 22 18 21 18014 15323 12524 11818 10794 516Cape Verde 0 0 o 1 0Congo, Dam R 2 1 0 o 1 2252 927 348 348 1114 1114Cote dlvoire 49 60 46 57 57 33630 31973 24371 30514 30514 532Egypt 234 248 277 238 253 198394 183908 178212 151264 137639 544Eritrea 1 1 1 1
E-thiopia 1 3 2 3 2 447 1918 1527 1695 1030 606Gabon 0 1 1 1 1 905 1524 1732 1685 1685 1872Ghana 7 7 10 17 17 5956 5956 8185 10394 10394 611Ouinect 1 2 1 1 2 656 2/30 1000 1300 801 534Kenya 10 11 11 15 15 9423 11952 10786 11409 11409 761Libya 3 7 7 16 11 3169 6489 6489 10625 7838 726Madagascar 4 3 5 3 1 5893 3676 5774 2716 1307 1188Malawi 7 2 3 3 5 6736 2635 3425 3425 2563 534Mali i 1 2 2 2 812 812 2318 2145 2415 1098Mauritania 1 4 2 1 5 313 1950 1370 1192 2263 471Mauritius 18 25 7 24 24 14355 19515 4193 26719 27937 1179Morocco 130 106 122 123 111 134052 99273 96093 87451 77307 696Mozambique 0 0 0 0 4 41 107 142 142 3512 837Namibia 11 11 21 12 21219 15645 24798 11640 995Niger o 1 1 1 1 296 992 1923 2737 2285 1758Nigeria 40 31 40 46 67 26522 22329 30154 30125 49106 736Reunion 4 4 4 4 4 5672 5672 5672 5672 5672 1284Rwanda 1 0 0 1 1 569 324 334 1042 600 1000Senegal 14 8 8 15 22 11900 8000 8000 9727 17476 784South Africa 178 178 155 142 140 166128 166128 183178 170481 161774 1154Sudan 3 4 1 1 5 1639 2038 778 778 4520 977Tanzania 1 1 2 4 9 1029 1226 1873 2855 7758 845Togo o 1 1 3 3 354 687 754 2676 2710 1084Tunisia 54 44 59 60 55 50719 34757 43429 47265 43998 807Uganda o 1 o 1 9 211 390 305 482 6699 720Zambia 2 2 0 5 5 1763 1763 180 3150 3985 791Zimbabwe 17 17 17 23 21 14221 18649 18649 14827 13078 623
N C America 3850 5122 6271 5368 6545 3075034 5681633 6810863 3566400 4301720 657
Bahamas 2 3 3 2 3 2024 4296 3712 2002 2636 976Barbados 3 3 6 5 3 3526 2745 8828 7834 3223 977Belize 2 2 2 2 2 1318 1121 1121 1426 1295 771Canada 840 1094 1782 1319 1533 660255 917570 1630791 1016000 1156512 754Costa Rica 203 236 227 227 290 119211 104933 91284 91284 174636 602Cuba 3 3 8 8 8 3836 4574 4343 4343 4343 550Dominica 2 4 3 2 2 1083 1835 1585 1745 2060 836Dominican Rp 73 66 83 89 91 47801 35388 42817 46854 51015 559El Salvador 39 20 30 35 48 28870 28870 32939 38601 53268 1110Guadeloupe 6 6 6 6 6 4919 4919 4919 4919 4919 825Guatemala 93 73 71 98 98 80901 39701 48828 66180 66180 674Haiti 6 3 2 2 3 4585 2460 3191 3191 3186 1028Honduras 78 86 68 138 52 57440 52545 41483 77941 34857 673Jamaica 43 31 26 31 32 39461 20845 17261 21233 20303 634Martinique 2 2 2 2 2 2687 2687 2687 2687 2687 1493Mexico 384 600 731 528 1088 253048 541336 685442 381703 804861 740NethAntilles 1 1 3 3 3 1477 1228 2838 2280 2593 991Nicaragua 3 4 4 4 6 2057 2766 2648 3436 4574 814Panama 75 80 61 34 37 44353 54092 57776 25201 25318 694St Lucia 9 9 9 9 9 3915 3915 3915 3915 3915 442St Vincent 5 4 3 5 5 2994 1643 1301 2155 2155 449Trinidad Tob 28 28 28 44 41 32807 32379 27701 39566 25461 629USA 1949 2764 3111 2774 3184 1674966 3818285 4091953 1720514 1850333 581SouthAmerica 1650 1720 2062 1700 1320 1578815 1452779 1787168 1408991 1023205 775Argentina 338 410 542 365 330 361685 420683 507353 331715 278647 845Bolivia 38 10 14 22 19 39209 6700 8888 19000 19397 1000Brazil 499 441 659 393 125 575591 477229 707862 444463 175443 1405Chile 154 174 195 224 161 100526 95609 116608 133580 100182 622Colombia 191 226 194 183 212 201825 185844 121334 117985 123113 581Ecuador 287 318 300 300 300 164852 159940 162209 162209 162209 540Guyana 4 4 4 4 4 2226 2171 2066 1909 1909
54Paraguay 9 13 10 14 13 7587 9094 7222 11166 16572 12555PeruSuriname
472
360
560
1000
511
349171688
26990412
46732482
78191482
41:8 13 8 82583
Uruguay 28 34 38 48 48 23184 26992 35775 45000 41343Venezuela 53 55 49 47 57 65320 40910 70432 63086 61687 15081
Asia 8037 10422 11324 10048 11968 7075762 7764267 7452825 6118564 7412797 619
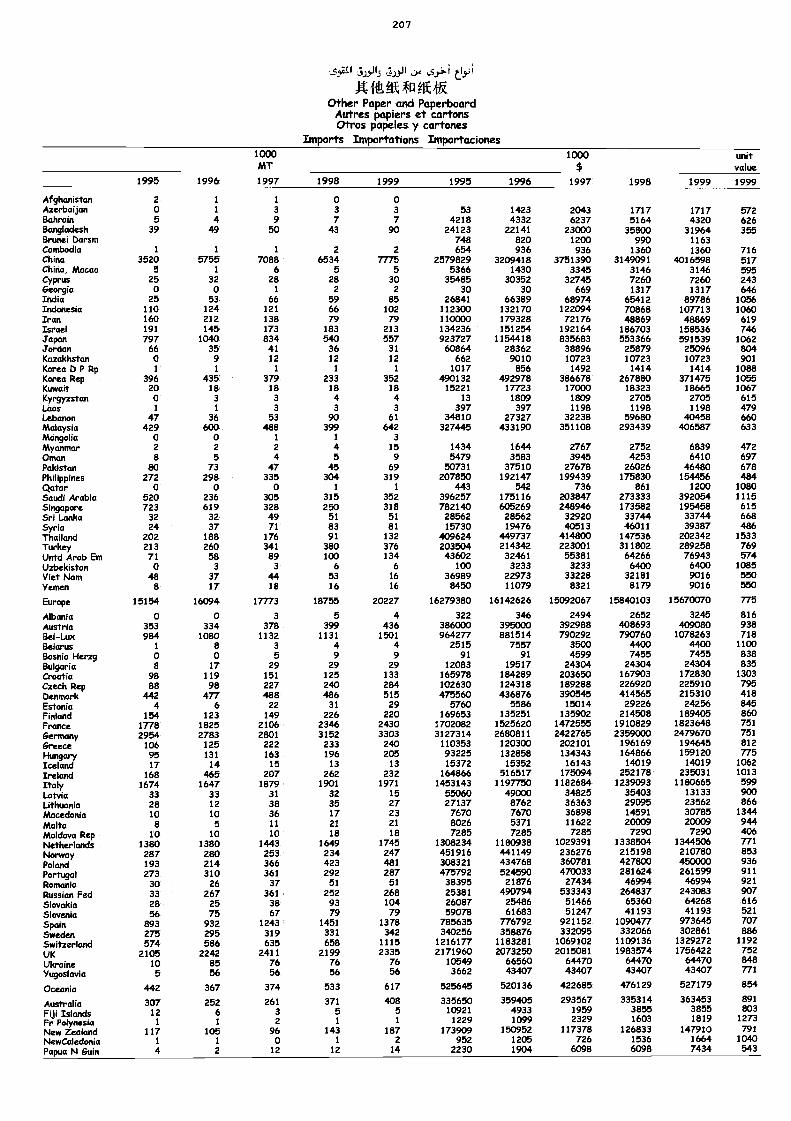
2 0 7
-sylai 3105 tipJEL-iLttklitK4N.
Other Paper and PaperboardAutres papiers et cartonsOtros papeles y cartones
Imports Importations Importaciones1000AiT
1000$
unityokm
1995 1996 1997 1998 1999 1995 1996 1997 1995 1999 1999
AfghanMtan 2 1 1 o 0Azerbaijan 0 1 3 3 3 53 1423 2043 1717 1717 572Bahrain 5 4 9 7 7 4218 4332 6237 5164 4320 626BangMdesh 39 49 50 43 90 24123 22141 23000 35800 31964 355Brunei Darsm 748 820 1200 990 1163CambodM 1 1 1 2 2 654 936 936 1360 1360 716China 3520 5755 7088 6534 7775 2579829 3209418 3751390 3149091 4016598 517China. Macao a 1 6 5 5 5366 1430 3345 3146 3144 595Cyprus 25 32 28 28 30 35485 30352 32745 7260 7260 243Georgia 0 0 1 2 2 30 30 669 1317 1317 646India 25 53 66 59 85 26841 66389 68974 65412 89786 1056Indonesia 110 124 121 66 102 112300 132170 122094 70868 107713 1060Iran 160 212 138 79 79 110000 179328 72176 48869 48869 619Israel 191 145 173 183 213 134236 151254 192164 186703 158536 746Japan 797 1040 834 540 557 923727 1154418 835683 553366 591539 1062jordan 66 35 41 36 31 60864 28362 38896 25879 25096 804Kazakhstan 0 9 12 12 12 662 9010 10723 10723 10723 901Korea 13 PRp 1 1 1 1 1 1017 856 1492 1414 1414 1088Korea Rep 396 435 379 233 352 490132 492978 386678 267880 371475 1055Kuwait 20 18 18 18 18 15221 17723 17000 18323 18665 1067Kyrgyzstan 0 3 3 4 4 13 1809 1809 2705 2705 615Laos 1 1 3 3 3 397 397 1198 1198 1198 479Lebanon 47 36 53 90 61 34810 27327 32238 59680 40458 660Malaysia 429 600 488 399 642 327445 433190 351108 293439 406587 633Mongolia 0 0 I 1 3NWCWWW 2 2 2 4 15 1434 1644 2767 2752 6839 472Omcm 8 5 4 5 9 5479 3583 3945 4253 6410 697Pakistan 80 73 47 45 69 53731 37510 27678 26026 46480 678PhilkpMes 272 298 335 304 319 207850 192147 199439 175830 154456 484Clatar 0 0 0 1 1 443 542 736 861 1200 1080SaudiAimbia 520 236 305 315 352 396257 175116 203847 273333 392054 1115Singmpore 723 619 328 250 318 782140 605269 248946 173582 195458 615Sri Lanka 32 32 49 51 51 28562 28562 32920 33744 33744 668Syria 24 37 71 83 81 15730 19476 40513 46011 39387 486Thailand 202 188 176 91 132 409624 449737 414800 147536 202342 1533Turkey 213 260 341 380 376 203504 214342 223001 311802 289258 769UntdArabEm 71 58 89 100 134 43602 32461 55381 64266 76943 574UzbekMtan 0 3 3 6 6 100 3233 3233 6400 6430 1085Viet Islam 48 37 44 53 16 36989 22973 33228 32181 9016 550Yemen 8 17 18 16 16 8450 11079 8321 8179 9016 550
Europe 15154 16094 17773 18755 20227 16279380 16142626 15092067 15840103 15670070 775
Albania 0 0 3 5 4 322 346 2494 2652 3245 816Austria 353 334 378 399 436 386000 395000 392988 408693 409080 938Bel-Lux 984 1080 1132 1131 1501 964277 881514 790292 790760 1078263 718Belarus I 8 3 4 4 2515 7557 3500 4400 4400 1100Bomna Hang 0 0 5 9 9 91 91 4599 7455 7455 838&Agmga 8 17 29 29 29 12083 19517 24304 24304 24304 835Croatia 98 119 151 125 133 165978 184289 203650 167903 172830 1303
Czech Rep 88 98 227 240 284 102630 124318 189288 226920 225910 795Denmark 442 477 488 486 515 475560 436876 390545 414565 215310 418Estonio 4 6 22 31 29 5760 5586 15014 29226 24256 845Finland 154 123 149 226 220 169653 135251 135902 214508 189405 860France 1778 1825 2106 2346 2430 1702082 1525620 1472555 1910829 1823648 751
Gemnony 2954 2783 2801 3152 3303 3127314 2680811 2422765 2359000 2479670 751
Greece 106 125 222 233 240 110353 120300 202101 196169 194645 812
Htin9arY 95 131 163 196 205 93225 132858 134343 164866 159120 775Iceland 17 14 15 13 13 15372 15352 16143 14019 14019 1062
Ireland 168 465 207 262 232 164866 516517 175094 252178 235031 1013
Italy 1674 1647 1879 1901 1971 1453143 1197750 1182684 1239093 1180665 599
Latvia 33 33 31 32 15 55060 49000 34825 35403 13133 900LithuaMa 28 12 38 35 27 27137 8762 36363 29095 23562 866Macedonia 10 10 36 17 23 7670 7670 36898 14591 30785 1344
Malta 8 5 11 21 21 8026 5371 11622 20009 20009 944Moldova Rep 10 10 10 18 18 7285 7285 7285 7290 7290 406
Netherlands 1380 1380 1443 1649 1745 1308234 1180938 1029391 1338504 1344506 771
NWrway 287 280 253 234 247 451916 441149 236276 215198 210780 853Poland 193 214 366 423 481 306321 434768 360781 427800 450000 936Portugal 273 310 361 292 287 475792 524590 470033 281624 261599 911
RomaMa 30 26 37 51 51 38395 21876 27434 46994 46994 921
RussionFed 33 267 361 252 268 25381 490794 533343 264837 243083 907
Skyalda 28 25 38 93 104 26087 25486 51466 65360 64268 616
5kweMa 56 75 67 79 79 59078 61683 51247 41193 41193 521
Spain 893 932 1243 1451 1378 785635 776792 921152 1090477 973645 707
Sweden 275 295 319 331 342 340256 358876 332095 332066 302861 886
Switzerland 574 586 635 658 1115 1216177 1183281 1069102 1109136 1329272 1192
UK 2105 2242 2411 2199 2335 2171960 2073250 2015081 1983574 1756422 752
Ukraine 10 85 76 76 76 10549 66560 64470 64470 64470 848
Yugoslavia 5 56 56 56 56 3662 43407 43407 43407 43407 771
OceaMa 442 367 374 533 617 525645 520136 422685 476129 527179 854
Australia 307 252 261 371 408 335650 359405 293567 335314 363453 891
FijiIslands 12 6 3 5 5 10921 4933 1959 3855 3855 803
Fr Polynesia 1 1 2 1 1 1229 1099 2329 1603 1819 1273
Ney2MoMmd 117 105 96 143 187 173909 150952 117378 126833 147910 791
NewCaledonia 1 1 o 1 2 952 1205 726 1536 1664 1040Papua N Guin 4 2 12 12 14 2230 1904 6098 6098 7434 543
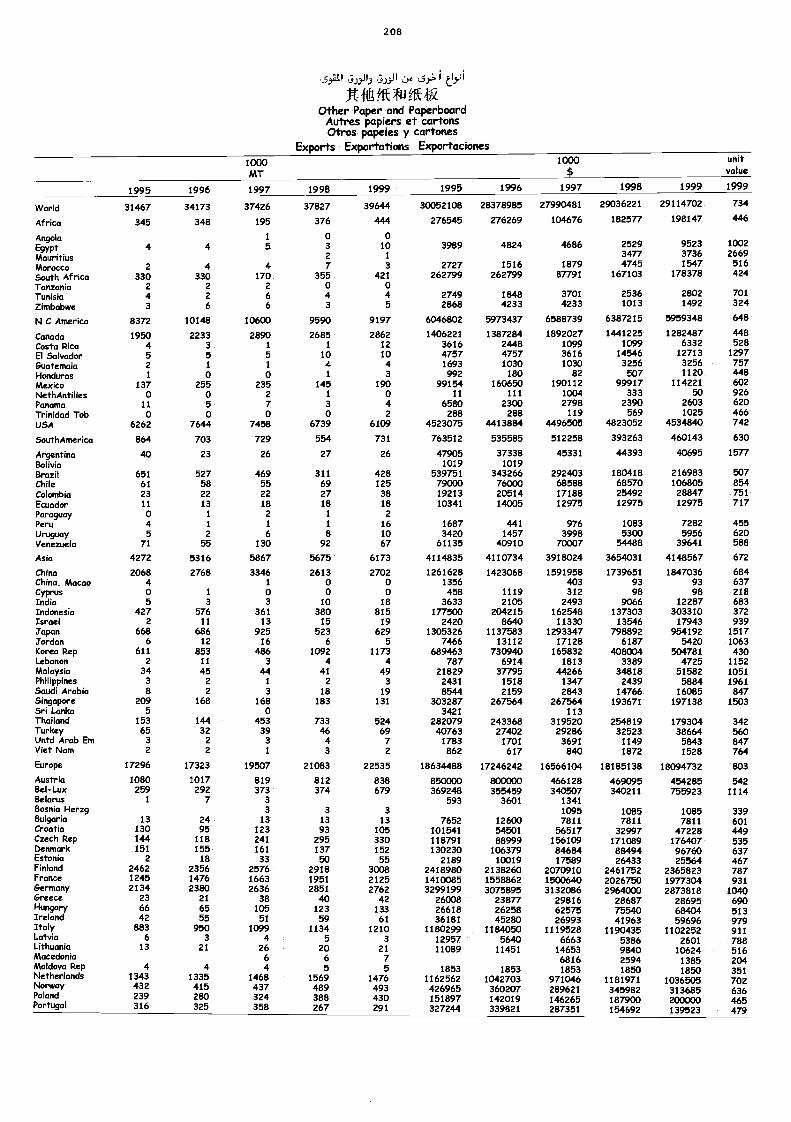
2 0 8
510/9 ;»Ji 1)4 5)."'
Afttl fnAt4kOther Paper and Paperboard
Autres papiers et cartonsOtros papeles y cartones
Exports Exportations Exportaciones1000MT
1000 unitvalue
1995 1996 1997 1998 1999 1995 1996 1997 1998 1999 1999
World 31467 34173 37426 37827 39644 30052108 28378985 27990481 29036221 29114702 734
Africa 345 348 195 376 444 276545 276269 104676 182577 198147 446
Angola 1 o oEgyptMauritius
4 4 5 32
101
3989 4824 4686 25293477
95233736
10022669
MOrOCCO 2 4 4 7 3 2727 1516 1879 4745 1547 516
South Africa 330 330 170 355 421 262799 262799 87791 167103 178378 424
Tanzania 2 2 2 o oTunisia 4 2 6 4 4 2749 1848 3701 2536 2802 701
Zimbabwe 3 6 6 3 5 2868 4233 4233 1013 1492 324
N C America 8372 10148 10600 9590 9197 6046802 5973437 6588739 6387215 5959348 648
Canada 1950 2233 2890 2685 2862 1406221 1387284 1892027 1441225 1282487 448
Costa Rica 4 3 1 1 12 3616 2448 1099 1099 6332 528
El Salvador 5 5 5 10 10 4757 4757 3616 14546 12713 1297Guatemala 2 1 1 4 4 1693 1030 1030 3256 3256 757Honduras 1 o o 1 3 992 180 82 507 1120 448
Mexico 137 255 235 145 190 99154 160650 190112 99917 114221 602
NethAntilles o 0 2 1 0 11 111 1004 333 50 926Panana 11 5 7 3 4 6580 2303 2798 2390 2603 620Trinidad lob o o o o 2 288 288 119 569 1025 466USA 6262 7644 7458 6739 6109 4523075 4413884 4496505 4823052 4534840 742
SouthArnerica 864 703 729 554 731 763512 535585 512258 393263 460143 630
Argentina 40 23 26 27 26 47905 37338 45331 44393 40695 1577Bolivia 1019 1019Brazil 651 527 469 311 428 539751 343266 292403 180418 216983 507Chile 61 58 55 69 125 79000 76000 68588 68570 106805 854Colombia 23 22 22 27 38 19213 20514 17188 25492 28847 751Ecuador 11 13 18 18 18 10341 14005 12975 12975 12975 717Paraguay o I 2 1 2Peru 4 1 1 1 16 1687 441 976 1083 7282 455Uruguay 5 2 6 8 10 3420 1457 3998 5300 5956 620Venezuela 71 55 130 92 67 61135 40910 70007 54488 39641 588
Asia 4272 5316 5867 5675 6173 4114835 4110734 3918024 3654031 4148567 672
China 2068 2768 3346 2613 2702 1261628 1423068 1591958 1739651 1847036 684China. Macao 4 1 0 0 1356 403 93 93 637Cyprus o I o o 0 458 1119 312 98 98 218India 5 3 3 10 18 3633 2105 2493 9066 12287 683Indonesia 427 576 361 380 815 177500 204215 162548 137303 303310 372Israel 2 11 13 15 19 2420 8640 11330 13546 17943 939Japan 668 686 925 523 629 1305326 1137583 1293347 798892 954192 1517Jordan 6 12 16 6 5 7466 13112 17128 6187 5420 1063Korea Rep 611 853 486 1092 1173 689463 730940 165832 408004 504781 430Lebanon 2 11 3 4 4 787 6914 1813 3389 4725 1152Malaysia 34 45 44 41 49 21829 37795 44266 34818 51582 1051Philippines 3 2 1 2 3 2431 1518 1347 2439 5884 1961Saudi Arabia 8 2 3 18 19 8544 2159 2843 14766 16085 847Singapore 209 168 168 183 131 303287 267564 267564 193671 197138 1503Sri Lanka 5 o 3421 113Thailand 153 144 453 733 524 282079 243368 319520 254819 179304 342Turkey 65 32 39 46 69 40763 27402 29286 32523 38664 560Untd Arab Em 3 2 3 4 7 1783 1701 3691 1149 5843 847Viet Nam 2 2 1 3 2 862 617 840 1872 1528 764
Europe 17296 17323 19507 21083 22535 18634488 17246242 16566104 18185138 18094732 803Austria 1080 1017 819 812 838 850000 800000 466128 469095 454285 542Bel-Lux 259 292 373 374 679 369248 355459 340507 340211 755923 1114Belarus 1 7 3 593 3601 1341Bosnia Herzg 3 3 3 1095 1085 1085 339Bulgaria 13 24 13 13 13 7652 12600 7811 7811 7811 601Croatia 130 95 123 93 105 101541 54501 56517 32997 47228 449Czech Rep 144 118 241 295 330 118791 88999 156109 171089 176407 535Denmark 151 155 161 137 152 130230 106379 84684 88494 96760 637Estonia 2 18 33 50 55 2189 10019 17589 26433 25564 467Finland 2462 2356 2576 2918 3008 2418980 2138260 2070910 2461752 2365823 787France 1245 1476 1663 1951 2125 1410085 1558862 1500640 2026750 1977304 931Germany 2134 2380 2636 2851 2762 3299199 3075895 3132086 2964000 2873818 1040Greece 23 21 38 ao 42 26008 23877 29816 28687 28695 690Hungary 66 65 105 123 133 26618 26258 62575 75540 68404 513Ireland 42 55 51 59 61 36181 45280 26993 41963 59696 979Italy 883 950 1099 1134 1210 1180299 1184050 1119528 11 90435 1102252 911Latvia 6 3 4 5 3 12957 5640 6663 5386 2601 788Lithuania 13 21 26 20 21 11089 11451 14653 9840 10624 516Macedonia 6 6 7 6816 2594 1385 204Moldova Rep 4 4 4 5 5 1853 1853 1853 1850 1850 351Netherlands 1343 1335 1468 1569 1476 1162562 1042703 971046 1181971 1036505 702Norway 432 415 437 489 493 426965 360207 289621 345982 313685 636Poland 239 280 324 388 430 151897 142019 146265 187900 200000 465Portugal 316 325 358 267 291 327244 339821 287351 154692 139523 479
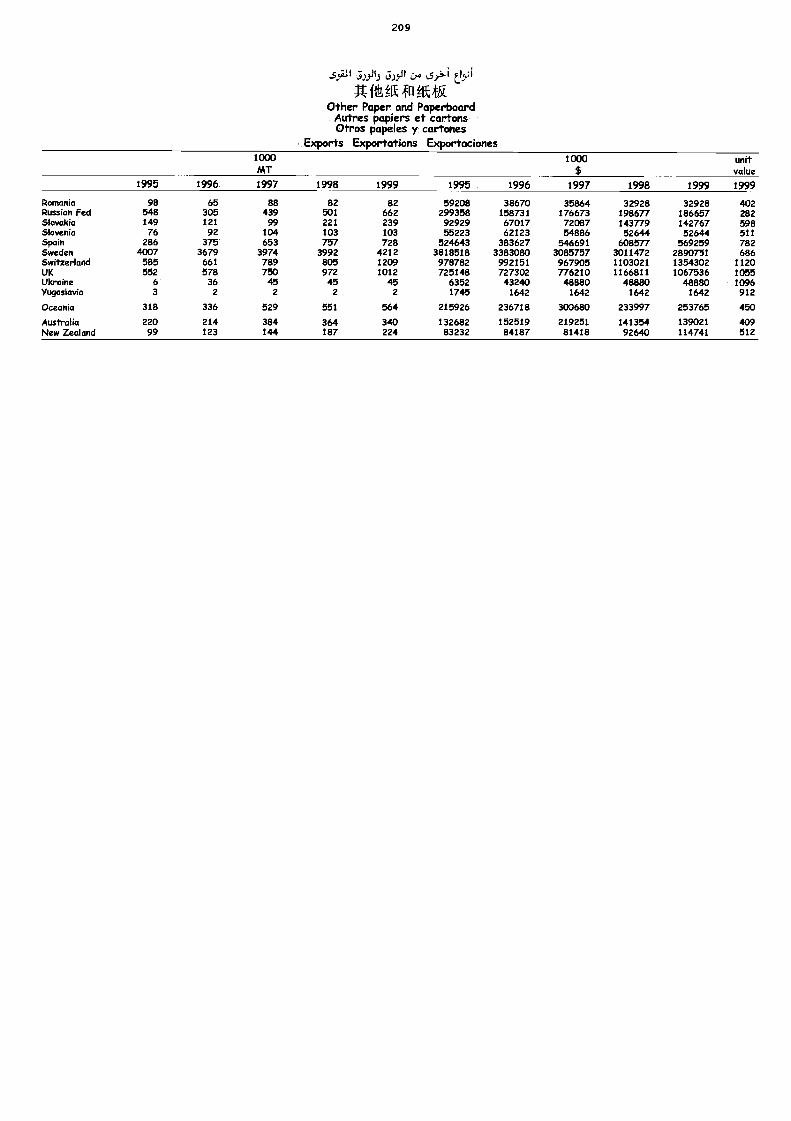
20 9
5105 L-92.114:, tYf-ttK fnkik*
Other Paper and PaperboardAutres papiers et cartonsOtros papeles y cartones
Exports Exportations Exportaciones1000MT
1000 unitvalue
1995 1996 1997 1998 1999 1995 1996 1997 1998 1999 1999
Romania 98 65 88 82 82 59208 38670 35864 32928 32928 402Russian Fed 548 305 439 501 662 299358 158731 176673 198677 186657 282Slovakia 149 121 99 221 239 92929 67017 72087 143779 142767 598Slovenia 76 92 104 103 103 55223 62123 54886 52644 52644 511Spain 286 375 653 757 728 524643 383627 546691 608577 569259 782Sweden 4007 3679 3974 3992 4212 3818518 3383080 3085757 3011472 2890751 686Switzerland 585 661 789 805 1209 978782 992151 967905 1103021 1354302 1120UK 552 578 750 972 1012 725148 727302 776210 1166811 1067536 1055Ukraine 6 36 45 45 45 6352 43240 48880 48880 48880 1096Yugoslavia 3 2 2 2 2 1745 1642 1642 1642 1642 912
Oceania 318 336 529 551 564 215926 236718 303680 233997 253765 450
Australia 220 214 384 364 340 132682 152519 219251 141354 139021 409New Zealand 99 123 144 187 224 83232 84187 81418 92640 114741 512
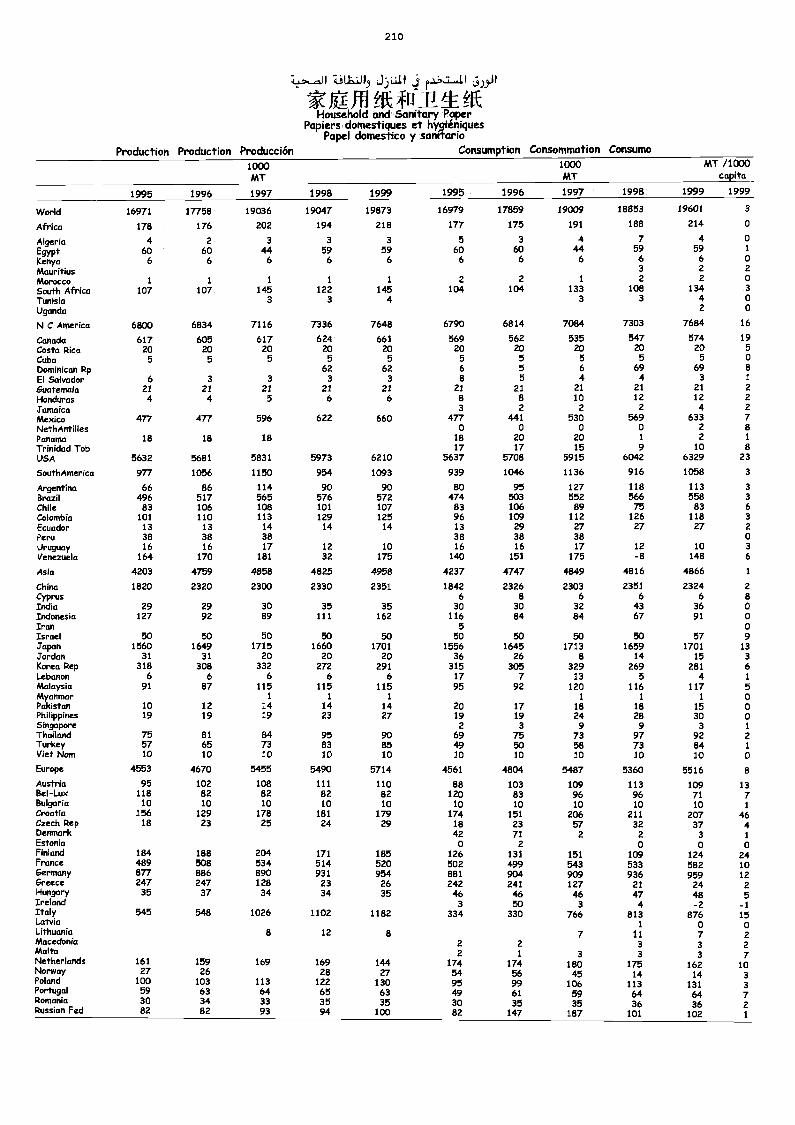
21 0
jJfIifE 411-121
Household and Sanitary PaperPapiers domestiques et hygiíniques
Papel domestico y sanrtarioProduction Production Producción Consumption Consommation Consumo
1000MT
1000MT
MT /1000capita
1995 1996 1997 1998 1999 1995 1996 1997 1998 1999 1999
World 16971 17758 19036 19047 19873 16979 17859 19009 1885$ 19601 3
Africa 178 176 202 194 218 177 175 191 188 214 o
Algeria 4 2 3 3 3 5 3 4 7 4 o
EgYPt 60 60 44 59 59 60 60 44 59 59 1
Kenya 6 6 6 6 6 6 6 6 6 6 oMauritius 3 2 2
MOI`OCCO 1 1 1 1 1 2 2 1 2 2 oSouth Africa 107 107 145 122 145 104 104 133 108 134 3
Tunisia 3 3 4 3 3 4 oUganda 2 o
N C America 6800 6834 7116 7336 7648 6790 6814 7084 7303 7684 16
Canada 617 605 617 624 661 569 562 535 547 574 19Costa Rica 20 20 20 20 20 20 20 20 20 20 sCuba 5 5 5 5 5 5 5 5 5 5 oDominican Rp 62 62 6 5 6 69 69 8El Salvador 6 3 3 3 3 8 5 4 4 3 /Guatemala 21 21 21 21 21 21 21 21 21 21 2Honduras 4 4 5 6 6 8 8 10 12 12 2
jarnaica 3 2 2 2 4 2
Mexico 477 477 596 622 660 477 441 530 569 633 7NethAntilles o o o o 2 8
Panama 18 18 18 18 20 20 1 2 1
Trinidad Tob 17 17 15 9 10 8USA 5632 5681 5831 5973 6210 5637 5708 5915 6042 6329 23
SouthAmerica 977 1056 1150 954 1093 939 1046 1136 916 1058 3
Argentina 66 86 114 so so so 95 127 118 113 3
Brazil 496 517 565 576 572 474 503 552 566 558 3Chile 83 106 108 101 107 83 106 89 75 83 6Colombia 101 110 113 129 125 96 109 112 126 118 3Ecuador 13 13 14 14 14 13 29 27 27 27 2Peru 38 38 38 38 38 38 0Uruguay 16 16 17 12 10 16 16 17 12 10 3Venezuela 164 170 181 32 175 140 151 175 -8 148 6
Asia 4203 4759 4858 4825 4958 4237 4747 4849 4816 4866 1
China 1820 2320 2300 2330 2351 1842 2326 2303 2351 2324 2
Cyprus 6 8 6 6 6 eIndia 29 29 30 35 35 30 30 32 43 36 oIndonesia 127 92 89 111 162 116 84 84 67 91 oIran 5 oIsrael 50 50 50 50 50 50 50 50 50 57 9Jcipan 1560 1649 1715 1660 1701 1556 1645 1713 1659 1701 13Jordan 31 31 20 20 20 36 26 8 14 15 3
Korea Rep 318 308 332 272 291 315 305 329 269 281 6Lebanon 6 6 6 6 6 17 7 13 5 4 1
Malaysia 91 87 115 115 115 95 92 120 116 117 5Myanmar 1 1 1 1 1 1 0Pakistan 10 12 14 14 14 20 17 18 18 15 oPhilippines 19 19 19 23 27 19 19 24 28 30 0Singapore 2 3 9 9 3 1Thailand 75 81 84 95 so 69 75 73 97 92 2Turkey 57 65 73 83 85 49 50 58 73 84 1Viet Nam 10 10 10 10 10 10 10 10 10 10 oEurope 4553 4670 5455 5490 5714 4561 4804 5487 5360 5516 e
Austria 95 102 108 111 110 88 103 109 113 109 13Bel-Lux 118 82 82 82 82 120 83 96 96 71 7Bulgaria 10 10 10 10 10 10 10 10 10 10 1Croatia 156 129 178 181 179 174 151 206 211 207 46Czech Rep 18 23 25 24 29 18 23 57 32 37 4DenmarkEstonia
42o
712
2 2o
3o
1
oFinland 184 188 204 171 185 126 131 151 109 124 24France 489 508 534 514 520 502 499 543 533 582 10Germany 877 886 890 931 954 881 904 909 936 959 12Greece 247 247 128 23 26 242 241 127 21 24 2Hungary 35 37 34 34 35 46 46 46 47 48 5Ireland 3 50 3 4 -2 -1Italy 545 548 1026 1102 1182 334 330 766 813 876 15Latvia
1 0 0Lithuania 8 12 8 7 11 7 2Macedonia z 2 3 3 2Malta 2 1 3 3 3 7Netherlands 161 159 169 169 144 174 174 180 175 162 10Norway 27 26 28 27 54 56 45 14 14 3Poland 100 103 113 122 130 95 99 106 113 131 3Portugal 59 63 64 65 63 49 61 59 64 64 7Romania 30 34 33 35 35 30 35 35 36 36 2Russian Fed 82 82 93 94 100 82 147 187 101 102 1
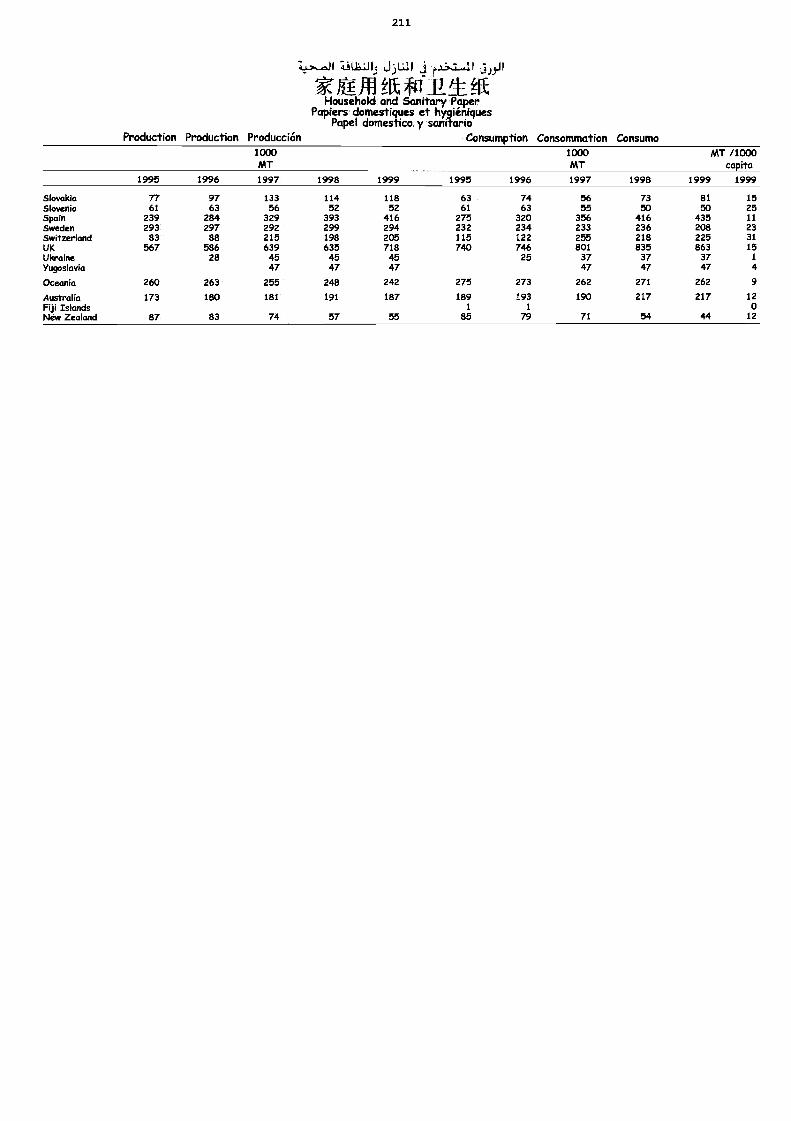
211
6.1:)1.111 r41 510jJfl#11II*
Household and Sanitary PáperPapiers domestiques et hygiehrques
Papel domestico y sanitarioProduction Production Producción Consumption Consommation Consumo
1000MT
1995 1996
1000MT
1997 1998
MT /1000capita
1999 19991995 1996 1997 1998 1999
Slovakia 77 97 133 114 118 63 74 56 73 81 15Slovenia 61 63 56 52 52 61 63 55 50 50 25Spain 239 284 329 393 416 275 320 356 416 435 11Sweden 293 297 292 299 294 232 234 233 236 208 23Switzerland 83 88 215 198 205 115 122 255 218 225 31UK 567 586 639 635 718 740 746 801 835 863 15Ukraine 28 45 45 45 25 37 37 37 1
Yugoslavia 47 47 47 47 47 47 4Oceania 260 263 255 248 242 275 273 262 271 262 9
Australia 173 180 181 191 187 189 193 190 217 217 12Fiji Islands 1 1 0New Zealand 87 83 74 57 55 85 79 71 54 44 12
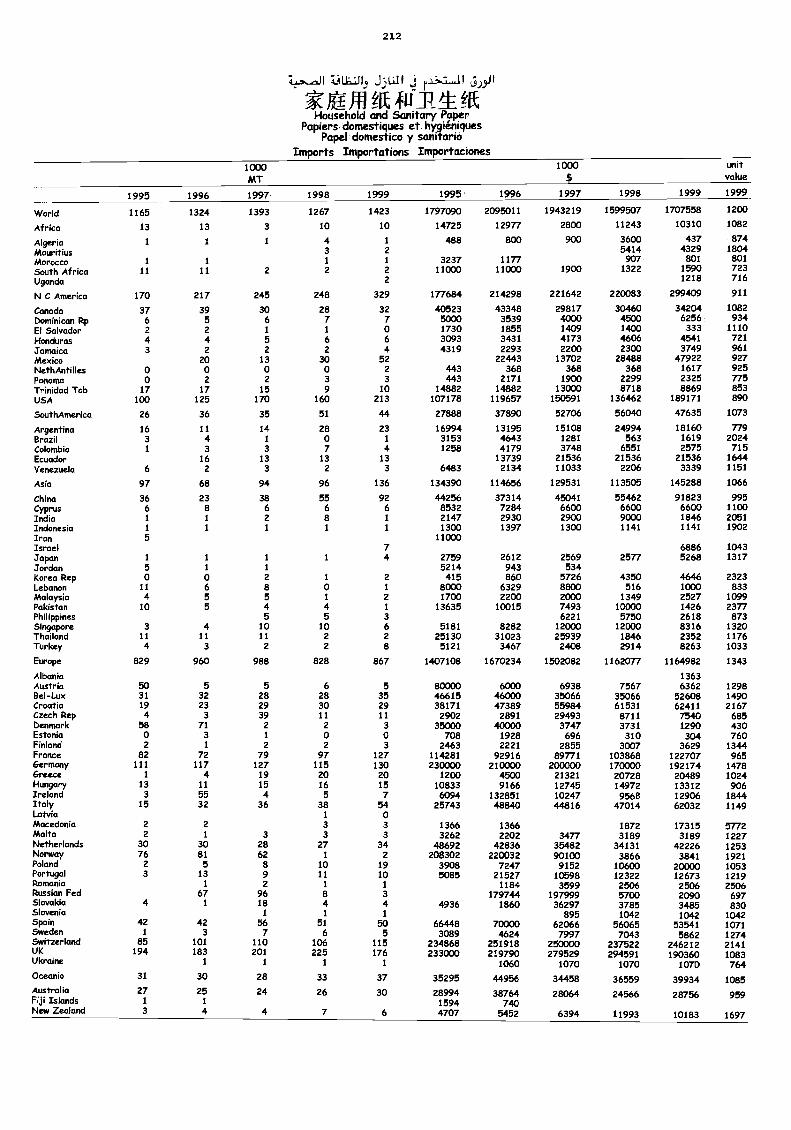
212
_iiuain.5 jti1Ij C9V
IliEl- T_ .fftHousehold and Sanitary Paper
Papiers domestiques et hygiéniquesPapel domestico y sanitario
Imports Importations Importaciones1000MT
1000 unftvalue
1995 1996 1997 1998 1999 1995 1996 1997 1998 1999 1999
WoHd 1165 1324 1393 1267 1423 1797090 2095011 1943219 1599507 1707558 1200
Africa 13 13 3 10 10 14725 12977 2800 11243 10310 1082
AlgeHa 1 1 1 4 i 488 800 900 3600 437 874Mauritius 3 2 5414 4329 1804
Morocco 1 1 1 1 3237 1177 907 801 801
South Africa 11 11 2 2 2 11000 11000 1900 1322 1590 723
Uganda 2 1218 716
NC Americo 170 217 245 248 329 177684 214298 221642 220083 299409 911
Coimda 37 39 30 28 32 40523 43348 29817 30460 34204 1082Dominican Rp 6 5 6 7 7 5000 3539 4000 4500 6256 934ElSalvador 2 2 1 1 0 1730 1855 1409 1400 333 1110Honduras 4 4 5 6 6 3093 3431 4173 4606 4541 721
Jamaica 3 2 2 2 4 4319 2293 2200 2300 3749 961Mexico 20 13 30 52 22443 13702 28488 47922 927NethAntilles 0 0 0 0 2 443 368 368 368 1617 925Panama 0 2 2 3 3 443 2171 1900 2299 2325 775THnidadTob 17 17 15 9 10 14882 14882 13000 8718 8869 853USA 100 125 170 160 213 107178 119657 150591 136462 189171 890
SouthAmmrica 26 36 35 51 44 27888 37890 52706 56040 47635 1073
Argentina 16 11 14 28 23 16994 13195 15108 24994 18160 779Brazil 3 4 i 0 1 3153 4643 1281 563 1619 2024Colombia 1 3 3 7 4 1258 4179 3748 6551 2575 715Ecuador 16 13 13 13 13739 21536 21536 21536 1644Venezuela 6 2 3 2 3 6483 2134 11033 2206 3339 1151
Asia 97 68 94 96 136 134390 114656 129531 113505 145288 1066
China 36 23 38 55 92 44256 37314 45041 55462 91823 995Cyprus 6 8 6 6 6 8532 7284 6600 6600 6600 1100India 1 1 2 8 1 2147 2930 2900 9000 1846 2051Indonesia 1 1 1 1 1 1300 1397 1300 1141 1141 1902Iran 5 11000Israel 7 6886 1043Japan 1 1 1 1 4 2759 2612 2569 2577 5268 1317Jordan 5 1 i 5214 943 534Korea Rep 0 0 2 1 2 415 860 5726 4350 4646 2323Lebanon 11 6 8 0 1 8000 6329 8800 516 1000 833Malaysia 4 5 5 1 2 1700 2200 2000 1349 2527 1099Pakistan 10 5 4 4 1 13635 10015 7493 10000 1426 2377PhilippMes 5 5 3 6221 5750 2618 873Singapore 3 4 10 10 6 5181 8282 12000 12000 8316 1320Thailand 11 11 11 2 2 25130 31023 25939 1846 2352 1176Turkey 4 3 2 2 8 5121 3467 2408 2914 8263 1033
Europe 829 960 988 828 867 1407108 1670234 1502082 1162077 1164982 1343
Albania 1363Austria 50 5 5 6 5 80000 6000 6938 7567 6362 1298Bel-Lux 31 32 28 28 35 46615 46000 35066 35066 52608 1490Croatia 19 23 29 30 29 38171 47389 55984 61531 62411 2167Czech Rep 4 3 39 11 11 2902 2891 29493 8711 7540 685Denmark 58 71 2 2 3 35000 40000 3747 3731 1290 430Estonia 0 3 1 0 0 708 1928 696 310 304 760Finland 2 1 2 2 3 2463 2221 2855 3007 3629 1344France 82 72 79 97 127 114281 92916 89771 103868 122707 965Germany 111 117 127 115 130 230000 210000 200000 170000 192174 1478Greece 1 4 19 20 20 1200 4500 21321 20728 20489 1024Hungary 13 11 15 16 15 10833 9166 12745 14972 13312 906Irekmd 3 55 4 5 7 6094 132851 10247 9568 12906 1844Iftly 15 32 36 38 54 25743 48840 44816 47014 62032 1149Latvia 1 0Macedonia 2 2 3 3 1366 1366 1872 17315 5772Malta 2 1 3 3 3 3262 2202 3477 3189 3189 1227Netherlands 30 30 28 27 34 48692 42836 35482 34131 42226 1253Norway 76 81 62 1 2 208302 220032 90100 3866 3841 1921Poland 2 5 8 10 19 3908 7247 9152 10600 20000 1053Portugal 3 13 9 11 10 5085 21527 10598 12322 12673 1219Rommnia 1 2 1 1 1184 3599 2506 2506 2506Russicm Fed 67 96 8 3 179744 197999 5700 2090 697Skwakia 4 1 18 4 4 4936 1860 36297 3785 3485 830Skweda 1 1 1 895 1042 1042 1042Spain 42 42 56 51 50 66448 70000 62066 56065 53541 1071Sweden 1 3 7 6 5 3089 4624 7997 7043 5862 1274Switzerland 85 101 110 106 115 234868 251918 250000 237522 246212 2141UK 194 183 201 225 176 233000 219790 279529 294591 190360 1083Ukraine 1 1 1 1 1060 1070 1070 1070 764Oceania 31 30 28 33 37 35295 44956 34458 36559 39934 1085Australia 27 25 24 26 30 28994 38764 28064 24566 28756 959FijiIskmds 1 1 1594 740New Zealand 3 4 4 7 6 4707 5452 6394 11993 10183 1697
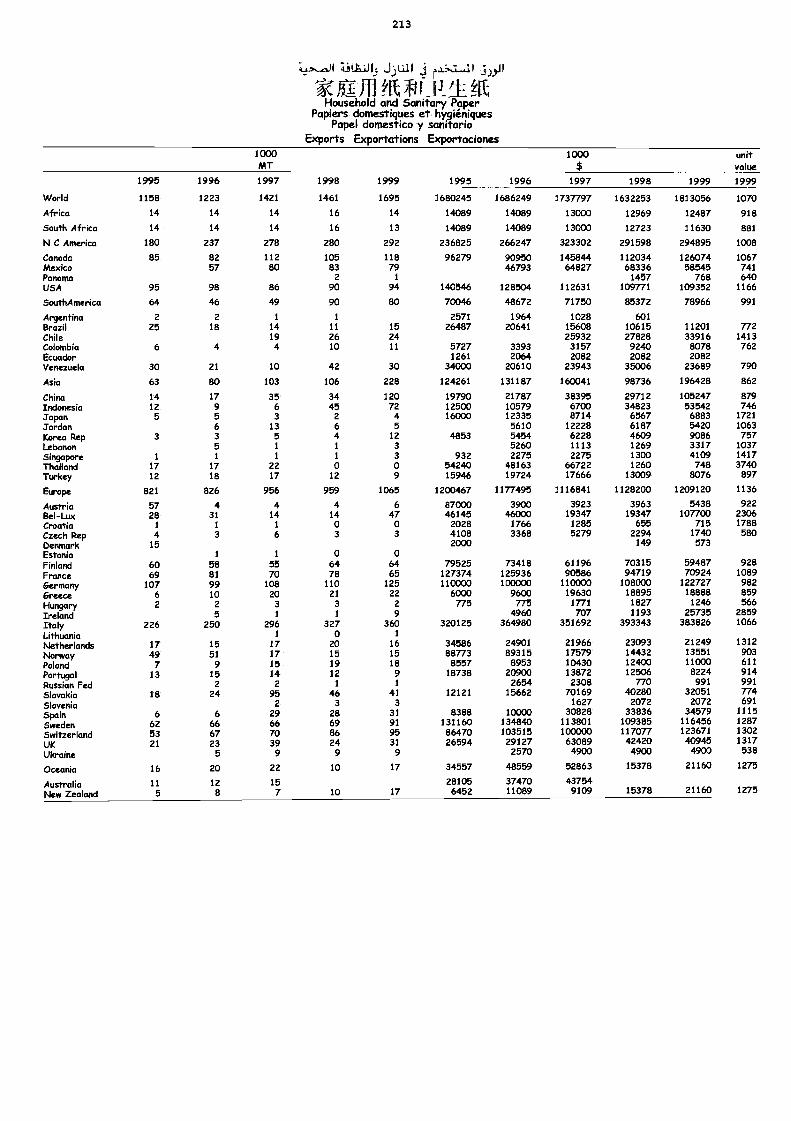
213
UJT1.fft 411-- RI:Household and Sanitary P51-perPapiers domestiques et hygieniques
Papel domestico y sanitarioExports Exportations Exportaciones
1000MT
1000 unitvalue
1995 1996 1997 1998 1999 1995 1996 1997 1998 1999 1999
World 1158 1223 1421 1461 1695 1680245 1686249 1737797 1632253 1813056 1070
Africa 14 14 14 16 14 14089 14089 13000 12969 12487 918
South Africa 14 14 14 16 13 14089 14089 13000 12723 11630 881
N C America 180 237 278 280 292 236825 266247 323302 291598 294895 1008
Cariada 85 82 112 105 118 96279 90950 145844 112034 126074 1067Mexico 57 80 83 79 46793 64827 68336 58545 741Panama 2 1 1457 768 640USA 95 98 86 90 94 140546 128504 112631 109771 109352 1166
SouthAmerica 64 46 49 90 80 70046 48672 71750 85372 78966 991
Argentina 2 2 1 1 2571 1964 1028 601Brazil 25 18 14 11 15 26487 20641 15608 10615 11201 772Chile 19 26 24 25932 27828 33916 1413Colombia 6 4 4 10 11 5727 3393 3157 9240 8078 762Ecuador 1261 2064 2082 2082 2082Venezuela 30 21 10 42 30 34000 20610 23943 35006 23689 790
Asia 63 BO 103 106 228 124261 131187 160041 98736 196428 862
China 14 17 35 34 120 19790 21787 38395 29712 105247 879Indonesia 12 9 6 45 72 12500 10579 6700 34823 53542 746Japan 5 5 3 2 4 16000 12335 8714 6567 6883 1721Jordan 6 13 6 5 5610 12228 6187 5420 1063Korea Rep 3 3 5 4 12 4853 5454 6228 4609 9086 757Lebanon 5 1 1 3 5260 1113 1269 3317 1037Singapore 1 1 1 1 3 932 2275 2275 1300 4109 1417Thailand 17 17 22 o 0 54240 48163 66722 1260 748 3740Turkey 12 18 17 12 9 15946 19724 17666 13009 8076 897
Europe 821 826 956 959 1065 1200467 1177495 1116841 1128200 1209120 1136
Austria 57 4 4 4 6 87000 3900 3923 3963 5438 922Bel-Lux 28 31 14 14 47 46145 46000 19347 19347 107700 2306Croatia 1 1 1 o o 2028 1766 1285 655 715 1788Czech Rep 4 3 6 3 3 4108 3368 5279 2294 1740 580Denmark 15 2000 149 573Estonia 1 1 o oFinland 60 58 55 64 64 79525 73418 61196 70315 59487 928
France 69 81 70 78 65 127374 125936 99586 94719 70924 1089
Germany 107 99 108 110 125 110000 100000 110000 108000 122727 982Greece 6 10 20 21 22 6000 9600 19630 18895 18888 859Hungary 2 2 3 3 2 775 775 1771 1827 1246 566
Ireland 5 1 1 9 4960 707 1193 25735 2859
Italy 226 250 296 327 360 320125 364980 351692 393343 383826 1066
Lithuania 1 0 1
Netherlands 17 15 17 20 16 34586 24901 21966 23093 21249 1312
Norway 49 51 17 15 15 88773 89315 17579 14432 13551 903
Poland 7 9 15 19 18 8557 8953 10430 12400 11000 611
Portugal 13 15 14 12 9 18738 20900 13872 12506 8224 914Russian Fed 2 2 1 1 2654 2308 770 991 991
Slovakia 18 24 95 46 41 12121 15662 70169 40280 32051 774Slovenia 2 3 3 1627 2072 2072 691
Spain 6 6 29 28 31 8388 10000 30828 33836 34579 1115
Sweden 62 66 66 69 91 131160 134840 113801 109385 116456 1287
Switzerland 53 67 70 86 95 86470 103515 100000 117077 123671 1302
UK 21 23 39 24 31 26594 29127 63089 42420 40945 1317
Ukraine 5 9 9 9 2570 4900 4900 4900 538
Oceania 16 20 22 10 17 34557 48559 52863 15378 21160 1275
Australia 11 12 15 28105 37470 43754New Zealand 5 8 7 10 17 6452 11089 9109 15378 21160 1275
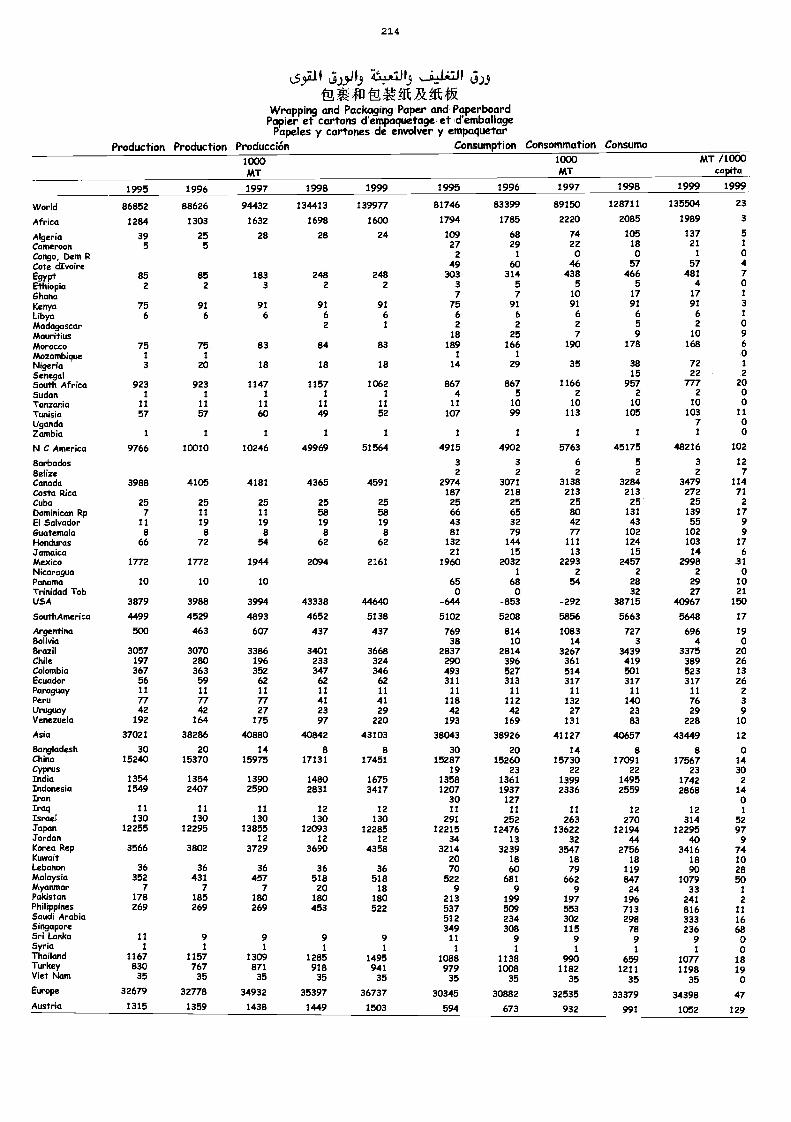
214
65.131 5..)9J .11=-*Ii. 519'WX-4)EvN*gftficAt,lk
Wrapping and Packaging Paper and PaperboardPapier et cartons d'empaquetage et d'emballage
Papeles y cartones de envolver y empaquetarProduction Production Producción Consumption Consommation Consumo
1000MT
1000MT
MT /1000capita
1995 1996 1997 1998 1999 1995 1996 1997 1998 1999 1999
World 86852 88626 94432 134413 139977 81746 83399 89150 128711 135504 23
Africa 1284 1303 1632 1698 1600 1794 1785 2220 2085 1989 3
Algeria 39 25 28 28 24 109 68 74 105 137 5
Cameroon 5 5 27 29 22 18 21 1
Congo, Dem R 2 1 0 0 1 0Cote avoire 49 60 46 57 57 4
Egypt 85 85 183 248 248 303 314 438 466 481 7Ethiopia 2 2 3 2 2 3 5 5 5 4 0Ghana 7 7 10 17 17 1
Kenya 75 91 91 91 91 75 91 91 91 91 3
Libya 6 6 6 6 6 6 6 6 6 6 1
Madagascar 2 1 2 2 2 5 2 0Mauritius 18 25 7 9 10 9Morocco 75 75 83 84 83 189 166 190 178 168 6
Mozambique 1 1 1 1 oNigeria 3 20 18 18 18 14 29 35 38 72 1
Senegal 15 22 2
South Africa 923 923 1147 1157 1062 867 867 1166 957 777 20Sudan 1 1 1 1 1 4 5 2 2 2 0Tanzania 11 11 11 11 11 11 10 10 10 10 oTunisia 57 57 60 49 52 107 99 113 105 103 11
Uganda 7 0Zambia 1 1 1 1 1 1 1 1 1 1 0
N C America 9766 10010 10246 49969 51564 4915 4902 5763 45175 48216 102
Barbados 3 3 6 5 3 12Belize 2 2 2 2 2 7Canada 3988 4105 4181 4365 4591 2974 3071 3138 3284 3479 114Costa Rica 187 218 213 213 272 71Cuba 25 25 25 25 25 25 25 25 25 25 2Dominican Rp 7 11 11 58 58 66 65 ao 131 139 17El Salvador 11 19 19 19 19 43 32 42 43 55 9Guatemala 8 8 8 8 8 81 79 77 102 102 9Honduras 66 72 54 62 62 132 144 111 124 103 17Jamaica 21 15 13 15 14 6Mexico 1772 1772 1944 2094 2161 1960 2032 2293 2457 2998 31Nicaragua 1 2 2 2 0Panama 10 10 10 65 68 54 28 29 10Trinidad Tob 0 0 32 27 21USA 3879 3988 3994 43338 44640 -644 -853 -292 38715 40967 150
SouthAmerica 4499 4529 4893 4652 5138 5102 5208 5856 5663 5648 17
Argentina 500 463 607 437 437 769 814 1083 727 696 19Bolivia 38 10 14 3 4 0Brazil 3057 3070 3386 3401 3668 2837 2814 3267 3439 3375 20Chile 197 280 196 233 324 290 396 361 419 389 26Colombia 367 363 352 347 346 493 527 514 501 523 13Ecuador 56 59 62 62 62 311 313 317 317 317 26Paraguay 11 11 11 11 11 11 11 11 11 11 2Peru 77 77 77 41 41 118 112 132 140 76 3Uruguay 42 42 27 23 29 42 42 27 23 29 9Venezuela 192 164 175 97 220 193 169 131 83 228 10
Asia 37021 38286 40880 40842 43103 38043 38926 41127 40657 43449 12
Bangladesh 30 20 14 8 8 30 20 14 8 8 aChina 15240 15370 15975 17131 17451 15287 15260 15730 17091 17567 14Cyprus 19 23 22 22 23 30India 1354 1354 1390 1480 1675 1358 1361 1399 1495 1742 2Indonesia 1549 2407 2590 2831 3417 1207 1937 2336 2559 2868 14Iran 30 127 0Iraq 11 11 11 12 12 11 11 11 12 12 1Israel 130 130 130 130 130 291 252 263 270 314 52Japan 12255 12295 13855 12093 12285 12215 12476 13622 12194 12295 97Jordan 12 12 12 34 13 32 44 40 9Korea Rep 3566 3802 3729 3690 4358 3214 3239 3547 2756 3416 74Kuwait 20 18 18 18 18 10Lebanon 36 36 36 36 36 70 60 79 119 90 28Malaysia 352 431 457 518 518 522 681 662 847 1079 50Myanmar 7 7 7 20 18 9 9 9 24 33 1Pakistan 178 185 180 180 180 213 199 197 196 241 2Philippines 269 269 269 453 522 537 509 553 713 816 11Saudi Arabia 512 234 302 298 333 16Singapore 349 308 115 78 236 68Sri Lanka 11 9 9 9 9 11 9 9 9 9 0Syria 1 1 1 1 1 1 1 1 1 1 0Thailand 1167 1157 1309 1285 1495 1088 1138 990 659 1077 18Turkey 830 767 871 918 941 979 1008 1182 1211 1198 19Viet Nam 35 35 35 35 35 35 35 35 35 35 oEurope 32679 32778 34932 35397 36737 30345 30882 32535 33379 34398 47Austria 1315 1359 1438 1449 1503 594 673 932 991 1052 129
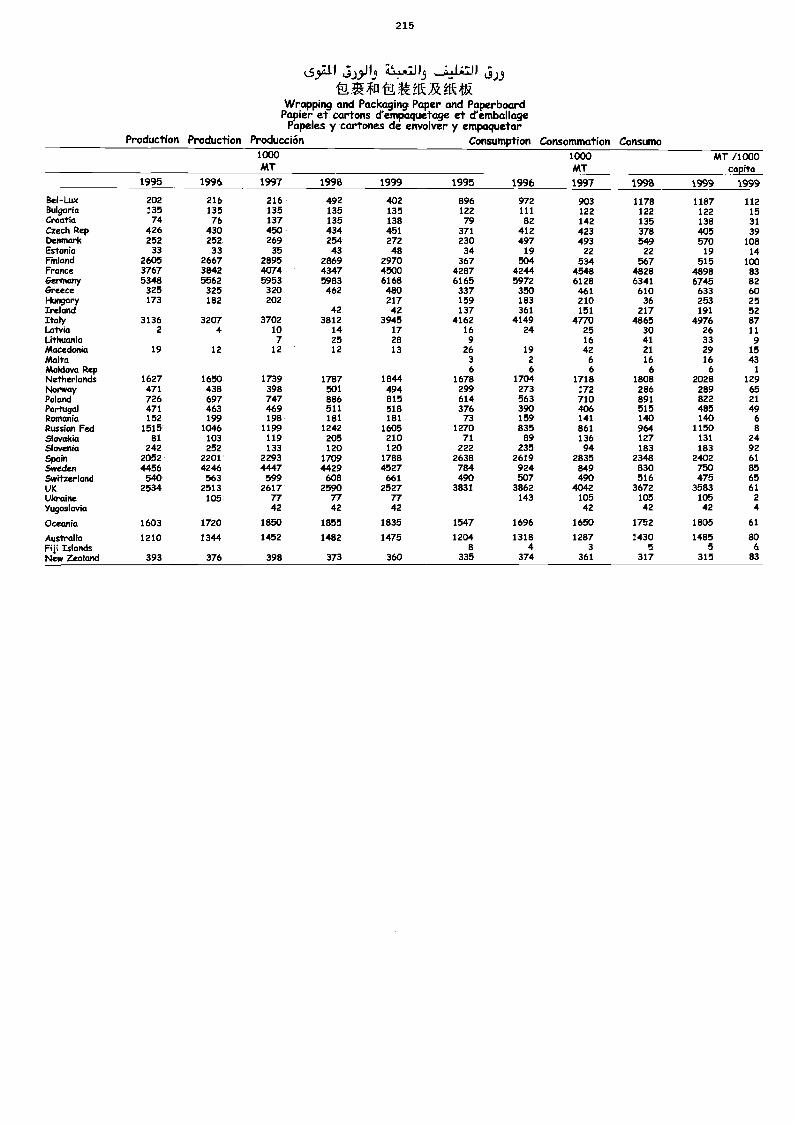
215
5.35.11.9 ,
t_Va411'g*fikAittfRWrapping and Packaging Paper and Paperboard
Papier et cartons crempaquetage et d'emballagePapeles y cartones de envolver y empaquetar
Production Production Producción Consumption Consommation Consumo1000MT
1000MT
MT /1000capita
19991995 1996 1997 1998 1999 1995 1996 1997 1998 1999
Bel-Lux 202 216 216 492 402 896 972 903 1178 1187 112Bulgaria 135 135 135 135 135 122 111 122 122 122 15Croatia 74 76 137 135 138 79 82 142 135 138 31Czech Rep 426 430 450 434 451 371 412 423 378 405 39Denmark 252 252 269 254 272 230 497 493 549 570 108Estonia 33 33 35 43 48 34 19 22 22 19 14Finland 2605 2667 2895 2869 2970 367 504 534 567 515 100France 3767 3842 4074 4347 4500 4287 4244 4548 4828 4898 83Germany 5348 5562 5953 5983 6168 6165 5972 6128 6341 6745 82Greece 325 325 320 462 480 337 350 461 610 633 60Huri9GrY 173 182 202 217 159 183 210 36 253 25Ireland 42 42 137 361 151 217 191 52Italy 3136 3207 3702 3812 3945 4162 4149 4770 4865 4976 87Latvia 2 4 10 14 17 16 24 25 30 26 11Lithuania 7 25 28 9 16 41 33 9Macedonia 19 12 12 12 13 26 19 42 21 29 15Malta 3 2 6 16 16 43Moldova Rep 6 6 6 6 6 1
Netherlands 1627 1650 1739 1787 1844 1678 1704 1718 1808 2028 129Norway 471 438 398 501 494 299 273 172 286 289 65Poland 726 697 747 886 815 614 563 710 891 822 21Portugal 471 463 469 511 518 376 390 406 515 485 49Romania 152 199 198 181 181 73 159 141 140 140 6Russian Fed 1515 1046 1199 1242 1605 1270 835 861 964 1150 8Slovakia 81 103 119 205 210 71 89 136 127 131 24Slovenia 242 252 133 120 120 222 235 94 183 183 92Spain 2052 2201 2293 1709 1788 2638 2619 2835 2348 2402 61Sweden 4456 4246 4447 4429 4527 784 924 849 830 750 85Switzerland 540 563 599 608 661 490 507 490 516 475 65UK 2534 2513 2617 2590 2527 3831 3862 4042 3672 3583 61Ukraine 105 77 77 77 143 105 105 105 2
Yugoslavia 42 42 42 42 42 42 4
Oceania 1603 1720 1850 1855 1835 1547 1696 1650 1752 1805 61
Australia 1210 1344 1452 1482 1475 1204 1318 1287 1430 1485 80Fiji Islands 8 4 3 5 5 6New Zealand 393 376 398 373 360 335 374 361 317 315 83
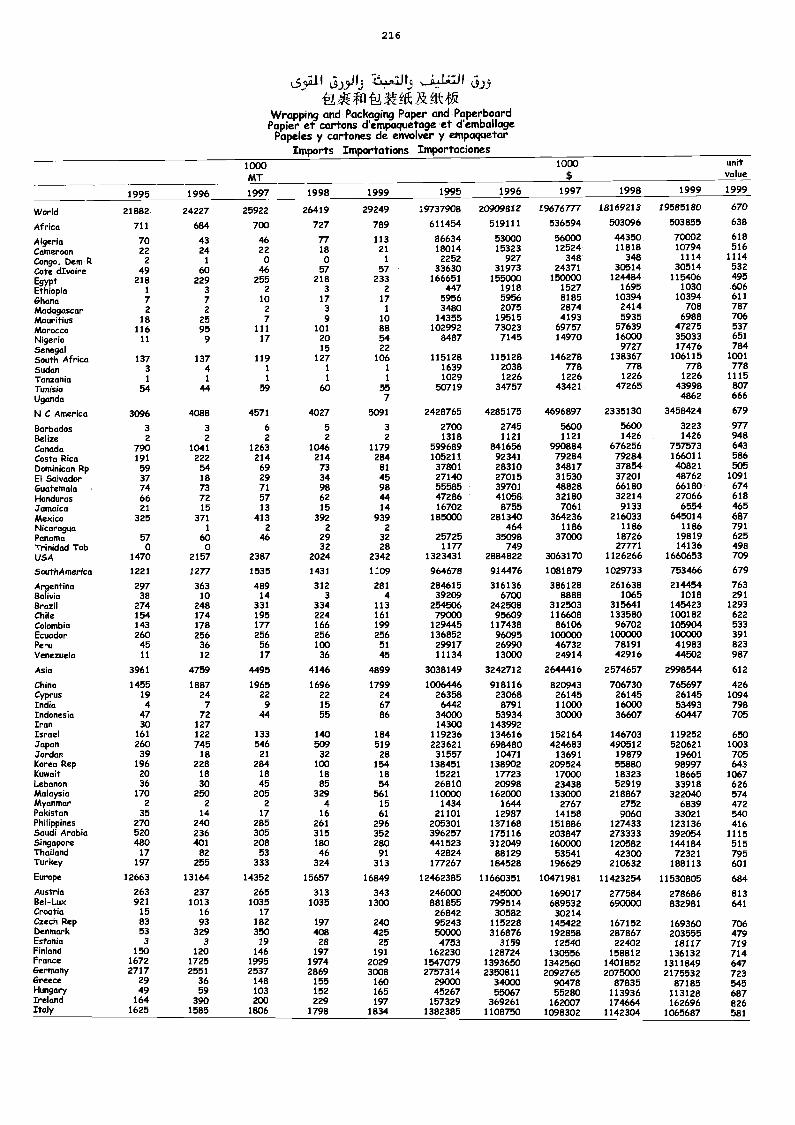
21 6
6,111 LLJ
'0A'ffi'N,X. KRAt*Wrapping and Packaging Paper and PaperboardPapier et cartons d'empo.quetage et d'emballage
Papeles y cartones de envolver y empaquetarImports Importations Importaciones
1000MT
1000 unitvalue
1995 1996 1997 1998 1999 1995 1996 1997 1998 1999 1999
World 21882 24227 25922 26419 29249 19737908 20909812 19676777 18169213 19585180 670
Africa 711 684 700 727 789 611454 519111 536594 503096 503855 638
Algeria 70 43 46 77 113 86634 53000 56000 44350 70002 618
Cameroon 22 24 22 18 21 18014 15323 12524 11818 10794 516
Congo, Dem Ft 2 1 0 0 1 2252 927 348 348 1114 1114
Cote dIvoire 49 60 46 57 57 33630 31973 24371 30514 30514 532
EgyptEthiopia
2181
2293
2552
2183
2332
166651447
1550001918
1500001527
1244841695
1154061030
495606
Ghana 7 7 10 17 17 5956 5956 8185 10394 10394 611
Madagascar 2 2 2 3 1 3480 2075 2874 2414 708 787Mauritius 18 25 7 9 10 14355 19515 4193 5935 6988 706
Morocco 116 95 111 101 88 102992 73023 69757 57639 47275 537
Nigeria 11 9 17 20 54 8487 7145 14970 16000 35033 651
Senegal 15 22 9727 17476 784South Africa 137 137 119 127 106 115128 115128 146278 138367 106115 1001
Sudan 3 4 1 1 1 1639 2038 778 778 778 778Tanzania 1 1 1 1 1 1029 1226 1226 1226 1226 1115
Tunisia 54 44 59 60 55 50719 34757 43421 47265 43998 807
Uganda 7 4862 666
N C America 3096 4088 4571 4027 5091 2428765 428517 4696897 2335130 3458424 679
Barbados 3 3 6 5 3 2700 2745 5600 5600 3223 977Belize 2 2 2 2 2 1318 1121 1121 1426 1426 948Canada 790 1041 1263 1046 1179 599689 841656 990884 676256 757573 643Costa Rica 191 222 214 214 284 105211 92341 79284 79284 166011 586Dominican Rp 59 54 69 73 81 37801 28310 34817 37854 40821 505El Salvador 37 18 29 34 45 27140 27015 31530 37201 48762 1091
Guatemala 74 73 71 98 98 55585 39701 48828 66180 66180 674Honduras 66 72 57 62 44 47286 41058 32180 32214 27066 618Jamaica 21 15 13 15 14 16702 8755 7061 9133 6554 465Mexico 325 371 413 392 939 185000 281340 364236 216033 645014 687Nicaragua 1 2 2 2 464 1186 1186 1186 791Panama 57 60 46 29 32 25725 35098 37000 18726 19819 625Trinidad Tob o o 32 28 1177 749 27771 14136 498USA 1470 2157 2387 2024 2342 1323431 2884822 3063170 1126266 1660653 709
SouthAmerica 1221 1277 1535 1431 1109 964678 914476 1081879 1029733 753466 679
Argentina 297 363 489 312 281 284615 316136 386128 261638 214454 763Bolivia 38 10 14 3 4 39209 6700 8688 1065 1018 291Brazil 274 248 331 334 113 254506 242508 312503 315641 145423 1293Chile 154 174 195 224 161 79000 95609 116608 133580 100182 622Colombia 143 178 177 166 199 129445 117438 86106 96702 105904 533Ecuador 260 256 256 256 256 136852 96095 100000 100000 100000 391Peru 45 36 56 100 51 29917 26990 46732 78191 41983 823Venezuela 11 12 17 36 45 11134 13000 24914 42916 44502 987
Asia 3961 4759 4495 4146 4899 3038149 3242712 2644416 2574657 2998544 612
China 1455 1887 1965 1696 1799 1006446 918116 820943 706730 765697 426Cyprus 19 24 22 22 24 26358 23068 26145 26145 26145 1094India 4 7 9 15 67 6442 8791 11000 16000 53493 798Indonesia 47 72 44 55 86 34000 53934 30000 36607 60447 705Iran 30 127 14300 143992Israel 161 122 133 140 184 119236 134616 152164 146703 119252 650Japan 260 745 546 509 519 223621 698480 424683 490512 520621 1003Jordan 39 16 21 32 28 31557 10471 13691 19879 19601 705Korea Rep 196 228 284 100 154 138451 138902 209524 55880 98997 643Kuwait 20 18 18 18 18 15221 17723 17000 18323 18665 1067Lebanon 36 30 45 85 54 26810 20998 23438 52919 33918 626Malaysia 170 250 205 329 561 110000 162000 133000 218867 322040 574Myanmar 2 2 2 4 15 1434 1644 2767 2752 6839 472Pakistan 35 14 17 16 61 21101 12987 14158 9060 33021 540Philippines 270 240 285 261 296 205301 137168 151886 127433 123136 416Saudi Arabia 520 236 305 315 352 396257 175116 203847 273333 392054 1115Singapore 480 401 208 180 280 441523 312049 160000 120582 144184 515Thailand 17 82 53 46 91 42824 88129 53541 42300 72321 795Turkey 197 255 333 324 313 177267 184528 196629 210632 188113 601
Europe 12663 13164 14352 15657 16849 12462385 11660351 10471981 11423254 11530805 684Austria 263 237 265 313 343 246000 245000 169017 277584 278686 813Bel-Lux 921 1013 1035 1035 1300 881855 799514 689532 690000 832981 641Croatia 15 16 17 26842 30582 30214Czech Rep 83 93 182 197 240 95243 115228 145422 167152 169360 706Denmark 53 329 350 408 425 50000 316876 192858 287867 203555 479Estonia 3 3 19 28 25 4753 3159 12540 22402
18
719FinlandFrance
1501672
1201725
1461995
1971974
1912029
1622301547079
1287241393650
1305561342560
14%581885122
1313161811431927
714647
Germany 2717 2551 2537 2869 3008 2757314 2350811 2092765 2075000 2175532 723Greece 29 36 148 155 160 29000 34000 90478 87835 87185 545Hungary 49 59 103 152 165 45267 55067 55280 113128 687Ireland 164 390 200 229 197 157329 369261
11117412963043646
162696 826Italy 1625 1585 1806 1798 1834 1382385 1108750 1(7983072 1065687 581
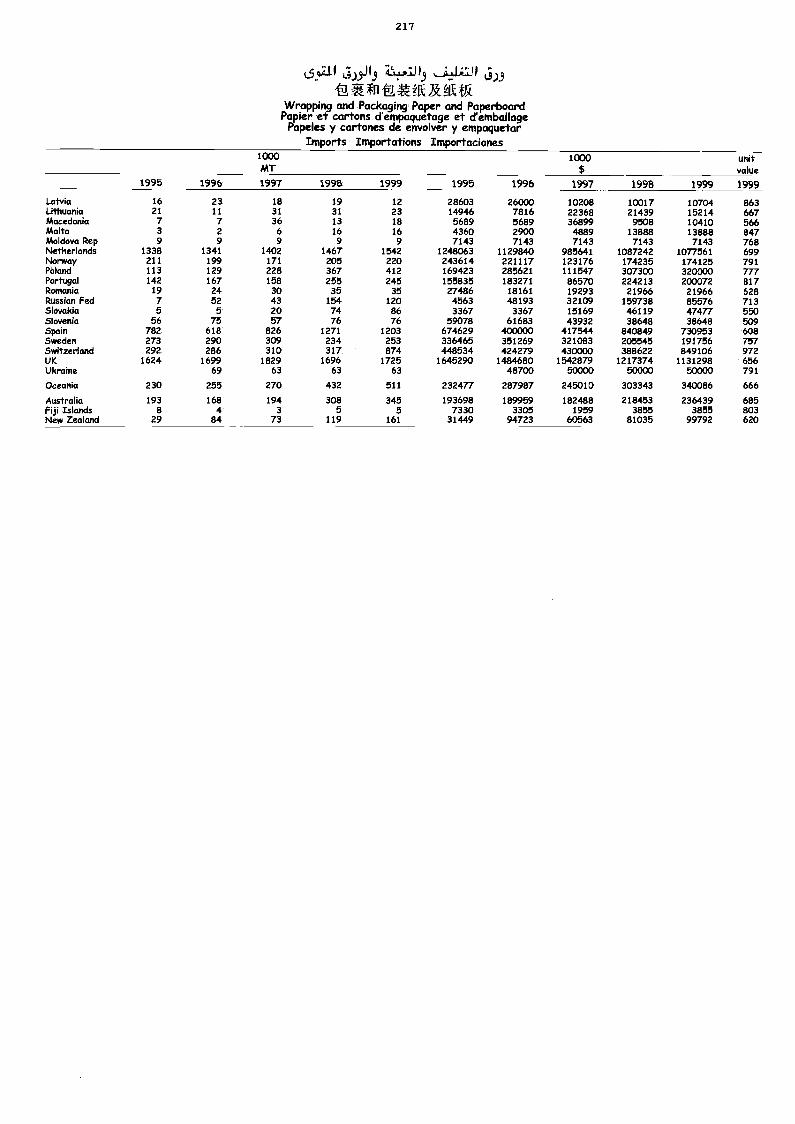
217
0,111 610.9 Zst....7J1.9 519
wg.R. K/A4.KfRWrapping and Packaging Paper and Paperboard
Papier et cartons d'empaquetage et d'emballagePapeles y cartones de envolver y empaquetar
Imports Importations Importaciones1000MT
1000$
unitvalue
1995 1996 1997 1998 1999 1995 1996 1997 1998 1999 1999
Latvia 16 23 18 19 12 28603 26000 10208 10017 10704 863Lithuania 21 11 31 31 23 14946 7816 22368 21439 15214 667Macedonia 7 7 36 13 18 5689 5689 36899 9508 10410 566Malta 3 2 6 16 16 4360 2900 4889 13888 13888 847Moldova Rep 9 9 9 9 9 7143 7143 7143 7143 7143 768Netherlands 1338 1341 1402 1467 1542 1248063 1129840 985641 1087242 1077561 699Norway 211 199 171 205 220 243614 221117 123176 174235 174125 791Poland 113 129 228 367 412 169423 285621 111547 307300 320000 777Portugal 142 167 158 255 245 155835 183271 86570 224213 200072 817Romania 19 24 30 35 35 27486 18161 19293 21966 21966 628Russian Fed 7 52 43 154 120 4563 48193 32109 159738 85576 713Slovakia 5 5 20 74 86 3367 3367 15169 46119 47477 550Slovenia 56 75 57 76 76 59078 61683 43932 38648 38648 509Spain 782 618 826 1271 1203 674629 400000 417544 840849 730953 608Sweden 273 290 309 234 253 336465 351269 321083 205545 191756 757Switzerland 292 286 310 317 874 448534 424279 430000 388622 849106 972UK 1624 1699 1829 1696 1725 1645290 1484680 1542879 1217374 1131298 656Ukraine 69 63 63 63 48700 50000 50000 50000 791
Oceania 230 255 270 432 511 232477 287987 245010 303343 340086 666
Australia 193 168 194 308 345 193698 189959 182488 218453 236439 685Fiji Islands 8 4 3 5 5 7330 3305 1959 3855 3855 803New Zealand 29 84 73 119 161 31449 94723 60863 81035 99792 620
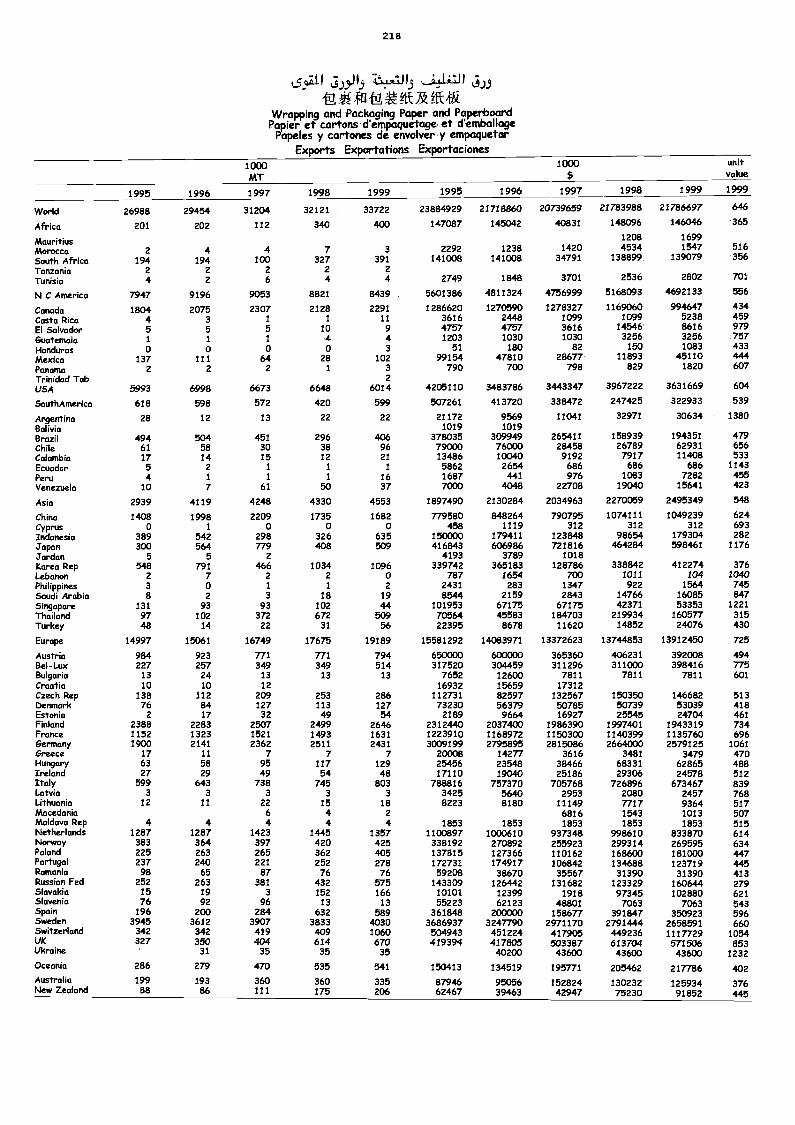
218
k.5.91 510.9 ."/"^/5'0,*fri'0,*?[tAfft)ffi.
VVrapping and Packaging Paper and PaperboardPapier et cartons d'empaquetage et d'emballage
Papeles y cartones de envolver y empaquetarExports Exportations Exportaciones
1000MT
1000 unitvalue
1995 1996 1997 1998 1999 1995 1996 1997 1998 1999 1999
World 26988 29454 31204 32121 33722 23884929 21718860 20739659 21783988 21786697 646
Africa 201 202 112 340 400 147087 145042 40831 148096 146046 365
Mauritius 1208 1699
Morocco 2 4 4 7 3 2292 1238 1420 4534 1547 516
South Africa 194 194 100 327 391 141008 141008 34791 138899 139079 356
Tanzania 2 2 2 2 2
Tunisia 4 2 6 4 4 2749 1848 3701 2536 2802 701
N C America 7947 9196 9053 8821 8439 5601386 4811324 4756999 5168093 4692133 556
Canada 1804 2075 2307 2128 2291 1286620 1270590 1278327 1169060 994647 434
Costa Rica 4 3 1 1 11 3616 2448 1099 1099 5238 459
El Salvador 5 5 5 10 9 4757 4757 3616 14546 8616 979
Guatemala 1 1 1 4 4 1203 1030 1030 3256 3256 757Honduras o o o o 3 51 180 82 150 1083 433
Mexico 137 111 64 28 102 99154 47810 28677 11893 45110 444Panama 2 2 2 1 3 790 700 798 829 1820 607Trinidad Tob 2USA 5993 6998 6673 6648 6014 4205110 3483786 3443347 3967222 3631669 604
SouthAmerica 618 598 572 420 599 507261 413720 338472 247425 322933 539
Argentina 28 12 13 22 22 21172 9569 11041 32971 30634 1380Bolivia 1019 1019Brazil 494 504 451 296 406 378035 309949 265411 158939 194351 479Chile 61 58 30 38 96 79000 76000 28458 26789 62931 656Colombia 17 14 15 12 21 13486 10040 9192 7917 11408 533Ecuador 5 2 1 1 1 5862 2654 686 686 686 1143Peru 4 1 1 1 16 1687 441 976 1083 7282 455Venezuela 10 7 61 50 37 7000 4048 22708 19040 15641 423
Asia 2939 4119 4248 4330 4553 1897490 2130284 2034963 2270059 2495349 548
China 1408 1998 2209 1735 1682 779580 848264 790795 1074111 1049239 624Cyprus 0 1 0 o o 458 1119 312 312 312 693Indonesia 389 542 298 326 635 150000 179411 123848 98654 179304 282Japan 300 564 779 408 509 416843 606986 721816 464284 598461 1176Jordan 5 5 2 4193 3789 1018Korea Rep 548 791 466 1034 1096 339742 365183 128786 338842 412274 376Lebanon 2 7 2 2 o 787 1654 700 1011 104 1040Philippines 3 o 1 1 2 2431 283 1347 922 1564 745Saudi Arabia 8 2 3 18 19 8544 2159 2843 14766 16085 847Singapore 131 93 93 102 44 101953 67175 67175 42371 53353 1221Thailand 97 102 372 672 509 70564 45583 184703 219934 160577 315Turkey 48 14 22 31 56 22395 8678 11620 14852 24076 430
Europe 14997 15061 16749 17675 19189 15581292 14083971 13372623 13744853 13912450 725
Austria 984 923 771 771 794 650000 600000 365360 406231 392008 494Bel-Lux 227 257 349 349 514 317520 304459 311296 311000 398416 775Bulgaria 13 24 13 13 13 7652 12600 7811 7811 7811 601Croatia 10 10 12 16932 15659 17312Czech Rep 138 112 209 253 286 112731 82597 132567 150350 146682 513Denmark 76 84 127 113 127 73230 56379 50785 50739 53039 418Estonia 2 17 32 49 54 2189 9664 16927 25545 24704 461Finland 2388 2283 2507 2499 2646 2312440 2037400 1986390 1997401 1943319 734France 1152 1323 1521 1493 1631 1223910 1168972 1150300 1140399 1135760 696Germany 1900 2141 2362 2511 2431 3009199 2795895 2815086 2664000 2579125 1061&recce 17 11 7 7 7 20008 14277 3616 3481 3479 470Hungary 63 58 95 117 129 25456 23548 38466 68331 62865 488Ireland 27 29 49 54 48 17110 19040 25186 29306 24578 512Italy 599 643 738 745 803 788816 757370 705768 726896 673467 839Latvia 3 3 3 3 3 3425 5640 2953 2080 2457 768Lithuania 12 11 22 15 18 8223 8180 11149 7717 9364 517Macedonia 6 4 2 6816 1543 1013 507Moldova Rep 4 4 4 4 4 1853 1853 1853 1853 1853 515Netherlands 1287 1287 1423 1445 1357 1100897 1000610 937348 998610 833870 614Norway 383 364 397 420 425 338192 270892 255923 299314 269595 634Poland 225 263 265 362 405 137815 127366 110162 168600 181000 447Portugal 237 240 221 252 278 172731 174917 106842 134688 123719 445Romania 98 65 87 76 76 59208 38670 35567 31390 31390 413Russian Fed 252 263 381 432 575 143309 126442 131682 123329 160644 279Slovakia 15 19 3 152 166 10101 12399 1918 97345 102880 621Slovenia 76 92 96 13 13 55223 62123 48801 7063 7063 543Spain 196 200 284 632 589 361848 200000 158677 391847 350923 596Sweden 3945 3612 3907 3833 4030 3686937 3247790 2971170 2791444 2658591
60Switzerland 342 342 419 409 1060 504943 451224 417905 449236 1117729 16054l/K 327 350 404 614 670 419394 417805 503387 613704 571506 853Ukraine 31 35 35 35 40200 43600 43600 43600 1232Oceania 286 279 470 535 541 150413 134519 195771 205462 217786 402Australia 199 193 360 360 335 87946 95056 152824 130232 125934 376New Zealand 88 86 111 175 206 62467 39463 42947 75230 91852 445
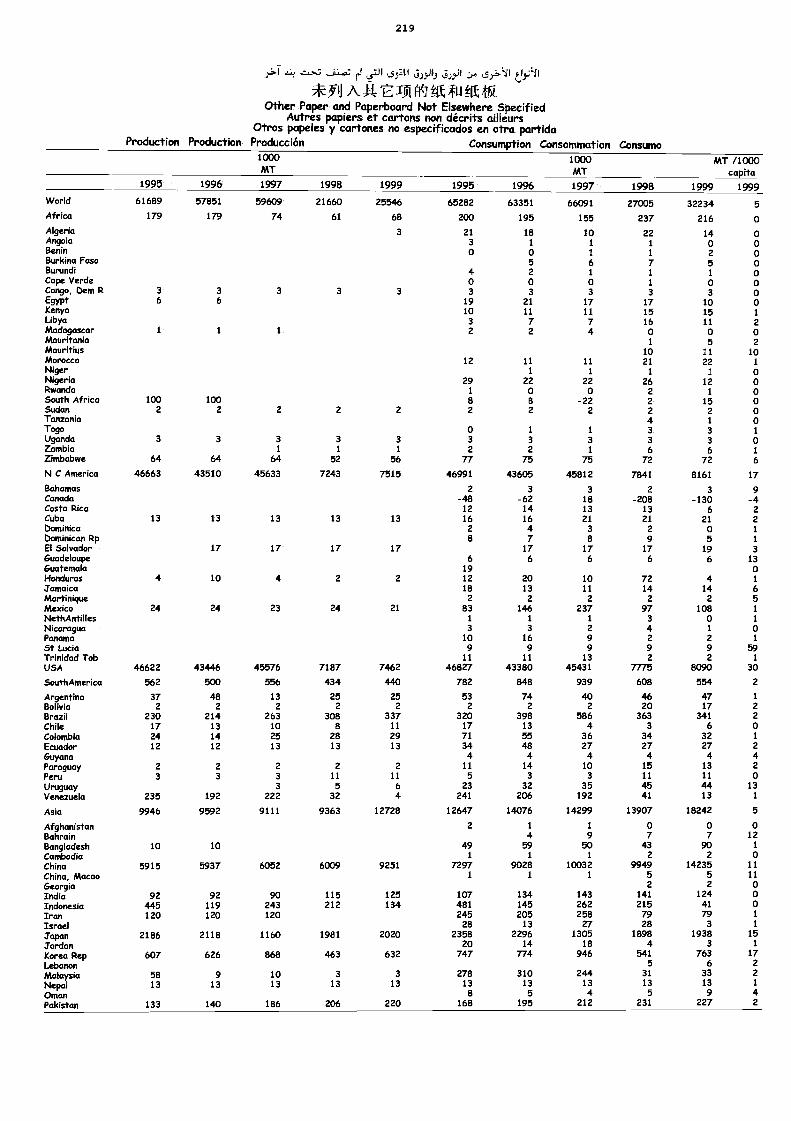
2 1 9
-1.1 A A te TA rr1 kEE fil M laOtkier Paper and Paperboard Not Elsewhere Specified
Autres papiers et cartons non décrits ailleursOtros papeles y cartones no especificados en otra partida
Production Production Producción Consumption Consommation Consumo1000MT
1000MT
MT /1000capita
1995 1996 1997 1998 1999 1995 1996 1997 1998 1999 1999World 61689 57851 59609 21660 25546 65282 63351 66091 27005 32234 5Africa 179 179 74 61 68 200 195 155 237 216 0Algeria 3 21 18 10 22 14 oAngola 3 1 1 1 o 0Benin o o 1 1 2 0Burkina Faso 5 6 7 5 oBurundi 4 2 1 1 1 oCape Verde 0 0 0 1 o 0Congo, Dem R 3 3 3 3 3 3 3 3 3 3 oEgypt 6 6 19 21 17 17 10 0Kenya 10 11 11 15 15 1Libya 3 7 7 16 11 2Madagascar 1 1 1 2 2 4 o o oMauritania 1 5 2Mauritius 10 11 10Morocco 12 11 11 21 22 1Niger 1 1 1 1 oNigeria 29 22 22 26 12 0Rwanda 1 0 0 2 1 0South Africa 100 100 a 8 -22 2 15 oSudan 2 2 2 2 2 2 2 2 2 2 0Tanzania 4 1 oTogo 0 1 1 3 3 1
Uganda 3 3 3 3 3 3 3 3 3 3 0Zambia 1 1 1 2 2 1 6 6 1
Zimbabwe 64 64 64 52 56 77 75 75 72 72 6
N C America 46663 43510 45633 7243 7515 46991 43605 45812 7841 8161 17
Bahamas 2 3 3 2 3 9Canada -48 -62 18 -208 -130 -4Costa Rica 12 14 13 13 6 2Cuba 13 13 13 13 13 16 16 21 21 21 2Dominica 2 4 3 2 o 1
Dominican Rp 8 7 8 9 5 1
El Salvador 17 17 17 17 17 17 17 19 3Guadeloupe 6 6 6 6 6 13Guatemala 19 oHonduras 4 10 4 2 2 12 20 10 72 4 1
Jamaica 18 13 11 14 14 6Martinique 2 2 2 2 2 5Mexico 24 24 23 24 21 83 146 237 97 108 1
NethAntilles 1 1 1 3 o 1
Nicaragua 3 3 2 4 1 oPanama 10 16 9 2 2 1
St Lucia 9 9 9 9 9 59Trinidad Tob 11 11 13 2 2 1
USA 46622 43446 45576 7187 7462 46827 43380 45431 7775 8090 30
SouthAmerica 562 500 556 434 440 782 848 939 608 554 2
Argentina 37 48 13 25 25 53 74 ao 46 47 1
Bolivia 2 2 2 2 2 2 2 2 20 17 2
Brazil 230 214 263 308 337 320 398 586 363 341 2
Chile 17 13 10 8 11 17 13 4 3 6 0Colombia 24 14 25 28 29 71 55 36 34 32 1
Ecuador 12 12 13 13 13 34 48 27 27 27 2
Guyana 4 4 4 4 4 4Paraguay 2 2 2 2 2 11 14 10 15 13 2
Peru 3 3 3 11 11 5 3 3 11 11 0Uruguay 3 5 6 23 32 35 45 44 13Venezuela 235 192 222 32 4 241 206 192 41 13 1
Asia 9946 9592 9111 9363 12728 12647 14076 14299 13907 18242 5
Afghanistan 2 1 1 o o 0Bahrain 4 9 7 7 12Bangladesh 10 10 49 59 50 43 90 1
Cambodia 1 1 / 2 2 0China 5915 5937 6052 6009 9251 7297 9028 10032 9949 14235 11
China, Macao 1 1 1 5 5 11
Georgia 2 2 oIndia 92 92 90 115 125 107 134 143 141 124 0Indonesia 445 119 243 212 134 481 145 262 215 41 oIran 120 120 120 245 205 258 79 79 1
Israel 28 13 27 28 3 1
Japan 2186 2118 1160 1981 2020 2358 2296 1305 1898 1938 15
Jordan 20 14 18 4 3 1
Korea Rep 607 626 868 463 632 747 774 946 541 763 17Leban on 5 6 2
Malaysia 58 9 10 3 3 278 310 244 31 33 2
Nepal 13 13 13 13 13 13 13 13 13 13 1
Oman 8 5 4 5 9 4Pakistan 133 140 186 206 220 168 195 212 231 227 2
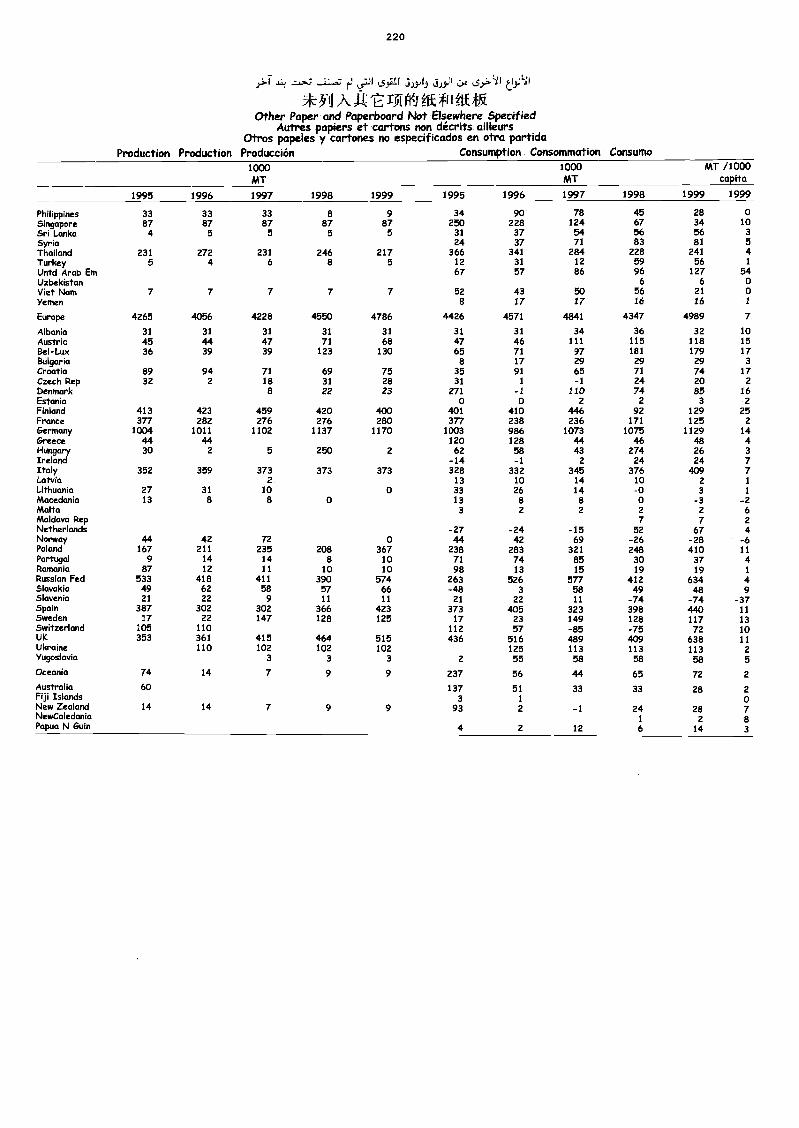
220
M 4 "'"L' 1310'1 Mt *LIM*Other Paper and Paperboard Not Elsewhere Specified
Autres papiers et cartons non décrits ailieursOtros papeles y cartones no especificados en otra partida
Production Production Producción Consumption Consommation Consumo1000MT
1000MT
MT /1000capita
1995 1996 1997 1998 1999 1995 1996 1997 1998 1999 1999
Philippines 33 33 33 8 9 34 90 78 45 28 0Singapore 87 87 87 87 87 250 228 124 67 34 10Sri Lanka 4 5 5 5 5 31 37 54 56 56 3Syria 24 37 71 83 81 5Thailand 231 272 231 246 217 366 341 284 228 241 4Turkey 5 4 6 8 5 12 31 12 59 56 1
Untd Arab Em 67 57 86 96 127 54Uzbekistan 6 6 0Viet Nam 7 7 7 7 7 52 43 50 56 21 0Yemen 8 17 17 16 26 /
Europe 4265 4056 4228 4550 4786 4426 4571 4841 4347 4989 7
Albania 31 31 31 31 31 31 31 34 36 32 10Austria 45 44 47 71 68 47 46 111 115 118 15Bel-Lux 36 39 39 123 130 65 71 97 181 179 17Bulgaria 8 17 29 29 29 3Croatia 89 94 71 69 75 35 91 65 71 74 17Czech Rep 32 2 18 31 28 31 1 -1 24 20 2Denmark 8 22 23 271 -1 110 74 85 16Estonia o o 2 2 3 2Finland 413 423 459 420 400 401 410 446 92 129 25France 377 282 276 276 280 377 238 236 171 125 2Germany 1004 1011 1102 1137 1170 1003 986 1073 1075 1129 14Greece 44 44 120 128 44 46 48 4Hungary 30 2 5 250 2 62 58 43 274 26 3Ireland -14 -1 2 24 24 7Italy 352 359 373 373 373 328 332 345 376 409 7Latvia 2 13 10 14 10 2 1
Lithuania 27 31 10 0 33 26 14 -0 3 1
Macedonia 13 8 8 o 13 8 8 o -3 -2Malta 3 2 2 2 2 6Moldova Rep 7 7 2Netherlands -27 -24 -15 52 67 4Norway 44 42 72 o 44 42 69 -26 -28 -6Poland 167 211 235 208 367 238 283 321 248 410 11Portugal 9 14 14 8 10 71 74 85 30 37 4Romania 87 12 11 10 10 98 13 15 19 19 1Russian Fed 533 418 411 390 574 263 526 577 412 634 4Slovakia 49 62 58 57 66 -48 3 58 49 48 9Slovenia 21 22 9 11 11 21 22 11 -74 -74 -37Spain 387 302 302 366 423 373 405 323 398 440 11Sweden 17 22 147 128 125 17 23 149 128 117 13Switzerland 105 110 112 57 -85 -75 72 10UK 353 361 415 464 515 436 516 489 409 638 11Ukraine 110 102 102 102 125 113 113 113 2Yugoslavia 3 3 3 2 55 58 58 58 5Oceania 74 14 7 9 9 237 56 44 65 72 2
Australia 60 137 51 33 33 28 2Fiji Islands 3 1 0New Zealand 14 14 7 9 9 93 2 -1 24 28 7NewCaledonia 1 2 aPapua N Guin 4 2 12 6 14 3
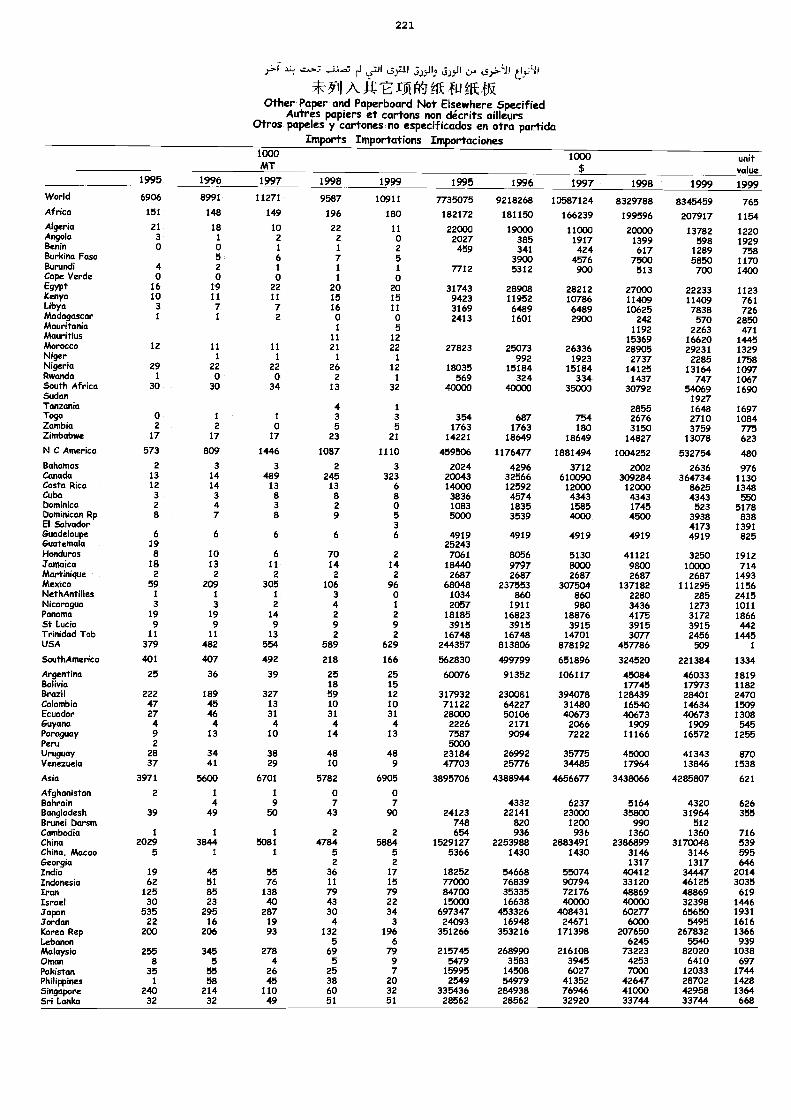
221
L5.7J1 Ls.9:41.1
*Y11 A i-t: -E- TA fiig fit ffk*Other Paper and Paperboard Not Elsewhere Specified
Autres papiers et cartons non décrits ailleursOtros papeles y cartones no especificados en otra partida
Imports Importations Importaciones1000MT
1000$
unitvalue
1995 1996 1997 1998 1999 1995 1996 1997 1998 1999 1999World 6906 8991 11271 9587 10911 7735075 9218268 10587124 8329788 8345459 765Africa 151 148 149 196 180 182172 181150 166239 199596 207917 1154Algeria 21 18 10 22 11 22000 19000 11000 20000 13782 1220Angola 3 1 2 2 0 2027 385 1917 1399 598 1929Benin o o 1 1 2 459 341 424 617 1289 758Burkina Faso 5 6 7 5 3900 4576 7500 5850 1170Burundi 4 2 / 1 1 7712 5312 900 513 700 1400Cape Verde o o o 1 oEgypt 16 19 22 20 20 31743 28908 28212 27000 22233 1123Kenya 10 11 11 15 15 9423 11952 10786 11409 11409 761Libya 3 7 7 16 11 3169 6489 6489 10625 7838 726Madagascar 1 1 2 o 0 2413 1601 2900 242 570 2850Mauritania 1 5 1192 2263 471Mauritius 11 12 15369 16620 1445Morocco 12 11 11 21 22 27823 25073 26336 28905 29231 1329Niger 1 1 1 1 992 1923 2737 2285 1758Nigeria 29 22 22 26 12 18035 15184 15184 14125 13164 1097Rwanda 1 o o 2 1 569 324 334 1437 747 1067South Africa 30 30 34 13 32 40000 40000 35000 30792 54069 1690Sudan 1927Tanzania 4 1 2855 1648 1697Togo 0 1 1 3 3 354 687 754 2676 2710 1084Zambia 2 2 o 5 5 1763 1763 180 3150 3759 775Zimbabwe 17 17 17 23 21 14221 18649 18649 14827 13078 623N C America 573 809 1446 1087 1110 459506 1176477 1881494 1004252 532754 480Bahamas 2 3 3 2 3 2024 4296 3712 2002 2636 976Canada 13 14 489 245 323 20043 32566 610090 309284 364734 1130Costa Rica 12 14 13 13 6 14000 12592 12000 12000 8625 1348Cuba 3 3 8 8 8 3836 4574 4343 4343 4343 550Dominica 2 4 3 2 0 1083 1835 1585 1745 523 5178Dominican Rp 8 7 8 9 5 5000 3539 4000 4500 3938 838El Salvador 3 4173 1391Guadeloupe 6 6 6 6 6 4919 4919 4919 4919 4919 825Guatemala 19 25243Honduras 8 10 6 70 2 7061 8056 5130 41121 3250 1912Jamaica 18 13 11 14 14 18440 9797 8000 9800 10000 714Martinique 2 2 2 2 2 2687 2687 2687 2687 2687 1493Mexico 59 209 305 106 96 68048 237553 307504 137182 111295 1156NethAntilles 1 1 1 3 o 1034 860 860 2280 285 2415Nicaragua 3 3 2 4 1 2057 1911 980 3436 1273 1011Panama 19 19 14 2 2 18185 16823 18876 4175 3172 1866St Lucia 9 9 9 9 9 3915 3915 3915 3915 3915 442Trinidad Tob 11 11 13 2 2 16748 16748 14701 3077 2456 1445USA 379 482 554 589 629 244357 813806 878192 457786 509 1
SouthAinerica 401 407 492 218 166 562830 499799 651896 324520 221384 1334
Argentina 25 36 39 25 25 60076 91352 106117 45084 46033 1819Bolivia 18 15 17745 17973 1182Brazil 222 189 327 59 12 317932 230081 394078 128439 28401 2470Colombia 47 45 13 10 10 71122 64227 31480 16540 14634 1509Ecuador 27 46 31 31 31 28000 50106 40673 40673 40673 1308Guyana 4 4 4 4 4 2226 2171 2066 1909 1909 545Paraguay 9 13 10 14 13 7587 9094 7222 11166 16572 1255Peru 2 5000Uruguay 28 34 38 48 48 23184 26992 35775 45000 41343 870Venezuela 37 41 29 10 9 47703 25776 34485 17964 13846 1538
Asia 3971 5600 6701 5782 6905 3895706 4388944 4656677 3438066 4285807 621
Afghanistan 2 1 1 0 oBahrain 4 9 7 7 4332 6237 5164 4320 626Bangladesh 39 49 50 43 90 24123 22141 23000 35800 31964 355Brunei Darsm 748 820 1200 990 512Cambodia 1 1 1 2 2 654 936 936 1360 1360 716China 2029 3844 5081 4784 5884 1529127 2253988 2883491 2386899 3170048 539China, Macao 5 1 1 5 5 5366 1430 1430 3146 3146 595Georgia 2 2 1317 1317 646India 19 45 55 36 17 18252 54668 55074 40412 34447 2014Indonesia 62 51 76 11 15 77000 76839 90794 33120 46125 3035Iran 125 85 138 79 79 84700 35335 72176 48869 48869 619Israel 30 23 ao 43 22 15000 16638 40000 40000 32398 1446Japan 535 295 287 30 34 697347 453326 408431 60277 65650 1931Jordan 22 16 19 4 3 24093 16948 24671 6000 5495 1616Korea Rep 200 206 93 132 196 351266 353216 171398 207650 267832 1366Lebanon 5 6 6245 5540 939Malaysia 255 345 278 69 79 215745 268990 216108 73223 82020 1038Oman 8 5 4 5 9 5479 3583 3945 4253 6410 697Pakistan 35 55 26 25 7 15995 14508 6027 7000 12033 1744Philippines 1 58 45 38 20 2549 54979 41352 42647 28702 1428Singapore 240 214 110 60 32 335436 284938 76946 41000 42958 1364Sri Lanka 32 32 49 51 51 28562 28562 32920 33744 33744 668
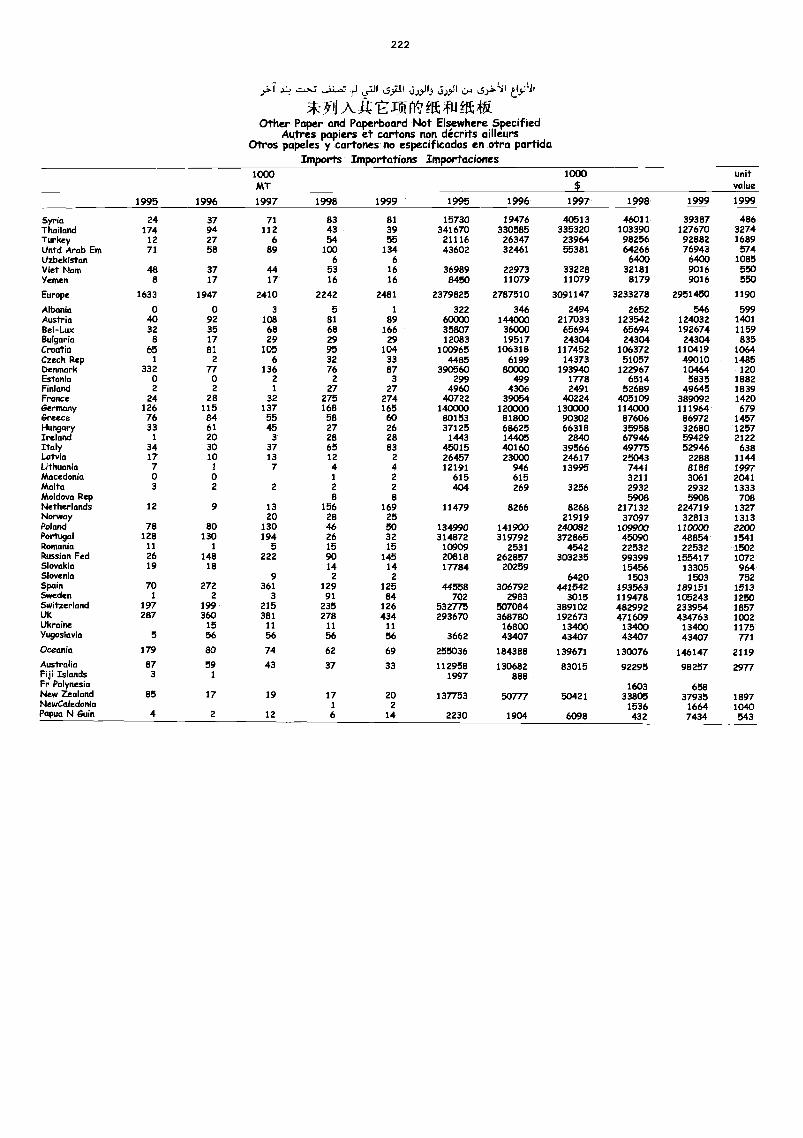
222
rJ L5.111 6,21 j»11
*0,1 AR. Lroirri.frE#1 itt*Other Paper and Paperboard Not Elsewhere Specified
Autres papiers et cartons non décrits ailleursOtros papeles y cartones no especificados en otra partida
Imports Importations Importaciones1000MT
1000$
unitvalue
1995 1996 1997 1998 1999 1995 1996 1997 1998 1999 1999
Syria 24 37 71 83 81 15730 19476 40513 46011 39387 486Thailand 174 94 112 43 39 341670 330585 335320 103390 127670 3274Turkey 12 27 6 54 55 21116 26347 23964 98256 92882 1689Untd Arab Em 71 58 89 100 134 43602 32461 55381 64266 76943 574Uzbekistan 6 6 6400 6400 1085Viet Nam 48 37 44 53 16 36989 22973 33228 32181 9016 550Yemen 8 17 17 16 16 8450 11079 11079 8179 9016 550
Europe 1633 1947 2410 2242 2481 2379825 2787510 3091147 3233278 2951450 1190
Albania 0 0 3 5 1 322 346 2494 2652 546 599Austria 40 92 108 81 89 60000 144000 217033 123542 124032 1401Bel-Lux 32 35 68 68 166 35807 36000 65694 65694 192674 1159Bulgaria 8 17 29 29 29 12083 19517 24304 24304 24304 835Croatia 65 81 105 95 104 100965 106318 117452 106372 110419 1064Czech Rep 1 2 6 32 33 4485 6199 14373 51057 49010 1485Denmark 332 77 136 76 87 390560 80000 193940 122967 10464 120Estonia 0 0 2 2 3 299 499 1778 6514 5835 1882Finland 2 2 1 27 27 4960 4306 2491 52689 49645 1839France 24 28 32 275 274 40722 39054 40224 405109 389092 1420Germany 126 115 137 168 165 140000 120000 130000 114000 111964 679Greece 76 84 55 58 60 80153 81800 90302 87606 86972 1457HunclarY 33 61 45 27 26 37125 68625 66318 35958 32680 1257Ireland 1 20 3 28 28 1443 14405 2840 67946 59429 2122Italy 34 30 37 65 83 45015 40160 39566 49775 52946 638Latvia 17 10 13 12 2 26457 23000 24617 25043 2288 1144Lithuania 7 1 7 4 4 12191 946 13995 7441 8188 1997Macedonia 0 0 1 2 615 615 3211 3061 2041Malta 3 2 2 2 2 404 269 3256 2932 2932 1333Moldova Rep 8 8 5908 5908 708Netherlands 12 9 13 156 169 11479 8266 8268 217132 224719 1327Norway 20 28 25 21919 37097 32813 1313Poland 78 80 130 46 50 134990 141900 240082 109900 110000 2200Portugal 128 130 194 26 32 314872 319792 372865 45090 48854 1541Romania 11 1 5 15 15 10909 2531 4542 22532 22532 1502Russian Fed 26 148 222 90 145 20818 262857 303235 99399 155417 1072Slovakia 19 18 14 14 17784 20259 15456 13305 964Slovenia 9 2 2 6420 1503 1503 752Spain 70 272 361 129 125 44558 306792 441542 193563 189151 1513Sweden 1 2 3 91 84 702 2983 3015 119478 105243 1250Switzerland 197 199 215 235 126 532775 507084 389102 482992 233954 1857UK 287 360 381 278 434 293670 368780 192673 471609 434763 1002Ukraine 15 11 11 11 16800 13400 13400 13400 1175Yugoslavia 5 56 56 56 56 3662 43407 43407 43407 43407 771Oceania 179 80 74 62 69 255036 184388 139671 130076 146147 2119Australia 87 59 43 37 33 112958 130682 83015 92295 98257 2977Fiji Islands 3 1 1997 888Fr Polynesia 1603 658New Zealand 85 17 19 17 20 137753 50777 50421 33805 37935 1897NewCaledonia 1 2 1536 1664 1040Papua N 6uin 4 2 12 6 14 2230 1904 6098 432 7434 543
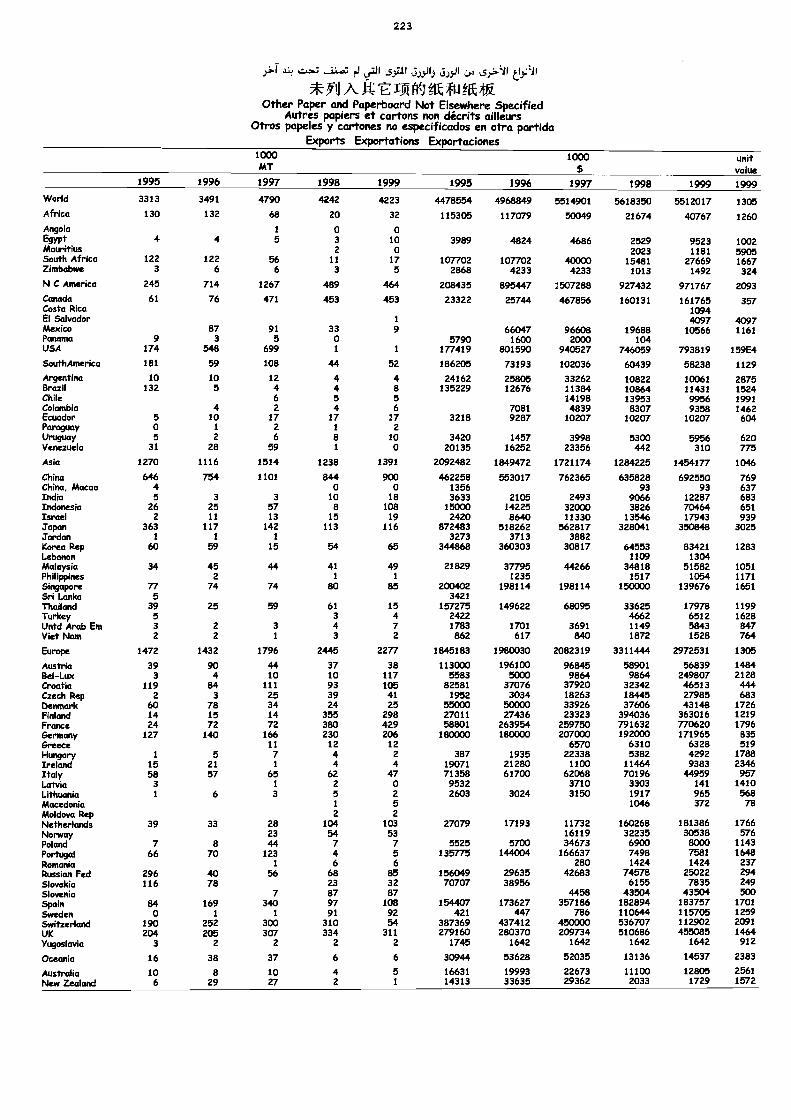
223
t-iLid! JA9,114:),4 L1).;111
fittikOther Paper and Paperboard Not Elsewhere Specified
Autres papiers et cartons non décrits ailleursOtros papeles y cartones no especificados en otra partida
Exports Exportations Exportaciones1000MT
1000$
unitvalue
1995 1996 1997 1998 1999 1995 1996 1997 1998 1999 1999World 3313 3491 4790 4242 4223 4478554 4968849 5514901 5618350 5512017 1305Africa 130 132 68 20 32 115305 117079 50049 21674 40767 1260Angola 1 0 0Egypt 4 4 5 3 10 3989 4824 4686 2529 9523 1002Mauritius 2 0 2023 1181 5905South Africa 122 122 56 11 17 107702 107702 40000 15481 27669 1667Zimbabwe 3 6 6 3 5 2868 4233 4233 1013 1492 324N C America 245 714 1267 489 464 208435 895447 1507288 927432 971767 2093Canada 61 76 471 453 453 23322 25744 467856 160131 161765 357Costa Rica 1094El Salvador 1 4097 4097Mexico 87 91 33 9 66047 96608 19688 10566 1161Panama 9 3 5 0 5790 1600 2000 104USA 174 548 699 1 1 177419 801590 940527 746059 793819 159E4
SouthArnerica 181 59 108 44 52 186205 73193 102036 60439 58238 1129
Argentina 10 10 12 4 4 24162 25805 33262 10822 10061 2875Brazil 132 5 4 4 8 135229 12676 11384 10864 11431 1524Chile 6 5 5 14198 13953 9956 1991Colombia 4 2 4 6 7081 4839 8307 9358 1462Ecuador 5 10 17 17 17 3218 9287 10207 10207 10207 604Paraguay 0 1 2 1 2Uruguay 5 2 6 8 10 3420 1457 3998 5300 5956 620Venezuela 31 28 59 1 0 20135 16252 23356 442 310 775
Asia 1270 1116 1514 1238 1391 2092482 1849472 1721174 1284225 1454177 1046
China 646 754 1101 844 900 462258 553017 762365 635828 692550 769China, Macao 4 0 0 1356 93 93 637India 5 3 3 10 18 3633 2105 2493 9066 12287 683Indonesia 26 25 57 8 108 15000 14225 32000 3826 70464 651Israel 2 11 13 15 19 2420 8640 11330 13546 17943 939Japan 363 117 142 113 116 872483 518262 562817 328041 350848 3025Jordan 1 1 1 3273 3713 3882Korea Rep 60 59 15 54 65 344868 360303 30817 64553 83421 1283Lebanon 1109 1304Malaysia 34 45 44 41 49 21829 37795 44266 34818 51582 1051Philippines 2 1 1 1235 1517 1054 1171
SiligaPore 77 74 74 80 85 200402 198114 198114 150000 139676 1651Sri Lanka 5 3421Thailand 39 25 59 61 15 157275 149622 68095 33625 17978 1199Turkey 5 3 4 2422 4662 6512 1628Untd Arab Em 3 2 3 4 7 1783 1701 3691 1149 5843 847Viet Nam 2 2 1 3 2 862 617 840 1872 1528 764
Europe 1472 1432 1796 2445 2277 1845183 1980030 2082319 3311444 2972531 1305
Austria 39 90 44 37 38 113000 196100 96845 58901 56839 1484Bel-Lux 3 4 10 10 117 5583 5000 9864 9864 249807 2128Croatia 119 84 111 93 105 82581 37076 37920 32342 46513 444Czech Rep 2 3 25 39 41 1952 3034 18263 18445 27985 683Denmark 60 78 34 24 25 55000 50000 33926 37606 43148 1726Finland 14 15 14 355 298 27011 27436 23323 394036 363016 1219France 24 72 72 380 429 58801 263954 259750 791632 770620 1796Germany 127 140 166 230 206 180000 180000 207000 192000 171965 835Greece 11 12 12 6570 6310 6328 519Hungary 1 5 7 4 2 387 1935 22338 5382 4292 1788Ireland 15 21 1 4 4 19071 21280 1100 11464 9383 2346Italy 58 57 65 62 47 71358 61700 62068 70196 44959 957Latvia 3 1 2 0 9532 3710 3303 141 1410Lithuania 1 6 3 5 2 2603 3024 3150 1917 965 568Macedonia 1 5 1046 372 78Moldova Rep 2 2Netherlands 39 33 28 104 103 27079 17193 11732 160268 181386 1766Norway 23 54 53 16119 32235 30538 576Poland 7 8 44 7 7 5525 5700 34673 6900 8000 1143Portugal 66 70 123 4 5 135775 144004 166637 7498 7581 1648Romania 1 6 6 280 1424 1424 237Russian Fed 296 40 56 68 85 156049 29635 42683 74578 25022 294Slovakia 116 78 23 32 70707 38956 6155 7835 249Slovenia 7 87 87 4458 43504 43504 500
5Pain 84 169 340 97 108 154407 173627 357186 182894 183757 1701Sweden o 1 1 91 92 421 447 786 110644 115705 1259Switzerland 190 252 300 310 54 387369 437412 450000 536707 112902 2091UK 204 205 307 334 311 279160 280370 209734 510686 455085 1464Yugoslavia 3 2 2 2 2 1745 1642 1642 1642 1642 912
Oceania 16 38 37 6 6 30944 53628 52035 13136 14537 2383
Australia 10 8 10 4 5 16631 19993 22673 11100 12805 2561New Zealand 6 29 27 2 1 14313 33635 29362 2033 1729 1572

iiiii'J un
FOREST PRODUCTS
PRODUITS FORESTIERS
PRODUCTOS FORESTALES
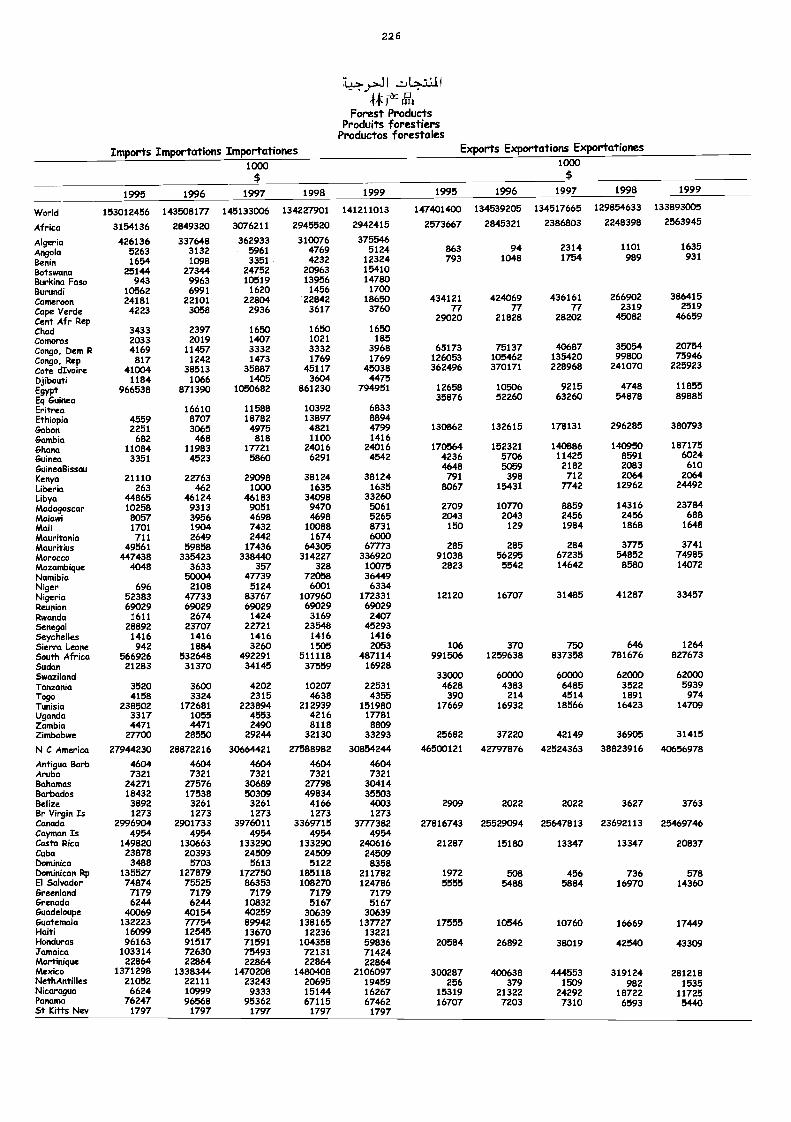
22 6
iJIn
Forest ProductsProduits forestiers
Productos forestales
Imports Importations Importationes Exports Exportations Exportationes1000 1000
1995 1996 1997 1998 1999 1995 1996 1997 1998 1999
World 153012456 143508177 145133006 134227901 141211013 147401400 134539205 134517665 129854633 133893005
Africa 3154136 2849320 3076211 2945520 2942415 2573667 2845321 2386803 2248398 2563945
Algeria 426136 337648 362933 310076 375546Angola 5263 3132 5961 4769 5124 863 94 2314 1101 1635
Benin 1654 1098 3351 4232 12324 793 1048 1754 989 931
Botswana 25144 27344 24752 20963 15410Burkina Faso 943 9963 10519 13956 14780Burundi 10562 6991 1620 1456 1700Cameroon 24181 22101 22804 22842 18650 434121 424069 436161 266902 386415
Cape Verde 4223 3058 2936 3617 3760 77 77 77 2319 2519
Cent Afr Rep 29020 21828 28202 45082 46659Chad 3433 2397 1650 1650 1650Comoros 2033 2019 1407 1021 185Congo, Dem R 4169 11457 3332 3332 3968 65173 75137 40687 35054 20754Congo, Rep 817 1242 1473 1769 1769 126053 105462 135420 99800 75946Cote dIvoire 41004 38513 35887 45117 45038 362496 370171 228968 241070 225923
Djibouti 1184 1066 1405 3604 4475EgyptEq Guinea
966538 871390 1050682 861230 794951 1265835876
1050652260
921563260
474854878
1185589885
Eritrea 16610 11588 10392 6833Ethiopia 4559 8707 18782 13897 8894Gabon 2251 3065 4975 4821 4799 130862 132615 178131 296285 380793Gambia 682 468 818 1100 1416Ghana 11084 11983 17721 24016 24016 170564 152321 140886 140950 187175Guinea 3351 4523 5860 6291 4542 4236 5706 11425 8591 6024Guineallissau 4648 5059 2182 2083 610Kenya 21110 22763 29098 38124 38124 791 398 712 2064 2064Liberia 263 462 1000 1635 1635 8067 15431 7742 12962 24492Libya 44865 46124 46183 34098 33260Madagascar 10258 9313 9051 9470 5061 2709 10770 8859 14316 23784Malawi 8057 3956 4698 4698 5265 2043 2043 2456 2456 688Mali 1701 1904 7432 10088 8731 150 129 1984 1868 1648Mauritania 711 2649 2442 1674 6000Mauritius 49561 59858 17436 64305 67773 285 285 284 3775 3741Morocco 447438 335423 338440 314227 336920 91038 56295 67235 54852 74985Mozambique 4048 3633 357 328 10075 2823 5542 14642 8580 14072Namibia 50004 47739 72058 36449Niger 696 2108 5124 6001 6334Nigeria 52383 47733 83767 107960 172331 12120 16707 31485 41287 33457Reunion 69029 69029 69029 69029 69029Rwanda 1611 2674 1424 3169 2407Senegal 28892 23707 22721 23548 45293Seychelles 1416 1416 1416 1416 1416Sierra Leone 942 1884 3260 1505 2053 106 370 750 646 1264South Africa 566926 532648 492291 511118 487114 991506 1259638 837358 781676 827673Sudan 21283 31370 34145 37559 16928Swaziland 33000 60000 60000 62000 62000Tanzania 3520 3600 4202 10207 22531 4628 4383 6485 3522 5939Togo 4158 3324 2315 4638 4355 390 214 4514 1891 974Tunisia 238502 172681 223894 212939 151980 17669 16932 18566 16423 14709Uganda 3317 1055 4553 4216 17781Zambia 4471 4471 2490 8118 8809Zimbabwe 27700 28550 29244 32130 33293 25682 37220 42149 36905 31415
N C America 27944230 28872216 30664421 27588982 30854244 46500121 42797876 42524363 38823916 40656978
Antigua Barb 4604 4604 4604 4604 4604Aruba 7321 7321 7321 7321 7321Bahamas 24271 27576 30689 27798 30414Barbados 18432 17538 50309 49834 35503Belize 3892 3261 3261 4166 4003 2909 2022 2022 3627 3763Br Virgin Is 1273 1273 1273 1273 1273Canada 2996904 2901733 3976011 3369715 3777382 27816743 25529094 25647813 23692113 25469746Cayman Is 4954 4954 4954 4954 4954Costa Rica 149820 130663 133290 133290 240616 21287 15180 13347 13347 20837Cuba 23878 20393 24509 24509 24509Dominica 3488 5703 5613 5122 8358Dominican Rp 135527 127879 172750 185118 211782 1972 508 456 736 578El Salvador 74874 75525 86353 108270 124786 5555 5488 5884 16970 14360Greenland 7179 7179 7179 7179 7179Grenada 6244 6244 10832 5167 5167Guadeloupe 40069 40154 40259 30639 30639Guatemala 132223 77754 89942 138165 137727 17555 10546 10760 16669 17449Haiti 16099 12545 13670 12236 13221Honduras 96163 91517 71591 104358 59836 20584 26892 38019 42540 43309Jamaica 103314 72630 75493 72131 71424Martinique 22864 22864 22864 22864 22864Mexico 1371298 1338344 1470208 1480408 2106097 300287 400638 444553 319124 281218NethAntilles 21052 22111 23243 20695 19459 256 379 1509 982 1535Nicaragua 6624 10999 9333 15144 16267 15319 21322 24292 18722 11725Panama 76247 96568 95362 67115 67462 16707 7203 7310 6593 5440St Kitts Nev 1797 1797 1797 1797 1797
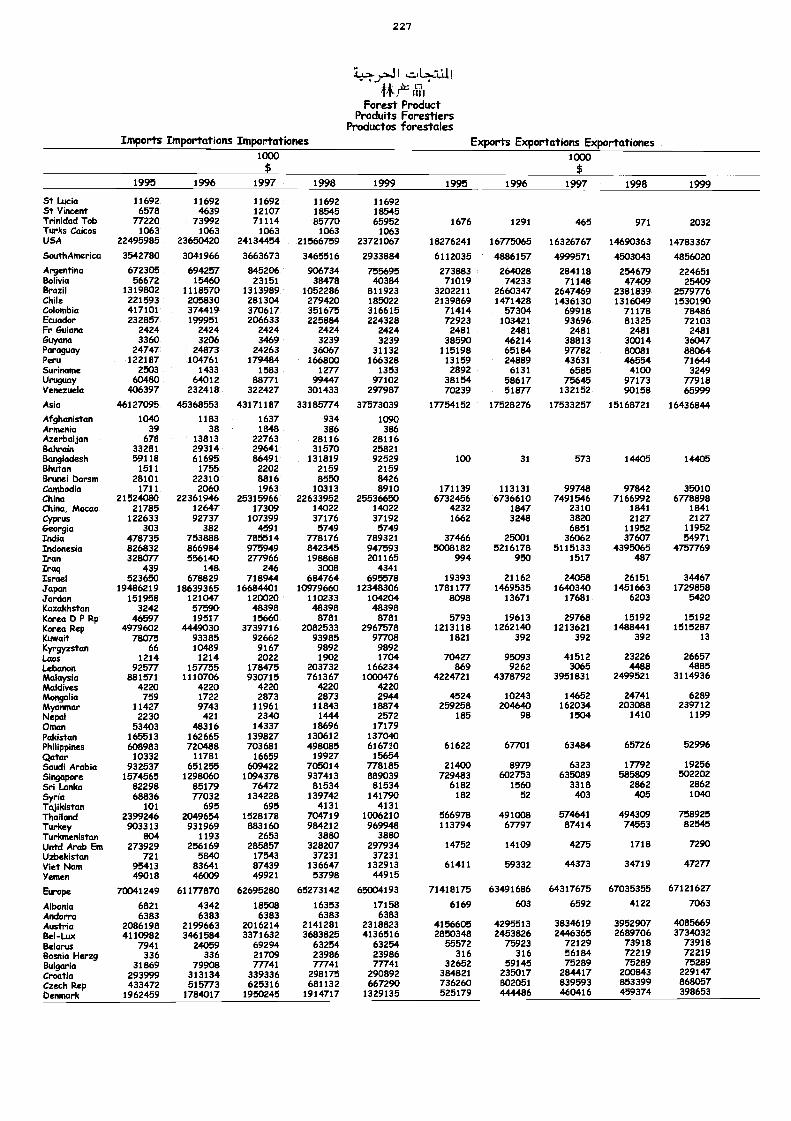
227
44ji'z
Forest ProductProduits Forestiers
Productos forestalesImports Importations Importationes Exports Exportations Exportationes
1000 1000
1995 1996 1997 1998 1999 1995 1996 1997 1998 1999
St Lucia 11692 11692 11692 11692 11692St Vincent 6578 4639 12107 18545 18545Trinidad Tob 77220 73992 71114 85770 65952 1676 1291 465 971 2032Turks Caicos 1063 1063 1063 1063 1063USA 22495985 23650420 24134454 21566759 23721067 18276241 16775065 16326767 14690363 14783367SouthAmerica 3542780 3041966 3663673 3465516 2933884 6112035 4886157 4999571 4503043 4856020Argentina 672305 694257 845206 906734 755695 273883 264028 284118 254679 224651Bolivia 56672 15460 23151 38478 40384 71019 74233 71148 47409 25409Brazil 1319802 1118570 1313989 1052286 811923 3202211 2660347 2647469 2381839 2579776Chile 221593 205830 281304 279420 185022 2139869 1471428 1436130 1316049 1530190Colombia 417101 374419 370617 351675 316615 71414 57304 69918 71178 78486Ecuador 232857 199951 206633 225884 224328 72923 103421 93696 81325 72103Fr Guiana 2424 2424 2424 2424 2424 2481 2481 2481 2481 2481Guyana 3360 3206 3469 3239 3239 38590 46214 38813 30014 36047Paraguay 24747 24873 24263 36067 31132 115198 65184 97782 80081 88064Peru 122187 104761 179484 166800 166328 13159 24889 43631 46554 71644Suriname 2503 1433 1583 1277 1353 2892 6131 6585 4100 3249Uruguay 60480 64012 88771 99447 97102 38154 58617 75645 97173 77918Venezuela 406397 232418 322427 301433 297987 70239 51877 132152 90158 65999
Asia 46127095 45368553 43171187 33185774 37573039 17754152 17528276 17533257 15168721 16436844Afghanistan 1040 1183 1637 934 1090Armenia 39 38 1848 386 386Azerbaijan 678 13813 22763 28116 28116Bahrain 33281 29314 29641 31570 25821Bangladesh 59118 61695 86491 131819 92529 100 31 573 14405 14405Bhutan 1511 1755 2202 2159 2159Brunei Darsm 28101 22310 8816 8550 8426Cambodia 1711 2060 1963 10313 8910 171139 113131 99748 97842 35010China 21524080 22361946 25315966 22633952 25536650 6732456 6736610 7491546 7166992 6778898China, Macao 21785 12647 17309 14022 14022 4232 1847 2310 1841 1841Cyprus 122633 92737 107399 37176 37192 1662 3248 3820 2127 2127Georgia 303 382 4591 5749 5749 6851 11952 11952India 478735 753888 785514 778176 789321 37466 25001 36062 37607 54971Indonesia 826832 866984 975949 842345 947593 5008182 5216178 5115133 4395065 4757769Iran 328077 556140 277966 198868 201165 994 950 1517 487Iraq 439 148 246 3008 4341Israel 523650 678829 718944 684764 695578 19393 21162 24058 26151 34467Japan 19486219 18639365 16684401 10979660 12348306 1781177 1469535 1640340 1451663 1729858jordan 151958 121047 120320 110233 104204 8098 13671 17681 6203 5420Kazakhstan 3242 57590 48398 48398 48398Korea D P Rp 46597 19517 15660 8781 8781 5793 19613 29768 15192 15192Korea Rep 4979602 4449030 3739716 2082533 2967578 1213118 1262140 1213621 1488441 1515287Kuwait 78075 93385 92662 93985 97708 1821 392 392 392 13Kyrgyzstan 66 10489 9167 9892 9892Laos 1214 1214 2022 1902 1704 70427 95093 41512 23226 26657Lebanon 92577 157755 178475 203732 166234 869 9262 3065 4488 4885Malaysia 881571 1110706 930715 761367 1000476 4224721 4378792 3951831 2499521 3114936Maldives 4220 4220 4220 4220 4220Mongolia 759 1722 2873 2873 2944 4524 10243 14652 24741 6289Myanmar 11427 9743 11961 11843 18874 259258 204640 162034 203088 239712Nepal 2230 421 2340 1444 2572 185 98 1504 1410 1199Oman 53403 48316 14337 18696 17179Pakistan 165513 162665 139827 130612 137040Philippines 608983 720488 703681 498085 616710 61622 67701 63484 65726 52996Qatar 10332 11781 16659 19927 15654Saudi Arabia 932537 651255 609422 705014 778185 21400 8979 6323 17792 19256Singapore 1574565 1298060 1094378 937413 889039 729483 602753 635089 585809 502202Sri Lanka 82298 85179 76472 81534 81534 6182 1560 3318 2862 2862Syria 68836 77032 134228 139742 141790 182 52 403 405 1040Tajikistan 101 695 695 4131 4131Thailand 2399246 2049654 1528178 704719 1006210 566978 491008 574641 494309 758925Turkey 903313 931969 883160 984212 969948 113794 67797 87414 74553 82545Turkmenistan 804 1193 2653 3880 3880Untd Arab Em 273929 256169 285857 328207 297934 14752 14109 4275 1718 7290Uzbekistan 721 5840 17543 37231 37231Viet Nam 95413 83641 87439 136647 132913 61411 59332 44373 34719 47277Yemen 49018 46009 49921 53798 44915
Europe 70041249 61177870 62695280 65273142 65004193 71418175 63491686 64317675 67035355 67121627
Albania 6821 4342 18508 16353 17158 6169 603 6592 4122 7063Andorra 6383 6383 6383 6383 6383Austria 2086198 2199663 2016214 2141281 2318823 4156605 4295513 3834619 3952907 4085669Bel-Lux 4110982 3461584 3371632 3683825 4136516 2850348 2453826 2446365 2689706 3734032Belarus 7941 24059 69294 63254 63254 55572 75923 72129 73918 73918Bosnia Herzg 336 336 21709 23986 23986 316 316 56184 72219 72219Bulgaria 31869 79908 77741 77741 77741 32652 59145 75289 75289 75289Croatia 293999 313134 339336 298175 290892 384821 235017 284417 200843 229147Czech Rep 433472 515773 625316 681132 667290 736260 802051 839593 853399 868057Denmark 1962459 1784017 1950245 1914717 1329135 525179 444486 460416 459374 398653
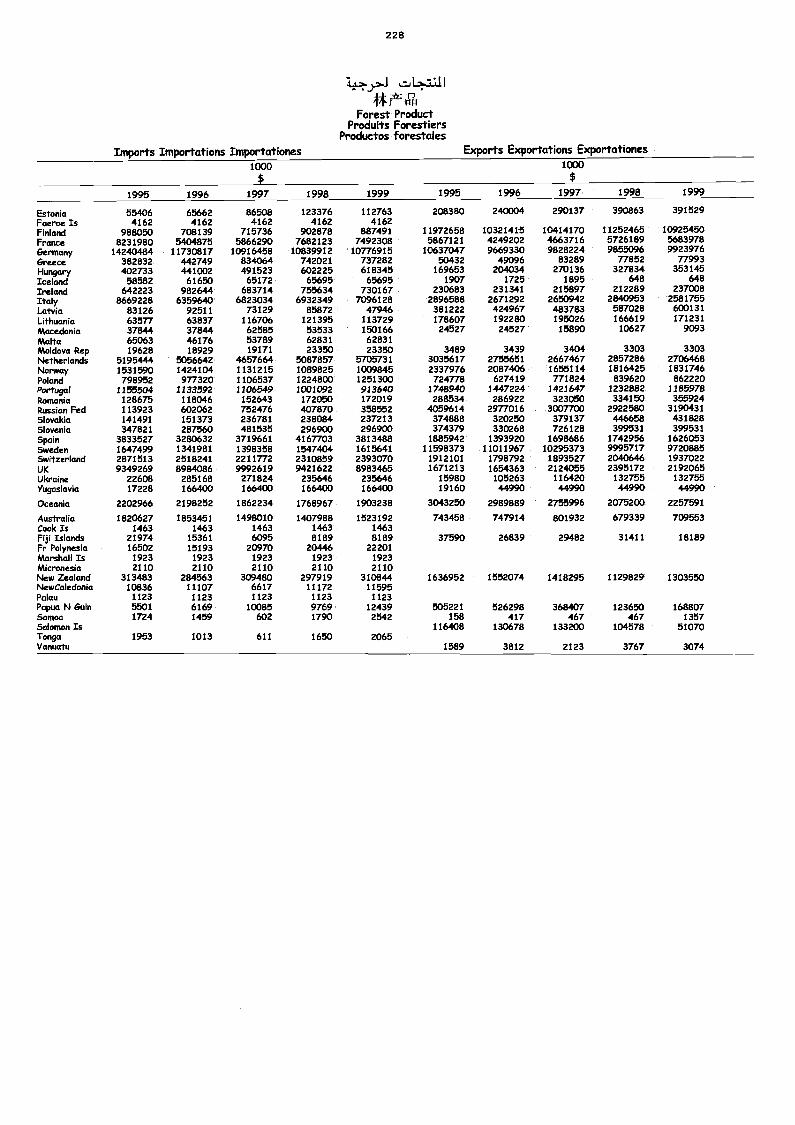
2 2 8
JI I
Forest ProductProduits forestiers
Productos forestalesImports Importations Importationes Exports Exportations Exportationes
1000 1000
1995 1996 1997 1998 1999 1995 1996 1997 1998 1999
Estonio 55406 65662 86508 123376 112763 208380 240004 290137 390863 391529Faeroe Is 4162 4162 4162 4162 4162Finkmd 988050 708139 715736 902878 887491 11972658 10321415 10414170 11252465 10925450France 8231980 5404875 5866290 7682123 7492308 5867121 4249202 4663716 5726189 5683978Gemnany 14240484 11730817 10916458 10839912 10776915 10637047 9669330 9828224 9855096 9923976Greece 382832 442749 834064 742021 737282 50432 49096 83289 77852 77993Hungary 402733 441002 491523 602225 618345 169653 204034 270136 327834 353145Icekmd 58582 61650 65172 65695 65695 1907 1725 1895 648 648Ireland 642223 982644 683714 755634 730167 230683 231341 215897 212289 237008Italy 8669228 6359640 6823034 6932349 7096128 2896588 2671292 2650942 2840953 2581755Latvia 83126 92511 73129 85872 47946 381222 424967 483783 587028 600131Lithuania 63577 63837 116706 121395 113729 178607 192280 195026 166619 171231Macedonia 37844 37844 62585 53533 150166 24527 24527 15890 10627 9093Mahm 65063 46176 53789 62831 62831Moldova Rep 19628 18929 19171 23350 23350 3489 3439 3404 3303 3303Netherlands 5195444 5056642 4657664 5087857 5705731 3035617 2755651 2667467 2857286 2706468Norway 1531590 1424104 1131215 1089825 1009845 2337976 2087406 1655114 1816425 1831746Poland 798952 977320 1106537 1224800 1251300 724778 627419 771824 839620 862220Portugal 1155504 1133592 1106549 1001092 913640 1748940 1447224 1421647 1232882 1185978Rmnania 128675 118046 152643 172050 172019 288534 286922 323050 334150 355924Russian Fed 113923 602062 752476 407870 358552 4059614 2977016 3007700 2922580 3190431Slovakia 141491 151373 236781 238084 237213 374888 320250 379137 446658 431828SloveMa 347821 287560 481535 296900 296900 374379 330268 726128 399531 399531Spain 3833527 3280632 3719661 4167703 3813488 1885942 1393920 1698686 1742956 1626053Sweden 1647499 1341981 1398358 1547404 1615641 11598373 11011967 10295373 9995717 9720885Svitzerland 2871513 2518241 2211772 2310859 2393070 1912101 1798792 1893527 2040646 1937022UK 9349269 8984086 9992619 9421622 8983465 1671213 1654363 2124055 2395172 2192065Ukrahm 22608 285168 271824 235646 235646 15980 105263 116420 132755 132755Yugoslavia 17228 166400 166400 166400 166400 19160 44990 44990 44990 44990
OteaMa 2202966 2198252 1862234 1768967 1903238 3043250 2989889 2755996 2075200 2257591
Australia 1820627 1853451 1498010 1407988 1523192 743458 747914 801932 679339 709553Cook Is 1463 1463 1463 1463 1463FisHIMands 21974 15361 6095 8189 8189 37590 26839 29482 31411 18189FrPolynesia 16502 15193 20970 20446 22201MarshaH Is 1923 1923 1923 1923 1923hMcroneMa 2110 2110 2110 2110 2110New Zeakmd 313483 284563 309480 297919 310844 1636952 1552074 1418295 1129829 1303550NewCaledonia 10836 11107 6617 11172 11595Pakm 1123 1123 1123 1123 1123Papa N Guin 5501 6169 10085 9769 12439 505221 526298 368407 123650 168807Samoa 1724 1459 602 1790 2542 158 417 467 467 1357SolomonIs 116408 130678 133200 104578 51070Tonga 1953 1013 611 1650 2065Vmuicau 1589 3812 2123 3767 3074
rt.])
DIRECTION OF TRADE
DIRECTION DU COMMERCE
DIRECCIÓN DEL COMERCIO
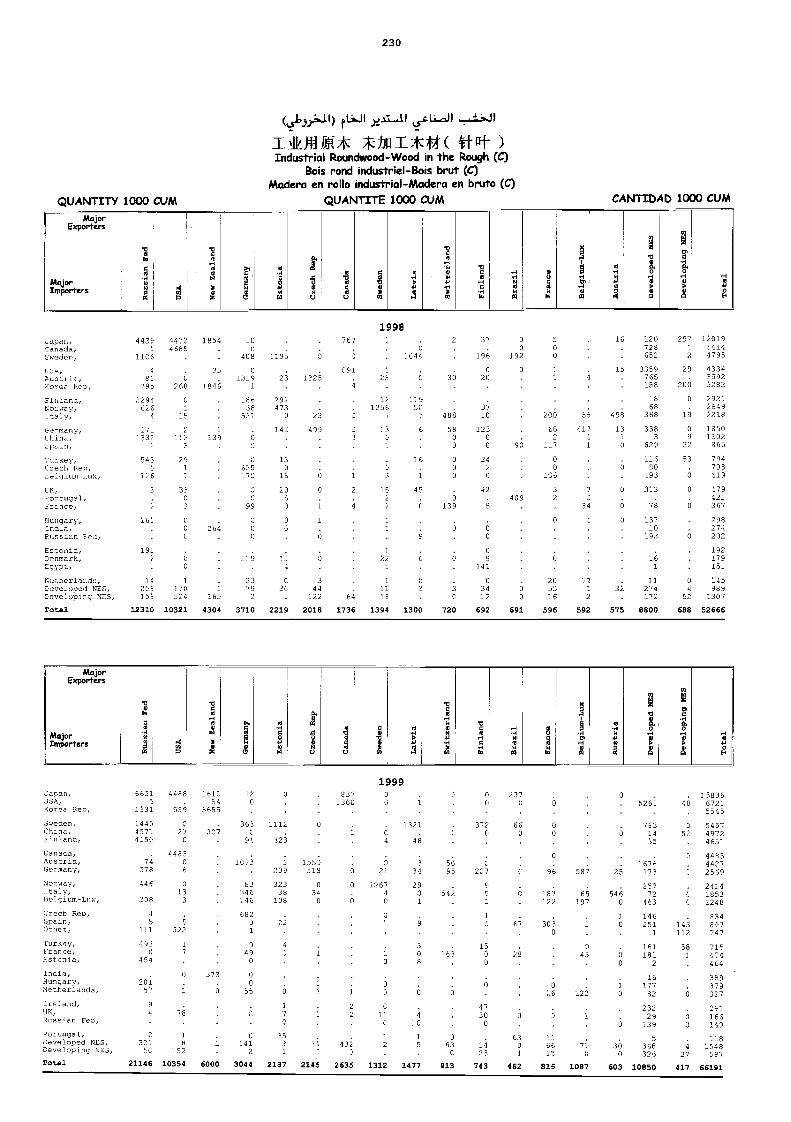
QUANTITY 1000 CUM
1998
(alw:o41) ft>JI jeal21 os:LL4J1 f)Industrial Roundwood-Wood in the Rough (C)
Bois rond industriel-Etois brut (C)Madera en rollo industrial-Madera en bruto (C)
QUANTITE 1000 CUM
230
CANTIDAD 1000 CUM
MejorExporters
oN
NV
MajorImporters
Tcm
o0
H N0o .g a
o..4
O0..
ag
io
4o...
0Ht1
crcm
s,0N¿e.aco
1oHo
-1w
.-1No14o
ooooHw
Io yo
O ...1 O'-1 -tmm a,-1 o VW oo 4 Q
o
mc-1a ,o-1 Ho o> o
OA H
,apan, 4439 4472 1854 _C 7E7 2 2 30 0 5 16 120 297 12019anada, C 4685 728 1 5454
1(144 196 19g O V 652 2 4795Sweden, 1106 . 4C8 1195 O : 6
139, 4 25 c 8910 15 3359 29 4334Austri, 8: C 1319 28 1228 C 30 2g 4 765 . 3392lotee Ros, 795 268 1846 1 4 0 158 200 3282
Finland, 2294 c 18E 292 12 18 0 2921Norway, 626 I3E 473 1256 50 . 37 68 . 2E49Italy, 4 IS 521 23 C 2 7 488 10 206 58 498 368 19 2218
Germany, 2 C 142 499 C Cl 6 58 123 68 413 13 338 O 1850China, 332 Y.3139 3 3 C O O 21 3 9 1602Spaln, 0 0 90 117 1 0 629 22 365
Turkey, 543 29 5 1316 0 24 0 116 53 794Czech Rep, 9 i 625
.
ig. 0 2 0 6 80 708
2.e1gium-Lux, 126 175 6 1 3 1 0 31 106 193 O 619
EK, 3. 33 5 20 0 2 5 45 . 42 3 3 0 313 0 479'frortugl, c 5 3 e 0 409 2421
'7 8 6 367Franco, 99 0 1 4 139 9 . 34 6.
flungary, I6C 0 1 C O O 137 298IncLa,c 264 O 6 o 20 27419,ssian 7ed, c O q O 193 o 202
Estonia, 191 192Denmark, 6 22 C 0 9 o 579Egypi, 4 141 151
Netherlands, 14 1 V 23 C 3 o 20 31 O 245Develooed NOS, 255 170 1 79 2C 4411 34 0 .55 2 32 274 4 989Developirg NOS, 155 524 165 122 84 18 12 0 16 2 172 52 1307
Total 12310 10321 4304 3710 2219 2018 1736 1394 1300 720 692 691 596 592 575 8800 688 52666
MajorExporters
'W
A No
Mejor N 4o N1.1
1-1
Importers eA
oO N0
o
1999lasas, 6651 4488 1612 12 O 837 0 O 237 O. 13836USA, 9 54 136C o 0 O
O.. 526: 40 6721
Korea Rep, 1331 559 3655 5545Sweden, 1440 3 363 1112 0 V . 1321 V 372 66 O763 5 5457Chfna, 4571 27 359 C O o 6 14 52 497271u1and, 4156 91 323 4 48 V25 4651Caseta,, 4433 . . . .o 4483Austria, 74 C 1078 1 1555 O 3 50
.
1676 4427Germany, 378 6 209 518 8 21 31 95 2227 58i 29 173 C 2569Norway, 446 5 83 323 0 0 1267 29257 2414
i , 4"taIy, 13 348 38 3 O 54; 6.
65 546 72 0 1853BeIgium-Lux, 258 3 146 138 0 O O 1 C r22 197 0 463 1248Czech Rep, 4 . 682
O C
146 834Spain, 5 5 22 91
6i 308 1 251 148 807Other, 111 322 1 OV V1 112 747
Turkey, 493 1 O 4 315 161 38 715E rance, 7 49 O 168 O E 43181O 1 4744'gEstonia, O 8 O 0 2 464India, 0 373 0 . 16 389Hungary, 201 0 .C 177 379Netherlands, Y! 6 55 0 O 6 6 16 128 10 82 6 337lreland, 9I C 47 232 291UN, 4 78 7 114 30 6 29 166RussianFeC, O C IC o 6 139 O 149Wornugal, 2 1 V C 251 o 63 1: 5 118Developed NOS, 301 8 141 432 8 5 63 14 0 66 71 368 4 1548Developing NES, tC 102 2 1 C 5 C 23 1 15 0 O 326 27 597Total 21146 10354 6000 3044 2187 2145 2635 1312 1477 913 743 462 816 1087 603 10850 417 66191
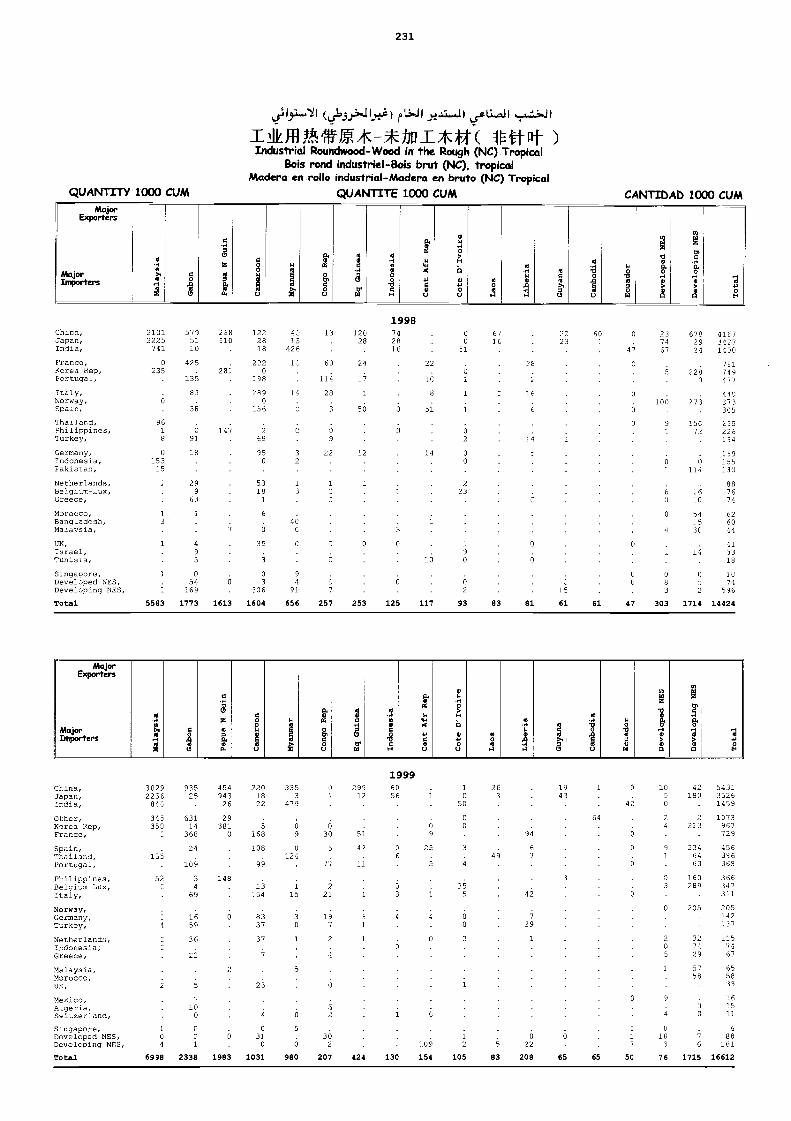
QUANTITY 1000 CUM
231
15.4.0"11 (6$173).:,..11".2.e) as.U.0JI
T.V11.!/. .T4Vjg*---h11_T-2K44( )Industrial Roundwood-Wood in the Rough (NC) Tropical
Bois rond industriel-Bois brut (NC), tropicalMadera en rollo industrial-Madera en bruto (NC) Tropical
QUANTITE 1000 CUM
199B
1999
CANTIDAD 1000 CUMMojar
Exporters
MajarLmporters
o-,40P
ri
aoio
o.0ouzooQ.aN
a814
'!U
w
14I,
aA
ooO4
U
0H
8W
W
o--1aoa.84H
Q.
gw'a444o0U
h
!IOU
4oA
0..-1
O
A
o04>,g
0
'IIo
1u
w
Ri00.
o
75aóH
i/o.
m.50.oH
o.H00oE
MiajorExporters
MiajorInmorters
Z O la 01 0 t m4.4.1.+
Ó
4,
'a
oao>, ,
a
.4 H H-r.
Ell
China,Japan,1rdia,Other,Korea Rep,France,Spain,Thailand,
30292236
840
345350
:
13
93525
.
63114
358
24
45494326
29381
O
2201822
5168
108
3353
479
O
9
0124
O
1
O
30
5
29912
51
42
6056
.
69
25
1
C
5C
C
3
2.31
3
4;
91
67
1343
64
O
6
O
1077
24
91
42180
.
2213
234E4
543135261159
1073967729
456396
Portugal,Philippines,Belgitm-Lux,Italy,Norway,Germany,Turkey,
Netherlands,Indonesia,Greece,Malaysia,Morocco,UK,
Mexico,Algeria,Switzerland,Singapore,Developed MES,
52:
4
1
O
10;34
69
1659
36
22
5
7
300
148
6
6
99
.
13154
8337
37
7
25
4
301
115
30
1
6
5
7;
221
197
2
52
30 30
11
1 3
1
1
0
C
/
35n
6o
3
49
729
1
0
3
6
6
0
03
O
205
9
4
1.
63
160289
.
205
327429
5758
0
369
366347311
205142137
1157467
655833
16lb11
588
Developing NES,Total
4
6998
1
2338 1983
0
1031
6
980
2
207 424 130
10;154
2
105
5
83
22
208 65 65
7
53
5
76
6
1715
161
16612
China,Capan,India,France,,<crea Re?,Portugal,Italy,Norway,Spain,lhailand,Philippines,1urkey,Germany,Indonesia,Pakistan,Netherlands,Belgiam-Iux,Greece,
Morocco,Bangladesh,
21012225
741
0235
O
9618
0153
15
1 3
5795110
425
139
83
36
C
91
18
299
63
1
258210
282
147
1222813
222O
198
289O
155
269
95O
5318
1
6
41.13
425
1:
14
32
13
4C
13
62
114
28
9
22
12028
24
50
12
742216
22
8
51
0O
51
1
2
oo
223
6716
38
1E.
2223
60 0
1;
237167
100
O
6782921
228O
279
15C72
0114
16
54:5
416731271400
721749177
149373305
255225134
1591551371
887674
6260
Malaysia,UK,:srael,Tunisia,Singapore,DeveLoped NES,Deve:Loping NES,
Total
1
3
_
5583
495
054
169
1773
;
0
1613
O
35
9
O
3306
1604
C
C
94
91
656
C
C
7
257
O
253
O
6
125 117
.02
93 83 81
lE
61 61
o
47
4
O
303
30
11
2
1714
44
13318
1074
596
14424
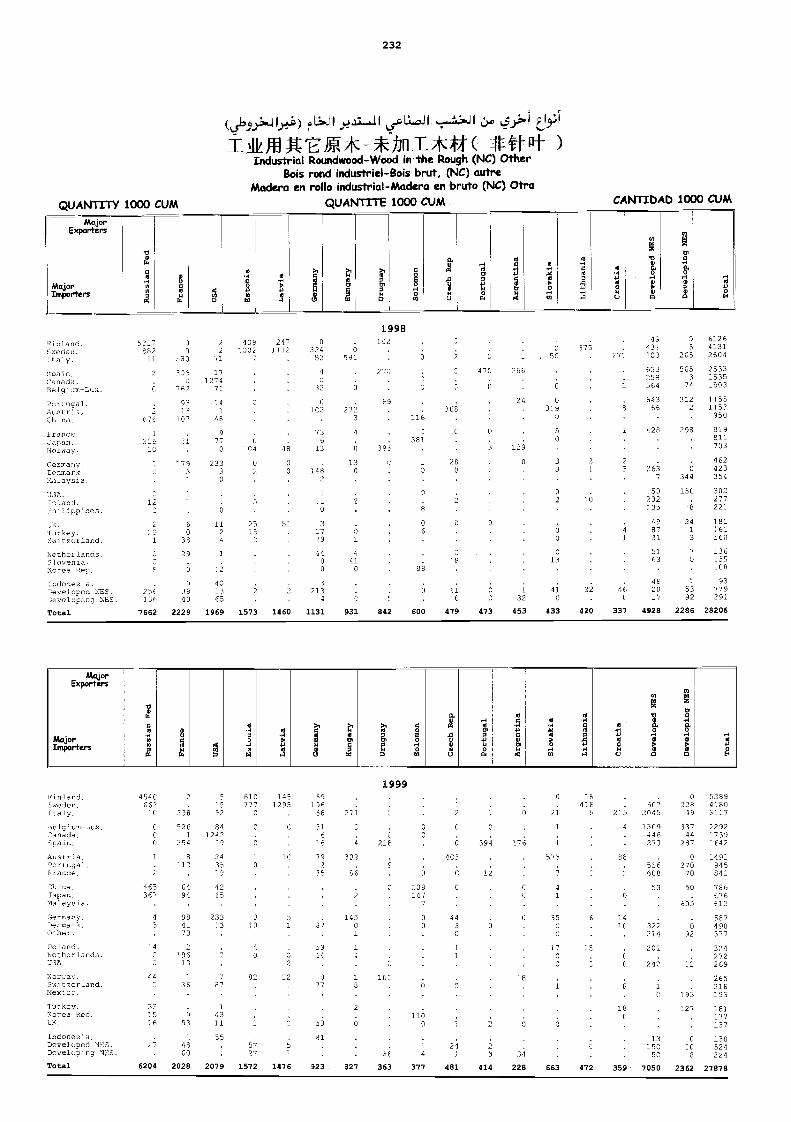
QUANTITY 1000 CUMMajor
Exporters
s)es
AUTIIndustrial
BoisMadera en
4s1.1.0JI '&0 bff
-*:/in * ( AVV-ntRoundwood-Wood in the Rough (NC) Otherrend industriel-Bois brut, (NC) autrerollo industrial-Madera en bruto (NC) Otra
QUAN1TTE 1000 CUM
232
1998
1999
1
CANTIDAD 1000 CUM
MorExporters
,
El a
s FI Hoa o
4-1
dl
Z
r-1
MajorImporters
C.
a
>.og,0wn
O
m O
om0.boOtI
'V,adim
4
,1
1O
...1M
o4o
Aa
mAaoONu n
óH4>4n
H44,0E
Fan:lard,Sweden,Ttaly,nelg'Ium-Lxx,Canada,
Austria,Portugal,Trance,China,Japan,"la ayo]
454C663
1C
C,
0
4653E7
2
338
526
'5 4
8117
6,194
5
52
841242
:92435,
4265
610777
C
o
1451.295
1C
69156
68
31
6
792
35
2,1
322
88
218
6
10814/
7
8
4C2
6
391
12
0
176
0
2i1
575
7
4
:6418
21;
4
88
CI
60,2045
1309446273
516608
53
020819
33744
287
027070
50
60;
53894:803117
2292:739:642
1491945841
786676612
Germany,erma7k,
Orher,Poland,Netherlands,ESA,
Norway,Switzcrland,MexAco,
qu-Akey,Norea Reo,1,11,
lndonesia,Develeued NES,Developing WS,Total
:4
Zr
331516
27
6204
984173
2196
13
36
C1
53
1
4860
2028
233:3
87
4311
35.
.
2079
3:2
4
82
57
1572
1
2
1476
53
077
53
81
923
145O
1
10
2
6
827
10C
3 8
363
1100
377
443
1
24
481
o
3
414
C
18
34
228
35
17
663
6
472
14
00
18
359
322214
201
242
13150
50
7050
692
193
127
c
2362
587490377
324272269
265216193
161177137
130324224
27878
7inland,SA:edou,1t: y,Spain,,:anada,Belgiam-Lux,Penuria],Austria,
irance,,Aapan,Notway,
Germany,recriar a,Ya_aysia,
5217082
11
2
8
2676
1
315IC
a33
335
762
9313
107
31
:79
22
171274
:41
46
0
233
o
4291002
7
0:C4
0
247.1112
48
0
0324
52
4
32
102
736
13
1482
599
0
2123
4
0
130
102
270
89
396
C
C
118
-381
368
28CI
f'.
47C
6
0
266
24
120
O
3:9
56
.
6
0
0
3
37677"
4943:703
633256564
64366
428
2637
753
265
5653
75
312
298
344
150
612641312604
25331535_503
11551153
950
819811703
4E2423254
30211/1A,
Po:and,ihilippines,
lurkey,Switzerland,
123
2
291
60
38
6
11 2515
51
o
31779
06
2
o0
10 232:35
498731
341.3
277221
181:61160
Netherlamds,Slovenia,:<.orea Rep,
29
43
440
3
410 88
5163
46
136135108
93Indonesia,7Aeveloped NES,1evelaping :AES,
251131
3940
1365
2134 0 32
4]0
32 48 2017
5392
779391
Total 7662 2229 1969 1573 1460 1131 931 842 600 479 473 453 433 420 337 4928 2286 28206
a 4o
A oU
rd
aV
4rd
4
N
0
rd
V g.0
0A
o oEr
MajorImporters
Fo
ooor4
Fo
o
al
rd 1.1
rg,a
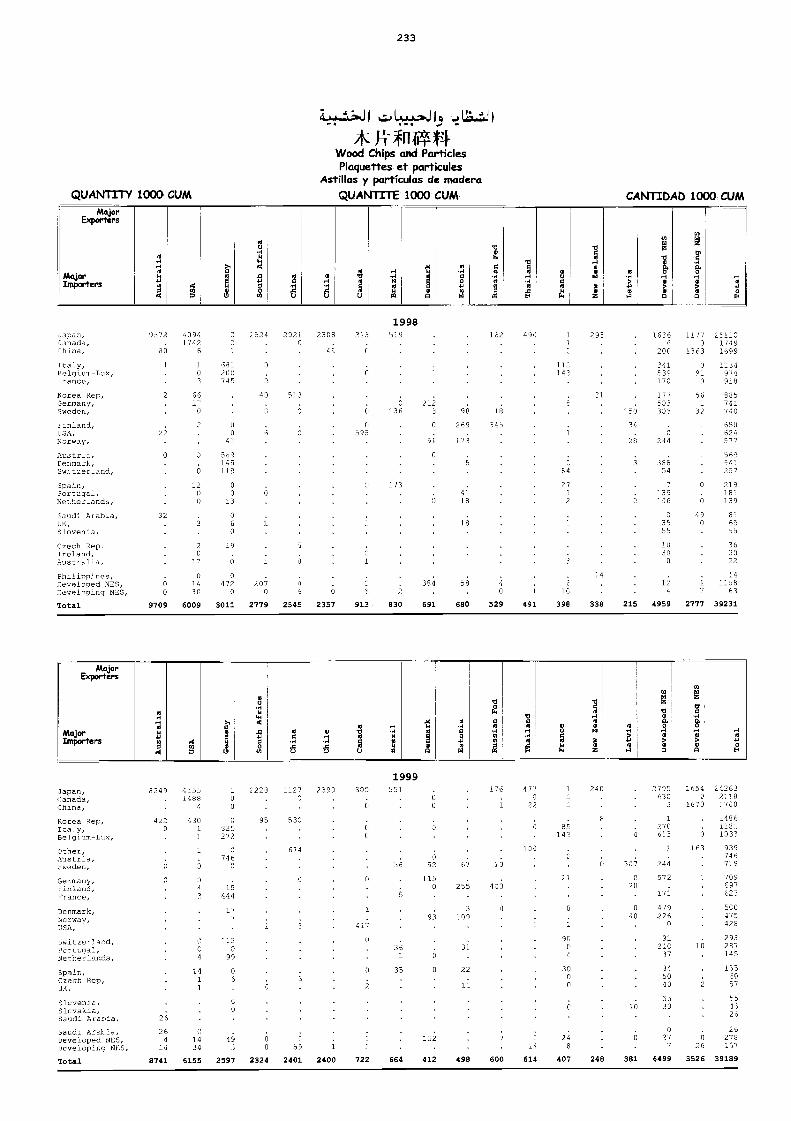
QUANTITY WOO CUM
1998
MajorExporters
u
IILL.1 I* A4[10-fl-
Wood Chips and ParticlesPlaquettes et particules
Astillas y partículas de maderaQUANTrTE 1000 CUM CANTIDAD 1000 CUM
0
L)
oIs
233
1999
r=1'
MajorExporters
aA
'wW
Hr?... v o
-1 CD
m
a,aH
MajorDepot-tars
s,44
:5o0
N
4o-ad
0H....IAu
a.0oa4u
-1Au0$.1
m
ae...ICl0g
aaH-AaAE
U
aoa14w
0al niN .r:
X0 mz a
a 0,0
,oH H0 0
0Ó 00 a
.2apan,Canada,China,
fta1y,RelgiuT-Tux,,rance,Korea Rep,Germany,Sweden,
zoniand,USA,Norway,
Austroo,Eenmark,
9672.
80
2
22
0
40941742
6
l03
6617
0
,
9
3:3
63220C745
00
41
549145
2524
0
0
40
8
6
20210
513
;
0
2308
43
213
8.
8
6
0595
519
C,
126212
3
C
91
c
.
98
269
172
132
18
345
490 1
1
2
112143
1
293
21
.
.
.150
34
16266
200
341539170
177503303
0244
384
11110
1363
09:
0
56I
32
2511011491699
1134974918
385741740
620624577
56954:
3wJt2er_and,
Spain,Rortugal,Neher_ands,Saudi Araboa, 32
6
22
0
710
00
13
0
o213
94118
64
27
2 3
54
7739
36
C
0
0
49
2E7
213181139
8:UK,Slovenia,Czech Rep,Ireland,Australia,Pholippines,7,eveloned NES,7/evelooing NES,Total
00
9709
3
20
17
0143C
6009
60
19
0472
0
3011
1
2070
2779
5
6
0
E
2545
6
2357
, '
913
.
2
830
389
691
58
680
40
529
1
491
S
10
398
14
338 215
3555
1030
0
124
4959
0
17
2777
6533
363022
141158
63
39231
Japan,Canada,China,Korea Rep,Ida..y,Belgium-Lux,
C-oder,AnsCria,Sweden,
Germany,Finland,Franco,
Denmark,Norway,7ISA,
5-witzer1 and,Per Jugal,Netherlands,Spain,Czech Roo,JA,
Slovenia,Slcvakia,
8299
4220
8
6;;
41551488
4301
1
3
4
3
C
C
4
1411
100
0825272
746
15144
177
:12
99
061
C
0
2223
95
11270
530
674
3
2399 300
8
i
41;
0
2
5E1
08
38
35
52
IlS0
93
0
0
67
255
3:09
31
22
1
176
13
413
0
9770
22
100
85141
21
0
9G0
3000
240
a
317
020
040
.
10
2705630
3
1270613
1
244
572.
171
479226
9121037
345040
5333
16543
1670
6
163
.
10
:i
242632118:700
248611811033
939146719
709697623
476.428
293287145
1356057
554326Saudi Arao ia,
Saudi Arabia,Developed NES,Developing NES,Total
26
11
8741
01434
6155
493
2597
o
0
2324
. ,
59
2401
.
.1
2400 722 664
1.'5
412 498
i
600
1;614
24a
407 248
0
381
o27
-7
6499
026
3526
26278167
39189
a0
N
A0
00
0 0o oEn
MajorImporters 4
A
Oo .4
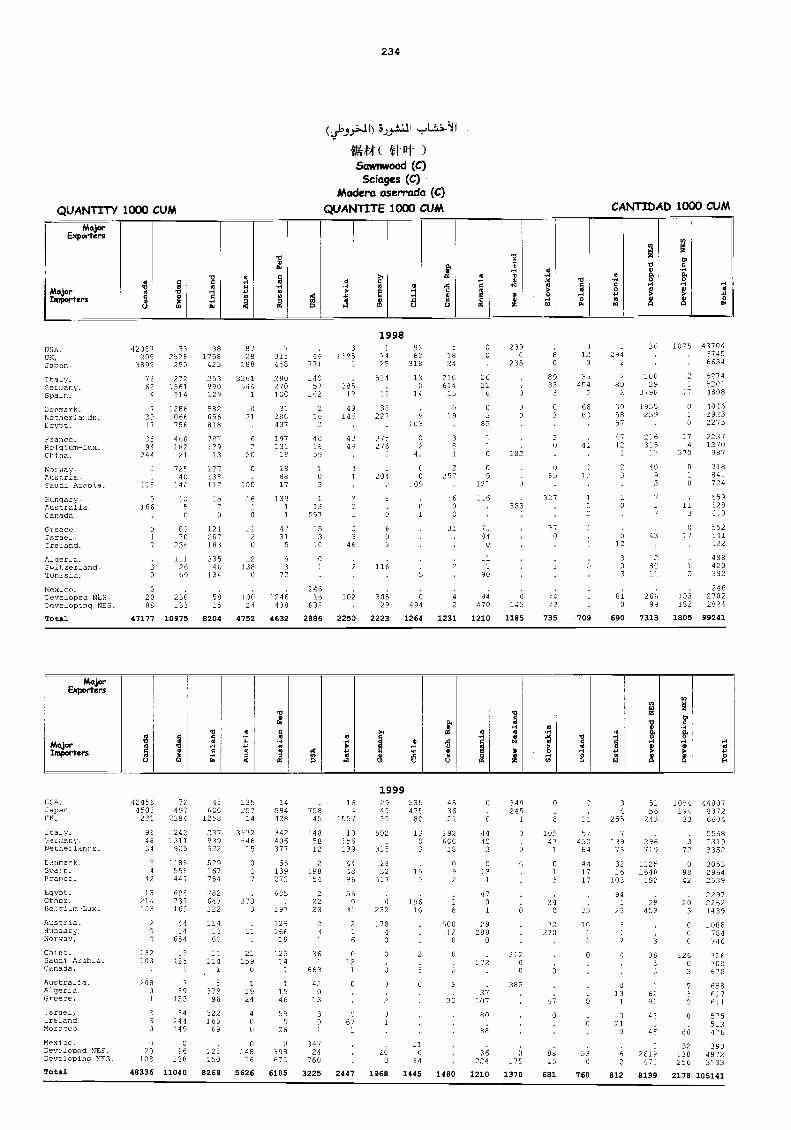
QUANTITY 1000 CUMMajor
Exporters
MajorImporters
4
4
(1.6»,11) .5)31.111
ilhtt(&Lynwood (C)
Sciages (C)Madera aserrada (C)
QUANTITE 1000 CUM
234
1999
1998
CANTIOAD 1000 CUM
MajorExporters
co
M
0 00 r ' a
o
0Aao
WO orImporters
,a4
Ao. a
*1
H
8 .44C.)
X?
W N
.1,
H H0 '
? .1.1
o oa E..
USA,UK,Japan,
42387209
3899
3221,28.
292
381758423
8728
188
7
315458 771
2:95,
1
25
9362
310
5
1824
239C
23580
0
120
,,294
2
36 1075 4370467456634
Italy,5er5lary,
7E62 2.561
272.253990
3261644
280270
11057 335
511.
13C
21C614
2621
8933
33154 EID
10029 1
202745201
Spain,
Denmark,Nethorlu, da
4
7
39
314
12061066
129
582696
1
021
1CC
--28C
162
216
19
49146
12
32227
14
9
15
319
5
03
6
00
3
03
5
66BO
2379C80 195558 259
17
01
1808
40452923
GdYPt,
9-ranee,Fralgium-Lux,China,
Norway,Amss.ria,Saudi Arabia,Hungary,Phstralia,Canada,
Greece,Tame:,Ire1and,
Alger:a,Switzer:and,
17
3594
244
C
_
118
c.
166.
O
1
7
0
756
468182
21
72540
140
105
6570
206
1112669
818
787129
13
:27138112
157
121287183
33546
134
62
2C
C
:22
161
0
2120
12138
0
437
197131le188817
1391
1
1731
5
43
ac
2
101659
]02
1
53597
i03
LC
C
4399
7
02
I5
4£
2
375276
,
I204
E
6
603
11£
1C3
C
2
4:
00
:09
01
3
81
2257
S60C
31
85
1
o9
12
116
7184
0
96
184;
0
383
20
063
327
570
41
5
2
C
3
57
47121
2
2
a
12
3Cl
3
226313
11
40-A
5
1
43
80
0
174
370
0
_
0
113
027
2273
22371270
987
918841724
6596286110
552541522
488420382
Niex_ce,-9eveloped NES,'Developing NOS,
Total
02000
47177
230133
10975
5015
8204
18024
4752
2246138
4632
24616
632
2886
106
2250
30829
2223
6494
1264
42
1231
94470
1210
0145
1185
7473
735 709
813
690
26699
7313
103182
1805
24627822224
99241
USA,Japan,UK,
Italy,7e/ciany,Netherlands,Genmark,Spain,France,
kgyot,
424564503
231
9E4334
5
4
12
13
72497
2384
2431311
905
1185551447
690
456CC
1258
237939572
529167754
782
135207
14
3572546
15
3
7
14594428
342406377
55139272
605
.
75845
1485812
2198
54
16
1557
10156139
444896
50
294935
502.
325
2932
537
.
53547580
1303
163
4036
2926CC18
092
0
6
4449
3
C
1
47
349245
0
0
G
0
10547
1
57130
64
411717
3 3156
255 243
.
2.39 29673 719
32 112516 1648
103 192
91
1034 44807134 8372
33 6604
35683 5314
72 '3352
0 305398 296442 2539
2297Cther,
¿instada,duagary,Norway,
China,Saudi Arab:a,Canada,
Australia,A:geraa,Greece,
7.srael,ireLand,MOrOCCO,
Mexico,Developed 1100.
214133
200
132108
20801
26
Ii20
737162
1414
654
1251
769
153
34244149
,i96
647122
11415
4
_
37996
322159
69
.223
3733
11
1590
1
1921
4
00
07:46
14:,
129166
19
125:4
1
1546
595
26
II1398
2223
03-_
36b
663
42
"A
39
1
34724
196031
2
6
012
1
0
367
0e1g1,2Lux,0292
78.1
0
o
6
01
20
16
2
110
i8
50012
Cl
Cl
01
29288
Cl
172
37107
80
88
3£
6
21200
385
3
24C
72270
0
4i0
35
1C11
0
0
.
53 £ 2619
. 2823 453
5
7 3
C 30
2
0 513 62
I 91
0 4321
9 43 88 476
26 22623 1439
C :066C 784C 746
126 760 7C83 678
0 6586:7
1 621
S 575513
32 390138 4872Developing NES,
Total102
48336
188
11040
153
8269
16
5626
672
6105
760
3225
.
2447
3
1968
94
1445 1480
224
1210
175
1370
15
681
0
760
2 47:
812 8189
256 3733
2178 105141
o
oooU
Nci
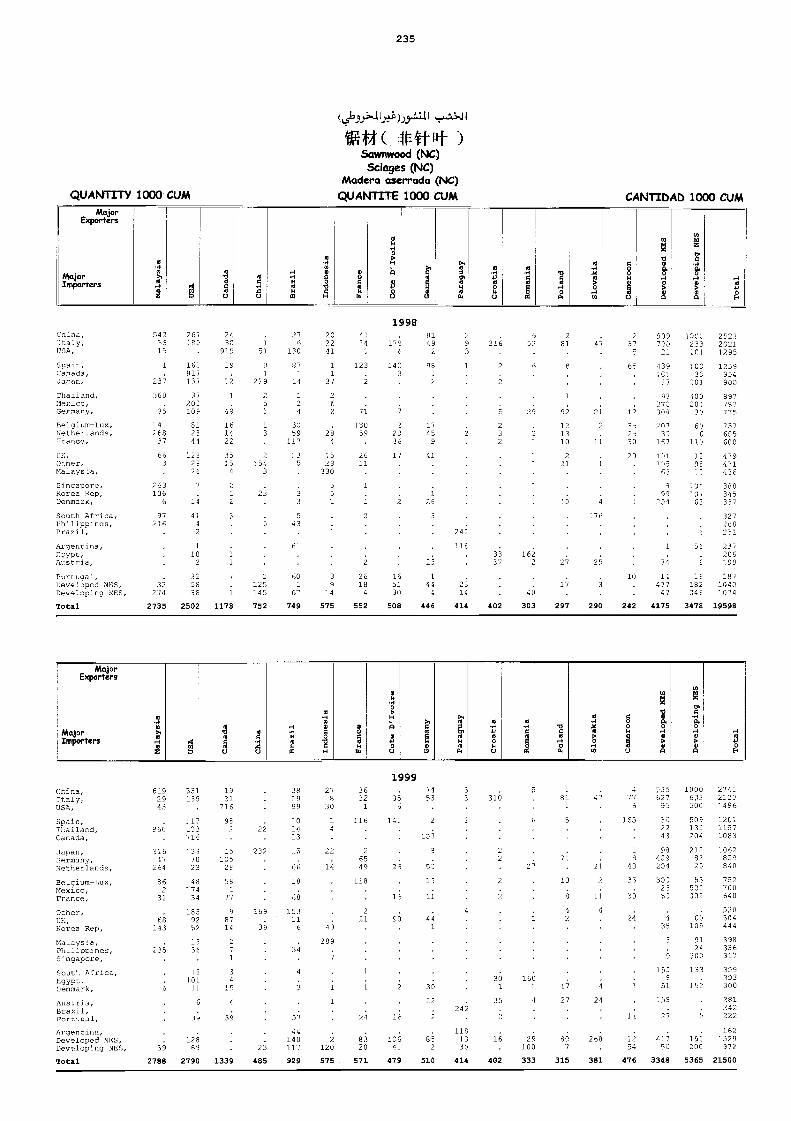
MajorExporters
235
1998
1999
n
T, 13,co ..4aó o
s4 ,1 H H4 0 t 41o
, . 81
o
MajorExporters
4 mM
14H
o+-I
04 >1 Id a
.00
0..-1
MajorImparters go u
oBA4u
.-1.-1-.1NoNrg
0oaOVCH
____r
.6(Li40ul
>,
1oo
m
gno14
oa
4..114o4,u
4.4C
/a
VgOH0a
.4
..40>oHn
0o1,
1u
P.oH
I ,n
0.o
-10 o> 4,o on E
China,7taly,
61929
381155
1531
38:9
278
3632 35
"453 316
584 4;
477
535627
1000633
274:2120
USA,
Spain,
43
06
.
117133
716
962 22
99
4014
30.
4
1
116
6
141 2 I 5 155
Si
5022
500
509133
1196
12011157
Car.ada,
Tapan,7ermany,Netherlands,Belgium-Tux,Mexico,France,Other,UK,Korea Pep,MaLaysia,15:,_ppines,Singapore,Sout.:. Africa,Egypt,Denmark,
Austria,Brazil,Por,:yal,Aruenaina,
31647
2(34
862
31
.
98143
23;
.
0
513
1237023
48174
34
1659252
1356
10101
11
6
33
.
10520
56
77
g
8711
271
3
19
4
39
232
168
33
.
13
15
46
18
65
15311
6
34
4
2
.
57
44
22
14
40
259.'l
i
1
26549
118
221
26
16
6
3
1;
136
3
53
19
11
441
33
22
3
.
242
118
22
2
301
35
2;
160
4
7
13
8
4
1;27
2I
2
4
4
24
845
35
33
43
93409204
3022250
1
30
153.E
51
156
2;
204
2128223
55503332
43105
9124
300
133
353
5
.
1083
;042859840
752700640
530504444
195336il7309303300
281242222
162Developed N7S,Developing NOS,
Total39
2788
1281.69
2790
.
1339
23
485
140117
929
120
575
8320
571
19641
479
65
2
510
1330
414
16
402
29100
333
269807
315 381
1254
476
41750
3348
150200
5365
T529972
21500
:nlna,3ta2y,
54255
247180
2430
1
2716
2022
4134 17;
8149
29 313
652
:,617004;
257 2C21509 1003233
2523
USA,
Spai-,Canada,lapsa,Thailand,Mexicc,Germany,
15
1
.227
350
35
160817137
37203100
919
:9.
12
1
49
5l.1
12,925
130
87
14,_
i
41
11
37
262
0
123
3
.
71
E
140
7
2
96
;
3
2
2
0:
6
23
e
1
0.
2 21
60
12
21
439:CI
37
03372309
101
ICC3C
201
40020130
1295
1259954900
897787775
Be:a:um-Lux,Netherands,0rance,
429827
912341
161422
1
33059
11725
4
13059
22030
1745
5
.2.
23 2
131310 11
_.
2530
20733
167
60C
110
737605600
UK,Ofner,Malays1a,
Singapore,Korea Rep,Denmark,
South Africa,PhilippTnes,
Argennina,1--9Y1Di-,Austria,Portugal,
Brazil,3
263106
6
97216
66:2029;E
7
:4
4142
1
102
32
3535
4
2
2
-
:
0
2T54
3
23
;
2
735
33
543
6'
60
;528
330
5
.
:
3
2411
2
'26
17
. 2
16
41
1
3.5
3
.
2;
1
.
24'2
716.33
37162
2
.
221
13
.
2i
4
074
20
.
1
10
101105
63
993
201
1
74
14
3295
:3:101
63
50.
E
:E6
479471436
388345337
327268231
237206799
180Developed NOS,Develop1no NES,
Total
32274
2735
0638
2502
1
1178
125145
752
6;
749
9T4
575
184
552
5130
508
444
446
2;14
414 402
40
303
1;
297
4773
290 242
104047
4175
182345
3478
-074
19598
MajorImmorters
40
U54
a Ou
ow
...o
gi
at B 7o
4+o ou S
.4
oU
a
o
(41,3)..;,tij+C)),J2,0
Cif( )Sawnwood (NC)
Sciages (NC)Madera aserrada (NC)
QUANTITY 1000 CUM QUANTITE 1000 CUM CANTIDAD 1000 CUM
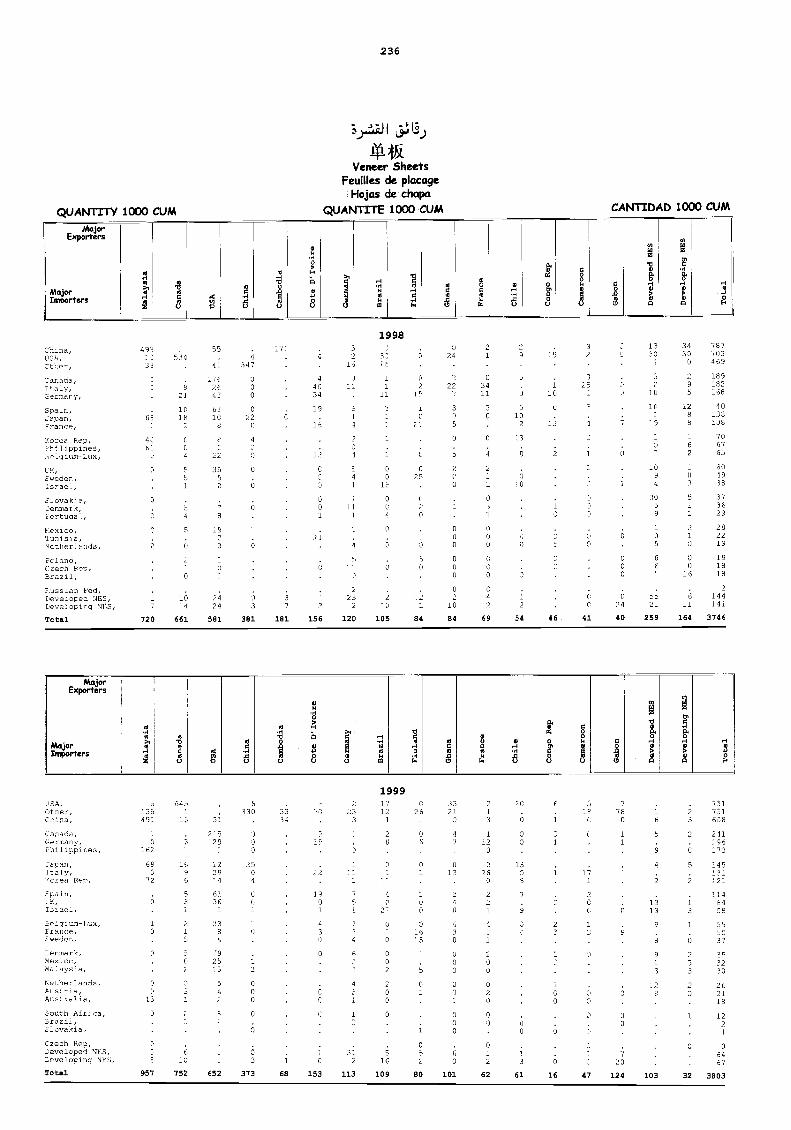
1-3
I.-,
IL' ,
00
0 IA
rt<
<ID
P,D
fD 0
1...
- i-
0 0
'11
0)0)
,(0(t
7 0.
0.0
"
0C
, G C
:G
tort
Ç'-'
0°' >
101-
-=' ..
k..,,
,:1
0.7:
r r
o03
0 0
.<14
al
.-'
l,,I
017
'Z.
..,_,
,TI
c., 0
MI
k 7
Irj
1G0
a,cc
0 r-
I
, ,T
.,I-
r,F
I,T
0 D
:I-
00,0
r-,
ftr. (7
, .--
- I,
O;0
)1.1
I,C
.,
01P-
07
.
...; -
, i
0 '1
0:12
G 1
'10
- .
1(0)
0 7
m,
ft .
, I-7
L, 0
Ii,
I.-
11 7
, n 1
,1-
` G
O.
.0 7
G-0
,-.:
-
h 1.
,r-
:.., 0 '1
.3 0 rt H
7.-.
0,r
,-,
rr,
rfr
'oG
G W
(DIO
N P
000,
11 C
l 7"(
0y
p rr
LO
1.6
1.0
r; ,,
,7_
, 7
,,,..
,,-
,6
, 6G
0 ,
r, 1
11.
1..b
z 5w
0,
e.'r
-O o
.0O
'
n: ,-
, r,
6 6-
,__
'1 7
0M
.C
eww
kri ,
n-
:fi
''t
6 ,
.:.,
0/ a
oo k,.,
,.
'Orl
o-1
0.0
. .0
Or
LC
.--,
7,70
% l-
-00
11't
,-.3
.0 S
`1-
'' M
I-7
'0C
ID"
a..-
' L,
h 1.
rn
L31
,.c.
, ...<
a, '
L.
',..1
r C
,Cl
, . :1
':+
' ..,
1
0' 7
...I
.e.,
0110
r.. C
OII
I.
...a
.JR
.?' '
CO
"
Mal
aysi
a,
c,,E
n(3
,
Can
ada
CO
.`.
CO co
tO,
1-O
D-I
`.7
,V
,0
,1. ,
,U
SA Chi
naw
0:
0 0
I, I
0 0
0O
..0
Lr'S
..-O
7 A
r;C
D0
Cam
bodi
aC
O h.
.
Cot
e D
'Ivoi
re3+
Ger
man
y
O "
,ID
ro'
IDB
razi
lO
,
-
3C3
IDO
D
Finl
and
o rr
wo
o0
Cr.
. OC
fi C
O, 0
,
f 0:
0
r<to
oln
C..
I, 0
,1".
0G
hana
Fran
ceN
ro I
O0
o C
roo
0I-
.ro
ro
001,
0 0
10:0
000
W.
IO
W ,A
n
Chi
leiu
t;0
0:-
.12.
to0.
or
c.c-
to r
<
Con
go R
ep
I
C.
0 I-
,
Cam
eroo
n
1-ro
0,
00:
0 10
"...1
In
, 41
Gab
on
o w
0,01
CO
I1.
0
0.0,
. Ww
W-r
ou-
CO
4:
Wm
, NW
...
,
J0...
1.0'
11,1
01 da.
, ,
or 0
.co ,
XC
O:G
.,,W
W,o
rs-o
w1,
0co
w.
I-
00 I
I'.01
01N
00, O
WY
,r-o
o go
o01
0.
,
0001
Dev
elop
ed B
ES
Dev
elop
ing
BE
S
Tot
al
90 a
Mal
aysi
a
Can
ada
USA Chi
na
Cam
bodi
a
Cot
e D
'Ivoi
re
Ger
man
y
Bra
zil
Finl
and
Gha
na
Fran
ce
Chi
le
Con
go R
ep
Cam
eroo
n
Gab
on
Dev
elop
ed B
ES
Dev
elop
ing
BE
S
Tot
al
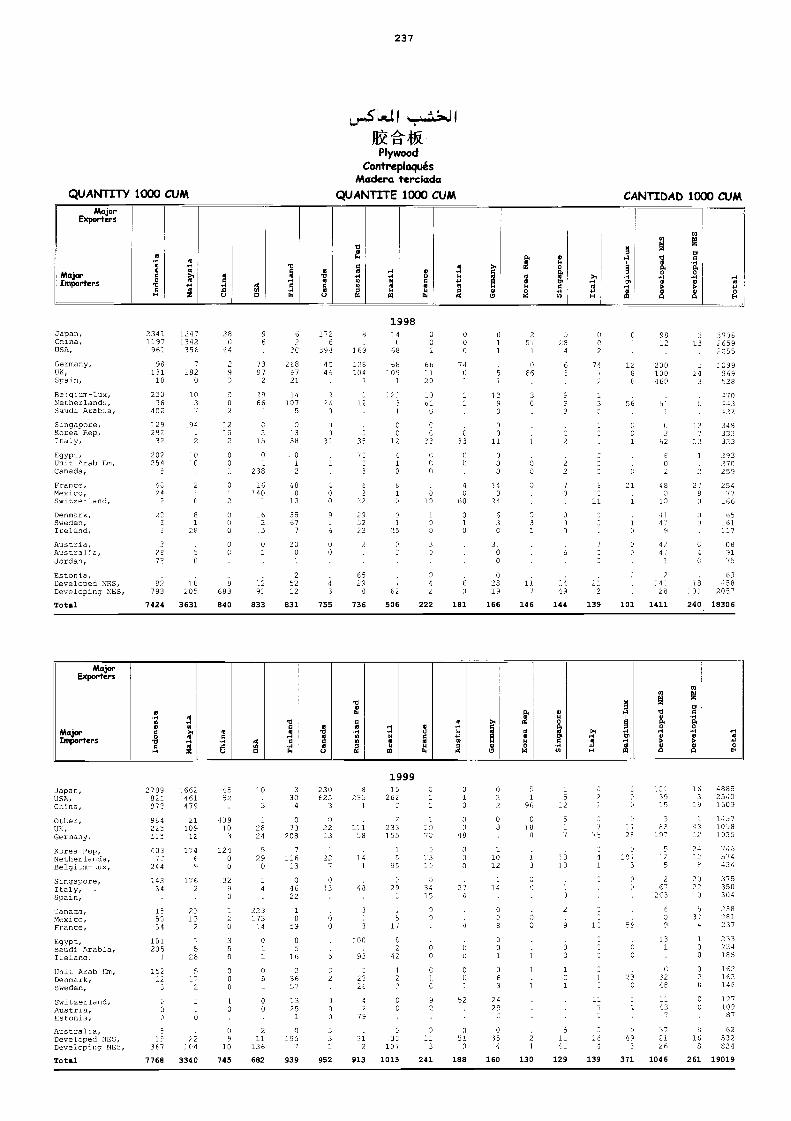
MajarExporters
1998
237
PlywoodContreplaqués
Madera terciadaQUANTITY 1000 CUM QUANTITE 1000 CUM CANTIDAD 1000 CUM
1999
MajorExporters
MajarImmilvrs
oHoU
g
0H
eel
,491
5.,o-1
g
mo..44U
4MO
4oeeU
m
r!.
aed-HNn
g
H-HN01 .1
M
wm0NN
44
a....w.0g
o,
i8
1mUNOK
o14
o5 'N.O.1-1
M
5, 1
H0
.1,H
0
..4MA0M
co
NTI
ll '
.-iV>NQ
m
Na ,a...I
g..-1O>0id
.-.1o.OE
Japan, 2341 1247 38 9 6 172 8 :4 o oComa, 1197 1342 O 2 E . o o o ..I 28 0 2 13 26591)
2 98 7.988
11575, 961 356 4 2C 390 789 68 2 C 1 1 4 2 . 2055
Germany, 98 ' 2 73 218 44 :DE, 68 6E, 7474 12 200 5 :C99UF, 131 182 9 97 46 :AH "09 11 O EG 8 100 24 968
Sweden, 1
Saudi Arabia, 402 7 2 2 5
Australia, 20 b C O
Jordan, 72 0,
Estonia, V V 2 . 65
Felgiurr-Lux, 250 10 2 29 11 3 3
Austria, 3 O 0 20 0 2 31
Netherlands, 36 3 0 66 107 26 17 9 C 0 3 56
Spain, 10 O 7 2 21 7 1 20 _ V (5469 8 528
SLngapore, 129 91 2 0 7 V 6 C. O C 348Korea Rep, 292 :3 8 C c c . o C 332Ttaly, 32 23 2 15 38 31 39 12 22 33 11 2 1 62 22 323
Egypt, 202 :O O o . o 72 4 O 2 293Unit Arab Em, 254 :01 1 3 6 2 270Canada, E 238 ' 3 0 D o 2 259
Franco, 41 2 0 16 48 4 0 8 4 14 o / 1 21 48 27 254Mexico, 24 V 140 O ) 2 1 o G 3 O 0 O 8 :77Switzerland, 2 0 2 _ 13 2 0 10 GO 24 11 l la 3 166
Denmark, 22 8 O 16 33 9 28 3 1 O O41 165
Ireland, 5 28 0 3 7 3 23 25 O O C 1 0 2 9 117
Developed NES, 92 10 9 521
2 )29 28 11 11 18 158Developing NEO, 793 205 683 12 0 62 a 19 7 19 2 . 28 101 2057
Total 7424 3631 840 833 831 755 736 506 222 181 166 146 144 139 101 1411 240 18306
0 67 22 o 1 O l 161
00
C
o 63
42
470412422
1089170
Japan,USA,China,
Canada,Mexico,France,
EgYPZ, 101 7 3
10 2350 1334 2
Sihgavore, 143 176 32 2 O
2789 1602 45 "o 3 230 8 15821 461 52 30 025 233 262973 479 3 4 3 1
223:73
Germany, 115 12 7 24 208 13 58 155 71 48UK, 225 109 10 28 73 22 111 233 :3 a 8 18
3 9.9
Other, 984 21 439 7 0 5 7 o C 5
Korea Pep, 403 174 124 5 71 746Netherlands, VS 6 O 29 116 22 1= 5 73 10 13 187 374Belgi=-1lux, 244
,
O :O 13 7 95 ID 3 12 3 13 3 s 9 434
italy, 34 9 46 43 29 34 27 67 22 350Spain, O 22 15 4 203 D 304
6 O '
'J O 51 2 1 5O 2 91 "..2
1(3
0 2 21 375
O 2 .798
O 11 3 12 00 5 4 237
O :00 62 1.. 1 233
, 281
39
3 1 113793 1038
16 48833 2540
18 1608
1025
Saudi Araba, 205 5 5Ireland. 1 28 O
5 2 6 O O O O
16 B 93 42 O C 1 O 2 C O 183
Estonia,
Unit Arab Em, 152 5oDenmark, 12 O
Sweden, 3. 2 O
Switzerland, 2V 1 L
Austria, 3 o60
Australia, 3 O 2 o 5 3
2
Developed NES, 18 27 9 11 :95 3 71 32 351 11 16 49 21 16 532Developing NES. 367 :04 10 136 7 1 2 107 3 D 4 i 41 4 3. 26 8 824
36 2 2 6 C 23 32 2 16257 20 2 C 3 1 7 C 40 C 140
13 O 4 C 9 52 24 __ C 12725 0 2 29 43 C 109
1 O 79 C 2 7 87
1
C C O 1 O 162
5 0 0 37 6 62
Total 7768 3340 745 682 939 952 913 1015 241 188 160 130 129 139 371 1046 261 19019
co
4 IIJN P. A a
o P.g.Majar
Importersao
o o
o4 o
wN
ANoi.o
140O
1-1
VVVf
O0to
o> IVI
o
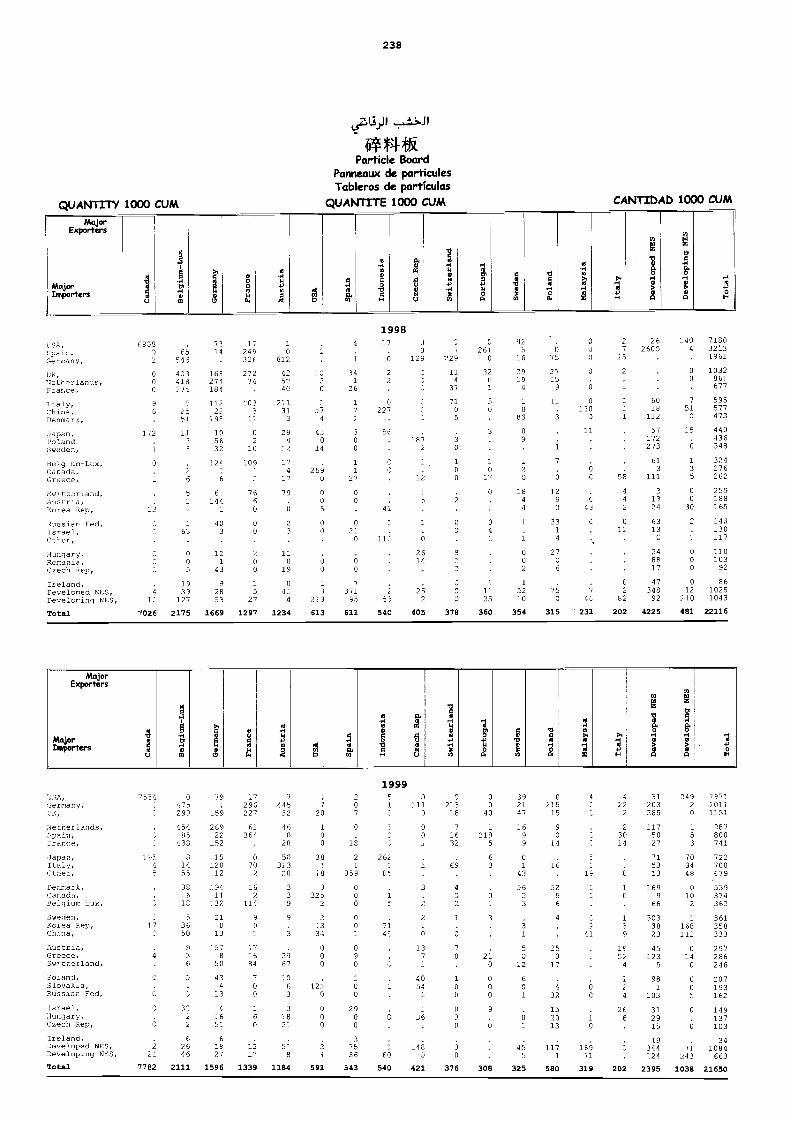
y on
, MW
W0
No
Ta,,,,
-,,:
0, o
csa
D.0
_.. 0
,,,,
,,',G
IP07
.0 0
07 M
r-N
-r, F
JP0
,70
110-
--0,
1cl
007
'000
.:0
01-1
'7 W
O,
140.
c"1
004
0
37-Y
.4W
n
..a ul
a..
...01 U
Wn,
WX0 0,, WO 1
N., .0. MN,
N .n
,n, ..N
00 03131
10,10 0130 N1410
NNI'
toCo -
A.A
WN
,A, NA.
w-J
,
,W
o0
0 0
O.
..W
..
0 .
.UE
0 O1.
3
,0
000
00.
0 0
=0,
01 N
-o
0-E
A. 0
040
0-.0
.011
4
UI
On
0,0-
1o
o.
N w A
H c
l-J.
010
N N
J 33
oN
J c,
NE
A A
rn
WN
031-
N (0
0,NmN
M,
1..111J .44' ,H.
0 Moon nmA nw, Aww
ON,
.wo
A N
0 ,PJ oM
o .7
..000 0.,
EN
E n
NE
-E,
,oo
00000
,,,
-E1- . NNW 000 ,0,
4.00
, AN00
.oN
,WA .00 ..-IN AwA -J,.
EM 0001 NW. ,OW nm. N.A m.. 0,0
0100
000
-.'tw
It 00
1ItO
_JO
0,01
0.1
11--
1001
0-0
1110
110
0'
Pgl r Can
ada
M Il aq
Bel
gium
-Lux
Ger
man
y
Fran
ce
Aus
tria
USA Sp
ain
Indo
nesi
a
Cze
ch R
ap
Switz
erla
nd
Port
ugal
Swed
en
Pola
nd
Mal
aysi
a
/taly
Dev
elop
ed B
ES
Dev
elop
ing
BE
S
Tot
al
o N
t.,0
1 3
0 31
¡I.
< <
E'D
13 r
o-0
0.:7
1-00
G c
o0
.7 ,1
o uo
a:
WnN
:G
, 0
tn 0
1-
Lo
< 0
1
wm
>7
3,-
0 01
0 (7
rt
0011
0,7'
0 3
. , T
--
.t7
0 3E
'-' 0
1I
...7
!..3
.. 0
, 7,,.
;_.
'.-,'
E--
7L
E 0
1017
/.0f'D
0101
0 1<
OE
0 ,
-1
,,?1-
.11-
1-'0
0001
17 3
3 a.
SP, r
o,1
-r)
,..-:
-0-
077
E.
:,--
O.
-, L
-7.
010
17 0
0-
E7
- 7
(7",
2,
"7
..-E
-E"
H-1
3.13
: -."
'1(3
1,
17 .3
LE
13"
1-,
7 -C7
010.
0_,
.t0 a
7 7 0.t
I- G DC
7 a. :nZ
.11
^.1
1.3
..'.
7.3
71 CO
717
171.
771:
7117
(7
HAN
NN
0 0.
0 .w
.nw 0.
0w
mm
m71
,uA
mw
m.
mum
, .v.
MI
to m33
4,w
,w0, .0
Loc
.,w
-to
1-t3
.3to
:-3
3
1,310
W 1
E-1
0,0
En
l O O
1co
iEA
-,-
o E
A1.
A N
., 01
11 0
0(3
0$,
N.1-
1*7
0-1
0 77
71
H r17
AW A
OD
...C
o 00
1007
EJ
n
1.J.
N.-
-..
...(J
J
,.3
.co
A.
0000
1 N
n,
HN.W
00,
A O
NE
W n
n,
o-
.0. 0
01 0
..
a,
c77.
.
ID IoA
I
37A
W
U,
03.4
w
o
o 0
=
= 0
0 -J
0 -l
u1-
O .0
)10
13.
33,o
M (
10 J
0000
0 0
117,
(JI
E0
1--
0 n.
71L
., E
.)'a
',n
3,AN
Ln 03 0
00.
o 7,A
--.,:
7;')E
AG
E 0
3J(-
J-4
t.43
o
W3-
37.
7.1
.0
,0
0.1
'7'-'
11(7
,(7
('1
-11(
7111
17(
7(N
IA,
NE
a, n
N17
.001
.10
E-
1000M
Na
NJ
W N
ON
NE
.NA,
AA.
1'30
1.0
..-o
100,
0N.A
0,0
M10
00.
001
001-
0,W
W,M.,
no,
mew
0 3, A
OS
,E1=
0o.
nN
03
I, M
o.Aw,
mA
o w
0,A
oN.
N IA,
Of
Eno
,,, ,E
-- N
JN
JN N w<JEW
L.J
LE
J L
IEn
-, ,
, C0
10, 0
7(.
7W
01
010WA.
nUJA
W,.
0000
0NW,
Am.
.m,... Wm,
aNN
EW
NA.
J.. ...
A..
,o,
000-
'-.1
noo
tW
W
NE
:J.
Can
ada
Bel
gium
-Lux
3-3
Ger
man
yA
3J
A,
ON
.
1, ,A,
n , N.,
Fran
ce
Aus
tria
USA
WSp
ain
01 ,
A
Indo
nesi
a.
ID 03
Cze
ch R
ep
w
o
Switz
erla
nd
Port
ugal
1.'oM
113
00'0
1-Sw
eden
E3,
-Po
land
no
Mal
aysi
aO
S.
Ital
y0,
-1N
ON
Dev
elop
ed B
ES
0.D
evel
opin
g B
ES
,01
00nm.
n-N
,0 ,W,
.NJ
,,0
0T
otal
WgT
:O
0100
-o
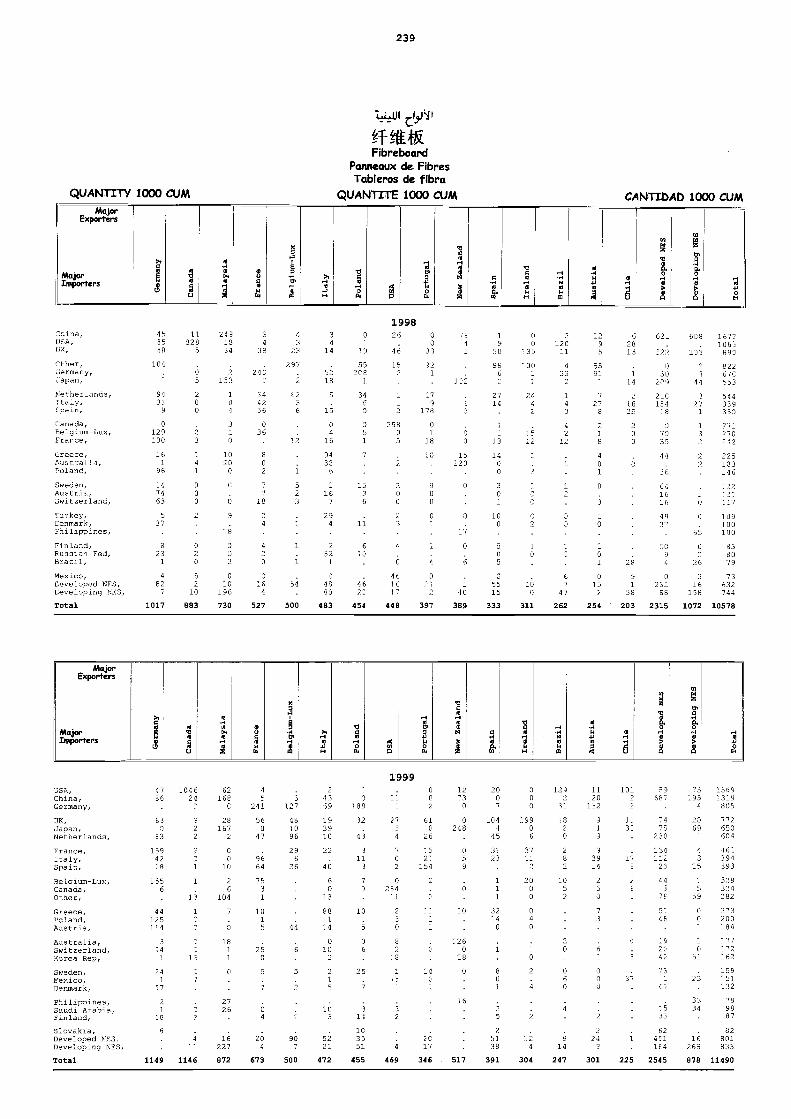
239
1998
1999
MajorExporters
1a
imt
CO
oa
C
H0o
.00 .-i
0...1
Wao
Hg.oMajor
Importers>.
ta .'A H
g0
N
iC."a.
05
0.. 0
MH
Hm 0
14
M
14.Peo4
.-iH...1 'gAu 41
m
H H0 a> .1,
8 1 oH
MajorExporters
NM*Inverters
t' '
18
0
... 0
"4
01
H.
.3..4
1104
aZ.ooó 0
...i H0>
E0 X
-P
Cnina,USA,UK,
Cther,3ermany,Japan,
Nether_ands,Ttalv,Spain,
Canada,Belgium-Lux,France,Greece,Australia,?oland,Sweden,Austria,Switzerland,Turkey,Cenmark,Philippines,Finland,Russian Fed,Brazil,Mexico,
45 1135 32833 5
10403
94 23: 0
9 0
0129 .:i
100 3
161 4
96 1
14 074 063 0
S 237
8 023 2
1 Cl
4 5
2491834
2153
1
04
370
1020
0
C
6
9
18
002
0
2
4
33
.
2403
344255
036
.
802
77
le24
2
0
4
323
297
2
023.
6
12
1
3
3
1
1
1
34
14
5218
5
15
0c
16
9432
6
1
167
294
232
1
c
0
19
552ee
1
3460
351
1536
11
610
26
4e
152
372
25835
200
2
A
6
46
00
33
921
17
178
0i
18
0
0
1
764
12:3
L
3
60
lb120
0
3
0
6
.
1
950
906C
2714
1
7
13
1400
30
100
t7
0
00
:35
-003
2
42
1512
C
212011
4
332
1
43
4
212
1.
12
6
1295
5591
278
21
8
401
0
3
0
62813
1
14
21620
203
2E
9
62:
322
o
30209
214154
18
07035
44
641616
49
509
0
608
123
2
341
7
271
1
32
2
65
02
26
3
16721063
693
e22
544339330
27E270212
225183146
22
109100100
83BO97 3
Developed 1405,Developing NOS,Total
827
1017
16
883
10196
730
164
527
59
500
48BO
483
4622
454
1617
448
21)2
397
-
46
389
5515
333
100
311
7
47
262
132
254
156
203
23388
2315
16158
1072
632744
10578
30 7,,China,Germany,
UK,Japan,Netherlands,France,italy,Spain,Belginm-Lux,Canada,Other,Greece,Pcland,Austria,
4736
630
33
1594213
1556
44125111
104624
1
6216e
C
28167
2
C
010
26
104
7
4
5241
560
47
9664
7531
101
3127
481096
29
26
41
21369
193910
22
40
60
13
38
1 1
0189
32
43
311
3
70
10
5
2734
7C
2
0264
11
230
0
20
610
26
..27
154
2
1
3
1273
0
0248
.
0_
0
0
10
20
7
1044
45
3123
111
3214
0
30
:9906
371"
2
2000
040
1242
31
1820
28:,
1052
1120
132
9
i9
9
39_6
250
73
1012
1133
158
2E
59687
7470
230
13411223
/45
75
46
7O395
4
2069
43
15
559
001
13691319805
772650604
461394393
328324282
273200:84
Australia,Switzerland,Korea Rep,Sweden,Mexico,Denmark,
Philippines,Saudi Arabia,Finland,Slovakia,
394
241
57
21
10
6
1811
2726
25C
e
5
010
103
.
06
25
3
11
le
82
18
.
:260
18
0
16
1
2
4
060
0
?
0
35
42
". 5
62
65:
2S
3334
:72:62
:59"51132
789887
82Developed NOS,Developing NOS,
Total 1149 1146
le227
872
20
673
907
500
35 5221
472
51
455
.
4
469
17
346 517
5138
391
:24
304
914
247
293
301 225
451164
2545
16263
878
801833
11490
ff.t1t4tFibreboard
Panneaux de FibresTableros de fibra
QUANTITY 1000 CUM QUANTITE 1000 CUM CANTIDAD 1000 CUM
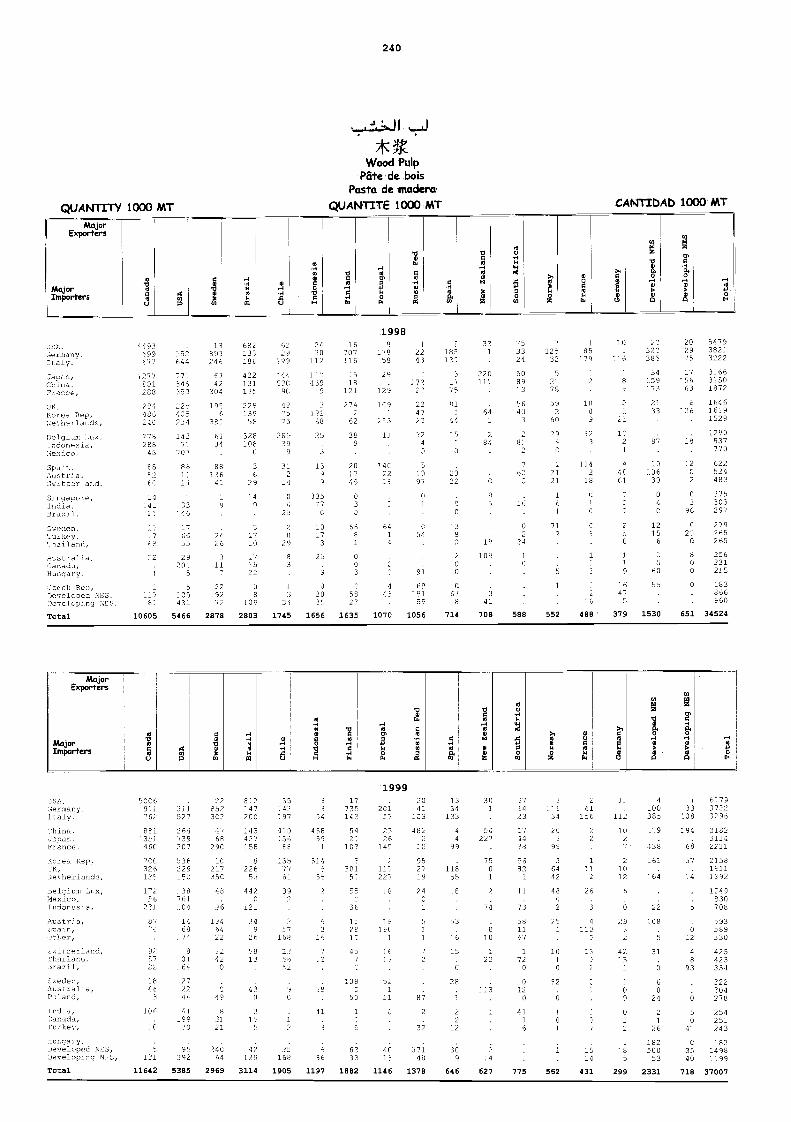
QUANTITY 1000 MTMajar
Exporters
Wood PulpPate de bois
Pasta de maderaQUANTITE 1000 MT
240
1998
CANTIDAD 1000 MT
1999
MajarExporters
MojarImporters
oH.,.1AU
o..-1oeaO.o0H
vaoH04
...Iomo4,N0io
o0
Hdz.
oao.-1ooNX
N
oo
.,-1ww4
500)
,4
0z
oUaouw
s.,
iooóHoo,on
II)
Nma..4
óH
Ec
Hoo0E
r.:TE,04ermany,Jtaiy,Japan,Ckine,7ranae,0K,Korea Rep,Netherlands,Relgiam-..ux,,ndonesia,Hextce,
Spa'n,Austria,
1493599577
5277801288
294486240
376786
40
ES7760
.
352644
771345353
22,405:34
1127'
707
851:11
13893216
6742
304
1956
382
5134
881764:
632:33186
422131130
22E:3953
326108
36
29
6229
"99
145330
'i(
ne7575
26539
312
14
2/.30
112
11:139
(9
1
19168
25
3
13
9
16707116
i518
121
2742
62
3E9
201749
8:7858
29
1214
109
2E73
11
4622
1
2243
4272
24
22477:
324
:
97
185127
91
44
2322
39
22011',
61
284
753324
3089
5640
3
2
12532
52"78
592
60
29
1
2121
:1
85779
1003
3:3
1142
18
lo
3
8a
31
1:2
4
4E61
2:323385
34:59:73
2133
.
10106
30
202975
-5663
6-26
:202
5479382:3222
3:6631501877
164616791528
2290837770
622521483
Singapere,India,Brazil,3weden,'Eurkey,1zailanu,?ustral7a,Cenada,Hungary,
0nach Rez,J.eveloped NES,7evelecin3 NES,Total
14
59
32
3
6:
10605
33"16
1766pp
29201
5
5:25431
5466
9
25
711
22:92
-72
2878
"4O
.
317:0
,022
08
109
2803
04
29
29
I
3
1745
33577
0
101713
25' .(4
03035
1656
O
33
66:3
1
O
.7
3
3
5823
1635
64i4
»
1070
C
51
.
91
69-9155
1056
3S
7
2
8
714
13
109
341
708
02
34
588
1
1
712.
5-
1
552
01
4
15
488:
1
9
:647
5
379
O
4
1215
6
60
1,p
1530
C
796
C
2:0
6
O
(1
651
375303297
279265265
256231215
183866960
34524
0SA,Clermany,1Laly,
5006971"62
1
527
22ese302
e:2T47
55:47:977001
EA
17735143
201204:
:4:3
1331
133
301
978123 54
261
155
11
112
4
:00385
1
337:8
677037323396
China, eei 261 443 1:0 458 54 23 402 4 54 :7 20 :94 3182lanar, : 351 739 68 427 130 59 3: 26
4227 -44 0 2 2
- .
31115rance, 460 207 290 :58 EE 1 103 14 : o 99 .111 99 438 68 2211
Ecrea Rep,114,N eEheriands,
Belgium 7.7,4,Mexino,Tadores'a,Austrla,63iair,40rher,
EgItzerl, d,ftailann,71-azil,
7wedes,Australia,Ro1ard,
India,Canada,Puzkey,
Hungary,Developed NOS,Deve.-Eop±zg. NES,
Total
70C.32612 . .
17256
221
67
0237
1845
3
106.
IC
L
131
11642
535229LEO
T:38761101
147
E8
8401
64
272244
41199
YO
9E392
5385
10237250
48
36 2
1346422
5242
019
,
24064
2969
8
22653
442C
121
349
26
5813
-'
'12129
3114
1357763
39
7E7
168
23E6
OS
168
1905
3115
56
7
03
772
11
3
.,:,
86
1197
E
3015:
33
13281:
457
:
1082
50
i
6333
1882
117227
18
19160
1
16
p2
11
0
.
4013
1146
9527:924
C,
r
(6
2
.'3
.
37118
1378
116SS
:6
53
15
28
2
3C9
646
7501
2
10
1
22
3
2: 4
627
82
71
7-3
581167
1
720
012
41I
6
775
6442
48
25
10
10
52
6
01
3
562
Il2
25
4
3
3
3
7.514
431
1?
5
10
293
42"3
1
O
9
5
299
:61
T64
.
22
108
5
31
6
6O
21
2
21 6
182500
53
2331
37
34
2
48
93
0
50
4'
O
3540
718
215810111332
1749830708
593589530
425423334
322304278
254251243
7821498:199
37007
MajorImporters 4
o
00oa
a
ro
a
40N0
aa
u
44
N
oa
o
.0E.o
HW>0o
N
0.aOH0>o
1
I
c
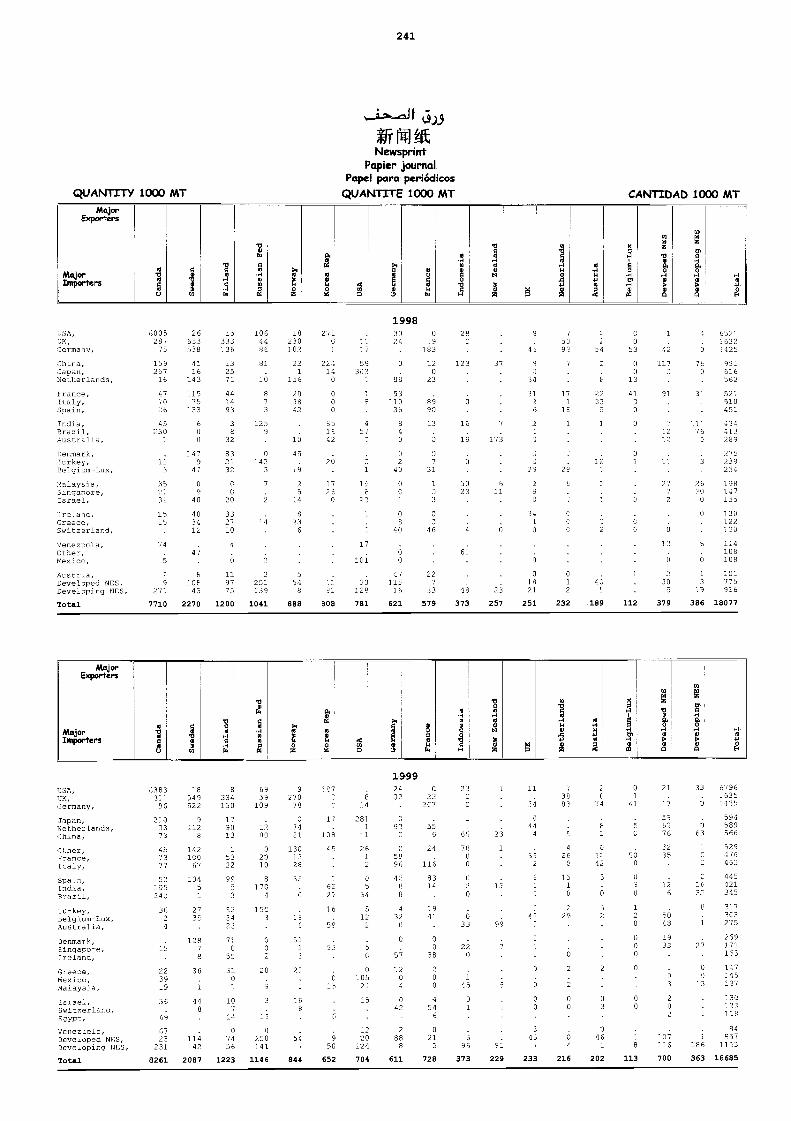
241
1998
21 33 07961635
17 2 :425
. 59 594Fc; 62 0 589
76 63 566
22 1 3291 35 ,ç 4/6. 162
O 4 4455 12 16 421O 6 22 345
1 . 4 3172 50 2C3O 48 275
O 19 269O 33
2i 11701O0- 4 147a
O :453 :3 137
(1) O
2 . :30723
2 . 118
84107 857
8 :16 186 1163
113 700 363 18685
NlajorExporters
D'D)
Mejor 4 ae
aoa
'0Aao
H ,aaAa
9,o e
u
oHoaa
'0 lioo aH
Hoo
a uN O
m..-1/4
0
oa
g-A
mio
óH
moAaoH HIortemprs a
OOU
T;
.-oag
0og
44 1411
W OD U
0014
W
0VOH g g O
Z
4 ,04
M,-i04
g0a
0 MP. 4Jo
Ela O
NicgorExporters
,.._V
.
a
-0
A I H.11ao
0o
W
Raa
gm 1o.o
AAajorIOmporters
ava5
o1 o
g HH 0O O
..-1
11, 1
ZO
5.. 4O M
,1
NHI-1
O
vO ó
H11, OH 9
OA
a 10H
;0HO00
U W g Z M D 3 z a a El
__ .
USA, 6005 26 75 106 18 231 30 0 28 8 7 2 C l I 652:OK, 287 633 333 44 230 0 12 24 14 C 50 2 O 1632Oormany,
7hina,Japan,Netherlands,
75
159257
16
538
4116
143
736
152531
86
81
1
102
221
156
22414
O
:7
59303
:
a.
88
183
1203
123 37
4;
83
34
93 54
2
8
53
00
13
43
1170
76a
.7±125981616562
trance,Italy,Spain,India,Brazil,Austrslia,Cenmark,Turkey,Beigihm-Lux,
473026
45250
1
11
11535
733
6O
0
:479
47
441493
38
32
832l32
873
1259
O
:423
20982
.
16
45
6
O
O
O
851E42
26
:8
4. ..)
:
1
53.1235
8
O
a2
40
8990
13
3
a7
31
6
16
19
6
7
173
3126
2
2
,...
29
17
11
1
22
2233
5
122
4130
O
.
.
31
91
7
:212
37
ill76
,
521510451
434413289
275
221:
Malaysia,Singapore,Israel,lreland,Greece,S witzerland,Venezuela,Other,Mexice,
Austria,Developed NEO,Developing NOS,Total
35
32
15
79
=,
2
S
27:7710
0
40 ,
403412
421
F,
:CE43
2270
O
420
332720
4
O
119775
1200
7
2
3
2251139
1041
25
14
B
2.:
554
8
888
1723
u
808
196
20
.:
17
101
33128
781
a,,
06
40
60
47115
16
621
1
a3
0O
46
22
33
579
5023
;1
6;
.-
48
373
611
6
V
,
23
257
29
O
341.
6
O
g251
E
, ,
'1
O
1
232
2
0 .
2
42
189 112:
27
2
6
13
0
,30
5
379
2630
O
6
0
1
329
386
198147135
130122120
114108108
101775916
18077
1999USA,UK,Germany,
Japan,Netherlands,China,
Cther,.3-ance,italy,
638331:96
2103373
457377
18349522
9112
8
142100
67
8334150
179013
.
5322
6959
109
:2
a2010
527078
37421
1301328
1870
7
11
109 4
45
814
2811
11
26
12
2432
C
97C
C5896
C
32207
536
24
116
23C
C
63
1
1
23
1
11
O
114
552
3883
4
26
20
74
82
o1242
Spa,n,1ndia,Srazil,2.urkey,5eigium-Lux,Australia,
52705240
3624
1045-
277
35
89
523423
817C
4
1113
35
O
ISE
'6221
16
53
0.5
34
512
2
428
4
32
8314
:94.
C
20
633
13
99
E
:42
0
1310
229
3
6
52
Denmark,Singapore,Treland,
Greece,Mexico,Malaysia,Israel,Switzerlana,FgYP7-,
Venezuela,Developed 8400,Developing 1400,
Total
1;
223919
:36
69
6723
231
8261
1287
8
36
O 1
448
.
11442
2087
71C
55
31O
1
107
11
O
3496
1223
O0
2
20
3 6
'19
O
250141
1146
511
20
168
.54
844
53
O
15
2
950
652
.5C
O
2052i
15
1220
124
704
O
52 7
.,O
4
0'2
788
8
611
O
O
38
2O
454
6
O
213
728
22O
1
45
'31
696
373
.7
_
82
229
S.
2
0O
.
343
233
2
. , 2
O
0
6L
216
2
a46
,
202
.640
flìItNewsprint
Papier journalPapel para periódicos
QUANTITY 1000 MT QUAN17TE 1000 MT CANTIDAD 1000 MT
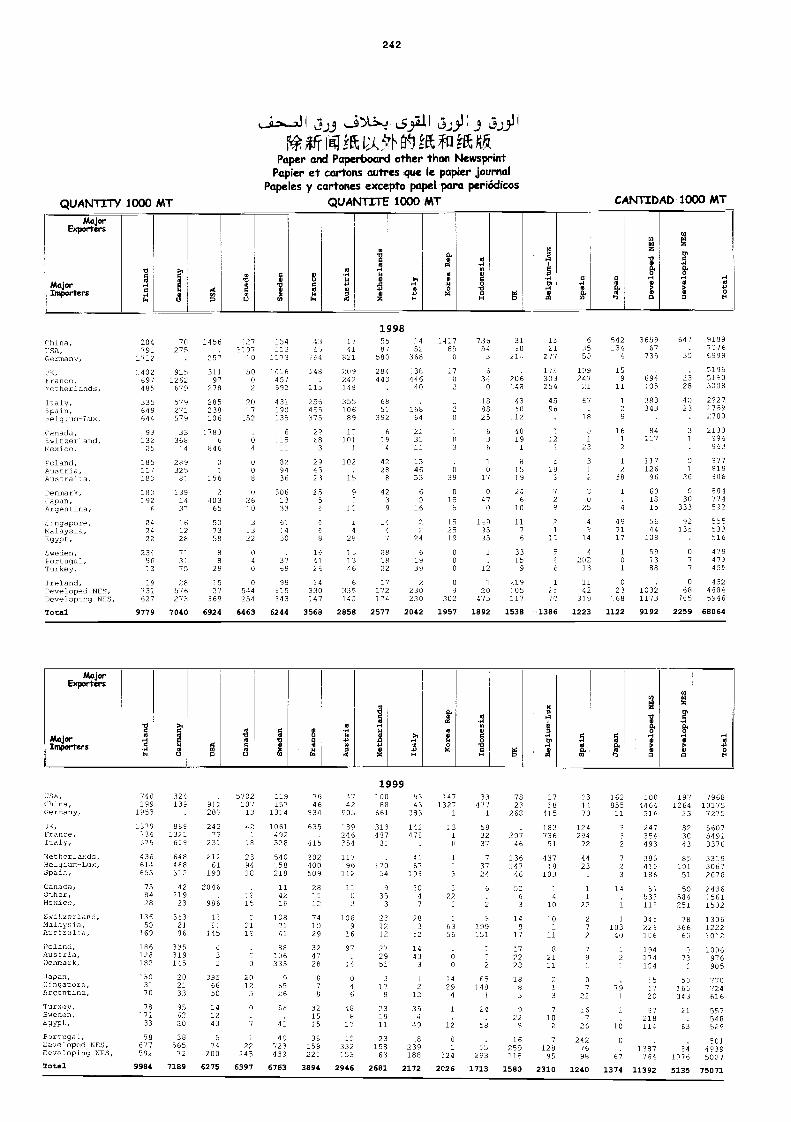
QUANTITY 1000 MT
242
3.).3 1.532-1
RO. iR kftPaper and Paperboard other than Newsprint
Papier et cartons nutres que le papier journalPapeles y cartones excepto papel para periódicos
QUANTITE 1000 MT
1998
CANTIDAD 1000 MT
1999
MajorEmlorters
MajarImportasI_..-
.-;
t'
110
4O0OU
5.5
Iti
0OeoUW
,-1uoga
oHo
11o0
44
o 9,.V 1,Z H
o.gOv44
t2
m
á
O...117,H00
2
.i.
0IvoÓ,-4O
O0
co
mo
...104OH H
13gO
w . o0 E
MojarExporters
IllojorImporters o
. .-1W
am0
a4
1)
w.w
W
e...1woak
...1
H
O
k
0. 0oO
,5,
15a.-.4 0
O..-1
& '
O
m
gma
..-104 1
OHgaci
China,7213,Germany,
Ck,r-ance,
Fctherlands,Icaly,Enain,5e1g.Lum-T.ux,
Cenada,Switzer1and,1-renco,
Ecland,Austria,Australla,Denmark,Japan,Argentina,Singapore,Nalaysia,ETYPt,
Sweden,
20479:
1712
5402697485
335649644
9313225
1057
180
180192
6
242422
234
70275
9151262679
579271579
33368
-4
289325
87
1391437
161228
77
1456
454
31197
278
285238:06
:7806
846
0
156
2403
65
507358
8
:275:97
10
5002
20'7
152
0
008
026
0
3_322
0
154:12
1173
-016457592
437790735
6:5"329436
3061333
51:450
.
436,
764
548
21;
256455375
2968
3
234523
255
49
16
1341
821
209242148
355106
89
11101
102
lb
s
1
4
26
12.
5587
580
284443
6855
392
6:9
4
4228
8
4239
1447
28
7452
368
:3844640
.
76864
223
:34653
6O
16
22
24
6
:41785
0
17
2
7
2
1
0
.
O
39
015
6
152513
0
73654
3
634
0
188825
63
1
017
047
O
1494535
1
31E0
214
2061.48
43E0
112
4019
1
a1519
246
10
117
6
33
1521
277
155333250
4596
181
729
21
12
2
63553
139247
21
67
1;
3
.22
1
2
50
25
4
354
4
542734
4
159
11
1
29
161
2
12
38
1.4
497117
1
365967
735
694:05
383343
841
117126
96
CO
1815
531
44:35
59
64:
33
2328
4023
.
31
.
31
26
030
333
92135
O
913977/66998
519551603308
202727592700
2130094063
817819806
804774502
555533516
479EcrtugaL,Turkey,
56:3
9:75
829
40
3769
4121
1346
1822
1939
O
O 1215
3 6
125213
01
1388
77
473455
Treland, :9 28 :5 0 99 24 6 -' 2 0 1 2.19 1 11 C . 0 452Developed NEC, 731 576 27 544 E15 330 335 172 230 3 20 105 25 42 23 1032 68 4884Developiny NES, 627 273 369 254 243 :47 140 174 230 302 473 117 70 319 768 1173 7E5 5546
Total 9779 7040 6924 6463 6244 3568 2858 2577 2042 1957 1892 1538 1386 1223 1122 9192 2259 68064
2SA,China,
740199
324139 912
5702107
1:9j_57
7646
4742
10088
9343
5471327
33477
7823
1718
2314
162855
1004464
197 79681264 10175
Germany, 1953 . 207 13 1314 834 005 661 383 1 1 268 415 70 11 216 23 7275Uk,France,icaly,Nether_ands,Bc_gium-Lux,Spain,Canada,Ocher,Mexicc,
SwiL2er1ang,Malaia,Ac.stmalia,
Poland,Austria,Denmark,
Japan,,;:ngapore,hrgentLna,Tur4ey,Sweden,Egypl,
Psrcugal,Ueve7opod NEO,Eeveloping 0155,
1379736376
436614653
750428
13650
169
186128182
1503170
7817133
586-77592
0691321629
6484E8312
42219
23
3632156
335319145
202133
956220
3856572
2427' .
237
21261
193
2040
98;
1591
145
O
32
3956630
141243
574
200
42b
Li
239418
15
52119
,, '
O
2012
0
I22
245
1061492528
540:58219
114216
1C83141
88106333
56526
56
41
42723433
635
41;202400509
28-5
2
741029
324728
C
6
321515
3E.159221
:39246354
11796
112
1:
2
1069
16
97
54
04
6
488
17
15332153
313427
31
27054
9
353
931212
272951
317
9
231911
23158
63
152472
4167
193
204
7
283
52
1443
3
1
212
354
49
10239188
:31O
122
5
6356
. 0
0
1429
1
1
1:2
O
3",i
503237
3724
6.2
3199151
2
65148
1
21.
58
55293
.
20746
13614746
5263
149
17
172228
1883
922
6
1625911E
183736
51
43759
103
1
10
:0I
82111
3
710
2
7128
95
124294
32
4423
1
122
272
79
O
7
22
167
231
242/6
96
2
29
723
14
1
1
10340
7;31
1
1C
C
Ei
247354493
383413186
532119
34822E116
194174104
156720
37218114
. .
317 4
82 56073C 549143 3376
85 33:9101 3067
51 2676
50 2436584 :561251 1502
78 1306366 1222
63 5052
1006976
S 905
55 770162 724343 616
21 557546
6; 529
84 49351076 5007
Total 9984 7189 6275 6397 6763 3894 2946 2681 2172 2026 1713 1590 2310 1240 1374 11392 5135 75071
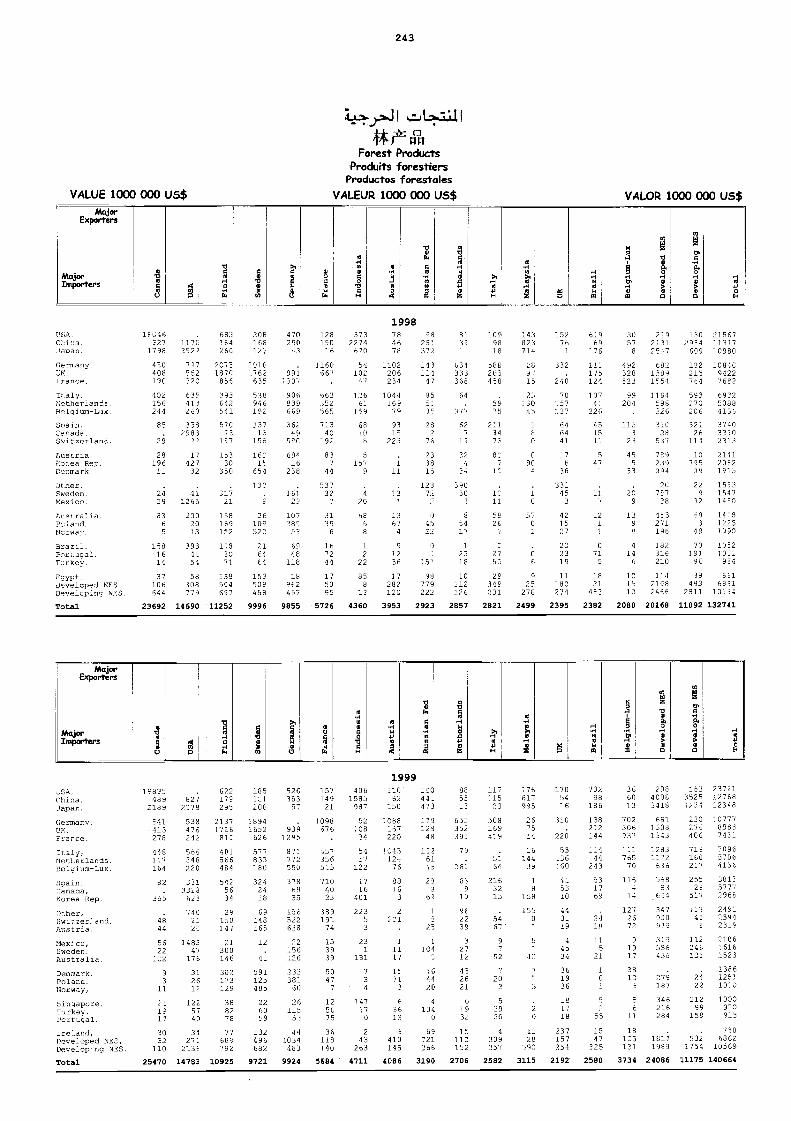
243
1998
1999
AAajorExporters
MM
VN.4
0W
11
g 4Z
I 000
A
AAajorImporters
1ag
'0g.0
aZ:
0QaN
4o0.8
00.44
Hwo >,
.40
A4NI4.8
.
6 04,0N.
a.0, ,
0>
,N
4.,
U g 0 MW
aH 4 0
S0H g 0 N
S 0 0E.
MajorExporters
0 b a
0N.
a0
imNA
5
m
&o
H
g
3a.o
HMajor m0ImportersgU
. -8
1N
o A0og
NIH0oH
A0H4M
H4>40
H
0.1
40
0P0H
USA,Crira,
10446327 1170
68.3164
208166
470290
128150
3732271
7846
98291
8139
10908
143823
15276
6969
3057
2192123
1302994
2156721317
Japan, 1798 3822 264 12) 43 16 670 78 372 C. 18 714 11 :76 8 2547 609 '0984Gerrr9ny,UK,Prance,
Italy,Netherlands,014:Igium-Lnx,
Sualn,
450408190
402156244
85
73756222C
635413260
358
2C73187C
856
393042541
570
20101.762635
530946192
337
.
991130,
906839669
262
1160667
663352565
713
54102
12661
159
68
1102206234
104416979
92
:1311447
85
35
28
631333368
64
62
588203458
.5975
211
28
15
2313040
1
332.
240
70157137
64
111175124
10741
226
45
492328523
99204
112
68213841554
1184596226
314
1022157E4
583:732C6
322
1004494227682
693250884134
2740Canada, . 2983 73 13 49 40 [0 15 2 7 34 9 64 15 3 28 26 3370Sw5tzerlan3,Austria,Corea Rep,Denmark,
31j1er,Sweden,Mexico,
29
28196
'1
2429
22
17427
32
.
411265
157
13330
350
31i21
158
16C15
654
132
58C
69416
238
16123
192
83'44
53732
,
h
5157
9
420
223
1
11
76
233815
12372
19
324
3.,
39030
3
73
827
1211
e
C
9Ca
cji
41
:70
36
33145
3
11
54,
1i
23
455
33
2C8
587
799239394
20757
38
111
10795
39
229
32
2313
21112082191b
155315471480
Australia,Poland,Norway,
8365
2002013
158169192
24109522
107285
53
3139
6
6868
:367
4
04522
65413
5E26
I,
57
2
421527
1.211
1398
153271196
693
49
142912251090
Brazil,Fortagal,Turkey,
1581614
3924154
1299471
2164EA
6948
118
167244
12
22
91236
0
:51
1
2318
C,
2752
.
06
2C2319
C
715
414
6
182214210
70191
94
10521011994
Fgypt, 37 58 138 153 18 17 85 17 98 10 29 9 11 18 1C 114 39 661Developed NEO, 106 308 544 500 9E2 50 8 282 779 112 349 25 :80 21 15 21E8 493 6591Developing NOS, 644 779 697 459 457 95 3 12C 222 126 231 278 274 453 10 2446 2911 13134
Total 23692 14690 11252 9996 9855 5726 4360 3953 2923 2857 2821 2499 2395 2382 2080 20168 11092 132741
1.SA, 19825 . 622 105 526 157 406 110 100 88 117 176 170 732 36 298 183 23721China, 189 827 139 111 363 149 1585 62 441 55 115 617 54 38 60 4008 3525 12768Japan, 2189 2278 295 200 99 21 987 I50 473 12 23 995 :6 186 13 3416 1224 12348
German'',UK,Frarce,Italy,Netierlands,
511413278
446117
538476242
566346
2137172681:
401566
78941652626
577833
.
9391245
871772
1098676
057356
52208
34
5437
:488167220
1445124
179128
48
12261
655352305
79.
508169419
51
267514
26144
310
226
53_36
138212:44
12:444
702306337
I7.1765
68131.0131343
12831172
230286406
719160
:C77799837431
70045706
Bolglum-Lux, 164 220 484 :80 550 515 122 76 43 361 64 39 :60 243 70 636 22:7 4136
Spain,Canada,Korea Rep,
22:6er,Switzer:and,Anstria,Mex1cc,Sweden,Australia,Denmark,Poland,
82.
365
4844
5622
102
8
3
3313318
623
7442122
148347
176
3126
5425634
29150147
21300146
302173
2242418
69148265
12
4:
591125
3786935
156522638
22156126
233381
7104023
389191
74
153939
5047
1716
401
22353
23
131
13
8816
3
2241
I
1117
1371
293
69
1.25
7
104:
1644
63
9E2239
32712
4326
2163215
5467
97
52
720
1
15:011
1550
5
42
7
415310
443:19
4
4534
3619
531769
2419
11
A
1 C
1164
14
1272672
91917
3810
56883
634
247930979
319556436
.
279
25129
517
31343
E
112246131
24
381327772968
24912344231_9
210676161523
13861251
Norway,
Singapore,Turkey,Rort,981,2reland,
11
201917
20
12
1225740
31
:29
388278
77
485
226059
132
60
26115
53
44
7
125C75
36
4
14717
0
2
.
E
3617
5
20
4
1340
69
21
61932
15
'5
3920
4
3
2
11
36
_81718
237
1
57
55
15
6
5
E
11
18
187
346216284
.
22
21299
158
.
1010
1000970913
720Dove,loped NE9, 52 2,1 609 496 1034 119 43 410 721 113 309 29 157 47 1:5 1827 532 6862Deve:op7ng 71ES, 110 2136 792 682 483 140 263 145 266 152 257 ',90 254 325 131 1493 1754 10569
Total 25470 14783 10925 9721 9924 5684 4711 4086 3190 2706 2582 3115 2192 2580 3734 24086 11175 140664
rraiForest Products
Produits forestiersProductos forestales
VALUE 1000 000 US$ VALEUR 1000 000 US$ VALOR 1000 000 US$
Sales and Marketing Group, inrormation Di vis ion, FAOviale deffe Terma di Caracalia, 00100 Rome,ItalyTel.: +39 0657051-Fax: +39 0657053360E-mail:pubilcations-salesafao.org
LolUli Lee 6.51.01
.3414/7--!/".Y2.1V-1-:%1.4:VVeRitgd1tt.#WFIEFIE 7'0 PUSICHASE FAO PUBLICATIONS LOCALLV
POINTS DE VENTE DES PUBLICA77ONS DE LA FAOPUNTOS DE VENTA DE PUBLICACIONES DE LA FAO
ANGOLA CHINA Mundi Prensa Libros S.A. HUNGARYEmpresa Nacional do Disco e de China National Publications Castellò 37, 28001 Madrid Ubrotrade Kft.Publicagóes, Import & Export Corporation Te/. +34 91 436 37 00 PO Box 126, H-1656 BudapestRua Cirilo da Conceicao Silva, N°7 16 Gongti East Road, Beijing 100020 Fax: +34 91 575 39 98 Tel.: +36 1 256 1672C.P. N° 1314-C, Luanda Tel.: +8610 6506 3070 Sitio Web: www.mundiprensa.com Fax: +361 256 8727
Fax: +86 10 6506 3101 Correo electrónico:ARGENTINA E-mail. [email protected] [email protected] INDIA
Libreria Agropecuaria Mundl Prensa - Barcelona Atad Publisher LtdPasteur 743, 1028 Buenos Aires COLOMBIA Consejo de Ciento 391 751 Mount RoadWorld Publications SA. INFOENLACE LTDA 08009 Barcelona Chennai 600 002Av. Córdoba 1877, 1120 Buenos Aires Calle 72 N°13-23 Piso 3 Tel.: +34 93 488 3492 Tel., +91 448523938/8523984Tel./Fax: +541148158156 Edificio Nueva Granada Fax: +34 93 487 76 59 Fax: +91 44 8520649Correo electronico: Santate de Bogota E-mail:wpbooks @infovia. com, a r Tel.: -1-57 1 2558783-2557969 F7NLAND [email protected]
Fax: +571 2480808-2176435 Akatearninen KirtalaampaSubscription E1VP Affiliated East-WestAUSTRALIA Correo electrónico. Services Press PVT, Ltd
Hunter Publications [email protected] PO 80x23, FIN-00371 Helsinki G-I/16, Ansari Road, Darya GanyPO Box 404, Abbotsford, Vic. 3067 Tel.: +358 9 121 4416 New Delhi 110 002Tel.: 613 9417 5361 CONGO Fax:-4-358 9 1214450 7-el.: +91 11 3264180Fax. 61 3 94197154 Office national des libralrles Fax: +91 11 3260 358E-mail: jpdavies @ozemail.com.au populaires FRANCE E-mail: affiliat@ nda.vsnl.net. in
B.P. 577, Brazzav:Ile Editions A. Pedone Oxford Book and Stationery Co.AUSTRIA 13, rue Soufflot, 75005 Paris Scindia House
Gerold Buch & Co. COSTA RICA Lavoisier Tec & Doc New Delhi 110001Weihburggasse 26,1010 Vienna Libreria Lehmann S.A. 14, rue de Provigny Tel.: +91 11 3315310
Av. Central, Apartado 10011 94236 Cachan Cedex Fax: +91 11 3713275BANGLADESH 1000 San José Mal.: [email protected] r E-mail: [email protected]
Assoc.iation of Deveiopment CINDE Site Web: www.lavoisierfr Periodical Expert Book AgencyAgencies in Bangladesh Coalición Costarricense de Iniciativas II:unirle du commeme intemational G-56, 2nd FloOr, Laxmi NagarHouse No. 1/3, Block F d e Desarrollo 10, avenue d'Iéna Vikas Marg, Delhi 110092Lalmatia, Dhaka 1207 Apartado 7170, 1000 San José 75783 Paris Cedex 16 Tel: +91 11 221504512150534
Correo electrónico: Mél.: pl@net-exportir Fax: +91 11 2418599BELGIQUE rtacinde@ sol. rassa.co.cr Site Web: www.cfce.fr E-mail: oriental @nde.vsnl.net.in
M.J. De Lannoy. WORLD DATA Bookwell202, avenue du Rol, B-1060 Bruxelles COTE D'IVOIRE 10, rue Nicolas Flamand Head Office:CCP: 000-0808993-13 CEDA 75004 Paris 2/72, Nirankari Colony, New Delhi -110009Me I.. [email protected] 04 B.P. 541. Abidjan 04 Tel.: +33 1 4278 0578 Tel.: +91 11 7251283
Tel.: +225 22 20 55 Télécopie: +331 4278 1472 Fax: +91 11 328 13 15BOLIVIA Télécopie: +225 21 7262 Sales Office:
Los Amigos del Ubro GERMANY 24/4800. Ansari RoadAv. Heroínas 311, Casilla 450 CUBA Alexander Hom Internationale Darya Ganj. New Delhi -110002Cochabamba; Ediciones Cubanas Btxthandiung Tel.: +91 11 326 8786Mercado 1315, La Paz Empresa de Comercio Exterior
de PublicacionesFriedrichstrasse 34D-65185 Wiesbaden
E-mail: bkwellende.vsnl.net.in
BOTSWANA Obispo 461, Apartado 605, La Habana Tel.: +49 611 992354019923541 IRANBotsalo Books (Pty) Ltd Fax: +496119923543 The FAO Bureau, internationalPO Box 1532, Gaborone CZECH REPUBLIC E-mail: [email protected] and Regional Specialized
Arta Pegas Press Ltd S. Toeche-IVIttiler Gmbil Organizations AffairsBRAZIL Import of Periodicals Versandbuchhandlung Ministry of Agriculture of the Islamic
Fundaça-oGetúlio Vargas Da Ido Metro, PO Box 825 Hindenburgstrasse 33 Republic of kanPraia do Botatogo 190, C.P. 9052 Národni 25, 111 21 Praha I D-64295 Darmstadt Keshavarz Bid, M.O.A., 17th floorRio de Janeiro Tel.: +49 61 51 336 65 TeheranNúcleo Editora da Universidad° DENMARK Fax: +49 6151 314 043Federal Fluminense Munksgaard, Direct E-mail: [email protected] rraLvRua Miguel de Frias 9 Ostergate 26 A - Postbox 173 Website: www.bookselicom/triops FAO BookshopIcaral-Niterbi 24 0K-1005 Copenhagen K. Uno Verlag Mala dalle Terrn e di Caracalla220-000 Rio de Janeiro Tel.: +45 77 33 33 33 Poppelsdorfer Altea 55 001 00 RomaFundactio da Universidad. Fax: +45 77 33 33 77 D-53115 Bonn 1 Tel.: +3906 5705 2313Federal do Paraná- FUNPAR E-mail: [email protected] Tel.: +49 228 94 90 20 Fax: +39 06 5705 3360Rua Alfredo Buf rem 140, 30°andar URL: www.munksgaardirect.dk Fax; +49 228 21 74 92 E-mal!: [email protected] Curitiba E-mail: [email protected] Librarla Comnassionarla ~son'
ECUADOR Website:www.uno-verlag.de S.p.A. -UcosaCAMEROUN Libri Mundi, Librería Internacional Via Duca di Calabria 111
CADDES Juan León Mera 851 GHANA 50125 FirenzeCentre Africain de Diffusion et Apartado Postal 3029, Quito SEDCO Publishing Ltd Tel,: +395564831Développement Social Correo electrónico: Sedco House, Tabon Street Fax: +39 55 64 12 57B.P. 7317, Douala Bassa [email protected] Off Ring Road Central, North Ridge E-mail: [email protected]él.:+237 43 37 83 Universidad Agraria del Ecuador PO Box 2051, Accra Librarla Scientifica Dott. Lucio de MestoTélécopie: +237 42 77 03 Centro de información Agraria Readwide Bookshop Ltd "Aeiou"
Av. 23 de julio, Apartado 09-01-1248 PO Box 0600 Osu, Accra Via Coronelli 6, 20146 MilanoCANADA Guayaquil Tel.: +233 21 22 1387
Rencor Pubilshing Librería Española Fax: +233 21 66 3347 JAPAN5369 chemin Canotek Road, Unit 1 Murgeon 364 y Ulloa, Quito E-mail: [email protected] Far Eastern BooksellersOttawa, Ontario K1 J 9J3 (Kyokaba Shoten Lid)Tel.: +1 613 745 2665 EGYPT GREECE 12 Kanda-Jimbocho 2 chameFax-+1 613 745 7660 MERIC Papasotiriou S.A. Chiyoda-ku - PO Box 72E-mail: renouf @fox.nstn.ca The MIddie East Readers' Information 35 Stournara Str., 10682 Athens Tokyo 101-91Website: www.renoutbooks.00m Centre Tel.: +30 1 3302 980 Tel.: +813 3265 7531
2 Baghat Aly Street, Appt. 24 Fax: +30 1 3648254 Fax: +81 3 3265 4656CHILE El Masry Tower D Alarmen CompanyLtd
Librería - Oficina Regional. FAO Calro/Zamalek GUYANA PO Box 5050c/o FAO, Oficina Regional para América Tel.: +202 3413824/34038818 Guyana NationalTredIng Tokyo I nternational 100-31Latina y el Caribe (RLC) Fax: +2023419355 Comoration Ltd Tel.: +813 3275 8585Avda. Dag Hammarskjold, 3241 E-mail: [email protected] 45-47 Water Street, PO 80x308 Fax: +81 3 3275 0656V itacura , SantiagoTel.: +5623372314 ESPAÑA
Georgetown E-mail: h_sugiyama @maruzen.co.jp
Correo electrónico: Librería Agrícola HONDURASgerman. rojas @field.fao.org Fernando VI 2,28004 Madrid Escuela Agrícola PanamericanaUniversitaria Textolibros Ltda. Librería de la General itat Libreria RTACAvda. L. Bernardo O'Higgins 1050 de Catalunya El Zamorano, Apartado 93, TegucigalpaSantiago Rambla deis Estudia 118 (Palau Moja) Oficina de la Escuela Agrícola
08002 Barcelona Panamericana en TegucigaipaTel.: +34 93 302 6462 Blvd. Morazan. Apts. GlapsonFax: +34 93 302 1299 Apartado 93, Tegucigalpa
iZA-4*,isa
..7tR-0L7 ORA'Autt81-VMINOINHERE TO PURCHASE FAO PUBLICA77ONS LOCALLY
POINTS DE VENTE DES PUBLICA77ONS DE LA FAOPUNTOS DE VENTA DE PUBLICACIONES DE LA FAO
KENYA NICARAGUA SUISSE UIVITED STATESTextBook Centre Ltd Librería HISPAMER UN Boolcshop Publications:Kijabe Street Costado Este Univ. Centroamericana Palais des Nations BERNAN Associates (ex UNIPUB)PO Box 47540, Nairobi Apartado Postal A-221, Managua CH-1211 Geneve 1 4611/F Assembly DriveTel.: +2542330342 Site Web: www.un.org Lanham, MD 20706-4391Fax: +254 2 22 57 79 NIGERIA Van Diemen Editions Techniques Toll-free: +1800 2744447Inter Africa Book Distribution University Bookshop (Nigeria) Ltd ADECO Fax: +1 800 865 3450Kencom House, Moi Avenue University of I badan, I badan 41 Lacuez, CH-1807 Blonzy E-mail: [email protected] Box 73580, Nairobi Website: www.bernan.comTel.: +254 2 211 184 PAKISTAN SURINAME United Nations PublicationsFax: +254 2 22 3 5 70 Mirza Book Agency Vaco n.v. In Suriname Two UN Plaza, Room DC2-853Legacy Books 65 Shahrah-e-Quaid-e-Azam Domineestraat 26, PO Box 1841 New York, NY 10017Mezzanine 1, Loita House, Loita Street PO Box 729, Lahore 3 Paramaribo Tel.: +1 212 963 8302/800 253 9646Nairobi, PO Box 68077 Fax: +1 212 963 3489Tel.: +254 2 303853 PARAGUAY SWEDEN E-mail: publications @ un.orgFax: +254 2 330854 Ubreria Intercontinental Wennergren IMIllams AB Website: www. unog.ch
Editora e Impresora S.R.L. PO Box 1305, S-171 25 Solna UN Bookshop (direct sales)LUXEMBOURG Caballero 270 c/Mcal Estigarribia Tel.: +468705 9750 The United Nations Bookshop
M.J. De Lannoy Asunción Fax:+46 8 27 00 71 General Assembly Building Room 32202, avenue du Roi E-mail: mail wwi.se New York, NY 100176-1060, Bruxelles (Belgique) PHILIPPINES BolcdistrIbutören Tel.: +1 212 963 7680Mél.: [email protected] International Booksource Center, Inc. do Longus Books Import Fax: +1 212 963 4910
1127-AAntipolo St, Barangay Valenzuela PO Box 610, S-151 27 Sódertalje E-mail: [email protected] Makati City Tel.: +46 8 55 09 49 70 Website: www.un.org
Centre dinformation et de Tel.: +63 2 8966501/8966505/8966507 Fax: +4685501 7610; E-mail: Periodicals:Documentation Sclentlfique et Fax: +632 8966497 [email protected] Ebsco Subscription ServicesTechnique E-mail: [email protected] PO Box 1943Ministere de la recherche appliquée THAILAND Birmingham, AL 35201-1943au développement POLAND Suksapan Panft Tel.: +1 205 991 66008. P. 6224, Tsimbazaza, Antananarivo Ars Polona
Krakowskie Przedmiescie 7Mansion 9, Rajdamnern Avenue,Bangkok
Fax: +1 205 991 1449The Faxon Company inc.
MALAYSIA 00-950 Warsaw 15 Southwest ParkSouthbound TOGO Westwood, MA02090Suite 20F Northam House PORTUGAL Librairie du Bon Pasteur Tel.: +1 617 329 335055 Jalan Sultan Ahmad Shah Uvraria Portugal, Dias e Andrade 6.P. 1164, Lorné Telex: 95 198010050 Penang Lida Cable: FWFaxon WoodTel.: +6042282169 Rua do Carmo, 70-74 TUMMYFax: +60 4 2281758 Apartado 2681, 1200 Lisboa Codex DUNYAINFOTEL URUGUAYE-mail: chin @south.pc.my 100. Vil Mahallesi Librería Agropecuarla S.R.L.Website: www.southbound.com.my REPÚBLICA DOMINICANA 34440 Bagcilar, Istanbu I Buenos Aires 335, Casilla 1755
CUESTA- Centro del libro Tel.: +90 212 629 0808 Montevideo C. P. 11000MALI Av. 27 de Febrero, esq. A. Lincoln Fax: +90 212 629 4689
Libraftle Traore Centro Comercial Nacional E-mail: [email protected] VENEZUELA
Rue SoundiataKeita X 115 Apartado 1241, Santo Domingo Website: www.dunya.com TecnI-Ciencia LibrosS.F. 3243, Bamako DOM F - Centro para el Desarrollo CCCT Nivel C-2
Agropecuario y Forestal, Inc. UGANDA CaracasMAROC Calle José Amado Soler, 50- Urban. Fountain Publishers Ltd Tel.: +5829594747
La Librakte Internationale Paraíso PO 60x488, Kampala Fax: +582959 563670, rue T'ssoule Apartado Postal, 567-2, Santo Domingo Tel.: +256 41 259 163 Correo electrónico:B.P. 302 (RP), Rabat Tel.: +001 809544-0616/544-0634/ Fax: +256 41 251 160 tclibros @attglobal.netTél./Télécopie: +21277501 83 565-5603 Fudeco, Ubseria
Fax: +001 809544-4727/567-6989 UNITED ARAB EMIRATES Avenida Libertador-EsteMÉXICO Correo electrónico: [email protected] Al Rawdha Bookshop Ed. Fudeco, Apartado 254
Librería, Universidad Auteonoma de PO Box 5027, Sharjah Barquisimeto G P. 3002, Ed. Lara
auPin90 SINGAPORE Tel.: +971 6 734687 Tel.: +58 51 538 022
56230 Chapingo Select Books Pte Ltd Fax: +971 6 384473 Fax: +58 51 544394LI bros y Editoriales S.A. 03-15 Tanglin Shopping Centre E-mail: [email protected] Librería FAGRO
Av. Progreso N°202-1° Piso A 19 Tangl in Road, Singapore 1024 Universidad Central de Venezuela (UCV)
Apartado Postal 18922 Tel.: +65 732 1515 UNITED KINGDOM Maracay
Col. Escand 6n, 11800 México D.F. Fax: +65 736 0855 The Stationer/ OfficeMundi Prensa Mexico, SA. 51 Nine Elms Lane ZIMBABWE
Río Panuco, 141 Col. Cuauhtémoc SLOVAK REPUBLIC London SVV8 5DR Grassroots Books
C.F.. 06500, México, DF Institute of Scientific and Technical Tel.: +44 20 7873 9090 (orders) The Book CaféTel.: +5255335658 Information for Agricuftum +44 20 7873 0011 (inquiries) Fife Avenue, Harare;Fax: +525 514 67 99 Samova 9, 950 10 Nitre Fax: +44 20 7873 8463 61a Fort Street, Bulawayo
Correo electrónico: Tel.: +421 87 522 185 and through The Stationery Office Tel.: +263 4 79 31 82
1015452361 @compuserve.com Fax: +421 87 525 275 Boolaihops Fax: +2634726243E-mail: uvtip @ nr.sanet.sk E-mail: postmaster@ theso.co .0 k
NETHSRANDS Website: www.the-stationery-Roodveldt knport b.v. SOMALIA of fice.co.ukBrouwersgracht 288 Semler Electronic products only:1013 HG Amsterdam PO Box 936, Mogadishu Microinfo LtdTel.: +31 20 622 80 35 PO 80x3, Omega RoadFax: +31 20 625 54 93 SOUTH AFRICA Alton, Hampshire GU34 2PGE-mail: [email protected] David Philip Publishers (Pty) Ltd Tel.: +441420 86 848Swets & Zeitlinger by. PO Box 23408, Claremont 7735 Fax: +44 1420 89 889PO Box 830, 2160 Lisse Tel.: CapeTown +27 21 64 4136 E-mail: [email protected] 3478, 2161 CA Lisse Fax: CapeTown +27 21 64 3358 Website: www.microinfo.co.ukE-mail:[email protected] E-mail: [email protected] kitermediate Technology BookshopWebsite: www.swets.n1 Website: www.twisted.co.za 103-105 Southampton Row
London WC184HHNEW ZEALAND SRI LANKA Tel.: +44 20 7436 9761
Legislation Services M.D. Gunasena &Co. Ltd Fax: +44 20 7436 2013PO Box 12418 217 Olcott Mawatha, PO 80x246 E-mail: orders@ itpubs. org.0 kThorndon, WellingtonE-mail: [email protected]
Colombo 11 Website: www.oneworld.org/itdg/publications.html
Oasis OfficialPO Box 3627, WellingtonTel.: +6444991551Fax +6444991972E-mail: [email protected]: www.oasisbooks.co. nzi
a1.J I 63 1.4.111t 11.3 Ls.96
SamaterP.O. Box 936
Mogadishu
MERICThe Middle East Readers'Information Centre
'41111 lc«JiJo 45,.LIs J.!
iJA11111 11141
(+Y V) rt1T'AVi Ti . TAMA :.._111..a
(WV V) rE [email protected]
La Librairie Internationale70, rue T'ssoule
B. P. 302 (RP)Rabat
Tél.frélécopie:+2127750183
LA,A)11 I jiedlo VV a.9.114.G. rtaal.
j1-4-tfil
(+c1V11) VTI1AV
(-PVN1) TAUNT :[email protected] II su.,
41.:411 JF./KJ 14. CytAi1* I .5141 Lri jJ1JLJi,I...J.c.J..111 IA ,r,11.
Sales and Marketing Group,Information Division, FAO,
Viale delle Terme di Caracalla,00100 Rome, ItalyTel. +39 06 57051
Fax +39 06 57053360E-mail: [email protected]
atat$J-161/
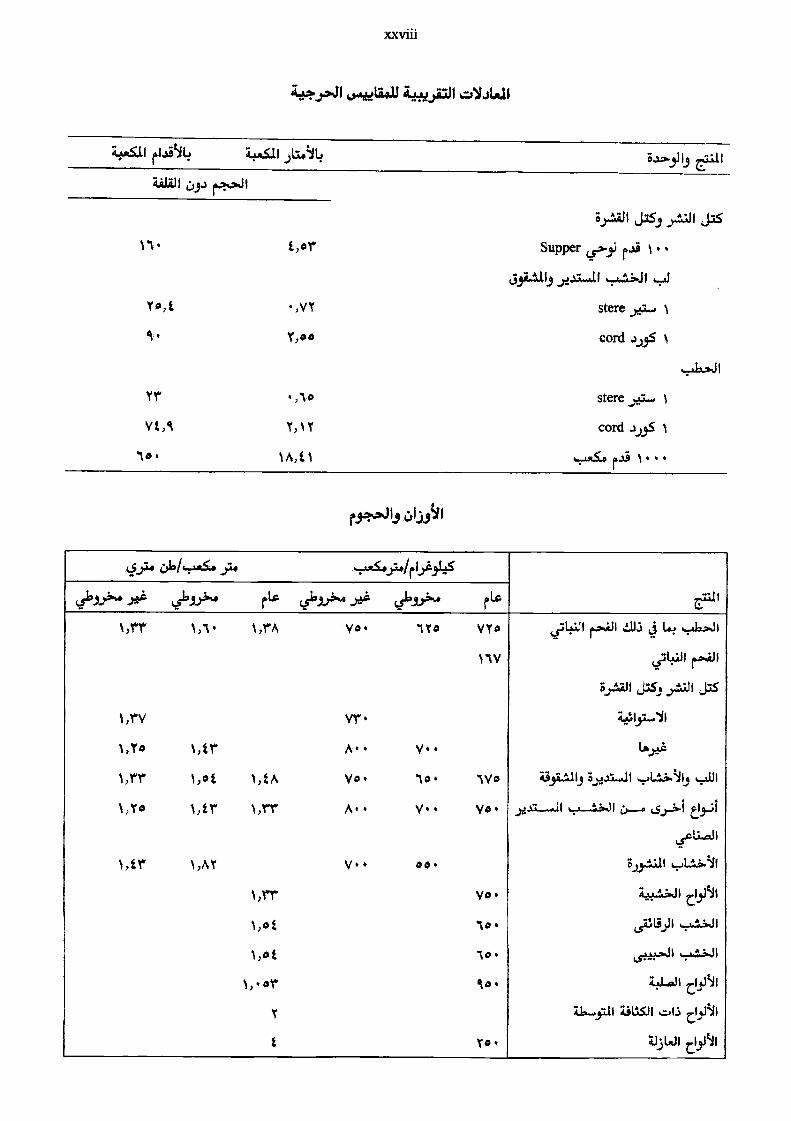
'4411 ti.Sitil? 4411 ts.'4.1k ed,:LW 0,9J 1.-1.,00,J1
3.153 jt J.75
11. t,or Supper cra...0 raj 1.
3
1.04 , V Y stere 1
y,ao cord ..1,26 1
yr ,"1, 0 stere
Vt,A 1*, 1 Y cord S1A,t1 ihrutS4
xxviii
.4.1. J.141 u.LWi .)14.11
4:0.331$1
0...)141 C:141-444,..):." ,.704.4,)14(.1.AiiS
rtA 4.61.44
%,ry
1,1°V
1,Y0
1,rr
1,Y*
1,ir
1,1.
%Jr
1,0t,
1,1r
1,AY
1,1°A
1,tA
1,11°
1,rr
1,01
120 t
1,*ry
I
V*
Vr
A
V*.
A.*
v..
1Y0
V
la
v..
0 0 6
WY*
1 lv
Iva
va.
vo.
1. o .
ioid,*
To.
tid.11 ra.1.11 41.1.'s 4 Lh. 4....daaJi
.454:411 f.4.431
5.4.01 j....4.9 ...4411 o
6,14.a
ra,Ltut3 besi...li ,...,L,....a.'*3 .;.J.U1
JALL...0.11
k»..thal k.rr .1".11
42:13)11 ..?..t,,141
,ts..***4$ ....14.:,.J1
:i.0.11 ti3hi
Ziu.sitt attiii
4136611 &ell
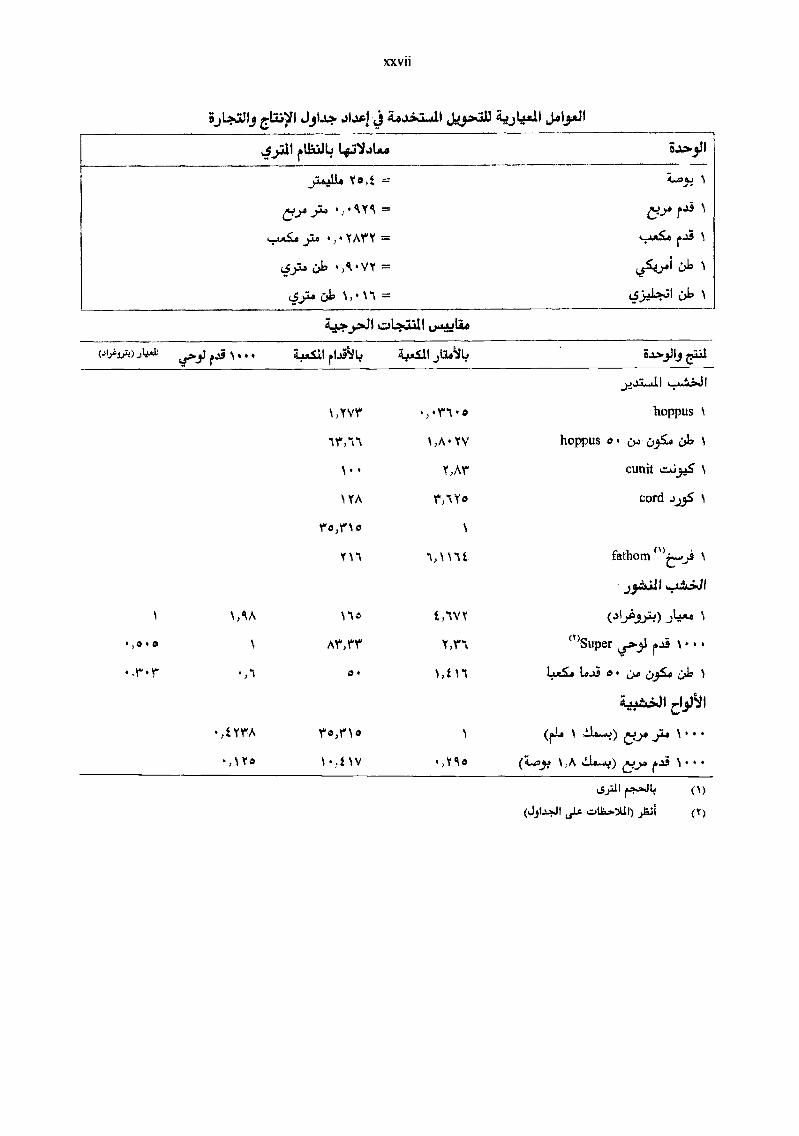
0,0.0
ji4adit t3 J,Ø. 4,44.ja.411
4)21 ettato 1.4041.14
J14.,16, Ysl,t =
c.4,y1 Ark =
510 =
cA3 V =
4544' cjIp 1, .1 =
4-14*-1J144Ic.f.s&Lt*
1 AA
1
,tYrA
,1Y o
xxvii
N.,yvr
1r,11
YA
ro,n0y
116
Ar',1`14
o.
ro,r1g)
,t 1V
jelp.11
1LIrxr.a.11,
(431.x.1../1 LfLe c.4.6..v.)L11)
15.1"..01
C.IY) 1"19
0..,346.zi 0.6
iia,...011 eat
)LJJ I
hoppus 1
hoppus o C.w c.)354
cunit 1
cord 4)35 1
fathom
ji'4 .4,11
(I)SUPer 1.46
6,3 454, &I,
cy'it
I
Ci-oy A .114-y) d t 4
(Ayili,),1441 Zpiti rishi?
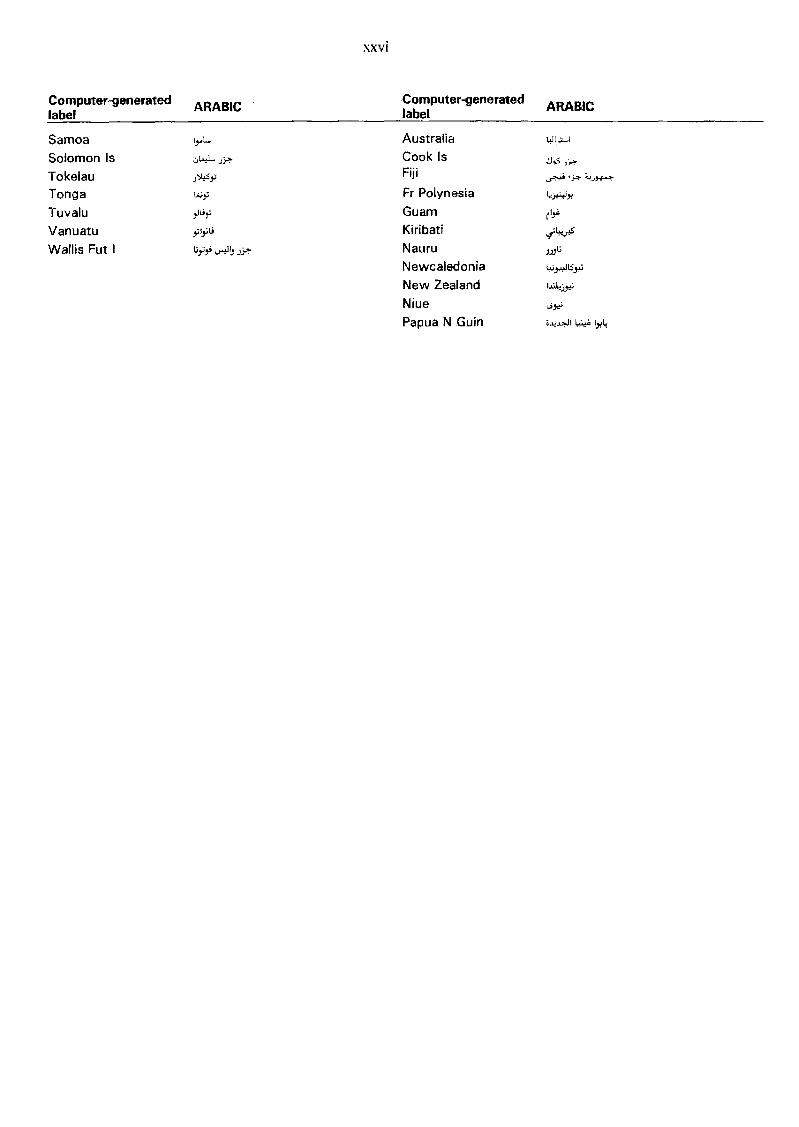
Computer-generatedlabel
Samoa
Solomon IsTokelauTongaTuvaluVanuatuWallis Fut I
ARABIC,
3.5t49:,
wi;
xxvi
Computer-generatedlabel
AustraliaCook IsFiji
Fr Polynesia
Guam
KiribatiNauru
NewcaledoniaNew ZealandNiuePapua N Guin
ARABIC
:45
43LP-)
14:94144
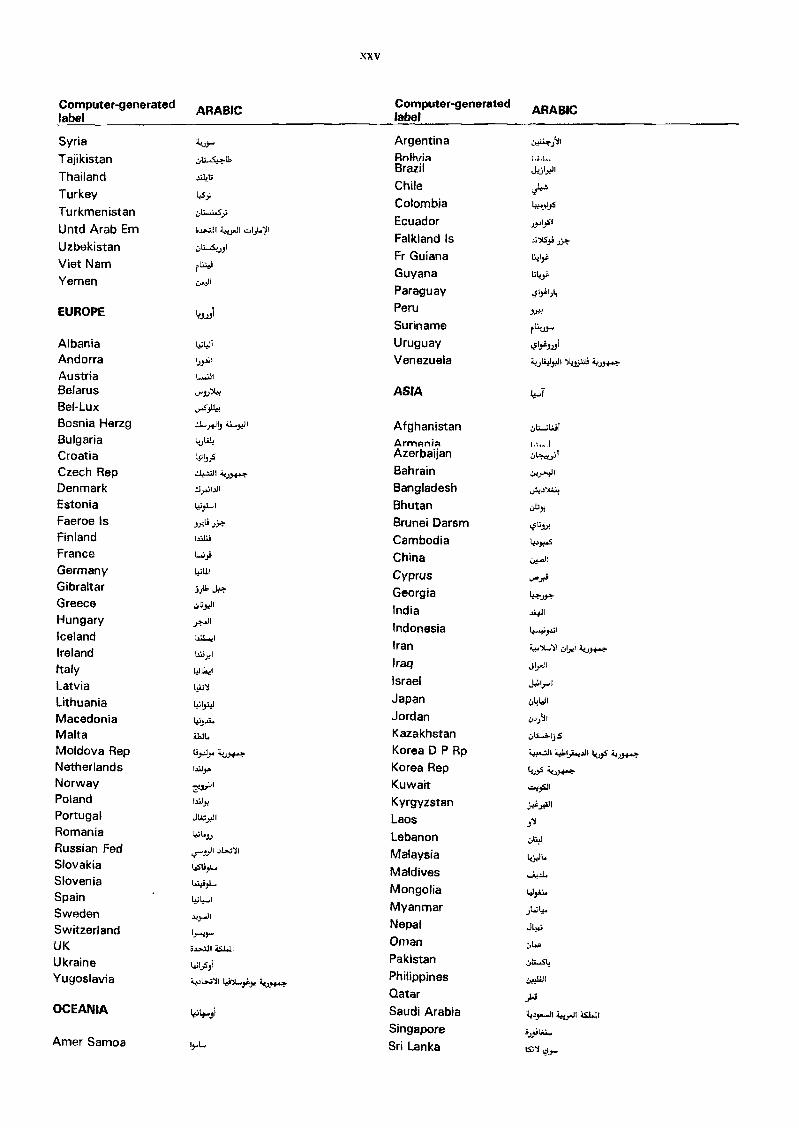
Computer-generatedlabel
ARABIC
XXV
Computer-generatedlabel ARABIC
Syria 744}. Argentina 4,434.,'/I
Tajikistan ,;,11 ,(4.1.11, Rniivia i3.i..Brazil ..161.,d1ThailandChile 44-'Turkey 1:.s.,;Colombia L....)/JSTurkmenistanEcuador
Untd Arab Emz,.1.,..11 i,..4y4.11 4:,I.,141Falkland Is A.ÒLS.0 J.it.Uzbekistan ZAL-&.'..01Fr Guiana 116i.Viet Nam FL4i Guyana ut,)
YemenParaguay
EUROPE 4:.tiPeru 1*Suriname rkt)-
Albania L,;14; Uruguay L,51,k1.)ii
Andorra !AA:0 Venezuela ze..42i.,..J11.0:+zi i,+.9++
Austria L.....li+
Belarus 6+1.1)1÷: ASIA .4,I
Bel-LuxBosnia Herzg :.1-0111 ,..L.,,,,J, 1 AfghanistanBulgaria lejlA-1.1 ArmaniaCroatia Loi)s Azerbaijan 4.,L1w..1:.1
Czech Rep .:4-1:j' zeJ}e....Bahrain 4,0-,.*11
DenmarkZ.1..*Jiall Bangladesh 0.5.0`14:4
Estonia 1,4-1 Bhutan ,,,by,
Faeroe is ..trItisi?' Brunei DarsmFinland Li.ai Cambodia loy,...5
France 1...z...,i China ¿J....4k
Germany 1+;11i Cyprus ..,.,0Gibraltar 3.,u, J4-1- Georgia 4... ..0..Greece 4,14,JI
India 441Hungary ,":./1 Indonesia 1+4,41Iceland 1.1.11-0
Iran 7,...31.4.il ZAH,I 4.94,,,i.Ireland 1..C.1.7f I
Iraq ,j1,41Italy 41.14.il
Israel pr.+Latvia 4,1Lithuania 1,615.0
Japan 4)44.JI
Macedonia 16;3E4Jordan 4.,,,,,,tJI
Malta i.1.11.. Kazakhstan z,U-,..&1,)L5
Moldova Rep ti.r.,.. 4.e.4.14.4. Korea D P Rp ..44.4.i' I 4.1:itoon 42,5 zeasw.-
Netherlands 14.1y, Korea Rep 1",05 "?2,4...
Norway ce-ti' Kuwait .,..,00Poland 4:41 Kyrgyzstan .id-i'shill
Portugal J1:4*.x.11 Laos .0Romania
,!.a..1,.) Lebanon ,..+14)
Russian Fed 4...n ..11.411 Malaysia L604..Slovakia ,..51:03.1- Maldives ,....Slovenia L,s41/2).-Mongolia
Spain t-_,;11-.1
MyanmarSweden .4,-)1NepalSwitzerland
UK '44..41 4141Oman
Ukraine14:4.,s3i
Pakistan ,:,11.511
Yugoslavia i.oL>411 tei/.....tkte Zwi..4. PhilippinesQatar
..44*
OCEANIA LiAlumli Saudi Arabia ir.,y-11 iityJI '45.4.11
Singapore .i.,,,ii.v.... ,
Amer Samoa iy.,L, Sri Lanka
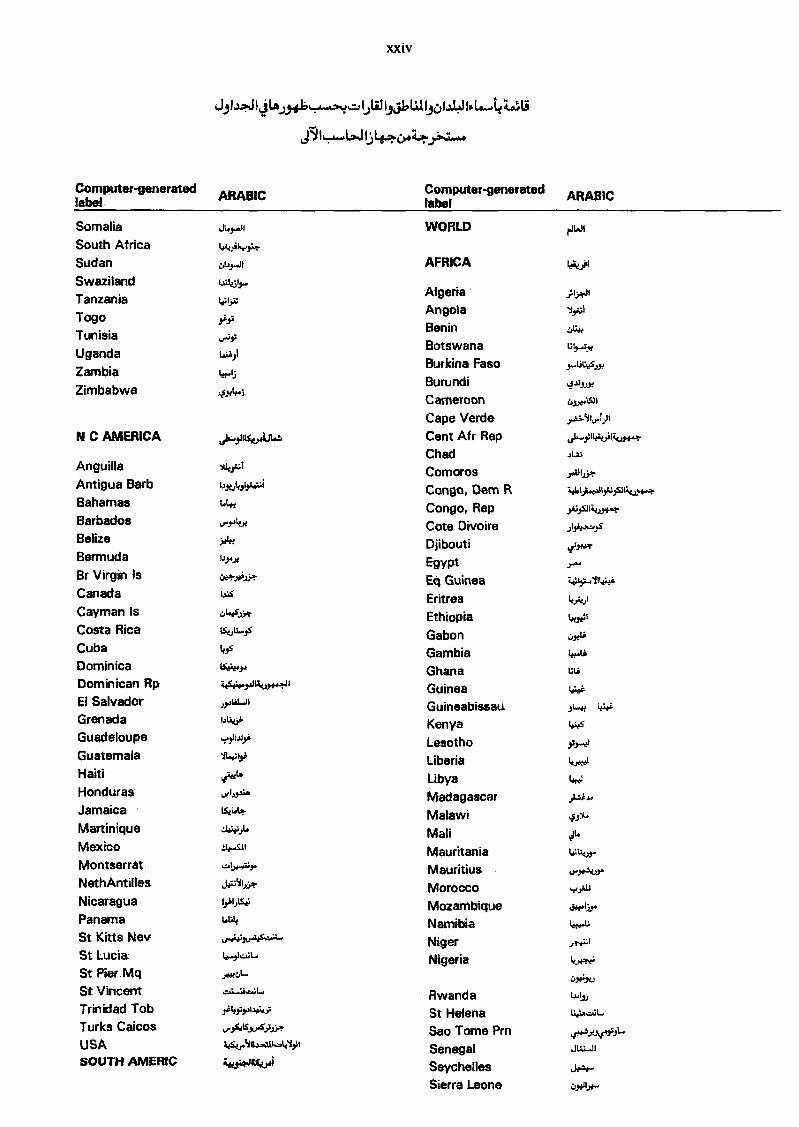
xxiv
4.131.1.1,1 1.) tit 1_01, U1130.411,14,.....te Lai
4.4-114-r.6.611,34-.1.0410,t.
Computer-generatedlabel ARABIC Computer-generated
label ARABIC
SomaliaSouth Africa
J41."11
kokiikeiNt.
WORLD
Sudan AFRICA keit)41
SwazilandTanzania
14105.
t.e1)11
Algeria
Togo Angola
Tunisia ur4t;BeninBotswana
UgandaZambia
1.40Burkina Faso 3-444JY
Zimbabwe 411144iBurundiCameroon
4.1.01
40431
Cape Verde
N C AMERICA 4),-.0itsteUt.' Cent Afr Rep 4641 'W010+4044*
AnguillaChad
Comoros
414:,
Antigua Barb 10.Y4t01.044.,1 Congo, Dam R 1461,1441341,04424.2rBahamas Congo, Rep Asitko.t+-1-Barbados urPitrt Cote Divoire J1310,44;0
Belize Djibouti 4,./01*Bermuda b.,.. EgyptBr Virgin Is Eq GuineaCanada EritreaCayman Is utts.uor Ethiopia k.okuCosta Rica istA4 Gabon 4*Axii
Cuba tos Gambia 1.aDominica GhanaDominican Rp 4544148kot.fili Guinea 10:4
El Salvador Guineabis.sau it-41 tog'Grenada
Guadeloupe
Weal,
44,1141.0
KenyaLesotho
441
Guatemala 16,01.0 Liberia td."sei
Haiti Libya tott)
Honduras MadagascarJamaica L5itAt Malawi 45.04Martinique 410:so,L. MaliMexico 4_541
Mauritania tiatorMontserrat MauritiusNethAntilles MoroccoNicaragua MozambiquePanama 4tat NamibiaSt Kitts Nev 04#1,2,45',401... NigerSt Lucia Nigeria toeqsSt Pier Mq
0.1;14r
St VincentTrinidad Tob
4.4-Zahzu'L.,
.0-4.tuf.a.44:7
RwandaSt Helena 1.410.4.6L
Turks Caicos vos.ats.,tes)»t Sao Tome PmUSA zosoNs.u..w....0.341 Senegal JIALJI
SOUTH AMERIC 4,1441041 SeychellesSierra Leone
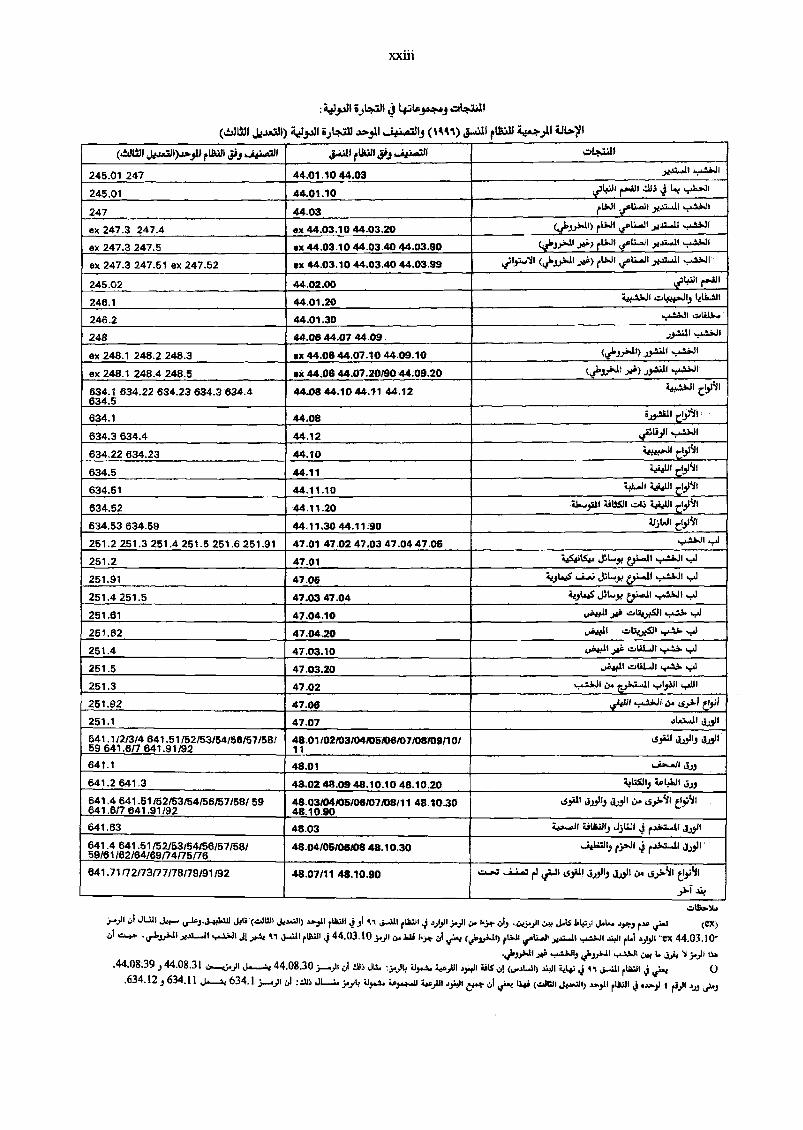
(aLtl,k.d.i11) ai.J149 jl4.14,111, ;,1*./.1113 (VII) j.411ftri1/ klAktti 414/
4,1 ..)L1.11 rtial 43i Vt .00 6;1- .01.3 cPIS 4.1.3 teX),02-.31.,..1:..111,4...1d VI j,:..11 tt11;11 4 44.0310 cokto.,u) rwt sesualt iJl 441i r1.1 ajttll "ex 44.03.10-
4,1.1,1.11 chN tia.44.08.39 )44.08.31 44.08.30 2,.....)1z,1 4iu iiJytx (0.41,...11) .3:01.0.0 4 A.% 4.4.ti twit 4 O
.634.12 )634.11 634.1 :41E. Zaajoi .1101 to.i. 4,1 ijs.4 rItta 1/4; cw.)1 t rk,111
(443.0»..t40,301D awl jij 411,4i j.,411f LIAO - +. --4141 ..:11.44.19
247245.01
).4.1...11ue.t.i.JI
245.01 i,1R1 1411 roll! ols.:, 4 Le ....6...11
247 44.03 eex 247.3 247.4 cx 44,03.10 44.03.20 (e eex 247.3 247.5 cx 44.03.10 44.03.40 44.03.90 (e e
245.02 44.02.00 3ji _t
11111111144.08 44.10 44.11 44.12
IMIIIIINIIIIIIIIIIMIIIIIEll
ui
Jiao...... cvil
C
246.2
634.1 634.22 634.23 634.3 634.4634.5
C
C.
C
4I'
4,4U tL*i JI
641.1 48.01
641.2 641.3 48.02 48.09 48.10.10 48.10.20 ;AO) 41.40.11,30
641.4 641.51/62/53/54/56/571581 59641,6/7 041.91/92
48.03/04/05/08/07/08/11 48.10.3048.10.90
LS.)1114403 39, .:,, d.o.til e.oi
641,63 48.03 40....11 UMW./ JAI 4r..,..44.4; wit
641.4 641.51/52/53/54/56/57/58/59/61/62/64/69/74/75/76
48.04/05/08/08 48.10.30 ...41411 0....11 4 1,...1.34....0 43.011
641.71/72/73/77/78/79191/92 48.07/11 48.10.90 - ',II.; ri 1..ii djail joii) ,14,01 z,,.. ,021i t..!,0
..,s,i 4f
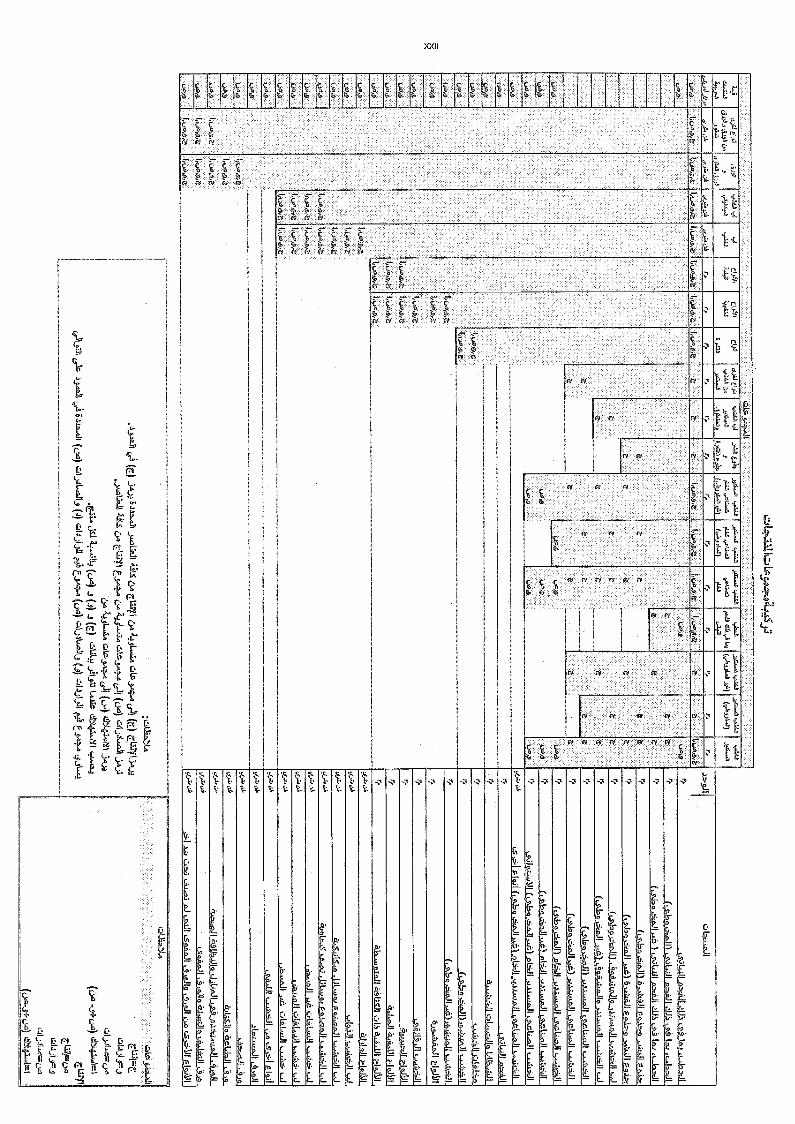
0.-S5_1.0J1100.
L5JJ1-",,
YJJ
It4.19,
SJJ45
5.5*4
L55,45,
tjJ6
...5,1:5 -.5i...1
C'J4'
CO
'C
L5'
JJ-J e'.0'Lr:A
:.-.1
'Jzze3.4.
"a'A4,4-',-',
...:.....,c.,...
J5 "
5.Z........1
5.L5....!5
,...
J.r
,.'
Ifuog,t:tc.p.,69,t
114.e.`tt.°'
ItA
I:
1-5,/5)lot.P
ra
1.05,2
t.01ZZ
4.44.4
114,04,7'.
Le '4
4.t,D
to1.50/Cr"51
500,9r9ri`.
1.04
1,4IrtoJe,ii;
4.5..55
/..-11'=4
'+ (A
.5", JP)
(,AL,-"j)
4,0,91..554,9
4.04
4.4
.4.01(E
) jJA
iU
tkitS',
ALA
clitt(E
) CLIT
IL3A
ZiL
S cjAE
L:011ey
all (04)4.1.04.414
CA
C,jA
ikal,f11
dt943.111
(L).0)(E
)c41.14
431_0 Sc. kyrell51.1a.4
(04) a,)31-.2.1i,1((.4) C
A.O
L.01.3(9)
Q14.A
111ft6
re
ifrz ,/tok
54,-'4'
xf.,''V
.1',014
cot.", ",-.11
tc4
LìJI pthJtSJS
(04)9Fq.L
.,.1Poi?'
.§.a.i....kaJlo4,441
(...54asaJI).
b.J1L
.
(.6h..0.3.1.m
ilJik,'(0.6o
5"-II
-1.5A fI4ji G
SQP.%
5655>J1
1,47W1,,d4j,,42
1/4..160 c,
6.0-"'^^/1 t10-1111
aJaa.11 &dull] ?-q.4/1
oh...Lucia 4:91.2.5J1
MsJV
I
ijtJI6.9JVI
jj4ww
e9.izu4.11
6,491A.4
Pai.o.o.11.011
-01
6..o.UIJi..>
Ii,iI
ts71...LA
.11 341
.41q_
6_91....1.r..11(59
.4,411.1
jai owl
FIN91
1111='
cf...1J4,6=04,
(u6 -.1+L),a)
dt941.1=1
EI:41
E.11.1=
0.c.
dt1.4a.',1=1
5JJ,9
re
t%,tt
WE
D
te.4It4.4oLT
414:1*
letJj,9/.7.5
irk.e.f9/e
rtre
t9rt
r.t
t1/5.5.445
It4.o.art
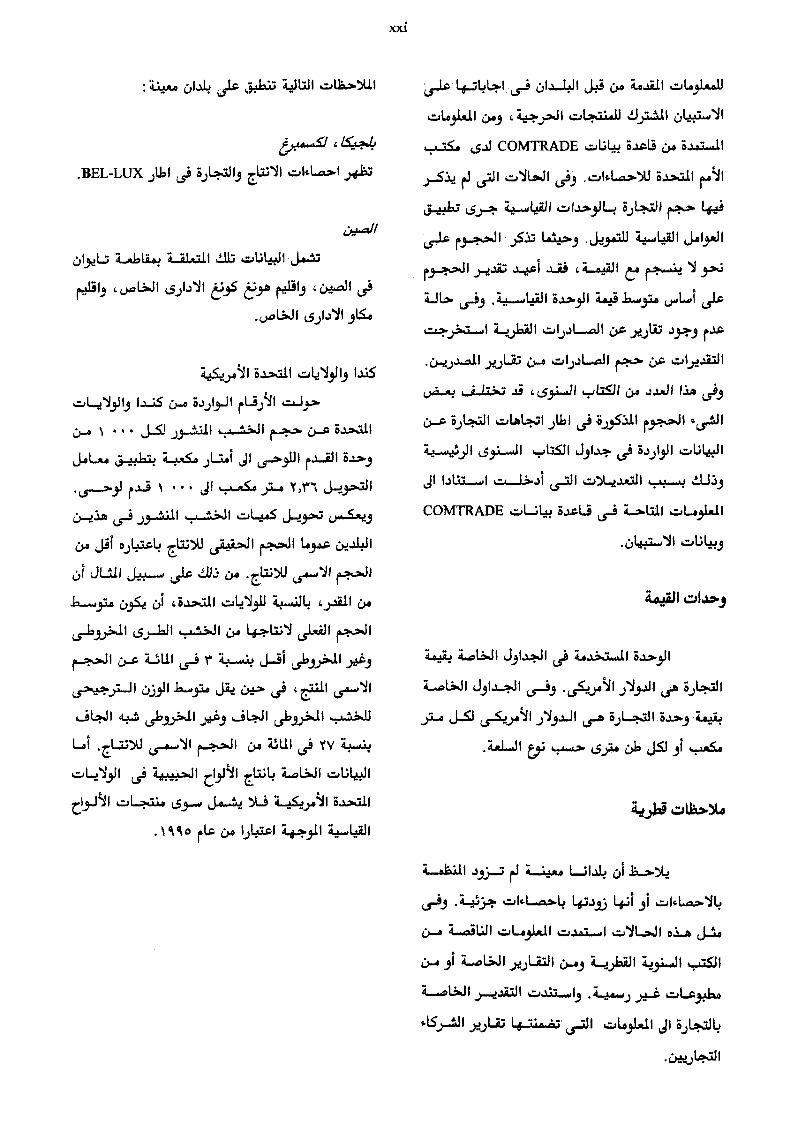
1t.0 01.114 Lilo z412.713
b., 0 14.74$
.BEL-LUX j11.1 ijiLt ,4i
Lklotio.; JI3
&:,ye 14i13 zho,..,ail L5.4
.00lik11 J1..)"11 315.4
1.1.4"
15.)
J-5./ j3.JLI,..?....t6J1
JAULO :t..÷$64L$.)
41
b_d:ub j_dya5
C.).0JI ULsL3.7.)tiji...")>J1 JI 1.03..s.iiI
JI.111 jic a.) co .s1Z)1.1
cA 0i =.4-,:J1.1 jail% I CO
L5J-6J1 r.1...a.11
ta,...11 L11.1 r
J'÷>' CAVI ea!4 L4JILs6»:,..11
Loi Zall tsiYVLr
LA9.11 c1.01 sLaiJI UiIc13-1:11 Ls"-,J U*4-44.14411SLI
.'° rig. co I jto.a. I '44.1.3.1.1 4.4111
L5-10
11
jai CO1VITRADE Ut Ba.a13 454 Ba.e..L.41
(61 t5111 4.1.43aW C.Jaal.' I r.4411
./41
Lrig 14,.. .J0-3411.1 4.4141 J.41Y41
*xi;iJ*.L.4.601 e
ts..k, ata
Jai ILJI jti; s_ga,i rag.
,L53.L.J1 ...A:LIP co a.104.11 lara Lit j
3.)10.41 LLiJU:31 Lri :01)35111 1,3.1
L531-.Ji Ji i34j1,11
Ji Lral
COMTRADE U1 i.Lï0-3
4.04.1.11
74.4yAJ: LAW{ Lo.:,.zuo.1.* I Baa.,Il
*j....al.W1 J3i.Ji jiILsa 5_1E41
5.1.4 J-5.1 (.5.5.4)4:11 A.1.11 Lra k)L.41
.Lti...11 tit 4.1.4.> c>6 J5.131
1-11.3.14
141-aalf L4..113 1.4.;i 0.--JI,Lotalli
(5,-4 pia J-to
45.4 *LitO I c1,43Le.)41.11
y.04; 1 itt h:r1.03141 J1 B.)L1.3JI.?
L.5:4111 1..3411 ..s..11.*J 14:1 .1.,V
*I%
47,14.-1.41 J1 LJL:c.C...1.1 cl.'41.;
1
Ja%JI%.-..>1.4.%? J1 bl..).141 oa..+1 LJIiJJL5 J.-2N., a..ta.11
04:7:4-4111
!Z.t-4.4 LiLs...4Ji Ls'itee.I IIL5.3JYJ .;.0.411 thJ cj1.5.-J1
J.3.0%1Lg
C)..0 tora,!..44.1, L01.Ws
01') 4.4A
'4+4.6-441 cygil
Z....ALLAII 3iiS,L.k) Lric cis.).411
4*4.4 .4.1t c.:411
tar4
e3/1J1
3#434;L.JILr's tyi
LQL.'Ji 'JI0 1A :.1.41
J1
(>4. t C.).41 e.A.T11
b5.0 104/00, 114. J1 " .44A, I CO 1 sLL; I
j La; "Jt DLI
jjyr. .11 J)L. .,
JL J1.o :9 ..11 4.701,41..1%:.1
X X
4-.06%31 U .141
1 0-4 J.1...c J1 4-411,, 4.../..110 JAL...11
L.4 J1 .141 J
(e.,1 11 c).4. 1.4.1Axe. 14%;)
LLJI Ji..:J1.1.1,17%11
A lit.; Ls.a es.o..1j..s....15.0.11
4.,41 .41a )4 AA LA, stiAl
0.7%11 c)1.41
1 Z.41.1....11 .14111)
jte Lsia r!11 .11
43431 "6 r.1.1.J;) r,,k)1 al.A3
t. ..1 I .4J12,.. j.13
.401
C.».41 1
J1......1z;Ji ;lib 41E., L.5.1.zi
a:)../9) 4,1.341 ti)t o ,.)1J
J.)1 .)4, .(1-La.o..1 7.15 4.4.
.41.6313 4..:441:9*i te.01...1%0J1 (is - .1.1 1
910.1":"A J96:41191 L554'..41. 13..3,11 ,7A3 4,4
6r"U C)4 >1)
ej..03 &Jail! ji 6...a:411.3 Xfl ÌJiLsio
:jSI L1.0 b.;t1I 0.&443
l+-5.31:43 1 Z)..
t a17A 5-0.) Ls,L4$11 19
&.4)5.11 a.o.J1
(51 ; (oi JI sja1 jjyill (45W)
'L53 7L2,1".."11 Lv....,5,11
:1ci tri
1)(+-4.11 611
1-1.0.11LOLL" (54, (5:`,14.)÷...411
t3.13-11 31 Lsi.).01 -41.11.9 j1..)111 :6144Y. 4/..3 0-rzti>43
S4-J1 d."1 L14 4»....5:4* Litif ksiolf
ji U6iIc).0 JAP Z.t..01{.3
ji jL,AI l1.44)
ji
.1/4,111 ¿j1.;10411.1 .1+45.11
xix
3.3-1.13.11
J.4..;z3) ;::1;1113 Kea'
lt it ,TAJ Lo."140.11 r.:,.."J1 31.2i ti..0
Jge-45.9) J." WI.5.Ij1.1.0 L.5.9 r j.).01
13.2i1.3 It13;i `--.'"I-1* J1 ji1.1
;14411 D.3.10 kjk.+6.6.1 (:).>4.8 L)s.'".' 1, I
ij 4-53111 3-9.113 Ci.),11 C.)4 (.$. 3'411
.1.1! tsi
4:3".))J1., 3_19.11
f61 Lid!) LoL.:,. old." 4141
r
jA9,1).7J13cUI
tp-1,011 cw-J1 Jo -4.'; LS t,!-U.1..».4.9 C640.03.11.9
L,J1.9 z.,L.3.1041 co L5
(3o JL.t>,11 J. )
.c.0)111., L9Ll:411 (3j3
jgal j3JI j.).3.111 ji,f1 Lo.f) 411.11 (.53
).1.* t4i t14.3 330,ifi ra:a.a1
-2.9) iiLJIjc...q...t..#111(iJ j
Sto -4.11., 410 jib &IA...1%4n J 13.1,
I all) $ I ajii 3i 0......24.13
6.:41 trti j:6 s1.# cto loyto 4-53-11.1 .91 C.3411 63..)..0 ....)÷tf-L" (-5.04
Lralt .44,1.411 JLJth jj1 3.101 34,11...11
ts o46t-ax:*-1,3.4.-oz L.5.21t .6-1s 33-Ji(U (3IpJ1 4:419 j.)99 (al:34 0-0.fr-19) 1. v-41
j.).9-11 L,01:".04;1.)...O41 ,344,11 (5-0 tylg Loll") LJl J4).,1-4:11 (>43 tp.1.0.4
1/4.. .41)
63-41 3)3.113 5.1931 a L5e!.0:11L5)-1 4:(1).-A t1.56.;1 71-iLS
J31-111 3 0,5 AI.J1 ,j4.40
1 c)-0 "4.4",..0J1
ty I ey4 Jr.) c)1.)..1.14113*.4-4.A.1.113
j.2-11
j..).5-3 I ("J.. ;t11 .J.4001;15.)15Z .Ltjj,-I I*4-1)0.1 f .7oLutii
j.).93 13 J3 I 4
63..)..,J1 4.4 1.1. c.,35jis.11.3
ri 4711 L5541 jj..0
I ';61.6'..J 431.j.1 si j»11
a-A-1,4) oat-. j..1.9
LiA tIL531 0.; .11 j3il J (t.; .1.+34
J. 1-114.,i1.-6, c ..)+A.
5, -11 JLU J JIjjJ,01-1.1,13 4.JI %0 Jo L-143 631.711
4.111/ j.e.31-43 4-41144.11
4)1 1611! 4-71.froS ..446.6.113
L594. 3,2iI.3 "41A:i1/3 r3->J1
L.53-4.
.145111 Zot...03JI
;1341 :11-1,11
-a jI4$.,L .04/ 4.1.4.44.ith LrIJ C.}.10
&JAI JLJi Lty..1.3. I .t. J I6rAi
LA1411 j1).--+JI
I )1 at,/,iIj4:Ly. ...O./ La (ae.1411
5,111:3 (.i I))
xviii
Lify.
j_14I L.J.G.ZZ ,r,
cal-451)1Si c.4.1aLLA.11
. 0.110:31e 4.744S
iiI .ì LSA 43.),11
L5Y;t11J I J<A.:
,Le1:41.9 j.).9 e).4
.11. )4-4e. *b 4-53.4 Lb.,1:13 43-).0 JI t1.0
.5.)L,..?,,:411 U41,..i.,31 041c jull 4,1J-14J1
k.)111 431.2.45
ta.5.1i9 liA14J1 j.01
Mij*4...4,1114.1 LOJI tb.311 jo.1/43
41J..) 4.!'135.1.13 Ze)L1.3
c>0.6.11.,:, 04) j3J1 I Li I4.11,74.,
j."..11 (5-4 4.).0.4A0 ej.t,
5sU.13 "1-14
L)01-.4.613 (:).: 1-y1 Ls-i
..)5L-33J1)
kz..9 otalLe 41+6/1.,1.101,11A, ^103
j )19 al*til Lg.L.46/1
4.".4) 6.3L.?,J I 04 Lsix
a
4 *1 .03-4 c)-*
,b3-113 3JI 41 J1
:»11 J.-444a% **3 . 14411 c1 13 k$3..kl.
31 0,03-413 (35 : LiLa..11) 3..L.a1.413 LP *.1 II
13 'LL5,.113IJi L.31413 LA-A.10J 1
1.; a'a-a) 6e1-..s.>aj L,,,,*tii.e3
4; ) 41i,A c)33-11
.(Z)
.3 IA1411 I
t-4 "L5J4I ;I I 4":`.° L' 1.6 L5-63
3)3-11 41:L.a ji 431 L6.41.a..3.1.41 t4L0«;
5LI1 j.).9-113 5.).3-11 J4-183.9 .L5.011
Lj...11 Sill dL-iaii 13 1.4.1-1.1 L5111 ")11
.(-5341/»JIL3.J1 SLI:d
sW 63-111t, a"..01
6,"41 j.)9J13 3.).0
4-Lke' jj,J1,9 j.2-11 J.5-64
LJJIj CL:A.:11 z)loLgo.Isi
L.1-4 t13.:;13 ,-L.14.4111
4.1siJi t.1...a5.3L40.11
o L LiW.9? tjt:i 40. Lsia
k-i-0,1 3-.111 rl12.J` 1 ; rl .419)
JøÇÇJ et-tAi r-t A ri.) 1.6.46):01.9
xvii
ry, -1t5.11 )1 1,..,4..94 )L J41Lri r r3....p3.,11 3i r
!3:111 ,r4,1)1.1 1,10,
4.e..53.1.1 all#46 64.0.43 *L.A.Wi
1114÷1/ J.)3., (Y. Z:jk) 4-44) t--613.1° j1k411 c:).3,11
Z.LL) Loo 1 e.3;31 c)4 -411.411
.zat-J1 4
,a4.1 L,-13
4-J3 ,51i1
1..14.! 1:
1÷;,41 if)eirt.e) 144;
r.,,ti,*4231 .5-LA
r9-249-ail C)---, 4 ***l (1J.,-.1 I'-»)
j4,1$4...13 4-t....hAS 46%43
4,.13:01 *-41 cy.aII
1 L.)1...111,,LïL.5
( X 1 : 413sa 11.../.1 1 4:63.-31
isi 41) (5.4 J41 0...iiio3t f.z../1.:. ,I441
t
.0A.441
c)61 c)4) L53144
:%-.J(").4 LhA3; 0-4 t.i.a.s (4J I 3i
Jil û-.Loht)-1JI 11-43 ()L WLsi
yaL.1.3
7. .2 ,-.ta33J 1
02u.ow L5-.13:11
.LJI 4--J 4...*.c.L.L4A3 1 Li
4-114.46 ri-.40...3,9 1/4)34.1..J1
4LiL4i 41 s.. .443_3 4.u.5
L1.:121.; 3.11 L.4.44c
s ' ).c ;L:9,6J Ae5.; ')1) j1-14 ù.33.1
4,t3645 JLye..914.11
1 4..J s.$) 11 1 3_23
L.-1J 14 1 ci..4 '41 oLtïs Îa141 E:su,.I I , 1 644o Z.,s3 1.445.1 1
4 141 C..14 t; s ' 7"Ati 1 %...4.13 s.L.ki 1)5) 4::,11,...)411...
c){.41-, ts*L-1.11 1.)3.4:J 1 544,
31 t )4.!...031 1 c.,A ...351.4)43
ts.W 1 J 13111 1 4.j..o .
5.33.1 0.1-,1 LsazLtI Ui,'Jt, 4-3 1+4
:ie31, 11Li J ) 13.2 jLJI
LW 1 sz.s 1 LA>. 1 .J.4.2L.i3.1 1 13:z
4.. 4. ;s, s s J 11 Z-A.,111 )-....214,41
02'.44. I .),as4
024.".4.1._ 1 c.1,111-411 4.43
L4I3312..)41 6r""L' Lrj
0'441 I -r1.-!:'
4 JJi .1 3:43
4.1 13 amms3.... .0 s4.-t,.21411
r2, cij j 1.1 I iiac ; 13
4;4-74 46'4 LFLA J L59 c.y../44 s. 4:L4.2,3
...5:01I 1:1-Z4 k 44:9 t-oi r 1.43
lL. 445.11
a.131.,RJ I
t)..4 ,c) :Li LIS 1.",) E13.11 ,523
r . L53.11 13:4-41 I )33 , JSJ
...11 1 c3-1.11 ,...:43,044r-".11 1:14 c.)15 1 4lA
'4.511 ..».41., 4.Ç$ 4..1.44.2.4.1 .3,3;4.4'211
L,.11.9 yin
s. 041
JI L 31
1 I I. C., . . 44'446::1 ?NZ II (...).0 41J:3i i IJjc13.14:11.,L534'1 jj3.113
cLX,V ,rj a-t j:vit,45 .jJyL.H
tj ty.a.-IN41
4-4.31.04-5
4.,frIjJI. 4 ',J1 4.33 7s._,,J 1, .4$
4) LA; .1) j1.1%11 (5.33i 1.a C.) La3
( Cra
L.ÇI JJ 4,4f
,.( JJ laao L5-1.0 J) sl..-ts,J
1.6.1.43.233 s s 44..1.J 1.4:..$)14.,a6 31 4,rt..1.4:2ki I ots., 31 0-1.12>
3.0`jI L..4e.1 1 31 t.
.1.33 JJJ jI LILi4,1t JJI4.).44.4%.7.3 ji 0
J.04.# LPL-91
c.,1.-112 'ILI 4-31.4. 45 *...1-.4.2.41 1 e3.31.43 --s's
(js \ Zs".x.. .)7!.;):" ) 1-1%1 f )10 *ZIA
J '66i4.41
L4,,S 1, s 1
4,4-43%11 11 1
vi
L.).* tys 0 4.,,D "23
o 31 4...31.3 01,443
ji Lb* 1Ala.2.1 Lri5.3 "5 4,9(5,3J1 .1.0.413
4.51).5.4_16. La ,..4131
to#5. ; ti,..aa I .! j.4.1).41
4,449 145.2...12J .4_,314,45 I tt.9.7,.4
L.J..9144. - 44$.-y t3.1.41i 7.$4.:,41
-,44J1 clghl
=1.--4.exo c.--" L5-43
c 6)-214 7u...531.! 40 ,.t -k;,31
jt-4fit 1-40: 141.3111 2_1.40)U1
(5-0.9) .t 74--:4.42)U1
:Liu!
.:;.:111 el i...11 .(c.-41.44.11
040 Z-bgualt
c1.311.-; ct-Tai z.11.4:40.1.1
.*1 c13.-i4113 2 :I AI ;1* .;s.:111
.1J3Litli
.2411
1144,11 24ì41 cl.,fit
Litli c131411
VUI Ls-i3 ji4.:;*. LI-SJ ,A
c.5.111 bas c)L5 \ (ko rt.-a ;;
411:) 5.1.03
".--obj 1-43 1414kt ri-JJ s2rt1 Lc)--0
t.13i 4-03.1..ca I III La Ikz..) Lipa.&1* J.4.64
'43344,.11 .A.9-11 ,L1J:)JI74-hiLa1 ji
Lub ,44,5 4.4.0.45
ZiL15..11 44.111
,* 14:5US 74:4131
A .1.6; "1 14.41
., Ls.:01 55a1 Lri3 LISJ
,4441. I cl3A1 a; :call I :lib ÙtS
s t I I_ (:).a hz.s .1.44 *1 a .1 L51.z..9 AloyiLixl. 1
xv
LieulLe LA-0 t1/11 &333 J31:1JI
4.5...)--5.7° ts:41A` Lsia
1,3-s j4.-tdo BJ1-8 c.4Î k,JI e.8 41)4
Cro a.44 7,t9:43$
0,53 t÷diu,, c»,...."1:4JJ
74.41.:4 '44.0.34
ceds-.7:, 4)44 4441 -.4,44.41.44,11c4h/ ji,41114,
LiAli I c3-S3 c;i
y< )51 (. a6.9.1 I
(5-0 33)...cl 2_, L1JJ I
L53) 5JlisLo4
-1-,13J1 a.i3L04
j.3-11
Ji-la
1,44u,"`lij L.456.11 y1.6-3,1113
LLtsis Lt Zujil
ij.tait
01.1.4,11 04,11? VAL4, (:)4,
tg--01 /.1-4) j .(g.1)-k II BiL:44)
.74J611p4tilq
2.o 13J13i 71.ss 43.L.a.4 isrbi
1.411 1.43 ..3J41..., 41 J1.0
(!-Li kJI, J..11.11,..9 ...).41.0.1 I 6iJSJ1iJIj
c1L.A,7) L5yiA.0 0,auL.JI LfAit.! Zji,410
b.-La lyti I (:)et J.I.ST
.; trkg . Lsej...t.03 4 .4,91,)11
Ji c1,1411., 4.11J1 1-..J1 4:4*
614-15 e.,14113 ot..1.4,11
14.2%.,te 703a:di! 2jI jIej.4
53-A0
1.,.$411
I I ..x.i13)13
035:9 La)LIje..)11.0.11
:11'4 j3..t.L3 3.2.,111
0.;
'YJ .j;; I, V ')L43i1
.0-411 cs:q
.Zp&.11 jt.1.41R,
c1,3 1
c_1.01
SO4:4, ;1:4i
ceztvi
.; .:1.113 c13.-14113 L.5.1411:31)1
JI .-1.11 c133`11 yvto rt..c
rLa L.Leas.13
c1,1'113yu.c13.11 J1 ui c13111 'ItA0
JJIZ12.-4 4441c..1,..i111 0-0 a:L4 c.13L11-.
11.4.11
c.,,51x11 I
').* cfrl 3-6
01 L5-La L.41c. Z.34-0.! 4.231,3 j..4=1;
0.0 5)4 J5
x iv
1.4 JI
,p1:4).1 c.13f13
t 111 c14%.1 .:1 03579 Ls.).;."11
L.5 _IQ c13,1'113 c13...111
31
(ZetAJI c.LZ. L9:01 1.0 441
ltj 11 4..JJI Co.))
:L-__;x5.41 j1--.1411;
,,,A.;...11 cf. Litz!
0-4 c "A.:1-,401
A.A.,
L51)
caq-0.4L :U LieL. LUJI
J-35 1"45
71.1_13 Li I J14.ci 41k, 5.)4:i113
J4::..5 V., .4W
(Z.l.A.11 Lsi) 5.444 71.*JI
J.:J. 1 L.51) Lt L.lc. 31 L4i c.)4
ji U.); 4,113 .9.3.14
4,2)4411 y...J.1%53c,131"1t
'2.311
L. )3,1? -411
.24W'
(.51:+3.)..1 1) 1t I
(L56.3.):3*-U
.tI A t'atI I
Z6-....13.! 31 1,431,3 31 L5.1..-6.1I
11,->J1
o 5.) .3.411 c..)A ;i.41iJ1
,IJ 1 1 I J.4_443
31 JI c_13.A13JJ
(4-;3.1? 31 ,......321.1L,0 1 :»J31 .e.*; 41 02,1)...eil f).).:,.0 .2
Lsix,
L51)
. 4-4 4)3J...,, 1IL 14.4.1 1
11.,A3 1 1 ,:).0 e.13.*:1
LA.4.11 I :*.11 t1.3:41
(L5.63.11)
(sc 1-1,0.11 II I Cy) L$).:
(L5173. 11 .»Ì)
1 ;J I L1.4.--te.3
1 b 1.1Jtot.1
: (J).:S,U II Le) Ls
:L.C.LJI s- g,SJI idIk 1J 1
La ..t.1 13 "113 1.2.41 4114,3
Lola.33
c)3.1.e 1 j '1
Ji )LL4JJ1,lAt...41119 0.5 L-4.01 riNii31
-,444;11
Ls:A.4 1 r.,..11 1
31 L4L:).. J1 L31).1>,"J L.; Lrt-t,:.,J1 j.0.4,43
r.-aal :
Lris. 31 .)3i3.5rw Ls; l4 1
1 Ls.i 141_46 LII tkal6:1--wo*N5i -4.)11I Î 0.0 La.:4 .6-953 ;JAL'
4%511 ..0.411L, 4.5 44S
1,,,J 1 a) 1.t.tl
1
ï_th II
c I 3,),.. xi-41
LI J1 t I ,11
.4135-,1 J1 ".,41,31.1
1.44 Y.? 6.:)L.4.,..41 .(4»,53-,1
JiJI 03..).e 1
1 J.:15* .).1.1.1 1 SS
( 3):1.J. 1 ) W j:5* 1 j5.5
;41;-'4 3Y-13'11JjJ-7631)5J 1 U ....1.-4.:1,1 1 J.0-113
K -1 I .191,ya ji yilI Ji i1i 4136 (
Bytai 1 rE11.:.1 Ls 1 31 13)
:J-i.) 31
(.113 (4-7/..9.1,,, .9i 41'11 JI 1
Ls-0.4.113 1 c13-113 1 04 .
cyo JI ,..rtLfl
JI (l.JIj IIJI J)LLI 1
i.:.1140111 D 3)-tai sLL.I 1
c)3..s.; ;4411 tsg,
kor4.4.1./.
.113 4 441
(L5.61)-'ki
61..4 k J 4'13
c-.kr 3.41.-1-41* 1 r_11
(xi is.)..6...4,11 J.9.3..01
r.04.1 1
;NJ 1 41%) L5.4 44311
(L.4,1=1)...iki ) r-2411 Lsbr Ji 10.; 4,4311
Ls.L31 rakil 1 ZA11.0
6:1-11 .1 t 41-1.14 t.C13
s1-1113ii1..)-411 4-335
0_4 1 4.14.4443 4.29 Uai
d3-1.1 Ls1 31 E3)...A113iI
L.5 :1-11 1 4.1...j15., I 4'1.4".)
Laj L5.3 L45) r-24.11 Lri
yZ t ;.11 .5-113.1.13
J.41.-c r 1 1 Led j.-Ao
L' ejt..-1.6114 c I
L4L1 L5-4 r.,J1
sil
4,9 xe re,o L.L.cti I)4i Ji
LeL1.0.11
Lel -II -41 ,-ri-.1%;,11
(Ls6.9.».1 J-2,164.0.
1 ag.1.14,.3 ;NJ 1
t.r-6.9)I 1 )4---i)
L.5:03:L;11
xii
01:o
L1 1 3.....A.1.11.e 1)-1;1 L5CJ.5 1.4.:A.c34-1,, 4;13
U.S11
4.1 ",utt",t5
fui L4 a!)La ..).)13.1 I r'Z403.04 1 j.01:,,,J1 j.5 aèj4-133 4.13:3
L.4.4
L4i o
1.
.641)1 4.k.: (54..e.,.! 3-1,0
crikit.H
(Ls19)
(5103).i41
ti 1
4:)-0J JI31.i1 31 .6.:41...a1.1
1 c.)..43 1 k k 1.,31'64 .445
3.1.-..""J I C"...0 J I LI
.40 J I 63 r
3.1,161 Le: 40.4a1
3Lth i 4i Ji4.1.r.) Lit Lt.,
Ji LèJi J-14' ) to j(t+-A4-1- 7.4., .,,z0L0.1`14.3
4j1)11 3i 1 442.2..! 1 ,..74;1.1.
eyogil M.:$4* ty)..."0 j.14-49
I 10,, 4.4311 : *WV 1
e3.1.1.3 _4111 eixo... raial 1 4.11.0 L.4.:9
4'd 13
31.4 d_ttoltiLeL:)..0.11
- Lel ,11 -(1JIj1-1.111ai Ji jeo. ,6J1
1 La .L1
'JI 6-4 ,S.I 1
,,..J.11.9 L4 1 r--1..0 1 4-1.t.,5111LÇ
- i
4I c.a.-1%1111
L5.111 ,......4.3)13.11 J414:1, AL? j t 4.;,...,%4d 1445.11
: j.43 Jj 67.0 1 AA.;
1 _As g11.., 4.4.0.1"41
I I $ 0:4 "4-c)111 bk.:sip:it 3i
L:ho. Ian 1P,
1 1 I1.1.,111** 1 J.44;3
Ls.5.1 I CI) 14,41 I J.0.4`z.9 1 JI c>0....."3 L.s3.11
Jo....4:4;
4_4 *51 ;154.11
rc.1.-J* 1 ..L.,1 $ 0.!*4 4. ,:41:412'11
.11 A-6 Lsix,
4.A.4
I . ;41; I 4
144-1-'11
tc.1-411 1 :1-44 1).) LAI 1 ru)
z.1.41-11
4.$ Ls)o,LIal 1 4J)Lp-..' 1 L5il-a
L51c..3L1 ØJJI1.).`,1) eit JJ10kc
c.)3.....Ss .).c. ;it
. 13.4 4.tr:P.11 )..o LW 1 c)L41,c 4...ui4.7... $1..;14 1
LibiLL..49 jJ :A-1.:LAI I c.:44.94.4
xi
cihaal I 1:16
JI LUc*,-c 1LiSIlic)2311 lic.ALLal 1 iiy,..s1.411
lit 4 t JI )1.1iI j JI II 1
ir4:; )1.1.4.1`..4J 1 J.44.4:4;1
t.10:01 ;1; 1/4,4JI
)1.1.2113 ,,Lxit113 J1c¡cL.J I
i) 4--4.4446 JA.1.9.a v.; I "7-'34:; L5:0 I
JII 1N11 J.1.4 ( 4,4412
LJI J-5.5.1 : Jo.4:4;lj
L:).0 y.4 43-17 L51 31 1
.1.4.1.A11 JI J.10
'41;411.1 ;1).1-11
- <II o :LA (5131 )1...aid 1) 1,31.A
L,41 (, ; II 4.11i11 4.4411 t.41;
(JiiI j4.43) iiIc) -
1 c),..1.9 L. fa-140J 1
YI
szot,4)1:511
4-315 cd_o Lr.K.1 1 I :63 3 i
o ii.).1>J I Lc...1-).J 1 1-1,1U- I
Lrj »,;ti Lc,1t,11 $1 L5411
< k j26) L1...44
0) 41 6 LA. C.)4 ky-t1+4
Lral EtZ I Jo.,.y. 61.3
4,11 Liti 04611,11 c.;.0
Lr-i
.4.÷..t.-1.1,J 1 cii,A 113 )c
MT
NC
4.0.1.4-p 7y.¡Al ; <11
0,11,.434.11.A..a 4.
1.1.1111 o 4.23
Lria 1_,+:;tt; ,...L244; L5:41- I )1.1
.; 41! )(-1.7 j.:41
1,34 1 Sal ..ru.t.:/..31. 0.+3:4111 ),
I (..)3.--1,43
31 J.JI.6...,L-4`...;11"
jI.)J11 '11
;4.4jf.fraYiLth/47-1
: L55"31.5 .4.133JJ I
_UiI L5-123,:iN4
45,44 cAu.. cji*.; Ls:in 4)141 0.:e Î
4.510744 " (.5 a-1J 13 Lbj....J I
Lgialy.3 0.56.11 IJ`43j-ta, I Siti.), 3)3.A:4 I
0O-ote ji 34.4! Ls :ASS LeStAtli t 1.4
Ls.",13:4-4* C..)4 463.):0 Lr4.1
':11 jt L2LA ci6.a.11 1:3-%
Ze.63..0,0 alea:L.1 1
4.04;r611 4;9 ;14.14.1 i 114)1
...46.6 ;Ls CUM
WIR
0.5.0 ZI.134, NES
-.4.4.5e..".4411 543411 a-a1.".'411 A.)
6:.$1-24.1"..441 L5-4 Layi
Ji i.4.1.;,4-0,1' I -,44.1.7).2....11
oa,141.4ye:j1 )4,153 .l÷;
1 Lii,új i L4 cA-.5.4'111 jai
aji . RAY (. Lo3) 1,0....7i4e7ora) lj
1R:d I Lrig.
.JI L4iJ 41:13.4.1.1
;441411
43.10.9
0_0 ; Ls_.:Jt iLtuue/I
JlLow4 LA' Z.....4L0,1 Veato.L.I.X.,:,03 I jo.../4
0.---Spti 4,o+ z.Z.1) 1
c)--o 4. ,x3;,...al 1
L:A+U I" .)..!..3.10
,4154.10,..41
C)..0 Ls-1%h! J..-.1-4.11 ...0..?-oK:J*3
4_16. Lri J1-0,:r11
31L Ui3
.31 alc j_5:)JL siLr si 1 c"1,1 I
Ulsi .1,11;) si
1
4,,c, j C.A.3-4 ii-ta
c>__J L5, . I 1 I ..).-1;
o L.,.1i 1 i J1 1-1Xsi 1
J. (:)_i* II :i.--a1;311.1 s-itk,yx, JI -0°1i cy.,....t,Us.
Planning and :4.5.9 r1---ji (*)-a rjStatistics Branch, FAO, Forestry Department, Viale
,delle Terme di Caracalla, 00100, Rome, 1121y
.+39-06-5705.5137 +39-06-5705.5514
z21.11 u.,;35; <1' 1
cl 1'4)11 ,z.,1,1 ,,[email protected]
FAOSTAT access -
ix
L5,91-J.1 01...t.ò3,! JL413)11 Lo-LIA 4.44.11 mir;t1
1 c133'11 .Ls."4.4-1z.11 Li 'II 411.7 116.
h-rf '1.15J1
c..z.)13' .11 ii.,1__4.11
1.4.40
15.):,.14.0% 4 1,0 J1 )1.040.1". J31.1.1.31 j'13.1.11)
J1 BJL../..:1113
"4.6.11.*1 r13111 1
ts.).e41....611
0.3141 4.,.,5411 Ùli12:111
.1 1-i1S.1 cjj,-113
Z..11A.:J.1 31 1.0.143
"0" :Lirw...o.s L i )4:411 543)11
J.J .J1 crLs-43'11 t11 J1 o
'14-411 4113 cs (.516J1
L531.1.1
74,..,tio 140.11 kLJI °J 14t
(F) :i .1;1f j)
(F) I% .(*)
J-14 L5 J.).:41 clit L53.1...,o sio I Ji IA.?. sic
o 4.140
L-1,0A.1.1 LI 5.1AL:4 Lri
FAOSTAT
61.-1:1.43
L45 .4.,..9-01-2,11i Lo.d:L.703
v.:JUL-kJ- I 1.--4.01,1
t.76.31 JI LNJO jo,..tyj
LAW.11 4.1043tii L.J1
5L i1
tJJ
)A-44 C.)...0
.L,Loyloull
Lr:Ji
e).0 ()A
L5 rIßI Lo.4) Lsisj
.J-,%.4.11 4-se
5,-.4 0,141 4.1i6 Lsji 4:41..L41
(5._o rikZ 1 Lia!
rtall î I,JI 4.1J5 c)a
Ls.:4 I LetiSit
c.)-0 Laya..1,0 J 1 14-1.2".,j
JI 45.4 ;14
1 4)1,.)..411 (:).1
J31,4,..141JLyJ.S.1
LsikZ Ls.'411 ULUm'ara
4 ,:)1.141 4"4-1.9. ":41-1L4413 J4 JI
c)-4 ...tot.11.1.?.11 (549 :.4).7,...t.11
1 I S J COMTRADE
t> 441 4-4140 ..1.94-1. 454kLU
Lc L1 14-41oac
.40-o.'11 (5_4 az.Z...).5--;'11 L5-4 FAOSTAT
jltail 7%..4)11.4.11 (54 Iii01.4.11
L4J oU.ît529
1.1.i) (5-.1
J5 JI LLI4..").,..11
.i j JI JIL.51° Lsic'
jf LlI o .4.531.4.ii
446.L11 Zay.6.4 L.,1311
(.5-4 . gt A it 4. 149.)
A, J1 L,,,aix? 1 laSJI i I fax
7C915 .41.1 JJ444.: .043 .10,1
...r,-1.143 1 AiJ JI ;,II tsiI
yteok . 1
L 3SN 94k A L.:OL, L6.11
k4W i.:1JUL2.? :14pJ t 14,1 I
4.7).361 I j13 .4...4.611.1 Lri Lfliti I 4-2.1.0.* d...5
t 1.9 ,_,..46.4" lao Lo:ti I
e3t 11.0, P3 :L.433.1)
I ùLUL 1,..423 ZJ17y1:14,4 ,44)1.11,1
ALI* I :L5..e.y....1J I L.4:*111
.1.),..4 1 &bit Lactit I
L)k--?'11 J jii; L5,91.0.0JLth Jo
Lg:t 4Lc_tts, .54011
,z,:;115311
r t.rJUSJ 4.0.1.1.-11?-4.9LS
Z,I.x.-431 ;St, (sig. Li.;11
1-44.41
. 1A A A ris,
4_4)1 L5 I c
*J- eg-0.?,4 ji j)(4:3--s'119
-.all L5-.1 t3...j LS-513
.04.4 ,zt.sit--3% I 5iIo-Al2.9Jt'4.J:1.1111
5Uii _Ji Lri .6.))13_31 Jjta-IJI
M.1Acko .1 I 4...i...a L.?
La.1.,Hal I JLJl.t.i.1* )1).,)Lxt 1.1.)13J13
.*J Lric
vi i
1,4,3.1411
Ill 1 sAR! 32* I:IA
1 4z,
J-Lc ,53:,--41 I LJI 1:u* Ls py.3 7L, 53 I
1--,1 iza. st_*.i;*J1 3.1*.5.1
,z--JL-g4t-tji:CetsUL:9 1k A9-19 40IJi
CL CL 3 IA:AA
4\ 11 r Lb) 1.1.0 Ls.:*1 1
(FAOSTAT CD) L>01...0i3
http://appsfao.org/foresM/. : I 15+4
3-.4 4.9.....A.P$ I
J3 Á
3; publications-sales(&fao.org : 0.:,3):L.5.1"11
bl3...1ft3t J1.4+:311
http://appsfao.or/products.htm
c i)6 4.5 all jp. U.1 j.113
J3.-0113 115i L*1:9 Llai. I z:+1,5 (.5JiIteri.c 1-actJ I -44 IL*4.:1.3 44-1.).>,i 1LLi L.41
Ldi4.7.4 la 1 c>4 1.4.5jT
,,113 '4_44.",11 -1'111 J..1:41 J3-511.1
L-4.1 r 1 JAP eL j-5
. I
1,....,543.0 1..itt L.5.,,LawAH I U.S..1 1 " nuai -63
,L*3.61.1 4ut* Ls:a 1.* "3.5.2..1 I 031.R.3
1:1-b .11.ki--.41 _63 . I Lyt.c. 442, Lsic
M I ja_c 64.9: t4. I ,...)314,4:0 ,:).* saot1 I
yro . .
Yrk . .. ... . .... . . lyy.1111
... .................... .. .
YrA . .......,...... zyitYrt -,44ka cVit
..... .. ...O...44.R. ..
11.1 4.01",..k. Nlia . 011,1" . Lb,
yy ...........--...Ytr........- . ..........,.. . .........
vi
yr..yr
4:1U:$1.1.41
4.A110,11 ,11
1.4) rLi-J1 el3-0-11 joa...4
( 4.1010,11 1.1.4 j./0....11
Yrr.... ...... . . ....... .. ........ 1.11.64.11
Tr' . . (41,1":,..11) A4:41 ,.4,:.6,11
Jbc,-,.11 4231 1 t 1 4.1)44..11 , st3311
I A . 44/)45.011 4 c.13.111I e . Z..4.11 , .<11 440. 1440311
I AY LI,J1J1 4 ..5,11 :,--.41.k)1)11 101 .i4.11 4 ZAZJI :,:...1.).A.4.11
-1 A t '441 4 ",.+4,511 1).)1-.831
4.011
k$.01/ t3,a.01) cb111
1A1 4.1)43.,A1 cE....111
SA9 111 7465.11 LIAO,
11V Z64.11 :e.701.),J1-411
al)
I A t ,c1.33'11
1411 1.4,.../.11 "440
141A 7,4.4:iii 14,,,511
ct
14.1 411471.011 4 Et:01
2.44id 4..511 :1,))1,.11
.r
4S1I kWh., S.).-%3 t1,3.11
Y t 41)4:4%0'11
Y 7.411 ,:iO41 c,....1.).)13.11
Y A 4441 4431 :,:.41)s1.41,11
:*.t.p..4,,J1 MJi J3u.ti 4 3.).01
v.Y1 Y Z.aH, 74411
I' I r 744A.11 ;42.S.11 44.01.1.410.A1 I
53741.1 ,3.1,113 JI...4).;14,11
Y 1 t 41'X *0.011 ,s1.0111
Y N Z84.11 4 441 4::01.,$)13.11
Y NA .1.4,i11 ja1.311
-`1 L.53211 3.3.09J1Z)-*jl
Yt'k 41141,011 13:.11
4441 .1.3.)1,11
YYT a..ii 47,4411
5 s31711JI
1*Y 41)1 '43....":11 4E1.3711
10Y' :t.411 4 7.,ks.
1* E 14.11 5.11 :
;4345
logo 4.1)41.411 4 cl.r..11
o V LAI 4411 4.01.).)13.11
I 0'1. .1.41 4 4411
04,41.a. c). Wl0441
11. 41)43-.11 4E13311
1'11 74.41 1 74411
S Y 1.1/4111 ¿a .JISi/ :6L4%11
jtkoSJI )61 c> et.11 sy,:w.11 4.4J1
111.' ..ti)L4L.1 cLIS1
t 14/1 4".4441 14)..11,0
LAI 4 46Si I 4,..11.4.i I
1
111 4J)4.L..11.4...»:.11
1'11/ 7.41 4 445.11 J13.11
11A 7.m.<11 .,:a 1 1.4.11
031/4%41-..131,1.411
11'S 41)4a...11 E.,1,3311
1 V 1 47.0<11
1 VS' Z441 441
74.'4:311 eL;31
1V I 41)41.11 4 C. 111'i I
VNI 0`4.43i
Set 4.4111 4. 4,411
44111 ,,,A1P j J.0
lvv 4J)41.;i1 cli:411
IVA tut:11 01,44111 :14.-JI.s.11,11
IVA Lyill -.44.5.31 :440. 1.)...11-mil
11.)..:411 ,ALij
1.1 d5141,411. eVil
1 A 3....11 44.45J1 6z,I.01}
11 .411 4'4411 :,:-.)1Jal...0.11
41.".1.1
111 41)14.1.;11 c'1.411
111 4.;411 ".44,,,$J1
t11 Ly.4" 1 -.4445.11 :+ztIpLall
Ze.,4041
1 1A 41)14.1.../1
1 Y 4,411 ck44.511 Nz$1.0,11
YY 4,4711/ 4411 :k.:r1)41.0.11
tylp
Yr LiJ
1 Y* Z1/44411 4411 Q.014.03.11
yv 3,44.741 4,41 :
;et -11 &Jill
1 YA 4E11111r 4,4231
ry LAI 4411 ;44-.4 J.A.:11
441.15./1 Ila...314 4411 6111
rr 41)1.4.1..11 4e3;11
1ro Z.411 44411 :6141.0,11
rv I 4.511
Z.136.11
111s 11 c L01
11* Z1/44,11 44.11
1 t Z1/4441/ 4 4411 sz.,1).11.0.11
461441 jJJit..9 6,411
1 t el:$*11
t z1/40 ,:14.<11 .:1.1.).)1,11
t A ;IAA» 1 44411 - oaab..4.011
iv
*A clz11
(u.10».341 Ih4)
o ct.141
titiNt13 444-40.%:Jleee.,a0,11.3 lUiI4.:,1,4111
4:4111 ra.4.11
1Y j)Lea..;/11 ct:01
-.44411 :
7t....4.11 4 4411
-..1.toaK113 le11411
74.44/111 4 441 G=G$1.31
4431
ZI:4:-.6.31.0.11
41)14.71-,)113 s11,111
v 3.4.."..1.11 -,44411 ls.)1,11
44,:(4114 .4.4.11 0.:01 jsLail
)5044" 14
21.1.p.:1.111
V t ct:01
VV Z.41 ky.<11
A 44.11 ,744.5.11 :,z,tisL011
(.461,Wi) :3)./eAll I 144%311
AY 41)445-411 3 Etr#11
A o 4,411 4431 ; '...14)1311
AY 4.4a.".11 Sil
(4103):,41 je.:6)
AA 41)41,'111 4 EUX11
A Y 3JI '..:.,1-3.)13.11
1401 44.i1 4.7.644.44)1
44,j,..11c01
21%4.1,11 tLVII
1.1 44:411 4 46531 1.).611
8 .1 Z.4.11 4 44JI
YY Z1/2411 4 i44J1 :4:-...6.3L1.11 vii '41....4..)11.1
(.413.11) tLJI 0.01:1-0.11)?,..$14.11 4,4..1.71 x 4.131.L.I.J, 1ai 74...k...41.* I 3y jil
Y 4 .t1N.41,..,'Jf3 1:4';',11 x L614).4 3 4z,Jt..14., .3.W.1 4.1.....,1
44.531 -.4..--..1.0J1 xx d31.1./.4J1 aL; .:-.A.6....56
rr z..,4,zi ,:iy..ASil :)..31-.43.11 xxii 4261)5
dA11.1.11 J,4..vc4113 Ai a..111 rtlia .44.,,,..,,11 :i310.11(463)..;,411)e.a..) f41.1,411 uot:64431 je..i:4*-di ,..,4.:1.;..11
xxiii 413-Ot 7:4)L411 a.2.3.1.1 i i;' -q11
ro ctzlixxv ,....-,uutlij ,i6val., z,41.1.1411 4-6-41, Zai
rA Ly.:4.1i 4 4,45,11 :Q,...-,1..))13.11
x xviii :4'..I. ,L;Ait je331 j.,41.,,c,
t. 74.4J1 4 4411A-1
rwt j.at.L.Ii.yexi-...114.141.1,11 A-3 ,),kjittif ,....5.).)ilt st:41:11
t v ;i4.- i 4 -444.5.11 :z.,14)13JI A-4 194A j'4,4...4)11 Zuw..:,...11 fj1.1.141
tr ZoLtRi: i 4 '44, SJI.-tti.A..44J1
ti...01 (u1...,....li,i) eL.,,,i 4ALLall)2'41.11 ......4.1.WI .10:4-1,1 4.4J. I
U -41,4i.11 4:44.<11 :,14,13,11Y 4,t,b4:4..- '113 t0I
t 1 :4441.11 ;4411 :.4.:..11.pLAII o 1.401 4 -.44445.11 : ,-...014.)1311
y '444.41 4 4.4J1 :.z4paLailb.:4;1113 .).4:4J1
t V
(4903).;,.4) 1_,)4:JI SA5-
t a
(412.17i." )t.'4)iJI LJI P.5
ot st:141
Zi3Lt.11) 4.4.U1
(4.13.11.74:g.) '45371.1.11.3
tt,",5.0N+3411 k:$14.14
4.rs.z.....1.41'." I
Q.
(4;91,4:14' 1
I I
tsiM ¿1J JLttjiJI453Lail
t 41N4:4'..;113 c1:0
14
(Lsk,:.n) .111:> 4 1..1
461;141 ,531,4111 r4.,4;411 4 L..e J.9i3J1 4.,4.1442.
LI JI -it13;1`
Y eL;11
JAI:wail
YY 4tbt.i.L.;113 e:01
(.5637i.411)Yo :i..4,4:411 Z.45,31 : ii.3j1311
or Li.1"11 44411
(5303,1,11) Zi31.44.1131 A 4,41 :12.44.5.11
I
La I r..St1PJJI *à...=. 04, L.r.-13 I .31 aV LF4'C'ill
1.113 Z4)1,.01 I
z...,L.1.1t1
: .4;11141 L,11 a.1.11
Chief, Publishing and Multimedia Service,Information Division, FAO, Viale delle Terme di Caracalla,
00100 Rome, Italy.
ISBN 92-5-004544-1
ISSN 1020-458X
I" =Iim' seri=\
c, I I 4.1 a.sL.4,11Y I .1/4..41. 1 j 1.....:L=Y I 4111_9.4 .11.1z1
J.11 tm.L.1.1 1,14.1 J I I
Forestry Planning and Statistics BranchForestry Policy and Planning DivisionFAO, Viale delle Terme di Caracalla00100 Rome, Italy
E-mail: [email protected]: +39 06 57055137
a..1s4):).11
: 4.411A1 43,-.1kV I a4JA4
wwvv.fao.org
© FAO 2001
5 is.43SA-1 Z.c. ...1.51 a. I axstrai.'
Lai)
4:.Jla,..L6.4 a 1,
IJl_e4.4rt
4.....-ALA,u,In a I-ast.):).11,5 a..lak.yi a At-v.t
O Y
° g
zt&I°11,3 Ir
00400
00 p
00 0
Ljdthlj,,..¡Ecqi
i) rLJA EIL;f1,11)
41.40,:,41)
1UP1 01I_VOLiCfriA- _ _
7 4 --;)
- Sl.qt0hOtAW I 1-114 `11:1018e
61110r t
,t'»!
h.. e
-41.46:11.
'
4011a
I Lu*Sif
- " -
ose,
= ;
,
4. -
;'..9Pt '9
Ott 94
",
1 ;.!
e..3
4;4i ;;"4:9
7' 7
,,, 4..,akyi ,/__J
Ls1 j3J1j
5,1.z..511
'
-
-r
1-