Embed Size (px)
Citation preview
Aqua-LAC - Vol. 9 - Nº. 1 - Mar. 201772
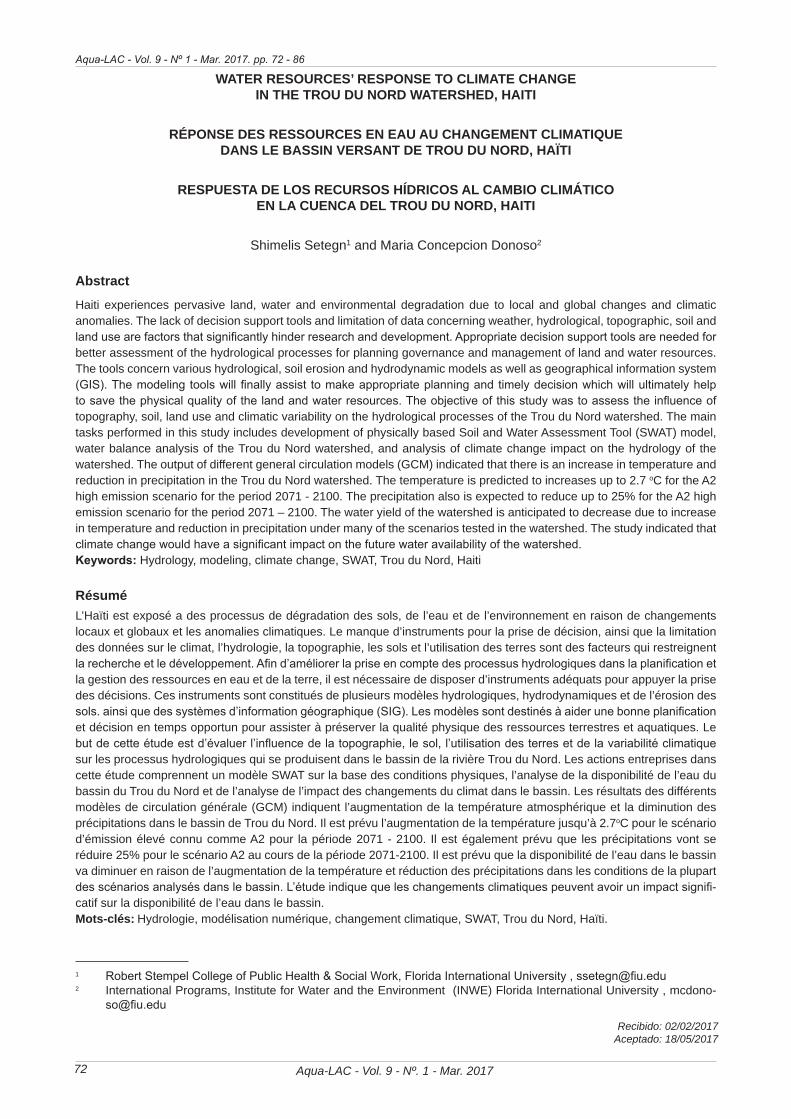
WATER RESOURCES’ RESPONSE TO CLIMATE ChANGE IN ThE TROU DU NORD WATERShED, hAITI
RÉPONSE DES RESSOURCES EN EAU AU ChANGEMENT CLIMATIqUE DANS LE BASSIN VERSANT DE TROU DU NORD, hAïTI
RESPUESTA DE LOS RECURSOS hÍDRICOS AL CAMBIO CLIMáTICO EN LA CUENCA DEL TROU DU NORD, hAITI
Shimelis Setegn1 and Maria Concepcion Donoso2
Abstract
Haiti experiences pervasive land, water and environmental degradation due to local and global changes and climatic anomalies. The lack of decision support tools and limitation of data concerning weather, hydrological, topographic, soil and land use are factors that significantly hinder research and development. Appropriate decision support tools are needed for better assessment of the hydrological processes for planning governance and management of land and water resources. The tools concern various hydrological, soil erosion and hydrodynamic models as well as geographical information system (GIS). The modeling tools will finally assist to make appropriate planning and timely decision which will ultimately help to save the physical quality of the land and water resources. The objective of this study was to assess the influence of topography, soil, land use and climatic variability on the hydrological processes of the Trou du Nord watershed. The main tasks performed in this study includes development of physically based Soil and Water Assessment Tool (SWAT) model, water balance analysis of the Trou du Nord watershed, and analysis of climate change impact on the hydrology of the watershed. The output of different general circulation models (GCM) indicated that there is an increase in temperature and reduction in precipitation in the Trou du Nord watershed. The temperature is predicted to increases up to 2.7 oC for the A2 high emission scenario for the period 2071 - 2100. The precipitation also is expected to reduce up to 25% for the A2 high emission scenario for the period 2071 – 2100. The water yield of the watershed is anticipated to decrease due to increase in temperature and reduction in precipitation under many of the scenarios tested in the watershed. The study indicated that climate change would have a significant impact on the future water availability of the watershed.Keywords: Hydrology, modeling, climate change, SWAT, Trou du Nord, Haiti
RésuméL’Haïti est exposé a des processus de dégradation des sols, de l’eau et de l’environnement en raison de changements locaux et globaux et les anomalies climatiques. Le manque d’instruments pour la prise de décision, ainsi que la limitation des données sur le climat, l’hydrologie, la topographie, les sols et l’utilisation des terres sont des facteurs qui restreignent la recherche et le développement. Afin d’améliorer la prise en compte des processus hydrologiques dans la planification et la gestion des ressources en eau et de la terre, il est nécessaire de disposer d’instruments adéquats pour appuyer la prise des décisions. Ces instruments sont constitués de plusieurs modèles hydrologiques, hydrodynamiques et de l’érosion des sols. ainsi que des systèmes d’information géographique (SIG). Les modèles sont destinés à aider une bonne planification et décision en temps opportun pour assister à préserver la qualité physique des ressources terrestres et aquatiques. Le but de cette étude est d’évaluer l’influence de la topographie, le sol, l’utilisation des terres et de la variabilité climatique sur les processus hydrologiques qui se produisent dans le bassin de la rivière Trou du Nord. Les actions entreprises dans cette étude comprennent un modèle SWAT sur la base des conditions physiques, l’analyse de la disponibilité de l’eau du bassin du Trou du Nord et de l’analyse de l’impact des changements du climat dans le bassin. Les résultats des différents modèles de circulation générale (GCM) indiquent l’augmentation de la température atmosphérique et la diminution des précipitations dans le bassin de Trou du Nord. Il est prévu l’augmentation de la température jusqu’à 2.7oC pour le scénario d’émission élevé connu comme A2 pour la période 2071 - 2100. Il est également prévu que les précipitations vont se réduire 25% pour le scénario A2 au cours de la période 2071-2100. Il est prévu que la disponibilité de l’eau dans le bassin va diminuer en raison de l’augmentation de la température et réduction des précipitations dans les conditions de la plupart des scénarios analysés dans le bassin. L’étude indique que les changements climatiques peuvent avoir un impact signifi-catif sur la disponibilité de l’eau dans le bassin.Mots-clés: Hydrologie, modélisation numérique, changement climatique, SWAT, Trou du Nord, Haïti.
1 Robert Stempel College of Public Health & Social Work, Florida International University , [email protected] International Programs, Institute for Water and the Environment (INWE) Florida International University , mcdono-
Recibido: 02/02/2017 Aceptado: 18/05/2017
Aqua-LAC - Vol. 9 - Nº 1 - Mar. 2017. pp. 72 - 86
Aqua-LAC - Vol. 9 - Nº. 1 - Mar. 2017 73
Resumen
Haití experimenta procesos de degradación de la tierra, el agua y el medio ambiente debido a cambios locales y globales y a anomalías climáticas. La falta de herramientas para la toma de decisiones, así como la limitación de datos relativos al clima, la hidrología, la topografía, los suelos y el uso de la tierra son factores que obstaculizan la investigación y el desarrollo. A fin de mejorar la consideración de los procesos hidrológicos en la planificación y la gestión de los recursos hídricos y territoriales se requiere poseer herramientas adecuadas de apoyo a la toma de decisiones. Estas herramien-tas contemplan varios modelos hidrológicos, hidrodinámicos y de erosión del suelo, así como sistemas de información geográfica (SIG). Los modelos tienen la finalidad de asistir a la planificación apropiada y la toma oportuna de decisiones que asistan a salvaguardar la calidad física de los recures de agua y tierra. El objetivo de este estudio es el de evaluar la influencia de la topografía, el suelo, el uso de la tierra y la variabilidad climática en los procesos hidrológicos que se dan en la cuenca del rio Trou du Nord. Las acciones llevadas a cabo en este estudio incluyen de un modelo SWAT basado en las condiciones físicas, el análisis del balance hídrico de la cuenca del Trou du Nord y el análisis del impacto de los cambios del clima en la cuenca. El output de los diferentes modelos de circulación global (GCM) indica el aumento de la temperatura atmosférica y la disminución de la precipitación en la cuenca del Trou du Nord. Se predice que la temperatura aumente hasta 2.7oC para el escenario de alta emisión conocido como A2 de alta emisión para el periodo 2071 - 2100. También se espera que la precipitación se reduzca hasta un 25% para el escenario A2 durante el periodo 2071 – 2100. Se anticipa que la disponibilidad de agua en la cuenca disminuya debido al incremento de la temperatura y la reducción de la precipitación bajo las condiciones de muchos de los escenarios examinados en la cuenca. El estudio indica que los cambios del clima pueden tener un impacto significativo en la disponibilidad de agua en la cuenta. Palabras clave: Hidrología, modelación numérica, cambio del clima, SWAT, Trou du Nord, Haití
1. INTRODUCTIONAvailability of freshwater resources to meet all the consumptive and non-consumptive needs is a global challenge which many nations are facing. The vulnerability of the Caribbean islands to natural and human-induced social, environmental and economic negative changes and disasters and their inability to cope with the problem necessitate the understanding of the hydrological processes and responses of the watersheds to various stressors. Haiti, in the island of Hispaniola, is the poorest country in the Caribbean, and therefore more susceptible to the impact of the drivers negatively affecting water resources. The challenge of managing water resources is further complicated at a time when demands for freshwater is increasing owing to population growth and the need for more food production in the face of uncertainty of the rainfall emanating from a changing climate. The severity of this problem is even further exacerbated in the Caribbean where freshwater resources and healthy coastal lines are the mainstay of economy for tourist attractions. The resources of the Trou du Nord watershed are important to the economic wellbeing of its inhabitants and management of these resources determines improvement or degradation for both agricultural and urban areas. Planning and management are needed to ensure the protection of resources and prevention of further degradation and for sustainability of water resources in the watershed. Hence, there is a need for hydrological research of the Trou du Nord basin that can support improved catchment management programs. A better understanding of the processes that govern individual watershed hydrology can be used to safeguard the alarming degradation of soil and water resources in the island. The present research is an attempt to obtain a scientific understanding of the hydrological characteristics
of the Trou du Nord watershed as well as defining adequate tools for long-term predictions of the basin characteristics. The main objective of this study is to develop a hydrological model and to analyze the spatiotemporal variability of hydrological processes and study the impact of climate change on water resources in the Trou du Nord watershed, Haiti.
2. METhODS
2.1 Description of trou du nord watershed
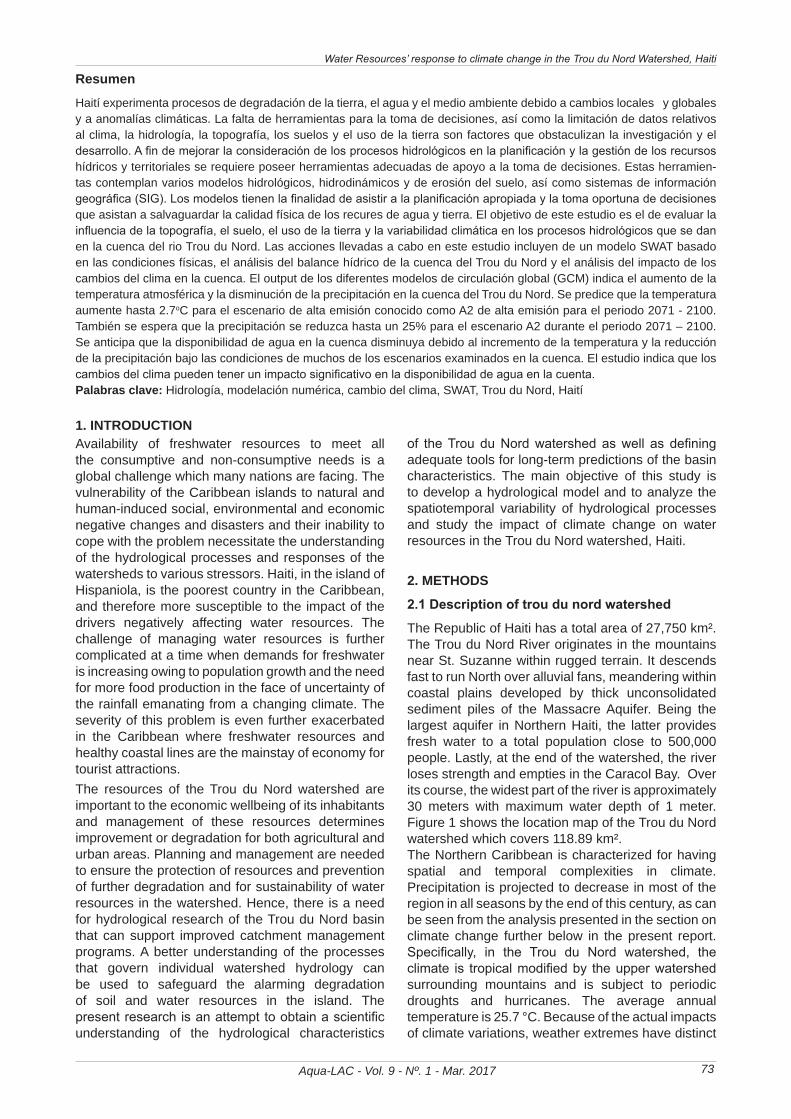
The Republic of Haiti has a total area of 27,750 km². The Trou du Nord River originates in the mountains near St. Suzanne within rugged terrain. It descends fast to run North over alluvial fans, meandering within coastal plains developed by thick unconsolidated sediment piles of the Massacre Aquifer. Being the largest aquifer in Northern Haiti, the latter provides fresh water to a total population close to 500,000 people. Lastly, at the end of the watershed, the river loses strength and empties in the Caracol Bay. Over its course, the widest part of the river is approximately 30 meters with maximum water depth of 1 meter. Figure 1 shows the location map of the Trou du Nord watershed which covers 118.89 km². The Northern Caribbean is characterized for having spatial and temporal complexities in climate. Precipitation is projected to decrease in most of the region in all seasons by the end of this century, as can be seen from the analysis presented in the section on climate change further below in the present report. Specifically, in the Trou du Nord watershed, the climate is tropical modified by the upper watershed surrounding mountains and is subject to periodic droughts and hurricanes. The average annual temperature is 25.7 °C. Because of the actual impacts of climate variations, weather extremes have distinct
Water Resources’ response to climate change in the Trou du Nord Watershed, Haiti
Aqua-LAC - Vol. 9 - Nº. 1 - Mar. 201774
effects on soil erosion, agricultural production, and water quality.Current climate data sets are poor for the Trou du Nord watershed. Precipitation data sets derived from stations close to the watershed are not continuous, but sporadic in time. Data obtained during the first half of the last century points towards having a bimodal rainfall, with the main rainy season occurring from September to December and the second rainy period extending from April to June. The analysis of more recent data (2000-2012) for Trou du Nord watershed indicate that these two maxima have shifted to April
and October respectively, but more important yet, rain volume seems to have declined. In average, about 1551 mm of precipitation falls annually. ENVIRON, 2011 indicated that the climate of the Trou du Nord floodplain is classified as a moderate arid climate, with an average mean annual precipitation of 1,280 mm. The mean annual precipitation progressively increases from east to west and follows a bimodal distribution, with a primary rainy season from September to November and a secondary, less pronounced, rainy season from April to June.
Figure 1. Location map of the Trou du Nord watershed
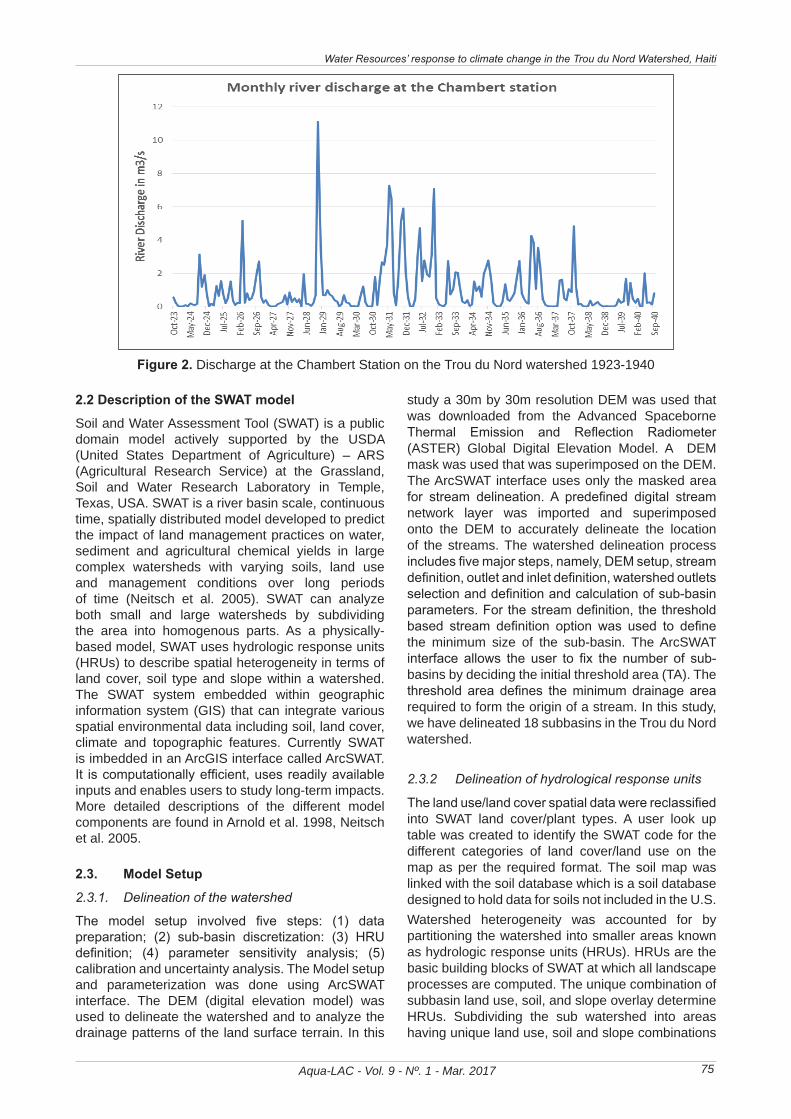
Daily river discharge values over the period 1923 – 1940 for the Trou du Nord River were provided by Centre National de l’Information Géo-Spatiale (CNIGS). This discharge data was measured at the Chambert Hydrological Station. The station is located just upstream from the industrial park (longitude of 72º 0’ 4’’ W and a latitude of 19º 38’ 44’’ North) in the vicinity of the bridge over the Trou du Nord in Route Nationale 6 close to the community of Chabert. Figure 2 indicates the time series daily discharge at the Chambert Station for the given period of 1923 to 1940. The daily discharge trend corresponds to the rainfall distribution in the watershed. These daily river discharges were used to understand the seasonal and inter annual variability of the river discharge which served to evaluate the prediction performance of the SWAT model under limited data conditions. Per the ENVIRON study (2011) reports indicate that during the primary dry seasons (February 2011) and mid- summer drought (July 2011) the Trou du Nord River averaged 0.45 m³/s and 0.70 m³/s respectively.
Figure 1. Location map of the Trou du Nord watershed
Daily river discharge values over the period 1923 – 1940 for the Trou du Nord River were provided by Centre National de l’Information Géo-Spatiale (CNIGS). This discharge data was measured at the Chambert Hydrological Station. The station is located just upstream from the industrial park (latitude of 19º38’44’’ N and a longitude of 72º00’40’’ W) in the vicinity of the bridge over the Trou du Nord in Route Nationale 6 close to the community of Chabert. Figure 2 indicates the time series daily discharge at the Chambert Station for the given period of 1923
to 1940. The daily discharge trend corresponds to the rainfall distribution in the watershed. These daily river discharges were used to understand the seasonal and inter annual variability of the river discharge which served to evaluate the prediction performance of the SWAT model under limited data conditions. Per the ENVIRON study (2011) reports indicate that during the primary dry seasons (February 2011) and mid summer drought (July 2011) the Trou du Nord River averaged 0.45 m³/s and 0.70 m³/s respectively.
Shimelis Setegn and Maria Concepcion Donoso
Aqua-LAC - Vol. 9 - Nº. 1 - Mar. 2017 75
Figure 2. Discharge at the Chambert Station on the Trou du Nord watershed 1923-1940
2.2. Description of the SWAT model
Soil and Water Assessment Tool (SWAT) is a public domain model actively supported by the USDA (United States Department of Agriculture) – ARS (Agricultural Research Service) at the Grassland, Soil and Water Research Laboratory in Temple, Texas, USA. SWAT is a river basin scale, continuous time, spatially distributed model developed to predict the impact of land management practices on water, sediment and agricultural chemical yields in large complex watersheds with varying soils, land use and management conditions over long periods of time (Neitsch et al. 2005). SWAT can analyze both small and large watersheds by subdividing the area into homogenous parts. As a physically-based model, SWAT uses hydrologic response units (HRUs) to describe spatial heterogeneity in terms of land cover, soil type and slope within a watershed. The SWAT system embedded within geographic information system (GIS) that can integrate various spatial environmental data including soil, land cover, climate and topographic features. Currently SWAT is imbedded in an ArcGIS interface called ArcSWAT. It is computationally efficient, uses readily available inputs and enables users to study long-term impacts.
More detailed descriptions of the different model components are found in Arnold et al. 1998, Neitsch et al. 2005.
2.3. Model Setup
2.3.1. Delineation of the watershed
The model setup involved five steps: (1) data preparation; (2) sub-basin discretization: (3) HRU definition; (4) parameter sensitivity analysis; (5) calibration and uncertainty analysis. The Model setup and parameterization was done using ArcSWAT interface. The DEM (digital elevation model) was used to delineate the watershed and to analyze the drainage patterns of the land surface terrain. In this study a 30 m by 30 m resolution DEM was used that was downloaded from the Advanced Spaceborne Thermal Emission and Reflection Radiometer (ASTER) Global Digital Elevation Model. A DEM mask was used that was superimposed on the DEM. The ArcSWAT interface uses only the masked area for stream delineation. A predefined digital stream network layer was imported and superimposed onto the DEM to accurately delineate the location of the streams. The watershed delineation process includes five major steps, namely, DEM setup, stream definition, outlet and inlet definition, watershed outlets selection and definition and calculation of sub-basin parameters. For the stream definition, the threshold based stream definition option was used to define the minimum size of the sub-basin. The ArcSWAT interface allows the user to fix the number of sub-basins by deciding the initial threshold area (TA). The threshold area defines the minimum drainage area required to form the origin of a stream. In this study, we have delineated 18 subbasins in the Trou du Nord watershed.
Figure 2. Discharge at the Chambert Station on the Trou du Nord watershed 1923-1940
2.2 Description of the SWAT model
Soil and Water Assessment Tool (SWAT) is a public domain model actively supported by the USDA (United States Department of Agriculture) – ARS (Agricultural Research Service) at the Grassland, Soil and Water Research Laboratory in Temple, Texas, USA. SWAT is a river basin scale, continuous time, spatially distributed model developed to predict the impact of land management practices on water, sediment and agricultural chemical yields in large complex watersheds with varying soils, land use and management conditions over long periods of time (Neitsch et al. 2005). SWAT can analyze both small and large watersheds by subdividing the area into homogenous parts. As a physically-based model, SWAT uses hydrologic response units (HRUs) to describe spatial heterogeneity in terms of land cover, soil type and slope within a watershed. The SWAT system embedded within geographic information system (GIS) that can integrate various spatial environmental data including soil, land cover, climate and topographic features. Currently SWAT is imbedded in an ArcGIS interface called ArcSWAT. It is computationally efficient, uses readily available inputs and enables users to study long-term impacts.More detailed descriptions of the different model components are found in Arnold et al. 1998, Neitsch et al. 2005.
2.3. Model Setup
2.3.1. Delineation of the watershed
The model setup involved five steps: (1) data preparation; (2) sub-basin discretization: (3) HRU definition; (4) parameter sensitivity analysis; (5) calibration and uncertainty analysis. The Model setup and parameterization was done using ArcSWAT interface. The DEM (digital elevation model) was used to delineate the watershed and to analyze the drainage patterns of the land surface terrain. In this
study a 30m by 30m resolution DEM was used that was downloaded from the Advanced Spaceborne Thermal Emission and Reflection Radiometer (ASTER) Global Digital Elevation Model. A DEM mask was used that was superimposed on the DEM. The ArcSWAT interface uses only the masked area for stream delineation. A predefined digital stream network layer was imported and superimposed onto the DEM to accurately delineate the location of the streams. The watershed delineation process includes five major steps, namely, DEM setup, stream definition, outlet and inlet definition, watershed outlets selection and definition and calculation of sub-basin parameters. For the stream definition, the threshold based stream definition option was used to define the minimum size of the sub-basin. The ArcSWAT interface allows the user to fix the number of sub-basins by deciding the initial threshold area (TA). The threshold area defines the minimum drainage area required to form the origin of a stream. In this study, we have delineated 18 subbasins in the Trou du Nord watershed.
2.3.2 Delineation of hydrological response units
The land use/land cover spatial data were reclassified into SWAT land cover/plant types. A user look up table was created to identify the SWAT code for the different categories of land cover/land use on the map as per the required format. The soil map was linked with the soil database which is a soil database designed to hold data for soils not included in the U.S. Watershed heterogeneity was accounted for by partitioning the watershed into smaller areas known as hydrologic response units (HRUs). HRUs are the basic building blocks of SWAT at which all landscape processes are computed. The unique combination of subbasin land use, soil, and slope overlay determine HRUs. Subdividing the sub watershed into areas having unique land use, soil and slope combinations
Water Resources’ response to climate change in the Trou du Nord Watershed, Haiti
Aqua-LAC - Vol. 9 - Nº. 1 - Mar. 201776
makes it possible to study the differences in evapotranspiration and other hydrologic conditions for different land covers, soils and slopes. Using the ArcSWAT interface, we overlaid land use, soil, and slope layers to create a unique combination of HRUs by subbasin.
2.4. Model Input
2.4.1. Geospatial data
GIS input files needed for the SWAT model include the digital elevation model (DEM), land cover, and soil layers. A 30 m by 30 m resolution DEM was used that was downloaded from the Advanced Spaceborne Thermal Emission and Reflection Radiometer (ASTER) Global Digital Elevation Model. The DEM was utilized by ArcSWAT to delineate basin and sub-basin boundaries, calculate sub-basin average slopes and delineate the stream network. The land use, soil and slope layers are used to create and define hydrological response units (HRUs).
2.4.2. Weather Data
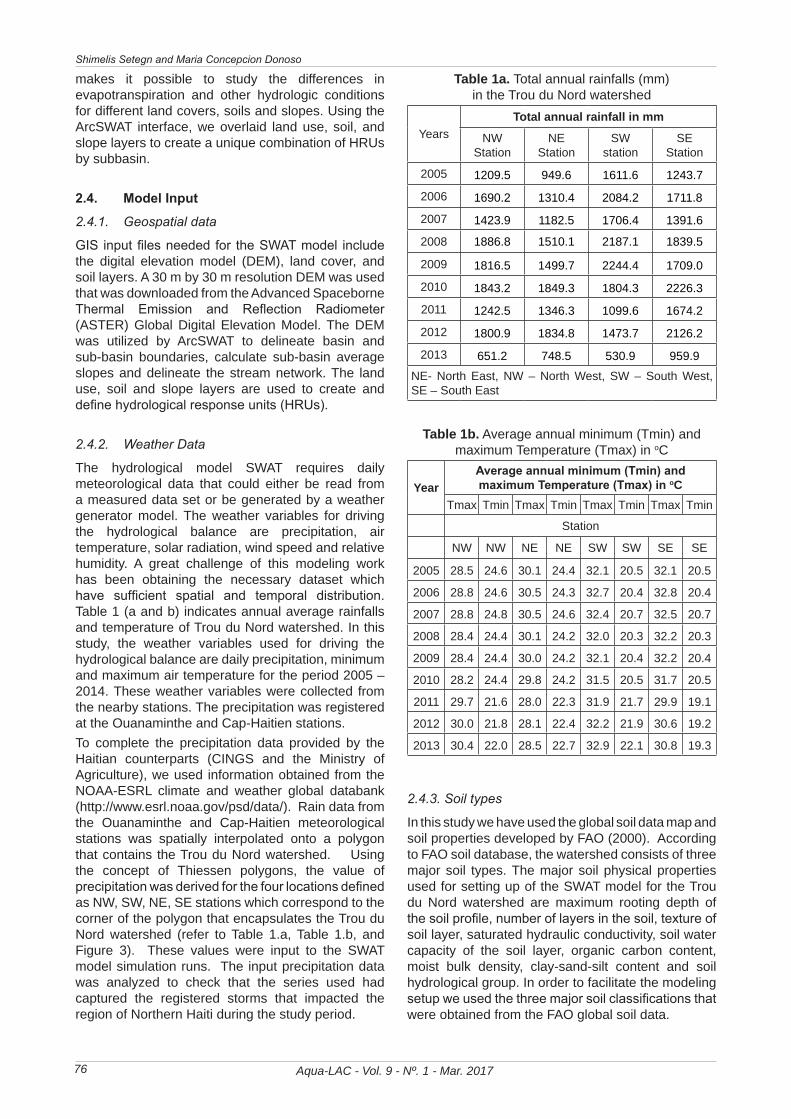
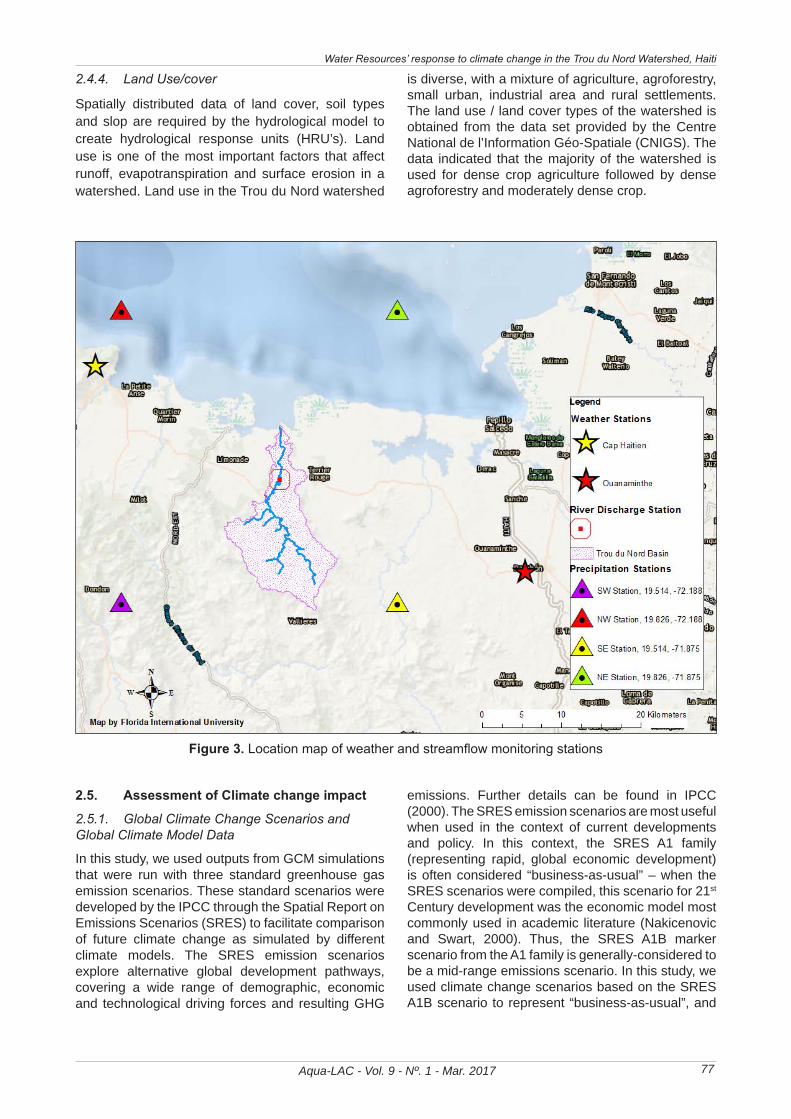
The hydrological model SWAT requires daily meteorological data that could either be read from a measured data set or be generated by a weather generator model. The weather variables for driving the hydrological balance are precipitation, air temperature, solar radiation, wind speed and relative humidity. A great challenge of this modeling work has been obtaining the necessary dataset which have sufficient spatial and temporal distribution. Table 1 (a and b) indicates annual average rainfalls and temperature of Trou du Nord watershed. In this study, the weather variables used for driving the hydrological balance are daily precipitation, minimum and maximum air temperature for the period 2005 – 2014. These weather variables were collected from the nearby stations. The precipitation was registered at the Ouanaminthe and Cap-Haitien stations. To complete the precipitation data provided by the Haitian counterparts (CINGS and the Ministry of Agriculture), we used information obtained from the NOAA-ESRL climate and weather global databank (http://www.esrl.noaa.gov/psd/data/). Rain data from the Ouanaminthe and Cap-Haitien meteorological stations was spatially interpolated onto a polygon that contains the Trou du Nord watershed. Using the concept of Thiessen polygons, the value of precipitation was derived for the four locations defined as NW, SW, NE, SE stations which correspond to the corner of the polygon that encapsulates the Trou du Nord watershed (refer to Table 1.a, Table 1.b, and Figure 3). These values were input to the SWAT model simulation runs. The input precipitation data was analyzed to check that the series used had captured the registered storms that impacted the region of Northern Haiti during the study period.
Table 1a. Total annual rainfalls (mm) in the Trou du Nord watershed
YearsTotal annual rainfall in mm
NW Station
NE Station
SW station
SE Station
2005 1209.5 949.6 1611.6 1243.7
2006 1690.2 1310.4 2084.2 1711.8
2007 1423.9 1182.5 1706.4 1391.6
2008 1886.8 1510.1 2187.1 1839.5
2009 1816.5 1499.7 2244.4 1709.0
2010 1843.2 1849.3 1804.3 2226.3
2011 1242.5 1346.3 1099.6 1674.2
2012 1800.9 1834.8 1473.7 2126.2
2013 651.2 748.5 530.9 959.9
NE- North East, NW – North West, SW – South West, SE – South East
Table 1b. Average annual minimum (Tmin) and maximum Temperature (Tmax) in oC
yearAverage annual minimum (Tmin) and maximum Temperature (Tmax) in oC
Tmax Tmin Tmax Tmin Tmax Tmin Tmax Tmin
Station
NW NW NE NE SW SW SE SE
2005 28.5 24.6 30.1 24.4 32.1 20.5 32.1 20.5
2006 28.8 24.6 30.5 24.3 32.7 20.4 32.8 20.4
2007 28.8 24.8 30.5 24.6 32.4 20.7 32.5 20.7
2008 28.4 24.4 30.1 24.2 32.0 20.3 32.2 20.3
2009 28.4 24.4 30.0 24.2 32.1 20.4 32.2 20.4
2010 28.2 24.4 29.8 24.2 31.5 20.5 31.7 20.5
2011 29.7 21.6 28.0 22.3 31.9 21.7 29.9 19.1
2012 30.0 21.8 28.1 22.4 32.2 21.9 30.6 19.2
2013 30.4 22.0 28.5 22.7 32.9 22.1 30.8 19.3
2.4.3. Soil types
In this study we have used the global soil data map and soil properties developed by FAO (2000). According to FAO soil database, the watershed consists of three major soil types. The major soil physical properties used for setting up of the SWAT model for the Trou du Nord watershed are maximum rooting depth of the soil profile, number of layers in the soil, texture of soil layer, saturated hydraulic conductivity, soil water capacity of the soil layer, organic carbon content, moist bulk density, clay-sand-silt content and soil hydrological group. In order to facilitate the modeling setup we used the three major soil classifications that were obtained from the FAO global soil data.
Shimelis Setegn and Maria Concepcion Donoso
Aqua-LAC - Vol. 9 - Nº. 1 - Mar. 2017 77
2.4.4. Land Use/cover
Spatially distributed data of land cover, soil types and slop are required by the hydrological model to create hydrological response units (HRU’s). Land use is one of the most important factors that affect runoff, evapotranspiration and surface erosion in a watershed. Land use in the Trou du Nord watershed
is diverse, with a mixture of agriculture, agroforestry, small urban, industrial area and rural settlements. The land use / land cover types of the watershed is obtained from the data set provided by the Centre National de l’Information Géo-Spatiale (CNIGS). The data indicated that the majority of the watershed is used for dense crop agriculture followed by dense agroforestry and moderately dense crop.
mixture of agriculture, agroforestry, small urban, industrial area and rural settlements. The land use / land cover types of the watershed is obtained from the data set provided by the Centre National de l’Information Géo-Spatiale (CNIGS). The data indicated that the majority of the watershed is used for dense crop agriculture followed by dense agroforestry and moderately dense crop.
Figure 3. Location map of weather and streamflow monitoring stations
2.5. Assessment of Climate change impact
2.5.1. Global Climate Change Scenarios and Global Climate Model Data
In this study, we used outputs from GCM simulations that were run with three standard greenhouse gas emission scenarios. These standard scenarios were developed by the IPCC through the Spatial Report on Emissions Scenarios (SRES) to facilitate comparison of future climate change as simulated by different climate models. The SRES emission scenarios explore alternative global development pathways, covering a wide range of demographic, economic and technological driving forces and resulting GHG emissions. Further details can be found in IPCC (2000). The SRES emission scenarios are most useful when used in the context of current developments and policy. In this context, the SRES A1 family (representing rapid, global economic development) is often considered “business-as-usual” – when the SRES scenarios were compiled, this scenario for 21st Century
Figure 3. Location map of weather and streamflow monitoring stations
2.5. Assessment of Climate change impact
2.5.1. Global Climate Change Scenarios and Global Climate Model Data
In this study, we used outputs from GCM simulations that were run with three standard greenhouse gas emission scenarios. These standard scenarios were developed by the IPCC through the Spatial Report on Emissions Scenarios (SRES) to facilitate comparison of future climate change as simulated by different climate models. The SRES emission scenarios explore alternative global development pathways, covering a wide range of demographic, economic and technological driving forces and resulting GHG
emissions. Further details can be found in IPCC (2000). The SRES emission scenarios are most useful when used in the context of current developments and policy. In this context, the SRES A1 family (representing rapid, global economic development) is often considered “business-as-usual” – when the SRES scenarios were compiled, this scenario for 21st Century development was the economic model most commonly used in academic literature (Nakicenovic and Swart, 2000). Thus, the SRES A1B marker scenario from the A1 family is generally-considered to be a mid-range emissions scenario. In this study, we used climate change scenarios based on the SRES A1B scenario to represent “business-as-usual”, and
Water Resources’ response to climate change in the Trou du Nord Watershed, Haiti
Aqua-LAC - Vol. 9 - Nº. 1 - Mar. 201778
the SRES B1 and A2 scenarios to represent low-end and high-end emission scenarios, respectively.The GCM output data used for this study were obtained from the World Climate Research Programme’s (WCRP’s) Coupled Model Inter-comparison Project phase 3 (CMIP3) multi-model data-set. We used climate change scenarios based on the SRES A1B, B1 and A2 scenarios. These were the most important transient scenarios run during the CMIP3 project. We used two sets of GCM ensembles. The first set was used to quantify the range of the projected climate changes for Haiti. This dataset comprised the monthly precipitation and air temperature outputs from 21 GCMs for the A1B scenario, and from 18 models for the B1 and A2 scenarios. These were all the GCMs for which data were readily accessible for these scenarios. Data were downloaded for the periods 2011-40, 2041-70 and 2071-2100. GCM outputs for 1961-1990 from the Climate of the 20th Century Experiment were used as base-period data.Our second set of GCM ensemble data were used to generate inputs for the SWAT model for assessing the impact of climate change on stream flows, soil moisture, ground water and other hydrological parameters in the selected watersheds. This dataset comprised daily precipitation, minimum and maximum air temperature from 8 GCM models, for the same three SRES scenarios. These were the only GCMs for which daily outputs for these variables were available. Daily data were only available from CMIP3 for the time-periods 2046-2065 and 2080-2098, and for the 1961-1990 base periods, for most of the GCMs.
2.5.2. Downscaling of Global Climate Models
Assessing the impact of climate change on stream flows, soil moisture, groundwater and other hydrological parameters essentially involves taking GCM outputs of climatic variables (e.g., precipitation, temperature, humidity, mean sea level pressure etc.) at a global scale, downscaling these global-scale climatic variables to local-scale hydrologic variables, computing hydrological components, and finally assessing future water resource variability and risks of hydrologic extremes. In this study, we use a statistical approach, following the historical-modification procedure of Harrold and Jones (2003) which produces climate time-series that have similar statistical properties to the observed calibration datasets. Daily climate projections were generated by modifying the historical datasets to represent changes in the GCM climatologies. The historical-modification approach was used because hydrological models often perform poorly when run
using datasets that have distributions of daily climate data different from their training data, and statistical downscaling techniques often result in distributions that are noticeably different from observed time-series (eg with compressed variance). Our method involved, in short, calculating the difference between the daily cumulative-frequency-distributions (CFDs) of a GCM output variable for a present-day period and a future period, and then applying these differences to an observed dataset.
3. RESULTS AND DISCUSSION
3.1. Calibration of SWAT model in the Trou du Nord watershed, haiti
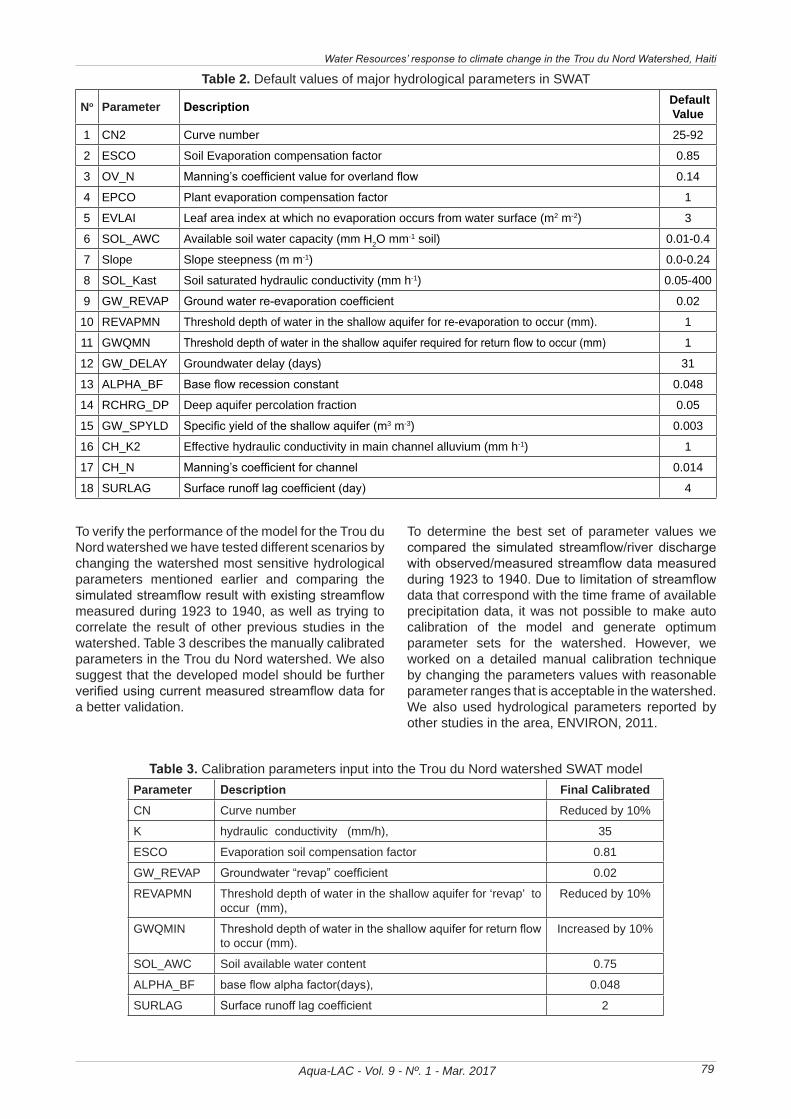
The Soil and Water Assessment Tool (SWAT) model was originally developed to operate in large‐scale ungauged basins with little or no calibration efforts (Arnold et al., 1998). Observed data on both spatial and temporal scales of interest are always very limited, especially in ungauged basins (Sivapalan et al., 2003). Still model performance evaluation in ungauged basins is an important research topic. One approach to addressing the use of hydrological models in ungauged basins is developing a model that uses physically based inputs both spatially and temporally along with comprehensiveness in the model’s interrelationships and ability to predict ungauged basins reasonably well (Srinivasan et al., 2010). The current task is an attempt to reasonably set up the model with the available physically based spatial and time series data. In SWAT there are 26 hydrological parameters that can be evaluated for development of the hydrological model for particular watershed. The parameter sensitivity analysis was done for the whole catchment. Sensitivity analysis is the process of determining the rate of change in model output with respect to changes in model inputs (parameters). Twenty six hydrological parameters were tested for sensitivity analysis for the simulation of the stream flow in the study area. Table 2 shows default values of major parameters in SWAT. The details of all hydrological parameters are found in the ArcSWAT interface for SWAT user‘s manual (Winchell et al. 2007). The most sensitive parameters that were considered for manual calibration in the Trou du Nord watershed are Curve Number II value, soil evaporation compensation factor, base flow alpha factor(days), available water capacity, hydraulic conductivity (mm/h), threshold depth of water in the shallow aquifer for ‘revap’ to occur (mm), (days), (mm WATER/mm soil), groundwater ‘revap’ coefficient, and threshold depth of water in the shallow aquifer for return flow to occur (mm).
Shimelis Setegn and Maria Concepcion Donoso
Aqua-LAC - Vol. 9 - Nº. 1 - Mar. 2017 79
Table 2. Default values of major hydrological parameters in SWAT
No Parameter Description Default Value
1 CN2 Curve number 25-92
2 ESCO Soil Evaporation compensation factor 0.85
3 OV_N Manning’s coefficient value for overland flow 0.14
4 EPCO Plant evaporation compensation factor 1
5 EVLAI Leaf area index at which no evaporation occurs from water surface (m2 m-2) 3
6 SOL_AWC Available soil water capacity (mm H2O mm-1 soil) 0.01-0.4
7 Slope Slope steepness (m m-1) 0.0-0.24
8 SOL_Kast Soil saturated hydraulic conductivity (mm h-1) 0.05-400
9 GW_REVAP Ground water re-evaporation coefficient 0.02
10 REVAPMN Threshold depth of water in the shallow aquifer for re-evaporation to occur (mm). 1
11 GWQMN Threshold depth of water in the shallow aquifer required for return flow to occur (mm) 1
12 GW_DELAY Groundwater delay (days) 31
13 ALPHA_BF Base flow recession constant 0.048
14 RCHRG_DP Deep aquifer percolation fraction 0.05
15 GW_SPYLD Specific yield of the shallow aquifer (m3 m-3) 0.003
16 CH_K2 Effective hydraulic conductivity in main channel alluvium (mm h-1) 1
17 CH_N Manning’s coefficient for channel 0.014
18 SURLAG Surface runoff lag coefficient (day) 4
To verify the performance of the model for the Trou du Nord watershed we have tested different scenarios by changing the watershed most sensitive hydrological parameters mentioned earlier and comparing the simulated streamflow result with existing streamflow measured during 1923 to 1940, as well as trying to correlate the result of other previous studies in the watershed. Table 3 describes the manually calibrated parameters in the Trou du Nord watershed. We also suggest that the developed model should be further verified using current measured streamflow data for a better validation.
To determine the best set of parameter values we compared the simulated streamflow/river discharge with observed/measured streamflow data measured during 1923 to 1940. Due to limitation of streamflow data that correspond with the time frame of available precipitation data, it was not possible to make auto calibration of the model and generate optimum parameter sets for the watershed. However, we worked on a detailed manual calibration technique by changing the parameters values with reasonable parameter ranges that is acceptable in the watershed. We also used hydrological parameters reported by other studies in the area, ENVIRON, 2011.
Table 3. Calibration parameters input into the Trou du Nord watershed SWAT modelParameter Description Final CalibratedCN Curve number Reduced by 10%
K hydraulic conductivity (mm/h), 35
ESCO Evaporation soil compensation factor 0.81
GW_REVAP Groundwater “revap” coefficient 0.02
REVAPMN Threshold depth of water in the shallow aquifer for ‘revap’ to occur (mm),
Reduced by 10%
GWQMIN Threshold depth of water in the shallow aquifer for return flow to occur (mm).
Increased by 10%
SOL_AWC Soil available water content 0.75
ALPHA_BF base flow alpha factor(days), 0.048
SURLAG Surface runoff lag coefficient 2
Water Resources’ response to climate change in the Trou du Nord Watershed, Haiti
Aqua-LAC - Vol. 9 - Nº. 1 - Mar. 201780
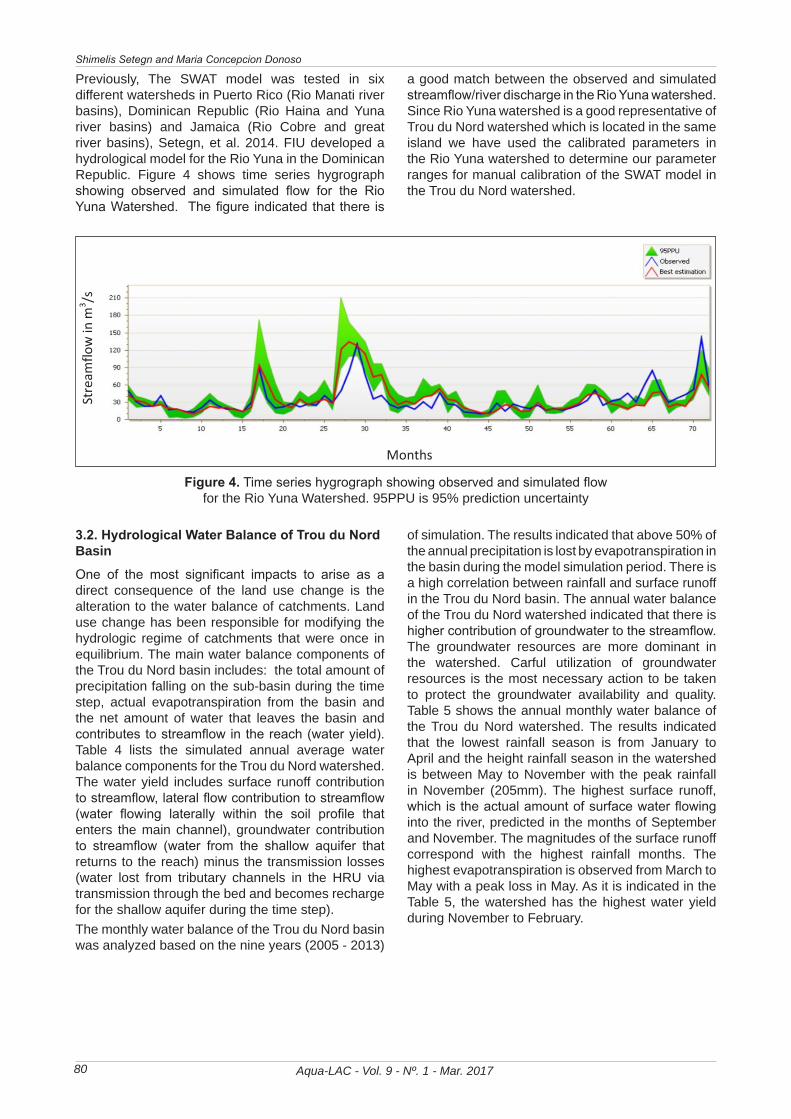
Previously, The SWAT model was tested in six different watersheds in Puerto Rico (Rio Manati river basins), Dominican Republic (Rio Haina and Yuna river basins) and Jamaica (Rio Cobre and great river basins), Setegn, et al. 2014. FIU developed a hydrological model for the Rio Yuna in the Dominican Republic. Figure 4 shows time series hygrograph showing observed and simulated flow for the Rio Yuna Watershed. The figure indicated that there is
a good match between the observed and simulated streamflow/river discharge in the Rio Yuna watershed. Since Rio Yuna watershed is a good representative of Trou du Nord watershed which is located in the same island we have used the calibrated parameters in the Rio Yuna watershed to determine our parameter ranges for manual calibration of the SWAT model in the Trou du Nord watershed.
ESCO Evaporation soil compensation factor 0.81 GW_REVAP Groundwater “revap” coefficient 0.02 REVAPMN Threshold depth of water in the shallow aquifer for ‘revap’ to
( ) Reduced by 10%
GWQMIN Threshold depth of water in the shallow aquifer for return flow to
Increased by 10% SOL_AWC Soil available water content 0.75 ALPHA_BF base flow alpha factor(days), 0.048 SURLAG Surface runoff lag coefficient 2 Previously, The SWAT model was tested in six different watersheds in Puerto Rico (Rio Manati river basins), Dominican Republic (Rio Haina and Yuna river basins) and Jamaica (Rio Cobre and great river basins), Setegn, et al. 2014. FIU developed a hydrological model for the Rio Yuna in the Dominican Republic. Figure 4 shows time series hygrograph showing observed and simulated flow for the Rio Yuna Watershed. The figure indicated that there is a good match between the observed and simulated streamflow/river discharge in the Rio Yuna watershed. Since Rio Yuna watershed is a good representative of Trou du Nord watershed which is located in the same island we have used the calibrated parameters in the Rio Yuna watershed to determine our parameter ranges for manual calibration of the SWAT model in the Trou du Nord watershed.
Figure 4. Time series hygrograph showing observed and simulated flow for the Rio Yuna Watershed. 95PPU is 95% prediction uncertainty. 3.2. Hydrological Water Balance of Trou du Nord Basin
One of the most significant impacts to arise as a direct consequence of the land use change is the alteration to the water balance of catchments. Land use change has been responsible for modifying the hydrologic regime of catchments that were once in equilibrium. The main water balance components of the Trou du Nord basin includes: the total amount of precipitation falling on the sub-basin during the time step, actual evapotranspiration from the basin and the net amount of water that leaves the basin and contributes to streamflow in the reach (water yield). Table 4 lists the simulated annual average water balance components for the Trou du Nord watershed. The water yield includes surface runoff contribution to streamflow, lateral flow contribution to streamflow (water flowing laterally within the soil profile that enters the main channel), groundwater contribution to streamflow (water from the shallow aquifer that returns to the reach) minus the transmission losses (water lost from tributary channels in the HRU via transmission through the bed and becomes recharge for the shallow aquifer during the time step). The monthly water balance of the Trou du Nord basin was analyzed based on the nine years (2005 - 2013) of simulation. The results indicated that above 50% of the annual precipitation is lost by evapotranspiration in the
Stre
amflo
w in
m3 /s
Months
Figure 4. Time series hygrograph showing observed and simulated flow for the Rio Yuna Watershed. 95PPU is 95% prediction uncertainty
3.2. Hydrological Water Balance of Trou du Nord Basin
One of the most significant impacts to arise as a direct consequence of the land use change is the alteration to the water balance of catchments. Land use change has been responsible for modifying the hydrologic regime of catchments that were once in equilibrium. The main water balance components of the Trou du Nord basin includes: the total amount of precipitation falling on the sub-basin during the time step, actual evapotranspiration from the basin and the net amount of water that leaves the basin and contributes to streamflow in the reach (water yield). Table 4 lists the simulated annual average water balance components for the Trou du Nord watershed. The water yield includes surface runoff contribution to streamflow, lateral flow contribution to streamflow (water flowing laterally within the soil profile that enters the main channel), groundwater contribution to streamflow (water from the shallow aquifer that returns to the reach) minus the transmission losses (water lost from tributary channels in the HRU via transmission through the bed and becomes recharge for the shallow aquifer during the time step). The monthly water balance of the Trou du Nord basin was analyzed based on the nine years (2005 - 2013)
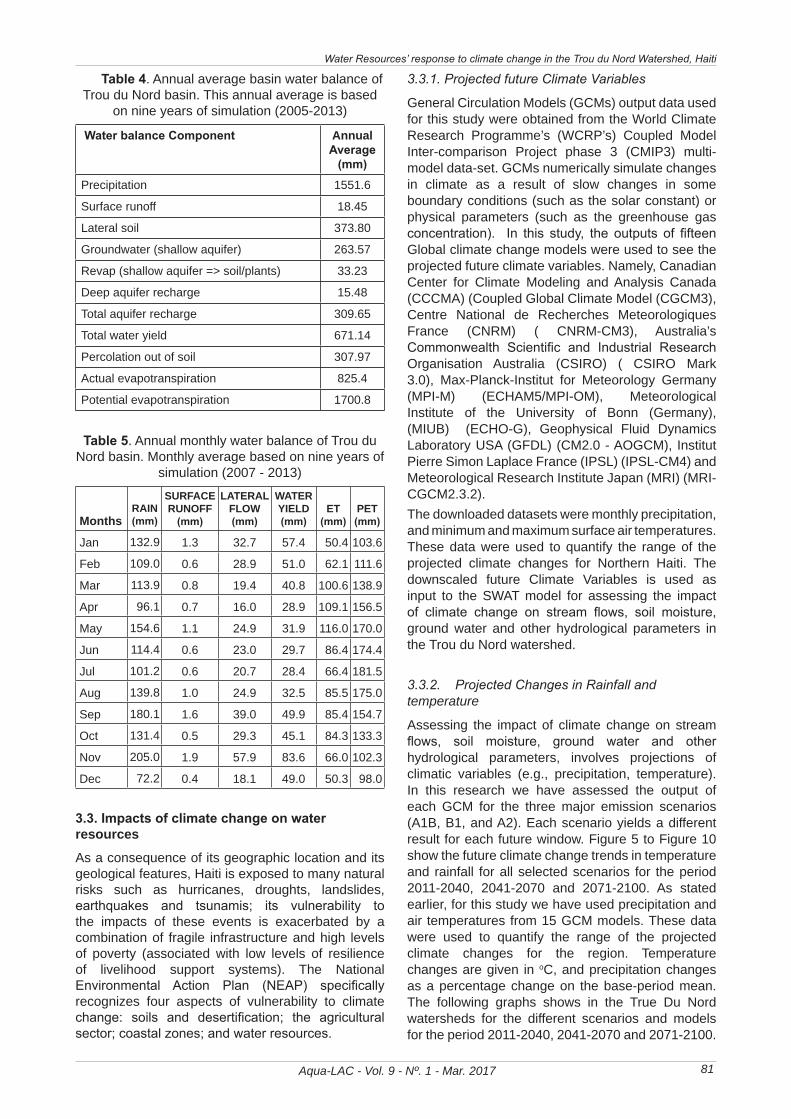
of simulation. The results indicated that above 50% of the annual precipitation is lost by evapotranspiration in the basin during the model simulation period. There is a high correlation between rainfall and surface runoff in the Trou du Nord basin. The annual water balance of the Trou du Nord watershed indicated that there is higher contribution of groundwater to the streamflow. The groundwater resources are more dominant in the watershed. Carful utilization of groundwater resources is the most necessary action to be taken to protect the groundwater availability and quality. Table 5 shows the annual monthly water balance of the Trou du Nord watershed. The results indicated that the lowest rainfall season is from January to April and the height rainfall season in the watershed is between May to November with the peak rainfall in November (205mm). The highest surface runoff, which is the actual amount of surface water flowing into the river, predicted in the months of September and November. The magnitudes of the surface runoff correspond with the highest rainfall months. The highest evapotranspiration is observed from March to May with a peak loss in May. As it is indicated in the Table 5, the watershed has the highest water yield during November to February.
Shimelis Setegn and Maria Concepcion Donoso
Aqua-LAC - Vol. 9 - Nº. 1 - Mar. 2017 81
Table 4. Annual average basin water balance of Trou du Nord basin. This annual average is based
on nine years of simulation (2005-2013)
Water balance Component Annual Average
(mm)Precipitation 1551.6
Surface runoff 18.45
Lateral soil 373.80
Groundwater (shallow aquifer) 263.57
Revap (shallow aquifer => soil/plants) 33.23
Deep aquifer recharge 15.48
Total aquifer recharge 309.65
Total water yield 671.14
Percolation out of soil 307.97
Actual evapotranspiration 825.4
Potential evapotranspiration 1700.8
Table 5. Annual monthly water balance of Trou du Nord basin. Monthly average based on nine years of
simulation (2007 - 2013)
Months
RAIN (mm)
SURFACE RUNOFF
(mm)
LATERAL FLOW (mm)
WATER yIELD (mm)
ET (mm)
PET (mm)
Jan 132.9 1.3 32.7 57.4 50.4 103.6
Feb 109.0 0.6 28.9 51.0 62.1 111.6
Mar 113.9 0.8 19.4 40.8 100.6 138.9
Apr 96.1 0.7 16.0 28.9 109.1 156.5
May 154.6 1.1 24.9 31.9 116.0 170.0
Jun 114.4 0.6 23.0 29.7 86.4 174.4
Jul 101.2 0.6 20.7 28.4 66.4 181.5
Aug 139.8 1.0 24.9 32.5 85.5 175.0
Sep 180.1 1.6 39.0 49.9 85.4 154.7
Oct 131.4 0.5 29.3 45.1 84.3 133.3
Nov 205.0 1.9 57.9 83.6 66.0 102.3
Dec 72.2 0.4 18.1 49.0 50.3 98.0
3.3. Impacts of climate change on water resources
As a consequence of its geographic location and its geological features, Haiti is exposed to many natural risks such as hurricanes, droughts, landslides, earthquakes and tsunamis; its vulnerability to the impacts of these events is exacerbated by a combination of fragile infrastructure and high levels of poverty (associated with low levels of resilience of livelihood support systems). The National Environmental Action Plan (NEAP) specifically recognizes four aspects of vulnerability to climate change: soils and desertification; the agricultural sector; coastal zones; and water resources.
3.3.1. Projected future Climate Variables
General Circulation Models (GCMs) output data used for this study were obtained from the World Climate Research Programme’s (WCRP’s) Coupled Model Inter-comparison Project phase 3 (CMIP3) multi-model data-set. GCMs numerically simulate changes in climate as a result of slow changes in some boundary conditions (such as the solar constant) or physical parameters (such as the greenhouse gas concentration). In this study, the outputs of fifteen Global climate change models were used to see the projected future climate variables. Namely, Canadian Center for Climate Modeling and Analysis Canada (CCCMA) (Coupled Global Climate Model (CGCM3), Centre National de Recherches Meteorologiques France (CNRM) ( CNRM-CM3), Australia’s Commonwealth Scientific and Industrial Research Organisation Australia (CSIRO) ( CSIRO Mark 3.0), Max-Planck-Institut for Meteorology Germany (MPI-M) (ECHAM5/MPI-OM), Meteorological Institute of the University of Bonn (Germany), (MIUB) (ECHO-G), Geophysical Fluid Dynamics Laboratory USA (GFDL) (CM2.0 - AOGCM), Institut Pierre Simon Laplace France (IPSL) (IPSL-CM4) and Meteorological Research Institute Japan (MRI) (MRI-CGCM2.3.2). The downloaded datasets were monthly precipitation, and minimum and maximum surface air temperatures. These data were used to quantify the range of the projected climate changes for Northern Haiti. The downscaled future Climate Variables is used as input to the SWAT model for assessing the impact of climate change on stream flows, soil moisture, ground water and other hydrological parameters in the Trou du Nord watershed.
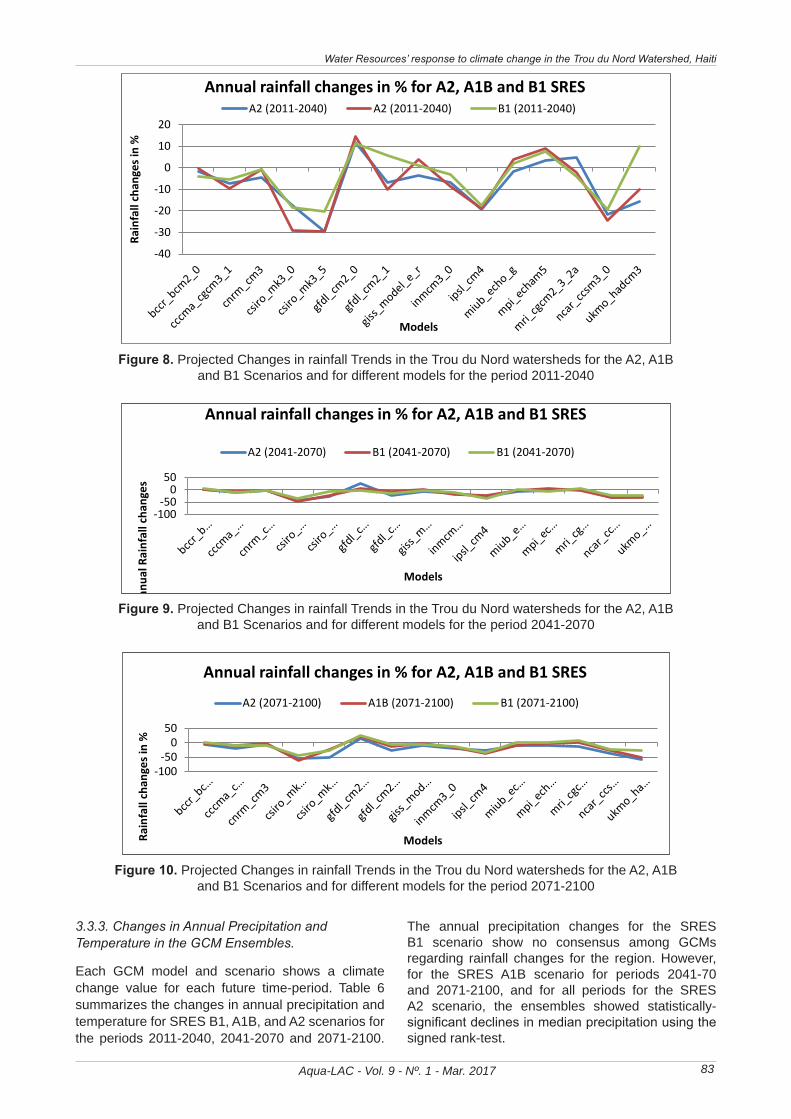
3.3.2. Projected Changes in Rainfall and temperature
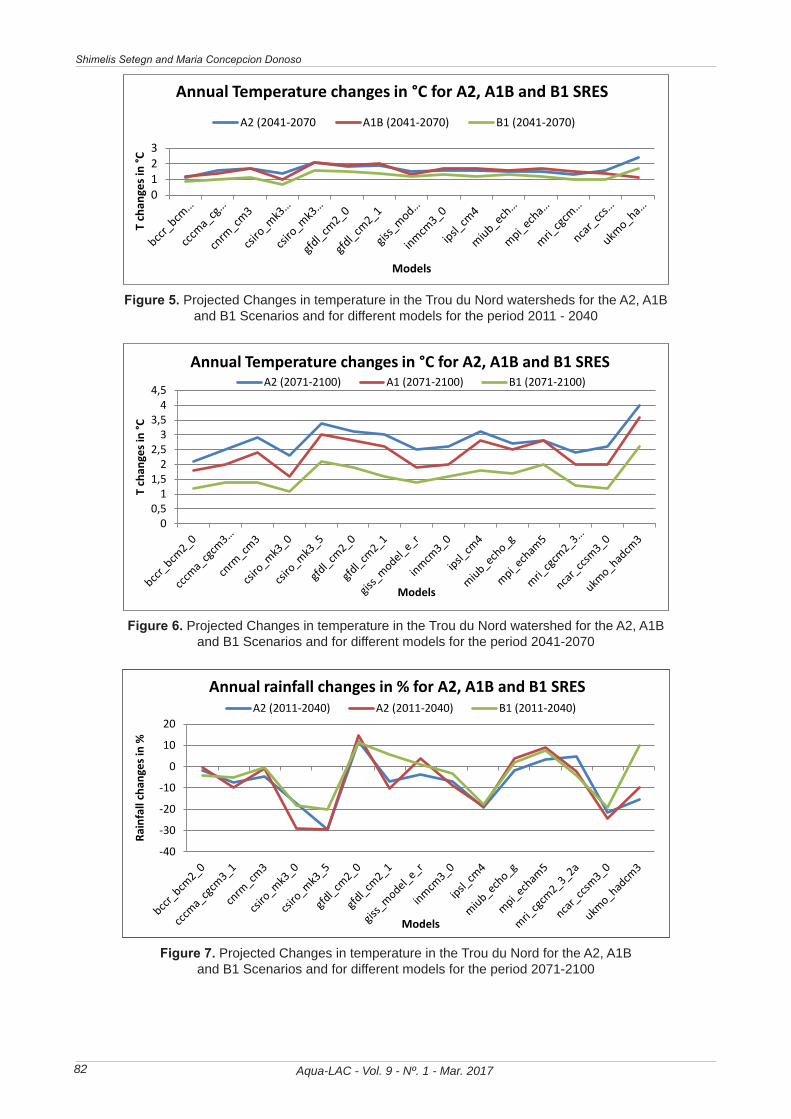
Assessing the impact of climate change on stream flows, soil moisture, ground water and other hydrological parameters, involves projections of climatic variables (e.g., precipitation, temperature). In this research we have assessed the output of each GCM for the three major emission scenarios (A1B, B1, and A2). Each scenario yields a different result for each future window. Figure 5 to Figure 10 show the future climate change trends in temperature and rainfall for all selected scenarios for the period 2011-2040, 2041-2070 and 2071-2100. As stated earlier, for this study we have used precipitation and air temperatures from 15 GCM models. These data were used to quantify the range of the projected climate changes for the region. Temperature changes are given in oC, and precipitation changes as a percentage change on the base-period mean. The following graphs shows in the True Du Nord watersheds for the different scenarios and models for the period 2011-2040, 2041-2070 and 2071-2100.
Water Resources’ response to climate change in the Trou du Nord Watershed, Haiti
Aqua-LAC - Vol. 9 - Nº. 1 - Mar. 201782
Figure 5. Projected Changes in temperature in the Trou du Nord watersheds for the A2, A1B and B1 Scenarios and for different models for the period 2011 - 2040
Figure 6. Projected Changes in temperature in the Trou du Nord watershed for the A2, A1B and B1 Scenarios
and for different models for the period 2041-2070
Figure 7. Projected Changes in temperature in the Trou du Nord for the A2, A1B and B1 Scenarios and for
different models for the period 2071-2100
0123
T ch
ange
s in
°C
Models
Annual Temperature changes in °C for A2, A1B and B1 SRES
A2 (2041-2070 A1B (2041-2070) B1 (2041-2070)
00,5
11,5
22,5
33,5
44,5
T ch
ange
s in
°C
Models
Annual Temperature changes in °C for A2, A1B and B1 SRES A2 (2071-2100) A1 (2071-2100) B1 (2071-2100)
Figure 5. Projected Changes in temperature in the Trou du Nord watersheds for the A2, A1B and B1 Scenarios and for different models for the period 2011 - 2040
Figure 5. Projected Changes in temperature in the Trou du Nord watersheds for the A2, A1B and B1 Scenarios and for different models for the period 2011 - 2040
Figure 6. Projected Changes in temperature in the Trou du Nord watershed for the A2, A1B and B1 Scenarios
and for different models for the period 2041-2070
Figure 7. Projected Changes in temperature in the Trou du Nord for the A2, A1B and B1 Scenarios and for
different models for the period 2071-2100
0123
T ch
ange
s in
°C
Models
Annual Temperature changes in °C for A2, A1B and B1 SRES
A2 (2041-2070 A1B (2041-2070) B1 (2041-2070)
00,5
11,5
22,5
33,5
44,5
T ch
ange
s in
°C
Models
Annual Temperature changes in °C for A2, A1B and B1 SRES A2 (2071-2100) A1 (2071-2100) B1 (2071-2100)
Figure 6. Projected Changes in temperature in the Trou du Nord watershed for the A2, A1B and B1 Scenarios and for different models for the period 2041-2070
Figure 8. Projected Changes in rainfall Trends in the Trou du Nord watersheds for the A2, A1B and B1
Scenarios and for different models for the period 2011-2040
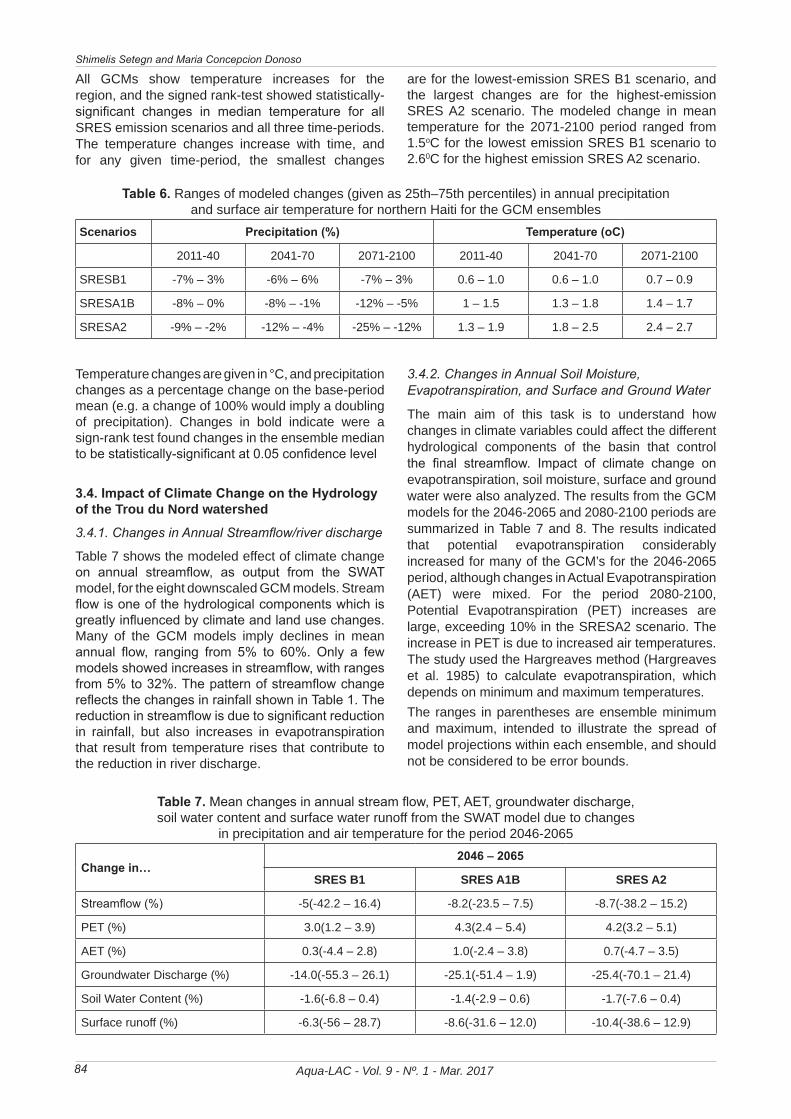
Figure 9. Projected Changes in rainfall Trends in the Trou du Nord watersheds for the A2, A1B and B1
Scenarios and for different models for the period 2041-2070
-40
-30
-20
-10
0
10
20
Rain
fall
chan
ges i
n %
Models
Annual rainfall changes in % for A2, A1B and B1 SRES A2 (2011-2040) A2 (2011-2040) B1 (2011-2040)
-100-50
050
Annu
al R
ainf
all c
hang
es
Models
Annual rainfall changes in % for A2, A1B and B1 SRES
A2 (2041-2070) B1 (2041-2070) B1 (2041-2070)
-100-50
050
Rain
fall
chan
ges i
n %
Models
Annual rainfall changes in % for A2, A1B and B1 SRES
A2 (2071-2100) A1B (2071-2100) B1 (2071-2100)
Figure 7. Projected Changes in temperature in the Trou du Nord for the A2, A1B and B1 Scenarios and for different models for the period 2071-2100
Shimelis Setegn and Maria Concepcion Donoso
Aqua-LAC - Vol. 9 - Nº. 1 - Mar. 2017 83
Figure 8. Projected Changes in rainfall Trends in the Trou du Nord watersheds for the A2, A1B and B1
Scenarios and for different models for the period 2011-2040
Figure 9. Projected Changes in rainfall Trends in the Trou du Nord watersheds for the A2, A1B and B1
Scenarios and for different models for the period 2041-2070
-40
-30
-20
-10
0
10
20Ra
infa
ll ch
ange
s in
%
Models
Annual rainfall changes in % for A2, A1B and B1 SRES A2 (2011-2040) A2 (2011-2040) B1 (2011-2040)
-100-50
050
Annu
al R
ainf
all c
hang
es
Models
Annual rainfall changes in % for A2, A1B and B1 SRES
A2 (2041-2070) B1 (2041-2070) B1 (2041-2070)
-100-50
050
Rain
fall
chan
ges i
n %
Models
Annual rainfall changes in % for A2, A1B and B1 SRES
A2 (2071-2100) A1B (2071-2100) B1 (2071-2100)
Figure 8. Projected Changes in rainfall Trends in the Trou du Nord watersheds for the A2, A1B and B1 Scenarios and for different models for the period 2011-2040
Figure 8. Projected Changes in rainfall Trends in the Trou du Nord watersheds for the A2, A1B and B1
Scenarios and for different models for the period 2011-2040
Figure 9. Projected Changes in rainfall Trends in the Trou du Nord watersheds for the A2, A1B and B1
Scenarios and for different models for the period 2041-2070
-40
-30
-20
-10
0
10
20Ra
infa
ll ch
ange
s in
%
Models
Annual rainfall changes in % for A2, A1B and B1 SRES A2 (2011-2040) A2 (2011-2040) B1 (2011-2040)
-100-50
050
Annu
al R
ainf
all c
hang
es
Models
Annual rainfall changes in % for A2, A1B and B1 SRES
A2 (2041-2070) B1 (2041-2070) B1 (2041-2070)
-100-50
050
Rain
fall
chan
ges i
n %
Models
Annual rainfall changes in % for A2, A1B and B1 SRES
A2 (2071-2100) A1B (2071-2100) B1 (2071-2100)
Figure 9. Projected Changes in rainfall Trends in the Trou du Nord watersheds for the A2, A1B and B1 Scenarios and for different models for the period 2041-2070
Figure 8. Projected Changes in rainfall Trends in the Trou du Nord watersheds for the A2, A1B and B1
Scenarios and for different models for the period 2011-2040
Figure 9. Projected Changes in rainfall Trends in the Trou du Nord watersheds for the A2, A1B and B1
Scenarios and for different models for the period 2041-2070
-40
-30
-20
-10
0
10
20Ra
infa
ll ch
ange
s in
%
Models
Annual rainfall changes in % for A2, A1B and B1 SRES A2 (2011-2040) A2 (2011-2040) B1 (2011-2040)
-100-50
050
Annu
al R
ainf
all c
hang
es
Models
Annual rainfall changes in % for A2, A1B and B1 SRES
A2 (2041-2070) B1 (2041-2070) B1 (2041-2070)
-100-50
050
Rain
fall
chan
ges i
n %
Models
Annual rainfall changes in % for A2, A1B and B1 SRES
A2 (2071-2100) A1B (2071-2100) B1 (2071-2100)
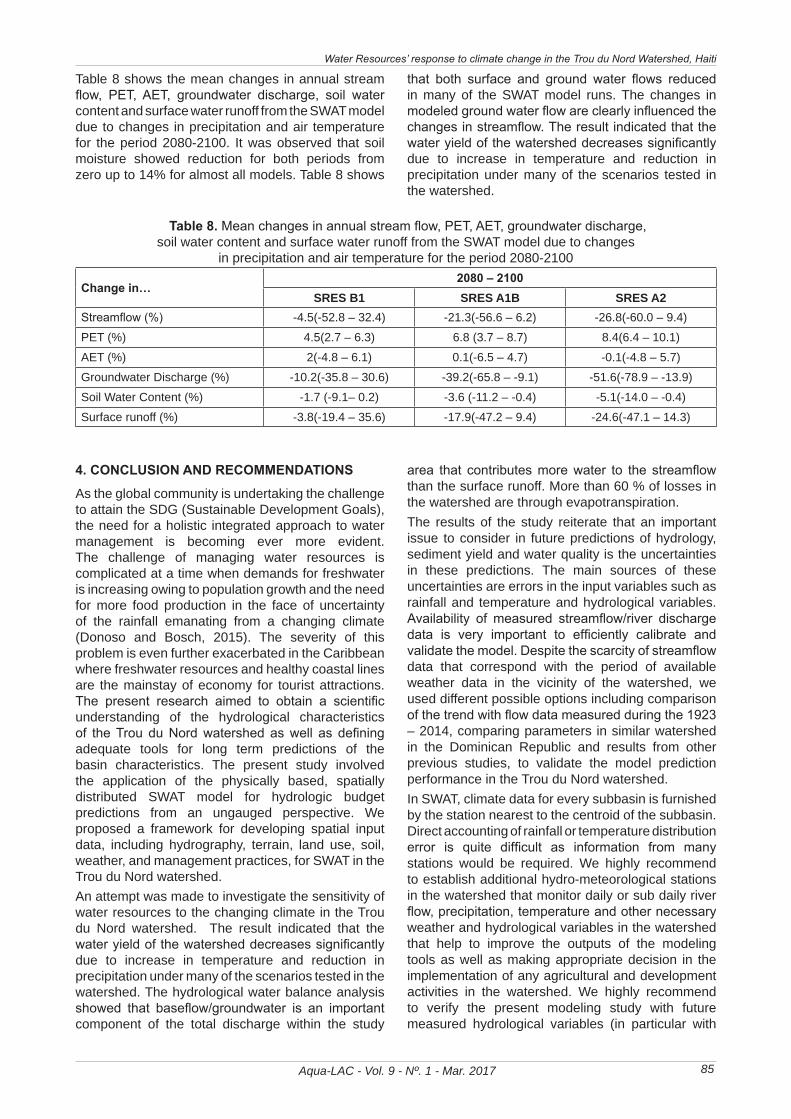
Figure 10. Projected Changes in rainfall Trends in the Trou du Nord watersheds for the A2, A1B and B1 Scenarios and for different models for the period 2071-2100
3.3.3. Changes in Annual Precipitation and Temperature in the GCM Ensembles.
Each GCM model and scenario shows a climate change value for each future time-period. Table 6 summarizes the changes in annual precipitation and temperature for SRES B1, A1B, and A2 scenarios for the periods 2011-2040, 2041-2070 and 2071-2100.
The annual precipitation changes for the SRES B1 scenario show no consensus among GCMs regarding rainfall changes for the region. However, for the SRES A1B scenario for periods 2041-70 and 2071-2100, and for all periods for the SRES A2 scenario, the ensembles showed statistically-significant declines in median precipitation using the signed rank-test.
Water Resources’ response to climate change in the Trou du Nord Watershed, Haiti
Aqua-LAC - Vol. 9 - Nº. 1 - Mar. 201784
All GCMs show temperature increases for the region, and the signed rank-test showed statistically-significant changes in median temperature for all SRES emission scenarios and all three time-periods. The temperature changes increase with time, and for any given time-period, the smallest changes
are for the lowest-emission SRES B1 scenario, and the largest changes are for the highest-emission SRES A2 scenario. The modeled change in mean temperature for the 2071-2100 period ranged from 1.5oC for the lowest emission SRES B1 scenario to 2.60C for the highest emission SRES A2 scenario.
Table 6. Ranges of modeled changes (given as 25th–75th percentiles) in annual precipitation and surface air temperature for northern Haiti for the GCM ensembles
Scenarios Precipitation (%) Temperature (oC)
2011-40 2041-70 2071-2100 2011-40 2041-70 2071-2100
SRESB1 -7% – 3% -6% – 6% -7% – 3% 0.6 – 1.0 0.6 – 1.0 0.7 – 0.9
SRESA1B -8% – 0% -8% – -1% -12% – -5% 1 – 1.5 1.3 – 1.8 1.4 – 1.7
SRESA2 -9% – -2% -12% – -4% -25% – -12% 1.3 – 1.9 1.8 – 2.5 2.4 – 2.7
Temperature changes are given in °C, and precipitation changes as a percentage change on the base-period mean (e.g. a change of 100% would imply a doubling of precipitation). Changes in bold indicate were a sign-rank test found changes in the ensemble median to be statistically-significant at 0.05 confidence level
3.4. Impact of Climate Change on the Hydrology of the Trou du Nord watershed
3.4.1. Changes in Annual Streamflow/river discharge
Table 7 shows the modeled effect of climate change on annual streamflow, as output from the SWAT model, for the eight downscaled GCM models. Stream flow is one of the hydrological components which is greatly influenced by climate and land use changes. Many of the GCM models imply declines in mean annual flow, ranging from 5% to 60%. Only a few models showed increases in streamflow, with ranges from 5% to 32%. The pattern of streamflow change reflects the changes in rainfall shown in Table 1. The reduction in streamflow is due to significant reduction in rainfall, but also increases in evapotranspiration that result from temperature rises that contribute to the reduction in river discharge.
3.4.2. Changes in Annual Soil Moisture, Evapotranspiration, and Surface and Ground Water
The main aim of this task is to understand how changes in climate variables could affect the different hydrological components of the basin that control the final streamflow. Impact of climate change on evapotranspiration, soil moisture, surface and ground water were also analyzed. The results from the GCM models for the 2046-2065 and 2080-2100 periods are summarized in Table 7 and 8. The results indicated that potential evapotranspiration considerably increased for many of the GCM’s for the 2046-2065 period, although changes in Actual Evapotranspiration (AET) were mixed. For the period 2080-2100, Potential Evapotranspiration (PET) increases are large, exceeding 10% in the SRESA2 scenario. The increase in PET is due to increased air temperatures. The study used the Hargreaves method (Hargreaves et al. 1985) to calculate evapotranspiration, which depends on minimum and maximum temperatures.The ranges in parentheses are ensemble minimum and maximum, intended to illustrate the spread of model projections within each ensemble, and should not be considered to be error bounds.
Table 7. Mean changes in annual stream flow, PET, AET, groundwater discharge, soil water content and surface water runoff from the SWAT model due to changes
in precipitation and air temperature for the period 2046-2065
Change in…2046 – 2065
SRES B1 SRES A1B SRES A2
Streamflow (%) -5(-42.2 – 16.4) -8.2(-23.5 – 7.5) -8.7(-38.2 – 15.2)
PET (%) 3.0(1.2 – 3.9) 4.3(2.4 – 5.4) 4.2(3.2 – 5.1)
AET (%) 0.3(-4.4 – 2.8) 1.0(-2.4 – 3.8) 0.7(-4.7 – 3.5)
Groundwater Discharge (%) -14.0(-55.3 – 26.1) -25.1(-51.4 – 1.9) -25.4(-70.1 – 21.4)
Soil Water Content (%) -1.6(-6.8 – 0.4) -1.4(-2.9 – 0.6) -1.7(-7.6 – 0.4)
Surface runoff (%) -6.3(-56 – 28.7) -8.6(-31.6 – 12.0) -10.4(-38.6 – 12.9)
Shimelis Setegn and Maria Concepcion Donoso
Aqua-LAC - Vol. 9 - Nº. 1 - Mar. 2017 85
Table 8 shows the mean changes in annual stream flow, PET, AET, groundwater discharge, soil water content and surface water runoff from the SWAT model due to changes in precipitation and air temperature for the period 2080-2100. It was observed that soil moisture showed reduction for both periods from zero up to 14% for almost all models. Table 8 shows
that both surface and ground water flows reduced in many of the SWAT model runs. The changes in modeled ground water flow are clearly influenced the changes in streamflow. The result indicated that the water yield of the watershed decreases significantly due to increase in temperature and reduction in precipitation under many of the scenarios tested in the watershed.
Table 8. Mean changes in annual stream flow, PET, AET, groundwater discharge, soil water content and surface water runoff from the SWAT model due to changes
in precipitation and air temperature for the period 2080-2100
Change in…2080 – 2100
SRES B1 SRES A1B SRES A2Streamflow (%) -4.5(-52.8 – 32.4) -21.3(-56.6 – 6.2) -26.8(-60.0 – 9.4)
PET (%) 4.5(2.7 – 6.3) 6.8 (3.7 – 8.7) 8.4(6.4 – 10.1)
AET (%) 2(-4.8 – 6.1) 0.1(-6.5 – 4.7) -0.1(-4.8 – 5.7)
Groundwater Discharge (%) -10.2(-35.8 – 30.6) -39.2(-65.8 – -9.1) -51.6(-78.9 – -13.9)
Soil Water Content (%) -1.7 (-9.1– 0.2) -3.6 (-11.2 – -0.4) -5.1(-14.0 – -0.4)
Surface runoff (%) -3.8(-19.4 – 35.6) -17.9(-47.2 – 9.4) -24.6(-47.1 – 14.3)
4. CONCLUSION AND RECOMMENDATIONS
As the global community is undertaking the challenge to attain the SDG (Sustainable Development Goals), the need for a holistic integrated approach to water management is becoming ever more evident. The challenge of managing water resources is complicated at a time when demands for freshwater is increasing owing to population growth and the need for more food production in the face of uncertainty of the rainfall emanating from a changing climate (Donoso and Bosch, 2015). The severity of this problem is even further exacerbated in the Caribbean where freshwater resources and healthy coastal lines are the mainstay of economy for tourist attractions. The present research aimed to obtain a scientific understanding of the hydrological characteristics of the Trou du Nord watershed as well as defining adequate tools for long term predictions of the basin characteristics. The present study involved the application of the physically based, spatially distributed SWAT model for hydrologic budget predictions from an ungauged perspective. We proposed a framework for developing spatial input data, including hydrography, terrain, land use, soil, weather, and management practices, for SWAT in the Trou du Nord watershed. An attempt was made to investigate the sensitivity of water resources to the changing climate in the Trou du Nord watershed. The result indicated that the water yield of the watershed decreases significantly due to increase in temperature and reduction in precipitation under many of the scenarios tested in the watershed. The hydrological water balance analysis showed that baseflow/groundwater is an important component of the total discharge within the study
area that contributes more water to the streamflow than the surface runoff. More than 60 % of losses in the watershed are through evapotranspiration. The results of the study reiterate that an important issue to consider in future predictions of hydrology, sediment yield and water quality is the uncertainties in these predictions. The main sources of these uncertainties are errors in the input variables such as rainfall and temperature and hydrological variables. Availability of measured streamflow/river discharge data is very important to efficiently calibrate and validate the model. Despite the scarcity of streamflow data that correspond with the period of available weather data in the vicinity of the watershed, we used different possible options including comparison of the trend with flow data measured during the 1923 – 2014, comparing parameters in similar watershed in the Dominican Republic and results from other previous studies, to validate the model prediction performance in the Trou du Nord watershed. In SWAT, climate data for every subbasin is furnished by the station nearest to the centroid of the subbasin. Direct accounting of rainfall or temperature distribution error is quite difficult as information from many stations would be required. We highly recommend to establish additional hydro-meteorological stations in the watershed that monitor daily or sub daily river flow, precipitation, temperature and other necessary weather and hydrological variables in the watershed that help to improve the outputs of the modeling tools as well as making appropriate decision in the implementation of any agricultural and development activities in the watershed. We highly recommend to verify the present modeling study with future measured hydrological variables (in particular with
Water Resources’ response to climate change in the Trou du Nord Watershed, Haiti
Aqua-LAC - Vol. 9 - Nº. 1 - Mar. 201786
streamflow/river discharge observations) so that the model can be further validated and used as decision support tools in the Trou du Nord Watershed as well as application of the model for other watersheds in Haiti. As it stands now, it is still the best available sufficiently robust tool capable to provide and simulate scenarios for the Trou du Nord watershed.
5. REFERENCES
Abbaspour, K.C., Yang, J., Maximov, I., Siber, R., Bogner, K., Mieleitner, J., Zobrist, J., Srinivasan, R., 2007. Modelling hydrology and water quality in the pre-alpine/alpine Thur watershed using SWAT. J. Hydrol. 333, 413–430.
Arnold, J.G., Srinivasan, R., Muttiah, R.R.,Williams, J.R., 1998. Large area hydrologic modeling and assessment part I: model development. J. Am. Water Resour. Assoc. 34 (1), 73–89.
Donoso, M.C. and M.C. Bosch. 2015. Integrated Water Resources Management in Latin America and the Caribbean, in S. Setegn and M.C.Donoso (edits.) Sustainability of Integrated Water Resources Management. Springer.
ENVIRON International Corporation. Preliminary Hydrological Assessment for the Development of an Industrial Park in Haiti. Project #:01-27631A prepared for the Inter-American Development Bank Washington, D.C. August 2011.
FAO. 2000. AQUASTAT country profile of Haiti. FAO, Rome, http://www.fao.org/nr/ water/aquastat/countries_regions/haiti/index.stm, 06/10/2010.
Harrold, T.I. & Jones, R.N. (2003). Downscaling GCM rainfall: a refinement of the perturbation method, In International Congress on Modelling and Simulation, pp. 14–17, MODSIM2003, Townsville, Australia, 4-17 July, 2003.
Hargreaves, G. L., G. H. Hargreaves, and J. P. Riley (1985), Agricultural benefits for Senegal River Basin, J. Irrig. Drain. Eng., 111(2), 113–124, doi:10.1061/(ASCE)0733-9437(1985)111:2(113).
Intergovernmental Panel on Climate Change (IPCC) (2000), Emissions Scenarios, edited by N. Nakicenovic, and R. Swart, 570 pp., Cambridge Univ. Press, Cambridge, U. K.
Nakicenovic, N. and Swart, R. (2000) Special Report on Emissions Scenarios: A Special Report of Working Group III of the International Panel on Climate Change. Cambridge University Press, Cambridge.
Neitsch, S.L., Arnold, J.G., Kiniry, J.R., Williams, J.R., 2005. Soil and Water Assessment Tool, Theoretical Documentation: Version. USDA Agricultural Research Service and Texas A&M Blackland Research Center, Temple, TX.
Setegn, S. G., D. Rayner, A. M. Melesse, B. Dargahi, and R. Srinivasan (2011), Impact of climate change on the hydroclimatology of Lake Tana Basin, Ethiopia, Water Resour. Res., 47, W04511, doi:10.1029/2010WR009248.
Setegn, Shimelis G, Melesse AM, Haiduk A, Webber D, Wang X, McClain ME. 2014. Modeling hydrological variability of fresh water resources in the Rio Cobre watershed, Jamaica. Catena. 2014; 120:81-90.j
Setegn, Shimelis Gebriye, Fikadu Yohannes, Shoeb Quraishi, V M Chowdary, B C Mal, 2009. Impact of land use/land cover transformations on Alemaya Lake, Ethiopia. Journal of Indian Water Resources Society, Vol. 29 No. 3, July, 2009
Srinivasan, R., Zhang, X., & Arnold, J. (2010). SWAT ungauged: Hydrological budget and crop yield predictions in the upper Mississippi River basin. Trans. ASABE, 53(5), 1533-1546. http://dx.doi.org/10.13031/2013.34903
Sivapalan, M., K. Takeuchi, S. W. Franks, V. K. Gupta, H. Karambiri, V. Lakshmi, X. Liang, J. J. McDonnell, E. M. Mendiondo, P. E. O’Connell, T. Oki, J. W. Pomeroy, D. Schertzer, S. Uhlenbrook, and E. Zehe. 2003. IAHS decade on predictions in ungauged basins (PUB), 2003‐2012: Shaping an exciting future for the hydrological sciences. Hydrol. Sci. J. 48(6): 857‐880.
Smucker, G. R., M. Bannister, H. D’Agnes, Y. Gossin, M. Portnoff, J. Timyan, S. Tobias, and R. Toussaint. 2007. Environmental vulnerability in Haiti: Findings and recommendations. Washington, D.C.: U.S. Agency for International Development
Winchell, M., Srinivasan, R., Di Luzio, M., Arnold, J. 2007. ArcSWAT Interface for SWAT User‘s Guide. Blackland Research Center, Texas Agricultural Experiment station and USDA Agricultural Research Service.
“Florida International University acknowledges the financial support for this work provided by the Inter-American Development Bank. The results, views, and opinions of the author(s)
presented herein do not necessarily state or reflect those of the IADB, FIU or UNESCO.”
Shimelis Setegn and Maria Concepcion Donoso