Embed Size (px)
Citation preview
DEPARTEMEN TRANSMIGRASI(REPUBLIK INDONESIA)
BIRO PERENCANAAN
INSTITUT FRANCAIS DE RECHERCHE SCIENTIFIQUE
POUR LE DEVELOPPEMENT EN COOPERATION
(REPUBLIQUE FRANCAISE)
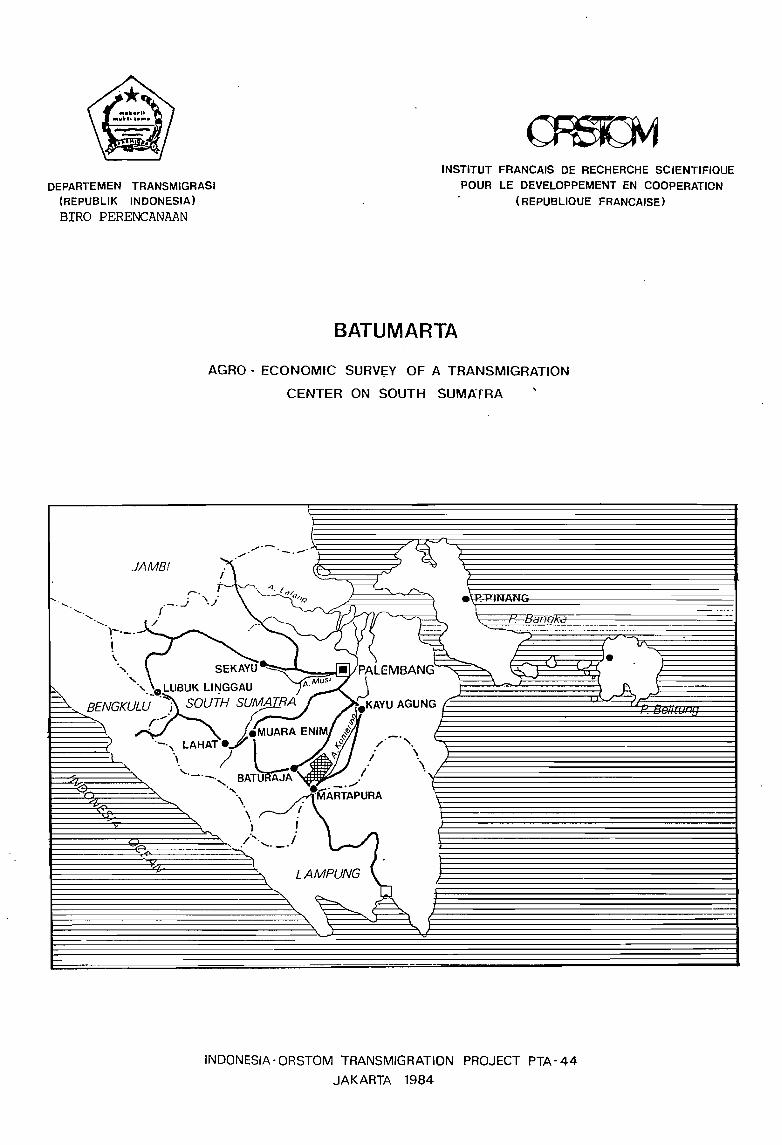
BATUMARTA
AGRO - ECONOMIC SURVI;Y OF A TRANSMIGRATION
CENTER ON SOUTH SUMATRA
JAMB!1
.-". .-'
" ,q. '<'1/ ~ F'- •
" <,; ( .;-'\j ~ -\E=NANG
"t / \I~ 'll ......... SEKAYU ~ us,Jiil PALEMBANG~ ~
~ " .• LliBUK L1~GGAU /,.M~BENGKU~U- .) SOUTH SUMft-RA .KAYU AGUNG
r". ( ~If.' j_MUARA ENIM i
LAMPUNG
INDONESIA-ORSTOM TRANSMIGRATION PROJECT PTA- 44
JAKARTA 1984
Âd- \- --
--
DEPARTEMEN TRANSMIGRASI
(REPUBLIK INDONE5IA)
BIRO PERENCANAAN
INSTITUT FRANCAIS DE RECHERCt1E SCIENTIFIQUE
POUR LE DEVELOPPEMENT EN COOPERATION
(REPUBLIQUE FRANCAISE)
BATUMARTA
AGRO - ECONOMIC SURVEY OF A TRANSMIGRATION
CENTER ON SOUTH SUMATRA
-_.--
P. LEVANG
Ir. RISKAN MARTEN
Translated tram French by Mrs. M. MENGER
INDONESlA -ORSTOM TRANSM IGRATION PROJECT PTA-44
JAKARTA 1984
ŒPARTMENT OF TRANSMIGRATlOOSUB PRUJEcr OF TRANSMIGRATlœ RESEARCH AND DEVEIDPMENT
IN THE FRAMEWORK OF INI'ERNATIœAL TECHNICAL ASSISTANCE moPERATlœ
1985
Jl. H. Agus Salim 58Ph. 323579
JAKARTA
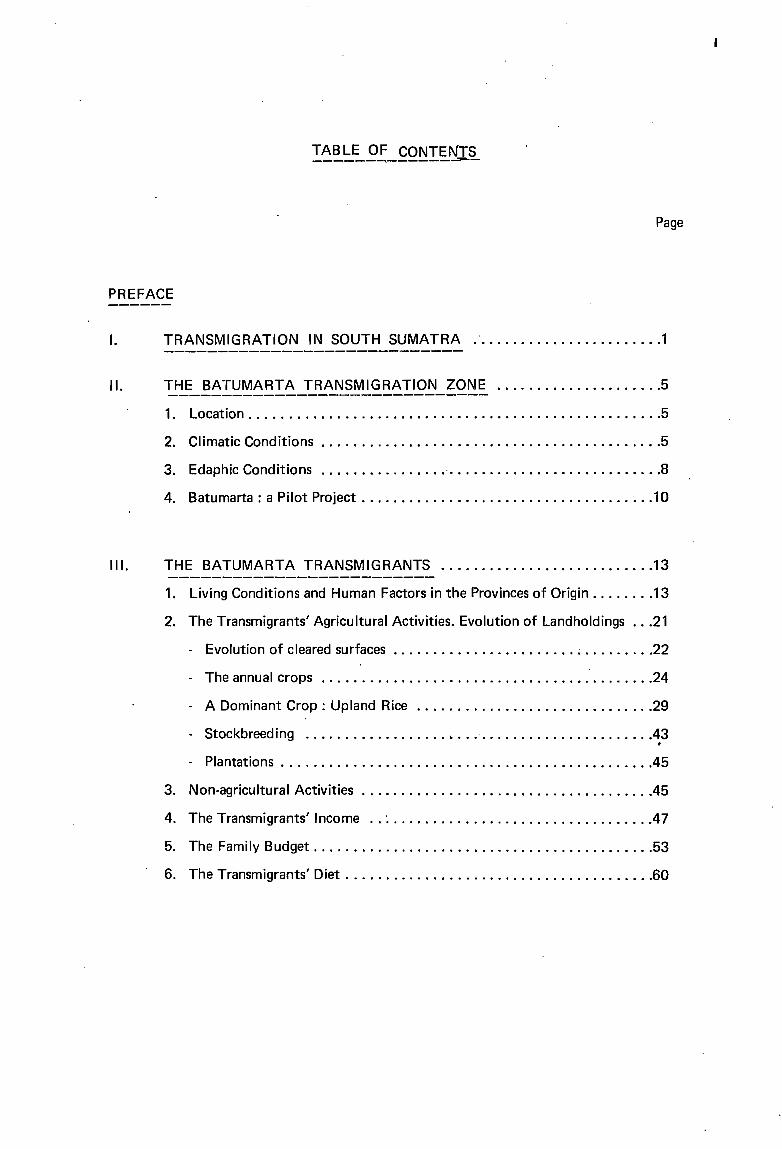
TABLE OF CONTENTS------~------~-
Page
PREFACE
1. TRANSMIGRATION 11\1 SOUTH SUMATRA .· 1
II. THE BATUMARTA TRANSMIGRATION ZOI\lE 5
1. Location 5
2. Climatic Conditions 5
3. Edaphic Conditions · 8
4. Batumarta: a Pilot Project ~ ..10
III. THE BATUMARTA TRANSMIGRANTS 13
1. Living Conditions and Hurnan Factors in the Provinces of Origin 13
2. The Transrnigrants' Agricultural Activities. Evolution of Landholdings 21
- Evolution of cleared surfaces ; 22
- The annual crops 24
A Dominant Crop : Upland Rice 29
- Stockbreeding , 43.- Plantations 45
3. Non-agricultural Activities .45
4. The Transmigrants' Incorne .. : .47
5. The Family Budget 53
6. The Transmigrants' Diet 60
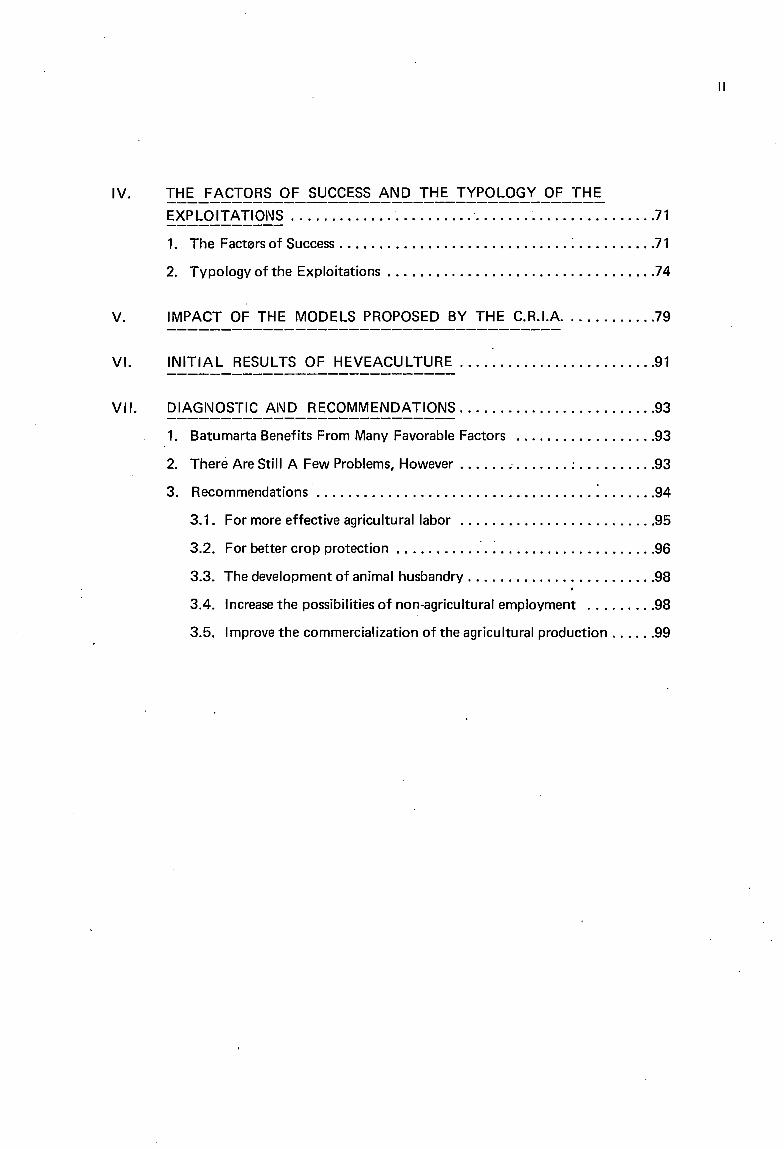
IV. THE FACTORS OF SUCCESS AND THE TYPOLOGY OF THE-----------------------------------------EXPLOITATIONS 71
1. The Facters of Success : 71
2. Typology of the Exploitations 74
V. IMPACT OF THE MODELS PROPOSED BY THE C.R.I.A 79
VI. INITIAL RESULTS OF HEVEACULTURE 91
VII. DIAGI\JOSTIC AI\JD RECOIVIMEI\JDATIOI\JS 93
1. Batumarta Benefits From Many Favorable Factors 93
2. There Are Still A Few Problems, However ; 93
3. Recommendations : 94
3.1. For more effective agricultural labor 95
3.2. For better crop protection 96
3.3. The development of animal husbandry 98
3.4. Increase the possibilities of non-agricultural employment 98
3.5. Improve the commercialization of the agricultural production 99
Il
PREFACE
As part of the working agreement between the Ministry of· Transmigration of the Republic
of Indonesia and the Office de la Recherche Scientifique et Technique Outre-Mer
(O.R.S.T.O.M.), a comparative study of several Transmigration Centers was begun in Sep
tember 1982. This study will continue for three to four years and will include, in ail, about a- .
dozen Transmigration projects distributed over severa1 provinces on Sumatra, Kalimantan,
and Sulawesi.
The initial objective of these studies is the obtention of basic agro-economic data that is as
precise and rel iable as possible. A complete record of the restrictions and of the factors fa
vorable to the growth of agricultural production, both at the physical and human levels, is
essential to the understanding of the production systems. It is also an indispensable prelimi
nary to any suggestion for improvement, for the ultimat~ objective of these studies will be
to provide the Transmigration Authorities with a coherent set of propositions and recom
mendations.
The following report only concerns one Transmigration Center, located in South Sumatra,
and covers the period from September 1982 to June 1983.
ln order to obtain data that is as precise as it is reliable, it was necessary to question the
Transmigrants themselves. To this end, a random survey of 60 Transmigrant families was
carried out, through direct enquiries and field observations, in four visits spaced two months
apart. There are many advantages to this method, because it allows the observer:
- to follo'w the same families for an entire agricultural year;
- to gain the farmers' confidance, after the trauma of the first visit;
- to compile surveys which are more complete than those taken in a single visit
(after an hour of ques'tioning, the persons being polled have violent headaches);
- to verify the truthfulness of previously.-given answers (there are numerous dissi
mulations or exaggerations, especially concerning yields and incomes);
to get a better grasp of the evolutions of the situations encountered;
III
IV
- and to obtain precise quantitative data by encouraging the farmers to record the
amount of time spent in work, to note the amounts of seed, fertiliser, and pesti
cides used, and to measu re their yields.
Along this same line, 10 of the householders (who were su fficientl y well-educated, serious,
and who wished to collaborate) were chosen to keep a journal. The results surpassed our
highest hopes, as out of the ten selected families, nine kept their journals corisistently and
conscientiously for seven months.
They were asked to keep daily records of:
- their food : type and quantity of food eaten at the morning, noon, and evening
meals;
- their work schedule : by type of occupation and le~gth oftime for every mem
ber of the family; participation of outside help; reciprocal assistance; paid labor; .
agricultural and non-agricultural jobs;
- their incomes : in cash or in goods, of agricultural source or not;
- and their expenditures : daily expenses and exceptional ones, gifts of cash or of
goods.
The success of this method is without a doubt due to the personal interest which most of
the householders took fn their journals, especially where the family budget is concerned.
Severa 1 of them insisted upon receiving the results of the analysis, at the end of the survey.
Only a part of the information obtained in this way was used to prepare the present report.
The remainder will be the object of separate publications.
Note See aise :
"SEBAMBAI\J 1 : An Agro-economic Study of a Transmigration Center on South
Kalimantan". ORSTOM - Trans. Dep. 1984.
1. TRANSMIGRATION IN SOUTH SUMATRA
With its area of 103,700 km 2, SUMATRA SELATAN. (South Sumatra) is the largest ofthe
Sumatranese provinces. Though relatively under-populated at the beginning of the century,
the province has undergone an unusually rapid population growth, essentially due to a heavy
migratory flow that is both spontaneous and organized. There were 4,630,000 inhabitants at
the time of the 1980 census, or in other words, an increase of 67% with respect to the 1961
census, and the population density rose from 27 to 45 inhabitants per square kilometer in
the same period.
The first organized transferrals of population to Sumatra Selatan date back to the colonial
period and were occasioned by an urgent need of labor on the Dutch plantations. These got
off to a particularly difficult start, since the first total failure of a Migration Center took
place at Mata Lintang in 1919. Only two centers survived the colonial period : Tugu Mulyo
and Belitang, both set up around 1937.
After a hait due to the Japanese occupation, the war for independance, and the reorganiza
tion of the young republic, the Transmigration operations started again in the early 1960's.
From that time on, the goals of organized migration increased consistently, reaching their
maximum during the third 5-Year-Plan with about 100,000 transmigrant families - one-fifth
of the national objective - planned for Sumatra Selatan alone.
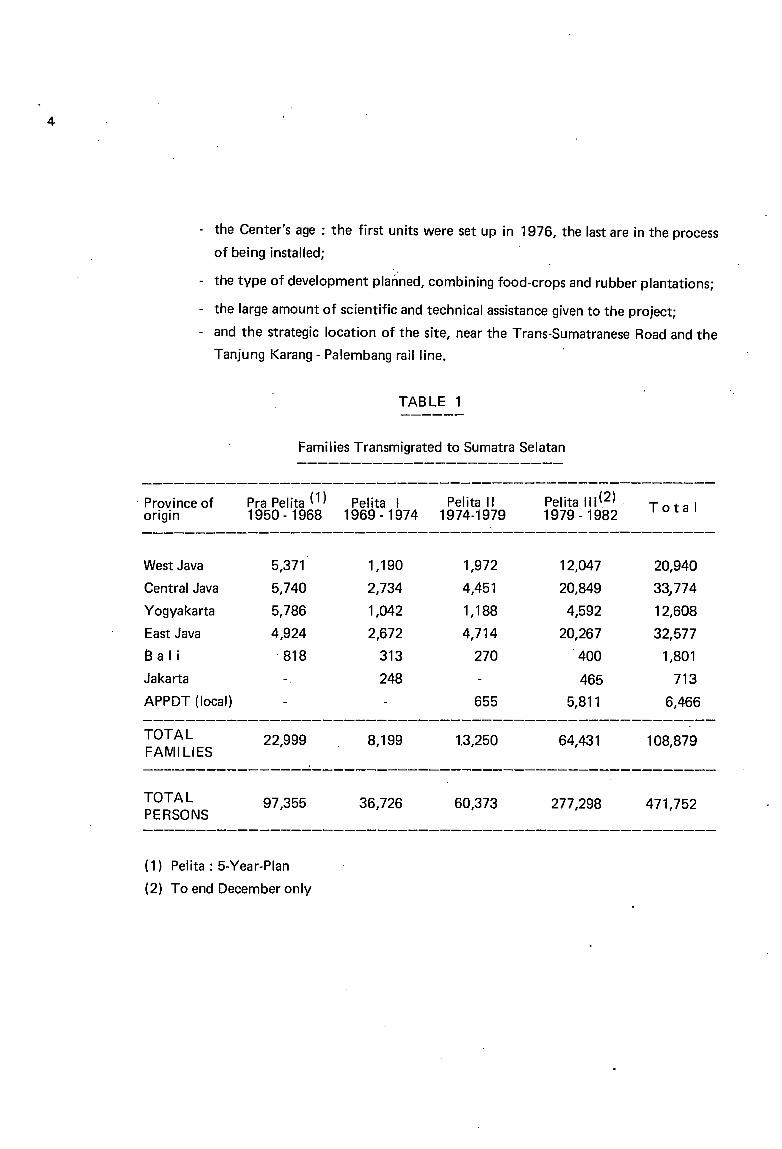
Table No. 1 gives the number of families transferred to Sumatra Selatan from 1950 to the
end of December 1982, in function of the provinces of origin.
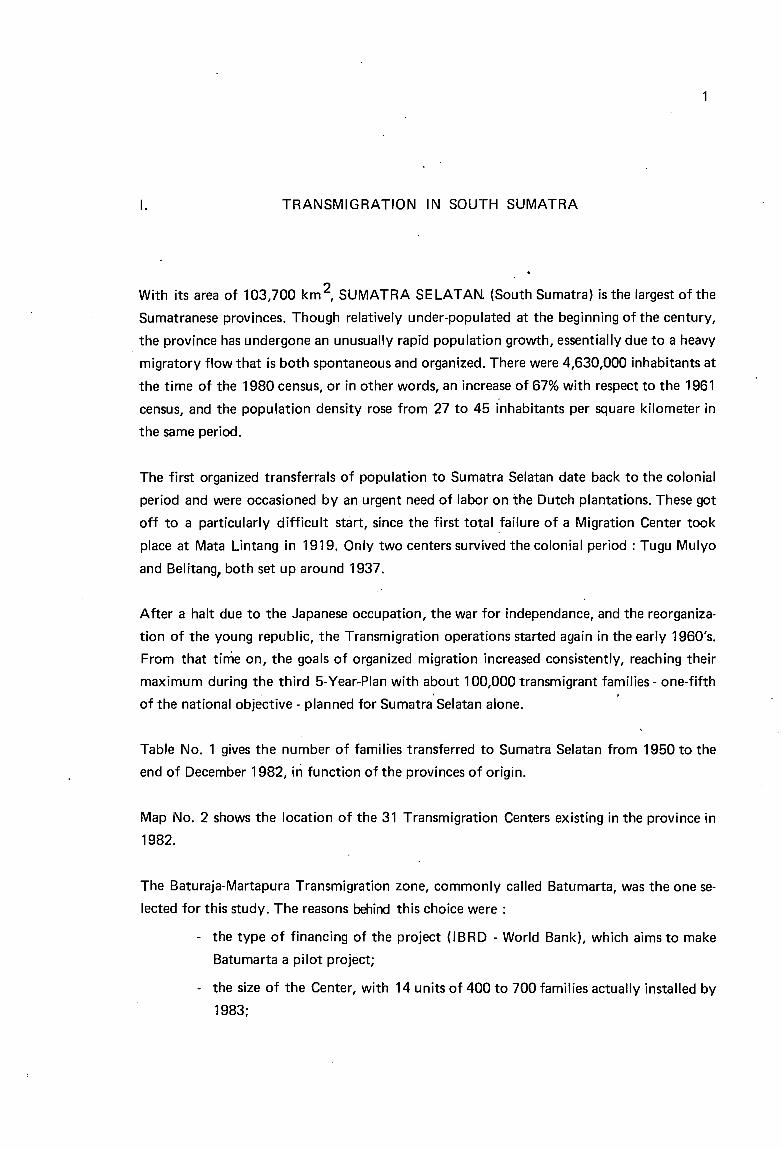
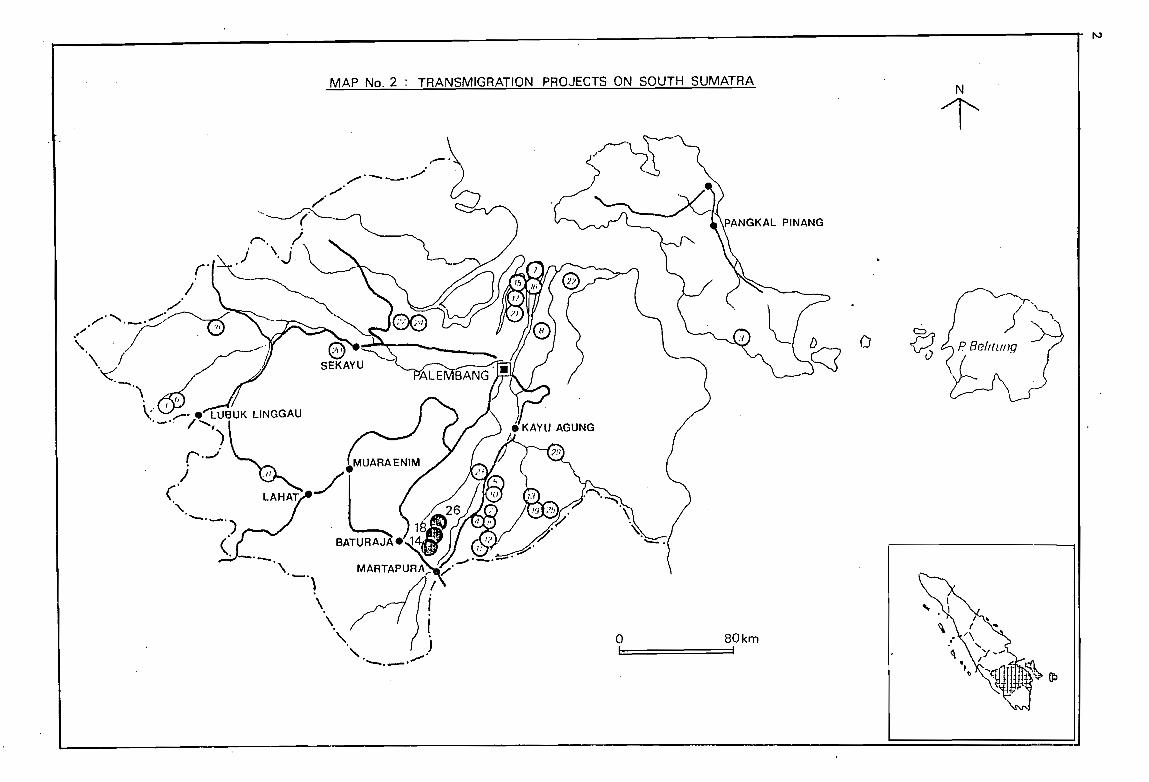
Map No. 2 shows the location of the 31 Transmigration Centers existing in the province in
1982.
The Baturaja-Martapura Transmigration zone, commonly called Batumarta, was the one se
lected for this study. The reasons behind this choice were :
- the type of financing of the project (IBRD - World Bank), which aims to make
Batumarta a pilot project;
- the size of the Center, with 14 units of 400 to 700 families actually installed by
1983;
N
N
l'
:t!ùo
o SOkm1 1
MAP No. 2 : TRANSMIGRATION PROJECTS ON SOUTH SUMATRA
MAP no 2 TRANSMIGRATION PROJEcrs ON SOurn: SUMATRA
lEGEND :
3
Colonisation : 1940
1. Tugu Mu1yo lAir ~ras
2. Be1itang
PRA PELITA 1950 - 1968
3. Batu Beturrpang
4. Be1itang
5. Rastman 1 M=ndaytm
PELITA l 1969 - 1974
6. Tugu IIRl1yo
7. Upang
8. Cinta Marlis
9. Belitang
10. Rasuan 1 Mendaytm
11. Way Hitam II
12. Way Hitam
13. Pulau Panggang
14. Baturaj a - M9.rtapura
15. Ta1ang
PELITA II 1974 - 1979
16. Upang
17. Talang l - II
18. Baturaj a - Martapura
19. Pema.tang Panggang
PELITA III 1979 - 1984
20. Sekayu
21. Talang
22. Air Sa1eh l - II
23. Air Sugihan
24. Betmg 1 Babat
25. Pematang Panggang
26. Baturaja - Martapura
27. Betmg
28. Lanbah Liam
29. Kayu Agung
30. Pangkalan Kersik 1 Betmg
31. Lahat 1 Tebing Tinggi
4
- the Center's age: the first units were set up in 1976, the last are in the process
of being installed;
- the type of development planned, combining food-crops and rubber plantations;
- the large amount of scientifie and technieal assistance given to the project;
- and the strategie location of the site, near the Trans-Sumatranese Road and the
Tanjung Karang - Palembang rai/fine.
TABLE 1
Families Transmigrated to Sumatra Selatan
Province of Pra Pelita (1) Pelita 1 Pelita Il Pelita 1"(2) To ta 1origin 1950 - 1968 1969 -1974 1974-1979 1979 - 1982------------------------------------------------------
West Java 5,371 1,190 1,972 12,047 20,940
Central Java 5,740 2,734 4,451 20,849 33}774
Yogyakarta 5,786 1,042 1,188 4,592 12,608
East Java 4,924 2,672 4,714 20,267 32,577
Bal i 818 313 270 400 1,801
Jakarta 248 465 713
APPDT (local) 655 5,811 6,466
TOTALFAMillES
22,999 8,199 1.3,250 64,431 108,879
--_._------------..:._-------------------------------------
TOTALPERSaNS
97,355 36,726 60,373 277,298 471,752
(1) Pelita: 5-Year-Plan
(2) To end December only
II.
.1. Location-------
THE BATUMARTA TRANSMIGRATION ZONE
5
\
•
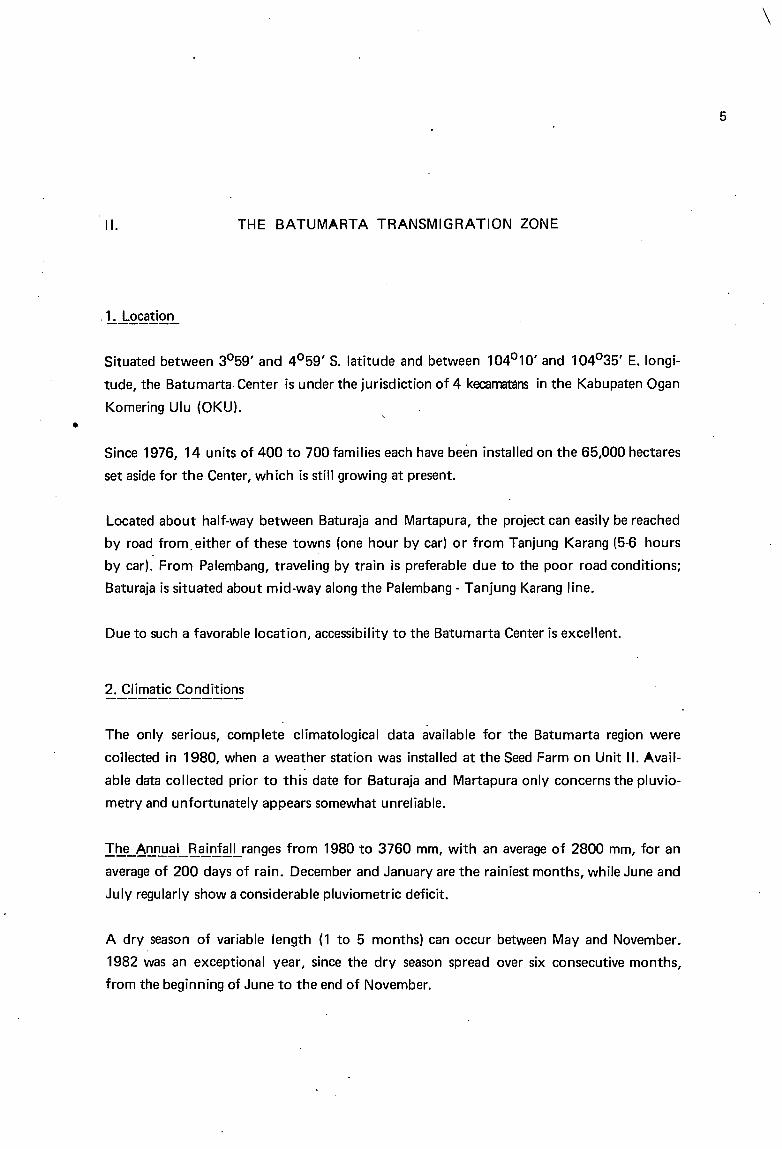
Situated between 30 59' and 40 59' S. latitude and between 1040 10' and 1040 35' E. longi
tude, the Batumarta Center is under the jurisdiction of 4 kecarnatéins in the Kabupaten Ogan
Komering Ulu (OKU) .
Since 1976, 14 units of 400 to 700 families each have beén installed on the 65,000 hectares
set aside for the Center, wh ich is still growing at present.
Located about half-way between Baturaja and Martapura, the project can easily be reached
by road from. either of these towns (one hour by car) or from Tanjung Karang (5-6 hours
by car). From Palembang, traveling by train is preferable due to the poor road conditions;
Baturaja is situated about mid-way along the Palembang - Tanjung Karang line.
Due to such a favorable location, accessibility to the Batumarta Center is excellent.
2. Climatic Conditions
The only serious, complete c1imatological data available for the Batumarta region were
collected in 1980, when a weather station was installed at the Seed Farm on Unit II. Avail
able data collected prior to this date for Baturaja and Martapura only concerns the pluvio
metry and unfortunately appears somewhat unreliable.
I!le_~!lnJ:.l.~LB..~IJi~Lranges from 1980 to 3760 mm, with an average of 2800 mm, for an
average of 200 days of rain. December and January are the rainiest months, while June and
July regularly show a considerable pluviometrie deficit.
A dry season of variable length (1 to 5 months) can occur between May and November.
1982 was an exceptional year, since the dry season spread over six consecutive months,
from the beginning of June to the end of November.
6
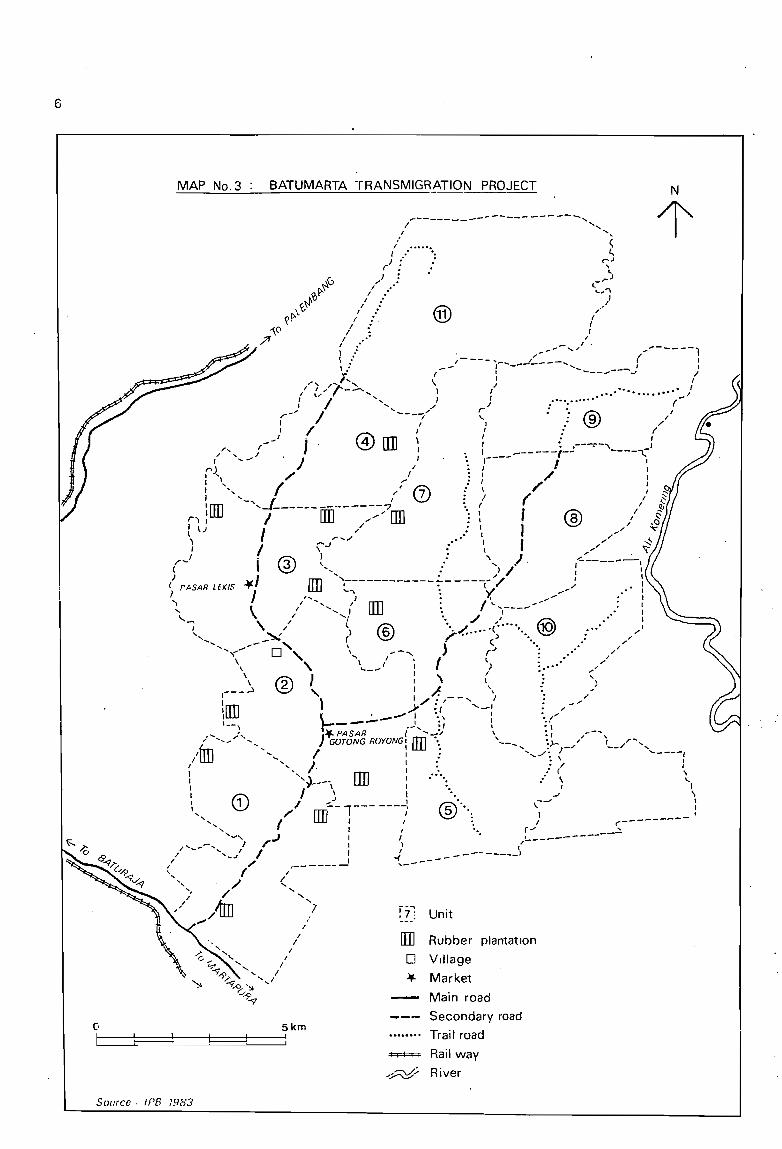
MAP No.3 BATUMARTA TRANSMIGRATION PROJECT
~------- -------- --- ---,l ", "
N
l'
Unit
[IlJ Rubber plantation
o Village
.. Market
Main road
Secondary road
Trail' road
'=*= Rail way
~~; River
, ~1 : l.,
(J f .: C"""{J ~),. l
" \,. ... "'\
1 .,,'
1/ GD /1 1
1 11 lOlO "i ./ ,,-,- ......" /"-----,\.: --,----,- ....__-/_----..... : :
1 1 --------..., 1,., ,-.}.... , \) 1
1 1", _~ l' •••... ...• •••• 1( "... / .... , J , : ••••••••• ".. _/l '.........,/ rI lOlO /
r-~ / ---ï" '- ®': / / l /." '4' [1]] \ 1 • 1
1- J \:!J 1 1 : ,---:--, .,-J... 1"........ 1 1 _-----1-- "
f"'J .... -- J " r--- 1 :: \ / j' / 1
\[IIJ ",-.......1--------.------/.' 0) ;~ (/ ,,:r) ~ 1 [[],..-' [1]] : 1 ® ,1( l) l ,/ Il l ,,', r .... / l, 1 /,.~, l '..J .,,," .
(-' i ® ~''''' '\ /) . I~------\J ..1 [IIl ....;------------------t"/ J \~ PASAR LEKIS l """\J '/, ~ __--~ :
~ \ /' ................ ( an l "- ...,----........ ~
'--; \,' t. ® .... ./.<.. (.J. " ". @> ." ,.:',.... ~ / / ..- ) '. "........ ~--", \ s···. ,"
..... '\"'"'....... 0 '" \ --"" ~ r" /" ...... 1 ~ f l • ,
\ \ \.. __ 1 } •• ' ,"
\ 1 \ ( '::,~ ® '" L.', ~,.
,--- '\ 1 /~/--, J • _,./"
\I rm ./:( ...... -: . ,./"U1J \ • ..-.-" 1 lOlO' l "./
1 1:':----- 1 tl l .,--) .. PASAR {- ........ ~/ , : l ,.--t;, ........ ~,.,·........ }GOTONG ROYONG: [[] ". '-.... :>-;-,.' ,__ / ............
'UlJ .... 1 ,: .... ./. ,,----," ........" l :: " .: ( :,\ "~__- [IJ] 1 ... \ '-
\ l '.: ../ ~\.... , CD 1 ~-1--- ----~ ®"\ c..... l
'........ /" [JJ: ,/ ". r) __--';,.----''''~.J II 1 ~~-------
/ ... _--........ Il 1# 1) __ -- - \/ ....... J ~
// / I .....l ...------
'".... ( /
'. / (...~ / ..... "
/1rn '1....
Source· (PB :983
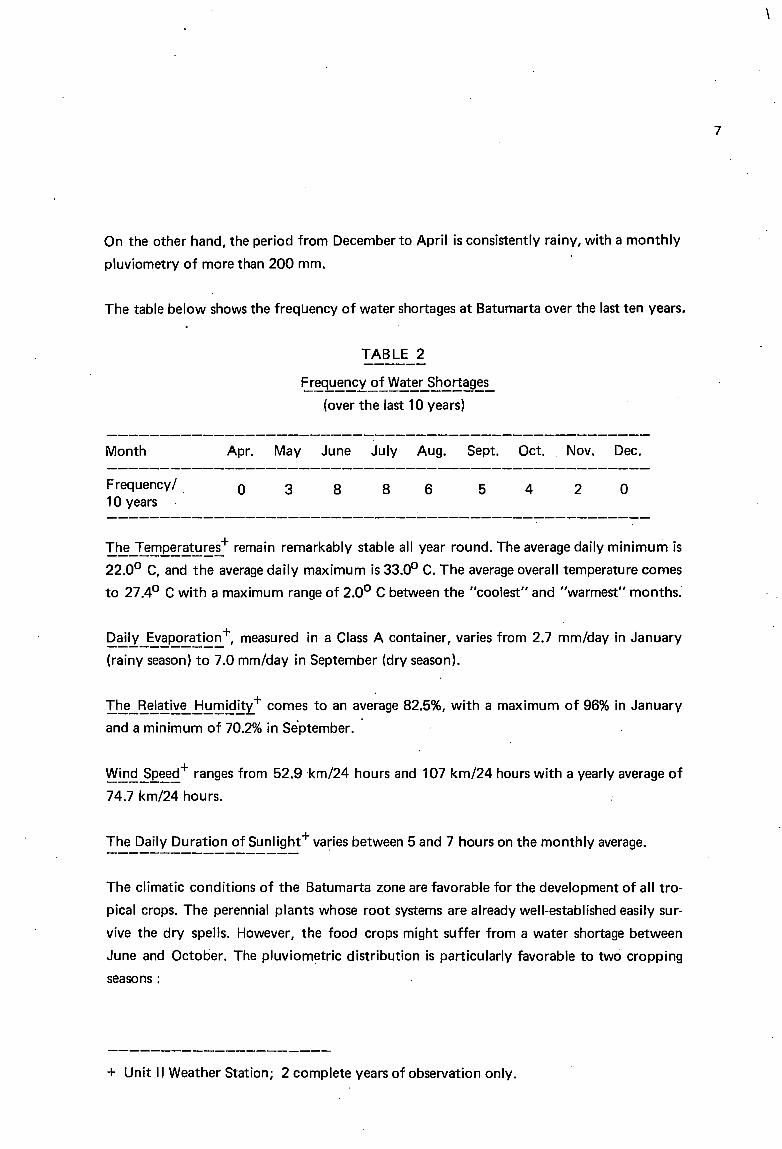
On the other hand, the period from December to April is consistently rainy, with a monthly
pluviometry of more than 200 mm.
The table below shows the freqLJency of water shortages at Batumarta over the last ten years.
TABLE 2
t:!~~~~.Y~!-~~~,=-~~!:!~~~(over the last 10 years)
7
Month Apr. May June July Aug. Sept. Oct. Nov. Dec.
Frequency/10 years
o 3 8 8 6 5 4 2 o
I.~_~.!:!1E~~~~~+ remain remarkably stable ail year round. The average daily minimum is
22.00 C, and the average daily maximum is 33.00 C. The average overall temperature comes
to 27,40 C with a maximum range of 2.00 C between the "coolest" and "warmest" months.
Q.~!y_~~~..!:.~~~+,measured in a Class A container, varies from 2.7 mm/day in January
(rainy season) to 7.0 mm/day in September (dry season).
I.~_'.!~a..!~~..t!~~!9.!!~t comes to an average 82.5%, with a maximum of 96% in January
and a minimum of 70.2% in Sèptember.
~!!JË~E.~Ë+ ranges from 52.9 'km/24 hours and 107 km/24 hours with a yearly average of
74.7 km/24 hours.
The Daily Duration of Sunlight+ varies between 5 and 7 hours on the monthly average.------------------
The climatic conditions of the Batumarta zone are favorable for the development of ail tro
pical crops. The perennial plants whose root systems are already well-established easily sur
vive the dry spells. However, the food craps might suffer fram a water shortage between
June and October. The pluviometrie distribution is particularly favorable to two cropping
seasons:
+ Unit" Weather Station; 2 complete years of observation only.
8
- An initial season from November to March would be particularly adapted to the
cultivation of' upland rice, either in monocultu're or complanted with maize and
cassava;
. A second season, from March to early June, could be profitably used for crops
of shorter cycles than that of upland rice, namely, peanut, soya, or maize.
Due to the high risk of water shortage for annual crops, the period from June to October
l 'should be set aside for clearing and soil preparation.
3. Edaphic Conditions
The edaphic conditions of the Batumarta region are far from being as favorable as the clima
tic conditions.
On the whole, the zone has a slightly to moderately rolling topography with slopes that are
generally inferior to 8%. There are nevertheless certain areas with slopes of 12 to 16%, but
over short distances. Yet despite the slight nature of the si opes, as soon as the soil is under
cultivation; certain forms of accelerated erosion appear after a few heavy rains. It is abso
lutely necessary for soil conservation, to bu ild terraces wherever the slopes exceed 8%.
Following excessive clearing, the greater. part of the land is covered in Alang-Alang (Impe
rata cylindrica) as weil as a few stretches of secondary forest. A handful of enclaves of small
plantations owned by natives complete the landscape.
Aside from the recent alluvial deposits, on either side of the main waterways, the ma'jority
of the soifs in the Batumarta region come under the classification of moderately desaturated
tropical ferralitic soils. The pedological studies carried out by the L.P.T. (Center for Soil
, Research of Bogor) gives the following results :
- Rather thin upper horizons (15 - 30 cms) of good structure and correct drainage,
covering more compact horizons that are very poor in organic matter and of
slow drainage. Hydromorphic spotting and iron concretions often appear at
slight depths. Despite the absence of any physical obstacle to their penetration,
the root systems of perennial plants generally remain Iimited to the 50 first cen
timeters.
- Texture: sand, 2%; loam, 76%, clay, 22%. (The amount of loam, far too high for
tropical soils, is probably due to a poor dispersion of the clays du ring the anal
Iysis.)
- Acidity: pH (H 20) == 4.5 and pH (KCI) == 3.8 in the surface horizon.
- Organic matter: C == 1.81% and N == 0.13%, that is, a C/N ratio of 13.9 in the
surface horizon.
- Exchangeable bases:
Ca : 1.7 meq/100 9
Mg : 1.0
K : 0.3
Na : 0.1
or a total of 3.1 meq of exchangeable bases for a cationic exchange capacity of
9.9 meq, which is to say, a 31% saturation rate only. The amounts of exchange
able Aluminium are always very high.
- Reserves (in HCI at 25%) :
P205 == 160 p.p.m.
K20 == 180 p.p.m.
The physico-ehemical characteristics ~ of the Batumarta soils are none too favorable for any
intensive use for annual crops (food crops or cash crops).
Most of the soil's fertility - which is already mediocre - is linked to the organic matter, as the
majority of the c1ays are of the kaolinite type with.a low exchange capacity. The relatively
compact nature and slow drainage of the underlying horizons leads to the formation of
temporary water tables and increases the risk of accelerated erosion, even on slight slopes.
The heavy rainfall, combined with limited cationic exchange capacities, reduces the effec
tiveness of fertilisation and leads to heavy losses if the fractioning is insufficient.
The high level of acidity in these soils prohibits the proper development of micro-organisms,
which is a serious handicap for peanut and soya crops. The large amounts of exchangeable
Aluminium, often combined with large amounts of Manganese, can lead to toxicity pheno
mena, especially in maize and leguminious crops.
Correcting the soils' acidity level and lack of phosphorus would necessitate massive quan
tities, on the order of :
9
10
- 4 to 10 tons of lime per hectare, and
- 5 to 10 hundredweight of TSP per hectare.
Needless to say, the cost of such an operation is absolutely impossible for the Transmigrants
to bear.
But, if the soils in Batumarta are not favorable to intensive food-cropping, they are on the
other hand particularly well-adapted to heveaculture. It was for this reason that Batumarta
was chosen by the World Bank for the organisation of a pilot project of the N.E.S. (Nucleus
Estate System) - rubber type.
The type of development chosen for the Batumarta Center (as weil as for the Way Abung
Center, in Lampung, and the Rimbo Bujang Center at Jambi) is based heavily on the Nu
cleus Estate System that the FELDA experimented with in Malaysia.
ln the FELDA system, the migrants are given four hectares of plantations and a small gar
den, but no land for food crops. The Indonesian national objectives of food self-sufficiency
have led the au~horities to prefer, for Batumarta, a mixed system combining annual crops
and rubber plantations.
Batumarta differs from a classic Transmigration Center essentially on two points:
- an investment of U.S. $ 5,000 to U.S. $ 6,000 per transmigrant family; to wit,
almost double that of a ~raditional Center.
an allotted area of 5 hectares per family, whereas the usual allotment is only 2
hectares.
Due to the large amount of financing provided by the World Bank, both Indonesian Univer
sities and institutes, and international consultants were able to carry out numerous studies
prior to the installation of the transmigrants. The administrative services have considerable
means at their disposai, and a great deal of scientific and technological knowledge is being
put to use. Thus Batumarta has a well-equipped weather station, a seed farm, and an expe
riment farm (C.R.I.A. : Central Research Institute for Agriculture, and I.P.B. : Bogor Agri
cultural Institute).
Each unit is subdivided into hamlets of 30 to 40 families each, installed near small dams
built to collect rainwater which secure the supplies of fresh drinking water. Each family is
allotted :
- 25 ares of garden (orchard, vegetable garden) around the house;
- 75 ares, also near the house, for food crops;
- 100 ares for the second food-cropping parcel, this time located on average one to
two kilometers from the house;
- 100 ares of spare land;
- 100 ares of rubber plantation, set up by the PTP-X, which will not be given to
the transmigrants until the sixth year, when the tapping begins:
- 100 ares of land which the transmi~rantwill plant in heveas himself.
As on the typical Centers, the settlers each receive a house, farm tools, fertilisers and oesti
cides, seeds and plants, c00kinq utensils, a mosquito net, etc....., as weil as complete alimen
tary aid to cover the needs of the family durinq the first vear of installation.
Contrary to the other Transmigration Centers, the large number of cattle brought in allows
each family to have one animal, by the third year of installation at the latèst. Supolies in
fertiliser and pesticides are also larger, since they more or less meet the transmigrants' needs
for the first three years.
Given the many studies and reoorts that have already been done on Batumarta, a supple
mentary monograph has but very little interest. Rather than studying Batumarta as a whole,
the following outline was preferred :
- Follow precisely about 60 transmigrant families for an entire agricultural year
(f\.JoventJer 1982 to June 1983);
- Determine their lifestvle as it was in theorovince of origin, then as it is on the
Center;
- List ail of their activities, favorable factors, and constraints;
- Study precisely the reasons behind the rejection or acceptation of the cultivation
methods and technical suggestions that are proposed to them;
- And then bring forth a list of propositions and recommendations adapted to the
transmigrants' needs and possibilities.
ln order to do this, 60 transmigrant families living in Unit 1(installed in 1976-77) and Unit
VII (installed in 1979-80) were chosen at random and followed in-depth during the 1982-83
agricultural year. As one of the 'householders left the Center du'ring the studv, the results
only concern 59 families.
11

III. THE BATUMARTA TRAI\lSMIGRANTS
13
1. Living Conditions and Human Factors in the Provinces of Origin
Due to the choice of Units 1 and VII for the study,. only 5 of the 8 provinces of origin are
represented in the sample.
J=.Jh.IJl~Q<2.I1lP...9jj:tlQfLQf..1~mQle...GLQUJJ
West Java 27%
Central Java 37%
East Java 17%
Bal i 17%
Local transmigrants
Housing
2%
Only 39 of the 59 families, or 66% of the sample group, owned lodgings in the province of
origin. The others either took advantage of the hospitality of parents or in-Iaws or, like
many of the Balinese, Iived in huts on the plantations which they were hired to maintain.
Out of the 39 families who owned th~ir own home, only 19 sold their house just before
their departure. The average sale price was Rp 314.000. The other 20 families preferred to
leave their lodgings in the care of family members, as its sale would not have broL1ght in a
profit.
.!:~~~~~~!~-
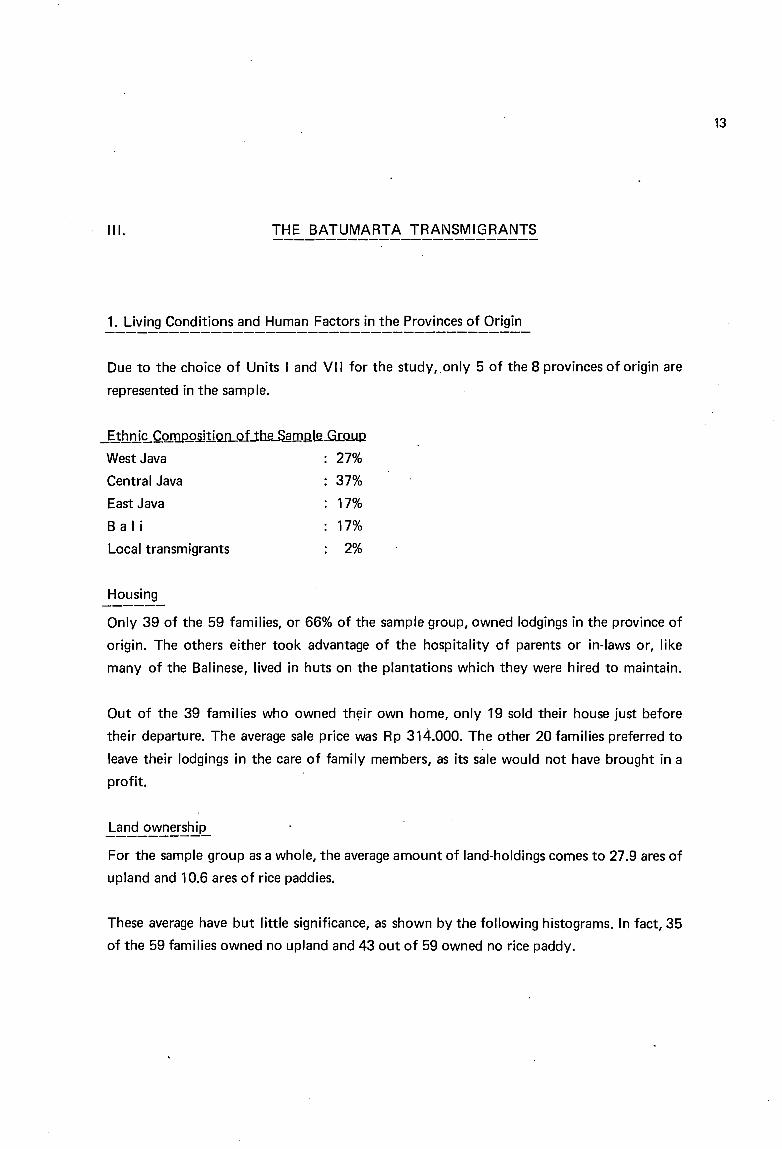
For the sample group as a who le, the average amount of land-holdings comes to 27.9 ares of
upland and 10.6 ares of rice paddies.
These average have but Iittle significance, as shown by the following histograms. In fact, 35
of the 59 families owned no upland and 43 out of 59 owned no rice paddy.
14
GRAPH No. 1
Land Ownership
Number offamilies
40
30
20
a. Dry land
Number offamilies
40 TI!?::
30 mmj20 ~mm
b. Rice-field
. 10 10 mm~ §
...... ......1:.i..;.:..:;:;....::~L·ii.i.···üi··~·.:.:!:::~;:Ei::=~=",-__ ha
o 0.5
Out of the 24 proprietors of dryland, 11 sold their fields before departure, at priees which
vary considerably according to the regions and locations. As for the 16 migrants who owned
rice paddies, 6 chose to sell, and the others preferred to leave their parcels in the care of a
family member.
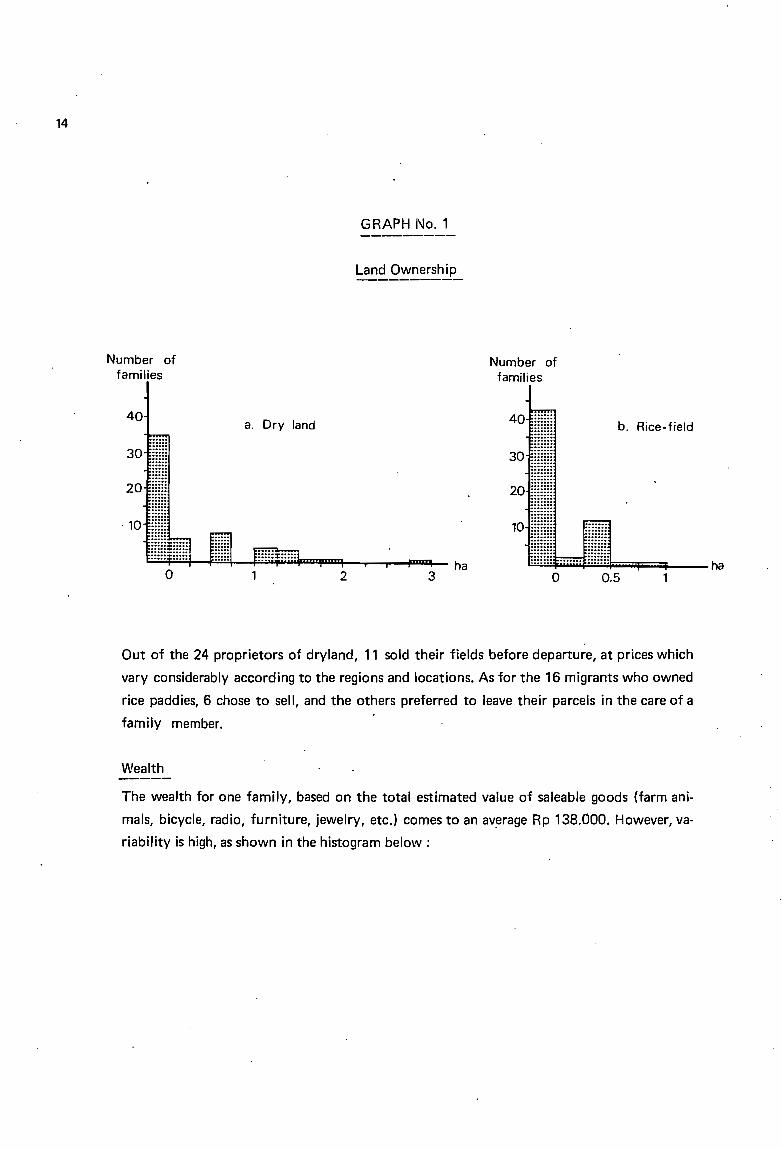
Wealth
The wealth for one family, based on the total estimated value of saleable goods (farm ani
mais, bicycle, radio, furniture, jewelry, etc.) cornes to an av~rage Rp 138.000. However, va
riability is high, as shown in the histogram below :
GRAPH NO.2---------
The Families' Wealth
Number offamilies
15
30
20
10
Thousand of1M.ii.i.........F"':.:...:.:;r==t=-=-=F"'=r==f==r==l---r--
10T"0-0- rupiah.
33 families out of 59 (56%) owned less than Rp 100.000 in goods.
Out of the average Rp 138.000 in goods owned per family :
- Rp 77.000 worth was sold before departure,
- Rp 28.000 worth was brought to the Center,
- Rp 33.000 worth was given to family members.
Available cash upon arrivai at the Center
At the time of their arrivai at the Center, two families had Rp 3.000.000 in cash at their
disposaI. Two other families had Rp 2.000.000 in cash, and 12 families had between
Rp 100.000 and Rp 500.000, while the other 43 - to wit. 73% of the study group had less
than Rp 100.000 in ready cash.
The next graph shows the migrants' activities in their home provinces and lists the number
of activities per family.
16
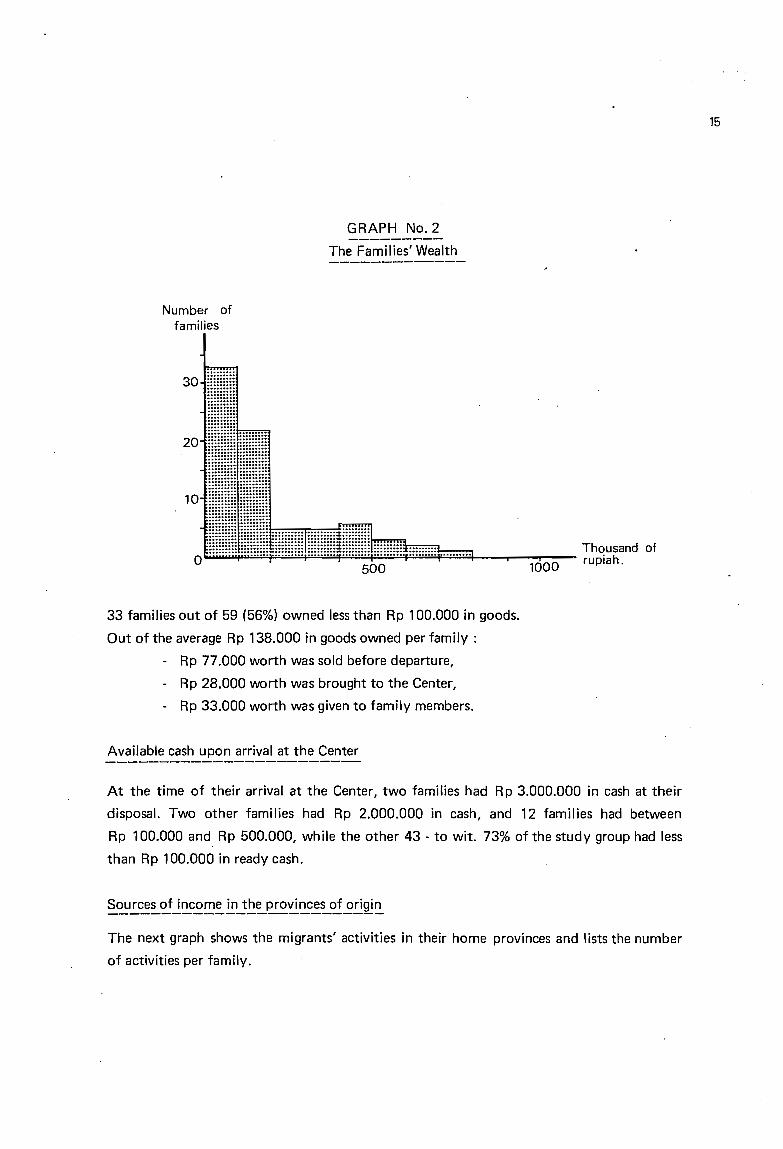
GRAPH No.3
_Sources of Income in the Provinces of Origin-----------------
Number offamilies
50
40
30
20
10
ITIIITI11 activity : 32 cases
l2'Zl 2 activities: 20 cases
~ 3 activities: 6 cases_4 activities: 1 cases
0l...-.:-~WJ..---+w.LlJL.Ll:...""""='.....!.U:WJ_!.l...--~:...L.!_-"""7"""~.lLl..-____!'=G_-~..L.I.1..--+'_"'-"l.-
Agriculture: Employee : Laborer i Pension-----------------, "------ï---T------! I--------r---~------~ l r ~
L_~~~!!.~~!: : ~ s:~!!1_~_~~~~ .1 L f..i~_~i~_!;1 ; L tl_l!~!?_a_'!q~y _
Agricultural activities remain predominant, as 50 families out of 59 had an agricultural
occupation.
More precisely, within the sample group:
- 9 householders did not consider themselves farmers,
20 householders had only been agricultural workers,
5 were share-croppers and agricultural workers,
5 were small-scale landowners and agricultural workers,
5 were exclusively share-croppers,
and 15 cultivated their own land only.
Technical level in agriculture
1n order to evaluate the technical level of agricultural skills"reached by the transmigrants, a
system of "scores" was used, with the emphasis on the following subjects : experience in
dry-farming, in rice paddies, in plantations, in the use of draught animais, in fertilisation, in
crop protection, in agricultural credit; membership in a farmers' cooperative or in a group of
productors, and the use of motorised equipment. Each skill is worth one point.
17
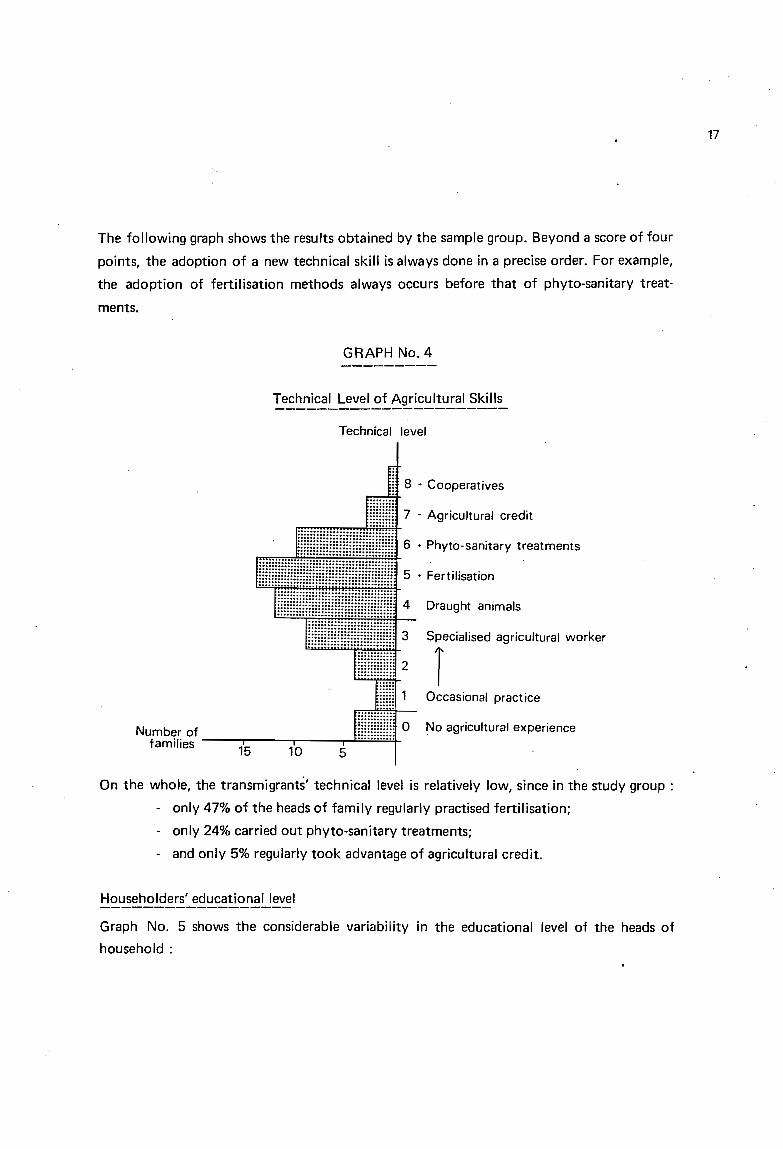
The following graph shows the results obtained by the sample group. Beyond a score of four
points, the adoption of a new technical skill is always done in a precise order. For example,
the adoption of fertilisation methods always occurs before that of phyto-sanitary treat
ments.
GRAPH No. 4
Technical Level of Agricultural Skills----------------------
Technical level
5 + Fertilisation
8 + Cooperatives
Specialised agricultural worker
rOccasional practice
Draught animais
No agricultural experience
7 - Agricultural credit
4
111111111mm11111mm; 3
H1HHHH: 2
Number offamilies --....,...--....,...--....,......r..:.:..:':":":":":'4
15 10 5
On the whole, the transmigrants' technical level is relatively Jow, since in the study group:
- only 47% of the heads of family regularly practised fertilisation;
- only 24% carried out phyto-sanitary treatments;
- and only 5% regularly took advantage of agricultural credit.
Householders' educational level
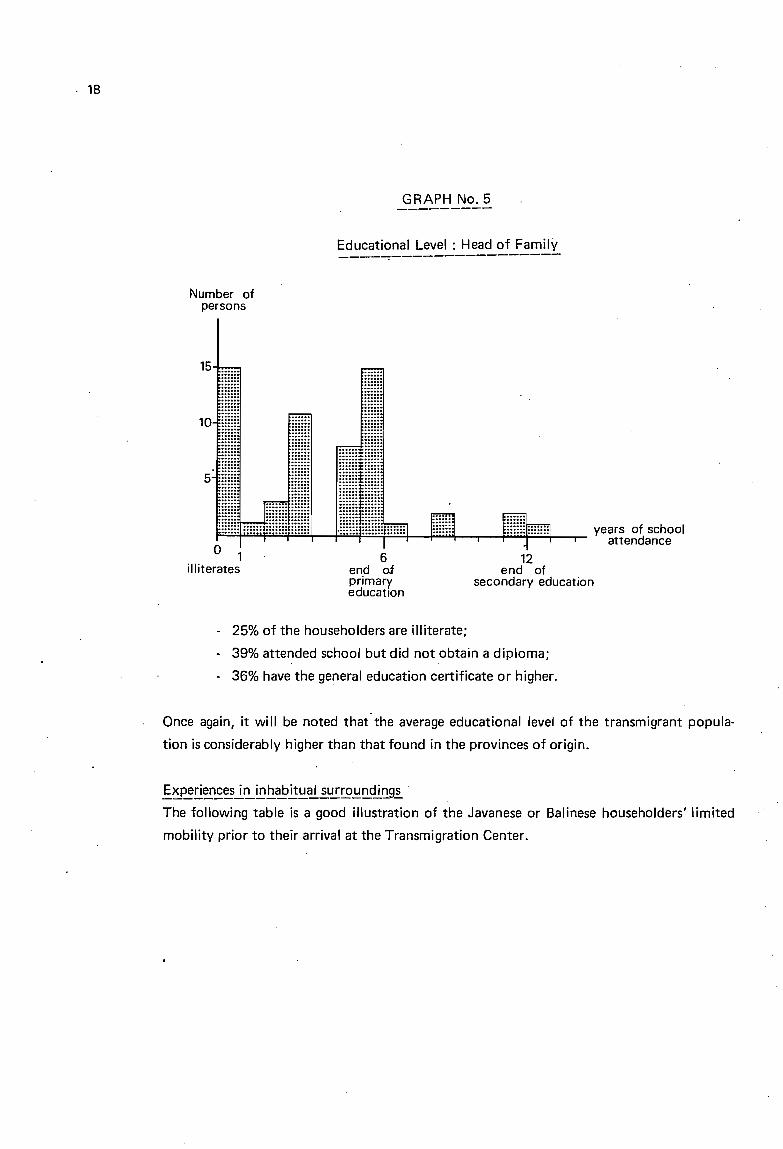
Graph No. 5 shows the considerable variability in the educational level of the heads of
household :
. 18
GRAPH No. 5
Educational Level : Head of Family----~----------------
Number ofpersons
15
10
o 1i/literates
6end aiprimaryeducatIon
12end of
secondary education
- 25% of the householders are illiterate;
- 39% attended school but did not obtain a diploma;
. 36% have the general education certificate or higher.
Once again, it will be noted that the average educational level of the transmigrant popula
tion is considerably higher than that found in the provinces of origin.
~~~!:!~~~i~I!:'b.~.!.!~é!!.~~~.!:!.~diQ9~.The following table is a good illustration of the Javanese or Balinese householders' limited
mobility prior to their arrivai at the Transmigration Center.
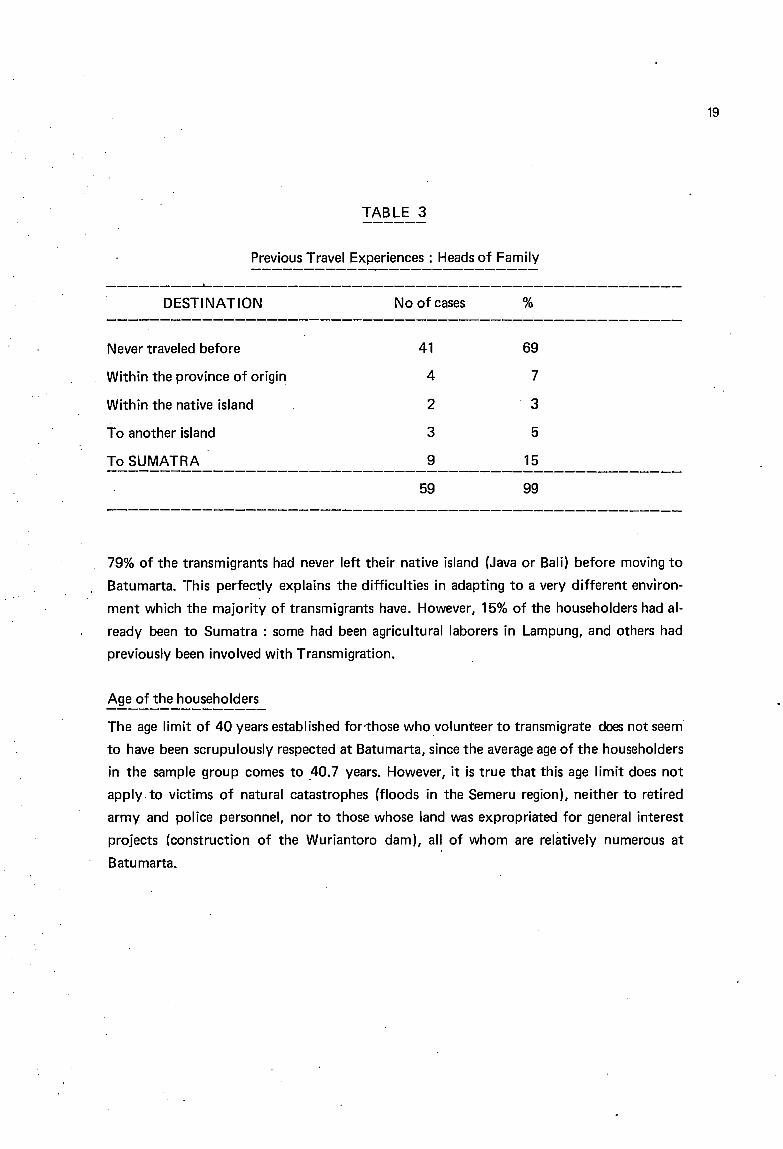
TABLE 3
Previous Travel Experiences: Heads of Family
---------~--------------------------------------------
19
DESTINATION
Never traveled before
Within the province of origin
Within the native island
To another island
To SUMATRA
No of cases
41
4
2
3
9
59
%
69
7
3
5
15
99
79% of the transmigrants had never left their native island (Java or Bali) before moving to
Batumarta. This perfectly explains the difficulties in adapting to a very different envlron
ment which the majority of transmigrants have. However, 15% of the householders had al
ready been to Sumatra: some had been agricultural laborers in Lampung, and others had
previously been involved with Transmigration.
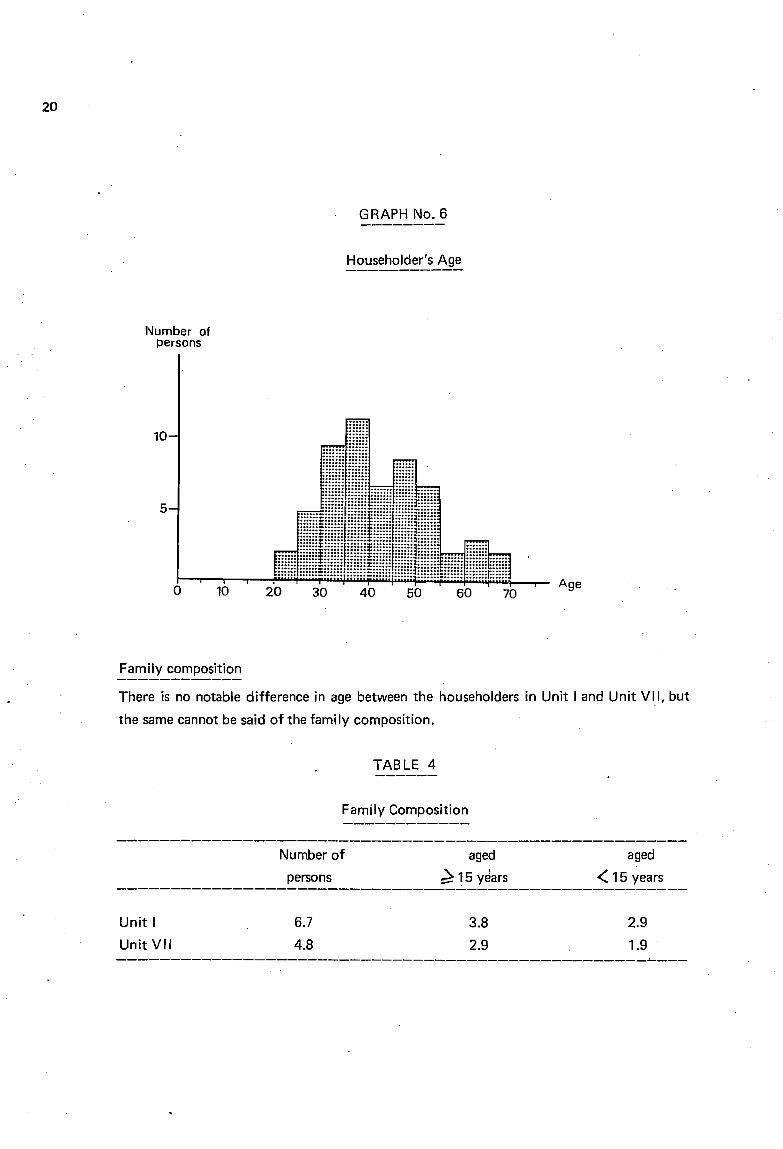
Age of the householders
The age limit of 40 years established for-those who yolunteer to transmigrate does not seem
to have been scrupulously respected at Batumarta, since the average age of the householders
in the sample group comes to .40.7 years. However, it is true that this age limit does not
apply. to victims of natural catastrophes (floods in the Semeru region), neither to retired
army and police personnel, nor to those whose land was expropriated for general interest
projects (construction of the Wuriantoro dam), ail of whom are relàtively numerous at
Batumarta.
20
GRAPH No. 6
Householder's Age
Number ofpersans
10
5
o 10
..................... ....... ........ ......... ......... ........ ........ ....... ....... .
,,;;;-ll!!li,!!IIII~llll!lil!lllillllllr"'.-l''''''!''''''l'""'Î"''''1'""';"""iiiii: !!;i!ill!l!ill!!li!II!!:·.il'il!!!il!lll~ii::i!.lll!lll, i::::
,20 30 40 50 60 70
Age
Family composition
There is no notable difference in age between the householders in Unit 1and Unit VU, but
the same cannot be said of the family composition ..
TABLE 4
Family Composition
Unit 1
Unit VII
Number of
persons
6.7
4.8
aged
à 15 y~ars
3.8
2.9
aged
<15 years
2.9
1.9--------------------------------------------------~---
The Unit 1fa!TIilies have on the average one more child and one more adult than the Unit VII
families, "thus a notably larger labor force.
The above-mentioned figures only take into account children that are still supported by the
family. Those children who are already married are included only if they live with their
parents, if they participate in -the agricultural chores, and/or if they share in the income and
expenditures.
Though the transmigrants are ail in the same initial situation when they arrive at the Center,
numerous factors from their past experiences - technical and educationaJ level, amount of
cash available in the beginning, family labor force, etc. - will lead to a large heterogeneity in
the development of the agricultural exploitations.
2. The Transmigrants' Agricultural Activities.Evolution of Landholdin9:i--------------------------------------- -
To prevent the transmigrants from sellillg their parcels, the Authorities have recently intro
duced the idea of usage rights for a limited period, which replaces the property rights. Thus,
only the transmigrants in Unit 1have titles to their land, and the Unit VII families only have
a usufruct for their parcels. When the Provincial Authorities take responsibility for the
Center (5 years after installation, as a rule), the settlers will be able to ask that their usufruct
be transformed into full proprietorship. This perspective is extremely worrisome for the
families, as it will necessitate numerous administrative paperwork and, of course, consider
able expenses.
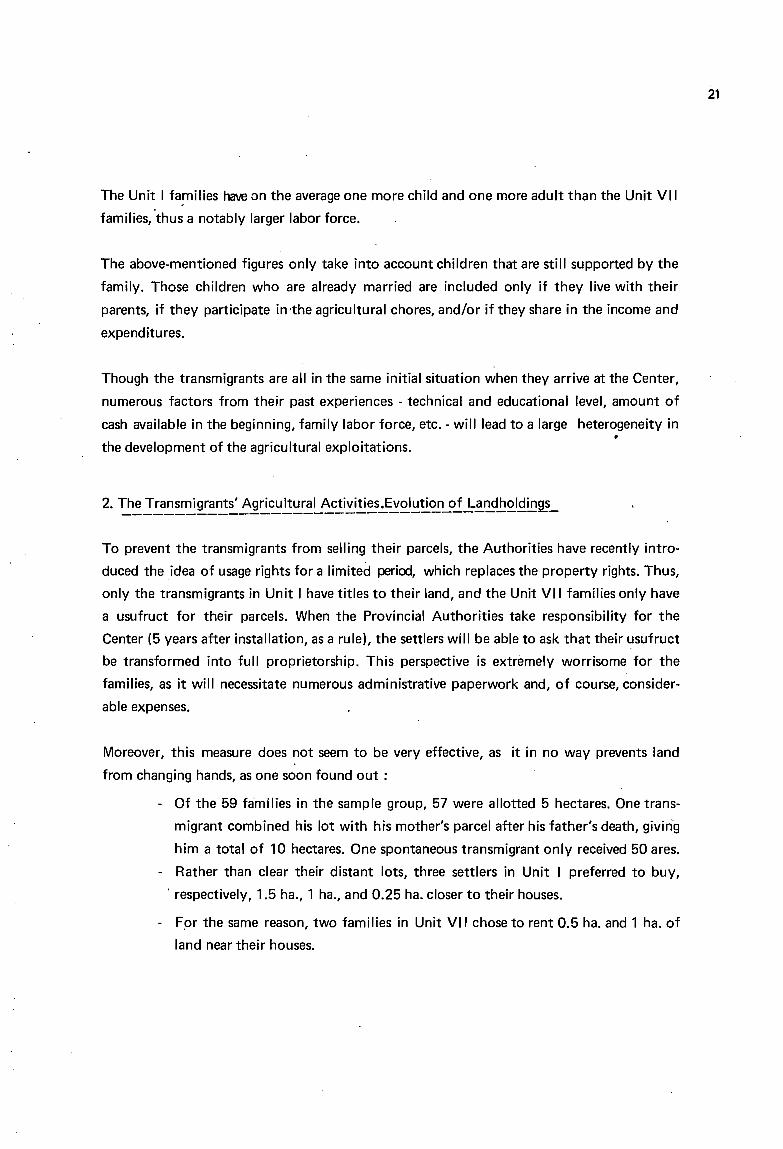
Moreover, this measure does not seem to be very effective, as it in no way prevents land
from changing hands, as one soon found out:
- Of the 59 families in the sample group, 57 were allotted 5 hectares. One trans
migrant combined his lot with his mother's parcel after his father's death, givin'g
him a total of 10 hectares. One spontaneous transmigrant only received 50 ares.
- Rather than c1ear their distant lots, three settlers in Unit 1 preferred to buy,
. respectively, 1.5 ha., 1 ha., and 0.25 ha. closer to their houses.
- F.or the same reason, two families in Unit VII chose to rent 0.5 ha. and 1 ha. of
land near their houses.
21
22'
- Sixteen families out of 59 cleared between 0.25 ha. and 1 ha. of community
land, without authorisation.
- Cases in which land was sold, or more precisely, transferred for an indemnity
(local terms), concern 6 families for areas ranging fram 0.25 ha. to 0.75 ha.
Most of the migrants hesitate to cultivate the second plot set aside for food crops, which is
usually between 1 and 2 kilometers from the house. Aside from the distance that must be
covered, these plots are often close to wooded areas and are regularly ravaged by herds of
wild pigs.
Evolution of c1eared surfaces
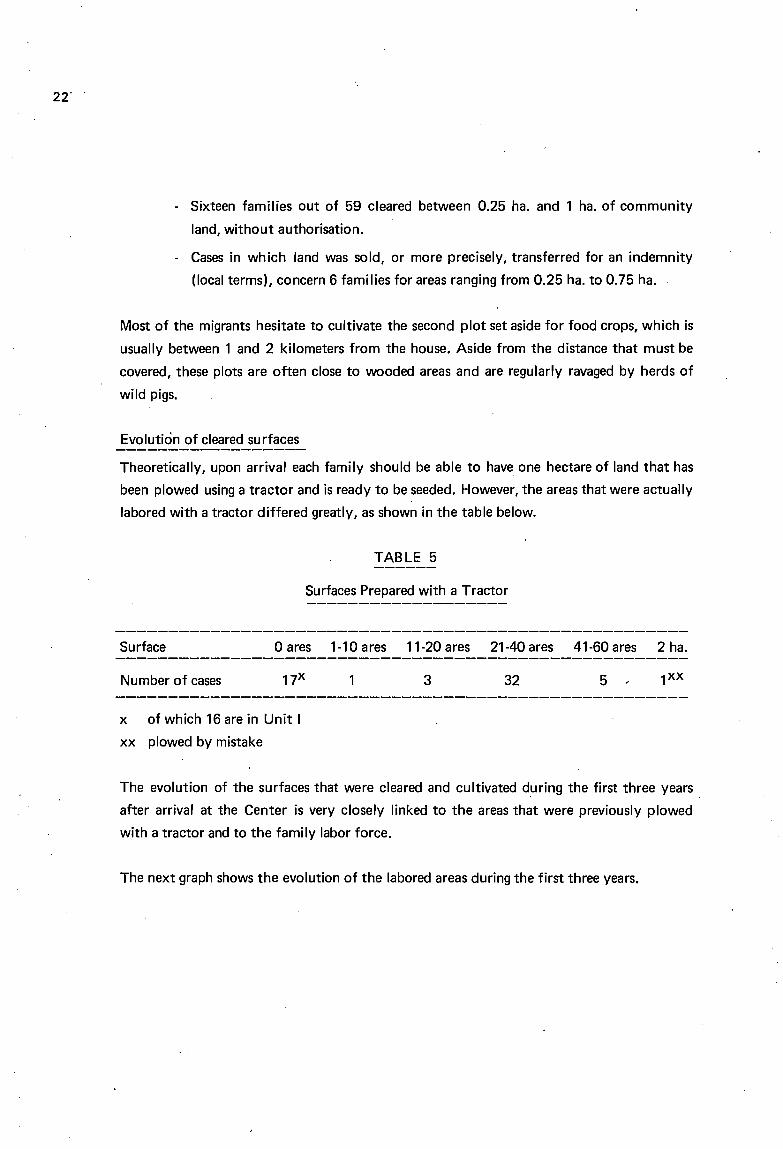
Theoretically, upon arrivai each family should be able to have one hectare of land that has
been plowed using a tractor and is ready to be seeded. However, the areas that were actually
labored with a tractor differed greatly, as shown in the table below.
TABLE 5
Surfaces Prepared with a Tractor
Surface oares 1-10 ares 11-20 ares 21-40 ares 41-60 ares 2 ha.
Number of cases 3 32 5
x of which 16 are in Unit 1
xx plowed by mistake
The evolution of the surfaces that were c1eared and cultivated d.uring the first three years
after arrivaI at the Center is very c10sely linked to the areas that were previously plowed
with a tractor and to the family labor force.
The next graph shows the evolution of the labored areas during the first three years.
23
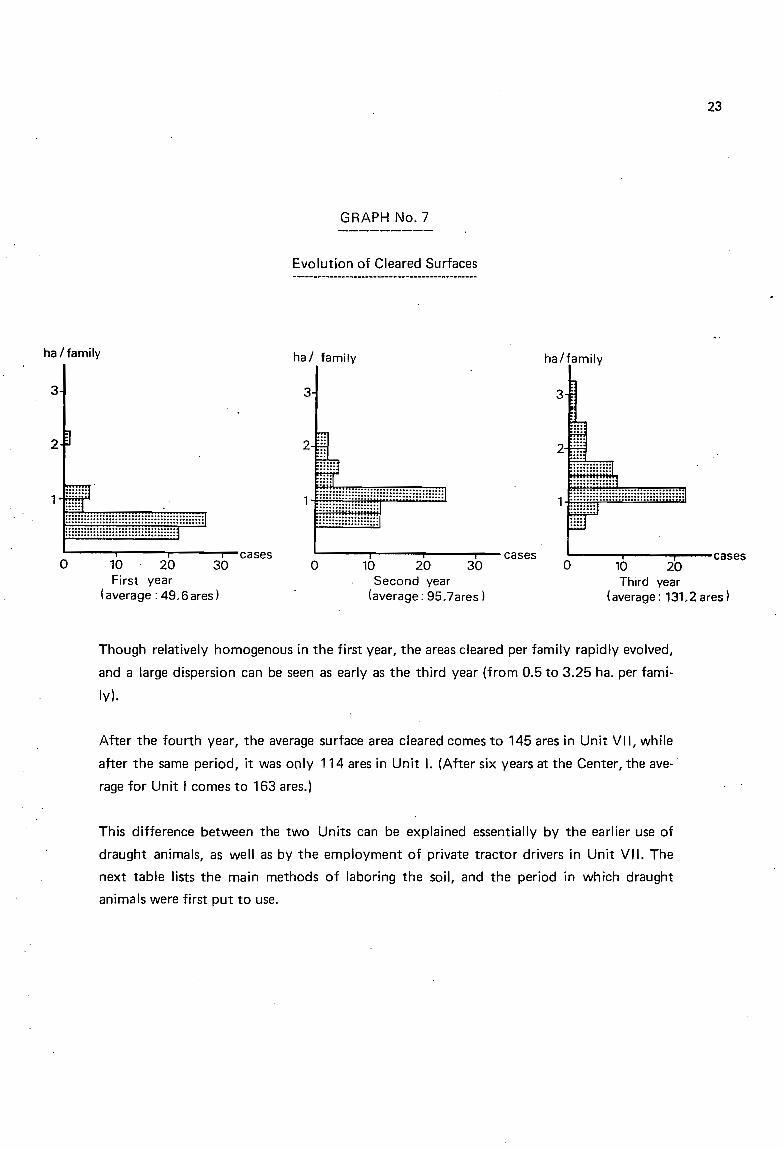
GRAPH No. 7
Evolution of Cleared Surfaces
...................::::::: .:::::::::::::::::::.....................................................................................................................................
:::::::::::::::::::::::::::::::::::
1
ha/family ha/ family ha/family
3 3 3
00'2 2 2
L.---"'T"""---,------,r--cases '----r-----,---T"""'"- cases10 20Third year
(average: 131.2 ares)
L---...,...----r--caseso10 20 30
Second year(average: 95.7ares )
o10 20 30First year
(average: 49.6 ares)
o
Though relativelv homogenous in the first vear, the areas cleared per familv rapidlv evolved,
and a large dispersion can be seen as earlv as the third vear (from 005 ta 3.25 ha. per fami·
IV).
After the fourth vear, the average surface area cleared cames to 145 ares in Unit VII, while
after the same period, it was onlv 114 ares in Unit 1. (After six vears at the Center, the ave· .
rage for Unit 1 cames ta 163 ares.)
This difference between the two Units can be explained essentiallv bV the earlier use of
draught animais, as weil as bV the emplovment of private tractor drivers in Unit VII. The
next table lists the main methods of laboring the soil, and the period in which draught
animais were first put to use.
24
TABLE 6
Use of draught animais beginning in the2nd year 3rd year 4th year
Stillmanual
Employment oftractor driver
Unit 1
Unit VII
12%
12%
35%
45%
22%
10%
31%
2% 9%
By the end of the third year, the growth of the peremnial crops set out ,in the "pekarangan"
the 25-are parcel around the house - progressively prevents their use for the food crops. For
Unit VIl, of the average 145 ares c1eared per family, 15 ares had already been ser aside for
the orchard in 1983. In Unit l, the orchards take up an average 20 ares or so. Some of the
plots cleared in the first years had already been abandoned.
The annual crops
The climatic conditions in the Batumarta area always allow two cropping seasons, and
sometime a third, if the dry season is /ate. However, in view of the high risk of drought,
most of the transmigrants (50 out of 59) would rather not take chances.
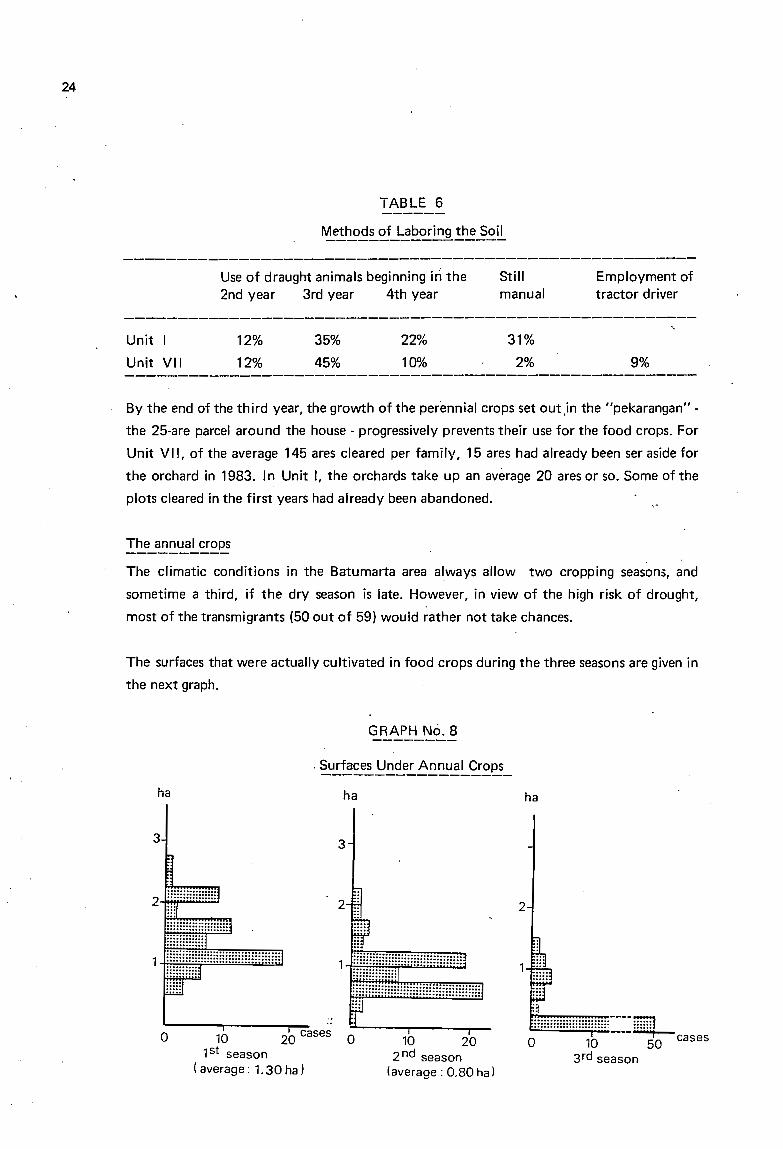
The surfaces that were actually cultivated in food crops during the three seasons are given in
the next graph.
GRAPH No. 8
ha
.~~~~~~~~.:.~~~~!-<2!"~~_ha ha
cases
:~
::::::::::::::::::::::::----mm11a 10 50
3 rd season
2
10 202 nd season
(average: 0.80 ha)
3
2
10 20 cases a1st season
(average: 1.30 ha)
a
3
2--titt;==
Of the 130 ares cultivated in the first season, only 80 were used for a second season. There
are several reasons behind this reduction :
- the necessity of seeding the parcels as quickly as possible so that the harvest will
fall before the dry season incites the migrants to reduce their cultivated surfaces;
- the lack of seed often makes it necessary to reduce the planted area;
- the second cropping season being generally reserved for plants which are very
tempting to the wild pigs (maize, peanuts, soya), ail the parcels located at a dis
tance from the house are usually left fallow.
Among the first-season crops, rice - the basic food - is obviously the transmigrants' prefe
rence. Of the 130 ares cultivated in the first season, an average 104 ares are set aside for rice.
Upland rice is traditionally cultivated in "Tumpang sari", that is to say, complanted with
maize and cassava (41 cases out of 59). Where the distance of the plots leads to a risk of
raids by wild pigs, rice as a single crop is the only solution. Aside from this, three families in
the sample group set up small irrigated ricefields.
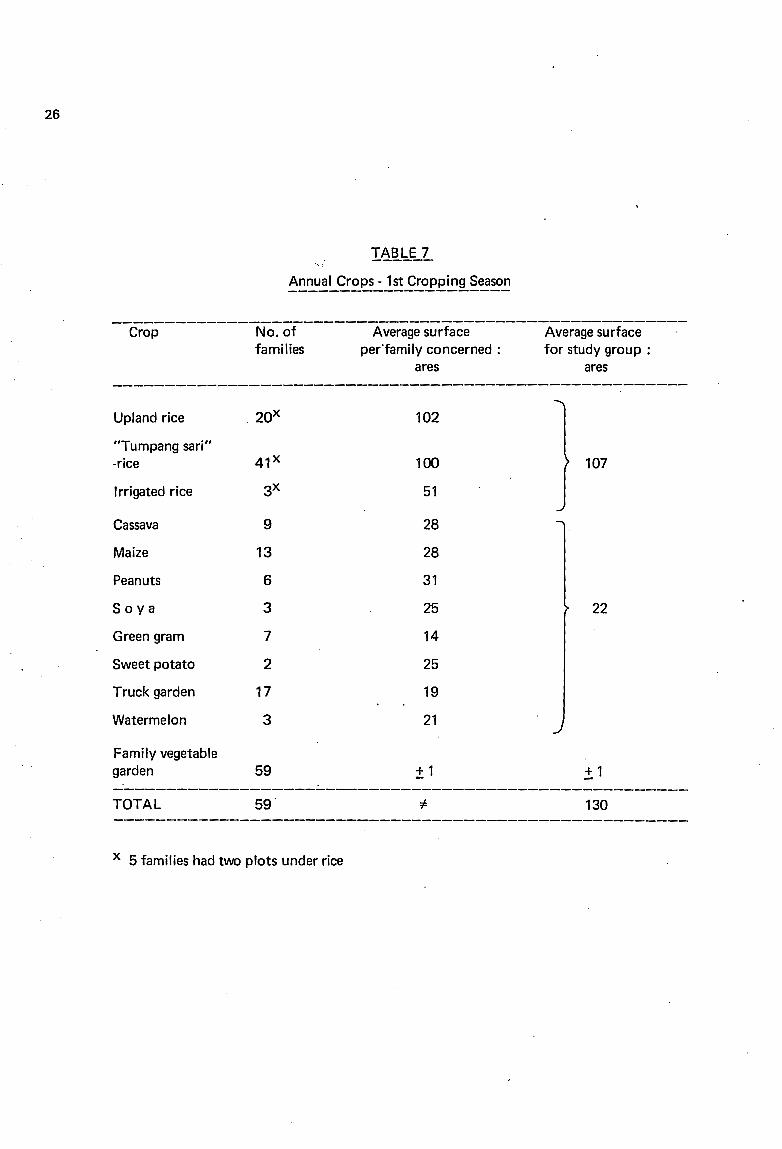
Table 7 Iists the types of crops grown, the number of families concerned, the average sur
faces cultivated in each crop, and the average surfaces cultivated for the sample group as a
whole.
25
26
Annual Crops - lst Cropping Season---------------------
Crop No.offamilies
Average surfaceper'family concerned :
ares
Average surfacefor study group:
ares
Upland rice .20x 102
"Tumpang sari"-rice 41 x 100 107
Irrigated rice 3x 51
Cassava 9 28
Maize 13 28
Peanuts 6 31
Soya 3 25 22
Green gram 7 14
Sweet patata 2 25
Truck garden 17 19
Watermelon 3 21
Family vegetablegarden 59 ±1 1 1------------------------------------------------------TOTAL 59 130
x 5 families had two plots under rice
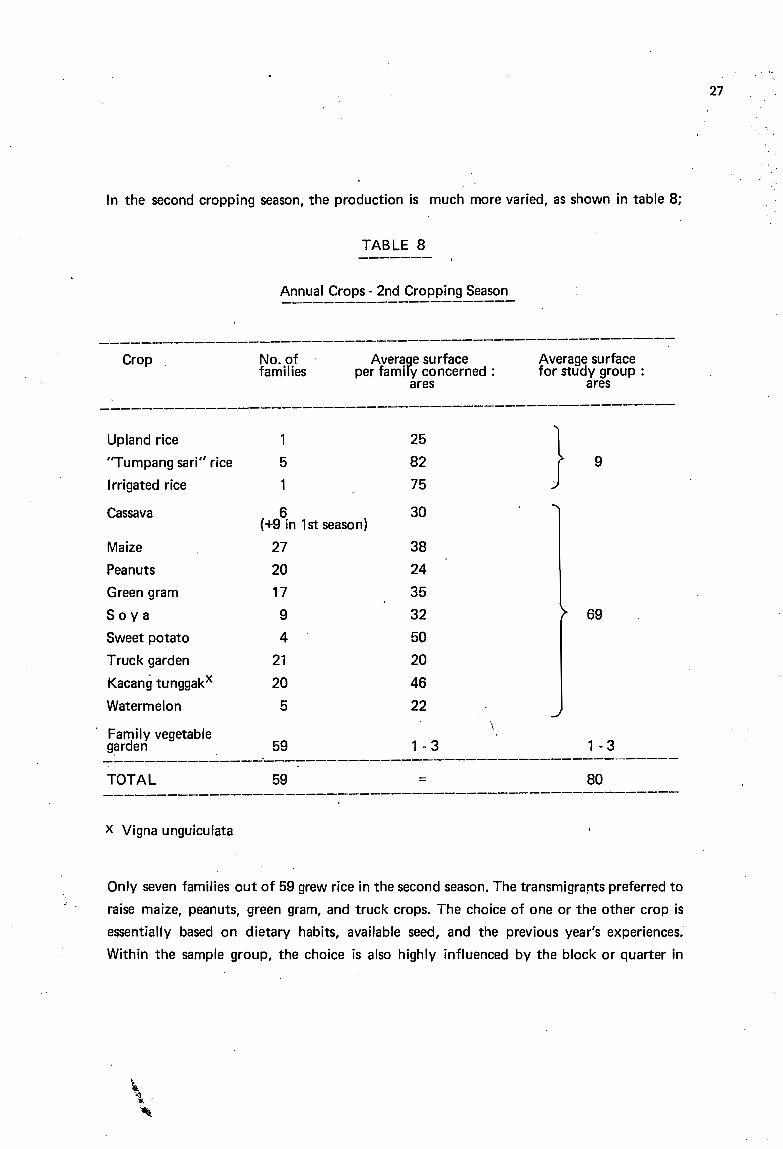
ln the second cropping season, the production is much more varied, as shown in table 8;
TABLE 8
Annual Crops - 2nd Cropping Season
27
Crop No. offamilies
Average surfaceper famiry concerned :
ares
Average su rfacefor study group :
ares
Upland rice 1 25 }"Tumpang sari" rice 5 82 91rrigated rice 1 75
Cassava 6 30(+9 in 1st season)
Maize 27 38
Peanuts 20 24
Green gram 17 35
Soya 9 32 69Sweet potato 4 50
Truck garden 21 20
Kacang tunggakX 20 46
Watermelon 5 22
Family vegetable \.
garden 59 1 - 3 1 - 3--------------~----------------------------------------
TOTAL 59 = 80
x Vigna unguiculata
Only seven families out of 59 grew rice in the second season. The transmigrants preferred to
raise maize, peanuts, green gram, and truck crops. The choice of one or the other crop is
essentially based on dietary habits, available seed, and the previous year's experiences.
Within the sample group, the choice is also highly influenced by the block or quarter in
28
which one lives. It is very rare for a transmigrant to single himself out by choosing a crop.
that is different from his neighbors', for were it to fail, he would be the laughingstock of the
neighborhood. On the other hand, should he succeed, there would soon be a great many
others following in his footsteps.
ln the third cropping season, if the farmers have been able to prepare the soil before the
onset of the dry season, sorne settlers try a crop of peanuts, green gram, or kacang tunggak
on plots of around 50 to 75 ares. Those families who have parcels near water holes prefer to
raise vegetables, a very profitable crop during the dry season.
Nevertheless, in an average year, only 9 families out of 59 cultivate their fields during the
third season.
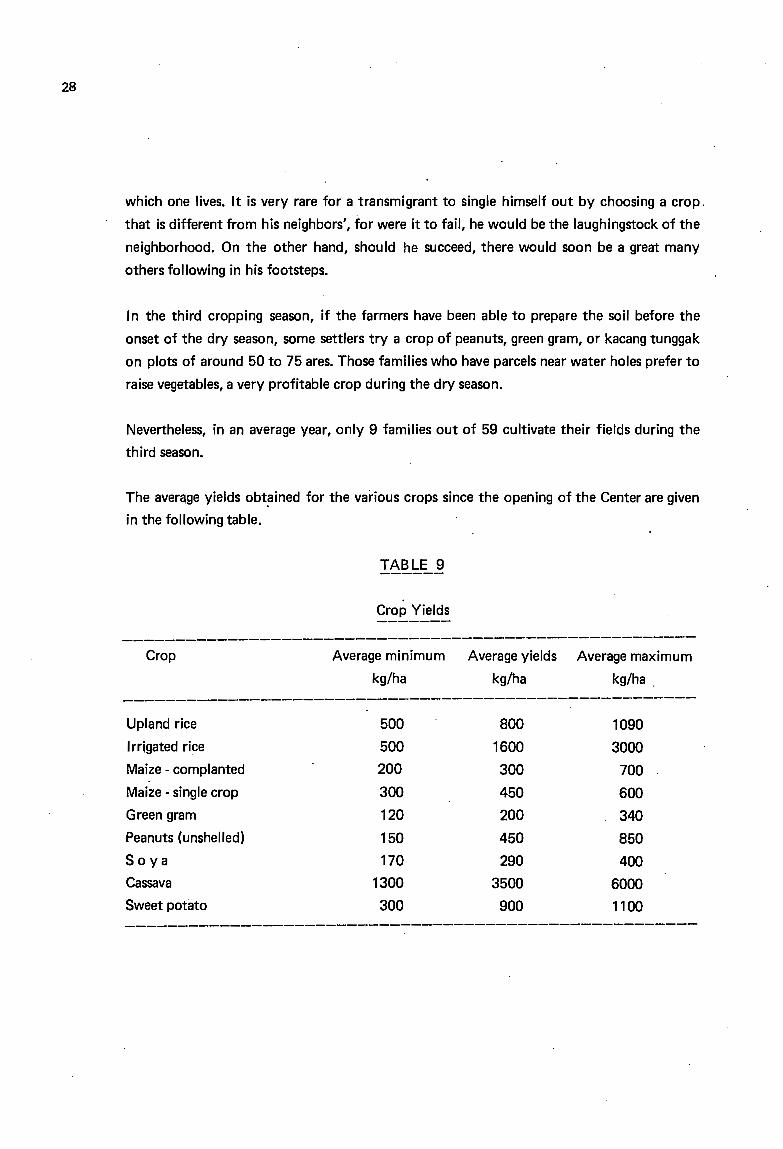
The averqge yields obt~ined for the vai-ious crops since the opening of the Center are given
in the following table.
TABLE 9
Crop Yields
------------------------------------------------------Crop Average minimum Average yields' Average maximum
kg/ha kg/ha kg/ha .------------------------------------------------------
Upland rice 500 800 1090
1rrigated rice 500 1600 3000
Maize - complanted 200 300 700
Maize - single crop 300 450 600
Green gram 120 200 340
Peanuts (unshelled) 150 450 850
Soya 170 290 400
Cassava 1300 3500 6000
Sweet potato 300 900 1100------------------------------------------------------
Rice cultivation, since it is of such importance to the transmigrants, deserves a more detailed
study. Moreover, as it is the only crop grown on a large-scale basis by ail the transmigrants,
studying it will allow one to evaluate the farmers' technical level in agriculture.
~!>~~ln~~~~~_~~-!~~~i~
The following figures were obtained through personal enquiries and field observations of the.
59 families surveyed during the 1982 - 1983 agricultural year.
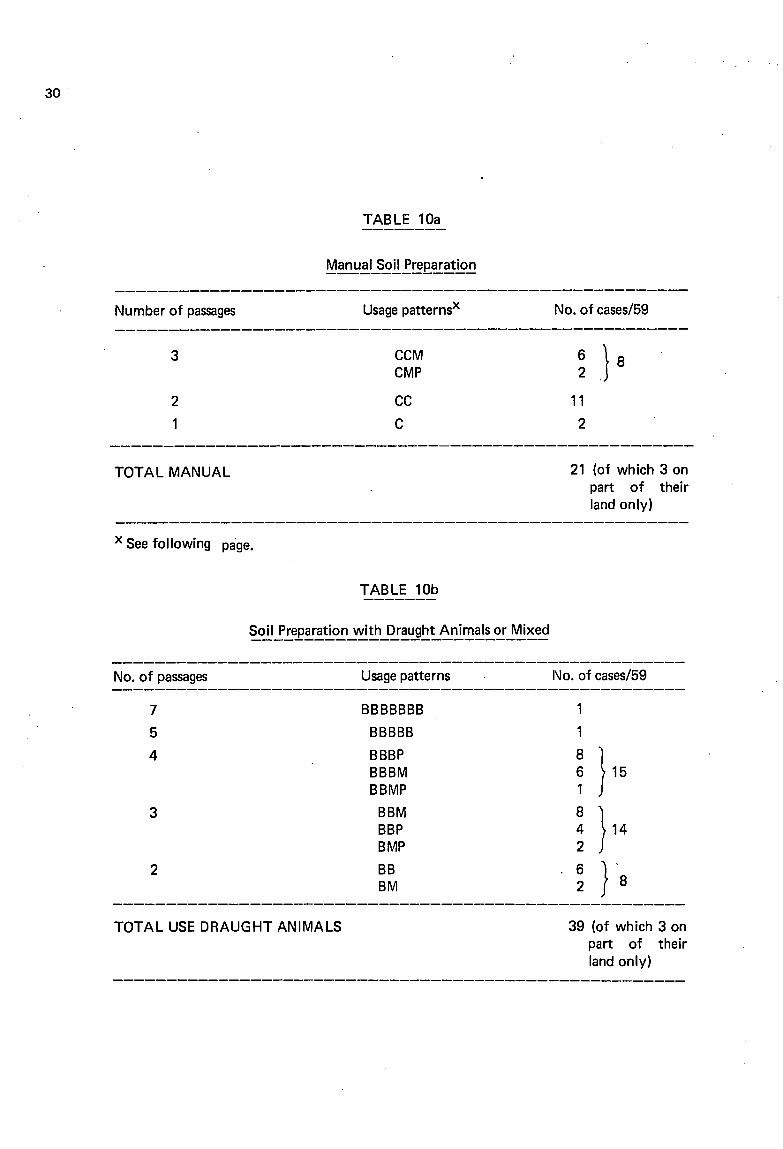
Soil preparation
There is a great deal of heterogeneity in the methods of soil preparation (tools used and
number of passages) employed by the migrants. However, for a single exploitation, the same
technical steps are generally followed for ail the plots, with the exception of recently
c1eared fields where the presence of roots and stumps does not permit the use of draught
animais.
1n 1982 . 1983, for 59 settlers :
- 18 prepared the soir exclusively with a hoe,
3 used a hoe on the recently-cleared plots and a plow on the others,
36 used draught animais, with occasionally one or two passages carried out ma·
nually,
2 hired private tractor drivers.
The frequency of the preparation methods, the number of passages, and the lisage patterns
are given in the following tables.
29
30
Number of passages
3
2
1
TOTAL MANUAL
x See following page.
TABLE 10a
Usage patternsX
CCMCMP
CCC
TABLE 10b
No. of cases/59
21 (of which 3 onpart of theirland only)
No. of passages
7
5
4
3
2
Usage patterns
BBBBBBB
BBBBB
BBBPBBBMBBIV1P
BBMBBPBMP
BBBM
l'Jo. of cases/59
1
1
~ } 15
~ } 14
~ }'8TOTAL USE DRAUGHT ANIMALS 39 (of which 3 on
part of theirland only)
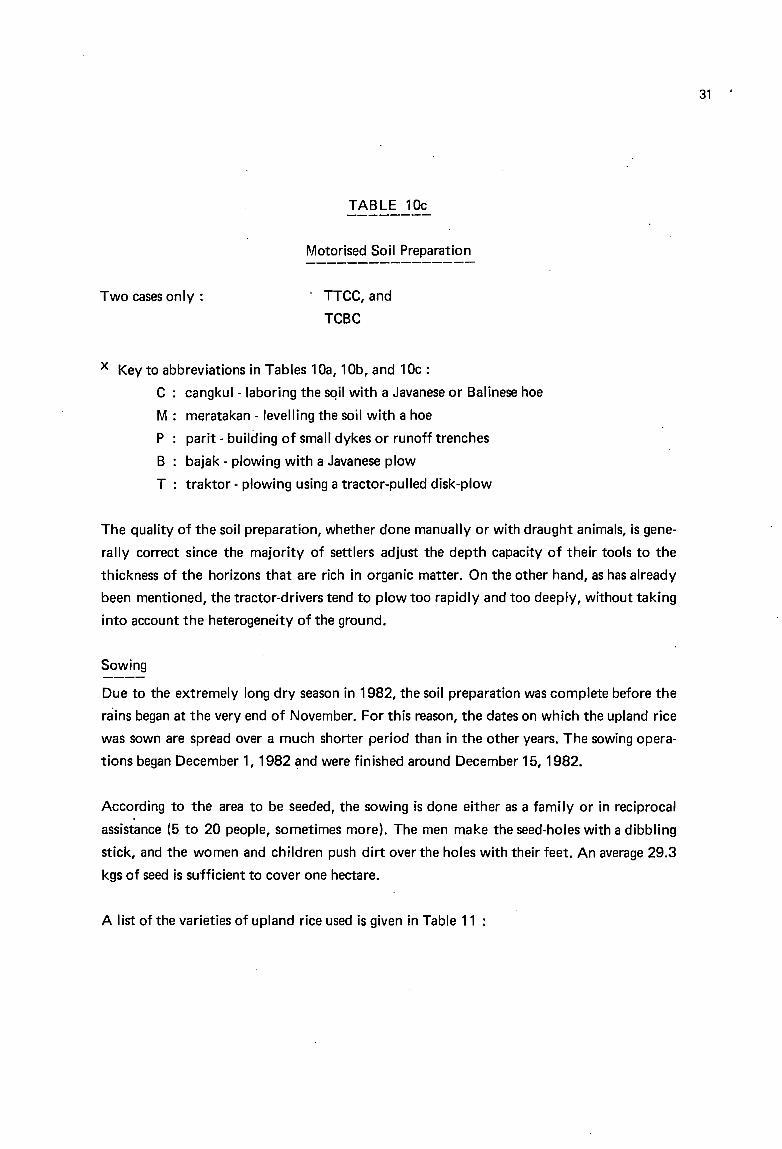
TABLE 10c
Motorised Soil Preparation
31
Two cases only : TTCC, and
TCBC
x Key to abbreviations in Tables 1Da, 1Ob, and 10c :
C : cangkul - laboring the sqil with a Javanese or Balinese hoe
M: meratakan - levelling the soil with a hoe
P parit - building of small dykes or runoff trenches
B bajak - plowing with a Javanese plow
T : traktor - plowing using a tractor-pulled disk-plow
The quality of the soil preparation, whether done manually or with draught animais, is gene
rally correct since the majority of settlers adjust the depth capacity of their tools to the
thickness of the horizons that are rich in organic matter. On the other hand, as has already
been mentioned, the tractor-drivers tend to plow too rapidly and too deeply, without taking
into account the heterogeneity of the ground.
Sowing
Due to the extremely long dry season in 1982, the soil preparation was complete before the
rains began at the very end of November. For this reason, the dates on which the upland rice
was sown are spread over a much shorter period than in the other years. The sowing opera
tions began December 1, 1982 and were fin ished around December 15, 1982.
According to the area to be seeded, the sowing is done either as a family or in reciprocal
assistance (5 to 20 people, sometimes more). The men make the seed-holes with a dibbling
stick, and the women and children push dirt over the holes with their feet. An average 29.3
kgs of seed is sufficient to cover one hectare.
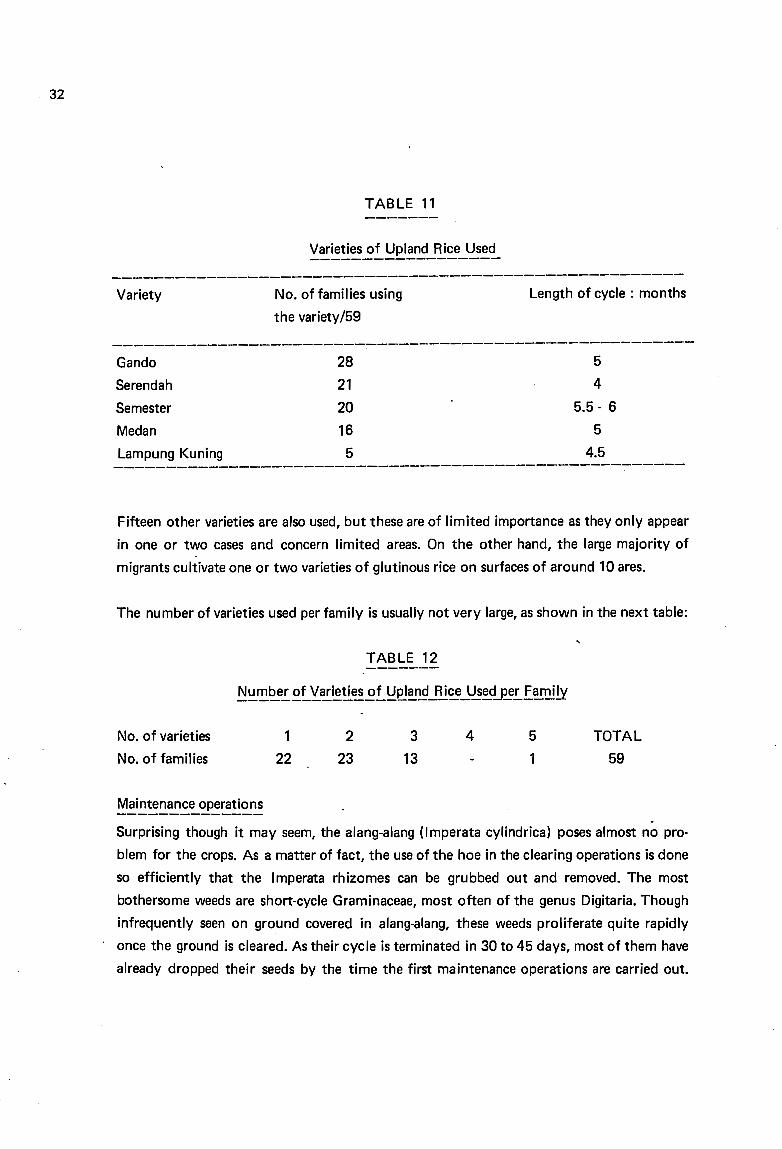
A list of the varieties of upland rice used is given in Table 11
32
Variety
TABLE 11
No. of families using
the variety/59
Length of cycle: months
Gando 28 5Serendah 21 4
Semester 20 5.5 - 6Medan 16 5Lampung Kuning 5 4.5
Fifteen other varieties are also used, but these are of limited importance as they only appear
in one or two cases and concern Iimited areas. On the other hand, the large majority of
migrants cultivate one or two varieties of glutinous rice on surfaces of around 10 ares.
The number of varieties used per family is usually not very large, as shown in the next table:
TABLE 12
No. of varieties
No. of families
Maintenance operations
1
22
2
233
13
4 5
1
TOTAL
59
Surprising though it may seem, the alang-alang (Imperata cylindrica) poses almost no pro
blem for the crops. As a matter of fact, the use of the hoe in the clearing operations is done
50 efficiently that the Imperata rhizomes can be grubbed out and removed. The most
bother5Ome weeds are short-cycle Graminaceae, most often of the genus Digitaria. Though
infrequently seen on ground covered in alang-alang, these weeds proliferate quite rapidly
once the ground is cleared. As their cycle is terminated in 30 to 45 days, most of them have
already dropped their seeds by the time the first maintenance operations are carried out.
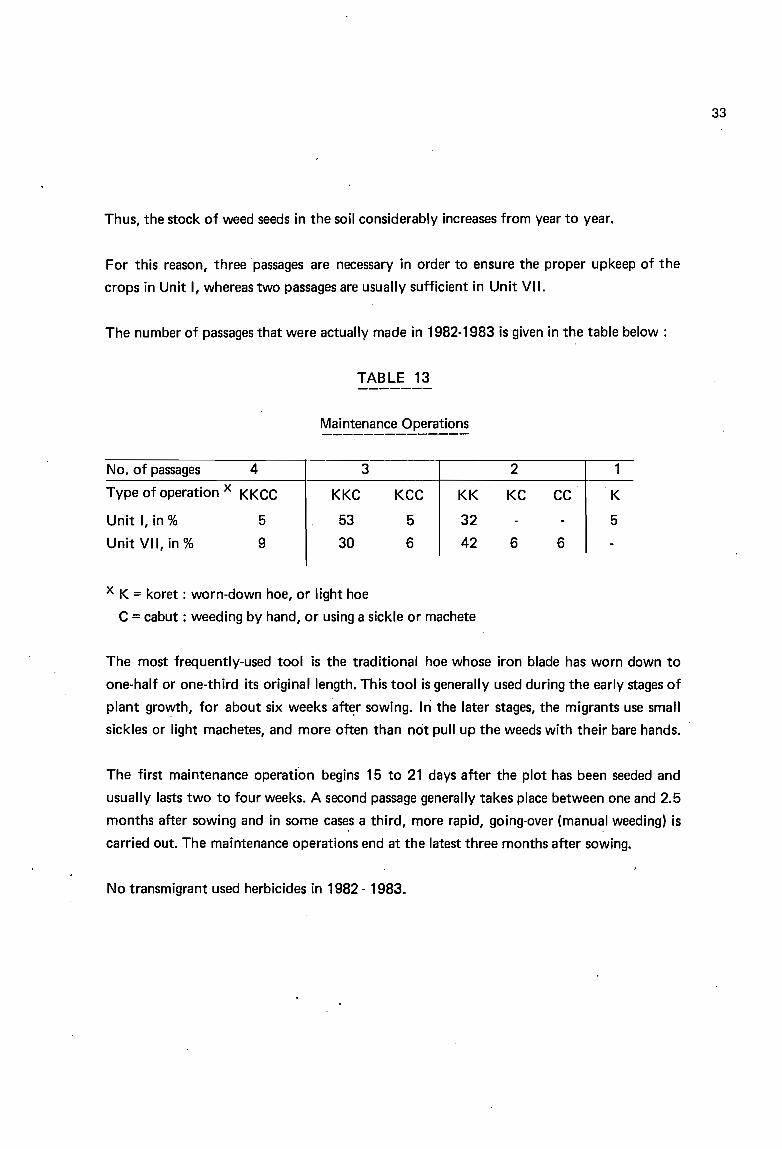
Thus, the stock of weed seeds in the soil considerably increases from year to year.
For this reason, three passages are necessary in order to ensure the proper upkeep of the
crops in Unit 1, whereas two passages are usually sufficient in Unit VII.
The number of passages that were actually made in 1982-1983 is given in the table below :
TABLE 13
Maintenance Operations
No. of passages 4 3 2 1
Type of operation x KKCC KKC KCC KK KC CC K
Unit 1, in % 5 53 5 32 - - 5
Unit VII, in % 9 30 6 42 6 6 -
x K = koret : worn-down hoe, or light hoe
C =cabut : weeding by hand, or using a sickle or machete
The most frequently-used tool is the traditional hoe whose iron blade has worn down to
one-half or one-third its original length. This tool is generally used du ring the early stages of
plant growth, for about six weeks aft~r sowing. lri the later stages, the migrants use small
sickles or light machetes, and more often than not pull up the weeds with their bare hands.
The first maintenance operation begins 15 to 21 days after the plot has been seeded and
usually lasts two to four weeks. A second passage generally takes place between one and 2.5
months after sowing and in some cases a third, more rapid, going-over (manual weeding) is
carried out. The maintenance operations end at the latest three months after sowing.
No transmigrant used herbicides in 1982 - 1983.
33
34
Fertilisation
While only 47% of the heads of family regularly carried out fertilisation in their home
provinces, in 1982-1983 ail used TSP (Triple Super Phosphate) and Urea to fertilise their
crops of upland rice.
However, only 20% of the farmers spread the natural phosphates distributed by the Agri
cultural Services (500 kgs/family). Most of the time the sacks were piled in a corner of
the garden and left to rot.
The use of potassium fertilisers and manure remains limited, respectively, 5% and 8% of
cases.
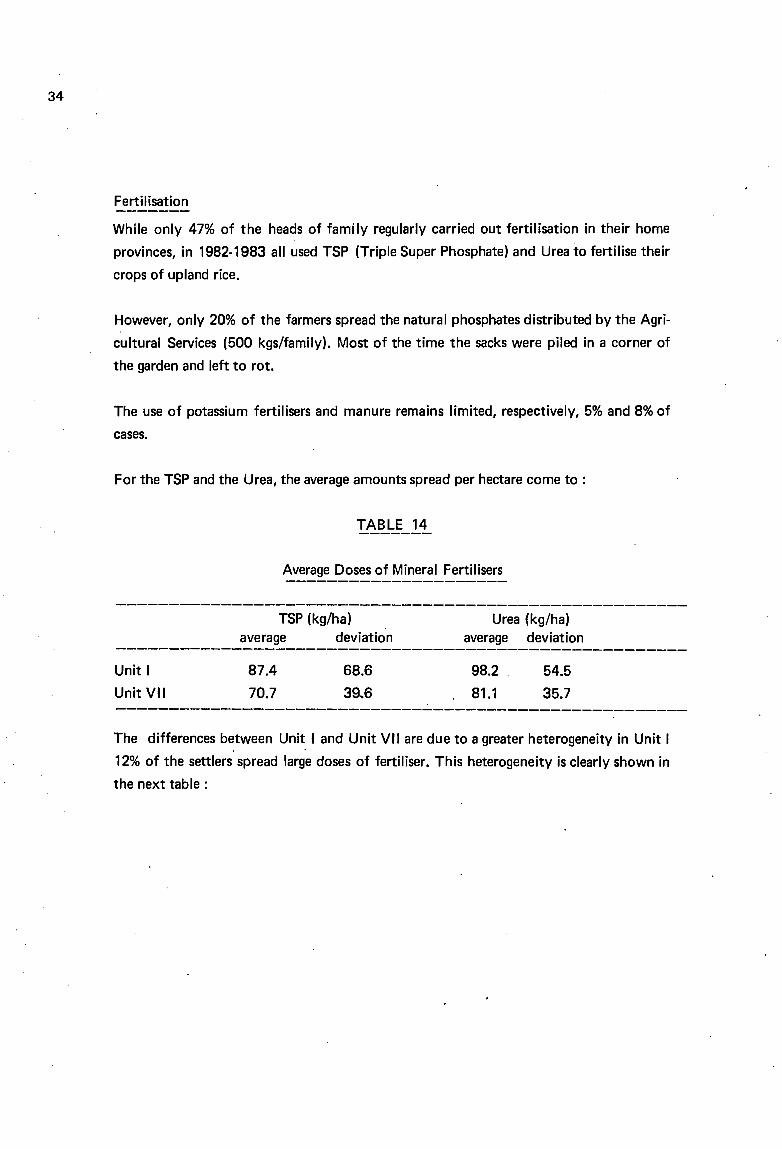
For the TSP and the Urea, the average amounts spread per hectare come to :
TABLE 14
Average Doses of Mineral Fertilisers
TSP (kg/ha)average deviation
Urea (kg/ha)average deviation
Unit 1
Unit VII
87.4
70.7
68.6
39.6
98.2
81.1
54.5
35.7
The differences between Unit' and Unit VII are due to a greater heterogeneity in Unit 1. .
12% of the settlers spread large doses of fertiliser. This heterogeneity is clearly shown in
the next table:
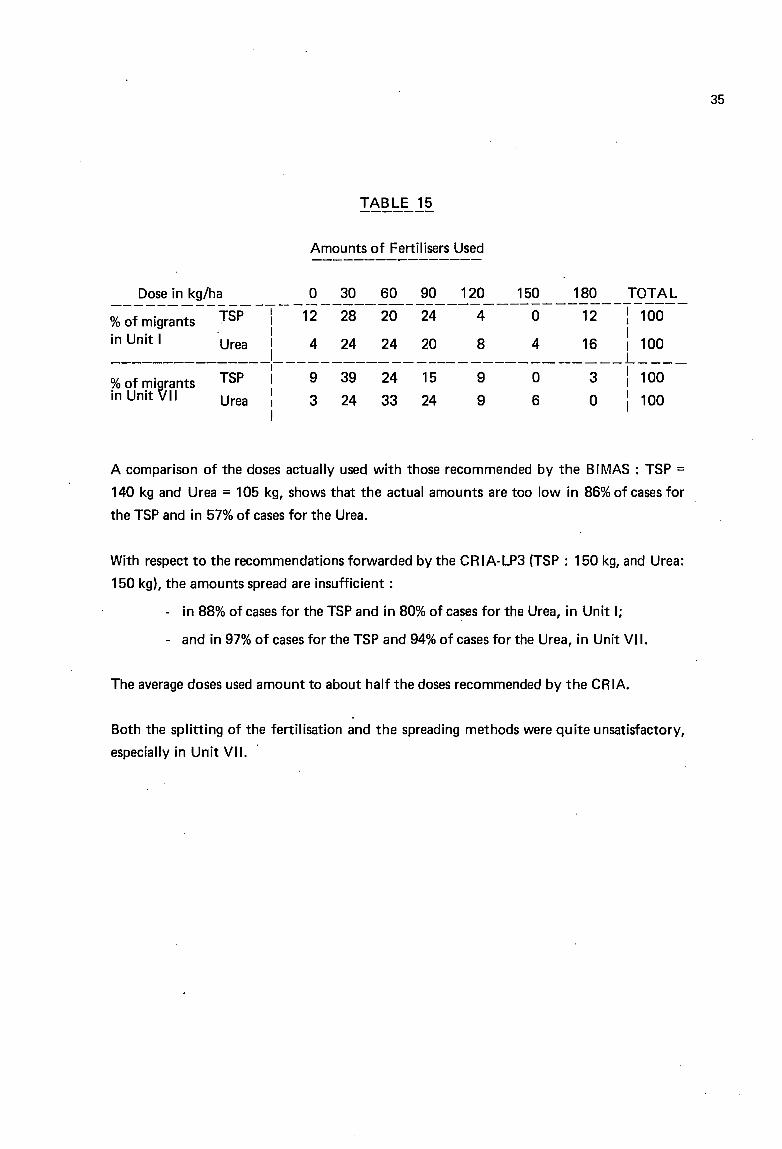
TABLE 15
Amounts of Fertilisers Used
A comparison of the doses actually used with those recommended by the BI MAS : TSP =
140 kg and Urea = 105 kg, shows that the actual amounts are too low in 86% of cases for
the TSP and in 57% of cases for the Urea.
With respect to the recommendations forwarded by the CR IA-LP3 (TSP : 150 kg, and Urea:
150 kg), the amounts spread are insufficient :
- in 88% of cases for the TSP and in 80% of cases for the Urea, in Unit 1;
- and in 97% of cases for the TSP and 94% of cases for the Urea, in Unit VII.
The average doses used amount to about ha If the doses recommended by the CRIA.
Both the splitting of the fertilisation and the spreading methods were quite unsatisfactory,
especially in Unit VII.
35
36
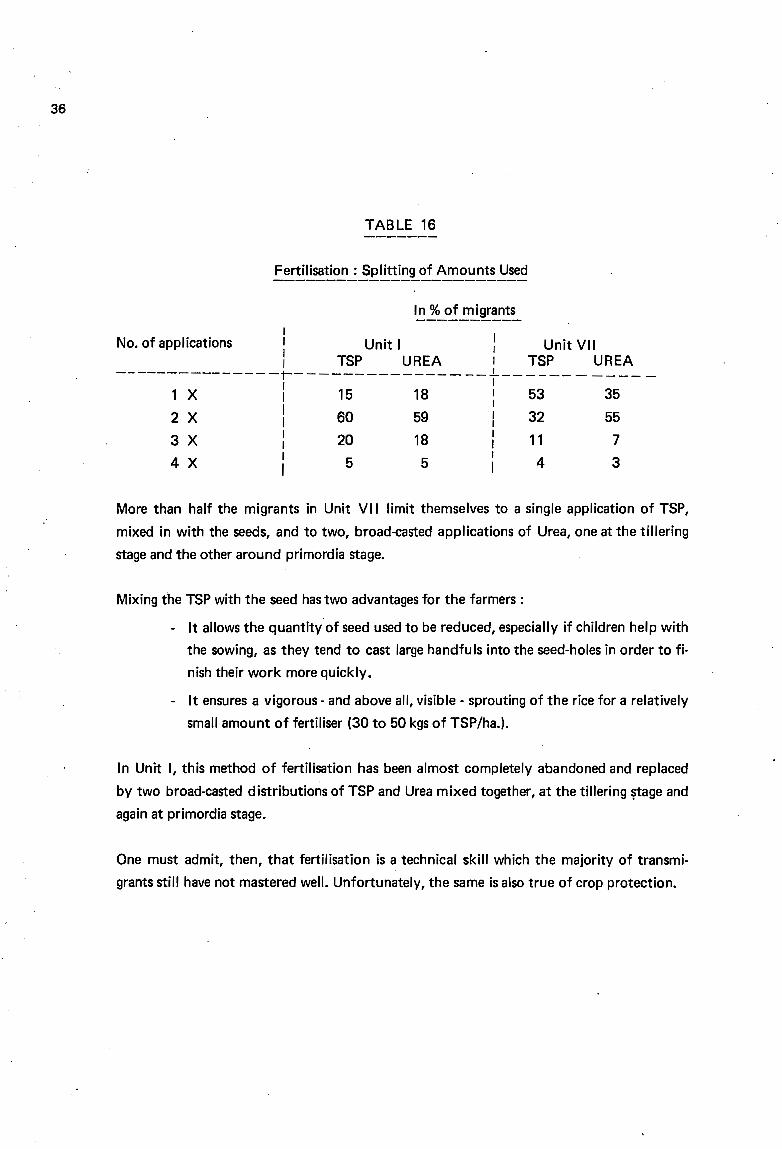
TABLE 16
Fertilisation: Splitting of Amounts Used------------------------
1No. of applications 1 Unit 1 Unit VII
1 TSP UREA 1 TSP UREA---------------t--------------- __ .1... - -----
1
1 X : 15 18 : 53 35
2 X i 60 59 1 32 55
3 X : 20 18 : 11 7
4X 1 5 5 1 4 3
More than half the migrants in Unit VII limit themselves to a single application of TSP,
mixed in with the seeds, and to two, broad-casted applications of Urea, one at the tillering
stage and the other around primordia stage.
Mixing the TSP with the seed has two advantages for the farmers :
- It allows the quantity of seed used to be reduced, especially if children help with
the 5Owing, as they tend to cast large handfuls into the seed-holes in order to fi
nish their work more quickly.
- It ensures a vigorous - and above ail, visible - sprouting of the rice for a relatively
small amount of fertiliser (30 to 50 kgs of TSP/ha.).
ln Unit 1, this method of fertilisation has been almost completely abandoned and replaced
by two broad-casted distributions of TSP and Urea mixed together, at the tillering ~age and
again at primordia stage.
One must admit, then, that fertilisation is a technical skill which the majority of transmi
grants still have not mastered weil. Unfortunately, the same is al50 true of crop protection.
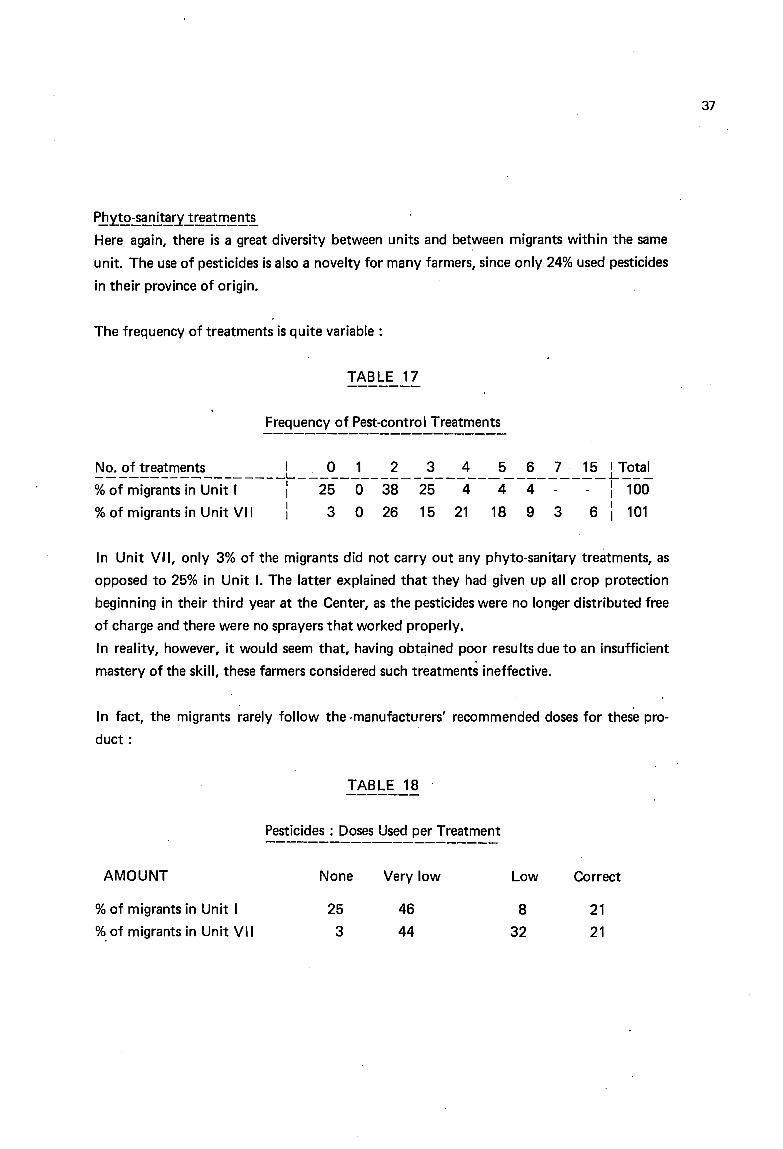
P.bY..~~~~~.Y..!~~t.!!l~!!.t.!
Here again, there is a great diversity between units and between migrants within the same
unit. The use of pesticides is also a novelty for many farmers, since only 24% used pesticides
in their province of origin.
The frequency of treatments is quite variable:
TABLE 17
Frequency of Pest-eontrol Treatments
No. of treatments 1. 0 1 2 3 4 5 6 7 15 1 Total__________________L L _
%of migrants in Unit 1 1 25 0 38 25 4 4· 4 : 100
% of migrants in Unit VII : 3 0 26 15 21 18 9 3 6: 101
ln Unit VII, only 3% of the migrants did not carry out any phyto-sanitary treatments, as
opposed to 25% in Unit 1. The latter explained that they had given up ail crop protection
beginning in their third year at the Center, as the pesticides were no longer distributed free
of charge and there were no sprayers that worked properly.
ln reality, however, it would seem that, having obtained poor results due to an insufficient
mastery of the skill, these farmers considered such treatments ineffective.
ln fact, the migrants rarely follow the ·manufacturers' recommended doses for these pro
duct:
TABLE 18
Pesticides: Doses Used per Treatment
37
AMOUNT
% of migrants in Unit 1
%. of migrants in Unit VII
None
25
3
Very low
46
44
Low
8
32
Correct
21
21
38
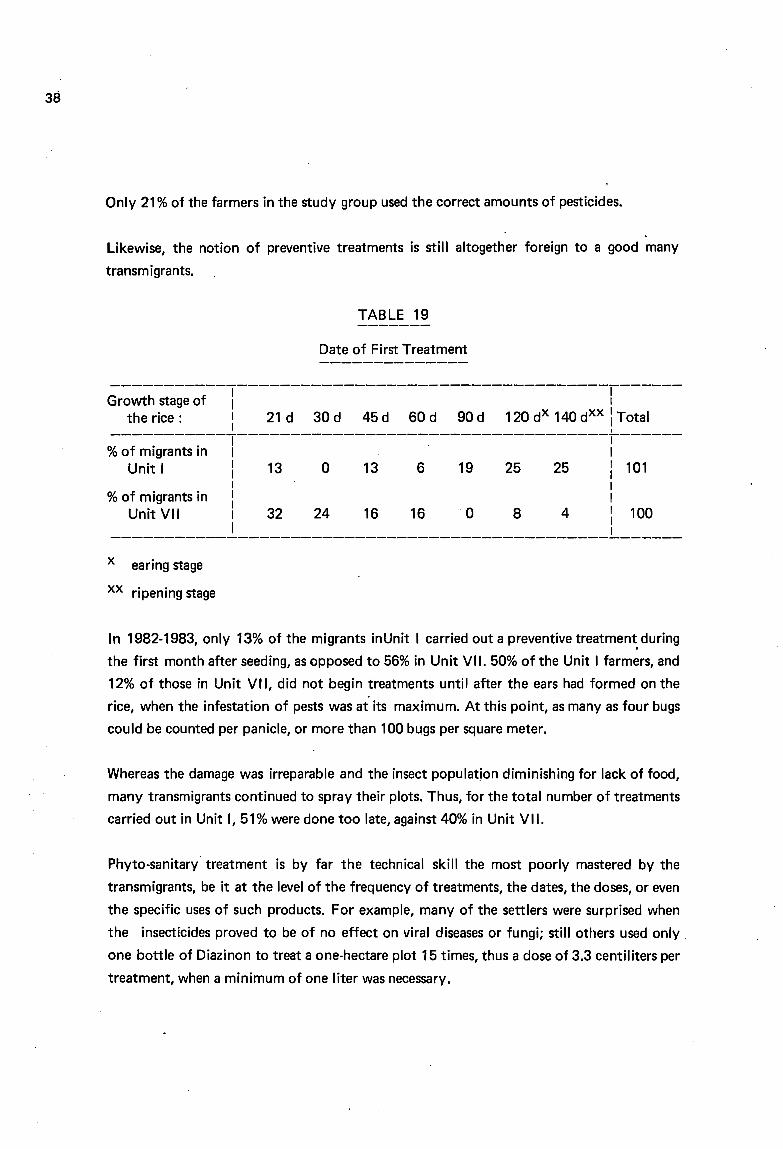
Only 21 % of the farmers in the study group used the correct amounts of pesticides.
Likewise, the notion of preventive treatments is still altogether foreign to a good many
transmigrants.
TABLE 19
Date of First Treatment
-----------1-----------------------------------1------Growth stage of 1 1
therice: 1 21 d 30d 45d 60d 90d 120dx 140dxX 1 Total1 1
1-----------,-----------------------------------1------% of migrants in 1 1
Unit 1 1 13 0 13 6 19 25 25 1 1011 11 1
% of migrants in 1 1
Unit VII : 32 24 16 16 0 8 4 : 1001 1------------------------------------------------------
x earing stage
xx ripening stage
ln 1982-1983, only 13% of the migrants inUnit 1 carried out a preventive treatment. du ring
the first month after seeding, as opposed to 56% in Unit VII. 50% of the Unit 1farmers, and
12% of those in Unit VII, did not begin treatments until after the ears had formed on the
rice, when the infestation of pests was at its maximum. At this point, as many as four bugs
could be counted per panicle, or more than 100 bugs per square meter.
Whereas the damage was irreparable and the insect population diminishing for lack of food,
many transmigrants continued to spray their plots. Thus, for the total number of treatments
carried out in Unit l,51 % were done too late, against 40% in Unit VII.
Phyto-sanitary treatment is by far the technical skill the most poorly mastered by the
transmigrants, be it at the lever of the frequency of treatments, the dates, the doses, or even
the specifie uses of such products. For example, many of the settlers were surprised when
the insecticides proved to be of no effect on viral diseases or fungi; still others used only .
one bottle of Diazinon to treat a one-hectare plot 15 times, thus a dose of 3.3 centiliters per
treatment, when a minimum of one liter was necessary.
Harvest
Once it has reached maturity, the upland rice is harvested panicle by panicle using an ~nJ.:-~'!!.,
or small harvesting knife. If the yield is small, the labor is exclusively a family affair. On the
other hand, should the production prove to be quite high, it will be necessary to get outside
help. Extra workers are paid according to the "bawon" system, with a fraction of the har
vest given to each worker. The cost of the harvest will depend to a certain extent upon the
availability of laborers, but is above ail in function of the yield. If the yie/d is high (heavy
density of mature panicles, high percentage of weil filled-out ears) a ski lied worker can
harvest 80 to 100 kg of panicles a day and will be satisfied with one-seventh of the harvest.
Should there be a lower yield, the worker will lose a great deal of time selecting the panicles
and will only bring in 40 to 50 kg of panicles a day. In this case, he will receive up to one
fifth to one-fourth of the harvest."
Once eut, the panicles are brought to the house, spread to dry, trod out, and winnowed. The
paddy will then be placed in sacks and stored in the house. If the production is higher than
the amount needed for the family's use, the surplus will be sold at the nearest rice mil!.
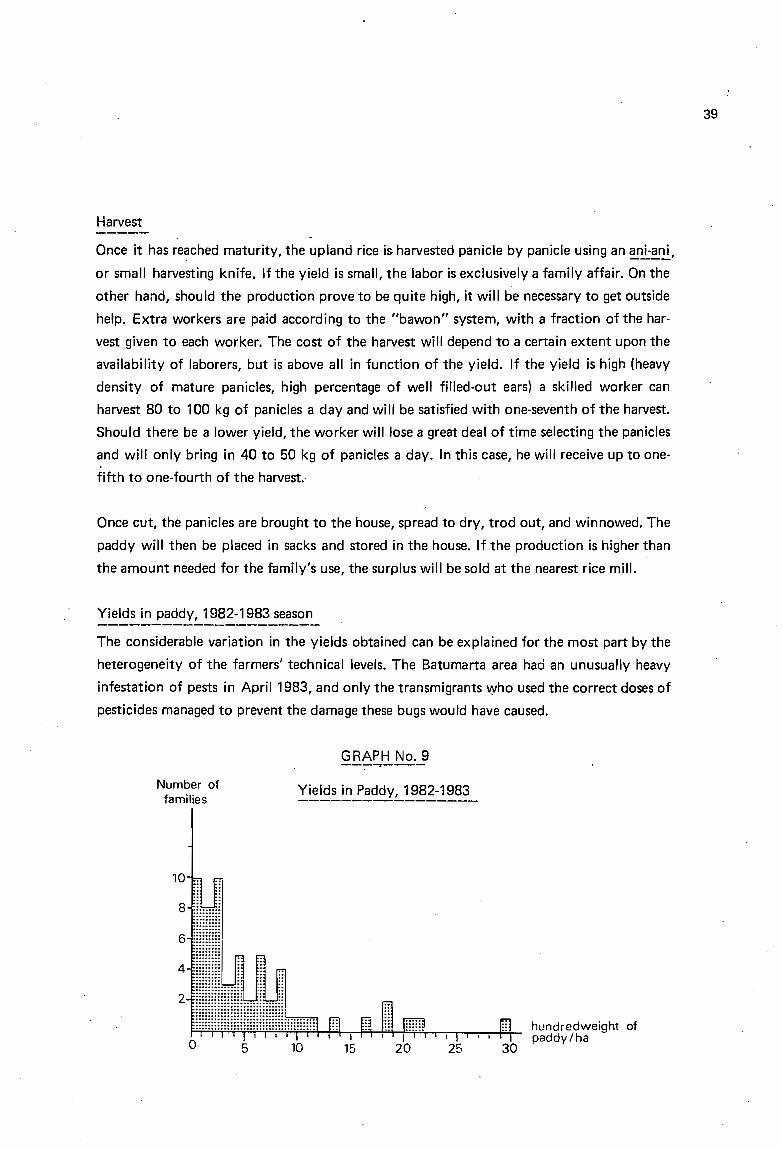
Yields in paddy, 1982-1983 season
The considerable variation in the yields obtained can be explained for the most part by the
heterogeneity of the farmers' technical levels. The Batumarta area had an unusually heavy
infestation of pests in April 1983, and only the transmigrants vyho used the correct doses of
pesticides managed to prevent the damage these bugs would have caused.
GRAPH No. 9
39
Number offamilies
Yields in Paddy, 1982-1983
10 tJ~8 11jjjW
21::::::::::::::: :: ::
mm!!!!1!!im1~1!L·ïï.. j.. ï·"j"·;·· ....;.. ··..·....·o 5 10
Iq 1 l fill,1H"I@illT~~~"r:'..,.......,c-r-T""T'...,.....II] hundredweight of~ Fr-l 1 1 i , , Ft- paddy/ha
15 20 25 30
40
Average yields come to :
- 399 kg of paddy/ha. in Unit l, and
- 704 kg of paddy/ha. in Unit VII,
with extreme figures ranging from 50 kg/ha to 2,900 kg/ha.
Only 15% of the families obtained yields that were superior to their yearly needs, and 61%
had a supply of less than 6 months' worth at their disposaI.
Economie results of this crop------------------ln 1982-1983, very few migrants hired paid workers. The average family income earned
from the cultivation of one hectare of upland rice is given in Table 20.
These figures, which are already low in terms of absolute value, appear frankly derisive when
one considers the amount of labor needed to cultivate one hectare of upland rice.
TABLE 20
Economie Results of the Cultivation of Upland Rice in Rupiah-------------------------------------
Unit 1 Unit VII---- ------Seed 2,800 3,000
Fertilisers 17,400 13,500
Pesticides 2,600 4,800
Total expenditures 22,800 21,300
Harvest value (Rp 1DO/kg paddy) 39,900 70,400
Return on family labor 17,100 49,100
Labor costs-------The amount of work needed depends mainly on the method of soil preparation. For one
hectare of upland rice, the average amounts of labor needed are as follows :
- Soil preparation using draught animais exclusively : 11.6 man-days (but 16.2
days for the team, as the teams only work 5 hours per day).
- Mixed preparation, both manual and draught : 26.6 man-days (of which 12 for
the team)
- Manual preparation exclusively : 118 man-days for two passages and 136 man
days for three passage.
Seeding the parcels does not vary to any great extent from one family to the next, and takes
an average of about 20 man-days per hectare.
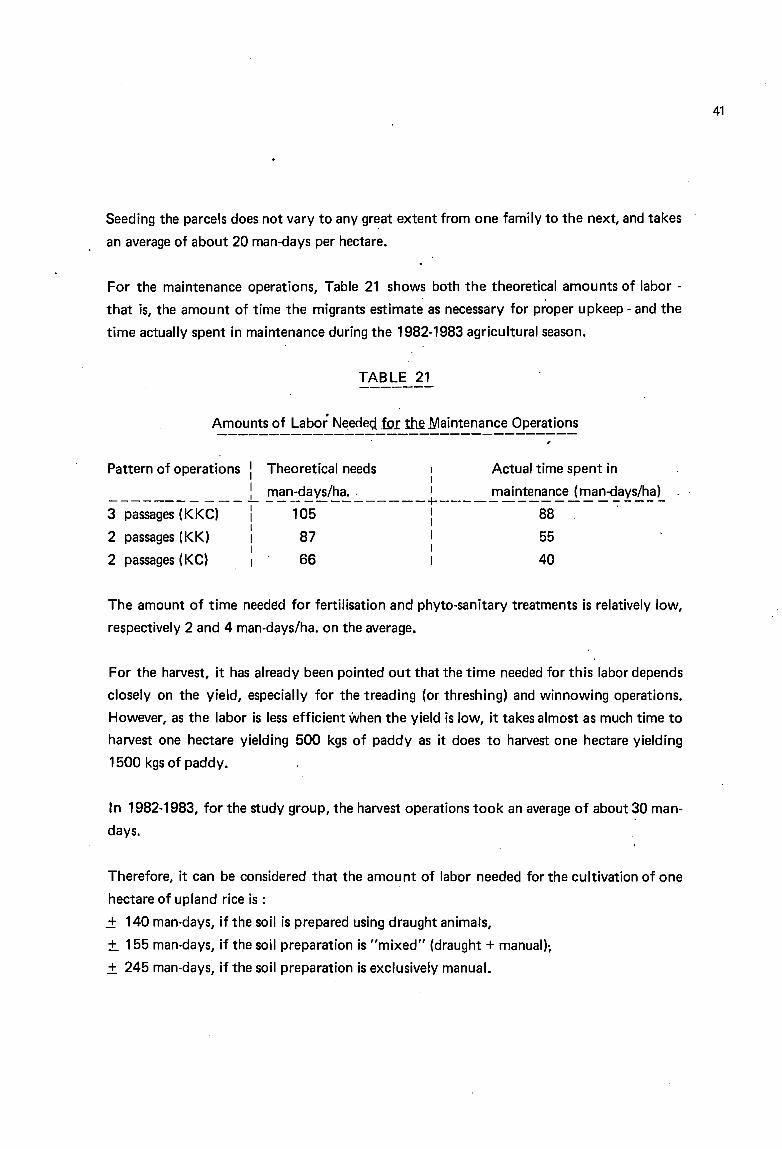
For the maintenance operations, Table 21 shows both the theoretical amounts of labor
that is, the amount of time the migrants estimate as necessary for proper upkeep - and the
time actually spent in maintenance during the 1982-1983 agricultural season.
TABLE 21
Amounts of Labor Needelj .ÏQr :tlu:. Maintenance Operations
Pattern of operations i Theoretical needs : Actual time spent in
! man-days/ha.. 1 maintenance (man-days/ha)-------- --- - -- -----------f------------- - -----3 passages (KKC) : 105 : 88·
12 passages (KK) 1 87 1 55
1 12 passages (KC) 1 66 1 40
The amount of time needéd for fertilisation and phyto-sanitary treatments is relatively low,
respectively 2 and 4 man-days/ha. on the average.
For the harvest, it has already been pointed out that the time needed for this labor depends
c10sely on the yield, especially for the treading (or threshing) and winnowing operations.
However, as the labor is less efficient when the yield is low, it takes almost as much time to
harvest one hectare yielding 500 kgs of paddy as it does to harvest one hectare yielding
1500 kgs of paddy.
ln 1982-1983, for the study group, the harvest operations took an average of about 30 man
days.
Therefore, it can be considered that the amount of labor needed for the cultivation of one
hectare of upland rice is :
.± 140 man-days, if the soil is prepared using draught animais,
±. 155 man-days, if the soil preparation is "mixed" (draught + manual);
± 245 man-days, if the soil preparation is exclusively manual.
41
42
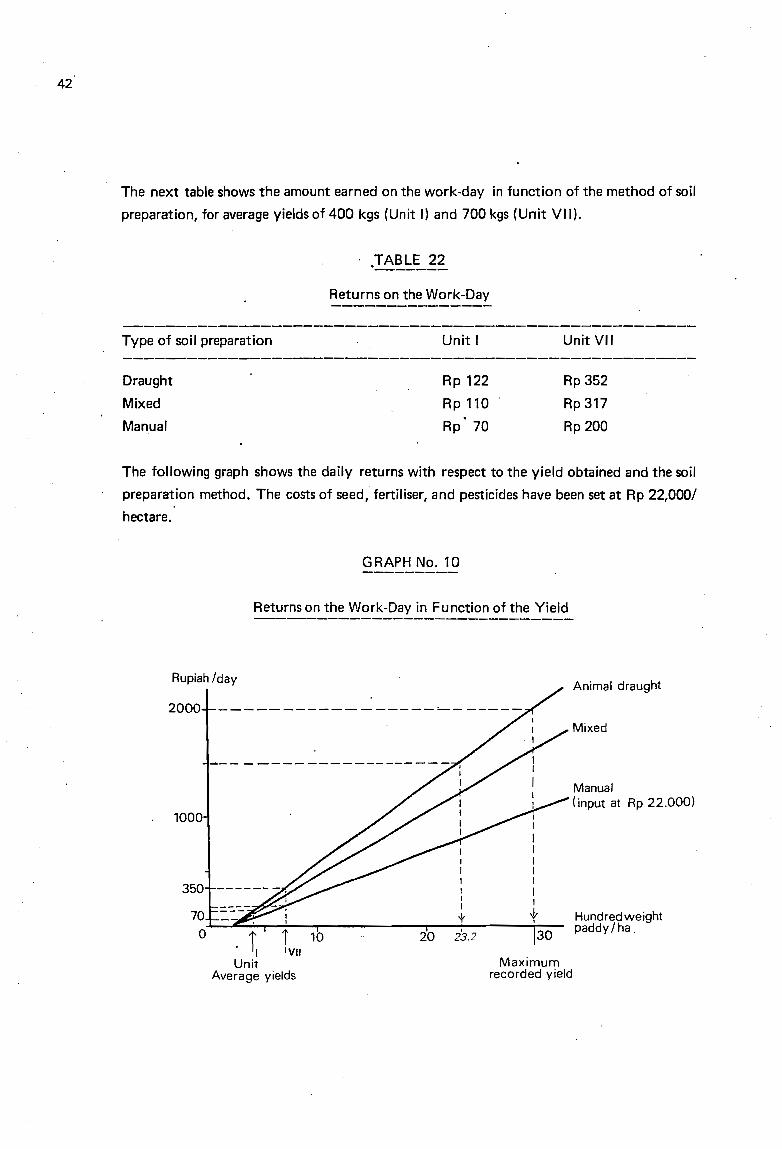
The next table shows the amount earned on the work-day in function of the method of soil
preparation, for average yields of 400 kgs (Unit 1) and 700 kgs (Unit VII).
Returns on the Work-Day
Type of soil preparation
Draught
Mixed
Manual
Unit 1
Rp 122
Rp 110
Rp' 70
Unit VII
Rp 352
Rp 317
Rp 200
The following graph shows the daily returns with respect to the yield obtained and the soil
preparation method. The costs of seed, fertiliser, and pesticides have been set at Rp 22,000/
hectare.
GRAPH No. 10
Returns on the Work-Day in Function of the Yield
Maximumrecorded yield
1000
Rupiah /day
2000 -----------------'--- -----
1
111
11
350 1
1
m t0-4.--e;;"':"'-r-~i--r------2"'0--2+3-.2---;-3-0-
. TI IVII 10Unit
Average yields
Animal draught
Mixed
Manual(input at Rp 22.000)
Hundredweightpaddy/ha .
As a hired worker at Batumarta receives Rp 1.500/day, it would take a minimum yield of
2320 kgs of paddy to cover the crop's labor cost. Now, in 1982-1983, for the 59 families
surveyed :
- only 6 got a return of Rp 1.000 or more on their work-day;
- 8 ~btained between Rp 500 and Rp 1:000;
- and 45 obtained less than Rp 500 per work-day.
Stockbreeding
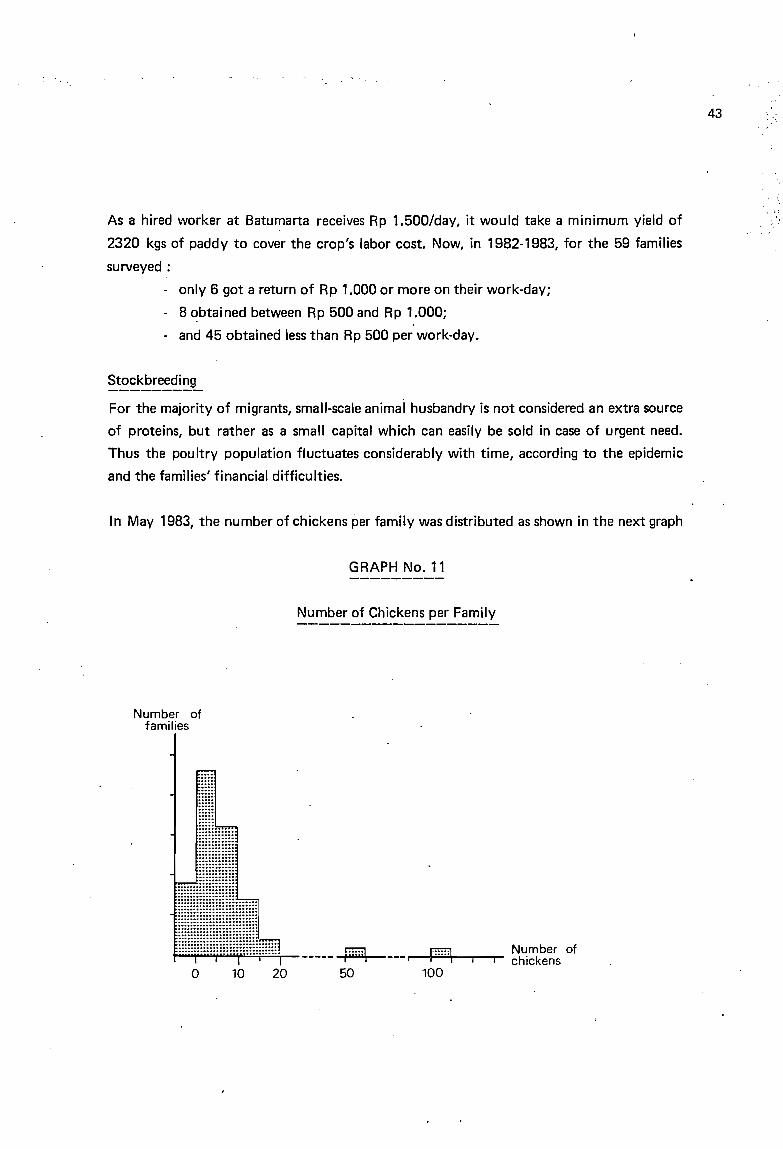
For the majority of migrants, small-scale animal husbandry is not considered an extra source
of proteins, but rather as a small capital which can easily be sold in case of urgent need.
Thus the poultry population fluctuates considerably with time, according to the epidemic
and the families' financial difficulties.
ln May 1983, the number of chickens per family was distributed as shown in the next graph
GRAPH No. 11
Number of Chickens per Family
Number offamilies
43
................................................................................~~~~~~~~~~~~~~~ ~~~;; ~~~;;
1iiiiiiiiIIIilllllllllllimmo 10 20
pm----- i
50
p] Number of--- ...., -It"'"'""'î.:.•••,:.:,••\-J---,.-,... chickens
100
44
There are relatively few other animais raised :
- Ducks: Two families have respectively 4 and 30 ducks.
- Goats : Eight families have in ail 23 goats.
- Sheep : One family owns 3 sheep.
- Pigs : Five Balinese families are fattening one pig each.
Raising cattle is the largest and above ail the best distributed form of stockbreeding. In May
1983 every family in the study group (both in Unit 1and Unit VII) had been given a cow or
a pair of cattle. Full proprietorship of these cattle becomes effective only after two caIves
have been returned to the project.
Out of the 26 cows given to the transmigrants in Unit 1, one died and 3 were sold back.
Forty calves were born, of which 29 were still suckling. Only 2 families increased their stock
by buying cattle from outside sources.
ln Unit VII, the low number of births that was noted can be explained by the fact that the
animais were too immature (having been recently distributed, in most cases). For 33 cows
distributed, 5 deaths and 6 births were registered. Two of the six caIves born at the Unit had
already died.
Sorne families consider owning a cow to be a hindrance instead of an advantage. Indeed,
since the animais cannot be allowed to wander, they must be fed and watered at the stable;
parasites must be dealt with, and the stable c1eaned and the manure taken away. Ali these
chores take an average 2 to 3 hours of work per day, which is indeed a handicap for families
with only a small labor force, or more exaetly, whose children are too young, since this sort
of task is usually given to boys 10 years old or older.
Another solution is to place the cattle with a third party, according to the traditional "ga
duhan" system in which one calf out of every two belollgs to the proprietor of the cow.
Aside from the problems of upkeep, many migrants are unfamiliar with cattle breeding,
which explains the relatively high death rate that was noted. The Stockbreeding Service,
which is being organized at Batumarta, unfortunately did not have enough qualified person
nel to carry out a really serious follow-up of the large number of cattle present at the Cen
ter. It appears to be just as unprepared, for the present, to develop the breeding of laying
hens and meat-producing chickens that would lead to an improvement in both the incomes
and the diet of the transmigrants.
Plantations
Rubber is naturally the most widely-spread type of plantation at Batumarta. However, as ail
the planting and maintenance operations are handled by the PTP X, the transmigrants' role
is Iimited to that of day laborers on the plantations. The migrants will not take possession of
their hectares of hevea until six years after the trees have been planted, when the tapping
begins.
The other perennial plants that are grown remain habitually located in the "pekarangan"
(25-are parcel around the house). These plots saon grow into orchards that vary greatly
from one family to the next, and contain a large number of plant species : coconut palms,
jackfruit trees, coffee shrubs, rambutans, guava trees, custard-apple trees, banana trees, va
rious ~y_Ei9l~~, plums, c1oves, ~~!!!~~~':'~' and so on.
aOnly eleven families out of 59 planted perennial species outside the "pekarangan". The
migrants generally prefer Citrus fruit (9 cases out of 11, with from 20 to 1000 saplings
planted) and coconut trees (6 cases out of 11, with from 15 to 120 saplings planted around
the edges of the plots). On the other hand, guava trees, cashew trees, rambutans, coffee
shrubs, and clove bushes are less frequently found (1 to 2 cases out of 11 for each species).
As most of the plantations are not yet producing, and since animal husbandry is still under
developed and the income from food crops insufficient, many transmigrants find themselves
obliged to carry out non-agricultural activities in order to feed their families.
3. Non-agricultural Activities
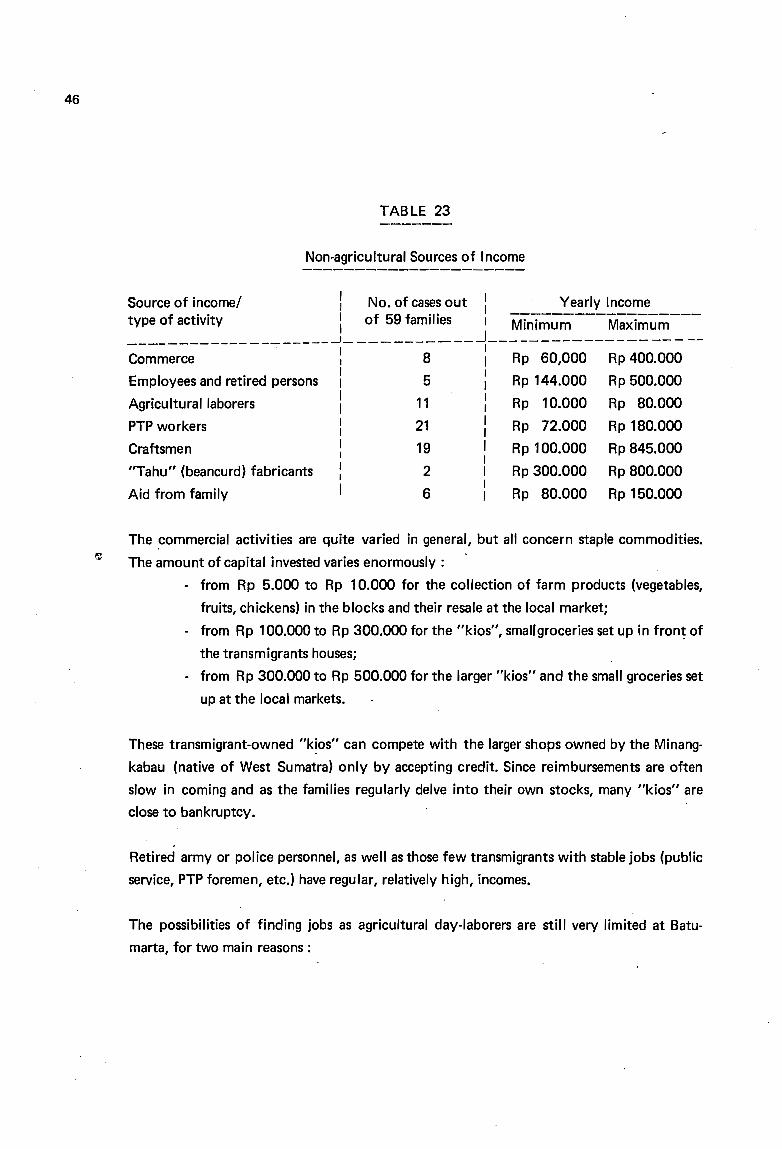
Of the 59 families in the study group, only 9 were exclusively farmers. Ali the others had
one, two, or even three complementary sources of income, which are listed in the next ta
ble.
45
46
TABLE 23
Non-agricultural Sources of Income
8
5
11
21
19
2
6
Commerce
Employees and retired persons
Agriculturallaborers
PTP workers
Craftsmen
"Tahu" (beancurd) fabricants
Aid from family
Source of income!type of activity
1 No. of cases out 1 Yearly Income: of 59 families l ·~iini~~~---M-;>d~~~---
_____________________1 .J -- ---11 Rp 60,000 Rp 400.00011 Rp 144.000 Rp 500.000
: Rp 10.000 Rp 80.000
i Rp 72.000 Rp 180.000
1 Rp 100.000 Rp 845.00011 Rp 300.000 Rp 800.0001
1 Rp 80.000 Rp 150.000
The ~ommercial activities are quite varied in general, but ail concern staple commodities.
The amount of capital invested varies enormously :
- from Rp 5.000 to Rp 10.000 for the collection of farm products (vegetabJes,
fruits, chickens) in the blocks and their resale at the local market;
- from Rp 100.000 to Rp 300.000 for the "kios", smallgroceries set up in fron~ of
the transmigrants houses;
- from Rp 300.000 to Rp 500.000 for the larger "kios" and the small groceries set
up at the local markets.
These transmigrant-owned "k!os" can compete with the larger shops owned by the Minang
kabau (native of West Sumatra) only by accepting credit. Since reimbursements are often
slow in coming and as the families regularly delve into their own stocks, many "kios" are
close to bankruptcy.
Retired army or police personnel, as weil as those few transmigrants with stable jobs (public
service, PTP foremen, etc.) have regular, relatively high, incomes.
The possibilities of finding jobs as agricultural day-Iaborers are still very limited at Batu
marta, for two main reasons :
- few families have an income large enough to allow them to employ paid la
borers;
- The transmigrants give priority to their own farms and only seek such jobs
during the slack periods in agricultural labor.
On the other hand, jobs as day-Iaborers on the PTP plantations can be had relatively
easily during the first three years. In th~ majority of the Unit VII families, it is mainly the
wives who work for the PTP. Unfortunately, this source of income dwindles by the third
year, since the plantations that are already weil under way do not require as much labor.
The craftsmen : sawyers, woodworkers, and carpenters, could obtain higher incomes if
they were better-organized. As they cannot fill large orders, they are most often exploited
by local contractors who sub-contract at low priees the greater part of the craftsmen's
work.
A few families in Unit 1 have set up small "tahu" (beancurd) facto ries that bring them
substantial profits. Unfortunately, the low soya production at the Center forces them to
buy the soya else-where at a relatively high priee.
Aside from these occupations, SOme families receive financial aid from family members
who remained in the province of origin or from grown children who work in town.
Other than the few cases that have been mentioned, the possibilities of non-agricultural
employment are still unfortunately very limited at the CeAter. One must encourage the
installation of small entreprises within Batumarta itself, and this as soon as possible so
that the second generation of transmigrants will not be obliged to leave the Center to find
work.
4. The Transmigrants' Income
Despite the great diversity in the individual situations that were encountered, a look at
the transmigrants' average y~arly income allows one to get an idea of the Center's lever of
economic success and above ail of the relative role played by each type of activity.
47
48
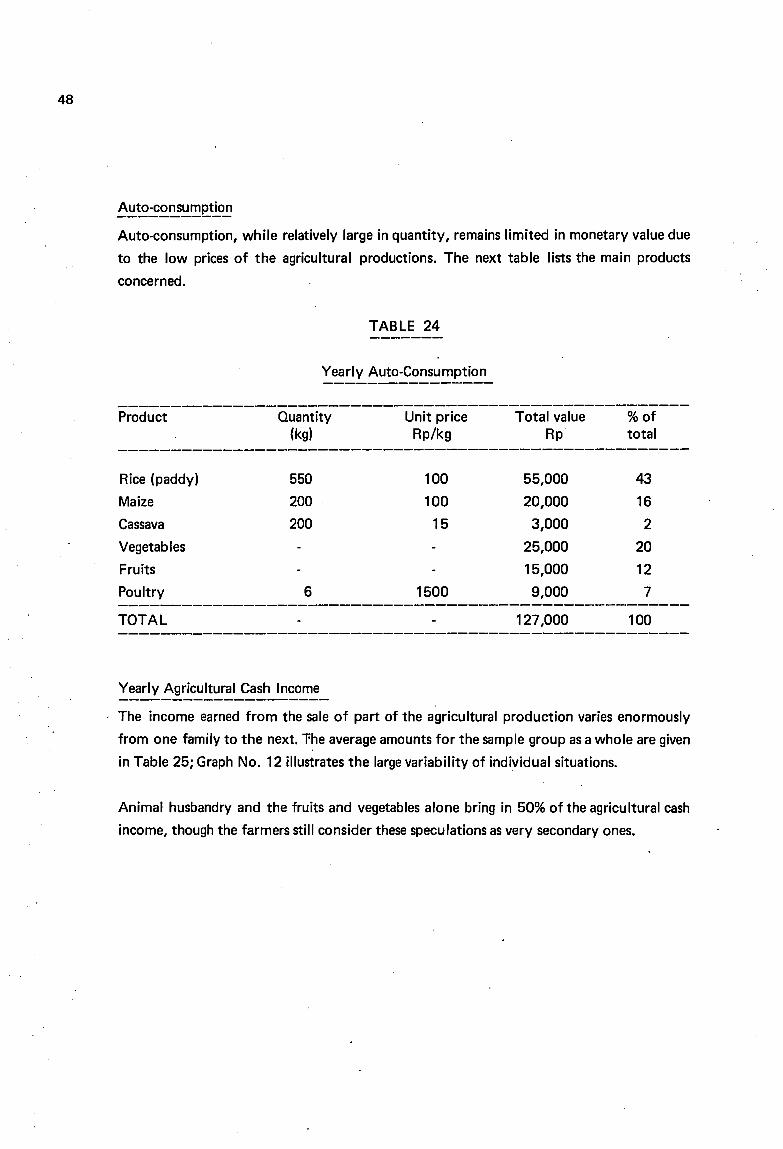
~~~~~~~!:!.t.!..o~
Auto-consumption, while relatively large in quantity, remains limited in monetary value due
to the low priees of the agricultural productions. The next table lists the main products
concerned.
TABLE 24
Yearly Auto-Consumption
Product Quantity(kg)
Unit prieeRp/kg
Total valueRp
%oftotal
Rice (paddy) 550 100 55,000 43
Maize 200 100 20,000 16
Cassava 200 15 3,000 2
Vegetables 25,000 20
Fruits 15,000 12
PouItry 6 1500 9,000 7------------------------------------------------------TOTAL 127,000 100
Yearly Agricultural Cash Income
The income earned from the sale of part of the agricultural production varies enormously
from one family to the next. T'he average amounts for the sample group as a whole are given
in Table 25; Graph No. 12 illustrates the large variability of individual situations.
Animal husbandry and the fruits and vegetables alone bring in 50% of the agricultural cash
income, though the farmers still consider these speculations as very secondary ones.
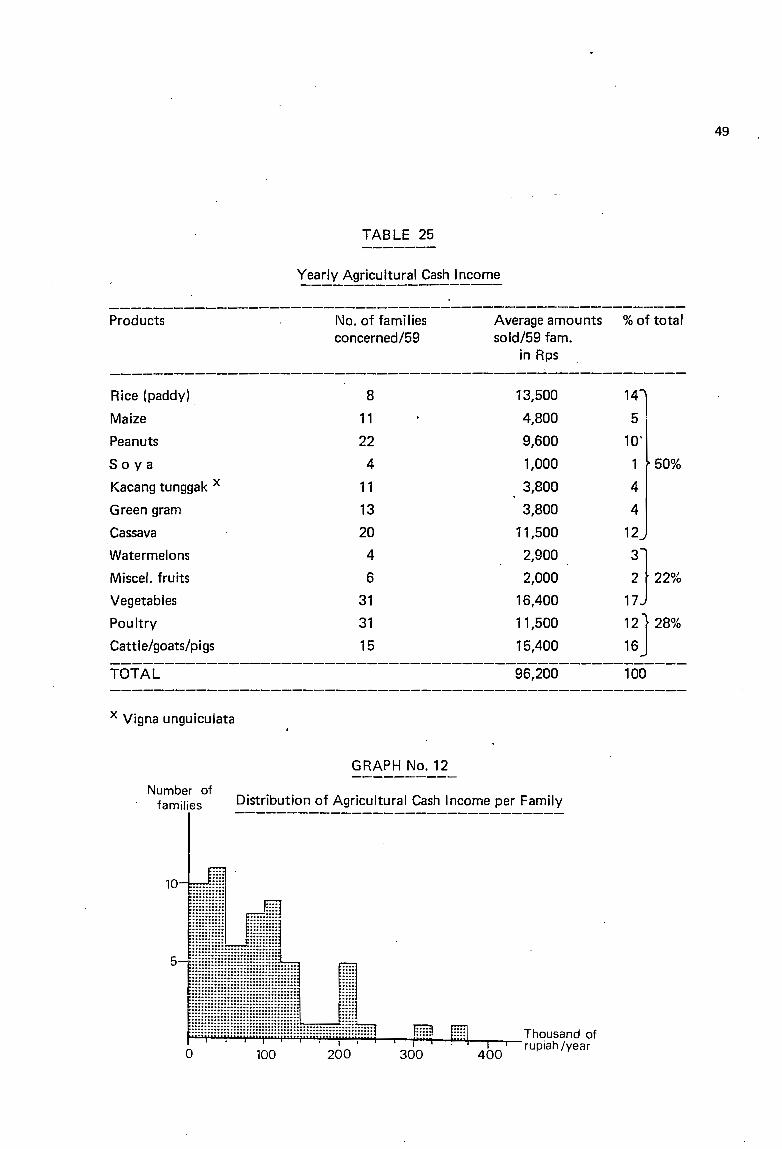
TABLE 25
49
Products l'Jo. of familieseoncerned/59
Average amounts %of totalsold/59 fam.
in Rps
Rice (paddy) 8 13,500
Maize 11 4,800
Peanuts 22 9,600 10'
S 0 y a 4 1,000 1 50%
Kacang tunggak x 11 3,800 4
Green gram 13 3,800 4
Cassava 20 11 ,500 12
Watermelons 4 2,900 3}
Misee!. fruits 6 2,000 2 22%
Vegetables 31 16,400 17
Poultry 31 11,500 12J 28%
Cattle/goats/pigs 15 15,400 16------------------------------------------------------TOTAL 96,200 100
x Vigna unguiculata
GRAPH No. 12
Number offamifies Distribution of Agricultural Cash Incorne per Family
10
50
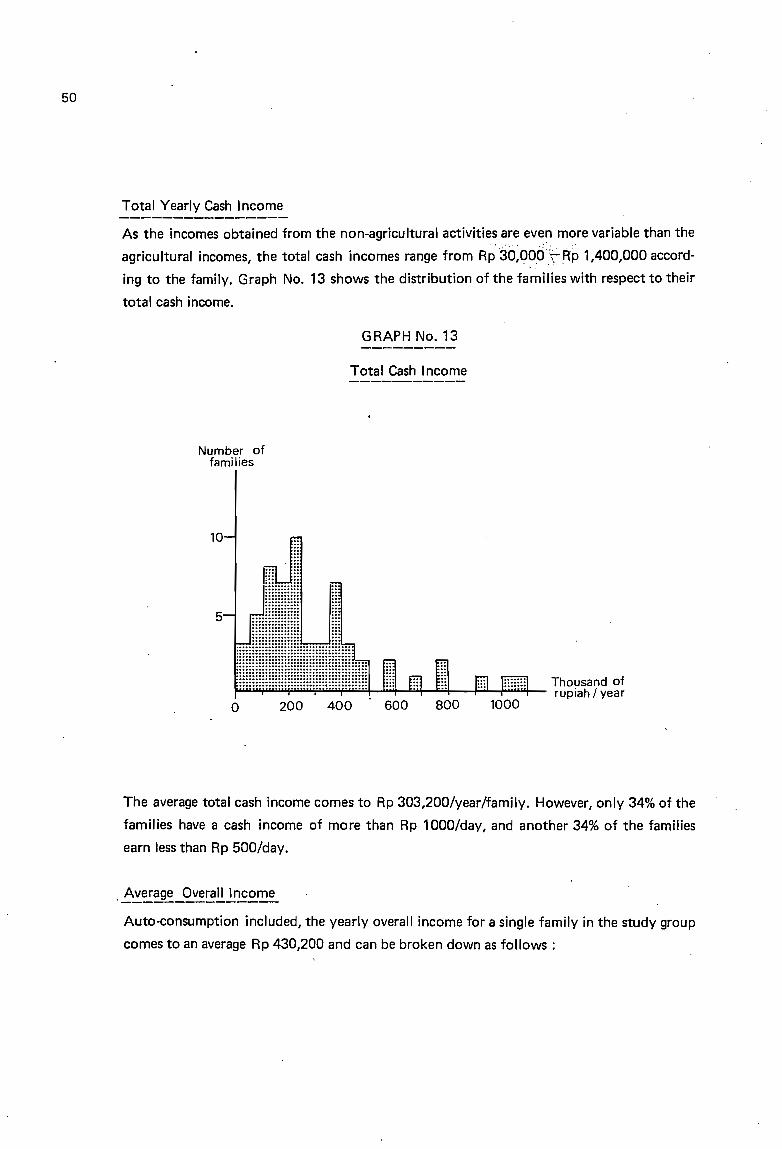
Total Yearly Cash Incarne
As the incarnes obtained from the non-agricultural activities are even more variable than the, ·'1'." '", "
agricultural incomes, the total cash incomes range from Rp 30,oocif- Rp 1,400,000 accord-
ing to the family. Graph No. 13 shows the distribution of the families with respect to their
total cash income.
GRAPH No. 13
Total Cash Income
Number offamilies
10
800600400200
........................................................................................................................................... ..........................................................................., ...........................................................................................................................................................................................................................................................................................:::::::::::::::::::::::::::::::::::::::: Thousand of
~'i.i.ifiiW.i.i'i"......""...~.........""......,...~.·.il···""··~lWf......E'-\-.E4-~:l-Fi.ilI--, rup iah / year1000o
5
The average total cash income cornes to Rp 303,200/year/family. However, only 34% of the
families have a cash income of more than Rp 1000/day, and another 34% of the families
earn less than Rp 500/day.
,Average Overall Income---------------Auto-consumption included, the yearly overall income for a single family in the study group
cornes to an average Rp 430,200 and can be broken down as follows :
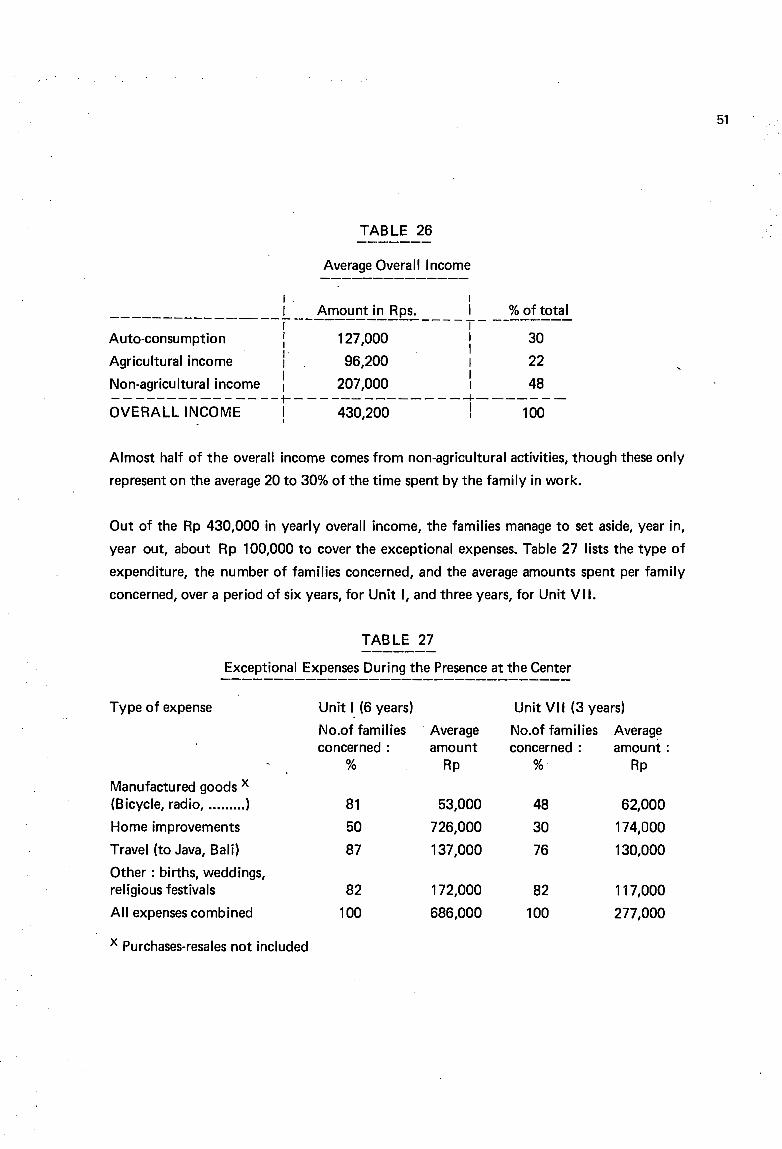
TABLE 26
Average Overall Income
1 . 1
1 Amount in Rps. 1 % of total----------------,--------------- - T- --------Auto-consumption 1 127,000 1 30
1 1Agricultural income 1 96,200 1 22
Non-agricultural income: 207,000 1 48-- --------- -- --+-- -- --- ------ - --+------ --OVERALL INCOME 1 430,200 ! 100
1
Almost half of the overall income cornes from non-agricultural activities, though these only
represent on the average 20 to 30% of the time spent by the family in work.
Out of the Rp 430,000 in yearly overall income, the families manage to set aside, year in,
year out, about Rp 100,000 to cover the exceptional expenses. Table 27 lists the type of
expenditure, the number of families concerned, and the average amounts spent per family
concerned, over a period of six years, for Unit l, and three years, for Unit VII.
TABLE 27
Exceptional Expenses During the Presence at the Center
Type of expense Unit 1(6 years) Unit VII (3 years)
No.of families . . Average l\Jo.of fami lies Averageconcerned: amount concerned: amount:
% Rp % Rp
Manufactured goods x(Bicycle, radio, .........) 81 53,000 48 62,000
Home improvements 50 726,000 30 174,000
Travel (to Java, Bali) 87 137,000 76 130,000
Other : births, weddings,religious festivals 82 172,000 82 117,000
Ali expenses combined 100 686,000 100 277,000
x Purchases-resales not included
51
52
Whatever the family's income level, priority exceptional expenses concern the organisation
of religious festivals, births, weddings, and so on. On such occasions, the family honor is at
stake and one must do at least as much as the neighbors.
The second priority is given to trips back to the province of origin. Sorne of these are ne
cessary due to the death or illness of close family members, but ail are taken advantage of to
visit the family, colleet a bit of money, and bring back seeds and plants. Since South Suma
tra is relatively close to Java and Bali, these trips can be made by bus for moderate sums of
around Rp 25,000 - Rp 30,000 round trip (1983 rates).
Purchasing manufactured goods : bicycles, radios, cassette players, jewelry, etc., is consi
dered more as a capital investment than an expenditure. Indeed, should there be an urgent
need of cash, this type of product can easily be resold without any great depreciation.
Home improvements only come as a last priority though great amounts of money are spent
on them. As the cost of building supplies is rather high, only the wealthiest families can
. afford home improvements. Of course, every family dreams of ownillg a large brick and
concrete house with a tiled roof, glass windowpanes, and woodwork painted in loud colors.
But the low incomes unfortunately force many families to put their dream aside for the
present.
Ali the result given in this chapter wer~ obtained through repeated enquiries made in 59
families in· the sample group. The verifications càrried out during the seeond and third
sessions allowed for the correction of a great many mistakes and omissions made by the
transmigrants. However, the figures obtained are only estimations. In fact, many househol
ders, hoping to obtain new government aid, tend to considerably underestimate their in
cornes. Others, on the contrary, wish to stress the differenœ between their situation and that
of their neighbors, and overestimate their incomes.
For this reason, ten families in Unit VII were chosen to keep a journal during the seven to
eight months of the study. The next chapter presents a part of the results obtained for
limited sampie.
5. The Family Budget
To obtain precise, reliable data concerning the transmigrants' incomes and expenditures, ten
families in Unit VII agreed to keep a journal for the entire study period.
Naturally, this limited ten-family sample is not representative of the population as a whole,
since it was necessary to pick transmigrants who knew how to write, were serious, and
wished to colaborate with the survey team. The bias thus introduced can be estimated by
comparing the results of the lin'lited group to those of the random sample of 59 families
which have already been studied. For example, the income lever is 62% higher in the skewed
sample with respect to the random one. However, as the results for the latter group were
obtained through enquiries, the income level has probably been underestimated. In fact, the
farmers rarely take into account such small, incidental, but frequent returns as the sale of
fruits and vegetables, whose yearly total is far from negligeable. For ail these reason, it can
be considered that the bias introduced scarcely exceeds 30%.
For convenience reasons, we have preferred to give the results by year or by month rather
than for the actual length of the study period. The seasonal aspect of the agricultural pro
duction has, of course, been taken into account in this extrapolation.
Auto-consu mption-----------The amounts and/or monetary values of the products concerned are given in the following
table:
53
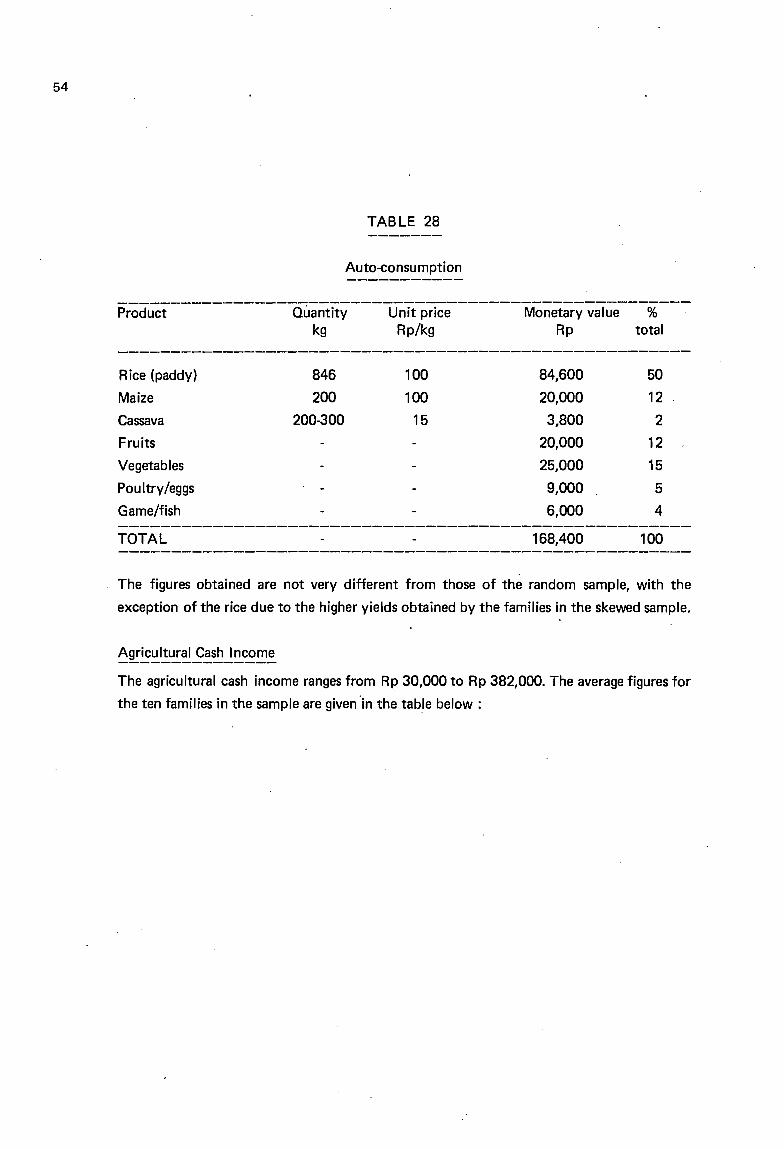
54
TABLE 28
Auto-consu mption
Rice (paddy) 846 100 84,600 50
Maize 200 100 20,000 12
Cassava 200-300 15 3,800 2
Fruits 20,000 12
Vegetables 25,00015
Poultry/eggs 9,000 5
Game/fish 6,000 4------------------------------------------------------TOTAL 168,400 100
The figures obtained are not very different from those of the random sample, with the
exception of the rice due to the higher yields obtained by the families in the skewed sample.
Agricultural Cash Income---------------The agricultural cash income ranges from Rp 30,000 to Rp 382,000. The average figures for
the ten families in the sample are given "in the tab.le below :
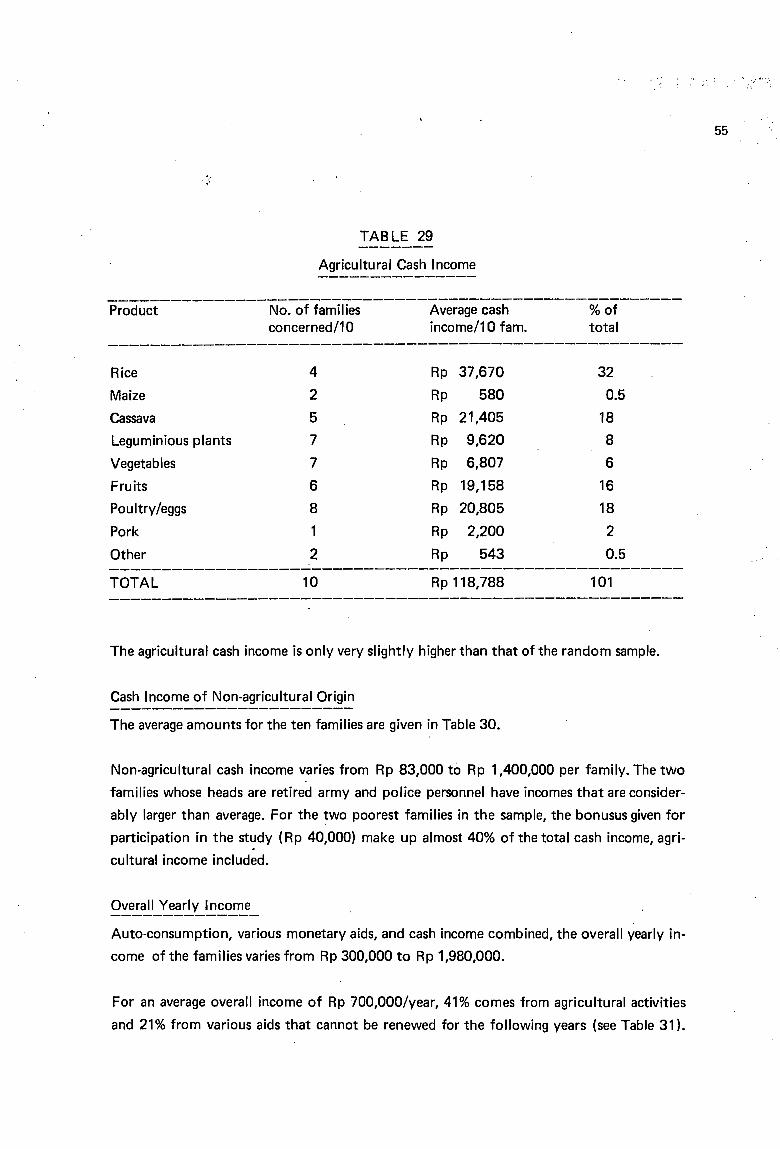
' ...'.
TABLE 29
Agricultural Cash Incorne
55
Product No. of farniliesconcerned /10
Average cashincorne/10 farn.
% oftotal
Rice 4 Rp 37,670 32
Maize 2 Rp 580 0.5
Cassava 5 Rp 21,405 18
Legurninious plants 7 Rp 9,620 8
Vegetables 7 Rp 6,807 6
Fru its 6 Rp 19,158 16
Poultry/eggs 8 Rp 20,805 18
Pork 1 Rp 2,200 2
Other 2 Rp 543 0.5------------------------------------------------------TOTAL 10 Rp 118,788 101
The agricultural cash incorne is only very slightly higher than that of the randorn sarnple.
Cash Incorne of Non-agricultural Origin
The average arnounts for the ten farnilies are given in Table 30.
Non-agricultural cash incorne varies frorn Rp 83,000 ta Rp 1,400,000 per farnily. The two
farnilies whose heads are retired arrny and police personnel have incornes that are consider
ably larger than average. For the two poorest farnilies in the sarnple, the bonusus given for
participation in the study (Rp 40,000) rnake up alrnost 40% of the total cash incorne, agri
cultural incorne included.
Overall Yearly Incorne
Auto-consurnption, various rnonetary aids, and cash incorne cornbined, the overall yearly in
come of the farnilies varies frorn Rp 300,000 to Rp 1,980,000.
For an average overall incorne of Rp 700,000/year, 41% cornes frorn agricultural activities
and 21% frorn various aids that cannot be renewed for the following years (see Table 31).
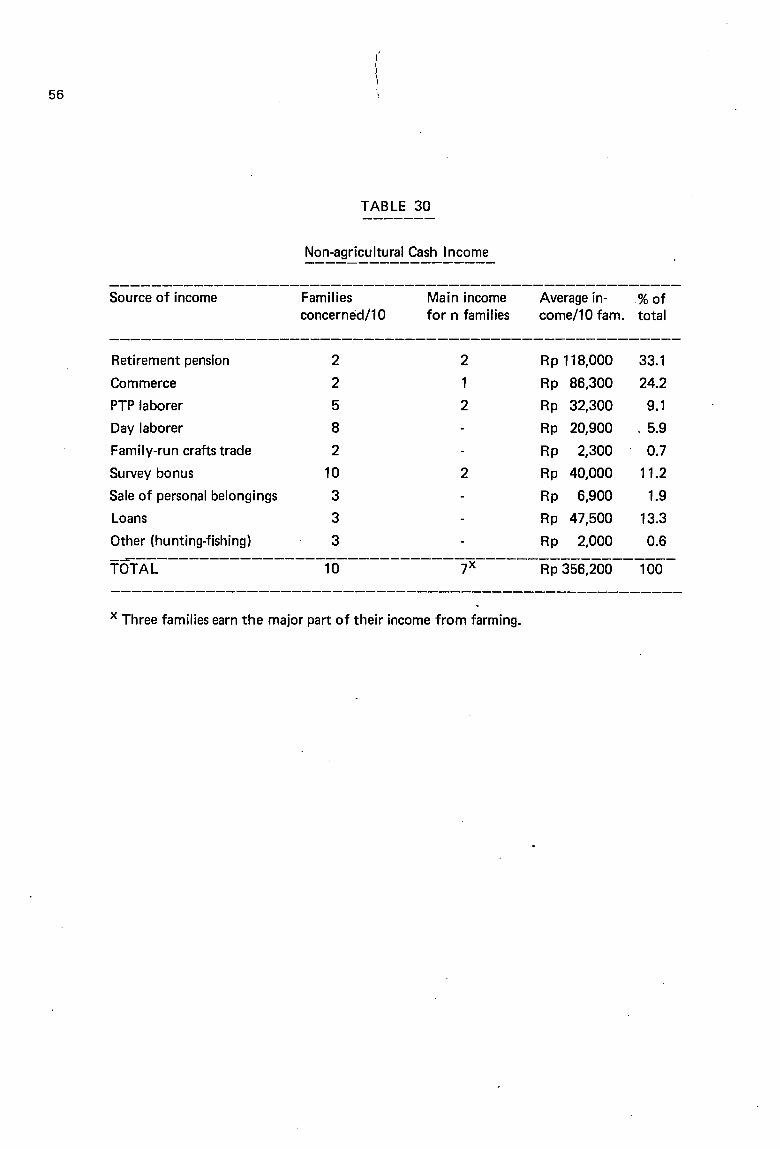
56
TABLE 30
Non-agricultural Cash Income
Source of income FamiliesconcernEid/10
Main incomefor n families
Average in- % ofcome/10 fam. total
Retirement pension 2 2 Rp 118,000 33.1
Commerce 2 1 Rp 86,300 24.2
PTP laborer 5 2 Rp 32,300 9.1
Day laborer 8 Rp 20,900 . 5.9
Family-run crafts trade 2 Rp 2,300 0.7
Surveybonus 10 2 Rp 40,000 11.2
Sale of personal belongings 3 Rp 6,900 1.9
Loans 3 Rp 47,500 13.3
Other (hunting-fishing) 3 Rp 2,000 0.6
TôTAL----------------w-----------7x------Rp35~~O--100-
x Three farnilies earn the major part of their incorne from farming.
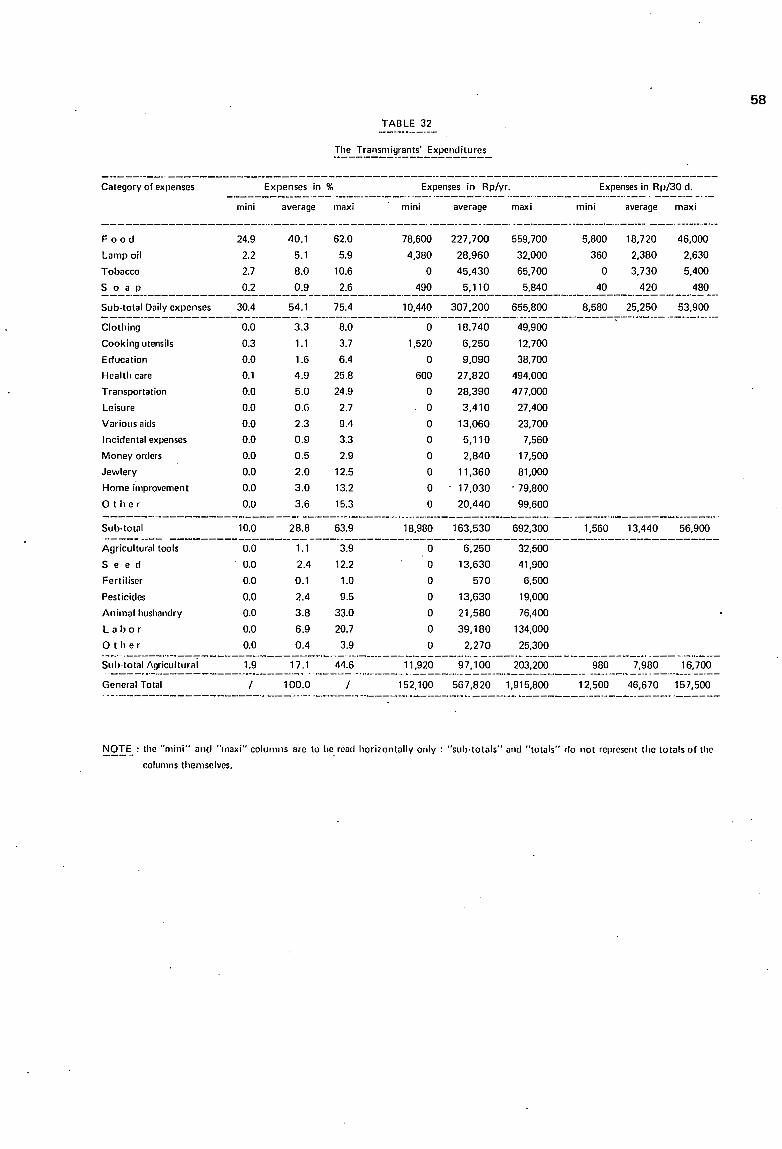
TABLE 32
58
Category of expenses
mini
Expenses in %
average maxi mini
Expenses in Rp/yr.
average maxi mini
Expenses in Rp/30 d.
average maxi
Food 24.9 40.1 62.0 78,600 227,700 559,700 5,800 18,720 46,000
Lamp oil 2.2 5.1 5.9 4,380 28,960 32,000 360 2,380 2,630
Tobacco 2.7 8.0 10.6 0 45,430 65,700 0 3,730 5,400
S 0 a Il 0.2 0.9 2.6 490 5,110 5,840 40 420 480------.---------------------- -------------_._----------------------------------_._._.__.~_._-Sub-total Daily expenses 30.4 54.1 75.4 10,440 307,200 655,800 8,580 25,250 53,900------.-------------------_. --------------------_ ..._----- ----_. ------------------.----- --------Clothing 0.0 3.3 8.0 0 18.740 49,900
Cooking utensils 0.3 1.1 3.7 1,520 6,250 12,700
Education 0.0 1.6 6.4 0 9,090 38,700
Hcalth care 0.1 4.9 25.8 600 27,820 494,000
Transportation 0.0 5.0 24.9 0 28,390 477,000
Leisure 0.0 O.G 2.7 0 3,410 27,400
VariOlls aids 0.0 23 9.4 0 13,060 23.700
Incidental expenses 0.0 0.9 3.3 0 5,110 7,560
Money orders 0.0 0.5 2.9 0 2,840 17,500
Jewlery 0.0 2.0 12.5 0 11,360 81,000
Home improvement 0.0 3.0 13.2 0 17,030 . 79,800
o the r 0.0 3.6 15.3 0 20,440 99,600
Sub·total 10.0 28.8 63.9 18,980 163,530 692,300 1,560 13,440 56,900
Agricultural tools 0.0 1.1 3.9 0 6,250 32,500
S e e d 0.0 2.4 12.2 0 13,630 41,900
Fertiliser 0.0 0.1 1.0 0 570 6,500
Pesticides 0.0 2.4 9.5 0 13,630 19,000
Animal hushandry 0.0 3.8 33.0 0 21,580 76,400
La b 0 r 0.0 6.9 20.7 0 39,180 134,000
o the r 0.0 0.4 3.9 0 2,270 25,300___ 0 _______________________________._0_______________• ______ ._. _________________ 0 •• ____ • _____
Suhtotal Agricultural 1.9 17.1 44.6 11,920 97,100 203,200 980 7,980 16,700.._-------------------------------_._-------------------------------_._----------_._--------General Total / 100.0 / 152,100 567,820 1,915,800 12,500 46,670 157,500
!:::!QI~ : the "mini" and "1"axi" colulllns are to he. read horizontally only : "sub·totnls" and "totals" do not represent the totals of the
COllllllllS thernselves.
: ...•
Indeed, during the study period, the incomes and expenditures for each family balanced
aknost perfectly. As a general rule, any money that comes in is spent in two to three days.
Therefore, it is very probable that during the slack periods of cultivation, the settlers expen
ses are lower. This is the season during which one buys on credit in the neighborhood
"kios,t.
. On the average, the major expenses concern, by order of importance:
- food 40.1%
- tobacco and cigarettes 8.0%
hired workers 6.9% (only for two wealthy families in thesample)
59
lampoil
- transportation
medical care
5.1%
5.0% (visits to the province of origin)
4.9% (very large hospital costs for one family)
.. ~..:.
Current daily expenses - food, lamp oil, tobacco, and soap amount to an average
Ap 307,200 per year, or Rp 840 per day. This represents an average 54.1% of the total ex
penses, but 30.4% for the wealthiest family as opposed to 75.4% for the poorest family.
The transmigrants invest relatively large sums in their farms, as agricultural expenses come
to an average 17.1 %, with extremes of 1.9% to 44.6%.
However, for the large majority of families, the major expenditure concerns food. There
fore, this subject necessitates a more detailed study.
60
6. The Transmigrants' Diet
Rice
The month/y consumption of rice per family fluctuated greatly during the study:- A period
of dearth in September and October (long dry season in 1982) was followed by more plenti
fui months when the special distributions of food were carried out.
The next table shows:
the actual monthly consumption during the study (Col. 1)
- the highest recorded monthly consumption (which includes inhabitual needs for
festivals or agricultural operations carried out through reciprocaJ help) (Col. 2)
- the amount of rice needed to feed the family according to the settlers them
selves: 13.3 kg/adult/month and 6.7 kg/child (Col. 3)
- the difference between the potential consumption and the actual amount con
sumed (Col. 4)
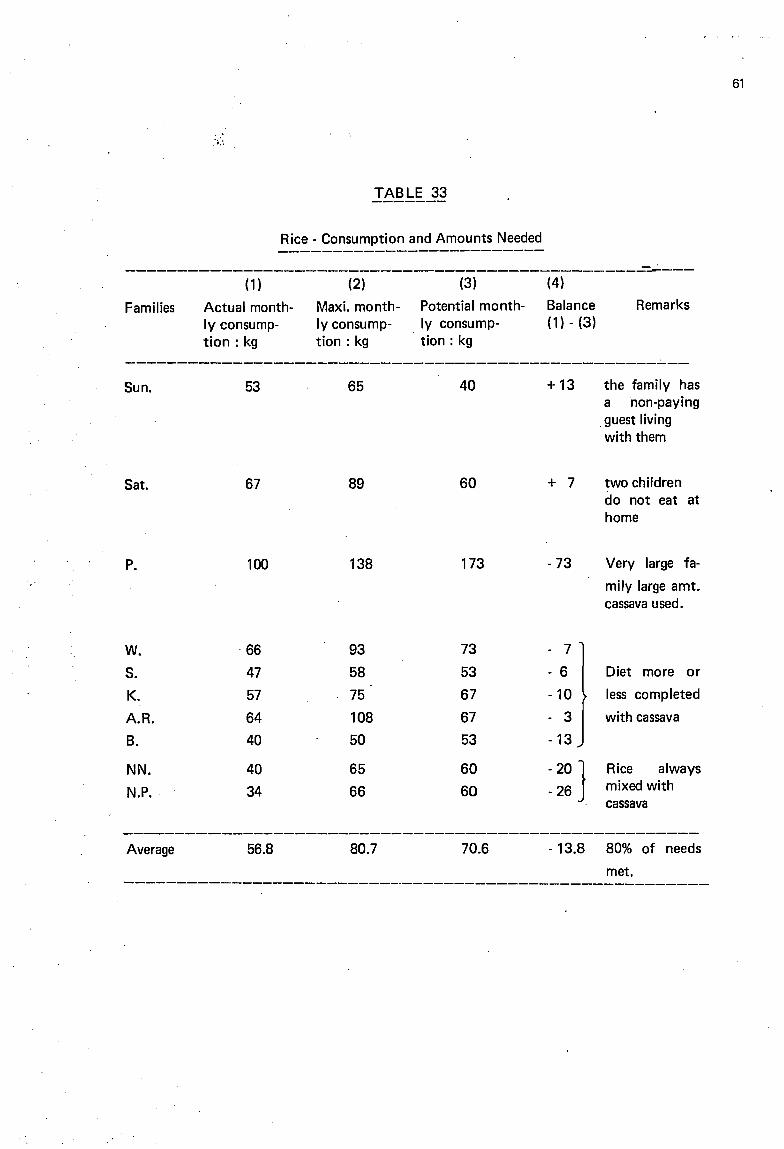
TABLE 33
Rice - Consumption and Amounts Needed
61
Families
(1)
Actual monthIy consumption : kg
(2)Maxi. monthIy consumption : kg
(3)
Potential monthIy consumption: kg
(4)
Balance(1) - (3)
Remarks
--------------------------------------------------~--
Sun.
Sato
P.
w.S.K.A.R.
B.
NN.
N.P..
53
67
100
·66
47
576440
4034
65
89
138
9358
75
108
50
65
66
40
60
173
73
53676753
60
60
+13
+ 7
- 73
- 7
- 6
- 10
- 3
- 13
-20]- 26
the family hasa non-paying
.guest livingwith them
two childrendo not eat athome
Very large fa
mily large amt.cassava used.
Diet more or
less completed
with cassava
Rice alwaysmixed withcassava
Average 56.8 80.7 70.6 - 13.8 80% of needs
met.
62
Of the average 56.8 kgs/month (about 680 kgs of husked rice/year) that is actually eaten by
the family :
- 9.5% is purchased
- 44.5% cornes fram alimentary aid
- 46% is auto-consumption.
Other Foodstuffs
Aside from fruits and vegetables, most of which are grown in the "pekarangan", many food
stuffs have to be purchased by the settlers. The next table Iists the quantities and priees of
the foodstuffs purchased.
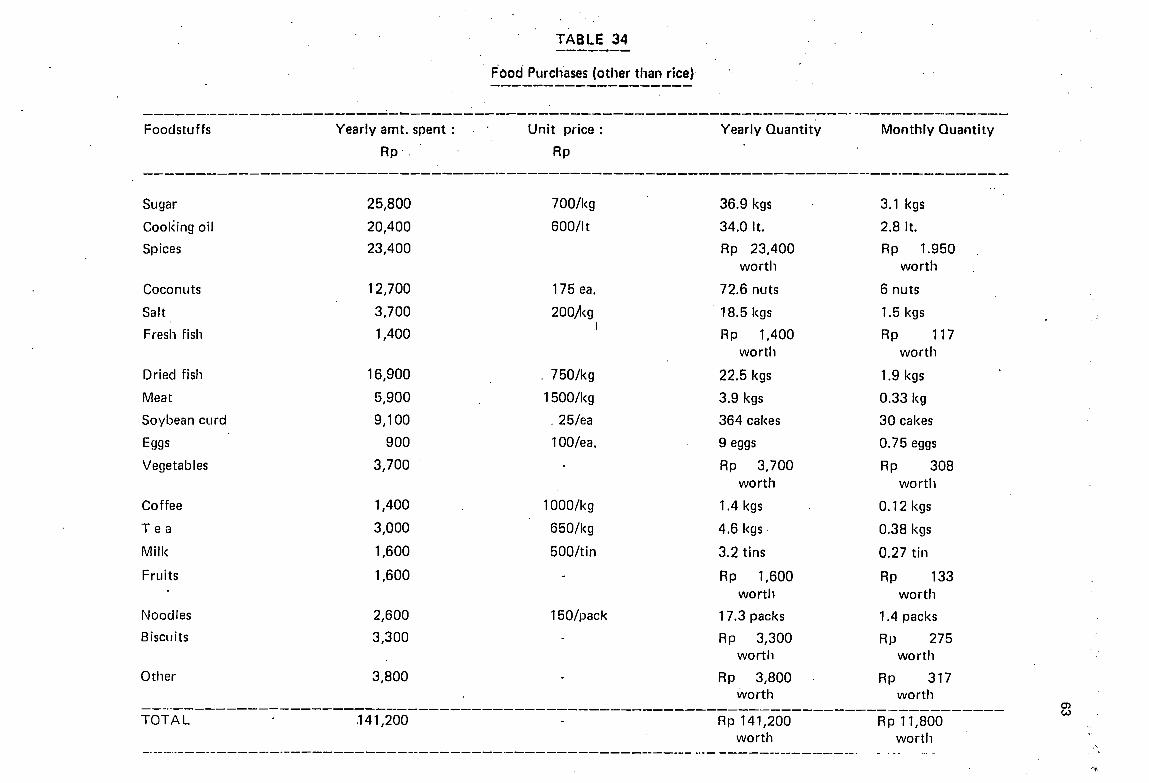
Foodstuffs Yearly amt. spent :
Ap'
TABLE 34
. F'ood Purchases (other than rice)
Unit priee:
Ap
Yearly Ouantity Monthly Ouantity
Sugar 25,800
Cooking oil 20,400
Spices 23,400
Coconuts 12,700
Salt 3,700
Fresil fish 1,400
Dried fish 16,900
Meat 5,900
Soybean curd 9,100
Eggs 900
Vegetables 3,700
Coffee 1,400
Te a 3,000
Milk 1,600
Fruits 1,600
Noodles 2,600
8 isclI its 3,300
Otller 3,800
700/kg
600/lt
175 ea.
200,'1<91
, 750/kg
1500/kg
, 25/ea
100/ea.
1000/kg
650/kg
500/tin
150/pack
36.9 kgs 3.1 kgs
34.0It. 2.8It.
Ap 23,400 Ap 1.950worth worth
72.6 nuts 6 nuts
18.5 kgs 1.5 kgs
Ap 1,400 Ap 117worth worth
22.5 kgs 1.9 kgs
3.9 kgs 0.33 kg
364 cakes 30 cakes
9 eggs 0.75 eggs
Ap 3,700 Ap 308worth worth
1.4 kgs 0.12 kgs
4.6 kgs . 0.38 kgs
3.2 tins 0.27 tin
Rp 1,600 Ap 133worth worth
17.3 packs 1.4 packs
Rp 3,300 Rp 275worth worth
Rp 3,800 Rp 317worth worth
TOTAL ,141,200 Rp 141,200worth
Rp 11,800worth
,,1'.
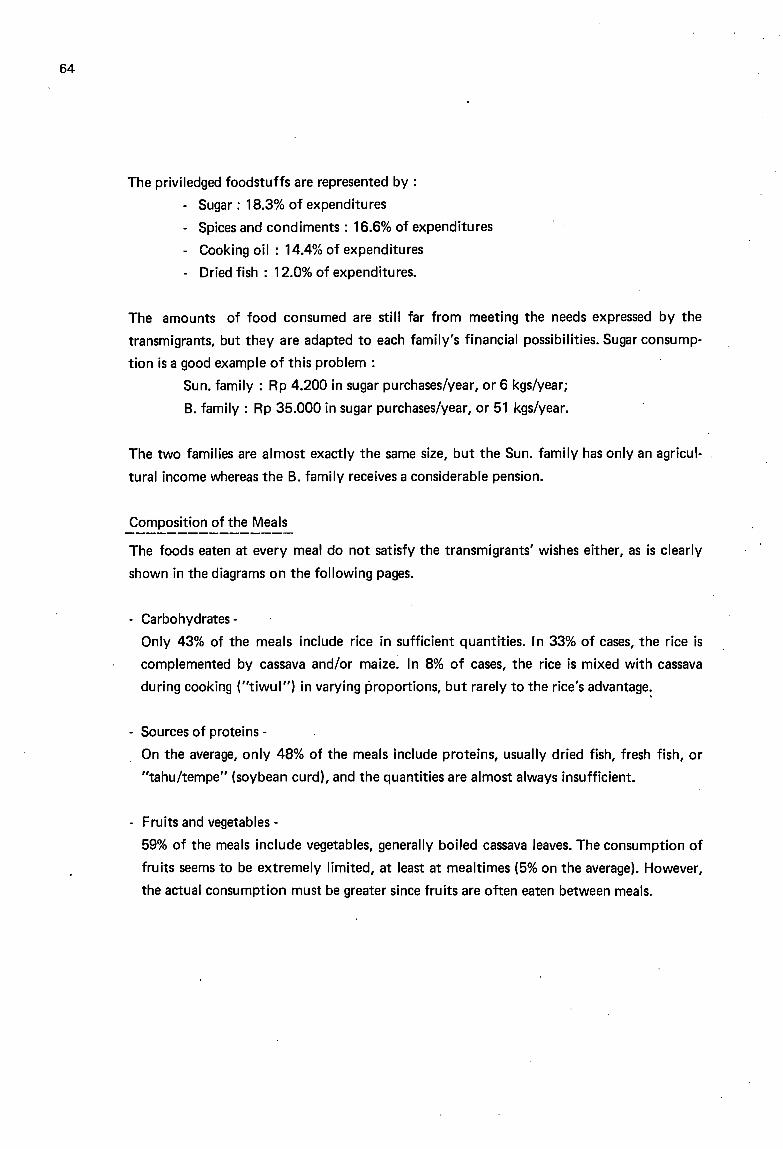
64
The priviledged foodstuffs are represented by :
- Sugar: 18.3% of expenditures
- Spices and condiments: 16.6% of expenditures
- Cooking oil : 14.4% of expenditures
- Dried fish : 12.0% of expenditures.
The amounts of food consumed are still far from meeting the needs expressed by the
transmigrants, but they are adapted to each family's financial possibilities. Sugar consump
tion is a good example of this problem :
Sun. family : Rp 4.200 in sugar purchases/year, or 6 kgs/year;
B. family : Rp 35.000 in sugar purchases/year, or 51 kgs/year.
The two families are almost exactly the same size, but the Sun. family has only an agricul
tural income whereas the B. family receives a considerable pension.
Composition of the Meals
The foods eaten at every meal do not satisfy the transmigrants' wishes either, as is clearly
shown in the diagrams on the following pages.
Carbohydrates -
Only 43% of the meals include rice in sufficient quantities. In 33% of cases, the rice is
complemented by cassava and/or maize: ln 8% of cases, the rice is mixed with cassava
during cooking ("tiwul") in varying proportions, but rarely to the rice's advantage:
- Sources of proteins -
On the average, only 48% of the meals include proteins, usually dried fish, fresh fish, or
"tahu/tempe" (soybean curd), and the quantities are almost always insufficient.
- Fruits and vegetables -
59% of the meals include vegetables, generally boiled cassava leaves. The consumption of
fruits seems to be extremely limited, at least at mealtimes (5% on the average). However,
the actual consumption must be greater since fruits are often eaten between meals.

GRAPH 14a CARBOHYDRATES 65
Key
- Mixture rice- cassava
~ Rice
Noon - Rice complemented withmaize or cassava
a Cassava
~ Maize
§ Wild yam ( OlOscnreél h,so,da)
~ Others
=t 0 Naught
?
--
Evening Ail meals
1
\1
, ' ,
.~~~.~..., .
.•...

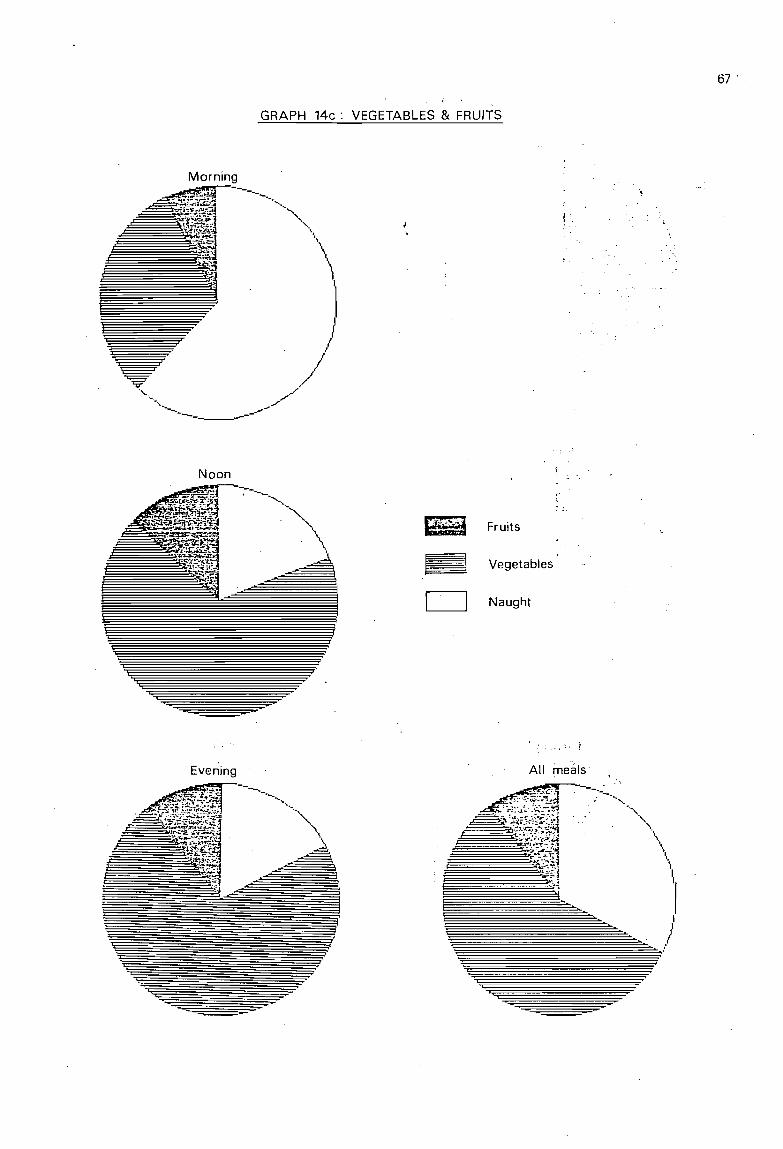
Morning
....~------
GRAPH 14c: VEGETABLES & FRUITS
67 .
Noon
>-~
'\1,
~1
go
Fruits
Vegetables
Naught
i',
Evening Ail meals
~~~:-~<..L~~-~~i-·:~~~~ . '-
~.f~;'-; \~~~~ .~
,,~:·t 1
"'Ç;; Il-,
,/
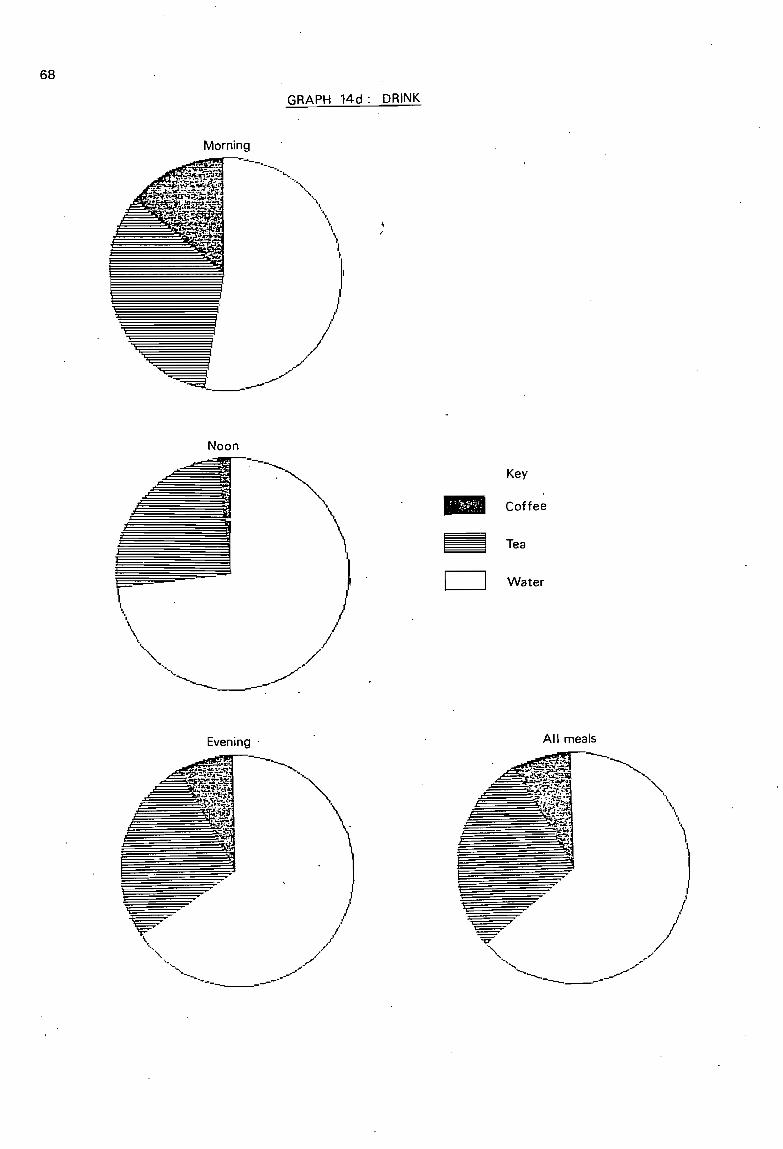
68
GRAPH 14d: DRINK
Morning
Noon
Evening .
----....--._.....~
\.
.............- -""
-~---------_ ..-..
Key
- Coffee
~ Tea
0 Water
Ail meals
~~,\,\,
" ../...... /'
~---------~
".~
Drinks -
The amount of tea and coffee drunk is still relatively small, as 56% of meals are accompa
nied by water alone.
Though far from being a healthy, balanced diet, it must be noted that the present composi
tion of the meals is practically the same as that in the transmigrants' provinces of origin.
A considerable effort remains ta be made ta improve the migrants' diet. Nevertheless,
dietary counseling appears unnecessary, since the quantity· and quality of foo~ is very
c10sely linked ta the families' financial possibilities and not ta their eating habits.
ln the preceeding chapters, we have attempted ta describe, as far as possible, the situation of
the "average transmigrant" at Batumarta. Yet in severa1 instances we came across an extra-
. ordinary diversity in the situations that presented themselves. Though the transmigrants
were placed in conditions that were exactly the same du ring the installation period, they did
not ail evolve in the same manner. Some seem ta be succeeding, while others are stagnating,
or even regressing. In the next chapter, we shall attempt ta determine the reasons for these
differences.
69

IV. THE FACTORS OF SUCCESS AND THE TYPOLOGY----------------------------------
OF THE EXPLOITATIONS
71
: 1. 'J •
With a variation coefficient of about 90% and extremes ranging from Rp 200.000 to more
than Rp 1.000.000, the yearly overall income of the families is one of the most heteroge
neous variable. It is also the most convenient variable for evaluating the migrants' level of
success.
ln order to determine the factors influencing the families' income level, the correlation
method was used, by combining more than 30 variables (for a representative sample of 59
families). The sample was then stratified in function of the overall income and the role of
agricultural production in the earning of this income, This new variable was then re-com
bined with the preceding ones.
1. The Factors of Success
By conserving only the significant links between the variables, it was possible to obtain the
diagram on page 72. The "+" and "." signs next to the arrows respectively indicate the
positive and negative correlation between variables.
Four determining factors affect the famllies income level :
- the size of the family and its labor force;
- the type and number of non~agriculturalactivities;,
. the technical lever in agricultural skills;
- and the educationallevel of the head of the family.
A fifth factor, that of the amount of capital brought back from the province of origin, is
heavily linked to the standard of wealth at the Center, though it does not concern the fa
mily income level.
The size of the family labor force has an obvious effect on the amount of land that is
cleared and cultivated. However, there is no significant link between the size ofthe exploita-
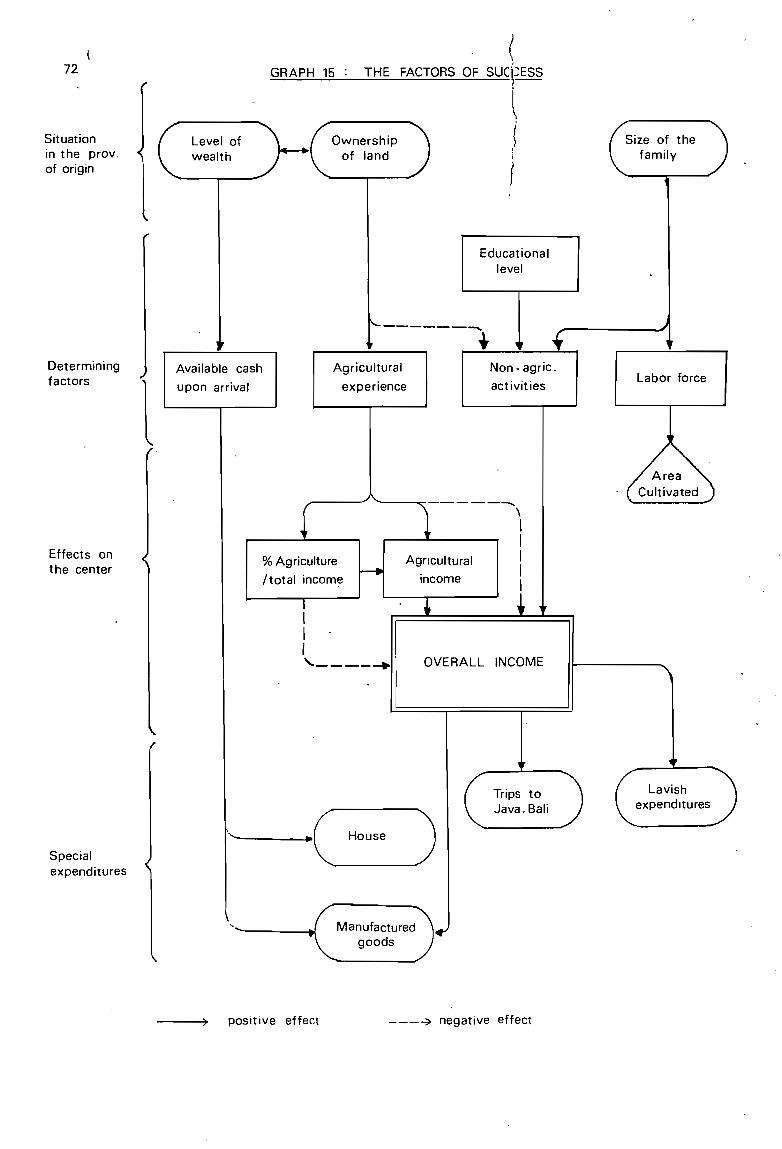
72
Situationin the provoof origin
Level ofwealth
GRAPH 15 THE
Ownershipof land
"FACTORS OF SUCi=ESS
\!\
lSize of the
family
Educationallevel
...---......;.....--------,---r----:+:......---:--....>...-....,Determiningfactors
lAvailable cash
upon arrivai
Agricultural
experience
Non - agric.
activitiesLabor force
income
Agricultural
-------,,------\111
1
1
% Agriculture
ftotal incorne
Effects onthe center
OVERALL INCOME
l11
l'---~-IL.::::::==::::;::::===:::::;:==::=U
Specialexpenditures
"--- -.{ Hous. )Trips toJava. Bali
Lavishexpendltures
Manufacturedgoods
positive effect ---~ negative effect
tions and the yields or crop productions. In fact, it has already been shown that the amount
produced depends for the rnost part on the quality of the phyto-sanitary treatments, and
not on the cultivated surfaces.
The strong link between the size of the family and the number of non-agricultural activities
can be easily explained. In the large families, once the heaviest agricultural labor, soir pre
paration and sowing, is over, the plots can be left in the care of the women and young
children. The head of the farnily and the boys who are old enough to work profit from this
slack period to seek paying jobs.
The best-paid types of non-agricultural activities naturally remain the domaine of those
settlers with a high level of education (administrative auxiliaries, employees, foremen, and
sa on), or those who have a professional qualification (carpenters, joiners, etc.). This factor
has a decisive influence on the income level.
The farmers who have a high lever of technical skills in agriculture were almost ail small-scale
landowners in their provinces of origin. These migrants are experienced in running an agri
cultural exploitation and have used fertilisers and phyto-sanitary treatments for a long time.
They obtain the highest yields at the Center and consequently a large agricultural income.
However, the negative connection that exists between the technical lever in agriculture and
the total incorne is proof of the low profitability of agricultural activities in comparisan to
other occupations. The higher the role played by agriculture in the total income, the lower
the total income wi Il be.
Some migrants who were moré or less wealthy in their home province brought non-neglige
able amounts of capital with them to the Center. The complete absence of any connection
between this factor and the income level can be easily explained by the use that was made
of this capital. As a matter of fact, these funds were rapidly depleted by the construction of
houses made of bricks and by the purchase of consumer goods (motorcycles, bicycles, tran
sistor radios, and so on). Very few migrants invested a part of such capital in a business or in
agricu Itu re.
73
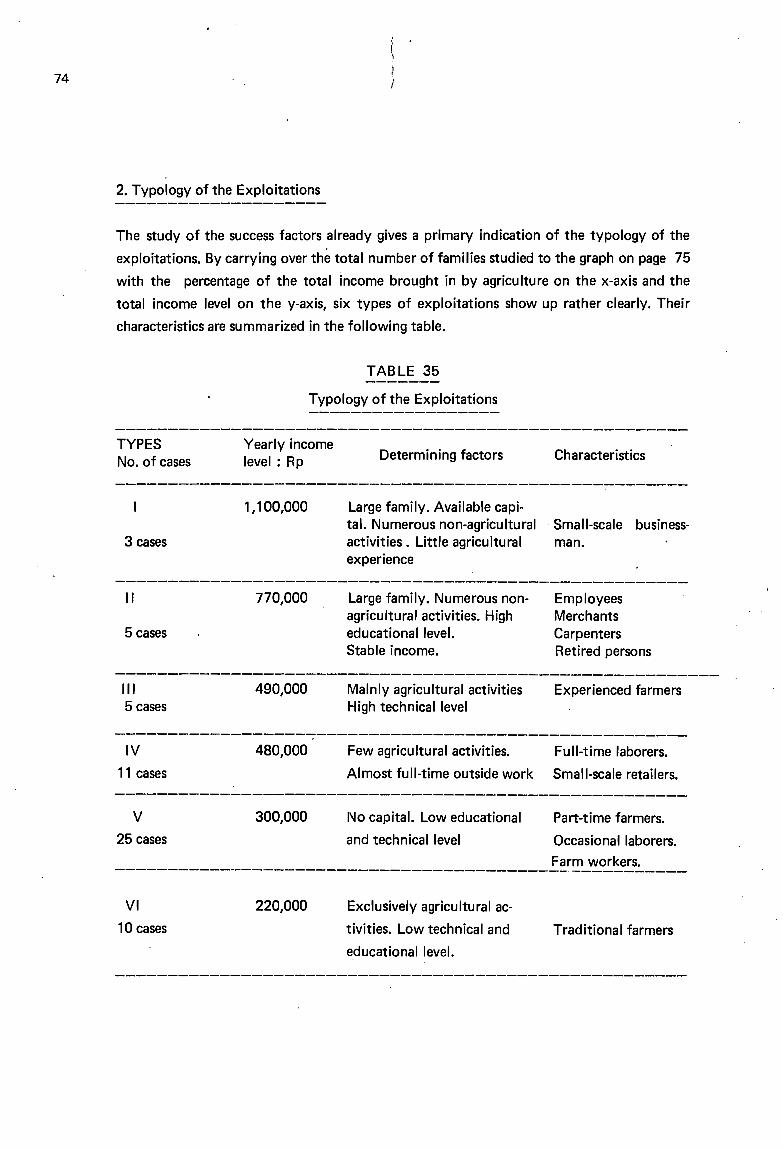
74
2. Typology of the Exploitations
The study of the success factors already gives a primary indication of the typology of the
exploitations. By carrying over thé total number of families studied to the graph on page 75
with the percentage of the total income brought in by agriculture on the x-axis and the
total income level on the y-axis, six types of exploitations show up rather c1early. Their
characteristics are summarized in the following table.
TABLE 35
Typology of the Exploitations
TYPESNo. of cases
Yearly incomelevel : Rp Determining factors Characteristics
3 cases
1,100,000 Large family. Available capi-tal. Numerous non-agricultural Small-scale business-activities. Little agricultural man.experience
1/
5 cases
III5 cases
IV
11 cases
V
25 cases
VI
10 cases
770,000
490,000
480,000
300,000
220,000
Large family. Numerous nonagricultural activities. Higheducational level.Stable income.
Malnly agricultural activitiesHigh technical level
Few agricultural activities.
Almost full-time outside work
1\10 capital. Low educational
and technical level
Exclusively agricultural ac·
tivities. Low technical and
educational level.
EmployeesMerchantsCarpentersRetired persons
Experienced farmers
Full-time laborers.
Small-scale retailers.
Part-time farmers.
Occasional laborers.
Farm workers.
Traditional farmers
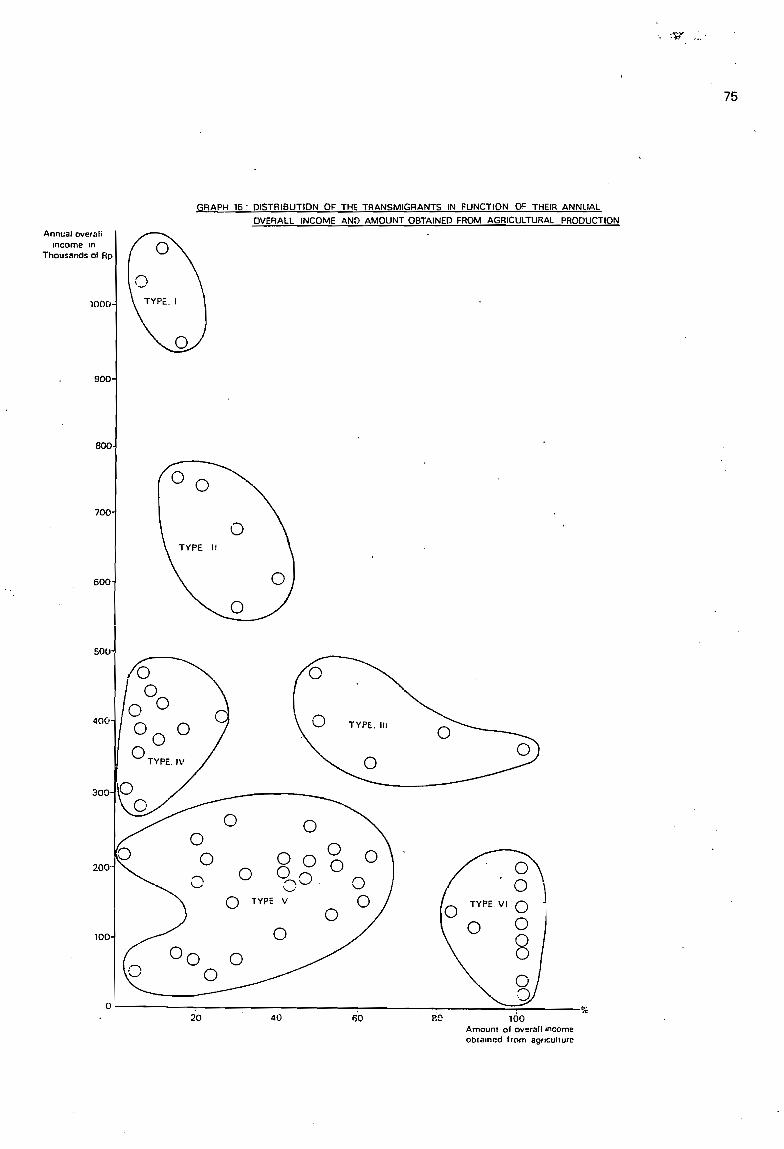
:V .. ·
75
GRAPH 16: DISTRIBUTION OF THE TRAN5MIGRANTS IN FUNCTION Oc THEIR ANNlIAL
OVERALL INCOME AND AMOUNT OBTAINED FROM AGRICULTURAL PRODUCTION
Annual overa liIncome ln
Thousands 01 Rp
1000
900
800
o700
600
0
500
00
o 0400
00
0
o TYPE. IV
300
0 00
00000 0 0 0 0
00 TYPE V
010
20 40 150
76
Types 1 and Il cannot in any way serve as models for the transmigrant population, since
their success is not connected to Transmigration itself. The persons in these two categories
have, as a rule, reinvested capital from the zones of origin and/or profited from the possibili
ties of the local labor market to obtain stable, relatively well-paid jobs.
Type III is, on the other hand, made up of experienced farmers with a high technicallevel in
agriculture (often superior to that of the extension workers posted at the Center). The di
versification of the agricultural production (food crops, cash crops, and small animal hus
bandry) and proper crop protection allows them to obtain yields that are more than satis
factory. Moving up from Types IV, V, and vt to Type 1-11 canonly be done by bettering the
technical level. This is the job of the extension workers (P.P.L.) Unfortunately, the latter
group's lack of experience (the P.P.L. are generally newly-graduated from the schools and
very young), the limited means at their disposai, and above ail a high level of absenteeism
will not help to remedy the present state of affairs.
Having considered the low amounts of agricultural income, the migrants in Type IV have
henceforth already chosen to concentrate on non-agricultural occupations. Since there are
almost no jobs available in the blocks, the members of this group are obliged to leave their
families for periods of from one week to one month in order to find work in the region.
Type V is made up of what are called agricultural laborers. In this category, agricultural
activities are still formost. However, the insufficient incomes force one or more members of
the family (usually the wife) to seek jobs as day laborers. The main possibility for this type
of non-qualified job which is offered the migrants is that of day laborer for the P.T.P.-X
(National Plantation Society), which is in charge of planting the hevea blocks. Unfortuna
tely, the labor demand, very high during the first three years, rapidly decreases. This ex
plains the predominance of Unit VII transmigrants (three to four years of presence at the
Center) in this category.
. The additional monthly income for one family in Unit VII was on the average Rp 15,000 in
1982 and dropped to Rp 6;000 in 1983 (9 to 10 days èfwork per month at Rp 640/day).
As this source of extra income dries up, the persons in Type V will move :
- either up to Type VI if they decide to favorise non-agricultural activities and if the labor
market is open,
- or down to Type VI if they decide to concentrate on agriculture.
Type VI is made up mainly of transmigrants in Unit 1who have only one source of income :
agriculture. Their educational and technlcal levels are very low, production is insufficient,
and the incomes are generally below subsistence level. Ali of the above-mentioned factors
condemn these migrants to stagnation.
The economic situation of Types Vand VI, which include 60% of the transmigrant families,
is a particularly difficult one. The Cropping patterns proposed by certain research institutes
like the CRIA-LP3 were not followed by the transmigrants. The analysis of the reasons to
this rejection is an indispensable preliminary to the definition of better-adapted cultivation
systems.
77

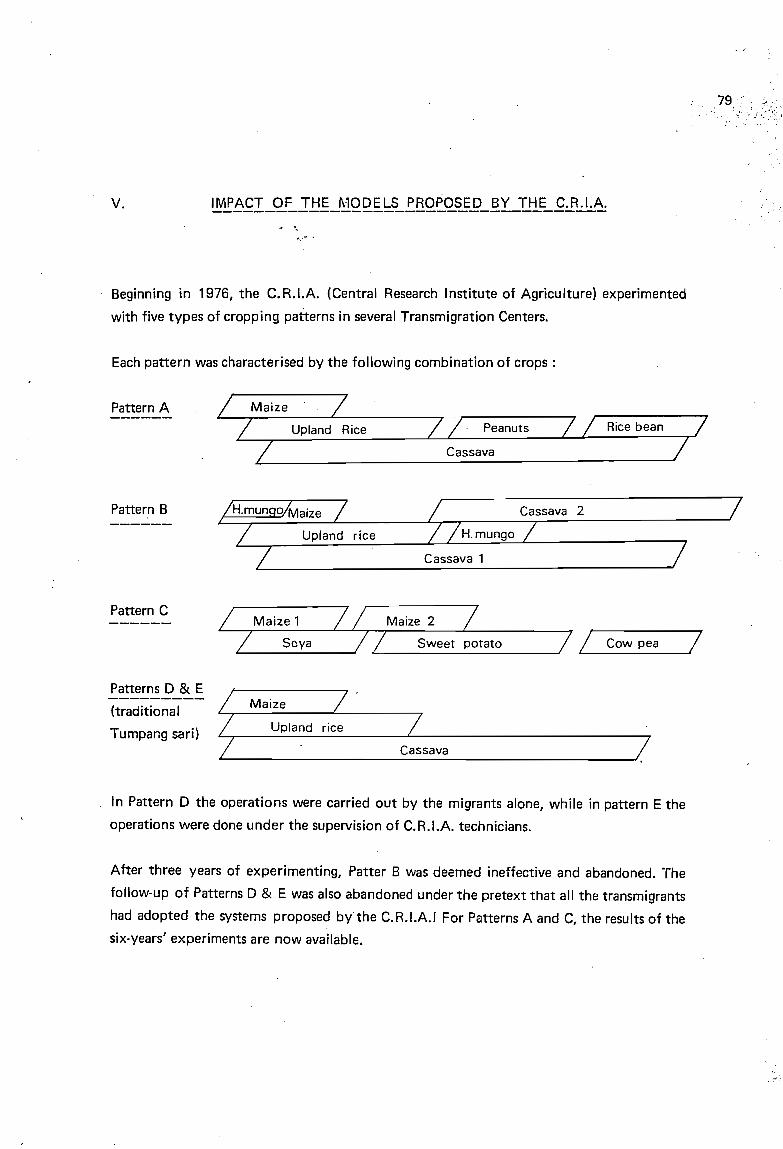
v. IMPACT OF THE r...10DELS PROPOSED BY THE C.R.I.A.-------------------------------------. '.
....... .
79'"
Beginning in 1976, the C. R.I.A. (Central Research Institute of Agriculture) experimented
with five types of cropping patterns in several Transmigration Centers.
Each pattern was characterised by the following combination of crops :
Pattern A
Upland Rice Peanuts
Cassava
Rice bean
Pattern B
Pattern C
rice
Cassava 1
2
/ / Cow pea
ln Pattern D the operations were carried out by the migrants alone, while in pattern Ethe
operations were done under the supervision of C.R.I.A. technicians.
After three years of experimenting, Patter B was deemed ineffective and abandoned. The
follow-up of Patterns D & E was also abandoned under the pretext that ail the transmigrants
had adopted the systems proposed by"the C.R.I.A.I For Patterns A and C, the results of the
six-years' experiments are now available.
7
~' ."
80
The impact of the C.R.I.A. unfortunately does not appear as large as their reports lead one
to believe. In fact, out of 59 families polled :
- 47 had never heard of the C.R.LA. patterns;
- 10 were acquainted with the C. R.LA. as they had worked as laborers on their trial plots;
- 2 had tried the C.R.LA. models: one gave up after one season and the other more or less
adapted the proposed pattern.
Yet, on the purely agronomicallevel, the suggested models present numerous advantages :
staggered seeding avoids the problem of cramming together the soil preparation and
harvest periods;
combining different crops allows for a better use of the land and diversifies the produc
tion (which lessens the risks);
the ground is almost permanently covered and thus well-protected from erosion risk;
the continuous maintenance of the plots ail year round (no slack periods) reduces the
amount of weeds;
the relatively high yields signaled by the C.R.LA. give very interesting net incomes per
hectare.
However, from the transmigrants' point of view, the suggested models have two major in
convenients : they necessitate a large amount of input and demand a great deal of labor.
Conscious of these disadvantages, the C. R.LA. tried as early as 1979-1980 to reduce the
input level and the amount of labor needed.
The economic results obtained for Pattern A from 1976-1977 to 1981-1982 are given in
Table 1\10. 36, on the next page.
The manner in which these figures were obtained, and above ail the presentation of the
results, can hardly be called satisfactory.
Severa1criticisms must be made:
- The parcels ruined by the wild pigs (a major problem whenever the cultivation of maize
and cassava is concerned) are never taken into account in the calcultaion of average
yields. Now, any parcel of rice complanted with maize and/or cassava, and located at any
distance from the house, is almost certain to be devastated by herds of wild pigs.
- ln the presentation of the results ~~..b!~~~ the authors have forgotten to specify that
the farmers participating in the experiments, these parcels are always near the houses.
Therefore, the profits per hectare are only theoretical ones. Moreover, the average labor
force of a single transmigrant family (450 man-days/year) would allow them to cultivate
50 ares at most, in view of their other activities.
As the plots destined for "real-life" trials under C.R.I.A. supervision have first priority,
the fields are prepared in the proper time limits and the seedin'g dates are always optimal.
To prepare one-hectare parcels within the necessary time limits, hired help is indispens
able.
- The costs of hired help are calculated on the same basis as the family labor force, that is,
Rp 400 per day for the first years, then Rp 500, and finally Rp 600-700 in 1981-1982.
However, the salary of a paid day laborer was Rp 1,500 in 1982.
81
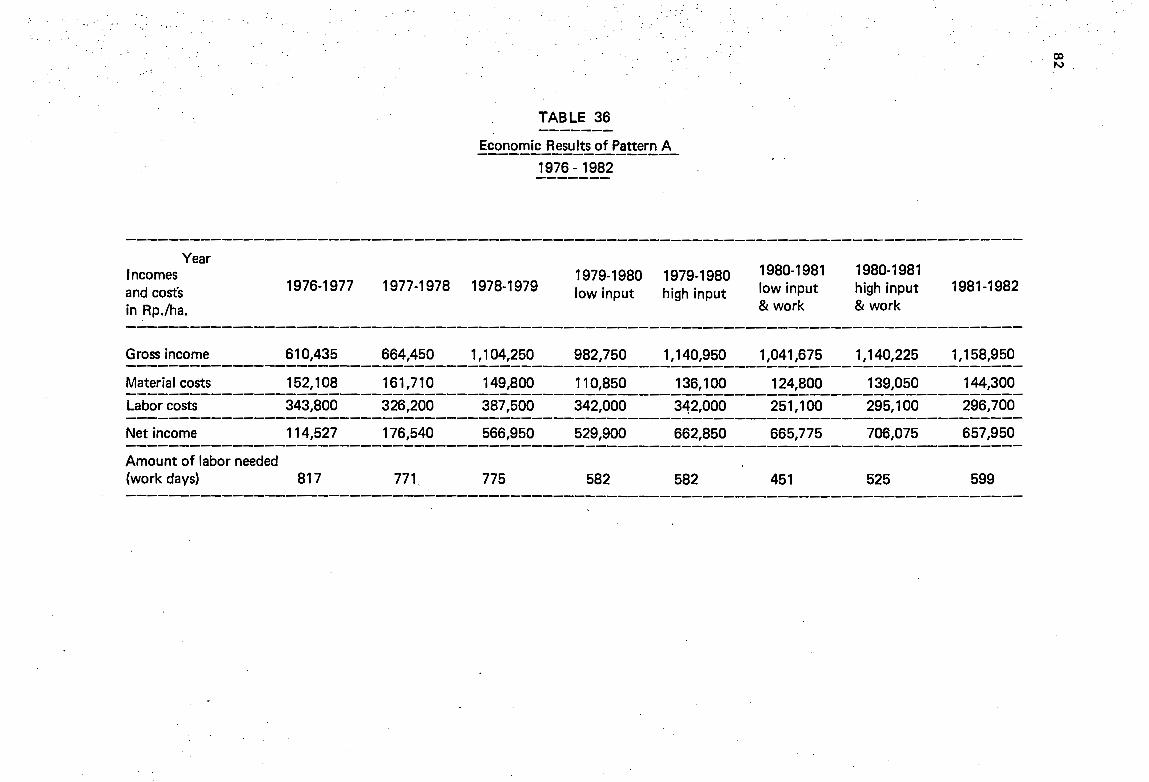
TABLE 36
Economie Results of Pattern A
1976 - 1982
coN.
Year'ncornesand cosfsin Rp./ha.
1976-1977 1977-1978 1978-19791979-1980low input
1979-1980high input
1980-1981low input& work
1980-1981high input& work
1981-1982
Gross income 610,435 664,450 1,104,250 982,750 1,140,950 1,041,675 1,140,225 1,158,950------------------------------------------------------------------------------------Material costs 152,108 161,710 149,800 110,850 136,100 124,800 139,050 144,300------------------------------------------------------------------------------------Labor costs 343,800 326,200 387,500 342,000 342,000 251,100 295,100 296,700------------------------------------------------------------------------------------Net income 114,527 176,540 566,950 529,900 662,850 665,775 706,075 657,950
Amount of labor needed(work days) 817 771 775 582 582 451 525 599
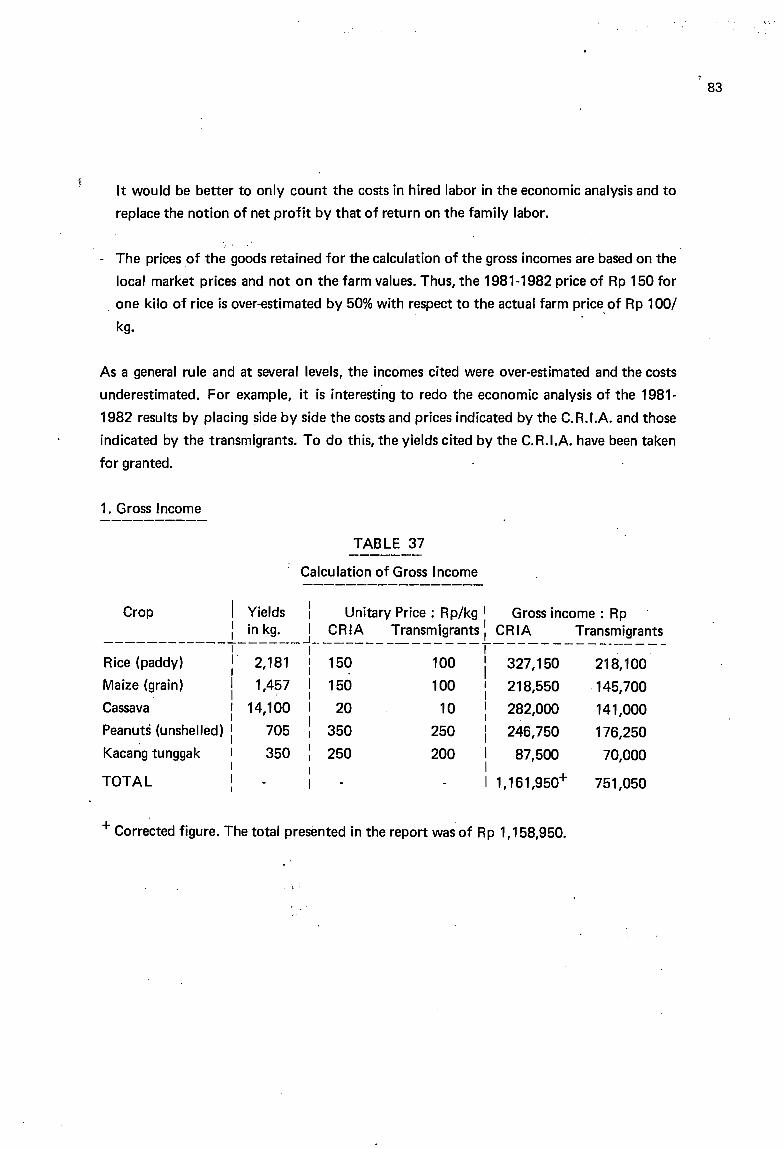
83
It would be better to only eount the eosts in hired labor in the eeonornic analysis and to
replace the notion of net profit by that of return on the farnily labor.
- The priees of the goods retained for the caleulation of the gross incornes are based on the
local market priees and not on the farrn values. Thus, the 1981-1982 priee of Rp 150 for
. one kilo of rice is over-estirnated by 50% with respect to the actual farrn priee,of Rp 1001
kg.
As a general rule and at several levels, the incarnes cited were over-estirnated and the costs
underestirnated. For exarnple, it is interesting to redo the econornic analysis of the 1981
1982 results by placing side by side the costs and priees indieated by the C.R.I.A. and those
indicated by the transrnigrants. To do this, the yields cited by the C.R.I.A. have been taken
for granted.
1. Gross Incorne
TABLE 37
Calculation of Gross Incorne
218,100
·145,700
141,000
176,250
70,000
751,050
327,150
218,550
282,000
246,750
87,500
1,161,950+
100
100
10
250
200
150
150
20
350
250
2,181
1,4?7
14,100
705
350
Crop 1 Yields i Unitary Priee: Rp/kg 1 Gross incorne : Rp
____________l_~~~.__J__C~~~ Tra~~rn~g~~~ ~ C~~~ ~r~ns~i~r~~s_111
11
1
1
11
1
1
1
Peanuts (unshelled)
Kacang tunggak
Riee (paddy)
Maize (grain)
Cassava
TOTAL
+ Corrected figure. The total presented in the report was of Rp 1,158,950.
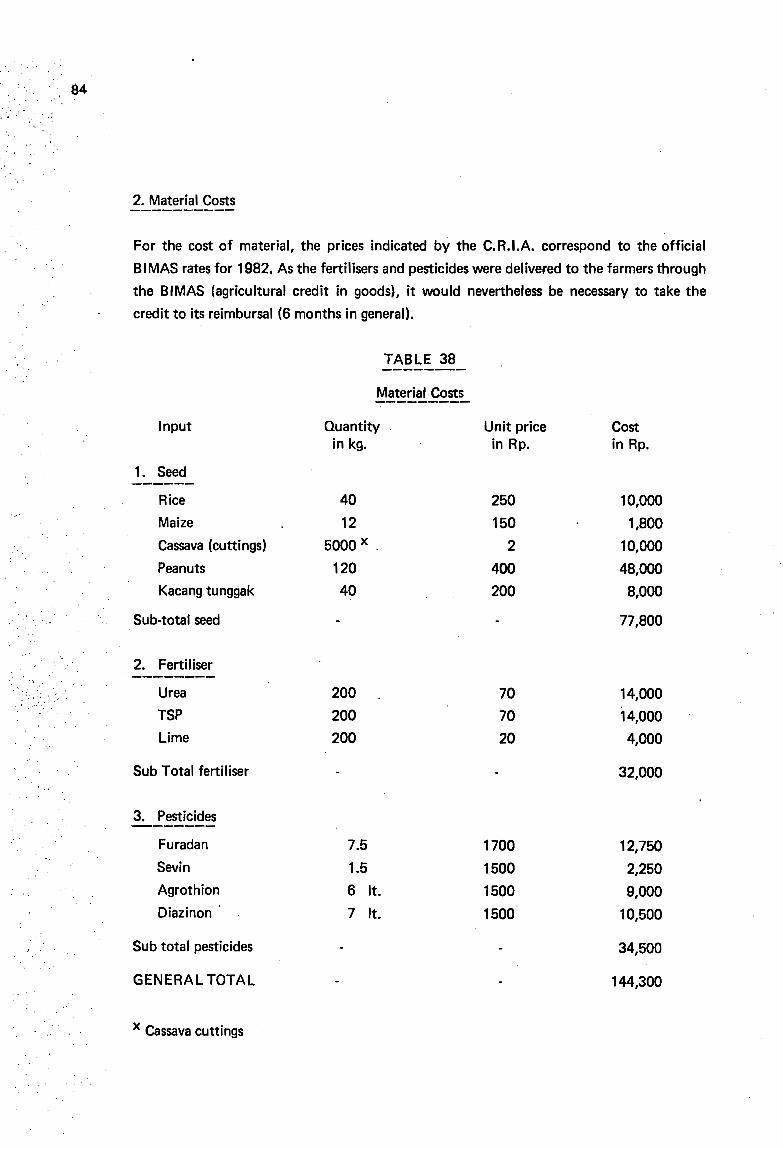
,. -.
84
2. Material Costs
For the cost of material, the priees indicated by the C.R.I.A. correspond to the official
BI MAS rates for 1982. As the fertilisers and pesticides were delivered to the farmers through
the BIMAS (agricultural credit in goods), it would nevertheless be necessary to take the
credit to its reimbursal (6 months in general).
TABLE 38
Material Costs
Input
1. Seed
Quantityin kg.
Unit prieein Rp.
Costin Rp.
Rice
Maize
Cassava (cuttings)
Peanuts
Kacang tunggak
Sub-total seed
2. Fertiliser
40 250 10,000
12 150 1,800
5000 x . 2 10,000
120 400 48,000
40 200 8,000
77,800
Urea
TSP
Lime
Sub Total fertiliser
3. Pesticides
200
200
200
70
70
20
14,000
14,000
4,000
32,000
Furadan
Sevin
Agrothion
Diazinon
Sub total pesticides
GENERAL TOTAL
x Cassava cuttings
7.5 1700 12,750
1.5 1500 2,250
6 It. 1500 9,000
7 It. 1500 10,500
34,500
144,300
.' "'7;::'';~~ ('.-\;\- ....~: :,
3. Labor Costs
ln order to carry out the three successive cultivations called for in Pattern A, the soil pre
paration and harvesting must be done within relatively short delays. Naturally, this implies
the employment of hired laborers whenever the cultivated surface exceeds a certain limit.
Table 39 Iists the needs in masculine and feminine labor for the various operations, as weil
as the amount of labor carried out by the family itself and that done by outside help.
The rates used by the C.R.I.A. vvere Rp 700/day for a man and Rp 600/day for a woman;
the total labor costs amount to Rp 396,700.
85
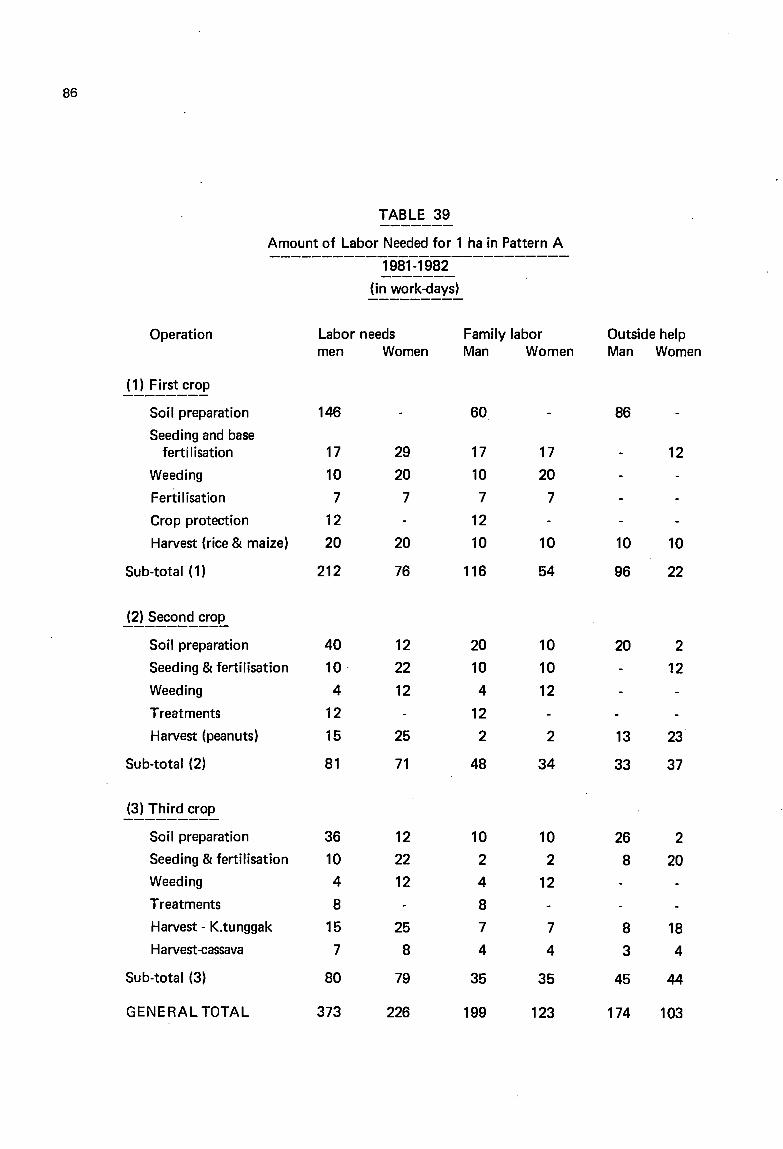
86
TABLE 39-------Amount of Labor Needed for 1 ha in Pattern A----------------------------1981-1982
-------(in work-days)---------
Operation Labor needs Family labor Outside helpmen Women Man Women Man Women
(1) First crop--------Soil preparation 146 60 86
Seeding and baseferti lisation 17 29 17 17 12
Weeding 10 20 10 20
Ferti 1isation 7 7 7 7
Crop protection 12 12
Harvest (rice & maize) 20 20 10 10 10 10
Sub-total (1) 212 76 116 54 96 22
i~.§~~~<!~~e..
Soil preparation 40 12 20 10 20 2
Seeding & fertilisation 10· 22 10 10 12
Weeding 4 12 4 12
Treatments 12 12
Harvest (peanuts) 15 25 2 2 13 23
Sub-total (2) 81 71 48 34 33 37
(3) Third crop---------
Soil preparation 36 12 10 10 26 2
Seeding & fertilisation 10 22 2 2 8 20
Weeding 4 12 4 12
Treatments 8 8
Harvest - K.tunggak 15 25 7 7 8 18
Harvest-eassava 7 8 4 4 3 4
Sub-total (3) 80 79 35 35 45 44
GENERAL TOTAL 373 226 199 123 174 103
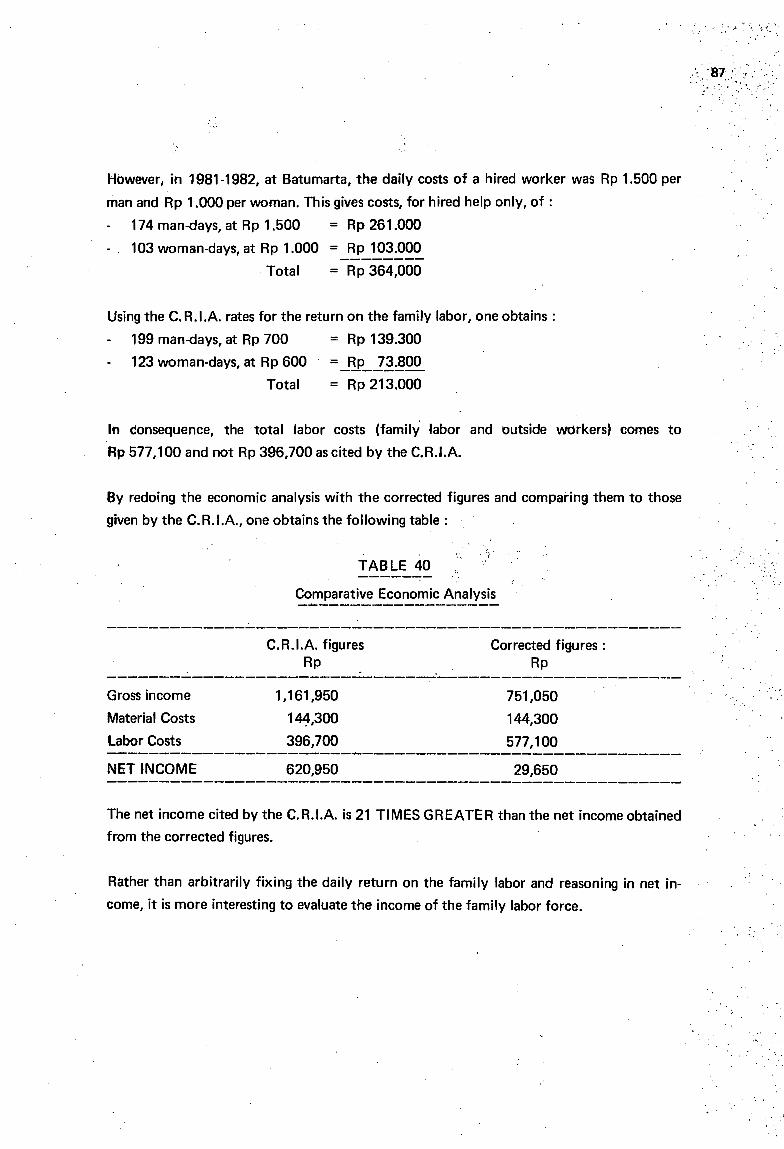
However, in 1981-1982, at Batumarta, the daily costs of a hired worker was Rp 1.500 per
man and Rp 1.000 per woman. This gives costs, for hired help only, of:
174 man-days, at Rp 1.500 = Rp 261.000
103 woman·days, at Rp 1.000 = Rp 103.000--------Total = Rp 364,000
Using the C. R.I.A. rates for the return on the family labor, one obtains :
199 man-days, at Rp 700 = Rp 139.300
123 wornan·days, at Rp 600 =_~_1~~Q.~Total = Rp 213.000
ln consequence, the total labor costs (family labor and outside workers) cornes to
Rp 577,100 and not Rp 396,700 as cited by the C.R.I.A.
By redoing the economic analysis with the corrected figures and comparing them to those
given by the C.R.I.A., one obtains the following table:
TABLE 40------- "
Comparative Economie Analysis
'..." .,.. .," ,l, :,.~ .... '.
,'. '87 '. '-.,.... ..'. ,~. ~ :.
:,' ,',
C.R.I.A. figuresRp
Corrected figures:Rp. .-------------------------------------------------------
Gross income 1,161,950 751,050
Material Costs 14~,3oo 144,300
LaborCosts 396,700 577,100------------------------------------------------------NET INCOME 620,950 29,650
The net incorne cited by the C.R.I.A. is 21 TIMES GREATER than the net income obtained
from the corrected figures.
Rather than arbitrarily fixing the daily return on the family labor and reasoning in net in
come, it is more interesting to evaluate the income of the family labor force.
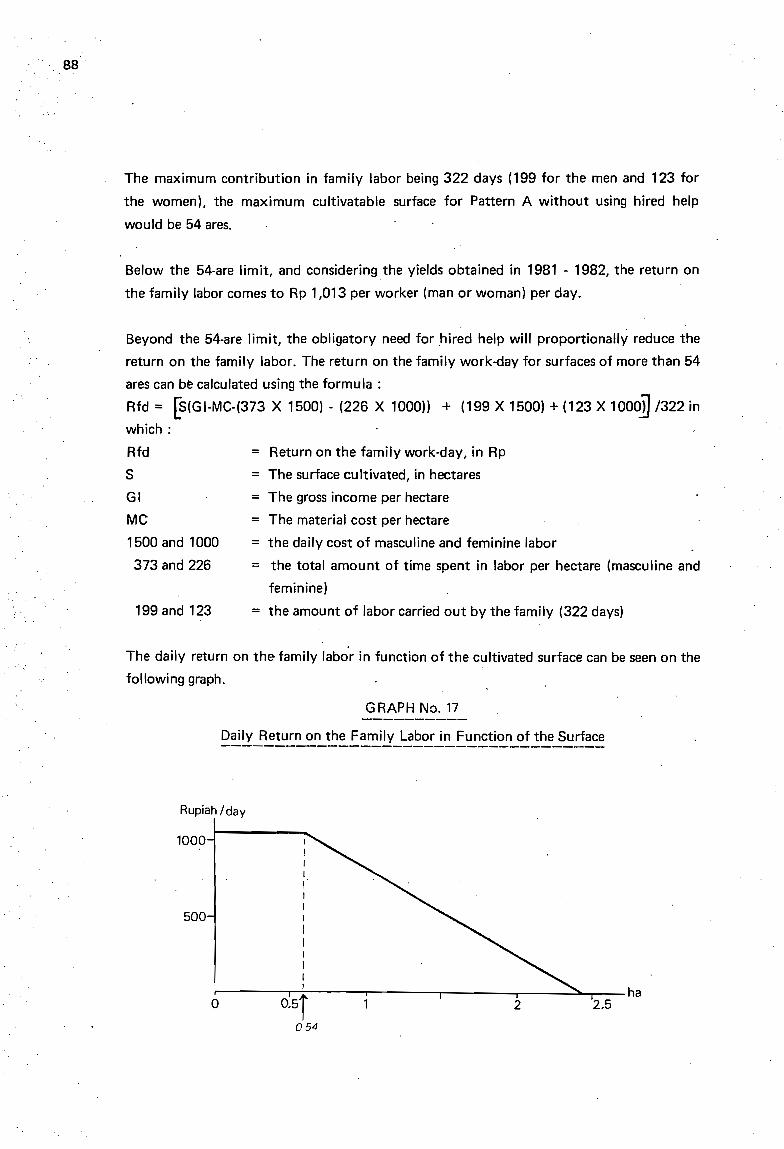
.88
The maximum contribution in family labor being 322 days (199 for the men and 123 for
the womenl, the maximum cultivatable surface for Pattern A without using hired help
would be 54 ares.
Below the 54-are limit, and considering the yÎelds obtained in 1981 - 1982, the return on
the family labor cames ta Rp 1,013 per worker (man or woman) per day.
Beyond the 54·are limit, the obligatory need for hired help will proportionally reduce the
return on the family labor. The return on the family work-day for surfaces of more than 54
ares can be calculated using the formula:
Rfd = [S(GI-MC.(373 X 1500) . (226 X 1000)) + (199 X 1500) + (123 X 1000] /322 in
which:
Rfd =S =GI =MC =1500 and 1000 =373 and 226 =
199 and 123 =
Return on the family work-day, in Rp
The surface cultivated, in hectares
The gross incarne per hectare
The material cast per hectare
the daily cast of masculine and feminine labor
the total amount of time spent in labor per hectare (masculine and
feminine)
the amount of labor carried out by the family (322 days)
The daily return on the family labor in function of the cultivated surface can be seen on the
following graph.
GRAPH No. 17
Rupiah /day
2.52
1
1111
111
111
11
~---...---j;,:'_---'------'r------.-----':::~r---haO.5j054
o
500
1000
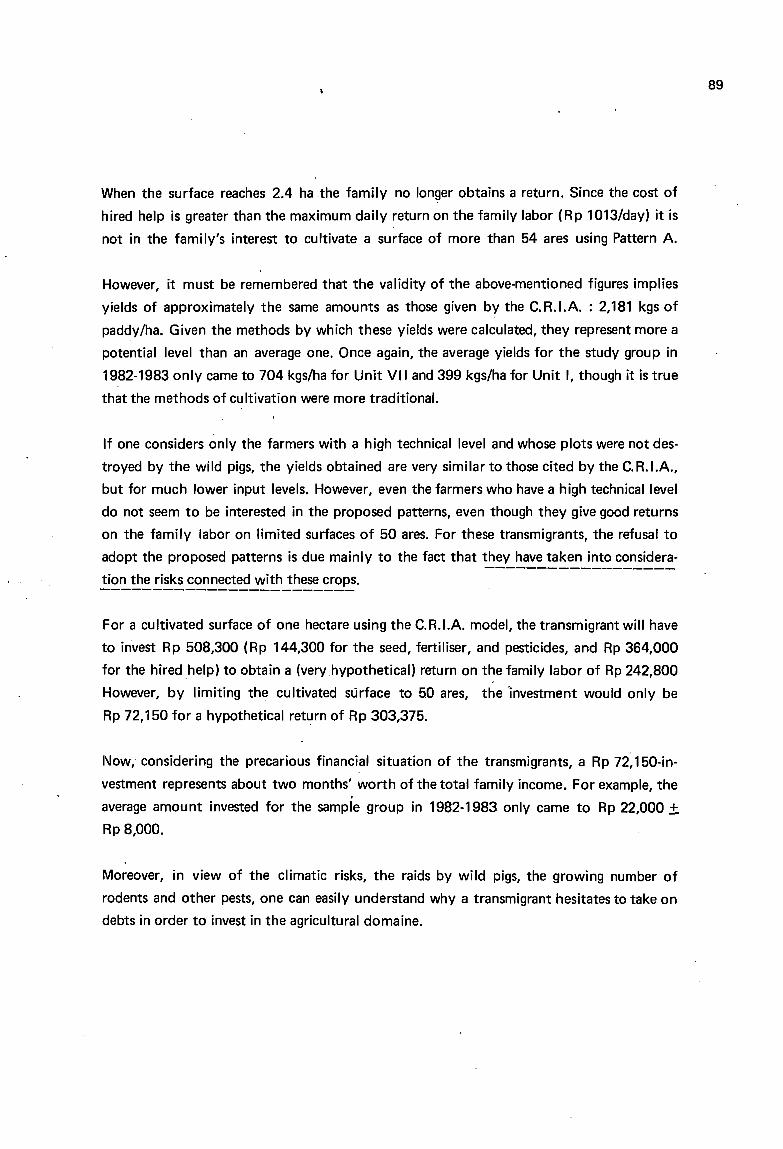
When the surface reaches 2.4 ha the family no longer obtains a return. Since the cost of
hired help is greater than the maximum daily return on the family labor (Rp 1013/day) it is
not in the family's interest to cultivate a surface of more than 54 ares using Pattern A.
However, it must be remembered that the validity of the above-mentioned figures implies
yields of approximately the same amounts as those given by the C. R.I.A. : 2,181 kgs of
paddy/ha. Given the methods by which these yields were calculated, they represent more a
potential lever than an average one. Once again, the average yields for the study group in
1982-1983 only came to 704 kgs/ha for Unit VII and 399 kgs/ha for Unit 1, though it is true
that the methods of cultivation were more traditional.
If one considers only the farmers with a high technical lever and whose plots were not des
troyed by the wild pigs, the yields obtained are very similar to those cited by the C. R.I.A.,
but for much lower input levels. However, even the farmers who have a high technicallevel
do not seem to be interested in the proposed patterns, even though they give good returns
on the family labor on limited surfaces of 50 ares. For these transmigrants, the refusai to
adopt the proposed patterns is due mainly to the fact that they have taken into considera--------------------
tion the risks connected with these crops.------------------------
For a cultivated surface of one hectare using the C.R.I.A. model, the transmigrant will have
to invest Rp 508,300 (Rp 144,300 for the seed, fertiliser, and pesticides, and Rp 364,000
for the hired help) to obtain a (veryhypothetical) return on the family labor of Rp 242,800
However, by limiting the cultivated sürface to 50 ares, the "investment would only be
Rp 72,150 for a hypothetical retl:lrn of Rp 303,375.
l\Iow, considering the precarious financial situation of the transmigrants, a Rp 72,150-in
vestment represents about two months' worth of the total family incomé. For example, the
average amount invested for the sample group in 1982-1983 only came to Rp 22,000 ±Rp 8,000.
Moreover, in view of the climatic risks, the raids by wild pigs, the growing number of
rodents and other pests, one can easily understand why a transmigrant hesitates to take on
debts in order to invest in the agricultural domaine.
89
90
Whatever thefarmer's technical level, the potential incorne he might obtain from food crops
"would not' allow him to' rise very far above the subsistence level. By the sixth year at the
Center, the heveas will begin producing and rapidly cornpete with the food crops. The high,
and above ail regular, incorne from the plantations will invariably lead to the reduction, if
not to altogether abandon; of the surfaces devoted to food crops. . . i
, • 1: ~ ; .
On our last trip to Batumarta in June 1983, the heveas in Unit 1 had already been tappedfor
:, three months. The initial results appear prornising.0' •
':. ,"
: ~ ',... .. .
:. \
: "
it
.0
! ;.:'{';
, .' f~" •'1
".; ,til,
l , ' . ' " " j; ,i
~ ~; " '. .' i '.
. i .;.'!' /.
, :
, t\i 1
. , , ~ . ': 1 r' ;":
;, l ,~ .'! '. . :. .t • \,' \ .. ;, ..
. . ~ ~ . . "
VI. INITIAL RESULTS OF HEVEACULTURE
91
Three months after the tapping began, the following average figures were noted for a sample
group of 22 transmigrants from Unit 1.
For one hectare of heveas,
- 408 were already being tapped
- 69 trees were not yet producing.
For two weekly tappings, the yields came to :
- 15.4 liters of latex per day during the first month of tapping
- 26.6 Iiters of latex by the third month.
ln other words, by the third month, the yield is an average 228 Iiters per month, which is to
say a gross income of Rp 33,000 per month at the average price of Rp 145/liter, and a net
income of Rp 30,000/month (10% is taken off by the cooperative system set up by the
PTP-X).
This means that for a minimal amount of work (4 to 5 hours per tapping day) the income
earned from one hectare of heveas will be, in the first year of tapping, about equal to the
total 1982 cash income of one transmigtant family,
As the yield in latex increases .consistently, the migrants will soon compare the plantations'
profitability to that of food crops. Moreover, the income from latex sales has the advantage
of being secure and regular, and not hypothetical and seasonal as it is for food crops. Under
these conditions, it is very probable that in the next few years the surfaces under food crops
will be reduced and those planted in heveas increased.
Thus there is v~ry little chance that the objective of food self-sufficiency will be met, since
the migrants prefer to buy their rice with the profits made from heveaculture.(J
On the other hand, the transmigrants' standard of living will rise very rapidly. Within a rela
tively short time one should see the creation of a c1ass of small-scale planters who hire
spontaneous transmigrants to carry out the maintenance and tapping of the heveas.
o1. ,'-.-.J

VII. DtAGNOSllC AND RECOMMEI\lDATlONS
~_~Œ..f~.!:!.!.!Y-!~~~L.E.!:!.!..~_.e.~.!!l~~Jt_!!:!~.!.«:'- :Because of the role of "pilot project" that the
World Bank chose to confer upon Batumarta, this
Center is altogether different from a classical
Transmigration Center.
93
1. BATUMARTA BENEFITS FROM MANY FAVORABLE FACTORS
- Very large amounts of money were spent, since the cost of installing one family at Batu
marta is almost double the amount generally allocated.
- The Center's administrative framework is solid and qualified. The Transmigration per
sonnel posted at Batumarta are competent and the working conditions very favorable
(offices, vehicles, etc.).
- Serious preliminary studies allowed the housing blocks to be set up near small retaining
dams 50 that fresh water would be available.
- Employing the PTP-X to set up the hevea plantations made possible the creation of indus
trial-quality plantations.
- The considerable scientific framework (Researéh Institutes, Universities, International
consultants), though it has not yet re50lved ail the problems, has led to a sound know
ledge of the area's characteristics and potential. There are a great many available basic
data at the "seed farm", "test farm", and weather station.
- The large-scale distribution of cattle allows for the rapid development of draught traction.
- A large number of infrastructures have already been set up : access roads, schools, dispen-
saries, houses of worship, cooperatives, markets, et cetera.
2. THERE ARE STI LL A FEW PROBLEMS, HOWEVER
- If the administration of the Center as a whole is of good quality, that of the Units is often
lacking. Spontaneous transmigrants wishing to settle on the lots abandoned by migrants
who had left the Center found themselves having to pay up to Rp 600,000 to certain Unit
headmen.
94
- The technical framework at the unit level is probably the least satisfactoryaspect. The
PPL (agricultural extension agents) posted in the Units are on the whole too young, in
experienced, and not very motivated. The average length of stay of the PPL in Unit VII is
only six months, not to mention the frequent absenteeism. Certain PPL's stocked plants
for severa1weeks before distributing them to the transmigrants, thus causing a great many
losses.
- The quality of the agricultural tools that were distributed" was sa disasterous that the
transmigrants did not even consider using them.
- The KUD (village cooperatives) still function very badly and above ail do not carry out
their role in the commercialization of the agricultural production.
- ln the units located at sorne distance from the administrative center, the costs of trans
portation are often prohibitive.
- The organization of artificial insemination and technical assistance for the stockbreeders
is taking a long time.
But the main problem for ail the transmigrants isthat of ensuring their self-sufficiency, or at
least their families' survival for the six years prior to the first tapping of the heveas. After
this difficult period, the incomes earned from the rubber plantations will rapidly provide a
secure future for the transmigrants.
3. RECOMMENDATIOI\JS
Ail too often, the recommendations made by the various Institutes and Consultants mention
but rarely the limiting factors and constraints which the transmigrants must overcome.
Such factors boil down to three main ones :
- a relatively low technical level,
- a limited labor force,
- . and financial possibilities that are practically inexistent.
As a result, any proposition that supposes an increase in the financial burden or the amount
of labor will never be accepted by the transmigrants.
Furthermore, any ambitious project such as building a tapioca or liquid sugar factory, vege
table of fruit canneries, and so on, will only merit consideration when large financial sources
have become available.
For ail of these reasons, we have confined ourselves to making only simple, realistic; inex
pensive propositions which take into account the transmigrants' possibilities and respond to
their needs.
These propositions concern :
- improving the effectiveness of the agricultural work,
- crop protection,
- the development of animal husbandry,
increasing the possibilities of non-agricultural employment,
- and improving the commercialization of the productions.
3.1. For more effective agricultural labor
- I~t:.~~~Ê~~~..!.b.~~~~~!.~!-tJ..~~s2~f!!~~~0.9..!.~J.~.Q would be quite considerableif ail the families had actually received one hectare c1eared with a tractor as planned. This
type of operation, while absolutely discouraged in the case of clearing primary or secon
dary forest, does not pose too many problems on land that is covered in Imperata cylin
drica, as is frequently the case at Batumarta. Unfortunately, the quality of the clearing
done with a tractor often leaves a great deal to be desired. The tractor-drivers tend to
plow too deeply and too rapidly, without cons.idering the differences within the plots. In
this manner, in the zones where the surface horizons are thin, the compact underlying
horizons that are rich in i(on' concretions and poor in organic matter and nutrients are
brought to the surface by plowing that is too deep.
Ultimately, the poor growth of crops in these zones gives the plots a characteristic
"Ieopard-skin" appearance.
, To remedy things, it would be necessary to :
improve the formation of the tractor-drivers and introduce the notion of labor quality
in the specifications required of the contractors.
favorise the use of pronged tools rather than disks in the zones where the superficial
horizons are thin, so that the soil will be broken up without turning it over.
95
96
Soil preparation
The large number of cattle distributed at Batumarta allows the migrants to make a rapid
changeover to draught traction for the soil preparation operations. Nevertheless, in some
units, the absence of blacksmiths hinders the fabrication and repair of plowshares and
mould-boards. It would be useful to plan and finance the installation of at least one or
two blacksmiths per unit.
- I~e_~m~~~~~...!.!-~_~~d~~..!~...!~~~~~J!~.E~at..!?~~~ould be significantly decreased
through the introduction of simple, efficient seeders mounted on the_ frame of multi-
cultivators of the type commonly used in Senegal.
The fabrication of this sort of material s/1ould be considered in Indonesia, and why not
near the large Transmigration Centers? Using seeders that would permit the obtention
of regularly-spaced seed-rows, the introduction of draught-traction weeding would be
possible for the first maintenance passages.
By reducing the amount of labor needed for soil preparation and sowing, the introduc
tion of a complete set of draught-powered tools would allow for:
a better result on the work-day and consequently a better return,
an increase in the surfaces cultivated with no need for paid laborers.
a reduction in the total amount of time needed for the operation, which would permit
the sowing dates to be more closely narrowed down to the beginning of the rainy
season.
Proper grouping of the sowing dates is an indispensable preliminary to an effective fight
against the infestation of bugs, stem-borers, and other pests.
Without spreading massive doses of fertilisers, one will never obtain very high yields in the
conditions of soil fertility at Batumarta. Unfortunately, the cost of such fertilisation is still
impossible for the large majority of transmigrants to bear.
On the other hand, improved crop protection would permit the farmers at Batumarta to at
least double their yields, and this at a very low cost.
ln fact, in the study group, the 10% of farmers whose technical lever is high and who master
phyto-sanitary treatments correctly obtain yields that are two to three times greaterthan the
average, though the doses of fertilisers are idèntical.
Given the limited technical lever of most of the PPL (extension workers), it appears unrealÎs
tic to count on them to organize any sort of effective crop protection. The best solution
would be to promote agricultural groups such as the "Kelompok Tani" that already exist
and to place the responsability for crop protection in the hands of groups and not of indivi
duals. This solution has numerous advantages :
Distributing the pesticides to the "Kelompok Tani" would avoid seeing them wasted or
resold,
The migrants with a high technical lever would automatically take charge of the opera
tions, which would permit the generalization of preventive treatments and correct
dosing of pesticides. This would also prevent correctly treated parcels from suffering
from the proximity of infested plots.
Organizing labor in reciprocal assistence ("Gotong Royong") would avoid additional
labor costs and would allow for a rapid evolution in the average technical lever of the
migrants.
The regrouping into "Kelompok Tani" would facilitate both access to agricultural credit
and the introduction of new methods.
For the crops other than upland rice, the raids made by wild pigs remain the major problem,
especially for the Moslem settlers. As a matter of fact, the problem does not seem to trouble
the Balinese, who are extremely fond of pork. Much to the contrary, sorne Balinese com
plain of the progressive increase in the distances they must cover to reach their hunting
grounds. Unfortunately, the relatively limited number of Balinese does not allow for perma
nent crop protection on ail the units at Batumarta.
As the fencing of certain plots has proved to be costly and above ail powerless to discourage
the wild pigs, the organization of regular hunts seems to be the best solution. To do this, the
Transmigration Authorities could cali upon the Army and Balinese beaters. The result of the
battues would largely cover the necessary costs and would also allow for an improvement in
the Balinese families' diet.
97
98
Cattle breeding
Cattle breeding is already relatively developed at Batumarta and will ensure the transmi
grants a non-negligeable income within a few years. At present, the main obstruction to its
development seems to be the limited manpower, financial means, and formation of the per
sonnel in the Breeding Services. After having started almost from scratch, these Services are
progressively getting organized, thanks to the large demand created by Transmigration.
Small-scale poultry farming
Contrary to many transmigrants' wishes, the official Services have not yet given much atten
tion to this activity.
Credit facilities with the Bank Rakyat Indonesia would allow certain migrants to specialize
in the breeding of laying hens and meat-producing chickens. This credit would be given
under the condition that the applicant participate in the training courses organized by the
Breeding Services.
Pig farming
This activity, which many Balinese would like to develop, cornes up against the obstacles
that are habitually present in the predominantly Islamic provinces. As the private transport
companies refuse to take on loads of pigs, it is absolutely necessary that the Authorities
organize the introduction of selected breeding stock. The system used for cattle could easily
be adapted to breeding pigs.
3.4. 1ncrease the possibilities of non-agricultural employnient-------------------------------------
The presence, in ail the units, of numerous sawyers, joiners, and carpenters, could be put to
better use by the Transmigration Authorities. More often than not, the latter cali upon local
companies to do the work of building and expanding the Center. The contractors then sub
contract transmigrants for a large part of the ~ork, most often at a low priee. If the crafts
men voluntarily accept building contracts for two or three houses, they are obviously not in
a situation to accept offers concerning 500 houses plus a dozen or so community buildings.
ln order to remedy this problem, the Transmigration Authorities should set up craftsmen's
cooperatives along the same lines as the KUD (village farm cooperatives). The existence of
such cooperatives would permit, in ail : to reduce the construction costs of the transmi
grants' houses, to increase the possibilities of employment and formation, and to increase
the craftsmen's incomes.
Other artisans, such as bicycle repairmen, blacksmiths, tempe/tahu manufacturers, and so
on, should aise be able to obtain credit facilities for the purchase of necessary material.
3.5. Improve the commercialization of the agricultural production
Batumarta benefits fram a priviledged geographical situation due to the proximity of two
secondary urban centers, Baturaja and Martapura; the Trans-Sumatranesé road; and the rail
road that connects Baturaja with two large urban centers : Palembang and Tanjung Karang.
Unfortunately, the transmigrants do not take much advantage of these excellent commer
cialization possibilities. This is quite obvious fram the simple comparison of the priees of
the products at the farm with those in Baturaja or Palembang.
On the other hand, transporters and wholesalers are making easy profits on the transmi
grants' urgent money need. As they cannot stock their production, the transmigrants sell it
in gross amounts after the harvest. The priees drop rapidly at the Center, but remain surpri
singly stable in Baturaja.
Certain migrants who are aware of this problem organize the collection and transport of the
productions. The high cost of transportation, eSp'ecially from the units that are at some dis-'
tance fram the administrative center, weighs heavily on the benefits of the operation. Once
in Baturaja, the buying priees offered by the wholesalers are only slightly higher than the
priees at the Center, due to illicit agreements between wholesalers. Likewise, numerous cases
of "weight loss" during transport have been signaled. A 1aa-kg sack of peanuts (weight veri
fied at the Center) only weighed 85 kgs when it arrived in Baturaja! The transmigrant,
having been obliged to advance the transportation fee, finds himself forced to sell at any
priee.
ln order that the migrants do not fall prey to such commercial practices, the Transmigration
Authorities should organize :
99
100
- the collection of the harvests,
- the temporary storage at the level of the Center, in order to sell du ring more favorable
periods,
- the transportation of the harvests to Baturaja (or Palembang, Tanjung Karang),
- the sale of the products at a market specially set up for the needs of Transmigration.
This type of organization, while difficult to consider for a c1assical Transmigration Center,
could easily be set up at Batumarta due to the Center's size (14 units in 1983) and the qua
lity of its administrative framework. Transport and organization costs considered, the addi
tional profit that would be thus realized would come to about 50% of the present sale priee.
Despite a few transitory problems, the future of the Batumarta Center looks quite promi
sing. The few recommendations forwarded above - which mainly concern an effort in forma
tion and organization, both of the transmigrants and the Official Services - would help make
this future a Jess distant one.