Embed Size (px)
Citation preview
Faculte de genie
Departement de genie civil
(Betons autopla^ants a haute resistance, muris a la vapeur, utilises pour les elements prefabriques et precontracts)
High-Strength, Steam-Cured Self-Consolidating Concrete for Precast, Prestressed Elements
Memoire de maitrise en sciences appliquees Speciality : genie civil
Rami Khatib
Sherbrooke (Quebec), Canada November, 2009
1 * 1 Library and Archives Canada
Published Heritage Branch
Bibliothgque et Archives Canada
Direction du Patrimoine de l'6dition
395 Wellington Street Ottawa ON K1A 0N4 Canada
395, rue Wellington Ottawa ON K1A 0N4 Canada
Your file Votre reference ISBN: 978-0-494-61444-0 Our file Notre r&fGrence ISBN: 978-0-494-61444-0
NOTICE: AVIS:
The author has granted a non-exclusive license allowing Library and Archives Canada to reproduce, publish, archive, preserve, conserve, communicate to the public by telecommunication or on the Internet, loan, distribute and sell theses worldwide, for commercial or non-commercial purposes, in microform, paper, electronic and/or any other formats.
L'auteur a accorde une licence non exclusive permettant a la Bibliotheque et Archives Canada de reproduire, publier, archiver, sauvegarder, conserver, transmettre au public par telecommunication ou par I'lnternet, preter, distribuer et vendre des theses partout dans le monde, a des fins commerciales ou autres, sur support microforme, papier, electronique et/ou autres formats.
The author retains copyright ownership and moral rights in this thesis. Neither the thesis nor substantial extracts from it may be printed or otherwise reproduced without the author's permission.
L'auteur conserve la propriete du droit d'auteur et des droits moraux qui protege cette these. Ni la these ni des extraits substantiels de celle-ci ne doivent etre imprimes ou autrement reproduits sans son autorisation.
In compliance with the Canadian Privacy Act some supporting forms may have been removed from this thesis.
Conformement a la loi canadienne sur la protection de la vie privee, quelques formulaires secondaires ont ete enleves de cette these.
While these forms may be included in the document page count, their removal does not represent any loss of content from the thesis.
Bien que ces formulaires aient inclus dans la pagination, il n'y aura aucun contenu manquant.
Canada
Abstract
Self-consolidating concrete (SCC) is widely used for several types of structural applications. The high workability of such concrete has been turned into tangible benefits in precast, prestress manufactories in terms of enhancement of the overall quality of the final product and high productivity. The range of benefits offered by SCC goes beyond fundamental aspects of concrete quality and productivity; it includes a major improvement in the health and safety of workers and the reduction of noise level on construction sites. Furthermore, to improve the productivity in the precast manufacturing plants, steam-curing is often used to expedite strength gain and shorten the construction cycle. It is well established that mechanical properties of steam-cured SCC are affected by mixture composition and can vary widely with the steam-curing parameters. The research project presented here aims to address the significance of mixture parameters governing the performance of SCC for precast applications. Two classes of SCC with design compressive strengths of 60 and 80 MPa at 56 days were investigated. The examined mixture parameters include the w/cm, binder content and type, and the type of superplasticizer. In addition, this research seeks to assess the effect of steam-curing parameters on early-mechanical properties of SCC and to optimize a steam-curing regime to meet fabrication requirements with efficiency and economy. The studied steam-curing parameters include the maximum curing temperature, the preset period prior to heat treatment, and the rate of heating. The employed mixtures proportioning and steam-curing regimes to achieve the anticipated early-strength were proposed by an experimental factorial design to cover a wide scope of SCC mix designs and steam-curing regimes. Among the modeled mixture parameters, the w/cm and binder content were shown to play key roles on the majority of steam-cured mechanical properties and workability criteria. Among the steam-curing parameters, the maximum steam-curing temperature was shown to have a dominant effect on early-age strength. The preset period exhibited a major influence on mechanical properties as well. SCC cured under a maximum chamber temperature of 65°C and a longer preset period of 5 hours was found to develop higher early-compressive strength. Beyond limits, increasing maximum curing temperature can adversely affect the strength development leading to a lower early-compressive strength. The early heat treatment was found to decrease early-age strength. Longer preset period of 5 hours is then recommended in terms of fuel and time saving in manufacturing plants.
Key-words: early-age strength, maximum chamber temperature, modulus of elasticity, precast, prestressed application, preset period, rate of heating, self-consolidating concrete, steam-curing.
Resume
Le beton autoplafant (BAP) est largement utilise pour differentes applications structurales. Plusieurs avantages palpables ont ete tires de la maniabilite de ce beton quant a la prefabrication et la manufacture des elements precontracts dans les termes de 1'amelioration de la qualite globale du produit final et une productivite elevee. L'eventail des avantages offerts par le BAP va au-dela des aspects fondamentaux de la qualite et la productivite des betons; il comprend une importante amelioration de la sante et de la securite des travailleurs et une reduction du niveau de bruit sur les chantiers de construction. De plus, pour ameliorer la productivite dans le domaine de la prefabrication, la cure a la vapeur est souvent utilisee afin d'accelerer le gain de resistances et ainsi reduire le temps de construction. Les proprietes mecaniques des BAP cures a la vapeur sont grandement affectees par la formulation du melange et sont sensibles aux variations des parametres de cures a la vapeur. Ce projet de recherche vise a faire ressortir l'importance des parametres du melange affectant la conception et la performance des BAP pour des applications dans le domaine de la prefabrication. Deux differentes classes de BAP ayant des resistances mecaniques de 60 et 80 MPa a 56 jours ont ete examinees. Le rapport E/L, le type et la teneur en liant et le type de superplastifiant sont les parametres de melange etudies. De plus, la recherche a pour but d'evaluer l'effet des differents parametres de la cure a la vapeur sur les proprietes mecaniques a jeune age des BAP et d'optimiser un regime de cure a la vapeur assurant le respect des exigences de la fabrication des melanges proposes de fa<?on efficace et economique. Les parametres de cures etudies sont la temperature maximale, la periode avant le debut de la cure et le taux de gain de chaleur. Les differentes proportions des formulations utilisees et le regime de cure applique ont ete choisis a l'aide d'un plan factoriel afin de couvrir une plus large gamme de formulation de BAP et de regime de cure. Parmi les parametres de melange etudies, le rapport E/L et la teneur en liant revelent avoir un role crucial sur la majorite des proprietes mecaniques et de maniabilite. Parmi les parametres de cure, la temperature maximale de la chambre de cure a la vapeur a un effet dominant sur la resistance mecanique a jeune age. La periode avant le traitement thermique revele aussi une grande influence sur les proprietes mecaniques. II a ete constate que curer le BAP sous la temperature maximale d'environ 65 °C dans la chambre de cure a la vapeur et avec une periode de 5 heures avant le traitement thermique conduit a la hausse des resistances a la compression a jeune age. Au-dela des limites, la temperature maximale de cure peut nuire au gain de resistance menant ainsi a une resistance a la compression moins elevee. Un traitement thermique applique tres tot peut retarder le developpement des resistances mecaniques a jeune age; il est done recommande d'avoir une periode d'environ 5 heures avant le traitement thermique afin de gagner du temps et de reduire la consommation de carburant.
Mots-cles : beton autopla9ant, cure a la vapeur, modulos de elasticity, periode avant traitement thermique, precontrainte prefabrication application, resistance a la compression a 18 heures, taux de gain de chaleur, temperature de cure maximale.

Acknowledgement
First of all, I would like to express my gratitude for the enthusiastic supervision of Prof.
Kamal Khayat, who greatly enriched my scientific understandings with his profound
knowledge and exceptional engineering insights. In life, it is painful when mistakes happen;
but years later those mistakes are called experience. I am deeply indebted to him, much more
than he knows, and I really look forward to the time when I can help others as he has helped
me.
I owe my deepest thanks to Dr. Trimbak Veerab Pavate and Dr. Soo-duck-Hwang for their
valuable advice and for having spent their precious time providing me with important
feedback.
Many thanks to the members of the thesis committee; Prof. Pierre-Claud Ai'tcin, Prof. Ammar
Yahia and Dr. Soo-duck-Hwang, for their help in improving the quality of my research.
Special thanks to SAMSUNG Engineering & Construction Company for funding this project,
in particular Dr. Hoi Keun Lee for his scientific collaboration.
I wish to express my gratitude to the technical staff, colleagues, research assistants, and all
members of the Research Group on Cement and Concrete in the department of Civil
Engineering at the University of Sherbrooke; your continued encouragement and interest in
my work have helped to make this project a joy to work on.
Far from the rush of professional life, my words fall when I am trying to thank my family.
To my dad, you always told me to "reach for the stars"; I think I got my first one. Thanks for
your unending faith in me.
To my mom, you have always been there when I needed you. You remind me of the love in
the world when I'm ready to give up on it. Thank you for your everlasting love.
To my brothers, you draw the joy on my face; thank you for always having hope in me when I
didn't have it myself.
And to all my dear friends, it is people like you who make the world a better place; all I need
is your love and faith to keep going.
Table of Contents
Table of Contents i
List of Figures v
List of Tables viii
CHAPTER 1 - INTRODUCTION 1
1.1 Background 1
1.2 Research Significance 4
1.3 Objectives and Organization of Thesis 4
CHAPTER 2 - LITERATURE REVIEW 6
2.1 Selection of Constituent Materials 6
2.1.1 General 6 2.1.2 Cement and cementitious materials 6
A) Cements and blended cements 7 B) Mineral admixtures and fillers 10 C) Aggregate characteristics 13 D) Chemical admixtures 16
2.2 Workability Characteristics of SCC and Test Methods 19
2.2.1 Workability requirement 19 2.2.2 Test methods to assess workability of SCC 22
A) Slump flow and T-50 flow test 22 B) J-Ringtest 23 C) L-boxtest 23 D) Filling capacity test (caisson box test) [Test method as proposed by AASHTO] 24 E) Visual stability index 25 F) Surface settlement test [Test method as proposed by AASHTO] 25 G) Concrete rheometer test 26
2.3 Effect of Steam-Curing Regime on Mechanical Properties of SCC 27
2.3.1 General 27 2.3.2 Effect of maximum temperature 28 2.3.3 Effect of rate of heating and cooling 31 2.3.4 Effect of preset period 33
2.4 Application of Maturity Method 40
2.5 Effect of Imposed Temperature on Maturity and Strength Gain in Steam-Cured SCC 43
CHAPTER 3 - EXPERIMENTAL PROGRAM 45
i
3.1 Introduction 45
3.2 Specific Objectives 45
3.3 Materials 46
3.3.1 Cement and supplementary cementitious materials 46 3.3.2 Aggregate and sand 46 3.3.3 Chemical admixtures 48
3.4 Mix Design 48
3.5 Test Methods 48
3.6 Scope of Investigation 49
3.7 Specimen Preparation 56
3.7.1 Mixing sequence 56 3.7.2 Sampling and curing 56
CHAPTER 4 - TEST RESULTS, DISCUSSION, AND MODELING OF SCC FRESH AND MECHANICAL PROPERTIES 58
4.1 Introduction 58
4.2 Research Approach 58
4.3 Factorial Design 59
4.4 Tests Results 61
4.5 Discussion and Modeling of Fresh Properties of SCC 64
4.5.1 Statistical models for fresh properties 64 4.5.2 Effect of mixture parameters on fresh properties of SCC 67
A) HRWRA demand 67 B) Passing ability 69 C) Filling capacity 70 D) Plastic viscosity 75
4.5.3 Temperature rise under semi-adiabatic conditions 75
4.6 Discussion and Modeling of Mechanical Properties of SCC 77
4.6.1 Statistical models for mechanical properties 77 4.6.2 Effect of mixture parameters on mechanical properties 80
A) 18-hour compressive strength 81 B) 28- and 56-day compressive strength under moist curing 81 C) Elastic modulus at 18 hours and 56 days 82
4.7 Significance of Mixture Parameters on SCC Properties 87
CHAPTER 5 - OPTIMIZATION OF STEAM-CURING REGIME FOR SCC USED IN PRECAST, PRESTRESSED APPLICATIONS 90
5.1 Introduction 90
i i
5.2 Research Approach 90
5.3 Factorial Design for Curing Regimes 91
5.4 Tests Results 92
5.5 Discussion and Modeling of Mechanical Properties of SCC 93
5.5.1 Effect of curing parameters on mechanical properties of SCC 93
A) Effect of maximum chamber temperature on mechanical properties 93 B) Effect of preset period on mechanical properties 97 C) Effect of rate of heating on mechanical properties 99
5.5.2 Statistical models for mechanical properties 101
A) Statistical models for SCC1 (design compressive strength of 80 MPa) 101
B) Statistical models for SCC2 (design compressive strength of 60 MPa) 105
5.6 Repeatability of Workability Responses 107
5.6.1 Single-operator repeatability 107
5.7 Significance of Steam-Curing Parameters on Mechanical Properties at Early Age 107 CHAPTER 6 - EFFECT OF MATURITY ON STRENGTH DEVELOPMENT IN STEAM-CURED SCC 110
6.1 Introduction 110
6.2 Experimental program I l l
6.3 Test Results and Discussion 112 6.3.1 Maturity development with respect to time in steam-cured SCC 112 6.3.2 Development of early-strength of steam-cured SCC with respect to time 116 6.3.3 Relationship between maturity and early-age strength in steam-cured SCC 119 6.3.4 Development of compressive strength in SCC moist and air cured after finishing steam-curing 120 6.3.5 Effect of preset-period and maximum chamber temperature on maturity index and strength development in steam-cured SCC 122
6.4 Conclusions 127
CHAPTER 7 - RECOMMENDATIONS FOR STEAM-CURED, HIGH-STRENGTH SCC FOR PRECAST, PRESTRESSED APPLICATIONS 129
7.1 Introduction 129
7.2 Mixture Proportioning Recommendations 129
7.2.1 General 129 7.2.2 Water-cementitious materials ratio 130 7.2.3 Cementitious materials content 130 7.2.4 Binder type 131 7.2.5 HRWRA type 131 7.2.6 Nominal maximum-size of aggregate 131
in
7.2.7 Recommendations for proportioning SCC with design compressive strengths of 60 and 80 MPa
7.3 Recommendations for Steam-Curing Regime
7.3.1 General 7.3.2 Maximum chamber temperature 7.3.3 Preset period 7.3.4 Rate of heating and cooling 7.3.5 Recommendations for steam-curing for SCC used for precast, prestressed applications with target 18-h cured compressive strength of 30 MPa
7.4 Future Work
APPENDIX A
APPENDIX B
APPENDIX C
REFERENCES
IV
List of Figures
Chapter 2 Fig. 2.1 - Schematic of L-box apparatus (NCHRP, 2009) 24 Fig. 2.2 - Schematic of caisson filling capacity test (AASHTO) 25 Fig. 2.3 - Geometry of the vane used to determine the rheological flow curves of SCC 26 Fig. 2.4 - Effect of maximum chamber temperature on compressive strength at 18 hours
(preset period of 5 hours) [Hanson, 1963] 30 Fig. 2.5 - Effect of rate of temperature rise on compressive strength at 18 hours (preset period
of 5 hours) [Hanson, 1963] 33 Fig. 2.6 - Relative compressive strength of concrete under various steam curing regimes (Type
I cement) [Hanson, 1963] 36 Fig. 2.7 - Relative compressive strength of concrete under various steam curing regimes (Type
I cement) [Hanson, 1963] 37 Fig. 2.8 - Effect of preset period on modulus of elasticity of steam-cured concrete
(temperature rise: 22°C/hour; maximum temperature: 65°C) [Hanson, 1963] 38 Fig. 2.9 - Curing regimes with different preset period and maximum temperatures [Koehler
and Fowler, 2007] 38 Fig. 2.10 - Relationship between strength at 18 hours and preset period [PCA, 2006] 39 Fig. 2.11 - Effect of temperature history on compressive strength [Koehler and Fowler, 2007]
39 Fig. 2.12 - Effect of temperature history on compressive strength [Koehler and Fowler, 2007]
40 Fig. 2.13 - Schematic of temperature history and temperature-time factor [Carino and Lew,
2001] 42 Fig. 2.14 - Maturity rule using temperature-time factor [Kehl et al., 1998] 43 Chapter 3 Fig. 3.1 - Particle-size distribution of sand and coarse aggregate 47 Fig. 3.2 - Particle-size distribution of combined aggregate retained on various sieve openings
47 Fig. 3.3 - Plan of investigation 50 Chapter 4 Fig. 4.1 - Comparison of HRWRA demand of SCC made with different w/cm 68 Fig. 4.2 - Comparison of HRWRA demand of SCC made with different binder types 68 Fig. 4.3 - Comparison of HRWRA demand of SCC made with different binder contents 69 Fig. 4.4 - Comparison of J-Ring flow of SCC made with different w/cm 70 Fig. 4.5 - Comparison of L-box blocking ratio (h^/hi) of SCC made with different w/cm 71 Fig. 4.6 - w/cm -binder content contour diagram of J-Ring flow at 10 minutes (R2 = 0.98).... 71 Fig. 4.7 - w/cm -binder content contour diagram of J-Ring flow at 10 minutes (R2 = 0.98).... 72 Fig. 4.8 - Comparison of J-Ring flow of SCC made with different HRWRA types 72 Fig. 4.9 - w/cm - binder content contour diagram of L-box blocking ratio (h2/hj) (R2 = 0.94) 73 Fig. 4.10 - Comparison of filling capacity of SCC made with different w/cm 73 Fig. 4.11 - Comparison of filling capacity of SCC made with different HRWRA types 74
v
2 Fig. 4.12 - Contour diagram of binder content-w/cw of filling capacity at 10 minutes (R = 0.92) 74
Fig. 4.13 - Contour diagram of binder content-w/cm of plastic viscosity at 10 minutes (R2 = 0.99) 75
Fig. 4.14 - Temperature variations under semi-adiabatic conditions for mixtures No. 3 and No.6 77
Fig. 4.15 - Development of compressive strength of 11 SCC and two HPC mixtures 80 Fig. 4.16 - Comparison of 18-hour steam-cured compressive strength of SCC made with
different w/cm 83 Fig. 4.17 - Comparison of 18-hour steam-cured compressive strength of SCC made with
different binder types 84 Fig. 4.18 - Comparison of 28-day compressive strength of SCC made with different w/cm... 84 Fig. 4.19 - Comparison of 56-day compressive strength of SCC made with different w/cm... 85 Fig. 4.20 - Comparison of 18-hour steam-cured elastic modulus of SCC made with different
w/cm 85 Fig. 4.21 - Comparison of 56-day elastic modulus of SCC made with different w/cm 86 Fig. 4.22 - Contour diagram of binder content-w/cm of 18-hour steam-cured elastic modulus
(R2 = 0.99) 86 Chapter 5 Fig. 5.1 - Comparison of 18-hour steam-cured compressive strength of SCC subjected to
steam-curing with different maximum chamber temperatures 96 Fig. 5.2 - Comparison of 18-hour steam-cured modulus of elasticity of SCC subjected to
steam-curing with different maximum chamber temperatures 97 Fig. 5.3 - Comparison of 18-hour steam-cured compressive strength of SCC subjected to
steam-curing with different preset periods 98 Fig. 5.4 - Comparison of 18-hour steam-cured elastic modulus of SCC steam cured with
different preset periods 99 Fig. 5.5 - Comparison of 18-hour steam-cured compressive strength of SCC steam cured with
different rates of heating 100 Fig. 5.6 - Comparison of 18-hour steam-cured elastic modulus of SCC steam cured with
different rates of heating 100 Fig. 5.7 - 3D diagram of 18-hour steam-cured compressive strength of SCC subject to various
steam-curing parameters 103 Fig. 5.8 - 3D Cube diagram of compressive strength ratio of 18-hour steam-cured relative to
28-day moist-cured for SCC1 104 Fig. 5.9 - 3D Cube diagram of compressive strength ratio of 18-hour steam-cured relative to
18-hour air-cured for SCC1 104 Chapter 6 Fig. 6.1 - Steam-curing regimes and testing ages for experimental program in Phase II-3 ... 113 Fig. 6.2 - Development of maturity with time of mixtures tested at 2 and 5 hours of preset-
period and at 65- and 75 °C max. temperature 115 Fig. 6.3 - Development of compressive strength with time in steam-cured concrete (2 and 5
hours of preset-period, 65 and 75 °C max. temperature) 118 Fig. 6.4 - Relation between maturity and compressive strength at different ages during steam-
curing 119
vi
Fig. 6.4 (cont'd) - Relation between maturity and compressive strength at different ages during steam-curing 119
Fig. 6.5 - Comparing between development of compressive strength with time in moist-cured concrete and in concrete moist-cured after finishing steam-curing 121
Fig. 6.5 (cont'd) - Comparing between development of compressive strength with time in moist-cured concrete and in concrete moist-cured after finishing steam-curing 121
Fig. 6.6 - Comparison between predicted and measured properties: 18-hour compressive strength and 18-hour maturity index 124
Fig. 6.7 - Maximum temperature and preset period contour diagrams for: a) 18-hour steam-cured compressive strength, b) maturity at 18 hours 125
Fig. 6.8 - Max. temp, and preset period contour diagrams for: c) 28-day fc of SCC moist-cured after steam-curing, d) 56-day fc of SCC moist-cured after steam-curing 126
vii
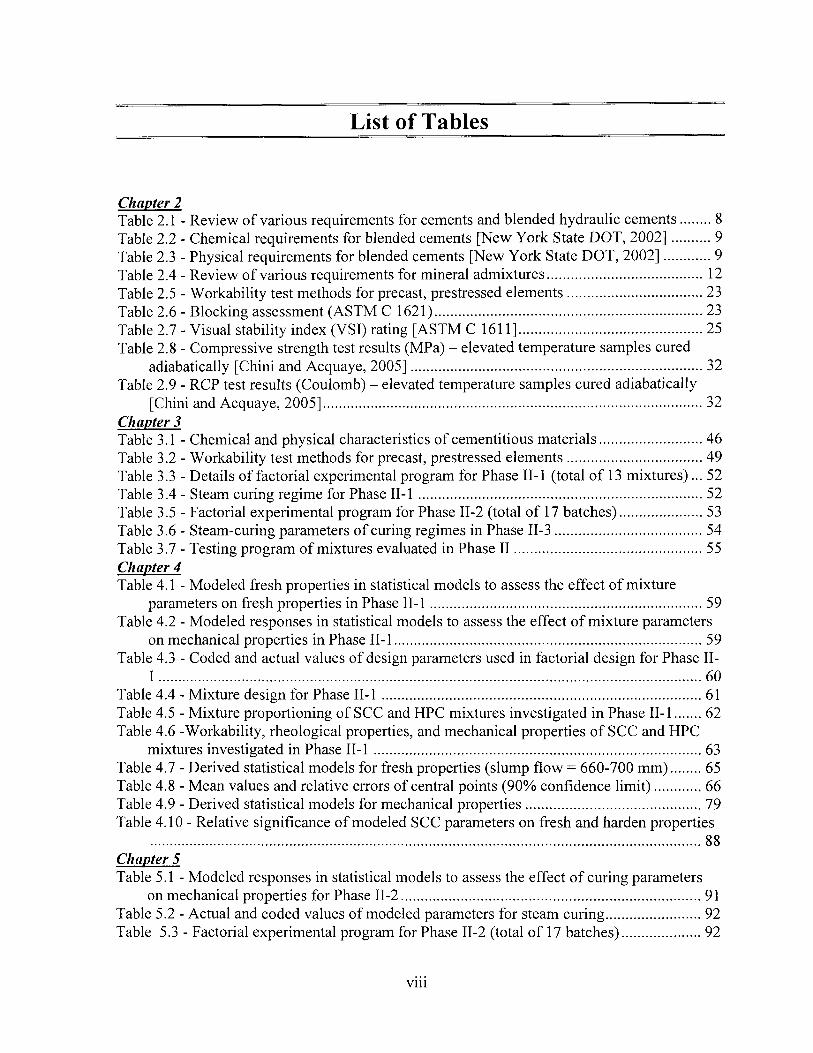
List of Tables
Chapter 2 Table 2.1 - Review of various requirements for cements and blended hydraulic cements 8 Table 2.2 - Chemical requirements for blended cements [New York State DOT, 2002] 9 Table 2.3 - Physical requirements for blended cements [New York State DOT, 2002] 9 Table 2.4 - Review of various requirements for mineral admixtures 12 Table 2.5 - Workability test methods for precast, prestressed elements 23 Table 2.6 - Blocking assessment (ASTM C 1621) 23 Table 2.7 - Visual stability index (VSI) rating [ASTM C 1611] 25 Table 2.8 - Compressive strength test results (MPa) - elevated temperature samples cured
adiabatically [Chini and Acquaye, 2005] 32 Table 2.9 - RCP test results (Coulomb) - elevated temperature samples cured adiabatically
[Chini and Acquaye, 2005] 32 Chapter 3 Table 3.1 - Chemical and physical characteristics of cementitious materials 46 Table 3.2 - Workability test methods for precast, prestressed elements 49 Table 3.3 - Details of factorial experimental program for Phase II-1 (total of 13 mixtures)... 52 Table 3.4 - Steam curing regime for Phase II-1 52 Table 3.5 - Factorial experimental program for Phase II-2 (total of 17 batches) 53 Table 3.6 - Steam-curing parameters of curing regimes in Phase II-3 54 Table 3.7 - Testing program of mixtures evaluated in Phase II 55 Chapter 4 Table 4.1 - Modeled fresh properties in statistical models to assess the effect of mixture
parameters on fresh properties in Phase II-1 59 Table 4.2 - Modeled responses in statistical models to assess the effect of mixture parameters
on mechanical properties in Phase II-1 59 Table 4.3 - Coded and actual values of design parameters used in factorial design for Phase II-
1 60 Table 4.4 - Mixture design for Phase II-1 61 Table 4.5 - Mixture proportioning of SCC and HPC mixtures investigated in Phase II-1 62 Table 4.6 -Workability, rheological properties, and mechanical properties of SCC and HPC
mixtures investigated in Phase II-1 63 Table 4.7 - Derived statistical models for fresh properties (slump flow = 660-700 mm) 65 Table 4.8 - Mean values and relative errors of central points (90% confidence limit) 66 Table 4.9 - Derived statistical models for mechanical properties 79 Table 4.10 - Relative significance of modeled SCC parameters on fresh and harden properties
88 Chapter 5 Table 5.1 - Modeled responses in statistical models to assess the effect of curing parameters
on mechanical properties for Phase II-2 91 Table 5.2 - Actual and coded values of modeled parameters for steam curing 92 Table 5.3 - Factorial experimental program for Phase II-2 (total of 17 batches) 92
Vlll
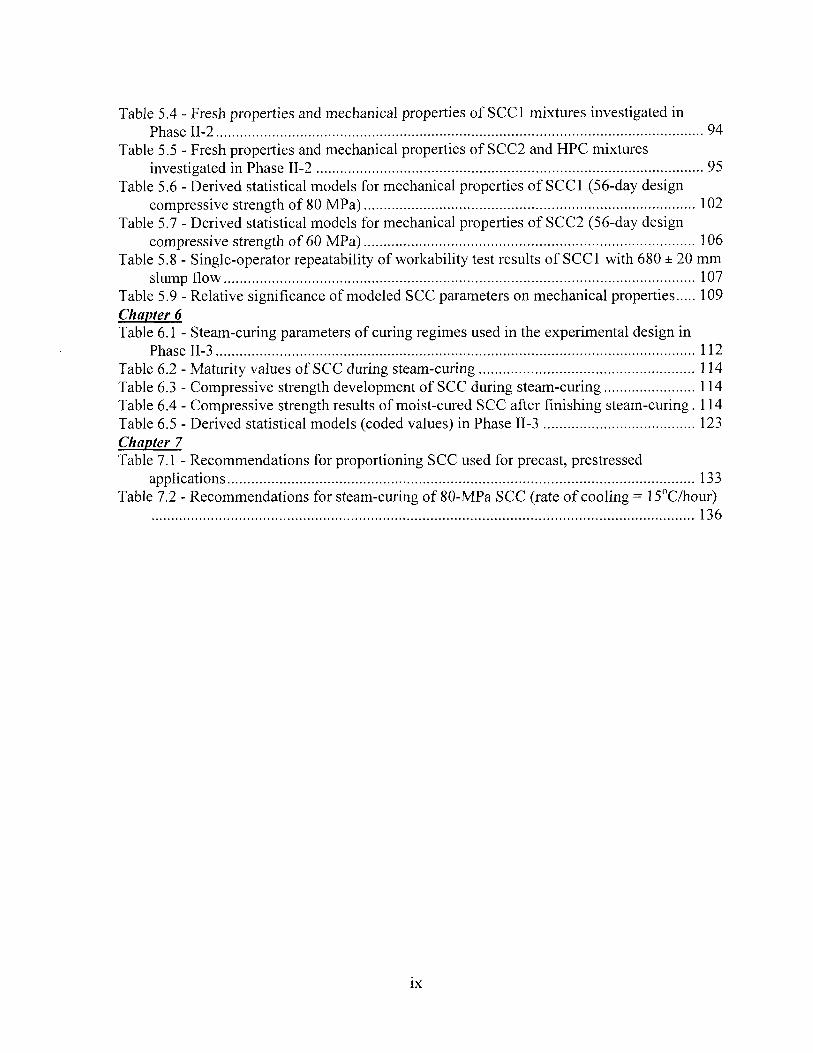
Table 5.4 - Fresh properties and mechanical properties of SCC1 mixtures investigated in Phase 11-2 94
Table 5.5 - Fresh properties and mechanical properties of SCC2 and HPC mixtures investigated in Phase II-2 95
Table 5.6 - Derived statistical models for mechanical properties of SCC1 (56-day design compressive strength of 80 MPa) 102
Table 5.7 - Derived statistical models for mechanical properties of SCC2 (56-day design compressive strength of 60 MPa) 106
Table 5.8 - Single-operator repeatability of workability test results of SCC1 with 680 ± 20 mm slump flow 107
Table 5.9 - Relative significance of modeled SCC parameters on mechanical properties 109 Chapter 6 Table 6.1 - Steam-curing parameters of curing regimes used in the experimental design in
Phase II-3 112 Table 6.2 - Maturity values of SCC during steam-curing 114 Table 6.3 - Compressive strength development of SCC during steam-curing 114 Table 6.4 - Compressive strength results of moist-cured SCC after finishing steam-curing. 114 Table 6.5 - Derived statistical models (coded values) in Phase II-3 123 Chapter 7 Table 7.1 - Recommendations for proportioning SCC used for precast, prestressed
applications 133 Table 7.2 - Recommendations for steam-curing of 80-MPa SCC (rate of cooling = 15°C/hour)
136
ix
Chapter 1 - Introduction
1.1 Background
Precast concrete is a form of construction where concrete is cast in a reusable mould (form
work) which is then cured in a controlled environment, transported to the construction site and
lifted in place. Precast system can adopt almost any aesthetic appreciations, incorporating a
variety of colors and textures. In addition to the structural advantages, the facility of its easy
installation and the reduction of space congestion on the job site are also outstanding benefits.
Further, the use of precast concrete promotes the productivity and allows in reduction of
wastage materials comparing to in-situ conventional casting. The limitation of human
involvements and closely monitored conditions in the manufacturing process provide higher
accuracy and better overall quality of the products. These benefits, from superior quality
control make the use of precast concrete regarded as an economic, durable, structurally sound
and architecturally versatile form of construction.
Nowadays, the precast concrete industry market is seriously affected by production cost,
productivity, and quality criteria. It is characterized by shorter construction time and
increasing labor costs. Lack of uniformity, and unsatisfactory surface quality, along with the
necessity of vibration techniques are considered as serious issues when conventional concrete
is used in complicated dimensional geometry. The early-strength development and service life
are also becoming increasingly desirable factors in the precast market. Therefore, developing
new methods of production are becoming important for improving overall work environment
with minimum expenditure.
Given the high workability characteristics, the use of self consolidating concrete (SCC) in the
precast industry experiences a steady increase over the last few years. SCC provides good
finished surface and reduces the remedial surface treatments of the product. It enhances
productivity given its ability to ensure fast filling of high reinforced precast elements. The
range of benefits offered by SCC goes beyond fundamental aspects of concrete quality and
productivity; it includes a major improvement in the health and safety of workers and the
1
reduction of noise level on construction sites. Furthermore, the use of SCC opens the way for
automation of concrete construction and allows building concrete structures in more efficient
ways.
The fabrication of precast elements using SCC relies on different curing systems. In general,
accelerated curing expedites the gain of compressive strength, thus reducing curing time and
consequently, production cost. Presently, steam-curing is probably the most widely used
method. That is mainly due to its high ability to assure optimum qualities that meet the various
technical and economical requirements of the fabricated elements.
The steam curing regime is divided into four phases. These include a delay period before
steaming (preset period), a temperature increase period, a constant temperature period, and a
temperature decrease period. Despite that steam-curing accelerates early strength development,
heat treatment has a profound effect on microstructure and properties of hardened cement
paste [PCA, 2006; Odler and Chen, 1995; Tepponen and Eriksson, 1987; and Klieger, I960].
Cases of expansion and crack formation in concrete cured at temperatures over 70°C due to
delayed ettringite formation (DEF) in the hydrated cement paste have been reported [Odler
and Chen, 1995]. Steam curing also influences the pore structure of cement paste by
increasing the proportion of large pores in the cement paste. This apparently reduces the
modulus of elasticity. Thus, it is very important to determine a suitable steam curing cycle for
each type of concrete taking into consideration the chemical and physical characterstics of
cement, including suplemantary materials in use. Various code regulations on steam curing
recommend limit values for the preset period, the rate of heating, the maximum temperature,
as well as the rate of cooling. The codes limitations concern to prevent surface defects and
cracking induced by inhomogeneous volume changes and to secure favourable mechanical
properties and durability at early and late ages. In general, the increase in maximum chamber
temperature can lead to an increase in the early-age mechanical properties. However, the
maximum chamber temperature must be controlled to avoid any adverse effect and to prevent
cracking caused by unfavourable expansion. For example, the curing regime should be
adjusted to avoid that the concrete temperature exceed 70°C in order to prevent heat-induced
delayed expansion and undue reduction in ultimate strength [PCA, 2006; Klieger, 1960; and
Tepponen and Eriksson, 1987]. CSA A23.4 stipulates that the maximum concrete temperature
should be 60°C for moisture category damp and 70 °C for moisture category dry. German and
2
Canadian Standards limit the maximum concrete curing temperature to 60°C for concrete that
will be exposed to "damp" conditions while in service [German Standard, 1989; CSA A23.4],
The Precast/Prestressed Concrete Institute (PCI) guidelines [MNL-116, 1999] allows concrete
to be cured to a concrete temperature of 82°C, unless a known potential for alkali-silica
reaction (ASR) or DEF exists, in which case the maximum recommended concrete curing
temperature is 70°C. In 2005, the PCI Technical Activities Committee (TAC) proposed that
the maximum allowable concrete curing temperature for precast concrete products be lowered
from the current 77°C to 65°C. For minimum risk, it is recommended that the concrete should
not be cured at temperature above 60°C for applications regularly exposed to a significant
amount of moisture, unless the cement is proven to be safe when cured at higher temperatures
[Tracy et al., 2004], This is also consistent with guidelines provide by Germany and CSA
Standards.
As in the case of the maximum temperature, early-age mechanical properties can increase
with the increase in preset period from 1 to 5 hours. The early-age strength increases
consistently along the increase in preset period from 3 to 5 hours, [Hanson, 1963; PCA, 2006],
Most of the specifications recommended that the steam-curing process should be applied after
initial setting time or at least 3 hours after the completion of placement, and the preset period
of 3 to 5 hours was normally applied to obtain maximum development of early-age strength.
The rate of heating of the steam atmosphere should be well adjusted to ensure the
development of early-age mechanical properties. As in the case of maximum curing
temperature and preset period, an increase in the rate of heating can lead to an increase in the
18-hour or early-age compressive strength up to a certain limit, which can vary from 11 to
44°C/hour from various code regulations. Canadian Standards, Texas DOT, Florida DOT,
Korean Standards, and New York DOT limit the maximum rate of heating up to 20°C/hour to
avoid detrimental cracking of the concrete might be caused by large temperature gradients
during the heating period.
1.2 Research Significance
Mechanical property of steam-cured SCC is greatly affected by mixture components. They
may also widely vary with diversifying in steam-curing parameters. Recently, the performance
of SCC in some precast concrete industries has far ranged from acceptable to problematic due
to a lack of standardized test procedures and performance criteria. Some, ambiguities
regarding the applicability of current design procedures are associated to manufacturing of
concrete members made using SCC. Limited information is available about the effect of
steam-curing regime on mechanical properties of SCC for precast, prestressed applications. In
addition, wide ranged responses of SCC to steam-curing regimes are observed in terms of
early-strength gaining due to diversity in mixture design. Therefore, research is needed to
address these factors that significantly influence the design and performance of SCC used for
precast, prestressed applications. Thorough understanding is required to monitor the
performance of SCC in field production environment and to evaluate the effect of steam-
curing regime on mechanical properties of such concrete.
1.3 Objectives and Organization of Thesis
The study focuses on assessing the factors that control the performance of SCC used for
precast, prestressed applications. The research also seeks to study the effect of steam-curing
parameters including, maximum curing temperature, preset period, and rate of heating and
cooling on mechanical properties of SCC. The final objective of this investigation, is to
develop recommendations for the fabrication of high strength precast, prestressed beam
elements made with SCC. In general, this study attempts to achieve the following objectives:
• To evaluate the influence of mixture parameters on workability, compressive strength
development, and modulus of elasticity, which are critical to the performance of
precast, prestressed applications; and to optimize mixture proportioning of high-
strength SCC with 56-day design compressive strengths of 60 and 80 MPa;
• To develop steam-curing regime of high-strength SCC as well as HPC suitable for
precast, prestressed applications; and
4
• To develop recommendations for the selection of raw materials, mixture
proportioning, fresh concrete Q/C testing, steam-curing regime, for such type of
concrete.
The study is reported into seven chapters. Background and presentation of the investigation,
and general objectives are presented in Chapter 1. Literature review regarding the selection of
constituent materials, the workability characteristics of SCC, test methods, and the effect of
steam-curing regime parameters on mechanical properties of SCC are presented in Chapter 2.
The experimental program, including mixture proportioning, and specimen preparation and
curing are illustrated in Chapter 3. The factorial design that used to model fresh and
mechanical properties of SCC is depicted in Chapter 4. Chapter 5 is dedicated to study the
effect of steam-curing parameters on mechanical properties of SCC. Chapter 6 is devoted to
discuss the strength development and maturity application in steam-cured concrete.
Conclusions and recommendations from this research are provided in Chapter 7.
Three appendixes are also attached:
Appendix A: Bingham flow curves and rheological parameters of mixtures investigated in
Phase II-1.
Appendix B: Variations of the chamber and concrete temperature during steam-curing for
SCC and HPC mixtures investigated in Phase II-1.
Appendix C: Variations of the chamber and concrete temperature during steam-curing for
SCC and HPC mixtures investigated in Phase II-2.
5
Chapter 2 - Literature Review
A literature review of recent papers relevant to the performance of high-strength SCC for
precast applications is presented. It includes raw material selection, workability characteristics,
fresh concrete testing for mix design, and steam-curing regimes.
2.1 Selection of Constituent Materials
2.1.1 General
Proper selection of concrete constituents is vital to optimize the mix design of SCC with
respect to workability requirements and long-term properties required for precast applications.
The production of SCC necessitates a uniform quality of all constituents better than those
required for conventional concrete. Therefore, specifying the characteristics of constituents
becomes critical in the case of SCC due to its sensitivity to any change in raw materials.
Moreover, it is important to check for any change in basic materials or proportions that may
affect the overall properties and surface appearance of SCC.
2.1.2 Cement and cementitious materials
It is well known that the physical and chemical properties of cement and cementitious
materials play a key role in the development of early age strength and the flow properties in
fresh concrete. The effect of binder properties on early age strength is more evident in steam-
cured concrete when accelerated hydration process is imposed. The hydration process is
greatly affected by binder properties such as, fineness, type, quantity, and chemical
composition [NCHRP report 628, 2009; and SAMSUNG Project, 2009]. Moreover, the effect
of binder properties is intimately correlated to the superplasticizer in use. The superplasticizer
has a tangible influence on the hydration process, consequently on the development of early-
age strength [NCHRP report 628, 2009; and SAMSUNG Project, 2009].
6
A) Cements and blended cements
All standardized cements which conform to the following specifications: ASTM C 150, C 595,
or C 1157 [ACI 237R-07, 2007], can be used for the production of SCC. The choice of cement
type is normally dictated by the specific requirements of each application or by the availability.
Differences in cement properties should be taken into account when designing mixtures for
specific applications. Type I portland cement (general-purpose cement), is suitable for all uses
where the special properties of other types of cement are not required. Type II and IV cements
can be used to reduce the heat of hydration. Type III cement provides high strength at early
age and is particularly appropriate for obtaining high release strengths. Type V cement is used
in concrete exposed to considerable and severe degrees of sulphate attack.
Blended hydraulic cements which conform to the AASHTO M 240 and ASTM C 595M can also be
used. Unless otherwise specified, Types I, II, or III cement; Types IA, IIA, or IIIA air-entrained
cement; or Types IP (portland-pozzolan cement) or IS (portland blast-furnace slag cement) blended
hydraulic cements can be used for the construction of precast, prestressed concrete elements. Types
I, II or III cements can be used with some replacement by supplementary cementitious materials and
other hydraulic binders. In general, fly ash and slag replacement values should not exceed 20% and
40%, respectively, to ensure high-early strength for satisfactory release of strands [PCI Bridge
Design Manual, 1997],
Table 2.1 presents some of the main requirements for cement and blended hydraulic cements
as recommended by AASHTO, ACI, New York State DOT, CSA, European Guidelines, and
KCI (Korean Concrete Institute). Types I, II, or III cement; Types IA, IIA, or IIIA air-
entrained cement; or Types IP or IS blended hydraulic cements shall be used for the
construction of precast, prestressed concrete elements, as recommended according to
AASHTO LRFD Bridge Design [2004] and Construction [1999]. In particular, the pozzolan
constituent in Type IP portland-pozzolan cement shall not exceed 20% of the mass of the
binder. As summarized in Table 2.1, all cement types that meet the requirements of ASTM
Standards can be used in SCC [ACI 237R-07, 2007], Similarly, all cements which conform to
[European Code 197-1, 2000] can be used for the production of SCC. The correct choice of
cement type is normally dictated by the specific requirements of each application or what is
7
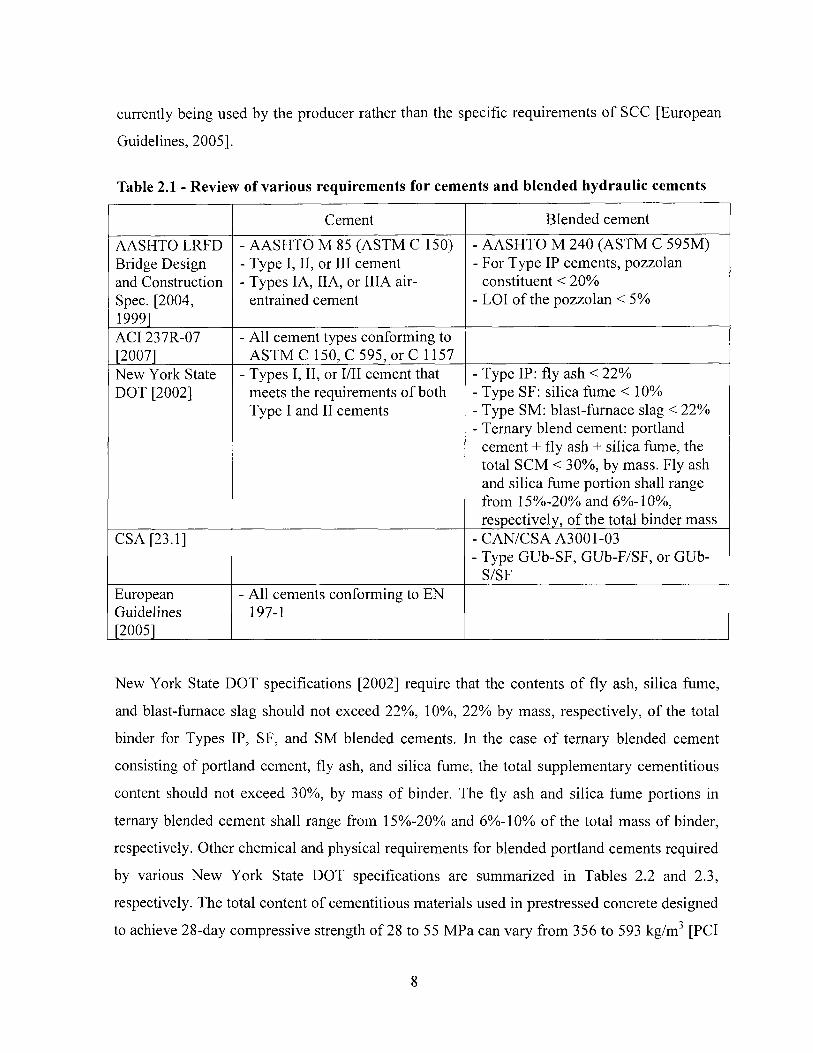
currently being used by the producer rather than the specific requirements of SCC [European
Guidelines, 2005].
Table 2.1 - Review of various requirements for cements and blended hydraulic cements
Cement Blended cement
AASHTO LRFD Bridge Design and Construction Spec. [2004, 1999]
- AASHTO M 85 (ASTM C 150) - Type I, II, or III cement - Types IA, IIA, or IIIA air-
entrained cement
- AASHTO M 240 (ASTM C 595M) - For Type IP cements, pozzolan
constituent < 20% - LOI of the pozzolan < 5%
ACI 237R-07 [20071
- All cement types conforming to ASTM C 150, C 595, or C 1157
New York State DOT [2002]
- Types I, II, or I/II cement that meets the requirements of both Type I and II cements
- Type IP: fly ash < 22% - Type SF: silica fume < 10%) - Type SM: blast-furnace slag < 22% - Ternary blend cement: portland
cement + fly ash + silica fume, the total SCM < 30%, by mass. Fly ash and silica fume portion shall range from 15%-20% and 6%-10%, respectively, of the total binder mass
CSA [23.1] - CAN/CSA A3001-03 - Type GUb-SF, GUb-F/SF, or GUb-
S/SF European Guidelines [2005]
- All cements conforming to EN 197-1
New York State DOT specifications [2002] require that the contents of fly ash, silica fume,
and blast-furnace slag should not exceed 22%, 10%, 22% by mass, respectively, of the total
binder for Types IP, SF, and SM blended cements. In the case of ternary blended cement
consisting of portland cement, fly ash, and silica fume, the total supplementary cementitious
content should not exceed 30%, by mass of binder. The fly ash and silica fume portions in
ternary blended cement shall range from 15%-20% and 6%-10% of the total mass of binder,
respectively. Other chemical and physical requirements for blended portland cements required
by various New York State DOT specifications are summarized in Tables 2.2 and 2.3,
respectively. The total content of cementitious materials used in prestressed concrete designed
to achieve 28-day compressive strength of 28 to 55 MPa can vary from 356 to 593 kg/m3 [PCI
8
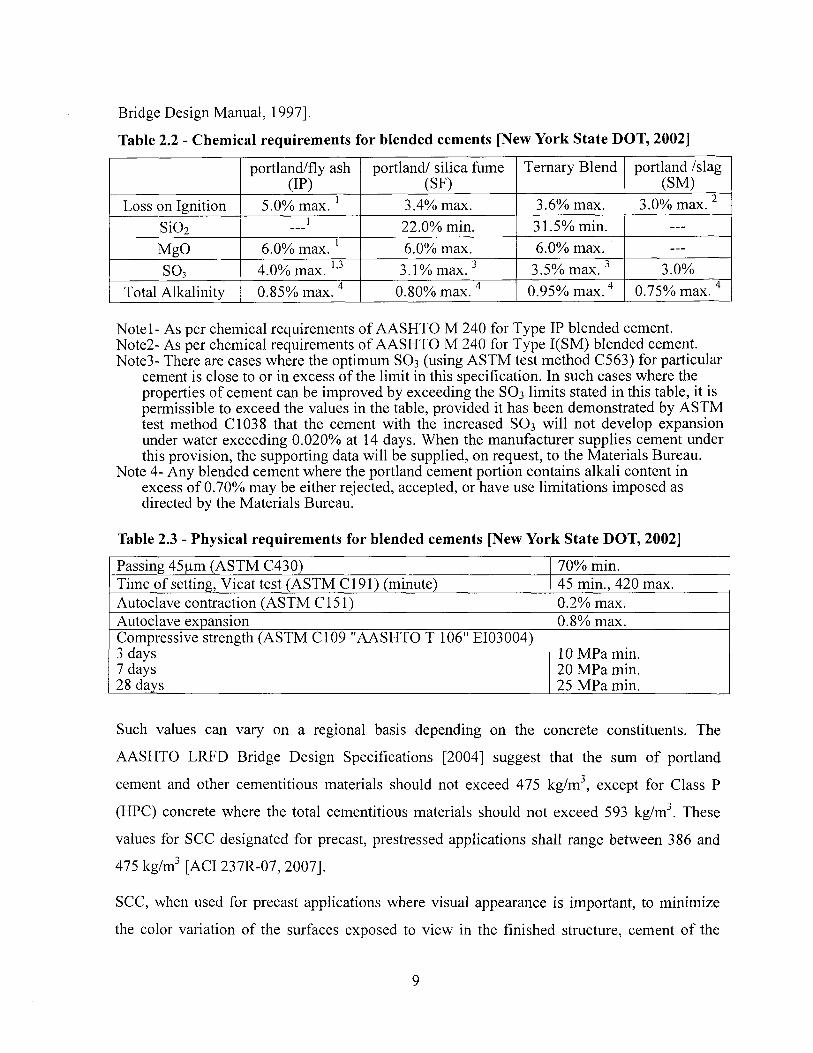
Bridge Design Manual, 1997],
Table 2.2 - Chemical requirements for blended cements [New York State DOT, 2002]
portland/fly ash (IP)
portland/ silica fume (SF)
Ternary Blend portland /slag (SM)
Loss on Ignition 5.0% max. 1 3.4% max. 3.6% max. 3.0% max. 2
Si02 1 22.0% min. 31.5% min. —
MgO 6.0% max. 1 6.0% max. 6.0% max. —
S03 4.0% max. u 3.1% max.3 3.5% max.3 3.0% Total Alkalinity 0.85% max. 4 0.80% max. 4 0.95% max.4 0.75% max. 4
Notel- As per chemical requirements of AASHTO M 240 for Type IP blended cement. Note2- As per chemical requirements of AASHTO M 240 for Type I(SM) blended cement. Note3- There are cases where the optimum SO3 (using ASTM test method C563) for particular
cement is close to or in excess of the limit in this specification. In such cases where the properties of cement can be improved by exceeding the SO3 limits stated in this table, it is permissible to exceed the values in the table, provided it has been demonstrated by ASTM test method CI038 that the cement with the increased S03 will not develop expansion under water exceeding 0.020% at 14 days. When the manufacturer supplies cement under this provision, the supporting data will be supplied, on request, to the Materials Bureau.
Note 4- Any blended cement where the portland cement portion contains alkali content in excess of 0.70% may be either rejected, accepted, or have use limitations imposed as directed by the Materials Bureau.
Table 2.3 - Physical requirements for blended cements [New York State DOT, 2002]
Passing 45[im (ASTM C430) 70% min. Time of setting, Vicat test (ASTM CI 91) (minute) 45 min., 420 max. Autoclave contraction (ASTM CI51) 0.2% max. Autoclave expansion 0.8% max. Compressive strength (ASTM C109 "AASHTO T 106" EI03004) 3 days 7 days 28 days
10 MPa min. 20 MPa min. 25 MPa min.
Such values can vary on a regional basis depending on the concrete constituents. The
AASHTO LRFD Bridge Design Specifications [2004] suggest that the sum of portland
cement and other cementitious materials should not exceed 475 kg/m3, except for Class P
(HPC) concrete where the total cementitious materials should not exceed 593 kg/m3. These
values for SCC designated for precast, prestressed applications shall range between 386 and
475 kg/m3 [ACI 237R-07, 2007],
SCC, when used for precast applications where visual appearance is important, to minimize
the color variation of the surfaces exposed to view in the finished structure, cement of the
9
same type, brand, and color from the same factory shall be used throughout a given project
[PCI Bridge Design Manual, 1997], Belite-rich portland cement has been used in Japan for
producing SCC in some cases [JSCE, 1999]. This cement contains a belite content
(2Ca0.Si02) of 40% to 70%), which is higher than moderate-heat portland cement and can
therefore develop lower heat rise.
B) Mineral admixtures and fillers
In SCC technology, mineral admixtures are often used to increase the content of the binder
necessary to produce high-quality SCC. Binder content less than 350 kg/m3 may only be
suitable to secure high deformability and stability, and can even lead to more expensive
mixtures with the higher demand of HRWRA compared to mixtures with a greater content of
mineral admixtures [Khayat, 1999]. In SCC design, the cement content can be limited to
relatively low values; however, other fines are required to increase the content of the binder.
Fine powder materials typically used in SCC include fly ash, pozzolan, blast-furnace slag, and
silica fume. In some cases, mostly in Europe and Japan, limestone filler is also used to
increase the powder content [Ai'tcin, 2006], Silica fume is very fine noncrystalline silica
produced in electric arc furnaces as a by product of the production of elemental silicon or
alloys containing silicon [ACI 116].
Fly ash is the finely divided residue that results from the combustion of ground or powdered
coal and that is transported by flue gasses from the combustion zone to the particle removal
system (ACI 116). Because of its spherical shape and fineness, fly ash can improve the
rheology of SCC. It is important to note that in this present research, the term cementitious
material refers to portland cement and supplementary cementitious materials, such as fly ash,
blast-furnace slag, silica fume, and other pozzolans. On the other hand, the term binder is used
for mixtures made with cementitious materials and other ultra-fine filler materials, such as
limestone filler.
The requirements for mineral admixtures, including fly ash, blast-furnace slag, and silica fume
are summarized in Table 2.4. Pozzolans and slag meeting ASTM C 618, C 989, or AASHTO
standards are supplementary cementitious material and may be added to portland cements
during the mixing to produce SCC with improved workability, increased strength, reduced
permeability and efflorescence, and improved durability. In general, Class F fly ash has shown
10
to be effective in SCC providing increased cohesion and robustness to changes in water
content [European Guidelines, 2005]. Slump flow values can be increased when the
replacement rates of fly ash are between 20% and 40% of portland cement [Fang, M. et al.,
1999]. Optimum replacement values are dictated by job specifications, material compatibility,
and cost [Sonebi et al., 2003],
Fly ash should conform to the AASHTO M 295 and ASTM C 618 [AASHTO LRFD Bridge
Design [2004] and Construction [1999] Specifications], In general, the content of cement
replaced by fly ash is 18% to 22% by mass [Florida DOT, 2004], In some cases, higher level
of fly ash replacement may reduce the ability of SCC to flow. The replacement rate of fly ash
also affects strength and durability. Replacement by fly ash delays the hydration process and
strength development. Fly ash can also affect air entrainment since the carbon present in fly
ash can absorb air-entraining admixture and adversely affect the ability to entrain air.
Therefore, state specific limits on loss of ignition (LOI) indicative of the carbon content. Fly
ash shall not be used with Type IP or IS cements. Silica fume can increase the stability of
mixtures. The mixture stability is increased by the silica fume's ability to reduce the mobility
of the water within the concrete matrix. Silica fume also improves resistance to segregation
and bleeding [Khayat, 1999]. Silica fume conforming to AASHTO M 307 and ASTM C 1240
can be used as supplementary cementitious material in the proportioning of SCC for improved
strength and durability. The required quantity of replacement will be generally affected by the
size, shape, and distribution of the cement particles. At relatively low replacement of (5% or
below), plastic viscosity of SCC decreases [ACI 237R-07, 2007]. When low replacement in
the SCC mixture is introduced, silica fume reduces friction between the larger cement
particles, thus lubricating the paste matrix. According to Florida DOT [2004], the quantity of
cement replacement with silica fume should be 7% to 9% by mass of cementitious materials.
However, special care should be taken to select the proper silica fume content. In some cases,
high level of silica fume addition besides increasing cost can cause rapid surface crusting that
leads to cold joints or surface defects if delays occur in concrete delivery or surface finish
[European Guidelines, 2005]. Ground granulated blast-furnace slag (GGBFS) meeting
AASHTO M 302 and ASTM C 989 may be used as supplementary cementitious materials.
GGBFS provides reactive fines and due to large replacement rate usually about 40% enables a
low heat of hydration.
11
Cement replacement by GGBFS is based on the severity of the environment to which the
concrete is exposed. The level of GGBFS addition is 25% to 70% for slightly and moderately
aggressive environments, and 50% to 70%) by mass when used in extremely aggressive
environments [Florida DOT, 2004]. When used in combination with silica fume and/or
metakaolin, GGBFS content should be limited to 50% to 55% of the total cementitious content,
by mass of binder [Florida DOT, 2004]. However, in precast prestressed members, the amount
of slag is usually 40%. GGBFS shall not be used with Type IP or Type IS cements.
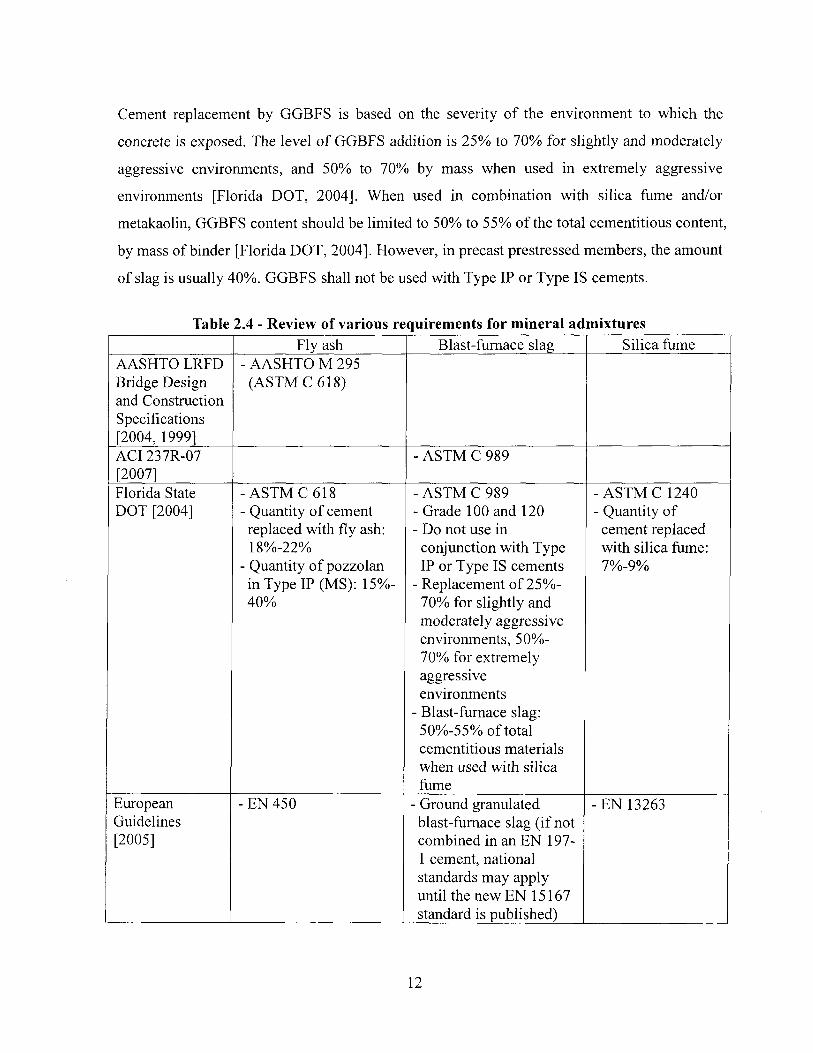
Table 2.4 - Review of various requirements for mineral admixtures Fly ash Blast-furnace slag Silica fume
AASHTO LRFD Bridge Design and Construction Specifications [2004, 1999]
- AASHTO M 295 (ASTM C 618)
ACI 237R-07 [2007]
- ASTM C 989
Florida State DOT [2004]
- ASTM C 618 - Quantity of cement replaced with fly ash: 18%-22%
- Quantity of pozzolan in Type IP (MS): 15%-40%
- ASTM C 989 - Grade 100 and 120 - Do not use in
conjunction with Type IP or Type IS cements
- Replacement of 25%-70% for slightly and moderately aggressive environments, 50%-70% for extremely aggressive environments
- Blast-furnace slag: 50%-55% of total cementitious materials when used with silica fume
- ASTM C 1240 - Quantity of cement replaced with silica fume: 7%-9%
European Guidelines [2005]
- EN 450 - Ground granulated blast-furnace slag (if not combined in an EN 197-1 cement, national standards may apply until the new EN 15167 standard is published)
- E N 13263
12
Special care should be taken to select the proper GGBFS content. The percentage of the
GGBFS replacement should be specified and be agreed to before SCC placement [ACI 237R-
07, 2007], A high proportion of GGBFS exceeding 40% may affect stability of SCC resulting
in reduced robustness with problems of consistency control while delayed setting can increase
the risk of static segregation [European Guidelines, 2005],
Due to the special rheological requirements of SCC, both inert and reactive additions are
commonly used to improve and maintain the workability, as well as to regulate the cement
content and so reduce the heat of hydration [EFNARC, 2002], Although the inert filler does
not meet any published specification, it often improves the quality of SCC. Inert filler,
obtained by grinding limestone or siliceous aggregates, can be used to enhance the portland
cement particle-size distribution and achieve better packing density. The fine fraction of these
fillers will increase the specific surface of the blend, while coarse fractions can help bridge the
gap between the sand and portland cement. The replacement of a portion of cement by finely
ground limestone filler is shown to improve filling ability and stability without affecting the 1-
day compressive strength. The concrete can exhibit up to 10% lower 28-day compressive
strength with similar concrete without filler [ACI 237R-07, 2007]. The replacement of part of
the cement with a less reactive powder may prove beneficial when project requirements limit
the heat of hydration. Other than limestone filler, non-standard fillers have been used in SCC
to increase the amount of powder, including crushed dolomite or granite and ground glass
filler. In all cases, the fraction less than 0.125 mm will be most beneficial to SCC flow
properties. It is important to note that dolomite may present a durability risk due to alkali-
carbonate reaction. Ground glass filler is usually obtained by finely grinding recycled glass.
The particle size should be less than 0.1 mm and the specific surface area should be less than
250 m /kg. Larger particle sizes may cause alkali-silica reaction [EFNARC, 2002],
C) Aggregate characteristics
It is well documented that aggregate properties affect significantly the workability and long
term properties of SCC. The effect of coarse aggregates can be induced in many individual
characteristics such as shape, texture, size distribution, maximum size, absorption,
mineralogical composition, strength and stiffness, etc, [Quiroga and Fowler, 2004], Moreover,
the substantial effect of aggregate as a component of the concrete mixture on flowability and
stability is introduced by the total volume of aggregate, coarse-to-fine aggregate volume,
granular skeleton, grading of aggregate, packing density.
Shape and texture of aggregate affect the required sand quantity to fill the voids between
larger size particles, and consequently affect the water demand to fulfill the workability
requirements, [Quiroga and Fowler, 2004]. Furthermore, the fresh properties of concrete in
terms of flowability, stability, and pumpability are affected significantly by grading and
particle size distribution, due to changing in water demand, [Quiroga and Fowler, 2004].
Uniformly distributed aggregates generally lead to lower voids content and higher packing
density. Additionally, the reduction in water demand due to higher packing density may allow
the use of lower w/cm ratio to achieve higher strength with less bleeding of the fresh cement
paste, [Wong and Kwan, 2007], In SCC gravel, crushed stone, or combinations can be used as
a coarse aggregate. In the case of fine aggregate, natural sand or manufactured sand can be
used, and it should conform to the grain-size distribution recommendations of the project
specifications. The nominal maximum size of coarse aggregate (MSA) should be selected
based on mix-requirements and the minimum clear spacing between the reinforcing steel,
clear cover to reinforcing steel, and thickness of the member, [PCI Bridge Design Manual,
1997]. A high value of MSA tends to reduce the compressive strength; however an increase in
MSA may lead to an increase in tendency of the mix to segregate [Das et al., 2006].
Additionally, rough particles tend to provide stronger bond than smooth particles resulting in
higher compressive strength and lower shrinkage, [Kaplan, 1959].
For prestressed concrete applications of normal consistency, the maximum size of aggregate
(MSA) is limited to 19 mm [AASHTO LRFD Bridge Design Specifications, 2004], In the
design of SCC, typically the MSA values are smaller than those of conventional vibrated
concrete. The reduction in MSA is required to reduce the risk of segregation. Proportioning of
SCC with relatively large MSA would necessitate an increase in yield value (lower
deformability) to prevent segregation.
According to PCI Interim Guidelines [2003], in general, the MSA of SCC mixtures shall not
exceed one-third of the thickness of panels, three-fourths of the minimum clear depth of
cover, and two-thirds of the spacing between individual reinforcing bars or bundles of bars or
pretensioning tendons or post-tensioning ducts. Additionally, aggregate particles smaller than
0.125 mm contribute to the powder content of the mix [EFNARC, 2002], Size and volume of
coarse aggregate are influential in obtaining the passing ability of the concrete. Therefore, the
MSA may accept one stone size smaller than suggested in ACI 301 to improve the passing
ability. The MSA depends on the particular applications and is usually limited to 20 mm
[EFNARC, 2002; PCI Interim Guidelines, 2003]. Typical values of MSA in SCC range
between 12.5 and 19 mm in North America and 16 to 20 mm in Europe. In some repair
applications or placement of SCC in highly congested and restricted sections, MSA values of
9.5 mm are used. In order to minimize the risk of blocking in SCC placement, the maximum
relative volume of coarse aggregate with MSA of 12.5 to 19 mm should be in the range of
28% of the total volume for casting sections with a high level of reinforcement and 32% for
sections with a low level of reinforcement [ACI 237R-07, 2004],
For a given reinforcement density and clear spacing considerations, the optimum coarse
aggregate content in SCC depends on the MSA and aggregate shape. The reduction in MSA
can enable the use of a higher proportion of coarse aggregate, and the use of rounded
aggregates can enable the use of a higher content than in the case of crushed aggregates. For
normal weight concrete, fine and coarse aggregates should conform to the requirements of
AASHTO M 6 and M 80, respectively [PCI Bridge Design Manual, 1997], Fine aggregate
component should be well-graded concrete sand; it may beneficial to blend natural and
manufactured sand to improve SCC plastic properties [ACI 237R-07, 2007], All normal
concreting sands, including crushed or rounded sands, siliceous or calcareous sands, can be
used. The amount of fines, including fine sand, that is less than 0.125 mm should be
considered as powder material in proportioning SCC. Such fine content can have marked
effect on the rheology of SCC. A minimum amount of fines (arising from the binders and fine
sand) must also be achieved to avoid segregation.
Achieving a high degree of packing density of the selected coarse and fine aggregates is
essential in reducing the paste content in SCC. [Khayat et al., 2000] observed that the increase
in packing density of combined sand and coarse aggregate can reduce HRWRA demand and
plastic viscosity of SCC made of various binder contents, especially for concrete with low
water-to-binder ratio. The moisture content, water absorption, grading and variations in fines
of all aggregates should be closely and continuously monitored and must be taken into
account in order to produce SCC of consistent quality. Aggregate absorption has an influential
15
effect on fresh properties, due to the adsorption of mixing water in the fresh concrete [Aitcin,
1992]. Aggregates with low absorption tend to reduce shrinkage and creep [Washa, 1998],
In general, changing the source of supply for aggregates is likely to make a significant change
to the concrete properties and should be carefully and fully evaluated [European Guidelines,
2005], As in the case of normal concrete, if aggregates susceptible to alkali-aggregate
reactivity are used in prestressed concrete members, special precautions must be observed.
These include the use of low-alkali cement, blended cements, or pozzolans [PCI bridge design
manual, 1997],
D) Chemical admixtures
Basically, producing SCC necessitates the use of chemical admixtures which provides many
advantages. Chemical admixtures are introduced in mixture proportioning for their multiple
functions such as reducing water content, improving deformability and stability, providing air
entrainment, accelerating strength development, enhancing workability retention, and
retarding setting time. The type of chemical admixture is normally dictated by the plant
materials and the specific requirements of the mixture application.
The proper dosage of the chemical additives is generally affected by the properties and
proportioning of the mixture compositions. The sand content and its absorption properties are
of prime importance to determine the w/cm, consequently the dosage of the utilized chemical
admixture. Compatibility between admixtures should be specifically addressed whenever
using more than one admixture in producing SCC, even if the same chemical admixture
company supplies the admixtures.
Unless otherwise specified, only Type A (water-reducing), Type B (retarding), Type D (water-
reducing and retarding), Type F (water-reducing, high range), or Type G (water-reducing,
high range, and retarding) should be used [AASHTO LRFD Bridge Design Specifications,
2004], In order to avoid corrosion problems, admixtures containing chloride ions shall be
limited to a maximum water-soluble chloride-ion content of 0.06% by mass of cement in the
case of prestressed concrete or 0.30% in the case of reinforced concrete without prestress
when tested in conformance to ASTM C 1218 [PCI Interim Guidelines, 2003], Similarly, for
prestressed concrete, chloride-ion content in chemical admixtures should be limited to 0.1%,
by mass of the admixture [AASHTO LRFD Bridge Design Specifications, 2004].
16
The use of Type F or G high-range water reducing admixture (HRWRA) is essential to
achieve SCC fluidity. Such HRWRA can be used in combination with regular water-reducing
admixtures or mid-range water-reducing admixtures. The HRWRA shall conform to the
requirements of ASTM C 494 Type F (water-reducing, high range) or G (water-reducing, high
range, and retarding) or ASTM C 1017. The admixture should enable the required water
reduction and fluidity during transport and placement. There are mid-range water-reducing
admixtures that may be classified under ASTM C 494 as Type A or F depending on dosage
rate. The required consistency retention will depend on the application. Precast concrete is
likely to require a shorter retention time than cast-in-place concrete.
There are varieties of commercially available HRWRAs that can be used to produce SCC.
Often, SCC is proportioned with polycarboxylate-based or copolymer HRWRA that can
develop higher early compressive strength and better fluidity retention than naphthalene or
melamine-based HRWRA. Depending on the synthesis and side chain composition of these
polymers, the newer type of sterical dispersing HRWRAs can impart some increase in
viscosity compared to conventional naphthalene- or melamine-based HRWRA. Water
included in HRWRA, as in the case of other chemical admixtures, should be considered as
part of the total allowed mixing water [AASHTO LRFD Bridge Construction Specifications,
1999]. Polycarboxylate-based HRWRA can entrap air, especially after mixing and agitation,
and are proportioned with de-foaming agents. In some cases, the high dosage rate of HRWRA,
coupled with the high fluidity can make it difficult to ensure the entrainment of a fine air-void
system in the concrete. Air-entraining admixture is then needed, often at reduced
concentration, to secure a given air-void system in SCC made with polycarboxylate-based
HRWRA. Admixtures that modify the cohesion of the SCC without significantly altering its
fluidity are called viscosity-modifying admixture (VMA). This admixture can be used in SCC
to minimize the effect of variations in moisture content, fines in the sands or its grain size
distribution, making the SCC more robust and less sensitive to small variations in the
proportions and condition of other constituents. However, they should not be regarded as a
way of avoiding the need for a good mix design and careful selection of other SCC
constituents [European Guidelines, 2005], High dosage of VMA may lead to increased
HRWRA demand and in some cases, some delay in setting, and development of early-age
mechanical properties. The use of a VMA gives more possibilities of controlling segregation
17
when the amount of powder material is limited. This is especially true where aggregate quality
and gradation are limited, powder content is low, or the production facility has poor moisture
control. The use of VMA should not justify that the total content of powder material be
reduced to a great extent, [NCHRP report 628, 2009].
In order to ensure a good stability of the fresh concrete, the recommendation is to use a VMA
for SCC proportioned with w/cm higher than 0.40, [NCHRP project, 2009]. The dosage rate of
VMA starts with low level and can be increased to the dosage rate that secures the desirable
level of stability. Air-entraining admixture (AEA) can be used in concrete primarily to
increase the resistance of the concrete to freeze-thaw damage. They may also be used to
increase the workability of the concrete and facilitate handling and finishing.
Entrained air bubbles are not like entrapped air voids, which occur in all concretes as a result
of mixing, handling, and placing are largely a function of aggregate characteristics [Kosmatka,
et al., 2002]. Intentionally entrained air bubbles are extremely small in size, between 10 to
1000(im in diameter, while entrapped voids are usually 1000 or larger. The majority of the
entrained air voids in normal concrete are between 10 and 100 |j.m in diameter. Air-entraining
admixtures shall conform to the requirements of AASHTO M 154 and ASTM C 260. Air-
entraining admixtures, as in the case of other admixtures, should be incorporated into the
concrete mixture in a water solution. In some cases, high dosage of HRWRA coupled with
the high fluidity of the mixture can make it difficult to ensure the entrainment of stable air-
void system in the concrete. HRWRA can also entrain coarse air bubbles. Compatibility
evaluation between the AEA and HRWRA is therefore needed to achieve the targeted air-void
characteristics. Set accelerating admixtures are used to decrease the setting time and increase
the early strength development. They are particularly beneficial in precast concrete
construction to facilitate early form removal and release of prestressing [PCI Bridge Design
Manual, 1997], In an absence of accelerated radiant heat or steam curing, the use of set
accelerating admixture in SCC may be beneficial in precast applications when using
naphthalene- or melamine-based HRWRA. On the other hand, the use of polycarboxylate-
based HRWRAs does not typically lead to set retardation, hence reducing the need for use of
set accelerating admixtures. ASTM C 494 Type D set-retarding admixture may be used during
hot weather concreting or when delay in setting is required, subject to an acceptance by the
engineer in charge. Some water-reducing admixtures at high dosage rates can act as retarding
admixtures. They should be used with caution. Set-accelerating admixture (Type C) shall be
used to decrease setting time and increase the development of early-age mechanical properties.
The admixture is particularly beneficial in precast concrete construction to facilitate early
form removal and release of prestressing [PCI Bridge Design Manual, 1997].
Coloring pigments used in SCC shall conform to the requirements of ASTM C 979. All
coloring admixtures required for a project shall be ordered in one lot and shall be finely
ground natural or synthetic mineral oxide or an organic phothalocyanine dye with a history of
satisfactory color stability in concrete [European Guidelines, 2005].
Incompatibility of admixtures with binders can lead to improper air void system and delayed
or accelerated setting time. Therefore, before the start of the manufacturing plants, concrete
with the job materials, including admixtures, should be tested to ensure compatibility. Such
testing should be repeated whenever there is a change in the binder and admixtures.
2.2 Workability Characteristics of SCC and Test Methods
2.2.1 Workability requirements
The unique workability of SCC is mainly induced by its ability to spread readily into place
under its own weight filling restricted sections with minimum separation of material
constituents. The use of SCC can improve productivity in structural applications such as repair
and precast/prestressed concrete and facilitate the filling of heavy-reinforced sections. In
general, the workability of concrete refers to the ease of mixing, placement, consolidating, and
finishing of concrete. In SCC technology, it also refers to the flowing and filling properties of
the concrete during placement. Workability of SCC is described in terms of filling ability,
passing ability, and stability [Khayat, 1999] these properties are characterized by specific
testing methods. In general, the workability requirements of SCC are complex and depend on
several parameters, including the type of construction, selected placement and consolidating
methods, the complexity and shape of the formwork, the degree of congestion of the structural
member, the intended placement method, labour skills, as well as quality assurance and
quality control measures [NCHRP report 628, 2009]. In the case of SCC, filling ability (also
referred to as deformability or unconfined flowability) describes the ability of the concrete to
undergo change in shape and flow around obstacles to completely encapsulate the
reinforcement and fill the formwork under its own weight without any mechanical
consolidation [NCHRP report 628, 2009],
Passing ability refers to the ability of the concrete to pass among various obstacles and narrow
spacing in the formwork without blockage, in the absence of any mechanical vibration. Such
blockage can rise from local aggregate segregation in the vicinity of obstacles.
Filling capacity is the ability of the concrete to completely fill intricate formwork or formwork
containing closely spaced obstacles, such as reinforcement. SCC can achieve high filling
capacity if it has high levels of filling ability and passing ability to spread into a
predetermined section, fill the form by the action of gravity alone, and achieve complete
filling of the section without segregation or blockage. Stability describes the ability of the
concrete to maintain a homogeneous distribution of its various constituents. There are two
types of stability characteristics: dynamic and static stability. Dynamic stability refers to the
resistance of concrete to the separation of constituents during transport, placement, and spread
into the formwork. Static stability refers to the resistance to segregation and bleeding after
casting while the concrete is still in a plastic state, [NCHRP report 628, 2009].
Properly designed SCC should have the high workability necessary for ease of placement
while maintaining high stability in order to secure homogeneous distribution of in-situ
engineering properties and durability [Khayat, 1999], The basic workability characteristics of
SCC that must be balanced to ensure successful casting of SCC include deformability (filling
ability), passing ability, and resistance to segregation. These properties are affected by a
number of parameters, including raw material properties and concrete proportioning. The
deformability of fresh SCC is closely related to that of the cement paste. An increase in w/cm,
or w/b, can secure high deformability; however, it can also reduce the cohesiveness of the
paste and mortar, thus leading to segregation of fine and coarse aggregate particles. Therefore,
a balance is needed to enhance deformability without a substantial reduction in cohesiveness.
Another major parameter that affects deformability is the interparticle friction between the
various solid particles in the concrete matrix. The use of HRWRA can disperse cement grains
and reduce interparticle friction among cement particles. It is also essential to reduce the
relative volume of coarse aggregate and sand, and increase the paste volume in order to
enhance deformability. Another primary parameter necessary to provide self-consolidating
20
properties is the passing ability of the concrete. The required level of passing ability is a
function of the structural detailing and formwork shape of the cast element [Khayat, 1999].
Concrete with low cohesiveness can segregate since it cannot maintain proper suspension of
aggregate to ensure uniform deformation around the various obstacles. The lack of stability
can weaken the interface between the aggregate and cement paste, and increase the tendency
to develop local microcracking that can increase permeability and reduce mechanical
properties. An important criterion for producing high-performance SCC is to provide high
resistance to segregation following the casting of the concrete to ensure homogenous
distribution of the in-place quality of the hardened concrete. The risk of segregation can
decrease by reducing the w/cm, coarse aggregate content, and MSA. The increase in viscosity
of the cement paste can enhance the suspension of solid particles during flow, hence leading
to better dynamic stability. The incorporation of VMA along with HRWRA can be effective in
controlling bleeding, segregation, and surface settlement of highly flowable concrete [Khayat
and Guizani, 1997],
From a workability point of view, the selection of material constituents of SCC intended for
use in precast, prestressed beam elements and the mixture proportioning should be tailored to
achieve the following performance characteristics necessary for successful casting of
structural elements:
• Self-consolidation - the SCC must flow into place and encapsulate the reinforcement
without segregation or blockage;
• Retention of deformability - compatible with duration of transport and provisions for
field adjustments. This is especially critical for confined flowability;
• Adequate stability during transport and placement (dynamic stability) - resistance to
material separation during pumping and spread through restricted spacing;
• Proper resistance to segregation, bleeding, and surface settlement during the dormant
period of cement hydration (static stability); and
• Uniform surface quality and homogeneous distribution of in-situ hardened concrete
[Khayat, 1999].
21
In developing the performance requirement of SCC for mix design purposes, it is necessary to
consider both, fresh and hardened properties of the concrete. The fresh properties of SCC are
dictated by flow characteristics of the concrete, which in turn, are influenced by a number of
factors, including the characteristics of locally available materials, the characteristics of the
cast element, and concrete production and placement considerations. Therefore, in specifying
the plastic properties of SCC, it is important to take into consideration the characteristics of
the cast element that can affect flow characteristics, including its shape, dimensions, and
density of reinforcement. The type of placement device should also be considered as various
placement devices (bucket, tucker, discharge truck, conveyor, or pump) can provide different
levels of energy to the cast concrete and continuity of the placement. The maximum required
spread distance in the formwork and initial free-fall drop height must also be considered in
selecting the performance characteristics of the fresh concrete. Finally, characteristics of local
available raw materials, including aggregate shape and grading, are also of prime importance
to the flow characteristics of SCC.
2.2.2 Test methods to assess workability of SCC
Various test methods are being used to assess the key workability characteristics of SCC. In
general, these methods include the equipments required for evaluating simultaneously filling
ability, passing ability, and stability, as these properties are rather interrelated.
The most promising test methods that are relevant for the fabrication of precast, prestressed
concrete beam elements are summarized in Table 2.5, and described briefly.
A) Slump flow and T-50 flow test
The slump flow test is used to evaluate the ability of SCC to deform under its own weight.
The slump flow test consists of determining the mean diameter of concrete spread at the end
of a slump test (ASTM C 143) and the time needed for the concrete to spread 500 mm (T-50)
is noted.
22
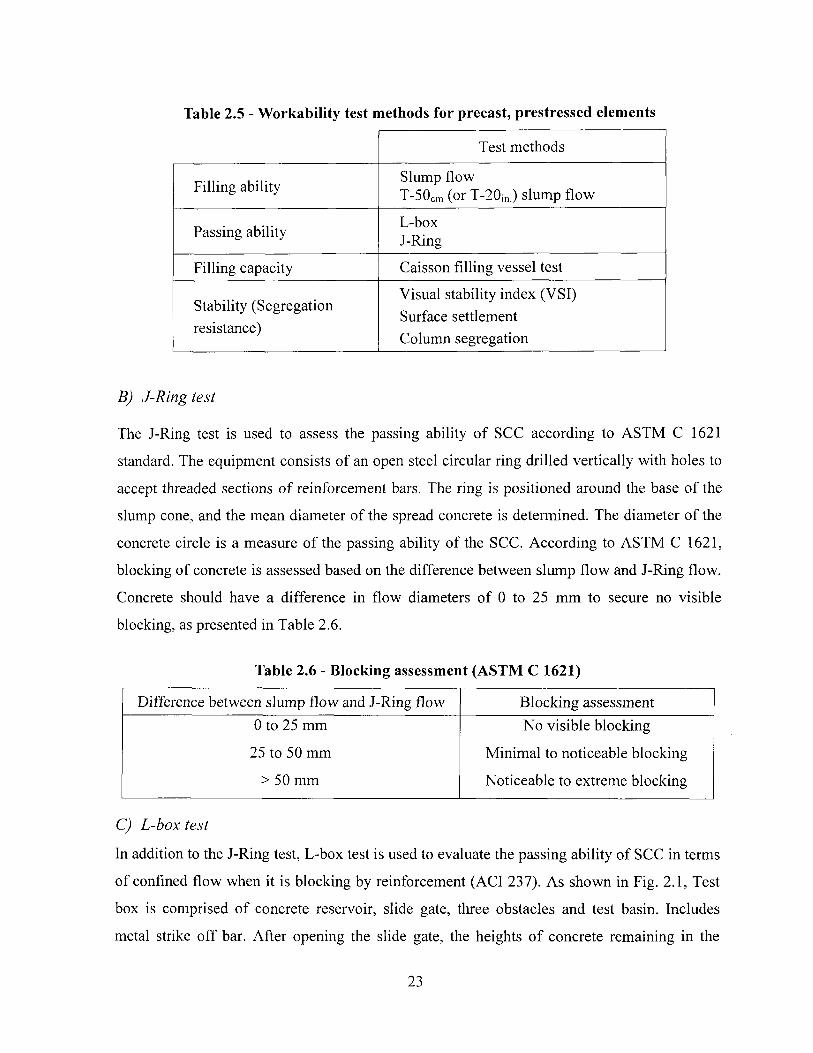
Table 2.5 - Workability test methods for precast, prestressed elements
Test methods
Filling ability Slump flow T-50cm (or T-20jn.) slump flow
Passing ability L-box J-Ring
Filling capacity Caisson filling vessel test
Stability (Segregation resistance)
Visual stability index (VSI) Surface settlement Column segregation
B) J-Ring test
The J-Ring test is used to assess the passing ability of SCC according to ASTM C 1621
standard. The equipment consists of an open steel circular ring drilled vertically with holes to
accept threaded sections of reinforcement bars. The ring is positioned around the base of the
slump cone, and the mean diameter of the spread concrete is determined. The diameter of the
concrete circle is a measure of the passing ability of the SCC. According to ASTM C 1621,
blocking of concrete is assessed based on the difference between slump flow and J-Ring flow.
Concrete should have a difference in flow diameters of 0 to 25 mm to secure no visible
blocking, as presented in Table 2.6.
Table 2.6 - Blocking assessment (ASTM C 1621)
Difference between slump flow and J-Ring flow Blocking assessment 0 to 25 mm
25 to 50 mm
> 50 mm
No visible blocking
Minimal to noticeable blocking
Noticeable to extreme blocking
C) L-box test
In addition to the J-Ring test, L-box test is used to evaluate the passing ability of SCC in terms
of confined flow when it is blocking by reinforcement (ACI 237). As shown in Fig. 2.1, Test
box is comprised of concrete reservoir, slide gate, three obstacles and test basin. Includes
metal strike off bar. After opening the slide gate, the heights of concrete remaining in the
23
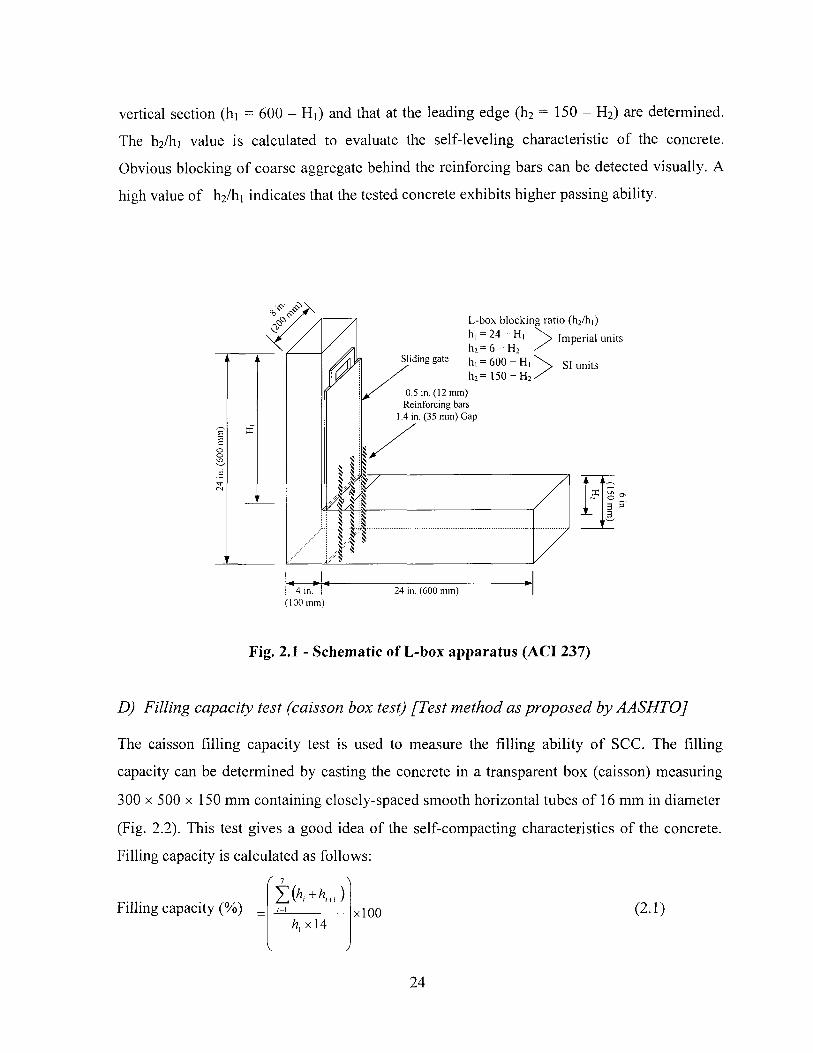
vertical section (hi = 600 - Hi) and that at the leading edge (h2 = 150 - H2) are determined.
The h2/h] value is calculated to evaluate the self-leveling characteristic of the concrete.
Obvious blocking of coarse aggregate behind the reinforcing bars can be detected visually. A
high value of h2/hi indicates that the tested concrete exhibits higher passing ability.
I 4 in (100 mm)
hi = 2 4 — Hi h 2 = 6 - H 2
Sliding gate h i = 6 Q o - H ,
h 2 = 150 - H 2
0.5 in. (12 mm) Reinforcing bars
1.4 in. (35 mm) Gap
L - b o x b l o c k i n g r a t io ( h 2 / h i )
24 in. (600 mm)
I m p e r i a l un i t s
SI u n i t s
x 3 = 3
Fig. 2.1 - Schematic of L-box apparatus (ACI 237)
D) Filling capacity test (caisson box test) [Test method as proposed by AASHTO]
The caisson filling capacity test is used to measure the filling ability of SCC. The filling
capacity can be determined by casting the concrete in a transparent box (caisson) measuring
300 x 500 x 150 mm containing closely-spaced smooth horizontal tubes of 16 mm in diameter
(Fig. 2.2). This test gives a good idea of the self-compacting characteristics of the concrete.
Filling capacity is calculated as follows:
Filling capacity (%) _ ;=1
h x 14 xlOO (2.1)
24
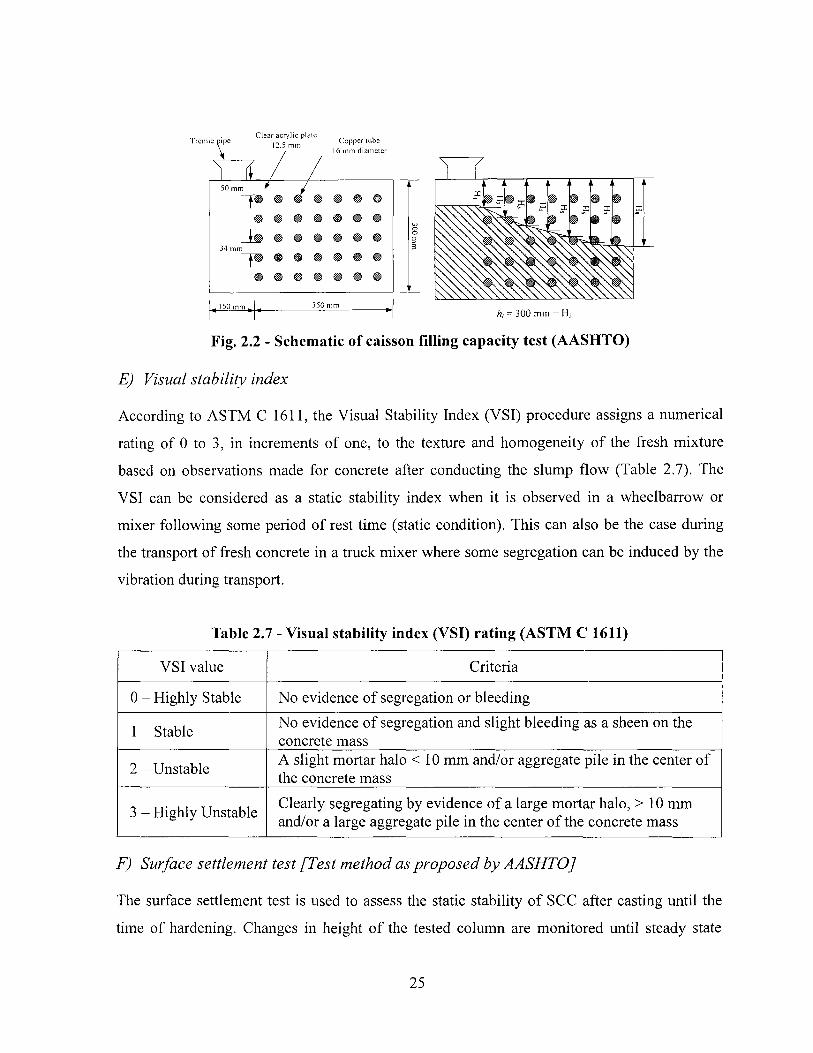
hi = 3 0 0 m m - Hj
Fig. 2.2 - Schematic of caisson filling capacity test (AASHTO)
E) Visual stability index
According to ASTM C 1611, the Visual Stability Index (VSI) procedure assigns a numerical
rating of 0 to 3, in increments of one, to the texture and homogeneity of the fresh mixture
based on observations made for concrete after conducting the slump flow (Table 2.7). The
VSI can be considered as a static stability index when it is observed in a wheelbarrow or
mixer following some period of rest time (static condition). This can also be the case during
the transport of fresh concrete in a truck mixer where some segregation can be induced by the
vibration during transport.
Table 2.7 - Visual stability index (VSI) rating (ASTM C 1611)
VSI value Criteria
0 - Highly Stable No evidence of segregation or bleeding
1 - Stable No evidence of segregation and slight bleeding as a sheen on the concrete mass
2 - Unstable A slight mortar halo < 10 mm and/or aggregate pile in the center of the concrete mass
3 - Highly Unstable Clearly segregating by evidence of a large mortar halo, > 10 mm and/or a large aggregate pile in the center of the concrete mass
F) Surface settlement test [Test method as proposed by AASHTO]
The surface settlement test is used to assess the static stability of SCC after casting until the
time of hardening. Changes in height of the tested column are monitored until steady state
25
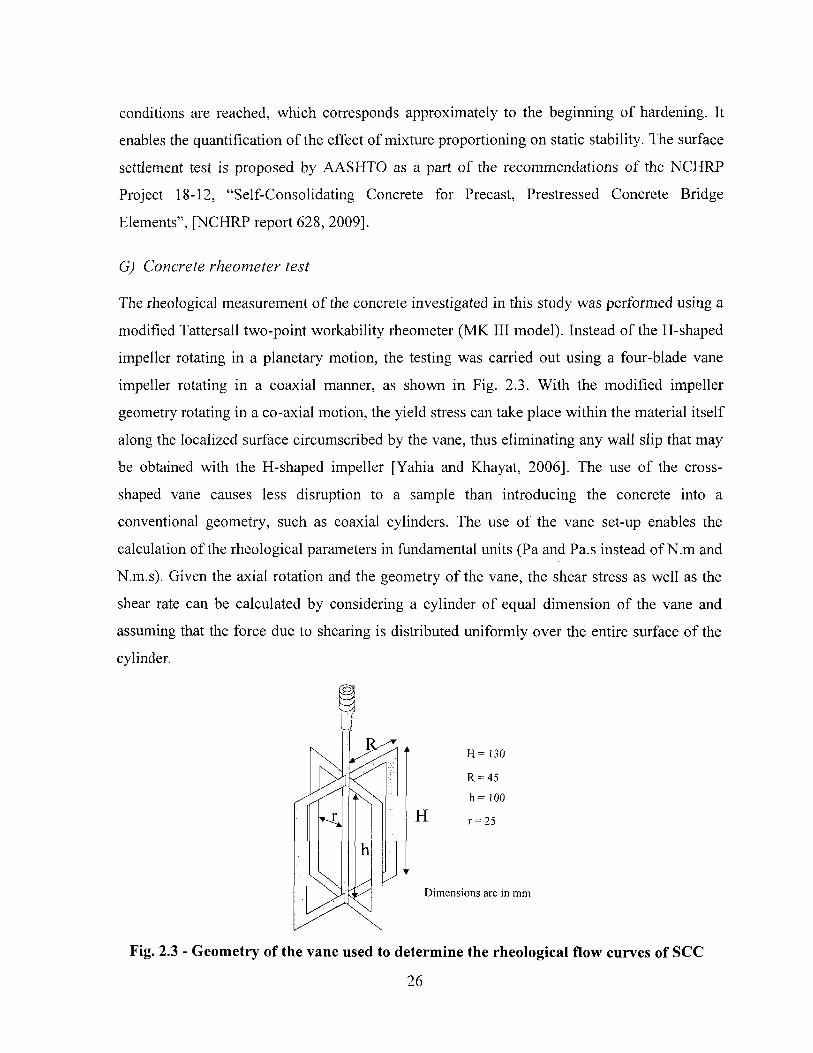
conditions are reached, which corresponds approximately to the beginning of hardening. It
enables the quantification of the effect of mixture proportioning on static stability. The surface
settlement test is proposed by AASHTO as a part of the recommendations of the NCHRP
Project 18-12, "Self-Consolidating Concrete for Precast, Prestressed Concrete Bridge
Elements", [NCHRP report 628, 2009].
G) Concrete rheometer test
The rheological measurement of the concrete investigated in this study was performed using a
modified Tattersall two-point workability rheometer (MK III model). Instead of the H-shaped
impeller rotating in a planetary motion, the testing was carried out using a four-blade vane
impeller rotating in a coaxial manner, as shown in Fig. 2.3. With the modified impeller
geometry rotating in a co-axial motion, the yield stress can take place within the material itself
along the localized surface circumscribed by the vane, thus eliminating any wall slip that may
be obtained with the H-shaped impeller [Yahia and Khayat, 2006], The use of the cross-
shaped vane causes less disruption to a sample than introducing the concrete into a
conventional geometry, such as coaxial cylinders. The use of the vane set-up enables the
calculation of the rheological parameters in fundamental units (Pa and Pa.s instead of N.m and
N.m.s). Given the axial rotation and the geometry of the vane, the shear stress as well as the
shear rate can be calculated by considering a cylinder of equal dimension of the vane and
assuming that the force due to shearing is distributed uniformly over the entire surface of the
cylinder.
H = 130
R = 45 h = 100
r = 25
h
Fig. 2.3 - Geometry of the vane used to determine the rheological flow curves of SCC
26
2.3 Effect of Steam-Curing Regime on Mechanical Properties of SCC
2.3.1 General
Steam curing, a method to accelerate the concrete curing, is beneficial when early strength
gain in concrete is important as in the area of precast and prestressed applications. Steam-
curing regime is commonly used due to its ability to adopt the various optimized hardening
properties of the cured precast members. Steam-curing regimes also results in considerable
savings and extra productivity. Moreover, steam cured concrete can develop lower drying
shrinkage and creep compared to those cured at standard conditions (23°C for 28 days)
[Tepponen and Eriksson, 1987]. Generally, two methods of steam curing are used; 1) live
steam at atmospheric pressure for enclosed cast-in-place structures and large precast concrete
units; 2) high-pressure steam in autoclaves for small manufactured units. In this investigation,
only live steam at atmospheric pressure is discussed. In general, the factors which have the
major influence on compressive strength development of steam-cured concrete are the same as
those affecting other concrete mechanical and visco-elastic properties. A steam curing cycle
can be divided into four periods, as follows:
(1) Preset period (an initial delay prior to steaming);
(2) Temperature increase period (a period for increasing the temperature);
(3) Constant temperature period (a period for holding the maximum temperature constant);
and
(4) Temperature decrease period (a period for decreasing the temperature).
Changes of steam-curing parameters can influence mechanical properties and performance
that may diverge from what is commonly expected from standard cured concrete [Hanson,
1963]. Changes in steam curing parameters may lead to different hardening properties. The
effect of each parameter is interacted with changes in other parameters. The type of binder and
HRWRA are of prime importance to determine the steam-curing regime and subsequently the
hardening properties of the cured elements. The response of steam-cured concrete to imposed
curing temperature in terms of hydration kinetics and early-strength development varied
depending on the properties of cementitious material and the superplasticizer.
27
In steam-curing, the total time of heat treatment and the curing temperature are adjusted
according to the targeted 1-day or 18-hour compressive strength of the cured elements.
Hanson [1963] carried out an intensive investigation of the effect of various steam curing
parameters on compressive strength, indirect tensile strength, and elastic properties of
concrete, with particular emphasis on steaming procedures compatible with the time
requirements of prestressing plants. This investigation generally involved the variation of the
delay prior to steaming (Preset period) from 1 to 7 hours and the steam curing period from 11
to 17 hours. The rate of increase of temperature in curing chamber, varied from 11 to
44°C/hour. The effect of steam curing on key mechanical properties of SCC and HPC are
presented in the following paragraph. They also include various specifications for steam
curing recommended by the Canadian Standards Association (CSA), Precast Concrete
Institute (PCI), Portland Cement Association (PCA), American Concrete Institute (ACI),
AASHTO standards, four State Department of Transportation (DOT) (Texas, Florida, New
York, and Washington) in United States, as well as Korean Standards.
2.3.2 Effect of maximum temperature
Basically, the chemical reactions of cement hydration take place rapidly under higher curing
temperatures. This results in greater early strength and faster turnover of precast products. The
necessity to control curing temperature exists for the following reasons:
Early heat application and high rate of temperature rise can adversely influence the
strength and other structural properties of concrete.
Always an optimum maximum curing temperature exists.
Homogeneous temperature within the product and from day-to-day production is
necessary to prevent differential shrinkage.
In general, an increase in the maximum chamber temperature can lead to an increase of the
18-hour compressive strength. However, a limit to the maximum temperature is set to secure
compressive strength at later ages and thus, to enhance durability. The effects of various
magnitudes of maximum temperature on the 18-hour compressive strengths of concrete using
Types I and III cements are presented in Fig. 2.4 [Hanson, 1963]. Compressive strength
curves rise at a uniform rate approximately to 65°C maximum temperature. Beyond this
28
temperature, the increase in relative strength is shown to slow down. This indicates that 18-
hour compressive strength improves rapidly as the maximum temperature increases to
approximately 65°C, with only a moderate additional advantage gained by using temperatures
greater than 65°C. The limit of maximum temperature to have a constant rate of strength gain
for Type III cement is lower than that for Type I cement [Hanson, 1963].
In many cases, the early strength seems to be optimum at about 65°C with little apparent gain
at temperatures above that limit. Most recommendations of curing regimes, suggest a
maximum curing temperature of 65 to 71°C to ensure minimum sacrifice of strength at later
ages. In general, steam temperature in the enclosure should be kept at about 60°C until the
desired concrete strength is developed [PCA, 2006], In addition to monitoring the chamber
temperature, the heat of hydration may also cause the internal temperature of the concrete to
exceed 70°C. It is recommended that the internal temperature of concrete should be restricted
to 70°C to avoid heat induced delayed ettringite formation and undue reduction of ultimate
strength [PCA, 2006; Klieger, 1960; and Tepponen and Eriksson, 1987], The curing
temperature can be compromised between the rate of strength gain and ultimate strength
because higher curing temperature lowers the ultimate strength [Mindess and Young, 1981].
The study on the accelerated curing conducted by the Concrete Technology Associates (CTA)
reveals that the reduction of strength at later ages due to an accelerated curing occurres when
an impermeable coating forms around the cement grains and restricts further hydration [CTA,
1973], The coating develops from an early hydration of C3A compound in the cement. A
premature "honeycomb-like" structure occurs when insufficient gypsum (SO3) is present in
order to fully retard C3A hydration. Higher temperatures accelerate the hydration of C3A and
lower the solubility of gypsum. The CTA [1973] concludes that cements containing low C3A
and with higher than normal optimum SO3 content tend to perform better under accelerated
curing conditions than those of cements that are high in C3A (greater than 8%) and low S03
content. However, this must be concluded after careful investigation because excess gypsum
can lead to expansion and disruption of paste set. As already noted in Fig. 2.4, the cement type
has a great importance in heat treatment applications.
29
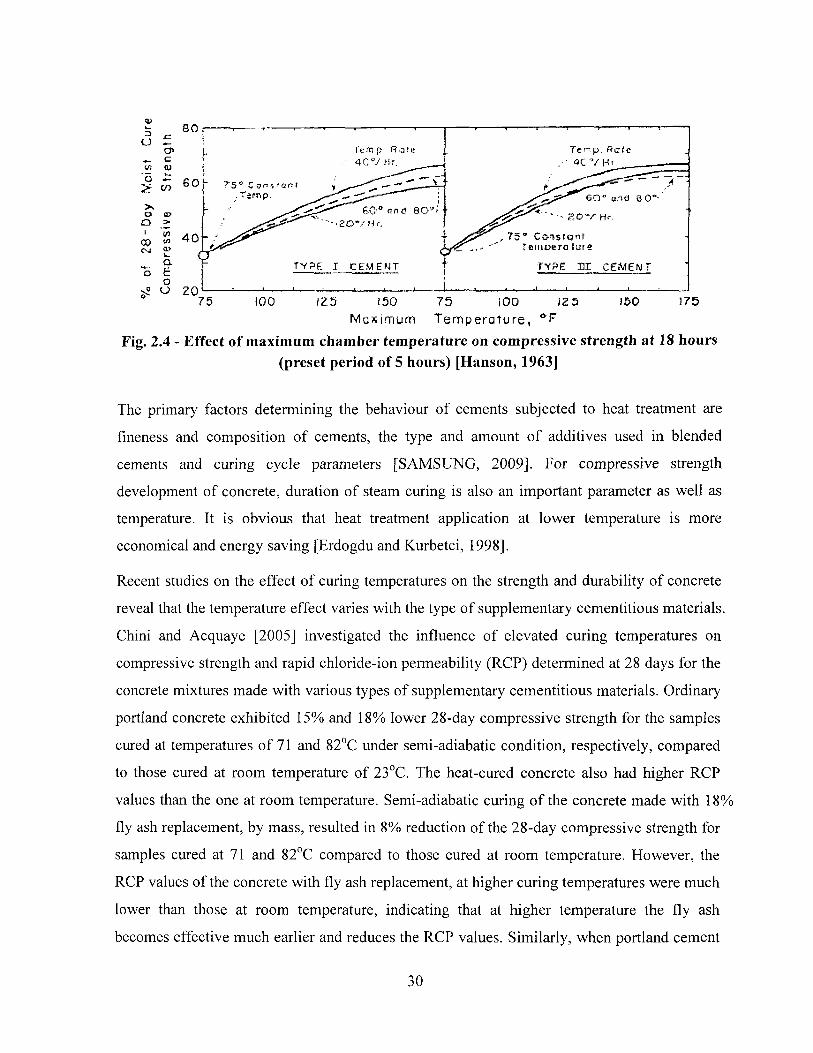
1>
Maximum Temperature, Fig. 2.4 - Effect of maximum chamber temperature on compressive strength at 18 hours
(preset period of 5 hours) [Hanson, 1963]
The primary factors determining the behaviour of cements subjected to heat treatment are
fineness and composition of cements, the type and amount of additives used in blended
cements and curing cycle parameters [SAMSUNG, 2009]. For compressive strength
development of concrete, duration of steam curing is also an important parameter as well as
temperature. It is obvious that heat treatment application at lower temperature is more
economical and energy saving [Erdogdu and Kurbetci, 1998],
Recent studies on the effect of curing temperatures on the strength and durability of concrete
reveal that the temperature effect varies with the type of supplementary cementitious materials.
Chini and Acquaye [2005] investigated the influence of elevated curing temperatures on
compressive strength and rapid chloride-ion permeability (RCP) determined at 28 days for the
concrete mixtures made with various types of supplementary cementitious materials. Ordinary
portland concrete exhibited 15% and 18% lower 28-day compressive strength for the samples
cured at temperatures of 71 and 82°C under semi-adiabatic condition, respectively, compared
to those cured at room temperature of 23°C. The heat-cured concrete also had higher RCP
values than the one at room temperature. Semi-adiabatic curing of the concrete made with 18%
fly ash replacement, by mass, resulted in 8% reduction of the 28-day compressive strength for
samples cured at 71 and 82°C compared to those cured at room temperature. However, the
RCP values of the concrete with fly ash replacement, at higher curing temperatures were much
lower than those at room temperature, indicating that at higher temperature the fly ash
becomes effective much earlier and reduces the RCP values. Similarly, when portland cement
30
is replaced by 50% blast furnace slag, the 28-day compressive strength of concrete samples
cured at elevated temperatures reduced by 7% and 15% for curing temperatures of 71 and
82°C compared to those cured at room temperature. The slag concrete also exhibited lower
RCP values when the high curing temperatures were applied. Compressive strength and RCP
results for the study of Chini and Acquaye [2005] are presented in Tables 2.8 and 2.9,
respectively.
2.3.3 Effect of rate of heating and cooling
Excessive rates of heating and cooling should be avoided to prevent damaging volume
changes. As in the case of the maximum chamber temperature, the rate of temperature rise of
the steam atmosphere is important to the development of early-age compressive strength.
Temperatures in the enclosure surrounding the concrete should not be increased or decreased
more than 22 to 33°C/hour depending on the size and shape of the concrete element [PCA,
2006], Hanson [1963] investigated the effect of the rate of heating on the compressive
strength of concrete. The rate varied from 11 to 44°C/hour up to three maximum temperatures
of 52, 65, and 80°C. Regardless of the maximum chamber temperature, for a given preset
period of 5 hours, maximum relative compressive strength values were obtained with the rate
of heating approximately 22°C/hour, as illustrated in Fig. 2.5. The early relative compressive
strength then decreases from this maximum point and tend to level out at the higher rates of
heating. In addition, it is important to note that the curves of Fig. 2.5 were quite flat near the
optimum heating rate and consequently the minor changes in the rate encountered in practical
steam plant operation would not yield significant variance on the compressive strength.
As might be expected, a slightly greater acceleration of 18-hour strength was obtained for
Type III cement concrete. This increase amounts to about 5% for the 52 and 65°C maximum
temperature curves. Little or no strength difference was found for the maximum chamber
temperature of 80°C. On the other hand, the rate of heating was shown to have significant
effect on the cracking of concrete surface as well as the mechanical properties. In general, the
intensity of cracking is lower for the concrete mixtures cured at lower heating rate compared
to those that are subjected to higher rate of heating and higher maximum chamber temperature.
The detrimental cracking of concrete can be caused by large temperature gradient during the
31
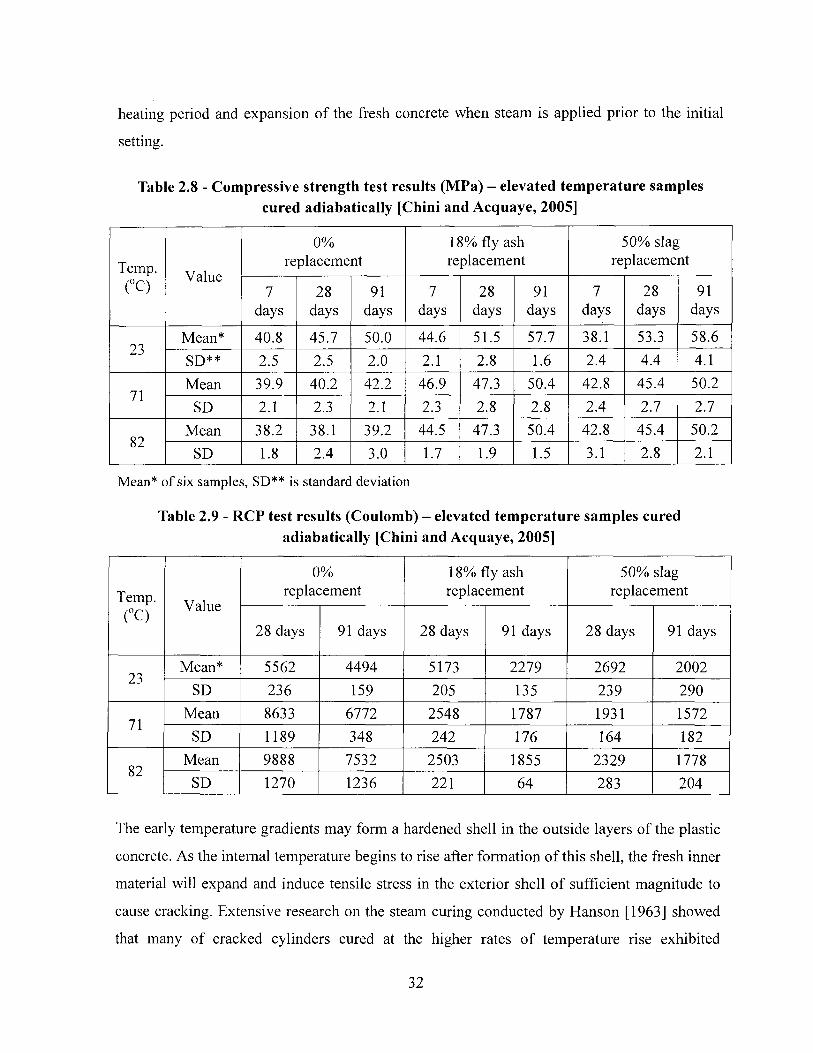
heating period and expansion of the fresh concrete when steam is applied prior to the initial
setting.
Table 2.8 - Compressive strength test results (MPa) - elevated temperature samples cured adiabatically [Chini and Acquaye, 2005]
Temp. (°C)
Value
0% replacement
18% fly ash replacement
50% slag replacement Temp.
(°C) Value
7 days
28 days
91 days
7 days
28 days
91 days
7 days
28 days
91 days
23 Mean* 40.8 45.7 50.0 44.6 51.5 57.7 38.1 53.3 58.6
23 SD** 2.5 2.5 2.0 2.1 2.8 1.6 2.4 4.4 4.1
71 Mean 39.9 40.2 42.2 46.9 47.3 50.4 42.8 45.4 50.2
71 SD 2.1 2.3 2.1 2.3 2.8 2.8 2.4 2.7 2.7
82 Mean 38.2 38.1 39.2 44.5 47.3 50.4 42.8 45.4 50.2
82 SD 1.8 2.4 3.0 1.7 1.9 1.5 3.1 2.8 2.1
Mean* of six samples, SD** is standard deviation
Table 2.9 - RCP test results (Coulomb) - elevated temperature samples cured adiabatically [Chini and Acquaye, 2005]
Temp. (°C) Value
0% replacement
18% fly ash replacement
50% slag replacement Temp.
(°C) Value
28 days 91 days 28 days 91 days 28 days 91 days
23 Mean* 5562 4494 5173 2279 2692 2002
23 SD 236 159 205 135 239 290
71 Mean 8633 6772 2548 1787 1931 1572
71 SD 1189 348 242 176 164 182
82 Mean 9888 7532 2503 1855 2329 1778
82 SD 1270 1236 221 64 283 204
The early temperature gradients may form a hardened shell in the outside layers of the plastic
concrete. As the internal temperature begins to rise after formation of this shell, the fresh inner
material will expand and induce tensile stress in the exterior shell of sufficient magnitude to
cause cracking. Extensive research on the steam curing conducted by Hanson [1963] showed
that many of cracked cylinders cured at the higher rates of temperature rise exhibited
32
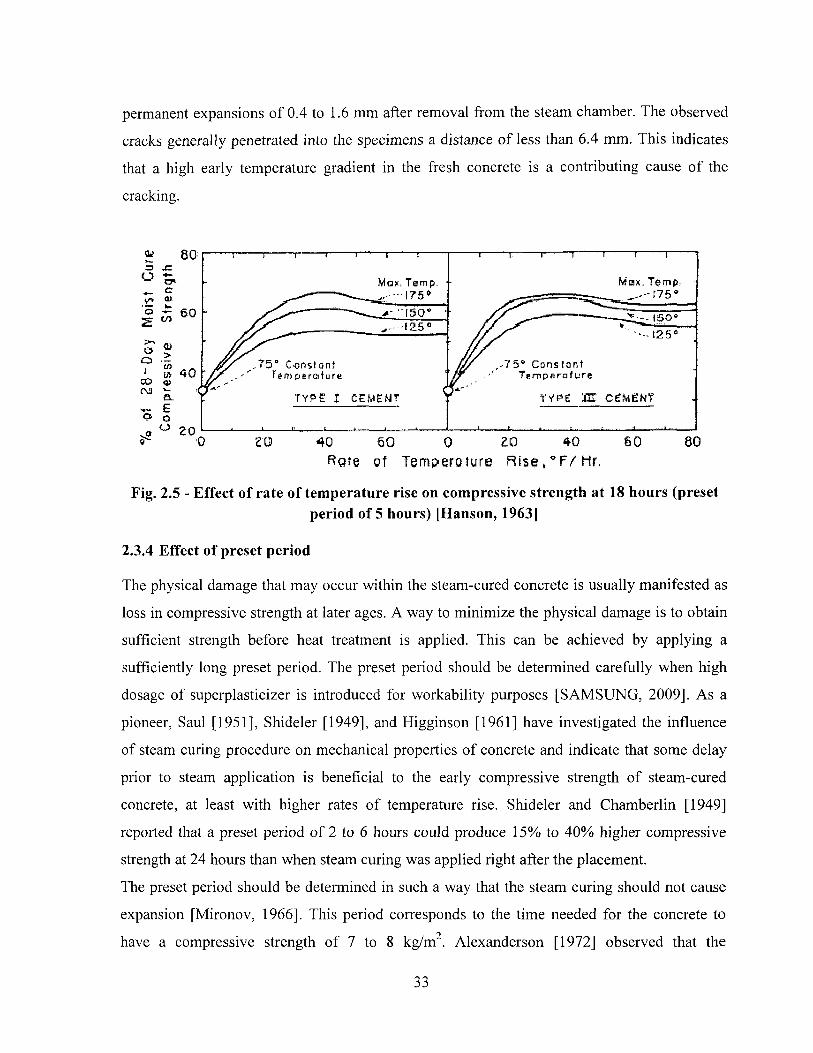
permanent expansions of 0.4 to 1.6 mm after removal from the steam chamber. The observed
cracks generally penetrated into the specimens a distance of less than 6.4 mm. This indicates
that a high early temperature gradient in the fresh concrete is a contributing cause of the
cracking.
£ 80 3 JZ
1 £ «>
b ® Q .2 i 01 4 0 CO «
O o o . a 20
t —I 1 r~ r •—i t~
Mqx, Temp,
' 1 li 1 1 1 1 1 :
Max. Temp. • ^ .,-,'75°
/ s „ 125° /'/ — -^^jso®
jpy ,-75* C-onstoni ' i f _»''' Temoerofurd . TYPE I CEMENT
/ / y f - 125°
f/f ,-75° Constant IT Temperature
t y p e M CEMENT
i - • ' 1 -a- a 20 40 60 0 zo 4 0 60 80
of Temperature R i s e , M r .
Fig. 2.5 - Effect of rate of temperature rise on compressive strength at 18 hours (preset period of 5 hours) [Hanson, 1963]
2.3.4 Effect of preset period
The physical damage that may occur within the steam-cured concrete is usually manifested as
loss in compressive strength at later ages. A way to minimize the physical damage is to obtain
sufficient strength before heat treatment is applied. This can be achieved by applying a
sufficiently long preset period. The preset period should be determined carefully when high
dosage of superplasticizer is introduced for workability purposes [SAMSUNG, 2009]. As a
pioneer, Saul [1951], Shideler [1949], and Higginson [1961] have investigated the influence
of steam curing procedure on mechanical properties of concrete and indicate that some delay
prior to steam application is beneficial to the early compressive strength of steam-cured
concrete, at least with higher rates of temperature rise. Shideler and Chamberlin [1949]
reported that a preset period of 2 to 6 hours could produce 15% to 40% higher compressive
strength at 24 hours than when steam curing was applied right after the placement.
The preset period should be determined in such a way that the steam curing should not cause
expansion [Mironov, 1966], This period corresponds to the time needed for the concrete to
have a compressive strength of 7 to 8 kg/m . Alexanderson [1972] observed that the
33
expansions can be neglected for preset periods of 4 to 7 hours (depending on w/cm) and lower
quality of concrete due to shorter preset period is the result of increased porosity and cracks
caused by the tensile stresses formed by the internal pressure in the pores. Similarly, the
investigation conducted by Concrete Technology Associates (CTA) [1973] revealed that the
effect of early heat application (1-hour preset period) reduced the 18-hour core strength by a
maximum of about 5% and the 28-day core strength by a maximum of about 10%. It is
recommended that the application of steam sooner than 2 hours after casting, unless concrete
temperatures are monitored to make sure that they do not reach 49°C before 2 or 3 hours
[CTA, 1973], The relationships between compressive strength at 18 hours and preset (pre-
steaming) period for Type I and Type III cements are presented in Figs. 2.6 and 3.4 2.7,
respectively. In both cases, the preset period plus the steaming period totalled 18 hours. As
shown in Figs. 2.6 and 2.7, the 18-hour compressive strength was shown to increase as the
preset period increases from 1 to 5 hours. From this maximum point, the early strength
decreases consistently with the increase in the preset period. This decrease is to be expected
since the total steaming time is also decreasing. Hanson [1963] reported that the 7- and 28-day
curves of compressive strength versus preset period had a characteristic S-shape, reaching a
maximum for 5 to 7 hours of preset period and the 28-day steam cured strengths varied from
80% to 95% of the 28-day moist cured strength. This loss of potential compressive strength
due to the steam curing agrees with the findings of previous investigators [Shideler, 1949 and
Higginson, 1961]. Early-age mechanical properties were shown to increase as the preset
period increases from 1 to 5 hours. From the maximum point of approximately 3 to 5 hours
depending on maximum curing temperature and binder type, the early-age strength decreases
consistently with the increase in the preset period. Previous studies on the steam-curing stated
that application of steam to the enclosure should be delayed until initial setting or at least 3
hours after final placement of concrete. In general, the preset period of 3 to 5 hours can be
applied to obtain maximum development of early-age mechanical properties of SCC or HPC
used for precast applications [SMASUNG project, 2009]. As Hanson's study, it can be
concluded that an optimum preset period for 18-hour compressive strength is about 5 hours,
and this optimum period is close to that indicated for maximum later age strengths. In addition,
the steaming time decreases with increasing the preset period, the longer preset period would
be more economical in steam plant fuel consumption, as well as giving maximum acceleration
34
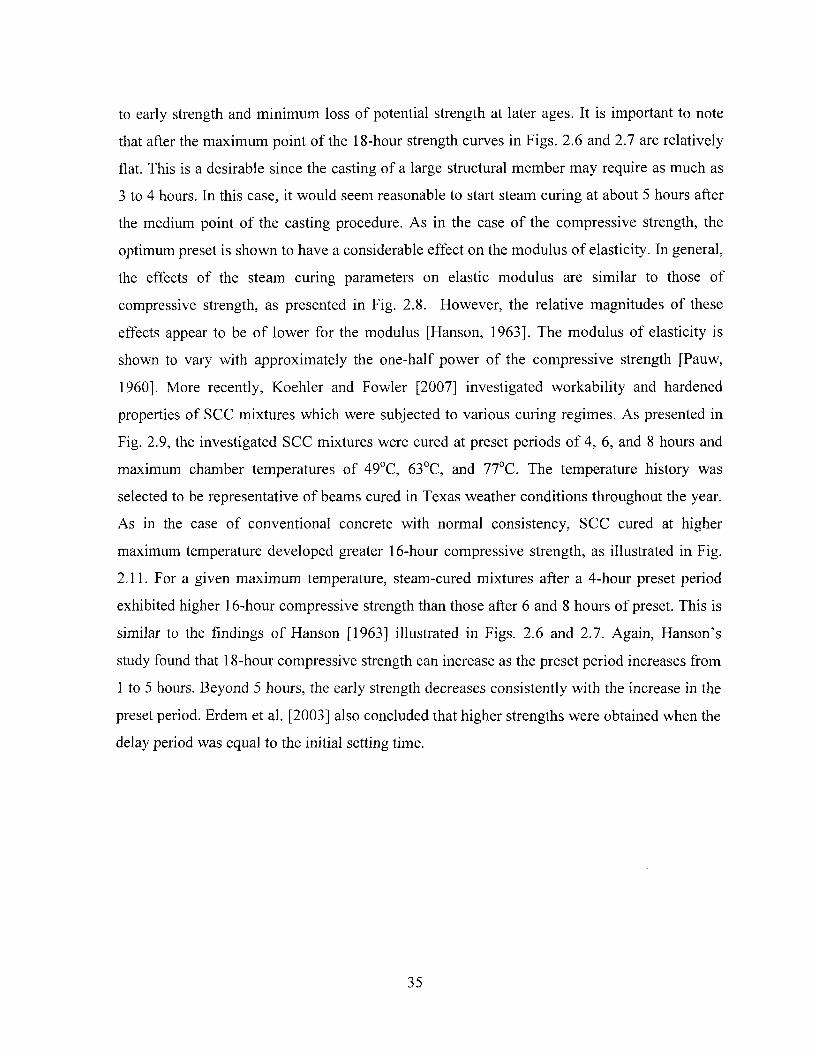
to early strength and minimum loss of potential strength at later ages. It is important to note
that after the maximum point of the 18-hour strength curves in Figs. 2.6 and 2.7 are relatively
flat. This is a desirable since the casting of a large structural member may require as much as
3 to 4 hours. In this case, it would seem reasonable to start steam curing at about 5 hours after
the medium point of the casting procedure. As in the case of the compressive strength, the
optimum preset is shown to have a considerable effect on the modulus of elasticity. In general,
the effects of the steam curing parameters on elastic modulus are similar to those of
compressive strength, as presented in Fig. 2.8. However, the relative magnitudes of these
effects appear to be of lower for the modulus [Hanson, 1963]. The modulus of elasticity is
shown to vary with approximately the one-half power of the compressive strength [Pauw,
I960], More recently, Koehler and Fowler [2007] investigated workability and hardened
properties of SCC mixtures which were subjected to various curing regimes. As presented in
Fig. 2.9, the investigated SCC mixtures were cured at preset periods of 4, 6, and 8 hours and
maximum chamber temperatures of 49°C, 63°C, and 77°C. The temperature history was
selected to be representative of beams cured in Texas weather conditions throughout the year.
As in the case of conventional concrete with normal consistency, SCC cured at higher
maximum temperature developed greater 16-hour compressive strength, as illustrated in Fig.
2.11. For a given maximum temperature, steam-cured mixtures after a 4-hour preset period
exhibited higher 16-hour compressive strength than those after 6 and 8 hours of preset. This is
similar to the findings of Hanson [1963] illustrated in Figs. 2.6 and 2.7. Again, Hanson's
study found that 18-hour compressive strength can increase as the preset period increases from
1 to 5 hours. Beyond 5 hours, the early strength decreases consistently with the increase in the
preset period. Erdem et al. [2003] also concluded that higher strengths were obtained when the
delay period was equal to the initial setting time.
35
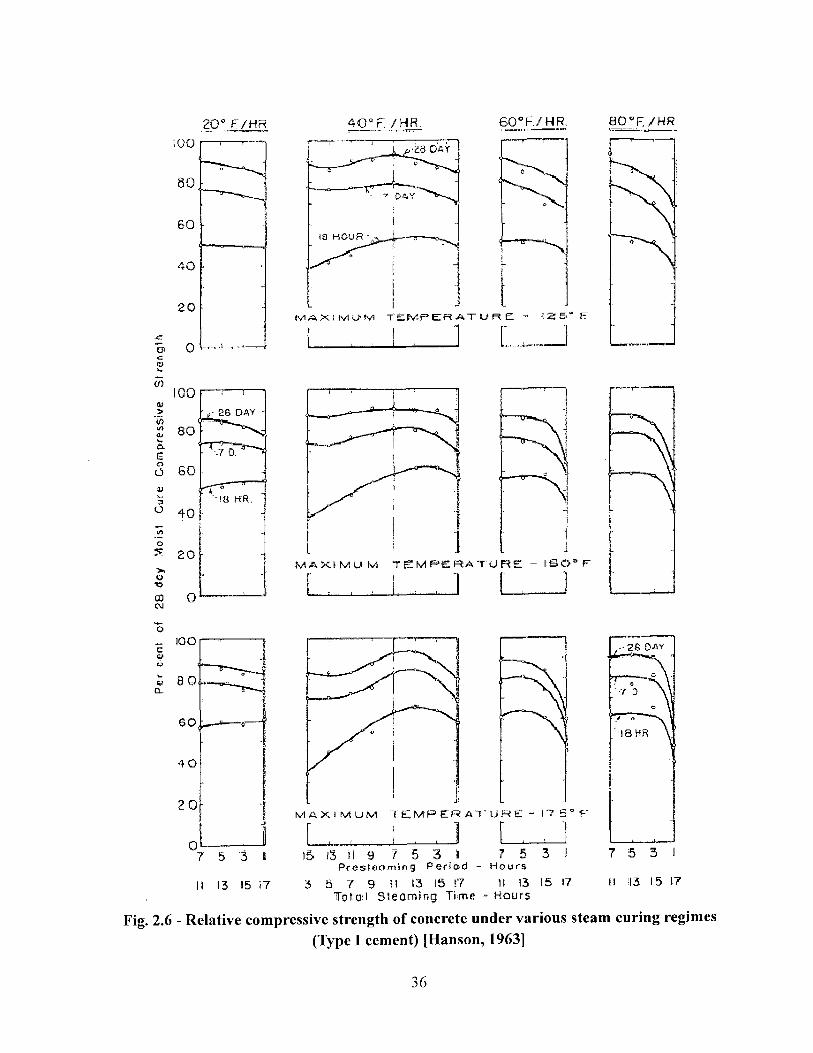
20° F / H R
o) 0
4 0 ° F / H R . 6 0 ° F . / HR, H 0 ° F / H R
m OAT
H O U R •
MAXIMv-W TEMPERATURE 125" F
r 1 1 L _ l
o
o
o
4 0
20
00 0 CM
ia HR.
M A X I M U M T E M P E R A T U R E : - ! S O " F I
lOO
MAXIMUM TEMPEKATUHE" l ? 5 ° f
I -_J • > 1 t < -15 13 H 9 7 5 3 * 7 5 3 I
Prestoe>rriin g Period - Hours 3 5 7 9 5' >3 15 U 1.5 17
TotoH Steaming Time - Hours
Fig. 2.6 - Relative compressive strength of concrete under various steam curing regimes (Type I cement) [Hanson, 1963]
36
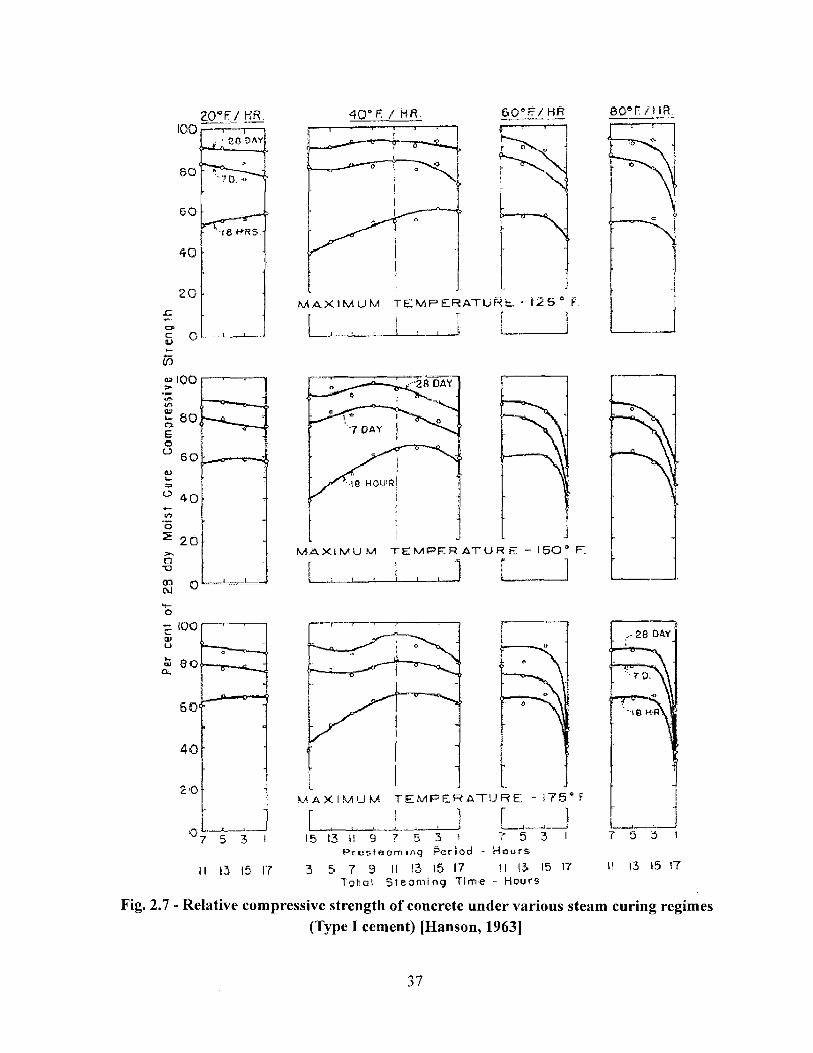
20° F/_HfL lOOf-^—t1
• ••'2:8
40° f. / HR. &Q'F/Hft
SO
4 0
20
i> tn
o
•16 WR5.
IOO
MAXIMUM TEMP ERATUR£ • 125° F.
_U 1 1 L- J
MAX! MUM TEMPER AT UF ' F.
iOO
MAXIMUM TEMPERATURE r . . . i [ 15 13 i! 9 3 1 7 5 3 1
P r u 6 * e o rfi i n g Period - Hours 3 5 7 9 II 13 15 17 1! 15 15 17
Total Steaming Tim-e - Hours Fig. 2.7 - Relative compressive strength of concrete under various steam curing regimes
(Type I cement) [Hanson, 1963]
37
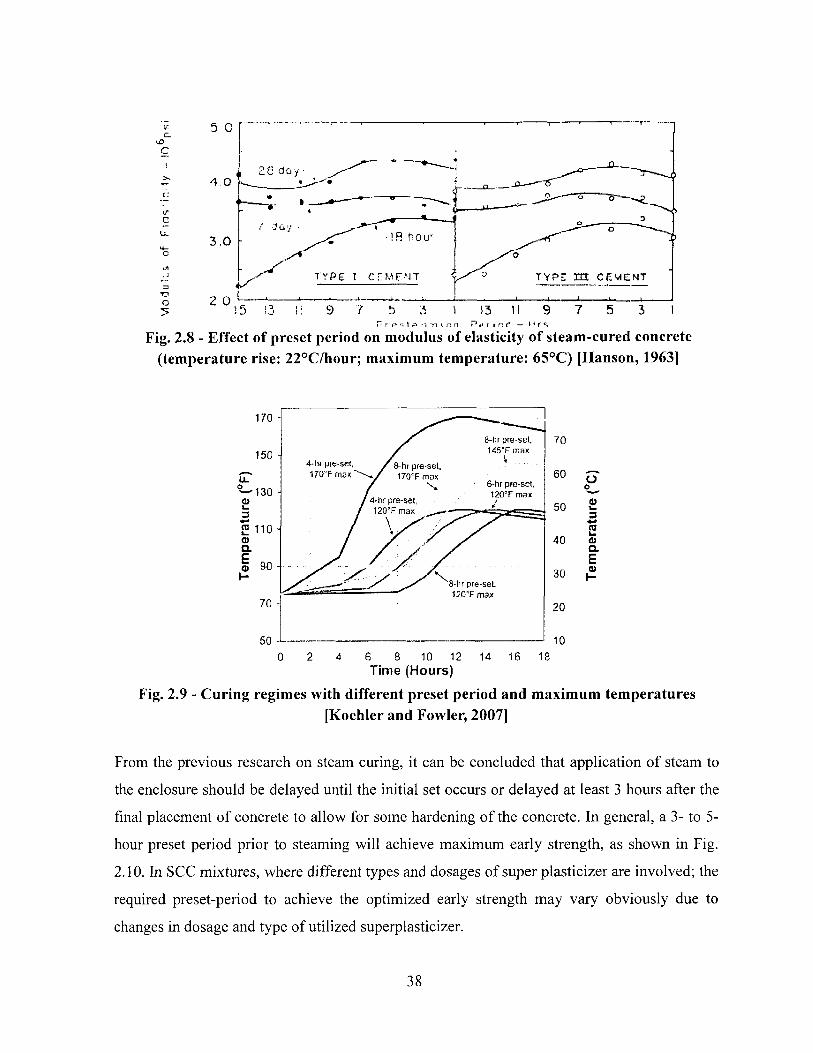
r r P s 1 : 1 "i t n n P f I P. C — L'FR,
Fig. 2.8 - Effect of preset period on modulus of elasticity of steam-cured concrete (temperature rise: 22°C/hour; maximum temperature: 65°C) [Hanson, 1963]
Time (Hours)
Fig. 2.9 - Curing regimes with different preset period and maximum temperatures [Koehler and Fowler, 2007]
From the previous research on steam curing, it can be concluded that application of steam to
the enclosure should be delayed until the initial set occurs or delayed at least 3 hours after the
final placement of concrete to allow for some hardening of the concrete. In general, a 3- to 5-
hour preset period prior to steaming will achieve maximum early strength, as shown in Fig.
2.10. In SCC mixtures, where different types and dosages of super plasticizer are involved; the
required preset-period to achieve the optimized early strength may vary obviously due to
changes in dosage and type of utilized superplasticizer.
38
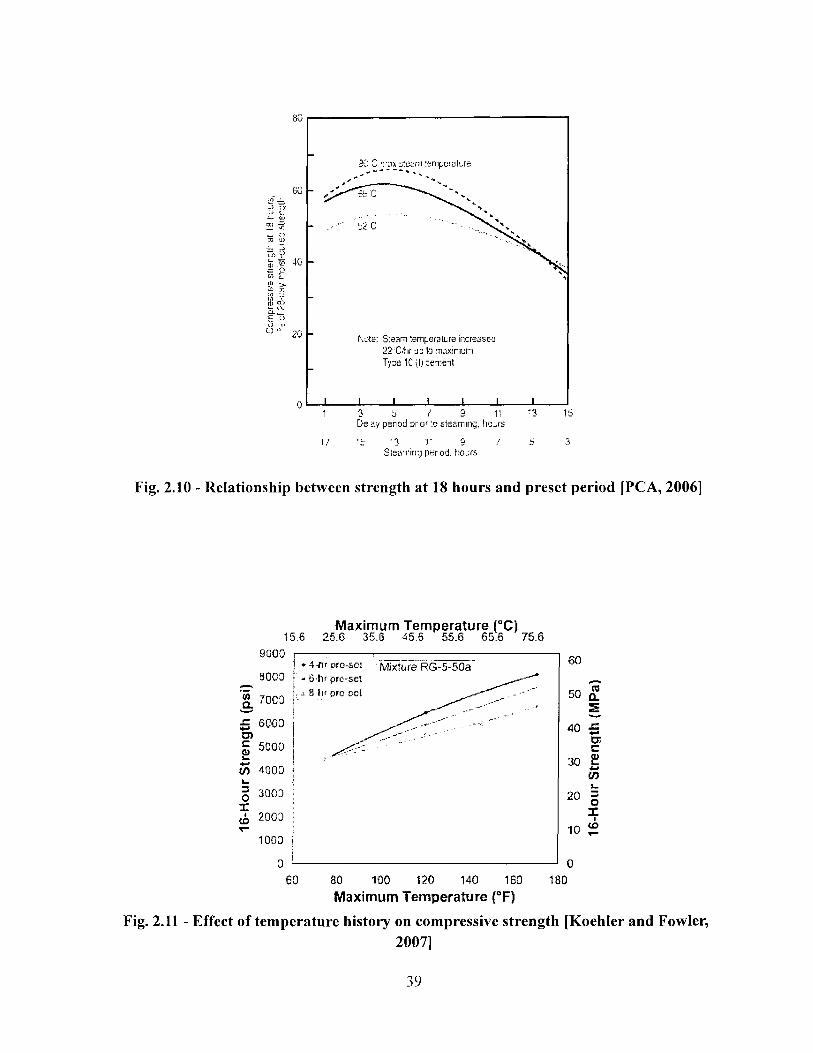
De sy period or <y :<s steaming, hc j fs
1/ *!.- '3 r 9 / i 3 Stea-ring perod, ho_rs
Fig. 2.10 - Relationship between strength at 18 hours and preset period [PCA, 2006]
15.6 Maximum Temperature (°C)
25,6 35.6 45.6 55.6 65.6 75.6 9000
8000
700Q
6000
5000
tf) 4000
3000
2000
1000
0
W 3 .c •w O) c 0)
3 0 X 1 CD
> 4-nr pro-sot • 6-hr pre-set Stir preset
Mixture RG-5-50a 60
50 S .
40 £ a
30 | £/3
20 g
10 f .
60 80 180 100 120 140 160 Maximum Temperature (°F)
Fig. 2.11 - Effect of temperature history on compressive strength [Koehler and Fowler, 2007]
39
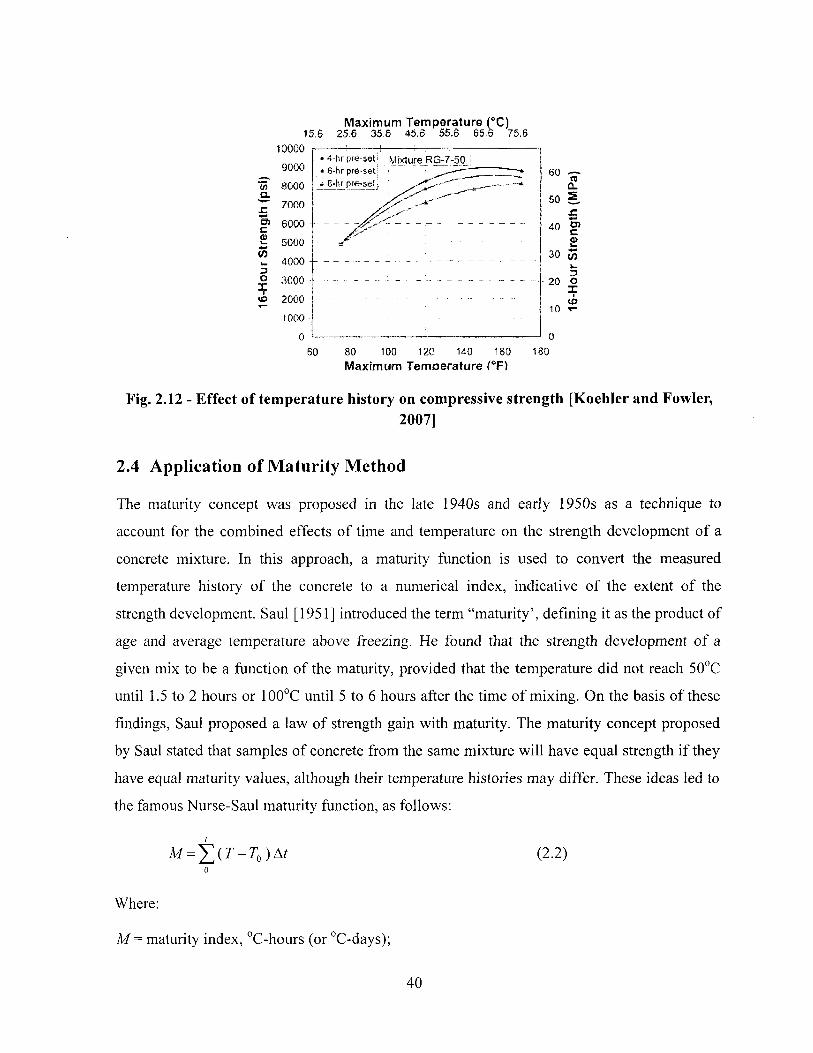
15.6 M a x i m u m T e m p e r a t u r e (°C)
25.6 35.6 45.6 55.S 65. S 75.5
(3) C 0) 25 3 a
X
10000
9000
8000
7000
6000
5000
4000
3000
2000
1000
0
* 4-hr pre-setl • 6-hr pre-set j, 6-hr p-e-se!
Mixture RG-7-50
60 80 100 120 140 160 M a x i m u m T e m o e r a t u r e (°F)
60
50
40
30
20
10
« Cl
5> C <D
( f ) u Z3 O X to
180
Fig. 2.12 - Effect of temperature history on compressive strength [Koehler and Fowler, 2007]
2.4 Application of Maturity Method
The maturity concept was proposed in the late 1940s and early 1950s as a technique to
account for the combined effects of time and temperature on the strength development of a
concrete mixture. In this approach, a maturity function is used to convert the measured
temperature history of the concrete to a numerical index, indicative of the extent of the
strength development. Saul [1951] introduced the term "maturity', defining it as the product of
age and average temperature above freezing. He found that the strength development of a
given mix to be a function of the maturity, provided that the temperature did not reach 50°C
until 1.5 to 2 hours or 100°C until 5 to 6 hours after the time of mixing. On the basis of these
findings, Saul proposed a law of strength gain with maturity. The maturity concept proposed
by Saul stated that samples of concrete from the same mixture will have equal strength if they
have equal maturity values, although their temperature histories may differ. These ideas led to
the famous Nurse-Saul maturity function, as follows:
M = £ ( r - r 0 ) A r (2.2)
0
Where:
M = maturity index, °C-hours (or °C-days);
40
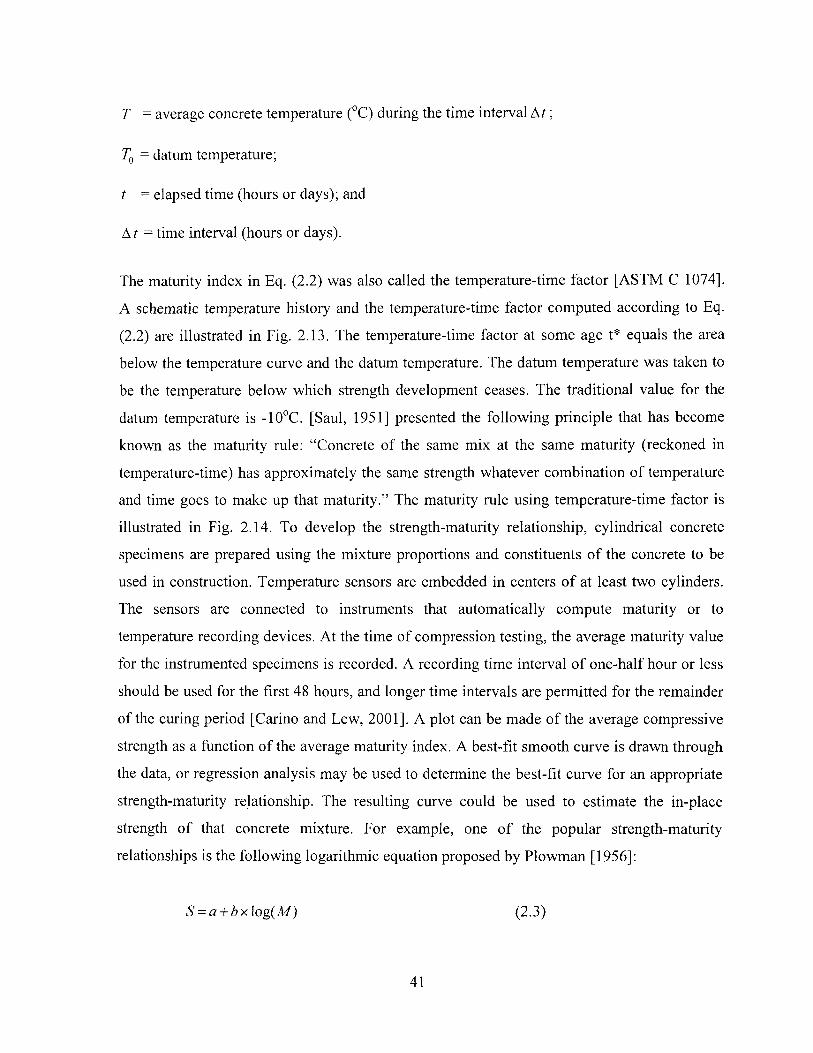
T = average concrete temperature (°C) during the time interval At;
T0 = datum temperature;
t = elapsed time (hours or days); and
At = time interval (hours or days).
The maturity index in Eq. (2.2) was also called the temperature-time factor [ASTM C 1074],
A schematic temperature history and the temperature-time factor computed according to Eq.
(2.2) are illustrated in Fig. 2.13. The temperature-time factor at some age t* equals the area
below the temperature curve and the datum temperature. The datum temperature was taken to
be the temperature below which strength development ceases. The traditional value for the
datum temperature is -10°C. [Saul, 1951] presented the following principle that has become
known as the maturity rule: "Concrete of the same mix at the same maturity (reckoned in
temperature-time) has approximately the same strength whatever combination of temperature
and time goes to make up that maturity." The maturity rule using temperature-time factor is
illustrated in Fig. 2.14. To develop the strength-maturity relationship, cylindrical concrete
specimens are prepared using the mixture proportions and constituents of the concrete to be
used in construction. Temperature sensors are embedded in centers of at least two cylinders.
The sensors are connected to instruments that automatically compute maturity or to
temperature recording devices. At the time of compression testing, the average maturity value
for the instrumented specimens is recorded. A recording time interval of one-half hour or less
should be used for the first 48 hours, and longer time intervals are permitted for the remainder
of the curing period [Carino and Lew, 2001], A plot can be made of the average compressive
strength as a function of the average maturity index. A best-fit smooth curve is drawn through
the data, or regression analysis may be used to determine the best-fit curve for an appropriate
strength-maturity relationship. The resulting curve could be used to estimate the in-place
strength of that concrete mixture. For example, one of the popular strength-maturity
relationships is the following logarithmic equation proposed by Plowman [1956]:
S = a + bxlog(M) (2.3)
Where, a refers to strength for maturity index M= 1. M and b are maturity index and slope of
strength-maturity curve, respectively. Similarly, Kehl et al. [1998] reported that the
logarithmic or natural logarithmic function as well as the rectangular hyperbola when
combined with maturity indices in terms of temperature-time factor can be used to predict
strengths for use in construction. Kehl et al. [1998] stated that experimental determination of
datum temperatures or activation energies is not necessary for strength-maturity models to
provide an acceptable level of accuracy in the strength predictions for typical field conditions
encountered during construction. The strength predictions using maturity were within 10% of
the measured ones when compared to carefully handled field-cured specimens and cores from
actual structures [Kehl et al., 1998].
Time, t
Fig. 2.13 - Schematic of temperature history and temperature-time factor [Carino and Lew, 2001]
A characteristic relation between strength and maturity exists for every type of concrete, as
this relation is dependent on the concrete composition. The maturity-strength relationships
usually apply only to concrete using the same materials and preset period. Variability in
mixture proportions that results from the batching operation is tolerable for using a unique
strength-maturity curve for a given mixture only if the requirements in ACI 304R-89 and in
ASTM C 94-94 are satisfied [Kehl et al., 1998], A change in cement composition or physical
properties, cement manufacturer, fly ash composition or physical properties, or fly ash
supplier, requires the development of a new strength-maturity relationship. A change in w/cm
of 0.05 or higher is the maximum tolerable before strengths from the maturity curve deviate
significantly from that otherwise predicted [Kehl et al., 1998].
42
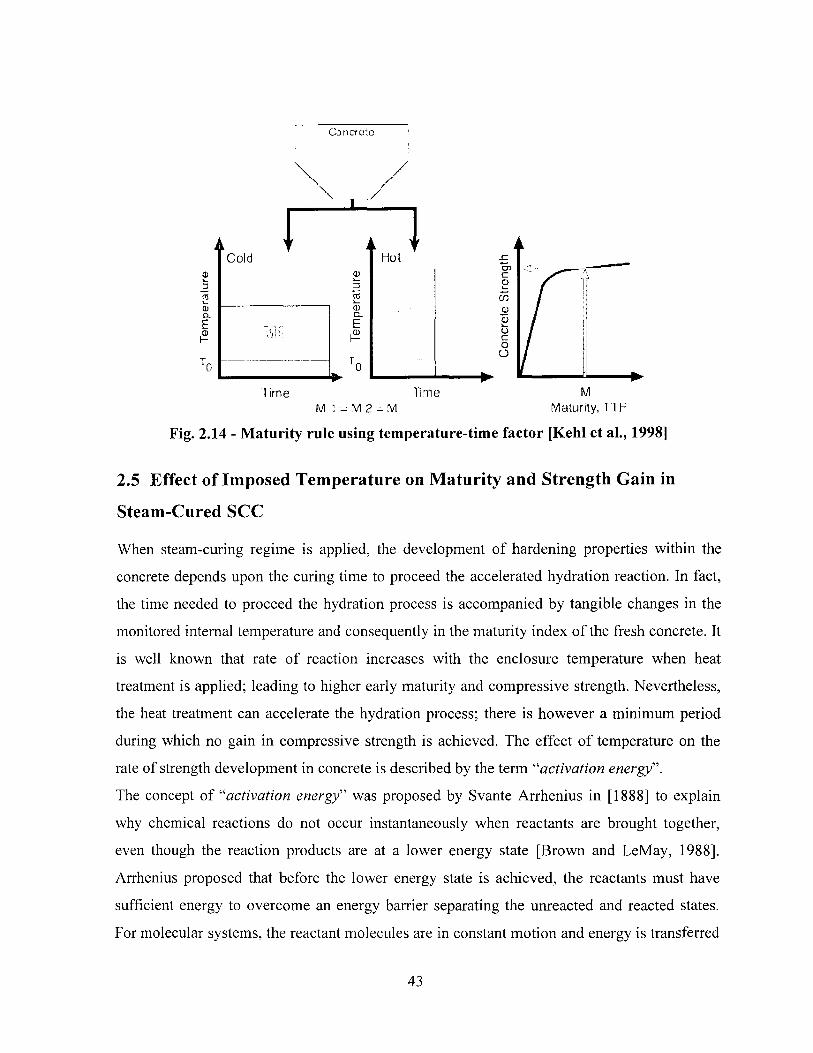
Co ncroto
M E = M 2 = M Maturity, 1 11
Fig. 2.14 - Maturity rule using temperature-time factor [Kehl et al., 1998]
2.5 Effect of Imposed Temperature on Maturity and Strength Gain in
Steam-Cured SCC
When steam-curing regime is applied, the development of hardening properties within the
concrete depends upon the curing time to proceed the accelerated hydration reaction. In fact,
the time needed to proceed the hydration process is accompanied by tangible changes in the
monitored internal temperature and consequently in the maturity index of the fresh concrete. It
is well known that rate of reaction increases with the enclosure temperature when heat
treatment is applied; leading to higher early maturity and compressive strength. Nevertheless,
the heat treatment can accelerate the hydration process; there is however a minimum period
during which no gain in compressive strength is achieved. The effect of temperature on the
rate of strength development in concrete is described by the term "activation energy".
The concept of "activation energy" was proposed by Svante Arrhenius in [1888] to explain
why chemical reactions do not occur instantaneously when reactants are brought together,
even though the reaction products are at a lower energy state [Brown and LeMay, 1988],
Arrhenius proposed that before the lower energy state is achieved, the reactants must have
sufficient energy to overcome an energy barrier separating the unreacted and reacted states.
For molecular systems, the reactant molecules are in constant motion and energy is transferred
43
between them as they collide [Brown and LeMay, 1988]. A certain number of molecules will
acquire sufficient energy to surmount the energy barrier and form the lower energy reaction
product. As the system is heated, the kinetic energy of the molecules increases and more
molecules will surmount the barrier. Thus, the rate of reaction increases with increasing
temperature.
ACI Committee 517 [1992] has also discussed the concept of maturity, and has indicated that
it might be applied to planning steaming procedures within considerable limitations. It was
reported that the concretes steamed at higher rates after a 1 hour preset period deviated widely
from the maturity curve of the other concretes.
44
Chapter 3 - Experimental Program
3.1 Introduction
An experimental program has been set up to evaluate the influence of mixture parameters on
fresh and hardening properties of steam-cured SCC used for precast, prestressed applications.
Further, the experimental work focuses on optimizing a proper steam-curing regime that
matches the required hardening properties for the fabrication of precast, prestressed beam
elements.
3.2 Specific Objectives
Specifically, the investigation seeks to fulfill the following research objectives:
• To evaluate the effect of binder content, binder type, w/cm, and the type of
superplasticizer HRWRA on workability, compressive strength development, and
modulus of elasticity which are critical to the performance of precast, prestressed
applications;
• To recommend workability test methods that can be readily used in precasting plants
for quality control of SCC;
• To investigate the effect of maximum chamber temperature, the rate of heating, and
preset period on compressive strength and elastic modulus of SCC;
• To develop steam-curing regime of high-strength SCC as well as HPC suitable for
precast, and prestressed applications;
• To study the development of maturity of the steam-cured SCC and to derive a relation
between maturity index and strength development for steam-cured SCC; and
• To develop recommendations for the selection of the raw materials, mixture
proportioning, steam-curing regime, those satisfy the required mechanical properties
of such type of concrete.
45
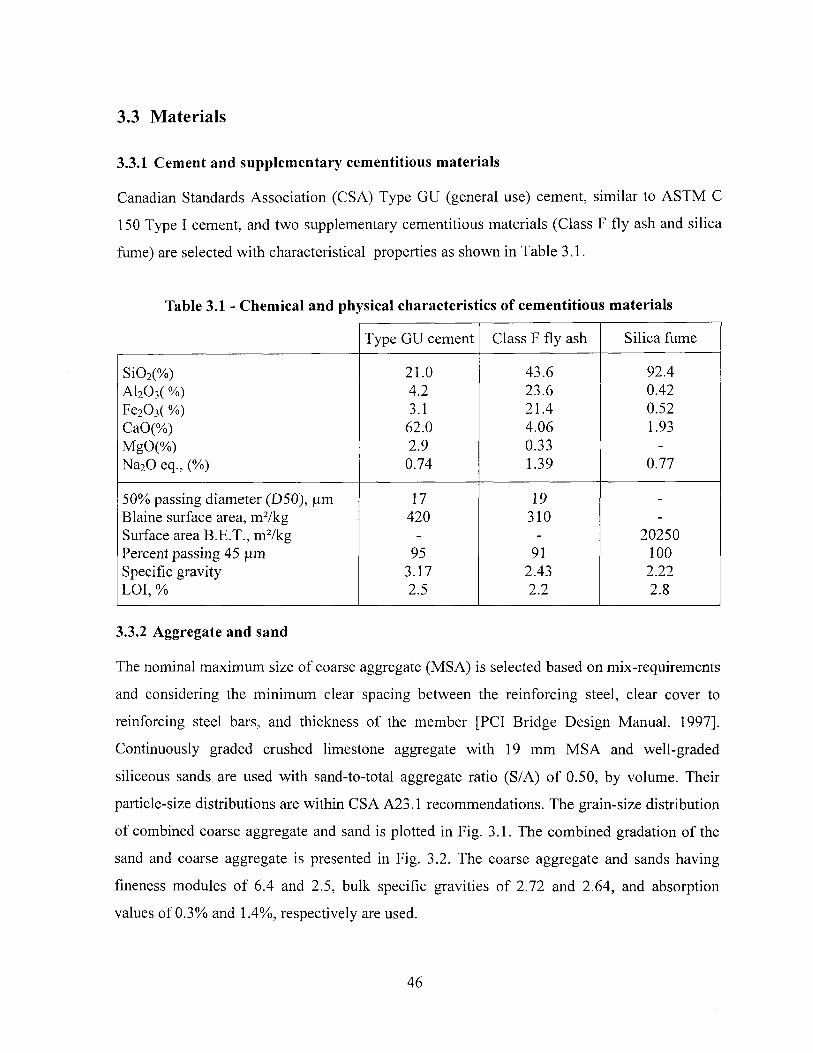
3.3 Materials
3.3.1 Cement and supplementary cementitious materials
Canadian Standards Association (CSA) Type GU (general use) cement, similar to ASTM C
150 Type I cement, and two supplementary cementitious materials (Class F fly ash and silica
fume) are selected with characteristical properties as shown in Table 3.1.
Table 3.1 - Chemical and physical characteristics of cementitious materials
Type GU cement Class F fly ash Silica fume
Si02(%) 21.0 43.6 92.4 A1203( %) 4.2 23.6 0.42 Fe203( %) 3.1 21.4 0.52 CaO(%) 62.0 4.06 1.93 MgO(%) 2.9 0.33 -
Na20 eq., (%) 0.74 1.39 0.77
50% passing diameter (D50), |j.m 17 19 -
Blaine surface area, m2/kg 420 310 -
Surface area B.E.T., m2/kg - - 20250 Percent passing 45 }im 95 91 100 Specific gravity 3.17 2.43 2.22 LOI, % 2.5 2.2 2.8
3.3.2 Aggregate and sand
The nominal maximum size of coarse aggregate (MSA) is selected based on mix-requirements
and considering the minimum clear spacing between the reinforcing steel, clear cover to
reinforcing steel bars, and thickness of the member [PCI Bridge Design Manual, 1997],
Continuously graded crushed limestone aggregate with 19 mm MSA and well-graded
siliceous sands are used with sand-to-total aggregate ratio (S/A) of 0.50, by volume. Their
particle-size distributions are within CSA A23.1 recommendations. The grain-size distribution
of combined coarse aggregate and sand is plotted in Fig. 3.1. The combined gradation of the
sand and coarse aggregate is presented in Fig. 3.2. The coarse aggregate and sands having
fineness modules of 6.4 and 2.5, bulk specific gravities of 2.72 and 2.64, and absorption
values of 0.3% and 1.4%, respectively are used.
46
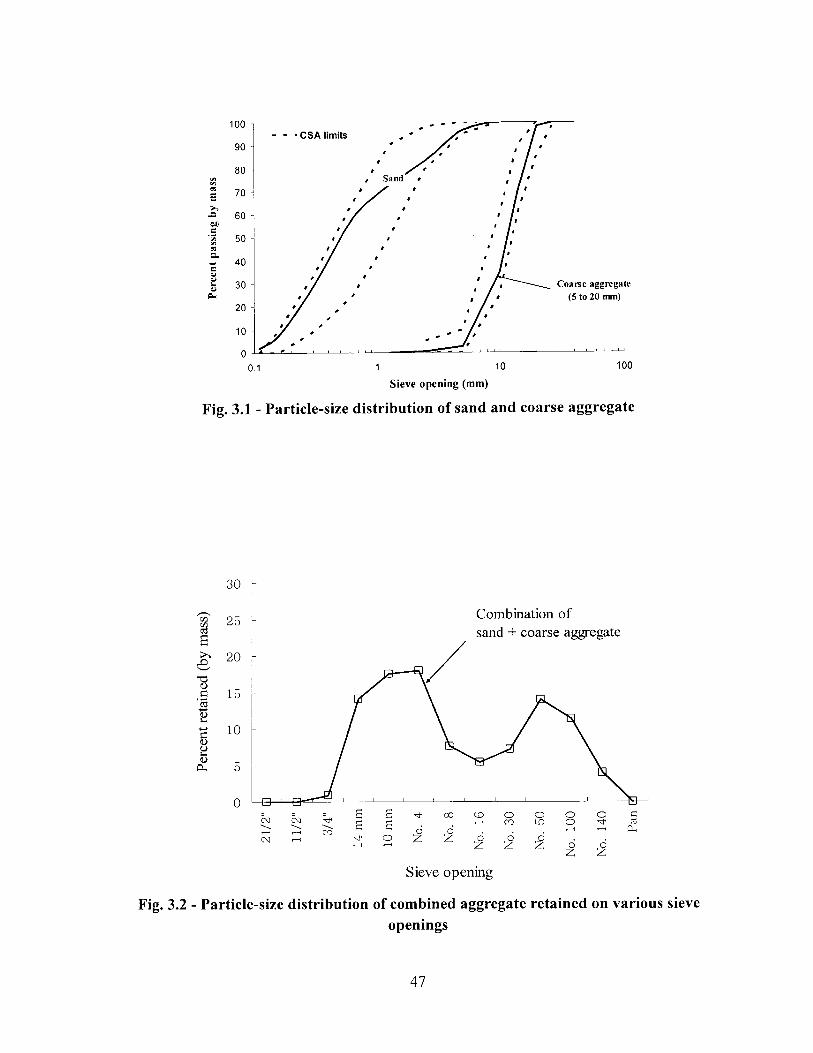
1 10
S i e v e o p e n i n g ( m m )
Coarse aggregate (5 to 20 mm)
100
Fig. 3.1 - Particle-size distribution of sand and coarse aggregate
-o 1) c '3
c 1> a <D cu
30
25
20
15
10
Combination of sand + coarse aggregate
Sieve opening
Fig. 3.2 - Particle-size distribution of combined aggregate retained on various sieve openings
47
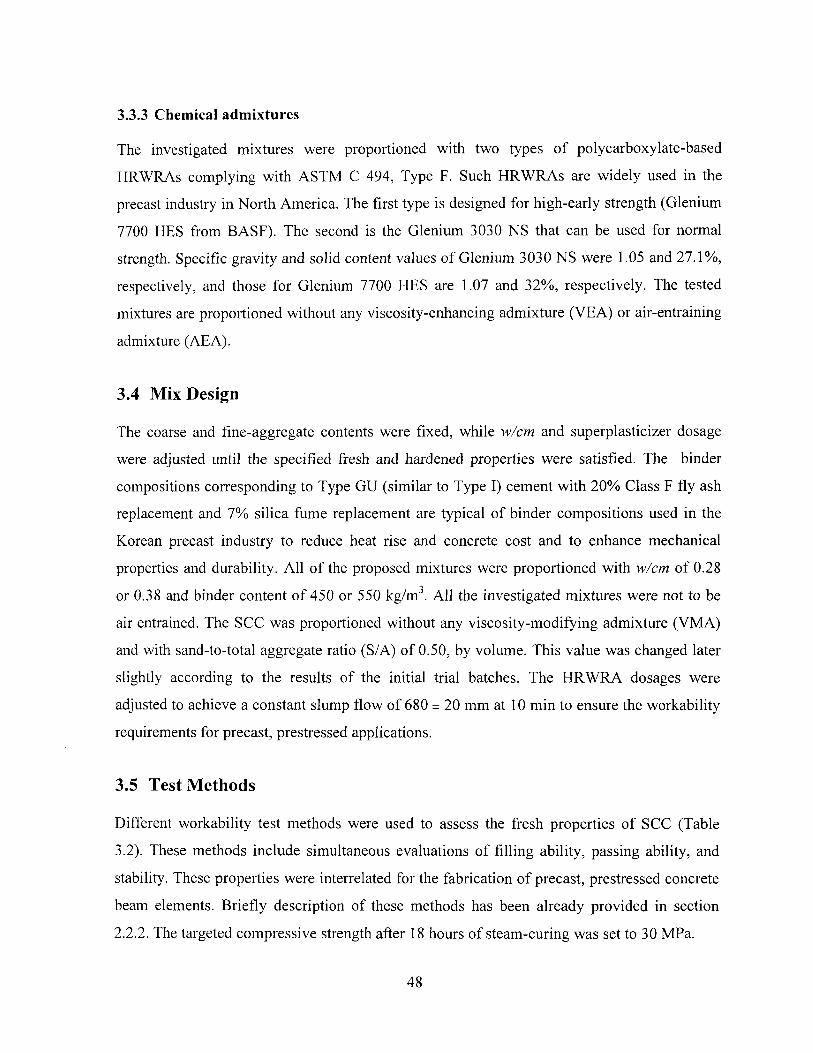
3.3.3 Chemical admixtures
The investigated mixtures were proportioned with two types of polycarboxylate-based
HRWRAs complying with ASTM C 494, Type F. Such HRWRAs are widely used in the
precast industry in North America. The first type is designed for high-early strength (Glenium
7700 HES from BASF). The second is the Glenium 3030 NS that can be used for normal
strength. Specific gravity and solid content values of Glenium 3030 NS were 1.05 and 27.1%,
respectively, and those for Glenium 7700 HES are 1.07 and 32%, respectively. The tested
mixtures are proportioned without any viscosity-enhancing admixture (VEA) or air-entraining
admixture (AEA).
3.4 Mix Design
The coarse and fine-aggregate contents were fixed, while w/cm and superplasticizer dosage
were adjusted until the specified fresh and hardened properties were satisfied. The binder
compositions corresponding to Type GU (similar to Type I) cement with 20% Class F fly ash
replacement and 7% silica fume replacement are typical of binder compositions used in the
Korean precast industry to reduce heat rise and concrete cost and to enhance mechanical
properties and durability. All of the proposed mixtures were proportioned with w/cm of 0.28
or 0.38 and binder content of 450 or 550 kg/m . All the investigated mixtures were not to be
air entrained. The SCC was proportioned without any viscosity-modifying admixture (VMA)
and with sand-to-total aggregate ratio (S/A) of 0.50, by volume. This value was changed later
slightly according to the results of the initial trial batches. The HRWRA dosages were
adjusted to achieve a constant slump flow of 680 ± 20 mm at 10 min to ensure the workability
requirements for precast, prestressed applications.
3.5 Test Methods
Different workability test methods were used to assess the fresh properties of SCC (Table
3.2). These methods include simultaneous evaluations of filling ability, passing ability, and
stability. These properties were interrelated for the fabrication of precast, prestressed concrete
beam elements. Briefly description of these methods has been already provided in section
2.2.2. The targeted compressive strength after 18 hours of steam-curing was set to 30 MPa.
48
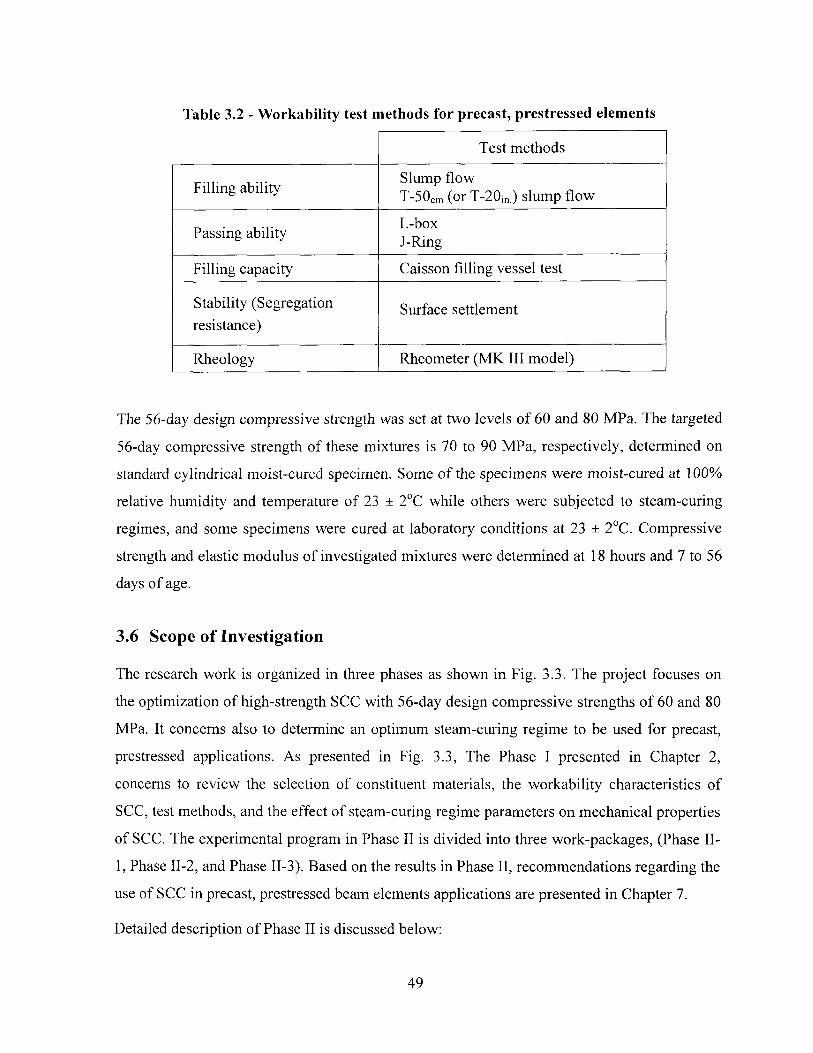
Table 3.2 - Workability test methods for precast, prestressed elements
Test methods
Filling ability Slump flow T-50cm (or T-20in.) slump flow
Passing ability L-box J-Ring
Filling capacity Caisson filling vessel test
Stability (Segregation resistance)
Surface settlement
Rheology Rheometer (MK III model)
The 56-day design compressive strength was set at two levels of 60 and 80 MPa. The targeted
56-day compressive strength of these mixtures is 70 to 90 MPa, respectively, determined on
standard cylindrical moist-cured specimen. Some of the specimens were moist-cured at 100%
relative humidity and temperature of 23 ± 2°C while others were subjected to steam-curing
regimes, and some specimens were cured at laboratory conditions at 23 ± 2°C. Compressive
strength and elastic modulus of investigated mixtures were determined at 18 hours and 7 to 56
days of age.
3.6 Scope of Investigation
The research work is organized in three phases as shown in Fig. 3.3. The project focuses on
the optimization of high-strength SCC with 56-day design compressive strengths of 60 and 80
MPa. It concerns also to determine an optimum steam-curing regime to be used for precast,
prestressed applications. As presented in Fig. 3.3, The Phase I presented in Chapter 2,
concerns to review the selection of constituent materials, the workability characteristics of
SCC, test methods, and the effect of steam-curing regime parameters on mechanical properties
of SCC. The experimental program in Phase II is divided into three work-packages, (Phase II-
1, Phase II-2, and Phase II-3). Based on the results in Phase II, recommendations regarding the
use of SCC in precast, prestressed beam elements applications are presented in Chapter 7.
Detailed description of Phase II is discussed below:
49
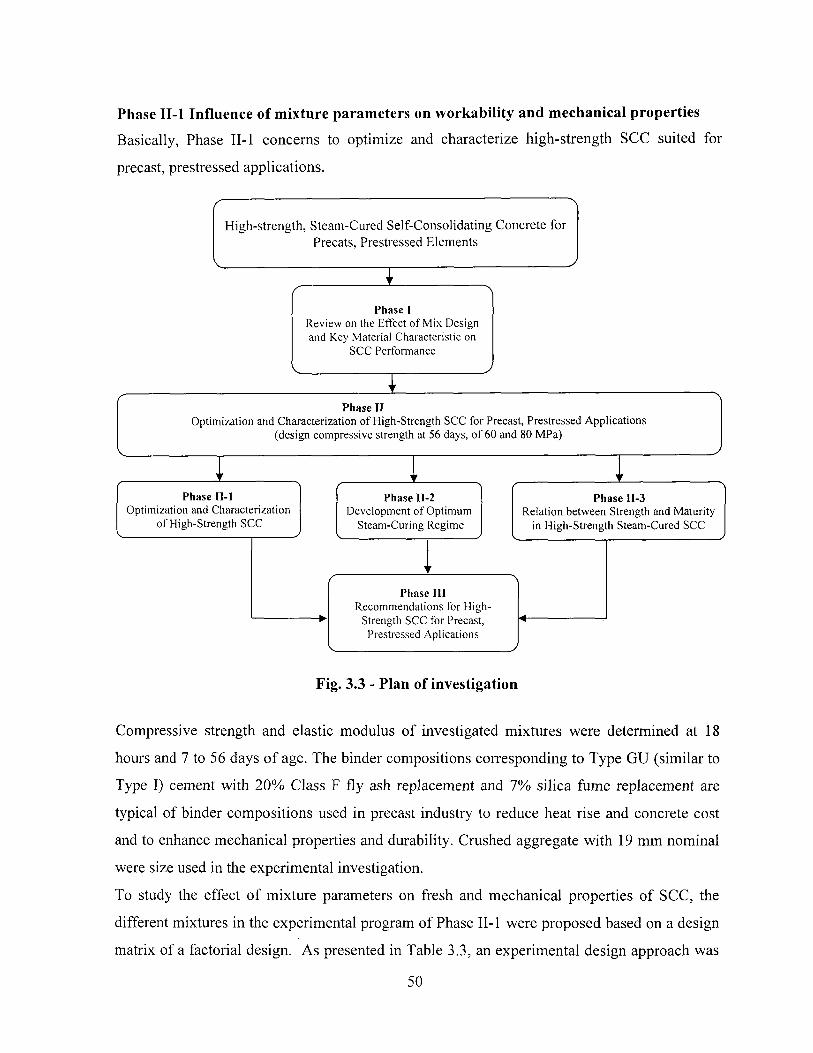
Phase II-l Influence of mixture parameters on workability and mechanical properties
Basically, Phase II-1 concerns to optimize and characterize high-strength SCC suited for
precast, prestressed applications.
Fig. 3.3 - Plan of investigation
Compressive strength and elastic modulus of investigated mixtures were determined at 18
hours and 7 to 56 days of age. The binder compositions corresponding to Type GU (similar to
Type I) cement with 20% Class F fly ash replacement and 7% silica fume replacement are
typical of binder compositions used in precast industry to reduce heat rise and concrete cost
and to enhance mechanical properties and durability. Crushed aggregate with 19 mm nominal
were size used in the experimental investigation.
To study the effect of mixture parameters on fresh and mechanical properties of SCC, the
different mixtures in the experimental program of Phase II-l were proposed based on a design
matrix of a factorial design. As presented in Table 3.3, an experimental design approach was
50
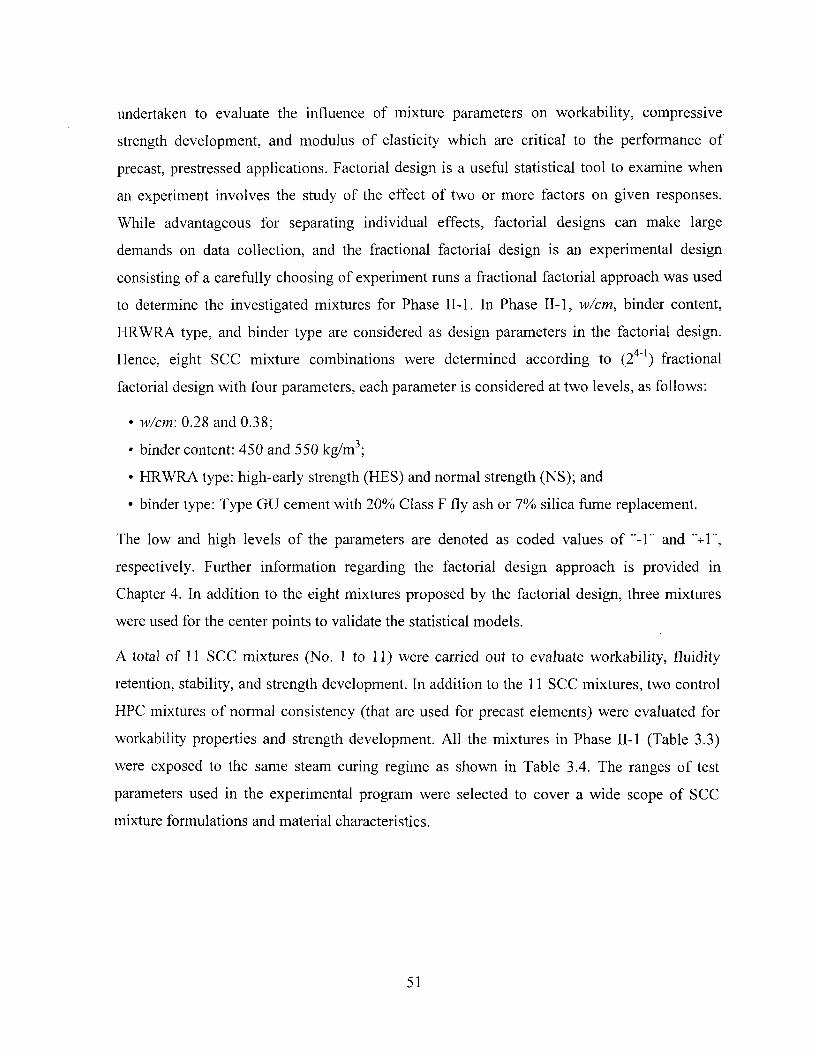
undertaken to evaluate the influence of mixture parameters on workability, compressive
strength development, and modulus of elasticity which are critical to the performance of
precast, prestressed applications. Factorial design is a useful statistical tool to examine when
an experiment involves the study of the effect of two or more factors on given responses.
While advantageous for separating individual effects, factorial designs can make large
demands on data collection, and the fractional factorial design is an experimental design
consisting of a carefully choosing of experiment runs a fractional factorial approach was used
to determine the investigated mixtures for Phase II-1. In Phase II-1, w/cm, binder content,
HRWRA type, and binder type are considered as design parameters in the factorial design.
Hence, eight SCC mixture combinations were determined according to (2 ) fractional
factorial design with four parameters, each parameter is considered at two levels, as follows:
• w/cm: 0.28 and 0.38;
• binder content: 450 and 550 kg/m3;
• HRWRA type: high-early strength (HES) and normal strength (NS); and
• binder type: Type GU cement with 20% Class F fly ash or 7% silica fume replacement.
The low and high levels of the parameters are denoted as coded values of "-1" and "+1",
respectively. Further information regarding the factorial design approach is provided in
Chapter 4. In addition to the eight mixtures proposed by the factorial design, three mixtures
were used for the center points to validate the statistical models.
A total of 11 SCC mixtures (No. 1 to 11) were carried out to evaluate workability, fluidity
retention, stability, and strength development. In addition to the 11 SCC mixtures, two control
HPC mixtures of normal consistency (that are used for precast elements) were evaluated for
workability properties and strength development. All the mixtures in Phase II-1 (Table 3.3)
were exposed to the same steam curing regime as shown in Table 3.4. The ranges of test
parameters used in the experimental program were selected to cover a wide scope of SCC
mixture formulations and material characteristics.
51
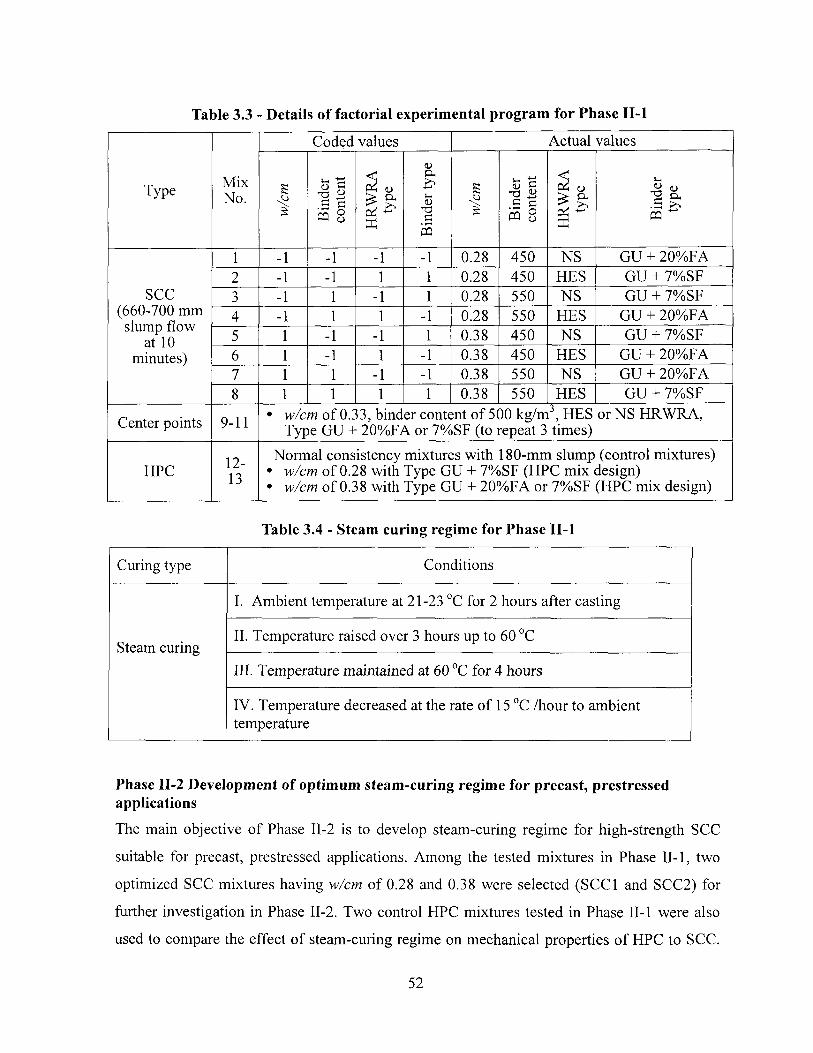
Table 3.3 - Details of factorial experimental program for Phase II-l
Type Mix No.
Coded values Actual values
Type Mix No. S
1 Bin
der
cont
ent
HR
WR
A
type
Bin
der
type
w/cm
Bin
der
cont
ent
HR
WR
A
type
Bin
der
type
SCC (660-700 mm slump flow
at 10 minutes)
1 -1 -1 -1 -1 0.28 450 NS GU + 20%FA
SCC (660-700 mm slump flow
at 10 minutes)
2 -1 -1 1 1 0.28 450 HES GU + 7%SF SCC
(660-700 mm slump flow
at 10 minutes)
3 -1 1 -1 1 0.28 550 NS GU + 7%SF SCC (660-700 mm slump flow
at 10 minutes)
4 -1 1 1 -1 0.28 550 HES GU + 20%FA SCC
(660-700 mm slump flow
at 10 minutes)
5 1 -1 -1 1 0.38 450 NS GU + 7%SF
SCC (660-700 mm slump flow
at 10 minutes) 6 1 -1 1 -1 0.38 450 HES GU + 20%FA
SCC (660-700 mm slump flow
at 10 minutes)
7 1 1 -1 -1 0.38 550 NS GU + 20%FA
SCC (660-700 mm slump flow
at 10 minutes)
8 1 1 1 1 0.38 550 HES GU + 7%SF
Center points 9-11 • w/cm of 0.33, binder content of 500 kg/m3, HES or NS HRWRA, Type GU + 20%FA or 7%SF (to repeat 3 times)
HPC 12-13
Normal consistency mixtures with 180-mm slump (control mixtures) • w/cm of 0.28 with Type GU + 7%SF (HPC mix design) • w/cm of 0.38 with Type GU + 20%FA or 7%SF (HPC mix design)
Table 3.4 - Steam curing regime for Phase II-l
Curing type Conditions
Steam curing
I. Ambient temperature at 21-23 °C for 2 hours after casting
Steam curing II. Temperature raised over 3 hours up to 60 °C
Steam curing III. Temperature maintained at 60 °C for 4 hours
Steam curing
IV. Temperature decreased at the rate of 15 °C /hour to ambient temperature
Phase II-2 Development of optimum steam-curing regime for precast, prestressed applications
The main objective of Phase II-2 is to develop steam-curing regime for high-strength SCC
suitable for precast, prestressed applications. Among the tested mixtures in Phase II-l, two
optimized SCC mixtures having w/cm of 0.28 and 0.38 were selected (SCC1 and SCC2) for
further investigation in Phase II-2. Two control HPC mixtures tested in Phase II-l were also
used to compare the effect of steam-curing regime on mechanical properties of HPC to SCC.
52
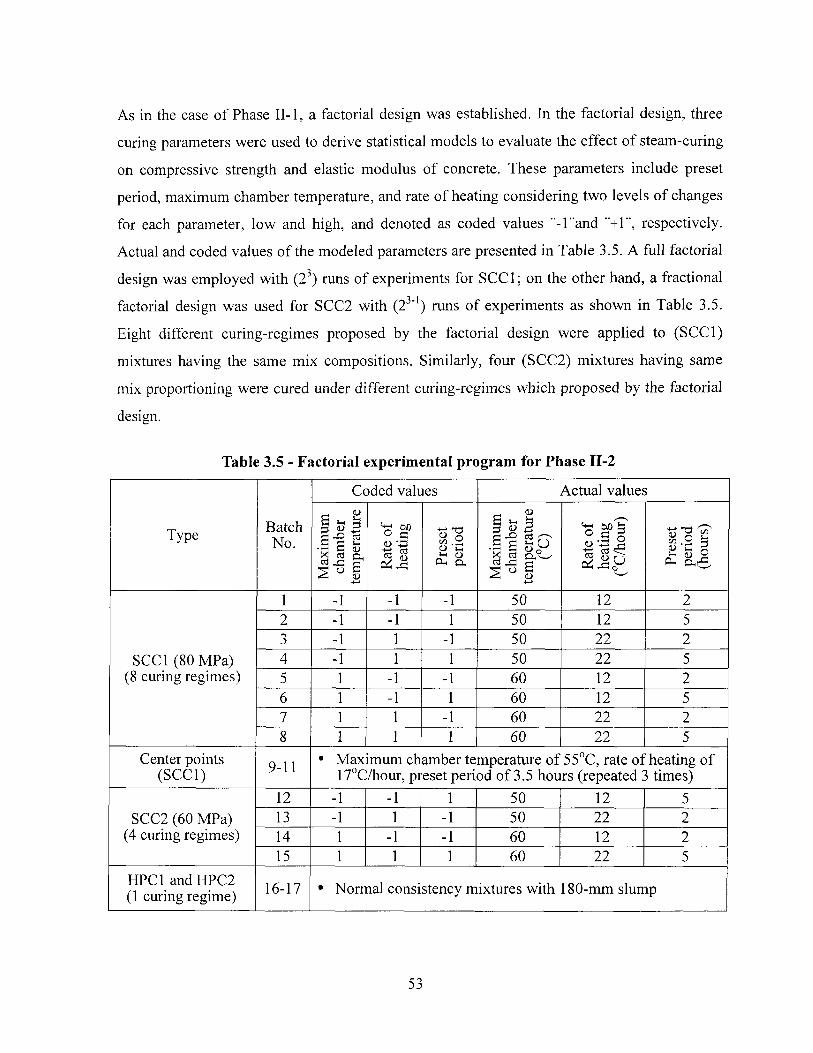
As in the case of Phase II-1, a factorial design was established. In the factorial design, three
curing parameters were used to derive statistical models to evaluate the effect of steam-curing
on compressive strength and elastic modulus of concrete. These parameters include preset
period, maximum chamber temperature, and rate of heating considering two levels of changes
for each parameter, low and high, and denoted as coded values "-l"and "+1", respectively.
Actual and coded values of the modeled parameters are presented in Table 3.5. A full factorial
design was employed with (23) runs of experiments for SCC1; on the other hand, a fractional
factorial design was used for SCC2 with (23"1) runs of experiments as shown in Table 3.5.
Eight different curing-regimes proposed by the factorial design were applied to (SCC1)
mixtures having the same mix compositions. Similarly, four (SCC2) mixtures having same
mix proportioning were cured under different curing-regimes which proposed by the factorial
design.
Table 3.5 - Factorial experimental program for Phase II-2
Type Batch No.
Coded values Actual values
Type Batch No.
Max
imum
ch
ambe
r te
mpe
ratu
re
Rat
e of
he
atin
g
Pres
et
perio
d
Max
imum
ch
ambe
r te
mpe
ratu
re
(°C)
Rat
e of
he
atin
g (°
C/h
our)
Pres
et
perio
d (h
ours
)
SCC1 (80 MPa) (8 curing regimes)
1 -1 -1 -1 50 12 2
SCC1 (80 MPa) (8 curing regimes)
2 -1 -1 1 50 12 5
SCC1 (80 MPa) (8 curing regimes)
3 -1 1 -1 50 22 2 SCC1 (80 MPa)
(8 curing regimes) 4 -1 1 1 50 22 5 SCC1 (80 MPa)
(8 curing regimes) 5 1 -1 -1 60 12 2 SCC1 (80 MPa)
(8 curing regimes) 6 1 -1 1 60 12 5
SCC1 (80 MPa) (8 curing regimes)
7 1 1 -1 60 22 2
SCC1 (80 MPa) (8 curing regimes)
8 1 1 1 60 22 5 Center points
(SCC1) 9-11 • Maximum chamber temperature of 55°C, rate of heating of 17°C/hour, preset period of 3.5 hours (repeated 3 times)
SCC2 (60 MPa) (4 curing regimes)
12 -1 1 50 12 5 SCC2 (60 MPa)
(4 curing regimes) 13 -1 1 -1 50 22 2 SCC2 (60 MPa)
(4 curing regimes) 14 1 -1 -1 60 12 2 SCC2 (60 MPa)
(4 curing regimes) 15 1 1 1 60 22 5
HPC1 and HPC2 (1 curing regime) 16-17 • Normal consistency mixtures with 180-mm slump
53
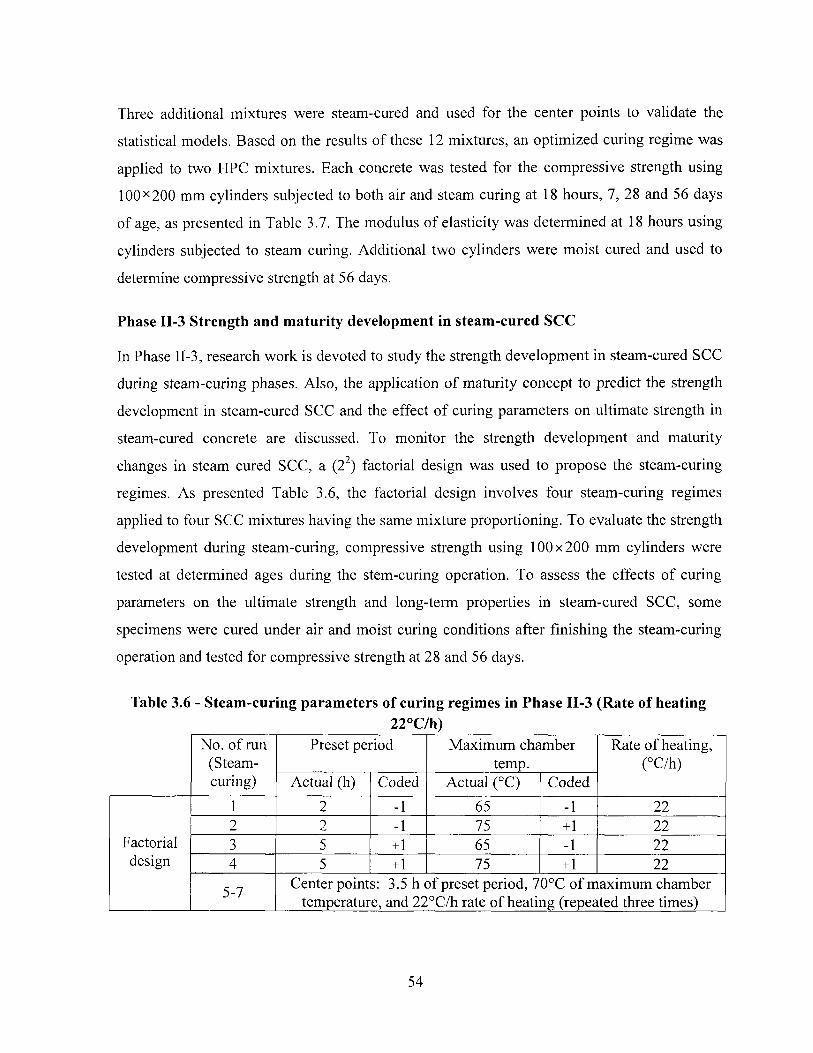
Three additional mixtures were steam-cured and used for the center points to validate the
statistical models. Based on the results of these 12 mixtures, an optimized curing regime was
applied to two HPC mixtures. Each concrete was tested for the compressive strength using
100x200 mm cylinders subjected to both air and steam curing at 18 hours, 7, 28 and 56 days
of age, as presented in Table 3.7. The modulus of elasticity was determined at 18 hours using
cylinders subjected to steam curing. Additional two cylinders were moist cured and used to
determine compressive strength at 56 days.
Phase II-3 Strength and maturity development in steam-cured SCC
In Phase II-3, research work is devoted to study the strength development in steam-cured SCC
during steam-curing phases. Also, the application of maturity concept to predict the strength
development in steam-cured SCC and the effect of curing parameters on ultimate strength in
steam-cured concrete are discussed. To monitor the strength development and maturity
changes in steam cured SCC, a (22) factorial design was used to propose the steam-curing
regimes. As presented Table 3.6, the factorial design involves four steam-curing regimes
applied to four SCC mixtures having the same mixture proportioning. To evaluate the strength
development during steam-curing, compressive strength using 100x200 mm cylinders were
tested at determined ages during the stem-curing operation. To assess the effects of curing
parameters on the ultimate strength and long-term properties in steam-cured SCC, some
specimens were cured under air and moist curing conditions after finishing the steam-curing
operation and tested for compressive strength at 28 and 56 days.
Table 3.6 - Steam-curing parameters of curing regimes in Phase II-3 (Rate of heating 22°C/h)
No. of run Preset period Maximum chamber Rate of heating, (Steam- temp. (°C/h) curing) Actual (h) Coded Actual (°C) Coded
1 2 -1 65 -1 22 2 2 -1 75 +1 22
Factorial 3 5 +1 65 -1 22 design 4 5 +1 75 +1 22
5-7 Center points: 3.5 h of preset period, 70°C of maximum chamber temperature, and 22°C/h rate of heating (repeated three times)
54
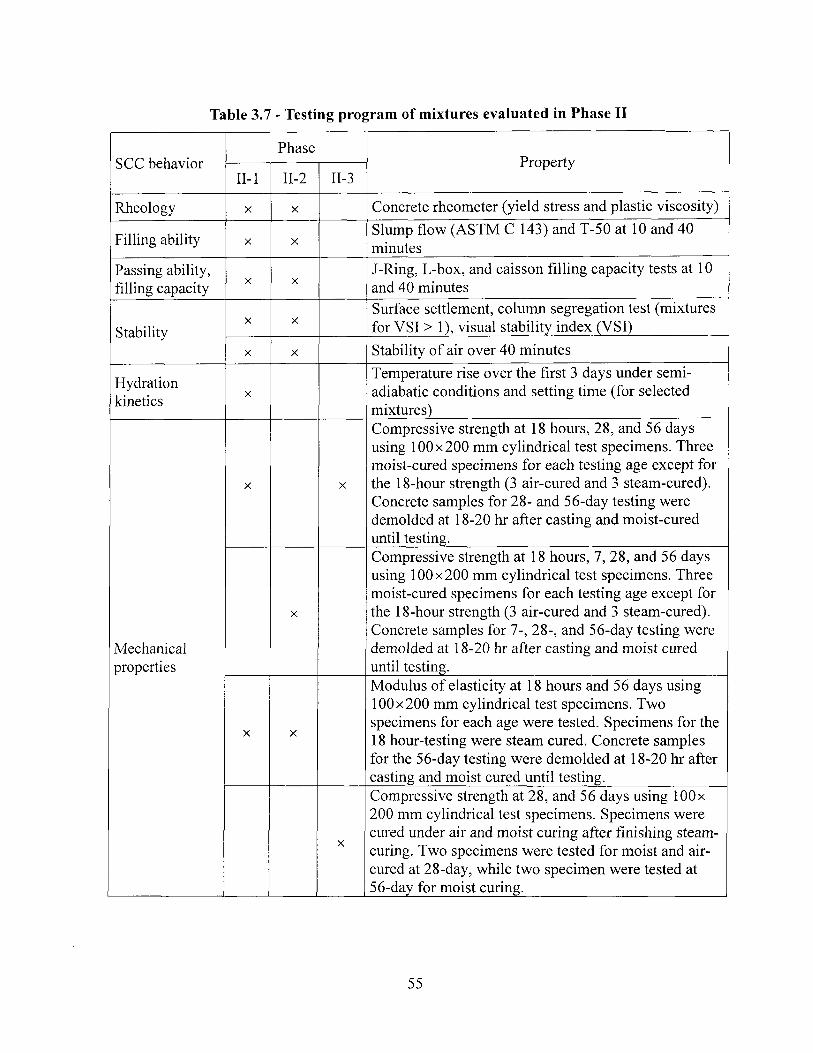
Table 3.7 - Testing program of mixtures evaluated in Phase II
SCC behavior Phase
Property SCC behavior II-1 II-2 II-3
Property
Rheology X X Concrete rheometer (yield stress and plastic viscosity)
Filling ability X X Slump flow (ASTM C 143) and T-50 at 10 and 40 minutes
Passing ability, filling capacity X X
J-Ring, L-box, and caisson filling capacity tests at 10 and 40 minutes
Stability X X
Surface settlement, column segregation test (mixtures for VSI > 1), visual stability index (VSI) Stability
X X Stability of air over 40 minutes
Hydration kinetics X
Temperature rise over the first 3 days under semi-adiabatic conditions and setting time (for selected mixtures)
Mechanical properties
X X
Compressive strength at 18 hours, 28, and 56 days using 100x200 mm cylindrical test specimens. Three moist-cured specimens for each testing age except for the 18-hour strength (3 air-cured and 3 steam-cured). Concrete samples for 28- and 56-day testing were demolded at 18-20 hr after casting and moist-cured until testing.
Mechanical properties
X
Compressive strength at 18 hours, 7, 28, and 56 days using 100x200 mm cylindrical test specimens. Three moist-cured specimens for each testing age except for the 18-hour strength (3 air-cured and 3 steam-cured). Concrete samples for 7-, 28-, and 56-day testing were demolded at 18-20 hr after casting and moist cured until testing.
Mechanical properties
X X
Modulus of elasticity at 18 hours and 56 days using 100x200 mm cylindrical test specimens. Two specimens for each age were tested. Specimens for the 18 hour-testing were steam cured. Concrete samples for the 56-day testing were demolded at 18-20 hr after casting and moist cured until testing.
Mechanical properties
X
Compressive strength at 28, and 56 days using 100x 200 mm cylindrical test specimens. Specimens were cured under air and moist curing after finishing steam-curing. Two specimens were tested for moist and air-cured at 2 8-day, while two specimen were tested at 56-day for moist curing.
55
3.7 Specimen Preparation
3.7.1 Mixing sequence
The SCC mixtures were prepared in 100- € batches using a drum mixer. The mixer was
equipped with speed gear to enable the simulation of concrete agitation at low rotational speed
corresponding to the construction-site conditions during transportation and field delivery. The
mixing sequence consisted of wetting the sand and coarse aggregate with half of the mixing
water, followed by introducing the binder. Once the aggregate particles were coated by a layer
of cement paste, the remaining water and HRWRA were introduced over 30 seconds, and the
concrete was mixed for 2.5 minutes. The concrete remained at rest in the mixer for 3 minutes
for fluidity adjustment (680 ± 20 mm). This enables any large entrapped air bubbles to rise to
the surface. The concrete is remixed for 2 minutes and then tested for workability
characteristics. The concrete was agitated at low rotational speed of 6 rpm between 10 and 40
minutes testing.
3.7.2 Sampling and curing
After the measurement of fresh properties at 40 minutes, several 100 x 200 mm cylinders were
sampled to determine compressive strength and elastic modulus at various ages, as presented
in Table 3.7. The cylinders were casted in one lift without any mechanical consolidation. The
investigation necessitated four different curing systems, air-curing, moist-curing, steam-curing
and moist or air-curing for some samples after finishing steam-curing. The air-cured samples
were covered and maintained at the laboratory conditions at 23 ± 2°C up until testing ages.
The steam-cured specimens were subjected to steam-curing regimes for 18-hour, then
compressive strength and elastic modulus were determined. The moist-cured specimens were
demolded at 18-20 hours after casting and moist cured in 100% relative humidity conditions at
23 ± 2°C until testing. Some specimens were cured under moist or air-curing conditions after
finishing their steam-curing treatment. In order to monitor the temperature rise in SCC and
HPC mixtures, samples measuring 150x300 mm were cured under semi-adiabatic conditions
for 70 hours. These conditions were obtained by enclosing the entire concrete with thick
insulating material (1 x 1 x 1-m styrofoam cube) to minimize heat transfer at indoor
conditions during testing time. In Phase II-3, different steam-curing regimes were applied on
56
concrete mixtures having the same mixture compositions. The temperature history was
monitored in the steam-cured mixtures to observe the maturity development within steam-
cured SCC. Further, strength development was determined in the cured mixtures during the
curing regime phases. The detailed curing regime parameters in Phase II-3 are presented in
Table 3.6.
57

Chapter 4 - Test Results, Discussion, and Modeling of SCC
Fresh and Mechanical Properties
4.1 Introduction
Mixture design plays a key role on fresh properties that control the workability criteria of SCC
used in manufacturing concrete precast elements. In addition to the significant effect of
mixture proportioning on fresh properties, the mixture components are vital parameters to
assure required early-age hardening properties of precast, prestressed elements.
Moreover, when SCC is subjected to special heat treatment, mixture design should be adjusted
in such a way to adopt best responses of cured concrete to steam-curing regimes in terms of
development early-strength with time. Compatibility between a proper mix design and the
applied heat treatment is substantial also in terms of time saving and in cost reduction.
The results of mixtures proposed by a factorial design in Phase II-1 (influence of mixture
parameters on key workability and mechanical properties) are employed in statistical analysis
to evaluate the significance of mix parameters on fresh and mechanical properties of steam-
cured SCC used for precast, prestressed applications.
4.2 Research Approach
The examined mixtures in Phase II-1 were proposed in accordance with a factorial design
established to model the effect of mixture design parameters, and material properties on
workability and mechanical properties of SCC used in the research program. In the factorial
design, the mixture parameters were considered as modeled parameters including the w/cm,
binder content and type, and HRWRA type. The ranges of modeled parameters were selected
to cover a wide scope of SCC mixture formulations proper for precast, prestressed
applications. Statistical models were derived to evaluate the effect of mixture parameters on
fresh and mechanical properties of SCC. As presented in Table 4.2, the fresh properties of
SCC, including passing and filling ability, filling capacity, stability, and rheology are
58
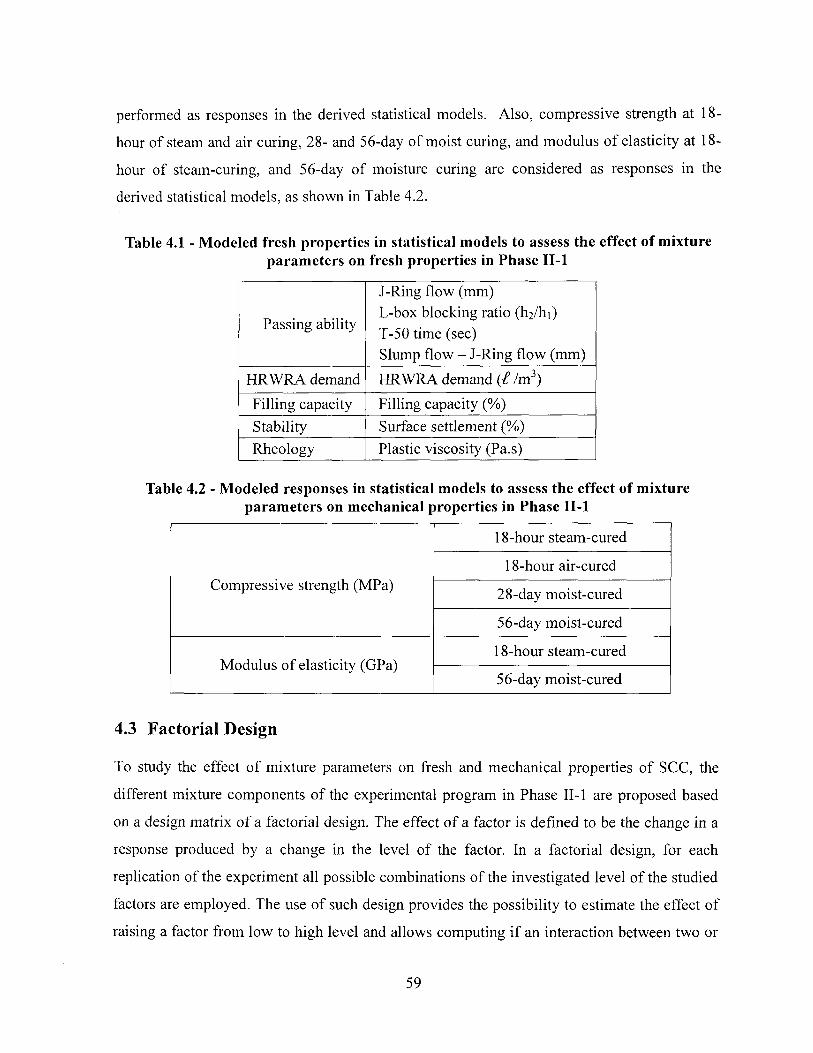
performed as responses in the derived statistical models. Also, compressive strength at 18-
hour of steam and air curing, 28- and 56-day of moist curing, and modulus of elasticity at 18-
hour of steam-curing, and 56-day of moisture curing are considered as responses in the
derived statistical models, as shown in Table 4.2.
Table 4.1 - Modeled fresh properties in statistical models to assess the effect of mixture parameters on fresh properties in Phase II-l
Passing ability
J-Ring flow (mm) L-box blocking ratio (h2/hi) T-50 time (sec) Slump flow - J-Ring flow (mm)
HRWRA demand HRWRA demand ( i /m3)
Filling capacity Filling capacity (%) Stability Surface settlement (%) Rheology Plastic viscosity (Pa.s)
Table 4.2 - Modeled responses in statistical models to assess the effect of mixture parameters on mechanical properties in Phase II-l
Compressive strength (MPa)
18-hour steam-cured
Compressive strength (MPa) 18-hour air-cured
Compressive strength (MPa) 28-day moist-cured Compressive strength (MPa)
56-day moist-cured
Modulus of elasticity (GPa) 18-hour steam-cured
Modulus of elasticity (GPa) 56-day moist-cured
4.3 Factorial Design
To study the effect of mixture parameters on fresh and mechanical properties of SCC, the
different mixture components of the experimental program in Phase II-l are proposed based
on a design matrix of a factorial design. The effect of a factor is defined to be the change in a
response produced by a change in the level of the factor. In a factorial design, for each
replication of the experiment all possible combinations of the investigated level of the studied
factors are employed. The use of such design provides the possibility to estimate the effect of
raising a factor from low to high level and allows computing if an interaction between two or
59
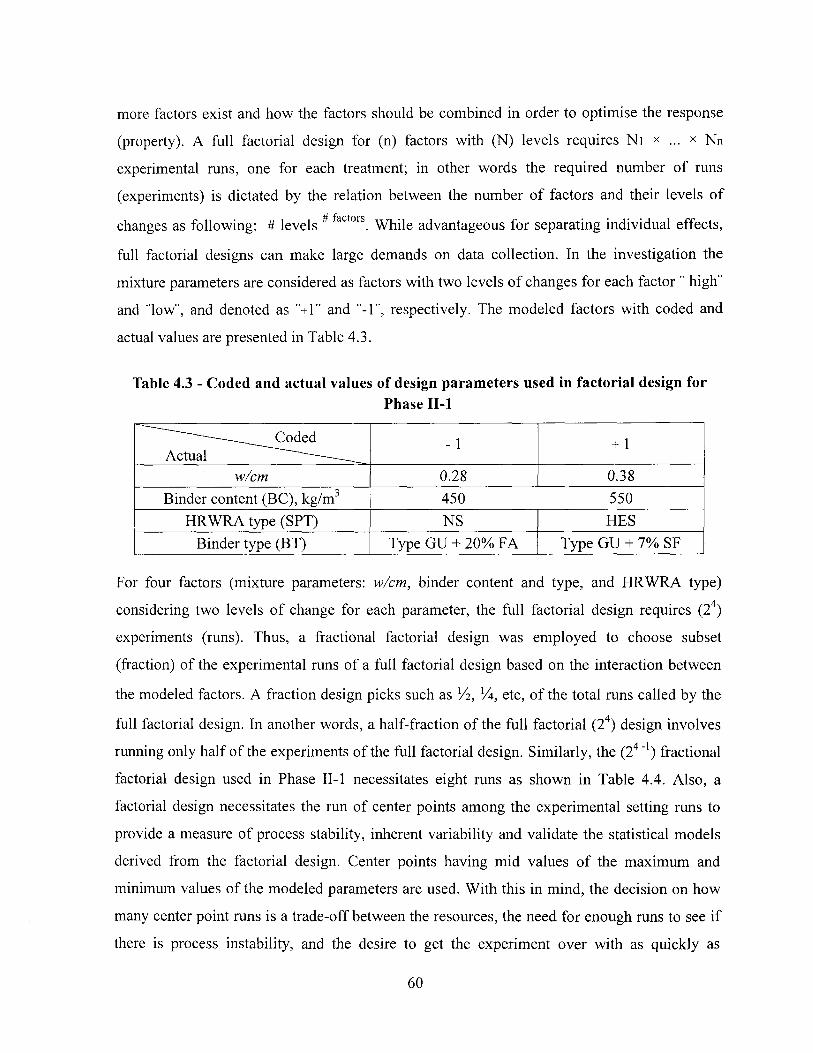
more factors exist and how the factors should be combined in order to optimise the response
(property). A full factorial design for (n) factors with (N) levels requires Ni x ... x Nn
experimental runs, one for each treatment; in other words the required number of runs
(experiments) is dictated by the relation between the number of factors and their levels of
changes as following: # levels # factors. While advantageous for separating individual effects,
full factorial designs can make large demands on data collection. In the investigation the
mixture parameters are considered as factors with two levels of changes for each factor " high"
and "low", and denoted as "+1" and "-1", respectively. The modeled factors with coded and
actual values are presented in Table 4.3.
Table 4.3 - Coded and actual values of design parameters used in factorial design for Phase II-l
Actual "— - 1 + 1
w/cm 0.28 0.38 Binder content (BC), kg/m3 450 550
HRWRA type (SPT) NS HES Binder type (BT) Type GU + 20% FA Type GU + 7% SF
For four factors (mixture parameters: w/cm, binder content and type, and HRWRA type)
considering two levels of change for each parameter, the full factorial design requires (24)
experiments (runs). Thus, a fractional factorial design was employed to choose subset
(fraction) of the experimental runs of a full factorial design based on the interaction between
the modeled factors. A fraction design picks such as V2, XA, etc, of the total runs called by the
full factorial design. In another words, a half-fraction of the full factorial (24) design involves
running only half of the experiments of the full factorial design. Similarly, the (24"') fractional
factorial design used in Phase II-1 necessitates eight runs as shown in Table 4.4. Also, a
factorial design necessitates the run of center points among the experimental setting runs to
provide a measure of process stability, inherent variability and validate the statistical models
derived from the factorial design. Center points having mid values of the maximum and
minimum values of the modeled parameters are used. With this in mind, the decision on how
many center point runs is a trade-off between the resources, the need for enough runs to see if
there is process instability, and the desire to get the experiment over with as quickly as
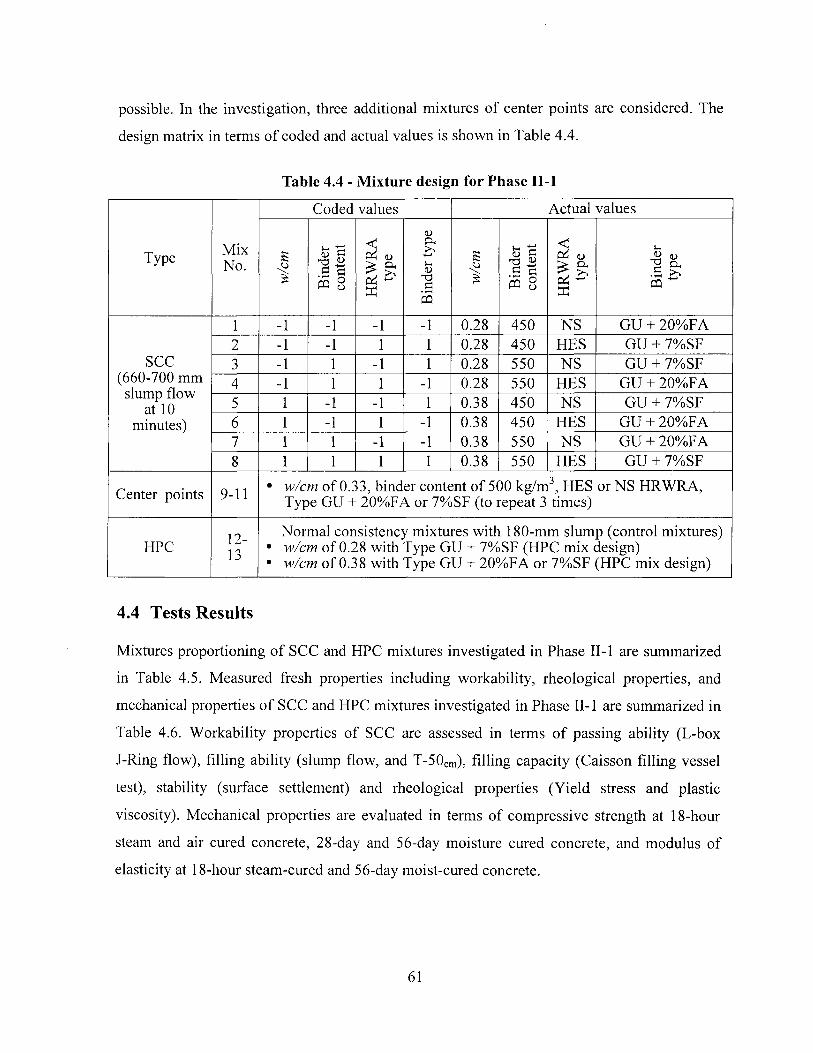
possible. In the investigation, three additional mixtures of center points are considered. The
design matrix in terms of coded and actual values is shown in Table 4.4.
Table 4.4 - Mixture design for Phase II-l
Type Mix No.
Coded values Actual values
Type Mix No.
w/cm
Bin
der
cont
ent
HR
WR
A
type
Bin
der
type
w/cm
Bin
der
cont
ent
HR
WR
A
type
Bin
der
type
SCC (660-700 mm slump flow
at 10 minutes)
1 -1 -1 -1 -1 0.28 450 NS GU + 20%FA
SCC (660-700 mm slump flow
at 10 minutes)
2 -1 -1 1 1 0.28 450 HES GU + 7%SF SCC
(660-700 mm slump flow
at 10 minutes)
3 -1 1 -1 1 0.28 550 NS GU + 7%SF SCC (660-700 mm slump flow
at 10 minutes)
4 -1 1 1 -1 0.28 550 HES GU + 20%FA SCC
(660-700 mm slump flow
at 10 minutes)
5 1 -1 -1 1 0.38 450 NS GU + 7%SF
SCC (660-700 mm slump flow
at 10 minutes) 6 1 -1 1 -1 0.38 450 HES GU + 20%FA
SCC (660-700 mm slump flow
at 10 minutes)
7 1 1 -1 -1 0.38 550 NS GU + 20%FA
SCC (660-700 mm slump flow
at 10 minutes)
8 1 1 1 1 0.38 550 HES GU + 7%SF
Center points 9-11 • w/cm of 0.33, binder content of 500 kg/m3, HES or NS HRWRA, Type GU + 20%FA or 7%SF (to repeat 3 times)
HPC 12-13
Normal consistency mixtures with 180-mm slump (control mixtures) • w/cm of 0.28 with Type GU + 7%SF (HPC mix design) • w/cm of 0.38 with Type GU + 20%FA or 7%SF (HPC mix design)
4.4 Tests Results
Mixtures proportioning of SCC and HPC mixtures investigated in Phase II-l are summarized
in Table 4.5. Measured fresh properties including workability, rheological properties, and
mechanical properties of SCC and HPC mixtures investigated in Phase II-l are summarized in
Table 4.6. Workability properties of SCC are assessed in terms of passing ability (L-box
J-Ring flow), filling ability (slump flow, and T-50cm), filling capacity (Caisson filling vessel
test), stability (surface settlement) and rheological properties (Yield stress and plastic
viscosity). Mechanical properties are evaluated in terms of compressive strength at 18-hour
steam and air cured concrete, 28-day and 56-day moisture cured concrete, and modulus of
elasticity at 18-hour steam-cured and 56-day moist-cured concrete.
61
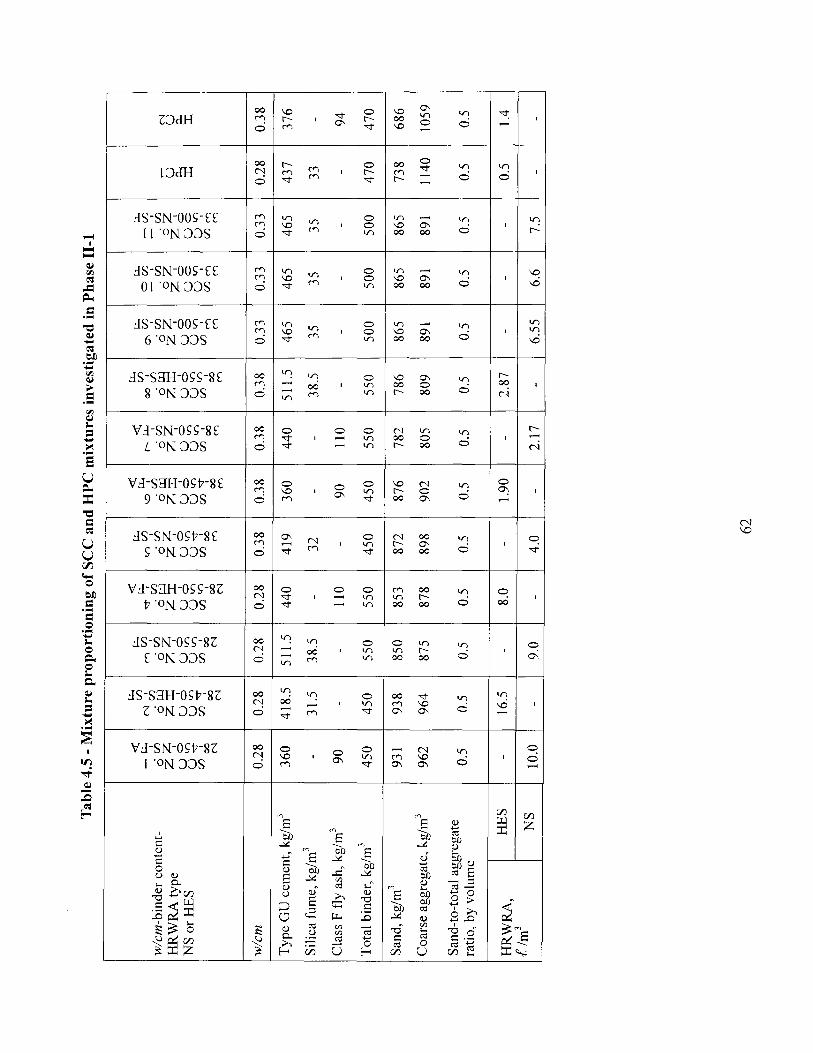
Tab
le 4
.5 -
Mix
ture
pro
port
ioni
ng o
f SC
C a
nd H
PC
mix
ture
s in
vest
igat
ed i
n P
hase
II-
l
w/c
m-b
inde
r con
tent
-H
RWRA
type
N
S or
HES
SCC No. 1 28-450-NS-FA
SCC No. 2 28-450-HES-SF
SCC No. 3 28-550-NS-SF
SCC No. 4 28-550-HES-FA
SCC No. 5 38-450-NS-SF
SCC No. 6 38-450-HES-FA
SCC No. 7 38-550-NS-FA
SCC No. 8 38-550-HES-SF
SCC No. 9 33-500-NS-SF
SCC No. 10 33-500-NS-SF
SCC No. 11 33-500-NS-SF
HPC1
HPC2
w/cm
0.
28
0.28
0.
28
0.28
0.
38
0.38
0.
38
0.38
0.
33
0.33
0.
33
0.28
0.
38
Type
GU
cem
ent,
kg/m
3 36
0 41
8.5
511.
5 44
0 41
9 36
0 44
0 51
1.5
465
465
465
437
376
Silic
a fu
me,
kg/
m3
-31
.5
38.5
-
32
--
38.5
35
35
35
33
-
Clas
s F
fly as
h, k
g/m
3 90
-
-11
0 -
90
110
--
--
-94
Total
bin
der,
kg/m
3 45
0 45
0 55
0 55
0 45
0 45
0 55
0 55
0 50
0 50
0 50
0 47
0 47
0
Sand
, kg/
m3
931
938
850
853
872
876
782
786
865
865
865
738
686
Coar
se a
ggre
gate
, kg/
m3
962
964
875
878
898
902
805
809
891
891
891
1140
10
59
Sand
-to-to
tal a
ggre
gate
ra
tio, b
y vo
lum
e 0.
5 0.
5 0.
5 0.
5 0.
5 0.
5 0.
5 0.
5 0.
5 0.
5 0.
5 0.
5 0.
5
HRW
RA,
€/m
3 H
ES
-16
.5
-8.
0 -
1.90
-2.
87
--
-0.
5 1.4
H
RWRA
, €/
m3
NS
10.0
-
9.0
-4.
0 -
2.17
-
6.55
6.
6 7.5
-
-
62
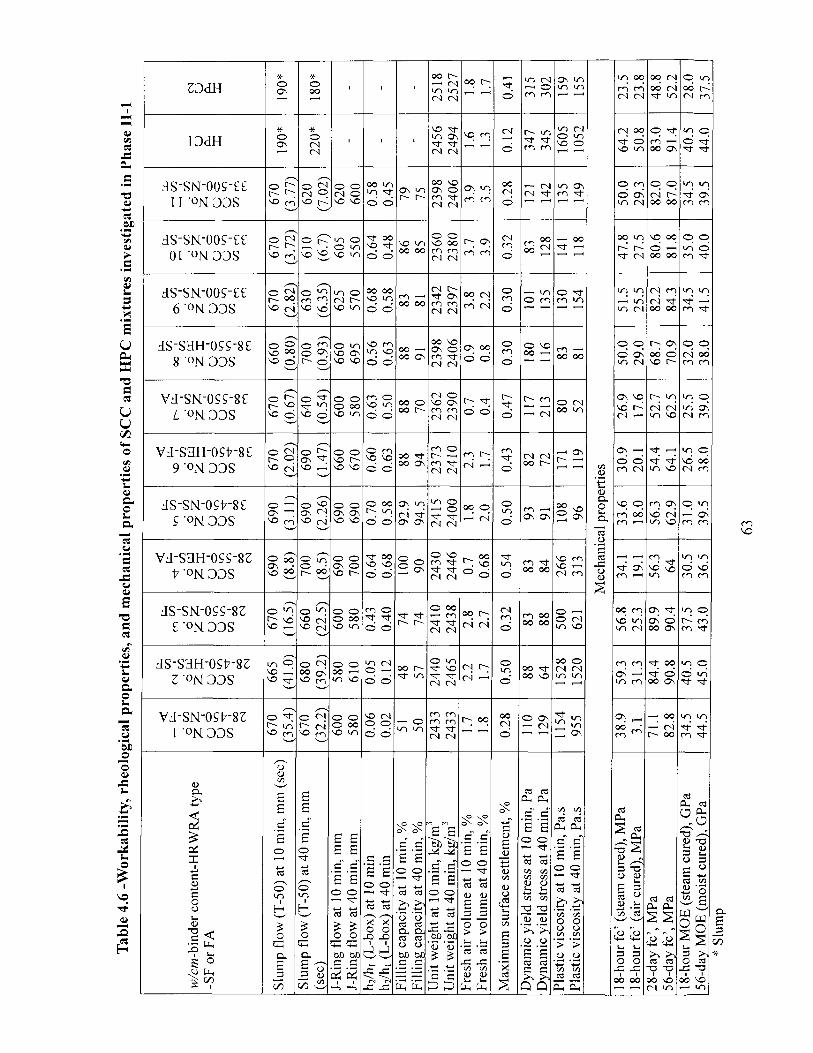
Tab
le 4
.6 -
Wor
kabi
lity,
rhe
olog
ical
pro
pert
ies,
and
mec
hani
cal
prop
ertie
s of
SC
C a
nd H
PC m
ixtu
res
inve
stig
ated
in
Phas
e II
-l
w/cm
-bin
der c
onte
nt-H
RWRA
type
-S
F or
FA
SCC No. 1 28-450-NS-FA
SCC No. 2 28-450-HES-SF
SCC No. 3 28-550-NS-SF
SCC No. 4 28-550-HES-FA
SCC No. 5 38-450-NS-SF
SCC No. 6 38-450-HES-FA
SCC No. 7 38-550-NS-FA
SCC No. 8 38-550-HES-SF
SCC No. 9 33-500-NS-SF
SCC No. 10 33-500-NS-SF
SCC No. 11 33-500-NS-SF
HPC1
HPC2
Slum
p flo
w (T
-50)
at 1
0 m
in, m
m (s
ec)
670
(35.
4)
665
(41.
0)
670
(16.
5)
690
(8.8
) 69
0 (3
.11)
67
0 (2
.02)
67
0 (0
.67)
66
0 (0
.80)
67
0 (2
.82)
67
0 (3
.72)
67
0 (3
.77)
19
0*
190*
Sl
ump
flow
(T-5
0) a
t 40
min
, mm
(s
ec)
670
(32.
2)
680
(39.
2)
660
(22.
5)
700
(8.5
) 69
0 (2
.26)
69
0 (1
.47)
64
0 (0
.54)
70
0 (0
.93)
63
0 (6
.35)
61
0 (6
.7)
620
(7.0
2)
220*
18
0*
J-Ri
ng fl
ow at
10
min
, mm
J-
Ring
flow
at 4
0 m
in, m
m
600
580
580
610
600
580
690
700
690
690
660
670
600
580
660
695
625
570
605
550
620
600
--
h 2/h
| (L-
box)
at 1
0 m
in
h 2/h
i (L-
box)
at 4
0 m
in
0.06
0.
02
0.05
0.
12
0.43
0.
40
0.64
0.
68
0.70
0.
58
0.60
0.
63
0.63
0.
50
0.56
0.
63
0.68
0.
58
0.64
0.
48
0.58
0.
45
--
Filli
ng c
apac
ity a
t 10
min
, %
Filli
ng c
apac
ity a
t 40
min
, %
51
50
48
57
74
74
100
90
92.9
94
.5
88
94
88
70
88
91
83
81
86
85
79
75
--
Uni
t wei
ght a
t 10
min
, kg/
mJ
Uni
t wei
ght a
t 40
min
, kg/
m3
2433
24
33
2440
24
65
2410
24
38
2430
24
46
2415
24
00
2373
24
10
2362
23
90
2398
24
06
2342
23
97
2360
23
80
2398
24
06
2456
24
94
2518
25
27
Fres
h ai
r vol
ume
at 1
0 m
in, %
Fr
esh
air v
olum
e at
40
min
, %
1.7
1.8
2.2 1.7
2.
8 2.
7 0.
7 0.
68
1.8
2.0
2.3 1.7
0.
7 0.
4 0.
9 0.
8 3.
8 2.
2 3.
7 3.
9 3.
9 3.
5 1.6
1.3
1.8
1.7
M
axim
um s
urfa
ce se
ttlem
ent,
%
0.28
0.
50
0.32
0.
54
0.50
0.
43
0.47
0.
30
0.30
0.
32
0.28
0.
12
0.41
D
ynam
ic y
ield
stre
ss a
t 10
min
, Pa
Dyn
amic
yie
ld s
tress
at 4
0 m
in, P
a 11
0 12
9 88
64
83
88
83
84
93
91
82
72
11
7 21
3 18
0 11
6 10
1 13
5 83
12
8 12
1 14
2 34
7 34
5 31
5 30
2 Pl
astic
visc
osity
at 1
0 m
in, P
a.s
Plas
tic v
iscos
ity a
t 40
min
, Pa.s
11
54
955
1528
15
20
500
621
266
313
108
96
171
119
80
52
83
81
130
154
141
118
135
149
1605
10
52
159
155
Mec
hani
cal p
rope
rties
18
-hou
r fc'
(ste
am c
ured
), M
Pa
18-h
our f
c' (a
ir cu
red)
, MPa
38
.9
3.1
59.3
31
.3
56.8
25
.3
34.1
19
.1
33.6
18
.0
30.9
20
.1
26.9
17
.6
50.0
29
.0
51.5
25
.5
47.8
27
.5
50.0
29
.3
64.2
50
.8
23.5
23
.8
28-d
ay f
c', M
Pa
56-d
ay f
c', M
Pa
71.1
82
.8
84.4
90
.8
89.9
90
.4
56.3
64
56
.3
62.9
54
.4
64.1
52
.7
62.5
68
.7
70.9
82
.2
84.3
80
.6
81.8
82
.0
87.0
83
.0
91.4
48
.8
52.2
18
-hou
r MO
E (s
team
cur
ed),
GPa
56
-day
MO
E (m
oist
cure
d), G
Pa
34.5
44
.5
40.5
45
.0
37.5
43
.0
30.5
36
.5
31.0
39
.5
26.5
38
.0
25.5
39
.0
32.0
38
.0
34.5
41
.5
35.0
40
.0
34.5
39
.5
40.5
44
.0
28.0
37
.5
* Sl
ump
63
4.5 Discussion and Modeling of Fresh Properties of SCC
Proper mix design of SCC is vital to satisfy the workability requirements and the desirable long-
term properties, in precast, perestressed applications. Definitely, SCC presents a great sensitivity
to changes in constituent materials, thus little change in mix proportioning may lead to large
differences in workability. Therefore, quantifying the mixture parameters is essential to ensure
variable workability requirements and to meet the workability criteria with efficiency and
economy. Discussions regarding the significance of mixture parameters on fresh properties of
SCC including HRWRA demand, passing ability, filling ability, and plastic viscosity for the
mixtures in Phase II-1 are provided.
4.5.1 Statistical models for fresh properties
A statistical model is a set of mathematical equations which describe the behaviour of an object
of study in terms of random variables and their associated probability distributions. If the model
has only one equation it is called a single-equation model, whereas if it has more than one
equation, it is known as a multiple-equation model.
From the results of SCC mixtures those proposed by a factorial design, statistical models were
established for the fresh properties of SCC using multi-regression analysis. Multiple regression
analysis is a statistical tool for understanding the relationship between two or more variables.
The established statistical models for fresh properties are employed to assess the effect of
modeled mixture parameters including w/cm, binder type and content, and type of HRWRA on
fresh properties of SCC in terms of passing ability, filling capacity, stability, and rheology.
The derived statistical models for fresh properties of SCC are summarized in Table 4.7. All
factors are expressed in terms of coded values "+l"and "-1". The correlation coefficient (R2)
values of the derived models ranged from 0.92 to 0.99. The correlation coefficient, sometimes
also called the cross-correlation coefficient, is a quantity that gives the quality of a least squares
fitting to the original data. As presented in Table 4.7, for the majority of the models, the high R2
values demonstrate excellent correlation considering that at least 90% of measured values can be
accounted for in the proposed models. The estimate for each factor in the statistical models refers
to the contribution of that factor to the modeled property. For each modeled response, the single-
operator relative error corresponding to 90% confidence limit is used to perform significance
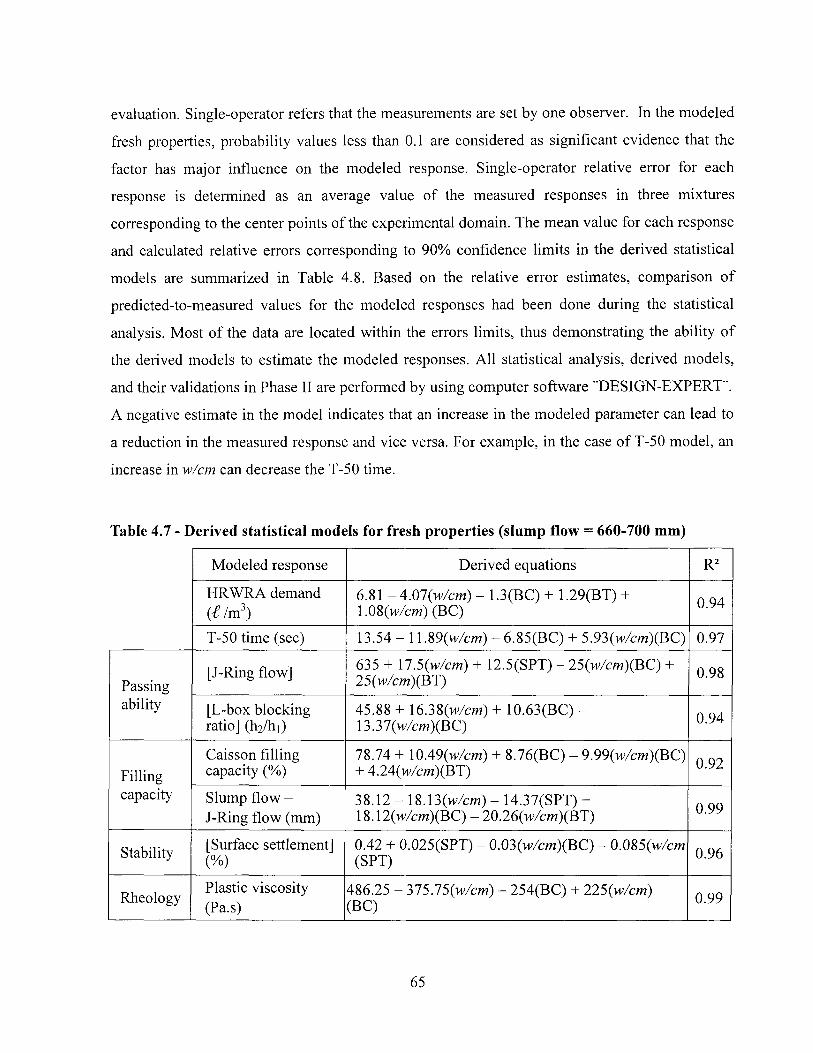
evaluation. Single-operator refers that the measurements are set by one observer. In the modeled
fresh properties, probability values less than 0.1 are considered as significant evidence that the
factor has major influence on the modeled response. Single-operator relative error for each
response is determined as an average value of the measured responses in three mixtures
corresponding to the center points of the experimental domain. The mean value for each response
and calculated relative errors corresponding to 90% confidence limits in the derived statistical
models are summarized in Table 4.8. Based on the relative error estimates, comparison of
predicted-to-measured values for the modeled responses had been done during the statistical
analysis. Most of the data are located within the errors limits, thus demonstrating the ability of
the derived models to estimate the modeled responses. All statistical analysis, derived models,
and their validations in Phase II are performed by using computer software "DESIGN-EXPERT".
A negative estimate in the model indicates that an increase in the modeled parameter can lead to
a reduction in the measured response and vice versa. For example, in the case of T-50 model, an
increase in w/cm can decrease the T-50 time.
Table 4.7 - Derived statistical models for fresh properties (slump flow = 660-700 mm)
Modeled response Derived equations R2
HRWRA demand (€/m3)
6.81 -A.01(w/cm) - 1.3(BC) + 1.29(BT) + \m(w/crn) (BC) 0.94
T-50 time (sec) 13.54 - 11.89(w/cm) -6.85(BC) + 5.93(w/cm)(BC) 0.97
Passing ability
[J-Ring flow] 635 + 17.5(w/cm) + 12.5(SPT) - 25(w/cm)(BC) + 25(w/cm)(BT) 0.98
Passing ability [L-box blocking
ratio] (h2/hi) 45.88 + 16.38 (w/cm) + 10.63(BC) -\3.31(w/cm)(BC) 0.94
Filling capacity
Caisson filling capacity (%)
78.74 + \QA9(w/cm) + 8.76(BC) - 9.99(w/cm)(BC) + 4.24(w/cm)(BT) 0.92
Filling capacity Slump flow -
J-Ring flow (mm) 38.12- 18.\3(w/cm)~ 14.37(SPT) + 18.12(w/cm)(BC) - 20.26(w/cm)(BT) 0.99
Stability [Surface settlement] (%)
0.42 + 0.025(SPT) - 0.03(w/cm)(BC) - 0.085(w/cm (SPT) 0.96
Rheology Plastic viscosity (Pa.s)
486.25 - 315.15(w/cm) - 254(BC) + 225(w/cm) (BC) 0.99
65
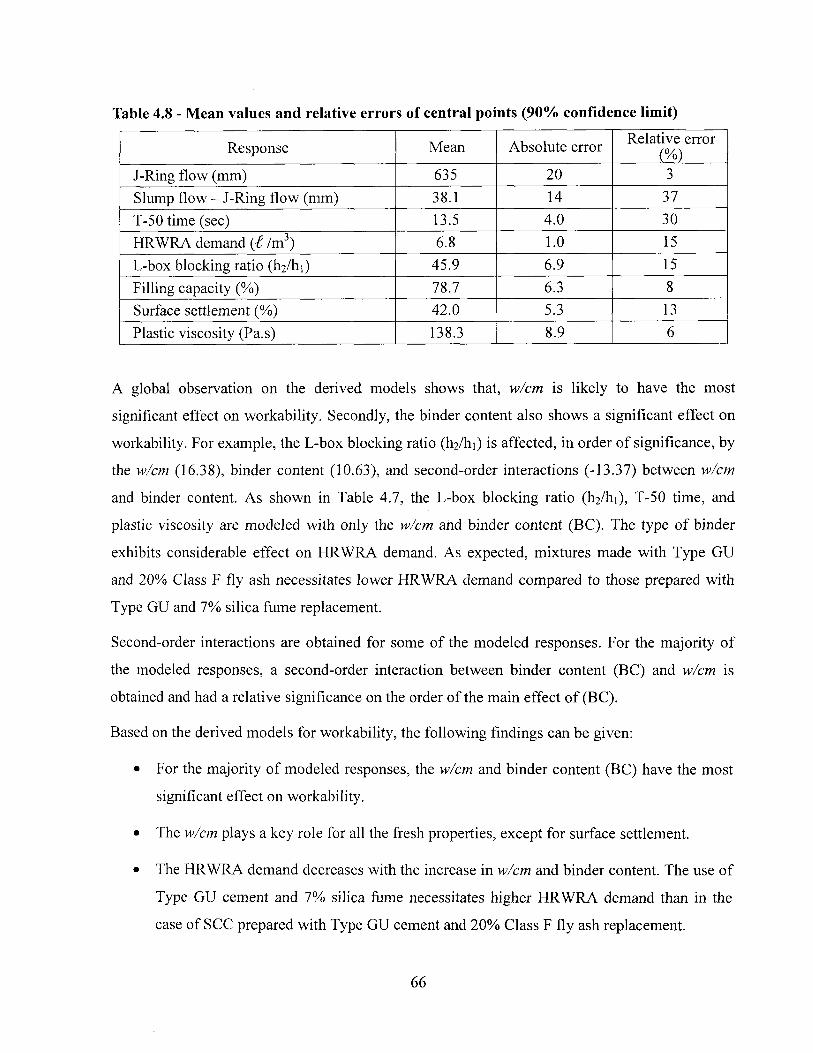
Table 4.8 - Mean values and relative errors of central points (90% confidence limit)
Response Mean Absolute error Relative error (%)
J-Ring flow (mm) 635 20 3 Slump flow - J-Ring flow (mm) 38.1 14 37 T-50 time (sec) 13.5 4.0 30 HRWRA demand ( t /m3) 6.8 1.0 15 L-box blocking ratio (h2/hi) 45.9 6.9 15 Filling capacity (%) 78.7 6.3 8 Surface settlement (%) 42.0 5.3 13 Plastic viscosity (Pa.s) 138.3 8.9 6
A global observation on the derived models shows that, w/cm is likely to have the most
significant effect on workability. Secondly, the binder content also shows a significant effect on
workability. For example, the L-box blocking ratio (h2/hi) is affected, in order of significance, by
the w/cm (16.38), binder content (10.63), and second-order interactions (-13.37) between w/cm
and binder content. As shown in Table 4.7, the L-box blocking ratio (h2/hi), T-50 time, and
plastic viscosity are modeled with only the w/cm and binder content (BC). The type of binder
exhibits considerable effect on HRWRA demand. As expected, mixtures made with Type GU
and 20% Class F fly ash necessitates lower HRWRA demand compared to those prepared with
Type GU and 7% silica fume replacement.
Second-order interactions are obtained for some of the modeled responses. For the majority of
the modeled responses, a second-order interaction between binder content (BC) and w/cm is
obtained and had a relative significance on the order of the main effect of (BC).
Based on the derived models for workability, the following findings can be given:
• For the majority of modeled responses, the w/cm and binder content (BC) have the most
significant effect on workability.
• The w/cm plays a key role for all the fresh properties, except for surface settlement.
• The HRWRA demand decreases with the increase in w/cm and binder content. The use of
Type GU cement and 7% silica fume necessitates higher HRWRA demand than in the
case of SCC prepared with Type GU cement and 20% Class F fly ash replacement.
66
• Passing ability [L-box blocking ratio (l^/hi) and J-Ring flow] and caisson filling capacity
can be improved by the increase in binder content and w/cm.
• The T-50 time is found to be decreased with the increase in w/cm and binder content.
• The type of HRWRA has a significant effect on surface settlement, J-Ring flow, as well
as slump flow - J-Ring flow.
• SCC made with NS type HRWRA can exhibit better static stability but lower passing
ability (J-Ring flow).
• Plastic viscosity decreases with the increase in binder content and w/cm. This is more
evident in the case of mixtures made with 20% Class F fly ash and HES type HRWRA.
• An increase in binder content can lead to a decrease in plastic viscosity and T-50 time
values.
• SCC made with HRWRA designed for high-early strength (Glenium 7700 HES) can
exhibit higher passing ability (J-Ring flow) and better filling capacity (less difference
between slump flow and J-Ring flow) than that with HRWRA made for normal strength
concrete (Glenium 3030 NS).
4.5.2 Effect of mixture parameters on fresh properties of SCC
Based on the results of statistical analysis of the fresh properties and the parametric studies; the
effects of following mixture parameters on workability properties of SCC are provided:
A) HRWRA demand
The HRWRA dosages to secure a given slump flow consistency of 680 ± 20 mm are compared in
Fig. 4.1. In general, mixtures made with lower w/cm of 0.28 necessitated higher HRWRA
demand compared to those prepared with the 0.38 w/cm. The HRWRA demand of SCC made
with 0.28 w/cm ranges from 8.0 to 16.5 £/va. The concrete prepared with 0.38 w/cm necessitated
HRWRA demand of 1.9 to 4.0 €/m3. For a given w/cm and binder content, mixtures made with
Type GU cement and 20% Class F fly ash necessitated lower HRWRA demand than those
prepared with the same cement and 7%> silica fume replacement as shown in Fig. 4.2. For
example, in the case of w/cm of 0.28, the 28-550-HES-FA and 28-450-NS-FA mixtures have
67
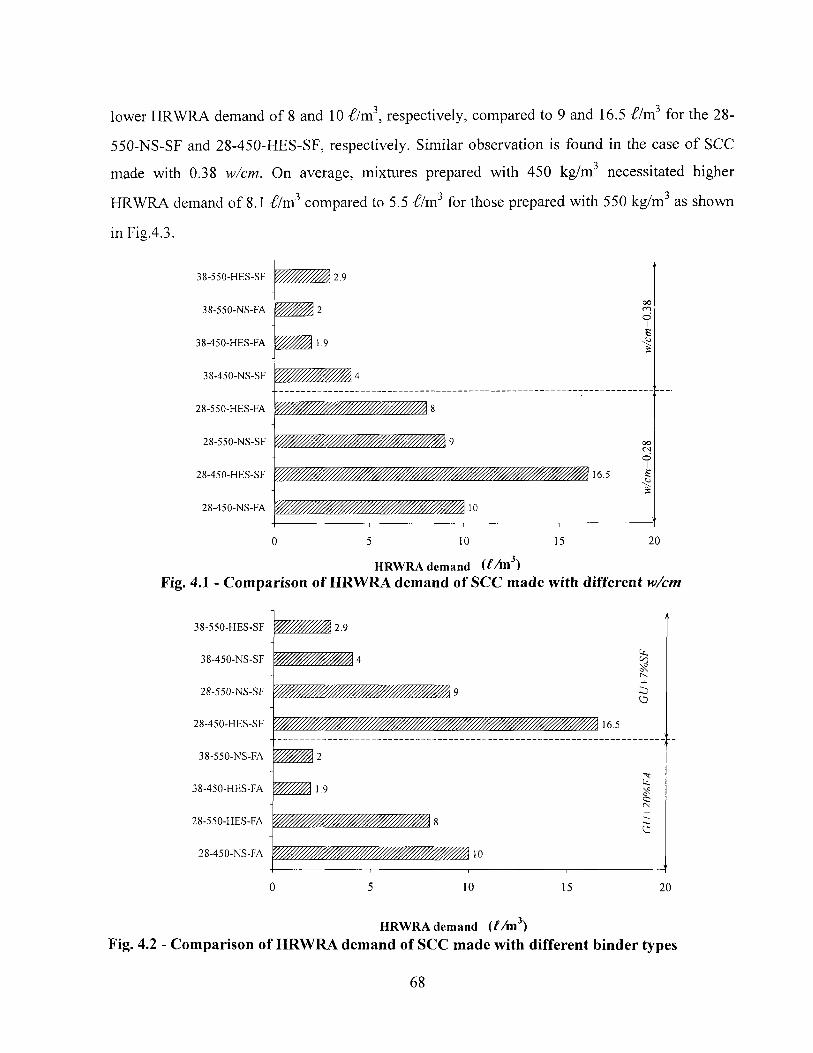
lower HRWRA demand of 8 and 10 €/m , respectively, compared to 9 and 16.5 €/m3 for the 28-
550-NS-SF and 28-450-HES-SF, respectively. Similar observation is found in the case of SCC
made with 0.38 w/cm. On average, mixtures prepared with 450 kg/m3 necessitated higher
HRWRA demand of 8.1 Hvcv compared to 5.5 / /m3 for those prepared with 550 kg/m3 as shown
in Fig.4.3.
10 20
HRWRA demand i t A n ) Fig. 4.1 - Comparison of HRWRA demand of SCC made with different w/cm
o 10 15 20
HRWRA demand (l/m ) Fig. 4.2 - Comparison of HRWRA demand of SCC made with different binder types
68
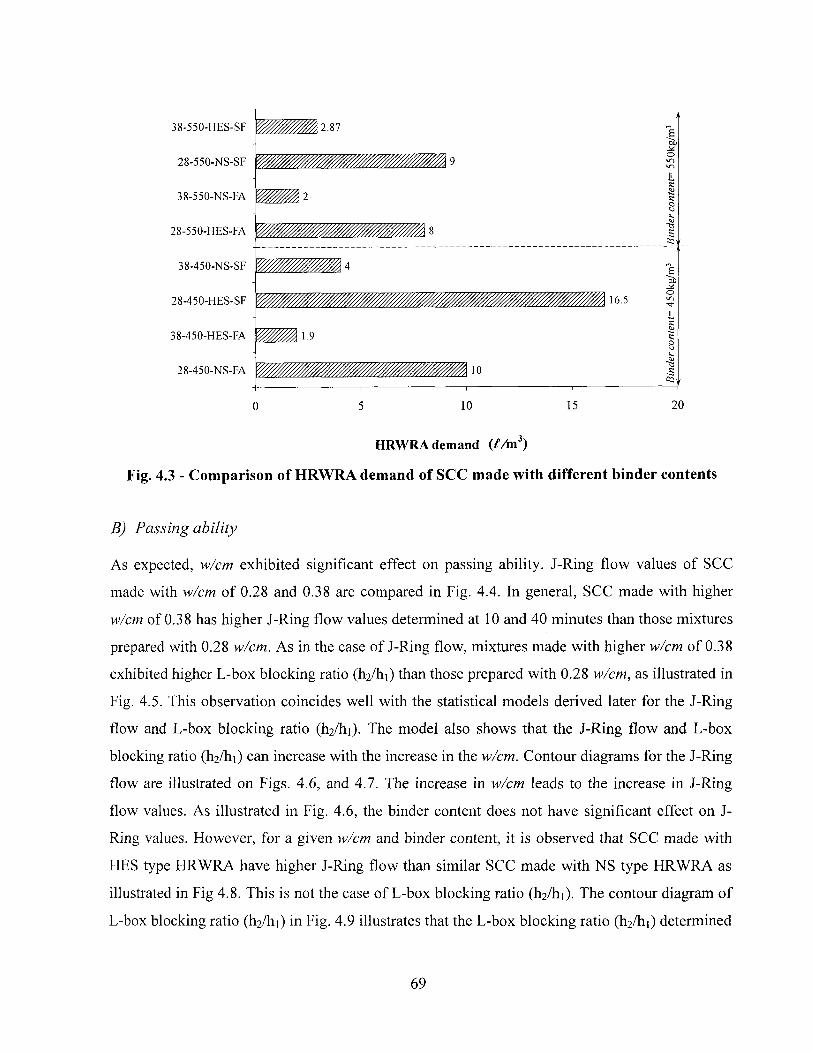
28-450-NS-FA
10 15 20
H R W R A demand ( M r i )
Fig. 4.3 - Comparison of HRWRA demand of SCC made with different binder contents
B) Passing ability
As expected, w/cm exhibited significant effect on passing ability. J-Ring flow values of SCC
made with w/cm of 0.28 and 0.38 are compared in Fig. 4.4. In general, SCC made with higher
w/cm of 0.38 has higher J-Ring flow values determined at 10 and 40 minutes than those mixtures
prepared with 0.28 w/cm. As in the case of J-Ring flow, mixtures made with higher w/cm of 0.38
exhibited higher L-box blocking ratio (hi/hi) than those prepared with 0.28 w/cm, as illustrated in
Fig. 4.5. This observation coincides well with the statistical models derived later for the J-Ring
flow and L-box blocking ratio (h2/hi). The model also shows that the J-Ring flow and L-box
blocking ratio (h2/hi) can increase with the increase in the w/cm. Contour diagrams for the J-Ring
flow are illustrated on Figs. 4.6, and 4.7. The increase in w/cm leads to the increase in J-Ring
flow values. As illustrated in Fig. 4.6, the binder content does not have significant effect on J-
Ring values. However, for a given w/cm and binder content, it is observed that SCC made with
HES type HRWRA have higher J-Ring flow than similar SCC made with NS type HRWRA as
illustrated in Fig 4.8. This is not the case of L-box blocking ratio (h2/hi). The contour diagram of
L-box blocking ratio (h2/hi) in Fig. 4.9 illustrates that the L-box blocking ratio (h2/hi) determined
69
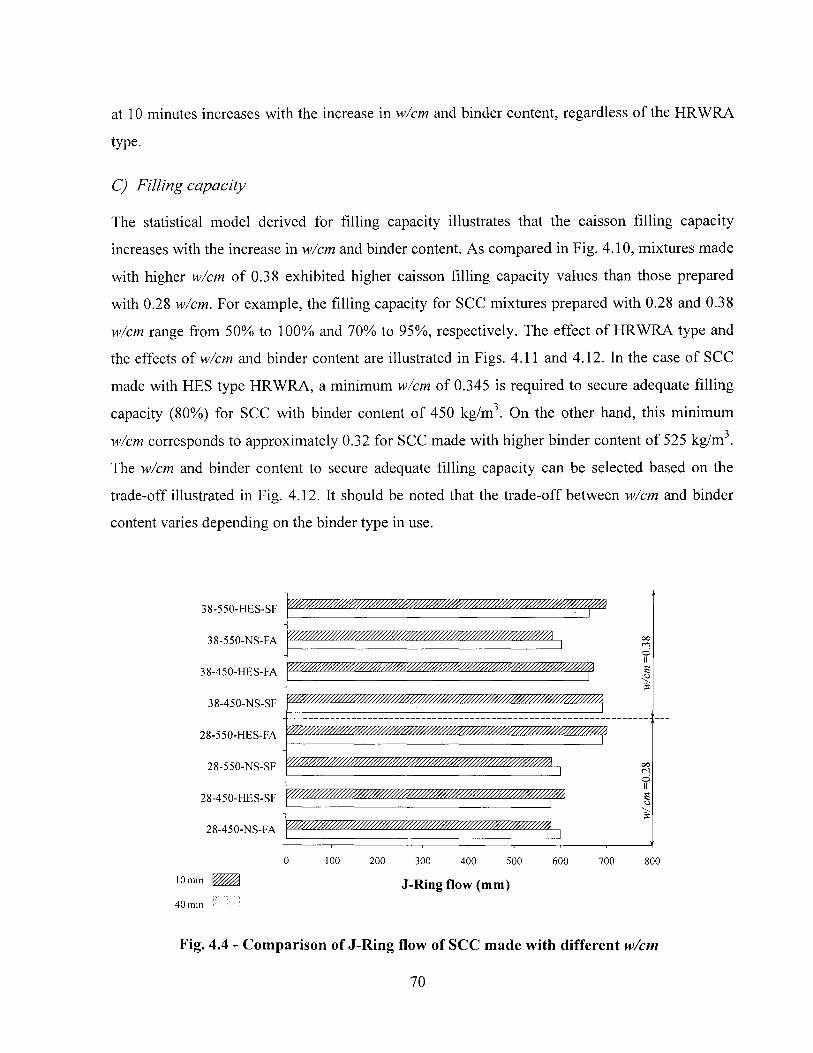
at 10 minutes increases with the increase in w/cm and binder content, regardless of the HRWRA
type.
C) Filling capacity
The statistical model derived for filling capacity illustrates that the caisson filling capacity
increases with the increase in w/cm and binder content. As compared in Fig. 4.10, mixtures made
with higher w/cm of 0.38 exhibited higher caisson filling capacity values than those prepared
with 0.28 w/cm. For example, the filling capacity for SCC mixtures prepared with 0.28 and 0.38
w/cm range from 50% to 100% and 70% to 95%, respectively. The effect of HRWRA type and
the effects of w/cm and binder content are illustrated in Figs. 4.11 and 4.12. In the case of SCC
made with HES type HRWRA, a minimum w/cm of 0.345 is required to secure adequate filling
capacity (80%) for SCC with binder content of 450 kg/m3. On the other hand, this minimum
w/cm corresponds to approximately 0.32 for SCC made with higher binder content of 525 kg/m .
The w/cm and binder content to secure adequate filling capacity can be selected based on the
trade-off illustrated in Fig. 4.12. It should be noted that the trade-off between w/cm and binder
content varies depending on the binder type in use.
38-550-HES-SF
38-550-NS-FA
38-450-HES-FA
38-450-NS-SF
28-550-HES-FA
28-550-NS-SF
28-450-HES-SF
28-450-NS-FA
W////////////M
10 min
4 0 min
m//////////////AV//////////////^^^
100 2 0 0 3 0 0 4 0 0 5 0 0 6 0 0
J-Ring flow (mm)
7 0 0 800
Fig. 4.4 - Comparison of J-Ring flow of SCC made with different w/cm
70
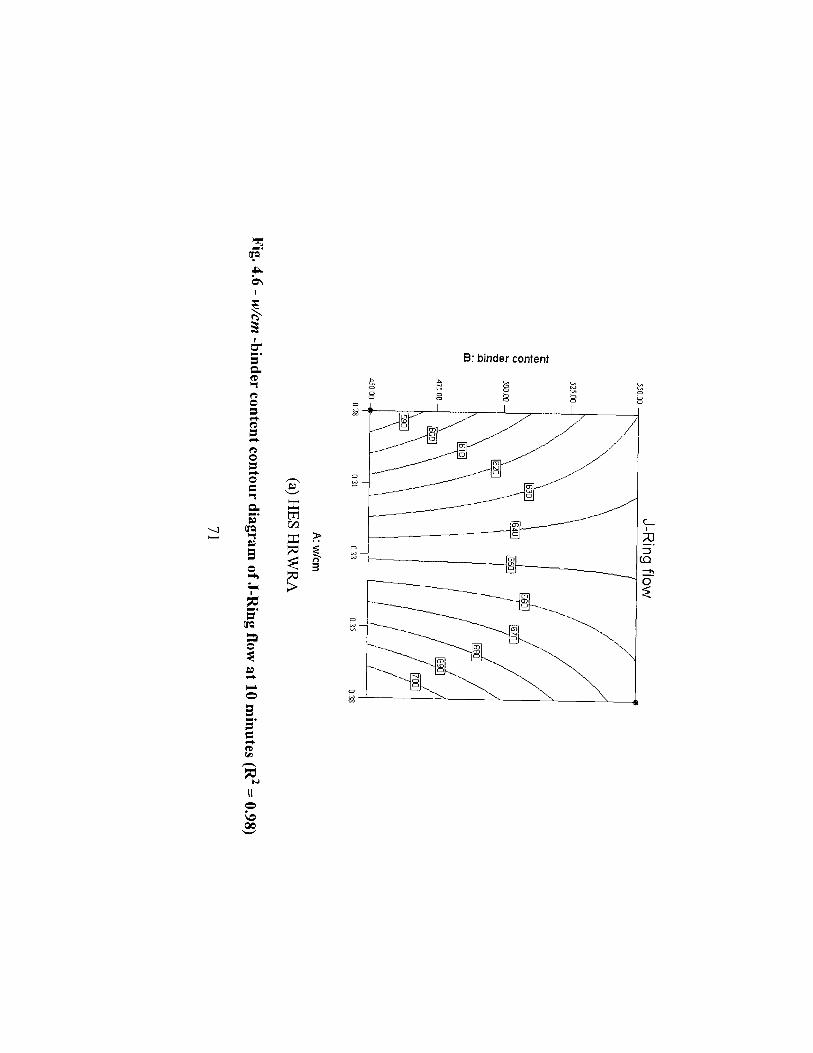
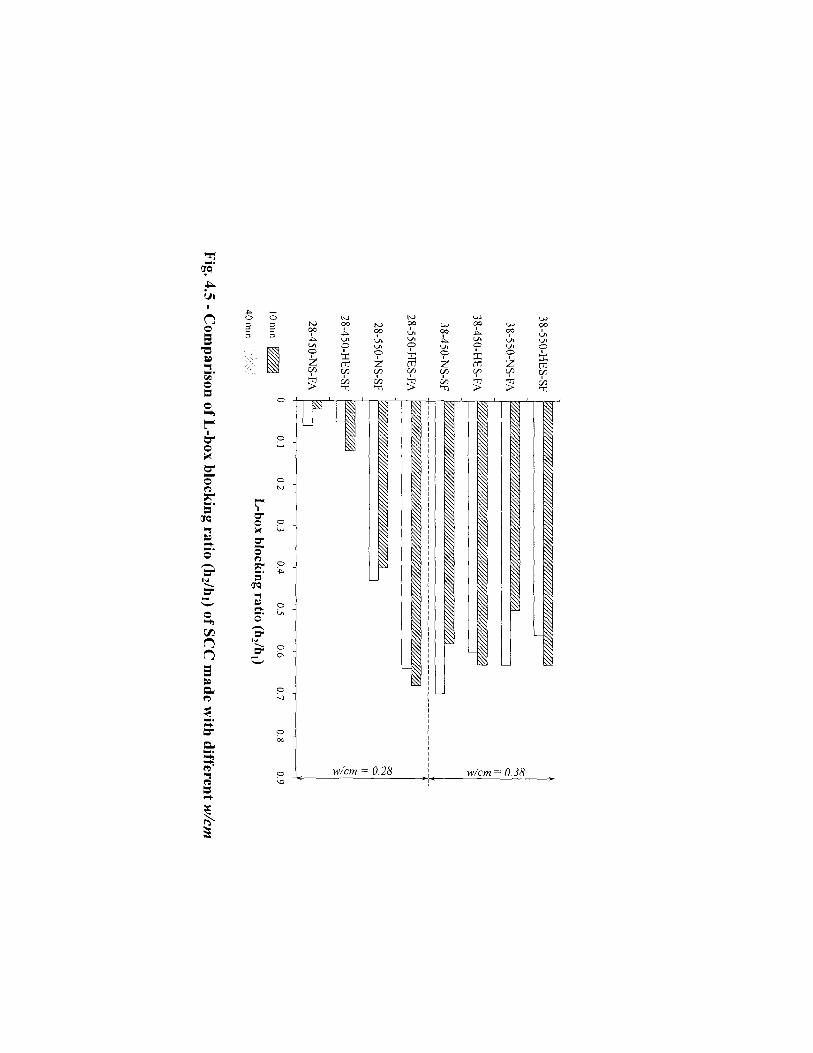
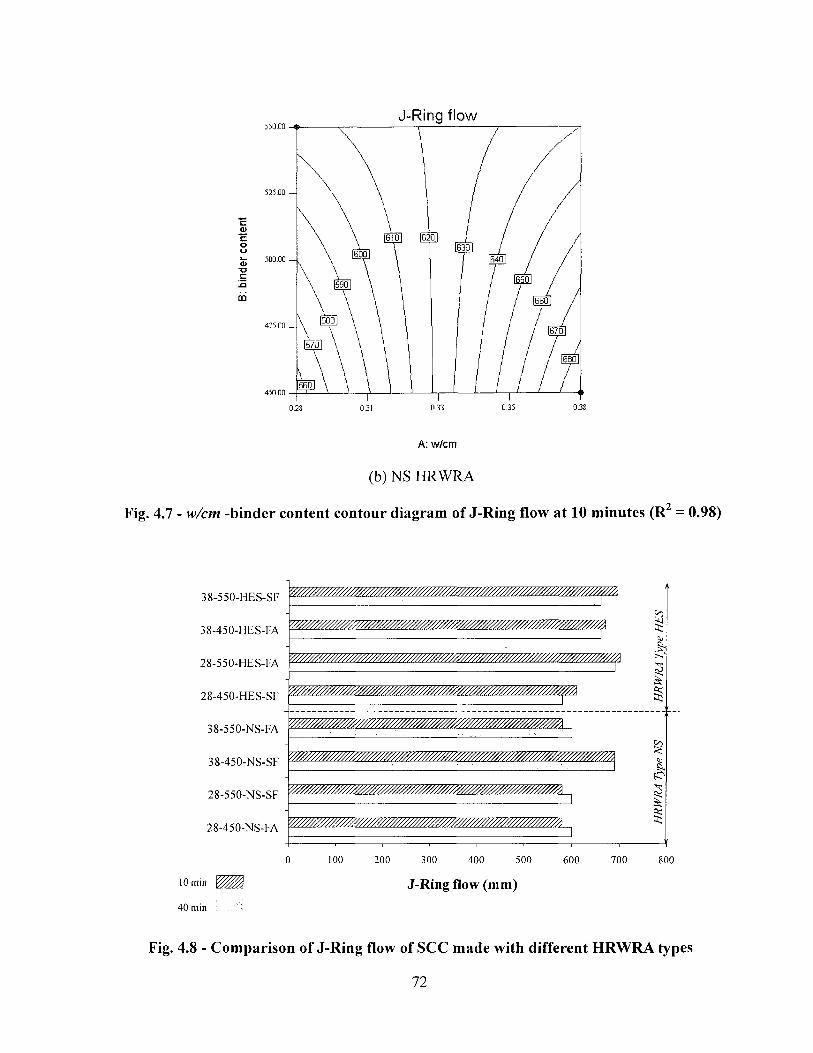
A: w / c m
(b) NS HRWRA
Fig. 4.7 - w/cm -binder content contour diagram of J-Ring flow at 10 minutes (R2 = 0.98)
3 8 - 5 5 0 - H E S - S F
3 8 - 4 5 0 - H E S - F A
2 8 - 5 5 0 - H E S - F A
2 8 - 4 5 0 - H E S - S F
3 8 - 5 5 0 - N S - F A
3 8 - 4 5 0 - N S - S F
2 8 - 5 5 0 - N S - S F
2 8 - 4 5 0 - N S - F A
10 min
100 200 300 400 500 600 700
J-Ring flow (mm)
01 £
§
§ <u £
§
800
40 min
Fig. 4.8 - Comparison of J-Ring flow of SCC made with different HRWRA types
72
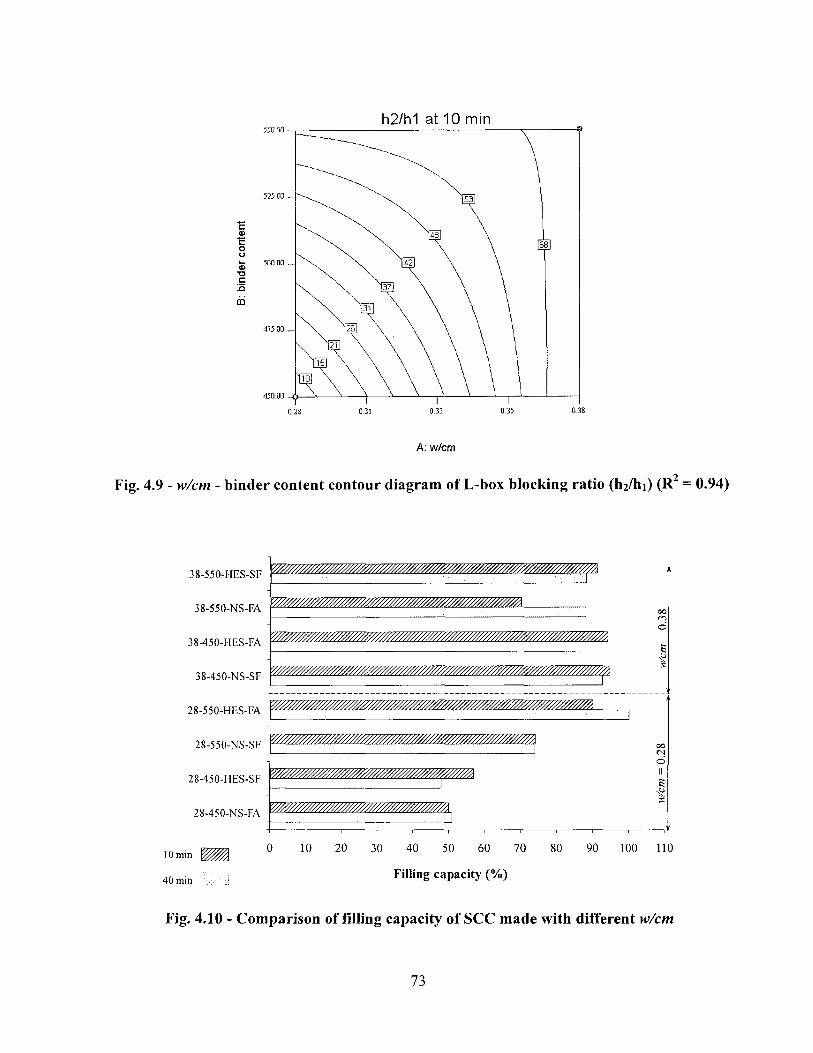
h2/h1 at 10 min
A: w/cm
2 Fig. 4.9 - w/cm - binder content contour diagram of L-box blocking ratio (h2/hi) (R = 0.94)
3 8 - 5 5 0 - H E S - S F
3 8 - 5 5 0 - N S - F A
3 8 - 4 5 0 - H E S - F A
3 8 - 4 5 0 - N S - S F
2 8 - 5 5 0 - H E S - F A
2 8 - 5 5 0 - N S - S F
2 8 - 4 5 0 - H E S - S F
2 8 - 4 5 0 - N S - F A
10 min
40 min
0 1 0 2 0 3 0 4 0 5 0 6 0 7 0
Filling capacity (%)
8 0 9 0 1 0 0 110
Fig. 4.10 - Comparison of filling capacity of SCC made with different w/cm
73
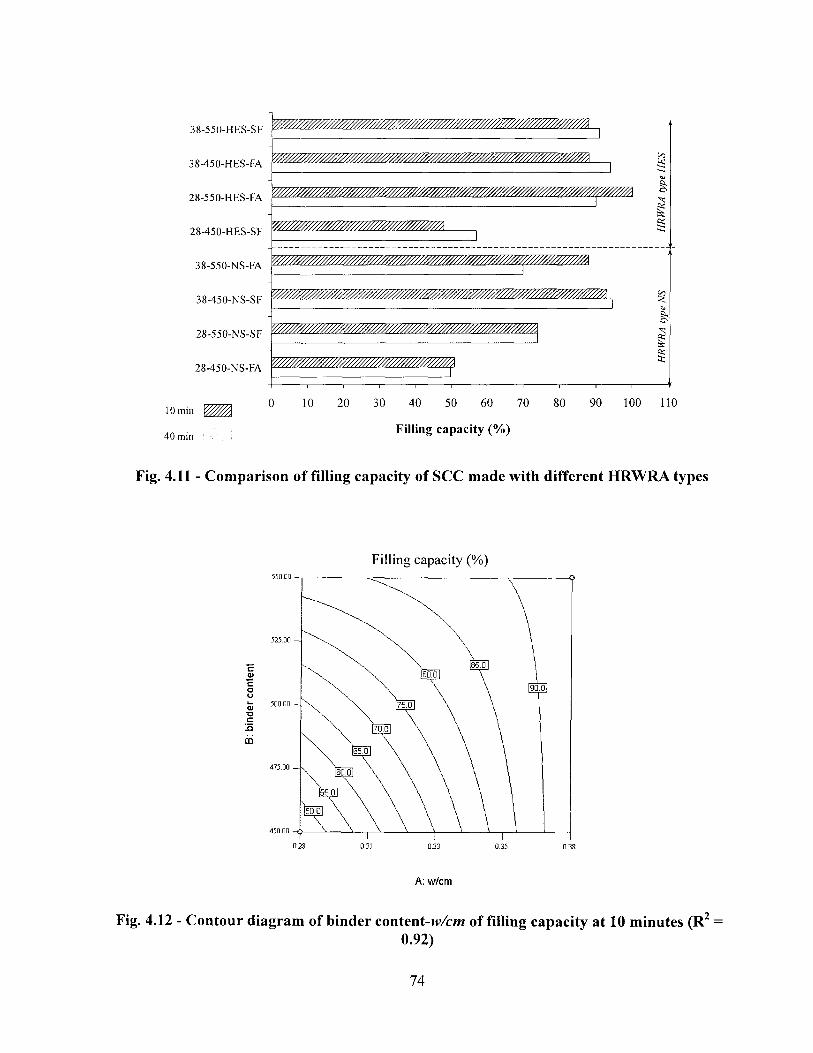
10 min
40 min
0 10 2 0 3 0 4 0 5 0 6 0 7 0 8 0 9 0 1 0 0 1 1 0
Filling capacity (%)
Fig. 4.11 - Comparison of filling capacity of SCC made with different HRWRA types
Filling capacity (%)
A: w/cm
Fig. 4.12 - Contour diagram of binder content -w/cm of filling capacity at 10 minutes (R2 = 0.92)
74
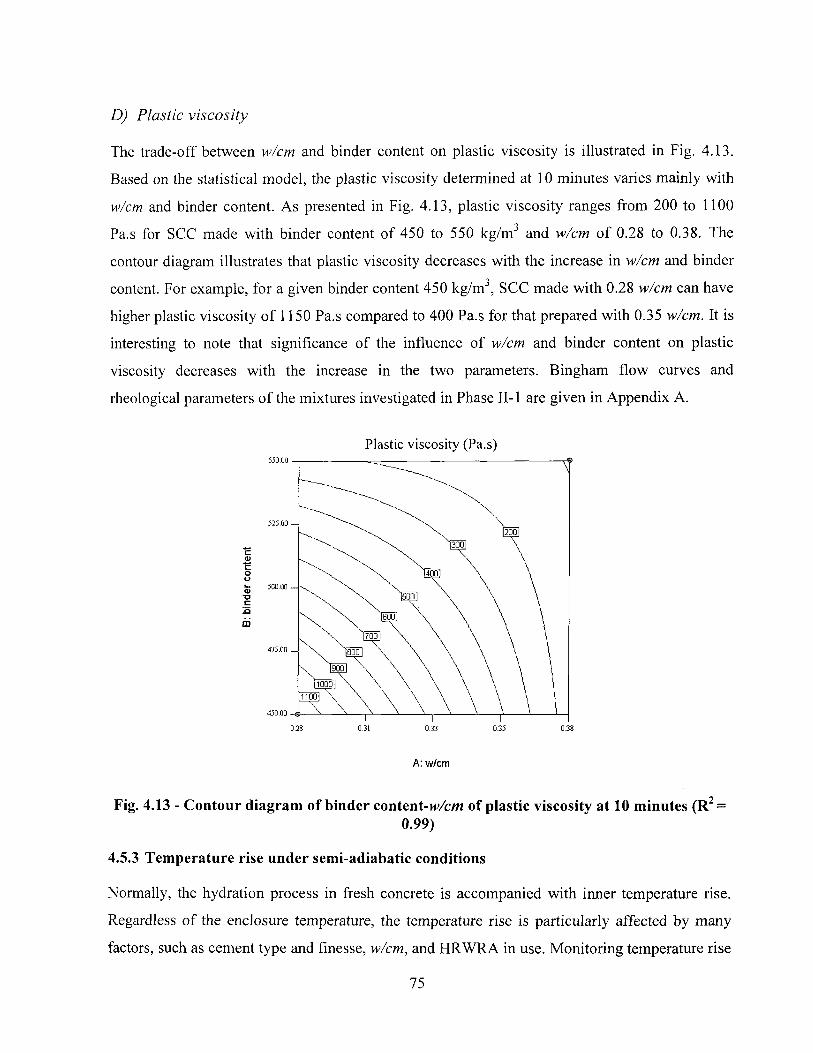
D) Plastic viscosity
The trade-off between w/cm and binder content on plastic viscosity is illustrated in Fig. 4.13.
Based on the statistical model, the plastic viscosity determined at 10 minutes varies mainly with
w/cm and binder content. As presented in Fig. 4.13, plastic viscosity ranges from 200 to 1100
Pa.s for SCC made with binder content of 450 to 550 kg/m3 and w/cm of 0.28 to 0.38. The
contour diagram illustrates that plastic viscosity decreases with the increase in w/cm and binder
content. For example, for a given binder content 450 kg/m3, SCC made with 0.28 w/cm can have
higher plastic viscosity of 1150 Pa.s compared to 400 Pa.s for that prepared with 0.35 w/cm. It is
interesting to note that significance of the influence of w/cm and binder content on plastic
viscosity decreases with the increase in the two parameters. Bingham flow curves and
rheological parameters of the mixtures investigated in Phase II-1 are given in Appendix A.
Plastic viscosity (Pa.s)
A: w/cm
Fig. 4.13 - Contour diagram of binder content -w/cm of plastic viscosity at 10 minutes (R2 = 0.99)
4.5.3 Temperature rise under semi-adiabatic conditions
Normally, the hydration process in fresh concrete is accompanied with inner temperature rise.
Regardless of the enclosure temperature, the temperature rise is particularly affected by many
factors, such as cement type and finesse, w/cm, and HRWRA in use. Monitoring temperature rise
75
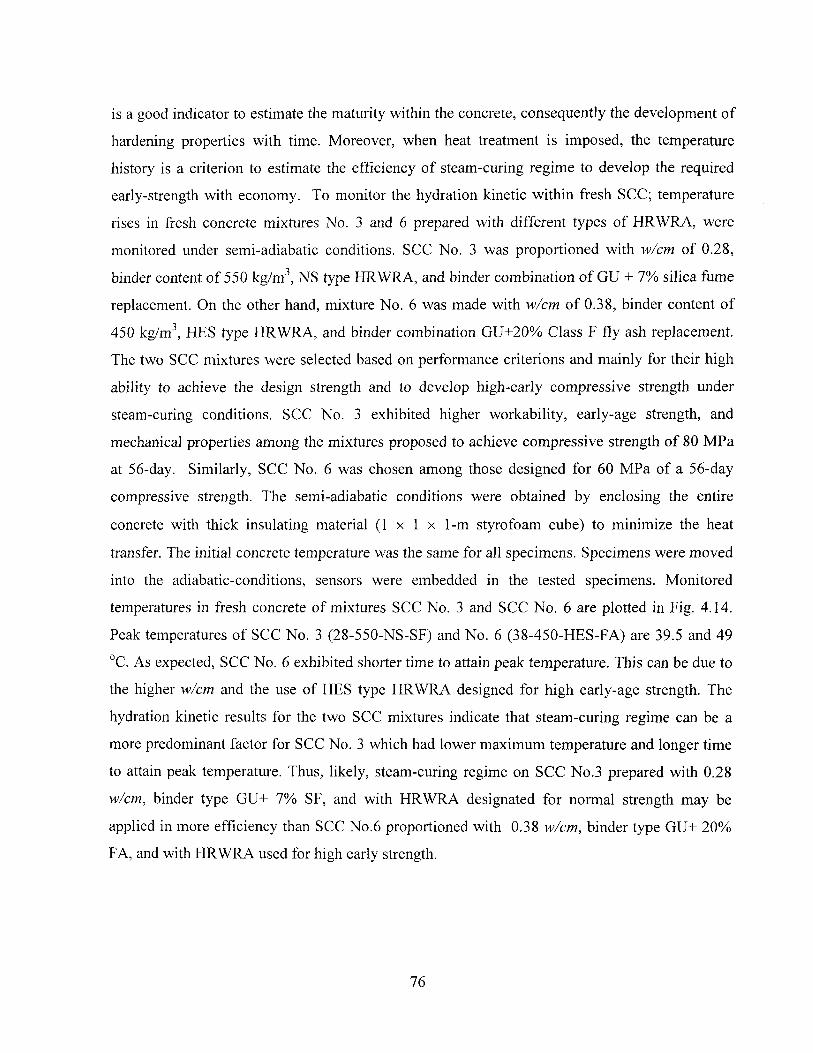
is a good indicator to estimate the maturity within the concrete, consequently the development of
hardening properties with time. Moreover, when heat treatment is imposed, the temperature
history is a criterion to estimate the efficiency of steam-curing regime to develop the required
early-strength with economy. To monitor the hydration kinetic within fresh SCC; temperature
rises in fresh concrete mixtures No. 3 and 6 prepared with different types of HRWRA, were
monitored under semi-adiabatic conditions. SCC No. 3 was proportioned with w/cm of 0.28,
binder content of 550 kg/mJ, NS type HRWRA, and binder combination of GU + 7% silica fume
replacement. On the other hand, mixture No. 6 was made with w/cm of 0.38, binder content of
450 kg/m3, HES type HRWRA, and binder combination GU+20% Class F fly ash replacement.
The two SCC mixtures were selected based on performance criterions and mainly for their high
ability to achieve the design strength and to develop high-early compressive strength under
steam-curing conditions. SCC No. 3 exhibited higher workability, early-age strength, and
mechanical properties among the mixtures proposed to achieve compressive strength of 80 MPa
at 56-day. Similarly, SCC No. 6 was chosen among those designed for 60 MPa of a 56-day
compressive strength. The semi-adiabatic conditions were obtained by enclosing the entire
concrete with thick insulating material (1 x 1 x 1-m styrofoam cube) to minimize the heat
transfer. The initial concrete temperature was the same for all specimens. Specimens were moved
into the adiabatic-conditions, sensors were embedded in the tested specimens. Monitored
temperatures in fresh concrete of mixtures SCC No. 3 and SCC No. 6 are plotted in Fig. 4.14.
Peak temperatures of SCC No. 3 (28-550-NS-SF) and No. 6 (38-450-HES-FA) are 39.5 and 49
°C. As expected, SCC No. 6 exhibited shorter time to attain peak temperature. This can be due to
the higher w/cm and the use of HES type HRWRA designed for high early-age strength. The
hydration kinetic results for the two SCC mixtures indicate that steam-curing regime can be a
more predominant factor for SCC No. 3 which had lower maximum temperature and longer time
to attain peak temperature. Thus, likely, steam-curing regime on SCC No.3 prepared with 0.28
w/cm, binder type GU+ 7% SF, and with HRWRA designated for normal strength may be
applied in more efficiency than SCC No.6 proportioned with 0.38 w/cm, binder type GU+ 20%
FA, and with HRWRA used for high early strength.
76
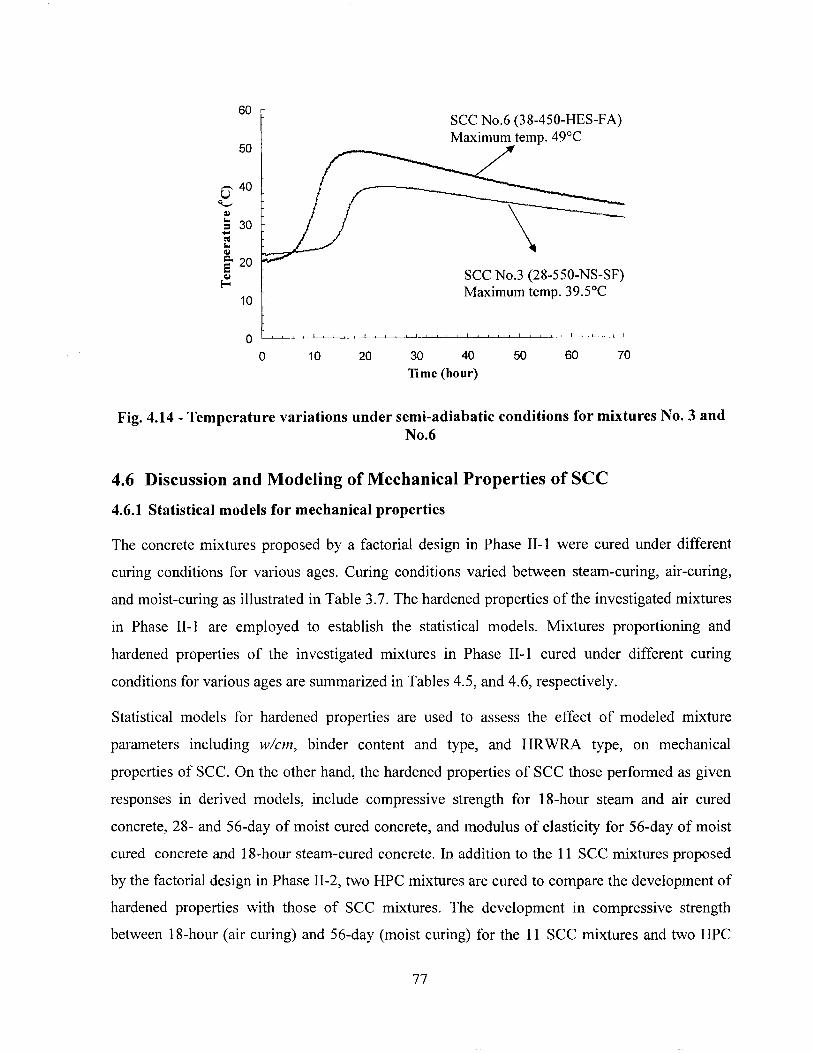
Time (hour)
Fig. 4.14 - Temperature variations under semi-adiabatic conditions for mixtures No. 3 and No.6
4.6 Discussion and Modeling of Mechanical Properties of SCC
4.6.1 Statistical models for mechanical properties
The concrete mixtures proposed by a factorial design in Phase II-1 were cured under different
curing conditions for various ages. Curing conditions varied between steam-curing, air-curing,
and moist-curing as illustrated in Table 3.7. The hardened properties of the investigated mixtures
in Phase II-1 are employed to establish the statistical models. Mixtures proportioning and
hardened properties of the investigated mixtures in Phase II-1 cured under different curing
conditions for various ages are summarized in Tables 4.5, and 4.6, respectively.
Statistical models for hardened properties are used to assess the effect of modeled mixture
parameters including w/cm, binder content and type, and HRWRA type, on mechanical
properties of SCC. On the other hand, the hardened properties of SCC those performed as given
responses in derived models, include compressive strength for 18-hour steam and air cured
concrete, 28- and 56-day of moist cured concrete, and modulus of elasticity for 56-day of moist
cured concrete and 18-hour steam-cured concrete. In addition to the 11 SCC mixtures proposed
by the factorial design in Phase II-2, two HPC mixtures are cured to compare the development of
hardened properties with those of SCC mixtures. The development in compressive strength
between 18-hour (air curing) and 56-day (moist curing) for the 11 SCC mixtures and two HPC
77
mixtures were presented in Fig. 4.15. Derived statistical models for compressive strength and
modulus of elasticity (MOE) of SCC are summarized in Table 4.9. All factors are expressed in
terms of coded values"-1 "and "+1". The correlation coefficient (R2) values of the proposed
models ranged from 0.90 to 0.99. As expected, the w/cm is found to have the most significant
effect on mechanical properties, except for the 18-hour air-cured compressive strength. Secondly,
binder type and content have considerable effect on mechanical properties. As presented in Table
4.9, the type of HRWRA has significant influence on the 18-hour air-cured compressive strength
and 56-day elastic modulus. Based on the derived models for mechanical properties, the
following findings can be stated:
• Compressive strength and elastic modulus increase with the decrease in w/cm.
• Increase in binder content can lead to higher 18-hour air-cured compressive strength.
• Binder type has the most significant effect on 18-hour compressive strength, regardless of
the curing type.
• SCC made with Type GU cement and 7% silica fume can develop higher compressive
strength at 18 hours, 28, and 56 days and modulus of elasticity at 18 hours compared to
those prepared with Type GU cement and 20% Class F fly ash.
• The type of HRWRA exhibited greater effect on 18-hour air-cured compressive strength
than the binder content.
• SCC incorporated with HES type HRWRA develops higher 18-hour air-cured
compressive strength but lower 56-day elastic modulus compared to those made with NS
HRWRA.
SCC mixtures proportioned with 0.28 w/cm (No. 1 to No. 4) develope higher 28-day compressive
strength of 56 to 90 MPa compare to between 53to 69 MPa for those made with 0.38 w/cm (No.
5 to No. 8). All of the steam-cured compressive strength values are lower than the 28-day
strength. On average, 18-hour steam-cured compressive strength is approximately 60% of the 28-
day compressive strength. 18-hour air-cured compressive strength is 30% of the 28-day strength.
The l-to-28 day strength ratio of SCC made with 0.38 w/cm is higher than that of SCC prepared
with 0.28 w/cm. This can be due to the higher HRWRA dosage of the former SCC, thus leading
to delay in the development of early-age strength. In the case of mixtures made with 0.28 w/cm,
78
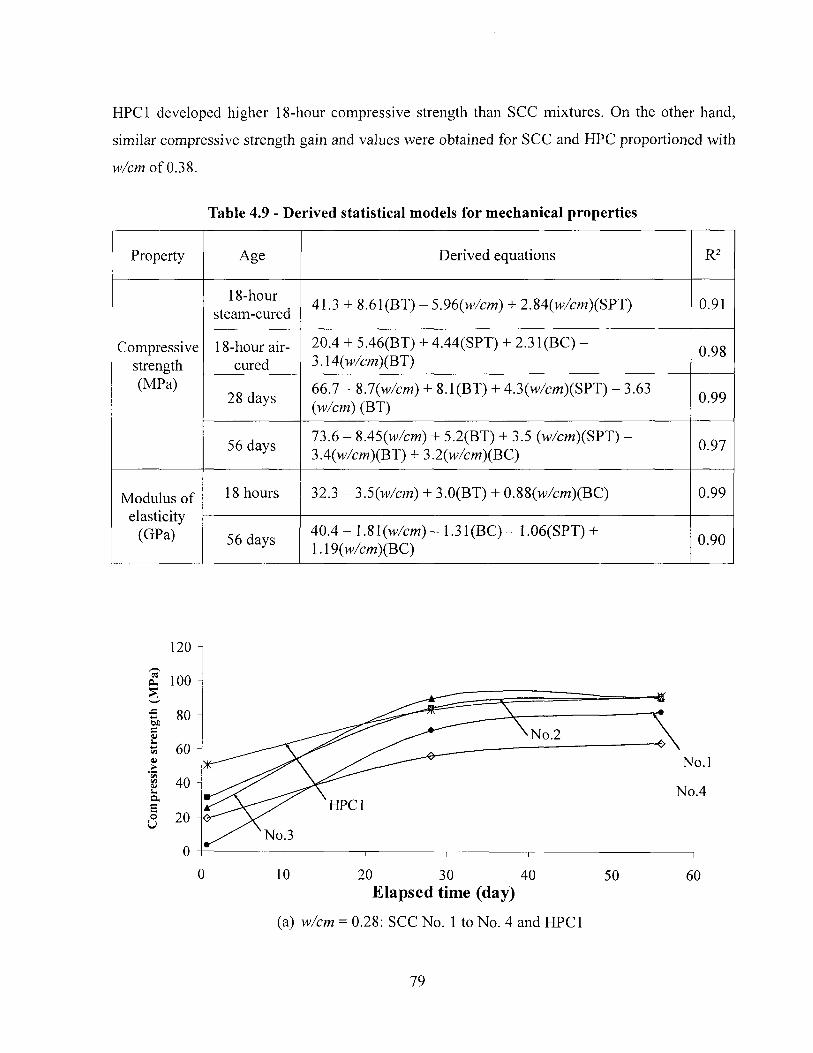
HPC1 developed higher 18-hour compressive strength than SCC mixtures. On the other hand,
similar compressive strength gain and values were obtained for SCC and HPC proportioned with
w/cm of 0.38.
Table 4.9 - Derived statistical models for mechanical properties
Property Age Derived equations R2
Compressive strength (MPa)
18-hour steam-cured 41.3 + 8.61(BT) - 5.96(w/cm) + 2M(w/cm)(S?T) 0.91
Compressive strength (MPa)
18-hour air-cured
20.4 + 5.46(BT) + 4.44(SPT) + 2.31(BC) -3A4(w/cm)(BT) 0.98 Compressive
strength (MPa)
28 days 66.7 - 8.7(w/cm) + 8.1(BT) + 4.3(w/cm)(SPT) - 3.63 (w/cm) (BT) 0.99
Compressive strength (MPa)
56 days 73.6 - 8.45(w/cm) + 5.2(BT) + 3.5 (w/cm)(SPT) -3A(w/cm)(BT) + 3.2(w/cm)(BC) 0.97
Modulus of elasticity
(GPa)
18 hours 32.3 - 3.5(w/cm) + 3.0(BT) + 0.88(w/cm)(BC) 0.99 Modulus of elasticity
(GPa) 56 days 40.4 - 1.81 (w/cw) - 1.31(BC) - 1.06(SPT) + I A9(w/cm)(BC) 0.90
Elapsed time (day)
(a) w/cm = 0.28: SCC No. 1 to No. 4 and HPC1
79
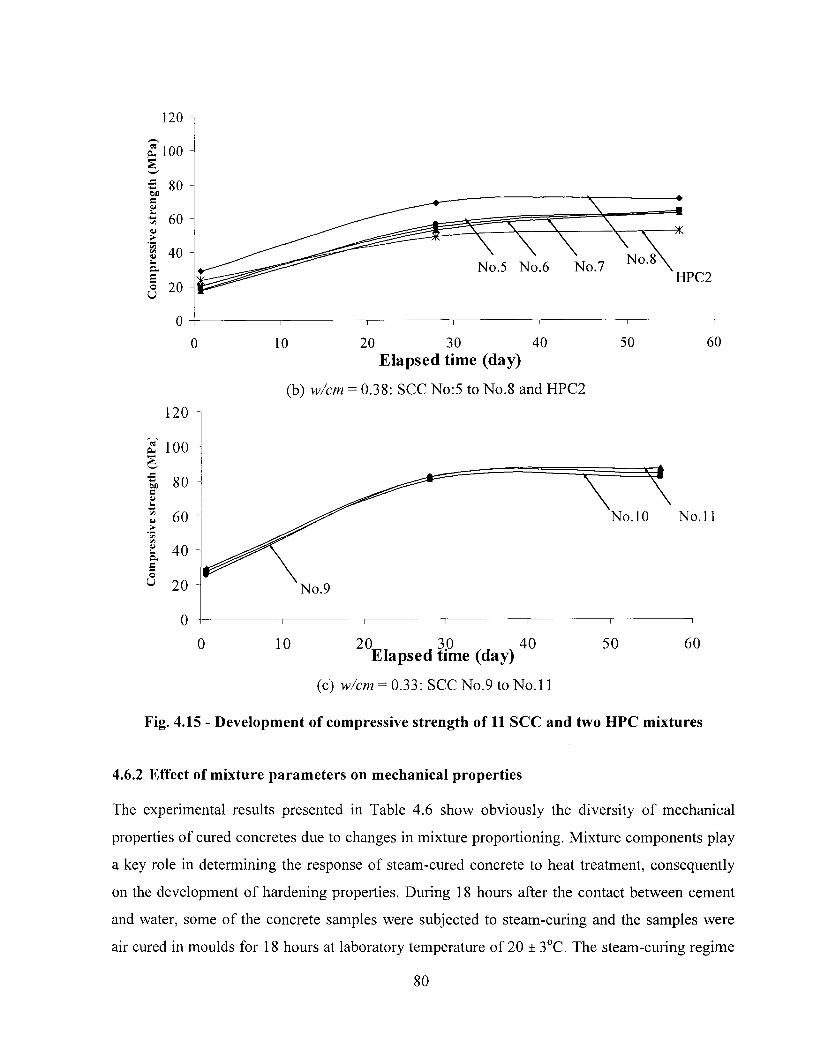
Elapsed time (day)
(b) w/cm = 0.38: SCC No:5 to No.8 and HPC2
(c) w/cm = 0.33: SCC No.9 toNo. l l
Fig. 4.15 - Development of compressive strength of 11 SCC and two HPC mixtures
4.6.2 Effect of mixture parameters on mechanical properties
The experimental results presented in Table 4.6 show obviously the diversity of mechanical
properties of cured concretes due to changes in mixture proportioning. Mixture components play
a key role in determining the response of steam-cured concrete to heat treatment, consequently
on the development of hardening properties. During 18 hours after the contact between cement
and water, some of the concrete samples were subjected to steam-curing and the samples were
air cured in moulds for 18 hours at laboratory temperature of 20 ± 3°C. The steam-curing regime
80
used in Phase II-l and the variations of steam-curing chamber and concrete temperatures are
given in Appendix B. The effects of mixture parameters including w/cm, binder content and type,
and HRWRA type on mechanical properties of SCC are discussed. The modeled mechanical
properties include 18-hour compressive strengths subjected to steam-curing and air-curing,
compressive strengths at 28- and 56-day of age, and modulus of elasticity at 18-hour of steam-
curing and at 56-day of moist curing.
A) 18-hour compressive strength
The compressive strength values after 18 hours of steam-curing for mixtures made with different
w/cm of 0.28 and 0.38 are compared in Fig. 4.16. The compressive strength subjected to 18 hours
of steam-curing ranged from 27 to 59 MPa. As expected, mixtures made with lower w/cm of 0.28
developed higher 18-hour compressive strength of 34 to 59 MPa compared to 27 to 50 MPa for
those prepared with 0.38 w/cm. This is not the case of air-cured compressive strength. Due to the
higher HRWRA dosage, SCC made with low w/cm of 0.28 exhibited relatively lower 18-hour
compressive strength subjected to air-curing. In particular, SCC No. 1 proportioned with w/cm of
0.28, binder content of 450 kg/m3, NS type HRWRA, and 20% fly ash replacement has
significantly lower 18-hour air-cured compressive strength of 3 MPa compared to 18 to 31 MPa
for the other mixtures. In addition, the difference in compressive strength between steam-cured
samples and air-cured ones is significantly larger for SCC made with 0.28 w/cm. This can also be
due to the higher dosage of HRWRA of such rich mixtures to secure a given slump flow
consistency. The binder type is shown to have a significant effect on 18-hour compressive
strength. As presented in Fig. 4.17, mixtures made with Type GU and 20% Class F fly ash have
significantly lower 18-hour steam-cured compressive strength than those prepared with Type GU
and 7% silica fume replacement (27 to 39 MPa vs. 34 to 59 MPa). This is also found for the 18-
hour air-cured compressive strength. For a given w/cm of 0.28, SCC made with 20% fly ash
replacement developed 18-hour air-cured compressive strengths of 3 and 19 MPa. These values
are 25 and 31 MPa for similar concrete prepared with 7% silica fume.
B) 28- and 56-day compressive strength under moist curing
The target 56-day design compressive strength is set to 60 and 80 MPa for mixtures proportioned
with w/cm of 0.38 and 0.28, respectively. After 18 hours of air-curing, concrete samples were
81
moist cured at 100% relative humidity and 23 ± 2°C until the age of testing. As expected, the
w/cm is found to have significant effect on the 28- and 56-day compressive strength. The 28-day
compressive strengths of SCC made with different w/cm are compared in Fig. 4.18. As expected,
mixtures proportioned with 0.28 w/cm developed relatively higher 28-day compressive strength
of 56 to 99 MPa compared to 53 to 69 MPa for those made with 0.38 w/cm. It is important to
note that variations of the compressive strength are larger for SCC made with lower w/cm of 0.28
than the latter one with 0.38 w/cm. This indicates that the influence of mixture parameters on
compressive strength is more predominant for mixtures prepared with low w/cm. Thus, special
care should be considered to select the types of binder and HRWRA for SCC made with low
w/cm. As presented in Fig. 4.19, mixtures proportioned with 0.28 w/cm developed relatively
higher 56-day compressive strength of 64 to 91 MPa compared to 53 to 71 MPa for those made
with 0.38 w/cm. As in the case of 28-day compressive strength, the variations of compressive
strength for SCC made with 0.28 w/cm are greater than those for 0.38 w/cm mixtures.
C) Elastic modulus at 18 hours and 56 days
The w/cm is shown to have the most significant effect on the modulus of elasticity. Mixtures
made with lower w/cm of 0.28 exhibited higher elastic modulus at 18 hours and 56 days than
those with 0.38 w/cm, as compared in Figs. 4.20 and 4.21. The former mixtures with 0.28 w/cm
have 18-hour elastic modulus of 31 to 41GPa. These values varied between 26 and 32 GPa for the
latter concrete made with higher w/cm of 0.38. Similar case is also found for the 56-day elastic
modulus. It is interesting to note that predominant factors on the elastic modulus after 18 hours
of steam-curing and 56-day of moist curing are different. For example, binder type is shown to
have a significant effect on the 18-hour elastic modulus. On the other hand, elastic modulus at 56
days of age varies with binder content and HRWRA type. As presented in Fig. 4.20, SCC
mixtures proportioned with Type GU and 7% silica fume replacement exhibit higher 18-hour
elastic modulus of 31 to 41 GPa compared to 26 to 35 GPa for those made with Type GU and 20%>
Class F fly ash. However, the binder type likely does not have any influence on the 56-day
elastic modulus. The contour diagrams of Fig. 4.22 illustrate that the 18-hour elastic modulus
increases with the decrease in w/cm and with the increase in binder content. It is important to
note that the trade-offs between w/cm and binder content varies with the binder type in use. In
the case of SCC made with 20% Class F fly ash replacement, SCC proportioned with w/cm of
82
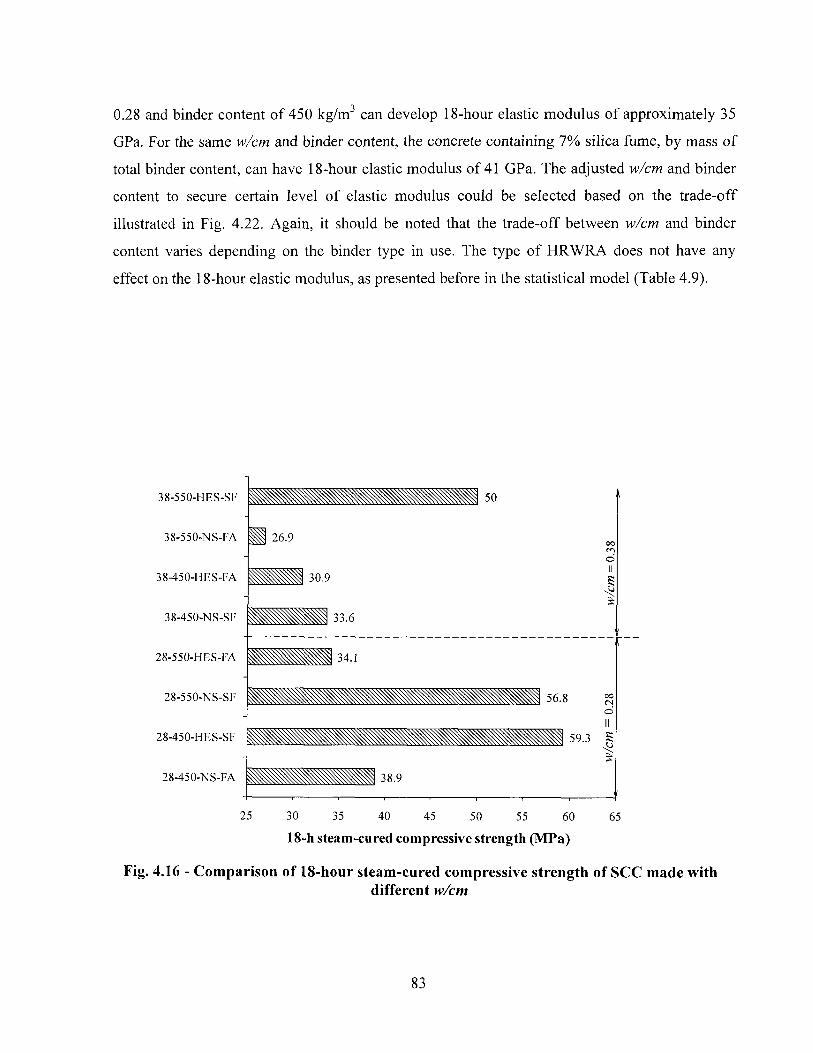
0.28 and binder content of 450 kg/m3 can develop 18-hour elastic modulus of approximately 35
GPa. For the same w/cm and binder content, the concrete containing 7% silica fume, by mass of
total binder content, can have 18-hour elastic modulus of 41 GPa. The adjusted w/cm and binder
content to secure certain level of elastic modulus could be selected based on the trade-off
illustrated in Fig. 4.22. Again, it should be noted that the trade-off between w/cm and binder
content varies depending on the binder type in use. The type of HRWRA does not have any
effect on the 18-hour elastic modulus, as presented before in the statistical model (Table 4.9).
3 8 - 5 5 0 - H E S - S F
3 8 - 5 5 0 - N S - F A
3 8 - 4 5 0 - H E S - F A
3 8 - 4 5 0 - N S - S F
2 8 - 5 5 0 - H E S - F A
2 8 - 5 5 0 - N S - S F
2 8 - 4 5 0 - H E S - S F
2 8 - 4 5 0 - N S - F A
2 5 3 0 3 5 4 0 4 5 5 0 5 5 6 0 6 5
18-h steam-cured compressive strength (MPa)
Fig. 4.16 - Comparison of 18-hour steam-cured compressive strength of SCC made with different w/cm
83
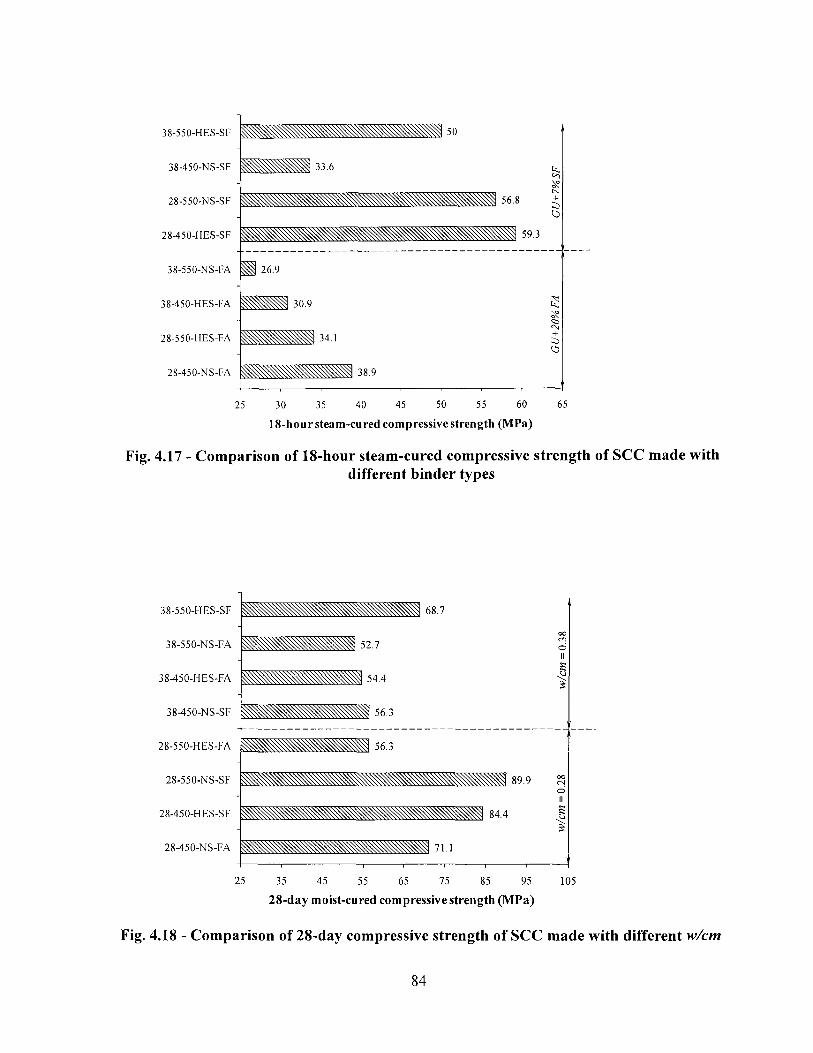
38-550-HES-SF
38-450-NS-SF
28-550-NS-SF
28-450-HES-SF
38-550-NS-FA
38-450-HES-FA
28-550-HES-FA
28-450-NS-FA
26.9
30.9
38.9
56.8
33.6
59.3
25 30 35 40 45 50 55 60 65
18-hoursteam-cured compressive strength (MPa)
Fig. 4.17 - Comparison of 18-hour steam-cured compressive strength of SCC made with different binder types
25 35 45 55 65 75 85 95 105
28-day moist-cured compressive strength (MPa)
Fig. 4.18 - Comparison of 28-day compressive strength of SCC made with different w/cm
84
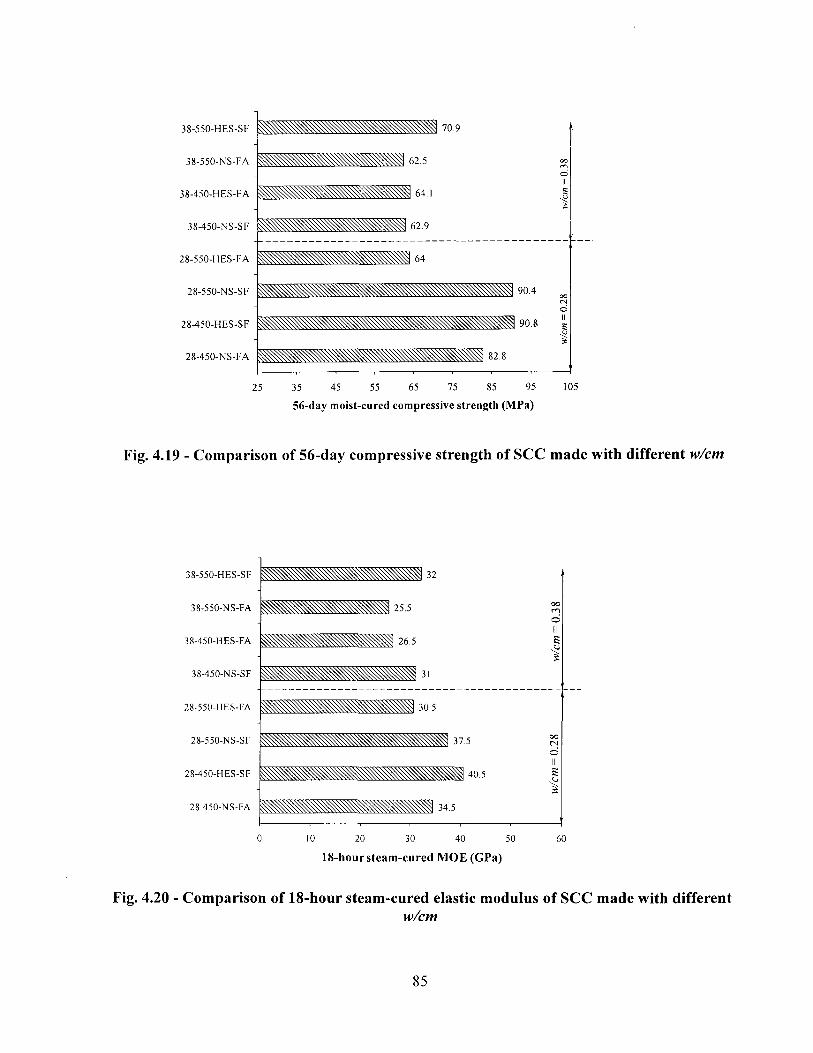
38-550-HES-SF
38-550-NS-FA
38-450-HES-FA
38-450-NS-SF
28-550-HES-FA
28-550-NS-SF
28-450-HES-SF
28-450-NS-FA
70.9
90.4
90.8
82.8
25 35 45 55 65 75 85 95
56-day moist-cured compressive strength (MPa)
105
Fig. 4.19 - Comparison of 56-day compressive strength of SCC made with different w/cm
38-550-HES-SF
38-550-NS-FA
38-450-HES-FA
38-450-NS-SF
28-550-HES-FA
28-550-NS-SF
28-450-HES-SF
28-450-NS-FA
10 20 30 40 50
18-hour steam-cured MOE (GPa) 60
Fig. 4.20 - Comparison of 18-hour steam-cured elastic modulus of SCC made with different w/cm
85
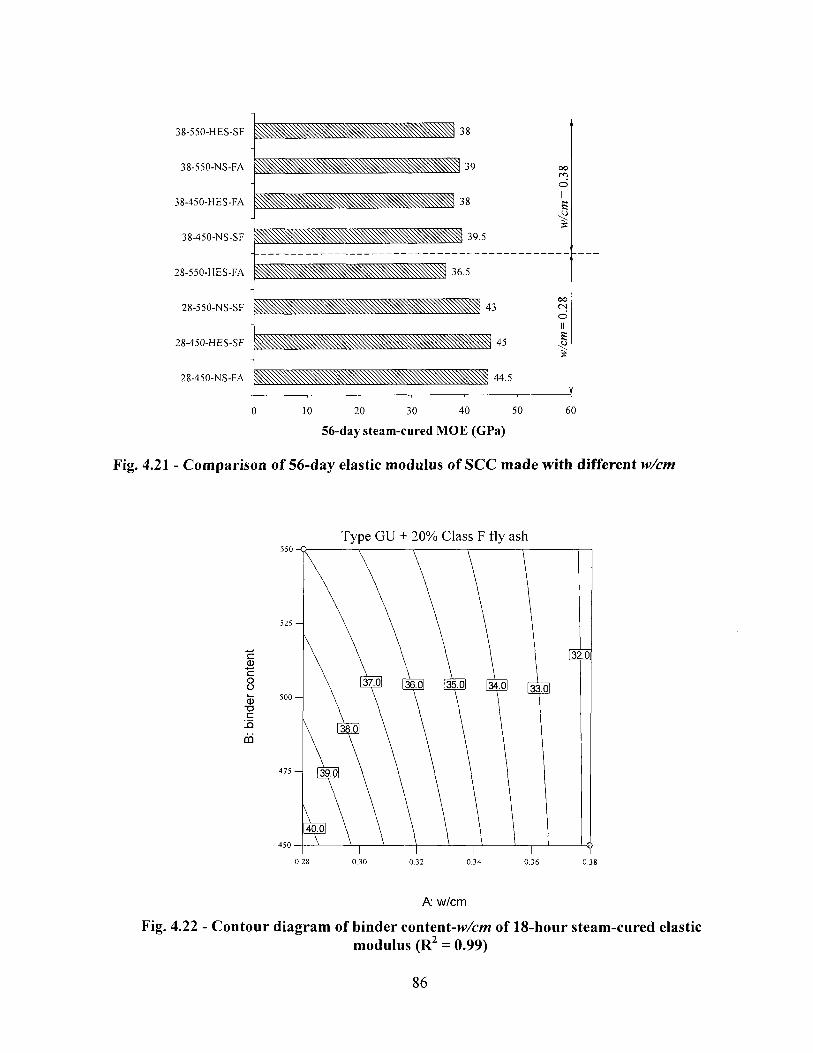
oo r»> o II
0 10 20 30 40 50 60
56-day steam-cured MOE (GPa)
Fig. 4.21 - Comparison of 56-day elastic modulus of SCC made with different w/cm
Type GU + 20% Class F fly ash
A w/cm
Fig. 4.22 - Contour diagram of binder content -w/cm of 18-hour steam-cured elastic modulus (R2 = 0.99)
86
4.7 Significance of Mixture Parameters on SCC Properties
Based on the results from the factorial design, the relative influences of the four investigated
parameters on modeled properties of SCC are summarized in Table 4.10. The binder content and
w/cm are shown to have significant influence on the majority of workability responses, including
plastic viscosity. The HRWRA type has significant impact on J-Ring flow, difference between
slump flow and J-Ring flow, and maximum surface settlement. The binder type has high
influence only on the HRWRA demand.
As expected, the w/cm exhibited the highest effect on mechanical properties. Unlike the case of
workability, the binder type has a significant effect on the majority of mechanical properties. In
general, the binder content and HRWRA type exhibited low or moderate influence on
mechanical properties. The binder content and HRWRA type have significant impact on 18-hour
compressive strength subjected to air-curing and 56-day elastic modulus. SCC made with 0.38
w/cm exhibited superior passing ability and filling capacity compared to SCC prepared with 0.28
w/cm. On the other hand, the latter concrete developed greater compressive strength and elastic
modulus subjected to steam-curing or air-curing. Therefore, SCC proportioned with higher w/cm
of 0.38 can be used to secure a 56-day design compressive strength of 60 MPa. The 56-day
compressive strength values of such concrete ranged from 63 to 71 MPa. On the other hand, SCC
made with low w/cm of 0.28 can be used for casting beam elements with 56-day compressive
strength of 80 MPa. However, special care should be devoted in selecting the binder type, binder
content, and HRWRA type to secure adequate passing ability and filling capacity. As presented
in Table 4.10, the binder content has a significant effect on workability. In general, mixtures
made with higher binder content of 550 kg/m3 exhibited lower HRWRA demand, superior
passing ability, and greater filling capacity compared to those prepared with binder content of
450 kg/m3. Unlike this, the binder content does not have a significant impact on mechanical
properties. It is important to note that special care should be taken to select binder content to
limit the volume of paste depending on the w/cm to control autogeneous shrinkage and creep. In
particular, mixtures made with w/cm of 0.28 and binder type of Type GU and 7% silica fume
replacement should be proportioned with low binder content to limit the paste volume, thus
leading to decrease any potential autogeneous shrinkage.
87
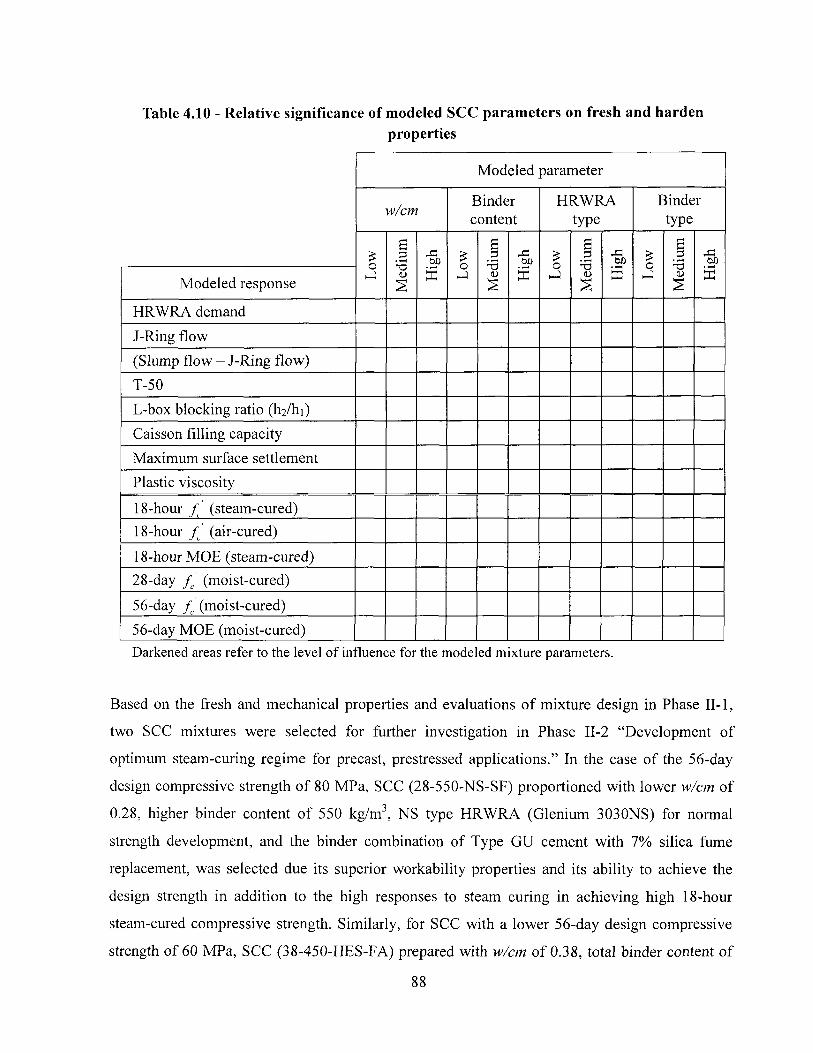
Table 4.10 - Relative significance of modeled SCC parameters on fresh and harden properties
Modeled parameter
w/cm Binder content
HRWRA type
Binder type
Low
Med
ium
Hig
h
Low
Med
ium
Hig
h
Low
Med
ium
Hig
h
Low
Med
ium
Hig
h
Modeled response Low
Med
ium
Hig
h
Low
Med
ium
Hig
h
Low
Med
ium
Hig
h
Low
Med
ium
Hig
h
HRWRA demand
J-Ring flow (Slump flow - J-Ring flow) T-50
L-box blocking ratio (h2/hi)
Caisson filling capacity Maximum surface settlement Plastic viscosity
18-hour fc (steam-cured) 18-hour fc (air-cured)
18-hour MOE (steam-cured) 28-day fc (moist-cured)
56-day fc (moist-cured) 56-day MOE (moist-cured) Darkened areas refer to the level of influence for the modeled mixture parameters.
Based on the fresh and mechanical properties and evaluations of mixture design in Phase II-1,
two SCC mixtures were selected for further investigation in Phase II-2 "Development of
optimum steam-curing regime for precast, prestressed applications." In the case of the 56-day
design compressive strength of 80 MPa, SCC (28-550-NS-SF) proportioned with lower w/cm of
0.28, higher binder content of 550 kg/m3, NS type HRWRA (Glenium 3030NS) for normal
strength development, and the binder combination of Type GU cement with 7% silica fume
replacement, was selected due its superior workability properties and its ability to achieve the
design strength in addition to the high responses to steam curing in achieving high 18-hour
steam-cured compressive strength. Similarly, for SCC with a lower 56-day design compressive
strength of 60 MPa, SCC (38-450-HES-FA) prepared with w/cm of 0.38, total binder content of
88
450 kg/m3, HES type HRWRA (Glenium 7700HES) used for early-age strength development,
and the binder combination of Type GU cement with 20% Class F fly ash replacement, was
chosen for further investigation in Phase II-2. For Phase II-2, the chosen SCC mixtures (28-550-
NS-SF) and (38-450-HES-FA) mixtures are codified as SCC1 and SCC2, respectively. Also, two
HPC mixtures investigated in Phase II-l are used to compare the effect of steam-curing regime
on mechanical properties of HPC to SCC in Phase II-2. The selected HPC mixtures were
prepared with the same binder content of 470 kg/m3 but with different w/cm and types of binder
and HRWRA.
89
Chapter 5 - Optimization of Steam-Curing Regime for SCC
Used in Precast, Prestressed Applications
5.1 Introduction
The early-age compressive strength is of prime importance among the hardening properties for
precast, prestressed elements. The 18-hour compressive strength is one of the most significant
indicators which determine the efficiency of steam-curing and the appropriate selection of raw
materials to achieve the required mechanical properties. The modulus of elasticity is also an
important characteristic for prestressed members particularly to determine the shortening of the
precast, prestressing elements and to minimize the prestressing loss when pressing forces are
imposed. Basically, SCC exhibits wide range responses to steam-curing regimes (ability to
develop high early-strength) to assure various technical and economical requirements of the
fabricated elements. Thus, steam-curing parameters should be adjusted carefully depending on
the mixture components and the anticipated hardening properties of the concrete.
5.2 Research Approach
The main objective of Phase II-2 is to optimize a steam-curing regime for high-strength SCC as
well as HPC suitable for precast, prestressed applications. Based on the fresh and mechanical
properties and the recommendations of mixture design in Phase II-1, mixtures (28-550-NS-SF)
and (38-450-HES-FA) coded as SCC1 and SCC2, were selected for further investigation on the
influence of steam-curing parameters on mechanical properties of SCC.
Each selected mixture was repeated with same mixture proportioning and was subjected to
various steam-curing regimes. The applied steam-curing regimes in Phase II-2 were set in
accordance with a factorial design to model the effect of curing parameters on mechanical
properties of SCC. The modeled mixture parameters include maximum chamber temperature,
rate of heating, and preset period. The ranges of modeled parameters were selected to cover a
wide scope of most common steam-curing regimes used in precast concrete industries. The
results of the mixtures proposed by the factorial design are employed to derive statistical models
90
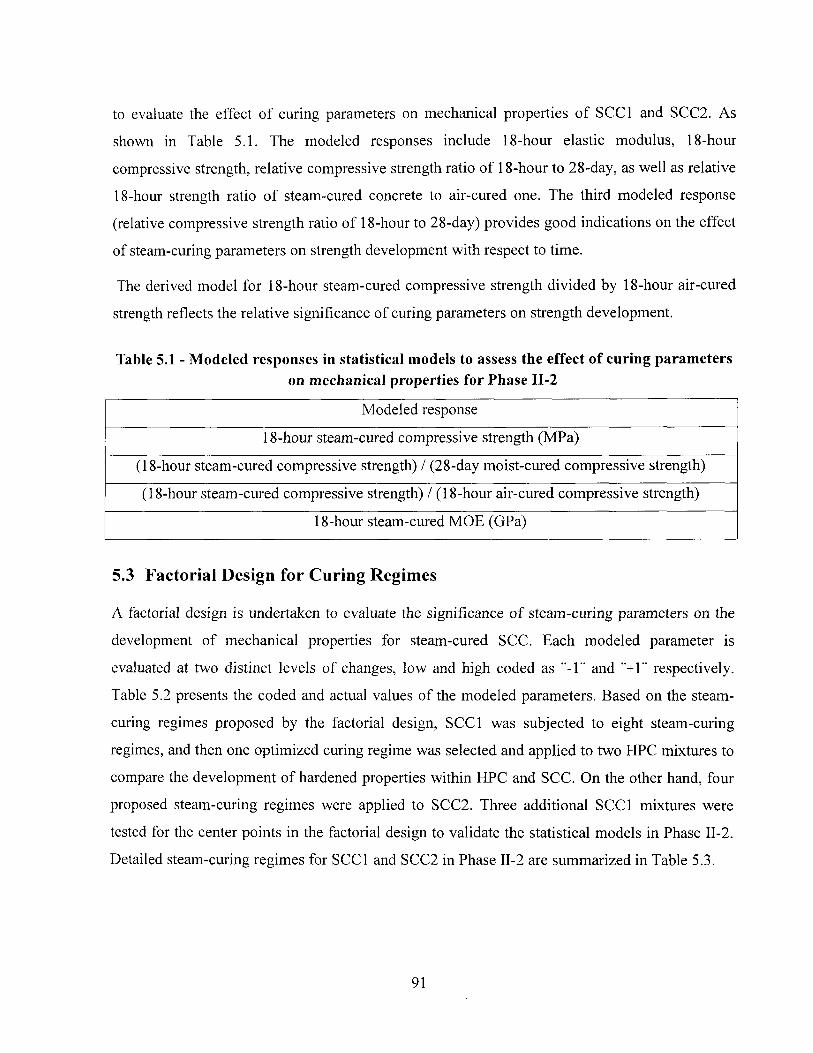
to evaluate the effect of curing parameters on mechanical properties of SCC1 and SCC2. As
shown in Table 5.1. The modeled responses include 18-hour elastic modulus, 18-hour
compressive strength, relative compressive strength ratio of 18-hour to 28-day, as well as relative
18-hour strength ratio of steam-cured concrete to air-cured one. The third modeled response
(relative compressive strength ratio of 18-hour to 28-day) provides good indications on the effect
of steam-curing parameters on strength development with respect to time.
The derived model for 18-hour steam-cured compressive strength divided by 18-hour air-cured
strength reflects the relative significance of curing parameters on strength development.
Table 5.1 - Modeled responses in statistical models to assess the effect of curing parameters on mechanical properties for Phase II-2
Modeled response
18-hour steam-cured compressive strength (MPa)
(18-hour steam-cured compressive strength) / (28-day moist-cured compressive strength)
(18-hour steam-cured compressive strength) / (18-hour air-cured compressive strength)
18-hour steam-cured MOE (GPa)
5.3 Factorial Design for Curing Regimes
A factorial design is undertaken to evaluate the significance of steam-curing parameters on the
development of mechanical properties for steam-cured SCC. Each modeled parameter is
evaluated at two distinct levels of changes, low and high coded as "-1" and "+1" respectively.
Table 5.2 presents the coded and actual values of the modeled parameters. Based on the steam-
curing regimes proposed by the factorial design, SCC1 was subjected to eight steam-curing
regimes, and then one optimized curing regime was selected and applied to two HPC mixtures to
compare the development of hardened properties within HPC and SCC. On the other hand, four
proposed steam-curing regimes were applied to SCC2. Three additional SCC1 mixtures were
tested for the center points in the factorial design to validate the statistical models in Phase II-2.
Detailed steam-curing regimes for SCC1 and SCC2 in Phase II-2 are summarized in Table 5.3.
91
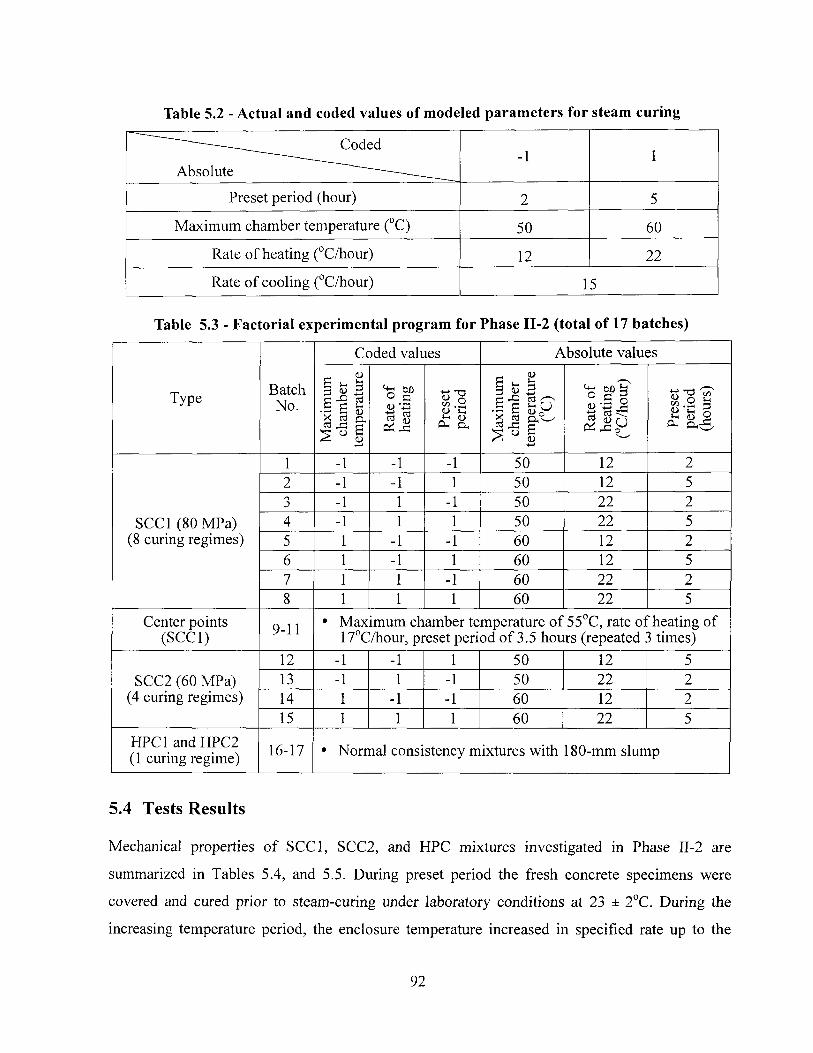
Table 5.2 - Actual and coded values of modeled parameters for steam curing
^ ^ ^ ^ Coded
Absolute —•—___________ -1 1
Preset period (hour) 2 5
Maximum chamber temperature (°C) 50 60
Rate of heating (°C/hour) 12 22
Rate of cooling (°C/hour) 15
Table 5.3 - Factorial experimental program for Phase II-2 (total of 17 batches)
Type Batch No.
Coded values Absolute values
Type Batch No.
Max
imum
ch
ambe
r te
mpe
ratu
re
Rat
e of
he
atin
g
Pres
et
perio
d
Max
imum
ch
ambe
r te
mpe
ratu
re
(°C)
Rat
e of
he
atin
g (°
C/h
our)
Pres
et
perio
d (h
ours
)
SCC1 (80 MPa) (8 curing regimes)
1 -1 -1 -1 50 12 2
SCC1 (80 MPa) (8 curing regimes)
2 -1 -1 1 50 12 5
SCC1 (80 MPa) (8 curing regimes)
3 -1 1 -1 50 22 2 SCC1 (80 MPa)
(8 curing regimes) 4 -1 1 1 50 22 5 SCC1 (80 MPa)
(8 curing regimes) 5 1 -1 -1 60 12 2 SCC1 (80 MPa)
(8 curing regimes) 6 1 -1 1 60 12 5
SCC1 (80 MPa) (8 curing regimes)
7 1 1 -1 60 22 2
SCC1 (80 MPa) (8 curing regimes)
8 1 1 1 60 22 5 Center points
(SCC1) 9-11 • Maximum chamber temperature of 55°C, rate of heating of 17°C/hour, preset period of 3.5 hours (repeated 3 times)
SCC2 (60 MPa) (4 curing regimes)
12 -1 -1 1 50 12 5 SCC2 (60 MPa)
(4 curing regimes) 13 -1 1 -1 50 22 2 SCC2 (60 MPa)
(4 curing regimes) 14 1 -1 -1 60 12 2 SCC2 (60 MPa)
(4 curing regimes) 15 1 1 1 60 22 5
HPC1 and HPC2 (1 curing regime) 16-17 • Normal consistency mixtures with 180-mm slump
5.4 Tests Results
Mechanical properties of SCC1, SCC2, and HPC mixtures investigated in Phase II-2 are
summarized in Tables 5.4, and 5.5. During preset period the fresh concrete specimens were
covered and cured prior to steam-curing under laboratory conditions at 23 ± 2°C. During the
increasing temperature period, the enclosure temperature increased in specified rate up to the
92
maximum target temperature. Maximum temperature was maintained meanwhile the constant
temperature duration. Then, the temperature was cooled down again to the laboratory
temperature 23 ± 2°C by the rate of 15 °C/h during the decreasing temperature period. The
concrete temperature was monitored during steam-curing operation using a thermal sensor
embedded in the center of one cured specimen. Another sensor was used to monitor the chamber
temperature during steam curing. The enclosure temperatures were well matched to the target
temperatures using automatic control system. Steam-curing regime used in Phase II-2 and the
variations of steam-curing chamber and concrete temperatures are given in Appendix C.
Each steam-cured concrete was tested for compressive strength using 100x200 mm cylinders
subjected to both of air and steam-curing at 18 hour. Compressive strength of moist-cured
concrete at 7, 28 and 56 days of age were tested. Modulus of elasticity was determined at 18
hours using cylinders subjected to steam-curing. Two additional cylinders were moist-cured and
tested at 56 days. The results of the repeatability of fresh properties of 8 SCC1 mixtures were
also used to determine the single-operator errors for mixtures made with a given slump flow
value.
5.5 Discussion and Modeling of Mechanical Properties of SCC
5.5.1 Effect of curing parameters on mechanical properties of SCC
A) Effect of maximum chamber temperature on mechanical properties
Compressive strength values of SCC1 subjected to 18-hour steam-curing with different
maximum chamber temperatures are compared in Fig. 5.1. In general, mixtures No. 1 to 4
subjected to higher maximum chamber temperature of 60°C developed higher 18-hour
compressive strength compared to mixtures No. 5 to 8 under lower chamber temperature of 50°C.
The 18-hour strength of SCC subjected to 60°C chamber temperature ranges from 54to 60 MPa.
The strength values for the latter concrete under 50°C vary from 50 to 53 MPa. On average,
concrete subjected to higher chamber temperature of 60°C exhibited 10% higher 18-hour
compressive strength than those cured under 50°C condition.
93
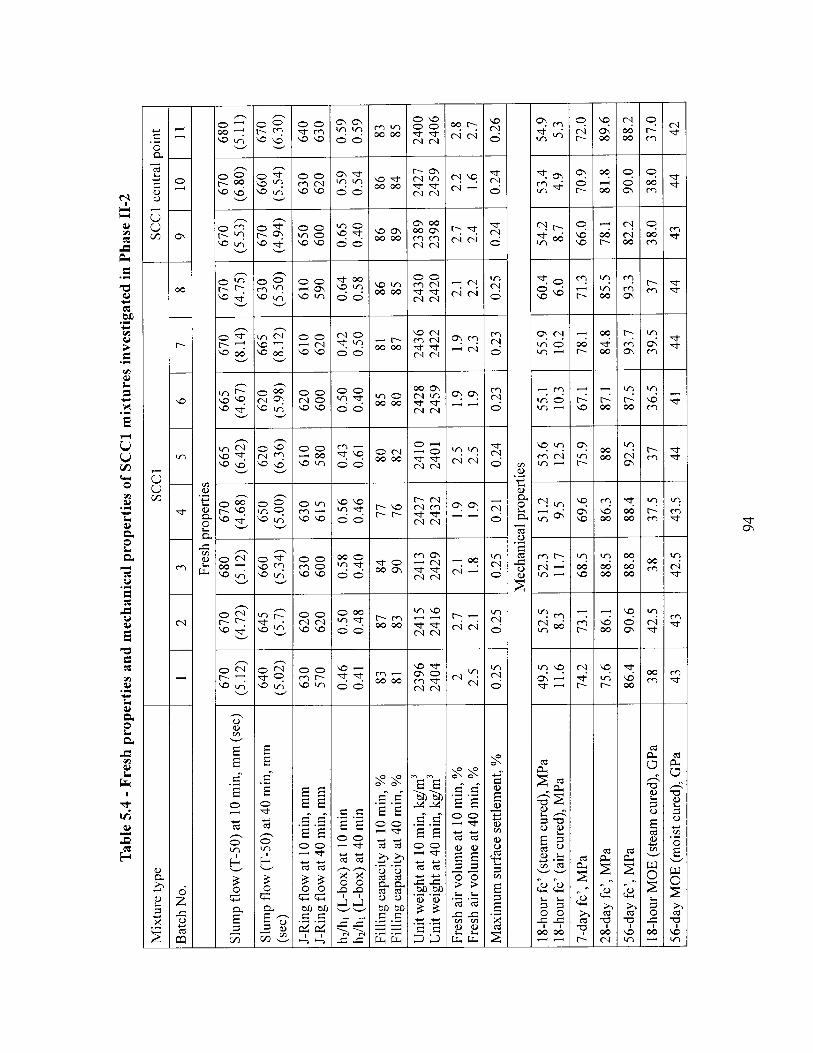
Tab
le 5
.4 -
Fres
h pr
oper
ties
and
mec
hani
cal p
rope
rtie
s of
SC
C1
mix
ture
s in
vest
igat
ed i
n Ph
ase
II-2
Mix
ture
type
SC
C1
SCC1
cen
tral p
oint
Batc
h N
o.
1 2
3 4
5 6
7 8
9 10
11
Fr
esh
prop
ertie
s
Slum
p flo
w (T
-50)
at 1
0 m
in, m
m (s
ec)
670
(5.1
2)
670
(4.7
2)
680
(5.1
2)
670
(4.6
8)
665
(6.4
2)
665
(4.6
7)
670
(8.1
4)
670
(4.7
5)
670
(5.5
3)
670
(6.8
0)
680
(5.1
1)
Slum
p flo
w (T
-50)
at 4
0 m
in, m
m
(sec
) 64
0 (5
.02)
64
5 (5
.7)
660
(5.3
4)
650
(5.0
0)
620
(6.3
6)
620
(5.9
8)
665
(8.1
2)
630
(5.5
0)
670
(4.9
4)
660
(5.5
4)
670
(6.3
0)
J-Ri
ng fl
ow at
10
min
, mm
J-
Ring
flow
at 4
0 m
in, m
m
630
570
620
620
630
600
630
615
610
580
620
600
610
620
610
590
650
600
630
620
640
630
h 2/h
| (L-
box)
at 1
0 m
in
h 2/h
, (L-
box)
at 4
0 m
in
0.46
0.
41
0.50
0.
48
0.58
0.
40
0.56
0.
46
0.43
0.
61
0.50
0.
40
0.42
0.
50
0.64
0.
58
0.65
0.
40
0.59
0.
54
0.59
0.
59
Filli
ng c
apac
ity a
t 10
min
, %
Filli
ng c
apac
ity a
t 40
min
, %
83
81
87
83
84
90
77
76
80
82
85
80
81
87
86
85
86
89
86
84
83
85
Uni
t wei
ght a
t 10
min
, kg/
m3
Uni
t wei
ght a
t 40
min
, kg/
m3
2396
24
04
2415
24
16
2413
24
29
2427
24
32
2410
24
01
2428
24
59
2436
24
22
2430
24
20
2389
23
98
2427
24
59
2400
24
06
Fres
h ai
r vol
ume
at 1
0 m
in, %
Fr
esh
air v
olum
e at
40
min
, %
2 2.5
2.7
2.1
2.1 1.8
1.9
1.9
2.
5 2.
5 1.9
1.9
1.9
2.
3 2.
1 2.
2 2.
7 2.
4 2.
2 1.6
2.8
2.7
Max
imum
sur
face
settl
emen
t, %
0.
25
0.25
0.
25
0.21
0.
24
0.23
0.
23
0.25
0.
24
0.24
0.
26
Mec
hani
cal p
rope
rties
18
-hou
r fc'
(ste
am c
ured
), M
Pa
18-h
our f
c' (a
ir cu
red)
, MPa
49
.5
11.6
52
.5
8.3
52.3
11
.7
51.2
9.
5 53
.6
12.5
55
.1
10.3
55
.9
10.2
60
.4
6.0
54.2
8.
7 53
.4
4.9
54.9
5.
3 7-
day
fc',
MPa
74
.2
73.1
68
.5
69.6
75
.9
67.1
78
.1
71.3
66
.0
70.9
72
.0
28-d
ay f
c', M
Pa
75.6
86
.1
88.5
86
.3
88
87.1
84
.8
85.5
78
.1
81.8
89
.6
56-d
ay f
c', M
Pa
86.4
90
.6
88.8
88
.4
92.5
87
.5
93.7
93
.3
82.2
90
.0
88.2
18-h
our M
OE
(ste
am c
ured
), G
Pa
38
42.5
38
37
.5
37
36.5
39
.5
37
38.0
38
.0
37.0
56
-day
MO
E (m
oist
cure
d), G
Pa
43
43
42.5
43
.5
44
41
44
44
43
44
42
94
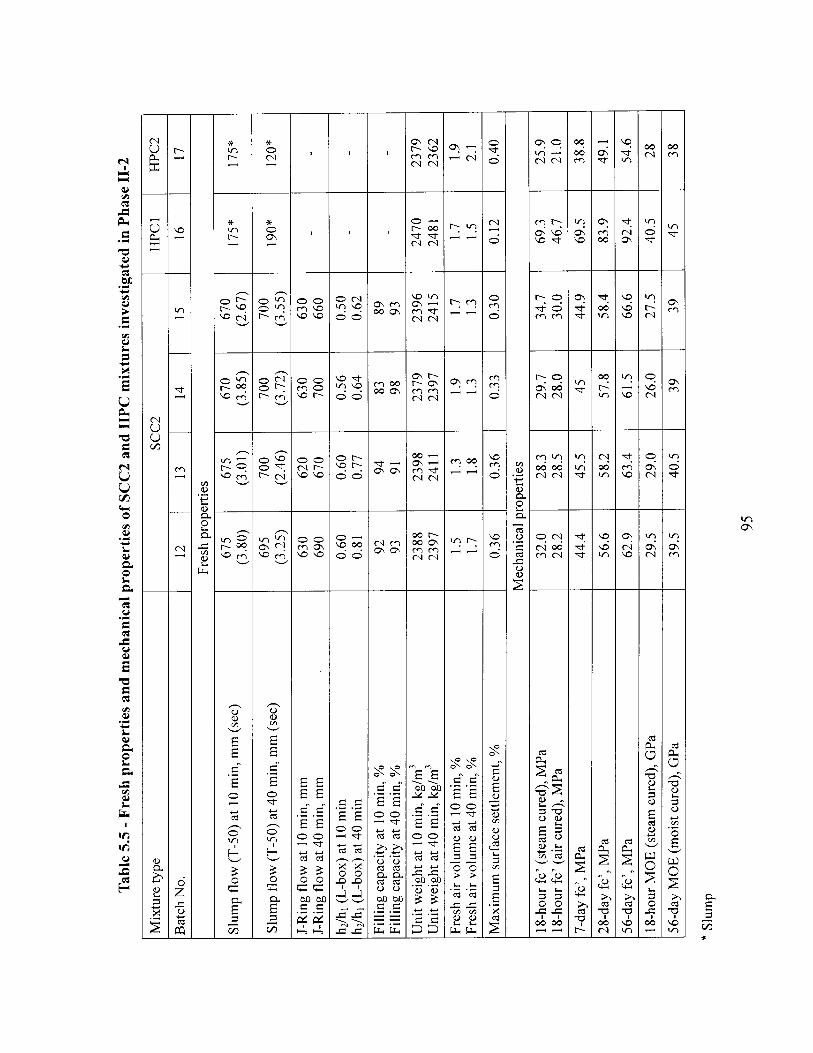
Tab
le 5
.5 -
Fres
h pr
oper
ties
and
mec
hani
cal p
rope
rtie
s of
SC
C2
and
HPC
mix
ture
s in
vest
igat
ed i
n Ph
ase
II-2
Mix
ture
type
SC
C2
HPC
l H
PC2
Batc
h N
o.
12
13
14
15
16
17
Fres
h pr
oper
ties
Slum
p flo
w (T
-50)
at 1
0 m
in, m
m (s
ec)
675
(3.8
0)
675
(3.0
1)
670
(3.8
5)
670
(2.6
7)
175*
17
5*
Slum
p flo
w (T
-50)
at 4
0 m
in, m
m (s
ec)
695
(3.2
5)
700
(2.4
6)
700
(3.7
2)
700
(3.5
5)
190*
12
0*
J-Ri
ng fl
ow at
10
min
, mm
J-
Ring
flow
at 4
0 m
in, m
m
630
690
620
670
630
700
630
660
--
h 2/h
! (L-
box)
at
10 m
in
h 2/h
] (L-
box)
at 4
0 m
in
0.60
0.
81
0.60
0.
77
0.56
0.
64
0.50
0.
62
--
Filli
ng c
apac
ity a
t 10
min
, %
Filli
ng c
apac
ity a
t 40
min
, %
92
93
94
91
83
98
89
93
--
Uni
t wei
ght a
t 10
min
, kg/
m3
Uni
t wei
ght a
t 40
min
, kg/
m3
2388
23
97
2398
24
11
2379
23
97
2396
24
15
2470
24
81
2379
23
62
Fres
h ai
r vol
ume
at 1
0 m
in, %
Fr
esh
air v
olum
e at
40
min
, %
1.5
1.7
1.3
1.8
1.9
1.3
1.7
1.3
1.7
1.5
1.9
2.1
Max
imum
sur
face
settl
emen
t, %
0.
36
0.36
0.
33
0.30
0.
12
0.40
M
echa
nica
l pro
perti
es
18-h
our f
c' (s
team
cur
ed),
MPa
18
-hou
r fc'
(air
cure
d), M
Pa
32.0
28
.2
28.3
28
.5
29.7
28
.0
34.7
30
.0
69.3
46
.7
25.9
21
.0
7-da
y fc
', M
Pa
44.4
45
.5
45
44.9
69
.5
38.8
28
-day
fc'
, MPa
56
.6
58.2
57
.8
58.4
83
.9
49.1
56
-day
fc'
, MPa
62
.9
63.4
61
.5
66.6
92
.4
54.6
18
-hou
r MO
E (s
team
cur
ed),
GPa
29
.5
29.0
26
.0
27.5
40
.5
28
56-d
ay M
OE
(moi
st cu
red)
, GPa
39
.5
40.5
39
39
45
38
* Sl
ump
95
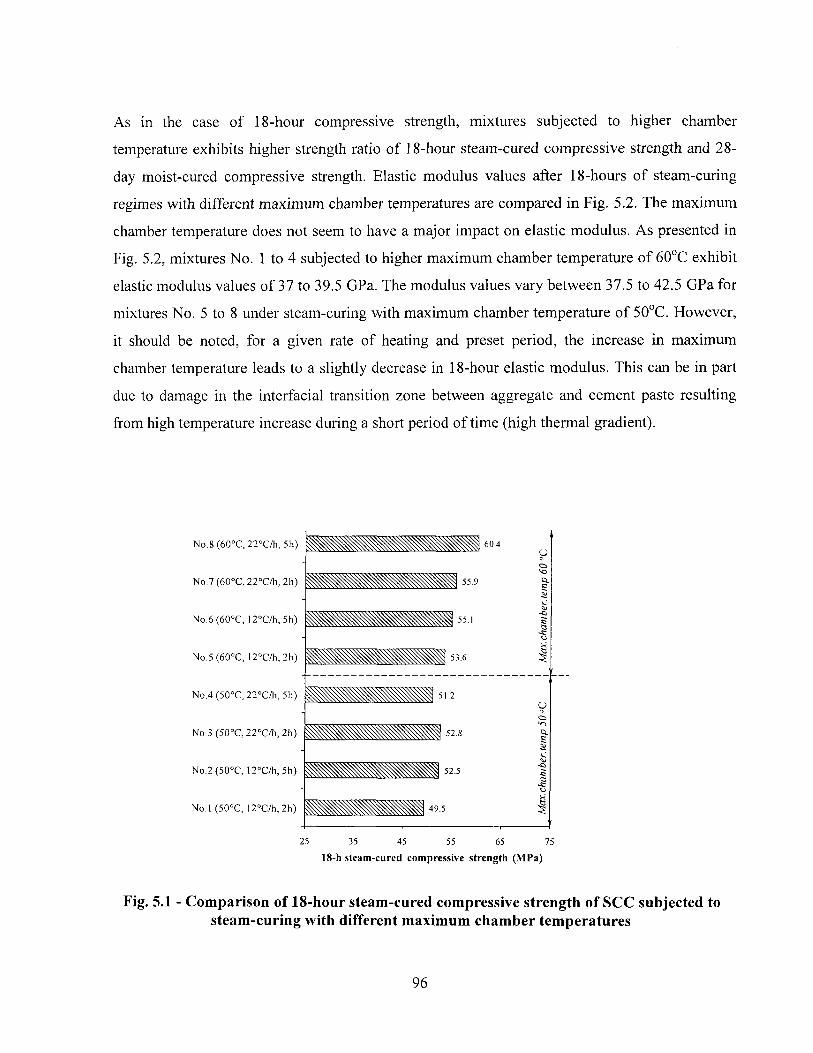
As in the case of 18-hour compressive strength, mixtures subjected to higher chamber
temperature exhibits higher strength ratio of 18-hour steam-cured compressive strength and 28-
day moist-cured compressive strength. Elastic modulus values after 18-hours of steam-curing
regimes with different maximum chamber temperatures are compared in Fig. 5.2. The maximum
chamber temperature does not seem to have a major impact on elastic modulus. As presented in
Fig. 5.2, mixtures No. 1 to 4 subjected to higher maximum chamber temperature of 60°C exhibit
elastic modulus values of 37 to 39.5 GPa. The modulus values vary between 37.5 to 42.5 GPa for
mixtures No. 5 to 8 under steam-curing with maximum chamber temperature of 50°C. However,
it should be noted, for a given rate of heating and preset period, the increase in maximum
chamber temperature leads to a slightly decrease in 18-hour elastic modulus. This can be in part
due to damage in the interfacial transition zone between aggregate and cement paste resulting
from high temperature increase during a short period of time (high thermal gradient).
No.8 (60°C, 22°C/h, 5h)
No.7 (60°C, 22°C/h; 2h)
No.6 (60°C, 12°C/h, 5h)
No.5 (60°C, 12°C/h, 2h)
No.4 (50°C, 22°C/h, 5h)
No.3 (50°C, 22°C/h, 2h)
No.2 (50°C, 12°C/h, 5h)
No. 1 (50°C, 12°C/h, 2h)
25 35 45 55 65 75
18-h steam-curcd compressive strength (MPa)
Fig. 5.1 - Comparison of 18-hour steam-cured compressive strength of SCC subjected to steam-curing with different maximum chamber temperatures
96

No.8 (60°C, 22°C/h, 5h)
No.7 (60°C, 22°C/h, 2h)
No.6 (60°C, l2°C/h, 5h)
No.5 (60°C, 12°C/h,2h)
No.4 (50°C, 22°C/h, 5h)
No.3 (50°C, 22°C/h: 2h)
No.2 (50°C, l2°C/h, 5h)
No.l (50°C, 12°C/h, 2h)
10 20 30 40 18-h stcam-curcd MOE (GPa)
Fig. 5.2 - Comparison of 18-hour steam-cured modulus of elasticity of SCC subjected to steam-curing with different maximum chamber temperatures
B) Effect of preset period on mechanical properties
The physical damage that occurred in the steam-cured concrete usually manifested itself as loss
in compressive strength at later ages. The preset period is a way to minimize the physical damage
that may occur due to thermal expansion, to obtain sufficient initial strength before heat
treatment is applied. In this investigation, different preset periods of 2 and 5 hours were applied
prior to heat treatment. Compressive strength values of SCC1 subjected to 18-hour steam-curing
with different preset periods of 2 and 5 hours are compared in Fig. 5.3. It is interesting to note
that the effect of the preset period varies with maximum chamber temperature used in the steam-
curing. In the case of maximum chamber temperature of 60°C, mixtures subjected to a longer
preset period of 5 hours developed higher 18-hour steam-cured compressive strength than those
with shorter preset period of 2 hours. For example, mixtures No. 6 and 8 subjected to steam-
curing with a maximum chamber temperature of 60°C and a 5-hour of preset period have higher
18-hour compressive strength than mixtures No. 5 and 7 with the same chamber temperature and
2 hours of preset period (55 and 60 MPa vs. 54 and 60 MPa). This is not the case with the
97
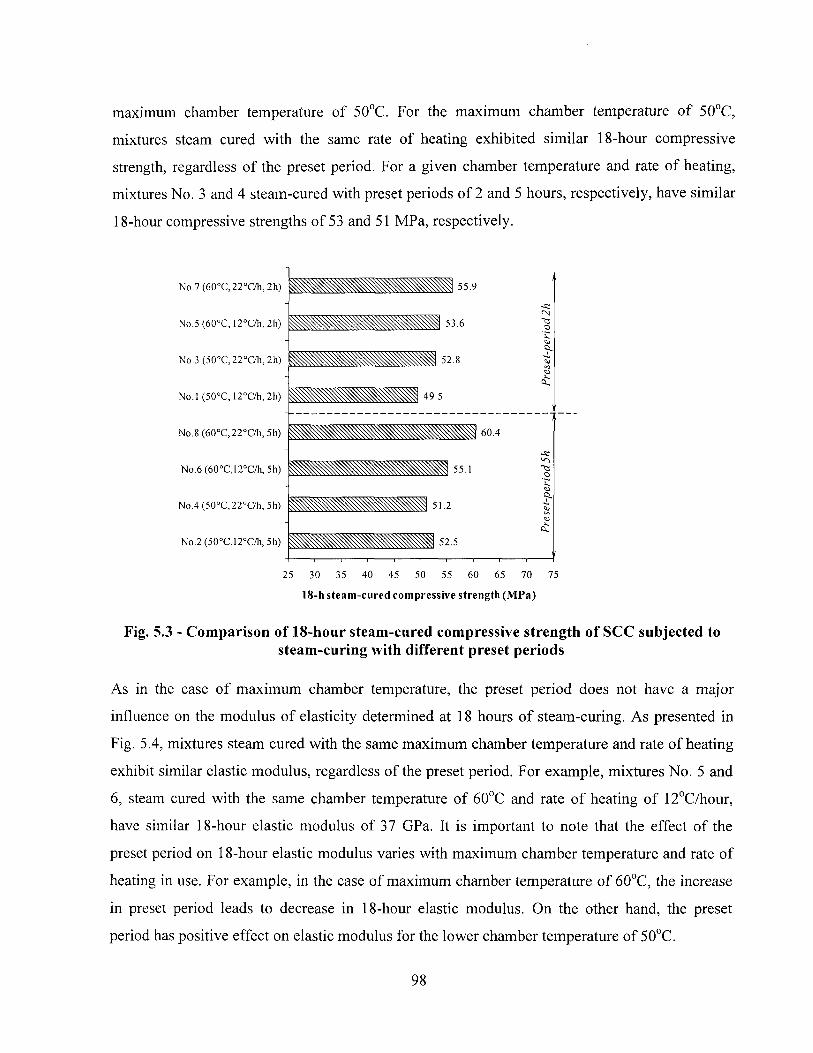
maximum chamber temperature of 50°C. For the maximum chamber temperature of 50°C,
mixtures steam cured with the same rate of heating exhibited similar 18-hour compressive
strength, regardless of the preset period. For a given chamber temperature and rate of heating,
mixtures No. 3 and 4 steam-cured with preset periods of 2 and 5 hours, respectively, have similar
18-hour compressive strengths of 53 and 51 MPa, respectively.
No.7 (60°C, 22°C/h, 2h)
No.5 (60°C, 12°C/li, 2li)
No.3 (50°C, 22°C/h, 2h)
No.l (50°C, 12°Ch, 2h)
No.8 (60°C,22°C/li, 5h)
No.6(60°CJ12°C/h, 5h)
No.4 (50°C, 22°C/h, 5h)
No.2 (50°C,12°C/h, 5h)
25 30 35 40 45 50 55 60 65 70 75
18-h s t eam-cured compress ive strength ( M P a )
Fig. 5.3 - Comparison of 18-hour steam-cured compressive strength of SCC subjected to steam-curing with different preset periods
As in the case of maximum chamber temperature, the preset period does not have a major
influence on the modulus of elasticity determined at 18 hours of steam-curing. As presented in
Fig. 5.4, mixtures steam cured with the same maximum chamber temperature and rate of heating
exhibit similar elastic modulus, regardless of the preset period. For example, mixtures No. 5 and
6, steam cured with the same chamber temperature of 60°C and rate of heating of 12°C/hour,
have similar 18-hour elastic modulus of 37 GPa. It is important to note that the effect of the
preset period on 18-hour elastic modulus varies with maximum chamber temperature and rate of
heating in use. For example, in the case of maximum chamber temperature of 60°C, the increase
in preset period leads to decrease in 18-hour elastic modulus. On the other hand, the preset
period has positive effect on elastic modulus for the lower chamber temperature of 50°C.
98
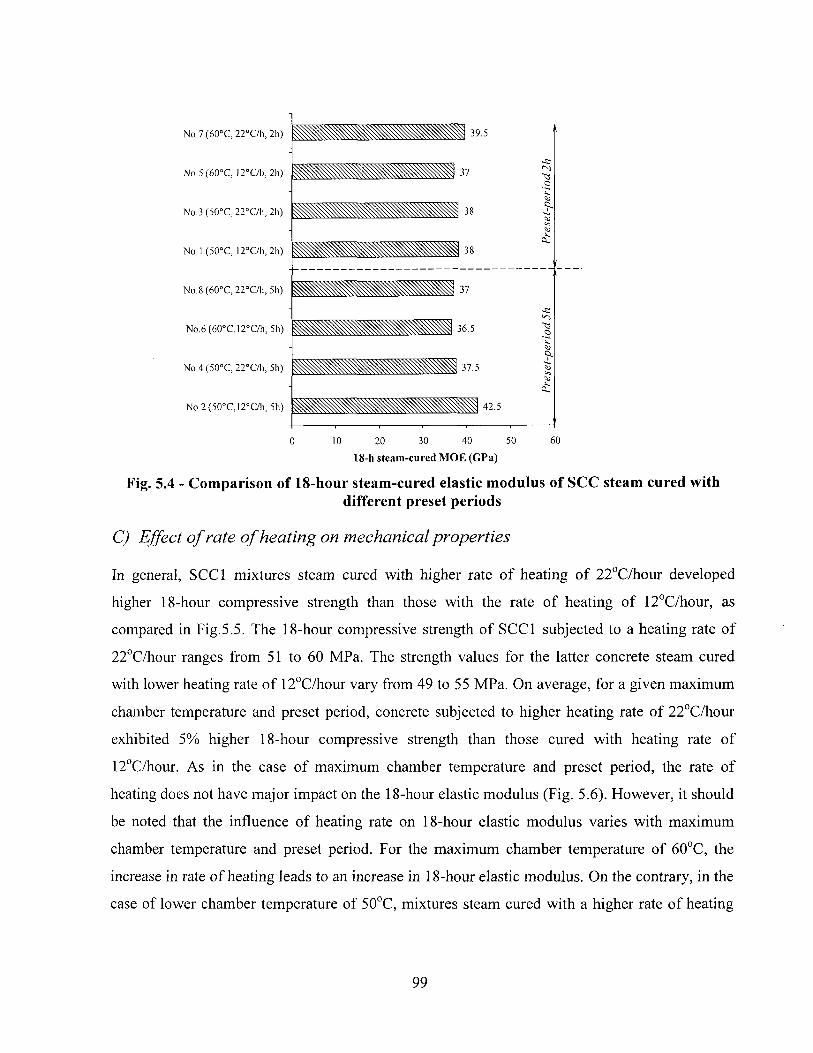
No.7 (60°C, 22°C/h, 2h)
No.5 (60°C, l2°C/h, 2h)
No. 3 (50°C, 22°C/h, 2h)
No. 1 (50°C, 12°C/h, 2h)
No. 8 (60°C, 22°C/h, 5h)
No.6 (60°C, 12°C/h, 5h)
No.4 (50°C, 22°C/h, 5h)
No.2 (50°C, 12°C/h, 5h)
0 10 20 30 40 50
18-h stcam-cured M O E (GPa)
Fig. 5.4 - Comparison of 18-hour steam-cured elastic modulus of SCC steam cured with different preset periods
C) Effect of rate of heating on mechanical properties
In general, SCC1 mixtures steam cured with higher rate of heating of 22°C/hour developed
higher 18-hour compressive strength than those with the rate of heating of 12°C/hour, as
compared in Fig.5.5. The 18-hour compressive strength of SCC1 subjected to a heating rate of
22°C/hour ranges from 51 to 60 MPa. The strength values for the latter concrete steam cured
with lower heating rate of 12°C/hour vary from 49 to 55 MPa. On average, for a given maximum
chamber temperature and preset period, concrete subjected to higher heating rate of 22°C/hour
exhibited 5% higher 18-hour compressive strength than those cured with heating rate of
12°C/hour. As in the case of maximum chamber temperature and preset period, the rate of
heating does not have major impact on the 18-hour elastic modulus (Fig. 5.6). However, it should
be noted that the influence of heating rate on 18-hour elastic modulus varies with maximum
chamber temperature and preset period. For the maximum chamber temperature of 60°C, the
increase in rate of heating leads to an increase in 18-hour elastic modulus. On the contrary, in the
case of lower chamber temperature of 50°C, mixtures steam cured with a higher rate of heating
99
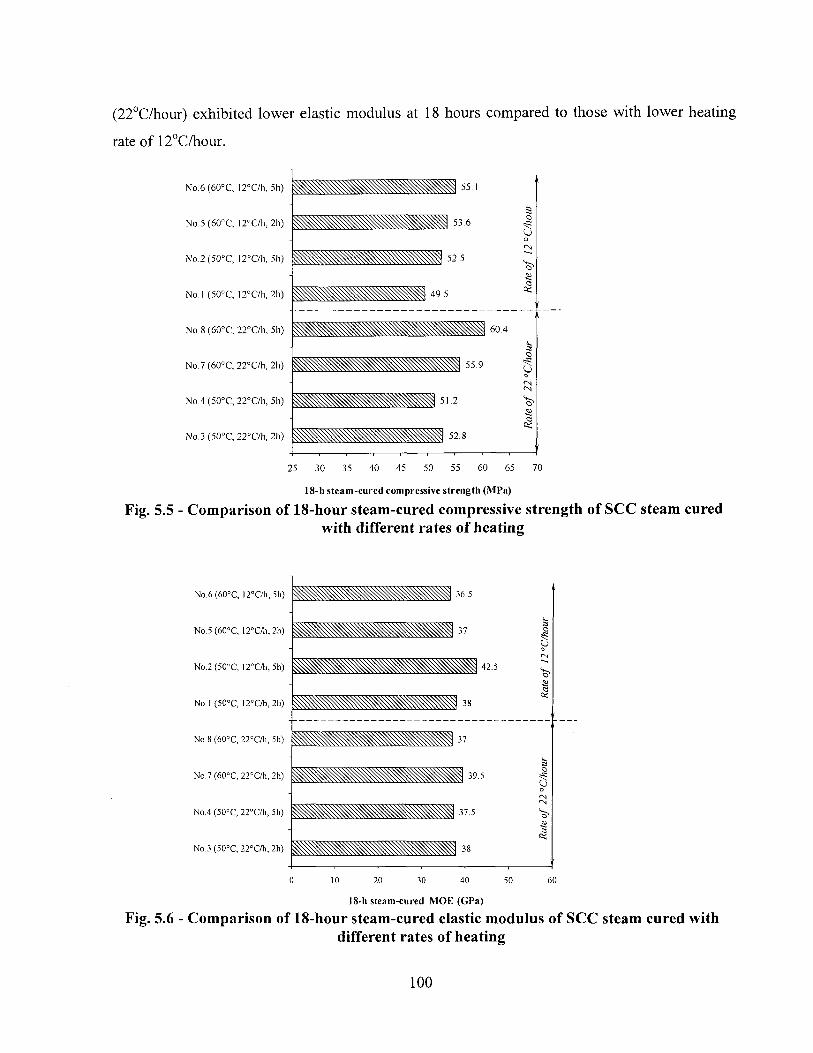
(22°C/hour) exhibited lower elastic modulus at 18 hours compared to those with lower heating
rate of 12°C/hour.
No.6 (60°C, l2°C/h, 5h)
No. 5 (60°C, l2°C/h, 2h)
No.2 (50°C, l2°C/h, 5h)
No. I (50°C, l2°C/h, 2h)
No.8 (60°C, 22°C/h, 5h)
No.7 (60°C, 22°C/h, 2h)
No.4 (50°C, 22°C/h, 5h)
No.3 (50°C, 22°C/h, 2h)
18-h s t e a m - c u r e d compress ive s t rength ( M P a )
Fig. 5.5 - Comparison of 18-hour steam-cured compressive strength of SCC steam cured with different rates of heating
No.6(60°C, l2°C/h, 5h)
No.5 (60°C, 12°C/h, 2h)
No.2 (50°C, 12°C/h,5h)
No.l (50°C, 12°C/h, 2b)
No.8 (60°C, 22°C/li,5h)
No.7 (60°C, 22°C/h, 2h)
No.4 (50°C, 22°C/h, 5h)
No.3 (50°C, 22°C/h, 2h)
10 20 30 40 50 60
18-h steam-cured M O E (GPa)
Fig. 5.6 - Comparison of 18-hour steam-cured elastic modulus of SCC steam cured with different rates of heating
100
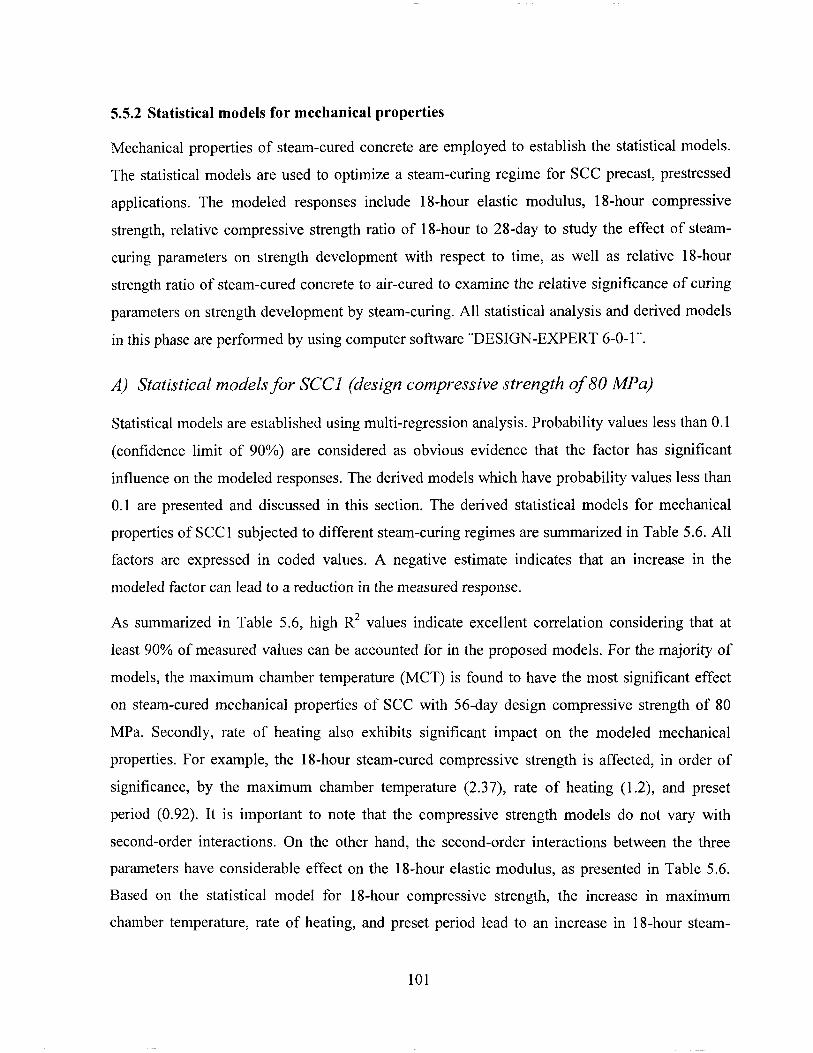
5.5.2 Statistical models for mechanical properties
Mechanical properties of steam-cured concrete are employed to establish the statistical models.
The statistical models are used to optimize a steam-curing regime for SCC precast, prestressed
applications. The modeled responses include 18-hour elastic modulus, 18-hour compressive
strength, relative compressive strength ratio of 18-hour to 28-day to study the effect of steam-
curing parameters on strength development with respect to time, as well as relative 18-hour
strength ratio of steam-cured concrete to air-cured to examine the relative significance of curing
parameters on strength development by steam-curing. All statistical analysis and derived models
in this phase are performed by using computer software "DESIGN-EXPERT 6-0-1".
A) Statistical models for SCC J (design compressive strength of 80 MPa)
Statistical models are established using multi-regression analysis. Probability values less than 0.1
(confidence limit of 90%) are considered as obvious evidence that the factor has significant
influence on the modeled responses. The derived models which have probability values less than
0.1 are presented and discussed in this section. The derived statistical models for mechanical
properties of SCC1 subjected to different steam-curing regimes are summarized in Table 5.6. All
factors are expressed in coded values. A negative estimate indicates that an increase in the
modeled factor can lead to a reduction in the measured response.
As summarized in Table 5.6, high R2 values indicate excellent correlation considering that at
least 90% of measured values can be accounted for in the proposed models. For the majority of
models, the maximum chamber temperature (MCT) is found to have the most significant effect
on steam-cured mechanical properties of SCC with 56-day design compressive strength of 80
MPa. Secondly, rate of heating also exhibits significant impact on the modeled mechanical
properties. For example, the 18-hour steam-cured compressive strength is affected, in order of
significance, by the maximum chamber temperature (2.37), rate of heating (1.2), and preset
period (0.92). It is important to note that the compressive strength models do not vary with
second-order interactions. On the other hand, the second-order interactions between the three
parameters have considerable effect on the 18-hour elastic modulus, as presented in Table 5.6.
Based on the statistical model for 18-hour compressive strength, the increase in maximum
chamber temperature, rate of heating, and preset period lead to an increase in 18-hour steam-
101
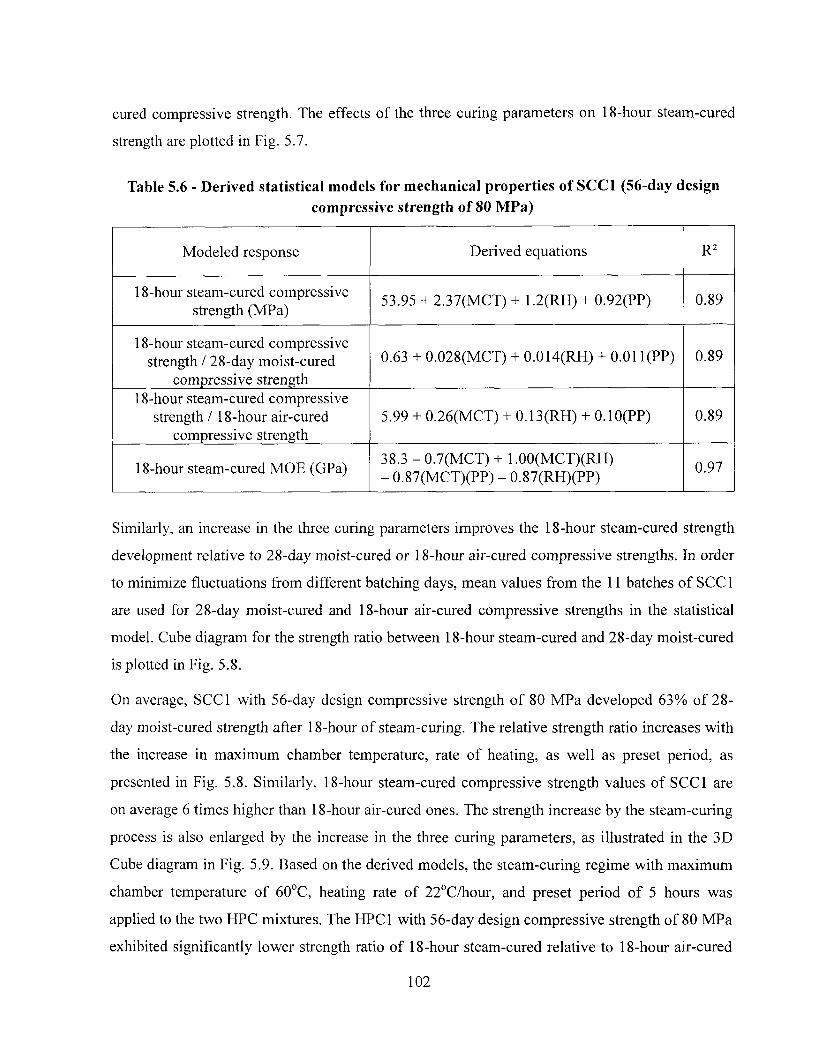
cured compressive strength. The effects of the three curing parameters on 18-hour steam-cured
strength are plotted in Fig. 5.7.
Table 5.6 - Derived statistical models for mechanical properties of SCC1 (56-day design compressive strength of 80 MPa)
Modeled response Derived equations R2
18-hour steam-cured compressive strength (MPa)
53.95 + 2.37(MCT) + 1.2(RH) + 0.92(PP) 0.89
18-hour steam-cured compressive strength / 2 8-day moist-cured
compressive strength 0.63 + 0.028(MCT) + 0.014(RH) + 0.011(PP) 0.89
18-hour steam-cured compressive strength / 18-hour air-cured
compressive strength 5.99 + 0.26(MCT) + 0.13(RH) + 0.10(PP) 0.89
18-hour steam-cured MOE (GPa) 38.3 -0.7(MCT) + 1.00(MCT)(RH) - 0.87(MCT)(PP) - 0.87(RH)(PP) 0.97
Similarly, an increase in the three curing parameters improves the 18-hour steam-cured strength
development relative to 28-day moist-cured or 18-hour air-cured compressive strengths. In order
to minimize fluctuations from different batching days, mean values from the 11 batches of SCC1
are used for 28-day moist-cured and 18-hour air-cured compressive strengths in the statistical
model. Cube diagram for the strength ratio between 18-hour steam-cured and 28-day moist-cured
is plotted in Fig. 5.8.
On average, SCC1 with 56-day design compressive strength of 80 MPa developed 63% of 28-
day moist-cured strength after 18-hour of steam-curing. The relative strength ratio increases with
the increase in maximum chamber temperature, rate of heating, as well as preset period, as
presented in Fig. 5.8. Similarly, 18-hour steam-cured compressive strength values of SCC1 are
on average 6 times higher than 18-hour air-cured ones. The strength increase by the steam-curing
process is also enlarged by the increase in the three curing parameters, as illustrated in the 3D
Cube diagram in Fig. 5.9. Based on the derived models, the steam-curing regime with maximum
chamber temperature of 60°C, heating rate of 22°C/hour, and preset period of 5 hours was
applied to the two HPC mixtures. The HPC1 with 56-day design compressive strength of 80 MPa
exhibited significantly lower strength ratio of 18-hour steam-cured relative to 18-hour air-cured
102
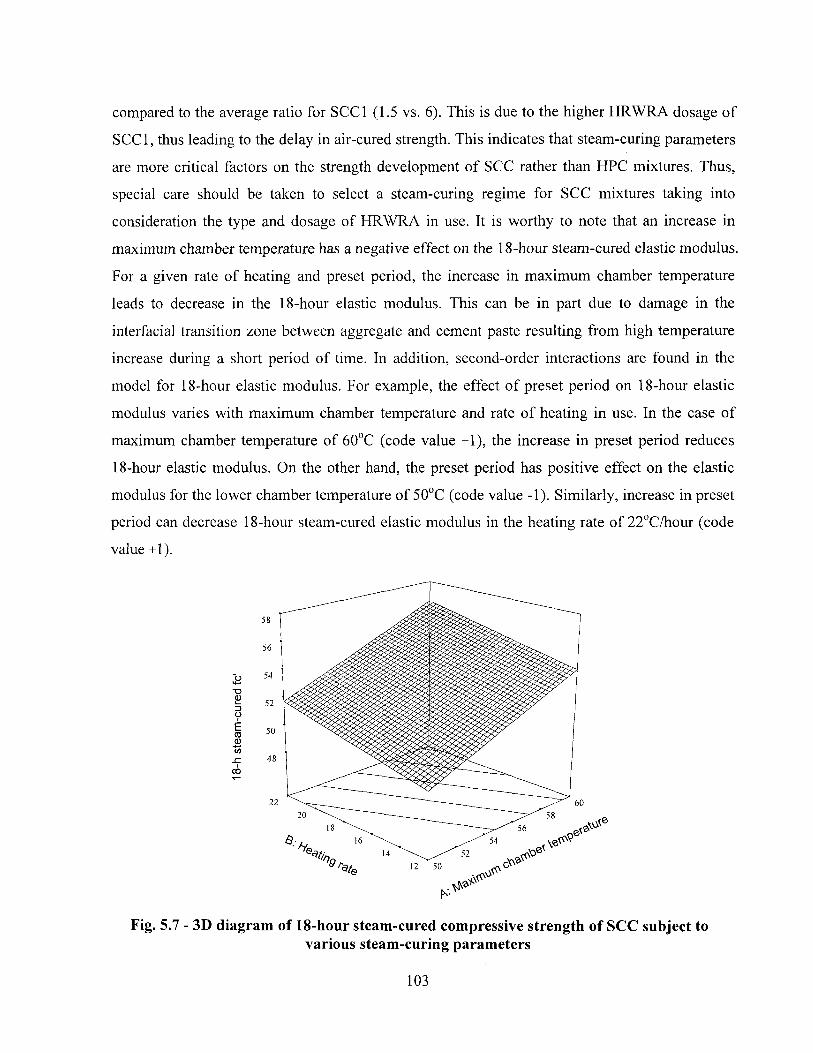
compared to the average ratio for SCC1 (1.5 vs. 6). This is due to the higher HRWRA dosage of
SCC1, thus leading to the delay in air-cured strength. This indicates that steam-curing parameters
are more critical factors on the strength development of SCC rather than HPC mixtures. Thus,
special care should be taken to select a steam-curing regime for SCC mixtures taking into
consideration the type and dosage of HRWRA in use. It is worthy to note that an increase in
maximum chamber temperature has a negative effect on the 18-hour steam-cured elastic modulus.
For a given rate of heating and preset period, the increase in maximum chamber temperature
leads to decrease in the 18-hour elastic modulus. This can be in part due to damage in the
interfacial transition zone between aggregate and cement paste resulting from high temperature
increase during a short period of time. In addition, second-order interactions are found in the
model for 18-hour elastic modulus. For example, the effect of preset period on 18-hour elastic
modulus varies with maximum chamber temperature and rate of heating in use. In the case of
maximum chamber temperature of 60°C (code value +1), the increase in preset period reduces
18-hour elastic modulus. On the other hand, the preset period has positive effect on the elastic
modulus for the lower chamber temperature of 50°C (code value -1). Similarly, increase in preset
period can decrease 18-hour steam-cured elastic modulus in the heating rate of 22°C/hour (code
value +1).
Fig. 5.7 - 3D diagram of 18-hour steam-cured compressive strength of SCC subject to various steam-curing parameters
103
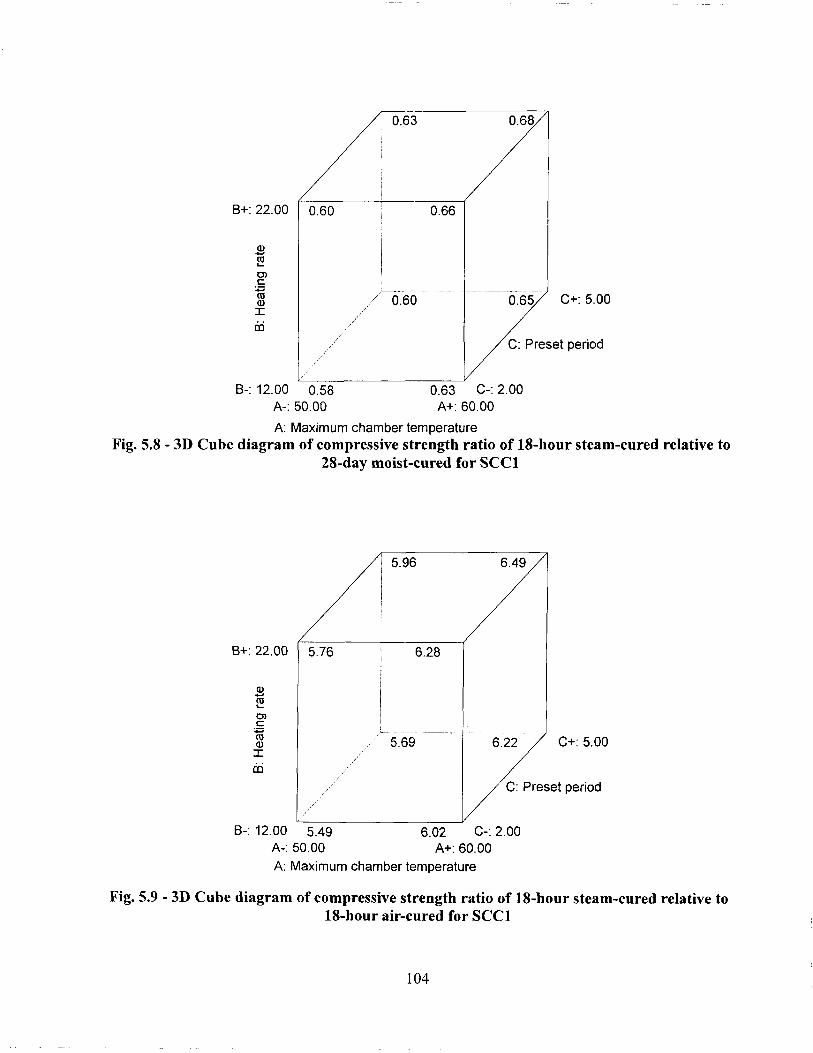
0.68/ 0.63
A-: 50.00 A+: 60.00
A: Maximum chamber temperature Fig. 5.8 - 3D Cube diagram of compressive strength ratio of 18-hour steam-cured relative to
28-day moist-cured for SCC1
A-: 50.00 A+: 60.00 A: Maximum chamber temperature
Fig. 5.9 - 3D Cube diagram of compressive strength ratio of 18-hour steam-cured relative to 18-hour air-cured for SCC1
104
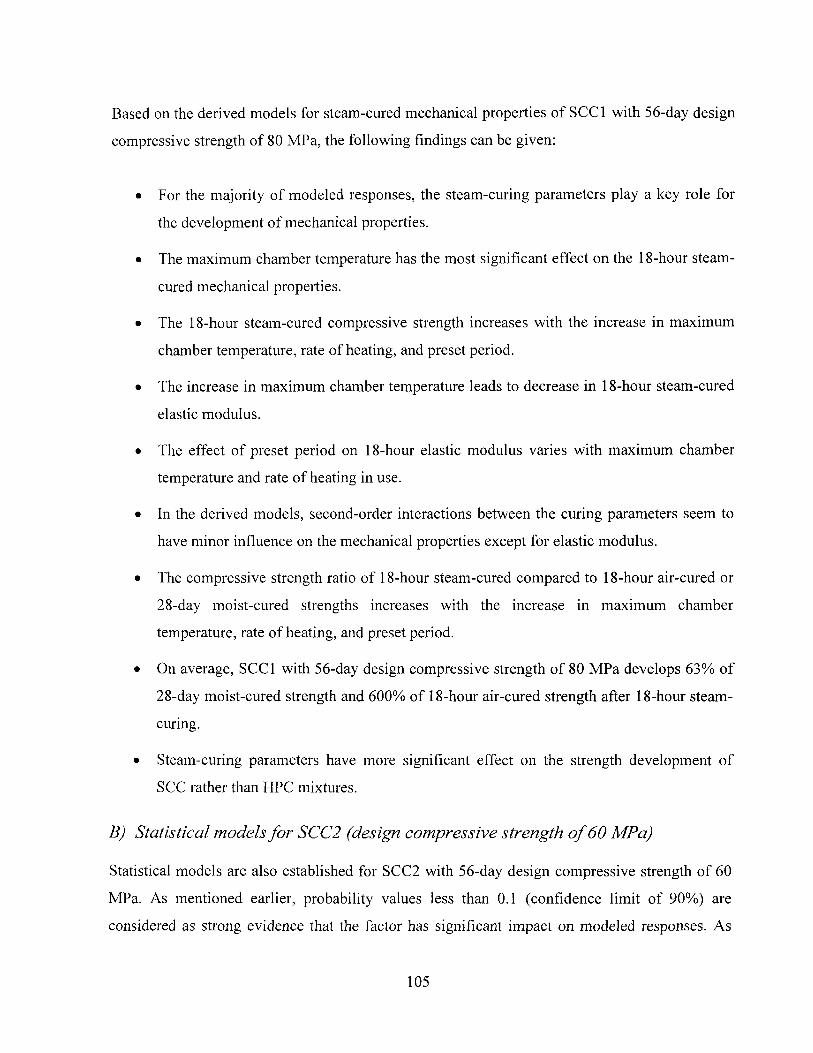
Based on the derived models for steam-cured mechanical properties of SCC1 with 56-day design
compressive strength of 80 MPa, the following findings can be given:
• For the majority of modeled responses, the steam-curing parameters play a key role for
the development of mechanical properties.
• The maximum chamber temperature has the most significant effect on the 18-hour steam-
cured mechanical properties.
• The 18-hour steam-cured compressive strength increases with the increase in maximum
chamber temperature, rate of heating, and preset period.
• The increase in maximum chamber temperature leads to decrease in 18-hour steam-cured
elastic modulus.
• The effect of preset period on 18-hour elastic modulus varies with maximum chamber
temperature and rate of heating in use.
• In the derived models, second-order interactions between the curing parameters seem to
have minor influence on the mechanical properties except for elastic modulus.
• The compressive strength ratio of 18-hour steam-cured compared to 18-hour air-cured or
28-day moist-cured strengths increases with the increase in maximum chamber
temperature, rate of heating, and preset period.
• On average, SCC1 with 56-day design compressive strength of 80 MPa develops 63% of
28-day moist-cured strength and 600% of 18-hour air-cured strength after 18-hour steam-
curing.
• Steam-curing parameters have more significant effect on the strength development of
SCC rather than HPC mixtures.
B) Statistical models for SCC2 (design compressive strength of 60 MPa)
Statistical models are also established for SCC2 with 56-day design compressive strength of 60
MPa. As mentioned earlier, probability values less than 0.1 (confidence limit of 90%) are
considered as strong evidence that the factor has significant impact on modeled responses. As
105
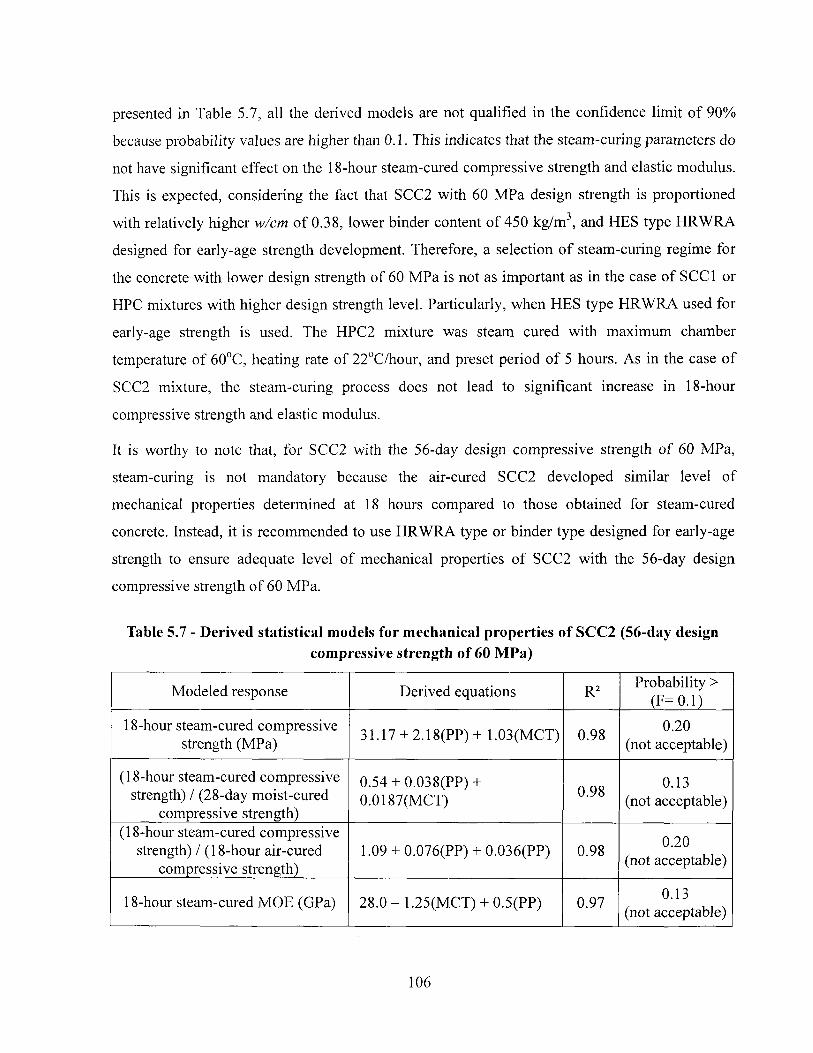
presented in Table 5.7, all the derived models are not qualified in the confidence limit of 90%
because probability values are higher than 0.1. This indicates that the steam-curing parameters do
not have significant effect on the 18-hour steam-cured compressive strength and elastic modulus.
This is expected, considering the fact that SCC2 with 60 MPa design strength is proportioned
with relatively higher w/cm of 0.38, lower binder content of 450 kg/m3, and HES type HRWRA
designed for early-age strength development. Therefore, a selection of steam-curing regime for
the concrete with lower design strength of 60 MPa is not as important as in the case of SCC1 or
HPC mixtures with higher design strength level. Particularly, when HES type HRWRA used for
early-age strength is used. The HPC2 mixture was steam cured with maximum chamber
temperature of 60°C, heating rate of 22°C/hour, and preset period of 5 hours. As in the case of
SCC2 mixture, the steam-curing process does not lead to significant increase in 18-hour
compressive strength and elastic modulus.
It is worthy to note that, for SCC2 with the 56-day design compressive strength of 60 MPa,
steam-curing is not mandatory because the air-cured SCC2 developed similar level of
mechanical properties determined at 18 hours compared to those obtained for steam-cured
concrete. Instead, it is recommended to use HRWRA type or binder type designed for early-age
strength to ensure adequate level of mechanical properties of SCC2 with the 56-day design
compressive strength of 60 MPa.
Table 5.7 - Derived statistical models for mechanical properties of SCC2 (56-day design compressive strength of 60 MPa)
Modeled response Derived equations R2 Probability > (F= 0.1)
18-hour steam-cured compressive strength (MPa) 31.17 + 2.18(PP) + 1.03(MCT) 0.98 0.20
(not acceptable)
(18-hour steam-cured compressive strength) / (28-day moist-cured
compressive strength)
0.54 + 0.038(PP) + 0.0187(MCT) 0.98 0.13
(not acceptable)
(18-hour steam-cured compressive strength) / (18-hour air-cured
compressive strength) 1.09 + 0.076(PP) + 0.036(PP) 0.98 0.20
(not acceptable)
18-hour steam-cured MOE (GPa) 28 .0 - 1.25(MCT) + 0.5(PP) 0.97 0.13 (not acceptable)
106
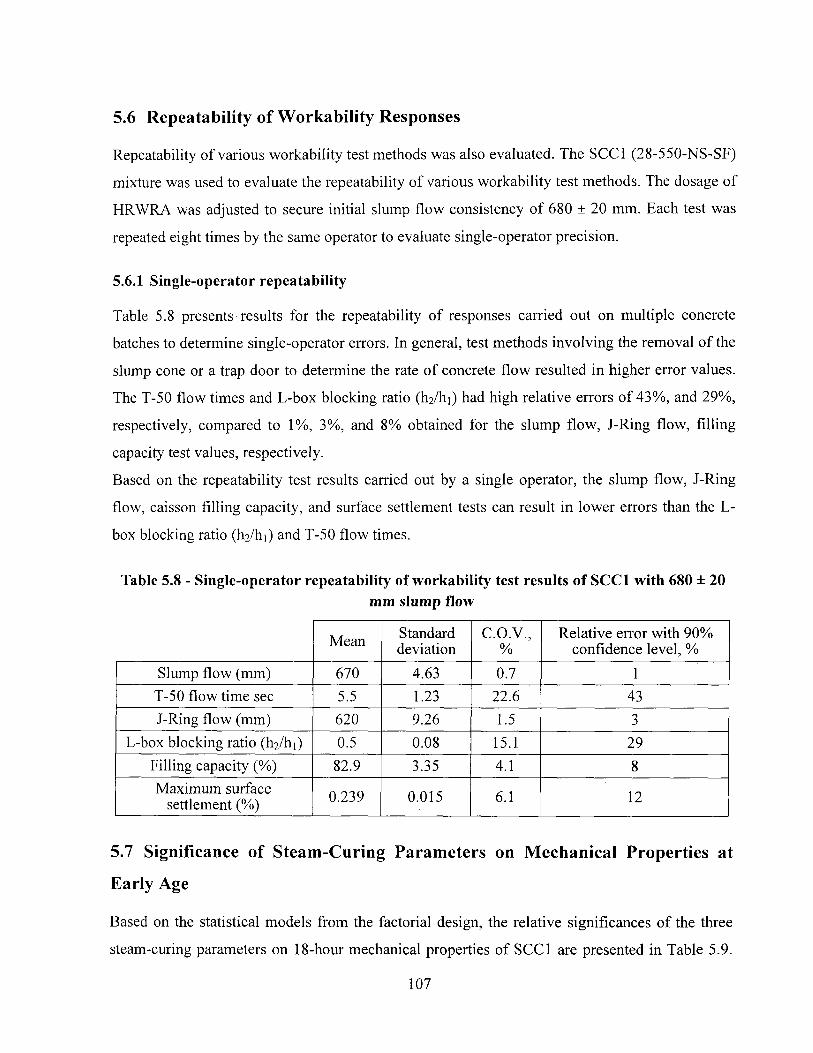
5.6 Repeatability of Workability Responses
Repeatability of various workability test methods was also evaluated. The SCC1 (28-550-NS-SF)
mixture was used to evaluate the repeatability of various workability test methods. The dosage of
HRWRA was adjusted to secure initial slump flow consistency of 680 ± 20 mm. Each test was
repeated eight times by the same operator to evaluate single-operator precision.
5.6.1 Single-operator repeatability
Table 5.8 presents results for the repeatability of responses carried out on multiple concrete
batches to determine single-operator errors. In general, test methods involving the removal of the
slump cone or a trap door to determine the rate of concrete flow resulted in higher error values.
The T-50 flow times and L-box blocking ratio (h2/hi) had high relative errors of 43%, and 29%,
respectively, compared to 1%, 3%, and 8% obtained for the slump flow, J-Ring flow, filling
capacity test values, respectively.
Based on the repeatability test results carried out by a single operator, the slump flow, J-Ring
flow, caisson filling capacity, and surface settlement tests can result in lower errors than the L-
box blocking ratio (h^/hi) and T-50 flow times.
Table 5.8 - Single-operator repeatability of workability test results of SCC1 with 680 ± 20 mm slump flow
Mean Standard deviation
C.O.V., %
Relative error with 90% confidence level, %
Slump flow (mm) 670 4.63 0.7 1 T-50 flow time sec 5.5 1.23 22.6 43 J-Ring flow (mm) 620 9.26 1.5 3
L-box blocking ratio (IVhi) 0.5 0.08 15.1 29 Filling capacity (%) 82.9 3.35 4.1 8 Maximum surface
settlement (%) 0.239 0.015 6.1 12
5.7 Significance of Steam-Curing Parameters on Mechanical Properties at
Early Age
Based on the statistical models from the factorial design, the relative significances of the three
steam-curing parameters on 18-hour mechanical properties of SCC1 are presented in Table 5.9.
107
In the case of SCC1 with higher design compressive strength at 56 days of 80 MPa, the
maximum chamber temperature is shown to have most significant influence on the 18-hour
steam-cured compressive strength and its strength ratio relative to the 28-day moist-cured or 18-
hour air-cured strengths, as well as elastic modulus determined at 18 hours. As summarized in
Table 5.9, the rate of heating and preset period also have high influence on 18-hour compressive
strength and the two strength ratios but exhibit medium significance on the 18-hour elastic
modulus. This is not the case of SCC2 which is designed for 56-day compressive strength of 60
MPa. As presented in Table 5.9, the three curing parameters do not exhibit significant effect on
the modeled responses. This is expected considering the fact that SCC2 proportioned with
relatively high w/cm of 0.38, low binder content of 450 kg/m3, and HES type HRWRA designed
for early-age strength, can develop similar level of 18-hour mechanical properties without
accelerated steam-curing process. SCC1 mixtures steam cured with higher maximum chamber
temperature of 60°C developed higher 18-hour compressive strength and higher strength ratios
relative to the 28-day moist-cured or 18-hour air-cured strengths and greater elastic modulus at
18 hours. Therefore, higher maximum chamber temperature of 60°C can be used to accelerate
compressive strength development of SCC1 with 80 MPa design strength. It is important to note
that an increase in maximum chamber temperature can lead to decrease in the 18-hour elastic
modulus. Therefore, special care should be taken to select the maximum chamber temperature to
achieve the early-strength considering the required high modulus of elasticity for prestressed
applications. As presented in Table 5.4, steam cured mixtures with higher heating rate of
22°C/hour and longer preset period of 5 hours exhibited higher 18-hour compressive strength
compared to those prepared with lower heating rate and shorter preset period. It is important to
note that the effect of the rate of heating and preset period on 18-hour elastic modulus varies with
maximum chamber temperature in use. Again, for prestressed elements where the modulus of
elasticity plays a major role in structural integrity, the optimum rate of heating and preset period
should be selected based on the maximum chamber temperature to secure adequate level of
elastic modulus to limit any prestress loss. Based on the derived models for mechanical
properties of steam-cured SCC, the following findings can be stated:
• For precast applications, select higher maximum chamber temperature, higher rate of
heating, and longer preset period to secure greater 18-hour compressive strength. It is
108
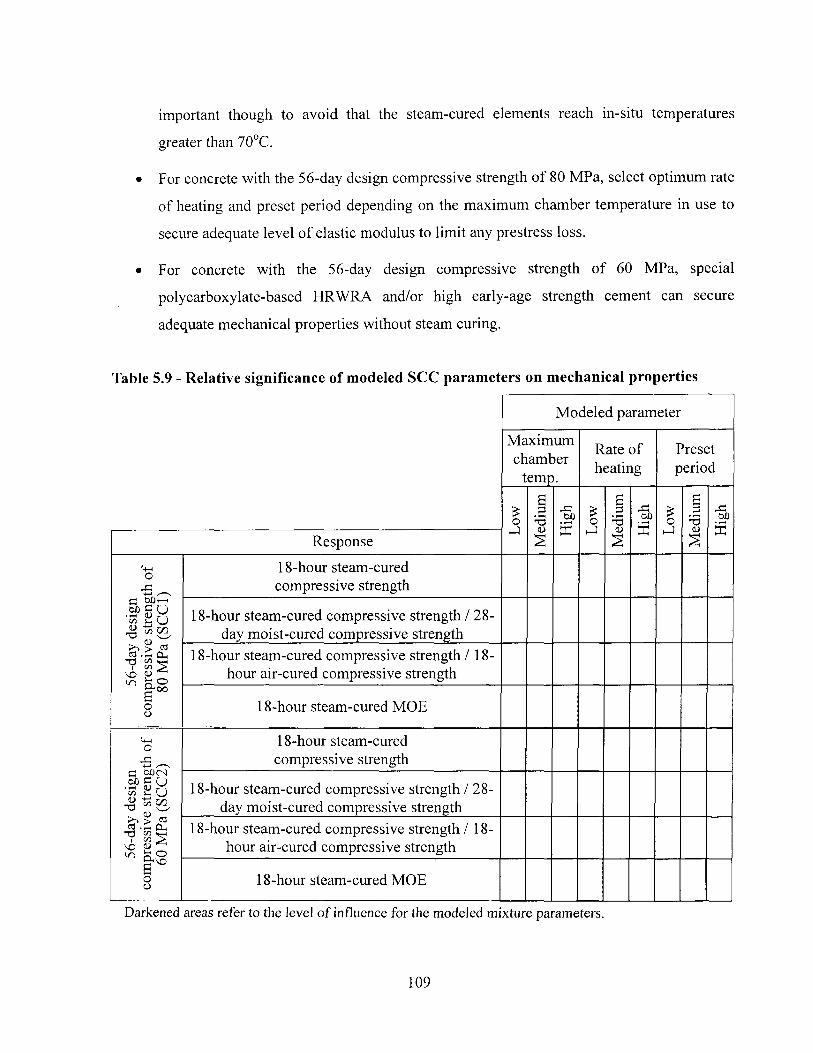
important though to avoid that the steam-cured elements reach in-situ temperatures
greater than 70°C.
• For concrete with the 56-day design compressive strength of 80 MPa, select optimum rate
of heating and preset period depending on the maximum chamber temperature in use to
secure adequate level of elastic modulus to limit any prestress loss.
• For concrete with the 56-day design compressive strength of 60 MPa, special
polycarboxylate-based HRWRA and/or high early-age strength cement can secure
adequate mechanical properties without steam curing.
Table 5.9 - Relative significance of modeled SCC parameters on mechanical properties
Modeled parameter
Maximum chamber
temp.
Rate of heating
Preset period
£ o J M
ediu
m
Hig
h £ o i—I
Med
ium
Hig
h £ o
Med
ium
Hig
h
Response
£ o J M
ediu
m
Hig
h £ o i—I
Med
ium
Hig
h £ o
Med
ium
Hig
h
56-d
ay d
esig
n co
mpr
essi
ve s
treng
th o
f 80
MPa
(SC
C1)
18-hour steam-cured compressive strength
56-d
ay d
esig
n co
mpr
essi
ve s
treng
th o
f 80
MPa
(SC
C1)
18-hour steam-cured compressive strength / 28-day moist-cured compressive strength
56-d
ay d
esig
n co
mpr
essi
ve s
treng
th o
f 80
MPa
(SC
C1)
18-hour steam-cured compressive strength / 18-hour air-cured compressive strength 56
-day
des
ign
com
pres
sive
stre
ngth
of
80 M
Pa (
SCC
1)
18-hour steam-cured MOE
56-d
ay d
esig
n co
mpr
essi
ve s
treng
th o
f 60
MPa
(SC
C2)
18-hour steam-cured compressive strength
56-d
ay d
esig
n co
mpr
essi
ve s
treng
th o
f 60
MPa
(SC
C2)
18-hour steam-cured compressive strength / 28-day moist-cured compressive strength
56-d
ay d
esig
n co
mpr
essi
ve s
treng
th o
f 60
MPa
(SC
C2)
18-hour steam-cured compressive strength / 18-hour air-cured compressive strength 56
-day
des
ign
com
pres
sive
stre
ngth
of
60 M
Pa (
SCC
2)
18-hour steam-cured MOE
Darkened areas refer to the level of influence for the modeled mixture parameters.
109
Chapter 6 - Effect of Maturity on Strength Development in
Steam-Cured SCC
6.1 Introduction
Cement hydration is accompanied with thermal change at early age which affects setting and
strength development. The maturity concept has been used as a reliable indicator of strength
development. Maturity notion relies on the principle that concrete strength development is
related to the coupled effect of time and temperature. Thus, the maturity function describes the
rate of heat evolution of cement hydration which governs strength development of concrete at
early age. It is well known that the hydration process in cement paste is governed by many
factors, such as w/cm, admixtures type and dosage, phase composition of the cement, cement
fineness, time, and temperature. Normally, the rate of hydration increases with the increase of
ambient temperature during the heat treatment leading to higher early-age mechanical properties.
On the other hand, the gain in early-strength under excessive curing temperature can be
compromised by loss in the ultimate strength [Hanson, 1963]. Moreover, the rate of strength
development in steam-cured concrete and the interaction between the inherent concrete
temperature and the enclosure curing temperature vary depending on many factors linked to the
mixture composition and curing conditions.
In this investigation, the determined temperature history for the steam-cured concrete was
converted to a numerical index that is indicative of the extent of the strength development using
The Nurse-Saul's maturity function [Saul, 1999]. This function assumes a linear relationship
between temperature and the rate of strength development where the maturity is determined by
multiplying an interval of time by the temperature of concrete in question. This product is
summed over time, and the maturity of the concrete is equal to the sum of these time-temperature
products as follow:
M = ̂ (T-T0)At (6.1) o
110
where:
M = maturity index, °C-hour (or °C-day),
T = average concrete temperature (°C) during the time interval A1,
T0 = datum temperature, usually, -10°C
t = elapsed time (hour or day), and
At = time interval (hour or day).
In Phase II-3, application of the maturity concept to estimate strength development in steam-
cured concrete and the relationship between maturity and strength development are discussed.
The development of compressive strength after steam-curing operation was monitored. An
experimental design was carried out to determine the influence of steam-curing parameters on
the maturity index, early-strength, and ultimate strength are investigated.
6.2 Experimental program
All of the investigated mixtures had the same mixture composition that was that of SCC1
mixture used in Phase II-2, (w/cm of 0.28, a binder content of 550 kg/m3, NS type HRWRA, and
binder corresponding to Type GU cement with 7% silica fume replacement). The superplasticizer
dosage was adjusted to secure 680 ± 20 mm slump flow at 10 minutes following water-binder
contact. To assess the effect of curing parameters on long-term properties, the mixtures were
subjected to four steam-curing regimes proposed by experimental factorial design. The
maximum chamber temperature (MCT) and the preset period (PP) were modeled in the factorial
design at two (2 ). The response properties were maturity, early-strength development, and the
ultimate strength. A total of four mixtures having the same mixture proportioning were made.
Three additional mixtures were used for the center points to validate the statistical models.
When determined slump flow had met, fresh concrete was cast in one lift in cylinders measuring
100x200 mm. The initial concrete temperature was fixed at 20 ± 3°C. At each testing time
during steam-curing three specimens are taken out from the steam-curing chamber and tested for
compressive strength. The testing ages during steam-curing are presented in Fig. 6.1. After
finishing the steam-curing regime, three specimens were cured under air-curing conditions and
111
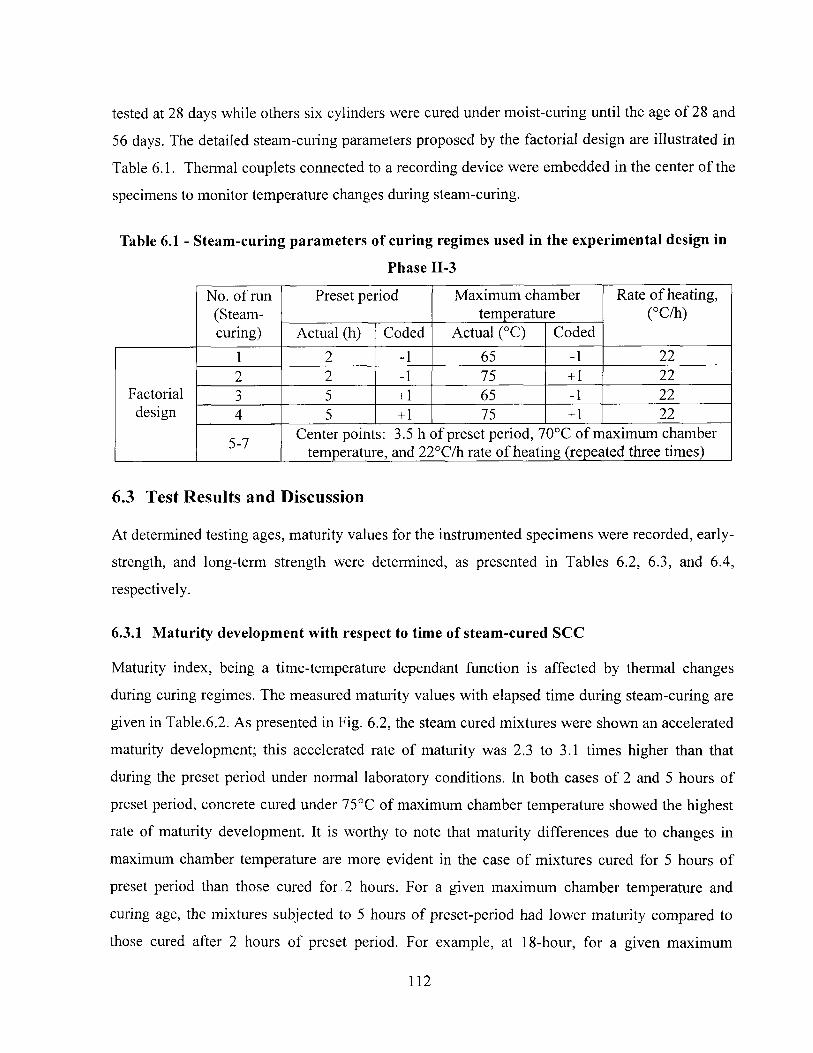
tested at 28 days while others six cylinders were cured under moist-curing until the age of 28 and
56 days. The detailed steam-curing parameters proposed by the factorial design are illustrated in
Table 6.1. Thermal couplets connected to a recording device were embedded in the center of the
specimens to monitor temperature changes during steam-curing.
Table 6.1 - Steam-curing parameters of curing regimes used in the experimental design in
Phase II-3
No. of run Preset period Maximum chamber Rate of heating, (Steam- temperature (°C/h) curing) Actual (h) Coded Actual (°C) Coded
1 2 -1 65 -1 22 2 2 -1 75 +1 22
Factorial 3 5 +1 65 -1 22 design 4 5 +1 75 +1 22
5-7 Center points: 3.5 h of preset period, 70°C of maximum chamber temperature, and 22°C/h rate of heating (repeated three times)
6.3 Test Results and Discussion
At determined testing ages, maturity values for the instrumented specimens were recorded, early-
strength, and long-term strength were determined, as presented in Tables 6.2, 6.3, and 6.4,
respectively.
6.3.1 Maturity development with respect to time of steam-cured SCC
Maturity index, being a time-temperature dependant function is affected by thermal changes
during curing regimes. The measured maturity values with elapsed time during steam-curing are
given in Table.6.2. As presented in Fig. 6.2, the steam cured mixtures were shown an accelerated
maturity development; this accelerated rate of maturity was 2.3 to 3.1 times higher than that
during the preset period under normal laboratory conditions. In both cases of 2 and 5 hours of
preset period, concrete cured under 75°C of maximum chamber temperature showed the highest
rate of maturity development. It is worthy to note that maturity differences due to changes in
maximum chamber temperature are more evident in the case of mixtures cured for 5 hours of
preset period than those cured for 2 hours. For a given maximum chamber temperature and
curing age, the mixtures subjected to 5 hours of preset-period had lower maturity compared to
those cured after 2 hours of preset period. For example, at 18-hour, for a given maximum
112
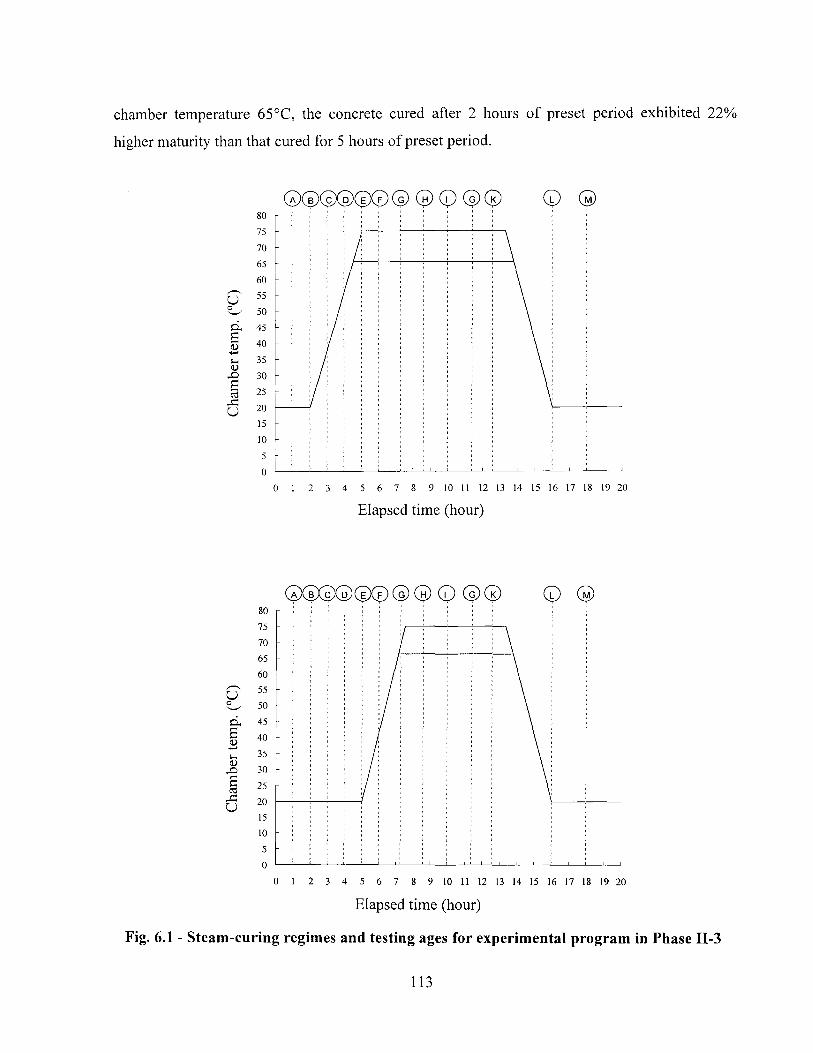
chamber temperature 65°C, the concrete cured after 2 hours of preset period exhibited 22%
higher maturity than that cured for 5 hours of preset period.
©©©©©©© © © © 0 CP ©
0 1 2 3 4 5 6 7 8 9 10 11 12 13 14 15 16 17 18 19 20
Elapsed time (hour)
© © © © 0 © © ® (D © © Q © 80 75 70 65 Art
u OU 55
o 50 si 45 a u 40
1-1 35 <u 30 X) 30 s ca 25
O 20 15 10 5 0
0 1 2 3 4 5 6 7 10 11 12 13 14 15 16 17 18 19 20
Elapsed time (hour)
Fig. 6.1 - Steam-curing regimes and testing ages for experimental program in Phase II-3
113
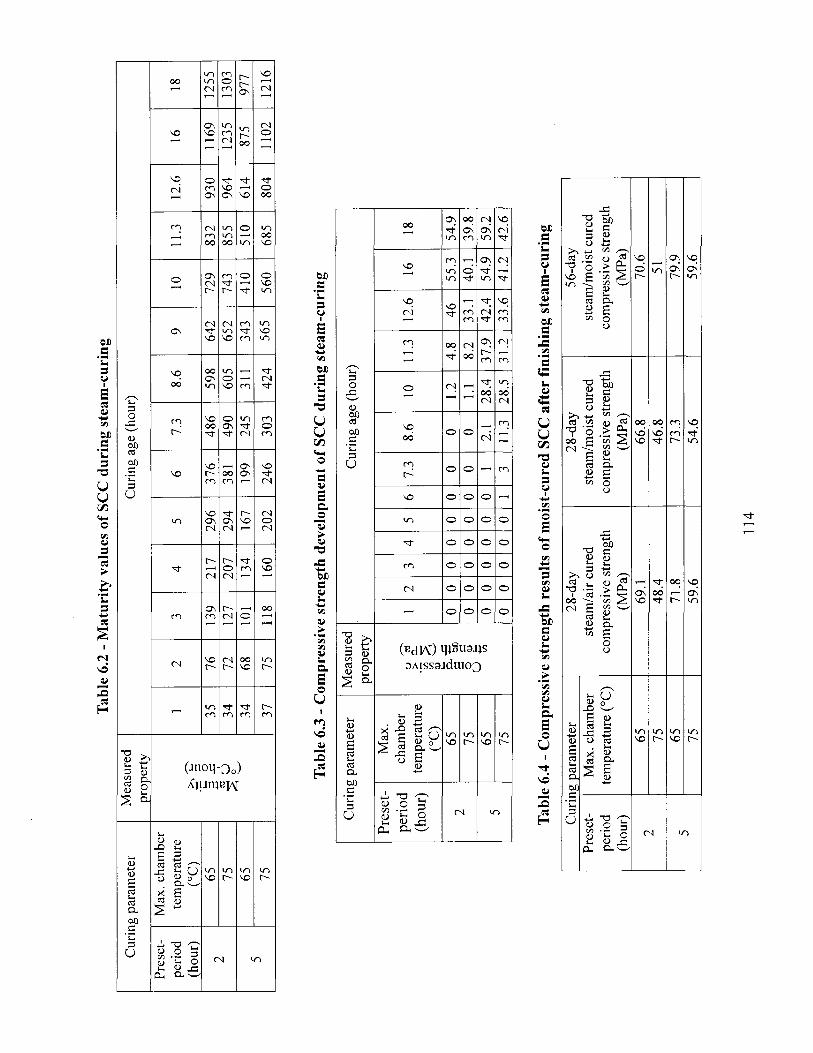
Tabl
e 6.
2 - M
atur
ity v
alue
s of
SC
C d
urin
g st
eam
-cur
ing
Curin
g pa
ram
eter
M
easu
red
prop
erty
Cu
ring
age
(hou
r)
Pres
et-
perio
d (h
our)
Max
. cha
mbe
r te
mpe
ratu
re
(°C)
Maturity (°C-hour)
1 2
3 4
5 6
7.3
8.6
9 10
11
.3
12.6
16
18
2 65
Maturity (°C-hour)
35
76
139
217
296
376
486
598
642
729
832
930
1169
12
55
2 75
Maturity (°C-hour)
34
72
127
207
294
381
490
605
652
743
855
964
1235
13
03
5 65
Maturity (°C-hour)
34
68
101
134
167
199
245
311
343
410
510
614
875
977
5 75
Maturity (°C-hour)
37
75
118
160
202
246
303
424
565
560
685
804
1102
12
16
Tabl
e 6.
3 - C
ompr
essi
ve s
tren
gth
deve
lopm
ent
of S
CC
dur
ing
stea
m-c
urin
g
Curin
g pa
ram
eter
M
easu
red
prop
erty
Cu
ring
age
(hou
r)
Pres
et-
Max
. pe
riod
(hou
r)
cham
ber
tem
pera
ture
(°
C)
I)
cd
> PL
,
to
&
<u
1 2
3 4
5 6
7.3
8.6
10
11.3
12
.6
16
18
2 65
o
. C
6X3
o OJ
U
£= VI
0 0
0 0
0 0
0 0
1.2
4.8
46
55.3
54
.9
2 75
o
. C
6X3
o OJ
U
£= VI
0 0
0 0
0 0
0 0
1.1
8.2
33.1
40
.1
39.8
5 65
o. C
6X3
o OJ
U
£= VI
0 0
0 0
0 0
1 2.
1 28
.4
37.9
42
.4
54.9
59
.2
5 75
0
0 0
0 0
1 3
11.3
28
.5
31.2
33
.6
41.2
42
.6
Tab
le 6
.4 -
Com
pres
sive
str
engt
h re
sults
of m
oist
-cur
ed S
CC
aft
er fi
nish
ing
stea
m-c
urin
g
Curin
g pa
ram
eter
28
-day
ste
am/a
ir cu
red
com
pres
sive
stren
gth
(MPa
)
28-d
ay
steam
/moi
st cu
red
com
pres
sive
stren
gth
(MPa
)
56-d
ay
steam
/moi
st cu
red
com
pres
sive
stren
gth
(MPa
)
Pres
et-
perio
d (h
our)
Max
. cha
mbe
r te
mpe
ratu
re (°
C)
28-d
ay
steam
/air
cure
d co
mpr
essiv
e str
engt
h (M
Pa)
28-d
ay
steam
/moi
st cu
red
com
pres
sive
stren
gth
(MPa
)
56-d
ay
steam
/moi
st cu
red
com
pres
sive
stren
gth
(MPa
)
2 65
69
.1
66.8
70
.6
2 75
48
.4
46.8
51
5 65
71
.8
73.3
79
.9
5 75
59
.6
54.6
59
.6
114
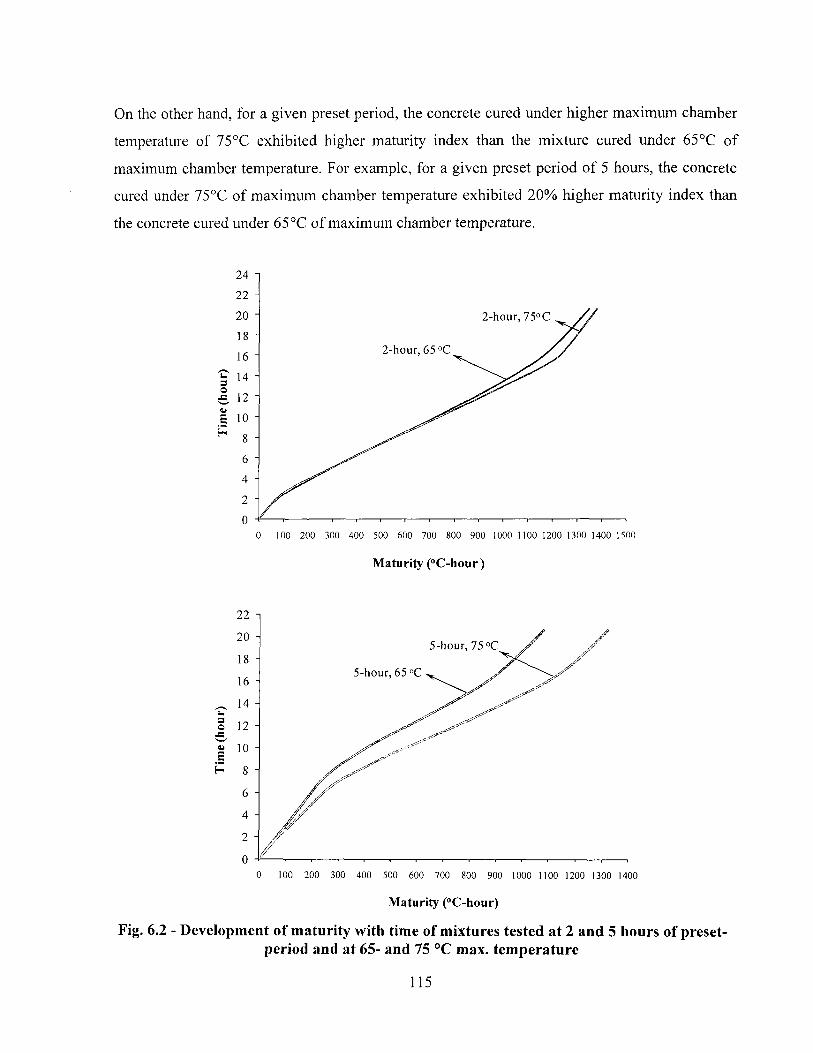
On the other hand, for a given preset period, the concrete cured under higher maximum chamber
temperature of 75°C exhibited higher maturity index than the mixture cured under 65°C of
maximum chamber temperature. For example, for a given preset period of 5 hours, the concrete
cured under 75°C of maximum chamber temperature exhibited 20% higher maturity index than
the concrete cured under 65 °C of maximum chamber temperature.
Maturity (°C-hour)
Maturity (°C-hour)
Fig. 6.2 - Development of maturity with time of mixtures tested at 2 and 5 hours of preset-period and at 65- and 75 °C max. temperature
115
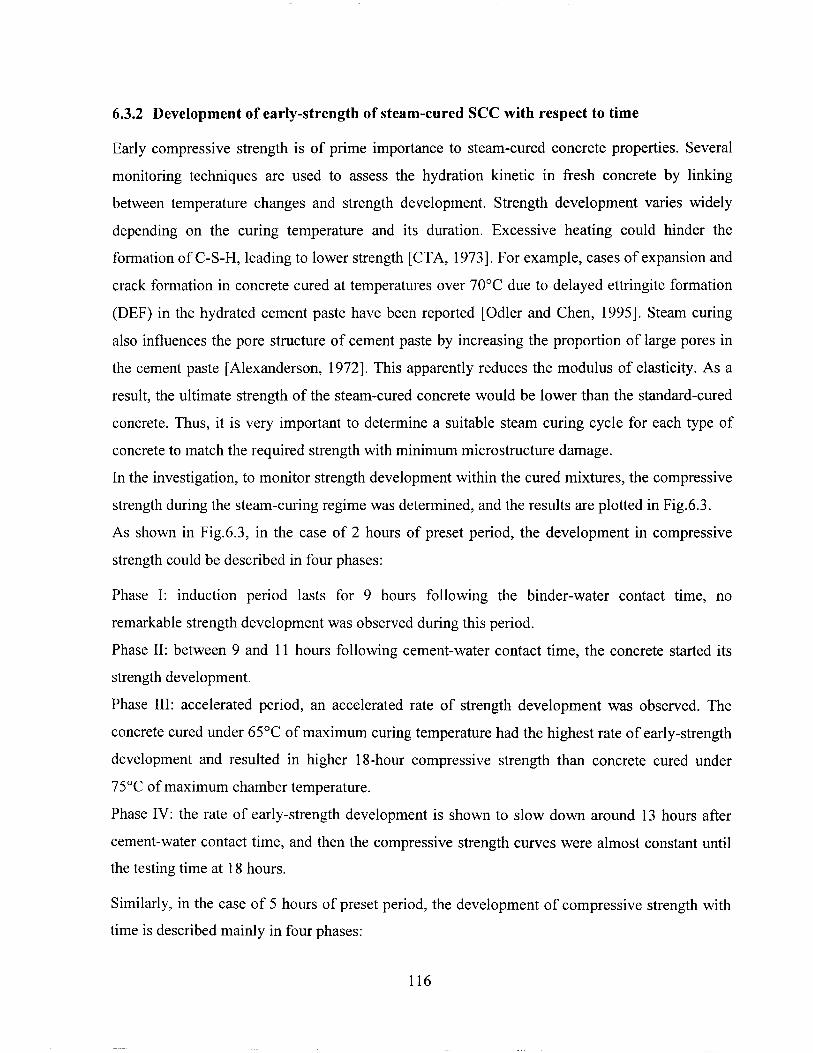
6.3.2 Development of early-strength of steam-cured SCC with respect to time
Early compressive strength is of prime importance to steam-cured concrete properties. Several
monitoring techniques are used to assess the hydration kinetic in fresh concrete by linking
between temperature changes and strength development. Strength development varies widely
depending on the curing temperature and its duration. Excessive heating could hinder the
formation of C-S-H, leading to lower strength [CTA, 1973], For example, cases of expansion and
crack formation in concrete cured at temperatures over 70°C due to delayed ettringite formation
(DEF) in the hydrated cement paste have been reported [Odler and Chen, 1995]. Steam curing
also influences the pore structure of cement paste by increasing the proportion of large pores in
the cement paste [Alexanderson, 1972], This apparently reduces the modulus of elasticity. As a
result, the ultimate strength of the steam-cured concrete would be lower than the standard-cured
concrete. Thus, it is very important to determine a suitable steam curing cycle for each type of
concrete to match the required strength with minimum microstructure damage.
In the investigation, to monitor strength development within the cured mixtures, the compressive
strength during the steam-curing regime was determined, and the results are plotted in Fig.6.3.
As shown in Fig.6.3, in the case of 2 hours of preset period, the development in compressive
strength could be described in four phases:
Phase I: induction period lasts for 9 hours following the binder-water contact time, no
remarkable strength development was observed during this period.
Phase II: between 9 and 11 hours following cement-water contact time, the concrete started its
strength development.
Phase III: accelerated period, an accelerated rate of strength development was observed. The
concrete cured under 65°C of maximum curing temperature had the highest rate of early-strength
development and resulted in higher 18-hour compressive strength than concrete cured under
75°C of maximum chamber temperature.
Phase IV: the rate of early-strength development is shown to slow down around 13 hours after
cement-water contact time, and then the compressive strength curves were almost constant until
the testing time at 18 hours.
Similarly, in the case of 5 hours of preset period, the development of compressive strength with
time is described mainly in four phases:
116
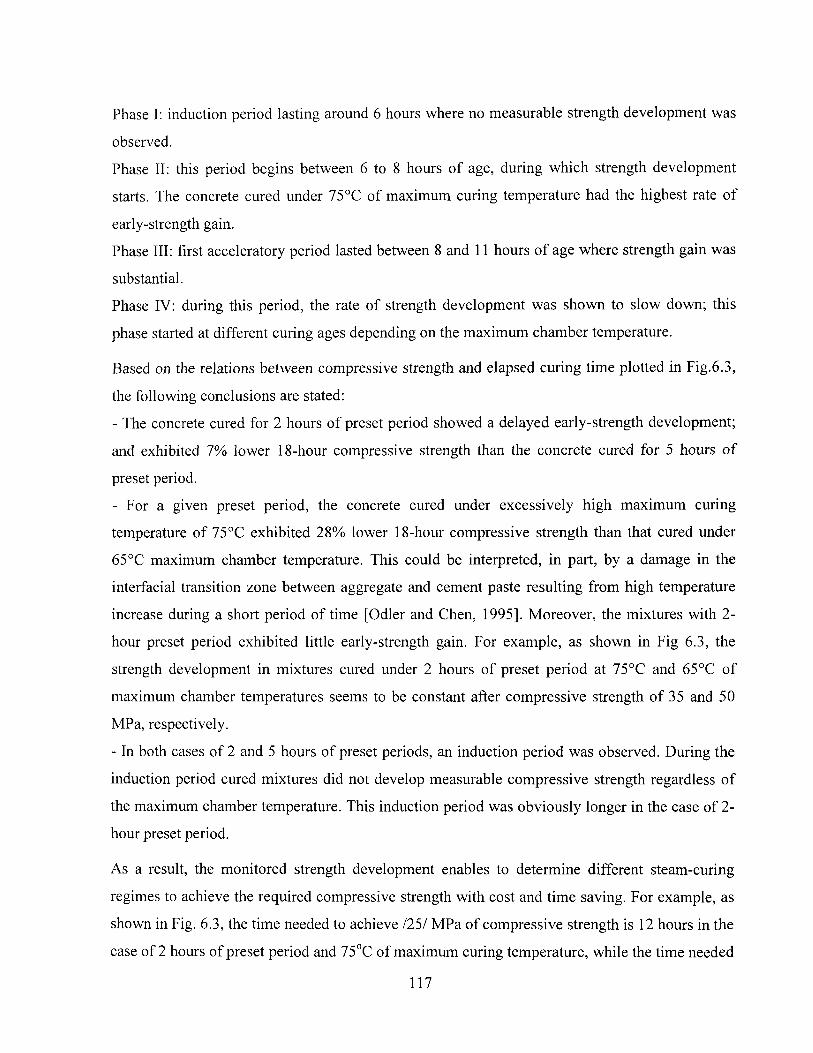
Phase I: induction period lasting around 6 hours where no measurable strength development was
observed.
Phase II: this period begins between 6 to 8 hours of age, during which strength development
starts. The concrete cured under 75°C of maximum curing temperature had the highest rate of
early-strength gain.
Phase III: first acceleratory period lasted between 8 and 11 hours of age where strength gain was
substantial.
Phase IV: during this period, the rate of strength development was shown to slow down; this
phase started at different curing ages depending on the maximum chamber temperature.
Based on the relations between compressive strength and elapsed curing time plotted in Fig.6.3,
the following conclusions are stated:
- The concrete cured for 2 hours of preset period showed a delayed early-strength development;
and exhibited 7% lower 18-hour compressive strength than the concrete cured for 5 hours of
preset period.
- For a given preset period, the concrete cured under excessively high maximum curing
temperature of 75°C exhibited 28% lower 18-hour compressive strength than that cured under
65°C maximum chamber temperature. This could be interpreted, in part, by a damage in the
interfacial transition zone between aggregate and cement paste resulting from high temperature
increase during a short period of time [Odler and Chen, 1995]. Moreover, the mixtures with 2-
hour preset period exhibited little early-strength gain. For example, as shown in Fig 6.3, the
strength development in mixtures cured under 2 hours of preset period at 75°C and 65°C of
maximum chamber temperatures seems to be constant after compressive strength of 35 and 50
MPa, respectively.
- In both cases of 2 and 5 hours of preset periods, an induction period was observed. During the
induction period cured mixtures did not develop measurable compressive strength regardless of
the maximum chamber temperature. This induction period was obviously longer in the case of 2-
hour preset period.
As a result, the monitored strength development enables to determine different steam-curing
regimes to achieve the required compressive strength with cost and time saving. For example, as
shown in Fig. 6.3, the time needed to achieve 1251 MPa of compressive strength is 12 hours in the
case of 2 hours of preset period and 75°C of maximum curing temperature, while the time needed
117
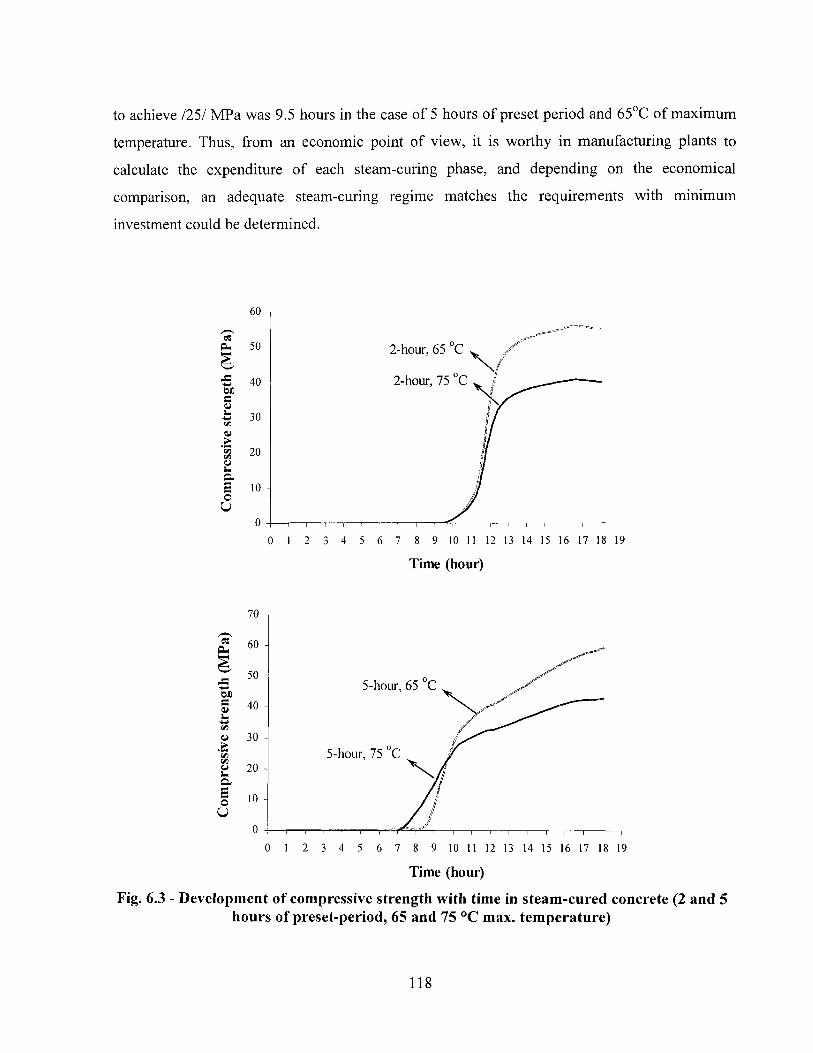
to achieve 1251 MPa was 9.5 hours in the case of 5 hours of preset period and 65°C of maximum
temperature. Thus, from an economic point of view, it is worthy in manufacturing plants to
calculate the expenditure of each steam-curing phase, and depending on the economical
comparison, an adequate steam-curing regime matches the requirements with minimum
investment could be determined.
bt> s
> m C. o U
0 1 2 3 4 5 6 7 8 9 10 11 12 13 14 15 16 17 18 19
Time (hour)
« Clh
DC
0> S-
a> '35 in o im Q, O u
7 0
60
5 0 -|
4 0
3 0
20
10
0
5-hour, 65 C
5-hour, 75 C
-i—i—i—i > i —i ~~t 0 1 2 3 4 5 6 7 8 9 10 11 12 13 14 15 16 17 18 19
Time (hour)
Fig. 6.3 - Development of compressive strength with time in steam-cured concrete (2 and 5 hours of preset-period, 65 and 75 °C max. temperature)
118
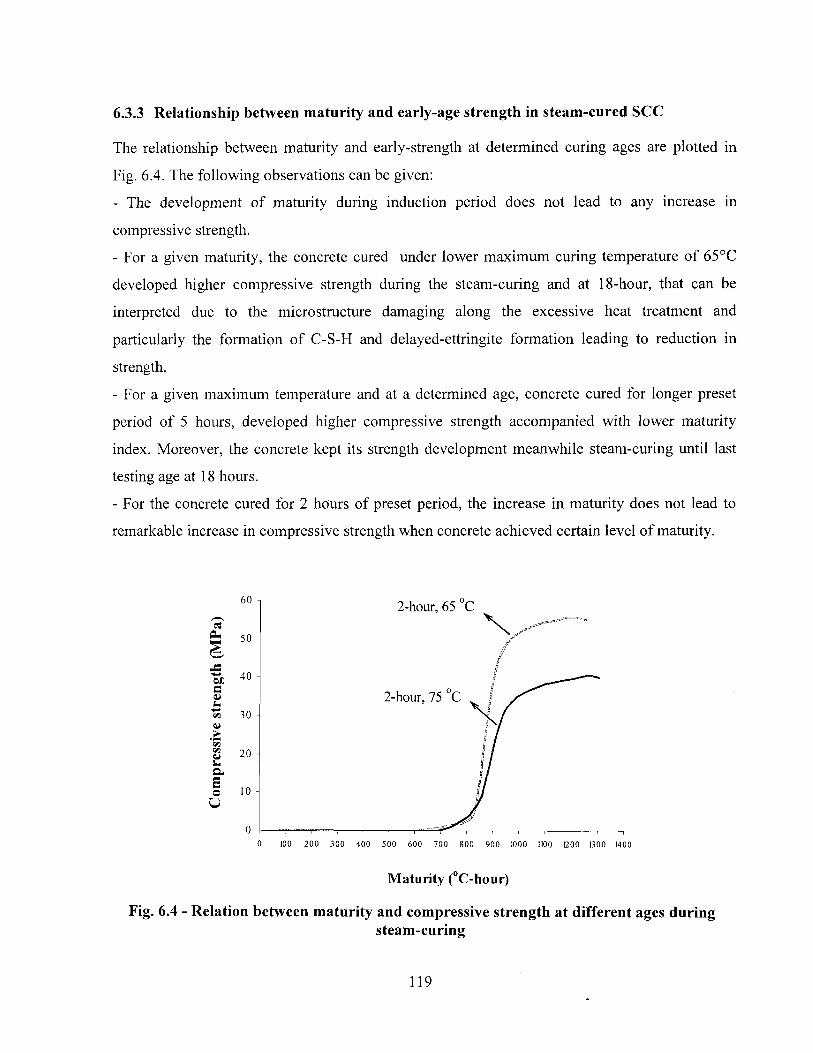
6.3.3 Relationship between maturity and early-age strength in steam-cured SCC
The relationship between maturity and early-strength at determined curing ages are plotted in
Fig. 6.4. The following observations can be given:
- The development of maturity during induction period does not lead to any increase in
compressive strength.
- For a given maturity, the concrete cured under lower maximum curing temperature of 65°C
developed higher compressive strength during the steam-curing and at 18-hour, that can be
interpreted due to the microstructure damaging along the excessive heat treatment and
particularly the formation of C-S-H and delayed-ettringite formation leading to reduction in
strength.
- For a given maximum temperature and at a determined age, concrete cured for longer preset
period of 5 hours, developed higher compressive strength accompanied with lower maturity
index. Moreover, the concrete kept its strength development meanwhile steam-curing until last
testing age at 18 hours.
- For the concrete cured for 2 hours of preset period, the increase in maturity does not lead to
remarkable increase in compressive strength when concrete achieved certain level of maturity.
«s o-
60
5 0
40 C V u
t S 3 0 4) > </} o s-c. S o U
2 0 -
1 0 -
2-hour, 65 C
2-hour, 75 °C
0 100 200 300 400 500 600 700 800 900 1000 1100 1200 BOO 1400
Maturity (°C-hour)
Fig. 6.4 - Relation between maturity and compressive strength at different ages during steam-curing
119
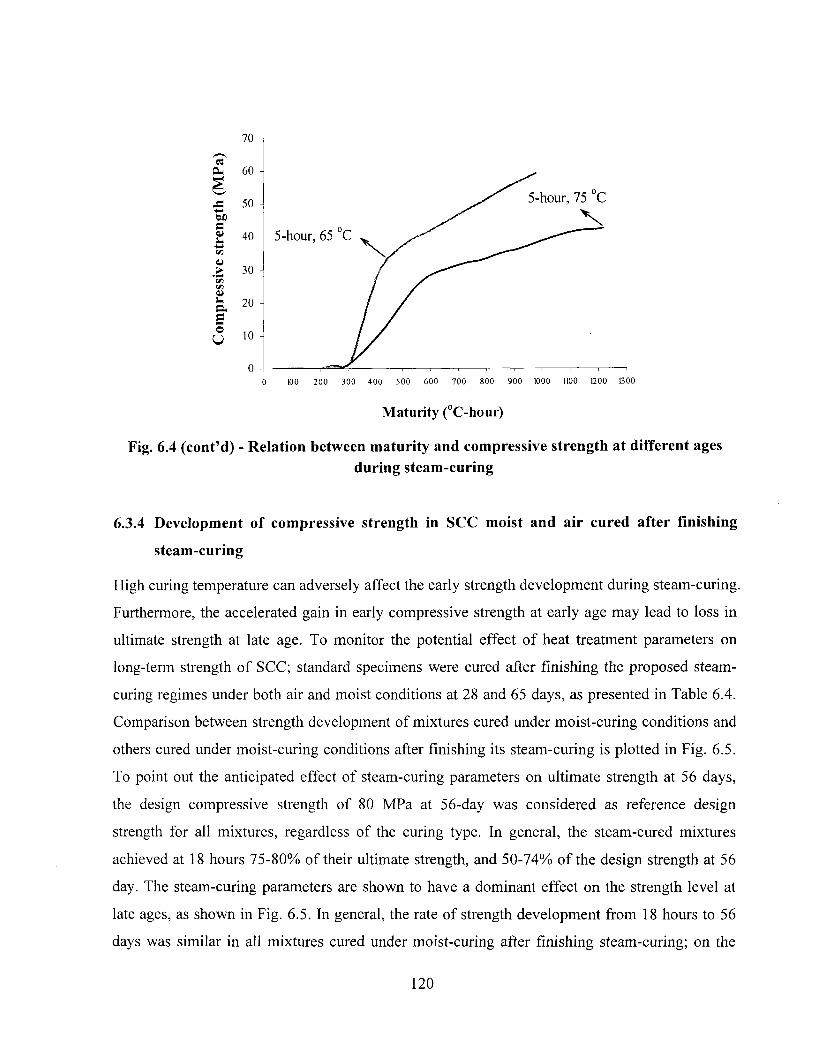
e« cu
bti a <u u o >
4> s-c. e o U
7 0
6 0 -
5 0 -
4 0 -
3 0 -
20
10 H
0
5-hour, 75 C
5-hour, 65 C
0 100 200 300 400 500 600 700 800 900 1000 1100 1200 BOO
Maturity (°C-hour)
Fig. 6.4 (cont'd) - Relation between maturity and compressive strength at different ages during steam-curing
6.3.4 Development of compressive strength in SCC moist and air cured after finishing
steam-curing
High curing temperature can adversely affect the early strength development during steam-curing.
Furthermore, the accelerated gain in early compressive strength at early age may lead to loss in
ultimate strength at late age. To monitor the potential effect of heat treatment parameters on
long-term strength of SCC; standard specimens were cured after finishing the proposed steam-
curing regimes under both air and moist conditions at 28 and 65 days, as presented in Table 6.4.
Comparison between strength development of mixtures cured under moist-curing conditions and
others cured under moist-curing conditions after finishing its steam-curing is plotted in Fig. 6.5.
To point out the anticipated effect of steam-curing parameters on ultimate strength at 56 days,
the design compressive strength of 80 MPa at 56-day was considered as reference design
strength for all mixtures, regardless of the curing type. In general, the steam-cured mixtures
achieved at 18 hours 75-80% of their ultimate strength, and 50-74% of the design strength at 56
day. The steam-curing parameters are shown to have a dominant effect on the strength level at
late ages, as shown in Fig. 6.5. In general, the rate of strength development from 18 hours to 56
days was similar in all mixtures cured under moist-curing after finishing steam-curing; on the
120
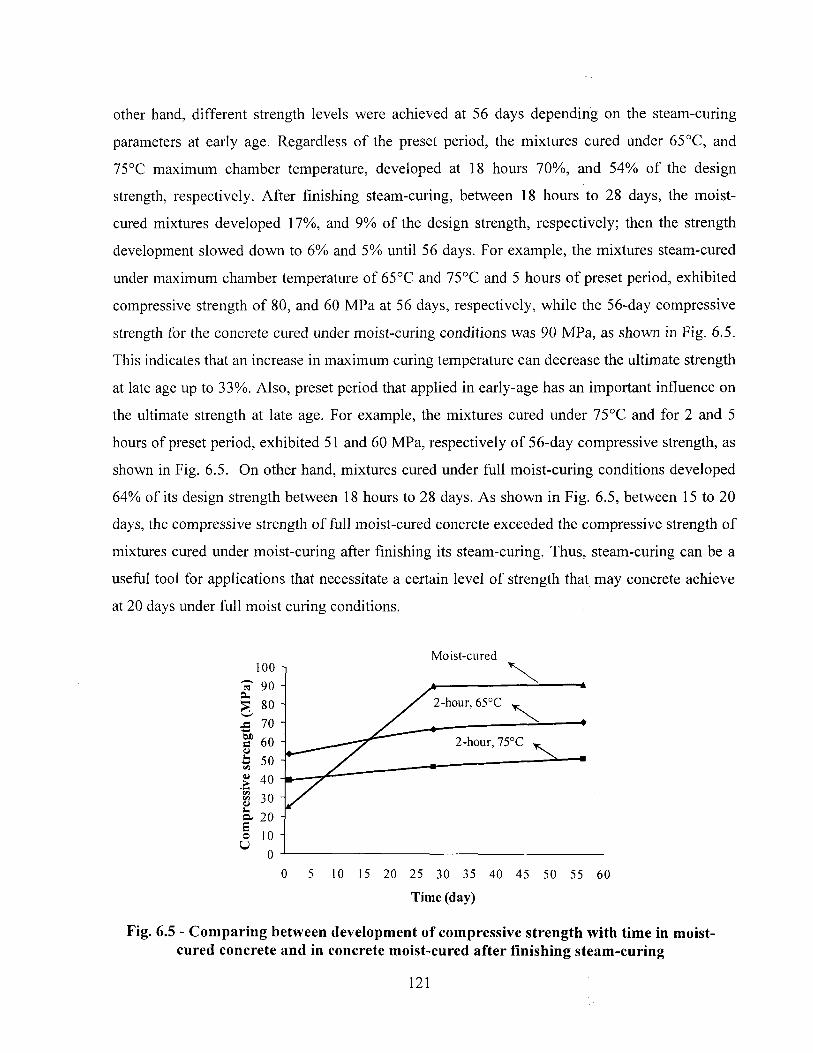
other hand, different strength levels were achieved at 56 days depending on the steam-curing
parameters at early age. Regardless of the preset period, the mixtures cured under 65°C, and
75°C maximum chamber temperature, developed at 18 hours 70%, and 54% of the design
strength, respectively. After finishing steam-curing, between 18 hours to 28 days, the moist-
cured mixtures developed 17%), and 9% of the design strength, respectively; then the strength
development slowed down to 6% and 5% until 56 days. For example, the mixtures steam-cured
under maximum chamber temperature of 65°C and 75°C and 5 hours of preset period, exhibited
compressive strength of 80, and 60 MPa at 56 days, respectively, while the 56-day compressive
strength for the concrete cured under moist-curing conditions was 90 MPa, as shown in Fig. 6.5.
This indicates that an increase in maximum curing temperature can decrease the ultimate strength
at late age up to 33%). Also, preset period that applied in early-age has an important influence on
the ultimate strength at late age. For example, the mixtures cured under 75°C and for 2 and 5
hours of preset period, exhibited 51 and 60 MPa, respectively of 56-day compressive strength, as
shown in Fig. 6.5. On other hand, mixtures cured under full moist-curing conditions developed
64%) of its design strength between 18 hours to 28 days. As shown in Fig. 6.5, between 15 to 20
days, the compressive strength of full moist-cured concrete exceeded the compressive strength of
mixtures cured under moist-curing after finishing its steam-curing. Thus, steam-curing can be a
useful tool for applications that necessitate a certain level of strength that may concrete achieve
at 20 days under full moist curing conditions.
0 5 10 15 20 25 30 35 40 45 50 55 60
Time (day)
Fig. 6.5 - Comparing between development of compressive strength with time in moist-cured concrete and in concrete moist-cured after finishing steam-curing
Moist-cured
a 20
121
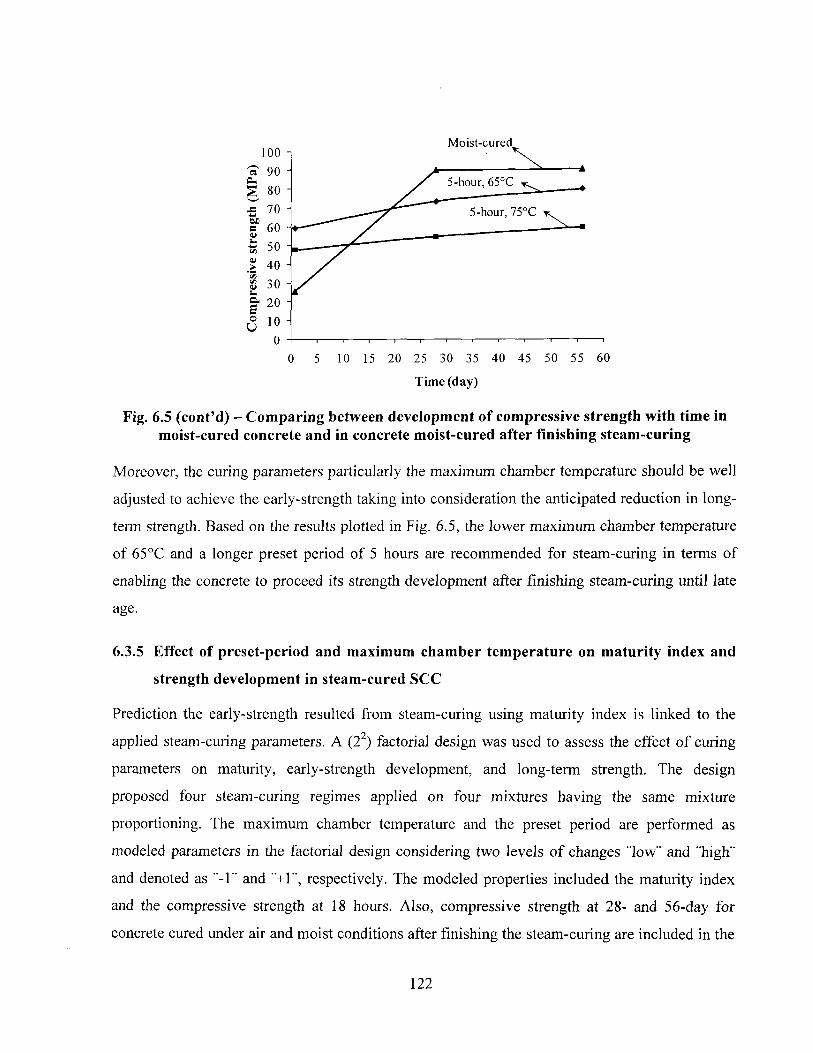
Time (day)
Fig. 6.5 (cont'd) - Comparing between development of compressive strength with time in moist-cured concrete and in concrete moist-cured after finishing steam-curing
Moreover, the curing parameters particularly the maximum chamber temperature should be well
adjusted to achieve the early-strength taking into consideration the anticipated reduction in long-
term strength. Based on the results plotted in Fig. 6.5, the lower maximum chamber temperature
of 65°C and a longer preset period of 5 hours are recommended for steam-curing in terms of
enabling the concrete to proceed its strength development after finishing steam-curing until late
age.
6.3.5 Effect of preset-period and maximum chamber temperature on maturity index and
strength development in steam-cured SCC
Prediction the early-strength resulted from steam-curing using maturity index is linked to the
applied steam-curing parameters. A (22) factorial design was used to assess the effect of curing
parameters on maturity, early-strength development, and long-term strength. The design
proposed four steam-curing regimes applied on four mixtures having the same mixture
proportioning. The maximum chamber temperature and the preset period are performed as
modeled parameters in the factorial design considering two levels of changes "low" and "high"
and denoted as "-1" and "+1", respectively. The modeled properties included the maturity index
and the compressive strength at 18 hours. Also, compressive strength at 28- and 56-day for
concrete cured under air and moist conditions after finishing the steam-curing are included in the
122
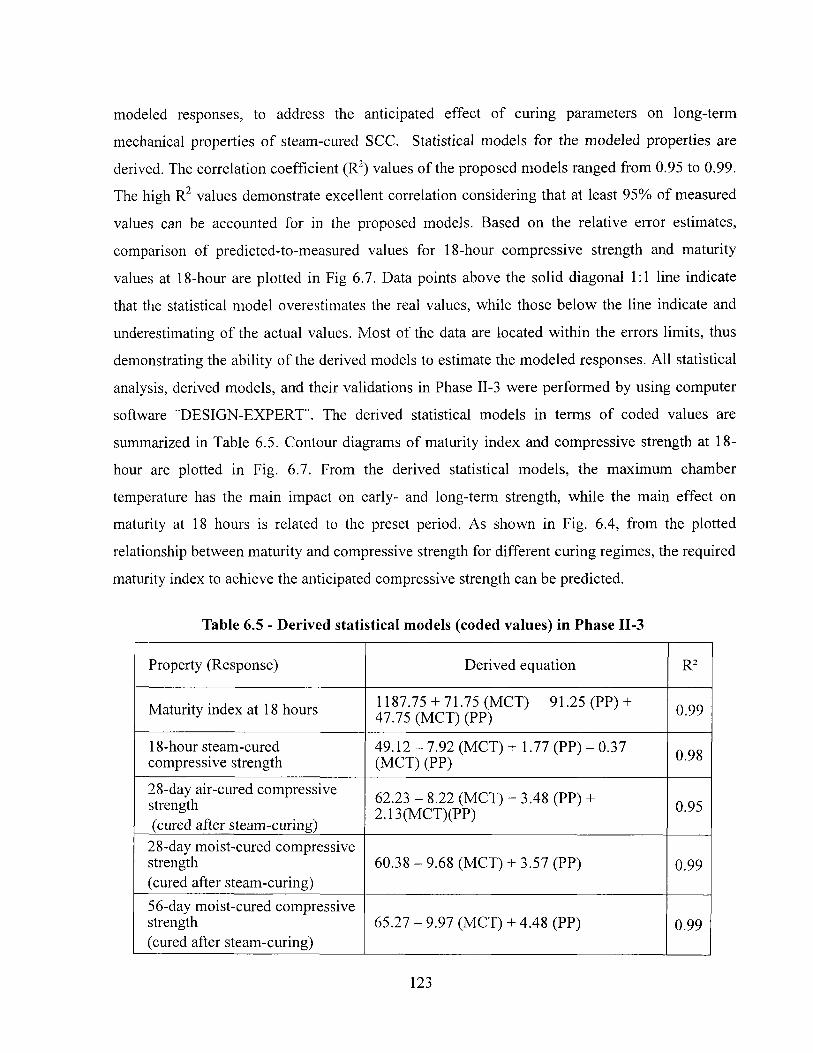
modeled responses, to address the anticipated effect of curing parameters on long-term
mechanical properties of steam-cured SCC. Statistical models for the modeled properties are
derived. The correlation coefficient (R2) values of the proposed models ranged from 0.95 to 0.99.
The high R2 values demonstrate excellent correlation considering that at least 95% of measured
values can be accounted for in the proposed models. Based on the relative error estimates,
comparison of predicted-to-measured values for 18-hour compressive strength and maturity
values at 18-hour are plotted in Fig 6.7. Data points above the solid diagonal 1:1 line indicate
that the statistical model overestimates the real values, while those below the line indicate and
underestimating of the actual values. Most of the data are located within the errors limits, thus
demonstrating the ability of the derived models to estimate the modeled responses. All statistical
analysis, derived models, and their validations in Phase II-3 were performed by using computer
software "DESIGN-EXPERT". The derived statistical models in terms of coded values are
summarized in Table 6.5. Contour diagrams of maturity index and compressive strength at 18-
hour are plotted in Fig. 6.7. From the derived statistical models, the maximum chamber
temperature has the main impact on early- and long-term strength, while the main effect on
maturity at 18 hours is related to the preset period. As shown in Fig. 6.4, from the plotted
relationship between maturity and compressive strength for different curing regimes, the required
maturity index to achieve the anticipated compressive strength can be predicted.
Table 6.5 - Derived statistical models (coded values) in Phase II-3
Property (Response) Derived equation R2
Maturity index at 18 hours 1187.75 +71.75 (MCT) - 91.25 (PP) + 47.75 (MCT) (PP) 0.99
18-hour steam-cured compressive strength
49.12 -7 .92 (MCT) + 1.77 (PP) - 0.37 (MCT) (PP) 0.98
28-day air-cured compressive strength (cured after steam-curing)
62.23 - 8.22 (MCT) + 3.48 (PP) + 2.13(MCT)(PP) 0.95
28-day moist-cured compressive strength (cured after steam-curing)
60.38 - 9.68 (MCT) + 3.57 (PP) 0.99
56-day moist-cured compressive strength (cured after steam-curing)
65.27 - 9.97 (MCT) + 4.48 (PP) 0.99
123
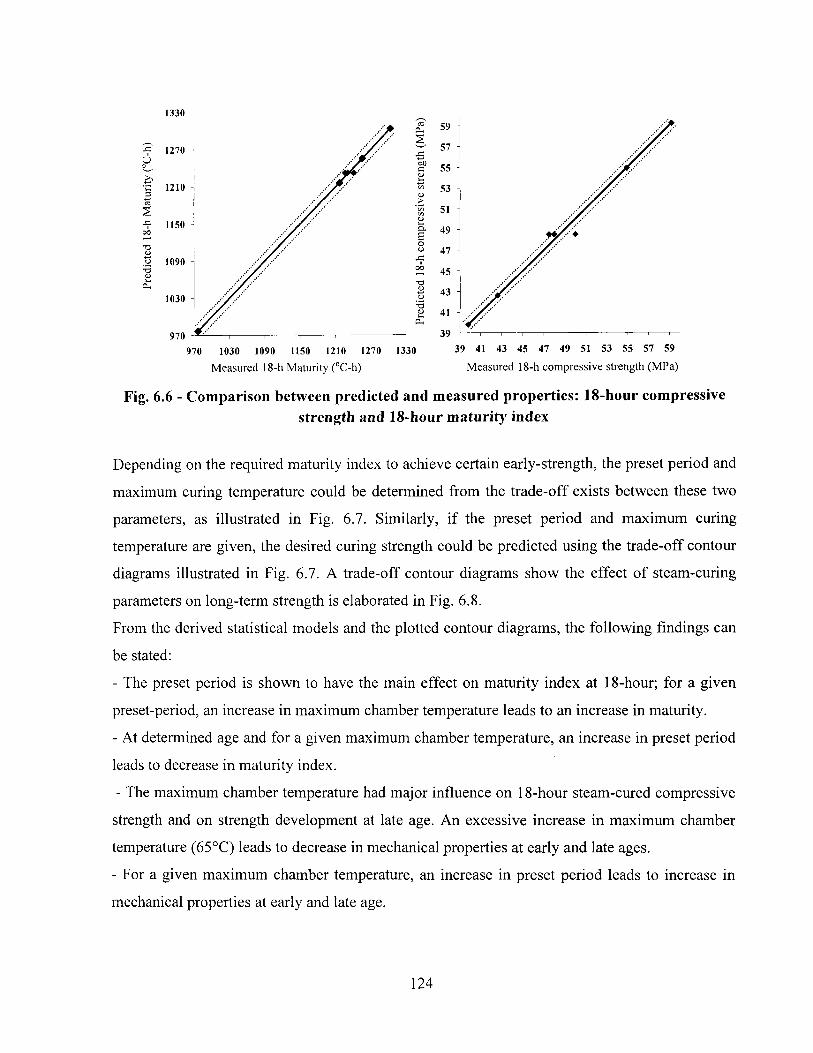
1330
1270 U
1210 3 13 •V 1150 oo
U 1090 T3 U CL,
1030
970
970 1030 1090 1150 1210 1270 1330
M e a s u r e d 18 -h M a t u r i t y ( ° C - h )
39 41 43 45 47 49 51 53 55 57 59
M e a s u r e d 18 -h c o m p r e s s i v e s t r e n g t h ( M P a )
Fig. 6.6 - Comparison between predicted and measured properties: 18-hour compressive strength and 18-hour maturity index
Depending on the required maturity index to achieve certain early-strength, the preset period and
maximum curing temperature could be determined from the trade-off exists between these two
parameters, as illustrated in Fig. 6.7. Similarly, if the preset period and maximum curing
temperature are given, the desired curing strength could be predicted using the trade-off contour
diagrams illustrated in Fig. 6.7. A trade-off contour diagrams show the effect of steam-curing
parameters on long-term strength is elaborated in Fig. 6.8.
From the derived statistical models and the plotted contour diagrams, the following findings can
be stated:
- The preset period is shown to have the main effect on maturity index at 18-hour; for a given
preset-period, an increase in maximum chamber temperature leads to an increase in maturity.
- At determined age and for a given maximum chamber temperature, an increase in preset period
leads to decrease in maturity index.
- The maximum chamber temperature had major influence on 18-hour steam-cured compressive
strength and on strength development at late age. An excessive increase in maximum chamber
temperature (65°C) leads to decrease in mechanical properties at early and late ages.
- For a given maximum chamber temperature, an increase in preset period leads to increase in
mechanical properties at early and late age.
124
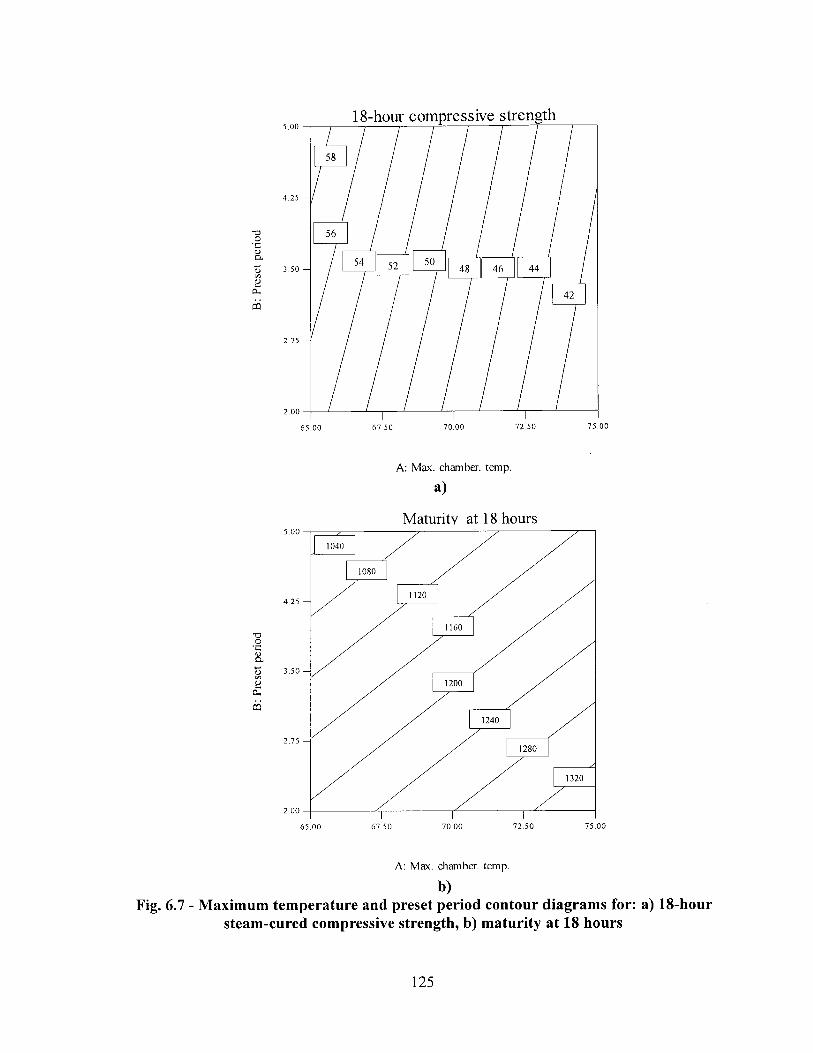
A : M a x . c h a m b e r , t e m p .
a)
Maturity at 18 hours
A: M a x . c h a m b e r , t e m p ,
b) Fig. 6.7 - Maximum temperature and preset period contour diagrams for: a) 18-hour
steam-cured compressive strength, b) maturity at 18 hours
125
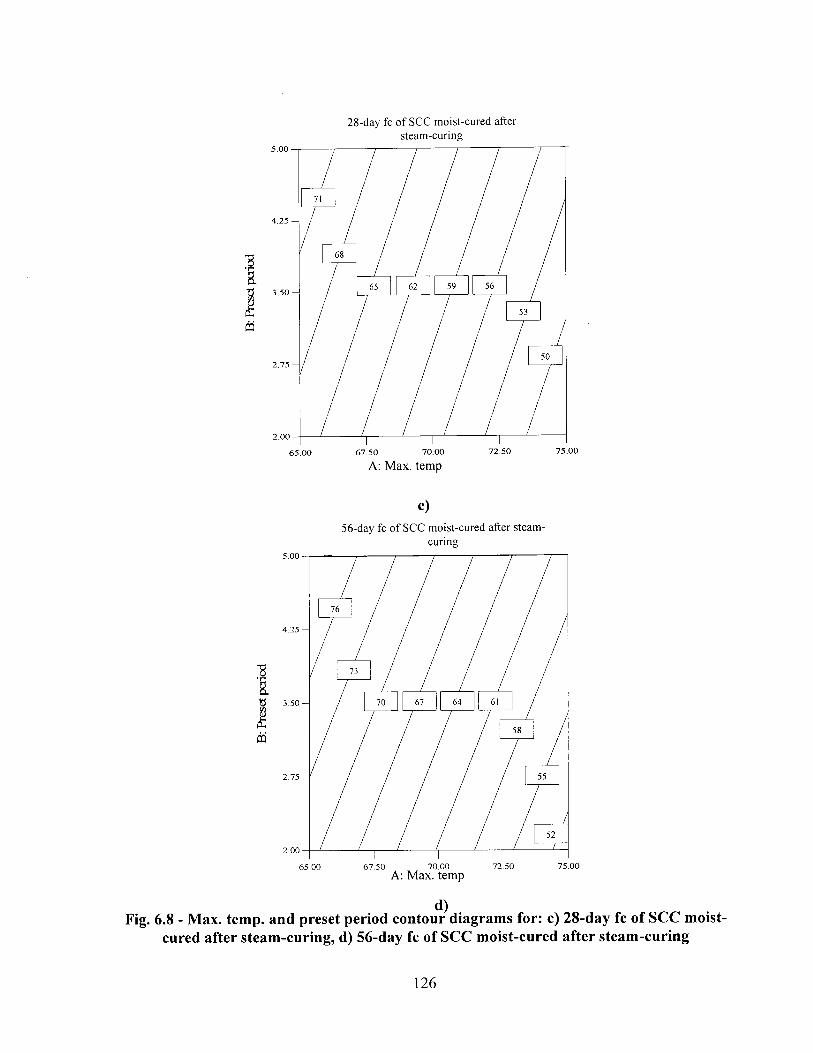
28-day fc of SCC moist-cured after steam-curing
A: Max. temp
5 6 - d a y f c o f S C C m o i s t - c u r e d a f t e r s t e a m -c u r i n g
Fig. 6.8 - Max. temp, and preset period contour diagrams for: c) 28-day fc of SCC moist-cured after steam-curing, d) 56-day fc of SCC moist-cured after steam-curing
126
6.4 Conclusions
Based on the results from the investigated cured mixtures and the statistical analysis, the
following conclusions can be stated:
• The maturity function provides a satisfying approach in determining the early-strength of
steam-cured concrete.
• The inherent thermal changes during the hydration process in steam-cured concrete
interact with the curing temperature leading to different expedited early-strength levels.
• Different steam cured regimes could be applied in manufacturing plants to achieve the
same strength level.
• During the induction period following the preset period, no gain in compressive strength
is achieved regardless of the maximum chamber temperature.
• There is no unique relation between maturity and steam-cured strength due to the variety
in maturity values depending on the curing parameters.
• Preset period is shown to have an essential impact on maturity index in steam-cured SCC.
• For a given preset period, higher maximum curing temperature resulted in higher
maturity index at 18 hours.
• The development of maturity during the induction period does not lead to remarkable
development in steam-cured compressive strength.
• Maximum chamber temperature has the major influence on 18-hour compressive strength.
• Higher early-strength can be achieved with lower maturity index when concrete cured for
longer preset period and maximum curing temperature around 65°C.
• Beyond limits (65°C) an increase in maximum curing temperature adversely affect the
strength development, resulting in lower early-strength.
• To estimate the compressive strength for cured concrete during steam-curing regime, a
particular relation between the maturity index and steam-cured compressive strength
should be used depending on the curing parameters.
• The excessive early heat treatment delays the early-strength development; thus from an
economical point of view, the use of longer preset period of 5 hours prior to heating is
more efficient and economic in manufacturing plants in terms of fuel consuming.
127
• The increase of maximum chamber temperature from 65°C to 75°C affects adversely
strength development in moist-cured concrete after heat treatment leading to 25 to 28 %
lower strength at 56 days.
• the 5-hour preset period and 65°C maximum chamber temperature are recommended to
achieve higher early-strength and to enable the concrete to proceed the strength
development after finishing steam-curing until 28 and 56 days.
128
Chapter 7 - Recommendations for Steam-Cured, High-
Strength SCC for Precast, Prestressed Applications
7.1 Introduction
Mixture design plays a key role on workability and long-term properties of SCC used for the
manufacturing of concrete precast elements. When SCC is subjected to heat treatment, mixture
design and imposed steam-curing regime should be adjusted in such a way to achieve the target
hardening properties with efficiency and economy. Compatibility between a proper mix design
and applied heat treatment is indispensable in terms of time and cost savings. Based on literature
review Phase I and findings from the work performed in Phase II, recommendations for SCC
designated for precast, prestressed applications are reported. In this chapter, the
recommendations include:
• mixture proportioning relating to workability and mechanical properties;
• optimization of steam-curing regime; and
• effect of curing regime on compressive strength and modulus of elasticity.
7.2 Mixture Proportioning Recommendations
7.2.1 General
As in the case of conventional vibrated concrete, the w/cm is one of the fundamental keys
governing strength and durability of SCC. Comparing to conventional concrete, in designing
SCC, there are a number of factors that should be taken into consideration with a greater
attention than conventional concrete [NCHRP, 2009]:
• properties of locally available raw materials, including mineral, geometric, and physical
properties of aggregates and cementitious materials;
• need for a higher level of quality control, greater awareness to aggregate gradation, and better
control of mix water and aggregate moisture content;
129
• choice of chemical admixtures and their compatibility with the selected binder types;
• consideration of placement techniques, configuration of cast elements, and work conditions.
Guidelines and recommendations reported here are for SCC with design compressive strength of
60 MPa and 80 MPa at 56 days.
7.2.2 Water-cementitious materials ratio
In general, the water-cementitious materials ratio (w/cm) has the most significant influence on
workability. The range of w/cm shall be 0.28 to 0.38 to achieve the targeted strength for precast,
prestressed applications. Mixtures proportioned with w/cm of 0.38 and 0.28 may be used to
ensure 56-day design compressive strengths of 60 and 80 MPa, respectively. The type and
content of cementitious materials or binder should be optimized through trial batches. Increase in
w/cm shall lead to improvement in workability and decrease in mechanical properties. For
example, SCC mixtures made with higher w/cm of 0.38 exhibits superior passing ability and
filling capacity than those with 0.28 w/cm. On the other hand, the latter concrete develops higher
compressive strength and elastic modulus.
7.2.3 Cementitious materials content
The concrete supplier shall determine the cementitious materials content required to satisfy the
specified concrete performance. Moreover, special care should be taken to select the binder
content to limit the volume of paste to control autogeneous shrinkage, drying shrinkage, and
creep. The type and content of cementitious materials or binder should be optimized through trial
batches to secure targeted strength. For example, use of low w/cm of 0.28 and higher binder
content of 550 kg/m3 is required for SCC with the 56-day design compressive strength of 80
MPa to ensure mechanical properties and adequate workability. For SCC with the 56-day design
compressive strength of 60 MPa, use of relatively high w/cm of 0.38 and lower binder content of
450 kg/m3 is recommended to secure adequate level of mechanical properties and limit
autogenous shrinkage and creep, respectively. For a given level of compressive strength, the
content of cementitious materials shall be varied with the w/cm in use. In general, for a given
w/cm, mixtures made with higher binder content exhibit lower HRWRA demand, superior
passing ability, and greater filling capacity compared to those prepared with lower binder content.
130
7.2.4 Binder type
The binder type should be determined to secure the required targeted mechanical properties since
the binder type has significant effect on mechanical properties and durability. Fly ash, GGBFS,
and silica fume are often used as partial replacement of cement. In general, SCC made with the
combination of Type I cement and silica fume shall exhibit higher mechanical properties than
that proportioned with the same cement and fly ash or GGBFS. For example, SCC mixtures
made with Type I cement and 7% silica fume replacement can develop higher compressive
strength and elastic modulus compared to those prepared with the same cement and 20% Class F
fly ash at 56 day. Special care should be taken to select the dosage rate of silica fume because,
for a given w/cm and binder content, the use of Type I cement and 7% silica fume replacement
necessitates higher HRWRA demand than SCC prepared with the same cement and 20% Class F
fly ash replacement.
7.2.5 HRWRA type
The type of HRWRA should be compatible with the binder type and other chemical admixtures
in use. The type of HRWRA has significant effect on filling ability, passing ability, static
stability, as well as mechanical properties of SCC. For precast, prestressed application, HRWRA
that can secure high-early strength is recommended. In particular, the use of type of HRWRA for
high-early strength application is recommended for SCC proportioned with low w/cm to reduce
the time of setting since the concrete would necessitate relatively high HRWRA demand. It is
important to note that accelerated steam-curing is mandatory for SCC made with low w/cm and
high dosage of normal-strength type HRWRA.
7.2.6 Nominal maximum-size of aggregate
The MSA is based on mixture requirements and minimum clear spacing between the reinforcing
steel, clear cover to reinforcing steel, and thickness of the cast member. Coarse aggregate with
MSA of 12.5 to 19 mm are typically used. Coarse aggregate of 10 mm MSA shall be used for
casting highly reinforced and restricted sections.
131
7.2.7 Recommendations for proportioning SCC with design compressive strengths of 60
and 80 MPa
Based on the findings of the investigation reported in this thesis, the following mixture
parameters are recommended for SCC used for precast and prestressed applications:
• The w/cm should be selected to secure the targeted mechanical properties. Special care should
be taken to select binder type and content to secure adequate passing ability, filling capacity,
and stability.
• Use relatively low w/cm (0.28) and high binder content of 550 kg/m3 is required for SCC with
56-day design compressive strength of 80 MPa to secure adequate mechanical properties and
workability. The combination of Type I cement and 7% silica fume is recommended for such
concrete.
• For SCC with 56-day design compressive strength of 60 MPa, use of relatively high w/cm of
0.38 and lower binder content of 450 kg/m3 to secure adequate mechanical properties and
limit autogenous shrinkage and creep resulting from high paste volume. The use of HES type
HRWRA is recommended to secure better passing ability, greater plastic viscosity, and lower
setting time than NS type HRWRA.
• Use of HES type HRWRA is recommended in case SCC is subjected to air-curing to secure
adequate mechanical properties at 18 hours.
• Use of the combination of Type I cement and 7% silica fume is required for SCC with high
design mechanical properties of 80 MPa.
The recommendations for the selection of concrete constituent materials and mixture
proportioning of SCC for precast, prestressed applications are presented in Table 7.1.
7.3 Recommendations for Steam-Curing Regime
7.3.1 General
In general, major consideration is given to compressive strength when optimizing the curing
regime. The factors which have the most influence on compressive strength development of
steam-cured concrete are the same as. those affecting other concrete mechanical and visco-elastic
132
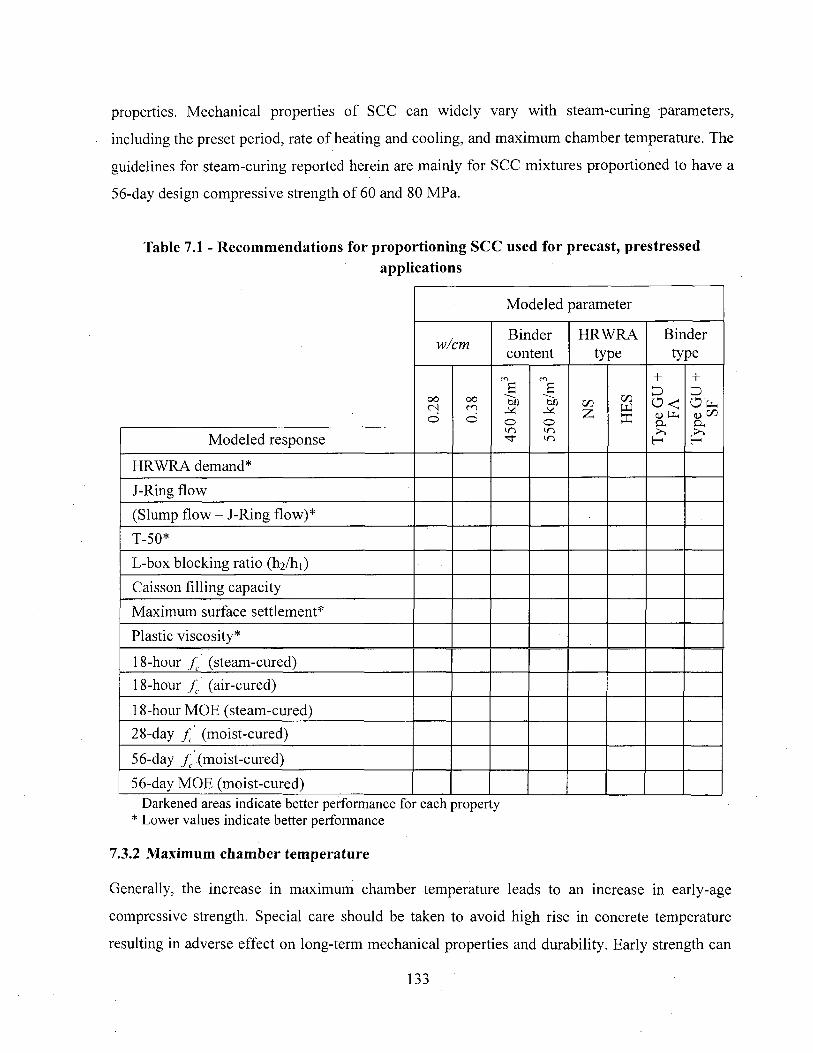
properties. Mechanical properties of SCC can widely vary with steam-curing parameters,
including the preset period, rate of heating and cooling, and maximum chamber temperature. The
guidelines for steam-curing reported herein are mainly for SCC mixtures proportioned to have a
56-day design compressive strength of 60 and 80 MPa.
Table 7.1 - Recommendations for proportioning SCC used for precast, prestressed applications
Modeled parameter
w/cm Binder HRWRA Binder w/cm content type type
oo <N O
OO m o
ro B
"DO M o
m s
~Sb M o
GO £ C/3 W X
+ P . o < <D PH &
+ D O n , u <*> D.
Modeled response in in in H H
HRWRA demand* J-Ring flow (Slump flow - J-Ring flow)* T-50* L-box blocking ratio (h^/hi) Caisson filling capacity Maximum surface settlement*
Plastic viscosity*
18-hour fc (steam-cured) 18-hour fc (air-cured)
18-hour MOE (steam-cured) 28-day fc (moist-cured)
56-day fc (moist-cured)
56-day MOE (moist-cured) Darkened areas indicate better performance for each property
* Lower values indicate better performance
7.3.2 Maximum chamber temperature
Generally, the increase in maximum chamber temperature leads to an increase in early-age
compressive strength. Special care should be taken to avoid high rise in concrete temperature
resulting in adverse effect on long-term mechanical properties and durability. Early strength can
133
be optimum when maximum chamber temperature is about 65°C with little apparent gain at
temperatures above that limit. The internal concrete temperature during steam-curing should be
limited to 70°C to avoid heat-induced delayed-ettringite formation and undue reduction in
ultimate strength [PCA, 2006; Klieger, 1960; and Tepponen and Eriksson, 1987],
In the case of SCC with 56-day design compressive strength of 80 MPa, a maximum chamber ' s
temperature of 60°C is recommended to achieve the target early-strength. To achieve high values
of modulus of elasticity, the maximum chamber temperature should be set in accordance with the
rate of heating. Thus, to secure high modulus of elasticity, maximum chamber temperature of
50°C is recommended if the heating rate was 12°C/hour; on the other hand, maximum chamber
temperature of 60°C of is recommended if the heating rate was 22°C/hour.
SCC with design compressive strength of 60 MPa at 56 days (SCC2) is not shown to be sensitive
to variations in the maximum chamber temperature. Such type of SCC proportioned with
relatively high w/cm (0.38) can develop similar mechanical properties at 18 hours when it is air-
cured or steam-cured. Therefore, steam-curing is not necessary for such SCC. Instead, select of
HRWRA type or binder type designed to promote early-age strength development, can be used.
7.3.3 Preset period
A minimum delay before the onset of steam-curing (preset period) is necessary to prevent
physical damage to the fresh concrete. The application of steam curing should be delayed until
the initial set occurs or at least 3 hours after concrete placement. For SCC with high dosage rates
of HRWRA that can exhibit delayed setting, a 4- to 5-hour preset period is necessary.
In general, an increase in the preset period shall lead to increase in early-age strength. For a
given steam curing period, the length of the preset period should be within the limit which can
ensure sufficient period for steam curing. Within the limit, a longer preset period is
recommended to minimize induced heat damage and to maximize early-age strength. Moreover,
the effect of the preset period on compressive strength shall vary with maximum chamber
temperature used in the steam-curing regime. In the case of maximum chamber temperature of
60°C, concrete mixtures subjected to longer preset period of 5 hours can develop higher 18-hour
steam-cured compressive strength than those with shorter preset period of 2 hours. For lower
134
maximum chamber temperature of 50°C, the concretes shall exhibit similar 18-hour compressive
strength, regardless of the preset period.
Preset-period should be set taking into consideration the induction period which no strength
development is achieved whatever the maximum chamber temperature is. The longer preset-
period enables the concrete to exhibits earlier responses to heat treatment in terms of earlier
strength development.
7.3.4 Rate of heating and cooling
The rate of temperature rise (heating) for steam-curing is important to the development of early-
age strength. Excessive rate of heating and cooling should be avoided to prevent sharp volume
changes. Temperature raise or cooling in the enclosure surrounding the concrete should not
exceed than 22 to 33°C/hour depending on the size and shape of the concrete element [PCA,
2006], The maximum cooling rate should be 15°C/hour and should be continued until the
concrete temperature is no more than 20°C above the ambient temperature of the enclosure [CSA
A23.4], For a given maximum chamber temperature and preset period, concrete subjected to
higher rate of heating shall develop higher early-age strength than those with lower heating rate.
The effect of heating rate on 18-hour elastic modulus varies with the maximum chamber
temperature. In particular, for prestressed elements where the elastic modulus plays a major role
on structural integrity, the optimum rate of heating should be selected based on the maximum
chamber temperature to secure adequate elastic modulus values. For example, for maximum
chamber temperature of 60°C, the increase in the rate of heating can lead to an increase in the 18-
hour elastic modulus. On the contrary, in the case of lower chamber temperature of 50°C, steam-
curing at higher rates of heating (22°C/hour) can lead to lower elastic modulus at 18 hours
compared to those with heating rate of 12°C/hour.
7.3.5 Recommendations for steam-curing for SCC used for precast, prestressed
applications with target 18-h cured compressive strength of 30 MPa
Based on the research findings, the following combinations of steam-curing parameters are
recommended for SCC used for precast and prestressed applications:
• Steam-curing regime with higher maximum chamber temperature (between 60 to 65 °C),
higher rate of heating, and longer preset period is recommended for precast members to
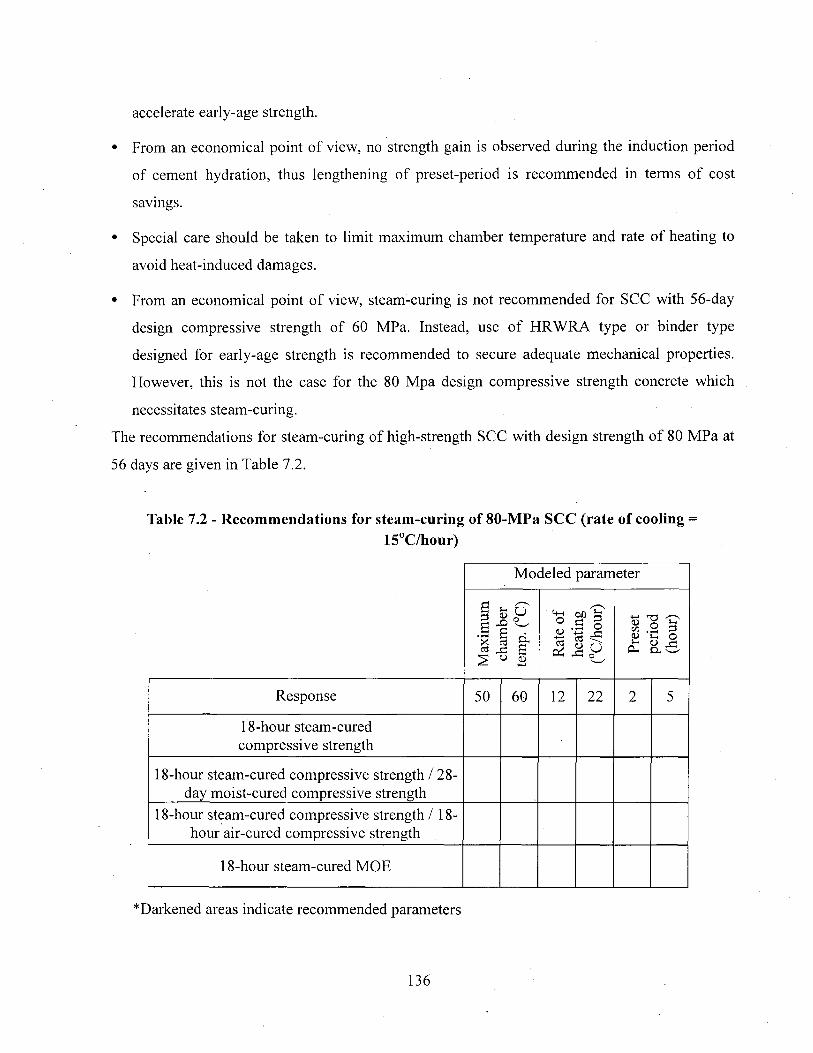
accelerate early-age strength.
• From an economical point of view, no strength gain is observed during the induction period
of cement hydration, thus lengthening of preset-period is recommended in terms of cost
savings.
• Special care should be taken to limit maximum chamber temperature and rate of heating to
avoid heat-induced damages.
• From an economical point of view, steam-curing is not recommended for SCC with 56-day
design compressive strength of 60 MPa. Instead, use of HRWRA type or binder type
designed for early-age strength is recommended to secure adequate mechanical properties.
However, this is not the case for the 80 Mpa design compressive strength concrete which
necessitates steam-curing.
The recommendations for steam-curing of high-strength SCC with design strength of 80 MPa at
56 days are given in Table 7.2.
Table 7.2 - Recommendations for steam-curing of 80-MPa SCC (rate of cooling = 15°C/hour)
Modeled parameter
Max
imum
ch
ambe
r te
mp.
(°C
)
Rat
e of
he
atin
g (°
C/h
our)
Pres
et
perio
d (h
our)
Response 50 60 12 22 2 5
18-hour steam-cured compressive strength
18-hour steam-cured compressive strength / 28-day moist-cured compressive strength
18-hour steam-cured compressive strength / 18-hour air-cured compressive strength
18-hour steam-cured MOE
* Darkened areas indicate recommended parameters
136
7.4 Future Work
Research is needed to identify the key parameters that influence the transport properties,
durability, creep, shrinkage, and shear strength of SCC subjected to the various steam-curing
parameters recommended for the 60- and 80- MPa SCC.
The hydration kinetic in steam-cured SCC varied widely depending on the mixture composition
and applied curing parameters resulting in different early-strength levels. Thus, better
understanding regarding the anticipated interaction between heat rise due to cement hydration
and the imposed curing temperature is required to avoid the excessive rise in concrete
temperature during steam-curing.
Moreover, the target hardening properties could be achieved by applying different steam-curing
regimes of different maximum curing temperature and preset-period. Therefore, an economical
comparison between the available different steam-curing regimes should be studied to select the
adequate curing regime that meets the requirements with economy and productive efficiency.
137
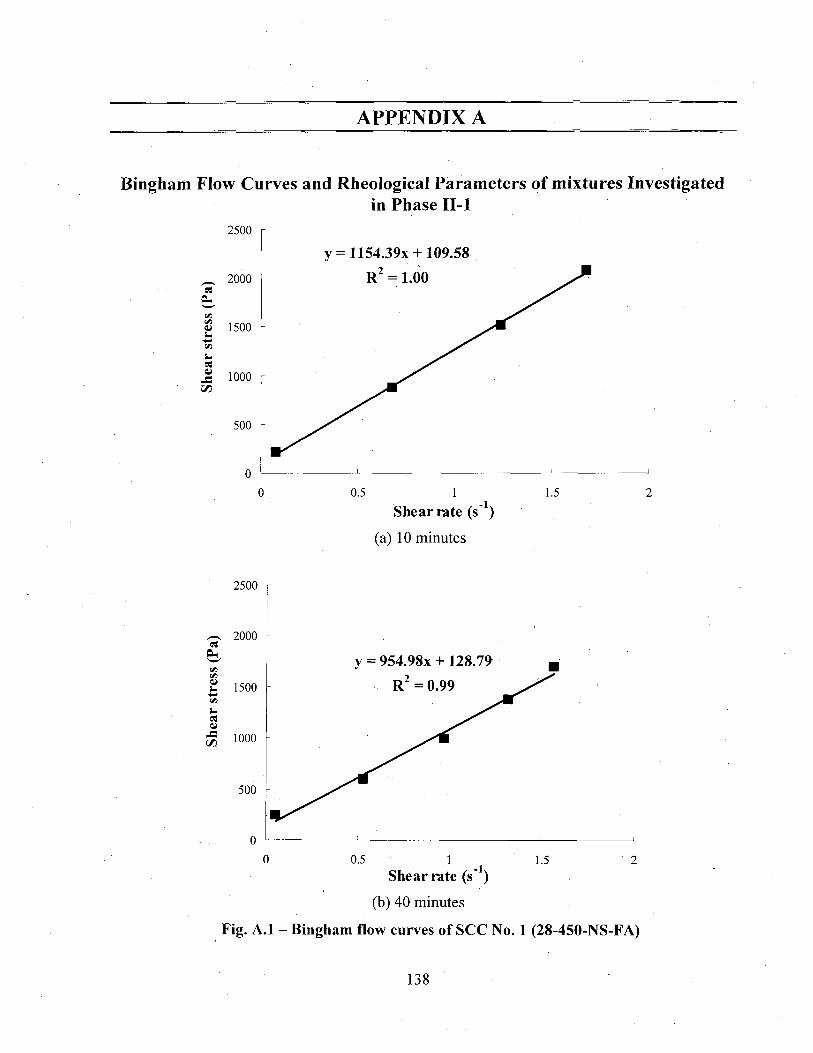
APPENDIX A
Bingham Flow Curves and Rheological Parameters of mixtures Investigated in Phase II-l
0 0.5 1 1.5 2 Shear rate (s"1)
(a) 10 minutes
0 0.5 1 1.5 2 Shear rate (s" )
(b) 40 minutes
Fig. A.9 - Bingham flow curves of SCC No. 9 (Central point-1)
138
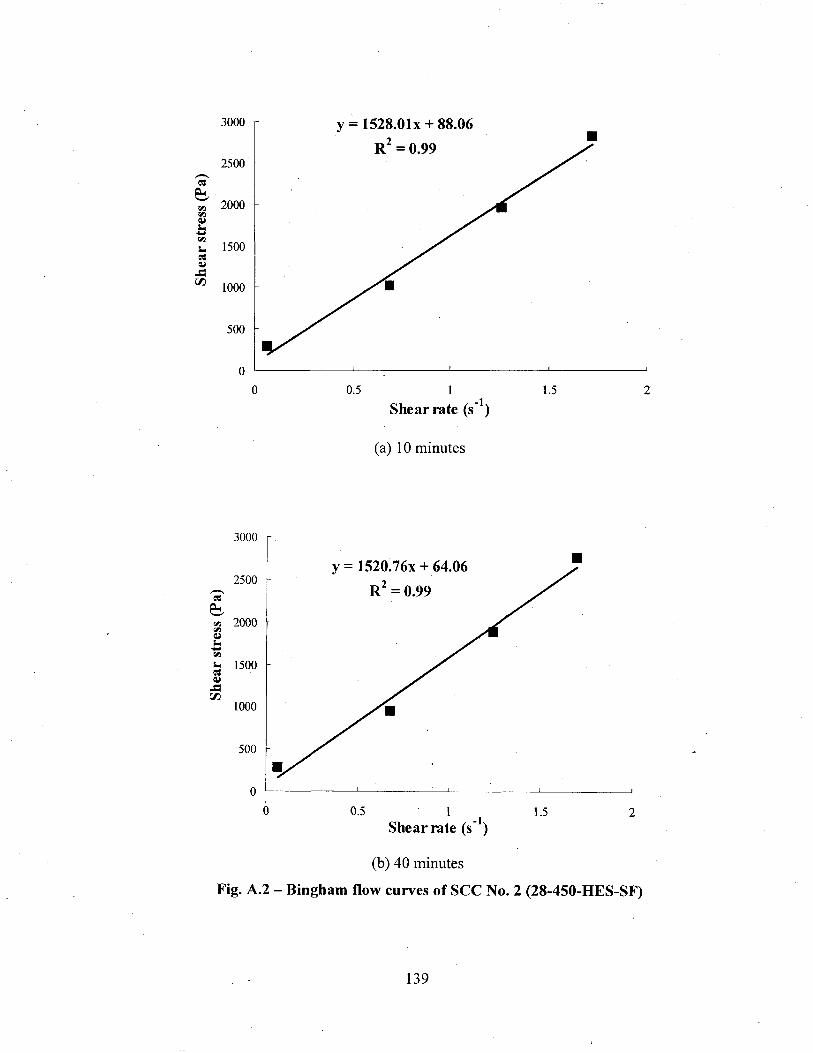
y = 1528.01x + 88.06
R2 = 0.99
0.5 -U Shear rate (s~ )
1.5
(a) 10 minutes
o 0.5 1 1.5 2 Shear rate (s" )
(b) 40 minutes
Fig. A.9 - Bingham flow curves of SCC No. 9 (Central point-1)
139
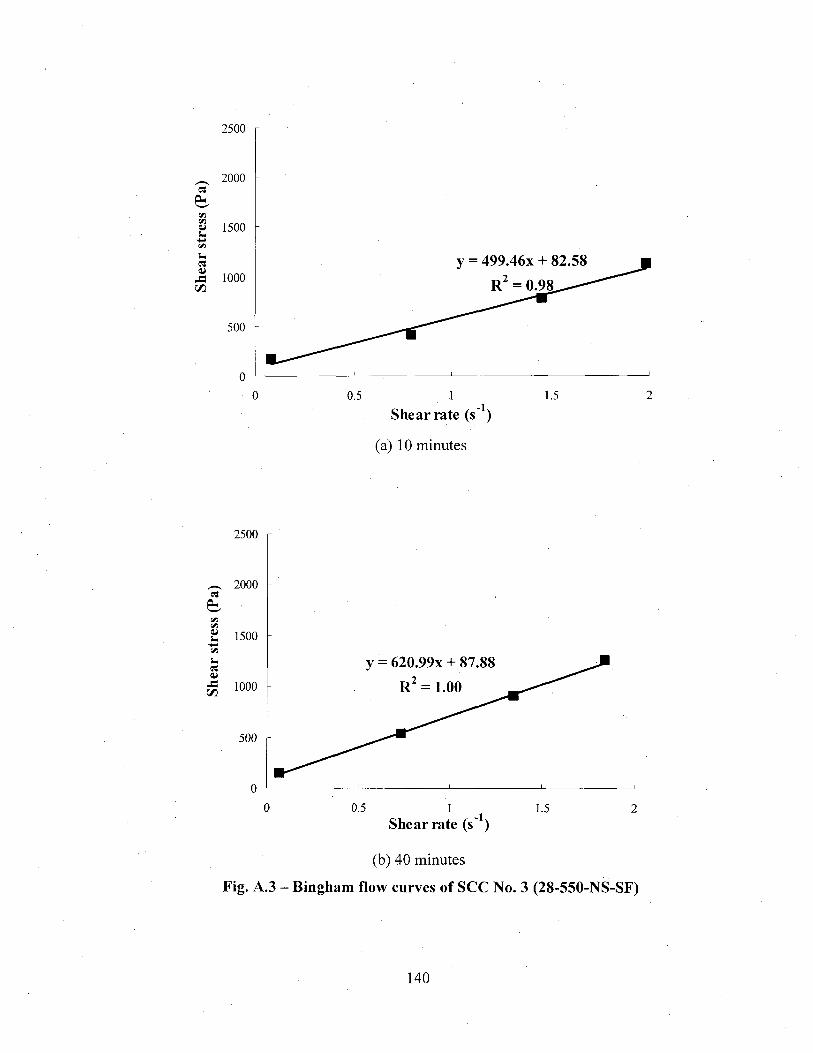
2500
«
» SB
2000
1500
u cs
j= 1000 CZ5
500
y = 499.46x + 82.58
R = 0.<
0.5 -K Shear rate (s )
(a) 10 minutes
1.5
e«
VI VI V S-S-« 4> JS in
2500 r
2000
1500
1000
500
y = 620.99x + 87.88
R2 = 1.00
0.5 Shear rate (s"1)
(b) 40 minutes
Fig. A.10 - Bingham flow curves of SCC No. 10 (Central point-2)
1.5
140
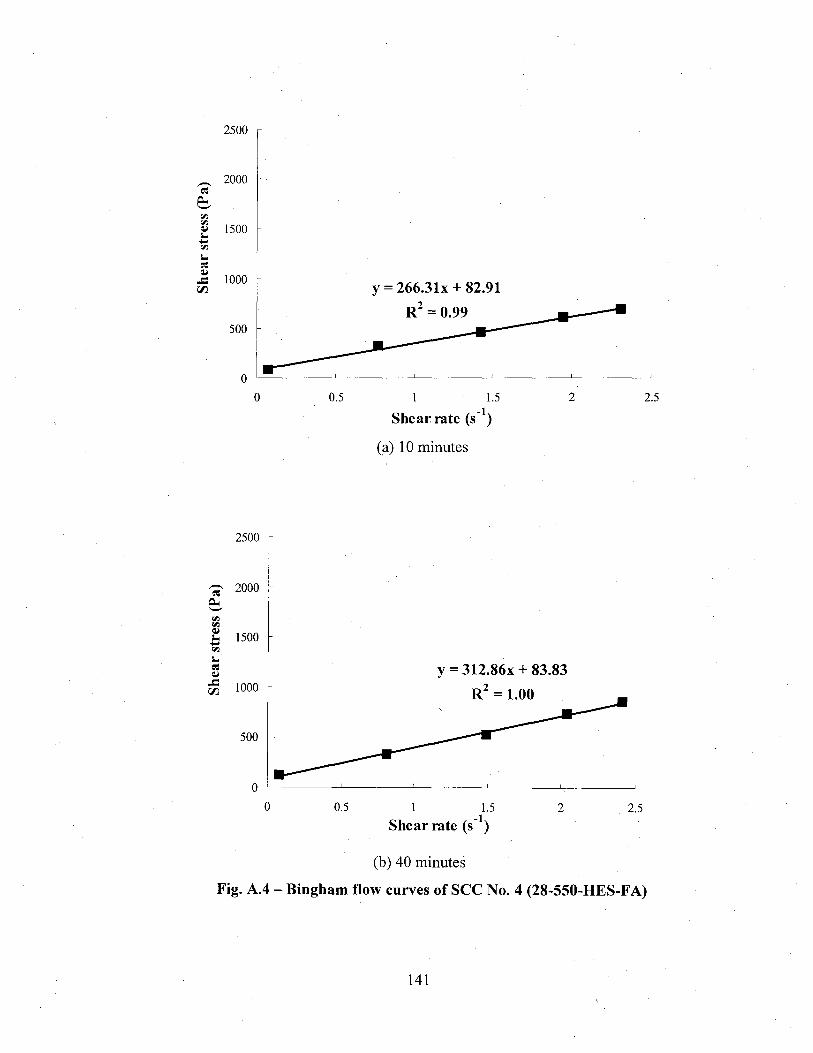
Shear rate ( s 1 )
(a) 10 minutes
0 0.5 1 1.5 2 2.5 Shear rate (s"1)
(b) 40 minutes
Fig. A.9 - Bingham flow curves of SCC No. 9 (Central point-1)
141
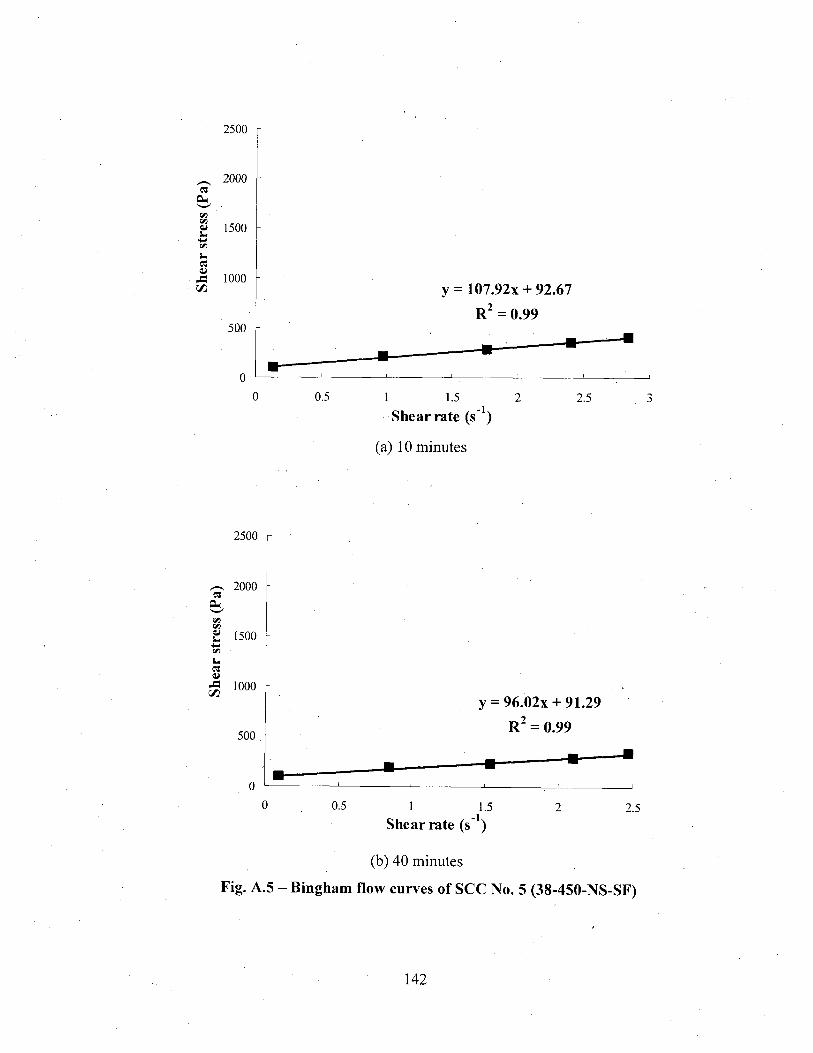
2500
2000
« 1500 M •S! U es
Jl 1000 m
500
0.5
y = 107.92x + 92.67
R2 = 0.99
1.5 -K Shear rate (s )
(a) 10 minutes
2.5
2500
2000
es | 1°00
500
0.5
y = 96.02x + 91.29
R 2 = 0.99
1.5 Shear rate (s"1)
(b) 40 minutes
Fig. A.10 - Bingham flow curves of SCC No. 10 (Central point-2)
2.5
142
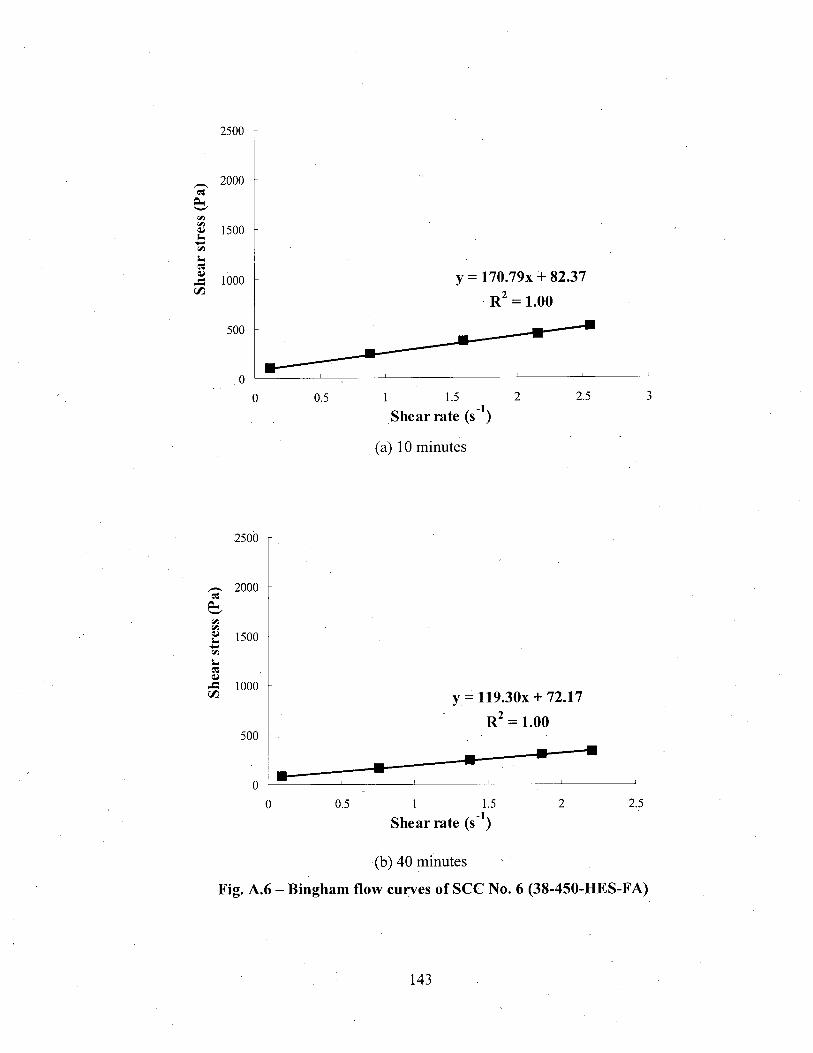
i. c« <u -S CZJ
2500 r
2000 es
« 1500
1000
500
0.5
y = 170.79x + 82.37
R2 = 1.00
1.5 -U Shear rate (s )
(a) 10 minutes
2.5
es
JS
2500 f
2000
1000
500
y = 119.30x +72.17
R2 = 1.00
0.5 1.5 -U
2.5
Shear rate (s" )
(b) 40 minutes
Fig. A.9 - Bingham flow curves of SCC No. 9 (Central point-1)
143

2500
^ 2000 «
2 1 5 0 0
so u « J : 1000 iZJ
5 0 0
0.5
y = 80.18x +116.50
R2 = 1.00
1.5
Shear rate (s"1)
(a) 10 minutes
2.5
2 5 0 0
2000
£ 1 5 0 0
03
• i 1000 c/5
5 0 0
0 . 5 ^ 1
y = 51.87x +213.56
R2 = 1.00
1.5
Shear rate (s_I)
(b) 40 minutes
Fig. A.7 - Bingham flow curves of SCC No. 7 (38-550-NS-FA)
2 . 5
144
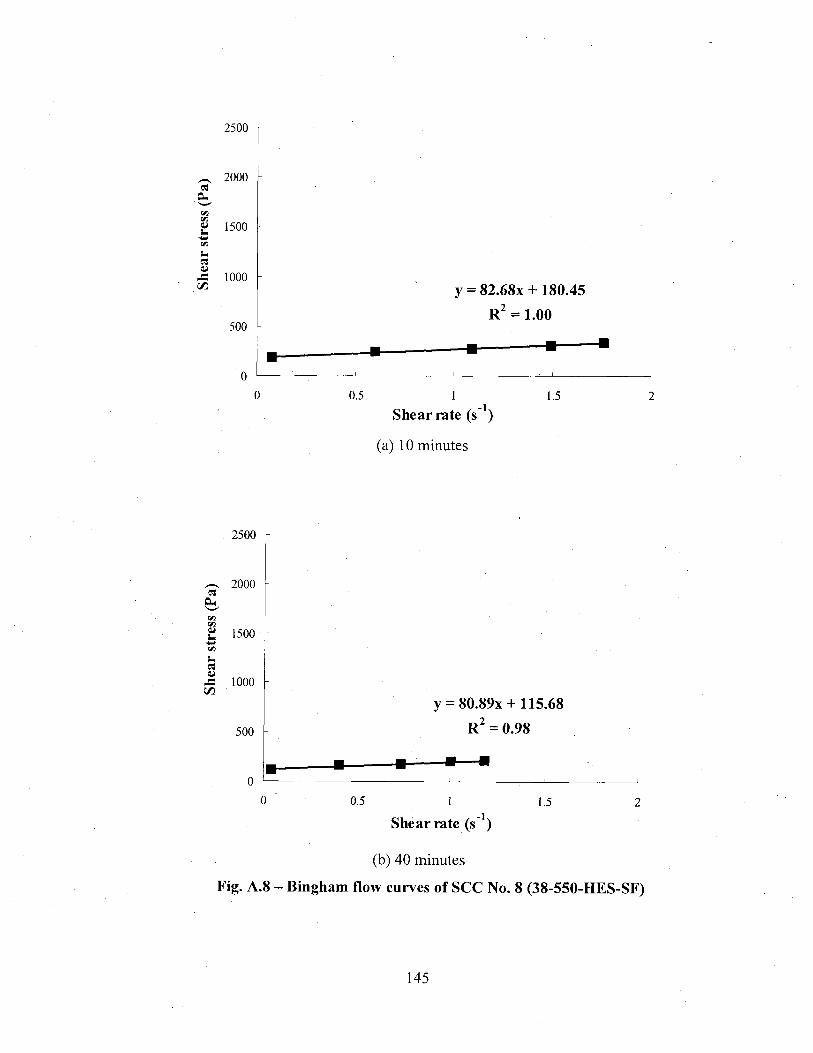
2500
Ph
s. VI
2000
1 5 0 0
u CS JS 1000
5 0 0
0 . 5
y - 82.68x + 180.45
R2 - 1.00
Shear rate (s )
(a) 10 minutes
1.5
«
VI a i -•+-»
2 5 0 0
2000
1 5 0 0
« J : 1000 </3
5 0 0
0 . 5
y = 80.89x + 115.68
R2 = 0.98
1.5 -K Shear rate (s" )
(b) 40 minutes
Fig. A.10 - Bingham flow curves of SCC No. 10 (Central point-2)
145
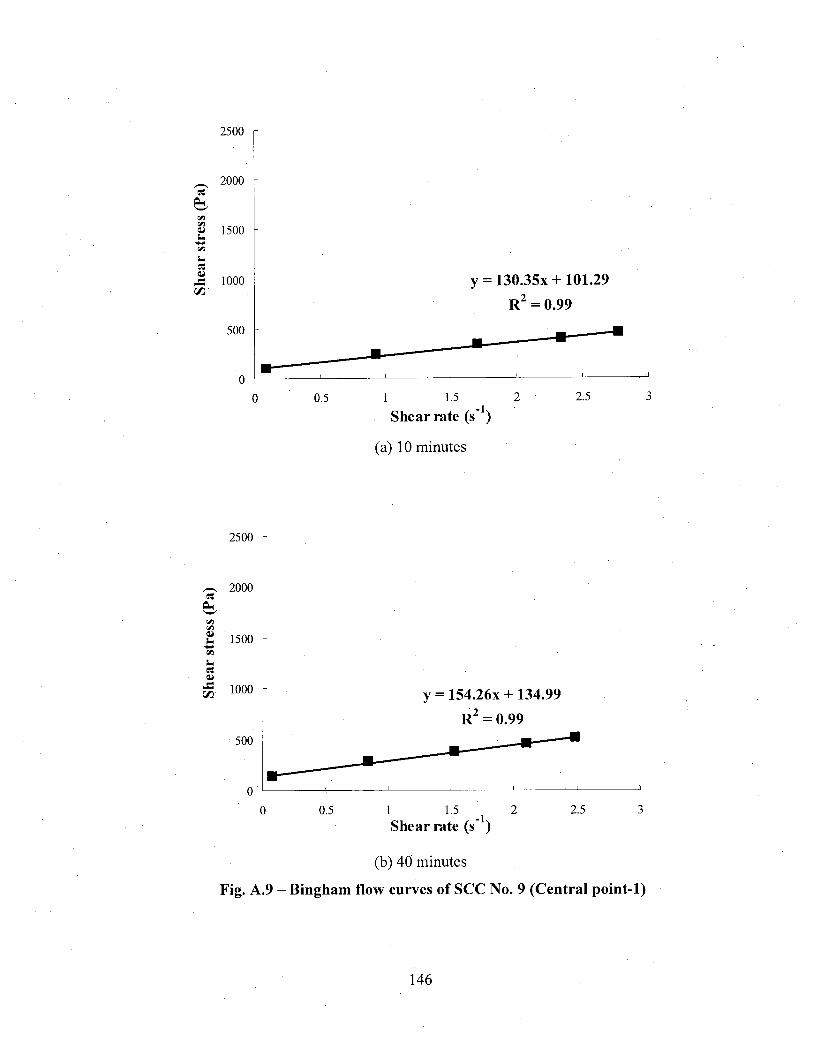
Shear rate (s"1)
(a) 10 minutes
0 0.5 1 1.5 2 2.5 3 Shear rate (s" )
(b) 40 minutes
Fig. A.9 - Bingham flow curves of SCC No. 9 (Central point-1)
146
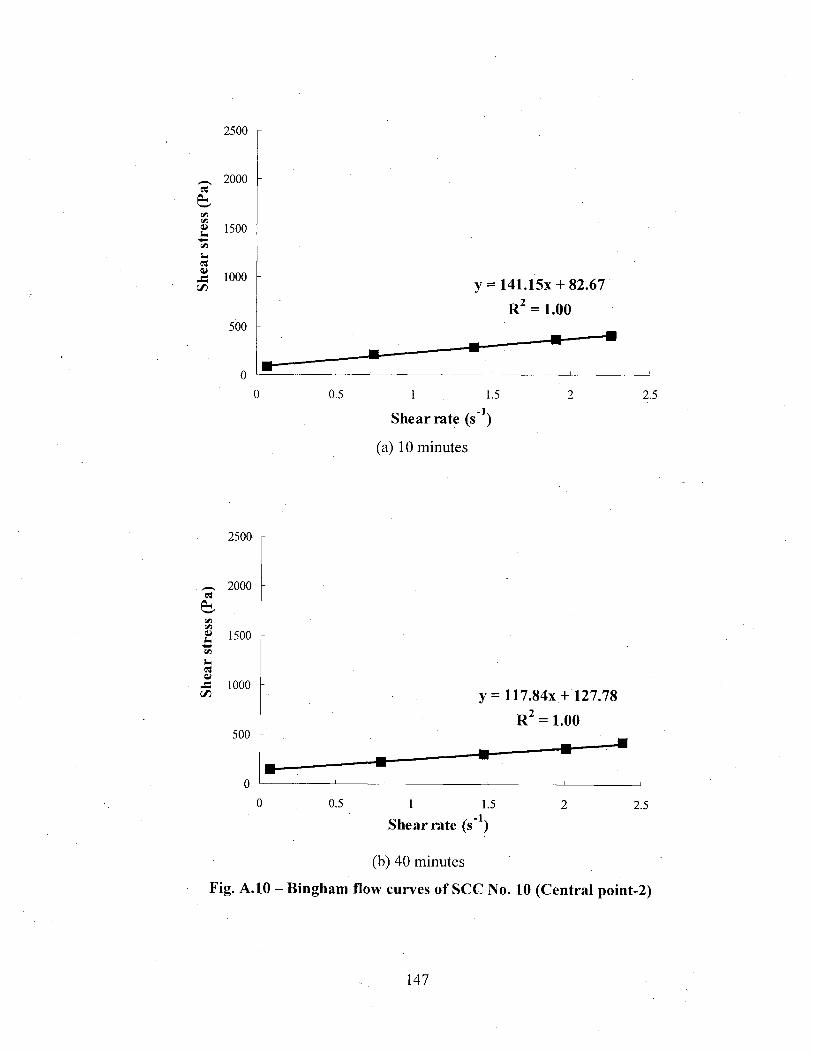
2500
«
u C3 0>
JS C/3
2000
« 1 5 0 0
1000
5 0 0
y = 141.15x + 82.67
R2 = 1.00
0 . 5 1 1.5
Shear rate ( s 1 )
(a) 10 minutes
2 . 5
«s
cc u i.
2 5 0 0
2000
1 5 0 0
,es Js iooo CZ5
5 0 0
y = 117.84x +127.78
R2 = 1.00
0 . 5 1.5 2 . 5
Shear rate ( s 1 )
(b) 40 minutes
Fig. A.10 - Bingham flow curves of SCC No. 10 (Central point-2)
147

2500
^ 2 0 0 0 -c5
so p 1500 -M VI
U
0 0.5 1 1.5 2 2.5
Shear rate (s" )
(a) 10 minutes
Shear rate (s1)
(b) 40 minutes
Fig. A . l l - Bingham flow curves of SCC No. 11 (Central point-3)
148
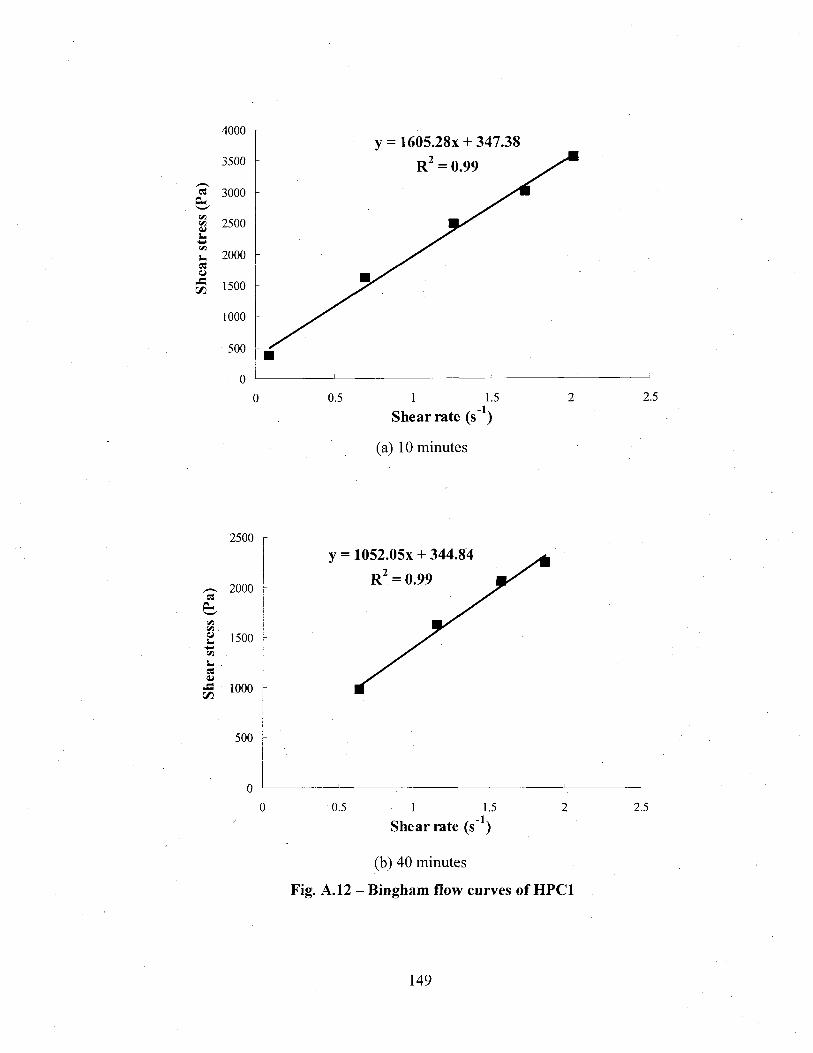
4000
3500
« 3000 &
| 2500
£ 2000 «s
M 1500
1000
500
0
y = 1605.28x + 347.38
R2 = 0.99
0.5 1.5 -K Shear rate (s )
(a) 10 minutes
2.5
2500
^ 2000 &
t/3 vi. « S-tfl 1m . «S
I 1000
1500
500
y = 1052.05x + 344.84
R2 = 0.99
0.5 1.5 2.5
Shear rate (s )
(b) 40 minutes
Fig. A.12 - Bingham flow curves of HPC1
149
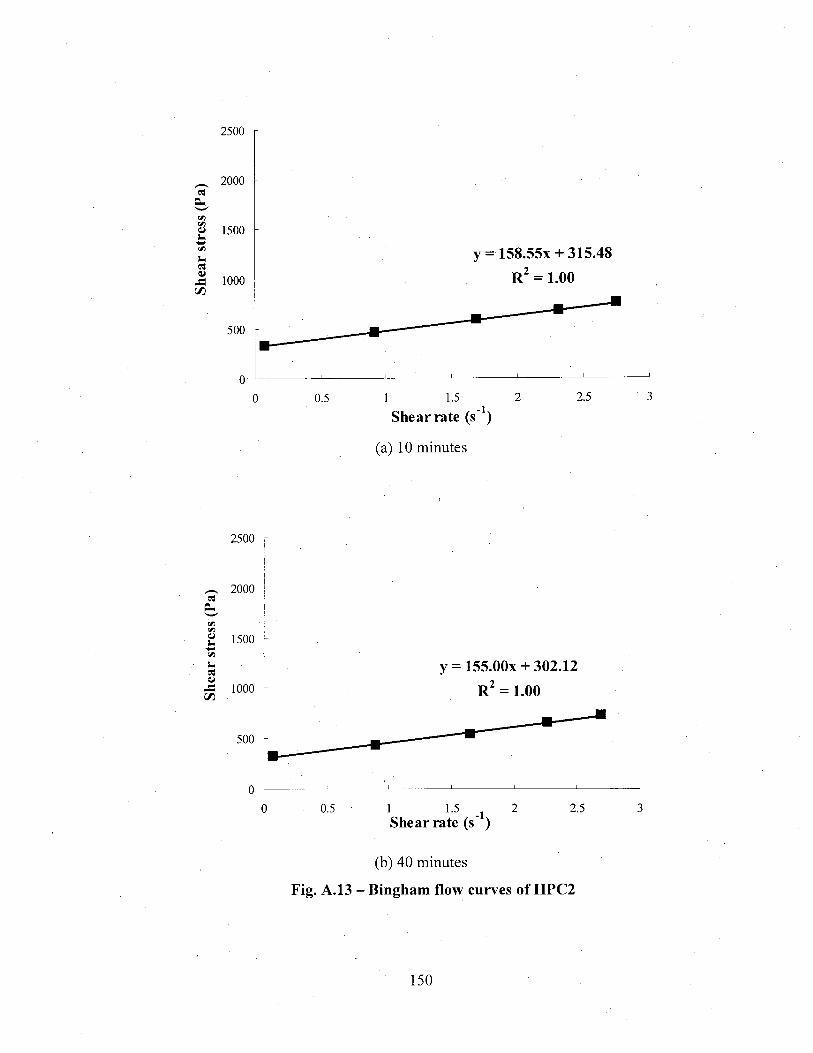
2500
^ 2000 «
& fx
p 1500 <*! s-cs
Ja 1000 !Z5
500
0.5
y = 158.55x + 315.48
R2 = 1.00
1.5 -U Shear rate (s~ )
(a) 10 minutes
2.5
«
2500
2000
1500 s~ U et
•J3 1000 tZ3 .
500
0.5
y = 155.00x + 302.12
R2 = 1.00
1.5 -U Shear rate (s" ) 2.5
(b) 40 minutes
Fig. A.13 - Bingham flow curves of HPC2
150
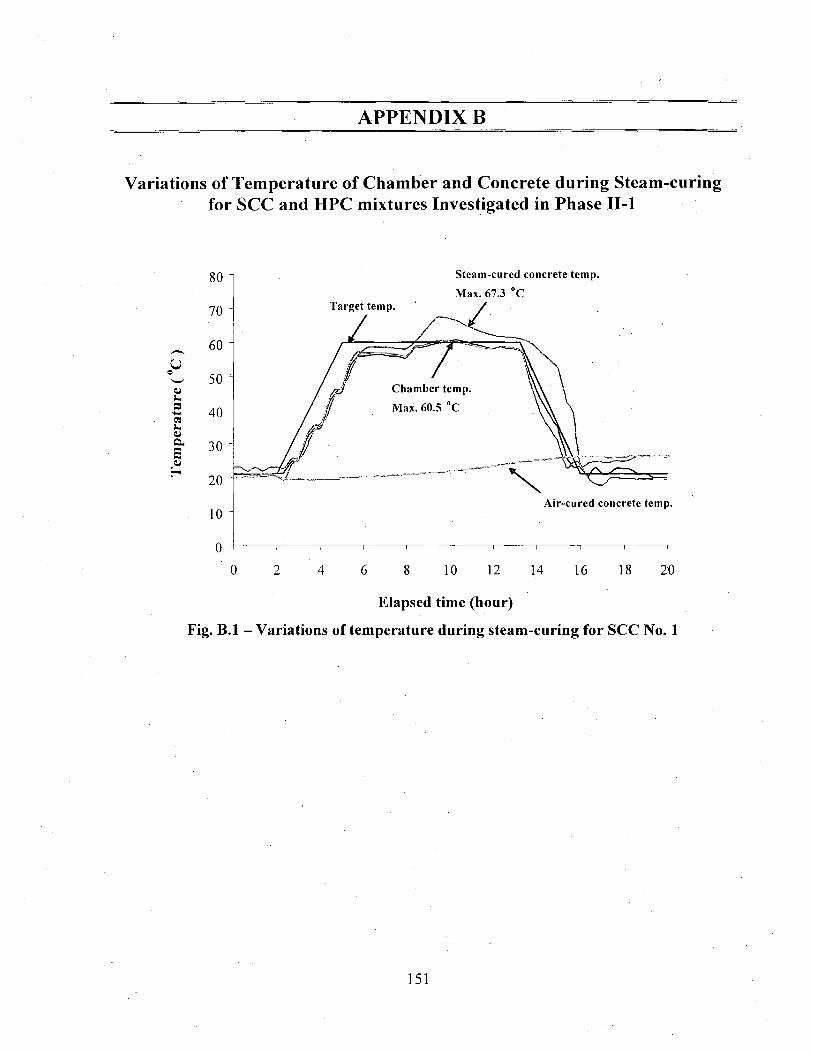
APPENDIX B
Variations of Temperature of Chamber and Concrete during Steam-curing for SCC and HPC mixtures Investigated in Phase II-l
Elapsed time (hour)
Fig. B.l - Variations of temperature during steam-curing for SCC No. 1
151
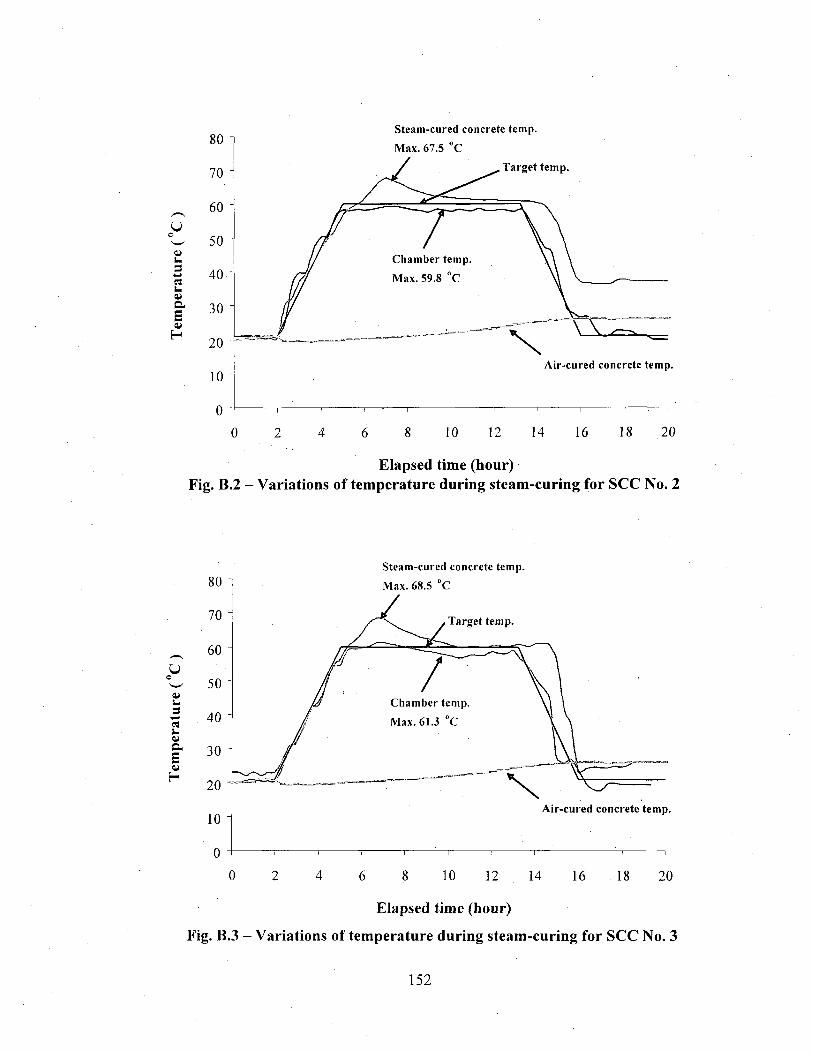
u
o S~ 3 et s-1> a £ o H
0
Steam-cured concrete temp.
Target temp. Max. 63.6 °C
, Target temp.
10 12 14 16 18 20
Elapsed time (hour) Fig. B.2 - Variations of temperature during steam-curing for SCC No. 2
V i-3
s-<LI a a H
80
70
60
50
40
30
20
10
0 0
Steam-cured concrete temp. Max. 68.5 °C
Target temp.
Air-cured concrete temp.
~r ; i r n I 1 1 1
10 12 14 16 18 20
Elapsed time (hour)
Fig. B.7 - Variations of temperature during steam-curing for SCC No. 7
152
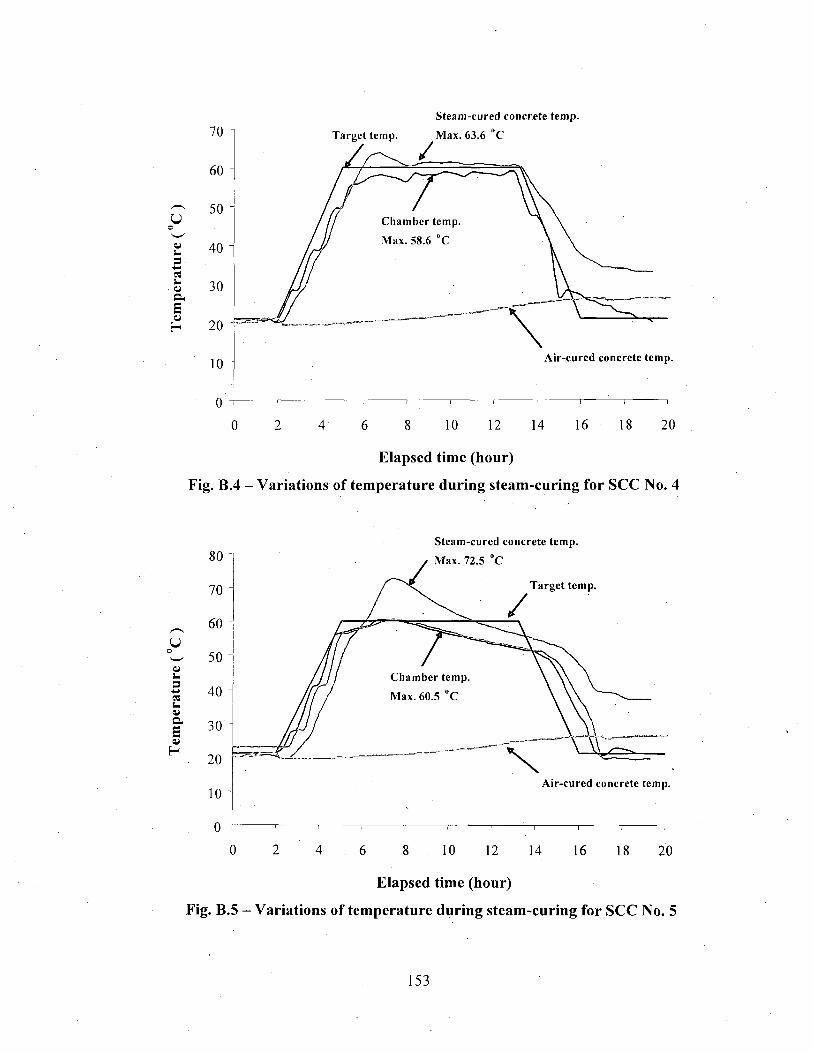
u
<u P-et k. u a E o H
Steam-cured concrete temp.
Target temp. Max. 63.6 °C
i 1 1
0 2 4 6 10 12 14 16 18 20
Elapsed time (hour)
Fig. B.4 - Variations of temperature during steam-curing for SCC No. 4
U
v s-S «
C. S H
Steam-cured concrete temp. Max. 72.5 °C
Target temp.
0 2 4 6 8 10 12 14 16 18 20
Elapsed time (hour)
Fig. B.7 - Variations of temperature during steam-curing for SCC No. 7
153
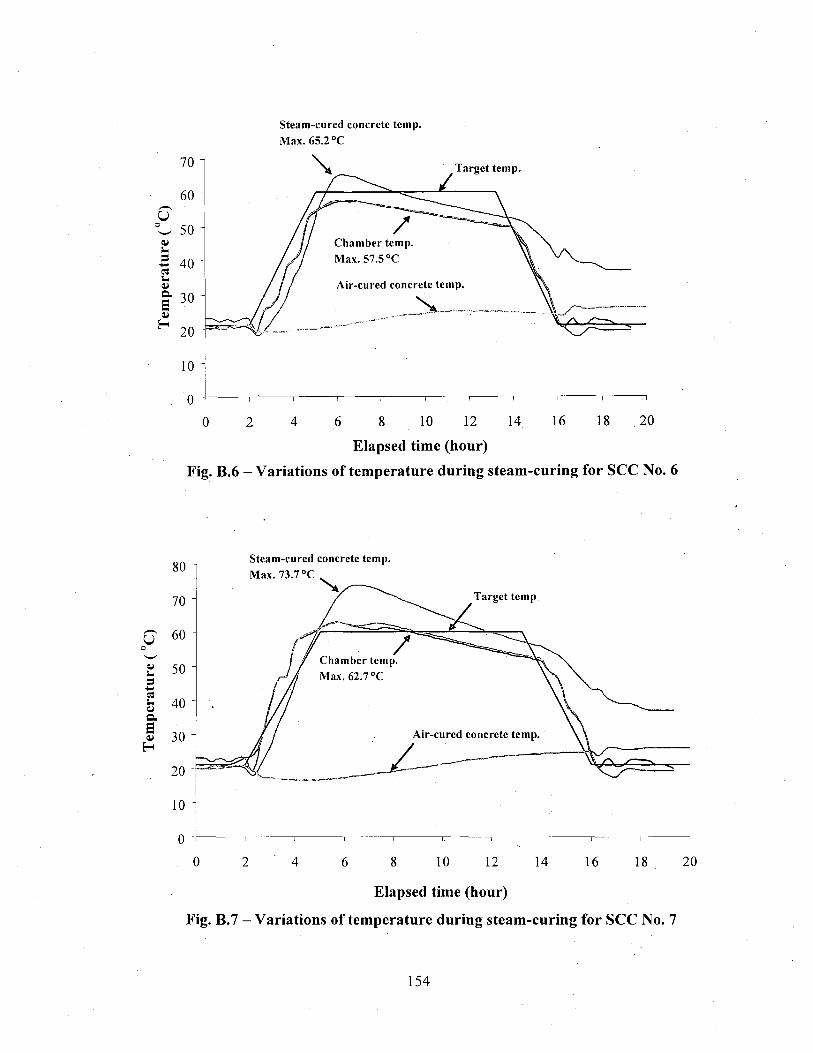
Steam-cured concrete temp. Target temp. Max. 63.6 °C
Elapsed time (hour)
Fig. B.6 - Variations of temperature during steam-curing for SCC No. 6
Elapsed time (hour)
Fig. B.7 - Variations of temperature during steam-curing for SCC No. 7
154
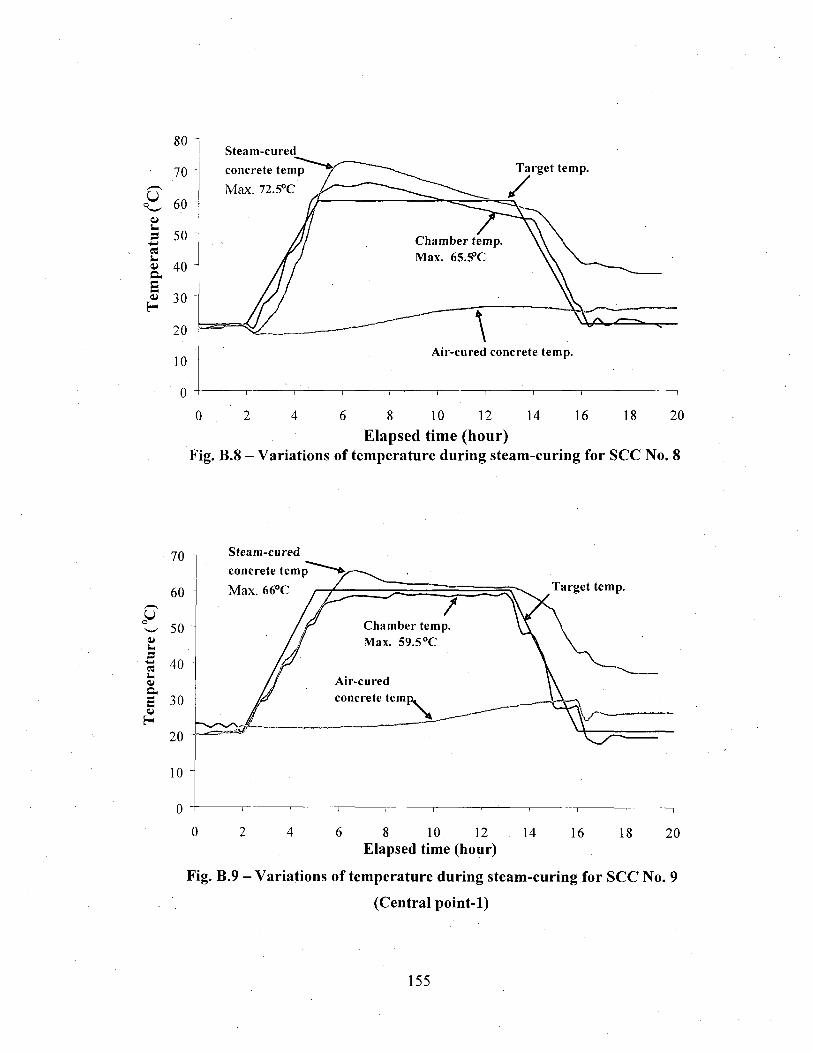
Elapsed time (hour) Fig. B.8 - Variations of temperature during steam-curing for SCC No. 8
70
60
Steam-cured concrete temp Max. 66°C
J Chamber temp. Max. 59.5°C
Air-cured concrete temp.
Target temp.
10
6 8 10 12 Elapsed time (hour)
14 16 18 20
Fig. B.9 - Variations of temperature during steam-curing for SCC No. 9
(Central point-1)
155
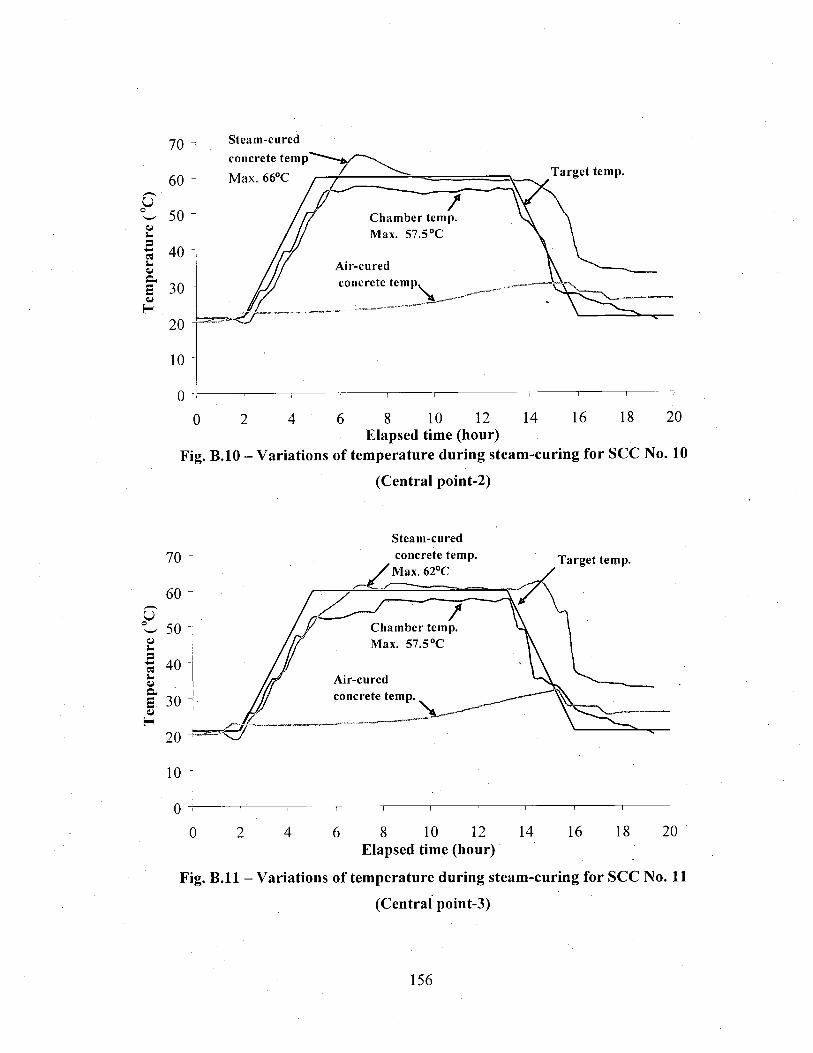
u
70
60
50 <u u 1 40 la QJ a s 30 <u H
20
10
0
Steam-cured concrete temp Max. 66°C Target temp.
0 16 18 20 2 4 6 8 10 12 14 Elapsed time (hour)
Fig. B.10 - Variations of temperature during steam-curing for SCC No. 10
(Central point-2)
U
70
60
50 s-i 40 <u a. S 30 O) H
20
10
0
Steam-cured concrete temp
'Max. 62°C
Chamber temp, Max. 57.5°C
Air-cured concrete temp.
Target temp.
6 8 10 12 14 16 18 20 Elapsed time (hour)
Fig. B . l l - Variations of temperature during steam-curing for SCC No. 11
(Central point-3)
156
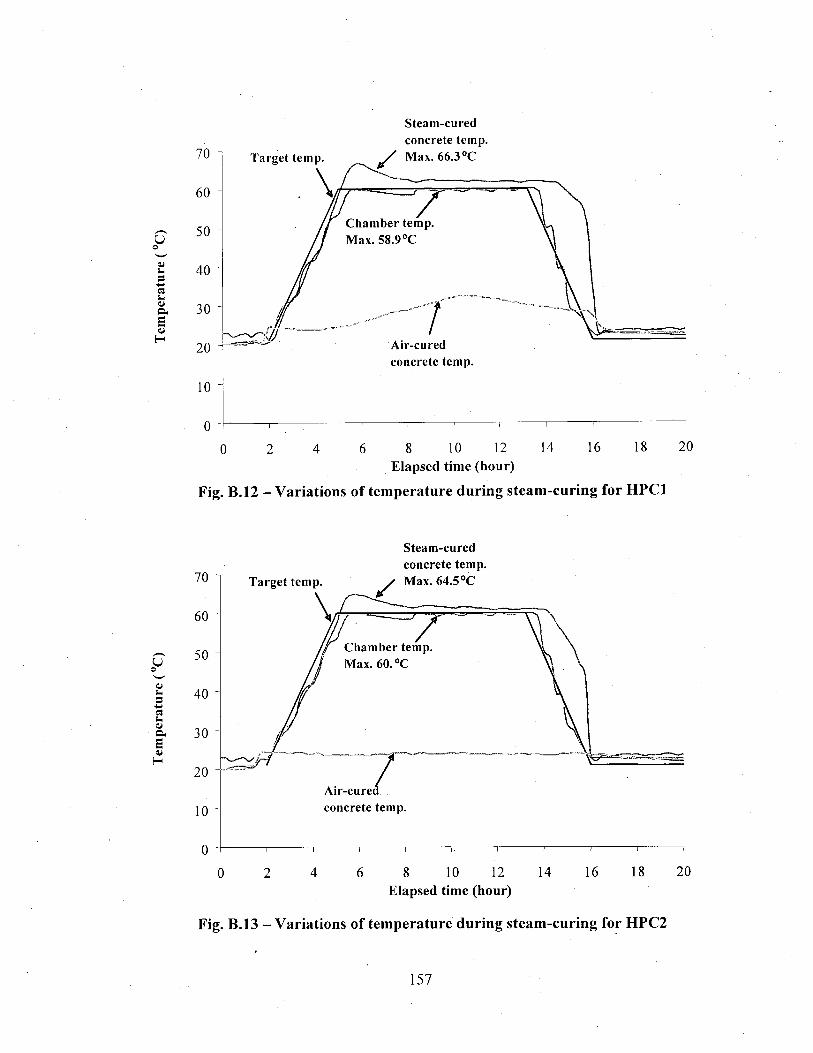
Steam-cured concrete temp.
Elapsed time (hour)
Fig. B.12 - Variations of temperature during steam-curing for HPC1
Steam-cured concrete temp.
Elapsed time (hour)
Fig. B.13 - Variations of temperature during steam-curing for HPC2
157
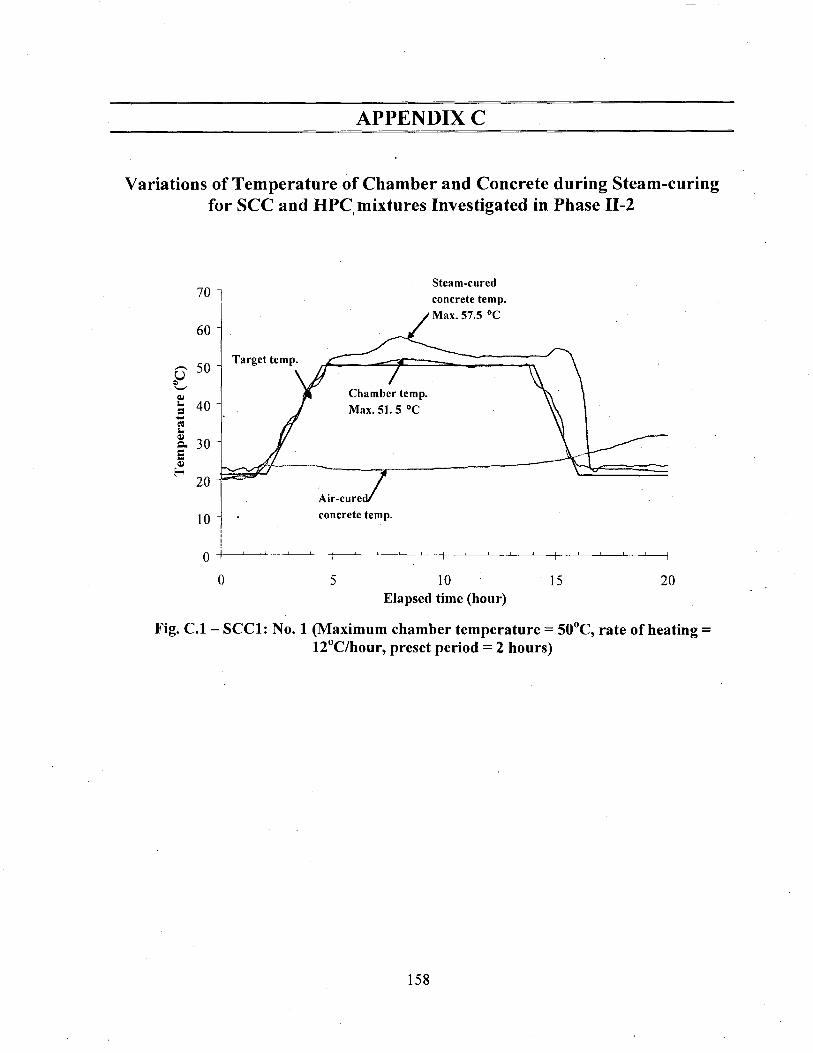
APPENDIX C
Variations of Temperature of Chamber and Concrete during Steam-curing for SCC and HPC mixtures Investigated in Phase II-2
Steam-cured
Elapsed time (hour)
Fig. C.l - SCC1: No. 1 (Maximum chamber temperature = 50°C, rate of heating = 12°C/hour, preset period = 2 hours)
158
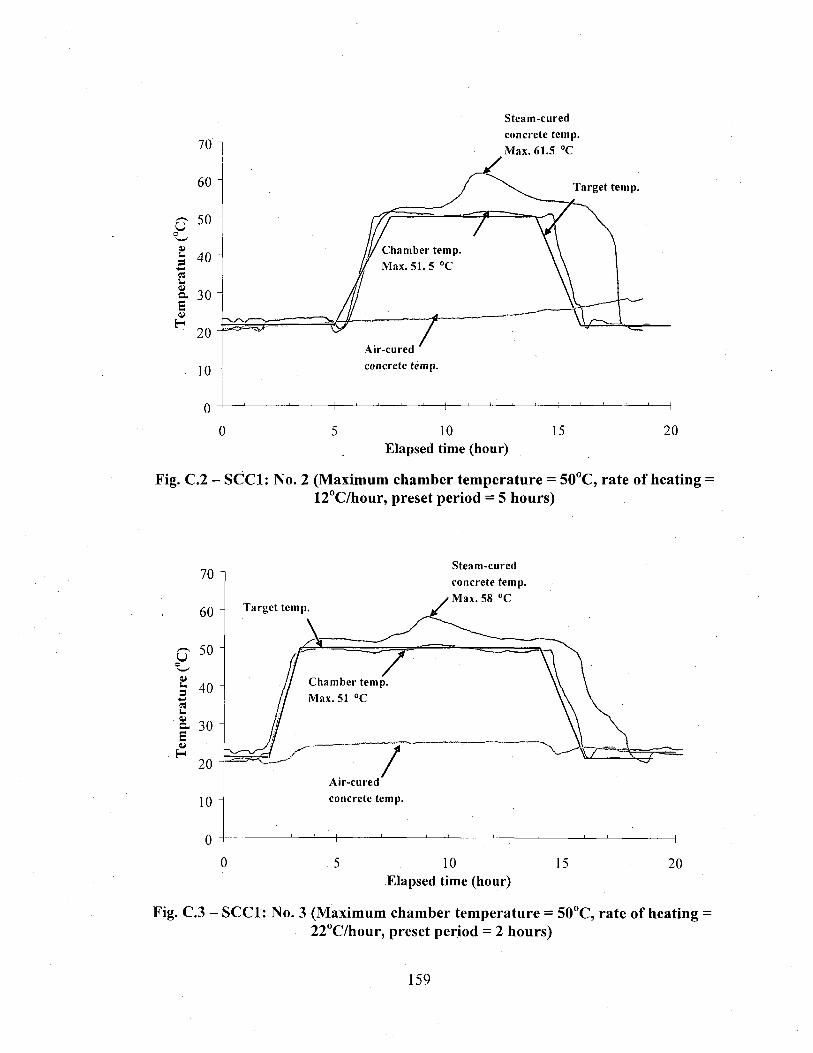
Steam-cured
Elapsed time (hour)
Fig. C.2 - SCC1: No. 2 (Maximum chamber temperature = 50°C, rate of heating = 12°C/hour, preset period = 5 hours)
U
70
60
50
u £ 40 a u
• O. 30 £ o» H
20
10
Target temp.
Steam-cured concrete temp.
'Max. 58 °C
Chamber temp. Max. 51 °C
Air-cured concrete temp.
10 15 Elapsed time (hour)
20
Fig. C.ll - SCC1: No. 11 (Maximum chamber temperature = 55°C, rate of heating 17°C/hour, preset period = 3.5 hours)
159
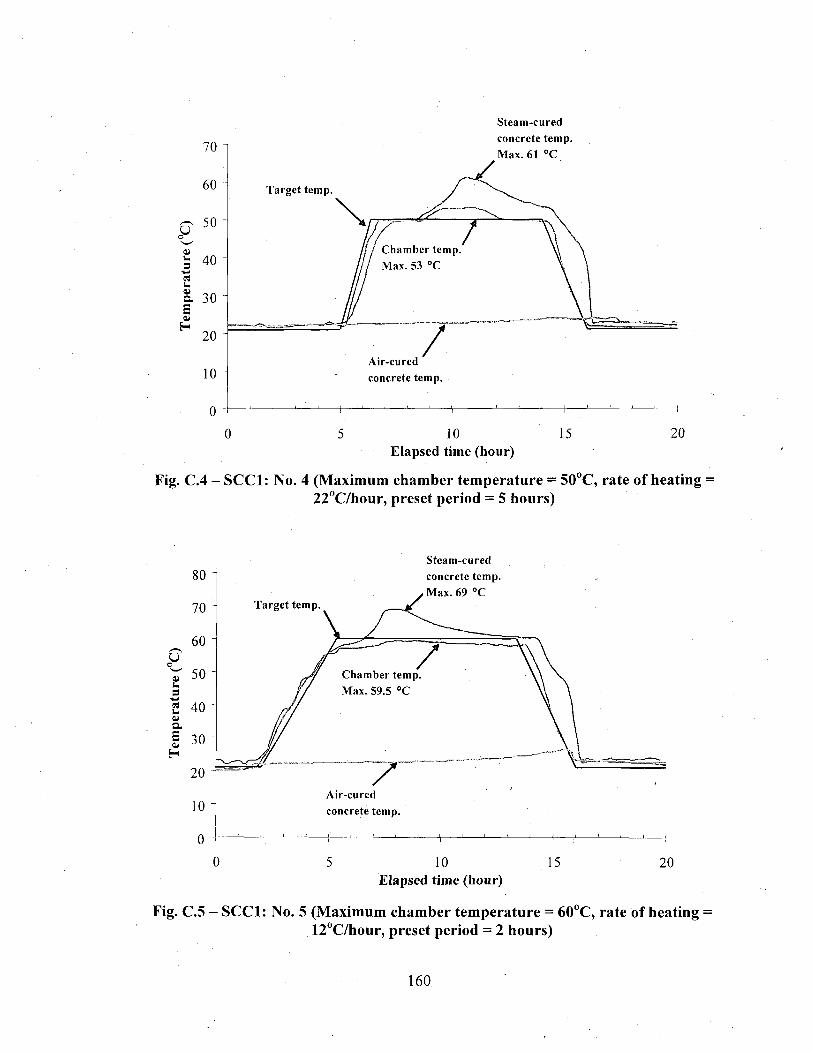
Steam-cured
Elapsed time (hour)
Fig. C.4 - SCC1: No. 4 (Maximum chamber temperature = 50°C, rate of heating = 22°C/hour, preset period = 5 hours)
S t e a m - c u r e d
Elapsed time (hour)
Fig. C.ll - SCC1: No. 11 (Maximum chamber temperature = 55°C, rate of heating 17°C/hour, preset period = 3.5 hours)
160
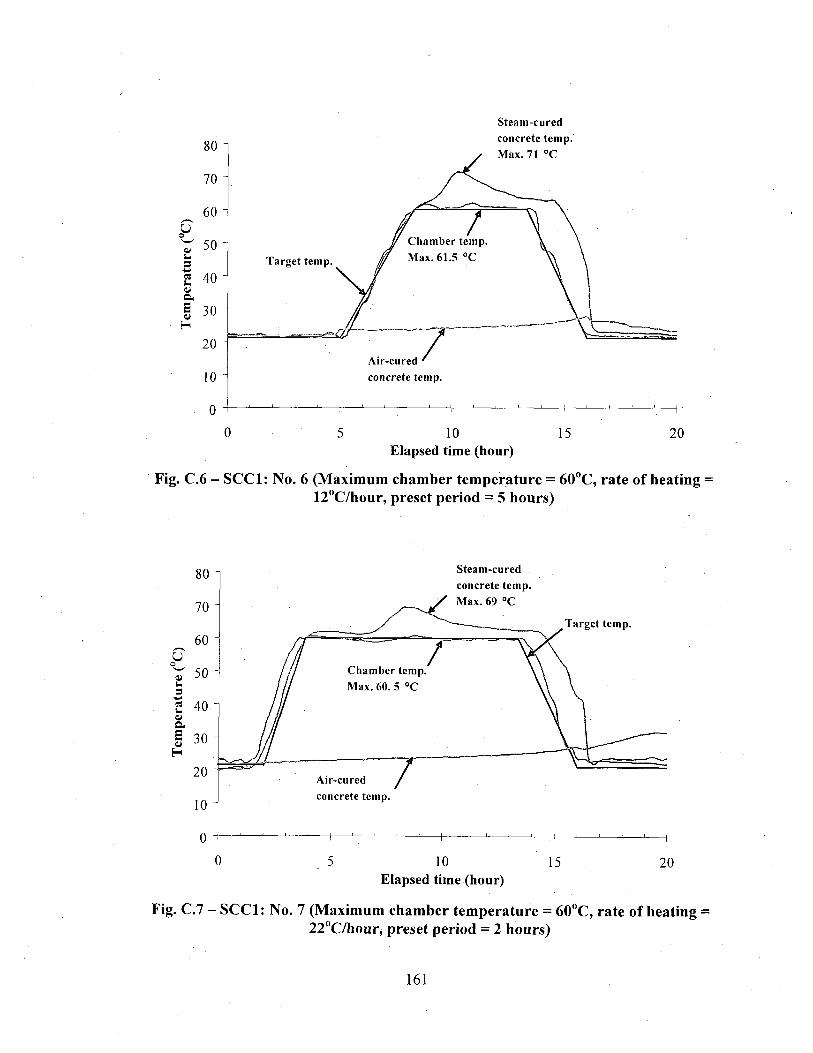
Steam-cured concrete temp. Max. 71 °C
10
Elapsed time (hour) 15 20
Fig. C.6 - SCC1: No. 6 (Maximum chamber temperature = 60°C, rate of heating :
12°C/hour, preset period = 5 hours)
Steam-cured concrete temp. Max. 69 °C
Target temp.
10 Elapsed time (hour)
15 20
Fig. C.7 - SCC1: No. 7 (Maximum chamber temperature = 60°C, rate of heating 22°C/hour, preset period = 2 hours)
161
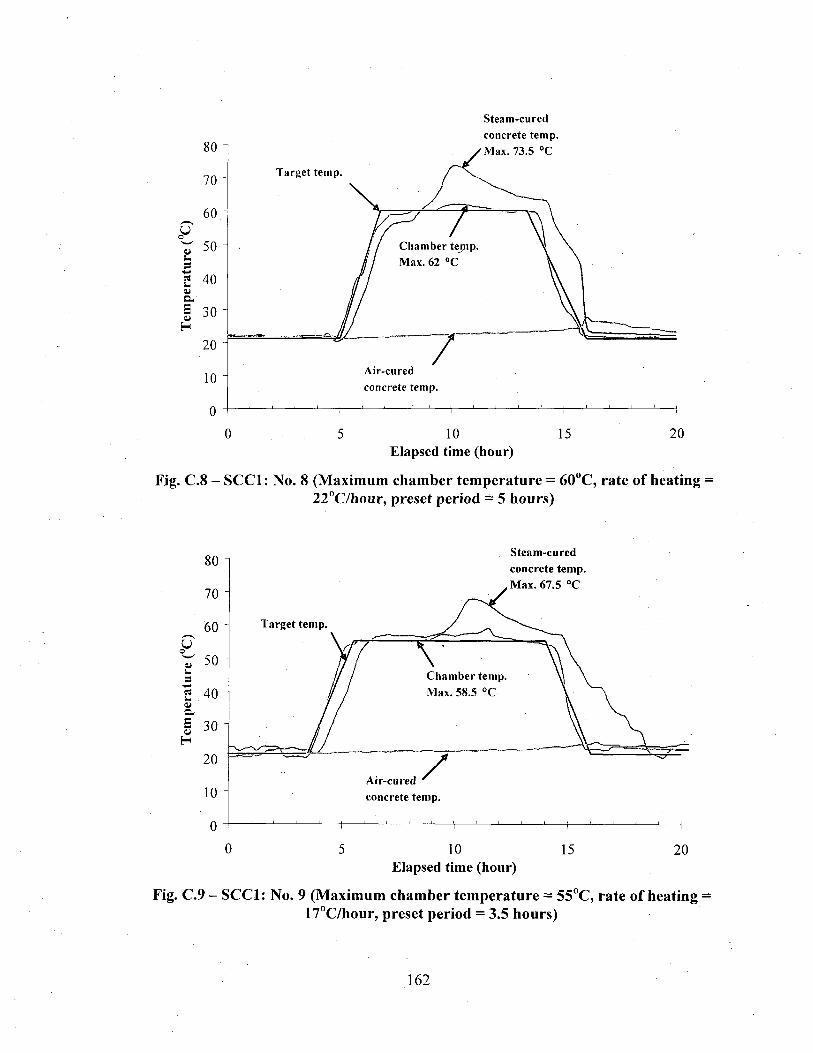
80 -
70 -
60." y o 50 -s « 40 J
at a. £ 30 -H
20 -
10 -
0 J
Steam-cured concrete temp. Max. 73.5 °C
10 Elapsed time (hour)
15 20
Fig. C.8 - SCC1: No. 8 (Maximum chamber temperature = 60°C, rate of heating 22°C/hour, preset period = 5 hours)
Steam-cured concrete temp. Max. 67.5 °C
10 Elapsed time (hour)
15 20
Fig. C.9 - SCC1: No. 9 (Maximum chamber temperature = 55°C, rate of heating :
17°C/hour, preset period = 3.5 hours)
162
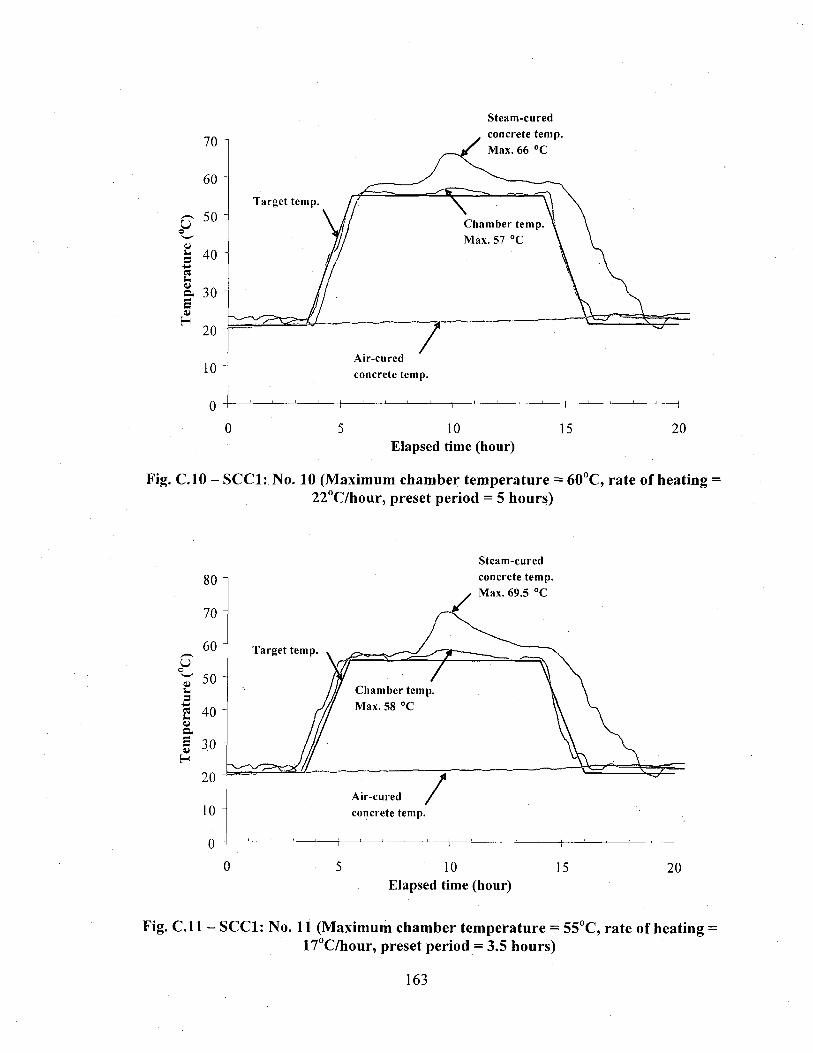
Steam-cured
Elapsed time (hour)
Fig. C.10 - SCC1: No. 10 (Maximum chamber temperature = 60°C, rate of heating = 22°C/hour, preset period = 5 hours)
80 "
70 "
60 " u
o 50 -s « ! - 40 -4> a. £ 3.0 -H
20 -
10 "
o
Steam-cured concrete temp. Max. 69.5 °C
5 10 Elapsed time (hour)
15 20
Fig. C . l l - SCC1: No. 11 (Maximum chamber temperature = 55°C, rate of heating 17°C/hour, preset period = 3.5 hours)
163
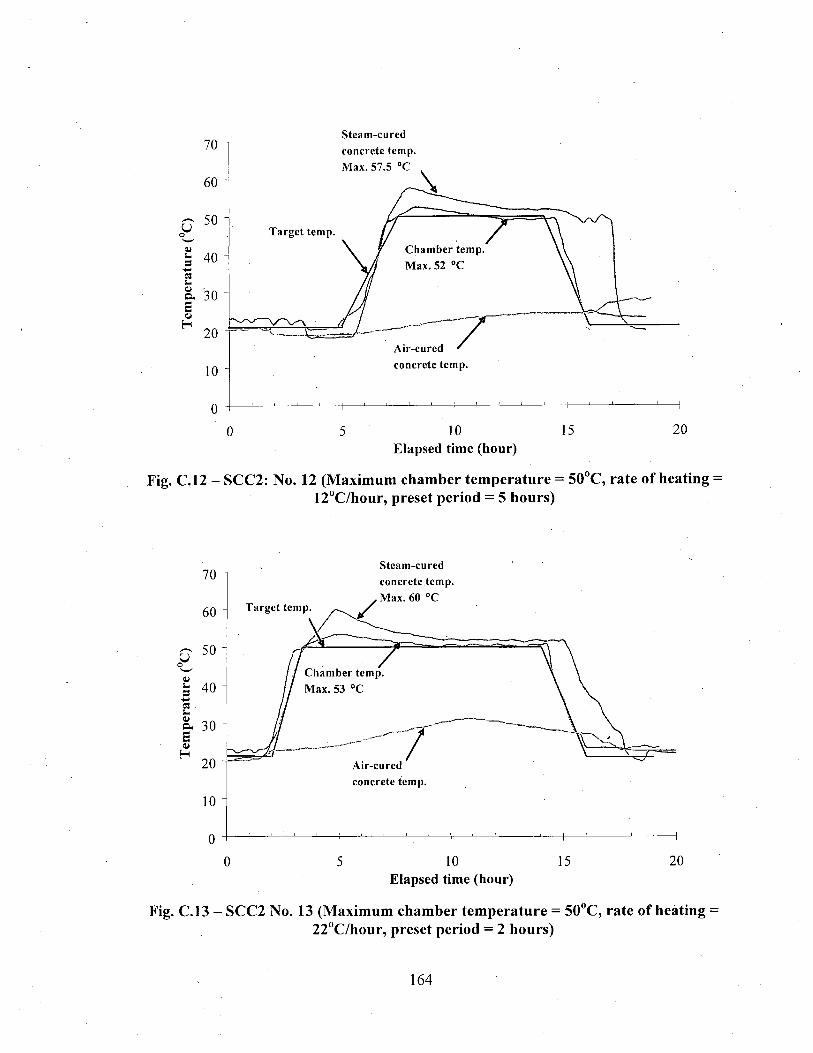
Steam-cured
Elapsed time (hour)
Fig. C.12 - SCC2: No. 12 (Maximum chamber temperature = 50°C, rate of heating = 12°C/hour, preset period = 5 hours)
70
60
50
£ 40 Ctf • 5-
S. 30 E it
H 20
10
Target temp.
Steam-cured concrete temp
, Max. 60 °C
Chamber temp. Max. 53 °C
Air-cured concrete temp.
10 Elapsed time (hour)
15 20
Fig. C.ll - SCC1: No. 11 (Maximum chamber temperature = 55°C, rate of heating 17°C/hour, preset period = 3.5 hours)
164
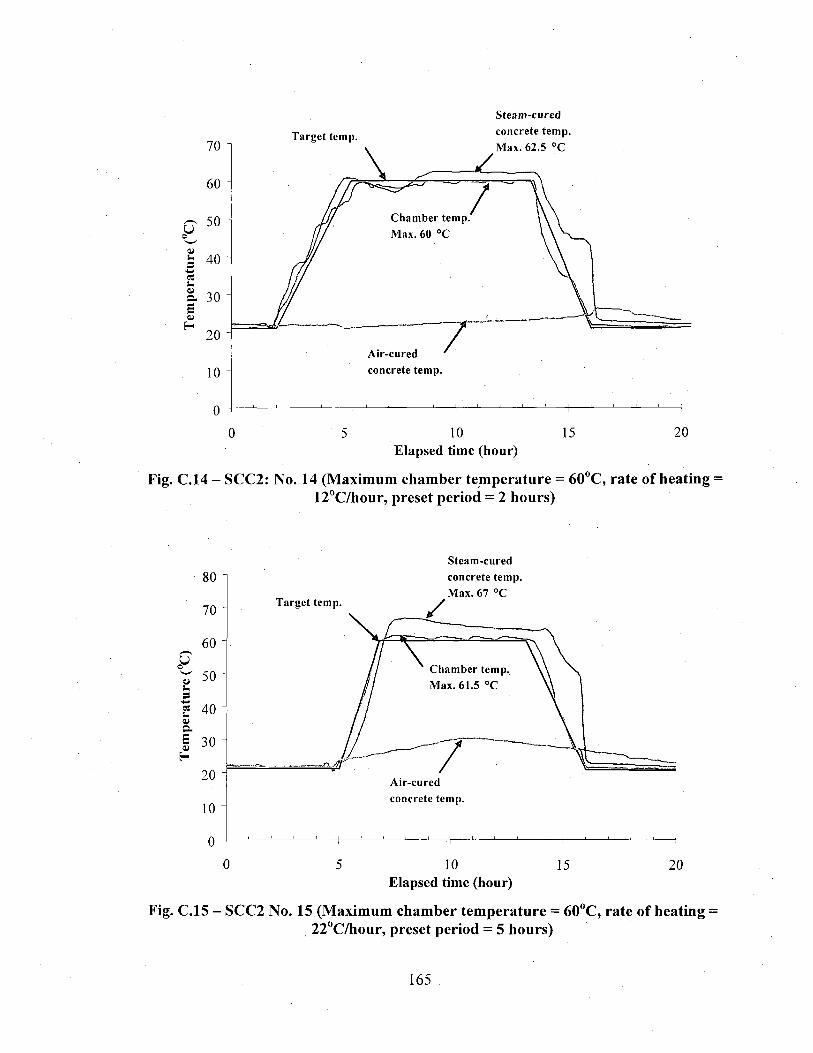
Target temp.
Steam-cured concrete temp. Max. 62.5 °C
10 Elapsed time (hour)
15 20
Fig. C.14 - SCC2: No. 14 (Maximum chamber temperature = 60°C, rate of heating 12°C/hour, preset period = 2 hours)
80 "
70 -
60 -
50 ~ s « s- 40 " V a. E 30 " H
20 -
10 -
0 4
Target temp.
Steam-cured concrete temp. Max. 67 °C
Air-cured concrete temp.
10 Elapsed time (hour)
15 20
Fig. C.15 - SCC2 No. 15 (Maximum chamber temperature = 60°C, rate of heating :
22°C/hour, preset period = 5 hours)
165
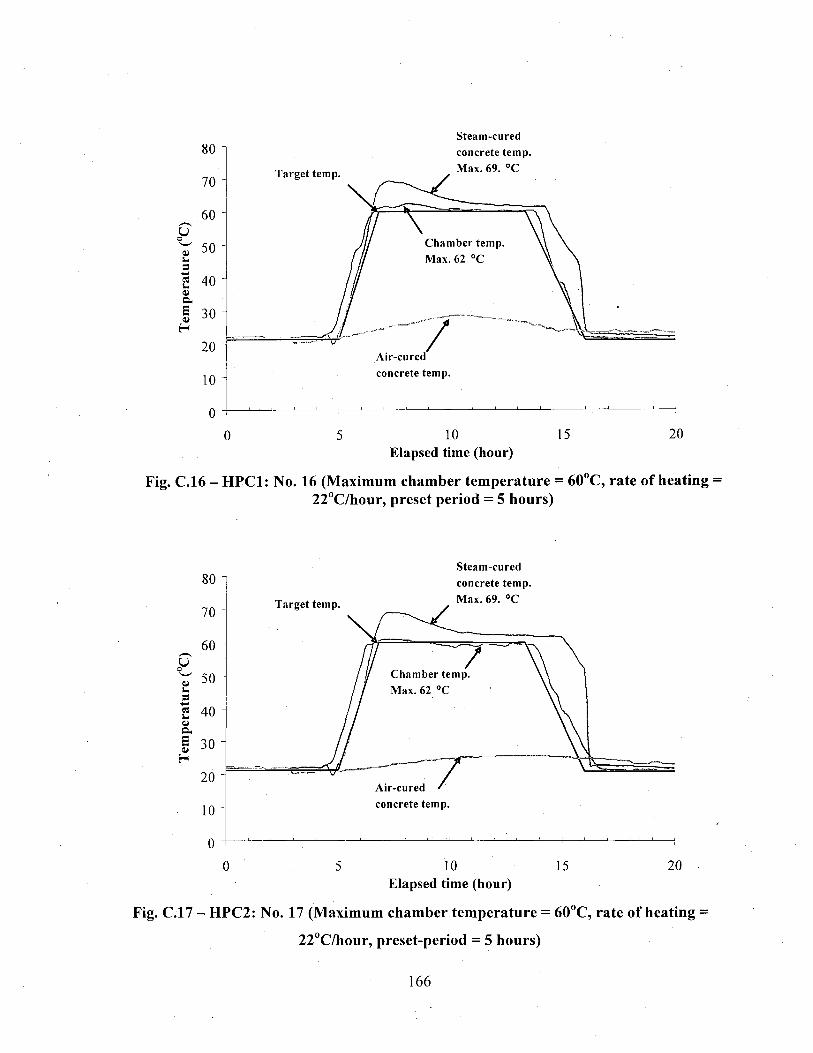
80
70
60 Jj 4) 50 i-3 « 40 a. E a 30 H
20
10
0
Target temp.
Steam-cured concrete temp. Max. 69. °C
Chamber temp. Max. 62 °C
7 Air-cured concrete temp.
10 Elapsed time (hour)
15 20
Fig. C.16 - HPC1: No. 16 (Maximum chamber temperature = 60°C, rate of heating = 22°C/hour, preset period = 5 hours)
80 -
70 "
60 -O 01 50 -3 es s- 40 J
O) o-£ 0) 30 ~ H
20 -
10 -
o -1
Steam-cured concrete temp. Max. 69. °C
Chamber temp. Max. 62 °C
Air-cured concrete temp.
10 15 20 Elapsed time (hour)
Fig. C.17 - H P C 2 : No. 17 (Maximum chamber temperature = 60°C, rate of heating
22°C/hour, preset-period = 5 hours)
166
References
• AASHTO, (1999) AASHTO LRFD Bridge Construction Specifications.
• AASHTO, (2004) AASHTO LRFD Bridge Design Specifications, 3rd edition.
• ACI Committee 237, (2007) Self-Consolidating Concrete, ACI 237R-07.
• Alexanderson, J., (1972) Strength Losses in Heat Cured Concrete, Proc: Swedish Cement
and Concrete Research Institution, vol. 43, Stockholm.
• American Concrete Institute, (1992) Accelerated Curing of Concrete at Atmospheric
Pressure, ACI Manual of Concrete Practice, ACI 517.2R-87, (revised 1992).
• Assaad, J., Khayat, K. H., and Daczko, J., (2004) Evaluation of Static Stability of Self-
Consolidating Concrete, ACI Materials Journal, vol. #101, No. (3), pp. 207-215.
• Assaad, J., Khayat, K. H., and Mesbah, H., (2003) Assessment ofThixotropy of Flowable
and Self-Consolidating Concrete, ACI Materials Journal, vol. 100, No. (2), pp. 111-120.
• Ai'tcin, Pieere-Claude (2006) Binders for Durable and Sustainable Concrete, Modern
Concrete Technology 16.
• Billberg, P., (1999) Self-Compacting Concrete for Civil Engineering Structures ~ the
Swedish Experience, CBI report 2:99, Swedish Cement and Concrete Research Institute,
80 p.
• Brameshuber, W., and Uebachs, S., (2001) Practical Experience with the Application of
Self-Compacting Concrete in Germany, Proc., 2nd International Symposium on Self-
Compacting Concrete, Tokyo, Japan, pp. 687-696.
• Canadian Standards Associations, (2005) Precast Concrete - Materials and Construction,
Canada.
• Carino, N. J., and Lew, H. S., (2001) The Maturity Method: from Theory to Application,
Proceeding of the 2001 Structures Congress & Exposition, American Society of Civil
Engineers, Virginia, 19 p.
167
Chini, A. R., and Acquaye, L., (2005; Effect of Elevated Curing Temperatures on the
Strength and Durability of Concrete, Materials and Structures, vol. 38, pp. 673-679.
Concrete Technology Associates, (1973) Accelerated Curing, Technical Bulletin 73-B9,
Washington, pp. 17-44.
Constantiner, D., and Daczko, J., (2002) Not All Applications are Created Equal;
Selecting the Appropriate SCC Performance Targets, Proc., 1st North American
Conference on the Design and Use of Self-Consolidating Concrete, Chicago, USA, pp.
179-184.
Daczko, J., and Kurtz, M., (2001) Development of High Volume Coarse Aggregate Self-
Compacting Concrete, Proc., 2nd International Symposium on Self-Compacting Concrete,
Tokyo, Japan, pp. 403-412.
Das, Debashis, V.K Gupta and S.K.Kaushik, (2006) Effect of maximum size and volume
of coarse aggregate on the properties of SCC; The Indian Concrete Journal, vol. 80. No.
3.
Deutshe Ausschuss fur Stahlbeton, (1989) Richtlinie zur Warmebehandlung von Beton,
Beath Verlag GmbH. Berlin and Koln, 6 p.
Erdem, T. K., Juranli, L., and Erdogan, T. Y., (2003) Setting Time: An Important
Criterion to Determine the Length of the Delay Period Before Steam Curing of Concrete,
Cement and Concrete Research, vol. 33, No. (5), pp. 741-745.
Erdogdu, S., and Kurbetci, S., (1998) Optimum Heat Treatment Cycle for Cements of
Different Type and Composition, Cement and Concrete Research, vol. 28, No. (11), pp.
1595-1604.
European Federation of National Trade Associations (EFNARC), (2002) Specification
and Guidelines for Self-Compacting Concrete, UK, 32 p.
European Federations (BIBM, CEMBUREAU, ERMCO, EFCA, and EFNARC), (2005).
The European Guidelines for Self-Compacting Concrete (Specification, Production and
Use), 63 p.
168
Fang, M., Wong, J.W.C., Ma, K.K., Wong, M.H., (1999) Co-composting of sewage
sludge and coal fly ash: nutrient transformations. Bioresource Technol. 67, pp. 19-24
Florida DOT, (2004) Standard Specifications for Road and Bridge Construction, Florida
State.
Hanson, J. A., (1963) Optimum Steam Curing Procedure in Precasting Plants, Proc.,
Journal of the American Concrete Institute, Illinois, USA, pp. 75-100.
Higginson, E. C., (1961) Effect of Steam Curing on the Important Properties of Concrete,
Proc., ACI Journal, vol. 58, No. (3), pp. 281-298.
Hwang, S.-D., Khayat, H. K., and Bonneau, O., (2006) Performance-Based
Specifications of Self Consolidating Concrete Used in Structural Applications, ACI
Materials Journal, vol. 103, No. (2), pp. 121-129.
Japan Society of Civil Engineers, (1998) Recommendation for Construction of Self-
Compacting Concrete, Technical Session: Recommendations and Materials, pp. 417-437.
Japan Society of Civil Engineers, (1999) Recommendations for Self-Compacting
Concrete, Tokyo, 77 p.
Kehl, R. J., Constantino, C. A., and Carrasquillo, R., (1998) Match-Cure and Maturity:
Taking Concrete Strength Testing to a Higher Level, Center for Transportation Research,
University of Texas at Austin, Project Summary Report 1714-S, 4 p.
Khayat, K. H., (1999) Workability, Testing, and Performance of Self-Consolidating
Concrete, ACI Materials Journal, vol. 96, No. (3), pp. 346-353.
Khayat, K. H., Hu, C., and Laye, J.-M. (2000) Influence of Aggregate Grain-Size
Distribution on Workability of Self-Consolidating Concrete (SCC), Proc., International
Conference on High-Performance Concrete, December 10-15, Hong Kong, pp. 1001-
1024.
Klieger, P., (1960) Some Aspects of Durability and Volume Change of Concrete for
Prestressing, PCA Research and Development Laboratories, Research Department
Bulletin 118, vol. 2, No. (3), pp. 2-12.
169
Koehler, E. P., and Fowler, D. W., (2007) Development of Self-Consolidating Concrete
for Prestressed Bridge Beams, ACI SP-247, American Concrete Institute, pp. 1-15.
Kosmatka, Kerhoff, Panarese, MacLeod, and Richard j. McGrath, (2002) Design and
Control of Concrete Mixtures. Seventh Canadian Edition P. 129.
Korea Concrete Institute, (2003) Standard Specifications for Concrete, Korea.
Mehta P.K., Aitcin P.C., (1990), Microstructural basis of selection of materials and
mix proportions for high-strength concrete, ACI Special Publication SP-121,pp265-86.
Martin, D. J., (2002) Economic Impact of SCC in Precast- Applications, Proc., 1st North
American Conference on the Design and Use of Self-Consolidating Concrete, Chicago,
Illinois, Nov. 12-13, pp. 153-159.
National cooperative highway research program (NCHRP) (2009) Self-Consolidating
Concrete for Precast, Prestressed Concrete Bridge Elements, NCHRP report 628,
Transportation Research Board of The National Academies.
Mindess, S., and Young, J. F., (1981) Concrete, Prentice-Hall, New Jersey.
Mironov, S. A., (1966) Some Generalizations in Theory and Technology of Acceleration
of Concrete Hardening, Highway Research Board Special Report, Issue Number: 90, pp.
465-474.
New York DOT, (2002) Standard Specifications - Construction and Materials, New
York State.
Odler, I., and Chen, Y., (1995) Effect of Cement Composition on the Expansion of Heat-
Cured Cement Pastes, Cement and Concrete Research, vol. 25, No. (4), pp. 853-862.
Pauw, A., (1960) Static Modulus of Elasticity of Concrete as Affected by Density, Proc.,
ACI Journal, vol. 57, No. (6), pp. 679-687.
Plowman, J. M., (1956) Maturity and the Strength of Concrete, Magazine of Concrete
Research, vol. 8, No. (22), pp. 13-22.
Portland Cement Association, (2006) Design and Control of Concrete Mixtures, 358 p.
170
Precast/Prestressed Concrete Institute, (1997) Precast Prestressed Concrete Bridge
Design Manual, 1st edition.
Precast/Prestressed Concrete Institute, (1999) Manual of Quality Control for Plants and
Production of Structural Precast Concrete Producers, MNL 116-99, 4th edition, Chicago.
Precast/Prestressed Concrete Institute, (2003) Interim Guidelines for the Use of Self-
Consolidating Concrete in Precast/Prestressed Concrete Institute Member Plants, April,
148 p.
Quiroga, Pedro Nel, and David W. Fowler, (2004) The Effects of Aggregates
Characteristics on the Performance of Portland Cement Concrete. Resarch Report
ICAR-104-1F.
SAMSUNG final report, (2009) Development of High Strength Self-Consolidating
Concrete for Precast, Prestressed Beam Elements, University of Sherbrooke, Sherbrooke,
Quebec, Canada.
Saul, A. G. A., (1951) Principles Underlying the Steam Curing of Concrete at
Atmospheric Pressure, Magazine of Concrete Research, vol. 2, No. (6), pp. 127-140.
Shidler, J. J., and Chamberlin, W. H., (1949). Early Strength of Concrete as Affected by
Steam Curing Temperatures, Proc., ACI Journal, vol. 46, No. (6), pp. 273-283.
Siedel H., Hempel, S., and Hempel, R., (1993) Secondary Ettringite Formation in Heat
Treated Portland Cement Concrete: Influence of Different w/c Ratios and Heat
Treatment Temperatures, Cement and Concrete Research, vol. 23, No. (2), pp. 453-461.
Skarendahl, A., and Petersson, O., (2001) State-of-the-Art Report of RILEM Technical
Committee 174-SCC, Self-Compacting Concrete, Report No. (23), 141 p.
Sofia Utsi, Jan-Erik Jonasson, Kjell Wallin, Tom Ekman, Development of SCC for Civil
Engineering Applications, (2003) Third International Symposium on Self-Compacting
Concrete, pp. 570-571.
Sonebi, M., Tamimi, A. K., and Bartos, P. J. M., (2003) Performance and Cracking
Behavior of Reinforced Beams Cast with Self-Consolidating Concrete, ACI Materials
Journal, vol. 100, No. (6), pp. 492-500.
171
Swedish Concrete Association, (2002) Self-Compacting Concrete, Recommendations for
Use, Concrete report No. 10(E), 84 p.
Tepponen, P., and Eriksson, B.-E., (1987) Damages in Concrete Railway Sleepers in
Finland, Nordic Concrete Research, Publication No. (6), pp. 199-209.
Texas DOT, (2004) Standard Specifications for Construction and Maintenance of
Highway, Streets, and Bridge, Texas State.
Tracy, S. L., Boyd, S. R.., and Connolly, J. D., (2004) Effect of Curing Temperature and
Cement Chemistry on the Potential for Concrete Expansion Due to DEF, PCI Journal, vol.
49, No. (1), pp. 46-57.
Washa, GW, (1998) Volume Changes and Creep, in Significance of Tests and Properties
in Concrete and Concrete Making-Materials, National Ready Mixed Concrete
Association, Silver Spring, MD, 2 pp.
Washington DOT, (2002) Standard Specifications, Washington State.
Wong, Henry H.C, and Albert K.H.Kwan, (2007). Packing Density: A Key Concept for
Mix Design of High Performance Concrete. Materials and Structures, China, pp. 689-701.
Yahia, A., Khayat, H.K., (2006) Modification of the Concrete Rheometer to Determine
Rheological Parameters of Self-Consolidating Concrete — Vane Device, 2nd
International Symposium on Concrete Through Sciences, Quebec, Canada.
172