Embed Size (px)
Citation preview
INRA - Plantes et Systèmes de
cultures Horticoles (AVIGNON)
CIRAD - FLH OR Réunion Institut National Agronomique
Station De Bassin Plat , „ Paris-GrignonEcole Doctorale ABIES
THESE
Pour obtenir le grade de
Docteur de l’institut National Agronomique Paris-Grignon
Discipline : Agronomie
présentée et soutenue publiquement par
Mathieu LÉCHAUDEL
Croissance et qualité organoleptique de la mangue (Mangifera
Indica) : analyse expérimentale et modélisation de l’effet de la
disponibilité hydrique et carbonée
Jury :
Mr B. NEY, Professeur à l’INA Paris-Grignon
Mme H. SALLANON, Professeur à l’Université Avignon
Mr J. GANRY, Directeur Adjoint, chargé des affaires scientifiques CIRAD-FLHOR
Mr P. LU, Senior Research Scientist, CSIRO (Australie)
Mr E. MALÉZIEUX, Délégué Scientifique CIRAD
Mr M. GENARD, Directeur de recherches INRA Avignon
Président
Rapporteur
Rapporteur
Examinateur
Examinateur
Directeur de thèse

Remerciements
Je remercie tout particulièrement Michel Génard qui a accepté d’encadrer ce travail, pour ses
soins attentifs et avisés au cours de ces trois années et ce malgré les difficultés liées à
Péloignement.
Je tiens à remercier les membres du jury d’avoir bien voulu analyser et étudier ce travail : je
remercie Madame Huguette Sallanon et Monsieur Jacky Ganry d’avoir accepté la lourde tâche
des rapporteurs, ainsi que Messieurs Ping Lu, Eric Malézieux et Bertrand Ney de faire partie
du jury.
Un grand merci à Magalie Jannoyer, chef du programme Arboriculture Fruitière au Cirad-
Flhor, pour la confiance qu’elle m’a accordée, pour son énergie et son soutien tout au long de
ce travail afin qu’il se déroule dans les meilleures conditions.
Je remercie Françoise Lescourret et Laurent Urban pour leurs conseils judicieux qui m’ont
toujours été d’une grande utilité. Merci pour le temps accordé et leur disponibilité.
Je dois beaucoup à la bonne volonté et à la gentillesse du personnel des stations de Bassin
Martin et Bassin Plat pour leur collaboration et leur sympathie. Mes remerciements vont entre
autre aux agents de l’équipe manguier pour le travail de terrain et l’acquisition des données.
Je me dois également de mentionner tous les stagiaires de passage pour leur aide. Je tiens à
remercier Jacques Joas, Yanis Caro et les stagiaires du Pôle Agroalimentaire (Cirad-Saint-
Denis) pour leur aide précieuse.
Une attention toute particulière à toutes les personnes de Montpellier qui m’ont apporté
conseils et soutien dans la réalisation de mon projet.
Je suis aussi reconnaissant envers tout le personnel de l’Unité PSH (Inra-Avignon) pour leur
accueil, leur soutien et les conseils qu’ils m’ont apporté lors de ma présence dans leur
laboratoire.
Enfin, je tiens à remercier mes proches pour leur soutien et leur patience tout au long de ces
trois années. Mes pensées iront droit à Anne Marie, mon épouse, qui par ses encouragements,
sa patience et sa bonne humeur m’ont permis d’avancer dans ce travail jour après jour, qu’elle
en soit ici remerciée pour tout cela.
1
à Lucas
“La vie de famille, si douce et si précieuse ...”
1
2
SommaireINTRODUCTION.....................................................................................................................................8
1 Cadre général................................................................................................................................ 9
1.1 La maîtrise de la qualité, un enjeu pour la mangue............................................... 10
1.2 Le contexte agronomique........................................................................................ 10
1.3 Le projet manguier à La Réunion............................................................................11
1.4 Objectifs et démarche de l’étude.............................................................................11
2 Facteurs influençant la croissance et l’élaboration de la qualité.............................. 13
2.1 Facteurs affectant la croissance du fruit................................................................. 13
2.1.1 Alimentation carbonée.................................................................................... 13
2.1.2 Alimentation hydrique..................................................................................... 14
2.2 Elaboration de la qualité.......................................................................................... 15
2.2.1 Alimentation carbonée.................................................................................... 15
2.2.2 Alimentation hydrique.....................................................................................16
3 La modélisation : outil d ’étude du fonctionnement du fruit.......................................18
4 Plan du travail............................................................................................................................20
CHAPITRE I : MATERIELS ET M E TH O D ES.........................................................................22
1 Conditions et dispositifs expérim entaux........................................................................... 23
1.1 Conditions expérimentales...................................................................................... 23
1.1.1 Le site expérimental de la station du CIRAD-FLHOR à Bassin P lat..........23
1.1.2 Suivi des paramètres climatiques................................................................... 23
1.2 Dispositifs expérimentaux....................................................................................... 24
1.2.1 Modification du rapport feuilles/fruit par décortication...............................24
1.2.2 Variation de l ’irrigation..................................................................................25
2 Mesures et analyses effectuées............................................................................................. 26
2.1 Caractérisation des organes sources........................................................................26
2.2 Caractérisation des organes puits............................................................................26
2.2.1 Etude de la croissance saisonnière des fru its ................................................26
2.2.2 Etude de la croissance horaire des fruits.......................................................27
2.2.3 Etude de l ’état hydrique des fru its ................................................................. 27
2.2.4 Etude de la composition biochimique des fruits............................................ 28
3
i
2.2.5 Etude du nombre de cellules à la fin de la croissance..................................28
3 Analyses statistiques................................................................................................................. 29
CHAPITRE II : EFFETS DE L ’ALIMENTATION CARBONEE ET HYDRIQUE SUR
L ’ELABORATION DE LA QUALITE DE LA M ANGUE......................................................30
1 Leaf-to-fruit ratio affects water and dry matter content in mango fruit................ 32
1.1 Introduction...............................................................................................................33
1.2 Materials and methods.............................................................................................34
1.2.1 Material and treatments.................................................................................. 34
1.2.2 Data collection and analyses..........................................................................34
1.3 RESULTS..................................................................................................................35
1.4 DISCUSSION.......................................... ................................................................36
2 Leaf to fruit ratio and irrigation supply affect seasonal changes in minerals,
organic acids, and sugars o f mango fruits.................................................................................. 38
2.1 Introduction...............................................................................................................40
2.2 Materials and methods............................................................................................ 42
2.2.1 Experimental conditions and treatments........................................................42
2.2.2 Measurements o f fruit composition................................................................42
2.2.3 Statistical analysis........................................................................................... 44
2.3 Results...................................................................................... ................................ 44
2.4 Discussion and conclusion...................................................................................... 46
2.4.1 Fruit composition and seasonal changes.......................................................46
2.4.2 Assimilate and water supply affect fruit quality............................................ 4 7
CHAPITRE III : ÉTUDE DU FONCTIONNEMENT CARBONÉ DE LA M ANGUE :
COMBINED EFFECTS OF CLIMATE AND SOURCE / SINK RELATIONS ON
MANGO FRUIT GROW TH STUDIED BY A MODELLING APPROACH.................... 50
1 Introduction................................................................................................................................ 54
2 Materials and methods.............................................................................................................57
2.1 Plant material............................................................................................................ 57
2.2 Model Presentation...................................................................................................57
2.2.1 Carbon assimilation by leaves....................................................................... 58
2.2.2 Fruit demand....................................................................................................59
2.3 Measurements of fruit growth................................................................................. 60
2.4 Measurements for parameters assessment.............................................................. 60
2.4.1 Growth and maintenance respiration o f fru it................................................60
2.4.2 Light saturated photosynthesis........................................................................62
2.4.3 Potential fruit growth and base temperature.................................................62
2.4.4 Reserves mobilisation...................................................................................... 63
2.4.5 Allometric relationships.................................................................................. 64
2.4.6 Parameters taken from the literature............................................................. 64
2.5 Model evaluation...................................................................................................... 64
2.6 Modelling Technique...............................................................................................64
2.7 Description of input data..........................................................................................65
2.8 Initial conditions....................................................................................................... 65
2.9 Description of a simulations used to assess the contribution of climate, initial
fruit dry mass, and leaf-to-fruit ratio on fruit growth and underlying physiological
processes................................................................................................................................ 65
3 R esults...........................................................................................................................................67
3.1 Estimation of model parameters..............................................................................67
3.2 Model test..................................................................................................................68
3.3 Analysis of model sensitivity to parameters.......................................................... 69
3.4 Contribution of the effects of climate, initial fruit dry mass, and leaf-to-fruit ratio
on fruit growth and underlying physiological processes....................................................70
4 Discussion.....................................................................................................................................71
4.1 Quality of adjustment and prediction of the model................................................71
4.2 How the initial fruit dry mass influences source/sink relationships?................... 71
4.3 How the leaf to fruit ratio influences source/sink relationships?..........................72
4.4 How the climate influences source/sink relationships?......................................... 73
CHAPITRE IV : ÉTUDE DU FONCTIONNEMENT HYDRIQUE DE LA MANGUE :
AN ANALYSIS OF ELASTIC AND PLASTIC FRUIT GROW TH IN RESPONSE TO
VARIOUS ASSIMILATE SUPPLIES.............................................................................................79
1....... Introduction................................................................................................................................ 83
2 Materials and methods.............................................................................................................86
5
t
2.1 Plant material............................................................................................................. 86
2.2 Model presentation....................................................................................................86
2.3 Measurements for parameter assessment................................................................90
2.3.1 Fruit surface conductance and hydraulic conductivity o f xylem .................90
2.3.2 Elastic modulus................................................................................................ 91
2.3.3 Wall extensibility (<f), yield turgor pressure (Y) and conductivity (aLj)..... 91
2.3.4 Allometric relationships.................................................................................. 92
2.3.5 Parameters o f the proportions o f osmotically-active solutes....................... 92
2.4 Measurements of fruit growth and water relations.................................................93
2.4.1 Seasonal variation o f fruit growth ................................................................. 93
2.4.2 Diurnal variation o f fruit growth....................................................................93
2.4.3 Water relations in the fruit flesh and in the stem .......................................... 93
2.5 Modelling Technique...............................................................................................94
2.6 Description of input data..........................................................................................94
2.7 Initial conditions....................................................................................................... 95
3 R esults...........................................................................................................................................96
3.1 Estimation of model parameters.............................................................................. 96
3.2 Test of the model...................................................................................................... 97
3.3 Analysis of model sensitivity to parameters..........................................................98
3.4 Elastic and plastic growth rates...............................................................................98
3.5 Effect of assimilate or water supply shortage on fruit water relations and
composition...........................................................................................................................99
4 Discussion.................................................................................................................................. 100
CHAPITRE V : MODELISATION DE L’ELABORATION DE LA QUALITE DE LA
MANGUE................................................................................................................................................ 104
1 Introduction..............................................................................................................................105
2 Matériel et méthodes..............................................................................................................107
2.1 Description des modifications apportées aux modèles utilisés.......................... 107
2.2 Matériel végétal......................................................................................................110
2.3 Mesures de croissance et de qualité..................................................................... 110
6
i
2.4 Description de l’étude virtuelle concernant l’effet de la masse initiale et de la date
de récolte sur la croissance et les critères de qualité à la récolte....................................110
3 Résultats..................................................................................................................................... 111
3.1 Test du modèle............................................................... ........................................111
3.2 Analyse par simulation de l’effet de la masse initiale et de la date de récolte... 112
4 Discussion...................................................................................................................................114
CONCLUSIONS ET PERSPECTIVES........................................................................................ 118
1 Bilan des connaissances acquises....................................................................................... 119
2 Perspectives de recherche.....................................................................................................122
2.1 Approfondissement de l’approche écophysiologique......................................... 122
2.1.1 Echelle de l ’arbre...........................................................................................122
2.1.2 Echelle du fru it...............................................................................................123
2.2 Application de l’approche de modélisation.......................................................... 125
Bibliographie...................................................................................................................................... 127
I
7

Introduction
Introduction
introduction
1 Cadre général
La mangue est un des fruits tropicaux les plus anciens, dont l’origine géographique se situe en
Asie du Sud, dans une vaste zone qui s’étend de l’Inde aux Philipines. Elle a été introduite
dans de nombreuses régions tropicales et sub-tropicales grâce aux échanges internationaux de
marchandises et aux navigateurs. La sélection de ce fruit pour améliorer sa qualité a débuté il
y a environ 4000 ans (Laroussilhe de, 1980). Il existerait environ un millier de variétés
cultivées à travers le monde (Morton, 1987). Ainsi, dans de nombreuses régions tropicales et
subtropicales, la mangue est un des fruits les plus populaires. La mangue est appréciée
gustativement et peut être un apport calorique non négligeable pour certaines populations car
elle contient des sucres (10 à 15 % de glucides dans la mangue mûre), elle est riche en
vitamines (vitamine A et C), minéraux (calcium et potassium) et anti-oxydants (beta-
carotène). Elle est également utilisée en médecine pour ses propriétés diurétiques et
diététiques.
Actuellement, la production mondiale est d’environ 25-30 millions de tonnes (1999-2000,
FAOSTAT 2000), dont 50% provient de l’Inde, 9% de Chine, et 6% du Mexique. Les
prédictions pour les années à venir sont une augmentation de la production de 50% pour 2005.
La demande en mangues est de plus en plus importante, en particulier durant ces dernières
années, de la part des consommateurs des régions tempérées, donc des zones non
traditionnelles de production. Le marché européen de la mangue est passé pour ces dix
dernières années de 44 000 tonnes (1993) à 120 000 tonnes (2000) de mangue importées, le
Brésil et le Mexique étant les principaux fournisseurs de ce marché pendant toute l’année.
Le manguier a été introduit sur l’île de La Réunion depuis l’Inde vers 1770. Il est à La
Réunion une espèce fruitière majeure, qu’on retrouve dans de nombreuses cours créoles. Le
manguier est cultivé sur la façade Ouest de l’île qui a des particularités climatiques et
pédologiques favorables à sa culture. La surface cultivée du manguier (16 % de la surface des
vergers) a été multipliée par huit en 20 ans, ce qui la situe en troisième position derrière celle
du letchi et des agrumes. Cette culture de diversification connaît ces dernières années un essor
important, en particulier pour les variétés ‘José’ (locale) et ‘Lirfa’ (floridienne) dont environ
quatre à cinq mille tonnes sont produites par an. Cet essor se concrétise sur le marché local
pour les deux variétés, mais également sur de nouveaux marchés (grande distribution et
exportation) plus rémunérateurs, en particulier pour la variété ‘Lirfa’ qui répond mieux aux
critères “export” (fermeté, forme et calibre adaptés, couleur attractive, goût). Les nouveaux
marchés sont toutefois plus exigeants en termes de qualité (calibre, goût, maturité, couleur),
d’homogénéité des produits, et de régularité de la production.
9
i
30
20 -
10 -
0
30 -
(%) 20 -
10
0
Arbre 1a /' \
/ \
/
\
i--------r \
Arbre 2
\
100 300 500
Masse fraîche fruit (g)
700
30
25
20
(%) 15
10
"8-10" "10-12" "12-14" "14-16" "16-18" "18-20" "20-22"
c l a s s e d e t e n e u r e n m a t iè r e s è c h e d e la p u lp e (%)
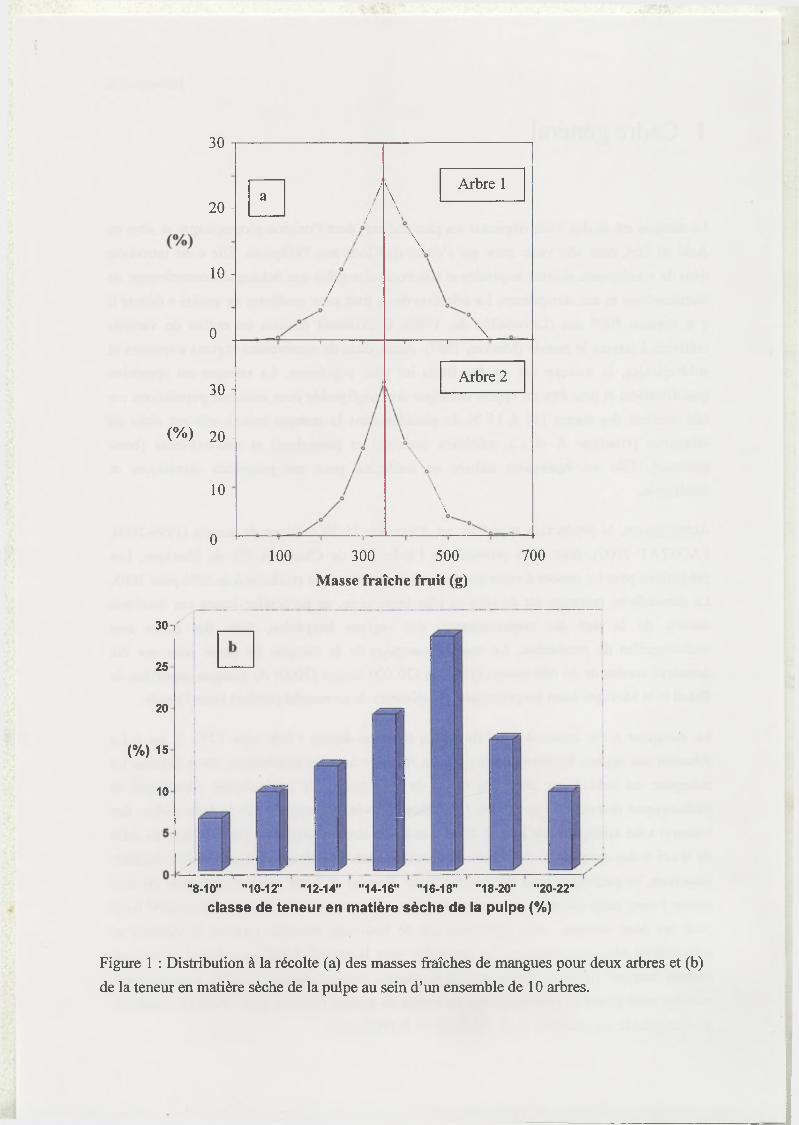
Figure 1 : Distribution à la récolte (a) des masses fraîches de mangues pour deux arbres et (b)
de la teneur en matière sèche de la pulpe au sein d’un ensemble de 10 arbres.
1.1 La maîtrise de la qualité, un enjeu pour la mangue
La notion de qualité d’un fruit varie suivant que l’on s’adresse au producteur, au distributeur
ou au consommateur. Pour le producteur, la qualité est principalement synonyme de calibre,
de précocité, et de résistance aux maladies. Le distributeur caractérise la qualité du produit par
sa durée de vie, l’homogénéité des lots de fruits et leur bonne tenue en conservation et durant
les transports. Enfin, pour le consommateur, la qualité est plutôt liée à l’aspect extérieur, au
goût et à la valeur nutritionnelle du fruit. Depuis plusieurs années, les professionnels des
filières fruitières confèrent à la qualité un statut privilégié. Ils sont intéressés par une
caractérisation plus complète de cette qualité, qui ne se limiterait pas aux critères dits
d’attractivité, comme le calibre et la coloration, mais à des critères liés à la qualité
organoleptique du fruit. Cette démarche fait suite à une attention plus particulière que les
consommateurs portent sur la spécificité gustative des fruits et sa non standardisation.
Ces considérations générales sur la volonté de mieux maîtriser la qualité des fruits
s’appliquent à la culture du manguier dont la demande en produits de qualité est en pleine
expansion aussi bien sur les marchés du Nord que du Sud. Pour répondre à ces enjeux, il est
nécessaire de mieux comprendre les mécanismes qui interviennent dans l’élaboration de la
qualité des fruits, et leurs possibles interactions.
1.2 Le contexte agronomique
La culture du manguier est limitée par (i) une faible productivité, due à une floraison
alternante (Singh, 1960), à des variations fortes du nombre d’inflorescences et à une
fructification fréquemment très inférieure à la floraison (Chaikiattiyos et al., 1994), et (ii) une
hétérogénéité des fruits produits (Jannoyer and Lauri, 2002a; Jannoyer and Lauri, 2002b),
conduisant à une mauvaise valorisation de la production. Il en résulte alors une variabilité
importante de la production et de la qualité organoleptique des fruits au sein d’une même
parcelle et d’un même arbre. On observe notamment une forte hétérogénéité de critères de
qualité simples à mesurer, comme le calibre (Figure la) et la teneur en matière sèche (Figure
lb) des fruits. Cette variabilité intra-arbre de la qualité des fruits oblige le producteur à
réaliser un tri sévère des fruits récoltés avant leur commercialisation car la mise sur le marché
des fruits implique l’utilisation de produits homogènes et de qualité. L’analyse de cette
variabilité est une étape préalable à la recherche de solutions techniques pour la maîtriser.
Introduction
10
1.3 Le projet manguier à La Réunion
Dans ce contexte général et pour répondre à une demande de plus en plus insistante fois des
producteurs des pays du sud sur les techniques et les modes de gestion intégrés, productifs et
durables en arboriculture fruitière tropicale, une équipe de recherche a été constituée en 2000
et a bénéficié d’une ATP (Action Thématique Programmée du CIRAD) avec pour objectif la
maîtrise de la production et de l’élaboration de la qualité organoleptique des fruits chez le
manguier. L’influence déterminante de l’alimentation carbonée est l’hypothèse principale
retenue pour le fonctionnement du manguier et sa production. Une approche couplant la mise
en place d’expérimentations sur les processus qui participent à la mise en production et à
l’élaboration de la qualité organoleptique, et l’utilisation des outils de modélisation du
fonctionnement de ces processus a été choisie. L’équipe s’organise autour de trois
thématiques principales complémentaires : l’organisation architecturale et la structure de
l’arbre, l’environnement lumineux et l’acquisition de carbone par la couronne, et la gestion du
carbone et de l’eau à différentes échelles (fruit, rameau, arbre) qui ont été associés pour mieux
rendre compte de la variabilité spatio-temporelle conditionnant de façon importante la
floraison, la production et la qualité organoleptique des fruits et afin de proposer des
techniques permettant de mieux maîtriser cette variabilité.
Mon travail de thèse concerne l’étude des processus qui participent à l’élaboration de la
qualité organoleptique de la mangue et des facteurs responsables de la variabilité de la qualité
dans la plante, dans le but de maîtriser la qualité du finit au champ. Ces travaux ont été menés
au sein de l’équipe du Pôle Fruits, Maraîchages et Plantes Aromatiques (CIRAD-Flhor) située
à Saint Pierre (île de La Réunion), en collaboration avec l’unité PSH (Plantes et Systèmes de
culture Horticoles) à l’INRA Avignon.
1.4 Objectifs et démarche de l’étude
Le travail de thèse a porté sur l’étude des processus physiologiques qui participent à
l’élaboration de la qualité organoleptique de la mangue, sous l’influence de facteurs
agronomiques et environnementaux. La démarche développée vise à intégrer les
connaissances acquises expérimentalement sur les processus physiologiques dans des
modèles. Un objectif important est de prendre en compte les possibles interactions entre les
critères de qualité, et d’analyser les causes de variabilité de la qualité des fruits sur un même
arbre. L’échelle de travail choisie est le rameau fructifère qui porte les fruits et les feuilles
assimilatrices. Ce choix repose sur le fait que le rameau fructifère est (i) l’unité de production
et de gestion des arboriculteurs, (ii) une unité relativement autonome dans la plante (Sprugel
et al., 1991).
Introduction
11
i

In troduction
Notre approche doit nous permettre d’analyser dans des conditions contrastées d’alimentation
en eau et en carbone :
> le fonctionnement hydrique et carboné de la mangue qui permet sa croissance,
> l’accumulation des sucres, acides et minéraux qui participent à l’élaboration de la
qualité organoleptique de la mangue,
et d’intégrer ces résultats dans un modèle de prédiction des caractéristiques du fruit à la
récolte (masse fraîche, qualité gustative, indicateurs de la durée de conservation).
2 Facteurs influençant la croissance et l’élaboration de
la qualité
introduction
La variabilité de la qualité des fruits semble fortement liée à celle de leur croissance. La
croissance détermine directement un critère de qualité comme le calibre et la qualité gustative
du fruit dépend du niveau de croissance. Ainsi chez la pêche, les fruits ayant une croissance
plus longue et plus importante sont les plus sucrés et les moins acides (Génard et al., 1991).
Un fruit est composé en majorité d’eau et de sucres, qui représentent respectivement environ
85 % et 12 % de sa masse fraîche à maturité. L’azote est un composé qui n’est pas très
abondant dans le fruit (en moyenne 0.1 % de la masse fraîche d’une mangue). La nutrition
azotée influe sur la croissance du fruit en agissant sur l’alimentation carbonée de ce dernier
(Habib et al., 1996). Toutefois, l’azote ne semble pas être l’élément qui influence en priorité
la croissance et la qualité des fruits. Par contre, les résultats de recherches concernant l’action
du carbone et de l’eau sur la croissance et la qualité des fruits de nombreuses espèces
soulignent l’importance de ces deux éléments (Miller et al., 1998; Mills et al., 1996; Simmons
et al., 1998; Souty et al., 1999).
2.1 Facteurs affectant la croissance du fruit
2.1.1 Alim entation carbonée
Souty et al. (1999) montrent que la croissance de pêches augmente avec le nombre de feuilles
par fruit. Chacko et al. (1982) obtiennent les mêmes résultats sur différentes variétés de
mangues (Dashehari, Langra et Totapuri). L’hypothèse de ces relations est la disponibilité en
assimilais carbonés qui est liée à la surface de feuilles par fruit et à la photosynthèse des
feuilles. Des travaux ont montré un effet positif de la charge en fruits sur la photosynthèse
foliaire chez de nombreuses espèces fruitières, comme la pomme (Palmer, 1992), le raisin
(Naor et al., 1997), la pêche (Ben Mimoun et al., 1996) et la mangue (Urban et al., 2002). Cet
effet est attribué à la régulation de la photosynthèse par la force de puits, associée à
l’accumulation des assimilais carbonés dans la feuille (Foyer, 1988). Dans des conditions de
disponibilité carbonée limitante, Chacko et al. (1982) ont noté une diminution des réserves
dans les feuilles. Ceci indique une utilisation rapide des produits de la photosynthèse et une
mobilisation des réserves précédemment accumulées pour permettre la croissance des fruits se
développant dans ces conditions (Reddy and Singh, 1991).
13
i
La croissance résulte pour l’essentiel des importations d’eau et de carbone par les flux
xylémien et phloémien et des pertes d’eau par transpiration (Ho et al., 1987; Lee, 1990). Pour
tenter d’expliquer les variations de croissance chez la tomate, Guichard (1999) a caractérisé
les effets d’une variation de la charge en fruits (nombre de fruits par bouquets) sur les
différents flux entrant et sortant du fruit. Cet auteur souligne qu’une modification de
l’équilibre source/puits a des effets significatifs sur ces différents flux. Ainsi, de faibles
charges en fruits augmentent surtout les flux entrant dans le fruit et dans une moindre mesure
les flux sortants. Les fruits reçoivent alors plus d’eau et de carbone et ont une croissance plus
rapide.
Les flux d’eau et de carbone sont contrôlés par des gradients de potentiel hydrique et de
concentrations. La pression osmotique du fruit est particulièrement sensible à la variation de
la concentrations des sucres qui ont un pouvoir osmotique fort, comme les hexoses (Mitchell
et al., 1991). Le potentiel hydrique foliaire est lié à la disponibilité de l’eau dans la plante et
aux pertes d’eau par transpiration qui sont régulées par la conductance stomatique de la
feuille. Les potentiels hydriques des feuilles et des fruits suivent généralement les mêmes
tendances (Syversten and Albrigo, 1980). Des auteurs, comme McFadyen et al. (1996), ont
noté que le potentiel hydrique des feuilles, celui du fruit et la pression osmotique du fruit
diminuaient dans les conditions d’une forte charge en fruits. La pression de turgescence des
fruits est alors réduite. Dans ces conditions, une réduction de la taille des fruits a été
également observée. Ainsi, pour ces auteurs, la variation de la charge en fruits des arbres
modifierait le fonctionnement hydrique des fruits, ce qui aurait un impact direct sur leur
croissance.
2.1.2 Alim entation hydrique
Des études sur les arbres fruitiers soulignent l’effet du stress hydrique sur la croissance des
fruits qui se traduit principalement par une réduction de leur taille, de leur poids frais et une
augmentation des teneurs en solutés (Berman and Dejong, 1996; Mills et al., 1996). Un stress
hydrique induit des modifications des relations hydriques chez la pomme (Mills et al., 1997)
et les agrumes (Huang et al., 2000; Yakushiji et al., 1998) qui se traduisent par une
diminution de leur potentiel hydrique, et de leur potentiel osmotique. Les auteurs suggèrent
que lors d’un stress hydrique, la pomme est capable d’ajuster son potentiel osmotique et de
maintenir sa turgescence. La contribution des acides organiques et l’accroissement de la
concentration en sucres dans le fruit pourraient permettre d’expliquer l’ajustement osmotique
du fruit (Mpelasoka et al., 2001; Yakushiji et al., 1998).
D’autres auteurs confirment ces observations sur pêcher et poursuivent plus particulièrement
la réflexion sur la mise en place d’un stockage plus important des sucres dans les fruits placés
en conditions de déficit hydrique. Ils suggèrent que l’acide abscissique, induit lors d’un stress
Introduction
14
Introduction
hydrique, intervient dans l’accroissement du processus d’accumulation des sucres (Kobayashi
and Us Salam, 2000). D’après Peel (1965), les facteurs qui affectent le potentiel hydrique
xylémien ont un effet direct sur la translocation du phloème. La croissance du fruit étant pour
de nombreuses espèces majoritairement déterminée par le flux phloémien (Erhet and Ho,
1986; Grange and Andrews, 1994), des modifications du potentiel hydrique dans la tige
influenceraient fortement la croissance du fruit.
Les effets de la transpiration sur la croissance du fruit a été étudiée. Lescourret et al. (2001)
ont simulé la croissance en matière fraîche et l’état hydrique de la pêche au cours d’une
saison. Un des résultats est que plus la perméabilité cuticulaire à l’eau est faible, plus la masse
fraîche du fruit est importante. Ils remarquent également avec les simulations que
l’augmentation de la perméabilité au cours du développement du fruit pourrait être
responsable de l’arrêt de la croissance du fruit. Li et al. (2001) ont modifié l’environnement
proche des fruits en les recouvrant d’un film plastique. La transpiration du fruit et sa
croissance en masse sèche s’en trouvent réduites. Ainsi, la modification d’un des flux
intervenant au niveau du fruit semble induire des variations des autres flux, ce qui n’est pas
sans conséquence pour la croissance et la qualité du fruit.
2.2 Elaboration de la qualité
2.2.1 Alim entation carbonée
Les flux d’assimilats influencent fortement la composition et donc la qualité des fruits (Souty
et al., 1999; Volz et al., 1993). Chez la pêche, l’accumulation du saccharose augmente avec le
nombre de feuilles par fruit. Des indicateurs de la qualité gustative comme le rapport entre les
concentrations en acide malique et acide citrique, et l’acidité titrable présentent des allures
bien différentes selon la charge en fruits (Poil et al., 1996; Wu et al., 2002). Les fruits qui se
sont développés dans des conditions de faible rapport feuilles/fruit sont plus acides au goût à
maturité. La chair de ces fruits contient en fait des teneurs en saccharose plus faibles et en
acide citrique plus importantes, ce qui modifie le rapport sucres/acides (Souty et al., 1999).
Simmons et al. (1998) ont complété ce type d’étude chez une variété de mangue, Kensington
Pride, en caractérisant les effets de rapports feuilles / fruit variables sur la concentration en
éléments minéraux et certains critères de qualité (coloration, fermeté, sucres solubles totaux et
acidité de la pulpe). Ces auteurs s’intéressent plus particulièrement au calcium. Le calcium est
en effet associé à la qualité du fruit par son rôle sur le mûrissement et la sénescence
(Ferguson, 1984). Il retarderait la mise en place de ces deux processus et réduirait les
désordres physiologiques au cours de la conservation des fruits (Bangerth, 1979). Les
résultats de leurs travaux montrent qu’un équilibre optimal entre la taille, la qualité du fruit et
la teneur en calcium est atteint pour un rameau comportant 60 feuilles par fruit.
15
I
Conditions climatique^ (Rg, T, C02)
Photosynthèse
1: jsPool de carbohydrates
calibre
Irrigation
R a p p o n \ Feuilles:Fruit/
r
Etat hydrique de la plante
Flux d’eaiyi et minéraux
composition minéralequalité gustative
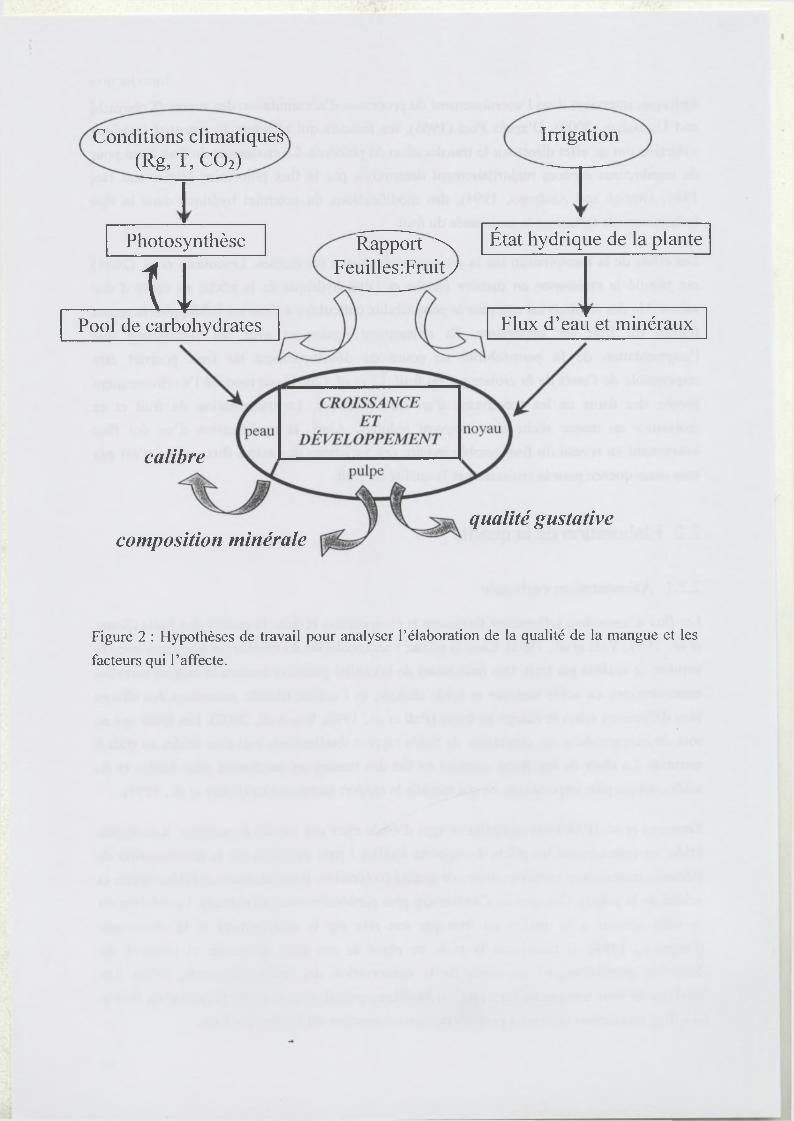
Figure 2 : Hypothèses de travail pour analyser l’élaboration de la qualité de la mangue et les
facteurs qui l’affecte.
Les résultats de Poll et al. (1996) suggèrent qu’une meilleure disponibilité de la fourniture en
assimilais, due en particulier à un rapport feuilles/fruit élevé, entraîne une augmentation de
l’accumulation des précurseurs des acides gras aromatiques et des arômes dans la pomme. La
voie métabolique du shikimate est importante car elle relie le métabolisme de composés
secondaires, comme certaines vitamines, au métabolisme des sucres (Jensen, 1985). Ainsi, des
variations de la disponibilité en assimilais carbonés peuvent modifier le métabolisme de ces
composés secondaires qui participent à l’élaboration de la qualité nutrítionnelle du fruit.
2.2.2 Alim entation hydrique
Un déficit hydrique appliqué au cours de la saison a des conséquences sur la qualité du fruit.
Un accroissement des concentrations en sucres est généralement observé au moment où le
déficit hydrique commence à être marqué, chez la pomme (Kilili et al., 1996), la mandarine
(Yakushiji et al., 1998) et la baie de raisin (Esteban et al., 1999). L’acidité du fruit, et plus
particulièrement les teneurs en acides citrique et malique peuvent être affectées par des
variations de l’alimentation hydrique (Gonzàlez-Altozano and Castel, 1999; Wu et al., 2002).
Cet effet de l’alimentation hydrique peut être dû à une réduction du transport des acides vers
le fruit (Andersen et al., 1995) ou à une dilution des acides dans le fruit (Mpelasoka et al.,
2000). Les concentrations en éléments minéraux, comme le calcium sont plus faibles dans les
fruits exposés à un stress hydrique (Behboudian et al., 1994; Mills et al., 1994). La fermeté du
fruit et la pigmentation de la peau varient également avec l’alimentation hydrique (Mills et
al., 1994). L’apparition plus rapide de la couleur rouge de la peau est due aux anthocyanes
dont la synthèse nécessite du saccharose, sucre s’accumulant plus rapidement dans les fruits
d’arbres non irrigués, et à la réduction de la teneur en azote qui est un constituant des
pigments chlorophylliens. L’application d’un stress hydrique semble avoir tendance à
améliorer certains critères de qualité et à accélérer la maturité des fruits.
Introduction
Ces différentes expérimentations montrent que l’alimentation carbonée influence la croissance
par ses effets sur les relations sources/puits. Au niveau des sources, la photosynthèse et la
mise en réserves ou leur mobilisation peuvent être affectées (Figure 2). Au niveau des puits, la
disponibilité des assimilais carbonés joue sur les flux de carbone, mais aussi fortement sur les
flux d’eau entrant et sortant du fruit et par conséquent sur l’état hydrique du fruit (Figure 2).
L’alimentation carbonée et hydrique affecte l’élaboration de la qualité organoleptique du fruit
principalement par leurs effets sur la composition du fruit en sucres, acides organiques et
éléments minéraux (Figure 2). Dans mon travail de thèse, je me suis tout d’abord intéressé à
vérifier ces hypothèses (Figure 2) généralement établies pour des fruits tempérés, sur un fruit
tropical, la mangue, en considérant les différents compartiments du fruit (peau, pulpe, noyau).
Ce fruit possède en outre un noyau plus volumineux que ce qui est habituellement rencontré
16
i

chez les fruits consommés. Il était donc important d’en étudier les coûts de construction. Nous
avons analysé le couplage de l’accumulation de l’eau et du carbone dans les différents
compartiments du fruit, puis les conséquences de ce couplage sur l’élaboration de la qualité
dues aux effets sur la teneur en matière sèche, sur la proportion de parois, et sur la teneur des
principaux composés. Ensuite, l’analyse des processus impliqués dans la croissance et
l’élaboration de la qualité et affectés par la disponibilité hydrique et carboné est réalisée par
une approche intégrée de manière à prendre en compte les interactions entre les processus.
Pour cette intégration, nous avons utilisé l’outil de modélisation.
Introduction
17
Introduction
3 La modélisation : outil d ’étude du fonctionnement du
fruit
La modélisation peut être un outil puissant pour analyser les processus physiologiques et leurs
interactions. Dans le cadre du système complexe qu’est le rameau fructifère, le modèle doit
prendre en compte les principaux processus impliqués dans le fonctionnement carboné du
rameau et du fruit (photosynthèse, dynamique des réserves, allocation des assimilats,
composition et croissance du fruit) et dans leur fonctionnement hydrique (flux d’eau entrant et
sortant, et état hydrique du rameau et du fruit).
La croissance des fruits a été modélisée à de nombreuses reprises par différentes approches.
Certains auteurs ont utilisé une approche stochastique de la vitesse de croissance (Hall et al.,
1996). Toutefois, la partie végétative de la plante n’est pas prise en compte ce qui limite
l’étude de l’effet des conditions climatiques et des pratiques culturales sur la croissance du
fruit. De plus, l’extrapolation de ces modèles empiriques à d’autres espèces ou d’autres
environnements (localisation, climat) peut parfois poser des problèmes. Une autre approche,
basée sur la description de l’assimilation et de l’allocation du carbone, qui inclut l’effet des
conditions climatiques, a été proposée sur kiwi (Buwalda, 1991) et pêche (Grossman and
Dejong, 1994). Ces modèles qui regroupent les organes de la plante en compartiment (fruits,
feuilles, tiges et racines), ne permettent pas la prise en compte de la variabilité au sein d’un
même arbre. Pour pallier cette limitation, la modélisation du fonctionnement carboné d’un
rameau fructifère a été proposée sur pêcher (Lescourret et al., 1998). Ce modèle permet de
rendre compte de la variabilité de la croissance en matière sèche du fruit selon les conditions
d’environnement lumineux et d’alimentation carbonée du rameau (Génard et al., 1998).
Les flux d’eau entrant dans le fruit et les flux de transpiration ont été représentés soit par une
approche empirique (Génard and Huguet, 1996; Lee, 1990), soit par une approche mécaniste
de type biophysique (Fishman and Génard, 1998). Cette dernière approche représente les
échanges d’eau et de matière sèche entre la plante et le fruit en considérant les flux
phloèmiens et xylémiens, et entre le fruit et son environnement en tenant compte des pertes de
carbone et d’eau par respiration et transpiration. La croissance irréversible et l’état hydrique
du fruit sont modélisés en appliquant la théorie de la croissance cellulaire pilotée par la
pression de turgescence, proposée par Lockhart (1965).
18
i
L’élaboration de la qualité a été peu modélisée. Des modèles mécanistes d’accumulation des
sucres (Génard and Souty, 1996) et des acides (Lobit et al., 2003) chez la pêche ont été
proposés.
La modélisation peut permettre d’analyser les effets de pratiques culturales, liées à l’irrigation
ou à la charge en fruit, sur la croissance (Doyle et al., 1989; Fishman and Génard, 1998;
Génard and Huguet, 1996; Lescourret et al., 1998) et sur la qualité des fruits (Génard et al.,
2003).
Les bases de certains de ces modèles (Fishman and Génard, 1998; Lescourret et al., 1998) ont
été reprises dans le cadre de cette thèse pour développer un modèle de fonctionnement
carboné et hydrique pour le rameau de manguier. Le modèle construit au cours de la thèse a
été utilisé dans des études virtuelles. Ces dernières permettent de bien contrôler des facteurs
internes à la plante et de faire varier chaque facteur un par un pour une étude complète des
effets du climat, de facteurs internes à la plante et de facteurs affectant les relations
sources/puits (alimentation carbonée et hydrique) sur les processus physiologiques impliqués
dans la croissance et l’élaboration de la qualité de la mangue. Cette approche intégrative est
nécessaire pour envisager le pilotage des pratiques culturales, comme l’irrigation et celles
influençant l’alimentation carbonée, par des simulateurs ayant pour objectif la maîtrise de la
qualité organoleptique.
Introduction
I
19
Introduction
4 Plan du travail
Dans une première partie, le fonctionnement carboné et hydrique de la mangue est présenté à
travers une étude descriptive. Une première étude porte sur l’effet de la disponibilité carbonée
(en faisant varier le rapport feuilles/fruit) sur l’accumulation de la matière sèche mais
également de l’eau dans les différents compartiments du fruit (peau, pulpe, et noyau). Cette
partie permet de proposer des relations empiriques entre la masse d’eau et la masse sèche de
chaque compartiment et de formaliser de manière descriptive le lien entre l’alimentation
carbonée et l’eau dans la mangue. Une deuxième étude descriptive porte sur l’effet de
l’alimentation carbonée et hydrique (en faisant varier le rapport feuilles/fruit et l’irrigation)
sur la composition biochimique de la mangue en croissance. Cette étude nous a permis de
préciser si ces facteurs influencent l’élaboration de la qualité chez la mangue, et quels sont les
critères de qualité les plus affectés (teneur en matière sèche, sucres, acides organiques,
éléments minéraux).
Dans une deuxième partie, l’étude du fonctionnement carboné de la mangue au niveau du
rameau fructifère est abordée. L’assimilation de carbone, sa régulation par la demande des
puits, et la dynamique des réserves, ont été caractérisées au niveau des sources. Au niveau des
puits, l’allocation de carbone, les coûts de constructions des principaux compartiments (la
peau, la pulpe et le noyau) et la croissance en masse sèche du fruit ont été déterminés. Nous
avons analysé l’activité “puits” d’un fruit qui dépend des conditions de sa croissance dans le
passé et de la taille initiale du puits. Une étude virtuelle basée sur la modélisation de la
croissance en matière sèche du fruit nous a permis de quantifier les effets des conditions
climatiques, de pratiques culturales, de facteurs internes à la plante et des interactions entre
ces facteurs sur les processus physiologiques impliqués dans la croissance du fruit.
Dans une troisième partie, nous présentons l’étude du fonctionnement hydrique de la mangue.
Des expérimentations ont été mises en place sur la croissance en volume du fruit, l’état
hydrique du rameau et du fruit pour analyser les propriétés plastique et élastique de la
mangue. Ces expérimentations nous ont permis de proposer des lois de variation des
paramètres liés à la plasticité et à l’élasticité des tissus et de construire un modèle du
fonctionnement hydrique du fruit capable de rendre compte de la croissance plastique et
élastique de la mangue. Les résultats de l’expérimentation sur l’élaboration de la qualité du
fruit ont été introduits dans ce modèle pour construire un modèle empirique de la composition
biochimique de la pulpe qui permet d’en calculer le potentiel osmotique. Ce modèle de
fonctionnement hydrique du fruit est également utilisé pour simuler l’autre composante de
l’état hydrique du fruit, la pression de turgescence. La modélisation du fonctionnement
20
i
hydrique de la mangue a permis au cours d’une étude virtuelle d’analyser l’effet d’une
réduction de la disponibilité carbonée et hydrique sur la croissance, les relations hydriques et
la composition biochimique du fruit.
Dans une quatrième partie, nous présentons l’intégration des deux modèles sur le
fonctionnement carboné et hydrique du fruit dans un modèle global au niveau du rameau
fructifère. Ce modèle global est utilisé pour simuler la croissance en matière fraîche de la
mangue. Il prédit différents critères de qualité à la récolte, comme le masse fraîche, les
concentrations en sucres, acides et éléments minéraux, et l’évolution de la saveur sucrée et
acide du fruit.
introduction
21
Chapitre I : Matériels et méthodes
Matériels et méthodes
Chapitre I : Matériels et méthodes
22
I
oo
<DCca>>.oEo>k.3re■—-o>o.Ea>
tu>sre"3k_ú)Ï5I3X
35.0
33.0
31.0
29.0
27.0
25.0
23.0
21.0
19.0
17.0
15.025
3500
3000
.2 2500
2000
1500
1000
500
0
Eo
recL-3O«jAOO)c0)Eaicco>.reOC
— 2000-2001 (f1) — 2000-2001 (f2)
2001-2002 (f1)— 2002-2003 (f1)— 2002-2003 (f2)
45 65 85 105 125
Jours après pleine floraison
145 165
65 85 105 125
Jours après pleine floraison
2000-2001 (f1) 2000-2001 (f2) 2001-2002 (f1) 2002-2003 (f1)
— 2002-2003 (f2)
165
— 2000-2001 (f1) I— 2000-2001 (f2) ! ;
2001-2002 (f1 ) ! j— 2002-2003 (f1) I — 2002-2003 (f2)
25 45 65 85 105 125
Jours après pleine floraison
145 165
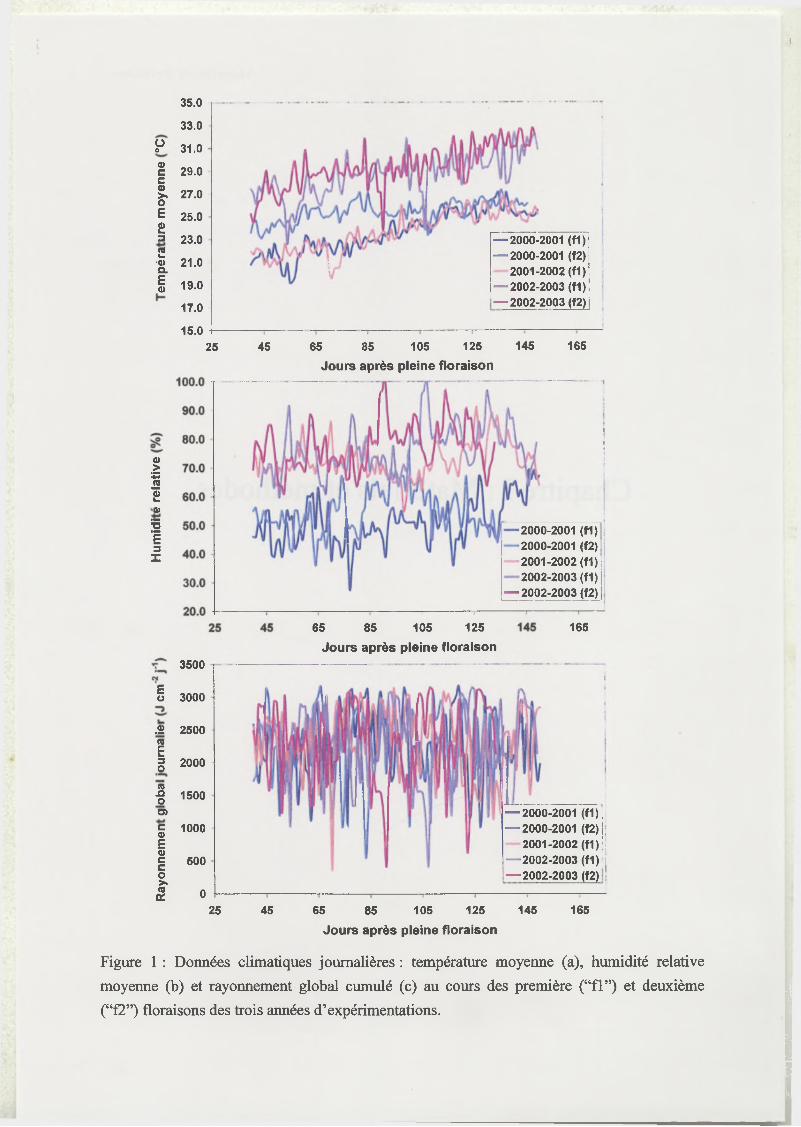
Figure 1 : Données climatiques journalières : température moyenne (a), humidité relative
moyenne (b) et rayonnement global cumulé (c) au cours des première (“f l”) et deuxième
(“f2”) floraisons des trois années d’expérimentations.
Matériels et méthodes
1 Conditions et dispositifs expérimentaux
1.1 Conditions expérimentales
1.1.1 Le site expérimental de la station du CIRAD-FLHOR à Bassin Plat
Le verger d’expérimentation se trouve sur la station CIRAD de Bassin Plat, à Saint Pierre (Ile
de la Réunion, 20°52’48” S, 55°31’48” E), à une altitude d’environ 150 m. Ce verger de
manguiers (Mangifera indicae) du cultivar “Lirfa” est constitué d’arbres âgés de 11 ans (en
2000), greffés sur le porte-greffe “Maison Rouge”, caractérisé par un enracinement puissant
favorisant une bonne résistance aux vents cycloniques et à la sécheresse. Le cultivar “Lirfa”
offre des avantages très intéressants pour les arboriculteurs : c’est un cultivar précoce dont la
récolte est groupée entre le 15 décembre et le 15 février, pouvant ainsi éviter des pertes de
production causées durant la période cyclonique de fin janvier à mi-mars et minimisant
égalemenent les impacts de la bactériose (Xanthomonas campestris pv. Mangiferaeindicae).
Le verger est séparé en deux par une haie d’acacia brise-vent. La parcelle 1 de ce verger est
composée de 10 rangées comprenant chacune 8 à 9 manguiers, dont l’espacement est de 4 m
entre les arbres de la même rangée, et de 6 m entre les arbres de deux rangées voisines. La
parcelle 2 de ce verger est composée de 8 rangées dont l’espacement entre les arbres est de 5
m sur une même rangée, et de 6 m entre les rangées. Les arbres ont atteint une hauteur
d’environ 3 m. La parcelle 1 a été utilisée pour les expérimentations en 2000 et 2002, alors
que la parcelle 2 a accueilli les expérimentations en 2001 et 2002.
1.1.2 Suivi des paramètres climatiques
1.1.2.1 Données météorologiques de la station du CIRAD
Les données climatiques journalières (température moyenne, rayonnement global cumulé, et
humidité relative moyenne) enregistrées sur la station météorologique du CIRAD située sur le
site de Ligne Paradis (Saint Pierre), au cours des trois années d’expérimentation sont
présentées en Figure 1. La saison de croissance 2002-2003 se caractérise par des températures
et des humidités relatives plus élevées. Les températures les plus fraîches ont eu lieu au cours
de la saison de croissance 2000-2001 issue de la première floraison et de la saison 2001-2002.
La saison 2000-2001 se caractérise par une atmosphère plus sèche, quelque soit l’origine des
fruits (première ou deuxième floraison). Peu de différences entre saisons se dégagent des
23
I
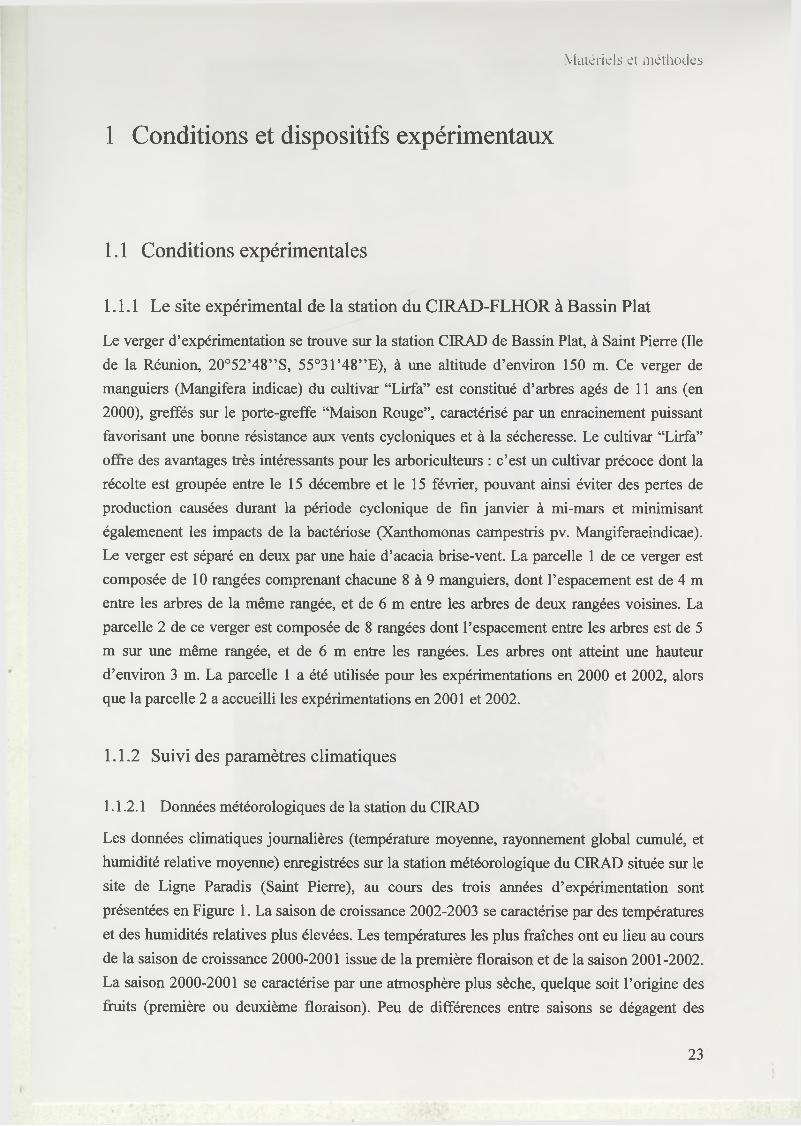
Figure 2 : Vue d’un rameau décortiqué (a) sur lequel les mangues (b) sont repérées pour
l’étude de leur croissance et de leur qualité.
données de rayonnement global journalier qui semblent être très variable au cours d’une
même saison de croissance.
1.1.2.2 Mesure du climat au voisinage du couvert
Une station météorologique a été installée en 2001 dans le verger d’expérimentation. Un
capteur de rayonnement (PAR, Photosynthetically Active Radiation) a été placé au dessus du
couvert, et des capteurs de température et d’humidité de l’air ont été installés dans le couvert
(environ à 2 m).
Les données acquises par la station du CIRAD et par la station sur la parcelle
d’expérimentation ont été comparées. Les résultats ont montré que les données
météorologiques des deux stations sont comparables. Nous avons choisi d’utiliser les données
acquises sur la station météorologique du CIRAD pendant toute mon étude.
Le climat au voisinage du fruit a été caractérisé par des mesures de température moyenne. Des
thermocouples (cuivre-constantan) ont été installés à la surface de ces fruits. Les résultats
montrent que la différence entre la température de l’air et celle de la surface du fruit n’est pas
très importante. En première approximation, la température de l’air a été considérée comme
une bonne estimation de celle du finit.
1.2 Dispositifs expérimentaux
Chaque année, un suivi de la floraison a été effectué de manière à noter les floraisons
successives, et la date pour laquelle 50 % des inflorescences étaient ouvertes, qui correspond
à la pleine floraison. Cette date est choisie comme le point de départ du développement du
fruit.
1.2.1 M odification du rapport feuilles/fruit par décortication
Généralement, six semaines après la floraison, entre 10 et 15 branches par arbre sont repérées,
situées le plus souvent dans les parties supérieures du couvert pour réduire la variabilité de
l’éclairement reçu par les feuilles qui influence leur activité photosynthétique (comm. pers.,
L. Urban), et affecte alors l’assimilation nette de carbone et la croissance du fruit. Une
annélation est pratiquée à la base du rameau étudié afin de l’isoler du reste de l’arbre du point
de vue du fonctionnement carboné. La décortication annulaire consiste à enlever le phloème
sur une largeur de 10 à 15 mm à l’aide d’un greffoir (Figure 2a). Le xylème reste intact, les
flux hydriques sont donc conservés en grande partie. Selon le traitement “nombre de feuilles
par firuit”, quelques fruits ou feuilles peuvent être retirés du rameau fructifère. Toutefois un
Matériels et méthodes
24
I
Matériels et méthodes
seul fruit par panicule est conservé pour éviter la compétition entre les fruits au sein de la
même panicule (Figure 2b). Durant la croissance du fruit, les pousses végétatives qui
apparaissant sur les rameaux sont retirées pour conserver un rapport feuilles/fruit constant. La
décortication du rameau a lieu quand la longueur du fruit est d’environ 5 cm. A ce stade de
développement, la chute physiologique des fruits qui diminue fortement le nombre de fruits
restants par rameaux, est terminée.
1.2.2 Variation de l ’irrigation
Nos expérimentations, en 2000 et 2002, ont été conduites dans des conditions d’arrosage non
limitantes. Tous les deux jours, une irrigation correspondant à la somme de
l’évapotranspiration de ces deux journées était effectuée. En 2001, un traitement “non irrigué”
a été appliqué sur une partie des arbres de la parcelle, l’autre partie des arbres étant irriguée de
façon non limitante dans les mêmes conditions que les deux autres années. Dans le traitement
“non irrigué”, l’irrigation a été arrêtée un mois après la pleine floraison. Les arbres ont alors
reçu uniquement de l’eau provenant des précipitations, soit environ 170 mm entre la mise en
place du traitement “non irrigué” et la fin de la saison de croissance des fruits. La parcelle a
été divisée en six blocs de 9 arbres, de manière à ce que les fruits étudiés soient portés par un
arbre entouré de huit arbres recevant le même traitement d’irrigation. Le même traitement
d’irrigation a été appliqué sur trois blocs différents.
!
25
Matériels et méthodes
2 Mesures et analyses effectuées
2.1 Caractérisation des organes sources
Partie détaillée dans le Chapitre III Combined effects o f climate and source / sink relations
on mango fruit growth studied by a modelling approach.
Nous avons mesuré l’activité photosynthétique des feuilles des rameaux décortiqués en 2000,
2001 et 2002 (travail piloté par Laurent Urban). Les mesures effectuées en 2000 et 2001 sur
les feuilles des traitements 25, 50 et 100 ont été utilisées pour obtenir la relation entre la
photosynthèse à rayonnement saturant et la demande des fruits. Quelque soit le dispositif
utilisé, la méthode de mesure de la photosynthèse était la même.
La surface foliaire totale du rameau a été obtenue par une relation allométrique établie avec le
nombre de feuilles, à partir de données acquises dans le cadre de l’ATP (Action Thématique
Programmée) CIRAD.
Au cours des expérimentations menées en 2000, nous avons récolté les feuilles sur lesquelles
les mesures de photosynthèse ont été effectuées et le bois des rameaux correspondants. La
biomasse fraîche de chaque compartiment était pesée, puis un échantillon était séché dans une
étuve ventilée à 70°C, puis pesé. Un autre échantillon était lyophilisé, puis des analyses de
son contenu en sucres solubles et amidon étaient réalisées pour déterminer les réserves de
chaque compartiment.
2.2 Caractérisation des organes puits
2.2.1 Etude de la croissance saisonnière des fruits
Partie détaillée dans le Chapitre III Combined effects o f climate and source / sink relations
on mango fruit growth studied by a modelling approach.
Nous avons étudié la croissance des fruits à partir de deux méthodes : soit par un suivi toutes
les semaines des trois dimensions (diamètre, largeur et longueur) du même fruit au cours de la
saison (“suivi non destructif’) à l’aide d’un pied à coulisse électronique à affichage digital,
soit par des pesées de fruits récoltés à des dates successives au cours de la saison (“suivi
destructif’). En 2000, les fruits pesés lors du “suivi destructif’ ont également été mesurés de
26
Aiguille
Capteur de iéplacement
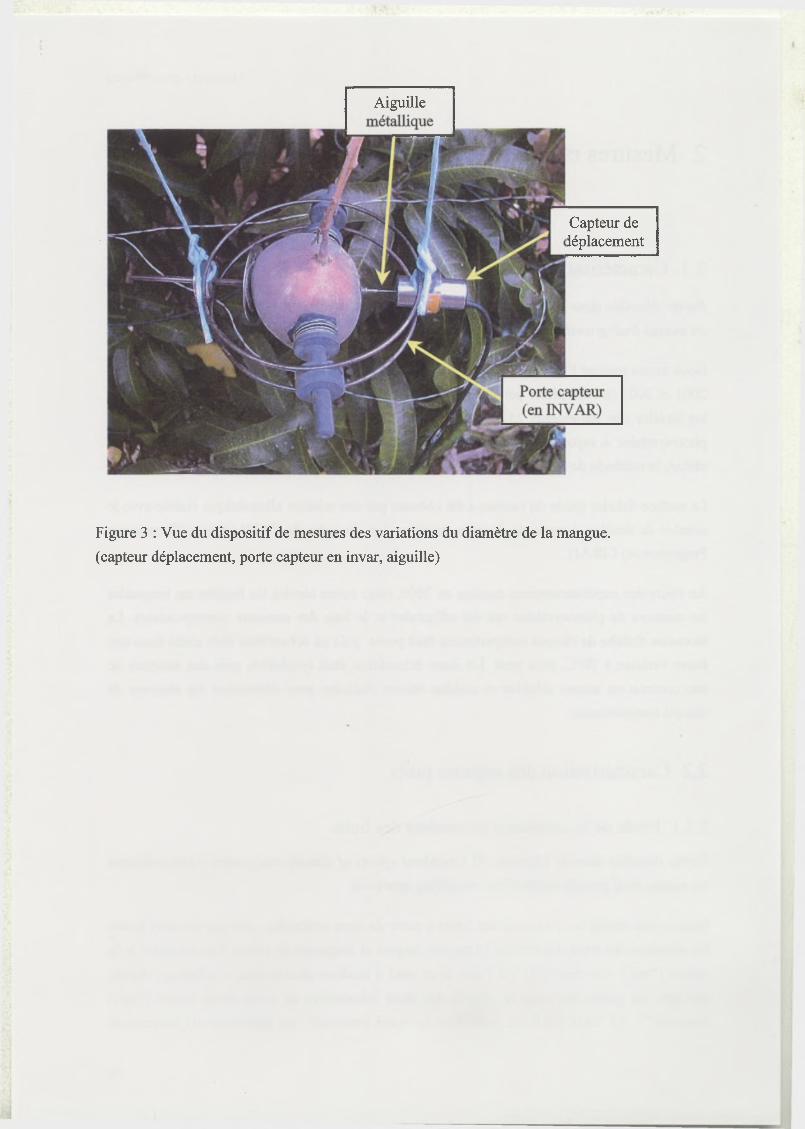
Figure 3 : Vue du dispositif de mesures des variations du diamètre de la mangue,
(capteur déplacement, porte capteur en invar, aiguille)
Matériels el méthodes
manière à établir des relations allométriques entre le diamètre et le masse fraîche ou sèche des
fruits.
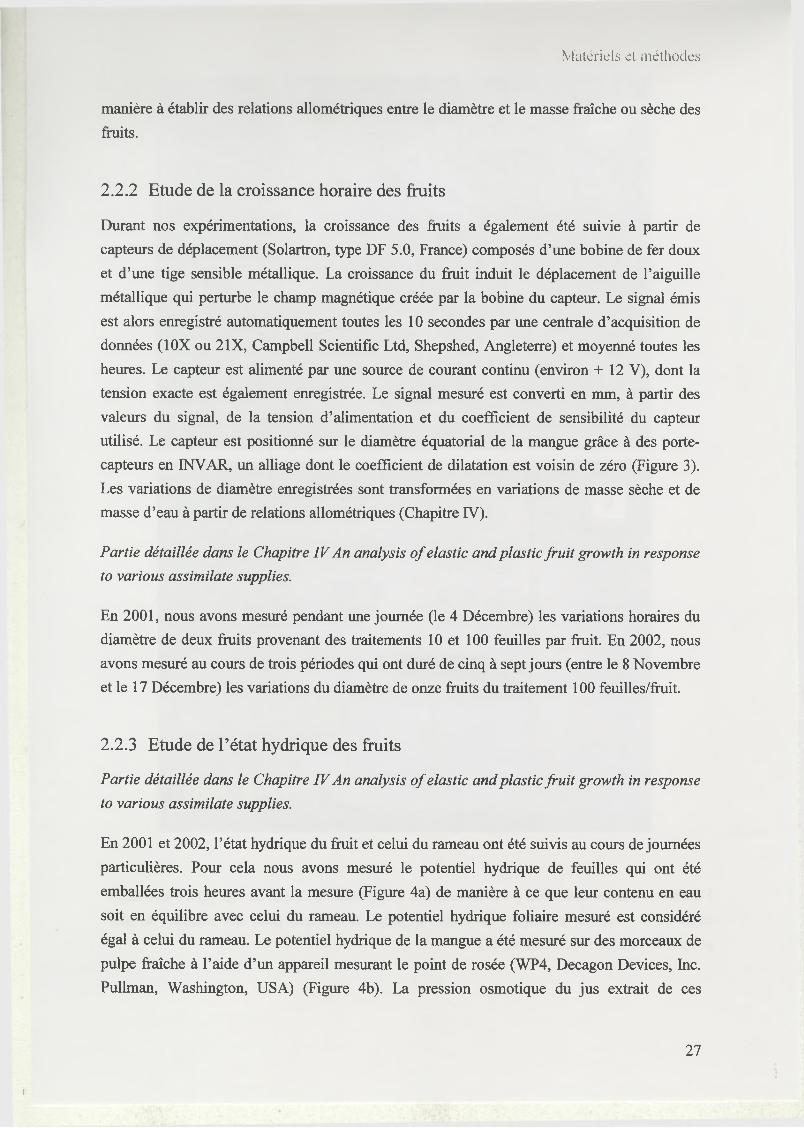
2.2.2 Etude de la croissance horaire des fruits
Durant nos expérimentations, la croissance des fruits a également été suivie à partir de
capteurs de déplacement (Solartron, type DF 5.0, France) composés d’une bobine de fer doux
et d’une tige sensible métallique. La croissance du fruit induit le déplacement de l’aiguille
métallique qui perturbe le champ magnétique créée par la bobine du capteur. Le signal émis
est alors enregistré automatiquement toutes les 10 secondes par une centrale d’acquisition de
données (10X ou 2IX, Campbell Scientific Ltd, Shepshed, Angleterre) et moyenné toutes les
heures. Le capteur est alimenté par une source de courant continu (environ + 12 V), dont la
tension exacte est également enregistrée. Le signal mesuré est converti en mm, à partir des
valeurs du signal, de la tension d’alimentation et du coefficient de sensibilité du capteur
utilisé. Le capteur est positionné sur le diamètre équatorial de la mangue grâce à des porte-
capteurs en INVAR, un alliage dont le coefficient de dilatation est voisin de zéro (Figure 3).
Les variations de diamètre enregistrées sont transformées en variations de masse sèche et de
masse d’eau à partir de relations allométriques (Chapitre IV).
Partie détaillée dans le Chapitre TV An analysis o f elastic and plastic fru it growth in response
to various assimilate supplies.
En 2001, nous avons mesuré pendant une journée (le 4 Décembre) les variations horaires du
diamètre de deux fruits provenant des traitements 10 et 100 feuilles par fruit. En 2002, nous
avons mesuré au cours de trois périodes qui ont duré de cinq à sept jours (entre le 8 Novembre
et le 17 Décembre) les variations du diamètre de onze fruits du traitement 100 feuilles/fruit.
2.2.3 Etude de l ’état hydrique des fruits
Partie détaillée dans le Chapitre TV An analysis o f elastic and plastic fruit growth in response
to various assimilate supplies.
En 2001 et 2002, l’état hydrique du fruit et celui du rameau ont été suivis au cours de journées
particulières. Pour cela nous avons mesuré le potentiel hydrique de feuilles qui ont été
emballées trois heures avant la mesure (Figure 4a) de manière à ce que leur contenu en eau
soit en équilibre avec celui du rameau. Le potentiel hydrique foliaire mesuré est considéré
égal à celui du rameau. Le potentiel hydrique de la mangue a été mesuré sur des morceaux de
pulpe fraîche à l’aide d’un appareil mesurant le point de rosée (WP4, Decagon Devices, Inc.
Pullman, Washington, USA) (Figure 4b). La pression osmotique du jus extrait de ces
27
I
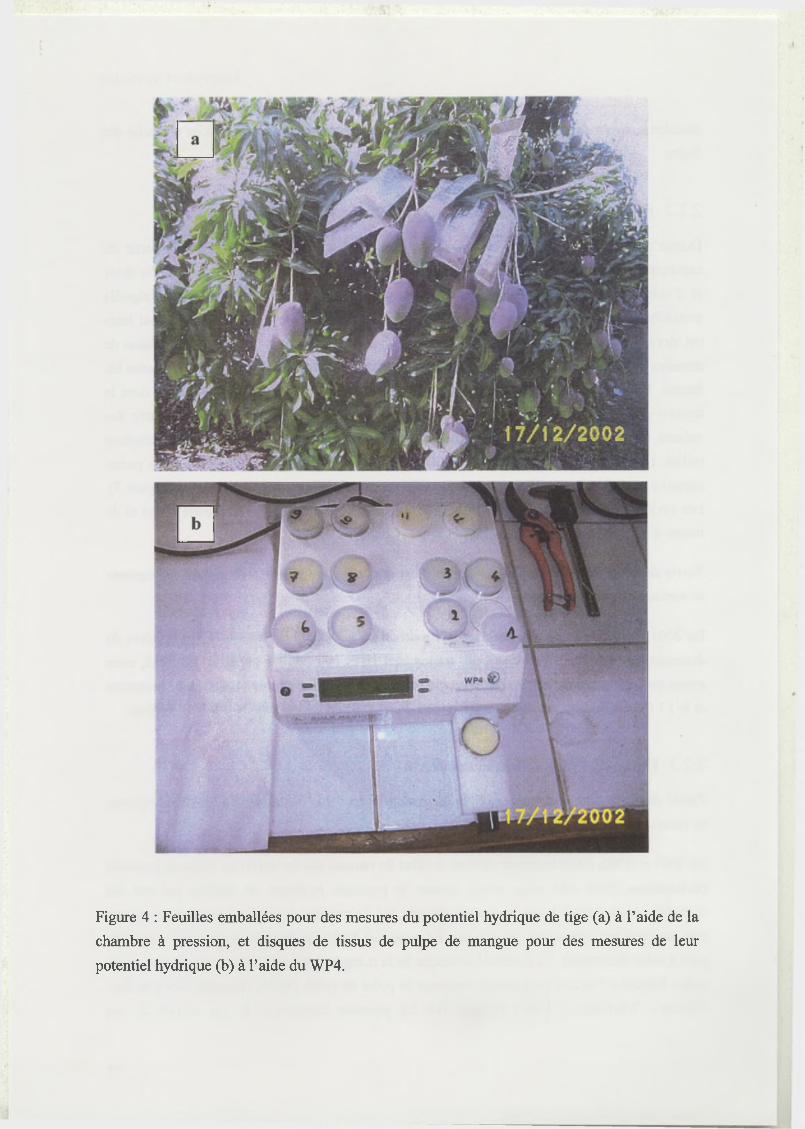
Figure 4 : Feuilles emballées pour des mesures du potentiel hydrique de tige (a) à l’aide de la
chambre à pression, et disques de tissus de pulpe de mangue pour des mesures de leur
potentiel hydrique (b) à l’aide du WP4.
Matériels et méthodes
morceaux de pulpe qui ont été congelés puis broyés a été mesurée à l’aide d’un osmomètre
(Wescor, Logan, Utah USA).
2.2.4 Etude de la com position biochimique des fruits
Partie détaillée dans le Chapitre II-2 Leaf to fruit ratio and irrigation supply affect seasonal
changes in minerals, organic acids, and sugars o f mango fruits.
Chaque année d’expérimentation, une partie de la pulpe des fruits récoltés au cours du “suivi
destructif’ a été conservée pour des analyses en sucres solubles (glucose, fructose,
saccharose), en acides organiques (acides malique, citrique, pyruvique, oxalique) et en
éléments minéraux (K+, Mg2+, Ca2+, NH4+, Na+).
En 2000, des analyses complémentaires consistant à mesurer les teneurs en carbone, azote et
cendres des différents compartiments du fruit (peau, pulpe et noyau) ont été effectuées sur les
fruits récoltés au cours du “suivi destructif’ pour calculer les coûts énergétiques de
biosynthèse de chaque compartiment (Partie détaillée dans le Chapitre III Combined effects
o f climate and source / sink relations on mango fruit growth studied by a modelling
approach).
2.2.5 Etude du nombre de cellules à la fin de la croissance
Cet essai a été réalisé en 2002 sur 18 fruits mûrs du traitement 100 feuilles/fruit dans le but
d’évaluer la taille des puits par comptage du nombre de cellules. Nous avons utilisé une
méthode mise au point sur tomate (Bertin et al., 2002). Pour chaque fruit récolté, la peau, la
pulpe et le noyau sont séparés délicatement. La totalité de la pulpe est pesée, coupée en
morceaux et digérée dans une solution contenant 3.5% de pectinase, 0.1M d’EDTA, 0.4M de
mannitol et une pincée d’antioxydant (sodium sulfite). Le pH de la solution de macération est
de 4 et la digestion dure 2 à 3 jours à 32°C. Après agitation de la solution, on en prélève un
échantillon de quelques pL qu’on dépose sur une lame de comptage (Fuchs-Rosenthal, 0.2
mm de profondeur). Trois prélèvements successifs sont réalisés dans le bas, le milieu et le
haut du bêcher contenant la pulpe en macération. Le nombre total de cellules contenues dans
la pulpe est déduit pour chaque échantillon prélevé du nombre de cellules compté sur la lame
de comptage, du volume de cette lame, de celui de la solution de macération et de celui de la
pulpe. Le nombre de cellules moyen de la pulpe est ensuite calculé comme la moyenne des 9
répétitions.
28
l
M a té r ie l s et m é t h o d e s
3 Analyses statistiques
Partie détaillé pour chaque Chapitre dans le paragraphe “statistical analysis ” ou “modelling
technique
Des analyses de variance suivies de test de comparaison de moyenne de Tukey ont été
effectuées pour tester l’effet des traitements, sur la croissance et l’élaboration de la qualité du
fruit. Les relations allométriques et les paramètres de modèle empirique (potentiel hydrique
rameau, composition de la pulpe) ont été obtenus par des régressions linéaires et non linéaires
selon les cas. L’estimation des paramètres des modèles est réalisée par une régression non
linéaire en minimisant un critère par la méthode des moindres carrés. L’ensemble des
procédures statistiques ont été réalisées avec le logiciel SPlus (Insightful Corp., USA).
2 9
( ha pi i re |¡ ; ! f iels J e l ' a l im e n ta t i o n c a r b o n é e et h> clrique su r la qu a l i t é de la m a n g u e
Chapitre II : Effets de l’alimentation carbonée
et hydrique sur l’élaboration de la qualité de la
mangue
C hapit re il : LlTels de l ' a l i m e n t a t i o n c a r b o n é e et h y d r iq u e su r la q u a l i t é d e la m a n m ie
Chapitre II : Effets de l’alimentation carbonée
et hydrique sur l’élaboration de la qualité de la
mangue
»
\
30
C hap i t r e II : l ’f iels d e l ’a l im e n ta t i o n c a r b o n é e et h y d r iq u e su r la q u a l i t é d e la m a n u i ie
Le calibre du finit est un critère de qualité qui dépend fortement de l’accumulation d’eau et de
matière sèche dans les trois compartiments du fruit : le noyau, la pulpe et la peau. Il apparaît
donc intéressant d’analyser l’accumulation d’eau et de matière sèche dans chaque
compartiment, de façon à différencier la pulpe qui est le compartiment du finit qui intéresse le
plus le consommateur du noyau et de la peau. L’étude de l’effet de la disponibilité en
assimilais carbonés sur le contenu en eau et en matière sèche des différents compartiments de
la mangue au cours de sa croissance est présentée dans une première partie (Léchaudel, M.,
Génard, G., Lescourret, F., Urban, L. et Jannoyer, M. Leaf-to-fruit ratio affects water and dry
matter content in mango fruit. 2002. Journal o f Horticultural Science & Biotechnology, 77,
773-777).
Dans une seconde partie, les effets de la disponibilité hydrique et carbonée sur l’élaboration
du critère de qualité de la mangue défini par la concentration des principaux sucres acides
organiques et éléments minéraux (en gramme par gramme de matière fraîche) sont présentés.
Dans le but de séparer l’effet de dilution dû aux variations de l’alimentation hydrique ou
carbonée, de l’effet plus direct des traitements sur le contenu de chaque composé par unité de
paroi, le critère de qualité étudié est décomposé en trois composantes : la teneur en matière
sèche totale de la pulpe, la teneur en matière sèche structurale, et la concentration de chaque
élément par gramme de matière sèche structurale. L’effet de ces facteurs agronomiques sur
chaque composante est alors quantifié (Léchaudel, M., Joas, J., Caro, Y. M., Génard, M. and
Jannoyer, M. Leaf to fruit ratio and irrigation supply affect seasonal changes in minerals,
organic acids, and sugars of mango fruits. Manuscript soumis à Journal o f the Science o f
Food and Agriculture).
31
1 Leaf-to-fruit ratio affects water and dry matter
content in mango fruit.
By M. LÉCHAUDEL1, M. GÉNARD2, F. LESCOURRET2, L., URBAN1 and M.
JANNOYER1
‘Centre de Coopération Internationale en Recherches Agronomique pour le Développement,
Département des Productions Fruitières et Horticoles, BP 180, 97455 Saint Pierre Cedex, Ile
de la Réunion, France
2 •Institut National de la Recherche Agronomique, Plantes et Systèmes de cultures Horticoles,
Domaine St Paul, 84914 AVIGNON Cedex 9, France
(e-mail : [email protected])
C h a p i t r e II : Hiïe ts de l ' a l i m e n t a t i o n c a r b o n é e et h y d r iq u e su r la qu a l i t é d e la m a n g u e
SUMMARY
Changes in water and dry matter content of developing mango fruit (Mangifera Indica L. cv.
‘Lirfa’) were investigated over a single season in Réunion Island, along with the effects of
leafifruit ratio (10, 25, 50, 100 and 150 leaves per fruit on girdled branches). As the fruit
developed, about 8-13% of fruit water weight was in the peel compared with 78-86% in the
pulp and 6-9% in the stone. When the data were expressed on a dry weight basis, 12-20% was
in the peel, 60-70% was in the pulp and 18-20% in the stone. At harvest, larger fruit, on
treatment 100, had a higher proportion of weight in the pulp. Good relationships between
water and dry weight of each fruit component were found, regardless of the treatment. They
showed that the rate of water accumulation decreased when the dry weight increased and that
the dry matter content increased as the fruit developed as well. Increasing leafifruit ratio to
100 leaves per fruit improved fruit yield by 300 g and pulp dry matter content by 6%, for a
total of 550 g and 20% at harvest. Fruit quality as estimated by pulp dry matter content could
be easily calculated during the changes in fruit weight over the season. Moreover, this
indicator could be useful to assess the maturity of mango fruit.
32
I
C hapitre II : lilïets de l'alimentation carbonée et hydrique sur la qualité de la manuue
1.1 Introduction
Fruit growth involves the net accumulation of water and dry matter in the reproductive
tissues. Fleshy fruit such as tomato and mango are more than 80% water (Ho et al., 1987;
Lakshimnarayana et al., 1970)
The dry matter content of fruit, especially of the pulp, is important from the point of view of
quality since it is linked to various quality traits such as total soluble solids in kiwifruit
(Richardson et al., 1997) and mango (Diczbalis et al., 1995). (Hofman et al., 1995) found that
mango fruits with higher dry matter content ripened more quickly and had a better gustatory
quality. Moreover, Diczbalis et al. (1995) suggested that dry matter content could be useful to
assess fruit maturity.
Dry matter content is strongly linked to water and dry matter accumulation (Ho et al., 1987).
Water is supplied by the phloem as well as the xylem. Water loss is often equivalent to water
imported by xylem (Huguet and Génard, 1995) for fruits with low transpiration rates and even
for fruits with high water loss such as yucca. In this fruit, 82% of the water is imported via
xylem, with 89% transpired (van Die and Willemnse, 1980). Thus, the phloem supplies both
water and dry matter for fruit growth in a wide range of crops. Changes in leaf: fruit ratio
affect the relative supply of carbohydrates available for fruit growth (Chacko et al., 1982) and
dry matter content (Simmons et al., 1998). These changes would be expected to alter water
and dry matter accumulation. When examining the water and dry matter accumulation from
the point of view of fruit quality, we must consider the various fruit components.
In mango fruit, which is a drupe, the peel, pulp and stone each have specific functions and
compositions and also appear to accumulate water and dry matter at different rates. The thick
peel protects the fruit from external agents and consists primarily of epidermal cells and a
cuticle layer covered by wax. The peel contains more phenols and cellulose composites than
the pulp (Leley et al., 1943). Peel cells have limited water uptake and tissue expansion
compared to the pulp. The pulp is normally sweet and succulent in commercial cultivars. The
large parenchyma cells in the pulp store water and sugars as the fruit expands (Mukeijee,
1959). The stone protects the seed and prevents it from drying. The stone contains the largest
quantities of lipids and lignin. It is soft during the first half of fruit development and then
hardens. It may loose water at this stage.
The aim of this paper was to examine changes in water and dry matter accumulation during
mango (Mangifera Indica L. cv. ‘Lirfa’) fruit growth over a single season in Reunion Island.
Different leaf:fruit ratios (10, 25, 50, 100 and 150 leaves per fruit on girdled branches) were
used to modify the relative supply of carbohydrates to the fruit. The water and dry matter
contents of the different components of the fruit were examined.
33
I
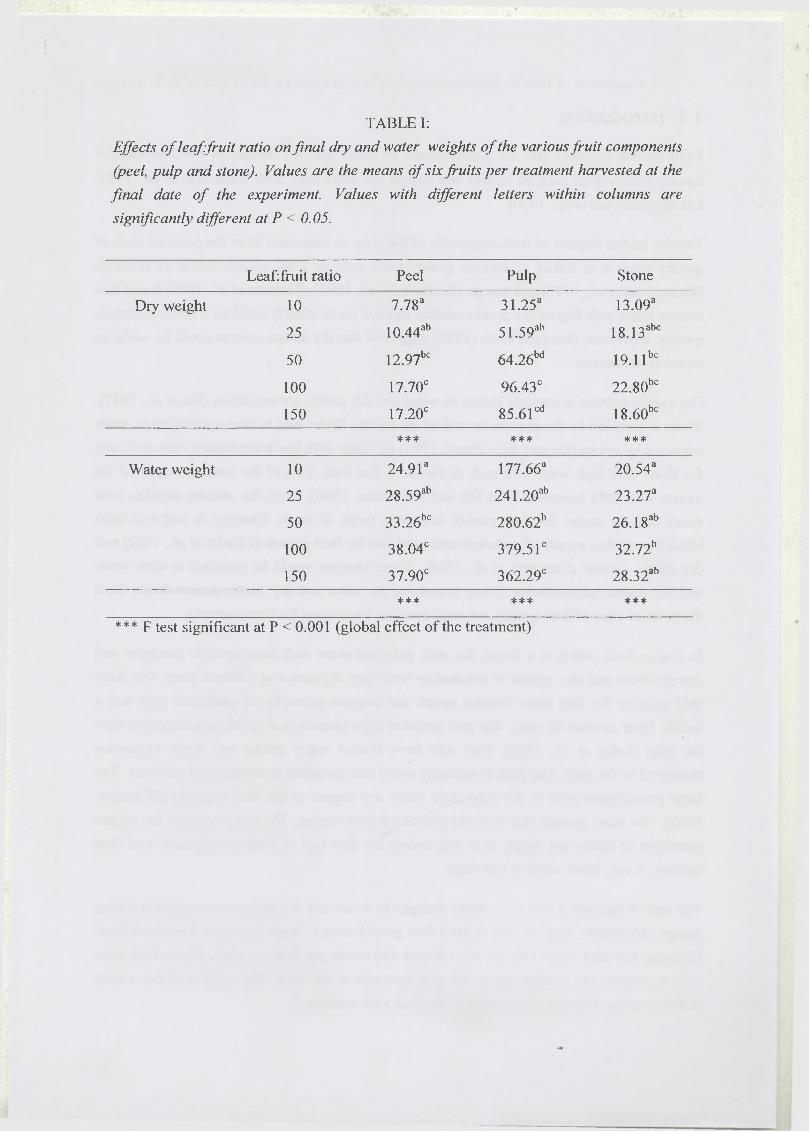
TABLE I:
Effects o f leaf fru it ratio on final dry and water weights o f the various fruit components
(peel, pulp and stone). Values are the means o f six fruits per treatment harvested at the
final date o f the experiment. Values
significantly different at P < 0.05.
with different letters within columns are
Leaf: fruit ratio Peel Pulp Stone
Dry weight 10 7.78a 31.25a 13.09a
25 10.44ab 51.59ab 18.13ab°
50 12.97bc 64.26bd 19.1 l bc
100 17.70c 96.43° 22.80b°
150 17.20c 85.61°d 18.60b°
*** *** ***
Water weight 10 24.91a 177.66a 20.54a
25 28.59ab 241,20ab 23.27a
50 33.26bc 280.62b 26.18ab
100 38.04° 379.51° 32.72b
150 37.90° 362.29° 28.32ab
*** *** * * *
*** F test significant at P < 0.001 (global effect of the treatment)
1.2 Materials and methods
1.2.1 Material and treatments
The experiment was conducted on 11-year-old trees of cv. ‘Lirfa’, grafted on ‘Maison
Rouge’, in Réunion Island (20°52’48” S, 55°31’48” E). The trees were planted in ten rows, 7
m apart, with nine trees each(3 m high), spaced 5 m apart. Trees received 100 kg N ha'1
(urea), 20 kg P ha'1 (superphosphate) and 100 kg K ha'1 (potassium sulphate) in March 2000
and after harvest, and 200 kg N ha'1 (urea), 20 kg P ha'1 (superphosphate) and 100 kg K ha'1
(potassium sulphate) on October 2000 (early fruit growth). Trees were irrigated every two
days to replace potential évapotranspiration. Data from eight linear variable displacement
transducers (LVDT, Solartron, UK) showed that daytime shrinkage was less than 20 pm for 3
to 4 cm thick stems, indicating that the trees were well watered.
Six weeks after flowering, two hundred and fifty branches were chosen on twenty-three trees.
Branches were ramified with different shoots of the current year and the previous one. Their
position was randomly chosen on the top of the tree to reduce the variability of light received
by leaves which could significantly change carbon assimilation and fruit growth as well.
About ten to fifteen branches per tree were used for this experiment representing less than
1/10 of the total branches on the tree canopy. After the branches were chosen, they were
girdled and sometimes defoliated to give 10, 25, 50, 100 and 150 leaves per fruit (with 50
leaves for 5 fruits, 100 leaves for 4 fruits, 100 leaves for 2 fruits, 100 leaves for 1 fruit and
150 leaves for 1 fruit, respectively). Branches were girdled by making a 10 to 15 mm cut
through the bark to the cambium. To keep the leaffruit ratios constant within each treatment,
new leaves were removed. The trees in this orchard were homogeneous and grown in the
same environment (climatic conditions and cultural practices). This indicated that there was
no tree effect on fruit growth of isolated branches which was confirmed by the results of a
randomised analysis of variance (treatment x time x tree; not shown).
C h a p i t r e II : h l ï e l s de l ' a l i m e n t a t i o n c a r b o n é e et h y d r iq u e su r la q u a l i t é d e la m a n g u e
1.2.2 Data collection and analyses
Six fruits from each treatment (leaffruit ratio) were harvested each week for two months after
girdling. For each fruit, the total fresh weight and that of its components (peel, pulp and
stone) was measured. Samples were then dried at 75°C for 48 h, and the corresponding dry
weights recorded. The absolute water weight (WW) of the various components was calculated
as the fresh weight (FW) minus the dry weight (DW). The relative dry matter content, in %,
was calculated as the ratio between the dry weight and the fresh weight. The sum of growing
3 4
I
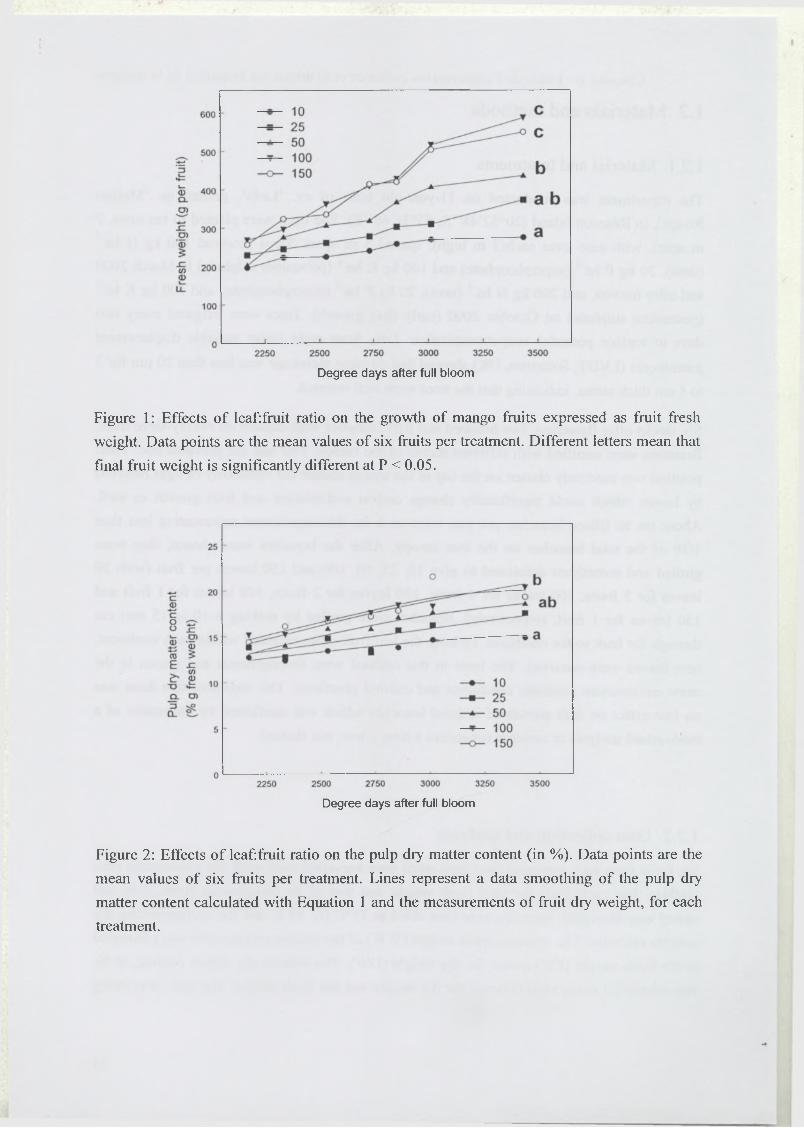
Degree days after full bloom
Figure 1: Effects of leaf:fruit ratio on the growth of mango fruits expressed as fruit fresh
weight. Data points are the mean values of six fruits per treatment. Different letters mean that
final fruit weight is significantly different at P < 0.05.
Degree days after full bloom
Figure 2: Effects of leaf:fruit ratio on the pulp dry matter content (in %). Data points are the
mean values of six fruits per treatment. Lines represent a data smoothing of the pulp dry
matter content calculated with Equation 1 and the measurements of fruit dry weight, for each
treatment.
Chapitre 11 : lilïets de l'ulimentation carbonée et hydrique sur la qualité de la mangue
degree days was calculated by adding up the average daily temperatures during the growing
season.
Relationships between water and dry weights of the whole fruit and those of its components
were assessed by power functions. Parameters of the different relationships were estimated by
non-linear regression. Each equation was log-transformed to calculate the coefficient of
determination R2 and to perform an F-statistic test in order to examine the significance of the
regression.
To analyse if equations of pulp and peel dry weight as a function of fruit dry weight were
different from those of water weight, the likelihood ratio test with an asymptotic level of 95%
was used, based on the results of the non-linear regressions (Huet et al., 1996). This type of
test makes it possible to compare nested models. The simple model with the same parameters
for water and dry weights was compared to complex models in which parameters were
different. The effect of treatment (leaf: fruit ratio) was analysed at harvest by analysis of the
variance of data related to the fruit fresh weight, the pulp dry matter content and the water and
dry weights of the various components. In the case of a significant effect, Tukey’s multiple
comparison test was performed to determine which treatments were significantly different at
the 0.05 level.
1.3 RESULTS
Fruit fresh weight increased with time (Figure 1). Fruit from branches with 100 or 150 leaves
per fruit were larger than those with 10, 25 or 50 leaves per fruit. At 3500 degree days, fruit
fresh weight on Treatment 100 and 150 was about 550 g. At this stage, it was possible to
harvest these fruits that had already begun to ripen. On the other hand, on Treatment 10, fruits
had 250 g of fresh weight, their skin colour had not changed and they were often green. There
was also a significant difference between branches with 10 and 50 leaves per fruit.
There was also a significant effect of the leafifruit ratio on the pulp dry matter content (Figure
2). The pulp dry matter content was greater in fruits of Treatment 100 - about 20%, as
opposed to 14% in Treatment 10.
The final dry and water weights of each component were significantly affected by the
leafifruit ratio (Table I). In the three components, the water and dry weights were greater in
fruits of Treatment 100 than in Treatment 10. There was also a significant difference of dry
and water weights in the pulp between Treatment 100 and Treatment 25 or 50. Larger fruit, on
Treatment 100, had a greater proportion of final fruit dry weight in the pulp (70.4%) than
smaller fruit on Treatment 10 (60.0%). As for dry weight, the proportion of final fruit water
weight was higher in the pulp and lower in the stone and in the peel in the highest leafifruit
ratio than in the lowest leafifruit ratio.
35
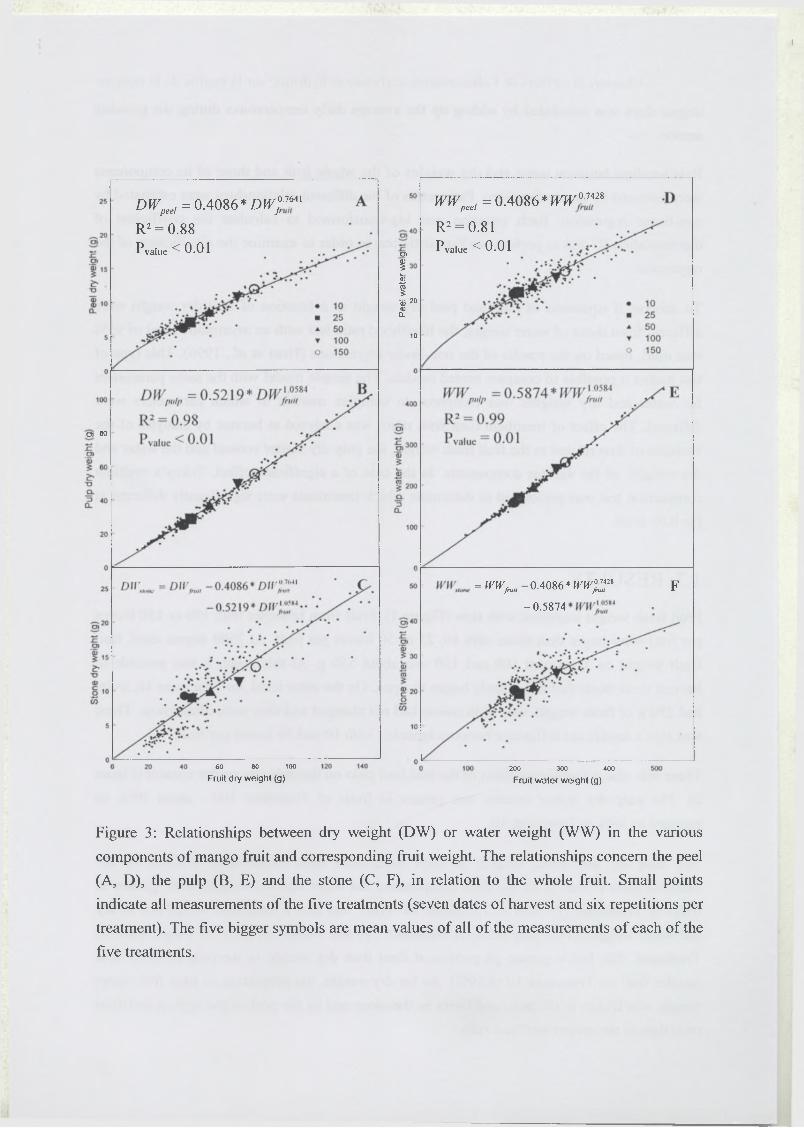
I
en 80
DWpeel= 0.4086:*DW;™'
R2 = 0.88P v a lu e < 0 . 0 1
200 300 400
Fruit water weight (g)
60 80 100
Fruit dry weight (g)
g>0)£à)1 ã 2° <D ÛL
10
= mvf~„ - 0.4086 * mv%¡» F- 0.5874
WWree/= 0.4086 *WW°™8
R2 = 0.81P value < 0 - 0 1
Figure 3: Relationships between dry weight (DW) or water weight (WW) in the various
components of mango fruit and corresponding fruit weight. The relationships concern the peel
(A, D), the pulp (B, E) and the stone (C, F), in relation to the whole fruit. Small points
indicate all measurements of the five treatments (seven dates of harvest and six repetitions per
treatment). The five bigger symbols are mean values of all of the measurements of each of the
five treatments.
There were strong relationships between the dry weight of the various fruit components and
the total fruit dry weight (Figures 3A, 3B, 3C). For each treatment, the dry weights of the
various components were accurately distributed along the fitted curves. All these relationships
were independent of the leaf:fruit ratio. As the fruit developed, about 12 to 20% of the fruit
dry weight was in the peel, 60 to 70% in the pulp and 18 to 20% in the stone. However, there
was a small gap between the stone weight and the fitted model (Figure 3C) during early fruit
growth. When the data were analysed on a water weight basis, similar relationships were
found (Figure 3D, 3E, 3F). Nevertheless, results of the likelihood ratio test have shown that
this second set of equations was significantly different with relationships concerning dry
weight. The model that accurately described measurements was not the complex model in
which all parameters are different but, rather, an intermediate model with several equal
parameters for the relationship concerning dry weight and that of water weight. About 8 to
13% of the fruit water weight was in the peel, 78 to 86% in the pulp and 6 to 9% in the stone.
The peel and the stone component were relatively low when expressed on a water weight
basis rather than on a dry weight basis because of the higher fruit water weight in the pulp.
Regardless of the treatment, there was a strong correlation between the water and dry weight
of each of the fruit components (Figure 4). All the exponents of the relationships were lower
than one. Therefore, the rate of water accumulation in each component decreased when the
dry weight increased. This rate was higher in the pulp followed by the peel and the stone. In
this last component, the fitted curve (Figure 4C) showed that its water weight increased
quickly during the first part of growth. Then, for a stone dry weight bigger than 7.5 g, this
component accumulated more dry matter than water, while, the two other components often
accumulated more water than dry matter during fruit development.
With the different relationships (see Figures 3 and 4), it was possible to calculate the dry
matter content of the various components on the basis of the fruit dry weight. For the pulp, we
obtained:
C hap i t r e II : h i lots d e I a l im e n ta t i o n c a r b o n é e et h \ d r iqiie su r la q u a l i t é de la m a n g u e
mango fruit growth (cv. ‘Lirfa’) by improving fruit size at harvest, as reported earlier for other
cultivars by Chacko et al. (1982) and Reddy and Singh (1991). Fruits of treatments with 100
(1)
Figure 2 shows that the prediction of the seasonal variation of dry matter content in the pulp,
using Equation 1 and measurements of fruit dry weight, was accurate.
1.4 DISCUSSION
In the present study, it was shown that increasing the number of leaves per fruit affected
36
I
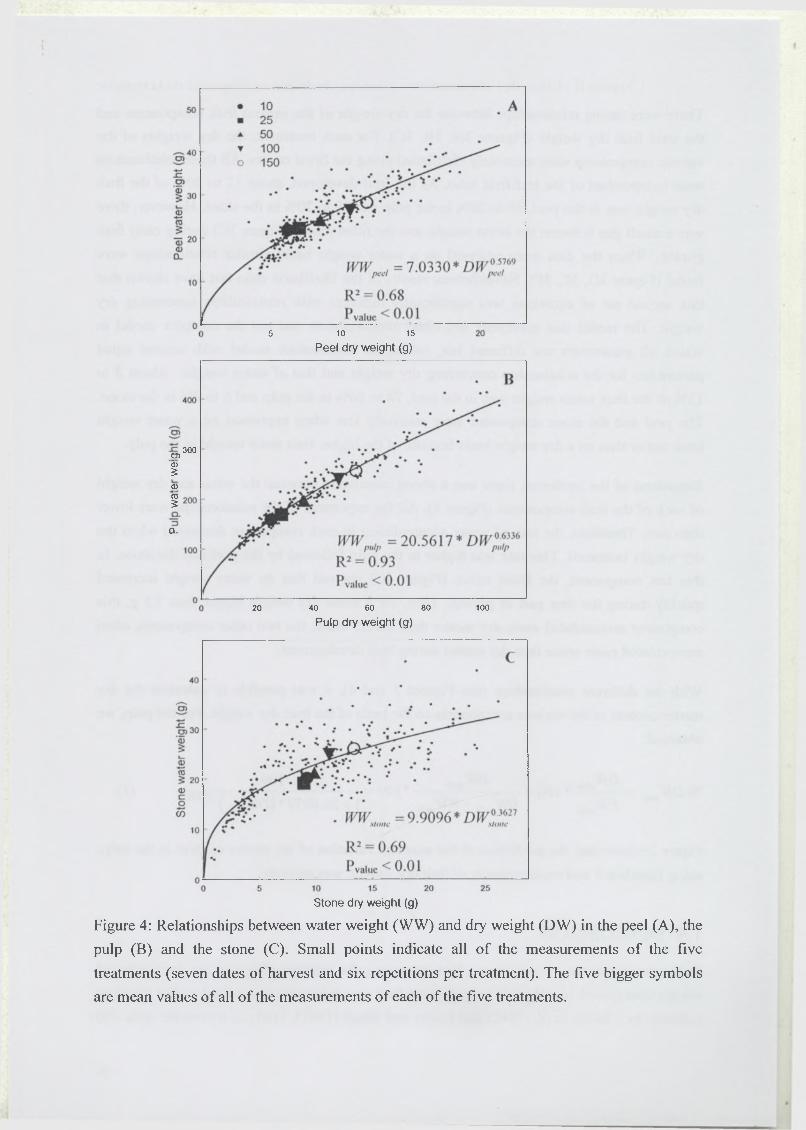
ÇT)(D£0)035
CL
300
20 40 60 80 100
Pulp dry weight (g)
5 10 15
Peel dry weight (g)
Stone dry weight (g)
Figure 4: Relationships between water weight (WW) and dry weight (DW) in the peel (A), the
pulp (B) and the stone (C). Small points indicate all of the measurements of the five
treatments (seven dates of harvest and six repetitions per treatment). The five bigger symbols
are mean values of all of the measurements of each of the five treatments.
leaves per fruit had the highest weight, implying that thinning mango trees could be
advantageous for improving fruit size. Moreover, since mango fruit development utilizes both
reserves and current photosynthesis carbohydrates (Chacko et al., 1982), larger amounts of
carbohydrates are withdrawn for fruit growth when there are just 10 leaves per fruit.
Therefore, increasing the leaffruit ratio could make it possible to accumulate starch reserves
for vegetative growth and fruiting in the following season (Chacko et al., 1982).
Chauhan and Pandey (1984), who measured 14C-sucrose translocated from leaves to mango
fruits at different stages of growth, found that the majority of this l4C-sucrose accumulated in
the pulp. This is in agreement with our results on dry weight. The stone had the particularity
of storing relatively more dry matter than water in the second half of fruit growth, during the
stone hardening phase. During early fruit growth, there was a small gap between stone weight
and the fitted model (Figure 3C). At this stage, the endocarp was thin and could not be easily
separated from the pulp. We may have underestimated the weight of the stone.
We also found that the accumulation of water and dry matter changed over time and as a
function of leaffruit ratio as well. These changes of water and dry weights were accurately
estimated each one by a unique relationship, regardless of the treatment. The rate of water
accumulation decreased as dry weight increased. Moreover the dry matter content increased
as the fruit developed and fruits on branches with a high leaffruit ratio such as 100 and 150
leaves per fruit, had the greatest pulp dry matter content. These changes indicate that the
treatment affected dry matter supply more than water supply. Similar increases in dry matter
content with higher leaffruit ratio were observed for cv. ‘Kensington’ mango fruit on
branches by Simmons et al. (1998). Pulp dry matter content is linked to quality traits
(Diczbalis et al., 1995; Richardson et al., 1997), so higher leaf to fruit ratios improved mango
fruit quality (Simmons et al., 1998). However, other traits of fruit quality such as sugars, acids
or Ca concentrations should be taken into account in order to give a more precise view of the
effect of leaffruit ratio on the quality and the storage performance of mango fruit. These
results are interesting for the mango industry in Réunion Island and could lead to higher
yields and the improvement of fruit quality.
The estimation of pulp dry matter content is very useful. As described in Equation 1, it just
depends on the fruit dry weight. Fruits from the highest leaffruit ratio reached maturity before
fruits in the other treatments. Pulp dry matter content could become an indicator of when to
harvest mango fruit, as is the case in other countries (Diczbalis et al., 1995).
C h ap i t r e II : E ffe ts d e l ' a l im e n ta t i o n c a r b o n é e et h y d r iq u e su r la qua l i té d e la m a n g u e
37
»
2 Leaf to fruit ratio and irrigation supply affect
seasonal changes in minerals, organic acids, and
sugars of mango fruits
C hapit re II : Ef fe ts de l’a l im e n t a t i o n c a r b o n é e et h y d r iq u e su r la q u a l i t é d e la i n á n im e
By Mathieu Léchaudel1, Jacques Joas2, Yanis Caro2, Michel Génard3, and Magalie
Jannoyer4
'Centre de Coopération Internationale en Recherches Agronomique pour le Développement,
Département des Productions Fruitières et Horticoles, Station Bassin Plat, BP 180, 97455
Saint Pierre Cedex, Ile de la Réunion, France
2CIRAD-Flhor, Station La Bretagne, BP 20, 97408 Saint Denis, Ile de la Réunion
3INRA-PSH, Domaine St Paul, 84914 Avignon Cedex 9, France
4CIRAD-Flhor, Boulevard de la Lironde, TA 50 / PS4, 34398 Montpellier Cedex 5
(e-mail : [email protected])
Running title : Seasonal variations of quality in mango
Soumis à Journal o f the Science o f Food and Agriculture
t
38
C h a p i t r e II : l . l ï e t s de l ' a l i m e n t a t i o n c a r b o n é e et h y d r iq u e su r la q u a l i t é d e la m a n g u e
Abstract
To determine the effects of assimilate and water supply on the determination of mango fruit
quality, the seasonal variation of minerals, acids, and sugars were investigated during two
successive years. To manipulate the assimilate supply, selected branches were girdled to
provide 10, 25, 50 and 100 leaves per fruit. Irrigation was managed to provide two levels of
water supply conditions. Fruit growth rate was greater with increasing leaf to fruit ratio. Total
dry matter content of flesh was higher in fruit with higher leaf to fruit ratio. No effect was
found on structural dry matter content of flesh. Potassium and magnesium concentrations
were not affected by the leaf to fruit ratio whereas calcium, transported via xylem, had a
higher concentration in flesh fruit from low leaf to fruit ratio, as 10 leaves per fruit. Low
assimilate supply increased malic and citric acid concentrations. Glucose remained almost
constant during fruit development regardless treatments. Fructose accumulated at higher rates
when assimilate supply was lower. Sucrose concentration was significantly increased by
higher leaf to fruit ratio. Close to maturity, levels of sucrose storage and starch breakdown
were positively correlated with assimilate supply. Levels of starch breakdown were correlated
with irrigation supply. This gradient of sugars and acids according to treatments may changed
fruit taste.
Keywords : Mangifera indica, mango, leaf to fruit ratio, irrigation, fruit composition, quality,
structural material.
i
39
C hap i t re II : Effe ts de l ' a l i m e n t a t i o n c a r b o n é e et h y d r iq u e su r la q u a l i t é de la m a n g u e
2.1 Introduction
The taste of fruit flesh depends greatly on the balance between soluble sugars and organic
acids. In mango flesh, the predominant acids are citric and malic acids, while the major sugars
are sucrose, fructose and glucose (Medlicott and Thompson, 1985). The overall sweetness of
fruit flesh is highly dependent on the composition of its sugars. Mango fruit would be of good
taste if its flesh stored large amounts of sucrose and fructose. Indeed fructose is 2.3 and 1.7
times sweeter than glucose and sucrose, respectively (Kulp et al., 1991). The sweetness,
however, is also affected by the composition of acids. Citric acid may decrease the sweetness
of sucrose (Bonnans and Noble, 1993), while malic acid may decrease that of fructose (Fabian
and Blum, 1943). The acidity o f mango flesh falls, while the total soluble sugar level
increases with maturity (Wahab and Khan, 1954). Loss in acidity during ripening is indicated
by decreased citric acid content. The reduction in starch, and the increase in sucrose,
sometimes glucose and fructose, during ripening make the fruit less sour (Selvaraj et al.,
1989). Fruit maturation, another trait of fruit quality, may be evaluated by the patterns of
different biochemical compounds such as starch or sucrose (Akamine and Goo, 1973;
Krishnamurthy and Subramanyam, 1970; Mendoza and Wills, 1984). From these studies a
consistent pattern of fruit maturation emerges whereby the starch content drops is followed by
a strong increase in sucrose and consequent sweetness (Tandon and Kalra, 1983).
In the tissue of many fruits including mango, calcium concentration or concentration ratios of
calcium to other minerals such as potassium and magnesium has been reported as important
factors governing fruit storage quality. Calcium is one of the minerals believed to contribute
to delay ripening, senescence (Ferguson, 1984), and to reduce storage disorders (Bangerth,
1979). Physiological disorders such as soft-nose in mangoes have been found to be associated
with low calcium levels in fruits, which may damage the structure integrity of cell walls
during fruit softening. Changes in flesh composition of mango fruit associated with ripening
were the predominant subject of many studies dealing with quality. Only a few studies, to our
knowledge, have evaluated mango fruit flesh composition all along the growth and the
maturation, which determines the quality at harvest.
The elaboration of gustatory quality, the maturation (Souty et al., 1999) and the shelf life
(Simmons et al., 1998) are linked to fruit growth. Various orchard management practices
affect fruit growth by changing assimilate supply and water availability. The effect of
assimilate supply was studied by analysing the effect of leaf to fruit ratio on water and dry
matter contents in mango fruit (Léchaudel et al., 2002). Mango fruit size decreases with
decreasing leaf to fruit ratio (Chacko et al., 1982), probably due to the limited availability of
assimilates. Low leaf to fruit ratio on peach reduced fruit growth rate, sweetness of the fruit,
and delayed fruit maturity as indicated by a latter rise of ethylene production (Souty et al.,
1999). At harvest the worst eating quality of fruit developed with reduced crop load was due
4 0
i
to lower sucrose and hexose sugars content (Bertin et al., 2000) and higher levels of citric
acid (Wu et al., 2002). However, these fruits contained the highest calcium and the lowest
potassium concentrations (Volz et al., 1993) which has a positive effect on fruit storage and
reduced disorders.
Response of trees to water stress depends on the stages of the fruit growth, the frequency, the
severity of the stress and also the cultivars. Water stress during the cell division phase affects
dramatically potential fruit size in apple (Naor et al., 1995) and nectarine (Berman and
Dejong, 1996). Reducing irrigation in the early growing season or during the entire season
decreases harvest weight whereas increases soluble sugars concentrations and acidity in pear
(Ramos et al., 1994), apple (Kilili et al., 1996; Mills et al., 1996), citrus fruits (Gonzàlez-
Altozano and Castel, 1999) and kiwifruit (Miller et al., 1998). Pear fruits tended to have
lower calcium concentration and higher storage disorders when they were exposed to water
stress at early season (Behboudian et al., 1994). Water stress applied later in the season have
less impact on fruit size and improved quality attributes either by advancing maturity in kiwi
(Miller et al., 1998) or by increasing sugar concentration and fruit storage quality in apple
(Mpelasoka et al., 2001).
Biochemical compounds of fruit flesh linked to quality components were generally
investigated in concentration of a certain compound (g) per kg of fresh weight. However
changes in the concentration expressed per fresh weight can be influenced by several factors
such as dilution, amount of cell wall material produced and the transport-metabolism process
of minerals, acids, and sugars, which may be differently sensitive to water and assimilate
supply. Fresh flesh is composed of water and dry matter. The latter is composed of structural
dry matter, such as cell walls, cellulose, and the non structural dry matter, like soluble sugars,
acids, minerals and starch.
To better understand which of these components are affected by water and assimilate supply,
we propose to analyse changes in: total dry matter content (total dry weight/total fresh
weight), structural dry matter content (structural dry weight/total dry weight), and
concentration of individual non-structural compound per structural dry weight of flesh. In this
study the structural dry weight of the flesh was calculated as the difference between the total
dry weight of the flesh and the sum of the dry weights of all the non-structural components.
The seasonal changes of the main quality components of fruit flesh, such as fruit weight, dry
matter content of fruit flesh, and the concentrations of minerals, acids, and sugars, were assess
in relation to assimilate and water supply during two successive years.
C h ap i t r e II : E f fe t s d e l ' a l i m e n t a t i o n c a r b o n é e et h y d r iq u e su r la qua l i té de la m a n g u e
41
Chapitre II : Effets de l'alimentation carbonée et hydrique sur la qualité de la mangue
2.2 Materials and methods
2.2.1 Experimental conditions and treatments
This study was conducted on 11-year-old mango trees of cv. ‘Lirfa’, grafted on ‘Maison
Rouge’, in La Réunion island (20°52’48” S, 55°31’48” E) during the 2000 and 2001 growing
seasons. The 2000 experimental plot consisted of ten rows, 7 m distant, each of them made of
nine trees spaced 5 m apart, and about 3 m high. The trees observed in 2001 were spaced at 5
m by 6 m and were around 3 m high in an adjacent plot.
During the 2000 growing season, all trees were well irrigated every two days at 100 %
replacement of evaporation. Data from eight linear variable displacement transducers (LVDT,
Solartron, UK) showed that daytime shrinkage was less than 20 pm for branches with
diameter of 3-4 cm, indicating that the trees were well watered. Six weeks after flowering,
250 branches were chosen on twenty-three trees. Branches were ramified with different shoots
of the current year and the previous one. Their position was randomly chosen on the top of the
tree to reduce the variability of light received by leaves which could significantly change
carbon assimilation and fruit growth as well. About ten to fifteen branches per tree were used
for this experiment, which represented less than 10 % of the total branches on the tree canopy.
After the branches were chosen, they were girdled, sometimes defruited and defoliated to give
25, 50 and 100 leaves per fruit (with 100 leaves for 4, 2 and 1 fruit respectively). Branches
were girdled by removing a band of bark of 10-15 mm wide. To keep the leaf to fruit ratios
constant within each treatment any new emerging leaves were removed.
During the 2001 growing season, two irrigation treatments were applied: control irrigation
(Cl) and no irrigation (NI) treatments. The Cl trees were well-irrigated with as in 2000. In the
NI treatment, irrigation was completely withheld one month after full bloom. These trees
received just water coming with the rainfall, about 170 mm from the beginning of the
irrigation stop to the end of the fruit growing season. It represented 24 % of the total water
received by trees from Cl treatment. Trees were divided into six blocks of nine trees. Thus,
eight neighbours of the studied tree had the same irrigation treatment. Three blocks received
the same irrigation treatment. Six weeks after flowering, the branches chosen with the same
precaution as in 2000 were girdled, sometimes defruited and defoliated to get 10 and 100
leaves per fruit (with respectively 50 leaves for 5 fruits and 100 leaves for 1 fruit).
2.2.2 Measurements o f fruit composition
During the 2000 growing season, six fruits from each treatment (three leaf to fruit ratios: 25,
50, 100) were harvested each week between 15 November 2000 to 4 January 2001. In the
second year of experiment, six fruits of each treatment (two leaf to fruit ratios, 10 and 100,
4 2
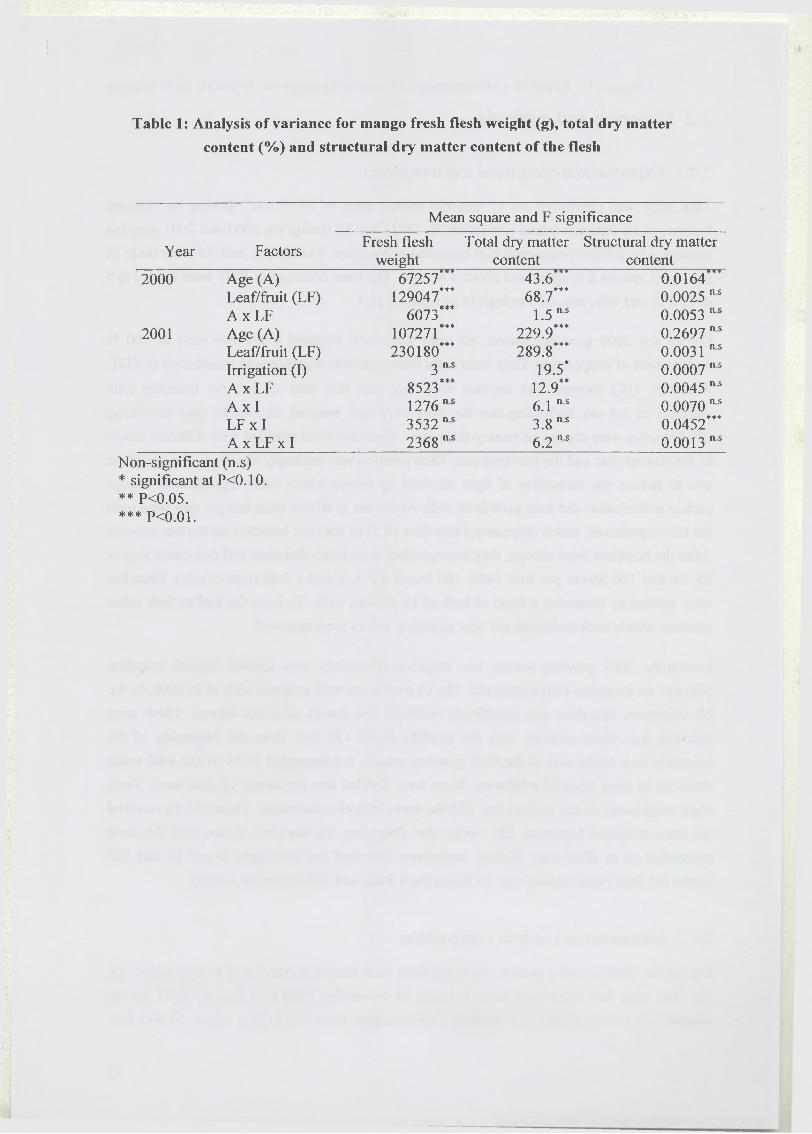
Table 1: Analysis of variance for mango fresh flesh weight (g), total dry matter
content (%) and structural dry matter content of the flesh
Year
Mean square and F significance
FactorsFresh flesh
weightTotal dry matter
contentStructural dry matter
content2000 Age (A) 67257"* 43.6“ * 0.0164"’
Leaf/fruit (LF) 129047*" 68.7*** 0.0025 n sA xL F 6073*** 1.5 ns 0.0053 ns
2001 Age (A) 107271*** 229.9*** 0.2697 n sLeaf/fruit (LF) 230180*** 289.8*** 0.0031 nsIrrigation (I) 3 ns 19.5* 0.0007 n sA xL F 8523** 12.9** 0.0045 n sA X I 1276 n s 6.1 ns 0.0070 n sLF X I 3532ns 3.8 ns 0.0452***A X LF X I 2368 ns 6.2 n s 0.0013 n s
Non-significant (n.s)* significant at P<0.10. ** P<0.05.*** PO.Ol.
with each of CI and NI) were harvested every fifteen days between 19 October 2001 to 21
January 2002. For each fruit, the fresh weight and the flesh weight were measured. A sample
of fresh flesh was taken from each fruit, weighted, and then dried at 75°C for 48 h, and the
corresponding dry weights recorded, whereas the remainder was frozen at -20°C for future
analysis. The relative dry matter content, in %, was calculated as the ratio between the dry
weight and the fresh weight of the flesh. The structural dry matter content was the ratio
between the structural dry weight and the total dry weight of the flesh. The structural dry
weight was determined as the difference between the total dry weight of the flesh and the sum
of dry weights of non-structural components.
For analyses in the 2000 growing season, the frozen flesh pulp was defrozen, homogenised
and centrifuged to extract the crude juice. Concentrations of calcium, magnesium and
potassium were determined on the diluted mango juice with a capillary ion analysis (CIA)
using a Waters's instrument (Waters, Massachusetts, USA). The CLA conditions were UV
CAT2 electrolyte, silica capillary, 10-p.A current and 20kV voltage, hydrostatic injection, 10
nL sample injected, Electro-osmotic flux migration, and UV detection (185 nm, mercury
lamp). Concentrations of organic acids were also determined using the Water's CIA
instrument based on the Laksaridou-Monnerville's method (Laksaridou-Monnerville, 1997)
using diluted mango pulp. Briefly, the CLA conditions were Phosphate 7.5pM/OFM-OH
electrolyte, silica capillary 75 pm x 60cm, 7-pA current and 17kV voltage, hydrostatic
injection, 10 nL sample injected, electro-osmotic flux migration, and UV detection (185 nm,
mercury lamp). Concentrations of sucrose, glucose and fructose were measured using a high-
performance liquid chromatography (HPLC) system (DIONEX Co., Sunnyvale, USA). The
HPLC conditions were CarbopacPAl guard-column and column, 25 pL sample injected,
isocratic elution by a 200mM NaOH and purified water mixture (85:15, v/v), flow rate at 1
mL/min, and amperometric detection (type ED40). Peaks of sugars were confirmed by
comparison to standard solution. Starch was hydrolysed with amyloglucosidase (14
amyloglucosidase units/ml, Novo Nordisk Bioindustries Ltd., Denmark) and its concentration
was determined by a colorimetric dosage of glucose (glucose analysis kit, ref
716251/Boehringer Mannheim, Diffchamb, France).
In the 2001 growing season, the fresh pulp was defrozen and finely homogenised by a
Polytron (PT1600E, Kinematica AG, Switzerland). The sugars, starch, and minerals were
analysed as in 2000. The concentrations of organic acids were analysed by using a HPLC
method. The conditions were CarbopacPAl guard-column, IonPacASll column, 25pL
sample injected, elution by a linear gradient from 0.5mM to 35mM NaOH in 25min, flow rate
at 2 mL/min, and conductimetric detection (type ED40 equipped with an automatic
suppressor: ASRS cartridge). Peaks of organic acids were confirmed by comparison to
standard mixture.
C h a p i t r e II : E f fe t s de l ' a l im e n ta t i o n c a r b o n é e et h y d r iq u e su r la qu a l i t é d e la m a n g u e
43
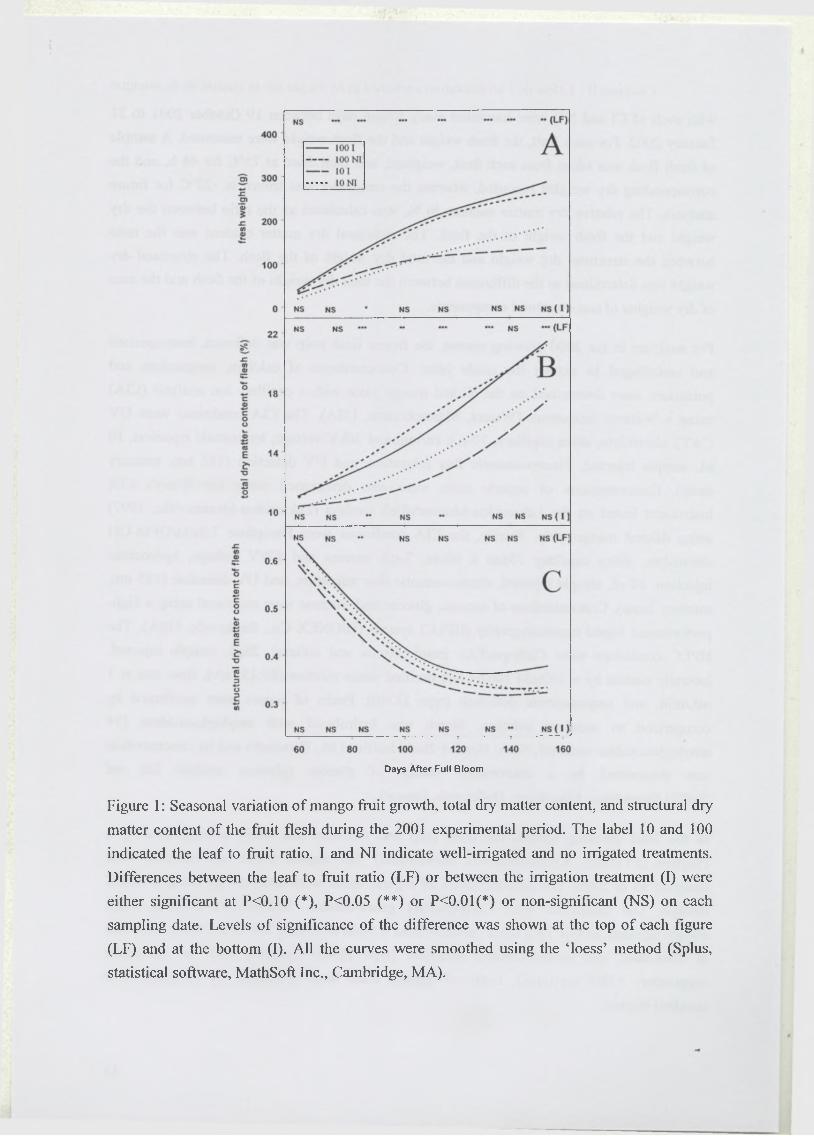
Days After Full Bloom
Figure 1 : Seasonal variation of mango fruit growth, total dry matter content, and structural dry
matter content of the fruit flesh during the 2001 experimental period. The label 10 and 100
indicated the leaf to fruit ratio. I and NI indicate well-irrigated and no irrigated treatments.
Differences between the leaf to fruit ratio (LF) or between the irrigation treatment (I) were
either significant at PO.IO (*), P 0 .0 5 (**) or P<0.01(*) or non-significant (NS) on each
sampling date. Levels of significance of the difference was shown at the top of each figure
(LF) and at the bottom (I). All the curves were smoothed using the ‘loess’ method (Splus,
statistical software, MathSoft Inc., Cambridge, MA).
Chapitre II : Effets de l 'a l im en ta t ion ca rbonée et hydrique sur la quali té de la m an g u e
2.2.3 Statistical analysis
An analysis of variance was performed on observed fresh mass, total dry matter content,
structural dry matter content, and concentrations of the non-structural components of the
flesh, from the two years of experiments to study the effects of fruit age, assimilate supply,
water supply and their two- or three-way interactions. As the period of sampling dates was
longer during the second than the first year of experiment, an analysis of variance was carried
out on each sampling dates with leaf to fruit ratio (LF) and irrigation (I) as factors.
2.3 Results
Both fresh flesh weight, total dry matter content and structural diy matter content of the flesh
were significantly influenced by fruit age (days after full bloom) in 2000 and 2001 (Table 1).
In 2001 fruit flesh weight increased almost linearly until 100 days after full bloom and then
tended to slow down (Figure 1A). The total dry matter content increased with the fruit
development (Figure IB). The structural dry matter content of the fruit flesh decreased rapidly
until 120 days after full bloom and then stayed nearly constant (Figure 1C). The effects of leaf
to fruit ratio on the fresh flesh weight and the total dry matter content of the flesh were
significant in both years of experiment (Table 1). An increase of the leaf to fruit ratio strongly
increased fruit size and total dry matter content of the flesh in 2001 (Figures 1A and IB). At
maturity, the latter was about 20 % higher in treatment 100 leaves per fruit than in treatment
10. In 2001, total dry matter content of the flesh was also affected by tree irrigation (Table 1).
Reducing irrigation seemed to increase it (Figure IB). Neither irrigation nor assimilate supply
had significant effect on the structural dry matter content of the flesh (Table 1) but their
interaction had some.
Flesh composition, such as minerals, organic acids and sugars were affected by fruit age
during the two years of experiment (Table 2). Seasonal trends in 2000 were similar to those in
2001 (data not shown). K represented more than 80 % of the pool of cation in mango fruit
flesh followed by Ca and Mg (Figure 2). In 2001, K concentration increased slightly with fruit
development between 0.015 to 0.030 g per g of structural dry weight (Figure 2A) whereas Mg
and Ca concentrations tended to decrease during fruit development (Figures 2B and 2C). The
effect of leaf to fruit ratio was particularly strong on Ca in the two years of experiment
(Table2). Ca concentration was higher in fruit flesh with low leaf to fruit ratio. The effect of
assimilate supply (leaf to fruit ratio) on Mg was less marked. No treatment effect was found
on K concentration, however there was an interaction effect between leaf to fruit ratio and tree
irrigation.
44
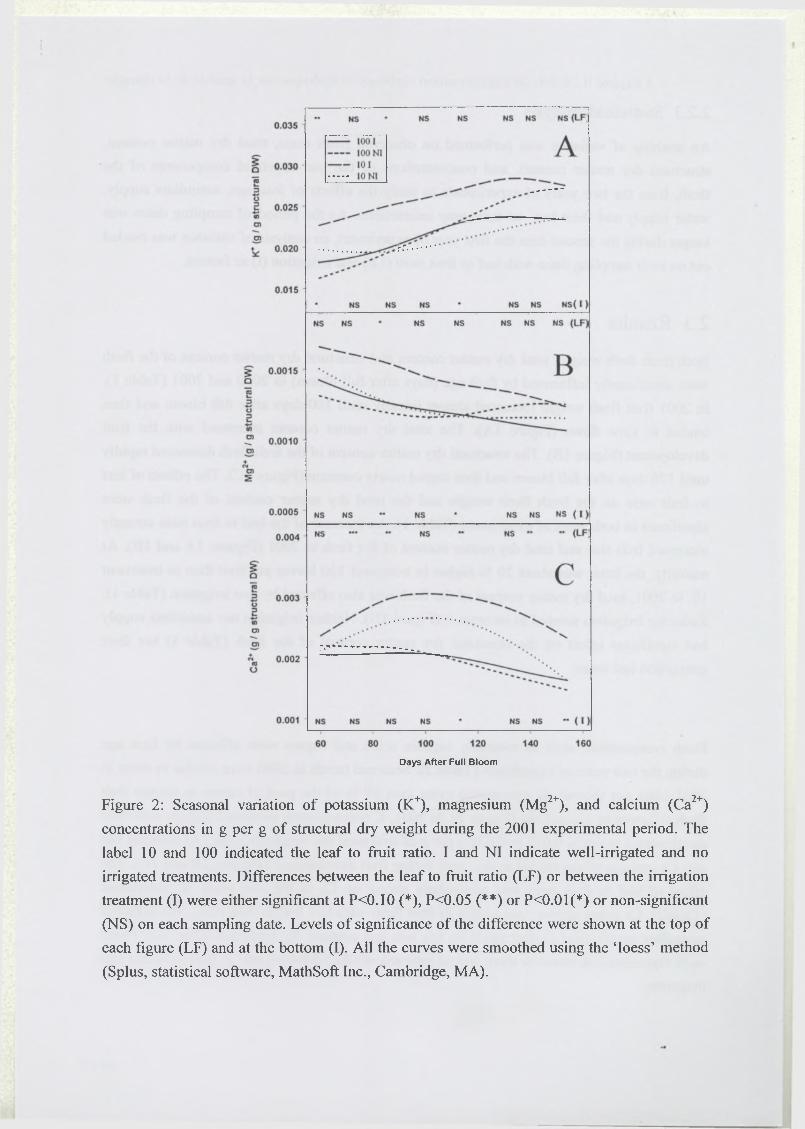
Days After Full Bloom
Figure 2: Seasonal variation of potassium (K+), magnesium (Mg2+), and calcium (Ca2+)
concentrations in g per g of structural dry weight during the 2001 experimental period. The
label 10 and 100 indicated the leaf to fruit ratio. I and NI indicate well-irrigated and no
irrigated treatments. Differences between the leaf to fruit ratio (LF) or between the irrigation
treatment (I) were either significant at PO.IO (*), P 0 .0 5 (**) or P<0.01(*) or non-significant
(NS) on each sampling date. Levels of significance of the difference were shown at the top of
each figure (LF) and at the bottom (I). All the curves were smoothed using the ‘loess’ method
(Splus, statistical software, MathSoft Inc., Cambridge, MA).
Citric acid increased until 90 days after full bloom to reach a maximum about 0.35 to 0.50 g
per g of structural dry weight according to treatments, and afterwards decreased gradually to
below 0.1 (Figure 3 A). In contrast malic acid concentration decreased continuously from 0.5-
0.1 g per g of structural dry weight to a minimum concentration of less than 0.037 at the time
of about 100 days after full bloom (Figure 3B). Then dining the last month, there was a
graduate and small increase. Malic and citric concentrations were significantly affected by
leaf to fruit ratio (Table 2). Citric and malic acid concentrations were higher almost all along
the fruit development from the lower leaf to fruit ratio (Figures 3A and 3B) even if difference
between treatments decreased as fruit developed. Irrigation treatment did not affect acid
concentration (Table 2).
C h a p i t r e il : E f fe t s d e l ' a l i m e n t a t i o n c a r b o n é e et h y d r iq u e s u r la q u a l i t é d e la m a n e u e
Soluble and insoluble sugars had different seasonal trends. The minor in concentration,
glucose was the only to decrease during the majority of the time of fruit development (Figure
4A). The concentration of fructose increased steadily all along fruit development to reach the
peaks at fruit maturity between 0.3 to 0.5 g per g of structural dry weight according to
treatments (Figure 4B). Sucrose concentration remained low, around 0.25 g per g of structural
dry weight until 100 days after full bloom, then it increased and could rise up a concentration
about 1.25 g per g of structural dry weight at the end of fruit growth (Figure 4C). Glucose and
fructose concentrations were significantly affected by assimilate supply the two years of
experiment (Table 2). Lower leaf to fruit ratio (10 leaves per fruit) significantly increased
glucose and fructose concentrations until 120 days after full bloom for glucose (Figure 4A),
and all along fruit development for fructose (Figure 4B). Sucrose concentration was higher in
fruits with higher leaf to fruit ratio during the latter stage of fruit development (Figure 4C).
Furthermore, an interaction between leaf to fruit ratio and tree irrigation was found on the
three soluble sugar concentrations (Table 2). The seasonal trend of starch concentration could
be separated in two phases (Figure 4D). During the first phase, starch concentration increased
to reach a maximum about 1.0 to 1.2 g per g of structural dry weight according to treatments.
Then, it decreased rapidly to about 0.2 g per g of structural dry weight towards the end of fruit
development. From 130 days after full bloom onwards, starch seemed to be affected by leaf to
fruit ratio (Table 2 and Figure 4D). During the period near maturity, fruit flesh from treatment
with higher assimilate supply had more sucrose and less starch than low leaf to fruit ratio.
Water stress enhanced the difference, especially for starch. For the same leaf to fruit ratio,
starch concentration was higher in water stressed trees (Figure 4D). Moreover, starch
breakdown occurred later in the fruit flesh from treatment with less assimilate and water
supply.
45
i
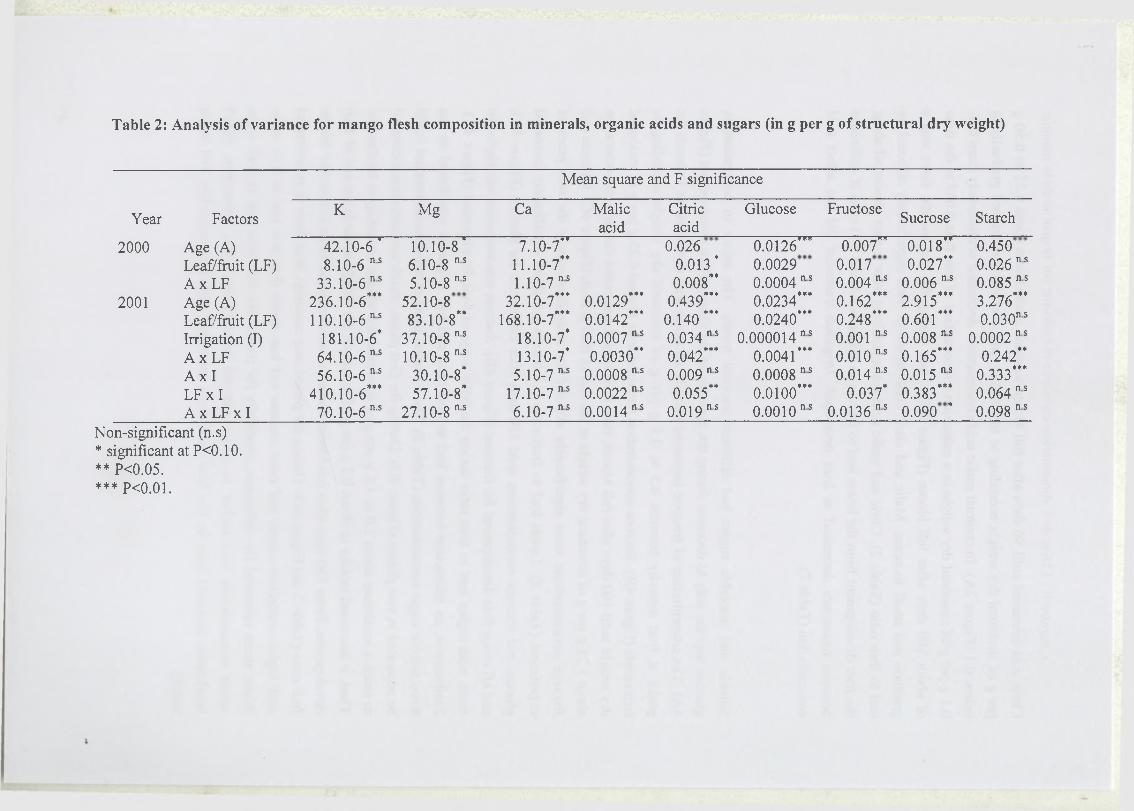
Table 2: Analysis of variance for mango flesh composition in minerals, organic acids and sugars (in g per g of structural dry weight)
Mean square and F significance
Year FactorsK Mg Ca Malic
acidCitricacid
Glucose FructoseSucrose Starch
2000 Age (A) 42.10-6' 10.10-8* 7.10-7’* 0.026 0.0126*" 0.007" 0.018”« .0.450
Leaf/fruit (LF) 8.10-6 ns 6.10-8 n s 11.10-7** 0.013* 0.0029 0.017 0.027** 0.026 ns
2001A x LF Age (A) Leaf/fruit (LF)
33.10-6 ns236.10-6***110.10-6 n s
5.10-8 n s 52.10-883.10-8**
1.10-7 n s 32.10-7***
168.10-7***
_ . . - _*** 0.01290.0142***
0.008** 0.439***
0.140 ***
0.0004 ns 0.0234*** 0.0240***
0.004 n s 0.162” * 0.248***
0.006 ns 2.915*** 0.601” *
0.085 n s . _ _ -*** 3.2760.030ns
Irrigation (I) A x LF
181.10-6* 64.10-6 n s
37.10-8 n s10.10-8 n s
18.10-7*13.10-7*
0.0007ns 0.0030**
0.034ns ***0.042
0.000014ns 0.0041***
0.001 ns 0.010ns
0.008 n s . + ** 0.165
0.0002 n s 0.242**
A x I 56.10-6 n s 30.10-8* 5.10-7 ns 0.0008 n s 0.009 n s 0.0008 n s 0.014 ns 0.015 n s 0.333***LF x I 410.10-6*** 57.10-8* 17.10-7 n s 0.0022ns 0.055** 0.0100*” 0.037*
_ ___**♦ 0.383 0.064ns
A x LF x I 70.10-6n'5 27.10-8 n s 6.10-7 n s 0.0014ns 0.019 n s 0.0010ns 0.0136 ns_ *0.090 0.098 n s
Non-significant (n.s)* significant at P<0.10.** P 0 .05 .*** PO.Ol.
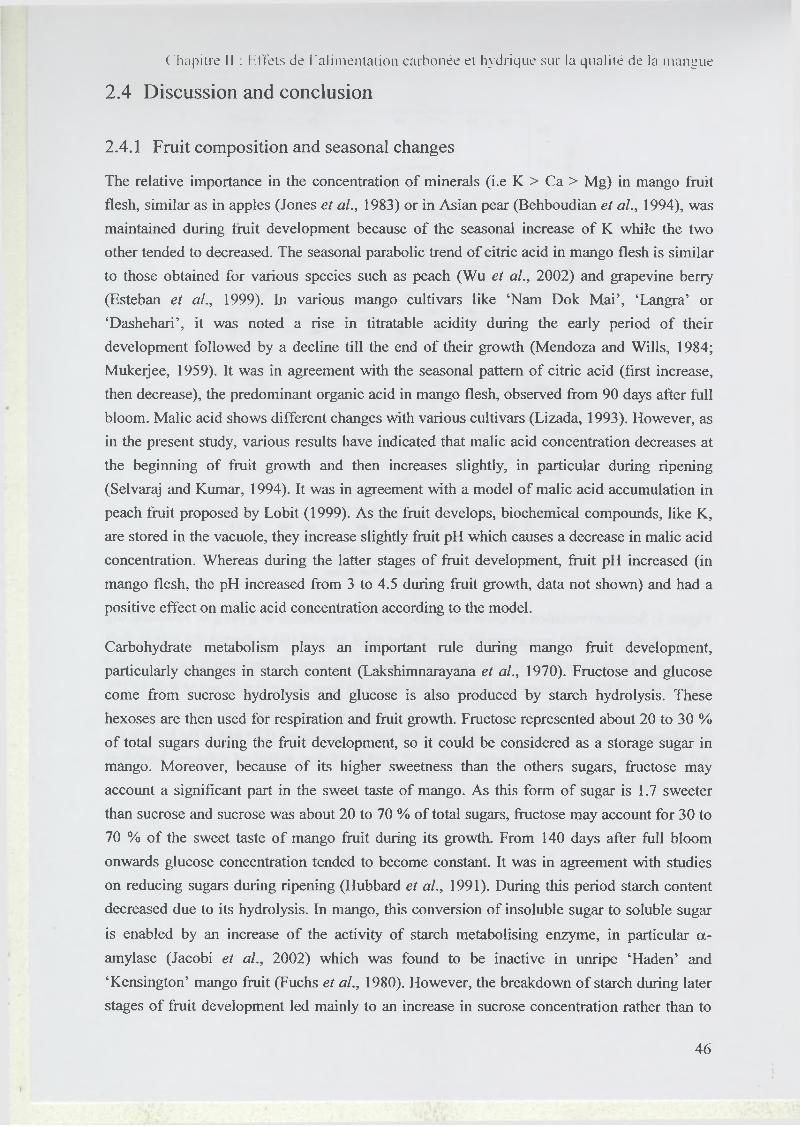
2.4 Discussion and conclusion
2.4.1 Fruit composition and seasonal changes
The relative importance in the concentration of minerals (i.e K > Ca > Mg) in mango fruit
flesh, similar as in apples (Jones et al., 1983) or in Asian pear (Behboudian et al., 1994), was
maintained during fruit development because of the seasonal increase of K while the two
other tended to decreased. The seasonal parabolic trend of citric acid in mango flesh is similar
to those obtained for various species such as peach (Wu et al., 2002) and grapevine berry
(Esteban et al., 1999). In various mango cultivars like ‘Nam Dok Mai’, ‘Langra’ or
‘Dashehari’, it was noted a rise in ti tratable acidity during the early period of their
development followed by a decline till the end of their growth (Mendoza and Wills, 1984;
Mukeijee, 1959). It was in agreement with the seasonal pattern of citric acid (first increase,
then decrease), the predominant organic acid in mango flesh, observed from 90 days after full
bloom. Malic acid shows different changes with various cultivars (Lizada, 1993). However, as
in the present study, various results have indicated that malic acid concentration decreases at
the beginning of fruit growth and then increases slightly, in particular during ripening
(Selvaraj and Kumar, 1994). It was in agreement with a model of malic acid accumulation in
peach fruit proposed by Lobit (1999). As the fruit develops, biochemical compounds, like K,
are stored in the vacuole, they increase slightly fruit pH which causes a decrease in malic acid
concentration. Whereas during the latter stages of fruit development, fruit pH increased (in
mango flesh, the pH increased from 3 to 4.5 during fruit growth, data not shown) and had a
positive effect on malic acid concentration according to the model.
Carbohydrate metabolism plays an important rule during mango fruit development,
particularly changes in starch content (Lakshimnarayana et al., 1970). Fructose and glucose
come from sucrose hydrolysis and glucose is also produced by starch hydrolysis. These
hexoses are then used for respiration and fruit growth. Fructose represented about 20 to 30 %
of total sugars during the fruit development, so it could be considered as a storage sugar in
mango. Moreover, because of its higher sweetness than the others sugars, fructose may
account a significant part in the sweet taste of mango. As this form of sugar is 1.7 sweeter
than sucrose and sucrose was about 20 to 70 % of total sugars, fructose may account for 30 to
70 % of the sweet taste of mango fruit during its growth. From 140 days after full bloom
onwards glucose concentration tended to become constant. It was in agreement with studies
on reducing sugars during ripening (Hubbard et al., 1991). During this period starch content
decreased due to its hydrolysis. In mango, this conversion of insoluble sugar to soluble sugar
is enabled by an increase of the activity of starch metabolising enzyme, in particular a-
amylase (Jacobi et al., 2002) which was found to be inactive in unripe ‘Haden’ and
‘Kensington’ mango fruit (Fuchs et al., 1980). However, the breakdown of starch during later
stages of fruit development led mainly to an increase in sucrose concentration rather than to
C h a p i t r e II : E f fe t s d e l ' a l i m e n t a t i o n c a r b o n é e et h y d r iq u e su r la q u a l i t é d e la m a n g u e
4 6
I
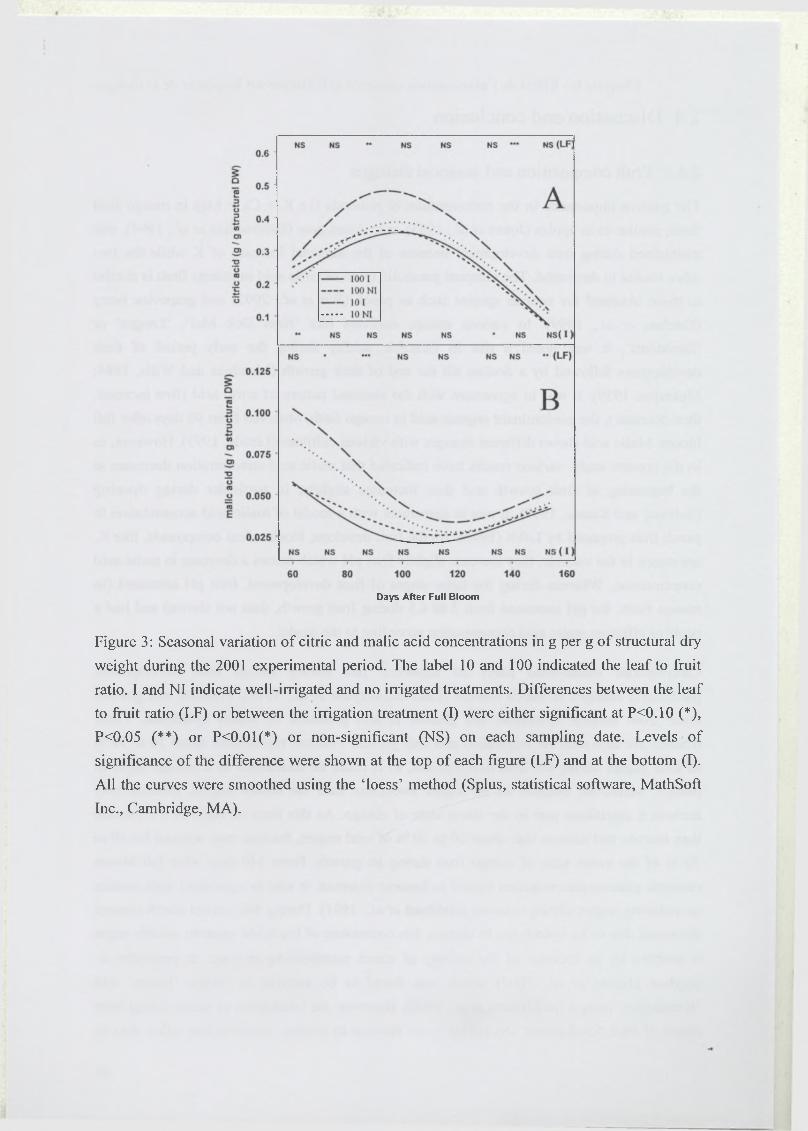
Days After Full Bloom
Figure 3: Seasonal variation of citric and malic acid concentrations in g per g of structural dry
weight during the 2001 experimental period. The label 10 and 100 indicated the leaf to fruit
ratio. I and NI indicate well-irrigated and no irrigated treatments. Differences between the leaf
to fruit ratio (LF) or between the irrigation treatment (I) were either significant at P<0.10 (*),
P 0 .0 5 (**) or P<0.01(*) or non-significant (NS) on each sampling date. Levels of
significance of the difference were shown at the top of each figure (LF) and at the bottom (I).
All the curves were smoothed using the ‘loess’ method (Splus, statistical software, MathSoft
Inc., Cambridge, MA).
Chapitre II : Effets de l 'a l im en ta t ion ca rbonée et hydrique sur la quali té de la m an g u e
an increase in glucose. In fact, mango flesh temporarily stored starch from 0.05 g per g of
structural dry weight until 1.0 to 1.2 g per g of structural dry weight before it accumulated
sucrose from 0.1 g per g of structural dry weight until 1.0 to 1.25 g per g of structural dry
weight. Our results indicated that starch was mobilised to provide about 85 % of the carbon
required for sucrose accumulation.
2.4.2 Assimilate and water supply affect fruit quality
In the present study, it was shown that increasing the number of leaves per fruit increased
mango fruit growth rate and final fruit size at harvest, as reported earlier for other cultivars by
Chacko et al. (1982) and Reddy and Singh (1991). Fruits from treatment with 100 leaves per
fruit were larger than those from treatment with 10, implying that fruit thinning could be
advantageous for improving mango fruit size, provided that fruit retention rate is adequate.
Mango fruit size was not affected by reducing irrigation under the conditions o f this study,
that is different from report on irrigation management on ‘Kensington’ fruit (Diczbalis et al.,
1995). Although the irrigation was completely withheld early in the season of fruit growth,
deep loamy soil and extensive root system with deep tap roots and rainfall (170 mm during
this period) might have presented the trees from experiencing medium to severe water stress
under our experimental conditions.
Fruits on branches with a high leaf to fruit ratio had flesh with the greatest total dry matter
content. Our earlier studies on water and dry matter accumulation in mango fruits (Léchaudel
et al., 2002) have shown that both dry matter and water increase with increasing the leaf to
fruit ratio, and the leaf to fruit ratio affected dry matter supply more than water supply.
Similar increases in dry matter content with higher leaf to fruit ratio were observed for
‘Kensington’ mango fruit by Simmons et al. (1998). Irrigation treatment seemed to have an
effect on total dry matter content of the flesh, for PO.IO. The largest difference was for flesh
from fruits within treatment with 10 leaves per fruit: those on trees without irrigation had
higher total dry matter content. Irrigation effect on total dry matter content of ‘Kensigton’
mango fruit was also noted by Diczbalis et al. (1995). The structural dry matter content of
fruit flesh was not affected by treatments. This result implies that the effect of assimilate and
water supply on the concentration based on fresh weight of an element x was only due to
changes in total dry matter content and in the concentration of non-structural compounds per
structural dry weight of the flesh.
Cations were differently affected by leaf to fruit ratio. K concentration was not affected by
leaf to fruit ratio. This cation is translocated into fruit with assimilate trough the phloem
(Nooden, 1988). Thus, the leaf to fruit ratio possibly influences both the assimilate and K
translocation to the fruit in the same way. The results on apple (Volz et al., 1993) and mango
(Simmons et al., 1998) which reported that higher leaf to fruit ratio increases fruit K
4 7
I
fruc
tose
(g
I g st
ruct
ural
DW
) gl
ucos
e (g
/ g st
ruct
ural
DW
)
Days After Full Bloom Days After Full Bloom
Figure 4: Seasonal variation of glucose, fructose, sucrose, and starch concentrations in g per
of structural diy weight during the 2001 experimental period. The label 10 and 100 indicated
the leaf to fruit ratio. I and NI indicate well-irrigated and no irrigated treatments. Differences
between the leaf to fruit ratio (LF) or between the irrigation treatment (I) were either
significant at P<0.10 (*), P<0.05 (**) or P<0.01(*) or non-significant (NS) on each sampling
date. Levels of significance of the difference was shown at the top of each figure (LF) and at
the bottom (I). All the curves were smoothed using the ‘loess’ method (Splus, statistical
software, MathSoft Inc., Cambridge, MA).
concentration on fresh weight basis possibly reflect difference in total dry matter content of
the flesh. The effect on Mg concentration was less marked, but could also be explained in the
same way as for K. Results showed that Ca concentration was up to 50 % higher in flesh fruit
from treatment with 10 leaves per fruit than from treatment with 100 leaves. Faster fruit
growth rate for high leaf to fruit ratio and a decline in surface area:volume ratio as fruit
enlarge may reduce water lost per unit of fruit weight via transpiration and the rate of Ca
accumulation (Wilkinson, 1968). Moreover, diurnal fluctuations in fruit growth have been
linked to bi-directional fluxes in apple fruit (Lang and Volz, 1998). They have found a
positive relationship between xylem sap inflows during the night and xylem sap outflows
during the day. (Jones et al., 1983) presented evidence that the outflowing sap contains much
less Ca than the inflowing sap. Urban et al. (2002) showed on mango that decreasing the leaf
to fruit ratio from about 100 to about 25 leaves per fruit increased the leaf diffusive
conductance to water vapour of about 45 %. Thus, larger amounts of water may be lost during
the day by fruits from the low leaf to fruit ratio treatment due to the higher transpiration rates
of surrounding leaves. At night, larger quantities of water would enter into these fruit via the
xylem replenish water lost during the day, provide also additional import of Ca into the fruit,
as well as extra water for fruit growth.
Low assimilate supply increased significantly malic acid concentration, especially early in the
season. That was in agreement with a negative relationship found in peach flesh between
assimilate supply and malic acid concentration at the beginning of growth (Wu et al., 2002).
However, at maturity, malic acid concentration was not positively correlated with assimilate
supply as observed in peach. Fruit flesh from treatment with fewer leaves seemed to store
more malic acid and cations. Lobit (1999) reported that in ripe fruit malic acid concentration
was linked with total cations concentration. Low assimilate supply increased citric acid
concentration. Citric acid production takes place in mitochondria and is mainly affected by
respiration demand of fruit (Douce, 1985). Citric acid is synthesised when fruit growth is
slower and when energetic demand is lower (Lobit, 1999). Thus, fruit flesh from lower leaf to
fruit ratio may accumulated more this organic acid.
Glucose concentration was lower in larger fruit. The effect of leaf to fruit ratio in the latter
stages of fruit development was less evident. The beginning of starch hydrolysis at these
stages could explain this. Higher leaf to fruit ratio tended to decrease fructose concentration.
In the case of the shortage of assimilate supply the higher glucose and fructose concentrations
may contribute to osmotic adjustment. Higher concentrations of hexoses were found in apple
(Wang and Stutte, 1992), mandarin (Yakushiji et al., 1996) and in strawberry (Pomper and
Breen, 1997) fruit under water stress. Leaves from the lowest leaf to fruit ratio had higher leaf
diffusive conductance to water vapour (Urban et al., 2002) and possibly lower water
potentials as Berman and Dejong (1996) found on leaves from trees with heavy crop load.
Storage of hexoses in fruit may occur by active accumulation to maintain water inflow in fruit
C h a p i t r e II : Effe ts d e l ' a l i m e n t a t i o n c a r b o n é e e t h y d r iq u e su r la q u a l i t é de la m a n g u e
4 8
I
and a positive cell turgor. This strategy contributes to continued growth during water stress
and perhaps during the time of low assimilate supply.
The rates of sucrose accumulation and starch breakdown seemed to be higher when assimilate
supply increased, as it was reported on peach fruit (Souty et al., 1999), and to be delayed in
fruit flesh from treatment with the lowest assimilate and water supply. It could be explain by a
strong relationship between sucrose and the rate of assimilate inflow and by an increase of
enzyme activities related to sucrose accumulation. In muskmelon fruit, sucrose phosphate
synthase activity was higher in mesocarp from control than in fruits developed with lower leaf
area (Hubbard et al., 1990). Near fruit maturity, the different levels of sucrose and starch
concentrations among treatments may provided consequences on the quality of these fruits, in
particular concerning their taste.
C h a p i t r e il : E f fe t s de l ' a l i m e n t a t i o n c a r b o n é e et h y d r iq u e su r la q u a l i t é d e la m a n t iu e
As far as fruit quality is concerned, element concentrations expressed per structural dry
weight of flesh give more information on what quality components were affected by water
and assimilate supply all along fruit development. Firstly, higher assimilate supply increased
total dry matter content of mango fruit flesh. Secondly, the part of structural material seemed
to be similar regardless treatments. Finally, seasonal changes of composition of the non-
structural compounds were mainly affected by assimilate supply and less by irrigation
treatments. Less assimilate supply tended to increase Ca, malic and citric acid concentrations.
Others cations, such as Mg and K, were less affected by leaf to fruit ratio. Sucrose
concentration was increased by higher assimilate supply. Near maturity the eating quality of
fruit seemed to be improved by higher leaf to fruit ratio as those fruits contained more
sucrose, less starch and acids, which increased the sweet taste. However it appeared that
fruit’s shelf life might be affected, as concentration of Ca expressed by structural dry weight
was lower.
ACKNOLEDGEMENTS
We gratefully acknowledge D Dessane and P Cabeu for their assistance during the field
experiments and G Frehaut and D Robbe for their assistance in the biochemical analyses. We
thank P LU (CSIRO, Australia) for revising the manuscript.
t
4 9
C h a p i t r e lü : E tu d e du f o n c t io n n e m e n t c a rb o n é e d e la m a n u u e
Chapitre III : Etude du fonctionnement
carboné de la mangue : Combined effects of
climate and source / sink relations on mango
fruit growth studied by a modelling approach
C h a p i t r e II! : E tu d e du fo n c t io n n e m e n t c a r b o n é e d e la m a n g u e
Chapitre III : Etude du fonctionnement
carboné de la mangue : Combined effects of
climate and source / sink relations on mango
fruit growth studied by a modelling approach
50
C h a p i t r e III : E tu d e d u fo n c t io n n e m e n t c a r b o n é e d e la m a n g u e
L’accumulation de matière sèche dans le fruit est sous l’influence de la disponibilité en
assimilais carbonés, facteur principal qui peut varier au sein d’un arbre. Nous faisons donc
l’hypothèse que le rapport feuilles/fruit influence la croissance en matière sèche du fruit en
modifiant les relations sources/puits à l’échelle du rameau qui affectent alors les processus
physiologiques impliqués dans la croissance en matière sèche, comme la photosynthèse
foliaire, les respirations d’entretien et de croissance, l’évolution des réserves dans les feuilles
et le bois, ou la demande du fruit.
Dans l’objectif de comprendre le fonctionnement carboné de la mangue, la croissance en
matière sèche de ce fruit a été étudiée puis modélisée au niveau d’un rameau qui comprend
des feuilles assimilatrices de carbone, du bois et des fruits en croissance. Un modèle a été
adapté pour reproduire le fonctionnement carboné du rameau fructifère en prenant en compte
les variations des relations sources/puits selon les conditions environnementales (Léchaudel,
M., Génard, M., Urban, L. and Jannoyer, M. Combined effects of climate and source / sink
relations on mango fruit growth studied by a modelling approach. Manuscript qui va être
soumis à Tree Physiology). Des hypothèses sont proposées pour reproduire l’effet de ces
variations sur les processus physiologiques intégrés dans le modèle. Les sorties du modèle
sont ensuite comparées aux mesures, et le modèle est utilisé dans une étude virtuelle pour
quantifier la contribution du climat et des principaux facteurs de variations des relations
sources/puits dans les processus impliqués dans la croissance en matière sèche du fruit.
51
C hapitre ill : Étude du fonctionnement ca rbonée de la m angue
Combined effects of climate and source / sink relations on mango fruit
growth studied by a modelling approach
By Mathieu Léchaudel1, Michel Génard2, Françoise Lescourret2, Laurent Urban3 and
Magalie Jannoyer4
'Centre de Coopération Internationale en Recherches Agronomique pour le Développement,
Département des Productions Fruitières et Horticoles, Station Bassin Plat, BP 180, 97455
Saint Pierre Cedex, Ile de la Réunion, France
2Inra-Psh, Domaine St Paul, 84914 Avignon Cedex 9, France
3Inra-Cirad, Station Bassin Plat, BP 180, 97455 Saint Pierre Cedex, Ile de la Réunion
4Cirad-Flhor, Boulevard de la Lironde, TA 50 / PS4, 34398 Montpellier Cedex 5
(e-mail : [email protected])
52
C h a p i t r e III : E tude du fo n c t io n n e m e n t c a r b o n é e de la m a n g u e
ABSTRACT
To assess the respective contribution of climate changes, initial fruit dry mass and leaf-to-fruit
ratio on processes involved in sources/sink balances and fruit growth, leaf photosynthesis,
fruit demand, respiration, and reserves mobilisation in leaves and stem, were characterised at
the shoot bearing level on mango. Fruit dry mass was measured during three successive years,
on various leaf-to-fruit ratio treatments. From these results a model of fruit growth was
developed for mango fruit. This model is able to account accurately for the variations of the
main processes involved in fruit growth, as the decrease of leaf photosynthesis and the high
reserves content in leaves and stem observed for high leaf to fruit ratio treatments. Simulation
results during the three successive years and for the various leaf-to-fruit ratio treatments
showed a good agreement with the observed data of fruit growth. The initial fruit dry mass
introduced to compute the maximum fruit dry mass in the fruit demand expression, allowed to
represent sink size in the early stage of fruit development assumed to be proportional to cell
number and thus to account climatic and resource limitations which may affect cell division
and fruit growth. Moreover, simulations on fruit growth assessed with various climate
conditions and different source/sink factors (initial fruit dry mass and leaf-to-fruit ratio)
demonstrate that variations in fruit growth between years can be partly explained by climate
variations through their effects on leaf photosynthesis, fruit demand, and fruit growth rate.
However, climate changes contribute less to observed changes in fruit growth than the initial
fruit dry mass and the leaf-to-fruit ratio.
i
53
1 Introduction
Fruit dry mass is an important ingredient of fruit quality, since dry matter covers mainly
carbohydrates, 60 % of which are sugars and acids, the main compounds involved in fruit
taste (Fishman and Génard, 1998; Mukeijee, 1959). Carbohydrates are synthesised by leaf
photosynthesis, then supplied via the phloem to the sinks, among which fruits take a large part
in the case of fruit trees.
The amount of carbohydrates produced by photosynthesis is related to the leaf area and to the
photosynthetic capacity and activity. The latter can be influenced by climatic conditions (Le
Roux et al., 2001; Rosati et al., 1999) and by changes in sources/sink balances, as it has been
reported in many species, including apple (Palmer, 1992), grapevine (Naor et al., 1997), and
mango (Urban et al., 2003). Factors affecting leaf photosynthesis generally modify
carbohydrate content in leaves (Foyer, 1988). This accumulation/depletion of carbohydrates
in the source leaves is generally believed to be the result of the balance between sink demand
and photosynthetic rates (Ben Mimoun et al., 1996).
The sink demand is generally defined as the sum of the assimilates required for maintenance
and potential growth of the sink organ, the latter being determined under optimal
environmental conditions, i.e. non-limiting supply of carbon and other resources (Ho, 1992;
Warren Wilson, 1972). The potential growth of finit is related to fruit mass, i.e. sink size, and
to the relative fruit growth rate, i.e. sink activity, both determining sink strength which is in
fruits the ability to attract assimilates to sustain fruit growth.
C h a p i t r e III : É tude d u fo n c t io n n e m e n t c a r b o n é e de la m a n g u e
Many cultural practices, by manipulating either source size or sink size, influence source-
sinks relationships involved in fruit growth. Thinning, which generally consists in removing
the smallest fruits, affects sink size. This technique, which aims at controlling crop load, is
known to usually increase fruit size sometimes at the expend of yield (Goffinet et al., 1995).
Pruning or partial defoliation is another practice which decreases total leaf area, and thus
source size (Layne and Flore, 1993). Girdling is known to favour carbohydrate accumulation
and fruit size, while reducing shoot growth (Cutting and Lyne, 1993).
Variation in fruit growth from year to year is sometimes observed, and may be caused by
climatic changes from one season to another. Light is required for photosynthesis and
54
Chapitre Ili : Ltude du fonc tionnem ent ca rbonée de la m angue
increased light levels could improve fruit size in the case of mango (Mendoza and Wills,
1984), pear (Kappel and Neilsen, 1994), and apple (Morgan el al., 1984), according to the
fruit demand limitation. Fruit growth depends upon physiological and biochemical processes,
which are under the influence of the temperature prevailing during the development period.
Temperature was found to be a source of variation of fruit growth rate in several fruit species,
such as apples (Tukey, 1960), satsuma mandarin (Marsh el al., 1999) and peach (Haun and
Coston, 1983). It appears in many studies that cumulative degree day after full bloom is an
adequate variable to explain the variability of growth between years and local sites
(Burondkar et al., 2000; Mosqueda-Vasquez and Ireta-Ojeda, 1993).
Modelling the distribution of carbohydrates within individual fruit trees is important to predict
the fruit growth (Grossman and Dejong, 1994; Lescourret et al., 1998). Models of fruit
growth in dry mass have been successfully used to determine the yield of horticultural fruit
crops (Marcelis et al., 1998) and to identify environmental factors limiting fruit growth
(Génard et al., 1998; Grossman and Dejong, 1994). In fruit trees, the variability of fruit
growth is generally large within the plant and models have to focuse on important production
units such as shoots bearing fruits. At this level the major physiological processes involved in
fruit growth can be studied through a model. The model of (Lescourret et al., 1998) is able to
take into account source/sink relationships and this possible variation in growth of the girdled
shoot bearing fruit through simulating main processes, as source activity, reserves
mobilisation, respiration, and fruit demand.
Mango fruit is an important tropical horticultural crop and is generally noted to have a strong
heterogeneity of fruit size at harvest. The objective of this study is to quantify the respective
effects of climate, early sink size and leaf-to-fruit ratio, and their interactions on fruit growth
and fruit size at harvest. In a first step, an approach coupling field experimentations and
modelling mango fruit growth was developed at the girdled shoot bearing fruit level to
analyse the source/sink relationships in mango. The source activity, the sink demand, the
respiration of the various organs and the reserves mobilisation were characterised. The
capacity of the model to account for the differences in fruit dry mass between various leaf-to-
fruit ratio treatments was tested. The sensitivity of fruit growth to the model parameters was
studied. In a second step, the combined effects of climate and source/sink factors (leaf-to-fruit
ratio, initial fruit dry mass) were studied using the model. With such a kind of simulations, it
is possible to vary factors exactly as expected while maintaining the other traits of the system
similar between treatments. This part of our study requires to have an important set of climate
data from various years and sites, and a model beforehand capable to predict fruit growth at
various source/sink ratios with good accuracy during several years.
55
I
C h a p i t r e III : É tu d e du fo n c t io n n e m e n t c a r b o n é e d e la m a n g u e
2 Materials and methods
2.1 Plant material
The experimental study was conducted on 11-year-old (in 2000) mango trees of cv. ‘Lirfa’,
grafted on ‘Maison Rouge’, in La Réunion island (20°52’48” S, 55°31’48” E) during the
2000, 2001 and 2002 growing seasons. The 2000 experimental plot, on orchard 1, consisted of
ten rows, 7 m distant, each of them made of nine trees spaced 5 m apart, and about 3 m high.
The trees observed in 2001 were spaced 5 m by 6 m and were around 3 m high in an adjacent
plot, called orchard 2. In 2002, experimental data were acquired from the two orchards.
During the experiment, all trees were irrigated every two days at 100 % replacement of
evaporation. Six weeks after flowering, about ten to fifteen branches per tree were chosen,
which represents less than 10 % of the total branches of the tree canopy. The branches were
all chosen on the top of the canopies to reduce the variability of light received by leaves
which could significantly change carbon assimilation and fruit growth as well. Branches were
girdled by removing a band of bark 10-15 mm wide. They were sometimes de fruited and
defoliated if needed to reach 10, 25, 50, 100 and 150 leaves per fruit (with 50 leaves for 5
fruits, 100 leaves for 4, 2 and 1 fruit, and 150 leaves for 1 fruit, respectively). To keep the
leaf-to-fruit ratio constant within each treatment, new emerging leaves were removed.
Girdling was performed after the heavy young fruit drop, when fruit length was about 5 cm.
2.2 Model Presentation
The model of carbon partitioning at the shoot-bearing fruit level proposed for peach by
Lescourret et al. (1998) was modified to take into account mango fruit properties. This model
describes the functioning of a system composed by three main components: fruit, leaves, and
stem. The vegetative part is of the current or the previous year. Carbohydrates partitioning is
simulated, based on organ demand and priority rules. Mango leaves and girdled stem do not
grow during the fruit growing season. The priority rules are: 1) maintenance of the system, 2)
reproductive growth, and 3) accumulation of reserves in the leaves and then in the stem.
When the potential fruit demand is higher than carbohydrates supplied by current
photosynthesis, the fruit can obtain assimilates from the stem and leaf reserves. Organ
respiration and reserve mobilisation are represented as in the initial model of Lescourret et al.
(1998). New equations are proposed for carbon assimilation and fruit demand. Parameters of
5 6
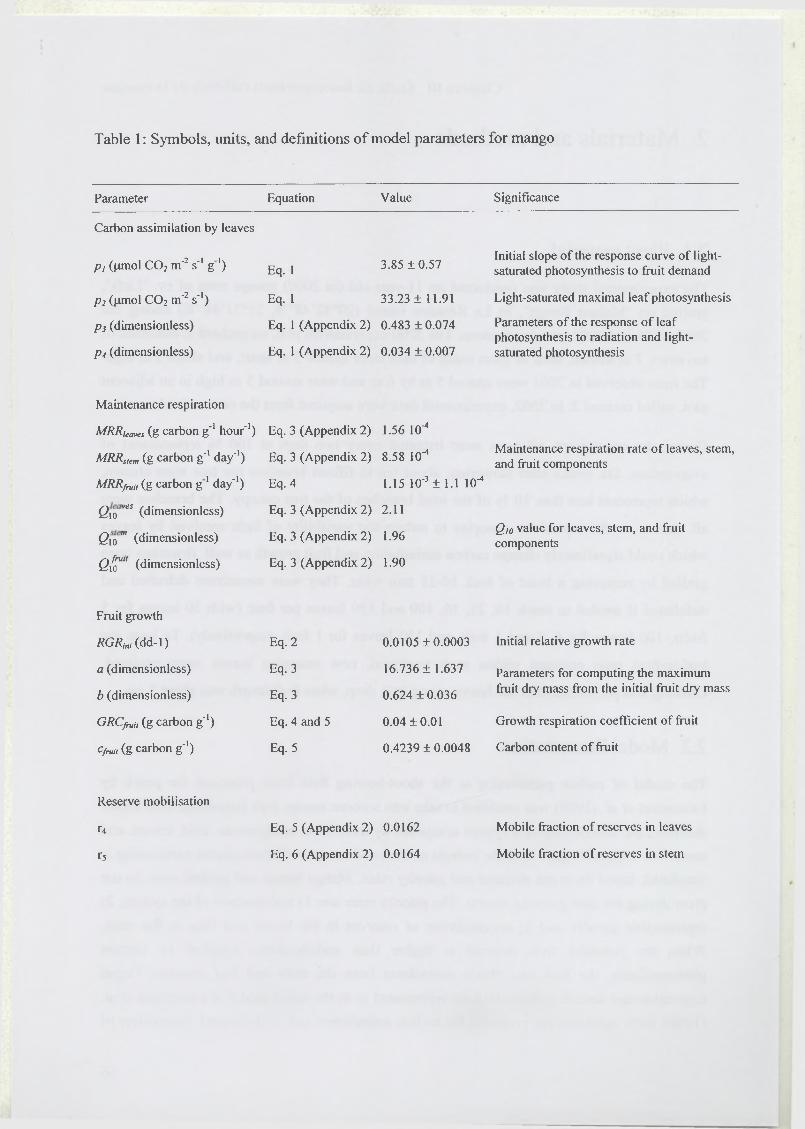
Table 1: Symbols, units, and definitions o f model parameters for mango
Parameter Equation Value Significance
Carbon assimilation by leaves
p, ((imol C 0 2 m'2 s '1 g 1) Eq. 1 3.85 ± 0.57Initial slope o f the response curve o f light- saturated photosynthesis to fruit demand
p 2 (^mol C 0 2 m"2 s '1) Eq. 1 33.23 ±11.91 Light-saturated maximal leaf photosynthesis
p 3 (dimensionless)
P4 (dimensionless)
Eq. 1 (Appendix 2)
Eq. 1 (Appendix 2)
0.483 ± 0.074
0.034 ± 0.007
Parameters o f the response o f leaf photosynthesis to radiation and light- saturated photosynthesis
Maintenance respiration
MRRteaves (g carbon g '1 hour-1) Eq. 3 (Appendix 2) 1.56 10"4
AÍRRsiem (g carbon g '1 day '1) Eq. 3 (Appendix 2) 8.58 10-4Maintenance respiration rate o f leaves, stem, and fruit components
MRRfruii (g carbon g 1 day '1) Eq. 4 1.15 10‘3 ± 1.1 10"1
Q \oVes (dimensionless) Eq. 3 (Appendix 2) 2.11
Q \om (dimensionless) Eq. 3 (Appendix 2) 1.96Q io value for leaves, stem, and fruit components
Q{™" (dimensionless) Eq. 3 (Appendix 2) 1.90
Fruit growth
RGRini (dd-1) Eq. 2 0.0105 ±0.0003 Initial relative growth rate
a (dimensionless) Eq. 3 16.736 ± 1.637 Parameters for computing the maximum
b (dimensionless) Eq. 3 0.624 ± 0.036fruit dry mass from the initial fruit dry mass
GRCfni, (g carbon g '1) Eq. 4 and 5 0.04 ±0.01 Growth respiration coefficient o f fruit
Cfruu (g carbon g '1) Eq. 5 0.4239 ± 0.0048 Carbon content o f fruit
Reserve mobilisation
r4 Eq. 5 (Appendix 2) 0.0162 Mobile fraction o f reserves in leaves
r5 Eq. 6 (Appendix 2) 0.0164 Mobile fraction o f reserves in stem
C hapitre III : Étude du fonctionnement carbonée de la m angue
the finit growth and maintenance respiration, and reserves mobilisation in the stem and the
leaves were established from experiments in mango cv. Lirfa (see ‘Measurements for
parameters assessment’). A schematic representation of the model is proposed in Appendix 1.
A list of the model parameters is presented in Table 1.
2.2.1 Carbon assimilation by leaves
For many plant species it has been noted that a balance is maintained between source supply
and sink demand (Foyer et al., 1995; Fujii and Kennedy, 1985; Ho, 1992). In grapevines,
measurements suggest that photosynthesis is regulated by an internal factor, possibly related
to sink demand (Quereix et al., 2001). Such results are well described by a model based on
the assumption that phloem-based feedback signal regulates the balance between source and
sink activities (Quereix et al., 2001). To take into account the effect of fruit demand on
photosynthesis, we adapted the simple model proposed by Ben Mimoun et al. (1996), which
assumes that the light-saturated leaf photosynthesis Pmax (pmol CO2 m'2 s '1) is an asymptotic
function of fruit demand, Dj u (g C m'2 d '1):
p - Pl Dfru" P l i f p < p '“ Pi **>jh* + P 2 ' - « (1)
P = P* if P > P'max max J max — max
with py (p. mol CO2 m'2 s '1 g C '1) represents the initial slope of the response curve of Pmax to
Dfruit, Pi (nmol CO2 m'2 s’1) a parameter and P m (pmol CO2 m"2 s '1), the potential light-
saturated photosynthesis which is equal to 15, the maximal value obtained from all our
measurements of leaf photosynthesis.
To calculate photosynthesis per unit leaf area and per unit time (junol CO2 m'2 s '1), we used
the same formulation (Appendix 2, equation 1) than in the model of Lescourret et al. (1998).
The net photosynthesis is a function of the light-saturated leaf photosynthesis, calculated in
equation 1, the photosynthetically active flux density, PPFD (input data, in pmol photon m"2 s'
*), and two parameters, p$ and p 4 estimated experimentally (Appendix 2, equation 1). The net
photosynthesis of shaded leaves is calculated from the radiation received by those leaves
which is obtained by an empirical relationship with PPFD, named g(PPFD), defined on an
experimental basis.
The fraction of sunlit and shaded leaf area is estimated from experimental measurements
taken by fish-eye photographs and considering that shadow changes during the day according
to the course of the sun, as explained by Lescourret et al. (1998).The amount of carbon
5 7
I
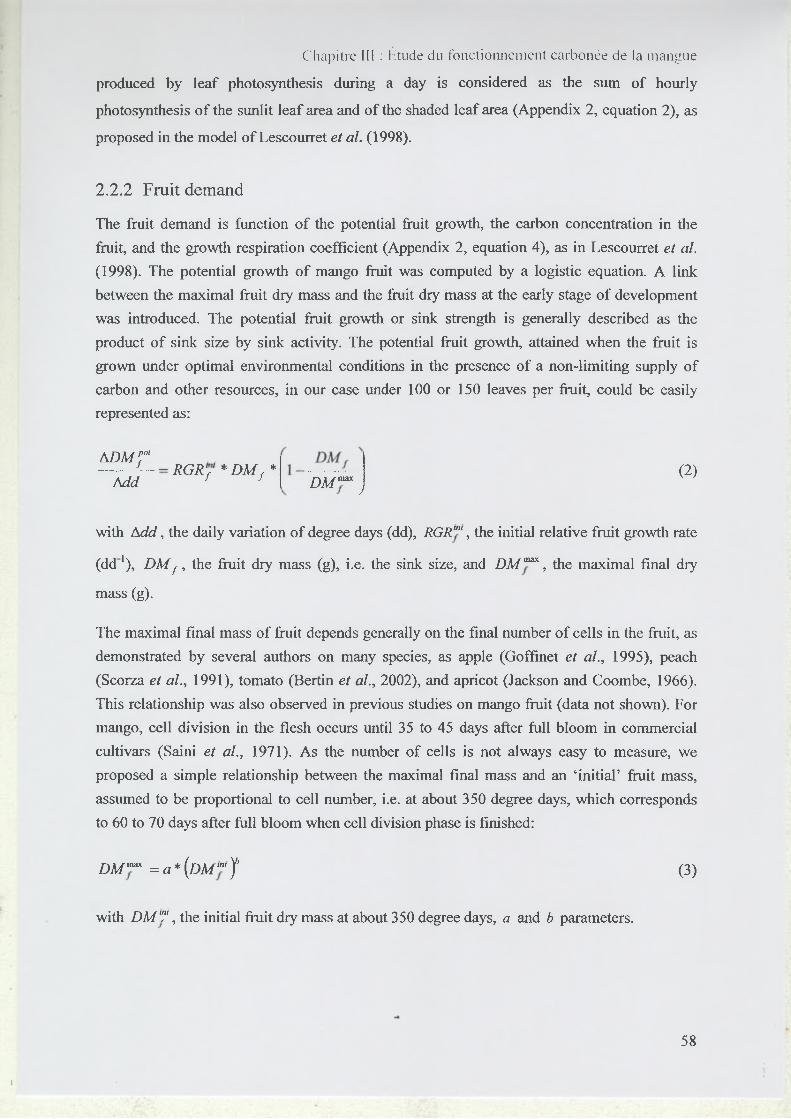
Chapitre III : Étude du fonctionnement ca rbonée de la m angue
produced by leaf photosynthesis during a day is considered as the sum o f hourly
photosynthesis o f the sunlit leaf area and o f the shaded leaf area (Appendix 2, equation 2), as
proposed in the model o f Lescourret et al. (1998).
2.2.2 Fruit demand
The fruit demand is function o f the potential fruit growth, the carbon concentration in the
fruit, and the growth respiration coefficient (Appendix 2, equation 4), as in Lescourret et al.
(1998). The potential growth o f mango fruit was computed by a logistic equation. A link
between the maximal fruit dry mass and the fruit dry mass at the early stage o f development
was introduced. The potential fruit growth or sink strength is generally described as the
product o f sink size by sink activity. The potential fruit growth, attained when the fruit is
grown under optimal environmental conditions in the presence o f a non-limiting supply o f
carbon and other resources, in our case under 100 or 150 leaves per fruit, could be easily
represented as:
AD Mpot
L - - *RGR'f1 * D M f * Add f f D M ™ ;
(2)
with A d d , the daily variation o f degree days (dd), RGR‘"‘, the initial relative fruit growth rate
(d d 1), D M f , the fruit dry mass (g), i.e. the sink size, and D M ™ , the maximal final dry
mass (g).
The maximal final mass o f fruit depends generally on the final number o f cells in the fruit, as
demonstrated by several authors on many species, as apple (Goffinet et al., 1995), peach
(Scorza et al., 1991), tomato (Bertin et al., 2002), and apricot (Jackson and Coombe, 1966).
This relationship was also observed in previous studies on mango fruit (data not shown). For
mango, cell division in the flesh occurs until 35 to 45 days after full bloom in commercial
cultivars (Saini et al., 1971). As the number o f cells is not always easy to measure, we
proposed a simple relationship between the maximal final mass and an ‘initial’ fruit mass,
assumed to be proportional to cell number, i.e. at about 350 degree days, which corresponds
to 60 to 70 days after full bloom when cell division phase is finished:
D M ™ = a*(DM ™ J (3)
with D M T , the initial fruit dry mass at about 350 degree days, a and b parameters.
5 8
I
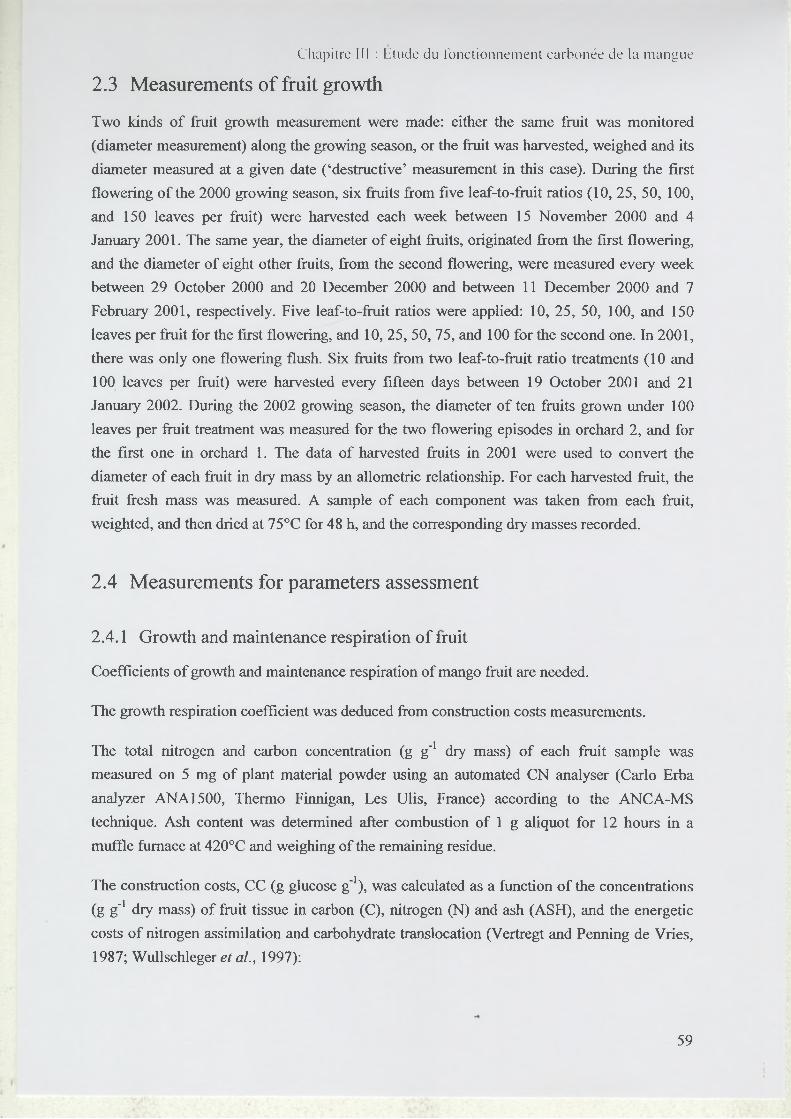
Chapitre III : btude du fonc tionnem ent ca rbonée de la m angue
2.3 Measurements of fruit growth
Two kinds o f fruit growth measurement were made: either the same fruit was monitored
(diameter measurement) along the growing season, or the fruit was harvested, weighed and its
diameter measured at a given date (‘destructive’ measurement in this case). During the first
flowering o f the 2000 growing season, six fruits from five leaf-to-fruit ratios (10, 25, 50, 100,
and 150 leaves per fruit) were harvested each week between 15 November 2000 and 4
January 2001. The same year, the diameter o f eight fruits, originated from the first flowering,
and the diameter o f eight other fruits, from the second flowering, were measured every week
between 29 October 2000 and 20 December 2000 and between 11 December 2000 and 7
February 2001, respectively. Five leaf-to-fruit ratios were applied: 10, 25, 50, 100, and 150
leaves per fruit for the first flowering, and 10, 25, 50, 75, and 100 for the second one. In 2001,
there was only one flowering flush. Six fruits from two leaf-to-fruit ratio treatments (10 and
100 leaves per fruit) were harvested every fifteen days between 19 October 2001 and 21
Januaiy 2002. During the 2002 growing season, the diameter o f ten fruits grown under 100
leaves per fruit treatment was measured for the two flowering episodes in orchard 2 , and for
the first one in orchard 1. The data o f harvested fruits in 2001 were used to convert the
diameter o f each fruit in dry mass by an allometric relationship. For each harvested fruit, the
fruit fresh mass was measured. A sample o f each component was taken from each fruit,
weighted, and then dried at 75°C for 48 h, and the corresponding dry masses recorded.
2.4 Measurements for parameters assessment
2.4.1 Growth and maintenance respiration o f fruit
Coefficients o f growth and maintenance respiration o f mango fruit are needed.
The growth respiration coefficient was deduced from construction costs measurements.
The total nitrogen and carbon concentration (g g'1 dry mass) o f each fruit sample was
measured on 5 mg o f plant material powder using an automated CN analyser (Carlo Erba
analyzer ANA1500, Thermo Finnigan, Les Ulis, France) according to the ANCA-MS
technique. Ash content was determined after combustion o f 1 g aliquot for 12 hours in a
muffle furnace at 420°C and weighing o f the remaining residue.
The construction costs, CC (g glucose g"‘), was calculated as a function o f the concentrations
(g g'1 dry mass) o f fruit tissue in carbon (C), nitrogen (N) and ash (ASH), and the energetic
costs o f nitrogen assimilation and carbohydrate translocation (Vertregt and Penning de Vries,
1987; Wullschleger e ta l., 1997):
5 9
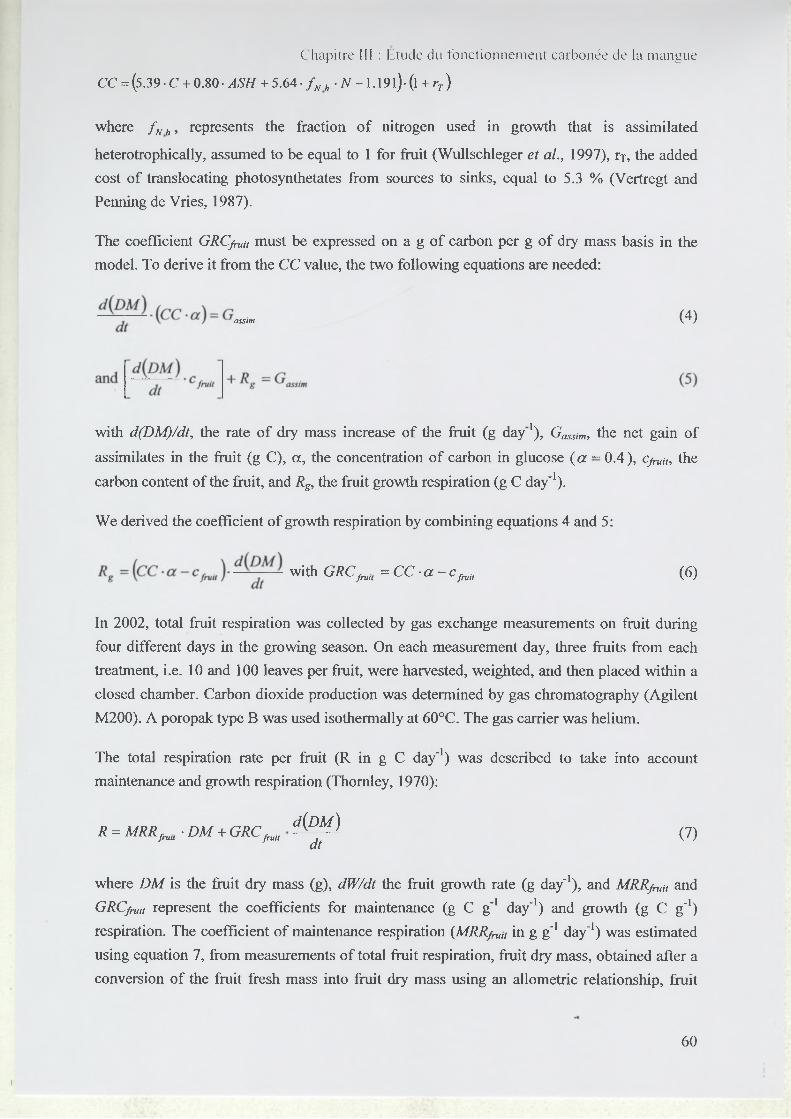
Chapitre Ili : Etude du fonc tionnem en t ca rbonée de la m angue
CC = (5.39 • C + 0.80 • ASH + 5.64 • f Nh • N — 1.191)* (l + iy)
where f N h, represents the fraction o f nitrogen used in growth that is assimilated
heterotrophically, assumed to be equal to 1 for fruit (Wullschleger et al., 1997), rx, the added
cost o f translocating photosynthetates from sources to sinks, equal to 5.3 % (Vertregt and
Penning de Vries, 1987).
The coefficient GRCfruu must be expressed on a g o f carbon per g o f dry mass basis in the
model. To derive it from the CC value, the two following equations are needed:
assimilates in the fruit (g C), a , the concentration o f carbon in glucose ( a - 0 .4), cjruu, the
carbon content o f the fruit, and Rg, the fruit growth respiration (g C day'1).
We derived the coefficient o f growth respiration by combining equations 4 and 5:
In 2002, total fruit respiration was collected by gas exchange measurements on fruit during
four different days in the growing season. On each measurement day, three fruits from each
treatment, i.e. 10 and 100 leaves per fruit, were harvested, weighted, and then placed within a
closed chamber. Carbon dioxide production was determined by gas chromatography (Agilent
M200). A poropak type B was used isothermally at 60°C. The gas carrier was helium.
The total respiration rate per fruit (R in g C day'1) was described to take into account
maintenance and growth respiration (Thomley, 1970):
where DM is the fruit dry mass (g), dW/dt the fruit growth rate (g day'1), and MRR/ruu and
using equation 7, from measurements o f total fruit respiration, fruit dry mass, obtained after a
conversion o f the fruit fresh mass into fruit dry mass using an allometric relationship, fruit
assim (4)
with d(DM)/dt, the rate o f dry mass increase o f the fruit (g d a y 1), Gassim, the net gain o f
with GRCfrult = C C - a - c fmU (6)
R = MRRfruit-D M + GRCfruild (D M )
dt(V)
GRC fruit represent the coefficients for maintenance (g C g'1 day'1) and growth (g C g'1)
respiration. The coefficient o f maintenance respiration (MRRf^,, in g g"1 day'1) was estimated
6 0
I
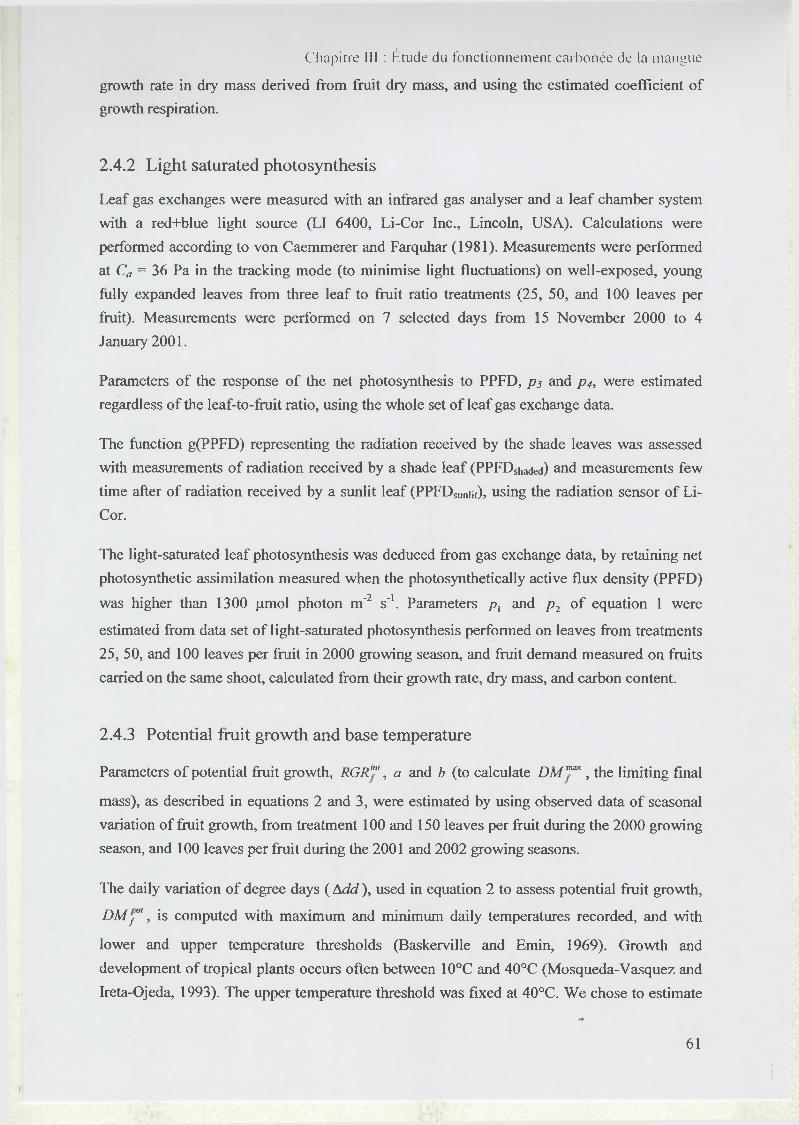
Chapitre III : Étude du fonctionnement carbonée de la mangue
growth rate in dry mass derived from fruit dry mass, and using the estimated coefficient o f
growth respiration.
2.4.2 Light saturated photosynthesis
Leaf gas exchanges were measured with an infrared gas analyser and a leaf chamber system
with a red+blue light source (LI 6400, Li-Cor Inc., Lincoln, USA). Calculations were
performed according to von Caemmerer and Farquhar (1981). Measurements were performed
at Ca = 36 Pa in the tracking mode (to minimise light fluctuations) on well-exposed, young
fully expanded leaves from three leaf to fruit ratio treatments (25, 50, and 100 leaves per
fruit). Measurements were performed on 7 selected days from 15 November 2000 to 4
January 2001.
Parameters o f the response o f the net photosynthesis to PPFD, p 3 and p 4, were estimated
regardless o f the leaf-to-fruit ratio, using the whole set o f leaf gas exchange data.
The function g(PPFD) representing the radiation received by the shade leaves was assessed
with measurements o f radiation received by a shade leaf ( P P F D Shaded) and measurements few
time after o f radiation received by a sunlit leaf (PPFDsuniit), using the radiation sensor o f Li-
Cor.
The light-saturated leaf photosynthesis was deduced from gas exchange data, by retaining net
photosynthetic assimilation measured when the photosynthetically active flux density (PPFD)
was higher than 1300 pmol photon m'2 s'1. Parameters p x and p 2 o f equation 1 were
estimated from data set o f light-saturated photosynthesis performed on leaves from treatments
25, 50, and 100 leaves per fruit in 2000 growing season, and fruit demand measured on fruits
carried on the same shoot, calculated from their growth rate, dry mass, and carbon content.
2.4.3 Potential fruit growth and base temperature
Parameters o f potential fruit growth, RGR'"‘ , a and b (to calculate DM",ax , the limiting final
mass), as described in equations 2 and 3, were estimated by using observed data o f seasonal
variation o f fruit growth, from treatment 100 and 150 leaves per fruit during the 2000 growing
season, and 100 leaves per fruit during the 2001 and 2002 growing seasons.
The daily variation o f degree days ( Add ), used in equation 2 to assess potential fruit growth,
D M j°', is computed with maximum and minimum daily temperatures recorded, and with
lower and upper temperature thresholds (Baskerville and Emin, 1969). Growth and
development o f tropical plants occurs often between 10°C and 40°C (Mosqueda-Vasquez and
Ireta-Ojeda, 1993). The upper temperature threshold was fixed at 40°C. We chose to estimate
61
I
C hapitre III : Étude du fonctionnement ca rbonée de la m angue
the base temperature (Tb) for mango fruit development in La Réunion. The base temperature
and the parameters o f the potential finit growth were estimated by minimising the following
basic criterion:
z h 4 - z (dk , - dmJ k j i
where k is the data set, Nj is the number o f fruit measured for a data set, DM^¡ and D M k]i the
dry mass o f fruit i, calculated by Equations 2 and 3 and measured, respectively, at the date j
and the data set k.
2.4.4 Reserves mobilisation
Parameters o f reserves mobilisation, r4 for the mobile fraction o f reserves in the leaves, and rs
for the mobile fraction o f reserves in the stem, were assessed by calibration o f the model. This
‘calibration procedure’ used the reserve data collected from 15 November 2000 to 4 January
2001, on 7 selected days for leaves and 4 selected days for stem. Each day o f measurements,
leaf areas and fresh masses o f the different components (stem and leaves) were measured. A
sample o f each component was taken, weighted, then dried by freeze-diying and the
corresponding dry masses recorded. Then, these samples were put at -20°C for future
biochemical analysis o f reserves. On leaf and stem samples, reserve content was studied by
measuring glucose, fructose and sucrose concentrations by HPLC following the method o f
(Gomez et al., 2002). Starch was determined by enzymatic hydrolysis to glucose (Gomez et
al., 2003).
The criterion to be minimised during model calibration was the following it takes into account
the reserve content o f both leaves and stem:
X " T • T T " X “ sr“ ) 2 + ~ ~ 2 ■ T T ~ X nki • (lrk, - K f*= 1 a srk srt i CTirk ^ l r k i
where k refers to the leaf-to-fruit ratio treatment (25, 50, and 100 leaves per fruit), labels sr
and Ir to the reserve contents (g g’1 dry mass) in stem and leaves, respectively, ct2 are
variances o f observed data, N is the number o f measurement dates for each treatment, the
number o f measurements at date i and for treatment k, xrki the carbon reserve content at date /
for treatment k calculated by the model, and xrkl the corresponding average o f
measurements, with x=^ for stem and x=l for leaves.
6 2
»
C hap itre III : Etude du f o n c t i o n n e m e n t c a r b o n é e d e la m a n g u e
2.4.5 Allometric relationships
The total leaf area, LA (m2), was empirically calculated from the number o f leaves, nieavcs, as
LA = 0.0051 * (n,eaves )°'937 (R2 = 0.94, n = 50).
The dry mass (DM) o f the fruit was related to the fruit diameter (D) by the empirical
relationships ( DM = 0.8736 • e(00527D), R2 = 0.91, n = 210).
2.4.6 Parameters taken from the literature
The values o f maintenance respiration rates o f stem, MRRstem, and leaves, MRRieaves, at 20 °C,
and the respective Qio values were those used by Grossman and Dejong (1994) for peach. The
Qio value for fruit respiration maintenance was the one proposed by Dejong et al. (1987) for
2.5 Model evaluation
A basic criterion , the root mean squared error (RMSE), describing the mean distance between
simulation and measurement (Kobayashi and Us Salam, 2000) was used to evaluate (i) the
goodness o f fit o f the model for data for parameter estimation (quality o f adjustment), and (ii)
the predictive quality o f the model on independent data. This criterion was expressed as:
with D M ‘ the fruit dry mass at the date i simulated by the model and D M , the average o f
dry mass measured at the date / for n, fruits. A relative RMSE, RRMSE, was also calculated
as the ratio between the RMSE and the mean o f all measurements.
2.6 Modelling Technique
Simulation o f seasonal diy mass o f the fruit was based on a daily scale, except for
photosynthesis, which runs on a hourly basis. The model was written using the S-PIus
language (Insightful Corp., USA).
peach fruit.
N
(=1
Parameters o f regulation o f light-saturated photosynthesis, p¡ and p 2, and parameters o f the
response o f net photosynthesis to PPFD, p 3 and p 4, were estimated by nonlinear least squares
regression. The parameter o f the function o f radiation received by shaded leaves (g(PPFD)), k,
Chapitre III : Etude du fonctionnement ca rbonée de la m angue
and the parameter o f maintenance respiration, MRR/ruu, were estimated by linear regression.
Criteria to estimate parameters o f reserve mobilisation, r<\ and r5, base temperature, Tb,
parameters o f potential fruit growth RGR™, a and b, were minimised by non-linear
adjustment.
2.7 Description of input data
The climatic data were collected by the meteorological station situated close to the orchard.
The maximum and minimum daily temperatures were used to compute the sum o f growing
degree days after full bloom. The hourly global radiation was recorded to simulate leaf
photosynthesis. The daily mean temperature was used to calculate maintenance respiration o f
the various organs.
2.8 Initial conditions
Initial values required by the model for fruit dry mass were chosen equal, for each year, and
for each leaf-to-fruit ratio treatment, to the mean o f data assessed the first day o f dry mass
measurement. Initial values for the ratio between reserve mass and dry mass in leaves and
stem were obtained from the first day o f reserves measurement in 2000. Those values are
required for calculating the initial mass o f reserves in leaves and stem.
2.9 Description of a simulations used to assess the contribution of
climate, initial fruit dry mass, and leaf-to-fruit ratio on fruit
growth and underlying physiological processes
The model was run for 14 climatic situations corresponding to seven growing seasons
between 1996 and 2002, and for two experimental sites, one in the North-West o f the island
and the other in the South-West. Two levels o f leaf-to-fruit ratios and o f initial fruit dry
masses were considered. The levels were 50 and 100 leaves per fruit for the leaf-to-fruit ratio,
which is consistent with current horticultural practices. For the initial fruit dry mass, a low
and a high level, 7 and 21 g respectively, were established in order to represent, 0.5 and 2
times the mean fruit dry mass measured in our experiments and allow to represent nearly the
variability o f measurements. For each climatic situation, the model was run by combining
factor conditions. As temperature strongly influences rates o f fruit growth and maturation,
temperature sum (degree days) is often used as an index o f ‘physiological time’. In our
experiments, during three successive years, and for various leaf-to-fruit ratios, the average o f
6 4
i
C hapitre III : Etude du fonc tionnem ent ca rbonée de la m an g u e
harvest date for mango was about 1100 degree days after full bloom. At this stage,
biochemical analysis showed that starch had decreased and sucrose had increased strongly,
respectively. Indicators o f fruit quality as the total soluble solids and the flesh dry matter
content were higher than 15° Brix and 16 %, respectively (data not shown). This sum o f
degree days, which was in agreement with the calculated heat units required for other mango
cultivars, like ‘Carabao’, to reach maturity (Mendoza and Wills, 1984),was the stop o f fruit
growth. The model run until this date.
Different daily variables concerning source and sink functioning were monitored, i.e.
photosynthesis and reserves mobilisation in the stem and the leaves, and maintenance and
growth respiration, demand and growth rate o f the fruit. The mean value o f those variables
was analysed by analysis o f variance (fixed effects). The analysis o f variance carried out the
main effects and the first-order interactions o f the three factors, i.e. climate, leaf-to-fruit ratio,
and initial fruit dry mass. The contribution o f the different factors and interactions to the
variance o f the studied variables was calculated as the ratio o f the corresponding sum o f
squares to the total sum o f squares.
6 5
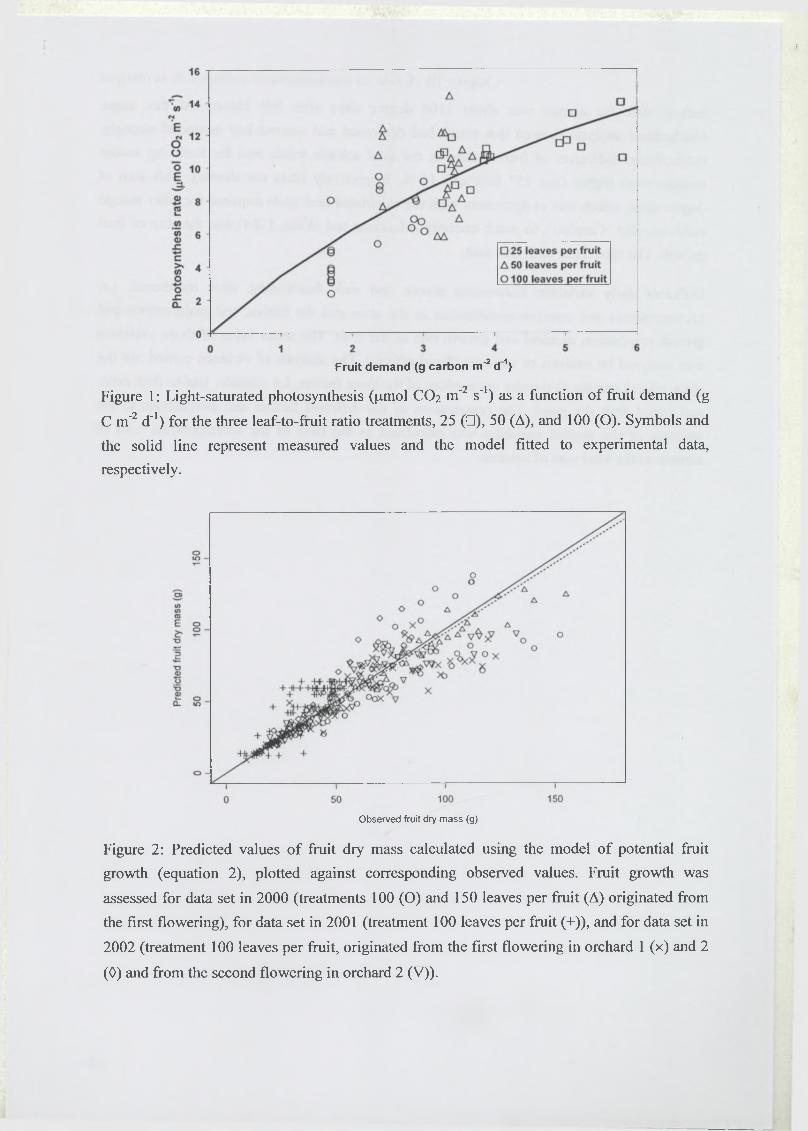
I
Fruit demand (g carbon m"2 d 1)
Figure 1: Light-saturated photosynthesis ((imol CO2 n f2 s‘l) as a function o f fruit demand (g
C m'2 d"1) for the three leaf-to-fruit ratio treatments, 25 ( □ ) , 50 (A), and 100 (O). Symbols and
the solid line represent measured values and the model fitted to experimental data,
respectively.
Observed fruit dry m ass (g)
Figure 2: Predicted values o f fruit dry mass calculated using the model o f potential fruit
growth (equation 2), plotted against corresponding observed values. Fruit growth was
assessed for data set in 2000 (treatments 100 (O) and 150 leaves per fruit (A) originated from
the first flowering), for data set in 2001 (treatment 100 leaves per fruit (+)), and for data set in
2002 (treatment 100 leaves per fruit, originated from the first flowering in orchard 1 (x) and 2
(0) and from the second flowering in orchard 2 (V)).
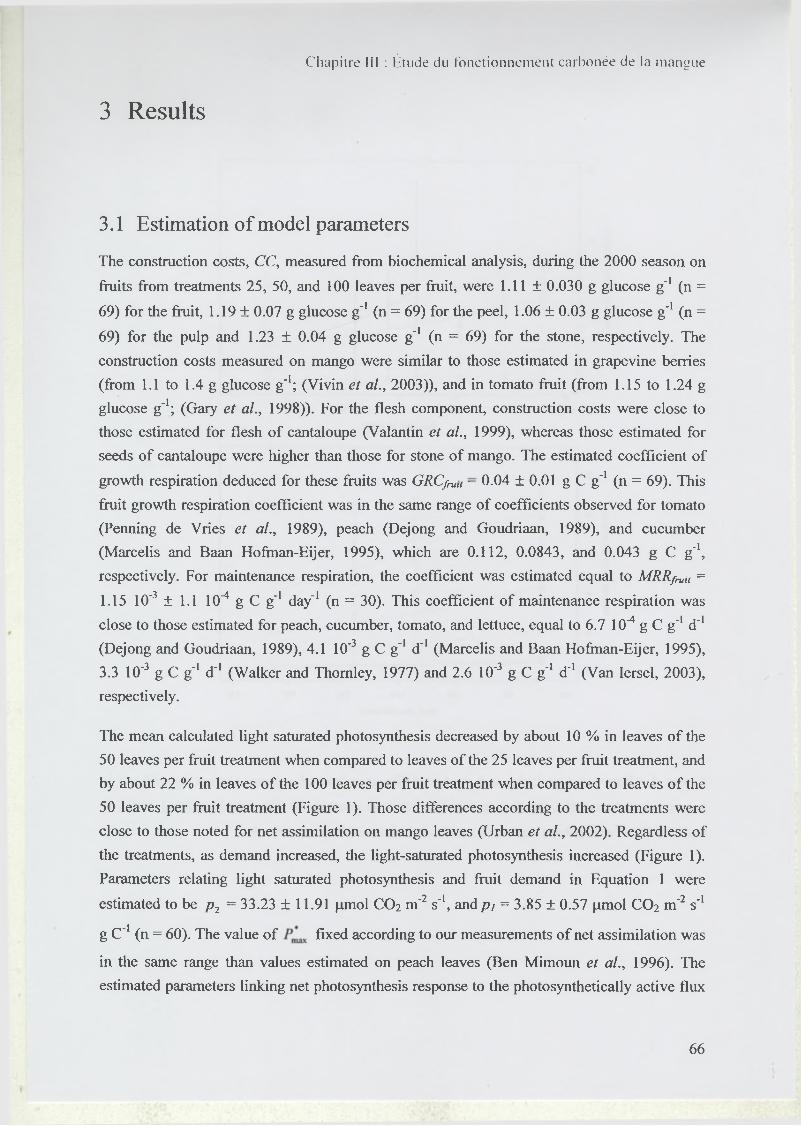
C hap itre III : É tu de du f o n c t i o n n e m e n t c a r b o n é e d e la m a n g u e
3 Results
3.1 Estimation of model parameters
The construction costs, CC, measured from biochemical analysis, during the 2000 season on
fruits from treatments 25, 50, and 100 leaves per fruit, were 1.11 ± 0.030 g glucose g'1 (n =
69) for the fruit, 1.19 ± 0.07 g glucose g"1 (n = 69) for the peel, 1.06 ± 0.03 g glucose g'1 (n =
69) for the pulp and 1.23 ± 0.04 g glucose g'1 (n = 69) for the stone, respectively. The
construction costs measured on mango were similar to those estimated in grapevine berries
(from 1.1 to 1.4 g glucose g'1; (Vivin et al., 2003)), and in tomato fruit (from 1.15 to 1.24 g
glucose g'1; (Gaiy et al., 1998)). For the flesh component, construction costs were close to
those estimated for flesh o f cantaloupe (Valantin et al., 1999), whereas those estimated for
seeds o f cantaloupe were higher than those for stone o f mango. The estimated coefficient o f
growth respiration deduced for these fruits was GRC/ruii - 0.04 ± 0.01 g C g'1 (n = 69). This
fruit growth respiration coefficient was in the same range o f coefficients observed for tomato
(Penning de Vries et al., 1989), peach (Dejong and Goudriaan, 1989), and cucumber
(Marcelis and Baan Hofrnan-Eijer, 1995), which are 0.112, 0.0843, and 0.043 g C g'1,
respectively. For maintenance respiration, the coefficient was estimated equal to MRR/^i, =
1.15 10'3 ± 1.1 10-4 g C g'1 day’1 (n = 30). This coefficient o f maintenance respiration was
close to those estimated for peach, cucumber, tomato, and lettuce, equal to 6.7 10"4 g C g'1 d’1
(Dejong and Goudriaan, 1989), 4.1 10'3 g C g’1 d'1 (Marcelis and Baan Hofrnan-Eijer, 1995),
3.3 10'3 g C g'1 d'1 (Walker and Thomley, 1977) and 2.6 10‘3 g C g'1 d'1 (Van Iersel, 2003),
respectively.
The mean calculated light saturated photosynthesis decreased by about 10 % in leaves o f the
50 leaves per fruit treatment when compared to leaves o f the 25 leaves per fruit treatment, and
by about 22 % in leaves o f the 100 leaves per fruit treatment when compared to leaves o f the
50 leaves per fruit treatment (Figure 1). Those differences according to the treatments were
close to those noted for net assimilation on mango leaves (Urban et al., 2002). Regardless o f
the treatments, as demand increased, the light-saturated photosynthesis increased (Figure 1).
Parameters relating light saturated photosynthesis and fruit demand in Equation 1 were
estimated to be p 2 = 33.23 ± 11.91 pmol CO2 m'2 s'1, and p¡ = 3.85 ± 0.57 pmol CO2 m'2 s'1
g C'1 (n = 60). The value o f fixed according to our measurements o f net assimilation was
in the same range than values estimated on peach leaves (Ben Mimoun et al., 1996). The
estimated parameters linking net photosynthesis response to the photosynthetically active flux
6 6
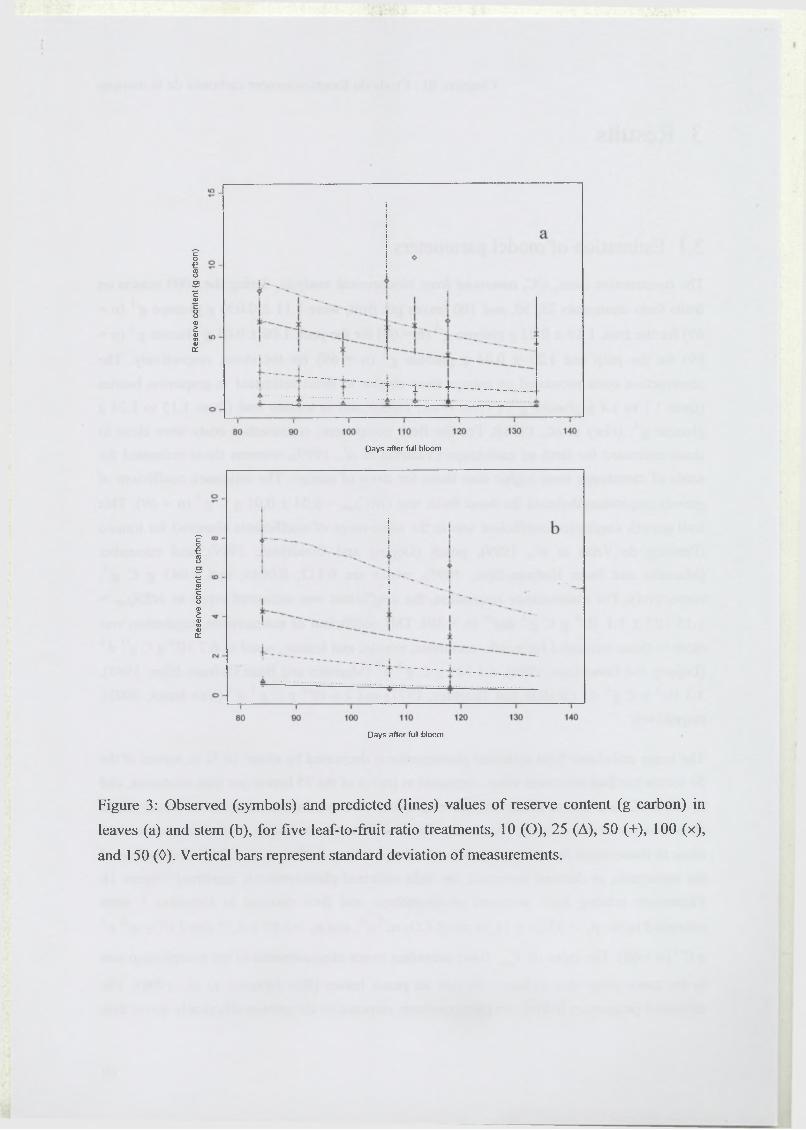
Res
erve
co
nte
nt
(g ca
rbo
n)
Res
erve
co
nte
nt
(g ca
rbo
n)
Days after full bloom
Days after full bloom
Figure 3: Observed (symbols) and predicted (lines) values o f reserve content (g carbon) in
leaves (a) and stem (b), for five leaf-to-fruit ratio treatments, 10 (O), 25 (A), 50 (+), 100 (x),
and 150 (0). Vertical bars represent standard deviation o f measurements.
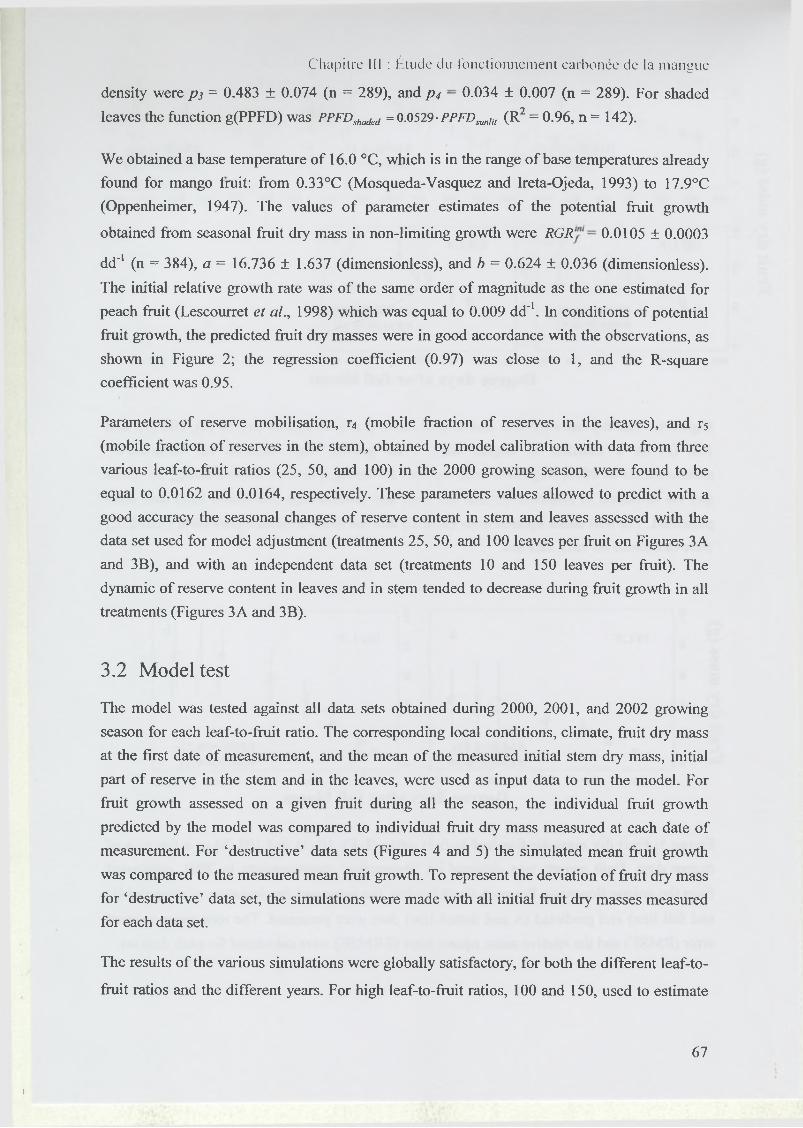
Chapitre III : Étude du fonctionnement carbonée de la mangue
density were ps = 0.483 ± 0.074 (n = 289), and p 4 — 0.034 ± 0.007 (n = 289). For shaded
leaves the function g(PPFD) was PPFD shaded = 0.0529 • PPFD svnUt (R2 = 0.96, n = 142).
We obtained a base temperature o f 16.0 °C, which is in the range o f base temperatures already
found for mango fruit: from 0.33°C (Mosqueda-Vasquez and Ireta-Ojeda, 1993) to 17.9°C
(Oppenheimer, 1947). The values o f parameter estimates o f the potential fruit growth
obtained from seasonal fruit dry mass in non-limiting growth were R G R 0.0105 ± 0.0003
dd"1 (n = 384), a = 16.736 ± 1.637 (dimensionless), and b = 0.624 ± 0.036 (dimensionless).
The initial relative growth rate was o f the same order o f magnitude as the one estimated for
peach fruit (Lescourret et al., 1998) which was equal to 0.009 dd'1. In conditions o f potential
fruit growth, the predicted fruit dry masses were in good accordance with the observations, as
shown in Figure 2; the regression coefficient (0.97) was close to 1, and the R-square
coefficient was 0.95.
Parameters o f reserve mobilisation, T4 (mobile fraction o f reserves in the leaves), and r5
(mobile fraction o f reserves in the stem), obtained by model calibration with data from three
various leaf-to-fruit ratios (25, 50, and 100) in the 2000 growing season, were found to be
equal to 0.0162 and 0.0164, respectively. These parameters values allowed to predict with a
good accuracy the seasonal changes o f reserve content in stem and leaves assessed with the
data set used for model adjustment (treatments 25, 50, and 100 leaves per fruit on Figures 3 A
and 3B), and with an independent data set (treatments 10 and 150 leaves per fruit). The
dynamic o f reserve content in leaves and in stem tended to decrease during fruit growth in all
treatments (Figures 3A and 3B).
3.2 Model test
The model was tested against all data sets obtained during 2000, 2001, and 2002 growing
season for each leaf-to-fruit ratio. The corresponding local conditions, climate, fruit dry mass
at the first date o f measurement, and the mean o f the measured initial stem dry mass, initial
part o f reserve in the stem and in the leaves, were used as input data to run the model. For
fruit growth assessed on a given fruit during all the season, the individual fruit growth
predicted by the model was compared to individual fruit dry mass measured at each date o f
measurement. For ‘destructive’ data sets (Figures 4 and 5) the simulated mean fruit growth
was compared to the measured mean fruit growth. To represent the deviation o f fruit dry mass
for ‘destructive’ data set, the simulations were made with all initial fruit dry masses measured
for each data set.
The results o f the various simulations were globally satisfactory, for both the different leaf-to-
fruit ratios and the different years. For high leaf-to-fruit ratios, 100 and 150, used to estimate
6 7
I
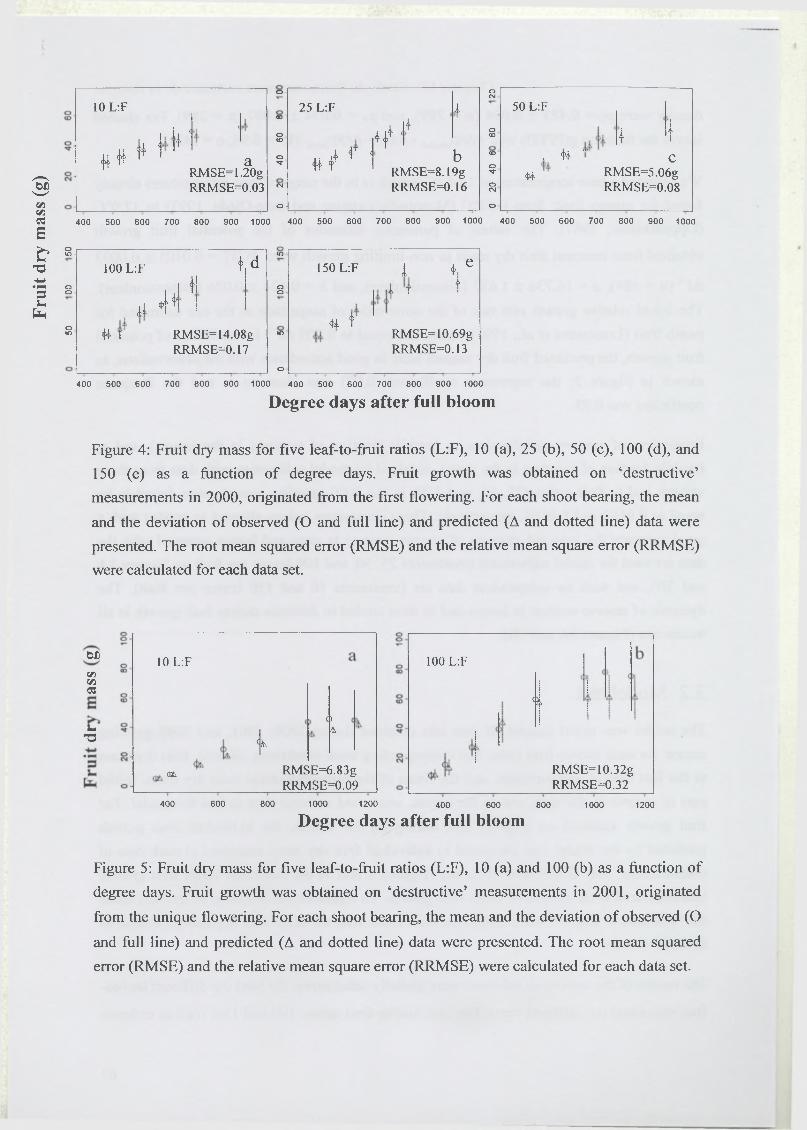
Frui
t dr
y m
ass
(g)
O OCM10 L:F 25 L:F A 50 L:F
<k 1 '1 ‘
<OO
oCD 4 f '4 O00 1
1i
44 44 t M aRMSE=1.20g
OM- . À f ‘ 44 f
bRMSE=8.19g
CO
o■'t
. W " c ^ RMSE=5.06g
RRMSE= 0.03 CN RRM SE=0.16 oCM RRMSE=0.08
O - O
400 500 600 700 800 900 1000 400 500 600 700 800 900 1000 400 500 600 700 800 900 1000
o in -
oo
om
400 500 600 700 800 900 1000 400 500 600 700 800 900 1000
Degree days after full bloom
Figure 4: Fruit dry mass for five leaf-to-fruit ratios (L:F), 10 (a), 25 (b), 50 (c), 100 (d), and
150 (e) as a function o f degree days. Fruit growth was obtained on ‘destructive’
measurements in 2000, originated from the first flowering. For each shoot bearing, the mean
and the deviation o f observed (O and full line) and predicted (A and dotted line) data were
presented. The root mean squared error (RMSE) and the relative mean square error (RRMSE)
were calculated for each data set.
100 L:F 1 dto
150 L:F 1 +| eI o A T t
i t ^
o
# t# T RMSE=14.08g to RMSE=10.69g
RRMSE=0.17 RRM SE=0.13
o
DD
(/5VIOS
uT3
10 L:F
(Ki
400 600
<k
<)A
RMSE=6.83gRRMSE=0.09
800 1000
100 L:F
1200 400 600
%
RMSE=10.32gRRMSE=0.32
800 1000 1200
Degree days after full bloom
Figure 5: Fruit dry mass for five leaf-to-fruit ratios (L:F), 10 (a) and 100 (b) as a function o f
degree days. Fruit growth was obtained on ‘destructive’ measurements in 2001, originated
from the unique flowering. For each shoot bearing, the mean and the deviation o f observed (O
and full line) and predicted (A and dotted line) data were presented. The root mean squared
error (RMSE) and the relative mean square error (RRMSE) were calculated for each data set.
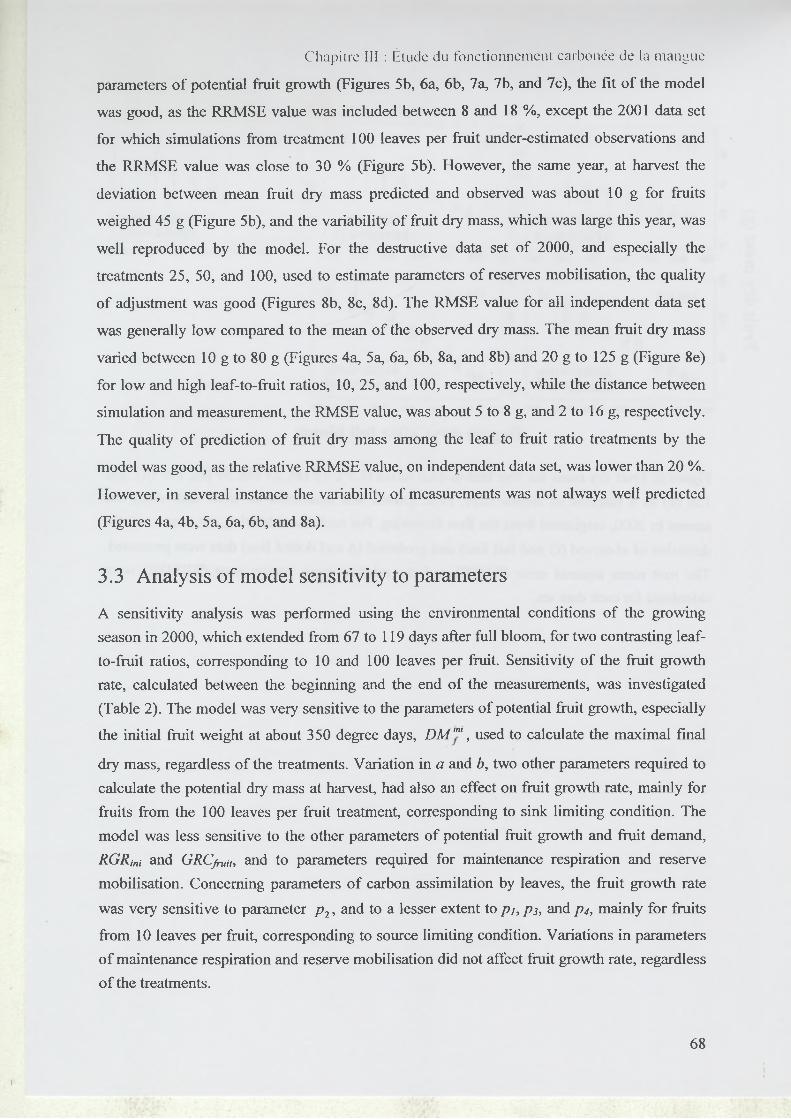
C hap i t re III : Étude du fonc tionnem ent ca rbonée de la m an g u e
parameters o f potential fruit growth (Figures 5b, 6a, 6b, 7a, 7b, and 7c), the fit o f the model
was good, as the RRMSE value was included between 8 and 18 %, except the 2001 data set
for which simulations from treatment 100 leaves per fruit under-estimated observations and
the RRMSE value was close to 30 % (Figure 5b). However, the same year, at harvest the
deviation between mean fruit dry mass predicted and observed was about 10 g for fruits
weighed 45 g (Figure 5b), and the variability o f fruit dry mass, which was large this year, was
well reproduced by the model. For the destructive data set o f 2000, and especially the
treatments 25, 50, and 100, used to estimate parameters o f reserves mobilisation, the quality
o f adjustment was good (Figures 8b, 8c, 8d). The RMSE value for all independent data set
was generally low compared to the mean o f the observed dry mass. The mean fruit dry mass
varied between 10 g to 80 g (Figures 4a, 5a, 6a, 6b, 8a, and 8b) and 20 g to 125 g (Figure 8e)
for low and high leaf-to-fruit ratios, 10, 25, and 100, respectively, while the distance between
simulation and measurement, the RMSE value, was about 5 to 8 g, and 2 to 16 g, respectively.
The quality o f prediction o f fruit dry mass among the leaf to fruit ratio treatments by the
model was good, as the relative RRMSE value, on independent data set, was lower than 20 %.
However, in several instance the variability o f measurements was not always well predicted
(Figures 4a, 4b, 5 a, 6a, 6b, and 8a).
3.3 Analysis of model sensitivity to parameters
A sensitivity analysis was performed using the environmental conditions o f the growing
season in 2000, which extended from 67 to 119 days after full bloom, for two contrasting leaf-
to-fruit ratios, corresponding to 10 and 100 leaves per fruit. Sensitivity o f the fruit growth
rate, calculated between the beginning and the end o f the measurements, was investigated
(Table 2). The model was very sensitive to the parameters o f potential fruit growth, especially
the initial fruit weight at about 350 degree days, DM'"‘, used to calculate the maximal final
dry mass, regardless o f the treatments. Variation in a and b, two other parameters required to
calculate the potential dry mass at harvest, had also an effect on fruit growth rate, mainly for
fruits from the 100 leaves per fruit treatment, corresponding to sink limiting condition. The
model was less sensitive to the other parameters o f potential fruit growth and fruit demand,
RGRini and GRCfruu, and to parameters required for maintenance respiration and reserve
mobilisation. Concerning parameters o f carbon assimilation by leaves, the fruit growth rate
was very sensitive to parameter p 2 , and to a lesser extent to p¡, p¡ , and p 4 , mainly for fruits
from 10 leaves per fruit, corresponding to source limiting condition. Variations in parameters
o f maintenance respiration and reserve mobilisation did not affect fruit growth rate, regardless
o f the treatments.
6 8
I
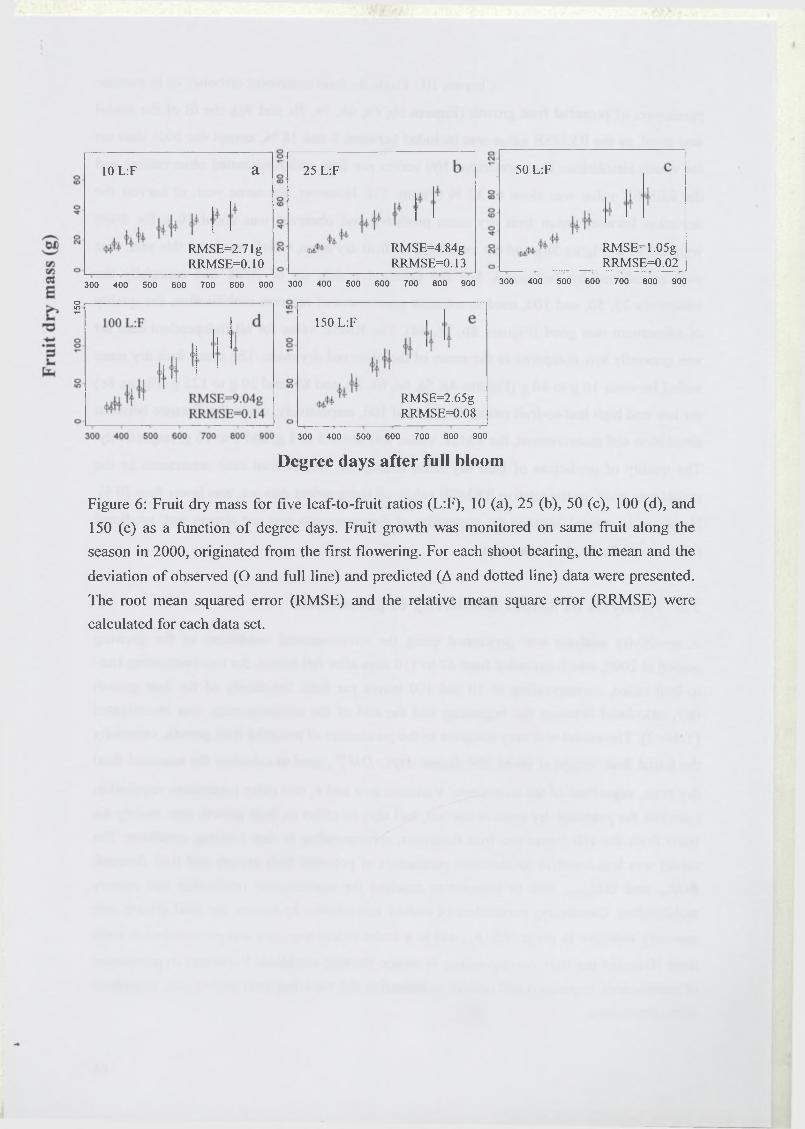
150
10 L:F a
RMSE=2.71g RRM SE=0.10
25 L:F
RMSE=4.84gRRMSE=0.13
50 L:F
RMSE=1.05gRRMSE=0.02
300 400 500 600 700 800 900 300 400 500 600 700 800 900 300 400 500 600 700 800 900
150 L:F
RMSE=2.65gRRMSE=0.08
300 400 500 600 700 800 900
Degree days after full bloom
Figure 6 : Fruit dry mass for five leaf-to-fruit ratios (L:F), 10 (a), 25 (b), 50 (c), 100 (d), and
150 (e) as a function o f degree days. Fruit growth was monitored on same fruit along the
season in 2000, originated from the first flowering. For each shoot bearing, the mean and the
deviation o f observed (O and full line) and predicted (A and dotted line) data were presented.
The root mean squared error (RMSE) and the relative mean square error (RRMSE) were
calculated for each data set.
3.4 Contribution of the effects of climate, initial fruit dry mass, and
leaf-to-fruit ratio on fruit growth and underlying physiological
processes
The contribution o f the different factors and o f their interactions to the variance o f the studied
variables was presented in Table 3. The three main factors affected significantly all the
studied variables. The contribution o f the initial fruit dry mass was the highest for all sink
variables, as respiration (about 93 %), demand (71.5 %) and growth rate (89.8 %) o f the finit,
and for stem reserves mobilisation too (about 67.6 %). The contribution o f the leaf-to-fruit
ratio was large for leaf photosynthesis and leaf reserves mobilisation, less important for fruit
respiration and demand, and almost null for fruit growth rate although the effect was
significant. However, the same experimental design with more contrasted leaf-to-fruit ratio
levels (i.e. 25 and 100 leaves per fruit) showed that the leaf-to-fruit ratio could contribute for
more than 70 % to the fruit growth rate variability (data not shown). In that case, the
contributions o f the other source/sink factors and o f the climate were minimised. The seasonal
average o f daily photosynthesis was 30 % higher in leaves from 50 than from 100 leaves per
fruit. For reserves, the mean balance over the season between mobilisation and accumulation
was almost null in leaves from 50 leaves per fruit, while it was positive in leaves from 100
leaves per fruit. The contribution o f the interaction between leaf-to-fruit ratio and initial fruit
dry mass was close to 10% for the fruit demand and the reserve mobilisation in stem. The
contribution o f the last factor, the climate, was globally the lowest o f the three factors. It was
especially low for the fruit respiration and the mobilisation o f leaf and stem reserves. The
contribution o f climate to fruit demand was close to 5 %. The largest contribution o f the
climate concerned photosynthesis (about 6.2 %) and the fruit growth rate (about 9.3 %). Fruit
growth length depended on the climate, especially on temperature and also the sum o f degree
days, as the end o f simulations, at 1100 degree days, varied to 23 days among the climate
data. The contribution o f the interaction between the climate and every other factor was weak.
C h ap itre III : h t u d e du f o n c t i o n n e m e n t c a r b o n é e d e la m a n g u e
6 9
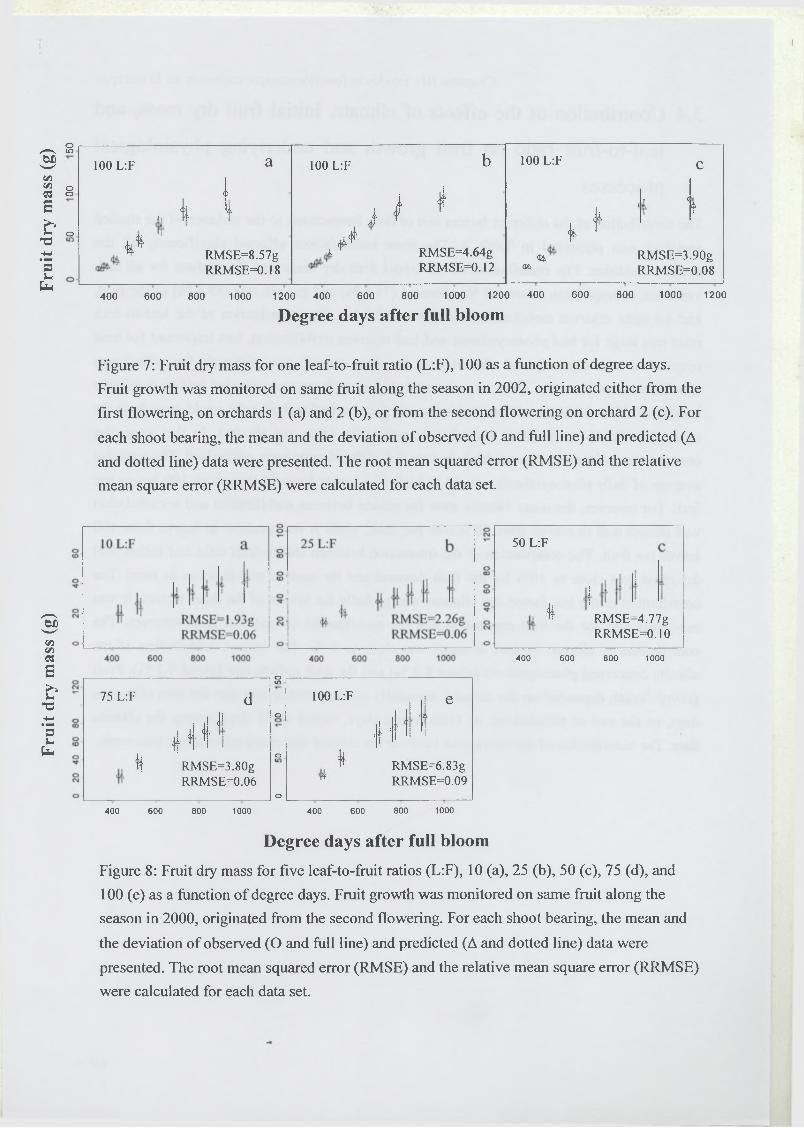
Frui
t dr
y m
ass
(g)
Frui
t dr
y m
ass
(g)
I
oto
oo
o
400 600 800 1000 1200 400 600 800 1000 1200 400 600 800 1000 1200
Degree days after full bloom
Figure 7: Fruit dry mass for one leaf-to-fruit ratio (L:F), 100 as a function o f degree days.
Fruit growth was monitored on same fruit along the season in 2002, originated either from the
first flowering, on orchards 1 (a) and 2 (b), or from the second flowering on orchard 2 (c). For
each shoot bearing, the mean and the deviation o f observed (O and full line) and predicted (A
and dotted line) data were presented. The root mean squared error (RMSE) and the relative
mean square error (RRMSE) were calculated for each data set.
100 L:F
I;
a
o
i I
100 L:F
,4j f
b
i
100 L:F
(L. <
C
t
** RMSE=8.57gy ' RMSE=4.64g
* 1
<t& RMSE=3.90gRRMSE=0.18 RRMSE=0.12 a& RRMSE=0.08
50 L:F
ft RMSE=4.77g RRMSE=0.10
400 600 800 1000
oin
75 L:F d 100 L:F ! ej o I <41
4 * ,1 , 1 <\ ' If t i
iTj
ii o 4Tf RMSE=3.80g Tf RMSE=6.83g
RRMSE=0.06 Tf RRMSE=0.09o
400 600 800 1000 400 600 800 1000
Degree days after full bloom
Figure 8 : Fruit dry mass for five leaf-to-fruit ratios (L:F), 10 (a), 25 (b), 50 (c), 75 (d), and
100 (e) as a function o f degree days. Fruit growth was monitored on same fruit along the
season in 2000, originated from the second flowering. For each shoot bearing, the mean and
the deviation o f observed (O and full line) and predicted (A and dotted line) data were
presented. The root mean squared error (RMSE) and the relative mean square error (RRMSE)
were calculated for each data set.
4 Discussion
C hap itre III : É tu de du f o n c t i o n n e m e n t c a r b o n é e d e la m a n g u e
4.1 Quality of adjustment and prediction of the model
The predictive quality o f the model, assessed on various experimental situations (different leaf
to fruit ratio treatments) during three successive years, was good. This model allows to predict
the main processes involved in the growth o f a fruit knowing the leaf-to-fruit ratio o f the
studied shoot bearing fruit, which is easily assessed by thinning, and allows to simulate the
variability between shoots and between years according to the initial fruit dry mass and to the
environmental conditions. The observed variability o f fruit dry mass was not always well
predicted. It could be due to the light environment o f the shoot which was not assessed for
each fruit studied. The contribution o f the shoot light environment to the fruit weight at
harvest on peach fruit was noted to be lower than that o f the leaf-to-fruit ratio and initial size
o f leafy shoot, but this contribution was all the same significant (Génard et al., 1998). This
fruit growth model studied here is capable to predict accurately regardless o f the treatment,
the dynamic o f the pool o f carbohydrates stored in leaves and stems, this level reflecting the
source/sink balance o f the system (Iglesias et al., 2002; Layne and Flore, 1993).
4.2 How the initial fruit dry mass influences source/sink
relationships?
Our model emphasizes the influence o f cell number on fruit growth as demonstrated by
several authors (Goffinet et al., 1995; Ho, 1992; Jackson and Coombe, 1966) by relating the
potential fruit mass to the early fruit size assessed after the cell division phase. The result o f
sensitivity analysis shows that the model is very sensitive to the parameter D M ™. The initial
fruit dry mass seems to be strongly implicated in source/sink balance, because, from results o f
the virtual study, this parameter has a larger contribution for the simulated fruit growth rate
than other source/factor like leaf to fruit ratio, and than climate too. Using the initial fruit dry
mass to calculate the maximal final dry mass allows to predict the variability observed
between years, especially between 2000 and 2001, two years with profoundly different rates
o f fruit growth. A limited fruit growth was noted in 2001, regardless o f the treatments, but a
lower initial fruit dry mass too. This small size at the early stage o f development could be due
to resources limitation during the cell division phase. It has been observed that fewer cell
divisions in fruits reduces subsequently their size and potential growth (Westwood, 1967). In
apple, Stanley et al. (2000) found that under conditions o f non-limiting growth after the cell
7 0
I
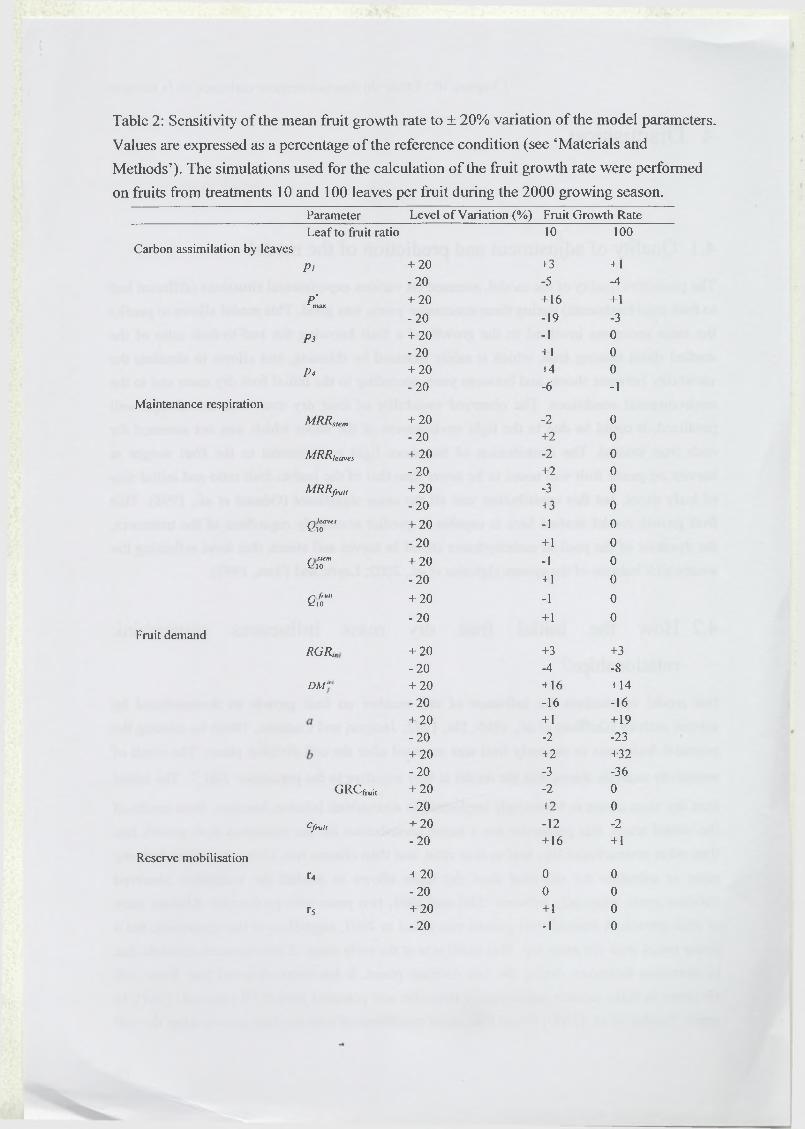
Table 2: Sensitivity o f the mean fruit growth rate to ± 20% variation o f the model parameters.
Values are expressed as a percentage o f the reference condition (see ‘Materials and
Methods’). The simulations used for the calculation o f the fruit growth rate were performed
on fruits from treatments 10 and 100 leaves per fruit during the 2000 growing season.
Parameter Level o f Variation (%) Fruit Growth Rate
Leaf to fruit ratioCarbon assimilation by leaves
Maintenance respiration
Fruit demand
Reserve mobilisation
Pi
P 'max
P3
P4
MRRslem
MRRteaves
MRR,lfruit
e leaves 10
G stem 10
0 /rv it 10
RGRir
d k ï :
GRCfr„it
cfruit
u
r 5
+ 20 -2 0 + 20 -2 0 + 20 -2 0 + 20 -2 0
+ 20 -20 + 20 -20 + 20 -20
+ 20
-20
+ 20
-20
+ 20
-20
+ 20 -20 + 20 -20 + 20 -20 + 20 -20 + 20 -20 + 20 -20
+ 20 -20 + 20 -20
10
+3
-5 +16
-19
-1
+ 1 +4
-6
-2
+2
-2 +2
-3
+3
-1
+ 1
-1
+ 1
-1
+ 1
+3
-4
+ 16
-16
+ 1 -2
+2 -3
-2
+2 -12
+ 16
0
0
+ 1 -1
100
+ 1 -4 +1
-3 0
0 0 -1
0
00
0
0
0
0
0
0
0
0
0
+3 -8
+ 14 -16 + 19 -23 +32 -36 0
0
-2 + 1
0000
division phase, fruit mass at harvest was well correlated to fruit mass 50 days after
pollination, which is in the same order o f magnitude as our date for determining the initial
fruit dry mass. In kiwifruit, measurements made 50 days after anthesis can explain nearly
75% o f the variation o f fruit growth (Hall et al., 1996).
The main part o f the fruit respiration was also explained by the initial fruit dry mass, as fruit
dry mass and fruit growth rate are directly linked to the expression o f maintenance and growth
respiration, respectively. The large contribution o f the initial fruit dry mass to the fruit
demand, resulted from simulations, is due to the importance o f the past growth in the
expression o f this variable (equations 2 and Appendix 2, equation 4). Moreover, this
contribution could be explained too by using directly the initial fruit dry mass to compute the
potential fruit growth and also the fruit demand (equations 2 and 3).
4.3 How the leaf to fruit ratio influences source/sink relationships?
The variations o f simulated reserves in treatments 10 and 25 leaves per fruit were in
accordance with results from studies on leaves o f cherry and citrus trees showing that
carbohydrates content decreased and is low in source-limiting conditions (Iglesias et al.,
2002; Layne and Flore, 1993). It was also noted that concentrations o f storage sugars, like
starch, were high in leaves from light crop load in apple (Wiinsche et al., 2000) and pecan
(Marquard, 1987) trees, as they were in mango leaves from treatment 100 leaves per fruit.
This high level o f sugars in leaves suggests that all assimilates produced by leaf
photosynthesis were not totally used by the fruit. This storage is the result o f the inability o f
sink tissues to use photoassimilates, which is referred to as a limitation o f sink strength
(Warren Wilson, 1972). The contribution, noted from simulations, o f the leaf-to-fruit ratio to
the fruit growth rate was very weak, whereas its contribution to the leaf photosynthesis was
close to 68 %. Increasing the leaf-to-fruit ratio from 50 to 100 leaves per fruit increased
source size and also the production o f assimilates o f the bearing shoot. However, there was
not a great increase o f fruit size. Those processes at source and sink levels confirmed that in
non-limiting supply o f carbon, i.e. high leaf-to-fruit ratio, the fruit growth rate is limited by
the sink, as it has already been reported by Wareing and Patrick (1975). This sink limitation
was balanced by the buffer role o f reserves, as it has already been noted in sour cherry trees
(Layne and Flore, 1993), and in alfalfa (Baysdorfer and Bassham, 1985). The excess o f
carbohydrates produced by photosynthesis was mainly stored in leaves in the 100 leaves per
fruit treatment, as shown by simulated and measured reserves content.
These changes o f sink/source balances according to leaf-to-fruit ratio or crop load are
generally associated with alterations in source activity (Wiinsche et al., 2000) which result in
a significant decrease in leaf photosynthesis observed in mango by increasing leaf-to-fruit
ratio and on peach (Ben Mimoun et al., 1996), grapevine (Naor et al., 1997), and apple
C h ap itre III : É tu d e du f o n c t i o n n e m e n t c a r b o n é e d e la m a n g u e
(Palmer, 1992). This relationship was well represented by the relationship between fruit
demand and light saturated photosynthesis implanted in the model. Several studies expressed
that end-products o f carbon dioxide assimilation results in the feedback inhibition o f
photosynthesis (Goldschmidt and Huber, 1992; Iglesias et al., 2002). Lescourret et al. (1998)
chose to use in their model o f fruit growth a direct relationship between the level o f reserves
in the leaves and light saturated photosynthesis. However, Quereix et al. (2001) suggested
that a phloem-based feedback signal may be involved in photosynthesis regulation, related to
sink/source balance.
The importance o f the nitrogen content o f the leaf is very important for determining the
photosynthetic capacity (Harmens et al., 2000). A study on a biochemical model o f
photosynthesis for mango leaves showed an effect o f source/sink relationships on
photosynthetic capacity o f leaves and on the amount o f leaf nitrogen per unit leaf area (Urban
et al., 2003). Such biochemical model o f photosynthesis may be used to improve the fruit
growth model by taking into account the associated changes in source-sink relationships on
photosynthetic capacity.
4.4 How the climate influences source/sink relationships?
Results o f simulations have shown that the climate contributes to processes involved in fruit
growth at the source level (photosynthesis) and at the sink level as well (fruit demand and
growth rate). The contribution o f climate to photosynthesis was large through (i) a direct
effect o f light on the rate o f electron flow, which depends on the photosynthetically active
photon flux density (Farquhar et al., 1980), and (ii) an indirect effect o f light on the leaf mass-
to-area ratio (Ma), and on the leaf nitrogen content per unit leaf area (Na) (Urban et al., 2003).
Light can modulate the activity or synthesis o f certain enzymes involved in carbon
metabolism in source tissues (Sicher and Krember, 1985; Vassey, 1989). Photosynthetic light
acclimation o f leaves results from changes in leaf nitrogen content per unit mass, mass-to-area
ratio, and changes in total nitrogen allocation between the various pools o f photosynthetic
machinery (Evans, 1989; Le Roux et al., 2001). In mango, the main effect o f light on
photosynthetic acclimation was through the mass-to-area ratio (Urban et al., 2003). This
relationship may be represented in a future model.
The contribution o f climate to the fruit demand could be due to the daily variation o f degree
days used to compute fruit demand. The sum o f growing degree days from full bloom varied
among the season, showing that seasonal temperature profiles differed between seasons and
among sites, as it was reported in a study o f apple fruit growth occurring in three geographical
regions during three seasons in New Zealand (Stanley et al., 2000). In this study, in condition
o f potential fruit growth obtained by controlling crop load, the response o f fruit growth with
these changes o f temperature between seasons was in accordance with our results from the
C hap itre III : b t u d e du f o n c t io n n e m e n t c a r b o n é e d e la m a n g u e
7 2
na^MSS¡SS5SSSS^¿¿¿:
Chapitre III : Étude du fonctionnement carbonée de la mangue
virtual study. Fruit growth differed significantly among sites and among season, as it was
reported by variance analysis. The fruit demand is also computed with coefficients o f growth
and maintenance respiration, which are temperature-independent and strongly temperature-
dependent, respectively, as reported on tomato by (Walker and Thomley, 1977).
The contribution o f temperature to fruit growth can be explained also by the variation o f fruit
growing length between years observed in the virtual study. This variation o f about 23 days
was o f the same order o f magnitude that changes o f the mean harvest date o f mango fruit
(Augais, pers. comm.). Such a variation in the time from pollination to harvest between years
was often noted; for apples, it varied between 132 and 157 days after full bloom (Stanley et
al., 2000). Others studies suggest that it would be the sum o f temperatures during the early
stage o f development, i.e. the first five to seven weeks, which can be used to predict the
length o f fruit development period, rather than the sum o f temperatures over the whole period
(Blanpied and Ben-David, 1970; Lombard et al., 1971; Tromp, 1997). It would be interesting
to reassess this observation for mango and if results show that it is more accurate to harvest at
a predicted date calculated with this assumption than at 1100 degree days regardless o f the
year, it would be introduced in the model. The influence o f temperature in the early-stages o f
fruit development was identified in many species, like satsuma mandarin (Marsh et al., 1999;
Richardson et al., 1997), and apples (Austin et al., 1999). They suggest that temperature may
affect the rate o f cell division, whereas temperature may have less impact on the cell
expansion phase. In the model developed here, we try to emphasize this effect o f early
temperatures by computing the maximum fruit dry mass from the initial fruit dry mass which
is assessed at a given sum o f degree days, proportional to daily changes in temperatures, and
not at a given number o f days after full bloom.
In comparison with the contribution o f source/sink factors to processes involved in fruit
growth, that o f the climate was often lower. Several studies are consistent with this finding.
Blanpied (1964) has found that the correlation coefficient o f the relationship between the
yearly sum o f degree days and the number o f days from full bloom to harvest was not
significant, and suggests that temperatures did not influence the length o f the growing season
for Delicious apples. Robinson et al. (1991) reported no significant variation in fruit size
during ten years on two cultivars o f apple. The temperature explained a weak part o f the total
variation in kiwifruit growth rate, a small but statistically temperature effect was detected
(Hall et al., 1996). Those experimental results and our virtual study indicate that although
temperature may affect fruit growth, other factors, like those influencing source/sink balance,
are much more important.
Conclusion
Experimentations and simulations allowed to study processes involved in mango fruit growth,
as source activity, sink demand, fruit respiration, and leaf and stem reserves. This model is
73
I
able to account accurately for the variations o f those main processes according to the leaf-to-
fruit ratio, and to predict with a good accuracy the variation o f the fruit diy mass for the
various treatments o f assimilate supply. The model was very sensitive to the parameters o f
potential fruit growth, especially the initial fruit mass, regardless o f the treatments, and to
parameters o f carbon assimilation by leaves. The model was less sensitive to parameters
required for maintenance respiration and reserve mobilisation in leaves and stem. Moreover,
simulations on fruit growth elaborated under various climate conditions and different
source/sink factors (initial fruit dry mass and leaf-to-fruit ratio) demonstrate that climate
contributes to the variations in leaf photosynthesis, fruit demand, and fruit growth rate, but
that contribution is globally lower than that o f the initial fruit dry mass and the leaf-to-fruit
ratio. It appears that climatic contribution could be more important in particular period o f fruit
growth, especially in the initial stage. Our results suggested that biochemical model o f
photosynthesis could be used and determination o f the initial fruit dry mass and factors
affecting it could be reassess to improve the fruit growth model.
Acknowledgements
The authors gratefully acknowledge J. Joas and Y. Caro (CIRAD-Réunion, Pôle
Agroalimentaire) for their assistance for total fruit respiration measurements, D. Bancel and
E. Rubio (ENRA-Avignon, Unité PSH) for their assistance in biochemical analysis. This work
was partly funded by the Action Thématique Programmée CIRAD-INRA “Modélisation de la
croissance des fruits dans une architecture ligneuse pour une meilleure maîtrise de la
production et de sa qualité”.
C hap itre III : E tude du f o n c t io n n e m e n t c a r b o n é e d e la m a n g u e
i
7 4
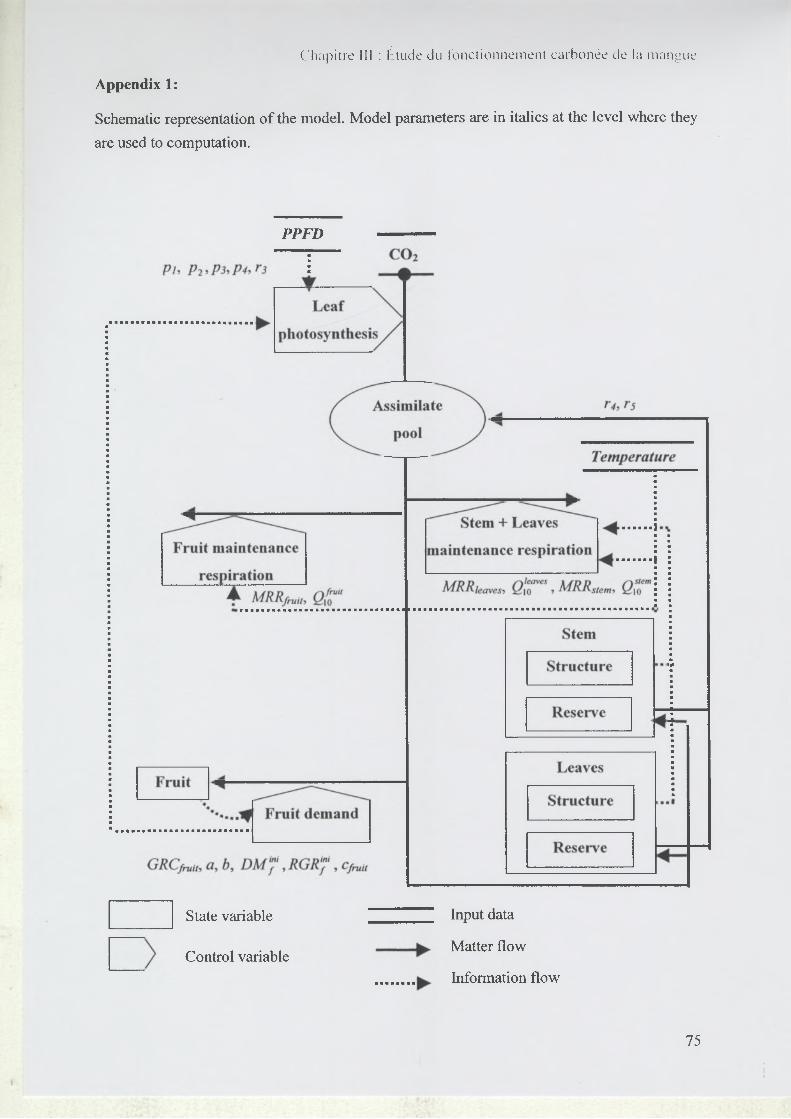
Chap itre III : Étude du f o n c t io n n e m e n t c a r b o n é e d e la m a n g u e
Appendix 1:
Schematic representation o f the model. Model parameters are in italics at the level where they
are used to computation.
PPFD
State variable
Control variable
Input data
Matter flow
Information flow
75
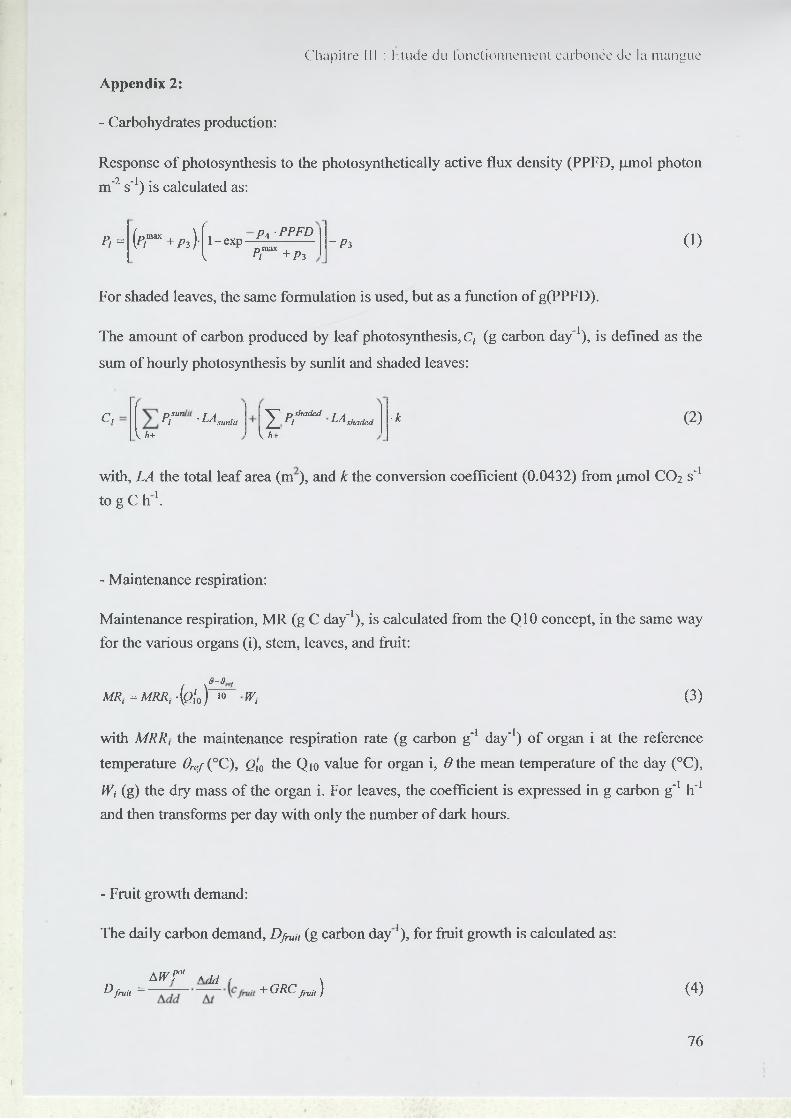
Response o f photosynthesis to the photosynthetically active flux density (PPFD, jimol photon
m'2 s'1) is calculated as:
C hap itre ill : E tude du f o n c t io n n e m e n t c a r b o n é e d e la m a n g u e
Appendix 2:
- Carbohydrates production:
P ,= ( P r + P i \ fl-exp P* 'PPFD{ p r + p ? , ,
- P 3 (D
For shaded leaves, the same formulation is used, but as a function o f g(PPFD).
The amount o f carbon produced by leaf photosynthesis, C, (g carbon day’1), is defined as the
sum o f hourly photosynthesis by sunlit and shaded leaves:
C , P r - L A sunlitV h+
Z n shaded , APl la_
V h+
shaded 'k (2)
with, LA the total leaf area (m ), and k the conversion coefficient (0.0432) from jxmol CO2 s-i
to g C h 1.
- Maintenance respiration:
Maintenance respiration, MR (g C day'1), is calculated from the Q10 concept, in the same way
for the various organs (i), stem, leaves, and fruit:
9 —9 j
MR, = MRR, ■ ( g l o Y w W, (3)
with MRR, the maintenance respiration rate (g carbon g'1 day'1) o f organ i at the reference
temperature 6 rej (°C), Q¡0 the Q(o value for organ i, 0 the mean temperature o f the day (°C),
W¡ (g) the dry mass o f the organ i. For leaves, the coefficient is expressed in g carbon g'1 h'1
and then transforms per day with only the number o f dark hours.
- Fruit growth demand:
The daily carbon demand, Dj iu (g carbon d a y 1), for fruit growth is calculated as:
AW!°‘ Kdd , xD fr .it = + G R C fruit ) ( 4 )
76
»
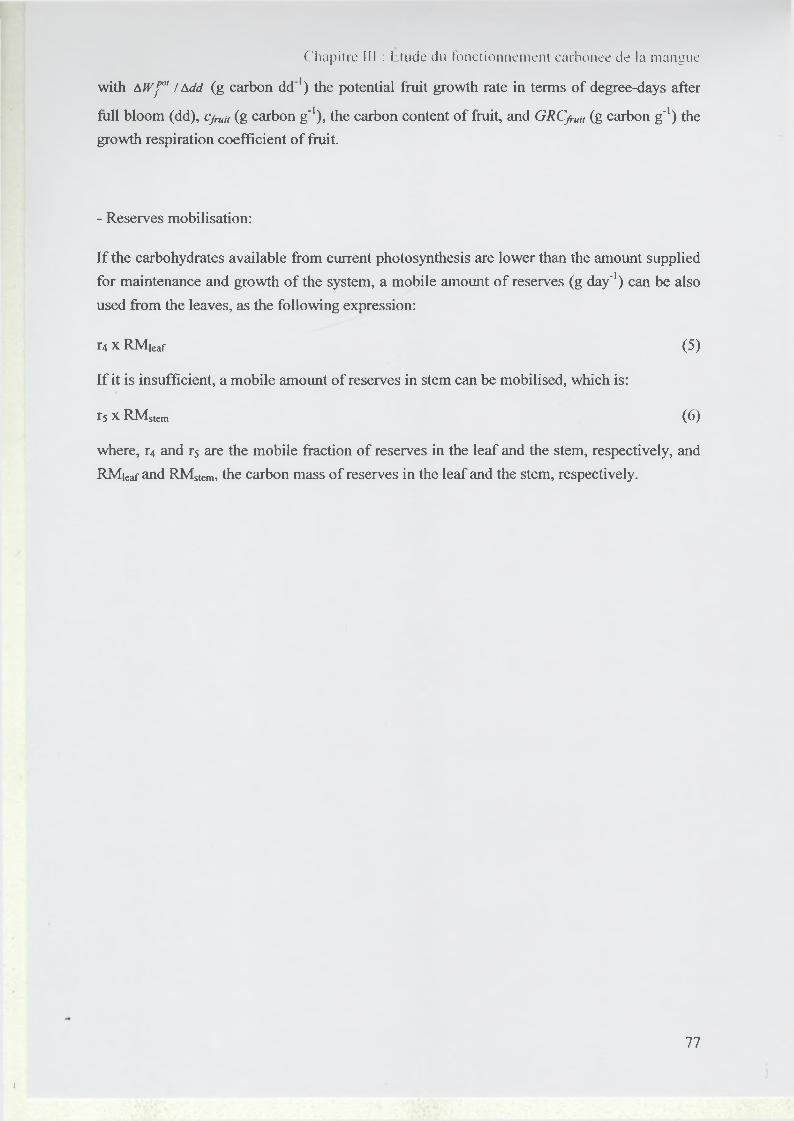
Chapitre III : Etude du fonctionnement carbonée de la mangue
with AWj*” I Add (g carbon d d 1) the potential fruit growth rate in terms o f degree-days after
full bloom (dd), cjn.it (g carbon g'1), the carbon content o f fruit, and GRCfruit (g carbon g'1) the
growth respiration coefficient o f fruit.
- Reserves mobilisation:
If the carbohydrates available from current photosynthesis are lower than the amount supplied
for maintenance and growth o f the system, a mobile amount o f reserves (g day'1) can be also
used from the leaves, as the following expression:
r4 X RM|eaf (5)
If it is insufficient, a mobile amount o f reserves in stem can be mobilised, which is:
T5 X R M s te m ( 6 )
where, 1 4 and r5 are the mobile fraction o f reserves in the leaf and the stem, respectively, and
RMieaf and RMstem, the carbon mass o f reserves in the leaf and the stem, respectively.
i
7 7
C hap itre IV : Etude du f o n c t io n n e m e n t h ydr iqu e d e la m a n g u e
Chapitre IV : Étude du fonctionnement
hydrique de la mangue : An analysis of elastic
and plastic fruit growth in response to various
assimilate supplies
C h ap itre IV : E tu de du f o n c t i o n n e m e n t h ydr iqu e d e la m a n g u e
Chapitre IV : Etude du fonctionnement
hydrique de la mangue : An analysis of elastic
and plastic fruit growth in response to various
assimilate supplies
78
C hap itre IV : É tude du f o n c t io n n e m e n t h yd r iq u e d e la m a n g u e
Dans l’objectif de comprendre le fonctionnement hydrique de la mangue, la croissance horaire
en matière fraîche du fruit a été étudiée puis modélisée en s’attachant principalement (i) à
prédire l’évolution de la composition biochimique de la chair de la mangue qui permet d’une
part de décrire l’élaboration de la qualité du fruit, et d’autre part de calculer la pression
osmotique du fruit, une composante de l’état hydrique du fruit, et (ii) à prédire les variations
de pression de turgescence, l’autre composante de l’état hydrique du fruit (Léchaudel, M.,
Lescourret, F., Vercambre, G. and Génard, M. An analysis o f elastic and plastic fruit growth
in response to various assimilate supplies. Manuscript soumis à Journal o f Experimental
Botany). L’étude de la croissance en matière fraîche de la mangue et de la pression de
turgescence des tissus a permis de déduire des paramètres importants indiquant les propriétés
d’élasticité et de plasticité des parois de ces tissus. Des lois de variations de ces paramètres
sont proposées et un modèle capable de rendre compte des variations de croissance élastique
et plastique observées chez la mangue est présenté. Ce modèle est utilisé pour simuler l ’effet
de la disponibilité hydrique et carbonée sur la croissance et les relations hydriques d’un fruit
virtuel.
»
7 9
Chapitre IV : Étude du fonc tionnem ent hydrique de la m angue
An analysis of elastic and plastic fruit growth in response to various
assimilate supplies
By Mathieu Léchaudel1, Françoise Lescourret2, Gilles Vercambre2 and Michel Génard2
'Centre de Coopération Internationale en Recherches Agronomique pour le Développement,
Département des Productions Fruitières et Horticoles, Station Bassin Plat, BP 180, 97455
Saint Pierre Cedex, Ile de la Réunion, France
2INRA-PSH, Domaine St Paul, 84914 Avignon Cedex 9, France
(e-mail: [email protected])
i
8 0
C hap itre IV : É tu d e du f o n c t io n n e m e n t h yd r iq u e d e la m a n g u e
ABSTRACT
Changes in elastic and plastic components o f fruit growth were analysed from a model o f fruit
growth and under various assimilate supplies. Elastic fruit variation is a function o f the elastic
modulus as well as o f turgor pressure variation. Plastic fruit variation is a function o f cell wall
extensibility and the difference between turgor pressure and yield threshold pressure. Water
relations, at the fruit level, encompassing water potential, osmotic pressure and turgor
pressure, were assessed in order to study the reversible and irreversible enlargement process.
The model used was partly based on the growth model proposed by Fishman and Génard
(1998). The introduction o f the reversible elastic enlargement makes it possible to simulate
positive turgor pressure during fruit shrinkage. Plastic growth parameters, yield threshold
pressure and cell wall extensibility were considered to vary in the model. The model was
applied to the mango fruit (Mangifera Indica L. cv. ‘Lirfa’). Both diurnal and seasonal fruit
growth were well simulated in the model. The diurnal variations o f water potential, osmotic
and turgor pressure were predicted with good accuracy. During the day, plastic growth as
described by the model was generally null and shrinkage and swelling were linked to the
elastic behaviour o f the fruit. Relationships between changes in fruit growth, fruit water
relations and fruit composition were compared on the basis o f changes in carbon or water
supply.
t
81
1 Introduction
After a short period o f cell division, fruit growth involves the enlargement o f fruit cells. For
fleshy fruit, this period o f enlargement is mainly characterised by a large accumulation o f
water which results from the balance between incoming and outgoing fluxes (Ho et al., 1987).
Water is supplied by the phloem as well as the xylem, and is lost through transpiration. The
phloem brings both water and dry matter for fruit growth. Changing the leaf-to-fruit ratio
affects finit growth by altering the supply o f carbohydrates to the fruit as well as water
accumulation (Léchaudel et al., 2002).
Fruits are submitted to large variations in volume resulting from the balance between these
various fluxes. This variation has elastic and plastic components. Elastic fruit variation, which
is a reversible process, is a function o f the elastic modulus as well as o f the variation in the
fruit turgor pressure (Ortega, 1990). Plastic fruit variation, which is an irreversible process, is
a function o f the cell wall extensibility and the turgor pressure at which wall yielding (Green
et al., 1971). Water relations at the fruit level, described by osmotic pressure and turgor
pressure, are often adequate for studying the reversible and irreversible enlargement process
(Boyer, 1985).
C hap itre IV : Étude du f o n c t io n n e m e n t h yd r iq u e de la m a n g u e
Diurnal variation, described by shrinking and swelling, is often less pronounced in fruit than
in stem (Huguet and Génard, 1995). However, this does not indicate that fruit elastic
deformation is limited but, rather, that the sum o f elastic and plastic variations results in
continuous enlargement for fruit and in shrinkage with slow growth for stem. When water
loss occurs during the day, the fruit shrinks and its turgor pressure is maintained by elastic
adjustment (Jones et al., 1985). In an elastic tissue, the decrease o f turgor is less than in a
rigid tissue for a given loss o f water (Tyree and Jarvis, 1982). When the fruit swells, the
elastic deformation is mainly caused by the increase o f pressure (Proseus et al., 1999). As
suggested by Wu et al. (1985), the cell wall elasticity is due to the structure and composition
o f the cell wall. The elastic behaviour can be expected to be purely physical (Proseus et al.,
1999).
The role o f turgor in extending the walls is well documented. According to Lockhart (1965),
turgor pressure above a given threshold pressure leads to cell wall extension. This model o f
plastic growth introduces two parameters: the yield threshold pressure, Y, and the wall
8 2
Chapitre IV : Étude du fonc tionnem ent hydrique de la m angue
extensibility, <j> (Dale and Sutcliffe, 1986). <}> denotes the irreversible and metabolism-linked
deformability o f the wall (Cosgrove, 1985). Rapid growth response to changes in plant water
status and linear relationships between growth rate and turgor pressure suggested that changes
in growth were caused by changes in turgor pressure, and that <}> and Y were constant. This
approximation was adopted by Nonami and Boyer (1990) to describe stem growth and by
Fishman and Génard (1998) to simulate the growth o f peach fruit. However, some reports
have demonstrated a substantial lack o f correlation between turgor and growth rate (Schackel
et al., 1987), particularly when growth is reduced by plant water deficits while turgor is
maintained due to solute accumulation (Michelena and Boyer, 1982; Nonami and Boyer,
1989). Therefore, variation in Y and <J) could be involved in the complex process o f cell
expansion.
Studies on the variations o f the mechanical properties o f walls revealed that wall extension is
sensitive to pH and that acids such as auxin induced wall extension and growth (Okamoto et
al., 1990). The acid growth theory predicted the existence o f wall-loosening proteins, such as
wall-bound proteins like expansins, which were reported to facilitate wall extensibility
(McQueen-Mason and Cosgrove, 1995). Proseus et al. (2000) suggested that factors involving
cell metabolism controlled (j) and the long-term growth o f the cell. As the cells mature,
expansin activity is reduced (McQueen-Mason, 1995) and alteration in wall structure appears
to prevent enzymes from inducing wall extension, probably regulating the cessation o f
growth. Okamoto-Nakazato et al. (2000) isolated two wall-bound proteins which affect the
yield threshold through acidification o f the cell walls. This suggests that <j> and Y are expected
to be predominantly biochemically controlled and to vary as a function o f fruit growth.
Fruit-growth response to carbon supply was studied using a model o f fruit volume variation,
partly based on the growth model proposed by Fishman and Génard (1998). Fishman and
Génard (1998) presented a model dealing with fruit growth, assuming only irreversible cell
extension. This model is based on the description o f water and sugar accumulation in the fruit.
The water inflow is governed by the difference o f water potential between the stem and the
fruit, by resistance to transfer and by the mechanical properties o f the cell wall. The water
outflow is proportional to the difference in relative humidity between the air-filled space
within the fruit and the ambient atmosphere, and to the conductance to vapour efflux. This
model predicts null turgor pressure during fruit shrinkage which conflicts with the positive
pressures usually measured in fruit tissues (Mills et al., 1997). This occurrence o f null
pressures probably results from the lack o f a reversible deformation process in the model. A
representation o f fruit volume variation based on the biophysical water transport in the fruit
and including the elasticity o f living tissue, as well as the plastic properties, may more
accurately simulate the way that the fruit functions.
83
I
Chapitre IV : Élude du fonctionnement hydrique de la mangue
The reversible elastic component was added to the model by introducing the volumetric
elastic modulus as proposed on the cell growth model by Ortega (1990). Regarding plastic
growth, the parameters o f Lockhart’s equation (Y and <)>) were considered to vary. Estimation
o f these variations required simultaneous measurements o f the fruit growth and o f the plant
and fruit water status. This was done on mango fruit which is o f great economic importance
since mango fruit is the number one tropical fruit produced in the world.
The model was tested on diurnal and seasonal dynamics o f fruit mass, considering the effect
o f various assimilate supplies. The simulations o f water relations were compared with
measurements obtained on mango flesh tissue. The sensitivity o f fruit shrinkage and fruit
growth rate to the model parameters was studied. The effects o f assimilate or water shortage
on fruit water relations, fruit growth and fruit composition were compared and discussed.
I
8 4
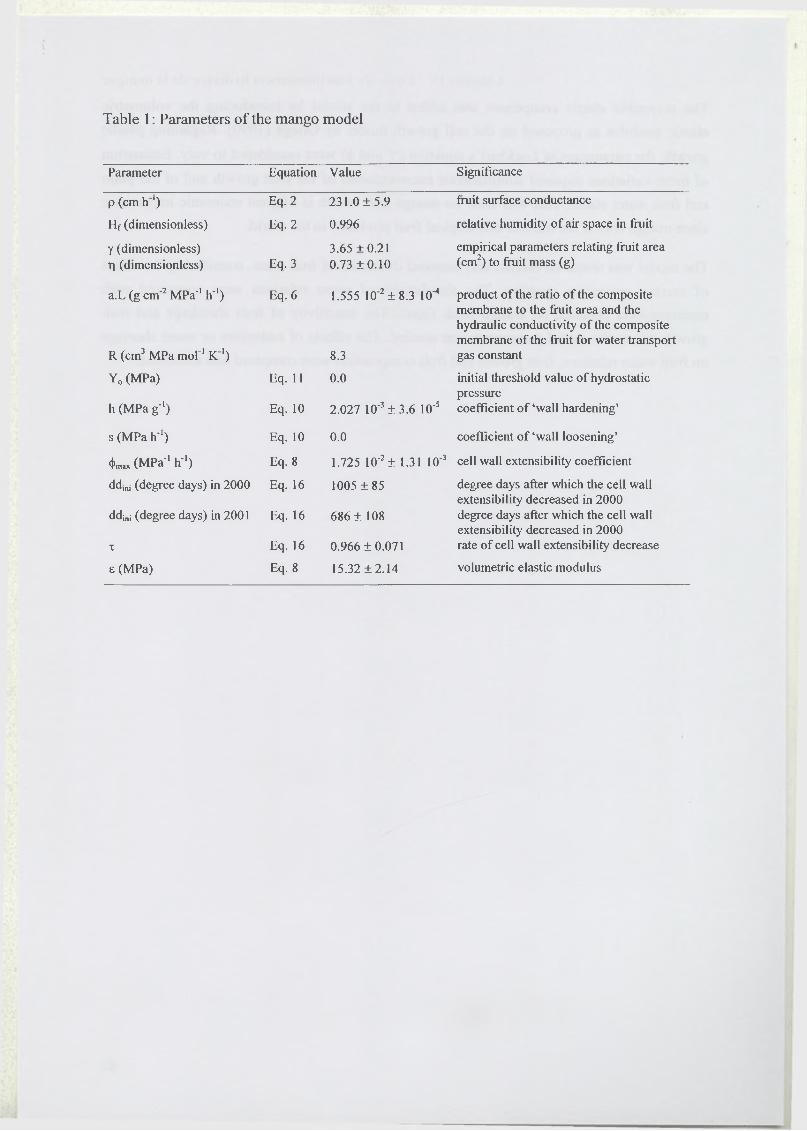
Table 1 : Parameters o f the mango model
Parameter Equation Value Significance
p (cm h'1) Eq. 2 231.0 ± 5 .9 fruit surface conductance
Hf (dimensionless) Eq. 2 0.996 relative humidity o f air space in fruit
y (dimensionless) 3.65 + 0.21 empirical parameters relating fruit area
r| (dimensionless) Eq. 3 0.73 ± 0 .1 0 (cm2) to fruit mass (g)
a.L (g cm'2 MPa'1 h'1) Eq. 6 1.555 10'2 ± 8.3 10-4 product o f the ratio o f the composite membrane to the fruit area and the hydraulic conductivity o f the composite membrane o f the fruit for water transport
R (cm3 MPa mol'1 K'1) 8.3 gas constant
Y0 (MPa) Eq. 11 0.0 initial threshold value o f hydrostatic pressure
h (MPa g'1) Eq. 10 2.027 10'3 ± 3.6 10'5 coefficient o f ‘wall hardening’
s (MPa h'1) Eq. 10 0.0 coefficient o f ‘wall loosening’
<tW (MPa'1 h'1) Eq. 8 1.725 10'2 ± 1.31 10'3 cell wall extensibility coefficient
ddini (degree days) in 2000 Eq. 16 1005 ± 85 degree days after which the cell wall extensibility decreased in 2000
ddini (degree days) in 2001 Eq. 16 686 ± 108 degree days after which the cell wall extensibility decreased in 2000
T Eq. 16 0.966 ± 0 .071 rate o f cell wall extensibility decrease
e (MPa) Eq. 8 15.32 ± 2 .1 4 volumetric elastic modulus
C hapitre IV' : E tu de du f o n c t io n n e m e n t h ydr iqu e d e la m a n g u e
2 Materials and methods
2.1 Plant material
The experimental study was conducted on 11-year-old (in 2000) mango trees o f cv. ‘Lirfa’,
grafted on ‘Maison Rouge’, in Reunion Island (20°52’48” S, 55031’48” E) during the 2000,
2001 and 2002 growing seasons. The 2000 experimental plot consisted o f ten rows, 7 m apart,
each o f them consisting o f nine trees spaced 5 m apart and about 3 m high. The trees observed
in 2001 and 2002 were spaced at 5 m by 6 m and were around 3 m high in an adjacent plot.
During the experiment, all trees were irrigated every two days at 100% replacement o f
evaporation. Six weeks after flowering, about ten to fifteen branches per tree were chosen,
representing less than 10% o f the total branches o f the tree. Their position was randomly
chosen on the top o f the tree to reduce the variability o f light received by leaves which could
significantly affect carbon assimilation and fruit growth as well. Branches were girdled by
removing a band o f bark, 10-15 mm wide, sometimes defruited and defoliated to give 10, 25,
50, 100 and 150 leaves per fruit (with 50 leaves for 5 fruits, 100 leaves for 4, 2 and 1 fruit,
and 150 leaves for 1 fruit, respectively). To keep the leaf-to-fruit ratios constant within each
treatment, all new emerging leaves were removed. The girdling treatment occurred after the
physiological fruit drop, when fruit length was about 5 cm.
2.2 Model presentation
The model is based on a biophysical representation o f fruit growth proposed by Fishman and
Génard (1998). It simulates hour-by-hour diurnal and seasonal fruit growth after the period o f
cell division. The fruit has two components. The first component includes the flesh and is
described as a single compartment. The second component is the stone. The growth in fresh
mass o f the stone is deduced from the growth in fresh mass o f the flesh by means o f an
empirical relationship.
The reversible elastic enlargement and the potential relationship between turgor, wall
structure and wall metabolism are taken into account by introducing the elastic modulus as
proposed in the cell growth model by Ortega (1990) and possible changes in <J> and Y in the
initial Lockhart equation.
A list o f the model parameters is presented in Table 1.
85
I
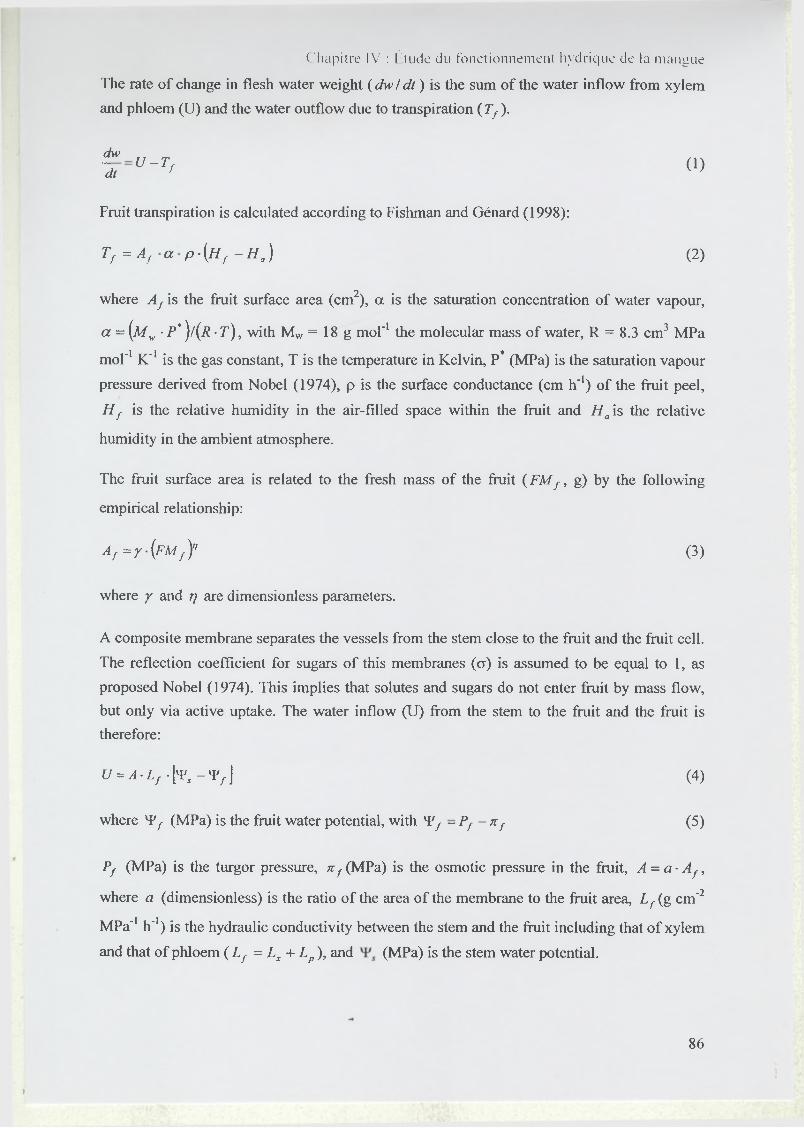
Chapitre IV : Étude du fonctionnement hydrique de la mangue
The rate o f change in flesh water weight ( d w ld t ) is the sum o f the water inflow from xylem
and phloem (U) and the water outflow due to transpiration ( Tf ).
dw
~dtU - T f (1)
Fruit transpiration is calculated according to Fishman and Génard (1998):
Tf = A , a p \ H f - H a) (2)
where Af is the fruit surface area (cm2), a is the saturation concentration o f water vapour,
a = (m w ■ P * )/(/? • T ) , with Mw = 18 g mol'1 the molecular mass o f water, R = 8.3 cm3 MPa
mol'1 K'1 is the gas constant, T is the temperature in Kelvin, P* (MPa) is the saturation vapour
pressure derived from Nobel (1974), p is the surface conductance (cm h'1) o f the fruit peel,
H f is the relative humidity in the air-filled space within the fruit and H a is the relative
humidity in the ambient atmosphere.
The fruit surface area is related to the fresh mass o f the fruit ( FMf , g) by the following
empirical relationship:
Af = y \ F M f y (3)
where y and 77 are dimensionless parameters.
A composite membrane separates the vessels from the stem close to the fruit and the fruit cell.
The reflection coefficient for sugars o f this membranes (a) is assumed to be equal to 1, as
proposed Nobel (1974). This implies that solutes and sugars do not enter fruit by mass flow,
but only via active uptake. The water inflow (U) from the stem to the fruit and the fruit is
therefore:
U = A. Lf \ v s - ' ¥ f \ (4)
where 'Vf (MPa) is the fruit water potential, with *¥f - Pf - nf (5)
Pf (MPa) is the turgor pressure, nf (MPa) is the osmotic pressure in the fruit, A = a- Af ,
where a (dimensionless) is the ratio o f the area o f the membrane to the fruit area, Lf (g cm'2
MPa'1 h'1) is the hydraulic conductivity between the stem and the fruit including that o f xylem
and that o f phloem ( Lf = Lx + Lp ), and (MPa) is the stem water potential.
8 6
i
Chapitre IV : Étude du fonctionnement hydrique de la m angue
The osmotic pressure is obtained by the following equation according to Nobel (1974):
nf = R T 'L J\ n J +naa)lw) (6 )
where n is the number o f moles o f osmotically-active solute j analysed, naa is the number o f
amino acids and w is the total volume o f water in the flesh (cm3).
The concentration o f total nitrogen in mango flesh was relatively constant during fruit growth
- about 0.05 to 0.12 g 100g_1FM (data not shown). The main nitrogen is in a soluble state in
fruit flesh with about two-thirds o f total nitrogen in peach (Lobit et al., 2002). The mass o f
amino acids was considered to be constant during fruit growth. A first approximation o f the
number o f moles o f amino acids was calculated using the average molar mass o f amino acids
found in mango (Hall et al., 1980).
The number o f moles o f the other osmotically-active solutes was expressed for each one as:
n j = [prop j • DM j , ) / M M j (7)
where p rop j (dimensionless) is the mass proportion o f the osmotically-active solute j
(minerals, organic acids and sugars) in the dry mass o f the flesh ( D M f l , g) and M M j (g mole'
') is the molar mass o f the osmotically-active solute j.
The proportion o f osmotically-active solute j ( propj ) in the flesh dry mass was estimated
from results o f biochemical analysis by linear regression with the following explanatory
variables: (i) the sum o f degree days after full bloom ( dd ), (ii) the dry mass o f flesh ( D M )
and (iii) their interaction:
propj = 8 ) + 8 ) ■ dd + 8 ) ■ DMfl + 8 ) ■ ( d m fl • dd), (8)
with S j , S 2j , S j, Sj as empirical parameters, depending on the compound j .
The change in flesh volume (V) due to water and dry matter accumulation is:
dV _ 1 dw { 1 d (D M ) 1 (u y 1 d(D M )
dt D w dt Ds dt Dw Ds dt
where — and ^ a r e the rates o f change in water and dry mass, respectively, and Dw dt dt
and Ds are the density o f water and carbohydrates. The density o f the main compounds o f dry
matter such as citric acid (1.67), glucose (1.56), fructose (1.60) and sucrose (1.58) was around
8 7
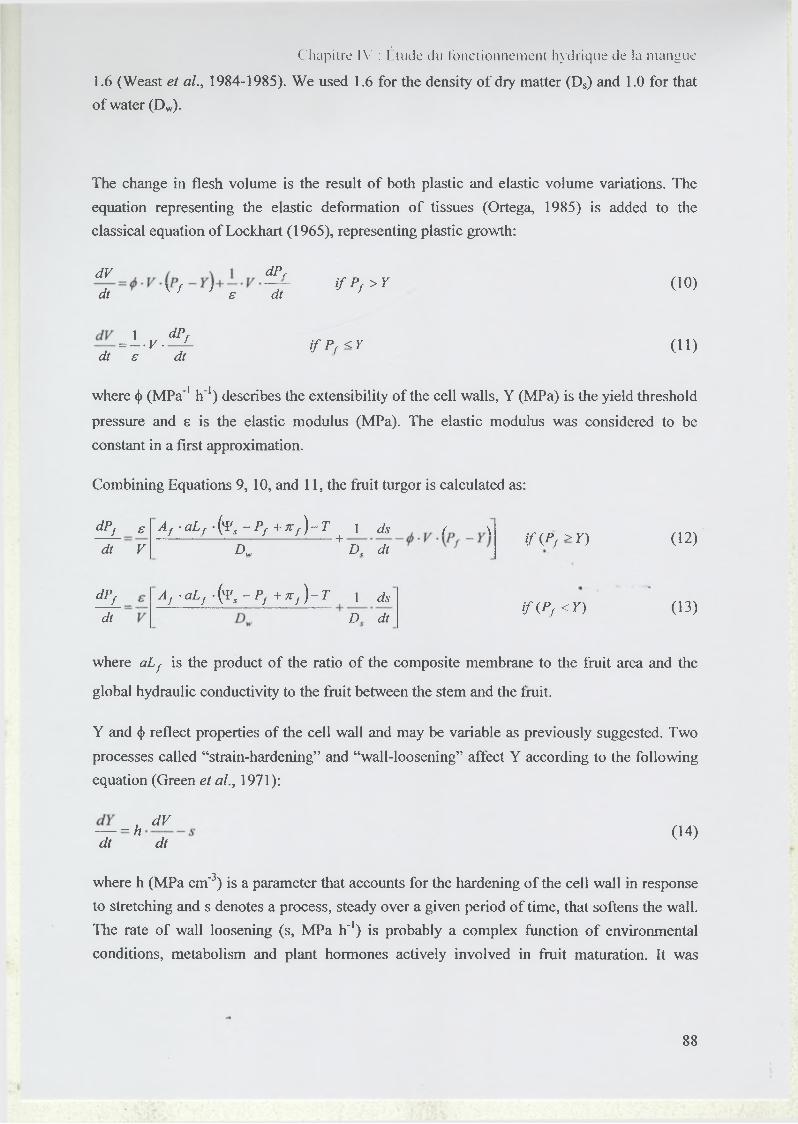
Chapi t re IV : Étude du fonc tionnement hydrique de la m angue
1.6 (Weast et al., 1984-1985). We used 1.6 for the density o f dry matter (Ds) and 1.0 for that
of water (Dw).
The change in flesh volume is the result o f both plastic and elastic volume variations. The
equation representing the elastic deformation of tissues (Ortega, 1985) is added to the
classical equation o f Lockhart (1965), representing plastic growth:
dV dP f
dt V / ’ s dti f P f > Y (10)
= L y . dt £
£ l
dti f P f <Y (11)
where <|> (MPa'1 h'1) describes the extensibility o f the cell walls, Y (MPa) is the yield threshold
pressure and s is the elastic modulus (MPa). The elastic modulus was considered to be
constant in a first approximation.
Combining Equations 9, 10, and 11, the fruit turgor is calculated as:
dPf £dt V
Af -aLf •('FS- P f +71 f ) - T 1 ds ( \_ Z ------ -------------- L------LL----- +
Dw D ' d ti f ( P f > Y ) (12)
Af -aLf - ^ s - P f + n f ) - T 1 ds£> dt
i f {Pr < Y) (13)dlL - dt
where aLf is the product o f the ratio o f the composite membrane to the fruit area and the
global hydraulic conductivity to the fruit between the stem and the fruit.
Y and <}> reflect properties of the cell wall and may be variable as previously suggested. Two
processes called “strain-hardening” and “wall-loosening” affect Y according to the following
equation (Green et al., 1971):
— - h dV dt dt
(14)
where h (MPa cm"3) is a parameter that accounts for the hardening o f the cell wall in response
to stretching and s denotes a process, steady over a given period o f time, that softens the wall.
The rate of wall loosening (s, MPa h"1) is probably a complex function o f environmental
conditions, metabolism and plant hormones actively involved in fruit maturation. It was
88
Chapi t re IV : Etude du fonctionnement hydrique de la m angue
initially assumed that s was zero since we consider the period of fruit growth before fruit
maturation.
Equation 14 is therefore integrated over a given period o f time and becomes, at time t after
full bloom:
Y{t) = Y0 +h-{V{t)-V0) (15)
where V0 (cm3) is the flesh volume at to, the time at which fruit growth begins, corresponding
to full bloom. For the sake of simplification, we considered that V0 and Y0 are equal to zero at
to and, therefore, Y(t) -h-V( t ) .
With regard to wall extensibility, <j), a correlation between the decrease in wall extensibility
and the cessation of growth has been reported (Bütenmeyer et al., 1998). When cells mature,
Proseus et al. (1999) suggest that <|> decreases and can reach zero. We propose an equation
where <j) is constant and maximal ( inax ) until a given time ( ddini in degree days) and then
decreases according to a rate parameter (x):
<t> = if dd < ddM
i f d d > d d M (16)
The main variables, turgor and osmotic pressure were calculated using Equations 6, 12, and
13, leading to the estimation o f the different fluxes (water inflow, transpiration). The rates of
change o f dry flesh mass (input data) were added to Equation 1 (rate o f change o f water flesh
mass), and subsequent integration gave the fresh mass o f the fruit flesh. To obtain the
variation o f the fresh fruit mass, the fresh mass o f the stone, established by allometric
relationship (see ‘Materials and methods’), was added to that of the flesh.
2.3 Measurements for parameter assessment
2.3.1 Fruit surface conductance and hydraulic conductivity of xylem
Measurements o f fruit diameter variations were carried out during two experimentations, over
three periods o f fruit growth, with four replicates, in 2001. Firstly, changes in fruit diameter
were monitored on detached fruits which were picked and suspended in the tree canopy at
their previous position in order to estimate fruit surface conductance from climatic data as
explained in Equation 2. Secondly, diameter changes were recorded on fruits with a girdled
89
I
Chapitre IV : Étude du fonc tionnement hydrique de la m angue
pedicel to stop phloem translocation. The model used estimated the product o f the ratio o f the
composite membrane area to the fruit area and the global hydraulic conductivity o f xylem
only, since phloem flow does not occur in this fruit, by calibration between predicted and
observed fruit volume variations.
2.3.2 Elastic modulus
The elastic modulus o f mango fruit was estimated during a period when the net accumulation
of fresh matter was close to zero, which occurred during the latter stage of the fruit growth
season. During this period, measured variation o f fruit volume was assumed to be only due to
elastic variation (Equation 11). Measurements o f the diurnal variation o f flesh volume and
turgor pressure were assessed on fruits from the 10- and 100-leaf-to-fruit ratio treatments on
one day in 2001 (4th December) and one day in 2002 (17th December), from 5 am to 8 pm.
The elastic modulus was estimated using averaged data of flesh volume variation and turgor
pressure of each measurement period.
2.3.3 Wall extensibility (<j>), yield turgor pressure (Y) and conductivity (aLf)
The turgor pressure and the diurnal variation volume were measured from 5 am to 10 pm, on
fruits from the 100-leaf-to-fruit ratio treatment during five periods between 8th November and
29th November in 2002. The relative rate o f elastic volume variation was then calculated,
taking into account the variation of turgor pressure and using the previously estimated elastic
modulus, as described in Equation 11. The relative rate o f plastic volume variation was then
determined after the elastic extension was subtracted from the total relative rate o f volume
variation (Equation 10). It was expected that plots o f the estimated relative rate of plastic
variation versus turgor pressure would result in lines with a slope equal to the maximal wall
extensibility, ((>max, and an intercept with the x-axis and the turgor threshold, Y. With this
method, possible variations o f <j> and Y were examined. <j>max was estimated.
The product o f the ratio o f the composite membrane area to the fruit area and the global
hydraulic conductivity o f the fruit, aLf, and the parameter o f “strain-hardening”, h, (including
the variation o f the yield threshold turgor, Y, according to Equation 15) were assessed by
calibration o f the model. This ‘calibration procedure’ used averaged data of volume
variations, monitored on fruits from the 100-leaf-to-fruit ratio treatment during three periods
of about three to four days, between 8th November and 2nd December 2002. Since fruit growth
was rapid during this period, the value o f <t>max was used as the wall extensibility value in the
model.
90
Chapitre IV : É tude du fonc tionnem ent hydrique de la m an g u e
Parameters linked to the variation o f wall extensibility, x and dd¡n¡ (Equation 16), were
estimated by using the model and averaged observed data o f the seasonal variation o f fruit
growth from the 100-leaf-to-fruit ratio treatment in 2000 and 2001.
2.3.4 Allometric relationships
The allometric relationship between the fruit fresh weight and the fruit skin area was studied
on 61 fruits picked during the growing season. Parameters relating the fruit surface (cm2) to
the fruit mass (g), as described in Equation 3, were estimated at: y = 3.65 ± 0.21 (n = 61) and
T) = 0.73 ± 0.10 (n = 61) (R2 = 0.98).
The dry mass (DM) and the water mass (WM) o f the flesh were related to the fruit diameter
(D) by empirical relationships {DM = 0.8191 • e 00510), R2 = 0.90, and WM = 14.168 • e om5 D\ R2
= 0.94, n = 253).
The fresh mass o f the stone (FMstone) was calculated empirically from the fresh mass o f the
flesh: FMstone = 0.1167 • FMflesh (R2 = 0.72, n = 253).
2.3.5 Parameters of the proportions o f osmotically-active solutes
Biochemical analyses used to estimate the parameters o f Equation 9 were made on fruits from
the 10- and 100-leaf-to-fruit ratio treatments during the 2001 growing season. The fresh pulp
was thawed and finely homogenised by a Polytron (PT1600E, Kinematica AG, Switzerland).
Concentrations o f calcium, magnesium and potassium were determined on the diluted mango
juice with a capillary ion analysis (CIA, Waters, Massachusetts, USA). The CIA conditions
were UV CAT2 electrolyte, silica capillary, 10-pA current and 20kV voltage, hydrostatic
injection, 10 nL sample injected, electro-osmotic flux migration and UV detection (185 nm,
mercury lamp). The concentrations of organic acids were analysed by using high-performance
liquid chromatography (HPLC, DIONEX Co., Sunnyvale, USA). The conditions were
CarbopacPAl guard-column, IonPacASll column, 25jxL sample injected, elution by a linear
gradient from 0.5mM to 35mM NaOH in 25min, flow rate at 2 mL/min and conductimetric
detection (type ED40 equipped with an automatic suppressor: ASRS cartridge). Peaks of
organic acids were confirmed by comparison with standard mixtures. Concentrations o f
sucrose, glucose and fructose were measured using an HPLC system. The HPLC conditions
were CarbopacPAl guard-column and column, 25fxL sample injected, isocratic elution by a
200mM NaOH and purified water mixture (85:15, v/v), flow rate at 1 mL/min and
91
1
Chapi t re IV : Étude du fonc tionnement hydrique de la m angue
amperometric detection (type ED40). Peaks o f sugars were confirmed by comparison with
standard solutions. Starch was hydrolysed with amyloglucosidase (14 amyloglucosidase
units/ml, Novo Nordisk Bioindustries Ltd., Denmark) and its concentration was determined
by a colorimetric dosage o f glucose (glucose analysis kit, ref 716251/Boehringer Mannheim,
Diffchamb, France).
2.4 Measurements of fruit growth and water relations
2.4.1 Seasonal variation of fruit growth
During the 2000 growing season, six fruits from the five leaf-to-fruit ratio treatments (10, 25,
50, 100 and 150 leaves per fruit) were harvested each week between 15 November 2000 and 4
January 2001. In the second year o f the experiment, six fruits from two leaf-to-fruit ratio
treatments (10 and 100 leaves per fruit) were harvested every fifteen days between 19 October
2001 and 21 January 2002. For each fruit, the fresh mass and masses o f the different fruit
components (peel, flesh and stone) were measured. A sample o f each component was taken
from each fruit, weighed and then dried at 75°C for 48 h, and the corresponding dry masses
recorded, whereas the remainder was frozen at -20°C for future biochemical analysis.
2.4.2 Diurnal variation o f fruit growth
The diurnal variations o f fruit diameter were measured continuously on two fruits from the
10-leaf-to-fruit ratio treatment on a day in 2001, and on four to 11 fruits from the 100-leaf-to-
fruit ratio treatment on four to seven successive days in 2002. Changes in fruit diameter were
continuously recorded using a linear variable differential transformer (LVDT) mounted on an
INVAR frame (Li et al., 1989). All the sensors were connected to a datalogger (21 X
datalogger from Campbell Scientific Ltd).
2.4.3 Water relations in the fruit flesh and in the stem
Diurnal variations in fruit water potential and fruit osmotic pressure were measured on one
and four days between November and December in 2001 and 2002, respectively. The only
measurement day in 2001 and the last day in 2002 corresponded to periods o f small growth
rate, whereas the three first days in 2002 corresponded to rapid fruit growth. Measurements
began between 5 am and 6 am and finished between 8 pm and 10 pm, at approximately three-
hour intervals. Fruit water potential was measured using the WP4 dewpoint potentiameter
(Decagon Devices, Inc. Pullman, Washington, USA). For each measurement, two fruits from
the 10-leaf-to-fruit ratio treatment were used in 2001, and three fruits from the 100-leaf-to-
fruit ratio treatment were used in 2002. The water potential was determined on a disc o f fruit
92
Chapitre IV : Ltude du fonc tionnem ent hydrique de ta m an g u e
flesh o f approximately 2.5 cm in diameter. Four replicates per fruit were used. As soon as the
water potential was measured, each disc was placed in a freezer. The osmotic pressure o f the
juice extracted from the thawed fruit was later determined using a vapour pressure osmometer
(Wescor, Logan, Utah USA). Turgor pressure was calculated by subtracting osmotic pressure
from fruit water potential.
The stem water potential was measured with a pressure chamber. Four hours before the
measurements, the leaf was enclosed in a bag wrapped in aluminium. This inhibited leaf
transpiration and the water potential in the leaf was in equilibrium with that o f the stem at the
point o f leaf insertion. Measurements were performed on eight to ten leaves for each period of
fruit potential measurement.
2.5 Modelling Technique
Simulation o f both diurnal and seasonal processes was based on an hourly scale. The model
was based on differential equations which were solved numerically by the first order Runge-
Kutta method. The model was written using the S-Plus language.
The parameters 8, h, aLf, x and ddim were estimated with the non-linear least squares
regression function, which minimises the sum o f squared residuals.
The empirical parameters, Sj ,Sj ,¿>¿,0*, used in Equation 9, were estimated by linear
regression.
2.6 Description of input data
The climatic data were collected by the local meteorological station located close to the
orchard (CIRAD, Saint Pierre). The maximum and minimum daily temperatures were used to
assess the sum of growing degree days after full bloom.
Discontinuous measurements o f stem water potential using a pressure chamber led to the
estimation o f an empirical linear relationship (the value o f the multiple R-squared was 0.41),
linking stem water potential to climatic data (temperature, relative humidity and global
radiation), which led to the simulation o f continuous stem water potential (data not shown),
one o f the input data of the model.
The rate o f dry matter accumulation in the fruit was derived from data on fruit diameter
changes. The daily rate o f dry mass was converted into an hourly rate, assuming a constant
rate throughout the day, which is consistent with observations o f constant sugar
93
I
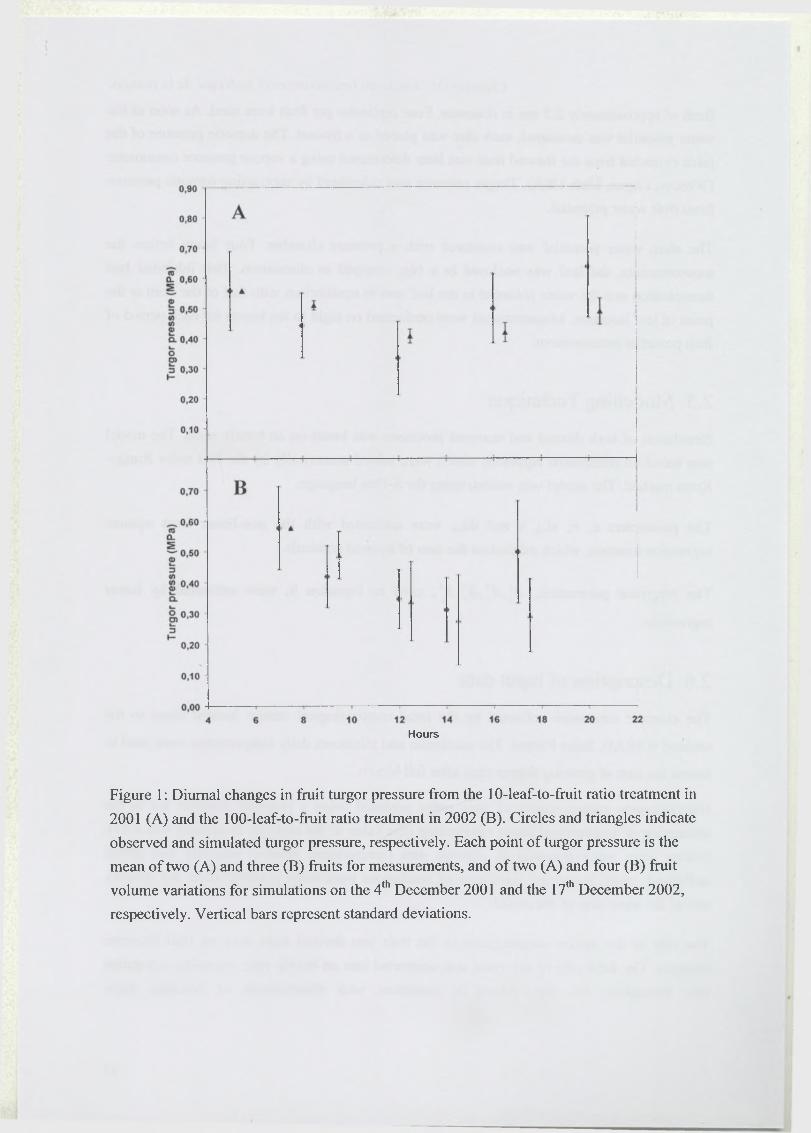
Hours
Figure 1: Diurnal changes in fruit turgor pressure from the 10-leaf-to-fruit ratio treatment in
2001 (A) and the 100-leaf-to-fruit ratio treatment in 2002 (B). Circles and triangles indicate
observed and simulated turgor pressure, respectively. Each point o f turgor pressure is the
mean of two (A) and three (B) fruits for measurements, and o f two (A) and four (B) fruit
volume variations for simulations on the 4th December 2001 and the 17th December 2002,
respectively. Vertical bars represent standard deviations.
Chapitre IV : Étude du fonctionnement hydrique de la mangue
concentrations in phloem during a day (Sovonick-Dunford, 1986), or simulations o f diurnal
changes o f peach dry weight (Fishman and Génard, 1998).
2.7 Initial conditions
The estimation o f the elastic modulus (e) and the parameters, aLf and h, required initial values
for fruit pressure. The average value o f all measurements assessed at predawn on the day of
estimation, was determined. When the model was run throughout the season, it also required
an initial value for turgor pressure which was determined as being equal to the average value
o f all measurements assessed at predawn in 2001 and 2002. Initial values for dry and fresh
fruit masses were obtained from measurements assessed the day when simulation began.
i
94
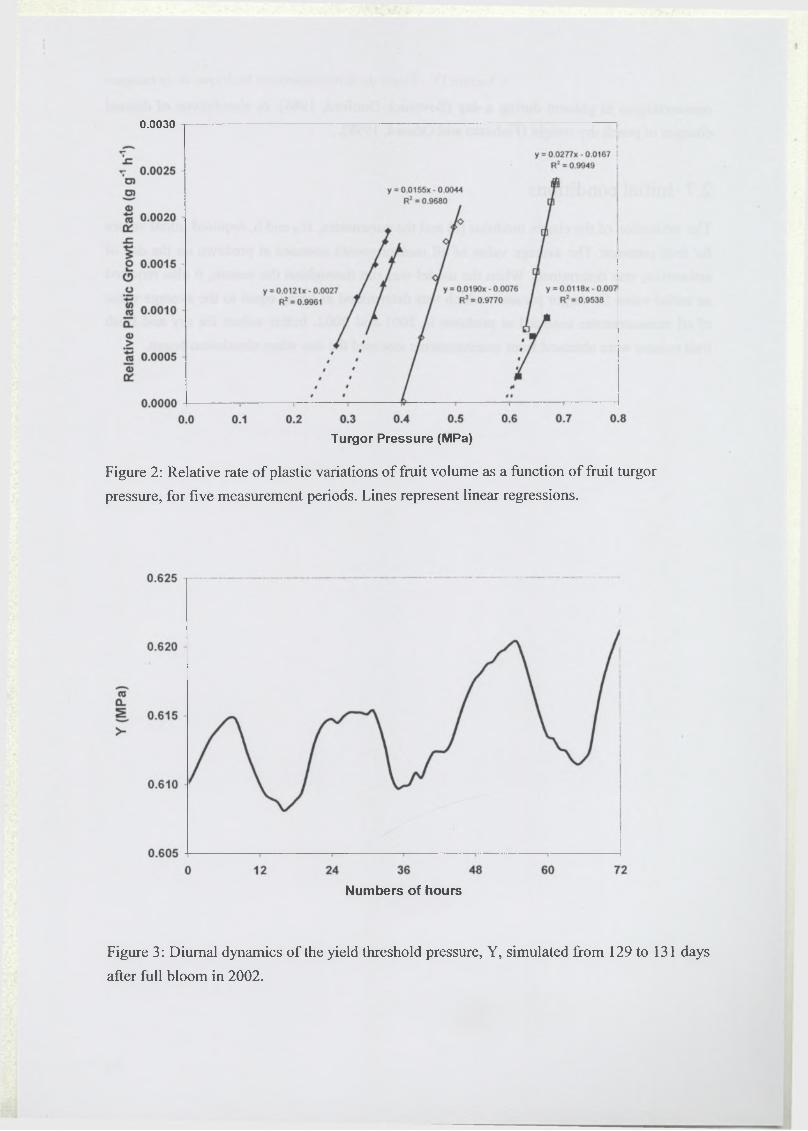
0.0030
Turgor Pressure (MPa)
Figure 2: Relative rate o f plastic variations o f fruit volume as a function of fruit turgor
pressure, for five measurement periods. Lines represent linear regressions.
Numbers of hours
Figure 3: Diurnal dynamics o f the yield threshold pressure, Y, simulated from 129 to 131 days
after full bloom in 2002.
3 Results
3.1 Estimation o f model parameters
The fitted parameter values o f the empirical model o f flesh composition leading to the
simulation of the number o f moles o f osmotically-active compounds are summarised in
Appendix 1. The relationship between the simulated and observed number o f moles o f the
total solutes was close to the first bisector and the R-squared value was equal to 0.7.
The estimated fruit surface conductance was p = 231.0 ± 5.9 cm h'1 (n = 12). This value is a
little higher than the surface conductance estimated on mature green mangoes cv. Keitt
(Fishman et al., 1996) and in the range o f fruit surface conductance values o f various peach
varieties, from 62 to 901 cm h'1 (Lescourret et al., 2001).
Chapitre IV : Etude du fonc tionnem ent hydrique de la m angue
We obtained an elastic modulus o f about 15.32 ± 2.14 MPa for fruits from the 10- and 100-
leaf-to-fruit ratio treatments over two growing seasons. This estimate is within the range o f
values obtained for cells o f higher plant tissues (0-30 MPa), apple fruit cells (2-16 MPa) and
stem tissue (2-50 MPa), as it has been reported (Dale and Sutcliffe, 1986; Génard et al., 2001;
Steudle and Wieneke, 1985; Tyree and Jarvis, 1982). When given as an input for diurnal
volume variations, the simulation of turgor pressure underestimated the last measurement of
the day but accurately described the mean o f the observations during the rest o f the day
(Figure 1). The relationship between simulated and observed turgor pressure was close to the
first bisector and the R-squared value was equal to 0.7. The variability was well simulated on
the second day o f measurement (Figure IB) and, to a lesser extent, on the first one (Figure
1 A), due mainly to the weak variability o f volume variations monitored.
Turgor pressure measurements were plotted against the corresponding plastic relative growth
rate (Figure 2). The plastic relative growth rate increased with turgor pressure. The
relationship was linear (R2 > 0.95), regardless o f the situation (Figure 2). The slope of
regression lines was similar, indicating that the wall extensibility was almost constant during
the five measurement periods in 2002 (between 81 and 103 DAB, corresponding to 454 and
625 degree days, respectively). The mean o f the different slope values, 0.01725 ± 0.00131
M Pa1 h '\ was used in the model as an estimate o f <()max- It was lower than the value obtained
95
i
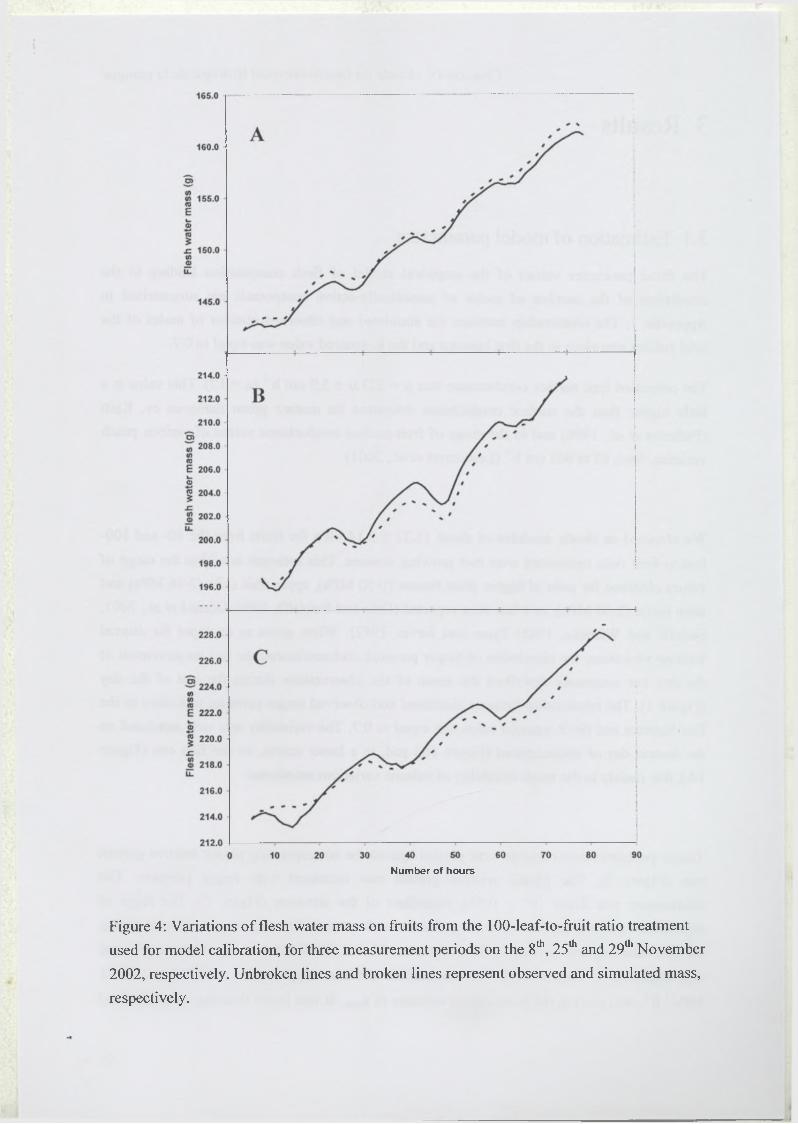
Number of hours
Figure 4: Variations o f flesh water mass on fruits from the 100-leaf-to-fruit ratio treatment
used for model calibration, for three measurement periods on the 8th, 25th and 29th November
2002, respectively. Unbroken lines and broken lines represent observed and simulated mass,
respectively.
C hapi t re IV : Étude du fonctionnement hydrique de la m aim ue
on leaves (Serpe and Matthews, 1992) and generally lower than the published results on cell
studies - about 0.03-0.2 h'1 MPa'1. The estimated value was also lower than the value used in
the model o f Fishman and Génard (1998) for peach fruit.
The estimations showed that x was constant, whereas dd¡ni varied with the year when the
experiment was performed. The fitted parameters were x = 0.966 ± 0.071 and dd¡ni = 1005 ±
85 degree days in 2000, and dd¡m = 686 ± 108 degree days in 2001, which corresponded to the
beginning of the growth slowdown for each growing season.
The intercept o f the linear relationship between plastic relative growth rate and turgor
pressure with the x-axis varied from 0.22 to 0.60 MPa (Figure 2) which is consistent with our
hypothesis about the variability o f the yield threshold, Y.
The parameter h from the Y function in Equation 14 was estimated to be h = 2.027 10'3 ± 3.6
10'5 MPa cm'3. Simulation of Y from 129 to 131 days after full bloom for fruit from the 100-
leaf-to-fruit ratio treatment under the 2000 growing season conditions, showed that Y
decreased in the first part o f the day (Figure 3) because o f fruit shrinkage and generally
increased after 2 pm to reach a maximum at the end o f the night because o f fruit swelling.
These changes in Y are proportional to the rate o f fruit volume change (Equation 14).
The parameter aLf was found to be equal to 1.555 10'2 ± 8.3 10"4 g cm'2 MPa’1 h'1. With a
ratio o f the composite membrane area to the fruit area o f 0.0273 (Fishman and Génard, 1998),9 1 1 .
the hydraulic conductivity o f the fruit is 0.570 g cm' MPa' h' . This value is o f the same
order o f magnitude as the hydraulic conductivity values found for maize roots - 9.72 10' g
cm'2 MPa'1 h'1 (Steudle et al., 1993) - and plant membranes - 0.2664 g cm'2 MPa*1 h*1 (Nobel,
1974). The product o f the ratio o f the composite membrane area to the fruit area and hydraulic
conductivity o f xylem was estimated to be 4.9 10'3 ± 1.9 ÎO-4 g cm’2 MPa'1 h"1, which is about
32% o f the global hydraulic conductivity o f the fruit. The hydraulic conductivity o f phloem is
therefore more than two times greater than that o f xylem, as reported for tomato (Ho et al.,
1987) and for grape berry, especially during the second stage o f fruit development (Ollat and
Gaudillère, 1996).
3.2 Test o f the model
Figure 4 shows that the model accurately predicted the water growth trend of the flesh during
three different periods when these estimated parameters were used. The shrinkage and the
swelling o f the fruit were also well simulated during the successive days o f simulation.
96
I
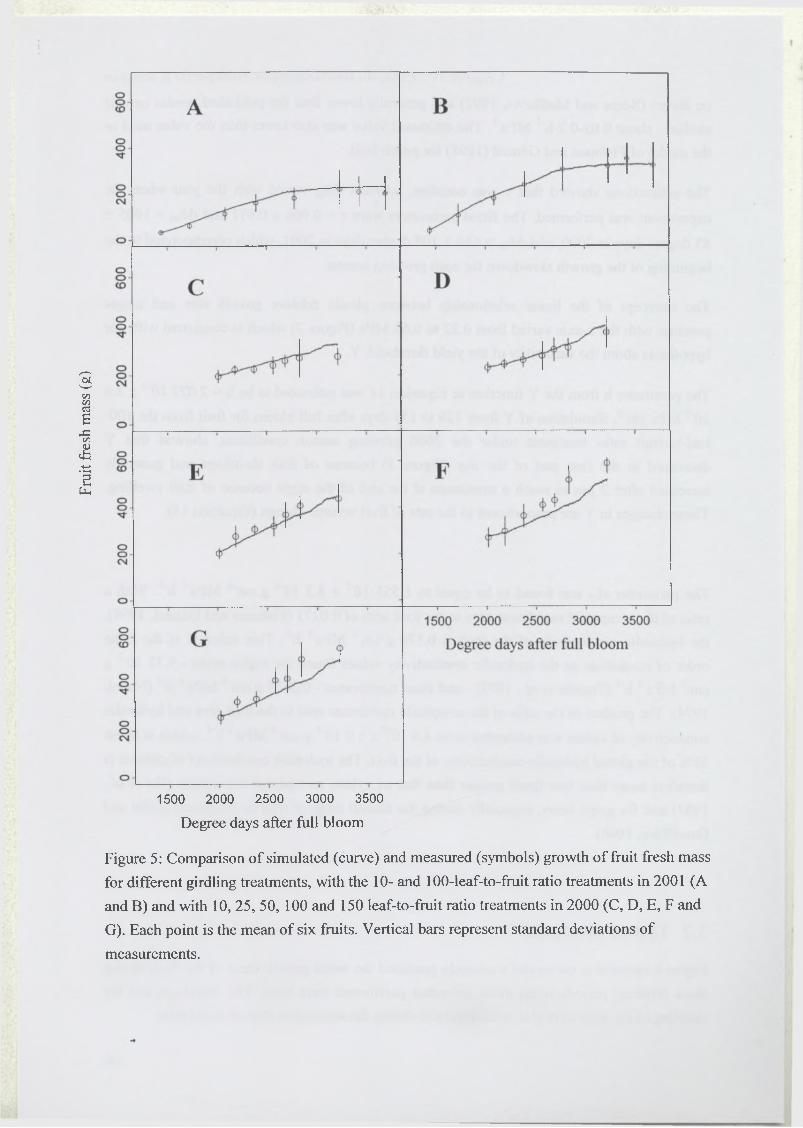
Frui
t fre
sh
mas
s (g
)
1500 2000 2500 3000 3500
Degree days after full bloom
Figure 5: Comparison o f simulated (curve) and measured (symbols) growth o f fruit fresh mass
for different girdling treatments, with the 10- and 100-leaf-to-fruit ratio treatments in 2001 (A
and B) and with 10, 25, 50, 100 and 150 leaf-to-fruit ratio treatments in 2000 (C, D, E, F and
G). Each point is the mean o f six fruits. Vertical bars represent standard deviations of
measurements.
Chapitre IV : Etude du fonc t ionnem en t hydrique de la m angue
The simulations o f fresh mass variation o f fruits from five leaf-to-fruit ratios in 2000 and two
leaf-to-fruit ratios in 2001 correctly fitted the observations (Figure 5). The model was able to
reproduce the effect o f leaf-to-fruit ratio on fruit growth in fresh mass over two successive
years. A weak underestimation o f fruit mass from treatments with a high leaf-to-fruit ratio
was observed in 2000 (Figures 5F and 5G).
Figure 6 shows the simulation of the determining variables concerning fruit water relations
such as water potential and osmotic and turgor pressures for three days during the season.
Simulated water potential and osmotic and turgor pressures were o f the same order of
magnitude as observations. The turgor pressure was well simulated except during the second
period o f measurement when it was underestimated (Figure 6B). The turgor pressure did not
decrease to zero even during fruit shrinkage. The osmotic pressure was well predicted
compared to measurements.
3.3 Analysis of model sensitivity to parameters
A sensitivity analysis was performed using the environmental conditions o f the growing
season in 2001 and the seasonal dry mass (input data) from 10- and 100-leaf-to-fruit ratio
treatments. Sensitivity o f the seasonal mean of the daily shrinkage and o f the fruit growth rate
to model parameters were investigated (Table 2). The shrinkage was sensitive to the fruit
surface conductance, p. Shrinkage was also sensitive to the elasticity modulus, 8, and to the
parameter, aLf, but not to plastic parameters such as the extensibility o f cell walls and h,
except in the case o f a 20 % decrease o f dd¡n¡.
The fruit growth rate was very sensitive to parameters ddjn¡, t and, to a lesser extent, to h. The
fruit growth rate was not sensitive to p, aLf and <j>max. Before the decrease o f the wall
extensibility (i.e. with dd < dd¡n¡), the fruit growth rate was two times more affected by
variations o f h than when (j) decreased (data not shown).
Shrinkage and fruit growth rates were sensitive in the same range, regardless o f the leaf-to-
fruit ratio.
3.4 Elastic and plastic growth rates
The model was used to analyse elastic and plastic growth rate on a diurnal basis. The
simulated elastic and plastic components o f the variations in fruit volume are presented on
Figure 7 for periods o f large and limited growth rate, between 91 and 93 DAB, and between
129 and 131 DAB, respectively, in 2000 for fruit from the 100-leaf-to-fruit ratio treatment.
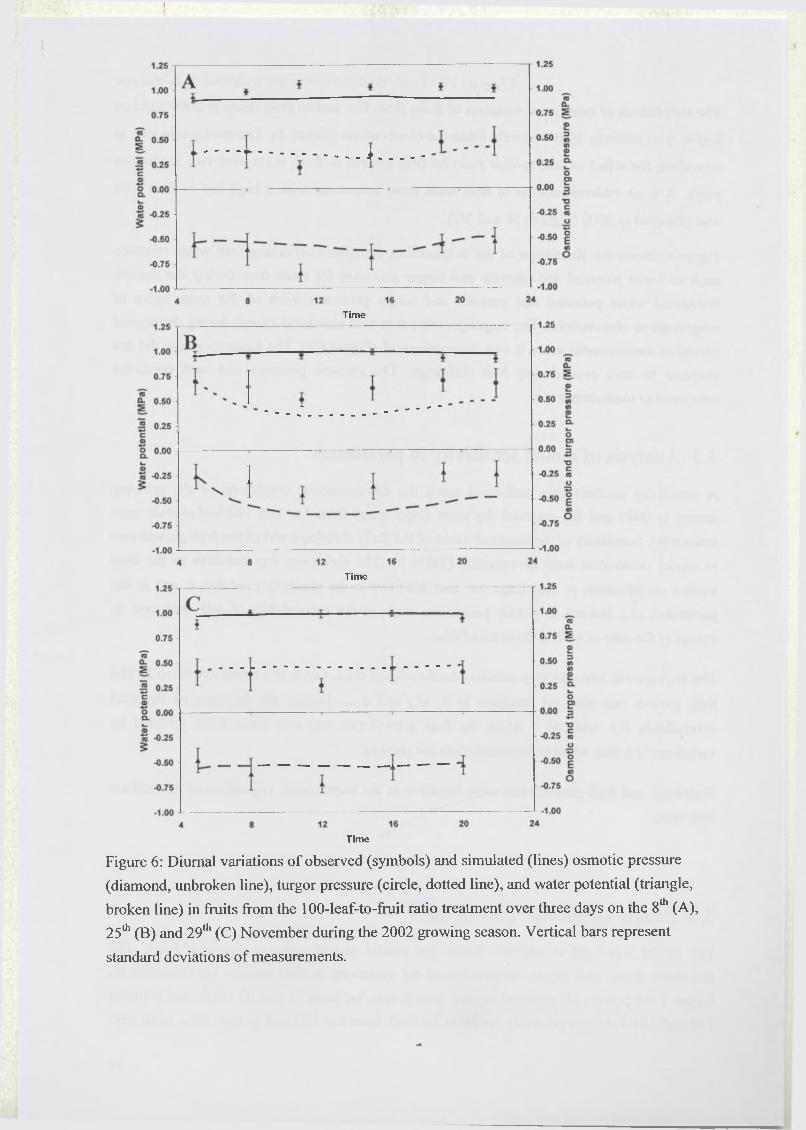
¡
Time
Time
Time
Figure 6: Diurnal variations o f observed (symbols) and simulated (lines) osmotic pressure
(diamond, unbroken line), turgor pressure (circle, dotted line), and water potential (triangle,
broken line) in fruits from the 100-leaf-to-fruit ratio treatment over three days on the 8th (A),
25th (B) and 29th (C) November during the 2002 growing season. Vertical bars represent
standard deviations o f measurements.
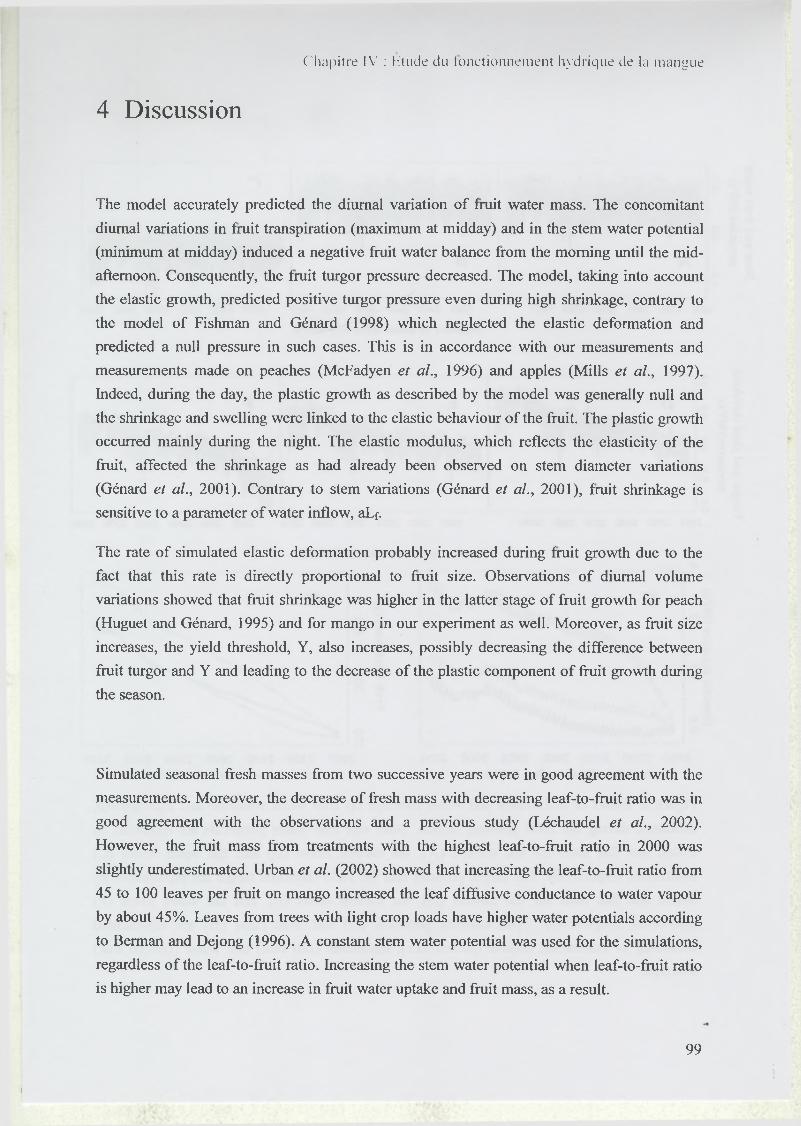
C hapi t re IV : Etude du fonc t ionnem ent hydrique de la m angue
4 Discussion
The model accurately predicted the diurnal variation o f fruit water mass. The concomitant
diurnal variations in fruit transpiration (maximum at midday) and in the stem water potential
(minimum at midday) induced a negative fruit water balance from the morning until the mid-
afternoon. Consequently, the fruit turgor pressure decreased. The model, taking into account
the elastic growth, predicted positive turgor pressure even during high shrinkage, contrary to
the model o f Fishman and Génard (1998) which neglected the elastic deformation and
predicted a null pressure in such cases. This is in accordance with our measurements and
measurements made on peaches (McFadyen et al., 1996) and apples (Mills et al., 1997).
Indeed, during the day, the plastic growth as described by the model was generally null and
the shrinkage and swelling were linked to the elastic behaviour o f the fruit. The plastic growth
occurred mainly during the night. The elastic modulus, which reflects the elasticity o f the
fruit, affected the shrinkage as had already been observed on stem diameter variations
(Génard et al., 2001). Contrary to stem variations (Génard et al., 2001), fruit shrinkage is
sensitive to a parameter o f water inflow, aLf.
The rate o f simulated elastic deformation probably increased during fruit growth due to the
fact that this rate is directly proportional to fruit size. Observations o f diurnal volume
variations showed that fruit shrinkage was higher in the latter stage o f fruit growth for peach
(Huguet and Génard, 1995) and for mango in our experiment as well. Moreover, as fruit size
increases, the yield threshold, Y, also increases, possibly decreasing the difference between
fruit turgor and Y and leading to the decrease o f the plastic component o f fruit growth during
the season.
Simulated seasonal fresh masses from two successive years were in good agreement with the
measurements. Moreover, the decrease o f fresh mass with decreasing leaf-to-fruit ratio was in
good agreement with the observations and a previous study (Léchaudel et al., 2002).
However, the fruit mass from treatments with the highest leaf-to-fruit ratio in 2000 was
slightly underestimated. Urban et al. (2002) showed that increasing the leaf-to-fruit ratio from
45 to 100 leaves per fruit on mango increased the leaf diffusive conductance to water vapour
by about 45%. Leaves from trees with light crop loads have higher water potentials according
to Berman and Dejong (1996). A constant stem water potential was used for the simulations,
regardless o f the leaf-to-fruit ratio. Increasing the stem water potential when leaf-to-fruit ratio
is higher may lead to an increase in fruit water uptake and fruit mass, as a result.
99
i
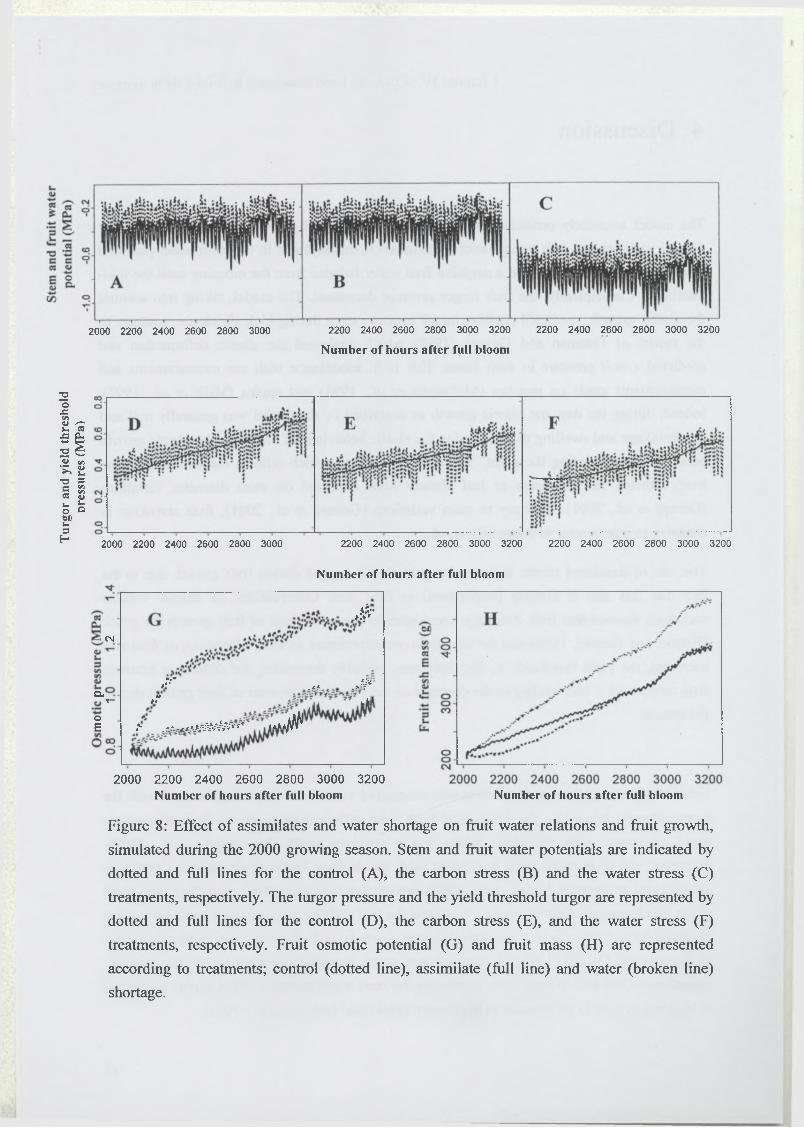
Tur
gor
and
yiel
d th
resh
old
Dre
ssur
es
(MP
a}
2000 2200 2400 2600 2800 3000 2200 2400 2600 2800 3000 3200 2200 2400 2600 2800 3000 3200
N um ber o f hours after full bloom
2000 2200 2400 2600 2800 3000—I---------- 1—
2200 2400 2600 2800 3000 3200
Number o f hours after full bloom
2200 2400 2600 2800 3000 3200
; cm
D-T
oE
S'
r.'" ¿V*. . t f . v : r
,r Ai
• ¡¡H.*■ ..v ..-^ íav A v ¿v av c iwi^ír
2000 2200 2400 2600 2800 3000 3200
Num ber o f hours after full bloom Number o f hours after full bloom
Figure 8: Effect o f assimilates and water shortage on fruit water relations and fruit growth,
simulated during the 2000 growing season. Stem and fruit water potentials are indicated by
dotted and full lines for the control (A), the carbon stress (B) and the water stress (C)
treatments, respectively. The turgor pressure and the yield threshold turgor are represented by
dotted and full lines for the control (D), the carbon stress (E), and the water stress (F)
treatments, respectively. Fruit osmotic potential (G) and fruit mass (H) are represented
according to treatments; control (dotted line), assimilate (full line) and water (broken line)
shortage.
Chapi t re IV : É tude du fonc tionnem ent hydrique de la m an g u e
The rate o f elastic growth was negative in the morning and became positive in the afternoon.
The plastic extension was positive during the night and became null after a few hours in the
morning. Since the plastic fruit growth is null during the day, the fruit volume variation only
depends on the elastic behaviour o f the fruit. During the period o f limited growth rate, the
plastic component o f fruit growth was lower and the elastic component o f fruit growth was
two times higher than during the period o f large growth rate (Figure 7B). However, regardless
of the period o f fruit growth, the sum of the rate o f elastic deformation over a day was close to
zero. As a consequence, the sum o f elastic deformation over the growing season was less than
2% o f the total fruit growth.
3.5 Effect of assimilate or water supply shortage on fruit water
relations and composition
The model was run for a ‘control’ fruit, and two fruits undergoing a continuous shortage in
assimilate or water supply, respectively. The ‘control’ fruit corresponded to a fruit growing on
a stem with 150 leaves, with a stem water potential in the range o f well-watering treatment. A
leaf-to-fruit ratio o f 25 and a stem water potential o f 0.40 MPa lower than the control were
imposed. During the season, the shortage o f water and carbon supply led to a final fruit mass
equal to 80% of the final fruit mass o f the control (Figure 8H). This carbon or water stress had
various effects on fruit water relations (Figure 8) and fruit composition (Figure 9). For the
water stress treatment, the fruit growth was almost totally stopped for a few days following
the water shortage (Figure 8H). This null fruit growth was the result o f a turgor pressure under
the yield threshold, Y (Figure 8F). Since the dry matter inflow was maintained and water
inflow was decreased after that time, the osmotic pressure increased sharply. The fruit
osmotic pressure shifted 0.5 MPa forward compared to the control, but the variations around
the trend were quite similar (Figure 8G). The shift in osmotic pressure increased the water
inflow to the fruit and led to turgor pressure over the yield threshold, inducing a resumption
o f growth. For the carbon supply treatment, fruit growth slowed down compared to the
control, due to a lower dry matter inflow that decreased the osmotic pressure (Figure 8G) and
the turgor pressure as well (Figure 8E), whereas fruit water potential was similar (Figure 8B).
The fruit composition varied considerably according to the kind of stress (Figure 9). Thus, at
maturity, total soluble sugar and mineral concentrations were higher in fruits from water
stress treatment. Differences in acid concentration were found during growth but none were
observed at maturity.
98
i
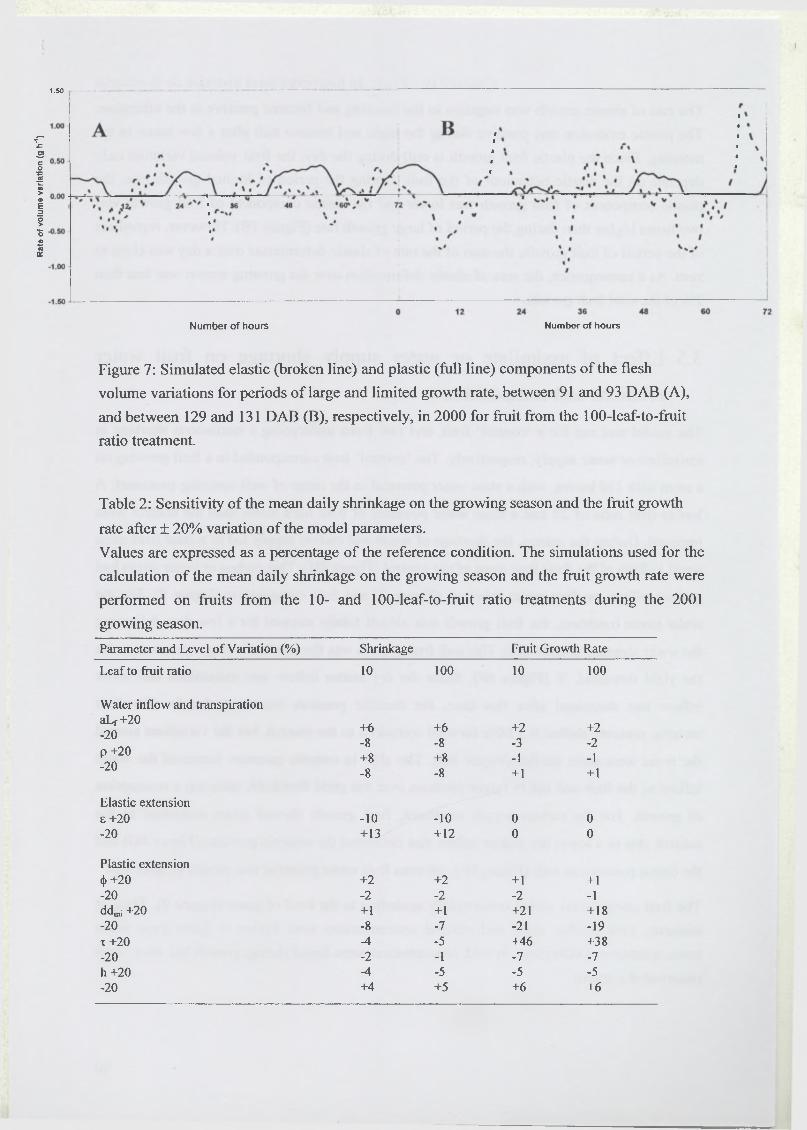
Rat
e of
vo
lum
e va
riat
ion
(g h
'1)
I
1.50 j
Number of hours Number of hours
Figure 7: Simulated elastic (broken line) and plastic (full line) components o f the flesh
volume variations for periods o f large and limited growth rate, between 91 and 93 DAB (A),
and between 129 and 131 DAB (B), respectively, in 2000 for fruit from the 100-leaf-to-fruit
ratio treatment.
Table 2: Sensitivity o f the mean daily shrinkage on the growing season and the fruit growth
rate after ± 20% variation of the model parameters.
Values are expressed as a percentage o f the reference condition. The simulations used for the
calculation o f the mean daily shrinkage on the growing season and the fruit growth rate were
performed on fruits from the 10- and 100-leaf-to-fruit ratio treatments during the 2001
growing season.
Parameter and Level o f Variation (%) Shrinkage Fruit Growth Rate
Leaf to fruit ratio 10 100 10 100
Water inflow and transpirationaLf+20 -20
+6 +6 +2 +2-8 -8 -3 -2
p +20+8 +8 -1 -1
-20-8 -8 + 1 + 1
Elastic extensione +20 -10 -10 0 0-20 +13 +12 0 0
Plastic extension<(>+20 +2 +2 +1 +1-20 -2 -2 -2 -1ddjni +20 +1 +1 +21 +18-20 -8 -7 -21 -19t +20 -4 -5 +46 +38-20 -2 -1 -7 -7h +20 -4 -5 -5 -5-20 +4 +5 +6 +6
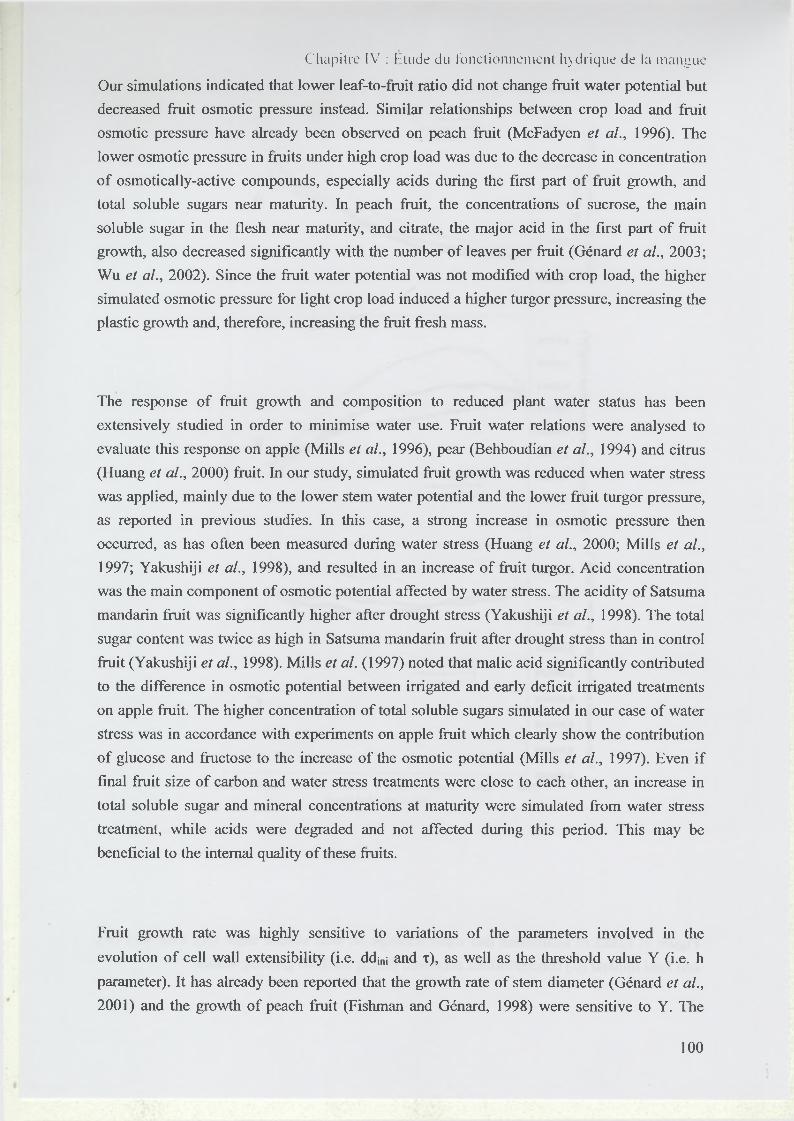
Chapitre IV : Etude du fonctionnement hydrique de la mangue
Our simulations indicated that lower leaf-to-fruit ratio did not change fruit water potential but
decreased fruit osmotic pressure instead. Similar relationships between crop load and fruit
osmotic pressure have already been observed on peach fruit (McFadyen et al., 1996). The
lower osmotic pressure in fruits under high crop load was due to the decrease in concentration
o f osmotically-active compounds, especially acids during the first part o f fruit growth, and
total soluble sugars near maturity. In peach fruit, the concentrations o f sucrose, the main
soluble sugar in the flesh near maturity, and citrate, the major acid in the first part o f fruit
growth, also decreased significantly with the number o f leaves per fruit (Génard et al., 2003;
Wu et al., 2002). Since the fruit water potential was not modified with crop load, the higher
simulated osmotic pressure for light crop load induced a higher turgor pressure, increasing the
plastic growth and, therefore, increasing the fruit fresh mass.
The response o f fruit growth and composition to reduced plant water status has been
extensively studied in order to minimise water use. Fruit water relations were analysed to
evaluate this response on apple (Mills et al., 1996), pear (Behboudian et al., 1994) and citrus
(Huang et al., 2000) fruit. In our study, simulated fruit growth was reduced when water stress
was applied, mainly due to the lower stem water potential and the lower fruit turgor pressure,
as reported in previous studies. In this case, a strong increase in osmotic pressure then
occurred, as has often been measured during water stress (Huang et al., 2000; Mills et al.,
1997; Yakushiji et al., 1998), and resulted in an increase o f fruit turgor. Acid concentration
was the main component o f osmotic potential affected by water stress. The acidity o f Satsuma
mandarin fruit was significantly higher after drought stress (Yakushiji et al., 1998). The total
sugar content was twice as high in Satsuma mandarin fruit after drought stress than in control
fruit (Yakushiji et al., 1998). Mills et al. (1997) noted that malic acid significantly contributed
to the difference in osmotic potential between irrigated and early deficit irrigated treatments
on apple fruit. The higher concentration of total soluble sugars simulated in our case o f water
stress was in accordance with experiments on apple fruit which clearly show the contribution
o f glucose and fructose to the increase o f the osmotic potential (Mills et al., 1997). Even if
final fruit size o f carbon and water stress treatments were close to each other, an increase in
total soluble sugar and mineral concentrations at maturity were simulated from water stress
treatment, while acids were degraded and not affected during this period. This may be
beneficial to the internal quality o f these fruits.
Fruit growth rate was highly sensitive to variations o f the parameters involved in the
evolution o f cell wall extensibility (i.e. ddjnj and x), as well as the threshold value Y (i.e. h
parameter). It has already been reported that the growth rate o f stem diameter (Génard et al.,
2001) and the growth o f peach fruit (Fishman and Génard, 1998) were sensitive to Y. The
100
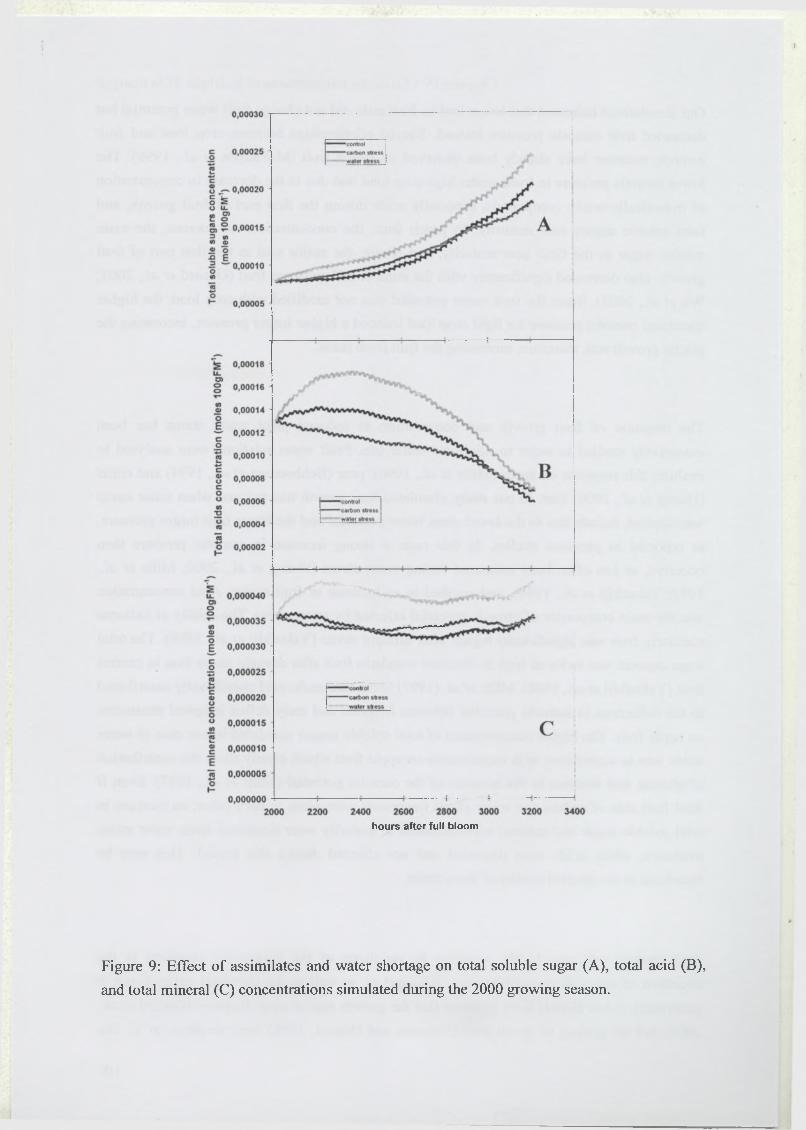
\
hours after full bloom
Figure 9: Effect o f assimilates and water shortage on total soluble sugar (A), total acid (B),
and total mineral (C) concentrations simulated during the 2000 growing season.
Chapitre IV : Étude du fonctionnement hydrique de la mangue
relationship between turgor pressure versus fruit volume variations established in our
experiment revealed that parameter Y is certainly variable. Y is a parameter which may
change rapidly, as demonstrated by Green et al. (1971) in Nitella. In the absence of metabolic
softening (this means that parameter s is equal to zero as assumed here), Y changes with the
fruit growth rate. When fruit turgor pressure decreases, the fruit growth and, therefore, Y are
reduced, which makes it possible to maintain growth at low turgor pressure. The possibility o f
a rapid adjustment in the yield threshold in response to changes in growth rate was shown by
Frensch and Hsiao (1995) after osmotic stress on maize roots. A similar change in Y was
reported in an intact seedling o f soybean (Maruyama and Boyer, 1994). To illustrate the
dynamics o f the yield threshold pressure, in vitro studies have demonstrated an acid-induced
decrease in the yield threshold tension (y) in the cell wall of hypocotyl segments (Okamoto
and Okamoto, 1994). Hormonal and pH controls o f Y will have to be considered in detail in
order to further develop the model. To promote elongation, the auxin-induced acidification o f
the apoplast changes the mechanical properties o f the cell wall. These properties are
controlled by functional proteins which were isolated as yieldin wall-bound proteins
(Okamoto-Nakazato et al., 2000).
The other main parameter which regulates fruit growth, cell wall extensibility, is also affected
by auxin-induced acidification (Okamoto and Okamoto, 1994).By analysing wall metabolism,
Huang et al. (2000) showed a wall adjustment mechanism affecting the cell wall extensibility
o f fruit under water stress conditions. Some wall-bound proteins like expansins are able to
disrupt the hydrogen bonds that connect the cellulose microfibrils and the hemicelluloses in
the cell wall (McQueen-Mason, 1995). McQueen-Mason (1995) used a cucumber hypocotyl
to demonstrate that as cells mature, expansin activity is reduced and the wall is modified. Cell
wall enzymes such as xyloglucan endotransglycosidase (XET) and specific peroxidases
(Thompson et al., 1998) are involved in the regulation of cell wall extensibility. This
alteration in wall structure regulates the cessation of growth. Analysing the correlation
between cell wall enzyme activities and tomato fruit growth, Thompson et al. (1998)
proposed that the rate o f fruit growth may be determined by epidermal XET activity, and the
end of growth by the rise o f peroxydase activity. In our model, fruit growth is partly regulated
by changes in cell wall extensibility. This variable was constant during the early development
and then decreased. The role o f pH was not directly introduced, even if the pH of the mango
flesh increases at the end o f fruit growth, which may be related to the decrease in cell wall
extensibility. Cell wall extensibility began to decrease at different times, depending on the
year. The pH may be a source o f this variation. Studies o f fruit pH during successive years
often reported an inter-annual variability o f this variable, as in the case o f peach (Lobit,
1999). It would be interesting to determine the link between changes in pH and the decrease
in wall extensibility through molecular studies that would isolate the main enzymes and their
various activities during fruit growth.
101
Acknowledgements
The authors gratefully acknowledge C. Soria (CIRAD-Réunion, Pôle Fruits et Légumes) for
his technical assistance and G. Wagman for revising the manuscript and improving English.
Chapi t re IV : Étude du fonc tionnement hydrique de la m angue
102
Chapitre Y : M odélisa t ion de l 'é laborat ion de la quali té de la m angue
Chapitre V : Modélisation de l’élaboration de
la qualité de la mangue
Chapitre V : M odél isa t ion de l 'é laborat ion de la quali té de la m an g u e
Chapitre V : Modélisation de l’élaboration de
la qualité de la mangue
103
i
Chapitre V : M odélisa t ion de l 'é labora t ion de la quali té de la m angue
1 Introduction
Dans ce dernier chapitre, les connaissances acquises sur le fonctionnement de la mangue sont
intégrées dans un modèle global qui permet de simuler l’élaboration de la qualité de la
mangue au cours de son développement. L’utilisation de ce modèle comme outil de prédiction
de la qualité du fruit rejoint la démarche plus appliquée de mon travail de thèse sur la maîtrise
de la qualité du fruit au champ par des techniques culturales comme l’éclaircissage du fruit, la
taille de formation de l’arbre, ou l’irrigation qui détermine Féclairement intercepté par le
rameau, la disponibilité carbonée et hydrique.
Les modèles utilisés pour construire ce modèle global sont le modèle de croissance en matière
sèche du fruit au niveau du rameau fructifère (Chapitre III), le modèle d’évolution de la
composition biochimique et minérale du fruit (Chapitre IV), et le modèle de fonctionnement
hydrique du fruit (Chapitre IV). Des simplifications sont apportées au modèle de
fonctionnement hydrique, en particulier le module d’élasticité est supprimé car la somme des
variations de volume dues à la croissance élastique du fruit est nulle sur la saison (Chapitre
IV). La suppression de la croissance élastique nécessite la modification des équations de
calcul de la pression de turgescence et des variations de volume du fruit. Le modèle global de
qualité du fruit fonctionne au pas de temps de la journée, excepté pour la photosynthèse
foliaire. Une valeur moyenne journalière de chaque variable d’état est simulée.
L’objectif de ce modèle global est l’étude par simulation de la variation de la qualité à la
récolte selon les conditions de croissance, le profil de qualité comprenant la masse fraîche du
fruit, la teneur en matière sèche de la pulpe et les concentrations des principaux sucres, acides
et éléments minéraux. Les concentrations simulées en sucres et en acides permettent de
calculer la saveur sucrée et acide du fruit.
Le modèle global de qualité du fruit au niveau du rameau fructifère a été testé en comparant la
croissance en matière fraîche simulée et observée pour différents jeux de données acquis
pendant les trois années d’expérimentations dans des conditions où la disponibilité en
assimilais carbonés était variable. Ce modèle a été également testé en confrontant des données
obtenues sur l’évolution des saveurs sucrée et acide au cours de la saison, et sur la qualité de
la mangue à la récolte (calibre, concentrations en éléments minéraux, acides et sucres) avec
les simulations correspondantes.
L’analyse de sensibilité du modèle de fonctionnement carboné et l’étude virtuelle de la
contribution de facteurs influençant les processus impliqués dans la croissance ont montré que
la masse initiale est un facteur explicatif important de la croissance en matière sèche. Par
104
I
Chapitre V : M odél isa t ion de l 'é labora t ion de la quali té de la m angue
ailleurs, la date de récolte est connue de longue date par les producteurs comme un levier de
maîtrise de la qualité. Le modèle global a donc été utilisé, dans les mêmes conditions
d’alimentation carbonée, pour analyser les effets de la masse initiale et de la date de récolte
sur la croissance, l’état hydrique du fruit et sur les principaux critères de qualité simulés par
ce modèle.
I't
105
Chapi t re V : M odélisa t ion de l 'é laborat ion de la quali té de la m angue
2 Matériel et méthodes
2.1 Description des modifications apportées aux modèles utilisés
Le modèle de croissance en matière sèche du fruit est utilisé dans sa version présentée dans le
Chapitre III. Il permet de simuler la photosynthèse foliaire, les respirations d’entretien des
différents compartiments et de croissance du fruit, la demande du fruit, et la remobilisation
des réserves, qui interviennent au cours de la croissance en matière sèche du fruit. La matière
sèche du fruit accumulée chaque jour est séparée entre le noyau et le reste du fruit à partir des
relations allométriques décrites dans le Chapitre II entre la masse sèche de chaque
compartiment (peau, pulpe, noyau) et la masses sèche du fruit.
Le modèle du fonctionnement hydrique du fruit est modifié principalement au niveau du
calcul de la pression de turgescence et des variations en volume de la pulpe qui ne tiennent
plus compte des variations élastiques du fruit.
Les variations de volume de la pulpe (V) sont liées au flux d’eau entrant (U), aux pertes par
'dw \ . , . . ( d ( DM ) \transpiration (T), et également à l’accumulation d’eau
dtet de matière sèche
dt 1
dV_ 1 d » { \ d (D i( ) 1 . , 1 4 d m )
dt Dv dt Ds dt Dw 1 Ds dt
avec Dw et Ds les densités de l’eau et de la matière sèche, respectivement égales à 1 et à 1.6.
Les flux d’eau entrant et sortant du fruit sont calculés de la même manière que pour le modèle
de fonctionnement hydrique du fruit (Chapitre IV).
Les variations de volume de la pulpe sont liées à la croissance irréversible par l’équation de
Lockhart (1965) :
106
¡f p, > y (2)
dV— = 0 i f P f < Y (3)
avec Pf, la pression de turgescence, <f> (MPa'1 j'1) l’extensibilité des parois, Y (MPa) la pression
seuil au-dessus de laquelle la croissance est irréversible.
Combinant les Equations 1, 2, et 3, la pression de turgescence du fruit est calculée de la
manière suivante :
t - V . Y + Ar aLf . ( % + 7 r f ) - T 1 ds
P' = -------------------r ^ A r o L , --------- — i f (P ' >~ ï ) (4)
P' ‘ - d T + Af .aLf ‘f ( P ' <Y ) (5)
2 1*1 •avec, aLf = 0.3732 g cm' MPa' j' , le produit du rapport de la surface de la membrane
composite, qui sépare les vaisseaux conducteurs des cellules, sur la surface du fruit, et de la
conductivité hydraulique du fruit, paramètre défini au Chapitre IV.
Y et <}> suivent les mêmes lois de variation que dans le modèle horaire de fonctionnement
hydrique du fruit (Chapitre IV), leurs unités respectives étant modifiées selon les cas :
(6,dt dt ’
Chapi t re V : M odél isa t ion de l 'é labora t ion de la quali té de la m an g u e
avec h (MPa cm'3), d’où Y(t) = h • V(t).
et pour l’extensibilité des parois :
= i f d d < d d mi
if dd >ddini (7)
107
\
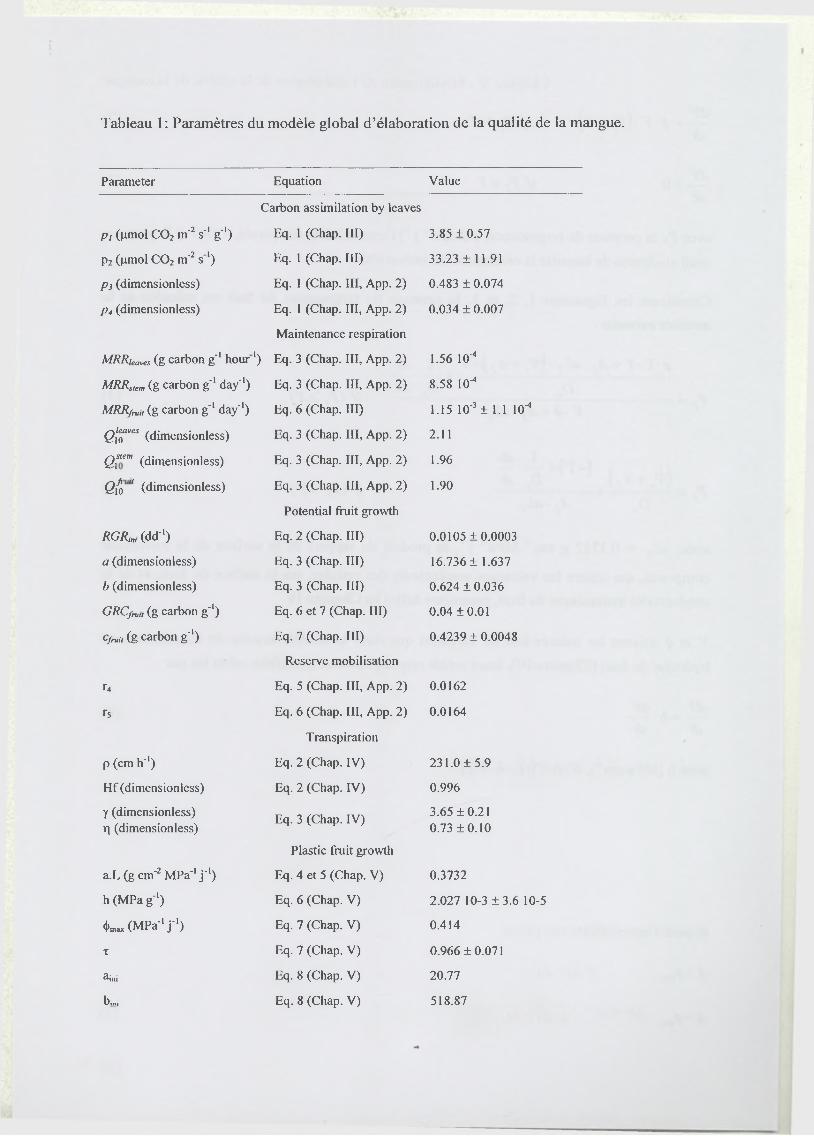
Tableau 1: Paramètres du modèle global d’élaboration de la qualité de la mangue.
Parameter Equation Value
P i (jxmol C 0 2 m'2 s'1 g'1)
p2 (|imol C 0 2 m'2 s 1)
Pi (dimensionless)
p 4 (dimensionless)
MRR,eaves (g carbon g'1 hour
MRRslem (g carbon g '1 day'1)
MRR/rv,, (g carbon g'1 day-1)
Q l r s (dimensionless)
0 i“ ” (dimensionless)
Q{q " (dimensionless)
RGRm, (dd"1)
a (dimensionless)
b (dimensionless)
GRC fry,, (g carbon g '1)
cfru« (g carbon g '1)
r4
r 5
p (cm h'1)
H f (dimensionless)
y (dimensionless)
r| (dimensionless)
a.L (g cm'2 MPa'1 j '1)
h (MPa g'1)
<t>max (MPa'1 j"')
T
ini
hini
Carbon assimilation by leaves
Eq. 1 (Chap. Ill)
Eq. 1 (Chap. Ill)
Eq. I (Chap. Ill, App. 2)
Eq. 1 (Chap. Ill, App. 2)
Maintenance respiration
•) Eq. 3 (Chap. Ill, App. 2)
Eq. 3 (Chap. Ill, App. 2)
Eq. 6 (Chap. Ill)
Eq. 3 (Chap. Ill, App. 2)
Eq. 3 (Chap. Ill, App. 2)
Eq. 3 (Chap. Ill, App. 2)
Potential fruit growth
Eq. 2 (Chap. Ill)
Eq. 3 (Chap. Ill)
Eq. 3 (Chap. Ill)
Eq. 6 et 7 (Chap. Ill)
Eq. 7 (Chap. Ill)
Reserve mobilisation
Eq. 5 (Chap. Ill, App. 2)
Eq. 6 (Chap. Ill, App. 2)
Transpiration
Eq. 2 (Chap. IV)
Eq. 2 (Chap. IV)
Eq. 3 (Chap. IV)
Plastic fruit growth
Eq. 4 et 5 (Chap. V)
Eq. 6 (Chap. V)
Eq. 7 (Chap. V)
Eq. 7 (Chap. V)
Eq. 8 (Chap. V)
Eq. 8 (Chap. V)
3.85 + 0.57
33.23 ±11 .91
0.483 ± 0.074
0.034 ± 0.007
1.56 10"*
8.58 10-4
1.15 10'3 ± 1.1 10-4
2.11
1.96
1.90
0 .0 1 0 5 + 0 .0 0 0 3
16.736 ± 1.637
0.624 ± 0.036
0.04 + 0.01
0.4239 ± 0.0048
0.0162
0.0164
231.0 + 5.9
0.996
3 .6 5 + 0 .2 1
0 .7 3 + 0 .1 0
0.3732
2.027 10-3 + 3 .6 10-5
0.414
0.966 + 0.071
20.77
518.87
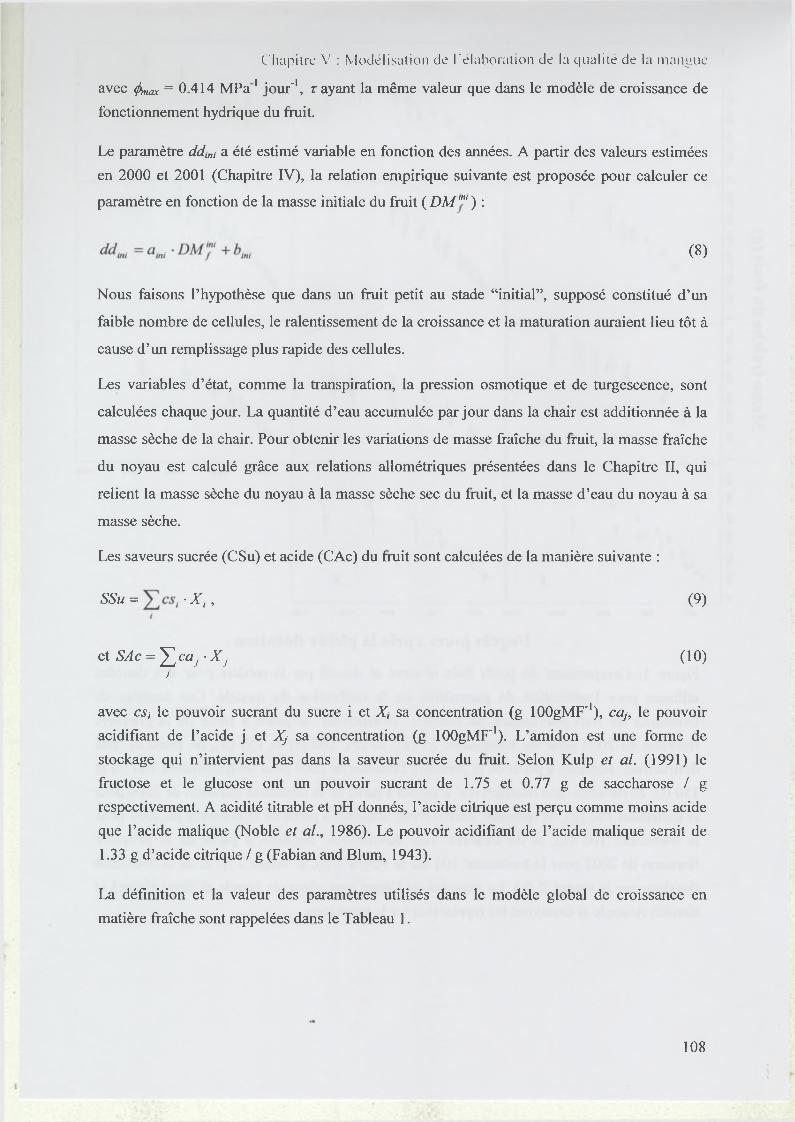
avec <f>max = 0.414 M Pa1 jour'1, rayant la même valeur que dans le modèle de croissance de
fonctionnement hydrique du fruit.
Chapi t re V : M odél isa t ion de l 'é labora t ion de la quali té de la m an g u e
Le paramètre ddini a été estimé variable en fonction des années. A partir des valeurs estimées
en 2000 et 2001 (Chapitre IV), la relation empirique suivante est proposée pour calculer ce
paramètre en fonction de la masse initiale du fruit ( DM'"' ) :
faible nombre de cellules, le ralentissement de la croissance et la maturation auraient lieu tôt à
cause d’un remplissage plus rapide des cellules.
Les variables d’état, comme la transpiration, la pression osmotique et de turgescence, sont
du noyau est calculé grâce aux relations allométriques présentées dans le Chapitre II, qui
relient la masse sèche du noyau à la masse sèche sec du fruit, et la masse d’eau du noyau à sa
masse sèche.
Les saveurs sucrée (CSu) et acide (CAc) du fruit sont calculées de la manière suivante :
avec es/ le pouvoir sucrant du sucre i et X¡ sa concentration (g lOOgMF'1), caj, le pouvoir
acidifiant de l’acide j et Xj sa concentration (g lOOgMF'1). L’amidon est une forme de
stockage qui n’intervient pas dans la saveur sucrée du fruit. Selon Kulp et al. (1991) le
fructose et le glucose ont un pouvoir sucrant de 1.75 et 0.77 g de saccharose / g
respectivement. A acidité titrable et pH donnés, l’acide citrique est perçu comme moins acide
que l’acide malique (Noble et al., 1986). Le pouvoir acidifiant de l’acide malique serait de
1.33 g d’acide citrique / g (Fabian and Blum, 1943).
La définition et la valeur des paramètres utilisés dans le modèle global de croissance en
matière fraîche sont rappelées dans le Tableau 1.
(8)
Nous faisons l’hypothèse que dans un fruit petit au stade “initial”, supposé constitué d’un
calculées chaque jour. La quantité d’eau accumulée par jour dans la chair est additionnée à la
masse sèche de la chair. Pour obtenir les variations de masse fraîche du fruit, la masse fraîche
SSu = -X, , (9)
et SAc = J ]c a J ■X J (10)J
108
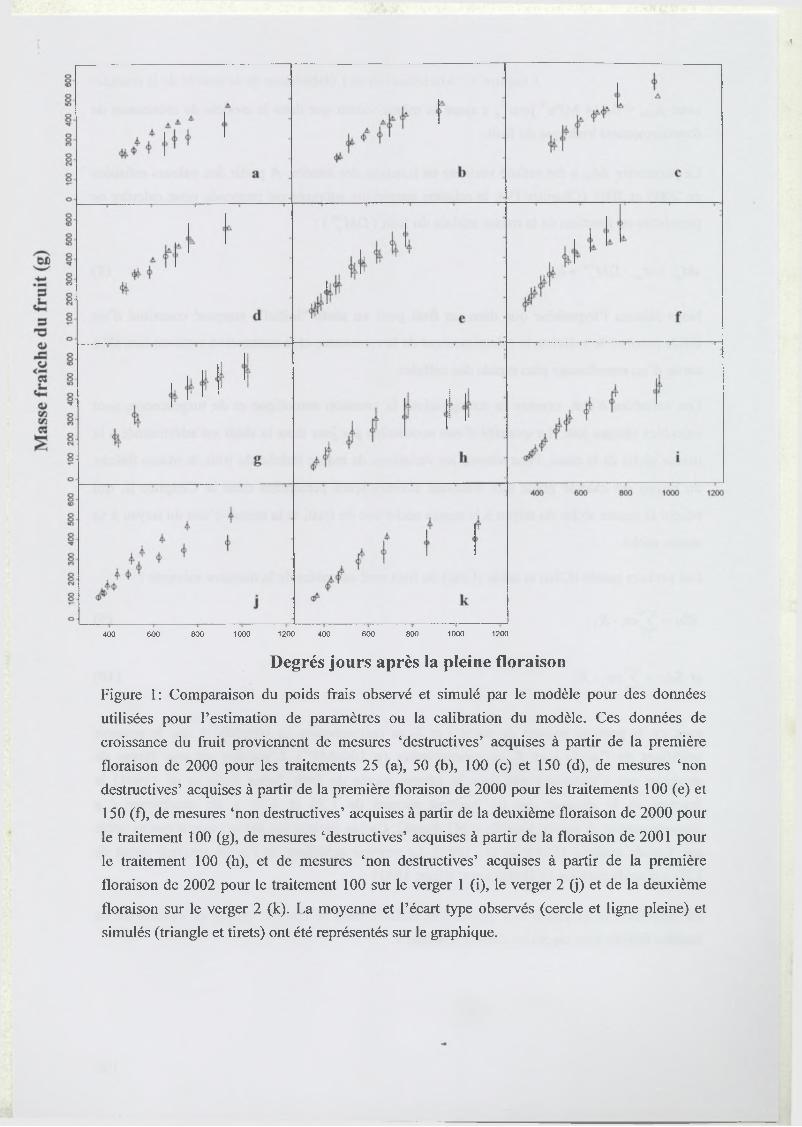
\
400 600 800 1000 1200 400 600 800 1000 1200
Degrés jours après la pleine floraison
Figure 1: Comparaison du poids frais observé et simulé par le modèle pour des données
utilisées pour l’estimation de paramètres ou la calibration du modèle. Ces données de
croissance du fruit proviennent de mesures ‘destructives’ acquises à partir de la première
floraison de 2000 pour les traitements 25 (a), 50 (b), 100 (c) et 150 (d), de mesures ‘non
destructives’ acquises à partir de la première floraison de 2000 pour les traitements 100 (e) et
150 (f), de mesures ‘non destructives’ acquises à partir de la deuxième floraison de 2000 pour
le traitement 100 (g), de mesures ‘destructives’ acquises à partir de la floraison de 2001 pour
le traitement 100 (h), et de mesures ‘non destructives’ acquises à partir de la première
floraison de 2002 pour le traitement 100 sur le verger 1 (i), le verger 2 (j) et de la deuxième
floraison sur le verger 2 (k). La moyenne et l’écart type observés (cercle et ligne pleine) et
simulés (triangle et tirets) ont été représentés sur le graphique.
Chapi t re V : M odél isa t ion de l 'é labora t ion de la quali té de la m angue
2.2 Matériel végétal
L’étude a été réalisée sur les parcelles 1 et 2 du verger d’expérimentation de Bassin Plat,
décrites dans le Chapitre I “Matériels et Méthodes”. Les différents traitements en rapports
feuilles/finit (10, 25, 50, 100, et 150 feuilles par fruit) ont été mis en place selon les règles
présentées dans le Chapitre I “Matériels et Méthodes”.
2.3 Mesures de croissance et de qualité
Nous avons utilisé les jeux de données de masses fraîches de fruit, acquis au cours des trois
années d’expérimentation, obtenus soit par un suivi ‘non destructif du diamètre du fruit, soit
par un suivi ‘destructif de la masse fraîche du fruit (Chapitre I “Matériels et Méthodes”). Les
fruits récoltés au cours des mesures ‘destructives’ ont été pesés, puis un échantillon de chaque
fruit a été congelé de manière à analyser sa composition biochimique, selon le protocole décrit
dans la partie II du Chapitre II.
2.4 Description de l’étude virtuelle concernant l’effet de la masse
initiale et de la date de récolte sur la croissance et les critères de
qualité à la récolte
Nous avons réalisé des simulations avec les données climatiques de la saison de croissance
correspondant à la première floraison de l’année 2000. Le rapport feuilles/fruit utilisé était de
50 feuilles par fruit, ce qui est proche du rapport optimal choisi par les producteurs. Les
masses sèches initiales du fruit étaient de 7 et 21 g à 3 5 0 degrés jours. Ces valeurs
représentent respectivement un faible et un fort niveau de masse initiale qui correspondent à
0.5 et 2 fois la moyenne observée. Nous avons choisi comme date de récolte 900 et 1100
degrés jours (équivaut à une différence de 20 jours). Ces deux dates correspondent aux deux
pics de récolte généralement observés sur une parcelle (Jannoyer and Lauri, 2002a; Jannoyer
and Lauri, 2002b) entre lesquels les arboriculteurs vont réaliser des passages successifs pour
récolter les mangues. Les effets de la masse initiale et de la date de récolte sur la croissance,
les variables d’état liées à l’état hydrique du fruit, comme les pressions osmotique et de
turgescence, et les critères de qualité a la récolte ont été analysés.
»
109
Degrés jours après la pleine floraison
Figure 2: Comparaison du poids frais observé et simulé par le modèle pour des données
indépendantes. Ces données de croissance du fruit proviennent de mesures ‘destructives’
acquises à partir de la première floraison de 2000 pour les traitements 10 (a), de mesures ‘non
destructives’ acquises à partir de la première floraison de 2000 pour les traitements 10 (b), 25
(c) et 50 (d), de mesures ‘non destructives’ acquises à partir de la deuxième floraison de 2000
pour les traitements 10 (e), 25 (f), 50 (g) et 75 (h), et de mesures ‘destructives’ acquises à
partir de la floraison de 2001 pour le traitement 10 (i). La moyenne et l’écart type observés
(cercle et ligne pleine) et simulés (triangle et tirets) ont été représentés sur le graphique.
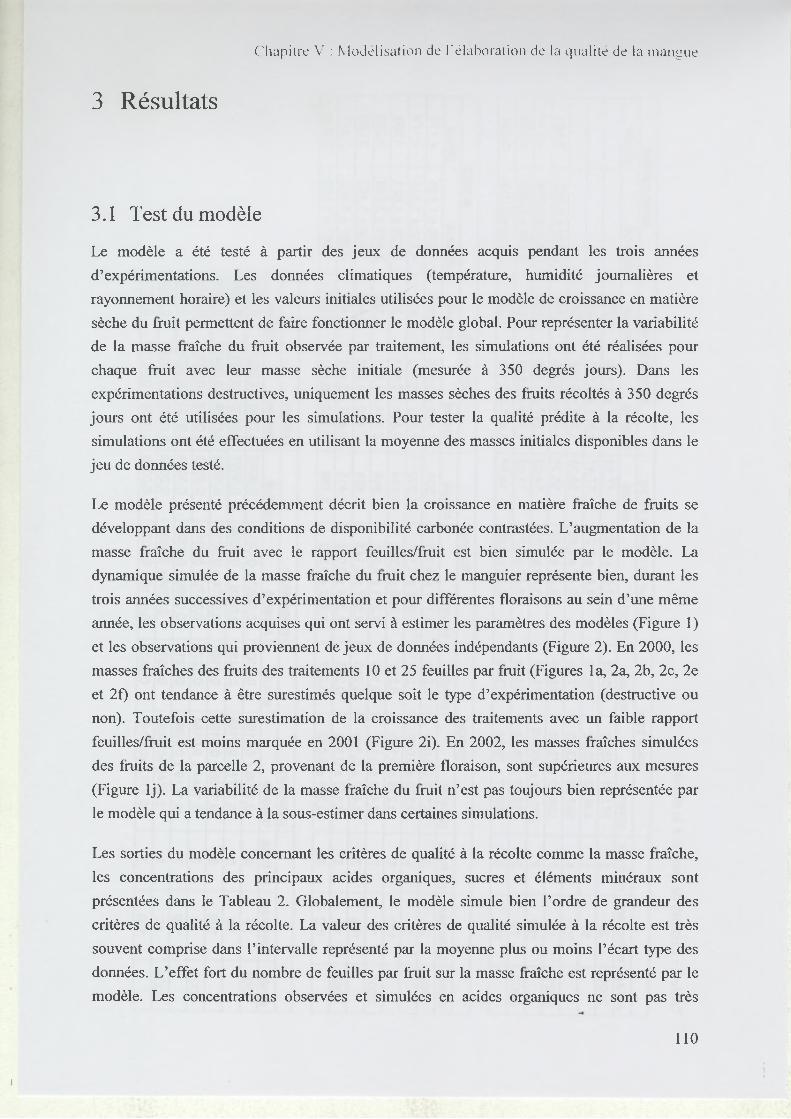
Chapi t re V : M odél isa t ion de l 'é laborat ion de la quali té de la m an g u e
3 Résultats
3.1 Test du modèle
Le modèle a été testé à partir des jeux de données acquis pendant les trois années
d’expérimentations. Les données climatiques (température, humidité journalières et
rayonnement horaire) et les valeurs initiales utilisées pour le modèle de croissance en matière
sèche du fruit permettent de faire fonctionner le modèle global. Pour représenter la variabilité
de la masse fraîche du fruit observée par traitement, les simulations ont été réalisées pour
chaque fruit avec leur masse sèche initiale (mesurée à 350 degrés jours). Dans les
expérimentations destructives, uniquement les masses sèches des fruits récoltés à 350 degrés
jours ont été utilisées pour les simulations. Pour tester la qualité prédite à la récolte, les
simulations ont été effectuées en utilisant la moyenne des masses initiales disponibles dans le
jeu de données testé.
Le modèle présenté précédemment décrit bien la croissance en matière fraîche de fruits se
développant dans des conditions de disponibilité carbonée contrastées. L’augmentation de la
masse fraîche du fruit avec le rapport feuilles/fruit est bien simulée par le modèle. La
dynamique simulée de la masse fraîche du fruit chez le manguier représente bien, durant les
trois années successives d’expérimentation et pour différentes floraisons au sein d’une même
année, les observations acquises qui ont servi à estimer les paramètres des modèles (Figure 1)
et les observations qui proviennent de jeux de données indépendants (Figure 2). En 2000, les
masses fraîches des fruits des traitements 10 et 25 feuilles par fruit (Figures la, 2a, 2b, 2c, 2e
et 2f) ont tendance à être surestimés quelque soit le type d’expérimentation (destructive ou
non). Toutefois cette surestimation de la croissance des traitements avec un faible rapport
feuilles/fruit est moins marquée en 2001 (Figure 2i). En 2002, les masses fraîches simulées
des fruits de la parcelle 2, provenant de la première floraison, sont supérieures aux mesures
(Figure lj). La variabilité de la masse fraîche du fruit n’est pas toujours bien représentée par
le modèle qui a tendance à la sous-estimer dans certaines simulations.
Les sorties du modèle concernant les critères de qualité à la récolte comme la masse fraîche,
les concentrations des principaux acides organiques, sucres et éléments minéraux sont
présentées dans le Tableau 2. Globalement, le modèle simule bien l’ordre de grandeur des
critères de qualité à la récolte. La valeur des critères de qualité simulée à la récolte est très
souvent comprise dans l’intervalle représenté par la moyenne plus ou moins l’écart type des
données. L’effet fort du nombre de feuilles par fruit sur la masse fraîche est représenté par le
modèle. Les concentrations observées et simulées en acides organiques ne sont pas très
110
i
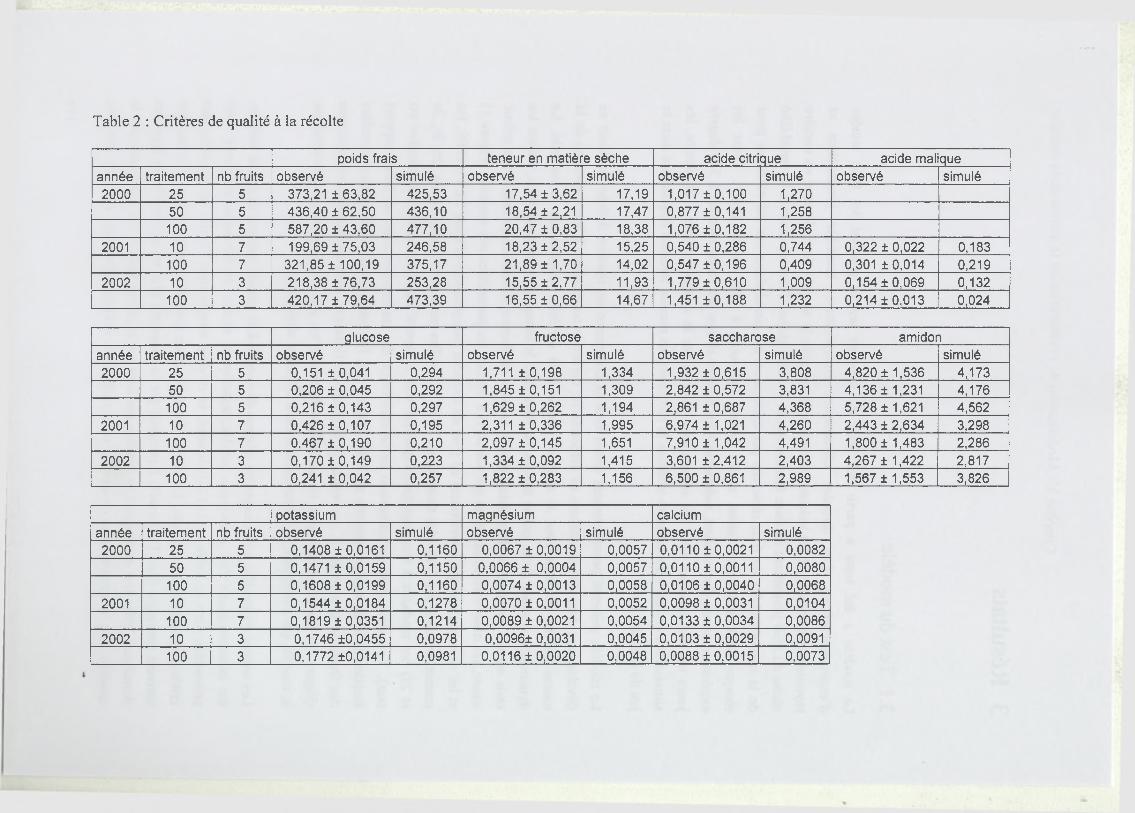
Table 2 : Cri tères de quali té à la récolte
poids frais teneur en matière sèche acide citrique acide malique
année traitement nb fruits observé simulé observé simulé observé simulé observé simulé
2000 25 5 373,21 ± 63,82 425,53 17,54 ±3 ,62 17,19 1,017 ±0 ,100 1,270
50 5 436,40 ± 62,50 436,10 18,54 ±2,21 17,47 0,877 ±0,141 1,258
100 5 587,20 ± 43,60 477,10 20,47 ± 0,83 18,38 1,076 ±0 ,182 1,256
2001 10 7 199,69 ±75,03 246,58 18,23 ±2,52 15,25 0,540 ± 0,286 0,744 0,322 ± 0,022 0,183
100 7 321,85 ± 100,19 375,17 21,89 ± 1,70 14,02 0,547 ±0,196 0,409 0,301 ±0,014 0,219
2002 10 3 218,38 ±76,73 253,28 15,55 ±2 ,77 11,93 1,779 ±0 ,610 1,009 0,154 ±0 ,069 0,132
100 3 420,17 ±79,64 473,39 16,55 ±0 ,66 14,67 1,451 ±0 ,188 1,232 0,214 ±0 ,013 0,024
glucose fructose saccharose amidon
année traitement nb fruits observé simulé observé simulé observé simulé observé simulé
2000 25 5 0,151 ± 0,041 0,294 1,711 ±0 ,198 1,334 1,932 ±0 ,615 3,808 4,820 ± 1,536 4,173
50 5 0,206 ± 0,045 0,292 1,845 ±0,151 1,309 2,842 ± 0,572 3,831 4,136 ± 1,231 4,176
100 5 0,216 ±0 ,143 0,297 1,629 ±0 ,262 1,194 2,861 ± 0,687 4,368 5,728 ± 1,621 4,562
2001 10 7 0,426 ±0 ,107 0,195 2,311 ±0 ,336 1,995 6,974 ± 1,021 4,260 2,443 ± 2,634 3,298
100 7 0,467 ±0 ,190 0,210 2,097 ±0 ,145 1,651 7,910 ± 1,042 4,491 1,800 ± 1,483 2,286
2002 10 3 0,170 ±0 ,149 0,223 1,334 ± 0,092 1,415 3,601 ±2 ,412 2,403 4,267 ± 1,422 2,817
100 3 0,241 ± 0,042 0,257 1,822 ±0 ,283 1,156 6,500 ±0,861 2,989 1,567 ± 1,553 3,826
potassium magnésium calcium
année traitement nb fruits observé simulé observé simulé observé simulé
2000 25 5 0,1408 ±0,0161 0,1160 0,0067 ±0,0019 0,0057 0,0110 ±0,0021 0,0082
50 5 0,1471 ± 0,0159 0,1150 0,0066 ± 0,0004 0,0057 0,0110 ±0,0011 0,0080
100 5 0,1608 ±0 ,0199 0,1160 0,0074 ±0,0013 0,0058 0,0106 ±0 ,0040 0,0068
2001 10 7 0,1544 ±0,0184 0,1278 0,0070 ±0,0011 0,0052 0,0098 ± 0,0031 0,0104
100 7 0,1819 ±0,0351 0,1214 0,0089 ±0,0021 0,0054 0,0133 ±0,0034 0,0086
2002 10 3 0,1746 ±0,0455 0,0978 0,0096± 0,0031 0,0045 0,0103 ±0,0029 0,0091
100 3 0,1772 ±0,0141 0,0981 0,0116 ±0,0020 0,0048 0,0088 ±0,0015 0,0073
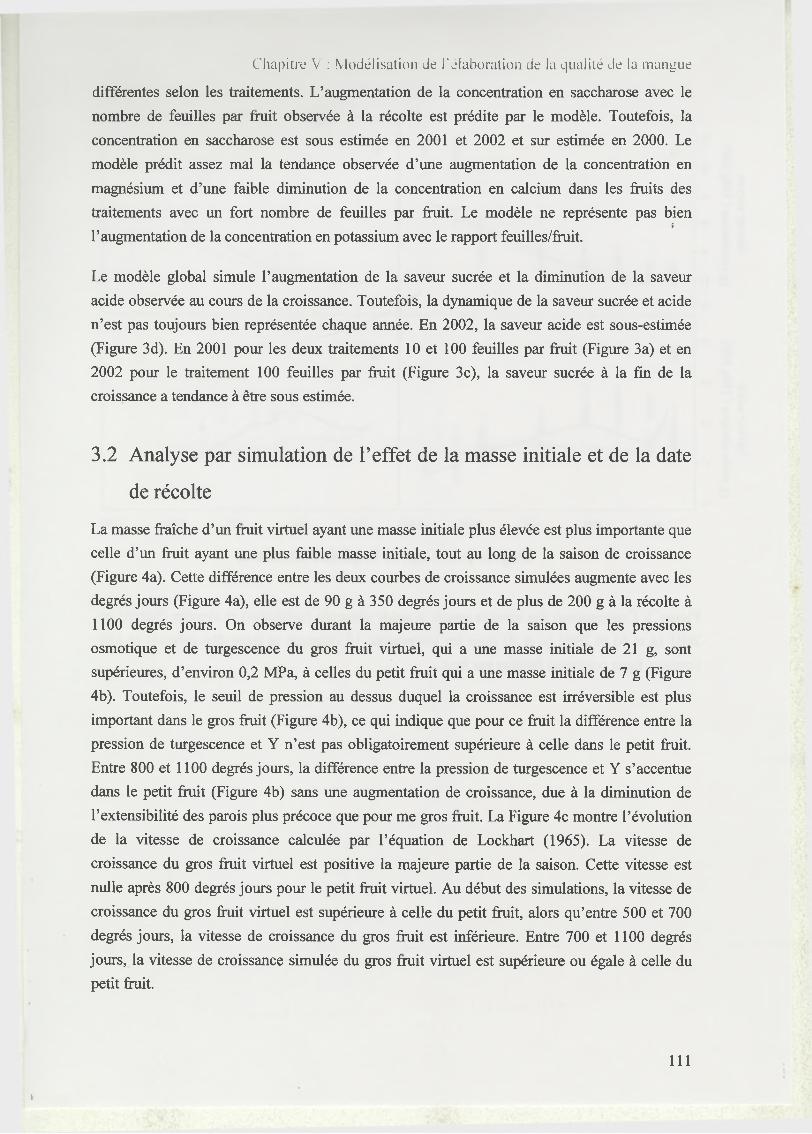
Chapitre V : Modélisation de l'élaboration de la qualité de la mangue
différentes selon les traitements. L’augmentation de la concentration en saccharose avec le
nombre de feuilles par fruit observée à la récolte est prédite par le modèle. Toutefois, la
concentration en saccharose est sous estimée en 2001 et 2002 et sur estimée en 2000. Le
modèle prédit assez mal la tendance observée d’une augmentation de la concentration en
magnésium et d’une faible diminution de la concentration en calcium dans les fruits des
traitements avec un fort nombre de feuilles par fruit. Le modèle ne représente pas bieni
l’augmentation de la concentration en potassium avec le rapport feuilles/fruit.
Le modèle global simule l’augmentation de la saveur sucrée et la diminution de la saveur
acide observée au cours de la croissance. Toutefois, la dynamique de la saveur sucrée et acide
n’est pas toujours bien représentée chaque année. En 2002, la saveur acide est sous-estimée
(Figure 3d). En 2001 pour les deux traitements 10 et 100 feuilles par fruit (Figure 3a) et en
2002 pour le traitement 100 feuilles par fruit (Figure 3c), la saveur sucrée à la fin de la
croissance a tendance à être sous estimée.
3.2 Analyse par simulation de l’effet de la masse initiale et de la date
de récolte
La masse fraîche d’un fruit virtuel ayant une masse initiale plus élevée est plus importante que
celle d’un fruit ayant une plus faible masse initiale, tout au long de la saison de croissance
(Figure 4a). Cette différence entre les deux courbes de croissance simulées augmente avec les
degrés jours (Figure 4a), elle est de 90 g à 350 degrés jours et de plus de 200 g à la récolte à
1100 degrés jours. On observe durant la majeure partie de la saison que les pressions
osmotique et de turgescence du gros fruit virtuel, qui a une masse initiale de 21 g, sont
supérieures, d’environ 0,2 MPa, à celles du petit fruit qui a une masse initiale de 7 g (Figure
4b). Toutefois, le seuil de pression au dessus duquel la croissance est irréversible est plus
important dans le gros fruit (Figure 4b), ce qui indique que pour ce fruit la différence entre la
pression de turgescence et Y n’est pas obligatoirement supérieure à celle dans le petit fruit.
Entre 800 et 1100 degrés jours, la différence entre la pression de turgescence et Y s’accentue
dans le petit fruit (Figure 4b) sans une augmentation de croissance, due à la diminution de
l’extensibilité des parois plus précoce que pour me gros fruit. La Figure 4c montre l’évolution
de la vitesse de croissance calculée par l’équation de Lockhart (1965). La vitesse de
croissance du gros fruit virtuel est positive la majeure partie de la saison. Cette vitesse est
nulle après 800 degrés jours pour le petit fruit virtuel. Au début des simulations, la vitesse de
croissance du gros fruit virtuel est supérieure à celle du petit fruit, alors qu’entre 500 et 700
degrés jours, la vitesse de croissance du gros fruit est inférieure. Entre 700 et 1100 degrés
jours, la vitesse de croissance simulée du gros fruit virtuel est supérieure ou égale à celle du
petit fruit.
111
I
Degrés jours après la pleine floraison
Figure 3: Comparaison des saveurs sucrée et acide observée (symboles) et simulée (lignes) en
2001 (a et b) et 2002 (c et d) pour les traitements 10 (triangle et ligne discontinue) et 100
(croix et ligne continue) feuilles par fruit.
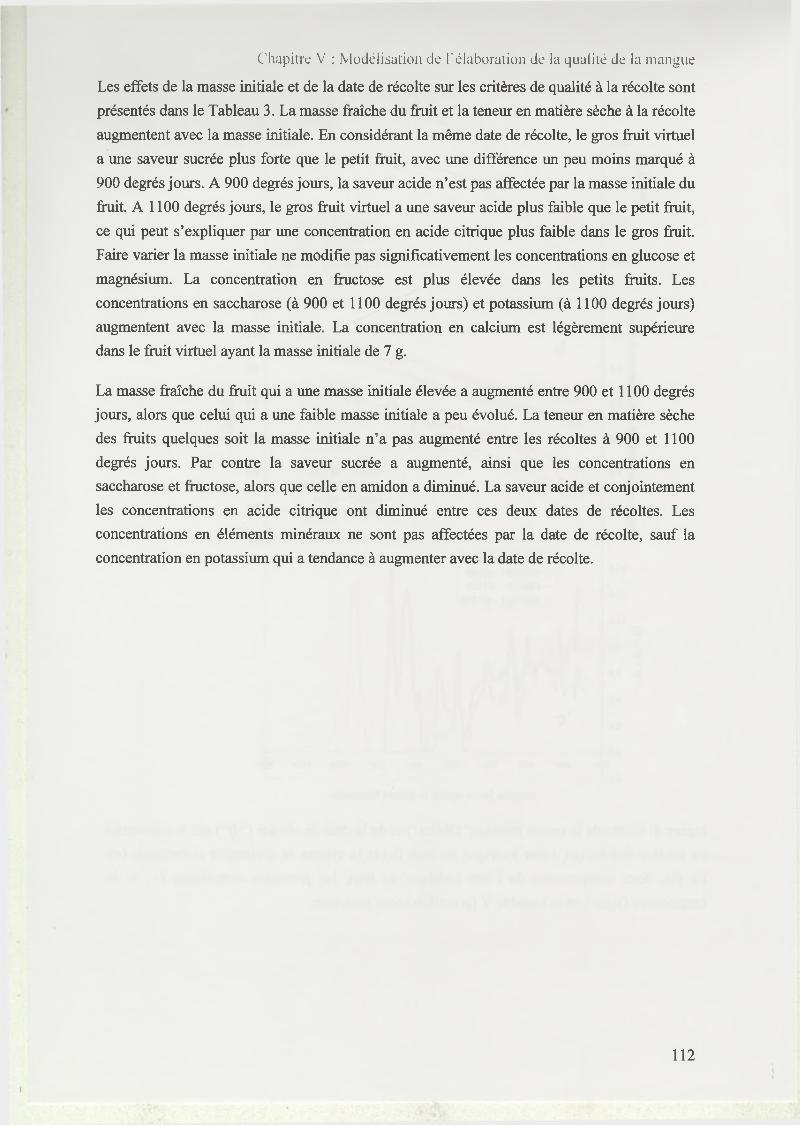
Les effets de la masse initiale et de la date de récolte sur les critères de qualité à la récolte sont
présentés dans le Tableau 3. La masse fraîche du fruit et la teneur en matière sèche à la récolte
augmentent avec la masse initiale. En considérant la même date de récolte, le gros fruit virtuel
a une saveur sucrée plus forte que le petit fruit, avec une différence un peu moins marqué à
900 degrés jours. A 900 degrés jours, la saveur acide n’est pas affectée par la masse initiale du
fruit. A 1100 degrés jours, le gros fruit virtuel a une saveur acide plus faible que le petit fruit,
ce qui peut s’expliquer par une concentration en acide citrique plus faible dans le gros fruit.
Faire varier la masse initiale ne modifie pas significativement les concentrations en glucose et
magnésium. La concentration en fructose est plus élevée dans les petits fruits. Les
concentrations en saccharose (à 900 et 1100 degrés jours) et potassium (à 1100 degrés jours)
augmentent avec la masse initiale. La concentration en calcium est légèrement supérieure
dans le fruit virtuel ayant la masse initiale de 7 g.
La masse fraîche du fruit qui a une masse initiale élevée a augmenté entre 900 et 1100 degrés
jours, alors que celui qui a une faible masse initiale a peu évolué. La teneur en matière sèche
des fruits quelques soit la masse initiale n’a pas augmenté entre les récoltes à 900 et 1100
degrés jours. Par contre la saveur sucrée a augmenté, ainsi que les concentrations en
saccharose et fructose, alors que celle en amidon a diminué. La saveur acide et conjointement
les concentrations en acide citrique ont diminué entre ces deux dates de récoltes. Les
concentrations en éléments minéraux ne sont pas affectées par la date de récolte, sauf la
concentration en potassium qui a tendance à augmenter avec la date de récolte.
Chapitre V : Modélisat ion de l 'é laborat ion de la quali té de la m angue
I
112
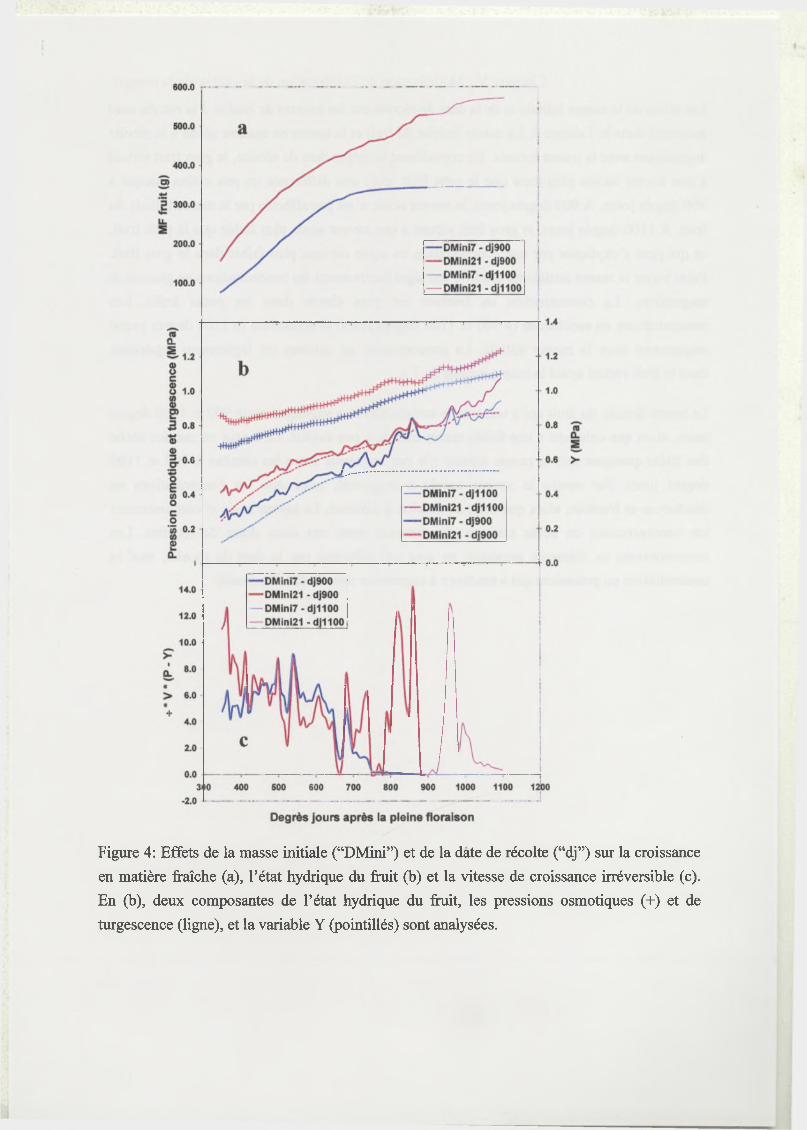
Figure 4: Effets de la masse initiale (“DMini”) et de la date de récolte (“dj”) sur la croissance
en matière fraîche (a), l’état hydrique du fruit (b) et la vitesse de croissance irréversible (c).
En (b), deux composantes de l’état hydrique du fruit, les pressions osmotiques (+) et de
turgescence (ligne), et la variable Y (pointillés) sont analysées.
Chapi t re V : M odél isa t ion de l 'é laborat ion de la quali té de la m angue
4 Discussion
Le modèle d’élaboration de la qualité du fruit au niveau du rameau est capable de représenter
l’évolution de la croissance en matière fraîche du fruit mesurée au cours des trois années
d’expérimentation et également les variations de croissance selon les niveaux de rapports
feuilles/fruit. La surestimation par le modèle de la masse fraîche des fruits des traitements
avec un faible rapport feuilles/fruit peut être due aux variations du potentiel hydrique de tige
en fonction du rapport feuilles/fruit qui ne sont pas prises en compte dans le modèle. En effet,
Urban et al. (2002) ont montré chez le manguier que la diminution du rapport feuilles/fruit de
100 à 25 entraînait une augmentation de 45 % de la conductance stomatique des feuilles. Du
fait de cette capacité transpiratoire plus importante, le potentiel hydrique de tige devrait être
plus faible pour les faibles rapports feuilles/fruit. Les observations de McFadyen et al. (1996)
sur le pêcher en forte et faible charge vont dans ce sens. Pour améliorer nos simulations, il
faudrait établir chez le manguier la loi de variation du potentiel hydrique de tige en fonction
du rapport feuilles/fruit.
La variation de la croissance en matière fraîche au sein d’un même traitement n’est pas
toujours bien décrite et elle est souvent inférieure à la variation observée. On peut expliquer
cela, d’une part, par le fait que pour les simulations on a considéré dans chaque cas un
éclairement “moyen” du rameau (valeur d’entrée), négligeant ainsi la variabilité réelle de
l’environnement lumineux. Cela a pu minimiser la variabilité simulée de la masse sèche du
fruit par rapport à la variabilité réelle (Chapitre III). D’autre part, lors du calcul de la
transpiration du fruit, nous avons choisi par soucis de simplicité de prendre un coefficient de
perméabilité de la peau du fruit à l’eau constant. Or, il apparaît chez certaines espèces que ce
coefficient varie au cours de la croissance (Lescourret et al., 2001), en raison notamment des
modifications de la structure et donc de l’épaisseur de la cuticule ; cas de la pêche (Crisosto et
al., 1994); cas de la cerise (Knoche et al., 2001), ou de l’apparition de microcraquelures au
niveau du péricarpe ; cas du letchi par exemple (Huang et al., 1999). La prise en compte dans
notre modèle de la variabilité de la perméabilité de la cuticule entre fruits est donc une voie
intéressante à explorer.
La cinétique des concentrations en sucres solubles et acides organiques n’est pas toujours bien
représentée par le modèle, ce qui affecte la qualité de l’estimation de la cinétique des saveurs
sucrée et acide. Toutefois, les critères de qualité à la récolte, comme la masse fraîche, la
teneur en matière sèche et les concentrations des principaux sucres, acides et éléments
minéraux sont globalement bien estimées. La teneur en matière sèche du fruit est sous estimée
113
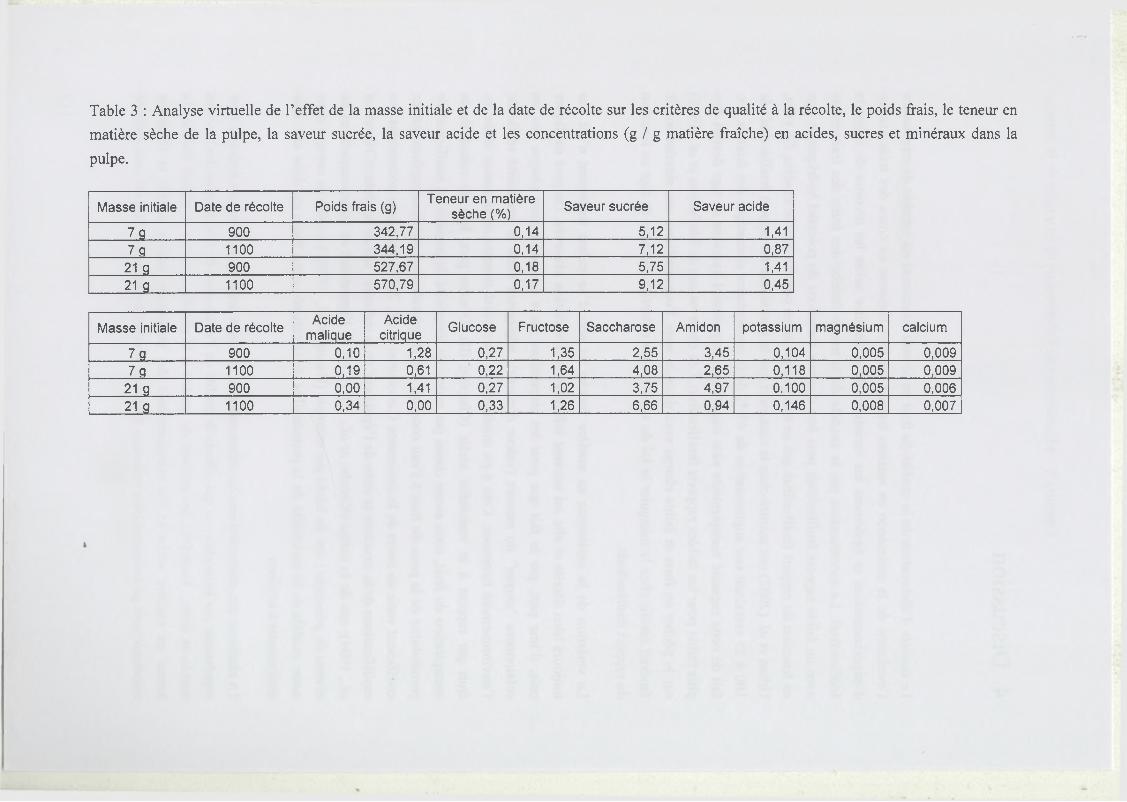
Table 3 : Analyse virtuelle de l’effet de la masse initiale et de la date de récolte sur les critères de qualité à la récolte, le poids frais, le teneur en
matière sèche de la pulpe, la saveur sucrée, la saveur acide et les concentrations (g / g matière fraîche) en acides, sucres et minéraux dans la
pulpe.
Masse initiale Date de récolte Poids frais (g)Teneur en matière
sèche (%)Saveur sucrée Saveur acide
7 g 900 342,77 0,14 5,12 1,41
7 g 1100 344,19 0,14 7,12 0,87
2 1 g 900 527,67 0,18 5,75 1,41
21 g ...... 1100 570,79 0,17 9,12 0,45
Masse initiale Date de récolteAcide
maliqueAcide
citriqueGlucose Fructose Saccharose Amidon potassium magnésium calcium
7 g 900 0,10 1,28 0,27 1,35 2,55 3,45 0,104 0,005 0,009
7 g 1100 0,19 0,61 0,22 1,64 4,08 2,65 0,118 0,005 0,009
2 1 g 900 0,00 1,41 0,27 1,02 3,75 4,97 0,100 0,005 0,006
21 g 1100 0,34 0,00 0,33 1,26 6,66 0,94 0,146 0,008 0,007
Chapitre Y : Modélisat ion de l ’élaboration de la quali té de la m angue
en 2001 du fait de la sous-estimation de la masse sèche du fruit (Chapitre III) et de la légère
surestimation de la masse fraîche.
Les différences entre les concentrations observées et simulées des différents composés sont en
particulier dues à l’utilisation du modèle empirique qui a été établi sur l’année
d’expérimentation 2001, et dont les capacité prédictives sont faibles comme c’est souvent le
cas pour ce type de modèle (Marcelis et al., 1998). De plus, la comparaison de concentrations
par gramme de masse fraîche est toujours délicate. Les concentrations sont un rapport entre
des quantités d’un élément et la masse fraîche du fruit. De petites erreurs sur les quantités et
sur la masse peuvent se traduire par une erreur importante de leur rapport, c'est-à-dire la
concentration. Nous avons également observé que le modèle empirique de composition de la
pulpe est très sensible à la matière sèche de la pulpe, une erreur sur cette variable peut avoir
des conséquences importantes sur les concentrations simulées.
Ces résultats sur la composition biochimique de la mangue indiquent qu’il serait intéressant
d’utiliser des approches plus mécanistes pour simuler l’élaboration de la qualité, comme celle
qui est proposée sur la pêche pour modéliser l’accumulation des sucres (Génard et al., 2003;
Génard and Souty, 1996) et des acides organiques (Lobit et al., 2003).
Dans le Chapitre III, nous avons vu que la masse initiale influençait fortement la croissance
en matière sèche de la mangue. Les résultats de l’étude virtuelle montrent que la croissance en
matière fraîche du fruit est également plus importante quand la masse initiale est forte. Dans
ce cas, la pression osmotique a augmenté ce qui est probablement dû à l’augmentation des
concentrations en sucres, lesquels représentent les principaux composés osmotiquement actifs
du fruit. Cette augmentation de la pression osmotique est contrebalancée par une
augmentation de la pression de turgescence ce qui induit une augmentation plus forte de la
croissance en matière fraîche des fruits, comme l’ont montré McFadyen et al. (1996) en
étudiant le lien entre les relations hydriques dans le fruit et sa croissance.
Le fruit virtuel qui a une masse initiale élevée a une vitesse de croissance plus importante que
celui qui a une faible masse initiale en cas de récolte tardive. Ce fruit est plus sucré et moins
acide, ce qui est en accord avec la relation entre la vitesse de croissance et la qualité gustative
du fruit observée chez la pêche (Génard et al., 1991). La diminution des concentrations en
acides pour les fruits ayant une plus grosse masse initiale et récoltés plus tard a été également
mis en évidence chez la pomme (Sullivan, 1965). En comparant des variétés de mangue,
Mukeijee (1959) a observé que la variété Dashehari qui est caractérisée par son petit calibre
accumule plus de sucres réducteurs que de sucres non réducteurs. Les plus fortes
114
1
concentrations en fructose simulées dans les fruits ayant une masse initiale de 7 g sont en
accord avec ces résultats.
L’effet de la masse initiale sur la conservation du fruit peut être pris en compte dans les
résultats de l’étude virtuelle. Les travaux de Simmons et al. (1998) et Hofman et al. (1995)
indiquent que des teneurs en matière sèche plus fortes et des concentrations en calcium plus
faibles, observées dans notre étude virtuelle pour les fruits ayant une plus grosse masse
initiale, s’accompagnent d’une réduction de la durée de conservation des fruits.
La croissance du fruit virtuel qui a une faible masse initiale n’a pas évolué entre 900 et 1100
degrés jours, alors que les concentrations en saccharose et fructose ont augmenté et celle en
amidon a diminué. Ces résultats indiquent que les processus impliqués dans la maturation
devaient avoir lieu à 900 degrés jours dans le petit fruit virtuel, ce qui est cohérent avec les
travaux sur la diminution de l’extensibilité des parois quand la croissance ralentit et que les
cellules deviennent matures (McQueen-Mason, 1995; Thompson et al., 1998). Cet effet est
moins marqué avec le gros fruit virtuel dont la masse fraîche augmente encore de 8 % entre
900 et 1100 degrés jours, ce qui indique que ce fruit accumule encore des assimilais carbonés.
La très faible concentration en amidon à la date de récolte la plus tardive indique que dans ce
fruit la maturation est bien avancée à cette date (Mendoza and Wills, 1984; Tandon and Kalra,
1983).
L’augmentation de la saveur sucrée avec l’éloignement de la date de récolte est surtout liée
chez la mangue à l’augmentation de la concentration en fructose et saccharose comme l’ont
observé Tandon and Kalra (1983) pour le cultivar ‘Dashehari’. L’augmentation de la
concentration en saccharose et la diminution de la concentration en amidon avec la date de
récolte indiquent que les fruits récoltés plus tard ont logiquement un stade de maturation plus
avancé et une meilleure qualité à la récolte. Toutefois, ces fruits récoltés plus tard devraient
avoir une qualité gustative après conservation plus faible (Volz et al., 1995).
Ces résultats montrent que le modèle proposé simule au moins qualitativement les
changements dans la composition de la mangue qui ont lieu en fin de croissance et qui
conditionnent sa qualité organoleptique. Le processus de maturation doit y participer
fortement et pourrait être influencé par des facteurs comme la masse initiale. Cet aspect serait
à étudier dans de futures recherches.
Chapitre \ : M odél isa t ion de l 'é laborat ion de la quali té de la m anque
Les modèles décrivant le fonctionnement carboné (Chapitre III) et hydrique (Chapitre IV) du
fruit nous ont permis de construire un modèle de croissance en matière fraîche du fruit et de
prédiction de la qualité à la récolte. Ce modèle est capable de décrire avec une bonne
précision l’évolution de la croissance en matière fraîche du fruit dans des conditions
115
contrastées d’alimentation carbonée. La prédiction de la dynamique des concentrations des
principaux composés biochimiques liés à la qualité du fruit n’est pas toujours très bonne,
néanmoins la prédiction de ces critères de qualité à une date de récolte proche de la pleine
maturité est acceptable. De plus, l’étude virtuelle réalisée à partir de ce modèle a montré que
l’effet de la masse initiale du fruit sur la croissance en matière fraîche était de plus en plus
marqué à mesure que le fruit se développe et pouvait s’expliquer par un effet sur les
composantes de l’état hydrique du fruit. La masse initiale affecte également la qualité des
fruits à la récolte en améliorant des critères de qualité gustative, mais en réduisant des
indicateurs de la durée de conservation du fruit, comme la teneur en matière sèche et la
concentration en calcium. Cette étude virtuelle a confirmé qu’une date de récolte tardive
permet d’améliorer des critères liés à la qualité gustative du fruit. Toutefois, retarder la date
de récolte ne permet un gain en masse fraîche que pour les fruits ayant une masse initiale
élevée.
C hapi t re Y : M odélisa t ion de 1 e laborat ion de la quali té de la m angue
116

v. o n e Ius ions cl p c rs p c c l iv c s
Conclusions et perspectives

( (.inclusions et perspectives
Conclusions et perspectives
117
1
Conclusions et perspectives
1 Bilan des connaissances acquises
L ’approche descriptive (Chapitre II) a montré l ’ importance de la liaison entre l ’accumulation
du carbone et de l ’eau dans les différents compartiments de la mangue (peau, pulpe, noyau).
Au cours du développement du fru it, dans chaque compartiment, la vitesse d ’accumulation de
l ’eau ralentit alors que celle de la matière sèche augmente. Ceci est fortement marqué dans le
noyau dont la deuxième partie du développement se distingue par la phase de durcissement
(Saini et a l., 1971). Le noyau est le compartiment dont les coûts de construction des tissus
sont les plus importants, suivi de la peau puis de la pulpe (Chapitre III). Des variations du
rapport feu illes/fru it m odifient la compartimentation du carbone, mais également celle de
l ’eau. A la récolte, les fruits du traitement 100 feu illes/fru it ont ainsi une part plus importante
de leur masse fraîche comprise dans la pulpe, en comparaison avec les fru its des traitements
avec un plus faible rapport feu illes/fru it. Cette observation est intéressante d ’un point de vue
pratique, la pulpe étant le compartiment qui intéresse le plus les consommateurs.
L ’approche descriptive concernant l ’effet de la disponibilité carbonée et hydrique sur
l ’élaboration de la qualité de la mangue a tout d’abord confirmé que la masse fraîche du fru it
était fortement affectée par des variations du rapport feu illes/fru it. Nous avons choisi dans
cette approche de décomposer la concentration par gramme de matière fraîche des principaux
composés présents dans la pulpe de mangue par le produit de la teneur en matière sèche, de la
teneur en matière sèche structurale, et de la concentration par gramme de matière sèche
structurale de chaque composé. Les effets des facteurs agronomiques sur chacune des trois
composantes sont les suivant :
• la teneur en matière sèche augmente avec le rapport feu ille /fru it.
• la teneur en matière sèche structurale qui représente la proportion de parois par
masse sèche de fru it, n ’est pas affectée par les facteurs agronomiques.
• les concentrations des différents composés exprimées par gramme de masse sèche
structurale sont positivement (saccharose), négativement (acides citrique et malique, calcium
et fructose) ou ne sont pas affectées (potassium, magnésium et glucose) par une augmentation
de la disponibilité carbonée.
Les expérimentations sur le fonctionnement carboné de la mangue ont permis de construire et
de valider un modèle de croissance en matière sèche du fru it qui prend en compte l ’effet du
118
I
climat, de facteurs internes à la plante et des facteurs agronomiques sur les relations
sources/puits. Ce modèle fonctionne bien pour la période de croissance comprise entre la
mesure de la masse in itia le du fru it (environ 350 degrés jours après la pleine floraison) et la
maturité.
Le modèle n ’est pas sensible aux paramètres liés à la respiration d’entretien du système, à la
respiration de croissance du fru it et à la m obilisation des réserves des feuilles et du rameau.
Par contre, le modèle est très sensible aux paramètres de la photosynthèse fo lia ire et à la
demande du fru it.
Une étude virtuelle nous a permis de quantifier les contributions respectives du clim at, de la
masse in itia le du fru it et du rapport feu illes/fru it pour les processus physiologiques impliqués
dans la croissance, en particulier la photosynthèse et la demande du fru it. Nous avons vu que
la contribution du clim at est globalement inférieure à celles des autres facteurs m odifiant les
relations sources/puits. Le rapport feu illes/fru it contribue fortement à la variation de la
photosynthèse folia ire. La forte contribution de la masse in itia le du fru it, considéré comme un
indicateur du nombre de cellules, dans sa demande et plus généralement dans sa croissance,
montre que la mangue s’ inscrit dans un schéma de fonctionnement où le développement
précoce du fru it conditionne la masse finale du fru it. Ce schéma a été mis en évidence chez
d’autres espèces comme la tomate (Ho, 1984) et la banane (Jullien, 2000).
Conclusions et perspectives
Les expérimentations sur le fonctionnement hydrique de la mangue nous ont permis de
construire un modèle qui intègre les propriétés d ’élasticité et de plasticité des parois des
cellules de la pulpe, ce qui n’ a jamais été fa it à notre connaissance au niveau du fru it. Ce
modèle simule des pressions de turgescence qui sont du même ordre de grandeur que les
pressions que nous avons mesurées sur des tissus de pulpe et celles obtenues sur pêches
(McFadyen et a l., 1996) et pommes (M ills et a l., 1997). Une orig inalité dans ce travail
d ’ intégration vient de l ’ introduction dans ce modèle des variables Y (le seuil de pression de
turgescence au dessus duquel la croissance est irréversible) et <(> (la plasticité des parois) pour
la croissance plastique (Lockhart, 1965), et d’un paramètre 8 (le module d ’élasticité) pour la
croissance élastique (Ortega, 1985). Les variables Y et <|> suivent des lois de variation dont
l ’expression générale provient d’ expérimentations au niveau cellulaire et tissulaire
(Bütenmeyer et a l., 1998; Green et a l., 1971; Proseus et a l., 1999). Ces lois de variation ont
ensuite été ajustées pour la mangue. Le modèle validé au pas de temps horaire permet de
séparer la croissance plastique, irréversible, de la croissance élastique, réversible.
Une étude virtuelle utilisant ce modèle de fonctionnement hydrique du fru it a été effectuée
pour analyser et comparer les effets d ’une variation de la disponibilité carbonée d ’une part et
hydrique d’ autre part sur la croissance et les relations hydriques du fru it. Les résultats des
119
i
simulations sont en accord avec les observations fournies par la littérature. Ce d ispositif
virtuel montre qu’ il est possible à partir de ce modèle, testé dans des conditions
d ’alimentation carbonée variables, d’étudier et de comprendre les effets d’autres facteurs, tel
que l ’alimentation hydrique, sur la croissance du fru it.
Des lim ites apparaissent dans cette étude du fonctionnement hydrique de la mangue. Le choix
d ’ introduire un module d ’élasticité constant peut être remis en question, car des travaux ont
mis en évidence que le module d ’élasticité serait fonction du volume des cellules (Jones et a l.,
1985; Steudle and Wieneke, 1985) et de la pression de turgescence (Ortega, 1990; Tyree and
Jarvis, 1982). I l peut être envisagé d ’appliquer des méthodes de déformation des tissus pour
mesurer la déformation élastique de ces tissus (M ilad and Shackel, 1992) et de réaliser une
étude plus approfondie du module d ’élasticité chez la mangue.
Conclusions et perspectives
Les modèles décrivant le fonctionnement carboné (Chapitre III) et hydrique (Chapitre IV ) du
fru it nous ont permis de construire un modèle de croissance en matière fraîche du fru it et de
prédiction de la qualité à la récolte. Nous avons vu dans le Chapitre V que la prédiction de la
dynamique des concentrations des principaux composés biochimiques liés à la qualité du fru it
n’est pas toujours très bonne, néanmoins les valeurs des critères de qualité simulés à la récolte
sont acceptables.
L ’étude virtuelle réalisée à partir de ce modèle global a montré que l ’effet de la masse in itia le
du fru it sur la croissance en matière fraîche était de plus en plus marquée au fur et à mesure
du développement du fru it et pouvait s’expliquer par un effet sur les composantes de l ’état
hydrique du fru it. De plus, l ’augmentation de la masse in itia le du fru it a tendance à améliorer
des critères de qualité gustative, comme la saveur sucrée, les concentrations en sucres et
acides, mais à affecter des indicateurs de la durée de conservation du fru it, comme la teneur
en matière sèche et la concentration en calcium. D ’un point de vue agronomique, cette étude
virtuelle a mis en évidence qu’une date de récolte tardive permettant d ’améliorer des critères
liés à la qualité gustative du fru it ne permet un gain en masse fraîche que pour les fruits ayant
une masse in itia le élevée.
120
Conclusions el perspectiv es
2 Perspectives de recherche
La question de la généralisation de la démarche présentée sur le fonctionnement d ’ un rameau
de manguier peut être abordée à deux niveaux : soit un approfondissement de l ’analyse
écophysiologique, en la généralisant à la plante entière, soit une application du modèle ( i) vers
l ’agronomie en utilisant le modèle comme un ou til d ’aide au pilotage de la parcelle et de
prédiction de caractéristiques de récolte, ( ii) vers l ’analyse de la variab ilité génétique de la
qualité de la mangue en utilisant les paramètres du modèle comme des constantes génétiques
dont on étudiera la variabilité (Q uillo t, 2003).
2.1 Approfondissement de l’approche écophysiologique
Si l ’on fa it l ’hypothèse que la variab ilité de la qualité dans la plante est avant tout due à celle
de l ’alimentation carbonée, i l semble nécessaire d ’une part d ’approfondir certains aspects du
fonctionnement du modèle de croissance en matière sèche, et d ’autre part d ’aborder les
transferts de carbone entre rameaux. Dans l ’approche originale, proposée dans la thèse, sur le
fonctionnement hydrique de la mangue l ’analyse et la modélisation concernant la lim ita tion
des flux d ’eau arrivant dans le fru it et les relations entre l ’extensibilité des parois des tissus et
la physiologie du fru it seraient à affiner. L ’ insuffisance des résultats des simulations du
modèle de prédiction de la qualité du fru it à la récolte suggère d ’ utiliser une approche
différente pour sim uler l ’accumulation des sucres et des acides. Enfin le processus de
maturation dont on connaît l ’ importance dans l ’expression de la qualité, n’a pas été étudié
dans le cadre de cette thèse. Des perspectives d ’étude de ce processus seront proposées.
2.1.1 Echelle de l’arbre
Au niveau des sources, modéliser la distribution des assimilats carbonés est im portant pour
prédire l ’hétérogénéité de la croissance du fru it au sein d ’un arbre (Grossman and Dejong,
1994; Le Roux et a l., 2001). Au cours du travail de thèse, nous avons utilisé un modèle
simple et peu précis de la photosynthèse folia ire, qui tient compte de la demande du fru it et de
l ’environnement lum ineux du rameau, pour déterminer la photosynthèse fo lia ire. Pour
approfondir cet aspect, j ’ai participé aux travaux de L. Urban sur le modèle biochim ique de
photosynthèse proposé par Farquhar et al. (1980), qui est fréquemment utilisé et qui relie les
paramètres clés de la capacité photosynthétique des feuilles à l ’azote fo lia ire par unité de
surface, Na. Urban et al. (2003) ont montré chez le manguier que la capacité photosynthétique
de feuilles proches de fru it était supérieure à celle des autres feuilles. M a participation à ces
121
travaux se concentre sur la partie concernant l ’effet du rapport feu illes/fru it sur les paramètres
clés de la capacité photosynthétique et sur Na. Ce travail a été décrit dans quatre articles, dont
deux sont parus (Urban, L., Bertheuil, F. and Léchaudel, M . 2002. A coupled photosynthesis
and stomatal conductance model fo r mango leaves. Acta H orticu lturae. 584 : 81-88 et Urban,
L., Léchaudel, M . and Lu, P. 2003. Phenological effects on photosynthesis: suggestions for
modelling. In P lant Growth M odeling and Applications, Bao-Gang Hu & M . Jaeger Eds.
Proceedings-PMA03, Beijing, China, October 13-16. p. 67-75), un soumis (Urban, L. and
Léchaudel, M . Effect o f leaf-to-fru it ratio on leaf nitrogen content and net photosynthesis in
girdled branches o f mango. Manuscript soumis à Tree Physiology) et un dernier en
élaboration (Urban, L., Léchaudel, M . and Lu, P. Interpreting the effect o f fru it load on leaf
photosynthesis in girdled branches o f mango. Manuscript à envoyer à Journa l o f
Experim ental Botany). Ces articles reprennent le modèle biochim ique de la photosynthèse
fo lia ire chez le manguier, présentent nos résultats concernant l ’effet du rapport feu illes/fru it
sur le contenu en azote et la photosynthèse des feuilles et sur les paramètres clés de la capacité
photosynthétique. Les perspectives sont de prendre explicitement en compte l ’effet de la
disponibilité carbonée sur la capacité photosynthétique en affinant la relation obtenue entre
les sucres totaux contenus dans les feuilles et Na, et d’ intégrer ce modèle biochim ique de
photosynthèse au modèle de fonctionnement carboné du rameau que nous avons proposé.
Conclusions et perspectives
La variab ilité de la croissance des fru its au niveau de l ’arbre est peu documentée, les modèles
existants regroupant l ’ensemble des fruits au sein d ’un même compartiment (Buwalda, 1991;
Grossman and Dejong, 1994). Il serait intéressant de coupler notre modèle de fonctionnement
carboné du rameau aux représentations du fonctionnement carboné de l ’arbre proposées dans
les modèles de croissance d ’arbres utilisés en foresterie et en écologie (Le Roux et a l., 2001).
Il serait possible de décrire le manguier comme une collection de rameaux qui ont un
fonctionnement proche de celui modélisé par notre modèle. Les transferts de carbohydrates
entre ces rameaux seraient à modéliser. Il existe de nombreuses approches pour modéliser
l ’allocation du carbone, comme l ’utilisation de coefficients d’allocation empiriques, de
schémas flux-résistances, ou des approches sources-puits (Le Roux et a l., 2001). Pour bien
simuler l ’acquisition du carbone, i l est nécessaire de connaître l ’environnement lum ineux des
rameaux. Notre approche devrait donc être couplée à une représentation de l ’architecture du
manguier (travail en cours dans le cadre de l ’ATP manguier du C IRAD, c f Introduction) et à
un modèle d ’ interception de la lumière par le couvert du manguier.
2.1.2 Echelle du fruit
Au niveau des puits, le modèle de fonctionnement carboné du rameau, qui prend en compte
l ’effet des conditions environnementales et des pratiques culturales sur les relations
122
sources/puits, simule correctement l ’évolution de la masse sèche du fru it pour la période de
croissance comprise entre la mesure de la masse in itia le du fru it (350 degrés jours après la
pleine floraison) et la maturité. Des travaux sur la croissance précoce sont à envisager. En
effet, l ’analyse de sensibilité du modèle de croissance en matière sèche et l ’expérimentation
virtuelle ont montré que la masse in itia le contribue fortement aux processus impliqués dans la
croissance du fru it. La caractérisation plus précise du stade “ masse in itia le ” dans le
développement du fru it est à effectuer, en travaillant depuis la floraison jusqu’à ce stade. Des
coupes histologiques pourraient être réalisées pour défin ir précisément les stades de
développement du fru it (phase active de division cellulaire, fin de mise en place des cellules
de la pulpe, indice m itotique), comme l ’a fa it Jullien (2000) sur la banane. L ’étude du
déterminisme du nombre de cellules est à envisager. Des travaux soulignent l ’ importance des
températures pendant les 5 à 6 semaines après la pleine floraison (Blanpied and Ben-David,
1970; Tromp, 1997). A insi, chez la pomme, des relations entre la température et la vitesse de
d ivision cellulaire ont été établies pour modéliser les phases précoces du développement
(Austin et a l., 1999). Le travail in itié au cours de la thèse pour relier la masse finale du fru it
au nombre fina l de cellules peut être poursuivi, car i l a donné des résultats prometteurs qui
sont en accord avec les travaux menés sur d ’autres fru its (Bertin et al., 2002; Cowan et a l.,
1997; Harmens et a l., 2000).
Lors de l ’analyse du fonctionnement hydrique de la mangue, le fru it a été considéré comme
une grosse cellule attachée directement au xylème. La mangue possède une longue panicule
qui la rattache au rameau. La conductivité hydraulique de ces tissus pourrait-elle être lim itante
pour la croissance du fru it ? Chez la tomate, des travaux indiquent que les résistances dans le
pédicelle du jeune fru it sont fortes, le potentiel hydrique de l ’eau à l ’entrée du fru it étant alors
très bas (Bussières, 2002). Nous avons considéré un flu x global d ’eau qui entre dans le fru it
par flux de masse. Une perspective de mon travail de thèse serait de séparer le flu x d ’eau
apporté par le xylème de celui apporté par le phloème et de vo ir comment les conductivités
hydrauliques du xylème et du phloème varient. Pour déterminer la conductivité hydraulique
du xylème, il faudrait suivre les variations de croissance d ’un fru it avec la panicule
décortiquée (phloème détruit) pendant assez de temps pour laisser le flux xylém ien se
stabiliser. Notre modèle de fonctionnement hydrique nous permettrait alors d ’estimer la
valeur de la conductivité hydraulique du xylème. A partir des variations de croissance d ’un
fru it témoin, la conductivité hydraulique du phloème pourrait être alors estimée.
L ’étude du paramètre d ’extensibilité des parois a mis en évidence la possibilité d ’une
décroissance de ce paramètre vers la fin du développement du fru it, quand sa croissance
ralentit, ce qui est cohérent avec la littérature. Les propriétés mécaniques des parois
(extension ou ramollissement) sont sensibles à des variations du pH et à des acides, comme
l ’auxine qui pourrait induire l ’ extension des parois et donc une croissance (Okamoto et a l.,
1990). (M ingo et a l., 2003) suggèrent que des signaux chimiques, tel que le pH, pourraient
Conclusions et perspectives
123
i
Conclusions et perspectiv es
jouer un rôle dans la régulation de l ’expansion des cellules du fru it lors d’ un stress hydrique.
Des études ont montré que des expansines (McQueen-Mason, 1995), des
endotransglycosidases (XET) et des peroxidases (Thompson et a l., 1998) joueraient un rôle
dans les changements des structures des parois qui se déclenchent dans la phase finale de la
croissance du fru it. L ’activité des péroxidases a été particulièrement mise en évidence dans
les parois de la peau juste avant le ralentissement de la croissance chez la tomate (Thompson
et a l., 1998). I l apparaît alors très intéressant de pouvoir faire le lien entre l ’arrêt de
croissance, l ’extensibilité des parois, et des changements de la physiologie du fru it, en mettant
en place des travaux avec des physiologistes sur les variations de pH et de structure des
parois, et avec des spécialistes en biologie moléculaire sur l ’étude de ces enzymes clés.
Les résultats du modèle global de croissance en matière fraîche et de prédiction de la qualité
du fru it à une date de récolte correspondant à la maturité sont globalement satisfaisants.
Toutefois, ces résultats montrent des lim ites lors de la prédiction de la dynamique des critères
de qualité et également lors de la généralisation du modèle aux différentes années
d ’expérimentation. On vo it ic i les lim ites d’ une approche purement statistique pour modéliser
l ’accumulation des sucres et des acides. Une approche alternative serait de mieux comprendre
les mécanismes et les enzymes impliqués dans l ’élaboration de la qualité de la mangue. Ce
type d ’approche plus mécaniste a permis de modéliser l ’accumulation des sucres (Génard et
al., 2003; Génard and Souty, 1996) et des acides (Lob it et a l., 2003) dans la pêche et semble
avoir une meilleure qualité prédictive.
Un autre aspect important de l ’élaboration de la qualité et peu abordé dans ce travail est le
processus de maturation du fru it. I l est envisagé de poursuivre les travaux initiés en parallèle
de mon travail de thèse (non présentés), en collaboration avec J. Joas (C IRAD Réunion) sur la
maturation et son contrôle, en développant des travaux sur l ’émission d ’éthylène considérée
comme une hormone importante de la maturation et sur la production des précurseurs de cette
hormone au cours la croissance de la mangue (Morgan and Drew, 1997; Pech et a l., 1994).
Nous pensons analyser ces processus en réponse à des variations du niveau d ’alimentation
carbonée, dont on connaît l ’ importance sur la maturité des fru its (Souty et a l., 1999). Ces
expérimentations devraient nous servir de base pour développer par une approche mécaniste
un travail de modélisation sur cette partie du développement du fru it.
2.2 Application de l’approche de modélisation
Le modèle que nous avons développé est un ou til intéressant pour analyser la variabilité
génétique de la qualité de la mangue. Notre étude a montré que la variation des paramètres
liés à la respiration et à la m obilisation des réserves ne joua it que faiblement sur la qualité et
que donc leur variab ilité génétique n ’a probablement que peu d ’ impact. Par contre, i l est
nécessaire d ’avoir une bonne estimation, à partir d ’expérimentations sur les génotypes
124
I
étudiées, des paramètres liés à la production d ’assimilats carbonés par la photosynthèse
fo lia ire et ceux liés à la demande du fru it. L ’analyse de sensibilité du modèle de
fonctionnement hydrique du fru it présentée dans le Chapitre IV à montré que ce modèle était
principalement sensible aux paramètres liés à la plasticité et l ’élasticité des parois qu’ i l serait
jud icieux d’étudier leur variation génotypique. Si la variation génotypique des paramètres est
importante, on pourrait envisager la recherche des QTLs (Quantitative T rait Loci) de ces
paramètres en vue d ’une application pour la sélection variétale comme cela a été proposé sur
la pêche par (Q uilot, 2003).
Conclusions et perspectives
L ’application agronomique de mon travail est un point important qui concerne l ’ob jectif de la
maîtrise au champ de la qualité de la mangue. La réponse à cet ob jectif passe par
l ’optim isation des pratiques culturales.
Dans son état actuel, le modèle développé peut être utilisé pour rendre compte des variations
des caractéristiques de la récolte (masse fraîche du fru it, qualité gustative à partir des saveurs
sucrée et acide, teneur en matière sèche et concentrations en calcium pour les indicateurs de la
durée de conservation) en réponse aux pratiques culturales affectant la disponibilité carbonée
(charge en fru its) et hydrique (irrigation) et aux facteurs climatiques. Ce genre d ’analyse se
rapproche des études virtuelles présentées dans le Chapitre IV . Pour prendre en compte un
acte technique comme l ’éclaircissage qui joue sur la charge en fruits, le lien entre le nombre
de fruits sur l ’arbre et le rapport feu illes/fru it moyen, qui est une donnée d’entrée du modèle,
est direct. La variable d ’entrée du modèle liée à l ’ irrigation est le potentiel hydrique du
rameau. Le lien entre cette variable d ’entrée et celle de pilotage utilisée par les arboriculteurs
est à modéliser. Une variable de pilotage pouvant être les variations de diamètre de tiges déjà
utilisées par les arboriculteurs pour p ilo ter l ’ irrigation (Am iraux, 2003) et présentant un lien
direct avec le potentiel hydrique du rameau (Génard et a l., 2001). L ’ indicateur tensiométrique
est également bien utilisé mais ic i un modèle reliant cet indicateur et le potentiel hydrique du
rameau serait à construire.
L ’extension de notre modèle à l ’arbre permettrait d ’analyser l ’effet des pratiques culturales
sur la variabilité de la qualité dans la plante, ce qui serait une avancée très importante en
matière de maîtrise de la qualité.
I
125
Bibliographie
Akam ine, E. K . and Goo, T . (1973). Respiration and ethylene production during
ontogeny o f fru it. Journa l o f the Am erican Society fo r H o rticu ltu ra l Science 98, 286-291.
A m iraux, C. (2003). Maîtrise de l'équilibre vigueur-fructification du pêcher pour une
nouvelle conduite de l'arbre et une gestion raisonnées de l'irrigation, pp. 204. Toulouse: Ecole
National d'Agronomie de Toulouse.
Andersen, P. C., B rodbeck, B. V. and M izel, R. F. (1995). Water stress- and nutrient
solution-mediated changes in water relations and amino acids, organic acids, and sugars in
xylem flu id o f Prunus sa lic ina and Lagerstroem ia indica. Journa l o f the Am erican Society fo r
H o rticu ltu ra l Science 120, 36-42.
A ustin , P. T ., H a ll, A . J., G andar, P. W ., W arring ton , I. J., Fu lton , T . A . and
H a lligan , E. A. (1999). Compartment model o f the effect o f early-season temperatures on
potential size and growth o f'D e lic ious ' apple fruits. Annals o f Botany 83, 129-143.
Bangerth, F. (1979). Calcium-related physiological disorders o f plants. Annual
Review o f Phytopathology 17, 97-122.
Baysdorfer, C. and Bassham, J. A . (1985). Photosynthetate supply and utiliza tion in
alfalfa. A developmental shift from a source to as sink lim ita tion o f photosynthesis. P lant
Physiology 77,313-317.
Behboudian, M . H ., Lawes, G. S. and G riffits , K . M . (1994). The influence o f water
defic it on water relations, photosynthesis and fru it growth in Asian pear (Pyrus serotina
Rehd.). Scientia H orticu ltu rae 60, 89-99.
Ben M im oun, M ., Longuenesse, J. J. and G cnard, M . (1996). Pmax as related to
le a ffru it ratio and fru it assimilate demand in peach. Journa l o f H o rticu ltu ra l Science 71, 767-
775.
Berm an, M . E. and Dejong, T . M . (1996). Water stress and crop load effects on fru it
fresh and dry weights in peach (.Prunus pérsica). Tree Physiology 16, 859-864.
126
i
B ertin , N., G autie r, H . and Roche, C. (2002). Number o f cells in tomato fru it
depending on fru it position and source-sink balance during plant development. P lant G row th
Regulation 36, 105-112.
B e rtin , N., G u ichard , S., Leonard, C., Longuenesse, J. J., Langlo is, D. and Navez,
B. (2000). Seasonal evolution o f the quality o f fresh glasshouse tomatoes under mediterranean
conditions, as affected by air vapour pressure de fic it and plant fru it load. Annals o f Botany 85,
741-750.
B lanpied, G. D. (1964). The relationship between growing season temperatures,
bloom dates and the length o f the growing season o f Red Delicious apples in North America.
Proceedings o f the Am erican Society fo r H o rticu ltu ra l Science 84, 72-81.
B lanpied, G. D. and Ben-David, S. (1970). A New York study o f'M cIn tosh ' apple
optimum harvest dates. Journa l o f the American Society fo r H o rticu ltu ra l Science 95, 151-
154.
Bonnans, S. and Noble, A. C. (1993). Effect o f sweetener type and o f sweetener and
acid levels on temporal perception o f sweetness, sourness and fruitiness. Chem ical Senses 18,
273-283.
Boyer, J. S. (1985). Water transport. Annual Review o f P lant Physiology 36, 473-516.
B u ron dkar, M . M ., Bhingarde, R. T ., Kore, V. N. and Powar, A . G. (2000).
Estimation o f heat units as m aturity indices for different mango varieties in Konkan region o f
Maharshtra. Acta H orticu ltu rae 509, 297-299.
Bussières, P. (2002). Water import in the young tomato fru it lim ited by pedicel
resistance and calyx transpiration. Functional P lan t B io logy 29, 631-641.
Bütenm eyer, K ., L iith e n , I I . and Bõttger, M . (1998). Auxin-induced changes in cell
wall extensibility o f maize roots. Planta 204, 515-519.
Buwalda, J. G. (1991). A mathematical model o f carbon acquisition and u tilisation by
k iw i fru it vines. Ecolog ica l M odelling 57, 43-64.
Chacko, E. K ., Reddy, Y . T. N. and Ananthanarayanan, T . V . (1982). Studies on
the relationship between leaf number and area and development in mango (M angifera indica
L.). Journa l o f H o rticu ltu ra l Science 57, 483-492.
127
i
C haik ia ttiyos, S., M enzel, C. M . and Rasmussen, T . S. (1994). Floral induction in
tropical fru it trees: separate effects o f temperature and water supply. Journa l o f H o rtic u ltu ra l
Science 68, 255-261.
Chauhan, P. S. and Pandey, R. M . (1984). Relative 14C02 fixa tion by leaves and
fruits, and translocation o f l4C-sucrose in mango. Scientia H orticu ltu rae 22, 121-128.
Cosgrove, D. J. (1985). Cell wall yie ld properties o f growing tissue. P lant Physiology
78, 347-356.
Cowan, A . K ., M oore-G ordon, C. S., B e rtling , I. and W olstenholm e, B. N. (1997).
M etabolic control o f avocado fru it growth. Plant Physiology 114, 511 -518.
Crisosto, C. H ., Johnson, R. S., Luza, J. G. and Crisosto, C. M . (1994). Irrigation
regimes affect fru it soluble solids concentration and rate o f water loss o f 'O 'Henry' peaches.
Hortscience 29, 1169-1171.
C u tting , J. G. M . and Lyne, M . C. (1993). G irdling and the reduction in shoot xylem
sap concentrations o f cytokinins and gibberellins in peach. Journa l o f H o rtic u ltu ra l Science
68,619-626.
Dale, J. E. and S u tcliffe , J. F. (1986). Water relations o f plant cells. In Plant
Physiology, vol. 9 (ed. F. C. Steward), pp. 1-48. Orlando, FL: Academic Press.
Dejong, T . M ., Doyle, J. F. and Day, K . R. (1987). Seasonal patterns o f reproductive
and vegetative sink activity in early and late maturing peach (Prunus pérsica) cultivars.
Physiologia P lantarum 71, 83-88.
Dejong, T . M . and G oudriaan, J. (1989). M odeling peach fru it growth and
carbohydrate requirements: réévaluation o f the double-sigmoid growth pattern. Journa l o f the
Am erican Society f o r H o rticu ltu ra l Science 114, 800-804.
D iczbalis, Y ., Hofm an, P., Landrigan , ML, K u lk a rn i, V. and L , S. (1995). Mango
irrigation management for fru it yield, m aturity and quality. In Mango 2000 m arketing seminar
and production workshop, pp. 85-90. Brisbane, Australia.
Douce, R. (1985). M itochondria in higher plants: structure, function, and biogenesis.
Orlando (USA): Academic Press.
128
I
Doyle, C. J., M oore, W . B. and Henzell, R. F. (1989). M odelling the economic
consequences o f potential management changes in a mature k iw ifru it orchard in New
Zealand. A g ricu ltu ra l System 31, 321-347.
E rhet, D. L . and Ho, L . C. (1986). Effects o f osmotic potential in nutrient solution on
diurnal growth o f tomato fru it. Journa l o f Experim ental Botany 37, 1294-1302.
Esteban, M . A ., V illanueva, M . J. and Lissarrague, J. R. (1999). E ffect o f irrigation
on changes in berry composition o f Tem pranillo during maturation. Sugars, Organic acids,
and m ineral elements. Am erican Journa l o f Enology and V iticu lture 50, 418-434.
Evans, J. R. (1989). Partitioning o f nitrogen between and w ith in leaves grown under
different irradiances. Austra lian Journa l o f P lant Physiology 16, 533-548.
Fabian, F. W . and B lum , H . B. (1943). Relative taste potency o f some basic food
constituents and their competitive and compensatory action. Food Research 8, 179-193.
F arquhar, G. D., von Caemm erer, S. and B erry , J. A . (1980). A biochemical model
o f photosynthetic CO2 assim ilation in leaves in C3 species. Planta 149, 78-90.
Ferguson, I. B. (1984). Calcium in plant senescence and fru it ripening. Plant, C e ll
and Environment 7, 397-405.
Fishman, S. and G énard, M . (1998). A biophysical model o f fru it growth: sim ulation
o f seasonal and diurnal dynamics o f mass. Plant, C e ll and Environment 21, 739-752.
Fishman, S., Rodov, V . and Ben-Yehoshua, S. (1996). Mathematical model for
perforation effect on oxygen and water vapor dynamics in modified-atmosphere packages.
Journa l o f Food Science 61, 956-961.
Foyer, C. H . (1988). Feedback inh ib ition o f photosynthesis through source-sink
regulation in leaves. Plant Physiology 26, 483-492.
Foyer, C. H ., Chaum ont, M ., M urch ie , E., G a ltie r, N. and F e rra rio , S. (1995).
End-product modulation o f carbon partitioning w ith a view to improved biomass production.
In Carbon p a rtitio n in g and source-sinks interactions in p lants, eds M . Madore and W.
Lucas), pp. 45-55. Rockville: American Society o f Plant Physiologists.
Frensch, J. and Hsiao, T. C. (1995). Rapid response o f the yie ld threshold and turgor
regulation during adjustment o f root growth to water stress in Zea mays. P lant Physiology
108.
129
I
Fuchs, Y ., Pesis, E. and Zauberm an, G. (1980). Changes in amylase activity, starch
and sugars contents in mango fru it pulp. Sciencia H orticu ltu rae 13, 155-160.
F u jii, J. A. and Kennedy, R. A . (1985). Seasonal changes in the photosynthetic rate
in apple trees. A comparison between fru iting and nonfruiting trees. P lan t Physiology 8, 519-
524.
G ary, C., B e rlin , N., Frossard, J.-S. and Le Bot, J. (1998). H igh mineral contents
explain the low construction cost o f leaves, stems and fruits o f tomato plants. Journa l o f
Experim ental Botany 49, 49-57.
G énard, M ., B ruchou, C. and Souty, M . (1991). Variabilité de la croissance et de la
qualité chez la pêche (Prunus pérsica L. Batsch) et liaison entre croissance et qualité.
Agronom ie 11, 829-845.
G énard, M ., Fishm an, S., Vercam bre, G., Huguet, J.-G ., Bussi, C., Besset, J. and
H abib , R. (2001). A biophysical analysis o f stem and root diameter variations in woody
plants. P lant Physiology 126, 180-202.
G énard, M . and Huguet, J.-G . (1996). M odeling the response o f peach fru it growth
to water stress. Tree Physiology 16, 407-415.
G énard, M ., Lescourret, F., Ben M im oun, M ., Besset, J. and Bussi, C. (1998). A
simulation model o f growth at the shoot-bearing fru it level. II. Test and effect o f source and
sink factors in the case o f peach. European Journa l o f Agronomy 9, 186-199.
G énard, M ., Lescourret, F., Gomez, L . and H abib, R. (2003). Changes in fru it
sugar concentrations in response to assimilate supply, metabolism and d ilu tion: a modeling
approach applied to peach fru it (Prunus pérsica). Tree Physiology 23, 373-385.
G énard, M . and Souty, M . (1996). M odeling the peach sugar contents in relation to
fru it growth. Journa l o f the Am erican Society fo r H o rticu ltu ra l Science 121, 1122-1131.
G o ffine t, M . C., Robinson, T . L . and Lakso, A . N. (1995). A comparison of'E m pire '
apple fru it size and anatomy in unthinned and hand-thinned trees. Jou rna l o f H o rticu ltu ra l
Science 70, 375-387.
G oldschm idt, E. E. and H uber, S. C. (1992). Regulation o f photosynthesis by end-
product accumulation in leaves o f plants storing starch, sucrose, and hexose sugars. P lant
Physiology 99, 1443-1448.
130
i
Gomez, L., Rubio, E. and Augé, M. (2002). A new procedure fo r extraction and
measurement o f soluble sugars in ligneous plants. Journa l o f the Science o f Food and
A gricu ltu re 82, 360-369.
Gomez, L., Rubio, E. and Lescourret, F. (2003). C ritica l study o f a procedure for the
assay o f starch in ligneous plants. Journa l o f the Science o f Food and A gricu ltu re 83, 1114-
1123.
Gonzàlez-Altozano, P. and Castel, J. R. (1999). Regulated defic it irrigation in
'Clementia de Nules' citrus trees. I. Y ie ld and fru it quality effects. Journa l o f H o rticu ltu ra l
Science and B iotechnology 74, 706-713.
Grange, R. I. and Andrews, J. (1994). Expansion rate o f young tomato fru it growing
on plants at positive water potential. Plant, C e ll and Environm ent 17, 181-187.
Green, P. B., Erickson, R. O. and Buggy, J. (1971). M etabolic and physical control
o f cell elongation rate. P lant Physiology 47, 423-430.
Grossman, Y. L. and Dejong, T. M. (1994). Peach: a sim ulation model o f
reproductive and vegetative growth in peach trees. Tree Physiology 14, 329-345.
Guichard, S. (1999). Flux hydriques, croissance et qualité du fru it de tomate
(Lycopersicon esculentum M ill. ) en conditions estivales sous serre, pp. 118. Marseille:
Université A ix-M arseille III.
Habib, R., Triboi, E., Génard, M. and Le Bail, M. (1996). La nutrition azotée des
cultures et de la qualité des produits. Maîtrise de l'azote dans les agrosystèmes. In Les
Colloques, vol. 83 (ed. INRA). Paris, France.
Hall, A. J., McPherson, H. G., Crawford, R. A. and Seager, N. G. (1996). Using
early-season measurements to estimate fru it volume at harvest in k iw ifru it. New Zealand
Journa l o f C rop and H o rticu ltu ra l Science 24.
Hall, N. T., Smoot, J. M., Knight, R. J. and Nagy, S. (1980). Protein and amino acid
compositions o f ten tropical fru its by gas-liquid chromatography. Journa l o f A gricu ltu re and
Food Chem istry 28, 1217-1221.
Harmens, H., Stirling, C. M., Marshall, C. and Farrar, J. F. (2000). Does down-
regulation o f photosynthetic capacity by elevated CO2 depends on N supply in D actylis
glom erata ? Physiologia P lantarum 108, 43-50.
131
I
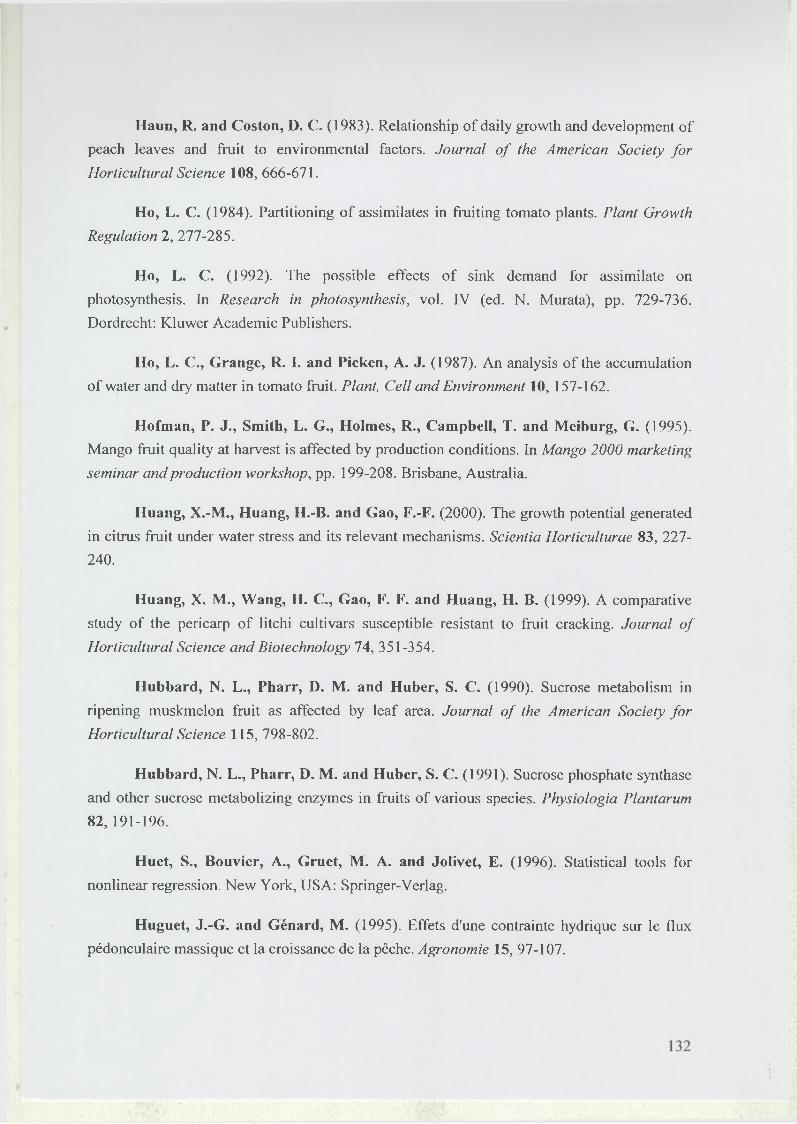
Haun, R. and Coston, D. C. (1983). Relationship o f daily growth and development o f
peach leaves and fru it to environmental factors. Journa l o f the Am erican Society fo r
H o rticu ltu ra l Science 108, 666-671.
Ho, L. C. (1984). Partitioning o f assimilates in fru iting tomato plants. P lant Growth
Regulation 2, 277-285.
Ho, L. C. (1992). The possible effects o f sink demand for assimilate on
photosynthesis. In Research in photosynthesis, vol. IV (ed. N. Murata), pp. 729-736.
Dordrecht: K luw er Academic Publishers.
Ho, L . C., Grange, R. I. and Picken, A. J. (1987). An analysis o f the accumulation
o f water and dry matter in tomato fru it. Plant, C e ll and Environm ent 10, 157-162.
Hofman, P. J., Smith, L. G., Holmes, R., Campbell, T. and Meiburg, G. (1995).
Mango fru it quality at harvest is affected by production conditions. In Mango 2000 m arketing
seminar and p roduction workshop, pp. 199-208. Brisbane, Australia.
Huang, X .-M ., Huang, H.-B. and Gao, F.-F. (2000). The growth potential generated
in citrus fru it under water stress and its relevant mechanisms. Scientia H orticu ltu rae 83, 227-
240.
Huang, X. M., Wang, H. C., Gao, F. F. and Huang, H. B. (1999). A comparative
study o f the pericarp o f litch i cultivars susceptible resistant to fru it cracking. Journa l o f
H o rticu ltu ra l Science and B iotechnology 74, 351-354.
Hubbard, N. L ., Pharr, D. M . and Huber, S. C. (1990). Sucrose metabolism in
ripening muskmelon fru it as affected by leaf area. Journa l o f the American Society f o r
H o rticu ltu ra l Science 115, 798-802.
Hubbard, N. L., Pharr, D. M. and Huber, S. C. (1991). Sucrose phosphate synthase
and other sucrose metabolizing enzymes in fruits o f various species. Physiologia P lantarum
82, 191-196.
Huet, S., Bouvier, A., Gruet, M. A. and Jolivet, E. (1996). Statistical tools for
nonlinear regression. New York, USA: Springer-Verlag.
Huguet, J.-G. and Génard, M. (1995). Effets d'une contrainte hydrique sur le flux
pédonculaire massique et la croissance de la pêche. Agronomie 15, 97-107.
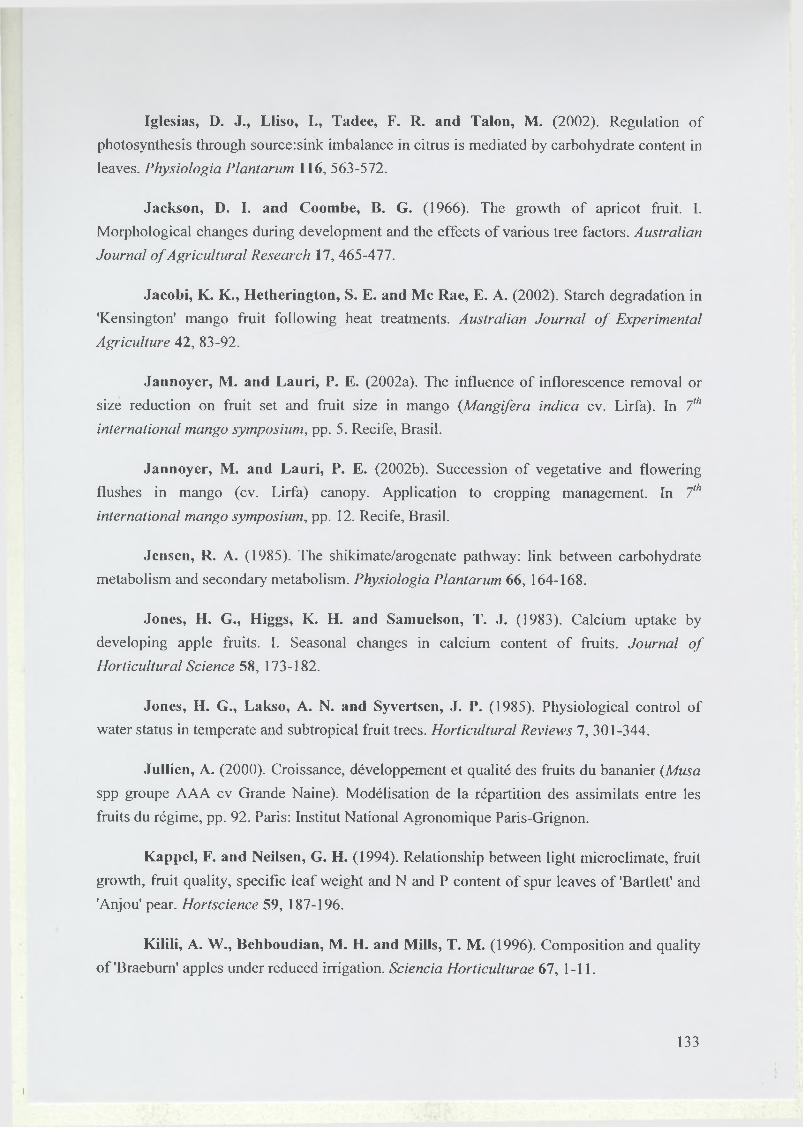
Iglesias, D. J., L liso , I., Tadee, F. R. and Talon, M . (2002). Regulation o f
photosynthesis through source:sink imbalance in citrus is mediated by carbohydrate content in
leaves. Physiologia P lantarum 116, 563-572.
Jackson, D. I. and Coombe, B. G. (1966). The growth o f apricot fru it. I.
M orphological changes during development and the effects o f various tree factors. Austra lian
Journa l o f A g r ic u ltu ra l Research 17, 465-477.
Jacobi, K . K ., H e therington, S. E. and Me Rae, E. A . (2002). Starch degradation in
'Kensington' mango fru it fo llow ing heat treatments. Austra lian Jou rna l o f Experim ental
A gricu ltu re 42, 83-92.
Jannoyer, M . and L a u ri, P. E. (2002a). The influence o f inflorescence removal or
size reduction on fru it set and fru it size in mango (M angifera indica cv. L irfa ). In 7th
in te rna tiona l mango symposium, pp. 5. Recife, Brasil.
Jannoyer, M . and L a u ri, P. E. (2002b). Succession o f vegetative and flowering
flushes in mango (cv. L irfa ) canopy. Application to cropping management. In 7th
in te rna tiona l mango symposium , pp. 12. Recife, Brasil.
Jensen, R. A. (1985). The shikimate/arogenate pathway: link between carbohydrate
metabolism and secondary metabolism. Physiologia P lantarum 66, 164-168.
Jones, H . G ., H iggs, K . H. and Samuelson, T . J. (1983). Calcium uptake by
developing apple fruits. I. Seasonal changes in calcium content o f fruits. Journa l o f
H o rticu ltu ra l Science 58, 173-182.
Jones, H. G ., Lakso, A . N. and Syvertsen, J. P. (1985). Physiological control o f
water status in temperate and subtropical fru it trees. H o rticu ltu ra l Reviews 7, 301-344.
Ju llie n , A . (2000). Croissance, développement et qualité des fru its du bananier (Musa
spp groupe A A A cv Grande Naine). Modélisation de la répartition des assimilais entre les
fru its du régime, pp. 92. Paris: Institut National Agronomique Paris-Grignon.
Kappel, F. and Neilsen, G. H . (1994). Relationship between ligh t m icroclimate, fru it
growth, fru it quality, specific leaf weight and N and P content o f spur leaves o f 'Bartlett' and
'Anjou' pear. Hortscience 59, 187-196.
K ili l i, A . W ., Behboudian, M . H. and M ills , T . M . (1996). Composition and quality
o f 'Braebum' apples under reduced irrigation. Sciencia H orticu ltu rae 67, 1-11.
133
i
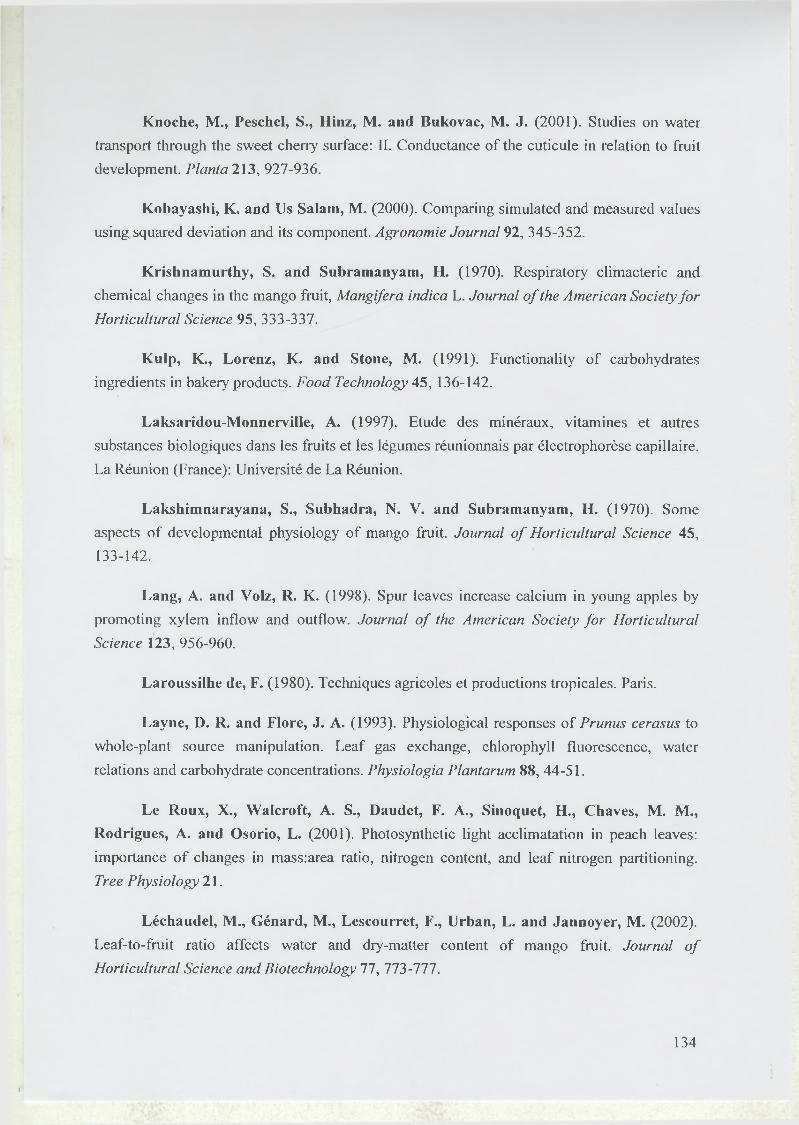
Knoche, M ., Peschel, S., H inz, M . and Bukovac, M . J. (2001). Studies on water
transport through the sweet cherry surface: II. Conductance o f the cuticule in relation to fru it
development. Planta 213, 927-936.
Kobayashi, K . and Us Salam, M . (2000). Comparing simulated and measured values
using squared deviation and its component. Agronom ie Journa l 92, 345-352.
K rish n a m u rth y , S. and Subram anyam , H . (1970). Respiratory clim acteric and
chemical changes in the mango fru it, M angifera indica L. Journa l o f the Am erican Society f o r
H o rticu ltu ra l Science 95, 333-337.
K u lp , K ., Lorenz, K . and Stone, M . (1991). Functionality o f carbohydrates
ingredients in bakery products. Food Technology 45, 136-142.
Laksa ridou-M onnerv ille , A . (1997). Etude des minéraux, vitamines et autres
substances biologiques dans les fru its et les légumes réunionnais par électrophorèse capillaire.
La Réunion (France): Université de La Réunion.
Laksh im narayana, S., Subhadra, N. V. and Subram anyam , H . (1970). Some
aspects o f developmental physiology o f mango fru it. Journa l o f H o rtic u ltu ra l Science 45,
133-142.
Lang, A. and Volz, R. K . (1998). Spur leaves increase calcium in young apples by
promoting xylem in flow and outflow . Journa l o f the American Society f o r H o rticu ltu ra l
Science 123, 956-960.
Laroussilhe de, F. (1980). Techniques agricoles et productions tropicales. Paris.
Layne, D. R. and F lore, J. A. (1993). Physiological responses o f Prunus cerasus to
whole-plant source manipulation. Leaf gas exchange, chlorophyll fluorescence, water
relations and carbohydrate concentrations. Physiologia P lantarum 88, 44-51.
Le Roux, X ., W a lc ro ft, A . S., Daudet, F. A ., Sinoquet, H ., Chaves, M . M .,
Rodrigues, A . and O sorio, L . (2001). Photosynthetic ligh t acclimatation in peach leaves:
importance o f changes in mass:area ratio, nitrogen content, and leaf nitrogen partitioning.
Tree Physiology 21.
Léchaudel, M ., G énard, M ., Lescourret, F., U rban, L . and Jannoyer, M . (2002).
Leaf-to-fru it ratio affects water and dry-matter content o f mango fru it. Journa l o f
H o rticu ltu ra l Science and Biotechnology 77, 773-777.
134
i
Lee, D. R. (1990). An unidirectional water flux model o f fru it growth. Canadian
Journa l o f Botany 68, 1286-1290.
Leley, V. K ., Narayana, N. and D a ji, J. A . (1943). Biochemical studies in the growth
and ripening o f the Alphonse mango. Ind ian Journa l o f A g ricu ltu ra l Science 13, 264-271.
Lescourret, F., Ben M im oun, M . and G énard, M . (1998). A sim ulation model o f
growth at the shoot-bearing fru it level. I. Description and parametrization fo r peach.
European Journa l o f Agronom y 9, 173-188.
Lescourret, F., G énard, M . and Fishman, S. (2001). Variation in surface
conductance to water vapor diffusion in peach fru it and its effects on fru it growth assessed by
a sim ulation model. Tree Physiology 21, 735-741.
L i, S. H ., G énard, M ., Huguet, J.-G ., H abib , R., Besset, J. and Lau ren t, R. (2001).
Fru it quality and leaf photosynthesis in response to m icroenvironment m odification around
individual fru it by covering the fru it w ith plastic in nectarine and peach trees. Journa l o f
H o rticu ltu ra l Science and Biotechnology 76, 61-69.
L i, S. H ., Huguet, J.-G . and Bussi, C. (1989). Irrigation scheduling in a mature peach
orchard using tensiometer and dendrometers. Irr ig a tio n Drainage System 3, 1-12.
L izada, C. (1993). Mango. In Biochemistry o f f r u it ripening, eds G. B. Seymour J. E.
Taylor and G. A. Tucker), pp. 255-271. London: Chapman and Hall.
L o b it, P. (1999). Etude et modélisation de l'acidité des pêches (Prunus pérsica L.
Batsch, cv. Fidelia). Application à l'étude des effets de la nutrition azotée. In Sciences
agronomiques, pp. 231. M ontpellier: ENSAM.
L o b it, P., G énard, M ., W u, B .-H ., Soing, P. and H ab ib , R. (2003). M odelling citrate
metabolism in fruits: responses to growth and temperature. Journa l o f Experim ental Botany
54, 2489-2501.
L o b it, P., Soing, P., Génard, M . and H abib , R. (2002). Theoretical analysis o f
relationships between composition, pH, and titratable acidity o f peach fru it. Journa l o f P lant
N u tritio n 25, 2775-2792.
L ockh a rt, J. A . (1965). An analysis o f irreversible plant cell elongation. Journa l o f
Theorica l B io logy 8, 264-275.
135
Lom bard, P. B., C ordy, C. B. and Hansen, E. (1971). Relation o f post-bloom
temperatures to 'Bartlett' pear maturation. Journa l o f the Am erican Society fo r H o rticu ltu ra l
Science 96, 799-801.
M arce lis, L . F. M . and Baan H o fm an-E ije r, L . R. (1995). Growth and maintenance
respiratory costs o f cucumber fru its as affected by temperature, and ontogeny and size o f the
fruits. Physiologia P lantarum 93.
M arce lis, L . F. M ., H euvelink, E. and G oudriaan, J. (1998). M odelling biomass
production and yie ld o f horticultural crops: a review. Scientia H orticu ltu rae 74, 82-111.
M a rq u a rd , R. D. (1987). Influence o f leaf to fru it ratio on nut quality, shoot
carbohydrates, and photosynthesis o f pecan. Hortscience 22, 256-257.
M arsh, K . B., R ichardson, A . C. and M acrae, E. A . (1999). Early- and mid-season
temperature effects on the growth and composition o f satsuma mandarins. Journa l o f
H o rticu ltu ra l Science and Biotechnology 74, 443-451.
M aruyam a, S. and Boyer, J. S. (1994). A uxin action on growth in intact plants:
threshold turgor is regulated. Planta 193, 44-50.
M cFadyen, M . L ., H u tton , R. J. and Barlow , E. W . R. (1996). Effects o f crop load
on fru it water relations and fru it growth in peach. Journa l o f H o rticu ltu ra l Science 71, 469-
480.
M cQueen-Mason, S. J. (1995). Expansins and cell wall expansion. Journa l o f
Experim ental Botany 46, 1639-1650.
M cQueen-Mason, S. J. and Cosgrove, D. J. (1995). Expansin mode o f action on cell
walls: Analysis o f wall hydrolysis, stress relaxation, and binding. Plant Physiology 107, 87-
100.
M ed lico tt, A . P. and Thompson, A. K . (1985). Analysis o f sugars and organic acids
in ripening mango fru its (M angifera indica L. var K e itt) by high performance liqu id
chromatography. Journa l o f the Science o f Food and A g ricu ltu ra l 36, 561-566.
Mendoza, D. B. and W ills , R. B. H . (1984). 3. Changes in mango during growth and
maturation. In Mango : F ru it Development, postharvest physiology and m arketing in ASEAN,
(ed. M. a. W ills ), pp. 21-38. Kuala Lumpur, Malaysia.
136
M ichelena, V . A. and Boyer, J. S. (1982). Complete turgor maintenance at low water
potentials in the elongation region o f maize leaves. P lant Physiology 69, 1145-1149.
M ila d , R. E. and Shackel, K . A . (1992). Water relations o f fru it end cracking in
french prune (Prunus domestica L. cv. French). Journa l o f the Am erican Society fo r
H o rticu ltu ra l Science 117, 824-828.
M ille r, S. A ., Sm ith, G. S., Bo ld ingh, H . L . and Johansson, A . (1998). Effects o f
water stress on fru it quality attributes o f k iw ifru it. Annals o f Botany 81, 73-81.
M ills , T . M ., Behboudian, M . H . and C lo th ie r, B. E. (1996). Water relations,
growth, and the composition o f 'Braebum' apple fru it under defic it irrigation. Journa l o f the
Am erican Society f o r H o rticu ltu ra l Science 121, 286-291.
M ills , T . M ., Behboudian, M . H . and C lo th ie r, B. E. (1997). The diurnal and
seasonal water relations, and composition, o f 'Braebum' apple fru it under reduced plant water
status. P lant Science 126, 145-154.
M ills , T . M ., Behboudian, M . H ., Tan, P. Y . and C lo th ie r, B. E. (1994). Plant water
status and fru it quality in 'Braebum' apples. Hortscience 29, 1274-1278.
M ingo, D. M ., Bacon, M . A . and Davies, W . J. (2003). Non-hydraulic regulation o f
fru it growth in tomato plants (Lycopersicon esculentum cv. Solairo) growing in drying soil.
Journa l o f Experim ental Botany 54, 1205-1212.
M itch e ll, J. P., Shennan, C. and G ra ttan , M . R. (1991). Developmental changes in
tomato fru it composition in response to water de fic it and salinity. Physiologia Plantarum 83,
177-185.
M organ, D. C., Stanley, C. J., Volz, R. and W arring ton , I. J. (1984). Summer
pruning o f 'Gala' apple: The relationships between pruning time, radiation penetration, and
fru it quality. Journa l o f the Am erican Society fo r H o rticu ltu ra l Science 109, 637-642.
M organ, P. W . and Drew , M . C. (1997). Ethylene and plant responses to stress.
Physiologia P lantarum 100, 620-630.
M o rto n , J. F. (1987). Fruits o f warm climates. M iam i.
Mosqueda-Vasquez, R. and Ire ta-O jeda, A . (1993). Degree-days and base
temperature required for inflorescence and fru it development in mango 'Manila'. Acta
H orticu ltu rae 341, 232-239.
137
M pelasoka, B. S., Behboudian, M . H ., D ixon, J., Neal, S. M . and C aspari, H . W .
(2000). Improvement o f fru it quality and storage potential o f 'Braebum' apple through defic it
irrigation. Journa l o f H o rticu ltu ra l Science and B iotechnology 75, 615-621.
M pelasoka, B. S., Behboudian, M . H . and M ills , T . M . (2001). Water relations,
photosynthesis, growth, yie ld and fru it size o f 'Braebum' apple:Responses to defic it irrigation
and to crop load. Journa l o f H o rticu ltu ra l Science and Biotechnology 76, 150-156.
M ukerjee , P. K . (1959). Biochemical and physiological studies during development
o f mango fru it. H o rticu ltu ra l Advance 3, 95-101.
N aor, A ., G al, Y . and Bravdo, B. (1997). Crop load affects assimilation rate,
stomatal conductance, stem water potential and water relations o f field-grown Sauvignon
blanc grapevines. Journa l o f Experim ental Botany 48, 1675-1680.
N aor, A ., K le in , I. and Doron, I. (1995). Stem water potential and apple size. Journa l
o f the Am erican Society f o r H o rticu ltu ra l Science 120, 577-582.
Nobel, P. S. (1974). Introduction to Biophysical Plant Physiology. San Fransisco, CA.
Noble, A ., P h ilb rick , K . and Boulton, R. (1986). Comparison o f sourness o f organic
anions at equal pH and equal titratable acidity. Journa l ofSensoty Studies 1, 1-8.
Nonam i, H. and Boyer, J. S. (1989). Turgor and growth at low water potentials.
P lant Physiology 89, 798-804.
Nonam i, H . and Boyer, J. S. (1990). Primary events regulating stem growth at low
water potentials. P lant Physiology 94, 1601-1609.
Nooden, L . D. (1988). Whole plant senescence. In Senescence and aging in p lants,
eds L. D. Nooden and A. Leopold), pp. 391-439. San Diego, USA: Academic Press.
O kam oto, A ., M iw a , C., Masuda, T ., N akahori, K . and Katou, K . (1990). Effects
o f auxin and anoxia on the cell wall yield threshold determined by negative pressure jumps in
segments o f cowpea hypocotyl. Plant and C e ll Physiology 31, 783-788.
O kam oto, H. and O kam oto, A. (1994). The pH-dependent yield threshold o f the cell
wall in a glycerinated hollow cylinder (in v itro system) o f cowpea hypocotyl. Plant, C e ll and
Environm ent 17, 979-983.
138
i
O kam oto-Nakazato, A ., N akam ura, T . and O kam oto, H . (2000). The isolation o f
wall-bound proteins regulating yie ld threshold tension in glycerinated hollow cylinders o f
cowpea hypocotyl. Plant, C e ll and Environm ent 23, 145-154.
O lla t, N. and G audillè re , J.-P. (1996). Investigation o f assimilates import
mechanisms in berries o f Vitis v in ifera var. Cabernet Sauvignon. Acta H orticu ltu rae 427,
141-149.
O ppenheim er, C. (1947). The acclimatatization o f new tropical and subtropical fruits
in Palestine. Rehovoth, Palestine: Agricultura l Research Station.
O rtega, J. K . E. (1985). Augmented growth equation fo r cell wall expansion. P lant
Physiology 79, 318-320.
O rtega, J. K . E. (1990). Governing equations for plant cell growth. Physiologia
Plantarum 79, 116-121.
Palm er, J. W . (1992). Effects o f varying crop load on photosynthesis, dry matter
production and partitioning o f C risp in/M .27 apple trees. Tree Physiology 11, 19-33.
Pech, J.-C ., Balague, C., Latche, A . and Bouzayen, M . (1994). Postharvest
physiology o f clim acteric fruits: recent development in the biosynthesis and action o f
ethylene. Sciences des A lim ents 14, 3-15.
Peel, A. J. (1965). The effect o f changes in the diffusion potential o f xylem water on
sieve-tube exudation from isolated stem segments. Journa l o f Experim ental Botany 16, 249-
260.
Penning de V ries, F. W . T ., Jansen, D. M ., M , t. B. H . F. and Bakema, A . (1989).
S im ulation o f ecophysiological processes for growth in several annual crops. In Sim ulation
monographs, vol. 29. Wageningen: Pudoc.
Poll, L ., R indom , A ., Toldam -Andersen, T . B. and Hansen, P. (1996). A v a ilib ility
o f assimilates and form ation o f aroma compounds in apples as affected by the fru it/le a f ratio.
Physiologia P lantarum 74, 772-776.
Pomper, K . W . and Breen, P. J. (1997). Expansion and osmotic adjustment o f
strawberry fru it during water stress. Journa l o f the American Society fo r H o rticu ltu ra l Science
122, 183-189.
139
Proseus, T . E., O rtega, J. K . E. and Boyer, J. S. (1999). Separating growth from
elastic deformation during cell enlargement. P lant Physiology 119, 775-784.
Proseus, T . E., Zhu, G. L . and Boyer, J. S. (2000). Turgor, temperature and the
growth o f plant cells: using Chara co ra llina as a model system. Journa l o f Experim ental
Botany 51, 1481-1494.
Q uereix, A ., Dewar, R. C., G audillè re, J. P., Dayau, S. and Valancogne, C. (2001).
Sink feedback regulation o f photosynthesis in vines: measurements and a model. Journa l o f
Experim ental Botany 52, 2313-2322.
Q u illo t, B. (2003). Vers une démarche de sélection variétale assistée par des modèles
écophysiologiques et génétiques. Cas de la qualité organoleptique chez la pêche {Prunus
pérsica L. Batsch), pp. 125. Paris: INA-PG.
Ramos, D. E., W einbaum , S. A ., Shackel, K . A ., SchwankI, L . J., M itcham , E. J.,
M itch e ll, F. G., Snyder, R. G ., M ayer, G. and M e G ourty , G. (1994). Influence o f tree
water status and canopy position on fru it size and quality o f bartlett pears. Acta H orticu ltu rae
367.
Reddy, Y. T . N. and Singh, G. (1991). Further studies on the relationship between
leaf number and area fru it development in mango (M angifera Ind ica L.). Journa l o f
H o rticu ltu ra l Science 66, 471-478.
R ichardson, A . C., M arsh, K . B. and Macrae, E. A . (1997). Temperature effects on
satsuma mandarin fru it development. Journa l o f H o rticu ltu ra l Science 2, 919-929.
Robinson, T. L ., Lakso, A . N. and C arpenter, S. G. (1991). Canopy development,
yield, and fru it quality o f 'Empire' and 'Delicious' apple trees grown in four orchard
production systems for ten years. Journa l o f the American Society fo r H o rticu ltu ra l Science
116, 179-187.
Rosati, A ., Esparza, G ., Dejong, T . M . and Pearcy, R. W . (1999). Influence o f
canopy ligh t environment and nitrogen availab ility on leaf photosynthetic characteristics and
photosynthetic nitrogen-use-efficiency o f field-grown nectarine trees. Tree Physiology 20,
271-276.
Saini, S. S., Singh, R. N. and Paliw al, G. S. (1971). Growth and development o f
mango (M angife ra Ind ica L.) fru it. I. Morphology and cell division. Ind ian Journa l o f
H orticu ltu re 28, 247-256.
140
i
Schackel, K. A., Matthews, M. A. and Morrison, J. C. (1987). Dynamic relation
between expansion and cellular turgor in growing grape (V itis v in ife ra L.) leaves. Plant
Physiology 84, 1166-1171.
Scorza, R., May, L. G., Purnell, B. and Upchurch, B. (1991). Differences in number
and area o f mesocarp cells between small- and large-fruited peach cultivars. Journa l o f the
Am erican Society fo r H o rticu ltu ra l Science 116, 861-864.
Selva raj, Y. and Kumar, R. (1994). Enzymatic regulation in ripening mango fru it.
Ind ian Jou rna l o f H orticu ltu re 51, 316-323.
Selvaraj, Y., Kumar, R. and Pal, D. K. (1989). Changes in sugars, organic acids,
amino acids, lip id constituents and aroma characteristics o f ripening mango (M angife ra indica
L.) fru it. Journa l o f Food and A gricu ltu re 26, 308-313.
Serpe, M. D. and Matthews, M. A. (1992). Rapid changes in cell w a ll yie lding o f
elongating Begonia argenteo-guttata L. leaves in response to changes in plant water status.
P lant Physiology 100, 1852-1857.
Sicher, R. C. and Krember, O. F. (1985). Possible control o f maize leaf sucrose-
phosphate synthase activity by ligh t modulation. P lant Physiology 79, 727-730.
Simmons, S. L., Hofman, P. J., Whiley, A. W. and Hetherington, S. E. (1998).
Effects o f leaf:fru it ratios on fru it growth, mineral concentration and quality o f mango
(M angifera indica L. cv. Kensington Pride). Journa l o f H o rticu ltu ra l Science and
Biotechnology 73, 367-374.
Singh, L . B. (1960). The mango, botany, cultivation and utilisation. New York:
Interscience.
Souty, M., Génard, M., Reich, M. and Albagnac, G. (1999). Effect o f assimilate
supply on peach fru it maturation and quality. Canadian Journa l o f P lan t Science 79, 259-268.
Sovonick-Dunford, S. (1986). Water relations parameters o f white ash sieve tubes. In
Phloem transport, Colloque 08-85. P lant b io logy IV , eds. J. Cronshaw W. J. Lucas and R. T.
G iaquinta), pp. 187-191. Asimolar, Californie.
Sprugel, D. G., Hinckley, T. M. and Schaap, W. (1991). The theory and practice o f
branch autonomy. Annual Review o f Ecology and Systematics 22, 309-334.
141
I
Stanley, C. J., T ustin , D. S., Lup ton , G. B., M cA rtney, S., Cashmore, W . M . and
De S ilva, H . N. (2000). Towards understanding the role o f temperature in apple fru it growth
responses in three geographical regions w ith in New Zealand. Journa l o f the H o rtic u ltu ra l
Science and Biotechnology 75, 413-422.
Steudle, E., M u rrm a n n , M . and Peterson, C. A. (1993). Transport o f water and
solutes across maize roots m odified py puncturing the endodermis. Further evidence fo r the
composite transport model o f root. P lant Physiology 103, 335-349.
Steudle, E. and W ieneke, J. (1985). Changes in water relations and elastic properties
o f apple fru it cells during growth and development. Journa l o f the Am erican Society f o r
H o rticu ltu ra l Science 110, 824-829.
Su llivan, D. T . (1965). The effect o f tim e o f bloom o f individual flowers on the size,
shape and m aturity o f apple fruits. Proceedings o f the Am erican Society f o r H o rticu ltu ra l
Science 87, 41-46.
Syversten, J. P. and A lb rig o , L . G. (1980). Seasonal and diurnal citrus leaf and fru it
water relations. Botany Gazette 141, 440-446.
Tandon, D. K . and K a lra , S. K . (1983). Changes in sugars, starch and amylase
activ ity during development o f mango fru it cv. Dashehari. Journa l o f H o rticu ltu ra l Science 5,
449-453.
Thompson, D. S., Davies, W . J. and Ho, L . C. (1998). Regulation o f tomato fru it
growth by epidermal cell wall enzymes. Plant, C e ll and Environment 21, 589-599.
Thorn ley, J. H . M . (1970). Respiration, growth and maintenance in plants. Nature
227, 304-305.
T rom p, J. (1997). M aturity o f apple cv. Elstar as affected by temperature during a six-
week period fo llow ing bloom. Journa l o f H o rticu ltu ra l Science 72, 811-819.
Tukey, L . D. (1960). Some effects o f night temperatures on the growth o f McIntosh
apples, II. Proceedings o f the American Society f o r H o rticu ltu ra l Science 75, 39-46.
Tyree, M . T. and Jarvis, P. G. (1982). Water in tissue and cells. In Physio log ical
P lant Ecology II. Water re lations and carbon assim ila tion , eds O. L. Lange P. S. Nobel C. B.
Osmond and H. Ziegler). Berlin and New York: Springer-Verlag.
142
i
Urban, L., Bertheuil, F. and Léchaudel, M. (2002). A coupled photosynthesis and
stomatal conductance model for mango leaves. Acta H orticu ltu rae 584, 81-88.
Urban, L., Le Roux, X., Sinoquet, H., Jaffuel, S. and Jannoyer, M. (2003). A
biochemical model o f photosynthesis fo r mango leaves: evidence for the effect o f fru it on
photosynthetic capacity o f nearby leaves. Tree Physiology 23, 289-300.
Valantin, M., Gary, C., Vaissière, B. E. and Frossard, J.-S. (1999). Effect o f fru it
load on partitioning o f dry matter and energy in cantaloupe (Cucumis melo L.). Annals o f
Botany 84, 173-181.
van Die, J. and Willemnse, N. C. M. (1980). The supply o f water and solutes by
phloem and xylem to growing fru its o f Yucca fla cc id a Haw. Berichte der Deutschen
Botanischen Gesselschaft 93.
Van IerseI, M. W. (2003). Carbon use efficiency depends on growth respiration,
maintenance respiration, and relative growth rate. A case study w ith lettuce. Plant, C e ll and
Environm ent 26, 1441 -1449.
Vassey, L. T. (1989). Light/dark profiles o f sucrose phosphate synthase, sucrose
synthase, and acid invertase in leaves o f sugarbeets. P lant Physiology 89, 347-351.
Vertregt, N. and Penning de Vries, F. W. T. (1987). A rapid method for determining
the efficiency o f biosynthesis o f plant biomass. Journa l o f Theoretical B io logy 128, 109-119.
Vivin, P., Castelan-Estrada, M. and Gaudillère, J. P. (2003). Seasonal changes in
chemical composition and construction costs o f grapevine tissues. Vitis 42, 5-12.
Volz, R. K., Ferguson, I. B., Bowen, J. H. and Watkins, C. B. (1993). Crop load
effects on fru it mineral nutrition, m aturity, fru iting and tree growth o f 'Cox's Orange Pippin'
apple. Journa l o f H o rticu ltu ra l Science 68, 127-137.
Volz, R. K., Palmer, J. W. and Gibbs, H. M. (1995). W ithin-tree variab ility in fru it
quality and m aturity fo r 'Royal Gala' apple. Acta H orticu ltu rae 379, 61-1A.
von Caemmerer, S. and Farquhar, G. D. (1981). Some relationships between the
biochemistry o f photosynthesis and the gas exchange o f leaves. Planta 153, 376-387.
Wahab, A. and Khan, A. J. (1954). Changes in the chemical composition o f
mangoes during ripening. Pakistan Journa l o f Scientific Research 6, 124-127.
143
Walker, A. J. and Thornley, J. H. M. (1977). The tomato fru it: im port, growth,
respiration and carbon metabolism at different fru it sizes and temperatures. Annals o f Botany
41, 977-985.
Wang, Z. and Stutte, G. (1992). The role o f carbohydrates in active osmotic
adjustment in apple under water stress. Journa l o f the Am erican Society fo r H o rticu ltu ra l
Science 117, 816-823.
Wareing, P. F. and Patrick, J. (1975). Source-sink relations and the partition o f
assimilates in the plant. In Photosynthesis and p roduc tiv ity in d iffe re n t environments, (ed. J.
P. Cooper), pp. 481-499. Cambridge: Cambridge University Press.
Warren Wilson, J. (1972). Control o f crop processes. In Crop processes in contro lled
environments, eds A. R. Rees K. E. Kockshull D. W. Hand and R. G. Hurd), pp. 7-30. New
York: Academic Press.
Weast, R. C., Astle, M. J. and Beyer, W. H. e. (1984-1985). Hanboock o f Chemistry
and Physics. Boca Raton, Florida.
Westwood, M. N. (1967). Cell size, cell number, and fru it density o f apples as related
to fru it size, position in cluster, and thinning method. Proceedings o f the Am erican Society fo r
H o rticu ltu ra l Science 91, 51-62.
Wilkinson, B. G. (1968). M ineral composition o f apples IX . Uptake o f calcium by the
fru it. Journa l o f the Science o f Food and A gricu ltu re 19, 646-647.
Wu, B.-H., Génard, M., Lescourret, F., Gomez, L. and Li, S.-H. (2002). Influence
o f assimilate and water supply on seasonal variation o f acids in peach (cv Suncrest). Journa l
o f the Science o f Food and A g ricu ltu ra l 82, 1829-1836.
Wu, H.-i., Spence, R. D., Sharpe, P. J. H. and Goeschl, J. D. (1985). Cell wall
elasticity: I. A critique o f the bulk elastic modulus approach and an analysis using polymer
elastic principles. Plant, C e ll and Environment 8, 563-570.
Wullschleger, S. D., Norby, R. J., Love, J. C. and Runck, C. (1997). Energetic costs
o f tissue construction in yellow-poplar and white oak trees exposed to long-term CO2
enrichment. Annals o f Botany 80, 289-297.
Wiinsche, J. N., Palmer, J. W. and Greer, D. H. (2000). Effects o f crop load on
fru iting and gas-exchange characteristics o f 'Braebum'/M.26 apple trees at fu ll canopy.
Journa l o f the Am erican Society f o r H o rticu ltu ra l Science 125, 93-99.
144
»
Yakushiji, H., Morinaga, K. and Nonami, H. (1998). Sugar accumulation and
partitioning in Satsuma mandarin tree tissues and fru it in response to drought stress. Journa l
o f the Am erican Society fo r H o rtic u ltu ra l Science 123, 719-726.
Yakushiji, H., Nonami, H., Fukuyama, T., Ono, S., Takagi, N. and Hashimoto, Y.
(1996). Sugar accumulation enhanced by osmoregulation in Satsuma mandarin fru it. Journa l
o f the Am erican Society f o r H o rtic u ltu ra l Science 121, 466-472.
145
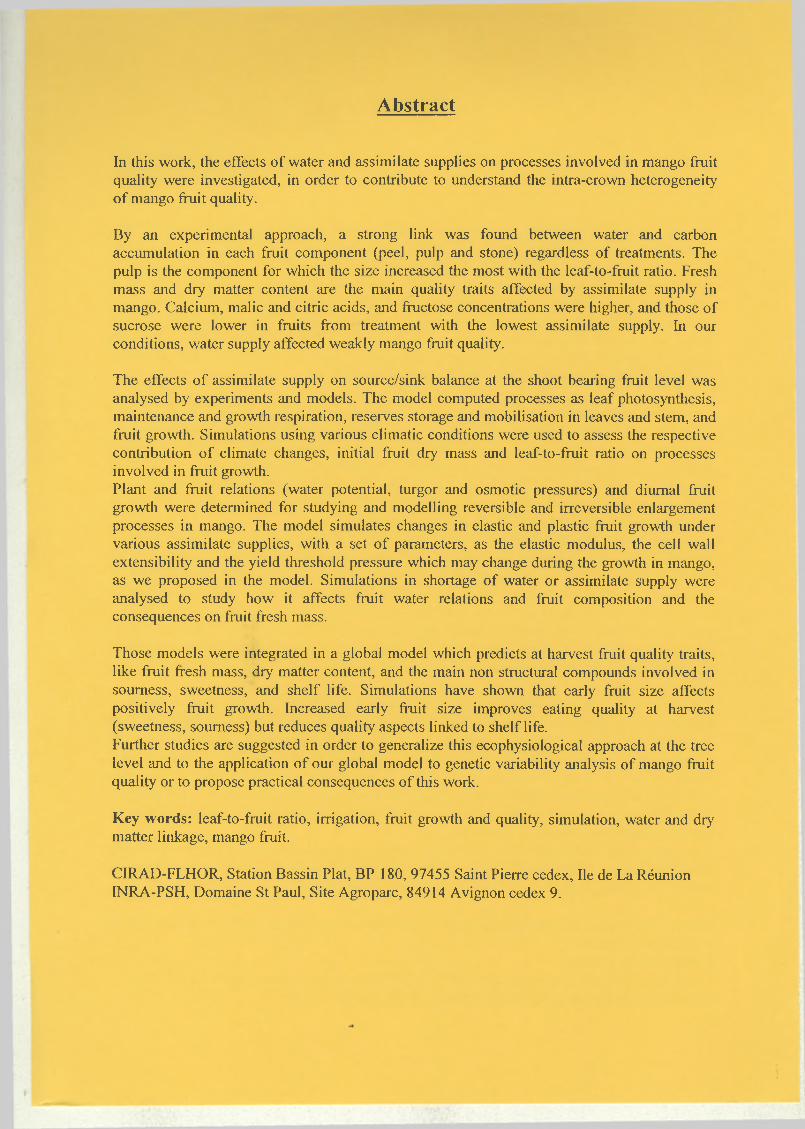
Abstract
In this work, the effects o f water and assimilate supplies on processes involved in mango fru it quality were investigated, in order to contribute to understand the intra-crown heterogeneity o f mango fru it quality.
By an experimental approach, a strong lin k was found between water and carbon accumulation in each fru it component (peel, pulp and stone) regardless o f treatments. The pulp is the component for which the size increased the most w ith the leaf-to-fru it ratio. Fresh mass and dry matter content are the main quality traits affected by assimilate supply in mango. Calcium, malic and c itric acids, and fructose concentrations were higher, and those o f sucrose were lower in fruits from treatment w ith the lowest assimilate supply. In our conditions, water supply affected weakly mango fru it quality.
The effects o f assimilate supply on source/sink balance at the shoot bearing fru it level was analysed by experiments and models. The model computed processes as leaf photosynthesis, maintenance and growth respiration, reserves storage and m obilisation in leaves and stem, and fru it growth. Simulations using various clim atic conditions were used to assess the respective contribution o f climate changes, in itia l fru it dry mass and leaf-to-fru it ratio on processes involved in fru it growth.Plant and fru it relations (water potential, turgor and osmotic pressures) and diurnal fru it growth were determined for studying and modelling reversible and irreversible enlargement processes in mango. The model simulates changes in elastic and plastic fru it growth under various assimilate supplies, w ith a set o f parameters, as the elastic modulus, the cell wall extensib ility and the yield threshold pressure which may change during the growth in mango, as we proposed in the model. Simulations in shortage o f water or assimilate supply were analysed to study how it affects fru it water relations and fru it composition and the consequences on fru it fresh mass.
Those models were integrated in a global model which predicts at harvest fru it quality traits, like fru it fresh mass, dry matter content, and the main non structural compounds involved in sourness, sweetness, and shelf life . Simulations have shown that early fru it size affects positively fru it growth. Increased early fru it size improves eating quality at harvest (sweetness, sourness) but reduces quality aspects linked to shelf life.Further studies are suggested in order to generalize this ecophysiological approach at the tree level and to the application o f our global model to genetic variab ility analysis o f mango fru it quality or to propose practical consequences o f this work.
Key words: leaf-to-fru it ratio, irrigation, fru it growth and quality, simulation, water and dry matter linkage, mango fru it.
C IRAD-FLHO R, Station Bassin Plat, BP 180, 97455 Saint Pierre cedex, Ile de La Réunion INRA-PSH, Domaine St Paul, Site Agroparc, 84914 Avignon cedex 9.
Résumé
Dans ce travail, l ’effet de la disponib ilité hydrique et carbonée sur les processus impliqués dans l ’élaboration de la qualité de la mangue a été étudié, afin de contribuer à expliquer la forte variab ilité de la qualité de ce fru it au sein d’ un même arbre.
Par une approche descriptive, un couplage fo rt entre l ’accumulation de l ’eau et de la matière sèche dans chaque compartiment de la mangue (peau, pulpe et noyau) à été mis en évidence. Il est apparu que la pulpe est le compartiment qui augmente le plus avec le rapport feu illes/fru it. Nous avons montré que la masse fraîche et la teneur en matière sèche de la pulpe sont les principaux critères de qualité influencés par l ’alimentation carbonée. Les concentrations en calcium, en acides malique et citrique, et en fructose sont plus élevées, celles en saccharose plus faibles, dans les fru its en condition d’alimentation carbonée lim itante que dans les fruits en condition non lim itante. Dans nos conditions, la disponibilité hydrique n’a eu qu’un faible impact sur la qualité des mangues.
L ’effet de la disponibilité carbonée sur les relations sources/puits au niveau du rameau fructifère a été étudié expérimentalement puis modélisé. Le modèle intègre les processus de photosynthèse, de respiration d ’entretien et de croissance, de mise en réserves dans les feuilles et le bois, et de croissance du fru it. Ce modèle a permis de simuler, au cours d ’une étude virtuelle sur deux sites à La Réunion et sept années successives, les processus impliqués dans le fonctionnement carboné du manguier et de quantifier l ’effet du clim at, de la ta ille in itia le du fru it et du rapport feu illes/fru it sur chacun des processus.La détermination de l ’état hydrique des tissus de pulpe de mangue (pression de turgescence et osmotique) et des variations horaires de croissance du fru it ont permis d ’étudier et de modéliser le fonctionnement hydrique de la mangue. Le modèle rend compte des variations de croissance réversible et irréversible grâce à l ’ introduction de variables liées aux propriétés d ’élasticité et de plasticité des tissus. Des lois de variations de ces variables sont proposées pour la mangue. Une étude virtuelle montre comment les relations hydriques et la composition du fru it sont modifiées par les variations de la disponibilité carbonée et hydrique et quelles en sont les conséquences sur la croissance en masse fraîche du fru it.
Les modèles de fonctionnement carboné et hydrique ont été intégrés dans un modèle global de prédiction d ’ un p ro fil de qualité comprenant la masse fraîche, la teneur en matière sèche, et les concentrations des principaux composés biochimiques et minéraux impliqués dans les saveurs sucrée et acide et liés à la conservation du fru it. L ’étude virtuelle a mis en évidence l ’effet p o s itif de la masse in itia le du fru it sur la croissance en matière fraîche. La masse in itia le du fru it améliore également des critères de qualité gustative (saveurs sucrée et acide) à la récolte, mais en réduisant des indicateurs de la durée de conservation du fru it (teneur en matière sèche et concentration en calcium).Des pistes de recherche sont proposées en vue d ’ une généralisation de l ’analyse écophysiologique à l ’échelle de l ’arbre et d ’ une application du modèle global à l ’analyse de la variab ilité génétique de la qualité de la mangue ou à l ’agronomie.
Mots clés: rapport feu illes/fru it, irrigation, croissance et qualité du fru it, modèle, couplage eau/carbone, mangue.Laboratoires d’accueil:CIRAD-FLHOR, Station Dassin Plat, BP 180, 97455 Saint Pierre cedex, Ile de La Réunion INRA-PSH, Domaine St Paul, Site Agroparc, 84914 Avignon cedex 9.