Embed Size (px)
Citation preview
DOCUMENT
DE TRAVAIL
N° 468
DIRECTION GÉNÉRALE DES ÉTUDES ET DES RELATIONS INTERNATIONALES
ASSESSING THE LOSSES IN EURO AREA POTENTIAL PRODUCTIVITY DUE TO THE FINANCIAL CRISIS
Valérie Chouard, Daniel Fuentes Castro,
Delphine Irac and Matthieu Lemoine
December 2013
DIRECTION GÉNÉRALE DES ÉTUDES ET DES RELATIONS INTERNATIONALES
ASSESSING THE LOSSES IN EURO AREA POTENTIAL PRODUCTIVITY DUE TO THE FINANCIAL CRISIS
Valérie Chouard, Daniel Fuentes Castro,
Delphine Irac and Matthieu Lemoine
December 2013
Les Documents de travail reflètent les idées personnelles de leurs auteurs et n'expriment pas nécessairement la position de la Banque de France. Ce document est disponible sur le site internet de la Banque de France « www.banque-france.fr ». Working Papers reflect the opinions of the authors and do not necessarily express the views of the Banque de France. This document is available on the Banque de France Website “www.banque-france.fr”.
1
Assessing the losses in euro area potential productivity due to the financial crisis*
Valérie Chouard♣, Daniel Fuentes Castro♣, Delphine Irac♣ and Matthieu Lemoine♣♠
* We are grateful to Annabelle Mourougane and seminar participants at the AFSE meeting 2013 and the Banque de France seminar for useful comments and suggestions. The views expressed in this paper do not necessarily reflect those of Banque de France. ♣ Banque de France, 39 rue Croix des Petits Champs, 75049 Paris Cedex 01 France. ♠ Corresponding author, email: [email protected].
2
Résumé
Nous montrons dans cet article que la récente crise financière a réduit significativement la productivité
globale des facteurs (PGF) potentielle des quatre plus grands pays de la zone euro, et également celle
du reste de la zone euro. Nous avons utilisé une équation en forme réduite de la PGF, fondée sur une
approche développée dans Cahn et Saint-Guilhem (2010). Nos résultats empiriques montrent que
l’impact permanent sur la PGF potentielle varie selon les pays entre -3,9 et -1,3 points de pourcentage
au T2 2012. Lorsque l’on prend en compte ces pertes, l’écart de PGF, défini comme l’écart entre la
PGF et son potentiel, évolue pour chaque pays de façon très similaire au taux d’utilisation des
capacités de production (TUC). De plus, dans le cas de la France, la prise en compte du TUC dans le
modèle de la PGF permet de diminuer les révisions affectant l’écart de PGF en temps quasi-réel.
Mots clés : fonction de production, productivité globale des facteurs, crise financière, utilisation des
capacités de production.
Codes JEL : E22, E23, E32, O47.
Abstract
In this paper, we show that the recent financial crisis has significantly affected the potential total
factor productivity (TFP) of the four largest euro area economies, as well as that of the rest of the euro
area. We used a reduced-form equation of TFP, based on an approach recently developed by Cahn and
Saint-Guilhem (2010). Our empirical findings show that the permanent impact on potential TFP varies
across countries from -3.9 points to -1.3 points in Q2 2012. When these losses are incorporated, TFP
gaps develop closely in line with capacity utilisation rates (CUR). Moreover, in the case of France,
including CUR in our TFP model improves the quasi real-time reliability of TFP gap estimates.
Key words: production function, total factor productivity, financial crisis, capacity utilisation.
JEL codes: E22, E23, E32, O47.
3
I. Introduction
The financial crisis continues to generate significant uncertainty regarding the measurement
of the output gap (the gap between actual and estimated potential output). Reliable measures of this
gap are especially valuable to policy makers as a vital tool for monetary and fiscal policy. The
breakdown of TFP between a potential component and a cyclical one (the TFP gap) is crucial since
the TFP gap contributes to the output gap proportionately in most standard production functions. In
this paper we investigate the size and duration of the impact of the crisis on potential TFP.
The theoretical literature and firm-level empirical literature show that the effects of
recessions on total factor productivity are ambiguous. Indeed, potential ‘cleansing effects’, where
crises eliminate less productive firms, may increase TFP levels (Caballero and Hammour, 1994). But
other factors may have a negative impact on TFP, such as ‘scarring effects’ where young, innovative
firms have fewer incentives to continue their activities in an uncertain environment (Ouyang, 2009),
or ‘sullying effects’, where the most productive firms face tighter financial constraints (Barlevy, 2002
and Barlevy, 2003). Long-term investment and R&D spending may also be reduced in times of
tightened financial constraints, lowering total factor productivity (Aghion et al., 2012).
According to the recent empirical literature on crises, the long-run impact of past financial
crises1 on potential output is a loss of around 1.5 to 2.4% on average, and of up to 4% for the most
severe crises (Furceri and Mourougane, 2012). Moreover, Oulton and Sebastia-Barriel (2013) show
that the long-run impact of past recessions on labour productivity is between 0.8% and 1.1% on
average. Note that these assessments mainly rely on narrative approaches à la Romer and Romer
(1989), where the authors consider a panel of countries that suffered a financial crisis between the
1960s and the 2000s, and where that crisis was generally confined to a single country or group of
countries. The crises are proxied using dummy variables and the estimated impact is more or less the
average of all the country-specific impacts. Since the last financial crisis was a global one, however,
affecting all countries in the world simultaneously, it is likely that its impact on growth will be more
pronounced.
The aim of this paper is to investigate how the recent recession has affected potential total
factor productivity in the euro area, that is in France, Germany, Italy, Spain and in the rest of the euro
area. Admittedly, potential TFP and the TFP gap are unobservable variables which can only be
1 Excluding the financial crisis of 2007-2008.
4
derived from theoretical and/or statistical models; for instance, the OECD uses an HP filter to identify
potential TFP. However, we argue that economists have at their disposal a key survey variable, the
capacity utilisation rate (CUR), which conveys crucial information about the TFP gap. Since any
underutilisation of capital stock leads to a decline in apparent TFP, it is economically intuitive to view
the CUR as a strong determinant of the TFP gap. Statistically, this variable also has a number of
features that make it extremely valuable from a practical point of view: 1) the CUR is observable and
available for many countries, which facilitates international comparisons (see the EU harmonised
Business Tendency Surveys); 2) CUR surveys are rapidly available (generally at the beginning of the
following month); 3) the CUR is not revised. By focusing on capacity utilisation, our approach builds
heavily on Planas et al. (2013) but in a trend-stationary framework à la Perron (1989).
Our contribution to the literature is therefore threefold. We propose a new measure of TFP
gaps closely correlated to capacity utilisation rates. In the case of France, we also show that including
the CUR in our TFP model improves the quasi real-time reliability of TFP gap estimates. Our second
contribution is that we consider the precise timing of the crisis and quantify the size of the losses in
potential TFP. Lastly, these losses are broken down by source (permanent losses, capital ageing
impact and construction sector impact).
II. TFP model
In this section, we extend a reduced-form equation developed by Cahn and Saint-Guilhem
(2010) to measure the cost of the recent financial crisis in terms of potential euro area TFP. Economy-
wide production technology is represented by a Cobb-Douglas-like production function with a
constant return to scale on labour and capital. As described in Cahn and Saint-Guilhem (2010), the
production function can be expressed analytically as:
( )ααγσ tttt
t HNKeY −= 1~, 0 < α < 1,
where Y stands for total GDP, K~
for the stock of available productive capital, N for total
employment, and H for per capita hours worked. The parameter α is the elasticity of output with
respect to employment, γ is the growth rate of a pure exogenous deterministic technical change and
σ a scale factor. Here, available productive capital is tied up with measured capital stock K and the
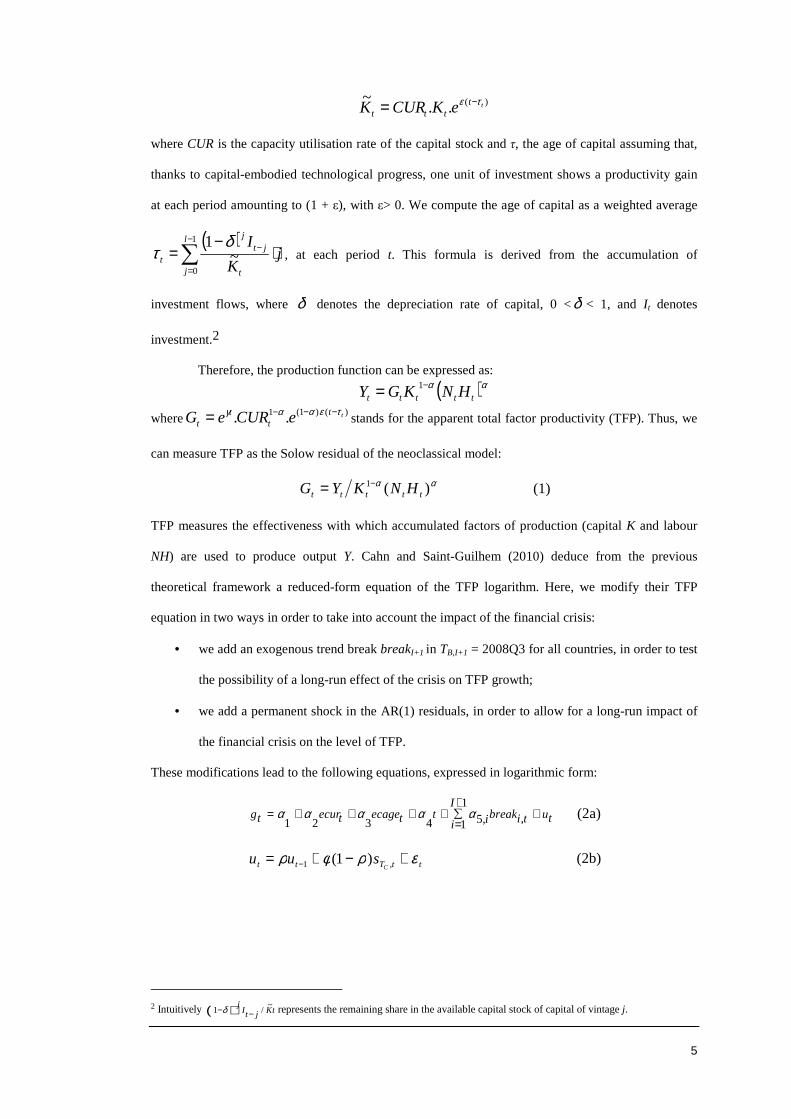
age of capital according to:
5
)(..~
ttttt eKCURK τε −=
where CUR is the capacity utilisation rate of the capital stock and τ, the age of capital assuming that,
thanks to capital-embodied technological progress, one unit of investment shows a productivity gain
at each period amounting to (1 + ε), with ε> 0. We compute the age of capital as a weighted average
( )j
K
Il
j t
jtj
t ∑−
=
− ⋅−
=1
0~
1 δτ , at each period t. This formula is derived from the accumulation of
investment flows, where δ denotes the depreciation rate of capital, 0 <δ < 1, and I t denotes
investment.2
Therefore, the production function can be expressed as:
( )ααttttt HNKGY −= 1
where)()1(1 .. tt
tt
t eCUReG τεααγ −−−= stands for the apparent total factor productivity (TFP). Thus, we
can measure TFP as the Solow residual of the neoclassical model:
αα )(1ttttt HNKYG −= (1)
TFP measures the effectiveness with which accumulated factors of production (capital K and labour
NH) are used to produce output Y. Cahn and Saint-Guilhem (2010) deduce from the previous
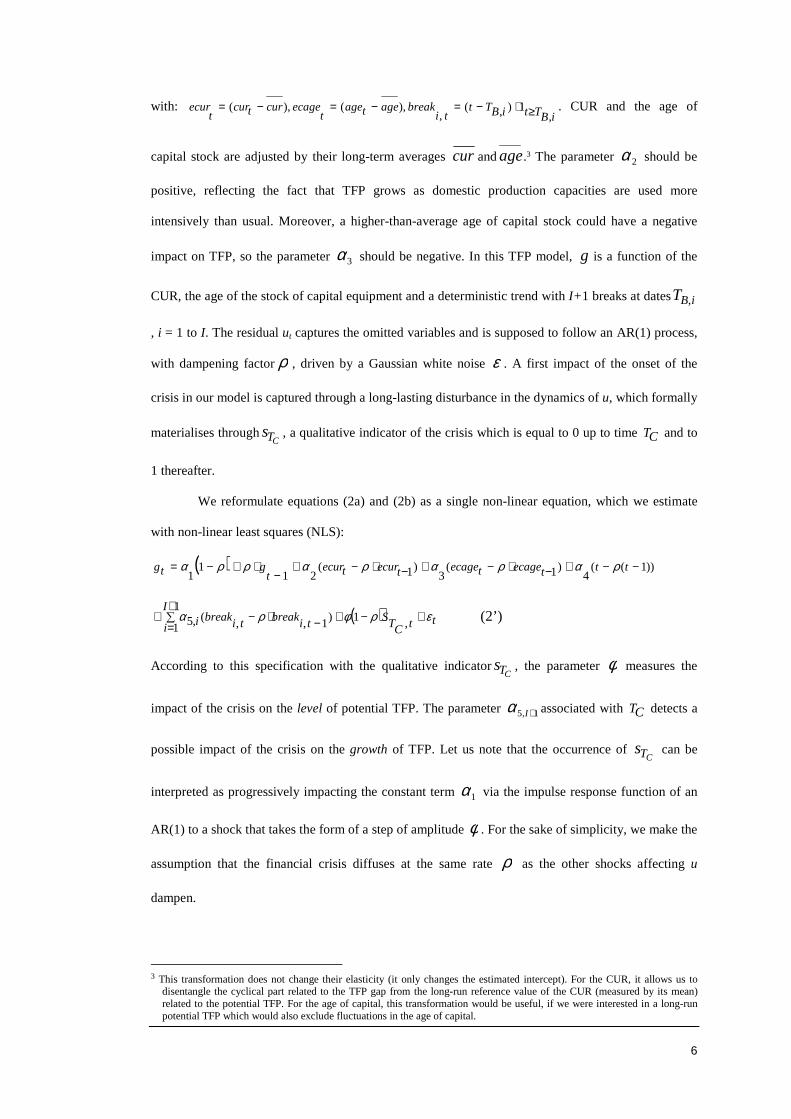
theoretical framework a reduced-form equation of the TFP logarithm. Here, we modify their TFP
equation in two ways in order to take into account the impact of the financial crisis:
• we add an exogenous trend break breakI+1 in TB,I+1 = 2008Q3 for all countries, in order to test
the possibility of a long-run effect of the crisis on TFP growth;
• we add a permanent shock in the AR(1) residuals, in order to allow for a long-run impact of
the financial crisis on the level of TFP.
These modifications lead to the following equations, expressed in logarithmic form:
tuI
i tibreakittecagetecurtg +∑+
=++++=
1
1 ,,54321ααααα (2a)
ttTtt Csuu ερφρ +−+= − ,1 )1( (2b)
2 Intuitively ( ) tKjtI
j ~/1 −−δ represents the remaining share in the available capital stock of capital of vintage j.
6
with: iBTtiBTt
tibreakagetage
tecagecurtcur
tecur
,1),(
,),(),( ≥⋅−=−=−= . CUR and the age of
capital stock are adjusted by their long-term averages cur andage.3 The parameter 2α should be
positive, reflecting the fact that TFP grows as domestic production capacities are used more
intensively than usual. Moreover, a higher-than-average age of capital stock could have a negative
impact on TFP, so the parameter 3α should be negative. In this TFP model, g is a function of the
CUR, the age of the stock of capital equipment and a deterministic trend with I+ 1 breaks at dates iBT ,
, i = 1 to I. The residual ut captures the omitted variables and is supposed to follow an AR(1) process,
with dampening factorρ , driven by a Gaussian white noise ε . A first impact of the onset of the
crisis in our model is captured through a long-lasting disturbance in the dynamics of u, which formally
materialises throughCTs , a qualitative indicator of the crisis which is equal to 0 up to time CT and to
1 thereafter.
We reformulate equations (2a) and (2b) as a single non-linear equation, which we estimate
with non-linear least squares (NLS):
( ) ))1((4
)1(3
)1(21
11
−−+−⋅−+−⋅−+−
⋅+−= tttecagetecagetecurtecurt
gtg ραραραρρα
( ) ttCTSI
i tibreaktibreaki ερφρα +−+∑+
= −⋅−+ ,11
1)1,,(,5 (2’)
According to this specification with the qualitative indicatorCTs , the parameter φ measures the
impact of the crisis on the level of potential TFP. The parameter 1,5 +Iα associated with CT detects a
possible impact of the crisis on the growth of TFP. Let us note that the occurrence of CTs can be
interpreted as progressively impacting the constant term 1α via the impulse response function of an
AR(1) to a shock that takes the form of a step of amplitude φ . For the sake of simplicity, we make the
assumption that the financial crisis diffuses at the same rate ρ as the other shocks affecting u
dampen.
3 This transformation does not change their elasticity (it only changes the estimated intercept). For the CUR, it allows us to
disentangle the cyclical part related to the TFP gap from the long-run reference value of the CUR (measured by its mean) related to the potential TFP. For the age of capital, this transformation would be useful, if we were interested in a long-run potential TFP which would also exclude fluctuations in the age of capital.
7
Applying the Bai-Perron test to a linearised version of this equation4 for the trend coefficient
with a trimming factor of 10% and over the pre-crisis period (from 1960 to 2007), we find the
following break dates: Q2 1973 and Q3 1985 for France; Q3 1978 and Q3 1997 for Germany; Q2
1997 for Italy; Q1 1996 for Spain; Q1 1995 for the rest of the euro area. For all countries, we also test
an additional break at the date of the Lehman bankruptcy (Q3 2008).5
Finally, potential TFP is derived from (2’) as follows:6
TC
I
itiittt S
LBreaktrendecageg
ρρφαααα
−−++++= ∑
+
= 1
11
1,1,5431
*
Now, in equation (3) below, the TFP gap (gap which is equal to g-g*) is directly linked to the CUR.
An additional term depicts AR(1) residuals that remain after fitting the gap with the CUR:
Lecurgap t
tt ρεα
−+=
12 (3)
By over-differentiating the variables, we can write this equation in the spirit of an error correction
representation:
ttttt ecurgapecurgap εαρα +−−−∆=∆ −− ))(1( 1212 (4)
where 1−−=∆ ttt gapgapgap . Thus, we can interpret the parameter 1-ρ as an adjustment speed
of the TFP gap to the CUR target.
III. Data
The data cover the period Q1 1960 to Q2 2012 for France, Germany, Italy, Spain and the rest
of the euro area. Data on labour markets, output and investment are from national statistical institutes
and Eurostat databases. Capital stock K is computed as the sum of two types of capital: KM, capital
for ‘machinery and equipment’ and KB, capital for ‘construction’. These stocks of capital are derived
from the standard permanent inventory equation.7 Capital for ‘machinery and equipment’ is
determined using investments in ‘machinery and equipment’ with an obsolescence rate of 0.024,
4 If we relax the constraints relating to the coefficients of equation (2’) by regressing the TFP on an intercept, its lag and lags of
all regressors (ecur, ecage, the time trend, breaks and the qualitative indicator), we get a linear equation and we can apply the Bai-Perron test. Another possible approach would have been to test break dates with the non-linear equation, by using the test of Boldea and Hall (2013).
5Since this break date is exogenous, testing its significance does not require tests of endogenous break dates (Bai-Perron or Boldea-Hall tests) and we simply use the standard distribution of the Student test.
6L is the lag operator. 7Kt = KM t+KBt with KMt = (1-0.024)*KMt-1+IM t and KBt = (1-0.004)*KBt-1+IB t, at each date t.
8
equivalent to a lifetime of nearly 10 years, and capital for ‘construction’ is determined using
investments in construction with an obsolescence rate of 0.004, equivalent to nearly 60 years (see
Cahn and Saint-Guilhem, 2010). Age of capital is calculated using historical time-series on
investments in machinery, vehicles and equipment.8 Figure 1 shows the evolution of the age of
‘machinery and equipment’ capital for France, Germany, Italy, Spain and the rest of the euro area.
CUR series are collected from regular national surveys on industrial sectors. The output elasticity of
labour α is calibrated as the average shares of wages in GDP.
IV. Impact of the financial crisis on potential TFP
The estimation results obtained using the previous model for TFP are shown in Table 1 and
summarised in Table 2. Table 1 presents the coefficient estimates of equation (2’) for each of the
economies under examination.9 We find that introducing an indicator of the crisis matters: its
parameter φ is significant for all the economies in question. This result shows that, for all countries,
permanent losses in potential TFP are substantial. The parameter 3α indicating the age of capital is
significant and negative for France, Germany and Spain. This represents a loss resulting from capital
ageing.
The TFP trend breaks assessed via the parameters i,5α show that the dynamics of TFP trends
differ across countries. The negative signs for 1,5α and 2,5α reflect decreases in TFP trends after the
breaks. For France, Germany and Italy in particular, TFP trends reached 1.0%, 0.7% and -0.1%
respectively before the crisis. For Spain, however, the parameter 3,5α captures a significant positive
impact from the crisis on the growth of TFP in Q32008. In Spain, the TFP trend reached 0.7% over
the period 2008-2012, after 0.2% over 1997-2008 and 1% over 1992-1997. These three sub-periods
correspond to structural breaks in the Spanish construction sector (the percentage share of this sector
in value added follows the same patterns as these TFP trends). An explanation for the increasing
productivity trend over 2008-2012 could be the disappearance of the low-productivity firms that were
created in the construction sector during the real estate bubble. For other countries, we wondered
8Historical data on investment are derived from Maddison’s databases for France and Germany, from Prados (2003) for Spain
and from Baffigi (2011) for Italy. 9 We have performed robustness tests on residuals which suggest homoscedasticity and non-autocorrelation. These additional
results are available upon request from the authors.
9
whether bubbles had also occurred before the crisis, but we do not find any significant break in TFP
growth over this period. This issue is discussed in Section IV.
The coefficient ρ represents the persistence of TFP shocks. The smaller this parameter, the
faster TFP returns to its mean value. We find that losses are more persistent in France and in Italy than
in other countries such as Germany and Spain. Impulse responses of CTs also illustrate this finding
(Figure 2).
Table 2 shows that the total impact on potential TFP stands at 4 percentage points for the
euro area in Q2 2012. Interestingly, this impact stems from a permanent impact (-2.8pp), a capital
ageing impact (-1.4pp) and a construction sector impact (+0.2pp). Permanent losses reflect the long-
run impact of the financial crisis. They appear to be greater in France (-3.3pp), in Italy (-3.7pp) and in
the rest of the euro area (-3.9pp). The losses caused by capital ageing result from depressed
investment in capital goods in France, Germany and Spain. There is no impact from the age of capital
in Italy and the rest of the euro area (REA) since this variable is not statistically significant. The
positive impact from the construction sector comes from Spain (with an impact of +2.1pp on Spanish
TFP).
Figures 3 and 4 depict the TFP gap and potential TFP growth for the economies under
examination. In Figures 3a to 3e, the magnitude of the permanent impact is observed in the TFP gap
curve. After being adjusted for the permanent impact, the TFP gap is more closely correlated to the
CUR, which now has a significant impact on TFP, except in the case of the REA (according to
estimates of 3α in Table 1). Figures 3a to 3e also compare the TFP gap for our TFP model (“TFP gap
with production function”) with the TFP gap obtained using the Hodrick-Prescott (HP) filter. We can
see that, for both methods, the gaps obtained and therefore the loss of potential TFP, are comparable,
particularly over the end of the period. Figures 4a to 4e show the growth of HP TFP trends and that of
our potential TFP. The results reveal that HP estimates of TFP trend had already begun to decrease
before the crisis in each euro-area country (e.g. in Q1 2006 for Germany), while our estimates of
potential TFP growth start to decrease at the date of the crisis (Q3 2008).
In Figures 5a to 5f, the loss in potential TFP is broken down according to the contribution of
each of the three impacts listed in Table 2: the impact of the crisis, of capital ageing and of the
construction sector. We can see the sharp decrease in TFP and potential TFP after the end of 2008.
10
This loss results mainly from the permanent impact caused by the crisis, followed by the impact of
capital ageing.
V. Robustness and quasi real-time reliability
How can we ensure that the analysis is not affected by a diagnosis error concerning the pre-
crisis period? Our estimate of the impact of the crisis on potential TFP hinges crucially on the
breakdown of effective TFP between its cyclical component and its trend during the pre-crisis period.
Any overestimation of potential growth before the crisis may result in an underestimation of the pre-
crisis (positive) output gap and an overestimation of the post-crisis loss of potential output. The
question of a possible negative break in TFP growth in the decade preceding the crisis has been
extensively discussed. Bénassy-Quéré et al. (2009) argue that between 1999 and 2007 “Cheap credit-
facilitated debt financed investment in real estate and financial assets, and contributed to excessive
risk taking. From a macroeconomic standpoint also, this crisis has been a crisis of leverage”. Many
other experts develop the same argument (Turner Review, Financial Services Authority, 2009; De
Larosière (2009) report prepared at the request of the European Commission). Indeed, the main
stylised fact of the 2000s was the generous availability of credit. Table 3 shows the significant rise in
euro area debt levels between 1999 and 2007.
However, we argue that the hypothesis of credit-fuelled economic growth is rejected by our
model. First, we note that Student tests confirm the stability of the TFP trend, since there was no
negative break in TFP trend for the economies under examination in the period preceding the crisis,
except in the case of Spain where the test detects a positive break. Secondly, a more convincing
argument is that no prolonged increase of CUR can be observed during the pre-crisis period for these
economies (except in the case of Spain, increases in CUR lasted less than two years on average during
the pre-crisis period) and no instability in the relationship between the CUR and the output gap is
observable. The CUR increases observed during bubble episodes in other countries appear to have
been a symptom of excess demand: for example, in Japan, before the speculative bubble at the
beginning of the 1990s, or in the United Kingdom, before the crisis at the end of the 1990s, the CUR
increased continuously over the four years preceding the event (OECD, 1996; OECD, 1997).
Consequently, for the economies studied here, we can consider that excess demand is not materialised.
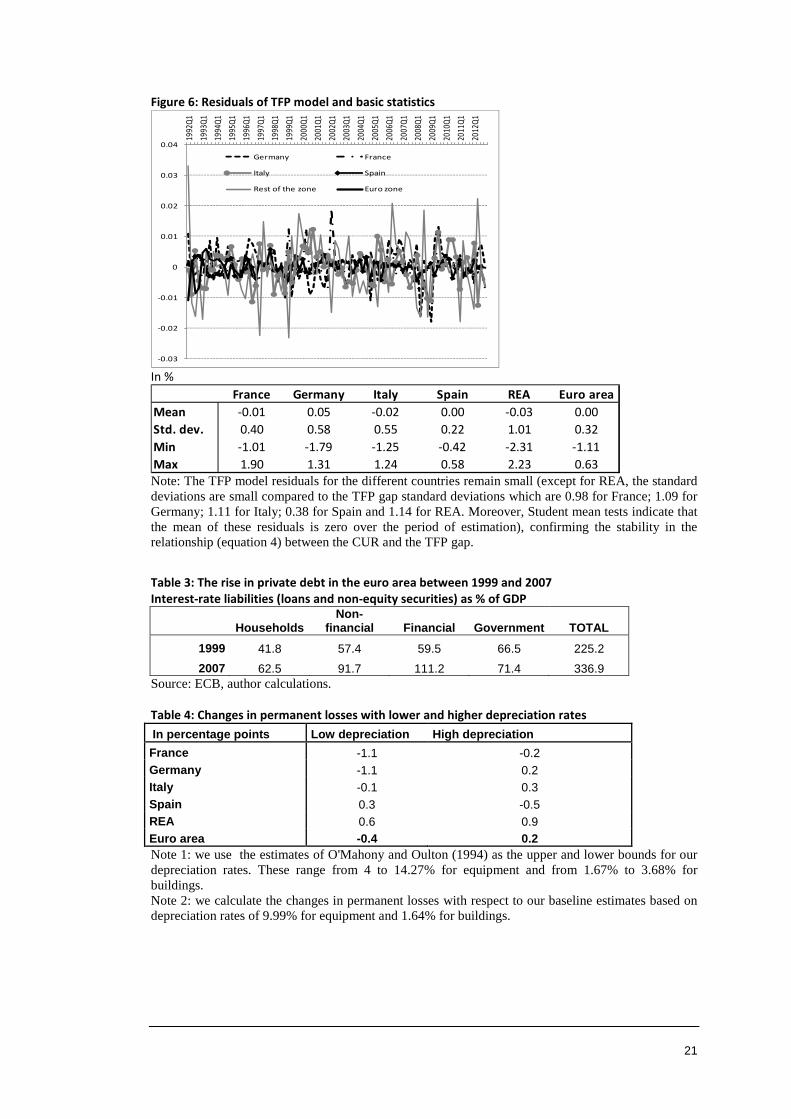
Figure 6 shows the residuals of the TFP model for the different countries in question, which detect
11
potential instabilities in the relationship (4) between the CUR and the TFP gap. Except for the rest of
the euro area, the residuals of the TFP model for the different countries remain small (their standard
deviation is small relative to that of the TFP gap). Moreover, Student mean tests indicate that their
mean is zero over the estimation period, confirming the stability in the relationship between the CUR
and the TFP gap.
Like Planas et al. (2013), but in a different framework, we find that including the CUR in our
TFP model improves the quasi real-time reliability10 of TFP gap estimates. We iteratively estimate the
TFP equation over samples going from a fixed start date to a rolling end date. The end date rolls over
the Q4 2008-Q2 2012 period, i.e. after the financial crisis. The results show that standard errors of
quasi real-time revisions over the post-crisis period decrease when the CUR is included, as in our TFP
model. For example for France, the standard errors decrease from 0.64 (when the CUR is not taken
into account) to 0.23 (when the CUR is included, as in our TFP model).
Another issue is that errors in the measurement of TFP might affect our estimates of TFP
losses. Working on the United Kingdom, O'Mahony and Oulton (1994) stress the importance of the
depreciation rate for measuring productivity. In Table 4, as a first attempt to investigate the sensitivity
of our results to depreciation rates, we examine the impact of using higher and lower values for these
rates. We use the ranges proposed in O’Mahony and Oulton (1994) as the lower and upper bounds for
our rates (from 4 to 14.27% for equipment and from 1.67% to 3.68% for buildings). The figures in
Table 4 show the variation in the permanent losses between the baseline scenario and these two
alternative estimates. We show that permanent losses caused by the crisis change by less than 0.4 at
the euro area level with these alternative assumptions.
VI. Conclusion
In this article we extend a reduced-form equation developed by Cahn and Saint-Guilhem
(2010) to measure the cost of the recent financial crisis in terms of potential TFP in the euro area. We
find that euro area economies have seen significant losses in their potential TFP. In our model, TFP
gaps closely follow the CUR. Moreover, in the case of France, including the CUR in our TFP model
improves the quasi real-time reliability of TFP gap estimates.
10We use the terminology of Orphanides and Van Norden (2002), who distinguish the quasi real-time reliability from the real-
time one: the quasi real-time reliability is only based on revision related to the sample availability, while the real-time reliability also takes into account data revisions.
12
In future research, several factors might revise our diagnosis. First, we would like to find
economic factors that could explain the heterogeneity of losses within the euro area. Second, with
more hindsight, we should improve our tests of trend breaks (coefficient estimates of a break in TFP
growth for France, Germany, Italy and the rest of euro area were not significant during the financial
crisis). This result can be interpreted as the crisis having no impact on potential TFP growth. Perhaps
a larger sample, in the years to come, may improve their significance.
13
References
Aghion, P. Askenazy, P. Berman, N. Cette, G. and Eymard, L. (2012) Credit Constraints and the
Cyclicality of R&D Investment: Evidence from France, Journal of the European Economic
Association 10(5), 1001–1024.
Andrews, D. W. K. (1993) Tests for Parameter Instability and Structural Change with Unknown
Change Point, Econometrica, 61, 821-856.
Baffigi, A. (2011) Quaderni di Storia Economica, Italian National Accounts, 1861-2011, October.
Bai, J. and Perron, P. (1998) Estimating and Testing Linear Models with Multiple Structural Changes,
Econometrica, 66, 47–78.
Barlevy, G. (2002) The Sullying Effect of Recessions, Review of Economic Studies 69, 65-96.
Barlevy, G. (2003) Credit Market Frictions and the Allocation of Resources Over the Business Cycle,
Journal of Monetary Economics 50, 1795-1818.
Bénassy-Quéré, A. Coeuré, B. Jacquet, P. and Pisani-Ferry, J. (2009) The Crisis: Policy Challenges
and Policy Responses, Bruegel Working Paper, December.
Boldea, O. and Hall, A.R. (2013). Estimation and Inference in Unstable NLS Models. Journal of
Econometrics, 172(1), pp 158-167.
Bonleu, A. Cette, G. and Horny, G. (2013) Capital Utilisation and Retirement, Applied Economics, 45,
pp. 3483-3494.
Caballero, R. and Hammour, M. (1994) The Cleansing Effect of Recessions, American Economic
Review, 84, 1350–1368.
Cahn, C. and Saint-Guilhem, A. (2010) Potential Output Growth in Several Industrialized Countries:
A Comparison, Empirical Economics, 39(1), 139-165.
De Larosière, J. (2009) Report of the High-Level Group on Financial Supervision in the EU,
February.
Financial Services Authority (2009) The Turner Review: A regulatory response to the global banking
crisis.
Furceri, D. and Mourougane, A. (2012) The Effect of Financial Crises on Potential Output: New
Empirical Evidence from OECD Countries, Journal of Macroeconomics 34, 822–832.
14
Maddison, A. (1993) Standardized Estimates of Fixed Capital Stock: a Six Country Comparison, in
Essays on Innovation Natural Resources and the International Economy, Innovazione E Materie
Prime, 1-29.
OECD (1996) Economic Surveys: United Kingdom 1995, May.
OECD (1997) Economic Surveys: Japan 1997, November.
Orphanides, A. and Van Norden, S. (2002) The Unreliability of Output-Gap Estimates in Real Time.
The Review of Economics and Statistics, vol. 84(4), pages 569-583.
O'Mahony, M.and Oulton, N. (1994) Productivity and Growth, Cambridge Books, Cambridge
University Press.
Oulton, N. and Sebastia-Barriel, M. (2013) Long and Short Term Effects of the Financial Crisis on
Labour Productivity, Capital and Output, Working Paper, Bank of England.
Ouyang, M. (2009) The Scarring Effect of Recessions, Journal of Monetary Economics 56, 184-199.
Perron, P. (1999) The Great Crash, the Oil Price Shock and the Unit Root Hypothesis, Econometrica
57, 1351-1401.
Planas, C. Roeger, W. and Rossi, A., M. (2013) The Information Content of Capacity Utilization for
Detrending Total Factor Productivity, Journal of Economic Dynamics and Control 37, 577–590.
Prados de la Escosura, L. (2003) El Progreso Economico de España 1850-2000, Fundacion BBVA.
Romer, C. and Romer, D. (1989) Does Monetary Policy Matter? A New Test in the Spirit of Friedman
and Schwartz, NBER Macroeconomics Annual 1989, 4, 121–184.
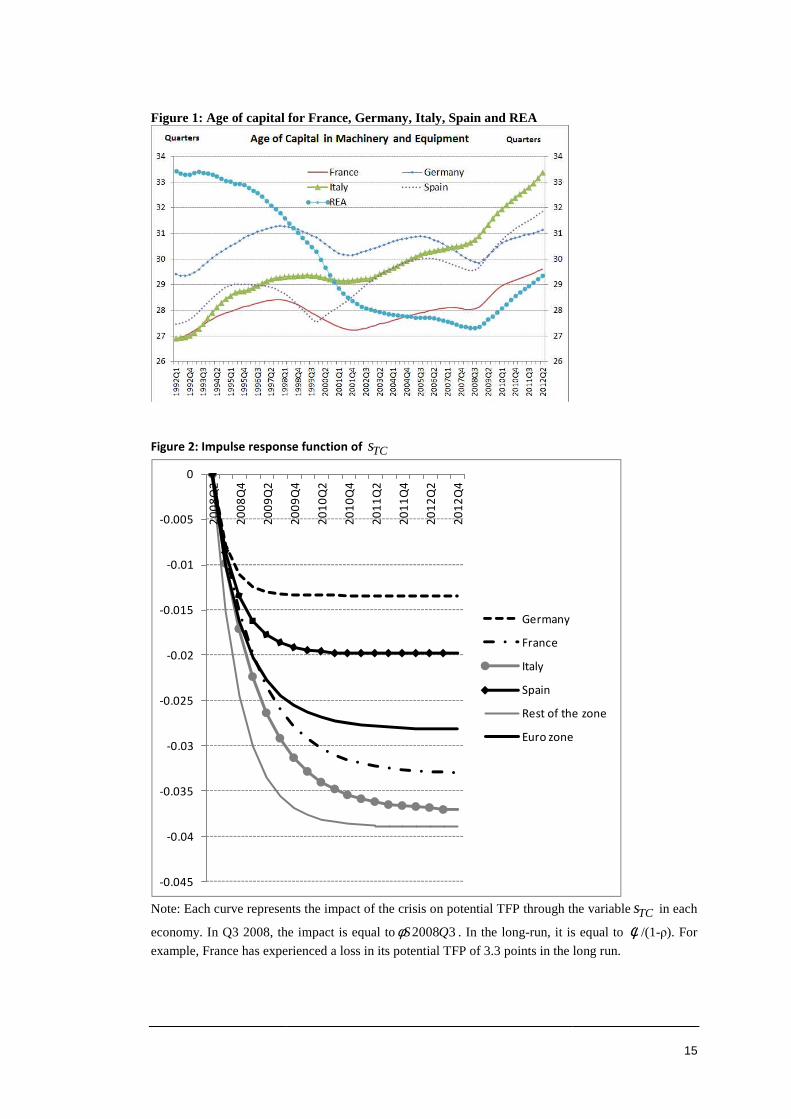
Figure 1: Age of capital for France
Figure 2: Impulse response function of
Note: Each curve represents the impact of the crisis on potential TFP through the variable
economy. In Q3 2008, the impact is equal to
example, France has experienced
-0.045
-0.04
-0.035
-0.03
-0.025
-0.02
-0.015
-0.01
-0.005
0
20
08
Q2
20
08
Q4
20
09
Q2
: Age of capital for France, Germany, Italy, Spain and REA
: Impulse response function of TCs
Note: Each curve represents the impact of the crisis on potential TFP through the variable
2008, the impact is equal to 32008QSφ . In the long-run, it is equal to
experienced a loss in its potential TFP of 3.3 points in the long
20
09
Q4
20
10
Q2
20
10
Q4
20
11
Q2
20
11
Q4
20
12
Q2
20
12
Q4
Germany
France
Italy
Spain
Rest of the zone
Euro zone
15
Note: Each curve represents the impact of the crisis on potential TFP through the variableTCs in each
run, it is equal to φ /(1-ρ). For
in the long run.
Rest of the zone
Euro zone
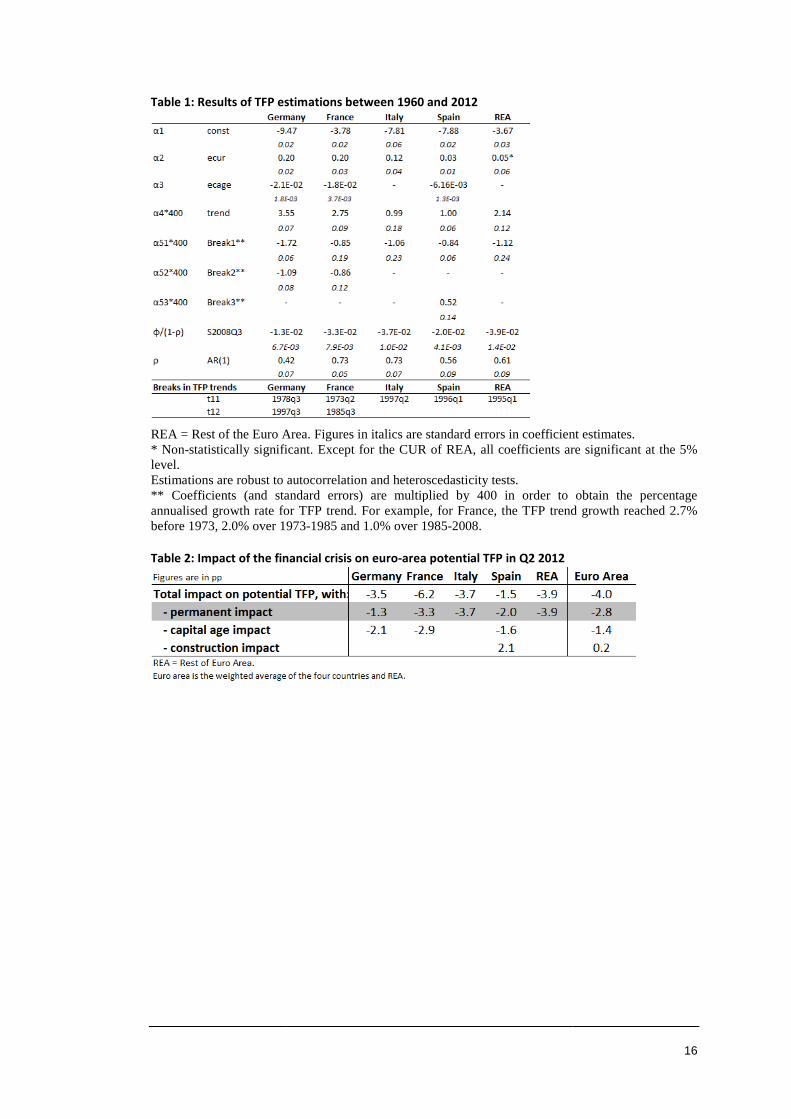
Table 1: Results of TFP estimations
REA = Rest of the Euro A* Non-statistically significant. Except for level. Estimations are robust to autocorrelation and ** Coefficients (and standard errors) are multiplied by 400 in order to annualised growth rate for before 1973, 2.0% over 1973
Table 2: Impact of the financial crisis on
Results of TFP estimations between 1960 and 2012
Area. Figures in italics are standard errors in coefficient estimates.statistically significant. Except for the CUR of REA, all coefficients are significant at
Estimations are robust to autocorrelation and heteroscedasticity tests. ** Coefficients (and standard errors) are multiplied by 400 in order to
for TFP trend. For example, for France, the TFP trend before 1973, 2.0% over 1973-1985 and 1.0% over 1985-2008.
of the financial crisis on euro-area potential TFP in Q2 2012
16
coefficient estimates. CUR of REA, all coefficients are significant at the 5%
** Coefficients (and standard errors) are multiplied by 400 in order to obtain the percentage TFP trend growth reached 2.7%
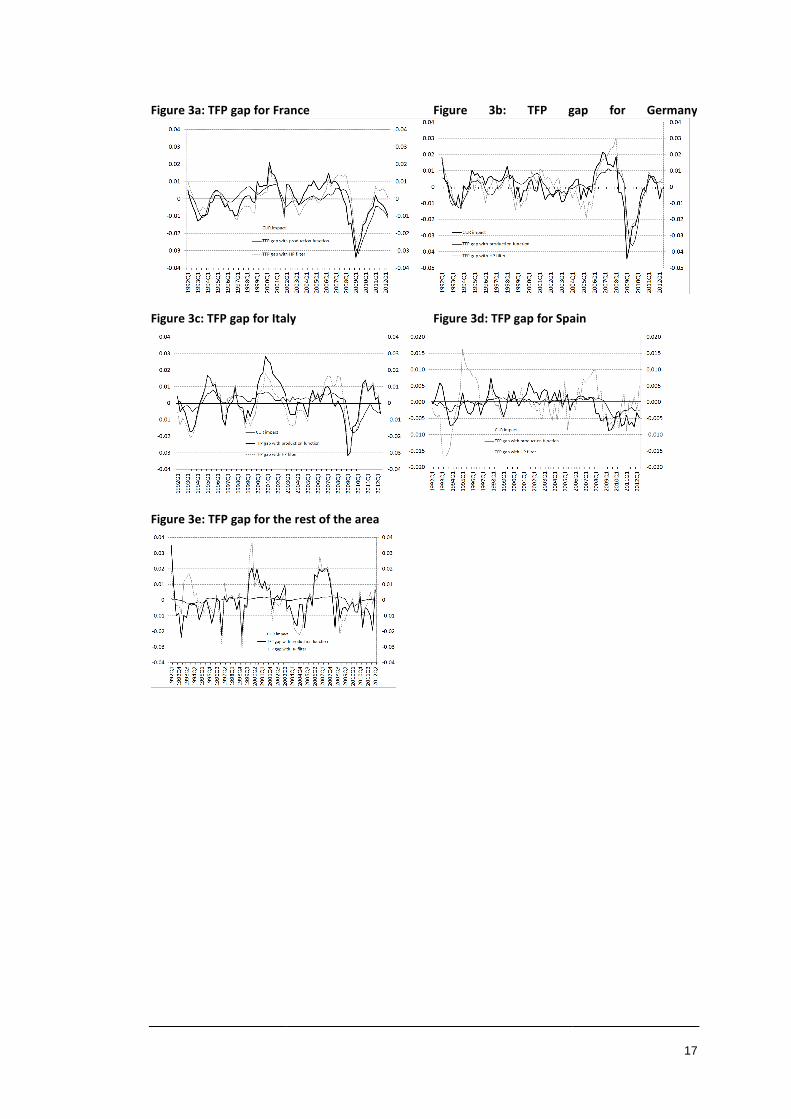
Figure 3a: TFP gap for France
Figure 3c: TFP gap for Italy
Figure 3e: TFP gap for the rest of the
France Figure 3b: TFP gap for Germany
c: TFP gap for Italy Figure 3d: TFP gap for Spain
Figure 3e: TFP gap for the rest of the area
17
TFP gap for Germany
d: TFP gap for Spain
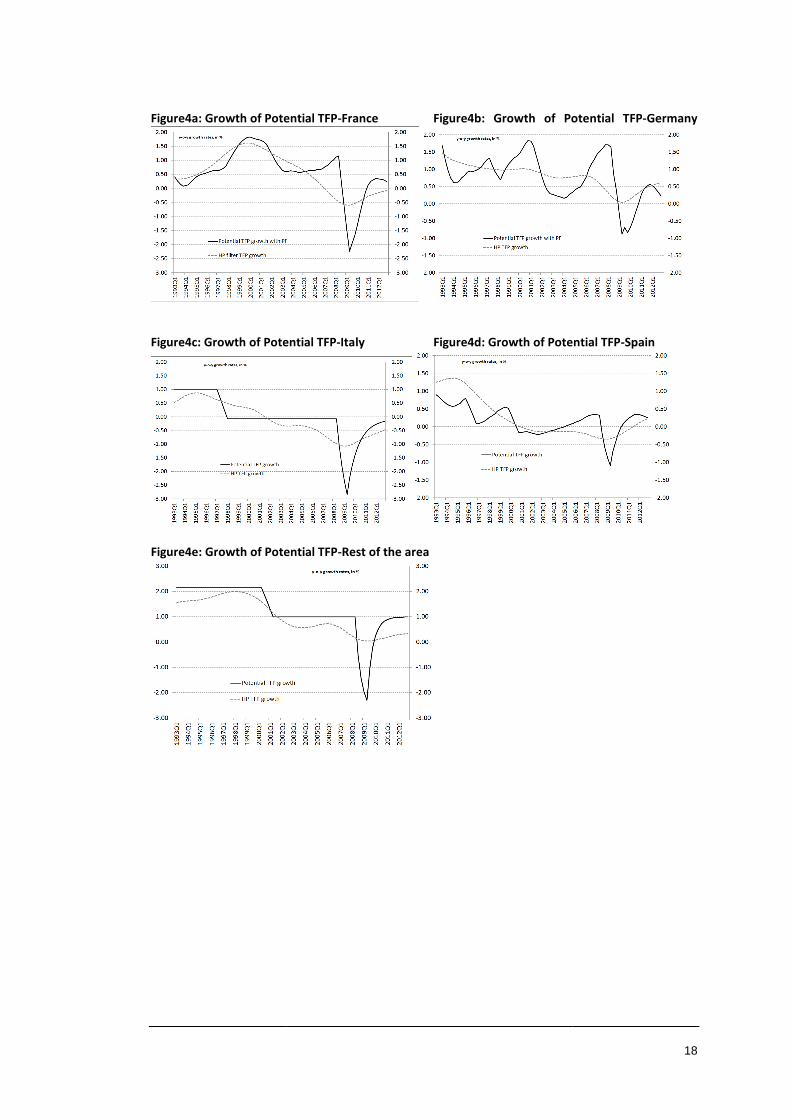
Figure4a: Growth of Potential TFP
Figure4c: Growth of Potential TFP
Figure4e: Growth of Potential TFP
a: Growth of Potential TFP-France Figure4b: Growth of Potential TFP
c: Growth of Potential TFP-Italy Figure4d: Growth of Potential TFP
e: Growth of Potential TFP-Rest of the area
18
b: Growth of Potential TFP-Germany
d: Growth of Potential TFP-Spain
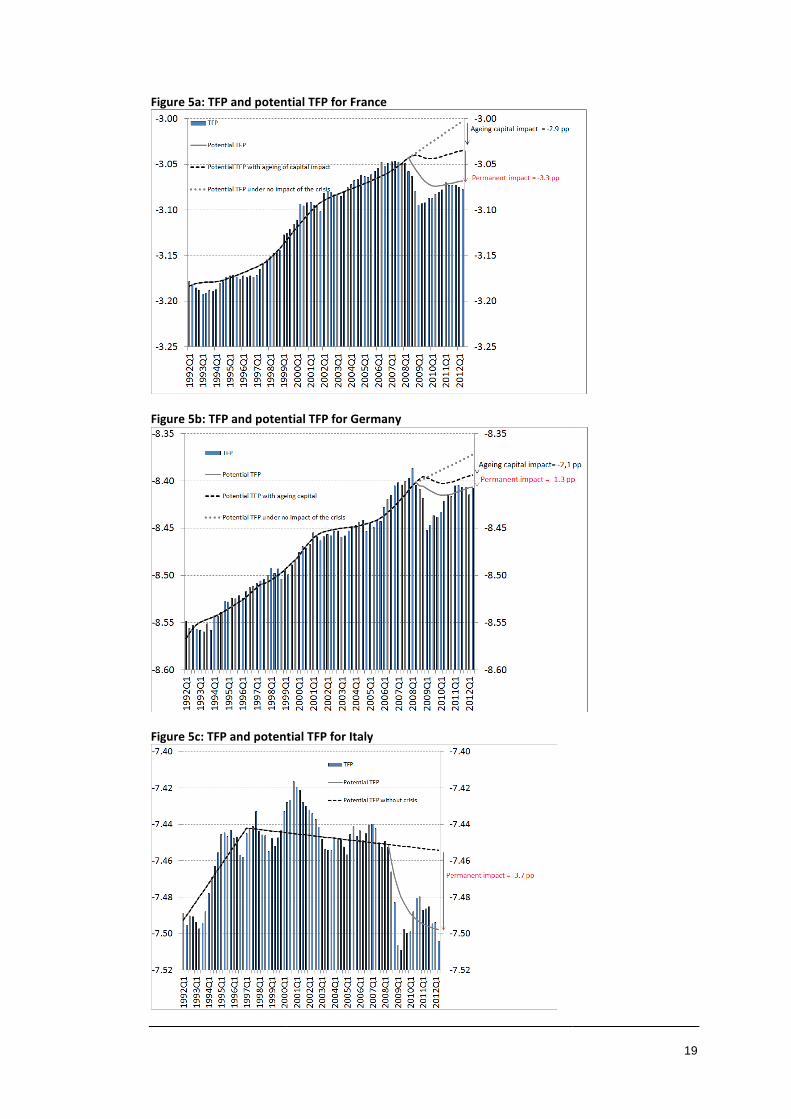
Figure 5a: TFP and potential TFP for France
Figure 5b: TFP and potential TFP for
Figure 5c: TFP and potential TFP for
TFP and potential TFP for France
: TFP and potential TFP for Germany
: TFP and potential TFP for Italy
19
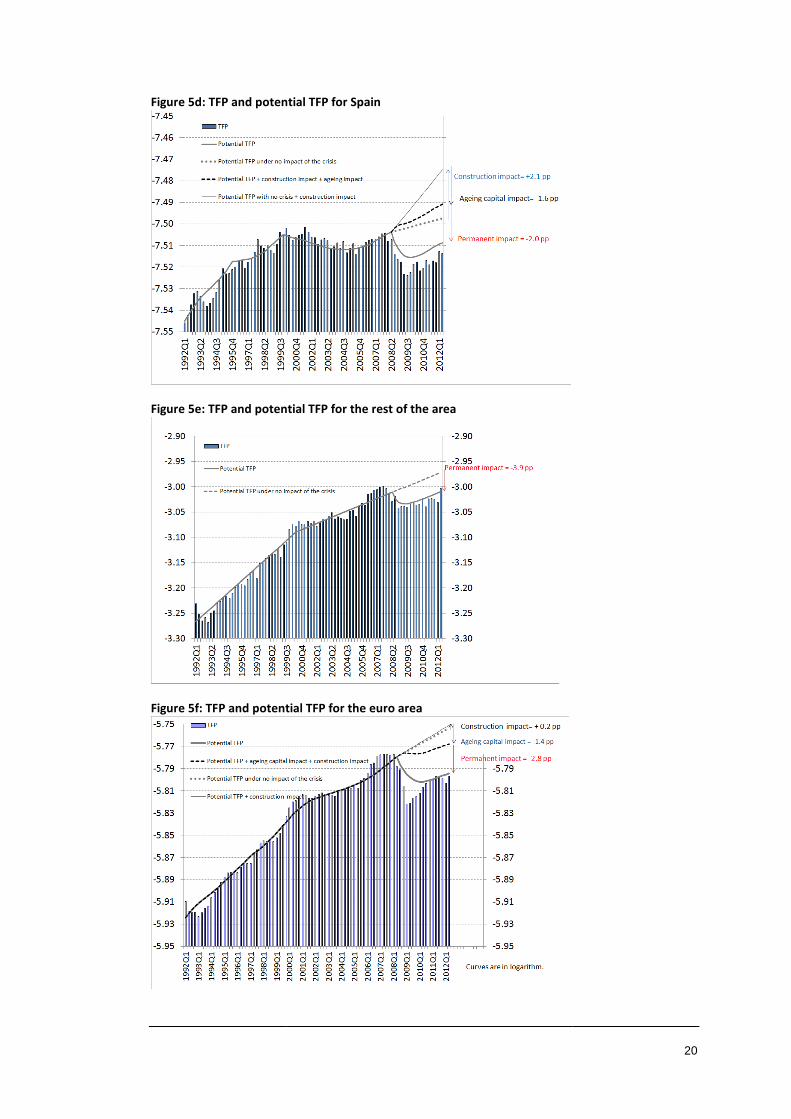
Figure 5d: TFP and potential TFP for
Figure 5e: TFP and potential TFP for
Figure 5f: TFP and potential TFP for the euro area
: TFP and potential TFP for Spain
: TFP and potential TFP for the rest of the area
f: TFP and potential TFP for the euro area
20
21
Figure 6: Residuals of TFP model and basic statistics
In %
Note: The TFP model residuals for the different countries remain small (except for REA, the standard deviations are small compared to the TFP gap standard deviations which are 0.98 for France; 1.09 for Germany; 1.11 for Italy; 0.38 for Spain and 1.14 for REA. Moreover, Student mean tests indicate that the mean of these residuals is zero over the period of estimation), confirming the stability in the relationship (equation 4) between the CUR and the TFP gap.
Table 3: The rise in private debt in the euro area between 1999 and 2007
Interest-rate liabilities (loans and non-equity securities) as % of GDP
Households Non-
financial Financial Government TOTAL
1999 41.8 57.4 59.5 66.5 225.2
2007 62.5 91.7 111.2 71.4 336.9 Source: ECB, author calculations.
Table 4: Changes in permanent losses with lower and higher depreciation rates
In percentage points Low depreciation High depreciation
France -1.1 -0.2 Germany -1.1 0.2 Italy -0.1 0.3 Spain 0.3 -0.5 REA 0.6 0.9 Euro area -0.4 0.2 Note 1: we use the estimates of O'Mahony and Oulton (1994) as the upper and lower bounds for our depreciation rates. These range from 4 to 14.27% for equipment and from 1.67% to 3.68% for buildings. Note 2: we calculate the changes in permanent losses with respect to our baseline estimates based on depreciation rates of 9.99% for equipment and 1.64% for buildings.
-0.03
-0.02
-0.01
0
0.01
0.02
0.03
0.04
1992
Q1
1993
Q1
1994
Q1
1995
Q1
1996
Q1
1997
Q1
1998
Q1
1999
Q1
2000
Q1
2001
Q1
2002
Q1
2003
Q1
2004
Q1
2005
Q1
2006
Q1
2007
Q1
2008
Q1
2009
Q1
2010
Q1
2011
Q1
2012
Q1
Germany France
Italy Spain
Rest of the zone Euro zone
France Germany Italy Spain REA Euro area
Mean -0.01 0.05 -0.02 0.00 -0.03 0.00
Std. dev. 0.40 0.58 0.55 0.22 1.01 0.32
Min -1.01 -1.79 -1.25 -0.42 -2.31 -1.11
Max 1.90 1.31 1.24 0.58 2.23 0.63
Documents de Travail
460. J. Carluccio and M. Bas, “The Impact of Worker Bargaining Power on the Organization of Global Firms,”
November 2013
461. F. Canova, F. Ferroni and C. Matthes, “Choosing the variables to estimate singular DSGE models,” November 2013
462. S. Avouyi-Dovi, G. Horny and P. Sevestre, “The dynamics of bank loans short-term interest rates in the Euro area: what lessons can we draw from the current crisis?,” November 2013
463. D. Fougère, C. Golfier, G. Horny et E. Kremp, “Quel a été l’impact de la crise de 2008 sur la défaillance des entreprises ?,” Novembre 2013
464. T. Duprey, “Heterogeneous Banking Efficiency: Allocative Distortions and Lending Fluctuations,” November 2013
465. L. Arrondel, M. Debbich and F. Savignac, “Financial Literacy and Financial Planning in France,” December 2013
466. P. Antipa, “Fiscal Sustainability and the Value of Money: Lessons from the British Paper Pound, 1797-1821,” December 2013
467. D. Bellas and Vincent Vicard, “French firms exports during downturns: evidence from past crises,” December 2013
468. V. Chouard, D. Fuentes Castro, D. Irac and M. Lemoine, “Assessing the losses in euro area potential productivity due to the financial crisis,” December 2013
Pour accéder à la liste complète des Documents de Travail publiés par la Banque de France veuillez consulter le site : www.banque-france.fr For a complete list of Working Papers published by the Banque de France, please visit the website: www.banque-france.fr Pour tous commentaires ou demandes sur les Documents de Travail, contacter la bibliothèque de la Direction Générale des Études et des Relations Internationales à l'adresse suivante : For any comment or enquiries on the Working Papers, contact the library of the Directorate General Economics and International Relations at the following address : BANQUE DE FRANCE 49- 1404 Labolog 75049 Paris Cedex 01 tél : 0033 (0)1 42 97 77 24 ou 01 42 92 63 40 ou 48 90 ou 69 81 email : [email protected]