Embed Size (px)
Citation preview
FRANCK GRATTEPANCHE
ETUDE D’UN SYSTEME DE PREFERMENTATION EN CONTINU DU LAIT PAR UNE CULTURE MIXTE
IMMOBILISEE FONCTIONNELLE
Thèse présentée à la Faculté des études supérieures de l’Université Laval
dans le cadre du programme de doctorat en sciences et technologie des aliments pour l’obtention du grade de Philosophiae Doctor (Ph.D.)
FACULTE DES SCIENCES DE L’AGRICULTURE ET DE L’ALIMENTATION
UNIVERSITE LAVAL QUEBEC
2005 © Franck Grattepanche, 2005

i
Résumé court
Le principal objectif de ce projet était d'étudier un système d'inoculation et préfermentation en continu du lait par une culture mixte avec cellules immobilisées et contenant une souche forte productrice de nisine Z, Lc. diacetylactis UL719, et deux souches sensibles à la bactériocine, un Lb. rhamnosus, producteur d’exopolysaccharides, et un Lc. cremoris, sélectionné pour ses capacités d’acidification. Des fermentations du lait inoculé de façon traditionnelle par la culture mixte en cellules libres ont également été réalisées. Durant ces fermentations en batch, la croissance de Lc. diacetylactis est stimulée par la présence des deux autres souches, entraînant une augmentation de la production de nisine. Le système d'inoculation et préfermentation en continu du lait avec cellules immobilisées, conduit sur une période de trois semaines, a permis d'inoculer massivement le lait par Lc. diacetylactis et Lb. rhamnosus. Le lait fermenté obtenu après une étape d'incubation additionnelle contenait également une population élevée de ces deux souches conduisant à une production élevée de nisine et une augmentation de la concentration d'exopolysaccharides comparativement à des fermentations en batch du lait par la culture mixte en cellules libres et inoculé de façon traditionnelle. La méthode de PCR en temps réel développée durant ce projet a permis de quantifier les faibles niveaux de populations de Lc. cremoris dans les laits fermentés et préfermentés. Une augmentation avec le temps de préfermentation de la tolérance à la nisine des cellules de Lb. rhamnosus ainsi que de la capacité acidifiante pour les deux souches majoritairement retrouvées dans le lait préfermenté fut également observée.

ii
Résumé long
Le principal objectif de ce projet était d'étudier un système d'inoculation et préfermentation en continu du lait par une culture mixte avec cellules immobilisées et contenant une souche forte productrice de nisine Z, Lc. diacetylactis UL719, et deux souches sensibles à la bactériocine, un Lb. rhamnosus, producteur d’exopolysaccharides, et un Lc. cremoris, sélectionné pour ses capacités d’acidification. Le comportement de ces trois souches en culture mixte avec cellules libres pour des fermentations en batch du lait inoculé de façon traditionnelle a également été étudié pour différentes températures d'incubation. Dans ces conditions de fermentation, la croissance de Lc. diacetylactis UL719 était stimulée par la présence des deux autres souches, entraînant une augmentation de la production de nisine Z. En fin de fermentation du lait par la culture mixte, les populations de Lc. cremoris et Lb. rhamnosus sont très significativement réduites. Toutefois, la production d'exopolysaccharides était suffisamment élevée pour modifier de façon significative la viscosité apparente du lait fermenté. De plus, la capacité acidifiante de la culture mixte, pour une température d'incubation de 34 et 38°C, était supérieure à celle de la souche acidifiante Lc. cremoris en culture pure. Le système d'inoculation et préfermentation en continu du lait avec cellules immobilisées, conduit sur une période de trois semaines, a permis d'obtenir des valeurs de productivité volumique élevées, variant de 8 à 12.5 h-1 avec une augmentation de la température de 27 à 35°C, et une inoculation massive du lait préfermenté par Lc. diacetylactis (8.1 log cfu/ml) dès le début de l'expérience, et par Lb. rhamnosus après une période d'adaptation d'environ une semaine. La concentration cellulaire de cette souche augmentait avec le temps de préfermentation pour atteindre un maximum (7.8 log cfu/ml) après 20 jours d'expérimentation. La population de Lc. cremoris, estimée par une méthode de PCR en temps réel développée durant le projet, dans le lait préfermenté a diminué rapidement durant les premiers jours de la préfermentation pour ensuite se stabiliser à 4.5 log cfu/ml. Dans le lait fermenté, obtenu après une étape d'incubation additionnelle, les différentes populations évoluaient parallèlement à celles du lait préfermenté. La concentration cellulaire de Lb. rhamnosus était significativement plus élevée à une température d'incubation de 35°C comparativement à 27 et 31°C. La population maximale pour cette souche (9.1 log cfu/ml) est atteinte au 20ième jour de préfermentation. La production d'exopolysaccharides dans le lait fermenté était nettement supérieure à celle observée durant des fermentations en batch du lait inoculé de façon traditionnelle par la culture mixte et en cellules libres tandis que la production de nisine se maintenait à des valeurs élevées variant de 177 à 363 UI/ml. Une évolution des paramètres d'acidification du lait préfermenté avec le temps de préfermentation, et tendant vers une augmentation de la capacité acidifiante de la culture, a également été observée. Ces résultats peuvent s'expliquer par des changements physiologiques affectant les cellules relâchées des billes de gel. En effet, les cellules de Lc. diacetylactis et de Lb. rhamnosus produites après 22 jours de préfermentation en continu présentaient une activité acidifiante supérieure à celles provenant de cultures pures contrôles obtenues par fermentation batch de lait inoculé de manière traditionnelle. Une augmentation de la tolérance à la nisine des cellules de Lb. rhamnosus dans le lait préfermenté entre le premier et le dernier jour de l'expérimentation a également été observée. Ce projet a ainsi mis en évidence le potentiel de l'immobilisation cellulaire associée à une préfermentation en continu pour la production d'un lait fermenté aux caractéristiques fonctionnelles améliorées.
iii
Abstract
The objective of this work was to study an immobilized-cell system for continuous inoculation and prefermentation of milk by a mixed culture containing a nisin Z producer (Lc. diacetylactis UL719) and two nisin-sensitive strains for acidification (Lc. cremoris) and exopolysaccharide production (Lb. rhamnosus RW-9595M). Batch fermentations of milk traditionally inoculated with free-cell mixed culture of the three strains were also performed at different temperatures. In these conditions, we showed that growth of Lc. diacetylactis was stimulated by commensalism, leading to an increase of nisin Z production. Continuous prefermentation of milk with immobilized cells carried out over 3 weeks leads to high inoculation of milk with Lc. diacetylactis and Lb. rhamnosus . In fermented milk, obtained after an additional batch incubation, populations of these two strains remained at high concentrations leading to high nisin production and higher exopolysaccharide concentration compared to traditional batch fermentation of milk. The real-time PCR method, developed in this project, was successfully used to quantify very low cell concentrations of Lc. cremoris in prefermented and fermented milks. Immobilization and continuous culture also lead to important cell physiological adaptations for Lb. rhamnosus and Lc. diacetylactis. Lb. rhamnosus became much more tolerant to nisin Z, and both strains exhibited a large increase in milk acidification capacity.

iv
Remerciements
Cette thèse est le fruit de quatre années de travail, durant lesquelles j'ai rencontré
des personnes exceptionnelles par leur gentillesse et leur professionnalisme et dont l'appui a
facilité la réalisation de mon projet de recherche.
J'adresse ma reconnaissance à mon directeur, Christophe Lacroix, pour ses judicieux
conseils, sa coutumière et remarquable disponibilité, et son soutien dans les différents
événements qui ont marqué ce projet. Je remercie également mon co-directeur, Pascal
Audet, pour sa gentillesse, ses encouragements et sa confiance.
Je tiens aussi à remercier Gisèle LaPointe pour m'avoir gentiment accueilli au sein
de son équipe pour les expériences de biologie moléculaire de ce projet, les compétences
dont elle m'a fait bénéficier dans ce domaine et son aide précieuse pour la rédaction du
premier article de cette thèse.
Mes remerciements vont également à Louise Tremblay et Héléne Bissonnette pour
leur aide concernant les questions d'ordre administratif et financier, ainsi qu'au personnel du
Centre STELA et du laboratoire pilote.
Je remercie également Janice pour sa disponibilité et la révision du texte des deux
derniers articles de ce projet.
Je garderai également un très bon souvenir de tous ses moments passés avec mes
amis étudiants.
Enfin, je souhaite remercier ma famille pour leur soutien inconditionnel et plus
particulièrement Mélanie pour son incommensurable patience.
v
Avant-Propos
Le corps de cette thèse est divisé en cinq chapitres. Le premier chapitre, intitulé
"Revue de littérature", propose un état de l’art des différents domaines abordés durant ce
projet de doctorat. Il couvre les principales caractéristiques physiologiques et métaboliques
des bactéries lactiques incluant la synthèse de nisine et d’exopolysaccharides et les
propriétés fonctionnelles de ces deux métabolites. Les phénomènes d’interaction résultant
de l’association des bactéries lactiques en culture mixte sont également abordés dans cette
section. La deuxième partie de ce chapitre est consacrée aux différentes méthodes de
quantification des populations bactériennes en culture mixte. La troisième section traite de
l’immobilisation cellulaire, de ses principes et effets sur la physiologie des cellules
bactériennes, et de ses applications dans l’industrie laitière. L’hypothèse, le but et les
objectifs de ce travail clôturent ce premier chapitre. Les références bibliographiques de la
revue de littérature et des chapitres suivants sont décrites dans une section unique située à
la fin du manuscrit.
Les trois chapitres suivants sont présentés sous la forme d’articles scientifiques
rédigés en anglais. Un résumé en français précède chacun de ces chapitres.
Le chapitre 2, intitulé "Quantification by real-time PCR of Lactococcus lactis subsp.
cremoris in milk femented by a mixed culture", présente une méthode de biologie
moléculaire développée dans le but de quantifier, dans une large gamme de concentrations,
une population de bactérie lactique sensible à la nisine en culture mixte avec une souche
productrice de la bactériocine et un Lactobacillus rhamnosus. Ces travaux ont été publiés
dans le journal "Applied Microbiology and Biotechnology". La réalisation de
l'expérimentation et la rédaction de l'article ont été effectuées en majeure partie sous la
supervision de Gisèle LaPointe, également correspondante de l'article.
Le troisième chapitre, intitulé "Milk fermentation by functional mixed culture
producing nisin Z and exopolysaccharides in a fresh cheese model", présente les résultats
de fermentations batch du lait réalisées avec des cultures pures et mixtes en cellules libres

vi
de deux souches sensibles à la nisine: un Lc. cremoris présentant une capacité
d'acidification élevée et un Lb. rhamnosus RW-9595M producteur d'exopolysaccharides, et
d'une souche forte productrice de nisine, Lc. diacetylactis UL719. Les effets de trois
températures d’incubation et de l'association des souches ont été étudiés sur les trois
populations bactériennes, les paramètres d’acidification des cultures et la production des
métabolites d’intérêt, nisine et exopolysaccharides. La quantification de Lc. cremoris, en
culture mixte, n'a été possible que par la technique décrite dans le chapitre 2. Ce travail a
permis, par la suite, de comparer les résultats obtenus à ceux du procédé d’inoculation et
fermentation en continu du lait avec cellules immobilisées décrit au chapitre 4. Cet article a
été soumis dans le journal "International Dairy Journal". J'ai réalisé l'ensemble des
expériences et la rédaction de cet article.
Le chapitre 4, intitulé "Immobilized cell technology improves functional
characteristics of nisin Z- and exopolysaccharide-producing mixed cultures for continuous
inoculation and fermentation of milk" traite d'une fermentation en continu du lait par une
culture mixte en cellules immobilisées, constituée des trois souches de bactéries lactiques
précédemment décrites. Les modifications physiologiques observées pour deux des souches
ont fait l'objet d'études complémentaires présentées dans ce chapitre. Ce travail sera
prochainement soumis dans la revue "Journal of Biotechnology".
Finalement, une conclusion générale sous la forme d'un cinquième chapitre souligne
les résultats importants de ce projet et présente une vue d'ensemble et les perspectives pour
de futurs travaux.

À Mélanie et mes Parents,

vii
Table des matières
RESUME COURT ........................................................................................................................I
RESUME LONG .........................................................................................................................II
ABSTRACT ..............................................................................................................................III
REMERCIEMENTS ................................................................................................................... IV
AVANT-PROPOS ...................................................................................................................... V
TABLE DES MATIERES ........................................................................................................... VII
LISTE DES TABLEAUX............................................................................................................. XI
LISTE DES FIGURES................................................................................................................ XII
INTRODUCTION ........................................................................................................................1
CHAPITRE 1. REVUE DE LITTERATURE ..................................................................................3
1.1 Bactéries importantes en fermentation laitière .............................................................4 1.1.1 Les lactocoques......................................................................................................4
1.1.1.1 Caractéristiques générales...............................................................................4 1.1.1.2 Métabolisme des sucres ..................................................................................4 1.1.1.3 Résistance aux stress environnementaux........................................................7 1.1.1.4 Formation d’arômes........................................................................................9
1.1.2 Les lactobacilles...................................................................................................13 1.1.2.1 Caractéristiques générales.............................................................................13 1.1.2.2 Utilisation des Lactobacillus en industrie laitière.........................................14
1.1.3 Les interactions entre les souches de bactéries lactiques.....................................17 1.1.3.1 Les phénomènes d’antagonisme ...................................................................17 1.1.3.2 Les phénomènes de stimulation....................................................................18
1.2 Métabolites d’intérêt produits par la culture modèle ..................................................20 1.2.1 La nisine...............................................................................................................20
1.2.1.1 Définition et classification ............................................................................20 1.2.1.2 Structure et propriétés physico-chimiques....................................................20 1.2.1.3 Biosynthèse...................................................................................................22 1.2.1.4 Spectre d’activité et modes d’action.............................................................22 1.2.1.5 Accélération de l’affinage des fromages ......................................................24 1.2.1.6 Modes de propagation...................................................................................25 1.2.1.7 Réglementation .............................................................................................27
1.2.2 Les exopolysaccharides .......................................................................................27 1.2.2.1 Classification et composition........................................................................27 1.2.2.2 Biosynthèse...................................................................................................28 1.2.2.3 Facteurs influençant la production d’EPS ....................................................31
viii 1.2.2.4 Applications ..................................................................................................33
1.3 Méthode de quantification des bactéries en culture mixte..........................................34 1.3.1 Techniques conventionnelles...............................................................................34
1.3.1.1 Facteurs de sélection.....................................................................................34 1.3.1.2 Géloses différentielles...................................................................................34
1.3.2 Méthodes alternatives ..........................................................................................35 1.3.3 Quantification par PCR en temps réel .................................................................37
1.3.3.1 Principe .........................................................................................................37 1.3.3.2 Technique du SYBR-Green I........................................................................38 1.3.3.3 Avantages et limites de la RT-PCR ..............................................................39
1.4 L’immobilisation cellulaire.........................................................................................39 1.4.1 Techniques d’immobilisation cellulaire...............................................................40
1.4.1.1 L’attachement ou l’adsorption sur un support préformé ..............................40 1.4.1.2 La rétention derrière des membranes ou bioréacteurs à membrane..............41 1.4.1.3 L’inclusion dans une matrice de polymères .................................................41
1.4.2 Distribution de la biomasse dans les billes de gel ...............................................42 1.4.3 Principe du relargage cellulaire ...........................................................................43 1.4.4 Phénomène de contamination croisée..................................................................43 1.4.5 Modifications physiologiques induites par l’immobilisation ..............................44 1.4.6 Applications de l’immobilisation cellulaire aux bactéries lactiques ...................45
1.4.6.1 Production de métabolites.............................................................................45 1.4.6.2 Production de biomasse ................................................................................47 1.4.6.3 Inoculation et pré-acidification en continu du lait ........................................48
1.5 Hypothèse, but et objectifs du travail .........................................................................50 1.5.1 Hypothèse ............................................................................................................50 1.5.2 But........................................................................................................................50 1.5.3 Objectifs spécifiques............................................................................................51
CHAPITRE 2. QUANTIFICATION BY REAL-TIME PCR OF LACTOCOCCUS LACTIS SUBSP. CREMORIS IN MILK FERMENTED BY A MIXED CULTURE / QUANTIFICATION PAR PCR EN TEMPS REEL D’UNE SOUCHE DE LACTOCOCCUS LACTIS SUBSP. CREMORIS DANS UN LAIT FERMENTE PAR UNE CULTURE MIXTE..............................................................................................................52
2.1 Résumé........................................................................................................................53 2.2 Abstract .......................................................................................................................54 2.3 Introduction.................................................................................................................55 2.4 Materials and methods ................................................................................................57
2.4.1 Bacterial strains....................................................................................................57 2.4.2 Preparation of quantification standards ...............................................................57 2.4.3 Batch fermentations .............................................................................................58 2.4.4 Determination of nisin sensitivity........................................................................58 2.4.5 Quantification of nisin Z activity.........................................................................59 2.4.6 DNA extraction....................................................................................................59 2.4.7 DNA quantification by agarose gel electrophoresis ............................................60 2.4.8 Oligonucleotide primers and real-time PCR quantification ................................60
2.5 Results.........................................................................................................................63 2.5.1 Primer specificity.................................................................................................63 2.5.2 Analyses of Lc. cremoris in milk samples by real-time quantitative PCR..........64
ix
2.5.3 Batch fermentations .............................................................................................66 2.5.4 Nisin sensitivity ...................................................................................................68
2.6 Discussion...................................................................................................................69 2.7 Acknowledgements.....................................................................................................72
CHAPITRE 3. MILK FERMENTATION BY FUNCTIONAL MIXED CULTURE PRODUCING NISIN Z AND EXOPOLYSACCHARIDES IN A FRESH CHEESE MODEL / FERMENTATION DU LAIT PAR UNE CULTURE MIXTE FONCTIONNELLE PRODUISANT DE LA NISINE Z ET DES EXOPOLYSACCHARIDES ET VISANT LA PRODUCTION DE FROMAGE FRAIS.....................................................................73
3.1 Résumé........................................................................................................................74 3.2 Abstract .......................................................................................................................75 3.3 Introduction.................................................................................................................76 3.4 Materials and methods ................................................................................................78
3.4.1 Bacterial strains and culture conditions ...............................................................78 3.4.2 Batch culture experiments ...................................................................................78 3.4.3 Cell enumeration..................................................................................................80 3.4.4 Citrate analyses ....................................................................................................80 3.4.5 Quantification of nisin Z in milk samples ...........................................................81 3.4.6 Exopolysaccharide extraction ..............................................................................81 3.4.7 Viscosity measurements ......................................................................................82 3.4.8 Phenotypic characterization.................................................................................82 3.4.9 Effect of nisin Z on cell lysis ...............................................................................83 3.4.10 Statistical analyses .............................................................................................83
3.5 Results.........................................................................................................................84 3.5.1 Acidification kinetics...........................................................................................84 3.5.2 Cell counts in fermented milk..............................................................................87 3.5.3 Citrate, nisin Z and exopolysaccharide concentrations in fermented milk..........88 3.5.4 Apparent viscosity of fermented milk .................................................................89 3.5.5 Phenotypic characterization.................................................................................90 3.5.6 Effect of nisin Z on cell lysis ...............................................................................91
3.6 Discussion...................................................................................................................92 3.7 Conclusion ..................................................................................................................96 Acknowledgements...........................................................................................................96
CHAPITRE 4. IMMOBILIZED CELL TECHNOLOGY IMPROVES FUNCTIONAL CHARACTERISTICS OF NISIN Z- AND EXOPOLYSACCHARIDE-PRODUCING MIXED CULTURES FOR CONTINUOUS INOCULATION AND FERMENTATION OF MILK / AMELIORATION DES CARACTERISTIQUES FONCTIONNELLES, PAR L'IMMOBILISATION CELLULAIRE, DE CULTURES MIXTES PRODUISANT DE LA NISINE Z ET DES EXOPOLYSACCHARIDES POUR L'INOCULATION ET LA FERMENTATION EN CONTINU DU LAIT ...............................................................................97
4.1 Résumé........................................................................................................................98 4.2 Abstract .......................................................................................................................99 4.3 Introduction...............................................................................................................100 4.4 Materials and methods ..............................................................................................102
4.4.1 Bacterial strains..................................................................................................102 4.4.2 Chemicals...........................................................................................................103 4.4.3 Cell immobilization procedure ..........................................................................103

x
4.4.4 Continuous prefermentation of milk..................................................................104 4.4.5 Final fermentation of the prefermented milk.....................................................105 4.4.6 Cell enumeration................................................................................................105 4.4.7 Quantification of nisin Z activity.......................................................................106 4.4.8 Determination of nisin sensitivity......................................................................107 4.4.9 Determination of EPS concentration .................................................................107 4.4.10 Acidification capacity of Lc. diacetylactis UL719 and Lb. rhamnosus RW-9595M.........................................................................................................................108 4.4.11 Statistical analyses ...........................................................................................108
4.5 Results.......................................................................................................................109 4.5.1 Milk dilution rate ...............................................................................................109 4.5.2 Microbial populations ........................................................................................109 4.5.3 Batch acidification of prefermented milk ..........................................................114 4.5.4 Nisin and EPS production..................................................................................117 4.5.5 Nisin sensitivity .................................................................................................119 4.5.6 Acidification capacity of Lc. diacetylactis UL719 and Lb. rhamnosus RW-9595M.........................................................................................................................120
4.6 Discussion.................................................................................................................123 4.7 Acknowledgments ....................................................................................................129
CHAPITRE 5. CONCLUSION GÉNÉRALE ..............................................................................130
BIBLIOGRAPHIE....................................................................................................................134

xi
Liste des tableaux
Tableau 1.1 : Principales espèces et sous espèces de lactobacilles utilisées en industrie laitière. * : contaminants, Lb. : Lactobacillus........................................................13
Tableau 1.2 : Utilisations commerciales et effets bénéfiques de quelques souches de Lactobacillus probiotiques....................................................................................16
Table 2.1 : Cycling regimes used for real-time quantitative PCR reactions.........................62
Table 3.1 : Kinetic parameters of milk acidification by pure and mixed cultures at different temperatures..........................................................................................................85
Table 3.2 : Cell counts in milk at the end of fermentations with pure and mixed cultures of the three strains for three incubation temperatures. Fermentations were stopped after an incubation time equal to that required for the mixed culture at the same temperature to reach pH 4.8 (Table 3.1). Reported data are means and standard deviations for four experiments ............................................................................88
Table 3.3 : Citrate, nisin and exopolysaccharide concentrations in milk at the end of fermentation with pure and mixed cultures for different temperatures. Reported data are means and standard deviations for four experiments ..............................89
Table 4.1 : Regression coefficients for models for bacterial populations in prefermented and fermented milks as function of temperature (T) and age (A) of the prefermentation...................................................................................................111
Table 4.2 : Regression coefficients for models for final pH (pH F), time to reach pH 5.25 (t pH 5.25) and maximal acidification rate (Vmax) measured during 22 h batch incubation of prefermented milks. ......................................................................116
Table 4.3 : Regression coefficients of the models for nisin Z and EPS productions in fermented milks after 22 h incubation. ...............................................................118
Table 4.4 : Acidification parameters and cells counts after 48 h incubation at 30 and 45°C of prefermented milk samples harvested at day 22 and control pure cultures of Lc. diacetylactis UL719 and Lb. rhamnosus RW-9595M. Reported data are means and standard deviations of duplicate experiments. .............................................122
xii
Liste des figures
Figure 1.1 : Métabolisme du lactose, galactose et glucose chez Lc. lactis sp et enzymes impliquées dans la voie métabolique centrale. Adapté de Cocaign-Bousquet et al. (2002)......................................................................................................................6
Figure 1.2 : Mécanisme de résistance à l’acide lactique induit par CitP chez Lc. diacetylactis. Adapté de Magni et al. (1999). .........................................................8
Figure 1.3 : Métabolisme du citrate conduisant à la formation du diacétyle. Adapté de Swindell et al. (1996)............................................................................................10
Figure 1.4 : Catabolisme des acides aminés par Lc. lactis sp. Dpp, Opp et aat représentent respectivement les systèmes de transport des di- et tri- peptides, oligopeptides et acides aminés. Adapté des travaux publiés par Pritchard et al. (1993) ; Christensen et al. (1999) ; Yvon et al. (2001) et Marilley et al. (2004)................12
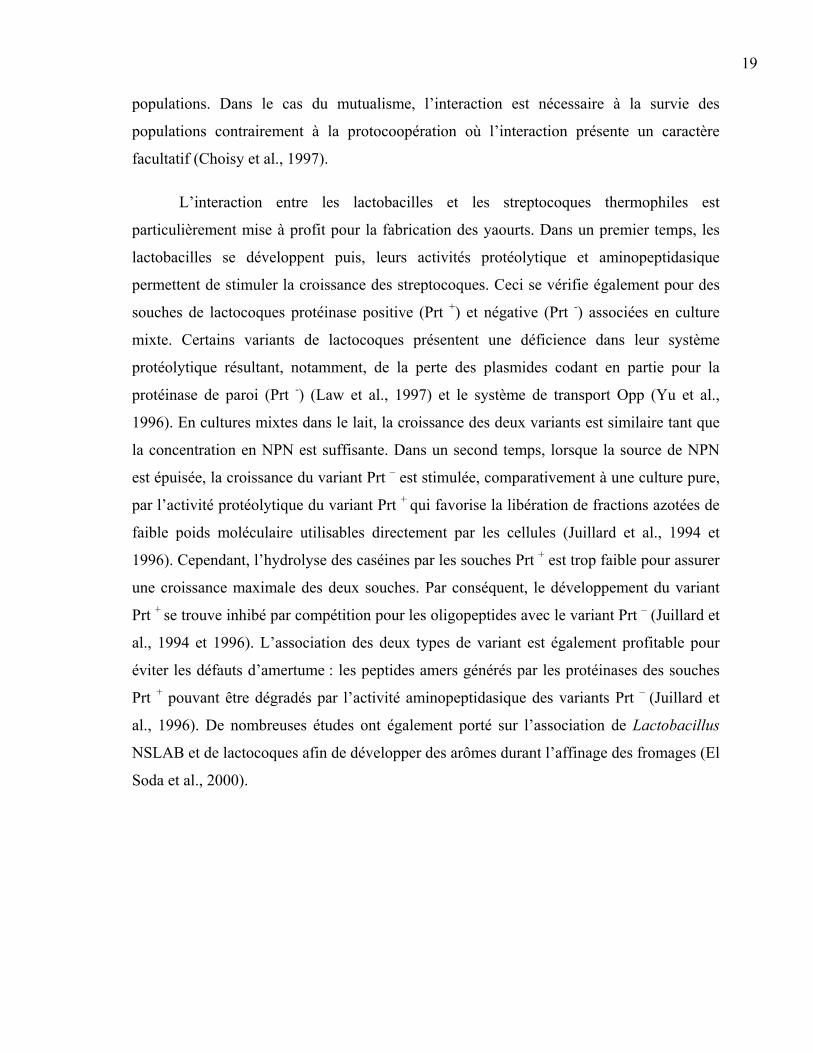
Figure 1.5 : Structure de la nisine A et de la nisine Z. Adapté de Mc Auliffe et al. (2001). 21
Figure 1.6 : Modèle de formation d’un pore trans-membranaire par la nisine. Adapté de Sahl et al. (1998)...................................................................................................23
Figure 1.7 : Composition et structure du motif répété de l’EPS produit par Lb. rhamnosus RW-9595M. Rha : rhamnose, Glc : glucose, Gal : galactose, p : forme pyranose. Adapté de Van Calsteren et al. (2002)..................................................................28
Figure 1.8 : Voie de biosynthèse des hétéropolysaccharides chez les bactéries lactiques. Adapté de De Vuyst et al. (2001). ........................................................................30
Figure 1.9 : Évolution du signal de fluorescence en fonction du nombre de cycles d’amplification pour des extraits d’ADN provenant de dilutions décimales d’une culture bactérienne................................................................................................37
Figure 2.1 : PCR carried out with DNA from Lactococcus cremoris ATCC 19257, Lc. diacetylactis UL719 and Lactobacillus rhamnosus RW-9595M with primer pairs a 68FCa33/16SR308 and b 16SF20/16SR308. Lanes: 1, 6, 11 100-bp DNA mass ladder (Invitrogen); 2, 7 Lc. cremoris ATCC 19257; 3,8 Lc. diacetylactis UL719; 4 9 Lb. rhamnosus RW-9595M; 5, 10 no template control. .................................63
Figure 2.2 : Standard curve obtained by plotting bacterial count against the threshold cycle obtained from real-time PCR serial 10-fold diluted DNA extracted from an overnight culture of Lc. cremoris ATCC 19257 at 6.27±2.11×10⁸ cfu/ml...........64
Figure 2.3 : Comparison between the logarithm of cfu/ml determined by real-time quantitative PCR and the plate count method. Each point was obtained from one extraction and all the samples were initially prepared from five independent cultures..................................................................................................................65
xiii
Figure 2.4 : Milk fermentation with a pure culture of Lc. cremoris ATCC 19257 and b mixed cultures of the three strains: bacterial populations of Lc. cremoris ATCC 19257 [obtained by plate count (open circles) and real-time PCR (filled circles)], Lc. diacetylactis UL719 (filled triangles), Lb. rhamnosus RW-9595M (crosses) and nisin Z concentration (open squares). c Acidification profiles during fermentation of milk with pure culture of Lc. cremoris ATCC 19257 (filled squares) and mixed culture of the three strains (open diamonds). The dotted line (b) represents the limit of detection of the nisin activity test. Error bars Standard deviation of duplicate tests ...................................................................................67
Figure 3.1 : Changes in pH during milk acidification by mixed culture ( ) and pure culture of: Lc. cremoris ATCC19257 ( ), Lc. diacetylactis UL719 ( ) and Lb. rhamnosus RW-9595M ( ) at different temperatures. Reported data are means from four repetitions. Error bars are standard deviations of four repetitions .......86
Figure 3.2 : Apparent viscosity measurement of milk fermented with mixed cultures at 30 ( ), 34 ( ), and 38°C ( ) and with pure culture of Lc. cremoris ATCC19257 (x) at 30°C as a function of time. Data are means of four repetitions with a deviation less than 10 %. Final pH of fermented milks with mixed and pure cultures was 4.80 and 4.61, respectively ..............................................................90
Figure 3.3 : Effect of nisin Z on cell lysis of Lc. cremoris ATCC19257 ( , ) and Lb. rhamnosus RW-9595M ( , ) after incubation of 3 (open symbols) and 18 (filled symbols) hours at 30°C. Error bars are standard deviation of duplicate experiments...........................................................................................................91
Figure 4.1 : Populations of Lc. cremoris ATCC19257 ( , ), Lc. diacetylactis UL719 ( , ) and Lb. rhamnosus RW-9595M ( , ) in gel beads (closed symbols) and prefermented milk (opened symbols) during continuous immobilized cell culture at different temperatures. For prefermented milk, data with more than 1 day interval corresponded to week-end interruptions. The dashed lines correspond to the effects of the age of prefermentation show on Lc. cremoris ATCC19257 ( ) and Lb. rhamnosus RW-9595M (----) cells counts predicted by the regression model for a temperature of 31°C. Bars represent standard deviations calculated from triplicate analyses.......................................................................................110
Figure 4.2 : Populations of Lc. cremoris ATCC19257 ( ), Lc. diacetylactis UL719 ( ) and Lb. rhamnosus RW-9595M ( ) in fermented milks after 22 h incubation of milks prefermented at different temperatures. Data with more than 1 day interval corresponded to week-end interruptions. The dashed lines correspond to the effects of age of prefermentation on Lc. cremoris ATCC19257 ( ) and Lb. rhamnosus RW-9595M (----) cells counts predicted by the regression model for a temperature of 31°C. Bars represent the standard deviations calculated from triplicate analyses................................................................................................113
Figure 4.3 : Change of pH during 22 h batch incubation of prefermented milks produced at different temperatures and different ages of fermentation. Bars represent the standard deviations calculated from three incubation repetitions.......................115
xiv
Figure 4.4 : Nisin Z concentration in fermented milks after 22 h incubation of prefermented milk produced at different ages and temperatures. Bars represent standard deviations calculated from analyses of three samples. .......................................117
Figure 4.5 : EPS concentration in fermented milks after 22 h incubation of prefermented milk produced at different ages and temperatures. The dashed lines shows the EPS concentration in fermented milks predicted by the regression model for different ages of prefermentation and temperatures. Bars represent the standard deviations calculated from analysis of three samples.........................................119
Figure 4.6 : Sensitivity to nisin Z of Lb. rhamnosus RW-9595M produced during control free-cell batch culture in MRS ( ), in prefermented milks harvested at day 1 ( ) and day 22 ( S0) and after 3, 6, 7 and 8 subcultures of cells from prefermented milk harvested at day 22 ( dashed lines, S3, S6, S7 and S8). Bars represent standard deviations calculated from three repetitions.........................................120
Figure 4.7 : Acidifying capacity of prefermented milk samples harvested at day 22, at a incubation temperature of 30 ( ) and 45°C ( ) and control cultures of Lc. diacetylactis UL719 at 30°C ( ) and Lb. rhamnosus RW-9595M at 45°C ( ). Error bars represent duplicate experiments. .......................................................121
1
Introduction
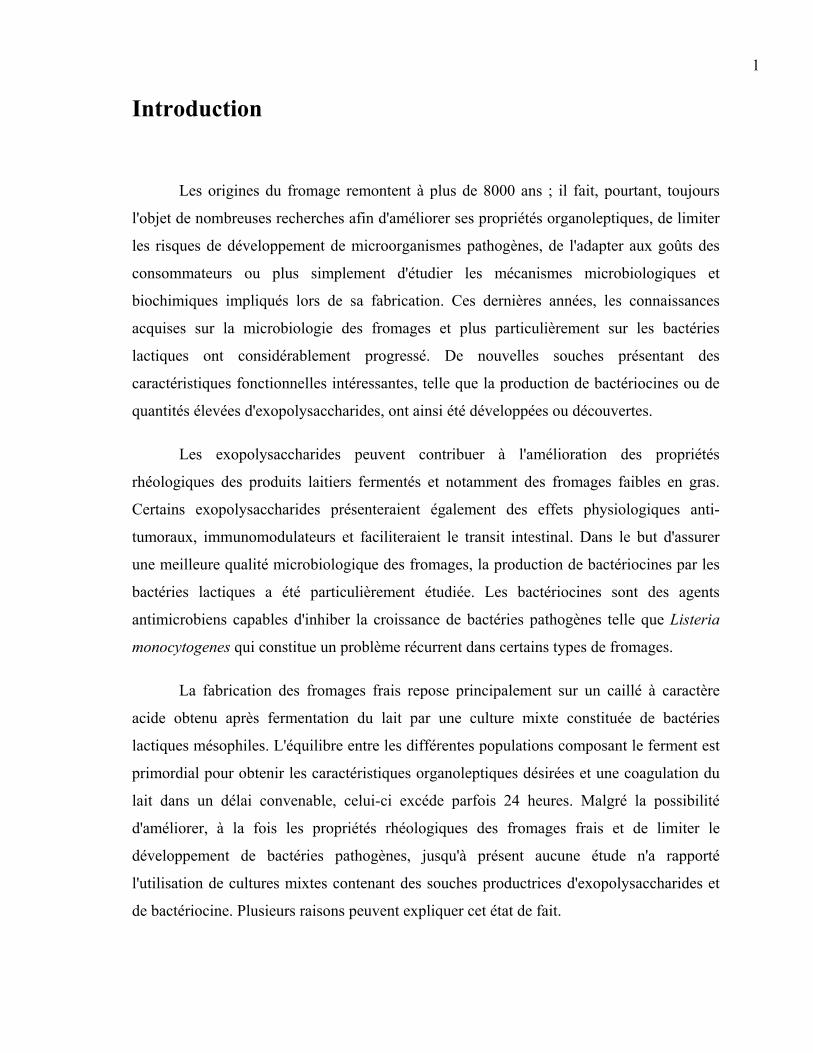
Les origines du fromage remontent à plus de 8000 ans ; il fait, pourtant, toujours
l'objet de nombreuses recherches afin d'améliorer ses propriétés organoleptiques, de limiter
les risques de développement de microorganismes pathogènes, de l'adapter aux goûts des
consommateurs ou plus simplement d'étudier les mécanismes microbiologiques et
biochimiques impliqués lors de sa fabrication. Ces dernières années, les connaissances
acquises sur la microbiologie des fromages et plus particulièrement sur les bactéries
lactiques ont considérablement progressé. De nouvelles souches présentant des
caractéristiques fonctionnelles intéressantes, telle que la production de bactériocines ou de
quantités élevées d'exopolysaccharides, ont ainsi été développées ou découvertes.
Les exopolysaccharides peuvent contribuer à l'amélioration des propriétés
rhéologiques des produits laitiers fermentés et notamment des fromages faibles en gras.
Certains exopolysaccharides présenteraient également des effets physiologiques anti-
tumoraux, immunomodulateurs et faciliteraient le transit intestinal. Dans le but d'assurer
une meilleure qualité microbiologique des fromages, la production de bactériocines par les
bactéries lactiques a été particulièrement étudiée. Les bactériocines sont des agents
antimicrobiens capables d'inhiber la croissance de bactéries pathogènes telle que Listeria
monocytogenes qui constitue un problème récurrent dans certains types de fromages.
La fabrication des fromages frais repose principalement sur un caillé à caractère
acide obtenu après fermentation du lait par une culture mixte constituée de bactéries
lactiques mésophiles. L'équilibre entre les différentes populations composant le ferment est
primordial pour obtenir les caractéristiques organoleptiques désirées et une coagulation du
lait dans un délai convenable, celui-ci excéde parfois 24 heures. Malgré la possibilité
d'améliorer, à la fois les propriétés rhéologiques des fromages frais et de limiter le
développement de bactéries pathogènes, jusqu'à présent aucune étude n'a rapporté
l'utilisation de cultures mixtes contenant des souches productrices d'exopolysaccharides et
de bactériocine. Plusieurs raisons peuvent expliquer cet état de fait.
2 D'une part, il est difficile de suivre l'évolution de chaque population bactérienne en
culture mixte en l'absence de méthode de quantification suffisamment sensible et spécifique
et plus particulièrement lorsque les souches appartiennent à la même espèce ou sous-
espèce. D'autre part, la présence d'une souche productrice de bactériocine peut entraîner un
déséquilibre entre les populations, par inhibition des espèces sensibles, ce qui favoriserait
une souche aux dépens d'une autre et conduirait par exemple à des défauts de saveurs, un
retard dans l'acidification ou une diminution de la production des métabolites d'intérêt.
L'utilisation de l'immobilisation cellulaire s'avère une technologie prometteuse pour
la production d'un lait fermenté par une culture mixte constituée de souches dont la
compétitivité diffère. Ce procédé, associé à une fermentation en continu, assure une
productivité élevée et il est possible de contrôler le ratio des populations dans l'effluent en
modifiant les conditions de la fermentation, comme par exemple la température. De plus,
les cellules relâchées des billes possèdent une résistance accrue à différents agents
inhibiteurs, notamment les antibiotiques et la nisine.

3
Chapitre 1. Revue de littérature
4
1.1 Bactéries importantes en fermentation laitière
1.1.1 Les lactocoques
1.1.1.1 Caractéristiques générales
Le genre Lactococcus correspond au groupe des streptocoques lactiques de Sherman
(1937) dont la principale espèce est Lactococcus lactis (Lc. lactis sp). Par définition, le
genre Lactoccoccus est formé de bactéries à Gram positif dont les cellules, en forme de
coques, sont associées par paires ou en chaînettes de longueur variable. Elles sont
dépourvues de catalase et ne sont pas capables d’utiliser l’oxygène mais se multiplient en
sa présence (anaérobies aérotolérantes). Parmi, les Lc. lactis sp, deux sous espèces et un
biovariant prédominent en fermentation laitière : Lc. lactis subsp. lactis (Lc. lactis), Lc.
lactis subsp. cremoris (Lc. cremoris) et Lc. lactis subsp. lactis biovar. diacetylactis (Lc.
diacetylactis). Le groupe des levains mésophiles, auquel les lactocoques appartiennent, est
le premier à avoir fait l’objet de sélection et de production pour l’industrie laitière. Les
souches sont sélectionnées pour leur aptitude à acidifier le lait, à travers leur métabolisme
homofermentaire, et former des arômes. Leur température optimale de croissance s’étend
de 25 à 35°C, respectivement pour les souches de Lc. cremoris et Lc. lactis. Les
Lactococcus sont capables de croître à 10°C mais pas à une température supérieure à 40°C.
1.1.1.2 Métabolisme des sucres
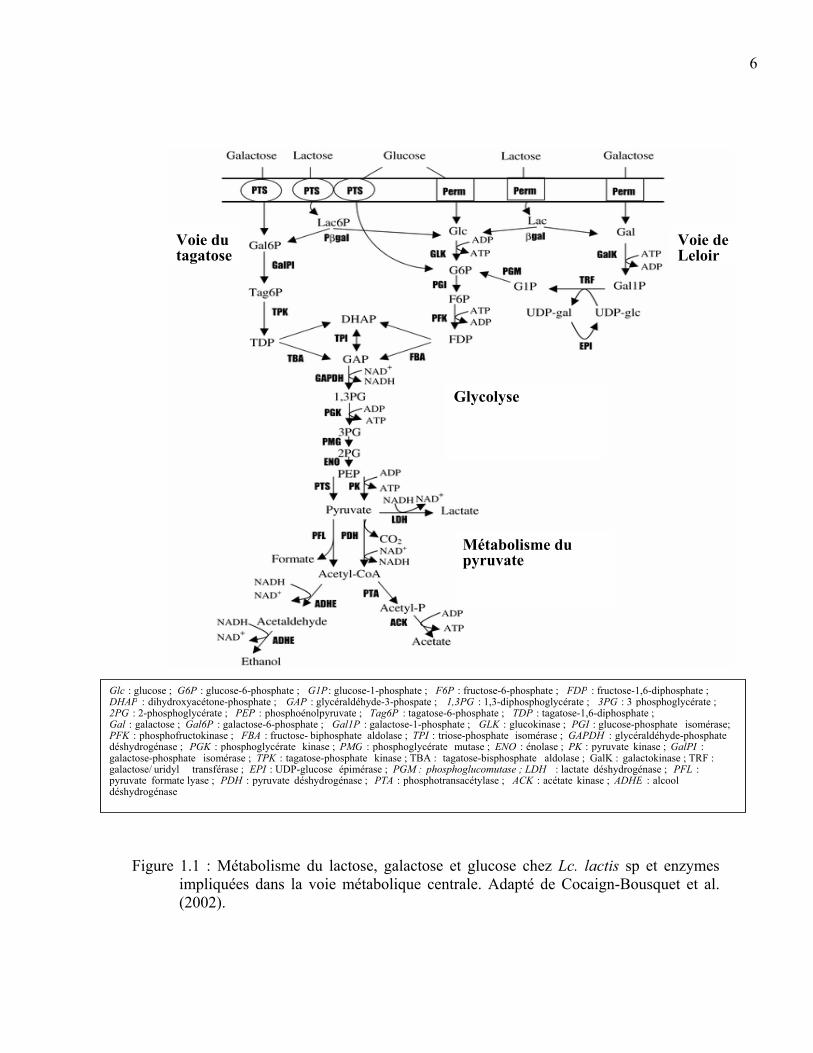
La Figure 1.1 présente les différentes voies métaboliques utilisées par Lc. lactis sp
pour l’utilisation du lactose, galactose et glucose. La plupart des sucres pénètrent dans le
cytoplasme grâce au système de transport phosphoénolpyruvate-phosphotransférase
(PEP/PTS) ou via la perméase. Chez Lc. lactis sp, la part de chaque système de transport
n’est pas connue (Cocaign-Bousquet et al., 2002). Les souches de Lc. lactis sp suivent
principalement une voie homofermentaire dans laquelle 90 à 95 % des sucres consommés
sont convertis en acide lactique, lorsque la glycolyse se déroule de façon optimale.

5 Cependant, sous certaines conditions de fermentation et pour quelques souches de
Lc. lactis sp, une partie du pyruvate peut dévier de la voie centrale de la glycolyse et être à
l’origine de la formation de divers composés : acétaldéhyde, éthanol, acétate et formate
(Melchiorsen et al., 2002).
Les Lc. lactis sp sont généralement associés à une forte capacité d’acidification du
lait. Cependant, plusieurs souches appartenant à cette espèce ne produisent que de faibles
quantités d’acide. L’opéron lactose contenant les gènes intervenant dans le transport et une
partie du métabolisme du lactose est souvent porté par un plasmide chez Lc. lactis sp (de
Vos et al., 2004). La perte de ces gènes rend les souches incapables d’acidifier le lait en 24
heures et de croître dans un milieu contenant le lactose comme seule source d’hydrate de
carbone (Lee et al., 2003). On parle alors de variants lents (slow coagulating variants) ou
de souche lactose négative (Lac -). L’activité protéolytique des souches de bactéries
lactiques est également un facteur influençant leur développement dans le lait et la
production d’acide (Christensen et al., 1999). Cette activité protéolytique est décrite aux
sections 1.1.1.4 : formation des arômes et 1.1.3 : interactions entre les bactéries lactiques.
6
Figure 1.1 : Métabolisme du lactose, galactose et glucose chez Lc. lactis sp et enzymes impliquées dans la voie métabolique centrale. Adapté de Cocaign-Bousquet et al. (2002).
Voie du tagatose
Voie de Leloir
Glycolyse
Métabolisme du pyruvate
Glc : glucose ; G6P : glucose-6-phosphate ; G1P : glucose-1-phosphate ; F6P : fructose-6-phosphate ; FDP : fructose-1,6-diphosphate ;DHAP : dihydroxyacétone-phosphate ; GAP : glycéraldéhyde-3-phospate ; 1,3PG : 1,3-diphosphoglycérate ; 3PG : 3 phosphoglycérate ;2PG : 2-phosphoglycérate ; PEP : phosphoénolpyruvate ; Tag6P : tagatose-6-phosphate ; TDP : tagatose-1,6-diphosphate ;Gal : galactose ; Gal6P : galactose-6-phosphate ; Gal1P : galactose-1-phosphate ; GLK : glucokinase ; PGI : glucose-phosphate isomérase;PFK : phosphofructokinase ; FBA : fructose- biphosphate aldolase ; TPI : triose-phosphate isomérase ; GAPDH : glycéraldéhyde-phosphatedéshydrogénase ; PGK : phosphoglycérate kinase ; PMG : phosphoglycérate mutase ; ENO : énolase ; PK : pyruvate kinase ; GalPI :galactose-phosphate isomérase ; TPK : tagatose-phosphate kinase ; TBA : tagatose-bisphosphate aldolase ; GalK : galactokinase ; TRF :galactose/ uridyl transférase ; EPI : UDP-glucose épimérase ; PGM : phosphoglucomutase ; LDH : lactate déshydrogénase ; PFL :pyruvate formate lyase ; PDH : pyruvate déshydrogénase ; PTA : phosphotransacétylase ; ACK : acétate kinase ; ADHE : alcooldéshydrogénase

7
1.1.1.3 Résistance aux stress environnementaux
Les deux sous espèces de Lactococcus se différencient par leur capacité à résister
aux stress environnementaux. Ainsi, les souches de Lc. lactis, plus résistantes aux stress,
peuvent se développer à 40°C, à un pH de 9.2 et en présence d’une concentration en NaCl
de 4 %, contrairement aux souches de Lc. cremoris (Carr et al., 2002). Dans des conditions
acides, le niveau sous létal et létal est respectivement de pH 4.5 et 2.5 pour Lc. lactis et de
pH 5.0 et 3.0 pour Lc. cremoris (Kim et al., 1999). Les différents mécanismes de réponse
des bactéries lactiques au stress acide ne sont pas bien connus. Il semble qu’au moins deux
systèmes distincts interviennent dans la réponse de Lc. lactis aux conditions acides en
fonction de la phase de croissance (Hartke et al., 1996). Durant la phase exponentielle, la
réponse est activée par la présence des protons H+ mais est indépendante du pH externe
durant la phase stationnaire (van de Guchte et al., 2002). Ces deux systèmes n’ont pas été
retrouvés chez Lc. cremoris (Kim et al., 1999). L’avènement de la transcriptomique a mis
en évidence le rôle clé de l’expression de plusieurs gènes intervenant dans les voies
métaboliques et pouvant expliquer les différences de sensibilité au stress acide entre les
deux sous espèces de Lactococcus (Even et al., 2002 ; Xie et al., 2004). C’est le cas
notamment pour l’expression du gène deoB, codant pour une phosphopentomutase
impliquée dans le métabolisme des nucléotides à base purique. Ces dernières régulent, en
partie, le niveau d’induction des réponses à différents stress (Rallu et al., 2000 ; Xie et al.,
2004).
Les souches de Lc. diacetylactis possèdent un mécanisme supplémentaire, relié au
métabolisme du citrate, leur permettant de s’adapter aux conditions acides. Haddad et al.
(1997) ont étudié la croissance d’une souche de Lc. diacetylactis citrate négative en co-
culture avec la souche parentale citrate positive dans du lait. Ces auteurs ont observé une
dominance de la population de la souche parentale sur le variant citrate négatif. Les souches
de Lc. diacetylactis ont la possibilité d’utiliser le citrate pour produire de l’énergie selon
différentes voies métaboliques en présence ou en absence d’oxygène (Snoep et al., 1992 ;
Haddad et al., 1997) cela leur confère un avantage sur les souches citrate négatives mais
n’explique pas leur capacité à s’adapter aux conditions acides. Avant d’être métabolisé, le

8
citrate est transporté à l’intérieur de la cellule grâce à une enzyme, la citrate perméase P
(CitP) (Drider et al., 2004). Le gène codant pour CitP, localisé sur un plasmide (Drider et
al., 2004), est exprimé durant l’acidification naturelle du milieu par la population
bactérienne (Garcia-Quintans et al., 1998 ; Magni et al., 1999). A des pH proches de la
neutralité, la voie de fermentation du citrate est constitutive. Une augmentation de
l’expression du gène citP est observée à des pH acides et en présence de lactate, forme
dissociée de l’acide lactique et toxique pour la cellule (Magni et al., 1999).
La Figure 1.2 reprend le mécanisme, proposé par Magni et al. (1999), expliquant le
rôle de CitP dans la résistance de Lc. diacetylactis aux conditions acides. Le lactate produit
à partir du glucose est éliminé dans le milieu extracellulaire via la citrate perméase qui
effectue également le passage du citrate dans le cytoplasme de la cellule. Cet échange crée
un potentiel membranaire. Le citrate est ensuite converti en acétate et oxaloacétate par la
citrate lyase. L’oxaloacétate est décarboxylé pour former le pyruvate. Cette décarboxylation
s’accompagne de la consommation de protons et par conséquent d’une alcalinisation du
milieu intracellulaire et d’un gradient de pH à travers la membrane. Comme la voie
métabolique du glucose est intimement liée à celle du citrate, l’expression « cométabolisme
du glucose et du citrate » est généralement employée.
Figure 1.2 : Mécanisme de résistance à l’acide lactique induit par CitP chez Lc. diacetylactis. Adapté de Magni et al. (1999).
Pyruvate
ATP
Lactate
Pyruvate
GlucoseCitrate
Citrate
Lactate
Lactate
+ + + + + +
- - - - - -
Milieu extracellulaire
Milieu intracellulaire
Condition acide
Condition alcaline
Acétate Oxaloacétate
H+
9
Ces études ont principalement été menées avec des milieux contenant du glucose
mais des résultats identiques ont été obtenus avec le lactose (Garcia-Quintans et al., 1998).
Dans le métabolisme du citrate, citP ne serait pas le seul gène dont l’expression est induite
par des conditions acides. Récemment, Martin et al. (2004) ont mis en évidence l’induction
à des pH acides de la transcription de l’opéron codant pour la citrate lyase.
1.1.1.4 Formation d’arômes
Outre son rôle dans l’un des mécanismes de résistance au stress acide de Lc.
diacetylactis, le métabolisme du citrate génère des arômes notamment le diacétyle
particulièrement recherché dans certains produits laitiers tels que le beurre et les fromages
frais. La Figure 1.3 présente la voie de synthèse du diacétyle à partir du citrate chez Lc.
diacetylactis. L’α-acétolactate est un intermédiaire particulièrement instable, il peut être
converti en acétoine par l’α-acétolactate décarboxylase ou subir une décarboxylation
oxydative menant à la formation du diacétyle.
Jusque dans les années 1980, une voie de synthèse du diacétyle, à partir de deux
molécules d’acétaldéhyde et de l’acétyl-CoA, fut généralement acceptée. Cependant, la
diacétyle synthétase proposée pour catalyser cette réaction n’a, à ce jour, jamais été
identifiée. La production de diacétyle est variable selon les conditions de fermentation. Par
exemple, une oxygénation importante favorise la décarboxylation oxydative d’α-
acétolactate et par conséquent la formation de diacétyle (Hugenholtz, 1993). D’importantes
variations ont également été rapportées parmi les souches de Lc. diacetylactis. Certaines
souches très productrices ne possèdent pas l’α-acétolactate décarboxylase. L’absence de
cette enzyme ne permet plus la conversion du citrate en acétoine et en 2,3-butanediol et
comme l’α-acétolactate est très instable la formation de diacétyle augmente (Hugenholtz,
1993 ; Monnet et al., 1999).

10
Figure 1.3 : Métabolisme du citrate conduisant à la formation du diacétyle. Adapté de Swindell et al. (1996).
Deux autres mécanismes sont également impliqués dans la production d’arômes par
Lc. lactis sp. Certaines souches de lactocoques possèdent des lipases capables d’hydrolyser
les lipides, présents dans le lait, en acides gras à courtes chaînes. Ces acides gras
constituent les précurseurs de composés aromatiques tels que le méthyl-cétone, les
thioesters et les lactones. Les bactéries lactiques sont faiblement lipolytiques
comparativement aux moisissures, notamment les Penicillium utilisés pour la préparation
des camemberts et des fromages bleus comme le Roquefort. Cependant, leur activité est
non négligeable dans la production de certains fromages à pâtes pressées de type Cheddar
et Edam (Collins et al., 2003 ; Tungjaroenchai et al., 2004). Il est à noter qu’une activité
lipolytique trop élevée peut conduire à des saveurs indésirables ou rances.
9
9
8
7
1
26
5
4
3
Citrate
Oxaloacétate
Pyruvate
Acétate
Lactose
Acide lactique
Acétate
AcétateFormateEthanol
α-Acétolactate
Diacétyle
Acétoine
2,3-Butanediol
Enzymes ou étape : citrate lyase (1); oxaloacétate décarboxylase (2); lactate déshydrogènase (3); pyruvatedéshydrogènase (4); pyruvate formate lyase (5); α-acétolactate synthase (6); décarboxylation oxydative (7);α-acétolactate décarboxylase (8); diacétyle-acétoine réductase (9).

11 Le deuxième mécanisme de formation des arômes, plus documenté que la lipolyse,
fait appel à l’activité protéolytique des lactocoques. Le catabolisme des acides aminés, issus
de la dégradation des caséines du lait, conduit à la production d’une large gamme de
composés aromatiques. Les voies menant de la dégradation des caséines au catabolisme des
acides aminés sont présentées sur la Figure 1.4. Deux types de protéinases de paroi ont été
mis en évidence chez Lc. lactis sp (Pritchard et al., 1993). La protéinase de type PI clive
préférentiellement la caséine β, tandis que la deuxième, de type PIII, hydrolyse aussi bien
les caséines αS1 et β. Les oligopeptides générés après action de la protéinase sont
susceptibles d’être dégradés en di- et tri- peptides ainsi qu’en acides aminés à l’extérieur de
la cellule. Cependant, la synthèse de peptidases extracellulaires n'a pas été démontrée (Law
et al., 1997). Un système de transport, Opp, assure le passage des oligopeptides d’une taille
maximale de 10 résidus d’acides aminés (Kunji et al., 1998) à travers la membrane
plasmique. Les oligopeptides sont ensuite dégradés dans le cytoplasme en di- et tri-
peptides puis en acides aminés par des mécanismes faisant intervenir de nombreuses
enzymes (Figure 1.4). Une partie de ces acides aminés, notamment ceux pour lesquels les
Lc. lactis sp sont auxotrophes, servira à la synthèse de nouvelles protéines (non représentée
sur la Figure 1.4) et une autre partie participera à la formation des arômes (Figure 1.4).
La protéolyse est parfois à l’origine d’un défaut de saveur : l’amertume. Ce défaut
résulte de l’accumulation de peptides de petite taille, ayant une hydrophobicité élevée et
dont la partie C terminale est constituée soit de leucine, de phénylalanine ou de tyrosine. Le
choix des souches est particulièrement important pour éviter ce défaut. Les variants lents de
lactocoques déficients en protéinase de paroi (Prt -) ne produisent pas d’amertume. De plus,
ces souches dites « non amères » possèdent des activités enzymatiques (Figure 1.4)
capables de dégrader les peptides amers en peptides non amers et acides aminés libres. La
spécificité des protéinases de paroi pour les caséines joue également un rôle sur le
développement de l’amertume (Broadbent et al., 2002).

12
Figure 1.4 : Catabolisme des acides aminés par Lc. lactis sp. Dpp, Opp et aat représentent respectivement les systèmes de transport des di- et tri- peptides, oligopeptides et acides aminés. Adapté des travaux publiés par Pritchard et al. (1993) ; Christensen et al. (1999) ; Yvon et al. (2001) et Marilley et al. (2004).
- Endopeptidases : O, F1 & F2 + non clasées- XPDAP- Aminopeptidases : A,C & N + non classée- Prolinase : P- Transaminations
- Déshydrogénations- Décarboxylations- Dégradations- Réductions- Désaminations
Caséines
Oligopeptides(< 10 aa et > 3 aa)
Acides aminés Di- et tri- peptides
Oppaat Dpp
Oligopeptides(> 10 aa)
Peptidasesextracellulaires ?
Protéinase
Di- et tri- peptidesAcides aminés
Oligopeptides(< 10 aa et > 3 aa)
Di- et tri- peptidesAcides aminés
- Dipeptidase : V- Proline iminopeptidase- Prolidase : Q- Tripeptidases : T + non classées
- Aldéhydes- Alcools- Acides organiques volatils- Composés aromatiques- Composés soufrés- Amines- Ammoniac
LAIT
PAROICELLULAIRE
MEMBRANEPLASMIQUE
CYTOPLASME + non classées
13
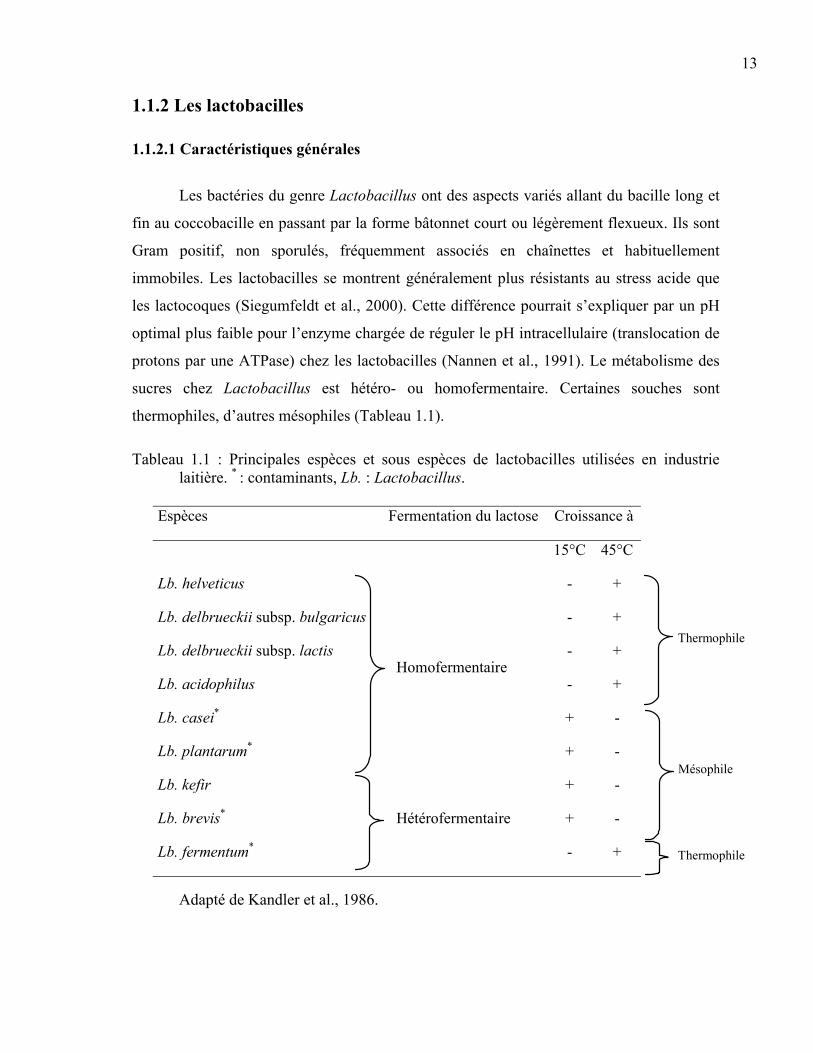
1.1.2 Les lactobacilles
1.1.2.1 Caractéristiques générales
Les bactéries du genre Lactobacillus ont des aspects variés allant du bacille long et
fin au coccobacille en passant par la forme bâtonnet court ou légèrement flexueux. Ils sont
Gram positif, non sporulés, fréquemment associés en chaînettes et habituellement
immobiles. Les lactobacilles se montrent généralement plus résistants au stress acide que
les lactocoques (Siegumfeldt et al., 2000). Cette différence pourrait s’expliquer par un pH
optimal plus faible pour l’enzyme chargée de réguler le pH intracellulaire (translocation de
protons par une ATPase) chez les lactobacilles (Nannen et al., 1991). Le métabolisme des
sucres chez Lactobacillus est hétéro- ou homofermentaire. Certaines souches sont
thermophiles, d’autres mésophiles (Tableau 1.1).
Tableau 1.1 : Principales espèces et sous espèces de lactobacilles utilisées en industrie laitière. * : contaminants, Lb. : Lactobacillus.
Adapté de Kandler et al., 1986.
Espèces Fermentation du lactose Croissance à
15°C 45°C
Lb. helveticus - +
Lb. delbrueckii subsp. bulgaricus - +
Lb. delbrueckii subsp. lactis - +
Lb. acidophilus - +
Lb. casei* + -
Lb. plantarum*
Homofermentaire
+ -
Lb. kefir + -
Lb. brevis* + -
Lb. fermentum*
Hétérofermentaire
- +
Thermophile
Mésophile
Thermophile
14
1.1.2.2 Utilisation des Lactobacillus en industrie laitière
Parmi le genre Lactobacillus, la sous espèce bulgaricus, indispensable à la
préparation du yaourt selon la définition du Codex Alimentarius de 2003, est la plus utilisée
en industrie laitière. A titre d’exemple, la production européenne de yaourts a atteint près
de 2 millions de tonnes en 1997 pour 6.34 millions de tonnes de fromages (tous types
confondus). Pour quelques pays, dont la Finlande, la Suède et la Bulgarie, la proportion de
yaourts est supérieure à celle des fromages (Données obtenues par le logiciel Eurostat
Visual Application disponible en ligne : http://europa.eu.int).
En fromagerie, les lactobacilles sont généralement utilisés pour la préparation de
pâtes dures ou semi-dures typiques des fromages suisses et italiens. Jusque dans les années
80, quelques espèces de Lactobacillus étaient considérées comme des contaminants (ou
NSLAB pour Non-Starter Lactic Acid Bacteria) (Tableau 1.1). Dans les années 1990,
plusieurs auteurs ont démontré que ces espèces participaient à l’affinage des fromages par
leur activité protéolytique, et la formation d’arômes qui en résulte (Lane et al., 1996 ;
Lynch et al., 1996). Cependant, l’arrivée des techniques de traitement du lait de fromagerie,
telle que la pasteurisation basse température couplée à la microfiltration, a contribué à une
diminution significative dans le lait de ces NSLAB. Cette constatation a incité les
producteurs de ferments fromagers à développer et commercialiser de nouvelles cultures,
dites auxiliaires, contenant des souches de Lactobacillus capables d’accentuer et
d’accélérer l’affinage des fromages (El Soda et al., 2000). Les mécanismes enzymatiques
impliqués dans l’activité protéolytique des lactobacilles sont moins documentés que ceux
de Lc. lactis sp. Toutefois, les voies métaboliques empruntées par ces deux genres
bactériens semblent relativement proches (Pritchard et al., 1993). La protéolyse est
cependant plus prononcée pour les lactobacilles (Marilley et al., 2004).
Ces dernières années, de nombreuses études ont été menées sur le caractère
probiotique des souches de bactéries lactiques. La définition d’un probiotique, proposée par
Guarner et al. 1998, est la suivante : ‘tout microorganisme vivant qui, une fois ingéré en
certaine quantité, exerce des effets bénéfiques sur la santé au-delà des fonctions

15
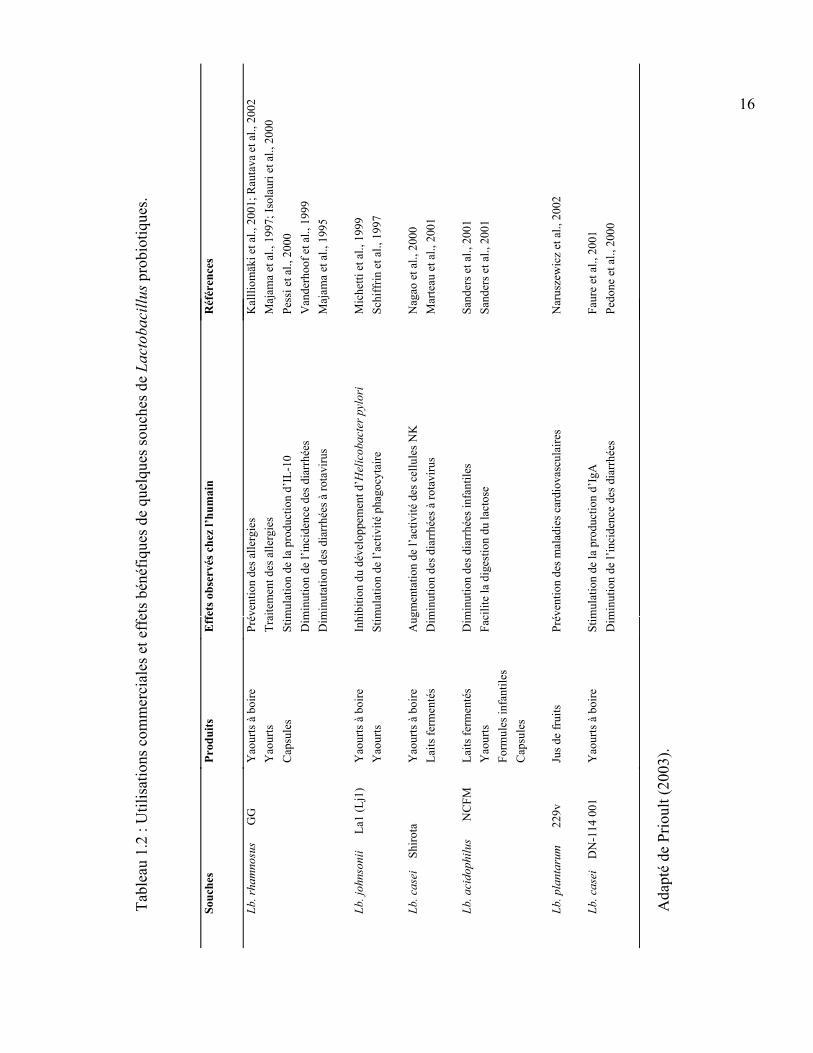
nutritionnelles de base’. Un groupe majeur constitué de 12 espèces de Lactobacillus figure
parmi les bactéries considérées comme probiotiques (Holzapfel et al., 2001). De nombreux
produits alimentaires et préparations contenant des souches probiotiques de Lactobacillus
sont commercialisés (Tableau 1.2).
Les souches probiotiques commerciales sont majoritairement véhiculées à travers
les produits laitiers (Tableau 1.2). Différentes raisons peuvent expliquer ce choix pour le
consommateur (Heller, 2001) :
- les produits laitiers fermentés sont perçus comme bénéfiques pour la santé
- les consommateurs sont habitués au fait que les produits fermentés contiennent des microorganismes vivants
- les probiotiques utilisés comme agent de fermentation combinent les images positives : probiotique et fermentation
- l’image bénéfique pour la santé des produits de type yaourt facilite la recommandation d’une consommation quotidienne
D’un point de vue technologique, les procédés utilisés pour la préparation des
produits laitiers fermentés sont déjà optimisés pour permettre la croissance des
microorganismes nécessaires à la fermentation. Par conséquent, la technologie existante ne
nécessite pas de changements majeurs afin de garantir la survie des probiotiques dans le
produit.
16
Tabl
eau
1.2
: Util
isat
ions
com
mer
cial
es e
t eff
ets b
énéf
ique
s de
quel
ques
souc
hes d
e La
ctob
acill
us p
robi
otiq
ues.
Ada
pté
de P
rioul
t (20
03).
Souc
hes
Prod
uits
Eff
ets o
bser
vés c
hez
l’hum
ain
Réf
éren
ces
Lb. r
ham
nosu
s G
G
Yao
urts
à b
oire
Prév
entio
n de
s alle
rgie
sK
allli
omäk
i et a
l., 2
001;
Rau
tava
et a
l., 2
002
Yao
urts
Trai
tem
ent d
es a
llerg
ies
Maj
ama
et a
l., 1
997;
Isol
auri
et a
l., 2
000
Cap
sule
sSt
imul
atio
n de
la p
rodu
ctio
n d’
IL-1
0Pe
ssi e
t al.,
200
0D
imin
utio
n de
l’in
cide
nce
des d
iarr
hées
V
ande
rhoo
f et a
l., 1
999
Dim
inut
atio
n de
s dia
rrhé
es à
rota
viru
sM
ajam
a et
al.,
199
5
Lb. j
ohns
onii
La
1 (L
j1)
Yao
urts
à b
oire
Inhi
bitio
n du
dév
elop
pem
ent d
’Hel
icob
acte
r pyl
ori
Mic
hetti
et a
l., 1
999
Yao
urts
Stim
ulat
ion
de l’
activ
ité p
hago
cyta
ireSc
hiff
rin e
t al.,
199
7
Lb. c
asei
Sh
irota
Y
aour
ts à
boi
reA
ugm
enta
tion
de l’
activ
ité d
es c
ellu
les N
K
Nag
ao e
t al.,
200
0La
its fe
rmen
tés
Dim
inut
ion
des d
iarr
hées
à ro
tavi
rus
Mar
teau
et a
l., 2
001
Lb. a
cido
philu
s N
CFM
La
its fe
rmen
tés
Dim
inut
ion
des d
iarr
hées
infa
ntile
sSa
nder
s et a
l., 2
001
Yao
urts
Faci
lite
la d
iges
tion
du la
ctos
eSa
nder
s et a
l., 2
001
Form
ules
infa
ntile
sC
apsu
les
Lb. p
lant
arum
22
9v
Jus d
e fr
uits
Prév
entio
n de
s mal
adie
s car
diov
ascu
laire
s N
arus
zew
icz
et a
l., 2
002
Lb. c
asei
D
N-1
14 0
01
Yao
urts
à b
oire
Stim
ulat
ion
de la
pro
duct
ion
d’Ig
AFa
ure
et a
l., 2
001
Dim
inut
ion
de l’
inci
denc
e de
s dia
rrhé
es
Pedo
ne e
t al.,
200
0

17
1.1.3 Les interactions entre les souches de bactéries lactiques
Lorsque les bactéries lactiques sont utilisées en cultures mixtes pour la fermentation
du lait, des interactions entre les différentes souches se manifestent. Ces interactions sont
généralement classées en deux groupes : l’antagonisme et la stimulation. Les points
suivants ne se veulent pas une liste exhaustive des interactions rencontrées lors de la
fabrication fromagère mais un résumé des principales observations résultant de
l’association de bactéries lactiques dans un même levain.
1.1.3.1 Les phénomènes d’antagonisme
La fermentation est historiquement utilisée comme un mode de conservation des
aliments. Durant la fermentation du lait, différents agents antimicrobiens ayant la capacité
d’inhiber le développement de bactéries pathogènes et/ou d’une flore de dégradation de
l’aliment sont produits par les bactéries lactiques. Cependant, lorsqu’ils atteignent une
certaine concentration, ces composés peuvent interrompre la croissance des souches
productrices, il s’agit d’autoinhibition, et/ou des autres souches constituant le levain. Ces
interactions négatives faisant intervenir la production de substances inhibitrices sont
connues sous le nom d’amensalisme. C’est notamment le cas des acides organiques issus
des mécanismes homofermentaire et hétérofermentaire des bactéries lactiques. L’inhibition
peut aussi résulter de la production de peroxyde d’hydrogène car contrairement à d’autres
genres bactériens, les bactéries lactiques sont dépourvues de catalase capable de dégrader
ce composé toxique. L’action inhibitrice du peroxyde d’hydrogène peut être renforcée par
le système lactoperoxydase-thiocyanate présent naturellement dans le lait (Gilliland,
1985a). Le thiocyanate est oxydé, en présence d’H2O2, en un composé bactériostatique pour
les bactéries Gram positif. Les bactériocines, produites par quelques souches de bactéries
lactiques, sont également des agents inhibiteurs très puissants dont le spectre d’activité
s’étend de souches phylogénétiquement proches de la souche productrice à des espèces
génétiquement plus éloignées (section 1.2.1).
18
Pour assurer leur développement dans le lait, les lactocoques possèdent un système
protéolytique capable de dégrader les caséines en acides aminés (Figure 1.4). Comme nous
l’avons vu précédemment, ils existent deux types de protéinases PI et PIII. En culture mixte
dans le lait, la population bactérienne possédant la protéinase de type PIII domine sur le
type PI (Flambard et al., 1997). Ce déséquilibre résulterait d’une inhibition de la synthèse
de l’enzyme PI ou d’un phénomène de compétition pour les peptides relâchés par les deux
types d’enzyme au niveau du système de transport des oligopeptides (Opp) (Flambard et
al., 1997).
Les phénomènes de compétition constituent la deuxième catégorie des interactions
négatives fréquemment rencontrées lors de la fermentation du lait par une culture mixte.
Certains nutriments, présents dans le lait en faibles quantités et indispensables à la
croissance bactérienne, peuvent être consommés préférentiellement par un groupe
microbien aux dépens d’un autre. C’est le cas notamment des matières azotées non-
protéiques (NPN de l’anglais Non-Protein-Nitrogen) regroupant l’urée, des acides aminés,
de courts peptides et les bases azotées adénine, guanine, uracile et xanthine. La
concentration en NPN dans le lait ne supporte la croissance que d’une faible densité
cellulaire de bactéries lactiques. Juillard et al. (1990 et 1991) ont ainsi observé que la
croissance d’une souche de lactocoque dans un lait ayant déjà préalablement servi à la
préculture de la souche était inférieure à celle réalisée dans du lait frais. Ce phénomène
s’explique par l’épuisement de la fraction azotée de faible poids moléculaire durant la
préculture.
1.1.3.2 Les phénomènes de stimulation
Les phénomènes de stimulation sont divisés en plusieurs catégories. On distingue le
commensalisme, lorsqu’une population est stimulée par la production d’une substance
essentielle ou la destruction d’un facteur inhibiteur par une autre population et le
mutualisme ou la protocoopération, lorsque l’interaction est positive pour chacune des
19
populations. Dans le cas du mutualisme, l’interaction est nécessaire à la survie des
populations contrairement à la protocoopération où l’interaction présente un caractère
facultatif (Choisy et al., 1997).
L’interaction entre les lactobacilles et les streptocoques thermophiles est
particulièrement mise à profit pour la fabrication des yaourts. Dans un premier temps, les
lactobacilles se développent puis, leurs activités protéolytique et aminopeptidasique
permettent de stimuler la croissance des streptocoques. Ceci se vérifie également pour des
souches de lactocoques protéinase positive (Prt +) et négative (Prt -) associées en culture
mixte. Certains variants de lactocoques présentent une déficience dans leur système
protéolytique résultant, notamment, de la perte des plasmides codant en partie pour la
protéinase de paroi (Prt -) (Law et al., 1997) et le système de transport Opp (Yu et al.,
1996). En cultures mixtes dans le lait, la croissance des deux variants est similaire tant que
la concentration en NPN est suffisante. Dans un second temps, lorsque la source de NPN
est épuisée, la croissance du variant Prt – est stimulée, comparativement à une culture pure,
par l’activité protéolytique du variant Prt + qui favorise la libération de fractions azotées de
faible poids moléculaire utilisables directement par les cellules (Juillard et al., 1994 et
1996). Cependant, l’hydrolyse des caséines par les souches Prt + est trop faible pour assurer
une croissance maximale des deux souches. Par conséquent, le développement du variant
Prt + se trouve inhibé par compétition pour les oligopeptides avec le variant Prt – (Juillard et
al., 1994 et 1996). L’association des deux types de variant est également profitable pour
éviter les défauts d’amertume : les peptides amers générés par les protéinases des souches
Prt + pouvant être dégradés par l’activité aminopeptidasique des variants Prt – (Juillard et
al., 1996). De nombreuses études ont également porté sur l’association de Lactobacillus
NSLAB et de lactocoques afin de développer des arômes durant l’affinage des fromages (El
Soda et al., 2000).
20
1.2 Métabolites d’intérêt produits par la culture modèle
1.2.1 La nisine
1.2.1.1 Définition et classification
La nisine est un agent antimicrobien produit par quelques souches de Lc. lactis sp.
Elle appartient au groupe des bactériocines définies par Tagg et al. (1976) comme des
composés protéiques ayant une activité inhibitrice contre des souches phylogénétiquement
proches de la souche productrice. De nombreuses bactériocines répondent à cette définition
mais certaines d’entre elles présentent un spectre d’activité plus large s’étendant à des
souches plus éloignées (Klaenhammer, 1993). La nisine fut découverte en 1928 par Rogers
lorsqu’il s’aperçut qu’un métabolite produit par Streptococcus lactis (Lc. lactis dans la
nouvelle nomenclature) possédait une activité inhibitrice contre d’autres bactéries lactiques.
La nisine appartient à la classe I des bactériocines (Klaenhammer, 1993). Cette
classe regroupe les composés protéiques d’une taille inférieure à 5 kDa et contenant les
acides aminés modifiés thioéther lanthionine et méthyllanthionine et des acides aminés
déshydratés tels que le didéshydrobutyrine (Dhb) et didéshydroalanine (Dha). Le terme
lantibiotique (par contraction des mots lanthionine et antibiotique) leur est généralement
réservé (Sahl et al., 1998).
1.2.1.2 Structure et propriétés physico-chimiques
La nisine est un peptide de 3488 Da constitué de 34 acides aminés dont la structure
est représentée à la Figure 1.5. Les molécules de nisine peuvent s’assembler en dimères ou
oligomères de 7000 à 14000 Da (Klaenhammer, 1993) via des réactions intermoléculaires
entre les résidus Dha et Dhb. La conformation en anneaux des lanthionines assurerait la
rigidité du peptide, diminuerait sa sensibilité à la protéolyse et augmenterait sa résistance à
la chaleur (Mc Auliffe et al., 2001).
21
Figure 1.5 : Structure de la nisine A et de la nisine Z. Adapté de Mc Auliffe et al. (2001).
Mulders et al. (1991) ont isolé un variant naturel de la nisine A, la nisine Z, qui
diffère par un acide aminé en position 27. La spécificité de l’activité antimicrobienne des
deux variants est identique. Cependant, des tests d’activité menés par la technique de
diffusion en gélose et des concentrations en bactériocines supérieures à 0.1 µg/ml ont
montré que la nisine A donnait des zones d’inhibition d’un diamètre inférieur à celles de la
nisine Z à concentrations identiques (de Vos et al., 1993). Cette différence s’explique par
une meilleure diffusion de la nisine Z dans l’agar (de Vos et al., 1993).
La solubilité de la nisine est fonction du pH et de la force ionique de la solution
(Rollema et al., 1995). En-dessous de pH 5, la nisine A présente une solubilité supérieure à
celle de la nisine Z. Dans des conditions de pH neutre ou basique, la solubilité des deux
variants est comparable (Rollema et al., 1995). Le pH influence de façon importante la
stabilité de la nisine à la température (Hurst, 1981 ; Rollema et al., 1995). La nisine dans
une solution à pH 5.0 et 6.8 perd respectivement 40 et plus de 90 % de son activité après un
autoclavage à 115.6°C, alors qu’à pH 2 aucune diminution de l’activité n’est observée
(Hurst, 1981).
1 34
Asparagine au lieu de l’histidine pour la nisine Z
22
1.2.1.3 Biosynthèse
Trois classes de transposons d’une taille de 70 kb contenant les gènes responsables
de la synthèse de nisine ont été identifiés chez Lc. lactis sp (Rauch et al., 1994). Les classes
I et II regroupent les transposons conjugatifs portant respectivement les gènes nisA et nisZ
codant pour le prépeptide de la nisine A et Z. Les membres de la classe III contiennent le
gène nisZ et sont non conjugatifs. Les transposons portent également les gènes des
protéines impliquées dans les modifications post-traductionnelles du prépeptide (nisB, nisC
et nisP), la sécrétion du peptide mature (nisT), de l’immunité de la souche productrice à la
bactériocine (nisI, nisF, nisE et nisG) et des facteurs de régulation de la transcription (nisK
et nisR) (Kleerebezem et al., 2001).
La production de nisine évolue en fonction de la phase de croissance. Elle débute au
milieu de la phase exponentielle pour atteindre un maximum de la fin de cette phase de
croissance au début de la phase stationnaire (Mc Auliffe et al., 2001 ; Kleerebezem et al.,
2001). La régulation se fait au niveau de la transcription par un système de type « quorum
sensing » (Kleerebezem, 2004). La production de bactériocine est également influencée par
les facteurs environnementaux, notamment le pH et l’aération du milieu de culture.
L’aération stimule la production de nisine Z par Lc. diacetylactis UL719 (Amiali et al.,
1998 ; Desjardins et al., 2001) tandis qu’elle possède un effet antagoniste pour la nisine A
(Hurst, 1981). Amiali et al. (1998) ont observé une diminution de 50 % de la concentration
en nisine Z, produite par Lc. diacetylactis UL719, lorsque la souche est cultivée à un pH de
5.0 comparativement aux pH 5.5, 6.0 et 6.5. Pour d’autres souches productrices de nisine,
différents auteurs ont mis en évidence une augmentation du titre en bactériocine pour des
cultures effectuées sans contrôle de pH ou dans des milieux non tamponnés (Cabo et al.,
2001 ; Guerra et al., 2003).
1.2.1.4 Spectre d’activité et modes d’action
Parmi toutes les bactériocines, la nisine possède un spectre d’activité très large
incluant des souches de Lactococcus, Lactobacillus, Listeria, Enterococcus, Micrococcus,
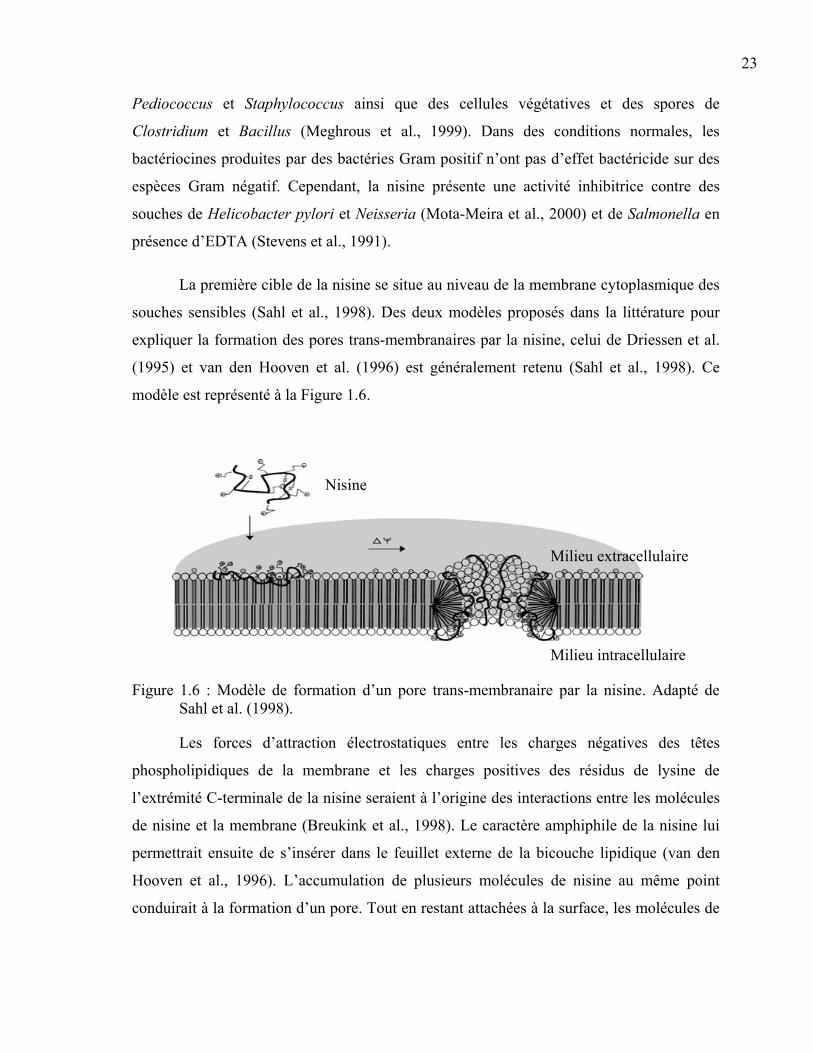
23
Pediococcus et Staphylococcus ainsi que des cellules végétatives et des spores de
Clostridium et Bacillus (Meghrous et al., 1999). Dans des conditions normales, les
bactériocines produites par des bactéries Gram positif n’ont pas d’effet bactéricide sur des
espèces Gram négatif. Cependant, la nisine présente une activité inhibitrice contre des
souches de Helicobacter pylori et Neisseria (Mota-Meira et al., 2000) et de Salmonella en
présence d’EDTA (Stevens et al., 1991).
La première cible de la nisine se situe au niveau de la membrane cytoplasmique des
souches sensibles (Sahl et al., 1998). Des deux modèles proposés dans la littérature pour
expliquer la formation des pores trans-membranaires par la nisine, celui de Driessen et al.
(1995) et van den Hooven et al. (1996) est généralement retenu (Sahl et al., 1998). Ce
modèle est représenté à la Figure 1.6.
Figure 1.6 : Modèle de formation d’un pore trans-membranaire par la nisine. Adapté de Sahl et al. (1998).
Les forces d’attraction électrostatiques entre les charges négatives des têtes
phospholipidiques de la membrane et les charges positives des résidus de lysine de
l’extrémité C-terminale de la nisine seraient à l’origine des interactions entre les molécules
de nisine et la membrane (Breukink et al., 1998). Le caractère amphiphile de la nisine lui
permettrait ensuite de s’insérer dans le feuillet externe de la bicouche lipidique (van den
Hooven et al., 1996). L’accumulation de plusieurs molécules de nisine au même point
conduirait à la formation d’un pore. Tout en restant attachées à la surface, les molécules de
Milieu extracellulaire
Milieu intracellulaire
Nisine
24
nisine se déplaceraient à travers la membrane, en réponse au potentiel électrique, entraînant
avec elles les lipides de la couche externe du côté cytoplasmique (Moll et al., 1996).
La formation transitoire de ces pores s’accompagne d’une rupture de la force proton
motrice par dissipation du potentiel électrique trans-membranaire (ΔΨ) et du gradient de
pH conduisant à l’arrêt de toutes biosynthèses (Montville et al., 1994). Les pores entraînent
également le passage dans le milieu extracellulaire d’ATP, d’acides aminés, de potassium
et de phosphate inorganique (Ruhr et al., 1985 ; Abee et al., 1994).
Le deuxième mode d’action de la nisine est l’inhibition de la biosynthèse de la paroi
cellulaire (Reisinger et al., 1980). Cette inhibition résulterait de la formation d’un complexe
entre le précurseur lipidique membranaire du peptidoglycane, le lipide II, et les molécules
de nisine. Le lipide II est également la seule cible spécifique de la nisine pour la formation
de pores (Mc Auliffe et al., 2001). Cette association engendrerait des pores stables et
uniformes composés de 8 molécules de nisine et 4 de lipides II selon un nouveau modèle
proposé par Hasper et al. (2004).
L’implication du Dha situé en 5ième position sur la molécule de nisine a clairement
été démontrée dans la capacité de la bactériocine à inhiber le développement des spores
(Chan et al., 1996). La double liaison du résidu Dha interagirait avec des facteurs associés à
la sporulation (Liu et al., 1993).
La nisine active également des facteurs reliés à l’autolyse de cellules sensibles.
Cette partie est discutée dans la prochaine section.
1.2.1.5 Accélération de l’affinage des fromages
L’ajout d’une culture nisinogène dans les levains destinés à la fabrication fromagère
ou de nisine, sous forme libre ou encapsulée dans le lait, a un impact positif sur le
développement des arômes durant le processus d’affinage et plus particulièrement lorsque
le levain contient des souches à forte activité aminopeptidasique (Garde et al., 2002 et

25
2003 ; Benech et al., 2003 ; Sallami et al., 2004). L’utilisation, pour la préparation d’une
pâte pressée, de la souche Lc. lactis INIA 415 productrice de nisine Z et de lacticine 481, de
deux Lc. lactis sp et un Streptococcus thermophilus, permet d’obtenir après 25 jours
d’affinage un fromage dont l’intensité aromatique est équivalente à celle d’un fromage
affiné durant 75 jours et préparé sans la souche bactériocinogène (Garde et al., 2002).
L’intensification des arômes est corrélée avec la libération dans le fromage d’enzymes
intracellulaires (Garde et al., 2002 et 2003).
Martinez-Cuesta et al. (2000) ont observé que la perte de viabilité des cellules de
quelques souches de Lc. lactis sp et Lactobacillus, sous l’action de la nisine, ne
s’accompagnait pas nécessairement d’une lyse cellulaire. Cependant, la nisine favorise la
lyse des souches contenant une autolysine, la N-acétylmuramidase. Cette enzyme est
responsable de l’activité autolytique pour quelques souches de Lc. lactis sp et Lactobacillus
(Delcour et al., 1999). Peu d’études ont porté sur les autolysines des bactéries lactiques
contrairement à celles d’autres bactéries Gram positif. Chez Bacillus subtilis, la régulation
des autolysines est dépendante de la force proton motrice (Calamita et al., 2002). La nisine
pourrait ainsi agir indirectement sur les autolysines bactériennes par rupture de la force
proton motrice.
1.2.1.6 Modes de propagation
La nisapline® est une forme libre, partiellement purifiée, de la nisine
commercialisée par Aplin & Barrett. Son usage est surtout répandu dans l’industrie
fromagère. L’incorporation dans du lait de la nisapline®, qui contient environ 2,5 % de
nisine A pure, à raison de 100 mg/litre permet d’inhiber la croissance d’une population
constituée de cinq souches de Listeria monocytogenes présentes à une concentration initiale
de 102-103 ufc/ml dans un fromage de type ricotta pendant plus de 8 semaines (Davies et
al., 1997). L’addition de 2000 unités internationales (UI) (soit 50 µg) par gramme de
fromage de type cottage réduit d’un facteur 1000 la concentration cellulaire de Listeria
monocytogenes après 3 jours à 20°C (Ferreira et al., 1996). Cependant, les interactions
entre certains composants de l’aliment, plus particulièrement les matières grasses, et la
26
bactériocine sous forme libre peuvent réduire fortement son activité inhibitrice (Jung et al.,
1992 ; Aasen et al., 2003 ; Bhatti et al., 2004).
Une alternative consiste à protéger la bactériocine en l’encapsulant. L’utilisation de
liposome permet de conserver 90 % de l’activité nisinogène initiale et de réduire de 4 à 5
log une population de Listeria innocua dans un fromage Cheddar après 6 mois d’affinage
(Benech et al., 2002a et 2002b). Toutefois, l’utilisation de nisine libre ou encapsulée peut
se révéler trop onéreuse pour une application industrielle en fromagerie.
La production in situ de la bactériocine par incorporation de la souche productrice
dans le starter est une voie plus économique. De plus, la bactériocine n’est pas considérée,
dans ce cas, comme un additif alimentaire puisqu’elle est produite durant la fabrication et
non ajoutée sous forme concentrée. Après 14 jours d’affinage à 12°C, Rilla et al. (2004) ont
observé une inhibition complète d’une population de Staphylococccus aureus résistante à la
méthicilline, présente initialement à 104 ufc/ml de lait, en incorporant une souche
productrice de nisine Z dans le levain. L’utilisation d'une souche nisinogène en cultures
pures ou mixtes s’est également avérée efficace pour inhiber la croissance de Listeria
monocytogenes dans des fromages à pâte pressée après 60 jours d’affinage (Rodriguez et
al., 2001) et du Camembert (Maisnier-Patin et al., 1992).
Les souches de Clostridium tyrobutyricum constituent une flore de dégradation pour
les fromages, notamment à pâte pressée ou cuite. Elles provoquent des gonflements tardifs
et des défauts de goût. L’addition de Lc. lactis IPLA 729, productrice de nisine Z, dans une
culture mixte, destinée à la préparation d’un fromage à pâte pressée, permet de réduire de 3
log la population de Clostridium tyrobutyricum CECT 4011 après 30 jours d’affinage à
12°C (Rilla et al., 2003). Dans un fromage Cheddar préparé avec une culture mixte
contenant Lc. diacetylactis UL719, Benech et al. (2002a) ont observé une réduction de 2
log des comptes viables de Listeria innocua après 6 mois d’affinage. Pour toutes ces
études, une perte de l’activité de la bactériocine, plus ou moins importante en fonction de la
durée l’affinage, est observée. Par conséquent, l’utilisation des cultures bactériocinogènes
semble plus appropriée pour des fromages ne nécessitant pas un affinage poussé.
27
1.2.1.7 Réglementation
La nisine est utilisée comme agent conservateur dans plus de 40 pays à travers le
monde (Cleveland et al., 2001). En Europe, elle porte la référence E234 et peut être ajoutée
à des concentrations variables selon l’aliment (Journal officiel des Communautés
européennes, 1995). Sa présence, à l’état naturel, est également admise dans certains
fromages obtenus par un processus de fermentation.
Aux États-Unis, l’utilisation des souches productrices de bactériocines dans
l’industrie alimentaire ne requiert pas de considération particulière si la souche est
considérée comme GRAS (Generally Recognized As Safe). La nisine reste la seule
bactériocine pouvant être utilisée en tant qu’additif car reconnue GRAS par la U.S. Food
and Drug Administration (U.S. Food and Drug Admisnistration, 1988).
1.2.2 Les exopolysaccharides
1.2.2.1 Classification et composition
Les exopolysaccharides (EPS) produits par les bactéries lactiques peuvent être
classés en deux catégories :
- les homopolysaccharides, composés d’un seul type de résidus monoses, sont
subdivisés en quatre groupes :
- les α-D-glucanes
- les β-D-glucanes
- les fructanes
- les autres homopolysaccharides tels que le polygalactane
- les hétéropolysaccharides constitués d’unités répétitives (ou monomères) de
résidus monoses. Ils sont produits aussi bien par des souches mésophiles que
thermophiles.
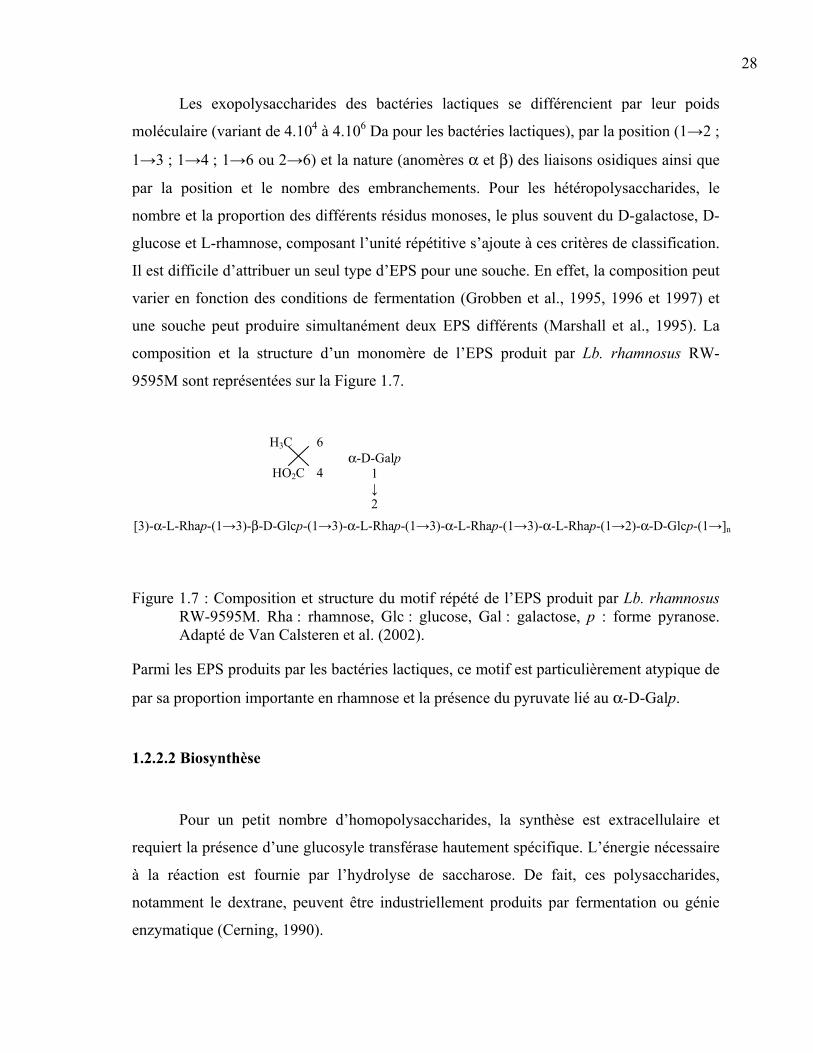
28 Les exopolysaccharides des bactéries lactiques se différencient par leur poids
moléculaire (variant de 4.104 à 4.106 Da pour les bactéries lactiques), par la position (1→2 ;
1→3 ; 1→4 ; 1→6 ou 2→6) et la nature (anomères α et β) des liaisons osidiques ainsi que
par la position et le nombre des embranchements. Pour les hétéropolysaccharides, le
nombre et la proportion des différents résidus monoses, le plus souvent du D-galactose, D-
glucose et L-rhamnose, composant l’unité répétitive s’ajoute à ces critères de classification.
Il est difficile d’attribuer un seul type d’EPS pour une souche. En effet, la composition peut
varier en fonction des conditions de fermentation (Grobben et al., 1995, 1996 et 1997) et
une souche peut produire simultanément deux EPS différents (Marshall et al., 1995). La
composition et la structure d’un monomère de l’EPS produit par Lb. rhamnosus RW-
9595M sont représentées sur la Figure 1.7.
Figure 1.7 : Composition et structure du motif répété de l’EPS produit par Lb. rhamnosus RW-9595M. Rha : rhamnose, Glc : glucose, Gal : galactose, p : forme pyranose. Adapté de Van Calsteren et al. (2002).
Parmi les EPS produits par les bactéries lactiques, ce motif est particulièrement atypique de
par sa proportion importante en rhamnose et la présence du pyruvate lié au α-D-Galp.
1.2.2.2 Biosynthèse
Pour un petit nombre d’homopolysaccharides, la synthèse est extracellulaire et
requiert la présence d’une glucosyle transférase hautement spécifique. L’énergie nécessaire
à la réaction est fournie par l’hydrolyse de saccharose. De fait, ces polysaccharides,
notamment le dextrane, peuvent être industriellement produits par fermentation ou génie
enzymatique (Cerning, 1990).
α-D-Galp 1 ↓ 2
[3)-α-L-Rhap-(1→3)-β-D-Glcp-(1→3)-α-L-Rhap-(1→3)-α-L-Rhap-(1→3)-α-L-Rhap-(1→2)-α-D-Glcp-(1→]n
H3C 6 HO2C 4
29 La voie de biosynthèse des hétéropolysaccharides est représentée sur la Figure 1.8.
Les sucres activés, dont sont constituées les unités répétitives, proviennent du catabolisme
de nucléotides pré-existant dans la cellule et du métabolisme des sucres. Une fraction de
l’UDP-glucose et de l’UDP-galactose générée par les enzymes de la voie de Leloir (Figure
1.1 et Figure 1.8) est essentielle pour la production d’EPS chez certaines souches,
notamment Str. thermophilus et Lb. bulgaricus galactose négative (Levander et al., 2001 ;
Marshall et al., 2001). L’assemblage des sucres activés en unités répétitives s’effectue dans
le cytoplasme par des glucosyles transférases spécifiques. Les connaissances actuelles ne
permettent pas d’expliquer avec certitudes le mécanisme de polymérisation : (i) les unités
répétitives passeraient par translocation à travers la membrane avant d’être polymérisées ou
(ii) la polymérisation s’effectuerait du côté interne de la membrane plasmique. Le
polymère, constitué de quelques centaines à plusieurs milliers de monomères, ainsi
synthétisé est ensuite sécrété dans le milieu extracellulaire sous forme libre ou capsulaire
s’il reste attaché à la cellule (DeVuyst et al., 1999 et 2001).

30
Figure 1.8 : Voie de biosynthèse des hétéropolysaccharides chez les bactéries lactiques. Adapté de De Vuyst et al. (2001).
La production d’hétéropolysaccharides est un caractère plus ou moins instable chez
certaines bactéries lactiques. Pour les souches mésophiles, plusieurs auteurs ont attribué
cette instabilité à la perte du plasmide codant pour des enzymes intervenant dans la
biosynthèse des polysaccharides (Kojic et al., 1992 ; Lonvaud-Funel et al., 1993 ; van
Kranenburg et al., 1998 et 2000). A ce jour, aucun plasmide codant pour la formation
d’EPS n’a été mis en évidence pour les souches thermophiles (De Vuyst et al., 2001). La
N-acétylglucosamine -1-phosphate
N-acétylglucosamine -6-phosphate 9
Milieu extracellulaire
Milieu intracellulaire
Membrame plasmique
Hétéropolysaccharides
Polymérisation / Sécrétion
GTS
GTS
GTS
11
10
8
7
6
5
4
3
2
1
Fructose-6-phosphate Glucose-1-phosphate
Glucose-6-phosphate
Lactose Glucose
Glucosamine-6-phosphate
UDP-N-acétylglucosamine
UDP-N-acétylgalactosamine
dTDP-glucose
dTDP-4 céto-6-désoxymannose
dTDP-rhamnose
Voie de Leloir
UDP-glucose
UDP-galactose
UNITES REPETITIVES
GTS
GTS
Enzymes impliquées : (1) phosphoglucose isomérase, (2) glutamine-fructose-6-phosphate transaminase, (3) glucosamine-phosphate acétyltransférase, (4) acétylglucosamine-phosphate mutase, (5) UDP-glucosamine pyrophosphorylase, (6) UDP-N-acétylglucosamine 4-épimérase, (7) phosphoglucomutase, (8) dTDP-glucose pyrophosphorylase, (9) déshydratase, (10) épimérase réductase, (11) UDP-galactose/glucose 4-épimérase, GTS : Glucosyl transférase spécifique
Membrane plasmique
31
présence de séquences d’insertion dans le locus eps et des réarrangements génétiques, par
transferts horizontaux intra- et inter-espèces durant des cultures mixtes, pourraient être à
l’origine d’un arrêt de la production d’EPS chez les souches thermophiles (Gancel et al.,
1994 ; Stingele et al., 1996 ; Bourgoin et al., 1999).
1.2.2.3 Facteurs influençant la production d’EPS
La production d’EPS est étroitement liée à la concentration, la nature et la
proportion des nutriments dans le milieu de culture. La croissance et la synthèse d’EPS de
Lb. bulgaricus sont stimulées par l’ajout de caséines hydrolysées dans le lait (Cerning et al.,
1990), mais pas dans le milieu MRS (Garcia-Garibay et al., 1991). Ceci peut s’expliquer
par une composition initiale différente entre les deux milieux ; le MRS ayant été
spécifiquement développé pour la croissance des lactobacilles, il contient notamment de
l’extrait de levure riche en NPN et des vitamines (de Man et al., 1960) tandis que le lait
contient peu de NPN (voir section 1.1.1.4). La source d’azote est un paramètre important
dans la production d’EPS. Dans un milieu à base de perméat de lactosérum, l’ajout d’un
concentré de protéines de lactosérum, favorise la production d’EPS par Lb. rhamnosus
RW-9595M (Macedo et al., 2002a). Macedo et al. (2002b) ont, par la suite, observé
l’influence significative des acides aminés sur la formation des hétéropolysaccharides par
Lb. rhamnosus RW-9595M. Le ratio carbone/azote et la nature de la source de carbone
influencent, quant à eux, la composition et le poids moléculaire du polymère formé
respectivement par Lc. cremoris LC330 et Lb. bulgaricus NCFB 2772 (Marshall et al.,
1995 ; Grobben et al., 1996 et 1997 ; Degeest et al., 1999).
La production d’EPS est, d’autre part, dépendante de la concentration dans le milieu
des minéraux, acides aminés et vitamines. Mozzi et al. (1995) ont observé qu’un ajout de
Mn2+ dans un milieu défini permettait de doubler la production d’EPS par Lb. casei CRL7.
L’absence d’un ou plusieurs acides aminés n’a pas d’effet sur la synthèse d’EPS par Lb.
bulgaricus NCFB 2772 (Grobben et al., 1998). Cependant, l’ajout d’acides aminés, dans un
milieu à base de perméat de lactosérum et additionné d’extrait de levure, stimule la
32
production d’EPS par Lb. rhamnosus RW-9595M de même que l’utilisation de minéraux
tandis que l’addition de vitamines n’a pas d’effet (Macedo et al., 2002a). La limitation de la
production dans le perméat de lactosérum provient essentiellement des concentrations
limitantes en Mn2+ et Mg2+ (Bergmaier et al., 2001). Grobben et al. (1998) ont observé une
croissance moindre de Lb. bulgaricus NCFB 2772 et une quantité d’EPS supérieure, dans
un milieu contenant uniquement les vitamines essentielles à son développement
comparativement à milieu complet.
Des conditions optimales de température, d’aération et de pH permettent
d’augmenter les rendements en EPS (De Vuyst et al., 1999 ; Ricciardi et al., 2000).
Toutefois, en fonction des souches utilisées, différents auteurs ont observé une stimulation
de la production d’EPS à des températures supérieures ou inférieures aux optima de
croissance (Kontusaari et al., 1988 ; Garcia-Garibay et al., 1991 ; Cerning et al., 1992 ;
Kojic et al., 1992 ; Gancel et al., 1994 ; Marshall et al., 1995 ; van den Berg et al., 1995 ;
Mozzi et al., 1996 ; Gamar et al., 1997 ; Gassem et al., 1997 ; Looijesteijn et al., 1999).
Une variation de la température de 22 à 42°C n’a par contre pas d’effet sur la production
d’EPS par Lb. rhamnosus RW-9595M dans les milieux lait et perméat de lactosérum
additionné d’extrait de levure (Dupont et al., 2000 ; Macedo et al., 2002a).
Une aération du milieu n’est pas nécessaire pour obtenir des rendements élevés en
EPS. Les plus fortes productions sont atteintes avec une faible tension en oxygène ou en
anaérobiose (van den Berg et al., 1995).
Le pH optimum pour la production d’EPS est généralement proche de celui pour la
croissance (Mozzi et al., 1994 et 1996 ; Gamar-Nourami et al., 1998 ; Grobben et al., 1998 ;
Petry et al., 2000). Gassem et al. (1997) suggère qu’un pH supérieur permettrait de
conserver les cellules en phase exponentielle de croissance sur une plus longue période et
ainsi augmenter la production d’EPS. D’autres auteurs ont montré qu’un contrôle de pH
durant la fermentation augmente le rendement en EPS (Grobben et al., 1995 ; Mozzi et al.,
1996 ; Gassem et al., 1997). L’effet du contrôle de pH est dans certains cas plus important
que l’optimisation du milieu de culture.
33
1.2.2.4 Applications
Pour une application industrielle en tant qu’additif alimentaire, la production d’EPS
par les bactéries lactiques devrait atteindre de 10 à 15 g/l pour être rentable (De Vuyst et
al., 1999). Or, à ce jour la production maximale, obtenue par Lb. rhamnosus RW-9595M,
est de 2.8 g/l (Macedo et al., 2002a). L’exploitation de ces EPS se fait donc principalement
à travers l’incorporation des souches productrices dans les levains destinés à la préparation
de produits fermentés.
La faculté des EPS à retenir l’eau est utilisée pour augmenter le pourcentage
d’humidité dans les fromages Mozzarella (Perry et al., 1997 et 1998 ; Low et al., 1998) et
limiter la synérèse des yaourts (Hess et al., 1997) faibles en gras. Outre leur rôle d’agents
stabilisants, les EPS améliorent également les caractéristiques rhéologiques des produits
laitiers fermentés. L’utilisation de souches épaississantes accentuent, généralement, la
viscosité et l’élasticité des yaourts. Toutefois, ces propriétés sont étroitement liées à la
nature, la composition et la taille de l’EPS ainsi qu’aux interactions entre le polymère et les
constituants du lait comme les micelles de caséines (De Vuyst et al., 1999 ; Ruas-Madiedo
et al., 2002). En effet, un polysaccharide non chargé se dissout plus facilement dans le
lactosérum et interagit moins facilement avec les caséines chargées positivement ; il
augmentera la viscosité du produit tout en se montrant peu efficace pour améliorer
l’élasticité du produit, à l’inverse d’un polysaccharide chargé négativement (Robijn et al.,
1995a, 1995b et 1996 ; van den Berg et al., 1995).
Ces dernières années, plusieurs études ont suggéré l’effet bénéfique sur la santé des
EPS produits par quelques souches probiotiques (section 1.1.2.2). Ces biopolymères
pourraient contribuer à la santé humaine en tant que prébiotiques ou par leur effet anti-
tumoral, anti-ulcère, immuno-modulateur ou anti-cholestérolémique (De Vuyst et al.,
1999 ; Ruas-Madiedo et al., 2002). Chabot et al. (2001) ont notamment montré un effet
stimulant de l’EPS de Lb. rhamnosus RW-9595M sur la production de cytokines par des
cellules immunocompétentes humaines et murines et des splénocytes murins.
34
1.3 Méthode de quantification des bactéries en culture mixte
1.3.1 Techniques conventionnelles
1.3.1.1 Facteurs de sélection
La différence du niveau de résistance à un stress environnemental ou à un agent
inhibiteur et l’auxotrophie pour un ou plusieurs nutriments figurent parmi les moyens
fréquemment utilisés pour sélectionner une population bactérienne dans une culture mixte.
Une augmentation de la température d’incubation des boîtes de Pétri permet, par exemple,
d’isoler des lactobacilles thermophiles en co-cultures avec des lactocoques mésophiles. La
résistance des bactéries lactiques au pH et au stress osmotique variant d’un genre à l’autre
(section 1.1.1.3), ces facteurs de sélection sont également utilisés pour isoler une
population (Carr et al., 2002). Une approche plus fine consiste à incorporer dans une gélose
des agents inhibiteurs, tels que des antibiotiques et des bactériocines. Finalement, une
population non auxotrophe en culture mixte peut être favorisée en éliminant du milieu, des
nutriments, tels que des vitamines et des acides aminés, essentiels à la croissance d’une
population auxotrophe (van Niel et al., 1999 ; Carr et al., 2002).
L’efficacité de ces techniques repose sur la sensibilité des souches aux agents de
sélection. Par conséquent, des souches présentant des réponses similaires ne pourront pas
être isolées en culture mixte par ces méthodes.
1.3.1.2 Géloses différentielles
Sur ces milieux, la différenciation entre les bactéries s’effectue sur la base de
critères métaboliques spécifiques. La gélose FSDA (Fast Slow Differential Agar),
développée par Huggins & Sandine (1984), est utilisée pour différencier les bactéries
lactiques en fonction de leur capacité à utiliser le lactose. L’acidification rapide du milieu
par les souches Lac+, Prt+ se traduit par l’apparition, après 24 heures d’incubation, d’un
halo rouge intense autour des colonies par changement de couleur de l’indicateur présent
35
dans le milieu, litmus ou bromocrésol pourpre pour le FSDA. Pour les souches Lac - ou
Prt -, cet halo n’apparaît qu’après une incubation additionnelle. D’autres milieux, plus
sensibles, permettent de différencier des souches appartenant à la même espèce de
lactocoques. C’est notamment le cas de la gélose Kempler & McKay (1980) Sur la base de
la consommation du citrate, les souches de Lc. cremoris (Cit -) vont donner des colonies
blanches et bleues ou blanches à centre bleu pour les souches de Lc. diacetylactis (Cit +).
Les souches de Lc. cremoris se distinguent également des souches de Lc. lactis sur le
milieu de Reddy et al. (1969) par leur capacité à utiliser l’arginine.
La limite de détection constitue l’inconvénient majeur de ces milieux. En effet,
lorsque l’écart entre les populations à dénombrer dépasse 2 logarithmes, la population la
plus petite n’est plus quantifiable. De plus, la production d’une substance antimicrobienne
par l’une des populations durant l’incubation des boîtes de Pétri, entraîne un biais dans le
dénombrement d’une population sensible. D’autre part, ces milieux sont généralement des
tests indicateurs, ayant une faible sensibilité et dont la base est plus ou moins adaptée à la
croissance des souches à différencier.
1.3.2 Méthodes alternatives
Les outils immunologiques sont suffisamment spécifiques pour la détection et la
quantification de bactéries pathogènes dans le domaine alimentaire et médical. La
spécificité est obtenue par l’utilisation d’anti-corps monoclonaux ou d’anti-corps
polyclonaux dirigés contre un composé très spécifique de la paroi bactérienne, le plus
souvent un facteur de virulence. Cependant, l’augmentation de la spécificité pour la
détection s’accompagne d’une diminution de la sensibilité et des seuils de détection des
méthodes de quantification (Vaira et al., 1999 ; Yu et al., 2004).
Depuis quelques années, le nombre des publications relatives aux séquençages
partiel ou complet de génomes bactériens connaît une progression considérable. Ceci a
permis de développer ou de redécouvrir certains outils de biologie moléculaire très
spécifique tel que le FISH (Fluorescence in situ Hybridization). Cette technique est basée

36
sur l’hybridation de l’ARNr 16S des bactéries par une sonde marquée avec un
fluorochrome. La visualisation après hybridation des cellules bactériennes s’effectue par
microscopie à épifluorescence ou confocale pour des échantillons plus épais. Le FISH
présente deux avantages : la possibilité de localiser la cellule dans son environnement et un
nombre de manipulations réduit par rapport à d’autres techniques de biologie moléculaire
nécessitant par exemple une amplification préalable de l’ADN avant la détection (Moter et
al., 2000 ; Ercolini et al., 2003).
Cependant, le FISH présente plusieurs limites pour une application quantitative. En
effet, la limite de détection, inhérente à la microscopie, se situe aux environs de 104 cellules
par ml (Matte-Tailliez et al., 2001 ; Gunasekera et al., 2003 ). D’autre part, la concentration
maximale ne doit pas excéder 106 cellules/ml pour quantifier deux souches de
Lactobacillus en culture mixte dans le lait sans effectuer de dilution (Matte-Tailliez et al.,
2001). La formation de chaînes par les cellules de Lactobacillus en phase exponentielle de
croissance diminue également l’efficacité des systèmes de détection (Matte-Tailliez et al.,
2001).
L’automatisation de la quantification par couplage du FISH et de la cytométrie de
flux a été proposée par plusieurs auteurs (Moter et al., 2000 ; Gunasekera et al., 2003).
Toutefois, le coût d’un cytomètre de flux et l’expérience nécessaire pour l’analyse des
données sont des facteurs limitant le développement de cette application.
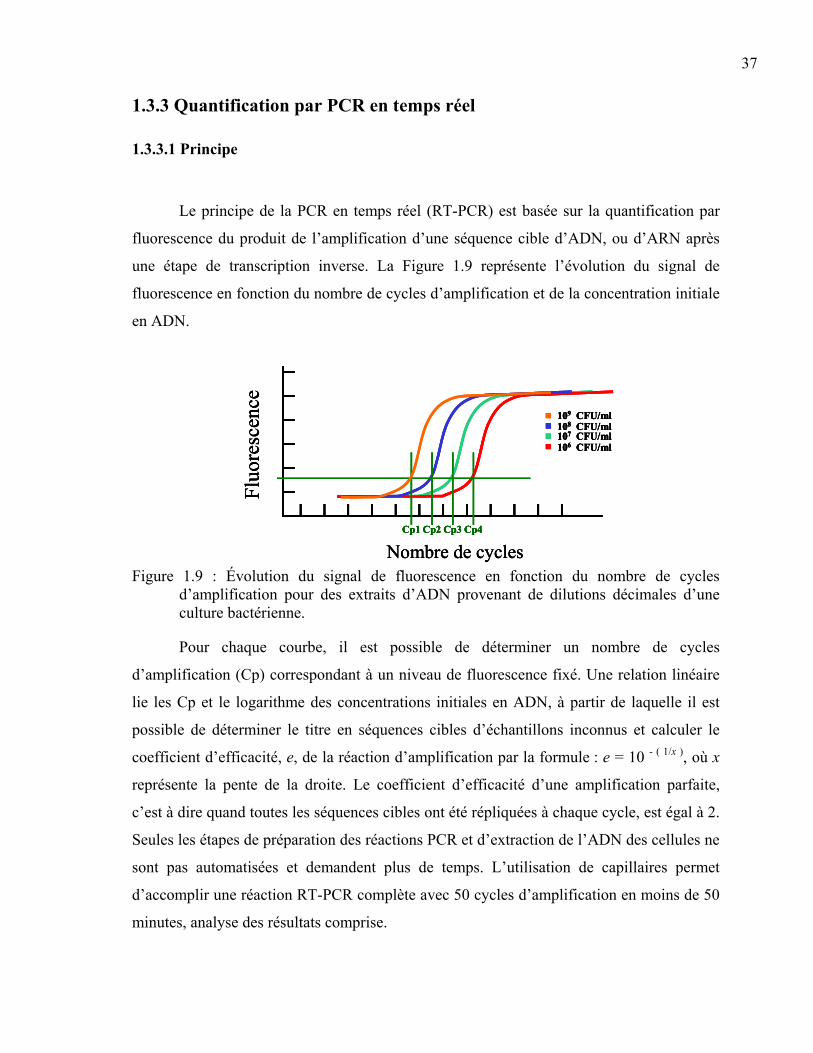
37
1.3.3 Quantification par PCR en temps réel
1.3.3.1 Principe
Le principe de la PCR en temps réel (RT-PCR) est basée sur la quantification par
fluorescence du produit de l’amplification d’une séquence cible d’ADN, ou d’ARN après
une étape de transcription inverse. La Figure 1.9 représente l’évolution du signal de
fluorescence en fonction du nombre de cycles d’amplification et de la concentration initiale
en ADN.
Figure 1.9 : Évolution du signal de fluorescence en fonction du nombre de cycles d’amplification pour des extraits d’ADN provenant de dilutions décimales d’une culture bactérienne.
Pour chaque courbe, il est possible de déterminer un nombre de cycles
d’amplification (Cp) correspondant à un niveau de fluorescence fixé. Une relation linéaire
lie les Cp et le logarithme des concentrations initiales en ADN, à partir de laquelle il est
possible de déterminer le titre en séquences cibles d’échantillons inconnus et calculer le
coefficient d’efficacité, e, de la réaction d’amplification par la formule : e = 10 - ( 1/x ), où x
représente la pente de la droite. Le coefficient d’efficacité d’une amplification parfaite,
c’est à dire quand toutes les séquences cibles ont été répliquées à chaque cycle, est égal à 2.
Seules les étapes de préparation des réactions PCR et d’extraction de l’ADN des cellules ne
sont pas automatisées et demandent plus de temps. L’utilisation de capillaires permet
d’accomplir une réaction RT-PCR complète avec 50 cycles d’amplification en moins de 50
minutes, analyse des résultats comprise.
Fluo
resc
ence
Nombre de cycles
109 CFU/ml108 CFU/ml107 CFU/ml106 CFU/ml
Cp1 Cp2 Cp3 Cp4
Fluo
resc
ence
Nombre de cycles
Fluo
resc
ence
Nombre de cycles
109 CFU/ml108 CFU/ml107 CFU/ml106 CFU/ml
Cp1 Cp2 Cp3 Cp4
109 CFU/ml108 CFU/ml107 CFU/ml106 CFU/ml
109 CFU/ml108 CFU/ml107 CFU/ml106 CFU/ml
Cp1 Cp2 Cp3 Cp4Cp1 Cp2 Cp3 Cp4
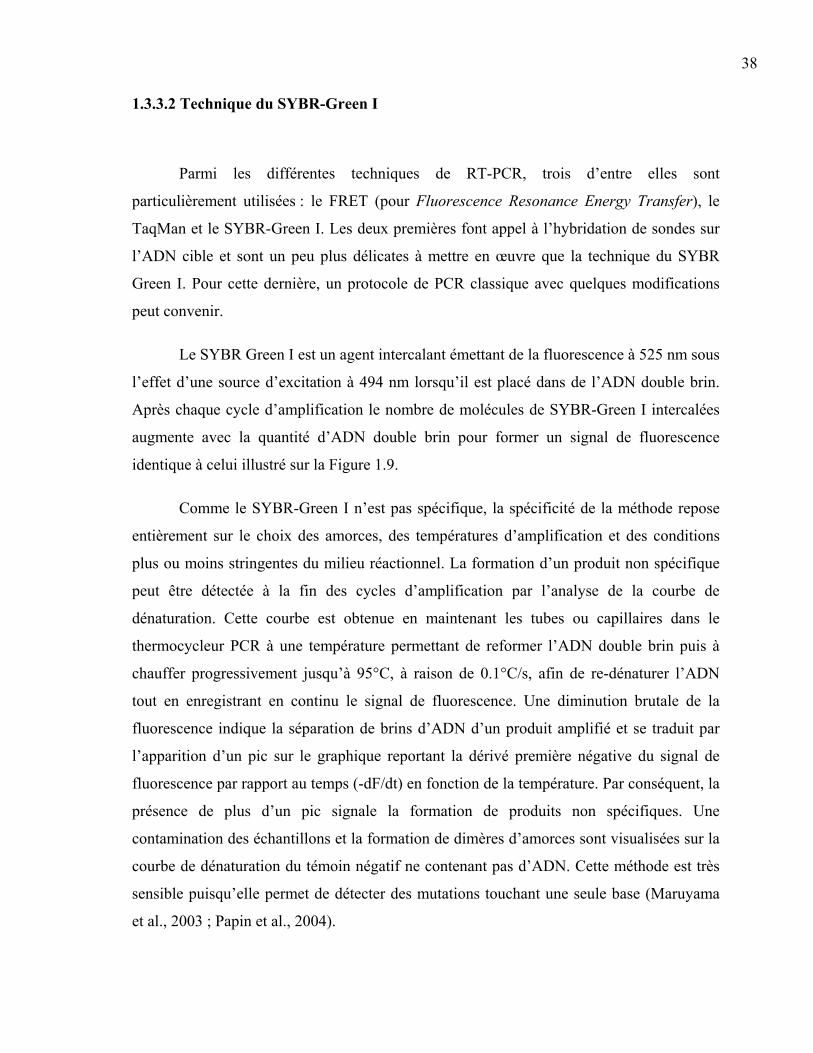
38
1.3.3.2 Technique du SYBR-Green I
Parmi les différentes techniques de RT-PCR, trois d’entre elles sont
particulièrement utilisées : le FRET (pour Fluorescence Resonance Energy Transfer), le
TaqMan et le SYBR-Green I. Les deux premières font appel à l’hybridation de sondes sur
l’ADN cible et sont un peu plus délicates à mettre en œuvre que la technique du SYBR
Green I. Pour cette dernière, un protocole de PCR classique avec quelques modifications
peut convenir.
Le SYBR Green I est un agent intercalant émettant de la fluorescence à 525 nm sous
l’effet d’une source d’excitation à 494 nm lorsqu’il est placé dans de l’ADN double brin.
Après chaque cycle d’amplification le nombre de molécules de SYBR-Green I intercalées
augmente avec la quantité d’ADN double brin pour former un signal de fluorescence
identique à celui illustré sur la Figure 1.9.
Comme le SYBR-Green I n’est pas spécifique, la spécificité de la méthode repose
entièrement sur le choix des amorces, des températures d’amplification et des conditions
plus ou moins stringentes du milieu réactionnel. La formation d’un produit non spécifique
peut être détectée à la fin des cycles d’amplification par l’analyse de la courbe de
dénaturation. Cette courbe est obtenue en maintenant les tubes ou capillaires dans le
thermocycleur PCR à une température permettant de reformer l’ADN double brin puis à
chauffer progressivement jusqu’à 95°C, à raison de 0.1°C/s, afin de re-dénaturer l’ADN
tout en enregistrant en continu le signal de fluorescence. Une diminution brutale de la
fluorescence indique la séparation de brins d’ADN d’un produit amplifié et se traduit par
l’apparition d’un pic sur le graphique reportant la dérivé première négative du signal de
fluorescence par rapport au temps (-dF/dt) en fonction de la température. Par conséquent, la
présence de plus d’un pic signale la formation de produits non spécifiques. Une
contamination des échantillons et la formation de dimères d’amorces sont visualisées sur la
courbe de dénaturation du témoin négatif ne contenant pas d’ADN. Cette méthode est très
sensible puisqu’elle permet de détecter des mutations touchant une seule base (Maruyama
et al., 2003 ; Papin et al., 2004).

39
1.3.3.3 Avantages et limites de la RT-PCR
L’étape d’amplification de l’ADN cible permet d’atteindre des seuils de détection
relativement bas. Par RT-PCR, la limite de détection de Staphylococcus aureus dans le
fromage est inférieure à 102 ufc/g avec le SYBR-Green I et le TaqMan (Hein et al. 2001) et
celle Listeria monocytogenes dans le lait est de 6 à 60 ufc/réaction, soit 103 ufc/25 ml, par
la technique FRET (Koo et al., 2003) et TaqMan (Nogva et al., 2000) avec une zone de
linéarité s’étendant sur plus de 7 logarithmes.
Le choix des amorces ou des sondes permet de cibler une souche particulière ou un
ensemble de souches d’espèces identiques ou différentes présentant des séquences
génétiques communes (Rueckert et al., 2005). Il est également possible de détecter
simultanément différentes cibles par une approche multiplex (Wittwer et al., 2001).
Panicker et al. (2004) ont détecté, par RT-PCR associée au SYBR-Green I, deux
populations de Vibrio vulnificus uniquement sur la base des gènes viub et vvh.
La précision est également un autre avantage de la RT-PCR. Klein (2002) rapporte
des coefficients de variation sur les valeurs de Cp inférieurs à 2 %.
Outre le coût des réactifs, la RT-PCR présente un inconvénient. L’amplification
étant exponentielle, les variations s’accentuent avec le nombre de cycle ainsi la méthode
d’extraction de l’ADN doit être quantitative et robuste pour éviter tout écart d’un
échantillon à l’autre (Klein, 2002 ; Mummy et al., 2004) qui serait par la suite amplifié.
1.4 L’immobilisation cellulaire
Contrairement aux cellules planctoniques cultivées dans un milieu liquide,
l’immobilisation cellulaire correspond à un état dans lequel les cellules ne peuvent pas se
déplacer librement sous l’effet d’un mouvement Brownien ou par sédimentation. Cette
définition générale englobe la formation naturelle de biofilms et d’agrégats par certains
microorganismes et les procédés qui consistent à retenir ou à inclure volontairement dans
40
une matrice des cellules bactériennes. Ces dernières années, de nombreuses études ont
présenté les avantages associés à l’utilisation de l’immobilisation cellulaire en fermentation
par rapport aux cellules planctoniques pour la production de biomasse et de métabolites
d’intérêt : haute densité cellulaire, ré-utilisation possible du support et des cellules
immobilisées, stabilité plasmidique, résistance à la contamination, stimulation de la
production et de la sécrétion de métabolites ainsi qu’une protection accrue des cellules face
à différents agents physiques et chimiques (Lacroix et al., 2005).
1.4.1 Techniques d’immobilisation cellulaire
En fonction de l’application et des caractéristiques des cellules à immobiliser,
différentes techniques ont été développées : l’attachement ou l’adsorption sur un support
préformé, la rétention derrière des barrières (membranes), l’inclusion dans une matrice de
polymères et la microencapsulation. Les trois premières techniques sont les plus utilisées
pour la production de biomasse et/ou de métabolites. La microencapsulation est
généralement destinée à préserver la viabilité de microorganismes, tels que les cultures
probiotiques, dans les aliments et le tractus gastro-intestinal (Picot et al., 2004).
1.4.1.1 L’attachement ou l’adsorption sur un support préformé
L’immobilisation par adsorption ou adhésion sur un support préformé est basée sur
la faculté des cellules à coloniser des surfaces solides et à s’y développer. La colonisation
s’effectuant dans des conditions douces par mise en contact des cellules et du support, la
viabilité est élevée. Ces supports se montrent également résistants aux forces de
cisaillement et de compression rencontrées dans un bioréacteur. Bergmaier et al. (2003) ont
rapporté de fortes concentrations de cellules de Lb. rhamnosus RW-9595M immobilisées
dans un support de caoutchouc de silicone poreux (8.5 1011 ufc/ml de support estimée
indirectement par mesure d’ADN) pour la production d’EPS. Pour des supports non
poreux, l’adhésion des cellules repose principalement sur leur capacité à former un biofilm,
41
cette technique n’est alors pas applicable à tous les microorganismes (Donlan, 2002). De
plus, le biofilm peut se détacher, lorsque les liaisons avec le support sont trop faibles
(Groboillot et al., 1994). Finalement, le coût élevé des supports limite leur utilisation pour
des produits à haute valeur ajoutée.
1.4.1.2 La rétention derrière des membranes ou bioréacteurs à membrane
Durant les fermentations continues classiques, les cellules quittent le bioréacteur
avec l’effluent. L’utilisation d’unité d’ultrafiltration ou de microfiltration à la sortie du
bioréacteur permet de retenir les cellules à l’intérieur du fermenteur tandis que le milieu
fermenté diffuse à travers les pores de la membrane. Ces systèmes sont intéressants pour la
production de biomasse puisqu’ils permettent d’obtenir des concentrations cellulaires 7 à
10 plus élevées qu’en fermentation batch (Taniguchi et al., 1987 ; Prigent et al., 1988).
Cependant, le pompage du milieu fermenté dans le système de filtration causerait un stress
pour les cellules se traduisant par une perte d’activité (Prigent et al., 1988 ; Bibal et al.,
1991).
Kulozik et al. (1999) ont appliqué avec succès la technologie des bioréacteurs à
membrane pour la production d’acide lactique par Lb. helveticus à partir de perméat de
lactosérum. Toutefois, l’investissement important, la maintenance complexe du système et
un encrassement régulier des membranes sont autant de facteurs qui limitent l’utilisation de
ces bioréacteurs (Tejayadi et al., 1995 ; Musale et al., 1998).
1.4.1.3 L’inclusion dans une matrice de polymères
Ce procédé est le plus utilisé pour des applications alimentaires. Il consiste à inclure
des cellules bactériennes dans une matrice poreuse de polymères formée après gélification.
Dans le domaine alimentaire, les gels de polysaccharides, tels que le κ-carraghénane et
l’alginate, sont préférentiellement choisis pour leur disponibilité, biocompatibilité, coût,
propriétés mécaniques et surtout leur non-toxicité. Durant plusieurs semaines de
42
fermentation continue du lait et du perméat de lactosérum par des bactéries lactiques, le gel
de κ-carraghénane associé à la gomme de caroube a présenté de bonnes résistances
mécaniques (Sodini et al., 1997a ; Lamboley et al., 1999 et 2001). Dans ces conditions,
l’utilisation de billes d’alginate est peu recommandée en raison de la chélation du calcium,
nécessaire à la stabilisation du gel, notamment par les ions lactates formés en cours de
fermentation (Groboillot et al., 1994).
Pour augmenter les transferts de masse et ainsi favoriser la libération des composés
toxiques accumulés dans la matrice durant la croissance bactérienne, la forme sphérique,
qui présente le rapport surface/volume le plus important, est préférée au gel rectangulaire
(Groboillot et al., 1994). La taille des billes influence également l’activité de la biomasse
immobilisée. Des billes d’un plus petit diamètre améliorent les transferts de masse d’où une
plus grande biomasse et une plus forte productivité (Prévost et al., 1988a) mais leur
structure se dégrade facilement sous l’action du développement cellulaire au centre des
billes et elles ne facilitent pas leur séparation du milieu de culture (Audet et al., 1991). Un
diamètre compris entre 1 à 2 mm représente un compromis sélectionné par plusieurs
auteurs (Sodini-Gallot et al., 1995 ; Sodini et al., 1997a et 1998 ; Lamboley et al., 1997,
1999 et 2001 ; Doleyres et al., 2002a, 2004a et 2004b).
1.4.2 Distribution de la biomasse dans les billes de gel
La productivité des systèmes de fermentation avec cellules immobilisées est
étroitement liée aux cinétiques des réactions cellulaires, aux transferts de masse interne et
externe du substrat et des produits d’inhibition, principalement l’acide lactique pour les
bactéries lactiques, mais aussi du relargage cellulaire de la surface des billes vers le milieu
externe. La limitation de la diffusion des produits d’inhibition du centre vers la périphérie
de la bille et du substrat dans le sens opposé s’accompagne d’un fort gradient de pH
(Masson et al., 1994 ; Cachon et al., 1998) limitant ainsi la croissance bactérienne vers le
centre comme différents auteurs l’ont observée (Arnaud et al., 1991 ; Sodini et al., 1997b ;
Prioult et al., 2000 ; Doleyres et al., 2002a).
43
1.4.3 Principe du relargage cellulaire
Lors de fermentations continues, des observations microscopiques réalisées sur des
billes immobilisant des cellules de Lc. lactis ont montré des ruptures localisées à la surface
du gel au niveau de cavités contenant des microcolonies (Sodini et al., 1997). Le relargage
cellulaire des billes de gel s’effectue spontanément sous l’influence de la croissance
bactérienne à la périphérie des billes et des forces de cisaillement dues à l’agitation
mécanique et aux collisions entre les billes (Arnaud et al., 1992). Ce phénomène est à la
base de la pré-fermentation continue du lait (Prévost et al., 1987, 1988a et 1988b ; Sodini-
Gallot et al., 1995 ; Sodini et al., 1997a et 1998) et de la production de biomasse libre
(Lamboley et al., 1997, 1999 et 2001 ; Doleyres et al., 2002b, 2004a et 2004b).
Le relargage est influencé par différents facteurs. L’agitation favorise l’ouverture
des cavités et la libération des microcolonies dans le milieu extérieur (Arnaud et al., 1992 et
1993). Cependant, une agitation mécanique trop forte affecte négativement la productivité
volumétrique du système en réduisant l’épaisseur de la couche périphérique du gel
contenant la biomasse active (Sodini-Gallot et al., 1995 ; Arnaud et al., 1993). Tous les
facteurs tels que le pH, la température, le milieu de culture et le taux de dilution lors d’une
fermentation continue, susceptibles d’influencer la croissance des cellules agissent
également de façon indirecte sur le relargage cellulaire (Champagne et al., 1993 ; Gobbetti
et al., 1993 ; Lamboley et al., 1997, 1999 et 2001).
1.4.4 Phénomène de contamination croisée
Des études récentes d’un système de fermentation continue du lait (Sodini et al.,
1997a) ou de perméat de lactosérum supplémenté (Lamboley et al., 1997, 1999 et 2001),
par une culture mixte de bactéries lactiques immobilisées séparément dans un gel de κ-
carraghénane/gomme de caroube, ont montré l’importance du phénomène de contamination
croisée entre les billes. En effet, les billes contenant initialement une culture pure sont
constituées d’un mélange des différentes souches de la culture mixte dans des proportions
constantes après plusieurs semaines de fermentation.
44 Le modèle proposé par Lacroix et al. (1996) suggère qu’après le relargage des
microcolonies, le gel de polysaccharide, qui présente des propriétés viscoélastiques,
referme partiellement la cavité, partiellement vidée de son contenue en cellules, en
emprisonnant une partie du milieu de culture contenant un mélange des souches. Les
cellules résidentes et captées du milieu pourraient alors former de nouvelles microcolonies
dans la matrice.
1.4.5 Modifications physiologiques induites par l’immobilisation
La limitation des transferts de masse dans les matrices d’immobilisation crée un
environnement adverse pour le développement des cellules. Ces conditions peuvent
s’apparenter à des stress environnementaux tels qu’un pH acide, un manque de nutriment et
l’absence d’oxygène pour certains microorganismes aérobies stricts. Les bactéries
possédant des capacités d’adaptation aux stress remarquables, la physiologie et la
morphologie des cellules peuvent ainsi présenter des comportements très différents selon
qu’elles sont immobilisées ou sous une forme planctonique. Krishnan et al. (2001) ont ainsi
observé le passage d’un métabolisme homofermentaire à hétérofermentaire chez des
cellules de Lb. plantarum immobilisées durant une fermentation continue. Plus
généralement, les auteurs montrent une augmentation de la résistance des cellules
immobilisées à différents agents : produits d’inhibition (Fortin et al., 1989, Texeira de
Mattos et al., 1994 ; Krisch et al., 1997), alcools (Holcberg et al., 1981 ; Curtain, 1986),
phénols (Keweloh et al., 1989 ; Heipieper et al., 1991 ; Diefenbach et al., 1992),
antibiotiques (Jouenne et al., 1994 ; Doleyres et al., 2002b et 2004a), peroxyde
d’hydrogène et nisine Z (Doleyres et al., 2002 et 2004a) et produits de nettoyages à base
d’ammonium quaternaire (Trauth et al., 2001).
Bergmaier et al. (2005) ont observé des changements importants de la physiologie et
de la morphologie de Lb. rhamnosus RW-9595 en culture immobilisée pour la production
en continu d’EPS. La production d’EPS soluble diminue tandis que des agrégats composés
45
d’EPS non solubles et de cellules viables se forment dans le bioréacteur. Le changement est
cependant réversible. Après quatre repiquages successifs, sous contrôle de pH, des agrégats
de cellules issus de l’effluent de la fermentation continue, la production d’EPS soluble
recouvre les valeurs initiales (1742 mg/l) et la production d’EPS insoluble disparaît.
Doleyres et al., 2004a ont suggéré que l’augmentation de la résistance à différents
stress environnementaux des cellules de Bifidobacterium longum et Lc. diacetylactis,
immobilisées dans un gel de κ-carraghénane/gomme de caroube pour la fermentation
continue de MRS résulterait d’une augmentation de l’épaisseur de la paroi cellulaire.
D’autres auteurs ont observé une augmentation du taux de conjugaisons entre des cellules
immobilisées comparativement à une culture planctonique et une modification de la
régulation de nombreux gènes, notamment ceux liés à la glycolyse chez Staphylococcus
aureus lorsque les cellules se présentent sous la forme d’un biofilm (Donlan, 2002). Des
études complémentaires restent à accomplir dans ce domaine pour mieux comprendre les
différents mécanismes intervenants dans les modifications physiologiques et
morphologiques des cellules immobilisées.
1.4.6 Applications de l’immobilisation cellulaire aux bactéries lactiques
1.4.6.1 Production de métabolites
L’acide lactique, la nisine Z et les EPS sont les principaux métabolites d’intérêt dont
la production par des cultures immobilisées de bactéries lactiques a fait l’objet d’études.
Pour tous ces travaux, les fermentations sont réalisées avec du perméat de lactosérum, sous
produit de l’industrie fromagère, supplémenté en extrait de levure afin de répondre aux
exigences nutritionnelles des bactéries lactiques.

46 Pour la production d’acide lactique, l’utilisation de la technologie des cellules
immobilisées de Lactobacillus couplée à une fermentation en continu permet d’atteindre
des productivités élevées (Norton et al., 1994a). Cependant, l’utilisation du lactose est
complète uniquement en utilisant un deuxième réacteur alimenté par l’effluent du réacteur
avec cellules immobilisées (Norton et al., 1994b). La productivité volumique en acide
lactique de ce système à deux étages est de 13.5 g/l.h avec une concentration en extrait de
levure initiale de 10 g/l et en sucre résiduel en fin de fermentation de 1 g/l. L’utilisation de
deux réacteurs avec cellules immobilisées conduit à une productivité encore plus élevée, de
21 g/l.h (Schepers et al., 2005). Les réacteurs à membrane permettent de porter la
productivité à 35 g/l.h pour Lb. helveticus (Kulozik et al., 1999) et 85 g/l.h pour Lb.
bulgaricus (Mehaia et al., 1986) pour la même concentration en extrait levure et une
consommation de lactose proche de 100 %. Toutefois, l’utilisation de ce type de bioréacteur
présente des limites importantes comme nous l’avons vu précédemment.
Peu d’études ont porté sur la production d’EPS par une culture immobilisée de
bactéries lactiques. La fermentation en batch répétés et contrôle de pH de perméat de
lactosérum supplémenté par une culture de Lb. rhamnosus RW-9595M immobilisée sur un
support solide poreux permet d’obtenir des concentrations élevées en polysaccharides
atteignant 1808 mg/l (Bergmaier et al., 2003). Néanmoins, l’association de la technologie
des cellules immobilisées et d’un système à deux étages a entraîné une diminution de la
production à 138 mg/l (Bergmaier et al., 2005). Ces auteurs ont expliqué ce résultat par
d’importantes modifications morphologiques et physiologiques des cellules et la formation
d’agrégats constitués d’EPS insoluble et de biomasse au dépend de l’EPS soluble.
L’immobilisation cellulaire a également été utilisée pour augmenter la densité
cellulaire dans un système destiné à la production en continu de nisine Z. Malgré, un
accroissement de la biomasse d’un facteur 10 dans le bioréacteur avec cellules
immobilisées par rapport aux cultures réalisées avec des cellules libres, la production de
nisine Z est similaire avec les deux systèmes (Desjardins et al., 2001). D’autres auteurs ont
rapporté une diminution de 25% de la production de nisine par des cellules de Lc. lactis IO-
1, adsorbées sur un support de résine photo-sensible en fermentation continue

47
comparativement à un réacteur avec cellules planctoniques (Sonomoto et al., 2000). Des
résultats similaires ont été observés pour la production de pédiocine par Pediococcus
acidilactici UL5 (Huang et al., 1996). Pour expliquer la diminution de la production
spécifique de bactériocine, ces auteurs ont proposé que les conditions constantes de la
fermentation continue avec cellules immobilisées étaient un facteur limitant pour des étapes
clés dans la biosynthèse de la bactériocine. Bertrand et al. (2001) ont notamment montré
que l’évolution des conditions de culture d’une fermentation batch était nécessaire pour une
forte production de nisine Z par des cellules de Lc. diacetylactis UL719 immobilisées dans
un gel de κ-carraghénane/gomme de caroube. Ils ont ainsi pu obtenir des concentrations en
nisine de 8200 UI/ml dans des batch à cycles répétés d’une heure avec contrôle de pH. La
productivité volumétrique de ce système, 5730 UI/ml.h, est nettement supérieure à celle
d’une culture batch avec cellules libres, 850 UI/ml.h, et cellules libres ou immobilisées en
fermentation continue, 460 et 1760 UI/ml.h, respectivement.
1.4.6.2 Production de biomasse
Les levains sont traditionnellement produits en fermentation batch avec cellules
libres. Cependant, l’accumulation rapide dans le milieu de culture des déchets du
métabolisme limite considérablement la croissance cellulaire. La fermentation par apport
continu de milieu frais peut palier à cet inconvénient mais les risques de contamination, la
perte de plasmides et le déséquilibre des populations en culture mixte sont des facteurs
limitant son utilisation (Gilliland, 1985b ; D’Angio et al., 1994). Une alternative
prometteuse consiste à produire le levain par fermentation en continu avec cellules
immobilisées. La forte biomasse immobilisée permet d’assurer une haute productivité tout
en réduisant les risques de contamination grâce aux importants taux de dilution et
d’inoculation. D’autre part, D’Angio et al. (1994) et Huang et al. (1996) ont montré que
l’immobilisation cellulaire permettait d’améliorer la stabilité plasmidique.
48 Lamboley et al. (1997) ont étudié la production d’un levain, composé de trois
souches de Lc. lactis sp, par fermentation en continu du perméat de lactosérum avec
cellules immobilisées dans des billes de κ-carraghénane/gomme de caroube. La
productivité élevée du système, 5.3x10¹² ufc/l.h, est restée stable durant plus de 50 jours et
la modification des paramètres de fermentation (pH, taux de dilution et température) a
permis de contrôler le ratio des populations dans l’effluent sans entraîner une baisse de
l’activité du levain. Néanmoins, la souche de Lc. diacetylactis devient rapidement
dominante sur Lc. lactis et Lc. cremoris dans l’effluent et les billes de gel, quelques soient
les conditions testées de température, pH et taux de dilution, et le ratio de départ entre les
populations immobilisées (Lamboley et al., 1997, 1999 et 2001). En effet, Lamboley et al.
(2001) ont observé que les cellules de Lc. diacetylactis colonisaient très largement, par
contamination croisée, les billes contenant initialement une culture pure des deux autres
souches tandis que le phénomène est moins prononcé pour les cellules de Lc. lactis et
inexistant pour Lc. cremoris, dans les limites de la méthode de quantification utilisée. La
dominance de Lc. diacetylactis sur Lc. cremoris et/ou Lc. lactis a également été observée
avec des souches d’origine différente et dans un système de pré-fermentation en continu du
lait (Sodini et al., 1997a et 1997b et Lamboley et al., 2001). Le co-métabolisme du glucose
ou lactose et du citrate (voir section 1.1.1.4) pourrait créer un microenvironnement plus
favorable à la croissance des cellules immobilisées de Lc. diacetylactis.
La modification du ratio initial de deux populations de Lc. cremoris, protéinase
positive et négative, immobilisées séparément dans un gel de κ-carraghénane/gomme de
caroube a permis de contrôler la proportion des cellules relarguées dans le milieu de culture
après 10 h de fermentation batch sous contrôle de pH (Audet et al., 1995).
1.4.6.3 Inoculation et pré-acidification en continu du lait
La première application des cellules immobilisées pour l’inoculation et pré-
acidification (pré-fermentation) en continu du lait a été développée pour la préparation de
yogourt (Prévost et al., 1987, 1988a et 1988b). Dans ce système, les cellules de Str.
thermophilus et Lb. bulgaricus sont immobilisées dans des billes d’alginate de calcium et le
49
pH est contrôlé par apport de lait frais. De ce fait, le taux de dilution est directement relié à
la capacité acidifiante de la culture. Avec une consigne de pH fixée à 5.7, le temps de
résidence du lait dans le bioréacteur est très court (8-9 minutes) et la production d’acide
lactique est 3.3 fois supérieures à celle d’un système avec cellules libres (Prévost et al.,
1988b). La productivité de ce système permet ainsi de réduire le temps de fermentation
pour la préparation de yogourt de 50 et 20 % comparativement à l’utilisation classique de
levains sous forme lyophilisée ou liquide (Prévost et al., 1988a). De plus, le ratio entre les
souches est resté stable durant les 10 jours de l’expérimentation et égal à 1 ce qui constitue
une valeur optimale pour la production de yogourt.
Sodini-Gallot et al. (1995) ont étudié un système de pré-fermentation en continu du
lait par quatre souches de bactéries lactiques mésophiles immobilisées séparément dans des
billes de κ-carraghénane/gomme de caroube pour la préparation de fromage frais. Ces
auteurs ont observé une productivité très élevée d’acide lactique et de biomasse,
respectivement 28 g/l.h et 7.7x10¹² ufc/l.h, lorsque le système opère à 30°C, pH 6.2 et avec
une charge en billes dans le bioréacteur correspondant à 40 % du volume utile. Dans ces
conditions, le taux d’inoculation du lait varie de 5.0x10⁷ à 1.5x10⁸ ufc/ml selon la souche.
Ce système permet de réduire de moitié le temps de fermentation pour la production du
fromage frais, obtenu après une étape additionnelle d’acidification du lait pré-fermenté
jusqu’à pH 4.8, par rapport à un procédé traditionnel (Sodini-Gallot et al., 1995 ; Sodini et
al., 1997a). Cette performance s’explique par le taux d’inoculation élevé et le pH plus
faible du lait pré-fermenté en sortie du bioréacteur. De plus, les cellules relarguées dans le
lait sont en phase exponentielle de croissance, il n’y a donc pas de phase de latence
comparativement à l’emploi de levains sous forme lyophilisée ou d’un ferment frais. Les
effets, sur la composition microbienne du lait pré-fermenté et les performances du système
à long terme (jusqu’à 9 semaines), des conditions opératoires de la pré-fermentation telles
que la température, le pH, la charge en billes, la vitesse d’agitation, le type de lait et sa
composition, ont fait l’objet de plusieurs études (Sodini-Gallot et al., 1995, Sodini et al.,
1997a, 1997b et 1998). De ces travaux, il ressort que les très forts taux de production, la
stabilité biologique des cellules et la réduction des temps de fermentation comptent parmi
les avantages majeurs du procédé d’inoculation et pré-acidification en continu du lait par
50
des cellules immobilisées. A titre d’exemple, un bioréacteur avec cellules immobilisées de
100 l produirait quotidiennement 100 000 litres de lait pré-fermenté inoculé à 1-2x10⁸
ufc/ml et cette production pourrait être 10 fois plus importante pour un taux d’inoculation,
classique pour les fromages frais, de 107 ufc/ml. Il est également possible d’arrêter le
système pour des opérations de maintenance du bioréacteur, ou des aspects
organisationnels et pratiques en usines, sans que cela affecte l’activité biologique des
cellules (Sodini et al., 1997a). De plus, les qualités organoleptiques ne sont pas
significativement différentes entre un produit obtenu par un ensemencement traditionnel du
lait et celui préparé à partir de lait pré-fermenté (Sodini et al., 1998).
1.5 Hypothèse, but et objectifs du travail
1.5.1 Hypothèse L'inoculation traditionnelle du lait par une culture mixte en cellules libres et
constituée de souches présentant des activités métaboliques antagonistes ne permet pas de
contrôler adéquatement le ratio entre les populations ni la production de métabolites
d'intérêt, nisine et exopolysaccharides, à la fin de la fermentation. L'utilisation de la
technologie des cellules immobilisées associée à une préfermentation en continu, permet
une inoculation massive et contrôlée du lait par une culture mixte composée d'un mélange
de bactéries fonctionnelles et éventuellement antagonistes, conduisant à un lait fermenté,
obtenu après une incubation additionnelle du lait préfermenté, aux caractéristiques
fonctionnelles améliorées.
1.5.2 But Le but de ce projet de recherche était de caractériser les différentes interactions, au
niveau des populations et de la production de métabolites, entre trois souches de bactéries
lactiques présentant des propriétés métaboliques différentes et antagonistes durant des
fermentations en batch du lait inoculé soit par une méthode traditionnelle, soit par
préfermentation en continu avec cellules immobilisées.
51
1.5.3 Objectifs spécifiques
Pour vérifier l'hypothèse et réaliser le but de ce projet de recherche différents
objectifs ont été fixés :
• Développer une méthode sensible et suffisamment spécifique de
quantification d'une souche de Lc. cremoris en culture mixte dans le lait avec
Lc. diacetylactis UL719 et Lb. rhamnosus RW-9595M. (Chapitre 2)
• Evaluer l'effet de la température et de l'association des trois souches en
culture mixte durant des fermentations en batch du lait avec des cellules
libres sur les paramètres d'acidification, l'équilibre entre les populations
bactériennes et la production de métabolites. (Chapitre 3)
• Réaliser et caractériser une préfermentation en continu du lait, menée à
différentes températures, par une culture mixte en cellules immobilisées des
trois souches, et complétée par une fermentation en batch du lait
préfermenté. Evaluer l'effet de l'immobilisation cellulaire et de la
préfermentation en continu sur des caractéristiques physiologiques des
cellules relâchées dans le lait préfermenté. (Chapitre 4)

52
Chapitre 2. Quantification by real-time PCR of Lactococcus lactis subsp. cremoris in milk fermented by a
mixed culture /
Quantification par PCR en temps réel d’une souche de Lactococcus lactis subsp. cremoris dans un lait fermenté
par une culture mixte
Les résultats de ce travail ont été publiés dans la revue Applied Microbiology and
Biotechnology (2005, 66 : 414-421). Les auteurs de cet article sont : Franck Grattepanche,
Christophe Lacroix, Pascal Audet et Gisèle LaPointe. Le contenu intégral de cet article,
rédigé en anglais, est présenté dans ce chapitre.
53
2.1 Résumé
Durant la fabrication fromagère, les interactions entre les différentes souches
bactériennes constituant le ferment jouent un rôle très important. Cependant, peu de
méthodes sont disponibles pour suivre spécifiquement, dans une culture mixte, l’évolution
des populations bactériennes et plus particulièrement lorsque les souches appartiennent à la
même espèce. L’objectif de notre étude était de développer une méthode de PCR en temps
réel pour quantifier dans un lait fermenté la population de Lc. cremoris ATCC19257 en
présence de Lb. rhamnosus RW-9595M et d’une souche productrice de bactériocine, Lc.
diacetylactis UL719. La spécificité des amorces 68FCa33 et 16SR308, utilisées pour
amplifier un fragment de 240–pb de l’ADN de Lc. cremoris a été démontrée par PCR
conventionnelle. L’association de ces amorces et de la PCR en temps réel a permis
d’obtenir une limite de détection de 2 cfu/réaction (i.e. 20 µl) et de 200 cfu de Lc. cremoris
par millilitre de lait fermenté par une culture mixte. Une bonne corrélation a été obtenue
entre les comptes effectués sur gélose et déterminés par PCR en temps réel, durant une
fermentation batch du lait par Lc. cremoris en culture pure. En culture mixte, la production
de nisine Z par Lc. diacetylactis UL719 entraîne une diminution des populations de Lb.
rhamnosus et Lc. cremoris. Cette diminution de la concentration cellulaire de Lc. cremoris
a été uniquement détectée par la méthode de PCR en temps réel, la différence entre les deux
populations de lactocoques excédant 1 logarithme.
54
2.2 Abstract
During cheese making, interactions between different strains of lactic acid bacteria
play an important role. However, few methods are available to specifically determine each
bacterial population in mixed cultures, in particular for strains of the same species. The aim
of this study was to develop a real-time PCR quantification method to monitor the
population of Lactococcus cremoris ATCC 19257 in mixed culture with Lactobacillus
rhamnosus RW-9595M and the bacteriocin-producing microorganism Lc. diacetylactis
UL719. The specificity of the two primers 68FCa33 and 16SR308 used to amplify a 240-bp
fragment of DNA from Lc. cremoris was demonstrated by conventional PCR. Using these
primers for real-time PCR, the detection limit was 2 cfu/reaction or 200 cfu of Lc. cremoris
ATCC 19257 per millilitre of mixed culture in milk. In pure culture batch fermentation,
good correlation was obtained between real-time PCR and the conventional plating method
for monitoring Lc. cremoris growth. In mixed culture batch fermentation, Lb. rhamnosus
and Lc. cremoris decreased due to nisin Z production by Lc. diacetylactis. The decrease of
the Lc. cremoris cell population detected by real-time PCR was not possible to observe by
the plate count method in the presence of a Lc. diacetylactis population that was 1 log
higher.
55
2.3 Introduction
In modern food manufacture, the lactic acid bacteria (LAB) are carefully selected
for good technological and organoleptic properties as well as for preservation of fermented
dairy products. Lactococcus lactis subsp. cremoris strains are generally incorporated into
starters for their acidifying and proteolytic activities. The biovariant diacetylactis of
Lactococcus lactis subsp. lactis takes part in the formation of the diacetyl flavour
compound by metabolism of citrate and is incorporated into starter cultures in order to
develop aroma. In some fermented dairy products, such as yoghurts, exopolysaccharide
(EPS)-producing strains of Lactococcus sp. and Lactobacillus spp. play an important role in
improving texture and reducing syneresis (Cerning 1990 ; Duboc and Mollet 2001). More
recently, bacteriocinogenic LAB cultures have been studied in order to prevent growth of
spoilage or pathogenic microorganisms (Cleveland et al. 2001). Bacteriocins are defined by
Tagg et al. (1976) as bacterial antimicrobial proteinaceous compounds that kill closely
related bacteria. Many LAB produce bacteriocins and can be selected as starter cultures
(Klaenhammer 1993; McAuliffe et al. 2001). Among bacteriocins, nisin, produced by some
strains of Lactococcus lactis species, is well documented (Delves-Broughton et al. 1996). It
is the only bacteriocin approved by the Food and Drug Administration as GRAS (United
States Food and Drug Administration 1988). In addition to inhibiting growth of pathogenic
microorganisms, bacteriocinogenic adjunct cultures have also been used to induce starter
culture lysis, which promotes the release of intracellular enzymes from sensitive strains
thus contributing to acceleration of the cheese ripening process (Benech et al. 2002b, 2003;
Sallami et al. 2004).
To evaluate the impact of bacteriocins on sensitive strains during cheese
manufacture, quantification of the bacterial populations is the most direct method. In mixed
culture, either temperature or antimicrobial compounds, such as antibiotics, are commonly
used to select a bacterial population. However, these methods cannot be applied to closely
related strains that grow at the same temperature and are resistant to the same antimicrobial
agents. In this case, differential media based on bacterial metabolism are available. For
56
example, lactococcal subspecies can be differentiated by citrate metabolism on Kempler
and McKay plate count agar (Kempler and McKay 1980). Lc. cremoris does not metabolise
citrate and gives white colonies, whereas Lc. diacetylactis forms blue colonies or white
colonies with a blue centre. Nevertheless, quantification of colonies of the two subspecies
on the same plate can only be performed for lactococcal populations that differ by no more
than one logarithm. In addition, production of bacteriocin by one strain of the mixture
during incubation of the plate inhibits growth of sensitive strains, hindering their detection.
Ribosomal RNA genes, in particular 16S rDNA, are used extensively to identify
bacterial strains in complex environments (Theron and Cloete 2000; Rudi et al. 2002).
Among the techniques based on rDNA that are suitable for quantifying bacteria, SYBR
Green I real-time PCR provides a precise and sensitive method (Hein et al. 2001; Stubner
2002; Newby et al. 2003; Morillo et al. 2003; De Medici et al. 2003). This technique
requires no specific probe and classic PCR protocols can be easily adapted. The non-
specific double-stranded DNA fluorescent binding dye allows monitoring of the amplified
product at each PCR cycle.
The objective of this study was to develop a rapid and accurate technique to
quantify a nisin-sensitive strain of Lc. cremoris in a model functional mixed culture with a
nisin-producing strain of Lc. diacetylactis as well as a Lactobacillus rhamnosus strain that
produces EPS. Based on the subspecies-specific probe used by Salama et al. (1991) to
differentiate between lactococcal subspecies, a primer was designed and used in real-time
quantitative PCR with the dye SYBR Green I.
57
2.4 Materials and methods
2.4.1 Bacterial strains
Lactococcus lactis subsp. cremoris ATCC 19257 was obtained from the American
Type Culture Collection (Manassas, Va.). Lactococcus lactis subsp. lactis biovar.
diacetylactis UL719, a nisin Z producer (Meghrous et al. 1997), Lactobacillus rhamnosus
RW-9595M (producing EPS) and Pediococcus acidilactici UL5 were from the Lactic Acid
Bacteria Research Network culture collection (STELA Dairy Research Centre, Université
Laval, Québec, QC, Canada). Cultures of the three strains from frozen stock (–80°C) were
grown twice during 24 h in M17 broth (Difco, Detroit, Mich.) at 30°C for lactococci and in
MRS broth (Difco) at 37°C for Lactobacillus before use. For nisin quantification, the
indicator strain Pediococcus acidilactici UL5 was always cultivated at 30°C in MRS.
2.4.2 Preparation of quantification standards
A 10-ml volume of UHT skim milk was inoculated at 1% (v/v) with Lc. cremoris
ATCC 19257 and incubated overnight. A 2-ml volume of this culture was subjected to
DNA extraction and used as standard. In order to check the efficiency of the real-time
quantitative PCR to detect specifically and quantitatively DNA from Lc. cremoris ATCC
19257 in the presence of high amounts of DNA from the two other strains, mixed samples
were performed as follows. Cultures of Lc. cremoris ATCC 19257 in milk were serially
diluted 10-fold in milk and 2 ml of each dilution was mixed with the same volume of an
overnight culture of Lc. diacetylactis UL719 and Lb. rhamnosus RW-9595M; 2 ml of this
mixed sample was subjected to DNA extraction. The bacterial population of each pure
culture was determined using M17 and MRS agar for lactococci and lactobacilli,
respectively.

58
2.4.3 Batch fermentations
Two pure cultures of Lc. cremoris ATCC 19257 and two mixed cultures with the
three strains Lc. cremoris ATCC 19257, Lc. diacetylactis UL719 and Lb. rhamnosus RW-
9595M were carried out in a 5-l fermentor (Biogénie, Ste-Foy, QC, Canada). For inoculum
preparation, each strain was grown in pure culture in UHT skim milk at 30°C for 6 h and 16
h for Lc. cremoris ATCC 19257 and Lc. diacetylactis UL719, respectively, and at 37°C for
16 h for Lb. rhamnosus RW-9595M. These cultures were used to inoculate 3-l UHT skim
milk at 0.5% (v/v) for each strain. The conditions of fermentation were 30°C with agitation
of 400 rpm with a small magnetic stir bar. Samples for cell enumeration, nisin
concentration and DNA extraction were taken every 2 h until 14 h of fermentation and then
at 24 h. Lactococci populations in pure and mixed cultures were determined by plating
appropriate dilutions in peptone water on Kempler and McKay (KMK) agar medium and
incubating at 30°C for 48 h. Lb. rhamnosus RW-9595M cells in mixed culture were
enumerated by spreading dilutions on plates of MRS agar and incubating at 45°C for 48 h.
2.4.4 Determination of nisin sensitivity
Sensitivity to nisin of Lc. cremoris ATCC 19257 and Lb. rhamnosus RW-9595M
was measured using an agar diffusion bioassay. A 30-ml volume of M17 or MRS with 7.5
g/l agar at 45°C was inoculated at 0.1% (v/v) with a culture of Lc. cremoris ATCC 19257
or Lb. rhamnosus RW-9595M, respectively. After solidification of the agar, wells were
formed with a sterile Pasteur pipette. Each well was filled with 100 µl pure nisin Z solution
of known concentration. After incubation of plates for 24 h at 30°C and 37°C, for the
lactococcal and lactobacillus strain, respectively, inhibition zones were measured and
plotted against the logarithm of nisin concentration. Pure nisin Z was extracted from an
overnight culture of Lc. diacetylactis UL719 in MRS and purified by immunoaffinity
chromatography using the anti-nisin Z monoclonal antibody as described by Benech et al.
(2002a).
59
2.4.5 Quantification of nisin Z activity
Nisin Z in milk fermented by mixed cultures was extracted using the method
described by Fowler et al. (1975), except that the filtration step was not performed. Nisin Z
activity was determined by the agar diffusion bioassay using the indicator strain P.
acidilactici UL5 (Benech et al. 2003) and solutions of purified nisin Z with concentrations
from 22 IU/ml to 701 IU/ml as standards.
2.4.6 DNA extraction
The method of DNA extraction was adapted from that used by Hein et al. (2001) for
cheese samples. Samples (2 ml) were mixed with 45 ml digestion buffer (100 mM Tris-
HCl, 100 mM EDTA, 0.5% sodium dodecyl sulfate, pronase at 20 mg/ml, pH 8.0) diluted
1:10. The solution was incubated at 40°C for 3 h. After centrifugation at 10,000 g at 4°C
for 15 min, the supernatant was discarded and the pellet washed twice with TE buffer (10
mM Tris-HCl, 1 mM EDTA, pH 8.0). For samples from batch fermentations, milk proteins
were removed by addition of 500 µl EDTA (500 mM, pH 8.0) to 1 ml sample followed by
centrifugation at 15,000 g for 15 min. The supernatant, containing soluble milk proteins,
was discarded and the cell pellet was washed twice with TE buffer. The pellets were then
resuspended in 400 µl TES buffer (50 mM Tris-HCl, 1 mM EDTA, 6.7% sucrose, pH 8.0).
To this suspension, 100 µl lysozyme (50 mg/ml in 25% sucrose), 10 µl mutanolysin (2
mg/ml in water) and 5 µl RNase (Roche Applied Science, Laval, QC, Canada) were added
and the sample was incubated for 1 h at 37°C. After addition of 50 µl SDS (10%) and 20 µl
proteinase (20 mg/ml), the sample was held at 55°C for 80 min and afterwards for 15 min
at 95°C. Protein material was eliminated by extracting with 500 µl phenol: chloroform:
isoamyl alcohol (25:24:1). The upper aqueous phase was collected after centrifugation at
15,000 g for 10 min and further extracted with an equal volume of chloroform. DNA was
then precipitated from the upper aqueous phase using 50 µl 3 M potassium acetate (pH 5.4)
and 1,100 µl 95% ethanol. The sample was held overnight at –20°C. The pellet obtained
60
after centrifugation at 19,000 g for 30 min was washed twice with 70% ethanol. The air-
dried DNA was resuspended in 100 µl TE buffer and stored at –20°C. Dilutions of DNA
extracts were performed in TE buffer. For external standards, DNA extracted from 2 ml of
an overnight culture of Lc. cremoris ATCC 19257 in milk was serially diluted in TE buffer.
2.4.7 DNA quantification by agarose gel electrophoresis
Electrophoresis was performed using horizontal 0.8% agarose (Invitrogen,
Burlington, ON, Canada) slab gels stained with ethidium bromide, in 20 mM Tris-acetate
and 0.5 mM EDTA, pH 8.0 and were run at 100 V for 45 min using the I-mupid mini-
electrophoresis unit (Cosmo Bio, Tokyo, Japan). High DNA mass ladder (Invitrogen) was
used as standard to quantify DNA concentrations in samples. Gels were documented using
Gene Snap Software Version 6.00.26 with a transilluminator and Gene Tools Analysis
Software Version 3.02.00 (all from SynGene, Cambridge, England). Results were
expressed as nanograms of DNA per 106 cells.
2.4.8 Oligonucleotide primers and real-time PCR quantification
All primers were purchased from Invitrogen. Design of the forward lactococcal
subspecies specific primer 68FCa33 (5-GAT GAA GAT TGG TGC TTG CAC CAA TTT
GAA GAG -3) was based on the study published by Salama et al. (1991). Our primer
targeted a 33-nucleotide variable region of the 16S rRNA that differed by eight bases
between Lc. cremoris and Lc. diacetylactis strains tested by Salama et al. (1991). The
forward primer 16SF20 (5-TGG CTC AGG ACG AAC GCT-3) and reverse 16SR308
primer (5-CCT CTC AGG TCG GCT ATG TA-3) matched a conserved sequence for the
three strains used in the present study. To check the specificity of the 68FCa33 primer and
the universality of the other two primers, classic PCR reactions were performed on purified
DNA from the three strains. Each 50 µl reaction mixture contained 0.2 mM each
deoxyribonucleotide triphosphate, 0.2 M each primer, 5 µl 10× Taq buffer (New England
Biolabs, Mississauga, ON, Canada), 2.5 U Taq DNA polymerase (New England Biolabs)
61
and 1 µl template DNA. The PCR amplification was carried out with a GeneAmp 2400
PCR system (Perkin-Elmer, Norwalk, Conn.) and the cycle parameters were 1 min at 94°C
for initial denaturation; 3 s at 94°C, 30 s at 55°C, 1.5 min at 72°C for 30 cycles and 5 min
at 72°C. The amplified products were visualised on a 1% agarose gel containing 0.5 g/ml
ethidium bromide along with a 100-bp DNA mass ladder (Invitrogen).
Quantitative PCR was performed with the FastStart DNA Master SYBR Green I kit
(Roche Diagnostics, Mannheim, Germany) in a LightCycler real-time PCR system (Roche).
Fluorescence emitted by the SYBR Green I dye bound to dsDNA was measured at the end
of each PCR cycle. The cycle threshold (CT) defined as the cycle number at which the
reaction begins the exponential phase (calculated by the Roche LightCycler software
version 3), was used to create the standard curve (CT values against the logarithm of serial
10-fold diluted standard concentration give a linear relationship) and to evaluate Lc.
cremoris DNA concentration in samples. For real-time PCR, each 20 µl reaction mixture
contained 3 mM MgCl2, 2 µl LightCycler FastStart DNA master SYBR Green I, a 600 nM
concentration of each primer and 2 µl of the template. For negative controls, the template
was replaced by water.
The time and temperature programs used with the LightCycler are presented in
Table 2.1. A melting curve was plotted at the end of each run to verify the specificity of the
amplification product. For each experiment, the reaction efficiency for standard and sample
curves was measured as described by Newby et al. (2003) and in the Roche LightCycler
manual.
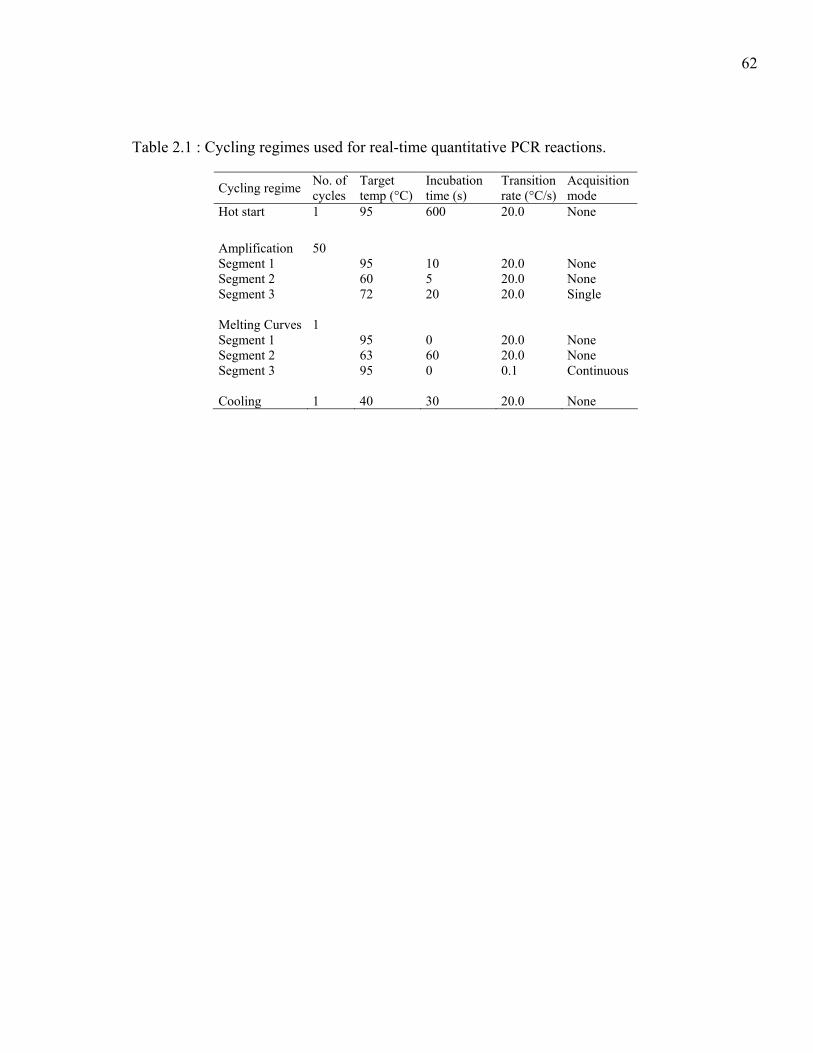
62
Table 2.1 : Cycling regimes used for real-time quantitative PCR reactions.
Cycling regime No. of cycles
Target temp (°C)
Incubation time (s)
Transition rate (°C/s)
Acquisition mode
Hot start 1 95 600 20.0 None
Amplification 50 Segment 1 95 10 20.0 None Segment 2 60 5 20.0 None Segment 3 72 20 20.0 Single Melting Curves 1 Segment 1 95 0 20.0 None Segment 2 63 60 20.0 None Segment 3 95 0 0.1 Continuous Cooling 1 40 30 20.0 None
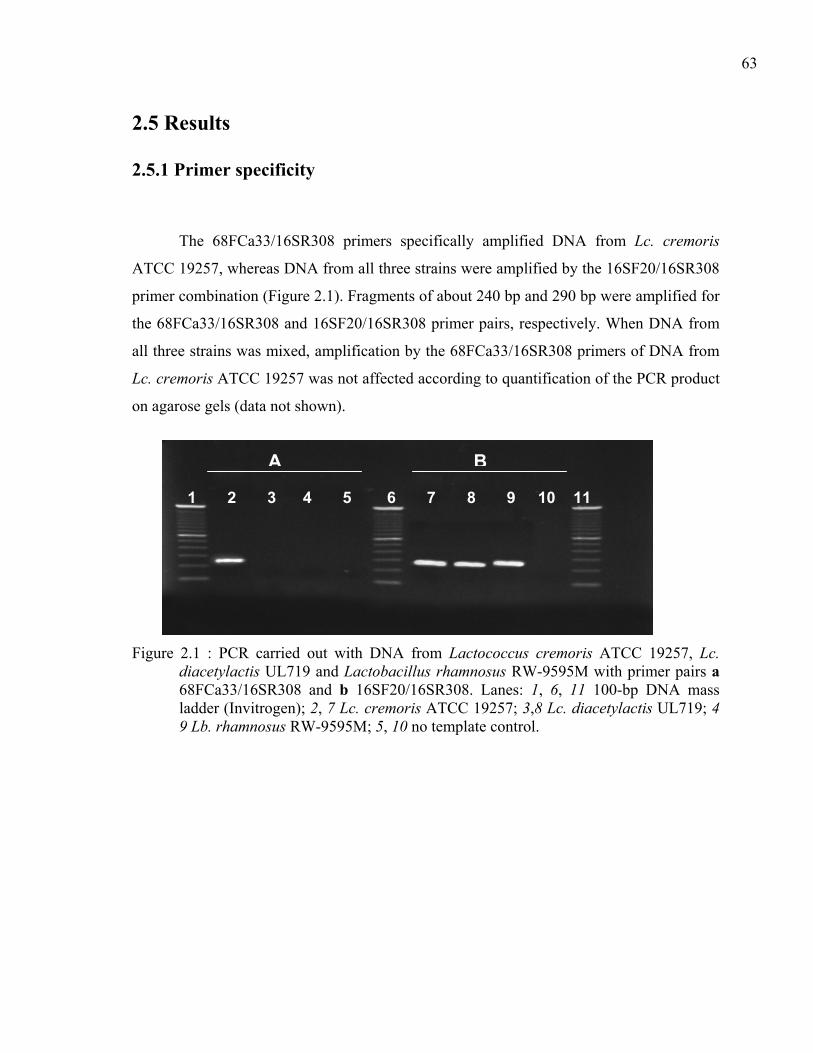
63
2.5 Results
2.5.1 Primer specificity
The 68FCa33/16SR308 primers specifically amplified DNA from Lc. cremoris
ATCC 19257, whereas DNA from all three strains were amplified by the 16SF20/16SR308
primer combination (Figure 2.1). Fragments of about 240 bp and 290 bp were amplified for
the 68FCa33/16SR308 and 16SF20/16SR308 primer pairs, respectively. When DNA from
all three strains was mixed, amplification by the 68FCa33/16SR308 primers of DNA from
Lc. cremoris ATCC 19257 was not affected according to quantification of the PCR product
on agarose gels (data not shown).
Figure 2.1 : PCR carried out with DNA from Lactococcus cremoris ATCC 19257, Lc. diacetylactis UL719 and Lactobacillus rhamnosus RW-9595M with primer pairs a 68FCa33/16SR308 and b 16SF20/16SR308. Lanes: 1, 6, 11 100-bp DNA mass ladder (Invitrogen); 2, 7 Lc. cremoris ATCC 19257; 3,8 Lc. diacetylactis UL719; 4 9 Lb. rhamnosus RW-9595M; 5, 10 no template control.
A B
1 2 3 4 5 6 7 8 9 10 11

64
2.5.2 Analyses of Lc. cremoris in milk samples by real-time quantitative PCR
The relationship of the logarithm of cells per reaction (20 µl) versus CT values
obtained with serial 10-fold dilutions of DNA extracted from an overnight culture in UHT
skim milk of Lc. cremoris ATCC 19257 at 6.27±2.11×10⁸ cfu/ml was linear (Figure 2.2).
The equation of the linear regression was y = -3.832x + 36.045 with a correlation
coefficient (R2) of 1.0000 and the reaction efficiency, determined by the formula:
e = 10 - (1/slope) , was equal to 1.82. Results were highly reproducible; from five standard
curves prepared with independent cultures of Lc. cremoris ATCC 19257, the efficiency
varied by only ±0.06 and all correlation coefficients were equal to 1.0000. The limit of
detection was 2 cfu/reaction and the magnitude of linearity was over 5 log. Analysis of the
melting curve showed a specific amplified product with a Tm of 85.72°C and no peak was
observed with the no template control.
Figure 2.2 : Standard curve obtained by plotting bacterial count against the threshold cycle obtained from real-time PCR serial 10-fold diluted DNA extracted from an overnight culture of Lc. cremoris ATCC 19257 at 6.27±2.11×10⁸ cfu/ml
To test the specificity of the quantification by real-time PCR of Lc. cremoris ATCC
19257 in mixed cultures, samples with known amounts of the three strains were analysed.
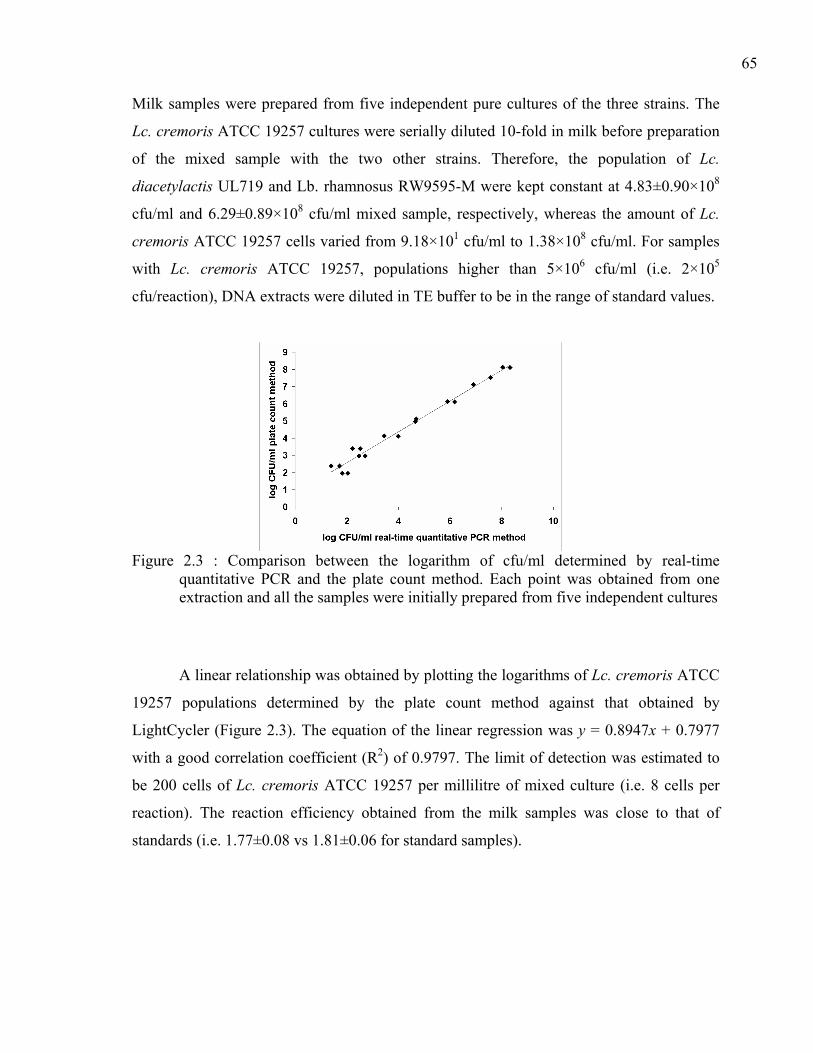
65
Milk samples were prepared from five independent pure cultures of the three strains. The
Lc. cremoris ATCC 19257 cultures were serially diluted 10-fold in milk before preparation
of the mixed sample with the two other strains. Therefore, the population of Lc.
diacetylactis UL719 and Lb. rhamnosus RW9595-M were kept constant at 4.83±0.90×10⁸
cfu/ml and 6.29±0.89×10⁸ cfu/ml mixed sample, respectively, whereas the amount of Lc.
cremoris ATCC 19257 cells varied from 9.18×101 cfu/ml to 1.38×10⁸ cfu/ml. For samples
with Lc. cremoris ATCC 19257, populations higher than 5×10⁶ cfu/ml (i.e. 2×10⁵
cfu/reaction), DNA extracts were diluted in TE buffer to be in the range of standard values.
Figure 2.3 : Comparison between the logarithm of cfu/ml determined by real-time quantitative PCR and the plate count method. Each point was obtained from one extraction and all the samples were initially prepared from five independent cultures
A linear relationship was obtained by plotting the logarithms of Lc. cremoris ATCC
19257 populations determined by the plate count method against that obtained by
LightCycler (Figure 2.3). The equation of the linear regression was y = 0.8947x + 0.7977
with a good correlation coefficient (R2) of 0.9797. The limit of detection was estimated to
be 200 cells of Lc. cremoris ATCC 19257 per millilitre of mixed culture (i.e. 8 cells per
reaction). The reaction efficiency obtained from the milk samples was close to that of
standards (i.e. 1.77±0.08 vs 1.81±0.06 for standard samples).
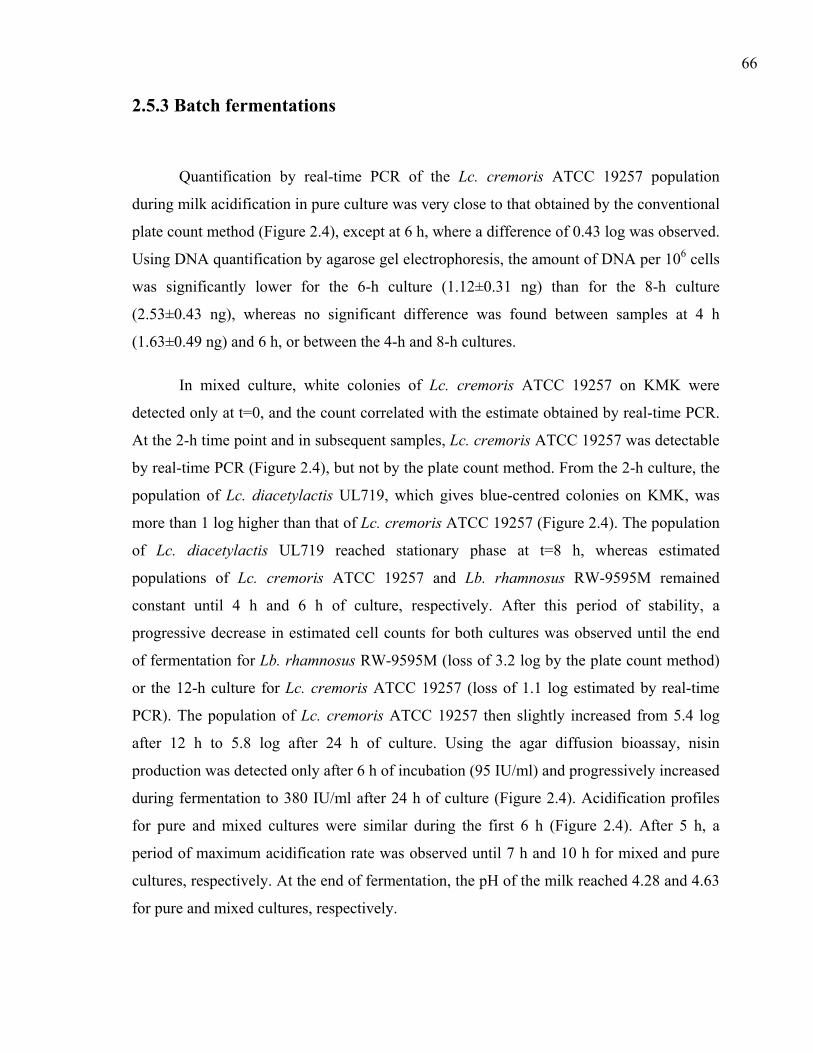
66
2.5.3 Batch fermentations
Quantification by real-time PCR of the Lc. cremoris ATCC 19257 population
during milk acidification in pure culture was very close to that obtained by the conventional
plate count method (Figure 2.4), except at 6 h, where a difference of 0.43 log was observed.
Using DNA quantification by agarose gel electrophoresis, the amount of DNA per 106 cells
was significantly lower for the 6-h culture (1.12±0.31 ng) than for the 8-h culture
(2.53±0.43 ng), whereas no significant difference was found between samples at 4 h
(1.63±0.49 ng) and 6 h, or between the 4-h and 8-h cultures.
In mixed culture, white colonies of Lc. cremoris ATCC 19257 on KMK were
detected only at t=0, and the count correlated with the estimate obtained by real-time PCR.
At the 2-h time point and in subsequent samples, Lc. cremoris ATCC 19257 was detectable
by real-time PCR (Figure 2.4), but not by the plate count method. From the 2-h culture, the
population of Lc. diacetylactis UL719, which gives blue-centred colonies on KMK, was
more than 1 log higher than that of Lc. cremoris ATCC 19257 (Figure 2.4). The population
of Lc. diacetylactis UL719 reached stationary phase at t=8 h, whereas estimated
populations of Lc. cremoris ATCC 19257 and Lb. rhamnosus RW-9595M remained
constant until 4 h and 6 h of culture, respectively. After this period of stability, a
progressive decrease in estimated cell counts for both cultures was observed until the end
of fermentation for Lb. rhamnosus RW-9595M (loss of 3.2 log by the plate count method)
or the 12-h culture for Lc. cremoris ATCC 19257 (loss of 1.1 log estimated by real-time
PCR). The population of Lc. cremoris ATCC 19257 then slightly increased from 5.4 log
after 12 h to 5.8 log after 24 h of culture. Using the agar diffusion bioassay, nisin
production was detected only after 6 h of incubation (95 IU/ml) and progressively increased
during fermentation to 380 IU/ml after 24 h of culture (Figure 2.4). Acidification profiles
for pure and mixed cultures were similar during the first 6 h (Figure 2.4). After 5 h, a
period of maximum acidification rate was observed until 7 h and 10 h for mixed and pure
cultures, respectively. At the end of fermentation, the pH of the milk reached 4.28 and 4.63
for pure and mixed cultures, respectively.
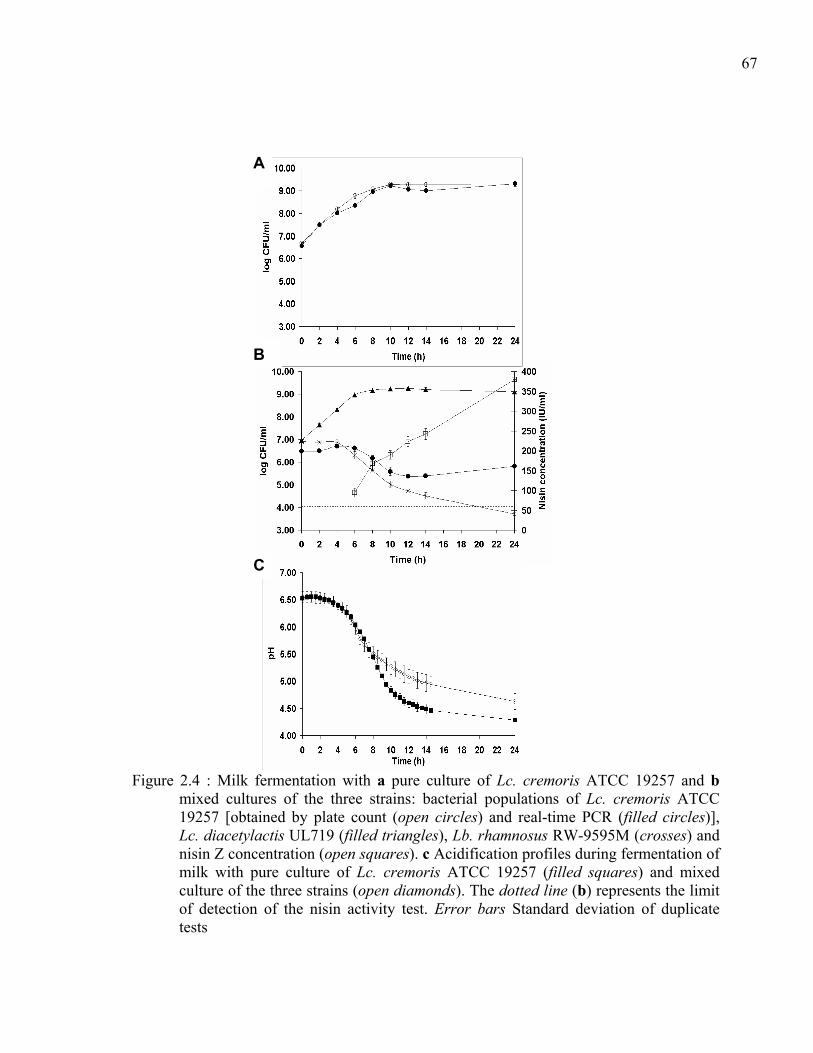
67
Figure 2.4 : Milk fermentation with a pure culture of Lc. cremoris ATCC 19257 and b mixed cultures of the three strains: bacterial populations of Lc. cremoris ATCC 19257 [obtained by plate count (open circles) and real-time PCR (filled circles)], Lc. diacetylactis UL719 (filled triangles), Lb. rhamnosus RW-9595M (crosses) and nisin Z concentration (open squares). c Acidification profiles during fermentation of milk with pure culture of Lc. cremoris ATCC 19257 (filled squares) and mixed culture of the three strains (open diamonds). The dotted line (b) represents the limit of detection of the nisin activity test. Error bars Standard deviation of duplicate tests
B
A
C
68
2.5.4 Nisin sensitivity
The equations from the linear relationship between the logarithm of nisin Z
concentration and the inhibition zone were y = 5.4673x + 0.2339 (R2 = 0.9957) and y =
5.0821x + 2.2667 (R2 = 0.9949) for Lc. cremoris ATCC 19257 and Lb. rhamnosus RW-
9595M, respectively. By extrapolation, a minimal inhibition zone of 6 mm gave a nisin Z
inhibitory concentration of 5 and 11 IU/ml for Lc. cremoris ATCC 19257 and Lb.
rhamnosus RW-9595M, respectively.
69
2.6 Discussion
Adjunct LAB cultures, such as Lactobacillus rhamnosus RW-9595M, which
produces EPS (Bergmaier et al. 2001), play an important role in the manufacture of dairy
products to improve their rheological properties. Moreover, some EPS have beneficial
effects on human health (Duboc and Mollet 2001). Therefore, we included Lactobacillus
rhamnosus RW-9595M with the two lactococci strains in the model culture to reflect the
processing of dairy products with functional mixed cultures producing acid, aroma,
bacteriocin and EPS, and in order to validate the quantification of Lc. cremoris ATCC
19257 by real-time quantitative PCR in a more complex environment.
The 68RCa oligonucleotide was first successfully used as a probe in RNA-DNA
hybridization experiments by Salama et al. (1991) and Urbach et al. (1997) who have tested
more than 50 strains of lactococci. The 68FCa33 primer used in the present study was
based on the forward 5’ region of the 16S rRNA published by Salama et al. (1991). In this
study, conventional PCR reactions have shown the efficiency of the 68FCa33 primer in
differentiating Lc. cremoris ATCC 19257 from the Lc. diacetylactis UL719 and Lb.
rhamnosus RW-9595M strains. Primer specificity is especially important when real-time
PCR is associated with SYBR Green I. This intercalating dye is not specific and detects all
double-stranded DNA fragments such as primer-dimer or nonspecific DNA amplification
products from other strains. In order to improve specificity of the primer, it was lengthened
by 13 nucleotides compared to the 68RCa oligonucleotide and incorporated a difference of
8 bases between Lc. cremoris and Lc. diacetylactis target regions instead of 4 bases in the
original sequence of the 68RCa oligonucleotide. Analysis of melting curves after each real-
time PCR run did not reveal any nonspecific peak.
Real-time PCR reaction efficiencies for standards and samples were comparable and
close to 1.80. In theory, the maximum reaction efficiency in PCR is equal to 2.00. Newby
et al. (2003) have also observed a lower reaction efficiency with SYBR Green I than with
5’-exonuclease and hybridization probe methods for quantification of Brucella abortus.
70
They explain this fact by an inhibitory effect of the intercalating dye. This inhibitory effect
of SYBR Green I was also demonstrated on different Taq polymerases by Arezi et al.
(2003).
The use of real-time PCR with 5’-exonuclease for quantification of Staphylococcus
aureus in cheese and Listeria monocytogenes in milk has been shown to be more sensitive
than SYBR Green I (Hein et al. 2001; Nogva et al. 2000). However, quantification by real-
time PCR of Lc. cremoris ATCC 19257 using SYBR Green I allowed detection of
concentrations as low as 2 CFU/reaction with a strict inverse correlation between CT values
and the logarithm of cell concentration per reaction. This standard curve detection limit
using SYBR Green I was less than that obtained by Hein et al. (2001) and Nogva et al.
(2000) with the 5’-exonuclease method, where 30 copies of the nuc gene from
Staphylococcus aureus and 15 CFU of Listeria monocytogenes respectively were detected
per PCR reaction (with 20 and 50 µl volumes, respectively). In the present study, specific
amplification of DNA from Lc. cremoris ATCC 19257 was not affected by the presence of
high concentrations of Lc. diacetylactis UL719 and Lb. rhamnosus RW-9595M in milk. A
detection limit of about 200 CFU of Lc. cremoris ATCC 19257 per ml of milk sample and
a good correlation coefficient were obtained between results from conventional and real-
time PCR methods. This detection limit is sufficient for many cheese manufacture
applications, because at this level the impact of the bacterial population on final product
could be considered as negligible.
Correlation between data from real-time PCR and conventional plate count methods
was high during batch fermentation of milk with a pure culture of Lc. cremoris ATCC
19257. The difference of 0.4 log observed at t = 6 h could result from an incomplete DNA
extraction or a physiological change in cells which leads to lower DNA replication. Under
an acid stress, a decrease in energy production and an increase in energy expenditure to
counter acidification of cytoplasm by increasing concentration of some enzymes, lead to
energetic limitations for biomass synthesis in Lactococcus lactis cells (Even et al. 2002)
and consequently for DNA replication. During sample preparation in peptone water for
plating and incubation of plates, cells could return to a no-stress physiological state and
71
therefore the decrease in biomass was not detected on agar plates. Akerlund et al. (1995)
have studied the variation of size and DNA content of Escherichia coli cells according to
growth phase. During exponential phase, they observed that variations of ratio between cell
mass and the average DNA content may occur. As quantification of bacterial cells by real-
time PCR is based on DNA, difference in DNA content per cell could lead to an error in
bacterial population estimation. However, the difference between cell counts by
conventional and real-time PCR methods was only detected with the 6 h culture and did not
drastically modify the growth pattern.
The Lb. rhamnosus RW-9595M and Lc. cremoris ATCC 19257 strains used in this
present study were strongly inhibited by nisin Z. However, enumeration of the lactobacillus
population in mixed culture with lactococcal strains can be performed with an incubation of
plates at 45°C, which does not permit growth of mesophilic bacteria. During milk
acidification by a mixed culture, the real-time quantitative PCR allowed us to monitor the
decrease of Lc. cremoris ATCC 19257 whereas conventional plate count method could not
detect Lc. cremoris ATCC 19257 because the ratio of the two strains was skewed. Thus, we
have observed a strong competition between Lc. diacetylactis UL719 and the nisin sensitive
strains. During the first 4 h of culture, nisin was not detected using the agar diffusion
bioassay method, which has a detection limit of about 60 IU/ml with the dilution factor
used for nisin extraction in milk. However, de novo nisin production and bacteriocin
brought with the Lc. diacetylactis UL719 inoculum could be present in milk and not
detected until 4 hours of fermentation. A low level of nisin Z of 5 and 11 IU/ml could
inhibit growth of Lc. cremoris ATCC 19257 and Lb. rhamnosus RW-9595M, respectively.
Inhibitory, but not bactericidal, concentrations of nisin Z could therefore explain the
stability of Lb. rhamnosus RW-9595M and Lc. cremoris ATCC 19257 during the first 4
and 6 h of culture, respectively. A competition for nutrients, especially for casein which is
essential to bacterial growth, could also occur between the three strains at the beginning of
the fermentation. Afterwards, the nisin concentration had a bactericidal effect on the two
nisin sensitive strains. However, after 12 h of culture, the population of Lc. cremoris ATCC
19257 slightly increased from 5.4 to 5.8 log as estimated by real-time PCR. The growth of
a nisin resistant subpopulation could explain this observation. Compared to pure culture,
72
the lower population of the acidifying strain Lc. cremoris ATCC 19257 in mixed culture
affected the acidification profile and the final pH reached was thus higher for mixed
culture.
In conclusion, real-time quantitative PCR using SYBR Green I is an accurate and
sensitive method to evaluate the population of Lc. cremoris in milk fermented by a mixed
LAB culture. Thus, this method can be used to evaluate the impact of the bacteriocinogenic
strain on the sensitive strains in mixed populations. It is currently being used to assess the
potential of immobilized cell technology for controlling strain ratios of complex functional
cultures during continuous milk inoculation and prefermentation.
2.7 Acknowledgements
The authors wish to thank the Natural Sciences and Engineering Research Council
of Canada (Research Partnerships Program – Research Network on Lactic Acid Bacteria),
Agriculture and Agri-Food Canada, Novalait Inc., Dairy Farmers of Canada and Institut
Rosell Inc. for financial support.
73
Chapitre 3. Milk fermentation by functional mixed culture producing nisin Z and exopolysaccharides in a
fresh cheese model /
Fermentation du lait par une culture mixte fonctionnelle produisant de la nisine Z et des exopolysaccharides et
visant la production de fromage frais
Les résultats de ce travail ont été soumis dans la revue International Dairy Journal.
Les auteurs de cet article sont : Franck Grattepanche, Pascal Audet et Christophe Lacroix.
Le contenu intégral de la version soumise, rédigée en anglais, est présenté dans ce
chapitre.
74
3.1 Résumé
Une souche forte productrice de nisine Z, Lc. diacetylactis UL719, et deux souches
sensibles à la bactériocine, Lb. rhamnosus RW-9595M, producteur d’exopolysaccharides
(EPS), et Lc. cremoris ATCC19257 pour ses capacités d’acidification, ont été testées en
cultures pures et mixtes pour la fermentation du lait. La culture mixte, constituée des trois
souches, présente une capacité d’acidification, à 34 et 38°C, supérieure à celles des cultures
pures, bien que la population de Lc. cremoris ATCC19257 en culture mixte soit très
largement réduite. La production de nisine Z par la culture mixte est de 3.1 à 4.6 fois
supérieure à celles observées avec les cultures pures de Lc. diacetylactis UL719. Ces
observations peuvent s’expliquer par un commensalisme résultant de l’activité
protéolytique élevée de Lc. cremoris ainsi que de l’autolyse et de la lyse cellulaire induite
par la nisine Z. En culture mixte, la production d’EPS est 3 fois inférieure à celle de Lb.
rhamnosus RW-9595M en culture pure.
Nos résultats démontrent qu’une culture mixte présentant des caractéristiques
fonctionnelles (production d'EPS et de nisine) et contenant une souche nisinogène et des
souches sensibles à la bactériocine peut être utilisée pour la préparation de fromages de
type frais.
75
3.2 Abstract
A nisin Z-producing strain, Lc. diacetylactis UL719 and two nisin-sensitive
cultures, Lb. rhamnosus RW-9595M producing exopolysaccharide (EPS), and Lc. cremoris
for acidification, were tested in pure and mixed cultures during milk fermentation. The
mixed culture of the three strains showed a higher acidifying capacity at 34 and 38°C, even
though populations of Lc. cremoris were largely reduced compared with pure cultures.
Bacteriocin production was 3.1 to 4.6-fold higher in mixed cultures than for pure cultures
of Lc. diacetylactis UL719. This data can be explained by commensalism behavior relying
on high proteolytic activity of Lc. cremoris and autolysis and nisin Z-induced lysis. In
mixed culture, EPS production was 3-fold lower than for Lb. rhamnosus RW-9595M pure
culture. Our data showed that this strain combination, with nisin-producing and sensitive
strains, can be used in mixed cultures for manufacture of fresh cheese with improved
functional properties.
76
3.3 Introduction
To manufacture fermented dairy products, lactic acid bacteria are traditionally
selected for their capacity to acidify milk and produce aroma compounds. During the last
decade, many studies have been carried out on lactic acid bacteria strains with functional
properties, such as bacteriocin and exopolysaccharide (EPS) production, to improve quality
and safety of food.
Bacteriocins are proteinaceous antimicrobial compounds that are active against
closely related bacteria and, for some bacteriocins, against a wide range of bacteria (Tagg,
Dajani & Wannamaker, 1976; Klaenhammer, 1993). Strains producing bacteriocins have
been extensively studied to efficiently inhibit the growth of pathogenic bacteria (Cleveland,
Montville, Nes & Chikindas, 2001) such as Listeria which is one of the more frequently
identified etiologic agents in food-borne diseases found in cheese (De Buyser, Dufour,
Maire & Lafarge, 2001), and to accelerate cheese ripening (Ross et al., 1999; Benech,
Kheadr, Laridi, Lacroix & Fliss, 2002).
Exopolysaccharides produced by lactic acid bacteria play an important role on
rheological properties of fermented milks (De Vuyst & Degeest, 1999). By interacting with
the network of casein micelles, EPS limit the susceptibility to syneresis and improve
viscosity of yoghurt (Hess, Roberts & Ziegler, 1997), and EPS increase moisture in
mozzarella cheese (Perry, McMahon & Oberg, 1997). Moreover, health beneficial effects
have been suggested for some EPS produced by lactic acid bacteria (Ruas-Madiedo,
Hugenholtz & Zoon, 2002).
Fresh cheese is generally made with mixed cultures of mesophilic lactic acid
bacteria containing strains of Lactococcus lactis, Lc. cremoris, Lc. diacetylactis or
Leuconostoc mesenteroides for acid, aroma and texture production (Sodini-Gallot, Corrieu,
Boquien, Latrille & Lacroix, 1995; Spinnler, Guichard & Grippon, 1997). Acidification of
milk by starter culture is a crucial step in fresh cheese manufacturing since acid production
is predominant in curd formation and acidification time to reach the final pH can exceed

77
24 h (Ramet, 1997). Despite the possibility of improving both rheological and
microbiological qualities of fresh cheese, until now no study has reported on milk
fermentation with mixed cultures containing EPS producers and bacteriocinogenic strains.
This can be partly explained by the difficulty of monitoring each strain in mixed cultures.
In addition, control of strain ratios in mixed cultures with nisin-producing strain is very
important in milk fermentations because bacteriocin-producing organisms can cause
delayed growth of other strains, reduced metabolite production and late acidification, and
nisin Z production is also largely affected by producer cell populations (Bouksaim,
Lacroix, Audet & Simard, 2000). In addition, the low amounts of lactic acid produced by
nisinogenic strains limits their use in pure cultures for cheese production (Roberts, Zottola
& McKay, 1992; de Vuyst & Vandamme, 1994; Benech et al., 2002).
The aim of this research was to study milk fermentation for model fresh cheese
production by mixed cultures containing a nisin Z and aroma-producing strain, Lc.
diacetylactis UL719, an EPS producer, Lactobacillus rhamnosus RW-9595M, and an
acidifying strain, Lc. cremoris ATCC19257. The effect of different temperatures was
studied on the acidifying activity of the starter culture, microbial composition and
metabolite production during milk fermentation.

78
3.4 Materials and methods
3.4.1 Bacterial strains and culture conditions
Lactococcus lactis subsp. cremoris ATCC19257 (American Type Culture
Collection, Manassas, VA, USA) was selected for its ability to acidify milk. Lactococus
lactis subsp. lactis biovar. diacetylactis UL719 was used as high nisin Z producer strain
(Meghrous, Lacroix, Bouksaim, Lapointe & Simard, 1997) and Lactobacillus rhamnosus
RW-9595M for its capacity to produce high amounts of EPS in dairy media (Dupont, Roy
& LaPointe, 2000; Macedo, Lacroix & Champagne, 2002; Bergmaier, Champagne &
Lacroix, 2003). Pediococcus acidilactici UL5 was used as a nisin Z indicator strain for the
bacteriocin activity assay (Meghrous et al., 1997). Lc. diacetylactis UL719, Lb. rhamnosus
RW-9595M and P. acidilactici UL5 were obtained from the culture collection of the
Canadian Research Network on lactic acid bacteria (STELA Dairy Research Centre,
Université Laval, Québec, QC, Canada). Before use, cultures from frozen stock (-80°C)
were grown twice for 24 h in M17 broth (Terzaghi & Sandine, 1975) at 30°C for
lactococcal strains and MRS broth (de Man, Rogosa & Sharpe, 1960) at 30 and 37°C for P.
acidilactici UL5 and Lb. rhamnosus RW-9595M, respectively. All media were from Difco
(Detroit, MI, USA).
3.4.2 Batch culture experiments
Batch culture experiments and inoculum preparations were performed in
commercial UHT skim milk (Agrinove, Ste-Claire, QC, Canada) transferred aseptically
before use. Three temperatures (30, 34 and 38°C) were tested during batch culture
experiments with pure and mixed cultures of the three strains. Inocula were prepared as
79
follows: 30 mL of milk were inoculated at 1% (v/v) with a pure culture of each strain and
incubated at 30°C for 6 and 16 h for Lc. cremoris ATCC19257 and Lc. diacetylactis
UL719, respectively, and at 37°C for 16 h for Lb. rhamnosus RW-9595M. Final inoculum
populations averaged 8.76 ± 0.05, 9.02 ± 0.06 and 9.26 ± 0.04 log10 of cfu mL–1 for Lc.
cremoris ATCC19257, Lc. diacetylactis UL719 and Lb. rhamnosus RW-9595M,
respectively.
Batch culture experiments with pure and mixed cultures were performed without
agitation in 500-mL beakers containing 400 mL milk. Mixed cultures were inoculated at
1.5% (v/v) with an equal volume ratio for the three strains, whereas pure cultures were
inoculated at 0.5% (v/v). The beakers were then placed in an incubator set at the tested
temperatures. The pH was recorded during incubation. Mixed culture fermentations were
stopped when pH reached 4.80. For pure cultures, fermentations were stopped after
incubation times equal to that for mixed cultures incubated at the same temperature. The
pH electrodes (ColeParmer, Labcor, Anjou, QC, Canada) were calibrated using two buffers
(pH 7 and pH 4), soaked in sodium hypochlorite (10%) for 45 s, thoroughly rinsed using
sterile deionized water, and inserted in the beaker through a hole of the rubber stopper. The
pH electrodes were connected to a switch box (EID Corporation, Prober pH-8, ColeParmer)
attached to a personal computer and data were collected every minute. A software written
in Basic (Quick Basic Version 4.5, Microsoft) was used to smooth pH vs. time using a
mobile mean over 20 points and to calculate the first derivative. The following acidification
parameters, as described by Spinnler and Corrieu (1989), were then calculated: maximal
acidification rate (Vmax), time and pH at which Vmax occurred (Tmax and pHmax,
respectively), final pH (pHF) and time to reach pH 4.8 (tpH 4.8). Fermentations with pure and
mixed cultures were repeated four times for each temperature tested.

80
3.4.3 Cell enumeration
For cell enumeration, appropriate dilutions of fermented milk in peptone water 0.1%
(w/v) were plated in triplicate on agar media. For pure cultures, enumeration of lactococci
and Lb. rhamnosus RW-9595M was performed on M17 or MRS agar incubated at 30°C or
37°C for 48 h, respectively. In mixed cultures, populations of Lc. diacetylactis UL719 and
Lb. rhamnosus RW-9595M were determined on KMK medium (Kempler & McKay, 1980)
(Geneq Inc., Montréal, QC, Canada) after incubation for 48 h at 30°C and on MRS agar
after incubation for 48 h at 45°C, respectively. On KMK, a differential lactococci agar
medium, Lc. diacetylactis and Lc. cremoris produced white colonies with blue centers and
white colonies, respectively, whereas Lb. rhamnosus RW-9595M did not grow under the
incubation conditions. However, Lc. cremoris ATCC19257 population was at low
concentration compared to Lc. diacetylactis UL719 in samples from mixed cultures and
could not be detected on the differential KMK medium at the dilution used for Lc.
diacetylactis UL719. This strain was quantified using a real-time PCR method as described
recently by Grattepanche, Lacroix, Audet and LaPointe (2005). Plate counts and real-time
PCR analyses were performed in duplicate.
3.4.4 Citrate analyses
Citrate concentration in milk fermented by pure culture of Lc. diacetylactis UL719
and mixed cultures was determined by HPLC (Waters, Millipore, Montreal, QC, Canada)
using a Phenomenex ion column (Phenomenex, Torrance, CA, USA) with 0.0065 N H2SO4
as mobile phase at a flow rate of 0.4 mL min-1, and a refractive index detector. As peaks for
citrate and lactose overlapped, samples of fermented milk were treated before citrate
analyses to remove lactose as follows. First milk samples were heated in a boiling water
81
bath for 5 min and 1 mL of 0.3% (w/v) sodium azide and 1 mL of β−galactosidase (Sigma,
Oakville, ON, Canada) solution (180 IU mL-1) were added to 1-mL heated sample. After
enzymatic digestion of lactose for 1 h at 30°C, 1 mL of trichloroacetic acid 5% (w/v) was
added to the mixture. The mixture was then centrifuged at 10,000 g, 4°C for 15 min, and
the supernatant was filtered using a 0.22-µm filter (Acrodisc, Pall Gelman Sciences, Ann
Arbor, MI, USA) before HPLC injection. Analyses were performed in duplicate.
3.4.5 Quantification of nisin Z in milk samples
Nisin Z in fermented milk samples was extracted using the method described by
Fowler, Jarvis and Tramer (1975) except that the filtration step was not performed
(Grattepanche et al., 2005). Bacteriocin activity was determined by the agar diffusion
bioassay, using Pediococcus acidilactici UL5 as indicator strain (Meghrous et al., 1997)
and purified nisin Z solutions as standards (Benech, Kheadr, Lacroix, & Fliss, 2003).
Analyses were performed in duplicate.
3.4.6 Exopolysaccharide extraction
EPS in milk samples fermented by mixed and pure cultures of Lb. rhamnosus RW-
9595M were extracted using an ultrafiltration method (Bergmaier, Lacroix, Macedo &
Champagne, 2001). A 4.5-mL sample of fermented milk was heated in a boiling water bath
for 10 min to inactivate bacteria and EPS-degrading enzymes. After cooling, 500 µL of
solution containing 0.5% (w/v) merthiolate and 5% (w/v) SDS were added to the sample
and the pH of the mixture was adjusted to 7.5. Proteins were then digested by adding 500
µL of pronase E solution (1232 U mL-1) (Roche Diagnostics, Laval, QC, Canada) at 40°C
for 20 h. After incubation, the mixture was heated in a boiling water bath for 10 min and
cells were removed by centrifugation at 4,000 g, 4°C for 10 min. Samples of supernatant
82
were then ultrafiltered in stirred cells with a molecular weight cut-off of 30 kDa (Pall
Gelman Sciences, Ann Arbor, MI, USA) and diafiltered with 0.1 M NaCl solution until no
carbohydrate was detected visually in the filtrate stream using the phenol-sulfuric method
(Dubois, Gilles, Hamilton, Rebers & Smith, 1956). The EPS concentration was measured
as total carbohydrate concentration in the retentate minus that of a final filtrate sample
determined by the phenol-sulfuric method using a calibration curve with glucose standards
and a spectrophotometer (HP 8453 UV-Vis Spectrophotometer, Hewlett Packard, Palo
Alto, CA, USA) at 490 nm. Reported EPS concentrations are means from triplicate
analyses.
3.4.7 Viscosity measurements
The coagulum obtained after milk acidification to pH 4.8 with mixed culture was
cooled to 1°C and broken by stirring with a glass rod (10 times clockwise; 10 times anti-
clockwise). Pure culture of Lc. cremoris ATCC1957 performed at 30°C for 10 h was used
as control without EPS. Apparent viscosity, in mPa s, was measured at 1.0 ± 0.5°C with a
Brookfield DVII+ viscometer (Brookfield Viscometers, CanAm, Oakville, ON, Canada)
using a N°2 LV spindle at 10 rpm (corresponding to a shear rate of 2 s-1). Values were
recorded every minute over a 30-min period.
3.4.8 Phenotypic characterization
Lactose (Lac) and proteinase (Prt) phenotypes of the three strains was determined
using the FSDA (Fast Slow Differential Agar) method as described by Huggins & Sandine
(1984). Overnight cultures of Lc. cremoris ATCC19257 and Lc. diacetylactis UL719 in
M17 broth at 30°C, and Lb. rhamnosus RW-9595M in MRS broth at 37°C were diluted in
0.1% peptone water and plated on FSDA. Plates were then incubated in anaerobic jars at 30
or 37°C for 24-48 h for the lactococci or Lactobacillus sp., respectively.
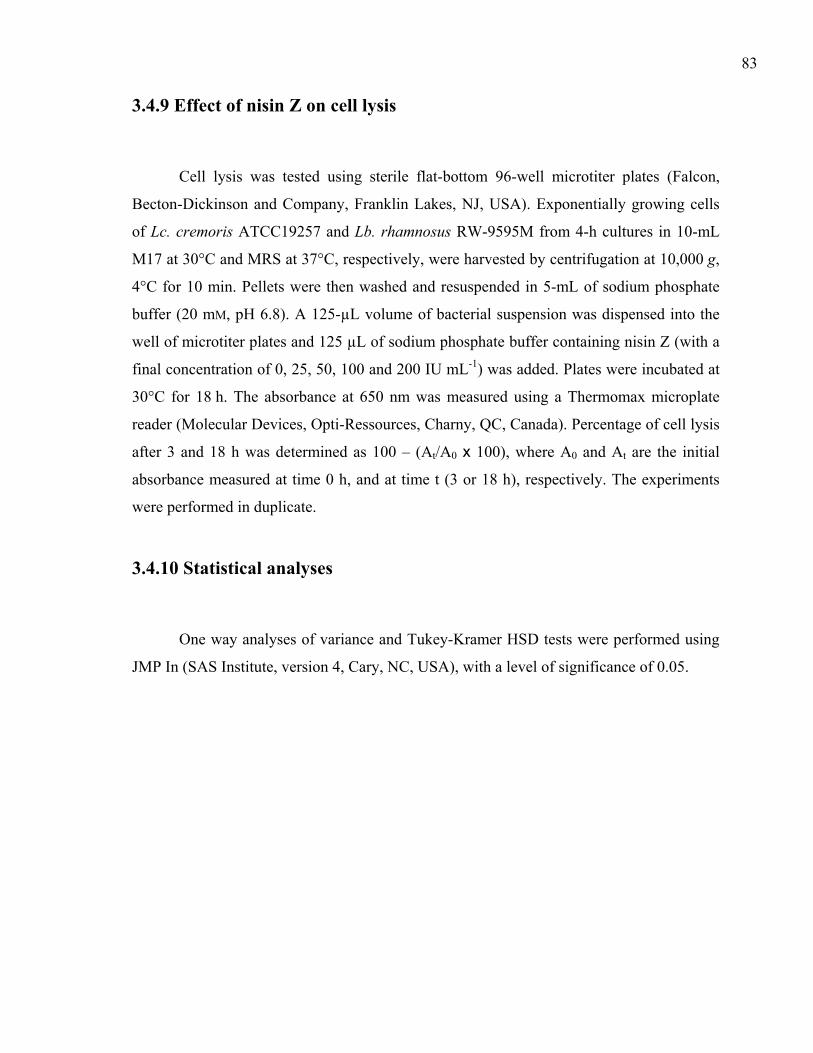
83
3.4.9 Effect of nisin Z on cell lysis
Cell lysis was tested using sterile flat-bottom 96-well microtiter plates (Falcon,
Becton-Dickinson and Company, Franklin Lakes, NJ, USA). Exponentially growing cells
of Lc. cremoris ATCC19257 and Lb. rhamnosus RW-9595M from 4-h cultures in 10-mL
M17 at 30°C and MRS at 37°C, respectively, were harvested by centrifugation at 10,000 g,
4°C for 10 min. Pellets were then washed and resuspended in 5-mL of sodium phosphate
buffer (20 mM, pH 6.8). A 125-µL volume of bacterial suspension was dispensed into the
well of microtiter plates and 125 µL of sodium phosphate buffer containing nisin Z (with a
final concentration of 0, 25, 50, 100 and 200 IU mL-1) was added. Plates were incubated at
30°C for 18 h. The absorbance at 650 nm was measured using a Thermomax microplate
reader (Molecular Devices, Opti-Ressources, Charny, QC, Canada). Percentage of cell lysis
after 3 and 18 h was determined as 100 – (At/A0 x 100), where A0 and At are the initial
absorbance measured at time 0 h, and at time t (3 or 18 h), respectively. The experiments
were performed in duplicate.
3.4.10 Statistical analyses
One way analyses of variance and Tukey-Kramer HSD tests were performed using
JMP In (SAS Institute, version 4, Cary, NC, USA), with a level of significance of 0.05.
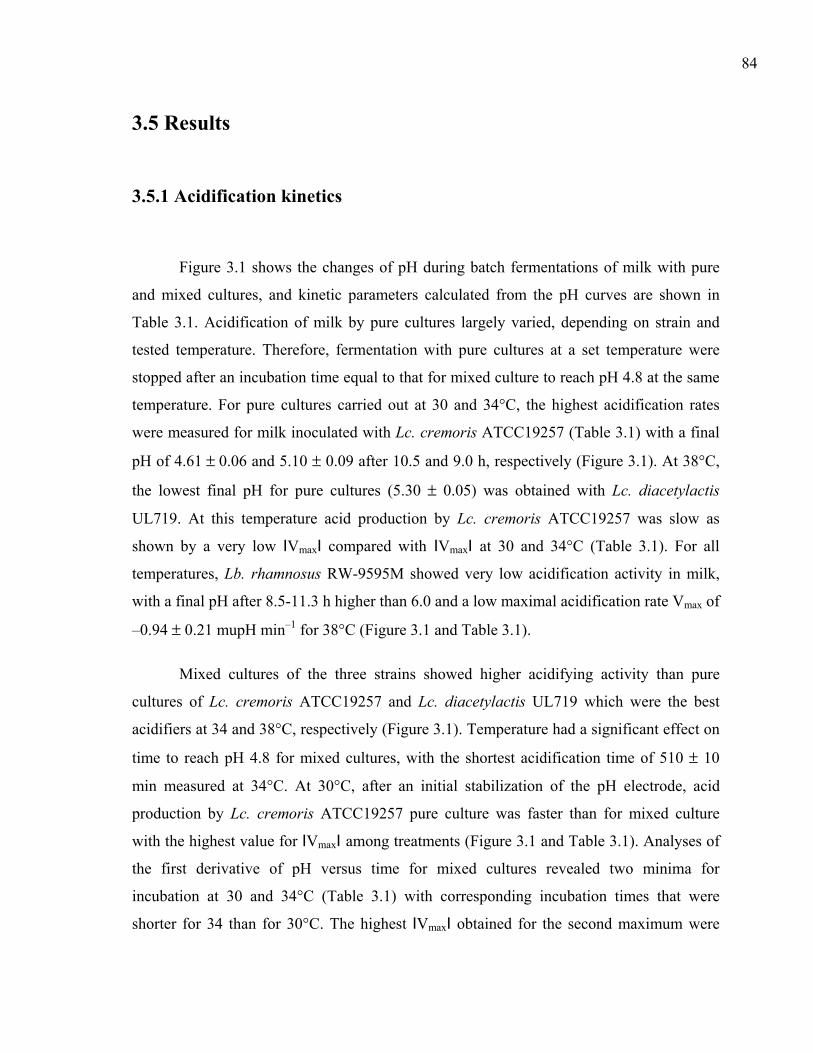
84
3.5 Results
3.5.1 Acidification kinetics
Figure 3.1 shows the changes of pH during batch fermentations of milk with pure
and mixed cultures, and kinetic parameters calculated from the pH curves are shown in
Table 3.1. Acidification of milk by pure cultures largely varied, depending on strain and
tested temperature. Therefore, fermentation with pure cultures at a set temperature were
stopped after an incubation time equal to that for mixed culture to reach pH 4.8 at the same
temperature. For pure cultures carried out at 30 and 34°C, the highest acidification rates
were measured for milk inoculated with Lc. cremoris ATCC19257 (Table 3.1) with a final
pH of 4.61 ± 0.06 and 5.10 ± 0.09 after 10.5 and 9.0 h, respectively (Figure 3.1). At 38°C,
the lowest final pH for pure cultures (5.30 ± 0.05) was obtained with Lc. diacetylactis
UL719. At this temperature acid production by Lc. cremoris ATCC19257 was slow as
shown by a very low IVmaxI compared with IVmaxI at 30 and 34°C (Table 3.1). For all
temperatures, Lb. rhamnosus RW-9595M showed very low acidification activity in milk,
with a final pH after 8.5-11.3 h higher than 6.0 and a low maximal acidification rate Vmax of
–0.94 ± 0.21 mupH min–1 for 38°C (Figure 3.1 and Table 3.1).
Mixed cultures of the three strains showed higher acidifying activity than pure
cultures of Lc. cremoris ATCC19257 and Lc. diacetylactis UL719 which were the best
acidifiers at 34 and 38°C, respectively (Figure 3.1). Temperature had a significant effect on
time to reach pH 4.8 for mixed cultures, with the shortest acidification time of 510 ± 10
min measured at 34°C. At 30°C, after an initial stabilization of the pH electrode, acid
production by Lc. cremoris ATCC19257 pure culture was faster than for mixed culture
with the highest value for IVmaxI among treatments (Figure 3.1 and Table 3.1). Analyses of
the first derivative of pH versus time for mixed cultures revealed two minima for
incubation at 30 and 34°C (Table 3.1) with corresponding incubation times that were
shorter for 34 than for 30°C. The highest IVmaxI obtained for the second maximum were
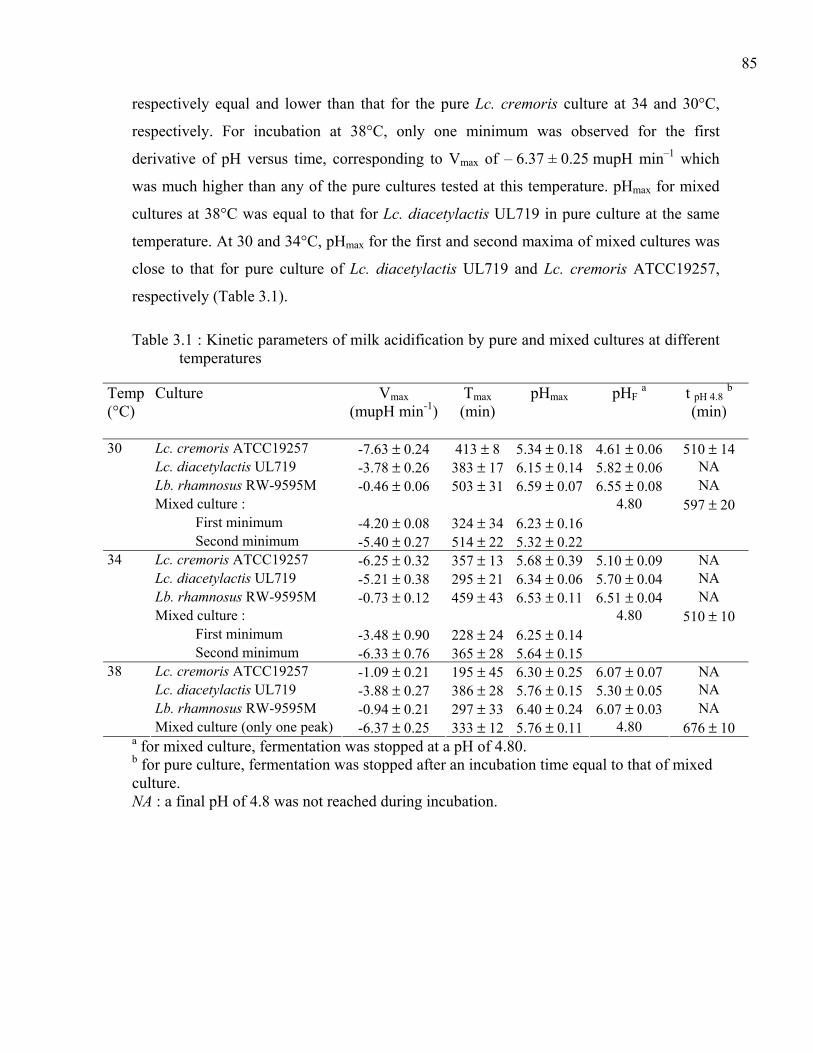
85
respectively equal and lower than that for the pure Lc. cremoris culture at 34 and 30°C,
respectively. For incubation at 38°C, only one minimum was observed for the first
derivative of pH versus time, corresponding to Vmax of – 6.37 ± 0.25 mupH min–1 which
was much higher than any of the pure cultures tested at this temperature. pHmax for mixed
cultures at 38°C was equal to that for Lc. diacetylactis UL719 in pure culture at the same
temperature. At 30 and 34°C, pHmax for the first and second maxima of mixed cultures was
close to that for pure culture of Lc. diacetylactis UL719 and Lc. cremoris ATCC19257,
respectively (Table 3.1).
Table 3.1 : Kinetic parameters of milk acidification by pure and mixed cultures at different temperatures
Temp(°C)
Culture Vmax (mupH min-1)
Tmax (min)
pHmax pHF a t pH 4.8 b (min)
Lc. cremoris ATCC19257 -7.63 ± 0.24 413 ± 8 5.34 ± 0.18 4.61 ± 0.06 510 ± 14 Lc. diacetylactis UL719 -3.78 ± 0.26 383 ± 17 6.15 ± 0.14 5.82 ± 0.06 NA Lb. rhamnosus RW-9595M -0.46 ± 0.06 503 ± 31 6.59 ± 0.07 6.55 ± 0.08 NA Mixed culture : 4.80 597 ± 20 First minimum -4.20 ± 0.08 324 ± 34 6.23 ± 0.16
30
Second minimum -5.40 ± 0.27 514 ± 22 5.32 ± 0.22
Lc. cremoris ATCC19257 -6.25 ± 0.32 357 ± 13 5.68 ± 0.39 5.10 ± 0.09 NA Lc. diacetylactis UL719 -5.21 ± 0.38 295 ± 21 6.34 ± 0.06 5.70 ± 0.04 NA Lb. rhamnosus RW-9595M -0.73 ± 0.12 459 ± 43 6.53 ± 0.11 6.51 ± 0.04 NA Mixed culture : 4.80 510 ± 10 First minimum -3.48 ± 0.90 228 ± 24 6.25 ± 0.14
34
Second minimum -6.33 ± 0.76 365 ± 28 5.64 ± 0.15 Lc. cremoris ATCC19257 -1.09 ± 0.21 195 ± 45 6.30 ± 0.25 6.07 ± 0.07 NA Lc. diacetylactis UL719 -3.88 ± 0.27 386 ± 28 5.76 ± 0.15 5.30 ± 0.05 NA Lb. rhamnosus RW-9595M -0.94 ± 0.21 297 ± 33 6.40 ± 0.24 6.07 ± 0.03 NA
38
Mixed culture (only one peak) -6.37 ± 0.25 333 ± 12 5.76 ± 0.11 4.80 676 ± 10 a for mixed culture, fermentation was stopped at a pH of 4.80. b for pure culture, fermentation was stopped after an incubation time equal to that of mixed culture. NA : a final pH of 4.8 was not reached during incubation.

86
Figure 3.1 : Changes in pH during milk acidification by mixed culture ( ) and pure culture of: Lc. cremoris ATCC19257 ( ), Lc. diacetylactis UL719 ( ) and Lb. rhamnosus RW-9595M ( ) at different temperatures. Reported data are means from four repetitions. Error bars are standard deviations of four repetitions
30°C
34°C
38°C
87
3.5.2 Cell counts in fermented milk
Table 3.2 shows cell counts obtained at the end of milk fermentations for pure and
mixed cultures. In pure cultures, the final population of Lc. cremoris ATCC19257
decreased with increasing temperature from 34 to 38°C, while Lb. rhamnosus RW-9595M
counts increased from 7.71 ± 0.03 to 8.14 ± 0.11 log10 cfu mL–1 between 30 to 34°C, with
no further increase for 38°C. A significant difference was also observed for Lc.
diacetylactis UL719 cell counts with a higher population at 34°C than at 30 and 38°C. In
mixed cultures, populations of Lc. cremoris ATCC19257 and Lb. rhamnosus RW-9595M
at the end of fermentation were reduced by ca 3 to 2 log10 of cfu mL–1 compared to initial
inoculated populations. Counts of Lc. cremoris ATCC19257 in mixed cultures could only
be estimated by RT-PCR because of differences between the two lactococci populations
exceeding 1 log10 cfu mL–1, white colonies of Lc. cremoris ATCC19257 could not be
detected on KMK differential agar medium. Populations of Lc. diacetylactis UL719 were
significantly higher in milk fermented with mixed than with pure cultures while
populations of Lc. cremoris ATCC19257 and Lb. rhamnosus RW-9595M in mixed cultures
were approximately 4.5 and 2.5 log10 of cfu mL–1 lower than with pure cultures,
respectively.
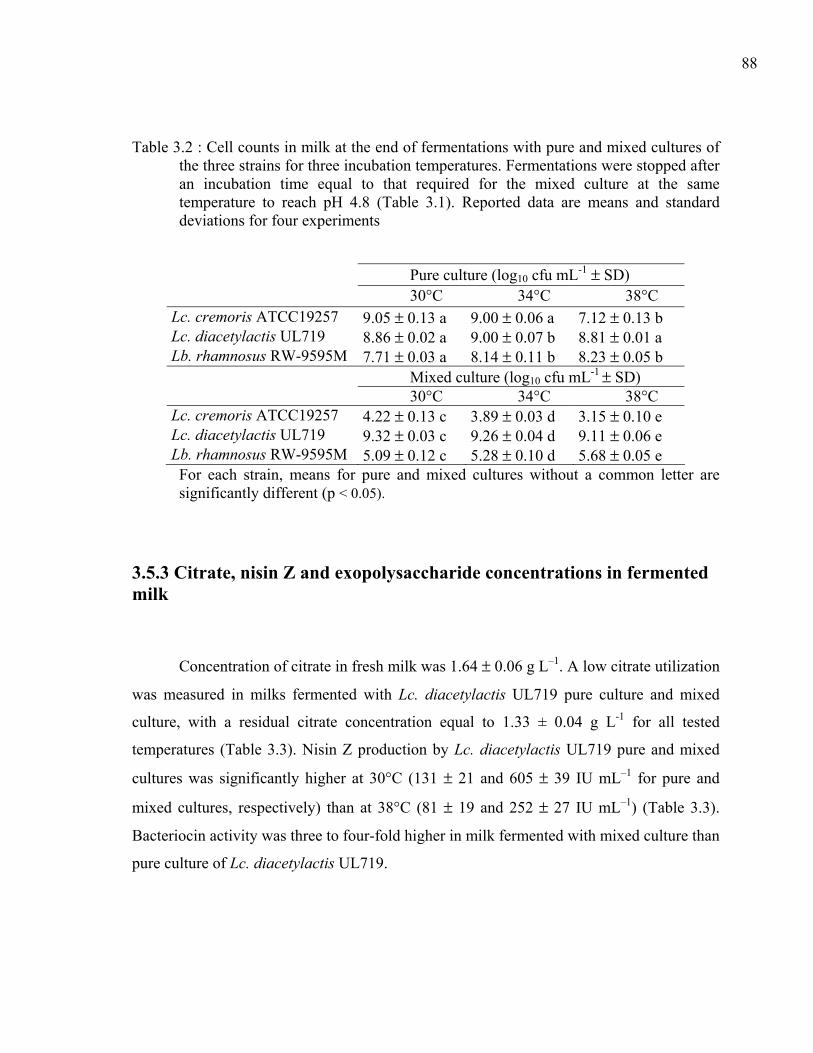
88
Table 3.2 : Cell counts in milk at the end of fermentations with pure and mixed cultures of the three strains for three incubation temperatures. Fermentations were stopped after an incubation time equal to that required for the mixed culture at the same temperature to reach pH 4.8 (Table 3.1). Reported data are means and standard deviations for four experiments
Pure culture (log10 cfu mL-1 ± SD) 30°C 34°C 38°C
Lc. cremoris ATCC19257 9.05 ± 0.13 a 9.00 ± 0.06 a 7.12 ± 0.13 b Lc. diacetylactis UL719 8.86 ± 0.02 a 9.00 ± 0.07 b 8.81 ± 0.01 a Lb. rhamnosus RW-9595M 7.71 ± 0.03 a 8.14 ± 0.11 b 8.23 ± 0.05 b
Mixed culture (log10 cfu mL-1 ± SD) 30°C 34°C 38°C
Lc. cremoris ATCC19257 4.22 ± 0.13 c 3.89 ± 0.03 d 3.15 ± 0.10 e Lc. diacetylactis UL719 9.32 ± 0.03 c 9.26 ± 0.04 d 9.11 ± 0.06 e Lb. rhamnosus RW-9595M 5.09 ± 0.12 c 5.28 ± 0.10 d 5.68 ± 0.05 e For each strain, means for pure and mixed cultures without a common letter are significantly different (p < 0.05).
3.5.3 Citrate, nisin Z and exopolysaccharide concentrations in fermented milk
Concentration of citrate in fresh milk was 1.64 ± 0.06 g L–1. A low citrate utilization
was measured in milks fermented with Lc. diacetylactis UL719 pure culture and mixed
culture, with a residual citrate concentration equal to 1.33 ± 0.04 g L-1 for all tested
temperatures (Table 3.3). Nisin Z production by Lc. diacetylactis UL719 pure and mixed
cultures was significantly higher at 30°C (131 ± 21 and 605 ± 39 IU mL–1 for pure and
mixed cultures, respectively) than at 38°C (81 ± 19 and 252 ± 27 IU mL–1) (Table 3.3).
Bacteriocin activity was three to four-fold higher in milk fermented with mixed culture than
pure culture of Lc. diacetylactis UL719.
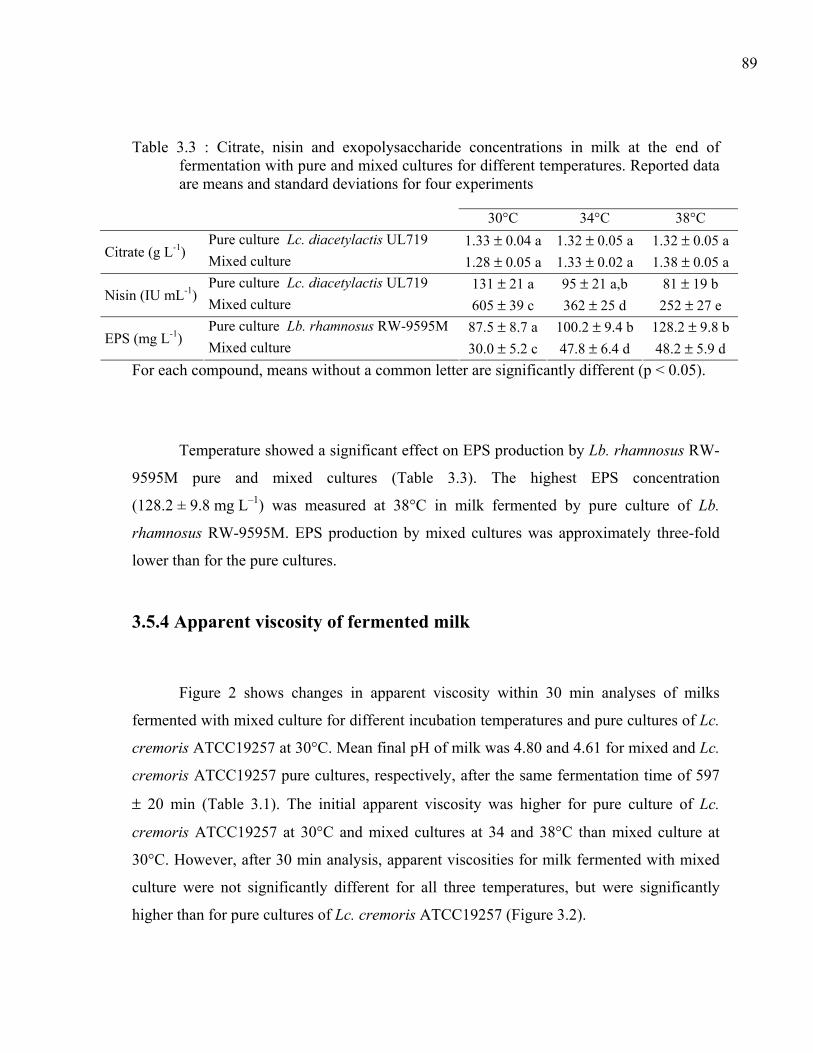
89
Table 3.3 : Citrate, nisin and exopolysaccharide concentrations in milk at the end of fermentation with pure and mixed cultures for different temperatures. Reported data are means and standard deviations for four experiments
30°C 34°C 38°C Pure culture Lc. diacetylactis UL719 1.33 ± 0.04 a 1.32 ± 0.05 a 1.32 ± 0.05 a
Citrate (g L-1) Mixed culture 1.28 ± 0.05 a 1.33 ± 0.02 a 1.38 ± 0.05 a Pure culture Lc. diacetylactis UL719 131 ± 21 a 95 ± 21 a,b 81 ± 19 b
Nisin (IU mL-1) Mixed culture 605 ± 39 c 362 ± 25 d 252 ± 27 e Pure culture Lb. rhamnosus RW-9595M 87.5 ± 8.7 a 100.2 ± 9.4 b 128.2 ± 9.8 b
EPS (mg L-1) Mixed culture 30.0 ± 5.2 c 47.8 ± 6.4 d 48.2 ± 5.9 d For each compound, means without a common letter are significantly different (p < 0.05).
Temperature showed a significant effect on EPS production by Lb. rhamnosus RW-
9595M pure and mixed cultures (Table 3.3). The highest EPS concentration
(128.2 ± 9.8 mg L–1) was measured at 38°C in milk fermented by pure culture of Lb.
rhamnosus RW-9595M. EPS production by mixed cultures was approximately three-fold
lower than for the pure cultures.
3.5.4 Apparent viscosity of fermented milk
Figure 2 shows changes in apparent viscosity within 30 min analyses of milks
fermented with mixed culture for different incubation temperatures and pure cultures of Lc.
cremoris ATCC19257 at 30°C. Mean final pH of milk was 4.80 and 4.61 for mixed and Lc.
cremoris ATCC19257 pure cultures, respectively, after the same fermentation time of 597
± 20 min (Table 3.1). The initial apparent viscosity was higher for pure culture of Lc.
cremoris ATCC19257 at 30°C and mixed cultures at 34 and 38°C than mixed culture at
30°C. However, after 30 min analysis, apparent viscosities for milk fermented with mixed
culture were not significantly different for all three temperatures, but were significantly
higher than for pure cultures of Lc. cremoris ATCC19257 (Figure 3.2).
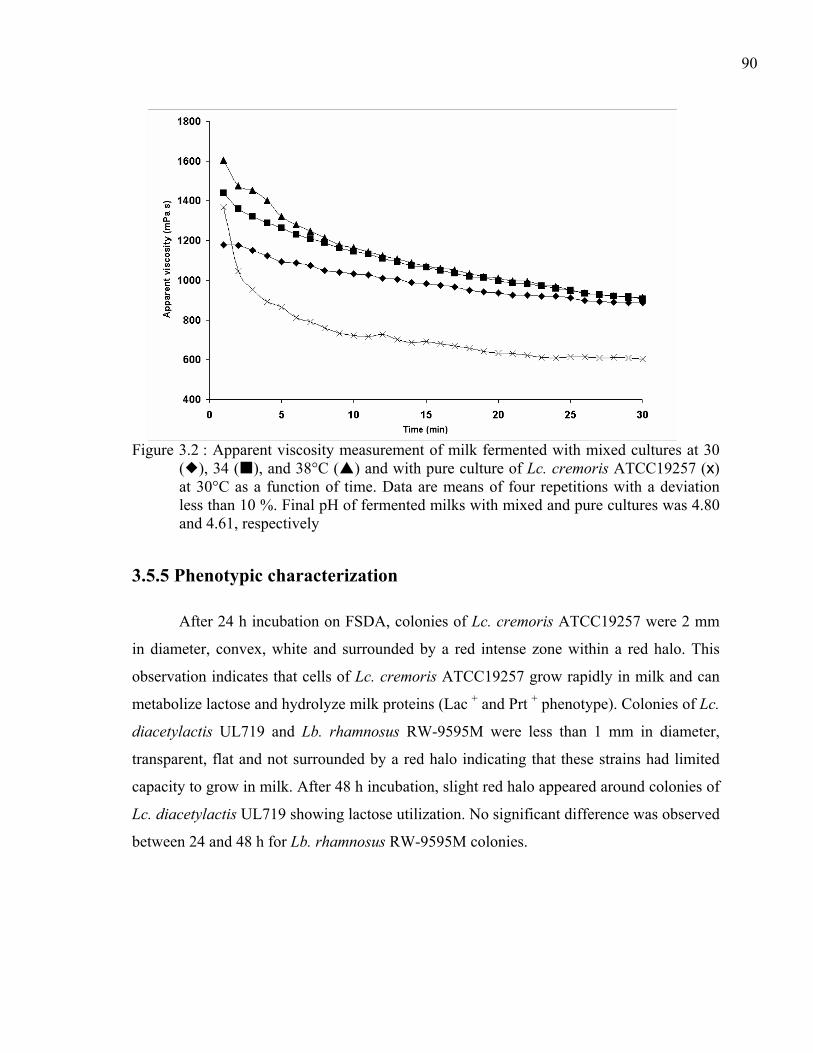
90
Figure 3.2 : Apparent viscosity measurement of milk fermented with mixed cultures at 30 ( ), 34 ( ), and 38°C ( ) and with pure culture of Lc. cremoris ATCC19257 (x) at 30°C as a function of time. Data are means of four repetitions with a deviation less than 10 %. Final pH of fermented milks with mixed and pure cultures was 4.80 and 4.61, respectively
3.5.5 Phenotypic characterization After 24 h incubation on FSDA, colonies of Lc. cremoris ATCC19257 were 2 mm
in diameter, convex, white and surrounded by a red intense zone within a red halo. This
observation indicates that cells of Lc. cremoris ATCC19257 grow rapidly in milk and can
metabolize lactose and hydrolyze milk proteins (Lac + and Prt + phenotype). Colonies of Lc.
diacetylactis UL719 and Lb. rhamnosus RW-9595M were less than 1 mm in diameter,
transparent, flat and not surrounded by a red halo indicating that these strains had limited
capacity to grow in milk. After 48 h incubation, slight red halo appeared around colonies of
Lc. diacetylactis UL719 showing lactose utilization. No significant difference was observed
between 24 and 48 h for Lb. rhamnosus RW-9595M colonies.
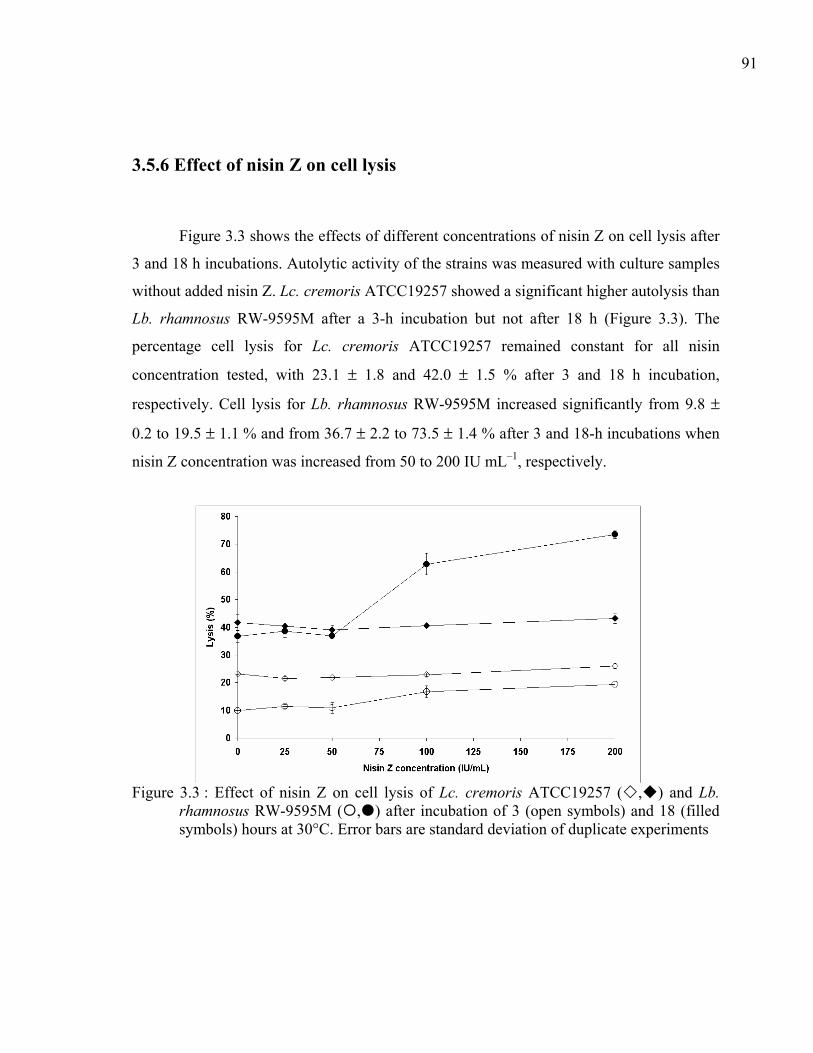
91
3.5.6 Effect of nisin Z on cell lysis
Figure 3.3 shows the effects of different concentrations of nisin Z on cell lysis after
3 and 18 h incubations. Autolytic activity of the strains was measured with culture samples
without added nisin Z. Lc. cremoris ATCC19257 showed a significant higher autolysis than
Lb. rhamnosus RW-9595M after a 3-h incubation but not after 18 h (Figure 3.3). The
percentage cell lysis for Lc. cremoris ATCC19257 remained constant for all nisin
concentration tested, with 23.1 ± 1.8 and 42.0 ± 1.5 % after 3 and 18 h incubation,
respectively. Cell lysis for Lb. rhamnosus RW-9595M increased significantly from 9.8 ±
0.2 to 19.5 ± 1.1 % and from 36.7 ± 2.2 to 73.5 ± 1.4 % after 3 and 18-h incubations when
nisin Z concentration was increased from 50 to 200 IU mL–1, respectively.
Figure 3.3 : Effect of nisin Z on cell lysis of Lc. cremoris ATCC19257 ( , ) and Lb. rhamnosus RW-9595M ( , ) after incubation of 3 (open symbols) and 18 (filled symbols) hours at 30°C. Error bars are standard deviation of duplicate experiments
92
3.6 Discussion
Bacterial strains used in this study were selected for their antimicrobial, texture-
building and acidifying properties for fresh cheese production. Several cases of food-borne
poisoning due to the pathogenic bacteria L. monocytogenes have been reported for fresh
cheese in Europe and the United States (De Buyser et al., 2001; Kabuki, Kuaye, Wiedmann
& Boor, 2004). The inclusion of a nisin-producing strains could help control the growth of
pathogenic bacteria (Cleveland et al., 2001). The EPS produced by lactic acid bacteria can
also improve rheological properties of fermented dairy products, in particular for those
obtained from acid coagulation of milk (Duboc & Mollet, 2001).
In pure cultures, the effects of temperature measured on acidification rate of
lactococcal strains are consistent with their optimal growth temperature which is lower for
Lc. cremoris than Lc. diacetylactis (Mundt, 1986). Goulhen et al. (1999) reported similar
growth for Lc. diacetylactis UL719 at 30 or 37°C during pH-controlled batch cultures in
supplemented whey permeate. However, in this study the acidifying capacity of Lc.
diacetylactis UL719 in pure culture was not suitable for cheese manufacturing as already
reported for this strain in milk (Bouksaim et al., 2000; Benech et al., 2002) and for other
nisin-producing strains (Roberts et al., 1992). This low acidifying capacity can be attributed
to specific nutritional requirements of different strains of lactococci and to the fact that milk
only contains low levels of free amino acids, which are easily assimilated by lactic acid
bacteria. Lactic acid bacteria metabolize caseins through their proteolytic system,
producing essential amino acids for growth in milk (Law & Haandrikman, 1997 ;
Christensen, Dudley, Pederson & Steele, 1999). Lc. diacetylactis UL719 has been shown to
grow well on lactose in dairy media such as yeast-extract supplemented whey permeate
(Amiali, Lacroix, & Simard, 1998). Data for FSDA test in this study showed that this strain
exhibited limited proteolytic activity in milk. This result supports data from Roberts et al.
(1992) who reported that out of six nisin-producing strains of Lc. lactis subsp. lactis
evaluated for their proteinase activity only one was able to coagulate milk without milk
protein hydrolysate supplementation after 24-h incubation at 21°C. These authors
93
postulated that the lack of proteinase-activity among nisin-producing strains could be the
result of proteinase plasmid loss or incompatibility between expression of these plasmids
and nisin production, as observed by Steele and McKay (1986) for lactose plasmids and
nisin-producing phenotypes.
For all temperatures tested, Lb. rhamnosus RW-9595M was the least acidifying
strain in milk, as also reported by Dupont et al. (2000). Data from FSDA test indicate that
Lb. rhamnosus RW-9595M exhibited a reduced capacity to grow in milk due to a Prt –
phenotype. Bergmaier, Champagne and Lacroix (2003) also showed that growth of, and
lactic acid and EPS productions by Lb. rhamnosus RW-9595M in yeast-extract
supplemented whey permeate was sharply enhanced when the medium was supplemented
with small amounts of MnSO4 and MgSO4. Therefore, lack of essential nutrients such as
mineral salts, amino acids, vitamins or an inadequate source of nitrogen could explain the
limited growth and lactic acid production of Lb. rhamnosus RW-9595M in milk.
The mixed cultures exhibited lower or higher acidifying capacity at 30 and 34°C,
respectively, compared with pure cultures of Lc. cremoris ATCC19257, the highest
acidifying strain. Lc. cremoris ATCC19257 and Lb. rhamnosus RW-9595M have been
shown to be very sensitive to nisin Z, with minimal inhibitory concentrations of 5 and 11
IU mL–1, respectively (Grattepanche et al., 2005). In mixed cultures, these strains were
inhibited by nisin Z produced by Lc. diacetylactis UL719 which reached high cell counts at
the end of fermentation. At 38°C, the acidification profile for mixed cultures was similar to
that for Lc. diacetylactis UL719 which was the best acidifying strain in pure culture at this
temperature and likely the main contributor for lactic acid production. However at 38°C,
the maximal acidification rate of mixed cultures was approximately twice higher than for
pure cultures of Lc. diacetylactis UL719, indicating a cooperative behavior for the three
strains. At 30 and 34°C, two maximum acidification rates were observed for milk
fermented by mixed cultures. According to pHmax and Tmax values, the first and second
maximum could be attributed to Lc. diacetylactis UL719 and Lc. cremoris ATCC19257,
respectively. Lamboley, Lacroix, Champagne & Vuillemard (1997) also reported two
maxima during milk fermentations by a mixed culture of Lc. diacetylactis, Lc. lactis and
94
Lc. cremoris. Our results suggest that Lc. cremoris ATCC19257 and Lc. rhamnosus RW-
9595M which are very sensitive to nisin Z can grow and contribute to milk acidification in
mixed cultures until nisin activity reaches the minimal inhibitory concentration. The
presence of only one acidification rate maximum for mixed cultures at 38°C could be
explained by the lack of growth of Lc. cremoris ATCC19257 at this high temperature.
Populations of Lc. diacetylactis UL719 at the end of milk fermentation with mixed
cultures were approximately 2.9-, 1.8- and 2.0-fold higher at 30, 34 and 38°C, respectively,
than for pure culture of this strain. This positive interaction could be partly due to lytic
effect of nisin Z on Lb. rhamnosus RW-9595M as well as high autolysis of Lc. cremoris
ATCC19257 which led to intracellular component release, such as proteolytic enzymes and
other nutrients, when a critical nisin concentration was reached, as already suggested in
cheese by Benech et al. (2003). The higher cell counts measured for Lc. diacetylactis
UL719 explain the high production of nisin Z measured in milk fermented by mixed
cultures which were 4.6-, 3.8- and 3.1-fold higher at 30, 34 and 38°C, respectively, than for
pure culture.
In this study, Lc. diacetylactis UL719 was the only strain that metabolized citrate.
Citrate is consumed by several lactic acid bacteria, in particular the diacetylactis biovariant
of Lc. lactis subspecies and some Leuconostoc and Lactobacilli species to produce C4-
flavor components, particularly diacetyl, an important flavor compound for butter and some
fresh cheeses. The low citrate utilization by Lc. diacetylactis UL719 for all tested culture
conditions could be explained by the hypothesis for plasmid incompatibility of Roberts et
al. (1992). Citrate permease, the enzyme for citrate uptake, is plasmid encoded (Drider,
Bekal & Prévost, 2004). The optimum pH for the activity of citrate permease is close to 5.0
(Hugenholtz, 1993). This pH was easily reached during mixed cultures but not with pure
cultures of Lc. diacetylactis UL719.
EPS production by Lb. rhamnosus RW-9595M in pure and mixed cultures was
significantly higher at 34 and 38°C, which is close to the optimal growth temperature
reported for this strain, than at 30°C. The very low EPS productions tested with pure and
mixed cultures in milk compared with the high production, up to 2.3 g L-1 in supplemented
95
whey permeate (Bergmaier et al., 2001 and 2003) can be explained by limited growth of
Lb. rhamnosus RW-9595M in milk and inhibition of Lb. rhamnosus RW-9595M by nisin Z
in mixed cultures, as indicated by low cell counts at the end of acidification compared with
pure cultures. On the other hand, nisin Z production occurs mainly at the end of incubation
when cell counts are high (Amiali et al., 1998). Therefore, nisin inhibition and killing of
sensitive cells takes place at the final stage of incubation, providing an explanation for the
much higher specific EPS production tested in mixed cultures (2.43 ± 0.42, 2.51 ± 0.34 and
1.01 ± 0.12 mg EPS per 107 cells of Lb. rhamnosus RW-9595M, at 30, 34 and 38°C,
respectively) compared with pure cultures of Lb. rhamnosus RW-9595M (0.02 mg EPS per
107 cells). This data also suggest that higher cell counts than those tested at the end of
fermentation, could be reached by Lb. rhamnosus RW-9595M during milk incubation.
Apparent viscosity of milk fermented by Lc. cremoris ATCC19257 and mixed
cultures of the three strains is time-dependent as also reported by many authors for yogurt
gel (Sodini, Remeuf, Haddad & Corrieu, 2004). Using a mixed culture of a Lb. bulgaricus
and a ropy strain of Streptococcus thermophilus, Beal, Skokanova, Latrille, Martin and
Corrieu (1999) showed that a lower final pH, achieved by increasing fermentation time, led
to increases in yogurt gel viscosity. Beal et al. (1999) attributed this result to a firmer gel
structure resulting from acid coagulation, textural activity of Lb. bulgaricus or higher EPS
production since no difference in flow behavior was observed when the non-ropy strain of
S. thermophilus was used (Beal et al., 1999). For the same incubation time, the present
study has reported a higher initial apparent viscosity for milk fermented with the non ropy
strain Lc. cremoris ATCC19257 in pure cultures compared with mixed cultures at 30°C.
This increase in viscosity could also be attributed to lower pH (i.e. 4.61 versus 4.80) of
milk fermented with pure cultures of Lc. cremoris ATCC1957 than mixed cultures. In
fermented milk, EPS interact with the casein gel matrix and can act on flow behavior
(Rohm & Kovac, 1994). The highest apparent viscosity of milk fermented by mixed
cultures was reached at 38°C when EPS concentration was maximal. This result is in
agreement with many authors who observed that the use of ropy strains for yogurt
manufacturing increased apparent viscosity (Hassan, Frank, Schmidt & Shalabi, 1996;
Rawson & Marshall, 1997; Doleyres, Schaub & Lacroix, 2005). As shown by the slower

96
decrease in apparent viscosity with time, the structural stability of milk gel seems to be
higher for mixed than pure cultures of Lc. cremoris ATCC19257. This observation may be
explained by the higher energy required to break interactions between bacteria and EPS or
EPS and casein micelles than interactions between micelles as postulated by Skriver,
Roemer and Qvist (1993) and Teggatz and Morris (1990), and the low shear rate (2 s-1)
used for rheological testing compared with that reported in the literature (> 10 s-1) (Hess et
al., 1997).
3.7 Conclusion In mixed cultures Lc. diacetylactis UL719 producing nisin Z showed clear
dominance over nisin Z-sensitive strains, Lc. cremoris ATCC19257 and Lb. rhamnosus
RW-9595M, for all tested temperatures. However, compared with the best acidifying strain
in pure cultures, acidification capacity of mixed cultures was slightly lower at 30°C and
higher for the other two temperatures, particularly at 38°C. Our data suggest that during the
first stage of milk fermentation with mixed cultures, bacteriocin-sensitive strains were not
inhibited and contributed to acidification, while during the latter stage, commensalism in
favor of Lc. diacetylactis UL719 took place, likely due to autolysis of Lc. cremoris
ATCC19257 and, to nisin Z-induced lysis of Lb. rhamnosus RW-9595M. This effect
stimulated growth and nisin production from Lc. diacetylactis UL719 in mixed cultures.
Although EPS production by Lb. rhamnosus RW-9595M was low, EPS increased apparent
viscosity of fermented milk compared with pure cultures of Lc. cremoris ATCC19257. Our
study showed that a combination of functional strains, including antagonistic cultures, can
be used in mixed cultures for fresh cheese manufacture with improved functional
properties.
Acknowledgements The authors wish to thank the Natural Sciences and Engineering Research Council
of Canada (Research Partnerships Program – Research Network on Lactic Acid Bacteria),
Agriculture and Agri-Food Canada, Novalait Inc., Dairy Farmers of Canada and Institut
Rosell Inc. for financial support.
97
Chapitre 4. Immobilized cell technology improves functional characteristics of nisin Z- and
exopolysaccharide-producing mixed cultures for continuous inoculation and fermentation of milk
/ Amélioration des caractéristiques fonctionnelles, par
l'immobilisation cellulaire, de cultures mixtes produisant de la nisine Z et des exopolysaccharides pour
l'inoculation et la fermentation en continu du lait
Les résultats de ce travail seront prochainement soumis dans la revue Journal of
Biotechnology. Les auteurs de cet article sont : Franck Grattepanche et Christophe
Lacroix.
98
4.1 Résumé
L'utilisation d'une souche bactériocinogène en culture mixte avec d'autres bactéries
est généralement à l'origine de phénomènes d'antagonisme. Une culture mixte constituée de
trois souches de bactéries lactiques immobilisées séparément dans des billes de gel : une
forte productrice de nisine Z, Lc. diacetylactis UL719, et deux souches sensibles à la
bactériocine, Lc. cremoris ATCC19257, sélectionnée pour sa capacité d'acidification, et Lb.
rhamnosus RW-9595M, productrice d'exopolysaccharides, a été utilisée pour la
préfermentation en continu du lait à différentes températures et sous un pH de 6.0 contrôlé
par apport de lait frais. Une forte productivité volumique, passant de 8.0 à 12.5 litres de lait
par litre de bioréacteur et par heure avec une augmentation de la température de 27 à 35°C,
a été mesurée. La concentration cellulaire de Lc. diacetylactis UL719 dans le lait
préfermenté et fermenté (obtenu après une incubation additionnelle de 22 h) est restée
stable durant les 3 semaines de l'expérimentation à 8.14 ± 0.13 and 8.88 ± 0.21 log cfu/ml,
respectivement. La population de Lc. cremoris ATCC19257, estimée par PCR en temps
réel, décroît rapidement durant la première semaine de préfermentation pour se stabiliser
ensuite à environ 4.5 log cfu/ml. La température n'a pas d'effet significatif sur la
concentration cellulaire, dans le lait préfermenté, de Lb. rhamnosus RW-9595M, elle
diminue durant les 3 premiers jours puis augmente significativement avec le temps de
préfermentation pour atteindre 7.8 log cfu/ml au 20ième jour. Dans le lait fermenté, la
population de cette souche est en moyenne 1.1 log plus élevée et les concentrations de
nisine Z et d'exopolysaccharides varient respectivement de 177 à 363 UI/ml et de 43 à 178
mg/l. L'immobilisation cellulaire et la préfermentation en continu ont également conduit à
d'importantes modifications physiologiques des cellules de Lc. diacetylactis UL719 et Lb.
rhamnosus RW-9595M. Les cellules de cette dernière se montrent plus tolérantes à la
nisine Z, et les deux souches présentent une meilleure capacité d'acidification du lait. Nos
résultats démontrent que la préfermentation en continu du lait avec cellules immobilisées
stimule la capacité d'acidification de souches initialement peu acidifiantes et peut être
utilisée pour la production de laits fermentés aux propriétés fonctionnelles accrues.
99
4.2 Abstract
Antagonistic phenomena between strains often occur in mixed culture containing
bacteriocinogenic strain. A nisin Z producer (Lc. diacetylactis UL719) and two nisin-
sensitive strains for acidification (Lc. cremoris) and exopolysaccharide (EPS) production
(Lb. rhamnosus RW-9595M) were immobilized separately in gel beads and used to
continuously preferment milk at different temperatures, with pH controlled at 6.0 by fresh
milk addition. The process showed high volumetric productivity that increased from 8.0 to
12.5 liters of prefermented milk per liter reactor volume and hour with temperature
increasing from 27 to 35°C. Lc. diacetylactis UL719 counts in pre-fermented and
fermented (after 22-h batch fermentation) milks were stable during 3-week continuous
fermentation (8.14 ± 0.13 and 8.88 ± 0.21 log cfu ml-1, respectively). Lc. cremoris
population (estimated with RTQ-PCR) decreased rapidly during the first week of
continuous culture to ca. 4.5 log cfu ml-1 and remained constant afterward. Lb. rhamnosus
counts in prefermented milk decreased during the first 3 days, and significantly increased
with fermentation time to reach 7.8 log cfu ml-1 at day 20, with no temperature effect. Lb.
rhamnosus counts increased by about 1.1 log cfu ml-1 during final milk fermentation. Nisin
Z reached high titers in fermented milk (from 177 to 363 IU ml-1), with EPS concentration
in the range from 43 to 178 mg l-1. Immobilization and continuous culture also lead to
important cell physiological adaptations for Lb. rhamnosus and Lc. diacetylactis. Lb.
rhamnosus became much more tolerant to nisin Z, and both strains exhibited a large
increase in milk acidification capacity. Our data showed that continuous milk
prefermentation with immobilized cells can stimulate acidification activity of low
acidifying strains and produce fermented milks with improved functional properties.
100
4.3 Introduction
Lactic acid bacteria play a major role in aroma development, microbiological safety
and texture of cheese. In recent years, strains with new functional properties such as
bacteriocin and exopolysaccharide (EPS) production have been studied and some used for
fermented milk and cheese production. Bacteriocins are defined as proteinaceous
antimicrobial compounds that have bactericidal activity against closely related species, and
for some, broad host range (Tagg et al., 1976; Klaenhammer, 1993). Lactic acid bacteria
bacteriocins have been extensively studied to control growth of pathogenic and spoilage
microorganisms in fermented and non-fermented foods (Cleveland et al., 2001). Nisin
produced by some strains of Lactococcus lactis sp. is well documented and is the only
bacteriocin approved for specific food uses in over 40 countries (Cleveland et al., 2001).
Lactic acid bacteria can also produce and secrete EPS into their environment (De
Vuyst et al., 2001). Utilization of EPS producers in fermented dairy products contributes to
texture, mouthfeel, taste perception and stability of the final product (Jolly et al., 2002).
Moreover, several authors have suggested that EPS have physiological functionality such
as antitumor and immunomudating activities (Ruas-Madiedo et al., 2002). Until now, the
highest EPS production for lactobacilli or lactococci, which are important components of
starter cultures for fermented dairy products, was reported for Lb. rhamnosus RW-9595M
grown in supplemented whey permeate (Bergmaier et al., 2001; Macedo et al., 2002b).
However, this strain showed a limited capacity to grow and produce acid in milk (Dupont
et al., 2000; Grattepanche et al., 2005a), similar to several other nisinogenic strains.
Roberts et al. (1992) have reported that among six nisin-producing strains of Lc.
lactis ssp., only one exhibited the proteinase positive phenotype that was required to ensure
suitable growth and acidification in milk for cheese manufacture (De Vuyst and
Vandamme, 1994), especially for fresh cheese which requires a long fermentation to reach
final pH, sometime exceeding 24 h (Ramet et al., 1997). Moreover, production of
bacteriocin may limits growth of bacteriocin-sensitive strains in mixed culture with the
producer organism.

101 In a previous paper, we showed that the combination of an acidifying strain of Lc.
cremoris with Lb. rhamnosus RW-9595M, which are both nisin-sensitive, and a nisin Z
producer, Lc. diacetylactis UL719 resulted in improved acidification parameters of the
mixed culture in milk compare with pure cultures of these strains (Grattepanche et al.,
2005a). This data was explained by commensalism phenomena. Nevertheless, at the end of
batch fermentation, populations of Lc. cremoris and Lb. rhamnosus RW-9595M were
largely reduced due to nisin Z inhibition and cell lysis leading to low amounts of EPS in
fermented milks (Grattepanche et al., 2005a).
Several studies have been carried out on dairy applications of immobilized cell
technology for continuous starter cultures and metabolite production and also continuous
milk inoculation and prefermentation (Lacroix et al., 2005). Immobilized cell technology
and continuous fermentation offers many advantages compared to free cell cultures: high
cell density leading to high process productivity, reuse of biocatalysts, retention of cell
plasmids, improved resistance to contamination, stimulation of production and secretion of
secondary metabolites and physical and chemical protection of the cells (Lacroix et al.,
2005).
Continuous inoculation and prefermentation of milk using cell immobilization is
based on release of cells, actively growing in peripheral layers within gel beads. In this
system, pH in the bioreactor is controlled by incoming milk, and milk feed rate is directly
related to acidification activity. The high inoculation level of prefermented milk and the
high activity of released cells, which are in exponential growing phase, allow a time
reduction of subsequent acidification to pH 4.70 by up to 70% compared with batch
fermentation using classical inoculation for fresh cheese manufacture (Sodini-Gallot et al.,
1995).
Doleyres et al. (2004a) have recently shown that cell immobilization allowed
continuous production of mixed lactic starters containing a competitive (Lc. diacetylactis)
and a less competitive strain (Bifidobacterium longum) and that it was possible to control
strain ratio in the effluent by changing the fermentation temperature. In another work, they
also reported a large physiological adaptation of bacterial cells of these two strains released
102
from gel beads which became much more resistant to various environmental stresses
(Doleyres et al., 2004b).
In the present study, we hypothesized that cell immobilization and continuous
culture would result in stable fermentation of milk with functional mixed culture containing
antagonistic strains, especially through physiological adaptations of cells to environmental
stresses. The tested mixed culture contained two nisin-sensitive strains, an acidifying strain
(Lc. cremoris ATCC19257) and an EPS-producing strain (Lb. rhamnosus RW-9595M), and
a high nisin Z producer (Lc. diacetylactis UL719). The effect of temperature was examined
on microbial populations in prefermented milks from the continuous culture and fermented
milks obtained after an additional 22-h batch incubation of prefermented milks, used to
model a fresh cheese fermentation, and on metabolites production.
4.4 Materials and methods
4.4.1 Bacterial strains
Lactobacillus rhamnosus RW-9595M was used as EPS producer (Dupont et al.,
2000) and Lactococcus lactis subsp. lactis biovariant diacetylactis UL719, previously
isolated from raw goat milk cheese, was the nisin-producing strain (Meghrous et al. 1997).
Pediococcus acidilactici UL5 was used as indicator strain for nisin Z quantification. All
strains were obtained from the Lactic Acid Bacterial Research culture collection (Dairy
Research Centre STELA, University Laval, Quebec, QC, Canada), except Lactococcus
lactis subsp. cremoris ATCC19257 which was obtained from the American Type Culture
Collection (Manassas, VA, USA). Before use, cultures from the frozen stocks (-80°C) were
grown twice during 24 h in M17 broth (Difco, Detroit, MI, USA) at 30°C for lactococci and
MRS broth (Difco) at 30 and 37°C for P. acidilactici UL5 and Lb. rhamnosus RW-9595M,
respectively.
103
4.4.2 Chemicals
Continuous cultures were carried out with a commercial microfiltrated skim milk
(PurFiltre, Québec, QC, Canada) supplemented with 500 mg l-1 of MgSO4.7H20 and 50 mg
l-1 MnSO4.H20. These salts were previously shown to stimulate growth of Lb. rhamnosus
RW-9595M in whey permeate-based medium (Bergmaier et al., 2003) and acid production
in milk (data not shown). The κ-carrageenan Genugel X0909 (Copenhagen Pectin Co.,
Lille Skensvd, Denmark) and locust bean gum (Lygomme, 6HV, no. 425, Sanofi Bio-
Industries, Waukesha, WI, USA) were used for cell immobilization in polysaccharide gel
beads.
4.4.3 Cell immobilization procedure
Each strain was separately immobilized using a two-phase dispersion procedure, as
described by Lamboley et al. (1997). The κ-carrageenan and locust bean gum gel (2.75 and
0.25% (w/v), respectively) was inoculated at 2% (v/v) with an overnight pure culture,
incubated at 30°C in M17 for lactococci and at 37°C in MRS for Lb. rhamnosus RW-
9595M. Gel beads with diameters ranging from 1 to 2 mm were selected by wet sifting with
a 0.2 M KCl solution. To increase immobilized biomass, beads with pure culture of each
strain were first incubated separately at 30°C in M17 and at 37°C in MRS for lactococci
and Lb. rhamnosus RW-9595M, respectively, during two successive batches of 20 and 6 h,
with pH controlled at 6.0 using 6 N NaOH. The M17 and MRS medium were supplemented
with 50 g l-1 lactose and 0.2 M KCl to avoid sugar limitation and to maintain the integrity
of gel beads, respectively. Batch cultures were carried out in a 1-L bioreactor (Biogenie,
Ste-Foy, QC, Canada) with a bead inoculum of approximately 10% (v/v). After this
colonization step, immobilized biomass reached 3.16 ± 0.24x10¹⁰, 1.52 ± 0.15x10¹¹ and
7.23 ± 0.58x10¹⁰ cfu g-1 gel bead for Lc. cremoris ATCC19257, Lc. diacetylactis UL719
and Lb. rhamnosus RW-9595M, respectively.
104
4.4.4 Continuous prefermentation of milk
The continuous inoculation and prefermentation of milk was conducted as described
by Sodini-Gallot et al. (1995). The continuous culture was performed in a-custom-made
glass bioreactor with a useful volume of 100 ml and mixing with a magnetic bar at 120
rpm. The system was inoculated with 25-ml colonized gel beads from the three strains, with
a strain ratio of 1/1/1 (vol/vol). The pH was continuously maintained at 6.0 by inflow of
milk. Before entering the bioreactor, milk at 2°C was preheated at the set temperature by
immersion of the tubing in a water bath. The pH was measured with a pH electrode (Cole
Parmer, Labcor, Anjou, QC, Canada) connected to a personal computer which regulated
and recorded the feeding peristaltic pump flow rate through PID control software
(Biogénie, Ste-Foy, QC, Canada). A peristaltic pump outlet set at a higher flow rate than
the feeding pump was used to continuously withdraw prefermented milk. A stainless steel
screen was installed at the outlet tubing to retain beads and was periodically purged with
nitrogen to prevent mesh clogging by clotted milk and beads. The prefermented milk flow
rate was measured daily using a graduated cylinder.
At the end of each week, the continuous prefermentation was stopped. The beads
were stored in a solution of peptone 0.1%, 0.2 M KCl and 0.03 M citrate buffer at pH 5.6
and the bioreactor was washed (Sodini et al., 1997a). At the beginning of each week, the
storage solution was removed by pumping milk at a high flow rate (3 l h-1) for 20 min. The
prefermentation was then allowed to stabilize for 2 days, except for the second week for
which steady state conditions, indicated by a stable milk flow rate were obtained after 1
day. To evaluate the effect of storage conditions, prefermentation was stopped and restarted
with the same set temperature (i.e. 31°C). The two other tested temperatures (27 and 35°C)
were randomly applied and repeated 4 times over the 3-week experiment (Figure 4.1).
Temperature changes were performed daily and pseudo steady state conditions, indicated

105
by variations in dilution rate of less than 0.4 h-1 within 4 hours of continuous culture, were
obtained in less than 7 h. Three 200-ml samples of prefermented milk, for chemical and
microbial analyses and for batch fermentations, were taken at 30-min interval two hours
before changing the set point of continuous prefermentation.
4.4.5 Final fermentation of the prefermented milk Three prefermented milk samples of 100 ml were transferred into 150-ml
erlenmeyers which were placed into a water bath set at the prefermentation temperature.
The pH was recorded every minute during incubation for 22 hours (Biogénie software).
The changes of pH versus time were smoothed using a mobile mean over 20 points. The
first derivative was then calculated using a software written in Basic (Quick Basic Version
4.5, Microsoft) to estimate the following acidification parameters: maximal acidification
rate (Vmax), time and pH at which Vmax occurred (tmax and pHmax, respectively), time to
reach pH 5.25 (tpH 5.25) and final pH (pHF) (Lamboley et al., 1997). At the end of
acidification, samples were collected for chemical analyses and cell enumeration.
4.4.6 Cell enumeration
Cells populations in prefermented and fermented milks, and in gel beads were
enumerated using appropriate dilutions in peptone water 0.1% (w/v) plated in triplicate on
agar media. Enumeration of Lc. diacetylactis UL719 and Lb. rhamnosus RW-9595M was
performed on the differential KMK (Kempler and McKay, 1980) medium (Geneq Inc,
Montreal, QC, Canada) after incubation for 48 h at 30°C and on MRS agar after incubation
for 48 h at 45°C, respectively. On KMK medium, lactococcal subspecies were
differentiated by citrate utilization, and Lc. cremoris ATCC19257 and Lc. diacetylactis
UL719 gave white colonies and white colonies with blue centers, respectively. Lb.
rhamnosus RW-9595M did grow on this medium with the incubation conditions. However,
populations of Lc. cremoris ATCC19257 in effluent and fermented milk samples were at
low concentrations compared with Lc. diacetylactis UL719 and could not be detected on
KMK medium at the dilution used for this strain. Therefore, the population of Lc. cremoris

106
ATCC19257 was estimated using a real-time PCR method, as described by Grattepanche et
al. (2005b).
Extraction of immobilized populations from gel beads was performed using two
methods. For enumeration of Lc. diacetylactis UL719 and Lb. rhamnosus RW-9595M, a
bead sample of approximately 1.0 g, accurately weighed, was placed in 9 ml peptone water
0.1% (w/v) and treated with an Ultra-Turrax (Janke and Kunkel, IKA Laborte, Staufen,
Germany) for 1 min at 20 000 rpm in ice. The mixture was then diluted in peptone water
and plated on the appropriate medium. For Lc. cremoris ATCC19257 immobilized
population, approximately 0.5 g of gel beads, accurately weighed, was placed in a tube
containing 9.5 ml of water and held at 90°C with periodic vortexing until the gel was
completely dissolved. After centrifugation at 10,000 g at room temperature for 10 min, the
supernatant was discarded and the cell pellet washed twice with sterile water. The pellet
was then resuspended in 400 µl TES buffer (50 mM Tris-HCl, 1 mM EDTA, 6.7% sucrose,
pH 8.0) before DNA extraction and quantification by real-time PCR. Analyses were
performed in duplicate.
4.4.7 Quantification of nisin Z activity
Nisin Z in prefermented and fermented milk samples was extracted using the
method described by Fowler et al. (1975), except that the filtration step was not performed.
For nisin Z in gel beads, the method proposed by Desjardins et al. (2001) was used. Nisin Z
activity was determined by the agar diffusion assay using P. acidilactici UL5 as indicator
strain and purified nisin Z solutions with concentrations from 24 to 771 international units
(IU) per ml as standards. Pure nisin Z was extracted from an overnight culture of Lc.
diacetylactis UL719 in MRS and purified by immunoaffinity chromatography using anti-
nisin Z monoclonal antibodies, as described by Benech et al. (2002a). Analyses were
performed in triplicate.
107
4.4.8 Determination of nisin sensitivity
Sensitivity of Lb. rhamnosus RW-9595M to nisin Z was measured using the agar
diffusion bioassay. Samples of prefermented milk from day 1 and 22 were diluted in
peptone water to obtain a final cell concentration for Lb. rhamnosus RW-9595M of 106 cfu
ml-1. A 30-ml volume of MRS with 7.5 g l-1 agar at 45°C was then inoculated at 1%
(vol/vol) with the bacterial suspension. After solidification of agar, wells (6 mm in
diameter) were made and filled with 100 µl pure nisin Z solutions at concentrations varying
from 47 to 1288 IU ml-1. After plate incubation for 48 h at 45°C, inhibition zones were
measured and plotted as a function of the logarithm of nisin concentration. An overnight
culture of Lb. rhamnosus RW-9595M in MRS broth at 45°C from the frozen stock was
used as control. To test reversibility of nisin tolerance of Lb. rhamnosus RW-9595M cells,
prefermented milk samples at day 22 were subcultured eight times in MRS medium with a
1% inoculum and incubated at 45°C for 18 h. Reported data are means of triplicate
analyses.
4.4.9 Determination of EPS concentration A 4.5-ml sample of fermented milk was heated in a boiling water bath for 10 min to
inactivate bacteria and EPS-degrading enzymes. The proteins were digested using 500 µl
solution containing merthiolate 0.5% (w/v), SDS 5% (w/v) and 616 U pronase E (Roche
Diagnostics, Mannheim, Germany). After incubating for 20 h at 40°C, the mixture was held
in a boiling water bath for 10 min. Cells were removed by centrifugation at 4000 g, 4°C for
10 min and EPS were extracted from the supernatant using an ultrafiltration method, as
described by Bergmaier et al. (2001). The EPS concentration was determined as total
carbohydrate concentration in the retentate minus that of a final filtrate sample using the
phenol-sulfuric method (Dubois et al., 1956) and glucose solution as standards. Absorbance
at 490 nm was measured using a spectrophotometer (HP 8453 UV-Vis Spectrophotometer,
108
Hewlett Packard, Palo Alto, CA, USA). Extraction and quantification were performed in
triplicate.
4.4.10 Acidification capacity of Lc. diacetylactis UL719 and Lb. rhamnosus RW-9595M
Additional acidification tests were carried out in milk to compare the acidifying
capacity of Lc. diacetylactis UL719 and Lb. rhamnosus RW-9595M in prefermented milk
harvested at day 22 to that of control pure cultures. Cell concentrations of inoculum were
adjusted to those in prefermented milk samples. For control and prefermented milks at day
22, incubations were performed at 30 and 45°C for 48 h for Lc. diacetylactis UL719 and
Lb. rhamnosus RW-9595M, respectively. The change of pH with time was recorded and
analyzed as described before. Experiments were performed in duplicate.
4.4.11 Statistical analyses
Multiple regression (JMP In Software, SAS Institute, version 4, Cary, NC, USA)
was used to fit bacterial populations in prefermented and fermented milk, acidification
parameters and metabolite responses as a function of first and second order of temperature
(T) and age of prefermentation (A). The regression model equation for temperature
comprised between 27 and 35°C and age of prefermentation between 2 and 22 days was in
the form:
( ) εααααα +−++−++= 20201
2201000 )()(, AT xAAxTTATY
where Tx and Ax were means of temperature (31°C) and age of prefermentation
(11.57 days), respectively. Regression coefficients αij were interpreted as: intercept (α00),
linear and quadratic effects of temperature (α10 and α20, respectively) and linear and
quadratic effects of age of the prefermentation (α01 and α02, respectively), and ε was the
109
residual. The overall model significance was tested with the Fisher test. The Student’s t test
was used to test the significance of model coefficients. p values less than 0.05 for a 95%
confidence interval indicate statistically significant non-zero coefficient.
4.5 Results
4.5.1 Milk dilution rate The dilution rate of prefermented milk increased from 8.0 ± 1.1 to 12.5 ± 1.5 h-1
with an increase of temperature from 27 to 35°C. The prediction model for dilution rate
explained 80% of the total variation and was highly significant (p < 0.01). Analyses of
variance of the effects showed that only temperature factor was significant (p = 0.0011) on
milk dilution rate.
4.5.2 Microbial populations The immobilized population of Lc. diacetylactis UL719 remained stable at 10.72 ±
0.04 log cfu g-1 gel beads over the 3 weeks of continuous fermentation (Figure 4.1).
Populations of Lc. cremoris ATCC19257, estimated by RT-PCR, decreased by 1 log after 2
weeks and remained constant afterward. A decrease in immobilized cell population of Lb.
rhamnosus RW-9595M from 10.44 ± 0.04 to 9.28 ± 0.11 log cfu g-1 was only observed for
the first week (Figure 4.1).
In prefermented milk, the population of Lc. diacetylactis UL719 of 8.11 ± 0.12 log
cfu ml-1 was not significantly changed by age of prefermentation and temperature (Figure
4.1 and Table 4.1). The populations of Lc. cremoris ATCC19257, estimated by RT-PCR,
and Lb. rhamnosus RW-9595M in milk effluent decreased and increased, respectively, with
age of prefermentation time, whereas temperature showed no significant effect (p > 0.05)
(Figure 4.1 and Table 4.1). The model for these two strains was significant and explained
65 and 76 % of the total variation for Lc. cremoris ATCC19257 and Lb. rhamnosus RW-
95959M cell counts, respectively (Table 4.1). Figure 4.1 also shows the effects of covariate

110
age at 31°C on Lc. cremoris ATCC19257 and Lb. rhamnosus RW-95959M populations in
prefermented milk. The covariate models for these two populations indicate maximum
increase of ca. 1.80 log and decrease of ca. 1.90 log for Lb. rhamnosus RW-95959M and
Lc. cremoris ATCC19257, respectively, with age of prefermentation. The highest cell
counts measured for Lb. rhamnosus RW-9595M (7.85 ± 0.03 log cfu ml-1) was reached at
day 20 for the highest tested temperature of 35°C. The population of Lc. cremoris
ATCC19257 decreased by more than 3 log cfu ml-1 over the 3 week continuous
fermentation as indicated by values measured at day 2 and 22 which corresponded to the
same temperature of 31°C (Figure 4.1).
Figure 4.1 : Populations of Lc. cremoris ATCC19257 ( , ), Lc. diacetylactis UL719 ( , ) and Lb. rhamnosus RW-9595M ( , ) in gel beads (closed symbols) and prefermented milk (opened symbols) during continuous immobilized cell culture at different temperatures. For prefermented milk, data with more than 1 day interval corresponded to week-end interruptions. The dashed lines correspond to the effects of the age of prefermentation show on Lc. cremoris ATCC19257 ( ) and Lb. rhamnosus RW-9595M (----) cells counts predicted by the regression model for a temperature of 31°C. Bars represent standard deviations calculated from triplicate analyses.
31 27 35 27 31 31 35 27 35 31 31 35 27 31
Temperature (°C)

111
Tabl
e 4.
1 :
Reg
ress
ion
coef
ficie
nts
for
mod
els
for
bact
eria
l po
pula
tions
in
pref
erm
ente
d an
d fe
rmen
ted
milk
s as
fun
ctio
n of
te
mpe
ratu
re (T
) and
age
(A) o
f the
pre
ferm
enta
tion.
Lc. c
rem
oris
ATC
C19
257
Lc. d
iace
tyla
ctis
UL7
19
Lb. r
ham
nosu
s RW
-959
5M
Estim
ate
Std
Erro
r p
Estim
ate
Std
Erro
r p
Estim
ate
Std
Erro
r p
Inte
rcep
t 6.
3726
1.
8861
0.
0077
8.
5139
0.
3000
<
0.00
01
3.36
68
1.41
05
0.04
08
T -0
.012
8 1.
8650
0.
8308
-0
.012
3 0.
0094
0.
2214
0.
0799
0 0.
0440
0.
1029
T2
0.02
49
0.05
82
0.28
24
0.00
42
0.00
35
0.26
22
0.01
03
0.01
64
0.54
62
Age
-0
.099
0 0.
0218
0.
0043
-0
.003
5 0.
0042
0.
4328
0.
0815
0.
0198
0.
0026
A
ge2
0.00
47
0.00
48
0.35
42
<0.0
001
0.00
08
0.97
43
-0.0
095
0.00
36
0.02
75
Pref
erm
ente
d
milk
Mod
el
R 2
= 0.
65,
p =
0.03
39
R 2
= 0.
33,
p =
0.41
66
R 2
= 0.
76,
p =
0.00
70
Inte
rcep
t 13
.275
0 2.
4822
0.
0005
8.
3314
0.
4667
<
0.00
01
2.36
58
1.85
93
0.23
51
T -0
.203
5 0.
0775
0.
0275
0.
0193
0.
0146
0.
2180
0.
1221
0.
0380
0.
0447
T2
-0.0
700
0.02
90
0.03
87
-0.0
019
0.00
54
0.73
41
0.03
44
0.02
17
0.14
72
Age
-0
.210
6 0.
0348
0.
0002
-0
.005
7 0.
0065
0.
4100
0.
1341
0.
0261
0.
0006
A
ge2
-0.0
006
0.00
67
0.93
06
-0.0
009
0.00
12
0.47
69
-0.0
144
0.00
48
0.01
48
Ferm
ente
d
milk
Mod
el
R 2
= 0.
85,
p =
0.00
08
R 2
= 0.
29,
p =
0.49
52
R 2
= 0.
83,
p =
0.00
17
112
Similar changes were observed for each population in prefermented and fermented
milks (Figure 4.1 and Figure 4.2). Age of prefermentation and temperature had no
significant effects on cell counts of Lc. diacetylactis UL719 in fermented milk which were
about 0.67 ± 0.16 log cfu ml-1 higher than in prefermented milk (Table 4.1, Figure 4.2). For
Lc. cremoris ATCC19257 and Lb. rhamnosus RW-9595M, the model explained 85 and
83% of total variations and was highly significant with p value of 0.0008 and 0.0017,
respectively. Analyses of variance showed that age of prefermentation had a highly
significant linear effect on populations of these two strains in fermented milk and a
significant quadratic effect for Lb. rhamnosus RW-9595M population (Table 4.1), as also
illustrated in figure 2 for a temperature of 31°C. Cells counts for the two strains were more
affected by age of prefermentation in fermented than prefermented milks, with Lc. cremoris
ATCC19257 counts decreasing by ca. 4.20 log during the 22-day culture and Lb.
rhamnosus RW-9595M increasing by ca. 2.84 log between day 2 and 14 and decreasing
slightly thereafter (Figure 4.1 and Figure 4.2). Cell counts for Lc. cremoris ATCC19257
and Lb. rhamnosus RW-9595M were also significantly affected by temperature (Table 4.1).
In fermented milk, the highest population of Lb. rhamnosus RW-9595M, 9.13 ± 0.03 log
cfu ml-1, was reached at day 20 for 35°C. After 20 days, the population of Lc. cremoris
ATCC19257 in fermented milk was less than 2 log cfu ml-1 for all three temperatures. A
sharp decrease in cell counts for this strain was also observed at day 11, 13 and 20 when
fermentations were conducted at 35°C.
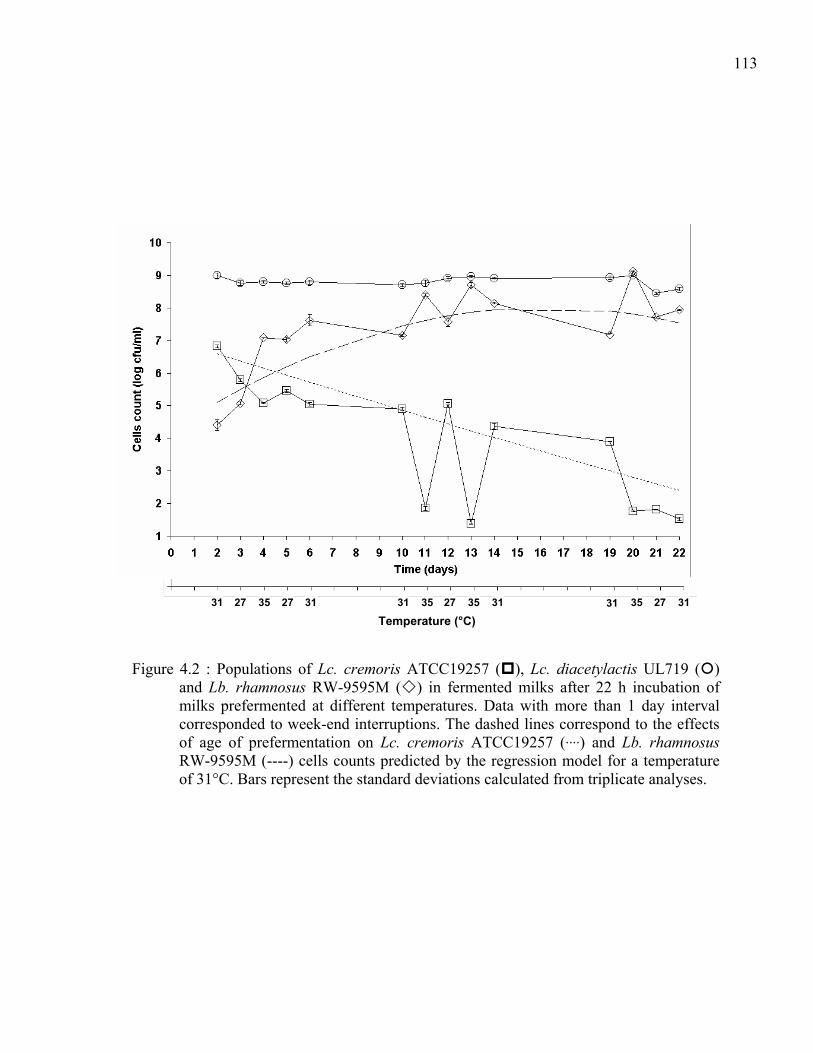
113
Figure 4.2 : Populations of Lc. cremoris ATCC19257 ( ), Lc. diacetylactis UL719 ( ) and Lb. rhamnosus RW-9595M ( ) in fermented milks after 22 h incubation of milks prefermented at different temperatures. Data with more than 1 day interval corresponded to week-end interruptions. The dashed lines correspond to the effects of age of prefermentation on Lc. cremoris ATCC19257 ( ) and Lb. rhamnosus RW-9595M (----) cells counts predicted by the regression model for a temperature of 31°C. Bars represent the standard deviations calculated from triplicate analyses.
31 27 35 27 31 31 35 27 35 31 31 35 27 31
Temperature (°C)
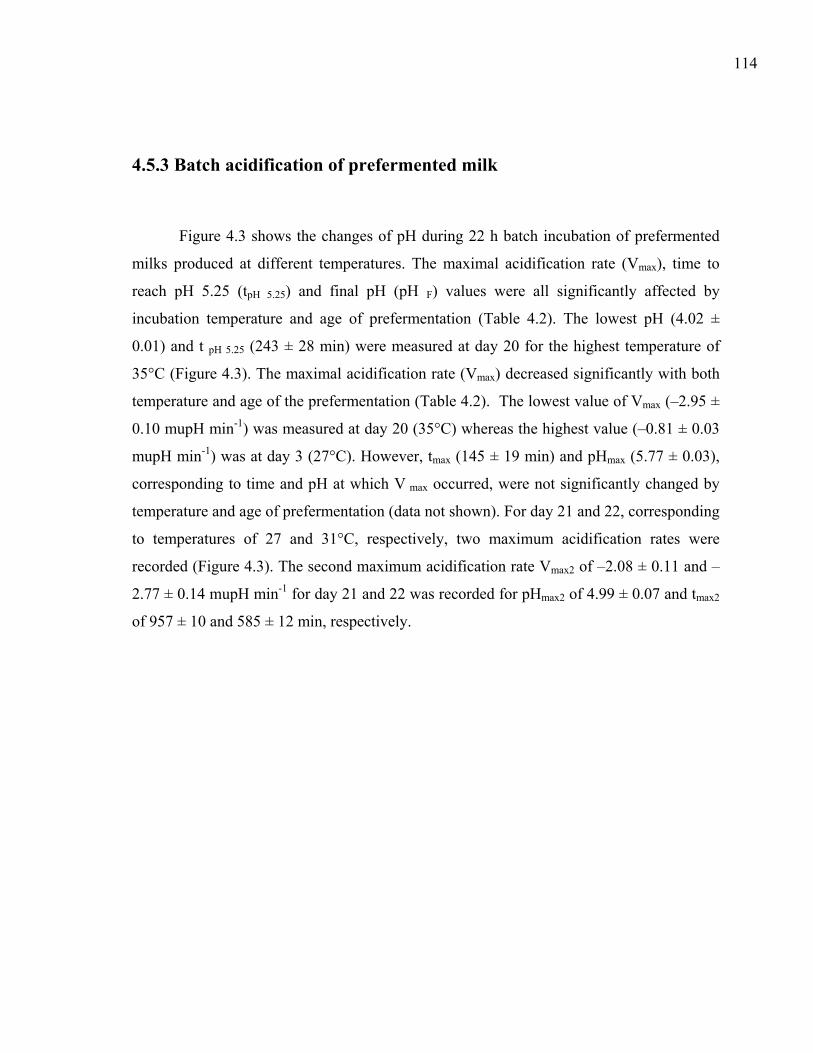
114
4.5.3 Batch acidification of prefermented milk
Figure 4.3 shows the changes of pH during 22 h batch incubation of prefermented
milks produced at different temperatures. The maximal acidification rate (Vmax), time to
reach pH 5.25 (tpH 5.25) and final pH (pH F) values were all significantly affected by
incubation temperature and age of prefermentation (Table 4.2). The lowest pH (4.02 ±
0.01) and t pH 5.25 (243 ± 28 min) were measured at day 20 for the highest temperature of
35°C (Figure 4.3). The maximal acidification rate (Vmax) decreased significantly with both
temperature and age of the prefermentation (Table 4.2). The lowest value of Vmax (–2.95 ±
0.10 mupH min-1) was measured at day 20 (35°C) whereas the highest value (–0.81 ± 0.03
mupH min-1) was at day 3 (27°C). However, tmax (145 ± 19 min) and pHmax (5.77 ± 0.03),
corresponding to time and pH at which V max occurred, were not significantly changed by
temperature and age of prefermentation (data not shown). For day 21 and 22, corresponding
to temperatures of 27 and 31°C, respectively, two maximum acidification rates were
recorded (Figure 4.3). The second maximum acidification rate Vmax2 of –2.08 ± 0.11 and –
2.77 ± 0.14 mupH min-1 for day 21 and 22 was recorded for pHmax2 of 4.99 ± 0.07 and tmax2
of 957 ± 10 and 585 ± 12 min, respectively.
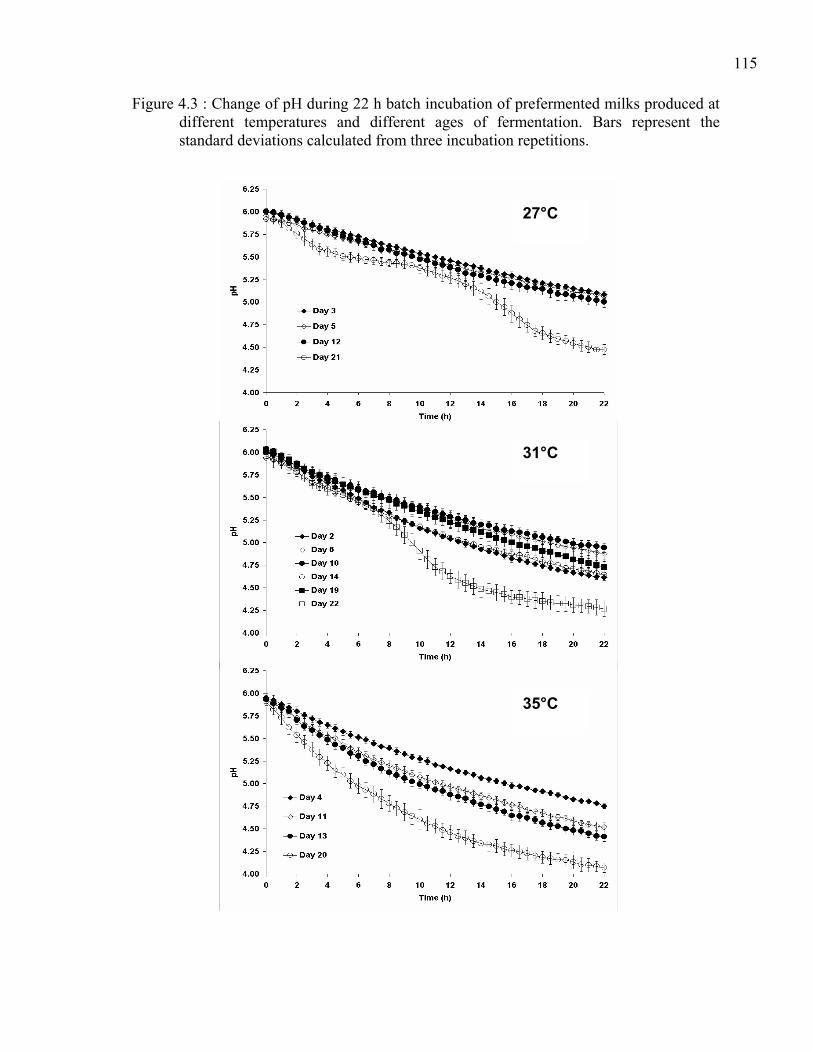
115
Figure 4.3 : Change of pH during 22 h batch incubation of prefermented milks produced at different temperatures and different ages of fermentation. Bars represent the standard deviations calculated from three incubation repetitions.
27°C
31°C
35°C
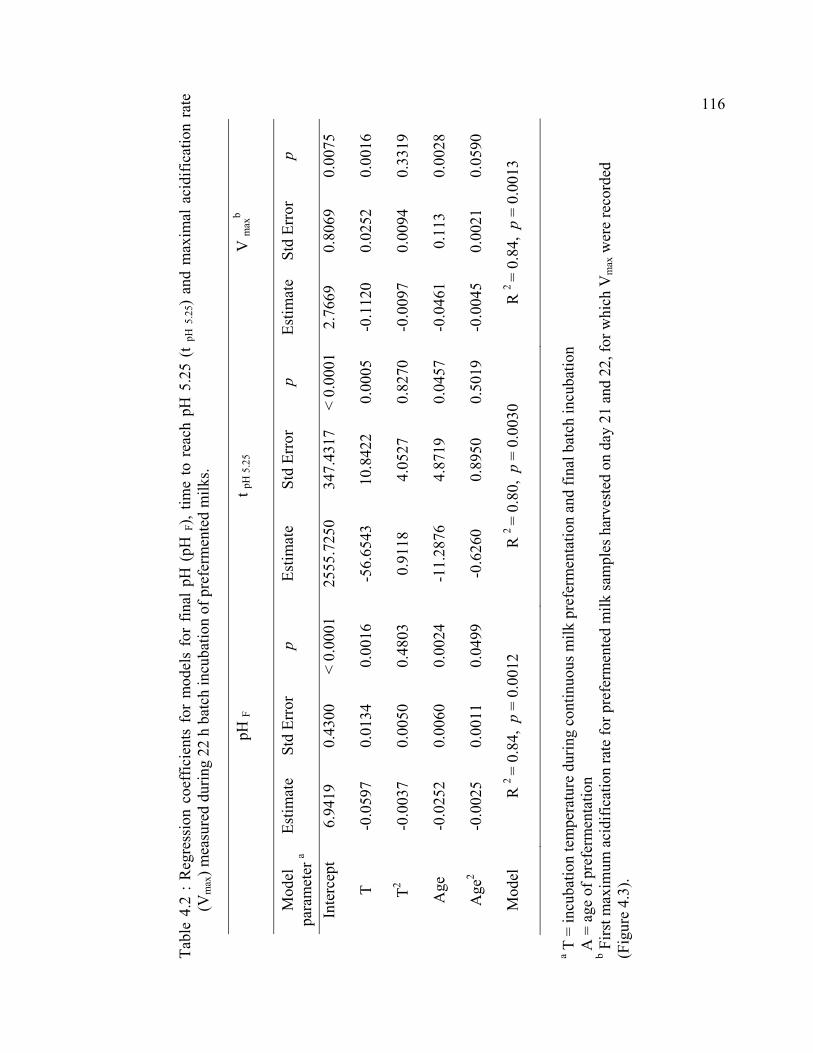
116
Tabl
e 4.
2 : R
egre
ssio
n co
effic
ient
s fo
r m
odel
s fo
r fin
al p
H (
pH F
), tim
e to
rea
ch p
H 5
.25
(t pH
5.2
5) a
nd m
axim
al a
cidi
ficat
ion
rate
(V
max
) mea
sure
d du
ring
22 h
bat
ch in
cuba
tion
of p
refe
rmen
ted
milk
s.
pH
F t p
H 5
.25
V m
axb
Mod
el
para
met
er a
Estim
ate
Std
Erro
r p
Estim
ate
Std
Erro
r p
Estim
ate
Std
Erro
r p
Inte
rcep
t 6.
9419
0.
4300
<
0.00
01
2555
.725
0 34
7.43
17
< 0.
0001
2.76
69
0.80
69
0.00
75
T -0
.059
7 0.
0134
0.
0016
-5
6.65
43
10.8
422
0.00
05
-0.1
120
0.02
52
0.00
16
T2 -0
.003
7 0.
0050
0.
4803
0.
9118
4.
0527
0.
8270
-0
.009
7 0.
0094
0.
3319
Age
-0
.025
2 0.
0060
0.
0024
-1
1.28
76
4.87
19
0.04
57
-0.0
461
0.11
3 0.
0028
Age
2 -0
.002
5 0.
0011
0.
0499
-0
.626
0 0.
8950
0.
5019
-0
.004
5 0.
0021
0.
0590
Mod
el
R 2
= 0.
84,
p =
0.00
12
R 2
= 0.
80,
p =
0.00
30
R 2
= 0.
84,
p =
0.00
13
a T =
incu
batio
n te
mpe
ratu
re d
urin
g co
ntin
uous
milk
pre
ferm
enta
tion
and
final
bat
ch in
cuba
tion
A =
age
of p
refe
rmen
tatio
n b F
irst m
axim
um a
cidi
ficat
ion
rate
for p
refe
rmen
ted
milk
sam
ples
har
vest
ed o
n da
y 21
and
22,
for w
hich
Vm
ax w
ere
reco
rded
(F
igur
e 4.
3).
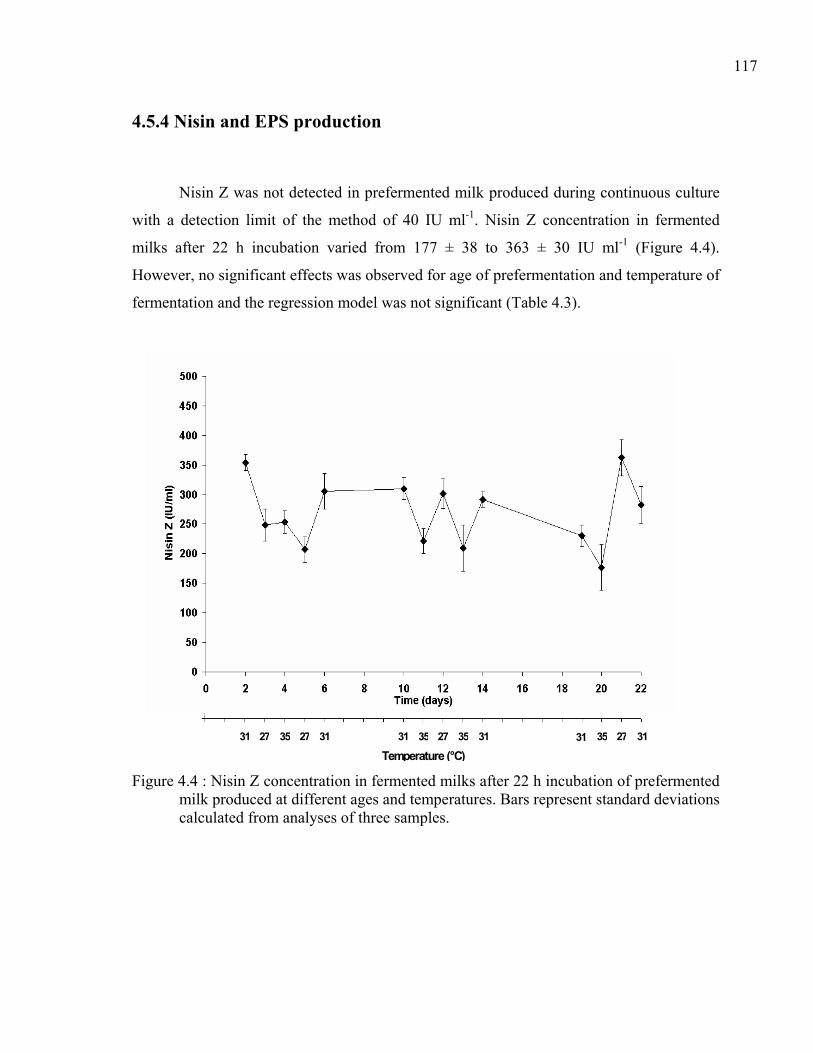
117
4.5.4 Nisin and EPS production
Nisin Z was not detected in prefermented milk produced during continuous culture
with a detection limit of the method of 40 IU ml-1. Nisin Z concentration in fermented
milks after 22 h incubation varied from 177 ± 38 to 363 ± 30 IU ml-1 (Figure 4.4).
However, no significant effects was observed for age of prefermentation and temperature of
fermentation and the regression model was not significant (Table 4.3).
Figure 4.4 : Nisin Z concentration in fermented milks after 22 h incubation of prefermented milk produced at different ages and temperatures. Bars represent standard deviations calculated from analyses of three samples.
31 27 35 27 31 31 35 27 35 31 31 35 27 31
Temperature (°C)
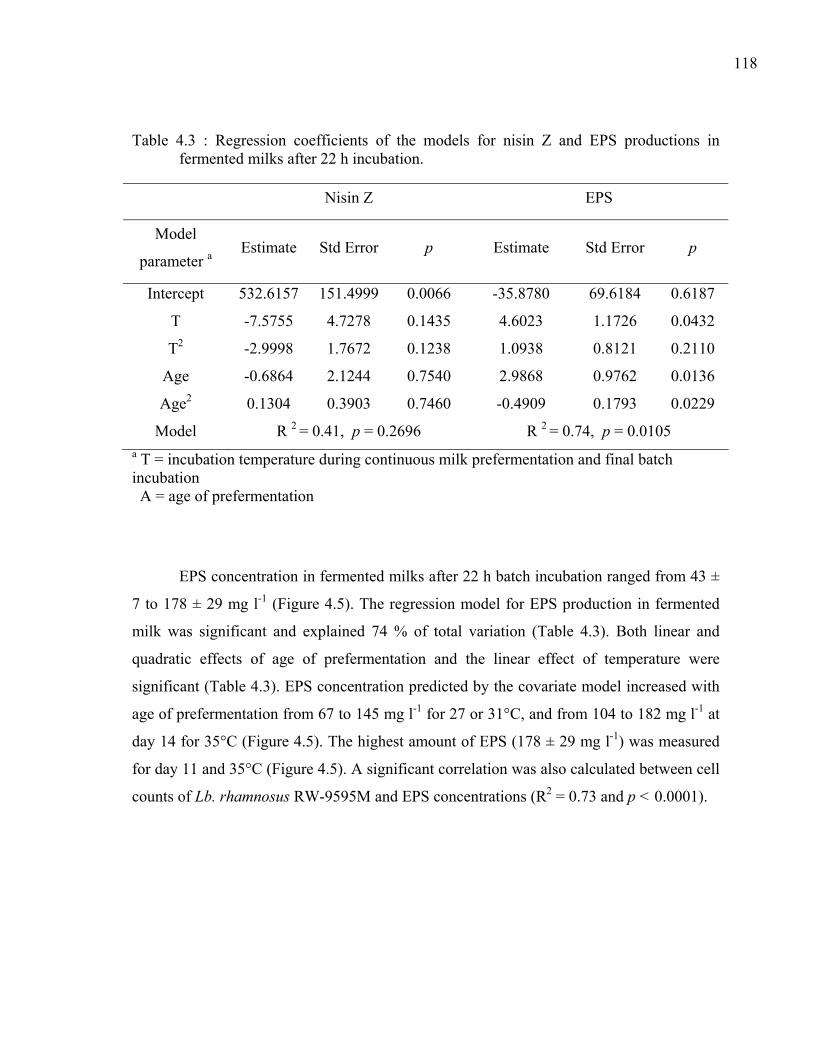
118
Table 4.3 : Regression coefficients of the models for nisin Z and EPS productions in fermented milks after 22 h incubation.
Nisin Z EPS
Model
parameter a Estimate Std Error p Estimate Std Error p
Intercept 532.6157 151.4999 0.0066 -35.8780 69.6184 0.6187
T -7.5755 4.7278 0.1435 4.6023 1.1726 0.0432
T2 -2.9998 1.7672 0.1238 1.0938 0.8121 0.2110
Age -0.6864 2.1244 0.7540 2.9868 0.9762 0.0136
Age2 0.1304 0.3903 0.7460 -0.4909 0.1793 0.0229
Model R 2 = 0.41, p = 0.2696 R 2 = 0.74, p = 0.0105 a T = incubation temperature during continuous milk prefermentation and final batch incubation A = age of prefermentation
EPS concentration in fermented milks after 22 h batch incubation ranged from 43 ±
7 to 178 ± 29 mg l-1 (Figure 4.5). The regression model for EPS production in fermented
milk was significant and explained 74 % of total variation (Table 4.3). Both linear and
quadratic effects of age of prefermentation and the linear effect of temperature were
significant (Table 4.3). EPS concentration predicted by the covariate model increased with
age of prefermentation from 67 to 145 mg l-1 for 27 or 31°C, and from 104 to 182 mg l-1 at
day 14 for 35°C (Figure 4.5). The highest amount of EPS (178 ± 29 mg l-1) was measured
for day 11 and 35°C (Figure 4.5). A significant correlation was also calculated between cell
counts of Lb. rhamnosus RW-9595M and EPS concentrations (R2 = 0.73 and p < 0.0001).
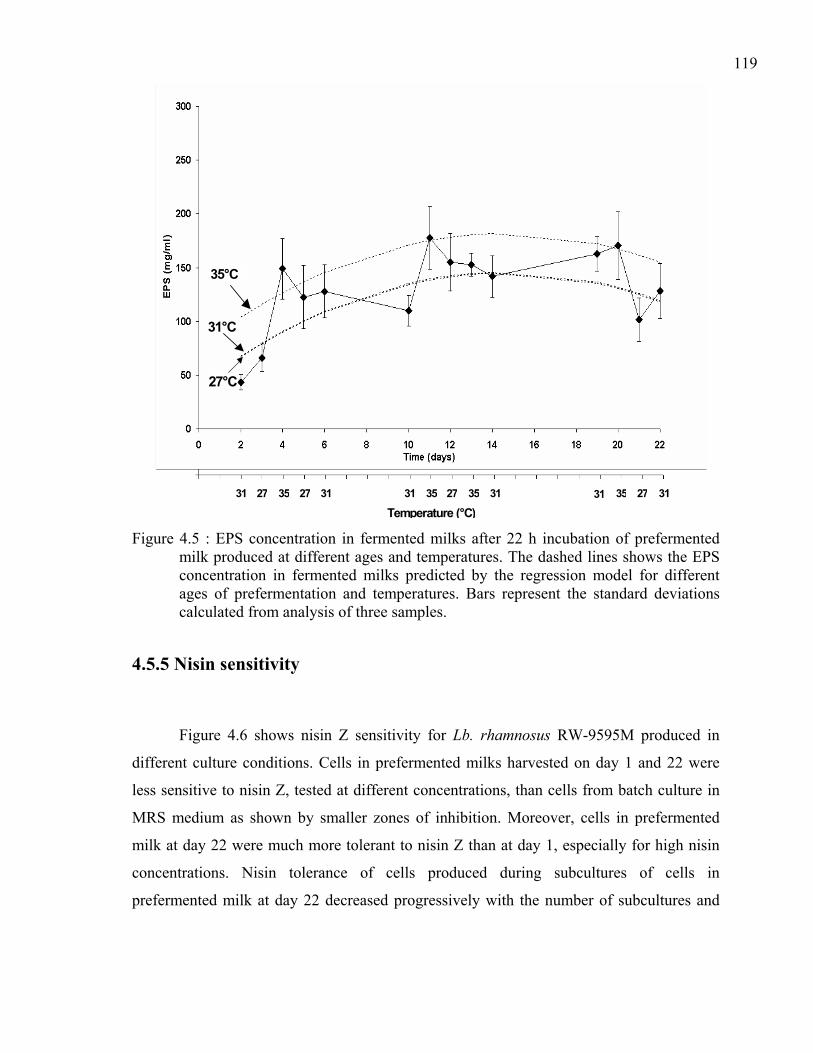
119
Figure 4.5 : EPS concentration in fermented milks after 22 h incubation of prefermented milk produced at different ages and temperatures. The dashed lines shows the EPS concentration in fermented milks predicted by the regression model for different ages of prefermentation and temperatures. Bars represent the standard deviations calculated from analysis of three samples.
4.5.5 Nisin sensitivity
Figure 4.6 shows nisin Z sensitivity for Lb. rhamnosus RW-9595M produced in
different culture conditions. Cells in prefermented milks harvested on day 1 and 22 were
less sensitive to nisin Z, tested at different concentrations, than cells from batch culture in
MRS medium as shown by smaller zones of inhibition. Moreover, cells in prefermented
milk at day 22 were much more tolerant to nisin Z than at day 1, especially for high nisin
concentrations. Nisin tolerance of cells produced during subcultures of cells in
prefermented milk at day 22 decreased progressively with the number of subcultures and
31 27 35 27 31 31 35 27 35 31 31 35 27 31
Temperature (°C)
35°C
27°C
31°C
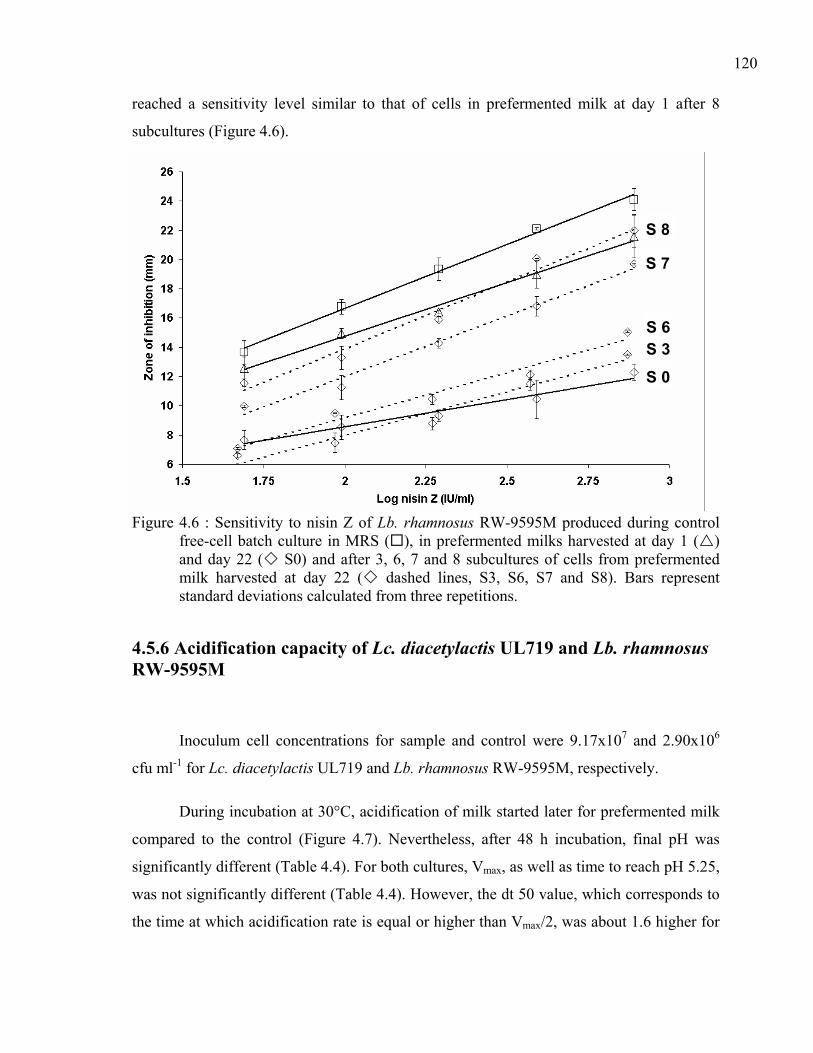
120
reached a sensitivity level similar to that of cells in prefermented milk at day 1 after 8
subcultures (Figure 4.6).
Figure 4.6 : Sensitivity to nisin Z of Lb. rhamnosus RW-9595M produced during control free-cell batch culture in MRS ( ), in prefermented milks harvested at day 1 ( ) and day 22 ( S0) and after 3, 6, 7 and 8 subcultures of cells from prefermented milk harvested at day 22 ( dashed lines, S3, S6, S7 and S8). Bars represent standard deviations calculated from three repetitions.
4.5.6 Acidification capacity of Lc. diacetylactis UL719 and Lb. rhamnosus RW-9595M
Inoculum cell concentrations for sample and control were 9.17x10⁷ and 2.90x10⁶
cfu ml-1 for Lc. diacetylactis UL719 and Lb. rhamnosus RW-9595M, respectively.
During incubation at 30°C, acidification of milk started later for prefermented milk
compared to the control (Figure 4.7). Nevertheless, after 48 h incubation, final pH was
significantly different (Table 4.4). For both cultures, Vmax, as well as time to reach pH 5.25,
was not significantly different (Table 4.4). However, the dt 50 value, which corresponds to
the time at which acidification rate is equal or higher than Vmax/2, was about 1.6 higher for
S 0
S 3S 6
S 8
S 7
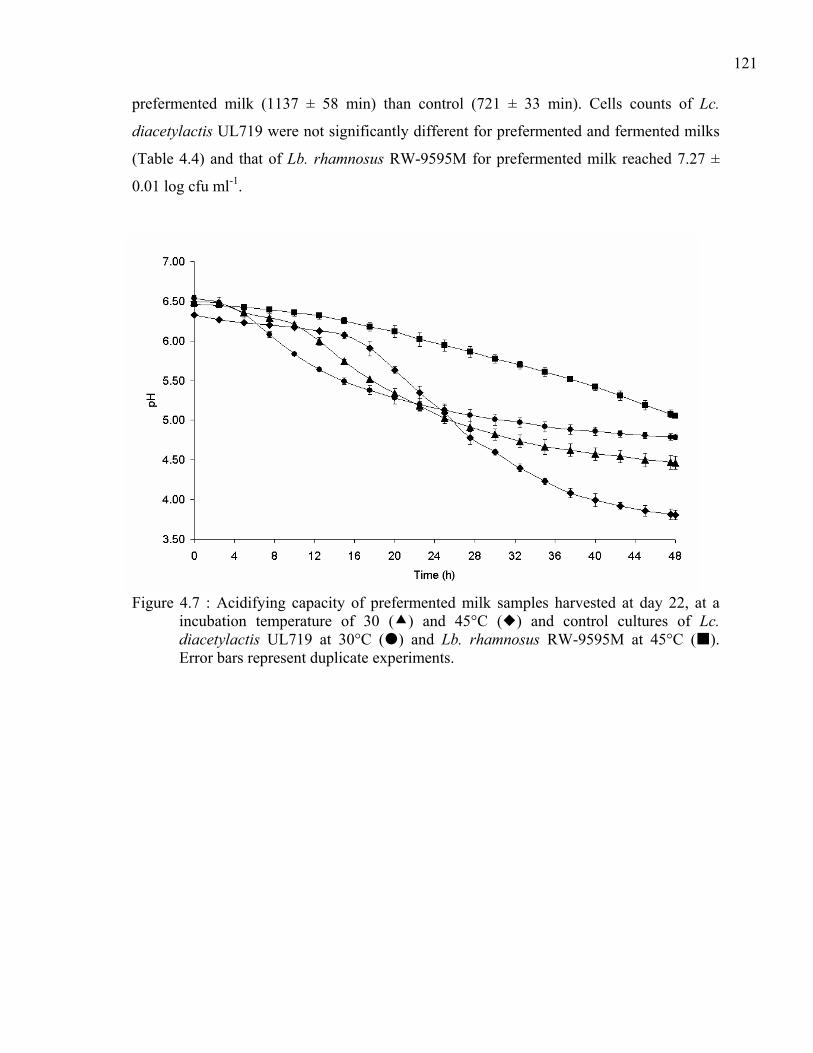
121
prefermented milk (1137 ± 58 min) than control (721 ± 33 min). Cells counts of Lc.
diacetylactis UL719 were not significantly different for prefermented and fermented milks
(Table 4.4) and that of Lb. rhamnosus RW-9595M for prefermented milk reached 7.27 ±
0.01 log cfu ml-1.
Figure 4.7 : Acidifying capacity of prefermented milk samples harvested at day 22, at a incubation temperature of 30 ( ) and 45°C ( ) and control cultures of Lc. diacetylactis UL719 at 30°C ( ) and Lb. rhamnosus RW-9595M at 45°C ( ). Error bars represent duplicate experiments.

122
Tabl
e 4.
4 : A
cidi
ficat
ion
para
met
ers
and
cells
cou
nts
afte
r 48
h in
cuba
tion
at 3
0 an
d 45
°C o
f pre
ferm
ente
d m
ilk s
ampl
es h
arve
sted
at
day
22 a
nd c
ontro
l pur
e cu
lture
s of
Lc.
dia
cety
lact
is U
L719
and
Lb.
rha
mno
sus
RW
-959
5M. R
epor
ted
data
are
mea
ns a
nd
stan
dard
dev
iatio
ns o
f dup
licat
e ex
perim
ents
.
Cel
l cou
nts (
log
cfu/
ml)
Aci
dific
atio
n pa
ram
eter
s
Lc. d
iace
tyla
ctis
U
L719
Lb
. rha
mno
sus
RW
-959
5M
pH F
t pH
5.2
5 (m
in)
V m
ax
(mup
H/m
in)
Con
trol
8.12
± 0
.04
a N
A 4.
79 ±
0.0
4 d
1305
± 1
36 h
-1
.55
± 0.
13 j
Incu
batio
n
at 3
0°C
Sa
mpl
e 8.
03 ±
0.0
4 a
7.27
± 0
.01
b 4.
47 ±
0.0
8 e
1310
± 4
6 h
-1.5
1 ±
0.14
j
Con
trol
NA
8.80
± 0
.05
c 5.
06 ±
0.0
3 f
2624
± 1
91 i
-0.8
7 ±
0.08
kIn
cuba
tion
at
45°
C
Sam
ple
ND
8.
77 ±
0.0
9 c
3.86
± 0
.06
g 14
26 ±
97
h -1
.82
± 0.
17 l
D
ata
with
out a
com
mon
lette
r are
sign
ifica
ntly
diff
eren
t usi
ng a
stud
ent’s
t te
st a
t p
= 0.
05
NA
: con
trol w
as p
erfo
rmed
with
pur
e cu
lture
N
D :
not d
etec
ted
at th
e de
tect
ion
limit
of 1
00 c
fu/m
l for
the
enum
erat
ion
met
hod.
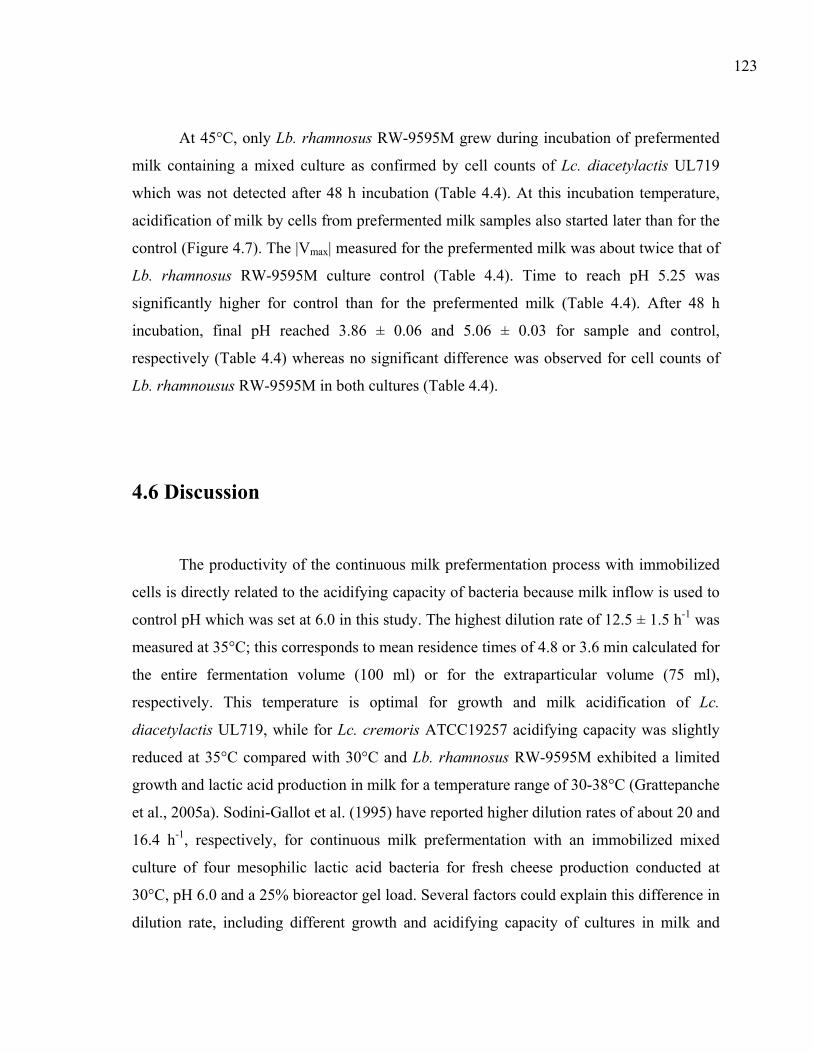
123
At 45°C, only Lb. rhamnosus RW-9595M grew during incubation of prefermented
milk containing a mixed culture as confirmed by cell counts of Lc. diacetylactis UL719
which was not detected after 48 h incubation (Table 4.4). At this incubation temperature,
acidification of milk by cells from prefermented milk samples also started later than for the
control (Figure 4.7). The |Vmax| measured for the prefermented milk was about twice that of
Lb. rhamnosus RW-9595M culture control (Table 4.4). Time to reach pH 5.25 was
significantly higher for control than for the prefermented milk (Table 4.4). After 48 h
incubation, final pH reached 3.86 ± 0.06 and 5.06 ± 0.03 for sample and control,
respectively (Table 4.4) whereas no significant difference was observed for cell counts of
Lb. rhamnousus RW-9595M in both cultures (Table 4.4).
4.6 Discussion
The productivity of the continuous milk prefermentation process with immobilized
cells is directly related to the acidifying capacity of bacteria because milk inflow is used to
control pH which was set at 6.0 in this study. The highest dilution rate of 12.5 ± 1.5 h-1 was
measured at 35°C; this corresponds to mean residence times of 4.8 or 3.6 min calculated for
the entire fermentation volume (100 ml) or for the extraparticular volume (75 ml),
respectively. This temperature is optimal for growth and milk acidification of Lc.
diacetylactis UL719, while for Lc. cremoris ATCC19257 acidifying capacity was slightly
reduced at 35°C compared with 30°C and Lb. rhamnosus RW-9595M exhibited a limited
growth and lactic acid production in milk for a temperature range of 30-38°C (Grattepanche
et al., 2005a). Sodini-Gallot et al. (1995) have reported higher dilution rates of about 20 and
16.4 h-1, respectively, for continuous milk prefermentation with an immobilized mixed
culture of four mesophilic lactic acid bacteria for fresh cheese production conducted at
30°C, pH 6.0 and a 25% bioreactor gel load. Several factors could explain this difference in
dilution rate, including different growth and acidifying capacity of cultures in milk and
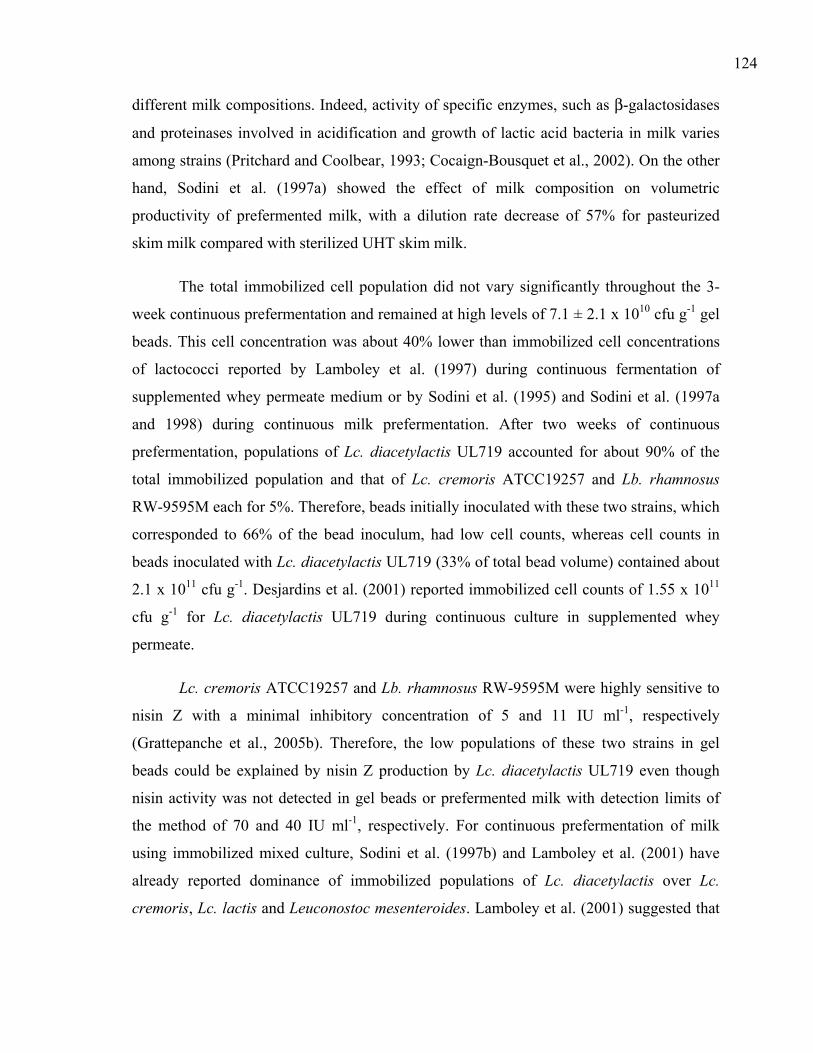
124
different milk compositions. Indeed, activity of specific enzymes, such as β-galactosidases
and proteinases involved in acidification and growth of lactic acid bacteria in milk varies
among strains (Pritchard and Coolbear, 1993; Cocaign-Bousquet et al., 2002). On the other
hand, Sodini et al. (1997a) showed the effect of milk composition on volumetric
productivity of prefermented milk, with a dilution rate decrease of 57% for pasteurized
skim milk compared with sterilized UHT skim milk.
The total immobilized cell population did not vary significantly throughout the 3-
week continuous prefermentation and remained at high levels of 7.1 ± 2.1 x 10¹⁰ cfu g-1 gel
beads. This cell concentration was about 40% lower than immobilized cell concentrations
of lactococci reported by Lamboley et al. (1997) during continuous fermentation of
supplemented whey permeate medium or by Sodini et al. (1995) and Sodini et al. (1997a
and 1998) during continuous milk prefermentation. After two weeks of continuous
prefermentation, populations of Lc. diacetylactis UL719 accounted for about 90% of the
total immobilized population and that of Lc. cremoris ATCC19257 and Lb. rhamnosus
RW-9595M each for 5%. Therefore, beads initially inoculated with these two strains, which
corresponded to 66% of the bead inoculum, had low cell counts, whereas cell counts in
beads inoculated with Lc. diacetylactis UL719 (33% of total bead volume) contained about
2.1 x 10¹¹ cfu g-1. Desjardins et al. (2001) reported immobilized cell counts of 1.55 x 10¹¹
cfu g-1 for Lc. diacetylactis UL719 during continuous culture in supplemented whey
permeate.
Lc. cremoris ATCC19257 and Lb. rhamnosus RW-9595M were highly sensitive to
nisin Z with a minimal inhibitory concentration of 5 and 11 IU ml-1, respectively
(Grattepanche et al., 2005b). Therefore, the low populations of these two strains in gel
beads could be explained by nisin Z production by Lc. diacetylactis UL719 even though
nisin activity was not detected in gel beads or prefermented milk with detection limits of
the method of 70 and 40 IU ml-1, respectively. For continuous prefermentation of milk
using immobilized mixed culture, Sodini et al. (1997b) and Lamboley et al. (2001) have
already reported dominance of immobilized populations of Lc. diacetylactis over Lc.
cremoris, Lc. lactis and Leuconostoc mesenteroides. Lamboley et al. (2001) suggested that
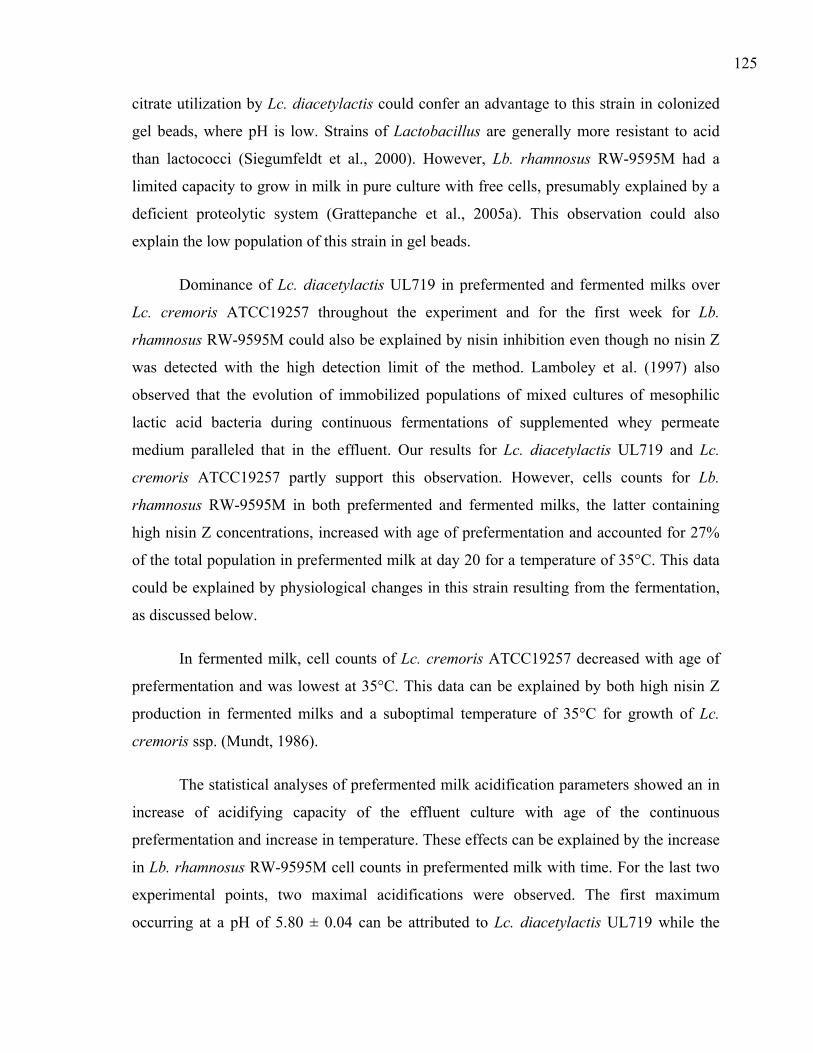
125
citrate utilization by Lc. diacetylactis could confer an advantage to this strain in colonized
gel beads, where pH is low. Strains of Lactobacillus are generally more resistant to acid
than lactococci (Siegumfeldt et al., 2000). However, Lb. rhamnosus RW-9595M had a
limited capacity to grow in milk in pure culture with free cells, presumably explained by a
deficient proteolytic system (Grattepanche et al., 2005a). This observation could also
explain the low population of this strain in gel beads.
Dominance of Lc. diacetylactis UL719 in prefermented and fermented milks over
Lc. cremoris ATCC19257 throughout the experiment and for the first week for Lb.
rhamnosus RW-9595M could also be explained by nisin inhibition even though no nisin Z
was detected with the high detection limit of the method. Lamboley et al. (1997) also
observed that the evolution of immobilized populations of mixed cultures of mesophilic
lactic acid bacteria during continuous fermentations of supplemented whey permeate
medium paralleled that in the effluent. Our results for Lc. diacetylactis UL719 and Lc.
cremoris ATCC19257 partly support this observation. However, cells counts for Lb.
rhamnosus RW-9595M in both prefermented and fermented milks, the latter containing
high nisin Z concentrations, increased with age of prefermentation and accounted for 27%
of the total population in prefermented milk at day 20 for a temperature of 35°C. This data
could be explained by physiological changes in this strain resulting from the fermentation,
as discussed below.
In fermented milk, cell counts of Lc. cremoris ATCC19257 decreased with age of
prefermentation and was lowest at 35°C. This data can be explained by both high nisin Z
production in fermented milks and a suboptimal temperature of 35°C for growth of Lc.
cremoris ssp. (Mundt, 1986).
The statistical analyses of prefermented milk acidification parameters showed an in
increase of acidifying capacity of the effluent culture with age of the continuous
prefermentation and increase in temperature. These effects can be explained by the increase
in Lb. rhamnosus RW-9595M cell counts in prefermented milk with time. For the last two
experimental points, two maximal acidifications were observed. The first maximum
occurring at a pH of 5.80 ± 0.04 can be attributed to Lc. diacetylactis UL719 while the
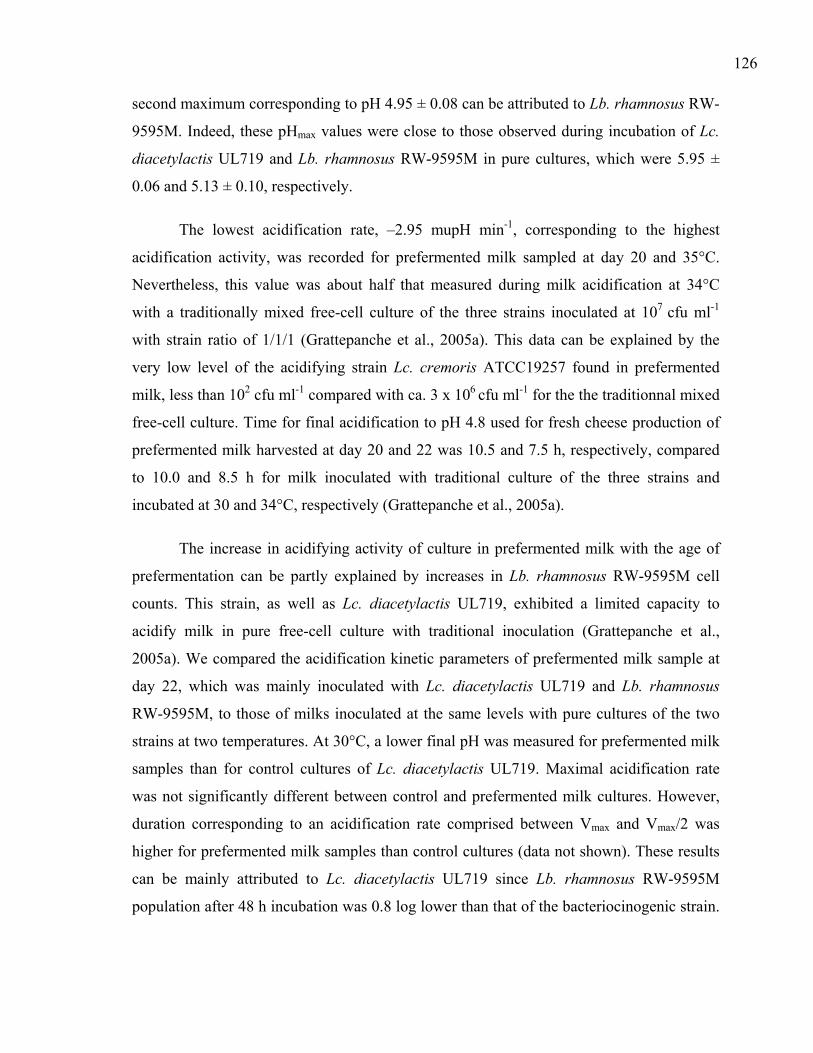
126
second maximum corresponding to pH 4.95 ± 0.08 can be attributed to Lb. rhamnosus RW-
9595M. Indeed, these pHmax values were close to those observed during incubation of Lc.
diacetylactis UL719 and Lb. rhamnosus RW-9595M in pure cultures, which were 5.95 ±
0.06 and 5.13 ± 0.10, respectively.
The lowest acidification rate, –2.95 mupH min-1, corresponding to the highest
acidification activity, was recorded for prefermented milk sampled at day 20 and 35°C.
Nevertheless, this value was about half that measured during milk acidification at 34°C
with a traditionally mixed free-cell culture of the three strains inoculated at 107 cfu ml-1
with strain ratio of 1/1/1 (Grattepanche et al., 2005a). This data can be explained by the
very low level of the acidifying strain Lc. cremoris ATCC19257 found in prefermented
milk, less than 102 cfu ml-1 compared with ca. 3 x 10⁶ cfu ml-1 for the the traditionnal mixed
free-cell culture. Time for final acidification to pH 4.8 used for fresh cheese production of
prefermented milk harvested at day 20 and 22 was 10.5 and 7.5 h, respectively, compared
to 10.0 and 8.5 h for milk inoculated with traditional culture of the three strains and
incubated at 30 and 34°C, respectively (Grattepanche et al., 2005a).
The increase in acidifying activity of culture in prefermented milk with the age of
prefermentation can be partly explained by increases in Lb. rhamnosus RW-9595M cell
counts. This strain, as well as Lc. diacetylactis UL719, exhibited a limited capacity to
acidify milk in pure free-cell culture with traditional inoculation (Grattepanche et al.,
2005a). We compared the acidification kinetic parameters of prefermented milk sample at
day 22, which was mainly inoculated with Lc. diacetylactis UL719 and Lb. rhamnosus
RW-9595M, to those of milks inoculated at the same levels with pure cultures of the two
strains at two temperatures. At 30°C, a lower final pH was measured for prefermented milk
samples than for control cultures of Lc. diacetylactis UL719. Maximal acidification rate
was not significantly different between control and prefermented milk cultures. However,
duration corresponding to an acidification rate comprised between Vmax and Vmax/2 was
higher for prefermented milk samples than control cultures (data not shown). These results
can be mainly attributed to Lc. diacetylactis UL719 since Lb. rhamnosus RW-9595M
population after 48 h incubation was 0.8 log lower than that of the bacteriocinogenic strain.
127
At 45°C, Lc. diacetylactis UL719 was not able to grow and the large differences observed
for acidification parameters between prefermented milk samples and control cultures of Lb.
rhamnosus RW-9595 can only be explained by physiological modifications occurring
during continuous prefermentation with immobilized cells. A shift in metabolism from
homo- to heterofermentative resulting in a decrease of lactic acid yields has been reported
during repeated-batch fermentation of chemically semi-defined medium for lactic acid
production by an immobilized culture of Lb. plantarum (Krishnan et al., 2001). Lamboley
et al. (1999) showed that the acidifying activity of a mesophilic lactic starter during
continuous fermentation of whey permeate in a immobilized cell reactor increased with
time of fermentation. These authors suggested that this observation was the result of an
increase in the immobilized population of Lc. diacetylactis strain and change in culture
composition with time. In the present study, the effects of cell immobilization and
continuous fermentation on acidification parameters of Lc. diacetylactis UL719 and Lb.
rhamnosus RW-9595M were clearly showed.
Nisin Z and EPS production in fermented milk were related to cell concentrations of
the producers organisms measured after 22-h batch incubation. Nisin Z production by Lc.
diacetylactis UL719 was shown to be growth-associated (Amiali et al., 1998). As for nisin
Z production, cell counts of Lc. diacetylactis UL719 in fermented milk were not
significantly affected by age of prefermentation and temperature. The amount of nisin Z
tested in fermented milk (177-363 IU ml-1) is in the range recommended to control spoilage
microorganisms (Roberts and Zottola, 1993). In prefermented milk, nisin Z was not
detected due to the high detection limit of the activity test and the very short mean
residence time of milk in the continuous reactor.
EPS production in fermented milks was correlated with cell counts of Lb.
rhamnosus RW-9595M, as also observed by Bergmaier et al. (2005) with free-cell
chemostat culture of the strain in supplemented whey permeate. The amount of EPS in
milks fermented at 35°C, averaging 165 ± 26 mg l-1, was similar to that reported by Dupont
et al. (2000) during milk acidification with Lb. rhamnosus RW-9595M for 21 h at 37°C,
and by Doleyres et al. (2005) for yogurt manufacture and 3.5 fold higher than for milk
128
inoculated with traditional mixed culture and incubated at 34°C (Grattepanche et al.,
2005a).
In a previous study, we showed that Lb. rhamnosus RW-9595M was inhibited
during batch fermentations of milk with mixed culture due to nisin Z production by Lc.
diacetylactis UL719 and that the strain was highly sensitive to low concentrations of nisin
Z (Grattepanche et al., 2005a and 2005b). However in the present work, cell counts of Lb.
rhamnosus RW-9595M in fermented milks largely increased with age of prefermentation
even though high nisin Z concentrations (> 177 IU ml-1) were produced. Cells of Lb.
rhamnosus RW-9595M in prefermented milk at day 22 were much more tolerant to nisin Z
than cells produced at day 1 or during control free cell culture, with respective inhibition
zones of 9.5, 16.3 and 18.8 mm for a nisin Z concentration of 177 IU ml-1. This increase in
nisin Z tolerance was also more pronounced for high bacteriocin concentrations and shown
to be progressively reversible. After 8 subcultures of cells in prefermented milk produced at
day 22, the cells retrieved the sensitivity level of cells in prefermented milk at day 1.
Doleyres et al. (2004b) previously reported that cell immobilization and continuous
fermentation increased tolerance of Bifidobacterium longum and Lc. diacetylactis strains to
different environmental stresses including nisin, antibiotics, H2O2 and simulated gastric and
intestinal juices. These authors suggested that conditions occurring in gel beads such as
limited diffusion of substrate and inhibitory products, leading to a steep pH gradient and
quorum-sensing can induce a non-specific stress adaptation of immobilized cells. Recently,
several proteomic and transcriptomic studies have shown that cell immobilization induced
or repressed gene expression involved at all cellular levels: membrane, metabolism, DNA
replication, transcription, translation and elongation factors, motility, adaptation,
protection, protein folding and nucleotide biosynthesis (Donlan, 2002; Junter and Jouenne,
2004).
Continuous prefermentation of milk with immobilized cells allowed high
inoculation levels with nisin-sensitive strain Lb. rhamnosus RW-9595M and increased its
tolerance to the bacteriocin, leading to an enhanced amount of EPS in fermented milk
compared with traditional inoculation of milk. Moreover, it was possible to control the

129
population of Lb. rhamnosus RW-9595M in fermented milk by changing the incubation
temperature. Lc. diacetylactis UL719 cell count and nisin production were high in
fermented milk throughout the 22-day continuous fermentation. The volumetric
productivity of the system could probably be improved by using an acidifying strain
showing higher nisin Z tolerance than Lc. cremoris ATCC19257 or by selecting a nisin-
tolerant subpopulation of this culture. We showed that cell immobilization and continuous
fermentation lead to large improvements in acidification parameters for Lb. rhamnosus
RW-9595M cells and to a lesser extent for Lc. diacetylactis UL719, allowing the
production of fermented milk containing EPS and nisin Z at concentrations that are relevant
for influencing texture and controlling bacterial contaminants.
4.7 Acknowledgments
The authors wish to thank the Natural Sciences and Engineering Research Council
of Canada (Research Partnerships Program – Research Network on Lactic Acid Bacteria),
Agriculture and Agri-Food Canada, Novalait Inc., Dairy Farmers of Canada and Institut
Rosell Inc. for financial support.

130
Chapitre 5. Conclusion générale
131
L'hypothèse de travail de ce projet était la suivante : "l'utilisation de la technologie
des cellules immobilisées associée à une préfermentation en continu, permet une
inoculation massive et contrôlée du lait par une culture mixte composée d'un mélange de
bactéries fonctionnelles et éventuellement antagonistes, conduisant à un lait fermenté,
obtenu après une incubation additionnelle du lait préfermenté, aux caractéristiques
fonctionnelles améliorées".
Le premier objectif consistait à développer une méthode suffisamment sensible et
spécifique pour quantifier une population de Lc. cremoris en culture mixte avec Lc.
diacetylactis et Lb. rhamnosus dans un lait fermenté. La technique de PCR en temps réel
mise au point dans ce projet a rempli cet objectif. La limite de détection est de 200 cellules
par ml de lait et la zone de linéarité de la méthode s'étend sur plus de 5 logarithmes. De
plus, l'absence de produit d'amplification non spécifique lorsque les échantillons de lait
fermenté contenaient une faible proportion de Lc. cremoris comparativement à la souche de
la même espèce, Lc. diacetylactis, et de Lb. rhamnosus, démontre la très bonne spécificité
de la méthode. Cette technique fut par la suite utilisée en routine et adaptée pour quantifier
une population immobilisée de Lc. cremoris dans des billes de gel.
Durant les fermentations en batch du lait avec des cultures pures en cellules libres et
inoculée de façon traditionnelle, nous avons mis en évidence le caractère très acidifiant de
la souche de Lc. cremoris comparativement aux deux autres souches Lc. diacetylactis et Lb.
rhamnosus. En culture mixte, la production de nisine par Lc. diacetylactis entraîne une
diminution très significative des populations de Lc. cremoris et Lb. rhamnosus en fin de
fermentation. Toutefois, le temps de fermentation pour atteindre un pH de 4.8 n'est pas
négativement affecté par la présence de la souche nisinogène dans la culture mixte. De plus,
la production de nisine et la concentration cellulaire de Lc. diacetylactis augmentent pour
les cultures mixtes comparativement aux cultures pures de cette souche. Ceci peut
132
s'expliquer par un phénomène de commensalisme qui résulte de la forte activité autolytique
de Lc. cremoris et d'une lyse cellulaire de Lb. rhamnosus induite par la nisine, libérant ainsi
dans le milieu des facteurs stimulant la croissance de Lc. diacetylactis. La production
d'exopolysaccharides est cependant significativement plus faible dans le lait fermenté par la
culture mixte par rapport aux cultures pures de Lb. rhamnosus, ce résultat étant en accord
avec les données de concentrations cellulaires de la souche en culture mixte. Cependant,
même en faibles quantités, la production d'exopolysaccharides permet d'améliorer la
viscosité apparente des laits fermentés par la culture mixte.
L'utilisation de la technologie des cellules immobilisées et de la préfermentation en
continu a permis d'obtenir des valeurs de productivité volumique élevées et une inoculation
massive du lait préfermenté par Lc. diacetylactis dès le début de l'expérience, et par Lb.
rhamnosus après une période d'adaptation d'environ une semaine. La population de Lc.
cremoris dans le lait préfermenté décroît rapidement durant les premiers jours pour ensuite
se stabiliser. Dans le lait fermenté, obtenu après une étape d'incubation additionnelle, les
populations évoluent parallèlement à celles du lait préfermenté, excepté pour le Lb.
rhamnosus dont la concentration cellulaire varie également en fonction de la température
d'incubation. La population de Lb. rhamnosus dans le lait fermenté, quelques jours après le
début de l'expérimentation, est très nettement supérieure à celle observée durant les
fermentations en batch du lait inoculé de façon traditionnelle par la culture mixte en
cellules libres. La production de nisine et d'exopolysaccharides est corrélée avec la
concentration cellulaire des souches productrices, respectivement Lc. diacetylactis et Lb.
rhamnosus. Les paramètres d'acidification du lait préfermenté évoluent avec le temps de
préfermentation et tendent vers une augmentation de la capacité acidificante de la culture.
Cette évolution ainsi que celle de la concentration cellulaire en Lb. rhamnosus dans le lait
fermenté peut s'expliquer par des modifications physiologiques touchant les deux souches
retrouvées majoritairement dans le lait préfermenté.
L'étude de la sensibilité à la nisine des cellules de Lb. rhamnosus issues du lait
préfermenté a montré une augmentation importante de la tolérance à la bactériocine avec le
temps de préfermentation. Les populations de Lc. diacetylactis et de Lb. rhamnosus
133
provenant du lait préfermenté après 22 jours d'opération présentent également une capacité
d'acidification supérieure dans le lait comparativement à celles de cultures contrôles
obtenues par fermentation de lait inoculé de manière traditionnelle.
Ce projet a mis en évidence le potentiel de l'immobilisation cellulaire associée à une
préfermentation en continu pour la production d'un lait fermenté aux caractéristiques
fonctionnelles améliorées et qui pourrait être utilisé pour la fabrication de fromage frais. Ce
procédé permet également d'améliorer les caractéristiques technologiques de souches
initialement peu acidifiantes.
Le remplacement du Lc. cremoris de cette étude par une souche aux propriétés
acidifiantes équivalentes mais présentant une meilleure capacité d'adaptation permettrait,
éventuellement, d'accroître la productivité du système et de diminuer le temps de
fermentation du lait préfermenté.
Afin de mieux comprendre les différences d'adaptation entre le Lc. cremoris et le
Lb. rhamnosus, il serait intéressant d'étudier les mécanismes impliqués dans les
modifications physiologiques, et leur caractère réversible, induites par l'immobilisation
cellulaire et la préfermentation en continu, en employant, par exemple, des techniques de
biologie moléculaire permettant de suivre simultanément l'expression de plusieurs gènes.

134
Bibliographie
135
Aasen IM, Markussen S, Moretro T, Katla T, Axelsson L, Naterstad K, (2003). Interactions
of the bacteriocins sakacin P and nisin with food constituents. Int J Food Microbiol 87: 35-43.
Abee T, Rombouts FM, Hugenholtz J, Guihard G, Letellier L, (1994). Mode of action of
nisin Z against Listeria monocytogenes Scott A grown at high and low temperatures. Appl Environ Microbiol 60: 1962-1968.
Akerlund T, Nordstrom K, Bernander R, (1995). Analysis of cell size and DNA content in
exponentially growing and stationnary-phase batch cultures of Escherichia coli. J Bacteriol 177: 6791-6797.
Amiali MN, Lacroix C, Simard RE, (1998). High nisin Z production by Lactococcus lactis
UL719 in whey permeate with aeration.World J Microbiol Biotechnol 14: 887-894. Arezi B, Xing W, Sorge JA, Hogrefe HH, (2003). Amplification efficiency of thermostable
DNA polymerases. Appl Biochem 321: 226-235. Arnaud JP, Lacroix C, (1991). Diffusion of lactose in κ-carrageenan / locust bean gum gel
beads with or without entrapped growing bacteria. Biotechnol Bioeng 38: 1041-1049.
Arnaud JP, Lacroix C, Chopin L, (1992). Effect of agitation rate on cell release rate and
metabolism during continuous fermentation with entrapped growing Lactobacillus casei subsp. casei. Biotechnol Techn 6: 265-270.
Arnaud JP, Lacroix C, Foussereau C, Chopin L, (1993). Shear stress effects on growth and
activity of Lactobacillus delbrueckii subsp. bulgaricus. J Biotechnol 29: 157-175. Audet P, Lacroix C, Paquin C, (1991). Continuous fermentation of a supplemented whey
permeate medium with immobilized Streptococcus salivarius subsp. thermophilus. Int Dairy J 2: 1-15.
Audet P, St Gelais D, Roy D, (1995). Production of mixed cultures of non-isogenic
Lactococcus lactis ssp. cremoris using immobilized cells. Milchwissenschaft 50: 18-22.
Beal C, Skokanova J, Latrille E, Martin N, Corrieu G, (1999). Combined effects of culture
conditions and storage time on acidification and viscosity of stirred yogurt. J Dairy Sci 82: 673-681.
136
Benech RO, Kheadr EE, Laridi R, Lacroix C, Fliss I, (2002a). Inhibition of Listeria innocua in Cheddar cheese by addition of nisin Z in liposomes or by in situ production in mixed culture. Appl Environ Microbiol 68: 3683-3690.
Benech RO, Kheadr EE, Lacroix C, Fliss I, (2002b). Antibacterial activities of nisin Z
encapsulated or produced in situ by mixed culture during Cheddar cheese ripening. Appl Environ Microbiol 68: 5607-5619
Benech RO, Kheadr EE, Lacroix C, Fliss I, (2003). Impact of nisin producing culture and
liposome-encapsulated nisin on ripening of Lactobacillus added-Cheddar cheese. J Dairy Sci 86: 1895-1909.
Bergmaier D, Lacroix C, Macedo MG, Champagne CP (2001). New method for
exopolysaccharide determination in culture broth using stirred ultrafiltration cells. Appl Microbiol Biotechnol 57: 401-406.
Bergmaier D, Champagne CP, Lacroix C, (2003). Exopolysaccharide production during
batch cultures with free and immobilized Lactobacillus rhamnosus RW-9595M. J Appl Microbiol 95: 1049-1057.
Bergmaier D, Champagne CP, Lacroix C, (2005). Growth and exopolysaccharide
production during free and immobilized cell chemostat culture of Lactobacillus rhamnosus RW-9595M. J Appl Microbiol 98: 272-284.
Bertrand N, Fliss I, Lacroix C, (2001). High nisin-Z production during repeated-cycle batch
cultures in supplemented whey permeate using immobilized Lactococcus lactis UL719. Int Dairy J 11: 953-960.
Bibal B, Vayssier Y, Goma G, Pareilleux A, (1991). High-concentration cultivation of
Lactococcus cremoris in a cell-recycle reactor. Biotechnol Bioeng 37: 746-754. Bhatti M, Veeramachaneni A, Shelef LA, (2004). Factors affecting the antilisterial effects
on nisin in milk. Int J Food Microbiol 97: 215-219. Bouksaim M, Lacroix C, Audet P, Simard RE (2000). Effects of mixed starter composition
on nisin Z production by Lactococcus lactis subsp. lactis biovar. diacetylactis UL719 during production and ripening of Gouda cheese. Int J Food Microbiol 59: 141-156.
Bourgoin F, Pluvinet A, Gintz B, Decaris B, Guédon G, (1999). Are horizontal transfers
involved in the evolution of the Streptococcus thermophilus exopolysaccharide synthesis loci ? Gene 233: 151-161.
Breukink E, van Kraaij C, van Dalen A, Demel RA, Siezen RJ, de Kruijff B, Kuipers OP,
(1998). The orientation of nisin in membranes. Biochemistry 36: 8153-8162.
137
Broadbent JR, Barnes M, Brennand C, Strickland M, Houck K, Johnson ME, Steele JL, (2002). Contribution of Lactococcus lactis cell enveloppe proteinase specificity to peptide accumulation and bitterness in reduced-fat Cheddar cheese. Appl Environ Microbiol 68: 1778-1785.
Cabo ML, Murado MA, Gonzalez MP, Pastoriza L, (2001). Effects on aeration and pH
gradient on nisin production. A mathematical model. Enzyme Microb Technol 29: 264-273.
Cachon R, Antérieux P, Diviès C, (1998). The comparative behavior of Lactococcus lactis
in free and immobilized culture processes. J Biotechnol 63: 211-218. Calamita HG, Doyle RJ, (2002). Regulation of autolysins in teichuronic acid-containing
Bacillus subtilis cells. Mol Microbiol 44: 601-606. Carr FJ, Chill D, Maida N, (2002). The lactic acid bacteria: a litterature survey. Crit Rev
Microbiol 28: 281-370. Cerning J, (1990). Exocellular polysaccharides produced by lactic acid bacteria. FEMS
Microbiol Rev 87: 113-130. Cerning J, Bouillanne C, Landon M, Desmazeaud MJ, (1990). Comparison of exocellular
polysaccharide production by thermophilic lactic acid bacteria. Sci Aliments: 10: 443-451.
Cerning J, Bouillanne C, Landon M, Desmazeaud MJ, (1992). Isolation and
characterization of exopolysaccharides from slime-forming mesophilic lactic acid bacteria. J Dairy Sci 75: 692-699.
Chabot S, Yu HL, De Léséleuc L, Cloutier D, van Calsteren MR, Lessard M, Roy D,
Lacroix M, Oth D, (2001). Exopolysaccharides from Lactobacillus rhamnosus RW-9595M stimulate TNF, IL-6 and IL-12 in human and mouse cultured immunocompetent cells, and IFN-γ in mouse splenocytes. Lait 81: 683-697.
Champagne CP, Girard F, Rodriguez N, (1993). Production of concentrated suspensions of
thermophilic lactic acid bacteria in calcium-alginate beads. Int Dairy J 3: 257-275. Chan WC, Dodd HM, Horn N, Maclean K, Lian LY, Bycroft BW, Gasson MJ, Roberts
GCK, (1996). Structure-activity relationships in the peptide antibiotic nisin: role of dehydroalanine 5. Appl Environ Microbiol 62: 2966-2969.
Choisy C, Desmazeaud M, Gueguen M, Lenoir J, Schmidt JL, Tourneur C (1997). Les
phénomènes microbiens. In : Le fromage, pages 377-446. Ed. Eck A, Gillis JC, Lavoisier Tec & Doc, Paris, France.
138
Christensen JE, Dudley EG, Pederson JA, Steele JL, (1999). Peptidases and amino acid catabolism in lactic acid bacteria. Antonie van Leeuwenhoek 76: 217-246.
Cleveland J, Montville TJ, Nes IF, Chikindas ML, (2001). Bacteriocins: safe, natural
antimicrobials for food preservation. Int J Food Microbiol 71: 1-20. Cocaign-Bousquet M, Even S, Lindley ND, Loubière L, (2002). Anaerobic sugar
catabolism in Lactococcus lactis: genetic regulation and enzyme control over pathway flux. Appl Microbiol Biotechnol 60: 24-32.
Codex Alimentarius, (2003). Norme codex pour les laits fermentés. Codex STAN 243-
2003. Page 1-5. Collins YF, Mc Sweeney PLH, Wilkinson MG, (2003). Evidence of a relationship between
autolysis of starter bacteria and lipolysis in Cheddar cheese during ripening. J Dairy Res 70: 105-113.
Curtain C, (1986). Understanding and avoiding ethanol inhibition. Trends Biotechnol 4:
110 D’Angio C, Beal C, Boquien CY, Corrieu G, (1994). Influence of dilution rate and cell
immobilization on plasmid stability during continuous cultures of recombinant strains of Lactococcus lactis subsp. lactis. J Biotechnol 34: 87-95.
Davies EA, Bevis HE, Delves-Broughton J, (1997). The use of the bacteriocin, nisin, as
preservative in ricotta-type cheeses to control the food-borne pathogen Listeria monocytogenes. Lett Appl Microbiol 24: 343-346.
De Buyser M, Dufour B, Maire M, Lafarge V, (2001). Implication of milk and milk
products in food-borne diseases in France and in different industrialised countries. Int J Food Microbiol 67: 1-17.
Degeest B, De Vuyst L, (1999). Indication that the nitrogen source influences both amount
and size of exopolysaccharides produced by Streptococcus thermophilus LY03 and modelling of the bacterial growth and exopolysaccharide production in a complex medium. Appl Environ Microbiol 65: 2863-2870.
Delcour J, Ferain T, Deghorain M, Palumbo E, Hols P, (1999). The biosynthesis and
functionnality of the cell-wall of lactic acid bacteria. Antonie van Leeuwenhoek 76: 159-184.
Delves-Broughton J, Blackburn P, Evans RL, Hugenholtz J, (1996). Applications of the
bacteriocin, nisin. Antonie van Leeuwenhoek 69: 193-202. de Man JC, Rogosa M, Sharpe ME, (1960). A medium for the cultivation of lactobacilli. J
Appl Bacteriol 23: 130-135.
139
de Medici D, Croci L, Delibato E, Di Pasquale S, Filetici E, Toti L, (2003). Evaluation of
DNA extraction methods for use in combination with SYBR Green I real-time PCR to detect Salmonella enterica serotype enteritidis in poultry. Appl Environ Microbiol 69: 3456-3461.
Desjardins P, Meghrous J, Lacroix C, (2001). Effect of aeration and dilution rate on nisin Z
production during continuous fermentation with free and immobilized Lactococcus lactis UL719 in supplemented whey permeate. Int Dairy J 11: 943-951.
de Vos WM, Mulders JWM, Siezen RJ, Hugenholtz J, Kuipers OP, (1993). Properties of
nisin Z and distribution of its gene, nis Z, in Lactococcus lactis. Appl Environ Microbiol 59: 213-218.
de Vos WM, Hugenholtz J, (2004). Engineering metabolic highways in Lactococci and
other lactic acid bacteria. Trends Biotechnol 22: 72-79. de Vuyst L, Vandamme EJ, (1994). Nisin, lantibiotic produced by Lactococcus lactis
subsp. lactis: properties, biosynthesis, fermentation and applications. In : Bacteriocins of lactic acid bacteria, pages 151-221. Ed. de Vuyst L, Vandamme EJ, Blackie Academic & Professional, Londres Royaume-Uni.
de Vuyst L, Degeest B, (1999). Heteropolysaccharides from lactic acid bacteria. FEMS
Microbiol Rev 23: 153-177. de Vuyst L, De Vin F, Vaningelgem F, Degeest B, (2001). Recent developments in the
biosynthesis and applications of the heteropolysaccharides from lactic acid bacteria. Int Dairy J 11: 687-707.
Diefenbach R, Keweloh H, Rehm HJ, (1992). Fatty acids impurities in alginate influence
the phenol tolerance of immobilized Escherichia coli. Appl Microbiol Biotechnol 36: 530-534.
Doleyres Y, Fliss I, Lacroix C, (2002a). Quantitative determination of the spatial
distribution of pure- and mixed-strain immobilized cells in gel beads by immunofluorescence. Appl Microbiol Biotechnol 59: 297-302.
Doleyres Y, Paquin C, LeRoy M, Lacroix C, (2002b). Bifidobacterium longum ATCC
15707 cell production during free- and immobilized-cell cultures in MRS-whey permeate medium. Appl Microbiol Biotechnol 60: 168-173.
Doleyres Y, Fliss I, Lacroix C, (2004a). Continuous production of mixed lactic starters
containing probiotics using immobilized cell technology. Biotechnol Prog 20: 145-150.
140
Doleyres Y, Fliss I, Lacroix C, (2004b). Increased stress tolerance of Bifidobacterium longum and Lactococcus lactis produced during continuous mixed-strain immobilized-cell fermentation. J Appl Microbiol 97: 527-539.
Doleyres Y, Schaub L, Lacroix C, (2005). Comparison of the functionality of
exopolysaccharides produced in situ or added as bioingredients on yoghurt properties. Submitted.
Donlan RM, (2002). Biofilms: microbial life on surfaces. Emerg Infect Dis 8: 881-890. Drider D, Bekal S, Prévost H, (2004). Genetic organization and expression of citrate
permease in lactic acid bacteria. Genet Mol Res 3: 273-281. Driessen AJM, van den Hooven HW, Kuiper W, van de Kamp M, Sahl HG, Konings RNH,
Konings WN (1995). Mechanistic studies of lantibiotic-induced permeabilization of phospholipid vesicles. Biochemistry 34: 1606-1614.
Duboc P, Mollet B, (2001). Applications of exopolysaccharides in the dairy industry. Int
Dairy J 11: 759-768. Dubois M, Gilles KA, Hamilton JK, Rebers PA, Smith F, (1956). Colorimetric method for
determination of sugars and related substances. Anal Chem 28: 350-356. Dupont I, Roy D, LaPointe G, (2000). Comparison of exopolysaccharide production by
strains of Lactobacillus rhamnosus and Lactobacillus paracasei grown in chemically defined medium and milk. J Ind Micrbiol Biotechnol 24: 251-255.
El Soda M, Madkor SA, Tong PS (2000). Adjunct Cultures: recent developments and
potential significance to the cheese industry. J Dairy Sci 83: 609-619. Ercolini D, Hill PJ, Dodd CER, (2003). Bacterial community structure and location in
Stilton cheese. Appl Environ Microbiol 69: 3540-3548. Even S, Lindley ND, Loubière P, Cocaign-Bousquet M, (2002). Dynamic response of
catabolic pathways to autoacidification in Lactococcus lactis: transcript profiling and stability in relation to metabolic and energetic constraints. Mol Microbiol 45: 1143-1152.
Ferreira MA, Lund BM, (1996). The effect of nisin on Listeria monocytogenes in culture
medium and long-life cottage cheese. Lett Appl Microbiol 22: 433-438. Flambard B, Richard J, Juillard J, (1997). Interaction between proteolytic strains of
Lactococcus lactis influenced by different types of proteinase during growth in milk. Appl Environ Microbiol 63: 2131-2135.

141
Fortin C, Vuillemard JC, (1989). Effect of immobilization in calcium alginate beads on regulation of protease production by Myxococcus xanthus cells. In: Physiology of immobilized cells. Ed de Bont JAM, Visser J, Mattiasson B, Tramper J, Elsevier Sience, Amsterdam, Pays-Bas.
Fowler GG, Jarvis B, Tramer J, (1975). The assay of nisin in foods. Soc Appl Bacteriol
Tech Ser 8: 91-105. Gamar L, Blondeau K, Simonet JM, (1997). Physiological approach to extracellular
polysaccharide production by Lactobacillus rhamnosus strain C83. J Appl Microbiol 83: 281-287.
Gamar-Nourami L, Blondeau K, Simonet JM, (1998). Influence of culture conditions on
exopolysaccharides production by Lactobacillus rhamnosus strain C83. J Appl Microbiol 85: 664-672.
Gancel F, Novel G, (1994). Exopolysaccharide production by Streptococcus salivarius ssp.
thermophilus cultures. 2. Distinct modes of polymer production and degradation among clonal variants. J Dairy Sci 77: 689-695.
Garcia-Garibay M, Marshall VME, (1991). Polymer production by Lactobacillus
delbrueckii ssp. bulgaricus. J Appl Bacteriol 70 : 325-328. Garcia-Quintans N, Magni C, de Mendoza D, Lopez P, (1998). The citrate transport system
of Lactococcus lactis subsp. lactis biovar diacetylactis is induced by acid stress. Appl Environ Microbiol 64: 850-857.
Garde S, Tomillo J, Gaya P, Medina M, Nunez M, (2002). Proteolysis in Hispanico cheese
manufactured using a mesophilic starter, a thermophilic starter, and bacteriocin-producing Lactococcus subsp. lactis INIA 415 adjunct culture. J Agric Food Chem 50: 3479-3485.
Garde S, Gaya P, Fernandez-Garcia E, Medina M, Nunez M, (2003). Proteolysis, volatile
compounds, and sensory evaluation in Hispanico cheese manufactured with the addition of a thermophilic adjunct culture, nisin, and calcium alginate-nisin microparticles. J Dairy Sci 86: 3038-3047.
Gassem MA, Schmidt KA, Frank JF, (1997). Exopolysaccharide production from whey
lactose by fermentation with Lactobacillus delbrueckii ssp. bulgaricus. J Food Sci 62: 171-173.
Gillilland SE, (1985a). Role of starter culture bacteria in food preservation. In : Bacterial
starter cultures for foods, pages 175-185. Ed. Gilliland SE, CRC Press, Inc. Boca Raton USA.
142
Gilliland SE, (1985b). Concentrated starter culture. In : Bacterial starter cultures for foods, pages 145-157. Ed. Gilliland SE, CRC Press, Inc. Boca Raton USA.
Gobbetti M, Rossi J, (1993). Continuous fermentation with free-growing and immobilized
multistaters to get a kefir production pattern. Microbiologie-Aliments-Nutrition 11: 119-127.
Goulhen F, Meghrous J, Lacroix C, (1999). Production of a nisin Z/pediocin mixture by
pH-controlled mixed-strain batch cultures in supplemented whey permeate. J Appl Microbiol 86: 399-406.
Grobben GJ, Sikkema J, Smith MR, De Bont JAM, (1995). Production of extracellular
polysaccharides by Lactobacillus delbrueckii ssp. bulgaricus NCFB 2772 grown in a chemically defined medium. J Appl Bacteriol 79: 103-107.
Grobben GJ, Smith MR, Sikkema J, De Bont JAM, (1996). Influence of fructose and
glucose on the production of exopolysaccharides and the activities of enzymes involved in the sugar metabolism and the synthesis of sugar nucleotides in Lactobacillus delbrueckii subsp. bulgaricus NCFB 2772. Appl Microbiol Biotechnol 46: 279-284.
Grobben GJ, Van Casteren WHM, Schols HA, Oosterveld A, Sala G, Smith MR, Sikkema
J, De Bont JAM, (1997). Analysis of the exopolysaccharides produced by Lactobacillus delbrueckii subsp. bulgaricus NCFB 2772 grown in continuous culture on glucose and fructose. Appl Microbiol Biotechnol 48: 516-521.
Grobben GJ, Chin-Joe I, Kitzen VA, Boels IC, Boer F, Sikkema J, Smith MR, de Bont
JAM, (1998). Enhancement of exopolysaccharide production by Lactobacillus delbrueckii susbp. bulgaricus NCFB 2772 with a simplified defined medium. Appl Environ Microbiol 64: 1333-1337.
Groboillot A, Boadi DK, Poncelet D, Neufeld RJ, (1994). Immobilization of cells for
application in the food industry. Crit Rev Biotechnol 14: 75-107. Guarner F, Schaafsman GJ, (1998). Probiotics. Int J Food Microbiol 39: 237-238. Guerra NP, Pastrana L, (2003). Influence of pH drop on both nisin and pediocin production
by Lactococcus lactis and Pediococcus acidilactici. Lett Appl Microbiol 37: 51-55. Gunasekera TS, Dorsch MR, Slade MB, Veal DA, (2003). Specific detection of
Pseudomonas spp. in milk by fluorescence in situ hybridization using ribosomal RNA directed probes. J Appl Microbiol 94: 936-945.
Haddad S, Sodini I, Monnet C, Latrille E, Corrieu G, (1997). Effect of citrate on growth of
Lactococcus lactis subsp. lactis in milk. Appl Microbiol Biotechnol 48: 236-241.
143
Hartke A, Bouché S, Giard JC, Benachour A, Boutibonnes P, Auffray Y, (1996). The lactic acid stress response of Lactococcus lactis subsp. lactis. Current Microbiol 3: 194-199.
Hasper HE, de Kruijff B, Breukink E, (2004). Assembly and stability of nisin-lipid II pores.
Biochemistry 43: 11567-11575. Hassan AN, Frank JF, Schmidt KA, Shalabi SI, (1996). Rheological properties of yogurt
made with encapsulated nonropy lactic cultures. J Dairy Sci 79: 2091-2097. Hein I, Lehner A, Rieck P, Klein K, Brandl E, Wagner M, (2001). Comparison of different
approaches to quantify Staphylococcus aureus cells by real-time quantitative PCR and application of this technique for examination of cheese. Appl Environ Microbiol 67: 3122-3126.
Heipieper HJ, Keweloh H, Rehm HJ, (1991). Influence of phenols on growth and
membrane permeability of the free immobilized Escherichia coli. Appl Environ Microbiol 57: 1213-1217.
Heller KJ, (2001). Probiotic bacteria in fermented foods: product characteristics and starter
organisms. Am J Clin Nutr 73(Suppl.): 374-379. Hess SJ, Roberts RF, Ziegler GR, (1997). Rheological properties of nonfat yogurt
stabilized using Lactobacillus delbrueckii ssp. bulgaricus producing exopolysaccharides or using commercial stabilizer systems. J Dairy Sci 80: 252-263.
Holcberg I, Margalith P, (1981). Alcoholic fermentation by immobilized yeast at high sugar
concentration. Eur J Appl Microbiol Bioechnol 13: 133-140. Holzapfel WH, Haberer P, Geisen R, Björkroth J, Schillinger U, (2001). Taxonomy and
important features of probiotic microorganisms in food and nutrition. Am J Clin Nutr 73(Suppl.): 365-373.
Huang J, Lacroix C, Daba H, Simard RE, (1996). Pediocin 5 production and plasmid
stability during continuous free and immobilized cell cultures of Pediococcus acidilactici UL5. J Appl Bacteriol 80: 635-644.
Hugenholtz J, (1993). Citrate metabolism in lactic acid bacteria. FEMS Microbiol Rev 12:
165-178. Huggins AR, Sandine WE, (1984). Differentiation of fast and slow milk-coagulating
isolates in strains of lactic streptococci. J Dairy Sci 67: 1674-1679. Hurst A, (1981). Nisin. Adv Appl Microbiol 27: 85-123.

144
Jolly L, Vincent SJF, Duboc P, Neeser JR, (2002). Exploiting exopolysaccharides from lactic acid bacteria. Antonie van Leeuwenhoek 82: 367-374.
Jouenne T, Tresse O, Junter GA, (1994). Agar-entrapped bacteria as an in vitro model of
biofilms and their susceptibility to antibiotics. FEMS Microbiol Lett 119: 237-242. Journal officiel des Communautés européennes. Directive 95/2/CE du Parlement Européen
et du Conseil, du 20 février 1995, concernant les additifs alimentaires autres que les colorants et les édulcorants. 18 mars 1995.
Juillard V, Richard J, (1990). Indirect interaction in milk between proteolytic and isogenic
non proteolytic strains of Lacotococcus lactis. I. Effect of pre-culturing by a non–proteolytic variant. Lait 70: 425-438.
Juillard V, Richard J, (1991). Indirect interaction in milk between proteolytic and isogenic
non proteolytic strains of Lacotococcus lactis. II. Effect of pre-culturing by a proteolytic strain. Lait 71: 55-64.
Juillard V, Richard J, (1994). Mixed cultures in milk of a proteinase-positive and a
proteinase-negative variant of Lactococcus lactis subsp. lactis: influence of initial percentage of proteinase-positive cells on the growth parameters of each strain and on the rate of acidification. Lait 74: 3-12.
Juillard V, Furlan S, Foucaud C, Richard J, (1996). Mixed cultures of proteinase-positive
and proteinase-negative strains of Lactococcus lactis in milk. J Dairy Sci 79: 964-970.
Jung DS, Bodyfelt FW, Daeschel MA, (1992). Influence of fat and emulsifiers on the
efficacy of nisin in inhibiting Listeria monocytogenes in fluid milk. J Dairy Sci 75: 387-393.
Junter GA, Jouenne T, (2004). Immobilized viable microbial cells: from the process to the
proteome... or the cart before the horse. Biotechnol Adv 22: 633-658. Kabuki DY, Kuaye AY, Wiedmann M, Boor KJ, (2004). Molecular subtyping and tracking
of Listeria monocytogenes in Latin style fresh cheese processing plants. J Dairy Sci 87: 2803-2812.
Kandler O, Weiss N, (1986). Genus Lactobacillus. In : Bergey’s Manual of Systematic
Bacteriology, vol 2, 9ième ed. Ed. Sneath PHA, Mair NS, Sharpe ME, Holt JG. Williams and Wilkins, Baltimore USA.
Kempler GM, Mc Kay LL, (1980). Improved medium for detection of citrate fermenting
Streptococcus lactis ssp. diacetylactis. Appl Environ Microbiol 4: 926-927.

145
Keweloh H, Heipieper HJ, Rehm HJ, (1989). Protection of bacteria against toxicity of phenol by immobilization in calcium alginate. Appl Microbiol Biotechnol 31: 383-389.
Kim WS, Ren J, Dunn NW, (1999). Differentiation of Lactococcus lactis subspecies lactis
and subspecies cremoris strains by their adaptive response to stresses. FEMS Microbiol Lett 171: 57-65.
Klaenhammer TR, (1993). Genetics of bacteriocins produced by lactic acid bacteria. FEMS
Microbiol Rev 12: 39-86. Kleerebezem M, Quadri LE, (2001). Peptide pheromone-dependent regulation of
antimicrobial peptide production in Gram-positive bacteria: a case of multicellular behavior. Peptides 22: 1579-1596.
Kleerebezem M, (2004). Quorum sensing control of lantibiotic production; nisin and
subtilin autoregulate their own biosynthesis. Peptides 25: 1405-1414. Klein D, (2002). Quantification using real-time PCR technology: applications and
limitations. Trends Mol Med 8: 257-260. Kojic M, Vujcic M, Banina A, Cocconcelli P, Cerning J, Topisirovic L, (1992). Analysis of
exopolysaccharides production by Lactobacillus casei CG11, isolated from cheese. Appl Environ Microbiol 58: 4086-4088.
Kontusaari S, Forsen R, (1988). Finnish fermented milk ‘viili’: involvement of two cell
surface protein in production of slime by Streptococcus lactis ssp. cremoris. J Dairy Sci 71: 3197-3202.
Koo K, Jaykus LA, (2003). Detection of Listeria monocytogenes from a model food by
fluorescence resonance energy transfer-based PCR with an asymmetric fluorogenic probe set. Appl Environ Microbiol 69: 1082-1088.
Krisch J, Szajani B, (1997). Ethanol and acetic tolerance in free and immobilized cells of
Saccharomyces cerevisiae and Acetobacter aceti. Biotechnol Lett 19: 525-528. Krishnan S, Gowda LR, Misra MC, Karanth NG, (2001). Physiological and morphological
changes in immobilized L. plantarum NCIM 2084 cells during repeated batch fermentation for production of lactic acid. Food Biotechnol 15: 193-202.
Kulozik U, Wilde J, (1999). Rapid lactic acid production at high cell concentrations in
whey ultrafiltrate by Lactobacillus helveticus. Enzyme Microb Technol 24: 297-302.
146
Kunji ERS, Fang G, Jeronimus-Stratingh CM, Bruins AP, Poolman B, Konings WN, (1998). Reconstruction of the proteolytic pathway for use of β-casein by Lactococcus lactis. Mol Microbiol 27: 1107-1118.
Lacroix C, Sodini I, Corrieu G, (1996). Microbiological stability of an immobilized cell
bioreactor with mixed lactic acid bacteria during continuous fermentation of milk. In : Immobilized cells : basic and applications. Ed. Wijffels RH, Buitelaar RM, Bucke C, Tramper J, Elsevier Science, Londres, Angleterre, p. 600-607.
Lacroix C, Grattepanche F, Doleyres Y, Bergmaier D, (2005). Immobilised cell
technologies for the dairy industry. In : Applications of cell immobilisation biotechnology. Série :Focus on biotechnology Vol. 8b. Ed. Nedovic V, Willaert R, Springer Verlag, New-York, USA. Sous presse.
Lamboley L, Lacroix C, Champagne CP, Vuillemard JC, (1997). Continuous mixed strain
mesophilic lactic starter production in supplemented whey permeate medium using immobilized cell technology. Biotechnol Bioeng 56: 502-516.
Lamboley L, Lacroix C, Artignan JM, Champagne CP, Vuillemard JC, (1999). Long-term
mechanical and biological stability of an immobilized cell reactor for continuous mixed-strain mesophilic lactic starter production in whey permeate. Biotechnol Prog 15: 646-654.
Lamboley L, Lacroix C. Sodini I, Lemay MJ, Champagne CP, (2001). Effect of inoculum
composition and low KCl supplementation on the biological and rheological stability of an immobilized-cell system for mesophilic lactic starter production. Biotechnol Prog 17: 1071-1078.
Lane CN, Fox PF, (1996). Contribution of starter and added lactobacilli to proteolysis in
Cheddar cheese during ripening. Int Dairy J 6: 715-728. Law J, Haandrikman A, (1997). Proteolytic enzymes of lactic acid bacteria. Int Dairy J 7:
1-11. Lee K, Moon SH, (2003). Growth kinetics of Lactococcus lactis ssp. diacetylactis
harboring different plasmid content. Current Microbiol 47: 17-21. Levander F, Radstrom P, (2001). Requirement for phosphoglucomutase in
exopolysaccharide biosynthsis in glucose- and lactose-utilizing Streptococcus thermophilus. Appl Environ Microbiol 67: 2734-2738.
Liu W, Hansen JN, (1993). The antimicrobial effect of a structural variant of subtilin
against outgrowing Bacillus cereus T spores and vegetative cells occurs by different mechanisms. Appl Environ Microbiol 59: 648-651.

147
Lonvaud-Funel A, Guilloux Y, Joyeux A, (1993). Isolation of a DNA probe for identification of glucan-producing Pediococcus damnosus in wines. J Appl Bacteriol 74: 41-47.
Looijesteijn PJ, Hugenholtz J, (1999). Uncoupling of growth and exopolysaccharide
production by Lactococcus lactis subsp. cremoris NIZO B40 and optimization of tis synthesis. J Biosci Bioeng 88: 178-182.
Low D, Ahlgren JA, Horne D, McMahon DJ, Oberg CJ, Broadbent JR, (1998). Role of
Streptococcus thermophilus MR-1C capsular exopolysaccharides in cheese moisture retention. Appl Environ Microbiol 64: 2174-2151.
Lynch CM, Mc Sweeney PLH, Fox PF, Cogan TM, Drinan FD, (1996). Manufacture of
Cheddar cheese with and without adjunct lactobacilli under controlled microbiological conditions. Int Dairy J 6: 851-867.
Macedo MG, Lacroix C, Gardner NJ, Champagne CP, (2002a). Effect of medium
supplementation on exopolysaccharide production by Lactobacillus rhamnosus RW-9595M in whey permeate. Int Dairy J 12: 419-426.
Macedo MG, Lacroix C, Champagne CP, (2002b). Combined effect of temperature and
medium composition on exopolysaccharide production by Lactobacillus rhamnosus RW-9595M in a whey permeate based medium. Biotechnol Prog 18: 167-173.
Magni C, de Mendoza D, Konings WN, Lolkema JS, (1999). Mechanism of citrate
metabolism in Lactococcus lactis: resistance against lactate toxicity at low pH. J Bacteriol 181: 1451-1457.
Maisner-Patin S, Deschamps SN, Tatini SR, Richard J, (1992). Inhibition of Listeria
monocytogenes in Camembert cheese made with a nisin-producing starter. Lait 72: 249-263.
Marilley L, Casey MG, (2004). Flavours of cheese products: metabolic pathways,
analytical tools and identification of producing strains. Int J Food Microbiol 90: 139-159.
Marshall VME, Cowie EN, Moreton RS, (1995). Analysis and production of two
exopolysaccharides from Lactococcus lactis subsp. cremoris LC330. J Dairy Res 62: 621-628.
Marshall VM, Laws AP, Gu Y, Levander F, Radstrom P, De Vuyst L, Degeest B,
Vaningelgem F, Dunn H, Elvin M, (2001). Exopolysaccharide-producing strains of thermophilic lactic acid bacteria cluster into groups according to their EPS structure. Lett Appl Microbiol 32: 433-437.
148
Martin MG, Sender PD, Peiru S, de Mendoza D, Magni C, (2004). Acid-inducible transcription of the operon encoding the citrate lyase complex of Lactococcus lactis biovar diacetylactis CRL264. J Bacteriol 186: 5649-5660.
Martinez-Cuesta MC, Kok J, Herranz E, Pelaez C, Requena T, Buist G, (2000).
Requirement of autolytic activity for bacteriocin-induced lysis. Appl Environ Microbiol 66: 3174-3179.
Maruyama T, Takata T, Ichinose H, Park LC, Kamaiya N, Goto M, (2003). Simple
detection of point mutations in DNA oligonucleotides using SYBR Green I. Biotechnol Lett 25: 1637-1641.
Masson F, Lacroix C, Paquin P, (1994). Direct measurement of pH profiles in gel beads
immobilizing Lactobacillus helveticus using a pH sensitive microelectrode. Biotechnol Tech 8: 551-556.
Matte-Tailliez O, Quénée P, Cibik R, van Opstal J, Dessevre F, Firmesse O, Tailliez P,
(2001). Detection and identification of lactic acid bacteria in milk and industrial starter culture with fluorescently labeled rRNA-targeted peptide nucleic acid probes. Lait 81: 237-248.
McAuliffe O, Ross PR, Hill C, (2001). Lantibiotics: structure, biosynthesis and mode of
action. FEMS Microbiol Rev 25: 285-308. Meghrous J, Lacroix C, Bouksaim M, LaPointe G, Simard RE, (1997). Genetic and
biochemical characterization of nisin Z produced by Lactococcus lactis ssp. lactis biovar diacetylactis UL719. J Appl Microbiol 83: 133-138.
Meghrous J, Lacroix C, Simard RE, (1999). The effects on vegetative cells and spores of
the three bacteriocins from lactic acid bacteria. Food Microbiol 16: 105-114. Mehaia MA, Cheryan M, (1986). Lactic acid from whey permeate in a membrane recycle
bioreactor. Enzyme Microb Technol 8: 289-292. Melchiorsen CR, Jokumsen KV, Villadsen J, Israelsen H, Arnau J, (2002). The level of
pyruvate-formate lyase controls the shift from homolactic to mixed-acid product formation. Appl Microbiol Biotechnol 58: 338-344.
Moll GN, Roberts GCK, Konings WN, Driessen AJM, (1996). Mechanism of lantibiotic-
induced pore-formation. Antonie van Leeuwenhoek 69: 185-191. Monnet C, Haddad S, Corrieu G, (1999). An improved method for screening α-acetolactate
producing mutants. J Microbiol Methods 37: 183-185.
149
Montville TJ, Bruno MEC, (1994). Evidence that dissipation of proton motive force is a common mechanism of action for bacteriocins and other antimicrobial proteins. Int J Food Microbiol 24: 53-74.
Morillo JM, Lau L, Sanz M, Herrera D, Silva A, (2003). Quantitative real-time PCR based
on single copy gene sequence for detection of Actinobacillus actinomycetemcomitans and Porphyromonas gingivalis. J Periodont Res 38: 518-524.
Mota-Meira M, LaPointe G, Lacroix C, Lavoie MC, (2000). MICs of mutacin B-Ny266,
nisin A, vancomycin, and oxacillin against bacterial pathogens. Antimicrob Agents Chemother 44: 24-29.
Moter A, Gobel UB, (2000). Fluorescence in situ hybridization (FISH) for direct
visualization of microorganisms. J Microbiol Methods 41: 85-112. Mozzi F, Savoy de Giori G, Oliver G, Font de Valdez G, (1994). Effect of culture pH on
the growth characteristics and polysaccharide production by Lactobacillus casei. Milchwissenschaft 49: 667-670.
Mozzi F, Savoy de Giori G, Oliver G, Font de Valdez G, (1995). Exopolysaccharide
production by Lactobacillus casei. I. Influence of salts. Milchwissenschaft 50: 186-188.
Mozzi F, Savoy de Giori G, Olivier G, Font de Valdez G, (1996). Exopolysaccharide
production by Lactobacillus casei in milk under different growth conditions. Milchwissenschaft 51: 670-673.
Mulders JWM, Boerrigter IJ, Rollema HS, Siezen RJ, de Vos WM, (1991). Identification
and characterization of the lantibiotic nisin Z, a natural nisin variant. Eur J Biochem 201: 581-584.
Mummy KL, Findlay RH, (2004). Convenient determination of DNA extraction efficiency
using an external recovery standard and quantitative-competitive PCR. J Microbiol Methods 57: 259-268.
Mundt JO, (1986). Lactic acid streptococci. In : Bergey’s Manual of Systematic
Bacteriology, vol 2, 9ième ed. Ed. Sneath PHA, Mair NS, Sharpe ME, Holt JG. Williams and Wilkins, Baltimore USA.
Musale DA, Kulkarni SS, (1998). Effect of whey composition on ultrafiltration
performance. J Agric Food Chem 46: 4717-4722. Nannen NL, Huntkins RW, (1991). Proton-translocating adenosine triphosphatase activity
in lactic acid bacteria. J Dairy Sci 74: 747-751.

150
Newby DT, Hadfield TL, Roberto FF, (2003). Real-time PCR detection of Brucella abortus: a comparative study of SYBR Green I, 5’ exonuclease, and hybridization probe assays. Appl Environ Microbiol 69: 4753-4759.
Nogva HK, Rudi K, Naterstad K, Holck A, Lillehaug D, (2000). Application of 5’-nuclease
PCR for quantitative detection of Listeria monocytogenes in pure cultures, water, skim milk, and unpasteurized whole milk. Appl Environ Microbiol 66: 4266-4271.
Norton S, Lacroix C, Vuillemard JC, (1994a). Kinetic study of a continuous fermentation
of whey permeate by immobilized Lactobacillus helveticus. Enzyme Microb Technol 16: 457-466.
Norton S, Lacroix C, Vuillemard JC, (1994b). Reduction of yeast extract supplementation
in lactic acid fermentation of whey permeate by immobilized cell technology. J Dairy Sci 77: 2494-2508.
Panicker G, Vickery MCL, Bej AK, (2004). Multiplex PCR detection of clinical and
environmental strains of Vibrio vulnificus in shellfish. Can J Microbiol 50: 911-922. Papin JF, Varhson W, Dittmer DP, (2004). SYBR Green-based real-time quantitative PCR
assay for detection of west nile virus circumvents false-negative results due to strain variability. J Clin Microbiol 42: 1511-1518.
Perry DB, McMahon DJ, Oberg CJ, (1997). Effect of exopolysaccharides producing
cultures on moisture retention in low fat Mozzarella cheese. J Dairy Sci 80: 799-805.
Perry DB, McMahon DJ, Oberg CJ, Craig J, (1998). Manufacture of low fat Mozzarella
cheese using exopolysaccharide-producing starter cultures. J Dairy Sci 81: 563-566. Petry S, Furlan S, Crepeau MJ, Cerning J, Desmazeaud M, (2000). Factors affecting
exocellular polysaccharide production by Lactobacillus delbrueckii subsp. bulgaricus grown in a chemically defined medium. Appl Environ Microbiol 66: 3427-3431.
Picot A, Lacroix C, (2004). Encapsulation of bifidobacteria in whey protein-based
microcapsules and survival in simulated gastrointestinal conditions and in yoghurt. Int Dairy J 14: 505-515.
Prévost H, Diviès C, (1987). Fresh fermented cheese production with continuous
prefermented milk by a mixed culture of mesophilic lactic streptococci entrapped in Ca-alginate. Biotechnol Lett 9: 789-791.
Prévost H, Diviès C, (1988a). Continuous pre-fermentation of milk by entrapped yoghurt
bacteria. II. Data for optimization of the process. Milchwissenschaft 43: 716-719.
151
Prévost H, Diviès C, (1988b). Continuous pre-fermentation of milk by entrapped yoghurt bacteria. I. Development of the process. Milchwissenschaft 43: 621-625.
Prigent C, Corre C, Boyaval P, (1988). Production of concentrated Streptococcus salivarius
subsp. thermophilus by coupling continuous fermentation and ultrafiltration. J Dairy Res 55: 579-577.
Prioult G, Lacroix C, Turcotte C, Fliss I, (2000). Simultaneous immunofluorescent
detection of coentrapped cells in gel beads. Appl Environ Microbiol 66: 2216-2219. Prioult G (2003). Effet des probiotiques sur l’induction et le maintien de la tolérance orale à
la β-lactoglobuline chez la souris et étude de leurs mécanismes d’action .Thèse Ph.D. Faculté des sciences de l’agriculture et de l’alimentation. Université Laval, Québec, PQ, Canada.
Pritchard GG, Coolbear T, (1993). The physiology and biochemistry of the proteolytic
system in lactic acid bacteria. FEMS Microbiol Rev 12: 179-206. Rallu F, Gruss A, Ehrlich SD, Maguin E, (2000). Acid- and multistress-resistant mutants of
Lactococcus lactis: identification of intracellular stress signals. Mol Microbiol 35: 517-528.
Ramet JP, (1997). Technologie comparée des différents types de caillé. In : Le Fromage,
3ième ed, pages 334-364. Ed. Eck A, Gillis JC. Lavoisier, Paris France. Rauch PJG, Beerthuyzen MM, de Vos WM, (1994). Distribution and evolution of nisin-
sucrose elements in Lactococcus lactis. Appl Environ Microbiol 60: 1798-1804. Rawson HL, Marshall VM, (1997). Effect of ‘ropy’ strains of Lactobacillus delbrueckii
ssp. bulgaricus and Streptococcus thermophilus on rheology of stirred yogurt. Int J Food Sci Technol 32: 213-220.
Reddy SM, Vedamuthu ER, Washam CJ, Reinbold GW, (1969). Differential agar medium
for separating Streptococcus lactis and Streptococcus cremoris. Appl Microbiol 18: 755-759.
Reisinger P, Seidel H, Tschesche H, Hammes WP, (1980). The effect of nisin on murein
synthesis. Arch Microbiol 127: 187-193. Ricciardi A, Clementi F, (2000). Exopolysaccharides from lactic acid bacteria: structure,
production and technological applications. Ital J Food Sci 12: 23-45. Rilla N, Martinez B, Delgado T, Rodriguez A, (2003). Inhibition of Clostridium
tyrobutyricum in Vidiago cheese by Lactococcus lactis ssp. lactis IPLA 729, a nisin Z producer. Int J Food Microbiol 85: 23-33.
152
Rilla N, Martinez B, Rodriguez A, (2004). Inhibition of a methicillin-resistant Staphylococcus aureus strain in Afuega’l cheese by nisin Z-producing strain Lactococcus lactis susbp. lactis IPLA 729. J Food Prot 67: 928-933.
Roberts RF, Zottola EA, McKay LL, (1992). Use of a nisin-producing starter culture
suitable for cheddar cheese manufacture. J Dairy Sci 75: 2353-2363. Roberts RF, Zottola EA, (1993). Shelf-life of pasteurized process cheese spreads made
from cheddar cheese manufactured with a nisin-producing starter culture. J Dairy Sci 76: 1829-1836.
Robijn GW, Thomas JR, Haas H, van den Berg DJC, Kamerling JP, Vliegenthart JFG,
(1995a). The structure of the exopolysaccharide produced by Lactobacillus helveticus 766. Carbohydr Res 276: 137-154.
Robijn GW, van den Berg DJC, Haas H, Kamerling JP, Vliegenthart JFG, (1995b).
Determination of the structure of the exopolysaccharide produced by Lactobacillus sake 0-1. Carbohydr Res 276: 117-136.
Robijn GW, Wienk HLJ, van den Berg DJC, Haas H, Kamerling JP, Vliegenthart JFG
(1996). Structural studies of the exopolysaccharide produced by Lactobacillus paracasei. Carbohydr Res 285: 129-139.
Rodriguez E, Arques JL, Gaya P, Nunez M, Medina M, (2001). Control of Listeria
monocytogenes by bacteriocins and monitoring of bacteriocin-producing lactic acid bacteria by colony hybridization in semi-hard raw milk cheese. J Dairy Res 68: 131-137.
Rogers LA, (1928). The inhibiting effect of Streptococcus lactis on Lactobacillus
bulgaricus. J Bacteriol 16: 321-325. Rohm H, Kovac A, (1994). Effects of starter cultures on linear viscoelastic and physical
properties of yogurt gels. J Text Stud 25: 311-329. Rollema HS, Kuipers OP, Both P, de Vos WM, Siezen RJ, (1995). Improvement of
solubility and stability of the antimicrobial peptide nisin by protein engineering. Appl Environ Microbiol 61: 2873-2878.
Ross PR, Galvin M, McAuliffe O, Morgan SM, Ryan MP, Twomey DP, Meaney WJ, Hill
C, (1999). Developping applications for lactococcal bacteriocins. Antonie van Leeuwenhoek 76: 337-346.
Ruas-Madiedo P, Hugneholtz J, Zoon P, (2002). An overview of the functionality of
exopolysacharrides produced by lactic acid bacteria. Int Dairy J 12: 163-171.
153
Rudi K, Nogva HK, Moen B, Nissen H, Bredholt S, Moretro T, Naterstad K, Holck A, (2002). Development and application of new nucleic acid-based technologies for microbial community analyses in foods. Int J Food Microbiol 78: 171-180.
Rueckert A, Ronimus RS, Morgan HW, (2005). Development of a rapid detection and
enumeration method for thermophilic bacilli in milk powders. J Microbiol Methods 60: 155-167.
Ruhr E, Sahl HG, (1985). Mode of action of the peptide antibiotic nisin and influence on
the membrane potential of whole cells and on cytoplasmic and artificial membrane vesicles. Antimicrob Agents Chemother 27: 841-845.
Sahl HG, Bierbaum G, (1998). Lantibiotics: biosynthesis and biological activities of
uniquely modified peptides from Gram-positive bacteria. Annu Rev Microbiol 52: 41-79.
Salama M, Sandine W, Giovannoni S, (1991). Development and application of
oligonucleotide probes for identification of Lactococcus lactis subsp. cremoris. Appl Environ Microbiol 57: 1313-1318.
Sallami L, Kheadr EE, Fliss I, Vuillemard JC, (2004). Impact of autolytic and proteolytic
lactobacilli and nisin-producing culture on proteolysis and sensory characteristics in Cheddar cheese. J Food Sci 69: 24-32.
Schepers AW, Thibault J, Lacroix C, (2005). Continuous lactic production in whey
permeate/yeast extract medium with immobilized Lactobacillus helveticus in a two stage process : model and experiments. Soumis.
Sherman JM, (1937). The streptococci. Bact Rev 1: 3-97. Siegumfeldt H, Rechinger KB, Jakobsen M, (2000). Dynamic changes of intracellular pH
in individual lactic acid bacterium cells in response to a rapid drop in extracellular pH. Appl Environ Microbiol 66: 2330-2335.
Skriver A, Roemer H, Qvist KB, (1993). Rheological characterization of stirred yoghurt
viscometry. J Text Stud 24: 185-198. Snoep JL, Teixeira de Mattos MJ, Starrenburg MJ, Hugenholtz J, (1992).Isolation,
characterization, and physiological role of pyruvate dehydrogenase complex and alpha-acetolactate synthase of Lactococcus lactis subsp. lactis bv. diacetylactis. J Bacteriol 174: 4838-4841.
Sodini-Gallot I, Corrieu G, Boquien CY, Latrille E, Lacroix C, (1995). Process
performance of continuous inoculation and acidification of milk with immobilized lactic acid bacteria. J Dairy Sci 78: 1407-1420.
154
Sodini I, Boquien CY, Corrieu G, Lacroix C, (1997a). Use of an immobilized cell bioreactor for the continuous inoculation of milk in fresh cheese manufacturing. J Ind Microbiol Biotechnol 18: 56-61.
Sodini I, Boquien CY, Corrieu G, Lacroix C, (1997b). Microbial dynamics of co- and
separetely entrapped mixed cultures of mesophilic lactic acid bacteria during the continuous prefermentation of milk. Enzyme Microb Technol 20: 381-388.
Sodini I, Lagace L, Lacroix C, Corrieu G, (1998). Effect of continuous prefermentation of
milk with an immobilized cell bioreactor on fermentation kinetics and curd properties. J Dairy Sci 81: 631-638.
Sodini I, Remeuf F, Haddad S, Corrieu G, (2004). The relative effect of milk base, starter,
and process on yogurt texture: a review. Crit Rev Food Sci Nut 44: 113-137. Sonomoto K, Chinachoti N, Endo N, Ishizaki A, (2000). Biosynthetic production of nisin Z
by immobilized Lactococcus lactis IO-1. J Mol Catal B Enzym 10: 325-334. Spinnler HE, Corrieu G, (1989). Automatic method to quantify starter activity based on pH
measurement. J Dairy Res 56: 755-764. Spinnler HE, Guichard E, Gripon JC, (1997). Les propiétés physiques et organoleptiques
du fromage. In : Le Fromage, 3ième ed, pages 479-505. Ed. Eck A, Gillis JC. Lavoisier, Paris France.
Steele JL, McKay LL, (1986). Partial characterization of the genetic basis for sucrose
metabolism and nisin production in Streptococcus lactis. Appl Environ Microbiol 51: 57-64.
Stevens KA, Sheldon BW, Klapes NA, Klaenhammer TR, (1991). Nisin treatment for
inactivation of Salmonella species and other Gram-negative bacteria. Appl Environ Microbiol 57: 3613-3615.
Stingele F, Neeser JR, Mollet B, (1996). Identification and characterization of the eps
(exopolysaccharide) gene cluster from Streptococcus thermophilus Sfi6. J Bacteriol 178: 1680-1690.
Stubner S, (2002). Enumeration of 16S rDNA of Desulfotomaculum lineage1 in rice field
soil by real-time PCR with SybrGreen detection. J Microbiol Methods 50: 155-164. Swindell SR, Benson KH, Griffin HG, Renault P, Erhlich SD, Gasson MJ, (1996). Genetic
manipulation of the pathway for diacetyl metabolism in Lactococcus lactis. Appl Environ Microbiol 62: 2641-2643.
Tagg JR, Dajani AS, Wannamaker LW, (1976). Bacteriocins of Gram-positive bacteria.
Microbiol Rev 40: 722-756.
155
Taniguchi M, Kotani N, Kobayashi T, (1987). High concentration of Bifidobacterium
longum in fermentor with cross-flow filtration. Appl Microbiol Biotechnol 25: 438-441.
Teggatz JA, Morris JA, (1990). Changes in the rheology and microstructure of ropy yogurt
during shearing. Food Struct 9: 133-138. Tejayadi S, Cheryan M, (1995). Lactic acid from cheese whey permeate. Productivity and
economics of a continuous membrane bioreactor. Appl Microbiol Biotechnol 38: 305-311.
Teixera de Mattos MJ, de Boer JP, Zoutberg GR, Neijssel OM, (1994). Metabolic shift
analysis at high cell densities. FEMS Microbiol Rev. 14: 21-28. Terzaghi BE, Sandine WE, (1975). Improved medium for lactic streptococci and their
bacteriophages. Appl Environ Microbiol 29: 807-813. Theron J, Cloete TE, (2000). Molecular techniques for determining microbial diversity and
community structure in natural environments. Crit Rev Microbiol 26: 37-57. Trauth E, Lemaitre JP, Rojas C, Diviès C, Cachon R, (2001). Resistance of immobilized
lactic acid bacteria to the inhibitory effect of quaternary ammonium sanitizers. Lebensm – Wiss Technol, 34:239-243.
Tungjaroenchai W, White CH, Holmes WE, Drake MA, (2004). Influence of adjunct
cultures on volatile free fatty acids in reduced-fat Edam cheese. J Dairy Sci 87: 3225-3234.
Urbach E, Daniels B, Salama MS, Sandine WE, Giovannoni SJ, (1997). The ldh phylogeny
for environmental isolates of Lactococcus lactis is consistent with rRNA genotypes but not with phenotypes. Appl Environ Microbiol 63: 694-702.
U.S. Food and Drug Administration, 1988. Nisin Preparation: Affirmation of GRAS status
as direct human food ingredient. Federal Register. 53, April 6. Vaira D, Holton J, Menegatti M, Ricci C, Landi F, Ali A, Gatta L, Acciardi C, Farinelli S,
Crosatti M, Berardi S, Miglioli M, (1999). New immunological assays for the diagnosis of Helicobacter pylori infection. Gut 45: 23-27.
van Calsteren MR, Pau-Roblot C, Bégin A, Roy D, (2002). Structure determination of the
exopolysaccharide produced by Lactobacillus rhamnosus RW-9595M. Biochem J 363: 7-17.
van de Guchte M, Serror P, Chervaux C, Smokvina T, Ehrlich SD, Maguin E, (2002).
Stress response in lactic acid bacteria. Antonie van Leeuwenhoek 82: 187-216.
156
van den Berg DJC, Robijn GW, Janssen AC, Guiseppin MLF, Vreeker R, Kamerling JP,
Vliegenthart JFG, Ledeboer AM, Verrips CT, (1995). Production of a novel extracellular polysaccharide by Lactobacillus sake 0-1 and characterization of the polysaccharide. Appl Environ Microbiol 61: 2840-2844.
van den Hooven HW, Sponk CAEM, van de Camp M, Konings RNH, Hilbers CW, van den
Ven FJM, (1996). Surface location and orientation of the lantibiotic nisin bound to membrane-mimickimg micelles of dodecylphosphocholine and of sodium dodecylsulphate. Eur J Biochem 235: 394-403.
van Kranenburg R, de Vos WM, (1998). Characterization of multiple regions involved in
replication and mobilization of plasmid pNZ4000 coding for exopolysaccharide production in Lactococcus lactis. J Bacteriol 180: 5285-5290.
van Kranenburg R, Kleerebezem M, de Vos WM, (2000). Nucleotide sequence analysis of
the lactococcal EPS plasmid pNZ4000. Plasmid 43: 130-136. van Niel EWJ, Hahn-Hagerdal B, (1999). Nutrient requirements of lactococci in defined
growth media. Appl Microbiol Biotechnol 52: 617-627. Wittwer CT, Herrmann MG, Gundry CN, Elenitoba-Johnson KSJ, (2001). Real-time
multiplex PCR assays. Methods 25: 430-442. Xie Y, Chou L, Cutler A, Weimer B, (2004). DNA Macroarray profiling of Lactococcus
lactis subsp. lactis IL1403 gene expression during environmental stresses. Appl Environ Microbiol 70: 6738-6747.
Yvon M, Rijnen L, (2001). Cheese flavour formation by amino acid catabolism. Int Dairy J
11: 185-201. Yu W, Gillies K, Kondo JK, Broadbent JR, Mc Kay LL, (1996). Loss of plasmid-mediated
oligopeptide transport system in Lactococci: another reason for slow milk coagulation. Plasmid 35: 145-155.
Yu KY, Noh Y, Chung M, Park HJ, Lee N, Youn M, Jung BY, Youn BS, (2004). Use of
monoclonal antibodies that recognize p60 for identification of Listeria monocytogenes. Appl Environ Microbiol 11: 446-451.