1
Development of a Regional Ionospheric TEC Map for Indonesia Asnawi Husin 1 *, Buldan Muslim 1 , Rizal Suryana 1 , Volvariella Volvacea 1 , Dyah RM 1 ,Agung Setyawan 2 1 Space Science Center , National Institute of Aeronautic and Space, LAPAN 2 Geospatial Information Agency , Badan Informasi Geospasial (BIG) *Correspondence: [email protected] ; Tel.:+62 226012602 Background It is well known that ionosphere has significantly influences radio propagation to distant places on the Earth In order to monitor and understand the physics that control the dynamics of the ionosphere, a number of global and regional ionospheric model and data mapping product have been developed over the last several decades. The models and data mapping products can provide information regarding change in the ionosphere on a daily basis, hourly basis, or near real time. The most ionospheric map are based on total electron content (TEC). The TEC data map are developed based on observations from hundreds of Global Navigation Satellite System (GNSS) receivers. The magnitude of TEC varies from a few total electron content unit, 1 TECU = 10 16 el m 2 (TECU) near the magnetic equator to 2050 TECU at the crest region depending on the day and season [Bagiya et al ., 2009]. TEC observations from ground-based GPS/ GNSS receivers are often uneven in distributions and concentrated over specific areas because of limited numbers of satellites and stations. An interpolation methods have an important role to play in develop ionospheric data mapping product, even on a regional scale. Previously reported interpolation technique for TEC-mapping studies include kriging, cubic B- spline and multiquadric (Stanislawska et al 2002., Wielgosz et al 2003., Orùs et al 2005., Grynyshyna-Poliuga et al 2014), as well as moving average covered area (Takahashi et al., 2016). Other technique based on least squares collocation (Krypiak-Gregorczyk et al., 2017) and Spherical cap harmonic (Liu et al 2010) have also been reported. In this paper, an ionospheric TEC mapping product (GoTEC-LAPAN) is developed based on multi- GNSS (GPS and GLONASS) observations for the Indonesian region. Method and performance of the ionospheric TEC mapping are carefully analyzed and validated using single station observation data and global model. The TEC data mapping product will be provided in a standard IONEX format so that it can be used for GNSS position correction application purpose. Objectives To developed ionospheric TEC mapping product (GoTEC-LAPAN) based on multi-GNSS (GPS and GLONASS) observations for the Indonesian region To validated by using single station observation data and global model. The TEC data mapping product will be provided in a standard IONEX format so that it can be used for GNSS position correction application purpose Data and Method Figure 1 : Indonesian Continuously Operating Reference Station by Badan Informasi Geospasial (BIG): http://nrtk.big.go.id/sbc/ Results and Discussion Conclusion References Fejer, B.G. Equatorial Ionospheric Electric Fields Associated With Magnetospheric Disturbances. Solar wind-Magnetosphere coupling, (Eds) Kamide, Y. and Slavin, J. A., Terra Scientific Publishing Company (TERRAPUB), Tokyo 1986, 519545. Fejer, B.G. Low Latitude Electrodynamic Drifts: A Review. Journal of Atmospheric and Terrestrial Physics 1991, 53, 677693. Fejer, B. G.; de Paula, E. R.; Gonzales, S. A.; Woodman, R. F. Average vertical and zonal F-region plasma drifts over Jicamarca, J. Geophys. Res 1991, 96, 13 90113 906. Fejer, B. G.; Kelley,M. C. Ionospheric irregularities, Rev. Geophys. Space Phys 1980, 18, 401454. Bailey, G. J.; Balan, N.; Su, Y. Z. The Sheffield University plasmasphere ionosphere model - a review. J. Atmos. Terr. Phys 1997,59, 15411552. Balan, N.; Bailey, G. J. Equatorial plasma fountain and its effects: Possibility of an additional layer, J. Geophys. Resv 1995, 100, 21 42121 432. Balan, N.; Bailey, G. J.; Abdu, M. A.; Oyama, K. I.; Richards, P. G.; MacDougall, J.; Batista, I. S. Equatorial plasma fountain and its effects over three locations: Evidence for an additional layer, the F3-layer, J. Geophys. Res 1997,102, 20472056. Shim, JA Soon. Analysis of Total Electron Content (TEC) Variations in the Low- and Middle-Latitude Ionosphere. (2009). All Graduate Theses and Dissertations. 403. https://digitalcommons.usu.edu/etd/403 Reddybattula, K.D.; Panda, S.K. Performance analysis of quiet and disturbed time ionospheric TEC responses from GPS-based observations, IGS-GIM, IRI-2016 and SPIM/IRI-Plas 2017 models over the low latitude Indian region, Advances in Space Research 2019, 64 (10), pp. 2026-2045. Tsagouri I.; Koutroumbas, K.; Elias, P. A new short-term forecasting model for the total electron content storm time disturbances. J. Space Weather Space Clim 2018. 8: A33 Bergeot N.; Tsagouri, I.; Bruyninx, C.; Legrand, J.; Chevalier, J. The influence of space weather on ionospheric total electron content during the 23rd solar cycle. J. Space Weather Space Clim 2013, 3, A25. Grynyshyna-Poliuga, O.; Stanislawska, I.; Swiatek, A. Regional Ionosphere Mapping with Kriging and B-spline Methods. In Mitigation of Ionospheric Threats to GNSS: an Appraisal of the Scientific and Technological Outputs of the TRANSMIT Project 2014. https://doi.org/10.5772/58776 Bagiya, M. S.; Joshi, H. P.; Iyer, K. N.; Aggarwal, M.; Ravindran, S.; Pathan, B. M. TEC variations during low solar activity period (20052007) near the Equatorial Ionospheric Anomaly Crest region in India, Ann. Geophys 2009, 27, 10471057. Takahashi, H.; Wrasse; C. M.; Denardini, C. M.; Pádua, M. B.; Paula, E. R.; Costa, S. M. A.; Otsuka, Y.; Shiokawa, K.; Monico,J.F.G.I.A.; Sant'Anna, N. IonosphericTEC Weather Map Over South America, Space Weather, 2016,14, 937949,doi:10.1002/2016SW001474 Stanislawska, I.; Juchnikowski, G.; Cander, L.R.; Ciraolo, L.; Bradley, P.A.; Zbyszynski, Z.; Swiatek, A. The kriging method of TEC instantaneous mapping. Adv. Space Res 2002, 29, 945948. Wielgosz, P.; Grejner-Brzezinska, D.A.; Kashani, I. Regional ionosphere mapping with kriging and multiquadric methods. J. Glob. Position. Syst 2003, 2, 4855. Orùs, R.; Hernández-Pajares, M.; Juan, J.M.; Sanz, J. Improvement of global ionospheric VTEC maps by using kriging interpolation technique. J. Atmos. Sol. Terr. Phys 2005, 67, 15981609. Krypiak-Gregorczyk, A.; Wielgosz, P.; Jarmołowski, W. A new TEC interpolation method based on the least squares collocation for high accuracy regional ionospheric maps. Meas. Sci. Technol 2017, 28, 045801. Liu, J., Chen, R., Wang, Z.; Zhang, H. Spherical cap harmonic model for mapping and predicting regional TEC. GPS Solutions 2010, 15,2, 109119. doi:10.1007/s10291-010-0174-8 Rama Rao, P. V. S.; Gopi Krishna, S.; Niranjan, K.; Prasad, D. S. V. V. D. Temporal and spatial variations in TEC using simultaneous measurements from the Indian GPS network of receivers during the low solar activity period of 2004-2005, Ann. Geophys 2006, 24, 3279-3292, doi:10.5194/angeo-24-3279-2006. Rajesh, P. K.; Liu, J. Y.; Balan, N.; Lin, C. H.; Sun, Y. Y.; Pulinets, S. A. Morphology of midlatitude electron density enhancement using total electron content measurements, J. Geophys. Res.- Space Phys 2016 15031507, https://doi.org/10.1002/2015JA022251. Dashora, N.; Suresh, S.; & Niranjan, K. Interhemispheric asymmetry in response of low‐latitude ionosphere to perturbation electric fields in the main phase of geomagnetic storms. J. Geophys. Res.- Space Phys 2019, 124, 72567282. https://doi.org/10.1029/2019JA026671 Shi, C.,; Zhang, T.; Wang, C.; Wang, Z.; Fan, L. Comparison of IRI-2016 model with IGS VTEC maps during low and high solar activity period. Results In Physics 2019,12,555-561. https://doi.org/10.1016/j.rinp.2018.12.022 Figure 2 : Geographical map marking the locations of ground-baed GNSS receiver stations from the INACORS BIG network that listed in table 1 Finally in order to see deviation and comparison with global model, GoTEC-LAPAN is evaluated based on Mean Absolute Percentage Error (MAPE). To test and validation our method, IGS global ionospheric model (GIM), IRI2016 and single-station observation data during a geomagnetic storm event were used to evaluate the TEC map model. The solar storm happened on April 20, Figure 4 shows the variations of the geomagnetic parameters, (Bz, Kp and Dst) from April 19 to 21, 2020. These indices can be obtained from NASA’s OMNI website (https://omniweb.gsfc.nasa.gov/form/dx1.html). The situation shown in figure 4 indicates that the North South component of interplanetary magnetic field (IMF-Bz) jumped to -14nT, Kp 5 and Dst index reached about -60 nT, (started at 06:00 UT), which was categorized as minor G1 geomagnetic storm conditions. However in this study we calibrated STEC sm in equation (6) using the differential code bias (DCB) data provided by Center for Orbit Determination in Europe (CODE) at ftp://ftp.unibe.ch/aiub/CODE/. The third step is convert slant TEC (STEC sm ) into vertical TEC (VTEC). The VTEC obtained by multiplying the STEC with the mapping function M(z), which, is defined as: Figure 6. Three day of the temporal variation of TEC values 19 - 21 April 2020, G1 Geomagnetic storm on April 20, as comparison of TEC measurement of GIM-IGS TEC (black dash line), GOPI-GPSTEC (blue line), IRI2016 (thin black dash line) and GoTEC-LAPAN (red line) .Apparently, the minor geomagnetic storm did not significantly affect the expected regular TEC variation. This might be because both set of measurements ware taken in the southern crest region (SCR), while the effect of TEC asymmetries during this geomantic storm primarily affected the northern crest region (NCR) as shown in Figure 5. The results in Figure 6 show three days of temporal variations of TEC for model and observations. These include GIM-IGS TEC (black dash line), Gopi-GPSTEC at BAKO (blue line), IRI2016 (thin black dash line) and GoTEC-LAPAN (red line). We can see that the global TEC model, (IRI2016 and GIM-IGS TEC) are lower than regional model (GoTEC- LAPAN) and single-station observation data (Gopi-GPSTEC at BAKO). The TEC values from GoTEC-LAPAN and Gopi-GPSTEC at BAKO have have a similar pattern. Figure 6. Three day of the temporal variation of TEC values 19 - 21 April 2020, G1 Geomagnetic storm on April 20, as comparison of TEC measurement of GIM-IGS TEC (black dash line), GOPI-GPSTEC (blue line), IRI2016 (thin black dash line) and GoTEC- LAPAN (red line) In the first stage of GoTEC-LAPAN model development, the first 9 GNSS station from INACORS BIG listed in table 1 and indicated as blue triangle in Figure 2, used for developed TEC map of GoTEC-LAPAN model which is covered latitude between 10 o North to 10 o South and Longitude form 85 o to 120 o . The TEC map is ( marked as blue triangles in Figure 2) were used to developed the TEC map, which covered latitude range between 10 o N and 10 o S and longitude range from 85 o E and 120 o E. The TEC map covered the area of Sumatra, Peninsular Malaysia, Java and West Kalimantan. Figure 7 shows a comparison of the global TEC (GIM) IGS (Figure 7(a), TEC IRI2016-TEC (Figure 7(c) model and GoTEC- LAPAN (Figure 7 (b) at 01:30 April 20, 2020. In Figure 7, IGS-GIM TEC and GoTEC-LAPAN model show similar spatial pattern of TEC variation and absolute TEC level, but IRI2016 TEC values were somewhat lower and exhibit different spatial variation. This different is likely due to the use of satellite bias in the TEC estimation method of TEC GIM and GoTEC-LAPAN. Generally, we had developed simple low order polynomial model for TEC mapping over Indonesian sector. Earlier results from stage 1 GoTEC-LAPAN (using 10 GNSS INACORS station, covered latitude range between 10 o N and 10 o S and longitude range from 85 o E and 120 o E as shown in Figure 7) showed quite good agreemment IGS-GIM and IRI2016. However, when GoTEC-LAPAN is further expanded by using 60 GNSS station from INACORS (covered latitude range of 10 o N to -15 o S and longitude range of 85 o E to 150 o E) ), the model results became quite different on spatial patern, especially during day time. Obviously IGS-GIM showed two maximum peak of TEC as a representation of equatorial anomaly (EIA) but GoTEC-LAPAN showed only one peak. The Mean Absolute Percentage Error (MAPE) of GoTEC-LAPAN model respect to IGS-GIM TEC about 14.62 %, and IRI2016 about 32.01%. The IGS-GIM TEC is support by world-wide network of IGS stations, the grids having IGS stations inside would give better accuracy than the grids without any IGS stations. Recently, there are about 5 sites of IGS station in the regional Indonesia, incluing of NTUS Singapore, that makes it even more accurate. However, IGS-GIM has a temporal resolution of two hours and a spatial resolution 2.5 o and 5 o so it is problem in practical purposes that requiring a resolution of less than two hours. GoTEC-LAPAN is developed by quite simple method of first order polynomial for build regional TEC map. Considering algorithm runtime, the method was choosen to provide near real time of TEC map with temporal resolution 5 minutes and spatial resolution 1 o x1 o . However, the next step for the effectiveness of the methods already used, the IONEX format as output of GOTEC-LAPAN need to be testing of accuracy for practical purposes as ionospheric correction model The regional ionospheric model from the INACORS BIG GNSS network over Indonesia has been developed. The Networked Transport of RTCM via Internet Protocol (NTRIP) used to retrieved RCTM data. TEC values derived from carrier phase measurements and we use satellite and receiver bias from IGS-GIM IONEX data. In the first stage we use 9 sites from INACORS then continued add to be 60 sites in the stage two. Result showed when using 9 site of GNSS INACORS, the IGS-GIM TEC and GoTEC-LAPAN model somewhat the same spatial pattern of TEC variation in the west region Indonesia and agree with TEC value, but IRI2016 TEC values lowest and showing slightly different spatial pattern of TEC variation. This different is due to the use of satellite bias in the TEC estimation method of TEC GIM and GoTEC-LAPAN. In the stage two, model is expanded by using 60 stations of GNSS INACORS, the TEC variation between GoTEC-LAPAN and IGS-GIM TEC quite same spatial patern compared to IRI2016 at 00:00 UT (07:00 LT). However, the model showing quite different of spatial patern at 08:00 UT (15:00 LT). IGS-GIM TEC showing two highest TEC peak (representation of EIA) compare to GoTEC-LAPAN which is only showing one highest TEC peak. The Mean Absolute Percentage Error (MAPE) of GoTEC-LAPAN model respect to IGS-GIM TEC about 14.62 %, and IRI2016 about 32.01%. Acknowledgments We would like to thank Rezy Pradipta for his comments and insightful suggestions of the manuscript. We would like to thank the Indonesian Geospatial Information Agency (Badan Informasi GeospasialBIG) for the INACORS RTCM data, the International GNSS Service (IGS), ftp://cddis.nasa.gov/gnss/products/ ionex, IRI2016 model https://ccmc.gsfc.nasa.gov/modelweb/models/ iri2016_vitmo.php) for model data and NASA’s official website (https://omniweb.gsfc.nasa.gov/form/ dx1.htm, geomagnetic index used in this study..

Figure 6. Three day of the temporal variation of TEC

  • Upload
    others

  • View
    1

  • Download
    0

Embed Size (px)

Citation preview

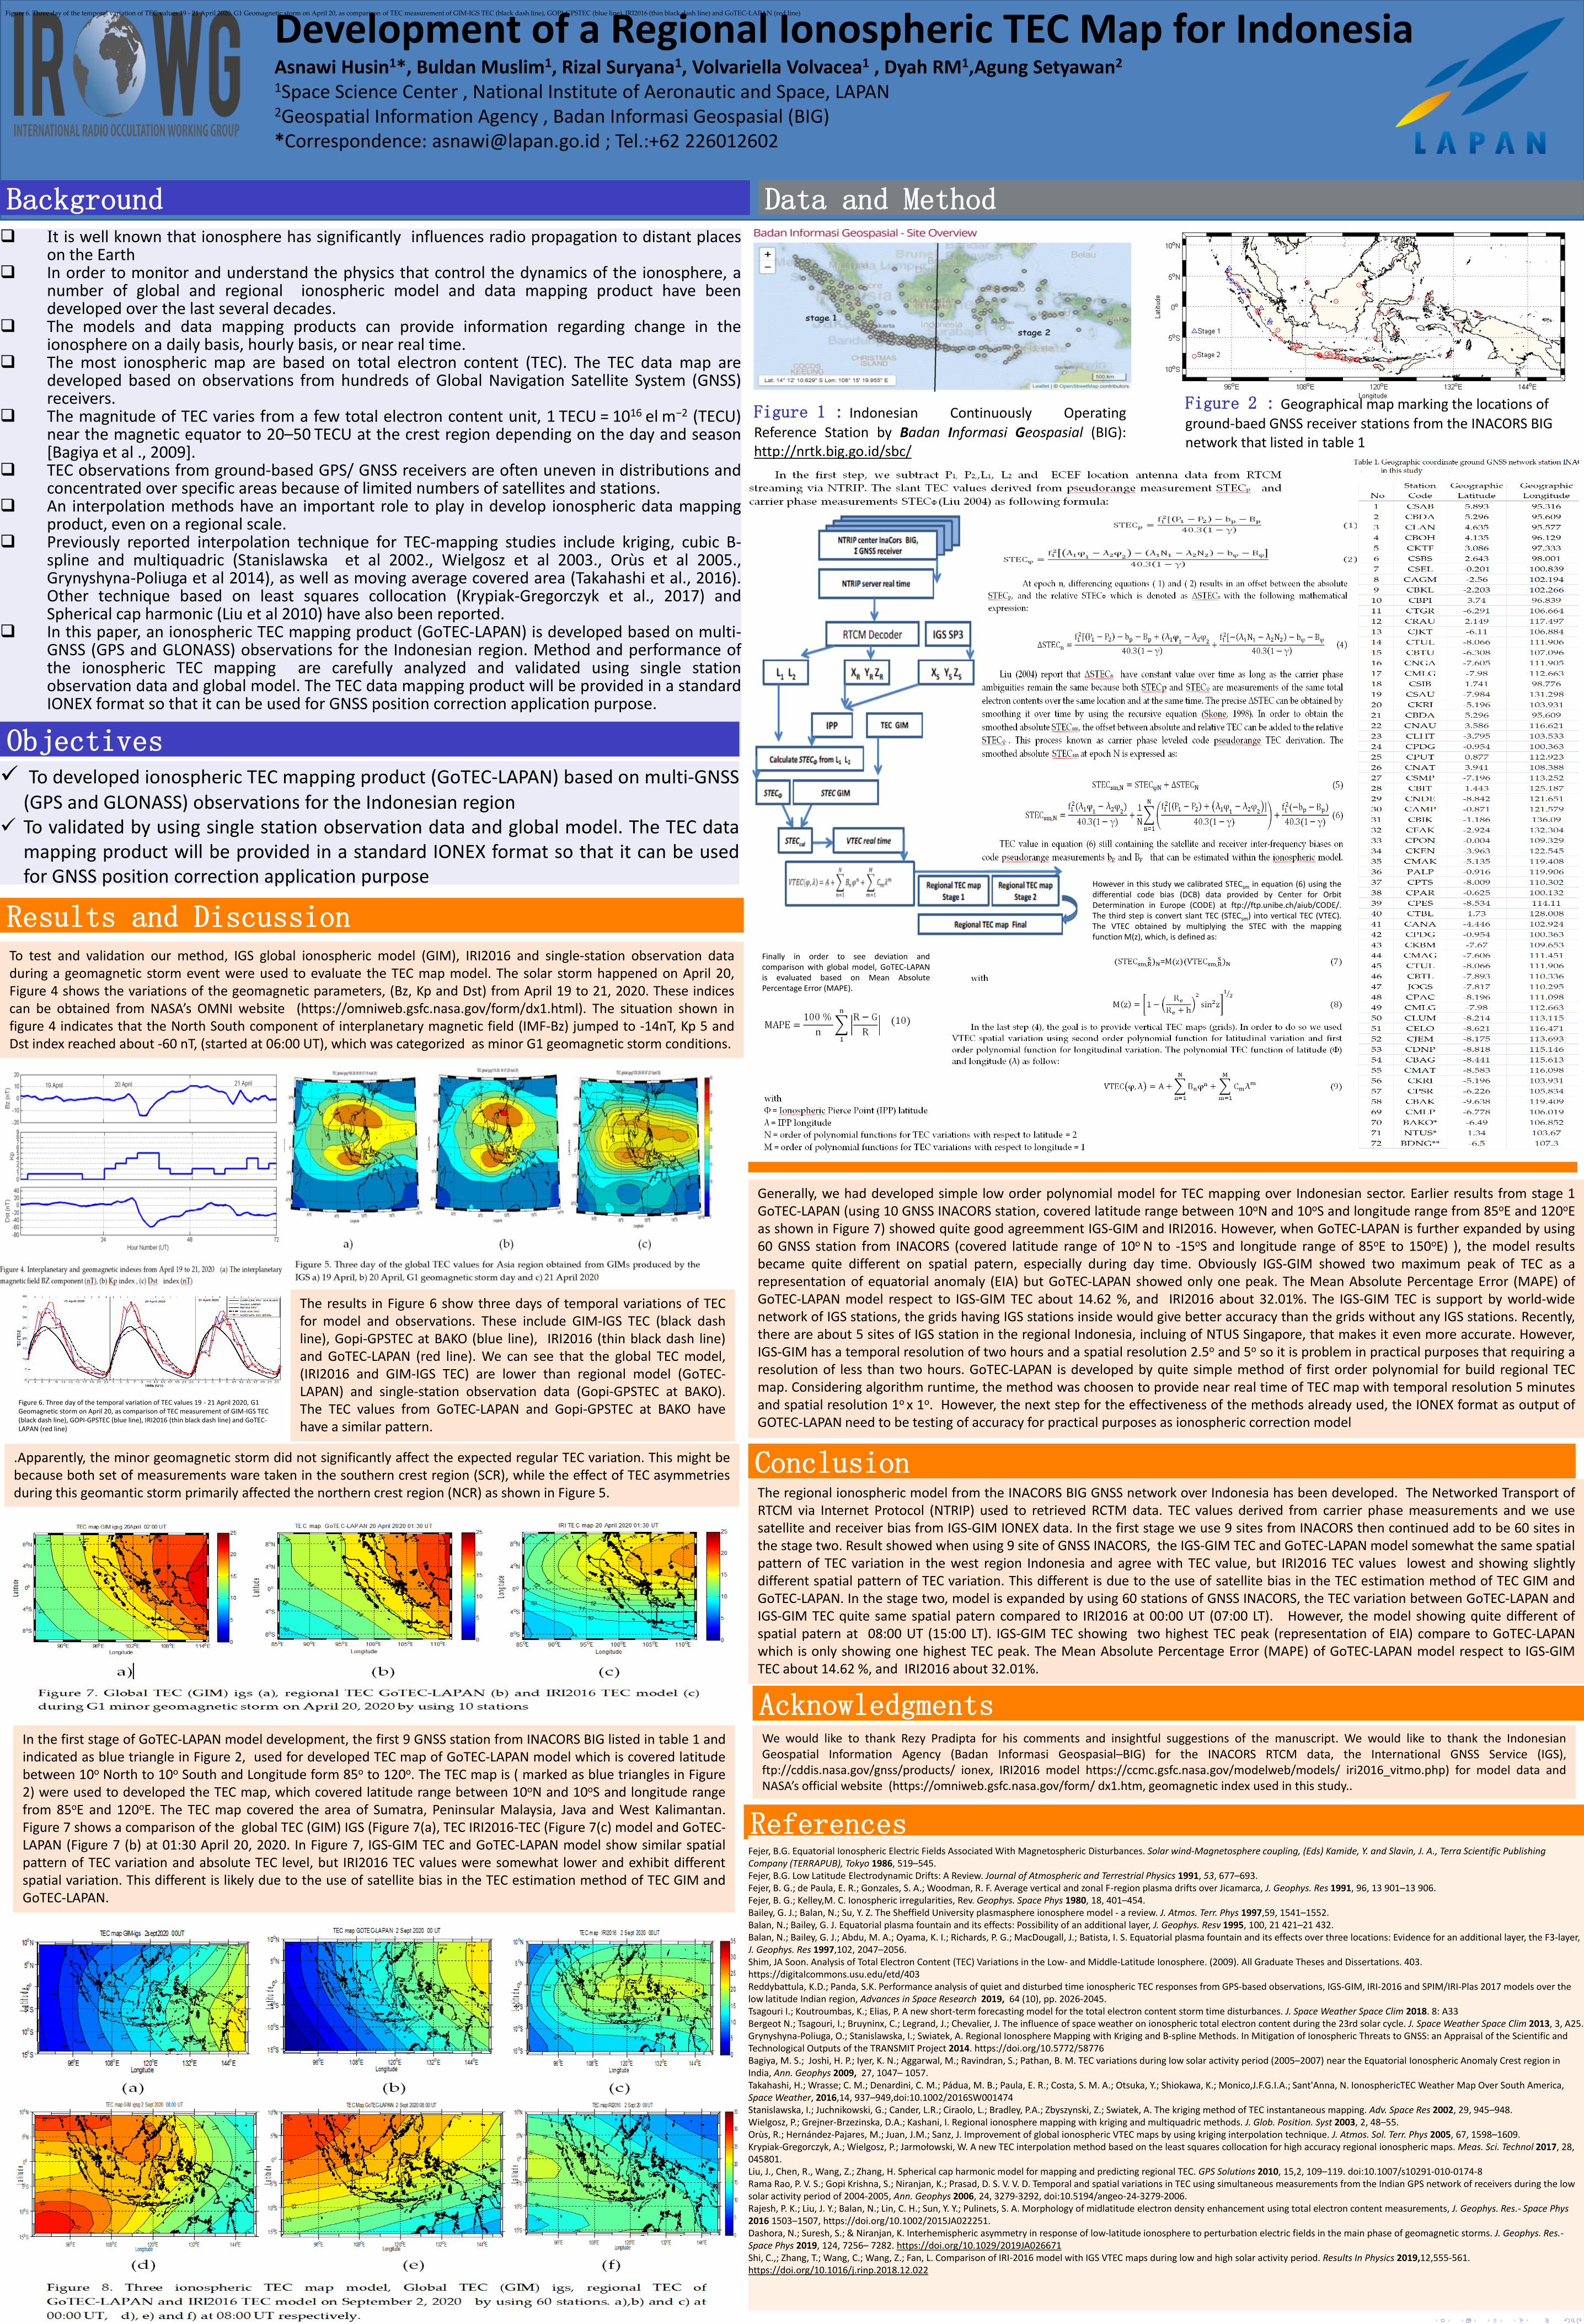
Development of a Regional Ionospheric TEC Map for IndonesiaAsnawi Husin1*, Buldan Muslim1, Rizal Suryana1, Volvariella Volvacea1 , Dyah RM1,Agung Setyawan2

1Space Science Center , National Institute of Aeronautic and Space, LAPAN 2Geospatial Information Agency , Badan Informasi Geospasial (BIG)*Correspondence: [email protected] ; Tel.:+62 226012602

Background It is well known that ionosphere has significantly influences radio propagation to distant places

on the Earth In order to monitor and understand the physics that control the dynamics of the ionosphere, a

number of global and regional ionospheric model and data mapping product have beendeveloped over the last several decades.

The models and data mapping products can provide information regarding change in theionosphere on a daily basis, hourly basis, or near real time.

The most ionospheric map are based on total electron content (TEC). The TEC data map aredeveloped based on observations from hundreds of Global Navigation Satellite System (GNSS)receivers.

The magnitude of TEC varies from a few total electron content unit, 1 TECU = 1016 el m−2 (TECU)near the magnetic equator to 20–50 TECU at the crest region depending on the day and season[Bagiya et al ., 2009].

TEC observations from ground-based GPS/ GNSS receivers are often uneven in distributions andconcentrated over specific areas because of limited numbers of satellites and stations.

An interpolation methods have an important role to play in develop ionospheric data mappingproduct, even on a regional scale.

Previously reported interpolation technique for TEC-mapping studies include kriging, cubic B-spline and multiquadric (Stanislawska et al 2002., Wielgosz et al 2003., Orùs et al 2005.,Grynyshyna-Poliuga et al 2014), as well as moving average covered area (Takahashi et al., 2016).Other technique based on least squares collocation (Krypiak-Gregorczyk et al., 2017) andSpherical cap harmonic (Liu et al 2010) have also been reported.

In this paper, an ionospheric TEC mapping product (GoTEC-LAPAN) is developed based on multi-GNSS (GPS and GLONASS) observations for the Indonesian region. Method and performance ofthe ionospheric TEC mapping are carefully analyzed and validated using single stationobservation data and global model. The TEC data mapping product will be provided in a standardIONEX format so that it can be used for GNSS position correction application purpose.

Objectives To developed ionospheric TEC mapping product (GoTEC-LAPAN) based on multi-GNSS

(GPS and GLONASS) observations for the Indonesian region To validated by using single station observation data and global model. The TEC data

mapping product will be provided in a standard IONEX format so that it can be usedfor GNSS position correction application purpose

Data and Method

Figure 1 : Indonesian Continuously Operating

Reference Station by Badan Informasi Geospasial (BIG):http://nrtk.big.go.id/sbc/

Results and Discussion

Conclusion

ReferencesFejer, B.G. Equatorial Ionospheric Electric Fields Associated With Magnetospheric Disturbances. Solar wind-Magnetosphere coupling, (Eds) Kamide, Y. and Slavin, J. A., Terra Scientific Publishing Company (TERRAPUB), Tokyo 1986, 519–545.Fejer, B.G. Low Latitude Electrodynamic Drifts: A Review. Journal of Atmospheric and Terrestrial Physics 1991, 53, 677–693.Fejer, B. G.; de Paula, E. R.; Gonzales, S. A.; Woodman, R. F. Average vertical and zonal F-region plasma drifts over Jicamarca, J. Geophys. Res 1991, 96, 13 901–13 906.Fejer, B. G.; Kelley,M. C. Ionospheric irregularities, Rev. Geophys. Space Phys 1980, 18, 401–454.Bailey, G. J.; Balan, N.; Su, Y. Z. The Sheffield University plasmasphere ionosphere model - a review. J. Atmos. Terr. Phys 1997,59, 1541–1552.Balan, N.; Bailey, G. J. Equatorial plasma fountain and its effects: Possibility of an additional layer, J. Geophys. Resv 1995, 100, 21 421–21 432.Balan, N.; Bailey, G. J.; Abdu, M. A.; Oyama, K. I.; Richards, P. G.; MacDougall, J.; Batista, I. S. Equatorial plasma fountain and its effects over three locations: Evidence for an additional layer, the F3-layer, J. Geophys. Res 1997,102, 2047–2056.Shim, JA Soon. Analysis of Total Electron Content (TEC) Variations in the Low- and Middle-Latitude Ionosphere. (2009). All Graduate Theses and Dissertations. 403. https://digitalcommons.usu.edu/etd/403Reddybattula, K.D.; Panda, S.K. Performance analysis of quiet and disturbed time ionospheric TEC responses from GPS-based observations, IGS-GIM, IRI-2016 and SPIM/IRI-Plas 2017 models over the low latitude Indian region, Advances in Space Research 2019, 64 (10), pp. 2026-2045. Tsagouri I.; Koutroumbas, K.; Elias, P. A new short-term forecasting model for the total electron content storm time disturbances. J. Space Weather Space Clim 2018. 8: A33Bergeot N.; Tsagouri, I.; Bruyninx, C.; Legrand, J.; Chevalier, J. The influence of space weather on ionospheric total electron content during the 23rd solar cycle. J. Space Weather Space Clim 2013, 3, A25.Grynyshyna-Poliuga, O.; Stanislawska, I.; Swiatek, A. Regional Ionosphere Mapping with Kriging and B-spline Methods. In Mitigation of Ionospheric Threats to GNSS: an Appraisal of the Scientific and Technological Outputs of the TRANSMIT Project 2014. https://doi.org/10.5772/58776Bagiya, M. S.; Joshi, H. P.; Iyer, K. N.; Aggarwal, M.; Ravindran, S.; Pathan, B. M. TEC variations during low solar activity period (2005–2007) near the Equatorial Ionospheric Anomaly Crest region in India, Ann. Geophys 2009, 27, 1047– 1057.Takahashi, H.; Wrasse; C. M.; Denardini, C. M.; Pádua, M. B.; Paula, E. R.; Costa, S. M. A.; Otsuka, Y.; Shiokawa, K.; Monico,J.F.G.I.A.; Sant'Anna, N. IonosphericTEC Weather Map Over South America, Space Weather, 2016,14, 937–949,doi:10.1002/2016SW001474Stanislawska, I.; Juchnikowski, G.; Cander, L.R.; Ciraolo, L.; Bradley, P.A.; Zbyszynski, Z.; Swiatek, A. The kriging method of TEC instantaneous mapping. Adv. Space Res 2002, 29, 945–948. Wielgosz, P.; Grejner-Brzezinska, D.A.; Kashani, I. Regional ionosphere mapping with kriging and multiquadric methods. J. Glob. Position. Syst 2003, 2, 48–55. Orùs, R.; Hernández-Pajares, M.; Juan, J.M.; Sanz, J. Improvement of global ionospheric VTEC maps by using kriging interpolation technique. J. Atmos. Sol. Terr. Phys 2005, 67, 1598–1609.Krypiak-Gregorczyk, A.; Wielgosz, P.; Jarmołowski, W. A new TEC interpolation method based on the least squares collocation for high accuracy regional ionospheric maps. Meas. Sci. Technol 2017, 28, 045801. Liu, J., Chen, R., Wang, Z.; Zhang, H. Spherical cap harmonic model for mapping and predicting regional TEC. GPS Solutions 2010, 15,2, 109–119. doi:10.1007/s10291-010-0174-8Rama Rao, P. V. S.; Gopi Krishna, S.; Niranjan, K.; Prasad, D. S. V. V. D. Temporal and spatial variations in TEC using simultaneous measurements from the Indian GPS network of receivers during the low solar activity period of 2004-2005, Ann. Geophys 2006, 24, 3279-3292, doi:10.5194/angeo-24-3279-2006.Rajesh, P. K.; Liu, J. Y.; Balan, N.; Lin, C. H.; Sun, Y. Y.; Pulinets, S. A. Morphology of midlatitude electron density enhancement using total electron content measurements, J. Geophys. Res.- Space Phys2016 1503–1507, https://doi.org/10.1002/2015JA022251.Dashora, N.; Suresh, S.; & Niranjan, K. Interhemispheric asymmetry in response of low‐latitude ionosphere to perturbation electric fields in the main phase of geomagnetic storms. J. Geophys. Res.-Space Phys 2019, 124, 7256– 7282. https://doi.org/10.1029/2019JA026671Shi, C.,; Zhang, T.; Wang, C.; Wang, Z.; Fan, L. Comparison of IRI-2016 model with IGS VTEC maps during low and high solar activity period. Results In Physics 2019,12,555-561. https://doi.org/10.1016/j.rinp.2018.12.022

Figure 2 : Geographical map marking the locations of

ground-baed GNSS receiver stations from the INACORS BIG network that listed in table 1

Finally in order to see deviation andcomparison with global model, GoTEC-LAPANis evaluated based on Mean AbsolutePercentage Error (MAPE).

To test and validation our method, IGS global ionospheric model (GIM), IRI2016 and single-station observation dataduring a geomagnetic storm event were used to evaluate the TEC map model. The solar storm happened on April 20,Figure 4 shows the variations of the geomagnetic parameters, (Bz, Kp and Dst) from April 19 to 21, 2020. These indicescan be obtained from NASA’s OMNI website (https://omniweb.gsfc.nasa.gov/form/dx1.html). The situation shown infigure 4 indicates that the North South component of interplanetary magnetic field (IMF-Bz) jumped to -14nT, Kp 5 andDst index reached about -60 nT, (started at 06:00 UT), which was categorized as minor G1 geomagnetic storm conditions.

However in this study we calibrated STECsm in equation (6) using thedifferential code bias (DCB) data provided by Center for OrbitDetermination in Europe (CODE) at ftp://ftp.unibe.ch/aiub/CODE/.The third step is convert slant TEC (STECsm) into vertical TEC (VTEC).The VTEC obtained by multiplying the STEC with the mappingfunction M(z), which, is defined as:

Figure 6. Three day of the temporal variation of TEC values 19 - 21 April 2020, G1 Geomagnetic storm on April 20, as comparison of TEC measurement of GIM-IGS TEC (black dash line), GOPI-GPSTEC (blue line), IRI2016 (thin black dash line) and GoTEC-LAPAN (red line)

.Apparently, the minor geomagnetic storm did not significantly affect the expected regular TEC variation. This might bebecause both set of measurements ware taken in the southern crest region (SCR), while the effect of TEC asymmetriesduring this geomantic storm primarily affected the northern crest region (NCR) as shown in Figure 5.

The results in Figure 6 show three days of temporal variations of TECfor model and observations. These include GIM-IGS TEC (black dashline), Gopi-GPSTEC at BAKO (blue line), IRI2016 (thin black dash line)and GoTEC-LAPAN (red line). We can see that the global TEC model,(IRI2016 and GIM-IGS TEC) are lower than regional model (GoTEC-LAPAN) and single-station observation data (Gopi-GPSTEC at BAKO).The TEC values from GoTEC-LAPAN and Gopi-GPSTEC at BAKO havehave a similar pattern.

Figure 6. Three day of the temporal variation of TEC values 19 - 21 April 2020, G1 Geomagnetic storm on April 20, as comparison of TEC measurement of GIM-IGS TEC (black dash line), GOPI-GPSTEC (blue line), IRI2016 (thin black dash line) and GoTEC-LAPAN (red line)

In the first stage of GoTEC-LAPAN model development, the first 9 GNSS station from INACORS BIG listed in table 1 andindicated as blue triangle in Figure 2, used for developed TEC map of GoTEC-LAPAN model which is covered latitudebetween 10o North to 10o South and Longitude form 85o to 120o. The TEC map is ( marked as blue triangles in Figure2) were used to developed the TEC map, which covered latitude range between 10oN and 10oS and longitude rangefrom 85oE and 120oE. The TEC map covered the area of Sumatra, Peninsular Malaysia, Java and West Kalimantan.Figure 7 shows a comparison of the global TEC (GIM) IGS (Figure 7(a), TEC IRI2016-TEC (Figure 7(c) model and GoTEC-LAPAN (Figure 7 (b) at 01:30 April 20, 2020. In Figure 7, IGS-GIM TEC and GoTEC-LAPAN model show similar spatialpattern of TEC variation and absolute TEC level, but IRI2016 TEC values were somewhat lower and exhibit differentspatial variation. This different is likely due to the use of satellite bias in the TEC estimation method of TEC GIM andGoTEC-LAPAN.

Generally, we had developed simple low order polynomial model for TEC mapping over Indonesian sector. Earlier results from stage 1GoTEC-LAPAN (using 10 GNSS INACORS station, covered latitude range between 10oN and 10oS and longitude range from 85oE and 120oEas shown in Figure 7) showed quite good agreemment IGS-GIM and IRI2016. However, when GoTEC-LAPAN is further expanded by using60 GNSS station from INACORS (covered latitude range of 10o N to -15oS and longitude range of 85oE to 150oE) ), the model resultsbecame quite different on spatial patern, especially during day time. Obviously IGS-GIM showed two maximum peak of TEC as arepresentation of equatorial anomaly (EIA) but GoTEC-LAPAN showed only one peak. The Mean Absolute Percentage Error (MAPE) ofGoTEC-LAPAN model respect to IGS-GIM TEC about 14.62 %, and IRI2016 about 32.01%. The IGS-GIM TEC is support by world-widenetwork of IGS stations, the grids having IGS stations inside would give better accuracy than the grids without any IGS stations. Recently,there are about 5 sites of IGS station in the regional Indonesia, incluing of NTUS Singapore, that makes it even more accurate. However,IGS-GIM has a temporal resolution of two hours and a spatial resolution 2.5o and 5o so it is problem in practical purposes that requiring aresolution of less than two hours. GoTEC-LAPAN is developed by quite simple method of first order polynomial for build regional TECmap. Considering algorithm runtime, the method was choosen to provide near real time of TEC map with temporal resolution 5 minutesand spatial resolution 1o x 1o. However, the next step for the effectiveness of the methods already used, the IONEX format as output ofGOTEC-LAPAN need to be testing of accuracy for practical purposes as ionospheric correction model

The regional ionospheric model from the INACORS BIG GNSS network over Indonesia has been developed. The Networked Transport ofRTCM via Internet Protocol (NTRIP) used to retrieved RCTM data. TEC values derived from carrier phase measurements and we usesatellite and receiver bias from IGS-GIM IONEX data. In the first stage we use 9 sites from INACORS then continued add to be 60 sites inthe stage two. Result showed when using 9 site of GNSS INACORS, the IGS-GIM TEC and GoTEC-LAPAN model somewhat the same spatialpattern of TEC variation in the west region Indonesia and agree with TEC value, but IRI2016 TEC values lowest and showing slightlydifferent spatial pattern of TEC variation. This different is due to the use of satellite bias in the TEC estimation method of TEC GIM andGoTEC-LAPAN. In the stage two, model is expanded by using 60 stations of GNSS INACORS, the TEC variation between GoTEC-LAPAN andIGS-GIM TEC quite same spatial patern compared to IRI2016 at 00:00 UT (07:00 LT). However, the model showing quite different ofspatial patern at 08:00 UT (15:00 LT). IGS-GIM TEC showing two highest TEC peak (representation of EIA) compare to GoTEC-LAPANwhich is only showing one highest TEC peak. The Mean Absolute Percentage Error (MAPE) of GoTEC-LAPAN model respect to IGS-GIMTEC about 14.62 %, and IRI2016 about 32.01%.

AcknowledgmentsWe would like to thank Rezy Pradipta for his comments and insightful suggestions of the manuscript. We would like to thank the IndonesianGeospatial Information Agency (Badan Informasi Geospasial–BIG) for the INACORS RTCM data, the International GNSS Service (IGS),ftp://cddis.nasa.gov/gnss/products/ ionex, IRI2016 model https://ccmc.gsfc.nasa.gov/modelweb/models/ iri2016_vitmo.php) for model data andNASA’s official website (https://omniweb.gsfc.nasa.gov/form/ dx1.htm, geomagnetic index used in this study..