Embed Size (px)
Citation preview
IMPACTS OF LARGE TRUCK RESTRICTIONS IN FREIGHT CARRIER OPERATIONS IN METRO MANILA
Jun T. CASTRO Research Associate Graduate School of Engineering Department of Social and Environmental Engineering Hiroshima University 1-4-1 Kagamiyama, Higashi Hiroshima-shi, Hiroshima 739-8527, Japan Fax: +81-82-424-7771 E-mail: [email protected]
Hirohito KUSE Professor Graduate School of Marine Science and Technology Tokyo University of Maritime Science and Technology 2-1-6 Etchujima, Koto-ku, Tokyo 135-8533, Japan Fax: +81-3-5245-7369 E-mail: [email protected]
Abstract: Large truck restrictions directly affect freight carrier operations. To estimate truck travel demands, it is necessary to look into the changes of freight carrier operations after the imposition of any truck restriction policy. An understanding of their operational and travel behaviors will be helpful in estimating latent truck demands that are usually neglected in travel demand forecasting. Using data from interview surveys of freight carrier operators, this paper aims to examine the impacts of the existing large truck restriction on their trucking operations. Interview surveys reveal that freight carriers cope with the large truck restriction policy by mainly changing their delivery routes and or shifting their delivery times. Through random utility discrete choice modeling, the paper tries to determine if freight carriers’ reaction depends on specific factors related to company and their operational characteristics. Key Words: Freight transportation, Truck restrictions, Trucking operations, Utility theory 1. INTRODUCTION Trucks are the most efficient and most available transportation mode for freight movement in urban areas. In the developing countries, trucks handle the majority of cargo due to the absence of freight transport services for the other modes. However, rapid and continuous increases in truck movements for intracity and intercity freight have significantly affected transportation efficiency. Truck movements, therefore, play a major role in the overall transportation system. One of the controversial issues and primary sources of debates in transportation policy is concerned with the effectiveness of restricting large trucks in urban areas. Restricting large trucks in cities has been one of the most popular measures in developing countries due to road capacity limitations. Large trucks are perceived as slow-moving and hindering the free-flow movement of traffic particularly during peak hours. In addition, trucks intimidate motorists and restrict their field of vision apparently because of their large sizes. Trucking industry and trade associations, however, have claimed that restrictions would be economically and environmentally detrimental. Large truck restriction schemes, therefore, present various arguments from different transport groups from the economic and social viewpoints. The truck restriction policy in Metro Manila is one of the most well-known cases of large truck restrictions currently in effect (Ogden, 1992; Campbell, 1995). The policy, introduced in
Journal of the Eastern Asia Society for Transportation Studies, Vol. 6, pp. 2947 - 2962, 2005
2947
1978 to ease traffic congestion, prohibits trucks with gross weights of more than 4.5 tons to travel along eleven primary arterial roads. Large trucks are prohibited from using the most heavily used arterial road EDSA from 6AM to 9 PM, and ten other major roads from 6-9 AM and 5-9 PM during weekdays except holidays. Alternate routes, which radiate from and to the port of Manila, are provided to be used by trucks at all times while the restriction is in effect. To understand the transport and economic impacts of the truck restriction scheme, it is necessary to look into the changes of freight carrier operations after the imposition of the policy in Metro Manila. Utilizing data from interview surveys of freight carriers, the paper aims to examine the effects of the existing large truck restriction scheme on trucking operations. The paper also tries to determine if freight carriers’ reaction to the truck restriction policy depends on specific factors concerned with company and their operational characteristics by using random utility choice analysis. The analysis therefore attempts to ascertain the behavior of freight carriers toward truck restrictions and how they cope with it. An understanding of their operational and travel behaviors will be helpful in estimating latent truck travel demands that are usually disregarded in travel demand forecasting. 2. REVIEW OF LITERATURE The large truck restriction policy in Metro Manila was implemented as a form of rationing scarce road space due to the city’s insufficient road capacities. Since the city relied on road-based public transport due to the lack of an efficient rail-based public transport system, the government enforced restraints on large trucks with the intention that buses and other public transport modes will not have to compete for limited road space. Therefore, large truck restrictions were primarily aimed at reducing congestion. There are also several cities that have implemented truck restrictions as a measure to mitigate traffic congestion. Truck regulation in Bangkok began with a time-restricted ban in the city center to alleviate traffic. The truck restriction scheme underwent several changes, implemented in stages, after the construction of the three public truck terminals in Bangkok. In Seoul, all trucks over 2.5 tons were banned since 1979 from circulating within the central area during working hours to help relieve congestion. There are complex rules allowing some access on designated routes but the general objective is to push truck arrivals and departures into the night when traffic volume is relatively light (Smith et al., 1986). Paris also approved an act in 1991 prohibiting delivery trucks to enter and park in the city. Truck entry and parking vary accordingly to vehicle type and time period (MOC, 2000). In some cities, truck restrictions are employed mainly to address environmental and safety issues. In Amsterdam, large trucks over 7.5 tons are not allowed to pass specific arterial roads unless they conform to three conditions: vehicle length of less than 9 meters, load factor greater than 80% and engine conformity to Euro II standard (MOC, 2000). In Leicester, truck routes were provided in 1998 to prohibit trucks from entering the city center to improve the traffic environment and encourage bicycle use and walking. In Los Angeles, an ordinance on peak period large truck restrictions was prepared in 1991 to reduce air pollutant emissions generated by heavy-duty trucks and to assist in the attainment of the ambient air quality standards of the Federal Clean Air Act, thereby protecting and preserving the public health and welfare (Campbell, 1995). With regards to the economic effects of the restriction scheme in Metro Manila, the National
Journal of the Eastern Asia Society for Transportation Studies, Vol. 6, pp. 2947 - 2962, 2005
2948
Economic and Development Authority (NEDA) in 1981 tried to evaluate the impacts and concluded in its report that economic losses due to the truck restriction are indeed substantial. It revealed that the trucking industry incurred losses since the productivity of each truck decreased by at most 50 percent. The frequency of truck trips per day decreased from an average of three trips to two. This has consequently affected the income of truck operators and drivers. Trucking firms likewise have to alter their work schedules to accommodate the truck restriction. Operators, drivers and employees have to report earlier for loading operations and delivery to avoid the truck restriction. Drivers and employees are normally paid on a per-trip basis, and thus, are not paid for overtime work even though they report earlier to work and end their work after the evening truck restriction hours. The report recommended the immediate lifting of the restriction to stave off further losses, not only to truck owners but to the economy as a whole (NEDA, 1981). A financial analysis of the impacts of the truck restriction on the trucking industry was done by the Road Transport Planning Division (RTPD) of the Department of Transportation and Communications (DOTC) in 1994. Using surveyed data of truck operators, the study found that the all-day truck restriction along the main arterial road EDSA has reduced the frequency of truck trips per day from three trips to one. This is a further reduction from the 1981 NEDA report. Thus, truck productivity decreased by almost 60 percent. The study further stated that the total loss to truck operators amounts to 86 million pesos annually. The study concluded that “traffic congestion cannot be solved by depressing a sector to the advantage of others considering that transport is a system whereby operation is not independent of each other but is actually interlocked that the efficiency of one mode will affect the operation of the whole system”. It recommended the lifting of the truck restriction and re-adoption of the previous truck restriction during peak hours only (RTPD, 1994). Reported truck operational changes that have occurred were shift in delivery schedules, reduced quantity of products delivered, and increased travel time of delivery vehicles. Trucking firms shortened their delivery schedules to adjust to the truck restriction hours. Effective delivery hours had been reduced since most of the customers received their goods during the day. Thus, only a limited quantity could be delivered during the restricted hours. The new schedule had also affected the company’s relationship with their customers due to late deliveries. If trucks cannot catch up with the loading time of outgoing vessels, the firms ran the risk of cancellation of demand orders. Thus, to maintain the same level of service in terms of number and volume of deliveries, trucking firms had been forced to use more delivery vehicles to handle the demand orders in a shortened working day. Aside from shifting from large trucks to smaller trucks not covered by the truck restriction, other firms have extended the dispatching of deliveries even after office hours. The problem of trucking companies switching to small trucks to avoid truck restrictions has been recognized as a consequence of large truck restrictions. Studies on truck restrictions in Los Angeles by Hall and Partyka (1991) reported that companies which seek to maintain a high level of customer service are most likely to shift to smaller trucks to maintain peak period operations. In Seoul, light own-account trucks have become popular as a consequence of the truck restriction implemented in 1979. Such trucks, mostly with a 2.5-ton capacity make up over half of all trucks in Korea, whereas in the UK they are a little over a quarter of the entire fleet. Korean owners and customers prefer smaller trucks because of the truck restrictions combined with preference for small consignments. In Metro Manila, Kirby et al. (1986) found that large truck restrictions, which began in 1978, triggered an increase in the use of small trucks not covered by the restrictions. The NEDA study likewise reported that
Journal of the Eastern Asia Society for Transportation Studies, Vol. 6, pp. 2947 - 2962, 2005
2949
trucking firms have acquired more vehicle units to be able to meet delivery schedules during the non-restricted hours since most customers are day-receivers and most have not revised their receiving schedules. Castro et al. (2003) found that around one-third of the total truck fleet used for distribution by freight forwarders and shippers now belongs to small trucks. They also pointed out that Metro Manila has been experiencing high annual growth increases of 14 percent in the registration of small trucks in the last decade. Case studies in RTPD indicated that the volume of production depends on the availability of materials received. Thus, the efficiency of production would be affected by the punctuality of raw material delivery to the production sites. Delays in delivery schedules would ultimately affect production rates. Some production firms had experienced significant delays in the delivery schedules of their inputs. Some firms used to receive deliveries daily, but with the imposition of the truck restriction, they receive their deliveries every other day. Thus, the rate of production slowed down. Some of the firms had also adopted bigger inventories to safeguard against uncertainty of delayed deliveries. This implies additional capital for the affected firms. The truck restriction schedule had been unfavorable to some firms because it resulted in broken working hours for their drivers and other personnel. Another economic impact of the truck restriction relates to transport costs. A study conducted by the Metro Manila Urban Transport Strategy Planning Project (MMUTSTRAP) in 1984 found that increased transport costs due to poor productivity are not absorbed by the truck operators, but are passed on to consumers. Using traffic assignment as a tool to determine the traffic impacts of the truck restriction in Metro Manila, Castro et al. (2003) reported that additional restrictions significantly increase total vehicle-kilometers, vehicle-hours and pollutant emissions. These may have serious consequences as distance and travel time are directly proportional to costs. However, their method did not consider the behavior of freight carriers and how they cope with the truck restrictions. Since this particular issue has not been examined in the literature, this paper will be the first attempt to understand travel behaviors of freight carriers due to the truck restriction policy. An understanding of the relationships between trucking operations and behaviors of freight carriers will be useful in the estimation of travel demands. 3. METHODOLOGY 3.1 Modeling Freight Carrier Behavior This paper uses random utility choice model to explain the relationship of the behavior of freight carriers toward truck restrictions. In random utility choice models, also known as discrete choice models, a decision maker j chooses between M distinct choice alternatives, and it is assumed that he will choose the alternative that gives maximum utility. The unobserved utility that decision maker j obtains from alternative m is Ujm, m = 1…M, which is expressed as:
jmjmjm VU ε+= (1) where Vjm is the representative utility function that captures the observed attributes of the alternatives, and εjm is the error term that may include effects from attributes not specified in Vjm.
Journal of the Eastern Asia Society for Transportation Studies, Vol. 6, pp. 2947 - 2962, 2005
2950
The probability that decision maker j would choose alternative i rather than any other alternative m in the choice set, can be expressed as the probability that the utility of i is higher that that of any other alternative, conditional on knowing the observed utility Vjm for all m alternatives in the choice set. This probability can be expressed as:
)(Prob
)(Prob
)(Prob
imVV
imVV
imUUP
jmjijijm
jmjmjiji
jmjiji
≠∀−<−=
≠∀+>+=
≠∀>=
εε
εε (2)
By assuming that the error terms are independently and identically distributed extreme value, also called Gumbel and Type I extreme value distribution with cumulative distribution of:
)exp()( jmeF jmεε −−= (3)
the logit choice probability can be derived (McFadden, 1973):
∑=
= M
mjm
jiji
V
VP
1)exp(
)exp( (4)
Assuming that the observed part of the utility function is specified to be linear in parameters, Vji =βXji, the probability becomes:
∑=
= M
mjm
jiji
X
XP
1)exp(
)exp(
β
β (5)
where Xji is a vector of observed variables relating to alternative i, and β is a vector containing the parameters of the model. Because the logit probabilities take a closed form, the traditional maximum-likelihood procedures can be applied. The log-likelihood function for a sample of size J is given by:
ji
J
j iji PyLL ln)(
1∑∑=
=β (6)
where yji is a dummy variable such that yji=1 if decision maker j chooses alternative i, and yji=0 otherwise. The estimator is the value of β that maximizes this function. 3.2 Data Set Transport managers of trucking companies operating in Metro Manila were surveyed in 1999. The main focus of the survey was to understand their behavior towards the truck restriction policy and its impact in their operations. Of particular interest was the change in their delivery operations.
Journal of the Eastern Asia Society for Transportation Studies, Vol. 6, pp. 2947 - 2962, 2005
2951
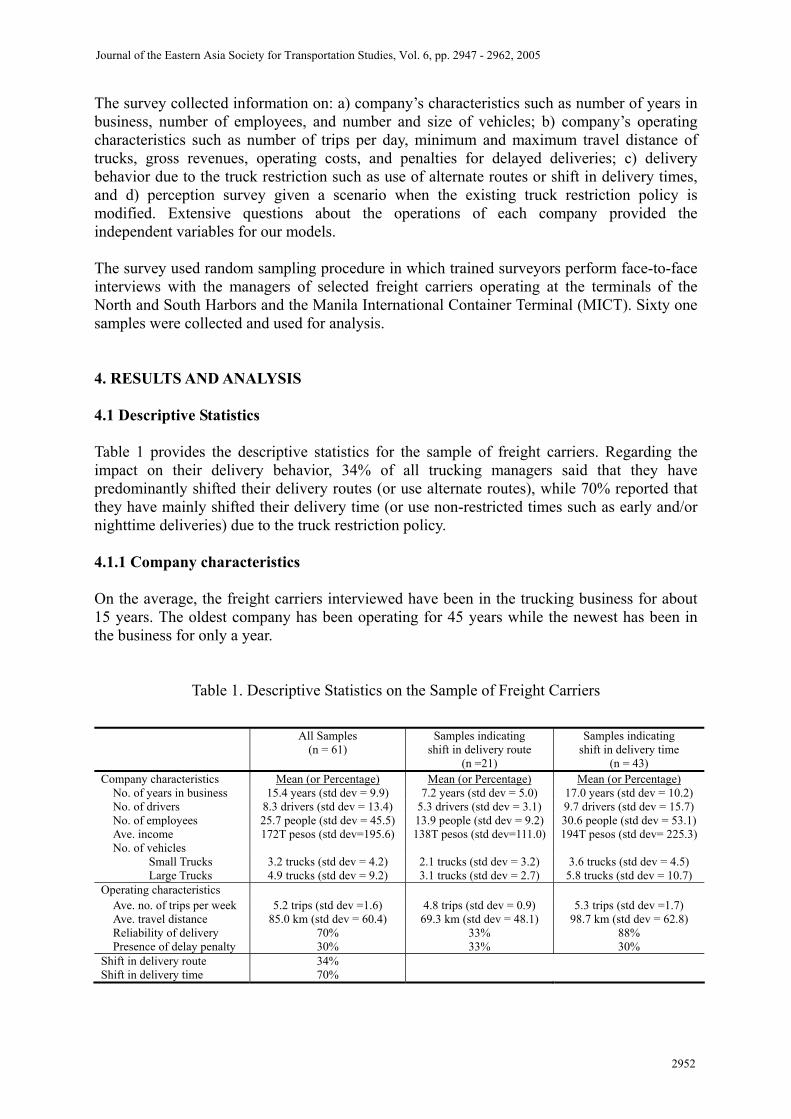
The survey collected information on: a) company’s characteristics such as number of years in business, number of employees, and number and size of vehicles; b) company’s operating characteristics such as number of trips per day, minimum and maximum travel distance of trucks, gross revenues, operating costs, and penalties for delayed deliveries; c) delivery behavior due to the truck restriction such as use of alternate routes or shift in delivery times, and d) perception survey given a scenario when the existing truck restriction policy is modified. Extensive questions about the operations of each company provided the independent variables for our models. The survey used random sampling procedure in which trained surveyors perform face-to-face interviews with the managers of selected freight carriers operating at the terminals of the North and South Harbors and the Manila International Container Terminal (MICT). Sixty one samples were collected and used for analysis. 4. RESULTS AND ANALYSIS 4.1 Descriptive Statistics Table 1 provides the descriptive statistics for the sample of freight carriers. Regarding the impact on their delivery behavior, 34% of all trucking managers said that they have predominantly shifted their delivery routes (or use alternate routes), while 70% reported that they have mainly shifted their delivery time (or use non-restricted times such as early and/or nighttime deliveries) due to the truck restriction policy. 4.1.1 Company characteristics On the average, the freight carriers interviewed have been in the trucking business for about 15 years. The oldest company has been operating for 45 years while the newest has been in the business for only a year.
Table 1. Descriptive Statistics on the Sample of Freight Carriers
All Samples (n = 61)
Samples indicating shift in delivery route
(n =21)
Samples indicating shift in delivery time
(n = 43) Company characteristics Mean (or Percentage) Mean (or Percentage) Mean (or Percentage)
No. of years in business 15.4 years (std dev = 9.9) 7.2 years (std dev = 5.0) 17.0 years (std dev = 10.2)No. of drivers 8.3 drivers (std dev = 13.4) 5.3 drivers (std dev = 3.1) 9.7 drivers (std dev = 15.7)No. of employees Ave. income
25.7 people (std dev = 45.5)172T pesos (std dev=195.6)
13.9 people (std dev = 9.2)138T pesos (std dev=111.0)
30.6 people (std dev = 53.1)194T pesos (std dev= 225.3)
No. of vehicles Small Trucks Large Trucks
3.2 trucks (std dev = 4.2) 4.9 trucks (std dev = 9.2)
2.1 trucks (std dev = 3.2) 3.1 trucks (std dev = 2.7)
3.6 trucks (std dev = 4.5) 5.8 trucks (std dev = 10.7)
Operating characteristics Ave. no. of trips per week 5.2 trips (std dev =1.6) 4.8 trips (std dev = 0.9) 5.3 trips (std dev =1.7) Ave. travel distance 85.0 km (std dev = 60.4) 69.3 km (std dev = 48.1) 98.7 km (std dev = 62.8) Reliability of delivery Presence of delay penalty
70% 30%
33% 33%
88% 30%
Shift in delivery route Shift in delivery time
34% 70%
Journal of the Eastern Asia Society for Transportation Studies, Vol. 6, pp. 2947 - 2962, 2005
2952
For the group of samples indicating a shift of their delivery routes, the mean number of business experience is 7 years, while for the group indicating a shift of their delivery times, the mean number of years in business is higher at around 17 years. The difference in the mean values may suggest that lesser business experience could be a determinant towards a shift of delivery routes while higher business experience could be a factor towards a shift of delivery times. Company size is characterized by the number of drivers and employees, monthly income and the size of vehicle fleet. Regarding the number of drivers, the survey obtained that companies have an average of 8 drivers. A mean value of about 5 people is obtained for operators using alternate routes while a higher value of about 10 people is obtained for those who make deliveries during non-restricted times. As for the number of employees, a company consists of an average of 26 people. This value decreases to 14 people for the group of operators indicating a shift in delivery routes and increases to 31 people for those indicating a shift in delivery times. With regards to monthly income, calculated as monthly revenue minus monthly expenses, the average is about 172 thousand pesos. This amount decreases to 138 thousand pesos for the group of operators using alternate delivery routes and increases to 194 thousand pesos for those who make deliveries during non-restricted hours. For the vehicle fleets, large trucks (trucks greater than 4.5 tons) generally composed the majority of the vehicle fleet size. The mean number of small trucks is around 3 vehicles while the mean for large trucks is around 5 vehicles. For the sample that indicates shift in delivery route, the mean values are 2.1 for small trucks and 3.1 for large trucks. For the sample that indicates shift in delivery time, the mean values are 3.6 and 5.8 vehicles, respectively. From these results, it is thus possible to hypothesize the relationship between company size and freight carrier reaction to the truck restriction policy. Increase in company size could be a factor towards a change in delivery times, and decreasing size could be a factor towards a shift in delivery routes. 4.1.2 Operating characteristics The average number of trips that a truck could make in a week is around 5 trips. This means that trucks could only make one delivery per day and therefore supports the findings of the RTPD study in 1994. A mean value of 4.8 trips is obtained for operators using alternate routes while a value of 5.3 trips is obtained for those who make delivery during non-restricted times. Overall, the average distance that a truck could travel is 85 km. Moreover, the minimum travel distance is found to range from 1 to 50 km while the maximum length of travel ranges from 5 to 350 km. The minimum travel distances would mean that the destinations are primarily areas within Metro Manila and its adjacent towns. The distance a truck travels may determine whether to use alternate routes or shift deliveries to non-restricted hours. For the group of samples using alternate routes, the average decreases to 69.3 km, and increases to 98.7 km for the group of operators making deliveries during non-restricted hours. Shorter distances may force companies to use alternate routes in the hope of increasing truck trip frequency and thus efficiently use available resources. Longer distances may compel carriers to shift their delivery times to non-restricted hours, especially during the night so that they can arrive the next day at the destination during receiving hours within the day.
Journal of the Eastern Asia Society for Transportation Studies, Vol. 6, pp. 2947 - 2962, 2005
2953
Freight carrier delivery performance is represented by the ability of the company to deliver its shipments on time, or specifically if the carrier could perform on-time deliveries more than 60 percent of the time. The survey reveals that 70 percent of the operators claim that more than 60 percent of their shipments arrive on time. For the group of samples using alternate routes, the average decreases to 33 percent, and increases to 88 percent for the group of operators performing deliveries during non-restricted hours. Thirty percent of the transport managers interviewed reported that they are penalized for late deliveries. For managers of truck operators that use alternate routes, this value increases to 33 percent. Thirty percent of operators that shift delivery hours said that they pay fees for late deliveries. The presence of penalties for late deliveries may be a strong determinant for using alternate routes. Freight carriers may be forced to use alternate routes to deliver the shipments on-time as consumers are usually day-receivers. 4.2 Modeling 4.2.1 Model Specification The data presented provide preliminary findings of how certain characteristics will affect the behavior of operators towards the truck restriction scheme. Because it is difficult to distinguish from these results the relative importance of company and operational characteristics in determining their behaviors, a multivariate model is employed to explore their relationship. It was determined that the reactions of freight carriers to the large truck restriction policy generally consist of two things - change in delivery route (or use of alternate routes) and shift in delivery time (or use of non-restricted times). These will be modeled using the random utility choice model discussed in Section 3.1. Because the dependent variable can now be transformed into a binary response or a dichotomous variable, the model can be simplified to a binary logit model. Two models will be created to determine the determinants that explain freight carrier behavior. The first model tries to determine the determinants affecting change in delivery route while the second model looks into the factors affecting shift in delivery time. The dependent variables, indicators of shift in delivery route and shift in delivery time, are represented by dummy variables where operators that predominantly use alternate routes and those that primarily shift their delivery times due to the truck restriction scheme are coded as 1, and 0 otherwise. The freight carrier’s company and operational characteristics, represented by Xs, serve as independent or predictor variables. Therefore, a logistics regression relationship can be defined as
εββββ +++++= nn XXXy ...22110 (7) where β0 is a constant and βi are the coefficients attached to each predictor variable X. Simplifying Equation (5), the probability of y occurring given known values of Xs can be predicted by Equation (8).
)...exp(1)...exp(
)1(22110
22110
nn
nn
XXXXXX
yPββββ
ββββ+++++
++++== (8)
The values of the coefficients are estimated using the maximum-likelihood method, which
Journal of the Eastern Asia Society for Transportation Studies, Vol. 6, pp. 2947 - 2962, 2005
2954
selects coefficients that make the observed values most likely to have occurred.
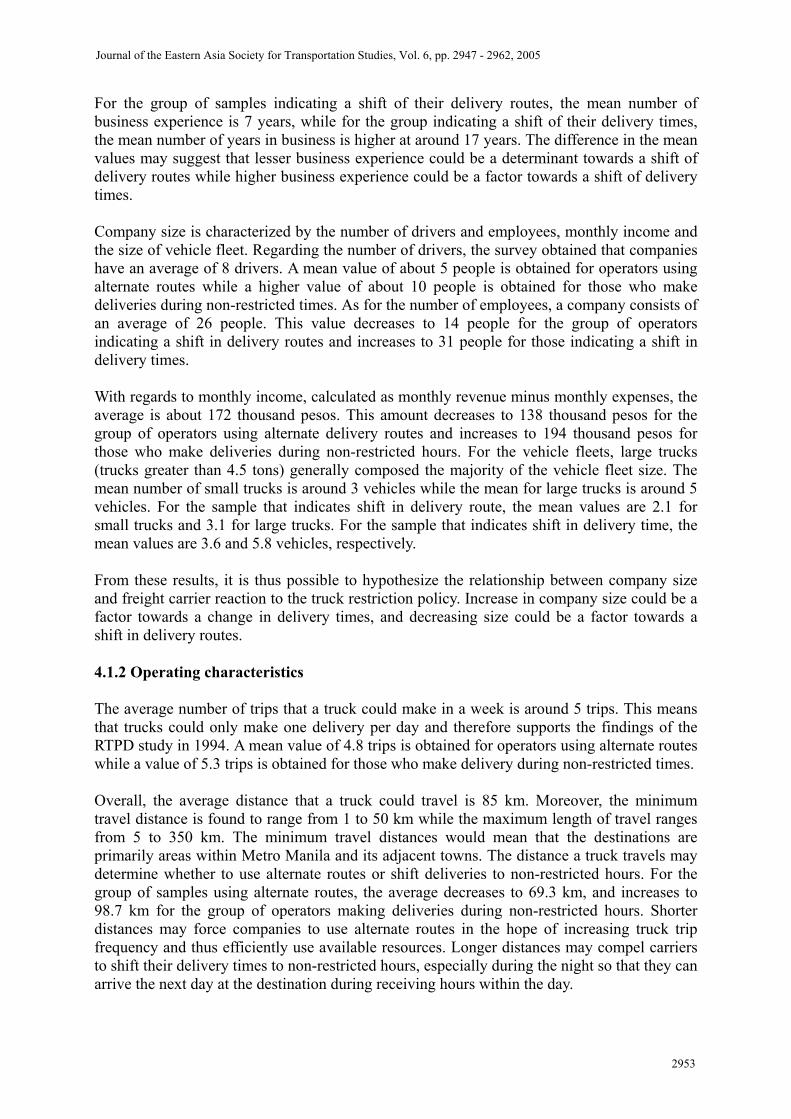
4.2.2 Variables Table 2 shows the final variables included in the models. The dependent variable yA in Model A is a dichotomous variable that indicates the operator’s behavior towards a shift of delivery routes and yB in Model B indicates a shift of delivery hours. These are the most common response to the question on how freight carriers cope with the large truck restriction scheme. The independent variables are initially composed of the company and operating characteristics identified in Section 4.1. Company characteristics include the continuous variable business experience (YRS_BUS) and variables related to company size, such as number of drivers (DRI), number of employees (EMP), income (INC) and number of vehicles. The number of vehicles is divided into small trucks (S_TRK) and large trucks (L_TRK) to determine if truck type has an effect on their travel behavior. Operating characteristics include the continuous variables of truck frequency and travel distance, represented by the average number of trips per week per truck (TRIP) and average travel distance per truck (DIS), respectively. Two categorical predictor variables are likewise included. Reliability of delivery (REL) indicates the freight carrier’s reliability or ability to perform on-time delivery. REL is coded as 1 if the operator indicated that it performs on-time deliveries more than 60 percent of the time. Thus, it can be considered as a measure of the company’s reputation for reliable deliveries. Another dummy variable indicating the presence of penalties for late delivery is included and represented by the variable PEN. It is coded as 1 if the operators generally pay additional penalty fees for late deliveries. To avoid the problem of multicollinearity, a Pearson correlation matrix of all the independent variables is first calculated to determine if any variables are highly correlated. High levels of collinearity increase the probability that a good predictor of the outcome y will be found non-significant and rejected from the model. A correlation above 0.80 suggests that one of the variables must be omitted from the model.
Table 2. Variables in the Model
Dependent variable Measurement Model A: Shift delivery route, yA
1 = if operator primarily uses alternate routes 0 = otherwise
Model B: Shift delivery time, yB 1 = if operator primarily shifts its delivery hours 0 = otherwise
Independent variables Measurement Company characteristics
Number of years in business (YRS_BUS)Number of vehicles:
Small vehicles (S_TRK) Large vehicles (L_TRK)
years trucks trucks
Operating Characteristics Ave. number of trips per week (TRIP)
Ave. travel distance (DIS) Reliability of delivery (REL) Penalty for late delivery (PEN)
trips kilometers 1 = operators reliability for on-time delivery 0 = otherwise 1 = if there are penalty fees for late delivery 0 = otherwise
Journal of the Eastern Asia Society for Transportation Studies, Vol. 6, pp. 2947 - 2962, 2005
2955
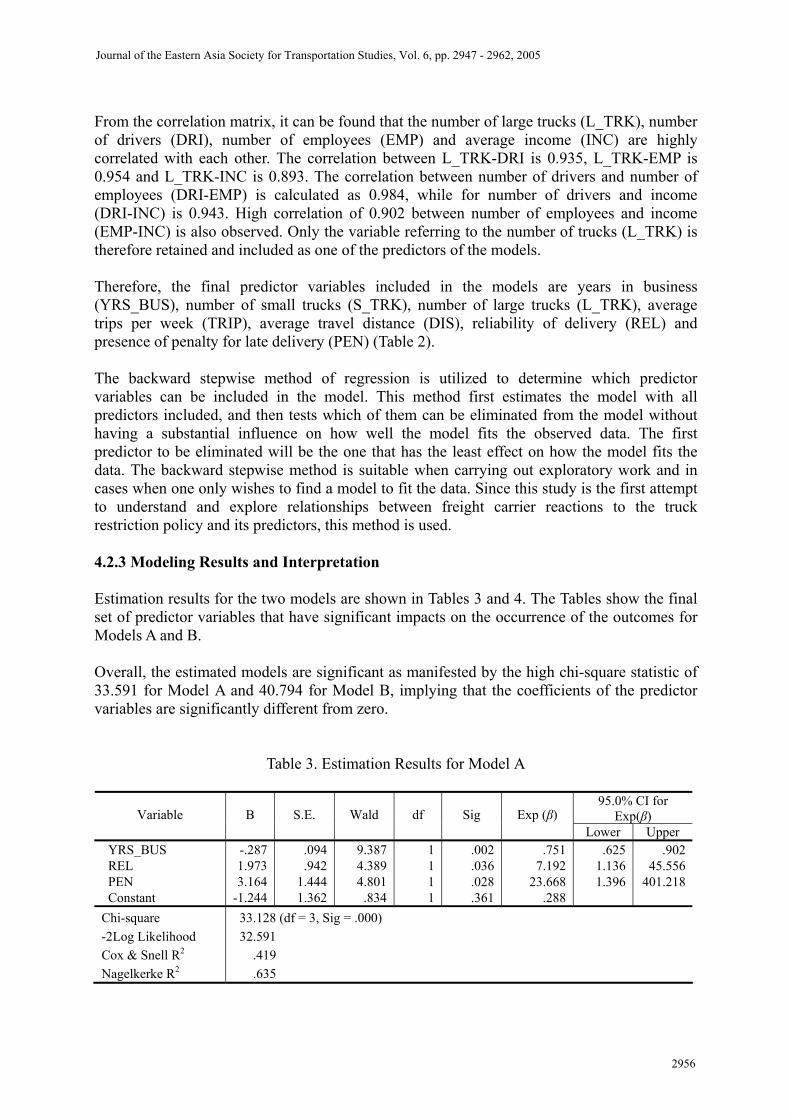
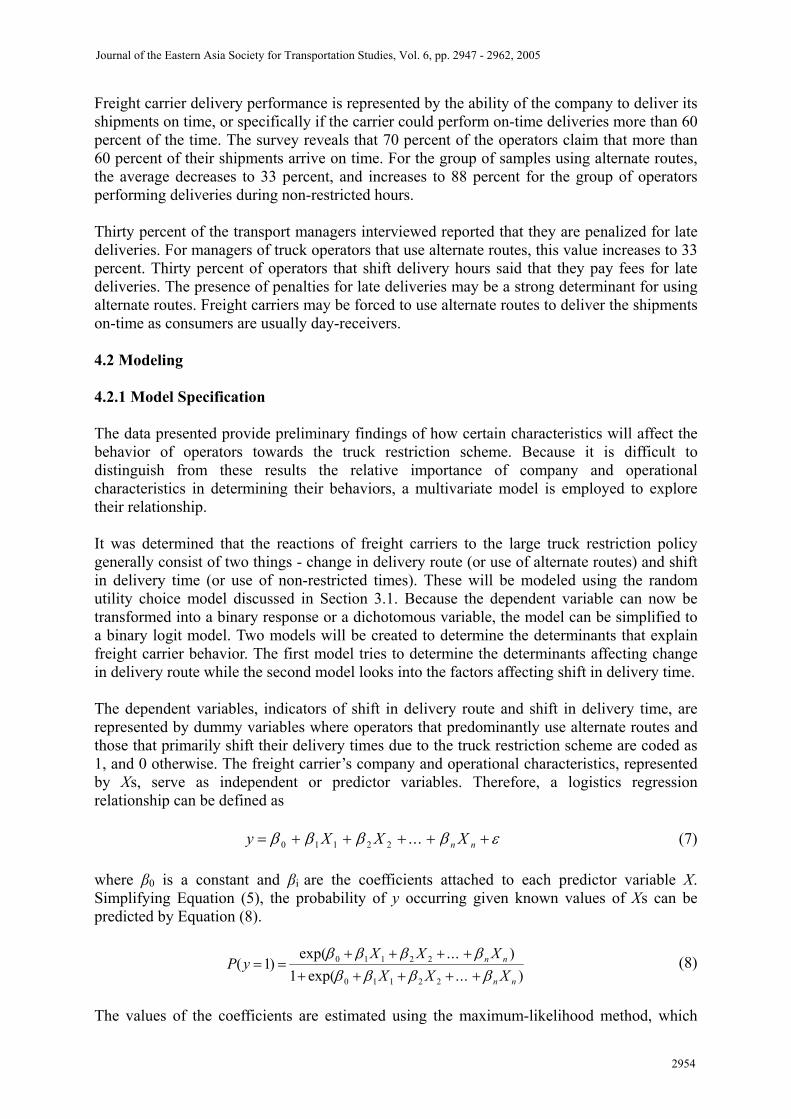
From the correlation matrix, it can be found that the number of large trucks (L_TRK), number of drivers (DRI), number of employees (EMP) and average income (INC) are highly correlated with each other. The correlation between L_TRK-DRI is 0.935, L_TRK-EMP is 0.954 and L_TRK-INC is 0.893. The correlation between number of drivers and number of employees (DRI-EMP) is calculated as 0.984, while for number of drivers and income (DRI-INC) is 0.943. High correlation of 0.902 between number of employees and income (EMP-INC) is also observed. Only the variable referring to the number of trucks (L_TRK) is therefore retained and included as one of the predictors of the models. Therefore, the final predictor variables included in the models are years in business (YRS_BUS), number of small trucks (S_TRK), number of large trucks (L_TRK), average trips per week (TRIP), average travel distance (DIS), reliability of delivery (REL) and presence of penalty for late delivery (PEN) (Table 2). The backward stepwise method of regression is utilized to determine which predictor variables can be included in the model. This method first estimates the model with all predictors included, and then tests which of them can be eliminated from the model without having a substantial influence on how well the model fits the observed data. The first predictor to be eliminated will be the one that has the least effect on how the model fits the data. The backward stepwise method is suitable when carrying out exploratory work and in cases when one only wishes to find a model to fit the data. Since this study is the first attempt to understand and explore relationships between freight carrier reactions to the truck restriction policy and its predictors, this method is used. 4.2.3 Modeling Results and Interpretation Estimation results for the two models are shown in Tables 3 and 4. The Tables show the final set of predictor variables that have significant impacts on the occurrence of the outcomes for Models A and B. Overall, the estimated models are significant as manifested by the high chi-square statistic of 33.591 for Model A and 40.794 for Model B, implying that the coefficients of the predictor variables are significantly different from zero.
Table 3. Estimation Results for Model A
95.0% CI for Exp(β) Variable
B
S.E.
Wald
df
Sig
Exp (β) Lower Upper
YRS_BUS REL PEN Constant
-.287 1.973 3.164
-1.244
.094
.9421.4441.362
9.3874.3894.801.834
1111
.002
.036
.028
.361
.751 7.192
23.668 .288
.625 1.136 1.396
.90245.556
401.218
Chi-square -2Log Likelihood Cox & Snell R2 Nagelkerke R2
33.128 (df = 3, Sig = .000) 32.591
.419
.635
Journal of the Eastern Asia Society for Transportation Studies, Vol. 6, pp. 2947 - 2962, 2005
2956
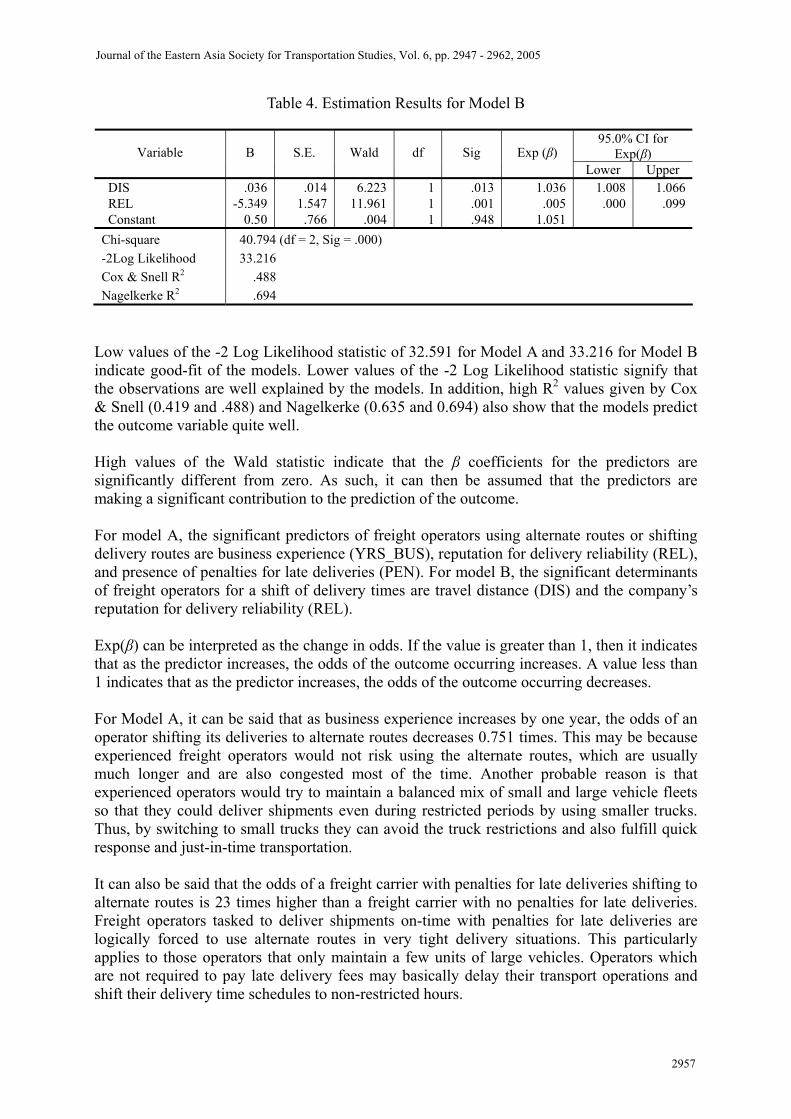
Table 4. Estimation Results for Model B
95.0% CI for Exp(β) Variable
B
S.E.
Wald
df
Sig
Exp (β) Lower Upper
DIS REL Constant
.036 -5.349
0.50
.0141.547.766
6.22311.961
.004
111
.013
.001
.948
1.036 .005
1.051
1.008 .000
1.066.099
Chi-square -2Log Likelihood Cox & Snell R2 Nagelkerke R2
40.794 (df = 2, Sig = .000) 33.216
.488
.694
Low values of the -2 Log Likelihood statistic of 32.591 for Model A and 33.216 for Model B indicate good-fit of the models. Lower values of the -2 Log Likelihood statistic signify that the observations are well explained by the models. In addition, high R2 values given by Cox & Snell (0.419 and .488) and Nagelkerke (0.635 and 0.694) also show that the models predict the outcome variable quite well. High values of the Wald statistic indicate that the β coefficients for the predictors are significantly different from zero. As such, it can then be assumed that the predictors are making a significant contribution to the prediction of the outcome. For model A, the significant predictors of freight operators using alternate routes or shifting delivery routes are business experience (YRS_BUS), reputation for delivery reliability (REL), and presence of penalties for late deliveries (PEN). For model B, the significant determinants of freight operators for a shift of delivery times are travel distance (DIS) and the company’s reputation for delivery reliability (REL). Exp(β) can be interpreted as the change in odds. If the value is greater than 1, then it indicates that as the predictor increases, the odds of the outcome occurring increases. A value less than 1 indicates that as the predictor increases, the odds of the outcome occurring decreases. For Model A, it can be said that as business experience increases by one year, the odds of an operator shifting its deliveries to alternate routes decreases 0.751 times. This may be because experienced freight operators would not risk using the alternate routes, which are usually much longer and are also congested most of the time. Another probable reason is that experienced operators would try to maintain a balanced mix of small and large vehicle fleets so that they could deliver shipments even during restricted periods by using smaller trucks. Thus, by switching to small trucks they can avoid the truck restrictions and also fulfill quick response and just-in-time transportation. It can also be said that the odds of a freight carrier with penalties for late deliveries shifting to alternate routes is 23 times higher than a freight carrier with no penalties for late deliveries. Freight operators tasked to deliver shipments on-time with penalties for late deliveries are logically forced to use alternate routes in very tight delivery situations. This particularly applies to those operators that only maintain a few units of large vehicles. Operators which are not required to pay late delivery fees may basically delay their transport operations and shift their delivery time schedules to non-restricted hours.
Journal of the Eastern Asia Society for Transportation Studies, Vol. 6, pp. 2947 - 2962, 2005
2957
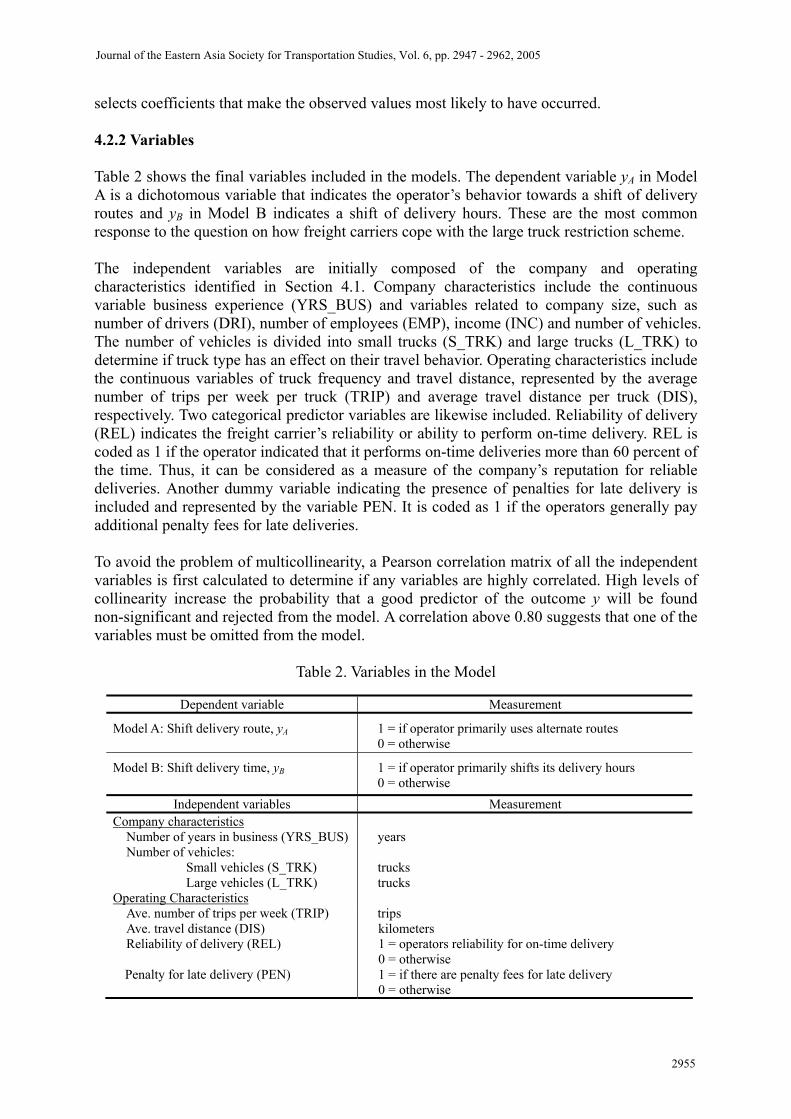
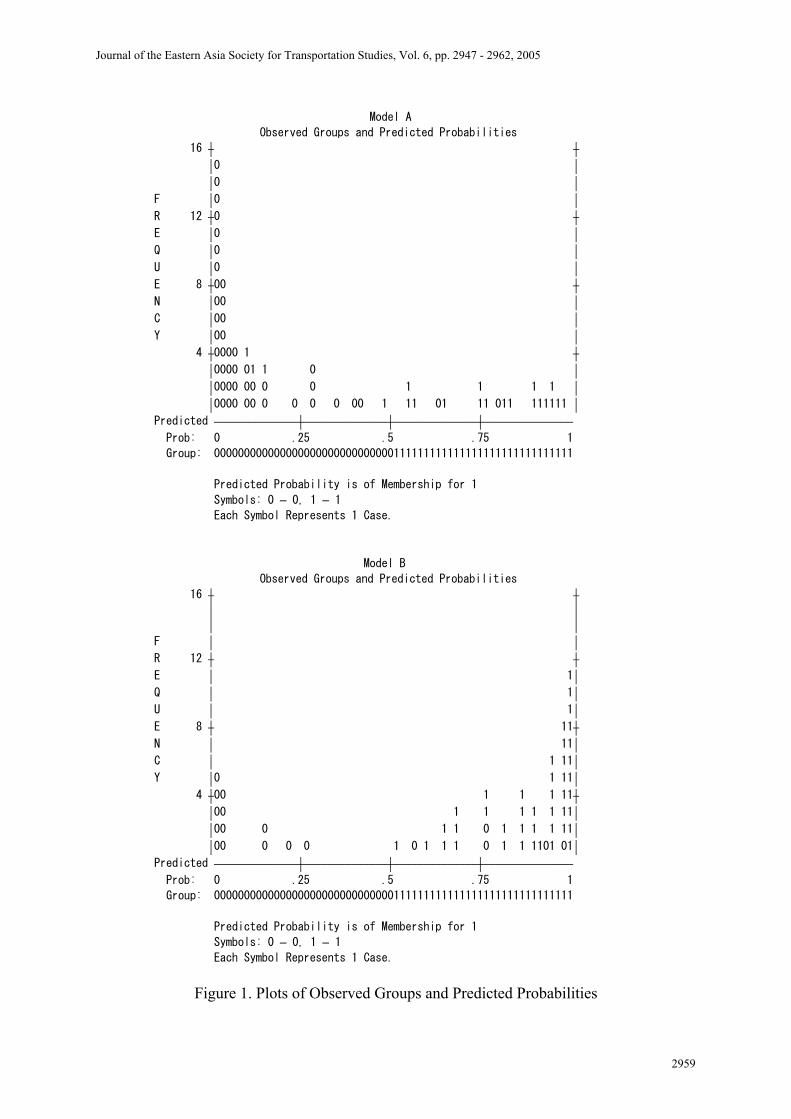
The odds of a freight carrier who basically have reliable deliveries shifting to alternate routes is 7 times higher than a carrier with lower reliability of deliveries. Therefore, freight carriers with relatively good delivery performance have higher probabilities of using alternate routes than carriers with inferior delivery performance. For Model B, it can be said that as travel distance increases by one kilometer, the odds of an operator making a shift of its delivery time schedule increases 1.036 times. Longer distances thus compel carriers to shift their delivery times to non-restricted hours, particularly during the night in order that the trucks arrive at the destination the following day during receiving hours. The receiving hours of customers are usually scheduled during office hours. Finally, it can be said that the odds of a freight operator with reliable delivery performance shifting its delivery time is 0.005 times lower than an operator with lower reliability of deliveries. Conversely, the odds of an operator who has lower delivery reliability shifting its delivery schedule is 0.0005 times higher than an operator with higher delivery reliability. The reason for this may be because freight operators with lower delivery reliability would rather deliver its shipments during non-restricted hours, especially during the early hours of the day or at night in which transport reliability is higher due to less traffic. 4.2.4 Regression Diagnostics The model is then examined by checking the residuals obtained from the logistic regression. The Studentized, standardized and deviance residuals are the most commonly used statistic in identifying points for which the model fits poorly. Observations with residual values in excess of ±2.5 may indicate lack of fit. In addition, the Cook’s distance statistic assesses the influence of individual cases and is a measure of the change in the regression coefficient if an observation is deleted from the model. Any values greater than 1 indicate possible influential cases. A check of the standardized, Studentized and deviance residuals reveals that all have values of less than ±2.5 indicating the absence of outliers in the model. In addition, there are no unusually high values of Cook’s distance which means that there are no influential cases having an effect on the model. Therefore, it can be said that the models have performed well. 4.2.5 Classification Plots The classification plot which shows the histogram of the predicted probabilities of a freight carrier shifting its delivery route (Model A) or shifting its delivery time (Model B) is shown in Figure 1. If the model perfectly fits the data, then this histogram should show all of the cases for which the event has occurred on the right-hand side, and all the cases for which the event has not occurred on the left-hand side. In other words, for Model A (or Model B), all the freight carriers who shifted delivery routes (or delivery times) should appear on the right and those who did not should appear on the left. Therefore, the more the cases cluster at each end of the graph, the better. Such a plot would show that when the outcome did actually occur or when the freight carrier did shift its delivery route (or delivery time) the predicted probability of the event occurring is also high or close to 1. Similarly, when the event did not occur or when the freight carrier did not shift its delivery route (or delivery time), the predicted probability of the event occurring is also low or close to zero. Since most cases are clustered at the ends of the plots and only a few cases are misclassified, it can be said that the models have correctly predicted the observed outcome data.
Journal of the Eastern Asia Society for Transportation Studies, Vol. 6, pp. 2947 - 2962, 2005
2958
Model A
Observed Groups and Predicted Probabilities
16 ô ô ó0 ó
ó0 ó F ó0 ó R 12 ô0 ô E ó0 ó Q ó0 ó U ó0 ó E 8 ô00 ô N ó00 ó C ó00 ó Y ó00 ó
4 ô0000 1 ô ó0000 01 1 0 ó ó0000 00 0 0 1 1 1 1 ó
ó0000 00 0 0 0 0 00 1 11 01 11 011 111111 ó Predicted òòòòòòòòòòòòòòôòòòòòòòòòòòòòòôòòòòòòòòòòòòòòôòòòòòòòòòòòòòòò Prob: 0 .25 .5 .75 1
Group: 000000000000000000000000000000111111111111111111111111111111
Predicted Probability is of Membership for 1
Symbols: 0 – 0, 1 – 1 Each Symbol Represents 1 Case.
Model B
Observed Groups and Predicted Probabilities
16 ô ô ó ó
ó ó F ó ó R 12 ô ô E ó 1ó Q ó 1ó U ó 1ó E 8 ô 11ô N ó 11ó C ó 1 11ó Y ó0 1 11ó
4 ô00 1 1 1 11ô ó00 1 1 1 1 1 11ó ó00 0 1 1 0 1 1 1 1 11ó ó00 0 0 0 1 0 1 1 1 0 1 1 1101 01ó
Predicted òòòòòòòòòòòòòòôòòòòòòòòòòòòòòôòòòòòòòòòòòòòòôòòòòòòòòòòòòòòò Prob: 0 .25 .5 .75 1
Group: 000000000000000000000000000000111111111111111111111111111111
Predicted Probability is of Membership for 1
Symbols: 0 – 0, 1 – 1 Each Symbol Represents 1 Case.
Figure 1. Plots of Observed Groups and Predicted Probabilities
Journal of the Eastern Asia Society for Transportation Studies, Vol. 6, pp. 2947 - 2962, 2005
2959
5. IMPLICATIONS TO TRAFFIC OF THE TRUCK RESTRICTION POLICY The truck restriction policy has significant implications to traffic and safety. Among the most important impacts are those that relate to veh-km, veh-hr, emissions and accidents. 5.1. Vehicle-kilometers Generally, truck restrictions are imposed on the main roads that have the highest volume of traffic and the most congested. Banning the flow of traffic on the main road network would encourage many large truck drivers to use the secondary road network, where routes are usually longer. In the absence of secondary routes, truck drivers would be forced to use circuitous alternate routes, or even routes not suitable for truck traffic due to physical constraints such as narrow road widths and low vertical clearances. This would directly result in increased travel distances or vehicle-kilometers. Another factor that may increase vehicle-kilometers is the increased number of trucks to deliver shipments. The truck restriction scheme would mean reduced delivery times for truck operations. This reduction in operational time implies that trucks would not be able to perform multi-stop consolidated deliveries. Thus, to alleviate this effect, trucking firms would be forced to use several trucks conducting single and direct deliveries. 5.2. Vehicle-hours The main benefit of the truck restriction for the peak hour period is the increased peak-period travel speed brought about by the reduced volume or absence of large trucks at banned routes, and/or elimination of broken-down trucks and truck-related incidents. The increased travel speed would mean that an expected reduction in the vehicle-hour can be achieved. On the other hand, the reduction of truck volume may also result in increased volume of passenger cars during peak-hours at banned routes. The available space due to the elimination of trucks would be simply utilized by private vehicles themselves. In addition, trucking companies who would want to maintain equal or higher service levels would be forced to used smaller trucks that are exempted from the restriction. The consequence for this would be the increased volume of small trucks using the banned routes during peak-hours. Thus, the increase in volume of both passenger cars and small trucks would result in decreased peak period travel speeds, thereby increasing vehicle-hours. 5.3. Emissions Emissions are strongly dependent on the amount of kilometers traveled and travel speed. Thus, any change in vehicle-kilometers and vehicle-hours would result in changes in the amount of emission. Factors that affect total travel distance include increased use of circuitous alternate routes by large trucks, and increased use of trucks with low load factors due to reduced truck delivery operation times. On the other hand, travel speed is affected positively by the reduction in truck volume at banned routes, and negatively by the increase in volume of passenger cars and small trucks exempted from the restriction. 5.4. Accidents Several factors affect accident occurrences. Among the major causes are due to road pavement damage, lack of visibility of trucks at night, driver’s lack of sleeping hours and
Journal of the Eastern Asia Society for Transportation Studies, Vol. 6, pp. 2947 - 2962, 2005
2960
fatigue. The truck restriction directly affects pavement deterioration by accelerating damage caused by truck overloading. Some trucking companies would try to overload their trucks to maximize operational efficiency during the truck restriction. The implementation of the truck restriction would result in the increased use of nighttime deliveries by affected trucking firms. This would have wide-ranging consequences on safety since drivers are forced to work overnight. Fatigue due to lack of sleeping hours could negatively affect the performance and alertness of drivers and could be a significant factor in the occurrence of accidents. Castro et al. (2001) confirmed that the truck restriction policy in Metro Manila has a direct impact on the likelihood of accidents among truck drivers. Using probit modeling, they found that the probability of accident to a truck driver unfamiliar with the restriction scheme increases by 15 percent, while a driver performing nighttime deliveries has 36 percent higher accident probability than a driver who drives only during the day. It was also found that the likelihood of accident increases by 4.7 percent as the number of sleeping hours decreases by an hour. 6. CONCLUSION This paper clarified the behavior of freight carriers and how they cope with the truck restriction policy in Metro Manila. It presented a model that tried to explain the factors affecting their travel behaviors, particularly on those factors that help determine their reaction of whether to change their delivery routes and/or delivery times. Results of the models reveal that company characteristics could significantly affect trucking operations due to the truck restriction scheme. It found that business experience, presence of penalties for late deliveries and the company’s reliability for on-time delivery are significant predictors of the operators’ response of using or shifting to alternate routes. Moreover, travel distances and reliability of delivery are found to be significant predictors of the operators’ response of shifting their delivery times. The empirical results in this paper should be supplemented by other studies on freight carrier behavior since the study has been the first attempt to understand carrier’s travel behavior due to the truck restriction policy. Additional and more accurate disaggregate data of the freight carrying industry can greatly improve the results given by the models. Likewise, additional appropriate predictor variables can give more meaningful results. As a policy implication of the study, the role of freight transport in urban economy should be further examined and higher priorities on trucks in urban transportation management should be considered. The issue of truck restrictions as a demand management measure is one that will remain of significant interest in the future because of its many social and traffic implications. Additional studies to investigate its social and environmental impacts using quantitative analysis should be pursued.
In addition, the issue of deregulation, in which governments remove selected regulations on business in order to encourage the efficient operation of markets, must also be explored. The transport sector, particularly trucking, is heavily regulated at present. Regulated truck carriers are therefore restricted to hauling only those commodities for which they have the authority to do so which often results in their trucks running empty on return trips. Moreover, because of truck restrictions, the routes of regular route carriers are often not direct but circuitous,
Journal of the Eastern Asia Society for Transportation Studies, Vol. 6, pp. 2947 - 2962, 2005
2961
resulting in wasted fuel and operating efficiencies. In some countries that have practiced deregulation, several positive changes have occurred such as raised level of competitiveness, higher productivity, more efficiency and lower prices. It will therefore be worthwhile to investigate the effects of deregulation in the trucking industry in future studies.
REFERENCES
Campbell, J. (1995) Peak period large truck restrictions and a shift to off-peak operations: Impact on truck emissions and performance, Journal of Business Logistics, Vol. 16, 227-248. Castro, J.T., Kuse, H. and Hyodo, T. (2003) A study on the impact and effectiveness of the truck ban scheme in Metro Manila, Journal of the Eastern Asia Society for Transportation Studies, Vol. 5, 2177-2192. Castro, J.T., Lidasan, H., and Kuse, H. (2001) Assessment of factors affecting safety in the trucking industry, Journal of the Eastern Asia Society for Transportation Studies, Vol. 4, 215-229. Department of Transportation and Communications (1994) Evaluation report of truck ban regulations in Metro Manila. Road Transport Planning Division (RTPD), Metro Manila. Hall, R.W. and Partyka, J.G. (1991) Peak Period Truck Restrictions: Impacts on the Los Angeles Economy. Logisolve, Walnut Creek, California. Kirby, R.F., Tagell M.T. and Ogden K.W. (1986) Traffic management in Metro Manila: Formulating traffic policies. Traffic Engineering Control, Vol. 27, 262-269. Maddala, G.S. (1983) Limited Dependent and Qualitative Variables in Economics. Cambridge University Press, Cambridge. McFadden, D. (1973) Conditional Logit Analysis of Qualitative Choice Behavior. In P. Zarembka (ed.), Frontiers in Econometrics. Academic Press. Metro Manila Urban Transportation Strategy Planning Project (MMUTSTRAP) (1984) Truck Operations. Ministry of Transportation and Communications, Metro Manila. Ministry of Construction, Japan (MOC) (2000) TDM International Experience. National Economic and Development Authority (NEDA) (1981) The truck ban in Metro Manila’s major thoroughfares: A policy analysis, Metro Manila. Ogden, K.W. (1992) Urban Goods Movement: A Guide to Policy and Planning. Ashgate Publishing Company, Brookfield, Vermont. Smith, G., Michell, T., and Shin, B. (1986) Assessing the effects of Trucking Regulation in Korea, World Bank Transportation Department.
Journal of the Eastern Asia Society for Transportation Studies, Vol. 6, pp. 2947 - 2962, 2005
2962