Embed Size (px)
Citation preview
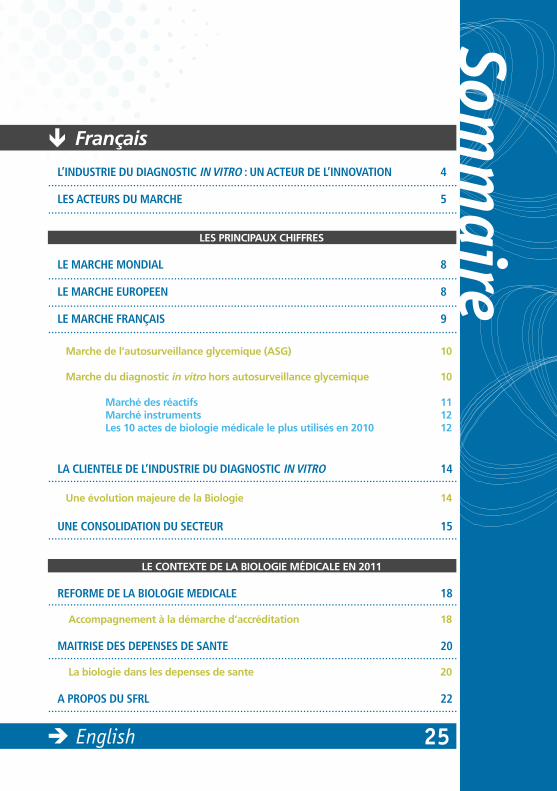
Sommaire
L’INDUSTRIE DU DIAGNOSTIC IN VITRO : UN ACTEUR DE L’INNOVATION 4
LES ACTEURS DU MARCHE 5
LES PRINCIPAUX CHIFFRES
LE MARCHE MONDIAL 8
LE MARCHE EUROPEEN 8
LE MARCHE FRANÇAIS 9
Marche de l’autosurveillance glycemique (ASG) 10 Marche du diagnostic in vitro hors autosurveillance glycemique 10
Marché des réactifs 11 Marché instruments 12 Les 10 actes de biologie médicale le plus utilisés en 2010 12
LA CLIENTELE DE L’INDUSTRIE DU DIAGNOSTIC IN VITRO 14
Une évolution majeure de la Biologie 14
UNE CONSOLIDATION DU SECTEUR 15
LE CONTEXTE DE LA BIOLOGIE MÉDICALE EN 2011
REFORME DE LA BIOLOGIE MEDICALE 18
Accompagnement à la démarche d’accréditation 18
MAITRISE DES DEPENSES DE SANTE 20
La biologie dans les depenses de sante 20
A PROPOS DU SFRL 22
..................................................................................................................................
..................................................................................................................................
..................................................................................................................................
..................................................................................................................................
..................................................................................................................................
..................................................................................................................................
..................................................................................................................................
..................................................................................................................................
..................................................................................................................................
..................................................................................................................................
Français
English 25
L’ industrie du diagnostic in vitro est constituée des entreprises qui conçoivent, fabriquent
et distribuent le matériel et les produits permet-tant d’obtenir une information médicale à partir d’échantillons prélevés sur le patient (sang, urine, peau…). Ces analyses effectuées en dehors du corps du patient se nomment tests de diagnostic in vitro.
Elles sont réalisées au sein des laboratoires de bio-logie médicale privés et hospitaliers, des établisse-ments français du sang, des centres de recherche anticancéreux. Certains de ces tests peuvent être réalisés dans les services hospitaliers ou des cabi-nets médicaux (test rapide du streptocoque hémo-lytique du groupe A), et d’autres par les patients eux-mêmes (tests d’autosurveillance glycémique, autotests de grossesse…).
60 à 70 % des décisions médicales s’appuient sur les résultats des tests de diagnostic in vitro1
Depuis plusieurs décennies, l’industrie du diagnostic in vitro a évolué grâce à sa capacité d’innovation. Les progrès scientifiques et techniques permanents lui ont permis d’améliorer et de diversifier les tests de diagnostic in vitro. En 2005, les résultats de ces tests participaient dans 60 à 70 % des décisions médicales. Depuis, les nouvelles innovations per-mettent de renforcer ce pourcentage. En 2009, les tests génétiques permettaient de dépister plus de 1700 maladies soit 450 de plus qu’en 20052.
Des innovations permanentes
Les tests sont également de plus en plus perfor-mants avec des techniques plus sensibles et plus spécifiques permettant d’améliorer l’efficacité de la prise en charge du patient. Par exemple, les tests utilisant des technologies s’appuyant sur l’ADN,
l’ARN ou la composition des protéines permettent une évaluation de la maladie au niveau moléculaire et personnaliser les soins du patient. D’autres inno-vations réduisent les couts et les temps d’analyses notamment en microbiologie avec des nouvelles méthodes de détection (spectrométrie de masse MALDI-TOF). La miniaturisation des instruments tend à développer les analyses au lit du patient ou dans d’autre cas les tests réalisés par le patient lui-même. Cela a permis notamment de rendre plus accessible le dépistage du VIH dans la population Française. Les tests rapides d’orientation diagnos-tique du VIH (TROD VIH), sont maintenant dispo-nibles aussi bien chez les médecins, infirmiers, sages femmes que dans les milieux associatifs.
Présents à tous les niveaux de la prise en charge du patient
Avec des tests évoluant en permanence, l’industrie du diagnostic in vitro occupe une position incon-tournable dans le système de santé et participe à tous les niveaux de la prise en charge du patient. Elle intervient plus particulièrement à trois étapes clés :
- La prévention des maladies avec le dépistage des populations à risques (rubéole, mucoviscidose, hépatites, cancer…),
- La confirmation fiable et précoce du diagnostic de la maladie,
- Le suivi et la prise en charge du traitement par la mesure des paramètres biologiques indis-pensables à une bonne gestion de la thérapie (dia-bète, cancérologie, HTA, cardiologie…).
4
L’INDUSTRIE DU DIAGNOSTIC IN VITRO :UN ACTEUR DE L’INNOVATION
1 - The Lewing Group: The value of diagnostics: innovation, adoption and diffusion into health care, 20052 - The Lewing Group: The value of Laboratory Screening and Diagnostic Tests for prevention and Health Care Improvement, 2009
C e haut niveau d’innovation implique une croissance constante des investissements
en Recherche et Développement, ce qui couplé à l’augmentation continue de la demande en services de santé, et la mise en œuvre des politiques de maitrises des dépenses de santé, influencent fortement le marché mondial du diagnostic in vitro en 2010. Ce contexte de contrainte économique impose aux industriels de rechercher de nouveaux leviers de croissance, notamment par le biais de fusions ou d’acquisitions.
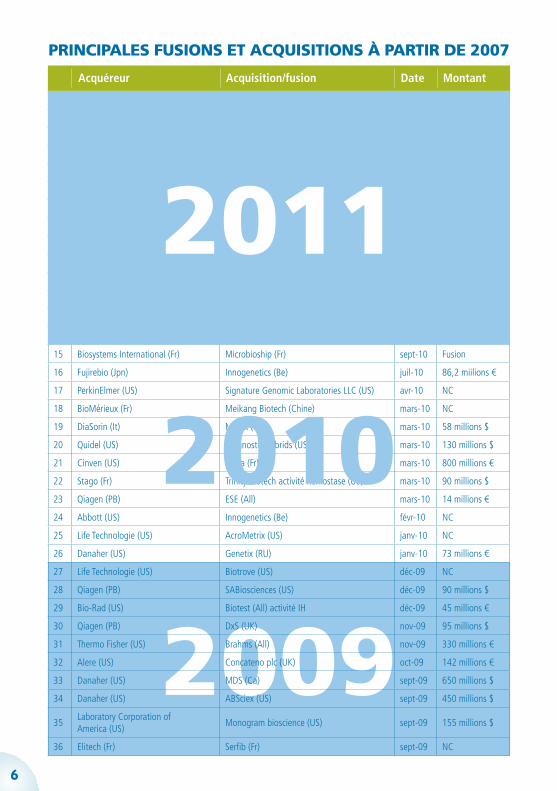
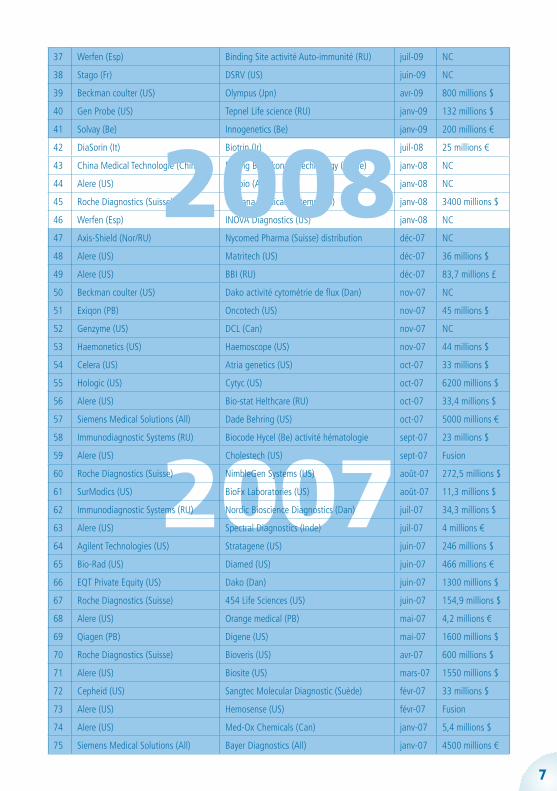
Depuis 2007, le secteur a connu plus de soixante dix transactions de ce type, avec récemment l’une des plus grosses réalisée depuis plusieurs années, l’acquisition de Beckman Coulter par le consortium Danaher. La société californienne faisant l’objet de rumeur d’achat depuis plus d’an a été valorisée à 6,8 milliards de $. Elle va intégrer la division sciences de la vie et diagnostic de Danaher rejoignant ainsi Leica, AB Sciex ou encore Radiometer. Par ce rachat, cette activité devient une part de plus en plus importante dans le consortium.
La société spécialiste du matériel médical Thermo Fisher a fait l’acquisition de la société Suédoise, Phadia, pour 3,47 milliards de $. L’entreprise américaine s’est renforcée ainsi, dans certains marchés de spécialité et s’est ouvert des opportunités de croissance sur le marché américain.
En Europe, Qiagen s’est renforcée dans son activité de biologie moléculaire. Après l’acquisition des sociétés DxS et SABiosciences spécialisées respectivement dans les tests compagnons et les technologies d’amplification de gêne, la société néerlandaise est rentrée au capital du français Ipsogen. Cette acquisition renforce la position de Qiagen dans le domaine des tests moléculaires pour la cancérologie personnalisée et donne à Ipsogen l’opportunité d’accélérer sa croissance et sa visibilité.
Un des autres récents évènements marquant est la série d’acquisition effectuée par BioMérieux. En effet, la société lyonnaise a fait l’acquisition en quelques mois de deux sociétés françaises, et d’une chinoise. La première, Argène, lui permet de se renforcer dans le domaine de la biologie moléculaire et notamment dans le suivi virologique des patients transplantés. La seconde, AES Chemunex, est un spécialiste du contrôle microbiologique industriel. Cette acquisition donne l’occasion à BioMérieux de devenir leader dans le domaine de la microbiologie industrielle. Enfin, BioMérieux a poursuivi son expansion en Chine avec le rachat de Meikang Biotech, présent sur le marché du diagnostic auprès du patient (Point-Of-Care) et des tests rapides dans les pays émergents et développés.
Enfin, un des évènements les plus marquants s’est déroulé en 2007 avec l’accélération de la stratégie de recentrage de la société Siemens qui après l’acquisition de DPC, avait racheté Bayer Diagnostics et Dade Behring (4,5 et 5 milliards d’euros).
5
LES ACTEURS DU MARCHÉ
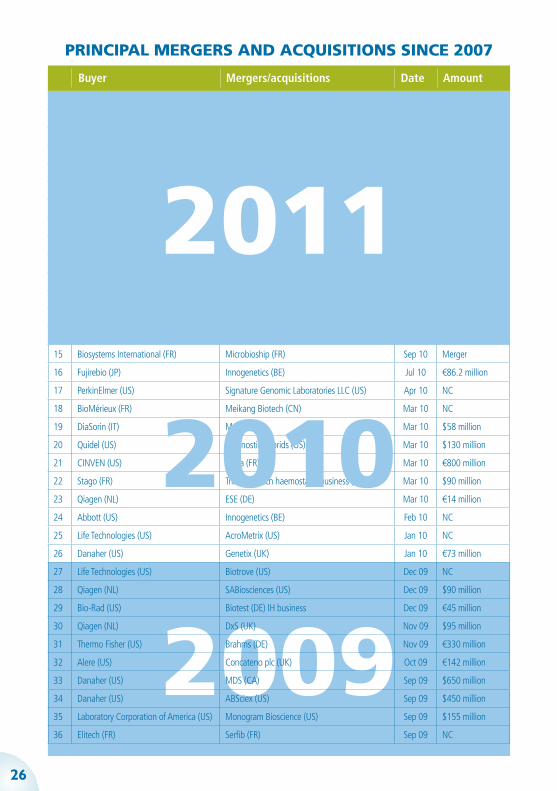
2009
1 Bio-Rad (US) QuantaLife (US) oct-11 162 millions $
2 Thermo Fisher (US) TREK (US) aout-11 NC
3 GE Healthcare (US) PAA laboratories (Aust) août-11 Fusion
4 Roche Diagnostics (Suisse) MTM laboratory (All) août-11 130 millions €
5 IVD Acquisition (US) Immucor (US) juil-11 1950 millions $
6 BioMérieux (Fr) Argène (Fr) juil-11 37,5 millions €
7 Sysmex (Jpn) Hyphen Biomed (Fr) juin-11 NC
8 Qiagen (PB) Ipsogen (Fr) juin-11 70 millions €
9 BioMérieux (Fr) AES Chemunex (Fr) mai-11 183 millions €
10 Thermo Fisher (US) Phadia (Su) mai-11 3500 millions $
11 Danaher (US) Beckman Coulter (US) avr-11 6800 millions $
12 Eurobio (Fr) Abcys (Fr) avr-11 Fusion
13 Abbott (US) Starlims (US) mars-11 123 millions $
14 PerkinElmer (US) Chemagen Biopolymer technologie (All) févr-11 NC
15 Biosystems International (Fr) Microbioship (Fr) sept-10 Fusion
16 Fujirebio (Jpn) Innogenetics (Be) juil-10 86,2 miilions €
17 PerkinElmer (US) Signature Genomic Laboratories LLC (US) avr-10 NC
18 BioMérieux (Fr) Meikang Biotech (Chine) mars-10 NC
19 DiaSorin (It) Murex (US) mars-10 58 millions $
20 Quidel (US) Diagnostic Hybrids (US) mars-10 130 millions $
21 Cinven (US) Sebia (Fr) mars-10 800 millions €
22 Stago (Fr) Trinity Biotech activité hémostase (US) mars-10 90 millions $
23 Qiagen (PB) ESE (All) mars-10 14 millions €
24 Abbott (US) Innogenetics (Be) févr-10 NC
25 Life Technologie (US) AcroMetrix (US) janv-10 NC
26 Danaher (US) Genetix (RU) janv-10 73 millions €
27 Life Technologie (US) Biotrove (US) déc-09 NC
28 Qiagen (PB) SABiosciences (US) déc-09 90 millions $
29 Bio-Rad (US) Biotest (All) activité IH déc-09 45 millions €
30 Qiagen (PB) DxS (UK) nov-09 95 millions $
31 Thermo Fisher (US) Brahms (All) nov-09 330 millions €
32 Alere (US) Concateno plc (UK) oct-09 142 millions €
33 Danaher (US) MDS (Ca) sept-09 650 millions $
34 Danaher (US) ABSciex (US) sept-09 450 millions $
35Laboratory Corporation ofAmerica (US)
Monogram bioscience (US) sept-09 155 millions $
36 Elitech (Fr) Serfib (Fr) sept-09 NC
2011
PRINCIPALES FUSIONS ET ACQUISITIONS À PARTIR DE 2007
Acquéreur Acquisition/fusion Date Montant
6
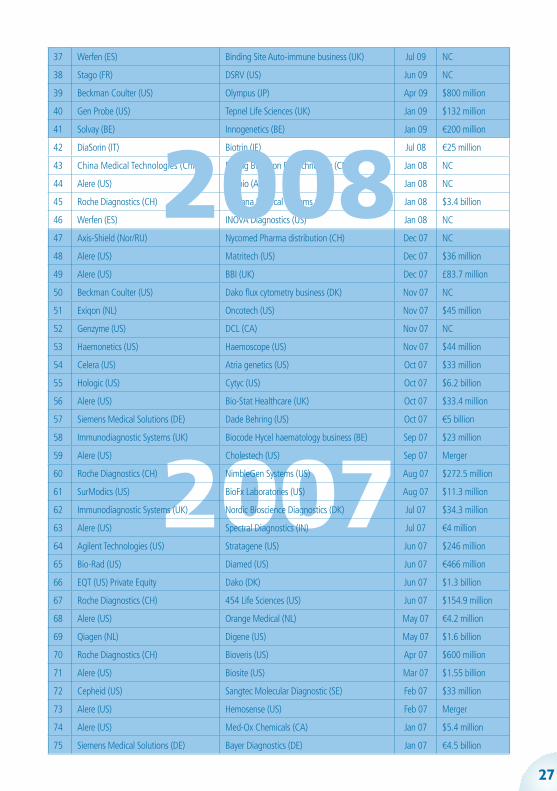
2010
2007
37 Werfen (Esp) Binding Site activité Auto-immunité (RU) juil-09 NC
38 Stago (Fr) DSRV (US) juin-09 NC
39 Beckman coulter (US) Olympus (Jpn) avr-09 800 millions $
40 Gen Probe (US) Tepnel Life science (RU) janv-09 132 millions $
41 Solvay (Be) Innogenetics (Be) janv-09 200 millions €
42 DiaSorin (It) Biotrin (Ir) juil-08 25 millions €
43 China Medical Technologie (Chine) Beijing Bio-Ekon Biotechnology (Chine) janv-08 NC
44 Alere (US) Panbio (Aus) janv-08 NC
45 Roche Diagnostics (Suisse) Ventana Médical Systems (US) janv-08 3400 millions $
46 Werfen (Esp) INOVA Diagnostics (US) janv-08 NC
47 Axis-Shield (Nor/RU) Nycomed Pharma (Suisse) distribution déc-07 NC
48 Alere (US) Matritech (US) déc-07 36 millions $
49 Alere (US) BBI (RU) déc-07 83,7 millions £
50 Beckman coulter (US) Dako activité cytométrie de flux (Dan) nov-07 NC
51 Exiqon (PB) Oncotech (US) nov-07 45 millions $
52 Genzyme (US) DCL (Can) nov-07 NC
53 Haemonetics (US) Haemoscope (US) nov-07 44 millions $
54 Celera (US) Atria genetics (US) oct-07 33 millions $
55 Hologic (US) Cytyc (US) oct-07 6200 millions $
56 Alere (US) Bio-stat Helthcare (RU) oct-07 33,4 millions $
57 Siemens Medical Solutions (All) Dade Behring (US) oct-07 5000 millions €
58 Immunodiagnostic Systems (RU) Biocode Hycel (Be) activité hématologie sept-07 23 millions $
59 Alere (US) Cholestech (US) sept-07 Fusion
60 Roche Diagnostics (Suisse) NimbleGen Systems (US) août-07 272,5 millions $
61 SurModics (US) BioFx Laboratories (US) août-07 11,3 millions $
62 Immunodiagnostic Systems (RU) Nordic Bioscience Diagnostics (Dan) juil-07 34,3 millions $
63 Alere (US) Spectral Diagnostics (Inde) juil-07 4 millions €
64 Agilent Technologies (US) Stratagene (US) juin-07 246 millions $
65 Bio-Rad (US) Diamed (US) juin-07 466 millions €
66 EQT Private Equity (US) Dako (Dan) juin-07 1300 millions $
67 Roche Diagnostics (Suisse) 454 Life Sciences (US) juin-07 154,9 millions $
68 Alere (US) Orange medical (PB) mai-07 4,2 millions €
69 Qiagen (PB) Digene (US) mai-07 1600 millions $
70 Roche Diagnostics (Suisse) Bioveris (US) avr-07 600 millions $
71 Alere (US) Biosite (US) mars-07 1550 millions $
72 Cepheid (US) Sangtec Molecular Diagnostic (Suède) févr-07 33 millions $
73 Alere (US) Hemosense (US) févr-07 Fusion
74 Alere (US) Med-Ox Chemicals (Can) janv-07 5,4 millions $
75 Siemens Medical Solutions (All) Bayer Diagnostics (All) janv-07 4500 millions €
7
2008

LES PRINCIPAUX CHIFFRES
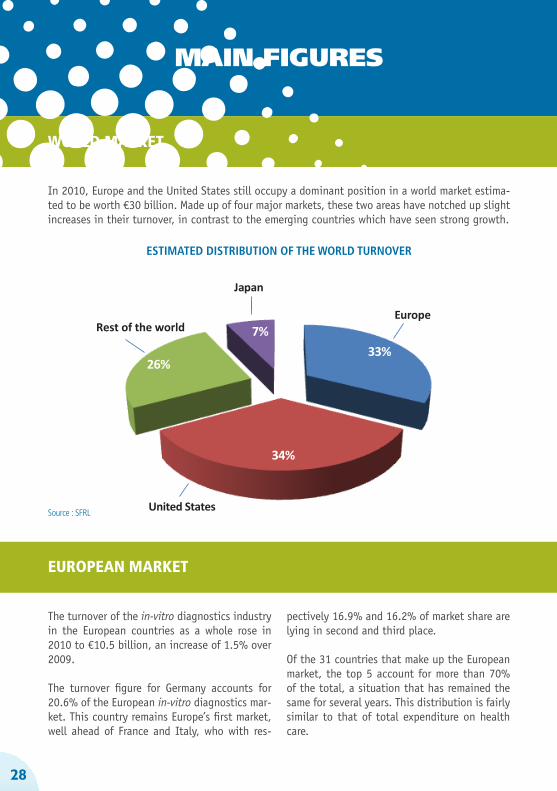
En 2010, l’Europe et les Etats-Unis occupent tou-jours une place prépondérante dans un marché mondial estimé à environ 30 milliards d’euros. Constitué de 4 grands marchés, ces deux zones
ont vu leur chiffre d’affaires faiblement progresser, à l’inverse des pays émergents qui ont connu une forte croissance.
EVALUATION DE LA REPARTITION DU CHIFFRE D’AFFAIRES MONDIAL
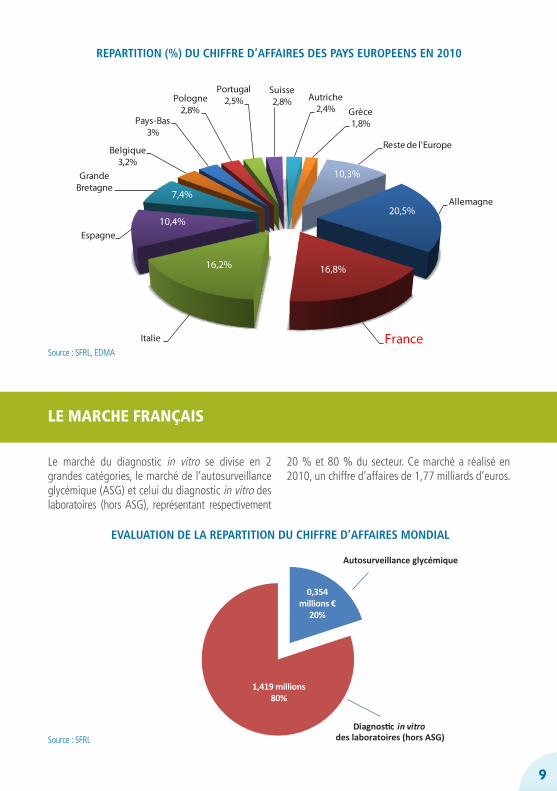
Le chiffre d’affaires de l’industrie du diagnostic in vitro de l’ensemble des pays d’Europe s’est élevé en 2010 à 10,5 milliards d’euros avec une progres-sion de 1,5 % par rapport à 2009.
Le chiffre d’affaires de l’Allemagne représente 20,6 % du marché européen du diagnostic in vitro. Ce pays demeure le premier marché d’Europe, à bonne distance de la France et de l’Italie
qui avec respectivement 16,9 % et 16,2 % de part de marché sont deuxième et troisième.
Sur 31 pays constituant le marché européen, les 5 premiers représentent plus de 70 % du marché total, ce qui est une constante depuis plusieurs années. Cette répartition est à peu près similaire à celle des dépenses totales de santé.
33%
34%
26%
7%
Etats Unis
Restedu monde
Japon
Europe
Source : SFRL
8
LE MARCHE MONDIAL
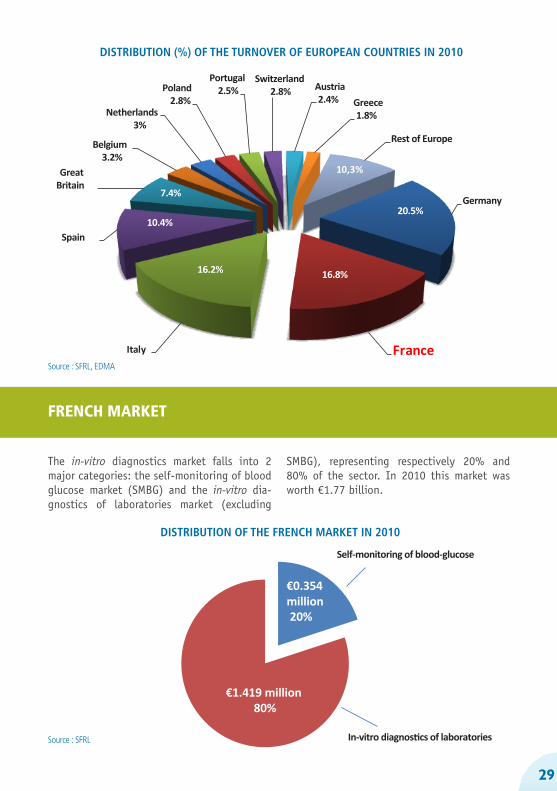
LE MARCHE EUROPÉEN
Allemagne
France Italie
Espagne
GrandeBretagne
Belgique3,2%
Pays-Bas3%
Pologne2,8%
Portugal2,5%
Suisse2,8% Autriche
2,4% Grèce1,8%
Reste de l'Europe
10,4%
16,2% 16,8%
20,5%
10,3%
7,4%
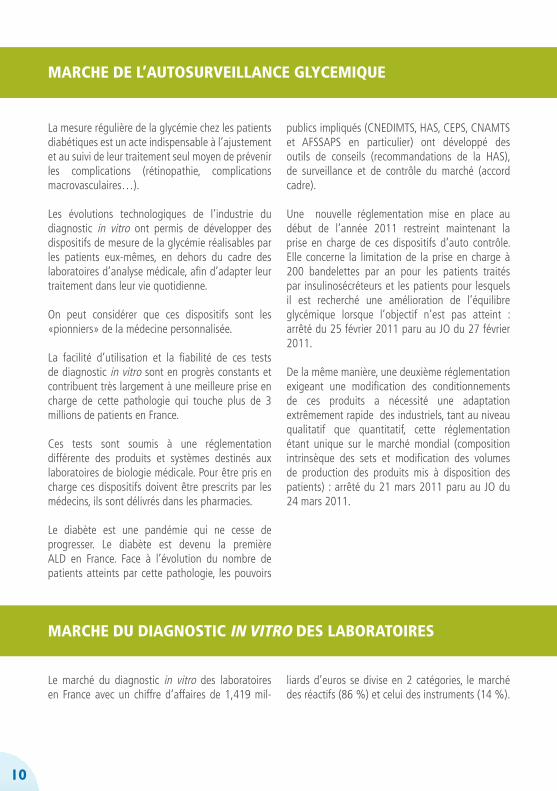
Le marché du diagnostic in vitro se divise en 2 grandes catégories, le marché de l’autosurveillance glycémique (ASG) et celui du diagnostic in vitro des laboratoires (hors ASG), représentant respectivement
20 % et 80 % du secteur. Ce marché a réalisé en 2010, un chiffre d’affaires de 1,77 milliards d’euros.
Diagnos c in vitrodes laboratoires (hors ASG)
Autosurveillance glycémique
1,419 millions80%
0,354millions €
20%
Source : SFRL
Source : SFRL, EDMA
9
LE MARCHE FRANÇAIS
REPARTITION (%) DU CHIFFRE D’AFFAIRES DES PAYS EUROPEENS EN 2010
EVALUATION DE LA REPARTITION DU CHIFFRE D’AFFAIRES MONDIAL
La mesure régulière de la glycémie chez les patients diabétiques est un acte indispensable à l’ajustement et au suivi de leur traitement seul moyen de prévenir les complications (rétinopathie, complications macrovasculaires…).
Les évolutions technologiques de l’industrie du diagnostic in vitro ont permis de développer des dispositifs de mesure de la glycémie réalisables par les patients eux-mêmes, en dehors du cadre des laboratoires d’analyse médicale, afin d’adapter leur traitement dans leur vie quotidienne.
On peut considérer que ces dispositifs sont les «pionniers» de la médecine personnalisée.
La facilité d’utilisation et la fiabilité de ces tests de diagnostic in vitro sont en progrès constants et contribuent très largement à une meilleure prise en charge de cette pathologie qui touche plus de 3 millions de patients en France.
Ces tests sont soumis à une réglementation différente des produits et systèmes destinés aux laboratoires de biologie médicale. Pour être pris en charge ces dispositifs doivent être prescrits par les médecins, ils sont délivrés dans les pharmacies.
Le diabète est une pandémie qui ne cesse de progresser. Le diabète est devenu la première ALD en France. Face à l’évolution du nombre de patients atteints par cette pathologie, les pouvoirs
publics impliqués (CNEDIMTS, HAS, CEPS, CNAMTS et AFSSAPS en particulier) ont développé des outils de conseils (recommandations de la HAS), de surveillance et de contrôle du marché (accord cadre).
Une nouvelle réglementation mise en place au début de l’année 2011 restreint maintenant la prise en charge de ces dispositifs d’auto contrôle. Elle concerne la limitation de la prise en charge à 200 bandelettes par an pour les patients traités par insulinosécréteurs et les patients pour lesquels il est recherché une amélioration de l’équilibre glycémique lorsque l’objectif n’est pas atteint : arrêté du 25 février 2011 paru au JO du 27 février 2011.
De la même manière, une deuxième réglementation exigeant une modification des conditionnements de ces produits a nécessité une adaptation extrêmement rapide des industriels, tant au niveau qualitatif que quantitatif, cette réglementation étant unique sur le marché mondial (composition intrinsèque des sets et modification des volumes de production des produits mis à disposition des patients) : arrêté du 21 mars 2011 paru au JO du 24 mars 2011.
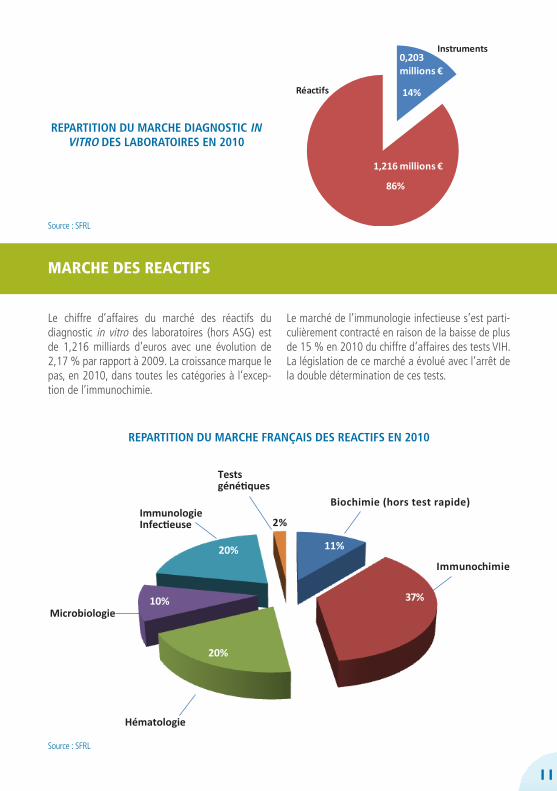
Le marché du diagnostic in vitro des laboratoires en France avec un chiffre d’affaires de 1,419 mil-
liards d’euros se divise en 2 catégories, le marché des réactifs (86 %) et celui des instruments (14 %).
10
MARCHE DE L’AUTOSURVEILLANCE GLYCEMIQUE
MARCHE DU DIAGNOSTIC IN VITRO DES LABORATOIRES
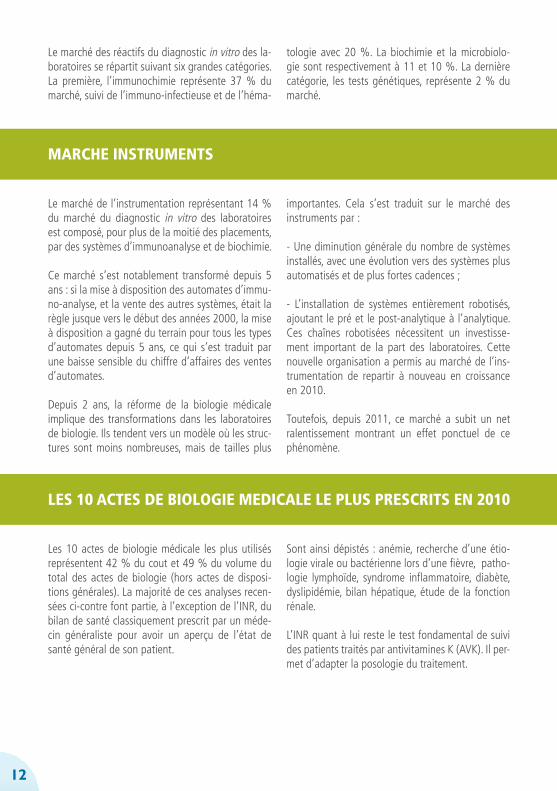
Le chiffre d’affaires du marché des réactifs du diagnostic in vitro des laboratoires (hors ASG) est de 1,216 milliards d’euros avec une évolution de 2,17 % par rapport à 2009. La croissance marque le pas, en 2010, dans toutes les catégories à l’excep-tion de l’immunochimie.
Le marché de l’immunologie infectieuse s’est parti-culièrement contracté en raison de la baisse de plus de 15 % en 2010 du chiffre d’affaires des tests VIH. La législation de ce marché a évolué avec l’arrêt de la double détermination de ces tests.
REPARTITION DU MARCHE FRANÇAIS DES REACTIFS EN 2010
REPARTITION DU MARCHE DIAGNOSTIC IN VITRO DES LABORATOIRES EN 2010
14%
86%
Instruments
Réactifs
0,203millions €
1,216 millions €
11
Source : SFRL
Source : SFRL
Biochimie (hors test rapide)
Immunochimie
Hématologie
Microbiologie
ImmunologieInfectieuse
Tests génétiques
11%
37%
20%
10%
20%
2%
MARCHE DES REACTIFS
12
Le marché de l’instrumentation représentant 14 % du marché du diagnostic in vitro des laboratoires est composé, pour plus de la moitié des placements, par des systèmes d’immunoanalyse et de biochimie.
Ce marché s’est notablement transformé depuis 5 ans : si la mise à disposition des automates d’immu-no-analyse, et la vente des autres systèmes, était la règle jusque vers le début des années 2000, la mise à disposition a gagné du terrain pour tous les types d’automates depuis 5 ans, ce qui s’est traduit par une baisse sensible du chiffre d’affaires des ventes d’automates.
Depuis 2 ans, la réforme de la biologie médicale implique des transformations dans les laboratoires de biologie. Ils tendent vers un modèle où les struc-tures sont moins nombreuses, mais de tailles plus
importantes. Cela s’est traduit sur le marché des instruments par :
- Une diminution générale du nombre de systèmes installés, avec une évolution vers des systèmes plus automatisés et de plus fortes cadences ;
- L’installation de systèmes entièrement robotisés, ajoutant le pré et le post-analytique à l’analytique. Ces chaînes robotisées nécessitent un investisse-ment important de la part des laboratoires. Cette nouvelle organisation a permis au marché de l’ins-trumentation de repartir à nouveau en croissance en 2010.
Toutefois, depuis 2011, ce marché a subit un net ralentissement montrant un effet ponctuel de ce phénomène.
Les 10 actes de biologie médicale les plus utilisés représentent 42 % du cout et 49 % du volume du total des actes de biologie (hors actes de disposi-tions générales). La majorité de ces analyses recen-sées ci-contre font partie, à l’exception de l’INR, du bilan de santé classiquement prescrit par un méde-cin généraliste pour avoir un aperçu de l’état de santé général de son patient.
Sont ainsi dépistés : anémie, recherche d’une étio-logie virale ou bactérienne lors d’une fièvre, patho-logie lymphoïde, syndrome inflammatoire, diabète, dyslipidémie, bilan hépatique, étude de la fonction rénale.
L’INR quant à lui reste le test fondamental de suivi des patients traités par antivitamines K (AVK). Il per-met d’adapter la posologie du traitement.
Le marché des réactifs du diagnostic in vitro des la-boratoires se répartit suivant six grandes catégories. La première, l’immunochimie représente 37 % du marché, suivi de l’immuno-infectieuse et de l’héma-
tologie avec 20 %. La biochimie et la microbiolo-gie sont respectivement à 11 et 10 %. La dernière catégorie, les tests génétiques, représente 2 % du marché.
MARCHE INSTRUMENTS
LES 10 ACTES DE BIOLOGIE MEDICALE LE PLUS PRESCRITS EN 2010
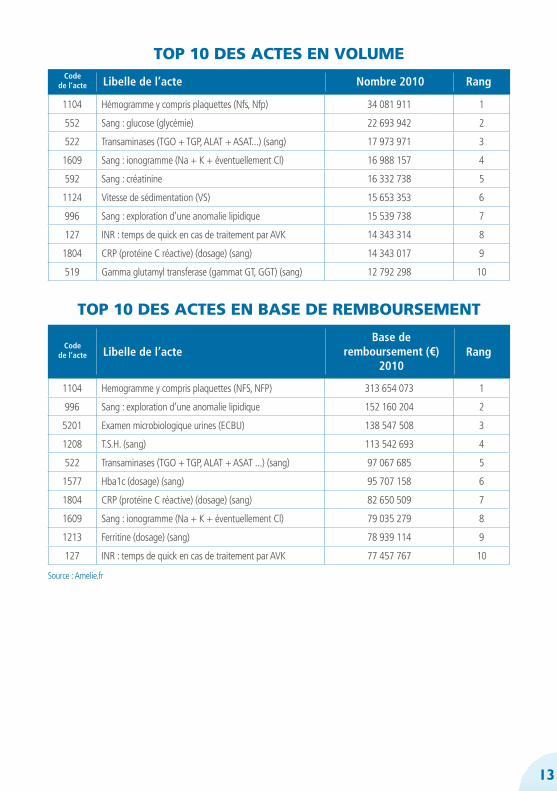
1104 Hemogramme y compris plaquettes (NFS, NFP) 313 654 073 1
996 Sang : exploration d’une anomalie lipidique 152 160 204 2
5201 Examen microbiologique urines (ECBU) 138 547 508 3
1208 T.S.H. (sang) 113 542 693 4
522 Transaminases (TGO + TGP, ALAT + ASAT ...) (sang) 97 067 685 5
1577 Hba1c (dosage) (sang) 95 707 158 6
1804 CRP (protéine C réactive) (dosage) (sang) 82 650 509 7
1609 Sang : ionogramme (Na + K + éventuellement Cl) 79 035 279 8
1213 Ferritine (dosage) (sang) 78 939 114 9
127 INR : temps de quick en cas de traitement par AVK 77 457 767 10
TOP 10 DES ACTES EN BASE DE REMBOURSEMENT
Codede l’acte Libelle de l’acte
Base deremboursement (€)
2010Rang
13
1104 Hémogramme y compris plaquettes (Nfs, Nfp) 34 081 911 1
552 Sang : glucose (glycémie) 22 693 942 2
522 Transaminases (TGO + TGP, ALAT + ASAT...) (sang) 17 973 971 3
1609 Sang : ionogramme (Na + K + éventuellement Cl) 16 988 157 4
592 Sang : créatinine 16 332 738 5
1124 Vitesse de sédimentation (VS) 15 653 353 6
996 Sang : exploration d’une anomalie lipidique 15 539 738 7
127 INR : temps de quick en cas de traitement par AVK 14 343 314 8
1804 CRP (protéine C réactive) (dosage) (sang) 14 343 017 9
519 Gamma glutamyl transferase (gammat GT, GGT) (sang) 12 792 298 10
TOP 10 DES ACTES EN VOLUMECode
de l’acte Libelle de l’acte Nombre 2010 Rang
Source : Amelie.fr
14
Centres hospitalierspublics et privés LBM
Privés
Etablissements Français du Sang
Autres
55%37%
6%2%
Source : SFRL
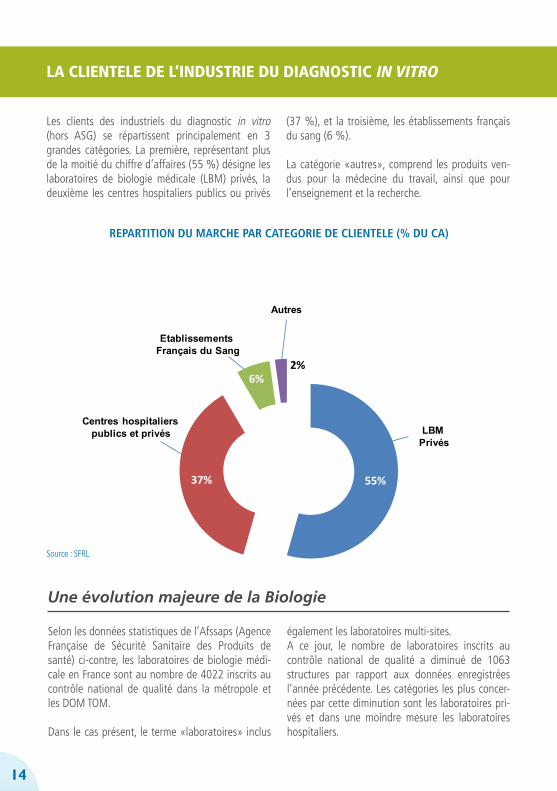
LA CLIENTELE DE L’INDUSTRIE DU DIAGNOSTIC IN VITRO
Les clients des industriels du diagnostic in vitro (hors ASG) se répartissent principalement en 3 grandes catégories. La première, représentant plus de la moitié du chiffre d’affaires (55 %) désigne les laboratoires de biologie médicale (LBM) privés, la deuxième les centres hospitaliers publics ou privés
(37 %), et la troisième, les établissements français du sang (6 %).
La catégorie «autres», comprend les produits ven-dus pour la médecine du travail, ainsi que pour l’enseignement et la recherche.
Une évolution majeure de la Biologie
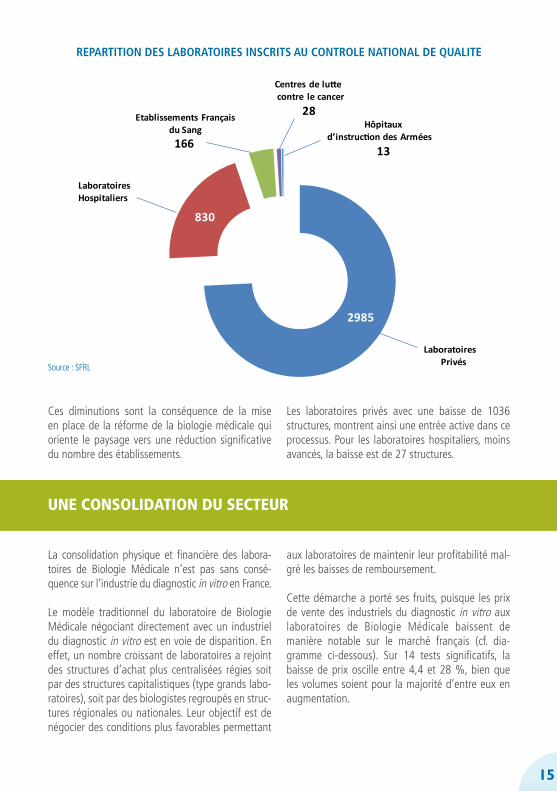
Selon les données statistiques de l’Afssaps (Agence Française de Sécurité Sanitaire des Produits de santé) ci-contre, les laboratoires de biologie médi-cale en France sont au nombre de 4022 inscrits au contrôle national de qualité dans la métropole et les DOM TOM.
Dans le cas présent, le terme «laboratoires» inclus
également les laboratoires multi-sites. A ce jour, le nombre de laboratoires inscrits au contrôle national de qualité a diminué de 1063 structures par rapport aux données enregistrées l’année précédente. Les catégories les plus concer-nées par cette diminution sont les laboratoires pri-vés et dans une moindre mesure les laboratoires hospitaliers.
REPARTITION DU MARCHE PAR CATEGORIE DE CLIENTELE (% DU CA)
15
UNE CONSOLIDATION DU SECTEUR
Ces diminutions sont la conséquence de la mise en place de la réforme de la biologie médicale qui oriente le paysage vers une réduction significative du nombre des établissements.
Les laboratoires privés avec une baisse de 1036 structures, montrent ainsi une entrée active dans ce processus. Pour les laboratoires hospitaliers, moins avancés, la baisse est de 27 structures.
La consolidation physique et financière des labora-toires de Biologie Médicale n’est pas sans consé-quence sur l’industrie du diagnostic in vitro en France.
Le modèle traditionnel du laboratoire de Biologie Médicale négociant directement avec un industriel du diagnostic in vitro est en voie de disparition. En effet, un nombre croissant de laboratoires a rejoint des structures d’achat plus centralisées régies soit par des structures capitalistiques (type grands labo-ratoires), soit par des biologistes regroupés en struc-tures régionales ou nationales. Leur objectif est de négocier des conditions plus favorables permettant
aux laboratoires de maintenir leur profitabilité mal-gré les baisses de remboursement.
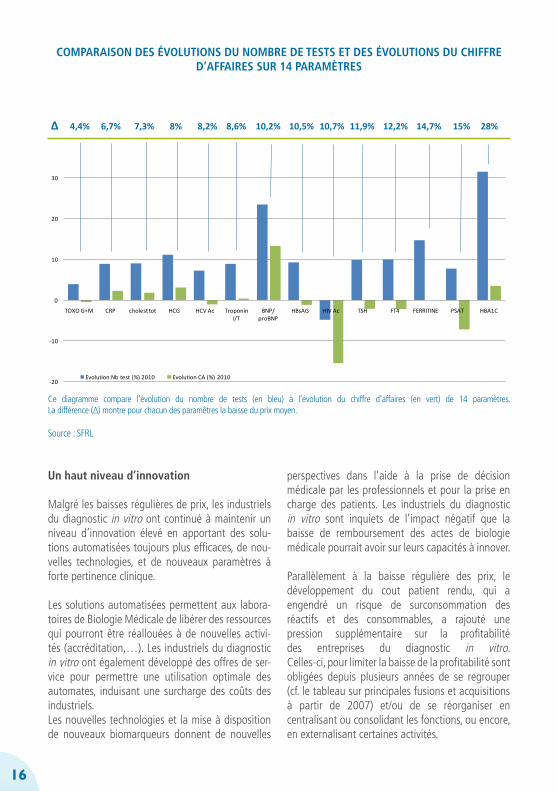
Cette démarche a porté ses fruits, puisque les prix de vente des industriels du diagnostic in vitro aux laboratoires de Biologie Médicale baissent de manière notable sur le marché français (cf. dia-gramme ci-dessous). Sur 14 tests significatifs, la baisse de prix oscille entre 4,4 et 28 %, bien que les volumes soient pour la majorité d’entre eux en augmentation.
Source : SFRL
Centres de lu econtre le cancer
LaboratoiresPrivés
Laboratoires Hospitaliers
2985
830
13
Hôpitaux d’instruc on des Armées
28Etablissements Françaisdu Sang166
REPARTITION DES LABORATOIRES INSCRITS AU CONTROLE NATIONAL DE QUALITE
16
-20
-10
0
10
20
30
40
TOXO G+M CRP cholest tot HCG HCV Ac Troponin I/T
BNP/ proBNP
HBsAG HIV Ac TSH FT4 FERRITINE PSAT HBA1C
Comparaison des évolutions du nombre de tests et des évolutions du Chiffre d'affaires - SFRL 2010
Evolution Nb test (%) 2010 Evolution CA (%) 2010
Source : SFRL
∆ 4,4% 6,7% 7,3% 8% 8,2% 8,6% 10,2% 10,5% 10,7% 11,9% 12,2% 14,7% 15% 28%
COMPARAISON DES ÉVOLUTIONS DU NOMBRE DE TESTS ET DES ÉVOLUTIONS DU CHIFFRE D’AFFAIRES SUR 14 PARAMÈTRES
Un haut niveau d’innovation
Malgré les baisses régulières de prix, les industriels du diagnostic in vitro ont continué à maintenir un niveau d’innovation élevé en apportant des solu-tions automatisées toujours plus efficaces, de nou-velles technologies, et de nouveaux paramètres à forte pertinence clinique.
Les solutions automatisées permettent aux labora-toires de Biologie Médicale de libérer des ressources qui pourront être réallouées à de nouvelles activi-tés (accréditation,…). Les industriels du diagnostic in vitro ont également développé des offres de ser-vice pour permettre une utilisation optimale des automates, induisant une surcharge des coûts des industriels. Les nouvelles technologies et la mise à disposition de nouveaux biomarqueurs donnent de nouvelles
perspectives dans l’aide à la prise de décision médicale par les professionnels et pour la prise en charge des patients. Les industriels du diagnostic in vitro sont inquiets de l’impact négatif que la baisse de remboursement des actes de biologie médicale pourrait avoir sur leurs capacités à innover.
Parallèlement à la baisse régulière des prix, le développement du cout patient rendu, qui a engendré un risque de surconsommation des réactifs et des consommables, a rajouté une pression supplémentaire sur la profitabilité des entreprises du diagnostic in vitro. Celles-ci, pour limiter la baisse de la profitabilité sont obligées depuis plusieurs années de se regrouper (cf. le tableau sur principales fusions et acquisitions à partir de 2007) et/ou de se réorganiser en centralisant ou consolidant les fonctions, ou encore, en externalisant certaines activités.
Ce diagramme compare l’évolution du nombre de tests (en bleu) à l’évolution du chiffre d’affaires (en vert) de 14 paramètres. La différence (∆) montre pour chacun des paramêtres la baisse du prix moyen.

17
Il apparait donc urgent pour les entreprises du diagnostic in vitro opérant en France, de trouver une nouvelle dynamique avec les laboratoires de Biologie Médicale, sous peine de voir leur perspective économique se retrouver dans une impasse.
Autrement, elles seront obligées de poursuivre le mouvement de concentration et de rationalisation des couts, qui à terme engendrera des situations de quasi-monopole sur certains segments, ou encore, nuira à la qualité des prestations.
18
Lors de la loi HPST, le gouvernement a réformé l’exercice de la biologie médicale par voie d’ordonnance. Déposée, mais non ratifié par le parlement, l’ordonnance possède une valeur réglementaire et, est applicable à l’exception des articles nécessitants des décrets d’application.
Le texte met en œuvre deux mesures phares, la médicalisation de la profession et son entrée dans un système d’accréditation des laboratoires, et organise une période de transition avant son application complète.
Dans ce contexte de réforme de la biologie médicale, les industriels du SFRL ont mis leur expérience des systèmes qualités au profit de tous, et ont proposé un accompagnement à la démarche d’accréditation. Un Groupe de Travail Accréditation a été crée en 2008 pour élaborer des outils pratiques et suivre les évolutions de la réforme.
Le premier outil de ce groupe fut la réalisation de la charte des fournisseurs : support à la démarche d’accréditation qui a apporté une première réponse aux demandes et aux interrogations des laboratoires de biologie médicale. Elle expose le contexte réglementaire et normatif des dispositifs médicaux de diagnostic in vitro, les obligations réglementaires des fournisseurs, ainsi que leurs propositions d’accompagnement dans la démarche qualité des laboratoires.
- Ordonnance n° 2010-49 du 13 janvier 2010 relative à la biologie médicale- Rapport au Président de la République relatif à l’ordonnance no 2010-49 du 13 janvier 2010 relative
à la biologie médicale- Arrêté du 5 août 2010 fixant les références des normes l’accréditation applicables aux laboratoires
de biologie médicale- Arrêté du 14 décembre 2010 définissant les conditions justificatives de l’entrée effective d’un
laboratoire de biologie médicale dans une démarche d’accréditation.
Textes parus au Journal Officiel
IntroductionFournisseurs signataires de la charte
La mise en conformité du système
qualité d’un laboratoire de biologie
médicale selon les exigences de
la norme ISO 15189 est de la
responsabilité de la Direction du
laboratoire. L’accréditation reconnait
le système qualité mais également
les compétences techniques évaluées
par des pairs. La norme s’attache
à la fois au système qualité du labo-
ratoire et exige qu’un responsable
qualité soit spécifi quement nommé
pour cette tâche. Ce système qualité
doit inclure un manuel qualité et
des procédures qui doivent traiter
des trois phases de l’analyse de
biologie médicale : pré-analytique,
analytique et post-analytique.
Pour répondre aux demandes des
laboratoires qui s’engagent dans cette
démarche d’accréditation, les four-
nisseurs de systèmes de diagnostic
in vitro adhérents du SFRL ont
décidé la rédaction d’une charte à
partir de laquelle ils se proposent
d’accompagner les laboratoires dans
leur démarche.
Cette charte s’inscrit pleinement
dans la démarche qualité engagée
par ces fournisseurs.
Elle a été rédigée dans un souci
de transparence pour établir un
partenariat client-fournisseur fondé
sur une compréhension mutuelle
des besoins et des contraintes de
leurs professions.
› ABBOTT
› ARGENE
› BECKMAN COULTER
› BECTON DICKINSON
› BIO ADVANCE
› BIOLABO
› BIOMEDICAL DIAGNOSTICS
› BIOMERIEUX
› BIO-RAD
› BIOSERVICES ANTILLES
› BIOTEST
› BRAHMS
› CEPHEID
› CIS BIO INTERNATIONAL
› DIAGAST
› DIAGNOSTICA STAGO
› DIASORIN
› ELITECH GROUP
› ELVETEC SERVICES
› EUROBIO
› FUMOUZE DIAGNOSTICS
› HORIBA MEDICAL
› HYPHEN BIOMED
› IMMUNODIAGNOSTIC SYSTEMS
(IDS) EURL
› INGEN
› INNOGENETICS FRANCE
› INSTITUT DE BIOTECHNOLOGIES
JACQUES BOY
› INSTRUMENTATION LABORATORY
› IPSOGEN
› MENARINI
› MERIDIAN BIOSCIENCE
› ORTHO-CLINICAL DIAGNOSTICS
› OXOID
› PERKINELMER
› PHADIA
› ROCHE DIAGNOSTICS
› SEBIA
› SIEMENS
› S-INTER
› SOBIODA
› SYSMEX
› THERMO FISHER SCIENTIFIC
› TOSOH BIOSCIENCE
› VENTANA MEDICAL SYSTEMS
No
vem
bre
200
9 fournisseurs
Support à la démarche
d’accréditation
des“Support à la démarche d'accréditation”
LE CONTEXTE DE LA BIOLOGIE MEDICALE EN 2011
REFORME DE LA BIOLOGIE MEDICALE
Accompagnement à la démarche d’accréditation
19
Ensuite, pour poursuivre cette démarche, une conférence-débat «Industrie du DIV et Biologie Médicale : Accompagnement à la démarche d’accréditation» a été organisée et a réuni les instances officielles acteurs de la réforme. Le SFRL au travers des exposés de M. BALLEREAU et Mme GALLOT de la DGS, de M. PIERRE et Mme MEHAY du Cofrac et de M. GHISLAIN de l’Afssaps a pu faire partager le point de vue de ces derniers à un large public formé d’industriels. Outre la présence de près de 200 industriels adhérents au SFRL, le public était également constitué des présidents des syndicats de biologistes, des syndicats partenaires du SFRL, des autorités de tutelles et des médias.
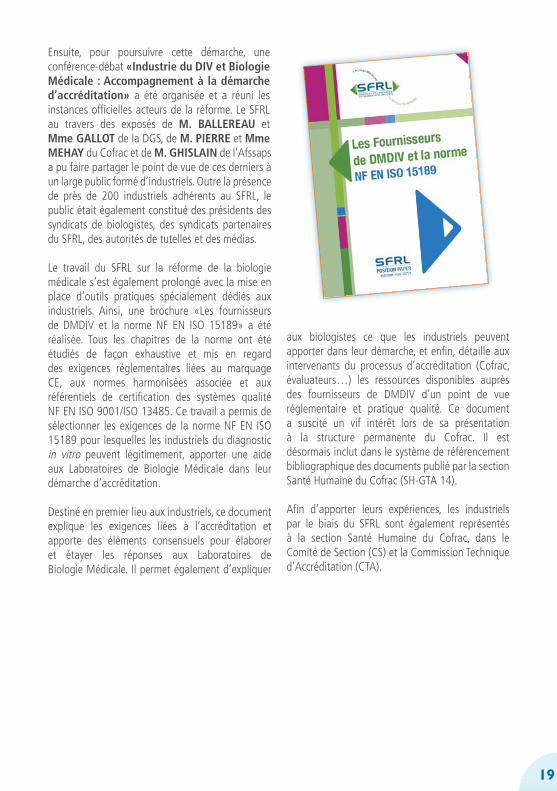
Le travail du SFRL sur la réforme de la biologie médicale s’est également prolongé avec la mise en place d’outils pratiques spécialement dédiés aux industriels. Ainsi, une brochure «Les fournisseurs de DMDIV et la norme NF EN ISO 15189» a été réalisée. Tous les chapitres de la norme ont été étudiés de façon exhaustive et mis en regard des exigences réglementaires liées au marquage CE, aux normes harmonisées associée et aux référentiels de certification des systèmes qualité NF EN ISO 9001/ISO 13485. Ce travail a permis de sélectionner les exigences de la norme NF EN ISO 15189 pour lesquelles les industriels du diagnostic in vitro peuvent légitimement, apporter une aide aux Laboratoires de Biologie Médicale dans leur démarche d’accréditation.
Destiné en premier lieu aux industriels, ce document explique les exigences liées à l’accréditation et apporte des éléments consensuels pour élaborer et étayer les réponses aux Laboratoires de Biologie Médicale. Il permet également d’expliquer
aux biologistes ce que les industriels peuvent apporter dans leur démarche, et enfin, détaille aux intervenants du processus d’accréditation (Cofrac, évaluateurs…) les ressources disponibles auprès des fournisseurs de DMDIV d’un point de vue réglementaire et pratique qualité. Ce document a suscité un vif intérêt lors de sa présentation à la structure permanente du Cofrac. Il est désormais inclut dans le système de référencement bibliographique des documents publié par la section Santé Humaine du Cofrac (SH-GTA 14).
Afin d’apporter leurs expériences, les industriels par le biais du SFRL sont également représentés à la section Santé Humaine du Cofrac, dans le Comité de Section (CS) et la Commission Technique d’Accréditation (CTA).
VALEURTAUX D’EVOLUTION
ANNUEL
2008 2009 2010 2008 2009 2010
1 - Soins hospitaliers 76,2 79,1 81,2 3,5 3,8 2,6
Publics Privés
58,218,0
60,318,9
61,819,5
3,05,0
3,64,7
2,53,1
2 - Soins de ville 42,1 43,2 44,0 3,3 2,7 1,8
dont Médecins Dentistes Auxiliaires médicaux Analyses Cures Thermales
18,29,69,94,10,3
18,59,710,44,20,3
18,49,9
11,04,30,3
2,22,66,32,7-0,6
1,61,65,92,20,1
-0,72,45,51,73,5
3 - Transports de malades 3,4 3,6 3,8 4,5 6,5 5,2
4 - Médicaments 33,4 34,1 34,4 2,1 2,0 1,1
5 - Autres biens médicaux 10,7 11,0 11,6 6,2 2,9 5,5
6 - CSPN (1 + ... + 5) 165,7 171,1 175,0 3,3 3,2 2,3
Sources : DREES, compte de la santé - base 2005
MAITRISE DES DEPENSES DE SANTE
LA CONSOMMATION DE SOINS ET BIENS MÉDICAUX
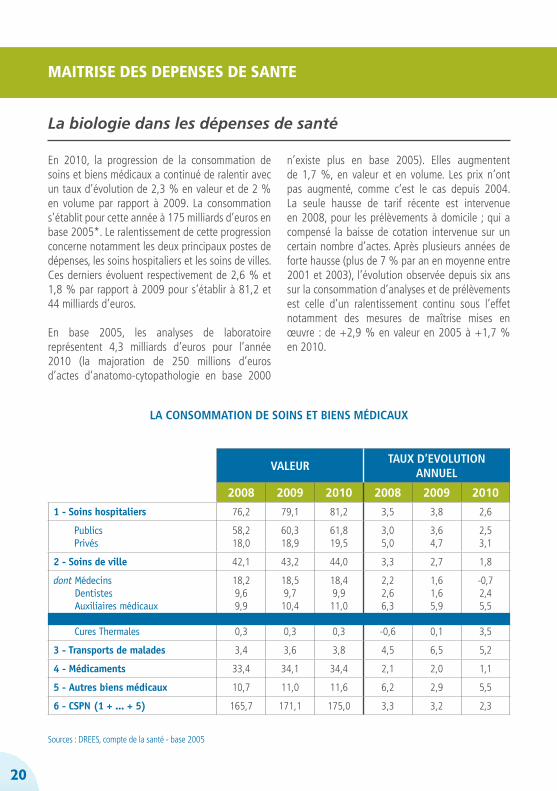
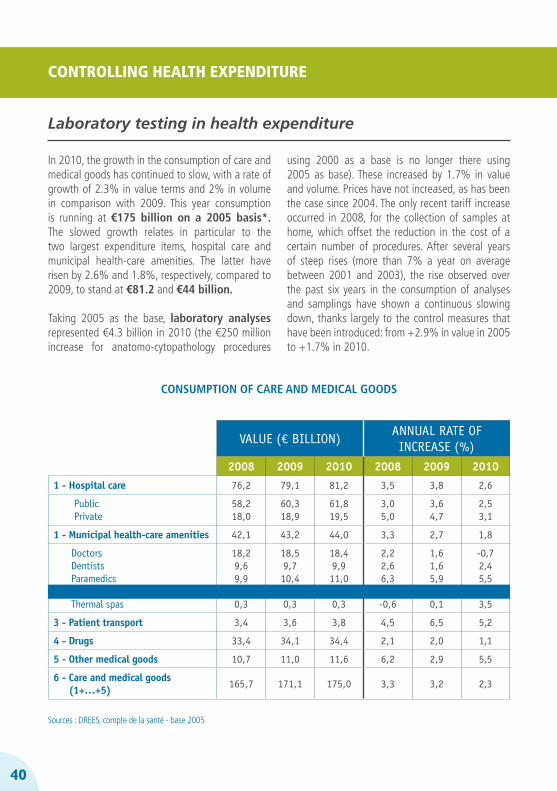
En 2010, la progression de la consommation de soins et biens médicaux a continué de ralentir avec un taux d’évolution de 2,3 % en valeur et de 2 % en volume par rapport à 2009. La consommation s’établit pour cette année à 175 milliards d’euros en base 2005*. Le ralentissement de cette progression concerne notamment les deux principaux postes de dépenses, les soins hospitaliers et les soins de villes. Ces derniers évoluent respectivement de 2,6 % et 1,8 % par rapport à 2009 pour s’établir à 81,2 et 44 milliards d’euros.
En base 2005, les analyses de laboratoire représentent 4,3 milliards d’euros pour l’année 2010 (la majoration de 250 millions d’euros d’actes d’anatomo-cytopathologie en base 2000
n’existe plus en base 2005). Elles augmentent de 1,7 %, en valeur et en volume. Les prix n’ont pas augmenté, comme c’est le cas depuis 2004. La seule hausse de tarif récente est intervenue en 2008, pour les prélèvements à domicile ; qui a compensé la baisse de cotation intervenue sur un certain nombre d’actes. Après plusieurs années de forte hausse (plus de 7 % par an en moyenne entre 2001 et 2003), l’évolution observée depuis six ans sur la consommation d’analyses et de prélèvements est celle d’un ralentissement continu sous l’effet notamment des mesures de maîtrise mises en œuvre : de +2,9 % en valeur en 2005 à +1,7 % en 2010.
La biologie dans les dépenses de santé
20
Sur un intervalle de plusieurs années, l’évolution de la consommation d’analyses et de prélèvements connait un ralentissement continu surtout depuis 2005. Effectivement, depuis 5 ans plusieurs me-sures de maîtrise des dépenses sont intervenues :
- En 2005 avec la mise en place, comme pour les actes des médecins exerçant en ambulatoire, d’une participation forfaitaire d’un euro qui reste à la charge des patients pour chaque analyse de biologie médicale ;
- En 2007, dans le cadre de la procédure d’alerte déclenchée lors du dépassement de l’ONDAM, avec l’augmentation à 4 euros du plafond du montant journalier de la participation forfaitaire et la baisse de la cotation de 51 actes d’analyses ;
- En 2009, avec la baisse de la cotation de près de 90 actes.
Outre leur effet direct sur la structure de finance-ment des dépenses, ces mesures ont contribué à une modération de la consommation depuis 2006, accentuée en 2010.
*Les modifications de la base 2005 par rapport à celle de 2000 portent d’une part sur les concepts et le champ des Comptes de la santé, et d’autre part sur les évaluations des séries.
Elles concernent essentiellement :- la redéfinition des contours des soins hospitaliers publics et privés et des soins de médecins- la révision de certains niveaux (analyses, médicaments, prothèses)- la prise en compte des soins de longue durée aux personnes handicapées et non plus seulement aux personnes âgées- l’intégration de nouvelles données sur les subventions au système de soins et les frais de gestion- le traitement des échanges extérieurs
21
A PROPOS DU SFRL
Créé en 1977, le SFRL est un syndicat professionnel regroupant actuellement près de 80 sociétés du diagnostic in vitro, et représentant plus de 95 % du chiffre d’affaires du secteur.
Il a pour mission de :
- Représenter ses membres et intervenir régulièrement au niveau des autorités de tutelles,
- Assurer la défense des intérêts économiques, matériels et moraux de ses membres,
- Participer activement à différentes commissions pouvant statuer sur les produits de cette industrie (AFSSAPS, CNDMDIV, DGS, DGE…),
- Réaliser des opérations de communication globale sur le rôle de l’industrie du diagnostic in vitro dans la gestion des soins,
- Développer et entretenir des relations avec les autres organisations et syndicats du monde de la santé,
- Fédérer ses adhérents et faire émerger leurs attentes et leurs propositions,
- Garantir un service permanent d’informations auprès de ses adhérents, particulièrement dans le domaine réglementaire.
Au-delà de ses missions, le SFRL s’engage au quotidien pour la reconnaissance du rôle stratégique de la biologie médicale dans toute décision de santé.
22
Sommaire
THE IN-VITRO DIAGNOSTIC INDUSTRY: COMITTED TO INNOVATION 24
THE MARKET PLAYERS 25
MAIN FIGURES
WORLD MARKET 28
EUROPEAN MARKET 28
FRENCH MARKET 29
Self-monitoring of blood glucose (SMBG) 30 In-Vitro diagnostics of laboratories market 30
Reagents market 31 Instruments market 32 The 10 most used biological tests in 2010 32
CLIENT BASE OF THE IN-VITRO DIAGNOSTICS INDUSTRY 34
Major change in medical laboratory 34
SECTOR CONSOLIDATION 35
BACKGROUND TO BIOLOGY MEDICAL LABORATORY IN 2011
REFORM OF BIOLOGY MEDICAL LABORATORY 38
Accompagn Support for the accreditation procedure 40
CONTROLLING HEALTH EXPENDITURE 40
Laboratory testing in health expenditure 40
ABOUT SFRL 42
..................................................................................................................................
..................................................................................................................................
..................................................................................................................................
..................................................................................................................................
..................................................................................................................................
..................................................................................................................................
..................................................................................................................................
..................................................................................................................................
..................................................................................................................................
..................................................................................................................................
English
Français 3
23
24
THE IN-VITRO DIAGNOSTICS INDUSTRY:COMMITTED TO INNOVATION
1 - The Lewing Group: The value of diagnostics: innovation, adoption and diffusion into health care, 20052 - The Lewing Group: The value of Laboratory Screening and Diagnostic Tests for prevention and Health Care Improvement, 2009
The in-vitro diagnostics industry is made up of companies that design, manufacture and
distribute the equipment and products with which medical information can be obtained from patient samples (blood, urine, skin, etc.). These analyses performed outside the patient’s body are called in-vitro diagnostic tests.
They are carried out at private and hospital medical laboratories, the French blood transfusion service and cancer research centres. Some of these tests can be performed in hospital departments or doctors’ office (group A haemolytic streptococcus quick-test), and others by the patients themselves (blood glucose self-monitoring, home pregnancy tests, etc.).
60 to 70% of medical decisions rely on the results of in-vitro diagnostic tests1
Over the past several decades, the in-vitro diagnostics industry has been growing thanks to its capacity for innovation. Constant scientific and technical advances have enabled it to improve and diversify its in-vitro diagnostic tests. In 2005, the results of these tests were a factor in 60 to 70% of medical decisions1. Since then, further innovations have come along to boost this percentage. In 2009, genetic testing offered the possibility of screening for over 1700 diseases – 450 more than in 20052.
Constant innovation
Tests have become increasingly sophisticated, relying on ever more sensitive and specific techniques, thus doing much to improve patient care. For example, tests using technologies based on DNA, RNA or protein composition allow an assessment of the disease at molecular level and to personalize patient care. Other innovations have
reduced the costs and the time spent on analyses, especially in microbiology with new detection methods (MALDI-TOF mass spectrometry). Instrument miniaturization is increasingly behind the development of patient of care and, in other cases, patient self-testing. Among other things, this has made HIV screening in the French population more accessible. HIV diagnostic quick-test kits (TROD VIH) are now available to doctors, nurses, midwives and in community centres.
Present at every level of patient care
With tests improving all the time, the in-vitro diagnostics industry holds an unassailable position in the health system and is involved at every level of patient care. More specifically, it is involved at three key stages:
- Disease prevention, with the screening of at-risk populations (German measles, cystic fibrosis, hepatitis, cancer, etc.),
- Reliable and early confirmation of a patient’s diagnosis,
- Treatment follow-up and management by measuring the biological parameters vital to being able to provide the appropriate therapy (diabetes, cancer, hypertension, heart disease, etc.).
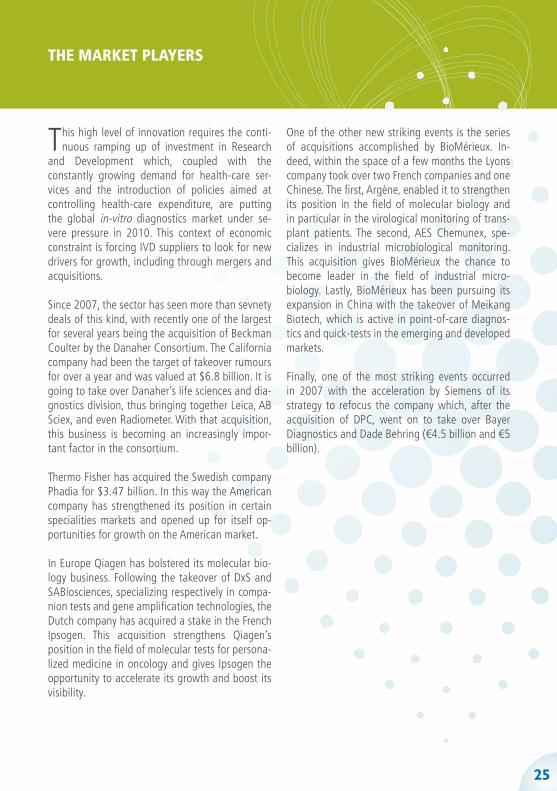
This high level of innovation requires the conti-nuous ramping up of investment in Research
and Development which, coupled with the constantly growing demand for health-care ser-vices and the introduction of policies aimed at controlling health-care expenditure, are putting the global in-vitro diagnostics market under se-vere pressure in 2010. This context of economic constraint is forcing IVD suppliers to look for new drivers for growth, including through mergers and acquisitions.
Since 2007, the sector has seen more than sevnety deals of this kind, with recently one of the largest for several years being the acquisition of Beckman Coulter by the Danaher Consortium. The California company had been the target of takeover rumours for over a year and was valued at $6.8 billion. It is going to take over Danaher’s life sciences and dia-gnostics division, thus bringing together Leica, AB Sciex, and even Radiometer. With that acquisition, this business is becoming an increasingly impor-tant factor in the consortium.
Thermo Fisher has acquired the Swedish company Phadia for $3.47 billion. In this way the American company has strengthened its position in certain specialities markets and opened up for itself op-portunities for growth on the American market.
In Europe Qiagen has bolstered its molecular bio-logy business. Following the takeover of DxS and SABiosciences, specializing respectively in compa-nion tests and gene amplification technologies, the Dutch company has acquired a stake in the French Ipsogen. This acquisition strengthens Qiagen’s position in the field of molecular tests for persona-lized medicine in oncology and gives Ipsogen the opportunity to accelerate its growth and boost its visibility.
One of the other new striking events is the series of acquisitions accomplished by BioMérieux. In-deed, within the space of a few months the Lyons company took over two French companies and one Chinese. The first, Argène, enabled it to strengthen its position in the field of molecular biology and in particular in the virological monitoring of trans-plant patients. The second, AES Chemunex, spe-cializes in industrial microbiological monitoring. This acquisition gives BioMérieux the chance to become leader in the field of industrial micro-biology. Lastly, BioMérieux has been pursuing its expansion in China with the takeover of Meikang Biotech, which is active in point-of-care diagnos-tics and quick-tests in the emerging and developed markets.
Finally, one of the most striking events occurred in 2007 with the acceleration by Siemens of its strategy to refocus the company which, after the acquisition of DPC, went on to take over Bayer Diagnostics and Dade Behring (€4.5 billion and €5 billion).
25
THE MARKET PLAYERS
2009
1 Bio-Rad (US) Quantalife (US) Oct 11 $167 million
2 Thermo Fisher (US) TREK (US) Aug 11 NC
3 GE Healthcare (US) PAA Laboratories (AU) Aug 11 Merger
4 Roche Diagnostics (CH) MTM Laboratory (DE) Aug 11 €130 million
5 IVD Acquisition (US) Immucor (US) Jul 11 $1.950 billion
6 BioMérieux (FR) Argène (FR) Jul 11 €37.5 million
7 Sysmex (JP) Hyphen Biomed (FR) Jun 11 NC
8 Qiagen (NL) Ipsogen (FR) Jun 11 €70 million
9 BioMérieux (FR) AES Chemunex (FR) May 11 €183 million
10 Thermo Fisher (US) Phadia (SE) May 11 $3.5 billion
11 Danaher (US) Beckman Coulter (US) Apr 11 $6.8 billion
12 Eurobio (FR) Abcys (FR) Apr 11 Merger
13 Abbott (US) Starlims (US) Mar 11 $123 million
14 PerkinElmer (US) Chemagen Biopolymer Technologie (DE) Feb 11 NC
15 Biosystems International (FR) Microbioship (FR) Sep 10 Merger
16 Fujirebio (JP) Innogenetics (BE) Jul 10 €86.2 million
17 PerkinElmer (US) Signature Genomic Laboratories LLC (US) Apr 10 NC
18 BioMérieux (FR) Meikang Biotech (CN) Mar 10 NC
19 DiaSorin (IT) Murex (US) Mar 10 $58 million
20 Quidel (US) Diagnostic Hybrids (US) Mar 10 $130 million
21 CINVEN (US) Sebia (FR) Mar 10 €800 million
22 Stago (FR) Trinity Biotech haemostasis business (US) Mar 10 $90 million
23 Qiagen (NL) ESE (DE) Mar 10 €14 million
24 Abbott (US) Innogenetics (BE) Feb 10 NC
25 Life Technologies (US) AcroMetrix (US) Jan 10 NC
26 Danaher (US) Genetix (UK) Jan 10 €73 million
27 Life Technologies (US) Biotrove (US) Dec 09 NC
28 Qiagen (NL) SABiosciences (US) Dec 09 $90 million
29 Bio-Rad (US) Biotest (DE) IH business Dec 09 €45 million
30 Qiagen (NL) DxS (UK) Nov 09 $95 million
31 Thermo Fisher (US) Brahms (DE) Nov 09 €330 million
32 Alere (US) Concateno plc (UK) Oct 09 €142 million
33 Danaher (US) MDS (CA) Sep 09 $650 million
34 Danaher (US) ABSciex (US) Sep 09 $450 million
35 Laboratory Corporation of America (US) Monogram Bioscience (US) Sep 09 $155 million
36 Elitech (FR) Serfib (FR) Sep 09 NC
2011
PRINCIPAL MERGERS AND ACQUISITIONS SINCE 2007
Buyer Mergers/acquisitions Date Amount
26
2010
2007
37 Werfen (ES) Binding Site Auto-immune business (UK) Jul 09 NC
38 Stago (FR) DSRV (US) Jun 09 NC
39 Beckman Coulter (US) Olympus (JP) Apr 09 $800 million
40 Gen Probe (US) Tepnel Life Sciences (UK) Jan 09 $132 million
41 Solvay (BE) Innogenetics (BE) Jan 09 €200 million
42 DiaSorin (IT) Biotrin (IE) Jul 08 €25 million
43 China Medical Technologies (China) Beijing Bio-Ekon Biotechnology (CN) Jan 08 NC
44 Alere (US) Panbio (AU) Jan 08 NC
45 Roche Diagnostics (CH) Ventana Medical Systems (US) Jan 08 $3.4 billion
46 Werfen (ES) INOVA Diagnostics (US) Jan 08 NC
47 Axis-Shield (Nor/RU) Nycomed Pharma distribution (CH) Dec 07 NC
48 Alere (US) Matritech (US) Dec 07 $36 million
49 Alere (US) BBI (UK) Dec 07 £83.7 million
50 Beckman Coulter (US) Dako flux cytometry business (DK) Nov 07 NC
51 Exiqon (NL) Oncotech (US) Nov 07 $45 million
52 Genzyme (US) DCL (CA) Nov 07 NC
53 Haemonetics (US) Haemoscope (US) Nov 07 $44 million
54 Celera (US) Atria genetics (US) Oct 07 $33 million
55 Hologic (US) Cytyc (US) Oct 07 $6.2 billion
56 Alere (US) Bio-Stat Healthcare (UK) Oct 07 $33.4 million
57 Siemens Medical Solutions (DE) Dade Behring (US) Oct 07 €5 billion
58 Immunodiagnostic Systems (UK) Biocode Hycel haematology business (BE) Sep 07 $23 million
59 Alere (US) Cholestech (US) Sep 07 Merger
60 Roche Diagnostics (CH) NimbleGen Systems (US) Aug 07 $272.5 million
61 SurModics (US) BioFx Laboratories (US) Aug 07 $11.3 million
62 Immunodiagnostic Systems (UK) Nordic Bioscience Diagnostics (DK) Jul 07 $34.3 million
63 Alere (US) Spectral Diagnostics (IN) Jul 07 €4 million
64 Agilent Technologies (US) Stratagene (US) Jun 07 $246 million
65 Bio-Rad (US) Diamed (US) Jun 07 €466 million
66 EQT (US) Private Equity Dako (DK) Jun 07 $1.3 billion
67 Roche Diagnostics (CH) 454 Life Sciences (US) Jun 07 $154.9 million
68 Alere (US) Orange Medical (NL) May 07 €4.2 million
69 Qiagen (NL) Digene (US) May 07 $1.6 billion
70 Roche Diagnostics (CH) Bioveris (US) Apr 07 $600 million
71 Alere (US) Biosite (US) Mar 07 $1.55 billion
72 Cepheid (US) Sangtec Molecular Diagnostic (SE) Feb 07 $33 million
73 Alere (US) Hemosense (US) Feb 07 Merger
74 Alere (US) Med-Ox Chemicals (CA) Jan 07 $5.4 million
75 Siemens Medical Solutions (DE) Bayer Diagnostics (DE) Jan 07 €4.5 billion
27
2008
MAIN FIGURES
In 2010, Europe and the United States still occupy a dominant position in a world market estima-ted to be worth €30 billion. Made up of four major markets, these two areas have notched up slight increases in their turnover, in contrast to the emerging countries which have seen strong growth.
The turnover of the in-vitro diagnostics industry in the European countries as a whole rose in 2010 to €10.5 billion, an increase of 1.5% over 2009.
The turnover figure for Germany accounts for 20.6% of the European in-vitro diagnostics mar-ket. This country remains Europe’s first market, well ahead of France and Italy, who with res-
pectively 16.9% and 16.2% of market share are lying in second and third place.
Of the 31 countries that make up the European market, the top 5 account for more than 70% of the total, a situation that has remained the same for several years. This distribution is fairly similar to that of total expenditure on health care.
Source : SFRL
28
WORLD MARKET
EUROPEAN MARKET
33%
34%
26%
7%
United States
Rest of the world
Japan
Europe
ESTIMATED DISTRIBUTION OF THE WORLD TURNOVER
Germany
France Italy
Spain
GreatBritain
Belgium3.2%
Netherlands3%
Poland2.8%
Portugal2.5%
Switzerland2.8% Austria
2.4% Greece1.8%
Rest of Europe
10.4%
16.2% 16.8%
20.5%
10,3%
7.4%
The in-vitro diagnostics market falls into 2 major categories: the self-monitoring of blood glucose market (SMBG) and the in-vitro dia-gnostics of laboratories market (excluding
SMBG), representing respectively 20% and 80% of the sector. In 2010 this market was worth €1.77 billion.
In-vitro diagnostics of laboratories
Self-monitoring of blood-glucose
80%
€0.354million20%
€1.419 million
Source : SFRL
Source : SFRL, EDMA
29
FRENCH MARKET
DISTRIBUTION (%) OF THE TURNOVER OF EUROPEAN COUNTRIES IN 2010
DISTRIBUTION OF THE FRENCH MARKET IN 2010
For diabetic patients, regular measurement of blood sugar levels is a vital routine procedure that allows them to monitor and adjust their treatment and is the sole means of preventing complications (retinopathy, macrovascular complications, etc.).
Technological advances in the in-vitro diagnostics industry have made it possible to develop blood glucose measuring devices that patients can use themselves – without the need to involve medical analytical and testing laboratories – in order to adapt their treatment to their everyday life.
One could see these devices as the pioneers of personalized medicine.
The ease of use and the reliability of these in-vitro diagnostic tests are improving all the time and are making a very considerable contribution to the better management of this disease, which affects more than 3 million patients in France.
These tests are subject to a different set of regulations to those that apply to systems destined for use in medical laboratories. To be approved, these devices must be prescribed by a doctor; they are dispensed through pharmacies.
Diabetes is a pandemic that is constantly on the increase. Diabetes has become the number one long-term disease in France.
Faced with the growth in the number of patients with this disease, the public authorities
concerned – CNEDIMTS (National commission for the evaluation of medical devices and health-care technologies), HAS (National authority for health), CEPS (Economic committee on health-care products), CNAMTS (Employees’ national sickness insurance fund) and AFSSAPS (French health product safety agency) in particular – have developed means of providing advice and support (HAS recommendations) and of monitoring and controlling the market (framework agreement).
A new regulation introduced in early 2011 now places a ceiling on the level of reimbursement payable in respect of these self-monitoring devices. It limits reimbursement to 200 test strips a year for patients treated with insulin secretors and patients in whom it is sought to improve their blood glucose balance, so long as this objective has not been achieved (Order of 25 February 2011, published in the Official Journal of 27 February 2011).
Similarly, another regulation requiring a change to the packaging of these products has meant that manufacturers have had to adapt extremely swiftly, on both a qualitative and quantitative level, this regulation being unique in the world market (intrinsic composition of the sets and change in the production volumes of products offered to patients): Order of 21 March 2011, published in the Official Journal of 24 March 2011.
The in-vitro diagnostics of laboratories market in France, which has a turnover of €1.419 billion,
falls into 2 categories: the reagents market (86%) and the instruments market (14%).
30
SELF-MONITORING OF BLOOD GLUCOSE
IN-VITRO DIAGNOSTICS OF LABORATORIES MARKET
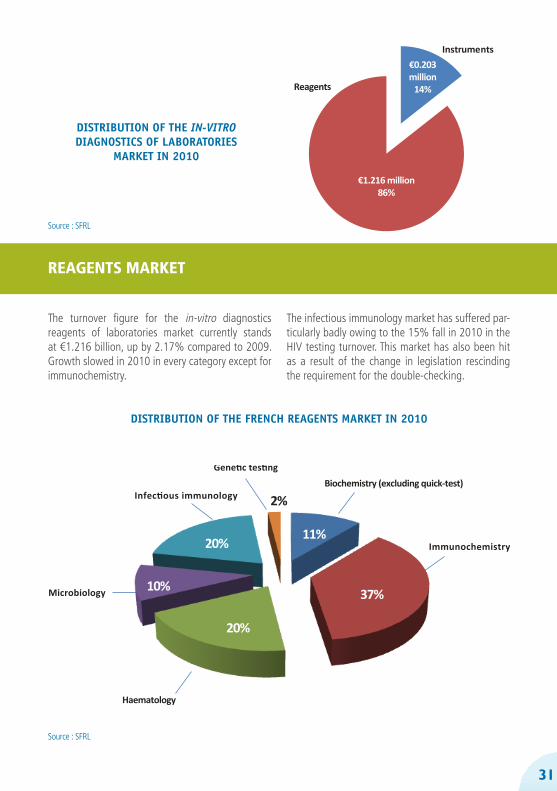
The turnover figure for the in-vitro diagnostics reagents of laboratories market currently stands at €1.216 billion, up by 2.17% compared to 2009. Growth slowed in 2010 in every category except for immunochemistry.
The infectious immunology market has suffered par-ticularly badly owing to the 15% fall in 2010 in the HIV testing turnover. This market has also been hit as a result of the change in legislation rescinding the requirement for the double-checking.
DISTRIBUTION OF THE IN-VITRODIAGNOSTICS OF LABORATORIES
MARKET IN 2010
Instruments
Reagents
€1.216 million86%
€0.203million
14%
31
Source : SFRL
Source : SFRL
Biochemistry (excluding quick-test)
Immunochemistry
Haematology
Microbiology
11%
37%
20%
10%
20%
2%
REAGENTS MARKET
DISTRIBUTION OF THE FRENCH REAGENTS MARKET IN 2010
32
The instrumentation market, accounting for 14% of the in-vitro diagnostics of laboratories market, is made up – in the case of over half the holdings – of immunoassay systems and biochemical analysers.
In the past five years this market has undergone a remarkable transformation: while the provision of automated immunoassay systems and the sale of other systems was the rule until around the start of the new millennium, provision has been gaining ground in the case of all types of automated systems over the past 5 years, which has meant a significant drop in the turnover from the sales of these systems.
Since two years ago, reforms in laboratory medicine have meant changes in the way medical labora-tories now work. There is a trend towards having fewer but larger facilities. The impact of this on the instruments market can be seen in:
- A general decrease in the number of systems ins-talled, with a move towards more automated sys-tems and worked more intensively;
- The installation of fully automated robotic systems, with the addition of pre- and post-analysis to the analysis. These robotized assembly lines require a sizeable investment and are generally invoiced to the laboratories. This latest development has enabled the instrumentation market to stage a resurgence starting in 2010. However, since 2011, this market has suffered a sharp slowdown showing off effect of this phenomenon.
The 10 most used medical procedures account for 42% of the total volume and 49% of the total cost of biological tests (excluding miscellaneous overhead charges). The majority of these analyses compiled here form part, with the exception of the INR, of the health check that a general practitioner will conven-tionally prescribe in order to have an insight into his patient’s general state of health.
Such a health check will screen for: anaemia, viral or bacterial aetiology in cases of fever, lymphatic disease, inflammatory syndrome, diabetes, dyslipi-daemia, liver function and kidney function.
As for the INR, this is a basic test used when fol-lowing up patients treated with anti-vitamin K (AVK). It allows the treatment dosage to be adjusted.
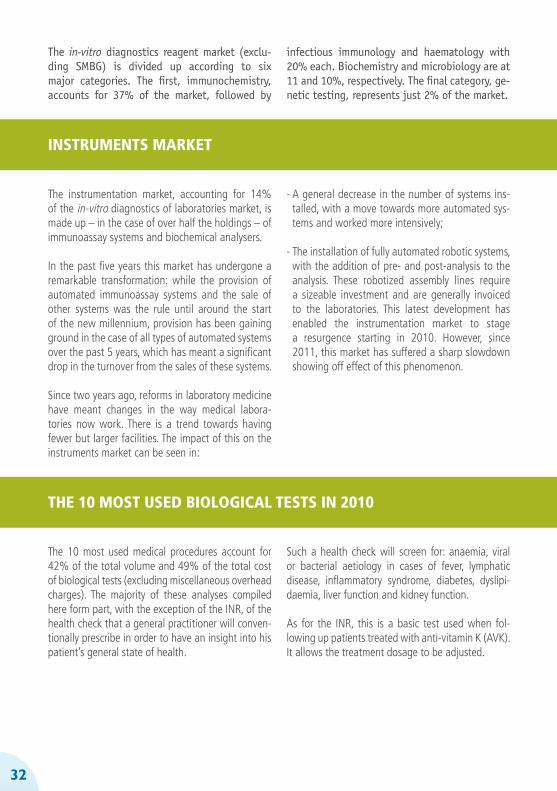
The in-vitro diagnostics reagent market (exclu-ding SMBG) is divided up according to six major categories. The first, immunochemistry, accounts for 37% of the market, followed by
infectious immunology and haematology with 20% each. Biochemistry and microbiology are at 11 and 10%, respectively. The final category, ge-netic testing, represents just 2% of the market.
INSTRUMENTS MARKET
THE 10 MOST USED BIOLOGICAL TESTS IN 2010
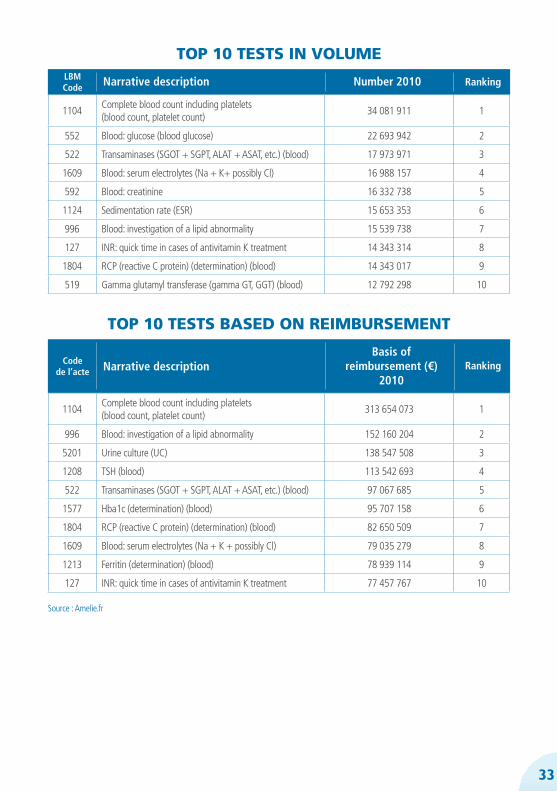
1104Complete blood count including platelets (blood count, platelet count)
313 654 073 1
996 Blood: investigation of a lipid abnormality 152 160 204 2
5201 Urine culture (UC) 138 547 508 3
1208 TSH (blood) 113 542 693 4
522 Transaminases (SGOT + SGPT, ALAT + ASAT, etc.) (blood) 97 067 685 5
1577 Hba1c (determination) (blood) 95 707 158 6
1804 RCP (reactive C protein) (determination) (blood) 82 650 509 7
1609 Blood: serum electrolytes (Na + K + possibly Cl) 79 035 279 8
1213 Ferritin (determination) (blood) 78 939 114 9
127 INR: quick time in cases of antivitamin K treatment 77 457 767 10
TOP 10 TESTS BASED ON REIMBURSEMENT
Codede l’acte Narrative description
Basis ofreimbursement (€)
2010
33
1104Complete blood count including platelets(blood count, platelet count)
34 081 911 1
552 Blood: glucose (blood glucose) 22 693 942 2
522 Transaminases (SGOT + SGPT, ALAT + ASAT, etc.) (blood) 17 973 971 3
1609 Blood: serum electrolytes (Na + K+ possibly Cl) 16 988 157 4
592 Blood: creatinine 16 332 738 5
1124 Sedimentation rate (ESR) 15 653 353 6
996 Blood: investigation of a lipid abnormality 15 539 738 7
127 INR: quick time in cases of antivitamin K treatment 14 343 314 8
1804 RCP (reactive C protein) (determination) (blood) 14 343 017 9
519 Gamma glutamyl transferase (gamma GT, GGT) (blood) 12 792 298 10
TOP 10 TESTS IN VOLUMELBMCode Narrative description Number 2010 Ranking
Source : Amelie.fr
Ranking
34
Privatemedicallaboratories
Other
55%37%
6%2%
Public and privatehospital centres
French bloodtransfusion service
Source : SFRL
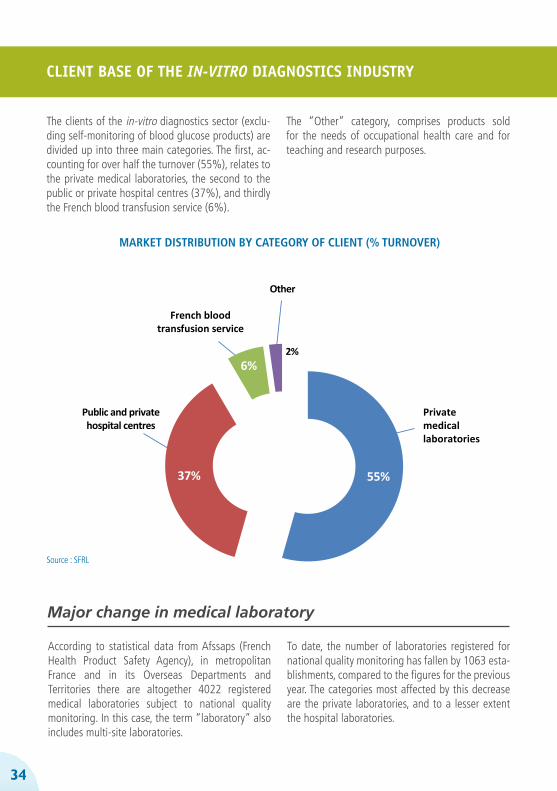
CLIENT BASE OF THE IN-VITRO DIAGNOSTICS INDUSTRY
The clients of the in-vitro diagnostics sector (exclu-ding self-monitoring of blood glucose products) are divided up into three main categories. The first, ac-counting for over half the turnover (55%), relates to the private medical laboratories, the second to the public or private hospital centres (37%), and thirdly the French blood transfusion service (6%).
The “Other” category, comprises products sold for the needs of occupational health care and for teaching and research purposes.
Major change in medical laboratory
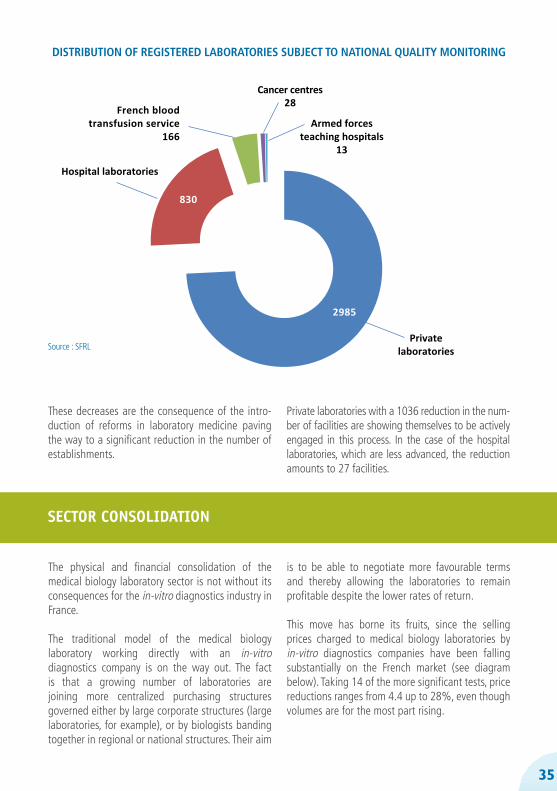
According to statistical data from Afssaps (French Health Product Safety Agency), in metropolitan France and in its Overseas Departments and Territories there are altogether 4022 registered medical laboratories subject to national quality monitoring. In this case, the term “laboratory” also includes multi-site laboratories.
To date, the number of laboratories registered for national quality monitoring has fallen by 1063 esta-blishments, compared to the figures for the previous year. The categories most affected by this decrease are the private laboratories, and to a lesser extent the hospital laboratories.
MARKET DISTRIBUTION BY CATEGORY OF CLIENT (% TURNOVER)
35
SECTOR CONSOLIDATION
These decreases are the consequence of the intro-duction of reforms in laboratory medicine paving the way to a significant reduction in the number of establishments.
Private laboratories with a 1036 reduction in the num-ber of facilities are showing themselves to be actively engaged in this process. In the case of the hospital laboratories, which are less advanced, the reduction amounts to 27 facilities.
The physical and financial consolidation of the medical biology laboratory sector is not without its consequences for the in-vitro diagnostics industry in France.
The traditional model of the medical biology laboratory working directly with an in-vitro diagnostics company is on the way out. The fact is that a growing number of laboratories are joining more centralized purchasing structures governed either by large corporate structures (large laboratories, for example), or by biologists banding together in regional or national structures. Their aim
is to be able to negotiate more favourable terms and thereby allowing the laboratories to remain profitable despite the lower rates of return.
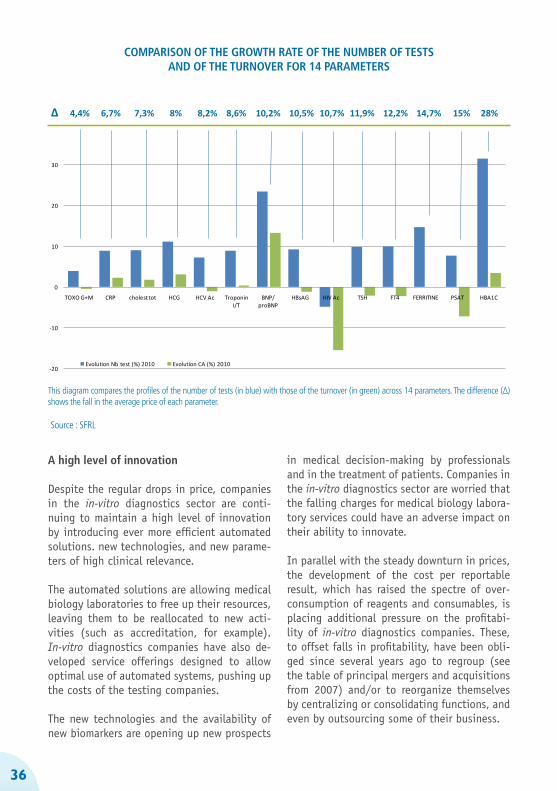
This move has borne its fruits, since the selling prices charged to medical biology laboratories by in-vitro diagnostics companies have been falling substantially on the French market (see diagram below). Taking 14 of the more significant tests, price reductions ranges from 4.4 up to 28%, even though volumes are for the most part rising.
Source : SFRL
Cancer centres
Hospital laboratories
2985
830
Armed forcesteaching hospitals
13
28French blood
transfusion service166
Privatelaboratories
DISTRIBUTION OF REGISTERED LABORATORIES SUBJECT TO NATIONAL QUALITY MONITORING
36
-20
-10
0
10
20
30
40
TOXO G+M CRP cholest tot HCG HCV Ac Troponin I/T
BNP/ proBNP
HBsAG HIV Ac TSH FT4 FERRITINE PSAT HBA1C
Comparaison des évolutions du nombre de tests et des évolutions du Chiffre d'affaires - SFRL 2010
Evolution Nb test (%) 2010 Evolution CA (%) 2010
Source : SFRL
∆ 4,4% 6,7% 7,3% 8% 8,2% 8,6% 10,2% 10,5% 10,7% 11,9% 12,2% 14,7% 15% 28%
COMPARISON OF THE GROWTH RATE OF THE NUMBER OF TESTSAND OF THE TURNOVER FOR 14 PARAMETERS
A high level of innovation
Despite the regular drops in price, companies in the in-vitro diagnostics sector are conti-nuing to maintain a high level of innovation by introducing ever more efficient automated solutions. new technologies, and new parame-ters of high clinical relevance.
The automated solutions are allowing medical biology laboratories to free up their resources, leaving them to be reallocated to new acti-vities (such as accreditation, for example). In-vitro diagnostics companies have also de-veloped service offerings designed to allow optimal use of automated systems, pushing up the costs of the testing companies.
The new technologies and the availability of new biomarkers are opening up new prospects
in medical decision-making by professionals and in the treatment of patients. Companies in the in-vitro diagnostics sector are worried that the falling charges for medical biology labora-tory services could have an adverse impact on their ability to innovate.
In parallel with the steady downturn in prices, the development of the cost per reportable result, which has raised the spectre of over-consumption of reagents and consumables, is placing additional pressure on the profitabi-lity of in-vitro diagnostics companies. These, to offset falls in profitability, have been obli-ged since several years ago to regroup (see the table of principal mergers and acquisitions from 2007) and/or to reorganize themselves by centralizing or consolidating functions, and even by outsourcing some of their business.
This diagram compares the profiles of the number of tests (in blue) with those of the turnover (in green) across 14 parameters. The difference (∆) shows the fall in the average price of each parameter.

37
It would seem to be a matter of some urgency, therefore, for in-vitro diagnostic companies operating in France to find a new dynamic with the medical laboratories, or else see their economic prospects irretrievably stymied. Otherwise they will find themselves forced to
go down the road of concentration and cost rationalization, which will in the long run lead to the creation of virtual monopolies in cer-tain segments or, worse still, have a delete-rious effect on service quality.
38
While it was in the process of passing the so-called HPST Bill (“hospitals, patients, health, territories”), the government reformed the practice of biology medical laboratory by means of an edict. Tabled, but not ratified by the French parliament, the edict does
have regulatory status and is applicable except for the articles that require implementing decrees. The text introduces the two key measures and arranges for a transition period before its full application.
The first such tool was the drawing up of the “charte des fournisseurs : support à la démarche d’accréditation” which elicited an initial response to the demands and questions of the medical laboratories. It looks at the regulatory and legislative background to in-vitro diagnostic medical devices, the regulatory obligations of suppliers, as well as their proposals for providing backing to the medical laboratories in their quality strategy.
Next, in line with this process, a conference and debate on «Industrie du DIV et Biologie Médicale : Accompagnement à la démarche d’accréditation» was organized and brought together the official bodies responsible for introducing the reforms. Through the speeches
- Edict No. 2010-49 of 13 January 2010 relating to laboratory medicine- Report to the President of the Republic relating to Edict No. 2010-49 of 13 January 2010 relating to
laboratory medicine- Order of 5 August 2010 fixing the references of the accreditation standards applicable to medical
laboratories- Order of 14 December 2010 setting out the conditions that a medical laboratory must satisfy to
qualify for accreditation
TEXTS PUBLISHED IN THE OFFICIAL JOURNAL
IntroductionFournisseurs signataires de la charte
La mise en conformité du système
qualité d’un laboratoire de biologie
médicale selon les exigences de
la norme ISO 15189 est de la
responsabilité de la Direction du
laboratoire. L’accréditation reconnait
le système qualité mais également
les compétences techniques évaluées
par des pairs. La norme s’attache
à la fois au système qualité du labo-
ratoire et exige qu’un responsable
qualité soit spécifi quement nommé
pour cette tâche. Ce système qualité
doit inclure un manuel qualité et
des procédures qui doivent traiter
des trois phases de l’analyse de
biologie médicale : pré-analytique,
analytique et post-analytique.
Pour répondre aux demandes des
laboratoires qui s’engagent dans cette
démarche d’accréditation, les four-
nisseurs de systèmes de diagnostic
in vitro adhérents du SFRL ont
décidé la rédaction d’une charte à
partir de laquelle ils se proposent
d’accompagner les laboratoires dans
leur démarche.
Cette charte s’inscrit pleinement
dans la démarche qualité engagée
par ces fournisseurs.
Elle a été rédigée dans un souci
de transparence pour établir un
partenariat client-fournisseur fondé
sur une compréhension mutuelle
des besoins et des contraintes de
leurs professions.
› ABBOTT
› ARGENE
› BECKMAN COULTER
› BECTON DICKINSON
› BIO ADVANCE
› BIOLABO
› BIOMEDICAL DIAGNOSTICS
› BIOMERIEUX
› BIO-RAD
› BIOSERVICES ANTILLES
› BIOTEST
› BRAHMS
› CEPHEID
› CIS BIO INTERNATIONAL
› DIAGAST
› DIAGNOSTICA STAGO
› DIASORIN
› ELITECH GROUP
› ELVETEC SERVICES
› EUROBIO
› FUMOUZE DIAGNOSTICS
› HORIBA MEDICAL
› HYPHEN BIOMED
› IMMUNODIAGNOSTIC SYSTEMS
(IDS) EURL
› INGEN
› INNOGENETICS FRANCE
› INSTITUT DE BIOTECHNOLOGIES
JACQUES BOY
› INSTRUMENTATION LABORATORY
› IPSOGEN
› MENARINI
› MERIDIAN BIOSCIENCE
› ORTHO-CLINICAL DIAGNOSTICS
› OXOID
› PERKINELMER
› PHADIA
› ROCHE DIAGNOSTICS
› SEBIA
› SIEMENS
› S-INTER
› SOBIODA
› SYSMEX
› THERMO FISHER SCIENTIFIC
› TOSOH BIOSCIENCE
› VENTANA MEDICAL SYSTEMS
No
vem
bre
200
9 fournisseurs
Support à la démarche
d’accréditation
des“Support à la démarche d'accréditation”
BACKGROUND TO BIOLOGYMEDICAL LABORATORY IN 2011
REFORM OF BIOLOGY MEDICAL LABORATORY
Accompagn Support for the accreditation procedure
39
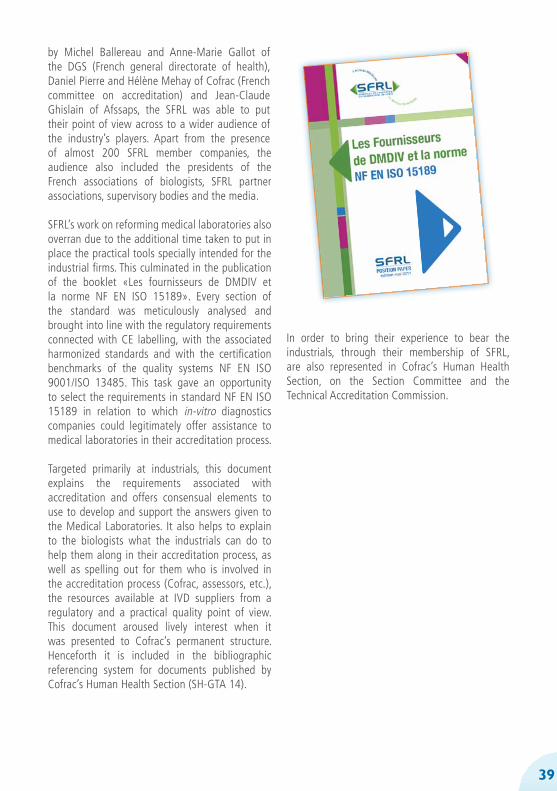
by Michel Ballereau and Anne-Marie Gallot of the DGS (French general directorate of health), Daniel Pierre and Hélène Mehay of Cofrac (French committee on accreditation) and Jean-Claude Ghislain of Afssaps, the SFRL was able to put their point of view across to a wider audience of the industry’s players. Apart from the presence of almost 200 SFRL member companies, the audience also included the presidents of the French associations of biologists, SFRL partner associations, supervisory bodies and the media.
SFRL’s work on reforming medical laboratories also overran due to the additional time taken to put in place the practical tools specially intended for the industrial firms. This culminated in the publication of the booklet «Les fournisseurs de DMDIV et la norme NF EN ISO 15189». Every section of the standard was meticulously analysed and brought into line with the regulatory requirements connected with CE labelling, with the associated harmonized standards and with the certification benchmarks of the quality systems NF EN ISO 9001/ISO 13485. This task gave an opportunity to select the requirements in standard NF EN ISO 15189 in relation to which in-vitro diagnostics companies could legitimately offer assistance to medical laboratories in their accreditation process.
Targeted primarily at industrials, this document explains the requirements associated with accreditation and offers consensual elements to use to develop and support the answers given to the Medical Laboratories. It also helps to explain to the biologists what the industrials can do to help them along in their accreditation process, as well as spelling out for them who is involved in the accreditation process (Cofrac, assessors, etc.), the resources available at IVD suppliers from a regulatory and a practical quality point of view. This document aroused lively interest when it was presented to Cofrac’s permanent structure. Henceforth it is included in the bibliographic referencing system for documents published by Cofrac’s Human Health Section (SH-GTA 14).
In order to bring their experience to bear the industrials, through their membership of SFRL, are also represented in Cofrac’s Human Health Section, on the Section Committee and the Technical Accreditation Commission.
VALUE (€ BILLION)ANNUAL RATE OF INCREASE (%)
2008 2009 2010 2008 2009 2010
1 - Hospital care 76,2 79,1 81,2 3,5 3,8 2,6
Public Private
58,218,0
60,318,9
61,819,5
3,05,0
3,64,7
2,53,1
1 - Municipal health-care amenities 42,1 43,2 44,0 3,3 2,7 1,8
Doctors Dentists Paramedics Analyses Thermal spas
18,29,69,94,10,3
18,59,710,44,20,3
18,49,911,04,30,3
2,22,66,32,7-0,6
1,61,65,92,20,1
-0,72,45,51,73,5
3 - Patient transport 3,4 3,6 3,8 4,5 6,5 5,2
4 - Drugs 33,4 34,1 34,4 2,1 2,0 1,1
5 - Other medical goods 10,7 11,0 11,6 6,2 2,9 5,5
6 - Care and medical goods (1+…+5) 165,7 171,1 175,0 3,3 3,2 2,3
Sources : DREES, compte de la santé - base 2005
CONTROLLING HEALTH EXPENDITURE
Laboratory testing in health expenditure
In 2010, the growth in the consumption of care and medical goods has continued to slow, with a rate of growth of 2.3% in value terms and 2% in volume in comparison with 2009. This year consumption is running at €175 billion on a 2005 basis*. The slowed growth relates in particular to the two largest expenditure items, hospital care and municipal health-care amenities. The latter have risen by 2.6% and 1.8%, respectively, compared to 2009, to stand at €81.2 and €44 billion.
Taking 2005 as the base, laboratory analyses represented €4.3 billion in 2010 (the €250 million increase for anatomo-cytopathology procedures
using 2000 as a base is no longer there using 2005 as base). These increased by 1.7% in value and volume. Prices have not increased, as has been the case since 2004. The only recent tariff increase occurred in 2008, for the collection of samples at home, which offset the reduction in the cost of a certain number of procedures. After several years of steep rises (more than 7% a year on average between 2001 and 2003), the rise observed over the past six years in the consumption of analyses and samplings have shown a continuous slowing down, thanks largely to the control measures that have been introduced: from +2.9% in value in 2005 to +1.7% in 2010.
40
CONSUMPTION OF CARE AND MEDICAL GOODS
Over a period of several years, the growth in the consumption of analyses and samples showed a continuous slowing down since 2005. Indeed, over the past 5 years a number of measures to curb expenditure have been introduced:
- In 2005 with the introduction, as in the case of procedures carried out by doctors practising in outpatient clinics, of a flat fee of €1 as a patient contribution for every laboratory test;
- In 2007, within the framework of the alert procedure triggered by the ONDAM (national health insurance spending target) overshoot, with the €4 increase in the ceiling for the daily flat-fee contribution and the reduction in the charges for 51 analytical procedures;
- In 2009, with the reduction in the charges of around 90 procedures.
Apart from their direct effect on the expenditure financing structure, these measures have helped reduce consumption since 2006, and especially in 2010.
*The changes in the 2005 base with respect to those in 2000 base relate, on the one hand, to the variables and the health accounts boundary, and on the other the series assessments.
Essentially they relate to:- redefining of the contours of public and private hospital care and of the medical care dispensed by doctors;- reviewing certain levels (analyses, drugs, prostheses);- reimbursing the costs of long-term care to the disabled, not just to the elderly;- adding new data on subsidies to the care system and the management costs;- external balance of goods and services.
41
ABOUT SFRL
Founded in 1977, the SFRL is a professional association currently bringing together 80 companies in the in-vitro diagnostics sector, between them accounting for 95% of the sector’s turnover.
Its mission is to:
- Represent its members’ interests on a regular basis before the supervisory authorities,
- Act in the defence of its members’ financial, material and moral interests,
- Play an active part on various commissions that have a say about products in this industry (AFSSAPS, CNDMDIV, DGS, DGE, etc.),
- Draw worldwide public attention to the in-vitro diagnostics industry’s role in health care management,
- Develop and maintain relations with other organizations and unions in the health-care world,
- Federate its members and encourage them to pursue their expectations and their proposals,
- Provide its members with a permanent information service, especially in the regulatory field.
Beyond its core missions, the SFRL undertakes to work unceasingly for the recognition of the strategic role that medical laboratories play in every health-related decision.
42

7, rue Mariotte - 75017 ParisTél : 01 40 70 00 12 - Fax : 01 40 69 66 99E-mail : [email protected] - Site : www.sfrl.fr