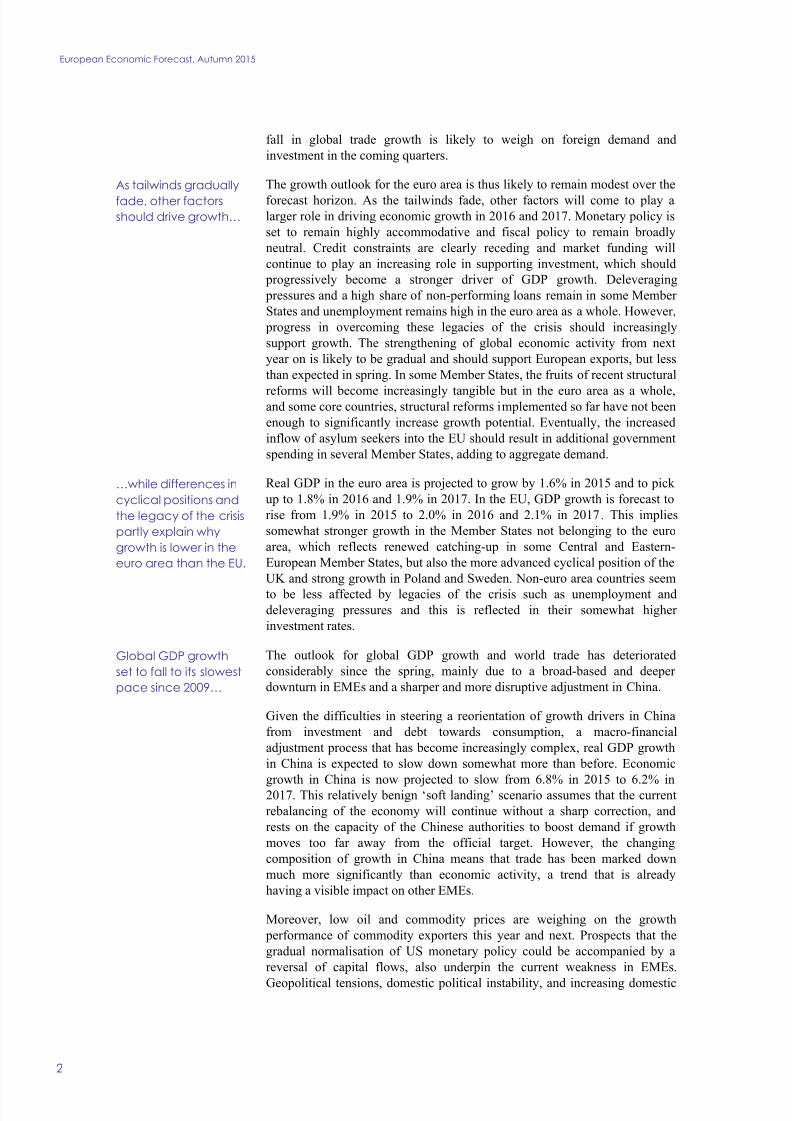
OVERVIEW 1 The economic recovery of the euro area and the EU is now entering its third year and is forecast to continue. Although subdued compared to past experiences, the present recovery has so far proven resilient to temporary bouts of uncertainty. T he slowdown in emerging market e conomies and the recent sharp fall in global trade growth, however, are set to take their toll, and downside risks related to the external environment have increased. As expected, the recovery in the euro area has been supported this year by a conjunction of positive factors including low oil prices, a relatively weak external value of the euro, and policy support, in particular the ECB's very accommodative monetary policy and a broadly neutral fiscal stance. These tailwinds have visibly stimulated private consumption and exports but the pace of economic growth overall remains relatively muted considering the strength of these factors. Investment activity, in particular, is still lagging despite favourable financing conditions due to economic and policy uncertainty. In some Member States, deleveraging pressures still linger. While economic growth should still benefit from these tailwinds, their strength is expected to fade and the euro area and EU economy now face headwinds from the slowdown in emerging market economies (EMEs), increased global uncertainty, and persistent geopolitical tensi ons. The euro’s past depreciation has so far helped to sustain euro area exports but the sharp A gradual and timid recovery continues amid more challenging global conditions Euro area recovery supported by tailwinds rate 2015 2016 2017 2015 2016 2017 2015 2016 2017 2015 2016 2017 2015 2016 2017 Belgium 1.3 1.3 1.7 0.6 1.7 1.5 8.6 8.4 7.9 1.8 2.0 1.9 -2.7 - 2.6 - 2.3 Germany 1.7 1.9 1.9 0.2 1.0 1.7 4.7 4.9 5.2 8.7 8.6 8.4 0.9 0.5 0.4 Estonia 1.9 2.6 2.6 0.1 1.8 2.9 6.5 6.5 7.6 1.6 1.2 -0.1 0.2 0.2 0.1 Ireland 6.0 4.5 3.5 0.3 1.4 1.6 9.5 8.7 7.9 5.9 5.7 4.7 -2.2 -1.5 - 1.5 Greece -1.4 -1.3 2.7 -1.0 1.0 0.9 25.7 25.8 24.4 -1.0 -0.3 0.1 -4.6 -3.6 -2.2 Spain 3.1 2.7 2.4 -0.5 0.7 1.2 22.3 20.5 19.0 1.4 1.3 1.4 -4.7 -3.6 -2.6 France 1.1 1.4 1.7 0.1 0.9 1.3 10.4 10.4 10.2 -1.3 -1.6 -2.2 -3.8 -3.4 -3.3 Italy 0.9 1.5 1.4 0.2 1.0 1.9 12.2 11.8 11.6 2.2 1.9 1.9 -2.6 - 2.3 -1.6 Cyprus 1.2 1.4 2.0 -1.6 0.6 1.3 15.6 14.6 13.3 -3.5 -3.2 -3.0 -0.7 0.1 0.3 Latvia 2.4 3.0 3.3 0.2 1.4 2.1 10.1 9.5 8.8 -1.8 -1.9 -2.2 -1.5 -1.2 -1.1 Lithuania 1.7 2.9 3.4 -0.8 0.6 2.2 9.4 8.6 8.1 -0.8 0.2 -0.3 -1.1 -1.3 -0.4 Luxembourg 3.1 3.2 3.0 0.3 1.7 1.7 5.9 5.8 5.8 4.3 4.0 3.7 0.0 0.5 0.5 Malta 4.3 3.6 3.1 1.1 1.8 2.2 5.8 5.7 5.8 2.0 3.8 4.2 -1.7 - 1.2 - 1.1 Netherlands 2.0 2.1 2.3 0.2 1.2 1.5 6.9 6.6 6.3 10.5 10.4 9.6 -2.1 -1.5 -1.2 Austria 0.6 1.5 1.4 0.9 1.8 2.0 6.1 6.1 6.0 2.6 2.6 2.8 -1.9 -1.6 - 1.3 Portugal 1.7 1.7 1.8 0.5 1.1 1.3 12.6 11.7 10.8 0.5 0.5 0.3 -3.0 -2.9 -2.5 Slovenia 2.6 1.9 2.5 -0.6 0.8 1.4 9.4 9.2 8.7 7.0 7.5 7.2 -2.9 - 2.4 - 2.0 Slovakia 3.2 2.9 3.3 -0.2 1.0 1.6 11.6 10.5 9.6 0.0 -1.2 -0.3 -2.7 -2.4 -2.0 Finland 0.3 0.7 1.1 -0.2 0.6 1.5 9.6 9.5 9.4 -1.1 -1.0 -0.9 -3.2 -2.7 -2.3 Euro area 1.6 1.8 1.9 0.1 1.0 1.6 11.0 10.6 10.3 3.7 3.6 3.4 -2.0 -1.8 -1.5 Bulgaria 1.7 1.5 2.0 -0.8 0.7 1.1 10.1 9.4 8.8 1.4 1.3 0.9 -2.8 -2.7 -2.7 Czech Republic 4.3 2.2 2.7 0.4 1.0 1.6 5.2 5.0 4.8 -2.5 -2.4 -2.1 -1.9 -1.3 -1.1 Denmark 1.6 2.0 1.8 0.4 1.5 1.9 6.1 5.8 5.5 7.0 6.9 6.5 -3.3 - 2.5 - 1.7 Croatia 1.1 1.4 1.7 -0.1 0.9 1.7 16.2 15.6 14.7 4.4 2.9 3.2 -4.9 -4.7 -4.1 Hungary 2.9 2.2 2.5 0.1 1.9 2.5 7.1 6.7 6.2 4.3 5.5 6.1 -2.3 - 2.1 - 2.0 Poland 3.5 3.5 3.5 -0.6 1.4 1.9 7.6 7.2 6.8 -0.5 -0.9 -1.5 -2.8 -2.8 -2.8 Romania 3.5 4.1 3.6 -0.4 -0.3 2.3 6.7 6.6 6.5 -0.8 -1.9 -2.6 -1.2 -2.8 -3.7 Sweden 3.0 2.8 2.7 0.8 1.5 1.7 7.7 7.7 7.4 5.9 5.9 5.8 -1.4 - 1.3 - 1.2 United Kingdom 2.5 2.4 2.2 0.1 1.5 1.7 5.4 5.4 5.5 -4.3 -3.9 -3.4 -4.4 -3.0 -1.9 EU 1.9 2.0 2.1 0.0 1.1 1.6 9.5 9.2 8.9 2.2 2.2 2.0 -2.5 -2.0 -1.6 USA 2.6 2.8 2.7 0.2 2.1 2.3 5.3 4.8 4.6 -2.3 -2.4 -2.7 -4.0 -3.5 -3.2 Japan 0.7 1.1 0.5 0.8 0.7 1.8 3.4 3.3 3.3 2.3 2.8 3.1 -6.6 - 5.7 - 5.1 China 6.8 6.5 6.2 : : : : : : : : : : : : World 3.1 3.5 3.7 : : : : : : : : : : : : Current account Table 1: Budget balance Inflation Real GDP Overview - the autumn 2015 forecast Unemployment Emerging market slowdown puts the brakes on world trade