Embed Size (px)
Citation preview
McCarthy, M.I., Porcu, E., Medici, M., Pistis, G., Volpato, C.B., Wilson, S.G., Cappola, A.R., Bos, S.D., Deelen, J., den Heijer, M., Freathy, R.M., Lahti, J., Liu, C., Lopez, L.M., Nolte, I.M., O'Connell, J.R., Tanaka, T., Trompet, S., Arnold, A., Bandinelli, S., Beekman, M., Böhringer, S., Brown, S.J., Buckley, B.M., Camaschella, C., de Craen, A.J.M., Davies, G., de Visser, M.C.H., Ford, I., Forsen, T., Frayling, T.M., Fugazzola, L., Gögele, M., Hattersley, A.T., Hermus, A.R., Hofman, A., Houwing-Duistermaat, J.J., Jensen, R.A., Kajantie, E., Kloppenburg, M., Lim, E.M., Masciullo, C., Mariotti, S., Minelli, C., Mitchell, B.D., Nagaraja, R., Netea-Maier, R.T., Palotie, A., Persani, L., Piras, M.G., Psaty, B.M., Räikkönen, K., Richards, J.B., Rivadeneira, F., Sala, C., Sabra, M.M., Sattar, N., Shields, B.M., Soranzo, N., Starr, J.M., Stott, D.J., Sweep, F.C.G.J., Usala, G., van der Klauw, M.M., van Heemst, D., van Mullem, A., H.Vermeulen, S., Visser, W.E., Walsh, J.P., Westendorp, R.G.J., Widen, E., Zhai, G., Cucca, F., Deary, I.J., Eriksson, J.G., Ferrucci, L., Fox, C.S., Jukema, J.W., Kiemeney, L.A., Pramstaller, P.P., Schlessinger, D., Shuldiner, A.R., Slagboom, E.P., Uitterlinden, A.G., Vaidya, B., Visser, T.J., Wolffenbuttel, B.H.R., Meulenbelt, I., Rotter, J.I., Spector, T.D., Hicks, A.A., Toniolo, D., Sanna, S., Peeters, R.P., and Naitza, S. (2013) A meta-analysis of thyroid-related traits reveals novel loci and gender-specific differences in the regulation of thyroid function. PLoS Genetics, 9 (2). e1003266. ISSN 1553-7390 Copyright © 2013 The Authors http://eprints.gla.ac.uk/82592/ Deposited on: 11 July 2013 Enlighten – Research publications by members of the University of Glasgow http://eprints.gla.ac.uk
A Meta-Analysis of Thyroid-Related Traits Reveals NovelLoci and Gender-Specific Differences in the Regulation ofThyroid FunctionEleonora Porcu1,2., Marco Medici3., Giorgio Pistis4,5.¤a¤b, Claudia B. Volpato6, Scott G. Wilson7,8,9,
Anne R. Cappola10, Steffan D. Bos11,12, Joris Deelen11,12, Martin den Heijer13,14, Rachel M. Freathy15,
Jari Lahti16, Chunyu Liu17, Lorna M. Lopez18,19, Ilja M. Nolte20, Jeffrey R. O’Connell21, Toshiko Tanaka22,
Stella Trompet23,24, Alice Arnold25, Stefania Bandinelli26, Marian Beekman11,12, Stefan Bohringer27,
Suzanne J. Brown7, Brendan M. Buckley28, Clara Camaschella4,29, Anton J. M. de Craen24, Gail Davies19,
Marieke C. H. de Visser30, Ian Ford31, Tom Forsen32,33,34,35, Timothy M. Frayling15, Laura Fugazzola36,
Martin Gogele6, Andrew T. Hattersley37, Ad R. Hermus13, Albert Hofman38,39, Jeanine J. Houwing-
Duistermaat27, Richard A. Jensen25, Eero Kajantie32,40, Margreet Kloppenburg41, Ee M. Lim7,42,
Corrado Masciullo4, Stefano Mariotti43, Cosetta Minelli6, Braxton D. Mitchell21, Ramaiah Nagaraja44,
Romana T. Netea-Maier13, Aarno Palotie45,46,47, Luca Persani48,49, Maria G. Piras1, Bruce M. Psaty50,51,
Katri Raikkonen16, J. Brent Richards8,52,53, Fernando Rivadeneira3,38,39, Cinzia Sala4, Mona M. Sabra54,
Naveed Sattar55, Beverley M. Shields37, Nicole Soranzo45, John M. Starr18,56, David J. Stott57,
Fred C. G. J. Sweep58, Gianluca Usala1, Melanie M. van der Klauw59,60, Diana van Heemst61, Alies van
Mullem3, Sita H.Vermeulen30, W. Edward Visser3, John P. Walsh7,9, Rudi G. J. Westendorp61,
Elisabeth Widen46, Guangju Zhai8,62, Francesco Cucca1,2, Ian J. Deary18,19, Johan G. Eriksson32,33,34,63,64,
Luigi Ferrucci22, Caroline S. Fox65,66, J. Wouter Jukema23,67,68, Lambertus A. Kiemeney30,69,
Peter P. Pramstaller6,70,71, David Schlessinger44, Alan R. Shuldiner21,72, Eline P. Slagboom11,12,
Andre G. Uitterlinden3,38,39, Bijay Vaidya73, Theo J. Visser3, Bruce H. R. Wolffenbuttel59,60,
Ingrid Meulenbelt11,12, Jerome I. Rotter74, Tim D. Spector8, Andrew A. Hicks6, Daniela Toniolo4,75,
Serena Sanna1"*, Robin P. Peeters3"*, Silvia Naitza1"*
1 Istituto di Ricerca Genetica e Biomedica (IRGB), Consiglio Nazionale delle Ricerche, c/o Cittadella Universitaria di Monserrato, Monserrato, Cagliari, Italy, 2 Dipartimento di
Scienze Biomediche, Universita di Sassari, Sassari, Italy, 3 Department of Internal Medicine, Erasmus MC, Rotterdam, The Netherlands, 4 Division of Genetics and Cell
Biology, San Raffaele Research Institute, Milano, Italy, 5 Universita degli Studi di Trieste, Trieste, Italy, 6 Center for Biomedicine, European Academy Bozen/Bolzano
(EURAC), Bolzano, Italy (Affiliated Institute of the University of Lubeck, Lubeck, Germany), 7 Department of Endocrinology and Diabetes, Sir Charles Gairdner Hospital,
Nedlands, Western Australia, Australia, 8 Department of Twin Research and Genetic Epidemiology, King’s College London, London, United Kingdom, 9 School of Medicine
and Pharmacology, University of Western Australia, Crawley, Western Australia, Australia, 10 University of Pennsylvania School of Medicine, Philadelphia, Pennsylvania,
United States of America, 11 Leiden University Medical Center, Molecular Epidemiology, Leiden, The Netherlands, 12 Netherlands Consortium for Healthy Ageing, Leiden,
The Netherlands, 13 Department of Endocrinology, Radboud University Nijmegen Medical Centre, Nijmegen, The Netherlands, 14 Department of Internal Medicine, Free
University Medical Center, Amsterdam, The Netherlands, 15 Genetics of Complex Traits, Peninsula College of Medicine and Dentistry, University of Exeter, Exeter, United
Kingdom, 16 Institute of Behavioural Sciences, University of Helsinki, Helsinki, Finland, 17 Center for Population Studies, National Heart, Lung, and Blood Institute,
Framingham, Massachusetts, United States of America, 18 Centre for Cognitive Ageing and Cognitive Epidemiology, University of Edinburgh, Edinburgh, United Kingdom,
19 Department of Psychology, University of Edinburgh, Edinburgh, United Kingdom, 20 Unit of Genetic Epidemiology and Bioinformatics, Department of Epidemiology,
University Medical Center Groningen, University of Groningen, Groningen, The Netherlands, 21 Department of Medicine, University of Maryland Medical School, Baltimore,
Maryland, United States of America, 22 Clinical Research Branch, National Institute on Aging, Baltimore, Maryland, United States of America, 23 Department of Cardiology,
Leiden University Medical Center, Leiden, The Netherlands, 24 Department of Gerontology and Geriatrics, Leiden University Medical Center, Leiden, The Netherlands,
25 Cardiovascular Health Research Unit and Department of Medicine, University of Washington, Seattle, Washington, United States of America, 26 Geriatric Unit, Azienda
Sanitaria Firenze (ASF), Florence, Italy, 27 Leiden University Medical Center, Medical Statistics and Bioinformatics, Leiden, The Netherlands, 28 Department of
Pharmacology and Therapeutics, University College Cork, Cork, Ireland, 29 Vita e Salute University, San Raffaele Scientific Institute, Milano, Italy, 30 Department for Health
Evidence, Radboud University Medical Centre, Nijmegen, The Netherlands, 31 Robertson Center for Biostatistics, University of Glasgow, Glasgow, United Kingdom,
32 Department of Chronic Disease Prevention, National Institute for Health and Welfare, Helsinki, Finland, 33 Department of General Practice and Primary Health Care,
University of Helsinki, Helsinki, Finland, 34 Helsinki University Central Hospital, Unit of General Practice, Helsinki, Finland, 35 Vaasa Health Care Centre, Diabetes Unit,
Vaasa, Finland, 36 Endocrine Unit, Fondazione Ca’ Granda Policlinico and Department of Clinical Sciences and Community Health, University of Milan, Milano, Italy,
37 Peninsula NIHR Clinical Research Facility, Peninsula College of Medicine and Dentistry, University of Exeter, Exeter, United Kingdom, 38 Department of Epidemiology,
Erasmus MC, Rotterdam, The Netherlands, 39 Netherlands Genomics Initiative (NGI)–sponsored Netherlands Consortium for Healthy Aging (NCHA), Rotterdam, The
Netherlands, 40 Hospital for Children and Adolescents, Helsinki University Central Hospital and University of Helsinki, Helsinki, Finland, 41 Department of Clinical
Epidemiology and Rheumatology, Leiden University Medical Center, Leiden, The Netherlands, 42 Pathwest Laboratory Medicine WA, Nedlands, Western Australia,
Australia, 43 Dipartimento di Scienze Mediche, Universita di Cagliari, c/o Cittadella Universitaria di Monserrato, Monserrato, Cagliari, Italy, 44 Laboratory of Genetics,
National Institute on Aging, Baltimore, Maryland, United States of America, 45 Wellcome Trust Sanger Institute, Wellcome Trust Genome Campus, Cambridge, United
Kingdom, 46 Institute for Molecular Medicine Finland (FIMM), University of Helsinki, Helsinki, Finland, 47 Department of Medical Genetics, University of Helsinki and
University Central Hospital, Helsinki, Finland, 48 Department of Clinical Sciences and Community Health, University of Milan, Milano, Italy, 49 Division of Endocrinology
and Metabolic Diseases, IRCCS Ospedale San Luca, Milan, Italy, 50 Cardiovascular Health Research Unit, Departments of Medicine, Epidemiology, and Health Services,
University of Washington, Seattle, Washington, United States of America, 51 Group Health Research Institute, Group Health Cooperative, Seattle, Washington, United
PLOS Genetics | www.plosgenetics.org 1 February 2013 | Volume 9 | Issue 2 | e1003266
States of America, 52 Department of Medicine, Jewish General Hospital, McGill University, Montreal, Quebec, Canada, 53 Departments of Human Genetics, Epidemiology,
and Biostatistics, Jewish General Hospital, Lady Davis Institute, McGill University, Montreal, Quebec, 54 Memorial Sloan Kettering Cancer Center, Medicine-Endocrinology,
New York, New York, United States of America, 55 BHF Glasgow Cardiovascular Research Centre, Faculty of Medicine, Glasgow, United Kingdom, 56 Alzheimer Scotland
Dementia Research Centre, University of Edinburgh, Edinburgh, United Kingdom, 57 Academic Section of Geriatric Medicine, Faculty of Medicine, University of Glasgow,
Glasgow, United Kingdom, 58 Department of Laboratory Medicine, Radboud University Nijmegen Medical Center, Nijmegen, The Netherlands, 59 LifeLines Cohort Study,
University Medical Center Groningen, University of Groningen, Groningen, The Netherlands, 60 Department of Endocrinology, University Medical Center Groningen,
University of Groningen, Groningen, The Netherlands, 61 Leiden University Medical Center, Gerontology and Geriatrics, Leiden, The Netherlands, 62 Discipline of Genetics,
Faculty of Medicine, Memorial University of Newfoundland, St. Johns, Newfoundland, Canada, 63 Folkhalsan Research Centre, Helsinki, Finland, 64 Vasa Central Hospital,
Vasa, Finland, 65 Division of Intramural Research, National Heart, Lung, and Blood Institute, Framingham, Massachusetts, United States of America, 66 Division of
Endocrinology, Hypertension, and Metabolism, Brigham and Women’s Hospital and Harvard Medical School, Boston, Massachusetts, United States of America, 67 Durrer
Center for Cardiogenetic Research, Amsterdam, The Netherlands, 68 Interuniversity Cardiology Institute of the Netherlands, Utrecht, The Netherlands, 69 Department of
Urology, Radboud University Medical Centre, Nijmegen, The Netherlands, 70 Department of Neurology, General Central Hospital, Bolzano, Italy, 71 Department of
Neurology, University of Lubeck, Lubeck, Germany, 72 Geriatric Research and Education Clinical Center, Veterans Administration Medical Center, Baltimore, Maryland,
United States of America, 73 Diabetes, Endocrinology and Vascular Health Centre, Royal Devon and Exeter NHS Foundation Trust, Exeter, United Kingdom, 74 Medical
Genetics Institute, Cedars-Sinai Medical Center, Los Angeles, California, United States of America, 75 Institute of Molecular Genetics–CNR, Pavia, Italy
Abstract
Thyroid hormone is essential for normal metabolism and development, and overt abnormalities in thyroid function lead tocommon endocrine disorders affecting approximately 10% of individuals over their life span. In addition, even mildalterations in thyroid function are associated with weight changes, atrial fibrillation, osteoporosis, and psychiatric disorders.To identify novel variants underlying thyroid function, we performed a large meta-analysis of genome-wide associationstudies for serum levels of the highly heritable thyroid function markers TSH and FT4, in up to 26,420 and 17,520 euthyroidsubjects, respectively. Here we report 26 independent associations, including several novel loci for TSH (PDE10A, VEGFA,IGFBP5, NFIA, SOX9, PRDM11, FGF7, INSR, ABO, MIR1179, NRG1, MBIP, ITPK1, SASH1, GLIS3) and FT4 (LHX3, FOXE1, AADAT,NETO1/FBXO15, LPCAT2/CAPNS2). Notably, only limited overlap was detected between TSH and FT4 associated signals, inspite of the feedback regulation of their circulating levels by the hypothalamic-pituitary-thyroid axis. Five of the reportedloci (PDE8B, PDE10A, MAF/LOC440389, NETO1/FBXO15, and LPCAT2/CAPNS2) show strong gender-specific differences, whichoffer clues for the known sexual dimorphism in thyroid function and related pathologies. Importantly, the TSH-associatedloci contribute not only to variation within the normal range, but also to TSH values outside the reference range, suggestingthat they may be involved in thyroid dysfunction. Overall, our findings explain, respectively, 5.64% and 2.30% of total TSHand FT4 trait variance, and they improve the current knowledge of the regulation of hypothalamic-pituitary-thyroid axisfunction and the consequences of genetic variation for hypo- or hyperthyroidism.
Citation: Porcu E, Medici M, Pistis G, Volpato CB, Wilson SG, et al. (2013) A Meta-Analysis of Thyroid-Related Traits Reveals Novel Loci and Gender-SpecificDifferences in the Regulation of Thyroid Function. PLoS Genet 9(2): e1003266. doi:10.1371/journal.pgen.1003266
Editor: Mark I. McCarthy, University of Oxford, United Kingdom
Received June 1, 2012; Accepted November 12, 2012; Published February 7, 2013
This is an open-access article, free of all copyright, and may be freely reproduced, distributed, transmitted, modified, built upon, or otherwise used by anyone forany lawful purpose. The work is made available under the Creative Commons CC0 public domain dedication.
Funding: This work was supported by Intramural Research Program of the NIH (grants AG-023629, AG-15928, AG-20098, AG-027058, 263 MD 9164, 263 MD821336,_NO1-AG-1-2109, U01 HL72515, R01 AG18728) and NIH General Clinical Research Centers Program, National Center for Research Resources (NCRR); NHLBIcontracts (N01-HC-85239, N01-HC-85079 through N01-HC-85086, N01-HC-35129, N01 HC-15103, N01 HC-55222, N01-HC-75150, N01-HC-45133,HHSN268201200036C, and NHLBI grants HL080295, HL087652, HL105756, contracts N01-HC-25195 and N02-HL-6-4278); R&D contract with MedStar ResearchInstitute; NINDS contract; National Center of Advancing Translational Technologies CTSI grant UL1TR000124; National Institute of Diabetes and Digestive andKidney Diseases grant DK063491; Robert Dawson Evans Endowment; Italian Ministry of Health grants ICS110.1/RF97.71 and Ricerca Finalizzata 2008; Ministry ofHealth and Department of Educational Assistance, University and Research of the Autonomous Province of Bolzano; European Union’s Seventh FrameworkProgramme (grant agreements FP7/2007-2011 and FP7/2007-2013, 259679, 223004 and ENGAGE project grant agreement HEALTH-F4-2007-201413, EPIGENESYSgrant agreement 257082, BLUEPRINT grant agreement HEALTH-F5-2011-282510); Dutch Innovation-Oriented Research Program on Genomics (SenterNovemIGE05007); Netherlands Organization for Scientific Research (NWO) (grants 050-060-810, 175.010.2005.011, 911-03-012, 050-060-810, MW 904-61-095, 911-03-016,917 66344, 911-03-012, 175.010.2007.006); South Tyrolean Sparkasse Foundation; Radboud University Nijmegen Medical Centre; University of Maryland GeneralClinical Research Center grant M01 RR 16500; Johns Hopkins University General Clinical Research Center, grant M01 RR 000052; Baltimore Veterans AdministrationGeriatric Research and Education Clinical Center (GRECC); Netherlands Research Institute for Diseases in the Elderly (grant 014-93-015; RIDE2); Erasmus MedicalCenter and Erasmus University, Rotterdam; Netherlands Organization for the Health Research and Development (ZonMw); Dutch Ministry for Health, Welfare andSports; European Commission (DG XII); Municipality of Rotterdam; German Bundesministerium fuer Forschung und Technology grants 01 AK 803 A-H, 01 IG 07015G; Wellcome Trust (grants WT089062, WT098051, WT091310,085541/Z/08/Z); English Department of Health, National Institute for Health Research (NIHR)Comprehensive Biomedical Research Centre; Canadian Institutes of Health Research, Canadian Foundation for Innovation; Fonds de la Recherche en SanteQuebec, Ministere du Developpement Economique, de l’Innovation et de l’Exportation; Lady Davis Institute of the Jewish General Hospital (JBR); AustralianNational Health and Medical Research Council (grants 1010494, 1031422); Sir Charles Gairdner Hospital Research Fund; Italian ‘‘Compagnia di San Paolo’’; Italian‘‘Fondazione Cariplo’’; Leiden University Medical Centre; Dutch Arthritis Association; Pfizer, Groton, CT, USA; Dutch Centre of Medical System Biology; NetherlandsGenomics Initiative (NGI), Netherlands Consortium of Healthy Aging’’ (grant 050-060-810); Academy of Finland; Finnish Diabetes Research Society; FolkhalsanResearch Foundation; Novo Nordisk Foundation; Finska Lakaresallskapet, Signe and Ane Gyllenberg Foundation; University of Helsinki; European ScienceFoundation (EUROSTRESS); Finnish Ministry of Education; Ahokas Foundation; Emil Aaltonen Foundation; Juho Vainio Foundation; Biotechnology and BiologicalSciences Research Council (BBSRC); Engineering and Physical Sciences Research Council (EPSRC); Economic and Social Research Council (ESRC); Medical ResearchCouncil (MRC), as part of the cross-council Lifelong Health and Wellbeing Initiative; AXA Research Fund; Research Into Ageing and programme grants from Helpthe Aged/Research Into Ageing (Disconnected Mind); Economic Structure Enhancing Fund (FES) of the Dutch government; Dutch Ministry of Economic Affairs;Dutch Ministry of Education, Culture and Science; Northern Netherlands Collaboration of Provinces (SNN); Province of Groningen; University of Groningen; DutchKidney Foundation and Dutch Diabetes Research Foundation; Bristol-Myers Squibb; Netherlands Heart Foundation grant 2001 D 032; National ComputingFacilities Foundation (NCF), Netherlands, for the use of supercomputer facilities; Endocrine Research Fund; http://www.chs-nhlbi.org/pi.htm. The funders had norole in study design, data collection and analysis, decision to publish, or preparation of the manuscript.
Genetic Regulation of Thyroid Function
PLOS Genetics | www.plosgenetics.org 2 February 2013 | Volume 9 | Issue 2 | e1003266
Competing Interests: The authors have declared that no competing interests exist.
* E-mail: [email protected] (S Sanna); [email protected] (RP Peeters); [email protected] (S Naitza)
¤a Current address: Istituto di Ricerca Genetica e Biomedica (IRGB), Consiglio Nazionale delle Ricerche, c/o Cittadella Universitaria di Monserrato, Monserrato, Cagliari,Italy¤b Current address: Dipartimento di Scienze Biomediche, Universita di Sassari, Sassari, Italy
. These authors contributed equally to this work.
" These authors also contributed equally to this work.
Introduction
Through the production of thyroid hormone (TH), the thyroidis essential for normal development, growth and metabolism ofvirtually all human tissues. Its critical role in heart, brain, bone,and general metabolism is illustrated by the clinical manifestationsof thyroid disease, which affects up to 10% of the population. Lowthyroid function (i.e., hypothyroidism) can lead to weight gain,high cholesterol, cognitive dysfunction, depression, and coldintolerance, whereas hyperthyroidism may result in weight loss,tachycardia, atrial fibrillation, and osteoporosis. Mild variation inthyroid function, both subclinical and within the normal range, isassociated with these TH-related clinical outcomes as well [1–4].
The thyroid gland secretes predominantly the pro-hormone
thyroxine (T4), which is converted into the active form triiodo-
thyronine (T3) in peripheral tissues. The production of TH by the
thyroid gland is regulated by the hypothalamus-pituitary-thyroid
(HPT) axis, via a so-called negative feedback loop. Briefly, low
levels of serum TH in hypothyroidism result in an increased
release of thyroid stimulating hormone (TSH) by the pituitary,
under the influence of hypothalamic thyrotropin releasing
hormone (TRH) [5]. TSH, a key regulator of thyroid function,
stimulates the synthesis and secretion of TH by the thyroid. When
circulating TH levels are high, as in hyperthyroidism, TRH and
TSH synthesis and secretion are inhibited.
In healthy (euthyroid) individuals, TSH and free T4 (FT4) levels
vary over a narrower range than the broad inter-individual
variation seen in the general population, suggesting that each
person has a unique HPT axis set-point that lies within the
population reference range [6]. Besides environmental factors such
as diet, smoking and medication, little is known about the factors
that influence this inter-individual variation in TSH and FT4
levels [7–9]. The heritability of TSH and FT4 has been estimated
from twin and family studies at about 65% and 40%, respectively
[10–12]. However, the underlying genetic variants are not fully
established, and the contribution of those discovered so far to the
overall variance is modest. Single nucleotide polymorphisms
(SNPs) in the phosphodiesterase type 8B (PDE8B), upstream of the
capping protein (actin filament) muscle Z-line, b (CAPZB) and, more
recently, of the nuclear receptor subfamily 3, group C, member 2 (NR3C2)
and of v-maf musculoaponeurotic fibrosarcoma oncogene homolog (MAF/
LOC440389) genes have been implicated in TSH variation by
genome-wide association studies (GWAS) [13–15], whereas SNPs
in the iodothyronine deiodinase DIO1 have been associated with
circulating levels of TH by candidate gene analysis [16–18].
To identify additional common variants associated with thyroid
function, we performed a meta-analysis of genome-wide associa-
tion data in 26,420 euthyroid individuals phenotyped for serum
TSH and 17,520 for FT4 levels, respectively. In addition, we also
assessed gender-specific effects and correlation with subclinical
thyroid dysfunction.
Results
To identify common genetic variants associated with serum
TSH and FT4 levels, we carried out a meta-analysis of genome-
wide association results from 18 studies for TSH and 15 studies for
FT4 levels, which assessed the additive effect of ,2.5 million
genotyped and HapMap-imputed SNPs in relation to those traits
in individuals of European ancestry (for cohort description see
Table 1 and Table S1). In order to avoid bias due to the presence
of thyroid pathologies, prior to analysis we excluded all individuals
with TSH values outside the normal range (TSH,0.4 mIU/L
and TSH.4.0 mIU/L) and those taking thyroid medication for
known thyroid pathologies whenever the relevant information was
available. Our meta-analysis was thereby carried out in up to
26,420 and 17,520 euthyroid subjects, respectively for TSH and
FT4. Additional exclusion criteria used by individual cohorts are
detailed in Table S1.
Using the standard genome-wide threshold of 561028, we
observed significant associations for SNPs at 23 loci, of which 19
were associated with TSH, and 4 with FT4 (Figure S1). The results
are presented in Table 2 and Figure 1, Figure 2, Figure 3, Figure 4,
Figure 5. In Table S2 single cohort results for each GW significant
SNP are reported.
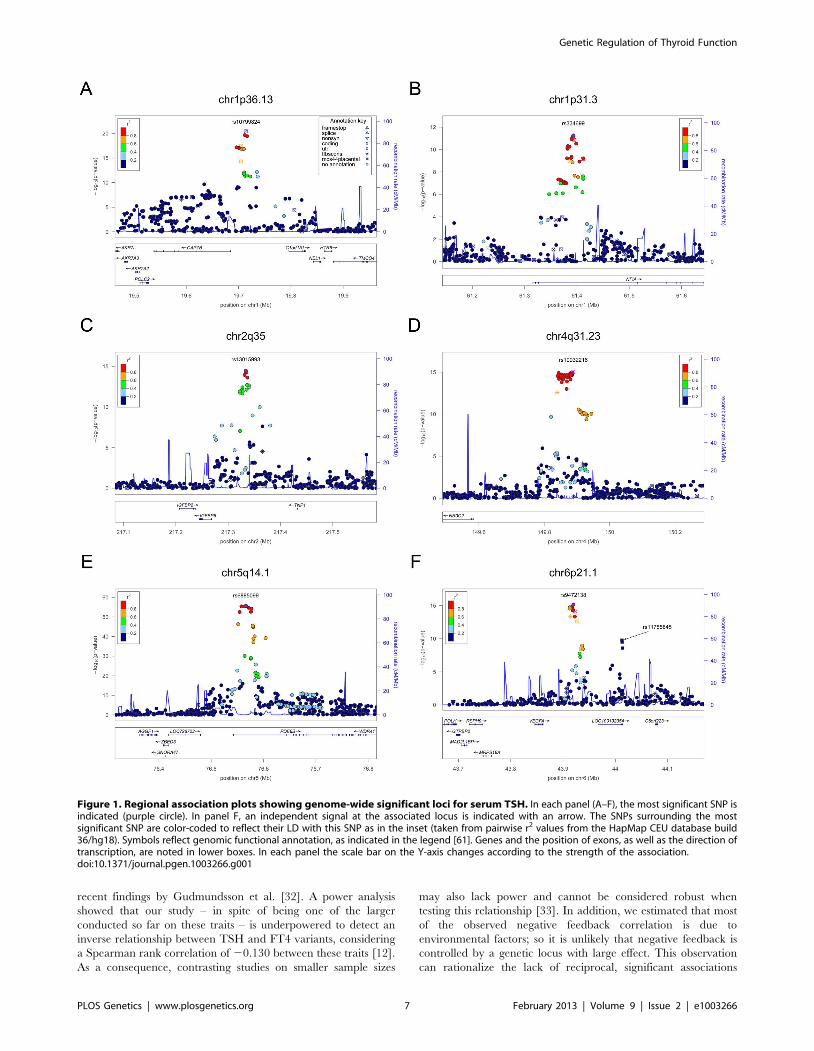
For TSH, 4 signals confirmed previously described loci with
proxy SNPs at PDE8B (P = 1.95610256, r2 = 0.94 with the
reported rs4704397), CAPZB (P = 3.60610221, r2 = 1 with the
reported rs10917469) and NR3C2 (P = 9.28610216, r2 = 0.90 with
the reported rs10028213), whereas the signal was coincident at
MAF/LOC440389 (P = 8.45610218) [13–15]. The remaining
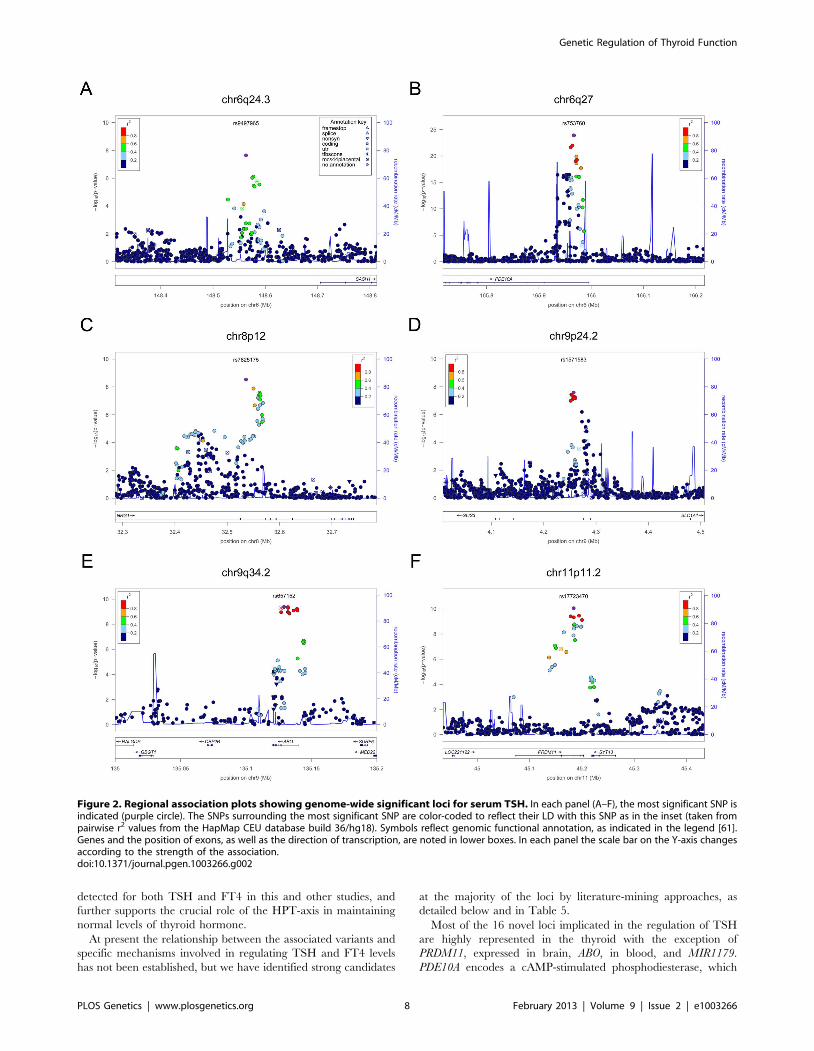
signals were in or near 15 novel loci: PDE10A (phosphodiesterase
type 10A, P = 1.21610224), VEGFA (Vascular endothelial growth factor,
P = 6.72610216), IGFBP5 (insulin-like growth factor binding protein 5,
P = 3.24610215), SOX9 (sex determining region Y-box 9,
P = 7.53610213), NFIA (nuclear factor I/A, P = 5.40610212), FGF7
(fibroblast growth factor 7, P = 1.02610211), PRDM11 (PR domain
containing 11, P = 8.83610211), MIR1179 (microRNA 1179,
P = 2.89610210), INSR (insulin receptor, P = 3.16610210), ABO
(ABO glycosyltransferase, P = 4.11610210), ITPK1 (inositol-tetrakispho-
sphate 1-kinase, P = 1.7961029), NRG1 (neuregulin 1, P = 2.9461029),
MBIP (MAP3K12 binding inhibitory protein 1, P = 1.1761028), SASH1
(SAM and SH3 domain containing 1, P = 2.2561028), GLIS3 (GLIS
family zinc finger 3, P = 2.5561028), (Figure 1, Figure 2, Figure 3,
Figure 4).
For FT4, we confirmed the DIO1 locus (P = 7.87610232), with
the same marker previously reported in candidate gene studies
[17,18], and identified 3 additional novel loci, LHX3 (LIM homeobox
3, P = 2.30610214), FOXE1 (forkhead box E1, P = 1.50610211) and
AADAT (aminoadipate aminotransferase, P = 5.2061029) (Figure 5).
The most associated SNP at the FOXE1 locus, rs7045138, is a
surrogate for rs1443434(r2 = 0.97), previously only suggestively
associated with FT4 levels [18], and is also correlated with SNPs
recently reported to be associated with both low serum TSH and
FT4 levels (r2 = 0.59 with rs965513) [19], as well as with
hypothyroidism (r2 = 0.59 with rs7850258) [20].
At each locus, a single variant was sufficient to explain entirely
the observed association, except for the VEGFA locus, which
contained an independent signal located 150 kb downstream of
the gene, detected by conditional analyses (Figure 1F and Table 2).
Genetic Regulation of Thyroid Function
PLOS Genetics | www.plosgenetics.org 3 February 2013 | Volume 9 | Issue 2 | e1003266
Of all 24 independent markers, significant evidence for
heterogeneity (P,0.002, corresponding to a Bonferroni threshold
of 0.5/24) was only observed at ABO (P = 1.2261024). Iodine
nutrition, which may profoundly affect thyroid function, is quite
different in some of the cohorts under study (i.e., Europe vs North
America). To test whether the observed heterogeneity could be
attributable to different iodine intake, we combined cohorts from
South Europe (an iodine-deficient region) and compared effect
sizes with those observed in a meta-analysis of North American
samples (an iodine-replete region). Interestingly, the effect size of
the top marker at ABO was three times larger in Europeans vs
North American, and this difference remained significant after
Bonferroni correction (P = 7.0.961024) (Table S3). However, the
relation of the ABO SNP, a tag for the blood group O, to iodine
intake remains to be determined.
Gender-specific analysesGiven the reported clinical differences in thyroid function in
males and females [21–23], we searched for gender-specific loci by
whole-genome sex-specific meta-analysis, analyzing males and
females separately in each cohort. Some of the loci detected in the
main meta-analysis were seen at genome-wide significance level
only in females (NR3C2, VEGFA, NRG1 and SASH1) or in males
(MAF/LOC440389, FGF7, SOX9, IGFBP5) with either the same
top SNP or one surrogate, but effect sizes at their variants were
significantly gender-specific only at PDE8B, PDE10A and MAF/
LOC440389, considering a false discovery rate of 5% [24]. In
addition, effects at MAF/LOC440389 were significantly different
also at the more stringent Bonferroni threshold of 1.961023
( = 0.05/26), and close to significance at PDE8B and PDE10A
(Table 3). At these latter loci, the TSH-elevating alleles showed a
stronger impact on trait variability in males compared to females
(Figure 6). In addition, the gender specific meta-analysis for FT4,
revealed a novel female-specific locus on chromosome 18q22, and
a novel male-specific locus on chromosome 16q12.2, that had not
been detected in the main meta-analysis (Table 3, Figure 6 and
Figure S2). The female-specific signal (rs7240777, P = 3.4961028)
maps in a ‘‘gene desert’’ region, with the nearest genes NETO1
(neuropilin (NRP) and tolloid (TLL)-like 1), located, about 550 kb
upstream and FBXO15 (F-box only protein 15) 500 kb downstream
(Figure 5D). The male-specific association is located in intron 11 of
the LPCAT2 (lysophosphatidylcholine acyltransferase 2) gene, and near
CAPNS2 (calpain, small subunit 2) (rs6499766, P = 4.6361028), a
gene which may play a role in spermatogenesis [25]. The FT4-
elevating alleles in the NETO1/FBXO15 and LPCAT2/CAPNS2
were fully gender-specific, i.e. there was no effect in males and in
females, respectively (P.0.01).
Overall, the 20 TSH and the 6 FT4 associations account,
respectively, for 5.64% and 2.30% of total trait variance.
Common loci regulating TSH and FT4 levelsTo explore overlap between TSH- and FT4-associated loci and
their involvement in the HPT-negative feedback loop, we assessed
the associations of the top TSH-associated SNPs on FT4 levels,
and vice versa. For the SNPs in or near PDE8B, MAF/LOC440389,
VEGFA, IGFBP5, NFIA, MIR1179, MBIP and GLIS3 the TSH-
elevating allele appeared to be associated with decreasing FT4
levels (P,0.05, Table S4). However, after application of
Bonferroni correction (threshold for FT4 association of TSH
SNPs, P = 2.561023), none of these reciprocal associations
remained significant.
By contrast, a positive relationship was seen for one of the FT4
associated loci, since the variant at the LHX3 locus was
significantly associated with higher levels of both FT4 and TSH
(P = 5.2561023, with Bonferroni threshold 0.05/6 = 0.008).
As the presence of reciprocal associations between TSH and
FT4 regulating SNPs would be expected from physiology, we
tested the power of our study to detect such a relationship. Power
calculation for the top SNP at PDE8B, which has the largest effect
on TSH levels, revealed that our meta-analysis only has 9% power
to detect an association of FT4 at a Bonferroni P = 2.561023. We
also carried out a bivariate analysis in the SardiNIA study using
poly software to estimate specific contributions [26]. This analysis
showed that most of the observed negative feedback correlation is
due to environmental factors (environmental correla-
tion = 20.130, genetic correlation = 20.065).
Association of loci with hypothyroidism andhyperthyroidism
To assess possible clinical implications, we investigated whether
the variants identified in individuals without overt thyroid
pathologies (i.e., with TSH levels within the normal range and
not taking thyroid medication) were also associated in individuals
with abnormal TSH values (i.e., outside the reference range), who
were not included in the initial meta-analysis as potentially affected
by thyroid pathology. Towards this, we first assessed the global
impact of TSH- and FT4-associated SNPs on the risk of increased
or decreased TSH levels by comparing weighted genotype risk
score (GRS) quartiles in the individuals with abnormal TSH values
that were discarded for the GWAS analyses. For the TSH-
associated SNPs, the odds of increased TSH levels were 6.65 times
greater in individuals with a GRS in the top quartile compared to
individuals in the bottom quartile (P = 3.43610220) (Table 4, top
panel, lower vs upper tail). When we compared subjects with high
TSH values with subjects within the normal TSH reference range,
subjects with a GRS in the top quartile had odds of an elevated
TSH 2.37 times greater than for subjects in the bottom quartile
(P = 1.06610217) (Table 4). With regard to low TSH values versus
the normal range, the odds ratio was 0.26 (P = 5.43610213)
(Table 4, top panel, lower vs normal tail). By contrast, with the
Author Summary
Levels of thyroid hormones are tightly regulated by TSHproduced in the pituitary, and even mild alterations intheir concentrations are strong indicators of thyroidpathologies, which are very common worldwide. Toidentify common genetic variants associated with thehighly heritable markers of thyroid function, TSH and FT4,we conducted a meta-analysis of genome-wide associationstudies in 26,420 and 17,520 individuals, respectively, ofEuropean ancestry with normal thyroid function. Ouranalysis identified 26 independent genetic variants regu-lating these traits, several of which are new, and confirmedpreviously detected polymorphisms affecting TSH (withinthe PDE8B gene and near CAPZB, MAF/LOC440389, andNR3C2) and FT4 (within DIO1) levels. Gender-specificdifferences in the genetic effects of several variants forTSH and FT4 levels were identified at several loci, whichoffer clues to understand the known sexual dimorphism inthyroid function and pathology. Of particular clinicalinterest, we show that TSH-associated loci contribute notonly to normal variation, but also to TSH values outsidereference range, suggesting that they may be involved inthyroid dysfunction. Overall, our findings add to thedeveloping landscape of the regulation of thyroidhomeostasis and the consequences of genetic variationfor thyroid related diseases.
Genetic Regulation of Thyroid Function
PLOS Genetics | www.plosgenetics.org 4 February 2013 | Volume 9 | Issue 2 | e1003266
FT4-associated SNPs we found no significant associations for any
of the tested comparisons (data not shown).
We also assessed the 20 independent TSH SNPs individually in
relation to the risk of abnormal TSH levels by case-control meta-
analysis in subjects with high (cases) versus low (controls) TSH
values. This analysis showed that variants at PDE8B, CAPZB,
FGF7, PDE10A, NFIA and ITPK1 loci are significantly associated
(Bonferroni threshold P = 2.561023) with abnormal TSH levels
(Table 4, bottom panel). PDE8B, CAPZB and FGF7 were also
strongly associated with the risk of decreased TSH levels in an
analysis of individuals with low (cases) versus normal range TSH
(controls). In addition, variants at VEGFA were also significantly
associated in this comparison. Finally, when individuals with high
TSH values were analyzed versus controls, the NR3C2 locus
appeared significantly associated in addition to PDE8B and
CAPZB.
Association of TSH lead SNPs in pregnant womenNormal thyroid function is particularly important during
pregnancy and elevated TSH levels are implicated in a number
of adverse outcomes for both mother and offspring. We therefore
assessed whether the TSH lead SNPs were also associated with
elevated TSH during pregnancy, when increased TH production
is necessary. We tested 9 of the 20 lead TSH variants (or their
proxies, see Text S1) in a cohort of 974 healthy pregnant women
at 28 weeks gestation [27] and found, as expected, that mean TSH
levels were correlated with the number of TSH-elevating alleles
(P = 3.0610212, Table S5). Effect size estimates in pregnant
women were not significantly different when compared to those of
women in the main gender-specific meta-analysis (heterogeneity P
value.0.05), suggesting that the effects of the TSH-elevating
alleles are no greater during pregnancy (data not shown).
However, there was evidence of association between the number
of TSH-raising alleles and subclinical hypothyroidism in pregnan-
cy, both in the whole sample (OR per weighted allele: 1.18
[95%CI: 1.01, 1.37], P = 0.04) and in TPO antibody-negative
women (1.29 [95%CI: 1.08, 1.55], P = 0.006) (Table S6).
Discussion
We report 26 independent SNPs associated with thyroid
function tests in euthyroid subjects, 21 of which represent novel
signals (16 for TSH and 5 for FT4). Overall they explain 5.64%
and 2.30% of the variation in TSH and FT4 levels, respectively.
We observed that carriers of multiple TSH-elevating alleles
have increased risk of abnormal TSH levels, and also found
association between the number of TSH-elevating alleles and
subclinical hypothyroidism in pregnancy. These results are
potentially clinically relevant, because abnormal TSH values are
the most sensitive diagnostic markers for both overt and subclinical
thyroid disease [4]. The variants identified in the current study, or
those in LD with them, may thus contribute to the pathogenesis of
thyroid disease. Of note, we found eight loci significantly
associated with abnormal TSH levels (PDE8B, PDE10, CAPZB,
VEGFA, NR3C2, FGF7, NFIA and ITPK1), of which two were
specifically associated with either abnormally low (VEGFA) or
elevated (NR3C2) TSH values, suggesting differential mechanisms
for the contribution of these variants to hyper- and hypothyroid-
ism, respectively. Interestingly, the mineralocorticoid receptor
NR3C2 gene has recently been found to be up-regulated in adult-
onset hypothyroidism [28], and PDE8B and CAPZB have been
suggestively associated with hypothyroidism by GWAS [29].
Alternatively, it may be that carriers of these alleles are healthy
individuals who may be misdiagnosed as having thyroid disease
because their genetically determined TSH concentrations fall
outside the population-based reference range. More research is
required to determine which of these interpretations is correct, and
the relevance of these variants as markers for thyroid dysfunction
or thyroid-related clinical endpoints.
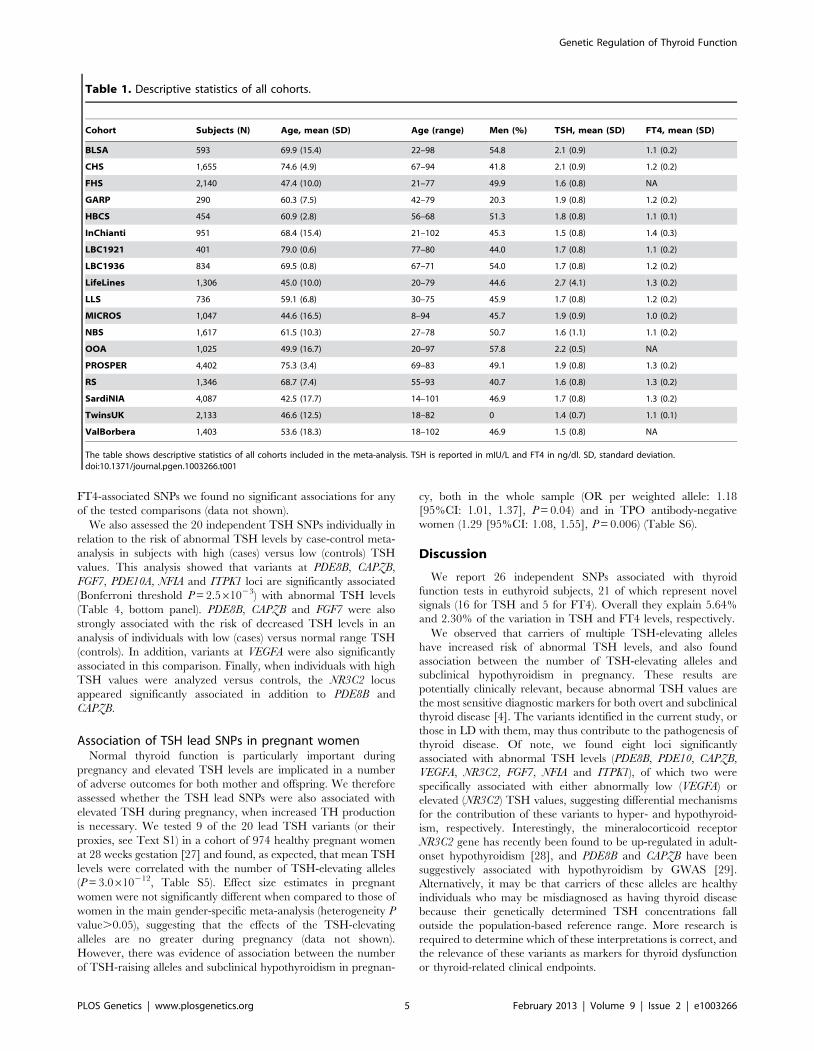
Table 1. Descriptive statistics of all cohorts.
Cohort Subjects (N) Age, mean (SD) Age (range) Men (%) TSH, mean (SD) FT4, mean (SD)
BLSA 593 69.9 (15.4) 22–98 54.8 2.1 (0.9) 1.1 (0.2)
CHS 1,655 74.6 (4.9) 67–94 41.8 2.1 (0.9) 1.2 (0.2)
FHS 2,140 47.4 (10.0) 21–77 49.9 1.6 (0.8) NA
GARP 290 60.3 (7.5) 42–79 20.3 1.9 (0.8) 1.2 (0.2)
HBCS 454 60.9 (2.8) 56–68 51.3 1.8 (0.8) 1.1 (0.1)
InChianti 951 68.4 (15.4) 21–102 45.3 1.5 (0.8) 1.4 (0.3)
LBC1921 401 79.0 (0.6) 77–80 44.0 1.7 (0.8) 1.1 (0.2)
LBC1936 834 69.5 (0.8) 67–71 54.0 1.7 (0.8) 1.2 (0.2)
LifeLines 1,306 45.0 (10.0) 20–79 44.6 2.7 (4.1) 1.3 (0.2)
LLS 736 59.1 (6.8) 30–75 45.9 1.7 (0.8) 1.2 (0.2)
MICROS 1,047 44.6 (16.5) 8–94 45.7 1.9 (0.9) 1.0 (0.2)
NBS 1,617 61.5 (10.3) 27–78 50.7 1.6 (1.1) 1.1 (0.2)
OOA 1,025 49.9 (16.7) 20–97 57.8 2.2 (0.5) NA
PROSPER 4,402 75.3 (3.4) 69–83 49.1 1.9 (0.8) 1.3 (0.2)
RS 1,346 68.7 (7.4) 55–93 40.7 1.6 (0.8) 1.3 (0.2)
SardiNIA 4,087 42.5 (17.7) 14–101 46.9 1.7 (0.8) 1.3 (0.2)
TwinsUK 2,133 46.6 (12.5) 18–82 0 1.4 (0.7) 1.1 (0.1)
ValBorbera 1,403 53.6 (18.3) 18–102 46.9 1.5 (0.8) NA
The table shows descriptive statistics of all cohorts included in the meta-analysis. TSH is reported in mIU/L and FT4 in ng/dl. SD, standard deviation.doi:10.1371/journal.pgen.1003266.t001
Genetic Regulation of Thyroid Function
PLOS Genetics | www.plosgenetics.org 5 February 2013 | Volume 9 | Issue 2 | e1003266
The evidence for gender-specific differences at several TSH and
FT4 regulatory loci is intriguing. They included variants at PDE8B,
PDE10A, and MAF/LOC440389, which showed significantly stronger
genetic effects with pituitary-thyroid function in males, and variants at
NETO1/FBX015 and LPCAT2/CAPNS2 which seems to have an effect
only in females and males, respectively. Sex differences in the
regulation of thyroid function have generally been linked to the
influence of sex hormones and autoimmune thyroid disease, resulting
in a higher prevalence of thyroid dysfunction in women, without clear
understanding of underlying molecular mechanisms [21–23]. Our
study suggests that differential genes and mechanisms are potentially
implicated in the regulation of thyroid function in men and women.
Given the impact of thyroid function on several disease outcomes as
well as male and female fertility and reproduction, clarifying the
underlying associations may provide additional insight for future
interventions.
Although it is well known that TSH and FT4 levels are tightly
regulated through a negative feedback loop involving the HPT
axis, we detected significant overlap between TSH and FT4
signals only at the LHX3 locus, which was primarily associated in
our study with FT4. The LHX3 allele is associated with an
increase of both TSH and FT4, which is consistent with the
essential role of this transcription factor in pituitary development.
Inactivating mutations in LHX3 cause the combined pituitary
hormone deficiency-3 syndrome [CPHD3 (MIM#221750)]
[30,31], characterized by low TSH and FT4 levels. The positive
association of the LHX3 variant with both TSH and FT4 suggests
an effect of this allele at the level of the HPT-axis, resulting in an
increased exposure to thyroid hormone throughout life. In
contrast, although several of the TSH-elevating alleles appeared
to be associated with decreasing FT4 levels, none of these
reciprocal associations remained significant after Bonferroni
correction. Lack of loci associated in a reciprocal manner with
both TSH and FT4 is somewhat puzzling, as their presence
would be expected from physiology. However, these findings are
consistent with initial reports by Shields et al. [27] and more
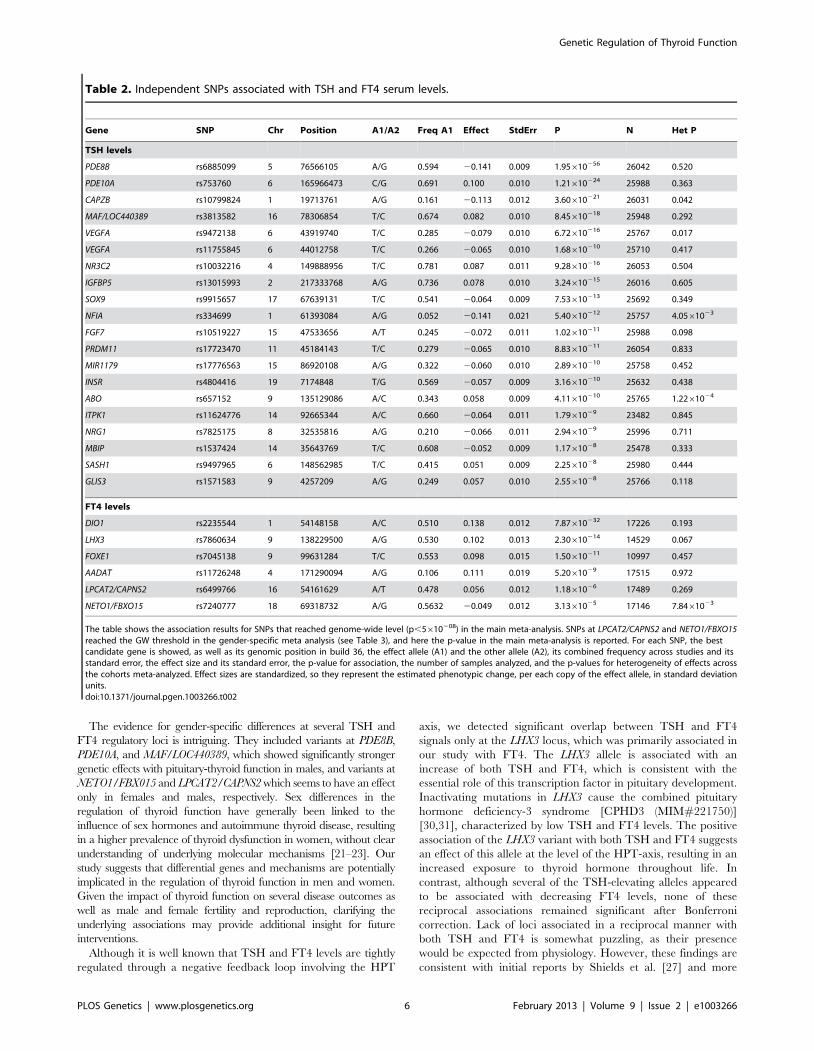
Table 2. Independent SNPs associated with TSH and FT4 serum levels.
Gene SNP Chr Position A1/A2 Freq A1 Effect StdErr P N Het P
TSH levels
PDE8B rs6885099 5 76566105 A/G 0.594 20.141 0.009 1.95610256 26042 0.520
PDE10A rs753760 6 165966473 C/G 0.691 0.100 0.010 1.21610224 25988 0.363
CAPZB rs10799824 1 19713761 A/G 0.161 20.113 0.012 3.60610221 26031 0.042
MAF/LOC440389 rs3813582 16 78306854 T/C 0.674 0.082 0.010 8.45610218 25948 0.292
VEGFA rs9472138 6 43919740 T/C 0.285 20.079 0.010 6.72610216 25767 0.017
VEGFA rs11755845 6 44012758 T/C 0.266 20.065 0.010 1.68610210 25710 0.417
NR3C2 rs10032216 4 149888956 T/C 0.781 0.087 0.011 9.28610216 26053 0.504
IGFBP5 rs13015993 2 217333768 A/G 0.736 0.078 0.010 3.24610215 26016 0.605
SOX9 rs9915657 17 67639131 T/C 0.541 20.064 0.009 7.53610213 25692 0.349
NFIA rs334699 1 61393084 A/G 0.052 20.141 0.021 5.40610212 25757 4.0561023
FGF7 rs10519227 15 47533656 A/T 0.245 20.072 0.011 1.02610211 25988 0.098
PRDM11 rs17723470 11 45184143 T/C 0.279 20.065 0.010 8.83610211 26054 0.833
MIR1179 rs17776563 15 86920108 A/G 0.322 20.060 0.010 2.89610210 25758 0.452
INSR rs4804416 19 7174848 T/G 0.569 20.057 0.009 3.16610210 25632 0.438
ABO rs657152 9 135129086 A/C 0.343 0.058 0.009 4.11610210 25765 1.2261024
ITPK1 rs11624776 14 92665344 A/C 0.660 20.064 0.011 1.7961029 23482 0.845
NRG1 rs7825175 8 32535816 A/G 0.210 20.066 0.011 2.9461029 25996 0.711
MBIP rs1537424 14 35643769 T/C 0.608 20.052 0.009 1.1761028 25478 0.333
SASH1 rs9497965 6 148562985 T/C 0.415 0.051 0.009 2.2561028 25980 0.444
GLIS3 rs1571583 9 4257209 A/G 0.249 0.057 0.010 2.5561028 25766 0.118
FT4 levels
DIO1 rs2235544 1 54148158 A/C 0.510 0.138 0.012 7.87610232 17226 0.193
LHX3 rs7860634 9 138229500 A/G 0.530 0.102 0.013 2.30610214 14529 0.067
FOXE1 rs7045138 9 99631284 T/C 0.553 0.098 0.015 1.50610211 10997 0.457
AADAT rs11726248 4 171290094 A/G 0.106 0.111 0.019 5.2061029 17515 0.972
LPCAT2/CAPNS2 rs6499766 16 54161629 A/T 0.478 0.056 0.012 1.1861026 17489 0.269
NETO1/FBXO15 rs7240777 18 69318732 A/G 0.5632 20.049 0.012 3.1361025 17146 7.8461023
The table shows the association results for SNPs that reached genome-wide level (p,5610208) in the main meta-analysis. SNPs at LPCAT2/CAPNS2 and NETO1/FBXO15reached the GW threshold in the gender-specific meta analysis (see Table 3), and here the p-value in the main meta-analysis is reported. For each SNP, the bestcandidate gene is showed, as well as its genomic position in build 36, the effect allele (A1) and the other allele (A2), its combined frequency across studies and itsstandard error, the effect size and its standard error, the p-value for association, the number of samples analyzed, and the p-values for heterogeneity of effects acrossthe cohorts meta-analyzed. Effect sizes are standardized, so they represent the estimated phenotypic change, per each copy of the effect allele, in standard deviationunits.doi:10.1371/journal.pgen.1003266.t002
Genetic Regulation of Thyroid Function
PLOS Genetics | www.plosgenetics.org 6 February 2013 | Volume 9 | Issue 2 | e1003266
recent findings by Gudmundsson et al. [32]. A power analysis
showed that our study – in spite of being one of the larger
conducted so far on these traits – is underpowered to detect an
inverse relationship between TSH and FT4 variants, considering
a Spearman rank correlation of 20.130 between these traits [12].
As a consequence, contrasting studies on smaller sample sizes
may also lack power and cannot be considered robust when
testing this relationship [33]. In addition, we estimated that most
of the observed negative feedback correlation is due to
environmental factors; so it is unlikely that negative feedback is
controlled by a genetic locus with large effect. This observation
can rationalize the lack of reciprocal, significant associations
Figure 1. Regional association plots showing genome-wide significant loci for serum TSH. In each panel (A–F), the most significant SNP isindicated (purple circle). In panel F, an independent signal at the associated locus is indicated with an arrow. The SNPs surrounding the mostsignificant SNP are color-coded to reflect their LD with this SNP as in the inset (taken from pairwise r2 values from the HapMap CEU database build36/hg18). Symbols reflect genomic functional annotation, as indicated in the legend [61]. Genes and the position of exons, as well as the direction oftranscription, are noted in lower boxes. In each panel the scale bar on the Y-axis changes according to the strength of the association.doi:10.1371/journal.pgen.1003266.g001
Genetic Regulation of Thyroid Function
PLOS Genetics | www.plosgenetics.org 7 February 2013 | Volume 9 | Issue 2 | e1003266
detected for both TSH and FT4 in this and other studies, and
further supports the crucial role of the HPT-axis in maintaining
normal levels of thyroid hormone.
At present the relationship between the associated variants and
specific mechanisms involved in regulating TSH and FT4 levels
has not been established, but we have identified strong candidates
at the majority of the loci by literature-mining approaches, as
detailed below and in Table 5.
Most of the 16 novel loci implicated in the regulation of TSH
are highly represented in the thyroid with the exception of
PRDM11, expressed in brain, ABO, in blood, and MIR1179.
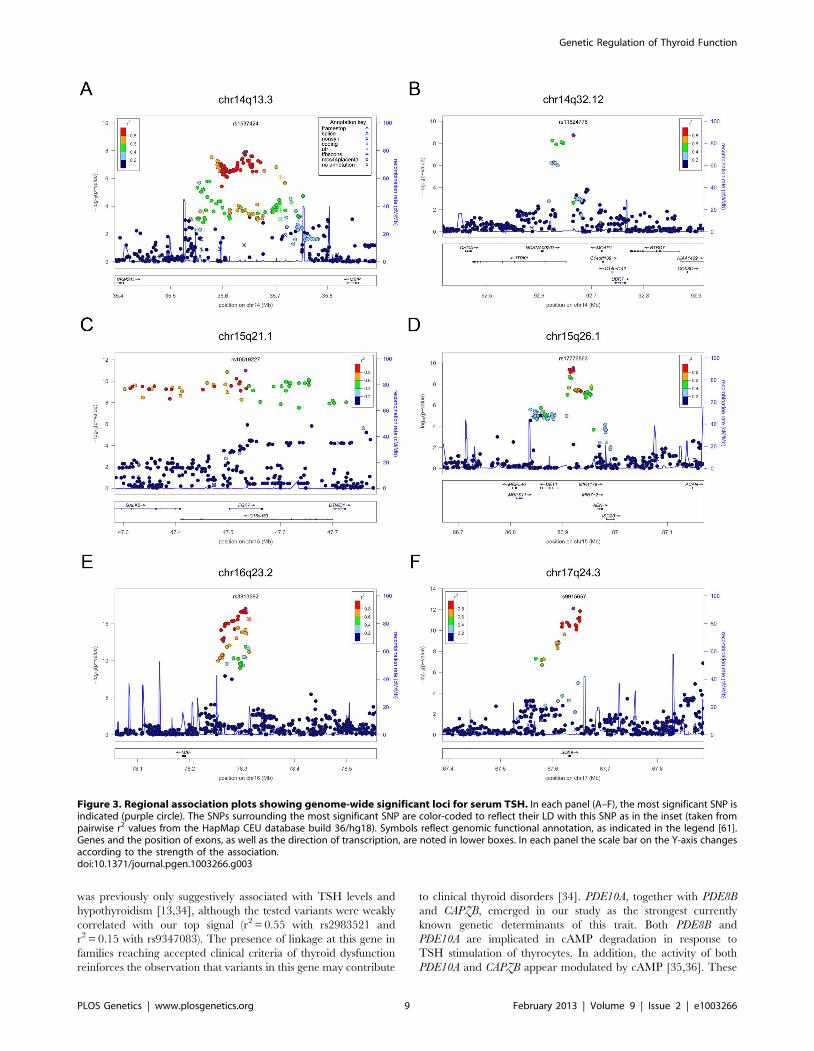
PDE10A encodes a cAMP-stimulated phosphodiesterase, which
Figure 2. Regional association plots showing genome-wide significant loci for serum TSH. In each panel (A–F), the most significant SNP isindicated (purple circle). The SNPs surrounding the most significant SNP are color-coded to reflect their LD with this SNP as in the inset (taken frompairwise r2 values from the HapMap CEU database build 36/hg18). Symbols reflect genomic functional annotation, as indicated in the legend [61].Genes and the position of exons, as well as the direction of transcription, are noted in lower boxes. In each panel the scale bar on the Y-axis changesaccording to the strength of the association.doi:10.1371/journal.pgen.1003266.g002
Genetic Regulation of Thyroid Function
PLOS Genetics | www.plosgenetics.org 8 February 2013 | Volume 9 | Issue 2 | e1003266
was previously only suggestively associated with TSH levels and
hypothyroidism [13,34], although the tested variants were weakly
correlated with our top signal (r2 = 0.55 with rs2983521 and
r2 = 0.15 with rs9347083). The presence of linkage at this gene in
families reaching accepted clinical criteria of thyroid dysfunction
reinforces the observation that variants in this gene may contribute
to clinical thyroid disorders [34]. PDE10A, together with PDE8B
and CAPZB, emerged in our study as the strongest currently
known genetic determinants of this trait. Both PDE8B and
PDE10A are implicated in cAMP degradation in response to
TSH stimulation of thyrocytes. In addition, the activity of both
PDE10A and CAPZB appear modulated by cAMP [35,36]. These
Figure 3. Regional association plots showing genome-wide significant loci for serum TSH. In each panel (A–F), the most significant SNP isindicated (purple circle). The SNPs surrounding the most significant SNP are color-coded to reflect their LD with this SNP as in the inset (taken frompairwise r2 values from the HapMap CEU database build 36/hg18). Symbols reflect genomic functional annotation, as indicated in the legend [61].Genes and the position of exons, as well as the direction of transcription, are noted in lower boxes. In each panel the scale bar on the Y-axis changesaccording to the strength of the association.doi:10.1371/journal.pgen.1003266.g003
Genetic Regulation of Thyroid Function
PLOS Genetics | www.plosgenetics.org 9 February 2013 | Volume 9 | Issue 2 | e1003266
three genes most likely act in a pathway that leads to cAMP-
dependent thyroid hormone synthesis and release, thus highlight-
ing a critical role of cAMP levels in thyroid function. For the other
TSH-associated loci (VEGFA, IGFBP5, SOX9, NFIA, FGF7,
PRDM11, MIR1179, INSR, ABO, ITPK1, NRG1, MBIP, SASH1
and GLIS3), hypotheses can be formulated based on the published
literature (see Table 5), but further studies will be necessary to
clarify the exact biological mechanisms and the specific genes
involved at each locus. The association of TSH levels with
IGFBP5, INSR and NR3C2 is, however, an indication of a specific
role of the growth hormone/insulin-like growth factor (GH/IGF)
pathway in thyroid function. Remarkably, expression of IGFBP5 is
tightly regulated by cAMP, again underlying the pivotal role of this
second messenger in determining net TSH levels [37].
For FT4, the DIO1, FOXE1 and LHX3 identified loci have
strong biological support as potential effectors. While both DIO1
and FOXE1 were previously associated with FT4 levels and
hypothyroidism by candidate gene analysis and functional studies
[17–19,38–41], association at LHX3 is novel and is consistent with
the essential role of this transcription factor in pituitary
development (see above) [30,31,42,43]. Consistent with the role
of pituitary in growth, this locus has also recently been associated
with height in Japanese [44]. The associations of AADAT, NETO1/
FXBO15 and LPCT2/CAPNS2 with FT4 levels are currently less
clear. It may be relevant that AADAT catalyzes the synthesis of
kynurenic acid (KYNA) from kynurenine (KYN), a pathway that
has been associated with the induction in brain of proinflamma-
tory cytokines that are known to activate the hypothalamo-
pituitary-adrenal (HPA) axis, in turn affecting the HPT axis and
thyroid function, including FT4 levels [45–49].
Additional pathway analyses by MAGENTA [50], GRAIL
[51], and IPA (Ingenuity Systems, www.ingenuity.com) to look for
functional enrichment of the genes mapping to the regions
associated with TSH, FT4 or both, yielded no novel interactions.
However, IPA highlighted an over-representation of genes
implicated in developmental processes (11/26, P = 6.2761026–
8.8561023) and cancer (16/26 loci, P = 2.4461026–9.3061023).
This is consistent with the notion that a normally developed
thyroid gland is essential for both proper function and thyroid
hormone synthesis, and that defects in any of the essential steps in
thyroid development or thyroid hormone synthesis may result in
morphologic abnormalities, impaired hormonogenesis and growth
dysregulation. It is also interesting to note that 11 of the 20 TSH
signals and 3 of the 6 FT4 signals are connected in a single protein
network, underlying the biological interrelationship between genes
regulating these traits (Figure S3).
While our manuscript was in preparation, a GWAS of
comparable sample size was published on levels of TSH in the
general Icelandic population, which confirmed 15 of our reported
loci (E. Porcu et al., 2011, ESHG, abstract), and inferred a role for
three TSH-lowering variants in thyroid cancer [32]. Four
additional TSH loci identified by Gudmundsson and colleagues
were also associated in our sample-set of euthyroid individuals
with p,0.05 and consistent direction of effects (VAV3, NKX2–3,
TPO and FOXA2). Finally, 2 loci (SIVA1, ELK3) could not be tested
because the corresponding SNPs or any surrogate (r2.0.5) were
not available in our data set (Table S7). Our study shows that most
of the loci described in Icelanders are reproducible in other
populations of European origin; differences in sample size,
phenotype definition (i.e., selection of euthyroid subjects vs general
population) and in the genetic map used to detect associations
most likely explain non-overlapping genome-wide significant
signals. Among them, the reported signals at SOX9, ABO, SASH1,
GLIS3 and MIR1179 will need to be confirmed in other studies;
but one of them - GLIS3- is a prime candidate, because it is
involved in congenital hypothyroidism [52]. Interestingly, despite
the use of variants detected through whole-genome sequencing in
Icelanders, the top signals at seven overlapping loci (PDE8B,
PDE10A, CAPZB, MAF/LOC440389, VEGFA, NR3C2, IGFBP5)
were either coincident or in high LD (r2.0.9) with those detected
in our HapMap-based meta-analysis. Thus, such variants are likely
to be the causative ones.
In conclusion, our study reports the first GWAS meta-analysis
ever carried out on FT4 levels, adds to the existing knowledge
novel TSH- and FT4-associated loci and reveals genetic factors
that differentially affect thyroid function in males and females.
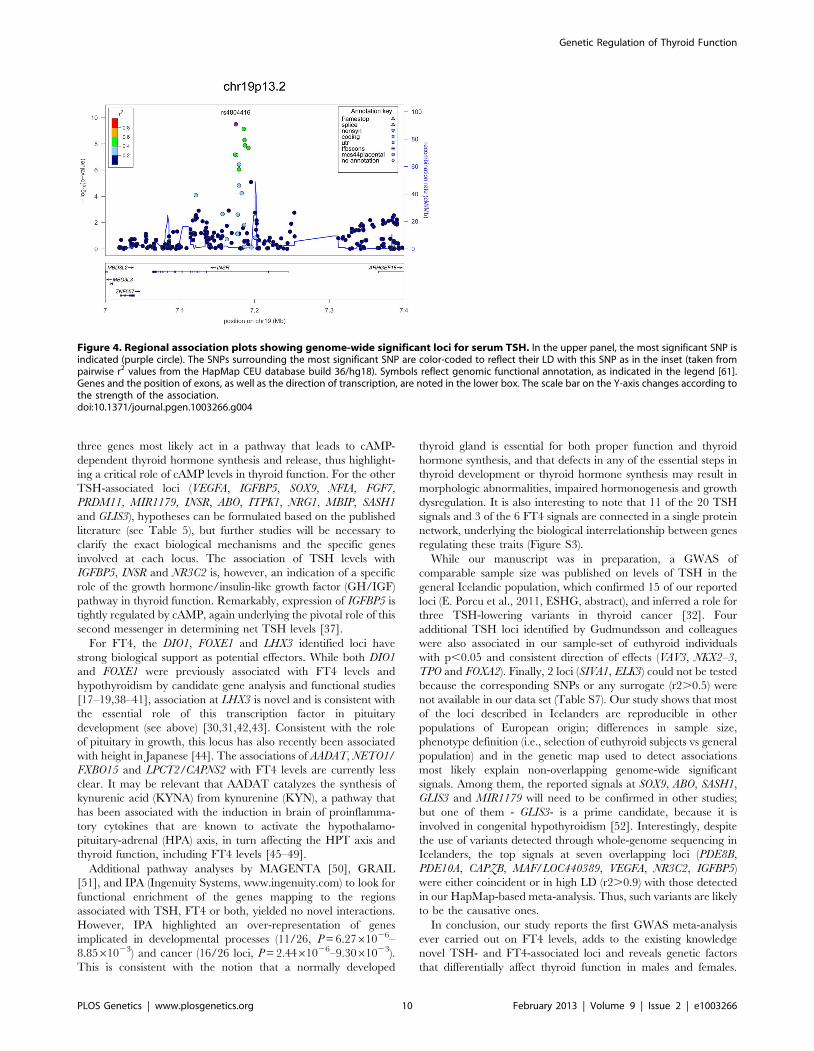
Figure 4. Regional association plots showing genome-wide significant loci for serum TSH. In the upper panel, the most significant SNP isindicated (purple circle). The SNPs surrounding the most significant SNP are color-coded to reflect their LD with this SNP as in the inset (taken frompairwise r2 values from the HapMap CEU database build 36/hg18). Symbols reflect genomic functional annotation, as indicated in the legend [61].Genes and the position of exons, as well as the direction of transcription, are noted in the lower box. The scale bar on the Y-axis changes according tothe strength of the association.doi:10.1371/journal.pgen.1003266.g004
Genetic Regulation of Thyroid Function
PLOS Genetics | www.plosgenetics.org 10 February 2013 | Volume 9 | Issue 2 | e1003266
Several detected loci have potential clinical relevance and have
been previously implicated both in Mendelian endocrine disorders
(LHX3 [MIMM#221750], FOXE1 [MIMM#241850], PDE8B
[MIMM#614190], NR3C2 [MIMM#177735], INSR [MIMM
#609968], GLIS3 [MIMM#610199]) and thyroid cancer (FOXE1
[19], VEGFA [53], IGFBP5 [54], INSR [55], NGR1 [32], MBIP
[32], FGF7 [56]). Furthermore, the TSH-associated variants were
found to contribute to TSH levels outside the reference range.
Overall, our findings add to the developing landscape of the
regulation of hypothalamic-pituitary-thyroid axis function and
the consequences of genetic variation for hypo- or hyperthyroid-
ism.
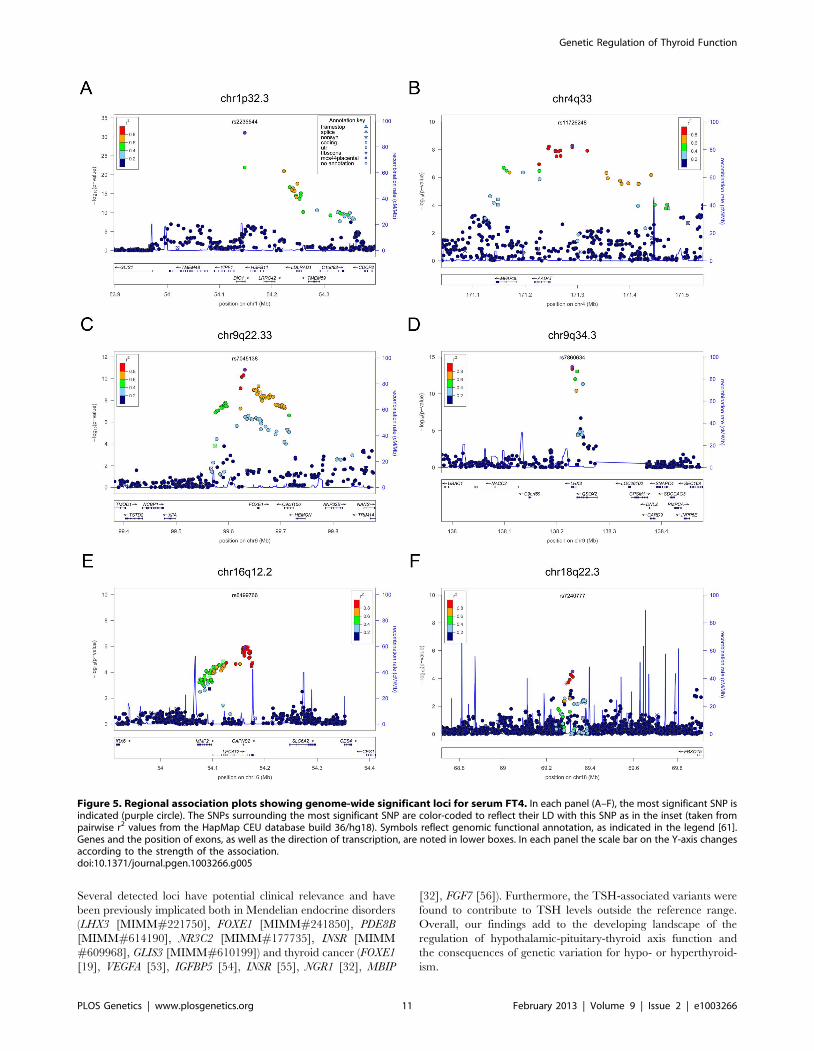
Figure 5. Regional association plots showing genome-wide significant loci for serum FT4. In each panel (A–F), the most significant SNP isindicated (purple circle). The SNPs surrounding the most significant SNP are color-coded to reflect their LD with this SNP as in the inset (taken frompairwise r2 values from the HapMap CEU database build 36/hg18). Symbols reflect genomic functional annotation, as indicated in the legend [61].Genes and the position of exons, as well as the direction of transcription, are noted in lower boxes. In each panel the scale bar on the Y-axis changesaccording to the strength of the association.doi:10.1371/journal.pgen.1003266.g005
Genetic Regulation of Thyroid Function
PLOS Genetics | www.plosgenetics.org 11 February 2013 | Volume 9 | Issue 2 | e1003266
Methods
Ethics statementAll human research was approved by the relevant institutional
review boards, and conducted according to the Declaration of Helsinki.
Cohort detailsCohort description, genotyping and statistical methods for
individual study cohorts are reported in Text S1 and Table S1.
Statistical analysesWe carried out a meta-analysis including up to 26,523,
individuals from 18 cohorts for TSH and up to 17,520 individuals
from 15 cohorts for FT4 (see Table 1). FT4 measures were not
available for all 21,955 individuals with TSH levels of the 15
participating cohorts. We combined evidence of associations from
single GWAS using an inverse variance meta-analysis, where
weights are proportional to the squared standard error of the beta
estimates, as implemented in METAL [57]. Prior to GWAS, each
study excluded individuals with known thyroid pathologies, taking
thyroid medication, who underwent thyroid surgery, and with out-
of-range TSH values (,0.4 mIU/L and .4 mIU/L), and an
inverse normal transformation was applied to each trait (Table
S1). Age, age-squared, and gender were fitted as covariates, as well
as principal components axes or additional variables, as required
(Table S1). Family-based correction was applied if necessary (see
Table S1). Uniform quality control filters were applied before
meta-analysis, including MAF ,0.01, call rate ,0.9, HWE
P,161026 for genotyped SNPs and low imputation quality
(defined as r2,0.3 or info ,0.4 if MACH [58] or IMPUTE
[59,60] were used, respectively) for imputed SNPs.
Genomic control was applied to individual studies if lambda was
.1.0. The overall meta-analysis showed no significant evidence
for inflated statistics (lambda for TSH, FT4 and were 1.05 and
1.03 respectively). To evaluate for heterogeneity in effect sizes
across populations, we used a chi-square test for heterogeneity,
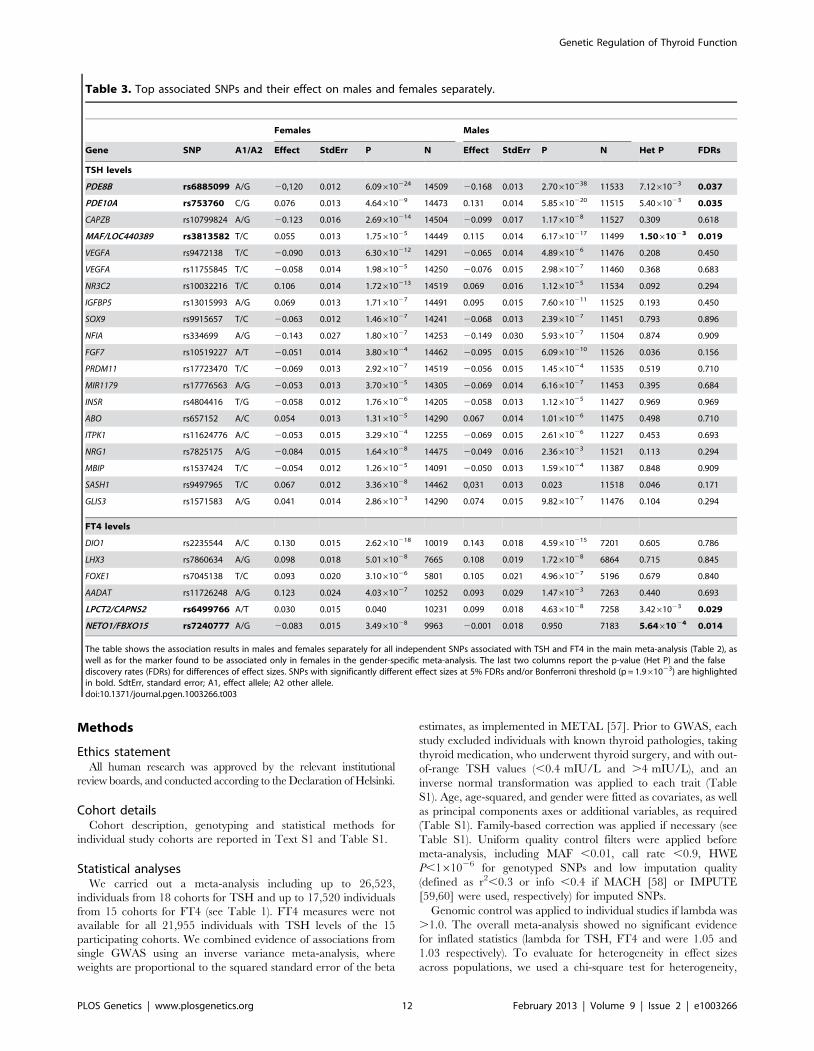
Table 3. Top associated SNPs and their effect on males and females separately.
Females Males
Gene SNP A1/A2 Effect StdErr P N Effect StdErr P N Het P FDRs
TSH levels
PDE8B rs6885099 A/G 20,120 0.012 6.09610224 14509 20.168 0.013 2.70610238 11533 7.1261023 0.037
PDE10A rs753760 C/G 0.076 0.013 4.6461029 14473 0.131 0.014 5.85610220 11515 5.4061023 0.035
CAPZB rs10799824 A/G 20.123 0.016 2.69610214 14504 20.099 0.017 1.1761028 11527 0.309 0.618
MAF/LOC440389 rs3813582 T/C 0.055 0.013 1.7561025 14449 0.115 0.014 6.17610217 11499 1.5061023 0.019
VEGFA rs9472138 T/C 20.090 0.013 6.30610212 14291 20.065 0.014 4.8961026 11476 0.208 0.450
VEGFA rs11755845 T/C 20.058 0.014 1.9861025 14250 20.076 0.015 2.9861027 11460 0.368 0.683
NR3C2 rs10032216 T/C 0.106 0.014 1.72610213 14519 0.069 0.016 1.1261025 11534 0.092 0.294
IGFBP5 rs13015993 A/G 0.069 0.013 1.7161027 14491 0.095 0.015 7.60610211 11525 0.193 0.450
SOX9 rs9915657 T/C 20.063 0.012 1.4661027 14241 20.068 0.013 2.3961027 11451 0.793 0.896
NFIA rs334699 A/G 20.143 0.027 1.8061027 14253 20.149 0.030 5.9361027 11504 0.874 0.909
FGF7 rs10519227 A/T 20.051 0.014 3.8061024 14462 20.095 0.015 6.09610210 11526 0.036 0.156
PRDM11 rs17723470 T/C 20.069 0.013 2.9261027 14519 20.056 0.015 1.4561024 11535 0.519 0.710
MIR1179 rs17776563 A/G 20.053 0.013 3.7061025 14305 20.069 0.014 6.1661027 11453 0.395 0.684
INSR rs4804416 T/G 20.058 0.012 1.7661026 14205 20.058 0.013 1.1261025 11427 0.969 0.969
ABO rs657152 A/C 0.054 0.013 1.3161025 14290 0.067 0.014 1.0161026 11475 0.498 0.710
ITPK1 rs11624776 A/C 20.053 0.015 3.2961024 12255 20.069 0.015 2.6161026 11227 0.453 0.693
NRG1 rs7825175 A/G 20.084 0.015 1.6461028 14475 20.049 0.016 2.3661023 11521 0.113 0.294
MBIP rs1537424 T/C 20.054 0.012 1.2661025 14091 20.050 0.013 1.5961024 11387 0.848 0.909
SASH1 rs9497965 T/C 0.067 0.012 3.3661028 14462 0,031 0.013 0.023 11518 0.046 0.171
GLIS3 rs1571583 A/G 0.041 0.014 2.8661023 14290 0.074 0.015 9.8261027 11476 0.104 0.294
FT4 levels
DIO1 rs2235544 A/C 0.130 0.015 2.62610218 10019 0.143 0.018 4.59610215 7201 0.605 0.786
LHX3 rs7860634 A/G 0.098 0.018 5.0161028 7665 0.108 0.019 1.7261028 6864 0.715 0.845
FOXE1 rs7045138 T/C 0.093 0.020 3.1061026 5801 0.105 0.021 4.9661027 5196 0.679 0.840
AADAT rs11726248 A/G 0.123 0.024 4.0361027 10252 0.093 0.029 1.4761023 7263 0.440 0.693
LPCT2/CAPNS2 rs6499766 A/T 0.030 0.015 0.040 10231 0.099 0.018 4.6361028 7258 3.4261023 0.029
NETO1/FBXO15 rs7240777 A/G 20.083 0.015 3.4961028 9963 20.001 0.018 0.950 7183 5.6461024 0.014
The table shows the association results in males and females separately for all independent SNPs associated with TSH and FT4 in the main meta-analysis (Table 2), aswell as for the marker found to be associated only in females in the gender-specific meta-analysis. The last two columns report the p-value (Het P) and the falsediscovery rates (FDRs) for differences of effect sizes. SNPs with significantly different effect sizes at 5% FDRs and/or Bonferroni threshold (p = 1.961023) are highlightedin bold. SdtErr, standard error; A1, effect allele; A2 other allele.doi:10.1371/journal.pgen.1003266.t003
Genetic Regulation of Thyroid Function
PLOS Genetics | www.plosgenetics.org 12 February 2013 | Volume 9 | Issue 2 | e1003266
implemented in METAL [57]. The same test was used to evalute
heterogeneity related to iodine intake, by comparing effect sizes
obtained in a meta-analysis of studies assessing individuals from
South Europe (InChianti, MICROS, Val Borbera, SardiNIA,
totaling up to 7,488 subjects) with those estimated in a meta-
analysis of studies assessing individuals from North America
(BLSA, CHS, FHS, OOA, totaling up to 5,407 subjects). Finally,
the main meta-analysis was carried out independently by two
analysts who obtained identical results.
Conditional analysisTo identify independent signals, each study performed GWA
analyses for both TSH and FT4 by adding the lead SNPs found in
the primary analysis (19 for TSH, and 4 for FT4, see Table 2) as
additional covariates to the basic model, and removing those from
the test data set. When lead SNPs were not available, the best
proxies (r2.0.8) were included. We then performed a meta-analysis
on the conditional GWAS results, using the same method and filters
as described above. We used the standard genome-wide significance
cutoff (P,561028) to declare a significant secondary association.
Gender-specific analysisTo identify sex-specific effects, each study performed GWA
analyses for each gender separately, using the same covariates and
transformation as in the basic model (with the exception of gender
covariate). We then performed a meta-analysis on association
results using the same method and filters described for the primary
analysis. To evaluate sex-specific differences we tested heteroge-
neity between effect sizes as described above. False-discovery rates
(FDRs) on the 26 associated SNPs were calculated with R’s
p.adjust() procedure via the method of Benjamini and Hochberg
[24].
Variance explainedThe variance explained by the strongest associated SNPs was
calculated, for each trait and in each cohort, as the difference of
R2 adjusted observed in the full and the basic models, where the
full model contains all the independent SNPs in addition to the
covariates. The estimates from each cohort were combined using a
weighted average, with weights proportional to the cohort sample
size.
Extreme phenotype analysisTo evaluate the impact of the detected variants with clinically
relevant TSH levels, we compared the allele frequencies observed
in different categories of individuals in a case-control approach.
Specifically, we compared individuals in the upper and lower TSH
tails (individuals with TSH .4 mIU/L and TSH ,0.4 mIU/L,
respectively, whom were excluded for the GWAS analyses), as well
as individuals in each tail with those in the normal TSH range. In
the first case, individuals in the lower tail were considered controls
and those in the upper tail cases. In the other two cases, we defined
individuals in the normal range as controls and individuals on the
two tails cases. To avoid sources of bias, individuals taking thyroid
medication and/or with thyroid surgery were excluded. Only
unrelated individuals were selected from the family-based cohort
SardiNIA, while GEE correction was applied to the TwinsUK
dataset. Results from single cohorts were then meta-analyzed. We
first assessed the global impact of the 20 TSH- and 6 FT4-
associated variants by defining a genotype-risk score (GRS) for
each individual as the weighted sum of TSH- and FT4-elevating
alleles, with weights proportional to the effect estimated in the
meta-analysis. For each comparison, we then calculated quartiles
from the global distribution (cases+controls) of the genotype score
and used quartile 1 as the baseline reference to compare the
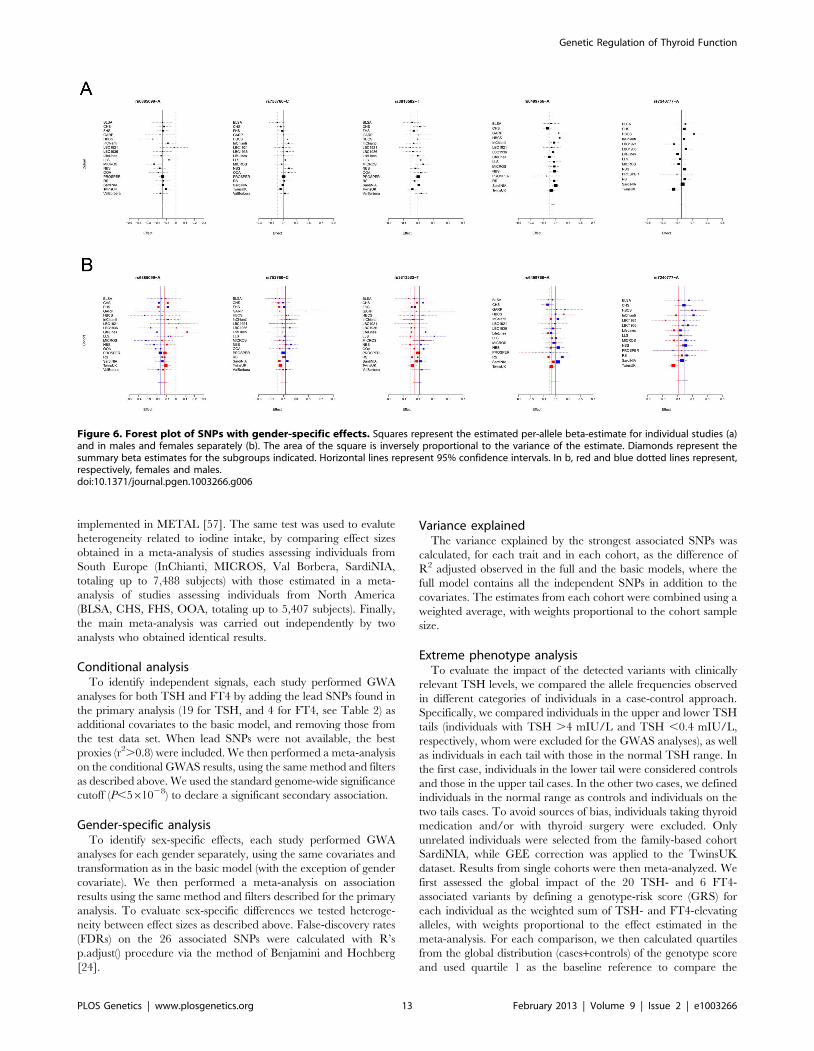
Figure 6. Forest plot of SNPs with gender-specific effects. Squares represent the estimated per-allele beta-estimate for individual studies (a)and in males and females separately (b). The area of the square is inversely proportional to the variance of the estimate. Diamonds represent thesummary beta estimates for the subgroups indicated. Horizontal lines represent 95% confidence intervals. In b, red and blue dotted lines represent,respectively, females and males.doi:10.1371/journal.pgen.1003266.g006
Genetic Regulation of Thyroid Function
PLOS Genetics | www.plosgenetics.org 13 February 2013 | Volume 9 | Issue 2 | e1003266
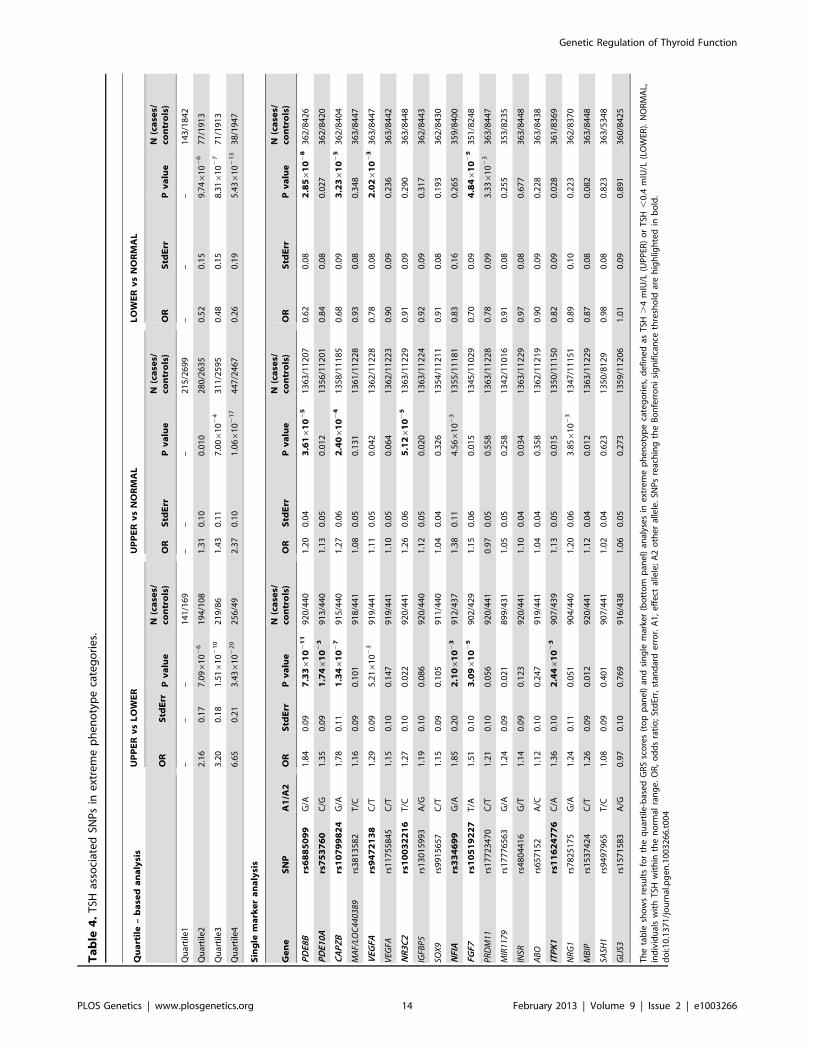
Ta
ble
4.
TSH
asso
ciat
ed
SNP
sin
ext
rem
ep
he
no
typ
eca
teg
ori
es.
Qu
art
ile
–b
ase
da
na
lysi
sU
PP
ER
vs
LO
WE
RU
PP
ER
vs
NO
RM
AL
LO
WE
Rv
sN
OR
MA
L
OR
Std
Err
Pv
alu
eN
(ca
ses/
con
tro
ls)
OR
Std
Err
Pv
alu
eN
(ca
ses/
con
tro
ls)
OR
Std
Err
Pv
alu
eN
(ca
ses/
con
tro
ls)
Qu
arti
le1
––
–1
41
/16
9–
––
21
5/2
69
9–
––
14
3/1
84
2
Qu
arti
le2
2.1
60
.17
7.0
961
02
61
94
/10
81
.31
0.1
00
.01
02
80
/26
35
0.5
20
.15
9.7
461
02
67
7/1
91
3
Qu
arti
le3
3.2
00
.18
1.5
161
02
10
21
9/8
61
.43
0.1
17
.006
10
24
31
1/2
59
50
.48
0.1
58
.316
10
27
71
/19
13
Qu
arti
le4
6.6
50
.21
3.4
361
02
20
25
6/4
92
.37
0.1
01
.066
10
21
74
47
/24
67
0.2
60
.19
5.4
361
02
13
38
/19
47
Sin
gle
ma
rke
ra
na
lysi
s
Ge
ne
SN
PA
1/A
2O
RS
tdE
rrP
va
lue
N(c
ase
s/co
ntr
ols
)O
RS
tdE
rrP
va
lue
N(c
ase
s/co
ntr
ols
)O
RS
tdE
rrP
va
lue
N(c
ase
s/co
ntr
ols
)
PD
E8B
rs6
88
50
99
G/A
1.8
40
.09
7.3
36
10
21
19
20
/44
01
.20
0.0
43
.616
10
25
13
63
/11
20
70
.62
0.0
82
.856
10
28
36
2/8
42
6
PD
E10
Ars
75
37
60
C/G
1.3
50
.09
1.7
46
10
23
91
3/4
40
1.1
30
.05
0.0
12
13
56
/11
20
10
.84
0.0
80
.02
73
62
/84
20
CA
PZ
Brs
10
79
98
24
G/A
1.7
80
.11
1.3
46
10
27
91
5/4
40
1.2
70
.06
2.4
06
10
24
13
58
/11
18
50
.68
0.0
93
.236
10
25
36
2/8
40
4
MA
F/LO
C44
0389
rs3
81
35
82
T/C
1.1
60
.09
0.1
01
91
8/4
41
1.0
80
.05
0.1
31
13
61
/11
22
80
.93
0.0
80
.34
83
63
/84
47
VEG
FArs
94
72
13
8C
/T1
.29
0.0
95
.216
10
23
91
9/4
41
1.1
10
.05
0.0
42
13
62
/11
22
80
.78
0.0
82
.026
10
23
36
3/8
44
7
VEG
FArs
11
75
58
45
C/T
1.1
50
.10
0.1
47
91
9/4
41
1.1
00
.05
0.0
64
13
62
/11
22
30
.90
0.0
90
.23
63
63
/84
42
NR
3C
2rs
10
03
22
16
T/C
1.2
70
.10
0.0
22
92
0/4
41
1.2
60
.06
5.1
26
10
25
13
63
/11
22
90
.91
0.0
90
.29
03
63
/84
48
IGFB
P5
rs1
30
15
99
3A
/G1
.19
0.1
00
.08
69
20
/44
01
.12
0.0
50
.02
01
36
3/1
12
24
0.9
20
.09
0.3
17
36
2/8
44
3
SOX
9rs
99
15
65
7C
/T1
.15
0.0
90
.10
59
11
/44
01
.04
0.0
40
.32
61
35
4/1
12
11
0.9
10
.08
0.1
93
36
2/8
43
0
NFI
Ars
33
46
99
G/A
1.8
50
.20
2.1
06
10
23
91
2/4
37
1.3
80
.11
4.5
661
02
31
35
5/1
11
81
0.8
30
.16
0.2
65
35
9/8
40
0
FGF7
rs1
05
19
22
7T
/A1
.51
0.1
03
.096
10
25
90
2/4
29
1.1
50
.06
0.0
15
13
45
/11
02
90
.70
0.0
94
.846
10
25
35
1/8
24
8
PR
DM
11rs
17
72
34
70
C/T
1.2
10
.10
0.0
56
92
0/4
41
0.9
70
.05
0.5
58
13
63
/11
22
80
.78
0.0
93
.336
10
23
36
3/8
44
7
MIR
1179
rs1
77
76
56
3G
/A1
.24
0.0
90
.02
18
99
/43
11
.05
0.0
50
.25
81
34
2/1
10
16
0.9
10
.08
0.2
55
35
3/8
23
5
INSR
rs4
80
44
16
G/T
1.1
40
.09
0.1
23
92
0/4
41
1.1
00
.04
0.0
34
13
63
/11
22
90
.97
0.0
80
.67
73
63
/84
48
AB
Ors
65
71
52
A/C
1.1
20
.10
0.2
47
91
9/4
41
1.0
40
.04
0.3
58
13
62
/11
21
90
.90
0.0
90
.22
83
63
/84
38
ITP
K1
rs1
16
24
77
6C
/A1
.36
0.1
02
.446
10
23
90
7/4
39
1.1
30
.05
0.0
15
13
50
/11
15
00
.82
0.0
90
.02
83
61
/83
69
NR
G1
rs7
82
51
75
G/A
1.2
40
.11
0.0
51
90
4/4
40
1.2
00
.06
3.8
561
02
31
34
7/1
11
51
0.8
90
.10
0.2
23
36
2/8
37
0
MB
IPrs
15
37
42
4C
/T1
.26
0.0
90
.01
29
20
/44
11
.12
0.0
40
.01
21
36
3/1
12
29
0.8
70
.08
0.0
82
36
3/8
44
8
SASH
1rs
94
97
96
5T
/C1
.08
0.0
90
.40
19
07
/44
11
.02
0.0
40
.62
31
35
0/8
12
90
.98
0.0
80
.82
33
63
/53
48
GLI
S3rs
15
71
58
3A
/G0
.97
0.1
00
.76
99
16
/43
81
.06
0.0
50
.27
31
35
9/1
12
06
1.0
10
.09
0.8
91
36
0/8
42
5
Th
eta
ble
sho
ws
resu
lts
for
the
qu
arti
le-b
ase
dG
RS
sco
res
(to
pp
ane
l)an
dsi
ng
lem
arke
r(b
ott
om
pan
el)
anal
yse
sin
ext
rem
ep
he
no
typ
eca
teg
ori
es,
de
fin
ed
asT
SH.
4m
IU/L
(UP
PER
)o
rT
SH,
0.4
mIU
/L(L
OW
ER).
NO
RM
AL,
ind
ivid
ual
sw
ith
TSH
wit
hin
the
no
rmal
ran
ge
.O
R,
od
ds
rati
o;
Std
Err,
stan
dar
de
rro
r.A
1,
eff
ect
alle
le;
A2
oth
er
alle
le.
SNP
sre
ach
ing
the
Bo
nfe
rro
ni
sig
nif
ican
ceth
resh
old
are
hig
hlig
hte
din
bo
ld.
do
i:10
.13
71
/jo
urn
al.p
ge
n.1
00
32
66
.t0
04
Genetic Regulation of Thyroid Function
PLOS Genetics | www.plosgenetics.org 14 February 2013 | Volume 9 | Issue 2 | e1003266
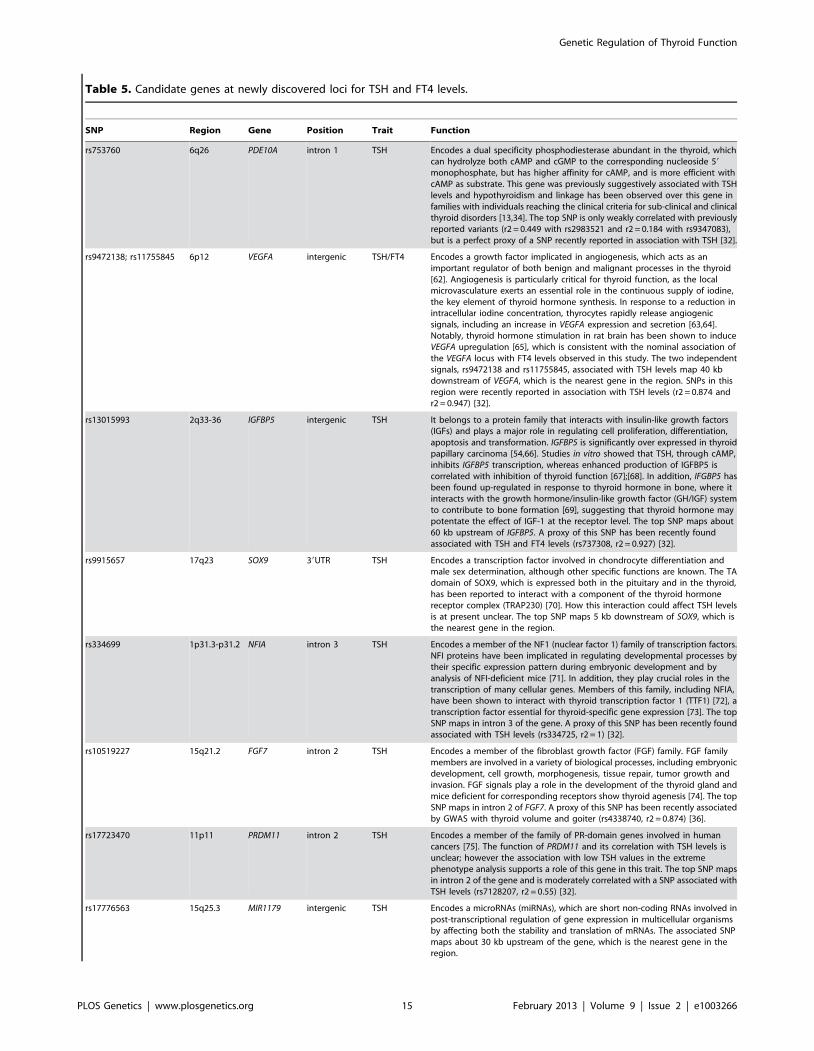
Table 5. Candidate genes at newly discovered loci for TSH and FT4 levels.
SNP Region Gene Position Trait Function
rs753760 6q26 PDE10A intron 1 TSH Encodes a dual specificity phosphodiesterase abundant in the thyroid, whichcan hydrolyze both cAMP and cGMP to the corresponding nucleoside 59
monophosphate, but has higher affinity for cAMP, and is more efficient withcAMP as substrate. This gene was previously suggestively associated with TSHlevels and hypothyroidism and linkage has been observed over this gene infamilies with individuals reaching the clinical criteria for sub-clinical and clinicalthyroid disorders [13,34]. The top SNP is only weakly correlated with previouslyreported variants (r2 = 0.449 with rs2983521 and r2 = 0.184 with rs9347083),but is a perfect proxy of a SNP recently reported in association with TSH [32].
rs9472138; rs11755845 6p12 VEGFA intergenic TSH/FT4 Encodes a growth factor implicated in angiogenesis, which acts as animportant regulator of both benign and malignant processes in the thyroid[62]. Angiogenesis is particularly critical for thyroid function, as the localmicrovasculature exerts an essential role in the continuous supply of iodine,the key element of thyroid hormone synthesis. In response to a reduction inintracellular iodine concentration, thyrocytes rapidly release angiogenicsignals, including an increase in VEGFA expression and secretion [63,64].Notably, thyroid hormone stimulation in rat brain has been shown to induceVEGFA upregulation [65], which is consistent with the nominal association ofthe VEGFA locus with FT4 levels observed in this study. The two independentsignals, rs9472138 and rs11755845, associated with TSH levels map 40 kbdownstream of VEGFA, which is the nearest gene in the region. SNPs in thisregion were recently reported in association with TSH levels (r2 = 0.874 andr2 = 0.947) [32].
rs13015993 2q33-36 IGFBP5 intergenic TSH It belongs to a protein family that interacts with insulin-like growth factors(IGFs) and plays a major role in regulating cell proliferation, differentiation,apoptosis and transformation. IGFBP5 is significantly over expressed in thyroidpapillary carcinoma [54,66]. Studies in vitro showed that TSH, through cAMP,inhibits IGFBP5 transcription, whereas enhanced production of IGFBP5 iscorrelated with inhibition of thyroid function [67];[68]. In addition, IFGBP5 hasbeen found up-regulated in response to thyroid hormone in bone, where itinteracts with the growth hormone/insulin-like growth factor (GH/IGF) systemto contribute to bone formation [69], suggesting that thyroid hormone maypotentate the effect of IGF-1 at the receptor level. The top SNP maps about60 kb upstream of IGFBP5. A proxy of this SNP has been recently foundassociated with TSH and FT4 levels (rs737308, r2 = 0.927) [32].
rs9915657 17q23 SOX9 39UTR TSH Encodes a transcription factor involved in chondrocyte differentiation andmale sex determination, although other specific functions are known. The TAdomain of SOX9, which is expressed both in the pituitary and in the thyroid,has been reported to interact with a component of the thyroid hormonereceptor complex (TRAP230) [70]. How this interaction could affect TSH levelsis at present unclear. The top SNP maps 5 kb downstream of SOX9, which isthe nearest gene in the region.
rs334699 1p31.3-p31.2 NFIA intron 3 TSH Encodes a member of the NF1 (nuclear factor 1) family of transcription factors.NFI proteins have been implicated in regulating developmental processes bytheir specific expression pattern during embryonic development and byanalysis of NFI-deficient mice [71]. In addition, they play crucial roles in thetranscription of many cellular genes. Members of this family, including NFIA,have been shown to interact with thyroid transcription factor 1 (TTF1) [72], atranscription factor essential for thyroid-specific gene expression [73]. The topSNP maps in intron 3 of the gene. A proxy of this SNP has been recently foundassociated with TSH levels (rs334725, r2 = 1) [32].
rs10519227 15q21.2 FGF7 intron 2 TSH Encodes a member of the fibroblast growth factor (FGF) family. FGF familymembers are involved in a variety of biological processes, including embryonicdevelopment, cell growth, morphogenesis, tissue repair, tumor growth andinvasion. FGF signals play a role in the development of the thyroid gland andmice deficient for corresponding receptors show thyroid agenesis [74]. The topSNP maps in intron 2 of FGF7. A proxy of this SNP has been recently associatedby GWAS with thyroid volume and goiter (rs4338740, r2 = 0.874) [36].
rs17723470 11p11 PRDM11 intron 2 TSH Encodes a member of the family of PR-domain genes involved in humancancers [75]. The function of PRDM11 and its correlation with TSH levels isunclear; however the association with low TSH values in the extremephenotype analysis supports a role of this gene in this trait. The top SNP mapsin intron 2 of the gene and is moderately correlated with a SNP associated withTSH levels (rs7128207, r2 = 0.55) [32].
rs17776563 15q25.3 MIR1179 intergenic TSH Encodes a microRNAs (miRNAs), which are short non-coding RNAs involved inpost-transcriptional regulation of gene expression in multicellular organismsby affecting both the stability and translation of mRNAs. The associated SNPmaps about 30 kb upstream of the gene, which is the nearest gene in theregion.
Genetic Regulation of Thyroid Function
PLOS Genetics | www.plosgenetics.org 15 February 2013 | Volume 9 | Issue 2 | e1003266
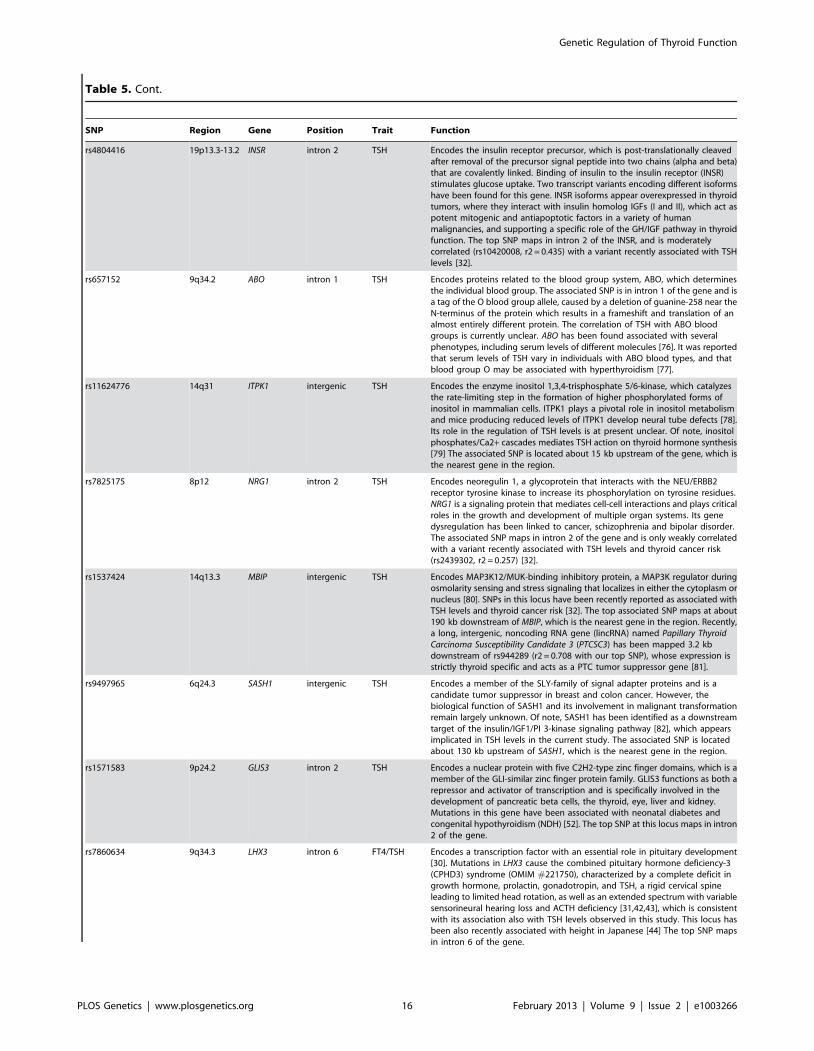
Table 5. Cont.
SNP Region Gene Position Trait Function
rs4804416 19p13.3-13.2 INSR intron 2 TSH Encodes the insulin receptor precursor, which is post-translationally cleavedafter removal of the precursor signal peptide into two chains (alpha and beta)that are covalently linked. Binding of insulin to the insulin receptor (INSR)stimulates glucose uptake. Two transcript variants encoding different isoformshave been found for this gene. INSR isoforms appear overexpressed in thyroidtumors, where they interact with insulin homolog IGFs (I and II), which act aspotent mitogenic and antiapoptotic factors in a variety of humanmalignancies, and supporting a specific role of the GH/IGF pathway in thyroidfunction. The top SNP maps in intron 2 of the INSR, and is moderatelycorrelated (rs10420008, r2 = 0.435) with a variant recently associated with TSHlevels [32].
rs657152 9q34.2 ABO intron 1 TSH Encodes proteins related to the blood group system, ABO, which determinesthe individual blood group. The associated SNP is in intron 1 of the gene and isa tag of the O blood group allele, caused by a deletion of guanine-258 near theN-terminus of the protein which results in a frameshift and translation of analmost entirely different protein. The correlation of TSH with ABO bloodgroups is currently unclear. ABO has been found associated with severalphenotypes, including serum levels of different molecules [76]. It was reportedthat serum levels of TSH vary in individuals with ABO blood types, and thatblood group O may be associated with hyperthyroidism [77].
rs11624776 14q31 ITPK1 intergenic TSH Encodes the enzyme inositol 1,3,4-trisphosphate 5/6-kinase, which catalyzesthe rate-limiting step in the formation of higher phosphorylated forms ofinositol in mammalian cells. ITPK1 plays a pivotal role in inositol metabolismand mice producing reduced levels of ITPK1 develop neural tube defects [78].Its role in the regulation of TSH levels is at present unclear. Of note, inositolphosphates/Ca2+ cascades mediates TSH action on thyroid hormone synthesis[79] The associated SNP is located about 15 kb upstream of the gene, which isthe nearest gene in the region.
rs7825175 8p12 NRG1 intron 2 TSH Encodes neoregulin 1, a glycoprotein that interacts with the NEU/ERBB2receptor tyrosine kinase to increase its phosphorylation on tyrosine residues.NRG1 is a signaling protein that mediates cell-cell interactions and plays criticalroles in the growth and development of multiple organ systems. Its genedysregulation has been linked to cancer, schizophrenia and bipolar disorder.The associated SNP maps in intron 2 of the gene and is only weakly correlatedwith a variant recently associated with TSH levels and thyroid cancer risk(rs2439302, r2 = 0.257) [32].
rs1537424 14q13.3 MBIP intergenic TSH Encodes MAP3K12/MUK-binding inhibitory protein, a MAP3K regulator duringosmolarity sensing and stress signaling that localizes in either the cytoplasm ornucleus [80]. SNPs in this locus have been recently reported as associated withTSH levels and thyroid cancer risk [32]. The top associated SNP maps at about190 kb downstream of MBIP, which is the nearest gene in the region. Recently,a long, intergenic, noncoding RNA gene (lincRNA) named Papillary ThyroidCarcinoma Susceptibility Candidate 3 (PTCSC3) has been mapped 3.2 kbdownstream of rs944289 (r2 = 0.708 with our top SNP), whose expression isstrictly thyroid specific and acts as a PTC tumor suppressor gene [81].
rs9497965 6q24.3 SASH1 intergenic TSH Encodes a member of the SLY-family of signal adapter proteins and is acandidate tumor suppressor in breast and colon cancer. However, thebiological function of SASH1 and its involvement in malignant transformationremain largely unknown. Of note, SASH1 has been identified as a downstreamtarget of the insulin/IGF1/PI 3-kinase signaling pathway [82], which appearsimplicated in TSH levels in the current study. The associated SNP is locatedabout 130 kb upstream of SASH1, which is the nearest gene in the region.
rs1571583 9p24.2 GLIS3 intron 2 TSH Encodes a nuclear protein with five C2H2-type zinc finger domains, which is amember of the GLI-similar zinc finger protein family. GLIS3 functions as both arepressor and activator of transcription and is specifically involved in thedevelopment of pancreatic beta cells, the thyroid, eye, liver and kidney.Mutations in this gene have been associated with neonatal diabetes andcongenital hypothyroidism (NDH) [52]. The top SNP at this locus maps in intron2 of the gene.
rs7860634 9q34.3 LHX3 intron 6 FT4/TSH Encodes a transcription factor with an essential role in pituitary development[30]. Mutations in LHX3 cause the combined pituitary hormone deficiency-3(CPHD3) syndrome (OMIM #221750), characterized by a complete deficit ingrowth hormone, prolactin, gonadotropin, and TSH, a rigid cervical spineleading to limited head rotation, as well as an extended spectrum with variablesensorineural hearing loss and ACTH deficiency [31,42,43], which is consistentwith its association also with TSH levels observed in this study. This locus hasbeen also recently associated with height in Japanese [44] The top SNP mapsin intron 6 of the gene.
Genetic Regulation of Thyroid Function
PLOS Genetics | www.plosgenetics.org 16 February 2013 | Volume 9 | Issue 2 | e1003266
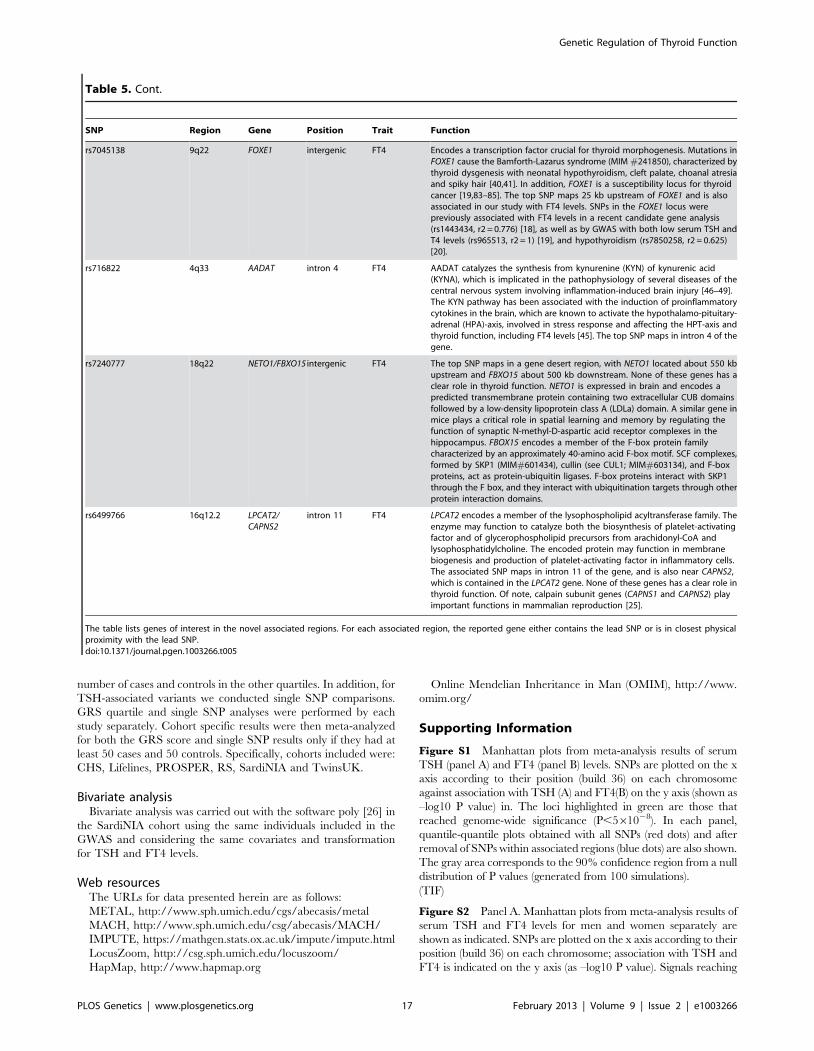
number of cases and controls in the other quartiles. In addition, for
TSH-associated variants we conducted single SNP comparisons.
GRS quartile and single SNP analyses were performed by each
study separately. Cohort specific results were then meta-analyzed
for both the GRS score and single SNP results only if they had at
least 50 cases and 50 controls. Specifically, cohorts included were:
CHS, Lifelines, PROSPER, RS, SardiNIA and TwinsUK.
Bivariate analysisBivariate analysis was carried out with the software poly [26] in
the SardiNIA cohort using the same individuals included in the
GWAS and considering the same covariates and transformation
for TSH and FT4 levels.
Web resourcesThe URLs for data presented herein are as follows:
METAL, http://www.sph.umich.edu/cgs/abecasis/metal
MACH, http://www.sph.umich.edu/csg/abecasis/MACH/
IMPUTE, https://mathgen.stats.ox.ac.uk/impute/impute.html
LocusZoom, http://csg.sph.umich.edu/locuszoom/
HapMap, http://www.hapmap.org
Online Mendelian Inheritance in Man (OMIM), http://www.
omim.org/
Supporting Information
Figure S1 Manhattan plots from meta-analysis results of serum
TSH (panel A) and FT4 (panel B) levels. SNPs are plotted on the x
axis according to their position (build 36) on each chromosome
against association with TSH (A) and FT4(B) on the y axis (shown as
–log10 P value) in. The loci highlighted in green are those that
reached genome-wide significance (P,561028). In each panel,
quantile-quantile plots obtained with all SNPs (red dots) and after
removal of SNPs within associated regions (blue dots) are also shown.
The gray area corresponds to the 90% confidence region from a null
distribution of P values (generated from 100 simulations).
(TIF)
Figure S2 Panel A. Manhattan plots from meta-analysis results of
serum TSH and FT4 levels for men and women separately are
shown as indicated. SNPs are plotted on the x axis according to their
position (build 36) on each chromosome; association with TSH and
FT4 is indicated on the y axis (as –log10 P value). Signals reaching
Table 5. Cont.
SNP Region Gene Position Trait Function
rs7045138 9q22 FOXE1 intergenic FT4 Encodes a transcription factor crucial for thyroid morphogenesis. Mutations inFOXE1 cause the Bamforth-Lazarus syndrome (MIM #241850), characterized bythyroid dysgenesis with neonatal hypothyroidism, cleft palate, choanal atresiaand spiky hair [40,41]. In addition, FOXE1 is a susceptibility locus for thyroidcancer [19,83–85]. The top SNP maps 25 kb upstream of FOXE1 and is alsoassociated in our study with FT4 levels. SNPs in the FOXE1 locus werepreviously associated with FT4 levels in a recent candidate gene analysis(rs1443434, r2 = 0.776) [18], as well as by GWAS with both low serum TSH andT4 levels (rs965513, r2 = 1) [19], and hypothyroidism (rs7850258, r2 = 0.625)[20].
rs716822 4q33 AADAT intron 4 FT4 AADAT catalyzes the synthesis from kynurenine (KYN) of kynurenic acid(KYNA), which is implicated in the pathophysiology of several diseases of thecentral nervous system involving inflammation-induced brain injury [46–49].The KYN pathway has been associated with the induction of proinflammatorycytokines in the brain, which are known to activate the hypothalamo-pituitary-adrenal (HPA)-axis, involved in stress response and affecting the HPT-axis andthyroid function, including FT4 levels [45]. The top SNP maps in intron 4 of thegene.
rs7240777 18q22 NETO1/FBXO15 intergenic FT4 The top SNP maps in a gene desert region, with NETO1 located about 550 kbupstream and FBXO15 about 500 kb downstream. None of these genes has aclear role in thyroid function. NETO1 is expressed in brain and encodes apredicted transmembrane protein containing two extracellular CUB domainsfollowed by a low-density lipoprotein class A (LDLa) domain. A similar gene inmice plays a critical role in spatial learning and memory by regulating thefunction of synaptic N-methyl-D-aspartic acid receptor complexes in thehippocampus. FBOX15 encodes a member of the F-box protein familycharacterized by an approximately 40-amino acid F-box motif. SCF complexes,formed by SKP1 (MIM#601434), cullin (see CUL1; MIM#603134), and F-boxproteins, act as protein-ubiquitin ligases. F-box proteins interact with SKP1through the F box, and they interact with ubiquitination targets through otherprotein interaction domains.
rs6499766 16q12.2 LPCAT2/CAPNS2
intron 11 FT4 LPCAT2 encodes a member of the lysophospholipid acyltransferase family. Theenzyme may function to catalyze both the biosynthesis of platelet-activatingfactor and of glycerophospholipid precursors from arachidonyl-CoA andlysophosphatidylcholine. The encoded protein may function in membranebiogenesis and production of platelet-activating factor in inflammatory cells.The associated SNP maps in intron 11 of the gene, and is also near CAPNS2,which is contained in the LPCAT2 gene. None of these genes has a clear role inthyroid function. Of note, calpain subunit genes (CAPNS1 and CAPNS2) playimportant functions in mammalian reproduction [25].
The table lists genes of interest in the novel associated regions. For each associated region, the reported gene either contains the lead SNP or is in closest physicalproximity with the lead SNP.doi:10.1371/journal.pgen.1003266.t005
Genetic Regulation of Thyroid Function
PLOS Genetics | www.plosgenetics.org 17 February 2013 | Volume 9 | Issue 2 | e1003266
genome-wide statistical significance in the gender specific analysis
are shown in green. Panel B. Quantile-quantile plots are shown for
all SNPs (red dots) and after removal of SNPs within associated
regions (blue dots).
(TIF)
Figure S3 Ingenuity pathway analysis (IPA) results for candidate
genes in the TSH and FT4 associated loci. A single protein
network connects most of the identified loci.
(PDF)
Table S1 Analysis details and methods for individual GWAS studies.
(XLS)
Table S2 GWAS results of top SNPs for single cohorts. In the
row named ‘‘G/I’’ we report the imputation quality (RSQR or
INFO, according to study specific imputation method) or indicate
with the letter ‘‘G’’ if the SNP was genotyped (G).
(XLSX)
Table S3 Heterogeneity analysis of South European vs North
American cohorts. The table shows the results of the two meta-
analyses carried out in studies of South Europe and North America
individuals, respectively. For each meta-analysis, we report the
frequency of the effect allele (FreqA1), the effect size and the
corresponding standard error (Effect, StdErr), the combined
association pvalue (P), the pvalue for heterogeneity between studies
(Het P), and the number of samples analyzed (N). The last two
columns report the pvalue for differences of the effect size estimated
in the two groups, and the total number of samples analyzed.
(DOC)
Table S4 Association results for TSH and FT4 overlapping loci
and their involvement in the negative feedback loop. The table
shows the association results for all independent TSH (top panel)
and FT4 (bottom panel) associated SNPs with FT4 and TSH
levels, respectively. Effect sizes are standardized, so they represent
the estimated phenotypic change, per each copy of the effect allele,
in standard deviation units.
(DOC)
Table S5 Genotype risk score for TSH alleles in pregnant women.
(DOC)
Table S6 Association between TSH genetic risk score in
pregnant women and subclinical hypothyroidism in pregnancy.
Genotype risk score (GRS) was calculated in women with TSH
level above reference range (.4.21 mIU/L) versus TSH level
#4.21 mIU/L. Notably, excluding the 2 women with overt
hypothyroidism (TSH.4.21 mIU/L and FT4 ,9.13 pg/L), the
results were essentially unchanged: Effect = 0.163, StdErr = 0.080,
P = 0.043, OR = 1.18. StdErr, standard error, OR, odds ratio.
(DOC)
Table S7 Association of SNPs reported by Gudmundsson and
colleagues in our dataset. The table shows the association results
for SNPs reported by Gudmundsson and colleagues [32] with
TSH and FT4 levels available in our data-set. When the same
marker was not available, we reported a proxy (r2.0.8) and the
relative r2. StdErr, standard error. Loci reaching genome-wide
significance in our data set with either the same SNP or a proxy
are highlighted in bold.
(DOC)
Text S1 Supplemental acknowledgments and funding informa-
tion, cohort description, phenotyping, genotyping, analysis
methods, supplemental references.
(DOC)
Acknowledgments
We thank all study participants, volunteers, and study personnel that made
this work possible. We also thank Dr. Dawood Dadekula for running
Ingenuity Pathway Analysis (IPA) on candidate genes. A detailed list of
acknowledgements for individual study cohorts is available in Text S1.
Author Contributions
Conceived and designed the experiments: S Sanna, RP Peeters, S Naitza.
Performed the experiments: CB Volpato, SG Wilson, AR Cappola, J
Deelen, LM Lopez, IM Nolte, S Bandinelli, M Beekman, BM Buckley, C
Camaschella, G Davies, MCH de Visser, L Ferrucci, T Forsen, TM
Frayling, AT Hattersley, AR Hermus, A Hofman, E Kajantie, EM Lim, C
Masciullo, R Nagaraja, A Palotie, MG Piras, BM Psaty, K Raikkonen, JB
Richards, F Rivadeneira, C Sala, N Sattar, N Soranzo, JM Starr, DJ Stott,
FGCJ Sweep, G Usala, MM van der Klauw, D van Heemst, JP Walsh, E
Widen, G Zhai, IJ Deary, JG Eriksson, CS Fox, LA Kiemeney, EP
Slagboom, AG Uitterlinden, B Vaidya, BHR Wolffenbuttel, TD Spector,
AA Hicks, RP Peeters. Analyzed the data: E Porcu, M Medici, G Pistis, SG
Wilson, SD Bos, J Deelen, RM Freathy, M den Heijer, J Lahti, C Liu, LM
Lopez, IM Nolte, JR O’Connell, T Tanaka, S Trompet, A Arnold, M
Beekman, S Bohringer, SJ Brown, AJM de Craen, I Ford, TM Frayling, M
Gogele, AT Hattersley, JJ Houwing-Duistermaat, RA Jensen, C Minelli, JB
Richards, SH Vermeulen, E Widen, G Zhai, B Vaidya, JI Rotter, S Sanna.
Contributed reagents/materials/analysis tools: AR Cappola, S Trompet,
AJM de Craen, I Ford, LT Forsen, L Fugazzola, AT Hattersley, AR
Hermus, AA Hicks, E Kajantie, M Kloppenburg, EM Lim, S Mariotti, BD
Mitchell, RT Netea-Maier, A Palotie, L Persani, BM Psaty, K Raikkonen,
F Rivadeneira, MM Sabra, BM Shields, JM Starr, A van Mullem, WE
Visser, JP Walsh, RGJ Westendorp, F Cucca, IJ Deary, JG Eriksson, L
Ferrucci, CS Fox, JW Jukema, PP Pramstaller, JI Rotter, D Schlessinger,
AR Shuldiner, EP Slagboom, AG Uitterlinden, B Vaidya, TJ Visser, BHR
Wolffenbuttel, TD Spector, D Toniolo, RP Peeters. Wrote the paper: E
Porcu, M Medici, G Pistis, CB Volpato, AR Cappola, SD Bos, I
Meulenbelt, D Toniolo, S Sanna, RP Peeters, S Naitza. Performed meta-
analyses: E. Porcu, M. Medici, G. Pistis.
References
1. Toft AD (2001) Clinical practice. Subclinical hyperthyroidism. N Engl J Med
345: 512–516.
2. Cooper DS (2001) Clinical practice. Subclinical hypothyroidism. N Engl J Med
345: 260–265.
3. Fernandez-Real JM, Lopez-Bermejo A, Castro A, Casamitjana R, Ricart W
(2006) Thyroid function is intrinsically linked to insulin sensitivity and
endothelium-dependent vasodilation in healthy euthyroid subjects. J Clin
Endocrinol Metab 91: 3337–3343.
4. Biondi B, Cooper DS (2008) The clinical significance of subclinical thyroid
dysfunction. Endocr Rev 29: 76–131.
5. Chiamolera MI, Wondisford FE (2009) Minireview: Thyrotropin-releasing hormone
and the thyroid hormone feedback mechanism. Endocrinology 150: 1091–1096.
6. Andersen S, Pedersen KM, Bruun NH, Laurberg P (2002) Narrow individual
variations in serum T(4) and T(3) in normal subjects: a clue to the understanding
of subclinical thyroid disease. J Clin Endocrinol Metab 87: 1068–1072.
7. Bulow Pedersen I, Knudsen N, Jorgensen T, Perrild H, Ovesen L, et al. (2002)
Large differences in incidences of overt hyper- and hypothyroidism associated
with a small difference in iodine intake: a prospective comparative register-based
population survey. J Clin Endocrinol Metab 87: 4462–4469.
8. Franklyn JA, Ramsden DB, Sheppard MC (1985) The influence of age and sex
on tests of thyroid function. Ann Clin Biochem 22 (Pt 5): 502–505.
9. Bartalena L, Bogazzi F, Brogioni S, Burelli A, Scarcello G, et al. (1996)
Measurement of serum free thyroid hormone concentrations: an essential tool
for the diagnosis of thyroid dysfunction. Horm Res 45: 142–147.
10. Hansen PS, Brix TH, Sorensen TI, Kyvik KO, Hegedus L (2004) Major genetic
influence on the regulation of the pituitary-thyroid axis: a study of healthy
Danish twins. J Clin Endocrinol Metab 89: 1181–1187.
11. Samollow PB, Perez G, Kammerer CM, Finegold D, Zwartjes PW, et al. (2004)
Genetic and environmental influences on thyroid hormone variation in Mexican
Americans. J Clin Endocrinol Metab 89: 3276–3284.
Genetic Regulation of Thyroid Function
PLOS Genetics | www.plosgenetics.org 18 February 2013 | Volume 9 | Issue 2 | e1003266
12. Panicker V, Wilson SG, Spector TD, Brown SJ, Falchi M, et al. (2008)
Heritability of serum TSH, free T4 and free T3 concentrations: a study of alarge UK twin cohort. Clin Endocrinol (Oxf) 68: 652–659.
13. Arnaud-Lopez L, Usala G, Ceresini G, Mitchell BD, Pilia MG, et al. (2008)
Phosphodiesterase 8B gene variants are associated with serum TSH levels andthyroid function. Am J Hum Genet 82: 1270–1280.
14. Panicker V, Wilson SG, Walsh JP, Richards JB, Brown SJ, et al. (2010) A locus
on chromosome 1p36 is associated with thyrotropin and thyroid function as
identified by genome-wide association study. Am J Hum Genet 87: 430–435.
15. Rawal R, Teumer A, Volzke H, Wallaschofski H, Ittermann T, et al. (2012)Meta-analysis of two genome-wide association studies identifies four genetic loci
associated with thyroid function. Hum Mol Genet.
16. Peeters RP, van Toor H, Klootwijk W, de Rijke YB, Kuiper GG, et al. (2003)Polymorphisms in thyroid hormone pathway genes are associated with plasma
TSH and iodothyronine levels in healthy subjects. J Clin Endocrinol Metab 88:
2880–2888.
17. Panicker V, Cluett C, Shields B, Murray A, Parnell KS, et al. (2008) A commonvariation in deiodinase 1 gene DIO1 is associated with the relative levels of free
thyroxine and triiodothyronine. J Clin Endocrinol Metab 93: 3075–3081.
18. Medici M, van der Deure WM, Verbiest M, Vermeulen SH, Hansen PS, et al.(2011) A large-scale association analysis of 68 thyroid hormone pathway genes
with serum TSH and FT4 levels. Eur J Endocrinol 164: 781–788.
19. Gudmundsson J, Sulem P, Gudbjartsson DF, Jonasson JG, Sigurdsson A, et al.
(2009) Common variants on 9q22.33 and 14q13.3 predispose to thyroid cancerin European populations. Nat Genet 41: 460–464.
20. Denny JC, Crawford DC, Ritchie MD, Bielinski SJ, Basford MA, et al. (2011)
Variants near FOXE1 are associated with hypothyroidism and other thyroidconditions: using electronic medical records for genome- and phenome-wide
studies. Am J Hum Genet 89: 529–542.
21. Boucai L, Hollowell JG, Surks MI (2011) An approach for development of age-,gender-, and ethnicity-specific thyrotropin reference limits. Thyroid 21: 5–11.
22. McGrogan A, Seaman HE, Wright JW, de Vries CS (2008) The incidence ofautoimmune thyroid disease: a systematic review of the literature. Clin
Endocrinol (Oxf) 69: 687–696.
23. Hollowell JG, Staehling NW, Flanders WD, Hannon WH, Gunter EW, et al.(2002) Serum TSH, T(4), and thyroid antibodies in the United States population
(1988 to 1994): National Health and Nutrition Examination Survey (NHANESIII). J Clin Endocrinol Metab 87: 489–499.
24. Benjamini Y, Hochberg Y (1995) Controlling the false discovery rate: a practical
and powerful approach to multiple testing. Journal of the Royal Statistical
Society Series B 57: 289–300.
25. Ben-Aharon I, Brown PR, Etkovitz N, Eddy EM, Shalgi R (2005) Theexpression of calpain 1 and calpain 2 in spermatogenic cells and spermatozoa of
the mouse. Reproduction 129: 435–442.
26. Pilia G, Chen WM, Scuteri A, Orru M, Albai G, et al. (2006) Heritability ofcardiovascular and personality traits in 6,148 Sardinians. PLoS Genet 2: e132.
doi:10.1371/journal.pgen.0020132
27. Shields BM, Freathy RM, Knight BA, Hill A, Weedon MN, et al. (2009)
Phosphodiesterase 8B gene polymorphism is associated with subclinicalhypothyroidism in pregnancy. J Clin Endocrinol Metab 94: 4608–4612.
28. Montero-Pedrazuela A, Fernandez-Lamo I, Alieva M, Pereda-Perez I, Venero
C, et al. (2011) Adult-onset hypothyroidism enhances fear memory andupregulates mineralocorticoid and glucocorticoid receptors in the amygdala.
PLoS ONE 6: e26582. doi:10.1371/journal.pone.0026582
29. Eriksson N, Tung JY, Kiefer AK, Hinds DA, Francke U, et al. (2012) Novel
Associations for Hypothyroidism Include Known Autoimmune Risk Loci. PLoSONE 7: e34442. doi:10.1371/journal.pone.0034442
30. Sheng HZ, Zhadanov AB, Mosinger B, Jr., Fujii T, Bertuzzi S, et al. (1996)
Specification of pituitary cell lineages by the LIM homeobox gene Lhx3. Science272: 1004–1007.
31. Netchine I, Sobrier ML, Krude H, Schnabel D, Maghnie M, et al. (2000)
Mutations in LHX3 result in a new syndrome revealed by combined pituitary
hormone deficiency. Nat Genet 25: 182–186.
32. Gudmundsson J, Sulem P, Gudbjartsson DF, Jonasson JG, Masson G, et al.(2012) Discovery of common variants associated with low TSH levels and
thyroid cancer risk. Nat Genet 44: 319–322.
33. Taylor PN, Panicker V, Sayers A, Shields B, Iqbal A, et al. (2011) A meta-analysis of the associations between common variation in the PDE8B gene and
thyroid hormone parameters, including assessment of longitudinal stability of
associations over time and effect of thyroid hormone replacement.Eur J Endocrinol 164: 773–780.
34. Volpato CB, De Grandi A, Gogele M, Taliun D, Fuchsberger C, et al. (2011)
Linkage and association analysis of hyperthyrotropinaemia in an Alpinepopulation reveal two novel loci on chromosomes 3q28–29 and 6q26–27.
J Med Genet 48: 549–556.
35. Kitazawa M, Yamakuni T, Song SY, Kato C, Tsuchiya R, et al. (2005)
Intracellular cAMP controls a physical association of V-1 with CapZ in culturedmammalian endocrine cells. Biochem Biophys Res Commun 331: 181–186.
36. Teumer A, Rawal R, Homuth G, Ernst F, Heier M, et al. (2011) Genome-wide
association study identifies four genetic loci associated with thyroid volume andgoiter risk. Am J Hum Genet 88: 664–673.
37. Duan C, Clemmons DR (1995) Transcription factor AP-2 regulates human
insulin-like growth factor binding protein-5 gene expression. J Biol Chem 270:
24844–24851.
38. de Jong FJ, Peeters RP, den Heijer T, van der Deure WM, Hofman A, et al.(2007) The association of polymorphisms in the type 1 and 2 deiodinase genes
with circulating thyroid hormone parameters and atrophy of the medial
temporal lobe. J Clin Endocrinol Metab 92: 636–640.
39. Gereben B, Zavacki AM, Ribich S, Kim BW, Huang SA, et al. (2008) Cellularand molecular basis of deiodinase-regulated thyroid hormone signaling. Endocr
Rev 29: 898–938.
40. De Felice M, Ovitt C, Biffali E, Rodriguez-Mallon A, Arra C, et al. (1998) Amouse model for hereditary thyroid dysgenesis and cleft palate. Nat Genet 19:
395–398.
41. Clifton-Bligh RJ, Wentworth JM, Heinz P, Crisp MS, John R, et al. (1998)Mutation of the gene encoding human TTF-2 associated with thyroid agenesis,
cleft palate and choanal atresia. Nat Genet 19: 399–401.
42. Pfaeffle RW, Savage JJ, Hunter CS, Palme C, Ahlmann M, et al. (2007) Fournovel mutations of the LHX3 gene cause combined pituitary hormone
deficiencies with or without limited neck rotation. J Clin Endocrinol Metab
92: 1909–1919.
43. Rajab A, Kelberman D, de Castro SC, Biebermann H, Shaikh H, et al. (2008)
Novel mutations in LHX3 are associated with hypopituitarism and sensorineural
hearing loss. Hum Mol Genet 17: 2150–2159.
44. Okada Y, Kamatani Y, Takahashi A, Matsuda K, Hosono N, et al. (2010) A
genome-wide association study in 19 633 Japanese subjects identified LHX3-
QSOX2 and IGF1 as adult height loci. Hum Mol Genet 19: 2303–2312.
45. Helmreich DL, Parfitt DB, Lu XY, Akil H, Watson SJ (2005) Relation betweenthe hypothalamic-pituitary-thyroid (HPT) axis and the hypothalamic-pituitary-
adrenal (HPA) axis during repeated stress. Neuroendocrinology 81: 183–192.
46. Vamos E, Pardutz A, Klivenyi P, Toldi J, Vecsei L (2009) The role ofkynurenines in disorders of the central nervous system: possibilities for
neuroprotection. J Neurol Sci 283: 21–27.
47. Goh DL, Patel A, Thomas GH, Salomons GS, Schor DS, et al. (2002)Characterization of the human gene encoding alpha-aminoadipate aminotrans-
ferase (AADAT). Mol Genet Metab 76: 172–180.
48. de Souza FR, Fontes FL, da Silva TA, Coutinho LG, Leib SL, et al. (2010)Association of kynurenine aminotransferase II gene C401T polymorphism with
immune response in patients with meningitis. BMC Med Genet 12: 51.
49. Han Q, Cai T, Tagle DA, Li J (2009) Structure, expression, and function ofkynurenine aminotransferases in human and rodent brains. Cell Mol Life Sci 67:
353–368.
50. Segre AV, Groop L, Mootha VK, Daly MJ, Altshuler D (2010) Commoninherited variation in mitochondrial genes is not enriched for associations with
type 2 diabetes or related glycemic traits. PLoS Genet 6: e1001058.
doi:10.1371/journal.pgen.1001058
51. Raychaudhuri S, Plenge RM, Rossin EJ, Ng AC, Purcell SM, et al. (2009)Identifying relationships among genomic disease regions: predicting genes at
pathogenic SNP associations and rare deletions. PLoS Genet 5: e1000534.doi:10.1371/journal.pgen.1000534
52. Senee V, Chelala C, Duchatelet S, Feng D, Blanc H, et al. (2006) Mutations in
GLIS3 are responsible for a rare syndrome with neonatal diabetes mellitus andcongenital hypothyroidism. Nat Genet 38: 682–687.
53. Salajegheh A, Smith RA, Kasem K, Gopalan V, Nassiri MR, et al. (2011) Single
nucleotide polymorphisms and mRNA expression of VEGF-A in papillarythyroid carcinoma: potential markers for aggressive phenotypes. Eur J Surg
Oncol 37: 93–99.
54. Stolf BS, Carvalho AF, Martins WK, Runza FB, Brun M, et al. (2003)Differential expression of IGFBP-5 and two human ESTs in thyroid glands with
goiter, adenoma and papillary or follicular carcinomas. Cancer Lett 191: 193–
202.
55. Vella V, Pandini G, Sciacca L, Mineo R, Vigneri R, et al. (2002) A novelautocrine loop involving IGF-II and the insulin receptor isoform-A stimulates
growth of thyroid cancer. J Clin Endocrinol Metab 87: 245–254.
56. Braunschweig T, Kaserer K, Chung JY, Bilke S, Krizman D, et al. (2007)Proteomic expression profiling of thyroid neoplasms. Proteomics Clin Appl 1:
264–271.
57. Willer CJ, Li Y, Abecasis GR (2010) METAL: fast and efficient meta-analysis ofgenomewide association scans. Bioinformatics 26: 2190–2191.
58. Li Y, Willer CJ, Ding J, Scheet P, Abecasis GR (2010) MaCH: using sequence
and genotype data to estimate haplotypes and unobserved genotypes. GenetEpidemiol 34: 816–834.
59. Marchini J, Howie B, Myers S, McVean G, Donnelly P (2007) A new multipoint
method for genome-wide association studies by imputation of genotypes. NatGenet 39: 906–913.
60. Howie BN, Donnelly P, Marchini J (2009) A flexible and accurate genotype
imputation method for the next generation of genome-wide association studies.PLoS Genet 5: e1000529. doi:10.1371/journal.pgen.1000529
61. Pruim RJ, Welch RP, Sanna S, Teslovich TM, Chines PS, et al. (2010)
LocusZoom: regional visualization of genome-wide association scan results.Bioinformatics 26: 2336–2337.
62. Klein M, Catargi B (2007) VEGF in physiological process and thyroid disease.
Ann Endocrinol (Paris) 68: 438–448.
63. Gerard AC, Poncin S, Caetano B, Sonveaux P, Audinot JN, et al. (2008) Iodinedeficiency induces a thyroid stimulating hormone-independent early phase of
microvascular reshaping in the thyroid. Am J Pathol 172: 748–760.
64. Yamada E, Yamazaki K, Takano K, Obara T, Sato K (2006) Iodide inhibits
vascular endothelial growth factor-A expression in cultured human thyroid
Genetic Regulation of Thyroid Function
PLOS Genetics | www.plosgenetics.org 19 February 2013 | Volume 9 | Issue 2 | e1003266
follicles: a microarray search for effects of thyrotropin and iodide on
angiogenesis factors. Thyroid 16: 545–554.65. Zhang L, Cooper-Kuhn CM, Nannmark U, Blomgren K, Kuhn HG (2010)
Stimulatory effects of thyroid hormone on brain angiogenesis in vivo and in
vitro. J Cereb Blood Flow Metab 30: 323–335.66. Yu H, Rohan T (2000) Role of the insulin-like growth factor family in cancer
development and progression. J Natl Cancer Inst 92: 1472–1489.67. Eggo MC, King WJ, Black EG, Sheppard MC (1996) Functional human thyroid
cells and their insulin-like growth factor-binding proteins: regulation by
thyrotropin, cyclic 39,59 adenosine monophosphate, and growth factors. J ClinEndocrinol Metab 81: 3056–3062.
68. Backeljauw PF, Dai Z, Clemmons DR, D’Ercole AJ (1993) Synthesis andregulation of insulin-like growth factor binding protein-5 in FRTL-5 cells.
Endocrinology 132: 1677–1681.69. Pepene CE, Kasperk CH, Pfeilschifter J, Borcsok I, Gozariu L, et al. (2001)
Effects of triiodothyronine on the insulin-like growth factor system in primary
human osteoblastic cells in vitro. Bone 29: 540–546.70. Zhou R, Bonneaud N, Yuan CX, de Santa Barbara P, Boizet B, et al. (2002)
SOX9 interacts with a component of the human thyroid hormone receptor-associated protein complex. Nucleic Acids Res 30: 3245–3252.
71. das Neves L, Duchala CS, Tolentino-Silva F, Haxhiu MA, Colmenares C, et al.
(1999) Disruption of the murine nuclear factor I-A gene (Nfia) results in perinatallethality, hydrocephalus, and agenesis of the corpus callosum. Proc Natl Acad
Sci U S A 96: 11946–11951.72. Nakazato M, Chung HK, Ulianich L, Grassadonia A, Suzuki K, et al. (2000)
Thyroglobulin repression of thyroid transcription factor 1 (TTF-1) geneexpression is mediated by decreased DNA binding of nuclear factor I proteins
which control constitutive TTF-1 expression. Mol Cell Biol 20: 8499–8512.
73. Moeller LC, Kimura S, Kusakabe T, Liao XH, Van Sande J, et al. (2003)Hypothyroidism in thyroid transcription factor 1 haploinsufficiency is caused by
reduced expression of the thyroid-stimulating hormone receptor. Mol En-docrinol 17: 2295–2302.
74. Revest JM, Spencer-Dene B, Kerr K, De Moerlooze L, Rosewell I, et al. (2001)
Fibroblast growth factor receptor 2-IIIb acts upstream of Shh and Fgf4 and isrequired for limb bud maintenance but not for the induction of Fgf8, Fgf10,
Msx1, or Bmp4. Dev Biol 231: 47–62.75. Jiang GL, Huang S (2000) The yin-yang of PR-domain family genes in
tumorigenesis. Histol Histopathol 15: 109–117.
76. Naitza S, Porcu E, Steri M, Taub DD, Mulas A, et al. (2012) A genome-wide
association scan on the levels of markers of inflammation in Sardinians reveals
associations that underpin its complex regulation. PLoS Genet 8: e1002480.
doi:10.1371/journal.pgen.1002480
77. Carmel R, Spencer CA (1982) Clinical and subclinical thyroid disorders
associated with pernicious anemia. Observations on abnormal thyroid-
stimulating hormone levels and on a possible association of blood group O
with hyperthyroidism. Arch Intern Med 142: 1465–1469.
78. Majerus PW, Wilson DB, Zhang C, Nicholas PJ, Wilson MP (2010) Expression
of inositol 1,3,4-trisphosphate 5/6-kinase (ITPK1) and its role in neural tube
defects. Adv Enzyme Regul 50: 365–372.
79. Grasberger H, Van Sande J, Hag-Dahood Mahameed A, Tenenbaum-
Rakover Y, Refetoff S (2007) A familial thyrotropin (TSH) receptor mutation
provides in vivo evidence that the inositol phosphates/Ca2+ cascade mediates
TSH action on thyroid hormone synthesis. J Clin Endocrinol Metab 92: 2816–
2820.
80. Fukuyama K, Yoshida M, Yamashita A, Deyama T, Baba M, et al. (2000)
MAPK upstream kinase (MUK)-binding inhibitory protein, a negative regulator
of MUK/dual leucine zipper-bearing kinase/leucine zipper protein kinase. J Biol
Chem 275: 21247–21254.
81. Jendrzejewski J, He H, Radomska HS, Li W, Tomsic J, et al. (2012) The
polymorphism rs944289 predisposes to papillary thyroid carcinoma through a
large intergenic noncoding RNA gene of tumor suppressor type. Proc Natl Acad
Sci U S A 109: 8646–8651.
82. Dubois F, Vandermoere F, Gernez A, Murphy J, Toth R, et al. (2009)
Differential 14-3-3 affinity capture reveals new downstream targets of
phosphatidylinositol 3-kinase signaling. Mol Cell Proteomics 8: 2487–2499.
83. Takahashi M, Saenko VA, Rogounovitch TI, Kawaguchi T, Drozd VM, et al.
The FOXE1 locus is a major genetic determinant for radiation-related thyroid
carcinoma in Chernobyl. Hum Mol Genet 19: 2516–2523.
84. Landa I, Ruiz-Llorente S, Montero-Conde C, Inglada-Perez L, Schiavi F, et al.
(2009) The variant rs1867277 in FOXE1 gene confers thyroid cancer
susceptibility through the recruitment of USF1/USF2 transcription factors.
PLoS Genet 5: e1000637. doi:10.1371/journal.pgen.1000637
85. Takahashi M, Saenko VA, Rogounovitch TI, Kawaguchi T, Drozd VM, et al.
(2010) The FOXE1 locus is a major genetic determinant for radiation-related
thyroid carcinoma in Chernobyl. Hum Mol Genet 19: 2516–2523.
Genetic Regulation of Thyroid Function
PLOS Genetics | www.plosgenetics.org 20 February 2013 | Volume 9 | Issue 2 | e1003266