Embed Size (px)
Citation preview
Laboratoire de l’Informatique du Parallélisme
École Normale Supérieure de LyonUnité Mixte de Recherche CNRS-INRIA-ENS LYON-UCBL no 5668
Non Gaussian and Long Memory
Statistical Characterisations for Internet
Traffic with Anomalies
Antoine Scherrer (LIP),Nicolas Larrieu (LAAS),Philippe Owezarski (LAAS)Pierre Borgnat (Physics Lab),Patrice Abry (Physics Lab)
September 2005
Research Report No 2005-35
École Normale Supérieure de Lyon46 Allée d’Italie, 69364 Lyon Cedex 07, France
Téléphone : +33(0)4.72.72.80.37Télécopieur : +33(0)4.72.72.80.80
Adresse électronique : [email protected]
Non Gaussian and Long Memory Statistical
Characterisations for Internet Traffic with Anomalies
Antoine Scherrer (LIP), Nicolas Larrieu (LAAS), Philippe Owezarski (LAAS)Pierre Borgnat (Physics Lab), Patrice Abry (Physics Lab)
September 2005
Abstract
The Internet aims at providing a wide range of services for a large variety of applica-tions. Hence, it is highly sensitive to traffic anomalies (e.g., failures, flash crowds,...)as well as to DoS attacks, which are likely to significantly reduce the Quality of Ser-vice level. Current intrusion detection systems, specially those based on anomalydetection, are not providing efficient nor satisfactory solutions for DoS attack track-ing. This is mainly due to difficulties in distinguishing between strong but legitimatetraffic variations and DoS attack induced changes. The goal of this work is to com-pare relevant statistical characteristics of regular traffic to those of traffic presentinganomalies. To do so, we introduce a non Gaussian long memory model and developestimators for the corresponding parameters. First, we show that this model rele-vantly describes Internet traffic for a wide range of aggregation levels, using both alarge set of data taken from public reference repositories (Bellcore, LBL, Auckland,UNC, CAIDA) and data collected by ourselves. Second, we show that the proposedmodel also describes meaningfully traffic with anomalies such as flash crowd and DoSattacks which we generated and collected. We show that the behaviors of the param-eters of the model enables us to discriminate between regular and anomalous traffic,and between flash crowds and DoS attacks. We also derive analytically procedures tonumerically synthesize realizations of stochastic processes with prescribed non Gaus-sian marginals and long range dependent covariances. This enables us to validatethe relevance and accuracy of our characterization procedures. Finally, we describevarious applications based on the proposed model.
Keywords: Intrusion detection, DoS attack, Flash Crowd, Non Gaussian Long Range
Dependent Process.
Resume
Internet fourni de multiples services de communication de qualites variees a un tresgrand nombre d’applications. C’est pourquoi il est tres sensible aux anomalies du trafic(dysfonctionnement, flash crowds,...) ainsi qu’aux attaques DoS (deni de service) quireduisent sensiblement la qualite de service fournie par le reseau. Les mecanismesactuels de detection d’intrusion, notamment ceux bases sur la recherche d’anoma-lies, ne parviennent pas a lutter efficacement contre les DoS car il est tres difficilede differencier les variations legitimes de trafic des variations dues a des attaques.Nous presentons ici une etude statistique de ces differentes variations (legitime etillegitime), dans le but d’aider les detecteurs d’intrusion a etre plus efficace. Pourcela, nous introduisons un modele stochastique de trafic base sur des processus alongue memoire non gaussien. Nous montrons que ce modele parvient a capturer lescaracteristiques statistiques d’ordre 1 et 2 du traffic de maniere satisfaisante sur destraces de trafic classiques (Bellcore, LBL, Auckland, UNC, CAIDA), ainsi que sur destraces de trafic contenant des anomalies. Nous montrons aussi que les variations desparametres de ce modele permettent de differencier les flash crowds et les attaquesDoS. Nous presentons enfin une methode pour generer des traces de trafic synthe-tiques en accord avec le modele, ce qui nous permet de valider les performances denos outils d’analyse.
Mots-cles: Detection d’intrusion, Attaques DoS, Flash Crowd,
Processus a longue memoire non gaussiens.
1 Introduction
The Internet is on the way of becoming the universal communication network for all kinds of information,ranging from the simple transfer of binary computer data to the real time transmission of voice, video,or interactive information. Simultaneously, the Internet is evolving from a single best effort service to amulti-service network, a major consequence being that it becomes highly sensitive to attacks, speciallydenial of services (DoS) and distributed DoS ones (DDoS). Indeed, DoS attacks are responsible for largechanges in traffic characteristics which may in turn significantly reduce the quality of service (QoS) levelperceived by all users of the network. This hence breaks the service level agreement (SLA) at the Internetservice provider (ISP) fault. DoS attacks can then induce financial losses for ISPs.
Reacting against DoS attacks is a difficult task and current intrusion detection systems (IDS), speciallythose based on anomaly detection, often fail in detecting them efficiently. This is first because DoS attackscan take a wide variety of multiple forms so that proposing a common definition is in itself a complexissue. Second, it is commonly observed that Internet traffic under normal conditions presents per se ornaturally large fluctuations and variations in its throughput at all scales [34], often described in termsof long memory [13], self-similarity [35], multifractality [15]. This significantly impairs the detection ofanomalies. Third, Internet traffic may exhibit strong, possibly sudden but legitimate variations (flashcrowds, for instance) that may be hard to distinguish from illegitimate ones.For those reasons, anomaly detection based IDS are often suffering from high false alarm rates, a majorshortcomings for their actual use. The current evolution of the Internet traffic, allowing a larger varietyof traffic and diversity of communication should result in an increase of difficulties in efficient IDS design.
This work, lead in the framework of the METROSEC project, mainly aims at analyzing the impact ofanomalies on traffic statistical characteristics as well as at determining discriminative profile signaturesfor traffic containing legitimate (e.g., flash crowds) and illegitimate (e.g., DDoS attacks) anomalies. Atend, it is expected that these findings could serve for improving networking schemes to react againsttraffic anomalies and particularly malicious ones.
To do so, we propose the use of non Gaussian long memory stochastic processes to model Internettraffic. We show experimentally that this model proves versatile enough to provide us with a relevantstatistical description for a large variety of regular traffic as well as for traffic with anomalies, be theylegitimate or not.We also show that the evolution with respect to the aggregation level of the fitted parameters for theproposed model enables us to distinguish between traffic with and without anomalies and to classifythem.
• Outline. Section 2 briefly reviews traffic modeling with a detection of anomalies perspective. Section 3describes the analyzed data which consist both of standard reference traces taken from publicly availabletraffic data repositories and of data collected by ourselves. In particular, it explains how DDoS attacksand flash crowds were conducted by ourselves in a controlled, reproducible and chosen manner as wellas how the corresponding traffic was collected by ourselves. Section 4 introduces the proposed modeland describes the practical analysis procedures. Section 5 presents with details the statistical character-izations and results obtained on traffic with and without anomalies and proposes some discussions andinterpretations. Section 6 explains an exact method to generate numerical time series whose marginalsand covariances follow that of the observed traffic, and it validates the analysis and modeling proceduresused in the previous section. Section 7 presents applications of the proposed modeling and analysis:traffic with prescribed statistics generator, traffic prediction and anomaly or attack detection.
2 Traffic Modeling : A Brief Overview
2.1 Traffic without anomalies
• Statistical modeling and network performance. Computer network traffic consists of packetsarrival processes. It has long been recognized that those arrival processes depart from Poisson or renewalprocesses, see for instance [37], insofar as the inter-arrival delays are not independent. This can bemodeled using, either non stationary Point processes [24] or stationary Markov modulated Point processes[3].
Therefore, a general description is in terms of marked point processes {(tl, Al), l = 0, 1, 2, ...} where
2
the tl denotes the arrival time stamp of the l-th packet and Al some attributes of the packet (such asits payload, its application/source/destination ports,...). However, given the huge number of packetsinvolved in any computer network traffic, this would result in huge data sets.This is why it is most often preferred to work on byte or packet aggregated count processes, denotedW∆(k) and X∆(k). They consists of the number of bytes (resp., packets) that lives within the k-thwindow of size ∆ > 0, i.e., whose time stamps lie between k∆ ≤ tl < (k+1)∆. It has also been proposedto model at the connexion or flow level instead of the packet one. In that case, one groups IP packetswith identical standard 5-tuples into connections or given any other definition for more generic flows,and one models the flow arrival process or, for example, the fluctuation of the number of active flows [4].In the present work, we remain at the packet level and mainly concentrate on the modeling of X∆(k).When modeling X∆, one mostly uses stationary processes and it is commonly accepted that marginaldistributions and auto-covariance functions are the two major factors that affect the performance of thenetwork and hence need to be modeled in priority. Reviews on traffic models can be found in, e.g.,[31, 35].
• Marginal Distributions. Because X∆(k) is designed from a packet arrival process, it has beenproposed to model its marginal via a Poisson distribution [14]. As X∆(k) is by definition a positiverandom variable, other works proposed to describe its marginal with common positive laws such as (one-sided) exponential, log-normal, Weibull or gamma distributions [31]. In many cases for highly aggregateddata, Gaussian distributions are also used as relevant approximations.
• Covariance Function. After the seminal work reported in [26], it has been commonly acceptedthat computer network traffic is characterized by a long memory or long range dependence property(cf. [7, 40]). Long range dependence (LRD) is usually defined through the fact that the power spectraldensity fX∆(ν) of the process behave at the origin as:
fX∆(ν) ∼ C|ν|−2d, |ν| → 0, with 0 < d < 0.5. (1)
Let us recall that the power spectral density is the Fourier transform of the auto-covariance. Long rangedependence in computer network traffic is a central property as it is likely to be responsible for decreasesof the QoS as well as of the performance of the network (see e.g., [43]). Taking it into account precisely isa necessary condition to perform accurate and relevant network design (buffer size,...) and performancepredictions (delay as a function of utility,...). It is hence crucial that long memory be incorporated indescription models. This rules out the use of processes such as Poisson or Markov processes as wellas some of their declinations, Markov Modulated Poisson Processes for instance [36]. Consequently,canonical long range dependent processes such as fractional Brownian motion, fractional Gaussian noise[33] or Fractionally Integrated Auto-Regressive Moving Average (FARIMA) have ben widely used todescribe and/or analyze Internet times series (see [35] and the references therein). It is also interestingto note that long memory can be incorporated directly into point processes using cluster point processmodels, yielding fruitful description of the packet arrival processes as pointed out in [18].
• Higher Orders. Multifractal processes are used to model scaling properties that are not fully cap-tured by the second statistical order and involve higher ones. The relevance and interest of multifractalprocesses for the modeling and analysis of the Internet has been discussed in details in numerous papersand is still an open issue (see [11, 15, 19, 41, 42, 52]). It turns out that the joint modeling of the firstand second order statistics is in itself already a difficult task. We will show in next sections that it alsoprovides us with rich enough model to detect and characterize anomalies in traffic. Therefore, in thepresent work, we concentrate only on the joint modeling of the first and second statistic orders by meansof non Gaussian long range dependent processes.
• Aggregation Level. A recurrent issue in traffic modeling lies in the choice of the relevant aggregationlevel ∆. This is an involved question whose answer mixes up the characteristics of the data themselves,the goal of the modeling as well as technical issues such as real time, buffer size, computational costconstraints. Facing this difficulty of choosing a priori ∆, it is of great interest to have at disposal astatistical model that may be relevant for a large range of values of ∆, a feature we seek in the modelproposed below.
3
Data Date T (s) Network(Link) PKT IAT Repository
PAUG 1989-08-29(11:25) 2620 LAN(10BaseT) 1 2.6 ita.ee.lbl.gov/index.htmlLBL-TCP-3 1994-01-20(14:10) 7200 WAN(10BaseT) 1.7 4 ita.ee.lbl.gov/index.htmlAUCK-IV 2001-04-02(13:00) 10800 WAN(OC3) 9 1.2 wand.cs.waikato.ac.nz/wand/witsCAIDA 2002-08-14(10:00) 600 Backbone(OC48) 65 0.01 www.caida.org/analysis/workload/oc48/UNC 2003-04-06(16:00) 3600 WAN(10BaseT) 4.6 0.8 www-dirt.cs.unc.edu/ts/
METROSEC-ref1 2004-12-09(18:30) 5000 LAN(10BaseT) 3.9 1.5 www.laas.fr/METROSEC/METROSEC-ref2 2004-12-10(02:00) 9000 LAN(10BaseT) 2.1 4.3 www.laas.fr/METROSEC/
METROSEC-DDoS 2004-12-09(20:00) 9000 LAN(10BaseT) 6.9 1.3 www.laas.fr/METROSEC/METROSEC-FC 2005-04-14(14:30) 1800 LAN(10BaseT) 3.7 0.48 www.laas.fr/METROSEC/
Table 1: Data Description. General parameters of the studied traces. T is the duration is the trace,in second. PKT is the number of packets in the trace, given in million. IAT is the mean inter-arrivaltime, in ms.
2.2 Anomaly Detection
IDS based on anomalies detection generally do not rely on the use of tools involving rich statistical mod-els. They are mainly based on monitoring simple traffic parameters such as its throughput or packet rate,and most IDS make use of specific packet sequences known as attack signatures [38]. Essentially, alarmsare raised whenever a threshold is reached [8, 17, 21, 45], yielding a significant number of false positives[32]. Therefore, they often remain unsatisfactory as they cannot discriminate between legitimate trafficvariations and attacks.Recently, progresses in traffic modeling obtained in various Internet traffic monitoring projects, signif-icantly renewed IDS design strategies. Though still at early stages of developments, interesting resultsmaking use of statistical characterizations were published. For instance, Ye proposed in [50] a Markovmodel for the temporal behavior of the traffic, that raises alarms whenever the traffic significantly de-viates from the model. Other authors [22, 51] have shown that DDoS attacks increase correlations intraffic, and this could provide a robust detection technique. Based on inter-correlation between trafficacross different links, Lakhina et al. proposed a method for detecting network wide anomalies in trafficmatrices [25]. Hussain and co-authors used the spectral density to find out signatures for various attacks[20]. Similarly, spectral estimation was used for comparing traffic with and without attacks [9]. Whilethe spectral density exhibits peaks around the Round Trip Time values for normal traffic, such peaksno longer appear under attacks. This fact can then be used in IDS design. Finally, Li and Lee used thewavelet technique developed in [47] to compute a so-called energy distribution; it was observed that thisenergy distribution presents peaks under attacks that do not exist for regular traffic [27]. The work in[5] exploits the multiresolution nature of the wavelet decomposition to track and detect traffic anomaliesin a so-called medium range of scales.A collection of promising works have hence already been published in the field of DDoS attacks [5, 23].The present work intends to contribute to that area of research by comparing statistical characterizationsobtained first on regular traffic, second on traffic presenting a variety of anomalies including legitimateones. A goal at end is to be able to discriminate between legitimate and illegitimate changes in traffic.
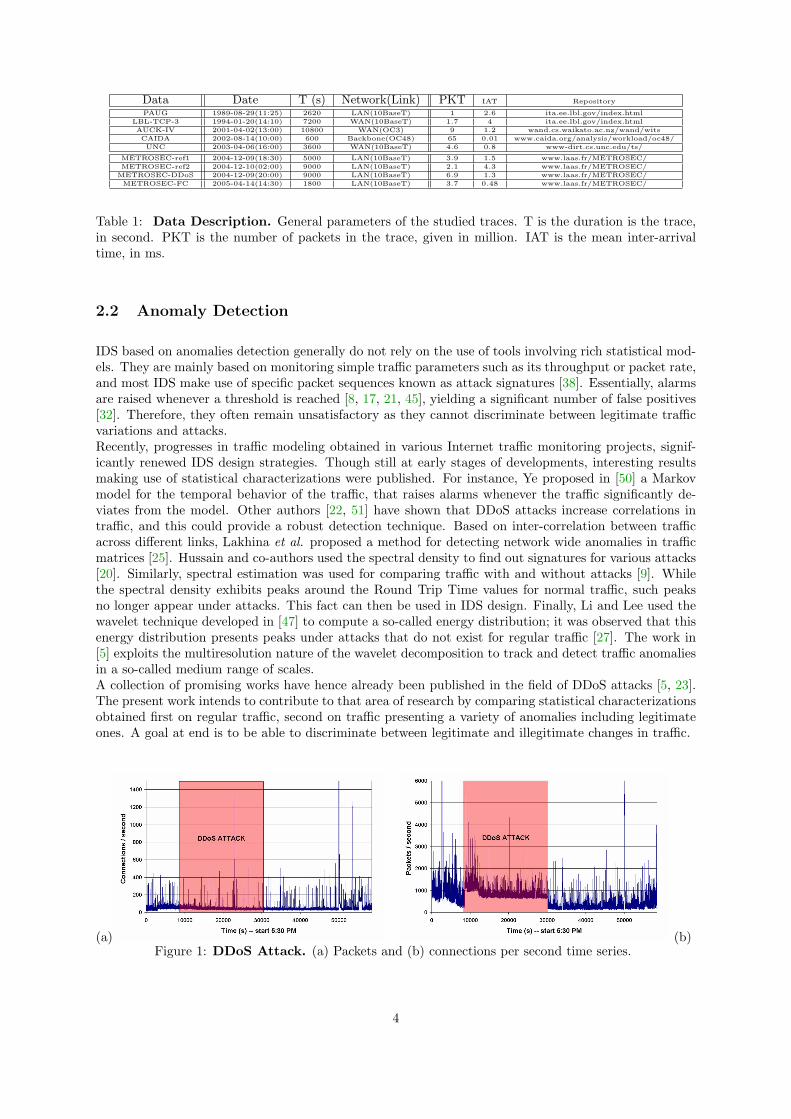
(a) (b)Figure 1: DDoS Attack. (a) Packets and (b) connections per second time series.
4
3 Data and Experiments
3.1 Traffic without anomalies
The model and analysis proposed hereafter are first illustrated on traffic presenting a priori no anomaly,described in details in Table 1. We use both standard data, gathered from most of the major avail-able Internet traces repositories (Bellcore, LBL, UNC, Auckland Univ, Univ North Carolina, CAIDA),and time series collected by ourselves within the METROSEC research project. Therefore, we cover asignificant variety of traffic, networks (Local Area Network, Wide Area Network,... and edge networks,core networks,...) and links, collected over the last 16 years (from 1989 to 2005). On each repository, alarge number of traces are available, we focussed here on one (or a few ones) that are representative ofa collection of others. PAUG corresponds to one of the celebrated early Bellcore Ethernet LAN traces,over which long range dependence was first evidenced [26]. LBL-TCP-3 is provided by the LawrenceBerkeley Laboratory and was collected at LAN gateways. Multifractal models were validated for thefirst time in computer network traffic on these data [15, 46]. AUCK-IV constitute high precisionsTCP/IP traces gathered at the Internet access point of the University of Auckland over a non saturatedlink. We also processed the CAIDA time series, another high time-stamp precision, collected over alarge backbone, kindly made available by CAIDA from their MFN network. UNC corresponds, to ourknowledge, to the most recent publicly available data. The METROSEC data were collected late 2004and early 2005, on the RENATER1 network using DAG systems [10] deployed in the framework of twoFrench research projects: METROPOLIS and METROSEC.
3.2 Traffic (or traces) with anomalies
Analyzing standard RENATER traffic, the only illegitimate activity we found is port scanning, but noDDoS attack. Therefore, we decided to perform both legitimate (Flash Crowds) and illegitimate (DDoSattacks) anomalies in an accurate and completely controlled manner. For each case, several experimentswere run on RENATER network.
• DDoS Attack. The DDoS attack studied here consists in a distributed UDP flooding attack. Ithas been generated from 5 different sites: IUT Mont de Marsan, LIAFA Paris, ENS Lyon, ESSI Nice,France and the university of Coimbra, Portugal, against the target site, LAAS, Toulouse, France. LAASis connected to RENATER thanks to a 100 Mbps Ethernet link which has not been saturated during theattack. A traffic trace is captured on the LAAS access link. The attack started at 8 pm on December9th, 2004 and lasted more than 5.30 hours. The basic traffic characteristics are depicted in Figures 2.2(a)and 2.2(b) which respectively shows the number of flows and packets on the LAAS access link. Whilethe former remains quite stable, the later presents a significant increase (the packet rate is multiplied byalmost 3 during the attack).
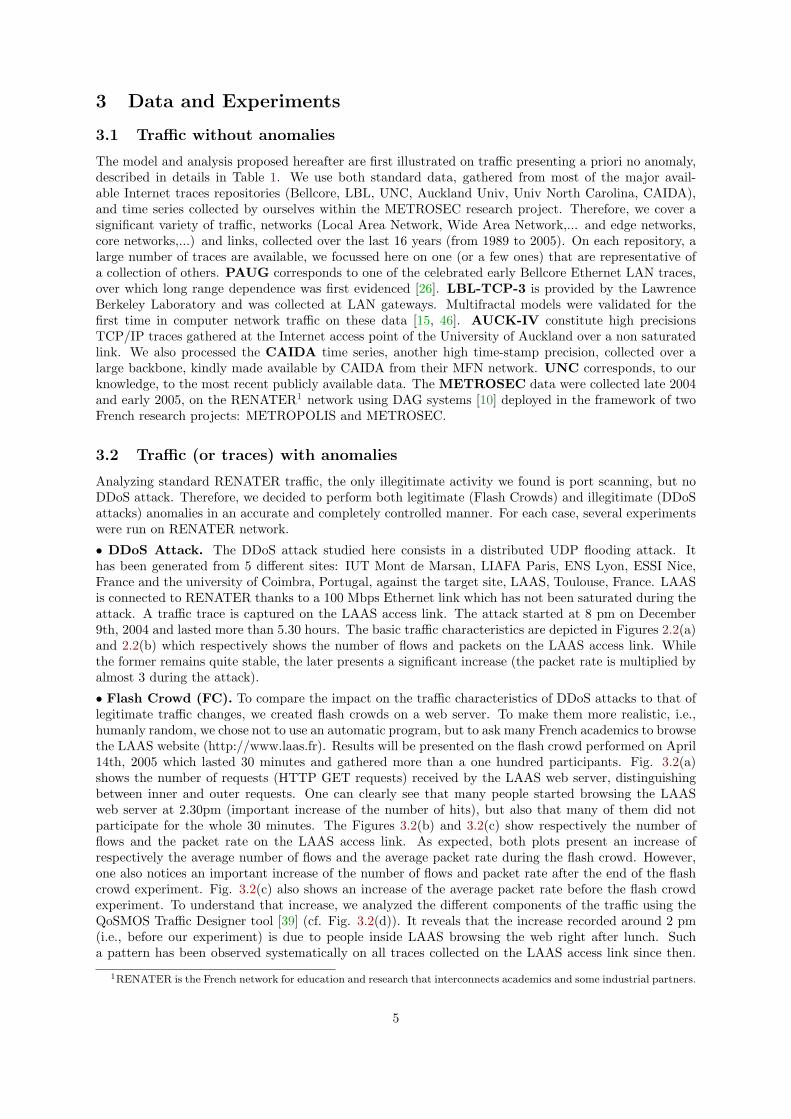
• Flash Crowd (FC). To compare the impact on the traffic characteristics of DDoS attacks to that oflegitimate traffic changes, we created flash crowds on a web server. To make them more realistic, i.e.,humanly random, we chose not to use an automatic program, but to ask many French academics to browsethe LAAS website (http://www.laas.fr). Results will be presented on the flash crowd performed on April14th, 2005 which lasted 30 minutes and gathered more than a one hundred participants. Fig. 3.2(a)shows the number of requests (HTTP GET requests) received by the LAAS web server, distinguishingbetween inner and outer requests. One can clearly see that many people started browsing the LAASweb server at 2.30pm (important increase of the number of hits), but also that many of them did notparticipate for the whole 30 minutes. The Figures 3.2(b) and 3.2(c) show respectively the number offlows and the packet rate on the LAAS access link. As expected, both plots present an increase ofrespectively the average number of flows and the average packet rate during the flash crowd. However,one also notices an important increase of the number of flows and packet rate after the end of the flashcrowd experiment. Fig. 3.2(c) also shows an increase of the average packet rate before the flash crowdexperiment. To understand that increase, we analyzed the different components of the traffic using theQoSMOS Traffic Designer tool [39] (cf. Fig. 3.2(d)). It reveals that the increase recorded around 2 pm(i.e., before our experiment) is due to people inside LAAS browsing the web right after lunch. Sucha pattern has been observed systematically on all traces collected on the LAAS access link since then.
1RENATER is the French network for education and research that interconnects academics and some industrial partners.
5
(a) (b)
(c) (d)Figure 2: Flash Crowd. (a) http requests, (b) connections, (c) packets and (d) distribution of through-puts per second time series. Fig. (d) follows a top-down approach: the application on top generates thelarger traffic.
The second peak, after the experiment, appears to be due to SMTP traffic. It can be explained in twoways. First, many researchers at LAAS use webmail. Because the server has been significantly sloweddown during the flash crowd experiment, they had stopped sending e-mails until the web server restartedto work with satisfactory performance. Second, the grey listing mechanism (used for spam reduction)delays some e-mails, and sends them all at scheduled door opening. The nearest one occurred at 3.15pm, just after the end of the flash crowd.
4 Non Gaussian Long Range Dependent Processes
4.1 The Gamma farima model
In the present work, we propose to model the {X∆(k), k ∈ Z} time series for each aggregation level ∆.Modeling the {W∆(k), k ∈ Z} time series gives equivalent results and we restrict here the discussion forthe sake of clarity. The model is a non Gaussian, long range dependent, stationary process: the Gamma(marginal) farima (covariance) process. Stationarity is assumed for the model because it is convenientfrom a theoretical point of view, and we empirically check during the analysis that the hypothesis isvalid.
• First order Statistics (Marginals): Gamma distribution. Because of the point process natureof traffic, Poisson and or exponential distributions are expected at small aggregation levels ∆, whileGaussian laws are at larger ∆s. None of them can satisfactorily model traffic marginals for a wide rangeof (small and large) ∆s. From our empirical studies, we found out that a Gamma distribution Γα,β
capture best the marginals of the X∆.A Γα,β distribution is defined for positive random variables X with
Γα,β(x) =1
βΓ(α)
(x
β
)α−1
exp(−xβ
), (2)
where Γ(u) is the standard Gamma function (see e.g., [14]), depends on two parameters: the shape αand the scale β. It has mean µ = αβ and variance σ2 = αβ2. Note that the inverse of the shapeparameter, 1/α, acts as an indicator of the distance from a Gaussian law. For instance, skewness andkurtosis (relative third and fourth moments) behave respectively as 2/
√α and 3 + 6/α.
6
• Second order Statistics (covariance): Long Range Dependence. As explained in Section 2,because long memory is a crucial property for computer traffic, stochastic processes that intrinsicallyincorporate it are suitable for modeling. However, because of the many different network mechanismsand various source characteristics, short term dependencies are also present and superimposed to thislong memory property. Therefore using the FARIMA process [7] is natural in that it allows both shortand long range dependencies.A farima(P, d,Q) model is defined via two polynomials of order P and Q and a fractional integrationD−d, of order −1/2 < d < 1/2, as:
X∆(k) =P∑
p=1
φpX∆(k − p) + D−d(ε(k)−Q∑
q=1
θqε(k − q)),
where the ε(l) are independent, identically distributed random variables, commonly referred to as inno-vations, with zero mean and variance σ2
ε . For fractional d, the fractional integrator is read via a formalpower series expansion: D−d =
∑∞i=0 bi(−d)Bi, where B is the backward operator, Bε(i) = ε(i− 1), and
bi(−d) = Γ(i+ d)/Γ(d)Γ(i+ 1). The Fourier spectrum for this process reads:
fX(ν) = σ2ε |1− e−i2πν |−2d
|1−∑Q
q=1 θqe−iq2πν |2
|1−∑P
p=1 φpe−ip2πν |2, (3)
for −1/2 < ν < 1/2. This shows that for d ∈ (0, 1/2), this process is long range dependent.In this case, the ARMA(P,Q) contribution and the fractional integration of order d account respectivelyfor short and long range correlations, in an independent and versatile way. The shape polynomials Pand Q can be used to fit the spectrum at high frequencies or, equivalently, fine scales, while d measuresthe “strength” of the long memory.• Comments. For the analysis and the illustrations reported in the present work, we will restrictourselves to the use of farima processes with polynomials P and Q of degree at most 1, hereafter labeledfarima(φ, d, θ).Then, the Γα,β - farima(φ, d, θ) processes involve only 5 parameters that need to be adjusted from thedata. As such they are parsimonious models, a much desired property as far as robust, practical, efficientreal time on-the-fly network monitoring is concerned.Note however that the specifications of the first and second order statistical properties do not fullycharacterize the process, because this model is not Gaussian. Room for further design to adjust otherproperties of the traffic remains available in the framework of the model, but this task, difficult to achieve,is not needed here for the properties of the traffic we intend to capture.
4.2 Analysis
• Stationarity of data. For each aggregation level ∆ independently, the analysis of theX∆ is conducted.Because for theoretical modeling stationarity of X∆ is assumed, we first perform empirically a consistencycheck of analysis and estimation results obtained from adjacent non overlapping sub-blocks. Then, weanalyze only data sets for which stationarity is a reasonable hypothesis. This approach is very close inspirit to the ones developed in [44, 48]. Then we estimate the parameters of the model for each chosen∆.• Gamma parameter estimation. Instead of the usual moment based technique, β = σ2/µ, α = µ/β
where µ and σ2 consist of the standard sample mean and variance estimators, we use maximum likelihoodbased estimates for the parameters α and β [16]. The joint distribution of n i.i.d. Γα,β variables canbe obtained as a product of n terms as in Eq. 2. Derivation of this product with respect to α and βyields the estimates. It is important to note that the term ML standardly attributed to that methodis here abusively used. Obviously, in our case, the X∆(k) are strongly dependent and hence do notsatisfy the i.i.d. assumption. Section 6is devoted to show empirically from numerical simulations thatthis estimation procedure nevertheless provides us with very accurate estimates even when applied toprocesses with long range dependence.• Farima parameter estimation. It is well known that the estimation of the long memory parameteris a difficult statistical task that received a considerable amount of works and attention (see e.g. [12] for
7
a thorough and up-to-date review), and hence, so will the joint estimation of both long and short rangeparameters of the farima(φ, d, θ) process. Full maximum likelihood estimation based on the analyticalform of the spectrum recalled in Eq. 3 are possible but computationally heavy.In this work, we develop a two step estimation procedure: the wavelet based methodology developed in[1, 2, 47] enables us to estimate first the long range dependence parameter d; second, the parameters ofthe residual ARMA part are estimated.
Let us first recall the wavelet framework (see [30] for a thorough introduction). Let ψ0 denoterespectively the mother wavelet. Let ψj,k(t) = 2−j/2ψ0(2−jt − k) denote its dilated and translatedtemplates and dX(j, k) = 〈ψj,k, X0〉 the corresponding wavelet coefficients. The mother-wavelet ψ0 isfurther characterized by an integer N ≥ 1, the number of vanishing moments that plays a key role in thetheoretical and practical analysis of long memory.For any second order stationary process X, its spectrum fX(ν) can be related to its wavelet coefficientsthrough:
EdX(j, k)2 =∫fX(ν)2j |Ψ0(2jν)|2dν, (4)
where Ψ0 stands for the Fourier transform of ψ0 and E for the expected value. When X is a long rangedependent process, with parameter d, Eq. 1 implies that:
EdX(j, k)2 ∼ C2j(2d+1), if 2j → +∞. (5)
Moreover, it has been proven that the {dX(j, k), k ∈ Z} form short range dependent sequences as soonas N > d + 1/2. This means that they no longer suffer from statistical difficulties implied by the longmemory property. In particular, the time averages Sj = 1/nj
∑nj
k=1 |dX(j, k)|2 can then be used asrelevant, efficient and robust estimators for EdX(j, k)2. Together with Eq. 4 above, this leads to thefollowing estimation procedure: a weighted linear regression of log2 Sj against log2 2j = j, performed inthe limit of the coarsest scales, provides us with an estimate of 2d + 1, hence of d. The plots log2 Sj
versus log2 2j = j are commonly referred to as logscale diagrams (LD). The possibility of varyingN bringsrobustness to these analysis and estimation procedures. The full definition as well as the performance ofthis estimation procedure are detailed in [1, 2, 47].
From this wavelet based estimate dW of d, we perform a fractional derivation of order dW of X∆.This removes the long memory from the process so that only the ARMA component is left. A standarditerative procedure (based on a Gauss-Newton algorithm) [28] is then applied to estimate the ARMAparameters.Obviously, the major weakness of this two step estimation procedure lies in the fact that be d poorlyestimated, then so will the ARMA parameters. However, the estimation performance of the procedureare studied numerically in Section 6 using synthetic Γα,β farima(φ, d, θ) process.
5 Results and discussions
5.1 Traffic without anomalies
The Γα,β - farima(φ, d, θ) analysis procedures described above are applied to traffic time series for variouslevels of aggregation independently. We present here detailed results for the AUCK-IV series and forthe Metrosec-ref1 series only. Similar results are obtained for the other series mentioned in Table 1,they are not reported here by lack of room (they are available on request).
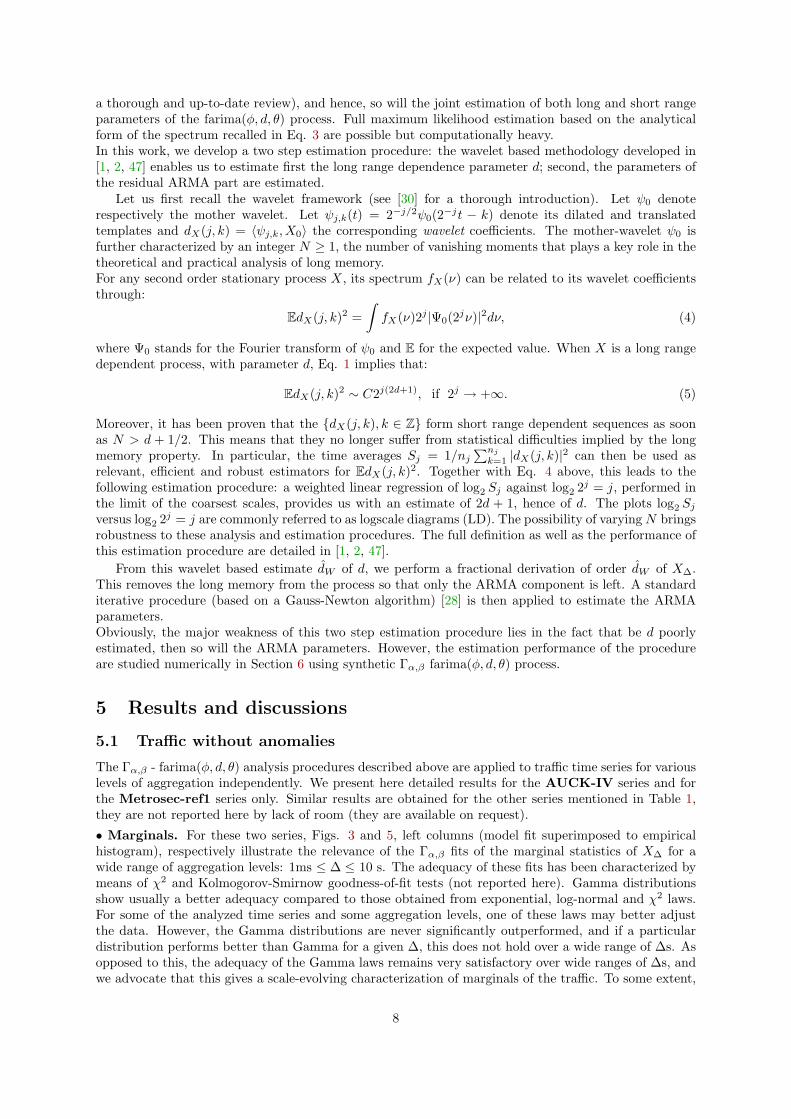
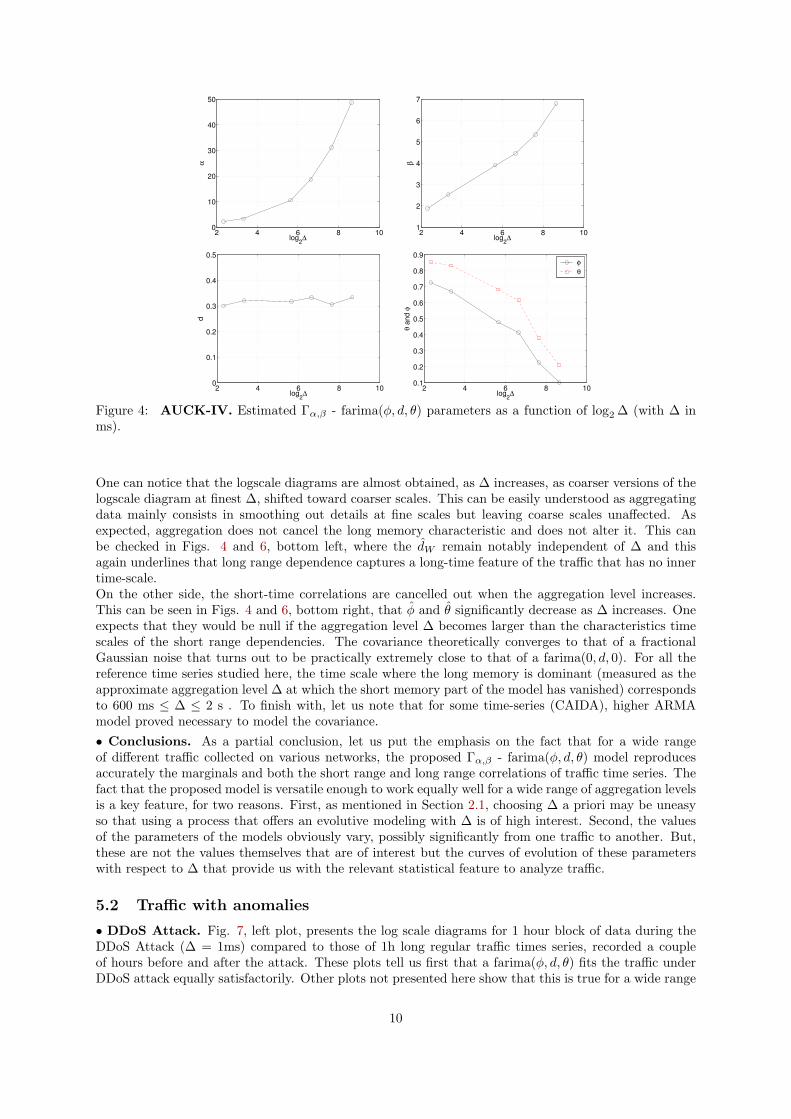
• Marginals. For these two series, Figs. 3 and 5, left columns (model fit superimposed to empiricalhistogram), respectively illustrate the relevance of the Γα,β fits of the marginal statistics of X∆ for awide range of aggregation levels: 1ms ≤ ∆ ≤ 10 s. The adequacy of these fits has been characterized bymeans of χ2 and Kolmogorov-Smirnow goodness-of-fit tests (not reported here). Gamma distributionsshow usually a better adequacy compared to those obtained from exponential, log-normal and χ2 laws.For some of the analyzed time series and some aggregation levels, one of these laws may better adjustthe data. However, the Gamma distributions are never significantly outperformed, and if a particulardistribution performs better than Gamma for a given ∆, this does not hold over a wide range of ∆s. Asopposed to this, the adequacy of the Gamma laws remains very satisfactory over wide ranges of ∆s, andwe advocate that this gives a scale-evolving characterization of marginals of the traffic. To some extent,
8
0 5 10 15 20 25 300
0.02
0.04
0.06
0.08
0.1
0.12
1 5 10 15−1
0
1
2
3
4
5
6
7
j
log 2S
j
0 50 100 150 2000
0.005
0.01
0.015
0.02
0.025
1 5 10 15−1
0
1
2
3
4
5
6
7
j
log 2S
j
100 200 300 400 5000
0.002
0.004
0.006
0.008
0.01
1 5 10 15−1
0
1
2
3
4
5
6
7
j
log 2S
j
Figure 3: AUCK-IV. Γα,β - farima(φ, d, θ) fits for the marginals (left column) and covariances (rightcolumn) for ∆ = 10, 100, 400 ms (top to bottom); j = 1 corresponds to 10 ms.
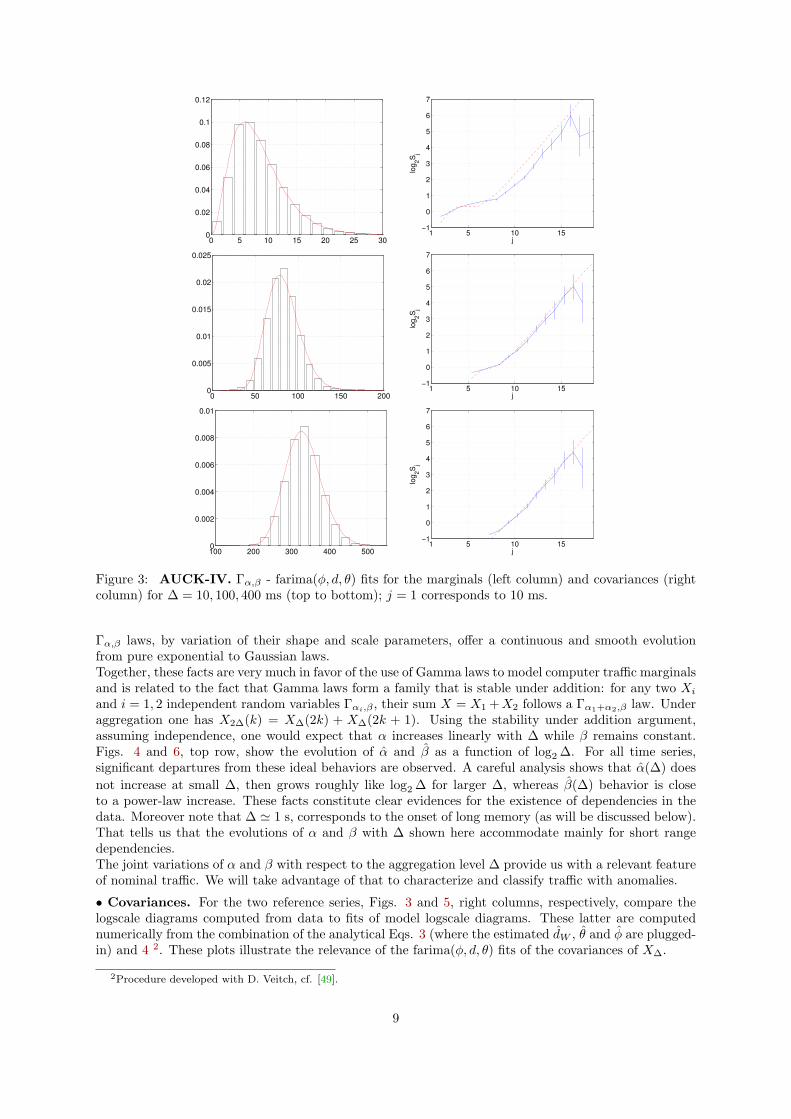
Γα,β laws, by variation of their shape and scale parameters, offer a continuous and smooth evolutionfrom pure exponential to Gaussian laws.Together, these facts are very much in favor of the use of Gamma laws to model computer traffic marginalsand is related to the fact that Gamma laws form a family that is stable under addition: for any two Xi
and i = 1, 2 independent random variables Γαi,β , their sum X = X1 +X2 follows a Γα1+α2,β law. Underaggregation one has X2∆(k) = X∆(2k) + X∆(2k + 1). Using the stability under addition argument,assuming independence, one would expect that α increases linearly with ∆ while β remains constant.Figs. 4 and 6, top row, show the evolution of α and β as a function of log2 ∆. For all time series,significant departures from these ideal behaviors are observed. A careful analysis shows that α(∆) doesnot increase at small ∆, then grows roughly like log2 ∆ for larger ∆, whereas β(∆) behavior is closeto a power-law increase. These facts constitute clear evidences for the existence of dependencies in thedata. Moreover note that ∆ ' 1 s, corresponds to the onset of long memory (as will be discussed below).That tells us that the evolutions of α and β with ∆ shown here accommodate mainly for short rangedependencies.The joint variations of α and β with respect to the aggregation level ∆ provide us with a relevant featureof nominal traffic. We will take advantage of that to characterize and classify traffic with anomalies.
• Covariances. For the two reference series, Figs. 3 and 5, right columns, respectively, compare thelogscale diagrams computed from data to fits of model logscale diagrams. These latter are computednumerically from the combination of the analytical Eqs. 3 (where the estimated dW , θ and φ are plugged-in) and 4 2. These plots illustrate the relevance of the farima(φ, d, θ) fits of the covariances of X∆.
2Procedure developed with D. Veitch, cf. [49].
9
2 4 6 8 100
10
20
30
40
50
log2∆
α
2 4 6 8 101
2
3
4
5
6
7
log2∆
β
2 4 6 8 100
0.1
0.2
0.3
0.4
0.5
log2∆
d
2 4 6 8 100.1
0.2
0.3
0.4
0.5
0.6
0.7
0.8
0.9
log2∆
θ an
d φ
φθ
Figure 4: AUCK-IV. Estimated Γα,β - farima(φ, d, θ) parameters as a function of log2 ∆ (with ∆ inms).
One can notice that the logscale diagrams are almost obtained, as ∆ increases, as coarser versions of thelogscale diagram at finest ∆, shifted toward coarser scales. This can be easily understood as aggregatingdata mainly consists in smoothing out details at fine scales but leaving coarse scales unaffected. Asexpected, aggregation does not cancel the long memory characteristic and does not alter it. This canbe checked in Figs. 4 and 6, bottom left, where the dW remain notably independent of ∆ and thisagain underlines that long range dependence captures a long-time feature of the traffic that has no innertime-scale.On the other side, the short-time correlations are cancelled out when the aggregation level increases.This can be seen in Figs. 4 and 6, bottom right, that φ and θ significantly decrease as ∆ increases. Oneexpects that they would be null if the aggregation level ∆ becomes larger than the characteristics timescales of the short range dependencies. The covariance theoretically converges to that of a fractionalGaussian noise that turns out to be practically extremely close to that of a farima(0, d, 0). For all thereference time series studied here, the time scale where the long memory is dominant (measured as theapproximate aggregation level ∆ at which the short memory part of the model has vanished) correspondsto 600 ms ≤ ∆ ≤ 2 s . To finish with, let us note that for some time-series (CAIDA), higher ARMAmodel proved necessary to model the covariance.• Conclusions. As a partial conclusion, let us put the emphasis on the fact that for a wide rangeof different traffic collected on various networks, the proposed Γα,β - farima(φ, d, θ) model reproducesaccurately the marginals and both the short range and long range correlations of traffic time series. Thefact that the proposed model is versatile enough to work equally well for a wide range of aggregation levelsis a key feature, for two reasons. First, as mentioned in Section 2.1, choosing ∆ a priori may be uneasyso that using a process that offers an evolutive modeling with ∆ is of high interest. Second, the valuesof the parameters of the models obviously vary, possibly significantly from one traffic to another. But,these are not the values themselves that are of interest but the curves of evolution of these parameterswith respect to ∆ that provide us with the relevant statistical feature to analyze traffic.
5.2 Traffic with anomalies
• DDoS Attack. Fig. 7, left plot, presents the log scale diagrams for 1 hour block of data during theDDoS Attack (∆ = 1ms) compared to those of 1h long regular traffic times series, recorded a coupleof hours before and after the attack. These plots tell us first that a farima(φ, d, θ) fits the traffic underDDoS attack equally satisfactorily. Other plots not presented here show that this is true for a wide range
10
0 10 20 30 40 500
0.02
0.04
0.06
0.08
0.1
1 5 10 15
−2
0
2
4
6
8
j
log 2S
j
0 50 100 150 200 250 3000
0.005
0.01
0.015
5 10 15
−2
0
2
4
6
8
j
log 2S
j
0 200 400 600 800 10000
0.5
1
1.5
2
2.5
3
3.5
4 x 10⁻³
1 5 10 15
−2
0
2
4
6
8
j
log 2S
j
Figure 5: METROSEC-ref1. Γα,β - farima(φ, d, θ) fits for the marginals (left column) and covariances(right column) for ∆ = 10, 100, 400 ms (top to bottom). j = 1 corresponds to 10 ms.
of aggregation levels.Moreover, for the behaviors of the logscale diagrams at scales larger than 500 ms (j = 9 in Fig. 7, leftplot), no discrepancies can be detected between before/after and during the attack. In particular, thelong memory parameter dW remains astonishingly constant. This tell us that long memory is not onlynot created by the attack, but also totally insensitive to its occurrence. The only change that can benoticed on the logscale diagram changes is a relative increase of the short-time component (at scales jfrom 4 to 7) after the attack: this is due to the fact that the traffic series after attack was recorded atnight, with a lower traffic load. The logscale diagram was shifted upwards to show that the long memoryparameter dW (given by the slope) does not change, even when the load is smaller, and consequently thefine scale part has been raised. We cannot detect the anomaly from the logscale diagram.
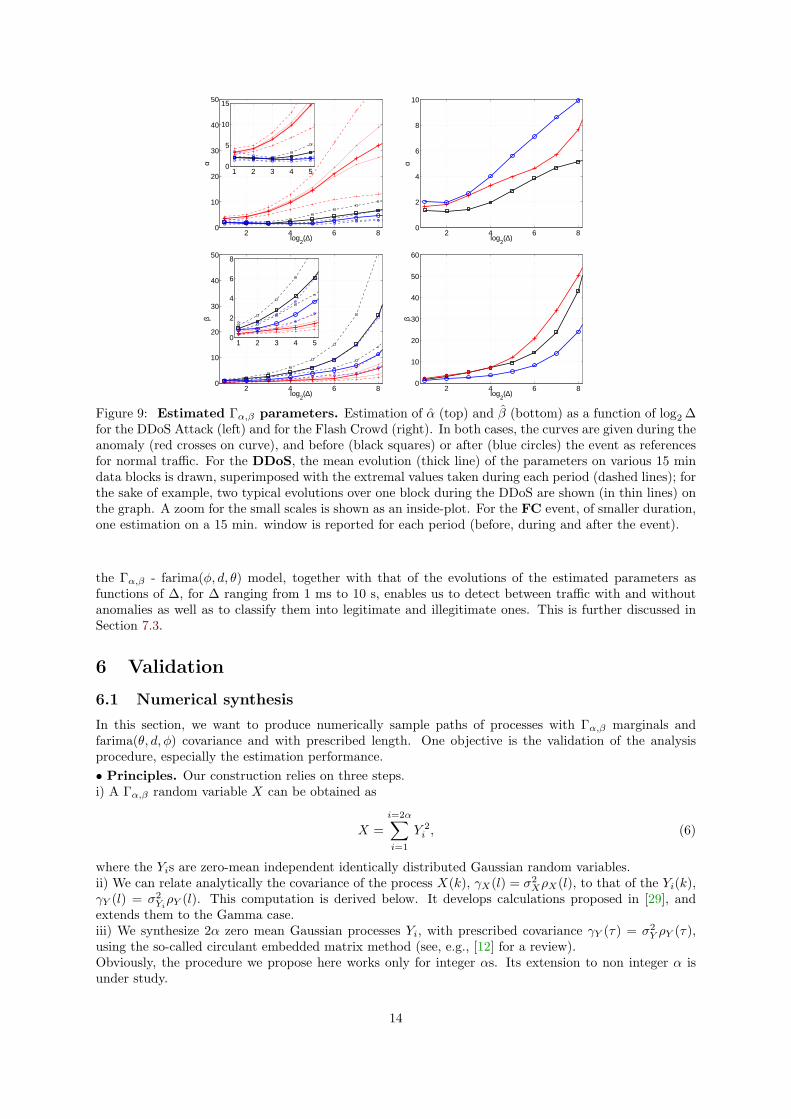
Fig. 8, left column, illustrates, in two plots, that Γα,β distributions adequately fit the marginals ofthe traffic under DDoS attack. Fig. 9, left column, illustrate the compared evolutions of the estimated αand β with respect to ∆ for traffic during (red curves with crosses) and before (black squares) and after(blue circles) the DDoS event. We represent the experimental average of estimation 15 minute-long non-overlapping blocks of data, superimposed with extremal values taken by the estimate during each period.Windows before and after the anomaly correspond to relevant nominal behaviors for regular traffic. Onesees that the functions of α(∆) and β(∆) corresponding to the DDoS attack depart dramatically fromregular behaviors. Let us put the emphasis on the fact that the values of the parameters may varynotably from one block to the other even within the DDoS event but that the evolutions in ∆ remaincomparable and define a path different from what happens with normal traffic.The attack causes an immediate and sharp increase of α starting from the finest ∆ levels whereas undernormal circumstances, α remains constant or with only small variations up to ∆ ' 20 ms. The evolution
11
2 4 6 8 101
1.5
2
2.5
3
3.5
4
4.5
5
log2∆
α
2 4 6 8 100
10
20
30
40
50
60
70
log2∆
β
2 4 6 8 100
0.1
0.2
0.3
0.4
0.5
log2∆
d
2 4 6 8 100
0.2
0.4
0.6
0.8
1
log2∆
θ an
d φ
φθ
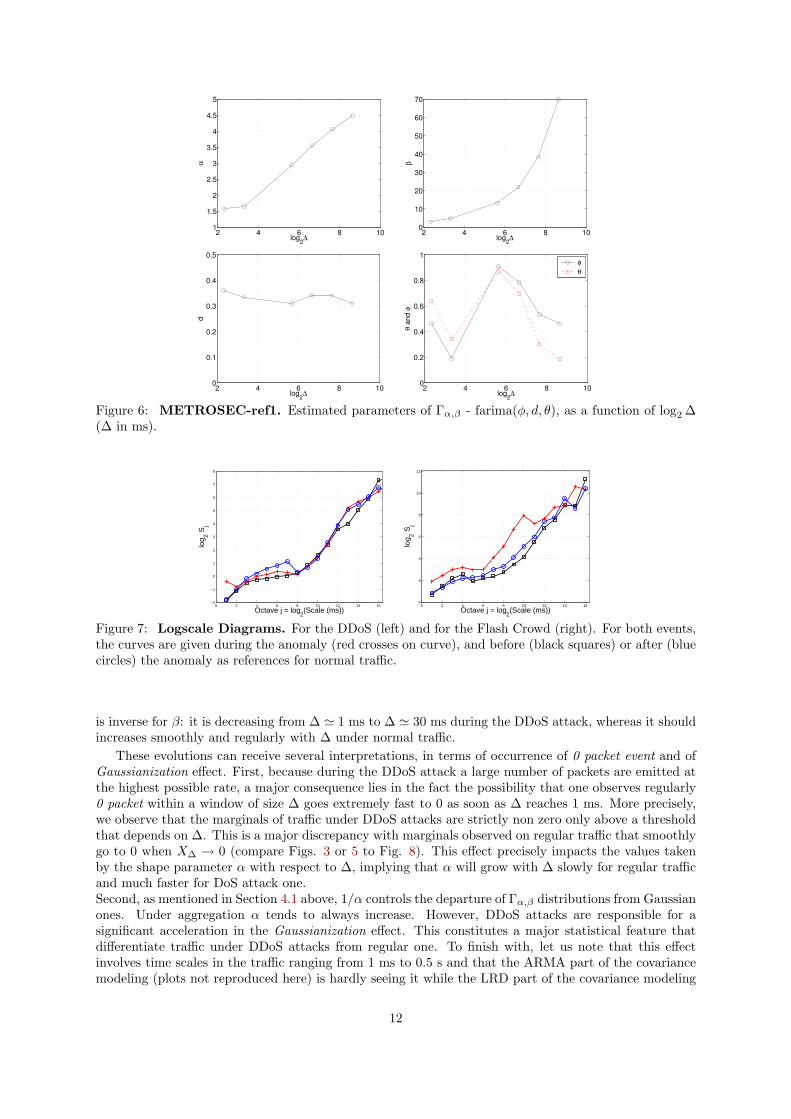
Figure 6: METROSEC-ref1. Estimated parameters of Γα,β - farima(φ, d, θ), as a function of log2 ∆(∆ in ms).
0 2 4 6 8 10 12 14 16−2
−1
0
1
2
3
4
5
6
7
8
Octave j = log2(Scale (ms))
log 2 S
j
0 2 4 6 8 10 12 14 160
2
4
6
8
10
12
Octave j = log2(Scale (ms))
log 2 S
j
Figure 7: Logscale Diagrams. For the DDoS (left) and for the Flash Crowd (right). For both events,the curves are given during the anomaly (red crosses on curve), and before (black squares) or after (bluecircles) the anomaly as references for normal traffic.
is inverse for β: it is decreasing from ∆ ' 1 ms to ∆ ' 30 ms during the DDoS attack, whereas it shouldincreases smoothly and regularly with ∆ under normal traffic.
These evolutions can receive several interpretations, in terms of occurrence of 0 packet event and ofGaussianization effect. First, because during the DDoS attack a large number of packets are emitted atthe highest possible rate, a major consequence lies in the fact the possibility that one observes regularly0 packet within a window of size ∆ goes extremely fast to 0 as soon as ∆ reaches 1 ms. More precisely,we observe that the marginals of traffic under DDoS attacks are strictly non zero only above a thresholdthat depends on ∆. This is a major discrepancy with marginals observed on regular traffic that smoothlygo to 0 when X∆ → 0 (compare Figs. 3 or 5 to Fig. 8). This effect precisely impacts the values takenby the shape parameter α with respect to ∆, implying that α will grow with ∆ slowly for regular trafficand much faster for DoS attack one.Second, as mentioned in Section 4.1 above, 1/α controls the departure of Γα,β distributions from Gaussianones. Under aggregation α tends to always increase. However, DDoS attacks are responsible for asignificant acceleration in the Gaussianization effect. This constitutes a major statistical feature thatdifferentiate traffic under DDoS attacks from regular one. To finish with, let us note that this effectinvolves time scales in the traffic ranging from 1 ms to 0.5 s and that the ARMA part of the covariancemodeling (plots not reproduced here) is hardly seeing it while the LRD part of the covariance modeling
12
0 5 10 150
0.1
0.2
0.3
0.4
0.5
0.6
0 5 10 15 20 250
0.05
0.1
0.15
0.2
0.25
0 10 20 30 40 50 60 70 80 90 1000
0.01
0.02
0.03
0.04
0.05
0.06
0.07
0.08
0 20 40 60 80 100 120 140 160 180 2000
0.005
0.01
0.015
0.02
0.025
0.03
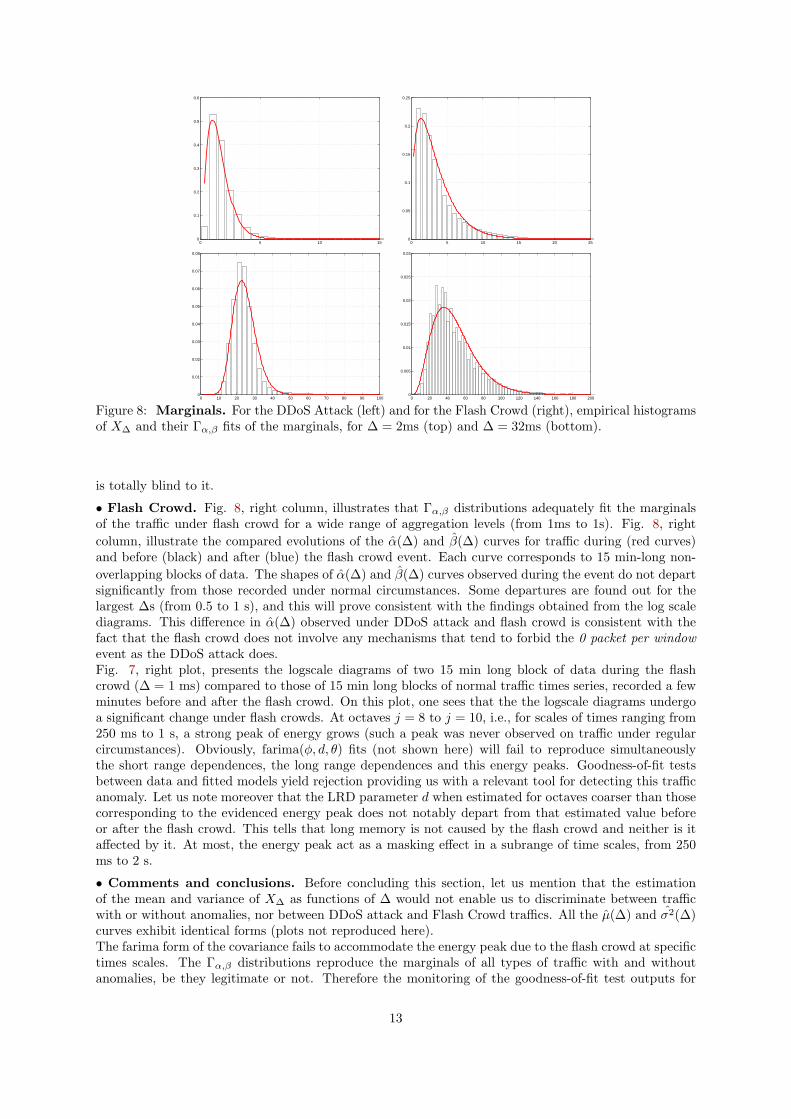
Figure 8: Marginals. For the DDoS Attack (left) and for the Flash Crowd (right), empirical histogramsof X∆ and their Γα,β fits of the marginals, for ∆ = 2ms (top) and ∆ = 32ms (bottom).
is totally blind to it.
• Flash Crowd. Fig. 8, right column, illustrates that Γα,β distributions adequately fit the marginalsof the traffic under flash crowd for a wide range of aggregation levels (from 1ms to 1s). Fig. 8, rightcolumn, illustrate the compared evolutions of the α(∆) and β(∆) curves for traffic during (red curves)and before (black) and after (blue) the flash crowd event. Each curve corresponds to 15 min-long non-overlapping blocks of data. The shapes of α(∆) and β(∆) curves observed during the event do not departsignificantly from those recorded under normal circumstances. Some departures are found out for thelargest ∆s (from 0.5 to 1 s), and this will prove consistent with the findings obtained from the log scalediagrams. This difference in α(∆) observed under DDoS attack and flash crowd is consistent with thefact that the flash crowd does not involve any mechanisms that tend to forbid the 0 packet per windowevent as the DDoS attack does.Fig. 7, right plot, presents the logscale diagrams of two 15 min long block of data during the flashcrowd (∆ = 1 ms) compared to those of 15 min long blocks of normal traffic times series, recorded a fewminutes before and after the flash crowd. On this plot, one sees that the the logscale diagrams undergoa significant change under flash crowds. At octaves j = 8 to j = 10, i.e., for scales of times ranging from250 ms to 1 s, a strong peak of energy grows (such a peak was never observed on traffic under regularcircumstances). Obviously, farima(φ, d, θ) fits (not shown here) will fail to reproduce simultaneouslythe short range dependences, the long range dependences and this energy peaks. Goodness-of-fit testsbetween data and fitted models yield rejection providing us with a relevant tool for detecting this trafficanomaly. Let us note moreover that the LRD parameter d when estimated for octaves coarser than thosecorresponding to the evidenced energy peak does not notably depart from that estimated value beforeor after the flash crowd. This tells that long memory is not caused by the flash crowd and neither is itaffected by it. At most, the energy peak act as a masking effect in a subrange of time scales, from 250ms to 2 s.
• Comments and conclusions. Before concluding this section, let us mention that the estimationof the mean and variance of X∆ as functions of ∆ would not enable us to discriminate between trafficwith or without anomalies, nor between DDoS attack and Flash Crowd traffics. All the µ(∆) and σ2(∆)curves exhibit identical forms (plots not reproduced here).The farima form of the covariance fails to accommodate the energy peak due to the flash crowd at specifictimes scales. The Γα,β distributions reproduce the marginals of all types of traffic with and withoutanomalies, be they legitimate or not. Therefore the monitoring of the goodness-of-fit test outputs for
13
2 4 6 80
10
20
30
40
50
α
log2(∆)
1 2 3 4 50
5
10
15
2 4 6 80
2
4
6
8
10
α
log2(∆)
2 4 6 80
10
20
30
40
50
β
log2(∆)
1 2 3 4 50
2
4
6
8
2 4 6 80
10
20
30
40
50
60
βlog
2(∆)
Figure 9: Estimated Γα,β parameters. Estimation of α (top) and β (bottom) as a function of log2 ∆for the DDoS Attack (left) and for the Flash Crowd (right). In both cases, the curves are given during theanomaly (red crosses on curve), and before (black squares) or after (blue circles) the event as referencesfor normal traffic. For the DDoS, the mean evolution (thick line) of the parameters on various 15 mindata blocks is drawn, superimposed with the extremal values taken during each period (dashed lines); forthe sake of example, two typical evolutions over one block during the DDoS are shown (in thin lines) onthe graph. A zoom for the small scales is shown as an inside-plot. For the FC event, of smaller duration,one estimation on a 15 min. window is reported for each period (before, during and after the event).
the Γα,β - farima(φ, d, θ) model, together with that of the evolutions of the estimated parameters asfunctions of ∆, for ∆ ranging from 1 ms to 10 s, enables us to detect between traffic with and withoutanomalies as well as to classify them into legitimate and illegitimate ones. This is further discussed inSection 7.3.
6 Validation
6.1 Numerical synthesis
In this section, we want to produce numerically sample paths of processes with Γα,β marginals andfarima(θ, d, φ) covariance and with prescribed length. One objective is the validation of the analysisprocedure, especially the estimation performance.• Principles. Our construction relies on three steps.i) A Γα,β random variable X can be obtained as
X =i=2α∑i=1
Y 2i , (6)
where the Yis are zero-mean independent identically distributed Gaussian random variables.ii) We can relate analytically the covariance of the process X(k), γX(l) = σ2
XρX(l), to that of the Yi(k),γY (l) = σ2
YiρY (l). This computation is derived below. It develops calculations proposed in [29], and
extends them to the Gamma case.iii) We synthesize 2α zero mean Gaussian processes Yi, with prescribed covariance γY (τ) = σ2
Y ρY (τ),using the so-called circulant embedded matrix method (see, e.g., [12] for a review).Obviously, the procedure we propose here works only for integer αs. Its extension to non integer α isunder study.
14
0 5 10 15 20 25 300
0.02
0.04
0.06
0.08
0.1
0.12
1 5 10 15−1
0
1
2
3
4
5
6
7
j
log 2(S
j)
0 50 100 150 2000
0.005
0.01
0.015
0.02
0.025
1 5 10 15−1
0
1
2
3
4
5
6
7
j
log 2(S
j)
100 200 300 400 5000
0.002
0.004
0.006
0.008
0.01
1 5 10 15−1
0
1
2
3
4
5
6
7
j
log 2(S
j)
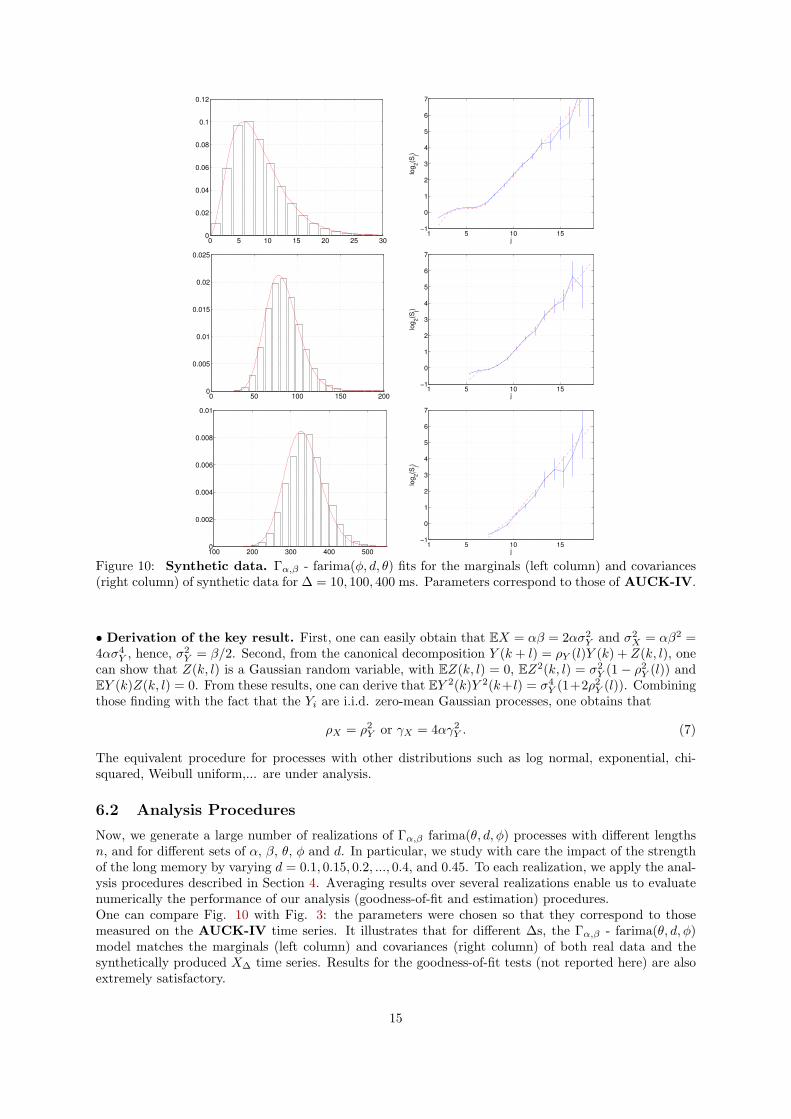
Figure 10: Synthetic data. Γα,β - farima(φ, d, θ) fits for the marginals (left column) and covariances(right column) of synthetic data for ∆ = 10, 100, 400 ms. Parameters correspond to those of AUCK-IV.
• Derivation of the key result. First, one can easily obtain that EX = αβ = 2ασ2Y and σ2
X = αβ2 =4ασ4
Y , hence, σ2Y = β/2. Second, from the canonical decomposition Y (k + l) = ρY (l)Y (k) + Z(k, l), one
can show that Z(k, l) is a Gaussian random variable, with EZ(k, l) = 0, EZ2(k, l) = σ2Y (1− ρ2
Y (l)) andEY (k)Z(k, l) = 0. From these results, one can derive that EY 2(k)Y 2(k+l) = σ4
Y (1+2ρ2Y (l)). Combining
those finding with the fact that the Yi are i.i.d. zero-mean Gaussian processes, one obtains that
ρX = ρ2Y or γX = 4αγ2
Y . (7)
The equivalent procedure for processes with other distributions such as log normal, exponential, chi-squared, Weibull uniform,... are under analysis.
6.2 Analysis Procedures
Now, we generate a large number of realizations of Γα,β farima(θ, d, φ) processes with different lengthsn, and for different sets of α, β, θ, φ and d. In particular, we study with care the impact of the strengthof the long memory by varying d = 0.1, 0.15, 0.2, ..., 0.4, and 0.45. To each realization, we apply the anal-ysis procedures described in Section 4. Averaging results over several realizations enable us to evaluatenumerically the performance of our analysis (goodness-of-fit and estimation) procedures.One can compare Fig. 10 with Fig. 3: the parameters were chosen so that they correspond to thosemeasured on the AUCK-IV time series. It illustrates that for different ∆s, the Γα,β - farima(θ, d, φ)model matches the marginals (left column) and covariances (right column) of both real data and thesynthetically produced X∆ time series. Results for the goodness-of-fit tests (not reported here) are alsoextremely satisfactory.
15
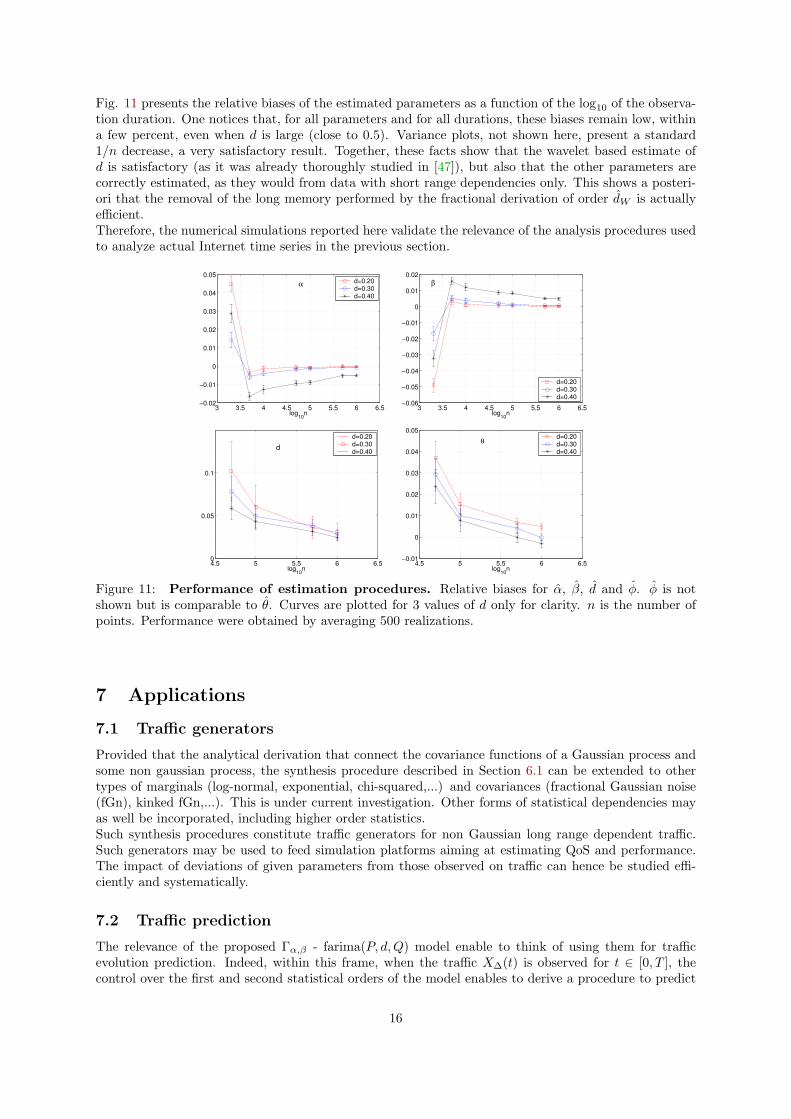
Fig. 11 presents the relative biases of the estimated parameters as a function of the log10 of the observa-tion duration. One notices that, for all parameters and for all durations, these biases remain low, withina few percent, even when d is large (close to 0.5). Variance plots, not shown here, present a standard1/n decrease, a very satisfactory result. Together, these facts show that the wavelet based estimate ofd is satisfactory (as it was already thoroughly studied in [47]), but also that the other parameters arecorrectly estimated, as they would from data with short range dependencies only. This shows a posteri-ori that the removal of the long memory performed by the fractional derivation of order dW is actuallyefficient.Therefore, the numerical simulations reported here validate the relevance of the analysis procedures usedto analyze actual Internet time series in the previous section.
3 3.5 4 4.5 5 5.5 6 6.5−0.02
−0.01
0
0.01
0.02
0.03
0.04
0.05α
log10
n
d=0.20d=0.30d=0.40
3 3.5 4 4.5 5 5.5 6 6.5−0.06
−0.05
−0.04
−0.03
−0.02
−0.01
0
0.01
0.02β
log10
n
d=0.20d=0.30d=0.40
4.5 5 5.5 6 6.50
0.05
0.1
d
log10
n
d=0.20d=0.30d=0.40
4.5 5 5.5 6 6.5−0.01
0
0.01
0.02
0.03
0.04
0.05
θ
log10
n
d=0.20d=0.30d=0.40
Figure 11: Performance of estimation procedures. Relative biases for α, β, d and φ. φ is notshown but is comparable to θ. Curves are plotted for 3 values of d only for clarity. n is the number ofpoints. Performance were obtained by averaging 500 realizations.
7 Applications
7.1 Traffic generators
Provided that the analytical derivation that connect the covariance functions of a Gaussian process andsome non gaussian process, the synthesis procedure described in Section 6.1 can be extended to othertypes of marginals (log-normal, exponential, chi-squared,...) and covariances (fractional Gaussian noise(fGn), kinked fGn,...). This is under current investigation. Other forms of statistical dependencies mayas well be incorporated, including higher order statistics.Such synthesis procedures constitute traffic generators for non Gaussian long range dependent traffic.Such generators may be used to feed simulation platforms aiming at estimating QoS and performance.The impact of deviations of given parameters from those observed on traffic can hence be studied effi-ciently and systematically.
7.2 Traffic prediction
The relevance of the proposed Γα,β - farima(P, d,Q) model enable to think of using them for trafficevolution prediction. Indeed, within this frame, when the traffic X∆(t) is observed for t ∈ [0, T ], thecontrol over the first and second statistical orders of the model enables to derive a procedure to predict
16
the samples X∆(T + τ) for τ > 0 within a window time that needs to be studied, that will depend onthe orders of the ARMA(P,Q) part of the model as well as on the strength of the long memory (i.e.,the value of the d parameter). In that respect, the use of larger orders for P and Q as long as they arerelevant may prove beneficial. This is under study.
7.3 Detection
1 2 3 4 50
5
10
15
20
α
log2(∆)
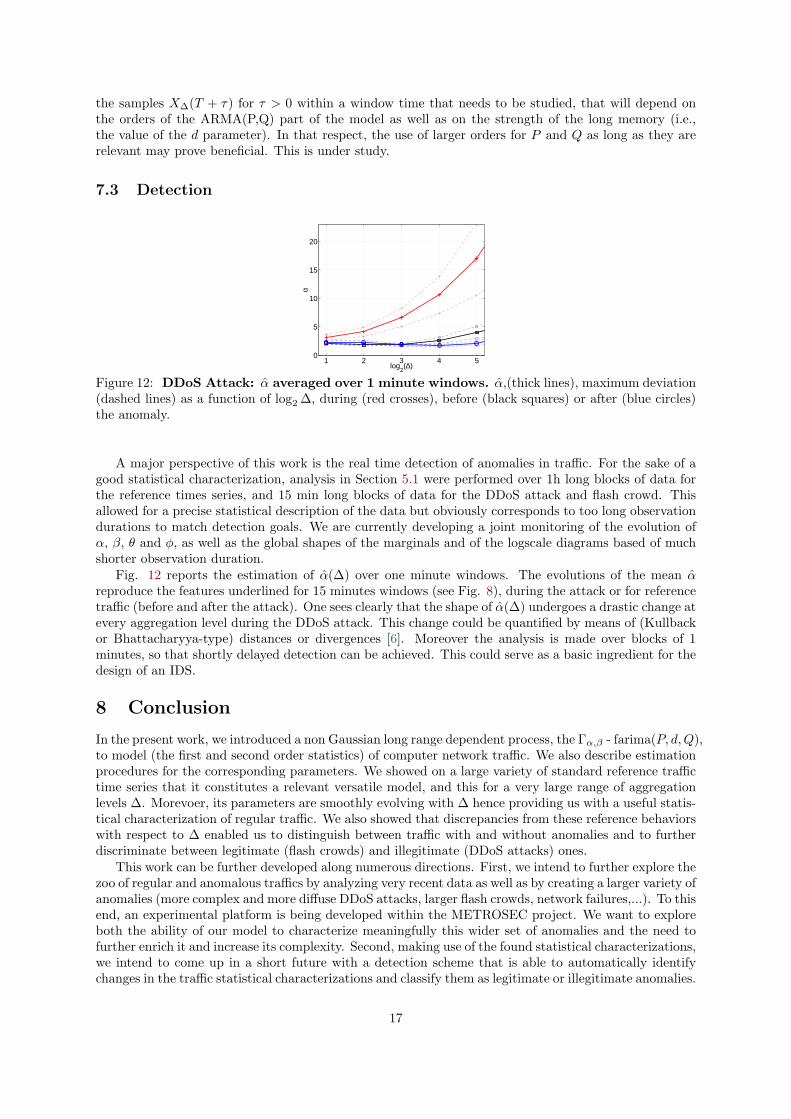
Figure 12: DDoS Attack: α averaged over 1 minute windows. α,(thick lines), maximum deviation(dashed lines) as a function of log2 ∆, during (red crosses), before (black squares) or after (blue circles)the anomaly.
A major perspective of this work is the real time detection of anomalies in traffic. For the sake of agood statistical characterization, analysis in Section 5.1 were performed over 1h long blocks of data forthe reference times series, and 15 min long blocks of data for the DDoS attack and flash crowd. Thisallowed for a precise statistical description of the data but obviously corresponds to too long observationdurations to match detection goals. We are currently developing a joint monitoring of the evolution ofα, β, θ and φ, as well as the global shapes of the marginals and of the logscale diagrams based of muchshorter observation duration.
Fig. 12 reports the estimation of α(∆) over one minute windows. The evolutions of the mean αreproduce the features underlined for 15 minutes windows (see Fig. 8), during the attack or for referencetraffic (before and after the attack). One sees clearly that the shape of α(∆) undergoes a drastic change atevery aggregation level during the DDoS attack. This change could be quantified by means of (Kullbackor Bhattacharyya-type) distances or divergences [6]. Moreover the analysis is made over blocks of 1minutes, so that shortly delayed detection can be achieved. This could serve as a basic ingredient for thedesign of an IDS.
8 Conclusion
In the present work, we introduced a non Gaussian long range dependent process, the Γα,β - farima(P, d,Q),to model (the first and second order statistics) of computer network traffic. We also describe estimationprocedures for the corresponding parameters. We showed on a large variety of standard reference traffictime series that it constitutes a relevant versatile model, and this for a very large range of aggregationlevels ∆. Morevoer, its parameters are smoothly evolving with ∆ hence providing us with a useful statis-tical characterization of regular traffic. We also showed that discrepancies from these reference behaviorswith respect to ∆ enabled us to distinguish between traffic with and without anomalies and to furtherdiscriminate between legitimate (flash crowds) and illegitimate (DDoS attacks) ones.
This work can be further developed along numerous directions. First, we intend to further explore thezoo of regular and anomalous traffics by analyzing very recent data as well as by creating a larger variety ofanomalies (more complex and more diffuse DDoS attacks, larger flash crowds, network failures,...). To thisend, an experimental platform is being developed within the METROSEC project. We want to exploreboth the ability of our model to characterize meaningfully this wider set of anomalies and the need tofurther enrich it and increase its complexity. Second, making use of the found statistical characterizations,we intend to come up in a short future with a detection scheme that is able to automatically identifychanges in the traffic statistical characterizations and classify them as legitimate or illegitimate anomalies.
17
It should operate as an IDS, and be based on short-time time window observation duration.Ultimately, the METROSEC project aims at developing network based (protocols, architectures,...)strategies to improve the robustness of the network against attacks. This increased insensitivity shouldhelp maintaining the targeted level of QoS. The present work constitute a first step toward that globalgoal.
9 Acknowledgments
The authors acknowledge the help of CRI ENSLyon, and L. Gallon (IUT Mont-de-Marsan, France) andL. Bernaille (LIP6, Paris) for their help in conducting data collection and DDoS attack. They alsogratefully acknowledge all the people who freely accepted to take part into the scheduled flash crowdevent analyzed here. Finally, they gratefully acknowledge colleagues from the major internet tracesrepositories (Bellcore, LBL, UNC, Auckland Univ, Univ North Carolina, CAIDA) for making their dataavailable to us. They specially thank S. Marron and F. Hernandez-Campos and C. Park from UNC, USA,and D. Veitch and N. Hohn from CubinLab, University of Melbourne, Australia for having performedthe pre-formatting of some of the time series used here. This work has been made possible thanks to thefinancial support the French MNRT ACI Securite et Informatique 2004 grant, within the METROSECproject.
18
References
[1] P. Abry, P. Flandrin, M.S. Taqqu, and D. Veitch. Wavelets for the analysis, estimation and synthesisof scaling data. In K. Park and W. Willinger, editors, Self-Similar Network Traffic and PerformanceEvaluation. Wiley, 2000.
[2] P. Abry and D. Veitch. Wavelet analysis of long-range dependent traffic. IEEE Trans. on Info.Theory, 44(1):2–15, January 1998.
[3] A. Andersen and B. Nielsen. A Markovian approach for modelling packet traffic with long rangedependence. IEEE journal on Selected Areas in Communications, 5(16):719–732, 1998.
[4] C. Barakat, P. Thiran, G. Iannaccone, C. Diot, and P. Owezarski. A flow-based model for internetbackbone traffic. In ACM/SIGCOMM Internet Measurement Workshop, pages 35–47, New York,NY, USA, 2002. ACM Press.
[5] P. Barford, J. Kline, D. Plonka, and A. Ron. A signal analysis of network traffic anomalies. InACM/SIGCOMM Internet Measurement Workshop, Marseille, France, November 2002.
[6] M. Basseville. Distance measures for signal processing and pattern recognition. Signal Processing,18:349–369, 1989.
[7] J. Beran. Statistics for Long-memory processes. Chapman & Hall, New York, 1994.
[8] J. Brutlag. Aberrant behavior detection in time series for network monitoring. In USENIX SystemAdministration Conference, New Orleans, December 2000.
[9] C-M. Cheng, H.T. Kung, and K-S. Tan. Use of spectral analysis in defense against DoS attacks. InIEEE Globecom, Taipei, Taiwan, 2002.
[10] J. Cleary, S. Donnelly, I. Graham, A. McGregor, and M. Pearson. Design principles for accuratepassive measurement. In Passive and Active Measurements, Hamilton, New Zealand, April 2000.
[11] N. Desaulniers-Soucy and A. Iuoras. Traffic modeling with universal multifractals. In IEEE Globe-com, 1999.
[12] P. Doukhan, G. Oppenheim, and M.S. Taqqu. Long-Range Dependence: Theory and Applications.Birkhauser, Boston, 2003.
[13] A. Erramilli, O. Narayan, and W. Willinger. Experimental queueing analysis with long-range de-pendent packet traffic. ACM/IEEE transactions on Networking, 4(2):209–223, 1996.
[14] M. Evans, N. Hastings, and B. Peacock. Statistical Distributions. Wiley (Interscience Division),June 2000.
[15] A. Feldmann, A.C. Gilbert, and W. Willinger. Data networks as cascades: Investigating the multi-fractal nature of internet wan traffic. In ACM/SIGCOMM conference on Applications, technologies,architectures, and protocols for computer communication, 1998.
[16] G.J. Hahn and S.S. Shapiro. Statistical Models in Engineering, page 88. Wiley (Interscience Divi-sion), June 1994.
[17] J. Hochberg, K. Jackson, C. Stallings, J.F. McClary, D. DuBois, and J. Ford. NADIR: an automatedsystem for detecting network intrusion and misuse. Journal of Computer Secururity, 12(3):235–248,1993.
[18] N. Hohn, D. Veitch, and P. Abry. Cluster processes, a natural language for network traffic. IEEETransactions on Signal Processing Special Issue on Signal Processing in Networking, 8(51):2229–2244, October 2003.
[19] N. Hohn, D. Veitch, and P. Abry. Multifractality in tcp/ip traffic: the case against. ComputerNetworks Journal, to appear, 2005.
19
[20] A. Hussain, J. Heidemann, and C. Papadopoulos. A framework for classifying denial of serviceattacks. In SIGCOMM, Karlsruhe, Germany, 2003.
[21] Javits and Valdes. The SRI IDES statistical anomaly detector. ESORICS, May 1991.
[22] S. Jin and D. Yeung. A covariance analysis model for DDoS attack detection. In IEEE InternationalConference on Communications, Paris, France, June 2004.
[23] J. Jung, B. Krishnamurthy, and M. Rabinovich. Flash Crowds and Denial of Service Attacks:Characterization and Implications for CDNs and Web Sites. In International WWW Conference,Honolulu, HI, May 2002.
[24] T. Karagiannis, M. Molle, M. Faloutsos, and A. Broido. A non stationary Poisson view of theinternet traffic. In INFOCOMM, 2004.
[25] A. Lakhina, M. Crovella, and C. Diot. Diagnosing network-wide traffic anomalies. In SIGCOMM,August 2004.
[26] W. E. Leland, M. S. Taqqu, W. Willinger, and D. V. Wilson. On the self-similar nature of ethernettraffic (extended version). ACM/IEEE transactions on Networking, 2(1):1–15, February 1994.
[27] L. Li and G. Lee. DDoS attack detection and wavelets. In International Conference on computercommunications and networks, August 2003.
[28] L. Ljung. System identification: theory for the user, chapter 10.2. PTR Prentice Hall, 1999.
[29] S.B. Lowen, S.S. Cash, M. Poo, and M.C. Teich. Quantal neurotransmitter secretion rate exhibitsfractal behavior. The journal of Neuroscience, 17(15):5666–5677, August 1997.
[30] S. Mallat. A Wavelet tour of signal processing. Academic Press, 1999.
[31] Benjamin Melamed. An overview of TES processes and modeling methodology. In Perfor-mance/SIGMETRICS Tutorials, pages 359–393, 1993.
[32] D. Moore, G.M. Voelker, and S. Savage. Inferring internet denial-of-service activity. In UsenixSecurity Symposium, 2001.
[33] I. Norros. On the use of fractional Brownian motion in the theory of connectionless networks. IEEEjournal on Selected Areas in Communications, 13(6), 1995.
[34] K. Park, G. Kim, and M. Crovella. On the relationship between file sizes, transport protocols, andself-similar network traffic. In International Conference on Network Protocols, page 171, Washington,DC, USA, 1996. IEEE Computer Society.
[35] K. Park and W. Willinger. Self-similar network traffic: An overview. In Kihong Park and WalterWillinger, editors, Self-Similar Network Traffic and Performance Evaluation, pages 1–38. Wiley(Interscience Division), 2000.
[36] S. Paulo, V. Rui, and P. Antonio. Multiscale fitting procedure using Markov Modulated PoissonProcesses. Telecommunication Systems, 23 (1/2):123–148, June 2003.
[37] V. Paxon and S. Floyd. Wide-area traffic: The failure of Poisson modeling. ACM/IEEE transactionson Networking, 3(3):226–244, June 1995.
[38] V. Paxson. Bro: a system for detecting network intruders in real-time. Computer Networks Journal,31(23–24):2435–2463, 1999.
[39] QoSMOS Traffic Designer. http://www.qosmos.net.
[40] G. Samorodnitsky and M. Taqqu. Stable Non-Gaussian Random Processes. Chapman&Hall, 1994.
[41] S. Sarvotham, R. Riedi, and R. Baraniuk. Connection-level analysis and modeling of network traffic.Technical report, ECE Dept., Rice Univ., 2001.
20
[42] M. Taqqu, V. Teverosky, and W. Willinger. Is network traffic self-similar or multifractal ? Fractals,5(1):63–73, 1997.
[43] B. Tsybakov and N.D. Georganas. Self similar processes in communications networks. IEEE Trans.on Info. Theory, 44(5):1713–1725, 1998.
[44] S. Uhlig, O. Bonaventure, and C. Rapier. 3D-LD: a graphical wavelet-based method for analyzingscaling processes. In ITC Specialist Seminar, pages 329–336, Wurzburg, Germany, 2003.
[45] H.S. Vaccaro and G.E. Liepins. Detection of anomalous computer session activity. In IEEE Sympo-sium on Security and Privacy, pages 280–289, Oakland, California, May 1989.
[46] J. Levy Vehel and R. H. Riedi. in Fractals in Engineering’97, J. Levy Vehel and E. Lutton andC. Tricot, editors, chapter Fractional Brownian motion and data traffic modeling: The other end ofthe spectrum. Springer, 1997.
[47] D. Veitch and P. Abry. A wavelet based joint estimator of the parameters of long-range depen-dence. IEEE Trans. on Info. Theory special issue on ”Multiscale Statistical Signal Analysis and itsApplications”, 45(3):878–897, April 1999.
[48] D. Veitch and P. Abry. A statistical test for the time constancy of scaling exponents. IEEETransactions on Signal Processing, 49(10):2325–2334, October 2001.
[49] D. Veitch, P. Abry, and M. S. Taqqu. On the automatic selection of the onset of scaling. Fractals,11(4):377–390, 2003.
[50] N. Ye. A Markov chain model of temporal behavior for anomaly detection. In Workshop onInformation Assurance and Security, West Point, NY, June 2000.
[51] J. Yuan and K. Mills. DDoS attack detection and wavelets. Technical report, National Institute ofStandards and Technology, 2004.
[52] Z. Zhang, V. Ribeiro, S. Moon, and C. Diot. Small time scaling behavior of internet backbonetraffic: an emprirical study. INFOCOMM, March 2003.
21


![SOLUTIONNAIRElacim.uqam.ca/~christo/Mathematiques algorithmiques...SOLUTIONNAIRE 167 s’assurer que : x 1 Ry x 2 Ry 2. C’est le cas car [ x1]2], y Rx , ( ~et ) x 2 Rx 1, y Ry d’où](https://img.pdfslide.fr/doc/110x75/6114f33a5d8f9a5a7c6a1935/christomathematiques-algorithmiques-solutionnaire-167-saassurer-que-x-1.jpg)