Embed Size (px)
Citation preview
2771
Numerical Simulation of the Load Tests on Bearing Capacity of Piled Raft Foundations
Simulations numériques d'essais de chargement pour établir la capacité portante des fondations mixtes radier sur pieux
Kaneda K., Honda T., Shigeno Y., Hamada J. Takenaka Corporation, Chiba, Japan
ABSTRACT: Field tests on the bearing capacity of pile, raft, and piled raft foundations are compared with simulations of the sametests. Those simulations used the SYS Cam-clay model developed by the Soil Mechanics Group of Nagoya University as the constitutive equations for material behavior. In this study, the material parameters and initial conditions were determined bylaboratory testing performed on specimens collected in the area of the field tests. We found that the numerical simulations reproduced the experimental data well. Furthermore, in our experiments, the total bearing capacity of the raft and pile were found to be equal tothat of the piled raft foundation. This was also confirmed via the simulations.
RÉSUMÉ : Cet article, qui traite de la capacité portante des pieux, des radiers et des fondations mixtes de type radier sur pieux, présente des résultats issus d’une comparaison entre des essais in situ et ceux obtenus par simulations numériques. Ces simulations utilisent le modèle de comportement SYS, développé par le groupe de mécanique des sols de l’Université de Nagoya. Les paramètres relatifs aux matériaux et aux conditions initiales ont été déterminés sur la base d’essais en laboratoire d’échantillons prélevés au même endroit où les essais in situ ont été exécutés. Ces simulations numériques ont convenablement reproduit les données expérimentales.Par ailleurs, lors des essais in situ, la capacité portante totale du radier et du pieu a été trouvée similaire à celle de la fondation mixte. Ce résultat a été aussi confirmé par les simulations.
KEYWORDS: piled raft foundations, numerical simulation, bearing capacity
1 INTRODUCTION
A significant number of studies have been carried out on the settlement and bearing capacity of pile, raft, and piled raft foundations. The designed bearing capacity for pile and piled raft foundations is considered to be the load at 10% settlement. In the present study, prototype vertical load simulations were carried out on such foundations to investigate the relationship between their settlement and bearing capacity at loads near their designed limits. This paper reports the results of these simulations and compares them to experimental data.
In this research, a combined soil and pile analysis was carried out. In the simulations, the SYS Cam clay model developed by the Soil Mechanics Group of Nagoya University was used as the constitutive mathematical model for the soil (Asaoka et al. (2000, 2002)). Since settlement exceeded 10% in the simulations, and since large soil deformations made the influence of geometrical non-linearity important, finite deformation analysis based on finite deformation theory was performed (Asaoka et al. (1994)). In addition, because the bearing capacity of saturated soils changes with loading rate, a soil-water coupled analysis was also carried out. The remainder of the present paper is organized as follows. A brief outline of the experiments is first provided, followed by a discussion on the determination of material parameters and initial conditions for the vertical loading experiments based on laboratory tests. Next, the use of these parameters to perform soil-water coupled analyses based on simulated loading rates is described, and the results are compared to experimental data. Differences in the bearing capacities of pile, raft, and piled raft foundations are then discussed.
2 EXPERIMENTAL CONDITIONS
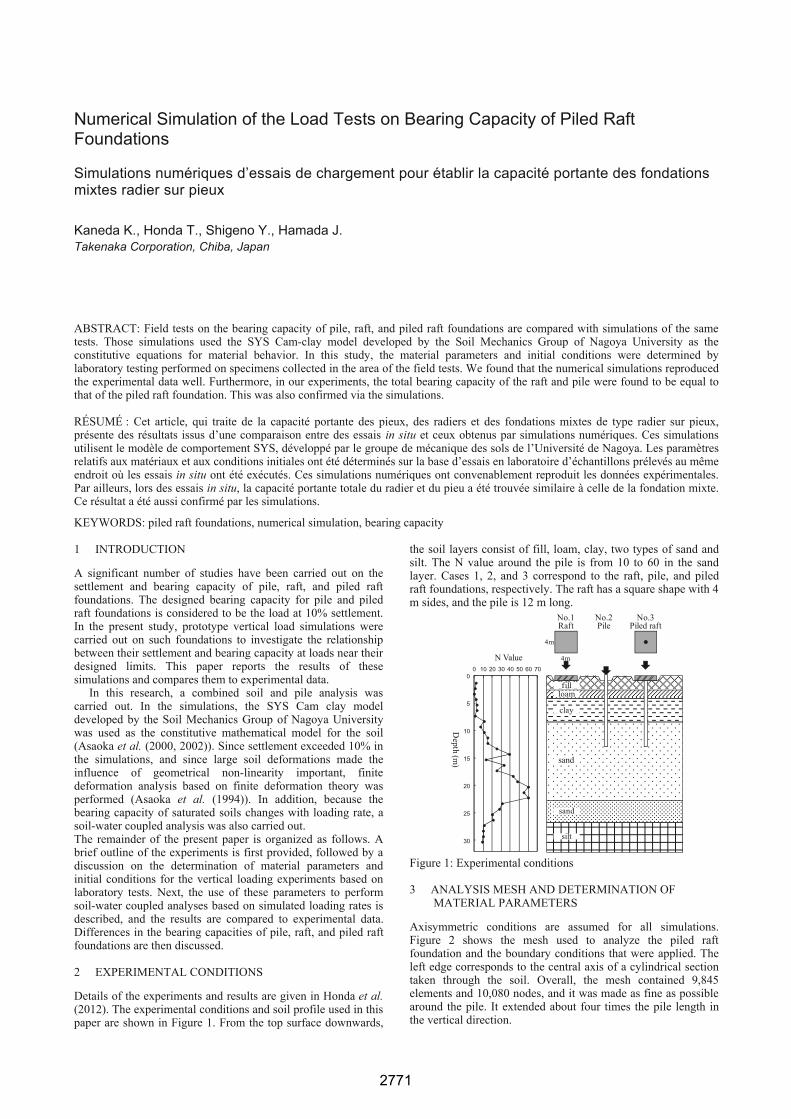
Details of the experiments and results are given in Honda et al. (2012). The experimental conditions and soil profile used in this paper are shown in Figure 1. From the top surface downwards,
the soil layers consist of fill, loam, clay, two types of sand and silt. The N value around the pile is from 10 to 60 in the sand layer. Cases 1, 2, and 3 correspond to the raft, pile, and piled raft foundations, respectively. The raft has a square shape with 4 m sides, and the pile is 12 m long.
0
5
10
15
20
25
30
0 10 20 30 40 50 60 70
4m
4m
No.1Raft
No.3Piled raft
No.2Pile
N Value
fillloam
clay
sand
sand
silt
Depth (m
)
Figure 1: Experimental conditions
3 ANALYSIS MESH AND DETERMINATION OF MATERIAL PARAMETERS
Axisymmetric conditions are assumed for all simulations. Figure 2 shows the mesh used to analyze the piled raft foundation and the boundary conditions that were applied. The left edge corresponds to the central axis of a cylindrical section taken through the soil. Overall, the mesh contained 9,845 elements and 10,080 nodes, and it was made as fine as possible around the pile. It extended about four times the pile length in the vertical direction.
2772
Proceedings of the 18th International Conference on Soil Mechanics and Geotechnical Engineering, Paris 2013
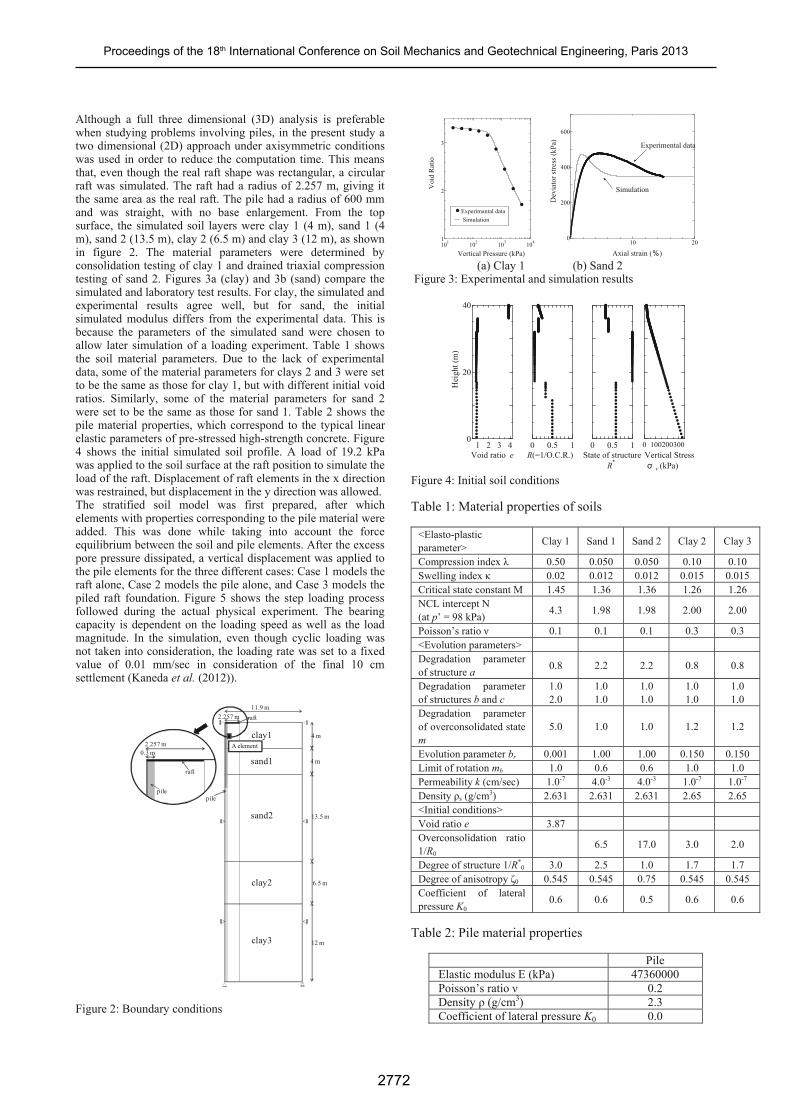
Although a full three dimensional (3D) analysis is preferable when studying problems involving piles, in the present study a two dimensional (2D) approach under axisymmetric conditions was used in order to reduce the computation time. This means that, even though the real raft shape was rectangular, a circular raft was simulated. The raft had a radius of 2.257 m, giving it the same area as the real raft. The pile had a radius of 600 mm and was straight, with no base enlargement. From the top surface, the simulated soil layers were clay 1 (4 m), sand 1 (4 m), sand 2 (13.5 m), clay 2 (6.5 m) and clay 3 (12 m), as shown in figure 2. The material parameters were determined by consolidation testing of clay 1 and drained triaxial compression testing of sand 2. Figures 3a (clay) and 3b (sand) compare the simulated and laboratory test results. For clay, the simulated and experimental results agree well, but for sand, the initial simulated modulus differs from the experimental data. This is because the parameters of the simulated sand were chosen to allow later simulation of a loading experiment. Table 1 shows the soil material parameters. Due to the lack of experimental data, some of the material parameters for clays 2 and 3 were set to be the same as those for clay 1, but with different initial void ratios. Similarly, some of the material parameters for sand 2 were set to be the same as those for sand 1. Table 2 shows the pile material properties, which correspond to the typical linear elastic parameters of pre-stressed high-strength concrete. Figure 4 shows the initial simulated soil profile. A load of 19.2 kPa was applied to the soil surface at the raft position to simulate the load of the raft. Displacement of raft elements in the x direction was restrained, but displacement in the y direction was allowed. The stratified soil model was first prepared, after which elements with properties corresponding to the pile material were added. This was done while taking into account the force equilibrium between the soil and pile elements. After the excess pore pressure dissipated, a vertical displacement was applied to the pile elements for the three different cases: Case 1 models the raft alone, Case 2 models the pile alone, and Case 3 models the piled raft foundation. Figure 5 shows the step loading process followed during the actual physical experiment. The bearing capacity is dependent on the loading speed as well as the load magnitude. In the simulation, even though cyclic loading was not taken into consideration, the loading rate was set to a fixed value of 0.01 mm/sec in consideration of the final 10 cm settlement (Kaneda et al. (2012)).
4 m
4 m
13.5 m
6.5 m
12 m
clay1
sand1
sand2
clay2
clay3
11.9 m2.257 m
0.3 m2.257 m
pilepile
raft
raft
A element
Figure 2: Boundary conditions
101 102 103 1041
2
3
Vertical Pressure (kPa)
Voi
d R
atio
Experimantal dataSimulation
10 20
0
200
400
600
Axial strain (%)
Dev
iato
r stre
ss (k
Pa)
Experimental data
Simulation
(a) Clay 1 (b) Sand 2
Figure 3: Experimental and simulation results
1 2 3 40
20
40
0 0.5 1 0 0.5 1 0 100200300Void ratio e R(=1/O.C.R.) State of structure
Hei
ght (
m)
Vertical Stress R* σ v (kPa)
Figure 4: Initial soil conditions
Table 1: Material properties of soils
<Elasto-plastic parameter> Clay 1 Sand 1 Sand 2 Clay 2 Clay 3
Compression index λ 0.50 0.050 0.050 0.10 0.10 Swelling index κ 0.02 0.012 0.012 0.015 0.015 Critical state constant M 1.45 1.36 1.36 1.26 1.26 NCL intercept N (at p’ = 98 kPa) 4.3 1.98 1.98 2.00 2.00
Poisson’s ratio ν 0.1 0.1 0.1 0.3 0.3 <Evolution parameters> Degradation parameter of structure a 0.8 2.2 2.2 0.8 0.8
Degradation parameter of structures b and c
1.0 2.0
1.0 1.0
1.0 1.0
1.0 1.0
1.0 1.0
Degradation parameter of overconsolidated state m
5.0 1.0 1.0 1.2 1.2
Evolution parameter br 0.001 1.00 1.00 0.150 0.150 Limit of rotation mb 1.0 0.6 0.6 1.0 1.0 Permeability k (cm/sec) 1.0-7 4.0-3 4.0-3 1.0-7 1.0-7 Density ρs (g/cm3) 2.631 2.631 2.631 2.65 2.65 <Initial conditions> Void ratio e 3.87 Overconsolidation ratio 1/R0
6.5 17.0 3.0 2.0
Degree of structure 1/R*0 3.0 2.5 1.0 1.7 1.7
Degree of anisotropy ζ0 0.545 0.545 0.75 0.545 0.545 Coefficient of lateral pressure K0
0.6 0.6 0.5 0.6 0.6
Table 2: Pile material properties
Pile Elastic modulus E (kPa) 47360000 Poisson’s ratio ν 0.2 Density ρ (g/cm3) 2.3 Coefficient of lateral pressure K0 0.0
2773
Technical Committee 212 / Comité technique 212
0
20
40
60
80
100
0 100 200 300 400
Disp
lace
men
t(m
m)
Time (min)
Case10.01mm/sec
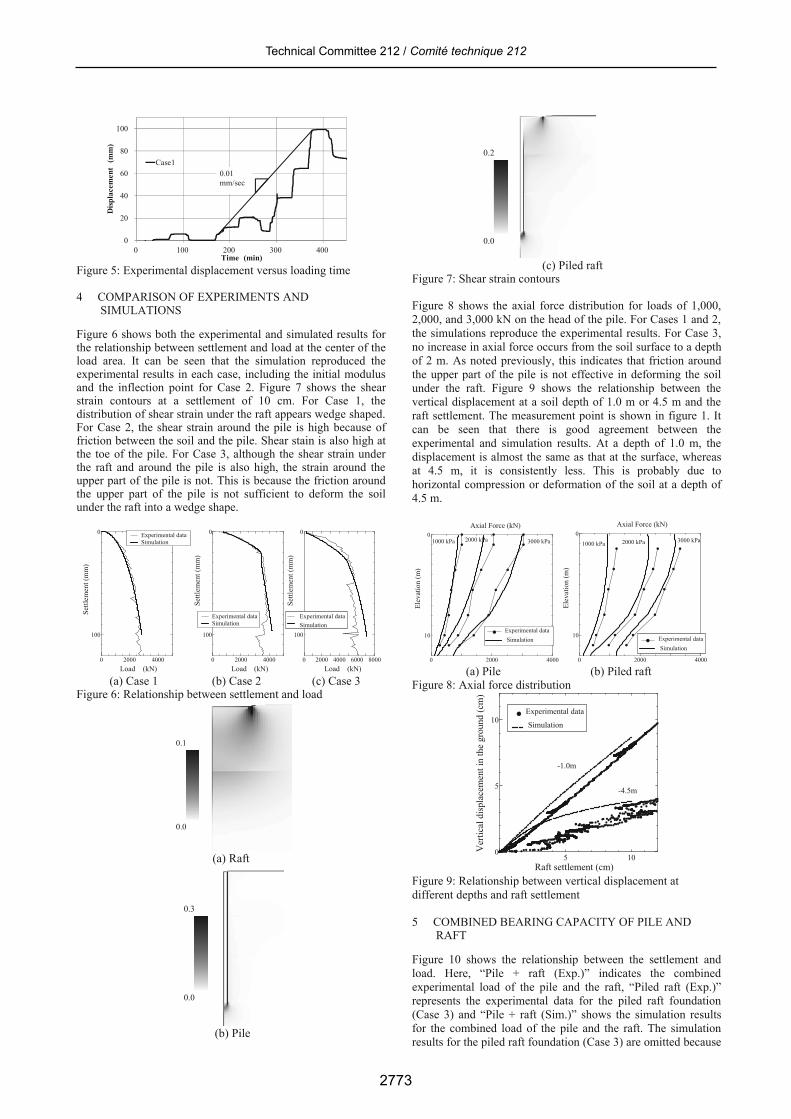
Figure 5: Experimental displacement versus loading time
4 COMPARISON OF EXPERIMENTS AND
SIMULATIONS
Figure 6 shows both the experimental and simulated results for the relationship between settlement and load at the center of the load area. It can be seen that the simulation reproduced the experimental results in each case, including the initial modulus and the inflection point for Case 2. Figure 7 shows the shear strain contours at a settlement of 10 cm. For Case 1, the distribution of shear strain under the raft appears wedge shaped. For Case 2, the shear strain around the pile is high because of friction between the soil and the pile. Shear stain is also high at the toe of the pile. For Case 3, although the shear strain under the raft and around the pile is also high, the strain around the upper part of the pile is not. This is because the friction around the upper part of the pile is not sufficient to deform the soil under the raft into a wedge shape.
0 2000 4000
100
0
Load (kN)
Settl
emen
t (m
m)
Experimental dataSimulation
0 2000 4000
100
0
Load (kN)
Settl
emen
t (m
m)
Experimental dataSimulation
0 2000 4000 6000 8000
100
0
Load (kN)
Settl
emen
t (m
m)
Experimental dataSimulation
(a) Case 1 (b) Case 2 (c) Case 3
Figure 6: Relationship between settlement and load
0.0
0.1
(a) Raft
0.0
0.3
(b) Pile
0.0
0.2
(c) Piled raft
Figure 7: Shear strain contours
Figure 8 shows the axial force distribution for loads of 1,000, 2,000, and 3,000 kN on the head of the pile. For Cases 1 and 2, the simulations reproduce the experimental results. For Case 3, no increase in axial force occurs from the soil surface to a depth of 2 m. As noted previously, this indicates that friction around the upper part of the pile is not effective in deforming the soil under the raft. Figure 9 shows the relationship between the vertical displacement at a soil depth of 1.0 m or 4.5 m and the raft settlement. The measurement point is shown in figure 1. It can be seen that there is good agreement between the experimental and simulation results. At a depth of 1.0 m, the displacement is almost the same as that at the surface, whereas at 4.5 m, it is consistently less. This is probably due to horizontal compression or deformation of the soil at a depth of 4.5 m.
0 2000 4000
10
0Axial Force (kN)
Elev
atio
n (m
)
Experimental dataSimulation
1000 kPa 2000 kPa 3000 kPa
0 2000 4000
10
0Axial Force (kN)
Elev
atio
n (m
)
Experimental dataSimulation
1000 kPa 2000 kPa 3000 kPa
(a) Pile (b) Piled raft
Figure 8: Axial force distribution
5 100
5
10
Raft settlement (cm)
Ver
tical
dis
plac
emen
t in
the
grou
nd (c
m)
Experimental data
Simulation
-4.5m
-1.0m
Figure 9: Relationship between vertical displacement at different depths and raft settlement
5 COMBINED BEARING CAPACITY OF PILE AND
RAFT
Figure 10 shows the relationship between the settlement and load. Here, “Pile + raft (Exp.)” indicates the combined experimental load of the pile and the raft, “Piled raft (Exp.)” represents the experimental data for the piled raft foundation (Case 3) and “Pile + raft (Sim.)” shows the simulation results for the combined load of the pile and the raft. The simulation results for the piled raft foundation (Case 3) are omitted because
2774
Proceedings of the 18th International Conference on Soil Mechanics and Geotechnical Engineering, Paris 2013
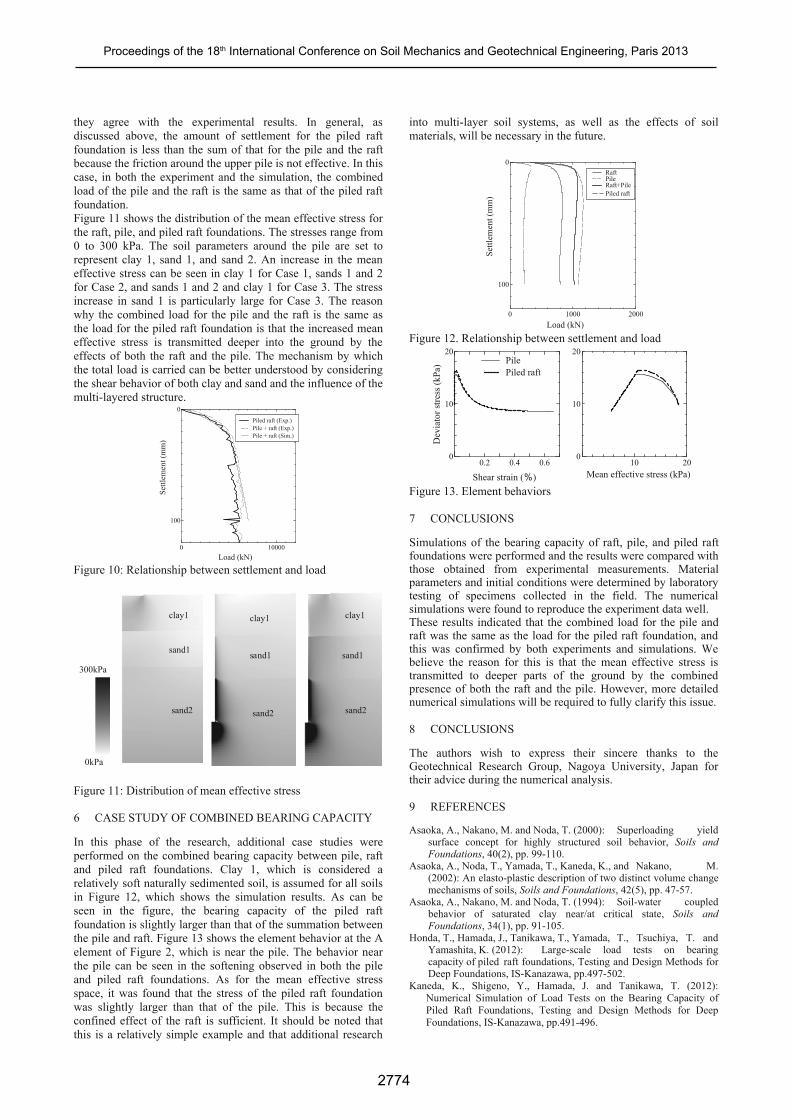
they agree with the experimental results. In general, as discussed above, the amount of settlement for the piled raft foundation is less than the sum of that for the pile and the raft because the friction around the upper pile is not effective. In this case, in both the experiment and the simulation, the combined load of the pile and the raft is the same as that of the piled raft foundation. Figure 11 shows the distribution of the mean effective stress for the raft, pile, and piled raft foundations. The stresses range from 0 to 300 kPa. The soil parameters around the pile are set to represent clay 1, sand 1, and sand 2. An increase in the mean effective stress can be seen in clay 1 for Case 1, sands 1 and 2 for Case 2, and sands 1 and 2 and clay 1 for Case 3. The stress increase in sand 1 is particularly large for Case 3. The reason why the combined load for the pile and the raft is the same as the load for the piled raft foundation is that the increased mean effective stress is transmitted deeper into the ground by the effects of both the raft and the pile. The mechanism by which the total load is carried can be better understood by considering the shear behavior of both clay and sand and the influence of the multi-layered structure.
0 10000
100
0
Settl
emen
t (m
m)
Load (kN)
Piled raft (Exp.)Pile + raft (Exp.)Pile + raft (Sim.)
Figure 10: Relationship between settlement and load
0kPa
300kPa
clay1 clay1 clay1
sand1 sand1 sand1
sand2 sand2 sand2
Figure 11: Distribution of mean effective stress 6 CASE STUDY OF COMBINED BEARING CAPACITY
In this phase of the research, additional case studies were performed on the combined bearing capacity between pile, raft and piled raft foundations. Clay 1, which is considered a relatively soft naturally sedimented soil, is assumed for all soils in Figure 12, which shows the simulation results. As can be seen in the figure, the bearing capacity of the piled raft foundation is slightly larger than that of the summation between the pile and raft. Figure 13 shows the element behavior at the A element of Figure 2, which is near the pile. The behavior near the pile can be seen in the softening observed in both the pile and piled raft foundations. As for the mean effective stress space, it was found that the stress of the piled raft foundation was slightly larger than that of the pile. This is because the confined effect of the raft is sufficient. It should be noted that this is a relatively simple example and that additional research
into multi-layer soil systems, as well as the effects of soil materials, will be necessary in the future.
0 1000 2000
100
0
Settl
emen
t (m
m)
Load (kN)
RaftPileRaft+PilePiled raft
Figure 12. Relationship between settlement and load
0.2 0.4 0.60
10
20
10 200
10
20
Dev
iato
r stre
ss (k
Pa)
Shear strain (%) Mean effective stress (kPa)
PilePiled raft
Figure 13. Element behaviors
7 CONCLUSIONS
Simulations of the bearing capacity of raft, pile, and piled raft foundations were performed and the results were compared with those obtained from experimental measurements. Material parameters and initial conditions were determined by laboratory testing of specimens collected in the field. The numerical simulations were found to reproduce the experiment data well. These results indicated that the combined load for the pile and raft was the same as the load for the piled raft foundation, and this was confirmed by both experiments and simulations. We believe the reason for this is that the mean effective stress is transmitted to deeper parts of the ground by the combined presence of both the raft and the pile. However, more detailed numerical simulations will be required to fully clarify this issue. 8 CONCLUSIONS
The authors wish to express their sincere thanks to the Geotechnical Research Group, Nagoya University, Japan for their advice during the numerical analysis. 9 REFERENCES
Asaoka, A., Nakano, M. and Noda, T. (2000): Superloading yield surface concept for highly structured soil behavior, Soils and Foundations, 40(2), pp. 99-110.
Asaoka, A., Noda, T., Yamada, T., Kaneda, K., and Nakano, M. (2002): An elasto-plastic description of two distinct volume change mechanisms of soils, Soils and Foundations, 42(5), pp. 47-57.
Asaoka, A., Nakano, M. and Noda, T. (1994): Soil-water coupled behavior of saturated clay near/at critical state, Soils and Foundations, 34(1), pp. 91-105.
Honda, T., Hamada, J., Tanikawa, T., Yamada, T., Tsuchiya, T. and Yamashita, K. (2012): Large-scale load tests on bearing capacity of piled raft foundations, Testing and Design Methods for Deep Foundations, IS-Kanazawa, pp.497-502.
Kaneda, K., Shigeno, Y., Hamada, J. and Tanikawa, T. (2012): Numerical Simulation of Load Tests on the Bearing Capacity of Piled Raft Foundations, Testing and Design Methods for Deep Foundations, IS-Kanazawa, pp.491-496.