Embed Size (px)
Citation preview
7/21/2019 Orth Et Al 2008 Jpsp
http://slidepdf.com/reader/full/orth-et-al-2008-jpsp 1/14
PERSONALITY PROCESSES AND INDIVIDUAL DIFFERENCES
Low Self-Esteem Prospectively Predicts Depression in Adolescenceand Young Adulthood
Ulrich Orth and Richard W. RobinsUniversity of California, Davis
Brent W. RobertsUniversity of Illinois at Urbana–Champaign
Low self-esteem and depression are strongly correlated in cross-sectional studies, yet little is known
about their prospective effects on each other. The vulnerability model hypothesizes that low self-esteem
serves as a risk factor for depression, whereas the scar model hypothesizes that low self-esteem is an
outcome, not a cause, of depression. To test these models, the authors used 2 large longitudinal data sets,
each with 4 repeated assessments between the ages of 15 and 21 years and 18 and 21 years, respectively.
Cross-lagged regression analyses indicated that low self-esteem predicted subsequent levels of depres-
sion, but depression did not predict subsequent levels of self-esteem. These findings held for both men
and women and after controlling for content overlap between the self-esteem and depression scales. Thus,
the results supported the vulnerability model, but not the scar model, of self-esteem and depression.
Keywords: self-esteem, depression, adolescence, young adulthood
Many theories of depression postulate that low self-esteem is a
defining feature of depression (e.g., Abramson, Seligman, & Teas-
dale, 1978; Beck, 1967; Blatt, D’Afflitti, & Quinlan, 1976; Brown
& Harris, 1978). Indeed, numerous studies have documented
strong concurrent relations between low self-esteem and depres-
sion (Joiner, Katz, & Lew, 1999; Kernis, Grannemann, & Mathis,
1991; Lewinsohn, Hoberman, & Rosenbaum, 1988; J. E. Roberts
& Monroe, 1992). However, the nature of this relation—
specifically, the temporal order—remains unclear. Does low self-
esteem lead to depression, does depression contribute to the de-
velopment of low self-esteem, or are they reciprocally related?Two dominant models exist in the literature. The vulnerability
model hypothesizes that low self-esteem serves as a risk factor for
depression, especially in the face of major life stressors (e.g., Beck,
1967; Butler, Hokanson, & Flynn, 1994; Metalsky, Joiner, Hardin,
& Abramson, 1993; J. E. Roberts & Monroe, 1992; Whisman &
Kwon, 1993). For example, according to Beck’s (1967) cognitive
theory of depression, negative beliefs about the self—one of three
central components of depressive disorders—are not just symp-
tomatic of depression but play a critical causal role in its etiology.
In contrast, the scar model hypothesizes that low self-esteem is an
outcome of depression rather than a cause. Specifically, depression is
assumed to persistently deteriorate personal resources such as self-
esteem, even after remittance of a depressive episode; that is, episodes
of depression may leave scars in the individual’s self-concept that
progressively chip away at self-esteem over time (cf. Coyne, Gallo,
Klinkman, & Calarco, 1998; Coyne & Whiffen, 1995; Rohde, Lewin-
sohn, & Seeley, 1990; Zeiss & Lewinsohn, 1988).
Thus far, the extant research has not provided clear support in favor
of either the vulnerability model or the scar model, in part because the
scar model has rarely been tested empirically and in part because the
two models have seldom been pitted against each other in the context
of a single study. To further address this issue, the present researchuses data from two longitudinal studies to examine reciprocal rela-
tions between self-esteem and depression1 in adolescence and young
adulthood. Below, we review models of the relation between self-
esteem and depression and then summarize previous longitudinal
research on the link between the two constructs.
Models of the Relation Between Self-Esteem
and Depression
Vulnerability Model
The vulnerability model states that low self-esteem is a risk
factor for future depression. The underlying assumption of the
1 Throughout this article, we use the term depression to denote a con-
tinuous variable (i.e., individual differences in depressive affect) rather
than a clinical category such as major depressive disorder (American
Psychiatric Association, 2000). Indeed, taxometric analyses have suggested
that depression is best conceptualized as a dimensional rather than a
categorical construct for children, adolescents, and adults (Hankin, Fraley,
Lahey, & Waldman, 2005; Lewinsohn, Solomon, Seeley, & Zeiss, 2000;
Prisciandaro & Roberts, 2005; Ruscio & Ruscio, 2000).
Ulrich Orth and Richard W. Robins, Department of Psychology, Uni-versity of California, Davis; Brent W. Roberts, Department of Psychology,
University of Illinois at Urbana–Champaign.
This research was supported by Grant PA001-113065 from the Swiss
National Science Foundation to Ulrich Orth and National Institutes of Health
Grant AG-022057 to Richard W. Robins. We thank Kali Trzesniewski and
Brent Donnellan for helpful comments on an earlier version of this article and
Keith Widaman for helpful statistical advice.
Correspondence concerning this article should be addressed to Ulrich
Orth, Department of Psychology, University of California, One Shields
Avenue, Davis, CA 95616. E-mail: [email protected]
Journal of Personality and Social Psychology, 2008, Vol. 95, No. 3, 695–708Copyright 2008 by the American Psychological Association 0022-3514/08/$12.00 DOI: 10.1037/0022-3514.95.3.695
695
7/21/2019 Orth Et Al 2008 Jpsp
http://slidepdf.com/reader/full/orth-et-al-2008-jpsp 2/14
vulnerability model is that self-esteem, like other personality traits,
is a diathesis exerting causal influence in the onset and mainte-
nance of depression. Low self-esteem might contribute to depres-
sion through both interpersonal and intrapersonal pathways. One
interpersonal pathway is that some individuals with low self-
esteem excessively seek reassurance about their personal worth
from friends and relationship partners, increasing the risk of beingrejected by their support partners and thereby increasing the risk of
depression (Joiner, 2000; Joiner, Alfano, & Metalsky, 1992; Joiner
et al., 1999). A second interpersonal pathway is that individuals
with low self-esteem seek negative feedback from their relation-
ship partners to verify their negative self-concept, which may
further degrade their self-concept (Giesler, Josephs, & Swann,
1996; Joiner, 1995; Swann, Wenzlaff, & Tafarodi, 1992). A third
interpersonal pathway is that low self-esteem motivates social
avoidance, thereby impeding social support, which has been linked
to depression (cf. Ottenbreit & Dobson, 2004). Relatedly, individ-
uals with low self-esteem are more sensitive to rejection and tend
to perceive their relationship partner’s behavior more negatively,
thereby undermining attachment and satisfaction in close relation-
ships (Murray, Holmes, & Griffin, 2000; Murray, Rose, Bellavia,Holmes, & Kusche, 2002). A fourth interpersonal pathway is that
individuals with low self-esteem engage in antisocial behaviors,
such as aggression and substance abuse, that might contribute to
their feeling excluded and alienated from others (Donnellan, Trz-
esniewski, Robins, Moffitt, & Caspi, 2005).
An intrapersonal pathway explaining how low self-esteem con-
tributes to depression might operate through rumination. The ten-
dency to ruminate about negative aspects of the self is closely
linked to depression (Morrow & Nolen-Hoeksema, 1990; Nolen-
Hoeksema, 1991, 2000; Nolen-Hoeksema & Morrow, 1991; Spa-
sojevic & Alloy, 2001; Trapnell & Campbell, 1999). Mor and
Winquist’s (2002) meta-analysis of correlational and experimental
studies showed that self-focused attention strongly and causallyinfluences negative affect (including depression) and, moreover,
that a ruminative self-focus has a particularly strong impact (com-
pared with a reflective self-focus).
Scar Model
The scar model, in contrast to the vulnerability model, states that
low self-esteem, like other correlates of depression such as nega-
tive attributional style, might be a consequence of depression
rather than a causal factor (Lewinsohn, Steinmetz, Larson, &
Franklin, 1981; Rohde et al., 1990). Indeed, it is conceivable that
the self-concept and self-esteem are permanently changed by the
experience of depression, especially after major depressive episodes.
Again, depression might impair an individual’s self-esteem throughboth intrapersonal and interpersonal pathways. A possible intraper-
sonal pathway is that the experience of depression might influence
self-esteem by persistently altering the way in which individuals
process self-relevant information; for example, the chronic nega-
tive mood associated with depression may lead the individual to
selectively attend to, encode, and retrieve negative information
about the self, resulting in the formation of more negative self-
evaluations. One interpersonal pathway is that depressive episodes
may damage important sources of self-esteem such as close rela-
tionships or social networks. Another interpersonal pathway is that
depression might change how the individual is perceived by others.
These representations may be relatively persistent and cause the
individual to be treated by others with low regard or in ways that
minimize the individual’s self-esteem, even if the depression has
already remitted (Joiner, 2000). Another pathway is that the dis-
closure of depression to others may not only shape how others
perceive the individual, but also amplify the intrapersonal effects
of depression on the self-concept (cf. Tice, 1992), thereby com-bining interpersonal and intrapersonal processes. Of course, the
vulnerability model and the scar model are not mutually exclu-
sive because both processes (i.e., low self-esteem contributing
to depression and depression eroding self-esteem) might oper-
ate simultaneously.
Common Factor Model
In addition to the vulnerability and scar models, some research-
ers have argued that self-esteem and depression are essentially one
construct and should be conceptualized as opposed endpoints on a
continuum (e.g., Watson, Suls, & Haig, 2002). From this perspec-
tive, it does not make sense to ask questions about the temporal
order of their relation, because low self-esteem and depression areboth assumed to derive from the broader construct of negative
emotionality. The appeal of the common factor model is its parsi-
mony, and empirical evidence has confirmed that the two constructs
indeed share a large proportion of variance. In three studies by
Watson et al. (2002), using samples of college students, self-
esteem correlated .64 to .74 with the depression scales of the
Mood and Anxiety Symptom Questionnaire (Watson et al., 1995)
and .79 with the depression facet of the neuroticism scale in the
Revised NEO Personality Inventory (Costa & McCrae, 1992). On
the basis of these results, Watson et al. (2002) cautioned against
treating trait measures of self-esteem and depression as distinct
constructs (see also Judge, Erez, Bono, & Thoresen, 2002).
However, several factors point to the usefulness of distinguish-ing between self-esteem and depression. First, the correlations
reported by Watson et al. (2002) are relatively high compared with
those reported in previous research. Cross-sectional correlations
ranging from .44 to .60 have been found in adult samples
(Abela, Webb, Wagner, Ho, & Adams, 2006; Lewinsohn et al.,
1988; J. E. Roberts & Monroe, 1992); ranging from .24 to .77
in college student samples (Butler et al., 1994; Hankin, Lak-
dawalla, Carter, Abela, & Adams, 2007; Kernis et al., 1991, 1998;
Joiner, 1995; Joiner et al., 1999; Whisman & Kwon, 1993); and of
.36 in an adolescent sample (J. E. Roberts & Gamble, 2001).
Thus, the correlation between self-esteem and depression varies
widely across studies, but the relation is not as strong as would be
expected if they were actually opposite poles of the same con-
struct.Second, the stability of self-esteem (i.e., rank-order stability) is
larger than the stability of depression, suggesting that they are
driven by different underlying causal dynamics. Trzesniewski,
Donnellan, and Robins (2003) reported that the stability of self-
esteem is moderately high across the entire lifespan (disattenuated
correlations averaging in the .50s to .60s), comparable to the
stability of other personality traits (B. W. Roberts & DelVecchio,
2000). In contrast, rank-order stabilities between .30 and .50
(disattenuated for measurement error) are typically reported for
depression (Lovibond, 1998). Third, there is emerging evidence
from studies using genetically informed research designs that
696 ORTH, ROBINS, AND ROBERTS
7/21/2019 Orth Et Al 2008 Jpsp
http://slidepdf.com/reader/full/orth-et-al-2008-jpsp 3/14
self-esteem and depression have unique genetic effects; that is, the
genetic influences on self-esteem are at least partially distinct from
the genetic influences on depression (Neiss et al., 2005; Trz-
esniewski, 2007).
Finally, as described below, some studies have shown that
self-esteem and depression are prospectively related to one an-
other, even after controlling for prior levels of each construct. Thispattern of findings is difficult to reconcile with the idea that they
make up a common factor. Given these differences, we believe that
it is useful to distinguish between self-esteem and depression and
to explore the nature of their relation.
Prospective Studies of the Link Between Self-Esteem
and Depression
In this section, we review studies of the relation between self-
esteem and depression that (a) are prospective (i.e., that tested
effects of self-esteem or depression at one time point and on the
other variable at a subsequent time point) and that (b) controlled
for effects of prior levels of the predicted variable (i.e., that ruled
out the possibility that prospective effects were due to concurrentrelations between the variables and the stability of the predicted
variable).
Reciprocal Effects
Only two studies have analyzed reciprocal prospective relations
between self-esteem and depression. In the first study, Shahar and
Davidson (2003) used data from a treatment study of 260 adults
with severe mental illness (such as schizophrenia spectrum disor-
ders, bipolar disorder, and psychotic major depression). Using
latent-variable modeling and a cross-lagged regression model,
these authors found a significant effect of depression on self-
esteem for one of the time intervals (from baseline to 4 months),but no significant effect for the other time interval (from 4 to 9
months). Thus, the results provide partial support for the scar
hypothesis, but not for the vulnerability hypothesis.
In the second study, Ormel, Oldehinkel, and Vollebergh (2004)
assessed self-esteem and major depressive episodes annually for 3
years in a large probability sample of the Dutch population. They
found that individuals who had low self-esteem at Year 1 were
more likely to experience a major depressive episode at Year 2 and
at Year 3. The effect of self-esteem on depression held for indi-
viduals with a recurrent history of major depressive episodes and
for those who experienced a major depressive episode for the first
time in their lives at Year 2 or 3. In contrast, Ormel et al. (2004)
did not find evidence for prospective effects of depression on
self-esteem; that is, individuals who experienced a major depres-sive episode at Year 2 (but not at Year 1 or 3) were not more likely
to decline in self-esteem across the 3-year period. Thus, the two
studies simultaneously investigating the vulnerability and the scar
models have yielded inconsistent findings, with Ormel et al.’s
(2004) supporting the vulnerability hypothesis and Shahar and
Davidson’s (2003) supporting the scar hypothesis.
Effect of Self-Esteem on Depression
Numerous studies have investigated the prospective effect of
self-esteem on depression (controlling for prior levels of depres-
sion), but not the effect of depression on self-esteem (and thus they
have addressed only the vulnerability hypothesis). In a study using
a large community sample of adults, self-esteem significantly
predicted depression across a 9-month interval, even after control-
ling for the occurrence of stressful life events and other variables
(Lewinsohn et al., 1988, reanalyzing data reported in Lewinsohn et
al., 1981). In another study using a large sample of adults, Fer-nandez, Mutran, and Reitzes (1998) found that self-esteem pre-
dicted depression scores 2 years later, especially among partici-
pants who reported that stressful life events occurred during the
time interval. Abela et al. (2006), using a community sample of
adults with a history of major depression, found that self-esteem,
in interaction with the occurrence of daily hassles, predicted de-
pression at several time points during the following year.
Many studies have been conducted using college student sam-
ples, often investigating reactions to stressful academic events. For
example, Metalsky et al. (1993) assessed participants several times
before and for 5 days after receiving a midterm grade. These
authors found that among students receiving a poor grade, low
self-esteem predicted depressive reactions on the 2nd through the
5th day after grading. Similarly, two other studies have found that
self-esteem prospectively predicted depression after stressful aca-
demic events (Ralph & Mineka, 1998; J. E. Roberts & Monroe,
1992). Other studies with college students confirmed the predictive
effects of self-esteem on depression in reaction to other types of
events or daily hassles (Hokanson, Rubert, Welker, Hollander, &
Hedeen, 1989; Kernis et al., 1998; Whisman & Kwon, 1993).
The effect of low self-esteem on depression has also been found
in samples of adolescents. Using data from a large representative
sample, Trzesniewski et al. (2006) found that self-esteem scores in
early adolescence (ages 11 to 15) predicted depression at age 26,
controlling for adolescent depression, gender, and socioeconomic
status. This finding held both for a clinical interview measure of
major depressive disorder and an informant-report measure (e.g.,ratings by a best friend, relationship partner, or family member) of
depressive affect. Likewise, in another study of adolescents, low
self-esteem predicted an increase in depression measured 3 months
later (Southall & Roberts, 2002). In a study of high school seniors
applying for college, participants were assessed several weeks
before receiving the admission decision, immediately after re-
ceiving the decision, and for a third time 4 days later (Abela,
2002). The results showed that among participants receiving a
negative outcome, low self-esteem predicted subsequent de-
pressive reactions.
However, some studies failed to find evidence that self-esteem
predicts subsequent depression. For example, in three studies with
college students, self-esteem was not longitudinally related todepression (Butler et al., 1994; Lakey, 1988; J. E. Roberts &
Gotlib, 1997), and in a study of adolescents, self-esteem at age 14
did not predict depression at age 18 (Block, Gjerde, & Block,
1991).
Effect of Depression on Self-Esteem
Besides the two studies testing reciprocal effects mentioned
above, we are not aware of any studies that have examined the
effects of depression on subsequent level of self-esteem after
controlling for prior levels of self-esteem.
697SELF-ESTEEM AND DEPRESSION
7/21/2019 Orth Et Al 2008 Jpsp
http://slidepdf.com/reader/full/orth-et-al-2008-jpsp 4/14
Design of the Present Research
Despite the previous research efforts, the temporal sequence of
self-esteem and depression is still unclear because most of the
studies examined only the vulnerability hypothesis, not the scar
hypothesis. The two studies that investigated the scar hypothesis
resulted in inconsistent findings (Ormel et al., 2004; Shahar &Davidson, 2003). Moreover, these studies were conducted over a
relatively short time period, and one of them was based on a highly
select sample (i.e., individuals with severe mental illness; Shahar
& Davidson, 2003), which is of important clinical interest but may
not generalize. It is unclear why these studies yielded different
results because they differ in so many respects, including sample
characteristics (e.g., age and education level), design characteris-
tics (e.g., time intervals between assessments and measures used),
and data analytic procedures (e.g., statistical analyses to estimate
effects across repeated time intervals and control for content
overlap between self-esteem and depression measures). Therefore,
in the present research, we used two longitudinal data sets to
examine long-term reciprocal relations between self-esteem and
depression.This research extends previous studies on self-esteem and de-
pression in several ways. First, we investigated reciprocal effects
of self-esteem and depression, and thus, simultaneously tested the
vulnerability and scar models. By doing so, we were able to
simultaneously test the vulnerability and scar models. Second, in
contrast to most previous studies, we used more appropriate sta-
tistical models based on latent variable modeling, providing better
estimates of the effects and more flexibility in controlling for
antecedent and concurrent effects (Finkel, 1995; for an application,
see, e.g., Wetherell, Gatz, & Pedersen, 2001). Third, we tested
whether self-esteem and depression are separate factors or whether
the data speak in favor of an underlying common factor as pro-
posed by Watson et al. (2002). Fourth, we used data sets thatincluded multiple repeated assessments so the effects could be
replicated across multiple time points, increasing both the reliabil-
ity and the validity of the estimates. Fifth, we cross-validated our
results using two large data sets with different design characteris-
tics; by replicating the findings across studies, we reduce method-
ological concerns unique to each study and strengthen confidence
in the overall pattern of results. Sixth, in Study 2, we addressed the
possible overlap in item content of self-esteem and depression
measures, a problem that has plagued previous research in this area
because some depression scales include items that refer explicitly
to negative beliefs about the self.
We decided to focus on adolescence and young adulthood for
several reasons. First, the prevalence of depressive disorders is
high during adolescence and young adulthood (Blazer, Kessler,McGonagle, & Swartz, 1994; Costello, Erkanli, & Angold, 2006;
Kessler et al., 2005), so this developmental period is particularly
important for understanding the underlying etiology of depression.
Second, self-esteem and depression are particularly likely to
show changes during adolescence and young adulthood because of
the many transitions that occur during this time of life (cf. Mi-
rowsky & Kim, 2007; Robins, Trzesniewski, Tracy, Gosling, &
Potter, 2002). The adolescent period is associated with rapid
maturational changes, shifting societal demands, conflicting role
demands, and increasingly complex romantic and peer relation-
ships. After graduating from high school, many young adults move
away from home for the first time, begin college and full-time
jobs, or marry and have children. Personality theorists and devel-
opmental psychologists have long highlighted the importance of
this period, describing the complex challenges that young adults
face and the patterns of adaptation that follow from their resolution
(Arnett, 2000; Erikson, 1983; Helson, 1983; White, 1966). More-
over, the developmental process of becoming an adult often entailsa questioning of one’s identity and subsequent reformulation of
conceptions and evaluations of the self. Together, these various
forces are likely to produce changes in self-esteem and depression.
Third, there are theoretical reasons to believe that self-esteem
and depression might be particularly strongly linked during ado-
lescence and young adulthood. The confluence of changes that
occur during this developmental stage are likely to tax the indi-
vidual’s psychological resources, and previous research has sug-
gested that the link between self-esteem and depression might be
stronger during stressful events. Moreover, one of the core devel-
opmental tasks of this stage of life centers on developing a sense
of mastery and competence (Galambos, Barker, & Krahn, 2006;
Roisman, Masten, Coatsworth, & Tellegen, 2004), which are
closely linked to self-esteem. Thus, it seems plausible that allaspects of adjustment and adaptation, including indicators of well-
being such as depression, would be particularly linked to success
in achieving the salient developmental task of this period, estab-
lishing a sense of competence and self-worth.
Study 1
Method
The data used in Study 1 come from the National Longitudinal
Survey of Youth (NLSY79), a national probability survey that was
started in 1979 (for further information about this study, see Center
for Human Resource Research, 2006). Since its start, the NSLY79has collected information on the children of female participants.
Since 1994, the NLSY79 began assessing the children who had
reached age 15 with separate interviews. These adolescents and
young adults were assessed biennially from 1994 to 2004, resulting
in six assessments. However, the number of assessments available
for each participant varies widely because there is a complex
pattern of planned missing data because of budgetary reasons. For
example, in 1998 only children between 15 and 20 were inter-
viewed, and in 2000 about 40% of the Black and Hispanic over-
samples were not surveyed. Moreover, because at every assess-
ment additional children reached age 15 and thus became eligible
for assessment, the sample size increased with every assessment
( N s ranged from 980 in 1994 to 5,024 in 2004). The design of the
study also produced substantial age heterogeneity (e.g., partici-pants in the 2004 assessment ranged in age from 15 to 34). To
reduce the sample’s age heterogeneity, we decided to analyze
sequences of four repeated assessments for those individuals who
began the survey in 1994, 1996, or 1998 at age 15 or 16. The data
for these three cohorts were restructured so that the age of every
individual was 15 or 16 at Time 1.
Participants
The sample consisted of 2,403 individuals (50% female). The
mean age of participants at the first assessment was 15.5 years
698 ORTH, ROBINS, AND ROBERTS
7/21/2019 Orth Et Al 2008 Jpsp
http://slidepdf.com/reader/full/orth-et-al-2008-jpsp 5/14
(SD 0.5, range 15 to 16). Sixty-one percent were White
(non-Hispanic), 21% were Black, 12% were Hispanic, 2% were
American Indian, and 4% were of other ethnicity. Self-esteem and
depression data were available for 2,094 individuals at Time 1,
1,272 individuals at Time 2, 710 individuals at Time 3, and 1,108
individuals at Time 4; overall, 15% of the data were missing
because of participant dropout, and 31% of the data were missingas a result of planned missing data because of budgetary reasons.
To investigate the potential impact of attrition, we tested for
differences on study variables between participants who completed
the Time 4 assessment and participants who dropped out of the
study before Time 4. For both self-esteem and depression, no
significant differences emerged.
Measures
Self-esteem. Self-esteem was assessed with the 10-item
Rosenberg Self-Esteem Scale (RSE; Rosenberg, 1965). The RSE
is the most commonly used and well-validated measure of global
self-esteem (cf. Robins, Hendin, & Trzesniewski, 2001). Re-
sponses were measured on a 4-point scale ranging from 1 (stronglydisagree) to 4 (strongly agree). The alpha reliability of the RSE was
.84 at Time 1, .87 at Time 2, .88 at Time 3, and .88 at Time 4.
Depression. Depression was assessed with the Center for Ep-
idemiological Studies Depression Scale (CES–D; Radloff, 1977).
The CES–D is a frequently used self-report measure for the as-
sessment of depressive symptoms in nonclinical, subclinical, and
clinical populations, and its validity has repeatedly been confirmed
(Eaton, Smith, Ybarra, Muntaner, & Tien, 2004). The NLSY79
uses a short version of the CES–D with 7 items: “I did not feel like
eating; my appetite was poor,” “I had trouble keeping my mind on
what I was doing,” “I felt depressed,” “I felt that everything I did
was an effort,” “My sleep was restless,” “I felt sad,” and “I could
not get ‘going.’” It is important to note that none of these items is
conceptually related to the construct of self-esteem, but all of them
are central to depression. For each item, participants were instructed
to assess the frequency of their reactions within the preceding 7 days.
Responses were measured on a 4-point scale (0 rarely, none of
the time, one day; 1 some, a little of the time, one to two days;
2 occasionally, moderate amount of the time, three to four days ;
and 3 most, all of the time, five to seven days). The alpha
reliability of this short form of the CES–D was .65 at Time 1, .66
at Time 2, .67 at Time 3, and .68 at Time 4.
Procedure for the Statistical Analysis
The analyses were conducted using Amos 5 (Arbuckle, 2003;
Arbuckle & Wothke, 1999). To deal with missing values, we used
the full information maximum likelihood procedure; this proce-
dure is recommended because the results are less biased and more
reliable compared with conventional methods of dealing with
missing data, such as listwise or pairwise deletion (Allison, 2003;
Schafer & Graham, 2002).
Model fit was assessed by means of the Tucker-Lewis-Index
(TLI), the comparative fit index (CFI), and the root-mean-squareerror of approximation (RMSEA), based on the recommendations
of Hu and Bentler (1998, 1999) and MacCallum and Austin
(2000). Hu and Bentler (1999) suggested that good fit is indicated
by values greater than or equal to .95 for TLI and CFI and less than
or equal to .06 for RMSEA. In addition to these indices, we report
chi-square statistics and the confidence intervals for RMSEA.
To test for differences in model fit, we followed the recommen-
dation of MacCallum, Browne, and Cai (2006) and used the test of
small differences in fit instead of the more commonly used chi-
square difference test. With sufficiently large samples, the chi-
square difference test for nested models will always be significant,
even when the true difference in fit is very small and theoretically
irrelevant (MacCallum et al., 2006). In contrast, the test of small
difference in fit tests for differences greater than an a priorispecified small difference, and thus a nonsignificant difference
implies that the true difference is small, assuming that the sample
size provides adequate statistical power. In the studies reported in
this article, using the test of small difference in fit is particularly
appropriate in view of the large size of the samples. In conducting
the test, we used the exact specifications given by MacCallum et
al. (2006, Program C): .05, RMSEAA .06, and RMSEA
B
.05 (RMSEAA and RMSEAB represent the a priori specified small
difference in fit). For all tests of small difference in fit reported in
this article, statistical power was very large, with values above .99
(MacCallum et al., 2006, Program D).
Results and Discussion
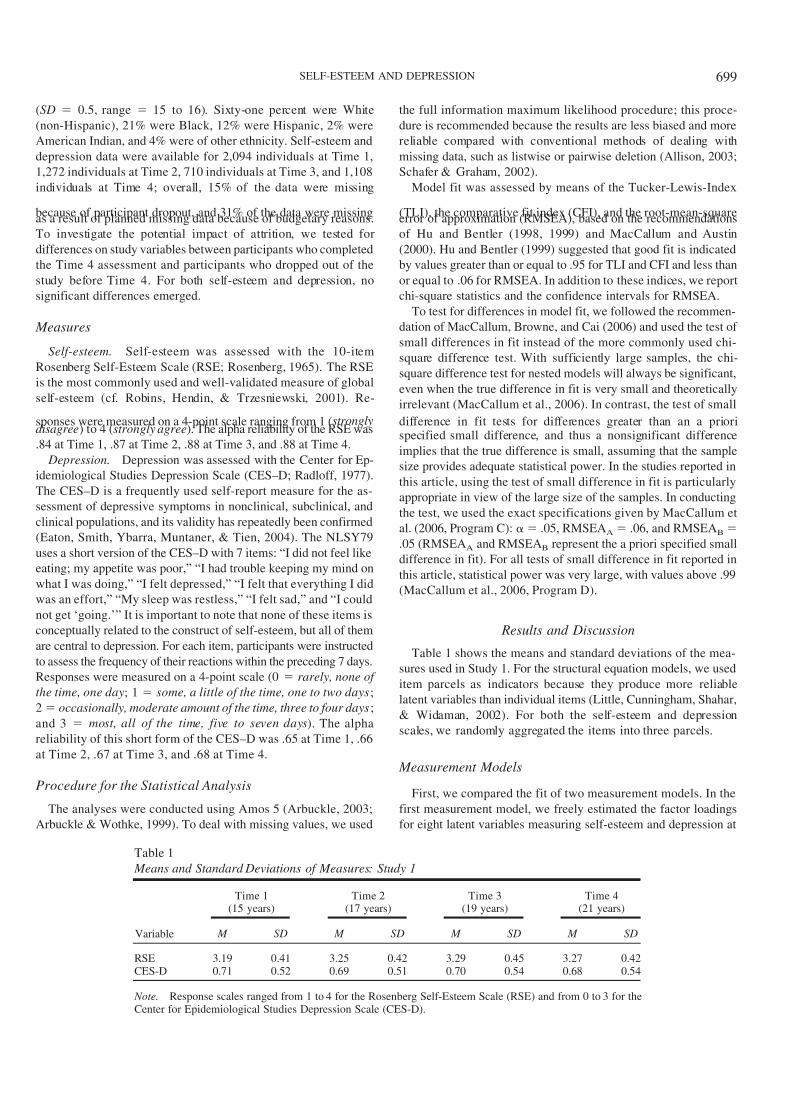
Table 1 shows the means and standard deviations of the mea-
sures used in Study 1. For the structural equation models, we used
item parcels as indicators because they produce more reliable
latent variables than individual items (Little, Cunningham, Shahar,
& Widaman, 2002). For both the self-esteem and depression
scales, we randomly aggregated the items into three parcels.
Measurement Models
First, we compared the fit of two measurement models. In the
first measurement model, we freely estimated the factor loadings
for eight latent variables measuring self-esteem and depression at
Table 1
Means and Standard Deviations of Measures: Study 1
Variable
Time 1(15 years)
Time 2(17 years)
Time 3(19 years)
Time 4(21 years)
M SD M SD M SD M SD
RSE 3.19 0.41 3.25 0.42 3.29 0.45 3.27 0.42CES-D 0.71 0.52 0.69 0.51 0.70 0.54 0.68 0.54
Note. Response scales ranged from 1 to 4 for the Rosenberg Self-Esteem Scale (RSE) and from 0 to 3 for theCenter for Epidemiological Studies Depression Scale (CES-D).
699SELF-ESTEEM AND DEPRESSION
7/21/2019 Orth Et Al 2008 Jpsp
http://slidepdf.com/reader/full/orth-et-al-2008-jpsp 6/14
Time 1 to Time 4 (Model 1); all factors were correlated with each
other and the uniquenesses of individual indicators were correlated
over time to account for consistency in parcel-specific variance.
The factor variances were fixed to 1 to identify the model. The fit
of the first measurement model was good (see Table 2). The
second measurement model was identical to the first except that
we constrained the factor loadings of each indicator to be equalacross time (Model 2). If the constrained model does not fit worse
than the unconstrained model, then the constraints are empirically
justified and ensure that the latent constructs are measured simi-
larly across time (i.e., factorial invariance).
Models 1 and 2 did not differ significantly in fit. Consequently,
we favored the more parsimonious Model 2 and retained the
longitudinal constraints on factor loadings in the subsequent anal-
yses. The cross-sectional (i.e., concurrent) correlations between
the latent constructs assessing self-esteem and depression were
.34 at Time 1, .37 at Time 2, .34 at Time 3, and .36 at Time
4 (all ps .01).
We also tested a one-factor model of self-esteem and depres-
sion, in which all indicators (i.e., the six parcels) loaded on one
common factor, separately for each time point. The fit of thismodel was low,
2(228, N 2,403) 2,876.7, p .01, TLI
.66, CFI .74, RMSEA .070, 90% CI of RMSEA .067–.072.
Because the one-factor and the two-factor models are non-nested
models, no formal test of difference in fit is possible; however, the
fit indices clearly indicate the favorability of the two-factor model.
Thus, the results suggest that the two constructs should be modeled
separately rather than as indicators of a common factor.
Finally, we tested for gender differences in the measurement
model, using a multiple group analysis. However, a model allow-
ing for different loading coefficients for male and female partici-
pants did not have a significantly better model fit, 2(416, N
2,403) 909.3, p .01, relative to a model with constraints
across gender, 2
(422, N 2,403) 964.4, p .01.
Structural Models
Next, we tested the fit of two structural cross-lagged models,
using the measurement model specified by Model 2. For each of
the construct factors, the first loading was set to 1 to identify the
model.2 In cross-lagged models, a latent variable at Time 2 is
predicted by the same variable at Time 1 (the autoregressor) and
the other latent variable at Time 1 (cf. Figure 1). The cross-lagged
paths indicate the effect of one variable on the other, after con-
trolling for the stability of the variables over time (Finkel, 1995).
We accounted for variance due to measurement occasion by cross-
sectionally correlating the disturbances of the corresponding fac-
tors (cf. Cole & Maxwell, 2003).In the first cross-lagged model (Model 3), all structural coeffi-
cients were freely estimated. Model fit was good (Table 2). In the
second cross-lagged model (Model 4), we constrained the struc-
tural parameters (stability coefficients and cross-lagged coeffi-
cients) to be equal across all three time intervals. The difference in
fit between Models 3 and 4 was nonsignificant. Consequently, we
favored the more parsimonious Model 4 and retained the longitudinal
constraints on structural coefficients in the subsequent analyses.
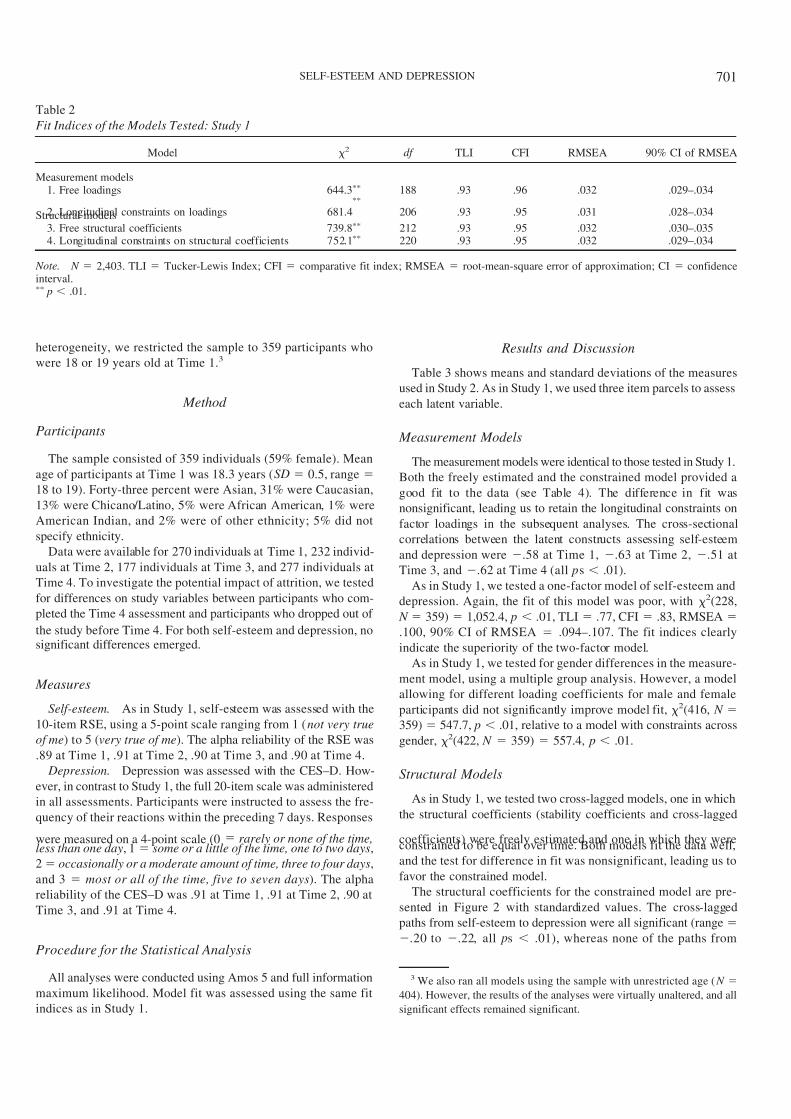
The structural coefficients for Model 4 are presented in Figure 1
with standardized values. The stability coefficients ranged from
.49 to .51 for depression and from .57 to .67 for self-esteem (all
ps .01), comparable to self-esteem stabilities reported by Trz-
esniewski et al. (2003). A consistent pattern emerged for the
cross-lagged paths: All of the paths from self-esteem to depression
were significant (range .09 to .10, all ps .01), whereas
none of the paths from depression to self-esteem were significant
(all three coefficients .04).
We also tested for gender differences in the structural coeffi-cients, using a multiple group analysis. A model allowing for
different coefficients for male and female participants did not
significantly improve model fit, 2(444, N 2,403) 1,008.0,
p .01, relative to a model with constraints across gender, 2(448,
N 2,403) 1,011.5, p .01. For both male and female
participants, the estimates of the structural coefficients were sim-
ilar to the estimates for the total sample, as displayed in Figure 1.
The results of Study 1 suggest that (a) self-esteem predicts
subsequent levels of depression (consistent with the vulnerability
model), (b) depression does not predict subsequent levels of self-
esteem (contrary to the scar model), and (c) self-esteem and
depression are not well modeled by a single factor (contrary to the
common factor model). However, there is a need to cross-validatethe findings. Therefore, we conducted a second longitudinal study
of the relation between self-esteem and depression. Study 2 dif-
fered from Study 1 in terms of sample characteristics (college
students vs. community sample in Study 1), age period studied (18
to 21 years vs. 15 to 21 years in Study 1), and the time interval
between assessments (1 year vs. 2 years in Study 1).
Study 2
Study 2 used data from the Berkeley Longitudinal Study, an
ongoing study of a cohort of individuals who entered the Univer-
sity of California, Berkeley, in 1992 (for further information, see
Robins et al., 2001; Robins, Noftle, Trzesniewski, & Roberts,2005). Participants were recruited at the beginning of their 1st year
in college and then assessed annually throughout college. Partic-
ipants were contacted by mail and asked to complete an extensive
questionnaire in exchange for money (the financial incentive
ranged from $6 to $20). Six assessments were conducted over a
4-year period: 1st week of college, end of first semester, and end
of 1st, 2nd, 3rd, and 4th year of college. For Study 2, we focused
our analyses on the latter four assessments (denoted as Time 1 to
Time 4 in the remainder of this article) because depression was not
assessed in the first two assessments. For 404 out of 508 partici-
pants, at least one measure of self-esteem or depression was
available at one of the assessments. However, to reduce age
2 Whereas in the measurement model the latent factors are identified by
setting the factor variances to 1 (corresponding to 8 degrees of freedom),
in the structural model the factors are identified by setting one loading per
construct to 1 (corresponding to 2 degrees of freedom). This difference
explains why the first structural model (Model 3) has only 6 more degrees
of freedom than the underlying measurement model (Model 2), even if the
structural part of the model constrains 12 parameters. In the structural
model, no other identification method is available because variances cannot
be modeled for the endogenous construct factors at Times 2 to 4. In the
measurement model, we decided to use the factor variances for identifica-
tion because this procedure allows testing measurement invariance simul-
taneously for all factor loadings.
700 ORTH, ROBINS, AND ROBERTS
7/21/2019 Orth Et Al 2008 Jpsp
http://slidepdf.com/reader/full/orth-et-al-2008-jpsp 7/14
heterogeneity, we restricted the sample to 359 participants who
were 18 or 19 years old at Time 1.3
Method
Participants
The sample consisted of 359 individuals (59% female). Mean
age of participants at Time 1 was 18.3 years (SD 0.5, range
18 to 19). Forty-three percent were Asian, 31% were Caucasian,
13% were Chicano/Latino, 5% were African American, 1% were
American Indian, and 2% were of other ethnicity; 5% did not
specify ethnicity.
Data were available for 270 individuals at Time 1, 232 individ-
uals at Time 2, 177 individuals at Time 3, and 277 individuals at
Time 4. To investigate the potential impact of attrition, we tested
for differences on study variables between participants who com-
pleted the Time 4 assessment and participants who dropped out of
the study before Time 4. For both self-esteem and depression, nosignificant differences emerged.
Measures
Self-esteem. As in Study 1, self-esteem was assessed with the
10-item RSE, using a 5-point scale ranging from 1 ( not very true
of me) to 5 (very true of me). The alpha reliability of the RSE was
.89 at Time 1, .91 at Time 2, .90 at Time 3, and .90 at Time 4.
Depression. Depression was assessed with the CES–D. How-
ever, in contrast to Study 1, the full 20-item scale was administered
in all assessments. Participants were instructed to assess the fre-
quency of their reactions within the preceding 7 days. Responses
were measured on a 4-point scale (0 rarely or none of the time,less than one day, 1 some or a little of the time, one to two days,
2 occasionally or a moderate amount of time, three to four days,
and 3 most or all of the time, five to seven days). The alpha
reliability of the CES–D was .91 at Time 1, .91 at Time 2, .90 at
Time 3, and .91 at Time 4.
Procedure for the Statistical Analysis
All analyses were conducted using Amos 5 and full information
maximum likelihood. Model fit was assessed using the same fit
indices as in Study 1.
Results and Discussion
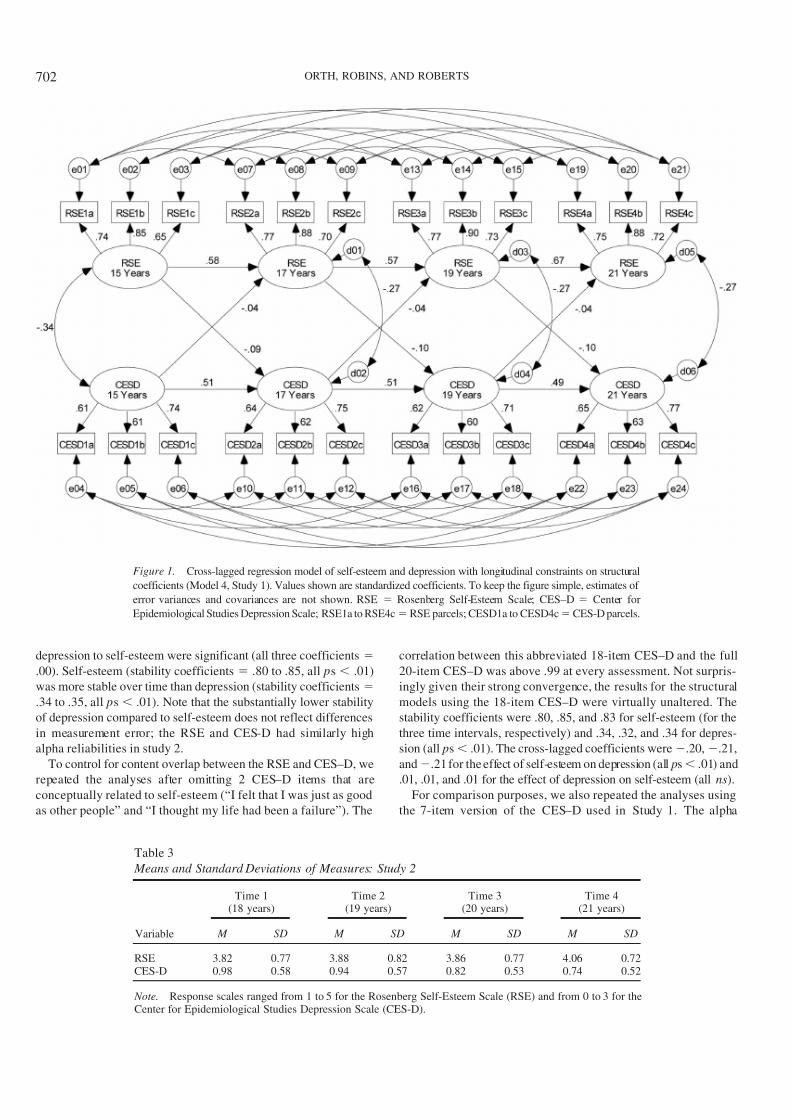
Table 3 shows means and standard deviations of the measures
used in Study 2. As in Study 1, we used three item parcels to assess
each latent variable.
Measurement Models
The measurement models were identical to those tested in Study 1.
Both the freely estimated and the constrained model provided a
good fit to the data (see Table 4). The difference in fit was
nonsignificant, leading us to retain the longitudinal constraints on
factor loadings in the subsequent analyses. The cross-sectional
correlations between the latent constructs assessing self-esteem
and depression were .58 at Time 1, .63 at Time 2, .51 at
Time 3, and .62 at Time 4 (all ps .01).
As in Study 1, we tested a one-factor model of self-esteem and
depression. Again, the fit of this model was poor, with 2(228,
N 359) 1,052.4, p .01, TLI .77, CFI .83, RMSEA
.100, 90% CI of RMSEA .094–.107. The fit indices clearly
indicate the superiority of the two-factor model.
As in Study 1, we tested for gender differences in the measure-
ment model, using a multiple group analysis. However, a model
allowing for different loading coefficients for male and female
participants did not significantly improve model fit, 2(416, N
359) 547.7, p .01, relative to a model with constraints across
gender, 2(422, N 359) 557.4, p .01.
Structural Models
As in Study 1, we tested two cross-lagged models, one in which
the structural coefficients (stability coefficients and cross-lagged
coefficients) were freely estimated and one in which they wereconstrained to be equal over time. Both models fit the data well,
and the test for difference in fit was nonsignificant, leading us to
favor the constrained model.
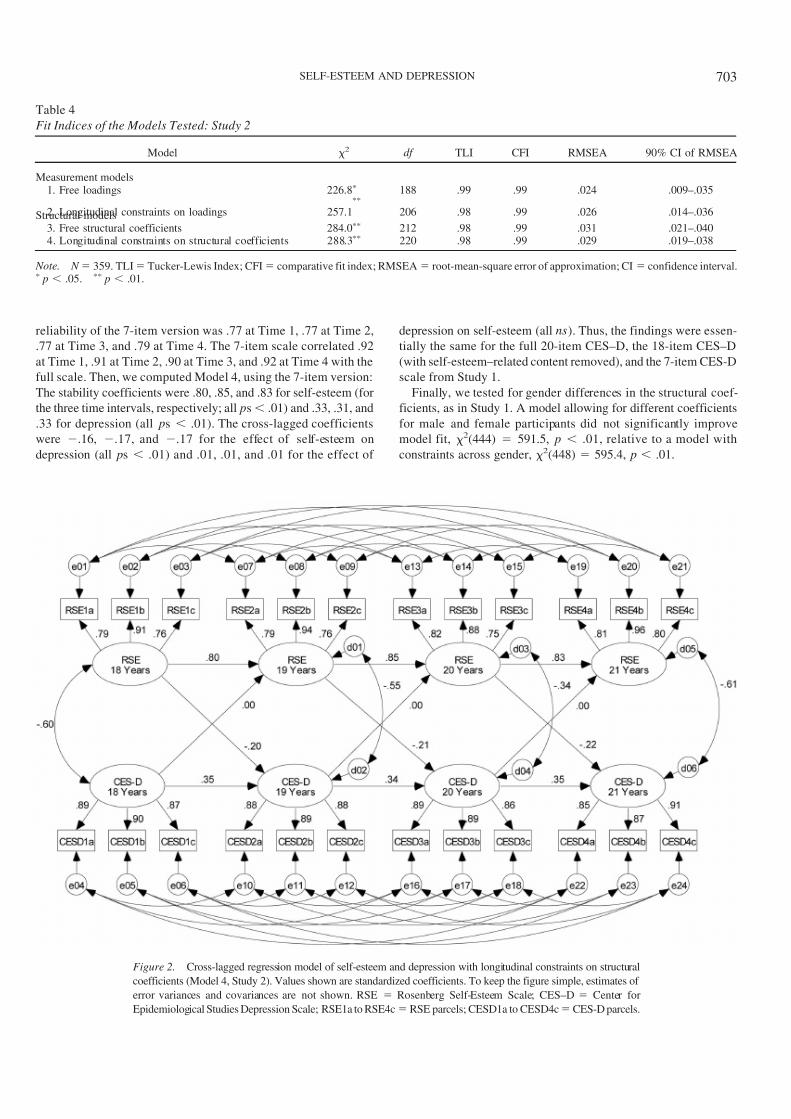
The structural coefficients for the constrained model are pre-
sented in Figure 2 with standardized values. The cross-lagged
paths from self-esteem to depression were all significant (range
.20 to .22, all ps .01), whereas none of the paths from
3 We also ran all models using the sample with unrestricted age ( N
404). However, the results of the analyses were virtually unaltered, and all
significant effects remained significant.
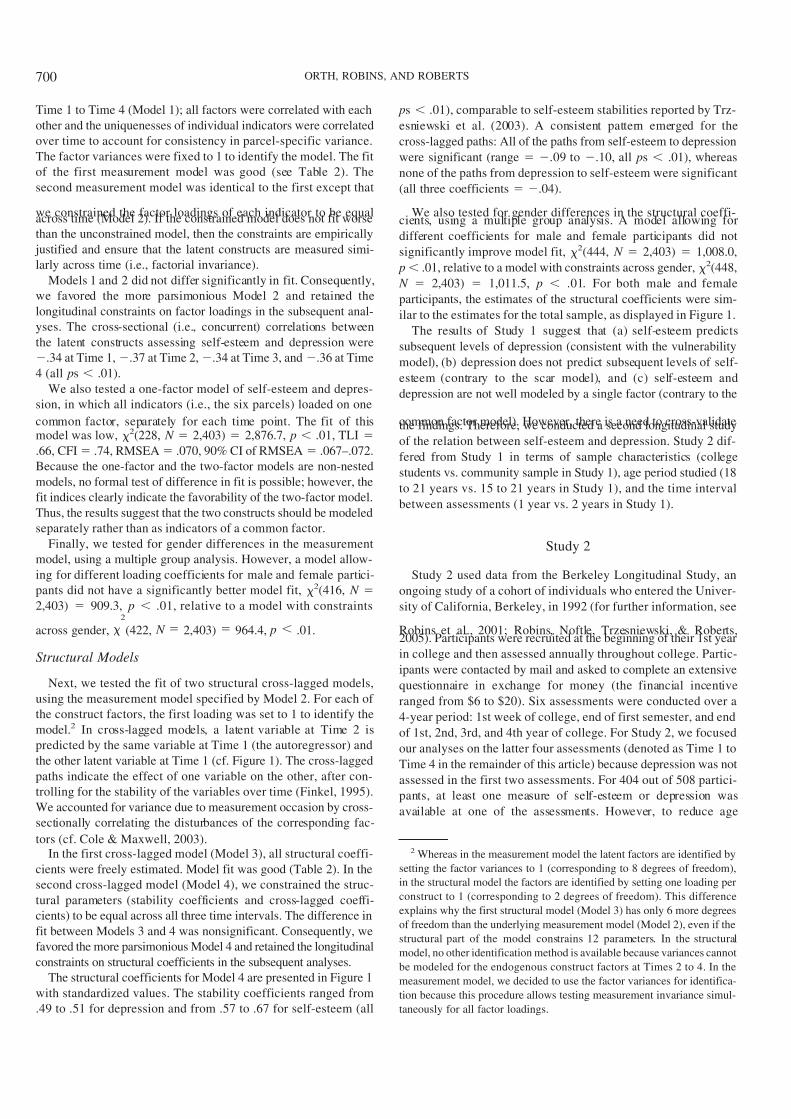
Table 2
Fit Indices of the Models Tested: Study 1
Model 2 df TLI CFI RMSEA 90% CI of RMSEA
Measurement models1. Free loadings 644.3 188 .93 .96 .032 .029–.034
2. Longitudinal constraints on loadings 681.4
206 .93 .95 .031 .028–.034Structural models3. Free structural coefficients 739.8 212 .93 .95 .032 .030–.0354. Longitudinal constraints on structural coefficients 752.1 220 .93 .95 .032 .029–.034
Note. N 2,403. TLI Tucker-Lewis Index; CFI comparative fit index; RMSEA root-mean-square error of approximation; CI confidenceinterval. p .01.
701SELF-ESTEEM AND DEPRESSION
7/21/2019 Orth Et Al 2008 Jpsp
http://slidepdf.com/reader/full/orth-et-al-2008-jpsp 8/14
depression to self-esteem were significant (all three coefficients
.00). Self-esteem (stability coefficients .80 to .85, all ps .01)
was more stable over time than depression (stability coefficients
.34 to .35, all ps .01). Note that the substantially lower stability
of depression compared to self-esteem does not reflect differences
in measurement error; the RSE and CES-D had similarly high
alpha reliabilities in study 2.
To control for content overlap between the RSE and CES–D, we
repeated the analyses after omitting 2 CES–D items that are
conceptually related to self-esteem (“I felt that I was just as good
as other people” and “I thought my life had been a failure”). The
correlation between this abbreviated 18-item CES–D and the full
20-item CES–D was above .99 at every assessment. Not surpris-
ingly given their strong convergence, the results for the structural
models using the 18-item CES–D were virtually unaltered. The
stability coefficients were .80, .85, and .83 for self-esteem (for the
three time intervals, respectively) and .34, .32, and .34 for depres-
sion (all ps .01). The cross-lagged coefficients were .20, .21,
and .21 for the effect of self-esteem on depression (all ps .01) and
.01, .01, and .01 for the effect of depression on self-esteem (all ns).
For comparison purposes, we also repeated the analyses using
the 7-item version of the CES–D used in Study 1. The alpha
Figure 1. Cross-lagged regression model of self-esteem and depression with longitudinal constraints on structural
coefficients (Model 4, Study 1). Values shown are standardized coefficients. To keep the figure simple, estimates of
error variances and covariances are not shown. RSE Rosenberg Self-Esteem Scale; CES–D Center for
Epidemiological Studies Depression Scale; RSE1a to RSE4c RSE parcels; CESD1a to CESD4c CES-D parcels.
Table 3
Means and Standard Deviations of Measures: Study 2
Variable
Time 1(18 years)
Time 2(19 years)
Time 3(20 years)
Time 4(21 years)
M SD M SD M SD M SD
RSE 3.82 0.77 3.88 0.82 3.86 0.77 4.06 0.72CES-D 0.98 0.58 0.94 0.57 0.82 0.53 0.74 0.52
Note. Response scales ranged from 1 to 5 for the Rosenberg Self-Esteem Scale (RSE) and from 0 to 3 for theCenter for Epidemiological Studies Depression Scale (CES-D).
702 ORTH, ROBINS, AND ROBERTS
7/21/2019 Orth Et Al 2008 Jpsp
http://slidepdf.com/reader/full/orth-et-al-2008-jpsp 9/14
reliability of the 7-item version was .77 at Time 1, .77 at Time 2,
.77 at Time 3, and .79 at Time 4. The 7-item scale correlated .92
at Time 1, .91 at Time 2, .90 at Time 3, and .92 at Time 4 with the
full scale. Then, we computed Model 4, using the 7-item version:
The stability coefficients were .80, .85, and .83 for self-esteem (for
the three time intervals, respectively; all ps .01) and .33, .31, and
.33 for depression (all ps .01). The cross-lagged coefficients
were .16, .17, and .17 for the effect of self-esteem on
depression (all ps .01) and .01, .01, and .01 for the effect of
depression on self-esteem (all ns). Thus, the findings were essen-
tially the same for the full 20-item CES–D, the 18-item CES–D
(with self-esteem–related content removed), and the 7-item CES-D
scale from Study 1.
Finally, we tested for gender differences in the structural coef-
ficients, as in Study 1. A model allowing for different coefficients
for male and female participants did not significantly improve
model fit, 2(444) 591.5, p .01, relative to a model with
constraints across gender, 2(448) 595.4, p .01.
Table 4
Fit Indices of the Models Tested: Study 2
Model 2 df TLI CFI RMSEA 90% CI of RMSEA
Measurement models1. Free loadings 226.8 188 .99 .99 .024 .009–.035
2. Longitudinal constraints on loadings 257.1
206 .98 .99 .026 .014–.036Structural models3. Free structural coefficients 284.0 212 .98 .99 .031 .021–.0404. Longitudinal constraints on structural coefficients 288.3 220 .98 .99 .029 .019–.038
Note. N 359. TLI Tucker-Lewis Index; CFI comparative fit index; RMSEA root-mean-square error of approximation; CI confidence interval. p .05. p .01.
Figure 2. Cross-lagged regression model of self-esteem and depression with longitudinal constraints on structural
coefficients (Model 4, Study 2). Values shown are standardized coefficients. To keep the figure simple, estimates of
error variances and covariances are not shown. RSE Rosenberg Self-Esteem Scale; CES–D Center for
Epidemiological Studies Depression Scale; RSE1a to RSE4c RSE parcels; CESD1a to CESD4c CES-D parcels.
703SELF-ESTEEM AND DEPRESSION
7/21/2019 Orth Et Al 2008 Jpsp
http://slidepdf.com/reader/full/orth-et-al-2008-jpsp 10/14
General Discussion
Summary of Key Findings
In the present research, we investigated the temporal sequence
of self-esteem and depression in adolescence and young adulthood,
using two longitudinal data sets with four repeated assessments
between the ages of 15 and 21 (Study 1) and 18 and 21 (Study 2),
respectively. The results of both studies support the vulnerability
model (low self-esteem contributes to depression), but not the scar
model (depression erodes self-esteem). Cross-lagged regression
analyses indicated that low self-esteem significantly predicted
subsequent levels of depression, controlling for prior levels of
depression. In contrast, depression did not predict subsequent
levels of self-esteem, controlling for prior levels of self-esteem.
In addition to providing insights into the temporal order of the
relation between self-esteem and depression, the results provide
further support for the importance of distinguishing between the
two constructs and counterclaims that self-esteem and depression
are simply positively and negatively keyed indicators of a broad
negative emotionality factor (e.g., Watson et al., 2002). First, it isunlikely that two indicators of a common factor would have
replicable cross-lagged effects because their shared variance has
been systematically removed; at the very least, the findings imply
that the unique variance in self-esteem is psychologically mean-
ingful and prospectively predicts subsequent levels of depression.
Second, in both studies, the one-factor model did not provide a
good fit to the self-esteem and depression data, whereas the two-
factor model did. Third, as in most previous studies, the cross-
sectional correlations were weaker (.30s in Study 1 and .50s in
Study 2) than one would expect between two variables that are
presumably opposing endpoints of the same continuum. Fourth,
and also consistent with previous studies, the rank-order stability
of self-esteem was considerably higher than the rank-order stabil-ity of depression, even after taking into account differences in the
reliability of the two scales; if self-esteem and depression are two
interchangeable indicators of negative emotionality, then they
should have comparable stabilities over time because their indi-
vidual stabilities should each reflect the stability of the broader
common factor.
Two additional results are of interest. First, the results of Study 2
showed that the correlation between self-esteem and depression is
not due to overlap in the item content of the two measures. The
cross-lagged coefficients were virtually unaltered when we elim-
inated the two items from the CES-D that are conceptually related
to self-esteem. Second, the results of both studies showed that the
structural coefficients were similar for men and women. Of course,
the fact that the structural model replicates across genders does notmean that men and women do not differ in their average level of
self-esteem and depression; in fact, men did tend to score higher in
self-esteem and lower in depression. However, it suggests that the
structural relations between self-esteem and depression are unaf-
fected by gender.
Illustration of Effect Sizes
The present findings show that low self-esteem serves as a risk
factor for depression in adolescence and young adulthood. But
how strong is this effect? The size of the cross-lagged effects can
be assessed by converting the regression coefficients into the r
metric (using sample size and the Z values computed from the
unstandardized coefficients and their associated standard errors;
see, e.g., Rosenthal, 1994). In Study 1, the effect of self-esteem on
depression corresponded to r .08, indicating a small effect.
The effect of depression on self-esteem, which was nonsignificant,
corresponded to r .03. In Study 2, the effect of self-esteem ondepression corresponded to r .23, indicating a medium effect.
The cross-lagged effect of depression on self-esteem, which was
nonsignificant, corresponded to r .00.
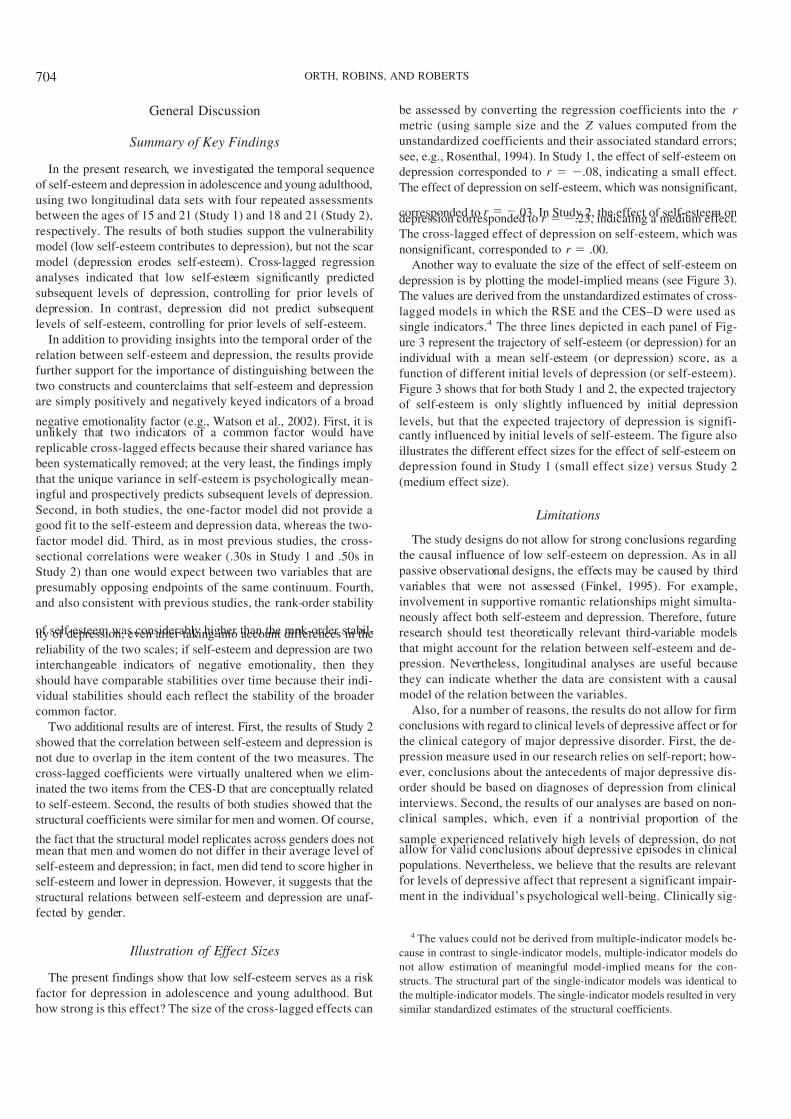
Another way to evaluate the size of the effect of self-esteem on
depression is by plotting the model-implied means (see Figure 3).
The values are derived from the unstandardized estimates of cross-
lagged models in which the RSE and the CES–D were used as
single indicators.4 The three lines depicted in each panel of Fig-
ure 3 represent the trajectory of self-esteem (or depression) for an
individual with a mean self-esteem (or depression) score, as a
function of different initial levels of depression (or self-esteem).
Figure 3 shows that for both Study 1 and 2, the expected trajectory
of self-esteem is only slightly influenced by initial depression
levels, but that the expected trajectory of depression is signifi-cantly influenced by initial levels of self-esteem. The figure also
illustrates the different effect sizes for the effect of self-esteem on
depression found in Study 1 (small effect size) versus Study 2
(medium effect size).
Limitations
The study designs do not allow for strong conclusions regarding
the causal influence of low self-esteem on depression. As in all
passive observational designs, the effects may be caused by third
variables that were not assessed (Finkel, 1995). For example,
involvement in supportive romantic relationships might simulta-
neously affect both self-esteem and depression. Therefore, future
research should test theoretically relevant third-variable models
that might account for the relation between self-esteem and de-
pression. Nevertheless, longitudinal analyses are useful because
they can indicate whether the data are consistent with a causal
model of the relation between the variables.
Also, for a number of reasons, the results do not allow for firm
conclusions with regard to clinical levels of depressive affect or for
the clinical category of major depressive disorder. First, the de-
pression measure used in our research relies on self-report; how-
ever, conclusions about the antecedents of major depressive dis-
order should be based on diagnoses of depression from clinical
interviews. Second, the results of our analyses are based on non-
clinical samples, which, even if a nontrivial proportion of the
sample experienced relatively high levels of depression, do notallow for valid conclusions about depressive episodes in clinical
populations. Nevertheless, we believe that the results are relevant
for levels of depressive affect that represent a significant impair-
ment in the individual’s psychological well-being. Clinically sig-
4 The values could not be derived from multiple-indicator models be-
cause in contrast to single-indicator models, multiple-indicator models do
not allow estimation of meaningful model-implied means for the con-
structs. The structural part of the single-indicator models was identical to
the multiple-indicator models. The single-indicator models resulted in very
similar standardized estimates of the structural coefficients.
704 ORTH, ROBINS, AND ROBERTS
7/21/2019 Orth Et Al 2008 Jpsp
http://slidepdf.com/reader/full/orth-et-al-2008-jpsp 11/14
nificant levels of depressed mood do not necessarily have to meet
the criteria for major depressive disorder as given in the Diagnos-
tic and Statistical Manual of Mental Disorders (4th ed., text rev.;
American Psychiatric Association, 2000), and many persons not in
treatment can have clinically significant levels of depressed mood.
Future research should, however, continue to examine self-esteem
as a risk factor in the onset, maintenance, remission, or recurrence
of depressive episodes in major depressive disorder (cf. J. E.
Roberts & Monroe, 1999).
Another limitation of the present research is that in both studies,
only self-report measures of depression were available. In futureresearch, it would be useful to include informant-based measures
to control for possible self-report biases (e.g., an unwillingness to
acknowledge the symptoms of depression) and to account for the
effects of shared method variance on the correlations between
depression and self-esteem. Note, however, that shared method
variance cannot account for cross-lagged effects because shared
method variance has already been statistically removed by con-
trolling for concurrent relations and the stability of each construct
over time.
One strength of the present research is the convergence of
findings across Studies 1 and 2, which helps alleviate some meth-
odological concerns. For example, a limitation of Study 1 was that
only a short version of the depression scale, a 7-item CES–D, was
used; however, this limitation was addressed in Study 2, in which
the complete 20-item CES–D was used. A limitation of Study 2
was that the sample, a cohort of college students, was not repre-
sentative of the U.S. population; however, this limitation was
addressed in Study 1, in which data from a national probability
sample were used, increasing confidence in the generalizability of
our findings. The two studies also differed in the age of the sample
(i.e., 15- to 21-year-olds in Study 1 vs. 18- to 21-year-olds in Study
2) and in the time interval between assessments (2 years in Study1 vs. 1 year in Study 2). These differences might also explain why
the studies yielded somewhat different effect sizes. However,
given that the two studies differed on several dimensions, it is not
possible to determine which of the many study characteristics
accounts for the observed differences in effect sizes. Moreover, as
always, effect size differences may simply reflect within-study
sampling error. The most important point in this context is that the
general pattern of results was identical in both studies, strength-
ening confidence in the results. An additional strength of the
present research, compared with previous studies, is the use of
more appropriate statistical models based on latent variable mod-
Figure 3. Model-implied means of self-esteem and depression for Study 1 and Study 2. The values are derived
from the unstandardized estimates of cross-lagged models in which the Rosenberg Self-Esteem Scale and the
Center for Epidemiological Studies Depression Scale were used as single indicators. The three lines depicted in
each panel represent the trajectory of a Variable X for an individual with mean values for X, as a function of
different initial values for the Variable Y (i.e., 1.96 SD, mean, and 1.96 SD, with the trajectory for the mean
initial value for Y indicated by solid lines). Because in the single-indicator models all cross-lagged effects had
negative values, the upper lines for X correspond to lower initial values for Y and vice versa. The dashed lines
mark the limits of the area where 95% of the expected trajectories are located, for individuals with mean initial
values for X.
705SELF-ESTEEM AND DEPRESSION
7/21/2019 Orth Et Al 2008 Jpsp
http://slidepdf.com/reader/full/orth-et-al-2008-jpsp 12/14
eling, which allow for more precise measurement across assess-
ments and more controlled tests of prospective effects.
Future Directions and Conclusions
In this study, we focused on one developmental stage—
adolescence and young adulthood. Future research, therefore,
should test whether the results hold at other developmental stages,
such as midlife and old age. It is possible that the general pattern
of results, such as the unidirectionality of the effect of low self-
esteem on depression, holds across age groups, but the processes
that might account for the effects (e.g., a tendency for individuals
with low self-esteem to seek negative feedback and engage in
excessive rumination) change over the life course.
Moreover, future studies should examine longitudinal relations
between self-esteem and depression across even longer periods of
time (e.g., decades instead of years), as well as across much shorter
time intervals, using daily or weekly assessments of self-esteem
and depression (for a discussion of temporal designs, see Collins,
2006). If the effects of self-esteem on depression were detectable
using a much shorter temporal resolution, then this finding wouldsuggest that the individual processes that account for the effect
operate across short time intervals. Effects revealed by studies
using longer time intervals might then be traced back to the
accumulation of short-term effects.
Future research should seek to identify the mediating processes
of the effect of self-esteem on depression, which might include, for
example, the interpersonal and intrapersonal processes described
in the introduction. Ideally, these studies should be conducted, like
the present research, using a longitudinal design with multiple
repeated assessments because only longitudinal mediator tests, not
cross-sectional tests, allow for valid conclusions about the tempo-
ral sequence of predictor, mediator, and outcome (Cole & Max-
well, 2003).Future research should also continue to examine the effects
of other aspects of self-esteem, besides its level, such as the
intraindividual stability of self-esteem. Prospective studies have
shown that self-esteem stability (typically measured as the
within-person standard deviation of a self-esteem measure
across several consecutive days) predicts subsequent levels of
depression, even when controlling for the effect of self-esteem
level (Butler et al., 1994; Kernis et al., 1991; J. E. Roberts &
Monroe, 1992).
Together, the future studies proposed here will contribute to
the development of a broader theory of how, when, why, and for
whom low self-esteem serves as a risk factor for depression.
Ultimately, such knowledge might serve as the basis for de-
signing effective interventions aimed at preventing or reducingdepression.
References
Abela, J. R. Z. (2002). Depressive mood reactionsto failure in theachievement
domain: A test of the integration of the hopelessness and self-esteem
theories of depression. Cognitive Therapy and Research, 26, 531–552.
Abela, J. R. Z., Webb, C. A., Wagner, C., Ho, M. H. R., & Adams, P.
(2006). The role of self-criticism, dependency, and hassles in the course
of depressive illness: A multiwave longitudinal study. Personality and
Social Psychology Bulletin, 32, 328–338.
Abramson, L. Y., Seligman, M. E. P., & Teasdale, J. D. (1978). Learned
helplessness in humans: Critique and reformulation. Journal of Abnor-
mal Psychology, 87, 49–74.
Allison, P. D. (2003). Missing data techniques for structural equation
modeling. Journal of Abnormal Psychology, 112, 545–557.
American Psychiatric Association. (2000). Diagnostic and statistical man-
ual of mental disorders (4th ed., text rev.). Washington, DC: Author.
Arbuckle, J. L. (2003). Amos 5.0 update to the Amos user’s guide. Chicago:
SPSS.
Arbuckle, J. L., & Wothke, W. (1999). Amos 4.0 user’s guide. Chicago:
SPSS.
Arnett, J. J. (2000). Emerging adulthood: A theory of development from the
late teens through the twenties. American Psychologist, 55, 469–480.
Beck, A. T. (1967). Depression: Clinical, experimental, and theoretical
aspects. New York: Harper & Row.
Blatt, S. J., D’Afflitti, J. P., & Quinlan, D. M. (1976). Experiences of
depression in normal young adults. Journal of Abnormal Psychology, 85,
383–389.
Blazer, D. G., Kessler, R. C., McGonagle, K. A., & Swartz, M. S. (1994).
The prevalence and distribution of major depression in a national com-
munity sample: The National Comorbidity Survey. American Journal of
Psychiatry, 151, 979–986.
Block, J. H., Gjerde, P. F., & Block, J. H. (1991). Personality antecedentsof depressive tendencies in 18-year-olds: A prospective study. Journal of
Personality and Social Psychology, 60, 726–738.
Brown, G. W., & Harris, T. (1978). Social origins of depression: A study
of psychiatric disorder. New York: Free Press.
Butler, A. C., Hokanson, J. E., & Flynn, H. A. (1994). A comparison of
self-esteem lability and low trait self-esteem as vulnerability factors for
depression. Journal of Personality and Social Psychology, 66, 166–177.
Center for Human Resource Research. (2006). NLSY79 child and young
adult data users guide. Columbus: Ohio State University.
Cole, D. A., & Maxwell, S. E. (2003). Testing mediational models with
longitudinal data: Questions and tips in the use of structural equation
modeling. Journal of Abnormal Psychology, 112, 558–577.
Collins, L. M. (2006). Analysis of longitudinal data: The integration of
theoretical model, temporal design, and statistical model. Annual Review
of Psychology, 57, 505–528.
Costa, P. T., & McCrae, R. R. (1992). Revised NEO Personality Inventory
(NEO-PI-R) and NEO Five-Factor Inventory (NEO-FFI) professional
manual. Odessa, FL: Psychological Assessment Resources.
Costello, E. J., Erkanli, A., & Angold, A. (2006). Is there an epidemic of
child or adolescent depression? Journal of Child Psychology and Psy-
chiatry, 47, 1263–1271.
Coyne, J. C., Gallo, S. M., Klinkman, M. S., & Calarco, M. M. (1998).
Effects of recent and past major depression and distress on self-concept
and coping. Journal of Abnormal Psychology, 107, 86–96.
Coyne, J. C., & Whiffen, V. E. (1995). Issues in personality as diathesis for
depression: The case of sociotropy– dependency and autonomy–self-
criticism. Psychological Bulletin, 118, 358–378.
Donnellan, M. B., Trzesniewski, K. H., Robins, R. W., Moffitt, T. E., &
Caspi, A. (2005). Low self-esteem is related to aggression, antisocialbehavior, and delinquency. Psychological Science, 16, 328–335.
Eaton, W. W., Smith, C., Ybarra, M., Muntaner, C., & Tien, A. (2004).
Center for Epidemiological Studies Depression Scale: Review and re-
vision (CESD and CESD-R). In M. E. Maruish (Ed.), The use of
psychological testing for treatment planning and outcomes assessment:
Volume 3. Instruments for adults (pp. 363–377). Mahwah, NJ: Erlbaum.
Erikson, E. H. (1983). Childhood and society. New York: Norton.
Fernandez, M. E., Mutran, E., & Reitzes, D. C. (1998). Moderating the effects
of stress on depressive symptoms. Research on Aging, 20, 163–182.
Finkel, S. E. (1995). Causal analysis with panel data. Thousand Oaks, CA:
Sage.
Galambos, N. L., Barker, E. T., & Krahn, H. J. (2006). Depression,
706 ORTH, ROBINS, AND ROBERTS
7/21/2019 Orth Et Al 2008 Jpsp
http://slidepdf.com/reader/full/orth-et-al-2008-jpsp 13/14
self-esteem, and anger in emerging adulthood: Seven-year trajectories.
Developmental Psychology, 42, 350–365.
Giesler, R. B., Josephs, R. A., & Swann, W. B. (1996). Self-verification in
clinical depression: The desire for negative evaluation. Journal of Ab-
normal Psychology, 105, 358–368.
Hankin, B. L., Fraley, R. C., Lahey, B. B., & Waldman, I. D. (2005). Is
depression best viewed as a continuum or discrete category? A taxo-
metric analysis of childhood and adolescent depression in a population-based sample. Journal of Abnormal Psychology, 114, 96–110.
Hankin, B. L., Lakdawalla, Z., Carter, I. L., Abela, J. R. Z., & Adams, P.
(2007). Are neuroticism, cognitive vulnerabilities and self-esteem over-
lapping or distinct risks for depression? Evidence from exploratory and
confirmatory factor analyses. Journal of Social and Clinical Psychology,
26, 29–63.
Helson, R. (1983). Where do they go from here? Mills Quarterly, Febru-
ary, 1–13.
Hokanson, J. E., Rubert, M. P., Welker, R. A., Hollander, G. R., & Hedeen,
C. (1989). Interpersonal concomitants and antecedents of depression
among college students. Journal of Abnormal Psychology, 98, 209–217.
Hu, L., & Bentler, P. M. (1998). Fit indices in covariance structure
modeling: Sensitivity to underparameterized model misspecification.
Psychological Methods, 3, 424–453.
Hu, L., & Bentler, P. M. (1999). Cutoff criteria for fit indexes in covariance
structure analysis: Conventional criteria versus new alternatives. Struc-
tural Equation Modeling, 6, 1–55.
Joiner, T. E. (1995). The price of soliciting and receiving negative feed-
back: Self-verification theory as a vulnerability to depression theory.
Journal of Abnormal Psychology, 104, 364–372.
Joiner, T. E. (2000). Depression’s vicious scree: Self-propagating and
erosive processes in depression chronicity. Clinical Psychology: Science
and Practice, 7, 203–218.
Joiner, T. E., Alfano, M. S., & Metalsky, G. I. (1992). When depression
breeds contempt: Reassurance seeking, self-esteem, and rejection of
depressed college students by their roommates. Journal of Abnormal
Psychology, 101, 165–173.
Joiner, T. E., Katz, J., & Lew, A. (1999). Harbingers of depressotypic
reassurance seeking: Negative life events, increased anxiety, and de-creased self-esteem. Personality and Social Psychology Bulletin, 25,
632–639.
Judge, T. A., Erez, A., Bono, J. E., & Thoresen, C. J. (2002). Are measures
of self-esteem, neuroticism, locus of control, and generalized self-
efficacy indicators of a common core construct? Journal of Personality
and Social Psychology, 83, 693–710.
Kernis, M. H., Grannemann, B. D., & Mathis, L. C. (1991). Stability of
self-esteem as a moderator of the relation between level of self-esteem
and depression. Journal of Personality and Social Psychology, 61,
80–84.
Kernis, M. H., Whisenhunt, C. R., Waschull, S. B., Greenier, K. D., Berry,
A. J., Herlocker, C. E., et al. (1998). Multiple facets of self-esteem and
their relations to depressive symptoms. Personality and Social Psychol-
ogy Bulletin, 24, 657–668.
Kessler, R. C., Berglund, P., Demler, O., Jin, R., Merikangas, K. R., &
Walters, E. E. (2005). Lifetime prevalence and age-of-onset distributions
of DSM-IV disorders in the National Comorbidity Survey Replication.
Archives of General Psychiatry, 62, 593–602.
Lakey, B. (1988). Self-esteem, control beliefs, and cognitive problem
solving skill as risk factors in the development of subsequent dysphoria.
Cognitive Therapy and Research, 12, 409–420.
Lewinsohn, P. M., Hoberman, H. M., & Rosenbaum, M. (1988). A pro-
spective study of risk factors for unipolar depression. Journal of Abnor-
mal Psychology, 97, 251–264.
Lewinsohn, P. M., Solomon, A., Seeley, J. R., & Zeiss, A. (2000). Clinical
implications of “subthreshold” depressive symptoms. Journal of Abnor-
mal Psychology, 109, 345–351.
Lewinsohn, P. M., Steinmetz, J. L., Larson, D. W., & Franklin, J. (1981).
Depression-related cognitions: Antecedent or consequence? Journal of
Abnormal Psychology, 90, 213–219.
Little, T. D., Cunningham, W. A., Shahar, G., & Widaman, K. F. (2002).
To parcel or not to parcel: Exploring the question, weighing the merits.
Structural Equation Modeling, 9, 151–173.
Lovibond, P. F. (1998). Long-term stability of depression, anxiety, and
stress syndromes. Journal of Abnormal Psychology, 107, 520–526.
MacCallum, R. C., & Austin, J. T. (2000). Applications of structural
equation modeling in psychological research. Annual Review of Psychol-
ogy, 51, 201–226.
MacCallum, R. C., Browne, M. W., & Cai, L. (2006). Testing differences
between nested covariance structure models: Power analysis and null
hypotheses. Psychological Methods, 11, 19–35.
Metalsky, G. I., Joiner, T. E., Hardin, T. S., & Abramson, L. Y. (1993).
Depressive reactions to failure in a naturalistic setting: A test of the
hopelessness and self-esteem theories of depression. Journal of Abnor-
mal Psychology, 102, 101–109.
Mirowsky, J., & Kim, J. (2007). Graphing age trajectories: Vector graphs,
synthetic and virtual cohort projections, and cross-sectional profiles of
depression. Sociological Methods and Research, 35, 497–541.
Mor, N., & Winquist, J. (2002). Self-focused attention and negative affect:A meta-analysis. Psychological Bulletin, 128, 638–662.
Morrow, J., & Nolen-Hoeksema, S. (1990). Effects of responses to depres-
sion on the remediation of depressive affect. Journal of Personality and
Social Psychology, 58, 519–527.
Murray, S. L., Holmes, J. G., & Griffin, D. W. (2000). Self-esteem and the
quest for felt security: How perceived regard regulates attachment pro-
cesses. Journal of Personality and Social Psychology, 78, 478–498.
Murray, S. L., Rose, P., Bellavia, G. M., Holmes, J. G., & Kusche, A. G.
(2002). When rejection stings: How self-esteem constrains relationship-
enhancing processes. Journal of Personality and Social Psychology, 83,
556–573.
Neiss, M. B., Stevenson, J., Sedikides, C., Kumashiro, M., Finkel, E. J., &
Rusbult, C. E. (2005). Executive self, self-esteem, and negative affec-
tivity: Relations at the phenotypic and genotypic level. Journal of
Personality and Social Psychology, 89, 593–606.
Nolen-Hoeksema, S. (1991). Responses to depression and their effects on
the duration of depressive episodes. Journal of Abnormal Psychology,
100, 569–582.
Nolen-Hoeksema, S. (2000). The role of rumination in depressive disorders
and mixed anxiety/depressive symptoms. Journal of Abnormal Psychol-
ogy, 109, 504–511.
Nolen-Hoeksema, S., & Morrow, J. (1991). A prospective study of depres-
sion and posttraumatic stress symptoms after a natural disaster: The
1989 Loma Prieta earthquake. Journal of Personality and Social Psy-
chology, 61, 115–121.
Ormel, J., Oldehinkel, A. J., & Vollebergh, W. (2004). Vulnerability
before, during, and after a major depressive episode. Archives of General
Psychiatry, 61, 990–996.
Ottenbreit, N. D., & Dobson, K. S. (2004). Avoidance and depression: Theconstruction of the Cognitive-Behavioral Avoidance Scale. Behaviour
Research and Therapy, 42, 293–313.
Prisciandaro, J. J., & Roberts, J. E. (2005). A taxometric investigation of
unipolar depression in the National Comorbidity Survey. Journal of
Abnormal Psychology, 114, 718–728.
Radloff, L. S. (1977). The CES-D Scale: A self-report depression scale for
research in the general population. Applied Psychological Measurement,
1, 385–401.
Ralph, J. A., & Mineka, S. (1998). Attributional style and self-esteem: The
prediction of emotional distress following a midterm exam. Journal of
Abnormal Psychology, 107, 203–215.
Roberts, B. W., & DelVecchio, W. F. (2000). The rank-order consistency
707SELF-ESTEEM AND DEPRESSION
7/21/2019 Orth Et Al 2008 Jpsp
http://slidepdf.com/reader/full/orth-et-al-2008-jpsp 14/14
of personality traits from childhood to old age: A quantitative review of
longitudinal studies. Psychological Bulletin, 126, 3–25.
Roberts, J. E., & Gamble, S. A. (2001). Current mood state and past
depression as predictors of self-esteem and dysfunctional attitudes
among adolescents. Personality and Individual Differences, 30, 1023–
1037.
Roberts, J. E., & Gotlib, I. H. (1997). Temporal variability in global
self-esteem and specific self-evaluation as prospective predictors of emotional distress: Specificity in predictors and outcome. Journal of
Abnormal Psychology, 106, 521–529.
Roberts, J. E., & Monroe, S. M. (1992). Vulnerable self-esteem and
depressive symptoms: Prospective findings comparing three alternative
conceptualizations. Journal of Personality and Social Psychology, 62,
804–812.
Roberts, J. E., & Monroe, S. M. (1999). Vulnerable self-esteem and social
processes in depression: Toward an interpersonal model of self-esteem
regulation. In T. Joiner & J. C. Coyne (Eds.), The interactional nature of
depression: Advances in interpersonal approaches (pp. 149–187).
Washington, DC: American Psychological Association.
Robins, R. W., Hendin, H. M., & Trzesniewski, K. H. (2001). Measuring
global self-esteem: Construct validation of a single-item measure and the
Rosenberg Self-Esteem Scale. Personality and Social Psychology Bul-
letin, 27, 151–161.Robins, R. W., Noftle, E. E., Trzesniewski, K. H., & Roberts, B. W.
(2005). Do people know how their personality has changed? Correlates
of perceived and actual personality change in young adulthood. Journal
of Personality, 73, 481–521.
Robins, R. W., Trzesniewski, K. H., Tracy, J. L., Gosling, S. D., & Potter,
J. (2002). Global self-esteem across the life span. Psychology and Aging,
17, 423–434.
Rohde, P., Lewinsohn, P. M., & Seeley, J. R. (1990). Are people changed
by the experience of having an episode of depression? A further test of
the scar hypothesis. Journal of Abnormal Psychology, 99, 264–271.
Roisman, G. I., Masten, A. S., Coatsworth, J. D., & Tellegen, A. (2004).
Salient and emerging developmental tasks in the transition to adulthood.
Child Development, 75, 123–133.
Rosenberg, M. (1965). Society and adolescent self-image. Princeton, NJ:
Princeton University Press.
Rosenthal, R. (1994). Parametric measures of effect size. In H. Cooper &
L. V. Hedges (Eds.), The handbook of research synthesis (pp. 231–244).
New York: Russell Sage Foundation.
Ruscio, J., & Ruscio, A. M. (2000). Informing the continuity controversy:
A taxometric analysis of depression. Journal of Abnormal Psychology,
109, 473–487.
Schafer, J. L., & Graham, J. W. (2002). Missing data: Our view of the state
of the art. Psychological Methods, 7, 147–177.
Shahar, G., & Davidson, L. (2003). Depressive symptoms erode self-
esteem in severe mental illness: A three-wave, cross-lagged study.
Journal of Consulting and Clinical Psychology, 71, 890–900.
Southall, D., & Roberts, J. E. (2002). Attributional style and self-esteem in
vulnerability to adolescent depressive symptoms following life stress: A
14-week prospective study. Cognitive Therapy and Research, 26, 563–579.
Spasojevic, J., & Alloy, L. B. (2001). Rumination as a common mechanism
relating depressive risk factors to depression. Emotion, 1, 25–37.
Swann, W. B., Wenzlaff, R. M., & Tafarodi, R. W. (1992). Depression and the
search for negative evaluations: More evidence on the role of self-
verification strivings. Journal of Abnormal Psychology, 101, 314–317.Tice, D. M. (1992). Self-concept change and self-presentation: The looking
glass self is also a magnifying glass. Journal of Personality and Social
Psychology, 63, 435–451.
Trapnell, P. D., & Campbell, J. D. (1999). Private self-consciousness and
the five-factor model of personality: Distinguishing rumination from
reflection. Journal of Personality and Social Psychology, 76, 284–304.
Trzesniewski, K. H. (2007, October). Clarifying the relation between
self-esteem and depression: New evidence from a behavioral genetic
investigation. Presented at the biannual meeting of the MacArthur Foun-
dation Midlife Research Network on Successful Midlife Development
Program, Madison, WI.
Trzesniewski, K. H., Donnellan, M. B., Moffitt, T. E., Robins, R. W.,
Poulton, R., & Caspi, A. (2006). Low self-esteem during adolescence
predicts poor health, criminal behavior, and limited economic prospects
during adulthood. Developmental Psychology, 42, 381–390.Trzesniewski, K. H., Donnellan, M. B., & Robins, R. W. (2003). Stability
of self-esteem across the life span. Journal of Personality and Social
Psychology, 84, 205–220.
Watson, D., Clark, L. A., Weber, K., Assenheimer, J. S., Strauss, M. E., &
McCormick, R. A. (1995). Testing a tripartite model: II. Exploring the
symptom structure of anxiety and depression in student, adult, and
patient samples. Journal of Abnormal Psychology, 104, 15–25.
Watson, D., Suls, J., & Haig, J. (2002). Global self-esteem in relation to
structural models of personality and affectivity. Journal of Personality
and Social Psychology, 83, 185–197.
Wetherell, J. L., Gatz, M., & Pedersen, N. L. (2001). A longitudinal
analysis of anxiety and depressive symptoms. Psychology and Aging, 16,
187–195.
Whisman, M. A., & Kwon, P. (1993). Life stress and dysphoria: The role
of self-esteem and hopelessness. Journal of Personality and Social
Psychology, 65, 1054–1060.
White, R. W. (1966). Lives in progress. New York: Holt, Rinehart,&
Winston.
Zeiss, A. M., & Lewinsohn, P. M. (1988). Enduring deficits after remis-
sions of depression: A test of the scar hypothesis. Behaviour Research
and Therapy, 26, 151–158.
Received October 15, 2007
Revision received March 10, 2008
Accepted March 24, 2008
708 ORTH, ROBINS, AND ROBERTS

![Enseignement d’ IRM - cerf.radiologie.fr · [Francois et al, AJR 2008] NATIVE Angiographie sans-injection - séquence FSE [Lim et al, JMRI 2008] ARM bSSFP and FSD ECG trigerred](https://img.pdfslide.fr/doc/110x75/5b9950d009d3f29c338c0b82/enseignement-d-irm-cerf-francois-et-al-ajr-2008-native-angiographie.jpg)