Embed Size (px)
Citation preview
PwC
Fin des quotas sucriers européens : quelles options stratégiques pour les acteurs de la filière en Europe ? Impacts et enseignements pour la filière française
PwC
Mars 2015
Sommaire L'essentiel 3
Points clés 4
1 Introduction 5
2 Dynamiques de marché 7
3 Un secteur en profonde mutation 12
4 Quatre enjeux pour les acteurs de la filière 19
5 Quel(s) scénario(s) pour les filières européenne et française ? 24
Informations détaillées 25
6 Fondamentaux et chiffres clés 26
7 Un secteur en profonde mutation 47
7.1 Enjeu n°1 : l’essor des pays émergents 48
7.2 Enjeu n°2 : l’évolution des équilibres commerciaux 54
7.3 Enjeu n°3 : la consolidation de la chaîne de valeur 62
8 Impacts et enjeux pour la filière en Europe et en France 71
9 Positionnement relatif des industriels du sucre en Europe 87
10 Bibliographie 93
2
Informations détaillées Points clés L'essentiel Sommaire
PwC
Mars 2015
L’essentiel
3
Fin des quotas sucriers européens : quelles options stratégiques pour les acteurs de la filière en Europe ?
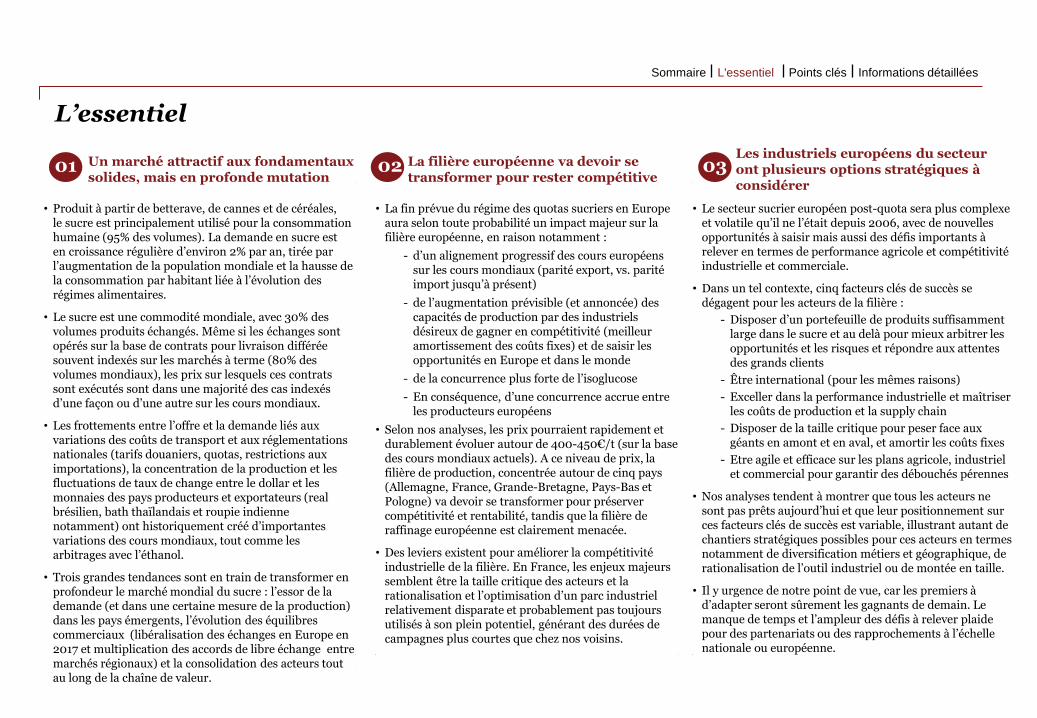
Un marché attractif aux fondamentaux solides, mais en profonde mutation
La filière européenne va devoir se transformer pour rester compétitive
Les industriels européens du secteur ont plusieurs options stratégiques à considérer
• Produit à partir de betterave, de cannes et de céréales, le sucre est principalement utilisé pour la consommation humaine (95% des volumes). La demande en sucre est en croissance régulière d’environ 2% par an, tirée par l’augmentation de la population mondiale et la hausse de la consommation par habitant liée à l’évolution des régimes alimentaires.
• Le sucre est une commodité mondiale, avec 30% des volumes produits échangés. Même si les échanges sont opérés sur la base de contrats pour livraison différée souvent indexés sur les marchés à terme (80% des volumes mondiaux), les prix sur lesquels ces contrats sont exécutés sont dans une majorité des cas indexés d’une façon ou d’une autre sur les cours mondiaux.
• Les frottements entre l’offre et la demande liés aux variations des coûts de transport et aux réglementations nationales (tarifs douaniers, quotas, restrictions aux importations), la concentration de la production et les fluctuations de taux de change entre le dollar et les monnaies des pays producteurs et exportateurs (real brésilien, bath thaïlandais et roupie indienne notamment) ont historiquement créé d’importantes variations des cours mondiaux, tout comme les arbitrages avec l’éthanol.
• Trois grandes tendances sont en train de transformer en profondeur le marché mondial du sucre : l’essor de la demande (et dans une certaine mesure de la production) dans les pays émergents, l’évolution des équilibres commerciaux (libéralisation des échanges en Europe en 2017 et multiplication des accords de libre échange entre marchés régionaux) et la consolidation des acteurs tout au long de la chaîne de valeur.
• La fin prévue du régime des quotas sucriers en Europe aura selon toute probabilité un impact majeur sur la filière européenne, en raison notamment :
- d’un alignement progressif des cours européens sur les cours mondiaux (parité export, vs. parité import jusqu’à présent)
- de l’augmentation prévisible (et annoncée) des capacités de production par des industriels désireux de gagner en compétitivité (meilleur amortissement des coûts fixes) et de saisir les opportunités en Europe et dans le monde
- de la concurrence plus forte de l’isoglucose
- En conséquence, d’une concurrence accrue entre les producteurs européens
• Selon nos analyses, les prix pourraient rapidement et durablement évoluer autour de 400-450€/t (sur la base des cours mondiaux actuels). A ce niveau de prix, la filière de production, concentrée autour de cinq pays (Allemagne, France, Grande-Bretagne, Pays-Bas et Pologne) va devoir se transformer pour préserver compétitivité et rentabilité, tandis que la filière de raffinage européenne est clairement menacée.
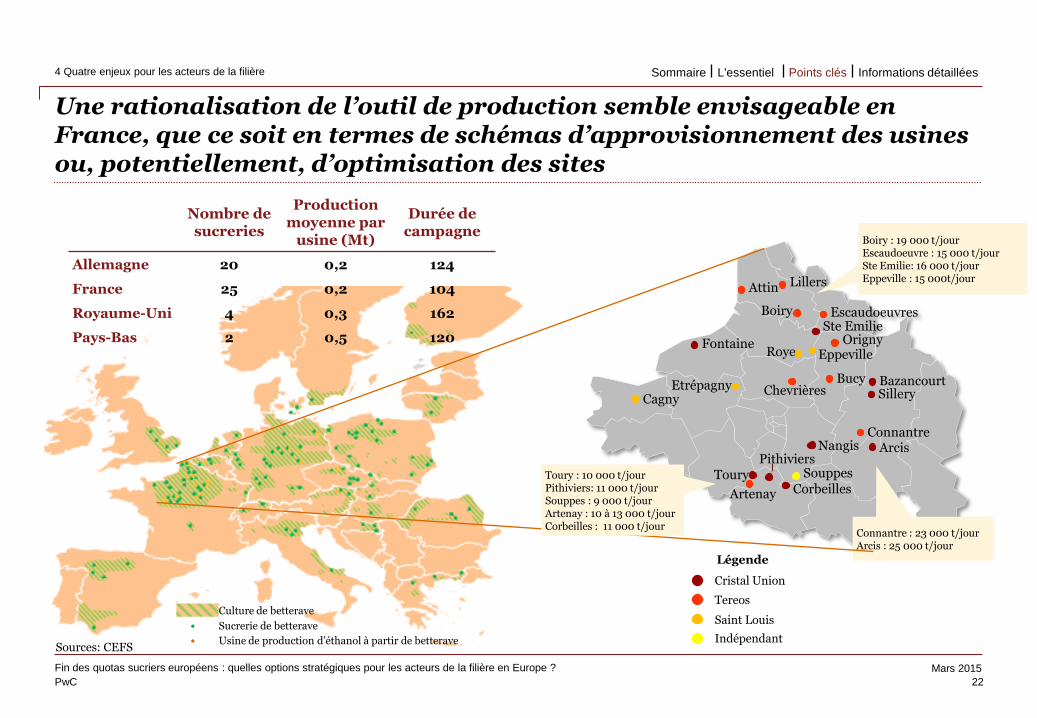
• Des leviers existent pour améliorer la compétitivité industrielle de la filière. En France, les enjeux majeurs semblent être la taille critique des acteurs et la rationalisation et l’optimisation d’un parc industriel relativement disparate et probablement pas toujours utilisés à son plein potentiel, générant des durées de campagnes plus courtes que chez nos voisins.
• Le secteur sucrier européen post-quota sera plus complexe et volatile qu’il ne l’était depuis 2006, avec de nouvelles opportunités à saisir mais aussi des défis importants à relever en termes de performance agricole et compétitivité industrielle et commerciale.
• Dans un tel contexte, cinq facteurs clés de succès se dégagent pour les acteurs de la filière :
- Disposer d’un portefeuille de produits suffisamment large dans le sucre et au delà pour mieux arbitrer les opportunités et les risques et répondre aux attentes des grands clients
- Être international (pour les mêmes raisons)
- Exceller dans la performance industrielle et maîtriser les coûts de production et la supply chain
- Disposer de la taille critique pour peser face aux géants en amont et en aval, et amortir les coûts fixes
- Etre agile et efficace sur les plans agricole, industriel et commercial pour garantir des débouchés pérennes
• Nos analyses tendent à montrer que tous les acteurs ne sont pas prêts aujourd’hui et que leur positionnement sur ces facteurs clés de succès est variable, illustrant autant de chantiers stratégiques possibles pour ces acteurs en termes notamment de diversification métiers et géographique, de rationalisation de l’outil industriel ou de montée en taille.
• Il y urgence de notre point de vue, car les premiers à d’adapter seront sûrement les gagnants de demain. Le manque de temps et l’ampleur des défis à relever plaide pour des partenariats ou des rapprochements à l’échelle nationale ou européenne.
01 02 03
Informations détaillées Points clés L'essentiel Sommaire
PwC
Mars 2015
Points clés
4
Points clés 4
1 Introduction 5
2 Dynamiques de marché 7
3 Un secteur en profonde mutation 12
4 Quatre enjeux pour les acteurs de la filière 19
5 Quel(s) scénario(s) pour les filières européenne et française ? 24
Informations détaillées Points clés L'essentiel Sommaire
PwC
Mars 2015
Use the divider control box below to
make the slide title appear in your
primary TOC and section TOCs.
Please follow these steps:
Type ‘Divider’ in the control box
provided below.
Click the Divider command on the
Smart ribbon.
Enter the text that you’d like to appear
in the TOCs and select a divider level.
Click Update. The slide title should now
appear on all TOCs.
To remove the slide title from your
TOCs, delete the ‘Divider’ text from the
divider control box and hit Update.
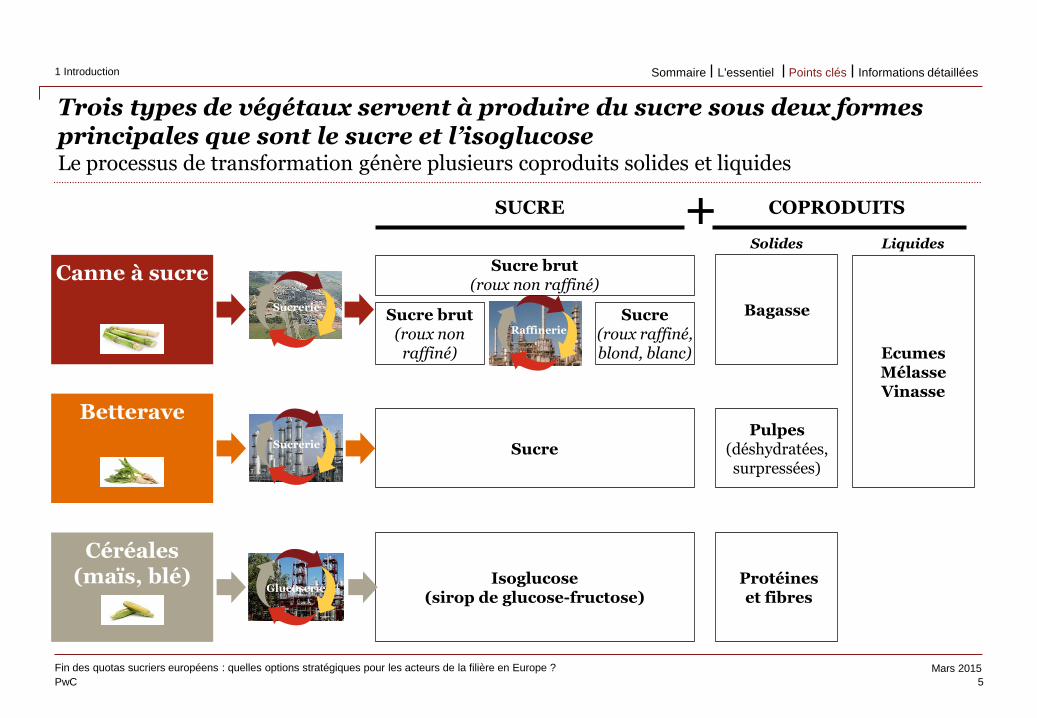
Trois types de végétaux servent à produire du sucre sous deux formes principales que sont le sucre et l’isoglucose Le processus de transformation génère plusieurs coproduits solides et liquides
5
Fin des quotas sucriers européens : quelles options stratégiques pour les acteurs de la filière en Europe ?
1 Introduction
Divider
Use the divider control box below to
make the slide title appear in your
primary TOC and section TOCs.
Please follow these steps:
Type ‘Divider’ in the control box
provided below.
Click the Divider command on the
Smart ribbon.
Enter the text that you’d like to appear
in the TOCs and select a divider level.
Click Update. The slide title should now
appear on all TOCs.
To remove the slide title from your
TOCs, delete the ‘Divider’ text from the
divider control box and hit Update.
Canne à sucre
Betterave
Céréales (maïs, blé)
Sucre brut (roux non
raffiné)
Sucre (roux raffiné, blond, blanc)
Isoglucose (sirop de glucose-fructose)
SUCRE COPRODUITS +
Pulpes (déshydratées, surpressées)
Bagasse
Ecumes Mélasse Vinasse
Sucrerie
Sucrerie
Glucoserie
Raffinerie
Protéines et fibres
Solides Liquides
Sucre
Sucre brut (roux non raffiné)
Informations détaillées Points clés L'essentiel Sommaire
PwC
Mars 2015
Use the divider control box below to
make the slide title appear in your
primary TOC and section TOCs.
Please follow these steps:
Type ‘Divider’ in the control box
provided below.
Click the Divider command on the
Smart ribbon.
Enter the text that you’d like to appear
in the TOCs and select a divider level.
Click Update. The slide title should now
appear on all TOCs.
To remove the slide title from your
TOCs, delete the ‘Divider’ text from the
divider control box and hit Update.
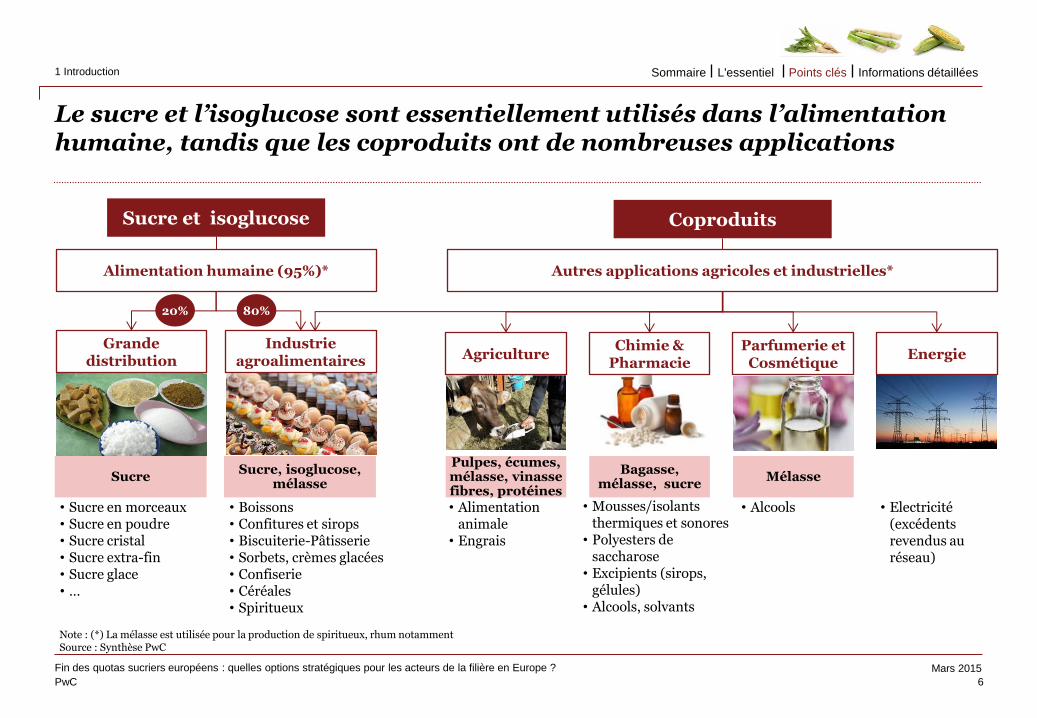
Le sucre et l’isoglucose sont essentiellement utilisés dans l’alimentation humaine, tandis que les coproduits ont de nombreuses applications
6
Fin des quotas sucriers européens : quelles options stratégiques pour les acteurs de la filière en Europe ?
1 Introduction
Use the divider control box below to
make the slide title appear in your
primary TOC and section TOCs.
Please follow these steps:
Type ‘Divider’ in the control box
provided below.
Click the Divider command on the
Smart ribbon.
Enter the text that you’d like to appear
in the TOCs and select a divider level.
Click Update. The slide title should now
appear on all TOCs.
To remove the slide title from your
TOCs, delete the ‘Divider’ text from the
divider control box and hit Update.
Grande distribution
Industrie agroalimentaires
• Boissons • Confitures et sirops • Biscuiterie-Pâtisserie • Sorbets, crèmes glacées • Confiserie • Céréales • Spiritueux
• Sucre en morceaux • Sucre en poudre • Sucre cristal • Sucre extra-fin • Sucre glace • …
• Mousses/isolants thermiques et sonores
• Polyesters de saccharose
• Excipients (sirops, gélules)
• Alcools, solvants
Sucre
Agriculture Chimie &
Pharmacie
• Alimentation animale
• Engrais
• Alcools
Parfumerie et Cosmétique
Sucre et isoglucose
Note : (*) La mélasse est utilisée pour la production de spiritueux, rhum notamment Source : Synthèse PwC
Sucre, isoglucose, mélasse
80% 20%
Alimentation humaine (95%)* Autres applications agricoles et industrielles*
Pulpes, écumes, mélasse, vinasse fibres, protéines
Bagasse, mélasse, sucre
Mélasse
Coproduits
Energie
• Electricité (excédents revendus au réseau)
Informations détaillées Points clés L'essentiel Sommaire
PwC
Mars 2015
Use the divider control box below to
make the slide title appear in your
primary TOC and section TOCs.
Please follow these steps:
Type ‘Divider’ in the control box
provided below.
Click the Divider command on the
Smart ribbon.
Enter the text that you’d like to appear
in the TOCs and select a divider level.
Click Update. The slide title should now
appear on all TOCs.
To remove the slide title from your
TOCs, delete the ‘Divider’ text from the
divider control box and hit Update.
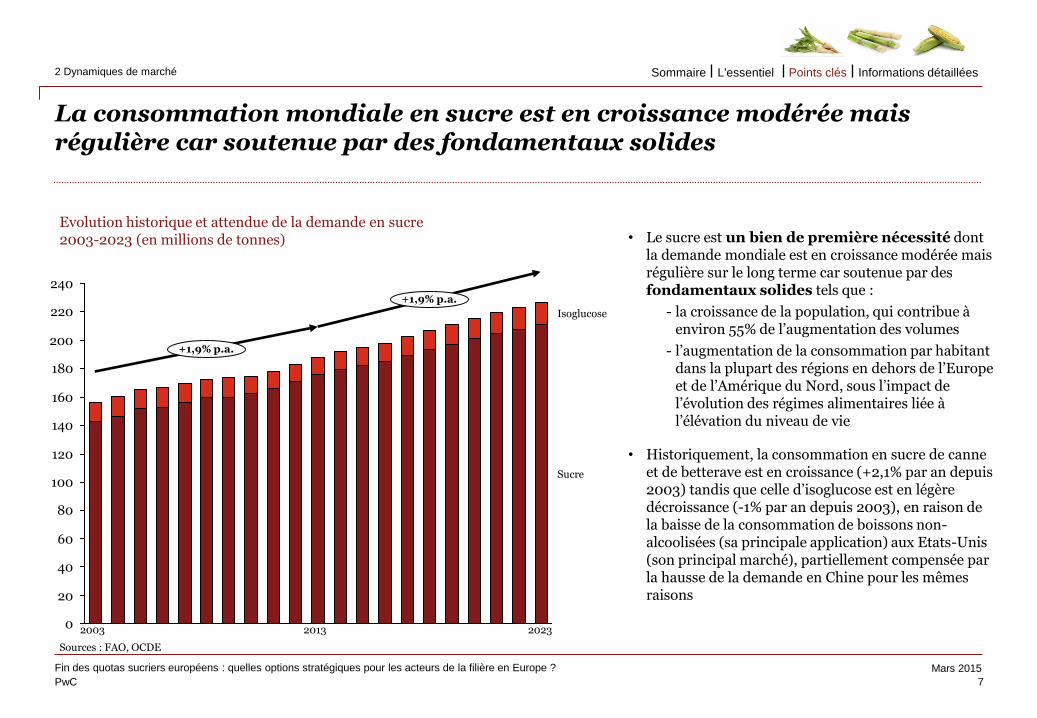
La consommation mondiale en sucre est en croissance modérée mais régulière car soutenue par des fondamentaux solides
Fin des quotas sucriers européens : quelles options stratégiques pour les acteurs de la filière en Europe ?
2 Dynamiques de marché
Divider
Use the divider control box below to
make the slide title appear in your
primary TOC and section TOCs.
Please follow these steps:
Type ‘Divider’ in the control box
provided below.
Click the Divider command on the
Smart ribbon.
Enter the text that you’d like to appear
in the TOCs and select a divider level.
Click Update. The slide title should now
appear on all TOCs.
To remove the slide title from your
TOCs, delete the ‘Divider’ text from the
divider control box and hit Update.
• Le sucre est un bien de première nécessité dont la demande mondiale est en croissance modérée mais régulière sur le long terme car soutenue par des fondamentaux solides tels que :
- la croissance de la population, qui contribue à environ 55% de l’augmentation des volumes
- l’augmentation de la consommation par habitant dans la plupart des régions en dehors de l’Europe et de l’Amérique du Nord, sous l’impact de l’évolution des régimes alimentaires liée à l’élévation du niveau de vie
• Historiquement, la consommation en sucre de canne et de betterave est en croissance (+2,1% par an depuis 2003) tandis que celle d’isoglucose est en légère décroissance (-1% par an depuis 2003), en raison de la baisse de la consommation de boissons non-alcoolisées (sa principale application) aux Etats-Unis (son principal marché), partiellement compensée par la hausse de la demande en Chine pour les mêmes raisons
60
40
20
0
80
100
120
140
160
180
200
220
240
+1,9% p.a.
+1,9% p.a.
Sucre
Isoglucose
7
Evolution historique et attendue de la demande en sucre 2003-2023 (en millions de tonnes)
2003 2013 2023 Sources : FAO, OCDE
Informations détaillées Points clés L'essentiel Sommaire
PwC
Mars 2015
Use the divider control box below to
make the slide title appear in your
primary TOC and section TOCs.
Please follow these steps:
Type ‘Divider’ in the control box
provided below.
Click the Divider command on the
Smart ribbon.
Enter the text that you’d like to appear
in the TOCs and select a divider level.
Click Update. The slide title should now
appear on all TOCs.
To remove the slide title from your
TOCs, delete the ‘Divider’ text from the
divider control box and hit Update.
40 26
27
20
18
16
14
14
11
11
73 91
0%
20%
40%
60%
80%
100%
Production Consommation
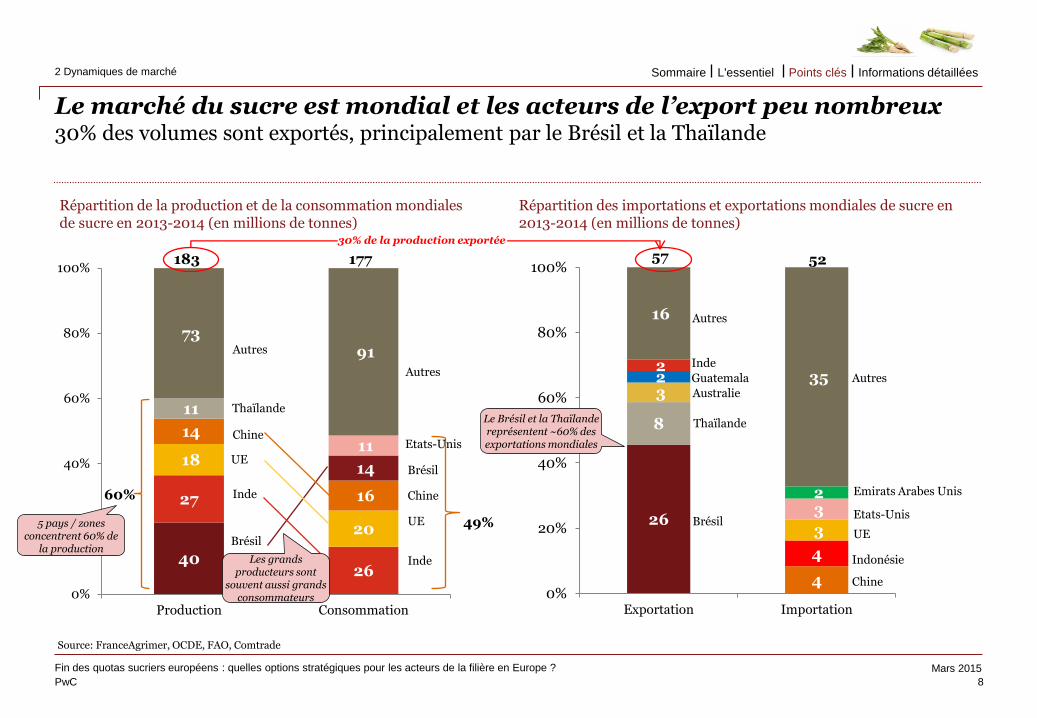
Le marché du sucre est mondial et les acteurs de l’export peu nombreux 30% des volumes sont exportés, principalement par le Brésil et la Thaïlande
8
Fin des quotas sucriers européens : quelles options stratégiques pour les acteurs de la filière en Europe ?
2 Dynamiques de marché
Répartition des importations et exportations mondiales de sucre en 2013-2014 (en millions de tonnes)
Use the divider control box below to
make the slide title appear in your
primary TOC and section TOCs.
Please follow these steps:
Type ‘Divider’ in the control box
provided below.
Click the Divider command on the
Smart ribbon.
Enter the text that you’d like to appear
in the TOCs and select a divider level.
Click Update. The slide title should now
appear on all TOCs.
To remove the slide title from your
TOCs, delete the ‘Divider’ text from the
divider control box and hit Update.
Source: FranceAgrimer, OCDE, FAO, Comtrade
Inde
UE
Brésil
Chine
Brésil
Inde
Chine
UE
183
Répartition de la production et de la consommation mondiales de sucre en 2013-2014 (en millions de tonnes)
Autres
177
Autres
60%
49%
Thaïlande
Etats-Unis
26
4
8
4
3
3
2
3
2
2
16
35
0%
20%
40%
60%
80%
100%
Exportation Importation
Brésil
Thaïlande
Autres
Autres
UE
Chine
Indonésie
Etats-Unis
57 52
Australie
Guatemala
Inde
Emirats Arabes Unis
Le Brésil et la Thaïlande représentent ~60% des exportations mondiales
30% de la production exportée
5 pays / zones concentrent 60% de
la production Les grands
producteurs sont souvent aussi grands
consommateurs
Informations détaillées Points clés L'essentiel Sommaire
PwC
Mars 2015
Use the divider control box below to
make the slide title appear in your
primary TOC and section TOCs.
Please follow these steps:
Type ‘Divider’ in the control box
provided below.
Click the Divider command on the
Smart ribbon.
Enter the text that you’d like to appear
in the TOCs and select a divider level.
Click Update. The slide title should now
appear on all TOCs.
To remove the slide title from your
TOCs, delete the ‘Divider’ text from the
divider control box and hit Update.
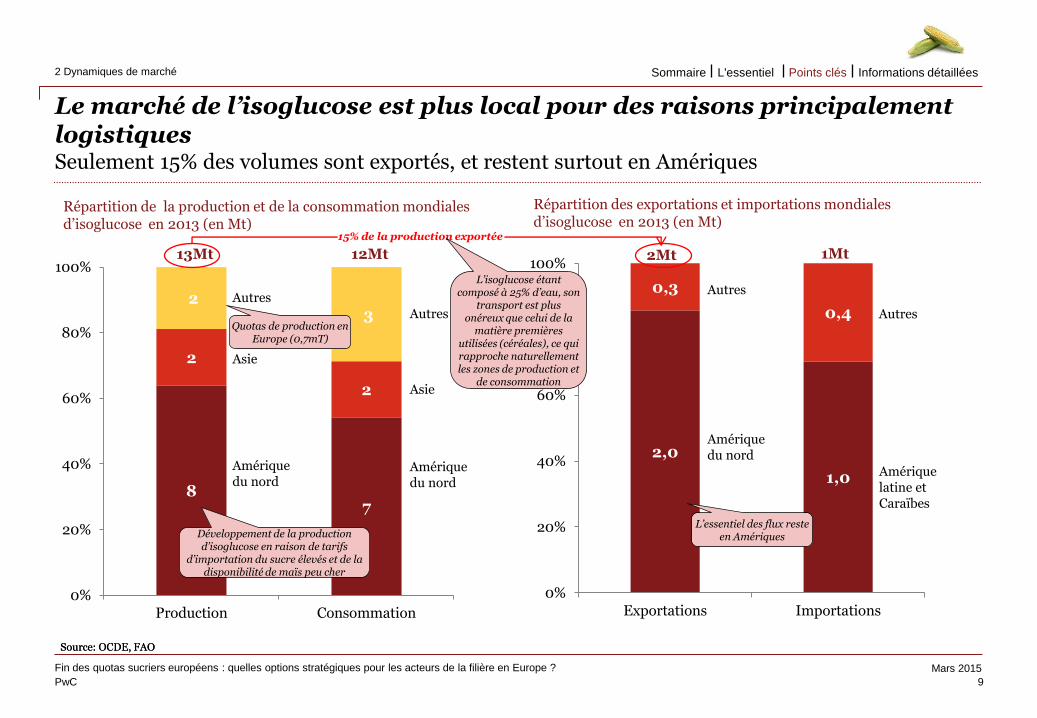
Le marché de l’isoglucose est plus local pour des raisons principalement logistiques Seulement 15% des volumes sont exportés, et restent surtout en Amériques
9
Fin des quotas sucriers européens : quelles options stratégiques pour les acteurs de la filière en Europe ?
2 Dynamiques de marché
Use the divider control box below to
make the slide title appear in your
primary TOC and section TOCs.
Please follow these steps:
Type ‘Divider’ in the control box
provided below.
Click the Divider command on the
Smart ribbon.
Enter the text that you’d like to appear
in the TOCs and select a divider level.
Click Update. The slide title should now
appear on all TOCs.
To remove the slide title from your
TOCs, delete the ‘Divider’ text from the
divider control box and hit Update.
Source: OCDE, FAO Source: OCDE, FAO
Répartition de la production et de la consommation mondiales d’isoglucose en 2013 (en Mt)
Répartition des exportations et importations mondiales d’isoglucose en 2013 (en Mt)
8 7
2
2
2 3
0%
20%
40%
60%
80%
100%
Production Consommation
13Mt 12Mt
Amérique du nord
Asie
Autres
2,0
1,0
0,3
0,4
0%
20%
40%
60%
80%
100%
Exportations Importations
Amérique du nord
Asie
Autres
1Mt 2Mt
Amérique du nord
Amérique latine et Caraïbes
Autres
Autres
Développement de la production d’isoglucose en raison de tarifs
d’importation du sucre élevés et de la disponibilité de maïs peu cher
Quotas de production en Europe (0,7mT)
15% de la production exportée
L’isoglucose étant composé à 25% d’eau, son
transport est plus onéreux que celui de la
matière premières utilisées (céréales), ce qui rapproche naturellement les zones de production et
de consommation
L’essentiel des flux reste en Amériques
Informations détaillées Points clés L'essentiel Sommaire
PwC
Mars 2015
Use the divider control box below to
make the slide title appear in your
primary TOC and section TOCs.
Please follow these steps:
Type ‘Divider’ in the control box
provided below.
Click the Divider command on the
Smart ribbon.
Enter the text that you’d like to appear
in the TOCs and select a divider level.
Click Update. The slide title should now
appear on all TOCs.
To remove the slide title from your
TOCs, delete the ‘Divider’ text from the
divider control box and hit Update.
Les prix du sucre peuvent varier fortement d’une année sur l’autre sous l’influence de la situation de marché dans les principaux pays producteurs, des politiques nationales et des fluctuations des taux de change
Fin des quotas sucriers européens : quelles options stratégiques pour les acteurs de la filière en Europe ?
2 Dynamiques de marché
Use the divider control box below to
make the slide title appear in your
primary TOC and section TOCs.
Please follow these steps:
Type ‘Divider’ in the control box
provided below.
Click the Divider command on the
Smart ribbon.
Enter the text that you’d like to appear
in the TOCs and select a divider level.
Click Update. The slide title should now
appear on all TOCs.
To remove the slide title from your
TOCs, delete the ‘Divider’ text from the
divider control box and hit Update.
10
0
0,2
0,4
0,6
0,8
1
1,2
0
100
200
300
400
500
600
700
1995 2000 2005 2010
Sucre brut Sucre raffiné BRE/USD
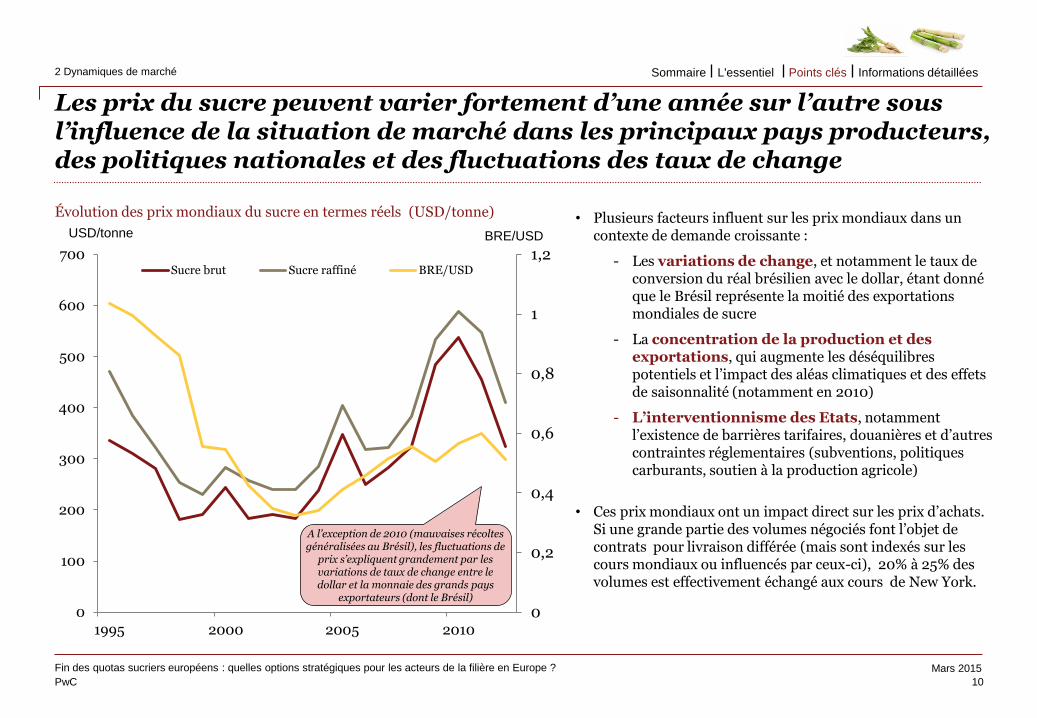
Évolution des prix mondiaux du sucre en termes réels (USD/tonne) • Plusieurs facteurs influent sur les prix mondiaux dans un contexte de demande croissante :
- Les variations de change, et notamment le taux de conversion du réal brésilien avec le dollar, étant donné que le Brésil représente la moitié des exportations mondiales de sucre
- La concentration de la production et des exportations, qui augmente les déséquilibres potentiels et l’impact des aléas climatiques et des effets de saisonnalité (notamment en 2010)
- L’interventionnisme des Etats, notamment l’existence de barrières tarifaires, douanières et d’autres contraintes réglementaires (subventions, politiques carburants, soutien à la production agricole)
• Ces prix mondiaux ont un impact direct sur les prix d’achats. Si une grande partie des volumes négociés font l’objet de contrats pour livraison différée (mais sont indexés sur les cours mondiaux ou influencés par ceux-ci), 20% à 25% des volumes est effectivement échangé aux cours de New York.
USD/tonne BRE/USD
A l’exception de 2010 (mauvaises récoltes généralisées au Brésil), les fluctuations de
prix s’expliquent grandement par les variations de taux de change entre le dollar et la monnaie des grands pays
exportateurs (dont le Brésil)
Informations détaillées Points clés L'essentiel Sommaire
PwC
Mars 2015
Use the divider control box below to
make the slide title appear in your
primary TOC and section TOCs.
Please follow these steps:
Type ‘Divider’ in the control box
provided below.
Click the Divider command on the
Smart ribbon.
Enter the text that you’d like to appear
in the TOCs and select a divider level.
Click Update. The slide title should now
appear on all TOCs.
To remove the slide title from your
TOCs, delete the ‘Divider’ text from the
divider control box and hit Update.
En Europe, L’OCM a cherché à sécuriser les revenus des filières agricoles locales. Pour autant, le déséquilibre entre l’offre et la demande a créé une hausse de prix entre 2011 et 2013
11
Fin des quotas sucriers européens : quelles options stratégiques pour les acteurs de la filière en Europe ?
2 Dynamiques de marché
Use the divider control box below to
make the slide title appear in your
primary TOC and section TOCs.
Please follow these steps:
Type ‘Divider’ in the control box
provided below.
Click the Divider command on the
Smart ribbon.
Enter the text that you’d like to appear
in the TOCs and select a divider level.
Click Update. The slide title should now
appear on all TOCs.
To remove the slide title from your
TOCs, delete the ‘Divider’ text from the
divider control box and hit Update.
Source : Commission Européenne
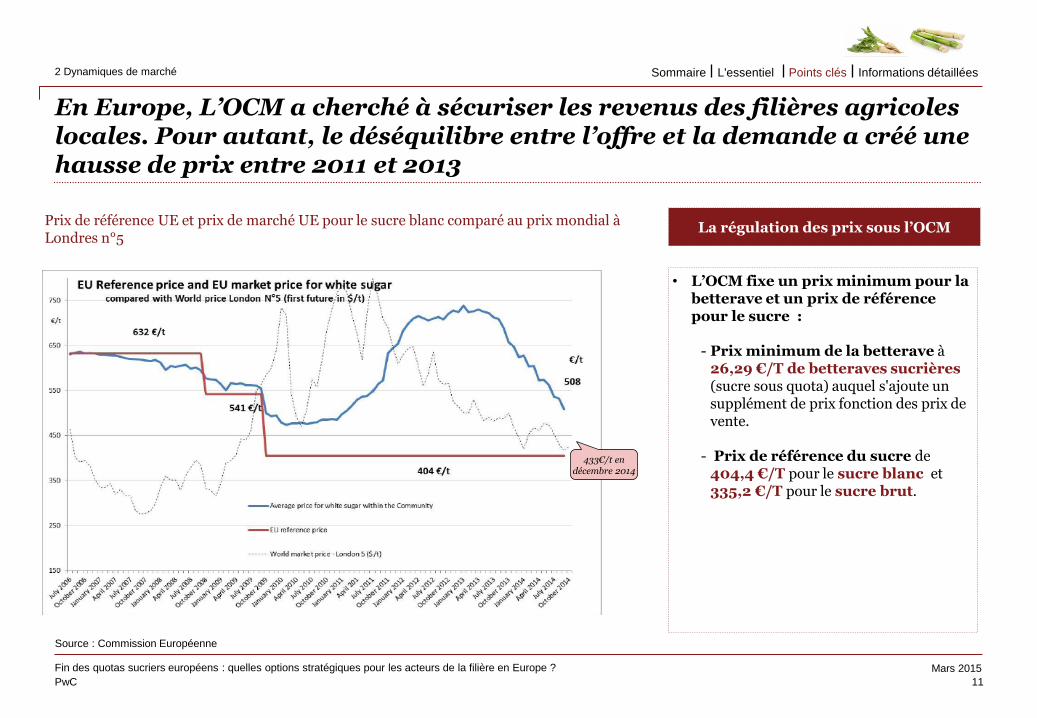
Prix de référence UE et prix de marché UE pour le sucre blanc comparé au prix mondial à Londres n°5
• L’OCM fixe un prix minimum pour la betterave et un prix de référence pour le sucre :
- Prix minimum de la betterave à 26,29 €/T de betteraves sucrières (sucre sous quota) auquel s'ajoute un supplément de prix fonction des prix de vente.
- Prix de référence du sucre de 404,4 €/T pour le sucre blanc et 335,2 €/T pour le sucre brut.
La régulation des prix sous l’OCM
433€/t en décembre 2014
Informations détaillées Points clés L'essentiel Sommaire
PwC
Mars 2015
Use the divider control box below to
make the slide title appear in your
primary TOC and section TOCs.
Please follow these steps:
Type ‘Divider’ in the control box
provided below.
Click the Divider command on the
Smart ribbon.
Enter the text that you’d like to appear
in the TOCs and select a divider level.
Click Update. The slide title should now
appear on all TOCs.
To remove the slide title from your
TOCs, delete the ‘Divider’ text from the
divider control box and hit Update.
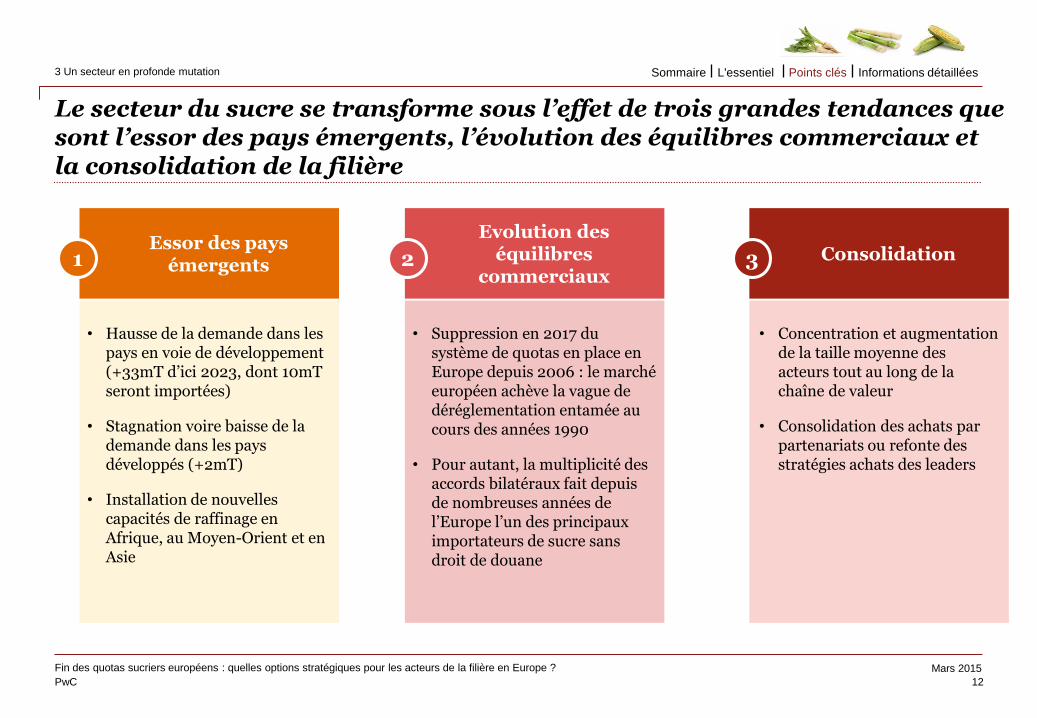
Le secteur du sucre se transforme sous l’effet de trois grandes tendances que sont l’essor des pays émergents, l’évolution des équilibres commerciaux et la consolidation de la filière
12
Fin des quotas sucriers européens : quelles options stratégiques pour les acteurs de la filière en Europe ?
3 Un secteur en profonde mutation
Divider
Use the divider control box below to
make the slide title appear in your
primary TOC and section TOCs.
Please follow these steps:
Type ‘Divider’ in the control box
provided below.
Click the Divider command on the
Smart ribbon.
Enter the text that you’d like to appear
in the TOCs and select a divider level.
Click Update. The slide title should now
appear on all TOCs.
To remove the slide title from your
TOCs, delete the ‘Divider’ text from the
divider control box and hit Update.
Consolidation Essor des pays
émergents
Evolution des équilibres
commerciaux 1 2 3
• Hausse de la demande dans les pays en voie de développement (+33mT d’ici 2023, dont 10mT seront importées)
• Stagnation voire baisse de la demande dans les pays développés (+2mT)
• Installation de nouvelles capacités de raffinage en Afrique, au Moyen-Orient et en Asie
• Suppression en 2017 du système de quotas en place en Europe depuis 2006 : le marché européen achève la vague de déréglementation entamée au cours des années 1990
• Pour autant, la multiplicité des accords bilatéraux fait depuis de nombreuses années de l’Europe l’un des principaux importateurs de sucre sans droit de douane
• Concentration et augmentation de la taille moyenne des acteurs tout au long de la chaîne de valeur
• Consolidation des achats par partenariats ou refonte des stratégies achats des leaders
Informations détaillées Points clés L'essentiel Sommaire
PwC
Mars 2015
Use the divider control box below to
make the slide title appear in your
primary TOC and section TOCs.
Please follow these steps:
Type ‘Divider’ in the control box
provided below.
Click the Divider command on the
Smart ribbon.
Enter the text that you’d like to appear
in the TOCs and select a divider level.
Click Update. The slide title should now
appear on all TOCs.
To remove the slide title from your
TOCs, delete the ‘Divider’ text from the
divider control box and hit Update.
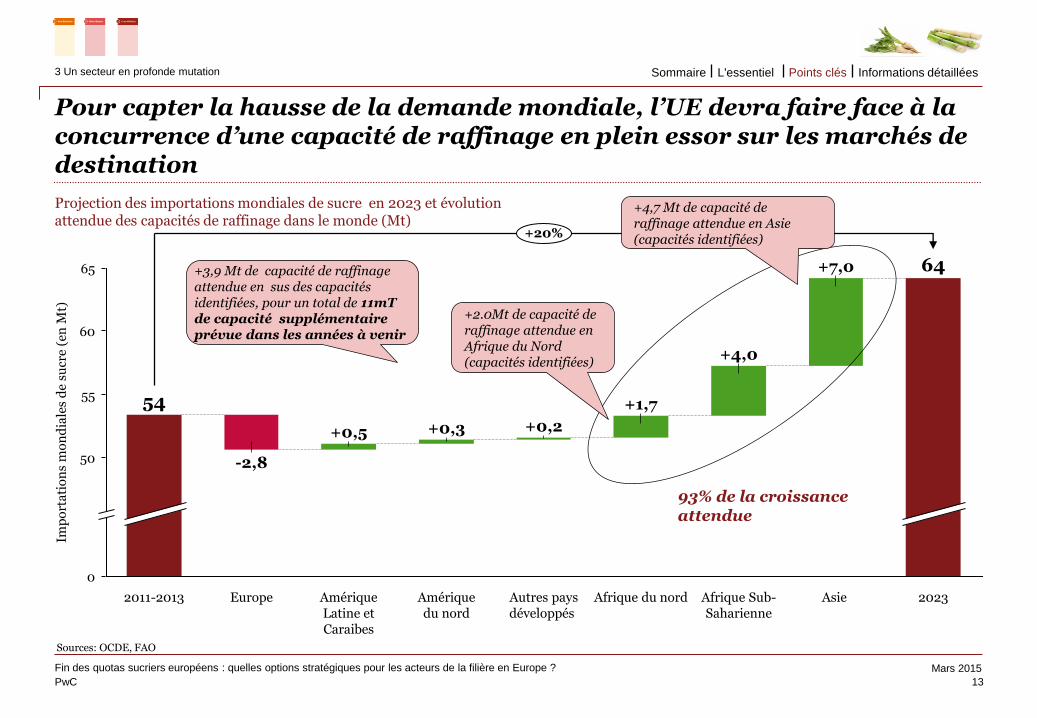
Pour capter la hausse de la demande mondiale, l’UE devra faire face à la concurrence d’une capacité de raffinage en plein essor sur les marchés de destination
Sources: OCDE, FAO
13
Fin des quotas sucriers européens : quelles options stratégiques pour les acteurs de la filière en Europe ?
3 Un secteur en profonde mutation
Use the divider control box below to
make the slide title appear in your
primary TOC and section TOCs.
Please follow these steps:
Type ‘Divider’ in the control box
provided below.
Click the Divider command on the
Smart ribbon.
Enter the text that you’d like to appear
in the TOCs and select a divider level.
Click Update. The slide title should now
appear on all TOCs.
To remove the slide title from your
TOCs, delete the ‘Divider’ text from the
divider control box and hit Update.
50
55
0
60
65 64
Asie
+7,0
Afrique Sub-Saharienne
+4,0
Amérique Latine et Caraibes
Amérique du nord
+0,2
Autres pays développés
+1,7
Imp
ort
ati
on
s m
on
dia
les
de
sucr
e (e
n M
t)
54
+0,3
2011-2013
-2,8
Europe
+0,5
+20%
2023 Afrique du nord
93% de la croissance attendue
+2.0Mt de capacité de raffinage attendue en Afrique du Nord (capacités identifiées)
+4,7 Mt de capacité de raffinage attendue en Asie (capacités identifiées)
+3,9 Mt de capacité de raffinage attendue en sus des capacités identifiées, pour un total de 11mT de capacité supplémentaire prévue dans les années à venir
Projection des importations mondiales de sucre en 2023 et évolution attendue des capacités de raffinage dans le monde (Mt)
Informations détaillées Points clés L'essentiel Sommaire
PwC
Mars 2015
Use the divider control box below to
make the slide title appear in your
primary TOC and section TOCs.
Please follow these steps:
Type ‘Divider’ in the control box
provided below.
Click the Divider command on the
Smart ribbon.
Enter the text that you’d like to appear
in the TOCs and select a divider level.
Click Update. The slide title should now
appear on all TOCs.
To remove the slide title from your
TOCs, delete the ‘Divider’ text from the
divider control box and hit Update.
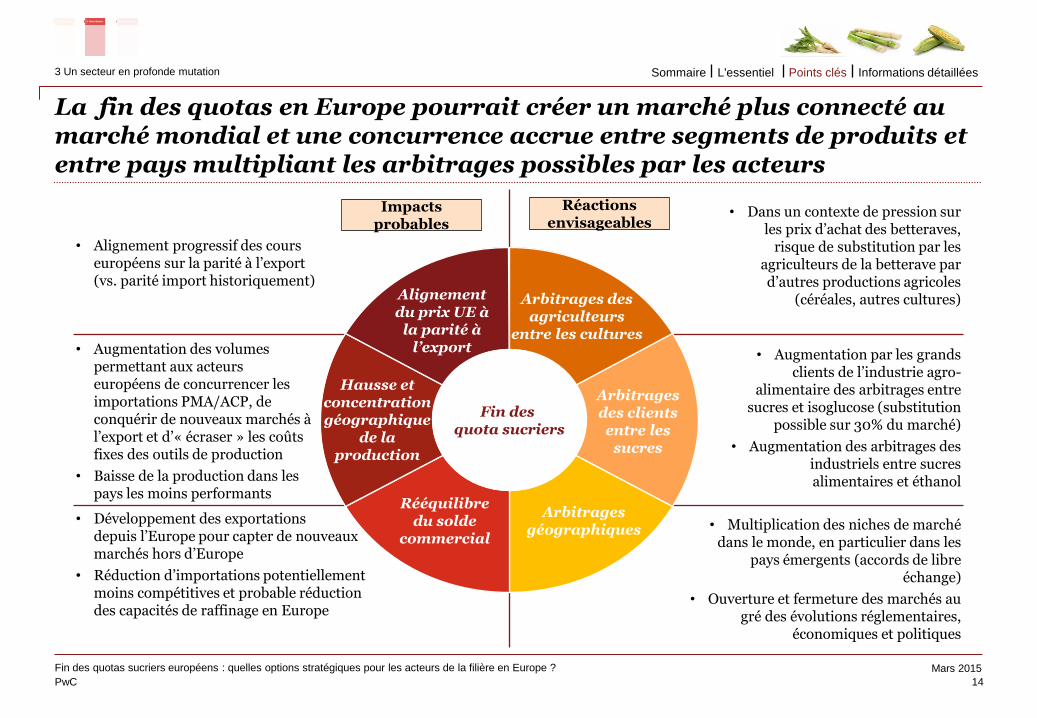
La fin des quotas en Europe pourrait créer un marché plus connecté au marché mondial et une concurrence accrue entre segments de produits et entre pays multipliant les arbitrages possibles par les acteurs
14
Fin des quotas sucriers européens : quelles options stratégiques pour les acteurs de la filière en Europe ?
3 Un secteur en profonde mutation
Use the divider control box below to
make the slide title appear in your
primary TOC and section TOCs.
Please follow these steps:
Type ‘Divider’ in the control box
provided below.
Click the Divider command on the
Smart ribbon.
Enter the text that you’d like to appear
in the TOCs and select a divider level.
Click Update. The slide title should now
appear on all TOCs.
To remove the slide title from your
TOCs, delete the ‘Divider’ text from the
divider control box and hit Update.
Fin des quota sucriers
Alignement du prix UE à
la parité à l’export
Arbitrages des clients entre les
sucres
Hausse et concentration géographique
de la production
Rééquilibre du solde
commercial
Arbitrages géographiques
• Augmentation des volumes permettant aux acteurs européens de concurrencer les importations PMA/ACP, de conquérir de nouveaux marchés à l’export et d’« écraser » les coûts fixes des outils de production
• Baisse de la production dans les pays les moins performants
• Dans un contexte de pression sur les prix d’achat des betteraves,
risque de substitution par les agriculteurs de la betterave par d’autres productions agricoles
(céréales, autres cultures)
• Alignement progressif des cours européens sur la parité à l’export (vs. parité import historiquement)
• Augmentation par les grands clients de l’industrie agro-
alimentaire des arbitrages entre sucres et isoglucose (substitution
possible sur 30% du marché)
• Augmentation des arbitrages des industriels entre sucres alimentaires et éthanol
• Multiplication des niches de marché dans le monde, en particulier dans les
pays émergents (accords de libre échange)
• Ouverture et fermeture des marchés au gré des évolutions réglementaires,
économiques et politiques
Arbitrages des agriculteurs
entre les cultures
• Développement des exportations depuis l’Europe pour capter de nouveaux marchés hors d’Europe
• Réduction d’importations potentiellement moins compétitives et probable réduction des capacités de raffinage en Europe
Impacts probables
Réactions envisageables
Informations détaillées Points clés L'essentiel Sommaire
PwC
Mars 2015
Use the divider control box below to
make the slide title appear in your
primary TOC and section TOCs.
Please follow these steps:
Type ‘Divider’ in the control box
provided below.
Click the Divider command on the
Smart ribbon.
Enter the text that you’d like to appear
in the TOCs and select a divider level.
Click Update. The slide title should now
appear on all TOCs.
To remove the slide title from your
TOCs, delete the ‘Divider’ text from the
divider control box and hit Update.
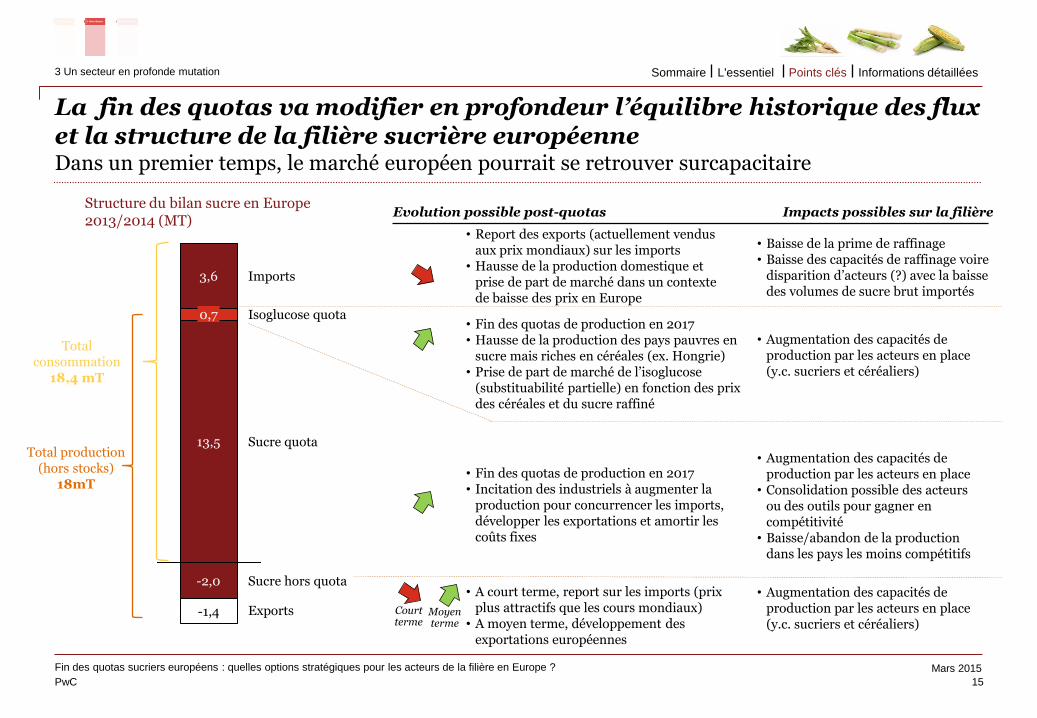
La fin des quotas va modifier en profondeur l’équilibre historique des flux et la structure de la filière sucrière européenne Dans un premier temps, le marché européen pourrait se retrouver surcapacitaire
15
Fin des quotas sucriers européens : quelles options stratégiques pour les acteurs de la filière en Europe ?
3 Un secteur en profonde mutation
Use the divider control box below to
make the slide title appear in your
primary TOC and section TOCs.
Please follow these steps:
Type ‘Divider’ in the control box
provided below.
Click the Divider command on the
Smart ribbon.
Enter the text that you’d like to appear
in the TOCs and select a divider level.
Click Update. The slide title should now
appear on all TOCs.
To remove the slide title from your
TOCs, delete the ‘Divider’ text from the
divider control box and hit Update.
Structure du bilan sucre en Europe 2013/2014 (MT)
3,6
0,7
13,5 Sucre quota
Exports
Sucre hors quota -2,0
-1,4
Isoglucose quota
Imports
Total production (hors stocks)
18mT
Total consommation
18,4 mT
Evolution possible post-quotas
Court terme
Moyen terme
• Fin des quotas de production en 2017 • Hausse de la production des pays pauvres en
sucre mais riches en céréales (ex. Hongrie) • Prise de part de marché de l’isoglucose
(substituabilité partielle) en fonction des prix des céréales et du sucre raffiné
• Report des exports (actuellement vendus aux prix mondiaux) sur les imports
• Hausse de la production domestique et prise de part de marché dans un contexte de baisse des prix en Europe
Impacts possibles sur la filière
• Fin des quotas de production en 2017 • Incitation des industriels à augmenter la
production pour concurrencer les imports, développer les exportations et amortir les coûts fixes
• Baisse de la prime de raffinage • Baisse des capacités de raffinage voire
disparition d’acteurs (?) avec la baisse des volumes de sucre brut importés
• Augmentation des capacités de production par les acteurs en place (y.c. sucriers et céréaliers)
• Augmentation des capacités de production par les acteurs en place
• Consolidation possible des acteurs ou des outils pour gagner en compétitivité
• Baisse/abandon de la production dans les pays les moins compétitifs
• A court terme, report sur les imports (prix plus attractifs que les cours mondiaux)
• A moyen terme, développement des exportations européennes
• Augmentation des capacités de production par les acteurs en place (y.c. sucriers et céréaliers)
Informations détaillées Points clés L'essentiel Sommaire
PwC
Mars 2015
Use the divider control box below to
make the slide title appear in your
primary TOC and section TOCs.
Please follow these steps:
Type ‘Divider’ in the control box
provided below.
Click the Divider command on the
Smart ribbon.
Enter the text that you’d like to appear
in the TOCs and select a divider level.
Click Update. The slide title should now
appear on all TOCs.
To remove the slide title from your
TOCs, delete the ‘Divider’ text from the
divider control box and hit Update.
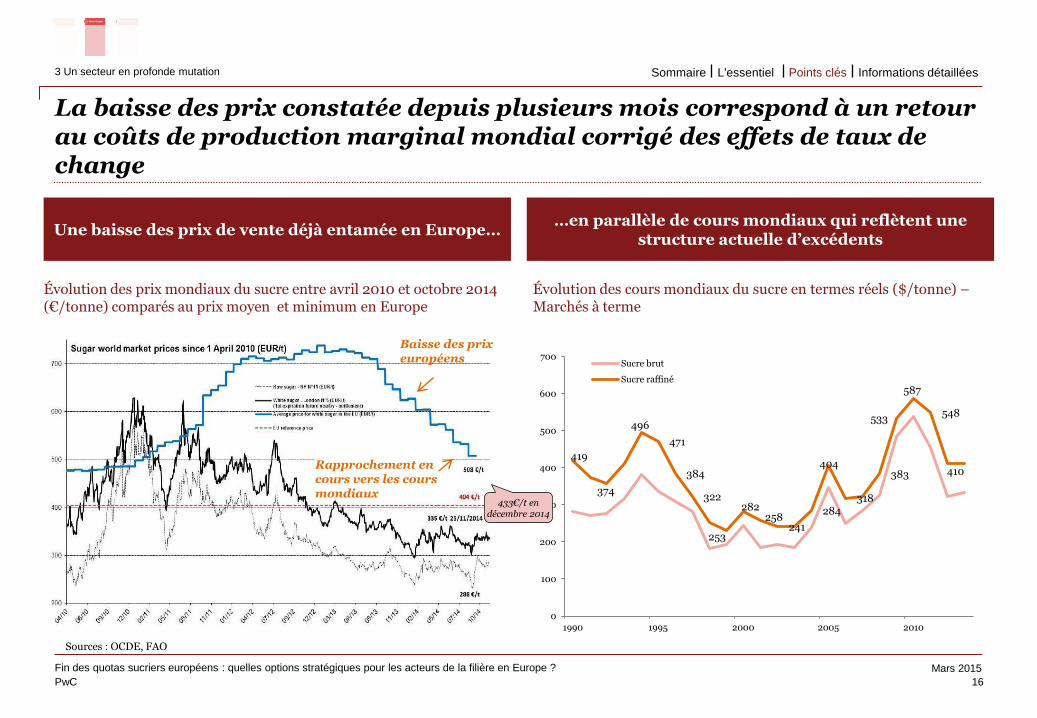
Une baisse des prix de vente déjà entamée en Europe… …en parallèle de cours mondiaux qui reflètent une
structure actuelle d’excédents
La baisse des prix constatée depuis plusieurs mois correspond à un retour au coûts de production marginal mondial corrigé des effets de taux de change
16
Fin des quotas sucriers européens : quelles options stratégiques pour les acteurs de la filière en Europe ?
3 Un secteur en profonde mutation
Use the divider control box below to
make the slide title appear in your
primary TOC and section TOCs.
Please follow these steps:
Type ‘Divider’ in the control box
provided below.
Click the Divider command on the
Smart ribbon.
Enter the text that you’d like to appear
in the TOCs and select a divider level.
Click Update. The slide title should now
appear on all TOCs.
To remove the slide title from your
TOCs, delete the ‘Divider’ text from the
divider control box and hit Update.
Évolution des prix mondiaux du sucre entre avril 2010 et octobre 2014 (€/tonne) comparés au prix moyen et minimum en Europe
Évolution des cours mondiaux du sucre en termes réels ($/tonne) – Marchés à terme
Sources : OCDE, FAO
419
374
496
471
384
322
253
282 258
241
284
404
318
383
533
587
548
410
0
100
200
300
400
500
600
700
1990 1995 2000 2005 2010
Sucre brut
Sucre raffiné
Baisse des prix européens
Rapprochement en cours vers les cours mondiaux
433€/t en décembre 2014
Informations détaillées Points clés L'essentiel Sommaire
PwC
Mars 2015
Use the divider control box below to
make the slide title appear in your
primary TOC and section TOCs.
Please follow these steps:
Type ‘Divider’ in the control box
provided below.
Click the Divider command on the
Smart ribbon.
Enter the text that you’d like to appear
in the TOCs and select a divider level.
Click Update. The slide title should now
appear on all TOCs.
To remove the slide title from your
TOCs, delete the ‘Divider’ text from the
divider control box and hit Update.
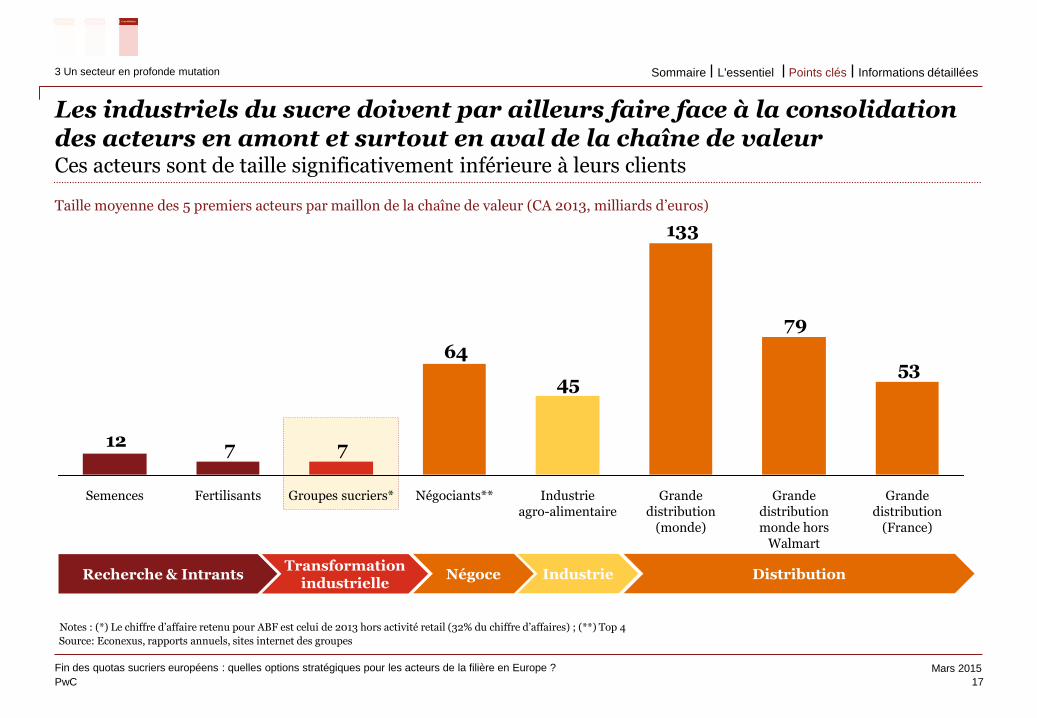
Les industriels du sucre doivent par ailleurs faire face à la consolidation des acteurs en amont et surtout en aval de la chaîne de valeur Ces acteurs sont de taille significativement inférieure à leurs clients
17
Fin des quotas sucriers européens : quelles options stratégiques pour les acteurs de la filière en Europe ?
3 Un secteur en profonde mutation
Use the divider control box below to
make the slide title appear in your
primary TOC and section TOCs.
Please follow these steps:
Type ‘Divider’ in the control box
provided below.
Click the Divider command on the
Smart ribbon.
Enter the text that you’d like to appear
in the TOCs and select a divider level.
Click Update. The slide title should now
appear on all TOCs.
To remove the slide title from your
TOCs, delete the ‘Divider’ text from the
divider control box and hit Update.
53
79
133
45
64
7712
Groupes sucriers* Semences Fertilisants Grande distribution monde hors
Walmart
Grande distribution
(monde)
Industrie agro-alimentaire
Négociants** Grande distribution
(France)
Recherche & Intrants Transformation
industrielle Négoce
Source: Econexus, rapports annuels, sites internet des groupes
Taille moyenne des 5 premiers acteurs par maillon de la chaîne de valeur (CA 2013, milliards d’euros)
Notes : (*) Le chiffre d’affaire retenu pour ABF est celui de 2013 hors activité retail (32% du chiffre d’affaires) ; (**) Top 4
Industrie Distribution
Informations détaillées Points clés L'essentiel Sommaire
PwC
Mars 2015
Use the divider control box below to
make the slide title appear in your
primary TOC and section TOCs.
Please follow these steps:
Type ‘Divider’ in the control box
provided below.
Click the Divider command on the
Smart ribbon.
Enter the text that you’d like to appear
in the TOCs and select a divider level.
Click Update. The slide title should now
appear on all TOCs.
To remove the slide title from your
TOCs, delete the ‘Divider’ text from the
divider control box and hit Update.
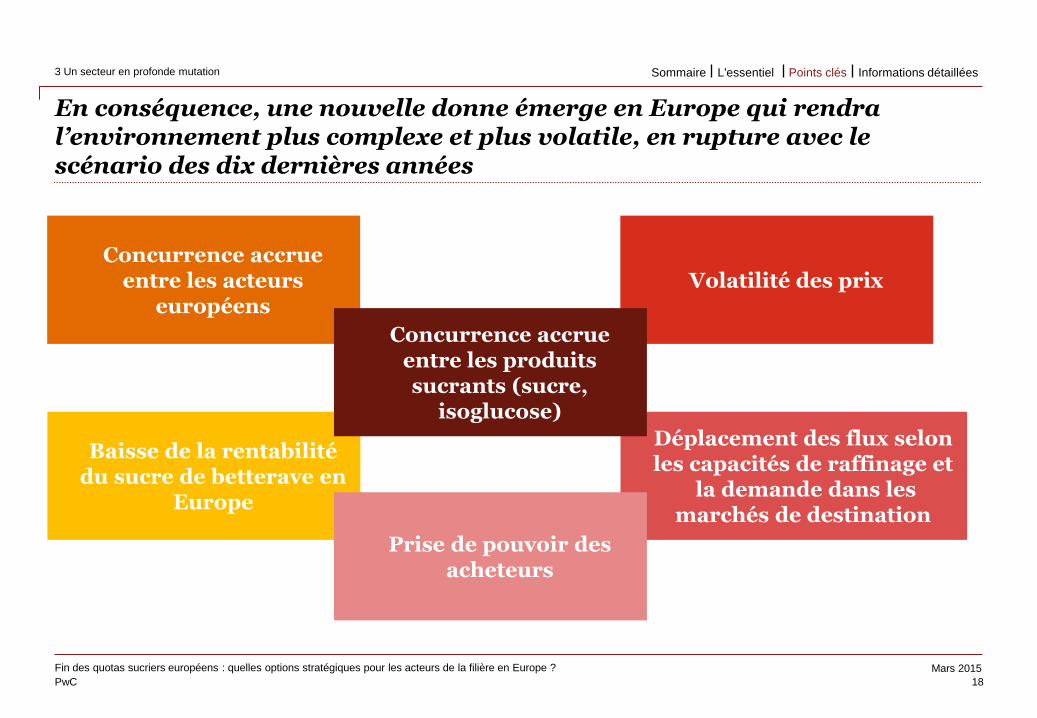
En conséquence, une nouvelle donne émerge en Europe qui rendra l’environnement plus complexe et plus volatile, en rupture avec le scénario des dix dernières années
18
Fin des quotas sucriers européens : quelles options stratégiques pour les acteurs de la filière en Europe ?
3 Un secteur en profonde mutation
Use the divider control box below to
make the slide title appear in your
primary TOC and section TOCs.
Please follow these steps:
Type ‘Divider’ in the control box
provided below.
Click the Divider command on the
Smart ribbon.
Enter the text that you’d like to appear
in the TOCs and select a divider level.
Click Update. The slide title should now
appear on all TOCs.
To remove the slide title from your
TOCs, delete the ‘Divider’ text from the
divider control box and hit Update.
Concurrence accrue entre les acteurs
européens
Baisse de la rentabilité du sucre de betterave en
Europe
Volatilité des prix
Déplacement des flux selon les capacités de raffinage et
la demande dans les marchés de destination
Concurrence accrue entre les produits sucrants (sucre,
isoglucose)
Prise de pouvoir des acheteurs
Informations détaillées Points clés L'essentiel Sommaire
PwC
Mars 2015
Use the divider control box below to
make the slide title appear in your
primary TOC and section TOCs.
Please follow these steps:
Type ‘Divider’ in the control box
provided below.
Click the Divider command on the
Smart ribbon.
Enter the text that you’d like to appear
in the TOCs and select a divider level.
Click Update. The slide title should now
appear on all TOCs.
To remove the slide title from your
TOCs, delete the ‘Divider’ text from the
divider control box and hit Update.
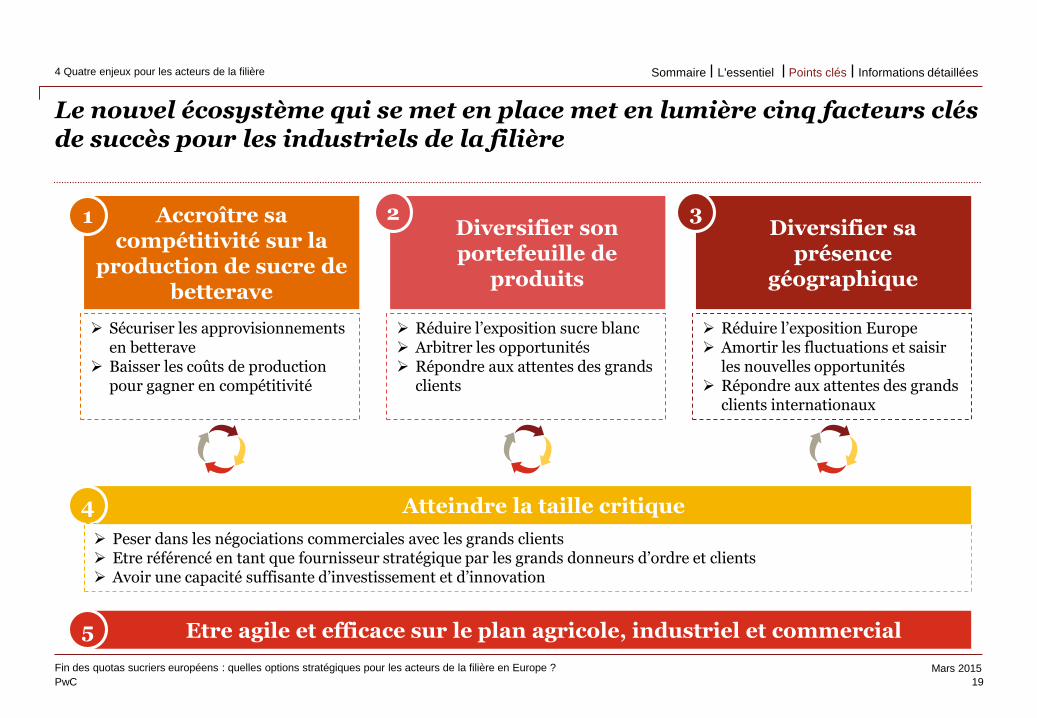
Le nouvel écosystème qui se met en place met en lumière cinq facteurs clés de succès pour les industriels de la filière
Diversifier sa présence
géographique
Accroître sa compétitivité sur la
production de sucre de betterave
Diversifier son portefeuille de
produits
19
Fin des quotas sucriers européens : quelles options stratégiques pour les acteurs de la filière en Europe ?
4 Quatre enjeux pour les acteurs de la filière
Divider
Use the divider control box below to
make the slide title appear in your
primary TOC and section TOCs.
Please follow these steps:
Type ‘Divider’ in the control box
provided below.
Click the Divider command on the
Smart ribbon.
Enter the text that you’d like to appear
in the TOCs and select a divider level.
Click Update. The slide title should now
appear on all TOCs.
To remove the slide title from your
TOCs, delete the ‘Divider’ text from the
divider control box and hit Update.
Atteindre la taille critique
1 2 3
4
Sécuriser les approvisionnements en betterave
Baisser les coûts de production pour gagner en compétitivité
Réduire l’exposition sucre blanc Arbitrer les opportunités Répondre aux attentes des grands
clients
Réduire l’exposition Europe Amortir les fluctuations et saisir
les nouvelles opportunités Répondre aux attentes des grands
clients internationaux
Peser dans les négociations commerciales avec les grands clients Etre référencé en tant que fournisseur stratégique par les grands donneurs d’ordre et clients Avoir une capacité suffisante d’investissement et d’innovation
Etre agile et efficace sur le plan agricole, industriel et commercial 5
Informations détaillées Points clés L'essentiel Sommaire
PwC
Mars 2015
Use the divider control box below to
make the slide title appear in your
primary TOC and section TOCs.
Please follow these steps:
Type ‘Divider’ in the control box
provided below.
Click the Divider command on the
Smart ribbon.
Enter the text that you’d like to appear
in the TOCs and select a divider level.
Click Update. The slide title should now
appear on all TOCs.
To remove the slide title from your
TOCs, delete the ‘Divider’ text from the
divider control box and hit Update.
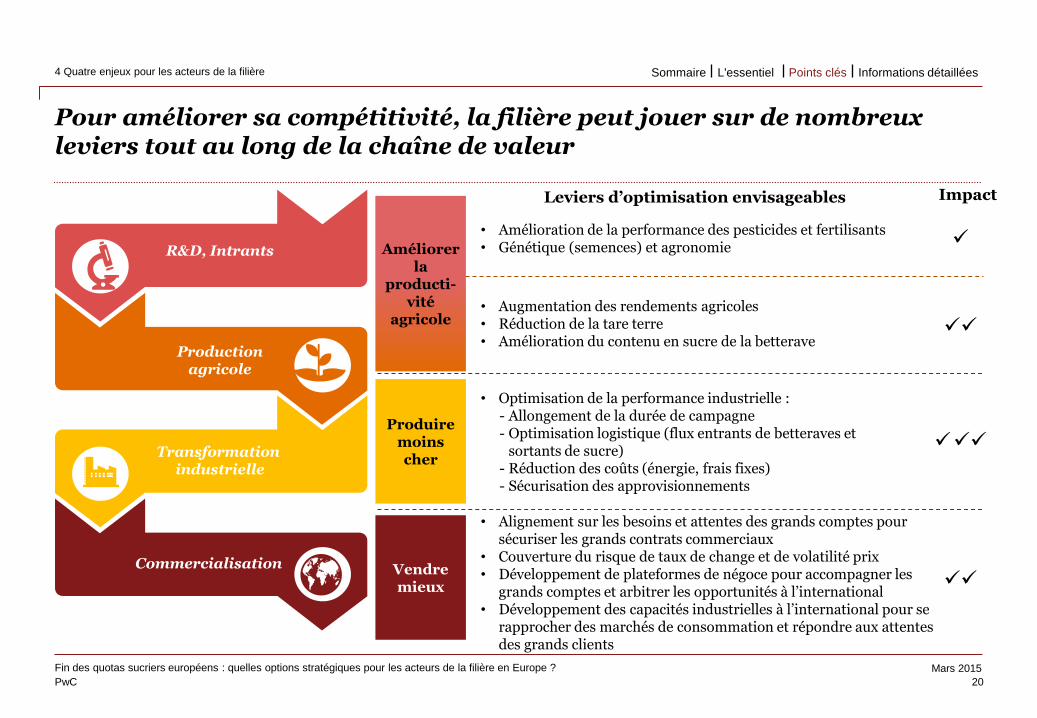
R&D, Intrants
Production agricole
Transformation industrielle
Commercialisation
• Amélioration de la performance des pesticides et fertilisants • Génétique (semences) et agronomie
• Augmentation des rendements agricoles • Réduction de la tare terre • Amélioration du contenu en sucre de la betterave
• Optimisation de la performance industrielle : - Allongement de la durée de campagne - Optimisation logistique (flux entrants de betteraves et
sortants de sucre) - Réduction des coûts (énergie, frais fixes) - Sécurisation des approvisionnements
• Alignement sur les besoins et attentes des grands comptes pour sécuriser les grands contrats commerciaux
• Couverture du risque de taux de change et de volatilité prix • Développement de plateformes de négoce pour accompagner les
grands comptes et arbitrer les opportunités à l’international • Développement des capacités industrielles à l’international pour se
rapprocher des marchés de consommation et répondre aux attentes des grands clients
Leviers d’optimisation envisageables
Pour améliorer sa compétitivité, la filière peut jouer sur de nombreux leviers tout au long de la chaîne de valeur
20
Fin des quotas sucriers européens : quelles options stratégiques pour les acteurs de la filière en Europe ?
4 Quatre enjeux pour les acteurs de la filière
Use the divider control box below to
make the slide title appear in your
primary TOC and section TOCs.
Please follow these steps:
Type ‘Divider’ in the control box
provided below.
Click the Divider command on the
Smart ribbon.
Enter the text that you’d like to appear
in the TOCs and select a divider level.
Click Update. The slide title should now
appear on all TOCs.
To remove the slide title from your
TOCs, delete the ‘Divider’ text from the
divider control box and hit Update.
Améliorer la
producti-vité
agricole
Produire moins cher
Vendre mieux
Impact
Informations détaillées Points clés L'essentiel Sommaire
PwC
Mars 2015
Use the divider control box below to
make the slide title appear in your
primary TOC and section TOCs.
Please follow these steps:
Type ‘Divider’ in the control box
provided below.
Click the Divider command on the
Smart ribbon.
Enter the text that you’d like to appear
in the TOCs and select a divider level.
Click Update. The slide title should now
appear on all TOCs.
To remove the slide title from your
TOCs, delete the ‘Divider’ text from the
divider control box and hit Update.
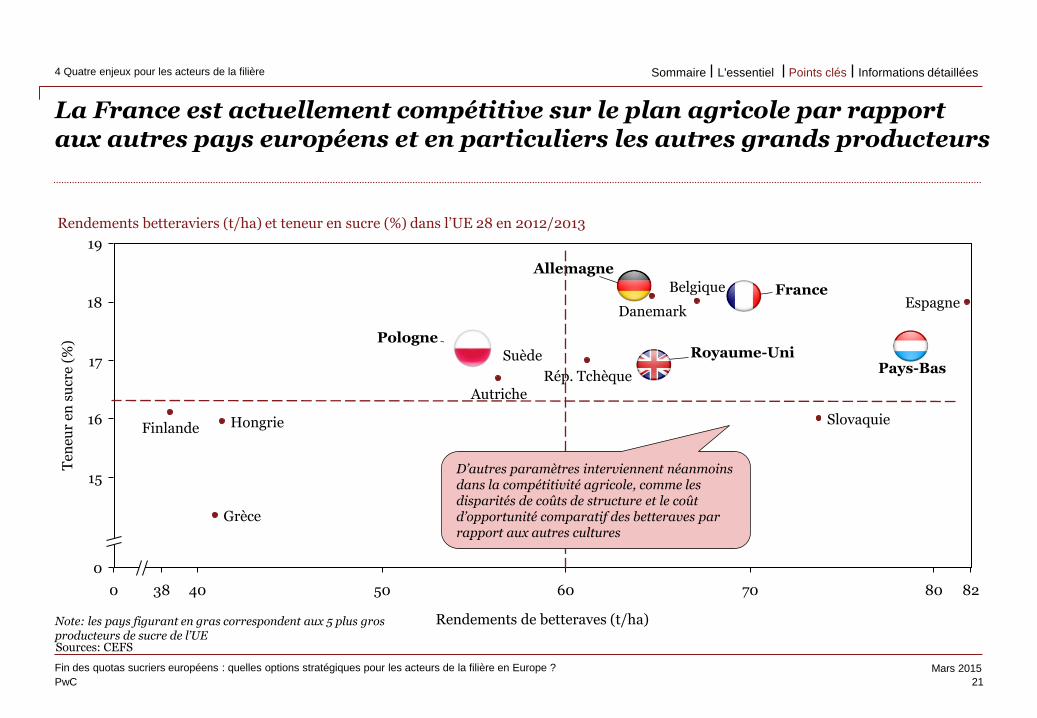
La France est actuellement compétitive sur le plan agricole par rapport aux autres pays européens et en particuliers les autres grands producteurs
21
Fin des quotas sucriers européens : quelles options stratégiques pour les acteurs de la filière en Europe ?
4 Quatre enjeux pour les acteurs de la filière
Use the divider control box below to
make the slide title appear in your
primary TOC and section TOCs.
Please follow these steps:
Type ‘Divider’ in the control box
provided below.
Click the Divider command on the
Smart ribbon.
Enter the text that you’d like to appear
in the TOCs and select a divider level.
Click Update. The slide title should now
appear on all TOCs.
To remove the slide title from your
TOCs, delete the ‘Divider’ text from the
divider control box and hit Update.
Sources: CEFS
Rendements betteraviers (t/ha) et teneur en sucre (%) dans l’UE 28 en 2012/2013
80
18
17
15
19
40
0
50 82 60
16
70 38 0
Hongrie
Rép. Tchèque
Suède
Ten
eur
en s
ucr
e (%
)
Rendements de betteraves (t/ha)
Slovaquie
Espagne
Grèce
Finlande
Danemark
Belgique
Autriche
Pays-Bas Royaume-Uni
Pologne
Allemagne
France
Note: les pays figurant en gras correspondent aux 5 plus gros producteurs de sucre de l’UE
D’autres paramètres interviennent néanmoins dans la compétitivité agricole, comme les disparités de coûts de structure et le coût d’opportunité comparatif des betteraves par rapport aux autres cultures
Informations détaillées Points clés L'essentiel Sommaire
PwC
Mars 2015
Use the divider control box below to
make the slide title appear in your
primary TOC and section TOCs.
Please follow these steps:
Type ‘Divider’ in the control box
provided below.
Click the Divider command on the
Smart ribbon.
Enter the text that you’d like to appear
in the TOCs and select a divider level.
Click Update. The slide title should now
appear on all TOCs.
To remove the slide title from your
TOCs, delete the ‘Divider’ text from the
divider control box and hit Update.
Une rationalisation de l’outil de production semble envisageable en France, que ce soit en termes de schémas d’approvisionnement des usines ou, potentiellement, d’optimisation des sites
22
Fin des quotas sucriers européens : quelles options stratégiques pour les acteurs de la filière en Europe ?
4 Quatre enjeux pour les acteurs de la filière
Use the divider control box below to
make the slide title appear in your
primary TOC and section TOCs.
Please follow these steps:
Type ‘Divider’ in the control box
provided below.
Click the Divider command on the
Smart ribbon.
Enter the text that you’d like to appear
in the TOCs and select a divider level.
Click Update. The slide title should now
appear on all TOCs.
To remove the slide title from your
TOCs, delete the ‘Divider’ text from the
divider control box and hit Update.
Culture de betterave
• Sucrerie de betterave
• Usine de production d’éthanol à partir de betterave
Nombre de sucreries
Production moyenne par
usine (Mt)
Durée de campagne
Allemagne 20 0,2 124
France 25 0,2 104
Royaume-Uni 4 0,3 162
Pays-Bas 2 0,5 120
Sources: CEFS
Légende
Cristal Union
Tereos
Saint Louis
Indépendant
Arcis
Bazancourt
Corbeilles
Fontaine
Nangis Pithiviers
Sillery
Ste Emilie
Toury
Attin
Boiry
Lillers
Escaudoeuvres
Origny
Bucy Chevrières
Connantre
Artenay
Cagny Etrépagny
Eppeville Roye
Souppes
Boiry : 19 000 t/jour Escaudoeuvre : 15 000 t/jour Ste Emilie: 16 000 t/jour Eppeville : 15 000t/jour
Connantre : 23 000 t/jour Arcis : 25 000 t/jour
Toury : 10 000 t/jour Pithiviers: 11 000 t/jour Souppes : 9 000 t/jour Artenay : 10 à 13 000 t/jour Corbeilles : 11 000 t/jour
Informations détaillées Points clés L'essentiel Sommaire
PwC
Mars 2015
Use the divider control box below to
make the slide title appear in your
primary TOC and section TOCs.
Please follow these steps:
Type ‘Divider’ in the control box
provided below.
Click the Divider command on the
Smart ribbon.
Enter the text that you’d like to appear
in the TOCs and select a divider level.
Click Update. The slide title should now
appear on all TOCs.
To remove the slide title from your
TOCs, delete the ‘Divider’ text from the
divider control box and hit Update.
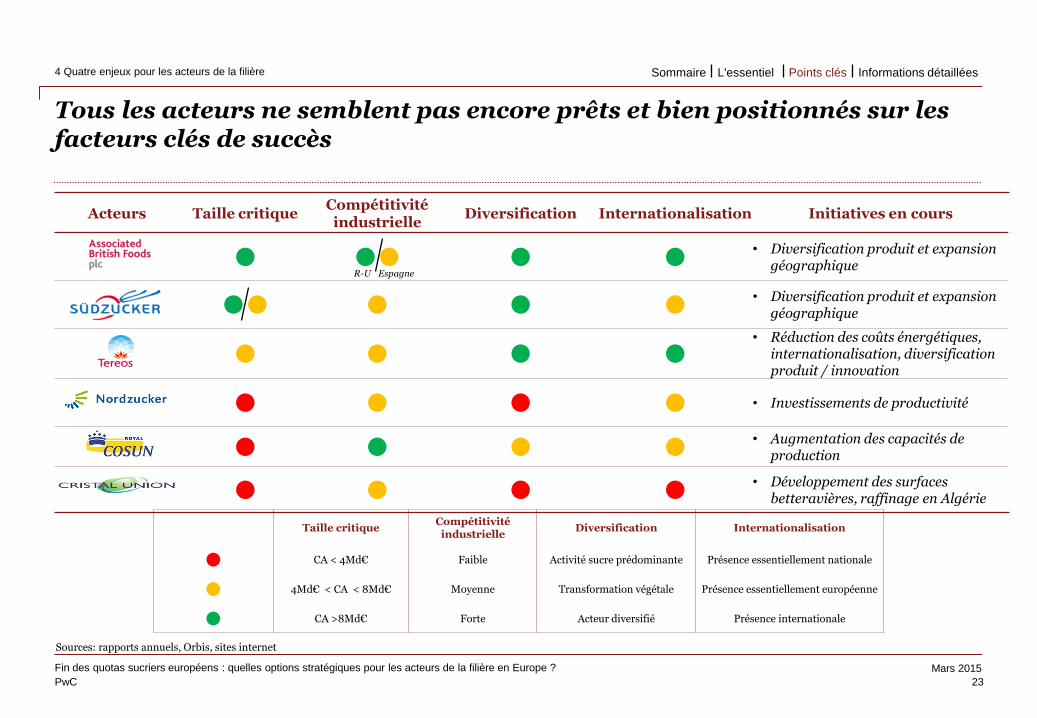
Tous les acteurs ne semblent pas encore prêts et bien positionnés sur les facteurs clés de succès
23
Fin des quotas sucriers européens : quelles options stratégiques pour les acteurs de la filière en Europe ?
4 Quatre enjeux pour les acteurs de la filière
Use the divider control box below to
make the slide title appear in your
primary TOC and section TOCs.
Please follow these steps:
Type ‘Divider’ in the control box
provided below.
Click the Divider command on the
Smart ribbon.
Enter the text that you’d like to appear
in the TOCs and select a divider level.
Click Update. The slide title should now
appear on all TOCs.
To remove the slide title from your
TOCs, delete the ‘Divider’ text from the
divider control box and hit Update.
Sources: rapports annuels, Orbis, sites internet
Acteurs Taille critique Compétitivité industrielle
Diversification Internationalisation Initiatives en cours
l ll l l • Diversification produit et expansion
géographique
ll l l l • Diversification produit et expansion
géographique
l l l l
• Réduction des coûts énergétiques, internationalisation, diversification produit / innovation
l l l l • Investissements de productivité
l l l l • Augmentation des capacités de
production
l l l l • Développement des surfaces
betteravières, raffinage en Algérie
Taille critique Compétitivité industrielle
Diversification Internationalisation
l CA < 4Md€ Faible Activité sucre prédominante Présence essentiellement nationale
l 4Md€ < CA < 8Md€ Moyenne Transformation végétale Présence essentiellement européenne
l CA >8Md€ Forte Acteur diversifié Présence internationale
R-U Espagne
Informations détaillées Points clés L'essentiel Sommaire
PwC
Mars 2015
Use the divider control box below to
make the slide title appear in your
primary TOC and section TOCs.
Please follow these steps:
Type ‘Divider’ in the control box
provided below.
Click the Divider command on the
Smart ribbon.
Enter the text that you’d like to appear
in the TOCs and select a divider level.
Click Update. The slide title should now
appear on all TOCs.
To remove the slide title from your
TOCs, delete the ‘Divider’ text from the
divider control box and hit Update.
En conclusion, des fondamentaux à long terme solides mais la nécessité de rapidement s’adapter aux enjeux stratégiques du secteur Les acteurs les moins performants pourraient se trouver rapidement marginalisés
24
Fin des quotas sucriers européens : quelles options stratégiques pour les acteurs de la filière en Europe ?
5 Quel(s) scénario(s) pour les filières européenne et française ?
Divider
Use the divider control box below to
make the slide title appear in your
primary TOC and section TOCs.
Please follow these steps:
Type ‘Divider’ in the control box
provided below.
Click the Divider command on the
Smart ribbon.
Enter the text that you’d like to appear
in the TOCs and select a divider level.
Click Update. The slide title should now
appear on all TOCs.
To remove the slide title from your
TOCs, delete the ‘Divider’ text from the
divider control box and hit Update.
• Un marché mondial du sucre en croissance tiré par des fondamentaux solides
• Un secteur en profonde mutation en raison de l’essor des pays émergents, une dérégulation imminente en Europe et la consolidation des acteurs et des pratiques achats tout au long de la chaîne de valeur
• Une demande mondiale majoritairement relayée par de grands clients (industriels et négociants) qui achètent préférentiellement à des producteurs de sucre ayant une présence multirégionale et une offre de produits large
• Une filière européenne qui va certainement se transformer en profondeur pour relever les défis d’une nouvelle donne (volatilité, complexité) caractérisée par une augmentation prévisible des volumes de production, un rééquilibrage des flux imports/exports et une convergence rapide des prix vers les prix mondiaux (parité export) avec stabilisation éventuelle à des niveaux bas historiques autour de 400-450€/tonne (au cours mondiaux actuels)
• Des acteurs diversement positionnés sur les facteurs clés de succès de demain que seront la performance agricole et industrielle, la diversité du portefeuille d’activités, la couverture géographique, la taille critique et l’efficacité commerciale
• En dépit d’initiatives en cours chez certains, la nécessité d’accélérer leur transformation pour éviter d’être pris en ciseau entre la baisse attendue des prix et celle potentielle de leurs volumes en cas de manque de compétitivité
• Une filière française ayant un enjeu immédiat de montée en taille et de gains de compétitivité industrielle pour préserver sa position dans un marché intérieur de plus en plus concurrentiel et renforcer ses positions sur les marchés export
• Compte tenu des enjeux et de l’urgence, une probable réorganisation à court terme de la filière
Informations détaillées Points clés L'essentiel Sommaire
PwC
Mars 2015
Informations détaillées
25
Informations détaillées 25
6 Fondamentaux et chiffres clés 26
7 Un secteur en profonde mutation 47
7.1 Enjeu n°1 : l’essor des pays émergents 48
7.2 Enjeu n°2 : l’évolution des équilibres commerciaux 54
7.3 Enjeu n°3 : la consolidation de la chaîne de valeur 62
8 Impacts et enjeux pour la filière en Europe et en France 71
9 Positionnement relatif des industriels du sucre en Europe 87
10 Bibliographie 93
Informations détaillées Points clés L'essentiel Sommaire
PwC
Mars 2015
Fondamentaux et chiffres clés
26
Fin des quotas sucriers européens : quelles options stratégiques pour les acteurs de la filière en Europe ?
6 Fondamentaux et chiffres clés Informations détaillées Points clés L'essentiel Sommaire
PwC
Mars 2015
Use the divider control box below to
make the slide title appear in your
primary TOC and section TOCs.
Please follow these steps:
Type ‘Divider’ in the control box
provided below.
Click the Divider command on the
Smart ribbon.
Enter the text that you’d like to appear
in the TOCs and select a divider level.
Click Update. The slide title should now
appear on all TOCs.
To remove the slide title from your
TOCs, delete the ‘Divider’ text from the
divider control box and hit Update.
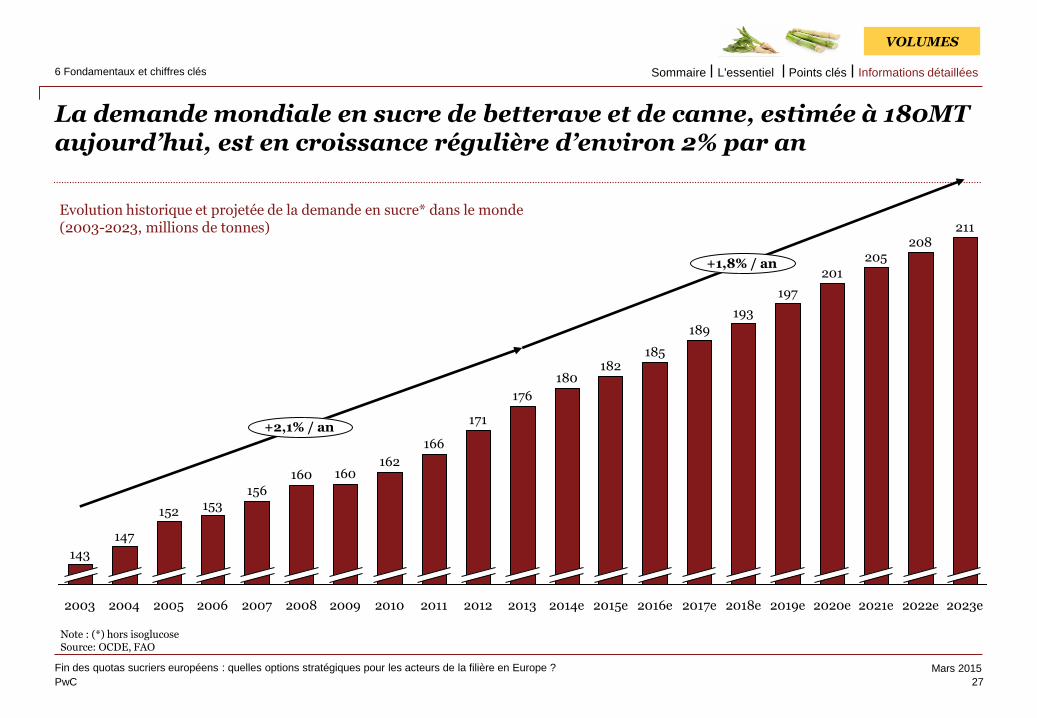
La demande mondiale en sucre de betterave et de canne, estimée à 180MT aujourd’hui, est en croissance régulière d’environ 2% par an
27
Fin des quotas sucriers européens : quelles options stratégiques pour les acteurs de la filière en Europe ?
6 Fondamentaux et chiffres clés
Use the divider control box below to
make the slide title appear in your
primary TOC and section TOCs.
Please follow these steps:
Type ‘Divider’ in the control box
provided below.
Click the Divider command on the
Smart ribbon.
Enter the text that you’d like to appear
in the TOCs and select a divider level.
Click Update. The slide title should now
appear on all TOCs.
To remove the slide title from your
TOCs, delete the ‘Divider’ text from the
divider control box and hit Update.
+1,8% / an
+2,1% / an
2023e
211
2022e 2021e 2019e
205 208
2020e
201
197
2018e
193
2017e
189
2016e
185
2015e
182
2014e
180
2013
176
2012
171
2011
166
2010
162
2009
160
2008
160
2007
156
2006
153
2005
152
2004
147
2003
143
Evolution historique et projetée de la demande en sucre* dans le monde (2003-2023, millions de tonnes)
Note : (*) hors isoglucose Source: OCDE, FAO
VOLUMES
Informations détaillées Points clés L'essentiel Sommaire
PwC
Mars 2015
Use the divider control box below to
make the slide title appear in your
primary TOC and section TOCs.
Please follow these steps:
Type ‘Divider’ in the control box
provided below.
Click the Divider command on the
Smart ribbon.
Enter the text that you’d like to appear
in the TOCs and select a divider level.
Click Update. The slide title should now
appear on all TOCs.
To remove the slide title from your
TOCs, delete the ‘Divider’ text from the
divider control box and hit Update.
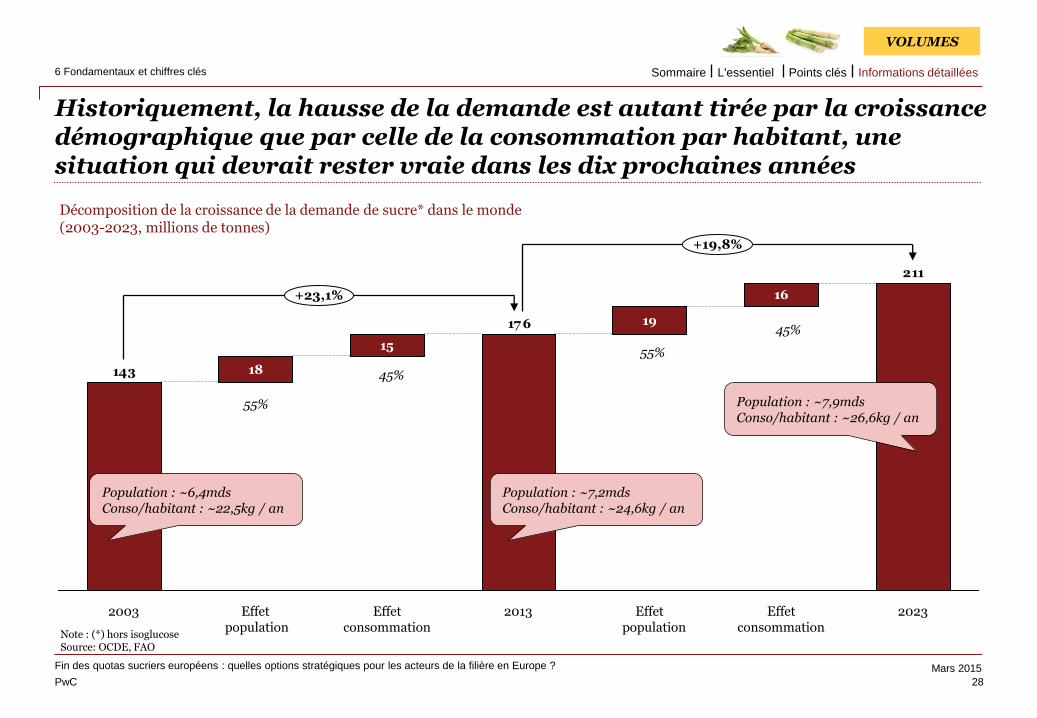
Historiquement, la hausse de la demande est autant tirée par la croissance démographique que par celle de la consommation par habitant, une situation qui devrait rester vraie dans les dix prochaines années
28
Fin des quotas sucriers européens : quelles options stratégiques pour les acteurs de la filière en Europe ?
6 Fondamentaux et chiffres clés
Use the divider control box below to
make the slide title appear in your
primary TOC and section TOCs.
Please follow these steps:
Type ‘Divider’ in the control box
provided below.
Click the Divider command on the
Smart ribbon.
Enter the text that you’d like to appear
in the TOCs and select a divider level.
Click Update. The slide title should now
appear on all TOCs.
To remove the slide title from your
TOCs, delete the ‘Divider’ text from the
divider control box and hit Update.
TCAM 03-13 +1,2% TCAL 13-23 +xx
15
19
16
18
211
17 6
143
Effet consommation
+23,1%
Effet population
Effet population
2003 2013
+19,8%
Effet consommation
2023
Décomposition de la croissance de la demande de sucre* dans le monde (2003-2023, millions de tonnes)
55%
45%
55%
45%
Population : ~6,4mds Conso/habitant : ~22,5kg / an
Population : ~7,2mds Conso/habitant : ~24,6kg / an
Population : ~7,9mds Conso/habitant : ~26,6kg / an
Note : (*) hors isoglucose Source: OCDE, FAO
VOLUMES
Informations détaillées Points clés L'essentiel Sommaire
PwC
Mars 2015
Use the divider control box below to
make the slide title appear in your
primary TOC and section TOCs.
Please follow these steps:
Type ‘Divider’ in the control box
provided below.
Click the Divider command on the
Smart ribbon.
Enter the text that you’d like to appear
in the TOCs and select a divider level.
Click Update. The slide title should now
appear on all TOCs.
To remove the slide title from your
TOCs, delete the ‘Divider’ text from the
divider control box and hit Update.
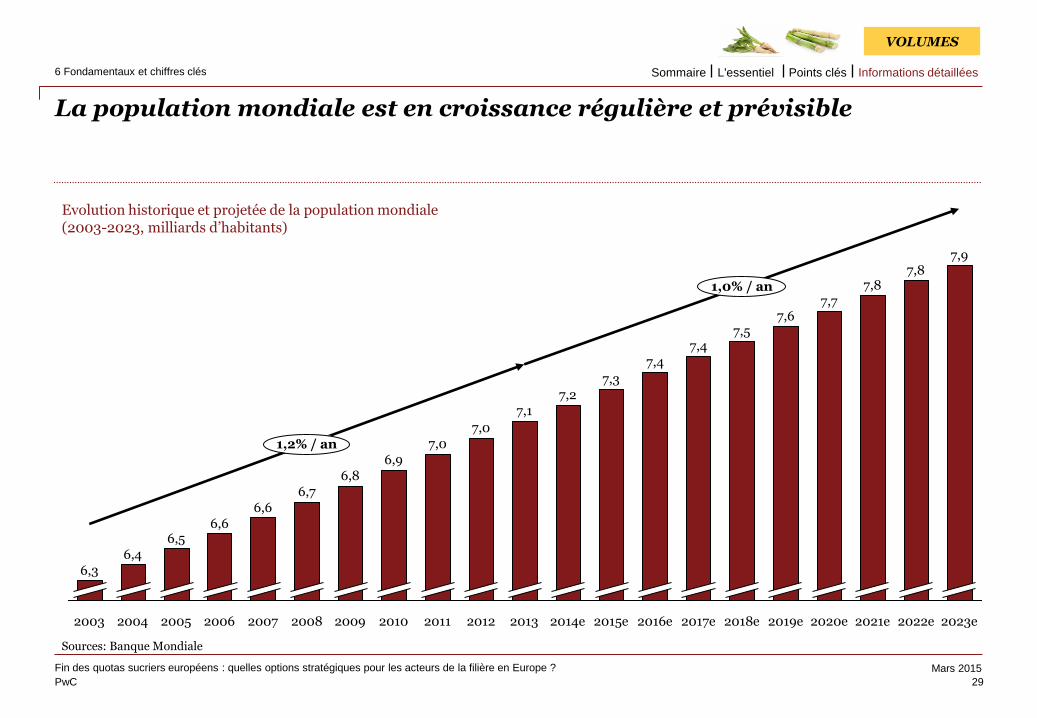
La population mondiale est en croissance régulière et prévisible
29
Fin des quotas sucriers européens : quelles options stratégiques pour les acteurs de la filière en Europe ?
6 Fondamentaux et chiffres clés
Use the divider control box below to
make the slide title appear in your
primary TOC and section TOCs.
Please follow these steps:
Type ‘Divider’ in the control box
provided below.
Click the Divider command on the
Smart ribbon.
Enter the text that you’d like to appear
in the TOCs and select a divider level.
Click Update. The slide title should now
appear on all TOCs.
To remove the slide title from your
TOCs, delete the ‘Divider’ text from the
divider control box and hit Update.
VOLUMES
Sources: Banque Mondiale
2018e 2019e 2020e 2021e 2022e 2023e
6,6 6,6
6,7 6,8
6,9 7,0
7,0
7,1 7,2
7,3
7,4
2007
7,5 7,6
7,7 7,8
7,8 7,9
6,5 6,4
6,3
2003 2004 2005 2008
1,2% / an
1,0% / an
2009 2006 2010 2011 2012 2013 2014e 2015e 2016e 2017e
7,4
Evolution historique et projetée de la population mondiale (2003-2023, milliards d’habitants)
Informations détaillées Points clés L'essentiel Sommaire
PwC
Mars 2015
Use the divider control box below to
make the slide title appear in your
primary TOC and section TOCs.
Please follow these steps:
Type ‘Divider’ in the control box
provided below.
Click the Divider command on the
Smart ribbon.
Enter the text that you’d like to appear
in the TOCs and select a divider level.
Click Update. The slide title should now
appear on all TOCs.
To remove the slide title from your
TOCs, delete the ‘Divider’ text from the
divider control box and hit Update.
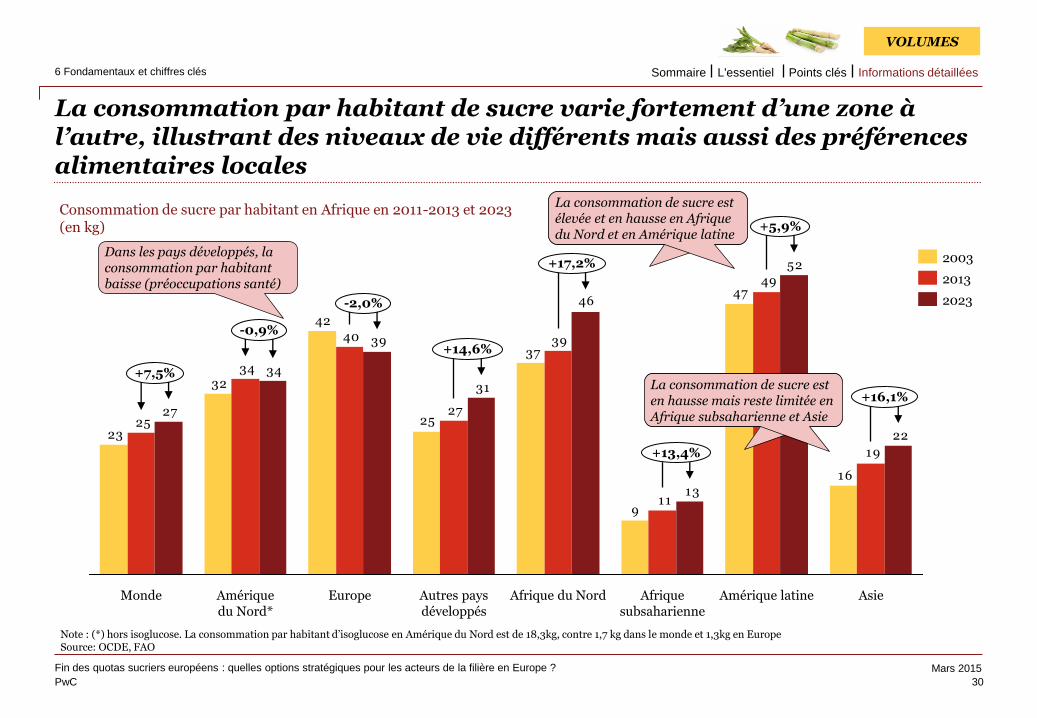
La consommation par habitant de sucre varie fortement d’une zone à l’autre, illustrant des niveaux de vie différents mais aussi des préférences alimentaires locales
30
Fin des quotas sucriers européens : quelles options stratégiques pour les acteurs de la filière en Europe ?
6 Fondamentaux et chiffres clés
Use the divider control box below to
make the slide title appear in your
primary TOC and section TOCs.
Please follow these steps:
Type ‘Divider’ in the control box
provided below.
Click the Divider command on the
Smart ribbon.
Enter the text that you’d like to appear
in the TOCs and select a divider level.
Click Update. The slide title should now
appear on all TOCs.
To remove the slide title from your
TOCs, delete the ‘Divider’ text from the
divider control box and hit Update.
Consommation de sucre par habitant en Afrique en 2011-2013 et 2023 (en kg)
Note : (*) hors isoglucose. La consommation par habitant d’isoglucose en Amérique du Nord est de 18,3kg, contre 1,7 kg dans le monde et 1,3kg en Europe Source: OCDE, FAO
16
47
9
37
25
42
32
23
19
49
11
39
27
40
34
2522
52
13
46
31
39
34
27
Monde Amérique du Nord*
Europe
-2,0%
Afrique subsaharienne
Asie
+14,6%
-0,9%
+16,1%
+7,5%
+17,2%
Afrique du Nord
+5,9%
Amérique latine Autres pays développés
+13,4%
2003
2023
2013
Dans les pays développés, la consommation par habitant baisse (préoccupations santé)
VOLUMES
La consommation de sucre est élevée et en hausse en Afrique du Nord et en Amérique latine
La consommation de sucre est en hausse mais reste limitée en Afrique subsaharienne et Asie
Informations détaillées Points clés L'essentiel Sommaire
PwC
Mars 2015
Use the divider control box below to
make the slide title appear in your
primary TOC and section TOCs.
Please follow these steps:
Type ‘Divider’ in the control box
provided below.
Click the Divider command on the
Smart ribbon.
Enter the text that you’d like to appear
in the TOCs and select a divider level.
Click Update. The slide title should now
appear on all TOCs.
To remove the slide title from your
TOCs, delete the ‘Divider’ text from the
divider control box and hit Update.
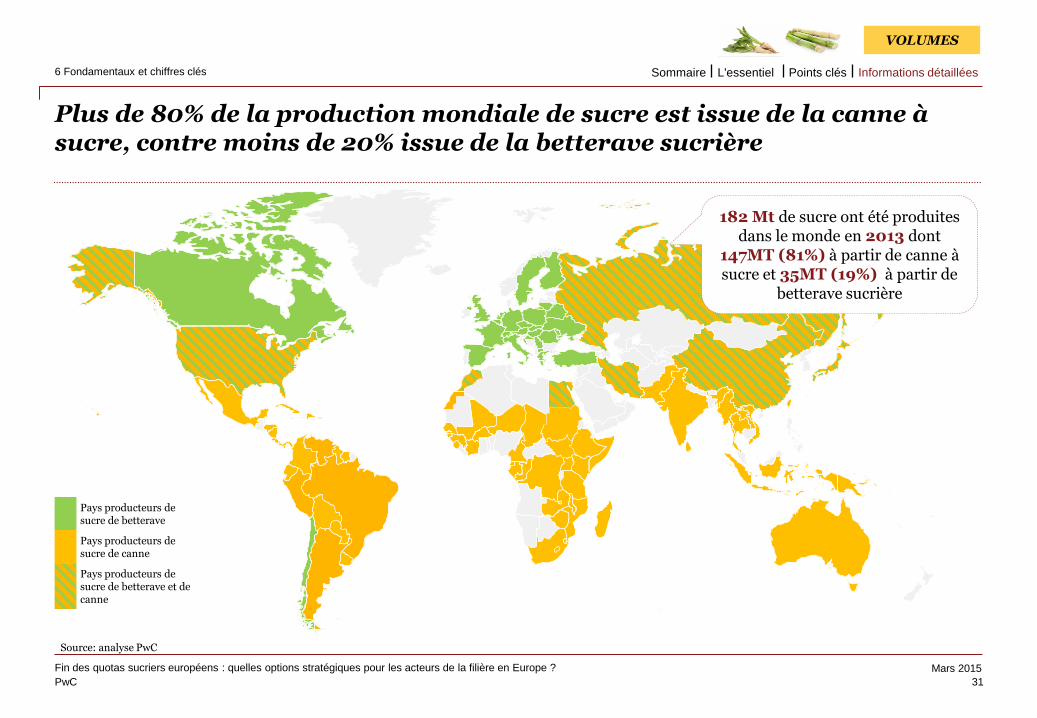
Plus de 80% de la production mondiale de sucre est issue de la canne à sucre, contre moins de 20% issue de la betterave sucrière
31
Fin des quotas sucriers européens : quelles options stratégiques pour les acteurs de la filière en Europe ?
6 Fondamentaux et chiffres clés
Use the divider control box below to
make the slide title appear in your
primary TOC and section TOCs.
Please follow these steps:
Type ‘Divider’ in the control box
provided below.
Click the Divider command on the
Smart ribbon.
Enter the text that you’d like to appear
in the TOCs and select a divider level.
Click Update. The slide title should now
appear on all TOCs.
To remove the slide title from your
TOCs, delete the ‘Divider’ text from the
divider control box and hit Update.
Source: analyse PwC
VOLUMES
Pays producteurs de sucre de betterave
Pays producteurs de sucre de canne
Pays producteurs de sucre de betterave et de canne
182 Mt de sucre ont été produites dans le monde en 2013 dont
147MT (81%) à partir de canne à sucre et 35MT (19%) à partir de
betterave sucrière
Informations détaillées Points clés L'essentiel Sommaire
PwC
Mars 2015
Use the divider control box below to
make the slide title appear in your
primary TOC and section TOCs.
Please follow these steps:
Type ‘Divider’ in the control box
provided below.
Click the Divider command on the
Smart ribbon.
Enter the text that you’d like to appear
in the TOCs and select a divider level.
Click Update. The slide title should now
appear on all TOCs.
To remove the slide title from your
TOCs, delete the ‘Divider’ text from the
divider control box and hit Update.
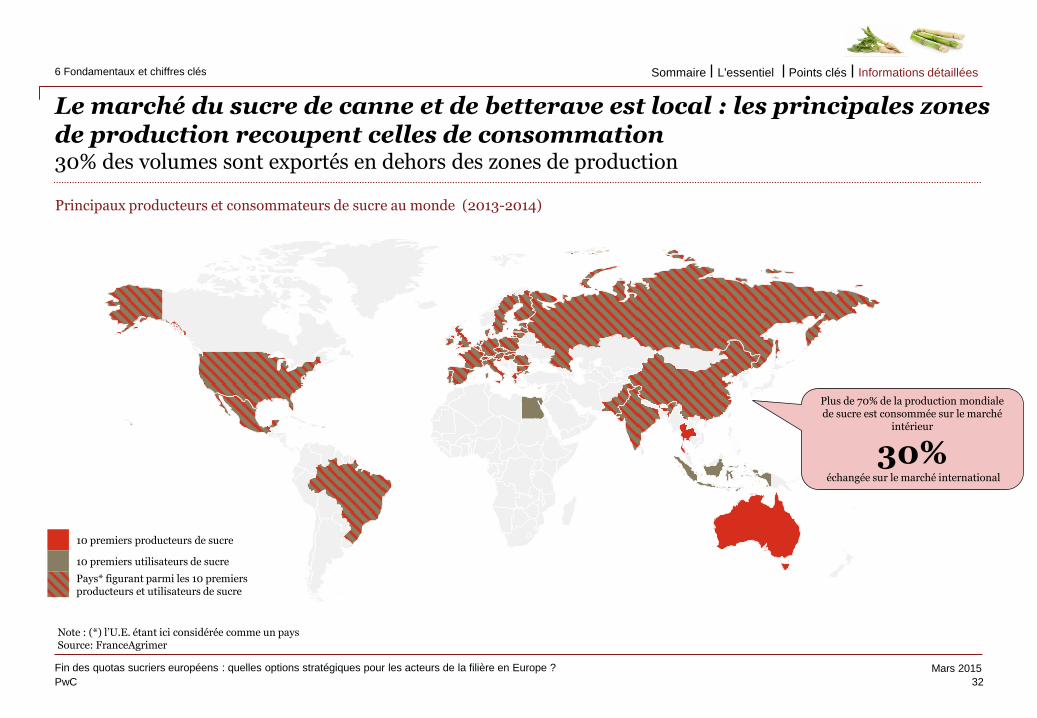
Le marché du sucre de canne et de betterave est local : les principales zones de production recoupent celles de consommation 30% des volumes sont exportés en dehors des zones de production
32
Fin des quotas sucriers européens : quelles options stratégiques pour les acteurs de la filière en Europe ?
6 Fondamentaux et chiffres clés
Principaux producteurs et consommateurs de sucre au monde (2013-2014)
Use the divider control box below to
make the slide title appear in your
primary TOC and section TOCs.
Please follow these steps:
Type ‘Divider’ in the control box
provided below.
Click the Divider command on the
Smart ribbon.
Enter the text that you’d like to appear
in the TOCs and select a divider level.
Click Update. The slide title should now
appear on all TOCs.
To remove the slide title from your
TOCs, delete the ‘Divider’ text from the
divider control box and hit Update.
Note : (*) l’U.E. étant ici considérée comme un pays Source: FranceAgrimer
10 premiers producteurs de sucre
10 premiers utilisateurs de sucre
Pays* figurant parmi les 10 premiers producteurs et utilisateurs de sucre
Plus de 70% de la production mondiale de sucre est consommée sur le marché
intérieur
30% échangée sur le marché international
Informations détaillées Points clés L'essentiel Sommaire
PwC
Mars 2015
Use the divider control box below to
make the slide title appear in your
primary TOC and section TOCs.
Please follow these steps:
Type ‘Divider’ in the control box
provided below.
Click the Divider command on the
Smart ribbon.
Enter the text that you’d like to appear
in the TOCs and select a divider level.
Click Update. The slide title should now
appear on all TOCs.
To remove the slide title from your
TOCs, delete the ‘Divider’ text from the
divider control box and hit Update.
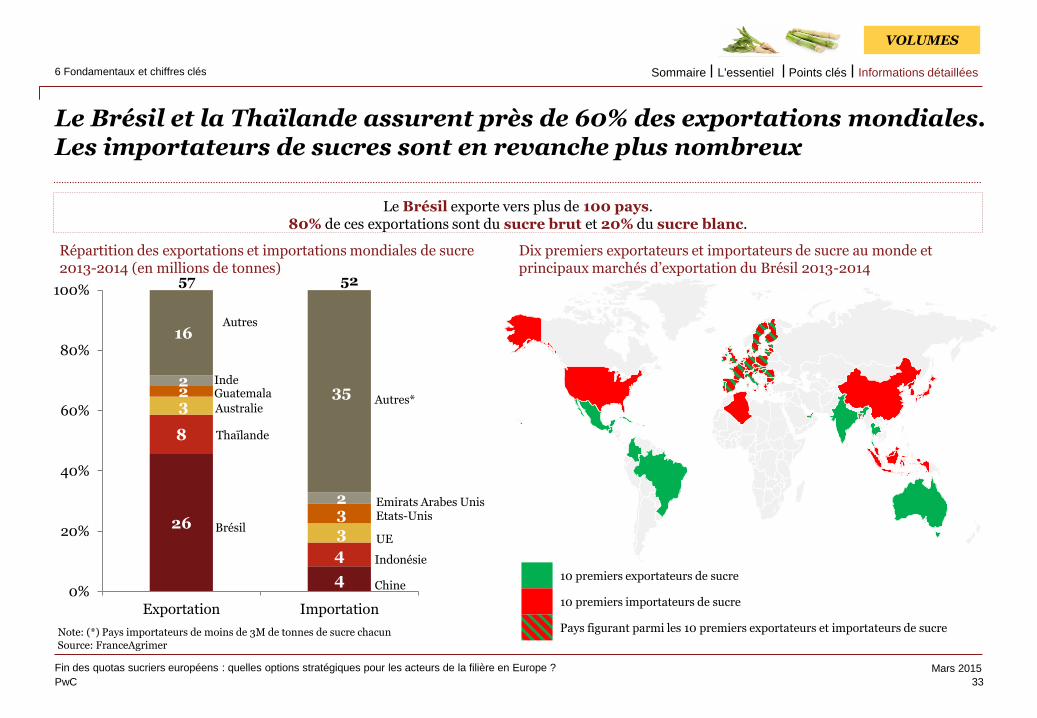
Le Brésil et la Thaïlande assurent près de 60% des exportations mondiales. Les importateurs de sucres sont en revanche plus nombreux
33
Fin des quotas sucriers européens : quelles options stratégiques pour les acteurs de la filière en Europe ?
6 Fondamentaux et chiffres clés
Use the divider control box below to
make the slide title appear in your
primary TOC and section TOCs.
Please follow these steps:
Type ‘Divider’ in the control box
provided below.
Click the Divider command on the
Smart ribbon.
Enter the text that you’d like to appear
in the TOCs and select a divider level.
Click Update. The slide title should now
appear on all TOCs.
To remove the slide title from your
TOCs, delete the ‘Divider’ text from the
divider control box and hit Update.
10 premiers exportateurs de sucre
10 premiers importateurs de sucre
Pays figurant parmi les 10 premiers exportateurs et importateurs de sucre
Dix premiers exportateurs et importateurs de sucre au monde et principaux marchés d’exportation du Brésil 2013-2014
26
4
8
4
3
3
2
3
2
2
16
35
0%
20%
40%
60%
80%
100%
Exportation Importation
Répartition des exportations et importations mondiales de sucre 2013-2014 (en millions de tonnes)
Brésil
Thaïlande
Autres*
Autres
UE
Chine
Indonésie
Etats-Unis
Le Brésil exporte vers plus de 100 pays. 80% de ces exportations sont du sucre brut et 20% du sucre blanc.
Note: (*) Pays importateurs de moins de 3M de tonnes de sucre chacun
57 52
Australie
Guatemala Inde
Emirats Arabes Unis
VOLUMES
Source: FranceAgrimer
Informations détaillées Points clés L'essentiel Sommaire
PwC
Mars 2015
Use the divider control box below to
make the slide title appear in your
primary TOC and section TOCs.
Please follow these steps:
Type ‘Divider’ in the control box
provided below.
Click the Divider command on the
Smart ribbon.
Enter the text that you’d like to appear
in the TOCs and select a divider level.
Click Update. The slide title should now
appear on all TOCs.
To remove the slide title from your
TOCs, delete the ‘Divider’ text from the
divider control box and hit Update.
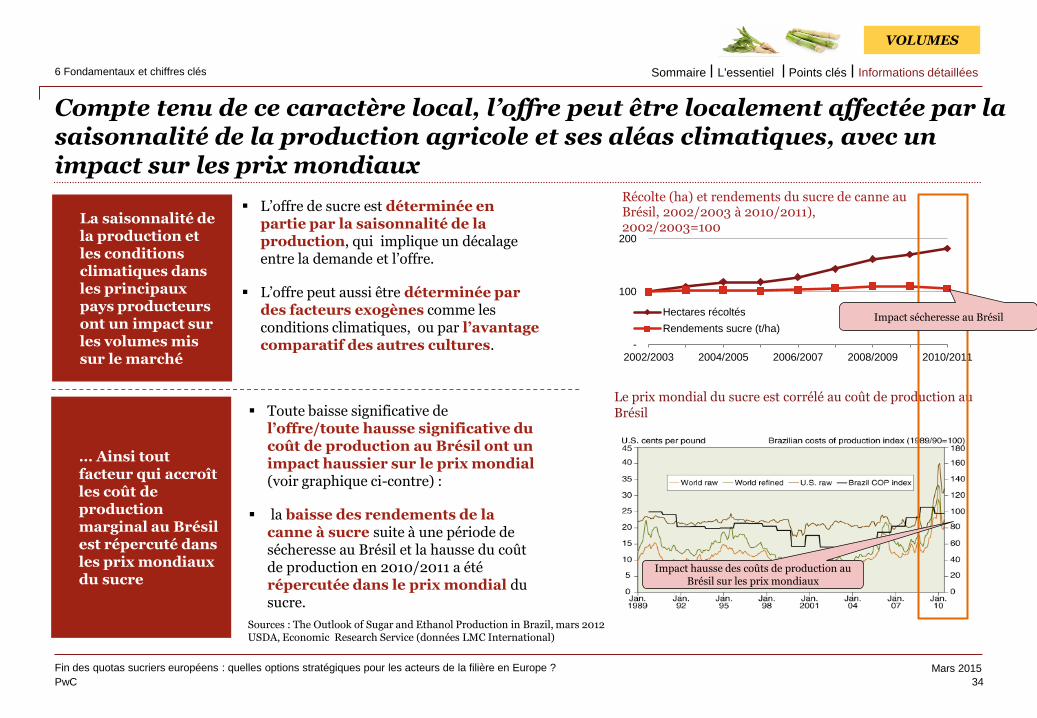
Compte tenu de ce caractère local, l’offre peut être localement affectée par la saisonnalité de la production agricole et ses aléas climatiques, avec un impact sur les prix mondiaux
34
Fin des quotas sucriers européens : quelles options stratégiques pour les acteurs de la filière en Europe ?
6 Fondamentaux et chiffres clés
Use the divider control box below to
make the slide title appear in your
primary TOC and section TOCs.
Please follow these steps:
Type ‘Divider’ in the control box
provided below.
Click the Divider command on the
Smart ribbon.
Enter the text that you’d like to appear
in the TOCs and select a divider level.
Click Update. The slide title should now
appear on all TOCs.
To remove the slide title from your
TOCs, delete the ‘Divider’ text from the
divider control box and hit Update.
VOLUMES
L’offre de sucre est déterminée en partie par la saisonnalité de la production, qui implique un décalage entre la demande et l’offre.
L’offre peut aussi être déterminée par des facteurs exogènes comme les conditions climatiques, ou par l’avantage comparatif des autres cultures.
La saisonnalité de la production et les conditions climatiques dans les principaux pays producteurs ont un impact sur les volumes mis sur le marché
… Ainsi tout facteur qui accroît les coût de production marginal au Brésil est répercuté dans les prix mondiaux du sucre
Toute baisse significative de l’offre/toute hausse significative du coût de production au Brésil ont un impact haussier sur le prix mondial (voir graphique ci-contre) :
la baisse des rendements de la canne à sucre suite à une période de sécheresse au Brésil et la hausse du coût de production en 2010/2011 a été répercutée dans le prix mondial du sucre.
Le prix mondial du sucre est corrélé au coût de production au Brésil
Sources : The Outlook of Sugar and Ethanol Production in Brazil, mars 2012 USDA, Economic Research Service (données LMC International)
-
100
200
2002/2003 2004/2005 2006/2007 2008/2009 2010/2011
Récolte (ha) et rendements du sucre de canne au Brésil, 2002/2003 à 2010/2011), 2002/2003=100
Hectares récoltés
Rendements sucre (t/ha)Impact sécheresse au Brésil
Impact hausse des coûts de production au Brésil sur les prix mondiaux
Informations détaillées Points clés L'essentiel Sommaire
PwC
Mars 2015
Use the divider control box below to
make the slide title appear in your
primary TOC and section TOCs.
Please follow these steps:
Type ‘Divider’ in the control box
provided below.
Click the Divider command on the
Smart ribbon.
Enter the text that you’d like to appear
in the TOCs and select a divider level.
Click Update. The slide title should now
appear on all TOCs.
To remove the slide title from your
TOCs, delete the ‘Divider’ text from the
divider control box and hit Update.
Le Brésil et la Thaïlande exportent du sucre brut principalement vers l’Asie, mais les exportations vers l’Afrique augmentent rapidement
35
Fin des quotas sucriers européens : quelles options stratégiques pour les acteurs de la filière en Europe ?
6 Fondamentaux et chiffres clés
Use the divider control box below to
make the slide title appear in your
primary TOC and section TOCs.
Please follow these steps:
Type ‘Divider’ in the control box
provided below.
Click the Divider command on the
Smart ribbon.
Enter the text that you’d like to appear
in the TOCs and select a divider level.
Click Update. The slide title should now
appear on all TOCs.
To remove the slide title from your
TOCs, delete the ‘Divider’ text from the
divider control box and hit Update.
0,0
0,0
0,1
0,0
0,00
2
4
6
8
10
12
Océanie
2,2
2
,4
2,2
2
,5
Europe
1,7
1,
8 3
,6
3,7
2
,9
Afrique du Nord
3,9
4
,4
1,8
1,
7
1,9
2
,0
1,3
Amériques Nord & Sud
9,0
8
,7
8,8
9,9
7
,7
Afrique de l’ouest
2,7
Amérique Centrale
0,0
0
,1
0,1
0
,1
0,1
Union Européene
1,1
1,0
1,
3
1,2
0
,5
Afrique Sub saharienne*
4,1
3
,5
3,0
Moyen Orient
5,0
4
,3
4,7
6,4
4
,7
Asie
9,5
7
,0
5,6
7
,7
7,8
Source: Comtrade, analyse PwC Note : (*) Hors Afrique de l’Ouest ; (**) Hors Afrique de l’Est
+5, 3% +1,4% +7,1% -12,4% +2,3% +3,7% +8,8% +20,8% +7,9% +3,5%
0,00,20,1
0,00,10,1
0,00,20,20,00,20,0
0,0
0,40,3
0
1
2
3
4
5
6
7
Moyen Orient
0,4
0
,5
0,6
0
,1
0,5
Asie
4,5
5,5
4
,8
4,0
3
,7
0,0
0
,0
0,0
0
,0
Union Européene
0,0
0
,0
0,1
0
,0
0,1
Afrique Sub saharienne**
0,1
0
,1
Europe
0,0
0
,0
0,1
0
,0
0,1
Afrique du Nord
0,1
0
,0
0,0
Amériques Nord & Sud
Afrique de l’est
Océanie*
0,1
0
,1
0,2
0
,1
0,1
Amérique Centrale
0,0
+4,9% -10% +39,7% -4% +27% -47% +66,2% -28,1% +121,3% +13,2%
2011 2012 2010 2009 2013
THAILANDE
BRESIL
TCAM 09-13
Exportations du Brésil par zone de destination entre 2009 et 2013
TCAM 09-13
VOLUMES
Informations détaillées Points clés L'essentiel Sommaire
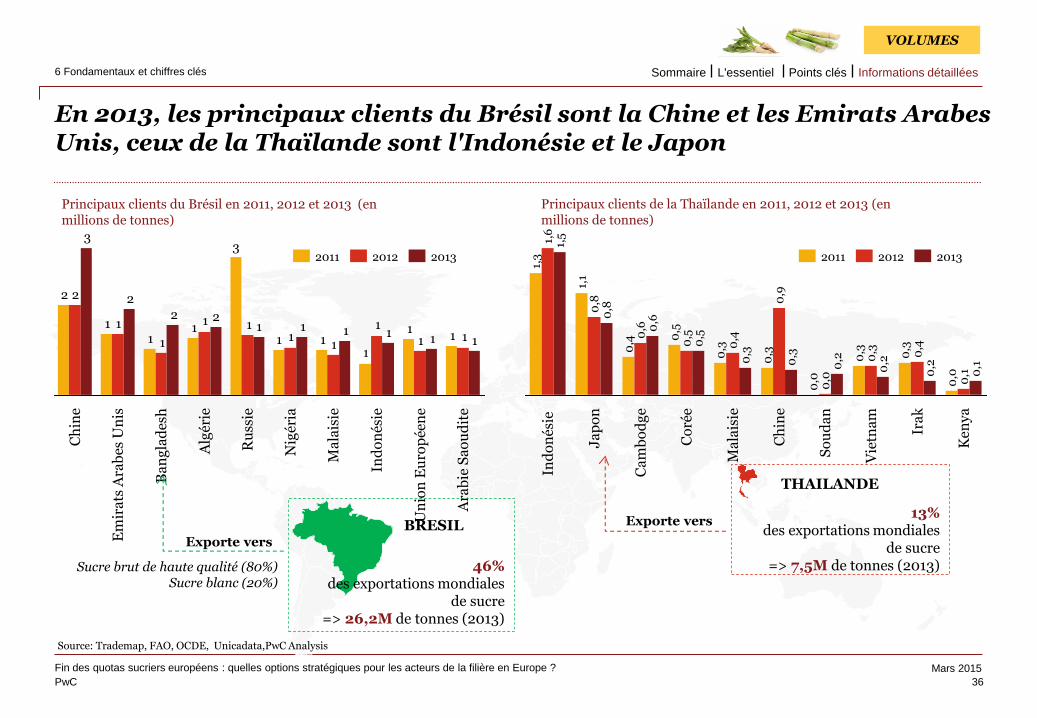
PwC
Mars 2015
Use the divider control box below to
make the slide title appear in your
primary TOC and section TOCs.
Please follow these steps:
Type ‘Divider’ in the control box
provided below.
Click the Divider command on the
Smart ribbon.
Enter the text that you’d like to appear
in the TOCs and select a divider level.
Click Update. The slide title should now
appear on all TOCs.
To remove the slide title from your
TOCs, delete the ‘Divider’ text from the
divider control box and hit Update.
En 2013, les principaux clients du Brésil sont la Chine et les Emirats Arabes Unis, ceux de la Thaïlande sont l'Indonésie et le Japon
36
Fin des quotas sucriers européens : quelles options stratégiques pour les acteurs de la filière en Europe ?
6 Fondamentaux et chiffres clés
Use the divider control box below to
make the slide title appear in your
primary TOC and section TOCs.
Please follow these steps:
Type ‘Divider’ in the control box
provided below.
Click the Divider command on the
Smart ribbon.
Enter the text that you’d like to appear
in the TOCs and select a divider level.
Click Update. The slide title should now
appear on all TOCs.
To remove the slide title from your
TOCs, delete the ‘Divider’ text from the
divider control box and hit Update.
11
111
3
11
1
2
11
1
11
11
1
1
2
11111122
2
3
Un
ion
Eu
rop
éen
e
Ind
on
ésie
Ma
lais
ie
Nig
éria
Ru
ssie
Alg
érie
Ba
ng
lad
esh
Em
ira
ts A
rab
es U
nis
Ch
ine
Ara
bie
Sa
ou
dit
e
2013 2012 2011
0,2
0,4
0
,3
Vie
tna
m
0,2
0
,3
0,3
So
ud
an
0
,2
0,0
0
,0
Ch
ine
0,3
Ira
k
0,1
0
,1
0,0
K
eny
a
0,9
0
,3
Ma
lais
ie
0,3
0,4
0
,3
Co
rée
0,5
0
,5
0,5
Ca
mb
od
ge
0,6
0
,6
0,4
Ja
po
n
0,8
0
,8
1,1
Ind
on
ésie
1,
5
1,6
1,
3
Exporte vers
Exporte vers
Sucre brut de haute qualité (80%) Sucre blanc (20%)
THAILANDE
BRESIL
Principaux clients du Brésil en 2011, 2012 et 2013 (en millions de tonnes)
Principaux clients de la Thaïlande en 2011, 2012 et 2013 (en millions de tonnes)
13% des exportations mondiales
de sucre => 7,5M de tonnes (2013)
46%
des exportations mondiales de sucre
=> 26,2M de tonnes (2013)
2011 2012 2013
Source: Trademap, FAO, OCDE, Unicadata,PwC Analysis
VOLUMES
Informations détaillées Points clés L'essentiel Sommaire
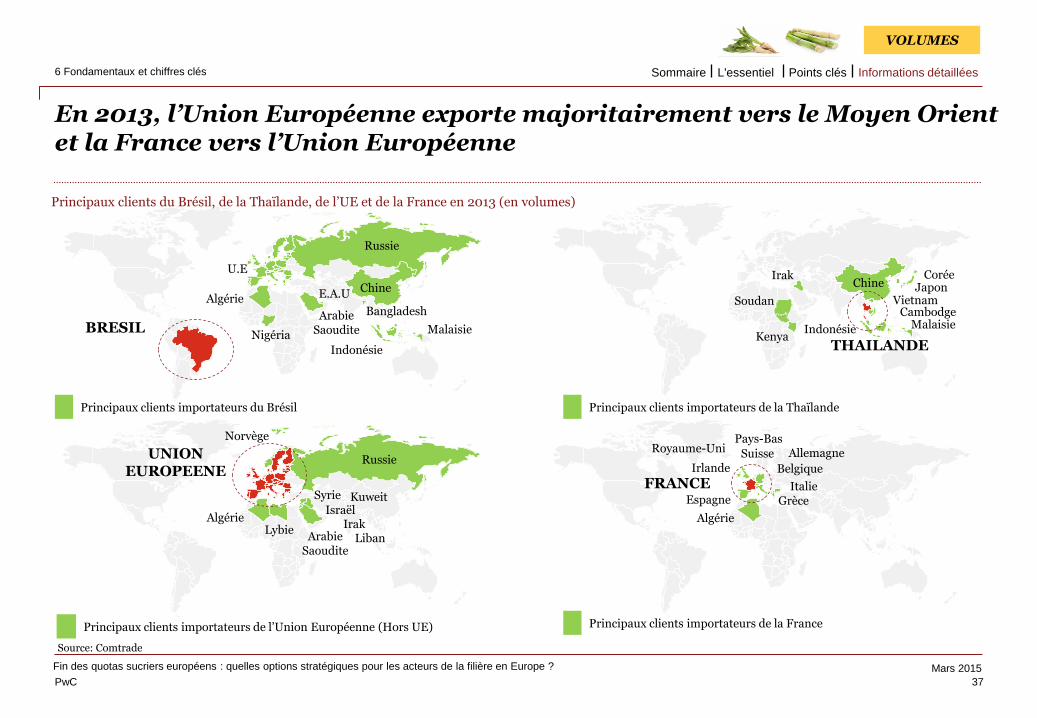
PwC
Mars 2015
Use the divider control box below to
make the slide title appear in your
primary TOC and section TOCs.
Please follow these steps:
Type ‘Divider’ in the control box
provided below.
Click the Divider command on the
Smart ribbon.
Enter the text that you’d like to appear
in the TOCs and select a divider level.
Click Update. The slide title should now
appear on all TOCs.
To remove the slide title from your
TOCs, delete the ‘Divider’ text from the
divider control box and hit Update.
En 2013, l’Union Européenne exporte majoritairement vers le Moyen Orient et la France vers l’Union Européenne
37
Fin des quotas sucriers européens : quelles options stratégiques pour les acteurs de la filière en Europe ?
6 Fondamentaux et chiffres clés
Use the divider control box below to
make the slide title appear in your
primary TOC and section TOCs.
Please follow these steps:
Type ‘Divider’ in the control box
provided below.
Click the Divider command on the
Smart ribbon.
Enter the text that you’d like to appear
in the TOCs and select a divider level.
Click Update. The slide title should now
appear on all TOCs.
To remove the slide title from your
TOCs, delete the ‘Divider’ text from the
divider control box and hit Update.
Principaux clients du Brésil, de la Thaïlande, de l’UE et de la France en 2013 (en volumes)
Principaux clients importateurs du Brésil
BRESIL
UNION EUROPEENE
THAILANDE
FRANCE
Principaux clients importateurs de l’Union Européenne (Hors UE)
Principaux clients importateurs de la Thaïlande
Principaux clients importateurs de la France
Source: Comtrade
Chine
Arabie Saoudite Malaisie
Indonésie
E.A.U Algérie
Nigéria
Russie
U.E
Bangladesh Malaisie Indonésie
Japon Corée
Chine
Vietnam Soudan
Irak
Kenya
Cambodge
Norvège
Algérie
Arabie Saoudite
Israël
Syrie
Russie
Lybie Irak Liban
Kuweit
Allemagne
Belgique
Italie Espagne
Algérie
Royaume-Uni Pays-Bas
Suisse Irlande
Grèce
VOLUMES
Informations détaillées Points clés L'essentiel Sommaire
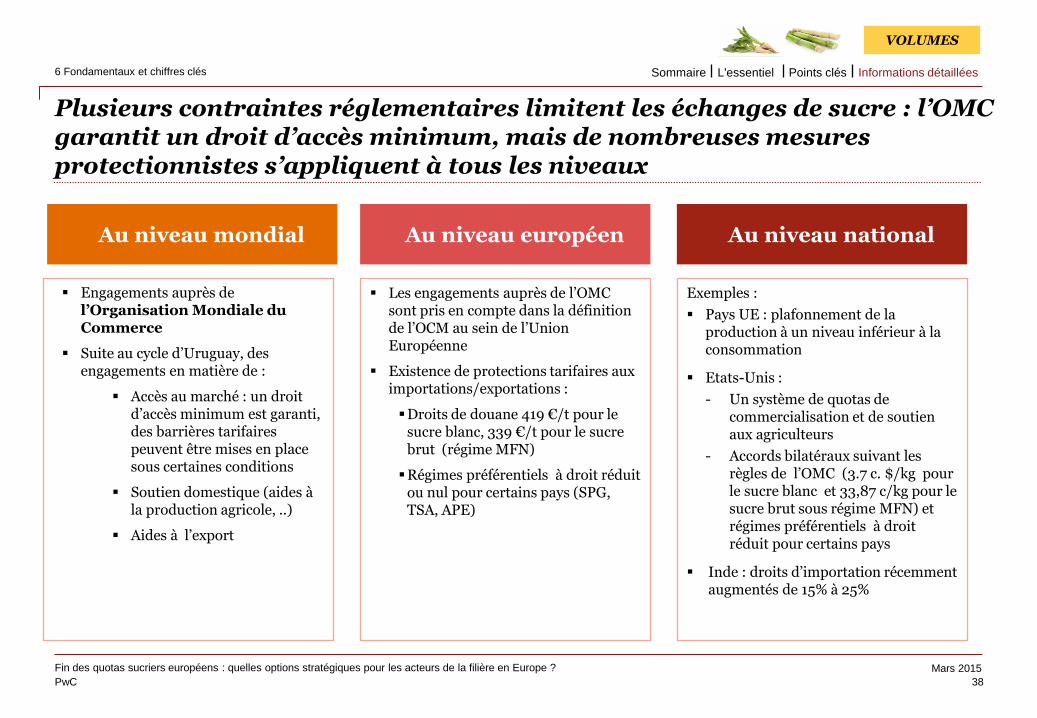
PwC
Mars 2015
Use the divider control box below to
make the slide title appear in your
primary TOC and section TOCs.
Please follow these steps:
Type ‘Divider’ in the control box
provided below.
Click the Divider command on the
Smart ribbon.
Enter the text that you’d like to appear
in the TOCs and select a divider level.
Click Update. The slide title should now
appear on all TOCs.
To remove the slide title from your
TOCs, delete the ‘Divider’ text from the
divider control box and hit Update.
Plusieurs contraintes réglementaires limitent les échanges de sucre : l’OMC garantit un droit d’accès minimum, mais de nombreuses mesures protectionnistes s’appliquent à tous les niveaux
38
Fin des quotas sucriers européens : quelles options stratégiques pour les acteurs de la filière en Europe ?
6 Fondamentaux et chiffres clés
Use the divider control box below to
make the slide title appear in your
primary TOC and section TOCs.
Please follow these steps:
Type ‘Divider’ in the control box
provided below.
Click the Divider command on the
Smart ribbon.
Enter the text that you’d like to appear
in the TOCs and select a divider level.
Click Update. The slide title should now
appear on all TOCs.
To remove the slide title from your
TOCs, delete the ‘Divider’ text from the
divider control box and hit Update.
VOLUMES
Au niveau national Au niveau mondial Au niveau européen
Les engagements auprès de l’OMC sont pris en compte dans la définition de l’OCM au sein de l’Union Européenne
Existence de protections tarifaires aux importations/exportations :
Droits de douane 419 €/t pour le sucre blanc, 339 €/t pour le sucre brut (régime MFN)
Régimes préférentiels à droit réduit ou nul pour certains pays (SPG, TSA, APE)
Engagements auprès de l’Organisation Mondiale du Commerce
Suite au cycle d’Uruguay, des engagements en matière de :
Accès au marché : un droit d’accès minimum est garanti, des barrières tarifaires peuvent être mises en place sous certaines conditions
Soutien domestique (aides à la production agricole, ..)
Aides à l’export
Exemples :
Pays UE : plafonnement de la production à un niveau inférieur à la consommation
Etats-Unis :
- Un système de quotas de commercialisation et de soutien aux agriculteurs
- Accords bilatéraux suivant les règles de l’OMC (3.7 c. $/kg pour le sucre blanc et 33,87 c/kg pour le sucre brut sous régime MFN) et régimes préférentiels à droit réduit pour certains pays
Inde : droits d’importation récemment augmentés de 15% à 25%
Informations détaillées Points clés L'essentiel Sommaire
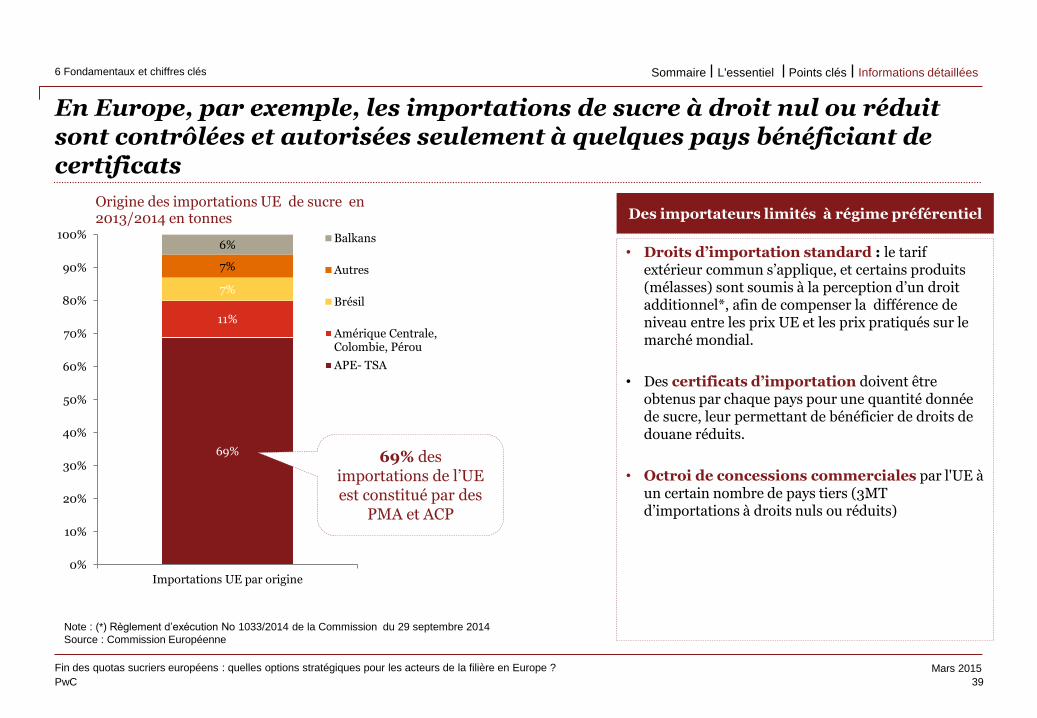
PwC
Mars 2015
Use the divider control box below to
make the slide title appear in your
primary TOC and section TOCs.
Please follow these steps:
Type ‘Divider’ in the control box
provided below.
Click the Divider command on the
Smart ribbon.
Enter the text that you’d like to appear
in the TOCs and select a divider level.
Click Update. The slide title should now
appear on all TOCs.
To remove the slide title from your
TOCs, delete the ‘Divider’ text from the
divider control box and hit Update.
En Europe, par exemple, les importations de sucre à droit nul ou réduit sont contrôlées et autorisées seulement à quelques pays bénéficiant de certificats
39
Fin des quotas sucriers européens : quelles options stratégiques pour les acteurs de la filière en Europe ?
6 Fondamentaux et chiffres clés
Use the divider control box below to
make the slide title appear in your
primary TOC and section TOCs.
Please follow these steps:
Type ‘Divider’ in the control box
provided below.
Click the Divider command on the
Smart ribbon.
Enter the text that you’d like to appear
in the TOCs and select a divider level.
Click Update. The slide title should now
appear on all TOCs.
To remove the slide title from your
TOCs, delete the ‘Divider’ text from the
divider control box and hit Update.
• Droits d’importation standard : le tarif extérieur commun s’applique, et certains produits (mélasses) sont soumis à la perception d’un droit additionnel*, afin de compenser la différence de niveau entre les prix UE et les prix pratiqués sur le marché mondial.
• Des certificats d’importation doivent être obtenus par chaque pays pour une quantité donnée de sucre, leur permettant de bénéficier de droits de douane réduits.
• Octroi de concessions commerciales par l'UE à un certain nombre de pays tiers (3MT d’importations à droits nuls ou réduits)
Des importateurs limités à régime préférentiel
69%
11%
7%
7%
6%
0%
10%
20%
30%
40%
50%
60%
70%
80%
90%
100%
Importations UE par origine
Origine des importations UE de sucre en 2013/2014 en tonnes
Balkans
Autres
Brésil
Amérique Centrale,Colombie, Pérou
APE- TSA
Note : (*) Règlement d’exécution No 1033/2014 de la Commission du 29 septembre 2014
Source : Commission Européenne
69% des importations de l’UE est constitué par des
PMA et ACP
Informations détaillées Points clés L'essentiel Sommaire
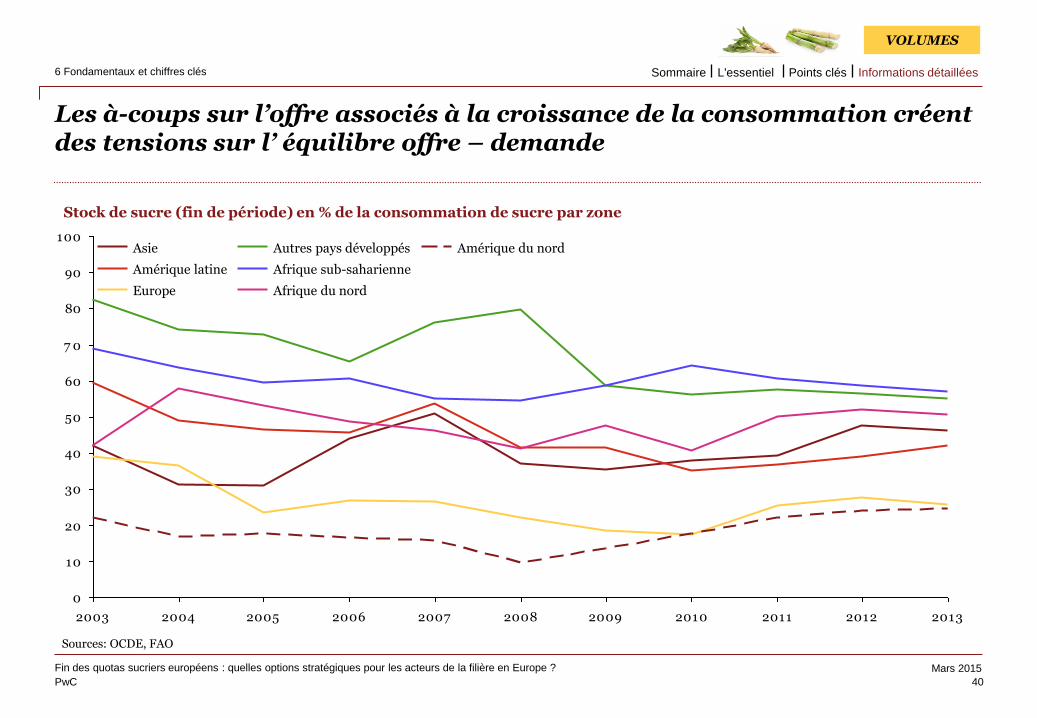
PwC
Mars 2015
Use the divider control box below to
make the slide title appear in your
primary TOC and section TOCs.
Please follow these steps:
Type ‘Divider’ in the control box
provided below.
Click the Divider command on the
Smart ribbon.
Enter the text that you’d like to appear
in the TOCs and select a divider level.
Click Update. The slide title should now
appear on all TOCs.
To remove the slide title from your
TOCs, delete the ‘Divider’ text from the
divider control box and hit Update.
Les à-coups sur l’offre associés à la croissance de la consommation créent des tensions sur l’ équilibre offre – demande
40
Fin des quotas sucriers européens : quelles options stratégiques pour les acteurs de la filière en Europe ?
6 Fondamentaux et chiffres clés
Use the divider control box below to
make the slide title appear in your
primary TOC and section TOCs.
Please follow these steps:
Type ‘Divider’ in the control box
provided below.
Click the Divider command on the
Smart ribbon.
Enter the text that you’d like to appear
in the TOCs and select a divider level.
Click Update. The slide title should now
appear on all TOCs.
To remove the slide title from your
TOCs, delete the ‘Divider’ text from the
divider control box and hit Update.
VOLUMES
Sources: OCDE, FAO
Stock de sucre (fin de période) en % de la consommation de sucre par zone
0
10
20
30
40
50
60
7 0
80
90
100
2003 2004 2005 2006 2007 2008 2009 2010 2011 2012 2013
Europe
Afrique sub-saharienne
Afrique du nord
Amérique du nord
Amérique latine
Autres pays développés Asie
Informations détaillées Points clés L'essentiel Sommaire
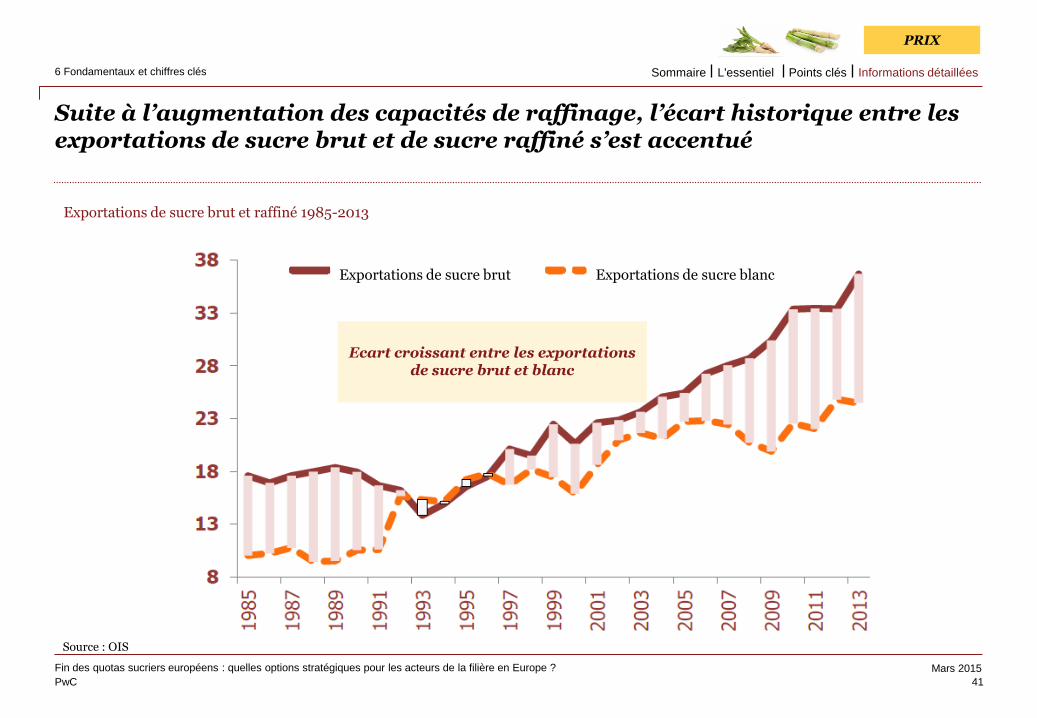
PwC
Mars 2015
Use the divider control box below to
make the slide title appear in your
primary TOC and section TOCs.
Please follow these steps:
Type ‘Divider’ in the control box
provided below.
Click the Divider command on the
Smart ribbon.
Enter the text that you’d like to appear
in the TOCs and select a divider level.
Click Update. The slide title should now
appear on all TOCs.
To remove the slide title from your
TOCs, delete the ‘Divider’ text from the
divider control box and hit Update.
Suite à l’augmentation des capacités de raffinage, l’écart historique entre les exportations de sucre brut et de sucre raffiné s’est accentué
41
Fin des quotas sucriers européens : quelles options stratégiques pour les acteurs de la filière en Europe ?
6 Fondamentaux et chiffres clés
Use the divider control box below to
make the slide title appear in your
primary TOC and section TOCs.
Please follow these steps:
Type ‘Divider’ in the control box
provided below.
Click the Divider command on the
Smart ribbon.
Enter the text that you’d like to appear
in the TOCs and select a divider level.
Click Update. The slide title should now
appear on all TOCs.
To remove the slide title from your
TOCs, delete the ‘Divider’ text from the
divider control box and hit Update.
Exportations de sucre brut et raffiné 1985-2013
Exportations de sucre brut Exportations de sucre blanc
Ecart croissant entre les exportations
de sucre brut et blanc
Source : OIS
PRIX
Informations détaillées Points clés L'essentiel Sommaire
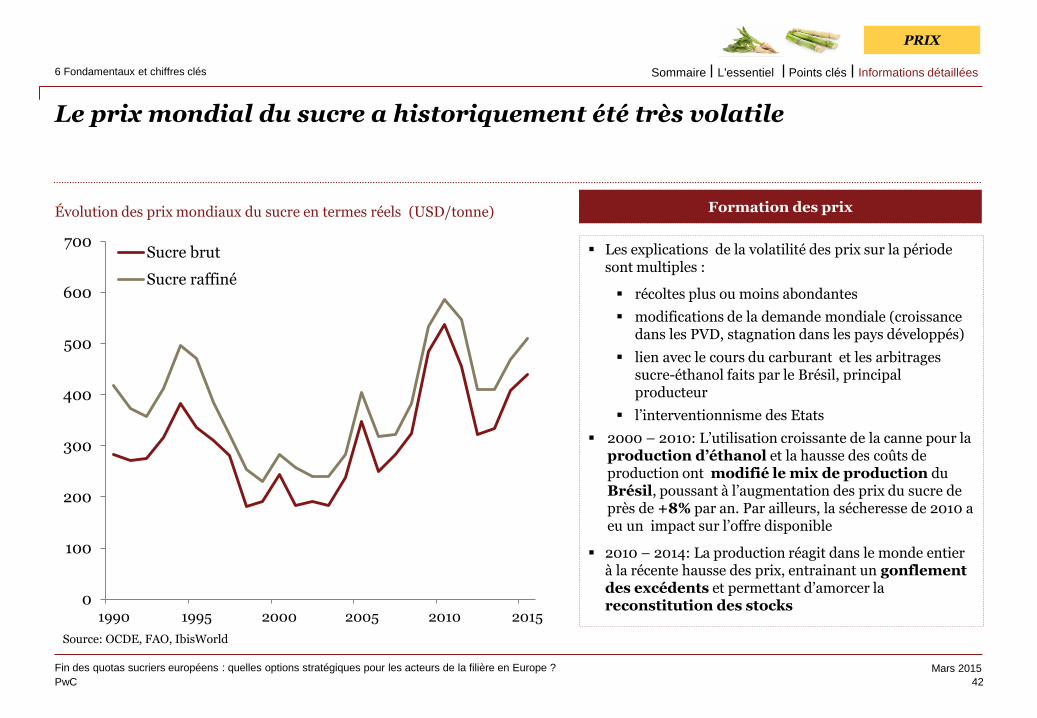
PwC
Mars 2015
Use the divider control box below to
make the slide title appear in your
primary TOC and section TOCs.
Please follow these steps:
Type ‘Divider’ in the control box
provided below.
Click the Divider command on the
Smart ribbon.
Enter the text that you’d like to appear
in the TOCs and select a divider level.
Click Update. The slide title should now
appear on all TOCs.
To remove the slide title from your
TOCs, delete the ‘Divider’ text from the
divider control box and hit Update.
Le prix mondial du sucre a historiquement été très volatile
42
Fin des quotas sucriers européens : quelles options stratégiques pour les acteurs de la filière en Europe ?
6 Fondamentaux et chiffres clés
Use the divider control box below to
make the slide title appear in your
primary TOC and section TOCs.
Please follow these steps:
Type ‘Divider’ in the control box
provided below.
Click the Divider command on the
Smart ribbon.
Enter the text that you’d like to appear
in the TOCs and select a divider level.
Click Update. The slide title should now
appear on all TOCs.
To remove the slide title from your
TOCs, delete the ‘Divider’ text from the
divider control box and hit Update.
Évolution des prix mondiaux du sucre en termes réels (USD/tonne)
Source: OCDE, FAO, IbisWorld
0
100
200
300
400
500
600
700
1990 1995 2000 2005 2010 2015
Sucre brut
Sucre raffiné
Les explications de la volatilité des prix sur la période sont multiples :
récoltes plus ou moins abondantes
modifications de la demande mondiale (croissance dans les PVD, stagnation dans les pays développés)
lien avec le cours du carburant et les arbitrages sucre-éthanol faits par le Brésil, principal producteur
l’interventionnisme des Etats
2000 – 2010: L’utilisation croissante de la canne pour la production d’éthanol et la hausse des coûts de production ont modifié le mix de production du Brésil, poussant à l’augmentation des prix du sucre de près de +8% par an. Par ailleurs, la sécheresse de 2010 a eu un impact sur l’offre disponible
2010 – 2014: La production réagit dans le monde entier à la récente hausse des prix, entrainant un gonflement des excédents et permettant d’amorcer la reconstitution des stocks
Formation des prix
PRIX
Informations détaillées Points clés L'essentiel Sommaire
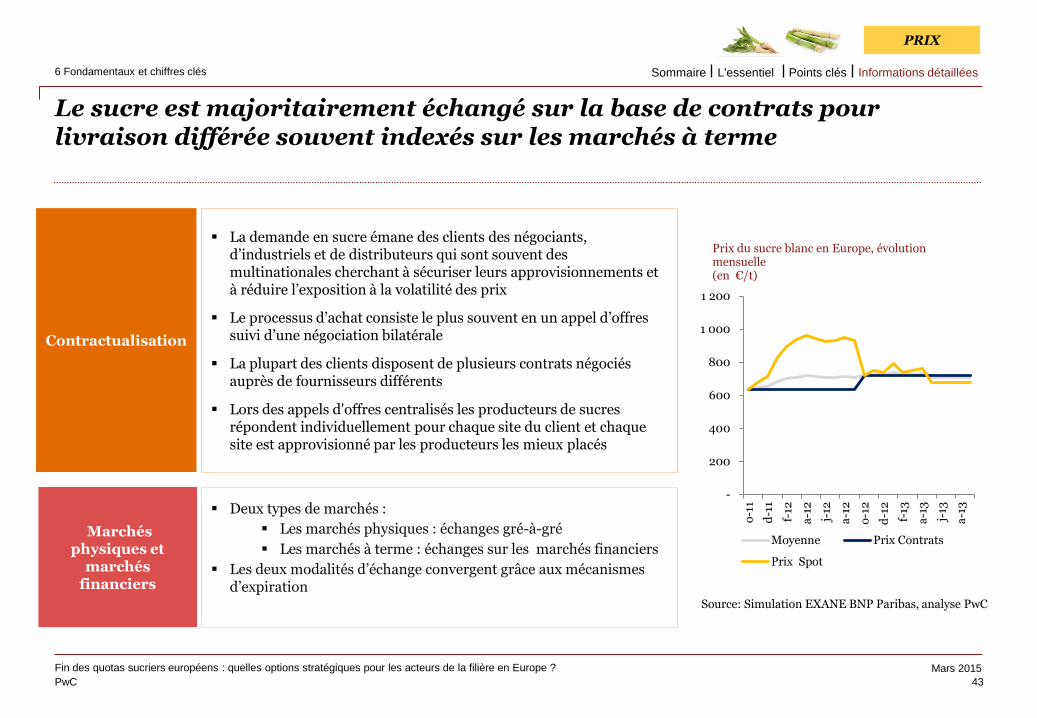
PwC
Mars 2015
Use the divider control box below to
make the slide title appear in your
primary TOC and section TOCs.
Please follow these steps:
Type ‘Divider’ in the control box
provided below.
Click the Divider command on the
Smart ribbon.
Enter the text that you’d like to appear
in the TOCs and select a divider level.
Click Update. The slide title should now
appear on all TOCs.
To remove the slide title from your
TOCs, delete the ‘Divider’ text from the
divider control box and hit Update.
Le sucre est majoritairement échangé sur la base de contrats pour livraison différée souvent indexés sur les marchés à terme
-
200
400
600
800
1 000
1 200
o-1
1
d-1
1
f-12
a-1
2
j-12
a-1
2
o-1
2
d-1
2
f-13
a-1
3
j-13
a-1
3
Prix du sucre blanc en Europe, évolution mensuelle (en €/t)
Moyenne Prix Contrats
Prix Spot
Source: Simulation EXANE BNP Paribas, analyse PwC
La demande en sucre émane des clients des négociants, d’industriels et de distributeurs qui sont souvent des multinationales cherchant à sécuriser leurs approvisionnements et à réduire l’exposition à la volatilité des prix
Le processus d’achat consiste le plus souvent en un appel d’offres suivi d’une négociation bilatérale
La plupart des clients disposent de plusieurs contrats négociés auprès de fournisseurs différents
Lors des appels d'offres centralisés les producteurs de sucres répondent individuellement pour chaque site du client et chaque site est approvisionné par les producteurs les mieux placés
Deux types de marchés :
Les marchés physiques : échanges gré-à-gré
Les marchés à terme : échanges sur les marchés financiers
Les deux modalités d’échange convergent grâce aux mécanismes d’expiration
01
02
43
Fin des quotas sucriers européens : quelles options stratégiques pour les acteurs de la filière en Europe ?
6 Fondamentaux et chiffres clés
Use the divider control box below to
make the slide title appear in your
primary TOC and section TOCs.
Please follow these steps:
Type ‘Divider’ in the control box
provided below.
Click the Divider command on the
Smart ribbon.
Enter the text that you’d like to appear
in the TOCs and select a divider level.
Click Update. The slide title should now
appear on all TOCs.
To remove the slide title from your
TOCs, delete the ‘Divider’ text from the
divider control box and hit Update.
PRIX
Contractualisation
Marchés physiques et
marchés financiers
Informations détaillées Points clés L'essentiel Sommaire
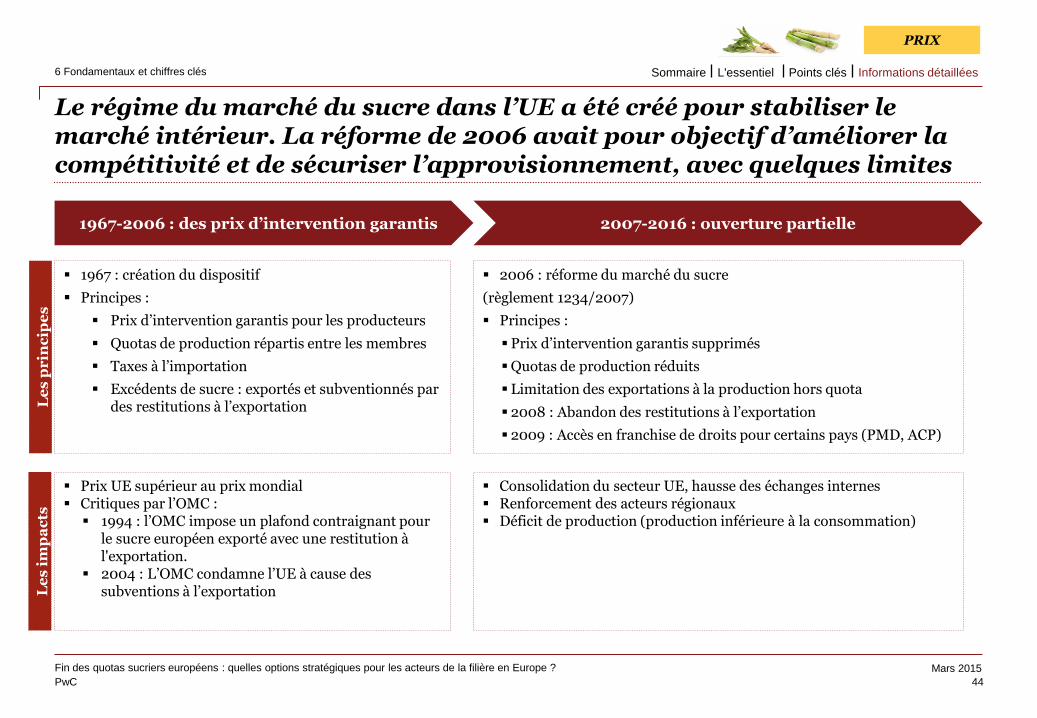
PwC
Mars 2015
Use the divider control box below to
make the slide title appear in your
primary TOC and section TOCs.
Please follow these steps:
Type ‘Divider’ in the control box
provided below.
Click the Divider command on the
Smart ribbon.
Enter the text that you’d like to appear
in the TOCs and select a divider level.
Click Update. The slide title should now
appear on all TOCs.
To remove the slide title from your
TOCs, delete the ‘Divider’ text from the
divider control box and hit Update.
Le régime du marché du sucre dans l’UE a été créé pour stabiliser le marché intérieur. La réforme de 2006 avait pour objectif d’améliorer la compétitivité et de sécuriser l’approvisionnement, avec quelques limites
1967-2006 : des prix d’intervention garantis 2007-2016 : ouverture partielle
1967 : création du dispositif
Principes :
Prix d’intervention garantis pour les producteurs
Quotas de production répartis entre les membres
Taxes à l’importation
Excédents de sucre : exportés et subventionnés par des restitutions à l’exportation
Prix UE supérieur au prix mondial Critiques par l’OMC : 1994 : l’OMC impose un plafond contraignant pour
le sucre européen exporté avec une restitution à l'exportation.
2004 : L’OMC condamne l’UE à cause des subventions à l’exportation
2006 : réforme du marché du sucre
(règlement 1234/2007)
Principes :
Prix d’intervention garantis supprimés
Quotas de production réduits
Limitation des exportations à la production hors quota
2008 : Abandon des restitutions à l’exportation
2009 : Accès en franchise de droits pour certains pays (PMD, ACP)
Consolidation du secteur UE, hausse des échanges internes Renforcement des acteurs régionaux Déficit de production (production inférieure à la consommation)
Le
s p
rin
cip
es
L
es
im
pa
cts
44
Fin des quotas sucriers européens : quelles options stratégiques pour les acteurs de la filière en Europe ?
6 Fondamentaux et chiffres clés
Use the divider control box below to
make the slide title appear in your
primary TOC and section TOCs.
Please follow these steps:
Type ‘Divider’ in the control box
provided below.
Click the Divider command on the
Smart ribbon.
Enter the text that you’d like to appear
in the TOCs and select a divider level.
Click Update. The slide title should now
appear on all TOCs.
To remove the slide title from your
TOCs, delete the ‘Divider’ text from the
divider control box and hit Update.
PRIX
Informations détaillées Points clés L'essentiel Sommaire
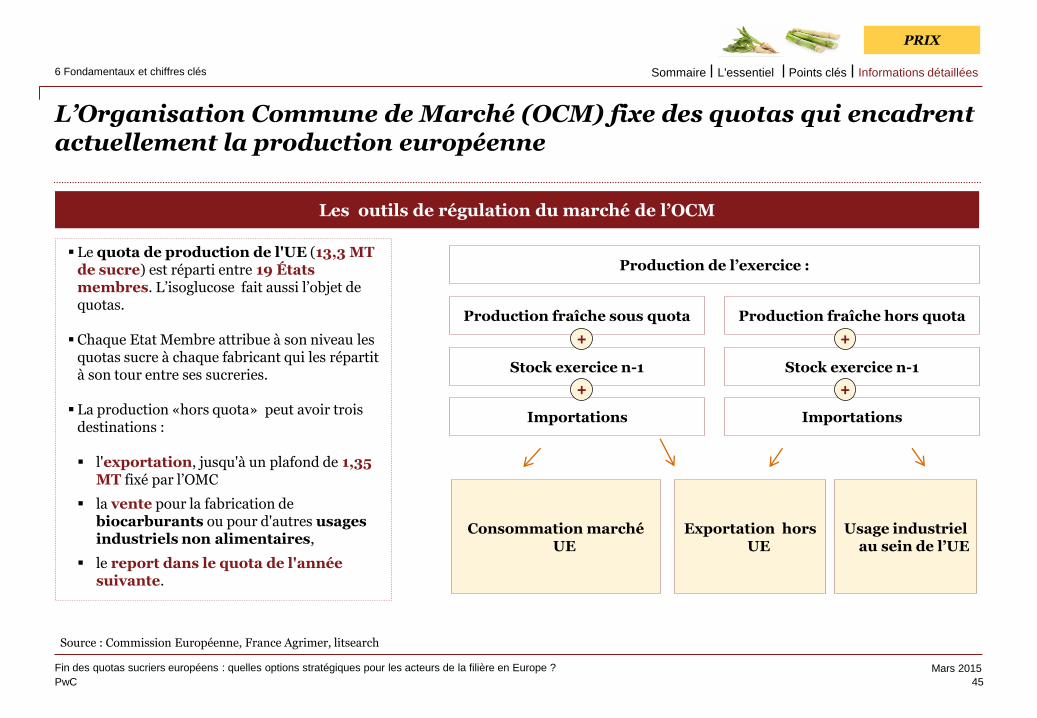
PwC
Mars 2015
Use the divider control box below to
make the slide title appear in your
primary TOC and section TOCs.
Please follow these steps:
Type ‘Divider’ in the control box
provided below.
Click the Divider command on the
Smart ribbon.
Enter the text that you’d like to appear
in the TOCs and select a divider level.
Click Update. The slide title should now
appear on all TOCs.
To remove the slide title from your
TOCs, delete the ‘Divider’ text from the
divider control box and hit Update.
L’Organisation Commune de Marché (OCM) fixe des quotas qui encadrent actuellement la production européenne
45
Fin des quotas sucriers européens : quelles options stratégiques pour les acteurs de la filière en Europe ?
6 Fondamentaux et chiffres clés
Use the divider control box below to
make the slide title appear in your
primary TOC and section TOCs.
Please follow these steps:
Type ‘Divider’ in the control box
provided below.
Click the Divider command on the
Smart ribbon.
Enter the text that you’d like to appear
in the TOCs and select a divider level.
Click Update. The slide title should now
appear on all TOCs.
To remove the slide title from your
TOCs, delete the ‘Divider’ text from the
divider control box and hit Update.
Les outils de régulation du marché de l’OCM
Le quota de production de l'UE (13,3 MT de sucre) est réparti entre 19 États membres. L’isoglucose fait aussi l’objet de quotas.
Chaque Etat Membre attribue à son niveau les quotas sucre à chaque fabricant qui les répartit à son tour entre ses sucreries.
La production «hors quota» peut avoir trois destinations :
l'exportation, jusqu'à un plafond de 1,35 MT fixé par l’OMC
la vente pour la fabrication de biocarburants ou pour d'autres usages industriels non alimentaires,
le report dans le quota de l'année suivante.
Source : Commission Européenne, France Agrimer, litsearch
Production de l’exercice :
Production fraîche sous quota Production fraîche hors quota
Stock exercice n-1 Stock exercice n-1
Importations Importations
Consommation marché UE
Exportation hors UE
Usage industriel au sein de l’UE
+
+
+
+
PRIX
Informations détaillées Points clés L'essentiel Sommaire
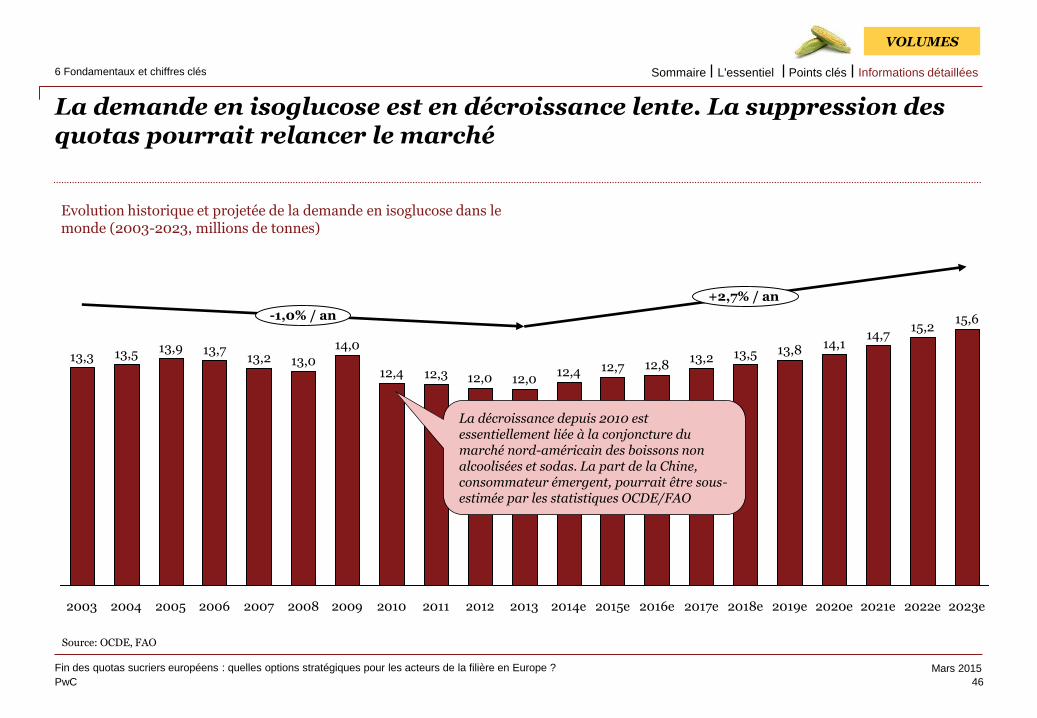
PwC
Mars 2015
Use the divider control box below to
make the slide title appear in your
primary TOC and section TOCs.
Please follow these steps:
Type ‘Divider’ in the control box
provided below.
Click the Divider command on the
Smart ribbon.
Enter the text that you’d like to appear
in the TOCs and select a divider level.
Click Update. The slide title should now
appear on all TOCs.
To remove the slide title from your
TOCs, delete the ‘Divider’ text from the
divider control box and hit Update.
La demande en isoglucose est en décroissance lente. La suppression des quotas pourrait relancer le marché
46
Fin des quotas sucriers européens : quelles options stratégiques pour les acteurs de la filière en Europe ?
6 Fondamentaux et chiffres clés
Use the divider control box below to
make the slide title appear in your
primary TOC and section TOCs.
Please follow these steps:
Type ‘Divider’ in the control box
provided below.
Click the Divider command on the
Smart ribbon.
Enter the text that you’d like to appear
in the TOCs and select a divider level.
Click Update. The slide title should now
appear on all TOCs.
To remove the slide title from your
TOCs, delete the ‘Divider’ text from the
divider control box and hit Update.
VOLUMES
13,8
2018e
13,5
2017e
13,2
2016e
12,8
2015e
12,7
2014e
12,4
2013
12,0
2012
12,0
2011
12,3
2010
12,4
2009
14,0
2008
13,0
2007
13,2
2006
13,7
2005
13,9
2004
13,5
2003
13,3
2020e
-1,0% / an
2023e
15,6
2022e
+2,7% / an
2021e
14,7 14,1
2019e
15,2
Evolution historique et projetée de la demande en isoglucose dans le monde (2003-2023, millions de tonnes)
Source: OCDE, FAO
La décroissance depuis 2010 est essentiellement liée à la conjoncture du marché nord-américain des boissons non alcoolisées et sodas. La part de la Chine, consommateur émergent, pourrait être sous-estimée par les statistiques OCDE/FAO
Informations détaillées Points clés L'essentiel Sommaire
PwC
Mars 2015
Un secteur en profonde mutation
47
Fin des quotas sucriers européens : quelles options stratégiques pour les acteurs de la filière en Europe ?
7 Un secteur en profonde mutation Informations détaillées Points clés L'essentiel Sommaire
PwC
Mars 2015
Enjeu n°1 : l’essor des pays émergents
48
Fin des quotas sucriers européens : quelles options stratégiques pour les acteurs de la filière en Europe ?
7.1 Enjeu n°1 : l’essor des pays émergents Informations détaillées Points clés L'essentiel Sommaire
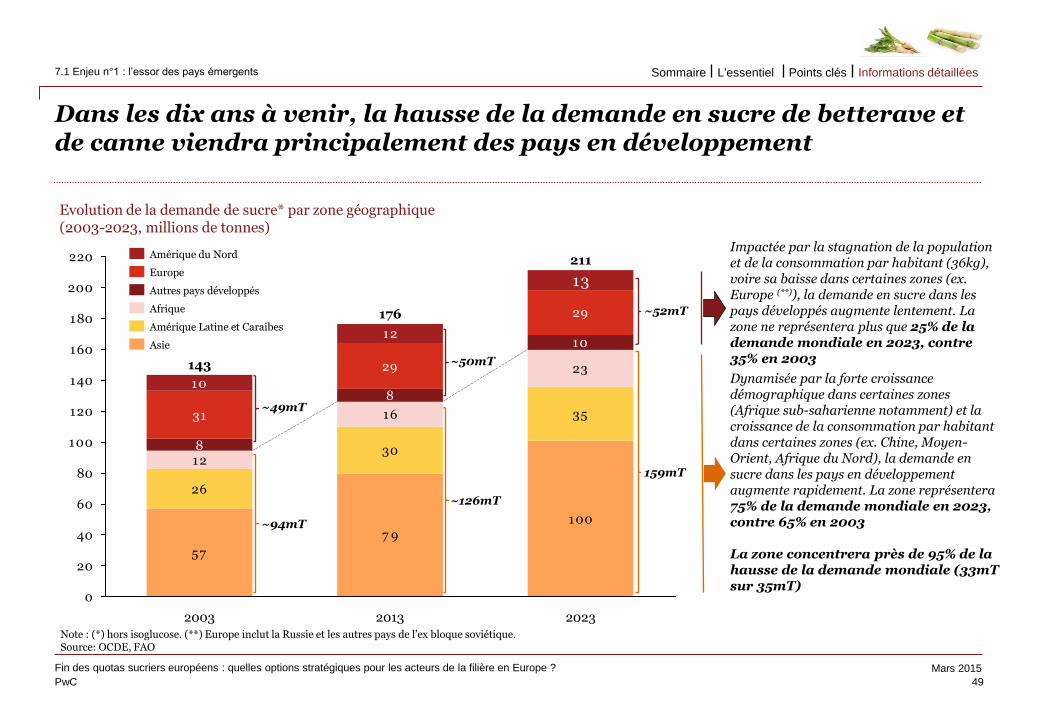
PwC
Mars 2015
Use the divider control box below to
make the slide title appear in your
primary TOC and section TOCs.
Please follow these steps:
Type ‘Divider’ in the control box
provided below.
Click the Divider command on the
Smart ribbon.
Enter the text that you’d like to appear
in the TOCs and select a divider level.
Click Update. The slide title should now
appear on all TOCs.
To remove the slide title from your
TOCs, delete the ‘Divider’ text from the
divider control box and hit Update.
Dans les dix ans à venir, la hausse de la demande en sucre de betterave et de canne viendra principalement des pays en développement
49
Fin des quotas sucriers européens : quelles options stratégiques pour les acteurs de la filière en Europe ?
7.1 Enjeu n°1 : l’essor des pays émergents
Use the divider control box below to
make the slide title appear in your
primary TOC and section TOCs.
Please follow these steps:
Type ‘Divider’ in the control box
provided below.
Click the Divider command on the
Smart ribbon.
Enter the text that you’d like to appear
in the TOCs and select a divider level.
Click Update. The slide title should now
appear on all TOCs.
To remove the slide title from your
TOCs, delete the ‘Divider’ text from the
divider control box and hit Update.
57
7 9
100
12
16
23
8
8
10
30
26
35
29
29
31
13
12
10
0
20
40
60
80
100
120
140
160
180
200
220
176
2023
143
2003 2013
211
Afrique
Amérique Latine et Caraibes
Europe
Amérique du Nord
Asie
Autres pays développés
Note : (*) hors isoglucose. (**) Europe inclut la Russie et les autres pays de l’ex bloque soviétique. Source: OCDE, FAO
Evolution de la demande de sucre* par zone géographique (2003-2023, millions de tonnes)
Impactée par la stagnation de la population et de la consommation par habitant (36kg), voire sa baisse dans certaines zones (ex. Europe (**)), la demande en sucre dans les pays développés augmente lentement. La zone ne représentera plus que 25% de la demande mondiale en 2023, contre 35% en 2003
Dynamisée par la forte croissance démographique dans certaines zones (Afrique sub-saharienne notamment) et la croissance de la consommation par habitant dans certaines zones (ex. Chine, Moyen-Orient, Afrique du Nord), la demande en sucre dans les pays en développement augmente rapidement. La zone représentera 75% de la demande mondiale en 2023, contre 65% en 2003 La zone concentrera près de 95% de la hausse de la demande mondiale (33mT sur 35mT)
~49mT
~50mT
~52mT
~94mT
~126mT
159mT
Informations détaillées Points clés L'essentiel Sommaire
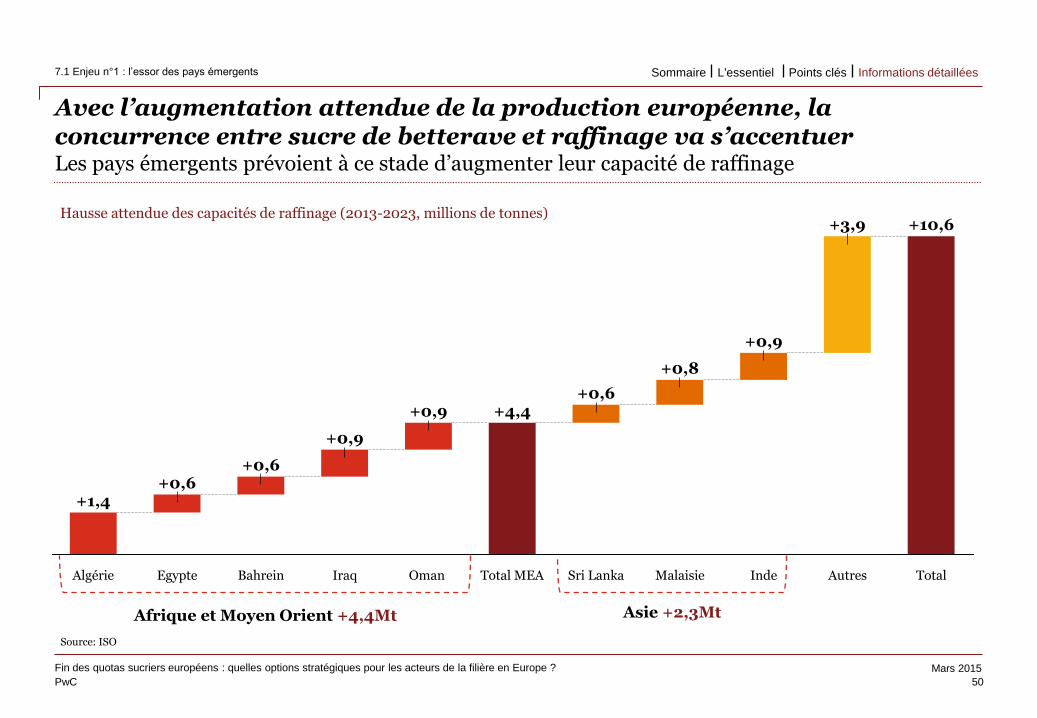
PwC
Mars 2015
Use the divider control box below to
make the slide title appear in your
primary TOC and section TOCs.
Please follow these steps:
Type ‘Divider’ in the control box
provided below.
Click the Divider command on the
Smart ribbon.
Enter the text that you’d like to appear
in the TOCs and select a divider level.
Click Update. The slide title should now
appear on all TOCs.
To remove the slide title from your
TOCs, delete the ‘Divider’ text from the
divider control box and hit Update.
Avec l’augmentation attendue de la production européenne, la concurrence entre sucre de betterave et raffinage va s’accentuer Les pays émergents prévoient à ce stade d’augmenter leur capacité de raffinage
50
Fin des quotas sucriers européens : quelles options stratégiques pour les acteurs de la filière en Europe ?
7.1 Enjeu n°1 : l’essor des pays émergents
Use the divider control box below to
make the slide title appear in your
primary TOC and section TOCs.
Please follow these steps:
Type ‘Divider’ in the control box
provided below.
Click the Divider command on the
Smart ribbon.
Enter the text that you’d like to appear
in the TOCs and select a divider level.
Click Update. The slide title should now
appear on all TOCs.
To remove the slide title from your
TOCs, delete the ‘Divider’ text from the
divider control box and hit Update.
Hausse attendue des capacités de raffinage (2013-2023, millions de tonnes)
+0,6
Total
+1,4
Autres
+3,9 +10,6
Inde
+0,9
Malaisie
+0,8
Sri Lanka
+0,6
Total MEA
+4,4
Oman
+0,9
Iraq
+0,9
Bahrein
+0,6
Egypte Algérie
Afrique et Moyen Orient +4,4Mt Asie +2,3Mt
Source: ISO
Informations détaillées Points clés L'essentiel Sommaire
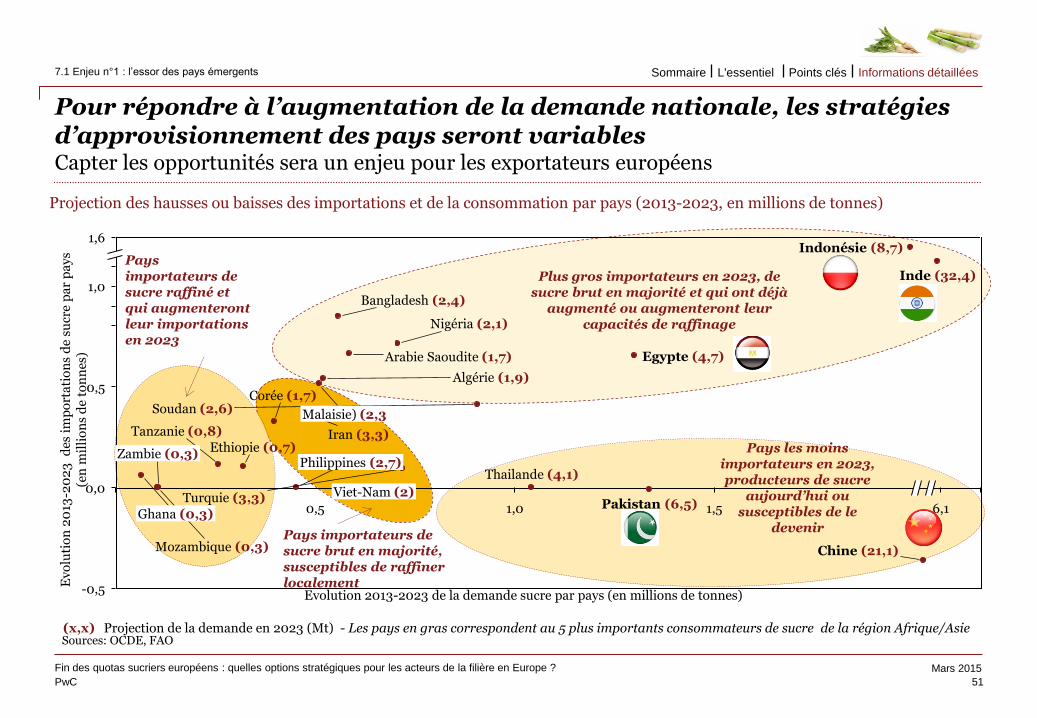
PwC
Mars 2015
Use the divider control box below to
make the slide title appear in your
primary TOC and section TOCs.
Please follow these steps:
Type ‘Divider’ in the control box
provided below.
Click the Divider command on the
Smart ribbon.
Enter the text that you’d like to appear
in the TOCs and select a divider level.
Click Update. The slide title should now
appear on all TOCs.
To remove the slide title from your
TOCs, delete the ‘Divider’ text from the
divider control box and hit Update.
Pour répondre à l’augmentation de la demande nationale, les stratégies d’approvisionnement des pays seront variables Capter les opportunités sera un enjeu pour les exportateurs européens
51
Fin des quotas sucriers européens : quelles options stratégiques pour les acteurs de la filière en Europe ?
7.1 Enjeu n°1 : l’essor des pays émergents
Use the divider control box below to
make the slide title appear in your
primary TOC and section TOCs.
Please follow these steps:
Type ‘Divider’ in the control box
provided below.
Click the Divider command on the
Smart ribbon.
Enter the text that you’d like to appear
in the TOCs and select a divider level.
Click Update. The slide title should now
appear on all TOCs.
To remove the slide title from your
TOCs, delete the ‘Divider’ text from the
divider control box and hit Update.
Sources: OCDE, FAO
0,0
1,0
0,5
1,6
0,5 1,0 1,5 6,1
-0,5
Algérie (1,9)
Soudan (2,6)
Nigéria (2,1)
Mozambique (0,3)
Pakistan (6,5)
Thailande (4,1)
Tanzanie (0,8)
Zambie (0,3)
Indonésie (8,7)
Chine (21,1)
Viet-Nam (2) Turquie (3,3)
Corée (1,7)
Bangladesh (2,4)
Malaisie) (2,3
Philippines (2,7)
Inde (32,4)
Arabie Saoudite (1,7)
Iran (3,3)
Egypte (4,7)
Ethiopie (0,7)
Ghana (0,3)
Projection des hausses ou baisses des importations et de la consommation par pays (2013-2023, en millions de tonnes)
Ev
olu
tio
n 2
013
-20
23
d
es i
mp
ort
ati
on
s d
e su
cre
pa
r p
ay
s
(en
mil
lio
ns
de
ton
nes
)
Evolution 2013-2023 de la demande sucre par pays (en millions de tonnes)
(x,x) Projection de la demande en 2023 (Mt) - Les pays en gras correspondent au 5 plus importants consommateurs de sucre de la région Afrique/Asie
Plus gros importateurs en 2023, de sucre brut en majorité et qui ont déjà
augmenté ou augmenteront leur capacités de raffinage
Pays les moins importateurs en 2023, producteurs de sucre
aujourd’hui ou susceptibles de le
devenir
Pays importateurs de sucre raffiné et qui augmenteront leur importations en 2023
Pays importateurs de sucre brut en majorité, susceptibles de raffiner localement
Informations détaillées Points clés L'essentiel Sommaire
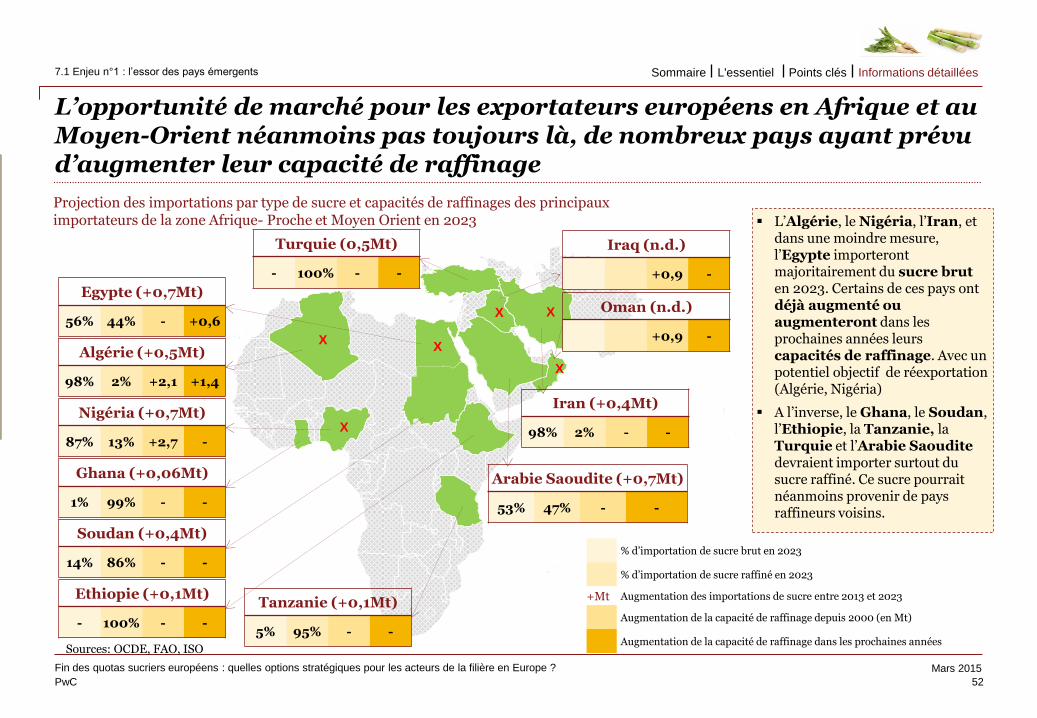
PwC
Mars 2015
Use the divider control box below to
make the slide title appear in your
primary TOC and section TOCs.
Please follow these steps:
Type ‘Divider’ in the control box
provided below.
Click the Divider command on the
Smart ribbon.
Enter the text that you’d like to appear
in the TOCs and select a divider level.
Click Update. The slide title should now
appear on all TOCs.
To remove the slide title from your
TOCs, delete the ‘Divider’ text from the
divider control box and hit Update.
L’opportunité de marché pour les exportateurs européens en Afrique et au Moyen-Orient néanmoins pas toujours là, de nombreux pays ayant prévu d’augmenter leur capacité de raffinage
52
Fin des quotas sucriers européens : quelles options stratégiques pour les acteurs de la filière en Europe ?
7.1 Enjeu n°1 : l’essor des pays émergents
Use the divider control box below to
make the slide title appear in your
primary TOC and section TOCs.
Please follow these steps:
Type ‘Divider’ in the control box
provided below.
Click the Divider command on the
Smart ribbon.
Enter the text that you’d like to appear
in the TOCs and select a divider level.
Click Update. The slide title should now
appear on all TOCs.
To remove the slide title from your
TOCs, delete the ‘Divider’ text from the
divider control box and hit Update.
% d’importation de sucre brut en 2023
% d’importation de sucre raffiné en 2023
+Mt Augmentation des importations de sucre entre 2013 et 2023
Augmentation de la capacité de raffinage depuis 2000 (en Mt)
Augmentation de la capacité de raffinage dans les prochaines années
Egypte (+0,7Mt)
56% 44% - +0,6
Algérie (+0,5Mt)
98% 2% +2,1 +1,4
Nigéria (+0,7Mt)
87% 13% +2,7 -
Ethiopie (+0,1Mt)
- 100% - -
Ghana (+0,06Mt)
1% 99% - -
Soudan (+0,4Mt)
14% 86% - -
Tanzanie (+0,1Mt)
5% 95% - -
Turquie (0,5Mt)
- 100% - -
Iran (+0,4Mt)
98% 2% - -
Arabie Saoudite (+0,7Mt)
53% 47% - -
Projection des importations par type de sucre et capacités de raffinages des principaux importateurs de la zone Afrique- Proche et Moyen Orient en 2023 L’Algérie, le Nigéria, l’Iran, et
dans une moindre mesure, l’Egypte importeront majoritairement du sucre brut en 2023. Certains de ces pays ont déjà augmenté ou augmenteront dans les prochaines années leurs capacités de raffinage. Avec un potentiel objectif de réexportation (Algérie, Nigéria)
A l’inverse, le Ghana, le Soudan, l’Ethiopie, la Tanzanie, la Turquie et l’Arabie Saoudite devraient importer surtout du sucre raffiné. Ce sucre pourrait néanmoins provenir de pays raffineurs voisins.
Sources: OCDE, FAO, ISO
X
X
X
X X
Iraq (n.d.)
+0,9 -
Oman (n.d.)
+0,9 -
X
Informations détaillées Points clés L'essentiel Sommaire
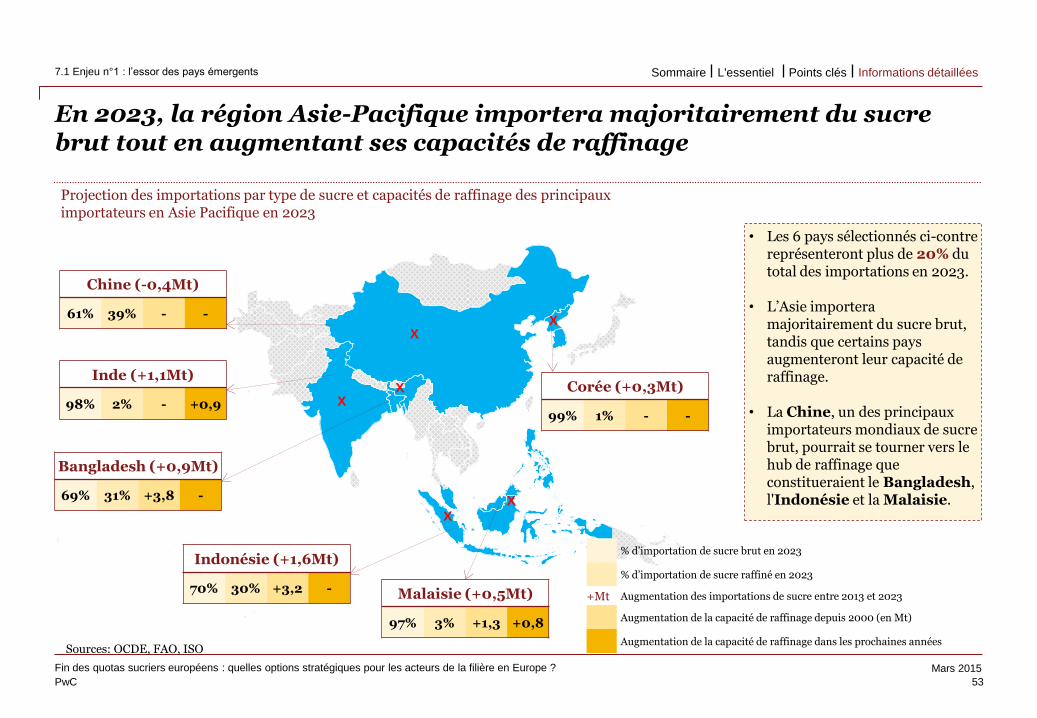
PwC
Mars 2015
Use the divider control box below to
make the slide title appear in your
primary TOC and section TOCs.
Please follow these steps:
Type ‘Divider’ in the control box
provided below.
Click the Divider command on the
Smart ribbon.
Enter the text that you’d like to appear
in the TOCs and select a divider level.
Click Update. The slide title should now
appear on all TOCs.
To remove the slide title from your
TOCs, delete the ‘Divider’ text from the
divider control box and hit Update.
En 2023, la région Asie-Pacifique importera majoritairement du sucre brut tout en augmentant ses capacités de raffinage
53
Fin des quotas sucriers européens : quelles options stratégiques pour les acteurs de la filière en Europe ?
7.1 Enjeu n°1 : l’essor des pays émergents
Use the divider control box below to
make the slide title appear in your
primary TOC and section TOCs.
Please follow these steps:
Type ‘Divider’ in the control box
provided below.
Click the Divider command on the
Smart ribbon.
Enter the text that you’d like to appear
in the TOCs and select a divider level.
Click Update. The slide title should now
appear on all TOCs.
To remove the slide title from your
TOCs, delete the ‘Divider’ text from the
divider control box and hit Update.
Sources: OCDE, FAO, ISO
Corée (+0,3Mt)
99% 1% - -
Bangladesh (+0,9Mt)
69% 31% +3,8 -
Chine (-0,4Mt)
61% 39% - -
Malaisie (+0,5Mt)
97% 3% +1,3 +0,8
Inde (+1,1Mt)
98% 2% - +0,9
Indonésie (+1,6Mt)
70% 30% +3,2 -
Projection des importations par type de sucre et capacités de raffinage des principaux importateurs en Asie Pacifique en 2023
• Les 6 pays sélectionnés ci-contre représenteront plus de 20% du total des importations en 2023.
• L’Asie importera
majoritairement du sucre brut, tandis que certains pays augmenteront leur capacité de raffinage.
• La Chine, un des principaux importateurs mondiaux de sucre brut, pourrait se tourner vers le hub de raffinage que constitueraient le Bangladesh, l'Indonésie et la Malaisie.
% d’importation de sucre brut en 2023
% d’importation de sucre raffiné en 2023
+Mt Augmentation des importations de sucre entre 2013 et 2023
Augmentation de la capacité de raffinage depuis 2000 (en Mt)
Augmentation de la capacité de raffinage dans les prochaines années
X
X
X
X
X
X
Informations détaillées Points clés L'essentiel Sommaire
PwC
Mars 2015
Enjeu n°2 : l’évolution des équilibres commerciaux
54
Fin des quotas sucriers européens : quelles options stratégiques pour les acteurs de la filière en Europe ?
7.2 Enjeu n°2 : l’évolution des équilibres commerciaux Informations détaillées Points clés L'essentiel Sommaire
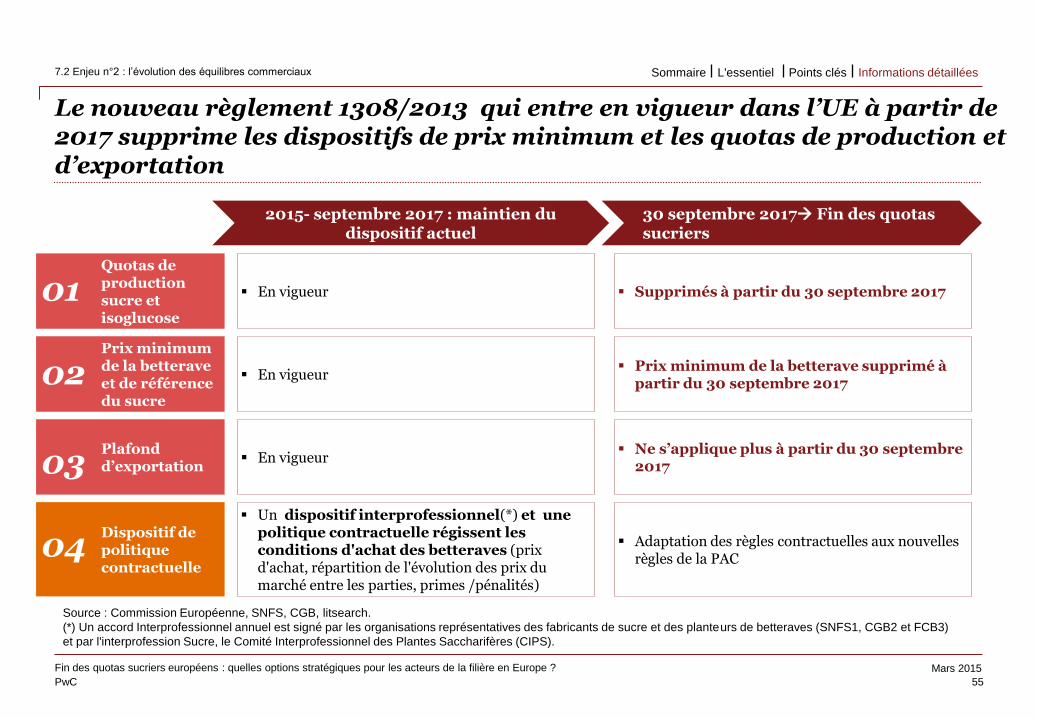
PwC
Mars 2015
Use the divider control box below to
make the slide title appear in your
primary TOC and section TOCs.
Please follow these steps:
Type ‘Divider’ in the control box
provided below.
Click the Divider command on the
Smart ribbon.
Enter the text that you’d like to appear
in the TOCs and select a divider level.
Click Update. The slide title should now
appear on all TOCs.
To remove the slide title from your
TOCs, delete the ‘Divider’ text from the
divider control box and hit Update.
Le nouveau règlement 1308/2013 qui entre en vigueur dans l’UE à partir de 2017 supprime les dispositifs de prix minimum et les quotas de production et d’exportation
55
Fin des quotas sucriers européens : quelles options stratégiques pour les acteurs de la filière en Europe ?
7.2 Enjeu n°2 : l’évolution des équilibres commerciaux
Use the divider control box below to
make the slide title appear in your
primary TOC and section TOCs.
Please follow these steps:
Type ‘Divider’ in the control box
provided below.
Click the Divider command on the
Smart ribbon.
Enter the text that you’d like to appear
in the TOCs and select a divider level.
Click Update. The slide title should now
appear on all TOCs.
To remove the slide title from your
TOCs, delete the ‘Divider’ text from the
divider control box and hit Update.
14%
57%
23%
6%
1 680 000
Un dispositif interprofessionnel(*) et une politique contractuelle régissent les conditions d'achat des betteraves (prix d'achat, répartition de l'évolution des prix du marché entre les parties, primes /pénalités)
Source : Commission Européenne, SNFS, CGB, litsearch.
(*) Un accord Interprofessionnel annuel est signé par les organisations représentatives des fabricants de sucre et des planteurs de betteraves (SNFS1, CGB2 et FCB3)
et par l'interprofession Sucre, le Comité Interprofessionnel des Plantes Saccharifères (CIPS).
30 septembre 2017 Fin des quotas sucriers
2015- septembre 2017 : maintien du dispositif actuel
Quotas de production sucre et isoglucose
Prix minimum de la betterave et de référence du sucre
Plafond d’exportation
01
02
03
Dispositif de politique contractuelle
04 Adaptation des règles contractuelles aux nouvelles règles de la PAC
Supprimés à partir du 30 septembre 2017
Prix minimum de la betterave supprimé à partir du 30 septembre 2017
Ne s’applique plus à partir du 30 septembre 2017
En vigueur
En vigueur
En vigueur
Informations détaillées Points clés L'essentiel Sommaire
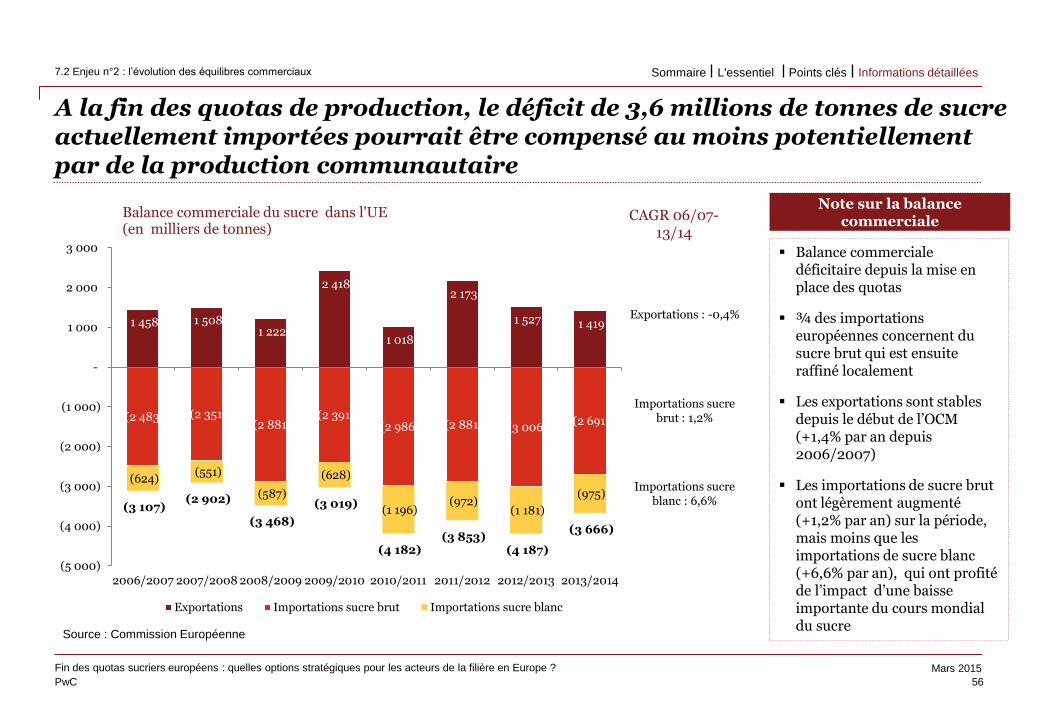
PwC
Mars 2015
Use the divider control box below to
make the slide title appear in your
primary TOC and section TOCs.
Please follow these steps:
Type ‘Divider’ in the control box
provided below.
Click the Divider command on the
Smart ribbon.
Enter the text that you’d like to appear
in the TOCs and select a divider level.
Click Update. The slide title should now
appear on all TOCs.
To remove the slide title from your
TOCs, delete the ‘Divider’ text from the
divider control box and hit Update.
A la fin des quotas de production, le déficit de 3,6 millions de tonnes de sucre actuellement importées pourrait être compensé au moins potentiellement par de la production communautaire
56
Fin des quotas sucriers européens : quelles options stratégiques pour les acteurs de la filière en Europe ?
7.2 Enjeu n°2 : l’évolution des équilibres commerciaux
Use the divider control box below to
make the slide title appear in your
primary TOC and section TOCs.
Please follow these steps:
Type ‘Divider’ in the control box
provided below.
Click the Divider command on the
Smart ribbon.
Enter the text that you’d like to appear
in the TOCs and select a divider level.
Click Update. The slide title should now
appear on all TOCs.
To remove the slide title from your
TOCs, delete the ‘Divider’ text from the
divider control box and hit Update.
1 458 1 508 1 222
2 418
1 018
2 173
1 527 1 419
(2 483) (2 351) (2 881)
(2 391) (2 986) (2 881) (3 006)
(2 691)
(624) (551)
(587)
(628)
(1 196) (972)
(1 181)
(975) (3 107)
(2 902)
(3 468)
(3 019)
(4 182) (3 853)
(4 187)
(3 666)
(5 000)
(4 000)
(3 000)
(2 000)
(1 000)
-
1 000
2 000
3 000
2006/2007 2007/2008 2008/2009 2009/2010 2010/2011 2011/2012 2012/2013 2013/2014
Balance commerciale du sucre dans l'UE (en milliers de tonnes)
Exportations Importations sucre brut Importations sucre blanc
Balance commerciale déficitaire depuis la mise en place des quotas
¾ des importations européennes concernent du sucre brut qui est ensuite raffiné localement
Les exportations sont stables depuis le début de l’OCM (+1,4% par an depuis 2006/2007)
Les importations de sucre brut ont légèrement augmenté (+1,2% par an) sur la période, mais moins que les importations de sucre blanc (+6,6% par an), qui ont profité de l’impact d’une baisse importante du cours mondial du sucre
Note sur la balance commerciale CAGR 06/07-
13/14
Exportations : -0,4%
Importations sucre brut : 1,2%
Importations sucre blanc : 6,6%
Source : Commission Européenne
Informations détaillées Points clés L'essentiel Sommaire
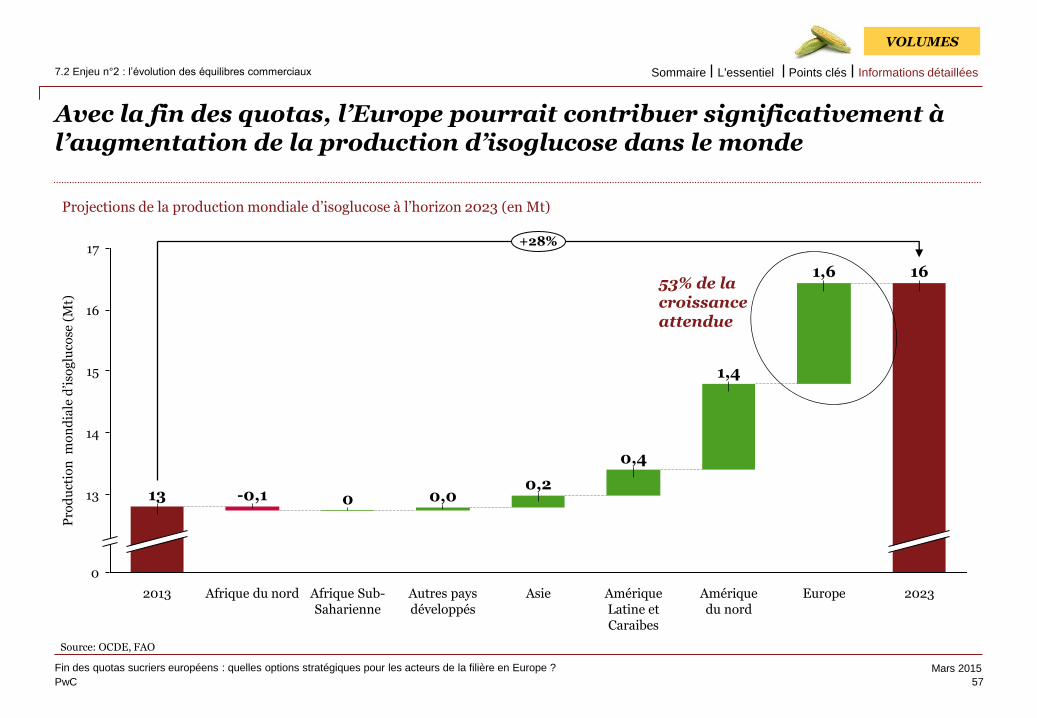
PwC
Mars 2015
Use the divider control box below to
make the slide title appear in your
primary TOC and section TOCs.
Please follow these steps:
Type ‘Divider’ in the control box
provided below.
Click the Divider command on the
Smart ribbon.
Enter the text that you’d like to appear
in the TOCs and select a divider level.
Click Update. The slide title should now
appear on all TOCs.
To remove the slide title from your
TOCs, delete the ‘Divider’ text from the
divider control box and hit Update.
Avec la fin des quotas, l’Europe pourrait contribuer significativement à l’augmentation de la production d’isoglucose dans le monde
57
Fin des quotas sucriers européens : quelles options stratégiques pour les acteurs de la filière en Europe ?
7.2 Enjeu n°2 : l’évolution des équilibres commerciaux
Use the divider control box below to
make the slide title appear in your
primary TOC and section TOCs.
Please follow these steps:
Type ‘Divider’ in the control box
provided below.
Click the Divider command on the
Smart ribbon.
Enter the text that you’d like to appear
in the TOCs and select a divider level.
Click Update. The slide title should now
appear on all TOCs.
To remove the slide title from your
TOCs, delete the ‘Divider’ text from the
divider control box and hit Update.
Source: OCDE, FAO
VOLUMES
17
13
16
15
14
0
Amérique du nord
2023
1,6
Europe
16
+28%
Pro
du
ctio
n m
on
dia
le d
’iso
glu
cose
(M
t)
1,4
Amérique Latine et Caraibes
0,4
Asie
0,2
Autres pays développés
0,0
Afrique Sub-Saharienne
0
Afrique du nord
-0,1
2013
13
Projections de la production mondiale d’isoglucose à l’horizon 2023 (en Mt)
53% de la croissance attendue
Informations détaillées Points clés L'essentiel Sommaire
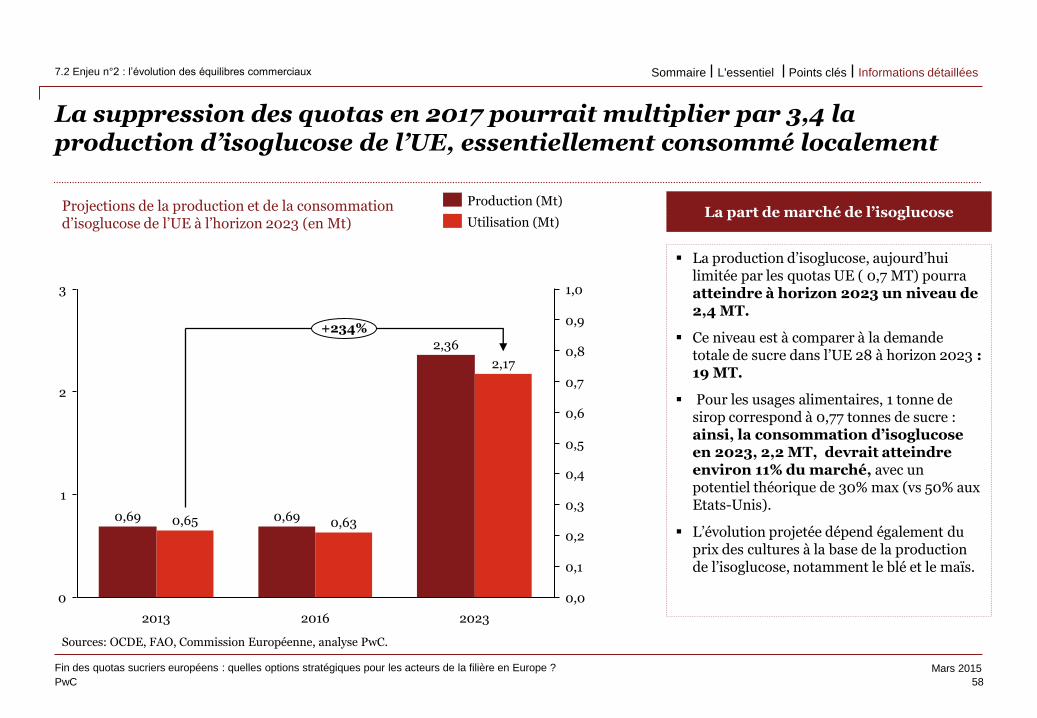
PwC
Mars 2015
Use the divider control box below to
make the slide title appear in your
primary TOC and section TOCs.
Please follow these steps:
Type ‘Divider’ in the control box
provided below.
Click the Divider command on the
Smart ribbon.
Enter the text that you’d like to appear
in the TOCs and select a divider level.
Click Update. The slide title should now
appear on all TOCs.
To remove the slide title from your
TOCs, delete the ‘Divider’ text from the
divider control box and hit Update.
La suppression des quotas en 2017 pourrait multiplier par 3,4 la production d’isoglucose de l’UE, essentiellement consommé localement
58
Fin des quotas sucriers européens : quelles options stratégiques pour les acteurs de la filière en Europe ?
7.2 Enjeu n°2 : l’évolution des équilibres commerciaux
Use the divider control box below to
make the slide title appear in your
primary TOC and section TOCs.
Please follow these steps:
Type ‘Divider’ in the control box
provided below.
Click the Divider command on the
Smart ribbon.
Enter the text that you’d like to appear
in the TOCs and select a divider level.
Click Update. The slide title should now
appear on all TOCs.
To remove the slide title from your
TOCs, delete the ‘Divider’ text from the
divider control box and hit Update.
Sources: OCDE, FAO, Commission Européenne, analyse PwC.
0,2
0,1
0,3
0,4
0,5
0
0,7
0,8
0,9
0,6
1,0 3
2
1
0,0
2,36
2,17
2023
+234%
0,69 0,65
2013
0,69 0,63
2016
Utilisation (Mt)
Production (Mt) Projections de la production et de la consommation d’isoglucose de l’UE à l’horizon 2023 (en Mt)
La production d’isoglucose, aujourd’hui limitée par les quotas UE ( 0,7 MT) pourra atteindre à horizon 2023 un niveau de 2,4 MT.
Ce niveau est à comparer à la demande totale de sucre dans l’UE 28 à horizon 2023 : 19 MT.
Pour les usages alimentaires, 1 tonne de sirop correspond à 0,77 tonnes de sucre : ainsi, la consommation d’isoglucose en 2023, 2,2 MT, devrait atteindre environ 11% du marché, avec un potentiel théorique de 30% max (vs 50% aux Etats-Unis).
L’évolution projetée dépend également du prix des cultures à la base de la production de l’isoglucose, notamment le blé et le maïs.
La part de marché de l’isoglucose
Informations détaillées Points clés L'essentiel Sommaire
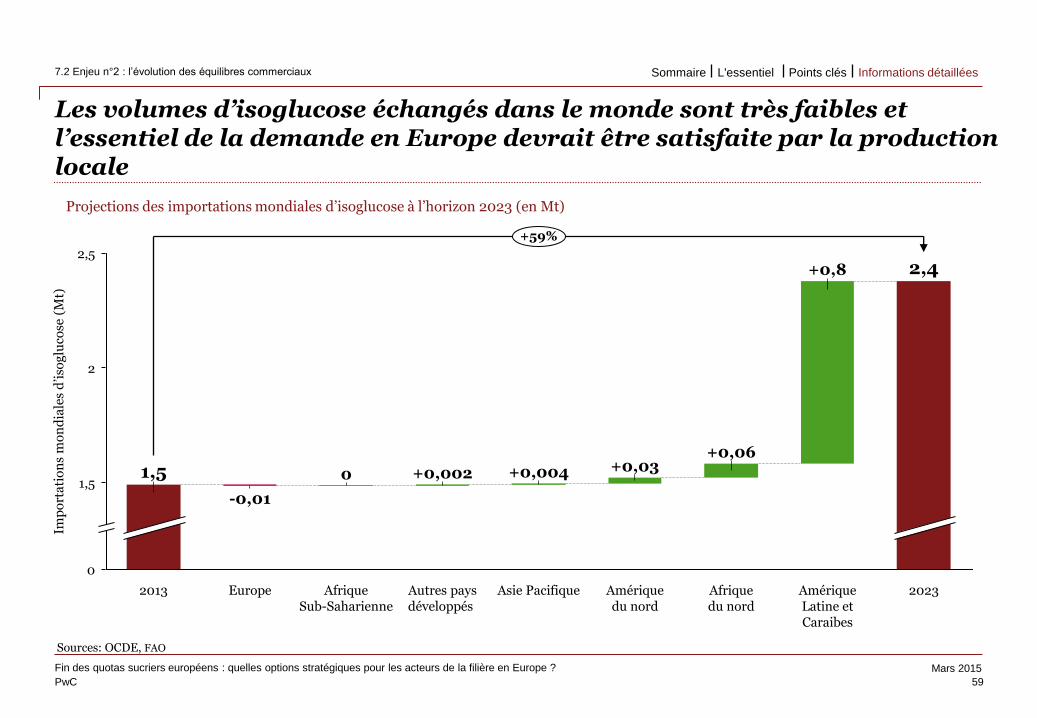
PwC
Mars 2015
Use the divider control box below to
make the slide title appear in your
primary TOC and section TOCs.
Please follow these steps:
Type ‘Divider’ in the control box
provided below.
Click the Divider command on the
Smart ribbon.
Enter the text that you’d like to appear
in the TOCs and select a divider level.
Click Update. The slide title should now
appear on all TOCs.
To remove the slide title from your
TOCs, delete the ‘Divider’ text from the
divider control box and hit Update.
Les volumes d’isoglucose échangés dans le monde sont très faibles et l’essentiel de la demande en Europe devrait être satisfaite par la production locale
Sources: OCDE, FAO
59
Fin des quotas sucriers européens : quelles options stratégiques pour les acteurs de la filière en Europe ?
7.2 Enjeu n°2 : l’évolution des équilibres commerciaux
Use the divider control box below to
make the slide title appear in your
primary TOC and section TOCs.
Please follow these steps:
Type ‘Divider’ in the control box
provided below.
Click the Divider command on the
Smart ribbon.
Enter the text that you’d like to appear
in the TOCs and select a divider level.
Click Update. The slide title should now
appear on all TOCs.
To remove the slide title from your
TOCs, delete the ‘Divider’ text from the
divider control box and hit Update.
2,5
1,5
0
2
+59%
Autres pays développés
+0,03
Afrique Sub-Saharienne
Europe
-0,01
2013
0
Amérique du nord
Afrique du nord
+0,002
Asie Pacifique 2023
+0,004
2,4
Amérique Latine et Caraibes
+0,8
+0,06
Imp
ort
ati
on
s m
on
dia
les
d’i
sog
luco
se (
Mt)
1,5
Projections des importations mondiales d’isoglucose à l’horizon 2023 (en Mt)
Informations détaillées Points clés L'essentiel Sommaire
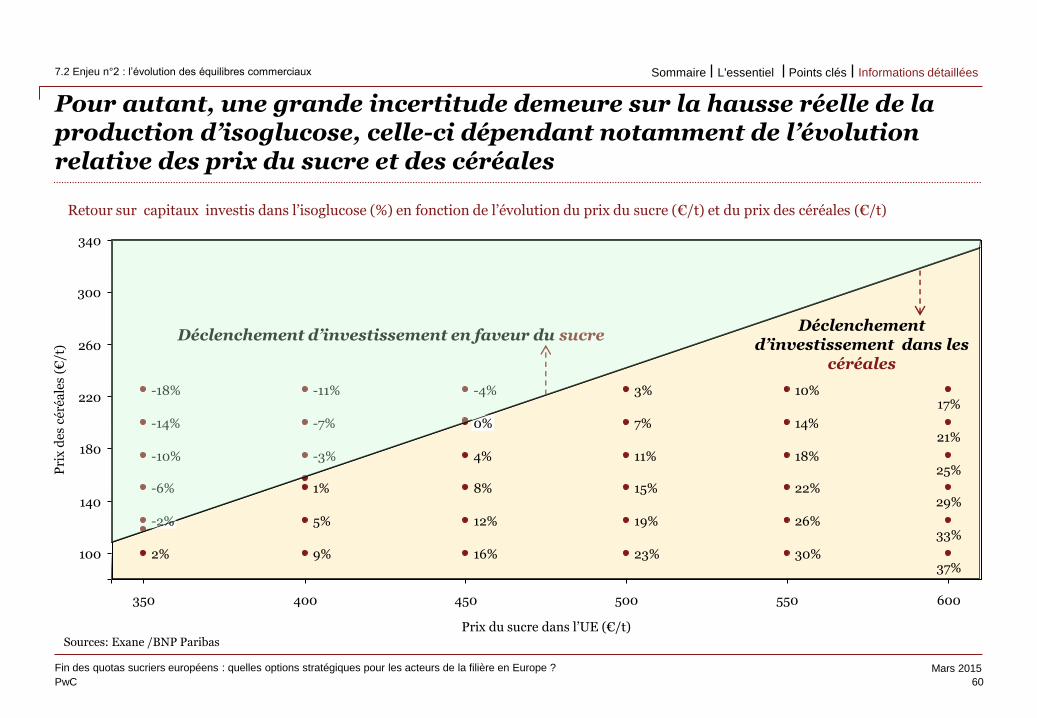
PwC
Mars 2015
Use the divider control box below to
make the slide title appear in your
primary TOC and section TOCs.
Please follow these steps:
Type ‘Divider’ in the control box
provided below.
Click the Divider command on the
Smart ribbon.
Enter the text that you’d like to appear
in the TOCs and select a divider level.
Click Update. The slide title should now
appear on all TOCs.
To remove the slide title from your
TOCs, delete the ‘Divider’ text from the
divider control box and hit Update.
Pour autant, une grande incertitude demeure sur la hausse réelle de la production d’isoglucose, celle-ci dépendant notamment de l’évolution relative des prix du sucre et des céréales
60
Fin des quotas sucriers européens : quelles options stratégiques pour les acteurs de la filière en Europe ?
7.2 Enjeu n°2 : l’évolution des équilibres commerciaux
Use the divider control box below to
make the slide title appear in your
primary TOC and section TOCs.
Please follow these steps:
Type ‘Divider’ in the control box
provided below.
Click the Divider command on the
Smart ribbon.
Enter the text that you’d like to appear
in the TOCs and select a divider level.
Click Update. The slide title should now
appear on all TOCs.
To remove the slide title from your
TOCs, delete the ‘Divider’ text from the
divider control box and hit Update.
600 550 500 450 400 350
220
300
340
260
100
140
180
17%
21%
25%
29%
33%
11%
15%
19%
23%
-4%
0%
4%
8%
12%
16%
-11% 3%
Pri
x d
es c
éréa
les
(€/t
)
30%
26%
22%
18%
14%
10%
37%
Prix du sucre dans l’UE (€/t)
-7%
-3%
1%
7%
9%
-18%
-14%
-10%
-6%
-2%
2%
5%
Retour sur capitaux investis dans l’isoglucose (%) en fonction de l’évolution du prix du sucre (€/t) et du prix des céréales (€/t)
Déclenchement d’investissement en faveur du sucre
Sources: Exane /BNP Paribas
Déclenchement d’investissement dans les
céréales
Informations détaillées Points clés L'essentiel Sommaire
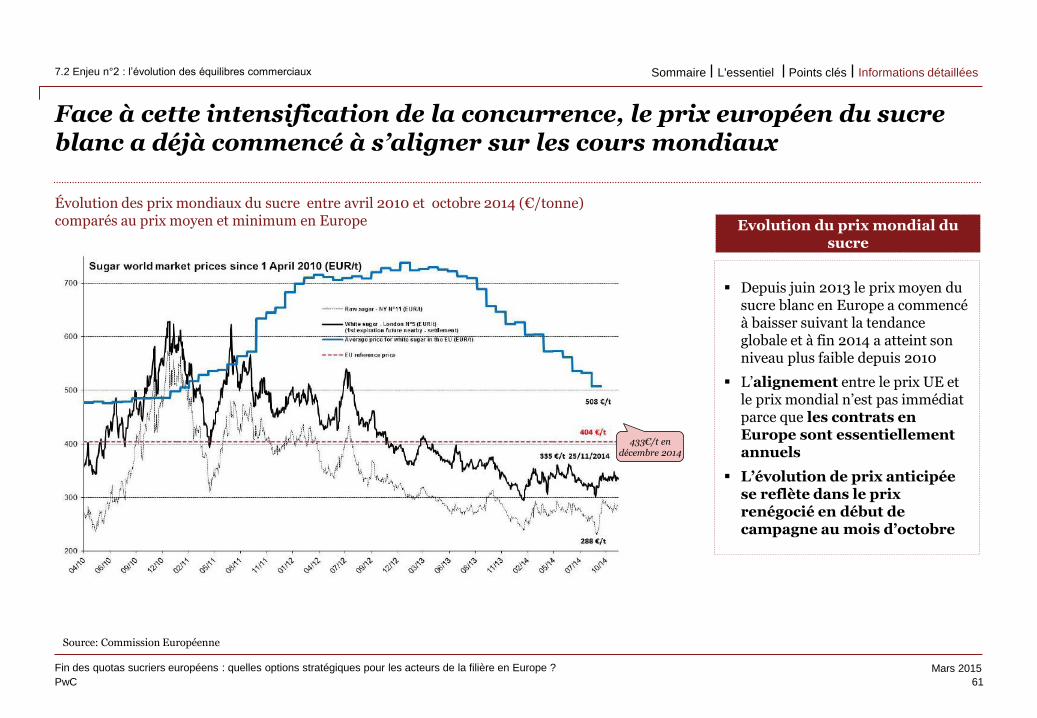
PwC
Mars 2015
Use the divider control box below to
make the slide title appear in your
primary TOC and section TOCs.
Please follow these steps:
Type ‘Divider’ in the control box
provided below.
Click the Divider command on the
Smart ribbon.
Enter the text that you’d like to appear
in the TOCs and select a divider level.
Click Update. The slide title should now
appear on all TOCs.
To remove the slide title from your
TOCs, delete the ‘Divider’ text from the
divider control box and hit Update.
Face à cette intensification de la concurrence, le prix européen du sucre blanc a déjà commencé à s’aligner sur les cours mondiaux
Depuis juin 2013 le prix moyen du sucre blanc en Europe a commencé à baisser suivant la tendance globale et à fin 2014 a atteint son niveau plus faible depuis 2010
L’alignement entre le prix UE et le prix mondial n’est pas immédiat parce que les contrats en Europe sont essentiellement annuels
L’évolution de prix anticipée se reflète dans le prix renégocié en début de campagne au mois d’octobre
Evolution du prix mondial du sucre
Source: Commission Européenne
Évolution des prix mondiaux du sucre entre avril 2010 et octobre 2014 (€/tonne) comparés au prix moyen et minimum en Europe
61
Fin des quotas sucriers européens : quelles options stratégiques pour les acteurs de la filière en Europe ?
7.2 Enjeu n°2 : l’évolution des équilibres commerciaux
Use the divider control box below to
make the slide title appear in your
primary TOC and section TOCs.
Please follow these steps:
Type ‘Divider’ in the control box
provided below.
Click the Divider command on the
Smart ribbon.
Enter the text that you’d like to appear
in the TOCs and select a divider level.
Click Update. The slide title should now
appear on all TOCs.
To remove the slide title from your
TOCs, delete the ‘Divider’ text from the
divider control box and hit Update. 433€/t en
décembre 2014
Informations détaillées Points clés L'essentiel Sommaire
PwC
Mars 2015
Enjeu n°3 : la consolidation de la chaîne de valeur
62
Fin des quotas sucriers européens : quelles options stratégiques pour les acteurs de la filière en Europe ?
7.3 Enjeu n°3 : la consolidation de la chaîne de valeur Informations détaillées Points clés L'essentiel Sommaire
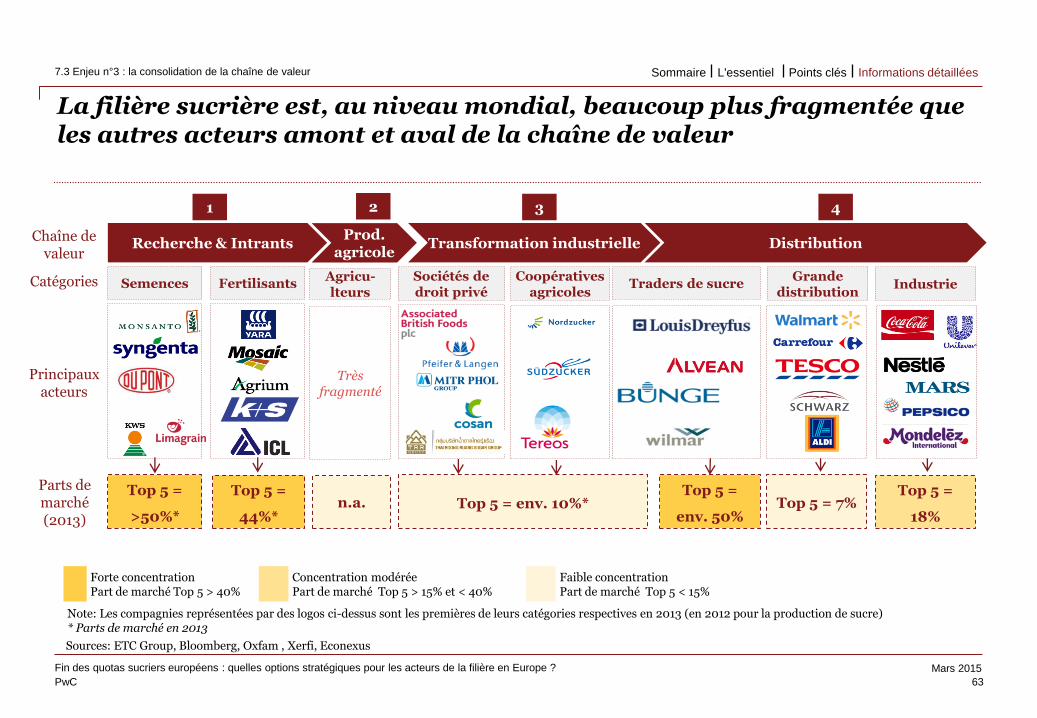
PwC
Mars 2015
Use the divider control box below to
make the slide title appear in your
primary TOC and section TOCs.
Please follow these steps:
Type ‘Divider’ in the control box
provided below.
Click the Divider command on the
Smart ribbon.
Enter the text that you’d like to appear
in the TOCs and select a divider level.
Click Update. The slide title should now
appear on all TOCs.
To remove the slide title from your
TOCs, delete the ‘Divider’ text from the
divider control box and hit Update.
Sources: ETC Group, Bloomberg, Oxfam , Xerfi, Econexus
La filière sucrière est, au niveau mondial, beaucoup plus fragmentée que les autres acteurs amont et aval de la chaîne de valeur
63
Fin des quotas sucriers européens : quelles options stratégiques pour les acteurs de la filière en Europe ?
7.3 Enjeu n°3 : la consolidation de la chaîne de valeur
Use the divider control box below to
make the slide title appear in your
primary TOC and section TOCs.
Please follow these steps:
Type ‘Divider’ in the control box
provided below.
Click the Divider command on the
Smart ribbon.
Enter the text that you’d like to appear
in the TOCs and select a divider level.
Click Update. The slide title should now
appear on all TOCs.
To remove the slide title from your
TOCs, delete the ‘Divider’ text from the
divider control box and hit Update.
Recherche & Intrants Transformation industrielle Distribution
1 2 3 4
Note: Les compagnies représentées par des logos ci-dessus sont les premières de leurs catégories respectives en 2013 (en 2012 pour la production de sucre) * Parts de marché en 2013
Coopératives agricoles
Traders de sucre Grande
distribution Industrie Semences
Sociétés de droit privé
Top 5 =
>50%* Top 5 = env. 10%*
Fertilisants
Top 5 =
env. 50%
Parts de marché (2013)
Top 5 =
44%*
Top 5 =
18% Top 5 = 7%
Principaux acteurs
Chaîne de valeur
Catégories
Forte concentration Part de marché Top 5 > 40%
Concentration modérée Part de marché Top 5 > 15% et < 40%
Faible concentration Part de marché Top 5 < 15%
Prod. agricole
Agricu-lteurs
n.a.
Très fragmenté
Informations détaillées Points clés L'essentiel Sommaire
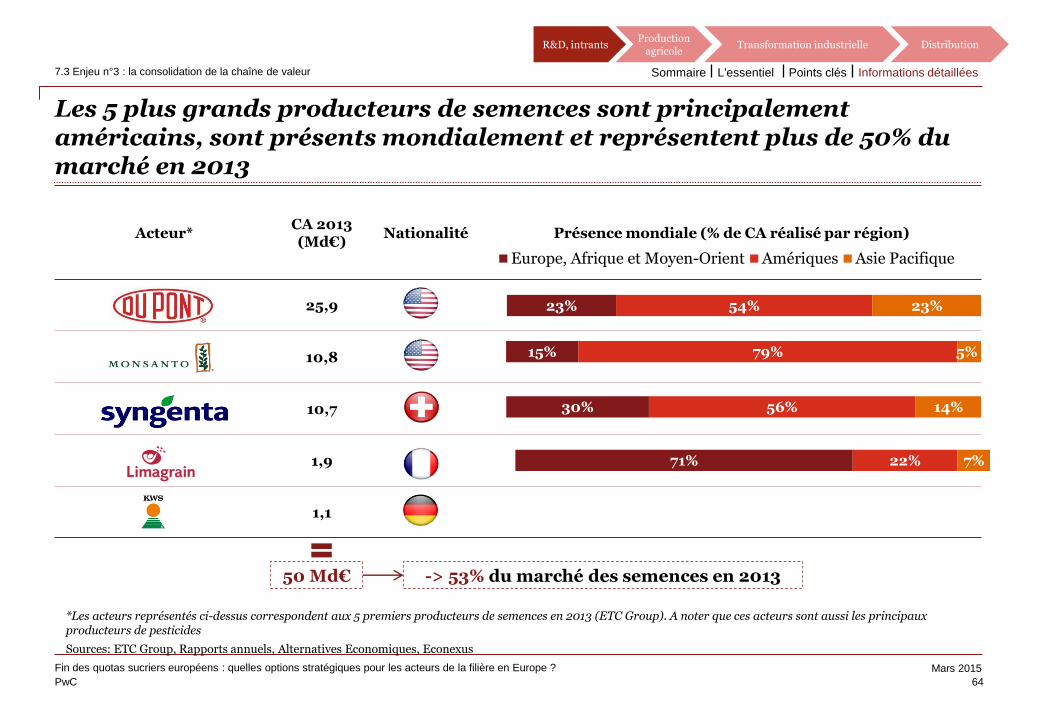
PwC
Mars 2015
Use the divider control box below to
make the slide title appear in your
primary TOC and section TOCs.
Please follow these steps:
Type ‘Divider’ in the control box
provided below.
Click the Divider command on the
Smart ribbon.
Enter the text that you’d like to appear
in the TOCs and select a divider level.
Click Update. The slide title should now
appear on all TOCs.
To remove the slide title from your
TOCs, delete the ‘Divider’ text from the
divider control box and hit Update.
Acteur* CA 2013 (Md€)
Nationalité Présence mondiale (% de CA réalisé par région)
25,9
10,8
10,7
1,9
1,1
Les 5 plus grands producteurs de semences sont principalement américains, sont présents mondialement et représentent plus de 50% du marché en 2013
23% 54% 23%
Europe, Afrique et Moyen-Orient Amériques Asie Pacifique
15% 79% 5%
30% 56% 14%
71% 22% 7%
Sources: ETC Group, Rapports annuels, Alternatives Economiques, Econexus
*Les acteurs représentés ci-dessus correspondent aux 5 premiers producteurs de semences en 2013 (ETC Group). A noter que ces acteurs sont aussi les principaux producteurs de pesticides
R&D, intrants Production
agricole Transformation industrielle Distribution
50 Md€ -> 53% du marché des semences en 2013
64
Fin des quotas sucriers européens : quelles options stratégiques pour les acteurs de la filière en Europe ?
7.3 Enjeu n°3 : la consolidation de la chaîne de valeur
Use the divider control box below to
make the slide title appear in your
primary TOC and section TOCs.
Please follow these steps:
Type ‘Divider’ in the control box
provided below.
Click the Divider command on the
Smart ribbon.
Enter the text that you’d like to appear
in the TOCs and select a divider level.
Click Update. The slide title should now
appear on all TOCs.
To remove the slide title from your
TOCs, delete the ‘Divider’ text from the
divider control box and hit Update.
Informations détaillées Points clés L'essentiel Sommaire
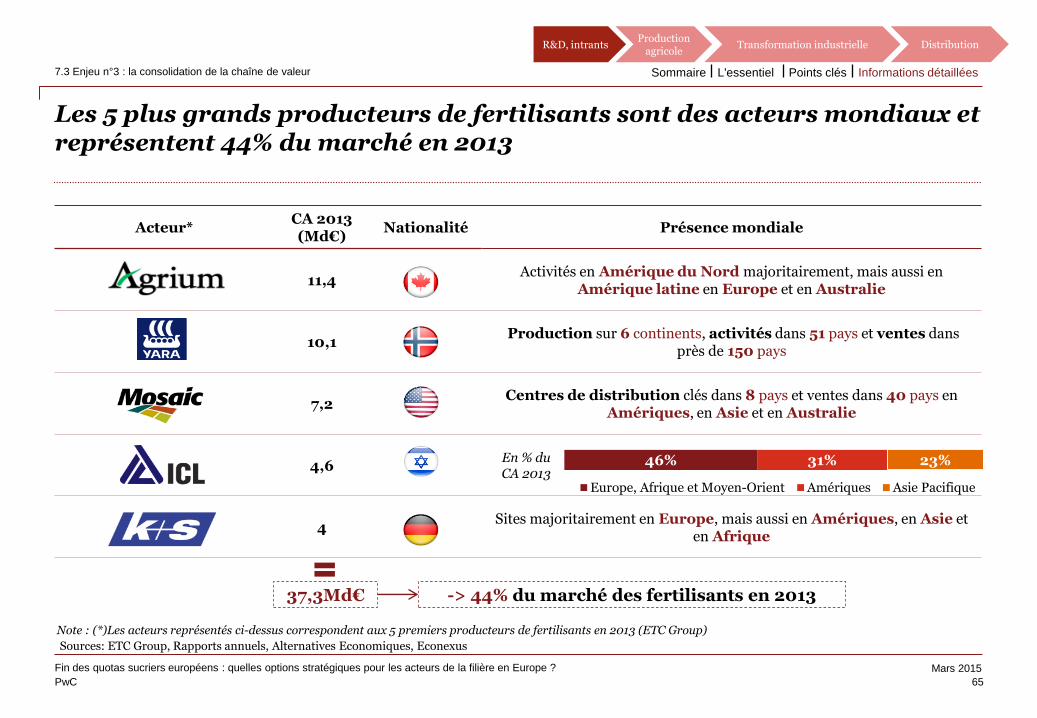
PwC
Mars 2015
Use the divider control box below to
make the slide title appear in your
primary TOC and section TOCs.
Please follow these steps:
Type ‘Divider’ in the control box
provided below.
Click the Divider command on the
Smart ribbon.
Enter the text that you’d like to appear
in the TOCs and select a divider level.
Click Update. The slide title should now
appear on all TOCs.
To remove the slide title from your
TOCs, delete the ‘Divider’ text from the
divider control box and hit Update.
Les 5 plus grands producteurs de fertilisants sont des acteurs mondiaux et représentent 44% du marché en 2013
R&D, intrants Production
agricole Transformation industrielle Distribution
Sources: ETC Group, Rapports annuels, Alternatives Economiques, Econexus
Note : (*)Les acteurs représentés ci-dessus correspondent aux 5 premiers producteurs de fertilisants en 2013 (ETC Group)
65
Fin des quotas sucriers européens : quelles options stratégiques pour les acteurs de la filière en Europe ?
7.3 Enjeu n°3 : la consolidation de la chaîne de valeur
Use the divider control box below to
make the slide title appear in your
primary TOC and section TOCs.
Please follow these steps:
Type ‘Divider’ in the control box
provided below.
Click the Divider command on the
Smart ribbon.
Enter the text that you’d like to appear
in the TOCs and select a divider level.
Click Update. The slide title should now
appear on all TOCs.
To remove the slide title from your
TOCs, delete the ‘Divider’ text from the
divider control box and hit Update.
Acteur* CA 2013 (Md€)
Nationalité Présence mondiale
11,4 Activités en Amérique du Nord majoritairement, mais aussi en
Amérique latine en Europe et en Australie
10,1 Production sur 6 continents, activités dans 51 pays et ventes dans
près de 150 pays
7,2 Centres de distribution clés dans 8 pays et ventes dans 40 pays en
Amériques, en Asie et en Australie
4,6
4 Sites majoritairement en Europe, mais aussi en Amériques, en Asie et
en Afrique
37,3Md€ -> 44% du marché des fertilisants en 2013
46% 31% 23%
Europe, Afrique et Moyen-Orient Amériques Asie Pacifique
En % du CA 2013
Informations détaillées Points clés L'essentiel Sommaire
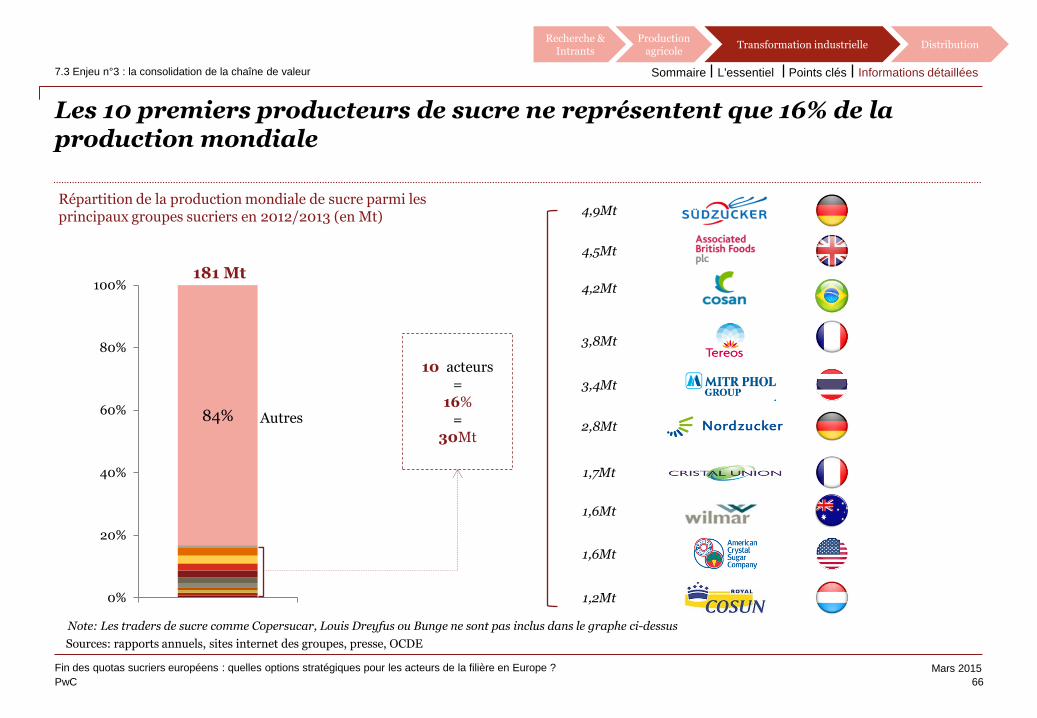
PwC
Mars 2015
Use the divider control box below to
make the slide title appear in your
primary TOC and section TOCs.
Please follow these steps:
Type ‘Divider’ in the control box
provided below.
Click the Divider command on the
Smart ribbon.
Enter the text that you’d like to appear
in the TOCs and select a divider level.
Click Update. The slide title should now
appear on all TOCs.
To remove the slide title from your
TOCs, delete the ‘Divider’ text from the
divider control box and hit Update.
Les 10 premiers producteurs de sucre ne représentent que 16% de la production mondiale
Recherche & Intrants
Production agricole
Transformation industrielle Distribution
66
Fin des quotas sucriers européens : quelles options stratégiques pour les acteurs de la filière en Europe ?
7.3 Enjeu n°3 : la consolidation de la chaîne de valeur
Use the divider control box below to
make the slide title appear in your
primary TOC and section TOCs.
Please follow these steps:
Type ‘Divider’ in the control box
provided below.
Click the Divider command on the
Smart ribbon.
Enter the text that you’d like to appear
in the TOCs and select a divider level.
Click Update. The slide title should now
appear on all TOCs.
To remove the slide title from your
TOCs, delete the ‘Divider’ text from the
divider control box and hit Update.
84%
0%
20%
40%
60%
80%
100%181 Mt
Autres
Sources: rapports annuels, sites internet des groupes, presse, OCDE
10 acteurs =
16% =
30Mt
Note: Les traders de sucre comme Copersucar, Louis Dreyfus ou Bunge ne sont pas inclus dans le graphe ci-dessus
Répartition de la production mondiale de sucre parmi les principaux groupes sucriers en 2012/2013 (en Mt) 4,9Mt
4,5Mt
4,2Mt
3,8Mt
2,8Mt
1,7Mt
1,6Mt
1,2Mt
3,4Mt
1,6Mt
Informations détaillées Points clés L'essentiel Sommaire
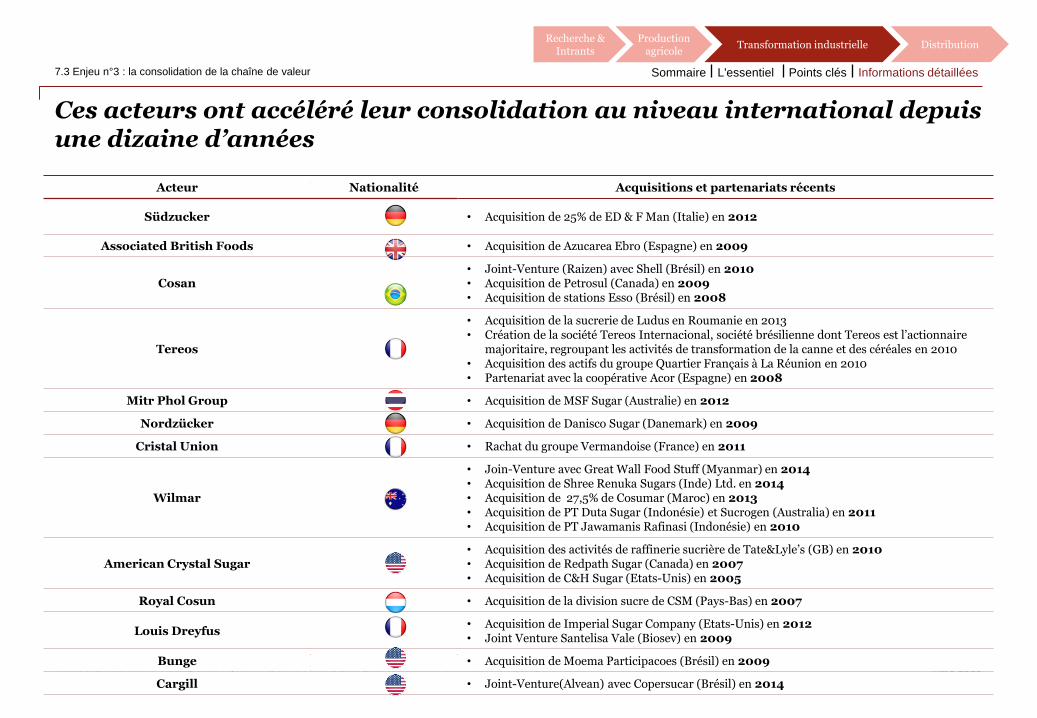
PwC
Mars 2015
Use the divider control box below to
make the slide title appear in your
primary TOC and section TOCs.
Please follow these steps:
Type ‘Divider’ in the control box
provided below.
Click the Divider command on the
Smart ribbon.
Enter the text that you’d like to appear
in the TOCs and select a divider level.
Click Update. The slide title should now
appear on all TOCs.
To remove the slide title from your
TOCs, delete the ‘Divider’ text from the
divider control box and hit Update.
Ces acteurs ont accéléré leur consolidation au niveau international depuis une dizaine d’années
Recherche & Intrants
Production agricole
Transformation industrielle Distribution
67
Fin des quotas sucriers européens : quelles options stratégiques pour les acteurs de la filière en Europe ?
7.3 Enjeu n°3 : la consolidation de la chaîne de valeur
Use the divider control box below to
make the slide title appear in your
primary TOC and section TOCs.
Please follow these steps:
Type ‘Divider’ in the control box
provided below.
Click the Divider command on the
Smart ribbon.
Enter the text that you’d like to appear
in the TOCs and select a divider level.
Click Update. The slide title should now
appear on all TOCs.
To remove the slide title from your
TOCs, delete the ‘Divider’ text from the
divider control box and hit Update.
Acteur Nationalité Acquisitions et partenariats récents
Südzucker • Acquisition de 25% de ED & F Man (Italie) en 2012
Associated British Foods • Acquisition de Azucarea Ebro (Espagne) en 2009
Cosan • Joint-Venture (Raizen) avec Shell (Brésil) en 2010 • Acquisition de Petrosul (Canada) en 2009 • Acquisition de stations Esso (Brésil) en 2008
Tereos
• Acquisition de la sucrerie de Ludus en Roumanie en 2013 • Création de la société Tereos Internacional, société brésilienne dont Tereos est l’actionnaire
majoritaire, regroupant les activités de transformation de la canne et des céréales en 2010 • Acquisition des actifs du groupe Quartier Français à La Réunion en 2010 • Partenariat avec la coopérative Acor (Espagne) en 2008
Mitr Phol Group • Acquisition de MSF Sugar (Australie) en 2012
Nordzücker • Acquisition de Danisco Sugar (Danemark) en 2009
Cristal Union • Rachat du groupe Vermandoise (France) en 2011
Wilmar
• Join-Venture avec Great Wall Food Stuff (Myanmar) en 2014 • Acquisition de Shree Renuka Sugars (Inde) Ltd. en 2014 • Acquisition de 27,5% de Cosumar (Maroc) en 2013 • Acquisition de PT Duta Sugar (Indonésie) et Sucrogen (Australia) en 2011 • Acquisition de PT Jawamanis Rafinasi (Indonésie) en 2010
American Crystal Sugar • Acquisition des activités de raffinerie sucrière de Tate&Lyle’s (GB) en 2010 • Acquisition de Redpath Sugar (Canada) en 2007 • Acquisition de C&H Sugar (Etats-Unis) en 2005
Royal Cosun • Acquisition de la division sucre de CSM (Pays-Bas) en 2007
Louis Dreyfus • Acquisition de Imperial Sugar Company (Etats-Unis) en 2012 • Joint Venture Santelisa Vale (Biosev) en 2009
Bunge • Acquisition de Moema Participacoes (Brésil) en 2009
Cargill • Joint-Venture(Alvean) avec Copersucar (Brésil) en 2014
Informations détaillées Points clés L'essentiel Sommaire
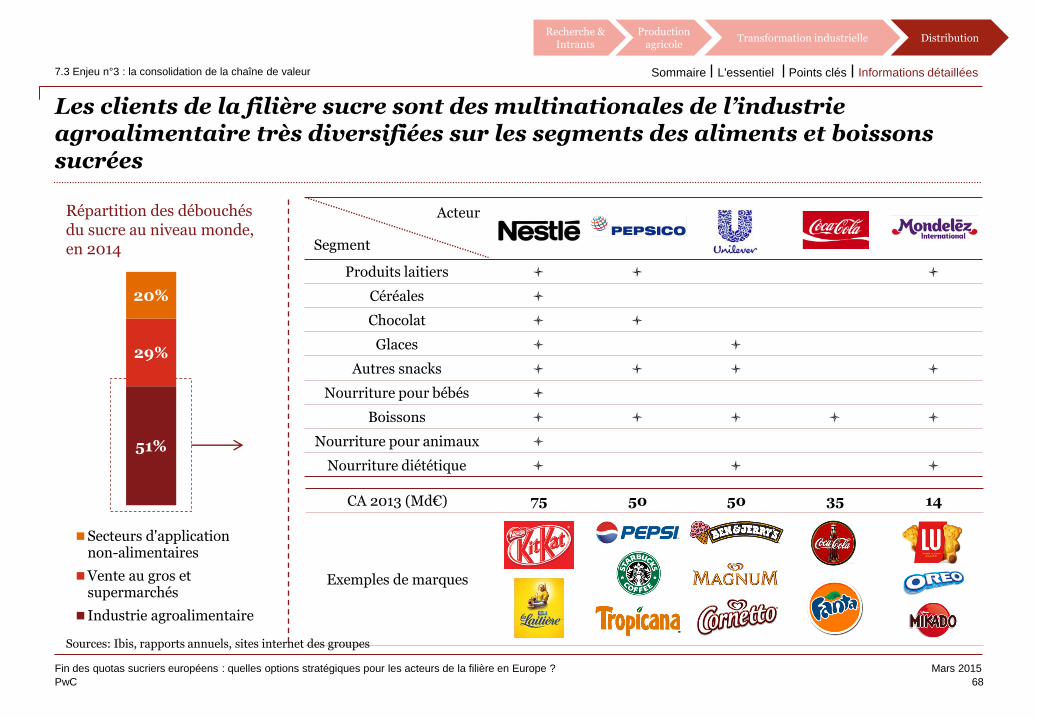
PwC
Mars 2015
Use the divider control box below to
make the slide title appear in your
primary TOC and section TOCs.
Please follow these steps:
Type ‘Divider’ in the control box
provided below.
Click the Divider command on the
Smart ribbon.
Enter the text that you’d like to appear
in the TOCs and select a divider level.
Click Update. The slide title should now
appear on all TOCs.
To remove the slide title from your
TOCs, delete the ‘Divider’ text from the
divider control box and hit Update.
Les clients de la filière sucre sont des multinationales de l’industrie agroalimentaire très diversifiées sur les segments des aliments et boissons sucrées
Recherche & Intrants
Production agricole
Transformation industrielle Distribution
7.3 Enjeu n°3 : la consolidation de la chaîne de valeur
Use the divider control box below to
make the slide title appear in your
primary TOC and section TOCs.
Please follow these steps:
Type ‘Divider’ in the control box
provided below.
Click the Divider command on the
Smart ribbon.
Enter the text that you’d like to appear
in the TOCs and select a divider level.
Click Update. The slide title should now
appear on all TOCs.
To remove the slide title from your
TOCs, delete the ‘Divider’ text from the
divider control box and hit Update.
Produits laitiers l l l
Céréales l
Chocolat l l
Glaces l l
Autres snacks l l l l
Nourriture pour bébés l
Boissons l l l l l
Nourriture pour animaux l
Nourriture diététique l l l
CA 2013 (Md€) 75 50 50 35 14
Exemples de marques
Segment
Acteur
68
Fin des quotas sucriers européens : quelles options stratégiques pour les acteurs de la filière en Europe ?
Sources: Ibis, rapports annuels, sites internet des groupes
51%
29%
20%
Secteurs d'applicationnon-alimentaires
Vente au gros etsupermarchés
Industrie agroalimentaire
Répartition des débouchés du sucre au niveau monde, en 2014
Informations détaillées Points clés L'essentiel Sommaire
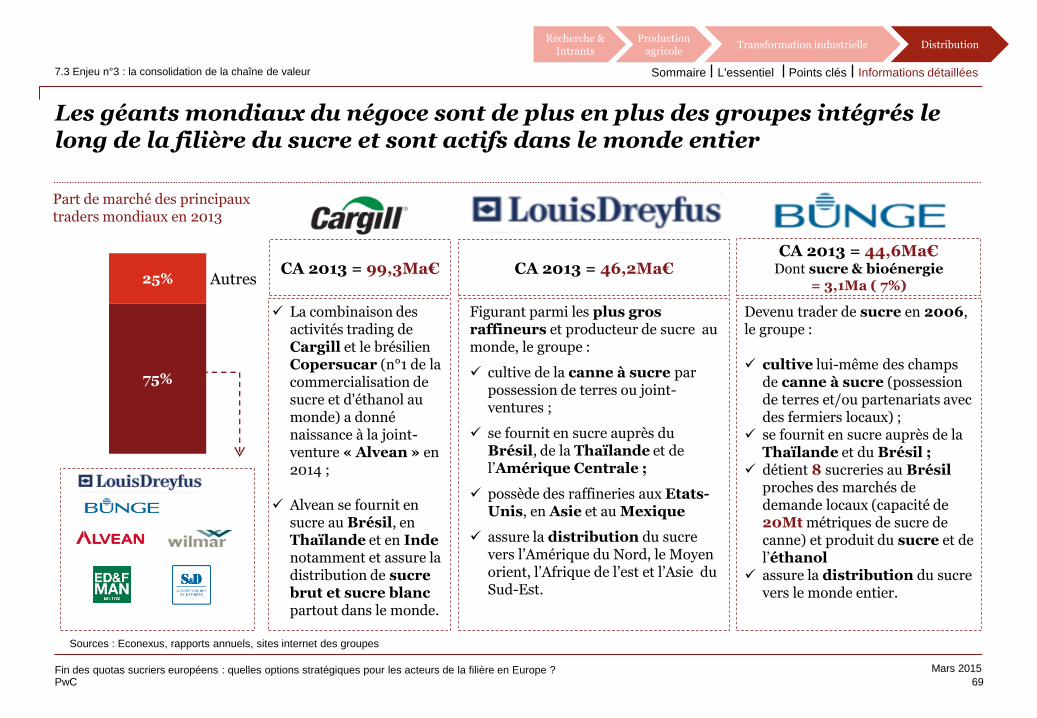
PwC
Mars 2015
Use the divider control box below to
make the slide title appear in your
primary TOC and section TOCs.
Please follow these steps:
Type ‘Divider’ in the control box
provided below.
Click the Divider command on the
Smart ribbon.
Enter the text that you’d like to appear
in the TOCs and select a divider level.
Click Update. The slide title should now
appear on all TOCs.
To remove the slide title from your
TOCs, delete the ‘Divider’ text from the
divider control box and hit Update.
Les géants mondiaux du négoce sont de plus en plus des groupes intégrés le long de la filière du sucre et sont actifs dans le monde entier
Recherche & Intrants
Production agricole
Transformation industrielle Distribution
69 Fin des quotas sucriers européens : quelles options stratégiques pour les acteurs de la filière en Europe ?
7.3 Enjeu n°3 : la consolidation de la chaîne de valeur
Use the divider control box below to
make the slide title appear in your
primary TOC and section TOCs.
Please follow these steps:
Type ‘Divider’ in the control box
provided below.
Click the Divider command on the
Smart ribbon.
Enter the text that you’d like to appear
in the TOCs and select a divider level.
Click Update. The slide title should now
appear on all TOCs.
To remove the slide title from your
TOCs, delete the ‘Divider’ text from the
divider control box and hit Update.
Sources : Econexus, rapports annuels, sites internet des groupes
75%
25%
Part de marché des principaux traders mondiaux en 2013
Autres
Devenu trader de sucre en 2006, le groupe : cultive lui-même des champs
de canne à sucre (possession de terres et/ou partenariats avec des fermiers locaux) ;
se fournit en sucre auprès de la Thaïlande et du Brésil ;
détient 8 sucreries au Brésil proches des marchés de demande locaux (capacité de 20Mt métriques de sucre de canne) et produit du sucre et de l’éthanol
assure la distribution du sucre vers le monde entier.
Figurant parmi les plus gros raffineurs et producteur de sucre au monde, le groupe :
cultive de la canne à sucre par possession de terres ou joint-ventures ;
se fournit en sucre auprès du Brésil, de la Thaïlande et de l’Amérique Centrale ;
possède des raffineries aux Etats-Unis, en Asie et au Mexique
assure la distribution du sucre vers l’Amérique du Nord, le Moyen orient, l’Afrique de l’est et l’Asie du Sud-Est.
CA 2013 = 44,6Ma€ Dont sucre & bioénergie
= 3,1Ma ( 7%) CA 2013 = 46,2Ma€ CA 2013 = 99,3Ma€
La combinaison des activités trading de Cargill et le brésilien Copersucar (n°1 de la commercialisation de sucre et d'éthanol au monde) a donné naissance à la joint-venture « Alvean » en 2014 ;
Alvean se fournit en sucre au Brésil, en Thaïlande et en Inde notamment et assure la distribution de sucre brut et sucre blanc partout dans le monde.
Informations détaillées Points clés L'essentiel Sommaire
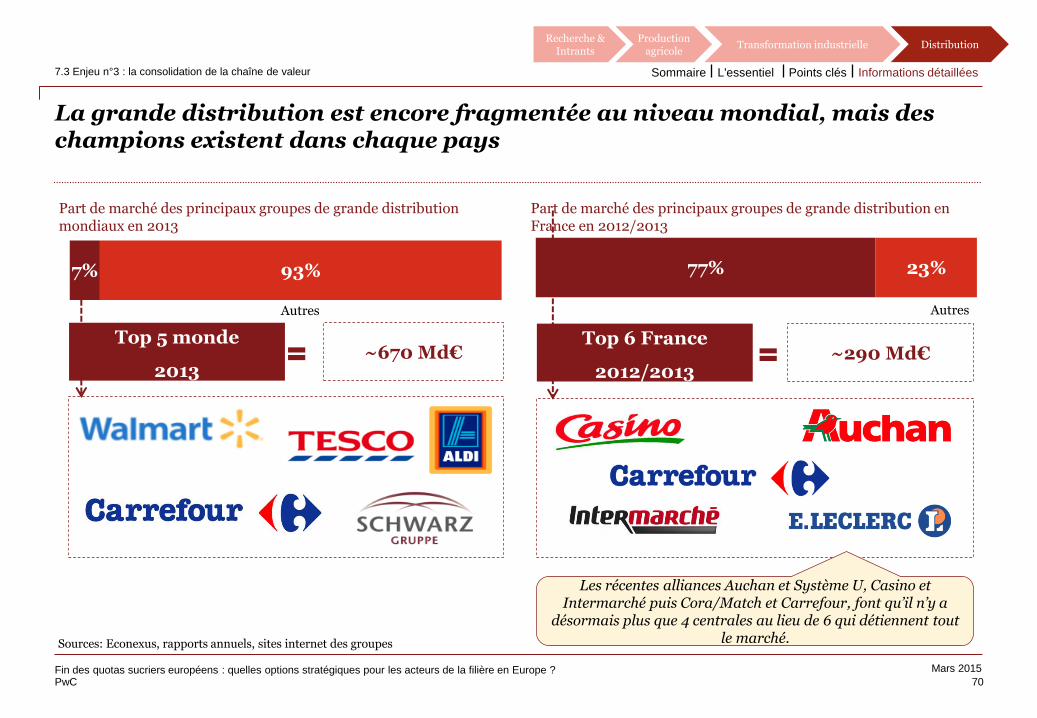
PwC
Mars 2015
Use the divider control box below to
make the slide title appear in your
primary TOC and section TOCs.
Please follow these steps:
Type ‘Divider’ in the control box
provided below.
Click the Divider command on the
Smart ribbon.
Enter the text that you’d like to appear
in the TOCs and select a divider level.
Click Update. The slide title should now
appear on all TOCs.
To remove the slide title from your
TOCs, delete the ‘Divider’ text from the
divider control box and hit Update.
La grande distribution est encore fragmentée au niveau mondial, mais des champions existent dans chaque pays
Recherche & Intrants
Production agricole
Transformation industrielle Distribution
70 Fin des quotas sucriers européens : quelles options stratégiques pour les acteurs de la filière en Europe ?
7.3 Enjeu n°3 : la consolidation de la chaîne de valeur
Use the divider control box below to
make the slide title appear in your
primary TOC and section TOCs.
Please follow these steps:
Type ‘Divider’ in the control box
provided below.
Click the Divider command on the
Smart ribbon.
Enter the text that you’d like to appear
in the TOCs and select a divider level.
Click Update. The slide title should now
appear on all TOCs.
To remove the slide title from your
TOCs, delete the ‘Divider’ text from the
divider control box and hit Update.
Top 5 monde
2013
Part de marché des principaux groupes de grande distribution mondiaux en 2013
Sources: Econexus, rapports annuels, sites internet des groupes
Part de marché des principaux groupes de grande distribution en France en 2012/2013
~670 Md€
7% 93%
Autres Autres
Top 6 France
2012/2013 ~290 Md€
77% 23%
Les récentes alliances Auchan et Système U, Casino et Intermarché puis Cora/Match et Carrefour, font qu’il n’y a
désormais plus que 4 centrales au lieu de 6 qui détiennent tout le marché.
Informations détaillées Points clés L'essentiel Sommaire
PwC
Mars 2015
Impacts et enjeux pour la filière en Europe et en France
71
Fin des quotas sucriers européens : quelles options stratégiques pour les acteurs de la filière en Europe ?
8 Impacts et enjeux pour la filière en Europe et en France Informations détaillées Points clés L'essentiel Sommaire
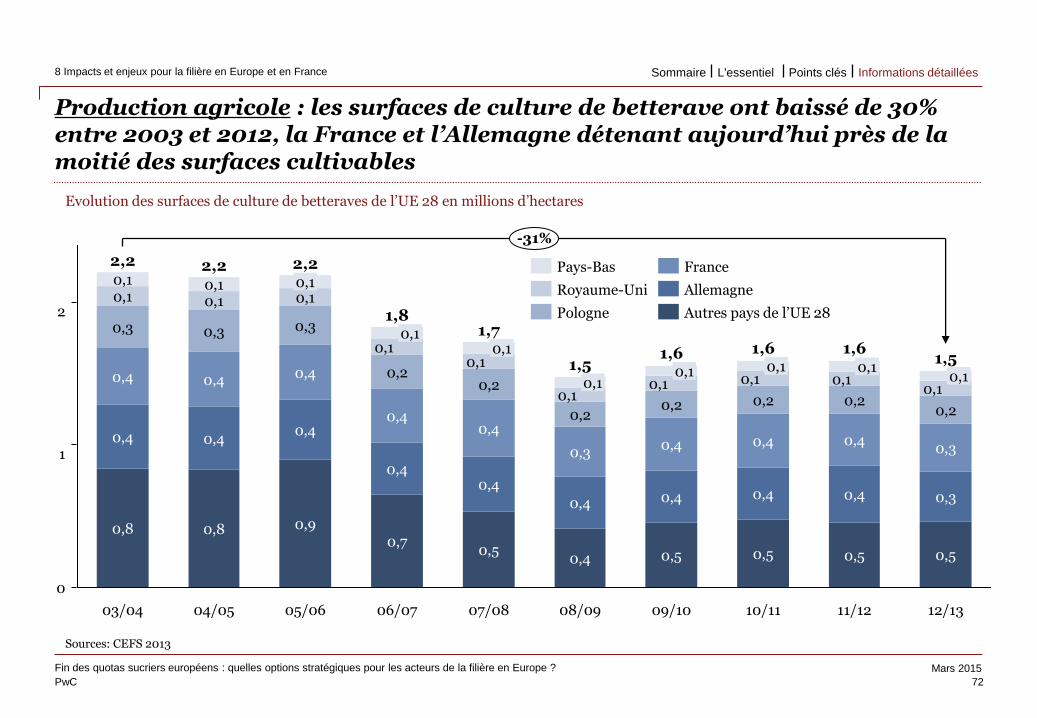
PwC
Mars 2015
Use the divider control box below to
make the slide title appear in your
primary TOC and section TOCs.
Please follow these steps:
Type ‘Divider’ in the control box
provided below.
Click the Divider command on the
Smart ribbon.
Enter the text that you’d like to appear
in the TOCs and select a divider level.
Click Update. The slide title should now
appear on all TOCs.
To remove the slide title from your
TOCs, delete the ‘Divider’ text from the
divider control box and hit Update.
Production agricole : les surfaces de culture de betterave ont baissé de 30% entre 2003 et 2012, la France et l’Allemagne détenant aujourd’hui près de la moitié des surfaces cultivables
72
Fin des quotas sucriers européens : quelles options stratégiques pour les acteurs de la filière en Europe ?
8 Impacts et enjeux pour la filière en Europe et en France
Use the divider control box below to
make the slide title appear in your
primary TOC and section TOCs.
Please follow these steps:
Type ‘Divider’ in the control box
provided below.
Click the Divider command on the
Smart ribbon.
Enter the text that you’d like to appear
in the TOCs and select a divider level.
Click Update. The slide title should now
appear on all TOCs.
To remove the slide title from your
TOCs, delete the ‘Divider’ text from the
divider control box and hit Update.
Sources: CEFS 2013
Evolution des surfaces de culture de betteraves de l’UE 28 en millions d’hectares
1
0
2
0,4
0,4
0,2
0,1
12/13
1,5
0,5
0,3
0,3
0,2
0,1 0,1
11/12
1,6
0,5
0,1 0,1
10/11
1,6
0,5
0,4
0,4
0,2
0,1 0,1
09/10
1,6
0,5
1,7
0,4
0,4
0,2 0,1
1,5
0,4
0,4
0,3
0,2
0,1
07/08
0,5
0,1 0,1
06/07
1,8
0,7
0,4
0,4
0,2
0,1 0,1
05/06
2,2
0,4
0,3
0,1 0,1
0,8
0,4
-31%
03/04
2,2
0,8
0,4
0,4
0,3
0,1 0,1
0,4 0,4
0,4
0,3
0,1 0,1
04/05
2,2
0,4
0,2
0,1
08/09
0,9
Autres pays de l’UE 28
France
Allemagne
Pologne
Pays-Bas
Royaume-Uni
Informations détaillées Points clés L'essentiel Sommaire
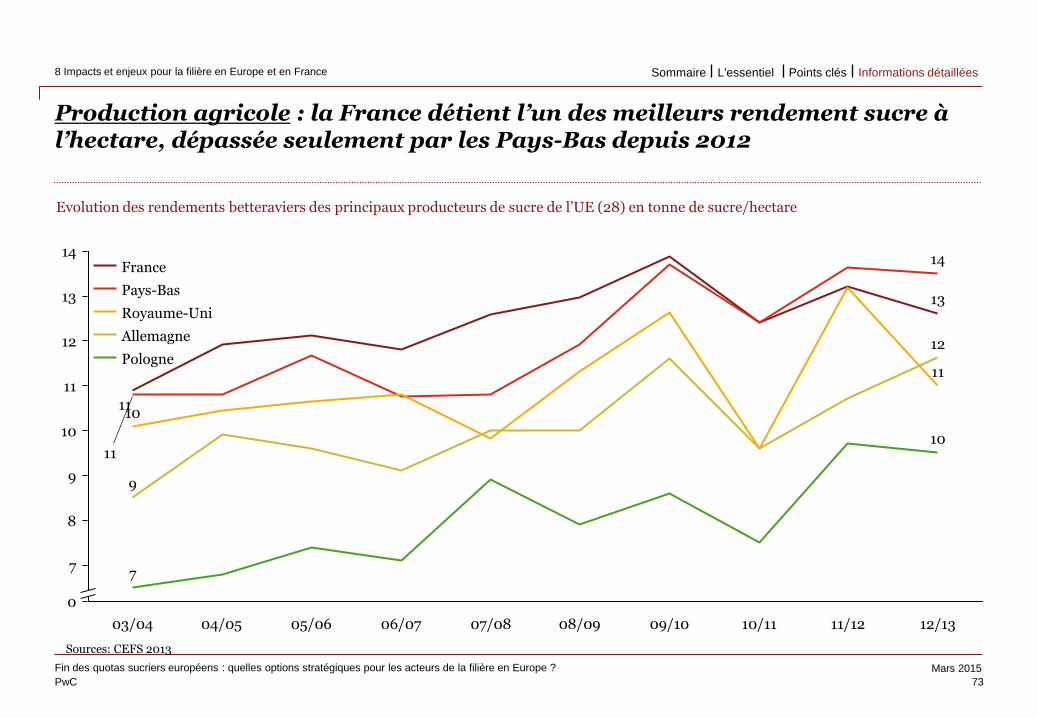
PwC
Mars 2015
Use the divider control box below to
make the slide title appear in your
primary TOC and section TOCs.
Please follow these steps:
Type ‘Divider’ in the control box
provided below.
Click the Divider command on the
Smart ribbon.
Enter the text that you’d like to appear
in the TOCs and select a divider level.
Click Update. The slide title should now
appear on all TOCs.
To remove the slide title from your
TOCs, delete the ‘Divider’ text from the
divider control box and hit Update.
Production agricole : la France détient l’un des meilleurs rendement sucre à l’hectare, dépassée seulement par les Pays-Bas depuis 2012
Sources: CEFS 2013
Evolution des rendements betteraviers des principaux producteurs de sucre de l’UE (28) en tonne de sucre/hectare
73
Fin des quotas sucriers européens : quelles options stratégiques pour les acteurs de la filière en Europe ?
8 Impacts et enjeux pour la filière en Europe et en France
Use the divider control box below to
make the slide title appear in your
primary TOC and section TOCs.
Please follow these steps:
Type ‘Divider’ in the control box
provided below.
Click the Divider command on the
Smart ribbon.
Enter the text that you’d like to appear
in the TOCs and select a divider level.
Click Update. The slide title should now
appear on all TOCs.
To remove the slide title from your
TOCs, delete the ‘Divider’ text from the
divider control box and hit Update. 10
14
13
12
11
9
8
7
0
04/05 03/04
7
06/07
9
10
11
11
07/08 08/09 09/10 10/11
13
14
11/12
11
12
10
12/13 05/06
Allemagne
Pologne
Royaume-Uni
Pays-Bas
France
Informations détaillées Points clés L'essentiel Sommaire
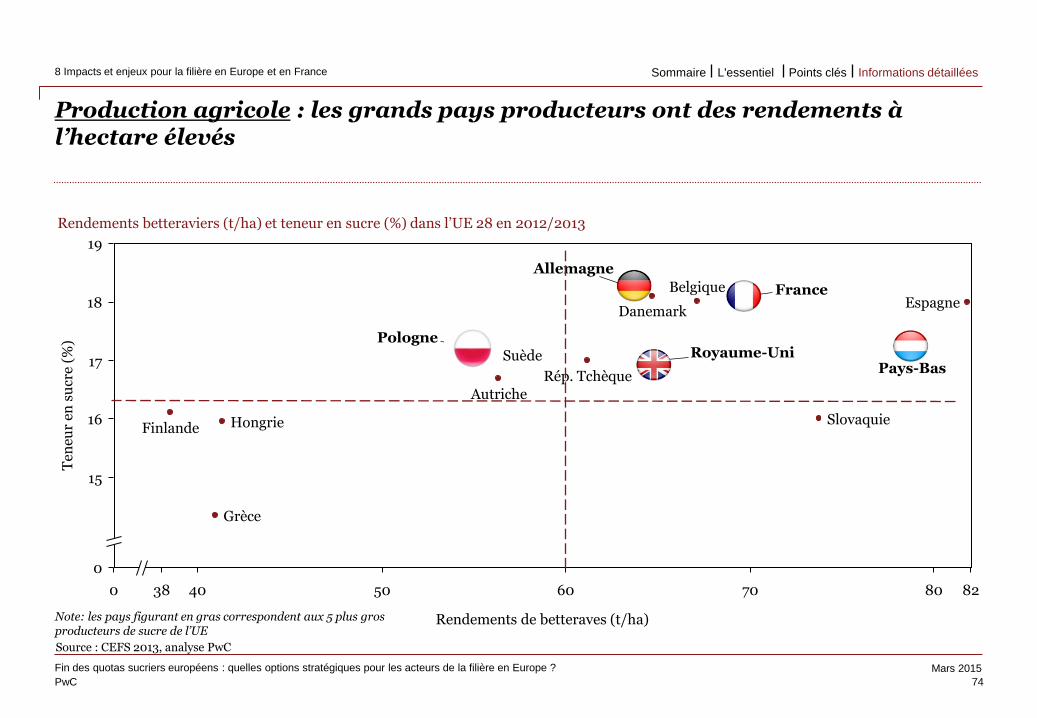
PwC
Mars 2015
Use the divider control box below to
make the slide title appear in your
primary TOC and section TOCs.
Please follow these steps:
Type ‘Divider’ in the control box
provided below.
Click the Divider command on the
Smart ribbon.
Enter the text that you’d like to appear
in the TOCs and select a divider level.
Click Update. The slide title should now
appear on all TOCs.
To remove the slide title from your
TOCs, delete the ‘Divider’ text from the
divider control box and hit Update.
Production agricole : les grands pays producteurs ont des rendements à l’hectare élevés
74
Fin des quotas sucriers européens : quelles options stratégiques pour les acteurs de la filière en Europe ?
8 Impacts et enjeux pour la filière en Europe et en France
Use the divider control box below to
make the slide title appear in your
primary TOC and section TOCs.
Please follow these steps:
Type ‘Divider’ in the control box
provided below.
Click the Divider command on the
Smart ribbon.
Enter the text that you’d like to appear
in the TOCs and select a divider level.
Click Update. The slide title should now
appear on all TOCs.
To remove the slide title from your
TOCs, delete the ‘Divider’ text from the
divider control box and hit Update.
Source : CEFS 2013, analyse PwC
Rendements betteraviers (t/ha) et teneur en sucre (%) dans l’UE 28 en 2012/2013
80
18
17
15
19
40
0
50 82 60
16
70 38 0
Hongrie
Rép. Tchèque
Suède
Ten
eur
en s
ucr
e (%
)
Rendements de betteraves (t/ha)
Slovaquie
Espagne
Grèce
Finlande
Danemark
Belgique
Autriche
Pays-Bas Royaume-Uni
Pologne
Allemagne
France
Note: les pays figurant en gras correspondent aux 5 plus gros producteurs de sucre de l’UE
Informations détaillées Points clés L'essentiel Sommaire
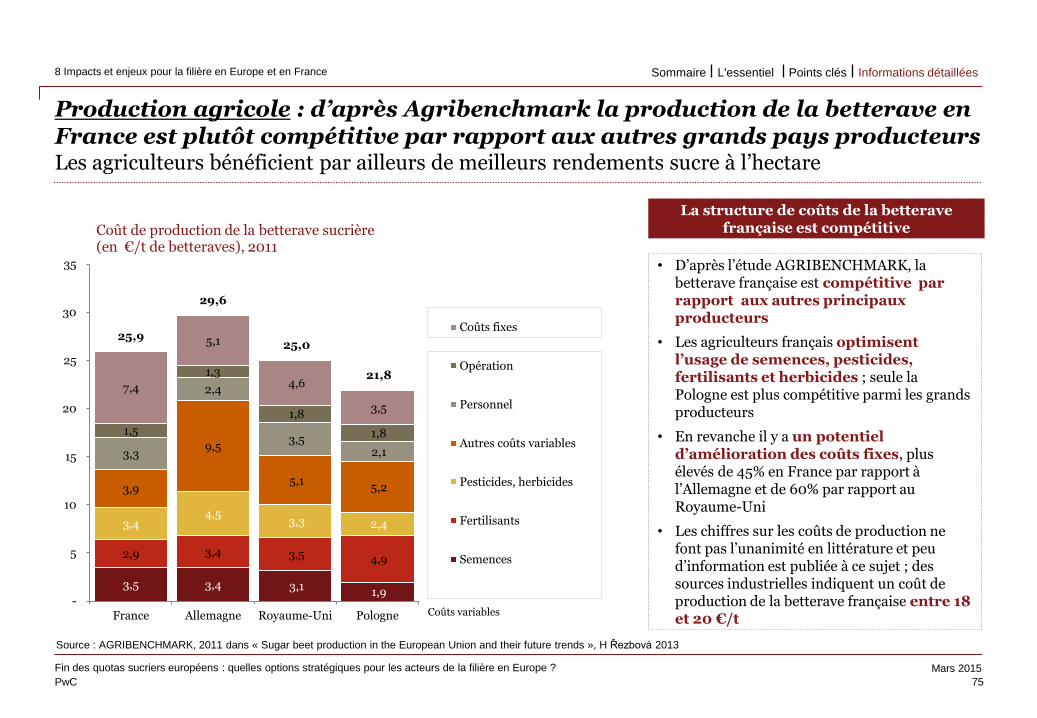
PwC
Mars 2015
Use the divider control box below to
make the slide title appear in your
primary TOC and section TOCs.
Please follow these steps:
Type ‘Divider’ in the control box
provided below.
Click the Divider command on the
Smart ribbon.
Enter the text that you’d like to appear
in the TOCs and select a divider level.
Click Update. The slide title should now
appear on all TOCs.
To remove the slide title from your
TOCs, delete the ‘Divider’ text from the
divider control box and hit Update.
Production agricole : d’après Agribenchmark la production de la betterave en France est plutôt compétitive par rapport aux autres grands pays producteurs Les agriculteurs bénéficient par ailleurs de meilleurs rendements sucre à l’hectare
Source : AGRIBENCHMARK, 2011 dans « Sugar beet production in the European Union and their future trends », H Řezbová 2013
75
Fin des quotas sucriers européens : quelles options stratégiques pour les acteurs de la filière en Europe ?
8 Impacts et enjeux pour la filière en Europe et en France
Use the divider control box below to
make the slide title appear in your
primary TOC and section TOCs.
Please follow these steps:
Type ‘Divider’ in the control box
provided below.
Click the Divider command on the
Smart ribbon.
Enter the text that you’d like to appear
in the TOCs and select a divider level.
Click Update. The slide title should now
appear on all TOCs.
To remove the slide title from your
TOCs, delete the ‘Divider’ text from the
divider control box and hit Update.
Coûts variables
• D’après l’étude AGRIBENCHMARK, la betterave française est compétitive par rapport aux autres principaux producteurs
• Les agriculteurs français optimisent l’usage de semences, pesticides, fertilisants et herbicides ; seule la Pologne est plus compétitive parmi les grands producteurs
• En revanche il y a un potentiel d’amélioration des coûts fixes, plus élevés de 45% en France par rapport à l’Allemagne et de 60% par rapport au Royaume-Uni
• Les chiffres sur les coûts de production ne font pas l’unanimité en littérature et peu d’information est publiée à ce sujet ; des sources industrielles indiquent un coût de production de la betterave française entre 18 et 20 €/t
La structure de coûts de la betterave française est compétitive
3,5 3,4 3,1 1,9
2,9 3,4 3,5 4,9
3,4 4,5
3,3 2,4
3,9
9,5
5,1 5,2
3,3
2,4
3,5 2,1
1,5
1,3
1,8
1,8
7,4
5,1
4,6
3,5
25,9
29,6
25,0
21,8
-
5
10
15
20
25
30
35
France Allemagne Royaume-Uni Pologne
Coût de production de la betterave sucrière (en €/t de betteraves), 2011
Coûts fixes
Opération
Personnel
Autres coûts variables
Pesticides, herbicides
Fertilisants
Semences
Informations détaillées Points clés L'essentiel Sommaire
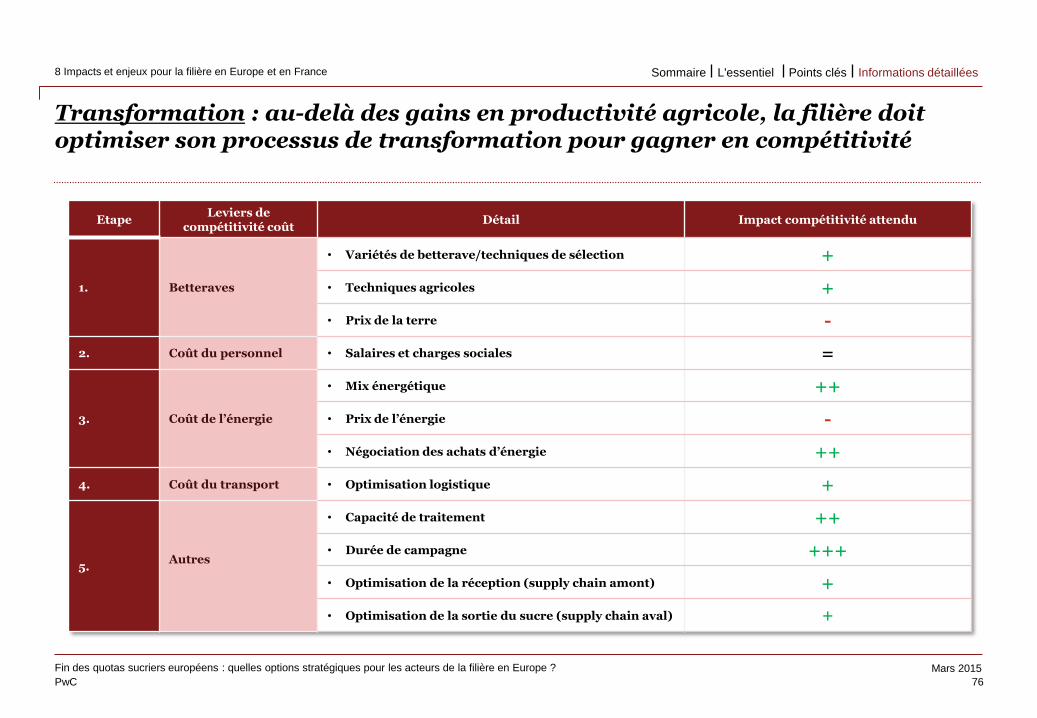
PwC
Mars 2015
Use the divider control box below to
make the slide title appear in your
primary TOC and section TOCs.
Please follow these steps:
Type ‘Divider’ in the control box
provided below.
Click the Divider command on the
Smart ribbon.
Enter the text that you’d like to appear
in the TOCs and select a divider level.
Click Update. The slide title should now
appear on all TOCs.
To remove the slide title from your
TOCs, delete the ‘Divider’ text from the
divider control box and hit Update.
Transformation : au-delà des gains en productivité agricole, la filière doit optimiser son processus de transformation pour gagner en compétitivité
76
Fin des quotas sucriers européens : quelles options stratégiques pour les acteurs de la filière en Europe ?
8 Impacts et enjeux pour la filière en Europe et en France
Use the divider control box below to
make the slide title appear in your
primary TOC and section TOCs.
Please follow these steps:
Type ‘Divider’ in the control box
provided below.
Click the Divider command on the
Smart ribbon.
Enter the text that you’d like to appear
in the TOCs and select a divider level.
Click Update. The slide title should now
appear on all TOCs.
To remove the slide title from your
TOCs, delete the ‘Divider’ text from the
divider control box and hit Update.
Etape Leviers de
compétitivité coût Détail Impact compétitivité attendu
1. Betteraves
• Variétés de betterave/techniques de sélection +
• Techniques agricoles +
• Prix de la terre -
2. Coût du personnel • Salaires et charges sociales =
3. Coût de l’énergie
• Mix énergétique ++
• Prix de l’énergie -
• Négociation des achats d’énergie ++
4. Coût du transport • Optimisation logistique +
5. Autres
• Capacité de traitement ++
• Durée de campagne +++
• Optimisation de la réception (supply chain amont) +
• Optimisation de la sortie du sucre (supply chain aval) +
Informations détaillées Points clés L'essentiel Sommaire
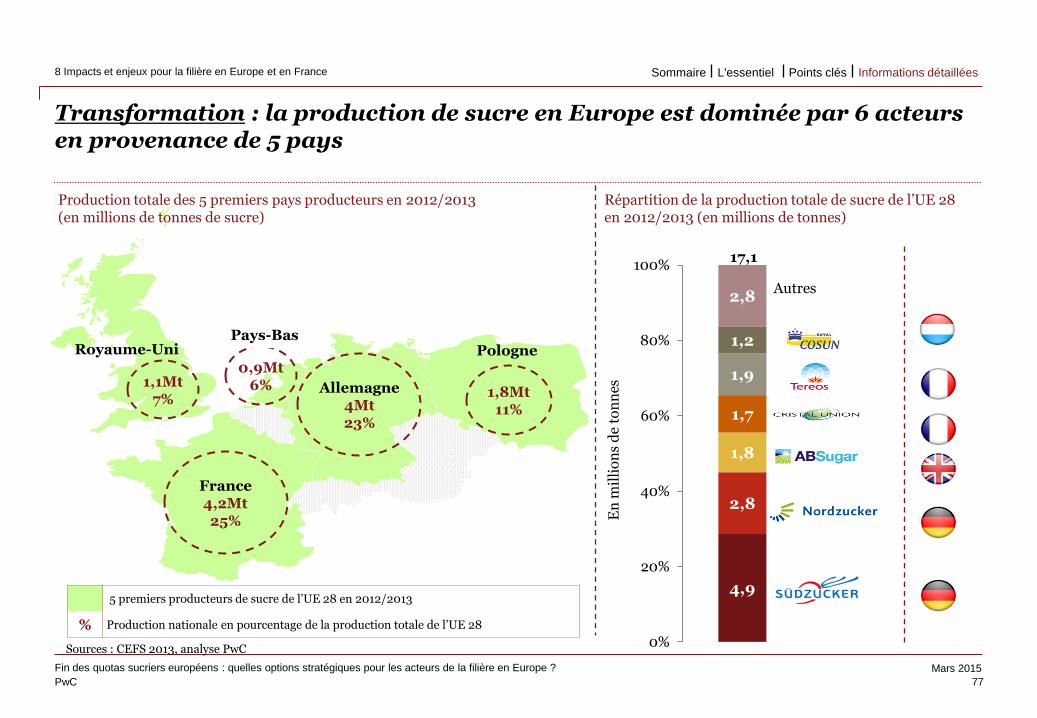
PwC
Mars 2015
Use the divider control box below to
make the slide title appear in your
primary TOC and section TOCs.
Please follow these steps:
Type ‘Divider’ in the control box
provided below.
Click the Divider command on the
Smart ribbon.
Enter the text that you’d like to appear
in the TOCs and select a divider level.
Click Update. The slide title should now
appear on all TOCs.
To remove the slide title from your
TOCs, delete the ‘Divider’ text from the
divider control box and hit Update.
4,9
2,8
1,8
1,7
1,9
1,2
2,8
0%
20%
40%
60%
80%
100%
Transformation : la production de sucre en Europe est dominée par 6 acteurs en provenance de 5 pays
5 premiers producteurs de sucre de l’UE 28 en 2012/2013
% Production nationale en pourcentage de la production totale de l’UE 28
Sources : CEFS 2013, analyse PwC
Production totale des 5 premiers pays producteurs en 2012/2013 (en millions de tonnes de sucre)
France 4,2Mt 25%
Allemagne 4Mt 23%
1,8Mt 11%
1,1Mt 7%
0,9Mt 6%
Pologne Pays-Bas
Royaume-Uni
Autres
Répartition de la production totale de sucre de l’UE 28 en 2012/2013 (en millions de tonnes)
17,1
En
mil
lio
ns
de
ton
nes
77
Fin des quotas sucriers européens : quelles options stratégiques pour les acteurs de la filière en Europe ?
8 Impacts et enjeux pour la filière en Europe et en France
Use the divider control box below to
make the slide title appear in your
primary TOC and section TOCs.
Please follow these steps:
Type ‘Divider’ in the control box
provided below.
Click the Divider command on the
Smart ribbon.
Enter the text that you’d like to appear
in the TOCs and select a divider level.
Click Update. The slide title should now
appear on all TOCs.
To remove the slide title from your
TOCs, delete the ‘Divider’ text from the
divider control box and hit Update.
Informations détaillées Points clés L'essentiel Sommaire

PwC
Mars 2015
Use the divider control box below to
make the slide title appear in your
primary TOC and section TOCs.
Please follow these steps:
Type ‘Divider’ in the control box
provided below.
Click the Divider command on the
Smart ribbon.
Enter the text that you’d like to appear
in the TOCs and select a divider level.
Click Update. The slide title should now
appear on all TOCs.
To remove the slide title from your
TOCs, delete the ‘Divider’ text from the
divider control box and hit Update.
Les sucreries européennes et production de sucre des principaux producteurs de l’UE 28 (en Mt, en 2012/2013)
Transformation : la production de sucre de betterave en Europe est assurée par plus de 100 sites industriels situés dans les zones de production agricole, dont 70% sont localisés dans les pays clés
Culture de betterave
• Sucrerie de betterave
•
Usine de production d’éthanol à partir de betterave
Sources: CEFS
78
Fin des quotas sucriers européens : quelles options stratégiques pour les acteurs de la filière en Europe ?
8 Impacts et enjeux pour la filière en Europe et en France
Use the divider control box below to
make the slide title appear in your
primary TOC and section TOCs.
Please follow these steps:
Type ‘Divider’ in the control box
provided below.
Click the Divider command on the
Smart ribbon.
Enter the text that you’d like to appear
in the TOCs and select a divider level.
Click Update. The slide title should now
appear on all TOCs.
To remove the slide title from your
TOCs, delete the ‘Divider’ text from the
divider control box and hit Update.
Royaume-Uni 4 sucreries
=> 1,1Mt de sucre
Allemagne 20 sucreries
=> 4Mt de sucre
France 25 sucreries
=> 4,2Mt de sucre
Pays-Bas 2 sucreries
=> 0,9Mt de sucre
Pologne 18 sucreries
=> 1,8Mt de sucre
La production totale de sucre de l’UE 28 en 2012/2013 s’élevait à 17,1Mt de sucre
Informations détaillées Points clés L'essentiel Sommaire
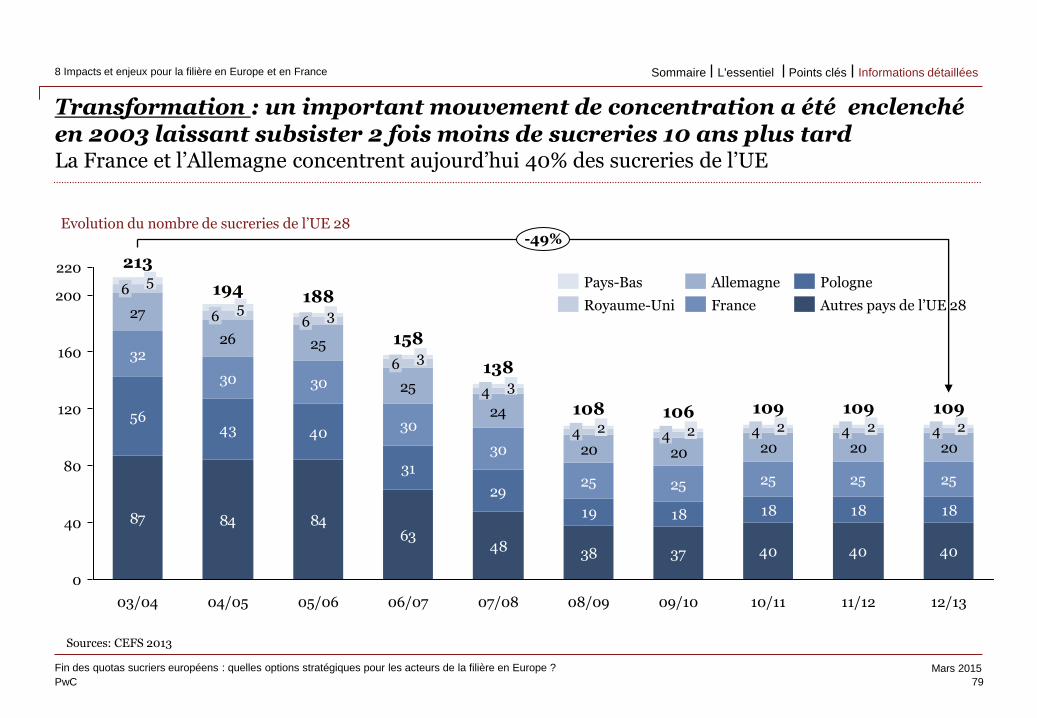
PwC
Mars 2015
Use the divider control box below to
make the slide title appear in your
primary TOC and section TOCs.
Please follow these steps:
Type ‘Divider’ in the control box
provided below.
Click the Divider command on the
Smart ribbon.
Enter the text that you’d like to appear
in the TOCs and select a divider level.
Click Update. The slide title should now
appear on all TOCs.
To remove the slide title from your
TOCs, delete the ‘Divider’ text from the
divider control box and hit Update.
Transformation : un important mouvement de concentration a été enclenché en 2003 laissant subsister 2 fois moins de sucreries 10 ans plus tard La France et l’Allemagne concentrent aujourd’hui 40% des sucreries de l’UE
79
Fin des quotas sucriers européens : quelles options stratégiques pour les acteurs de la filière en Europe ?
8 Impacts et enjeux pour la filière en Europe et en France
Use the divider control box below to
make the slide title appear in your
primary TOC and section TOCs.
Please follow these steps:
Type ‘Divider’ in the control box
provided below.
Click the Divider command on the
Smart ribbon.
Enter the text that you’d like to appear
in the TOCs and select a divider level.
Click Update. The slide title should now
appear on all TOCs.
To remove the slide title from your
TOCs, delete the ‘Divider’ text from the
divider control box and hit Update.
Sources: CEFS 2013
Evolution du nombre de sucreries de l’UE 28
87 84 8463
48 38 37 40 40 40
5643 40
31
29
19 18 18 18 18
32
30 30
30
30
25 25 25 25 25
27
26 25
25
24
20 20 20 20 20
80
0
220
200
160
120
40
109
4 2
11/12
109
4 2
10/11
109
4 2
09/10
106
4 2
08/09
108
4 2
07/08
138
4 3
06/07
158
6
-49%
05/06
188
6 3
04/05
194
3
5
03/04
213
6 5
12/13
6 Autres pays de l’UE 28 France
Pologne Allemagne
Royaume-Uni
Pays-Bas
Informations détaillées Points clés L'essentiel Sommaire
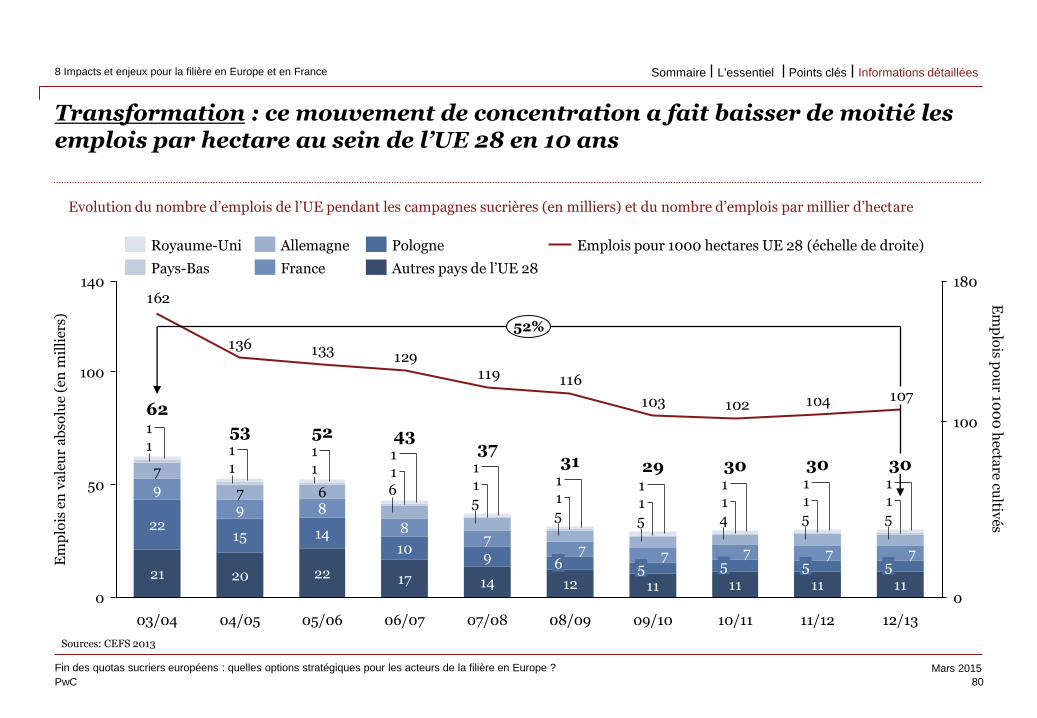
PwC
Mars 2015
Use the divider control box below to
make the slide title appear in your
primary TOC and section TOCs.
Please follow these steps:
Type ‘Divider’ in the control box
provided below.
Click the Divider command on the
Smart ribbon.
Enter the text that you’d like to appear
in the TOCs and select a divider level.
Click Update. The slide title should now
appear on all TOCs.
To remove the slide title from your
TOCs, delete the ‘Divider’ text from the
divider control box and hit Update.
Transformation : ce mouvement de concentration a fait baisser de moitié les emplois par hectare au sein de l’UE 28 en 10 ans
80
Fin des quotas sucriers européens : quelles options stratégiques pour les acteurs de la filière en Europe ?
8 Impacts et enjeux pour la filière en Europe et en France
Use the divider control box below to
make the slide title appear in your
primary TOC and section TOCs.
Please follow these steps:
Type ‘Divider’ in the control box
provided below.
Click the Divider command on the
Smart ribbon.
Enter the text that you’d like to appear
in the TOCs and select a divider level.
Click Update. The slide title should now
appear on all TOCs.
To remove the slide title from your
TOCs, delete the ‘Divider’ text from the
divider control box and hit Update.
Evolution du nombre d’emplois de l’UE pendant les campagnes sucrières (en milliers) et du nombre d’emplois par millier d’hectare
107104102103
116119129133136
162140
100
50
180
0 0
100
5
10/11
30
11
5 7
4
11
Em
plo
is e
n v
ale
ur
ab
solu
e (e
n m
illi
ers)
1 1
11/12
5
30
11
7
12/13
30
11
5 7
5 1
5 1
Em
plo
is po
ur 10
00
hecta
re cultiv
és
29 1
09/10
1
52%
1
04/05
53
20
15
9
05/06
22
52
14
8 6
1
7
1 1
03/04
14
9
7
5 1 1
06/07
43
17
10
8
6 1 1
62
21
22
9
7
1 1
5
7
1 1
08/09
31
12
6 7
5 1 1
07/08
37
Pologne
Autres pays de l’UE 28 France
Allemagne
Pays-Bas
Royaume-Uni Emplois pour 1000 hectares UE 28 (échelle de droite)
Sources: CEFS 2013
Informations détaillées Points clés L'essentiel Sommaire
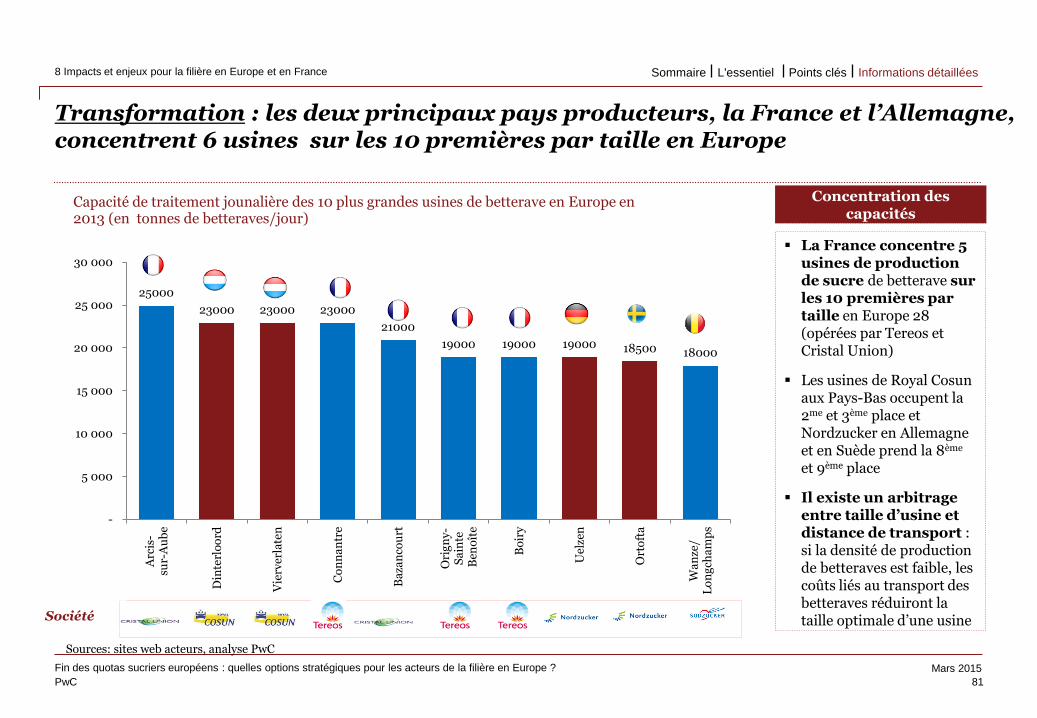
PwC
Mars 2015
Use the divider control box below to
make the slide title appear in your
primary TOC and section TOCs.
Please follow these steps:
Type ‘Divider’ in the control box
provided below.
Click the Divider command on the
Smart ribbon.
Enter the text that you’d like to appear
in the TOCs and select a divider level.
Click Update. The slide title should now
appear on all TOCs.
To remove the slide title from your
TOCs, delete the ‘Divider’ text from the
divider control box and hit Update.
Transformation : les deux principaux pays producteurs, la France et l’Allemagne, concentrent 6 usines sur les 10 premières par taille en Europe
25000
23000 23000 23000
21000
19000 19000 19000 18500 18000
-
5 000
10 000
15 000
20 000
25 000
30 000
Arc
is-
sur-
Au
be
Din
terl
oo
rd
Vie
rver
late
n
Co
nn
an
tre
Ba
zan
cou
rt
Ori
gn
y-
Sa
inte
Ben
oît
e
Bo
iry
Uel
zen
Ort
oft
a
Wa
nze
/L
on
gch
am
ps
Capacité de traitement jounalière des 10 plus grandes usines de betterave en Europe en 2013 (en tonnes de betteraves/jour)
La France concentre 5 usines de production de sucre de betterave sur les 10 premières par taille en Europe 28 (opérées par Tereos et Cristal Union)
Les usines de Royal Cosun aux Pays-Bas occupent la 2me et 3ème place et Nordzucker en Allemagne et en Suède prend la 8ème et 9ème place
Il existe un arbitrage entre taille d’usine et distance de transport : si la densité de production de betteraves est faible, les coûts liés au transport des betteraves réduiront la taille optimale d’une usine
Concentration des capacités
Société
Sources: sites web acteurs, analyse PwC
81
Fin des quotas sucriers européens : quelles options stratégiques pour les acteurs de la filière en Europe ?
8 Impacts et enjeux pour la filière en Europe et en France
Use the divider control box below to
make the slide title appear in your
primary TOC and section TOCs.
Please follow these steps:
Type ‘Divider’ in the control box
provided below.
Click the Divider command on the
Smart ribbon.
Enter the text that you’d like to appear
in the TOCs and select a divider level.
Click Update. The slide title should now
appear on all TOCs.
To remove the slide title from your
TOCs, delete the ‘Divider’ text from the
divider control box and hit Update.
Informations détaillées Points clés L'essentiel Sommaire
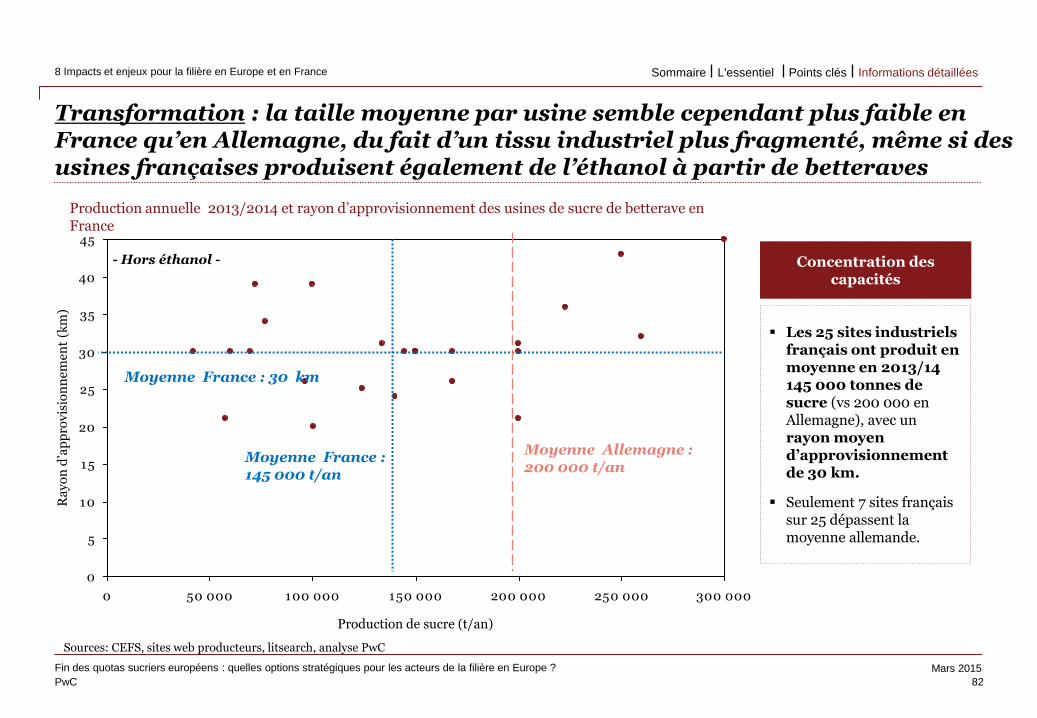
PwC
Mars 2015
Use the divider control box below to
make the slide title appear in your
primary TOC and section TOCs.
Please follow these steps:
Type ‘Divider’ in the control box
provided below.
Click the Divider command on the
Smart ribbon.
Enter the text that you’d like to appear
in the TOCs and select a divider level.
Click Update. The slide title should now
appear on all TOCs.
To remove the slide title from your
TOCs, delete the ‘Divider’ text from the
divider control box and hit Update.
Transformation : la taille moyenne par usine semble cependant plus faible en France qu’en Allemagne, du fait d’un tissu industriel plus fragmenté, même si des usines françaises produisent également de l’éthanol à partir de betteraves
82
Fin des quotas sucriers européens : quelles options stratégiques pour les acteurs de la filière en Europe ?
8 Impacts et enjeux pour la filière en Europe et en France
Use the divider control box below to
make the slide title appear in your
primary TOC and section TOCs.
Please follow these steps:
Type ‘Divider’ in the control box
provided below.
Click the Divider command on the
Smart ribbon.
Enter the text that you’d like to appear
in the TOCs and select a divider level.
Click Update. The slide title should now
appear on all TOCs.
To remove the slide title from your
TOCs, delete the ‘Divider’ text from the
divider control box and hit Update.
0
5
10
15
20
25
30
35
40
45
0 50 000 100 000 150 000 200 000 250 000 300 000
Production de sucre (t/an)
Ra
yo
n d
’ap
pro
vis
ion
nem
ent
(km
)
Production annuelle 2013/2014 et rayon d’approvisionnement des usines de sucre de betterave en France
Moyenne France : 30 km
Moyenne France : 145 000 t/an
Moyenne Allemagne : 200 000 t/an
Les 25 sites industriels français ont produit en moyenne en 2013/14 145 000 tonnes de sucre (vs 200 000 en Allemagne), avec un rayon moyen d’approvisionnement de 30 km.
Seulement 7 sites français sur 25 dépassent la moyenne allemande.
Concentration des capacités
Sources: CEFS, sites web producteurs, litsearch, analyse PwC
- Hors éthanol -
Informations détaillées Points clés L'essentiel Sommaire
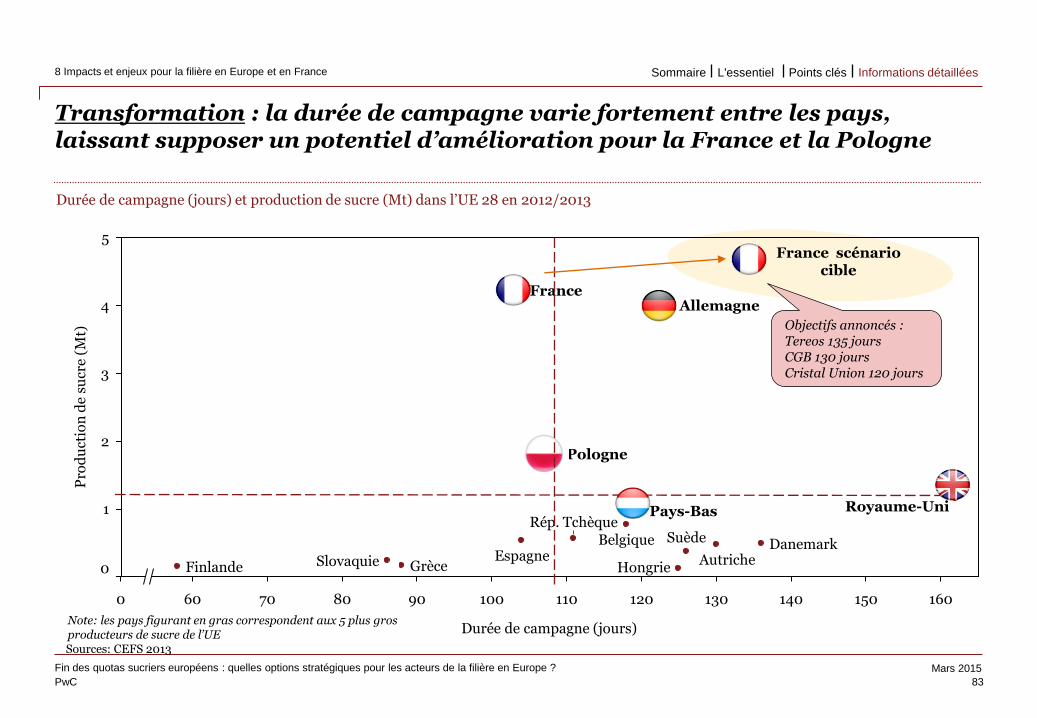
PwC
Mars 2015
Use the divider control box below to
make the slide title appear in your
primary TOC and section TOCs.
Please follow these steps:
Type ‘Divider’ in the control box
provided below.
Click the Divider command on the
Smart ribbon.
Enter the text that you’d like to appear
in the TOCs and select a divider level.
Click Update. The slide title should now
appear on all TOCs.
To remove the slide title from your
TOCs, delete the ‘Divider’ text from the
divider control box and hit Update.
Transformation : la durée de campagne varie fortement entre les pays, laissant supposer un potentiel d’amélioration pour la France et la Pologne
Sources: CEFS 2013
Durée de campagne (jours) et production de sucre (Mt) dans l’UE 28 en 2012/2013
83
Fin des quotas sucriers européens : quelles options stratégiques pour les acteurs de la filière en Europe ?
8 Impacts et enjeux pour la filière en Europe et en France
Use the divider control box below to
make the slide title appear in your
primary TOC and section TOCs.
Please follow these steps:
Type ‘Divider’ in the control box
provided below.
Click the Divider command on the
Smart ribbon.
Enter the text that you’d like to appear
in the TOCs and select a divider level.
Click Update. The slide title should now
appear on all TOCs.
To remove the slide title from your
TOCs, delete the ‘Divider’ text from the
divider control box and hit Update.
100 90 80 70 60
5
4
1
3
2
0 0 160 150 140 130 120 110
Pro
du
ctio
n d
e su
cre
(Mt)
Durée de campagne (jours)
Slovaquie Hongrie
Rép. Tchèque Suède
Espagne Grèce Finlande
Danemark Belgique
Autriche
Pays-Bas Royaume-Uni
Pologne
Allemagne France
Note: les pays figurant en gras correspondent aux 5 plus gros producteurs de sucre de l’UE
France scénario cible
Objectifs annoncés : Tereos 135 jours CGB 130 jours Cristal Union 120 jours
Informations détaillées Points clés L'essentiel Sommaire
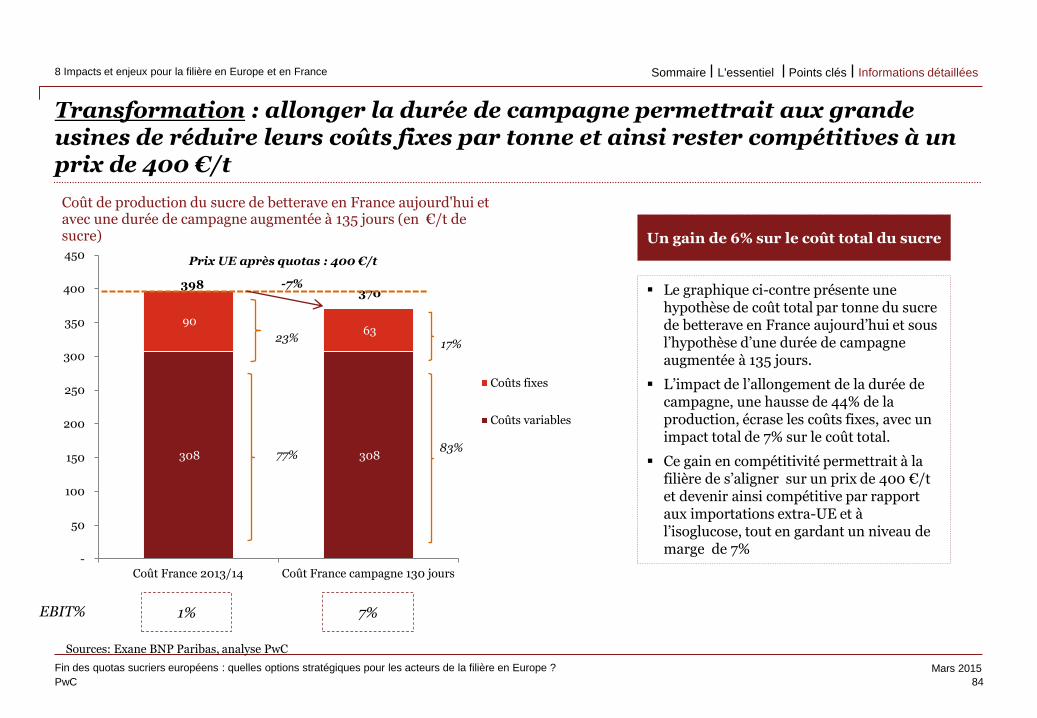
PwC
Mars 2015
Use the divider control box below to
make the slide title appear in your
primary TOC and section TOCs.
Please follow these steps:
Type ‘Divider’ in the control box
provided below.
Click the Divider command on the
Smart ribbon.
Enter the text that you’d like to appear
in the TOCs and select a divider level.
Click Update. The slide title should now
appear on all TOCs.
To remove the slide title from your
TOCs, delete the ‘Divider’ text from the
divider control box and hit Update.
Transformation : allonger la durée de campagne permettrait aux grande usines de réduire leurs coûts fixes par tonne et ainsi rester compétitives à un prix de 400 €/t
84
Fin des quotas sucriers européens : quelles options stratégiques pour les acteurs de la filière en Europe ?
8 Impacts et enjeux pour la filière en Europe et en France
Use the divider control box below to
make the slide title appear in your
primary TOC and section TOCs.
Please follow these steps:
Type ‘Divider’ in the control box
provided below.
Click the Divider command on the
Smart ribbon.
Enter the text that you’d like to appear
in the TOCs and select a divider level.
Click Update. The slide title should now
appear on all TOCs.
To remove the slide title from your
TOCs, delete the ‘Divider’ text from the
divider control box and hit Update.
308 308
90 63
398 370
-
50
100
150
200
250
300
350
400
450
Coût France 2013/14 Coût France campagne 130 jours
Coût de production du sucre de betterave en France aujourd'hui et avec une durée de campagne augmentée à 135 jours (en €/t de sucre)
Coûts fixes
Coûts variables
Prix UE après quotas : 400 €/t
23% 17%
77% 83%
1% 7% EBIT%
Le graphique ci-contre présente une hypothèse de coût total par tonne du sucre de betterave en France aujourd’hui et sous l’hypothèse d’une durée de campagne augmentée à 135 jours.
L’impact de l’allongement de la durée de campagne, une hausse de 44% de la production, écrase les coûts fixes, avec un impact total de 7% sur le coût total.
Ce gain en compétitivité permettrait à la filière de s’aligner sur un prix de 400 €/t et devenir ainsi compétitive par rapport aux importations extra-UE et à l’isoglucose, tout en gardant un niveau de marge de 7%
Un gain de 6% sur le coût total du sucre
-7%
Sources: Exane BNP Paribas, analyse PwC
Informations détaillées Points clés L'essentiel Sommaire
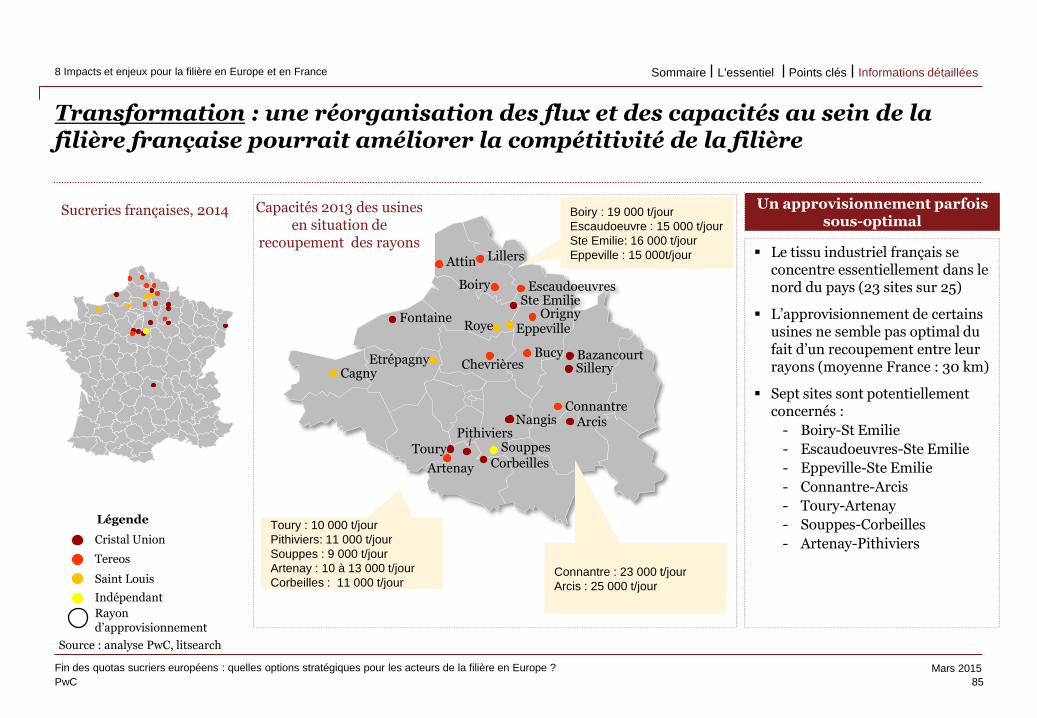
PwC
Mars 2015
Use the divider control box below to
make the slide title appear in your
primary TOC and section TOCs.
Please follow these steps:
Type ‘Divider’ in the control box
provided below.
Click the Divider command on the
Smart ribbon.
Enter the text that you’d like to appear
in the TOCs and select a divider level.
Click Update. The slide title should now
appear on all TOCs.
To remove the slide title from your
TOCs, delete the ‘Divider’ text from the
divider control box and hit Update.
Transformation : une réorganisation des flux et des capacités au sein de la filière française pourrait améliorer la compétitivité de la filière
85
Fin des quotas sucriers européens : quelles options stratégiques pour les acteurs de la filière en Europe ?
8 Impacts et enjeux pour la filière en Europe et en France
Use the divider control box below to
make the slide title appear in your
primary TOC and section TOCs.
Please follow these steps:
Type ‘Divider’ in the control box
provided below.
Click the Divider command on the
Smart ribbon.
Enter the text that you’d like to appear
in the TOCs and select a divider level.
Click Update. The slide title should now
appear on all TOCs.
To remove the slide title from your
TOCs, delete the ‘Divider’ text from the
divider control box and hit Update.
Légende
Cristal Union
Tereos
Saint Louis
Indépendant
Rayon d’approvisionnement
Arcis
Bazancourt
Corbeilles
Fontaine
Nangis Pithiviers
Sillery
Ste Emilie
Toury
Attin
Boiry
Lillers
Escaudoeuvres
Origny
Bucy Chevrières
Connantre
Artenay
Cagny Etrépagny
Eppeville Roye
Souppes
Boiry : 19 000 t/jour
Escaudoeuvre : 15 000 t/jour
Ste Emilie: 16 000 t/jour
Eppeville : 15 000t/jour
Toury : 10 000 t/jour
Pithiviers: 11 000 t/jour
Souppes : 9 000 t/jour
Artenay : 10 à 13 000 t/jour
Corbeilles : 11 000 t/jour Connantre : 23 000 t/jour
Arcis : 25 000 t/jour
Sucreries françaises, 2014
Le tissu industriel français se concentre essentiellement dans le nord du pays (23 sites sur 25)
L’approvisionnement de certains usines ne semble pas optimal du fait d’un recoupement entre leur rayons (moyenne France : 30 km)
Sept sites sont potentiellement concernés :
- Boiry-St Emilie
- Escaudoeuvres-Ste Emilie
- Eppeville-Ste Emilie
- Connantre-Arcis
- Toury-Artenay
- Souppes-Corbeilles
- Artenay-Pithiviers
Un approvisionnement parfois sous-optimal
Capacités 2013 des usines en situation de
recoupement des rayons
Source : analyse PwC, litsearch
Informations détaillées Points clés L'essentiel Sommaire
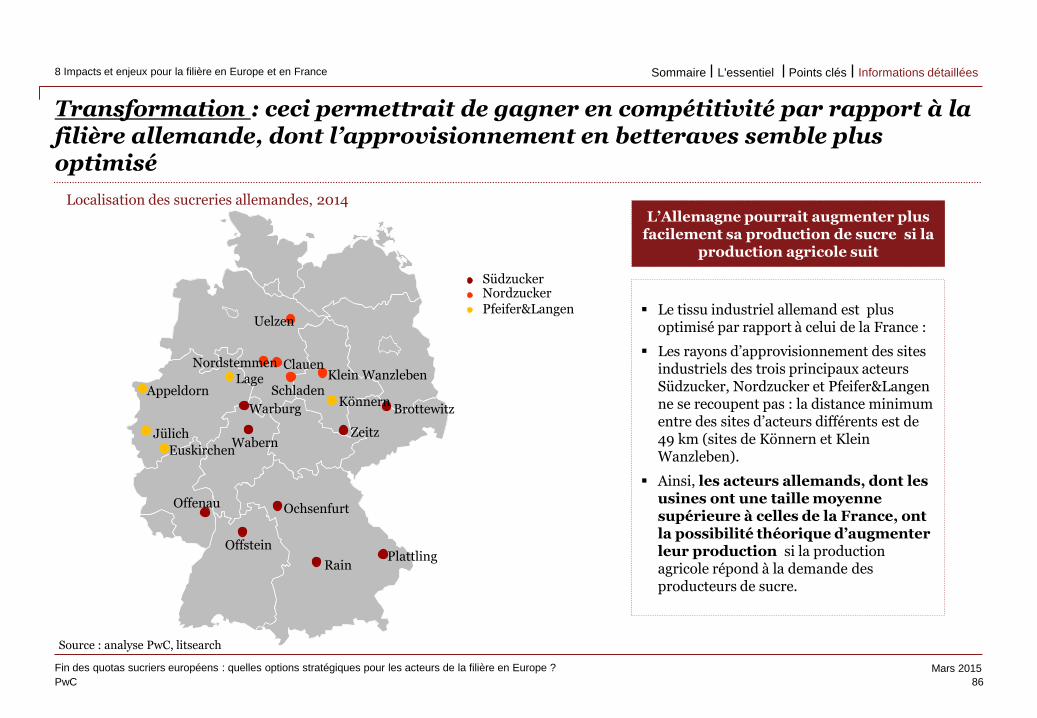
PwC
Mars 2015
Use the divider control box below to
make the slide title appear in your
primary TOC and section TOCs.
Please follow these steps:
Type ‘Divider’ in the control box
provided below.
Click the Divider command on the
Smart ribbon.
Enter the text that you’d like to appear
in the TOCs and select a divider level.
Click Update. The slide title should now
appear on all TOCs.
To remove the slide title from your
TOCs, delete the ‘Divider’ text from the
divider control box and hit Update.
Transformation : ceci permettrait de gagner en compétitivité par rapport à la filière allemande, dont l’approvisionnement en betteraves semble plus optimisé
86
Fin des quotas sucriers européens : quelles options stratégiques pour les acteurs de la filière en Europe ?
8 Impacts et enjeux pour la filière en Europe et en France
Use the divider control box below to
make the slide title appear in your
primary TOC and section TOCs.
Please follow these steps:
Type ‘Divider’ in the control box
provided below.
Click the Divider command on the
Smart ribbon.
Enter the text that you’d like to appear
in the TOCs and select a divider level.
Click Update. The slide title should now
appear on all TOCs.
To remove the slide title from your
TOCs, delete the ‘Divider’ text from the
divider control box and hit Update.
Südzucker Nordzucker Pfeifer&Langen
Rain
Zeitz
Brottewitz
Wabern
Offstein
Offenau
Plattling
Ochsenfurt
Warburg
Clauen Nordstemmen Klein Wanzleben
Schladen
Uelzen
Appeldorn
Euskirchen
Jülich
Könnern
Lage
Localisation des sucreries allemandes, 2014
Le tissu industriel allemand est plus optimisé par rapport à celui de la France :
Les rayons d’approvisionnement des sites industriels des trois principaux acteurs Südzucker, Nordzucker et Pfeifer&Langen ne se recoupent pas : la distance minimum entre des sites d’acteurs différents est de 49 km (sites de Könnern et Klein Wanzleben).
Ainsi, les acteurs allemands, dont les usines ont une taille moyenne supérieure à celles de la France, ont la possibilité théorique d’augmenter leur production si la production agricole répond à la demande des producteurs de sucre.
L’Allemagne pourrait augmenter plus facilement sa production de sucre si la
production agricole suit
Source : analyse PwC, litsearch
Informations détaillées Points clés L'essentiel Sommaire
PwC
Mars 2015
Positionnement relatif des industriels du sucre en Europe
87
Fin des quotas sucriers européens : quelles options stratégiques pour les acteurs de la filière en Europe ?
9 Positionnement relatif des industriels du sucre en Europe Informations détaillées Points clés L'essentiel Sommaire
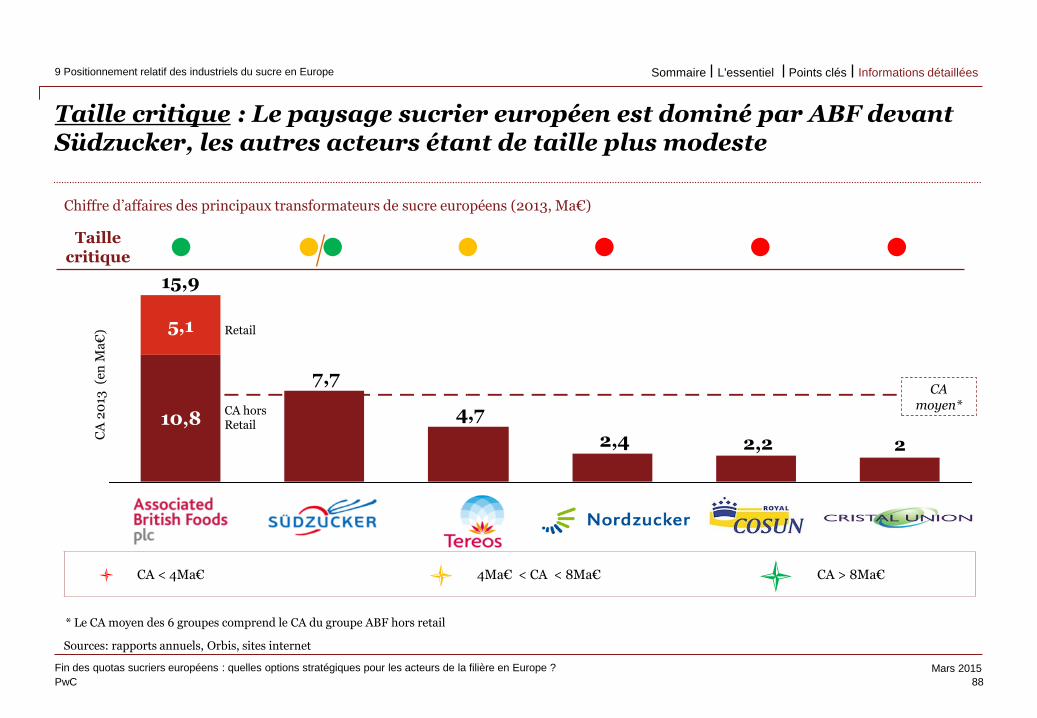
PwC
Mars 2015
Use the divider control box below to
make the slide title appear in your
primary TOC and section TOCs.
Please follow these steps:
Type ‘Divider’ in the control box
provided below.
Click the Divider command on the
Smart ribbon.
Enter the text that you’d like to appear
in the TOCs and select a divider level.
Click Update. The slide title should now
appear on all TOCs.
To remove the slide title from your
TOCs, delete the ‘Divider’ text from the
divider control box and hit Update.
Taille critique : Le paysage sucrier européen est dominé par ABF devant Südzucker, les autres acteurs étant de taille plus modeste
88
Fin des quotas sucriers européens : quelles options stratégiques pour les acteurs de la filière en Europe ?
9 Positionnement relatif des industriels du sucre en Europe
Use the divider control box below to
make the slide title appear in your
primary TOC and section TOCs.
Please follow these steps:
Type ‘Divider’ in the control box
provided below.
Click the Divider command on the
Smart ribbon.
Enter the text that you’d like to appear
in the TOCs and select a divider level.
Click Update. The slide title should now
appear on all TOCs.
To remove the slide title from your
TOCs, delete the ‘Divider’ text from the
divider control box and hit Update.
Sources: rapports annuels, Orbis, sites internet
Chiffre d’affaires des principaux transformateurs de sucre européens (2013, Ma€)
10,8
2,22,4
4,7
7,7
5,1
15,9
2
CA
20
13 (
en M
a€
)
Taille critique l ll l l l l
l CA < 4Ma€ l 4Ma€ < CA < 8Ma€ l CA > 8Ma€
Retail
CA hors Retail
CA moyen*
* Le CA moyen des 6 groupes comprend le CA du groupe ABF hors retail
Informations détaillées Points clés L'essentiel Sommaire
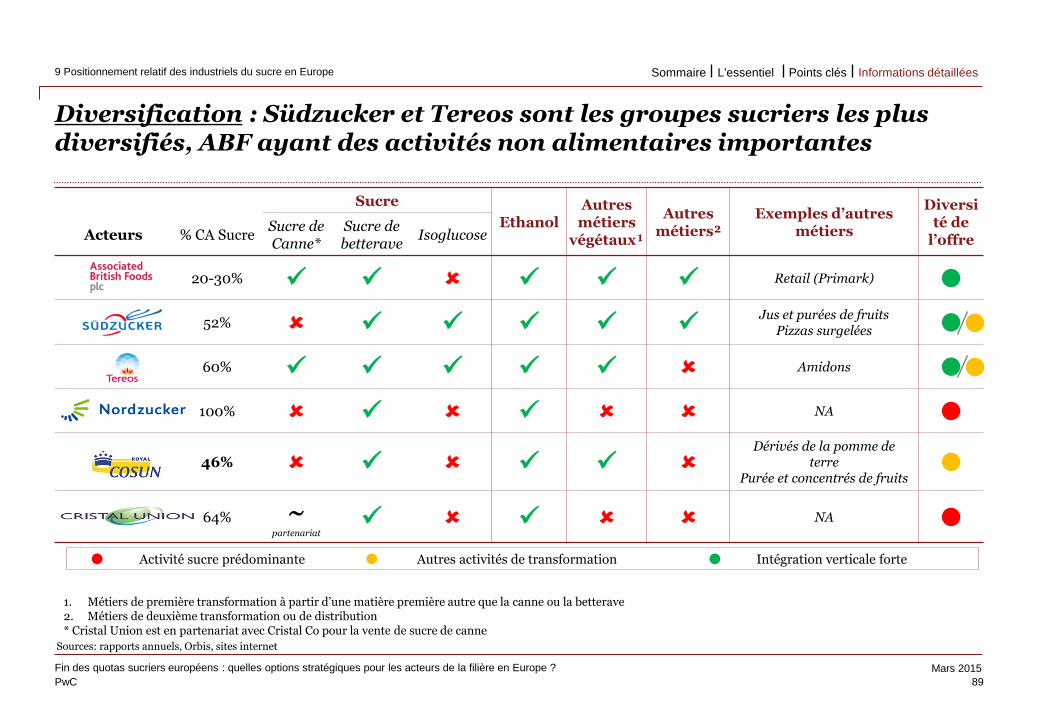
PwC
Mars 2015
Use the divider control box below to
make the slide title appear in your
primary TOC and section TOCs.
Please follow these steps:
Type ‘Divider’ in the control box
provided below.
Click the Divider command on the
Smart ribbon.
Enter the text that you’d like to appear
in the TOCs and select a divider level.
Click Update. The slide title should now
appear on all TOCs.
To remove the slide title from your
TOCs, delete the ‘Divider’ text from the
divider control box and hit Update.
Diversification : Südzucker et Tereos sont les groupes sucriers les plus diversifiés, ABF ayant des activités non alimentaires importantes
89
Fin des quotas sucriers européens : quelles options stratégiques pour les acteurs de la filière en Europe ?
9 Positionnement relatif des industriels du sucre en Europe
Use the divider control box below to
make the slide title appear in your
primary TOC and section TOCs.
Please follow these steps:
Type ‘Divider’ in the control box
provided below.
Click the Divider command on the
Smart ribbon.
Enter the text that you’d like to appear
in the TOCs and select a divider level.
Click Update. The slide title should now
appear on all TOCs.
To remove the slide title from your
TOCs, delete the ‘Divider’ text from the
divider control box and hit Update.
Sucre
Ethanol Autres métiers
végétaux¹
Autres métiers²
Exemples d’autres métiers
Diversité de
l’offre Acteurs % CA Sucre Sucre de Canne*
Sucre de betterave
Isoglucose
20-30% Retail (Primark) l
52% Jus et purées de fruits
Pizzas surgelées l
60% Amidons l
100% NA l
46%
Dérivés de la pomme de terre
Purée et concentrés de fruits l
64% ~ partenariat
NA l
Sources: rapports annuels, Orbis, sites internet
1. Métiers de première transformation à partir d’une matière première autre que la canne ou la betterave 2. Métiers de deuxième transformation ou de distribution * Cristal Union est en partenariat avec Cristal Co pour la vente de sucre de canne
l Activité sucre prédominante l Autres activités de transformation l Intégration verticale forte
l
l
Informations détaillées Points clés L'essentiel Sommaire
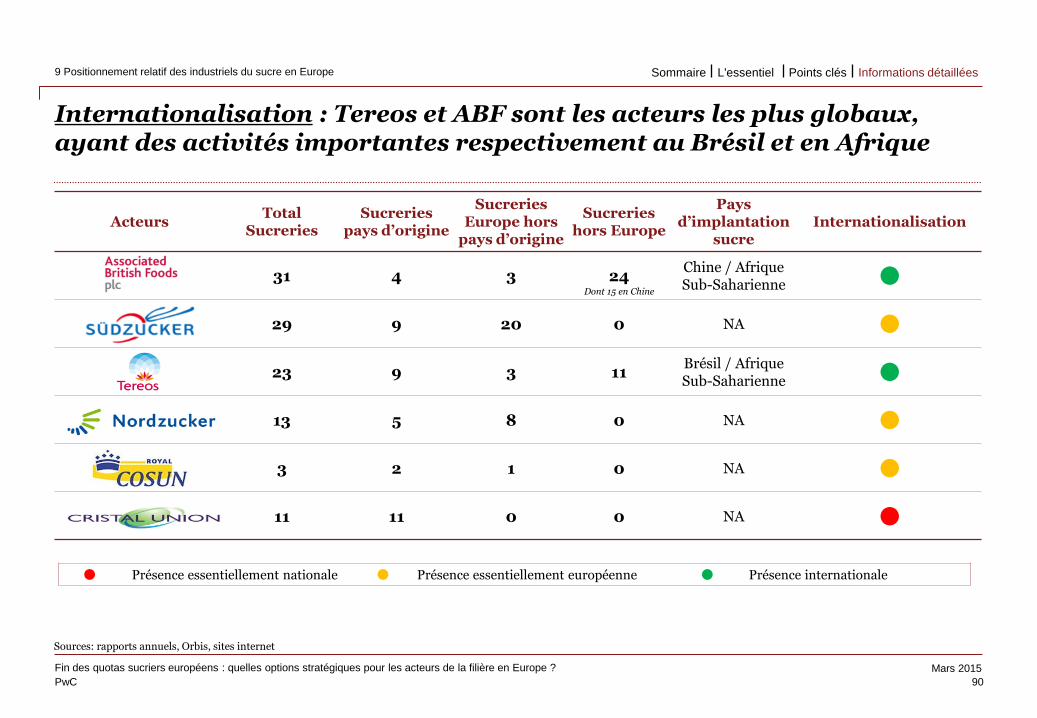
PwC
Mars 2015
Use the divider control box below to
make the slide title appear in your
primary TOC and section TOCs.
Please follow these steps:
Type ‘Divider’ in the control box
provided below.
Click the Divider command on the
Smart ribbon.
Enter the text that you’d like to appear
in the TOCs and select a divider level.
Click Update. The slide title should now
appear on all TOCs.
To remove the slide title from your
TOCs, delete the ‘Divider’ text from the
divider control box and hit Update.
Internationalisation : Tereos et ABF sont les acteurs les plus globaux, ayant des activités importantes respectivement au Brésil et en Afrique
90
Fin des quotas sucriers européens : quelles options stratégiques pour les acteurs de la filière en Europe ?
9 Positionnement relatif des industriels du sucre en Europe
Use the divider control box below to
make the slide title appear in your
primary TOC and section TOCs.
Please follow these steps:
Type ‘Divider’ in the control box
provided below.
Click the Divider command on the
Smart ribbon.
Enter the text that you’d like to appear
in the TOCs and select a divider level.
Click Update. The slide title should now
appear on all TOCs.
To remove the slide title from your
TOCs, delete the ‘Divider’ text from the
divider control box and hit Update.
Sources: rapports annuels, Orbis, sites internet
Acteurs Total
Sucreries Sucreries
pays d’origine
Sucreries Europe hors
pays d’origine
Sucreries hors Europe
Pays d’implantation
sucre Internationalisation
31 4 3 24 Chine / Afrique Sub-Saharienne l
29 9 20 0 NA l
23 9 3 11 Brésil / Afrique Sub-Saharienne l
13 5 8 0 NA l
3 2 1 0 NA l
11 11 0 0 NA l
l Présence essentiellement nationale l Présence essentiellement européenne l Présence internationale
Dont 15 en Chine
Informations détaillées Points clés L'essentiel Sommaire
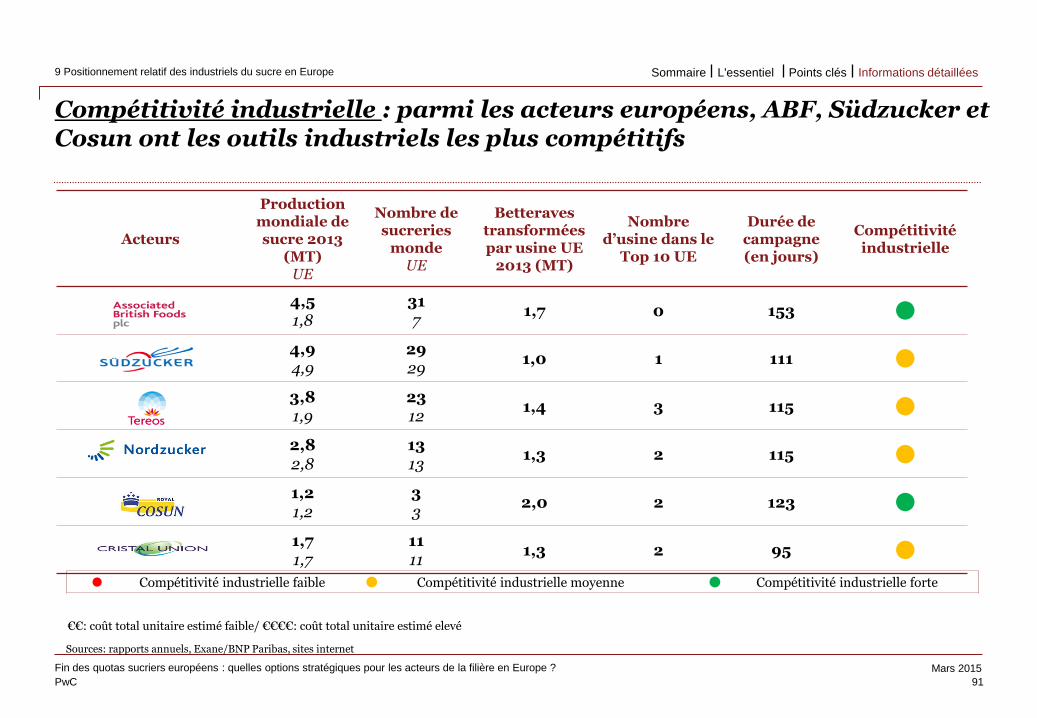
PwC
Mars 2015
Use the divider control box below to
make the slide title appear in your
primary TOC and section TOCs.
Please follow these steps:
Type ‘Divider’ in the control box
provided below.
Click the Divider command on the
Smart ribbon.
Enter the text that you’d like to appear
in the TOCs and select a divider level.
Click Update. The slide title should now
appear on all TOCs.
To remove the slide title from your
TOCs, delete the ‘Divider’ text from the
divider control box and hit Update.
Compétitivité industrielle : parmi les acteurs européens, ABF, Südzucker et Cosun ont les outils industriels les plus compétitifs
91
Fin des quotas sucriers européens : quelles options stratégiques pour les acteurs de la filière en Europe ?
9 Positionnement relatif des industriels du sucre en Europe
Use the divider control box below to
make the slide title appear in your
primary TOC and section TOCs.
Please follow these steps:
Type ‘Divider’ in the control box
provided below.
Click the Divider command on the
Smart ribbon.
Enter the text that you’d like to appear
in the TOCs and select a divider level.
Click Update. The slide title should now
appear on all TOCs.
To remove the slide title from your
TOCs, delete the ‘Divider’ text from the
divider control box and hit Update.
Sources: rapports annuels, Exane/BNP Paribas, sites internet
Acteurs
Production mondiale de sucre 2013
(MT) UE
Nombre de sucreries
monde UE
Betteraves transformées par usine UE
2013 (MT)
Nombre d’usine dans le
Top 10 UE
Durée de campagne (en jours)
Compétitivité industrielle
4,5 1,8
31 7
1,7 0 153 l
4,9 4,9
29 29
1,0 1 111 l
3,8 1,9
23 12
1,4 3 115 l
2,8 2,8
13 13
1,3 2 115 l
1,2 1,2
3 3
2,0 2 123 l
1,7 1,7
11 11
1,3 2 95 l
l Compétitivité industrielle faible l Compétitivité industrielle moyenne l Compétitivité industrielle forte
€€: coût total unitaire estimé faible/ €€€€: coût total unitaire estimé elevé
Informations détaillées Points clés L'essentiel Sommaire
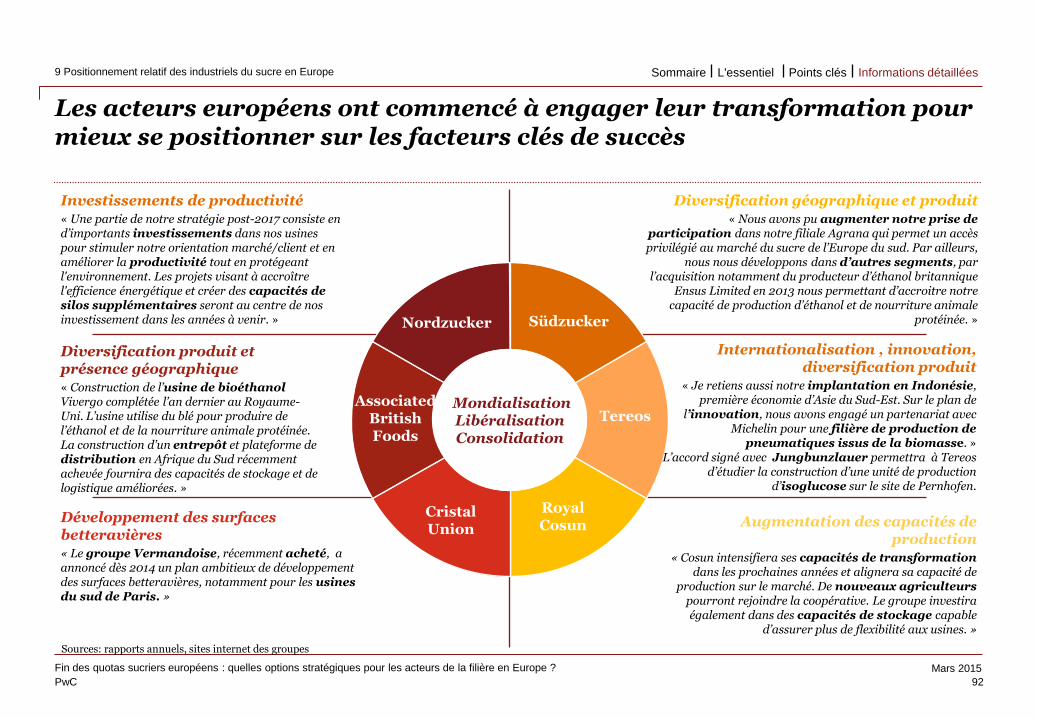
PwC
Mars 2015
Use the divider control box below to
make the slide title appear in your
primary TOC and section TOCs.
Please follow these steps:
Type ‘Divider’ in the control box
provided below.
Click the Divider command on the
Smart ribbon.
Enter the text that you’d like to appear
in the TOCs and select a divider level.
Click Update. The slide title should now
appear on all TOCs.
To remove the slide title from your
TOCs, delete the ‘Divider’ text from the
divider control box and hit Update.
Les acteurs européens ont commencé à engager leur transformation pour mieux se positionner sur les facteurs clés de succès
92
Fin des quotas sucriers européens : quelles options stratégiques pour les acteurs de la filière en Europe ?
9 Positionnement relatif des industriels du sucre en Europe
Use the divider control box below to
make the slide title appear in your
primary TOC and section TOCs.
Please follow these steps:
Type ‘Divider’ in the control box
provided below.
Click the Divider command on the
Smart ribbon.
Enter the text that you’d like to appear
in the TOCs and select a divider level.
Click Update. The slide title should now
appear on all TOCs.
To remove the slide title from your
TOCs, delete the ‘Divider’ text from the
divider control box and hit Update.
Diversification produit et présence géographique « Construction de l’usine de bioéthanol Vivergo complétée l’an dernier au Royaume-Uni. L’usine utilise du blé pour produire de l’éthanol et de la nourriture animale protéinée. La construction d’un entrepôt et plateforme de distribution en Afrique du Sud récemment achevée fournira des capacités de stockage et de logistique améliorées. »
Diversification géographique et produit « Nous avons pu augmenter notre prise de
participation dans notre filiale Agrana qui permet un accès privilégié au marché du sucre de l’Europe du sud. Par ailleurs,
nous nous développons dans d’autres segments, par l’acquisition notamment du producteur d’éthanol britannique
Ensus Limited en 2013 nous permettant d’accroitre notre capacité de production d’éthanol et de nourriture animale
protéinée. »
Investissements de productivité « Une partie de notre stratégie post-2017 consiste en d’importants investissements dans nos usines pour stimuler notre orientation marché/client et en améliorer la productivité tout en protégeant l'environnement. Les projets visant à accroître l'efficience énergétique et créer des capacités de silos supplémentaires seront au centre de nos investissement dans les années à venir. »
Internationalisation , innovation, diversification produit
« Je retiens aussi notre implantation en Indonésie, première économie d’Asie du Sud-Est. Sur le plan de
l’innovation, nous avons engagé un partenariat avec Michelin pour une filière de production de
pneumatiques issus de la biomasse. » L’accord signé avec Jungbunzlauer permettra à Tereos
d’étudier la construction d’une unité de production d’isoglucose sur le site de Pernhofen.
Augmentation des capacités de production
« Cosun intensifiera ses capacités de transformation dans les prochaines années et alignera sa capacité de
production sur le marché. De nouveaux agriculteurs pourront rejoindre la coopérative. Le groupe investira également dans des capacités de stockage capable
d’assurer plus de flexibilité aux usines. »
Développement des surfaces betteravières « Le groupe Vermandoise, récemment acheté, a annoncé dès 2014 un plan ambitieux de développement des surfaces betteravières, notamment pour les usines du sud de Paris. »
Nordzucker
Associated British Foods
Tereos
Royal Cosun
Cristal Union
Südzucker
Sources: rapports annuels, sites internet des groupes
Mondialisation Libéralisation Consolidation
Informations détaillées Points clés L'essentiel Sommaire
PwC
Mars 2015
Bibliographie
93
Fin des quotas sucriers européens : quelles options stratégiques pour les acteurs de la filière en Europe ?
10 Bibliographie Informations détaillées Points clés L'essentiel Sommaire
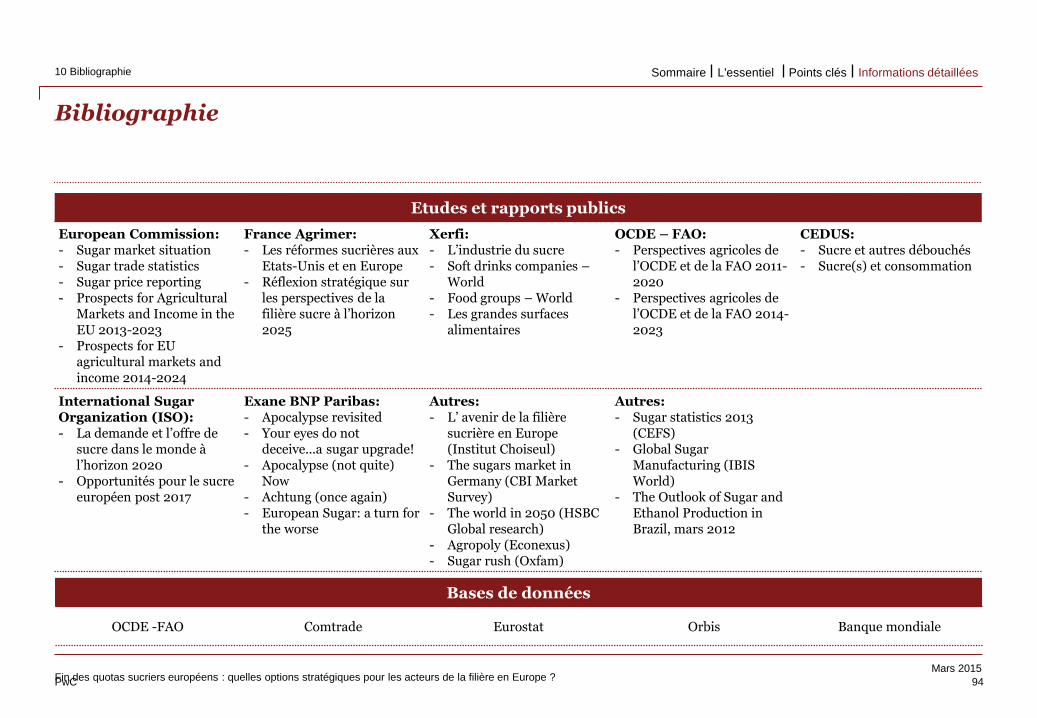
PwC
Mars 2015
Use the divider control box below to
make the slide title appear in your
primary TOC and section TOCs.
Please follow these steps:
Type ‘Divider’ in the control box
provided below.
Click the Divider command on the
Smart ribbon.
Enter the text that you’d like to appear
in the TOCs and select a divider level.
Click Update. The slide title should now
appear on all TOCs.
To remove the slide title from your
TOCs, delete the ‘Divider’ text from the
divider control box and hit Update.
Bibliographie
94 Fin des quotas sucriers européens : quelles options stratégiques pour les acteurs de la filière en Europe ?
10 Bibliographie
Use the divider control box below to
make the slide title appear in your
primary TOC and section TOCs.
Please follow these steps:
Type ‘Divider’ in the control box
provided below.
Click the Divider command on the
Smart ribbon.
Enter the text that you’d like to appear
in the TOCs and select a divider level.
Click Update. The slide title should now
appear on all TOCs.
To remove the slide title from your
TOCs, delete the ‘Divider’ text from the
divider control box and hit Update.
Etudes et rapports publics
European Commission: - Sugar market situation - Sugar trade statistics - Sugar price reporting - Prospects for Agricultural
Markets and Income in the EU 2013-2023
- Prospects for EU agricultural markets and income 2014-2024
France Agrimer: - Les réformes sucrières aux
Etats-Unis et en Europe - Réflexion stratégique sur
les perspectives de la filière sucre à l’horizon 2025
Xerfi: - L’industrie du sucre - Soft drinks companies –
World - Food groups – World - Les grandes surfaces
alimentaires
OCDE – FAO: - Perspectives agricoles de
l’OCDE et de la FAO 2011-2020
- Perspectives agricoles de l’OCDE et de la FAO 2014-2023
CEDUS: - Sucre et autres débouchés - Sucre(s) et consommation
International Sugar Organization (ISO): - La demande et l’offre de
sucre dans le monde à l’horizon 2020
- Opportunités pour le sucre européen post 2017
Exane BNP Paribas: - Apocalypse revisited - Your eyes do not
deceive...a sugar upgrade! - Apocalypse (not quite)
Now - Achtung (once again) - European Sugar: a turn for
the worse
Autres: - L’ avenir de la filière
sucrière en Europe (Institut Choiseul)
- The sugars market in Germany (CBI Market Survey)
- The world in 2050 (HSBC Global research)
- Agropoly (Econexus) - Sugar rush (Oxfam)
Autres: - Sugar statistics 2013
(CEFS) - Global Sugar
Manufacturing (IBIS World)
- The Outlook of Sugar and Ethanol Production in Brazil, mars 2012
Bases de données
OCDE -FAO Comtrade Eurostat Orbis Banque mondiale
Informations détaillées Points clés L'essentiel Sommaire
This publication has been prepared for general guidance on matters of interest only, and does not
constitute professional advice. You should not act upon the information contained in this publication
without obtaining specific professional advice. No representation or warranty (express or implied) is
given as to the accuracy or completeness of the information contained in this publication, and, to the
extent permitted by law, PricewaterhouseCoopers, its members, employees and agents do not accept
or assume any liability, responsibility or duty of care for any consequences of you or anyone else
acting, or refraining to act, in reliance on the information contained in this publication or for any
decision based on it.
© 2015 PwC. All rights reserved.