Embed Size (px)
Citation preview
Recommandation sur la photométrie des signaux lumineux des aides à la navigation maritime Recommandation AISM E-122 Juin 2001
Recommendation on the Photometry of Marine Aids to Navigation Signal Lights
IALA Recommendation E-122
June 2001
20ter, rue Schnapper – 78100 Saint Germain en Laye – France Telephone : +33 1 34 51 70 01 Telefax : +33 1 34 51 82 05 E-mail : iala [email protected] Internet : http://www.iala-aism.org
AIS
M A
ssoc
iatio
n In
tern
atio
nale
de
Sig
nalis
atio
n M
ariti
me
IA
LA In
tern
atio
nal A
ssoc
iatio
n of
Mar
ine
Aid
s to
Nav
igat
ion
and
Ligh
thou
se A
utho
ritie
s

IALA Recommendation E. 122 on the Photometry of Marine Aids-to-Navigation Signal Lights
2 of 33

IALA Recommendation E. 122 on the Photometry of Marine Aids-to-Navigation Signal Lights
3 of 33
IALA Recommendation E. 122 on the Photometry of Marine Aids-to-Navigation Signal Lights
4 of 33
IALA Recommendation on the Photometry of Marine
Aids-to-Navigation Signal Lights (Recommendation E-122)
THE COUNCIL
NOTING the function of the IALA with respect to Safety of Navigation, the efficiency of maritime transport and the protection of the environment, RECOGNISING that the measurement of marine aids-to-navigation signal lights has been conducted historically by various Lighthouse Authorities, equipment manufacturers, and independent laboratories using methodologies developed for similar equipment.
RECOGNISING ALSO that the procedures and processes originally selected by the various measurement facilities were not identical. Consequently, reporting of the optical performance of marine aids-to-navigation signal lights may vary.
RECOGNISING FURTHER that as marketplaces expand beyond national boundaries, it becomes increasingly important that the measurement and reporting of the optical performance of marine aids-to-navigation signal lights be conducted in a uniform manner.
NOTING THAT the annex to this recommendation was prepared to encourage uniform measurement practices. NOTING ALSO that the annex to this recommendation complements earlier recommendations made by IALA, namely “Recommendations on the Determination of the Luminous Intensity of a Marine Aid-to-Navigation Light,” December 1977 and “Recommendations for the Calculation of the Effective Intensity of a Rhythmic Light” November 1980. ADOPTS the Standards for the Photometry of Marine Aids to Navigation Signal Lights set out in the annex of this recommendation; and RECOMMENDS National Members and other appropriate Authorities providing, or intending to provide marine aids to navigation signal lights, to use the Minimum Photometry Standards set out in the annex to this recommendation.
* * *
IALA Recommendation E. 122 on the Photometry of Marine Aids-to-Navigation Signal Lights
5 of 33
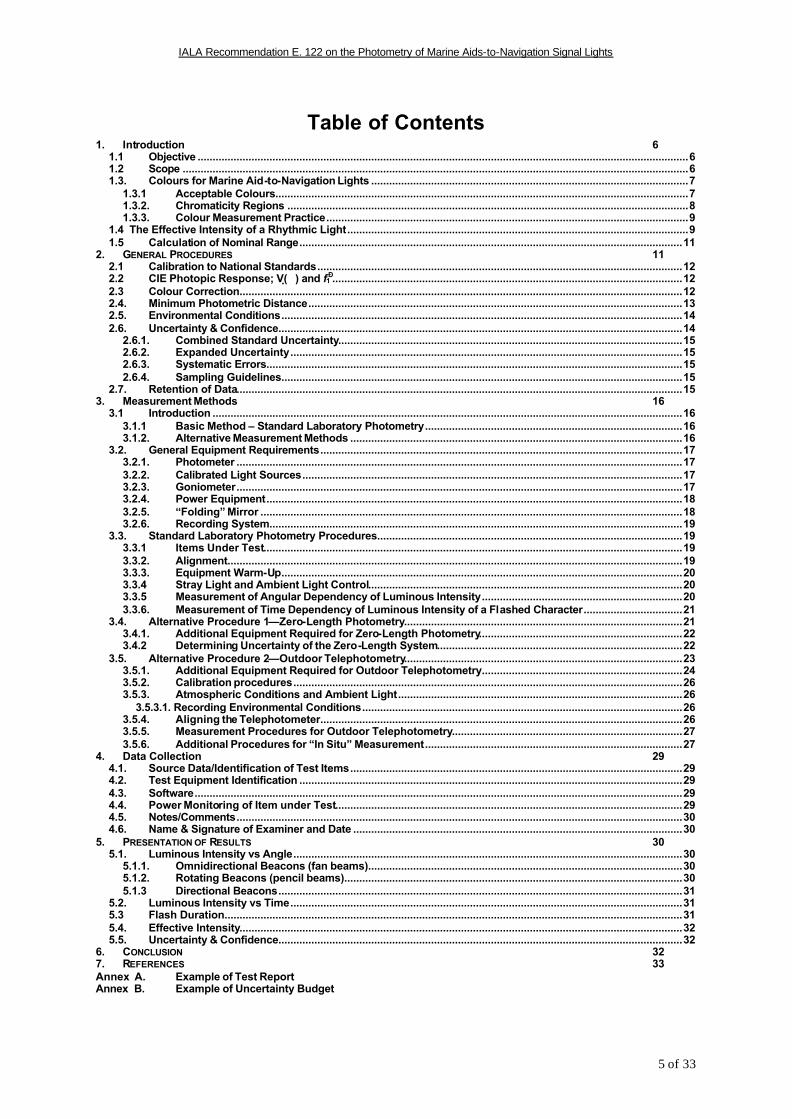
Table of Contents 1. Introduction 6
1.1 Objective ....................................................................................................................................................................6 1.2 Scope .........................................................................................................................................................................6 1.3. Colours for Marine Aid-to-Navigation Lights ..........................................................................................................7
1.3.1 Acceptable Colours..........................................................................................................................................7 1.3.2. Chromaticity Regions ......................................................................................................................................8 1.3.3. Colour Measurement Practice.........................................................................................................................9
1.4 The Effective Intensity of a Rhythmic Light..................................................................................................................9 1.5 Calculation of Nominal Range................................................................................................................................11
2. GENERAL PROCEDURES 11 2.1 Calibration to National Standards..........................................................................................................................12 2.2 CIE Photopic Response; V(�) and f1Ð.....................................................................................................................12 2.3 Colour Correction....................................................................................................................................................12 2.4. Minimum Photometric Distance.............................................................................................................................13 2.5. Environmental Conditions......................................................................................................................................14 2.6. Uncertainty & Confidence.......................................................................................................................................14
2.6.1. Combined Standard Uncertainty...................................................................................................................15 2.6.2. Expanded Uncertainty...................................................................................................................................15 2.6.3. Systematic Errors...........................................................................................................................................15 2.6.4. Sampling Guidelines......................................................................................................................................15
2.7. Retention of Data.....................................................................................................................................................15 3. Measurement Methods 16
3.1 Introduction .............................................................................................................................................................16 3.1.1 Basic Method – Standard Laboratory Photometry......................................................................................16 3.1.2. Alternative Measurement Methods ...............................................................................................................16
3.2. General Equipment Requirements.........................................................................................................................17 3.2.1. Photometer .....................................................................................................................................................17 3.2.2. Calibrated Light Sources...............................................................................................................................17 3.2.3. Goniometer.....................................................................................................................................................17 3.2.4. Power Equipment...........................................................................................................................................18 3.2.5. “Folding” Mirror .............................................................................................................................................18 3.2.6. Recording System..........................................................................................................................................19
3.3. Standard Laboratory Photometry Procedures......................................................................................................19 3.3.1 Items Under Test............................................................................................................................................19 3.3.2. Alignment........................................................................................................................................................19 3.3.3. Equipment Warm-Up......................................................................................................................................20 3.3.4 Stray Light and Ambient Light Control.........................................................................................................20 3.3.5 Measurement of Angular Dependency of Luminous Intensity...................................................................20 3.3.6. Measurement of Time Dependency of Luminous Intensity of a Flashed Character.................................21
3.4. Alternative Procedure 1—Zero-Length Photometry.............................................................................................21 3.4.1. Additional Equipment Required for Zero-Length Photometry....................................................................22 3.4.2 Determining Uncertainty of the Zero-Length System..................................................................................22
3.5. Alternative Procedure 2—Outdoor Telephotometry.............................................................................................23 3.5.1. Additional Equipment Required for Outdoor Telephotometry...................................................................24 3.5.2. Calibration procedures..................................................................................................................................26 3.5.3. Atmospheric Conditions and Ambient Light...............................................................................................26
3.5.3.1. Recording Environmental Conditions...........................................................................................................26 3.5.4. Aligning the Telephotometer.........................................................................................................................26 3.5.5. Measurement Procedures for Outdoor Telephotometry.............................................................................27 3.5.6. Additional Procedures for “In Situ” Measurement......................................................................................27
4. Data Collection 29 4.1. Source Data/Identification of Test Items...............................................................................................................29 4.2. Test Equipment Identification ................................................................................................................................29 4.3. Software...................................................................................................................................................................29 4.4. Power Monitoring of Item under Test....................................................................................................................29 4.5. Notes/Comments.....................................................................................................................................................30 4.6. Name & Signature of Examiner and Date ..............................................................................................................30
5. PRESENTATION OF RESULTS 30 5.1. Luminous Intensity vs Angle..................................................................................................................................30
5.1.1. Omnidirectional Beacons (fan beams).........................................................................................................30 5.1.2. Rotating Beacons (pencil beams).................................................................................................................30 5.1.3 Directional Beacons.......................................................................................................................................31
5.2. Luminous Intensity vs Time...................................................................................................................................31 5.3 Flash Duration.........................................................................................................................................................31 5.4. Effective Intensity....................................................................................................................................................32 5.5. Uncertainty & Confidence.......................................................................................................................................32
6. CONCLUSION 32 7. REFERENCES 33 Annex A. Example of Test Report Annex B. Example of Uncertainty Budget

IALA Recommendation E. 122 on the Photometry of Marine Aids-to-Navigation Signal Lights
6 of 33
Standards for the Photometry of Marine Aids to Navigation Signal lights
1. Introduction 1.1 Objective
The objective of this standard is to provide an approved methodology to promote uniformity in determining and reporting the optical performance of a diverse group of marine aids-to-navigation signal lights. Marine aids-to-navigation signal lights encompass projection-type equipment, using various light sources, lenses and mirrors, singly or in combination, and Fresnel-type drum lenses.
1.2 Scope
This standard applies to the photometric measurement and characterisation of all marine aids-to-navigation signal lights. In general, the emissions provided by these signal lights may be categorized as “pencil beams” or “fan” beams.
Equipments used to generate pencil beams include searchlight-style or projector beacons, with single or multiple optics, and assemblies of “bulls-eye” lenses, which are formed by rotating a Fresnel profile about a horizontal axis, rotating about a common focal point. The peak fixed intensities provided by these beacons range from a few thousand to several million candelas, with beam spreads (as measured between the 50% intensity points) typically less than ten degrees in any cross section. Searchlight-style beacons may be fixed in position, to provide a leading light for marking a navigational channel, or may be rotated about a vertical axis to sweep the horizon and provide the appearance of a flashed light when viewed from a distance.
Fresnel drum lenses typically generate fan beams. These optics may be used to produce a uniform light signal about the horizontal plane (an omnidirectional signal). The signal may be blanked or coloured in one or more sections around the horizon, or may exhibit one or more areas of increased intensity by the use of condensing panels. The peak fixed intensities provided by these beacons range from a few tens of candelas to tens of thousands of candelas. Light sources used in marine aids-to-navigation signal lights are typically incandescent lamps or discharge lamps. Light emitting diodes (LEDs) are increasingly used in low-intensity beacons, while the use of acetylene open flame or gas-mantles as a light source is becoming increasingly rare.
IALA Recommendation E. 122 on the Photometry of Marine Aids-to-Navigation Signal Lights
7 of 33
1.3. Colours for Marine Aid-to-Navigation Lights
1.3.1 Acceptable Colours
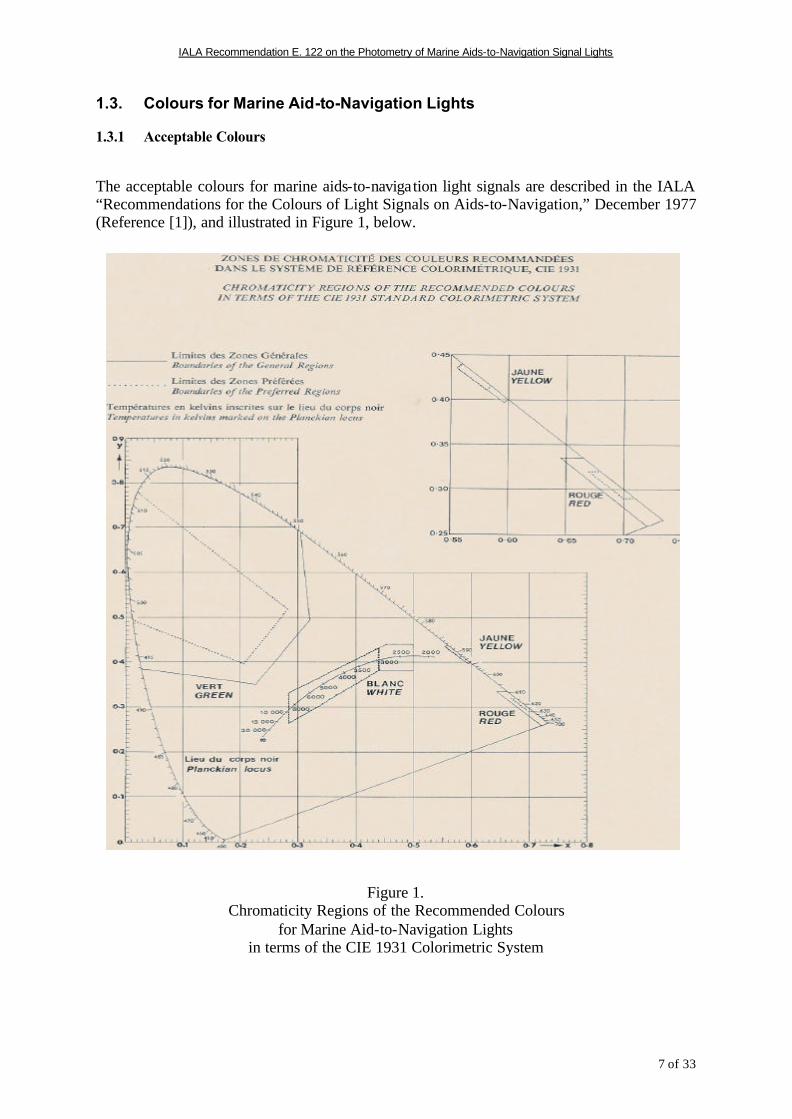
The acceptable colours for marine aids-to-navigation light signals are described in the IALA “Recommendations for the Colours of Light Signals on Aids-to-Navigation,” December 1977 (Reference [1]), and illustrated in Figure 1, below.
Figure 1. Chromaticity Regions of the Recommended Colours
for Marine Aid-to-Navigation Lights in terms of the CIE 1931 Colorimetric System

IALA Recommendation E. 122 on the Photometry of Marine Aids-to-Navigation Signal Lights
8 of 33
1.3.2. Chromaticity Regions
It is recommended by IALA that the chromaticity of the colours of marine AtoN light signals lie within the preferred regions shown in Figure 1. However the use of the general regions in Figure 1 is considered to be acceptable. The preferred regions take into account the problems of people with defective colour vision and give a higher probability of recognition. 1.3.2.1 Corner Coordinates for General Regions
1 2 3 4 5 6 Colou
r x y x y x y x y x y x y
Red 0.735
0.265
0.721
0.259
0.645
0.335
0.665
0.335
Yellow
0.600
0.400
0.596
0.396
0.555
0.435
0.560
0.440
Green 0.305
0.689
0.321
0.494
0.228
0.351
0.028
0.385
White 0.500
0.382
0.440
0.382
0.285
0.264
0.285
0.332
0.453
0.440
0.500
0.440
1.3.2.2 Corner Co-ordinates for Preferred Regions
1 2 3 4 Colour x y x y x y x y
Red 0.710 0.290 0.700 0.290 0.670 0.320 0.680 0.320 Yellow 0.585 0.415 0.581 0.411 0.555 0.435 0.560 0.440 Green 0.022 0.778 0.282 0.518 0.207 0.397 0.013 0.494 White 0.440 0.382 0.285 0.264 0.285 0.332 0.440 0.432
IALA Recommendation E. 122 on the Photometry of Marine Aids-to-Navigation Signal Lights
9 of 33
1.3.3. Colour Measurement Practice
To measure the colour of a light signal, the appropriate colorimetric or spectroradiometric measurement should be carried out. The use of three filter (tristimulus) colorimeters is acceptable for broadband coloured lights, for example those obtained by using a coloured filter in conjunction with a white light. However, their use is not generally recommended for the measurement of light sources with a narrow spectral distribution, such as coloured LEDs. A spectroradiometer is an acceptable instrument to use for colour measurements of all light sources [15]. 1.4 The Effective Intensity of a Rhythmic Light
To assist mariners in recognizing aid-to-navigation light signals, the lights generally provide a time-dependent signal. The effective intensity of the light signal is defined by its equivalence to a fixed light at detection threshold. A full discussion on this concept may be found in IALA “Recommendations on the Determination of the Luminous Intensity of a Marine Aid-to-Navigation Light,” December 1977 [2]. Calculation of the effective intensity requires knowledge of the instantaneous luminous intensity with time. For a system of rotating pencil beams, this can be achieved by measurement of the intensity profile of the beam along the plane that is described by the optical axis of the signal and which is normal to the axis of rotation. The angular dependency of the luminous intens ity may be converted to a time dependency for specified rotation rates. For lights that are flashed by eclipsing or switching the light source, the instantaneous luminous intensity profile versus time must be measured directly.
Conversion of the time dependent luminous intensity, I(t), to the rated effective intensity of the light is performed by application of the method of Schmidt-Clausen [3] over the range of characters recommended by IALA [16]:
o
e
IJ
C
JI
+= Equation 1.
where: Ie = effective intensity (candelas) J = integrated intensity of the flash (candela.seconds)
dttIJflash∫= )( Equation 2.
Io = the maximum intensity during the flash interval (candelas) C = a visual time constant, taken to be 0.2 seconds for night-time observation and 0.1 seconds for daytime observation.
IALA Recommendation E. 122 on the Photometry of Marine Aids-to-Navigation Signal Lights
10 of 33
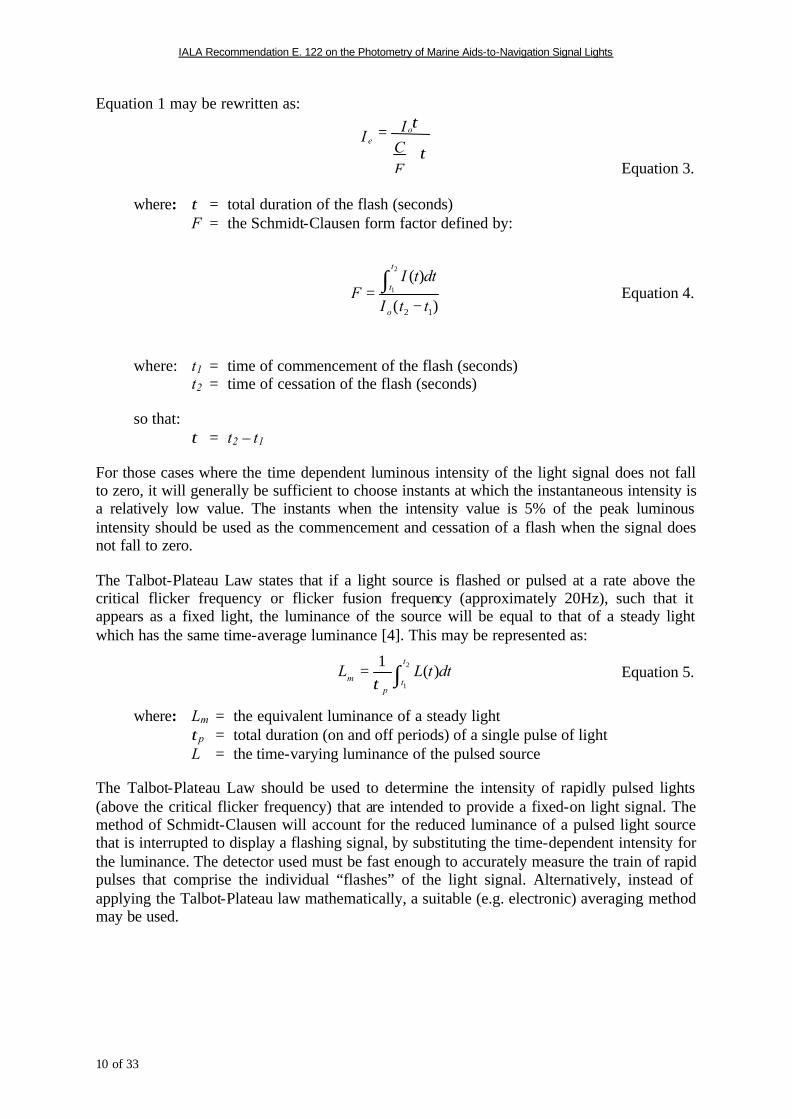
Equation 1 may be rewritten as:
τ
τ
+=
FCI
I oe
Equation 3.
where: τ = total duration of the flash (seconds) F = the Schmidt-Clausen form factor defined by:
)(
)(
12
2
1
ttI
dttIF
o
t
t
−=
∫ Equation 4.
where: t1 = time of commencement of the flash (seconds) t2 = time of cessation of the flash (seconds)
so that: τ = t2 – t1
For those cases where the time dependent luminous intensity of the light signal does not fall to zero, it will generally be sufficient to choose instants at which the instantaneous intensity is a relatively low value. The instants when the intensity value is 5% of the peak luminous intensity should be used as the commencement and cessation of a flash when the signal does not fall to zero.
The Talbot-Plateau Law states that if a light source is flashed or pulsed at a rate above the critical flicker frequency or flicker fusion frequency (approximately 20Hz), such that it appears as a fixed light, the luminance of the source will be equal to that of a steady light which has the same time-average luminance [4]. This may be represented as:
∫= 2
1
)(
1 t
tp
m dttLLτ
Equation 5.
where: Lm = the equivalent luminance of a steady light τp = total duration (on and off periods) of a single pulse of light L = the time-varying luminance of the pulsed source
The Talbot-Plateau Law should be used to determine the intensity of rapidly pulsed lights (above the critical flicker frequency) that are intended to provide a fixed-on light signal. The method of Schmidt-Clausen will account for the reduced luminance of a pulsed light source that is interrupted to display a flashing signal, by substituting the time-dependent intensity for the luminance. The detector used must be fast enough to accurately measure the train of rapid pulses that comprise the individual “flashes” of the light signal. Alternatively, instead of applying the Talbot-Plateau law mathematically, a suitable (e.g. electronic) averaging method may be used.

IALA Recommendation E. 122 on the Photometry of Marine Aids-to-Navigation Signal Lights
11 of 33
An increase in brightness for lights pulsed at rates below the flicker fusion frequency was first reported by Brücke (1864). While brightness enhancement has been verified by several studies, the degree of enhancement and the optimal frequency are dependent on the luminance level. Some studies have indicated no enhancement at luminance levels approaching the detection threshold [4]. 1.5 Calculation of Nominal Range
The luminous range of a light is defined as the maximum distance at which a light can be seen, as determined by the luminous intensity of the light, the meteorological visibility, and the threshold of illuminance at the eye of an observer. The IALA Recommendation for the Notation of Luminous Intensity and Range of Lights, November 1966, states that the “nominal” range is the luminous range of a light when the meteorological visibility is 10 nautical miles, and a threshold of illuminance of 0.2 microlux is used for nighttime observation. Calculation of the “nominal” range is made using Allard’s Law [14]:
2D
TIE
D∗= Equation 6.
where: E = illuminance at the eye of the observer (lux) I = luminous intensity of the light (candelas) T = the transmissivity of the atmosphere, defined as the ratio of the amount
of light that exits a unit length of atmosphere to the amount of light that entered the unit length of atmosphere
D = the distance between the observer and the light (metres)
Meteorological visibility is defined as the distance required for the atmosphere to reduce the contrast of a black object against its background to 5% of the original contrast value at zero distance. The relationship between transmissivity and meteorological visibility is given as:
05.0=VT Equation 7.
where: V = is the meteorological visibility (metres). Allard’s Law may be rearranged to solve for the required intensity of a light signal to produce a given value of illuminance at some distance under specific conditions of visibility, thus:
V
D
DEI
)05.0(
2∗= Equation 8.
The resultant nominal range should be calculated in metres, converted to nautical miles and rounded off to the nearest nautical mile [14]. 2. GENERAL PROCEDURES
Testing facilities should establish and maintain a quality system appropriate to the type, range and volume of calibration and testing activities it undertakes. All procedures for conducting calibrations and photometric measurements should be documented as part of the quality system.
IALA Recommendation E. 122 on the Photometry of Marine Aids-to-Navigation Signal Lights
12 of 33
2.1 Calibration to National Standards
All test equipment should be calibrated at an accredited test house and the calibration traceable to a national standard. Test equipment should be calibrated at regular intervals and, if calibrated in house, should be calibrated using equipment traceable to national standards. When a replacement calibration certificate is issued, the calibration notes should be checked for any undue variations from the previous calibration. Large changes to calibrated values may affect the uncertainty budget of prior measurements.
All items of test equipment must be uniquely identified. Details of all test equipment should be logged in a register stating manufacturer, model number and serial number. The register should also show calibration due dates for each separate item of test equipment, to ensure that calibration is maintained at correct intervals. Calibration labels, identified with the calibration certificate serial number, equipment serial number and next due date of calibration, should be firmly fixed to the test equipment by the test house upon completion of calibration. Any obsolete calibration labels should be removed from the test equipment by the test house.
All equipment shall be maintained in a clean and working condition. Any faults occurring with test equipment should be repaired promptly. Following the repair of the fault, the equipment should be recalibrated before it is put back into service. If test equipment calibration seals are broken for any reason, the affected equipment should be removed from service and recalibrated.
2.2 CIE Photopic Response; V(λλ) and f1Ð
The overall spectral response of the photometric system used should approximate closely the spectral luminous efficiency curve V(λ) for the CIE standard photometric observer in photopic vision [5][17]. For broadband emitters, such as incandescent lamps, a single value measurement of the spectral response, the closeness of fit (f1Ð) figure of the system, may be used to determine measurement uncertainty. The f1
Ð is a term recommended by CIE [6]. For selective emitters, such as LEDs or metal-halide lamps, the deviation of the response of the photometric system from V(λ) for specific wavelengths may have to be accounted for by use of colour correction.
2.3 Colour Correction
Even photometric systems with low f1Ð figures can exhibit significant uncertainties at extremes
of the visible spectrum. If the light source being measured has a spectral output that exhibits rapid changes of radiant intensity with wavelength, such as LED sources, colour correction should be undertaken [2]. An accepted method of correction is by use of a spectral correction factor, SCF [18] as given by
) ( ) ( ) ( ) (
) ( ) ( ) ( ) (
∫ ∫ ∫ ∫ =
λ λ
λ λ λ λ λ λ λ λ
λ λ λ λ λ λ
d s S d V S
d V S d s S SCF
rel t A
t rel A
Equation 9.
where St(λ) is the spectral power distribution of the test lamp, SA(λ) is the spectral data of the CIE Illuminant A, and srel(λ) is the relative spectral responsivity of the photometer [7]. Using this equation, the correction factor can be obtained for any light source of known spectral
IALA Recommendation E. 122 on the Photometry of Marine Aids-to-Navigation Signal Lights
13 of 33
power distribution (see 1.3.3.). If a calibrated light source is being used as a reference, its spectral power distribution SR(λ) may be substituted for SA(λ).
The correction factor will have an associated uncertainty derived from the spectral measurement process and the pertinent calibration details of equipment used in the measurement.
A second method of colour correction is by use of a calibrated light source with the same spectral power distribution as that of the test lamp. Measurement of the calibrated light source will establish a scaling factor that may be used to correct the measured illuminance of the item under test. 2.4. Minimum Photometric Distance
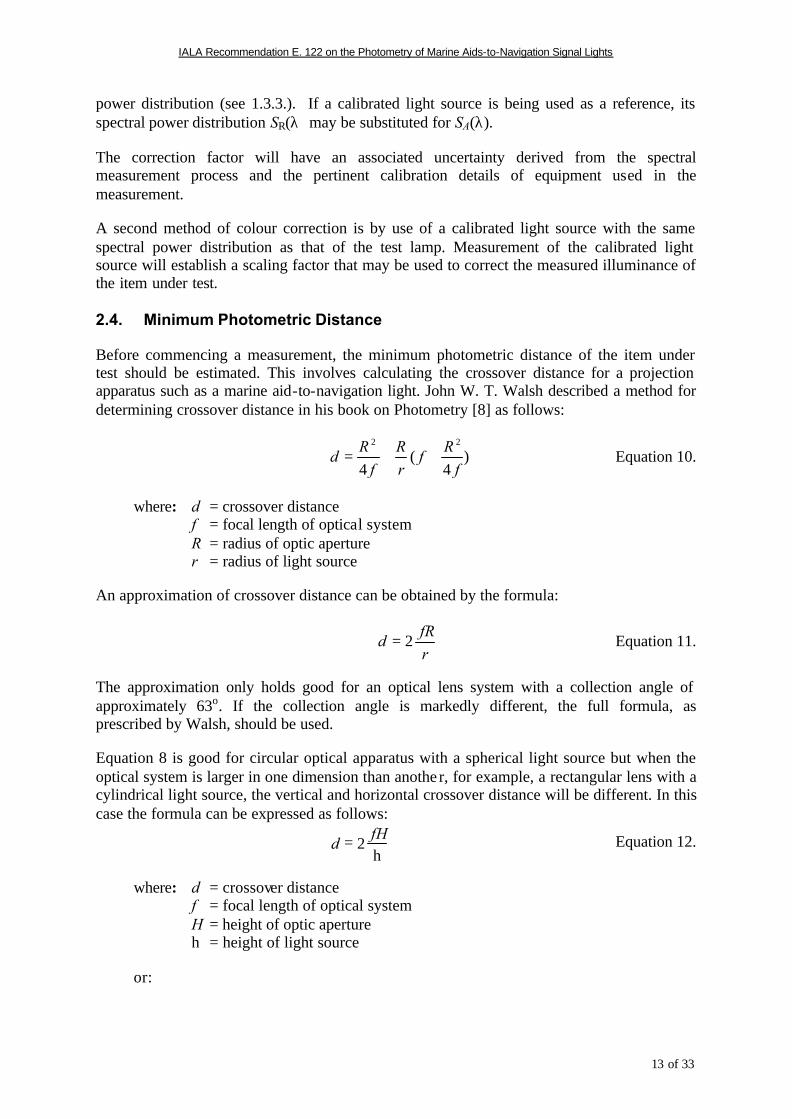
Before commencing a measurement, the minimum photometric distance of the item under test should be estimated. This involves calculating the crossover distance for a projection apparatus such as a marine aid-to-navigation light. John W. T. Walsh described a method for determining crossover distance in his book on Photometry [8] as follows:
)4
(4
22
fR
frR
fR
d ++= Equation 10.
where: d = crossover distance f = focal length of optical system R = radius of optic aperture r = radius of light source
An approximation of crossover distance can be obtained by the formula:
rfR
d 2= Equation 11.
The approximation only holds good for an optical lens system with a collection angle of approximately 63o. If the collection angle is markedly different, the full formula, as prescribed by Walsh, should be used.
Equation 8 is good for circular optical apparatus with a spherical light source but when the optical system is larger in one dimension than anothe r, for example, a rectangular lens with a cylindrical light source, the vertical and horizontal crossover distance will be different. In this case the formula can be expressed as follows:
h fH
d 2 = Equation 12.
where: d = crossover distance f = focal length of optical system H = height of optic aperture h = height of light source
or:

IALA Recommendation E. 122 on the Photometry of Marine Aids-to-Navigation Signal Lights
14 of 33
w fW
d 2 = Equation 13.
where: d = crossover distance f = focal length of optical system W = width of optic aperture w = width of light source
Both the crossover distances of height and width should be calculated and the greater of the two used. For an omnidirectional beacon, only the vertical crossover is relevant, therefore only equation 9 is relevant. For a precision sector projector, the crossover distance may be expressed as follows:
α R
d 2 =
Equation 14.
where: d = crossover distance f = focal length of optical system R = radius of optic aperture α = requested angular resolution
The minimum photometric distance may be taken as twice the calculated crossover distance.
In cases where the sizes of optical components are unknown, the minimum photometric distance may be determined by measuring the intensity at several different distances from the beacon, always on the same radial coordinate, and assessing the distance beyond which the resultant measured intensity is consistent [20]. In practice this will be restricted to small sealed beacons, whose component parts are not measurable. 2.5. Environmental Conditions
Ambient conditions for indoor measurements should be stabilized at 25(+5/-10) oC and 60(±10)% relative humidity. In the case of outdoor measurements, the temperature and relative humidity should be noted at the time of the measurement. Any significant changes in ambient conditions during the course of the measurement should be recorded.
2.6. Uncertainty & Confidence
An expression of the result of a measurement is incomplete unless it includes a statement of the associated uncertainty. The results of all measurements should state the range, within which the measured value is estimated to lie, for a stated level of confidence. All type A and type B uncertainties associated with the measurement process should be evaluated in accordance with ISO Publication No. 2, Guide to the Expression of Uncertainty in Measurement, 1993 [9]. Type A evaluation of uncertainty is made by statistical analysis of a series of observations, and type B evaluation of uncertainty is made by means other than the statistical analysis of the observations.
IALA Recommendation E. 122 on the Photometry of Marine Aids-to-Navigation Signal Lights
15 of 33
2.6.1. Combined Standard Uncertainty
The combined standard uncertainty is calculated by combining the individual uncertainties that comprise the uncertainty budget using the square root of the sum of the squares of the individual uncertainties. 2.6.2. Expanded Uncertainty
The expanded uncertainty is obtained by multiplying the combined standard uncertainty by a coverage factor, k. Unless otherwise determined, it may be assumed that the probability distribution of a measurement result and the combined standard uncertainty is approximately normal. The combined standard uncertainty is equivalent to the standard deviation of the Gaussian distribution. An appropriate coverage factor should be determined in order to provide a confidence level of 95%. 2.6.3. Systematic Errors
Any fixed errors within the measuring system should be evaluated and, where possible, corrected by the use of an appropriate correction factor. These errors and corrections should be given with the measurement results. Appropriate uncertainty and confidence figures associated with error correction should be included in the uncertainty budget. 2.6.4. Sampling Guidelines
Sampling consists of taking a sufficient number of measurements for a given condition to minimize the impact of minor random fluctuations in the measurement process. A coverage factor between 2 and 3 should be achieved, consistent with the evaluation of uncertainty figures and confidence levels [9] (see Annex B – Welch-Satterthwaite). Sampling procedures should be documented as part of the standard laboratory procedures. Exceptions to standard sampling procedures should be discussed in any test results. 2.7. Retention of Data
All source data recorded during the course of a measurement and the ensuing results, whatever the recording method, should be retained in safe storage for at least 36 calendar months. A copy of any publication ensuing from measurements carried out should also be retained safely for this period, or longer depending on the predicted service life.

IALA Recommendation E. 122 on the Photometry of Marine Aids-to-Navigation Signal Lights
16 of 33
3. Measurement Methods 3.1 Introduction
The methodologies described herein have been reviewed and accepted as providing equivalent results, within stated uncertainties. The primary method of measuring luminous intensity described herein will be called “Standard Laboratory Photometry.” Other methods of measurement are not excluded, but must meet the same criteria for traceability and evaluation of uncertainty described in this standard. Alternative methodologies that are anticipated to have widespread application should be presented to the IALA Engineering Committee for review and inclusion in this document. 3.1.1 Basic Method – Standard Laboratory Photometry
The measurement of the luminous intensity of a light source in the laboratory is usually carried out by taking an illuminance reading, in lux, of the light source at a measured distance, in metres. The luminous intensity in candelas may then be calculated by multiplying the illuminance by the square of the distance, this is known as the Photometric Distance Law [19] (see Allard’s Law in 1.5). The transmissivity of the atmosphere over short distances in the laboratory may be taken as unity. The light source and photometric receptors are usually mounted on an optical bench or table to reduce the uncertainty of distance measurement. To ascertain the luminous intensity of the light source in more than one direction, the light source may be rotated about its light centre and several illuminance readings taken at different orientations. To ascertain the overall luminous flux emitted by a light source, an integrating sphere may be used. Photometers, used for measuring illuminance, have a photopic spectral response that approximates the standard human observer, V(λ) [17]. Provided the measuring distance is relatively large compared to the size of the light source (greater than fifteen times as a rule of thumb), this method is simple and accurate for unfocussed light sources. However, when measuring light beam projection apparatus, such as a light source and lens or mirror system, much greater measuring distances are required to ensure an error free result when using this method (see 2.4). At these greater distances several problems arise, such as the effects of atmospheric transmissivity and disturbance, and the difficulty in measuring much lower levels of illuminance. The projection apparatus may be rotated through different angles and illuminance readings taken to determine the shape of the projected beam. Further guidance on basic pho tometry can be obtained from CIE publications No. 18.2, The Basis of Physical Photometry 1983; No. 70 “The Measurement of Absolute Luminous Intensity Distributions”, 1987; and from No. 121 “The Photometry and Goniophotometry of Luminaires”, 1996. 3.1.2. Alternative Measurement Methods
In addition to Standard Laboratory Photometry, two alternative methods, for the photometry of projection apparatus such as aid-to-navigation signal lights, have been reviewed and approved for inclusion in this document; Zero-Length Photometry (section 3.4) and Outdoor Telephotometry (section 3.5). Much of the equipment and measurement procedures outlined in sections 3.2 and 3.3 are the same for all three methods. Unique requirements for the two alternative methods are discussed in their respective sections.
IALA Recommendation E. 122 on the Photometry of Marine Aids-to-Navigation Signal Lights
17 of 33
3.2. General Equipment Requirements
3.2.1. Photometer
Use of a calibrated photometer is recommended. Standard photometers display a high degree of linearity over several orders of output current. They typically comprise a silicon photodiode, a V(λ)-correction filter, and a precision aperture. Use of a calibrated detector, within the limits of the rated output, eliminates the requirement to maintain calibrated sources. For the measurement of flashing lights, the response time of the photometer must be less than one tenth of the calculated time interval between the 50% intensity points of the flash being measured. For rapidly pulsed lights, the response time of the photometer must be less than one tenth of the on-period of the pulse cycle.
The spectral response of the photometric system should closely approximate the spectral luminous efficiency curve V(λ) for the CIE standard photometric observer in photopic vision (see 2.2). The calibration documentation for the photometric system should include the spectral response values of the detector from 380 to 780 nm, in increments no greater than 5 nm. Where possible, the documentation should include the spectral response values from 360 to 830 nm in increments of 1 nm. Calibration documentation should also include the f1Ð value. An f1' < 1.5% is desired, although typical values may range from 2.5 to 5.0%.
3.2.2. Calibrated Light Sources
Calibrated sources, while not required when a calibrated photometer is used, are useful for making comparative measurements. A calibrated selective emitter, such as an LED source, may also be used as an alternative to colour correction when the relative spectral responsivity of the photometer is not available. 3.2.3. Goniometer
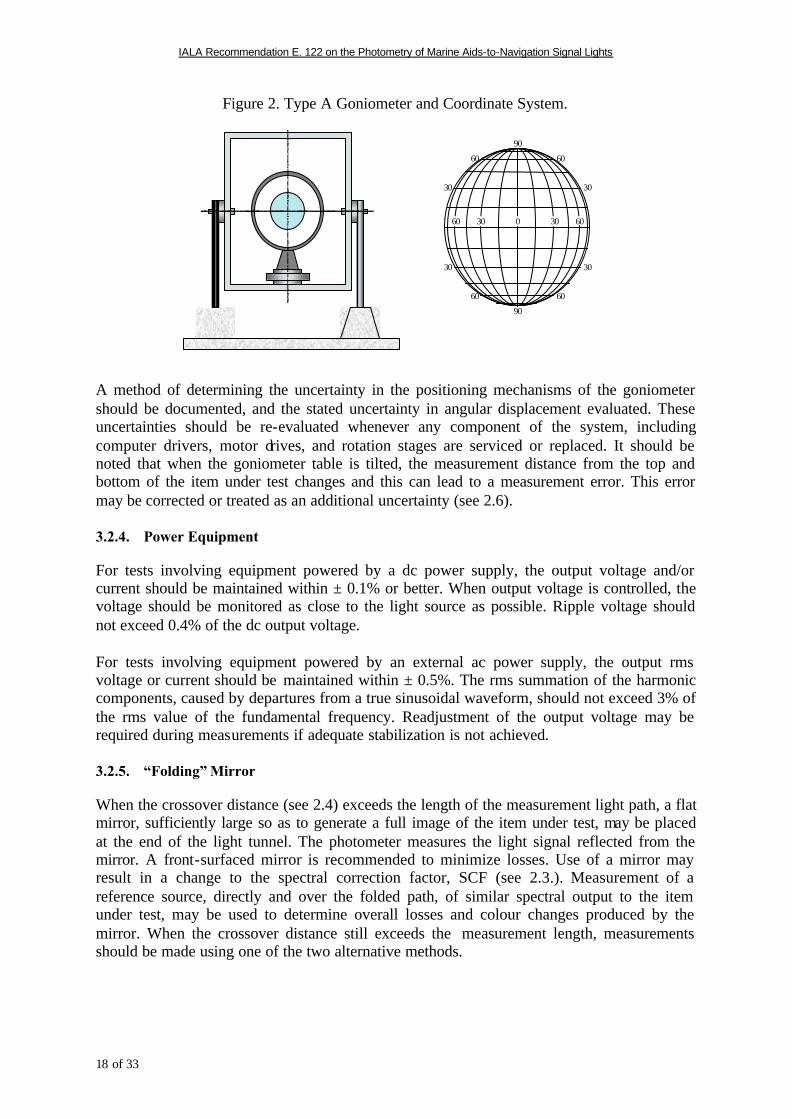
A type A goniometer, where the source is tilted about a fixed horizontal axis and also turned about an axis which, in the position of rest, is vertical, and upon rotation follows the movement of the horizontal axis, should be used in the photometry of marine aids to navigation lights. Figure 2 illustrates a typical type A goniometer, and the loci traced by the goniometer in relation to the photocell. The related coordinate system to be used with the type A goniometer is described in CIE Recommendation 43 of 1979 Appendix C.2. [10].
IALA Recommendation E. 122 on the Photometry of Marine Aids-to-Navigation Signal Lights
18 of 33
Figure 2. Type A Goniometer and Coordinate System.
030 3060 60
30 30
30 30
60 60
60 60
90
90
A method of determining the uncertainty in the positioning mechanisms of the goniometer should be documented, and the stated uncertainty in angular displacement evaluated. These uncertainties should be re-evaluated whenever any component of the system, including computer drivers, motor drives, and rotation stages are serviced or replaced. It should be noted that when the goniometer table is tilted, the measurement distance from the top and bottom of the item under test changes and this can lead to a measurement error. This error may be corrected or treated as an additional uncertainty (see 2.6). 3.2.4. Power Equipment
For tests involving equipment powered by a dc power supply, the output voltage and/or current should be maintained within ± 0.1% or better. When output voltage is controlled, the voltage should be monitored as close to the light source as possible. Ripple voltage should not exceed 0.4% of the dc output voltage. For tests involving equipment powered by an external ac power supply, the output rms voltage or current should be maintained within ± 0.5%. The rms summation of the harmonic components, caused by departures from a true sinusoidal waveform, should not exceed 3% of the rms value of the fundamental frequency. Readjustment of the output voltage may be required during measurements if adequate stabilization is not achieved. 3.2.5. “Folding” Mirror
When the crossover distance (see 2.4) exceeds the length of the measurement light path, a flat mirror, sufficiently large so as to generate a full image of the item under test, may be placed at the end of the light tunnel. The photometer measures the light signal reflected from the mirror. A front-surfaced mirror is recommended to minimize losses. Use of a mirror may result in a change to the spectral correction factor, SCF (see 2.3.). Measurement of a reference source, directly and over the folded path, of similar spectral output to the item under test, may be used to determine overall losses and colour changes produced by the mirror. When the crossover distance still exceeds the measurement length, measurements should be made using one of the two alternative methods.
IALA Recommendation E. 122 on the Photometry of Marine Aids-to-Navigation Signal Lights
19 of 33
3.2.6. Recording System
All relevant light range measurement information must be recorded. The recording medium may be manually operated pen and paper, automatic chart plotter or electronic storage such as a computer. The recording system in use must have a response time fast enough to faithfully record all relevant data output from the measuring system.
3.3. Standard Laboratory Photometry Procedures
3.3.1 Items Under Test
The item should be checked to ensure that it is in good operating condition. The optical system should be outfitted with the appropriate light source, which may be supplied by the manufacturer or be a standard laboratory test lamp, and focused (if required) in accordance with the manufacturer’s instructions or standard laboratory procedure. Laboratory test lamps should be selected for close conformance to design dimensions, rated power consumption, and rated lumen output. Manufacturing tolerances between individual lamps of the same manufacturer’s specification may be very large causing a correspondingly large variation in the intensity of a beacon. Parameters such as filament coil spacing and size also impact greatly on the intensity distribution, therefore close inspection and selection is recommended. A test procedure should be written to ensure conformance of laboratory test lamp properties within 3% of the manufacturer’s specification [10]. When a lampchanger is included as part of the test item, lamps should be installed in all positions of the lampchanger where they might impact on the photometric output of the item under test. Lamps should be seasoned by running them for a few tens of hours prior to initial use [11]. Marine aid-to-navigation light signals should be tested at rated voltage, rather than current or power. The voltage should be monitored, with sense leads attached as close as practical to the lamp inputs or controlling circuitry inputs, and kept constant throughout the measurement process. Current should also be monitored and recorded, to detect any changes in the input power during measurements and allow for correction of measured photometric output (see 3.2.4). In the case of LED light sources with conditioning circuitry, both the input voltage and current to that circuitry should be monitored. Stand alone LED’s are normally rated at a given current rather than voltage because dI/dV is very large at the operating point therefore, in the absence of conditioning circuitry, current should be controlled and monitored rather than voltage.
3.3.2. Alignment
A datum point should be identified on the perimeter of the item under test such that it clearly defines a direction of radiation towards the horizon. This may be a manufacturer’s mark or one put there by the testing laboratory. Items under test should be installed on the goniometer and aligned with the measurement system such that the datum point is in line with the measurement direction. Where possible, the height of the goniometer table should be adjustable so that both the horizontal and vertical axes of the optic may be aligned with the rotational axes of the goniometer. If this is not possible, due to the design constraints of the

IALA Recommendation E. 122 on the Photometry of Marine Aids-to-Navigation Signal Lights
20 of 33
goniometer table, the errors in measurement distance caused by tilting the table should be corrected or included in the uncertainty budget. The centre of the photodetector aperture should lie along the line normal to the rotational axes of the goniometer. The alignment process and its associated uncertainty should be part of the documented laboratory procedure. When a flat folding mirror is used, the distance from the item under test to the mirror should be as close as possible to the distance from the mirror to the photometer. The reflection angle of the light path should be minimised. The normal of the mirror surface must lie on the plane described by the optical axis of the item under test and the reference direction of the goniometer [10]. 3.3.3. Equipment Warm-Up
All test equipment requiring electrical power should be switched on and allowed to warm up in accordance with the manufacturers’ operating instructions or calibration certificates before commencement of any tests or measurements. In the absence of such guidance, the measurement facility should evaluate the performance of test equipment to determine the required warm up period to prevent drift for each piece of equipment. Items under test should be run at rated power for a sufficient period of time to ensure stability. The warm-up time selected for any type of light source should be documented in the laboratory procedures, and used consistently. 3.3.4 Stray Light and Ambient Light Control
Stray light control includes eliminating reflected light of the item under test, from walls, floors, and other surfaces, from reaching the photodetector. Ambient light control includes eliminating or reducing the amount of light from sources other than the item under test. The impact of ambient light may be determined by removing power to the item under test and recording the output of the photodetector. The impact of both elements may be determined by taking measurements with the item under test on, but with the direct light path occluded. 3.3.5 Measurement of Angular Dependency of Luminous Intensity
In order to carry out angular measurements using the goniometer it is necessary to make the item under test exhibit a fixed light. For rotating beacons this can be achieved by disabling the rotation mechanism and locking the mechanism in one position. If the item under test emits more than one beam, each beam axis or surface should be identified with the datum clearly defined. Separate vertical and horizontal plots should be carried out for each beam axis. If the light source within a rotating beacon is non-uniform and the measurement is to be carried out by rotating the whole beacon, including the light source, on the goniometer, additional output data for the bare light source, for example a lamp polar plot, must be obtained. If the measurement is to be carried out with the lamp in a fixed position and not rotated with the goniometer, measurements of all emitted beams must be carried out with the light source in two different positions, those that give maximum and minimum intensity. For omnidirectional beacons with a flashing light source, the light source should be made to light continuously by following instructions in the manufacturer’s handbook. If no instructions are available, advice from the manufacturer or supplier should be sought. It should be noted that the continuous intensity of a beacon exhibiting a fixed light may be different to the peak intensity of the same beacon when it exhibits a flashing light (see 3.3.6.).

IALA Recommendation E. 122 on the Photometry of Marine Aids-to-Navigation Signal Lights
21 of 33
3.3.5.1. Minimum Requirements for Angular Resolution
The following are minimum requirements for the two main types of marine aids-to-navigation optical systems: • Omnidirectional lantern—(fan beams)
horizontal profile, 360 degree plot, readings every 1.0 degrees; and vertical profile to the 5% intensity points, readings every 0.1 degrees.
A minimum of three equidistant vertical profiles should be recorded, one of which should be taken at a position where the on-axis intensity is close to the mean of the values for the horizontal profile. Additional vertical profiles may be necessary to adequately investigate irregularities in the horizontal profile. • Directional and rotating beacons and precision projectors
horizontal profile to 5% intensity points, readings every 0.1 degrees; and vertical profile to 5% intensity points, readings every 0.1 degrees.
3.3.6. Measurement of Time Dependency of Luminous Intensity of a Flashed Character
In order to determine the effective intensity of a flashing omnidirectional aid-to-navigation light operating at a chosen character, the time-dependent luminous intensity profile must be measured. The absolute values of the instantaneous luminous intensity do not have to be measured, as long as the peak intensity during a flash is equal to the intensity measured when the item under test provides a fixed light. This requires tha t the time duration of a flash generated by a contact-closure (such as a tungsten- incandescent lamp that is switched on and off) is of sufficient length to ensure that full output of the light source is achieved. Examples of types of illuminant that may exhibit different values of instantaneous peak intensity and continuous intensity are: 3.3.6.1. A tungsten filament lamp whose time to reach full incandescence is greater than the contact closure time (CCT) of the device controlling the lamp supply [2 – p.35] 3.3.6.2. An LED whose luminous intensity reduces with time when supplied with constant current, this being the result of an increase in junction temperature of the LED. Care should therefore be taken to ensure that such devices either reach full incandescence during the measurement of the flash profile or that the relationship between instantaneous peak intensity and continuous intensity is known. The latter may be treated as an error to which a correction factor is applied with an associated correction uncertainty. For rotating beacons, the instantaneous luminous intensity may be plotted against time by allowing the beacon to rotate under its own power and recording each beam as it passes the measuring instrument. With this method, the light source does not usually rotate. If the light source is non-uniform, measurements of all emitted beams will be carried out with the light source in two different positions, those that give maximum and minimum intensity.
3.4. Alternative Procedure 1—Zero-Length Photometry
Zero-Length Photometry is a methodology for approximating far-field conditions in a short distance. The principal technique of Zero-Length Photometry is the use of a paraboloidal
IALA Recommendation E. 122 on the Photometry of Marine Aids-to-Navigation Signal Lights
22 of 33
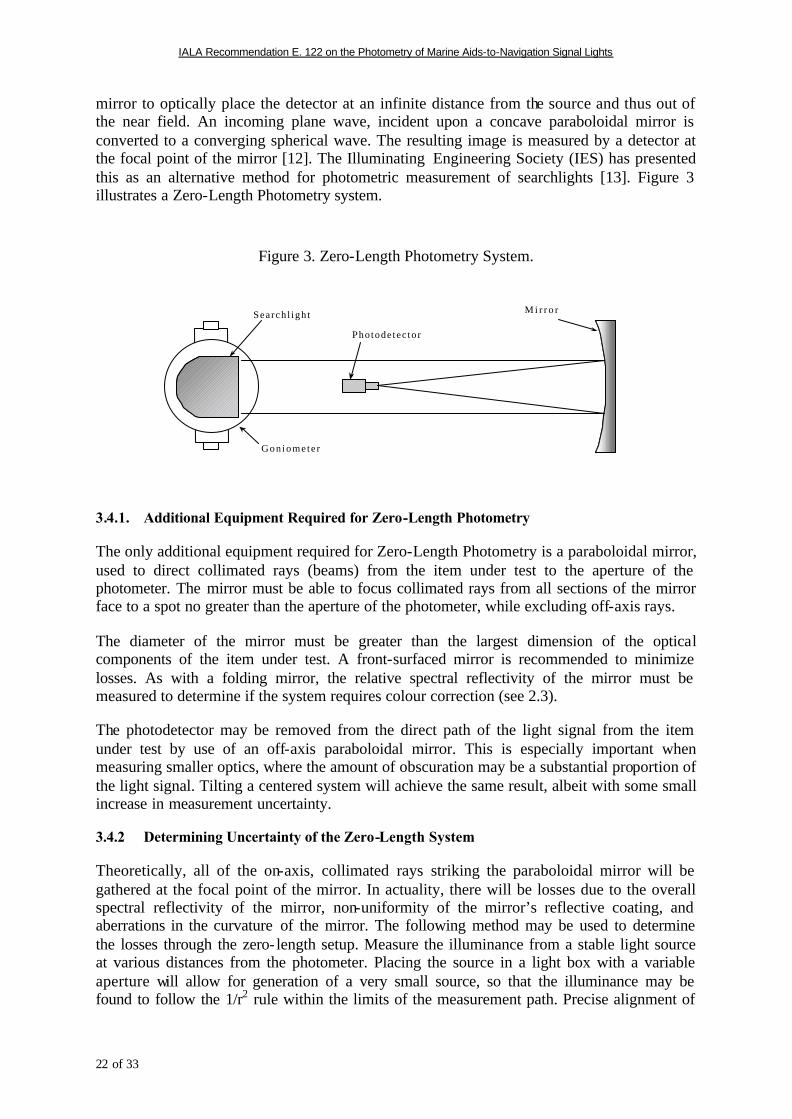
mirror to optically place the detector at an infinite distance from the source and thus out of the near field. An incoming plane wave, incident upon a concave paraboloidal mirror is converted to a converging spherical wave. The resulting image is measured by a detector at the focal point of the mirror [12]. The Illuminating Engineering Society (IES) has presented this as an alternative method for photometric measurement of searchlights [13]. Figure 3 illustrates a Zero-Length Photometry system.
Figure 3. Zero-Length Photometry System.
M i r r o rSearch l igh t
Gon iome te r
Photode tec tor
3.4.1. Additional Equipment Required for Zero-Length Photometry
The only additional equipment required for Zero-Length Photometry is a paraboloidal mirror, used to direct collimated rays (beams) from the item under test to the aperture of the photometer. The mirror must be able to focus collimated rays from all sections of the mirror face to a spot no greater than the aperture of the photometer, while excluding off-axis rays.
The diameter of the mirror must be greater than the largest dimension of the optical components of the item under test. A front-surfaced mirror is recommended to minimize losses. As with a folding mirror, the relative spectral reflectivity of the mirror must be measured to determine if the system requires colour correction (see 2.3).
The photodetector may be removed from the direct path of the light signal from the item under test by use of an off-axis paraboloidal mirror. This is especially important when measuring smaller optics, where the amount of obscuration may be a substantial proportion of the light signal. Tilting a centered system will achieve the same result, albeit with some small increase in measurement uncertainty.
3.4.2 Determining Uncertainty of the Zero-Length System
Theoretically, all of the on-axis, collimated rays striking the paraboloidal mirror will be gathered at the focal point of the mirror. In actuality, there will be losses due to the overall spectral reflectivity of the mirror, non-uniformity of the mirror’s reflective coating, and aberrations in the curvature of the mirror. The following method may be used to determine the losses through the zero- length setup. Measure the illuminance from a stable light source at various distances from the photometer. Placing the source in a light box with a variable aperture will allow for generation of a very small source, so that the illuminance may be found to follow the 1/r2 rule within the limits of the measurement path. Precise alignment of

IALA Recommendation E. 122 on the Photometry of Marine Aids-to-Navigation Signal Lights
23 of 33
the light box with the detector is required. The lamp current should be monitored and controlled. Make a series of measurements at distances beyond the minimum distance required for the 1/r2 rule to apply. Determine the intensity of the source and variance from the series of measurements. Move the light box to the goniometer and align with the mirror and the photometer. Monitor and control the lamp current as the illuminance (Emeas) is measured through the zero-length system. Using the intensity determined from the direct measurements (Idirect), calculate the “corrected” length of the light tunnel,
meas
directcorr E
Ir = Equation 15.
where: I direct is in candelas
E is in lux
Rcorr is in metres
The corrected length of the zero-length setup, rcorr, is then used to calculate the luminous intensity of the item(s) under test. Determination of the corrected length of the zero- length setup should be carried out whenever new data are to be recorded. Changes to the corrected length that cannot be accounted for in the uncertainty budget should be examined to determine if they are caused by some systematic error or equipment malfunction.
The variance recorded during the series of direct measurements of the light box includes the effects of a significant proportion of the elements that comprise the total uncertainty budget of the zero- length photometry setup. The variance may be used as the unexpanded uncertainty for those elements.
3.5. Alternative Procedure 2—Outdoor Telephotometry
Because some aid to navigation lights are projection systems, with minimum photometric distances in excess of 100 metres, all or part of the light range path may be situated outdoors. IALA Recommendations on the Determination of the Luminous Intensity of a Marine Aid-to-Navigation Light - 1977 provides an overall recommendation for this type of measurement. Advantages are that a large building is not required and stray light bouncing off walls will not distort the measurement result. A further advantage is that this method allows for photometric measurements of lighthouses “in situ” [2]. Disadvantages of outdoor telephotometry are that ambient light levels, such as daylight, may be high and/or variable and that the state of the weather may affect the light path. The timing of the measurement may therefore be important, and testing may be limited to periods of fine weather or at night.
A further problem with long distance photometric measurements is that the photometer may not be sensitive enough to measure illuminance from a light source several hundred metres away. One solution to this is to use a sensitive photometer receptor (e.g. photomultiplier), another is to use optical magnification (e.g. telephoto lens or telescope) in front of the receptor. At extreme distances both options may be required [2].
Outdoor measurements may be divided into two types:
• Those carried out on an outdoor light range, where the item under test is mounted on a goniometer table and its intensity is measured against angular displacement; and
IALA Recommendation E. 122 on the Photometry of Marine Aids-to-Navigation Signal Lights
24 of 33
• Those of a lighthouse “in situ” where no goniometer is used, the character of the light is measured against time and shallow prisms are used to obtain a plot of the vertical beam profile
Just as for standard laboratory photometry, the path length used in outdoor telephotometry must be greater than the crossover distance of the item under test. A flat folding mirror may be used to double the path length of the light range. The photometer must be shielded from stray light emitted by the item under test when folding the light path. 3.5.1. Additional Equipment Required for Outdoor Telephotometry
3.5.1.1. Telephotometer
The low values of illuminance that may be incurred when using an outdoor light range may result in the need to couple the photometer to a collecting telescope. The telescope should be capable of collecting light from the item under test and any reference source that might be used. It should also incorporate an iris so that the acceptance angle may be adjusted to exclude unwanted background light. The use of a telescope, or any such device in the optical measurement path, may alter the spectral correction factor, SCF (see 2.3.).
3.5.1.2. Reference Light
To overcome uncertainties caused by varying atmospheric transmissivity over a longer measurement path, a reference light should be used. This is a light source of known intensity, usually one calibrated to national standards, with a controlled supply voltage and current. For long-range measurements of high intensity beacons, a calibrated, high intensity reference projector should be used as the reference light. The reference projector should be of comparable intensity, within two orders of magnitude, to the item under test.
In practice two measurements are made, one of the item under test and one of the reference light, which is placed in the same (or equivalent) physical position as the item under test. The two readings are then compared. This method does not rely on accurate measurements of distance nor does it require the photometer to be calibrated in absolute units. However, the photometer output must be directly proportional to the illuminance input. The measurement path from the reference light to the receptor should, as far as possible, be the same as that from the item under test to the receptor.
3.5.1.3. Prisms and Prism Frame
For in situ measurements of large optical systems, a lighthouse lantern for example, it may not be feasible to mount the item under test on a goniometer table; nor may it be feasible to tilt the item. In these cases, the vertical beam profile may be measured by placing prismatic sheets on the focal plane of the item under test, to “tilt” the beam by refraction. Two sets of such prisms, each providing 0.5o and 1.5o deviation, enable measurements to be taken over ±2o in 0.5o steps; a total of nine points on the vertical beam plot. A further step at ±3o is possib le by the provision of a second set of 1.5o prisms; for a total of 11 points. The relative spectral transmissivity of the prisms, singly and in combination, should be determined and recorded. See Figure 4.

IALA Recommendation E. 122 on the Photometry of Marine Aids-to-Navigation Signal Lights
25 of 33
+1.5+0.5 +1.5 +1.5-0.5 +0.5
-1.5+0.5-1.5-0.5 -1.5 -0.5
+1.5-1.5+1.5+1.5 -1.5-1.5 +0.5-0.5
=+2.0 =+1.5 =+1.0 =+0.5
=-2.0 =-1.5 =-1.0 =-0.5
=+3.0 =-3.0 =0 =0
Measure transmittance of prisms
Blanking
6 prisms of 1.5° refraction angle
Prisms placed in front ofa fresnel section optic.
This will refract the beamupwards 1.5°.
acrylic sheetmade from
Typical prism
Figure 4. The Use of Prisms to Diverta Beam Through a Vertical Angle
No prisms
=0
IALA Recommendation E. 122 on the Photometry of Marine Aids-to-Navigation Signal Lights
26 of 33
3.5.2. Calibration procedures
The use of a reference light as the comparator eliminates the need for absolute calibration of the light range system. However, calibration is required of the reference light itself, and test equipment. The uncertainty in measurements due to the geometric relationships between the reference light, the item under test, and the photometer must also be evaluated and quantified.
3.5.3. Atmospheric Conditions and Ambient Light
One of the greatest uncertainties in outdoor photometry is that caused by changing atmospheric conditions during measurements. Those contributing most to the uncertainty figure are changing visibility and scintillation. A sizable error may result when visibility varies between the time of measurement of the item under test and the time of measurement of the reference light. If visibility is varying considerably, due to fog or rain, measurements should not be undertaken.
Variation of received light due to scintillation can increase the uncertainty of the resulting intensity figure in the same way as noise. This variation can be reduced by increasing the response time of the photometer or by using some averaging of the photometer output. However, care should be exercised when measuring flashing lights. Increasing the response time of the photometer may cause distortion of the measured flash profile. The response time used should be less than one tenth of the expected duration between the 50% intensity points of the flash. Several measurements should be made and an average of each flash profile can then be calculated. Variation in ambient light, for instance when the measurement is being undertaken in daylight, can produce an error similar to a zeroing error. Care should be taken to ensure that readings taken from the photometer under ambient light conditions, i.e. with the item under test and reference light switched off, do not vary significantly. 3.5.3.1. Recording Environmental Conditions
A record should be made at the time of the measurement of the following environmental conditions:
• general weather; • visibility; • temperature; and • relative humidity.
These data should be saved with the light range measurement data for the item under test. Visibility meters placed in the optical measurement path can be useful indicators during the hours of darkness.
3.5.4. Aligning the Telephotometer
Using a viewing sight, or similar apparatus, look into the optical path of the telescope and adjust the telescope alignment and focus until the item under test can be seen clearly in the centre of the eyepiece. The output aperture should then be adjusted so that only the item under test is visible.
The item under test should then be lit and allowed to come to full brightness. When viewed once more through the eyepiece care should be taken to avoid excessive glare to the eye. A
IALA Recommendation E. 122 on the Photometry of Marine Aids-to-Navigation Signal Lights
27 of 33
filter may be inserted at the eyepiece to facilitate comfortable viewing. The goniometer table should then be turned through the desired angles of measurement to ensure that there is no obscuration of the light emitting surfaces by components in the optical path. When the image is satisfactory in all positions, the optical path output from the telescope should be directed to the photometer receptor. 3.5.5. Measurement Procedures for Outdoor Telephotometry
Ensure the photometer is switched on and warmed up. The received light from the item under test falling upon the receptor should be measurable on the photometer readout. The gain of the photometer may need adjusting until a satisfactory reading is obtained. To ensure that the reading obtained is caused by received light, the light path can be interrupted and the effect on the reading observed.
The item under test should then be extinguished and the photometer reading observed. If the reading is not zero, due to ambient light, a zero offset may be used to reduce the photometer readout in ambient light conditions. Care should be taken however, when ambient conditions are variable, not to allow the reading to go below zero unless the recording system is suitable.
Complete measurements of the angular and time dependency of the luminous intensity of the item under test, as outlined in section 3.3.
Following measurement of the item under test, mount the reference light on the goniometer table, and ensure that it is in the same position relative to the photometer as was the item under test. Allow the output of the reference light to stabilise, in compliance with the reference lamp calibration data. Take at least two measurements of the luminous intensity of the reference light as soon after the measurement of the item under test as is possible.
The reference light should then be powered down (or baffled, depending on the calibration conditions) and further photometer readings of the ambient light (or ambient plus stray light) recorded. The resultant average value of the reference light minus ambient light (or ambient plus stray light) and associated uncertainties should be calculated and recorded.
A minimum of three complete measurements should be carried to obtain average and uncertainty values. 3.5.6. Additional Procedures for “In Situ” Measurement
In situ measurements are generally conducted on existing lighthouse optics. Because measurement sites using telephotometry must be situated on land, it should be remembered that in situ measurements are usually only feasible in one or two directions within the zone of utilisation of the light. During the course of the measurements, the operational availability of the lighthouse may be affected. Appropriate navigational warnings should be raised.
3.5.6.1. Choice of Measurement Site
The first requirement when carrying out a field light measurement is to find a suitable measurement site. This should be a site where stable mounting of the photometric equipment is possible, preferably away from any adverse conditions of weather or unwanted interference from extraneous light sources. The whole of the optic to be measured must be clearly visible from the measurement site.

IALA Recommendation E. 122 on the Photometry of Marine Aids-to-Navigation Signal Lights
28 of 33
Calculations of the crossover distance of the optic being measured should be made to establish the minimum photometric distance. Once this minimum is established, a measurement site should be sought which is beyond the minimum photometric distance, and within plus or minus one degree of a line between the optic centre and the horizon. This vertical tolerance of two degrees is approximate and depends on the vertical beam profile of the light to be measured. The closer the measurement site is to the nominal beam centre, the less the measurement uncertainty.
3.5.6.2. Setting Up the Telephotometer
The iris of the telephotometer should be set to accept light from the optic being measured and the reference light. The field outside that of interest should be stopped. Daytime is the best time to set up the equipment because the field of view can be easily seen and any potential obstructions accounted for.
3.5.6.3. Setting Up the Lighthouse Optic
The lighthouse optic to be measured should be inspected and cleaned. The optic type and dimensions plus any manufacturer’s details should be noted, as should any faults or defects in its operation.
The optic should be outfitted with lamps that conform to design dimensions, rated power consumption, and rated lumen output (see 3.3.1). The light source should be positioned in the optic in accordance with the procedures established by the optic manufacturer and the Lighthouse Authority. If the optic is a rotating type, with several light emitting axes, each one should be identified and numbered if not already done so by the manufacturer. This may be done by identifying a unique mark on the rotating part of the item under test (e.g. datum mark or optic door hinge) and numbering each beam or axis from there in the direction opposite to the direction of rotation.
3.5.6.4. Setting Up the Prism Frame and Prisms
Install the prism frame between the optic and the measurement site so as to include the maximum area of the lens (or lenses) as possible. Any remaining area of the emitting surface(s) should be screened to prevent light from the optic going past the outside of the frame in the direction of the measurement site. See Figure 4. It should be noted that any blanked area will increase uncertainty of beam profile measurement as upper and lower reflectors/refractors may affect beam shape. 3.5.6.5. Setting Up the Reference Projector
A reference projector should be installed on the outside of the lantern, e.g. on the gallery handrail, as close as possible to the optic and directed towards the measurement site. The path between the reference projector and the measurement site should be free from obstructions.
3.5.6.6. In Situ Measurements
Measurements may commence as soon as conditions allow. Bear in mind that zero conditions are those of ambient light, if the ambient light level is varying significantly, e.g. because of clouds passing in front of the sun, measurement uncertainties will be increased. Most field light measurements will need to be carried out at night and in good weather.

IALA Recommendation E. 122 on the Photometry of Marine Aids-to-Navigation Signal Lights
29 of 33
On commencement, the reference projector must first be aligned so that its beam centre is directed towards the measurement site. The amount of variation in the reference light reading will give a good indication of the suitability of conditions.
Measurements with different prisms should then be carried out to ascertain the vertical beam profile. Each set of prisms is inserted and the flash profile(s) from the optic recorded. Each measurement set should contain a sample of reference light and ambient light. The range setting on the telephotometer should be recorded.
When all relevant prism positions have been recorded, the prisms, prism frame and screening should be removed. Flashes from the unobstructed optic should then be recorded along with reference light, ambient light and photometer settings. At least three recordings of each flash profile should be taken.
A minimum of three complete measurements should be carried out for each complete character to obtain average and uncertainty values. 4. Data Collection 4.1. Source Data/Identification of Test Items
Each item under test should be described and uniquely identified. If there is no manufacturer’s label, or if the label contains insufficient information to enable the item to be identified uniquely, a label should be attached giving a unique identification for test purposes. The information given on the label must be included in the test results and any documentation produced from those results. 4.2. Test Equipment Identification
A list of all test equipment used in the measurement, including model numbers, serial numbers and calibration details, must be included in the test results and any documentation produced from those results. 4.3. Software
Details of all software used in any measurement process should be recorded. Custom software used in data acquisition, analysis, and/or presentation of results should be documented, and a printed copy maintained with other test procedure documentation. Algorithms used to manipulate data should be documented. 4.4. Power Monitoring of Item under Test
The power consumption of the item under test should be measured and recorded at the time of the photometric measurement. For electrical systems, power monitoring should be conducted throughout the measurement process. For other systems, such as gas or liquid fuel, monitoring of fuel consumption rate should be carried out, as a minimum, at the beginning and end of the measurement process or as an average over the time taken to carry out the measurement.

IALA Recommendation E. 122 on the Photometry of Marine Aids-to-Navigation Signal Lights
30 of 33
4.5. Notes/Comments
A copy of all information relevant to the measurement, including observations, modifications, statement of requirements and item under test manufacturer’s instructions, should be retained with the recorded data. 4.6. Name & Signature of Examiner and Date
A record of the person carrying out the measurement, along with the date when the signature was written and the place where the measurement was carried out, should be kept with the recorded test results and on any ensuing publication. 5. PRESENTATION OF RESULTS
A test report should be prepared containing all relevant results annotated to clearly identify the item under test, including the optical assembly and the light source (if separable). The testing procedures (standard laboratory photometry, zero- length photometry, or outdoor telephotometry) should be identified. Test conditions, including voltage settings, current consumption of the item under test and/or the light source (if independently powered) should be listed. Results of measurements of any laboratory test lamp used should be presented with results of the item under test. 5.1. Luminous Intensity vs Angle
Results of the angular dependence of the luminous intensity should be graphically presented to clearly illustrate the performance of the lantern. Graphs should be linear and annotated to identify causes of irregularities in the intensity measurements, such as shadowing due to filament supports, effects of lens seams, etc. For beacons or projectors with coloured sectors, the angle of indecision between sectors will normally be defined by visual observation, not by photometric measurement. 5.1.1. Omnidirectional Beacons (fan beams)
The following values of the luminous intensity should be listed on the graph of the horizontal profile for an omnidirectional light signal: maximum, minimum, mean, and the value equal to or exceeded by 90% of the individual measurement. This final value, equalled or exceeded by 90% of the individual measurements of the luminous intensity in the horizontal plane, will be the value used to define the fixed intensity of the beacon.
Graphs of the vertical profiles should be plotted between the points where the intensity falls below 5% of maximum and annotated with the maximum intensity value, and the angular width between the 50% intensity points (full-width at half maximum—FWHM). The FWHM will be used to define the vertical divergence of the beacon. 5.1.2. Rotating Beacons (pencil beams)
Graphs of the vertical and horizontal profiles should be plotted between the points where the intensity falls below 5% of maximum and annotated with the maximum intensity value and FWHM. The FWHM will be used to define the vertical and horizontal divergences of the beam. The horizontal angular intensity variation may be converted to a time-dependent profile at specific rotation rates for calculation of the effective intensity and flash duration..
IALA Recommendation E. 122 on the Photometry of Marine Aids-to-Navigation Signal Lights
31 of 33
For rotating beacons with more than one emitted light beam, the results of all beams will be shown. The beam of least effective intensity shall be used to calculate the nominal range of the beacon (see 1.4 and 1.5). If the light source within the beacon is non-uniform and the measurement was carried out by rotating the whole beacon, including the light source, on the goniometer table, additional output data for a bare lamp, e.g. a polar plot, must be presented. If the measurement was carried out with a non-uniform lamp in a fixed position and not rotated with the goniometer table, measurement results of all emitted beams will be presented for positions of the light source that give maximum and minimum intensity. 5.1.3 Directional Beacons
Graphs of the vertical and horizontal profiles should be plotted between the points where the intensity falls below 5% of maximum and annotated with the maximum intensity value and FWHM. The FWHM will be used to define the vertical and horizontal divergences of the beam.
5.2. Luminous Intensity vs Time
For aid-to-navigation light signals that are flashed by eclipsing or switching the light source, the instantaneous luminous intensity profile versus time (flash profile) should be plotted with the luminous intensity as the dependent variable (ordinate) and time as the independent variable (abscissa). The plot should be linear and include the entire cycle of the flash character; illustrating both the on and off periods. Secondary plots may be used to illustrate any short-duration fluctuations of the instantaneous luminous intensity. For rotating beacons where the instantaneous luminous intensity is plotted against time by allowing the beacon to rotate under its own power, plots should be linear and show the luminous intensity profile against time for one complete revolution of the beacon. Secondary plots should also be used to illustrate individual emitted beams in greater detail. If the light source is non-uniform, measurement results of all emitted beams will be presented for positions of the light source that give maximum and minimum intensity. 5.3 Flash Duration
Due to the lack of a suitable model of human visual perception of flashing lights there are no universally agreed points between which the flash duration should be measured. The overall flash duration may be quoted between the points where intensity falls below 5%. Measured flash duration may be quoted at FWHM (i.e. the 50% intensity points), however various authorities use other intensities, for example the British Standard BS 942 recommended 10% points for rotating beacons and 90% points for flashed light sources. Scientific work is being carried out on this topic at the present time (CIE Division 1). Until an internationally agreed standard is established any statement of flash duration must include the percentage of maximum intensity between which the time measurement has been made or a statement on how the flash duration was derived.

IALA Recommendation E. 122 on the Photometry of Marine Aids-to-Navigation Signal Lights
32 of 33
5.4. Effective Intensity
The effective intensity of a marine aid-to-navigation light shall be presented in the final results having been calculated using the method of Schmidt-Clausen, as outlined in section 1.4. 5.5. Uncertainty & Confidence
The results of all measurements should be presented with a statement of uncertainty and confidence level as outlined in 2.6. Also see Annex B. 6. CONCLUSION
This standard provides the necessary information to perform measurements in order to ascertain the photometric performance of a marine aid-to-navigation signal light. On completion of those measurements it is incumbent upon engineers installing the aid-to-navigation to ensure that the ‘in situ’ performance meets the measured performance with regard to effective intensity, nominal range and published character. The following criteria should therefore be adhered to:
• The electrical supply to the light source or its power supply should maintain the correct voltage throughout the operating cycle of the light source.
• If the measured light system is installed within a lantern then losses through the lantern glazing must be accounted for in the nominal range calculations [2].
• In the case of lanterns with flat glazing (usually historic lighthouses) “false flashes” may be generated by internal reflections within the lantern causing an incorrect character to be exhibited. These will require site investigations to identify the path of the reflected beams and practical means of obscuration.
• A service regime should be developed to renew lamps before their performance starts to degrade. In the case of LEDs there will be some reduction in intensity during the life of the LED that should be accounted for.
• Plastic glazing and plastic lenses will degrade due to exposure to sunlight and the guidelines on service condition losses [2] provide information on accounting for such losses.
• Replacement light sources should fall within the specification of the original light source.
• ‘In situ’ measurements should be carried out, where possible, after initial installation and after any modifications that could affect performance.
• Adequate procedures should be in place to ensure that replacement light sources are correctly positioned within the optical apparatus and that the apparatus itself is maintained in a serviceable condition.
IALA Recommendation E. 122 on the Photometry of Marine Aids-to-Navigation Signal Lights
33 of 33
7. REFERENCES
[1] International Association of Marine Aids to Navigation and Lighthouse Authorities (IALA), “Recommendations for the Colours of Light Signals on Aids to Navigation,” December 1977.
[2] IALA, “Recommendations on the Determination of the Luminous Intensity of a Marine Aid-to-Navigation Light,” December 1977.
[3] Schmidt-Clausen, H.J., Über das Wahrnehmen verschiedenartiger Lichtimpulse bei veränderlichen Umfeldleuchtdichten (Concerning the perception of various light flashes with varying surrounding luminances, Darmstadt Dissertation D17, Darmstadt University of Technology, 1968.
[4] Graham, C.H., ed. Vision and Visual Perception, John Wiley & Sons, Inc., New York, 1965.
[5] International Commission on Illumination (CIE), Publication No. 18.2, “The Basis of Physical Photometry,” 1983.
[6] CIE Publication No. 69, “Methods of Characterizing Illuminance Meters and Luminance Meters,” 1987.
[7] National Institute of Standards and Technology (NIST), Special Publication 250-37, Photometric Calibrations, U.S. Department of Commerce, July 1997.
[8] John W. T. Walsh, “Photometry,” Dover Publications, 1965. [9] ISO Publication No. 2, Guide to the Expression of Uncertainty in Measurement, 1993. [10] CIE Publication No. 43, Photometry of Floodlights (Appendix C.2), 1979. [11] Illuminating Engineering Society (IES), Publication LM-54-1991, IES Guide to Lamp
Seasoning, 1991. [12] J. Johnson, “Zero-Length Searchlight Photometry System,” ILLUMINATING
ENGINEERING, Vol 57, No. 3, March 1962, p. 187. [13] IES, Publication LM-11-84, IES Guide for Photometric Testing of Searchlights, July
1984. [14] IALA, “Recommendation for the Notation of Luminous Intensity and Range of Lights,”
November 16, 1966. [15] CIE Publication No. 63, The Spectroradiometric Measurement of Light Sources, 1984 [16] IALA Recommendation E-110 on the Rhythmic Characters of Lights on Aids-to-
Navigation”, May 1998. [17] CIE Publication No. 86, CIE 1988 2° Spectral Luminous Efficiency Function for
Photopic Vision, 1990. [18] CIE Publication No. 127, Measurement of LEDs (Technical Report), 1997. [19] CIE Publication No. 70, The Measurement of Absolute Luminous Intensity
Distributions, 1987. [20] CIE Publication No. 121, The Photometry and Goniophotometry of Luminaires, 1996
The production of this Standard has been possible only through the hard work and dedication of the IALA Engineering Committee. In particular a debt of gratitude is owed to a special Working Group of the Committee that included: Mr. Omar Frits Eriksson (Denmark); Ms. Teresa Molina (AIDO, Spain); Mr. Ian Tutt and Mr. Adrian Wilkins (England, Trinity House); M. Jean-Pierre Wallard (France); Mr. John Rochfort (Vega Industries). Dr. Ing. Hans-R Gerdes (Germany); Mr. Leo van der Harst, Mr. Henk Roos and Mr. Sipka Hoekstra (Netherlands); Mr. Carl Andersen, Mr. Scot Tripp and Mr. Harley Cleveland (USCG);
EXAMPLE ONLY Sodor Test Report 248
Sodor Laboratory, Oldtown, Westshire, tel:+99 0123456789, fax: +99 0123456790
A - 1
Annex A. Example of Test Report
In this example, a typical indoor light measurement is featured. The contents and layout are only for guidance, for other types of measurement contents may differ. For instance, an outdoor light measurement may include environmental conditions for each test carried out if they were outside the quoted indoor range of temperature, relative humidity etc. There may also be the need to include further information if it is specifically requested, such as the measured average power consumption when exhibiting a certain flash character. On the other hand, minimal information, such as the nominal range at a certain character, may be all that is required by the person requesting the measurement. Whatever the form of the test report issued or published, it is important to give sufficient information for the results to be fully understood and not taken out of context. The names and general information quoted in this example are fictitious and do not knowingly refer to any person or entity.

EXAMPLE ONLY Sodor Test Report 248
Sodor Laboratory, Oldtown, Westshire, tel:+99 0123456789, fax: +99 0123456790
A - 2
SODOR LABORATORY PHOTOMETRY TEST REPORT
Test Report No: 248 Prepared by: J. Bloggs
Date of Issue: 19 February 2001 Approved by: H. Houdini
Commercial in Confidence Statement (if required) INTRODUCTION
The Acme Buoy Company of Newtown, Westshire requested the Sodor Laboratory to carry out tests on its prototype buoy beacon type ABB1. Assessment of omnidirectional light output and colour conformance were required as well as the flash profile of a specified character. These tests were carried out in accordance with the IALA Standard for the Photometry of Marine Aids-to-Navigation. EQUIPMENT UNDER TEST The equipment under test was an Acme Buoy Beacon type ABB1, serial number 0001 received on the 18th February 2001. The beacon, an omnidirectional marine aids-to-navigation signal light coloured red, was a prototype device not yet in final production. The light source was a cylindrical array of LEDs powered by an integral Acme LED power and flasher unit. The supply voltage range of the equipment was 11 - 16VDC with a maximum current requirement of 2A. The beacon was hermetically sealed with supply connections via an integral two-metre cable. Selection of the flash character was carried out via a remote infra-red controller, type ABC1, supplied with the beacon. OBJECT The object was to measure the horizontal and vertical profiles of the Acme Buoy Beacon type ABB1 supplied together with a flash profile of the character Iso 1s. A measurement of chromaticity was also required to ensure conformance of the beacon to the correct IALA colour region. TEST CONDITIONS Photometric tests on this beacon were carried out using standard laboratory photometry in the darkened goniophotometer room of the Sodor Laboratory where ambient conditions of 20oC temperature and 61% relative humidity prevailed. The light path was folded by a one metre square front silvered flat mirror. The overall folded light path length for goniophotometry and flash photometry was 20m. Established written procedures for light range measurement were followed. Spectroradiometric tests were carried out over a light path of 0.5m in a direction 180 degrees from the photometric light path.

EXAMPLE ONLY Sodor Test Report 248
Sodor Laboratory, Oldtown, Westshire, tel:+99 0123456789, fax: +99 0123456790
A - 3
TEST METHOD The beacon was inspected and found to be in good condition. It was placed in the centre of the goniometer table, with its light centre on the tilt axis and the datum mark aligned with the direction of measurement. The goniometer table was set to level and the beacon was set to level on the table by means of its integral bubble level. The beacon was firmly secured in this position by means of the integral mounting lugs and supplied with 12.00VDC from a stabilized linear power supply. The controller was utilized to force the beacon to exhibit a fixed light and, when this condition was attained, the beacon was left to stabilise for twenty minutes. Supply voltage and current was continuously monitored at the input to the supply cable. Goniophotometry The goniometer table was rotated about its vertical axis clockwise from the datum to an x value of –180o.
A plot was then carried out of the horizontal plane from x = -180o to x = +180o by rotating the table in an anticlockwise direction and recording the photometer reading every 0.5 o. This plot was carried out with the table level, i.e. at y = 0 o.
The table was returned to datum and tilted to a position of y = -10 o. A plot was then carried out of the vertical beam profile through the datum (at x = 0 o) from –10o to +10o by tilting the table about its horizontal axis and recording the photometer reading every 0.1 o. This process of plotting the vertical beam profile was repeated at x = +120o and x = -120o.
Spectroradiometry (at x = 180, y = 0) Upon completion of goniophotometric tests, whilst the beacon was in the datum position on the goniometer
table and exhibiting a fixed light, a plot of the spectral output of the beacon was carried out using a monochromator type spectroradiometer. The slit aperture was placed 0.5m away from the beacon, level with the light centre, at x = 180o. An average plot of the visible spectrum between 380nm and 780nm at 1nm intervals was obtained.
Flash Photometry (at Datum x = 0, y = 0) The controller was used to change the character exhibited by the beacon from fixed to Iso 1.0s (a contact
closure of 0.5 seconds followed by a contact opening of 0.5 seconds). At that character the beacon was allowed to stabilise for twenty minutes. The output of the photometer was then input to the event logger and a plot of luminous intensity vs time was carried out for ten consecutive flashes of the beacon. Averages of five alternate flashes were taken to obtain the plot shown in the graph.
TEST EQUIPMENT
Instrument Maker Type Serial No Last Cal Date
Photometer Lite Lab LLP042 C308-3 03.09.00
Reference Lamp Althorpe 12.75V 25.00A R21A79 443.4cd 09.12.00 Voltmeter Meterex 2001 50518866 23.04.00 Ammeter Meterex 2002 50518867 23.04.00
Power Supply Powerlab SP 060 C309A 14.06.00 Goniometer Sodor Laboratory Drawing No. 4321
version 02 N/A 01.02.01
Event Logger Time systems Maxi Log 2 368195 01.02.01 Spectroradiometer SpecPal SP6 S345981 31.05.00
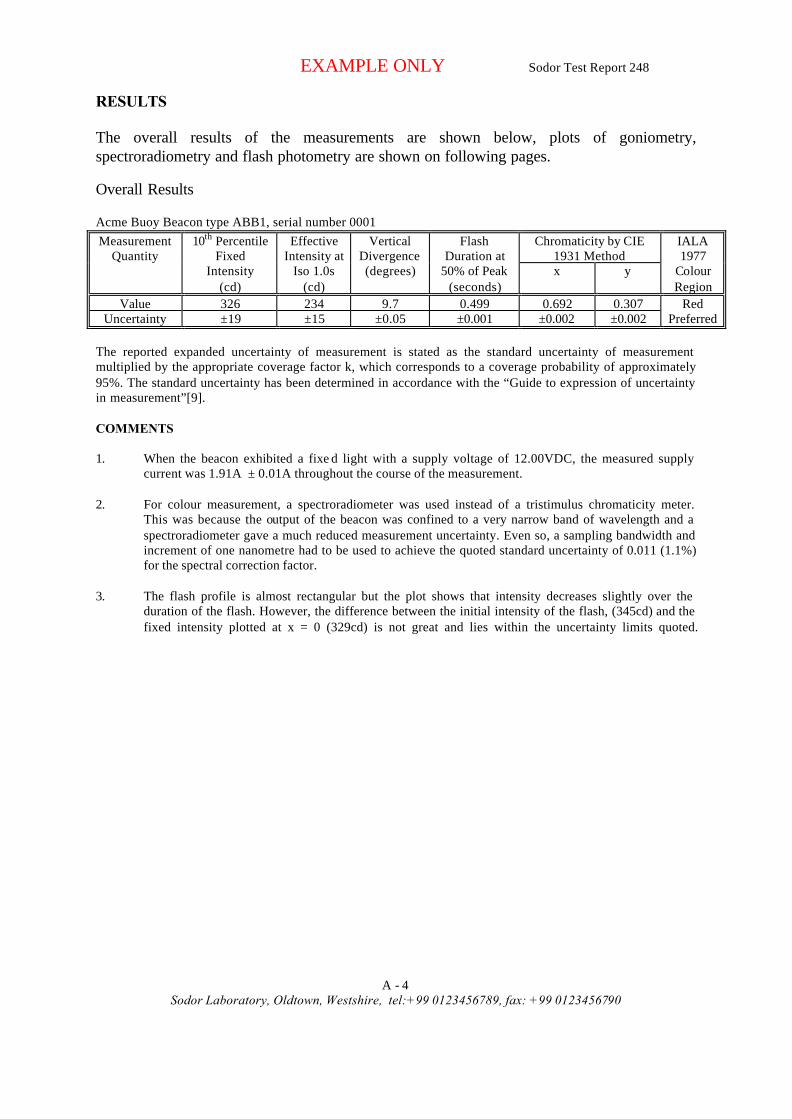
EXAMPLE ONLY Sodor Test Report 248
Sodor Laboratory, Oldtown, Westshire, tel:+99 0123456789, fax: +99 0123456790
A - 4
RESULTS The overall results of the measurements are shown below, plots of goniometry, spectroradiometry and flash photometry are shown on following pages. Overall Results Acme Buoy Beacon type ABB1, serial number 0001
Chromaticity by CIE 1931 Method
Measurement Quantity
10th Percentile Fixed
Intensity (cd)
Effective Intensity at
Iso 1.0s (cd)
Vertical Divergence (degrees)
Flash Duration at
50% of Peak (seconds)
x y
IALA 1977
Colour Region
Value 326 234 9.7 0.499 0.692 0.307 Uncertainty ±19 ±15 ±0.05 ±0.001 ±0.002 ±0.002
Red Preferred
The reported expanded uncertainty of measurement is stated as the standard uncertainty of measurement multiplied by the appropriate coverage factor k, which corresponds to a coverage probability of approximately 95%. The standard uncertainty has been determined in accordance with the “Guide to expression of uncertainty in measurement”[9]. COMMENTS 1. When the beacon exhibited a fixe d light with a supply voltage of 12.00VDC, the measured supply
current was 1.91A ± 0.01A throughout the course of the measurement. 2. For colour measurement, a spectroradiometer was used instead of a tristimulus chromaticity meter.
This was because the output of the beacon was confined to a very narrow band of wavelength and a spectroradiometer gave a much reduced measurement uncertainty. Even so, a sampling bandwidth and increment of one nanometre had to be used to achieve the quoted standard uncertainty of 0.011 (1.1%) for the spectral correction factor.
3. The flash profile is almost rectangular but the plot shows that intensity decreases slightly over the
duration of the flash. However, the difference between the initial intensity of the flash, (345cd) and the fixed intensity plotted at x = 0 (329cd) is not great and lies within the uncertainty limits quoted.
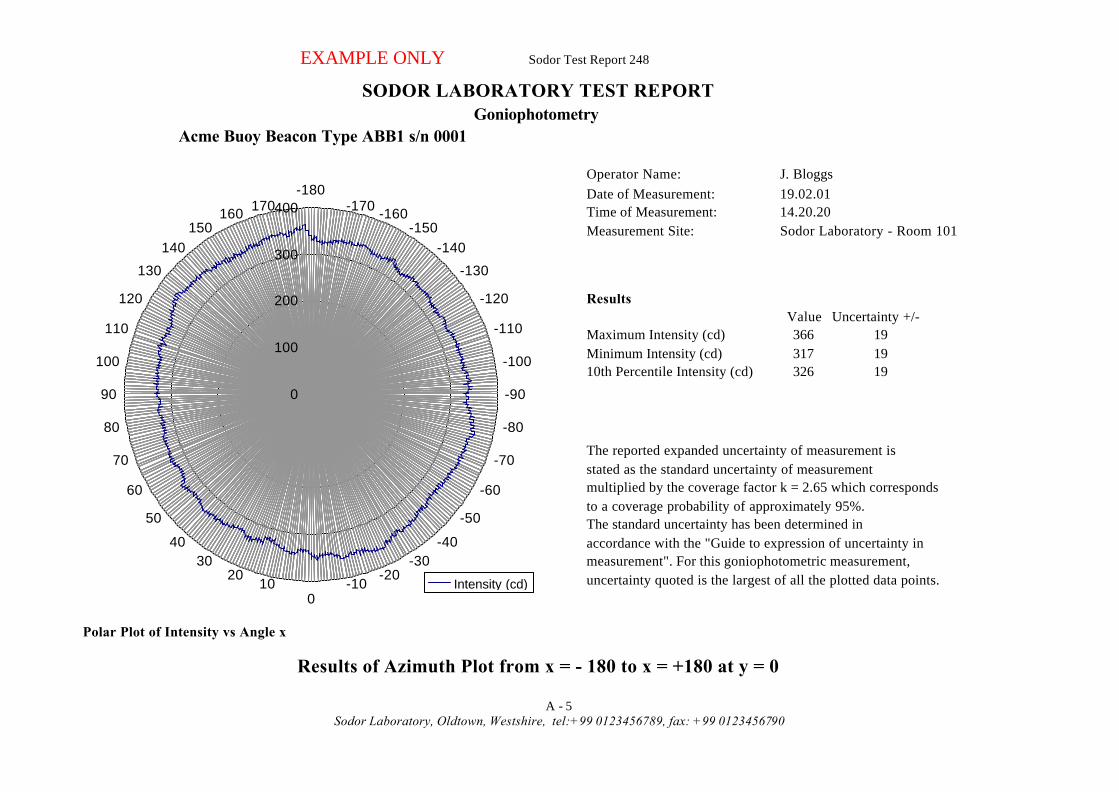
EXAMPLE ONLY Sodor Test Report 248
Sodor Laboratory, Oldtown, Westshire, tel:+99 0123456789, fax: +99 0123456790
A - 5
Operator Name: J. BloggsDate of Measurement: 19.02.01Time of Measurement: 14.20.20Measurement Site: Sodor Laboratory - Room 101
ResultsValue Uncertainty +/-
Maximum Intensity (cd) 366 19Minimum Intensity (cd) 317 1910th Percentile Intensity (cd) 326 19
The reported expanded uncertainty of measurement is stated as the standard uncertainty of measurementmultiplied by the coverage factor k = 2.65 which corresponds to a coverage probability of approximately 95%.The standard uncertainty has been determined inaccordance with the "Guide to expression of uncertainty inmeasurement". For this goniophotometric measurement, uncertainty quoted is the largest of all the plotted data points.
Results of Azimuth Plot from x = - 180 to x = +180 at y = 0
Acme Buoy Beacon Type ABB1 s/n 0001
Polar Plot of Intensity vs Angle x
SODOR LABORATORY TEST REPORTGoniophotometry
0
100
200
300
400-180
-170 -160-150
-140
-130
-120
-110
-100
-90
-80
-70
-60
-50
-40-30
-20-10
010
2030
40
50
60
70
80
90
100
110
120
130
140150
160 170
Intensity (cd)

EXAMPLE ONLY Sodor Test Report 248
Sodor Laboratory, Oldtown, Westshire, tel:+99 0123456789, fax: +99 0123456790
A - 6
Operator Name: J. BloggsDate of Measurement: 19.02.01Time of Measurement: 14.22.09Measurement Site: Sodor Laboratory - Room 101
Results Value Uncertainty +/-
Peak Intensity (cd) 329 21Divergence at 50% (degrees) 9.7 0.05
The reported expanded uncertainty of measurement is stated as the standard uncertainty of measurementmultiplied by the coverage factor k = 2.65 which corresponds to a coverage probability of approximately 95%.The standard uncertainty has been determined inaccordance with the "Guide to expression of uncertainty inmeasurement". For this goniophotometric measurement, uncertainty quoted is the largest of all the plotted data points.
SODOR LABORATORY TEST REPORT
Results of Elevation Plot from y = - 10 to y = +10 at x = 0
Cartesian Plot of Intensity vs Angle
Acme Buoy Beacon Type ABB1 s/n 0001Goniophotometry
0
50
100
150
200
250
300
350
-10 -9 -8 -7 -6 -5 -4 -3 -2 -1 0 1 2 3 4 5 6 7 8 9 10
Elevation (degrees)
Inte
nsi
ty (
cd)
Intensity (cd)50% of Peak Intensity
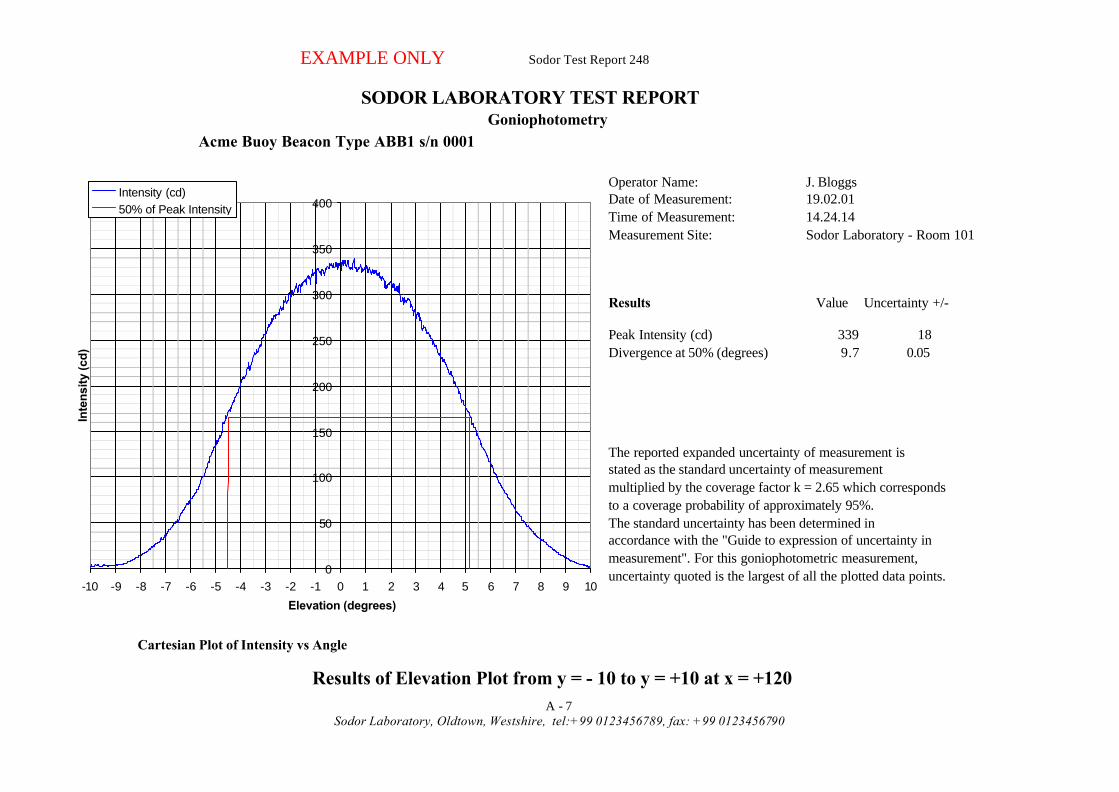
EXAMPLE ONLY Sodor Test Report 248
Sodor Laboratory, Oldtown, Westshire, tel:+99 0123456789, fax: +99 0123456790
A - 7
Operator Name: J. BloggsDate of Measurement: 19.02.01Time of Measurement: 14.24.14Measurement Site: Sodor Laboratory - Room 101
Results Value Uncertainty +/-
Peak Intensity (cd) 339 18Divergence at 50% (degrees) 9.7 0.05
The reported expanded uncertainty of measurement is stated as the standard uncertainty of measurementmultiplied by the coverage factor k = 2.65 which corresponds to a coverage probability of approximately 95%.The standard uncertainty has been determined inaccordance with the "Guide to expression of uncertainty inmeasurement". For this goniophotometric measurement, uncertainty quoted is the largest of all the plotted data points.
SODOR LABORATORY TEST REPORT
Results of Elevation Plot from y = - 10 to y = +10 at x = +120
Cartesian Plot of Intensity vs Angle
Acme Buoy Beacon Type ABB1 s/n 0001Goniophotometry
0
50
100
150
200
250
300
350
400
-10 -9 -8 -7 -6 -5 -4 -3 -2 -1 0 1 2 3 4 5 6 7 8 9 10
Elevation (degrees)
Inte
nsi
ty (c
d)
Intensity (cd)50% of Peak Intensity

EXAMPLE ONLY Sodor Test Report 248
Sodor Laboratory, Oldtown, Westshire, tel:+99 0123456789, fax: +99 0123456790
A - 8
Operator Name: J. BloggsDate of Measurement: 19.02.01Time of Measurement: 14.26.53Measurement Site: Sodor Laboratory - Room 101
Results Value Uncertainty +/-
Peak Intensity (cd) 323 19Divergence at 50% (degrees) 9.7 0.05
The reported expanded uncertainty of measurement is stated as the standard uncertainty of measurementmultiplied by the coverage factor k = 2.65 which corresponds to a coverage probability of approximately 95%.The standard uncertainty has been determined inaccordance with the "Guide to expression of uncertainty inmeasurement". For this goniophotometric measurement, uncertainty quoted is the largest of all the plotted data points.
SODOR LABORATORY TEST REPORT
Results of Elevation Plot from y = - 10 to y = +10 at x = -120
Cartesian Plot of Intensity vs Angle
Acme Buoy Beacon Type ABB1 s/n 0001Goniophotometry
0
50
100
150
200
250
300
350
-10 -9 -8 -7 -6 -5 -4 -3 -2 -1 0 1 2 3 4 5 6 7 8 9 10
Elevation (degrees)
Inte
nsi
ty (
cd)
Intensity (cd)50% of Peak Intensity

EXAMPLE ONLY Sodor Test Report 248
Sodor Laboratory, Oldtown, Westshire, tel:+99 0123456789, fax: +99 0123456790
A - 9
Operator Name: J. BloggsDate of Measurement: 19.02.01Time of Measurement: 14.46.11Measurement Site: Sodor Laboratory - Room 101
Results Value Uncertainty +/-
Chromaticity x 0.692 0.002y 0.307 0.002
IALA Colour Region
Spectral Correction FactorSCF 0.955 0.022
The reported expanded uncertainty of measurement is stated as the standard uncertainty of measurementmultiplied by the coverage factor k = 2 which corresponds to a coverage probability of approximately 95%.The standard uncertainty has been determined inaccordance with the "Guide to expression of uncertainty inmeasurement".
Results of Spectral Plot from 380nm to 780nm
Acme Buoy Beacon Type ABB1 s/n 0001
SODOR LABORATORY TEST REPORTSpectroradiometry
Red Preferred
Cartesian Plot of Irradiance vs Wavelength
0.0
0.1
0.2
0.3
0.4
0.5
0.6
0.7
0.8
0.9
1.0
380 400 420 440 460 480 500 520 540 560 580 600 620 640 660 680 700 720 740 760 780Wavelength (nm)
No
rmal
ised
Irr
adia
nce

EXAMPLE ONLY Sodor Test Report 248
Sodor Laboratory, Oldtown, Westshire, tel:+99 0123456789, fax: +99 0123456790
A - 10
2.
Operator Name: J. BloggsDate of Measurement: 19.02.01Time of Measurement: 14.31.25Measurement Site: Sodor Laboratory - Room 101
ResultsValue Uncertainty +/-
Peak Intensity (cd) 344 15Effective Intensity 245 15Flash Duration (seconds) 0.499 0.001(measured to 50% of peak)
Night-time Nominal Range (M) 7(as per IALA 1966)
The reported expanded uncertainty of measurement is stated as the standard uncertainty of measurementmultiplied by the coverage factor k = 2 which corresponds to a coverage probability of approximately 95%.The standard uncertainty has been determined inaccordance with the "Guide to expression of uncertainty inmeasurement".
SODOR LABORATORY TEST REPORTFlash Photometry
Results of Time Dependent Plot at x = 0, y = 0Cartesian Plot of Intensity vs Time
Acme Buoy Beacon Type ABB1 s/n 0001
0
50
100
150
200
250
300
350
400
0 0.1 0.2 0.3 0.4 0.5 0.6 0.7 0.8 0.9 1 1.1 1.2 1.3 1.4 1.5 1.6 1.7
Time (seconds)
Inte
nsity
(cd
)
Intensity (cd)
50% of Peak Intensity

26th April, 2001
Annex B. Example of Uncertainty Budget
This example of an uncertainty budget is meant for guidance only. It has been compiled in accordance with ISO Guide No. 2 and incorporates current methodologies. The model used is a simple one incorporating those inputs thought to have a significant effect on uncertainty. The model may change depending on the particular measurement method, measurement equipment or item being measured. For instance, if the same method and equipment shown in the example were used to measure a beacon with a tungsten filament lamp with a similar spectral output to that of the reference lamp, no spectral correction would be necessary. Furthermore, it can be seen from the uncertainty contributions shown in the example that the uncertainty of photometer gain has little influence on uncertainty and could possibly be excluded from the budget. A separate uncertainty budge t for each individual measurement process should be compiled if there is insufficient knowledge of the uncertainty of the result. For example, the spectroradiometer plot shown in the test report would have its own uncertainty budget for the evaluation of the spectral correction factor (SCF). This would include, as the model, the equation for determining SCF (see 2.3.). In general, if there is any doubt as to the significance of an uncertainty contribution, it should be evaluated, used if necessary or discarded if insignificant. A reduction in uncertainty should always be strived for and unnecessary sources of uncertainty should, wherever possible, be eliminated. Significant types of uncertainty and other limiting factors for two measurement methods are as follows: Outdoor Photometry Uncertainties:
• establishing and measuring beyond the minimum photometric distance • stray and ambient light • photometer calibration • colour correction of photometer for red and green colours • environmental conditions
Limiting factors: • finding suitable dark real estate • obtaining sufficient meter sensitivity at the minimum photometric distance
Zero-Length Photometry Uncertainties:
• shape, accuracy and reflectance of parabolic mirror • alignment and calibration of system • stray and ambient light • photometer calibration • colour correction of photometer (plus mirror) for red and green colours
Limiting factors: • cost and accuracy of parabolic mirror • size of specimen optic is limited to size of mirror
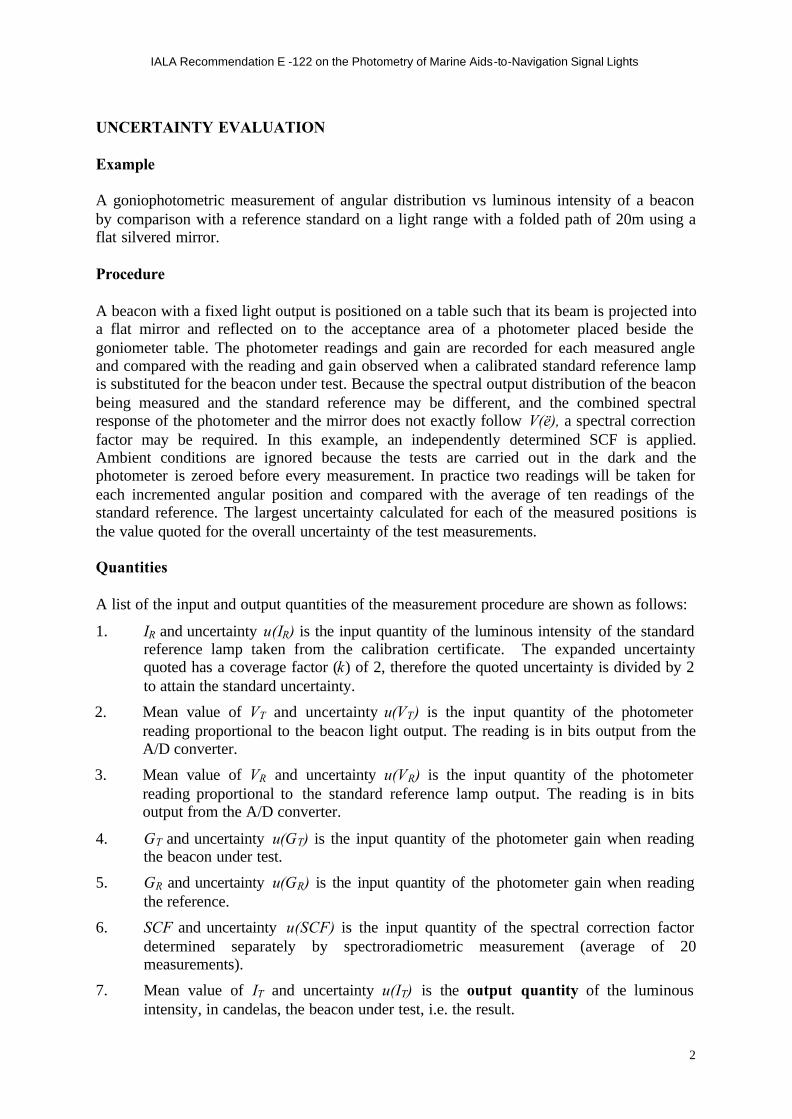
IALA Recommendation E -122 on the Photometry of Marine Aids-to-Navigation Signal Lights
2
UNCERTAINTY EVALUATION Example A goniophotometric measurement of angular distribution vs luminous intensity of a beacon by comparison with a reference standard on a light range with a folded path of 20m using a flat silvered mirror. Procedure A beacon with a fixed light output is positioned on a table such that its beam is projected into a flat mirror and reflected on to the acceptance area of a photometer placed beside the goniometer table. The photometer readings and gain are recorded for each measured angle and compared with the reading and gain observed when a calibrated standard reference lamp is substituted for the beacon under test. Because the spectral output distribution of the beacon being measured and the standard reference may be different, and the combined spectral response of the photometer and the mirror does not exactly follow V(ë), a spectral correction factor may be required. In this example, an independently determined SCF is applied. Ambient conditions are ignored because the tests are carried out in the dark and the photometer is zeroed before every measurement. In practice two readings will be taken for each incremented angular position and compared with the average of ten readings of the standard reference. The largest uncertainty calculated for each of the measured positions is the value quoted for the overall uncertainty of the test measurements. Quantities A list of the input and output quantities of the measurement procedure are shown as follows:
1. IR and uncertainty u(IR) is the input quantity of the luminous intensity of the standard reference lamp taken from the calibration certificate. The expanded uncertainty quoted has a coverage factor (k) of 2, therefore the quoted uncertainty is divided by 2 to attain the standard uncertainty.
2. Mean value of VT and uncertainty u(VT) is the input quantity of the photometer reading proportional to the beacon light output. The reading is in bits output from the A/D converter.
3. Mean value of VR and uncertainty u(VR) is the input quantity of the photometer reading proportional to the standard reference lamp output. The reading is in bits output from the A/D converter.
4. GT and uncertainty u(GT) is the input quantity of the photometer gain when reading the beacon under test.
5. GR and uncertainty u(GR) is the input quantity of the photometer gain when reading the reference.
6. SCF and uncertainty u(SCF) is the input quantity of the spectral correction factor determined separately by spectroradiometric measurement (average of 20 measurements).
7. Mean value of IT and uncertainty u(IT) is the output quantity of the luminous intensity, in candelas, the beacon under test, i.e. the result.

IALA Recommendation E -122 on the Photometry of Marine Aids-to-Navigation Signal Lights
3
Data The value, associated standard uncertainty and type of distribution assigned to each input quantity is shown as follows: Quantity Value Uncert Distribution IR = 443.4cd ± 3cd to 95% confidence (k=2) 443.4 1.5 Rectangular VT1 = x1 bits) Mean VT = (x1+x2)/2 208.0 2.5 Normal VT2 = x2 bits) ± u(VT) bits VR = 617 ± 10 Bits (result of ten measurements) 617.0 7.0 Normal GT = 250 ± 2.5% (k=2) 250 0.0125 Rectangular GR = 100 ± 2.5% (k=2) 100 0.0125 Rectangular SCF = 0.955 ± 0.011 0.955 0.011 Normal Model From the measurement process we can create a mathematical model, in this case a formula, to derive the output quantity from the input quantities thus: IT = IR . VT . GT . SCF / VR . GR Sensitivity Coefficient The formula can be transformed for each input quantity in turn to determine the impact of that particular input on the output quantity.
c1 IT/IR = VT . GT . SCF / VR . GR 0.804862237
c2 IT/VT = IR . GT . SCF / VR . GR 1.715749595
c3 IT/VR = IR . VT . GT . SCF / VR . VR . GR 0.57840505
c4 IT/GT = IR . VT . SCF / VR. . GR 1.427503663
c5 IT/GR = IR . VT . GT . SCF / VR . GR . GR 3.568759157
c6 IT/SCF = IR . VT . GT / VR . GR 373.6920583
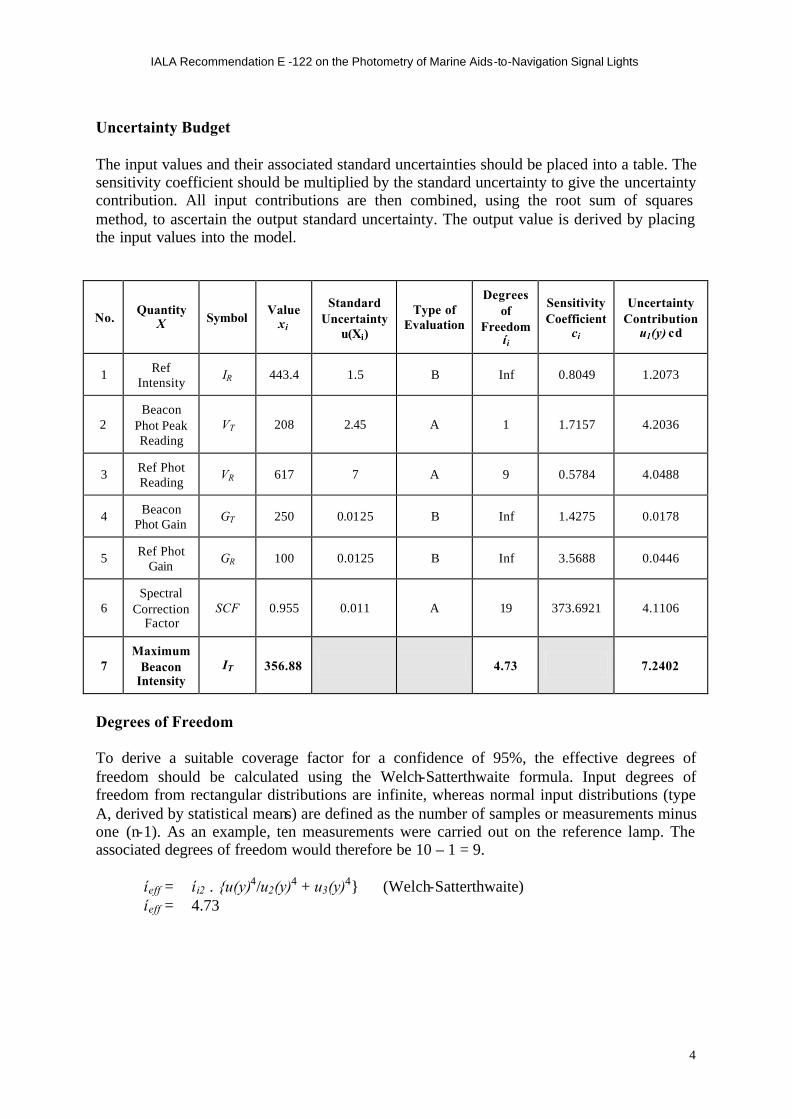
IALA Recommendation E -122 on the Photometry of Marine Aids-to-Navigation Signal Lights
4
Uncertainty Budget The input values and their associated standard uncertainties should be placed into a table. The sensitivity coefficient should be multiplied by the standard uncertainty to give the uncertainty contribution. All input contributions are then combined, using the root sum of squares method, to ascertain the output standard uncertainty. The output value is derived by placing the input values into the model.
No. Quantity
X Symbol Value
xi
Standard Uncertainty
u(Xi)
Type of Evaluation
Degrees of
Freedom íi
Sensitivity Coefficient
ci
Uncertainty Contribution
u1(y) cd
1 Ref Intensity
IR 443.4 1.5 B Inf 0.8049 1.2073
2 Beacon
Phot Peak Reading
VT 208 2.45 A 1 1.7157 4.2036
3 Ref Phot Reading
VR 617 7 A 9 0.5784 4.0488
4 Beacon Phot Gain
GT 250 0.0125 B Inf 1.4275 0.0178
5 Ref Phot Gain
GR 100 0.0125 B Inf 3.5688 0.0446
6 Spectral
Correction Factor
SCF 0.955 0.011 A 19 373.6921 4.1106
7 Maximum
Beacon Intensity
IT 356.88 4.73 7.2402
Degrees of Freedom To derive a suitable coverage factor for a confidence of 95%, the effective degrees of freedom should be calculated using the Welch-Satterthwaite formula. Input degrees of freedom from rectangular distributions are infinite, whereas normal input distributions (type A, derived by statistical means) are defined as the number of samples or measurements minus one (n-1). As an example, ten measurements were carried out on the reference lamp. The associated degrees of freedom would therefore be 10 – 1 = 9.
íeff = íi2 . {u(y)4/u2(y)4 + u3(y)4} (Welch-Satterthwaite) íeff = 4.73
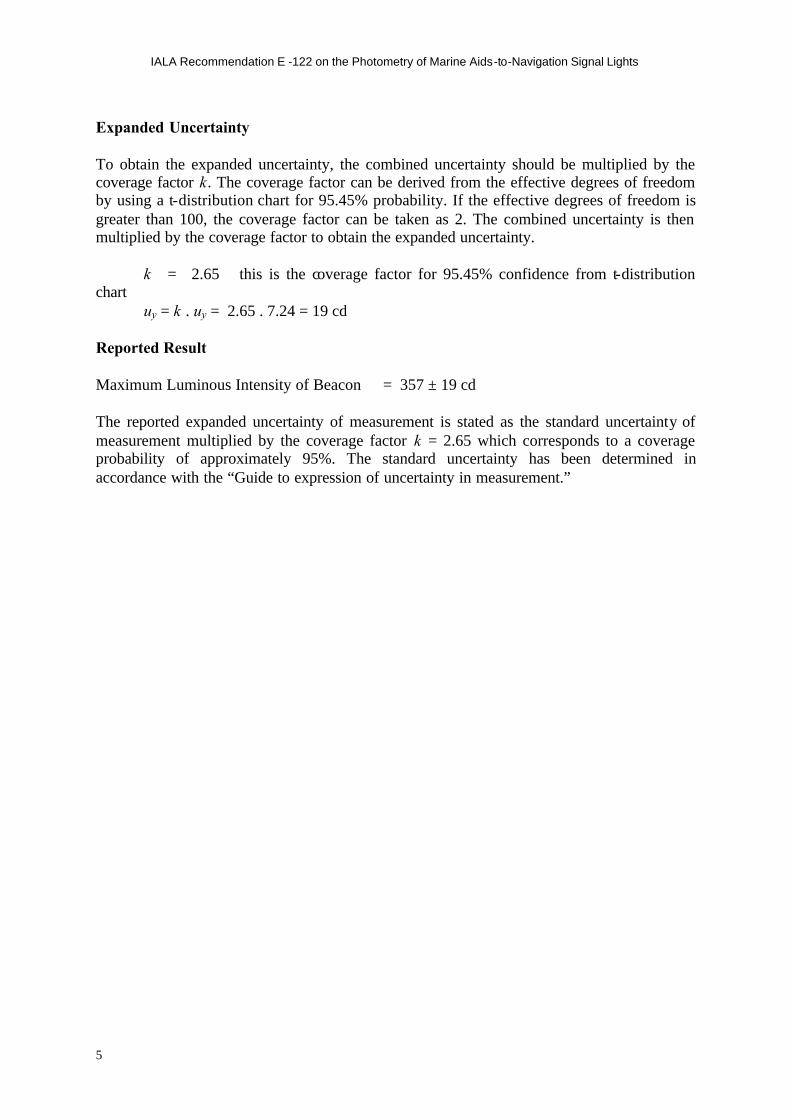
IALA Recommendation E -122 on the Photometry of Marine Aids-to-Navigation Signal Lights
5
Expanded Uncertainty To obtain the expanded uncertainty, the combined uncertainty should be multiplied by the coverage factor k. The coverage factor can be derived from the effective degrees of freedom by using a t-distribution chart for 95.45% probability. If the effective degrees of freedom is greater than 100, the coverage factor can be taken as 2. The combined uncertainty is then multiplied by the coverage factor to obtain the expanded uncertainty.
k = 2.65 this is the coverage factor for 95.45% confidence from t-distribution chart uy = k . uy = 2.65 . 7.24 = 19 cd Reported Result Maximum Luminous Intensity of Beacon = 357 ± 19 cd The reported expanded uncertainty of measurement is stated as the standard uncertainty of measurement multiplied by the coverage factor k = 2.65 which corresponds to a coverage probability of approximately 95%. The standard uncertainty has been determined in accordance with the “Guide to expression of uncertainty in measurement.”


![signal [Mode de compatibilité] - educnet.enpc.fr · Classification des signaux signaux déterministes aléatoires permanents transitoires stationnaires non-stationnaires Signaux](https://img.pdfslide.fr/doc/110x75/5b9956f909d3f2cb468b9fda/signal-mode-de-compatibilite-classification-des-signaux-signaux-deterministes.jpg)