Embed Size (px)
Citation preview
i
Forschungszentrum Karlsruhe
Technik und Umwelt
Wissenschaftliche Berichte
FZKA 6488
Sorption and Migration of Radionuclides inGranite (HRL ÄSPÖ, Sweden)
P. Vejmelka, Th. Fanghaenel, B. Kienzler, E. Korthaus, J. Roemer,W. Schuessler, R. Artinger
Institut für Nukleare Entsorgung
Forschungszentrum Karlsruhe GmbH, Karlsruhe
2000

ii
The work was performed within the Project Agreement for collaboration on certainexperiments related to the disposal of radioactive waste in the Hard Rock LaboratoryÄspö (HRL) between the Bundesministerium für Bildung, Wissenschaft und Tech-nologie (BMBF) and Svensk Kärnbränslehantering AB (SKB).
The authors thank the staff of HRL for preparation of rock and water samples and for theexcellent cooperation.
iii
Sorption and Migration of Radionuclides inGranite (HRL ÄSPÖ, Sweden)
Abstract
Within the scope of a bilateral cooperation an Actinide Migration Experiment is planned byINE to be performed at the Äspö Hard Rock Laboratory in Sweden. The experiment will beperformed using fractured rock samples. The experimental set-up is constructed in order tofit into the CHEMLAB probe which allows to study the behavior of radionuclides under themost realistic conditions attainable. In preparation of these experiments, and to design theexperimental setup, some sorption experiments (batch experiments and column experi-ments) with fracture filling material and granite, respectively, and with groundwater from thearea of CHEMLAB were conducted under inert gas conditions (argon/1% CO2) in the labo-ratory. In this paper the results of sorption experiments using actinides such as Pu, Np, Amare presented for both types of experiments. Details of the experimental setup are docu-mented.
Geochemical model calculations for determination of the actinide tracer concentrations of thesolution applied in the migration experiment are presented. In order to evaluate actinidebreakthrough and recovery, the hydraulic properties of fractured rock samples are investi-gated. HTO is used as inert tracer at different flow rates. The results of the HTO experimentsare modelled by means of matrix diffusion models.
iv
Sorption und Migration von Radionukliden imGranit (HRL ÄSPÖ, Schweden)
Zusammenfassung
Im Rahmen einer bilateralen Zusammenarbeit ist von INE die Durchführung des ActinidenMigration Experiments im Hard Rock Laboratory ÄSPÖ in Schweden vorgesehen. Für dasExperiment werden geklüftete Granitproben verwendet. Die Proben werden entsprechendden experimentellen Randbedingungen vorbereitet, so dass sie in die in ÄSPÖ verfügbareCHEMLAB Experimentiersonde eingesetzt werden können. Die in situ Experimente ermögli-chen das Studium des Verhaltens der Radionuklide unter den weitestgehend natürlichenphyikalisch/chemischen Bedingungen. Zur Vorbereitung der in situ Experimente und zurAuslegung der experimentellen Randbedingungen wurden zunächst Sorptionsexperimente(batch- und Säulenversuche) mit Kluftfüllmaterial und Granit unter Verwendung von Grund-wasser aus der Umgebung des CHEMLAB unter Sauerstoffausschluss (Ar/1%CO2) im Labordurchgeführt. Im vorliegenden Bericht wird über die Ergebnisse der Sorptionsexperimenteberichtet, die mit den Radionukliden Pu, Np und Am durchgeführt wurden. Einzelheiten derexperimentellen Anordnung werden beschrieben.
Zur Vorhersage der Actinidenkonzentrationen unter den in situ Bedingungen wurden geo-chemische Modellrechnungen durchgeführt. Um die Actinidenmigration und das Recoveryermitteln zu können, wurden die hydraulischen Eigenschaften der klüftigen Granitproben be-stimmt. HTO wurde als inerter Tracer bei unterschiedlichen Fließgeschwindigkeiten verwen-det. Die Ergebnisse der HTO-Experimente wurden unter Anwendung eines Matrix-Diffusions-Modells modelliert.
v
Contents
Abstract ................................................................................................................................. iii
Contents .................................................................................................................................v
List of figures .........................................................................................................................vi
List of Tables ........................................................................................................................ vii
1 Introduction..................................................................................................................... 1
2 Laboratory Experiments.................................................................................................. 32.1 Characterization of the Starting Materials ................................................................... 3
2.1.1 Characterization of the ÄSPÖ Groundwater ........................................................ 32.1.2 Characterization of the Fracture Filling Material................................................... 3
2.2 Batch Experiments ..................................................................................................... 52.2.1 Results of the Sorption Experiments.................................................................... 7
2.2.1.1 “Groundwater + fracture filling material” unconditioned System ...................... 72.2.1.2 “Groundwater + Fracture Filling Material” Conditioned System ....................... 82.2.1.3 “Groundwater + Granite” Conditioned System............................................... 12
2.3 Column Experiments ................................................................................................ 13
3 Characterization of Core Samples for Laboratory and In Situ Experiments ................... 153.1 Preparation of the Core samples .............................................................................. 153.2 Analytical investigations of the solids in the fracture ................................................. 183.3 Determination of the hydraulic properties of the core samples.................................. 213.4 HTO Dispersion in the PEEK Line ............................................................................ 223.5 Laboratory Migration Experiments with a core sample ............................................. 23
4 Modelling ...................................................................................................................... 244.1 Geochemical Modeling of Actinide Solubilities.......................................................... 244.2 Modelling of tracer tests with column 2 (Hydraulic calibration).................................. 29
5 Summary ...................................................................................................................... 32
6 References ................................................................................................................... 35
7 Annex ........................................................................................................................... 36
vi
List of figures
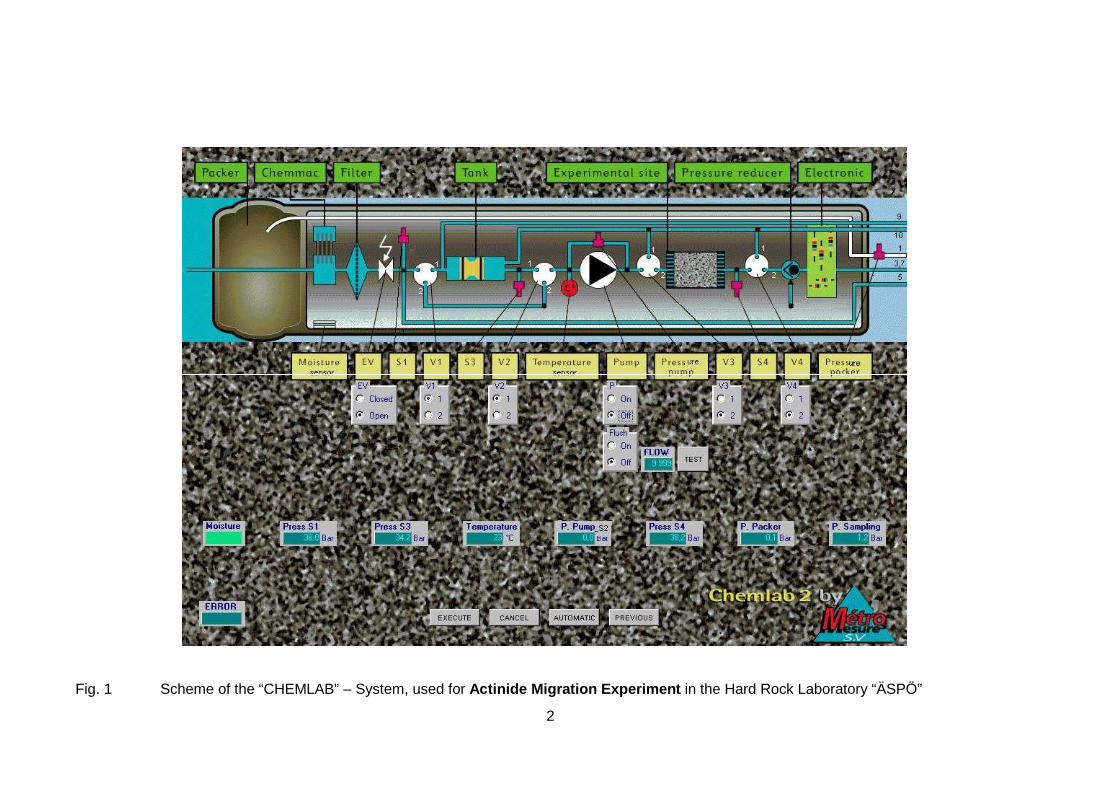
Fig. 1 Scheme of the “CHEMLAB” – System, used for Actinide Migration Experimentin the Hard Rock Laboratory “ÄSPÖ” 2
Fig. 2 X-ray diffraction pattern of the ÄSPÖ-fracture filling material 5
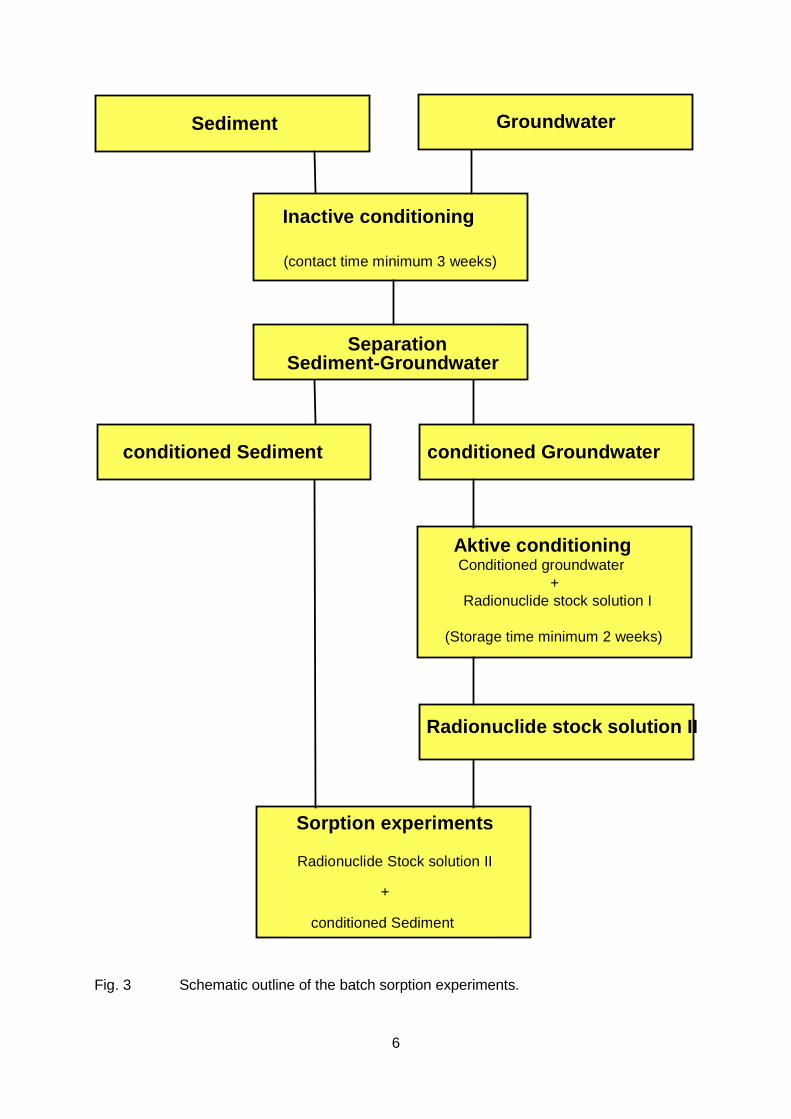
Fig. 3 Schematic outline of the batch sorption experiments. 6
Fig. 4 Development, as a function of time, of the RN concentrations in the sorptionsamples of the “unconditioned groundwater/fracture filling material” system. 8
Fig. 5 Development, as a function of time, of the Pu concentration in the sorptionsamples of the “conditioned groundwater/fracture filling material” system. 9
Fig. 6 Development, as a function of time, of the Am concentration in the sorptionsamples of the “conditioned groundwater/fracture filling material” system. 10
Fig. 7 Development, as a function of time, of the Np concentration in the sorptionsamples of the “conditioned groundwater/fracture filling material” system. 11
Fig. 8 Development, as a function of time, of the Rn concentration in the sorptionsamples of the “conditioned groundwater/ÄSPÖ granite” system. 12
Fig. 9 Np and HTO breakthrough curve for the “fracture filling material/groundwater”ÄSPÖ system. (Np concentration added: 1.1 x 10⁻⁵ mol/l, pump rate: 0.69 m/d.)13
Fig. 10 Np absorption spectra of the injected solution and eluate fraction 44. 14
Fig. 11 Set-up of the experiment: Autoclave, fractured core, lid and draining system 16
Fig. 12 ÄSPÖ core sample with fracture. 17
Fig. 13 ÄSPÖ core sample embedded in a stainless steel sleeve; top and bottom ends17
Fig. 14 Laboratory setup with the ÄSPÖ column for migration studies. 18
Fig. 15 SEM-image of a fracture 19
Fig. 16 EDX analysis of the average rock and an Fe-particle 19
Fig. 17 Element mapping and mineral phases (upper line left) of the fracture 20
Fig. 18 HTO breakthrough curves for ÄSPÖ columns 2, 3 and 4. 21
vii
Fig. 19 Effect of the length of a PEEK line on the HTO dispersion (distance betweenautoclave and sampling station) 22
Fig. 20 Breakthrough curve for Np-237 for ÄSPÖ column 1. 23
Fig. 21 Am(III) solubility in Äspö groundwatwer 26
Fig. 22 Np(V) solubility in Äspö groundwatwer 27
Fig. 23 Comparison of Np solubility at different granite sites: Äspö HRL (Sweden) andGrimsel (Switzerland) having different groundwater conditions 28
Fig. 24 Pu(IV) solubility in Äspö groundwatwer 29
Fig. 25 Conceptual design of the combined matrix diffusion model 30
Fig. 26 HTO breakthrough curve of Test C2HTO2 compared to model calculation 31
Fig. 27 HTO breakthrough curve of Test C2HTO4 compared to model calculation 32
List of Tables
Tab I Composition of the Äspö groundwater (mg/l) 3
Tab II Elemental composition of various Äspö fracture filling materials (wt. %) 4
Tab III Characteristic data of the prepared cores 22
Tab IV Parameter values for the combined matrix diffusion model 30
Tab V: Dependence on time of the radionuclide concentrations (mol/l) in the unconditioned“groundwater + fracture filling material” system 36
Tab VI: Dependence on time of the Am concentration (mol/l) in the conditioned“groundwater + fracture filling material” system 36
Tab VII: Dependence on time of the Np concentration (mol/l) in the conditioned “groundwater+ fracture filling material” system 37
Tab VIII:Dependence on time of the Pu concentration (mol/l) in the conditioned “groundwater+ fracture filling material” system 37
Tab IX: Dependence on time of the radionuclide concentration (mol/l) in the “groundwater +fracture backfill material” system 37
Tab X: Radionuclide concentrations in the ÄSPÖ cocktail 38

viii
1
1 Introduction
The Äspö Hard Rock Laboratory (HRL) was established in Sweden in a granite rock forma-tion for in-situ experiments with radionuclides (Jansson 1997). The aims of this facility are:
- To examine which methods are most suitable for research in the bedrock.- To develop and demonstrate methods for deciding in what way a deep repository can be
planned and constructed in accordance with the local characteristics of the bedrock.- To increase scientific understanding of a deep repository's safety margins.- To develop and demonstrate the technique that will be used during the disposal of spent
nuclear fuel.
One tool which is available at Äspö HRL is a drill hole probe CHEMLAB which can be usedto investigate actinide elements under the pressure and geochemical conditions of the hostrock. The experiments planned by INE to be performed with the CHEMLAB are to study thebehavior of radionuclides with respect to diffusion, migration, solubility, and sorption underthe most realistic conditions attainable. Within the scope of a bilateral co-operation, INEplans migration experiments with actinides such as Pu, Am, and Np.
The objectives of the experiments are:� investigation of applicability of radionuclide retention coefficients measured in batch
experiments for in-situ conditions� to validate the radionuclide retardation measured in laboratories by data from in-situ ex-
periments in rock� to demonstrate that the laboratory data are reliable and correct under the conditions pre-
vailing in the rock� to reduce the uncertainity in the retardation properties of the radionuclides americium,
neptunium and plutonium.
In preparation of these experiments, and to design the experimental setup, some first orien-tating sorption experiments (batch experiments and column experiments) with fracture fillingmaterial and granite, respectively, and with groundwater from the area of CHEMLAB wereconducted under inert gas conditions (argon/1% CO2) in the laboratory. Figure 1 shows aschematic representation of the CHEMLAB design.
As a prerequisite of the CHEMLAB experiments a series of laboratory experiments have tobe performed at INE. These investigations cover
- Characteristics of groundwater and rock material (granite and altered fracture filling mate-rial)
- Sorption behaviour of actinides onto solid phases- Characterisation of the fractures with respect to groundwater flow- Development and test of the experimental setup for the CHEMLAB probe- Determination of the breakthrough and recovery of the actinides in order to design the
experimental schedule and analytical requirements
2
Fig. 1 Scheme of the “CHEMLAB” – System, used for Actinide Migration Experiment in the Hard Rock Laboratory “ÄSPÖ”
3
2 Laboratory Experiments
2.1 Characterization of the Starting Materials
2.1.1 Characterization of the ÄSPÖ Groundwater
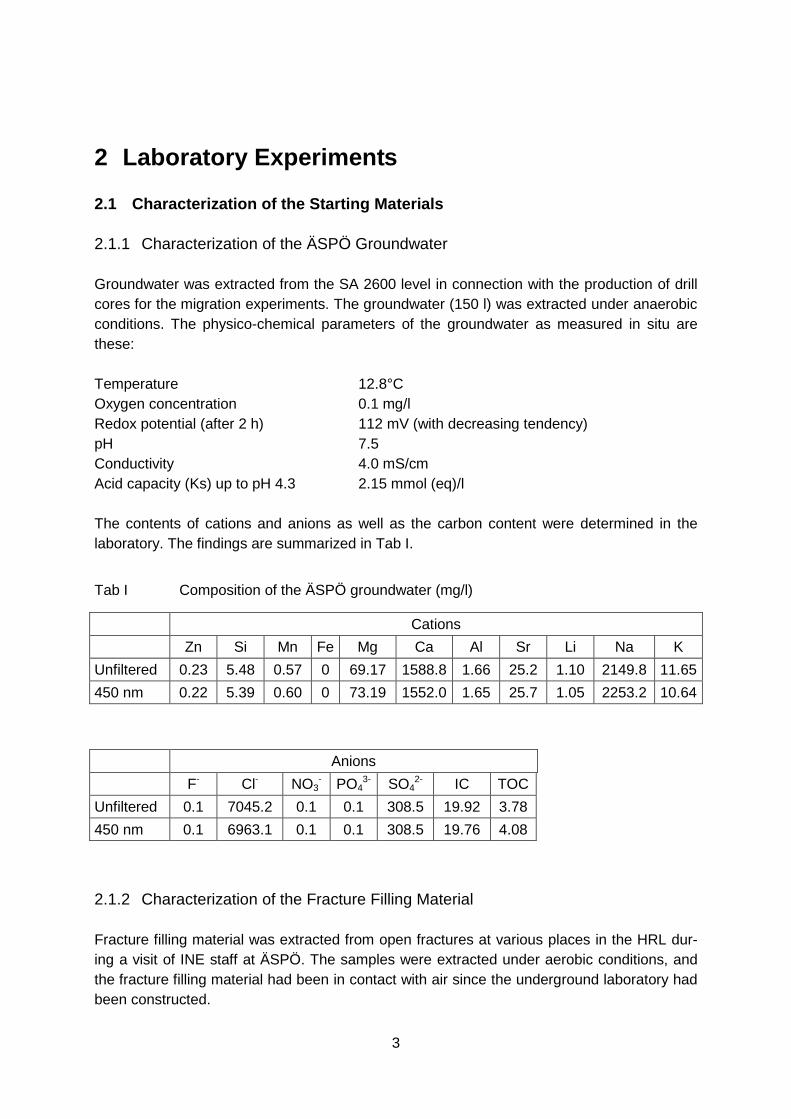
Groundwater was extracted from the SA 2600 level in connection with the production of drillcores for the migration experiments. The groundwater (150 l) was extracted under anaerobicconditions. The physico-chemical parameters of the groundwater as measured in situ arethese:
Temperature 12.8°COxygen concentration 0.1 mg/lRedox potential (after 2 h) 112 mV (with decreasing tendency)pH 7.5Conductivity 4.0 mS/cmAcid capacity (Ks) up to pH 4.3 2.15 mmol (eq)/l
The contents of cations and anions as well as the carbon content were determined in thelaboratory. The findings are summarized in Tab I.
Tab I Composition of the ÄSPÖ groundwater (mg/l)
CationsZn Si Mn Fe Mg Ca Al Sr Li Na K
Unfiltered 0.23 5.48 0.57 0 69.17 1588.8 1.66 25.2 1.10 2149.8 11.65450 nm 0.22 5.39 0.60 0 73.19 1552.0 1.65 25.7 1.05 2253.2 10.64
AnionsF- Cl- NO3
- PO43- SO4
2- IC TOCUnfiltered 0.1 7045.2 0.1 0.1 308.5 19.92 3.78450 nm 0.1 6963.1 0.1 0.1 308.5 19.76 4.08
2.1.2 Characterization of the Fracture Filling Material
Fracture filling material was extracted from open fractures at various places in the HRL dur-ing a visit of INE staff at ÄSPÖ. The samples were extracted under aerobic conditions, andthe fracture filling material had been in contact with air since the underground laboratory hadbeen constructed.
4
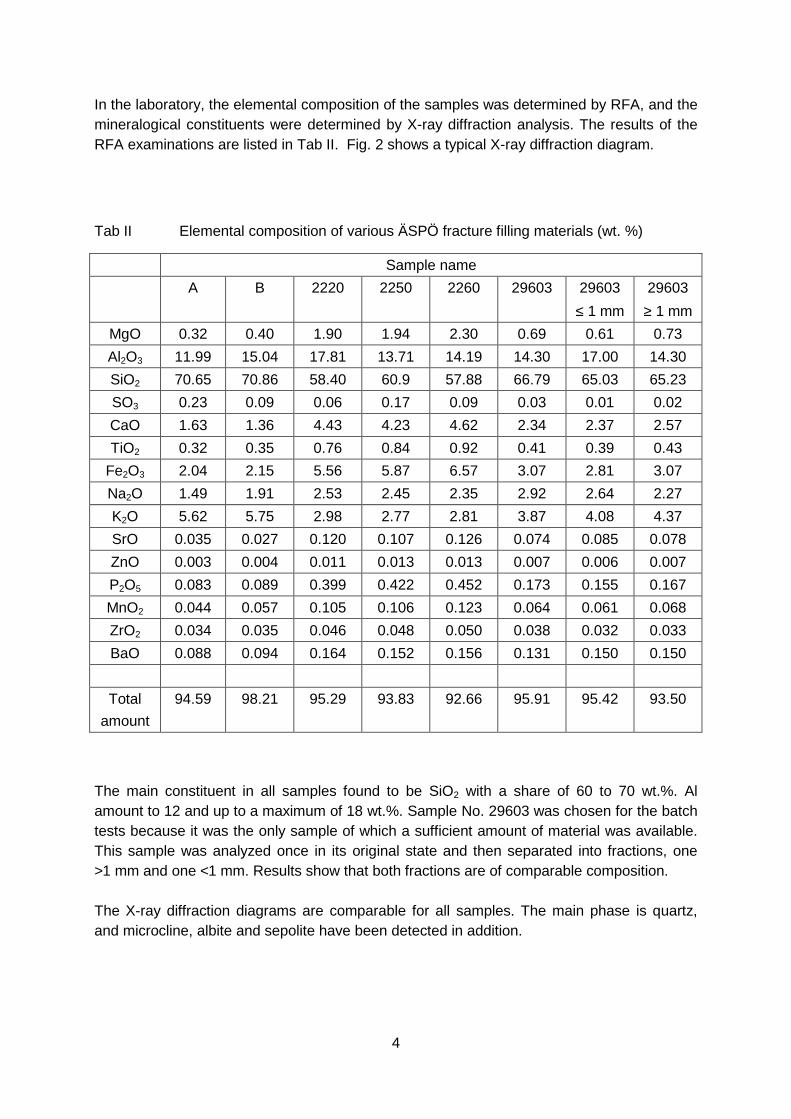
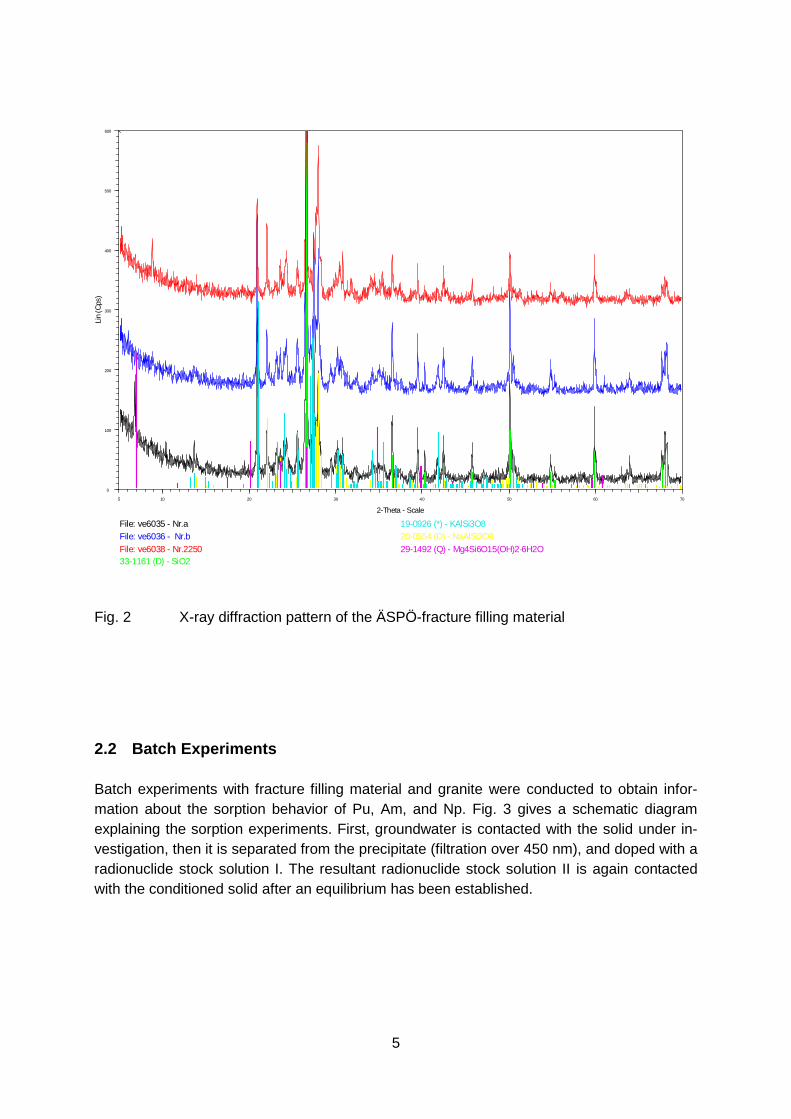
In the laboratory, the elemental composition of the samples was determined by RFA, and themineralogical constituents were determined by X-ray diffraction analysis. The results of theRFA examinations are listed in Tab II. Fig. 2 shows a typical X-ray diffraction diagram.
Tab II Elemental composition of various ÄSPÖ fracture filling materials (wt. %)
Sample nameA B 2220 2250 2260 29603 29603
≤ 1 mm29603≥ 1 mm
MgO 0.32 0.40 1.90 1.94 2.30 0.69 0.61 0.73Al2O3 11.99 15.04 17.81 13.71 14.19 14.30 17.00 14.30SiO2 70.65 70.86 58.40 60.9 57.88 66.79 65.03 65.23SO3 0.23 0.09 0.06 0.17 0.09 0.03 0.01 0.02CaO 1.63 1.36 4.43 4.23 4.62 2.34 2.37 2.57TiO2 0.32 0.35 0.76 0.84 0.92 0.41 0.39 0.43
Fe2O3 2.04 2.15 5.56 5.87 6.57 3.07 2.81 3.07Na2O 1.49 1.91 2.53 2.45 2.35 2.92 2.64 2.27K2O 5.62 5.75 2.98 2.77 2.81 3.87 4.08 4.37SrO 0.035 0.027 0.120 0.107 0.126 0.074 0.085 0.078ZnO 0.003 0.004 0.011 0.013 0.013 0.007 0.006 0.007P2O5 0.083 0.089 0.399 0.422 0.452 0.173 0.155 0.167MnO2 0.044 0.057 0.105 0.106 0.123 0.064 0.061 0.068ZrO2 0.034 0.035 0.046 0.048 0.050 0.038 0.032 0.033BaO 0.088 0.094 0.164 0.152 0.156 0.131 0.150 0.150
Totalamount
94.59 98.21 95.29 93.83 92.66 95.91 95.42 93.50
The main constituent in all samples found to be SiO2 with a share of 60 to 70 wt.%. Alamount to 12 and up to a maximum of 18 wt.%. Sample No. 29603 was chosen for the batchtests because it was the only sample of which a sufficient amount of material was available.This sample was analyzed once in its original state and then separated into fractions, one>1 mm and one <1 mm. Results show that both fractions are of comparable composition.
The X-ray diffraction diagrams are comparable for all samples. The main phase is quartz,and microcline, albite and sepolite have been detected in addition.
5
29-1492 (Q) - Mg4Si6O15(OH)2·6H2O20-0554 (D) - NaAlSi3O819-0926 (*) - KAlSi3O8
33-1161 (D) - SiO2File: ve6038 - Nr.2250 File: ve6036 - Nr.b File: ve6035 - Nr.a
Lin
(Cps
)
0
100
200
300
400
500
600
2-Theta - Scale5 10 20 30 40 50 60 70
Fig. 2 X-ray diffraction pattern of the ÄSPÖ-fracture filling material
2.2 Batch Experiments
Batch experiments with fracture filling material and granite were conducted to obtain infor-mation about the sorption behavior of Pu, Am, and Np. Fig. 3 gives a schematic diagramexplaining the sorption experiments. First, groundwater is contacted with the solid under in-vestigation, then it is separated from the precipitate (filtration over 450 nm), and doped with aradionuclide stock solution I. The resultant radionuclide stock solution II is again contactedwith the conditioned solid after an equilibrium has been established.
6
Inactive conditioning
(contact time minimum 3 weeks)
SeparationSediment-Groundwater
Aktive conditioningConditioned groundwater
+Radionuclide stock solution I
(Storage time minimum 2 weeks)
Radionuclide stock solution II
Sorption experiments
Radionuclide Stock solution II
+
conditioned Sediment
Sediment Groundwater
conditioned Sediment conditioned Groundwater
Fig. 3 Schematic outline of the batch sorption experiments.
7
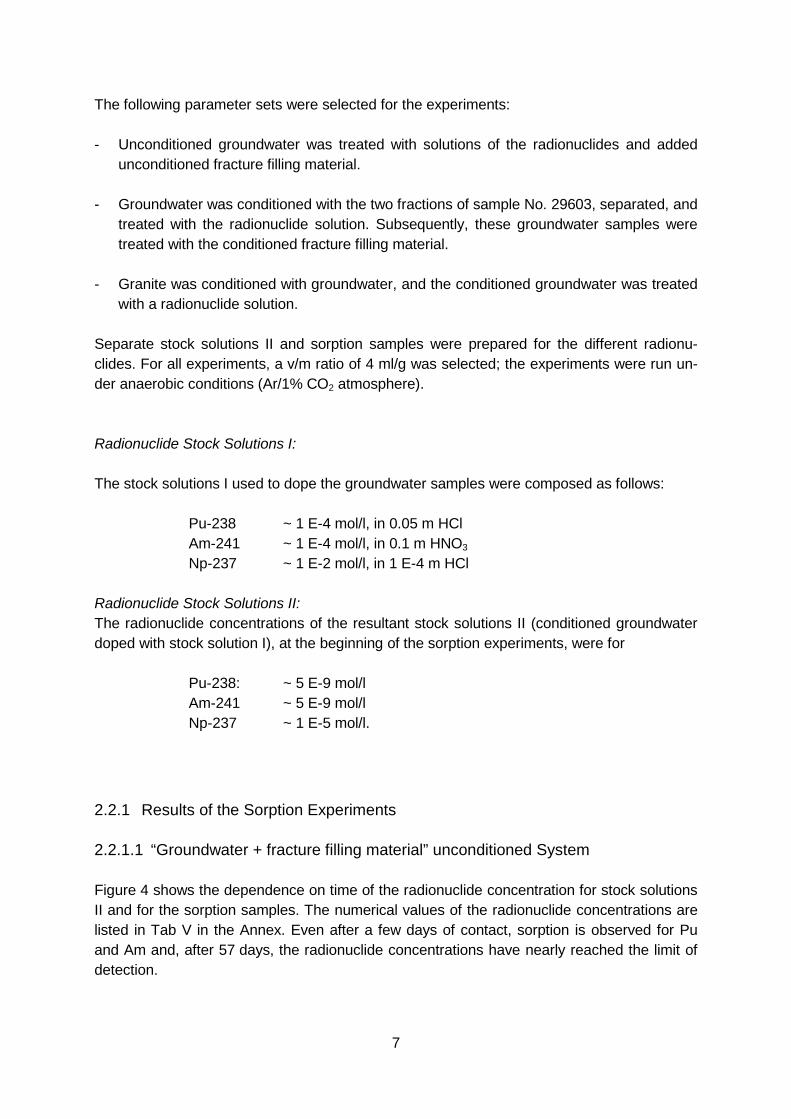
The following parameter sets were selected for the experiments:
- Unconditioned groundwater was treated with solutions of the radionuclides and addedunconditioned fracture filling material.
- Groundwater was conditioned with the two fractions of sample No. 29603, separated, andtreated with the radionuclide solution. Subsequently, these groundwater samples weretreated with the conditioned fracture filling material.
- Granite was conditioned with groundwater, and the conditioned groundwater was treatedwith a radionuclide solution.
Separate stock solutions II and sorption samples were prepared for the different radionu-clides. For all experiments, a v/m ratio of 4 ml/g was selected; the experiments were run un-der anaerobic conditions (Ar/1% CO2 atmosphere).
Radionuclide Stock Solutions I:
The stock solutions I used to dope the groundwater samples were composed as follows:
Pu-238 ~ 1 E-4 mol/l, in 0.05 m HClAm-241 ~ 1 E-4 mol/l, in 0.1 m HNO3
Np-237 ~ 1 E-2 mol/l, in 1 E-4 m HCl
Radionuclide Stock Solutions II:The radionuclide concentrations of the resultant stock solutions II (conditioned groundwaterdoped with stock solution I), at the beginning of the sorption experiments, were for
Pu-238: ~ 5 E-9 mol/lAm-241 ~ 5 E-9 mol/lNp-237 ~ 1 E-5 mol/l.
2.2.1 Results of the Sorption Experiments
2.2.1.1 “Groundwater + fracture filling material” unconditioned System
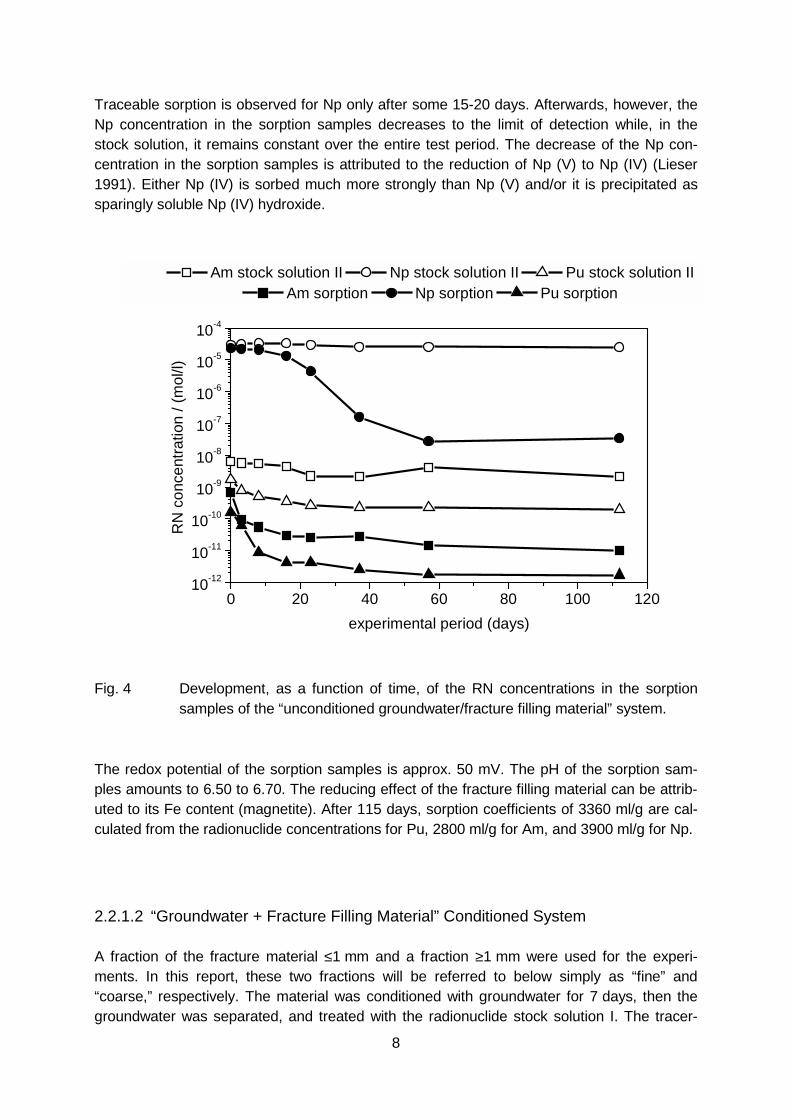
Figure 4 shows the dependence on time of the radionuclide concentration for stock solutionsII and for the sorption samples. The numerical values of the radionuclide concentrations arelisted in Tab V in the Annex. Even after a few days of contact, sorption is observed for Puand Am and, after 57 days, the radionuclide concentrations have nearly reached the limit ofdetection.
8
Traceable sorption is observed for Np only after some 15-20 days. Afterwards, however, theNp concentration in the sorption samples decreases to the limit of detection while, in thestock solution, it remains constant over the entire test period. The decrease of the Np con-centration in the sorption samples is attributed to the reduction of Np (V) to Np (IV) (Lieser1991). Either Np (IV) is sorbed much more strongly than Np (V) and/or it is precipitated assparingly soluble Np (IV) hydroxide.
0 20 40 60 80 100 12010-12
10-11
10-10
10-9
10-8
10-7
10-6
10-5
10-4
Am stock solution II Np stock solution II Pu stock solution II Am sorption Np sorption Pu sorption
RN
con
cent
ratio
n / (
mol
/l)
experimental period (days)
Fig. 4 Development, as a function of time, of the RN concentrations in the sorptionsamples of the “unconditioned groundwater/fracture filling material” system.
The redox potential of the sorption samples is approx. 50 mV. The pH of the sorption sam-ples amounts to 6.50 to 6.70. The reducing effect of the fracture filling material can be attrib-uted to its Fe content (magnetite). After 115 days, sorption coefficients of 3360 ml/g are cal-culated from the radionuclide concentrations for Pu, 2800 ml/g for Am, and 3900 ml/g for Np.
2.2.1.2 “Groundwater + Fracture Filling Material” Conditioned System
A fraction of the fracture material ≤1 mm and a fraction ≥1 mm were used for the experi-ments. In this report, these two fractions will be referred to below simply as “fine” and“coarse,” respectively. The material was conditioned with groundwater for 7 days, then thegroundwater was separated, and treated with the radionuclide stock solution I. The tracer-
9
labeled groundwater was again contacted with the preconditioned solid. Fig. 4 to Fig. 8 showthe development, as a function of time, of the radionuclide concentrations in the stock solu-tions II and the sorption samples. The numerical values of the radionuclide concentrationsare listed in Tab V to Tab IX in the Annex.
The results also exhibit relatively good agreement with the results obtained with the uncondi-tioned system. The pH levels of the sorption samples are 6.50 to 6.70. The redox potential ofthe sorption samples with the <1 mm fracture filling material amounts to approx. 150 mV,while the potential for the >1 mm fraction samples is lower, amounting to -100 mV.
Plutonium
0 20 40 60 80 100 120 1401E-12
1E-11
1E-10
1E-9
1E-8
Pu stock solution II < 1 mm Sorption < 1 mm Pu stock solution II coarse Sorption coarse
Pu c
once
ntra
tion
/ mol
/l
experimental period / days
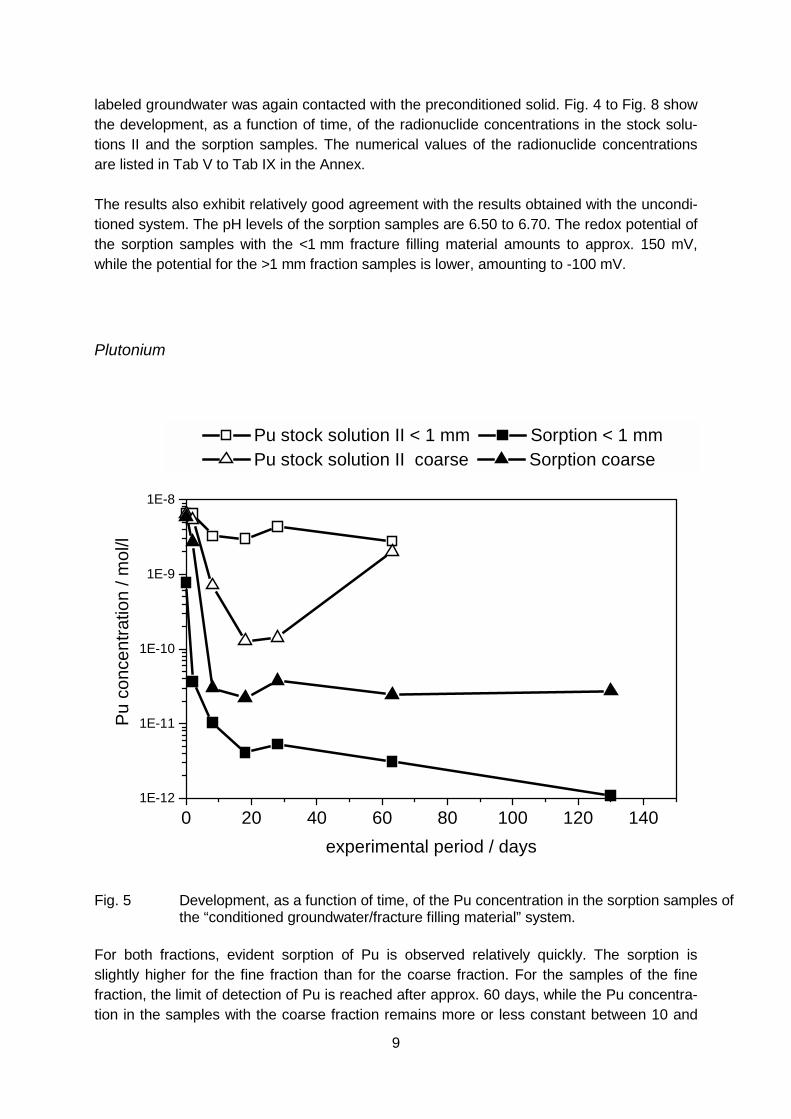
Fig. 5 Development, as a function of time, of the Pu concentration in the sorption samples ofthe “conditioned groundwater/fracture filling material” system.
For both fractions, evident sorption of Pu is observed relatively quickly. The sorption isslightly higher for the fine fraction than for the coarse fraction. For the samples of the finefraction, the limit of detection of Pu is reached after approx. 60 days, while the Pu concentra-tion in the samples with the coarse fraction remains more or less constant between 10 and
10
60 days and is clearly above the limit of detection. Further studies, e.g. by ultrafiltration, areplanned to detect the cause of this difference.
Another striking fact is the different stability of Pu in the stock solutions II. In the stock solu-tion II of the coarse fraction, the Pu concentration clearly decreases in the course of the ex-periment from 6.5 E-9 mol/l to 1.4 E-10 mol/l, and then rises again, while, in the stock solu-tion II of the fine fraction, the Pu concentration is relatively constant in the range between 6.5E-9 mol/l and 4.4 E-9 mol/l.
Americium
0 10 20 30 40 50 60 70
1E-11
1E-10
1E-9
1E-8
Am stock solution II <1mm Sorption < 1mm Am stock solution II coarse Sorption coarse
Am c
onze
ntra
tion
/ mol
/l
experimental period / days
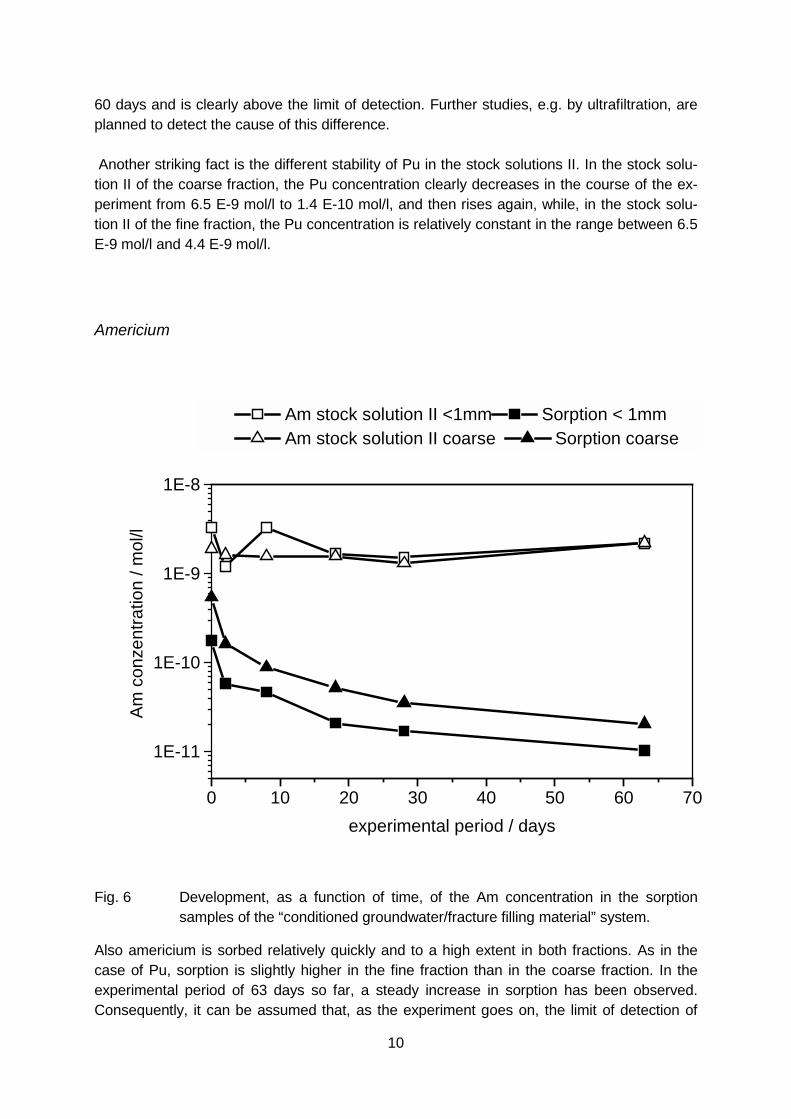
Fig. 6 Development, as a function of time, of the Am concentration in the sorptionsamples of the “conditioned groundwater/fracture filling material” system.
Also americium is sorbed relatively quickly and to a high extent in both fractions. As in thecase of Pu, sorption is slightly higher in the fine fraction than in the coarse fraction. In theexperimental period of 63 days so far, a steady increase in sorption has been observed.Consequently, it can be assumed that, as the experiment goes on, the limit of detection of
11
Am will be reached. In contrast to the situation with Pu, the Am concentrations are constantover the duration of the experiment in both stock solutions II.
Neptunium
0 10 20 30 40 50 60 701E-8
1E-7
1E-6
1E-5
Np stock solution II < 1mm Sorption < 1 mm Np stock solution II coarse Sorption coarse
Np
conz
entra
tion
/ mol
/l
experimental period / days
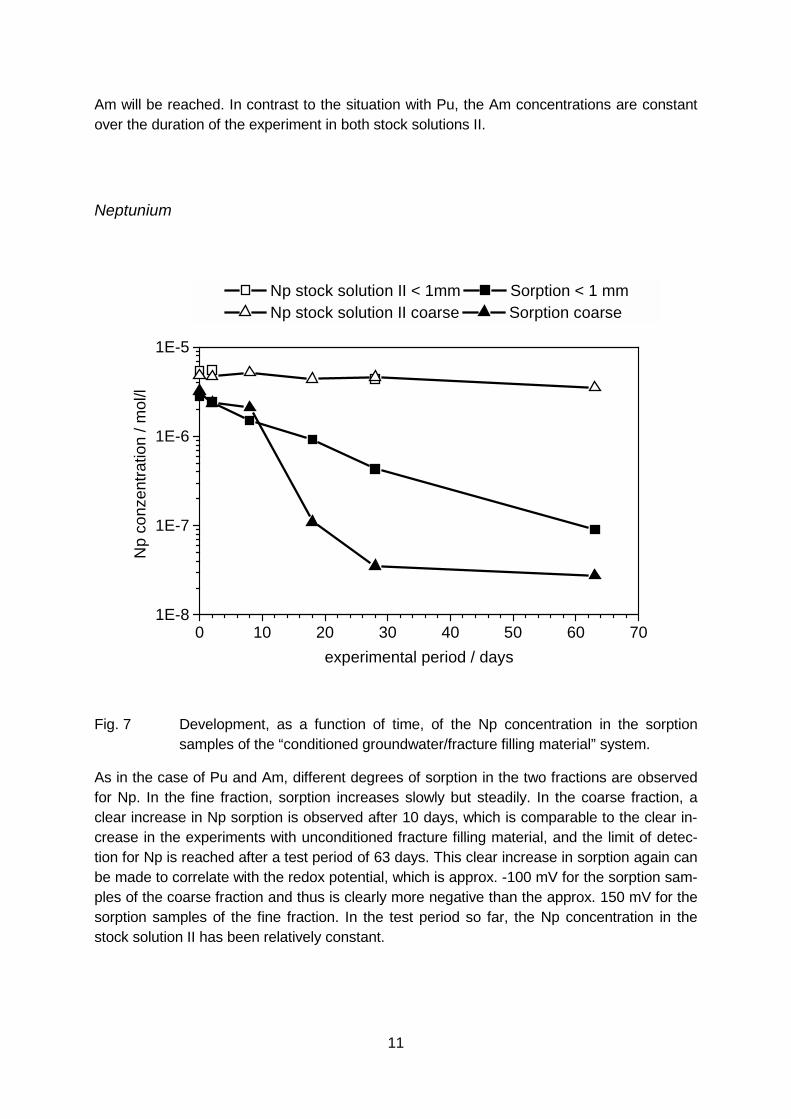
Fig. 7 Development, as a function of time, of the Np concentration in the sorptionsamples of the “conditioned groundwater/fracture filling material” system.
As in the case of Pu and Am, different degrees of sorption in the two fractions are observedfor Np. In the fine fraction, sorption increases slowly but steadily. In the coarse fraction, aclear increase in Np sorption is observed after 10 days, which is comparable to the clear in-crease in the experiments with unconditioned fracture filling material, and the limit of detec-tion for Np is reached after a test period of 63 days. This clear increase in sorption again canbe made to correlate with the redox potential, which is approx. -100 mV for the sorption sam-ples of the coarse fraction and thus is clearly more negative than the approx. 150 mV for thesorption samples of the fine fraction. In the test period so far, the Np concentration in thestock solution II has been relatively constant.
12
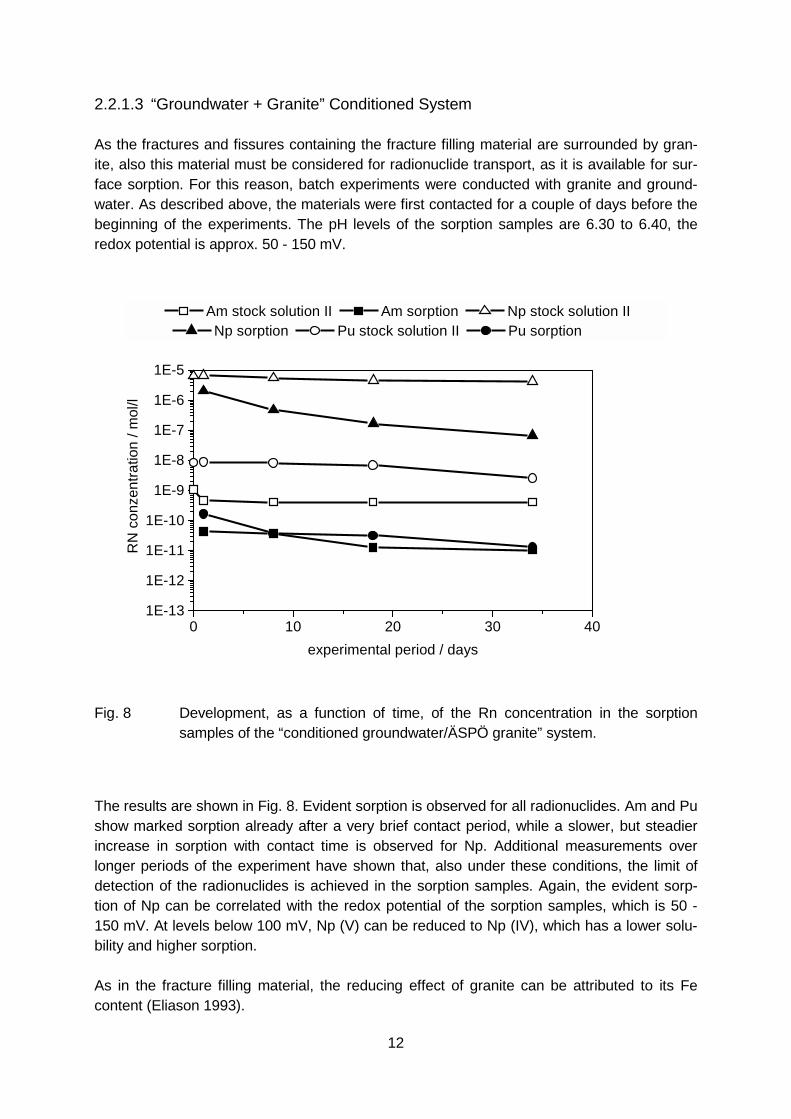
2.2.1.3 “Groundwater + Granite” Conditioned System
As the fractures and fissures containing the fracture filling material are surrounded by gran-ite, also this material must be considered for radionuclide transport, as it is available for sur-face sorption. For this reason, batch experiments were conducted with granite and ground-water. As described above, the materials were first contacted for a couple of days before thebeginning of the experiments. The pH levels of the sorption samples are 6.30 to 6.40, theredox potential is approx. 50 - 150 mV.
0 10 20 30 401E-13
1E-12
1E-11
1E-10
1E-9
1E-8
1E-7
1E-6
1E-5
Am stock solution II Am sorption Np stock solution II Np sorption Pu stock solution II Pu sorption
RN
con
zent
ratio
n / m
ol/l
experimental period / days
Fig. 8 Development, as a function of time, of the Rn concentration in the sorptionsamples of the “conditioned groundwater/ÄSPÖ granite” system.
The results are shown in Fig. 8. Evident sorption is observed for all radionuclides. Am and Pushow marked sorption already after a very brief contact period, while a slower, but steadierincrease in sorption with contact time is observed for Np. Additional measurements overlonger periods of the experiment have shown that, also under these conditions, the limit ofdetection of the radionuclides is achieved in the sorption samples. Again, the evident sorp-tion of Np can be correlated with the redox potential of the sorption samples, which is 50 -150 mV. At levels below 100 mV, Np (V) can be reduced to Np (IV), which has a lower solu-bility and higher sorption.
As in the fracture filling material, the reducing effect of granite can be attributed to its Fecontent (Eliason 1993).
13
2.3 Column Experiments
2.3.1 Column Experiment with Fracture Filling Material
In a first preliminary experiment, the migration behavior of Np (V) was studied with in situfracture filling material and groundwater. For this purpose, the fracture filling material with agrain size <1 mm was incorporated in a column 10 cm long and with an inner diameter of 1cm (porosity 22.7 %), and conditioned with the SA 2600 A groundwater for two weeks.
0 5 10 15
0.0
0.2
0.4
0.6
0.8
1.0
Fraction No. 44
HTO Np
Np/
HTO
con
zent
ratio
n / C
/Co
Volume ratio / V/Vp
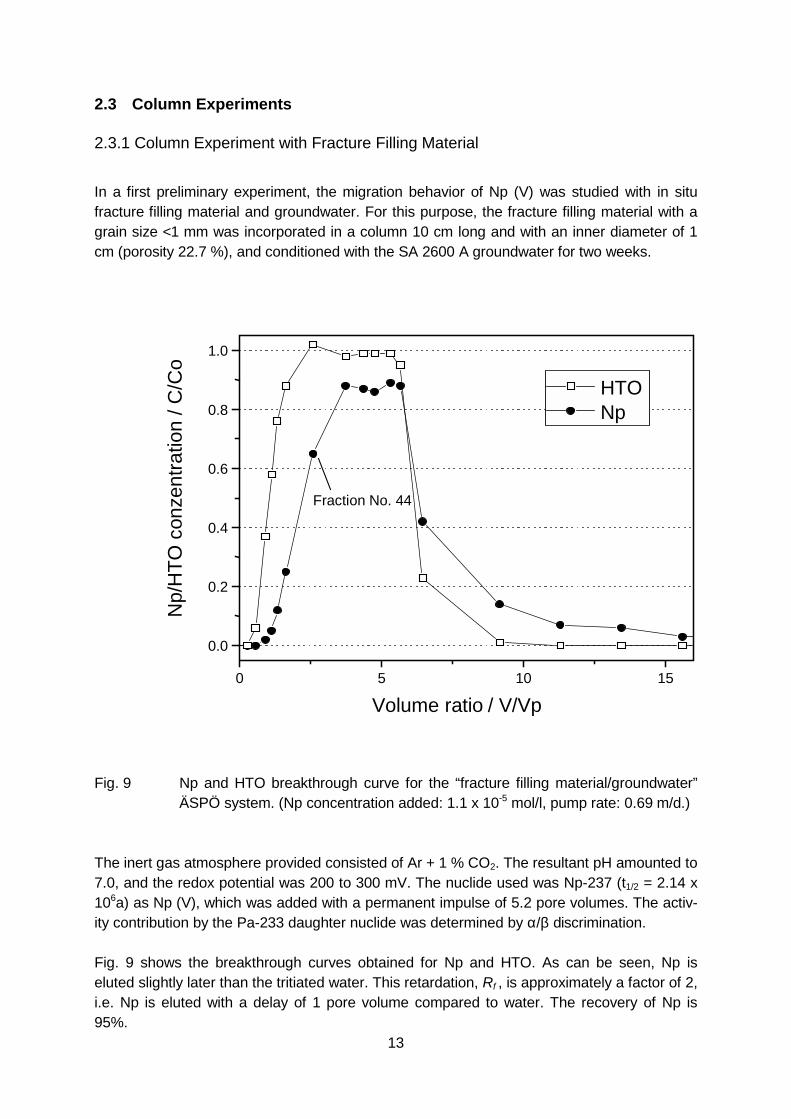
Fig. 9 Np and HTO breakthrough curve for the “fracture filling material/groundwater”ÄSPÖ system. (Np concentration added: 1.1 x 10⁻⁵ mol/l, pump rate: 0.69 m/d.)
The inert gas atmosphere provided consisted of Ar + 1 % CO2. The resultant pH amounted to7.0, and the redox potential was 200 to 300 mV. The nuclide used was Np-237 (t1/2 = 2.14 x10⁶a) as Np (V), which was added with a permanent impulse of 5.2 pore volumes. The activ-ity contribution by the Pa-233 daughter nuclide was determined by α/β discrimination.
Fig. 9 shows the breakthrough curves obtained for Np and HTO. As can be seen, Np iseluted slightly later than the tritiated water. This retardation, Rf , is approximately a factor of 2,i.e. Np is eluted with a delay of 1 pore volume compared to water. The recovery of Np is95%.
14
940 960 980 1000 1020 1040-0.001
0.000
0.001
0.002
0.003
0.004
0.005Np(V) in the groundwaterbefore injection
Extin
ctio
n
wavelength / (nm)
Np(V), Fraction No. 44column discharge end
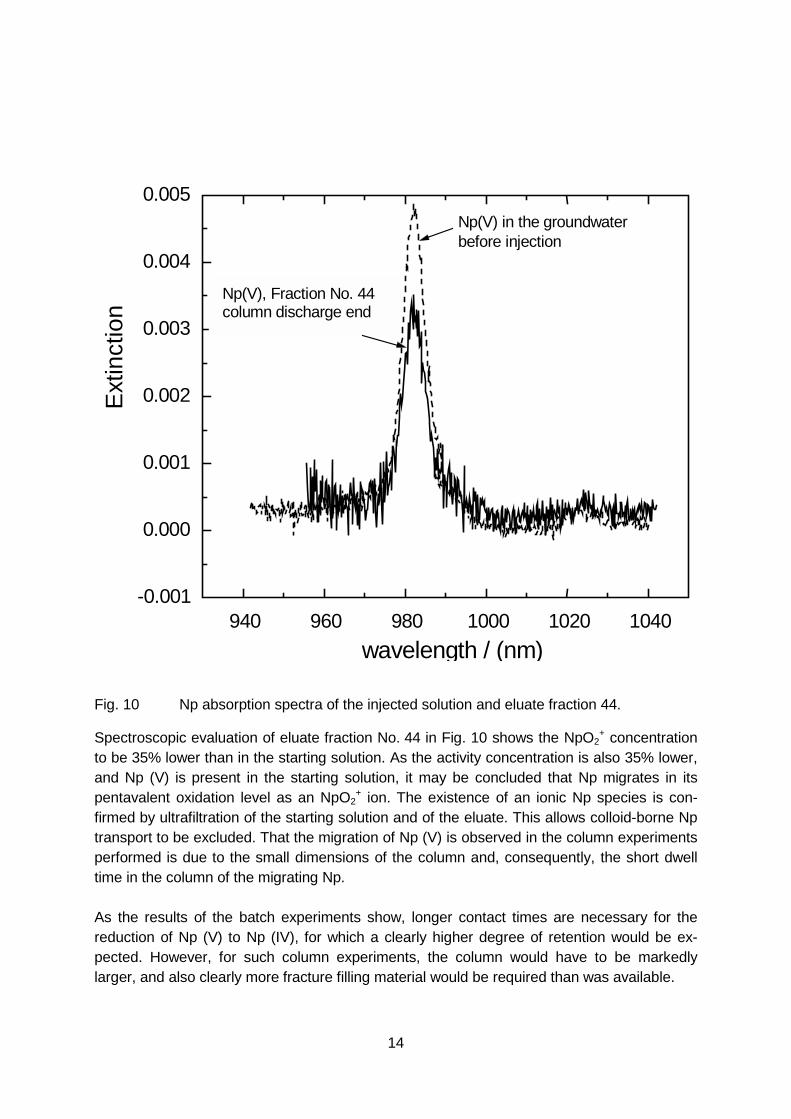
Fig. 10 Np absorption spectra of the injected solution and eluate fraction 44.
Spectroscopic evaluation of eluate fraction No. 44 in Fig. 10 shows the NpO2+ concentration
to be 35% lower than in the starting solution. As the activity concentration is also 35% lower,and Np (V) is present in the starting solution, it may be concluded that Np migrates in itspentavalent oxidation level as an NpO2
+ ion. The existence of an ionic Np species is con-firmed by ultrafiltration of the starting solution and of the eluate. This allows colloid-borne Nptransport to be excluded. That the migration of Np (V) is observed in the column experimentsperformed is due to the small dimensions of the column and, consequently, the short dwelltime in the column of the migrating Np.
As the results of the batch experiments show, longer contact times are necessary for thereduction of Np (V) to Np (IV), for which a clearly higher degree of retention would be ex-pected. However, for such column experiments, the column would have to be markedlylarger, and also clearly more fracture filling material would be required than was available.
15
3 Characterization of Core Samples for Laboratoryand In Situ Experiments
3.1 Preparation of the Core samples
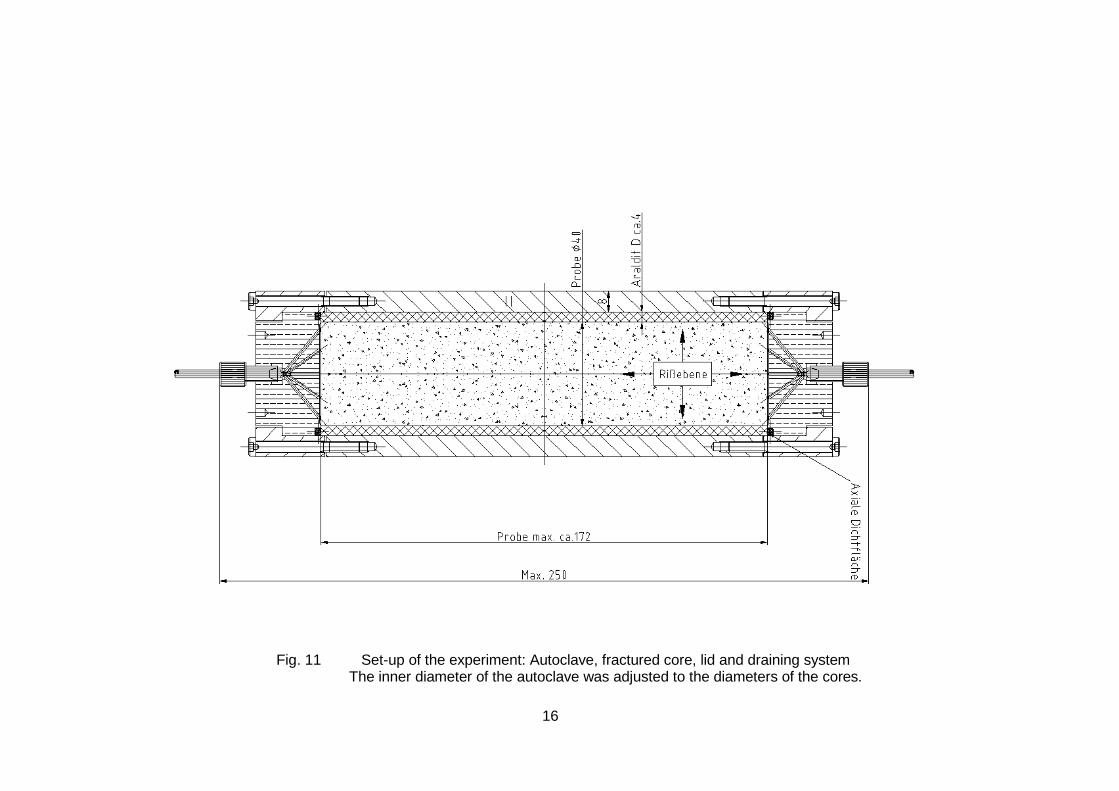
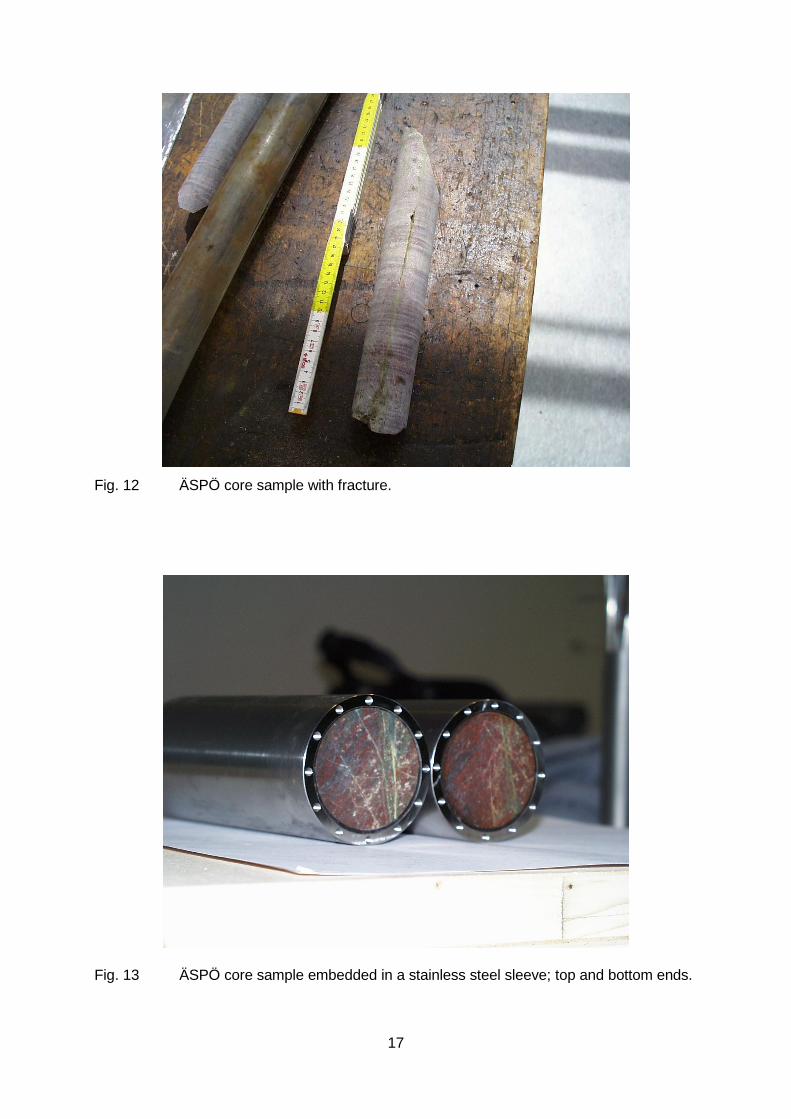
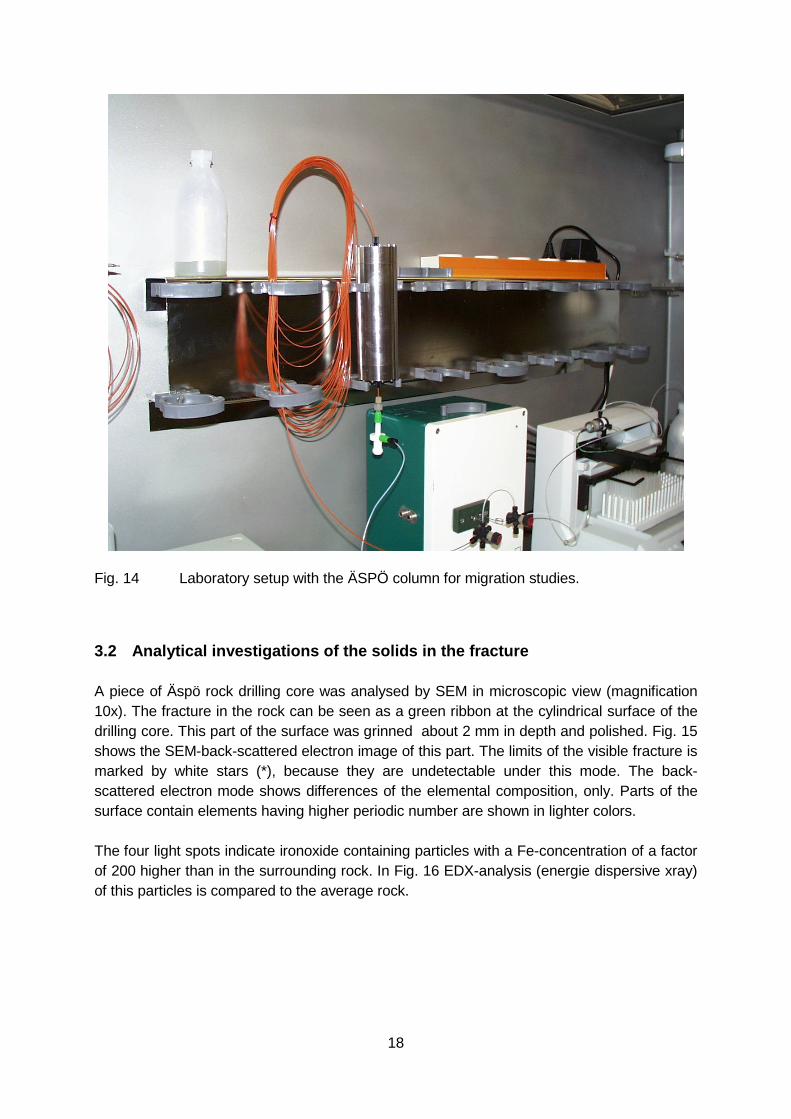
To run the migration experiments in CHEMLAB, a core sample with a fracture must beplaced into an autoclave and the hydraulic properties of the fracture must be known. For thispurpose, experiments were conducted initially on the tight enclosure of core samples in anautoclave. The core sample chosen, with a continuous fracture, were placed in a sleeve ofstainless steel, and the periphery was filled with epoxy resin. The top and the bottom endswere closed with acrylic glass covers sealed relative to the stainless steel sleeve with an O-ring, and which contained the bore for feeding and extracting the groundwater lines. Fig. 11show the construction drawing of the autoclave and Fig. 12 to Fig. 14 show a core samplewith the fracture, the core sample in the autoclave and the complete autoclave in a glovebox.
The tightness of the column was tested in subsequent laboratory experiments in which thecolumn was exposed to 60 bar of fluid pressure. The experiments indicate that the columnswere leaktight up to the 60 bar of pressure applied. The fluid pressure in CHEMLAB is about27 bar; consequently, no leakage of the columns is to be expected under in situ conditions. Atotal of three columns of the appropriate dimensions were prepared out of the core samplesavailable and can now be used for the laboratory and in situ experiments.
16
Fig. 11 Set-up of the experiment: Autoclave, fractured core, lid and draining systemThe inner diameter of the autoclave was adjusted to the diameters of the cores.
17
Fig. 12 ÄSPÖ core sample with fracture.
Fig. 13 ÄSPÖ core sample embedded in a stainless steel sleeve; top and bottom ends.
18
Fig. 14 Laboratory setup with the ÄSPÖ column for migration studies.
3.2 Analytical investigations of the solids in the fracture
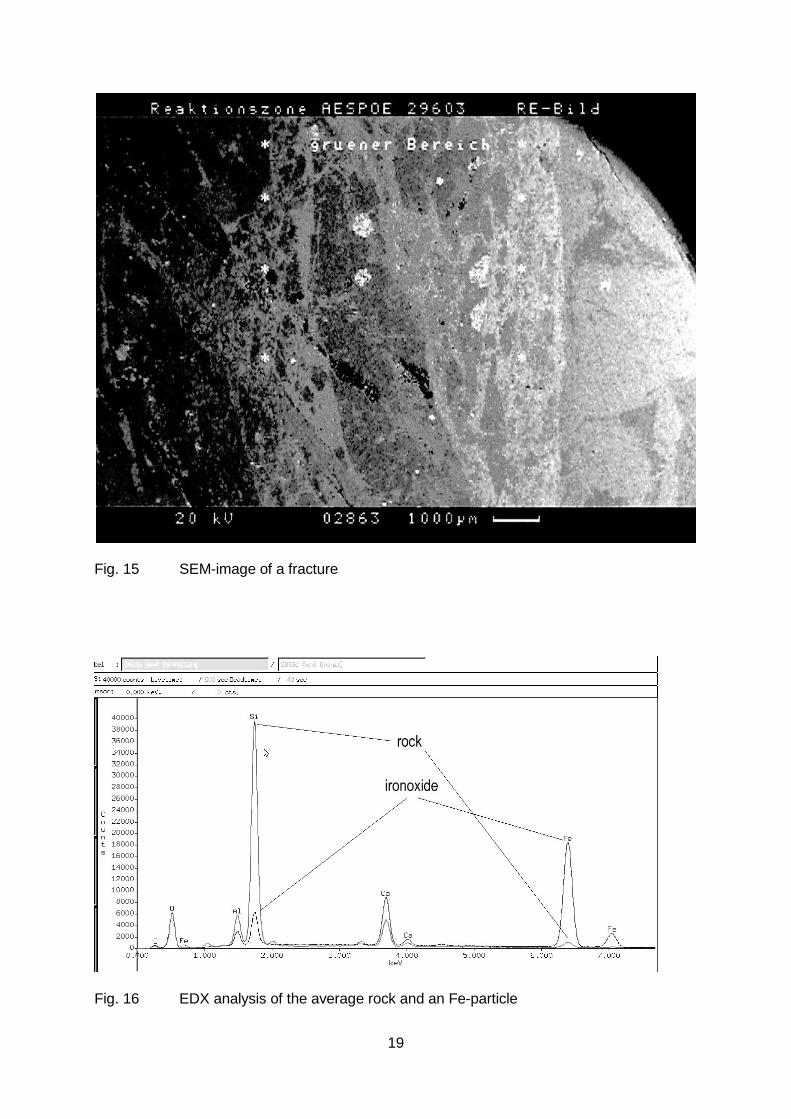
A piece of Äspö rock drilling core was analysed by SEM in microscopic view (magnification10x). The fracture in the rock can be seen as a green ribbon at the cylindrical surface of thedrilling core. This part of the surface was grinned about 2 mm in depth and polished. Fig. 15shows the SEM-back-scattered electron image of this part. The limits of the visible fracture ismarked by white stars (*), because they are undetectable under this mode. The back-scattered electron mode shows differences of the elemental composition, only. Parts of thesurface contain elements having higher periodic number are shown in lighter colors.
The four light spots indicate ironoxide containing particles with a Fe-concentration of a factorof 200 higher than in the surrounding rock. In Fig. 16 EDX-analysis (energie dispersive xray)of this particles is compared to the average rock.
19
Fig. 15 SEM-image of a fracture
Fig. 16 EDX analysis of the average rock and an Fe-particle
20
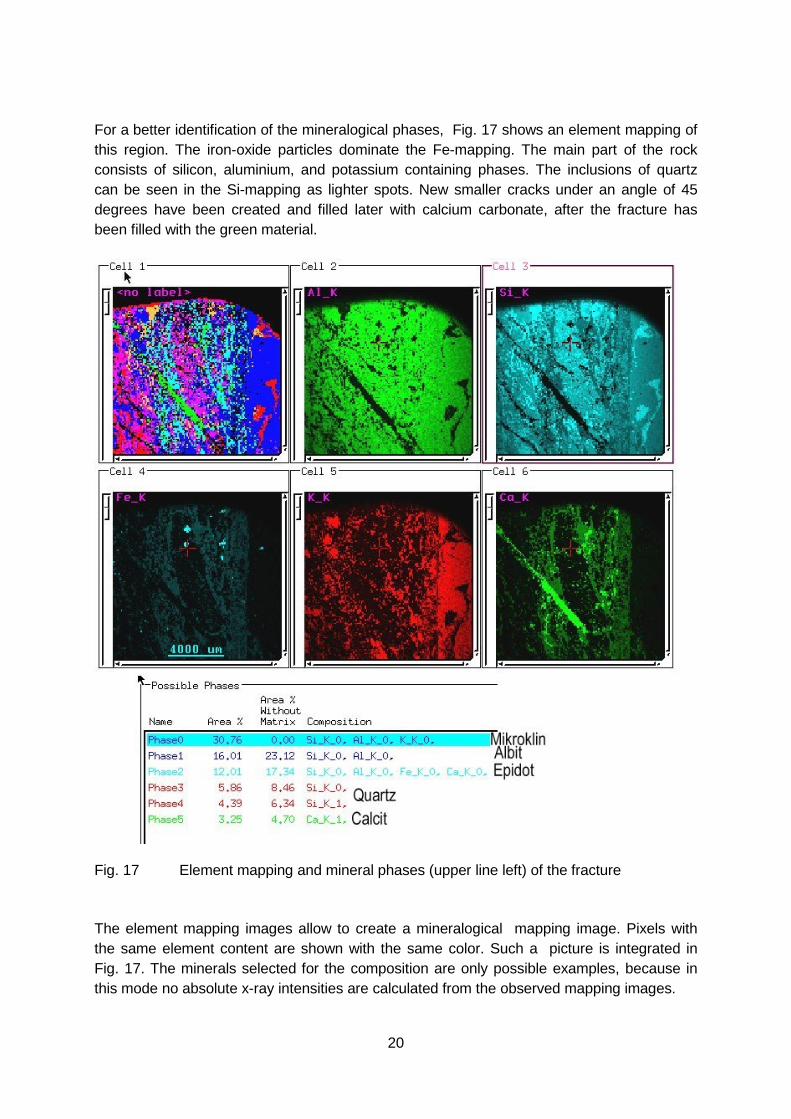
For a better identification of the mineralogical phases, Fig. 17 shows an element mapping ofthis region. The iron-oxide particles dominate the Fe-mapping. The main part of the rockconsists of silicon, aluminium, and potassium containing phases. The inclusions of quartzcan be seen in the Si-mapping as lighter spots. New smaller cracks under an angle of 45degrees have been created and filled later with calcium carbonate, after the fracture hasbeen filled with the green material.
Fig. 17 Element mapping and mineral phases (upper line left) of the fracture
The element mapping images allow to create a mineralogical mapping image. Pixels withthe same element content are shown with the same color. Such a picture is integrated inFig. 17. The minerals selected for the composition are only possible examples, because inthis mode no absolute x-ray intensities are calculated from the observed mapping images.
21
3.3 Determination of the hydraulic properties of the core samples
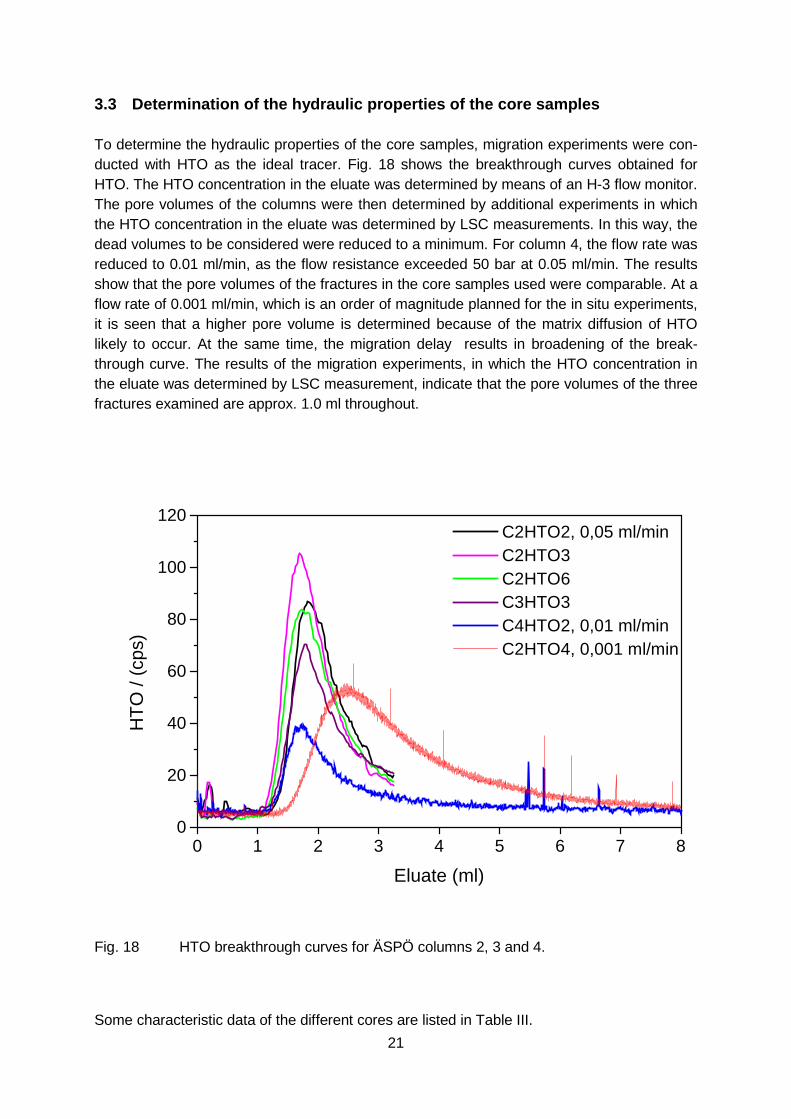
To determine the hydraulic properties of the core samples, migration experiments were con-ducted with HTO as the ideal tracer. Fig. 18 shows the breakthrough curves obtained forHTO. The HTO concentration in the eluate was determined by means of an H-3 flow monitor.The pore volumes of the columns were then determined by additional experiments in whichthe HTO concentration in the eluate was determined by LSC measurements. In this way, thedead volumes to be considered were reduced to a minimum. For column 4, the flow rate wasreduced to 0.01 ml/min, as the flow resistance exceeded 50 bar at 0.05 ml/min. The resultsshow that the pore volumes of the fractures in the core samples used were comparable. At aflow rate of 0.001 ml/min, which is an order of magnitude planned for the in situ experiments,it is seen that a higher pore volume is determined because of the matrix diffusion of HTOlikely to occur. At the same time, the migration delay results in broadening of the break-through curve. The results of the migration experiments, in which the HTO concentration inthe eluate was determined by LSC measurement, indicate that the pore volumes of the threefractures examined are approx. 1.0 ml throughout.
0 1 2 3 4 5 6 7 80
20
40
60
80
100
120 C2HTO2, 0,05 ml/min C2HTO3 C2HTO6 C3HTO3 C4HTO2, 0,01 ml/min C2HTO4, 0,001 ml/min
HTO
/ (c
ps)
Eluate (ml)
Fig. 18 HTO breakthrough curves for ÄSPÖ columns 2, 3 and 4.
Some characteristic data of the different cores are listed in Table III.
22
Tab III Characteristic data of the prepared cores
Core 1 Core 2 Core 3 Core 4Flow rate[ml/min]
> 0.05 0.05 / 0.001 0.05 0.01
Length 10.5 cm 15.0 cm 18.0 cm 15.0 cmPore Volume ~ 0.7 ml ~ 1.0 ml ~1.0 ml ~1.0 mlPressure drop - 12 / 3 bar 23 bar 44 barRemarks Test core to be used in
CHEMLABredundancy for
CHEMLABactinide experiments
in laboratory
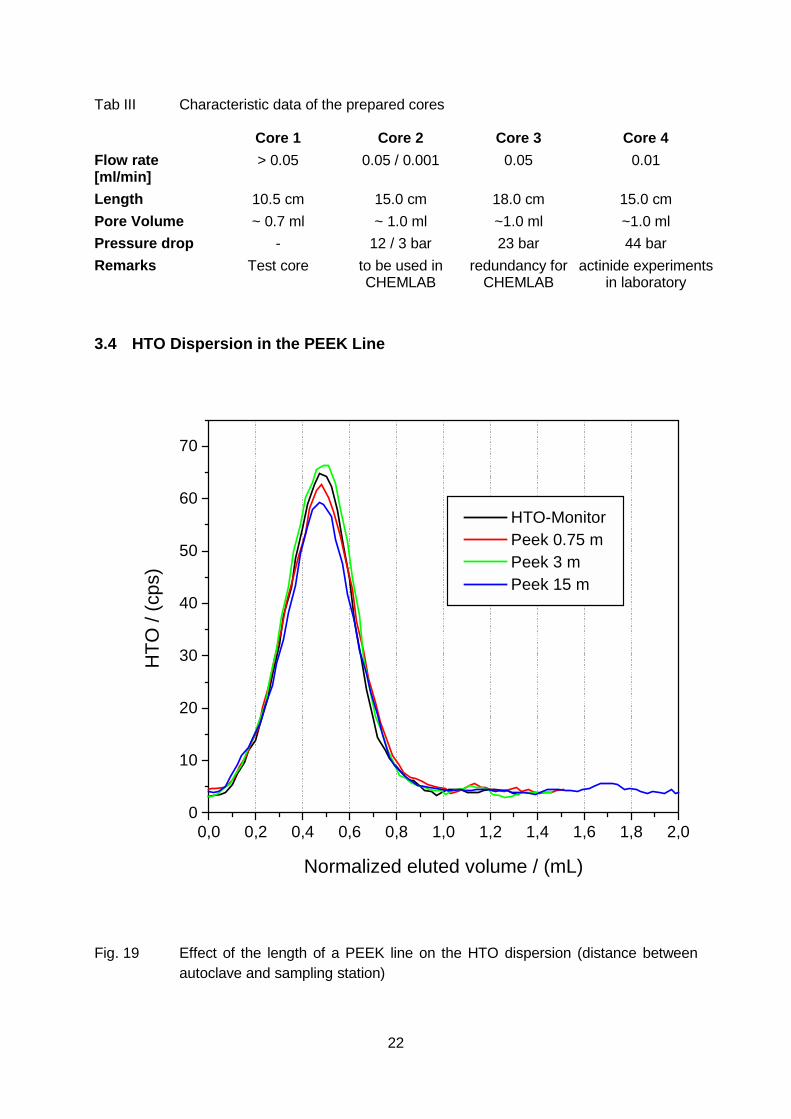
3.4 HTO Dispersion in the PEEK Line
0,0 0,2 0,4 0,6 0,8 1,0 1,2 1,4 1,6 1,8 2,00
10
20
30
40
50
60
70
HTO-Monitor Peek 0.75 m Peek 3 m Peek 15 m
HTO
/ (c
ps)
Normalized eluted volume / (mL)
Fig. 19 Effect of the length of a PEEK line on the HTO dispersion (distance betweenautoclave and sampling station)
23
In the in situ experiment in CHEMLAB, approx. 20 m of PEEK line is required from the coresample in place to the sampling station in the inert gas glovebox. For this reason, it had to befound out whether the lengths of the line had an influence on dispersion. The measurementsof HTO dispersion with PEEK lines of different lengths again were conducted with the HTOflow monitor. Fig. 19 shows the results of the experiments conducted, in which the length ofthe groundwater discharge line was varied between 0.75 m and 15 m. The results indicatethat the length of the PEEK line has no influence on HTO dispersion.
3.5 Laboratory Migration Experiments with a core sample
To prepare the in situ experiments, migration experiments must first be run in the laboratoryunder largely identical experimental conditions in order to define the experimental boundaryconditions for the in situ experiments. This relates particularly to the sampling intervals and tothe flow rate.
0 1 2 3 4 5 6 7 8 9 10 110
2
4
6
8
10
12
14
16
18
20
22
Column 1, 0,05 ml/min., 50 mikrol Cocktail (365 ng Np), 450 nm recovery 10,9% recovery 11,5%,
(HTO-break through 0,7 ml)
Np-
Con
cent
ratio
n (n
g/m
l)
Eluate (ml)
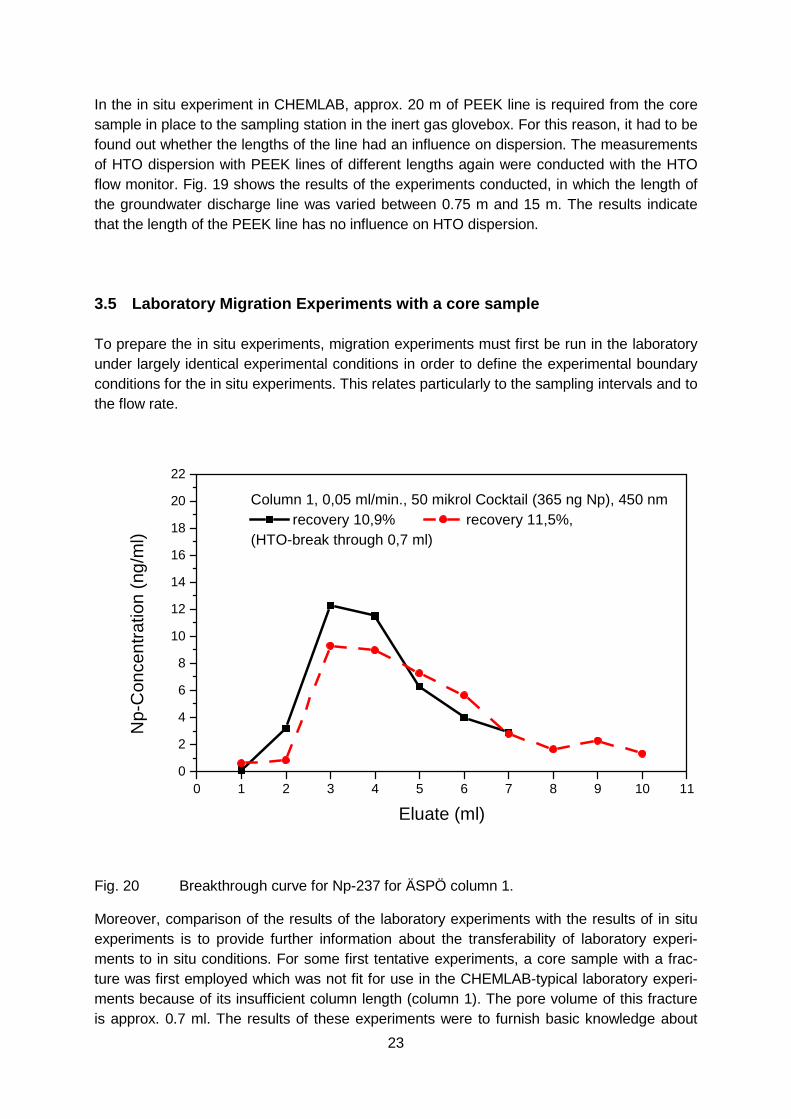
Fig. 20 Breakthrough curve for Np-237 for ÄSPÖ column 1.
Moreover, comparison of the results of the laboratory experiments with the results of in situexperiments is to provide further information about the transferability of laboratory experi-ments to in situ conditions. For some first tentative experiments, a core sample with a frac-ture was first employed which was not fit for use in the CHEMLAB-typical laboratory experi-ments because of its insufficient column length (column 1). The pore volume of this fractureis approx. 0.7 ml. The results of these experiments were to furnish basic knowledge about
24
the definition of the experimental parameters for the subsequent experiments to be run withcore samples typical of CHEMLAB. The migration experiments were run with a so called“ÄSPÖ Cocktail”. This ÄSPÖ cocktail, which was prepared from ÄSPÖ groundwater condi-tioned with the fracture filling material, contains the three radionuclides to be studied, Pu-244(1E-8 mol/l), Np-237 (1E-5 mol/l), and Am-243 (1E-6 mol/l). The concentrations of the radio-nuclides in the cocktail are also listed in Tab X. In these experiments, the radionuclide con-centration in the eluate was determined by α-spectroscopy and, at the same time, by ICP-MSmeasurement. Fig. 20 shows the breakthrough curves obtained for Np-237.
The migration of Np is retarded compared to the migration of HTO; the breakthrough peakoccurs at approx. 3 - 4 ml of eluate as compared to 0.7 ml for the HTO breakthrough curve.The recovery for Np-237 is approx. 10%. This result shows that the bulk of Np is retaineddespite the comparatively short residence time in the fracture. The Np concentration in theeluate does not exceed approx. 4 E-8 mol/l. In some samples of the eluate, also Am-243 wasdetected in low concentrations in the order of 1 E-11 mol/l. However, because of the lowconcentrations, these results carry a large error. Moreover, no unequivocal dependence ontime of the release of Am-243 can be derived from the values determined.
However, the results show that, even over the relatively short residence time in the fracture,only very small quantities of Am-243 must be considered for migration. This applies also toPu-244, which was not found in any of the samples examined.
For further preparation of the in situ experiments, laboratory studies are currently being con-ducted at appropriately lower flow rates on the order of approx. 3 - 5 ml/24 h. Based on theresults of the experiments with HTO at the lower flow rate the peak and breakthrough forNp-237 should occur at approx. 5 ml of eluate. Some first results show that no peak concen-tration has so far been observed up to an eluate volume of 11.0 ml, and that a further reduc-tion of the Np-237 concentration in the eluate is determined on the order of <1 E-9 mol/l.These experiments are to be continued to show whether there is a clearly retarded release ofNp-237, or whether the release of Np-237 remains clearly lower also over prolonged periodsof migration, as a consequence of the increasing influence of the reduction of Np (V) to Np(IV), because of the longer residence time in the fracture.
4 Modelling
4.1 Geochemical Modeling of Actinide Solubilities
The speciation code EQ3/6 was used to calculate the thermodynamic solubility of the acti-nides Am, Np and Pu. First calculations were performed using one of the standard files,data0.com.V8.R6, as a basis. This file was chosen, because it has the largest number ofthermodynamic species available in the concentration range relevant to the Actinide Migra-
25
tion Experiment at Äspö HRL. Consistency checks on the database for the actinides underconsideration showed, that it was not possible to reproduce the data of published solubilityexperiments with the chosen data base. Therefore, all actinide data from thedata0.com.V8.R6 file were discarded and replaced with a set of thermodynamic reactionsand constants, which was found to describe consistent the published experimental data foractinide solubility. This work was done at INE and is finished for the tri and pentavalent oxi-dation states. The equilibrium constants used for An(III) and An(V) are taken from literature.(Neck 1998), (Novak 1997), (Neck 1995), (Fanghänel 1995). For the tetra and hexavalentoxidation states a preliminary set of equilibrium constants exists. These constants are listedin the appendix together with their literature references. The notation of the equilibrium con-stants in this paper is as follows: log β°1yz is 1 metal ion/metal ion unit, y OH- groups and zCO3
2- groups. For U(OH)2(CO3)22- the notation is log β°122 .
All solubility calculations were performed at 25°C. Solubility calculations were performed forthe water composition given in Tab I. [CO3
2-] in the system is controlled up to pH 7.3 by equi-librium with the CO2 partial pressure of log pCO2 = -2.5. Above pH 7.3 [CO3
2-] is controlled byequilibrium with CaCO3. In the Fig. 21 to Fig. 24 the relevant pH conditions of the Äspö HRLgroundwaters are indicated by an arrow at the pH (x-axis).
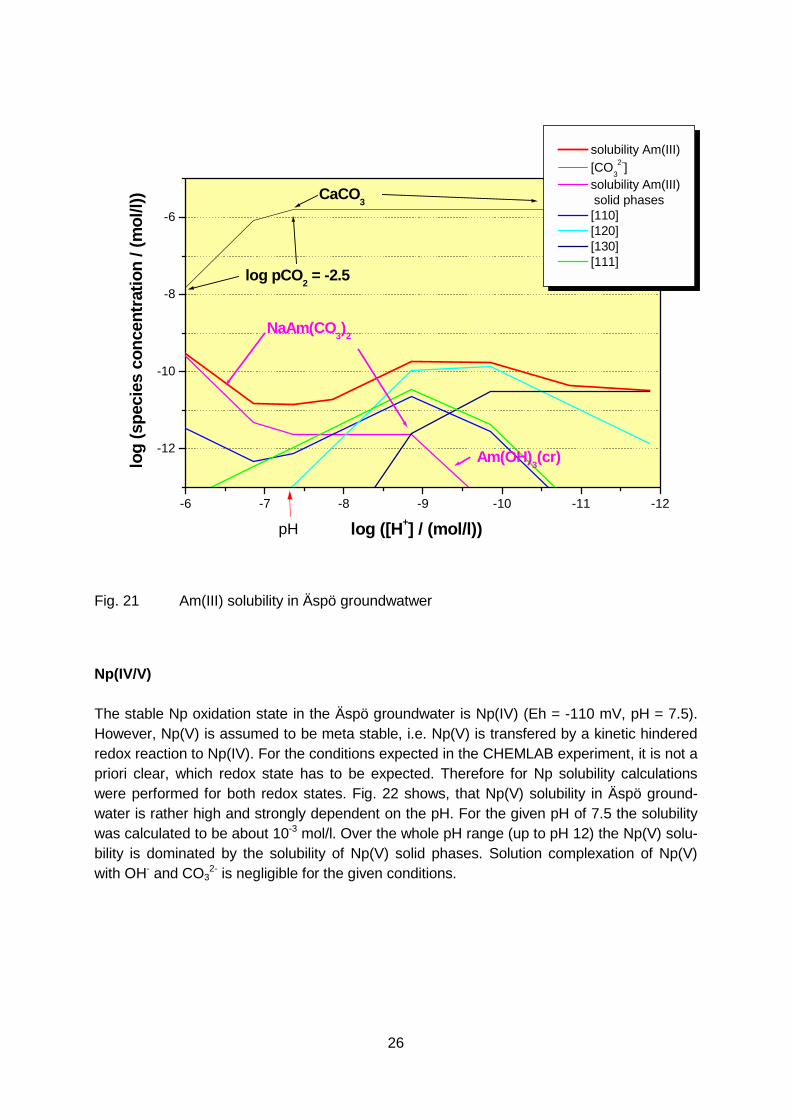
Am(III)
Am(III) solubility in Äspö groundwater was calculated to be in the order of 10-10 mol/l (Fig.21). Calculations were performed for different pH values. It was found, that up to pH 7 theAm(III) solubility is dominated by the solubility of NaAm(CO3)2. From pH 7 to 9 solidNaAm(CO3)2 is the solubility controlling phase, complexation of Am(III) with OH- and CO3
2-
has to be taken into account. Above pH 9 the solubility controlling phase is Am(OH)3(cr).
26
-6 -7 -8 -9 -10 -11 -12
-12
-10
-8
-6
log pCO2 = -2.5
CaCO3
pH
Am(OH)3(cr)
NaAm(CO3)2
solubility Am(III) [CO3
2-] solubility Am(III)
solid phases [110] [120] [130] [111]
log
(spe
cies
con
cent
ratio
n / (
mol
/l))
log ([H+] / (mol/l))
Fig. 21 Am(III) solubility in Äspö groundwatwer
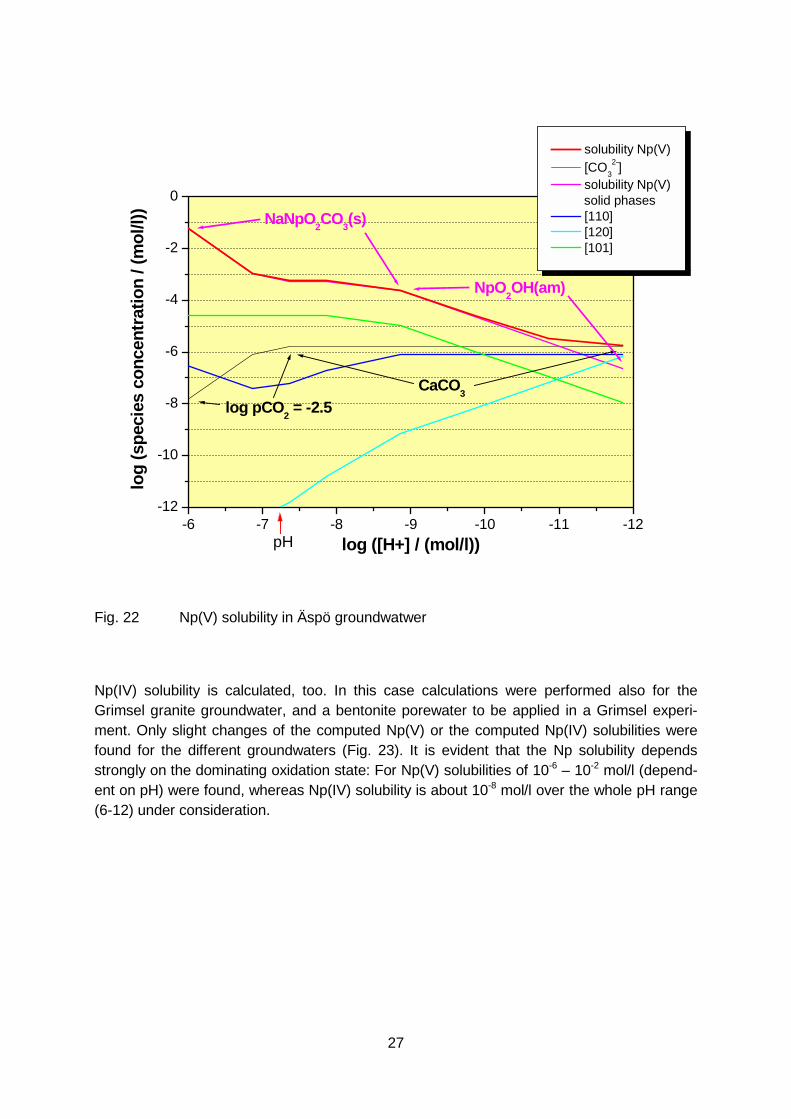
Np(IV/V)
The stable Np oxidation state in the Äspö groundwater is Np(IV) (Eh = -110 mV, pH = 7.5).However, Np(V) is assumed to be meta stable, i.e. Np(V) is transfered by a kinetic hinderedredox reaction to Np(IV). For the conditions expected in the CHEMLAB experiment, it is not apriori clear, which redox state has to be expected. Therefore for Np solubility calculationswere performed for both redox states. Fig. 22 shows, that Np(V) solubility in Äspö ground-water is rather high and strongly dependent on the pH. For the given pH of 7.5 the solubilitywas calculated to be about 10-3 mol/l. Over the whole pH range (up to pH 12) the Np(V) solu-bility is dominated by the solubility of Np(V) solid phases. Solution complexation of Np(V)with OH- and CO3
2- is negligible for the given conditions.
27
-6 -7 -8 -9 -10 -11 -12-12
-10
-8
-6
-4
-2
0
CaCO3log pCO2 = -2.5
pH
NpO2OH(am)
NaNpO2CO3(s)
solubility Np(V) [CO3
2-] solubility Np(V)
solid phases [110] [120] [101]
log
(spe
cies
con
cent
ratio
n / (
mol
/l))
log ([H+] / (mol/l))
Fig. 22 Np(V) solubility in Äspö groundwatwer
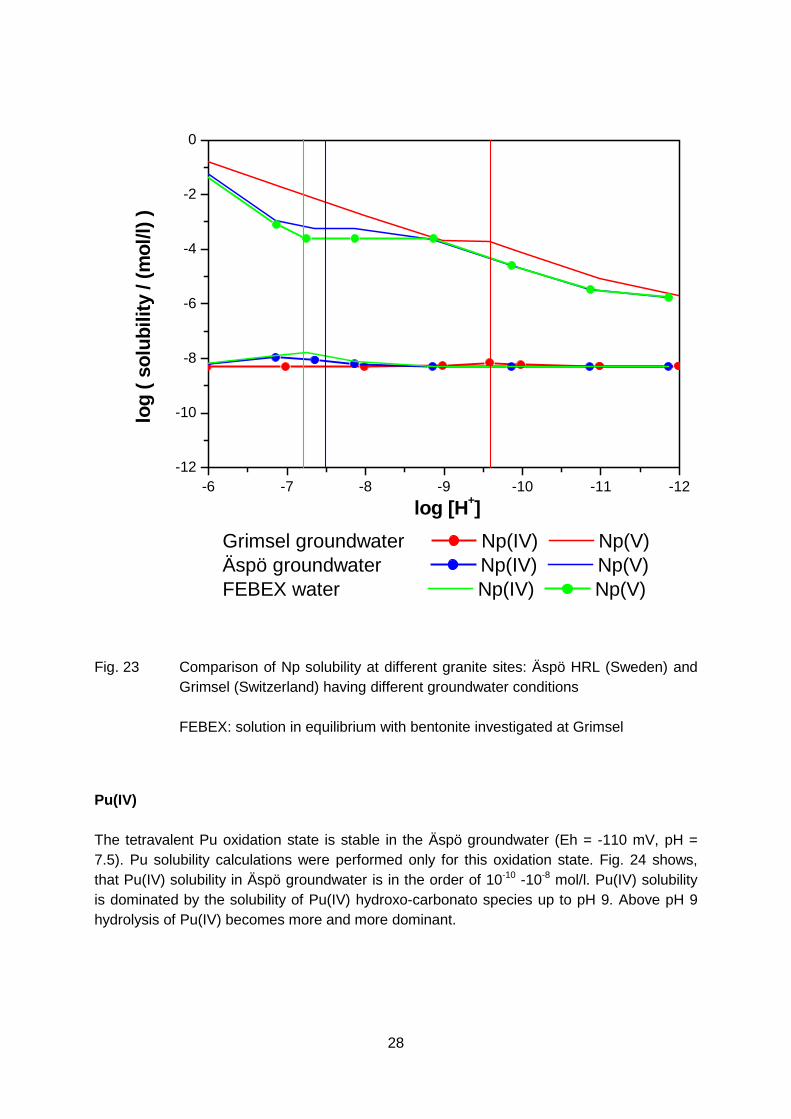
Np(IV) solubility is calculated, too. In this case calculations were performed also for theGrimsel granite groundwater, and a bentonite porewater to be applied in a Grimsel experi-ment. Only slight changes of the computed Np(V) or the computed Np(IV) solubilities werefound for the different groundwaters (Fig. 23). It is evident that the Np solubility dependsstrongly on the dominating oxidation state: For Np(V) solubilities of 10-6 – 10-2 mol/l (depend-ent on pH) were found, whereas Np(IV) solubility is about 10-8 mol/l over the whole pH range(6-12) under consideration.
28
-6 -7 -8 -9 -10 -11 -12-12
-10
-8
-6
-4
-2
0
Grimsel groundwater Np(IV) Np(V)Äspö groundwater Np(IV) Np(V)FEBEX water Np(IV) Np(V)
log
( sol
ubili
ty /
(mol
/l) )
log [H+]
Fig. 23 Comparison of Np solubility at different granite sites: Äspö HRL (Sweden) andGrimsel (Switzerland) having different groundwater conditions
FEBEX: solution in equilibrium with bentonite investigated at Grimsel
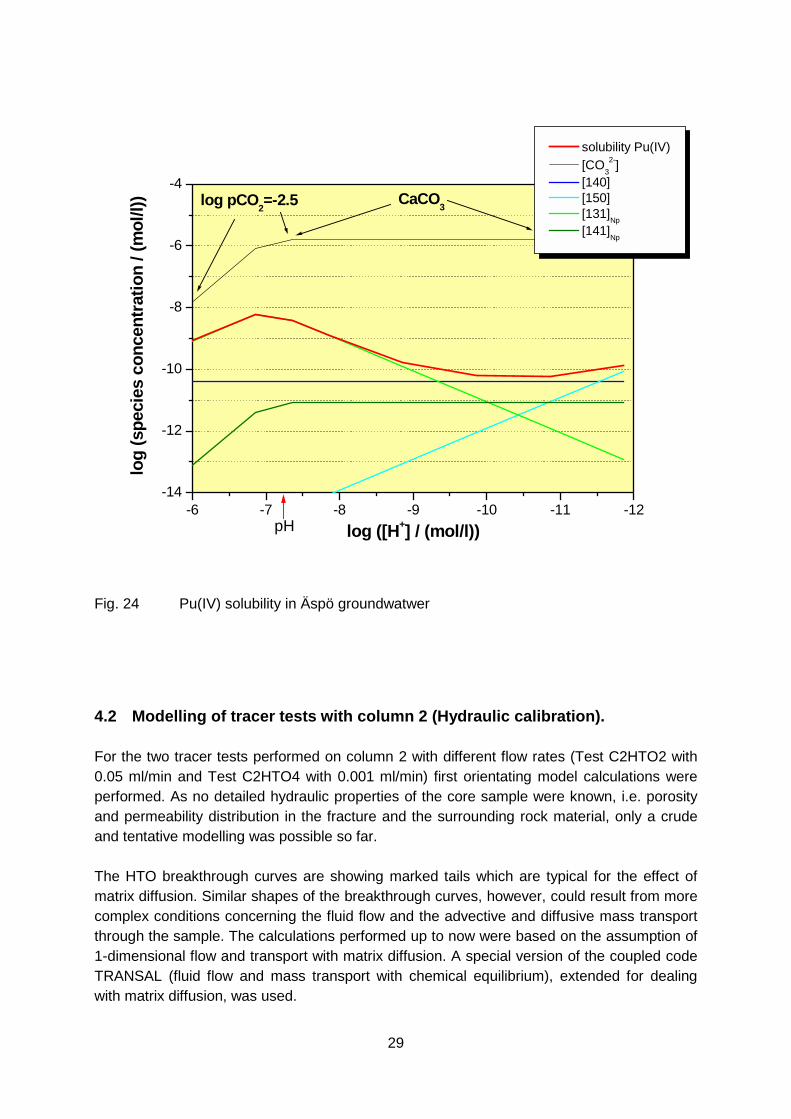
Pu(IV)
The tetravalent Pu oxidation state is stable in the Äspö groundwater (Eh = -110 mV, pH =7.5). Pu solubility calculations were performed only for this oxidation state. Fig. 24 shows,that Pu(IV) solubility in Äspö groundwater is in the order of 10-10 -10-8 mol/l. Pu(IV) solubilityis dominated by the solubility of Pu(IV) hydroxo-carbonato species up to pH 9. Above pH 9hydrolysis of Pu(IV) becomes more and more dominant.
29
-6 -7 -8 -9 -10 -11 -12-14
-12
-10
-8
-6
-4
pH
log pCO2=-2.5 CaCO3
solubility Pu(IV) [CO3
2-] [140] [150] [131]Np [141]Np
log
(spe
cies
con
cent
ratio
n / (
mol
/l))
log ([H+] / (mol/l))
Fig. 24 Pu(IV) solubility in Äspö groundwatwer
4.2 Modelling of tracer tests with column 2 (Hydraulic calibration).
For the two tracer tests performed on column 2 with different flow rates (Test C2HTO2 with0.05 ml/min and Test C2HTO4 with 0.001 ml/min) first orientating model calculations wereperformed. As no detailed hydraulic properties of the core sample were known, i.e. porosityand permeability distribution in the fracture and the surrounding rock material, only a crudeand tentative modelling was possible so far.
The HTO breakthrough curves are showing marked tails which are typical for the effect ofmatrix diffusion. Similar shapes of the breakthrough curves, however, could result from morecomplex conditions concerning the fluid flow and the advective and diffusive mass transportthrough the sample. The calculations performed up to now were based on the assumption of1-dimensional flow and transport with matrix diffusion. A special version of the coupled codeTRANSAL (fluid flow and mass transport with chemical equilibrium), extended for dealingwith matrix diffusion, was used.
30
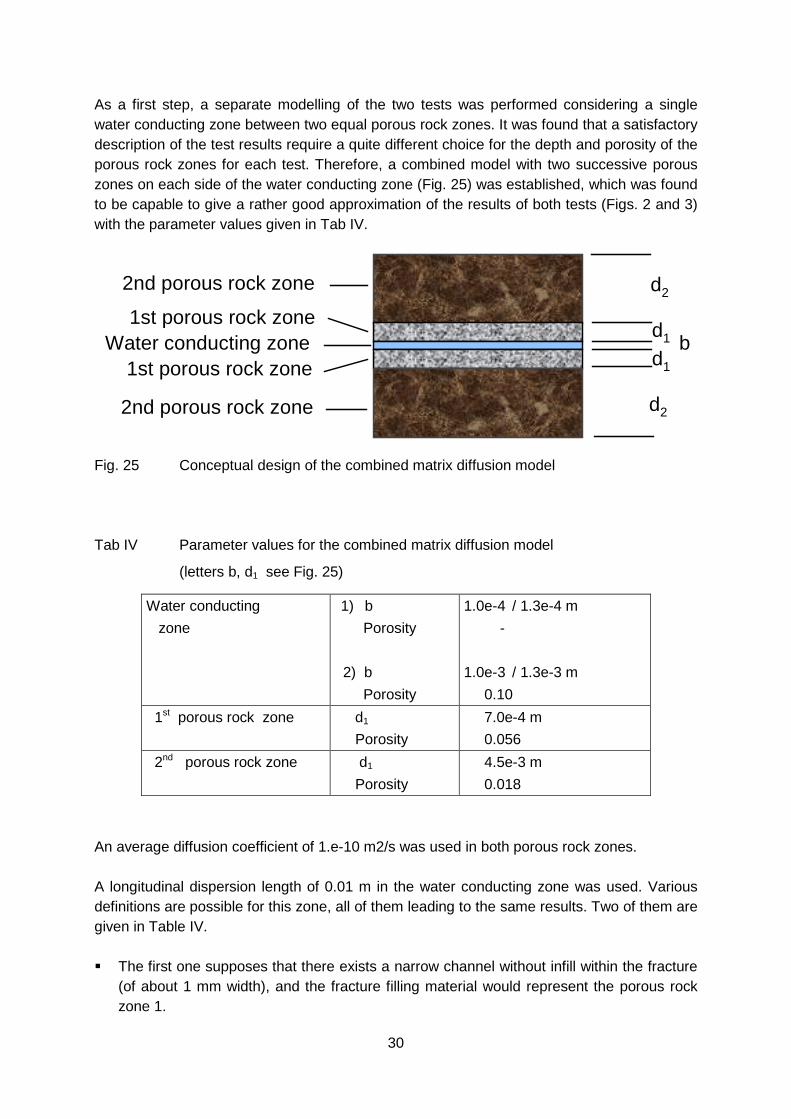
As a first step, a separate modelling of the two tests was performed considering a singlewater conducting zone between two equal porous rock zones. It was found that a satisfactorydescription of the test results require a quite different choice for the depth and porosity of theporous rock zones for each test. Therefore, a combined model with two successive porouszones on each side of the water conducting zone (Fig. 25) was established, which was foundto be capable to give a rather good approximation of the results of both tests (Figs. 2 and 3)with the parameter values given in Tab IV.
2nd porous rock zone
2nd porous rock zone
Water conducting zone1st porous rock zone
1st porous rock zone
d2
bd1
d1
d2
Fig. 25 Conceptual design of the combined matrix diffusion model
Tab IV Parameter values for the combined matrix diffusion model
(letters b, d1 see Fig. 25)
Water conducting zone
1) b Porosity
2) b Porosity
1.0e-4 / 1.3e-4 m -
1.0e-3 / 1.3e-3 m 0.10
1st porous rock zone d1
Porosity 7.0e-4 m 0.056
2nd porous rock zone d1
Porosity 4.5e-3 m 0.018
An average diffusion coefficient of 1.e-10 m2/s was used in both porous rock zones.
A longitudinal dispersion length of 0.01 m in the water conducting zone was used. Variousdefinitions are possible for this zone, all of them leading to the same results. Two of them aregiven in Table IV.
� The first one supposes that there exists a narrow channel without infill within the fracture(of about 1 mm width), and the fracture filling material would represent the porous rockzone 1.
31
� The second one assumes that the fracture itself with its porous infill represents the waterconducting zone, such that the porous rock zone 1 is to be interpreted as a distorted sec-tion of the granite core.
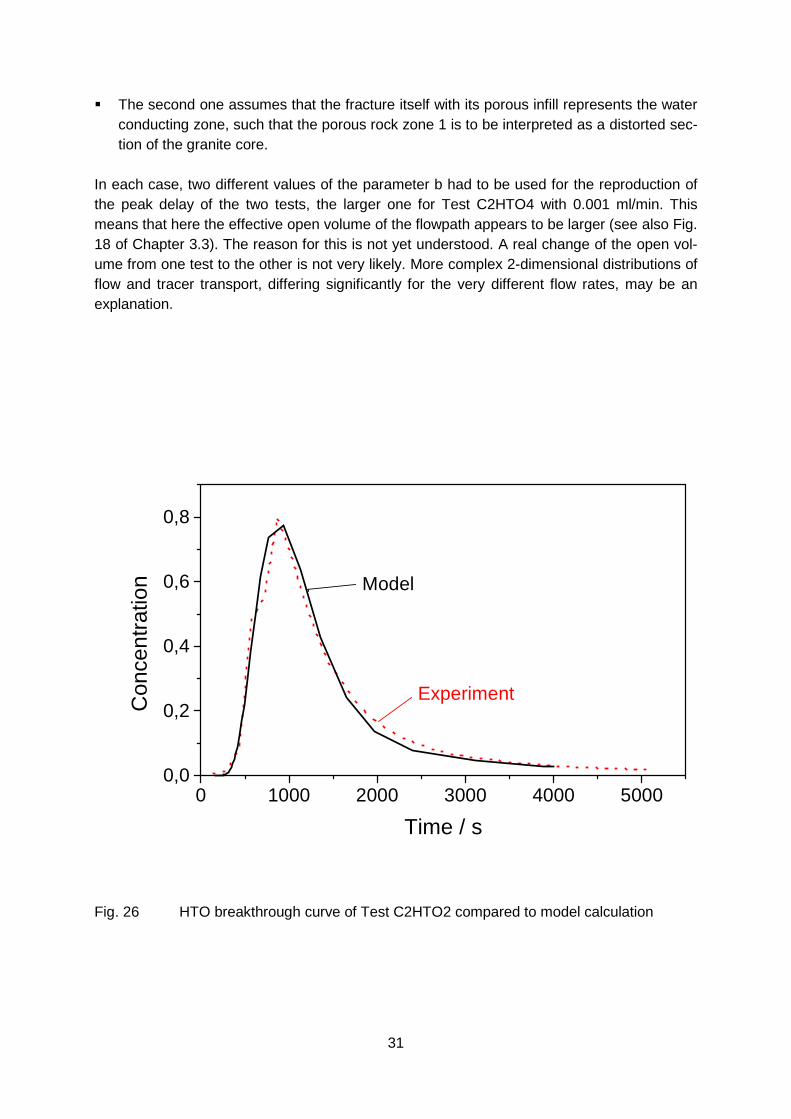
In each case, two different values of the parameter b had to be used for the reproduction ofthe peak delay of the two tests, the larger one for Test C2HTO4 with 0.001 ml/min. Thismeans that here the effective open volume of the flowpath appears to be larger (see also Fig.18 of Chapter 3.3). The reason for this is not yet understood. A real change of the open vol-ume from one test to the other is not very likely. More complex 2-dimensional distributions offlow and tracer transport, differing significantly for the very different flow rates, may be anexplanation.
0 1000 2000 3000 4000 50000,0
0,2
0,4
0,6
0,8
Model
ExperimentCon
cent
ratio
n
Time / s
Fig. 26 HTO breakthrough curve of Test C2HTO2 compared to model calculation
32
0 1x10⁵ 2x10⁵ 3x10⁵ 4x10⁵ 5x10⁵ 6x1050
20
40
60
HTO
(cps
)
Time / s
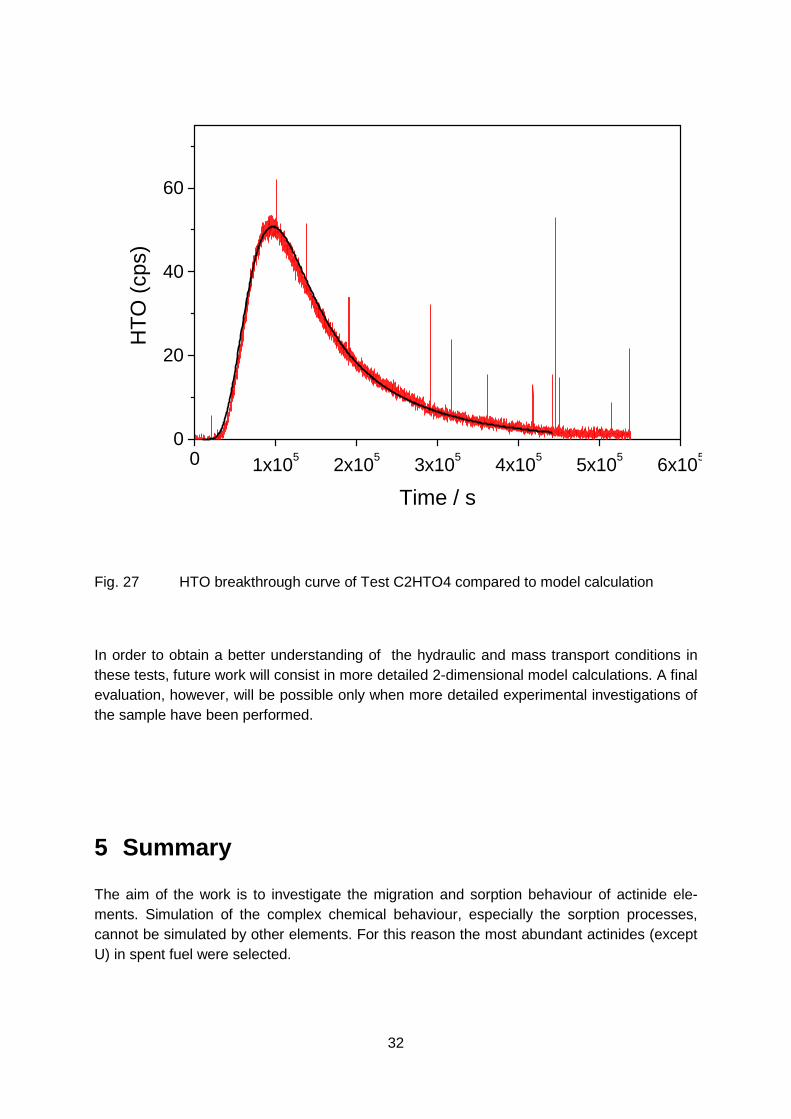
Fig. 27 HTO breakthrough curve of Test C2HTO4 compared to model calculation
In order to obtain a better understanding of the hydraulic and mass transport conditions inthese tests, future work will consist in more detailed 2-dimensional model calculations. A finalevaluation, however, will be possible only when more detailed experimental investigations ofthe sample have been performed.
5 Summary
The aim of the work is to investigate the migration and sorption behaviour of actinide ele-ments. Simulation of the complex chemical behaviour, especially the sorption processes,cannot be simulated by other elements. For this reason the most abundant actinides (exceptU) in spent fuel were selected.
33
- Am is a representative for the trivalent actinides. It shows a strong tendency to form hy-droxo or carbonato complexes at relevant pH. This feature may influence the sorptionbehaviour. Am may be also sorbed onto inorganic colloids present in the ground water.
- Np can exist in tetravalent or pentavalent state. It is expected from sorption experimentsthat tetravalent Np species are sorbed strongly whereas the pentavalent state will migrateunretarded. However, under the conditions of the granite (such as the Fe(II) content ofthe rock) Np(V) will be reduced to Np(IV). It could be shown in batch experiments thatthis process is subjected to distinct kinetics. The aim of our experiment is to discriminatebetween the two different valence states and to investigate the different migra-tion/sorption properties.
- Pu shows the most complex chemical behaviour. Especially in the tetravalent state it hasa strong tendency to form colloids or to be sorbed onto colloids present in the ground-water. The aim of Actinide Migration Experiment is to investigate how and if Pu migratesunder the conditions of Äspö.
Laboratory experiments were run in preparation of in situ migration experiments with Pu, Am,and Np in the CHEMLAB underground laboratory (ÄSPÖ, Sweden).
Batch experiments with the Pu, Am, and Np radionuclides in systems consisting of ÄSPÖgroundwater and fracture filling material, and with ÄSPÖ granite, respectively, show that theradionuclides in the systems are sorbed up to the limit of detection even after relatively shortcontact periods. Np in this case shows a clear dependence on time, which is attributed to thereduction of Np (V) to Np (IV). Column experiments with Np, which were conducted with onlya small column because of the relatively small amount of fracture filling material available,show that, under these experimental conditions, the Np (V) fed is not yet reduced to Np (IV).This would require longer dwell times in the column.
On the basis of the laboratory experiments and the geochemical calculations the conditionsfor the CHEMLAB experiment could be fixed:
For analytical reasons a rather high chemical concentration of the actinide elements shouldbe applied, in order to have sufficient high concentration in the effluent or on the inner sur-faces of our rock sample. Measurements will be performed by means of ICP-MS and not byradioactivity counting. For this reason actinide isotopes could be selected having very longhalf-lifes and consequently low specific radioactivity. The total activity could be reduced to bein the range of several kBq present in the reservoir of the CHEMLAB:
1.8 kBq Am-243 (containing by 4.1 kBq Cm 243/244)6.2 kBq Np-2370.16 Bq Pu-244 (containing 4.3 Bq Pu-239/240)2.7 Bq Pu-2360.3 Bq Pu-242
First transport calculations for the HTO tests were performed in order to fit the hydraulic pa-rameters of a fractured rock core. A one-dimensional code was applied considering matrixdiffusion. The results however are not unambiguous. From the experiments using differentflow rates one can assume that either a narrow channel without infill represents the flowpath

34
surrounded by porous material (porous rock), or the fracture itself with its porous infill repre-sents the water conducting zone. In the last case, the porous rock zone can be interpreted asa distorted section of the granite core. A final evaluation of the hydraulic and mass transportconditions in these tests, however, will be possible only when detailed investigations of theflowpath have been performed.
35
6 References
(Jansson 1997) Mats Jansson, Trygve E. Erikson,CHEMLAB-In-Situ Diffusion Experiments Using Radioactive Tracers, Migration 97.
(Lieser 1991) Lieser K.H., MühlenwegNeptunium in the Hydrosphere and the Geosphere, Radiochimica Acta, 43, 27 (1991).
(Eliason 1993) Thomas EliasonMineralogy, Geochemistry and Petrophysics of Red Coloured Granite Adjacent to Fractures,SKB 93-06, March 1993.
(Neck 1998) Neck, V.; Fanghänel, Th.; Kim, J.I.Aquatische Chemie und thermodynamische Modellierung von trivalenten Actiniden;ReportFZKA 6110, 1998
(Novak 1997) Novak et al., 1997, J. Solution Chem. 26, 681;
(Neck 1995) Neck et al., 1995, Radiochim. Acta 69, 39;
(Fanghänel 1995) Fanghänel et al., 1995, Radiochim. Acta 69, 169
36
7 Annex
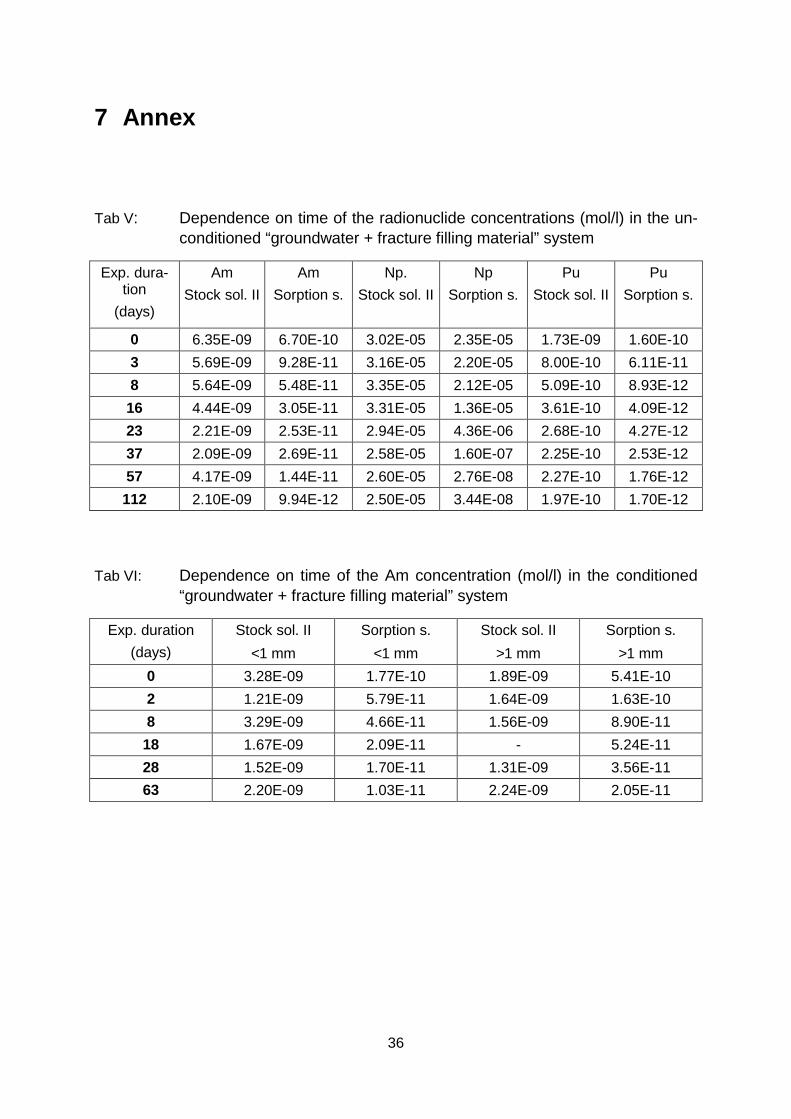
Tab V: Dependence on time of the radionuclide concentrations (mol/l) in the un-conditioned “groundwater + fracture filling material” system
Exp. dura-tion
(days)
AmStock sol. II
AmSorption s.
Np.Stock sol. II
NpSorption s.
PuStock sol. II
PuSorption s.
0 6.35E-09 6.70E-10 3.02E-05 2.35E-05 1.73E-09 1.60E-103 5.69E-09 9.28E-11 3.16E-05 2.20E-05 8.00E-10 6.11E-118 5.64E-09 5.48E-11 3.35E-05 2.12E-05 5.09E-10 8.93E-12
16 4.44E-09 3.05E-11 3.31E-05 1.36E-05 3.61E-10 4.09E-1223 2.21E-09 2.53E-11 2.94E-05 4.36E-06 2.68E-10 4.27E-1237 2.09E-09 2.69E-11 2.58E-05 1.60E-07 2.25E-10 2.53E-1257 4.17E-09 1.44E-11 2.60E-05 2.76E-08 2.27E-10 1.76E-12112 2.10E-09 9.94E-12 2.50E-05 3.44E-08 1.97E-10 1.70E-12
Tab VI: Dependence on time of the Am concentration (mol/l) in the conditioned“groundwater + fracture filling material” system
Exp. duration(days)
Stock sol. II<1 mm
Sorption s.<1 mm
Stock sol. II>1 mm
Sorption s.>1 mm
0 3.28E-09 1.77E-10 1.89E-09 5.41E-102 1.21E-09 5.79E-11 1.64E-09 1.63E-108 3.29E-09 4.66E-11 1.56E-09 8.90E-11
18 1.67E-09 2.09E-11 - 5.24E-1128 1.52E-09 1.70E-11 1.31E-09 3.56E-1163 2.20E-09 1.03E-11 2.24E-09 2.05E-11
37
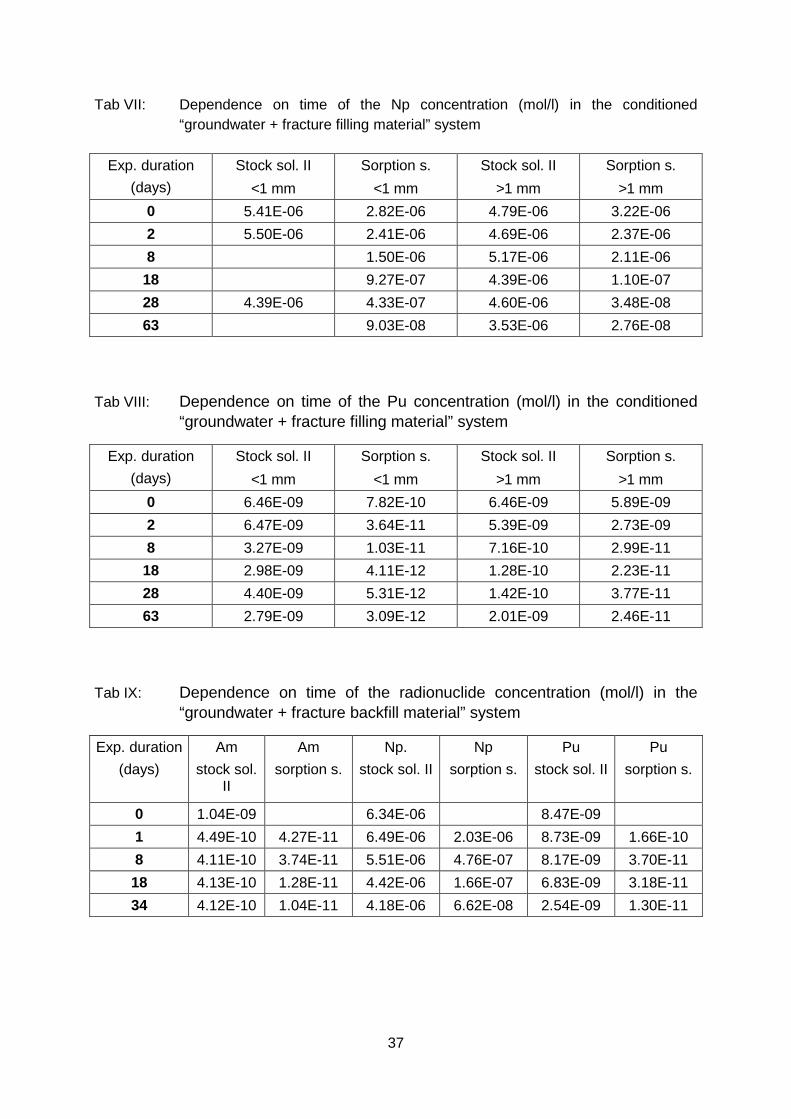
Tab VII: Dependence on time of the Np concentration (mol/l) in the conditioned“groundwater + fracture filling material” system
Exp. duration(days)
Stock sol. II<1 mm
Sorption s.<1 mm
Stock sol. II>1 mm
Sorption s.>1 mm
0 5.41E-06 2.82E-06 4.79E-06 3.22E-062 5.50E-06 2.41E-06 4.69E-06 2.37E-068 1.50E-06 5.17E-06 2.11E-06
18 9.27E-07 4.39E-06 1.10E-0728 4.39E-06 4.33E-07 4.60E-06 3.48E-0863 9.03E-08 3.53E-06 2.76E-08
Tab VIII: Dependence on time of the Pu concentration (mol/l) in the conditioned“groundwater + fracture filling material” system
Exp. duration(days)
Stock sol. II<1 mm
Sorption s.<1 mm
Stock sol. II>1 mm
Sorption s.>1 mm
0 6.46E-09 7.82E-10 6.46E-09 5.89E-092 6.47E-09 3.64E-11 5.39E-09 2.73E-098 3.27E-09 1.03E-11 7.16E-10 2.99E-11
18 2.98E-09 4.11E-12 1.28E-10 2.23E-1128 4.40E-09 5.31E-12 1.42E-10 3.77E-1163 2.79E-09 3.09E-12 2.01E-09 2.46E-11
Tab IX: Dependence on time of the radionuclide concentration (mol/l) in the“groundwater + fracture backfill material” system
Exp. duration(days)
Amstock sol.
II
Amsorption s.
Np.stock sol. II
Npsorption s.
Pustock sol. II
Pusorption s.
0 1.04E-09 6.34E-06 8.47E-091 4.49E-10 4.27E-11 6.49E-06 2.03E-06 8.73E-09 1.66E-108 4.11E-10 3.74E-11 5.51E-06 4.76E-07 8.17E-09 3.70E-1118 4.13E-10 1.28E-11 4.42E-06 1.66E-07 6.83E-09 3.18E-1134 4.12E-10 1.04E-11 4.18E-06 6.62E-08 2.54E-09 1.30E-11
38
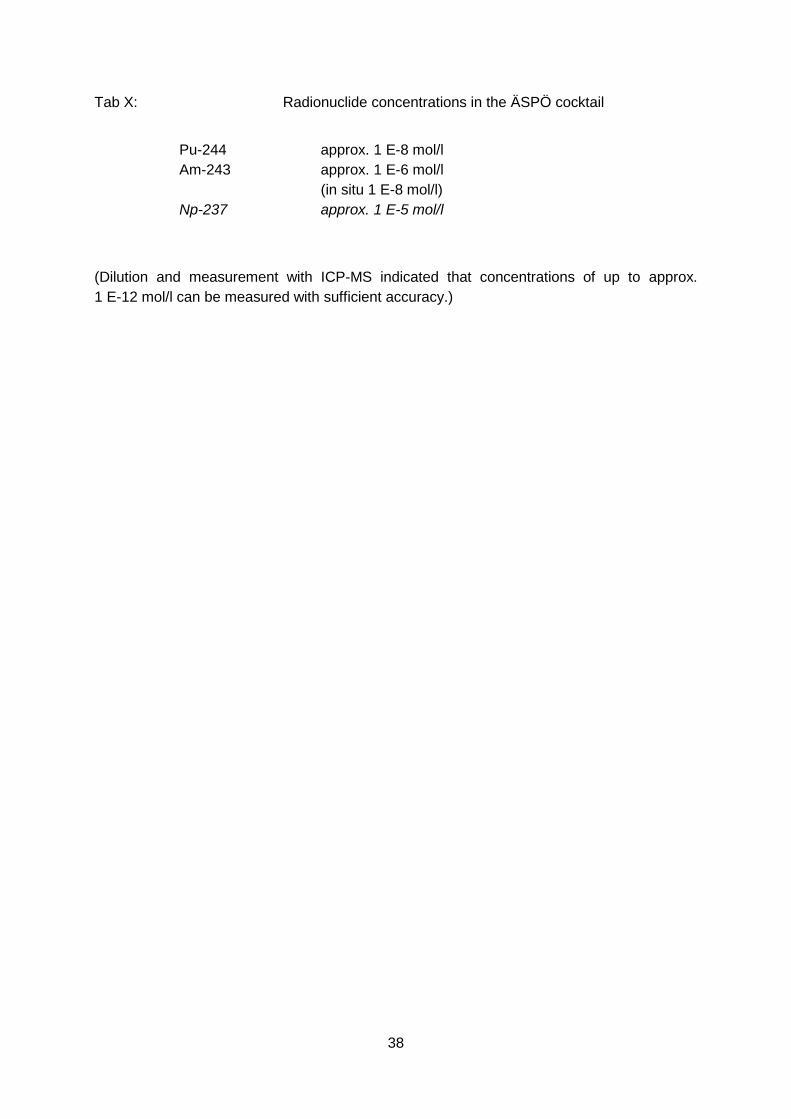
Tab X: Radionuclide concentrations in the ÄSPÖ cocktail
Pu-244 approx. 1 E-8 mol/lAm-243 approx. 1 E-6 mol/l
(in situ 1 E-8 mol/l)Np-237 approx. 1 E-5 mol/l
(Dilution and measurement with ICP-MS indicated that concentrations of up to approx.1 E-12 mol/l can be measured with sufficient accuracy.)