Embed Size (px)
Citation preview
Tous droits réservés © Cahiers de géographie du Québec, 2004 Ce document est protégé par la loi sur le droit d’auteur. L’utilisation desservices d’Érudit (y compris la reproduction) est assujettie à sa politiqued’utilisation que vous pouvez consulter en ligne.https://apropos.erudit.org/fr/usagers/politique-dutilisation/
Cet article est diffusé et préservé par Érudit.Érudit est un consortium interuniversitaire sans but lucratif composé del’Université de Montréal, l’Université Laval et l’Université du Québec àMontréal. Il a pour mission la promotion et la valorisation de la recherche.https://www.erudit.org/fr/
Document généré le 7 jan. 2022 07:53
Cahiers de géographie du Québec
Straits, Passages and ChokepointsA Maritime Geostrategy of Petroleum DistributionJean-Paul Rodrigue
Les détroits maritimesVolume 48, numéro 135, décembre 2004
URI : https://id.erudit.org/iderudit/011797arDOI : https://doi.org/10.7202/011797ar
Aller au sommaire du numéro
Éditeur(s)Département de géographie
ISSN0007-9766 (imprimé)1708-8968 (numérique)
Découvrir la revue
Citer cet articleRodrigue, J.-P. (2004). Straits, Passages and Chokepoints: A MaritimeGeostrategy of Petroleum Distribution. Cahiers de géographie du Québec,48(135), 357–374. https://doi.org/10.7202/011797ar
Résumé de l'articleLe transport du pétrole représente l’une des plus importantes circulations deressources au sein de l’économie mondiale. Son rôle ne peut être exagéré.Cependant, le pétrole est devenu un produit de base «stratégiquementinvisible» puisque sa circulation a toujours été continue, avec des rupturesalarmantes, mais limitées, telles que le premier choc pétrolier de 1973. L’offrede pétrole est pratiquement prise pour acquis. Puisque les deux tiers de laproduction pétrolière mondiale sont acheminés par voie maritime, il existed’inévitables contraintes de distribution, parmi lesquelles l’utilisation d’unensemble limité de détroits et passages: les goulots d’étranglement de lacirculation maritime. Cet article se penche sur la géographie de l’offre et de lademande de pétrole, de même que sur les problèmes stratégiques liés à sacirculation maritime. Les goulots d’étranglement sont perçus en tant queressources dont la valeur varie en fonction de leur niveau d’utilisation. Alorsque la suprématie du pétrole tire à sa fin, l’importance et la vulnérabilité despassages stratégiques risquent de s’accroître en conséquence. Leur capacitéd’admission des trafics supplémentaires apparaît limitée, ce qui implique queles futurs chocs (ou ruptures) pétroliers seront vraisemblablement liés à laproblématique de sa circulation.
Cahiers de Géographie du Québec ◆ Volume 48, n° 135, décembre 2004 ◆ Pages 357-374
Straits, Passages and ChokepointsA Maritime Geostrategy of Petroleum Distribution
Jean-Paul RodrigueHofstra University, Hempstead (N.Y.)[email protected]
Abstract
The transportation of petroleum represents one of the most strategically importantcirculations of resources in the global economy. Its role cannot be overstated. Yet, petroleumhas become a “strategically invisible” commodity as its flow has been continuous withlimited, but eye-opening, disruptions such as the First Energy Crisis is 1973. Petroleumsupplies are virtually taken for granted. Since approximately two-thirds of the world’spetroleum production is shipped by sea, there are inherent distribution constraints, whichrequire navigating through straits and passages; chokepoints of maritime circulation. Thispaper presents an overview of the geography of oil supply and demand, and the strategicissues that are linked to its maritime circulation. Chokepoints are perceived as resources,the value of which varies according to degree of use. As the era of petroleum dominationdraws to a close, the importance and vulnerability of strategic passages will increase.Their ability to handle additional traffic appears to be limited, implying that future energycrises or oil shortages are more likely to be attributable to the challenges of distribution.
Keywords: Petroleum Distribution, Maritime Transport, Strategic Passages, Hormuz, Suez,Malacca, Bab el-Mandeb, Bosphorus, Panama
Résumé
Le transport du pétrole représente l’une des plus importantes circulations de ressour-ces au sein de l’économie mondiale. Son rôle ne peut être exagéré. Cependant, le pétroleest devenu un produit de base «stratégiquement invisible» puisque sa circulation a tou-jours été continue, avec des ruptures alarmantes, mais limitées, telles que le premier chocpétrolier de 1973. L’offre de pétrole est pratiquement prise pour acquis. Puisque les deuxtiers de la production pétrolière mondiale sont acheminés par voie maritime, il existed’inévitables contraintes de distribution, parmi lesquelles l’utilisation d’un ensemble li-mité de détroits et passages: les goulots d’étranglement de la circulation maritime. Cetarticle se penche sur la géographie de l’offre et de la demande de pétrole, de même quesur les problèmes stratégiques liés à sa circulation maritime. Les goulots d’étranglementsont perçus en tant que ressources dont la valeur varie en fonction de leur niveau d’utili-sation. Alors que la suprématie du pétrole tire à sa fin, l’importance et la vulnérabilité despassages stratégiques risquent de s’accroître en conséquence. Leur capacité d’admissiondes trafics supplémentaires apparaît limitée, ce qui implique que les futurs chocs (ou rup-tures) pétroliers seront vraisemblablement liés à la problématique de sa circulation.
Mots clés: Distribution du pétrole, transport maritime, passages stratégiques, Hormuz, Suez,Malacca, Bab el-Mandeb, Bosphore, Panama
5-Rodrigue.pmd 10/02/2005, 11:06357
358 Cahiers de Géographie du Québec ◆ Volume 48, n° 135, décembre 2004
THE GEOSTRATEGY OF PETROLEUM
The Spice must flow.
Frank Herbert, Spacing Guild. Dune
This simple statement taken from an acclaimed science-fiction chronicle is ananalogy of one of the core foundations of the global economy, to which there iscurrently no reasonable palliative or short-term alternative available. As Spicewas to the fantasy future Empire, very few commodities are as vital as petroleumto the tangible operations of the real world. The flexibility of oil use has made it aremarkable commodity; it can be used as an energy source or lubricant and rawmaterial in the manufacturing of plastics and fertilizers. It has even been arguedthat petroleum is too valuable a commodity to be used as fuel. As a commodity ofstrategic importance, petroleum has been, over the last century, the object ofgeopolitical conflicts for access, control and distribution. Although the energyintensity 1 of the global economy has declined, expanding oil consumptionunderlines a growing global dependency. The distribution of petroleum from oilfields to refineries and then to consumers cannot, under any circumstances, beinterrupted in any significant manner. The fallout would be political and economicchaos, and a vulnerable and petroleum-dependent global economy could come toa grinding halt.
OIL SUPPLY STRATEGIES
To ensure a constant and uninterrupted oil supply, the strategies of industrializednations have been articulated by the use of military force (primarily by the UnitedStates), economic incentives and uneasy alliances with oil producers, namely inthe Persian Gulf. Access to this strategic location, especially Saudi Arabia, is likelyto be the most important factor in contemporary energy geopolitics (Klare, 2001).The growing dependency among developed nations on external sources of oilreinforces these conventional strategic considerations, when a few key maritimepassages chokepoints of the global economy are considered valuable resourceswith a rather fixed supply (Nincic, 2002). Moreover, increased Asian oil demand,especially within China, has caused a new shift in petroleum circulation and hasstepped up competition over existing known oil resources, including thechokepoints themselves. The new geography of petroleum circulation is thuschallenging conventional distribution networks, their security and their reliability.
Control of oil supply is becoming increasingly strained with limited alternati-ves other than to pursue policies and strategies implemented decades ago. For thisreason, the Carter Doctrine, drafted to address the security of the Persian Gulf,grows more relevant after over 50 years of US military presence in the region.
An attempt by an outside force to gain control of the Persian Gulf region will beregarded as an assault on the vital interests of the United States of America, andsuch an assault will be repelled by any means necessary, including military force.(President Jimmy Carter, State of the Union Address, January 23, 1980).
5-Rodrigue.pmd 10/02/2005, 11:06358
359Straits, Passages and Chokepoints
This doctrine was initially aimed at deterring the Soviet Union after its invasionof Afghanistan in 1979, but it has been implemented as the result of very differentevents and circumstances. With the former Cold War nemesis gone, the hostileforce turned out to be from within the Gulf region itself: Iraq. The Carter Doctrinehas been implemented twice; in 1990 during the First Gulf War and in 2003 for theSecond Gulf War. In the first case it was to quell the intentions of Iraq to gaincontrol over a large portion of regional oil fields with damaging economic andpolitical potential. In the second case, a hidden agenda was to ensure future stabilityin the Persian Gulf region and hence, its oil supplies. The policy, however, came ata huge economic and political cost, which can be viewed as a subsidy for stable oilsupplies, paid by the end consumer. The cost of securing access to Middle Easternoil, ranging from deployment of forces in the Persian Gulf, the patrol of its waterand the supply of military assistance to nations in the region is estimated to be inthe range of US$50 billion a year (IAGS, 2003). The cost of the First Gulf War wasover US$80 billion, while the final cost of the Second Gulf War has yet to be talliedand could range anywhere between US$125 billion to US$1 trillion, including costsfor security and to rebuild. Securing oil resources has thus become a complex andexpensive undertaking.
OIL CIRCULATION AND CHOKEPOINTS
The whole issue of oil dependency among nations that lack political stability orreliability opens the door to occasional disruptions, price changes and a transfer ofwealth. According to the US Department of Energy, the cost of political instabilityhas been over US$3.4 trillion in the last 30 years, and the transfer of wealth to oilexporters has accounted for US$1.16 trillion over the same period. The post-September 11 era is one of realization of the geopolitical consequences this transferhas had on stability in the Middle East and the acknowledgement that petroleummust continue to flow regardless. Price fluctuations of the commodity itself havebeen substantial and are often linked to periods of growth and recession of theglobal economy (Hamilton, 1985). In spite of all the concerns and calls to action,the ability to substitute for alternative energy sources remains limited (Rifkin, 2002).Under such circumstances, the global economy will remain dependent andvulnerable to the circulation of oil, especially over its chokepoints, for at least thefirst two decades of the XXIst century.
Chokepoints are a common concept in transport geography, as they refer tolocations that limit the capacity of circulation and cannot be easily bypassed, if atall. This implies that any alternative to a chokepoint involves a level of detour oruse of an alternative that translates into significant financial costs and delays.They can also be perceived as a resource whose usefulness varies with the ebband flow of the geography of circulation. Considering the characteristics of mari-time transportation, maritime chokepoints are particularly prevalent. Many ofthem are the result of the constraints of physical geography while others, namelySuez and Panama, are artificial creations. Three core concepts thus define achokepoint as a resource:
- Physical characteristics. To begin, a chokepoint is a location that forces trafficto converge and, by virtue of its physical characteristics, namely depth, width
5-Rodrigue.pmd 10/02/2005, 11:06359
360 Cahiers de Géographie du Québec ◆ Volume 48, n° 135, décembre 2004
or navigability, limits movement. Its physical capacity to accommodatemaritime circulation is thus limited.
- Usage. The value of a chokepoint is proportional to its degree of usage andthe availability of alternatives. The fact that a chokepoint acts as a limit tocirculation imposes a threshold to its use. The closer the traffic is to thisthreshold, the more the resource is deemed to be exhausted.
- Access. As a valuable resource, some degree of control must be establishedto ensure access to the chokepoint. This requires agreements to regulate useand settle disputes if access becomes contested. Tolls can also be levied ifthe chokepoint falls within a well-defined jurisdiction to control access toinfrastructures such as locks.
Although the physical characteristics of most chokepoints are very stable,implying a fixed capacity, their use and value can fluctuate significantly. With thegrowth of maritime circulation and global trade, many have become extremelyvaluable resources, and represent some of the most important strategic locationsin the world. Like all fixed supply resources, however, there is a limit to whichthey can be used. The closer they come to exhaustion, the more unstable their useand the more effort required to secure access.
This paper reviews contemporary evidence related to oil supply, demand anddistribution. Although petroleum-related strategic and economic issues areunderstood and have been discussed at length (Yergin, 1991; Venn, 1986), the uni-que geography of global petroleum distribution, including its maritime chokepointscertainly merits review. The principal argument is that distribution is as importantas production and pricing issues, since distribution is a fundamental factor toensuring that supply meets demand. We begin by discussing the complexrelationship between petroleum and the global economy, particularly in terms ofsupply, demand, reserves and distribution. Given the importance of distribution,we follow with an analysis of the major chokepoints in the maritime circulation ofpetroleum. Even as the era of petroleum dominance draws to a close, the significanceof these chokepoints is likely to increase with shrinking supply and growingdemand, particularly from Pacific Asia.
PETROLEUM AND THE GLOBAL ECONOMY
PETROLEUM PRODUCTION AND CONSUMPTION
The oil industry is oligopolistic in terms of supply, demand, control, functionand geographical concentration (Clo, 2000). Demand is controlled by a few verylarge multinational conglomerates, each with its own production and distributionsystems that include refineries, storage facilities, distribution centres and, at theend of the supply chain, gas stations. Supply is controlled by a few countries wherethe oil industry is often nationalized or under a uniform price-fixing policy ofOPEC 2, which controls approximately 37% of world oil production. The geographyof production and consumption is characterized by a strong spatial differentiationof supply and demand. Due to geographical and geological factors, oil is produced
5-Rodrigue.pmd 10/02/2005, 11:06360
361Straits, Passages and Chokepoints
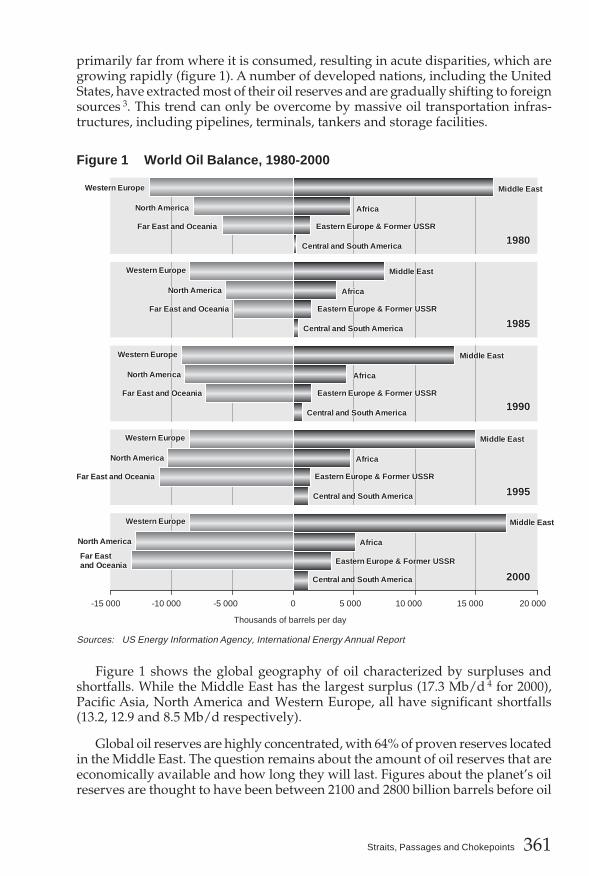
primarily far from where it is consumed, resulting in acute disparities, which aregrowing rapidly (figure 1). A number of developed nations, including the UnitedStates, have extracted most of their oil reserves and are gradually shifting to foreignsources 3. This trend can only be overcome by massive oil transportation infras-tructures, including pipelines, terminals, tankers and storage facilities.
Figure 1 World Oil Balance, 1980-2000
Sources: US Energy Information Agency, International Energy Annual Report
Figure 1 shows the global geography of oil characterized by surpluses andshortfalls. While the Middle East has the largest surplus (17.3 Mb/d 4 for 2000),Pacific Asia, North America and Western Europe, all have significant shortfalls(13.2, 12.9 and 8.5 Mb/d respectively).
Global oil reserves are highly concentrated, with 64% of proven reserves locatedin the Middle East. The question remains about the amount of oil reserves that areeconomically available and how long they will last. Figures about the planet’s oilreserves are thought to have been between 2100 and 2800 billion barrels before oil
-15 000 -10 000 -5 000 0
Thousands of barrels per day
5 000 10 000 15 000 20 000
North America
Central and South America
Western Europe
Eastern Europe & Former USSR
Middle East
Africa
Far East and Oceania
North America
Central and South America
Western Europe
Eastern Europe & Former USSR
Middle East
Africa
Far East and Oceania
North America
Central and South America
Western Europe
Eastern Europe & Former USSR
Middle East
Africa
Far East and Oceania
North America
Central and South America
Western Europe
Eastern Europe & Former USSR
Middle East
Africa
Far East and Oceania
North America
Central and South America
Western Europe
Eastern Europe & Former USSR
Middle East
Africa
Far Eastand Oceania
1985
1980
1990
1995
2000
North America
Central and South America
Western Europe
Eastern Europe & Former USSR
Middle East
Africa
Far East and Oceania
North America
Central and South America
Western Europe
Eastern Europe & Former USSR
Middle East
Africa
Far East and Oceania
North America
Central and South America
Western Europe
Eastern Europe & Former USSR
Middle East
Africa
Far East and Oceania
North America
Central and South America
Western Europe
Eastern Europe & Former USSR
Middle East
Africa
Far East and Oceania
North America
Central and South America
Western Europe
Eastern Europe & Former USSR
Middle East
Africa
Far Eastand Oceania
1985
1980
1990
1995
2000
5-Rodrigue.pmd 10/02/2005, 11:06361
362 Cahiers de Géographie du Québec ◆ Volume 48, n° 135, décembre 2004
development began in the XIXth century. As of 2001, an estimated 1020 billion barrelsof proven oil reserves were available and 900 billion barrels have been extracted,which represents approximately one-third of all available oil reserves 5. To thisfigure, can be added between 200 to 900 billion barrels of oil that potentially remainto be found (Campbell and Laherrere, 1998). Based on these figures, global oil pro-duction should peak around 2005-2010 and then begin to decline. In a long-termperspective, control by OPEC will grow since the bulk of remaining oil reserves islocated within its jurisdiction. Saudi Arabia alone accounts for approximately 25%of the world’s total oil reserves, putting upward pressure on energy prices.
Oil production steadily increased in the second half of the XXth century to meetgrowing demand. On average 68 million barrels of crude oil are produced each day(2000 figures), 32% of it in the Middle East, the single most important oil-producingregion in the world. Approximately 60% of the total oil currently produced has alreadybeen committed and 40% is sold on open markets. More significantly, the capacityand geographical origin of surplus oil production is limited and 90% of this surplusoil production is in the Persian Gulf. In addition to accounting for the world’s largestoil reserves, Saudi Arabia holds an added advantage as the only major supplier ableto increase production immediately, when needed. Surplus production capacity iscrucial in the event of a major supply disruption since capacity can be immediatelyincreased to maintain current oil supply levels. Recent events, such as the conflict inIraq and civil unrest in Venezuela and Nigeria, have stretched the world’s extracapacity thin to about one million barrels a day in 2003. Additional sources of oil arethus scarce and when they are located, the ability to develop and transfer oil to mar-kets takes several years.
The global economy has become dependent on cheap oil, the United States beingthe most powerful example (Greene et al., 2002). Since transportation activitiesaccount for 52% of total oil consumption, motorization is one of the driving forcesbehind petroleum consumption. An average 77.5 Mb/d were consumed in 2002,57% of it in developed nations. While the United States rank as the leading globalconsumer of oil (20.1 Mb/d), the rapid growth of the Chinese economy over thelast decade has propelled China to the second rank of oil consumers (5.5 Mb/d),surpassing Japan (5.3 Mb/d). China accounts for approximately 40% of globalgrowth in oil demand in recent years. Almost 55% of total oil consumed in theUnited States was imported in 2002. This figure is expected to rise to 65% by 2010.Demand is also subject to some degree of seasonality, with increased use for heatingoil in winter and higher gasoline demand in the summer. Depending on theeconomic sector, price elasticity ranges from small to significant. While a growthin oil prices may adversely impact air transportation, car-dependent commutersare much more likely to bear the increase. Other industrial sectors are alsosignificantly affected by oil prices, notably plastics and fertilizers. Higher energyprices are likely to further stimulate relocation to lower cost locations asmanufacturers try to reduce the costs over which they have some control, such aslabor, real estate and taxes.
5-Rodrigue.pmd 10/02/2005, 11:06362
363Straits, Passages and Chokepoints
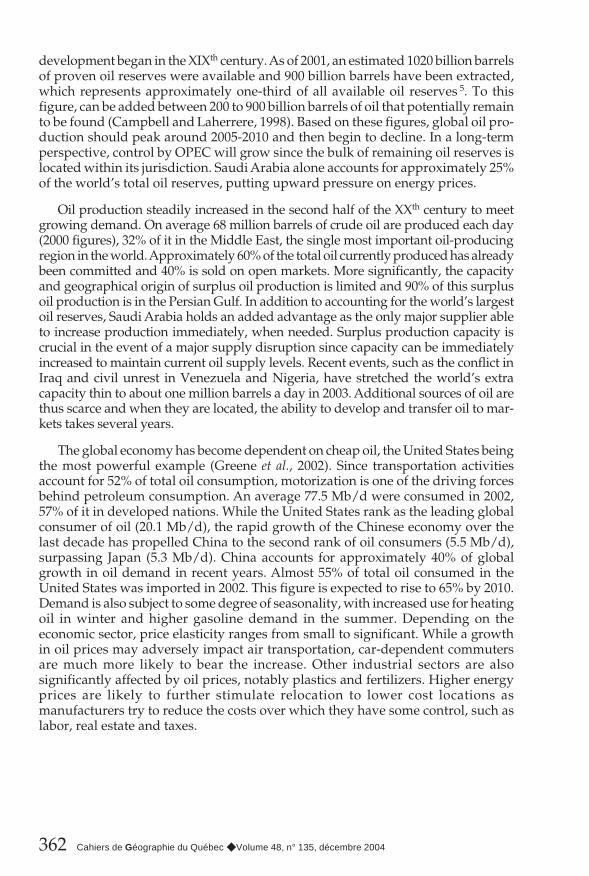
Figure 2 Inter-Regional Petroleum Movements, 1998 (in million tons)
Source: OECD
The international oil trade is correlated with oil prices and transport costs, andoil flows are often linked to the proximity of suppliers and consumers (figure 2).Since the 1970s, there has been a shift in the global flows of petroleum, which weredominated by flows from the Middle East to Western Europe and North America.There has been an acceleration of the trend that began with the re-industrializationof Japan after World War II. Development of the “Tigers” – South Korea, Taiwan,Hong Kong and Singapore – has brought with it growing oil demand in PacificAsia and a corresponding shift of oil flows predominantly served by the MiddleEast. The growth of China, however, is the single most important factor in theincrease of global oil demand, and raw materials in general, since it squeezes supplyand drives prices upwards.
PETROLEUM TRANSPORTATION
Petroleum transportation is one of the best examples of a derived transportdemand as its circulation is a direct consequence of consumption. This tightlyintegrated distribution network involves a continuous flow from the oil fields tothe final consumption, with rather limited storage outside of strategic reserves 6.The volume of international oil trade increased as a result of world economic growthand higher energy demand. The largest oil consumers are the most highly-developednations, including the United States, Western Europe and Japan, which accountfor approximately 75% of global crude oil imports. International oil trade is necessaryto compensate for the spatial imbalances between supply and demand (figure 1).Unlike most other countries, which either consume almost their entire production(United States) or have privileged partners (Russia and Western Europe), a major por-tion of OPEC’s oil is traded on international markets.
0 50 100In millions tons
150 200 250 300
Middle East / Asia
Middle East / Europe
Middle East / Japan
South America / USA
NIS / Europe
Middle East / USA
North Africa / Europe
Canada / USA
West Africa / USA
Mexico / USA
5-Rodrigue.pmd 10/02/2005, 11:06363
364 Cahiers de Géographie du Québec ◆ Volume 48, n° 135, décembre 2004
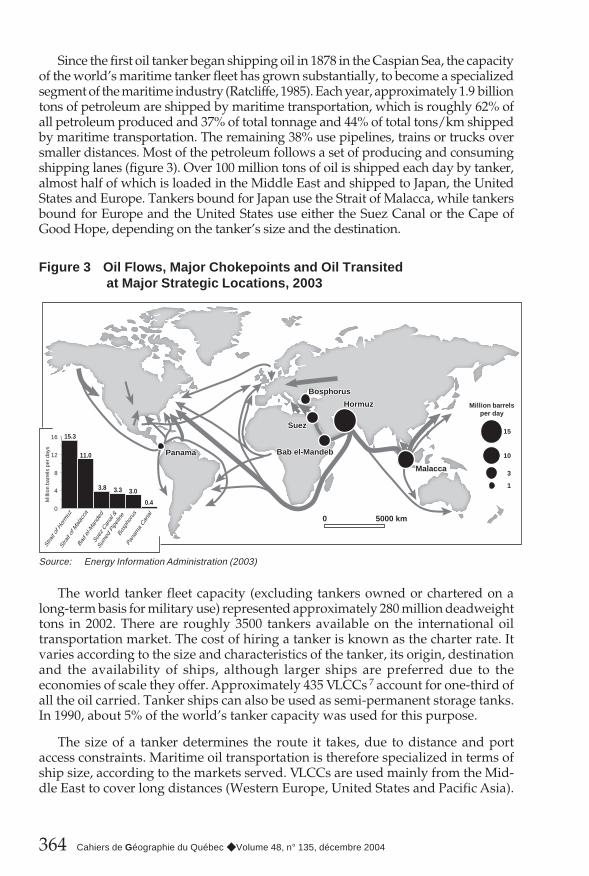
Since the first oil tanker began shipping oil in 1878 in the Caspian Sea, the capacityof the world’s maritime tanker fleet has grown substantially, to become a specializedsegment of the maritime industry (Ratcliffe, 1985). Each year, approximately 1.9 billiontons of petroleum are shipped by maritime transportation, which is roughly 62% ofall petroleum produced and 37% of total tonnage and 44% of total tons/km shippedby maritime transportation. The remaining 38% use pipelines, trains or trucks oversmaller distances. Most of the petroleum follows a set of producing and consumingshipping lanes (figure 3). Over 100 million tons of oil is shipped each day by tanker,almost half of which is loaded in the Middle East and shipped to Japan, the UnitedStates and Europe. Tankers bound for Japan use the Strait of Malacca, while tankersbound for Europe and the United States use either the Suez Canal or the Cape ofGood Hope, depending on the tanker’s size and the destination.
Figure 3 Oil Flows, Major Chokepoints and Oil Transited at Major Strategic Locations, 2003
Source: Energy Information Administration (2003)
The world tanker fleet capacity (excluding tankers owned or chartered on along-term basis for military use) represented approximately 280 million deadweighttons in 2002. There are roughly 3500 tankers available on the international oiltransportation market. The cost of hiring a tanker is known as the charter rate. Itvaries according to the size and characteristics of the tanker, its origin, destinationand the availability of ships, although larger ships are preferred due to theeconomies of scale they offer. Approximately 435 VLCCs 7 account for one-third ofall the oil carried. Tanker ships can also be used as semi-permanent storage tanks.In 1990, about 5% of the world’s tanker capacity was used for this purpose.
The size of a tanker determines the route it takes, due to distance and portaccess constraints. Maritime oil transportation is therefore specialized in terms ofship size, according to the markets served. VLCCs are used mainly from the Mid-dle East to cover long distances (Western Europe, United States and Pacific Asia).
15
10
3
Million barrelsper day
Panama
Bosphorus
Hormuz
Suez
Malacca
Bab el-MandebPanama
0 5000 km
1
3
10
15
Bosphorus
Hormuz
Suez
Malacca
Bab el-Mandeb
0.4
3.03.8 3.3
15.3
11.0
0
4
8
12
16
Strait of H
ormuz
Pana
ma Can
al
Strait of M
alac
ca
Bad el-M
ande
d
Suez
Can
al &
Sumed
Pipeline
Bosp
horus
Mill
ion
barr
els
per
days
5-Rodrigue.pmd 10/02/2005, 11:06364
365Straits, Passages and Chokepoints
“Suezmax” 8 tankers are used mainly for long to medium hauls between West Africaand Western Europe and the United States, while “Aframax” 9 tankers are used forshort to medium hauls, such as between Latin America and the United States. Trans-port costs have a significant impact on market selection. For instance, three-quartersof United States oil imports originate from the Atlantic Basin (including WesternAfrica), with journeys of less than 20 days. Venezuelan oil takes about 8 days toreach the United States, while Saudi oil takes 6 weeks. The vast majority of Asianoil imports come from the Middle East, a 3-week journey. Moreover, due toenvironmental and security concerns, single-hulled tankers are gradually beingphased out and replaced by double-hulled tankers (Timmons, 2004).
Transportation costs account for a small percentage of the total cost of gasolineat the pump, about 5 to 10% of the added value of oil. As United States dependencyon oil imports increases and as new consumers create additional demand, morepressure will be felt on oil circulation chokepoints.
STRATEGIC PASSAGES:CHOKEPOINTS OF THE GLOBAL ECONOMY
Maritime transportation, as the dominant purveyor of international freight dis-tribution, operates over a global maritime space. This space has its own constraints,however, such as the profile of continental masses. International shipping lanesare forced to go through specific locations such as passages, capes and straits. Thereare approximately 200 of these locations, but only a handful are of strategic impor-tance. By definition chokepoints tend to be shallow and narrow, impairing naviga-tion and their capacity is being challenged by growing maritime circulation andlarger ships (Feller, 2004). Many chokepoints are in close proximity to politicallyunstable nations, which increases navigation risks and compromises access anduse. In recent years, the threat of terrorism has raised additional concerns overmaritime circulation (Richardson, 2004). Strategic passages can be mined, blockedby sinking ships, or interdicted by naval forces, artillery or missile systems.Chokepoints truly are the geographical Achilles heels of the global economy.
The geostrategy of maritime petroleum circulation involves six majorchokepoints (figure 3), which handle over 35 Mb/d. Their use is shared with regularflows of commercial maritime shipping, including containers and other cargos.Two are extremely important: Hormuz and Malacca, since they account for over60% of oil transits. Hormuz represents the most important strategic passage in theworld, solely because of its access to the oil fields of the Middle East, while Ma-lacca is an active commercial point of transit between the Indian and Pacific Oceans.From the Persian Gulf, two major axis of oil circulation serve Western Europe andthe United States (westbound) and Pacific Asia (eastbound). As eastbound andwestbound oil shipments grow, so too does the need to maintain the integrity ofthe strategic passages that support its trade. This is particularly the case for China,since its oil imports stretch from the Strait of Hormuz, Malacca and the South ChinaSea, most of which are patrolled by the United States.
5-Rodrigue.pmd 10/02/2005, 11:06365
366 Cahiers de Géographie du Québec ◆ Volume 48, n° 135, décembre 2004
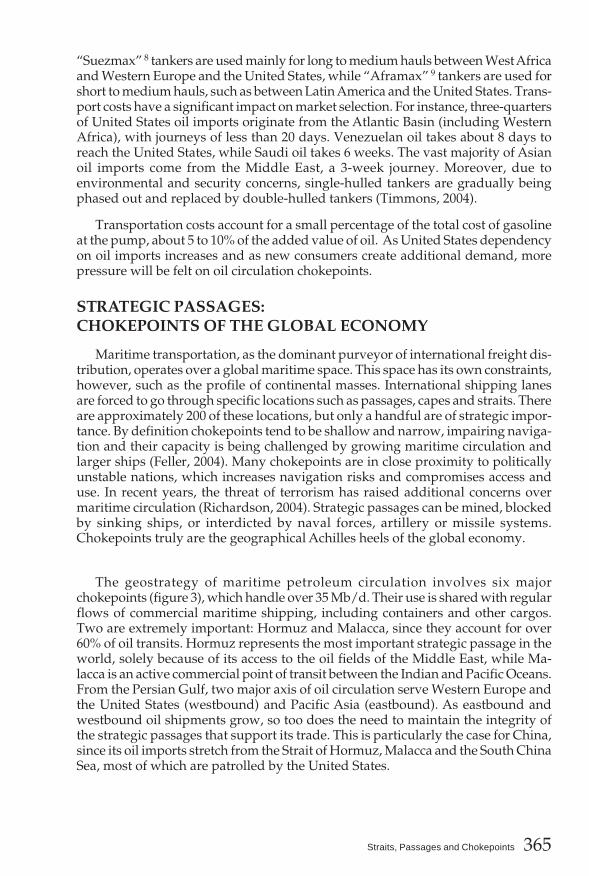
Figure 4 Shipping Lanes and Strategic Passages in the Middle East
STRAIT OF HORMUZ
The Strait of Hormuz forms a strategic link between the oil fields of the PersianGulf, the Gulf of Oman and the Indian Ocean (figure 4). It is 48 to 80 km wide, butnavigation is limited to two 3-km-wide channels, each used exclusively for inboundor outbound traffic. Circulation in and out of the Persian Gulf is therefore extremelyconfined, because the sizable number of tankers makes navigation difficult alongthe narrow channels. In addition, islands that ensure control of the strait arecontested by Iran and the United Arab Emirates. Security within the strait has oftenbeen compromised. Between 1984 and 1987 there was a “Tanker War” betweenIran and Iraq, during which each party, in their own belligerence (Iran-Iraq War of1980-1988), began firing on tankers, even neutrals, bound for their respective ports.Shipping in the Persian Gulf dropped 25%, forcing the intervention of the UnitedStates to help secure oil shipping lanes.
Crude oil production(millions of barrels per day)
Estimated crude oil reserves (billions of barrels)
Oil transited(millions of barrels per day)
0.2 0.6
0.6
0.5 2.5
2.9
2.0
3.42.0
1.9
0.4
0.7
4.0
7.6 0.95.5
97.8
96.5
89.7
112.5
261.815.2
Sudan
Egypt
Yemen
Iran
Syria
Saudi Arabia
Qatar
Kuwait
Iraq
Oman
United ArabEmirates
Bosphorus 3.0
Hormuz 15.5
Suez 3.8
Bab el-Mandeb 3.3
Méditerranean Sea
Indian Ocean
Black Sea
50ºE 60ºE
20ºN
40ºN
0.2 0.6
0.6
0.5 2.5
2.9
2.0
3.42.0
1.9
0.4
0.7
4.0
7.6 0.95.5
97.8
96.5
89.7
112.5
261.815.2
Sudan
Egypt
Yemen
Iran
Syria
Saudi Arabia
Qatar
Kuwait
Iraq
Oman
United ArabEmirates
Bosphorus 3.0
Hormuz 15.5
Suez 3.8
Bab el-Mandeb 3.3
Mediterranean Sea
Persian Gulf
Red S
ea
Indian Ocean
Black Sea
50ºE 60ºE
20ºN
40ºN
0 1000 km
5-Rodrigue.pmd 10/02/2005, 11:06366
367Straits, Passages and Chokepoints
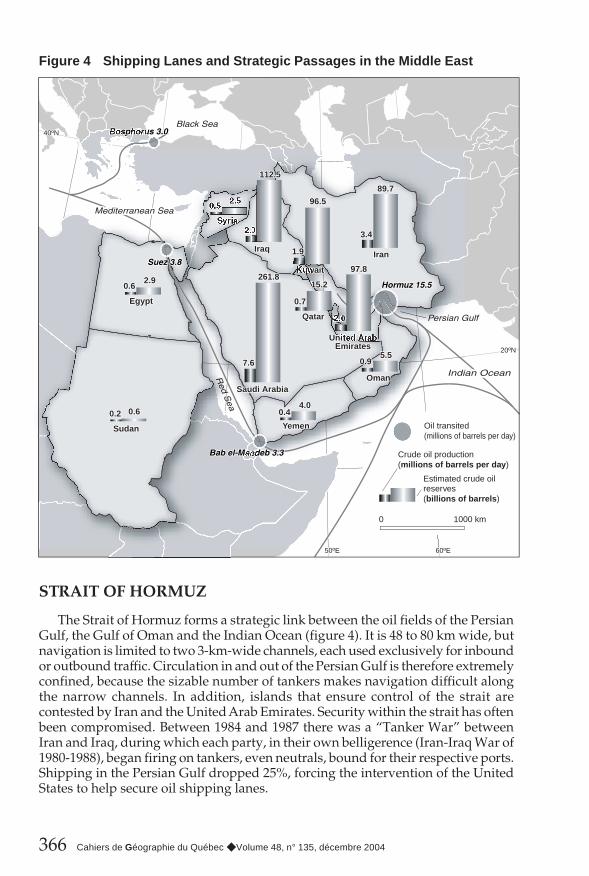
Approximately 88% of all the petroleum exported from the Persian Gulf tran-sits through the Strait of Hormuz, bound to Asia, Western Europe and the UnitedStates. Its importance in global oil circulation cannot be overstated. For instance,75% of all Japanese oil imports transit through the strait. There are thus very fewalternative outlets for oil exports from the Persian Gulf if the traffic, which representsapproximately 14 Mb/d, going through Hormuz was compromised (figure 5).Moreover, an unannounced closure of the strait would trap roughly 7 to 10% of theglobal VLCC fleet in the Persian Gulf.
Figure 5 Oil Exports from the Persian Gulf per Outlet, 2002
The only other significant outlet for Persian Gulf oil is the pipeline to the SaudiArabian port of Yanbu on the Red Sea, which can handle approximately 4.8 Mb/d.The Sumed pipeline, which runs relatively parallel to the Suez Canal is alsoindirectly an outlet of the Persian Gulf but would be dependent on the capacity toship Middle Eastern oil (mainly Saudi) to the Red Sea either by pipeline (Yanbu) orthrough Bab el-Mandeb. The other two pipelines link northern Iraq (Kirkuk region)to Syria or Turkey (port of Ceyhan on the Mediterranean) and do not offer significantadditional capacity.
SUEZ CANAL AND STRAIT OF BAB EL-MANDEB
The opening of the Suez Canal in 1869 ushered in a new era of European in-fluence in Pacific Asia. The journey from Asia to Europe was remarkably reduced,by saving 6500 km from the circum Africa route. The canal has no locks, becausethe Mediterranean Sea and Gulf of Suez have roughly the same water level. In1874, Britain bought the shares to the Suez Canal Company. Under the 1888 agree-ment, the canal was to remain open to vessels from all nations in time of peace orwar. Great Britain, however, claimed the need to control the area in order to maintainits maritime power and colonial interests (namely in South Asia). In 1936, it acquiredthe right to maintain defense forces along the Suez Canal, which turned out to beof strategic importance during World War II to uphold Asia-Europe supply routesfor the Allies.
0 2 4 6
Millions of barrels per day
8 10 12 14
Strait of Hormuz
TrafficAdditionalCapacity
Pipeline to Yanbu
Sumed Pipeline
Pipeline to Ceyhan
Pipeline through Syria
Strait of Hormuz
TrafficAdditionalCapacity
Pipeline to Yanbu
Sumed Pipeline
Pipeline to Ceyhan
Pipeline through Syria
5-Rodrigue.pmd 10/02/2005, 11:06367
368 Cahiers de Géographie du Québec ◆ Volume 48, n° 135, décembre 2004
The second half of the XXth century saw renewed geopolitical instability in theregion with the end of colonialism and the emergence of Middle Eastern nationalism.In 1954 Egypt and Great Britain signed an agreement that superseded the 1936 treatyand provided for the gradual withdrawal of all British troops from the Canal Zone.All British troops were withdrawn by June 1956 as the canal was nationalized byEgypt. This triggered problems with Israel, as Israeli ships were not permitted tocross the canal. This threat was also extended to France and Britain, the former ownersof the canal because they refused to help finance the Aswan High Dam project, asinitially promised. Israel, France and Britain thus invaded Egypt in 1956. Egyptresponded by sinking ships in the canal, effectively closing it between 1956 and 1957.An agreement regarding use of the canal was subsequently reached.
Geopolitical problems persisted, however, as tensions between Israel and Arabnations increased in the 1960s. The Six Days War between Israel and Egypt and theinvasion of the Sinai Peninsula by Israel caused the Suez Canal to close between1967 and 1975. This event significantly destabilized international transportationand favoured the development of ever larger tankers for use along the lengthycircum Africa route. The canal was re-opened in 1975 and Egypt agreed to allowIsrael to use it. Significant improvements were made between 1976 and 1980, mainlywidening of the canal to accommodate 200 000-ton VLCCs, ensuring the oil tradebetween Europe and the Middle East. The minimum width of the channel is60 metres and ships with up to 16 metres (58 feet) of draft can make the transit.This means that ULCCs cannot pass through the Canal when fully loaded. Acommon practice is to unload parts of Mediterranean-bound ships and use theSumed pipeline. Through additional deepening and widening projects, the depthof the canal is expected to reach 22 metres by 2010.
The canal can accommodate up to 25 000 ships each year, but handlesapproximately 14 000, which is 38 ships each day on average, accounting for 14%of the global trade. Since the canal can handle only unidirectional traffic, crossingsmust be organized into convoys of about 10-15 ships. Three convoys each day, twosouthbound and one northbound, are organized. Missing a convoy causes additionaldelays. Many maritime companies therefore choose to skip a port call to ensurethat their ship arrives on time at the Suez Canal to be part of a specific convoy.
The Strait of Bab el-Mandeb, a strategic link between the Indian Ocean and RedSea, controls access to the Suez Canal. The large amount of tanker traffic makesnavigation difficult along the narrow channels. A closure of this strait would haveserious consequences, since it would force a detour around the Cape of Good Hopeand in the process require additional tanker space.
BOSPHORUS
The Passage of Bosphorus is 30 km long and 1 km wide at its narrowest point,linking the Black Sea to the Mediterranean Sea (figure 4). Two conflicts have eruptedover this passage, namely the Crimean War (1854) and the Battle of the Dardanel-les (1915). The passage was fortified by Turkey after the Convention of Montreuxin 1936, which recognized its control of Bosphorus but granted free passage inpeace time to any commercial vessel without inspection. With the passage of the
5-Rodrigue.pmd 10/02/2005, 11:06368
369Straits, Passages and Chokepoints
Dardanelles, Bosphorus forms the only link between the Black Sea andMediterranean Sea. In light of current world affairs, the Bosphorus represents apassage of growing strategic importance, notably after the fall of the Soviet Union.The Caspian Sea has vast oil reserves and a large amount must likely transit throughthe Black Sea and Bosphorus to reach outside markets, namely around theMediterranean Sea. Although pipelines offer an alternative, the cost differentialsfavour use of maritime transportation. For instance, the cost of moving oil alongthe Baku-Ceyhan pipeline ranges between US$1 and US$2 per barrel, whereasshipping oil by tanker through the Black Sea costs 20 cents per barrel (Brito, 1999).
Approximately 50 000 ships, including 5500 tankers, transit through the pas-sage each year, which is approaching capacity. The physical limits of the strait canaccommodate tankers to a maximum capacity of 200 000 dwt. The amount of oiltransiting through the Bosphorus has growth significantly in recent years, with thedevelopment of oil fields around the Caspian Sea. Approximately 3 Mb/d weretransiting through the passage in 2003. Future growth of petroleum circulationthrough Bosphorus is therefore highly problematic, notably the risk of collisionand oil spills in the midst of Istanbul. In response, the Turkish governmentprohibited, in 2002, use of the passage during the night by large tankers.
STRAIT OF MALACCA
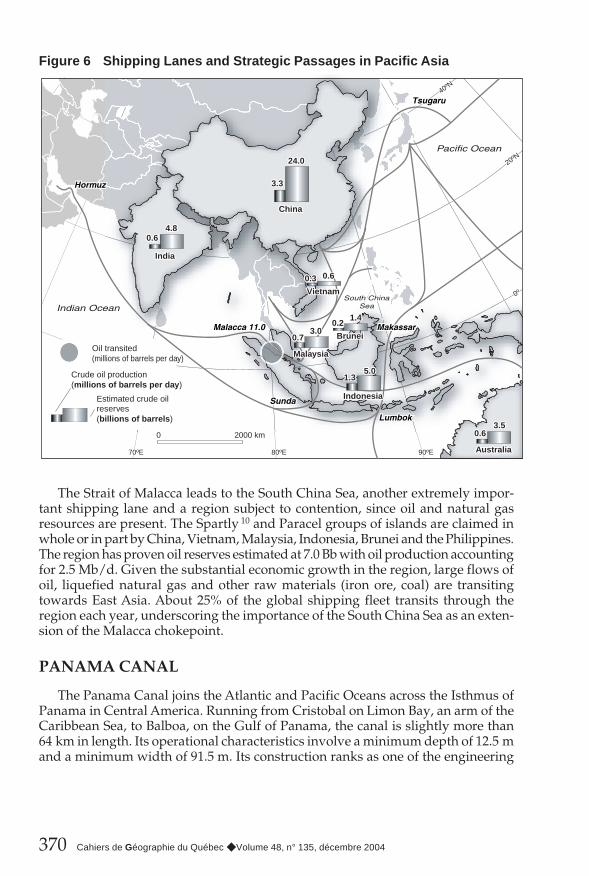
The Strait of Malacca is one of the most important strategic passages in the worldbecause it supports the bulk of the maritime trade between Europe and Pacific Asia,which accounts for 50 000 ships each year (600 per day). The strait is approximately800 km long and between 50 to 320 km wide (2.5 km at its narrowest point) and has aminimum channel depth of 23 metres (roughly 70 feet). It is the longest strait in theworld used for international navigation. Close to 30% of the world’s trade and 80% ofpetroleum imports to Japan, South Korea and Taiwan transit through the strait, whichrepresented approximately 11 Mb/d in 2003. As the main passage between the Pacificand Indian Oceans, Malacca is an unavoidable bottleneck, with the Strait of Sunda(Indonesia) being the closest alternative (figure 6).
For centuries, the Strait of Malacca has been part of the Arab trade routes linkingthe Middle East, Southeast Asia and China. By the early XVIth century the Portugueseconquered the stronghold of Malacca, a key trading centre after which the straitbears its name. In 1867, England formally took control of the passage. Singaporebecame a main harbour and other important centers, such as Malacca and Penang,formed the Strait Settlements. This control lasted up to the Second World War andthe independence of Malaysia in 1957. As Pacific trade swelled after the SecondWorld War, so too did the importance of the passage. Singapore, located at thesouthern tip of the Strait of Malacca, is one of the most important ports in theworld and a major oil refining centre. Dredging is one of the main problems of theStrait of Malacca, since some sections are barely deep enough to accommodateships of approximately 300 000 deadweight tons. Because the strait is locatedbetween Malaysia, Indonesia and Singapore, it is difficult to reach an agreementabout how the dredging costs should be shared and how fees for its use should belevied. Political stability and piracy are also major issues for the safety of maritimecirculation, especially on the Indonesian side.
5-Rodrigue.pmd 10/02/2005, 11:06369
370 Cahiers de Géographie du Québec ◆ Volume 48, n° 135, décembre 2004
Figure 6 Shipping Lanes and Strategic Passages in Pacific Asia
The Strait of Malacca leads to the South China Sea, another extremely impor-tant shipping lane and a region subject to contention, since oil and natural gasresources are present. The Spartly 10 and Paracel groups of islands are claimed inwhole or in part by China, Vietnam, Malaysia, Indonesia, Brunei and the Philippines.The region has proven oil reserves estimated at 7.0 Bb with oil production accountingfor 2.5 Mb/d. Given the substantial economic growth in the region, large flows ofoil, liquefied natural gas and other raw materials (iron ore, coal) are transitingtowards East Asia. About 25% of the global shipping fleet transits through theregion each year, underscoring the importance of the South China Sea as an exten-sion of the Malacca chokepoint.
PANAMA CANAL
The Panama Canal joins the Atlantic and Pacific Oceans across the Isthmus ofPanama in Central America. Running from Cristobal on Limon Bay, an arm of theCaribbean Sea, to Balboa, on the Gulf of Panama, the canal is slightly more than64 km in length. Its operational characteristics involve a minimum depth of 12.5 mand a minimum width of 91.5 m. Its construction ranks as one of the engineering
0 2000 km
0.6
0.6
0.7
0.6
3.3
3.0
3.5
0.3
0.21.4
1.3
24.0
4.8
5.0
India
China
Vietnam
Brunei
Indonesia
Malaysia
Australia70ºE 80ºE 90ºE
0º
20ºN
40ºN
Indian Ocean
Pacific Ocean
Hormuz
Malacca 11.0
Sunda
Lumbok
Makassar
Tsugaru
South ChinaSea
0.6
0.6
0.7
0.6
3.3
3.0
3.5
0.3
0.21.4
1.3
24.0
4.8
5.0
India
China
Vietnam
Brunei
Indonesia
Malaysia
Australia
Crude oil production(millions of barrels per day)
Estimated crude oil reserves (billions of barrels)
Oil transited(millions of barrels per day)
70ºE 80ºE 90ºE
0º
20ºN
40ºN
Hormuz
Malacca 11.0
Sunda
Lumbok
Makassar
Tsugaru
South ChinaSea
5-Rodrigue.pmd 10/02/2005, 11:06370
371Straits, Passages and Chokepoints
marvels of all time, since it averts a long detour around South America, thussupporting the maritime flows of world trade. The Panama Canal is strategicallyimportant to the United States because it is a rapid link between the east and westcoast, saving approximately 13 000 km (from 21 000 km to 8000 km). It is comprisedof three main elements, the Gatun Locks (Atlantic Ocean access) the Gaillard Cut(continental divide) and the Miraflores Locks (Pacific Ocean access).
In its 90 years of existence, over 800 000 vessels have transited the canal, carrying6 billion tons of cargo. About 13 000 ships transit the canal every year, with anaverage of 35 ships each day. The canal, however, has the capacity to handle 50 shipsa day. Grains account for roughly 43% of traffic, while containers and petroleumproducts account for 11% and 10% respectively, representing oil traffic ofapproximately 0.6 Mb/d. The Panama Canal Authority collects tolls on all shipsthat cross the canal. A loaded ship pays about US$2.57 per net ton and the averagetoll is about US$45 000. The introduction of super-tankers in the early 1950s forceda rethinking of its strategic importance since economies of scale in petroleumshipping are limited by the size of the canal. It is synonymous with a standard inmaritime transport related to capacity, the Panamax standard, which is equivalentto 65 000 deadweight tons and a draft of 12 metres.
The canal handles close to 12% of the American international seaborne trade ofthe United States. Under the control of the United States until 1979, its administra-tion was entrusted to the State of Panama by the Panama Canal Treaty of 1977. InDecember 1999, ownership of the canal was returned to Panama and is managedby the Panama Canal Authority. The same year, the Hong Kong port operator,Hutchison-Whampoa, leased terminals on the Atlantic (Cristobal) and Pacific (Bal-boa) portions of the Canal with a 25-year lease. This raised concerns within theUnited States government as it was perceived that control of the canal was fallinginto foreign interests, namely to a company perceived to be a façade for the Chinesegovernment. There is also the issue of improvement to the rail line between thetwo ports to handle growing containerized traffic. This rail line is important becauseit offers an alternative to the size limitations of the canal, preventing large – “post-panamax”– containerships to go through. The same rationale applies to oil circula-tion with the trans-panama pipeline, which resumed operations in 2003. Theadditional capacity this pipeline provides, however, is limited to approximately1 Mb/d. New oil development projects, namely in Ecuador and Peru, are likely toincrease the importance of Panama in global oil distribution.
5-Rodrigue.pmd 10/02/2005, 11:06371
372 Cahiers de Géographie du Québec ◆ Volume 48, n° 135, décembre 2004
CONCLUSION
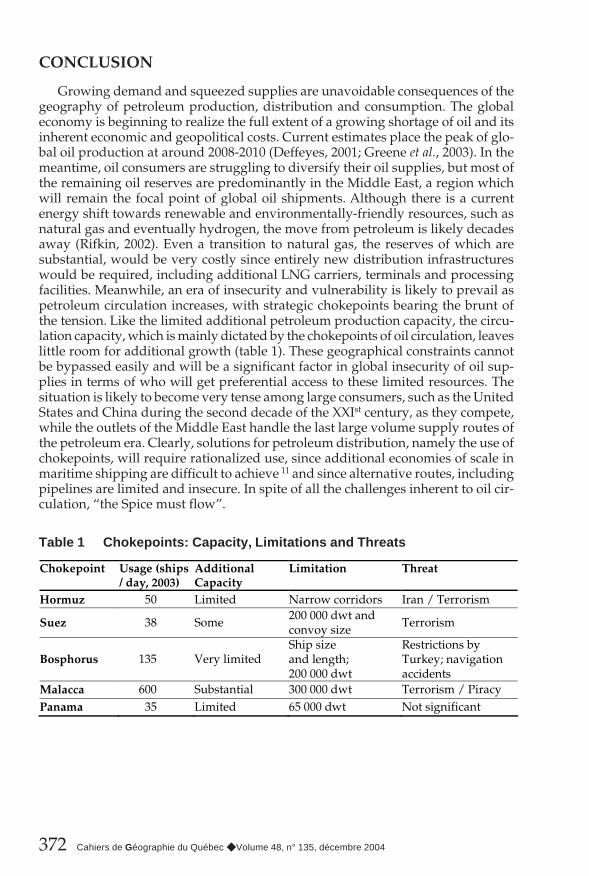
Growing demand and squeezed supplies are unavoidable consequences of thegeography of petroleum production, distribution and consumption. The globaleconomy is beginning to realize the full extent of a growing shortage of oil and itsinherent economic and geopolitical costs. Current estimates place the peak of glo-bal oil production at around 2008-2010 (Deffeyes, 2001; Greene et al., 2003). In themeantime, oil consumers are struggling to diversify their oil supplies, but most ofthe remaining oil reserves are predominantly in the Middle East, a region whichwill remain the focal point of global oil shipments. Although there is a currentenergy shift towards renewable and environmentally-friendly resources, such asnatural gas and eventually hydrogen, the move from petroleum is likely decadesaway (Rifkin, 2002). Even a transition to natural gas, the reserves of which aresubstantial, would be very costly since entirely new distribution infrastructureswould be required, including additional LNG carriers, terminals and processingfacilities. Meanwhile, an era of insecurity and vulnerability is likely to prevail aspetroleum circulation increases, with strategic chokepoints bearing the brunt ofthe tension. Like the limited additional petroleum production capacity, the circu-lation capacity, which is mainly dictated by the chokepoints of oil circulation, leaveslittle room for additional growth (table 1). These geographical constraints cannotbe bypassed easily and will be a significant factor in global insecurity of oil sup-plies in terms of who will get preferential access to these limited resources. Thesituation is likely to become very tense among large consumers, such as the UnitedStates and China during the second decade of the XXIst century, as they compete,while the outlets of the Middle East handle the last large volume supply routes ofthe petroleum era. Clearly, solutions for petroleum distribution, namely the use ofchokepoints, will require rationalized use, since additional economies of scale inmaritime shipping are difficult to achieve 11 and since alternative routes, includingpipelines are limited and insecure. In spite of all the challenges inherent to oil cir-culation, “the Spice must flow”.
Table 1 Chokepoints: Capacity, Limitations and Threats
Chokepoint Usage (ships / day, 2003)
Additional Capacity
Limitation Threat
Hormuz 50 Limited Narrow corridors Iran / Terrorism
Suez 38 Some 200 000 dwt and convoy size
Terrorism
Bosphorus 135 Very limited Ship size and length; 200 000 dwt
Restrictions by Turkey; navigation accidents
Malacca 600 Substantial 300 000 dwt Terrorism / Piracy Panama 35 Limited 65 000 dwt Not significant
5-Rodrigue.pmd 10/02/2005, 11:06372
373Straits, Passages and Chokepoints
ACKNOWLEDGEMENT
The author would like to thank anonymous referees for helpful comments andcorrections.
NOTES
1 The amount of energy used per unit of output.2 Organization of Petroleum Exporting Countries.3 As of 2003, the United States were extracting about 8.8 Mb/d and had an oil reserve of
approximately 72 677 million barrels.4 Millions of barrels per day (Mb/d). A barrel is the equivalent of 42 US gallons or
159 litres.5 There have been serious issues regarding the actual availability of oil reserves, since
some figures have been inflated to uphold the confidence of markets and investors.For instance the oil giant Royal Dutch/Shell acknowledged in 2004 that it hadoverestimated its oil and gas reserves by 22% (approximately 4.5 billion barrels).
6 As of 2002, United States strategic reserves were just under 600 million barrels, whichwould be enough to supply the United States economy for about a month.
7 Very Large Crude Carriers, which can carry up to 300 000 deadweight tons of crude oil,about 2 million barrels.
8 Tankers between 120 000 to 200 000 deadweight tons.9 Tankers between 80 000 and 120 000 deadweight tons.10 A group of about 230 uninhabitable islands totaling a mere 8 square kilometres.11 Not necessarily because of ship size, but because of terminal access.
BIBLIOGRAPHIE
Air Transport Association (2000) Energy Supply Issues relating to Crude Oil, Heating Oiland Transportation Fuels. [On line]. http://www.air-transport.org/public/testimony/display2.asp?nid=870
BRITO, Dagobert L. (1999) Congestion of the Turkish Straits: A Market Alternative. WorkingPapers, Rice University, Deparment of Economics. [On line]. http://www.ruf.rice.edu/~econ/papers/1999papers/08Brito.pdf
CAMPBELL, Colin J. and LAHERRÈRE, Jean H. (1998) The End of Cheap Oil. ScientificAmerican, March, pp. 78-83.
CHAPMAN, Duane and KHANN, Neha (2001) An Economic Analysis of Aspects ofPetroleum and Military Security in the Persian Gulf. Contemporary Economic Policy,vol. 19, n° 4, pp. 371-381.
CLO, Alberto (2000) Oil Economics and Policy. Boston, Kluwer Academic Publishers.
DEFFEYES, Kenneth S. (2001) Hubbert’s Peak: The Impending World Oil Shortage. Princeton(NJ), Princeton University Press.
Energy Information Administration (2003) World Oil Transit Chokepoints. [On line].http://www.eia.doe.gov/emeu/cabs/choke.html.
FELLER, Gordon (2004) Something to Get Choked up About. PetroMin, April. [On line].http://www.petromin.safan.com/mag/papr04/r14.pdf
GREENE, David L. and TISHCHISHYNA, Nataliya I. (2002) Costs of Oil Dependence: A2000 Update. Oak Ridge National Laboratory, ORNL/TM-2000/152, Oak Ridge (TN).[On line]. http://www-cta.ornl.gov/cta/Publications/pdf/ORNL-TM-2000-152.pdf
5-Rodrigue.pmd 10/02/2005, 11:06373
374 Cahiers de Géographie du Québec ◆ Volume 48, n° 135, décembre 2004
GREENE David L., HOPSON, Janet .L. and LI, Jia (2003) Running Out of and into Oil:Analyzing Global Oil Depletion and Transition through 2050. Oak Ridge NationalLaboratory. [On line]. http://www-cta.ornl.gov/cta/Publications/pdf/ORNL-TM-2003-259.pdf
HAMILTON, James D. (1985) Historical Causes of Postwar Oil Shocks and Recessions.Energy Journal, vol. 6, pp. 97-116.
Institute for the Analysis of Global Security (2003) How much are we paying for a gallon ofgas? [On line]. http://www.iags.org/costofoil.html.
KLARE, Michael T. (2001) Resource Wars: The New Landscape of Global Conflict. New York,Henry Holt and Company.
NINCIC, Donna J. (2002) Sea Lane Security and U.S. Maritime Trade: Chokepoints as ScarceResources. In S.J. Tangredi (dir.) Globalization and Maritime Power, Washington (DC), NationalDefence University, Institute for National Strategic Studies, pp. 143-170.
RATCLIFFE, Mike (1985) Liquid Gold Ships. A History of the Tanker, 1859-1984. London,Lloyd’s of London Press.
RICHARDSON, Michael (2004) A Time Bomb for Global Trade: Maritime-related Terrorismin an Age of Weapons of Mass Destruction. Viewpoints, Singapore, The Institute ofSoutheast Asian Studies. [On line]. http://www.iseas.edu.sg/viewpoint/mricsumfeb04.pdf.
RIFKIN, Jeremy (2002) The Hydrogen Economy. New York, Tarcher & Putnam.
TIMMONS, Heather (2004) Got Oil? Now, Try to Find Tankers to Carry It. New York Times,June 9.
VENN, Fiona (1986) Oil Diplomacy in the Twentieth Century. New York, St. Martin’s Press.
YERGIN, Daniel (1991) The Prize: The Epic Quest for Oil, Money and Power. New York, Simonand Schuster.
5-Rodrigue.pmd 10/02/2005, 11:06374


![Lire quelques passages [7 Histoires / 206]](https://img.pdfslide.fr/doc/110x75/586e08ee1a28abf0508b60f3/lire-quelques-passages-7-histoires-206.jpg)