Embed Size (px)
Citation preview
UNIVERSITÉ DE MONTRÉAL
ÉTUDE DE LA PERFORMANCE DE PILES À COMBUSTIBLE
MICROBIENNES ET L’EFFET DES MATÉRIAUX D’ÉLECTRODES
EDITH MARTIN
DÉPARTEMENT DE GÉNIE CHIMIQUE
ÉCOLE POLYTECHNIQUE DE MONTRÉAL
THÈSE PRÉSENTÉE EN VUE DE L’OBTENTION
DU DIPLÔME DE PHILOSOPHIÆ DOCTOR
(GÉNIE MÉTALLURGIQUE)
AVRIL 2011
© Edith Martin, 2011.
UNIVERSITÉ DE MONTRÉAL
ÉCOLE POLYTECHNIQUE DE MONTRÉAL
Cette thèse intitulée:
ÉTUDE DE LA PERFORMANCE DE PILES À COMBUSTIBLE MICROBIENNES ET
L’EFFET DES MATÉRIAUX D’ÉLECTRODES
Présentée par : MARTIN Edith
en vue de l’obtention du diplôme de : Philosophiæ Doctor
a été dûment accepté par le jury d’examen constitué de :
M.PERRIER Michel, Ph.D., président
M.SAVADOGO Oumarou, D. d’état, membre et directeur de recherche
M.TARTAKOVSKY Boris, Ph.D., membre et codirecteur de recherche
M.SRINIVASAN Bala, Ph.D., membre
M.JUCK David, Ph.D., membre
iii
REMERCIEMENTS
Je tiens à remercier plusieurs personnes qui furent indispensables pour moi tout au long de ce
cheminement en me permettant d’accomplir et de terminer cette thèse par leur présence, leur
soutien, leur assistance et leur encouragement.
Tout d’abord, je remercie mon directeur de recherche, M. Oumarou Savadogo, pour ses conseils
judicieux, son expertise et son savoir, de même que ses incessants encouragements dans les
moments plus difficiles.
Je remercie aussi mon codirecteur de recherche, M. Boris Tartakovsky, pour sa patience, sa
rigueur, sa compétence, sa disponibilité et sa coopération qui m’ont permis de mener ce long
projet à terme.
Je remercie l’École Polytechnique de Montréal, l’Institut de Recherche en Biotechnologie du
Conseil National de Recherches Canada (IRB-CNRC) et le Conseil de Recherches en Sciences
Naturelles et en Génie du Canada (CRSNG) pour avoir permis l’aboutissement de ce diplôme de
doctorat, financièrement et matériellement.
Je tiens à souligner l’appui et l’encouragement de Mmes Michelle-France Manuel, Huimin Tian
et Carole Massicotte qui m’ont épaulée pendant mes essais en laboratoire, que ce soit dans
l’apprentissage du fonctionnement des piles à combustible microbiennes, des techniques et
manipulations pour les essais électrochimiques ou pour tout autre besoin en matière
d’équipement et de matériel. J’ai de plus particulièrement apprécié les longues discussions sur les
évènements et péripéties de la vie. Plusieurs autres personnes m’ont aussi été d’une aide
appréciable en laboratoire, notamment Jérôme Breton, Marc Lacroix, Stéphane Deschamps et
Marie-Josée Lévesque.
iv
Les différentes personnes que j’ai côtoyées, tant à l’École Polytechnique qu’à l’Institut de
Recherche en Biotechnologie, furent une présence très agréable durant mon parcours.
Mes amis et amies ont su m’apporter encouragement mais aussi divertissement, me permettant de
repartir sur une bonne note après une mauvaise période. Je remercie spécialement Mireille &
David (et Leyla!), Daniel & Valérie, Thomas & Élizabeth, David, Colin et Françoise.
Le soutien de ma famille a été tout aussi essentiel à mon équilibre et à ma recherche de sagesse
durant cette période de ma vie, mais je tiens à remercier spécialement ma sœur Céline, son
conjoint Guy et leurs enfants, de même que mes parents et beaux-parents.
Je tiens à souligner la présence de mes deux matous, qui ont su me relaxer de par leurs ronrons et
leur affection inconditionnelle, tout en mettant de la vie dans la maison pendant ma période de
rédaction.
Finalement, un merci tout spécial à Joël, mon conjoint et homme de ma vie, pour toute la
patience et l’encouragement dont il a toujours su faire preuve malgré mes humeurs en montagnes
russes, et pour tout l’amour et la joie dont il sait m’emplir chaque jour. Sans toi, je ne serais pas
rendue où je suis aujourd’hui! Je t’aime!
v
RÉSUMÉ
Les récents changements climatiques ont amené une toute autre dimension au domaine de
l’énergie puisqu’on se doit maintenant de changer ce qui constitue notre source principale, les
carburants fossiles. Des alternatives explorées est survenue la pile à combustible microbienne,
une source d’énergie permettant à la fois l’enlèvement des matières organiques contenues dans
les eaux usées et la génération d’électricité. Fonctionnant avec plusieurs types de composés
organiques, cette technologie prometteuse peut être implantée dans de multiples milieux: usines
d’épuration des eaux usées, exploitations et industries agroalimentaires et installations de pâtes et
papiers. Cette technologie ouvre ainsi la porte à la production universelle d’électricité à bon
marché puisque tout pays génère une quantité substantielle d’eaux usées et de biomasse.
Étant donné la complexité d’un tel système entremêlant microbiologie, électrochimie et
phénomènes d’échange au sein d’un réacteur, il est important d’analyser la performance des piles
microbiennes sous diverses conditions expérimentales. Ce projet a donc pour objectif d’améliorer
la compréhension générale conduisant à la maximisation des performances d’une telle pile. Il est
supposé que le fonctionnement des piles à combustible microbiennes est influencé par les
conditions d’opération de même que par le développement du biofilm et d’autres limitations. Il
est également approprié de présumer que les matériaux d’électrodes ont eux aussi des
conséquences soit sur l’activité des microorganismes ou encore la réactivité de la réaction
électrochimique. Ainsi, diverses conditions d’opération et configurations sont testées pour
permettre d’identifier les effets concrets de ces changements sur la performance des piles. Aussi,
le développement du biofilm est étudié en profondeur sous diverses conditions afin d’améliorer
l’échange d’électrons à l’interface du biofilm actif et de l’anode.
Les expérimentations de ce projet sont effectuées sur une pile microbienne à une seule chambre
et ne contenant pas de membrane à échange ionique, pile inoculée à l’aide de boues anaérobies et
approvisionnée de substrats simples (glucose, acétate). La pile est généralement opérée à
température ambiante et à pH neutre. Le suivi périodique du courant généré par la pile
microbienne tout au long de son opération a permis de noter l’évolution de la croissance du
biofilm anodique ainsi que son activité. Les caractéristiques de la pile (résistance interne et
résistance des électrodes, courant et puissance générés) ont été évaluées à l’aide des techniques
de polarisation et de spectroscopie d’impédance électrochimique. La voltammétrie cyclique a
vi
permis l’observation de l’activité électrochimique des microorganismes électricigènes et la
détermination de leur potentiel d’oxydoréduction, de même que la réversibilité du système ainsi
que sa limitation par la diffusion. Par ailleurs, il est possible d’évaluer les modifications lors de
l’opération des piles sous diverses conditions à l’aide de calculs, soit l’efficience de l’enlèvement
des matières organiques ainsi que le rendement coulombique (efficacité de la transformation de la
charge organique en électricité). Pour se faire, la chromatographie gazeuse est utilisée pour
évaluer la concentration de substrat en solution ou encore la constitution des gaz générés au sein
du réacteur. Finalement, diverses analyses complémentaires nous renseignent quant à la
dispersion, la taille et la forme des microorganismes sur les électrodes (microscopies optique et
électronique) et sur le relâchement d’ions métalliques provenant des cathodes testées
(spectrométrie d’absorption atomique).
Ces expérimentations et analyses ont permis de cibler divers effets pouvant améliorer la
performance de la pile à combustible microbienne. Ainsi, l’influence de la charge organique
(avec glucose et acétate), du pH et de la température d’opération de la pile a été montrée et des
valeurs optimales ont été déterminées, conduisant à une augmentation significative de l’activité
du biofilm anodique et à une diminution de l’activité des méthanogènes, ces derniers réduisant
l’efficacité coulombique en déviant une quantité non négligeable du substrat à leur profit. Or, une
charge organique de 2 à 4 g L-1
jour-1
, un pH entre 6,25 et 6,5 de même qu’une température
élevée à la cathode (62°C) mais modérée à l’anode (30°C) a amené un accroissement de la
puissance maximale générée à 19,2 W m-3
. Durant les expériences effectuées avec l’acétate
comme substrat, la distance entre les électrodes de même que le volume de la pile ont été
diminués, conduisant à une puissance volumique de 92,4 W m-3
. Toutes ces observations font
l’objet du premier article présenté dans cette thèse.
Puisque la puissance générée par la pile est fonction du nombre de microorganismes
électricigènes peuplant le biofilm, cette relation est approfondie dans le second article. Ce
dernier, dont le but était d’étudier le développement du biofilm, met en lumière l’influence de la
vitesse de variation de la charge externe lors de la croissance du biofilm actif. Ainsi, lorsque la
charge externe est ajustée rapidement pour avoisiner la valeur de la résistance interne de la pile,
l’échange d’électrons est favorisé, de même que la prolifération des microorganismes
responsables de la génération de ces électrons. En favorisant la croissance plus rapide des
microorganismes électricigènes, les autres espèces non-électricigènes sont quelque peu
vii
désavantagées et la consommation du substrat participe principalement à la production
d’électricité plutôt que tout autre produit non désiré (ex. : méthane). Cet article démontre aussi
l’influence du degré de développement du biofilm sur la limitation par diffusion de la réaction
anodique, limitation qui s’accentue à mesure que le biofilm croît.
Le troisième article éclaircit la cause de la diffusion du transfert de charge à l’anode. Ainsi, la
variation de la charge organique d’acétate dans des piles microbiennes dont l’anode est formée de
carbone sous forme de feutre (3D) et de papier (2D) de même que la baisse de la conductivité de
l’électrolyte a permis de cibler la diffusion des protons hors du biofilm comme facteur limitant de
la génération de courant. De plus, une réaction électrochimique secondaire a été identifiée à
l’anode, celle-ci créant une augmentation de la résistance de cette électrode et par le fait même,
une légère diminution de la puissance produite. Finalement, les multiples analyses
électrochimiques ont permis d’établir avec une grande certitude que le mécanisme de transfert
d’électrons effectué par les microorganismes électricigènes est par contact direct avec l’anode
soit des microorganismes eux-mêmes ou de la matrice conductrice du biofilm, les cytochromes
étant responsables du transport d’électrons dans les deux cas.
Le dernier article traite de l’évaluation de nouveaux matériaux de cathodes (carbone, Mn2O3 et
Fe2O3) comparativement à une cathode de platine. Ces matériaux ont été choisis pour leur
potentiel à stimuler le développement de microorganismes pouvant influencer l’activité de la
cathode afin d’obtenir une biocathode; toutefois ce phénomène n’a pas été vérifié. Néanmoins, il
a été constaté que les différents matériaux de cathodes effectuaient tous la réduction de l’oxygène
tel qu’observé sur le platine, et que l’activité des catalyseurs cathodiques peut devenir un facteur
limitant important de la performance des piles microbiennes. Or, le Mn2O3 s’est avéré une bonne
voie à explorer comme matériau de remplacement du platine.
Somme toute, le rendement obtenu dans nos expérimentations ne surpasse pas encore les
bioréacteurs générant du méthane à partir d’eaux usées. Aussi, plusieurs aspects doivent être
améliorés afin de voir leur implantation en milieux industriels, soit l’utilisation de matériaux
cathodiques efficaces et peu coûteux ainsi que l’amélioration de la configuration et
l’agrandissement d’une pile à haut rendement. Des alternatives intéressantes se situent au niveau
de leur transposition pour le traitement d’eaux contaminées par certains métaux lourds (uranium,
cuivre) ou pour la génération d’hydrogène à la cathode en imposant de l’électricité au système.
viii
ABSTRACT
Recent climate change has brought a whole new dimension to the energy field since now we must
change our primary source, fossil fuels. The microbial fuel cell (MFC) technology emerged as a
result of recent efforts in the development of alternative sources of energy. The MFC technology
provides organic matter removal in wastewater along with electricity generation. Functioning
with many types of organic compounds, this promising technology may be implemented in
multiple settings: sewage treatment plants, farms and food processing plants and pulp and paper
industries. This technology opens the door to universal and inexpensive electricity production
since every country generates a substantial amount of wastewater and biomass.
Given the complexity of such system combining microbiology, electrochemistry and transport
phenomena in a reactor, it is important to analyze the performance of microbial fuel cells under
various experimental conditions. This project therefore aims to improve the general
understanding that leads to the performance maximization of such cell. It is assumed that the
microbial fuel cells’ functioning is influenced by the operation conditions as well as the biofilm
development and other limitations. It is also appropriate to suppose that the electrode materials
also have consequences on either the microorganisms’ activity or the electrochemical reaction
reactivity. Thus, various operating conditions and configurations are tested to identify the specific
effects of these changes on cell performance. Also, the development of the biofilm is extensively
studied under various conditions to improve the electrons transfer between the active biofilm and
the anode.
Experiments in this project are performed in a membraneless single-chamber microbial cell
inoculated with anaerobic sludge and supplied with simple substrates (glucose, acetate). The cell
is generally operated at room temperature and neutral pH. Periodic monitoring of the current
generated by microbial fuel cell throughout its operation permitted to notice the evolution of
anodic biofilm growth and activity. The cell characteristics (internal and electrodes resistance,
current and power generation) were evaluated using polarization and electrochemical impedance
spectroscopy techniques. Cyclic voltammetry allowed the observation of the electrochemical
activity of anode-reducing microorganisms and determination of their redox potential, as well as
the system reversibility and its diffusion limitation. Moreover, it is possible to evaluate changes
in the fuel cells operation under various conditions using calculations of organic matter removal
ix
effectiveness and coulombic efficiency (conversion efficiency of substrate to electricity). For
these calculations, gas chromatography is used to evaluate the substrate concentration in solution
or the generated gas composition within the reactor. Finally, various further tests show the
distribution, size and shape of microorganisms on the electrodes (light and electron microscopies)
and the release of metal ions from the cathode tested (atomic absorption spectroscopy).
These experiments and analyses permitted to identify various effects that can improve the
microbial fuel cell performance. Thus, the influence of organic load (of glucose and acetate), pH
and operating temperature of the fuel cell has been shown and optimal values were determined,
leading to a significant increase in the anodic biofilm activity and a decrease of the methanogens
activity, the latter reducing the coulombic efficiency by diverting a non-negligible substrate
amount for their benefit. Hence, organic loading of 2 to 4 g L-1
day-1
, pH between 6,25 and 6,5 as
well as high cathode temperature (62 °C) but moderate anode temperature (30 °C) caused a
maximum power generation increase to 19,2 W m-3
. During the experiments with acetate as
substrate, distance between electrodes and fuel cell volume have been reduced, leading to a
power density of 92,4 W m-3
. All these observations are the subject of the first article presented in
this thesis.
Since the microbial fuel cell power generation depends on the number of anode-reducing
microorganisms populating the biofilm, this relationship was deepened in the second manuscript.
This article, which intended to monitor the biofilm development, highlights the influence of
external load changing rate during the active biofilm growth. Thus, when the external load is
adjusted rapidly to approach the cell internal resistance, electrons exchange is enhanced as well
as the proliferation of microorganisms responsible of these electrons generation. By promoting
faster anode-reducing microorganisms growth, other species are somewhat disadvantaged and
substrate consumption is primarily involved in the electricity production rather than any other
unwanted products (eg.: methane). This article also demonstrates the influence of the biofilm
development level on the diffusion limitation of the anodic reaction, a limitation that becomes
more pronounced as the biofilm grows.
The third article clarifies the diffusion limitation of the charge transfer at the anode. Therefore,
the organic load variation of acetate in microbial fuel cells with carbon felt (3D) and carbon
paper (2D) anodes as well as the electrolyte conductivity decrease has targeted protons diffusion
x
out of the biofilm as the current generation limitation. In addition, a secondary electrochemical
reaction has been identified at the anode, creating an electrode resistance increase and thereby a
slight power output decrease. Finally, multiple electrochemical analyses helped to establish with
certainty that the electron transfer mechanism carried out by anode-reducing microorganisms is
by direct contact with the anode via microorganisms themselves or the conductive biofilm matrix,
cytochromes being responsible for the electrons transport in both cases.
The last manuscript deals with new cathode materials (carbon, Mn2O3 and Fe2O3) evaluation in
comparison to a platinum cathode. These materials were chosen for their potential to stimulate
the proliferation of microorganisms capable of influencing cathode activity in order to obtain a
biocathode; however, this phenomenon has not been verified. Nevertheless, it was found that the
different cathode materials were all performing oxygen reduction reaction as observed with
platinum, and that cathodic catalysts activity can become a major limiting factor of microbial cell
performance. However, the Mn2O3 was found to be a good alternative to investigate as platinum
replacement material.
Overall, the performance obtained in our setup does not yet surpass bioreactors that generate
methane from wastewater. Also, several aspects should be improved in order to see their
implementation in industries, for instance the use of effective and inexpensive cathode materials
as well as the setup improvement and the enlargement of a high performance microbial fuel cell.
Interesting alternatives reside in their transposition for treatment of heavy metals contaminated
water (uranium, copper) and for hydrogen generation at the cathode by injecting electricity in the
system.
xi
TABLE DES MATIÈRES
REMERCIEMENTS ..................................................................................................................... III
RÉSUMÉ ........................................................................................................................................ V
ABSTRACT ............................................................................................................................... VIII
TABLE DES MATIÈRES ............................................................................................................ XI
LISTE DES TABLEAUX ........................................................................................................... XV
LISTE DES FIGURES .............................................................................................................. XVII
LISTE DES SIGLES ET ABRÉVIATIONS .............................................................................. XX
INTRODUCTION ........................................................................................................................... 1
CHAPITRE 1 REVUE DE LITTÉRATURE ............................................................................. 6
1.1 Fonctionnement d’une pile à combustible microbienne .................................................. 6
1.2 Inoculum, micro-organismes électricigènes et substrats ................................................ 10
1.2.1 Inoculum à population mixte ...................................................................................... 10
1.2.2 Souches pures de micro-organismes électricigènes ................................................... 12
1.2.3 Substrats utilisés comme combustibles ...................................................................... 14
1.3 Opération et configurations des piles à combustible microbiennes ............................... 15
1.3.1 Modes et conditions d’opération des piles ................................................................. 15
1.3.2 Configurations des piles ............................................................................................. 16
1.4 Matériaux d’électrodes employés dans les piles microbiennes ...................................... 19
1.4.1 Matériaux d’anodes .................................................................................................... 19
1.4.2 Matériaux de cathodes ................................................................................................ 23
1.4.2.1 Cathodes abiotiques ............................................................................................ 24
1.4.2.2 Biocathodes ........................................................................................................ 28
1.5 Aspects électrochimiques des piles à combustible microbiennes .................................. 32
xii
CHAPITRE 2 DÉMARCHE ET ORGANISATION DE LA RECHERCHE .......................... 37
CHAPITRE 3 THE INFLUENCE OF OPERATIONAL CONDITIONS ON THE
PERFORMANCE OF A MICROBIAL FUEL CELL SEEDED WITH MESOPHILIC
ANAEROBIC SLUDGE ............................................................................................................... 41
3.1 Abstract .......................................................................................................................... 41
3.2 Introduction .................................................................................................................... 41
3.3 Materials and methods ................................................................................................... 42
3.3.1 MFC design and operation ......................................................................................... 42
3.3.2 Inoculum, media composition, and analytical methods ............................................. 44
3.3.3 Electrical measurements and calculations .................................................................. 44
3.4 Results ............................................................................................................................ 45
3.4.1 Glucose tests ............................................................................................................... 45
3.4.2 Acetate tests ................................................................................................................ 49
3.4.3 pH-stat tests ................................................................................................................ 51
3.4.4 Temperature tests ....................................................................................................... 53
3.5 Discussion ...................................................................................................................... 54
3.6 Conclusion ...................................................................................................................... 59
3.7 Acknowledgments .......................................................................................................... 59
3.8 References ...................................................................................................................... 59
CHAPITRE 4 ELECTROCHEMICAL CHARACTERIZATION OF ANODIC BIOFILM
GROWTH IN A MICROBIAL FUEL CELL ............................................................................... 63
4.1 Abstract .......................................................................................................................... 63
4.2 Introduction .................................................................................................................... 63
4.3 Materials and methods ................................................................................................... 64
4.3.1 MFC design and operation ......................................................................................... 64
xiii
4.3.2 Inoculum, media composition and analytical methods .............................................. 65
4.3.3 Protein measurements ................................................................................................ 65
4.3.4 Electrochemical measurements .................................................................................. 66
4.4 Results and discussion .................................................................................................... 67
4.5 Conclusion ...................................................................................................................... 77
4.6 Acknowledgement .......................................................................................................... 78
4.7 References ...................................................................................................................... 78
CHAPITRE 5 ELECTROCHEMICAL STUDY OF THE EFFECT OF THE ANODIC
BIOFILM LIMITATIONS ON THE PERFORMANCES OF MICROBIAL FUEL CELLS ..... 81
5.1 Abstract .......................................................................................................................... 81
5.2 Introduction .................................................................................................................... 81
5.3 Materials and methods ................................................................................................... 82
5.3.1 MFC design and operation ......................................................................................... 82
5.3.2 Inoculum, media composition and analytical methods .............................................. 83
5.3.3 Electrochemical measurements .................................................................................. 84
5.4 Results ............................................................................................................................ 86
5.4.1 Effect of acetate concentration ................................................................................... 86
5.4.2 Effect of electrolyte conductivity ............................................................................... 89
5.4.3 Effect of external load ................................................................................................ 92
5.5 Discussion ...................................................................................................................... 94
5.5.1 MFC resistance evaluation ......................................................................................... 94
5.5.2 Anodic secondary electrochemical process ................................................................ 95
5.5.3 Concentration losses – current density limitation ...................................................... 96
5.5.4 Electron transfer mechanism and limitations ............................................................. 98
5.6 Conclusion .................................................................................................................... 100
xiv
5.7 Acknoledgement ........................................................................................................... 101
5.8 References .................................................................................................................... 101
CHAPITRE 6 CATHODE MATERIALS EVALUATION IN MICROBIAL FUEL CELLS:
A COMPARISON OF CARBON, Mn2O3, Fe2O3 AND PLATINUM MATERIALS ............... 106
6.1 Abstract ........................................................................................................................ 106
6.2 Introduction .................................................................................................................. 106
6.3 Materials and methods ................................................................................................. 108
6.3.1 Cathode preparation ................................................................................................. 108
6.3.2 MFC design and operation ....................................................................................... 108
6.3.3 Inoculum and media composition ............................................................................ 110
6.3.4 Electrochemical measurements ................................................................................ 110
6.3.5 Analytical methods and calculations ........................................................................ 112
6.4 Results .......................................................................................................................... 113
6.5 Discussion .................................................................................................................... 121
6.6 Conclusion .................................................................................................................... 126
6.7 Acknowledgements ...................................................................................................... 127
6.8 References .................................................................................................................... 127
CHAPITRE 7 DISCUSSION GÉNÉRALE ........................................................................... 132
7.1 Conditions d’opération et configuration des piles ........................................................ 132
7.2 Anodes et cathodes ....................................................................................................... 139
7.3 Synthèse des résultats ................................................................................................... 143
CONCLUSION ET RECOMMANDATIONS ........................................................................... 149
RÉFÉRENCES ............................................................................................................................ 152
xv
LISTE DES TABLEAUX
Tableau 1.1 : Matériaux testés à l’anode dans les piles à combustible microbiennes .................... 22
Tableau 1.2 : Matériaux de cathodes abiotiques testés dans les piles à combustible microbiennes
................................................................................................................................................ 26
Tableau 1.2 : Matériaux de cathodes abiotiques testés dans les piles à combustible microbiennes
(suite et fin) ............................................................................................................................ 27
Table 3.1: Operational conditions and MFC-1 performance observed in glucose, pH, and
temperature tests. The MFC was operated at Rext = 200 Ω ................................................. 49
Table 3.2: Dependence of MFC-2 performance on acetate load and acetate concentration in the
anodic chamber. MFC was operated at Rext= 35 Ω ................................................................ 51
Table 3.3: MFC-1 performance during temperature tests. The underlined values indicate
temperature set points and the thermocouple used for temperature control .......................... 54
Table 4.1: Characterization of MFC1 and MFC2 operated with a fast adjustment of Rext resulting
in Rext ~ Rint ............................................................................................................................ 68
Table 4.2: Characterization of MFC3 and MFC4 operated with a slow adjustment of Rext resulting
in Rext >> Rint .......................................................................................................................... 69
Table 5.1: Operating conditions tested in each MFC ..................................................................... 84
Table 5.2: MFCs characterization of carbon paper (MFC1) and carbon felt (MFC2) at various
OLR ........................................................................................................................................ 87
Table 5.3: Characterization under low and standard electrolyte conductivity in MFC2 and MFC4
................................................................................................................................................ 90
Table 5.4: Characterization of MFC3 under Rext of 30 and 100 Ω ................................................ 92
Table 5.5: MFC3 anode resistance by EIS characterization under operational external load (Rext)
of 30 and 100 Ω during polarization curves ........................................................................... 94
Table 6.1: Electrochemical parameters of cathodic materials under atmospheres of air and O2 . 114
xvi
Table 6.2: ORR onset potentials of cathodic materials under atmospheres of O2 and N2 in a half-
cell ........................................................................................................................................ 116
Table 6.3: COD removal and coulombic efficiency (CE) of cathodic materials under atmospheres
of air and O2 ......................................................................................................................... 120
Table 6.4: Iron and manganese concentrations in MFC and half-cell solutions for C, Fe2O3 and
Mn2O3 cathodes .................................................................................................................... 121
Tableau 7.1 : Puissance, taux de méthane produit et efficacité obtenus en variant la charge
organique dans deux types de piles à combustible microbiennes ........................................ 133
Tableau 7.2 : Puissance, taux de méthane produit et efficacité obtenus en variant le pH ........... 135
Tableau 7.3 : Puissance, taux de méthane produit et efficacité obtenus en variant la température
des électrodes ....................................................................................................................... 136
Tableau 7.4 : Puissance et efficacité obtenues en variant la conductivité de l’électrolyte .......... 138
Tableau 7.5 : Puissance et efficacité obtenues en opérant la pile à différentes charges externes 139
Tableau 7.6 : Puissance et efficacité obtenues avec des anodes de feutre et de papier de carbone
.............................................................................................................................................. 140
Tableau 7.7 : Puissance et efficacité obtenues avec des cathodes de carbone, Fe2O3, Mn2O3 et Pt
.............................................................................................................................................. 142
Tableau 7.8 : Comparaison de la puissance de piles à combustible microbiennes ...................... 145
Tableau 7.9 : Comparaison de la puissance de différentes cathodes de carbone ......................... 146
Tableau 7.10 : Comparaison de la puissance de différentes cathodes d’oxydes de manganèse .. 147
Tableau 7.11 : Comparaison de la puissance de différentes cathodes à base de fer .................... 148
Tableau 7.12 : Comparaison de la puissance de différentes cathodes de platine dans des piles
microbiennes de configuration et conditions d’opération similaires ................................... 148
xvii
LISTE DES FIGURES
Figure 1-1 : Exemple de transport intracellulaire d’électrons (Omc : cytochrome de la membrane
externe; Ppc : cytochrome périplasmique) ............................................................................... 7
Figure 1-2 : Fonctionnement d’une pile à combustible microbienne ............................................... 8
Figure 1-3 : Mécanismes de transfert des électrons à l’anode via : A) nanofils, B) médiateurs
externes et C) par transfert direct via protéines intramembranaires ......................................... 9
Figure 1-4 : Mécanismes de transfert d’électrons au sein d’un biofilm issu d’un consortium : A)
via un médiateur produit par la bactérie; B) via cytochrome où la bactérie électricigène
oxyde un sous-produit généré par une autre espèce; C) via médiateur produit par une autre
espèce; et D) via contact direct d’un cytochrome ou de nanofils ........................................... 11
Figure 1-5 : Divers designs de piles à combustible microbiennes ................................................. 18
Figure 1-6 : Anodes formées de fibres de carbone sous forme de brosse (A) et de feutre (B) (C :
grossissement de 150X) ......................................................................................................... 20
Figure 1-7 : Biocathode où s’effectuent la réduction et la déposition du MnO2 ........................... 30
Figure 1-8 : Courbe de polarisation d’une pile à combustible microbienne (noire) et pertes
associées : activation (rouge), ohmiques (vert) et concentration (bleu) ................................. 34
Figure 2-1 Résumé de la démarche et de l’organisation de la thèse .............................................. 38
Figure 3-1: Diagram of continuous flow MFC setup (left panel) and anodic chamber diagram
showing positions of heaters, thermocouples, and electrodes (right panel) ........................... 43
Figure 3-2: Polarization (A) and power (B) curves obtained at different organic loads of glucose
in MFC-1. The curves were acquired by decreasing external resistance from 5000 to 5 Ω
with 10 min intervals between resistance changes ................................................................. 47
Figure 3-3: The effect of organic load in MFC-1 on (A) cell internal resistance, power generation
at optimal Rext, and (B) substrate flux distribution for electricity and methane production.
Pmax and Rint were estimated in polarization tests (Fig. 3-2) performed at each organic load.
Substrate fluxes were estimated based on a methane yield of 0,35 L g-COD-1
and an electron
yield of n=24 for glucose. All tests were carried out at pH 7 (OLR: organic load rate) ....... 48
xviii
Figure 3-4: Polarization (A) and power (B) curves obtained in MFC-2 at different organic loads
of acetate. Electrode potentials were acquired against an Ag/AgCl reference electrode using
a potentiostat .......................................................................................................................... 50
Figure 3-5: The effect of pH on (A) cell internal resistance, power generation at optimal Rext, and
(B) substrate flux distribution for electricity and methane production. All tests were carried
out in MFC-1 at a glucose load of 1,9 g -1
AL day-1
................................................................... 52
Figure 3-6: Approximation of power and methane production rates observed in the glucose fed
MFC-1 (A), and acetate-fed MFC-2 (B) by Andrews (power output) and Monod (methane
production) dependencies. Power outputs obtained in polarization tests at Rext=Rint were
used for the approximation ..................................................................................................... 56
Figure 4-1: A two time-constant model ........................................................................................ 67
Figure 4-2: Anode polarization (A,C) and power (B, D) curves obtained during polarization tests
in MFC2 operated at Rext ~ Rint (A,B) and in MFC4 operated at Rext > Rint (C,D) ................ 71
Figure 4-3: (A) Measurements of time-related evolution of protein concentration at the anode and
current density; (B) anode OCP and Rint measurements. MFC2 and MFC5 were operated at
Rext ~ Rint, while MFC3 and MFC4 were operated at Rext > Rint ............................................ 72
Figure 4-4: Anode EIS spectra observed during (A) days 0-15; and (B) days 15-28 of MFC2
operation ................................................................................................................................. 73
Figure 4-5: Cyclic voltammograms of anode obtained during MFC2 (Rext ~ Rint) (A) and MFC4
(Rext > Rint) (B) operation. CVs were acquired at a scan rate of 100 mV s-1
.......................... 75
Figure 4-6: Anodic peak current density (ip,a) acquired during CV tests at 50 mV s-1
for MFC2
operated at Rext ~ Rint and MFC4 operated at Rext > Rint ........................................................ 76
Figure 4-7: Dependence of the normalized anodic peak current density (i/imin) on the square root
of the scan rate measured during MFC4 test (Rext > Rint) ...................................................... 77
Figure 5-1: Polarization (A, C) and power curves (B) of MFC1 under various OLRs .................. 88
Figure 5-2: EIS spectra of MFC1 (A) and MFC2 (B) at various OLRs ......................................... 89
Figure 5-3: Cyclic voltammograms of MFC2 during acetate exhaustion at time 0 and after 3, 6,
12 and 24 hours (scan rate of 50 mV s-1
) ............................................................................... 90
xix
Figure 5-4: Dependence of the normalized anodic peak current density (ip, a/ip,a,min) with the
square root of the scan rate for MFC 2 (A, B, D) and MFC3 (C) at various OLRs (A), during
acetate exhaustion (B, C) and at low electrolyte conductivity (D) ........................................ 91
Figure 5-5: Polarization (A) and power (B) curves of MFC3 operated at Rext of 30 and 100 Ω ... 93
Figure 5-6: Cyclic voltammograms of MFC3 before and after biofilm damage caused by high
cathodic counter current generation (scan rate of 5 mV s-1
) ................................................ 100
Figure 6-1: MFC setup diagram showing external resistance (Rext), recirculation loop, influent
and gas entries, effluent and gas exits, anodic windowed plate (1), anode (2), J-cloth
(3),
cathode (4), cathodic windowed plate (5) and closing plates (6 and 7) ............................... 109
Figure 6-2: Three time constants equivalent circuit for EIS data fitting ...................................... 111
Figure 6-3: EIS spectra of cathodes inserted in MFCs ................................................................. 115
Figure 6-4: Voltammograms of cathode materials at 5 mV/s, 10 days after insertion (inset: Mn2O3
reduction peak into Mn2+
) .................................................................................................... 116
Figure 6-5: Polarization (A) and power (B) curves of cathodic materials in air 10 days after
insertion in MFCs ................................................................................................................. 118
Figure 6-6: Polarization (A) and power (B) curves and electrodes potential (C) during
polarization of Fe2O3 cathode in air, N2 and O2 atmospheres .............................................. 119
xx
LISTE DES SIGLES ET ABRÉVIATIONS
t Intervalle de temps [s]
Surtension [Ω]
Vitesse de balayage [V s-1
]
b Pente de Tafel
i Densité de courant [A m-2
]
i0 Densité de courant limite [A m-2
]
km, S Constante de demi-saturation de la production de méthane [mg L-1
]
kp,I Constante d’inhibition de la puissance produite [mg L-1
]
kp,S Constante de demi-saturation de la puissance produite [mg L-1
]
n Nombre d’électrons par mole de substrat [e- mol
-1]
pH Potentiel hydrogène
pm Puissance volumétrique maximale [W m-3
]
Taux de production de méthane [ L
-1 jour
-1]
rm Taux volumétrique maximale de production de méthane [ L
-1 jour
-1]
AGV Acides gras volatiles
CEA Rendement coulombique apparent (Apparent Coulombic Efficiency)
COD Demande chimique en oxygène (Chemical Oxygen Demand)
CPE Élément de phase constant (Constant Phase Element)
CV Voltammétrie cyclique (Cyclic Voltammetry)
E0 Potentiel théorique dans les conditions standards [V]
EIS Spectroscopie d’impédance électrochimique (Electrochemical Impedance
Spectroscopy)
xxi
Efem Force électromotrice d’une pile
Emesuré
Potentiel mesuré expérimentalement [V]
EMFC Potentiel de la pile à combustible microbienne [V]
ENH Électrode normale à hydrogène
EOCP Potentiel en circuit ouvert (open circuit potential) [V]
Eredox Potentiel d’oxydo-réduction [V]
ESEM Microscope électronique à balayage à chambre environnementale (Environmental
Scanning Electron Microscope)
Eth
Potentiel théorique dans les conditions d’expérimentations [V]
EVCO Voltage (ou tension) en circuit ouvert [V]
Ework Potentiel de travail [V]
F Constante de Faraday [C mol-1
]
FL Taux de circulation de liquide [L s-1
]
FRA Analyseur de réponse en fréquence (Frequency Response Analyzer)
GC Chromatographie gazeuse (Gas chromatography)
GDE Électrode à diffusion gazeuse (Gas Diffusion Electrode)
HPLC Chromatographie liquide à haute performance (High-Performance Liquid
Chromatography)
I Courant [A, A m-2
]
M Masse moléculaire [g]
MFC Pile à combustible microbienne (Microbial Fuel Cell)
NHE Électrode normale à hydrogène (Normal Hydrogen Electrode)
OCP Potentiel en circuit ouvert (Open Circuit Potential) [V]
OCV Voltage en circuit ouvert (Open Circuit Voltage) [V]
ORR Réaction de réduction de l’oxygène (Oxygen Reduction Reaction)
xxii
PDA Détecteur à photodiodes (PhotoDiode Array)
P Puissance produite [W m-3
]
Pmax Puissance maximale [W, W m-3
]
PT Test de polarisation (Polarization Test)
R Constante universelle des gaz parfaits [J mol-1
K-1
]
RA Résistance de l’anode [Ω]
RC Résistance de la cathode [Ω]
Rct Résistance au transfert de charge []
Rext Résistance (ou charge) externe [Ω]
Rint Résistance interne [Ω]
Roth
Autre résistance []
Rs Résistance de la solution []
RΩ Résistance ohmique [Ω]
S Concentration du substrat dans la majeure partie de la solution [g L-1
]
SCE Électrode à calomel saturé (Saturated Calomel Electrode)
Sin Concentration du substrat dans l’affluent [g L-1
]
T Température [K, °C]
V Voltage (ou tension) [V]
Vapp Potentiel appliqué [V]
VCO Voltage (ou tension) en circuit ouvert [V]
VFA Acides gras volatiles (Volatile Fatty Acids)
VSS Solides volatiles en suspension (Volatile Suspended Solids)
W Quantité de substrat consommé [g]
WE Quantité de substrat équivalent
1
INTRODUCTION
Durant les dernières années, le besoin de diminuer notre dépendance aux hydrocarbures s’est fait
de plus en plus pressant. Nous ressentons progressivement l’urgence de mettre fin à cette ère de
l’énergie fossile puisque la disponibilité de ce combustible est particulièrement réduite et que son
extraction nécessite des technologies plus avancées, polluantes et parfois dévastatrices sur
l’environnement, causant au bout du compte l’augmentation du prix du baril de pétrole. De plus,
cette source d’énergie génère des gaz à effets de serre lors de sa combustion, agissant ainsi sur les
changements climatiques qui perturbent à leur tour l’environnement et les écosystèmes fragiles
de notre planète exceptionnelle à l’équilibre précaire.
L’avènement récent de sources énergétiques relativement non polluantes et renouvelables, tels le
vent, l’eau, les marées et le soleil, a ouvert la porte à une approche énergétique moderne. La
recherche innove ainsi promptement en ce sens, ces sources étant de plus en plus exploitées et de
nouvelles étant aussi prospectées. C’est ainsi que les déchets organiques liquides et solides,
souvent difficiles à traiter, sont désormais une source originale d’énergie sous diverses formes, et
ce, en ayant établi une collaboration étroite entre l’ingéniosité humaine et certaines aptitudes
bactériennes surprenantes.
Les avantages de cette coopération technologie/bactéries sont édifiants. D’abord, les déchets
organiques solides et liquides sont une des ressources les plus abondantes, naturelles et
universelles. Deuxièmement, les micro-organismes sont des agents fort travaillants ne nécessitant
qu’un environnement propice à leur croissance et leur bonne métabolisation, soit nutriments et
minéraux. Finalement, plusieurs bactéries possèdent la capacité de produire soit du méthane, de
l’hydrogène ou encore de l’électricité, trois sources d’énergie devenant ainsi accessibles et
abordables avec l’utilisation de systèmes optimisés et performants.
La génération d’électricité par des micro-organismes dégradant des composés organiques a été
démontrée au début du vingtième siècle par Michael Cresse Potter (Potter, 1911). Cette
découverte a perdu de son intérêt pendant plusieurs années, mais a gagné beaucoup d’attention
pendant l’exploration spatiale, ce projet de recherche ayant été récupéré par la NASA qui
cherchait à recycler les déchets humains (Schroder, 2007). Dans les deux dernières décennies,
plusieurs équipes de recherche se sont tournées vers cette alternative étonnante et d’immenses
progrès ont été faits au niveau entre autres des dispositifs utilisés et des micro-organismes
2
électricigènes (pouvant générer de l’électricité), augmentant substantiellement la quantité
d’énergie pouvant être produite (Franks & Nevin, 2010). Cette propriété exceptionnelle a conduit
au développement de réacteurs biologiques générant de l’électricité appelés « piles à combustible
microbiennes ».
Une pile à combustible microbienne est un système permettant de coupler le traitement d’eaux
usées riches en matières organiques et inorganiques avec la génération d’électricité. Comme son
nom l’indique, le système étudié est une pile, donc elle comporte deux bornes (ou électrodes),
l’anode et la cathode. Les micro-organismes jouent ici le rôle de catalyseurs à une des électrodes
de la pile, dégradant toutes substances pouvant leur être utiles et excrétant par la suite des
produits qui seront utilisés à leur tour à l’autre électrode. Il est à noter que le terme catalyseur
n’est pas tout-à-fait approprié puisque les bactéries conservent une partie de l’énergie générée par
la dégradation des composés organiques pour combler leurs propres besoins (Schroder, 2007).
Le fonctionnement des piles à combustible microbiennes repose conséquemment sur des
réactions (bio)électrochimiques siégeant à l’anode et à la cathode (les détails de leur
fonctionnement seront traités ultérieurement dans le chapitre 1). Plusieurs facteurs agissent sur
les réactions anodiques et cathodiques, et par le fait même, sur la performance générale des piles
microbiennes. Ainsi, l’atteinte des objectifs poursuivis dans le présent travail de recherche se fera
principalement en utilisant des techniques électrochimiques reconnues et employées pour la
caractérisation des piles et piles à combustible, permettant de cibler les diverses influences et
leurs effets sur les réactions électrochimiques, donc sur la puissance électrique pouvant être
ultimement générée par les piles microbiennes étudiées.
Tel que mentionné précédemment, plusieurs changements apportés aux piles microbiennes ont
permis l’amélioration notable des performances des systèmes. Par contre, plusieurs des aspects
modifiés sont spécifiques au design ou aux conditions d’opération des réacteurs utilisés, d’où la
nécessité d’étudier sous plusieurs angles le système qui sera employé pour la présente étude afin
d’en optimiser son fonctionnement. Les objectifs principaux de ce projet sont donc :
d’évaluer les performances de la pile à combustible microbienne utilisée en laboratoire en
identifiant ses limitations sous diverses conditions;
d’étudier les réactions électrochimiques et phénomènes de transfert de charges qui siègent
aux électrodes, soit à l’anode et la cathode.
3
Les facteurs et limitations pouvant modifier le fonctionnement des piles microbiennes sont reliés
entre autres à la réactivité des (bio)catalyseurs ou des matériaux d’électrodes ainsi qu’à diverses
conditions d’opération. Afin d’atteindre les deux objectifs principaux, plusieurs objectifs
spécifiques ont donc été établis, soit :
l’étude de la puissance générée par la pile à combustible microbienne, ses limitations
(pertes causées par la résistance interne de la pile et le transport des différentes espèces)
ainsi que son efficacité (enlèvement des matières organiques, efficacité électrique) en
diverses situations:
o conditions d’opération : variation de la concentration du substrat, du pH, de la
conductivité, de la température de l’électrolyte et de la charge externe entre
l’anode et la cathode;
o lors du développement du biofilm selon deux vitesses d’ajustement de la charge
externe;
o avec divers matériaux d’anodes (papier ou feutre de carbone) et de cathodes (Pt,
Fe2O3, Mn2O3 et C);
l’étude des réactions et phénomènes siégeant aux électrodes:
o en fonction du développement du biofilm;
o en fonction des matériaux d’électrodes utilisés (structure, composition).
Les multiples expérimentations et résultats issus du présent travail de recherche seront donc
synthétisés et exposés dans cette thèse en plusieurs chapitres. Le premier chapitre présentera une
revue critique de la littérature afin d’expliquer toute la théorie se rapportant au sujet traité. Y sera
expliqué entre autres le fonctionnement détaillé de la pile à combustible microbienne, les micro-
organismes impliqués et les substrats pouvant être dégradés par ces derniers, de même que les
différentes configurations des réacteurs, les matériaux d’électrodes utilisés jusqu’à présent et les
aspects électrochimiques nécessaires à la compréhension de la thèse.
Les chapitres subséquents seront composés de quatre articles scientifiques. Le premier article vise
à apporter une meilleure compréhension de diverses conditions d’opération influençant les
performances du type de pile à combustible microbienne étudié, observations pouvant être
transposées à certains autres types de piles microbiennes. Les variations de ces conditions
4
permettront d’identifier la compétition entre les populations électricigènes et méthanogènes
toutes deux présentes au sein du réacteur, de même que de cibler l’effet des diverses conditions
sur l’un et l’autre des types de micro-organismes. Ainsi, la concentration en substrat (glucose,
acétate), le pH et la température de l’électrolyte sont variés sur une gamme de valeurs tout en
effectuant le suivi des performances des piles microbiennes (courant et puissance générés,
résistance interne) ainsi que des taux d’enlèvement de matières organiques et de production de
méthane. Connaissant les conséquences des conditions d’opération, il est possible d’optimiser la
génération d’électricité des piles à combustible microbiennes en favorisant les espèces
électricigènes et en limitant la méthanogénèse. Cette étude a aussi démontré l’utilité de diminuer
la distance entre les électrodes de même que le volume de la pile, conduisant à une plus grande
puissance volumique générée par la pile microbienne.
Le second article contribue à mieux cerner le développement du biofilm formé à l’anode selon
des conditions d’opération différentes, le biofilm anodique étant l’élément clé de toutes piles
microbiennes. Ainsi, l’influence de la vitesse d’ajustement de la charge externe reliant l’anode et
la cathode sur l’activité des microorganismes responsables de la génération d’électricité sera
étudiée par diverses techniques électrochimiques. Une adaptation rapide de la charge externe afin
qu’elle s’approche de la résistance interne de la pile microbienne et un ajustement lent de cette
même charge sont effectués. Ces variations permettent d’identifier le rôle de l’aptitude de l’anode
à capter les électrons générés et son influence sur le développement des diverses espèces
microbiennes, de même que la variation des performances découlant de ces deux modes
d’opération (courant et puissance, résistance de la pile et des électrodes, limitations causées par la
diffusion, enlèvement de l’acétate). Puisque cette étude mène à une meilleure connaissance de
l’impact de la vitesse d’ajustement de la charge externe sur l’activité du biofilm anodique, il
devient encore une fois possible d’optimiser les performances des piles à combustible
microbiennes en favorisant la croissance et la prolifération des espèces électricigènes au sein du
biofilm formé lors du démarrage de la pile.
Le troisième article porte sur l’analyse approfondie par techniques électrochimiques des
performances et limitations de la pile microbienne dont le biofilm anodique est à maturité, et ce,
en fonction de la variation de certaines conditions d’opération. De plus, deux matériaux
anodiques, soit du carbone sous forme de feutre et de papier, seront testés afin d’évaluer
l’influence de la géométrie de l’anode (2D vs 3D). Ainsi, la variation de la concentration
5
d’acétate de l’affluent pour les deux types d’anode, le changement de la conductivité de l’affluent
ainsi que l’effet de la charge externe seront évalués dans des piles microbiennes. Ces
modifications permettent de déterminer leur effet sur les processus électrochimiques siégeant aux
électrodes, leur influence sur les limitations par la diffusion au sein du biofilm et sur la
performance générale des piles microbiennes (courant et puissance, résistance, etc.). Ces
connaissances peuvent contribuer au perfectionnement des systèmes en optimisant les conditions
d’opération de même qu’en améliorant certains aspects du design, tout ceci dans le but de réduire
les limitations dues à la diffusion qui conduiront à un meilleur fonctionnement des piles à
combustible microbiennes.
Le dernier article porte sur l’essai de trois matériaux de cathode comme alternative au platine
visant à stimuler le développement de biocathodes. Ainsi, des cathodes conçues en laboratoire
comportant des poudres de carbone et des oxydes de manganèse (Mn2O3) et de fer (Fe2O3) sont
installées dans des piles microbiennes. Seront évaluées par la suite la réaction cathodique de
même que la performance des électrodes en fonction du temps (puissance, résistance, etc.) afin de
noter une amélioration ou une diminution de l’activité de la cathode. Ces résultats permettent de
conclure quant à l’effet du biofilm cathodique aérobie s’étant formé à sa surface et son possible
rôle sur la réaction de réduction de l’oxygène ayant lieu à la cathode. Ces observations
contribueront à améliorer le développement de nouveaux matériaux cathodiques à base de
métaux non nobles pouvant effectuer la réduction de l’oxygène.
Le chapitre final consiste en une discussion générale faisant ressortir les résultats clés ayant
découlés de ces expérimentations tout en les reliant à la littérature, appuyant ou non certaines
observations et théories ayant été émises sur les piles microbiennes. De plus, le potentiel de cette
technologie relativement nouvelle sera évalué en rapport à d’autres méthodes de production
d’électricité considérées comme des alternatives « vertes ». Suivront finalement des
recommandations basées sur les résultats obtenus, permettant d’orienter des recherches futures
sur les piles à combustibles microbiennes tant sur le choix du design du système, de
l’optimisation des conditions d’opération que des nouveaux matériaux de cathodes.
6
CHAPITRE 1 REVUE DE LITTÉRATURE
Plusieurs éléments influencent le fonctionnement des piles à combustible microbiennes, c’est
pourquoi il est essentiel d’explorer toutes les facettes de ce système. Effectivement, tant le design
du réacteur, les matériaux utilisés que les micro-organismes électricigènes peuvent affecter la
puissance générée (Pham, Aelterman & Verstraete, 2009). Ainsi, le présent chapitre s’applique à
décrire plus en détails le fonctionnement des piles à combustible microbiennes, les sources et
types de micro-organismes utilisés pour inoculer les réacteurs de même que les substrats
(combustibles) pouvant approvisionner les micro-organismes. De plus, les différents modes
opératoires et configurations des piles microbiennes, de même que les matériaux d’électrodes
employés seront approfondis, et les aspects électrochimiques étudiés au cours de la thèse seront
éclaircis.
1.1 Fonctionnement d’une pile à combustible microbienne
Tel que brièvement exposé en introduction, la pile à combustible microbienne est un dispositif
utilisant comme catalyseurs les bactéries qui forment un biofilm à l’anode et y oxydent les
matières organiques et inorganiques avec l’ultime objectif de générer un courant électrique. Cette
propriété est possible grâce à la respiration intracellulaire effectuée par les micro-organismes,
processus leur permettant de subvenir à leur besoins énergétiques (Franks, Malvankar & Nevin,
2010; Schroder, 2007).
Pendant la métabolisation des composés organiques par les micro-organismes, les substrats sont
oxydés, produisant ainsi des électrons (e-) à l’intérieur de la bactérie. Ceux-ci sont par la suite
éjectés de la cellule par une multitude de réactions cellulaires jusqu’au dernier échange avec
l’accepteur final d’électron, situé à l’extérieur de la bactérie (Logan et al., 2006; Shukla, Suresh,
Berchmans & Rajendran, 2004). La chaîne respiratoire intracellulaire transportant les électrons et
les protons peut comporter la déshydrogénase, les quinones, les coenzymes Q, les protéines
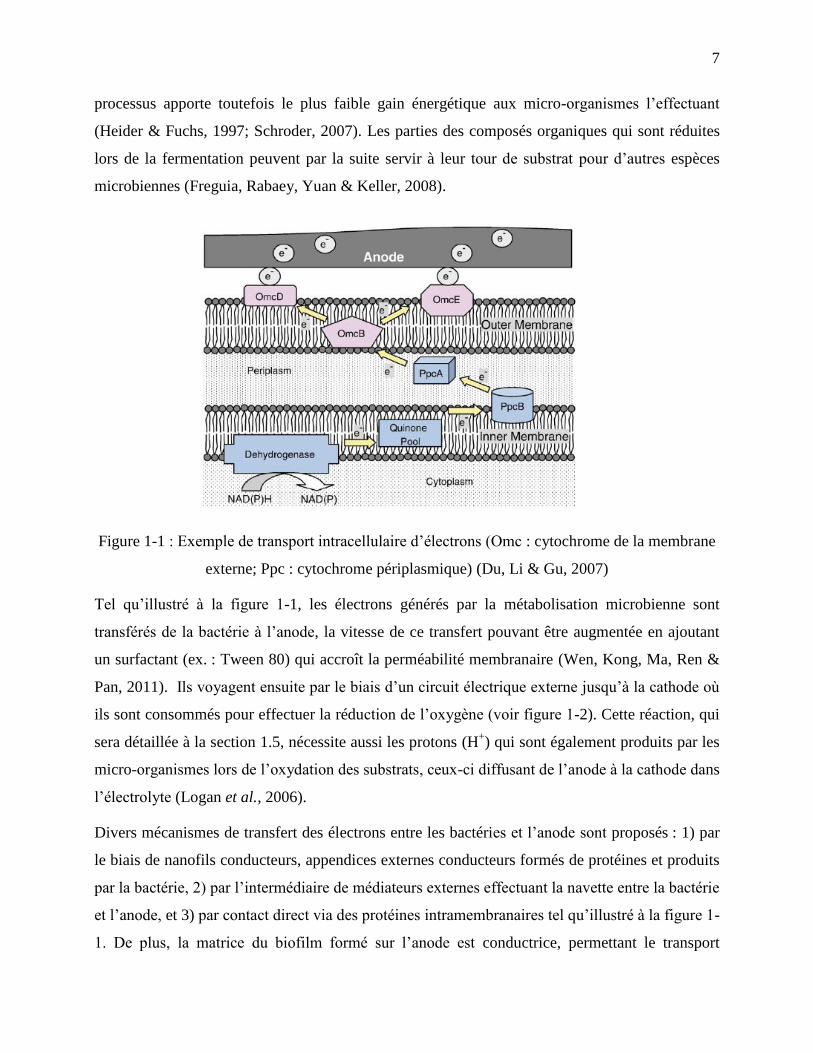
fer/soufre et les cytochromes (Rabaey & Verstraete, 2005). La figure 1-1 présente le schéma d’un
exemple de transport intracellulaire des électrons au sein de micro-organismes.
Les composés organiques peuvent aussi être fermentés, dépendamment de la complexité du
substrat et des micro-organismes présents. Dans ce cas précis, une fraction du composé organique
dégradé sert elle-même d’accepteur d’électrons et est réduite, alors qu’une autre part s’oxyde. Ce
7
processus apporte toutefois le plus faible gain énergétique aux micro-organismes l’effectuant
(Heider & Fuchs, 1997; Schroder, 2007). Les parties des composés organiques qui sont réduites
lors de la fermentation peuvent par la suite servir à leur tour de substrat pour d’autres espèces
microbiennes (Freguia, Rabaey, Yuan & Keller, 2008).
Figure 1-1 : Exemple de transport intracellulaire d’électrons (Omc : cytochrome de la membrane
externe; Ppc : cytochrome périplasmique) (Du, Li & Gu, 2007)
Tel qu’illustré à la figure 1-1, les électrons générés par la métabolisation microbienne sont
transférés de la bactérie à l’anode, la vitesse de ce transfert pouvant être augmentée en ajoutant
un surfactant (ex. : Tween 80) qui accroît la perméabilité membranaire (Wen, Kong, Ma, Ren &
Pan, 2011). Ils voyagent ensuite par le biais d’un circuit électrique externe jusqu’à la cathode où
ils sont consommés pour effectuer la réduction de l’oxygène (voir figure 1-2). Cette réaction, qui
sera détaillée à la section 1.5, nécessite aussi les protons (H+) qui sont également produits par les
micro-organismes lors de l’oxydation des substrats, ceux-ci diffusant de l’anode à la cathode dans
l’électrolyte (Logan et al., 2006).
Divers mécanismes de transfert des électrons entre les bactéries et l’anode sont proposés : 1) par
le biais de nanofils conducteurs, appendices externes conducteurs formés de protéines et produits
par la bactérie, 2) par l’intermédiaire de médiateurs externes effectuant la navette entre la bactérie
et l’anode, et 3) par contact direct via des protéines intramembranaires tel qu’illustré à la figure 1-
1. De plus, la matrice du biofilm formé sur l’anode est conductrice, permettant le transport
8
d’électrons éjectés entre les bactéries très éloignées de la surface et cette dernière, ce transfert
étant effectué par des composantes telles que des nanofils, des cytochromes extracellulaires ou
encore des médiateurs d’électrons liés à la matrice (Busalmen, Esteve-Núñez, Berná & Feliu,
2008; Debabov, 2008; Du et al., 2007; Hernandez & Newman, 2001; Logan et al., 2006; Lovley,
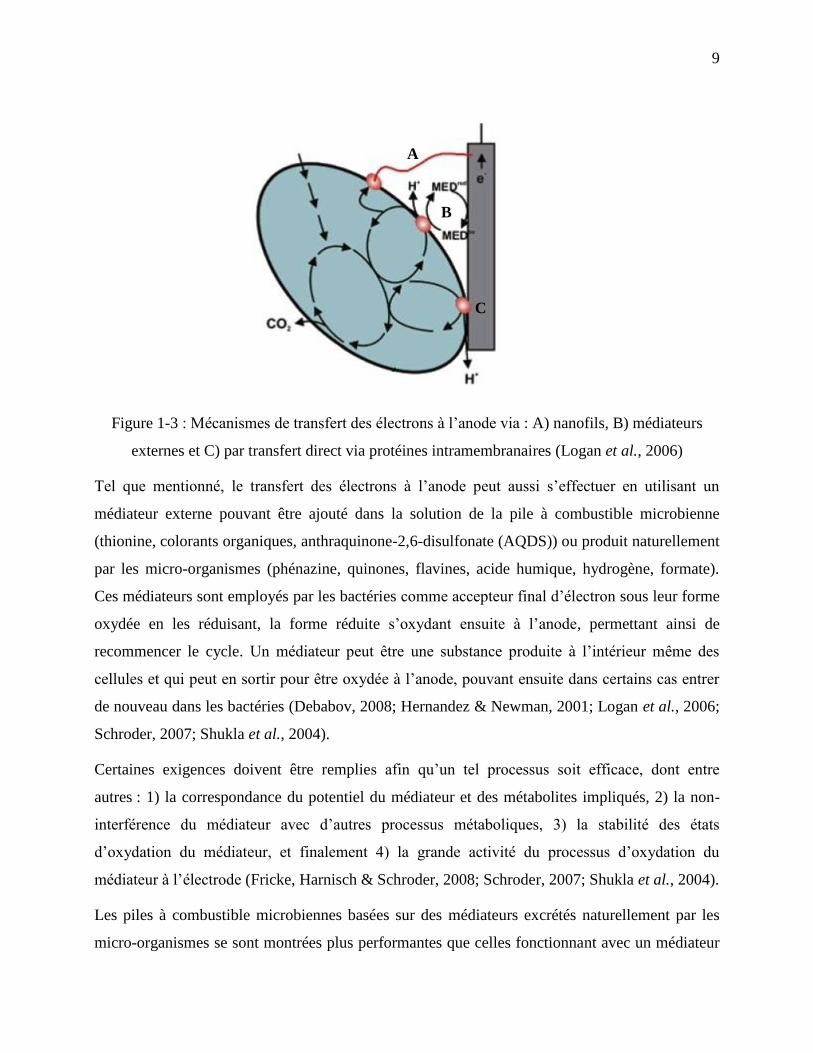
2008; Richter et al., 2009; Schroder, 2007; Torres et al., 2009). La figure 1-3 illustre les trois
premiers mécanismes cités. Un même micro-organisme peut éjecter les électrons par plus d’un
mécanisme ; de la même façon, un consortium microbien peut utiliser plusieurs systèmes pour
transférer ses électrons à l’anode, dépendamment de leur position au sein du biofilm formé
(Hernandez & Newman, 2001; Lovley, 2008), ceci étant traité dans la section suivante.
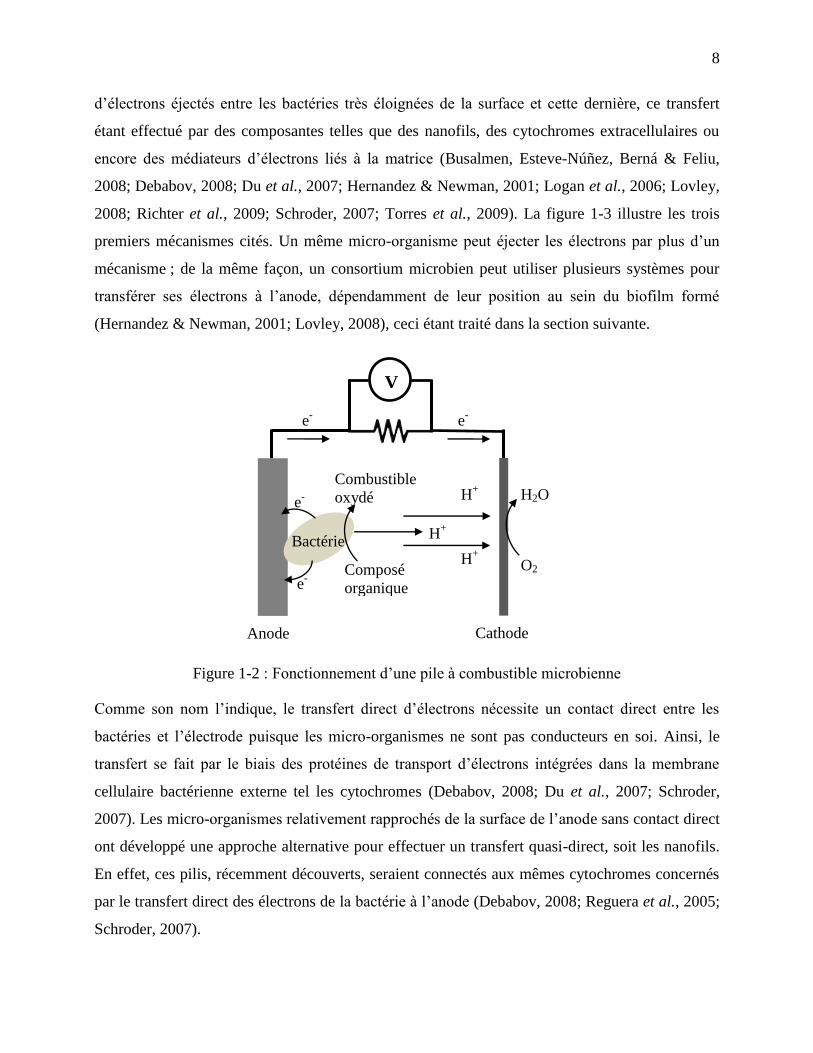
Figure 1-2 : Fonctionnement d’une pile à combustible microbienne
Comme son nom l’indique, le transfert direct d’électrons nécessite un contact direct entre les
bactéries et l’électrode puisque les micro-organismes ne sont pas conducteurs en soi. Ainsi, le
transfert se fait par le biais des protéines de transport d’électrons intégrées dans la membrane
cellulaire bactérienne externe tel les cytochromes (Debabov, 2008; Du et al., 2007; Schroder,
2007). Les micro-organismes relativement rapprochés de la surface de l’anode sans contact direct
ont développé une approche alternative pour effectuer un transfert quasi-direct, soit les nanofils.
En effet, ces pilis, récemment découverts, seraient connectés aux mêmes cytochromes concernés
par le transfert direct des électrons de la bactérie à l’anode (Debabov, 2008; Reguera et al., 2005;
Schroder, 2007).
e-
e-
V
Anode Cathode
O2
H2O
Composé
organique
Combustible
oxydé
H+
H+
H+
e-
e-
Bactérie
9
Figure 1-3 : Mécanismes de transfert des électrons à l’anode via : A) nanofils, B) médiateurs
externes et C) par transfert direct via protéines intramembranaires (Logan et al., 2006)
Tel que mentionné, le transfert des électrons à l’anode peut aussi s’effectuer en utilisant un
médiateur externe pouvant être ajouté dans la solution de la pile à combustible microbienne
(thionine, colorants organiques, anthraquinone-2,6-disulfonate (AQDS)) ou produit naturellement
par les micro-organismes (phénazine, quinones, flavines, acide humique, hydrogène, formate).
Ces médiateurs sont employés par les bactéries comme accepteur final d’électron sous leur forme
oxydée en les réduisant, la forme réduite s’oxydant ensuite à l’anode, permettant ainsi de
recommencer le cycle. Un médiateur peut être une substance produite à l’intérieur même des
cellules et qui peut en sortir pour être oxydée à l’anode, pouvant ensuite dans certains cas entrer
de nouveau dans les bactéries (Debabov, 2008; Hernandez & Newman, 2001; Logan et al., 2006;
Schroder, 2007; Shukla et al., 2004).
Certaines exigences doivent être remplies afin qu’un tel processus soit efficace, dont entre
autres : 1) la correspondance du potentiel du médiateur et des métabolites impliqués, 2) la non-
interférence du médiateur avec d’autres processus métaboliques, 3) la stabilité des états
d’oxydation du médiateur, et finalement 4) la grande activité du processus d’oxydation du
médiateur à l’électrode (Fricke, Harnisch & Schroder, 2008; Schroder, 2007; Shukla et al., 2004).
Les piles à combustible microbiennes basées sur des médiateurs excrétés naturellement par les
micro-organismes se sont montrées plus performantes que celles fonctionnant avec un médiateur
A
B
C
10
ajouté, mais toutefois moins qu’une pile basée exclusivement sur le transfert direct d’électrons
(Ieropoulos, Greenman, Melhuish & Hart, 2005), cette conclusion étant basée sur l’efficacité
coulombique (taux de transformation du substrat en électricité). Il est toutefois important de noter
que l’addition d’un médiateur doit se répéter périodiquement afin de conserver la capacité
d’échange d’électrons entre les micro-organismes et l’électrode (Schroder, 2007), alors que la
génération de médiateurs par les bactéries est naturellement augmentée par la présence de l’anode
chargée, ces médiateurs pouvant être utilisés par d’autres bactéries que celles les ayant produits
(Hernandez & Newman, 2001; Rabaey, Boon, Hofte & Verstraete, 2005a).
1.2 Inoculum, micro-organismes électricigènes et substrats
Les piles à combustible microbiennes peuvent être inoculées en un premier temps à partir de
sources qui contiennent un très grand nombre d’espèces de micro-organismes différents
(consortium bactérien). Une seconde option, moins adéquate pour les applications pratiques,
consiste à utiliser une souche bactérienne pure ayant été cultivée en laboratoire afin qu’un biofilm
de cette unique espèce croisse à la surface de l’anode. Dans les deux cas, une multitude de
composés organiques peuvent être retirés d’eaux usées issues de sources variées.
1.2.1 Inoculum à population mixte
Un inoculum à population mixte peut être prélevé dans certains environnements naturels tels les
sédiments d’océan, de mer, de bassin ou de rivière (He, Shao & Angenent, 2007; Lowy, Tender,
Zeikus, Park & Lovley, 2006; Reimers et al., 2006; Zhang, Xu, Diao & Shuang, 2006), ou encore
les boues anaérobies (Rabaey, Lissens, Siciliano & Verstraete, 2003) et les eaux usées
domestiques (Fan, Hu & Liu, 2007) ou industrielles (Rabaey, Boon, Siciliano, Verhaege &
Verstraete, 2004). Il est possible aussi d’inoculer une pile microbienne avec différentes sources
(boues aérobies, anaérobies et de milieux humides), conduisant à de meilleures performances de
la pile (Sun, Hu, Bi & Cao, 2009). Ces microflores effectuent souvent le transfert des électrons à
l’anode soit par contact direct ou encore en utilisant un médiateur naturel produit par des espèces
autres que celles étant électricigènes, tel qu’illustré à la figure 1-4.
Lorsque des boues anaérobies ou des eaux usées sont utilisées pour l’inoculation des réacteurs, il
est possible d’observer la lutte entre les différentes espèces microbiennes, soit pour la
consommation du substrat qui est essentiel à leur survie, soit au niveau de l’espace de croissance
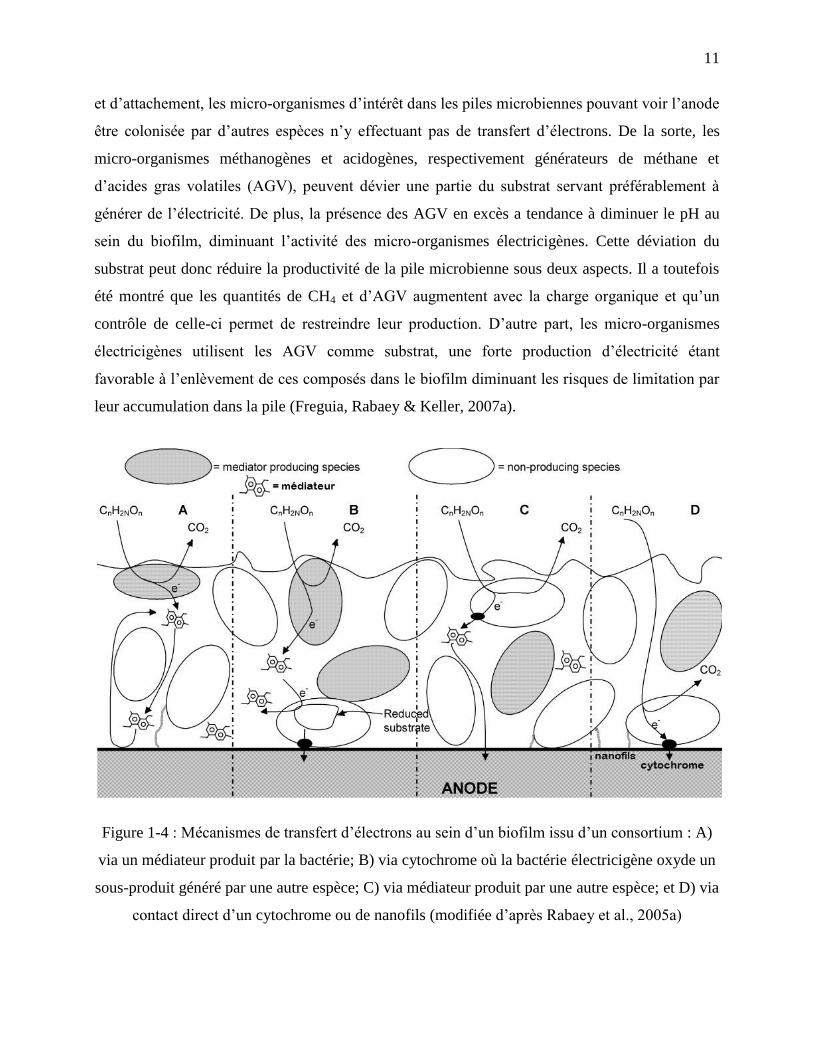
11
et d’attachement, les micro-organismes d’intérêt dans les piles microbiennes pouvant voir l’anode
être colonisée par d’autres espèces n’y effectuant pas de transfert d’électrons. De la sorte, les
micro-organismes méthanogènes et acidogènes, respectivement générateurs de méthane et
d’acides gras volatiles (AGV), peuvent dévier une partie du substrat servant préférablement à
générer de l’électricité. De plus, la présence des AGV en excès a tendance à diminuer le pH au
sein du biofilm, diminuant l’activité des micro-organismes électricigènes. Cette déviation du
substrat peut donc réduire la productivité de la pile microbienne sous deux aspects. Il a toutefois
été montré que les quantités de CH4 et d’AGV augmentent avec la charge organique et qu’un
contrôle de celle-ci permet de restreindre leur production. D’autre part, les micro-organismes
électricigènes utilisent les AGV comme substrat, une forte production d’électricité étant
favorable à l’enlèvement de ces composés dans le biofilm diminuant les risques de limitation par
leur accumulation dans la pile (Freguia, Rabaey & Keller, 2007a).
Figure 1-4 : Mécanismes de transfert d’électrons au sein d’un biofilm issu d’un consortium : A)
via un médiateur produit par la bactérie; B) via cytochrome où la bactérie électricigène oxyde un
sous-produit généré par une autre espèce; C) via médiateur produit par une autre espèce; et D) via
contact direct d’un cytochrome ou de nanofils (modifiée d’après Rabaey et al., 2005a)
12
D’après l’analyse des gènes, on observe que parmi les populations microbiennes mixtes, certains
micro-organismes se développent en plus grand nombre lorsque soumis aux conditions présentes
dans une pile à combustible microbienne. Ainsi, des espèces telles Shewanella affinis, Vibrio
parahaemolyticus, Pseudoalteromonas sp., Brevundimonas aurantiaca et Geobacter sp. semblent
faire partie des bactéries électricigènes dominantes, dépendamment de la source et des composés
organiques utilisés comme substrat (Jung & Regan, 2007; Lee, Parameswaran, Kato-Marcus,
Torres & Rittmann, 2008; Liu, Harnisch, Fricke, Sietmann & Schröder, 2008; Logan, Murano,
Scott, Gray & Head, 2005). De plus, le fait de changer de type de substrat peut conduire à une
modification des espèces électricigènes dominantes peuplant l’anode, quelques jours étant parfois
nécessaires à l’adaptation des microorganismes pour générer à nouveau un courant élevé et stable
(Zhang, Min, Huang & Angelidaki, 2011).
Il peut être utile d’enrichir un inoculum afin d’obtenir une plus grande quantité de micro-
organismes électricigènes, et ce, soit en transférant le biofilm obtenu sur l’anode d’une pile à
combustible vers une autre (Kim, Min & Logan, 2005), en mettant en contact l’électrode vierge
avec une électrode inoculée, toutes deux étant à un potentiel imposé (Liu et al., 2008) ou encore
en inoculant la nouvelle pile avec l’effluent d’une pile microbienne déjà fonctionnelle
(Aelterman, Freguia, Keller, Verstraete & Rabaey, 2008a). L’ajout d’inhibiteur de
méthanogénèse permet aussi d’empêcher la formation de méthane, augmentant l’efficacité de la
pile par l’utilisation du substrat presque exclusivement par les bactéries anodophiles (Kim et al.,
2005), cette technique ne consistant pas en une approche utile car le traitement doit être répété
périodiquement et peut s’avérer qu’en partie efficace.
1.2.2 Souches pures de micro-organismes électricigènes
Tel que mentionné précédemment, les piles microbiennes peuvent utiliser comme inoculum
autant une souche pure qu’un consortium bactérien anaérobie. Dans le premier cas, on retrouve
des espèces telles que Shewanella putrefaciens, Shewanella oneidensis, Geobacter
sulfurreducens, Aeromonas hydrophila, Rhodoferax ferrireducens, Klebsiella pneumoniae et
Clostridium sp., micro-organismes ayant démontré leur capacité à effectuer un transfert direct au
Fe(III) pour le réduire en Fe(II) via la présence de cytochromes intramembranaires (Beliaev et
al., 2005; Chaudhuri & Lovley, 2003; Kim et al., 1999; Park et al., 2001; Rabaey & Verstraete,
2005; Zhang et al., 2008b). Dans le cas de Shewanella et Geobacter, il a récemment été proposé
13
que ces espèces utilisent des nanofils conducteurs pour effectuer le transfert des électrons
(Reguera et al., 2005; Schroder, 2007).
La bactérie bien connue Escherichia coli a aussi été employée dans les piles à combustible
microbiennes, celle-ci nécessitant par contre l’ajout d’un médiateur afin de transférer avec succès
ses électrons à l’anode (Ieropoulos et al., 2005; Park & Zeikus, 2003). De la même façon, la
levure Saccharomyces cerevisiae a aussi été expérimentée comme donneur d’électrons dans une
pile microbienne où le bleu de méthylène servait de médiateur (Walker & Walker, 2006).
D’autres micro-organismes utilisent aussi des médiateurs comme navettes, soit Pseudomonas
aeruginosa, Erwinia dissolvens et Desulfuvibrio desulfuricans (Ieropoulos et al., 2005; Rabaey &
Verstraete, 2005; Zhao et al., 2009), illustrant les nombreuses possibilités des espèces
bactériennes pouvant générer de l’électricité dans une pile à combustible microbienne.
Une population binaire s’avère parfois nécessaire dans certains cas précis. En effet, lorsqu’un
substrat complexe telle la cellulose sert de combustible, une première espèce (Clostridium
cellulolyticum) doit d’abord dégrader le composé organique complexe en composé plus simple,
pour qu’ensuite la seconde souche (Geobacter sulfurreducens) prenne la relève et génère des
électrons par la digestion du substrat (Ren, Ward & Regan, 2007). Un autre exemple est
l’affiliation de bactéries gram positives et négatives, certaines espèces gram positives
(Brevibacillus) étant capables d’effectuer un transfert d’électrons à une électrode seulement en
présence d’autres espèces microbiennes gram négatives (Pseudomonas produisant des
métabolites de phénazine) (Pham et al., 2008).
Les souches pures microbiennes sont parfois destinées à utiliser un seul ou une gamme très
restreinte de substrats. Il a par contre été montré qu’il était possible d’élargir la variété de
combustibles digérés par le micro-organisme Shewanella oneidensis en effectuant sa croissance
en présence d’oxygène, ce qui a augmenté significativement l’expression de protéines clé dans la
dégradation de certains substrats (Biffinger, Byrd, Dudley & Ringeisen, 2008). La même
technique de croissance de cette espèce a aussi démontré l’augmentation de la génération de
puissance, ceci étant dû à l’accroissement de l’activité de la biomasse de même qu’une utilisation
plus efficace du substrat (Rosenbaum, Cotta & Angenent, 2010b). Toutefois, la présence
d’oxygène peut amener le détournement d’une somme importante d’électrons vers la respiration
14
aérobie plutôt que la production d’électricité si le substrat est présent en quantité insuffisante
pour les espèces électricigènes (Oh, Kim, Joo & Logan, 2009).
1.2.3 Substrats utilisés comme combustibles
Plusieurs substrats ont été utilisés comme combustibles dans les piles microbiennes afin de
générer de l’électricité, ceux-ci pouvant inclure des composés organiques complexes ou encore
des substances très simples. Leur composition et provenance peuvent de plus être très variées
puisque ces dispositifs sont destinés au traitement d’eaux usées diverses.
Du nombre des substrats employés en laboratoire pour simuler différents effluents, on retrouve
l’acétate (Lee et al., 2008; Liu, Cheng & Logan, 2005b; Thygesen, Poulsen, Min, Angelidaki &
Thomsen, 2009; Zhang et al., 2006), le formate (Ha, Tae & Chang, 2008), le butyrate (Liu et al.,
2005b), le glucose (Chaudhuri & Lovley, 2003; Lee et al., 2008; Rabaey et al., 2003; Thygesen
et al., 2009), le sucrose (Bennetto et al., 1985), le xylose (Huang & Logan, 2008b; Huang, Zeng
& Angelidaki, 2008; Thygesen et al., 2009), la cystéine (Logan et al., 2005), la cellulose (Ren et
al., 2007; Rezaei, Richard & Logan, 2008; Rismani-Yazdi et al., 2007), le phénol (Luo, Liu,
Zhang & Jin, 2009), les polyalcools (Catal, Xu, Li, Bermek & Liu, 2008b), les sulfites (Zhao et
al., 2009) et le CO et le syngaz (CO + H2) (Mehta et al., 2010). Une étude exhaustive a quant à
elle employé douze différents monosaccharides pour générer de l’électricité à partir des piles
microbiennes : glucose, galactose, fructose, fucose, rhamnose, mannose, xylose, arabinose, ribose
et les acides galacturonique, glucoronique et gluconique (Catal, Li, Bermek & Liu, 2008a). Dans
le cas du formate, seule une petite partie du substrat fut consommée par les micro-organismes
électricigènes issus de l’inoculum provenant de boues anaérobies, démontrant ici la difficulté
d’obtenir une bonne efficacité coulombique lorsqu’on ne peut contrôler les espèces occupant
l’anode (Ha et al., 2008).
Les piles à combustible microbiennes ayant comme future application le traitement des eaux
usées, plusieurs eaux de rejets provenant de sources variées ont été testées dans de telles piles
afin de prouver leur efficacité à générer l’électricité à partir de tout type de déchets liquides.
Ainsi, a été confirmée l’efficience des eaux usées domestiques (Liu, Ramnarayanan & Logan,
2004; Min & Logan, 2004; Rabaey, Ossieur, Verhaege & Verstraete, 2005c), des eaux de rejets
venant de la transformation d’aliments (bière, distillerie, maïs, riz, céréales, amidon, pommes,
yogourt) (Behera, Jana, More & Ghangrekar, 2010; Cercado-Quezada, Delia & Bergel, 2010;
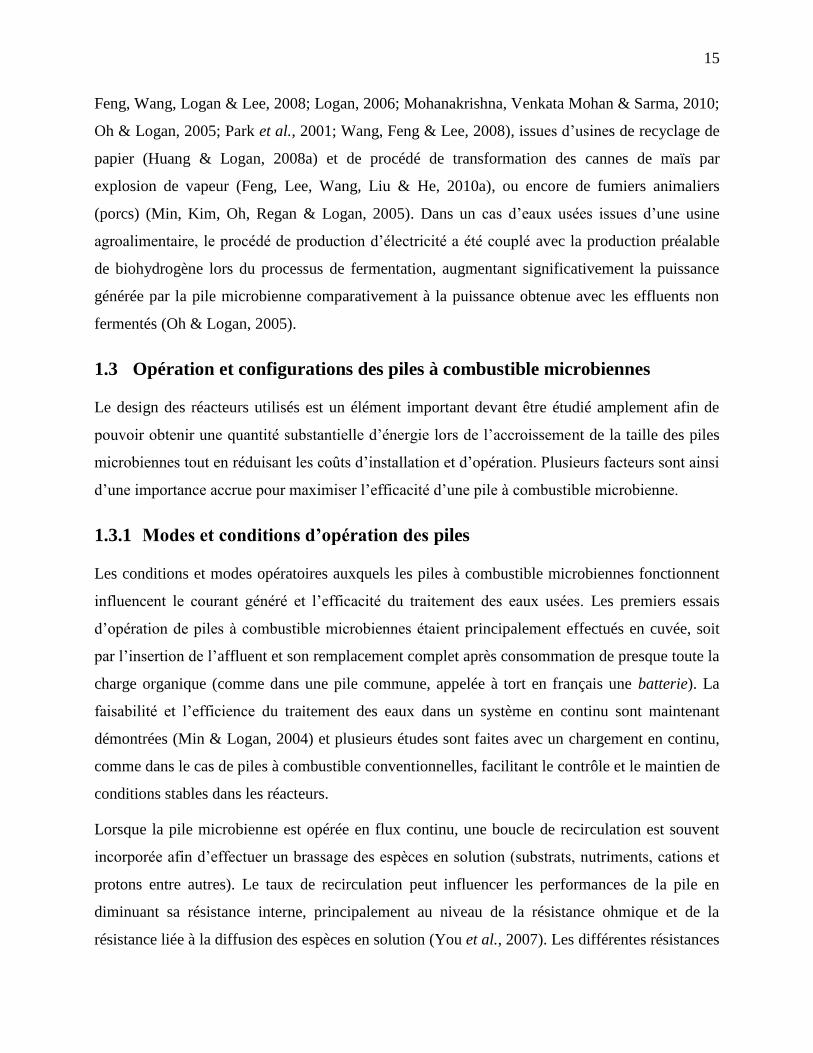
15
Feng, Wang, Logan & Lee, 2008; Logan, 2006; Mohanakrishna, Venkata Mohan & Sarma, 2010;
Oh & Logan, 2005; Park et al., 2001; Wang, Feng & Lee, 2008), issues d’usines de recyclage de
papier (Huang & Logan, 2008a) et de procédé de transformation des cannes de maïs par
explosion de vapeur (Feng, Lee, Wang, Liu & He, 2010a), ou encore de fumiers animaliers
(porcs) (Min, Kim, Oh, Regan & Logan, 2005). Dans un cas d’eaux usées issues d’une usine
agroalimentaire, le procédé de production d’électricité a été couplé avec la production préalable
de biohydrogène lors du processus de fermentation, augmentant significativement la puissance
générée par la pile microbienne comparativement à la puissance obtenue avec les effluents non
fermentés (Oh & Logan, 2005).
1.3 Opération et configurations des piles à combustible microbiennes
Le design des réacteurs utilisés est un élément important devant être étudié amplement afin de
pouvoir obtenir une quantité substantielle d’énergie lors de l’accroissement de la taille des piles
microbiennes tout en réduisant les coûts d’installation et d’opération. Plusieurs facteurs sont ainsi
d’une importance accrue pour maximiser l’efficacité d’une pile à combustible microbienne.
1.3.1 Modes et conditions d’opération des piles
Les conditions et modes opératoires auxquels les piles à combustible microbiennes fonctionnent
influencent le courant généré et l’efficacité du traitement des eaux usées. Les premiers essais
d’opération de piles à combustible microbiennes étaient principalement effectués en cuvée, soit
par l’insertion de l’affluent et son remplacement complet après consommation de presque toute la
charge organique (comme dans une pile commune, appelée à tort en français une batterie). La
faisabilité et l’efficience du traitement des eaux dans un système en continu sont maintenant
démontrées (Min & Logan, 2004) et plusieurs études sont faites avec un chargement en continu,
comme dans le cas de piles à combustible conventionnelles, facilitant le contrôle et le maintien de
conditions stables dans les réacteurs.
Lorsque la pile microbienne est opérée en flux continu, une boucle de recirculation est souvent
incorporée afin d’effectuer un brassage des espèces en solution (substrats, nutriments, cations et
protons entre autres). Le taux de recirculation peut influencer les performances de la pile en
diminuant sa résistance interne, principalement au niveau de la résistance ohmique et de la
résistance liée à la diffusion des espèces en solution (You et al., 2007). Les différentes résistances
16
de la pile microbienne sont traitées subséquemment dans la section « 1.5 Aspects
électrochimiques des piles à combustible microbiennes ».
Le temps de rétention hydraulique, soit la durée où l’électrolyte demeure dans le réacteur, doit
être optimisé puisqu’un temps de rétention court permet une plus grande génération de courant
mais une moins bonne efficacité au niveau de l’enlèvement de la charge organique. Dans la
même lignée, le taux de chargement du substrat est important puisqu’un affluent possédant une
trop grande concentration de matières organiques produira un meilleur gain en courant, mais
seulement jusqu’à un certain point car une trop grande présence de composés organiques cause
une diminution du courant généré (Moon, Chang, Jang & Kim, 2005).
D’autres conditions d’opération, soit la température, le pH et la conductivité de l’électrolyte, sont
aussi des facteurs importants affectant la performance des piles à combustible microbiennes.
Ainsi, à une température de 30°C, la puissance est presque le double de ce qui est observé à
22°C. De plus, une activité électrique minimale a été remarquée à une température de 15°C, ces
observations suivant la loi d’Arrhénius (Liu, Cheng & Logan, 2005a; Min, Román & Angelidaki,
2008). Un pH neutre indique une plus faible quantité de protons qu’en pH acide, d’où la nécessité
d’un brassage de l’électrolyte pour permettre d’amener les protons à la cathode. D’autre part,
l’acidité et la basicité peuvent diminuer considérablement le métabolisme microbien, affectant
certaines espèces plus que d’autres, ou à l’extrême causer la mort des micro-organismes (Gil et
al., 2003; He, Huang, Manohar & Mansfeld, 2008; Jadhav & Ghangrekar, 2009; Veer Raghavulu,
Venkata Mohan, Venkateswar, Mohanakrishna & Sarma, 2009). Une bonne conductivité permet
quant à elle le transport plus aisé des espèces électroactives devant rejoindre les micro-
organismes et catalyseurs cathodiques, respectivement à l’anode et la cathode, ce qui augmente
significativement la puissance générée par la pile microbienne par la diminution de sa résistance
ohmique. Certaines espèces microbiennes ne peuvent toutefois supporter une conductivité trop
élevée (Huang, Sun & Zhang, 2010; Liu et al., 2005a; Nam, Kim, Lim, Shin & Logan, 2010).
1.3.2 Configurations des piles
Les réacteurs formant les piles microbiennes présentent différentes configurations, tant au niveau
de la forme même du réacteur, du nombre de chambres qu’il comporte (une ou deux), de
l’utilisation ou non de la membrane à échange de protons, de cations ou autres matières ayant la
même fonction et finalement des matériaux d’électrodes utilisés et la distance les séparant.
17
Il est possible de réunir plusieurs piles pour former un empilement avec quelques modifications
des systèmes, cette option permettant d’accroître le voltage des systèmes et donc la puissance
générée. Toutefois, dépendamment de la façon dont les piles sont connectées, différents
problèmes peuvent survenir. Ainsi, des piles branchées en série peuvent voir le courant d’un des
assemblages anode/cathode s’inverser, diminuant substantiellement la puissance (Aelterman,
Rabaey, Pham, Boon & Verstraete, 2006; Oh & Logan, 2007). D’un autre côté, le branchement
en parallèle, quoiqu’il génère un très fort courant, entraîne aussi des pertes plus grandes au sein
des matériaux (Dekker, Heijne, Saakes, Hamelers & Buisman, 2009). Il est aussi possible
d’effectuer un branchement mixte série/parallèle, permettant ainsi l’augmentation à la fois du
courant et du voltage de la pile et démontrant une efficacité supérieure (Ieropoulos, Greenman &
Melhuish, 2008). Les empilements de piles microbiennes sont une voie explorée pour avoir des
piles de volumes importants permettant le traitement d’une plus grande quantité d’eaux usées en
parallèle avec une puissance plus élevée.
La figure 1-5 présente divers designs de piles à combustible microbiennes, comportant une ou
deux chambres. Dans le cas des piles à deux compartiments, la configuration la plus simple
consiste à connecter deux bouteilles de verre (fig.1-5A) (Zhang et al., 2006). D’autres designs
employés en laboratoire consistent entre autres en un réacteur tubulaire où la cathode en forme de
U se situe à l’intérieur du réacteur (fig.1-5B) (He, Wagner, Minteer & Angenent, 2006) ou encore
un réacteur rectangulaire à flux ascendant (fig.1-5C) (Tartakovsky & Guiot, 2006). Parmi les
piles à une chambre, on note un réacteur tubulaire où la cathode se situe à l’extérieur (fig.1-5D)
(Rabaey, Clauwaert, Aelterman & Verstraete, 2005b) et un réacteur cylindrique dont les
électrodes sont situées à chacune des extrémités (fig.1-5E) (Liu & Logan, 2004). Il est à noter que
plusieurs autres modèles de réacteurs ont été construits et évalués, mais l’énumération de tous ces
types serait trop exhaustive et n’est pas essentielle pour le présent travail de recherche. Un
réacteur à deux chambres est utilisé lorsque la réaction cathodique nécessite une solution liquide
(ex. : ferricyanure, peroxyde d’hydrogène). Cette option a comme problématique le
remplacement constant du catholyte ou son oxygénation, de même que la possibilité d’une fuite
dans le compartiment anodique au travers de la membrane polymérique séparant les deux
chambres (Tartakovsky & Guiot, 2006). Avec le développement de la cathode à diffusion
gazeuse qui permet à l’air ambiant d’atteindre la surface des catalyseurs, la construction de piles
microbiennes à une chambre s’est répandue, réduisant les coûts de construction et d’opération
18
tout en générant un courant semblable, voire plus élevé (Liu & Logan, 2004; Park & Zeikus,
2003).
Figure 1-5 : Divers designs de piles à combustible microbiennes (adapté de He et al., 2006; Liu
& Logan, 2004, Rabaey et al., 2005b; Tartakovsky & Guiot, 2006; Zhang et al., 2006)
Dans les piles à un compartiment, il ne s’avère désormais plus nécessaire d’employer une
membrane polymérique, celle-ci augmentant significativement la résistance interne du système.
Par contre, une telle disposition du réacteur peut voir son efficacité diminuée par la présence
d’oxygène dans l’anolyte, déviant une quantité substantielle d’électrons (Liu & Logan, 2004).
L’application de couches successives de polytétrafluoroéthylène (PTFE) sur la surface en contact
avec l’air peut contrer ce désavantage (Cheng, Liu & Logan, 2006a). Plusieurs alternatives ont
été testées pour remplacer les membranes polymériques (ex. : membrane de nylon ou de
cellulose) (Biffinger, Ray, Little & Ringeisen, 2007), mais ce sont les chiffons JMD
qui ont
démontré les meilleures performances des piles lors de leur utilisation, permettant de sandwicher
les deux électrodes et maximisant ainsi la génération de la puissance à un niveau encore inégalé
(plus de 1000 W m-3
) (Fan et al., 2007).
Il apparaît donc évident que la distance entre les électrodes est un facteur décisif qui doit être
minimisé afin de réduire la résistance du transport des espèces actives dans l’électrolyte,
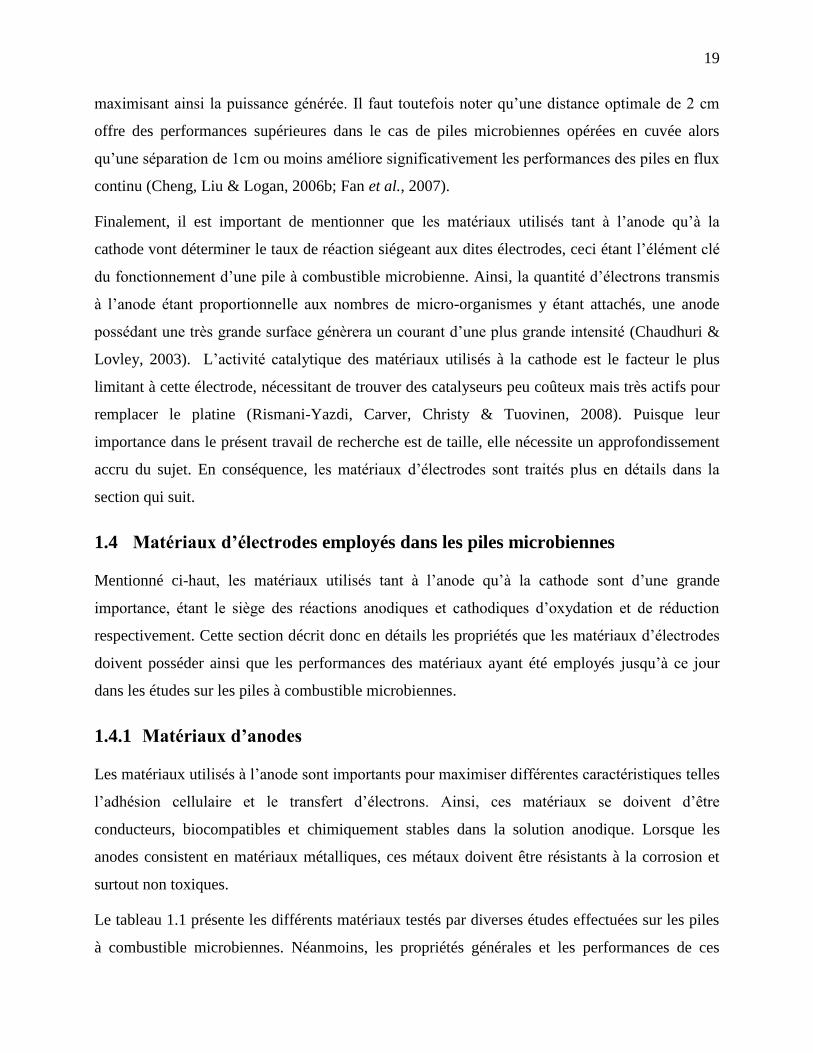
19
maximisant ainsi la puissance générée. Il faut toutefois noter qu’une distance optimale de 2 cm
offre des performances supérieures dans le cas de piles microbiennes opérées en cuvée alors
qu’une séparation de 1cm ou moins améliore significativement les performances des piles en flux
continu (Cheng, Liu & Logan, 2006b; Fan et al., 2007).
Finalement, il est important de mentionner que les matériaux utilisés tant à l’anode qu’à la
cathode vont déterminer le taux de réaction siégeant aux dites électrodes, ceci étant l’élément clé
du fonctionnement d’une pile à combustible microbienne. Ainsi, la quantité d’électrons transmis
à l’anode étant proportionnelle aux nombres de micro-organismes y étant attachés, une anode
possédant une très grande surface génèrera un courant d’une plus grande intensité (Chaudhuri &
Lovley, 2003). L’activité catalytique des matériaux utilisés à la cathode est le facteur le plus
limitant à cette électrode, nécessitant de trouver des catalyseurs peu coûteux mais très actifs pour
remplacer le platine (Rismani-Yazdi, Carver, Christy & Tuovinen, 2008). Puisque leur
importance dans le présent travail de recherche est de taille, elle nécessite un approfondissement
accru du sujet. En conséquence, les matériaux d’électrodes sont traités plus en détails dans la
section qui suit.
1.4 Matériaux d’électrodes employés dans les piles microbiennes
Mentionné ci-haut, les matériaux utilisés tant à l’anode qu’à la cathode sont d’une grande
importance, étant le siège des réactions anodiques et cathodiques d’oxydation et de réduction
respectivement. Cette section décrit donc en détails les propriétés que les matériaux d’électrodes
doivent posséder ainsi que les performances des matériaux ayant été employés jusqu’à ce jour
dans les études sur les piles à combustible microbiennes.
1.4.1 Matériaux d’anodes
Les matériaux utilisés à l’anode sont importants pour maximiser différentes caractéristiques telles
l’adhésion cellulaire et le transfert d’électrons. Ainsi, ces matériaux se doivent d’être
conducteurs, biocompatibles et chimiquement stables dans la solution anodique. Lorsque les
anodes consistent en matériaux métalliques, ces métaux doivent être résistants à la corrosion et
surtout non toxiques.
Le tableau 1.1 présente les différents matériaux testés par diverses études effectuées sur les piles
à combustible microbiennes. Néanmoins, les propriétés générales et les performances de ces
20
matériaux étant dépendantes entre autres de la composition de l’électrolyte, du design du
réacteur, de son mode opératoire ainsi que des matériaux eux-mêmes et des micro-organismes
électricigènes, seules les références y sont citées car les comparaisons ne sont possibles, ceci
étant causé par une trop grande disparité des conditions expérimentales entre chaque étude.
Le matériau le plus employé est le carbone, que ce soit sous forme de plaque compacte, de tige,
de granules, de matériel fibreux (feutre, tissu, papier, etc.) ou le carbone vitreux (réticulé ou non).
Les matériaux fibreux sont plus adoptés car ceux-ci offrent une plus grande surface
d’attachement pour les micro-organismes, augmentant substantiellement la puissance générée par
la pile microbienne (Chaudhuri & Lovley, 2003; Logan et al., 2006). La figure 1-6 montre deux
exemples de fibres de carbone sous des formes couramment utilisées dans les piles microbiennes.
L’utilisation de nanotubes et de nanofils de carbone, tout en augmentant considérablement la
surface de l’anode, permet aussi l’accroissement de la puissance générée par la pile microbienne
(Sun, Zhao, Yang, Song & Xue, 2010; Tsai, Wu, Lee & Shih, 2009; Zhao et al., 2010), quoique
leur coût limite leur application dans des systèmes de traitement d’eaux usées.
Figure 1-6 : Anodes formées de fibres de carbone sous forme de brosse (A) (Logan, Cheng,
Watson & Estadt, 2007) et de feutre (B) (SGL Group, 2010) (C : grossissement de 150X)
Différents matériaux ou dépôts ont été évalués comme anode, et ce, dans le but d’augmenter le
transfert d’électrons entre les micro-organismes et l’électrode. Or, malgré la quête au
remplacement du platine comme catalyseur dans toutes piles à combustible, une équipe a testé ce
matériau comme catalyseur anodique pour augmenter le taux de transfert d’électrons entre les
bactéries et le papier de carbone formant l’anode (Park, Sanchez, Cho & Yun, 2008). Ce dépôt a
A B
C
21
augmenté significativement le courant produit. Toutefois, le choix du platine comme catalyseur
demeure questionnable de même que la réaction électrochimique générant la majeure partie des
électrons, ceux-ci pouvant provenir en partie de l’oxydation de l’eau plutôt que de la dégradation
microbienne du substrat. Si les électrons ne sont plus générés par les micro-organismes, on ne
peut plus considérer être en présence d’une pile à combustible microbienne.
De la même façon, le titane a aussi été testé sous forme de plaque, avec et sans dépôt de platine
(ter Heijne, Hamelers, Saakes & Buisman, 2008). Le titane a démontré son inaptitude à être
utilisé comme anode dans une pile microbienne. De plus, le choix des matériaux est encore une
fois problématique puisque le titane est aussi dispendieux pour de telles applications, tout comme
le platine, et la présence de ce dernier met en doute la réaction d’oxydation siégeant à l’anode tel
que mentionné précédemment.
Un dépôt de Fe2O3 a été effectué afin de favoriser la croissance des micro-organismes
électricigènes par rapport aux micro-organismes méthanogènes, augmentant ainsi la puissance
générée par la pile microbienne. Ce dépôt a effectivement conduit à une production supérieure
d’électricité (de 22 à 30 W m-3
), mais cette alternative n’a pas accru la puissance autant que
l’enrichissement de la flore microbienne électricigène (Kim et al., 2005).
Du rouge neutre a été immobilisé sur du graphite, augmentant ainsi la production d’énergie par la
pile microbienne tout en diminuant les coûts en évitant d’ajouter régulièrement ce médiateur dans
l’anolyte (Park & Zeikus, 2003). Par contre, il n’est pas révélé si, avec une longue période
d’opération, le médiateur se retrouve en solution et est évacué, tel qu’on peut le présager.
Le même groupe a procédé à la fabrication d’électrodes de graphite contenant du Mn4+
, Mn2+
et
Ni2+
, Fe3O4, Fe3O4 et Ni2+
, de même qu’en immobilisant sur la surface des médiateurs tels le
naphtoquinone (NQ) et l’AQDS (Lowy et al., 2006; Park & Zeikus, 2003). Chacun de ces
traitements a montré avoir une plus grande activité anodique pour le transfert des électrons,
principalement pour l’électrode de Mn2+
et Ni2+
. Les électrodes modifiées possédaient un
potentiel différent du carbone non modifié, suggérant des réactions électrochimiques différentes
siégeant à l’anode.
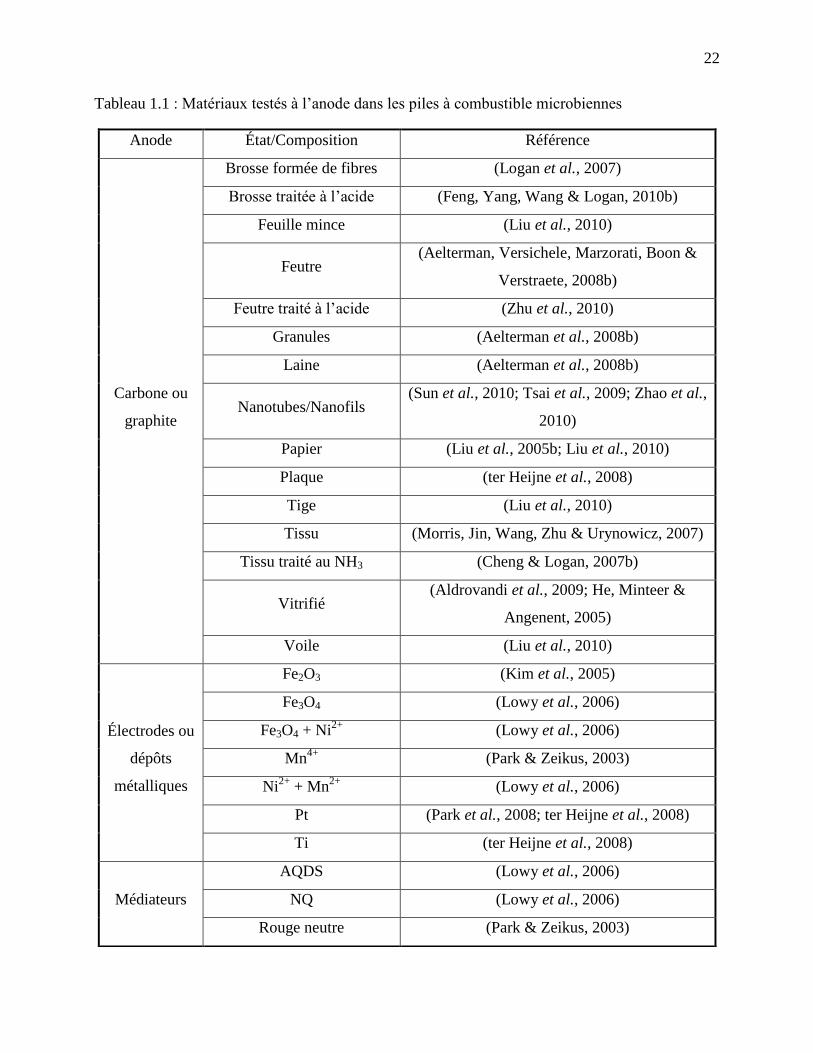
22
Tableau 1.1 : Matériaux testés à l’anode dans les piles à combustible microbiennes
Anode État/Composition Référence
Carbone ou
graphite
Brosse formée de fibres (Logan et al., 2007)
Brosse traitée à l’acide (Feng, Yang, Wang & Logan, 2010b)
Feuille mince (Liu et al., 2010)
Feutre (Aelterman, Versichele, Marzorati, Boon &
Verstraete, 2008b)
Feutre traité à l’acide (Zhu et al., 2010)
Granules (Aelterman et al., 2008b)
Laine (Aelterman et al., 2008b)
Nanotubes/Nanofils (Sun et al., 2010; Tsai et al., 2009; Zhao et al.,
2010)
Papier (Liu et al., 2005b; Liu et al., 2010)
Plaque (ter Heijne et al., 2008)
Tige (Liu et al., 2010)
Tissu (Morris, Jin, Wang, Zhu & Urynowicz, 2007)
Tissu traité au NH3 (Cheng & Logan, 2007b)
Vitrifié (Aldrovandi et al., 2009; He, Minteer &
Angenent, 2005)
Voile (Liu et al., 2010)
Électrodes ou
dépôts
métalliques
Fe2O3 (Kim et al., 2005)
Fe3O4 (Lowy et al., 2006)
Fe3O4 + Ni2+
(Lowy et al., 2006)
Mn4+
(Park & Zeikus, 2003)
Ni2+
+ Mn2+
(Lowy et al., 2006)
Pt (Park et al., 2008; ter Heijne et al., 2008)
Ti (ter Heijne et al., 2008)
Médiateurs
AQDS (Lowy et al., 2006)
NQ (Lowy et al., 2006)
Rouge neutre (Park & Zeikus, 2003)
23
Différents traitements de surface peuvent aussi être appliqués pour augmenter les performances
des matériaux d’anode. Un simple traitement de la surface d’électrodes avec du NH3 gazeux a
montré une amélioration du temps d’acclimatation nécessaire à la production d’électricité par une
pile microbienne due à l’augmentation de la charge de la surface, de même qu’un accroissement
de la puissance générée causé par la présence de groupes fonctionnels à la surface de l’électrode
traitée (Cheng & Logan, 2007b). Quant à eux, les traitements à l’acide sulfurique, à l’acide
nitrique et à l’acide nitrique suivie d’éthylènediamine permettent aussi d’accroître la puissance
générée en modifiant les groupes fonctionnels de surface, soit respectivement par l’enlèvement de
groupements C-O tout en laissant place à un ratio azote/carbone plus élevé, par l’augmentation du
ratio N/C, et finalement par l’accroissement du ratio oxygène/carbone et l’adhésion de groupes
azotés (Feng et al., 2010b; Zhu et al., 2010).
Ainsi, la meilleure option pour l’anode est d’utiliser un matériau tel le carbone sous une forme
possédant une très grande surface (feutre, brosse) tout en limitant le traitement de surface effectué
pour minimiser leurs coûts de fabrication. Les traitements à l’acide ou au NH3 gazeux semblent
réalisables puisqu’ils sont abordables et modifient positivement les groupements fonctionnels à
la surface. L’ajout de médiateurs ou autres dépôts métalliques peuvent conduire à un ratio
puissance/coût trop bas par rapport aux simples traitements de surface.
1.4.2 Matériaux de cathodes
Du côté de la cathode, les options sont aussi très nombreuses, d’autant plus que les matériaux
choisis affectent significativement la performance des piles à combustible microbiennes. Afin de
remplacer le platine et le ferricyanide couramment employés, plusieurs perspectives ont été
envisagées, concentrées dans deux domaines précis : 1) le développement de nouveaux matériaux
catalyseurs pouvant effectuer la réduction de l’oxygène (cathodes abiotiques), et 2) le
développement de biocathodes, soit d’une cathode dont le catalyseur consiste en micro-
organismes. Dans le deuxième cas de figure, différents mécanismes et micro-organismes ont été
étudiés, ouvrant la porte à toute une panoplie de solutions possibles qui sont fonction des eaux
traitées (donc des accepteurs d’électrons) et des métabolismes bactériens. Des catalyseurs
enzymatiques peuvent être envisagés, mais ceux-ci doivent d’abord être isolés et ont tendance à
nécessiter un remplacement périodique puisqu’ils se désactivent et se dénaturent, ce qui n’est pas
envisageable dans le cas de traitement d’eaux usées (He & Angenent, 2006; Schroder, 2007).
24
1.4.2.1 Cathodes abiotiques
Dans le cas de cathodes abiotiques en présence d’une pile à deux compartiments, la réduction du
ferricyanide est communément utilisée, où [Fe(CN)6]3-
est réduit en [Fe(CN)6]4-
(He & Angenent,
2006). Son remplacement par du peroxyde d’hydrogène (Tartakovsky & Guiot, 2006), du
permanganate (MnO4-
) avec déposition de MnO2 sur la cathode de carbone (You, Zhao, Zhang,
Jiang & Zhao, 2006), une solution de persulfate de potassium (K2S2O8) (Li et al., 2009), un
catholyte de chélateurs du fer (Aelterman, Versichele, Genettello, Verbeken & Verstraete, 2009),
des colorants azoïques (Liu, Li, Feng & Li, 2009), une eau usée contaminée au Cr6+
(Li, Zhang &
Lei, 2008; Wang, Huang & Zhang, 2008) ou une solution de Cu2+
avec la déposition du cuivre
sur la cathode de carbone (Wang, Lim, Lu, Fan & Choi, 2010) a été envisagé et évalué.
Néanmoins, tel que discuté précédemment, cette configuration augmente substantiellement les
coûts du procédé puisque les catholytes doivent constamment être remplacés ou oxygénés. De
plus, l’oxygène possédant une faible limite de solubilité dans l’eau, la réactivité avec la phase
gazeuse, soit l’oxygène présent dans l’air ambiant, est favorisée (Kim, Chang & Gadd, 2007).
Toutefois, certains catholytes sont en soi des eaux contaminées, cette configuration peut donc être
requise dans certaines applications très spécifiques.
Dans une pile à une chambre, le catalyseur principalement utilisé jusqu’à maintenant pour
effectuer la réduction de l’oxygène dans l’air est le platine, catalyseur possédant une excellente
réactivité. Toutefois, on cherche à éviter sa présence dans les piles à combustible pour diverses
raisons. D’abord, l’accroissement de sa rareté due à sa disponibilité limitée comme ressource
naturelle et sa popularité grandissante dans de nombreux domaines rend son coût très élevé, et
celui-ci va en augmentant continuellement. De plus, l’activité catalytique du platine est
facilement diminuée due à sa contamination par les multiples composés présents au sein des eaux
usées. En effet, la réaction cathodique nécessite la présence de protons, mais il s’avère qu’ils ne
sont pas les seuls cations présents en solution (entre autres K+, Ca
2+, Na
+), ceux-ci pouvant
occasionner des réactions adverses diminuant le potentiel de la cathode et par le fait même la
puissance de la pile microbienne (Clauwaert et al., 2008; Harnisch, Wirth & Schröder, 2009;
Rismani-Yazdi et al., 2008; Tran et al., 2010; Zhao et al., 2006). Ces facteurs limitent son
utilisation et le rendent inapte à son application pour le traitement d’eaux de rejets.
25
La réduction de l’oxygène sur les électrodes de carbone/graphite pur étant très lente, différents
mécanismes, catalyseurs et traitements ont été employés et étudiés. Le tableau 1.2 présente les
divers matériaux étudiés comme cathodes de piles à combustible microbiennes dans le but de
remplacer le platine; par contre, puisque les mesures de performances ne sont pas toujours
présentes ou évaluées de façon et dans des conditions comparables, encore une fois seules les
références y sont indiquées. Toutefois, tous les matériaux évalués ont montré de meilleures
performances que le carbone/graphite pur et non traité. Malgré que la réduction de l’oxygène
s’effectue plus souvent dans des piles à une chambre, deux compartiments sont parfois utilisés
dans le but d’isoler toute contribution parasitique de l’anolyte ou des micro-organismes.
Une première option envisagée a été de diminuer la quantité de platine utilisé en testant certains
alliages tel le Pt:Ru (ratio molaire 1:1) (Logan et al., 2005), mais le platine demeure toujours
présent. D’autres métaux tels le fer et le cobalt se sont montrés des matériaux de remplacement
appropriés comme médiateur entre les électrons arrivant à la cathode et l’oxygène présent
puisque leur réactivité est relativement élevée entre leurs différents états d’oxydation (He &
Angenent, 2006; Lefebvre et al., 2008), d’autant plus que ces métaux sont beaucoup moins
coûteux que les catalyseurs employés couramment dans les piles à combustible. Leur activité
demeure toutefois relativement faible.
Dans le cas du fer, les cathodes ont été imprégnées de composés comportant le fer soit sous sa
forme Fe(III) (sulfate ferrique) où celui-ci est réduit à l’état Fe(II) par les électrons générés à
l’anode pour ensuite être réoxydés en Fe(III) par l’oxygène, ou encore sous l’état Fe(II) sous
forme d’acétate de fer (FeAc) réalisant la réduction de l’oxygène. Ces types de cathodes ont
montré une amélioration de la vitesse de la réaction cathodique lorsque comparée au
carbone/graphite sans traitement ou catalyseur (Park & Zeikus, 2003).
Le manganèse a été évalué sous diverses formes comme matériaux de cathodes pour les piles
microbiennes. Pour le remplacement du platine comme réducteur d’oxygène, le MnO2 a été testé,
démontrant des performances très intéressantes au niveau de l’activité catalytique et de la
puissance générée par les piles (Roche, Katuri & Scott, 2010; Zhang et al., 2009b).
Un groupe de recherche a plutôt essayé le dioxyde de plomb (PbO2) comme catalyseur étant
donné son très faible coût, ses performances au niveau de la réaction de réduction de l’oxygène
étant supérieures à celles du platine (Morris et al., 2007). Par contre, ce catalyseur doit être
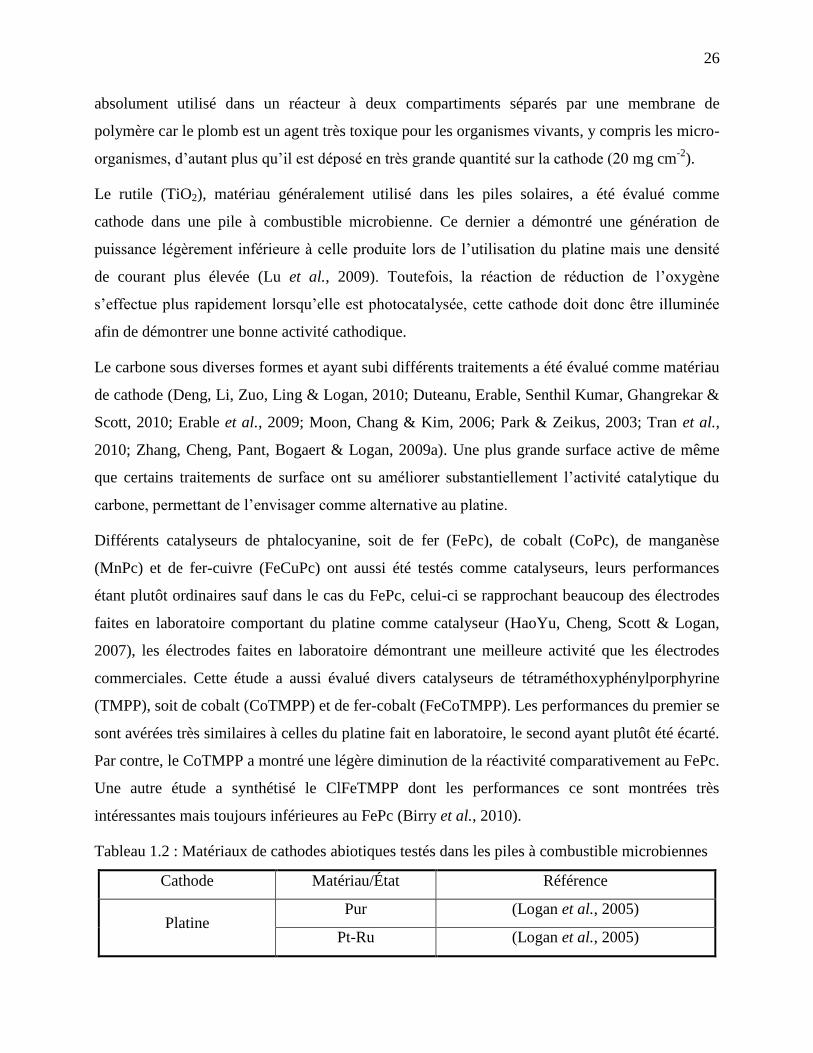
26
absolument utilisé dans un réacteur à deux compartiments séparés par une membrane de
polymère car le plomb est un agent très toxique pour les organismes vivants, y compris les micro-
organismes, d’autant plus qu’il est déposé en très grande quantité sur la cathode (20 mg cm-2
).
Le rutile (TiO2), matériau généralement utilisé dans les piles solaires, a été évalué comme
cathode dans une pile à combustible microbienne. Ce dernier a démontré une génération de
puissance légèrement inférieure à celle produite lors de l’utilisation du platine mais une densité
de courant plus élevée (Lu et al., 2009). Toutefois, la réaction de réduction de l’oxygène
s’effectue plus rapidement lorsqu’elle est photocatalysée, cette cathode doit donc être illuminée
afin de démontrer une bonne activité cathodique.
Le carbone sous diverses formes et ayant subi différents traitements a été évalué comme matériau
de cathode (Deng, Li, Zuo, Ling & Logan, 2010; Duteanu, Erable, Senthil Kumar, Ghangrekar &
Scott, 2010; Erable et al., 2009; Moon, Chang & Kim, 2006; Park & Zeikus, 2003; Tran et al.,
2010; Zhang, Cheng, Pant, Bogaert & Logan, 2009a). Une plus grande surface active de même
que certains traitements de surface ont su améliorer substantiellement l’activité catalytique du
carbone, permettant de l’envisager comme alternative au platine.
Différents catalyseurs de phtalocyanine, soit de fer (FePc), de cobalt (CoPc), de manganèse
(MnPc) et de fer-cuivre (FeCuPc) ont aussi été testés comme catalyseurs, leurs performances
étant plutôt ordinaires sauf dans le cas du FePc, celui-ci se rapprochant beaucoup des électrodes
faites en laboratoire comportant du platine comme catalyseur (HaoYu, Cheng, Scott & Logan,
2007), les électrodes faites en laboratoire démontrant une meilleure activité que les électrodes
commerciales. Cette étude a aussi évalué divers catalyseurs de tétraméthoxyphénylporphyrine
(TMPP), soit de cobalt (CoTMPP) et de fer-cobalt (FeCoTMPP). Les performances du premier se
sont avérées très similaires à celles du platine fait en laboratoire, le second ayant plutôt été écarté.
Par contre, le CoTMPP a montré une légère diminution de la réactivité comparativement au FePc.
Une autre étude a synthétisé le ClFeTMPP dont les performances ce sont montrées très
intéressantes mais toujours inférieures au FePc (Birry et al., 2010).
Tableau 1.2 : Matériaux de cathodes abiotiques testés dans les piles à combustible microbiennes
Cathode Matériau/État Référence
Platine Pur (Logan et al., 2005)
Pt-Ru (Logan et al., 2005)
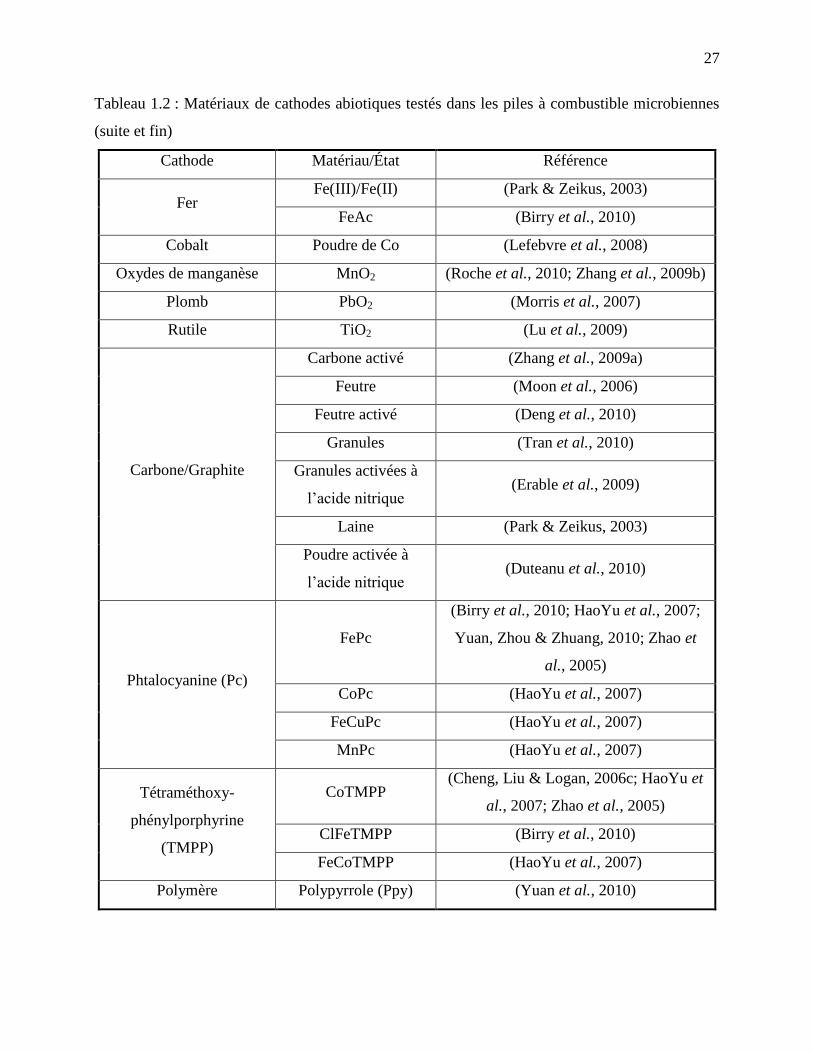
27
Tableau 1.2 : Matériaux de cathodes abiotiques testés dans les piles à combustible microbiennes
(suite et fin)
Cathode Matériau/État Référence
Fer Fe(III)/Fe(II) (Park & Zeikus, 2003)
FeAc (Birry et al., 2010)
Cobalt Poudre de Co (Lefebvre et al., 2008)
Oxydes de manganèse MnO2 (Roche et al., 2010; Zhang et al., 2009b)
Plomb PbO2 (Morris et al., 2007)
Rutile TiO2 (Lu et al., 2009)
Carbone/Graphite
Carbone activé (Zhang et al., 2009a)
Feutre (Moon et al., 2006)
Feutre activé (Deng et al., 2010)
Granules (Tran et al., 2010)
Granules activées à
l’acide nitrique (Erable et al., 2009)
Laine (Park & Zeikus, 2003)
Poudre activée à
l’acide nitrique (Duteanu et al., 2010)
Phtalocyanine (Pc)
FePc
(Birry et al., 2010; HaoYu et al., 2007;
Yuan, Zhou & Zhuang, 2010; Zhao et
al., 2005)
CoPc (HaoYu et al., 2007)
FeCuPc (HaoYu et al., 2007)
MnPc (HaoYu et al., 2007)
Tétraméthoxy-
phénylporphyrine
(TMPP)
CoTMPP (Cheng, Liu & Logan, 2006c; HaoYu et
al., 2007; Zhao et al., 2005)
ClFeTMPP (Birry et al., 2010)
FeCoTMPP (HaoYu et al., 2007)
Polymère Polypyrrole (Ppy) (Yuan et al., 2010)
28
Un polymère conducteur ayant présenté une activité catalytique a été évalué récemment comme
catalyseur cathodique dans une pile microbienne. Le polypyrrole (Ppy) a permis une génération
d’électricité supérieure à celle observée par le FePc, quoique inférieure au platine (Yuan et al.,
2010). Par contre, vu le coût avantageux de ce matériau, il constitue donc une alternative
intéressante au platine.
Pour résumer, tous les matériaux mentionnés ont démontré une meilleure activité catalytique que
le carbone/graphite pur et sans traitement, mais certains ont présenté des propriétés et
performances les plaçant en tête de liste des remplaçants du platine. En effet, l’oxyde de
manganèse, le Ppy, le FePc et le CoTMPP utilisés comme matériaux de cathodes ont permis aux
piles microbiennes de générer une puissance électrique à peine moins élevée que lors de
l’utilisation du platine, d’autant plus qu’ils ne présentent pas de conséquence adverse et sont
beaucoup moins dispendieux (le ratio puissance/coût est élevé). Certaines cathodes de
carbone/graphite traitées présentent aussi de bonnes performances, faisant de ces matériaux de
bonnes alternatives puisqu’ils sont moins coûteux que les autres matériaux évalués.
1.4.2.2 Biocathodes
Certaines enzymes oxydantes reliées aux cytochromes catalysent la réduction de l’oxygène en
eau en effectuant une réaction complète sans production d’intermédiaires toxiques. En effet,
l’oxydation de l’oxygène s’effectue sur le platine en diverses étapes, dont la production de
peroxyde d’hydrogène fait partie. De plus, cette oxydation est parfois partielle, alors que les
enzymes possèdent l’habileté d’effectuer la réduction complète (Rismani-Yazdi et al., 2008;
Wang, 2005).
Une réaction cathodique basée sur les métabolismes microbiens est donc une des perspectives
explorées comme matériaux de cathodes puisqu’elle offre plusieurs avantages : 1) la réduction
des coûts de fabrication puisque les métaux nobles ou les médiateurs artificiels seraient évités; 2)
l’évitement de l’empoisonnement ou de la perte des catalyseurs métalliques coûteux pendant
l’opération du réacteur; 3) l’enlèvement non seulement de la charge organique mais aussi d’autres
polluants tels les phosphates, les nitrates, les sulfures, ou autres ions métalliques (Mn4+
, Fe3+
); et
4) la production possible d’un produit utile (médicaments, hydrogène) (He & Angenent, 2006).
Dépendamment de l’accepteur final d’électron employé pour effectuer la réaction cathodique, les
biocathodes peuvent être séparées en deux catégories : aérobie et anaérobie. L’oxygène est
29
l’accepteur d’électrons le plus souvent utilisé de par son abondance naturelle (donc son faible
coût) et son potentiel de réduction élevé. Il a d’ailleurs été constaté que la réduction microbienne
de l’oxygène peut être observée sur une cathode d’acier inoxydable (Bergel, Féron & Mollica,
2005; Dumas et al., 2007) ou encore sur des tiges de carbone vitrifié par une multitude de micro-
organismes aérobies stricts et facultatifs (Cournet, Délia, Bergel, Roques & Bergé, 2010).
Toutefois, l’effet et le mécanisme de réduction de l’oxygène par les micro-organismes requièrent
toujours d’être élucidés, quoique les cytochromes, les enzymes hydrogénases et certains
médiateurs soient fortement soupçonnés d’être en cause dans cette réaction (He & Angenent,
2006; Rosenbaum, Aulenta, Villano & Angenent, 2010a). Une étude sur la réduction de
l’oxygène par un biofilm marin mixte amène la potentialité d’interactions synergétiques entre les
espèces présentes au sein du consortium (Erable et al., 2010), donc la possibilité de multiples
mécanismes de transferts d’électrons, tel que constaté pour les biofilms anodiques.
L’oxydation et la réduction microbienne du manganèse est un exemple de mécanisme bactérien
aérobie pouvant être utilisé à la cathode. Ainsi, un dépôt de MnO2 est effectué sur la cathode,
oxyde qui est réduit en un composé intermédiaire en acceptant un électron et un proton, le
MnOOH. Ensuite, ce composé est réduit en Mn2+
par l’arrivée d’un autre électron, le cation
produit se retrouvant en solution. Finalement, les micro-organismes tel le Leptothrix discophora
oxydent le Mn2+
en MnO2, qui est déposé sur la cathode, tout en transférant deux électrons à
l’oxygène (Ehrlich, 1996; He & Angenent, 2006). La figure 1-7 illustre ce phénomène.
De façon similaire au Mn4+
, le fer peut servir de catalyseur, ce métal étant plus abondant que le
manganèse. L’oxydation de Fe(II) en Fe(III) peut s’effectuer par certains micro-organismes, par
exemple le Thiobacillus ferrooxidans. Par contre, le montage employé pour la démonstration de
ce phénomène nécessitait un apport externe de courant (Ehrlich, 1996; He & Angenent, 2006;
Lovley, 2008). Ainsi, il reste encore à étudier la possibilité pour de tels micro-organismes
d’accomplir l’oxydation du Fe(II) en utilisant les électrons générés par l’oxydation anodique
microbienne.
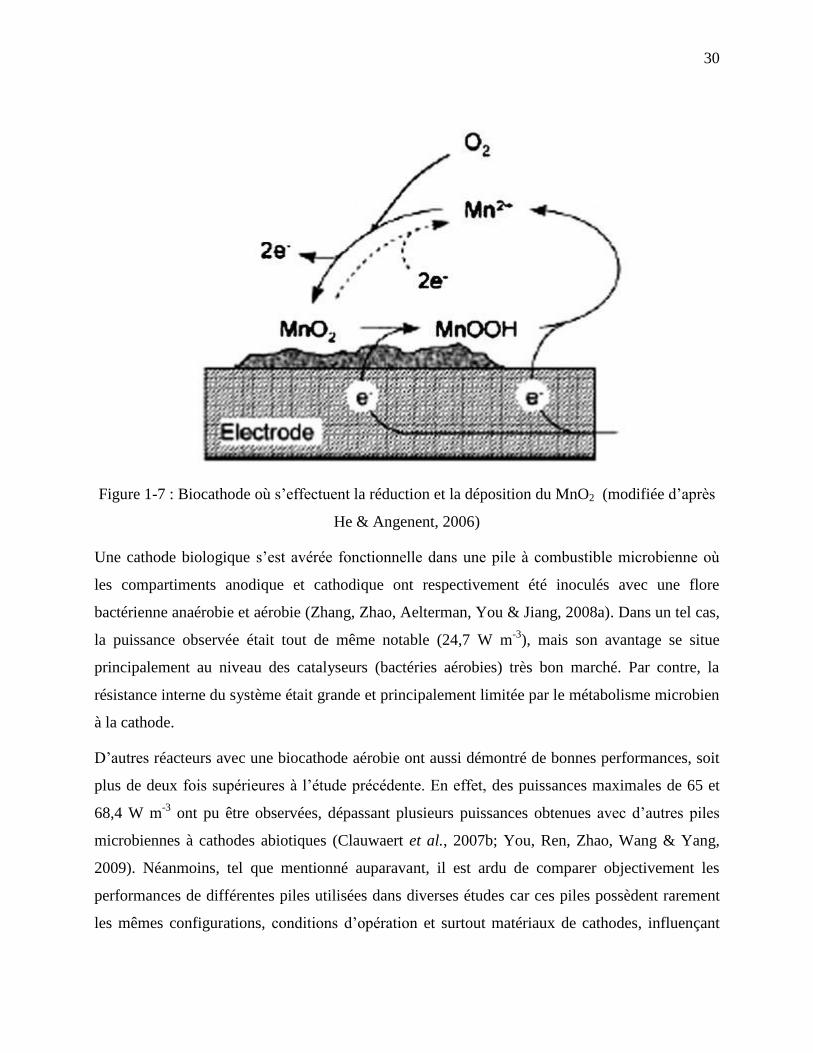
30
Figure 1-7 : Biocathode où s’effectuent la réduction et la déposition du MnO2 (modifiée d’après
He & Angenent, 2006)
Une cathode biologique s’est avérée fonctionnelle dans une pile à combustible microbienne où
les compartiments anodique et cathodique ont respectivement été inoculés avec une flore
bactérienne anaérobie et aérobie (Zhang, Zhao, Aelterman, You & Jiang, 2008a). Dans un tel cas,
la puissance observée était tout de même notable (24,7 W m-3
), mais son avantage se situe
principalement au niveau des catalyseurs (bactéries aérobies) très bon marché. Par contre, la
résistance interne du système était grande et principalement limitée par le métabolisme microbien
à la cathode.
D’autres réacteurs avec une biocathode aérobie ont aussi démontré de bonnes performances, soit
plus de deux fois supérieures à l’étude précédente. En effet, des puissances maximales de 65 et
68,4 W m-3
ont pu être observées, dépassant plusieurs puissances obtenues avec d’autres piles
microbiennes à cathodes abiotiques (Clauwaert et al., 2007b; You, Ren, Zhao, Wang & Yang,
2009). Néanmoins, tel que mentionné auparavant, il est ardu de comparer objectivement les
performances de différentes piles utilisées dans diverses études car ces piles possèdent rarement
les mêmes configurations, conditions d’opération et surtout matériaux de cathodes, influençant
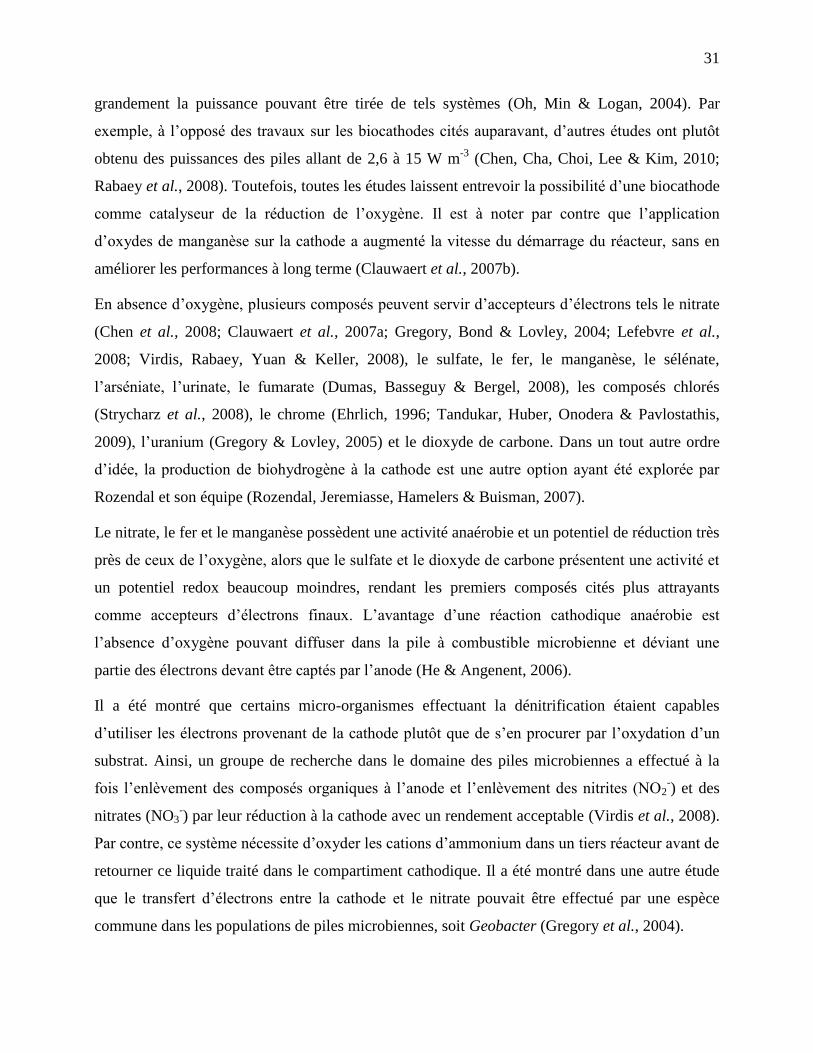
31
grandement la puissance pouvant être tirée de tels systèmes (Oh, Min & Logan, 2004). Par
exemple, à l’opposé des travaux sur les biocathodes cités auparavant, d’autres études ont plutôt
obtenu des puissances des piles allant de 2,6 à 15 W m-3
(Chen, Cha, Choi, Lee & Kim, 2010;
Rabaey et al., 2008). Toutefois, toutes les études laissent entrevoir la possibilité d’une biocathode
comme catalyseur de la réduction de l’oxygène. Il est à noter par contre que l’application
d’oxydes de manganèse sur la cathode a augmenté la vitesse du démarrage du réacteur, sans en
améliorer les performances à long terme (Clauwaert et al., 2007b).
En absence d’oxygène, plusieurs composés peuvent servir d’accepteurs d’électrons tels le nitrate
(Chen et al., 2008; Clauwaert et al., 2007a; Gregory, Bond & Lovley, 2004; Lefebvre et al.,
2008; Virdis, Rabaey, Yuan & Keller, 2008), le sulfate, le fer, le manganèse, le sélénate,
l’arséniate, l’urinate, le fumarate (Dumas, Basseguy & Bergel, 2008), les composés chlorés
(Strycharz et al., 2008), le chrome (Ehrlich, 1996; Tandukar, Huber, Onodera & Pavlostathis,
2009), l’uranium (Gregory & Lovley, 2005) et le dioxyde de carbone. Dans un tout autre ordre
d’idée, la production de biohydrogène à la cathode est une autre option ayant été explorée par
Rozendal et son équipe (Rozendal, Jeremiasse, Hamelers & Buisman, 2007).
Le nitrate, le fer et le manganèse possèdent une activité anaérobie et un potentiel de réduction très
près de ceux de l’oxygène, alors que le sulfate et le dioxyde de carbone présentent une activité et
un potentiel redox beaucoup moindres, rendant les premiers composés cités plus attrayants
comme accepteurs d’électrons finaux. L’avantage d’une réaction cathodique anaérobie est
l’absence d’oxygène pouvant diffuser dans la pile à combustible microbienne et déviant une
partie des électrons devant être captés par l’anode (He & Angenent, 2006).
Il a été montré que certains micro-organismes effectuant la dénitrification étaient capables
d’utiliser les électrons provenant de la cathode plutôt que de s’en procurer par l’oxydation d’un
substrat. Ainsi, un groupe de recherche dans le domaine des piles microbiennes a effectué à la
fois l’enlèvement des composés organiques à l’anode et l’enlèvement des nitrites (NO2-) et des
nitrates (NO3-) par leur réduction à la cathode avec un rendement acceptable (Virdis et al., 2008).
Par contre, ce système nécessite d’oxyder les cations d’ammonium dans un tiers réacteur avant de
retourner ce liquide traité dans le compartiment cathodique. Il a été montré dans une autre étude
que le transfert d’électrons entre la cathode et le nitrate pouvait être effectué par une espèce
commune dans les populations de piles microbiennes, soit Geobacter (Gregory et al., 2004).
32
1.5 Aspects électrochimiques des piles à combustible microbiennes
Malgré la multitude de substrats pouvant servir de combustible, l’acétate demeure un substrat très
utilisé, la simplicité de sa structure chimique faisant qu’il ne génère pas de composés organiques
lors de son oxydation. Cette réaction sera donc celle discutée dans cette section.
Les réactions globales prenant place aux deux électrodes sont les suivantes (Chaudhuri & Lovley,
2003; Shukla et al., 2004):
Réaction anodique : CH3COO- + 4H2O 2HCO3
- + 9H
+ + 8e
- (1.1)
Réaction cathodique : O2 + 4H+ + 4e
- 2H2O (1.2)
Le potentiel théorique de l’anode par rapport à l’électrode normale à hydrogène (ENH) est donné
par l’équation (1.3), où le potentiel théorique de l’anode pour l’acétate est de 0,187 V, les
concentrations [CH3COO-] = [HCO3
-] = 0,017 mol (1 g L
-1 d’acétate) à pH = 7 ([H
+] = 10
-7), R
est la constante universelle des gaz parfaits (8,314 J mol-1
K-1
), T est la température en degré
Kelvin (298 K pour la température ambiante), n est le nombre d’électrons libérés par l’oxydation
de l’acétate, soit 8, et F est la constante de Faraday (96485,34 C mol-1
) (Logan et al., 2006).
De la même façon, le potentiel théorique de la cathode est déterminé par l’équation (1.4), où
est de 1,229 V à pH = 7, et n = 4 pour l’oxygène, sa pression partielle étant de 0,2.
La force électromotrice d’une cellule électrochimique est donnée par Efem =
à pH
identique pour les deux réactions. Ainsi, en théorie, une pile à combustible microbienne
alimentée par l’acétate devrait pouvoir atteindre un potentiel de (0,805-(-0,292)) = 1,097 V. Par
contre, cette valeur demeure théorique et dans la réalité, plusieurs pertes surviennent, comme
dans tout système électrochimique, soit les pertes dues aux réactions parasitiques, les pertes
d’activation, ohmiques et de concentration. Ces pertes sont illustrées sur la courbe de polarisation
présentée à la figure 1-8.
Dans toutes piles, les réactions parasitiques empêchent l’atteinte de la tension théorique calculée,
ces réactions consistant principalement à l’adsorption des espèces en solution à la surface des
(1.4)
(1.3)
33
électrodes, espèces qui peuvent être impliquées ou non dans la réaction électrochimique. Les
pertes d’activation se manifestent parce que les réactions d’oxydation et de réduction nécessitent
de l’énergie afin d’être accomplies. Ces pertes surviennent lors du transfert d’électrons vers ou à
partir des substances réactives aux électrodes, comprenant aussi les réactions résultant du
métabolisme de respiration microbienne. Ces pertes sont généralement plus grandes à faible
densité de courant et croissent très lentement en augmentant le courant. Il est possible de
minimiser ces pertes en augmentant la surface des électrodes, l’activité catalytique des électrodes
ou par l’établissement d’un biofilm enrichi sur l’anode (Clauwaert et al., 2008; Logan et al.,
2006; Rismani-Yazdi et al., 2008).
Les chutes ohmiques sont attribuées à la résistance au flux des électrons dans les électrodes et
dans le circuit électrique externe, de même que la résistance à la circulation des ions dans
l’électrolyte et au travers de la membrane polymérique lorsque cette dernière est présente. Cette
résistance, grandement influencée par le design des réacteurs, peut être diminuée en rapprochant
les deux électrodes, en augmentant la conductivité des matériaux utilisés comme électrodes ou
pour le circuit électrique externe ou encore en augmentant la conductivité de l’électrolyte à la
limite de la tolérance des bactéries (Clauwaert et al., 2008; Liang, Huang, Fan, Cao & Wang,
2007; Logan et al., 2006; Rismani-Yazdi et al., 2008).
Finalement, les pertes de concentration surviennent lorsque le transport des espèces impliquées
dans les réactions électrochimiques voyageant vers et depuis les électrodes limite la production
d’électricité. Ces pertes se produisent principalement à une grande densité de courant à cause de
la diffusion limitée des espèces chimiques aux électrodes. À l’anode, ces pertes sont causées par
la limitation de la décharge des espèces oxydées à l’électrode ou par la limitation de
l’approvisionnement à l’anode d’espèces réduites. L’inverse de ces phénomènes à la cathode peut
de la même façon produire une baisse du potentiel cathodique. Un bon mélange des fluides du
système permet de restreindre les limitations en diffusion des espèces dans le biofilm, limitation
pouvant aussi causer des pertes de transport de masses (Clauwaert et al., 2008; Logan et al.,
2006; Rismani-Yazdi et al., 2008).
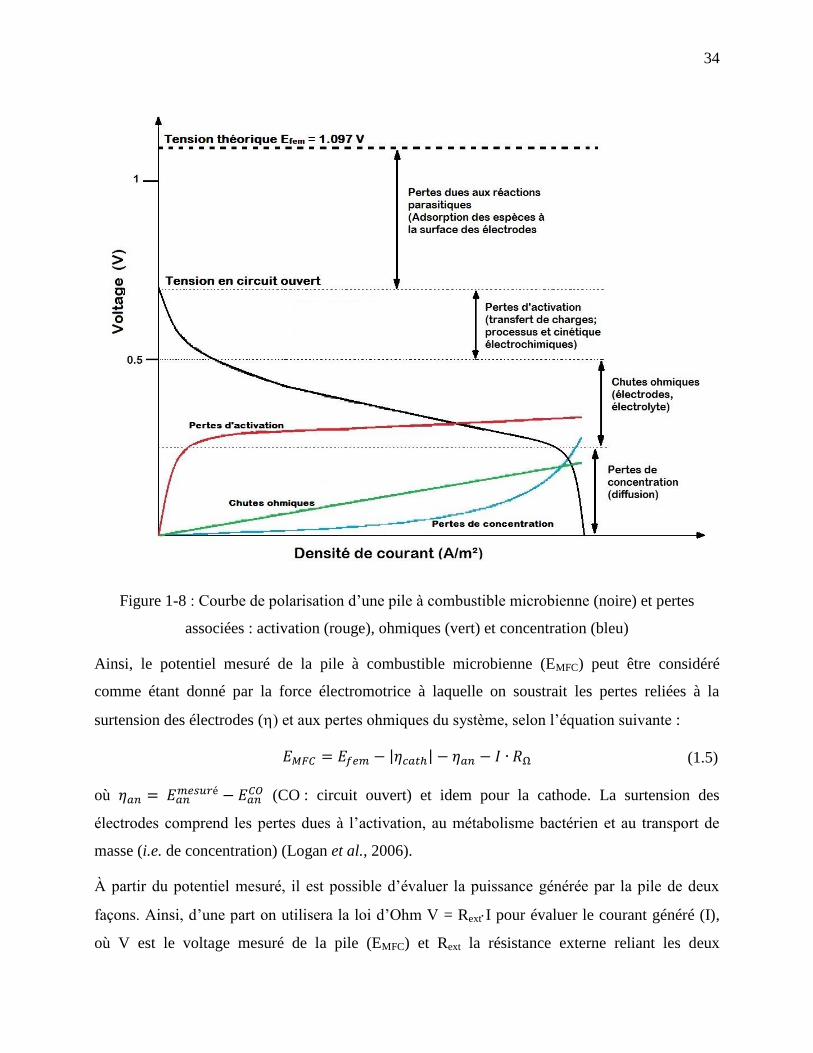
34
Figure 1-8 : Courbe de polarisation d’une pile à combustible microbienne (noire) et pertes
associées : activation (rouge), ohmiques (vert) et concentration (bleu)
Ainsi, le potentiel mesuré de la pile à combustible microbienne (EMFC) peut être considéré
comme étant donné par la force électromotrice à laquelle on soustrait les pertes reliées à la
surtension des électrodes () et aux pertes ohmiques du système, selon l’équation suivante :
où
(CO : circuit ouvert) et idem pour la cathode. La surtension des
électrodes comprend les pertes dues à l’activation, au métabolisme bactérien et au transport de
masse (i.e. de concentration) (Logan et al., 2006).
À partir du potentiel mesuré, il est possible d’évaluer la puissance générée par la pile de deux
façons. Ainsi, d’une part on utilisera la loi d’Ohm V = RextI pour évaluer le courant généré (I),
où V est le voltage mesuré de la pile (EMFC) et Rext la résistance externe reliant les deux
(1.5)
35
électrodes (représentée par sur la figure 1-2), pour ensuite calculer la puissance P = VI.
L’autre méthode consiste à mesurer simultanément le potentiel et le courant produit par la pile
pour directement calculer la puissance.
Il est possible d’estimer la résistance interne du système (Rint) lorsque le courant généré se situe
dans la région linéaire de la figure 1-8 en utilisant l’équation 1.6, où EVCO est le voltage en circuit
ouvert (VCO, la tension de la cellule lorsqu’il n’y a pas de courant) :
L’estimation de la résistance interne peut être plus juste en calculant la pente de la partie linéaire
de la courbe de polarisation à la figure 1-8. De la même façon, il est possible de mesurer le
potentiel des électrodes lors de la polarisation et d’évaluer leur résistance en calculant la pente
des courbes V vs I obtenues. Cette estimation des résistances est relativement précise tout en
tenant compte des pertes d’activation, ohmiques et de concentration. Toutefois, la technique de
spectroscopie d’impédance électrochimique est un meilleur outil pour évaluer individuellement
les différentes résistances du système (Clauwaert et al., 2008; Logan et al., 2006).
Pour générer l’énergie qu’ils utilisent pour eux-mêmes, les micro-organismes échangent des
électrons arrachés à un substrat à bas potentiel vers un accepteur final hors des cellules à potentiel
élevé, et ce, via la chaîne de transport intracellulaire. Les réactions d’oxydation des substrats
organiques se produisent à un potentiel entre approximativement -0,4 et 0 V, dépendamment des
voies métaboliques microbiennes et des micro-organismes. Dans le cas d’une pile microbienne,
l’anode est l’accepteur d’électron final, et la différence de potentiel entre l’oxydation
intracellulaire du substrat et le dernier transfert à l’anode détermine le gain énergétique des
micro-organismes, un potentiel anodique élevé leur étant favorable. Par contre, plus l’anode
possède un haut potentiel, plus les micro-organismes gagnent de l’énergie et moins la pile
montrera un voltage élevé, réduisant par le fait même la puissance pouvant être générée (Logan et
al., 2006).
Il a par contre été montré récemment qu’à partir d’un certain potentiel anodique, l’activité
microbienne diminue grandement, supposant que l’activité et la génération de courant possèdent
un optimum à un potentiel anodique entre -256 et -220 mV (Cheng, Ho & Cord-Ruwisch, 2008).
Dans un même ordre d’idée, un potentiel imposé de -200 mV a démontré générer plus d’électrons
(1.6)
36
par grammes de biomasse (biomasse plus active) que des potentiels imposés de 0 et 200 mV
(Aelterman et al., 2008a). Ce phénomène est expliqué en supposant qu’un plus faible gain
énergétique pour les micro-organismes induit une plus grande activité de ceux-ci, ces micro-
organismes étant de la sorte capables de concurrencer d’autres bactéries électroactives à des
potentiels anodiques plus élevés et ainsi de modifier le potentiel de l’anode pour leur propre
bénéfice (Clauwaert et al., 2008).
L’oxydation du combustible est effectuée de façon microbiologique par les micro-organismes
électricigènes attachés à l’anode. Il est pensé que le transport des réactifs et produits au sein du
biofilm est la clé de la performance des piles à combustible microbiennes, celui-ci étant limité
principalement par la diffusion (Richter et al., 2009; Rodriguez, Batstone, Yuan & Rabaey, 2007;
Torres, Marcus & Rittmann, 2008). Cette supposition est remise en doute par une étude de
spectroscopie d’impédance (Ramasamy, Ren, Mench & Regan, 2008b) qui montre que le facteur
limitant est le transfert de charge s’effectuant à l’anode, la pile n’ayant pas montré de limitation
en diffusion des espèces. De plus, cette étude a démontré qu’un biofilm à électroactivité
importante croît efficacement lorsque soumis à un environnement propice, soit l’accès à un
accepteur d’électron solide permettant une grande génération de courant (donc lié à une cathode
non limitante). Une étude approfondie par diverses techniques sous diverses conditions
d’opération pourrait déterminer quelles sont vraiment les causes limitant la puissance générée par
les piles microbiennes, qui nécessitent encore aujourd’hui d’être démystifiées afin de pouvoir
adapter ce système à des applications pratiques dans un futur rapproché.
37
CHAPITRE 2 DÉMARCHE ET ORGANISATION DE LA RECHERCHE
Le domaine des piles à combustible microbiennes est en plein essor depuis près d’une vingtaine
d’années, mais jusqu’à maintenant son perfectionnement se déroule principalement en laboratoire
afin de démystifier tous les recoins de cette technologie. Comme il a été mentionné dans le
chapitre 1 « Revue de littérature », plusieurs aspects des piles microbiennes ont été évalués, tant
les matériaux d’électrodes, les conditions d’opération et la configuration des réacteurs que la
compréhension fondamentale du travail des microorganismes au sein de ces piles. Toutefois, ces
études sont fonction des conditions expérimentales et ne peuvent être transposées sur toutes les
piles microbiennes. Cette thèse, qui a pour but d’élucider l’influence des conditions d’opération
et de la configuration de la pile évaluée dans ce projet sur sa performance générale, s’insère dans
le travail déjà effectué en apportant à la communauté scientifique un regard pointu au niveau de
l’électrochimie tout en employant des techniques moins utilisées jusqu’à présent. De plus,
certains acquis peuvent reflétés des comportements généralisés à d’autres types de piles. La
connaissance approfondie des facteurs influençant directement la puissance pouvant être générée
par une pile microbienne est ainsi d’une importance accrue afin que cette technologie puisse
passer à un niveau supérieur, soit son application pratique dans l’industrie.
La figure 2-1 résume la démarche et l’organisation de la recherche composant cette thèse, où l’on
remarque le lien qui est fait entre les conditions d’opération et les configurations des piles à
combustible microbiennes avec la réponse électrochimique et les analyses physico-chimiques,
ceci permettant de conclure sur les performances générales des piles, leur efficacité et leurs
limitations. Une description de chacun des articles est aussi effectuée dans ce chapitre, mettant au
premier plan la cohérence de ceux-ci par rapport aux objectifs établis et leur contribution pour la
communauté scientifique ainsi que l’avancement des piles à combustible microbiennes.
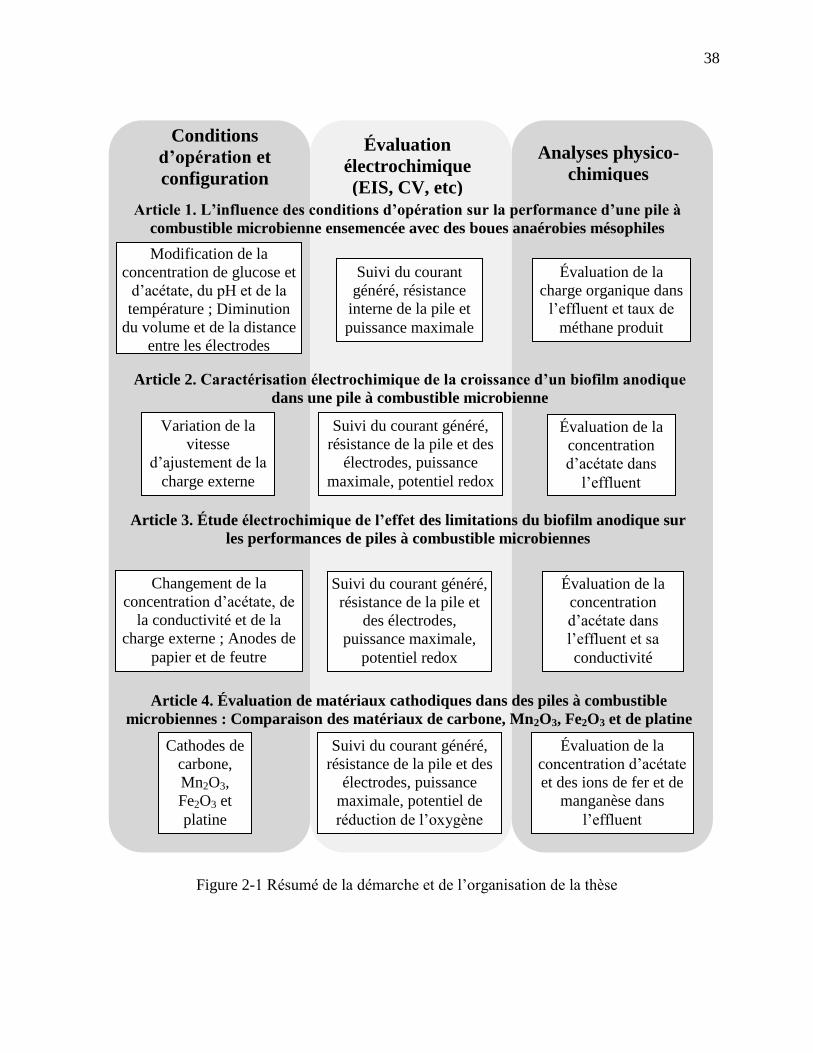
38
Figure 2-1 Résumé de la démarche et de l’organisation de la thèse
Conditions
d’opération et
configuration
Évaluation
électrochimique
(EIS, CV, etc)
Analyses physico-
chimiques
Article 2. Caractérisation électrochimique de la croissance d’un biofilm anodique
dans une pile à combustible microbienne
Variation de la
vitesse
d’ajustement de la
charge externe
Suivi du courant généré,
résistance de la pile et des
électrodes, puissance
maximale, potentiel redox
Évaluation de la
concentration
d’acétate dans
l’effluent
Article 3. Étude électrochimique de l’effet des limitations du biofilm anodique sur
les performances de piles à combustible microbiennes
Changement de la
concentration d’acétate, de
la conductivité et de la
charge externe ; Anodes de
papier et de feutre
Évaluation de la
concentration
d’acétate dans
l’effluent et sa
conductivité
Suivi du courant généré,
résistance de la pile et
des électrodes,
puissance maximale,
potentiel redox
Article 4. Évaluation de matériaux cathodiques dans des piles à combustible
microbiennes : Comparaison des matériaux de carbone, Mn2O3, Fe2O3 et de platine
Cathodes de
carbone,
Mn2O3,
Fe2O3 et
platine
Évaluation de la
concentration d’acétate
et des ions de fer et de
manganèse dans
l’effluent
Suivi du courant généré,
résistance de la pile et des
électrodes, puissance
maximale, potentiel de
réduction de l’oxygène
Article 1. L’influence des conditions d’opération sur la performance d’une pile à
combustible microbienne ensemencée avec des boues anaérobies mésophiles
Modification de la
concentration de glucose et
d’acétate, du pH et de la
température ; Diminution
du volume et de la distance
entre les électrodes
Suivi du courant
généré, résistance
interne de la pile et
puissance maximale
Évaluation de la
charge organique dans
l’effluent et taux de
méthane produit
39
Le premier article traite de l’influence de la variation de certaines conditions d’opération (charge
organique, pH, température) et de différentes configurations (distance entre les électrodes,
volume de la pile) sur l’efficacité et la puissance pouvant être produite par notre pile à
combustible microbienne. Tel que mentionné précédemment, toutes ces situations influencent la
performance générale des piles microbiennes, et l’identification de leurs effets et limitations fait
partie du premier objectif principal fixé. Il sera montré comment ces variations permettront
d’identifier les effets bénéfiques ou néfastes sur les différentes populations au sein du réacteur,
principalement les espèces électricigènes et méthanogènes, exposant ainsi la compétition régnant
entre elles. De plus, des valeurs optimales conduisant à l’amélioration significative de la
performance de la pile seront déterminées. Ces relations étant connues, il devient possible
d’améliorer l’efficacité et la puissance de nos piles microbiennes en favorisant les espèces
électricigènes et en diminuant les pertes liées à la configuration de la pile. Plusieurs de ces
observations peuvent de plus être transposées à d’autres types de piles microbiennes, permettant
l’avancement des connaissances générales dans ce domaine.
L’efficacité et la puissance des piles à combustible microbiennes sont aussi dépendantes de la
quantité de microorganismes électricigènes peuplant l’anode, ceux-ci jouant le rôle de catalyseurs
de la réaction d’oxydation tel qu’énoncé au chapitre 1. Le premier objectif fixé étant l’évaluation
des conditions limitant la performance des piles, l’influence de la vitesse d’ajustement de la
résistance externe sur le développement du biofilm anodique sera approfondi. Il est ainsi mis en
évidence l’effet de cette condition d’opération avec le développement des espèces électricigènes
en rapport aux autres espèces microbiennes. De plus, il sera montré que le développement du
biofilm est responsable de la limitation en diffusion de la réaction anodique, ceci s’inscrivant
dans le deuxième objectif principal consistant à étudier les phénomènes de transfert de charges
aux électrodes. Ainsi, ces résultats peuvent se rapporter à d’autres piles microbiennes ayant été
inoculées avec des sources bactériennes mixtes, et conduire à l’amélioration de la performance
des piles éventuellement développées en milieux industriels.
Après avoir démontré l’influence de la diffusion sur le transfert de charge siégeant à l’anode,
l’éclaircissement de cette limitation dans un biofilm mature sera traité dans le troisième article, et
ce, en variant une fois de plus diverses conditions d’opération (charge organique, conductivité,
charge externe) de même qu’en employant deux types d’anodes (papier et feutre de carbone) pour
leur différente géométrie. Ces expérimentations sont donc partie intégrante des objectifs établis
40
en évaluant les causes de limitations sur l’activité des catalyseurs biologiques à l’anode, et par
incidence directe, sur la performance et l’efficacité des piles à combustible microbiennes. Ces
clarifications servent à l’amélioration des systèmes en optimisant des conditions d’opération
différentes et en améliorant d’autres aspects du design. Ces connaissances conduisent ainsi au
perfectionnement des multiples types de piles microbiennes, menant à un fonctionnement et une
puissance accrus permettant d’envisager leur implantation industrielle prochaine.
Finalement, l’évaluation de nouveaux matériaux de cathodes alternatifs au platine sera traitée
dans le quatrième article. Des poudres de carbone, de Fe2O3 et de Mn2O3 ont été choisies pour
étudier leur potentiel à stimuler le développement d’une biocathode, les matériaux et les
biocathodes étant tous deux des éléments très récents de la recherche sur les piles à combustible
microbiennes. Ainsi, cette partie de la présente étude s’inscrit à nouveau dans les deux objectifs
principaux, soit l’évaluation des performances et limitations de la pile selon les matériaux de
cathodes, de même que l’étude des transferts de charges siégeant à cette même électrode. Ces
résultats amèneront un regard inédit sur le rôle potentiel des biocathodes aérobies et contribueront
au développement de nouveaux matériaux cathodiques à base de métaux non nobles, ceux-ci
permettant une diminution substantielle des coûts reliés à l’implantation de cette technologie.
41
CHAPITRE 3 THE INFLUENCE OF OPERATIONAL CONDITIONS ON
THE PERFORMANCE OF A MICROBIAL FUEL CELL SEEDED WITH
MESOPHILIC ANAEROBIC SLUDGE
Article publié dans Biochemical Engineering Journal le 15 septembre 2010
Auteurs : Edith Martin, Oumarou Savadogo, Serge R. Guiot et Boris Tartakovsky
3.1 Abstract
In this work, the influence of operational parameters such as organic load, pH and temperature on
power generation and methane production was studied in a continuous flow air-cathode microbial
fuel cell (MFC) seeded with mesophilic anaerobic sludge. Power generation was accompanied by
methane production, when fed with either glucose or acetate, however the ratio of methane-to-
electricity production strongly depended on operational conditions. At a pH of 7, electricity
production exhibited an Andrews-like dependence on carbon source concentration, whereas
methane production followed a Monod-like dependence. pH-stat tests showed maximal power
output at a pH of 6,3, which coincided with a decreased methane production. Cathode heating to
62°C resulted in increased electricity generation with an insignificant increase in methane
production.
Keywords : MFC; organic load; pH; temperature; methanogenesis
3.2 Introduction
Electricity production in a microbial fuel cell (MFC) offers an alternative method of power
generation, where a broad range of renewable carbon sources can be used [1-7]. In a MFC,
anodophilic microorganisms degrade organic matter and transfer electrons to the anode via
membrane-bound proteins, nanowires, or by self-produced mediators [8-10]. MFC studies
suggest that electricigenesis is widespread among microbial communities. Diverse sources of
anodophilic microorganisms, such as anaerobic sludge [11], activated sludge [12], domestic
wastewater [13], and marine sediments [14] have successfully been used for MFC inoculation.
42
Application of MFC technology for wastewater treatment might require the presence of a mixed
microbial consortium capable of hydrolysis and fermentation of long-chain carbohydrates and
proteins to readily degradable substrates such as volatile fatty acids, which is why an anaerobic
mesophilic sludge with its diverse microbial community of hydrolytic, fermentative, acidogenic,
and acetogenic microorganisms is a good inoculum choice. However, the anaerobic sludge also
contains significant methanogenic population, which is expected to compete with the anodophilic
microorganisms for acetate, thereby decreasing the apparent Coulombic efficiency of power
generation [15-17]. Previous studies have evaluated power production from a variety of carbon
sources [3, 4, 6] and have shown the co-existence of methanogenic and anodophilic
microorganisms [17, 18] as well as the influence of pH, organic load, and temperature on MFC
performance [19-24], but their focus was mainly on electricity production. Also, most of the
previous tests were conducted in fed-batch MFCs [21, 23, 24], which complicated the analysis of
the process kinetics. In this study, a steady state approach was used to evaluate the impact of
operating conditions on the electricity and power production in a continuous-flow MFC.
3.3 Materials and methods
3.3.1 MFC design and operation
Two single chamber MFCs with air-cathodes [25] were used. The cathodes were gas diffusion
electrodes (GDE) with a Pt load of 0,5 mg cm-2
(GDE-LT-120EW, E-TEK Division, PEMEAS
Fuel Cell Technologies, Somerset, NJ, USA). To prevent water losses through the cathode
surface, a silicon spray (Silicone Water-Guard, Atsko Inc, Orangeburg, SC, USA) was used to
create a hydrophobic coating on the side of the cathode exposed to air. The anodes consisted of a
5 x 10 cm piece of carbon felt (Speer Canada, Kitchener, ON, Canada) with a thickness of 5 mm.
The anodic chambers were made of polycarbonate plates. One MFC (MFC-1) was assembled
using two plates and had a volume of 110 mL. The distance between the electrodes in this MFC
was 1,5 cm and the anode occupied only 25% of the chamber volume. Another MFC (MFC-2)
contained one anodic plate so that the chamber volume was reduced to 50 mL. In this MFC a
layer of J-Cloth
was used to separate the electrodes, providing an electrode spacing of
approximately 1 mm and reducing electrolyte ohmic resistance.
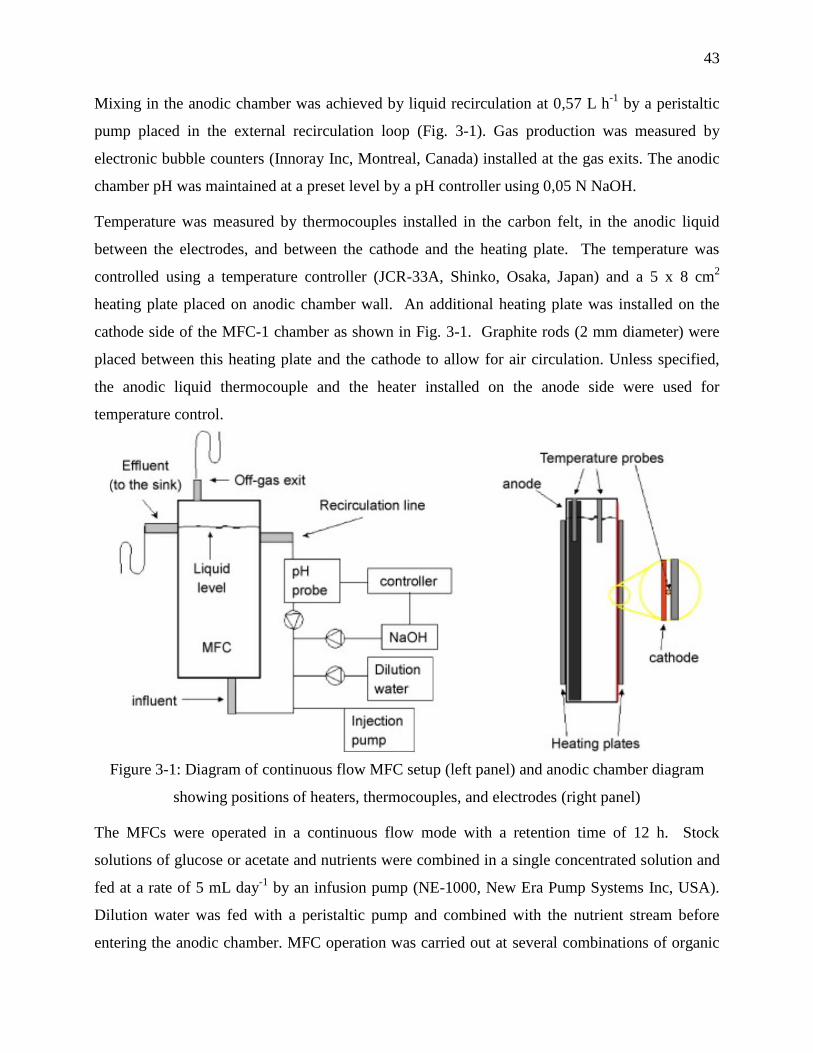
43
Mixing in the anodic chamber was achieved by liquid recirculation at 0,57 L h-1
by a peristaltic
pump placed in the external recirculation loop (Fig. 3-1). Gas production was measured by
electronic bubble counters (Innoray Inc, Montreal, Canada) installed at the gas exits. The anodic
chamber pH was maintained at a preset level by a pH controller using 0,05 N NaOH.
Temperature was measured by thermocouples installed in the carbon felt, in the anodic liquid
between the electrodes, and between the cathode and the heating plate. The temperature was
controlled using a temperature controller (JCR-33A, Shinko, Osaka, Japan) and a 5 x 8 cm2
heating plate placed on anodic chamber wall. An additional heating plate was installed on the
cathode side of the MFC-1 chamber as shown in Fig. 3-1. Graphite rods (2 mm diameter) were
placed between this heating plate and the cathode to allow for air circulation. Unless specified,
the anodic liquid thermocouple and the heater installed on the anode side were used for
temperature control.
Figure 3-1: Diagram of continuous flow MFC setup (left panel) and anodic chamber diagram
showing positions of heaters, thermocouples, and electrodes (right panel)
The MFCs were operated in a continuous flow mode with a retention time of 12 h. Stock
solutions of glucose or acetate and nutrients were combined in a single concentrated solution and
fed at a rate of 5 mL day-1
by an infusion pump (NE-1000, New Era Pump Systems Inc, USA).
Dilution water was fed with a peristaltic pump and combined with the nutrient stream before
entering the anodic chamber. MFC operation was carried out at several combinations of organic
44
load, pH, and temperature, as described in Table 3.1 and Table 3.2. Each set of operational
parameters was maintained for at least 3 days to insure steady state conditions. Experimental
results obtained at steady-state were used for performance evaluation. Overall, each MFC was
operated for about 4 months.
3.3.2 Inoculum, media composition, and analytical methods
The anodic compartments of the MFCs were inoculated with 3 mL of homogenized anaerobic
mesophilic sludge (VSS = 50 g L-1
) (A. Lassonde Inc., Rougemont, Quebec, Canada). The stock
solution of nutrients contained (g L-1
): yeast extract (0,93), NH4Cl (18,68), KCl (148,09),
K2HPO4 (64,04), KH2PO4 (40,69), and glucose or acetate. The stock solution of microelements
contained (in g L-1
): FeCl24H2O (2), H3BO3 (0,05), ZnCl2 (0,05), CuCl2 (0,03), MnCl24H2O
(0,5), (NH4)6Mo7O244H2O (0,05), AlCl3 (0,05), CoCl26H2O (0,05), NiCl2 (0,05), EDTA (0,5)
and concentrated HCl (1µL). 1 mL of this stock solution was added to each litre of dilution water.
The concentration of sodium acetate (anhydrous) in the stock solution was varied from 27,3 to
109,3 g L-1
and glucose concentration was varied from 4 to 160 g L-1
in order to obtain the
desired organic load. All stock solutions were filter-sterilized. The influent solution, which
combined dilution water, microelements, and nutrients, had a conductivity of 14-16mS cm-1
.
Glucose and lactate concentrations were measured by high-performance liquid chromatography
(HPLC, Waters Chromatography, Milford, MA, USA) with a PDA detector model 2996. The
detection limit for glucose was 0,5-1,0 mg L-1
. Volatile fatty acids (acetic, butyric and propionic)
were measured by gas chromatography (GC) using an Agilent 6890 (Wilmington, DE) with a
detection limit of 0,2 mg L-1
. Gas composition was measured using a gas chromatograph (6890
Series, Hewlett Packard, Wilmington, DE). Method details can be found elsewhere [11].
3.3.3 Electrical measurements and calculations
MFC-1 polarization curves were acquired by manually changing the external resistance (Rext).
The resistance was changed from 5000 to 10 . An interval of 10 min was allowed between
the changes. During MFC-2 operation polarization tests were performed using a potentiostat
(273A, Princeton Applied Research, Tennessee, USA). The anode was employed as a working
electrode, while the cathode was used as a counter and reference electrode. The anode and
cathode potentials were measured against an Ag/AgCl reference electrode (222 mV vs NHE)
45
using a data acquisition card (LabJack U12, LabJack Corporation, Colorado, USA). The
polarization test was performed starting from open-circuit potential (OCP) to short-circuit
potential at a scan rate of 0,5mV s-1
.
MFC internal resistance (Rint) was estimated from the linear part (i.e. ohmic losses) of the
polarization curve (EMFC vs I). Anode and cathode potentials were also plotted against the
current, where available, which permitted to evaluate the total internal resistances of the anode
(RA) and cathode (RC) as the slope of the linear part of the corresponding curves.
Apparent Coulombic efficiency (CEA) was calculated as
where I is the average current (A); t is the time interval during which current was measured (s);
M is the substrate molecular weight (180 g and 60 g for glucose and acetate, respectively); F is
the Faraday constant, 96485 (C mol-1
), n is the number of electrons per mol of the substrate (24
and 8 for glucose and acetate, respectively); W is the amount of substrate consumed (g). For a
continuous flow cell W was estimated as W = FL(Sin – S), where FL is the liquid flow rate (L s-1
),
Sin is the influent substrate concentration (g L-1
), and S is the bulk substrate concentration in the
anodic chamber (g L-1
). Because of intensive mixing, the bulk and effluent substrate
concentrations were assumed to be equal.
Substrate equivalent (WE) of a current I generated over a period of time t was calculated
assuming CEA=100% :
3.4 Results
3.4.1 Glucose tests
Following the inoculation, MFC-1 was operated at an external resistance of 200 Ω. A gradual
voltage increase was observed during the first 9 days of operation with the output voltage
stabilizing at 0,37 - 0,40 V. At a glucose loading rate of 1,9 g -1
AL day-1
(LA: anode compartment
volume in liter), the anodic chamber liquid contained 30-37 mg L-1
propionate, and 21-80 mg L-1
of acetate. The glucose concentration was below the level of detection. In addition to electricity
(3.1)
(3.2)
46
generation, methane production was also observed. The biogas production rate was 40 - 50 mL
day-1
. On average this biogas contained 77% CH4, which corresponded to an apparent methane
yield of 0,07 L-CH4 (g-COD)-1
.
To study the influence of the organic load on MFC performance, the glucose load was varied
from 0,2 to 7,4 g -1
AL day-1
in several steps, while maintaining constant hydraulic retention time
and pH (Table 3.1). Stable power generation was observed approximately 24 h after each change
in glucose load. At all glucose loads tested, glucose was not detected in the anodic liquid
suggesting a rapid transformation of glucose to volatile fatty acids (VFAs), with acetate as the
main observed degradation product, and propionate to a lesser extent. At the highest glucose load,
5,8 mg -1L of lactate was also detected in the anodic liquid. The carbon source concentration in
the anodic chamber liquid (bulk concentration) was calculated by a summation of all measurable
products of glucose degradation and expressed in its chemical oxygen demand (COD) equivalent.
Polarization tests shown in Fig. 3-2 were conducted at each glucose load to estimate total internal
resistance and maximal power output. These values are summarized and compared with
corresponding glucose loads in Fig. 3-3. This comparison shows that power output increased with
increasing the glucose load up to 2 g -1
AL day-1
such that the highest Rint estimation was obtained at
the lowest glucose load. Further increase of the load above 4 g -1
AL day-1
led to a decreased power
output. Accordingly, at glucose loads above 0,46 g -1
AL day-1
, Rint decreased to 70-80 Ω, but
increased at the highest glucose load. Methane production was directly proportional to the
glucose load and reached its maximum (0,7 L -1
AL day-1
) at the highest glucose load of 7,4 g -1
AL
day-1
(Table 3.1).
In spite of a relatively low Coulombic efficiency, combined anodophilic and methanogenic
activity provided high COD removal efficiency in a broad range of organic loads, as can be seen
from the material balance presented in Table 3.1. Overall, for glucose loads between 0,2 and 3,7
g -1
AL day-1
, there was 82 - 93% COD removal efficiency.
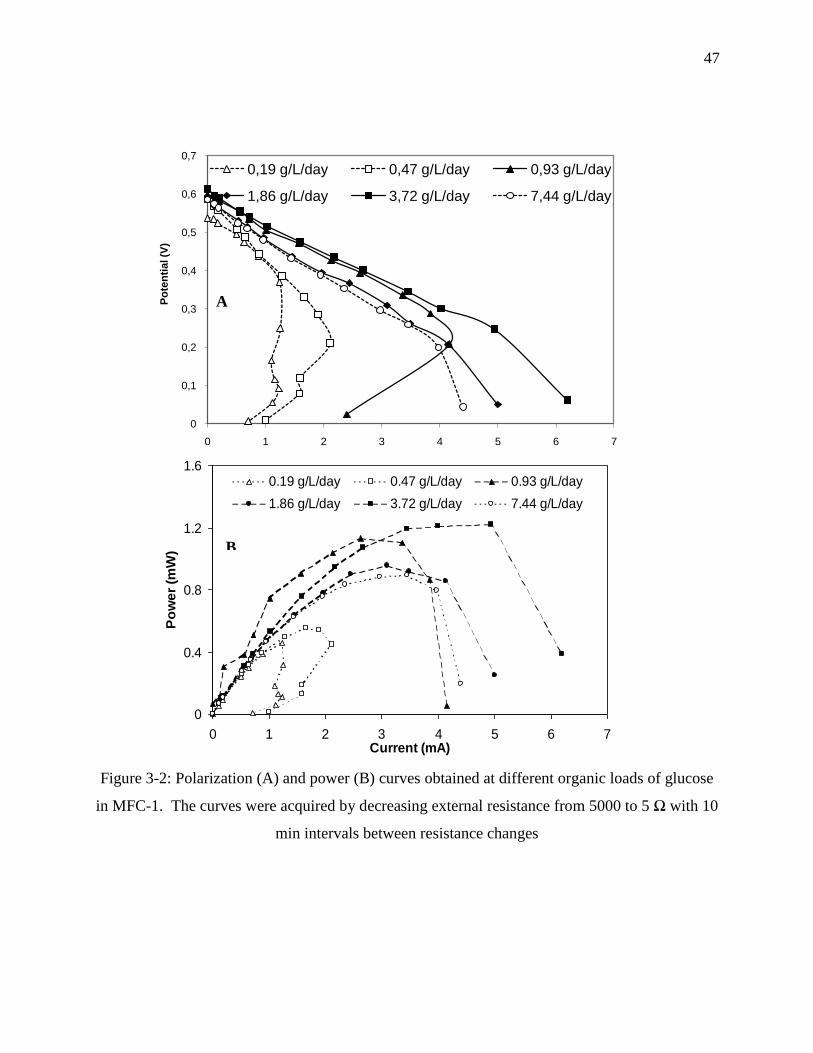
47
Figure 3-2: Polarization (A) and power (B) curves obtained at different organic loads of glucose
in MFC-1. The curves were acquired by decreasing external resistance from 5000 to 5 Ω with 10
min intervals between resistance changes
0
0,1
0,2
0,3
0,4
0,5
0,6
0,7
0 1 2 3 4 5 6 7
Po
ten
tial (V
)
Current (mA)
0,19 g/L/day 0,47 g/L/day 0,93 g/L/day
1,86 g/L/day 3,72 g/L/day 7,44 g/L/day
0
0.4
0.8
1.2
1.6
0 1 2 3 4 5 6 7Current (mA)
Po
we
r (m
W)
0.19 g/L/day 0.47 g/L/day 0.93 g/L/day
1.86 g/L/day 3.72 g/L/day 7.44 g/L/day
B
A
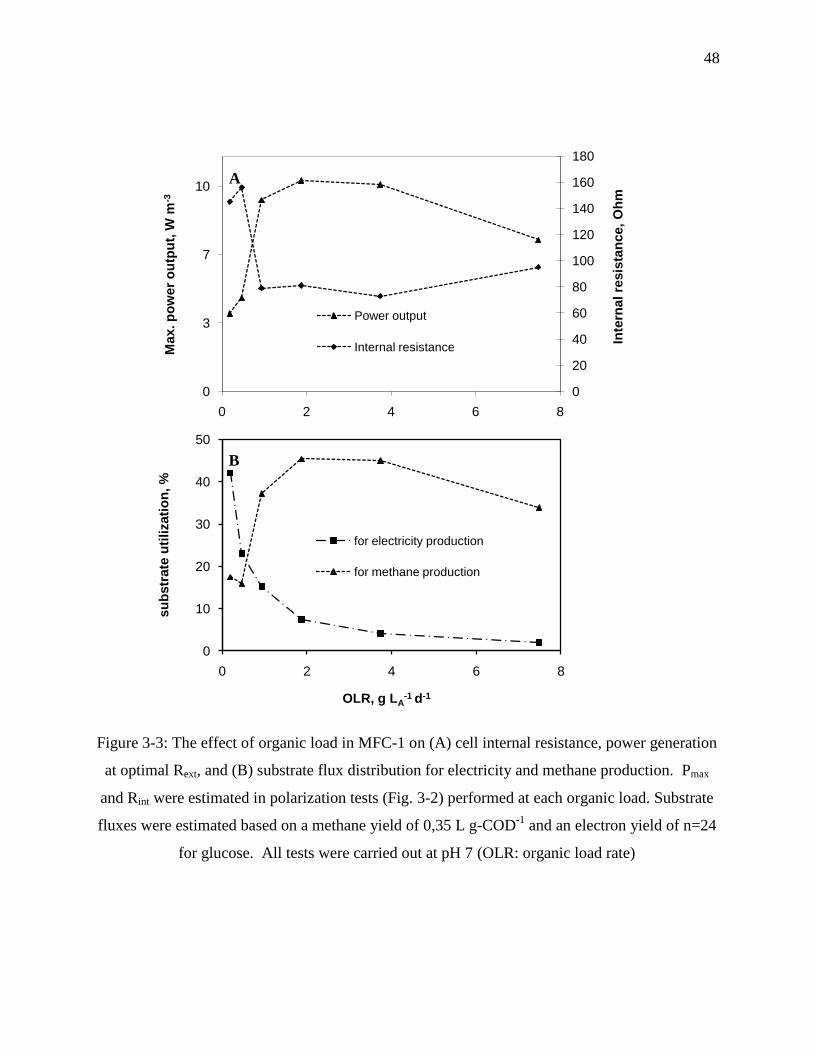
48
0
20
40
60
80
100
120
140
160
180
0
3
7
10
0 2 4 6 8
Inte
rnal re
sis
tan
ce,
Oh
m
Max. p
ow
er
ou
tpu
t, W
m-3
Power output
Internal resistance
0
10
20
30
40
50
0 2 4 6 8
su
bstr
ate
uti
lizati
on
, %
OLR, g LA-1 d-1
for electricity production
for methane production
B
Figure 3-3: The effect of organic load in MFC-1 on (A) cell internal resistance, power generation
at optimal Rext, and (B) substrate flux distribution for electricity and methane production. Pmax
and Rint were estimated in polarization tests (Fig. 3-2) performed at each organic load. Substrate
fluxes were estimated based on a methane yield of 0,35 L g-COD-1
and an electron yield of n=24
for glucose. All tests were carried out at pH 7 (OLR: organic load rate)
A
49
Table 3.1: Operational conditions and MFC-1 performance observed in glucose, pH, and
temperature tests. The MFC was operated at Rext = 200 Ω
3.4.2 Acetate tests
Based on the results of glucose tests in MFC-1, MFC design was refined by decreasing the
distance between the electrodes and, consequently, reducing the anodic chamber volume to 50
mL. The modified MFC (MFC-2) was fed with acetate to confirm the impact of acetate
concentration on electricity production. After the homogenized anaerobic sludge was added to the
anodic chamber, the startup was carried out at an acetate load of 4 g -1
AL day-1
. As in the previous
test, a gradual increase of the output voltage was observed. At a steady state, the concentration of
acetate in the anodic chamber was 171,83 9,92 mg L-1
and the biogas production was at 0,2-0,3
L -1
AL day-1
.
Test
OLR
g -1
AL d-1
pH
anodic
liquid
temp, °C
P200
W m-3
CEA
%
CH4 prod.
L (LA d)-1
CH44 yield
L g-COD-1
COD
removal,
%
glucose
0,19
7 25
2,7 42,1 0,01 0,06 92,7
0,47 4,8 23,1 0,02 0,06 89,7
0,93 7,9 15,3 0,11 0,13 87,1
1,86 7,8 7,0 0,26 0,16 87,9
3,72 8,2 4,1 0,49 0,16 82,3
7,44 6,6 2,0 0,66 0,12 74,3
pH 1,86
6,5
25
9,8 8,1 0,15 0,09 91,2
6,25 9,6 8,6 0,10 0,06 85,3
6 8,8 9,1 0,12 0,09 77,2
5,5 2,2 5,2 0,002 0,002 67,6
temp. 3,72 6,25
25 9,4 4,7 0,16 0,06 76,6
32 9,8 4,8 0,5 0,17 77,7
36 10,4 5,2 0,19 0,07 74,0
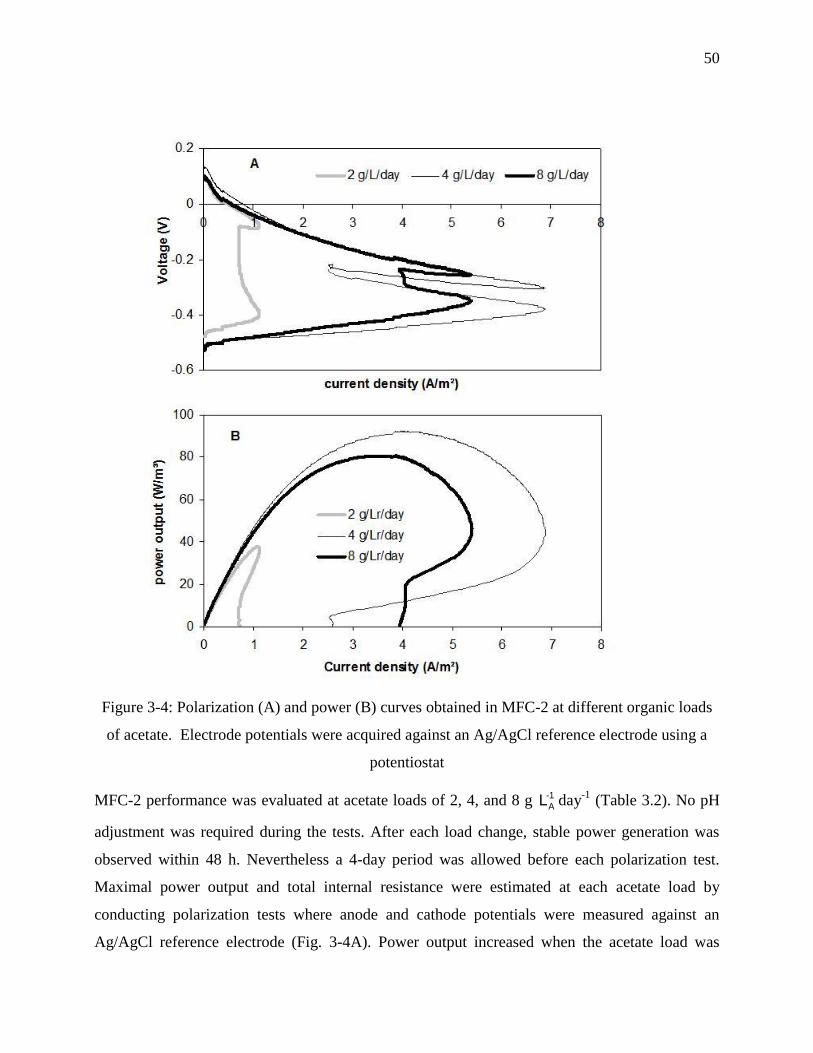
50
Figure 3-4: Polarization (A) and power (B) curves obtained in MFC-2 at different organic loads
of acetate. Electrode potentials were acquired against an Ag/AgCl reference electrode using a
potentiostat
MFC-2 performance was evaluated at acetate loads of 2, 4, and 8 g -1
AL day-1
(Table 3.2). No pH
adjustment was required during the tests. After each load change, stable power generation was
observed within 48 h. Nevertheless a 4-day period was allowed before each polarization test.
Maximal power output and total internal resistance were estimated at each acetate load by
conducting polarization tests where anode and cathode potentials were measured against an
Ag/AgCl reference electrode (Fig. 3-4A). Power output increased when the acetate load was
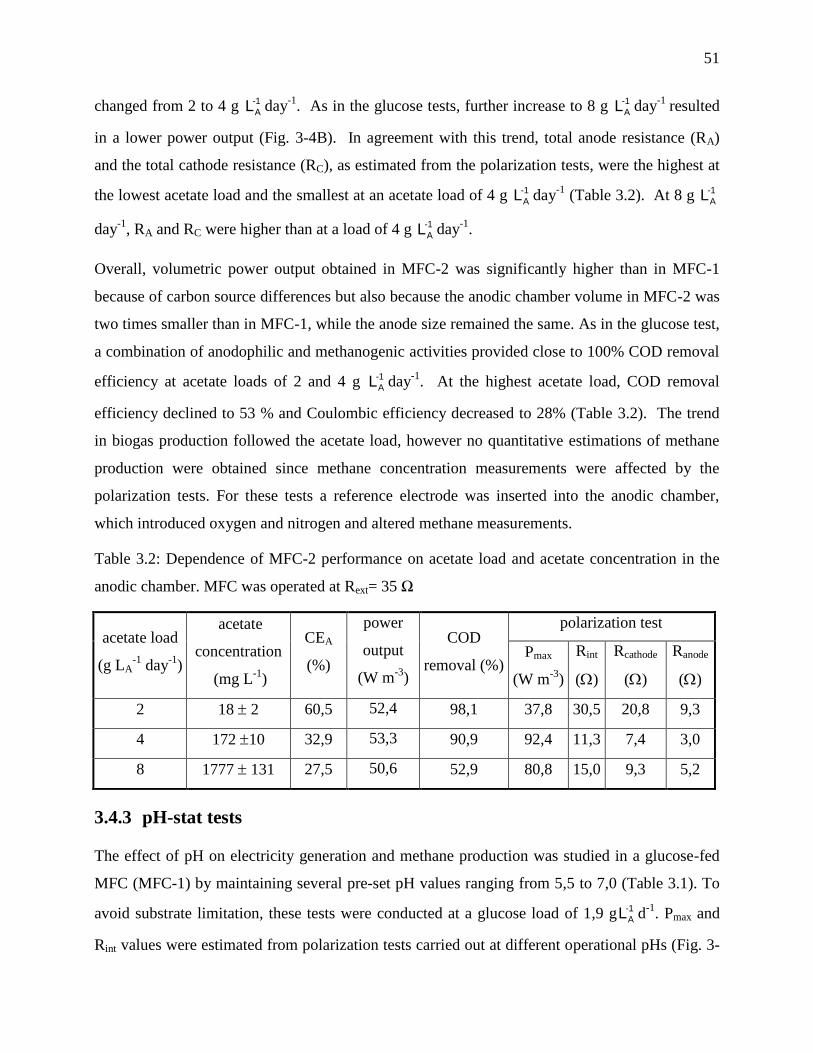
51
changed from 2 to 4 g -1
AL day-1
. As in the glucose tests, further increase to 8 g -1
AL day-1
resulted
in a lower power output (Fig. 3-4B). In agreement with this trend, total anode resistance (RA)
and the total cathode resistance (RC), as estimated from the polarization tests, were the highest at
the lowest acetate load and the smallest at an acetate load of 4 g -1
AL day-1
(Table 3.2). At 8 g -1
AL
day-1
, RA and RC were higher than at a load of 4 g -1
AL day-1
.
Overall, volumetric power output obtained in MFC-2 was significantly higher than in MFC-1
because of carbon source differences but also because the anodic chamber volume in MFC-2 was
two times smaller than in MFC-1, while the anode size remained the same. As in the glucose test,
a combination of anodophilic and methanogenic activities provided close to 100% COD removal
efficiency at acetate loads of 2 and 4 g -1
AL day-1
. At the highest acetate load, COD removal
efficiency declined to 53 % and Coulombic efficiency decreased to 28% (Table 3.2). The trend
in biogas production followed the acetate load, however no quantitative estimations of methane
production were obtained since methane concentration measurements were affected by the
polarization tests. For these tests a reference electrode was inserted into the anodic chamber,
which introduced oxygen and nitrogen and altered methane measurements.
Table 3.2: Dependence of MFC-2 performance on acetate load and acetate concentration in the
anodic chamber. MFC was operated at Rext= 35 Ω
3.4.3 pH-stat tests
The effect of pH on electricity generation and methane production was studied in a glucose-fed
MFC (MFC-1) by maintaining several pre-set pH values ranging from 5,5 to 7,0 (Table 3.1). To
avoid substrate limitation, these tests were conducted at a glucose load of 1,9 g -1
AL d-1
. Pmax and
Rint values were estimated from polarization tests carried out at different operational pHs (Fig. 3-
acetate load
(g LA-1
day-1
)
acetate
concentration
(mg L-1
)
CEA
(%)
power
output
(W m-3
)
COD
removal (%)
polarization test
Pmax
(W m-3
)
Rint
()
Rcathode
()
Ranode
()
2 18 2 60,5 52,4 98,1 37,8 30,5 20,8 9,3
4 172 10 32,9 53,3 90,9 92,4 11,3 7,4 3,0
8 1777 131 27,5 50,6 52,9 80,8 15,0 9,3 5,2
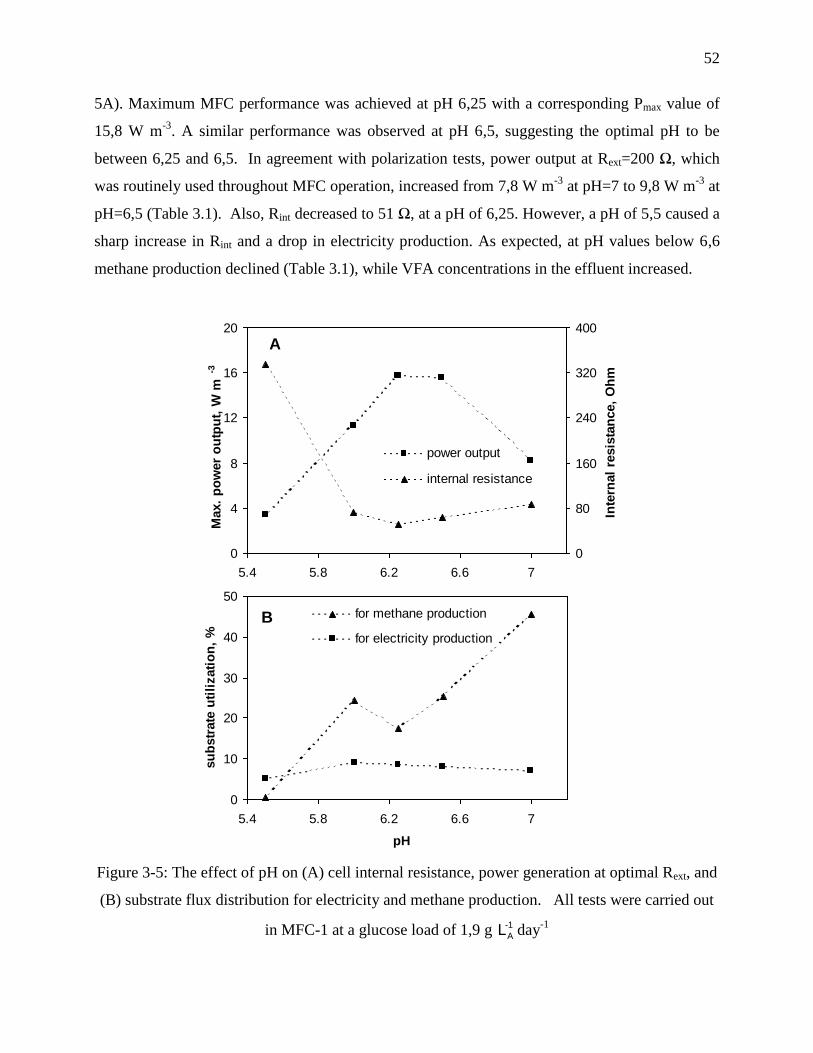
52
5A). Maximum MFC performance was achieved at pH 6,25 with a corresponding Pmax value of
15,8 W m-3
. A similar performance was observed at pH 6,5, suggesting the optimal pH to be
between 6,25 and 6,5. In agreement with polarization tests, power output at Rext=200 Ω, which
was routinely used throughout MFC operation, increased from 7,8 W m-3
at pH=7 to 9,8 W m-3
at
pH=6,5 (Table 3.1). Also, Rint decreased to 51 Ω, at a pH of 6,25. However, a pH of 5,5 caused a
sharp increase in Rint and a drop in electricity production. As expected, at pH values below 6,6
methane production declined (Table 3.1), while VFA concentrations in the effluent increased.
Figure 3-5: The effect of pH on (A) cell internal resistance, power generation at optimal Rext, and
(B) substrate flux distribution for electricity and methane production. All tests were carried out
in MFC-1 at a glucose load of 1,9 g -1
AL day-1
0
4
8
12
16
20
5.4 5.8 6.2 6.6 7
pH
Max.
po
wer
ou
tpu
t, W
m-3
0
80
160
240
320
400
Inte
rnal
resis
tan
ce,
Oh
m
power output
internal resistance
A
0
10
20
30
40
50
5.4 5.8 6.2 6.6 7
pH
su
bstr
ate
uti
lizati
on
, %
for methane production
for electricity production
B
53
COD removal varied from 85 to 91% at pHs of 6,25-7,0. At pH 5,5, the removal efficiency
dropped to 67% and both electricity generation and methane production declined. CEA value of
8,6% was calculated at pH 6,25, but at pH = 5,5 it decreased to 5,2%. As mentioned above, these
CEA values were obtained at a Rext of 200 . An optimal resistance of 51 was estimated from
the polarization test corresponding to an apparent Coulombic efficiency of over 22%.
3.4.4 Temperature tests
The impact of temperature on MFC performance was studied in MFC-1 at a glucose load of 3,7 g
-1
AL day-1
and a pH setpoint of 6,25. In the first test MFC was operated at a setpoint of 25C using
the thermocouple located in the anodic liquid between the electrodes and the heater installed on
the anode side (Fig. 3-1). Because of this configuration, the temperature measured by the
thermocouple placed inside the anode was 27C, while at the cathode it was 23C (Table 3.3). In
the next test the anode thermocouple was used for temperature control and the temperature
setpoint was increased to 38°C. Again, the heater installed on the anode side was used. Since,
the cathode electrode was exposed to room temperature, a significant temperature difference was
observed (Table 3.3). A higher anode temperature resulted in an increase in both electricity and
methane production. A polarization test yielded Rint=38 Ω and Pmax=18,3 W m-3
, as compared to
16,2 W m-3
at a setpoint of 25C. Also, MFC operation at Rext=200 Ω and an anode temperature
of 38C resulted in P=9,8 W m-3
, which corresponded to a 4% increase as compared to 27C. At
the same time, methane production increased from 0,16 to 0,5 L -1
AL day-1
.
In the third test, the anodic chamber was heated via a heating plate installed on the outside of the
cathode electrode as shown in Fig. 3-1. Consequently, the cathode surface facing the heater plate
reached a temperature of 62C. Because of heat losses in the anodic chamber and the external
recirculation loop, the temperature of the anodic liquid was significantly lower, 36C, and the
temperature of the anode electrode itself was even lower, 30C. Under these conditions values of
Rint=39 Ω and Pmax=19,2 W m-3
were estimated from the polarization test. Here, the methane
production was at 0,19 L -1
AL day-1
(Table 3.1 and 3.3).
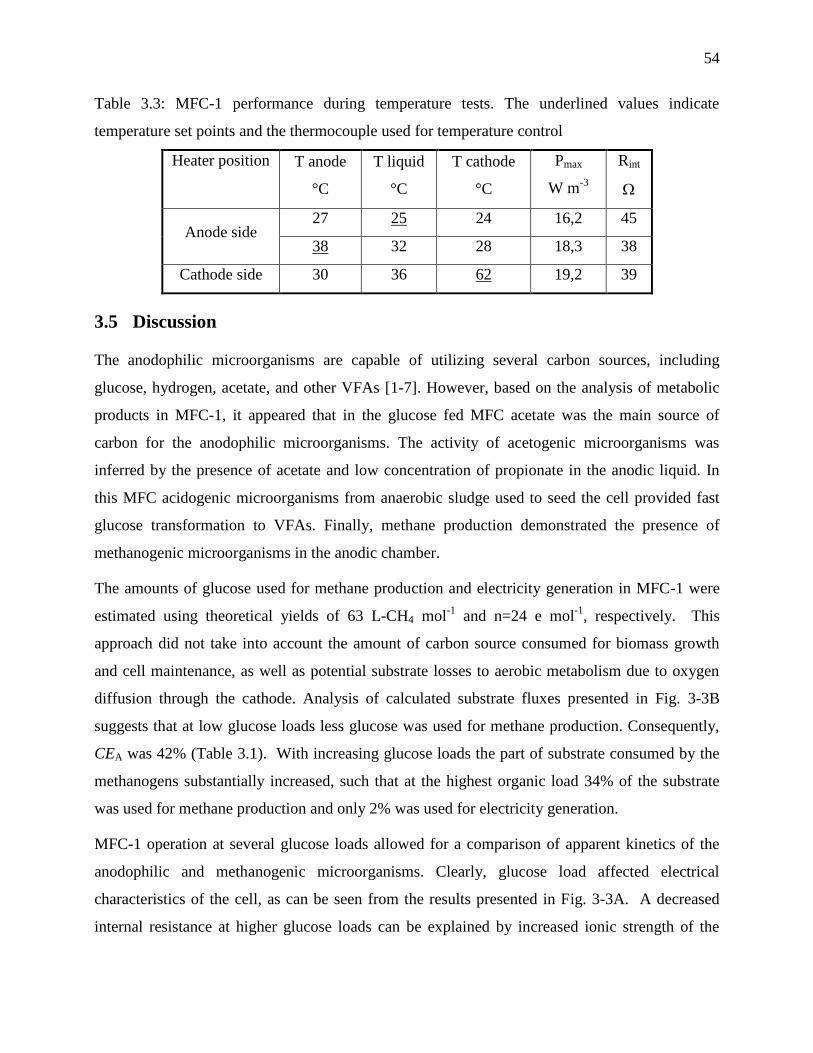
54
Table 3.3: MFC-1 performance during temperature tests. The underlined values indicate
temperature set points and the thermocouple used for temperature control
Heater position T anode
°C
T liquid
°C
T cathode
°C
Pmax
W m-3
Rint
Anode side 27 25 24 16,2 45
38 32 28 18,3 38
Cathode side 30 36 62 19,2 39
3.5 Discussion
The anodophilic microorganisms are capable of utilizing several carbon sources, including
glucose, hydrogen, acetate, and other VFAs [1-7]. However, based on the analysis of metabolic
products in MFC-1, it appeared that in the glucose fed MFC acetate was the main source of
carbon for the anodophilic microorganisms. The activity of acetogenic microorganisms was
inferred by the presence of acetate and low concentration of propionate in the anodic liquid. In
this MFC acidogenic microorganisms from anaerobic sludge used to seed the cell provided fast
glucose transformation to VFAs. Finally, methane production demonstrated the presence of
methanogenic microorganisms in the anodic chamber.
The amounts of glucose used for methane production and electricity generation in MFC-1 were
estimated using theoretical yields of 63 L-CH4 mol-1
and n=24 e mol-1
, respectively. This
approach did not take into account the amount of carbon source consumed for biomass growth
and cell maintenance, as well as potential substrate losses to aerobic metabolism due to oxygen
diffusion through the cathode. Analysis of calculated substrate fluxes presented in Fig. 3-3B
suggests that at low glucose loads less glucose was used for methane production. Consequently,
CEA was 42% (Table 3.1). With increasing glucose loads the part of substrate consumed by the
methanogens substantially increased, such that at the highest organic load 34% of the substrate
was used for methane production and only 2% was used for electricity generation.
MFC-1 operation at several glucose loads allowed for a comparison of apparent kinetics of the
anodophilic and methanogenic microorganisms. Clearly, glucose load affected electrical
characteristics of the cell, as can be seen from the results presented in Fig. 3-3A. A decreased
internal resistance at higher glucose loads can be explained by increased ionic strength of the
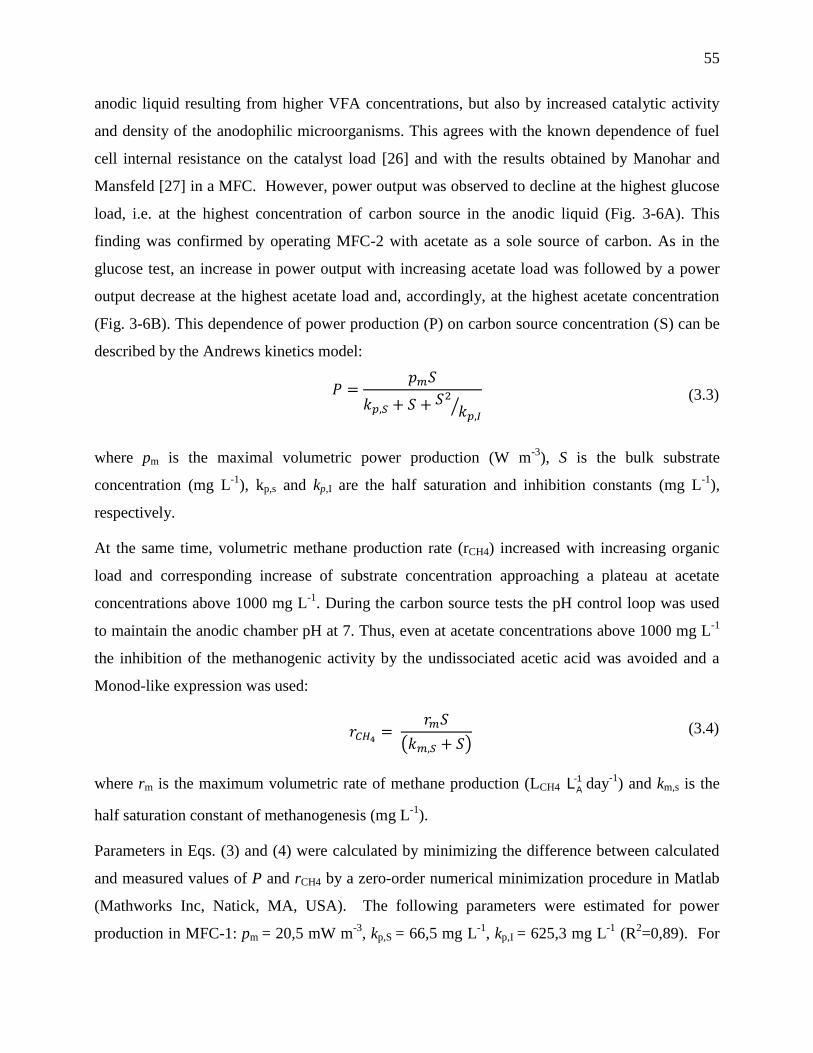
55
anodic liquid resulting from higher VFA concentrations, but also by increased catalytic activity
and density of the anodophilic microorganisms. This agrees with the known dependence of fuel
cell internal resistance on the catalyst load [26] and with the results obtained by Manohar and
Mansfeld [27] in a MFC. However, power output was observed to decline at the highest glucose
load, i.e. at the highest concentration of carbon source in the anodic liquid (Fig. 3-6A). This
finding was confirmed by operating MFC-2 with acetate as a sole source of carbon. As in the
glucose test, an increase in power output with increasing acetate load was followed by a power
output decrease at the highest acetate load and, accordingly, at the highest acetate concentration
(Fig. 3-6B). This dependence of power production (P) on carbon source concentration (S) can be
described by the Andrews kinetics model:
where pm is the maximal volumetric power production (W m-3
), S is the bulk substrate
concentration (mg L-1
), kp,s and kp,I are the half saturation and inhibition constants (mg L-1
),
respectively.
At the same time, volumetric methane production rate (rCH4) increased with increasing organic
load and corresponding increase of substrate concentration approaching a plateau at acetate
concentrations above 1000 mg L-1
. During the carbon source tests the pH control loop was used
to maintain the anodic chamber pH at 7. Thus, even at acetate concentrations above 1000 mg L-1
the inhibition of the methanogenic activity by the undissociated acetic acid was avoided and a
Monod-like expression was used:
where rm is the maximum volumetric rate of methane production (LCH4 -1
AL day-1
) and km,s is the
half saturation constant of methanogenesis (mg L-1
).
Parameters in Eqs. (3) and (4) were calculated by minimizing the difference between calculated
and measured values of P and rCH4 by a zero-order numerical minimization procedure in Matlab
(Mathworks Inc, Natick, MA, USA). The following parameters were estimated for power
production in MFC-1: pm = 20,5 mW m-3
, kp,S = 66,5 mg L-1
, kp,I = 625,3 mg L-1
(R2=0,89). For
(3.4)
(3.3)
56
methane production in MFC-1 a maximal volumetric production rate rm= 0,98 LCH4 -1
AL day-1
and
a half-saturation coefficient km,S of 364,7 mg L-1
( R2
=0,99) were estimated. Because of a
smaller size of the anodic chamber, a shorter distance between the electrodes, and the absence of
VFAs other than acetate in MFC-2, the estimated values were different for the acetate test (pm =
139 mW m-3
; kp,I = 2616 mg L-1
; kp,S was unchanged), but the same trend was observed (Fig. 3-
6B).
Figure 3-6: Approximation of power and methane production rates observed in the glucose fed
MFC-1 (A), and acetate-fed MFC-2 (B) by Andrews (power output) and Monod (methane
production) dependencies. Power outputs obtained in polarization tests at Rext=Rint were used for
the approximation
0
2
4
6
8
10
12
14
0 200 400 600 800 1000 1200
substrate concentration, mg-COD L-1
po
wer
ou
tpu
t (W
/m3)
0
0.2
0.4
0.6
0.8
meth
an
e f
low
(L
/LA/d
ay)
power output
methane flow
A
0
20
40
60
80
100
120
0 500 1000 1500 2000
substrate (acetate) concentration (mg-COD/L)
po
wer
ou
tpu
t (W
/m³)
B
57
A comparison of apparent half-saturation constants suggested that anodophilic microorganisms
had a higher affinity for acetate implying their competitiveness with methanogens at low
substrate concentrations in the liquid, i.e. at low organic loads. This conclusion agrees with the
estimation of carbon source fluxes at different glucose loads (Fig. 3-3B), which showed that the
part of substrate consumed by anodophilic microorganisms increased with decreasing organic
load. Therefore, methane production can be restricted by maintaining low bulk substrate
concentration in the anodic chamber, for instance by controlling influent flow rate.
The observed link between the organic loads and estimated values of Rint (Fig. 3-3A) can be
attributed to ionic strength variations due to changing VFA levels, however a link with metabolic
activity and density of anodophilic microorganisms can not be excluded. At low substrate
concentrations CEA was improved because less substrate was used for methane production,
although MFC internal resistance was higher. Thus, a better electron recovery does not
necessarily lead to better MFC performance. Although the observed values of CEA were
relatively low, they were in line with other tests conducted with glucose as a source of carbon,
e.g. a Coulombic efficiency of 14% was obtained by Min and Logan [3].
Analysis of kinetic curves in Fig. 3-6 showed that the ratio of electricity-to-methane production
can be controlled by organic load and that simultaneous power generation and methane
production can be accomplished under carbon source non-limiting conditions, i.e. in a range of
150-400 mg-COD L-1
. This approach for maximizing COD removal efficiency and combining
methane and power production in a MFC has been already suggested by Clauwaert et al [28].
In addition to organic load, the electricity-to-methane production ratio can be controlled by the
anodic chamber pH. Most often MFC tests are conducted without pH control, or at a neutral pH,
which is considered to be optimal for electricity generation [19], although MFC operation under
acidophilic conditions has been demonstrated [29]. In MFC-1 at pH values below 6,6
methanogenesis decreased significantly, thus leaving more substrate for electricity production. As
a result, power output was increased at a pH of 6,25. At pH values below 6,2, both methanogenic
and anodophilic populations were inhibited leading to a drop in the overall MFC performance
(Fig. 3-4). Calculations of substrate fluxes corroborated with this conclusion suggesting that the
use of substrate for methane production was minimal at around pH 6,25 (Fig. 3-5B), which
corresponded to maximal power production. This conclusion is different from the results of the
58
pH optimization tests obtained in MFCs with a proton exchange membrane [19, 22] or operated
in a fed-batch mode [21, 23] where the best performance was observed at pH 7 or higher. The use
of a proton exchange membrane might lead to the existence of significant pH gradients between
the electrodes, while fed-batch MFC operation results in pH variations within each cycle.
Temperature is yet another operational parameter that can be used to control growth and
metabolism of microbial populations in MFC. Overall, methane production was more
temperature-sensitive than power generation. An anode temperature increase from 27°C to 38°C
increased methane production 3 times (from 0,16 to 0,5 L -1
AL day-1
). At the same time, power
production only increased by 12% (Pmax increase from 16,2 to 18,2 W m-3
). Cathode heating
appeared to have a more significant impact on power production. When the cathode was heated
to 62°C while maintaining the anode temperature at 30°C, the power output increased by 18%
(19,2 W m-3
, Table 3.1). This suggested significant charge transfer limitation at the cathode.
Apparently, cathode heating increased catalytic activity [30], while the effect on anodophilic
populations was less pronounced.
Overall, the heating may be useful if performed in the vicinity of the cathode so as to increase
cathodic kinetics without excessively increasing activity of methanogenic populations in the
anodic chamber. Temperatures of 20-35C are often used in anaerobic wastewater treatment,
which requires reactor heating. Similarly, MFC might be heated to at least maintain a mesophilic
range of temperatures and this heating can be accomplished by a heater installed in proximity to
the cathode.
Throughout the tests, the MFC-1 was routinely operated at an external load of Rext=200 .
Meanwhile, polarization data showed internal resistance in a range of 70-80 . Since power
output is maximized when Rext=Rint, MFC-1 operation at an optimal or close to optimal external
load would increase power output. This was demonstrated during MFC-2 operation, which was
carried out at Rext values close to Rint estimations resulting in increased power output. However,
a cautious approach should be taken as to avoid MFC operation at external resistances below the
internal resistance value as this results in the abrupt performance decline. In this regard, an on-
line control of electric load must be considered in order to maximize MFC power output at
varying operating conditions [31, 32].
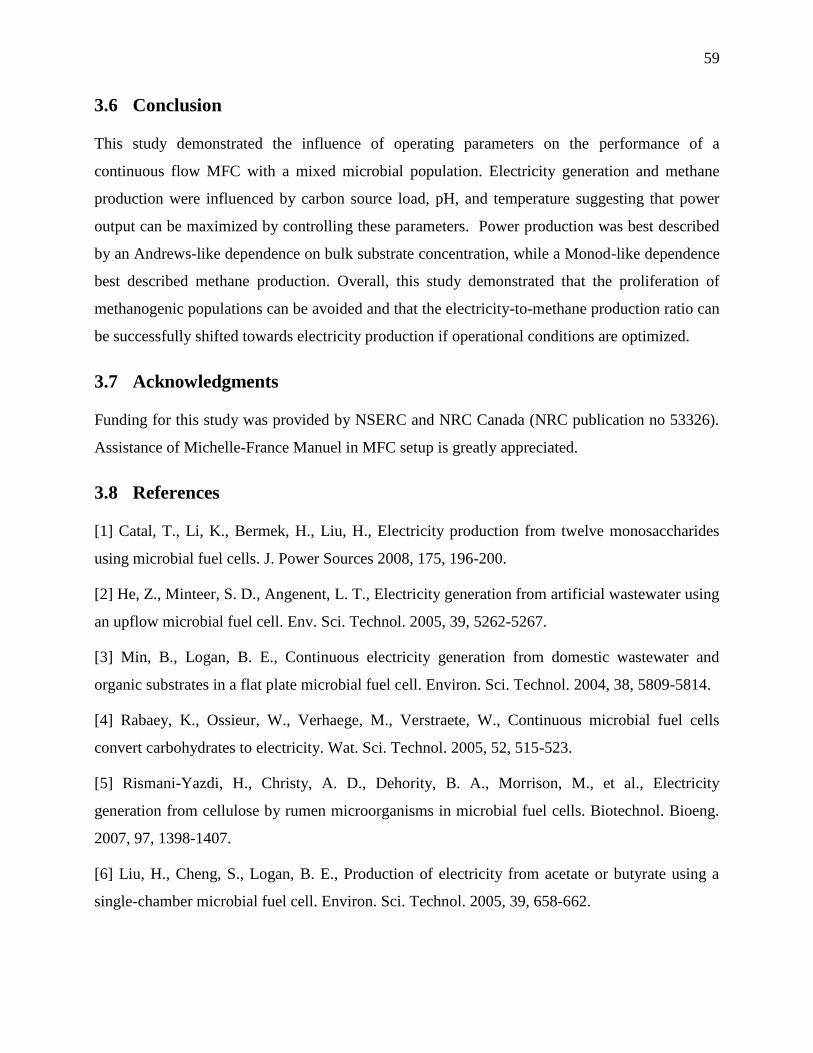
59
3.6 Conclusion
This study demonstrated the influence of operating parameters on the performance of a
continuous flow MFC with a mixed microbial population. Electricity generation and methane
production were influenced by carbon source load, pH, and temperature suggesting that power
output can be maximized by controlling these parameters. Power production was best described
by an Andrews-like dependence on bulk substrate concentration, while a Monod-like dependence
best described methane production. Overall, this study demonstrated that the proliferation of
methanogenic populations can be avoided and that the electricity-to-methane production ratio can
be successfully shifted towards electricity production if operational conditions are optimized.
3.7 Acknowledgments
Funding for this study was provided by NSERC and NRC Canada (NRC publication no 53326).
Assistance of Michelle-France Manuel in MFC setup is greatly appreciated.
3.8 References
[1] Catal, T., Li, K., Bermek, H., Liu, H., Electricity production from twelve monosaccharides
using microbial fuel cells. J. Power Sources 2008, 175, 196-200.
[2] He, Z., Minteer, S. D., Angenent, L. T., Electricity generation from artificial wastewater using
an upflow microbial fuel cell. Env. Sci. Technol. 2005, 39, 5262-5267.
[3] Min, B., Logan, B. E., Continuous electricity generation from domestic wastewater and
organic substrates in a flat plate microbial fuel cell. Environ. Sci. Technol. 2004, 38, 5809-5814.
[4] Rabaey, K., Ossieur, W., Verhaege, M., Verstraete, W., Continuous microbial fuel cells
convert carbohydrates to electricity. Wat. Sci. Technol. 2005, 52, 515-523.
[5] Rismani-Yazdi, H., Christy, A. D., Dehority, B. A., Morrison, M., et al., Electricity
generation from cellulose by rumen microorganisms in microbial fuel cells. Biotechnol. Bioeng.
2007, 97, 1398-1407.
[6] Liu, H., Cheng, S., Logan, B. E., Production of electricity from acetate or butyrate using a
single-chamber microbial fuel cell. Environ. Sci. Technol. 2005, 39, 658-662.
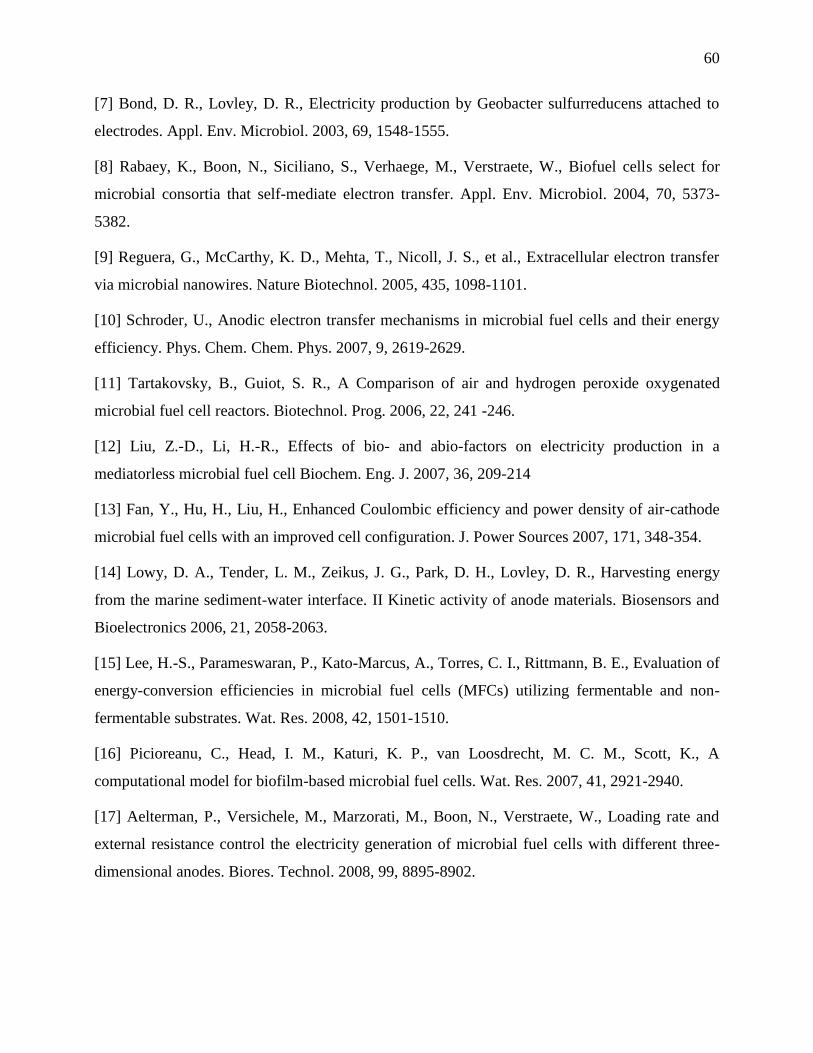
60
[7] Bond, D. R., Lovley, D. R., Electricity production by Geobacter sulfurreducens attached to
electrodes. Appl. Env. Microbiol. 2003, 69, 1548-1555.
[8] Rabaey, K., Boon, N., Siciliano, S., Verhaege, M., Verstraete, W., Biofuel cells select for
microbial consortia that self-mediate electron transfer. Appl. Env. Microbiol. 2004, 70, 5373-
5382.
[9] Reguera, G., McCarthy, K. D., Mehta, T., Nicoll, J. S., et al., Extracellular electron transfer
via microbial nanowires. Nature Biotechnol. 2005, 435, 1098-1101.
[10] Schroder, U., Anodic electron transfer mechanisms in microbial fuel cells and their energy
efficiency. Phys. Chem. Chem. Phys. 2007, 9, 2619-2629.
[11] Tartakovsky, B., Guiot, S. R., A Comparison of air and hydrogen peroxide oxygenated
microbial fuel cell reactors. Biotechnol. Prog. 2006, 22, 241 -246.
[12] Liu, Z.-D., Li, H.-R., Effects of bio- and abio-factors on electricity production in a
mediatorless microbial fuel cell Biochem. Eng. J. 2007, 36, 209-214
[13] Fan, Y., Hu, H., Liu, H., Enhanced Coulombic efficiency and power density of air-cathode
microbial fuel cells with an improved cell configuration. J. Power Sources 2007, 171, 348-354.
[14] Lowy, D. A., Tender, L. M., Zeikus, J. G., Park, D. H., Lovley, D. R., Harvesting energy
from the marine sediment-water interface. II Kinetic activity of anode materials. Biosensors and
Bioelectronics 2006, 21, 2058-2063.
[15] Lee, H.-S., Parameswaran, P., Kato-Marcus, A., Torres, C. I., Rittmann, B. E., Evaluation of
energy-conversion efficiencies in microbial fuel cells (MFCs) utilizing fermentable and non-
fermentable substrates. Wat. Res. 2008, 42, 1501-1510.
[16] Picioreanu, C., Head, I. M., Katuri, K. P., van Loosdrecht, M. C. M., Scott, K., A
computational model for biofilm-based microbial fuel cells. Wat. Res. 2007, 41, 2921-2940.
[17] Aelterman, P., Versichele, M., Marzorati, M., Boon, N., Verstraete, W., Loading rate and
external resistance control the electricity generation of microbial fuel cells with different three-
dimensional anodes. Biores. Technol. 2008, 99, 8895-8902.
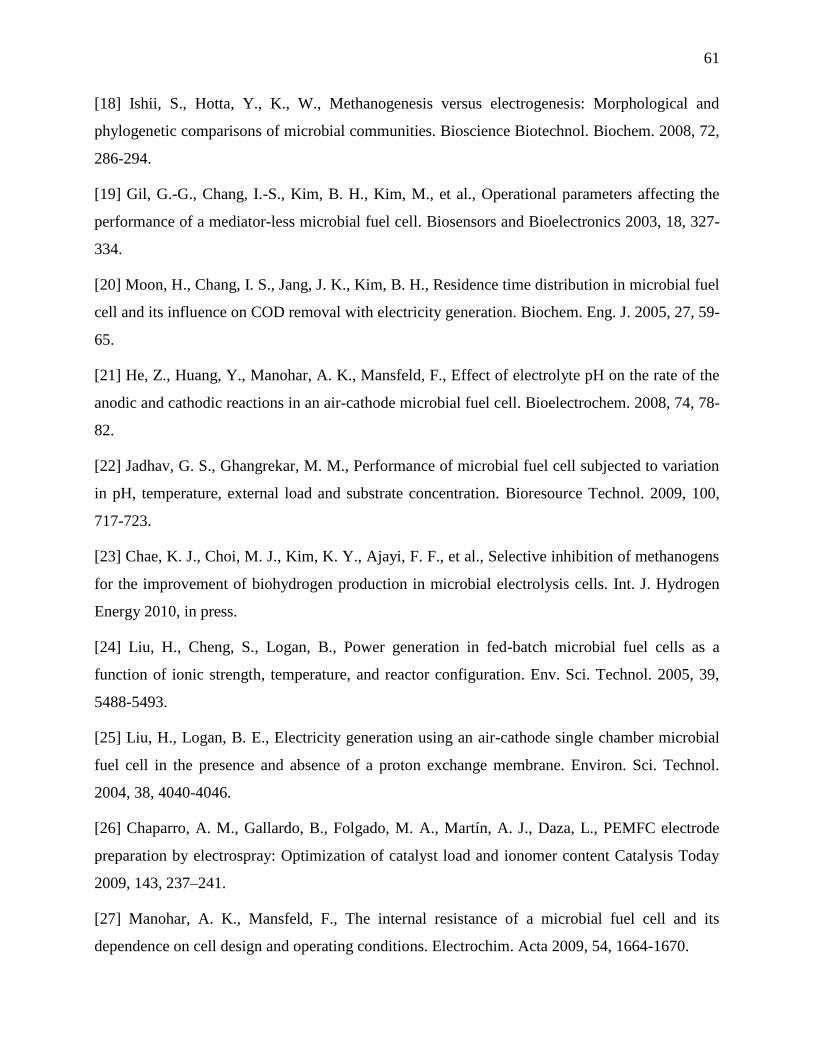
61
[18] Ishii, S., Hotta, Y., K., W., Methanogenesis versus electrogenesis: Morphological and
phylogenetic comparisons of microbial communities. Bioscience Biotechnol. Biochem. 2008, 72,
286-294.
[19] Gil, G.-G., Chang, I.-S., Kim, B. H., Kim, M., et al., Operational parameters affecting the
performance of a mediator-less microbial fuel cell. Biosensors and Bioelectronics 2003, 18, 327-
334.
[20] Moon, H., Chang, I. S., Jang, J. K., Kim, B. H., Residence time distribution in microbial fuel
cell and its influence on COD removal with electricity generation. Biochem. Eng. J. 2005, 27, 59-
65.
[21] He, Z., Huang, Y., Manohar, A. K., Mansfeld, F., Effect of electrolyte pH on the rate of the
anodic and cathodic reactions in an air-cathode microbial fuel cell. Bioelectrochem. 2008, 74, 78-
82.
[22] Jadhav, G. S., Ghangrekar, M. M., Performance of microbial fuel cell subjected to variation
in pH, temperature, external load and substrate concentration. Bioresource Technol. 2009, 100,
717-723.
[23] Chae, K. J., Choi, M. J., Kim, K. Y., Ajayi, F. F., et al., Selective inhibition of methanogens
for the improvement of biohydrogen production in microbial electrolysis cells. Int. J. Hydrogen
Energy 2010, in press.
[24] Liu, H., Cheng, S., Logan, B., Power generation in fed-batch microbial fuel cells as a
function of ionic strength, temperature, and reactor configuration. Env. Sci. Technol. 2005, 39,
5488-5493.
[25] Liu, H., Logan, B. E., Electricity generation using an air-cathode single chamber microbial
fuel cell in the presence and absence of a proton exchange membrane. Environ. Sci. Technol.
2004, 38, 4040-4046.
[26] Chaparro, A. M., Gallardo, B., Folgado, M. A., Martín, A. J., Daza, L., PEMFC electrode
preparation by electrospray: Optimization of catalyst load and ionomer content Catalysis Today
2009, 143, 237–241.
[27] Manohar, A. K., Mansfeld, F., The internal resistance of a microbial fuel cell and its
dependence on cell design and operating conditions. Electrochim. Acta 2009, 54, 1664-1670.
62
[28] Clauwaert, P., Verstraete, W., Methanogenesis in membraneless microbial electrolysis cells.
Appl. Microbiol. Biotechnol. 2008, 82, 829-836.
[29] Mohan, S. V., Mohanakrishna, G., Reddy, B. P., Saravanan, R., Sarma, P. N., Bioelectricity
generation from chemical wastewater treatment in mediatorless (anode) microbial fuel cell
(MFC) using selectively enriched hydrogen producing mixed culture under acidophilic
microenvironment. Biochem. Eng. J. 2008, 39, 121-130.
[30] O'Hayre, R., Cha, S. W., Colella, W., Prinz, F. B., Fuel cell reaction kinetics, Fuel cell
fundamentals, John Wiley & Sons Inc 2006, p. 409.
[31] Woodward, L., Perrier, M., Srinivasan, B., Pinto, R. P., Tartakovsky, B., Comparison of
real-time methods for maximizing power output in microbial fuel cells. AIChE J. 2010, in press.
[32] Woodward, L., Tartakovsky, B., Perrier, M., Srinivasan, B., Maximizing power production
in a stack of microbial fuel cells using multiunit optimization method. Biotechnol. Prog. 2009,
25, 676-682.
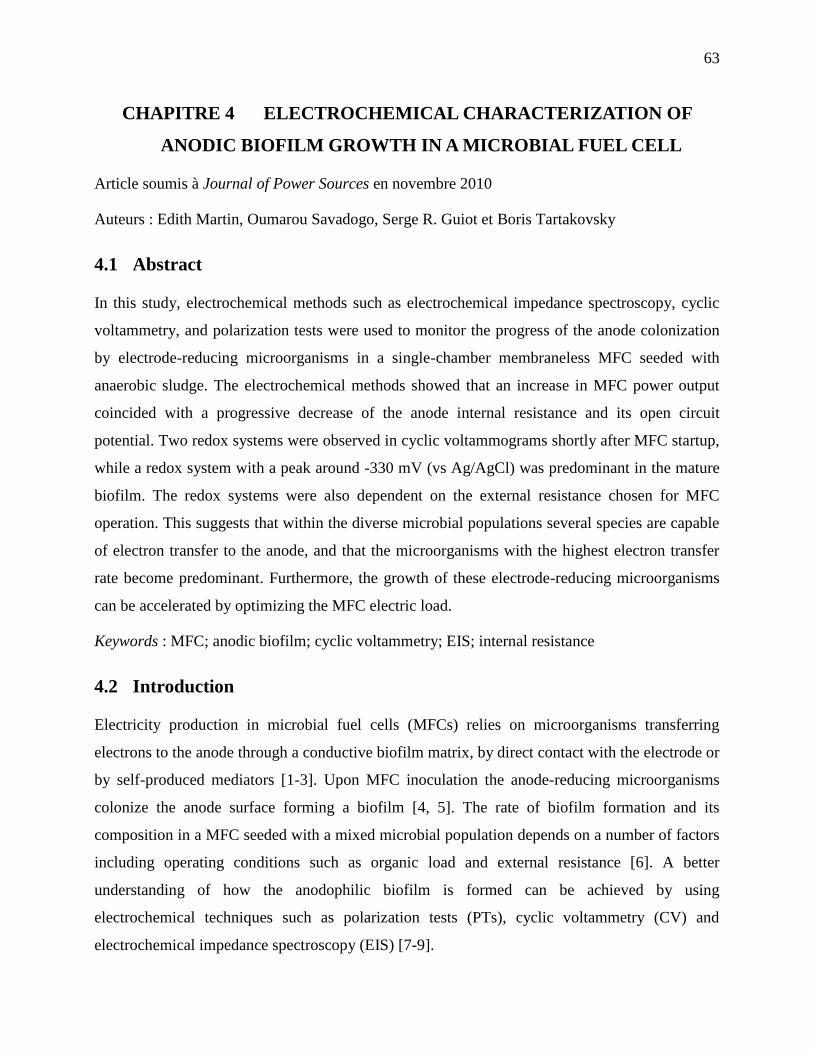
63
CHAPITRE 4 ELECTROCHEMICAL CHARACTERIZATION OF
ANODIC BIOFILM GROWTH IN A MICROBIAL FUEL CELL
Article soumis à Journal of Power Sources en novembre 2010
Auteurs : Edith Martin, Oumarou Savadogo, Serge R. Guiot et Boris Tartakovsky
4.1 Abstract
In this study, electrochemical methods such as electrochemical impedance spectroscopy, cyclic
voltammetry, and polarization tests were used to monitor the progress of the anode colonization
by electrode-reducing microorganisms in a single-chamber membraneless MFC seeded with
anaerobic sludge. The electrochemical methods showed that an increase in MFC power output
coincided with a progressive decrease of the anode internal resistance and its open circuit
potential. Two redox systems were observed in cyclic voltammograms shortly after MFC startup,
while a redox system with a peak around -330 mV (vs Ag/AgCl) was predominant in the mature
biofilm. The redox systems were also dependent on the external resistance chosen for MFC
operation. This suggests that within the diverse microbial populations several species are capable
of electron transfer to the anode, and that the microorganisms with the highest electron transfer
rate become predominant. Furthermore, the growth of these electrode-reducing microorganisms
can be accelerated by optimizing the MFC electric load.
Keywords : MFC; anodic biofilm; cyclic voltammetry; EIS; internal resistance
4.2 Introduction
Electricity production in microbial fuel cells (MFCs) relies on microorganisms transferring
electrons to the anode through a conductive biofilm matrix, by direct contact with the electrode or
by self-produced mediators [1-3]. Upon MFC inoculation the anode-reducing microorganisms
colonize the anode surface forming a biofilm [4, 5]. The rate of biofilm formation and its
composition in a MFC seeded with a mixed microbial population depends on a number of factors
including operating conditions such as organic load and external resistance [6]. A better
understanding of how the anodophilic biofilm is formed can be achieved by using
electrochemical techniques such as polarization tests (PTs), cyclic voltammetry (CV) and
electrochemical impedance spectroscopy (EIS) [7-9].
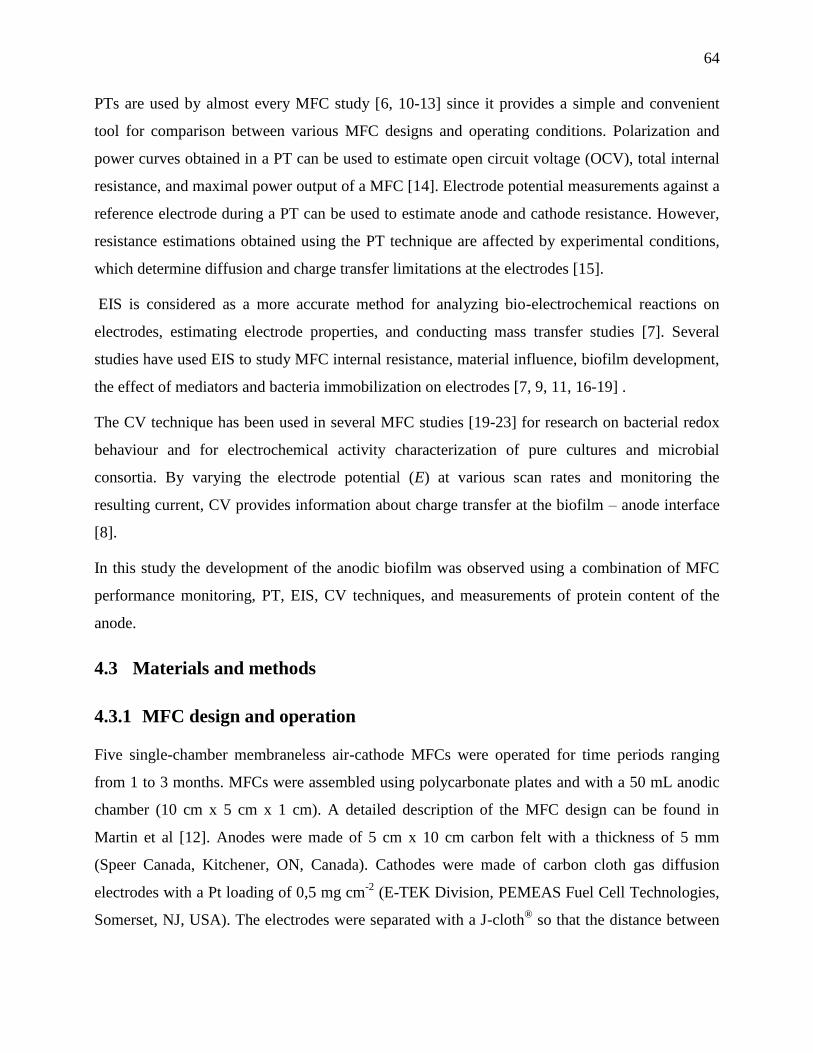
64
PTs are used by almost every MFC study [6, 10-13] since it provides a simple and convenient
tool for comparison between various MFC designs and operating conditions. Polarization and
power curves obtained in a PT can be used to estimate open circuit voltage (OCV), total internal
resistance, and maximal power output of a MFC [14]. Electrode potential measurements against a
reference electrode during a PT can be used to estimate anode and cathode resistance. However,
resistance estimations obtained using the PT technique are affected by experimental conditions,
which determine diffusion and charge transfer limitations at the electrodes [15].
EIS is considered as a more accurate method for analyzing bio-electrochemical reactions on
electrodes, estimating electrode properties, and conducting mass transfer studies [7]. Several
studies have used EIS to study MFC internal resistance, material influence, biofilm development,
the effect of mediators and bacteria immobilization on electrodes [7, 9, 11, 16-19] .
The CV technique has been used in several MFC studies [19-23] for research on bacterial redox
behaviour and for electrochemical activity characterization of pure cultures and microbial
consortia. By varying the electrode potential (E) at various scan rates and monitoring the
resulting current, CV provides information about charge transfer at the biofilm – anode interface
[8].
In this study the development of the anodic biofilm was observed using a combination of MFC
performance monitoring, PT, EIS, CV techniques, and measurements of protein content of the
anode.
4.3 Materials and methods
4.3.1 MFC design and operation
Five single-chamber membraneless air-cathode MFCs were operated for time periods ranging
from 1 to 3 months. MFCs were assembled using polycarbonate plates and with a 50 mL anodic
chamber (10 cm x 5 cm x 1 cm). A detailed description of the MFC design can be found in
Martin et al [12]. Anodes were made of 5 cm x 10 cm carbon felt with a thickness of 5 mm
(Speer Canada, Kitchener, ON, Canada). Cathodes were made of carbon cloth gas diffusion
electrodes with a Pt loading of 0,5 mg cm-2
(E-TEK Division, PEMEAS Fuel Cell Technologies,
Somerset, NJ, USA). The electrodes were separated with a J-cloth® so that the distance between
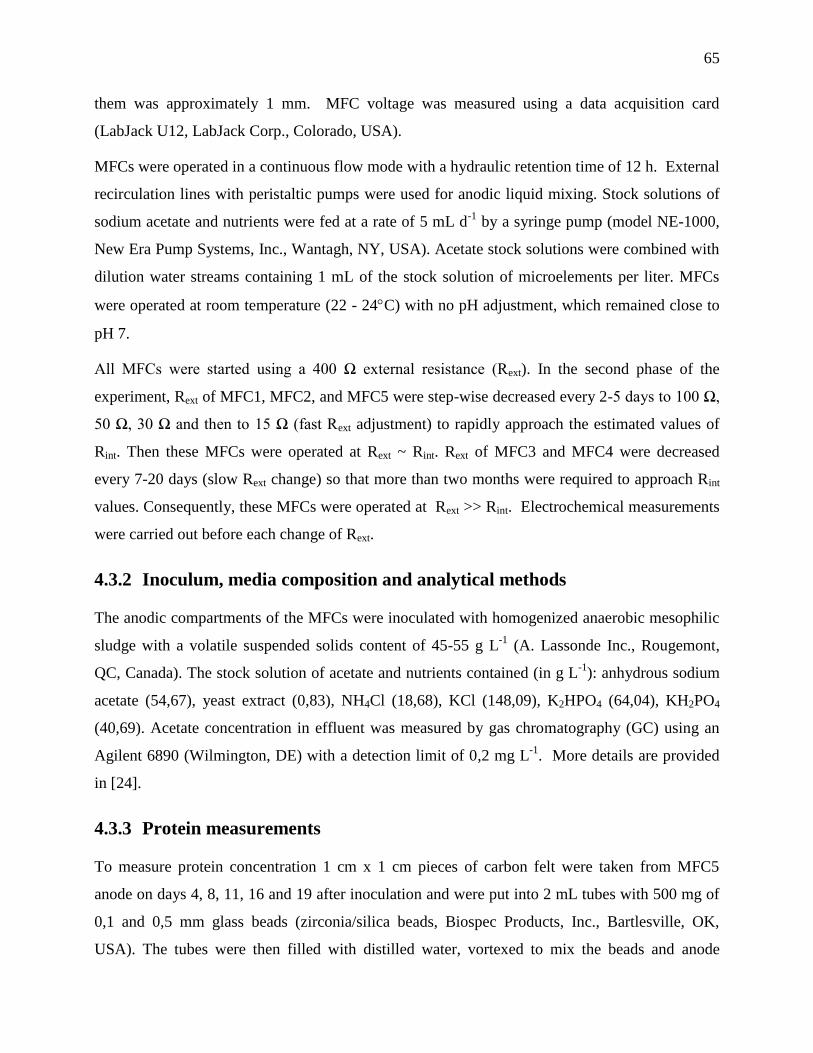
65
them was approximately 1 mm. MFC voltage was measured using a data acquisition card
(LabJack U12, LabJack Corp., Colorado, USA).
MFCs were operated in a continuous flow mode with a hydraulic retention time of 12 h. External
recirculation lines with peristaltic pumps were used for anodic liquid mixing. Stock solutions of
sodium acetate and nutrients were fed at a rate of 5 mL d-1
by a syringe pump (model NE-1000,
New Era Pump Systems, Inc., Wantagh, NY, USA). Acetate stock solutions were combined with
dilution water streams containing 1 mL of the stock solution of microelements per liter. MFCs
were operated at room temperature (22 - 24C) with no pH adjustment, which remained close to
pH 7.
All MFCs were started using a 400 Ω external resistance (Rext). In the second phase of the
experiment, Rext of MFC1, MFC2, and MFC5 were step-wise decreased every 2-5 days to 100 Ω,
50 Ω, 30 Ω and then to 15 Ω (fast Rext adjustment) to rapidly approach the estimated values of
Rint. Then these MFCs were operated at Rext ~ Rint. Rext of MFC3 and MFC4 were decreased
every 7-20 days (slow Rext change) so that more than two months were required to approach Rint
values. Consequently, these MFCs were operated at Rext >> Rint. Electrochemical measurements
were carried out before each change of Rext.
4.3.2 Inoculum, media composition and analytical methods
The anodic compartments of the MFCs were inoculated with homogenized anaerobic mesophilic
sludge with a volatile suspended solids content of 45-55 g L-1
(A. Lassonde Inc., Rougemont,
QC, Canada). The stock solution of acetate and nutrients contained (in g L-1
): anhydrous sodium
acetate (54,67), yeast extract (0,83), NH4Cl (18,68), KCl (148,09), K2HPO4 (64,04), KH2PO4
(40,69). Acetate concentration in effluent was measured by gas chromatography (GC) using an
Agilent 6890 (Wilmington, DE) with a detection limit of 0,2 mg L-1
. More details are provided
in [24].
4.3.3 Protein measurements
To measure protein concentration 1 cm x 1 cm pieces of carbon felt were taken from MFC5
anode on days 4, 8, 11, 16 and 19 after inoculation and were put into 2 mL tubes with 500 mg of
0,1 and 0,5 mm glass beads (zirconia/silica beads, Biospec Products, Inc., Bartlesville, OK,
USA). The tubes were then filled with distilled water, vortexed to mix the beads and anode
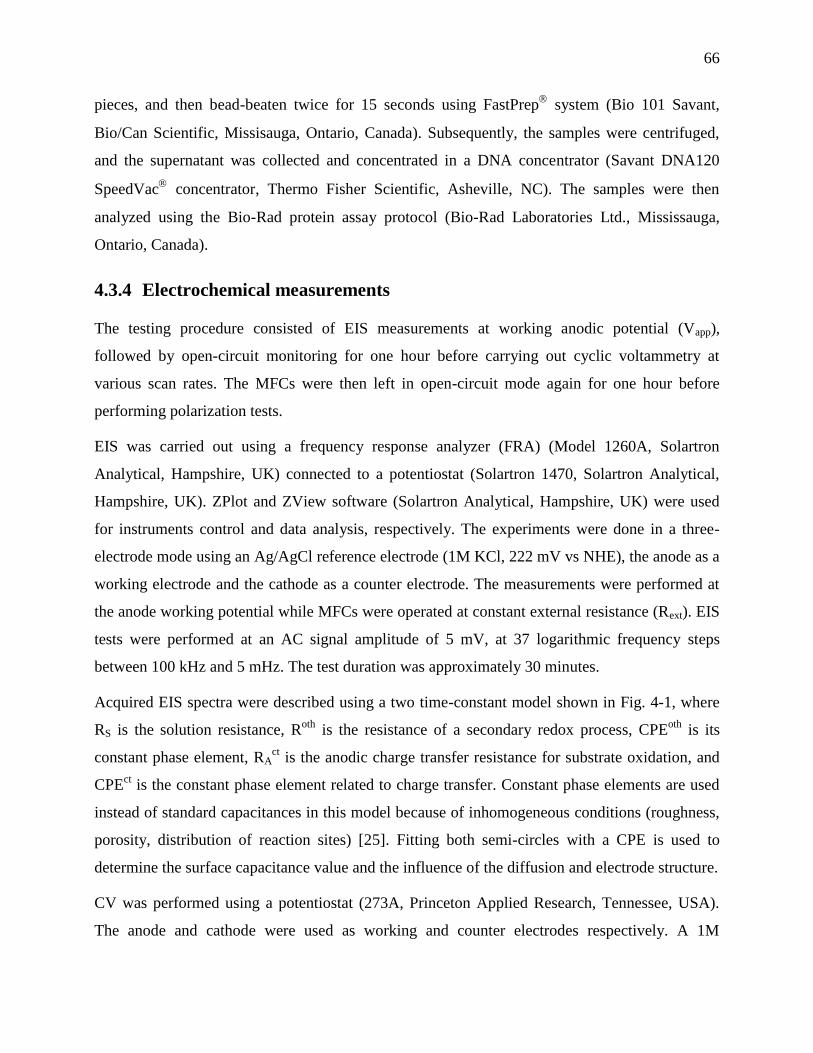
66
pieces, and then bead-beaten twice for 15 seconds using FastPrep
system (Bio 101 Savant,
Bio/Can Scientific, Missisauga, Ontario, Canada). Subsequently, the samples were centrifuged,
and the supernatant was collected and concentrated in a DNA concentrator (Savant DNA120
SpeedVac
concentrator, Thermo Fisher Scientific, Asheville, NC). The samples were then
analyzed using the Bio-Rad protein assay protocol (Bio-Rad Laboratories Ltd., Mississauga,
Ontario, Canada).
4.3.4 Electrochemical measurements
The testing procedure consisted of EIS measurements at working anodic potential (Vapp),
followed by open-circuit monitoring for one hour before carrying out cyclic voltammetry at
various scan rates. The MFCs were then left in open-circuit mode again for one hour before
performing polarization tests.
EIS was carried out using a frequency response analyzer (FRA) (Model 1260A, Solartron
Analytical, Hampshire, UK) connected to a potentiostat (Solartron 1470, Solartron Analytical,
Hampshire, UK). ZPlot and ZView software (Solartron Analytical, Hampshire, UK) were used
for instruments control and data analysis, respectively. The experiments were done in a three-
electrode mode using an Ag/AgCl reference electrode (1M KCl, 222 mV vs NHE), the anode as a
working electrode and the cathode as a counter electrode. The measurements were performed at
the anode working potential while MFCs were operated at constant external resistance (Rext). EIS
tests were performed at an AC signal amplitude of 5 mV, at 37 logarithmic frequency steps
between 100 kHz and 5 mHz. The test duration was approximately 30 minutes.
Acquired EIS spectra were described using a two time-constant model shown in Fig. 4-1, where
RS is the solution resistance, Roth
is the resistance of a secondary redox process, CPEoth
is its
constant phase element, RAct is the anodic charge transfer resistance for substrate oxidation, and
CPEct is the constant phase element related to charge transfer. Constant phase elements are used
instead of standard capacitances in this model because of inhomogeneous conditions (roughness,
porosity, distribution of reaction sites) [25]. Fitting both semi-circles with a CPE is used to
determine the surface capacitance value and the influence of the diffusion and electrode structure.
CV was performed using a potentiostat (273A, Princeton Applied Research, Tennessee, USA).
The anode and cathode were used as working and counter electrodes respectively. A 1M
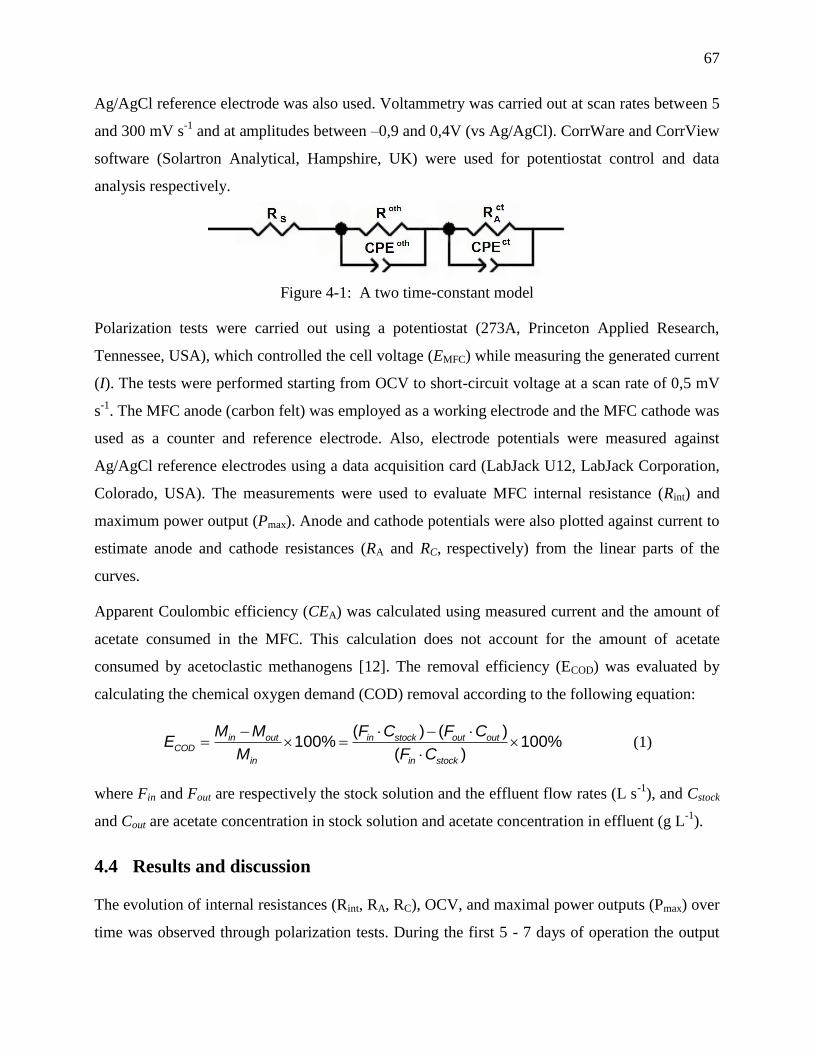
67
Ag/AgCl reference electrode was also used. Voltammetry was carried out at scan rates between 5
and 300 mV s-1
and at amplitudes between –0,9 and 0,4V (vs Ag/AgCl). CorrWare and CorrView
software (Solartron Analytical, Hampshire, UK) were used for potentiostat control and data
analysis respectively.
Figure 4-1: A two time-constant model
Polarization tests were carried out using a potentiostat (273A, Princeton Applied Research,
Tennessee, USA), which controlled the cell voltage (EMFC) while measuring the generated current
(I). The tests were performed starting from OCV to short-circuit voltage at a scan rate of 0,5 mV
s-1
. The MFC anode (carbon felt) was employed as a working electrode and the MFC cathode was
used as a counter and reference electrode. Also, electrode potentials were measured against
Ag/AgCl reference electrodes using a data acquisition card (LabJack U12, LabJack Corporation,
Colorado, USA). The measurements were used to evaluate MFC internal resistance (Rint) and
maximum power output (Pmax). Anode and cathode potentials were also plotted against current to
estimate anode and cathode resistances (RA and RC, respectively) from the linear parts of the
curves.
Apparent Coulombic efficiency (CEA) was calculated using measured current and the amount of
acetate consumed in the MFC. This calculation does not account for the amount of acetate
consumed by acetoclastic methanogens [12]. The removal efficiency (ECOD) was evaluated by
calculating the chemical oxygen demand (COD) removal according to the following equation:
( ) ( )100% 100%
( )in out in stock out out
COD
in in stock
M M F C F CE
M F C
(1)
where Fin and Fout are respectively the stock solution and the effluent flow rates (L s-1
), and Cstock
and Cout are acetate concentration in stock solution and acetate concentration in effluent (g L-1
).
4.4 Results and discussion
The evolution of internal resistances (Rint, RA, RC), OCV, and maximal power outputs (Pmax) over
time was observed through polarization tests. During the first 5 - 7 days of operation the output
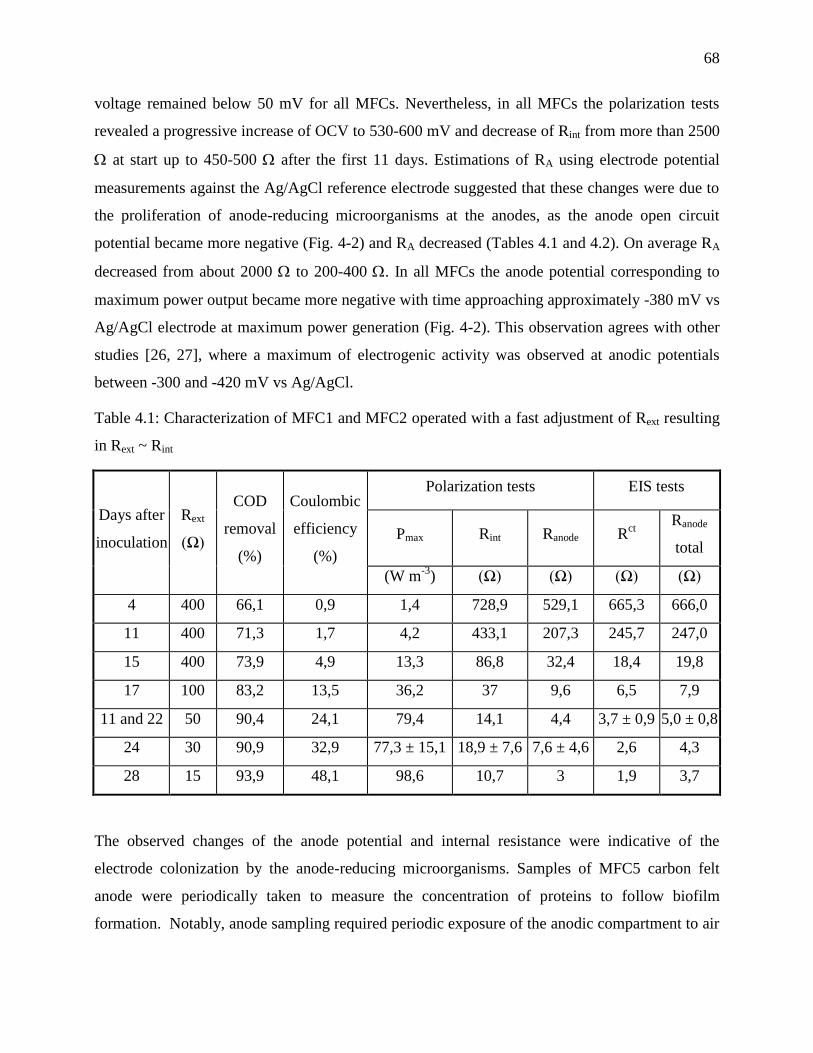
68
voltage remained below 50 mV for all MFCs. Nevertheless, in all MFCs the polarization tests
revealed a progressive increase of OCV to 530-600 mV and decrease of Rint from more than 2500
at start up to 450-500 after the first 11 days. Estimations of RA using electrode potential
measurements against the Ag/AgCl reference electrode suggested that these changes were due to
the proliferation of anode-reducing microorganisms at the anodes, as the anode open circuit
potential became more negative (Fig. 4-2) and RA decreased (Tables 4.1 and 4.2). On average RA
decreased from about 2000 to 200-400 . In all MFCs the anode potential corresponding to
maximum power output became more negative with time approaching approximately -380 mV vs
Ag/AgCl electrode at maximum power generation (Fig. 4-2). This observation agrees with other
studies [26, 27], where a maximum of electrogenic activity was observed at anodic potentials
between -300 and -420 mV vs Ag/AgCl.
Table 4.1: Characterization of MFC1 and MFC2 operated with a fast adjustment of Rext resulting
in Rext ~ Rint
The observed changes of the anode potential and internal resistance were indicative of the
electrode colonization by the anode-reducing microorganisms. Samples of MFC5 carbon felt
anode were periodically taken to measure the concentration of proteins to follow biofilm
formation. Notably, anode sampling required periodic exposure of the anodic compartment to air
Days after
inoculation
Rext
(Ω)
COD
removal
(%)
Coulombic
efficiency
(%)
Polarization tests EIS tests
Pmax Rint Ranode Rct
Ranode
total
(W m-3
) (Ω) (Ω) (Ω) (Ω)
4 400 66,1 0,9 1,4 728,9 529,1 665,3 666,0
11 400 71,3 1,7 4,2 433,1 207,3 245,7 247,0
15 400 73,9 4,9 13,3 86,8 32,4 18,4 19,8
17 100 83,2 13,5 36,2 37 9,6 6,5 7,9
11 and 22 50 90,4 24,1 79,4 14,1 4,4 3,7 ± 0,9 5,0 ± 0,8
24 30 90,9 32,9 77,3 ± 15,1 18,9 ± 7,6 7,6 ± 4,6 2,6 4,3
28 15 93,9 48,1 98,6 10,7 3 1,9 3,7
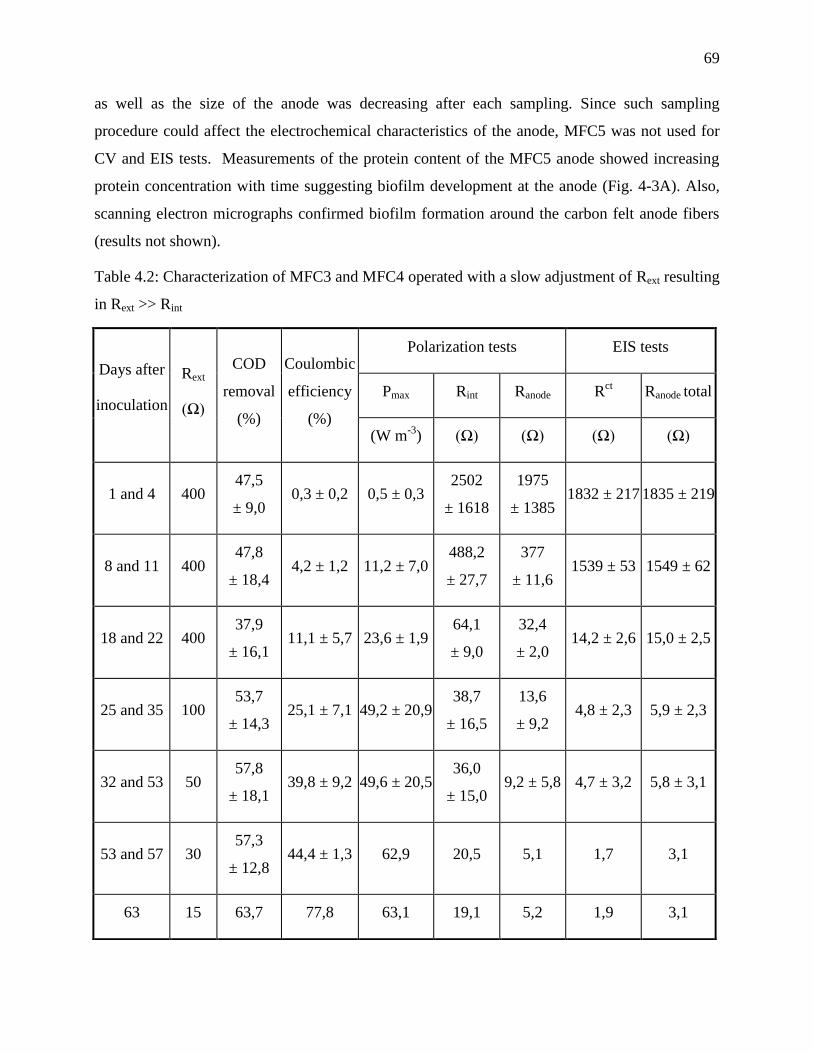
69
as well as the size of the anode was decreasing after each sampling. Since such sampling
procedure could affect the electrochemical characteristics of the anode, MFC5 was not used for
CV and EIS tests. Measurements of the protein content of the MFC5 anode showed increasing
protein concentration with time suggesting biofilm development at the anode (Fig. 4-3A). Also,
scanning electron micrographs confirmed biofilm formation around the carbon felt anode fibers
(results not shown).
Table 4.2: Characterization of MFC3 and MFC4 operated with a slow adjustment of Rext resulting
in Rext >> Rint
Days after
inoculation
Rext
(Ω)
COD
removal
(%)
Coulombic
efficiency
(%)
Polarization tests EIS tests
Pmax Rint Ranode Rct Ranode total
(W m-3
) (Ω) (Ω) (Ω) (Ω)
1 and 4 400 47,5
± 9,0 0,3 ± 0,2 0,5 ± 0,3
2502
± 1618
1975
± 1385 1832 ± 217 1835 ± 219
8 and 11 400 47,8
± 18,4 4,2 ± 1,2 11,2 ± 7,0
488,2
± 27,7
377
± 11,6 1539 ± 53 1549 ± 62
18 and 22 400 37,9
± 16,1 11,1 ± 5,7 23,6 ± 1,9
64,1
± 9,0
32,4
± 2,0 14,2 ± 2,6 15,0 ± 2,5
25 and 35 100 53,7
± 14,3 25,1 ± 7,1 49,2 ± 20,9
38,7
± 16,5
13,6
± 9,2 4,8 ± 2,3 5,9 ± 2,3
32 and 53 50 57,8
± 18,1 39,8 ± 9,2 49,6 ± 20,5
36,0
± 15,0 9,2 ± 5,8 4,7 ± 3,2 5,8 ± 3,1
53 and 57 30 57,3
± 12,8 44,4 ± 1,3 62,9 20,5 5,1 1,7 3,1
63 15 63,7 77,8 63,1 19,1 5,2 1,9 3,1
70
Interestingly, protein concentration of MFC5 anode, which was operated under the same
conditions as MFC1 and MFC2 (fast resistance adjustment), continued to increase even after RA
and OCP values in these MFCs were observed to stabilize (Fig.4-3). The observed increase of the
protein concentration coincided with the continuing improvement of MFC performance
expressed as MFC current density in Fig. 4-3A. Also, acetate removal and Coulombic
efficiencies increased with time reaching 99% and 48%, respectively (Table 4.1). This evolution
in MFC performance agrees with the increasing density of the electrode-reducing
microorganisms, as internal resistance is known to be linked to the catalyst load [28].
The strategy of fast Rext adjustment to approach Rint led to higher power outputs and a faster
decrease of RA in MFC1 and MFC2 as compared to MFC3 and MFC4, which were operated at
Rext >> Rint (Fig. 4-2 and Tables 4.1,4.2). We hypothesize that by operating MFCs at Rext values
close to Rint, which facilitates electron transfer to the anode by increasing its potential, growth
advantages for anode-reducing microorganisms were provided resulting in higher density of the
microorganisms, which in turn improved MFC performance as observed in other studies [6, 29].
Although by the end of the experiment Rint and RA values were not significantly different for all
MFCs, the power output of MFC1 and MFC2 remained higher. Overall, the polarization tests
showed that Rint and RA decreased to 10-20 and 3-5 , respectively. This observation suggests
that MFC performance, although linked to biofilm density, might be also influenced by the
microbial community structure, which is not only time-dependent, but is also affected by the
external resistance chosen for MFC operation [5, 13, 16].
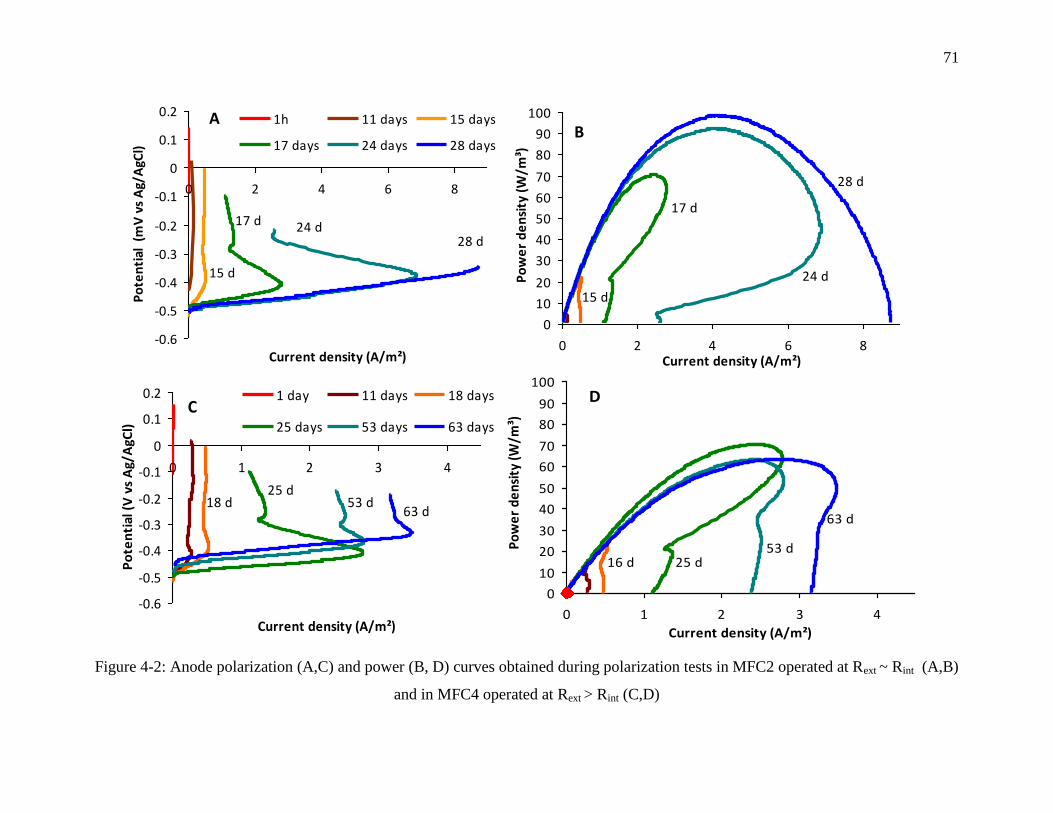
71
Figure 4-2: Anode polarization (A,C) and power (B, D) curves obtained during polarization tests in MFC2 operated at Rext ~ Rint (A,B)
and in MFC4 operated at Rext > Rint (C,D)
-0.6
-0.5
-0.4
-0.3
-0.2
-0.1
0
0.1
0.2
0 2 4 6 8
Current density (A/m²)
Po
ten
tial
(m
V v
s A
g/A
gCl)
1h 11 days 15 days
17 days 24 days 28 days
28 d24 d17 d
15 d
A
-0.6
-0.5
-0.4
-0.3
-0.2
-0.1
0
0.1
0.2
0 1 2 3 4
Current density (A/m²)
Po
ten
tial
(V
vs
Ag/
AgC
l)
1 day 11 days 18 days
25 days 53 days 63 days
63 d53 d
25 d18 d
C
0
10
20
30
40
50
60
70
80
90
100
0 2 4 6 8Current density (A/m²)
Po
we
r d
en
sity
(W
/m³)
B
28 d
24 d
17 d
15 d
0
10
20
30
40
50
60
70
80
90
100
0 1 2 3 4
Current density (A/m²)
Po
we
r d
en
sity
(W
/m³)
D
63 d
53 d25 d16 d
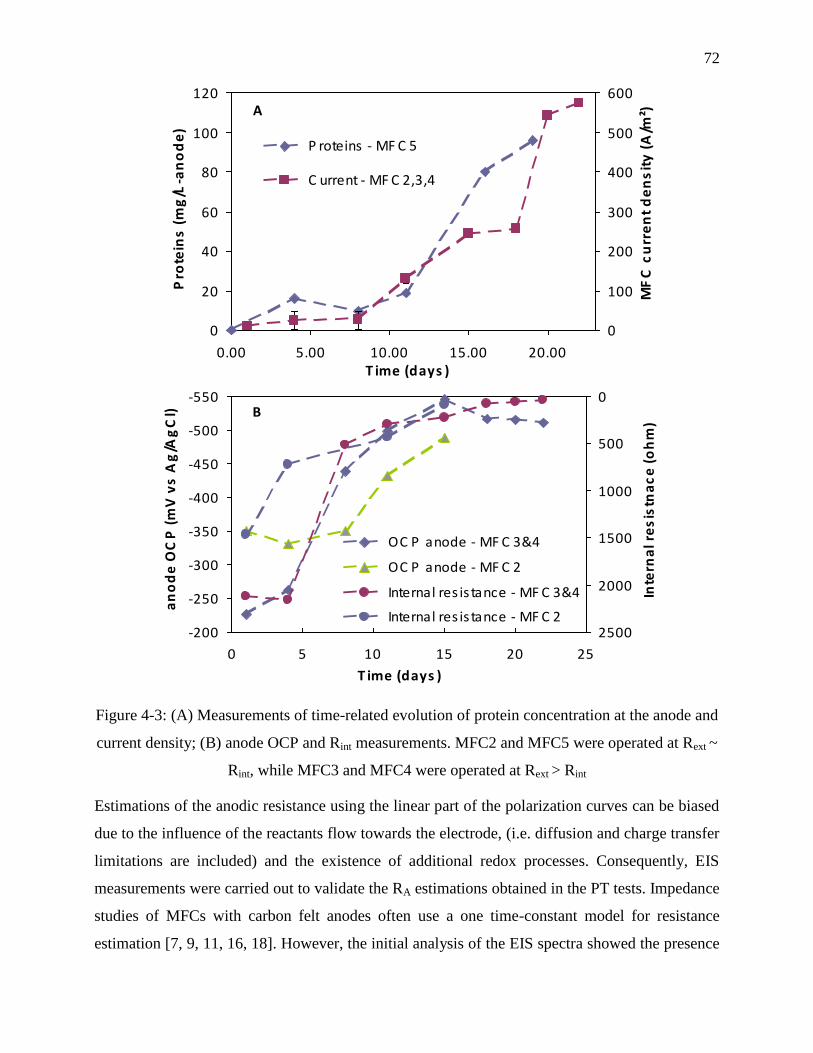
72
Figure 4-3: (A) Measurements of time-related evolution of protein concentration at the anode and
current density; (B) anode OCP and Rint measurements. MFC2 and MFC5 were operated at Rext ~
Rint, while MFC3 and MFC4 were operated at Rext > Rint
Estimations of the anodic resistance using the linear part of the polarization curves can be biased
due to the influence of the reactants flow towards the electrode, (i.e. diffusion and charge transfer
limitations are included) and the existence of additional redox processes. Consequently, EIS
measurements were carried out to validate the RA estimations obtained in the PT tests. Impedance
studies of MFCs with carbon felt anodes often use a one time-constant model for resistance
estimation [7, 9, 11, 16, 18]. However, the initial analysis of the EIS spectra showed the presence
0
20
40
60
80
100
120
0.00 5.00 10.00 15.00 20.00T ime (days )
Pro
tein
s (
mg
/L-a
no
de
)
0
100
200
300
400
500
600
MF
C c
urr
en
t d
en
sit
y (
A/m
²)
P roteins - MF C 5
C urrent - MF C 2,3,4
A
-550
-500
-450
-400
-350
-300
-250
-200
0 5 10 15 20 25
T ime (days )
an
od
e O
CP
(m
V v
s A
g/A
gC
l)
0
500
1000
1500
2000
2500In
tern
al r
es
istn
ac
e (
oh
m)
OC P anode - MF C 3&4
OC P anode - MF C 2
Internal res is tance - MF C 3&4
Internal res is tance - MF C 2
B
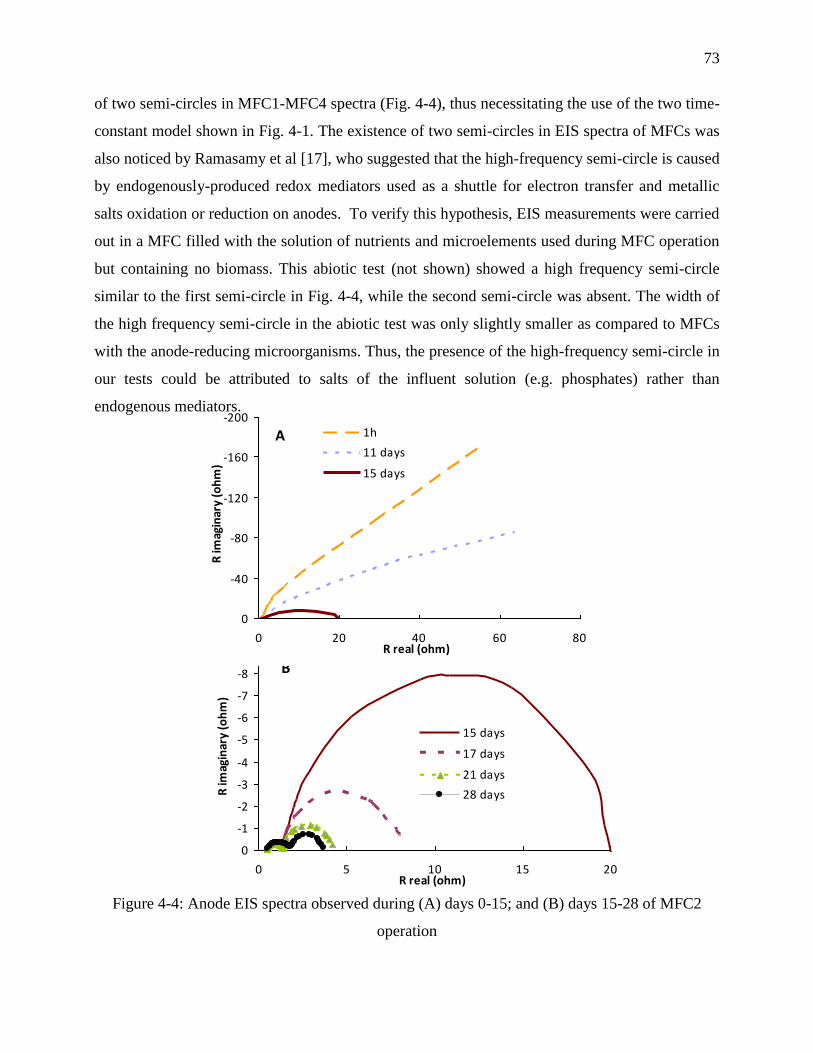
73
-9
-8
-7
-6
-5
-4
-3
-2
-1
0
0 5 10 15 20R real (ohm)
R im
agin
ary
(oh
m)
15 days
17 days
21 days
28 days
B
-200
-160
-120
-80
-40
0
0 20 40 60 80R real (ohm)
R im
agin
ary
(oh
m)
1h
11 days
15 days
A
of two semi-circles in MFC1-MFC4 spectra (Fig. 4-4), thus necessitating the use of the two time-
constant model shown in Fig. 4-1. The existence of two semi-circles in EIS spectra of MFCs was
also noticed by Ramasamy et al [17], who suggested that the high-frequency semi-circle is caused
by endogenously-produced redox mediators used as a shuttle for electron transfer and metallic
salts oxidation or reduction on anodes. To verify this hypothesis, EIS measurements were carried
out in a MFC filled with the solution of nutrients and microelements used during MFC operation
but containing no biomass. This abiotic test (not shown) showed a high frequency semi-circle
similar to the first semi-circle in Fig. 4-4, while the second semi-circle was absent. The width of
the high frequency semi-circle in the abiotic test was only slightly smaller as compared to MFCs
with the anode-reducing microorganisms. Thus, the presence of the high-frequency semi-circle in
our tests could be attributed to salts of the influent solution (e.g. phosphates) rather than
endogenous mediators.
Figure 4-4: Anode EIS spectra observed during (A) days 0-15; and (B) days 15-28 of MFC2
operation
74
Overall, EIS measurements confirmed RA trends obtained in the polarization tests. It also showed
the decrease in charge transfer resistance (Rct) with time (Tables 4.1 and 4.2). RA values
estimated by the two methods were in a reasonable agreement, although values obtained in
polarization tests tended to be higher, at least at the beginning of biofilm formation when the RA
was high. Interestingly, EIS measurements revealed an increase in MFC capacitance on average
from 79 38 mF measured after first two weeks of MFC operation to 440 272 mF by the end
of the test. The capacitance measured at the end of the experimental period was similar to values
reported for a mature biofilm in another study [16]. The considerable capacitance increase
indicates a larger active surface area and an increase of the reaction active sites. This suggests an
increase in anode colonization by anode-reducing microorganisms rather than an increase in the
microbial activity of a near constant number of microorganisms. The CPE used for fitting
provided, along with the capacitance estimation, an indication of the significant influence of the
electrode heterogeneity on anodic charge transfer, rather than diffusion processes [9, 16, 18].
Cyclic voltammograms provided another valuable monitoring tool showing the appearance of
redox peaks at potentials around -330 mV and –170 mV (vs Ag/AgCl electrode) shortly after
MFC start up and before the increase in output voltage was observed around day 5 - 7 (Fig. 4-5).
Voltammograms of MFC1 and MFC2 showed that simultaneously with the voltage increase, the
redox system located at –330 mV intensified, while the redox system at -170 mV either remained
unchanged or appeared to merge with the redox system at -330 mV (Fig. 4-5A). CVs of MFC3
and MFC4 where Rext remained above Rint showed that the redox system at -330 mV was
predominant, while the second redox system eventually disappeared (Fig. 4-5B).
Voltammograms of all MFCs showed increased current generated by the oxidation reaction with
time as can be seen from the evolution of the normalized current density corresponding to the
current peak at around -330 mV (Fig. 4-6). Once again, this pointed to the proliferation of the
anode-reducing microorganisms.
The presence of multiple redox systems indicates that more than one oxidation-reduction reaction
of biological matter can occur at the anode surface. Based on these results, we hypothesized that
more than one electroactive species (microorganisms or mediators) could be responsible for
charge transfer, although only one of them was predominant. Indeed, anaerobic sludge contains a
diverse microbial population capable of electron transfer using different charge transfer
mechanisms (e.g. through cytochrome-based and mediated transfer) as described by Aelterman
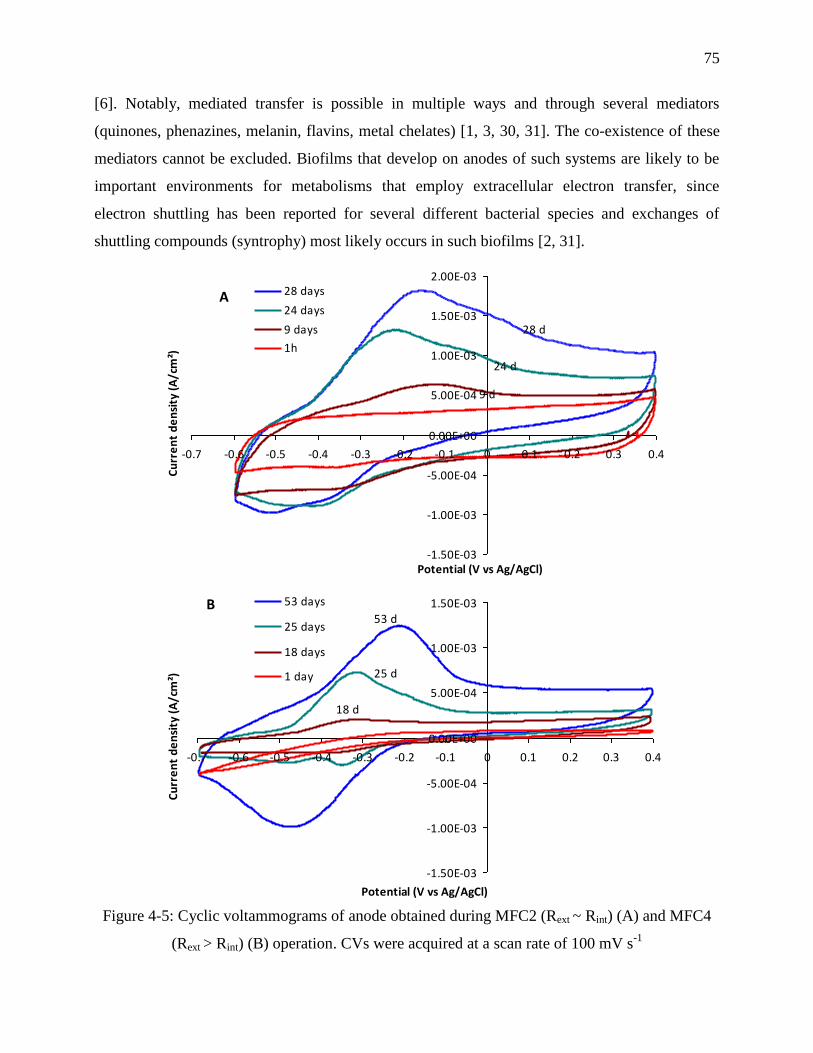
75
[6]. Notably, mediated transfer is possible in multiple ways and through several mediators
(quinones, phenazines, melanin, flavins, metal chelates) [1, 3, 30, 31]. The co-existence of these
mediators cannot be excluded. Biofilms that develop on anodes of such systems are likely to be
important environments for metabolisms that employ extracellular electron transfer, since
electron shuttling has been reported for several different bacterial species and exchanges of
shuttling compounds (syntrophy) most likely occurs in such biofilms [2, 31].
Figure 4-5: Cyclic voltammograms of anode obtained during MFC2 (Rext ~ Rint) (A) and MFC4
(Rext > Rint) (B) operation. CVs were acquired at a scan rate of 100 mV s-1
-1.50E-03
-1.00E-03
-5.00E-04
0.00E+00
5.00E-04
1.00E-03
1.50E-03
2.00E-03
-0.7 -0.6 -0.5 -0.4 -0.3 -0.2 -0.1 0 0.1 0.2 0.3 0.4
Potential (V vs Ag/AgCl)
Cu
rre
nt
de
nsi
ty (
A/c
m²)
28 days
24 days
9 days
1h
A
28 d
24 d
9 d
-1.50E-03
-1.00E-03
-5.00E-04
0.00E+00
5.00E-04
1.00E-03
1.50E-03
-0.7 -0.6 -0.5 -0.4 -0.3 -0.2 -0.1 0 0.1 0.2 0.3 0.4
Potential (V vs Ag/AgCl)
Cu
rre
nt
de
nsi
ty (
A/c
m²)
53 days
25 days
18 days
1 day
B53 d
25 d
18 d
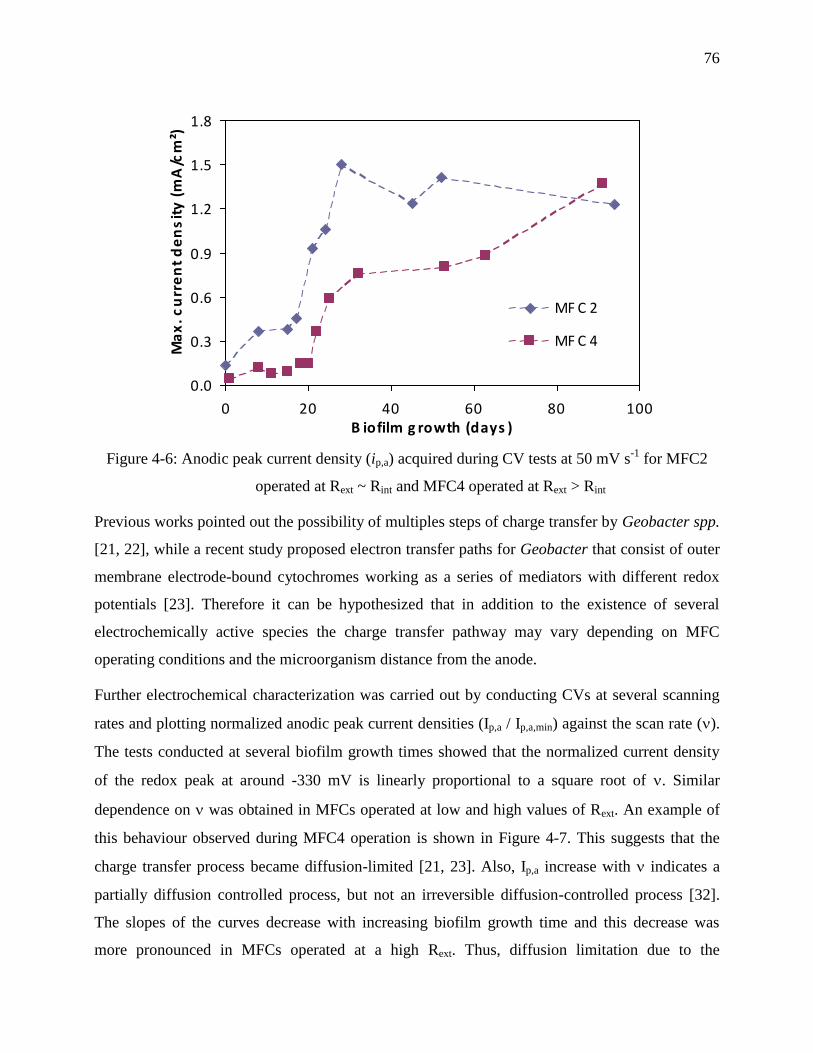
76
Figure 4-6: Anodic peak current density (ip,a) acquired during CV tests at 50 mV s-1
for MFC2
operated at Rext ~ Rint and MFC4 operated at Rext > Rint
Previous works pointed out the possibility of multiples steps of charge transfer by Geobacter spp.
[21, 22], while a recent study proposed electron transfer paths for Geobacter that consist of outer
membrane electrode-bound cytochromes working as a series of mediators with different redox
potentials [23]. Therefore it can be hypothesized that in addition to the existence of several
electrochemically active species the charge transfer pathway may vary depending on MFC
operating conditions and the microorganism distance from the anode.
Further electrochemical characterization was carried out by conducting CVs at several scanning
rates and plotting normalized anodic peak current densities (Ip,a / Ip,a,min) against the scan rate ().
The tests conducted at several biofilm growth times showed that the normalized current density
of the redox peak at around -330 mV is linearly proportional to a square root of . Similar
dependence on was obtained in MFCs operated at low and high values of Rext. An example of
this behaviour observed during MFC4 operation is shown in Figure 4-7. This suggests that the
charge transfer process became diffusion-limited [21, 23]. Also, Ip,a increase with indicates a
partially diffusion controlled process, but not an irreversible diffusion-controlled process [32].
The slopes of the curves decrease with increasing biofilm growth time and this decrease was
more pronounced in MFCs operated at a high Rext. Thus, diffusion limitation due to the
0.0
0.3
0.6
0.9
1.2
1.5
1.8
0 20 40 60 80 100B iofilm g rowth (days )
Ma
x. c
urr
en
t d
en
sit
y (
mA
/cm
²)
MF C 2
MF C 4
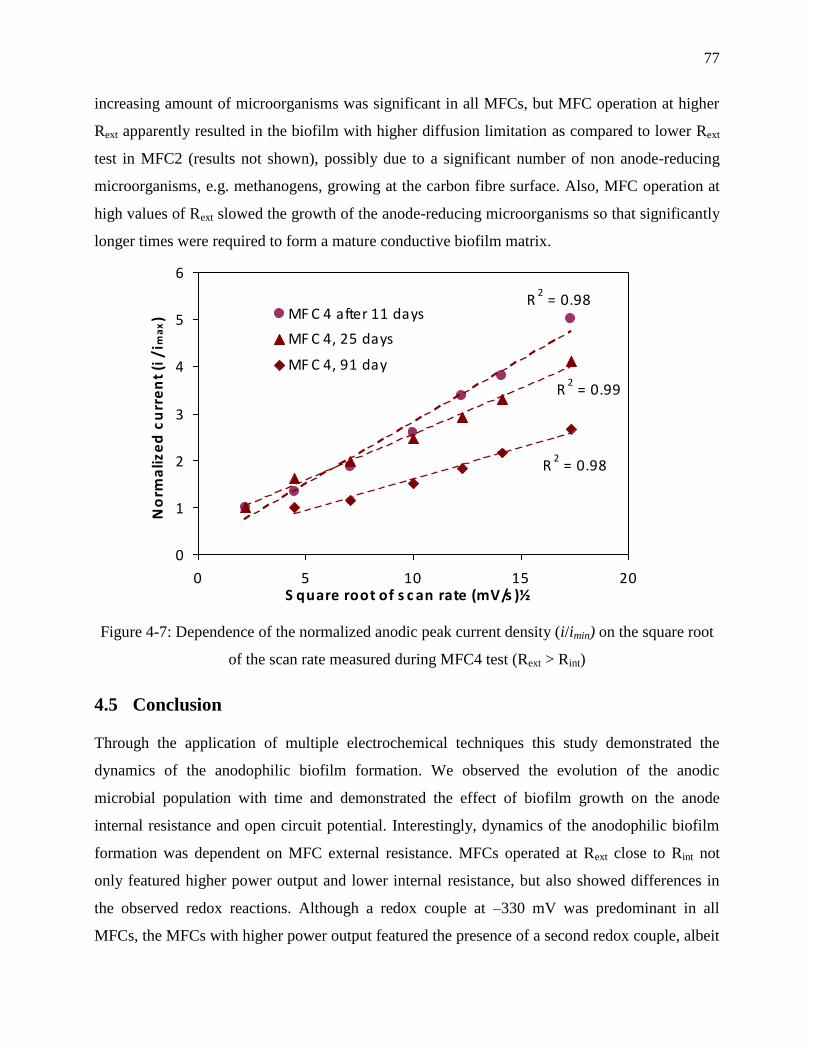
77
increasing amount of microorganisms was significant in all MFCs, but MFC operation at higher
Rext apparently resulted in the biofilm with higher diffusion limitation as compared to lower Rext
test in MFC2 (results not shown), possibly due to a significant number of non anode-reducing
microorganisms, e.g. methanogens, growing at the carbon fibre surface. Also, MFC operation at
high values of Rext slowed the growth of the anode-reducing microorganisms so that significantly
longer times were required to form a mature conductive biofilm matrix.
Figure 4-7: Dependence of the normalized anodic peak current density (i/imin) on the square root
of the scan rate measured during MFC4 test (Rext > Rint)
4.5 Conclusion
Through the application of multiple electrochemical techniques this study demonstrated the
dynamics of the anodophilic biofilm formation. We observed the evolution of the anodic
microbial population with time and demonstrated the effect of biofilm growth on the anode
internal resistance and open circuit potential. Interestingly, dynamics of the anodophilic biofilm
formation was dependent on MFC external resistance. MFCs operated at Rext close to Rint not
only featured higher power output and lower internal resistance, but also showed differences in
the observed redox reactions. Although a redox couple at –330 mV was predominant in all
MFCs, the MFCs with higher power output featured the presence of a second redox couple, albeit
R2 = 0.98
R2 = 0.98
R2 = 0.99
0
1
2
3
4
5
6
0 5 10 15 20S quare root of s c an rate (mV/s )½
No
rma
lize
d c
urr
en
t (i
/ im
ax) MF C 4 after 11 days
MF C 4, 25 days
MF C 4, 91 day
78
with a smaller peak area. We hypothesize that best efficiency in MFCs can be achieved by
combining several charge transfer mechanisms and that MFC operation at Rext close to its Rint
value promotes the growth of several electrode-reducing microorganisms.
4.6 Acknowledgement
Assistance of Punita Mehta in performing protein analysis is greatly appreciated. Funding for this
study was provided by NSERC and NRC Canada (NRC publication no 00000).
4.7 References
[1] U. Schroder, Physical Chemistry Chemical Physics 9 (2007) 2619-2629.
[2] D. R. Lovley, Current Opinion in Biotechnology 19 (2008) 564-571.
[3] C. Torres, I. , A. K. Marcus, H.-S. Lee, P. Parameswaran, R. Krajmalnik-Brown, B. Rittmann,
E. , FEMS Microbiology Reviews 34 (2009) 3-17.
[4] A. E. Franks, N. Malvankar, K. P. Nevin, Biofuels 1 (2010) 589-604.
[5] P. Kiely, D. Call, M. Yates, J. Regan, B. Logan, Applied Microbiology and Biotechnology 88
(2010) 371-380.
[6] P. Aelterman, M. Versichele, M. Marzorati, N. Boon, W. Verstraete, Bioresource Technology
99 (2008) 8895-8902.
[7] Z. He, F. Mansfeld, Energy & Environmental Science 2 (2009) 215-219.
[8] B. E. Logan, B. Hamelers, R. Rozendal, U. Schroder, J. Keller, S. Freguia, P. Aelterman, W.
Verstraete, K. Rabaey, Environ. Sci. Technol. 40 (2006) 5181-5192.
[9] A. K. Manohar, O. Bretschger, K. H. Nealson, F. Mansfeld, Bioelectrochemistry 72 (2008)
149-154.
[10] P.-Y. Zhang, Z.-L. Liu., J. Power Sources 195 (2010) 8013-8018.
[11] A. K. Manohar, F. Mansfeld, Electrochim. Acta 54 (2009) 1664-1670.
[12] E. Martin, O. Savadogo, S. R. Guiot, B. Tartakovsky, Biochemical Engineering Journal 51
(2010) 132-139.
[13] D. Y. Lyon, F. Buret, T. M. Vogel, J.-M. Monier, Bioelectrochem. 78 (2010) 2-7.
79
[14] P. Clauwaert, P. Aelterman, T. Pham, L. De Schamphelaire, M. Carballa, K. Rabaey, W.
Verstraete, Applied Microbiology and Biotechnology 79 (2008) 901-913.
[15] L. Flandin, A. S. Danerol, C. Bas, E. Claude, G. De-Moor, N. Alberola, Journal of The
Electrochemical Society 156 (2009) B1117-B1123.
[16] A. P. Borole, D. Aaron, C. Y. Hamilton, C. Tsouris, Environmental Science & Technology
44 (2010) 2740-2745.
[17] R. Ramasamy, P. , V. Gadhamshetty, L. Nadeau, J. , G. Johnson, R. , Biotechnology and
Bioengineering 104 (2009) 882-891.
[18] R. Ramasamy, P., Z. Ren, M. Mench, M. , J. Regan, M. , Biotechnology and Bioengineering
101 (2008) 101-108.
[19] S. Srikanth, E. Marsili, M. Flickinger, C., D. Bond, R. , Biotechnology and Bioengineering
99 (2008) 1065-1073.
[20] K. Chung, S. Okabe, Applied Microbiology and Biotechnology 83 (2009) 965-977.
[21] K. Fricke, F. Harnisch, U. Schroder, Energy & Environmental Science 1 (2008) 144-147.
[22] Y. Liu, F. Harnisch, K. Fricke, U. Schröder, V. Climent, J. M. Feliu, Biosensors and
Bioelectronics 25 (2010) 2167-2171.
[23] H. Richter, K. P. Nevin, H. Jia, D. A. Lowy, D. R. Lovley, L. M. Tender, Energy &
Environmental Science 2 (2009) 506-516.
[24] B. Tartakovsky, S. R. Guiot, Biotechnology Progress 22 (2006) 241-246.
[25] E. Barsoukov, J. R. Macdonald Impedance Spectroscopy - Theory, Experiment, and
Applications; John Wiley & Sons, Inc.: Hoboken, New Jersey, 2005.
[26] C. Torres, I. , A. K. Marcus, B. Rittmann, E., Biotechnology and Bioengineering 100 (2008)
872-881.
[27] K. Y. Cheng, G. Ho, R. Cord-Ruwisch, Environmental Science & Technology 42 (2008)
3828-3834.
[28] A. M. Chaparro, B. Gallardo, M. A. Folgado, A. J. Martín, L. Daza, Catalysis Today 143
(2009) 237-241.
80
[29] S. Freguia, K. Rabaey, Z. Yuan, J. r. Keller, Environmental Science & Technology 41
(2007) 2915-2921.
[30] V. Debabov, Microbiology 77 (2008) 123-131.
[31] M. E. Hernandez, D. K. Newman, Cellular and Molecular Life Sciences 58 (2001) 1562-
1571.
[32] A. J. Bard, L. R. Faulkner Electrochemical Methods: Fundamentals and Applications; 2nd
ed.; John Wiley & Sons, Inc.: Toronto, 2001.
81
CHAPITRE 5 ELECTROCHEMICAL STUDY OF THE EFFECT OF
THE ANODIC BIOFILM LIMITATIONS ON THE PERFORMANCES
OF MICROBIAL FUEL CELLS
Article soumis à Journal of Power Sources en mars 2011
Auteurs : Edith Martin, Boris Tartakovsky et Oumarou Savadogo
5.1 Abstract
In this work we use electrochemical techniques (electrochemical impedance spectroscopy (EIS),
cyclic voltammetry (CV) and polarization tests) to investigate anode performance and microbial
fuel cells limitation under various operational conditions of membraneless air-cathode microbial
fuel cells (MFCs). It is shown that the value of the evaluated resistance depends on the method of
measurement, e.g. polarization or EIS. EIS measurements revealed the presence of a secondary
electrochemical process occurring on anodes, which is caused by the oxidation and/or reduction
of the electrolyte salts (acetate, phosphates, chlorides). Polarization curves showed significant
concentration losses, which we assess to be due to proton accumulation in the biofilm at
considerable acetate concentration and high current density, causing local acidification that might
limit acetate uptake by microorganisms. This was confirmed by cyclic voltammetry tests under
various organic loads and low electrolyte conductivity. Lower acetate concentration and
conductivity leads to lower power generation and acetate consumption, therefore proton
accumulation is a non-negligible limitation that can only be circumvented with a buffer
concentration increase to keep good MFCs performance. It was concluded that the diffusion
process in the biofilm is the limiting factor of MFCs performance.
Keywords : MFC, cyclic voltammetry, electrochemical impedance spectroscopy, linear
polarization, limitations, losses
5.2 Introduction
A microbial fuel cell (MFC) is a promising environmental technology combining organic matter
removal from wastewater and electricity production [1, 2]. This fuel cell type relies on
microorganisms transferring electrons to the anode while oxygen reduction reaction is commonly
performed at the cathode [3, 4]. The electrode-reducing microorganisms in the anodic biofilm
82
play a key role in MFCs performance [5, 6]. Accordingly, it is very important to develop
knowledge on a better understanding of the biofilm limitations on MFC performance.
The activation, ohmic and concentration over voltages are the main losses in a MFC. These
losses are responsible for the decrease of the MFC current and power. Protons and acetate
transport through biofilm, external load, electrolyte conductivity as well as cathodic activity are
amongst the main influencing factors on MFCs performance [7-13]. Limitations identification
can be achieved from electrochemical evaluation under different operational conditions by using
techniques such as polarization test, cyclic voltammetry (CV) and electrochemical impedance
spectroscopy (EIS) [14-16]. These techniques are recognized as good characterization methods
for analyzing MFCs internal, anode and cathode resistances and properties, electrochemical
reactions taking place onto electrodes, microbial metabolism, mass transfer limitations and power
generation [15, 17, 18].
Depending on the design (air-cathode vs. 2-compartments MFC), inoculum (pure vs. mixed
culture), operational conditions, substrate nature and availability, MFC performance and
electrochemical response may vary since the biofilm will be influenced by these parameters [6,
19-23]. MFC systems based on the diversity of microorganisms allow high current and power
densities using a variety of carbon sources. However, they are usually affected by the formation
of electrochemically inactive side reactions products [5]. This paper is dedicated to the
investigation of the limitations of MFC performance related to the anodic biofilm. We will use
various electrochemical techniques (EIS, CV and polarization) under different operational
conditions (organic load rate, conductivity, external load) with two types of anodes (carbon paper
and felt) for a better characterization and understanding of losses and limitations in a single-
chamber membraneless air-cathode acetate-fed MFC.
5.3 Materials and methods
5.3.1 MFC design and operation
Four single-chamber membraneless air-cathode MFCs were operated for time periods ranging
from 1 to 7 months. MFC design can be found in Martin et al. [23]. The anodic chamber volume
was 50 mL (5 cm x 10 cm X 1cm). A 5 cm x 10 cm carbon paper (NCBE, University of Reading,
UK) was used as anode in MFC1. In MFC2, MFC3 and MFC4, anodes consisted of 5 cm x 10
83
cm 5mm-thick carbon felts (SGL Carbon SE). Cathodes consisted of a gas diffusion electrode
(GDE) with a Pt loading of 0,5 mg cm-2
(E-TEK Division, PEMEAS Fuel Cell Technologies,
Somerset, NJ, USA). The felt anodes were separated from cathodes with a J-cloth®, resulting in a
distance of approximately 1mm between electrodes; carbon paper anode was placed at a distance
of 10mm to avoid electron diversion to oxygen. MFC voltage was monitored via a data
acquisition card (LabJack U12, Lab Jack Corporation, Colorado, USA).
MFCs were operated at room temperature in a continuous flow mode with a hydraulic retention
time of 12 h. Anodic electrolyte required no pH adjustment (pH7) and its mixing was achieved
by a peristaltic pump in the recirculation line. Stock solution of sodium acetate and nutrients was
fed at a rate of 5 mL d-1
by a syringe pump (model NE-1000, New Era Pump Systems, Inc.,
Wantagh, NY, USA). Acetate and nutrients stock solution were combined with dilution water
containing 1 mL of stock solution of microelements per liter.
Following the addition of inoculum in the anodic compartment, microbial fuel cells were firstly
operated at an external resistance (Rext) of 1000 (MFC1) and 400 (MFC2 to 4). Rext was
periodically decreased to fit MFC internal resistance until attainment of lower Rint and maximal
power generation. MFCs and anodes performance were then monitored and growth and activity
of electrode-reducing microorganisms was evidenced by cells voltage monitoring as well as by
electrochemical measurements.
5.3.2 Inoculum, media composition and analytical methods
MFCs were inoculated with homogenized anaerobic mesophilic sludge (VSS 50 g L-1
) (A.
Lassonde Inc., Rougemont, Quebec, Canada). The stock solution of microelements contained (in
g L-1
): FeCl24H2O (2), H3BO3 (0,05), ZnCl2 (0,05), CuCl2 (0,03), MnCl24H2O (0,5),
(NH4)6Mo7O244H2O (0,05), AlCl3 (0,05), CoCl26H2O (0,05), NiCl2 (0,05), EDTA (0,5) and HCl
(1µL). The standard stock solution of acetate and nutrients contained (in g L-1
): yeast extract
(0,83), NH4Cl (18,68), KCl (148,09), K2HPO4 (64,04), KH2PO4 (40,69), and anhydrous sodium
acetate (54,67). Acetate and salts concentration have been changed in some experiments, as will
be stated below. Acetate quantity was halved or doubled to obtain respective concentrations of
27,34 and 109,34 g L-1
in stock solutions, allowing organic loads (OLRs) of 2, 4 and 8 g L-1
day-
1. In another solution phosphates and chlorides quantity was lowered to one fifth to study low
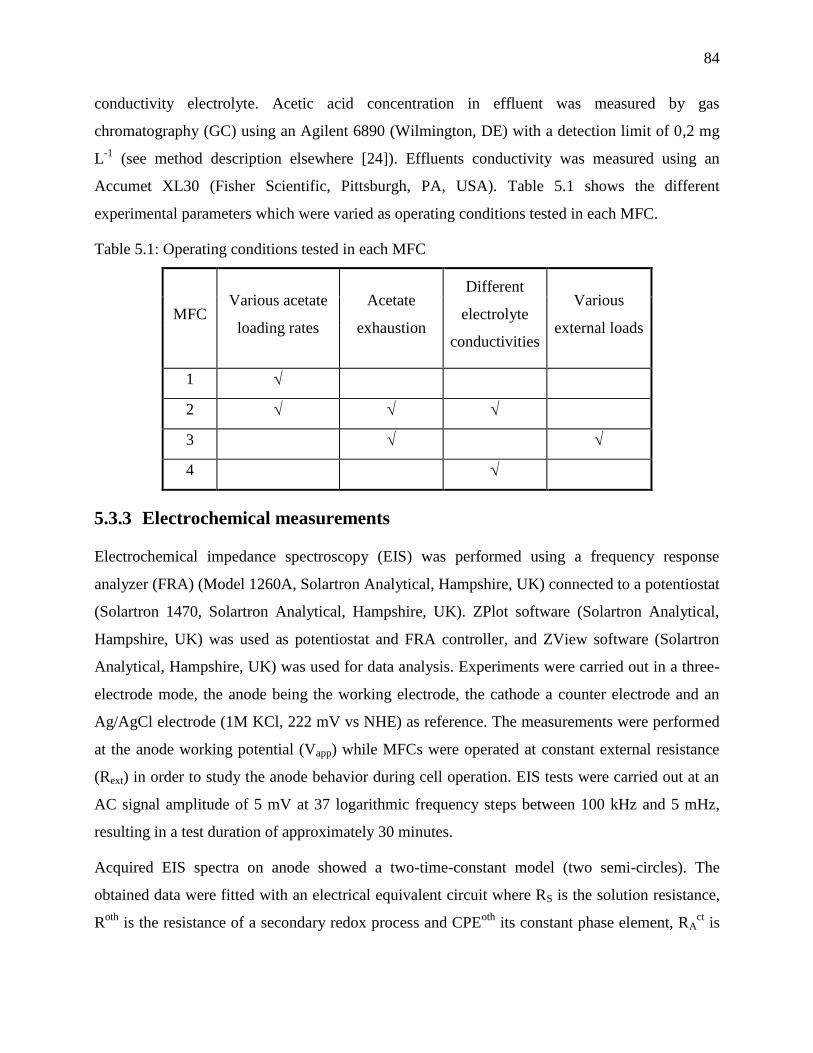
84
conductivity electrolyte. Acetic acid concentration in effluent was measured by gas
chromatography (GC) using an Agilent 6890 (Wilmington, DE) with a detection limit of 0,2 mg
L-1
(see method description elsewhere [24]). Effluents conductivity was measured using an
Accumet XL30 (Fisher Scientific, Pittsburgh, PA, USA). Table 5.1 shows the different
experimental parameters which were varied as operating conditions tested in each MFC.
Table 5.1: Operating conditions tested in each MFC
MFC Various acetate
loading rates
Acetate
exhaustion
Different
electrolyte
conductivities
Various
external loads
1
2
3
4
5.3.3 Electrochemical measurements
Electrochemical impedance spectroscopy (EIS) was performed using a frequency response
analyzer (FRA) (Model 1260A, Solartron Analytical, Hampshire, UK) connected to a potentiostat
(Solartron 1470, Solartron Analytical, Hampshire, UK). ZPlot software (Solartron Analytical,
Hampshire, UK) was used as potentiostat and FRA controller, and ZView software (Solartron
Analytical, Hampshire, UK) was used for data analysis. Experiments were carried out in a three-
electrode mode, the anode being the working electrode, the cathode a counter electrode and an
Ag/AgCl electrode (1M KCl, 222 mV vs NHE) as reference. The measurements were performed
at the anode working potential (Vapp) while MFCs were operated at constant external resistance
(Rext) in order to study the anode behavior during cell operation. EIS tests were carried out at an
AC signal amplitude of 5 mV at 37 logarithmic frequency steps between 100 kHz and 5 mHz,
resulting in a test duration of approximately 30 minutes.
Acquired EIS spectra on anode showed a two-time-constant model (two semi-circles). The
obtained data were fitted with an electrical equivalent circuit where RS is the solution resistance,
Roth
is the resistance of a secondary redox process and CPEoth
its constant phase element, RAct is
85
the anodic charge transfer resistance and CPEct the constant phase element related to charge
transfer. Constant phase elements (CPE) are used instead of standard capacitances in the
modeling because of inhomogeneous conditions (roughness, porosity, distribution of reaction
sites) [25]. Fitting both semi-circles with a CPE is used to determine the surface capacitance
value and the influence of the diffusion and electrode structure.
Cyclic voltammetry (CV) was performed utilizing a potentiostat (273A, Princeton Applied
Research, Tennessee, USA). The anode and cathode were used as working and counter electrodes
respectively, while an Ag/AgCl electrode was employed as reference. Voltammetry was carried
out at different scan rates between 300 and 5 mV/s, at potentials between –0,9 and 0,4V vs
Ag/AgCl. CorrWare and CorrView software (Solartron Analytical, Hampshire, UK) were used
respectively for potentiostat control and data analysis.
Polarization and power curves were acquired with a potentiostat (273A, Princeton Applied
Research, Tennessee, USA), which controlled the cell voltage (EMFC) while measuring the
generated current (I). The tests were performed from open circuit voltage (OCV) to short circuit
at a scan rate of 0,5mV/s. The anode was employed as working electrode while the cathode was
used as counter and reference electrode. Both electrodes potential were measured against
Ag/AgCl references via a data acquisition card (LabJack U12, LabJack Corporation, Colorado,
USA). In some instances manual polarization was carried out, where Rext was manually decreased
from 10 000 (OCV) to 1 Ω by logarithmic steps every 5 minutes. Cell voltage and electrodes
potential were measured as well. During manual polarization, EIS measurements were performed
at Rext of 5000, 200, 70, 20 and <10 Ω.
Power (P) was calculated as P = EMFC * I. Cell voltage and power were plotted against current,
allowing the respective evaluation of the MFC internal resistance (Rint) as the slope of the linear
part of the polarization curve (EMFC vs I) and maximum power output (Pmax) in the power curve.
Anode and cathode potentials were also plotted against current, which allows the estimation of
anode and cathode resistances (RA and RC respectively) from the linear part of corresponding
curves.
86
5.4 Results
5.4.1 Effect of acetate concentration
The effect of acetate concentration on MFCs performances was studied in several ways. The first
method was to perform electrochemical tests at organic loading rates of 2, 4 and 8 g L-1
day-1
in
MFC1 (carbon paper) and MFC2 (carbon felt). Results of the polarization tests are shown in table
5.2. The optimum power density of the MFC was obtained respectively with carbon paper and
carbon felt based anode for an optimal acetate loading of 4 g L-1
day-1
for both electrodes. This
optimum power density was higher for carbon felt anode (92,4 W m-3
) than for the carbon paper
anode (16,7 W m-3
). These maximal power generations (table 5.2, figure 5-1) resulted in lowest
MFC and electrode resistances, EIS measurements showing lower Rct for the optimal load in
MFC1 (figure 5-2A) but no significant effect could be seen on Rs and Roth
. On the other hand,
MFC2 showed a slightly lower Rct at 2 g L
-1 day
-1 but accompanied by diffusion limitation on the
EIS spectrum (linear curve extending to low frequencies [26], figure 5-2B), which is hardly
measurable in term of anodic resistance. As well, Rs increased while Roth
decreased. Polarization
tests thus explicitly showed that an OLR of 2 g L-1
day-1
leads to significantly higher values of RA
and RC, hence generating lower power output. The loading rates of 4 and 8 g L-1
day-1
resulted in
similar EIS spectra. The polarization evaluations clearly showed that the highest loading rate
increases anode, cathode and MFC resistances, also resulting in lower power generation. In all
cases, important concentration losses are observed and they are linked to the anode (figure 5-1C).
The absence of the loading effect on Rs and Roth
in MFC1 is in agreement with the small variation
between the highest power generation of 16,7 W m-3
and the lowest value of 12 W m-3
. On the
contrary the power generation variation in MFC2 (the highest and lowest values are respectively
92,4 W m-3
and 32,7 W m-3
) is more important leading to a significant change of Rs and Roth
.
Very high acetate concentration in MFC1 at 8 g L-1
day-1
is assumed to be caused by the lack of
substrate consumption, leading to its accumulation in the MFC.
Cyclic voltammetry was performed at several scan rates and at various organic loads. Normalized
anodic current peaks (ip,a/ip,a,min) were plotted against the scan rate (). Figure 5-4A shows that
normalized current density of MFC2 redox peak is linearly proportional to the square root of ,
suggesting a diffusion-limited charge transfer reaction, but not an irreversible diffusion-
controlled process [9, 27, 28]. Moreover, this dependency is also linked to organic load rates as
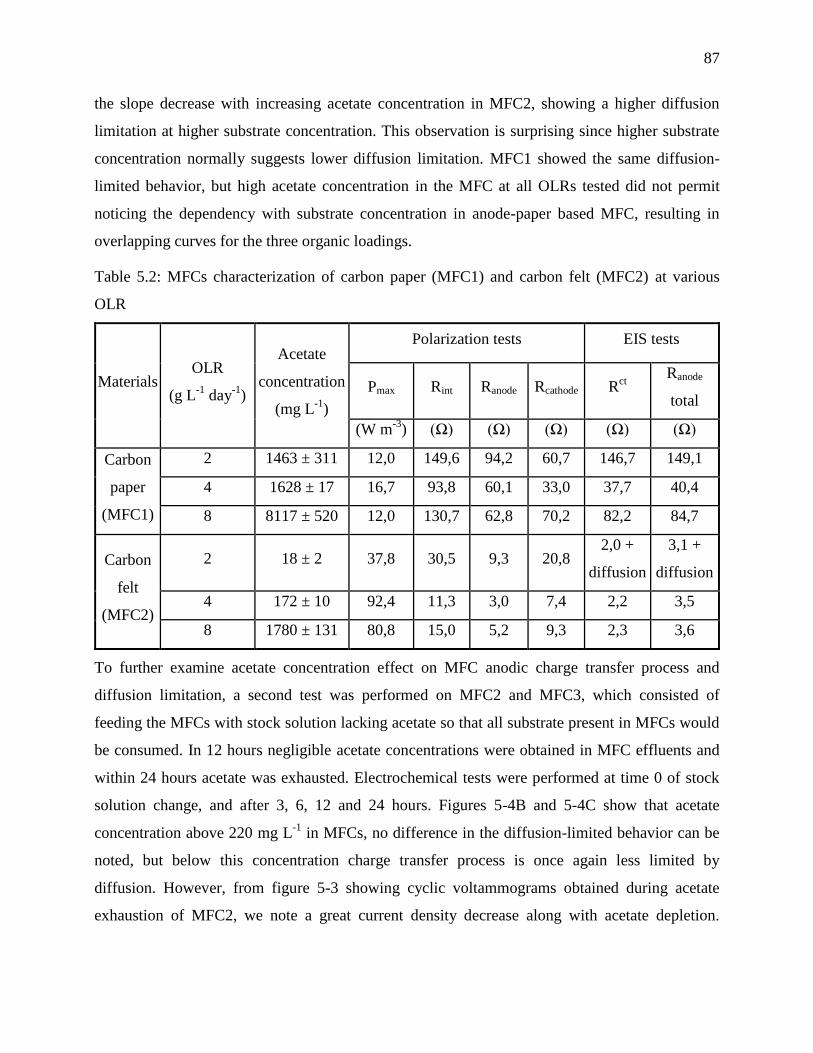
87
the slope decrease with increasing acetate concentration in MFC2, showing a higher diffusion
limitation at higher substrate concentration. This observation is surprising since higher substrate
concentration normally suggests lower diffusion limitation. MFC1 showed the same diffusion-
limited behavior, but high acetate concentration in the MFC at all OLRs tested did not permit
noticing the dependency with substrate concentration in anode-paper based MFC, resulting in
overlapping curves for the three organic loadings.
Table 5.2: MFCs characterization of carbon paper (MFC1) and carbon felt (MFC2) at various
OLR
Materials OLR
(g L-1
day-1
)
Acetate
concentration
(mg L-1
)
Polarization tests EIS tests
Pmax Rint Ranode Rcathode Rct
Ranode
total
(W m-3
) (Ω) (Ω) (Ω) (Ω) (Ω)
Carbon
paper
(MFC1)
2 1463 ± 311 12,0 149,6 94,2 60,7 146,7 149,1
4 1628 ± 17 16,7 93,8 60,1 33,0 37,7 40,4
8 8117 ± 520 12,0 130,7 62,8 70,2 82,2 84,7
Carbon
felt
(MFC2)
2 18 ± 2 37,8 30,5 9,3 20,8 2,0 +
diffusion
3,1 +
diffusion
4 172 ± 10 92,4 11,3 3,0 7,4 2,2 3,5
8 1780 ± 131 80,8 15,0 5,2 9,3 2,3 3,6
To further examine acetate concentration effect on MFC anodic charge transfer process and
diffusion limitation, a second test was performed on MFC2 and MFC3, which consisted of
feeding the MFCs with stock solution lacking acetate so that all substrate present in MFCs would
be consumed. In 12 hours negligible acetate concentrations were obtained in MFC effluents and
within 24 hours acetate was exhausted. Electrochemical tests were performed at time 0 of stock
solution change, and after 3, 6, 12 and 24 hours. Figures 5-4B and 5-4C show that acetate
concentration above 220 mg L-1
in MFCs, no difference in the diffusion-limited behavior can be
noted, but below this concentration charge transfer process is once again less limited by
diffusion. However, from figure 5-3 showing cyclic voltammograms obtained during acetate
exhaustion of MFC2, we note a great current density decrease along with acetate depletion.
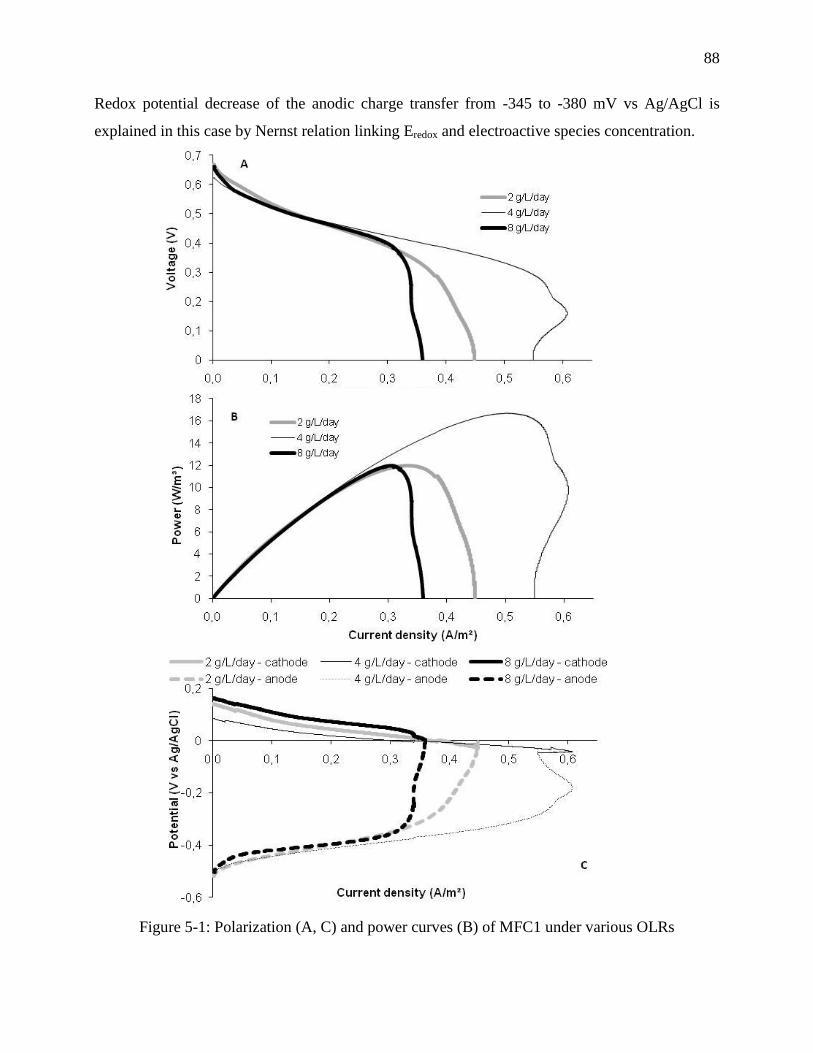
88
Redox potential decrease of the anodic charge transfer from -345 to -380 mV vs Ag/AgCl is
explained in this case by Nernst relation linking Eredox and electroactive species concentration.
Figure 5-1: Polarization (A, C) and power curves (B) of MFC1 under various OLRs
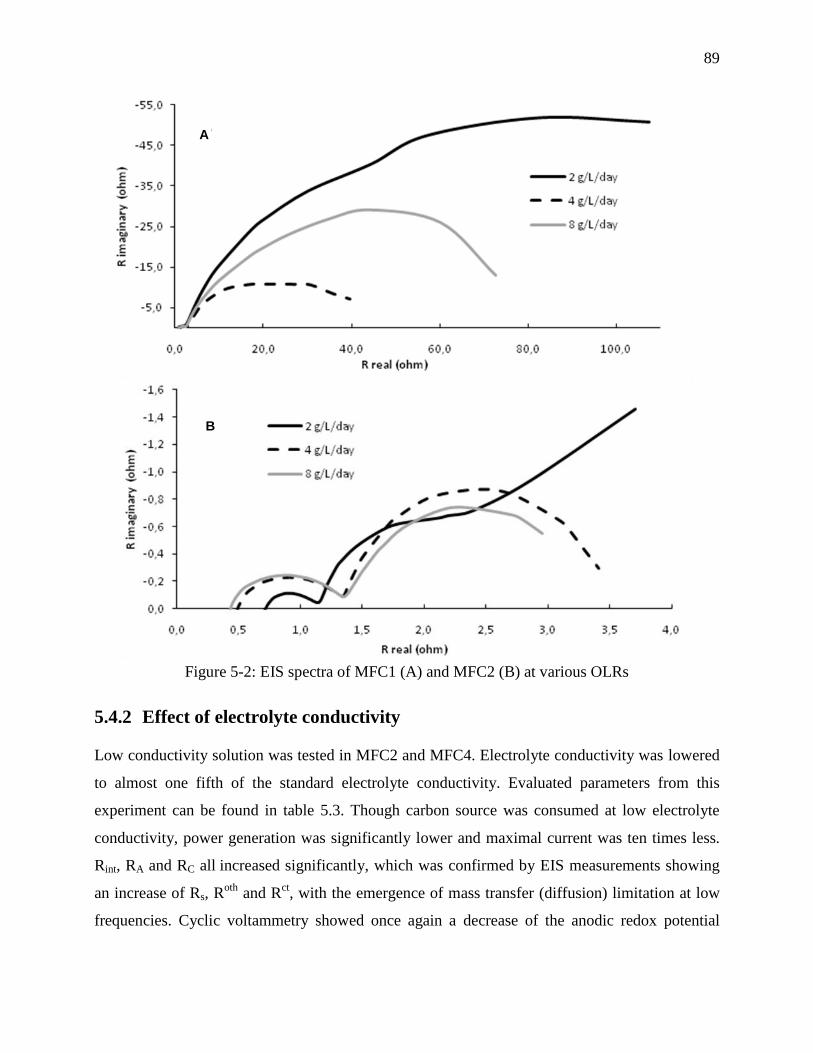
89
Figure 5-2: EIS spectra of MFC1 (A) and MFC2 (B) at various OLRs
5.4.2 Effect of electrolyte conductivity
Low conductivity solution was tested in MFC2 and MFC4. Electrolyte conductivity was lowered
to almost one fifth of the standard electrolyte conductivity. Evaluated parameters from this
experiment can be found in table 5.3. Though carbon source was consumed at low electrolyte
conductivity, power generation was significantly lower and maximal current was ten times less.
Rint, RA and RC all increased significantly, which was confirmed by EIS measurements showing
an increase of Rs, Roth
and Rct, with the emergence of mass transfer (diffusion) limitation at low
frequencies. Cyclic voltammetry showed once again a decrease of the anodic redox potential
A
B
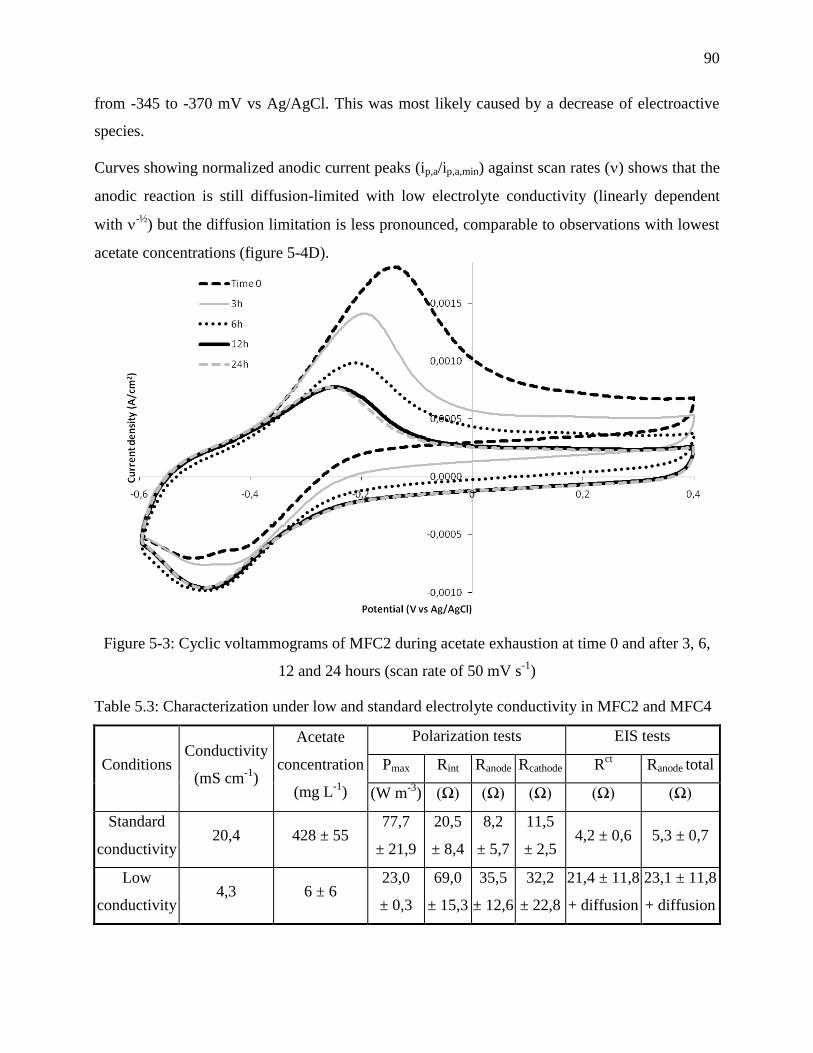
90
from -345 to -370 mV vs Ag/AgCl. This was most likely caused by a decrease of electroactive
species.
Curves showing normalized anodic current peaks (ip,a/ip,a,min) against scan rates () shows that the
anodic reaction is still diffusion-limited with low electrolyte conductivity (linearly dependent
with -½
) but the diffusion limitation is less pronounced, comparable to observations with lowest
acetate concentrations (figure 5-4D).
Figure 5-3: Cyclic voltammograms of MFC2 during acetate exhaustion at time 0 and after 3, 6,
12 and 24 hours (scan rate of 50 mV s-1
)
Table 5.3: Characterization under low and standard electrolyte conductivity in MFC2 and MFC4
Conditions Conductivity
(mS cm-1
)
Acetate
concentration
(mg L-1
)
Polarization tests EIS tests
Pmax Rint Ranode Rcathode Rct Ranode total
(W m-3
) (Ω) (Ω) (Ω) (Ω) (Ω)
Standard
conductivity 20,4 428 ± 55
77,7
± 21,9
20,5
± 8,4
8,2
± 5,7
11,5
± 2,5 4,2 ± 0,6 5,3 ± 0,7
Low
conductivity 4,3 6 ± 6
23,0
± 0,3
69,0
± 15,3
35,5
± 12,6
32,2
± 22,8
21,4 ± 11,8
+ diffusion
23,1 ± 11,8
+ diffusion
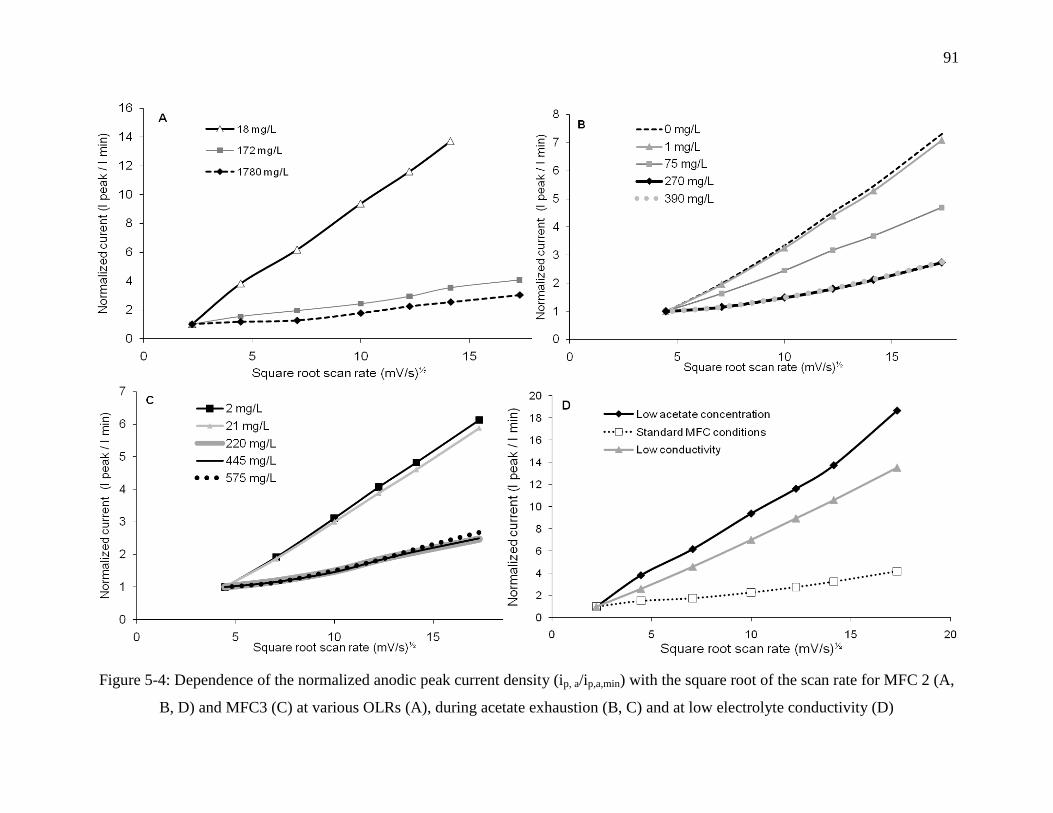
91
Figure 5-4: Dependence of the normalized anodic peak current density (ip, a/ip,a,min) with the square root of the scan rate for MFC 2 (A,
B, D) and MFC3 (C) at various OLRs (A), during acetate exhaustion (B, C) and at low electrolyte conductivity (D)
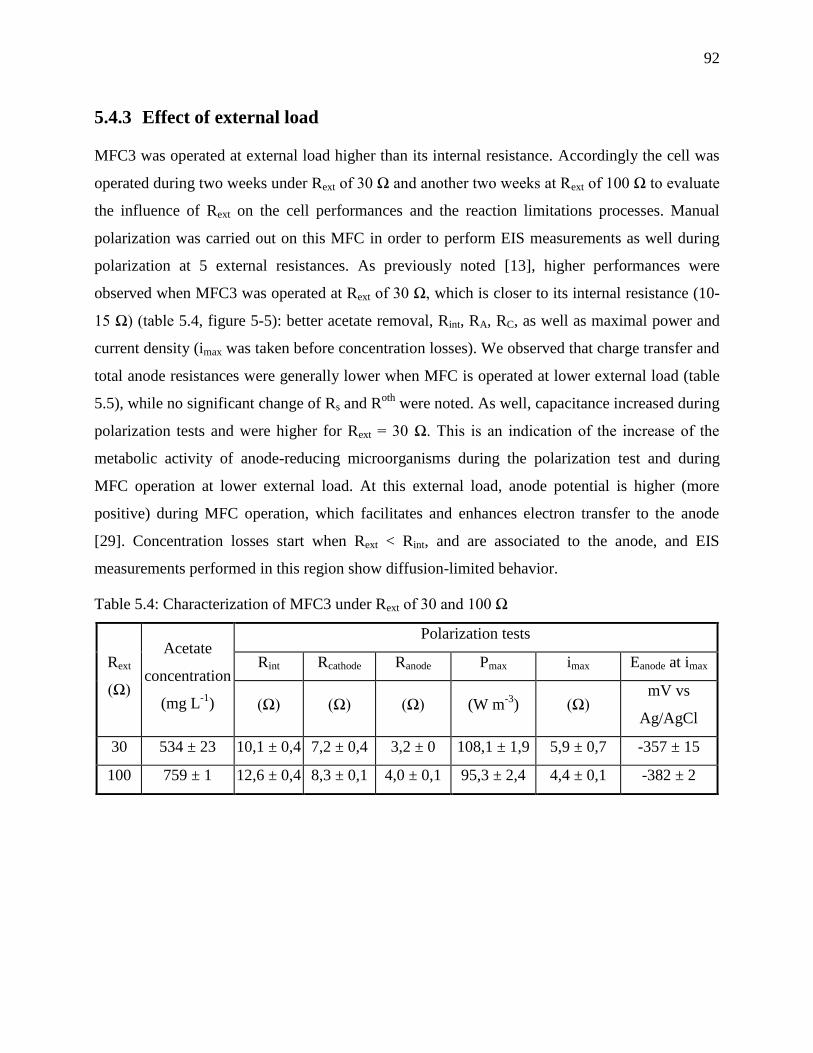
92
5.4.3 Effect of external load
MFC3 was operated at external load higher than its internal resistance. Accordingly the cell was
operated during two weeks under Rext of 30 Ω and another two weeks at Rext of 100 Ω to evaluate
the influence of Rext on the cell performances and the reaction limitations processes. Manual
polarization was carried out on this MFC in order to perform EIS measurements as well during
polarization at 5 external resistances. As previously noted [13], higher performances were
observed when MFC3 was operated at Rext of 30 Ω, which is closer to its internal resistance (10-
15 Ω) (table 5.4, figure 5-5): better acetate removal, Rint, RA, RC, as well as maximal power and
current density (imax was taken before concentration losses). We observed that charge transfer and
total anode resistances were generally lower when MFC is operated at lower external load (table
5.5), while no significant change of Rs and Roth
were noted. As well, capacitance increased during
polarization tests and were higher for Rext = 30 Ω. This is an indication of the increase of the
metabolic activity of anode-reducing microorganisms during the polarization test and during
MFC operation at lower external load. At this external load, anode potential is higher (more
positive) during MFC operation, which facilitates and enhances electron transfer to the anode
[29]. Concentration losses start when Rext < Rint, and are associated to the anode, and EIS
measurements performed in this region show diffusion-limited behavior.
Table 5.4: Characterization of MFC3 under Rext of 30 and 100 Ω
Rext
(Ω)
Acetate
concentration
(mg L-1
)
Polarization tests
Rint Rcathode Ranode Pmax imax Eanode at imax
(Ω) (Ω) (Ω) (W m-3
) (Ω) mV vs
Ag/AgCl
30 534 ± 23 10,1 ± 0,4 7,2 ± 0,4 3,2 ± 0 108,1 ± 1,9 5,9 ± 0,7 -357 ± 15
100 759 ± 1 12,6 ± 0,4 8,3 ± 0,1 4,0 ± 0,1 95,3 ± 2,4 4,4 ± 0,1 -382 ± 2
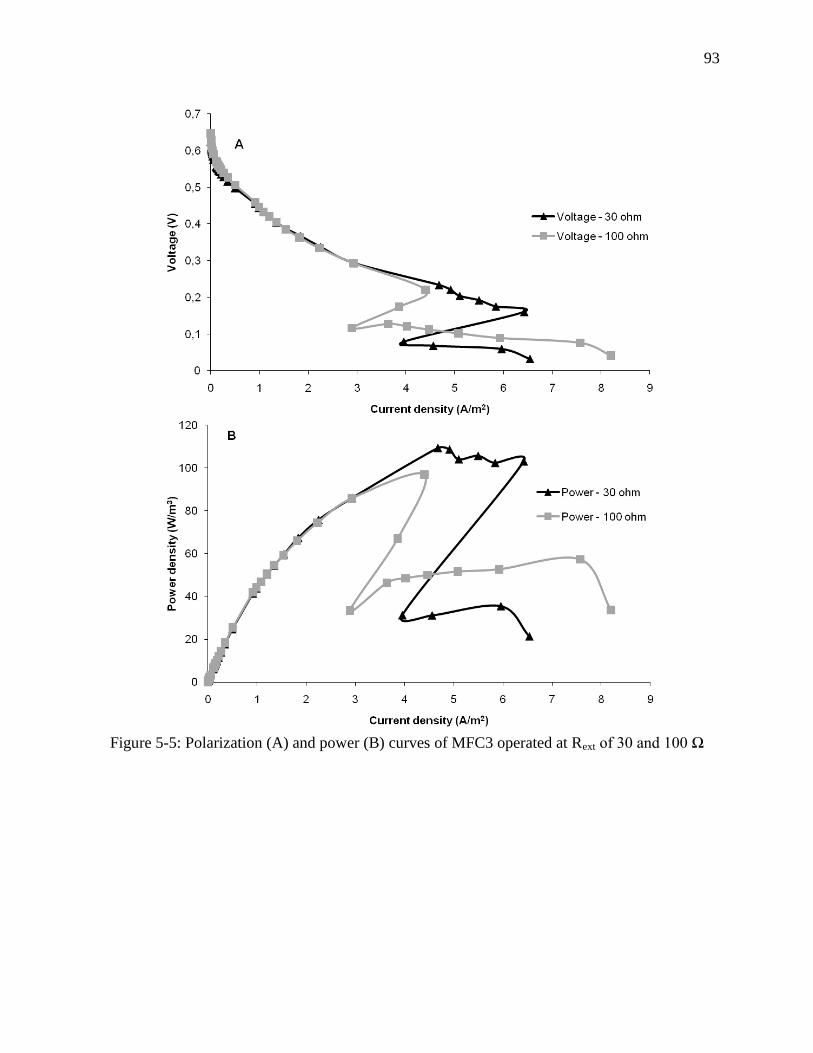
93
Figure 5-5: Polarization (A) and power (B) curves of MFC3 operated at Rext of 30 and 100 Ω
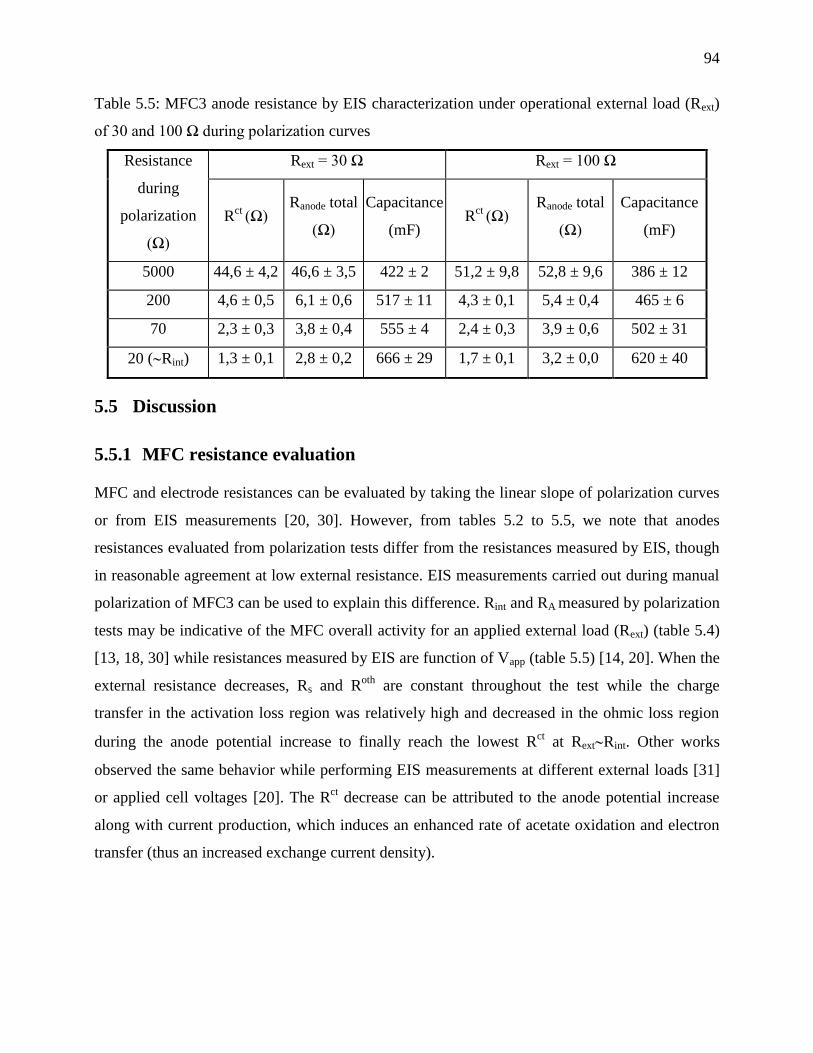
94
Table 5.5: MFC3 anode resistance by EIS characterization under operational external load (Rext)
of 30 and 100 Ω during polarization curves
Resistance
during
polarization
(Ω)
Rext = 30 Ω Rext = 100 Ω
Rct
(Ω) Ranode total
(Ω)
Capacitance
(mF) R
ct (Ω)
Ranode total
(Ω)
Capacitance
(mF)
5000 44,6 ± 4,2 46,6 ± 3,5 422 ± 2 51,2 ± 9,8 52,8 ± 9,6 386 ± 12
200 4,6 ± 0,5 6,1 ± 0,6 517 ± 11 4,3 ± 0,1 5,4 ± 0,4 465 ± 6
70 2,3 ± 0,3 3,8 ± 0,4 555 ± 4 2,4 ± 0,3 3,9 ± 0,6 502 ± 31
20 (Rint) 1,3 ± 0,1 2,8 ± 0,2 666 ± 29 1,7 ± 0,1 3,2 ± 0,0 620 ± 40
5.5 Discussion
5.5.1 MFC resistance evaluation
MFC and electrode resistances can be evaluated by taking the linear slope of polarization curves
or from EIS measurements [20, 30]. However, from tables 5.2 to 5.5, we note that anodes
resistances evaluated from polarization tests differ from the resistances measured by EIS, though
in reasonable agreement at low external resistance. EIS measurements carried out during manual
polarization of MFC3 can be used to explain this difference. Rint and RA measured by polarization
tests may be indicative of the MFC overall activity for an applied external load (Rext) (table 5.4)
[13, 18, 30] while resistances measured by EIS are function of Vapp (table 5.5) [14, 20]. When the
external resistance decreases, Rs and Roth
are constant throughout the test while the charge
transfer in the activation loss region was relatively high and decreased in the ohmic loss region
during the anode potential increase to finally reach the lowest Rct at RextRint. Other works
observed the same behavior while performing EIS measurements at different external loads [31]
or applied cell voltages [20]. The Rct decrease can be attributed to the anode potential increase
along with current production, which induces an enhanced rate of acetate oxidation and electron
transfer (thus an increased exchange current density).
95
5.5.2 Anodic secondary electrochemical process
Impedance studies on MFCs with carbon felt anode usually follow a one-time-constant model
resulting of charge transfer resistance [14, 15, 20, 32] while our EIS measurements show two
semi-circles. Control measurements carried out in a non-inoculated MFC with 1) deionized water
and 2) microelements in distilled water showed no significant effect on high-frequency
resistance. On the other hand, tests performed in the abiotic MFC with the complete influent
showed a semi-circle not completely closed with a slightly lower width, which is similar to
passive film formed onto electrodes that blocks reaction sites [25].
Ramasamy et al. [33], who observed similar EIS spectra, proposed that this high-frequency
reaction may be caused by endogenously-produced redox mediators used as shuttle as well as
metallic salts oxidation or reduction onto anodes. The results of our tests show that this secondary
electrochemical process is only slightly more resistive with the biofilm growth. EIS
measurements carried out during manual polarization using various resistances showed that Roth
was constant throughout the test while Rct diminished with increasing anodic potential.
Accordingly we may conclude that this process is not related to the charge transfer from
microorganisms to the anode but to some secondary side reactions of the electrolyte species.
Moreover, very low acetate concentration in MFC, probably resulting in acetate shortage at the
electrode surface, decreases Roth
significantly. Carbon paper anode also showed this semi-circle,
which exhibits a resistance 2-4 times greater than those obtained with the carbon felt. Hence from
our findings, this secondary reaction is mainly related to these side reactions of the reduction
and/or oxidation of salts present in the electrolyte (acetate, phosphates, chlorides), on the anode
surface, which is also influenced by the anode surface area.
The decrease in the electrolyte conductivity results in the resistance increase of this secondary
electrochemical process. Data fitting from our experimental results have shown clearly that this
reaction is limited by a diffusion process that increases with low salts concentration. We may
assume that the electrolyte conductivity is restraining this process by limiting the amount of ions
flowing toward and away from the anode surface (i.e. mass transport limitation). Since salts and
nutrients are not likely to be removed from the influent, this reaction will keep on occurring on
both electrodes and will increase their resistances (i.e. parasitic reaction). This process most
likely forms a resistive layer at the anode surface that is observed on cyclic voltammograms as
96
charging current (baseline seen before MFC inoculation, not shown), hence blocking reaction
sites for electrode-reducing microorganisms [27].
5.5.3 Concentration losses – current density limitation
Standard polarization curves obtained in carbon felt anode MFCs, which are similar to curves in
figure 5-1, show that MFCs suffer from activation, ohmic and concentration losses. From figure
5-1C we note that activation losses are more important at the cathode side while concentration
losses are caused by anodic limitations. Cathodic activation losses can be minimized by
increasing temperature, catalyst activity, O2 concentration and cathode surface [3, 4, 23]. Ohmic
losses are greatly influenced by MFCs design [34], though they are lessened in our MFCs since
no polymeric exchange membrane is used, the distance between electrodes is minimized and the
electrolyte conductivity is relatively high. Anodic concentration losses are important in our
MFCs starting at a saturation current density and/or anodic potential depending on organic load
rates and external load. A lack of this saturation is common in MFCs with low cathodic activity
or high ohmic resistance, where the process is not limited by anodes performance [17].
The resistance caused by the substrate diffusion limitation observed in the EIS spectrum was
noticed at the lowest organic load rate (figure 5-2B) and at low electrolyte conductivity in carbon
felt MFCs. The first phenomenon probably happened because of an acetate shortage at the anode
surface due to a low substrate feeding. The second one is most likely caused by small acetate
concentration inside the porous electrode as illustrated in figure 5-4D, either because of low
diffusion rate due to low electrolyte conductivity inside biofilm pores or acetate shortage because
of complete substrate consumption by non electroactive species. These observations agree with a
study mentioning the effect of insufficient acetate concentration in bulk electrolyte, low substrate
penetration and mass transfer coefficient causing small substrate concentration near the anode
surface [35]. Acetate shortage to microorganisms is not likely responsible for concentration
losses since high acetate concentration in MFC1 and MFC2, maintained for more than two days,
also led to this limitation behavior. A previous study stated that limiting current density was
assumed to be reflecting maximal biomass activity on flat electrodes and was not linked to
substrate limitation [36]. However EIS measurements carried out during manual polarization in
the mass transfer loss region showed diffusion-limited behavior.
97
The present study showed saturation potentials of -380 to -360 mV for carbon felt anode and -330
mV for carbon paper anode, potentials over which concentration losses appeared during
polarization. Previous studies mentioned that potential affinity of electrode-reducing
microorganisms between potentials of -450 and -300 mV vs Ag/AgCl indicates that bacteria
prefer a particular anodic potential rather than being most active at a more positive anodic
potential [37, 38]. In addition, Aelterman et al. hypothesized that an enzymatic system only
adapted to anode potentials lower than –300mV may be the cause of sharp current decrease
during polarization [39]. This critical anodic potential appears if the biochemical electron flow
was saturated by the availability of the terminal electron acceptor (oxidized mediators or anode
itself).
On the other hand, it has been hypothesized that this current decrease could arise because of a
lower enzymatic rate of the metabolism [39]. High acetate load implicates more protons
generated that hinder anode-reducing microorganisms by products accumulation in biofilm
(protons, oxidized intermediates), which may change redox conditions or cause acidification that
hampers the metabolic activity in the biofilm [6, 18]. As well, it has been shown that the flux of
protons generated within the biofilm from microbial oxidation limits the rate of electron transfer
in biofilms [9, 10, 40, 41]. Protons diffusion out of biofilm has been shown to be linked to
H2PO4- diffusion. At higher current densities, diffusion rate of protons out of the biofilm is much
lower than microbial protons generation, causing micro-environmental pH decrease and hence
inhibiting microbial acetate uptake that becomes the rate limiting step [10, 41]. An increase of
buffer concentration augmented proton diffusion that increased maximal achievable current
density and power [10, 30]. The effect of proton accumulation in biofilm is supported by results
obtained in this study. As seen on figure 5-4, high acetate concentration induced more diffusion-
limited anodic reaction. In addition, polarization tests performed before cyclic voltammetry led to
higher current generation than if the test sequence was inverted, which can be explained by
increased proton accumulation in biofilm during voltammetry causing metabolic activity
inhibition in subsequent testing. Hence, diffusion limitations are not believed to be related to
substrate availability but caused by a significant increase of protons generation, signifying that
diffusion-limited behavior in concentration losses region observed in EIS measurements are
related to protons excess causing an electroactive species (cytochromes or mediators) deficiency
since acetate uptake was hindered.
98
Current density either stabilizes or slightly increases in the concentration loss region after its
abrupt diminution in polarization tests performed with a potentiostat. During manual polarization
this behavior results in current generation that can overcome imax observed before concentration
losses (figure 5-5). As significant charge storage is known to exist in bacteria and biofilm (in
cytochromes) and in double-layer (capacitance effect) [29, 34, 37, 42], we may hypothesize that
reaching maximal current density has emptied charge storage and that after sudden current
decrease electrons are then delivered from microorganisms at smaller rates because of significant
proton stock in biofilm. Slower acquisition of polarization measurements permits enhanced
proton diffusion out of biofilm, hence increasing current density. In addition, MFC operated at
higher Rext resulted in lower anode-reducers activity as can be noticed from capacitances (table
5.5), thus less acetate consumption and lower protons generation leading to higher current density
production (figure 5-5). However, this behavior indicates that anode potential is not the major
influence on concentration losses since high current densities were as well observed at anodic
potential between -215 and -175 mV in MFC operated at 30 Ω.
5.5.4 Electron transfer mechanism and limitations
Electron transfer performed by direct contact and extracellular membrane-bound cytochromes
through a conductive matrix is thought to be the dominant charge transfer mechanisms since even
with no acetate in the electrolyte, redox peaks are seen and current density does not decrease to
levels observed before MFCs inoculation. Moreover, injection of substrate into the MFCs
immediately affected current production, which increased almost to its level before acetate
exhaustion in 7-8 minutes, as observed with Geobacter sp. [43]. Previous tests (not shown)
performed with anodic biofilm suspensions proved that biofilm formation was required in order
to observe substantial redox response. Kinetic evaluation supports this assumption as conduction
through solid matrix can lead to current densities over 10 A m-2
[41], close to currents generated
in our carbon felt based MFCs. We assume the redox system to be related to Geobacter, an
electricigenic species well known for direct electron transfer through membrane-bound
cytochromes and pili [19, 44, 45], this hypothesis being supported by other studies that observed
redox system of pure culture of Geobacter sp. or Geobacter enriched mixed culture in MFCs at
about the same potential during voltammetry [9, 28, 46, 47].
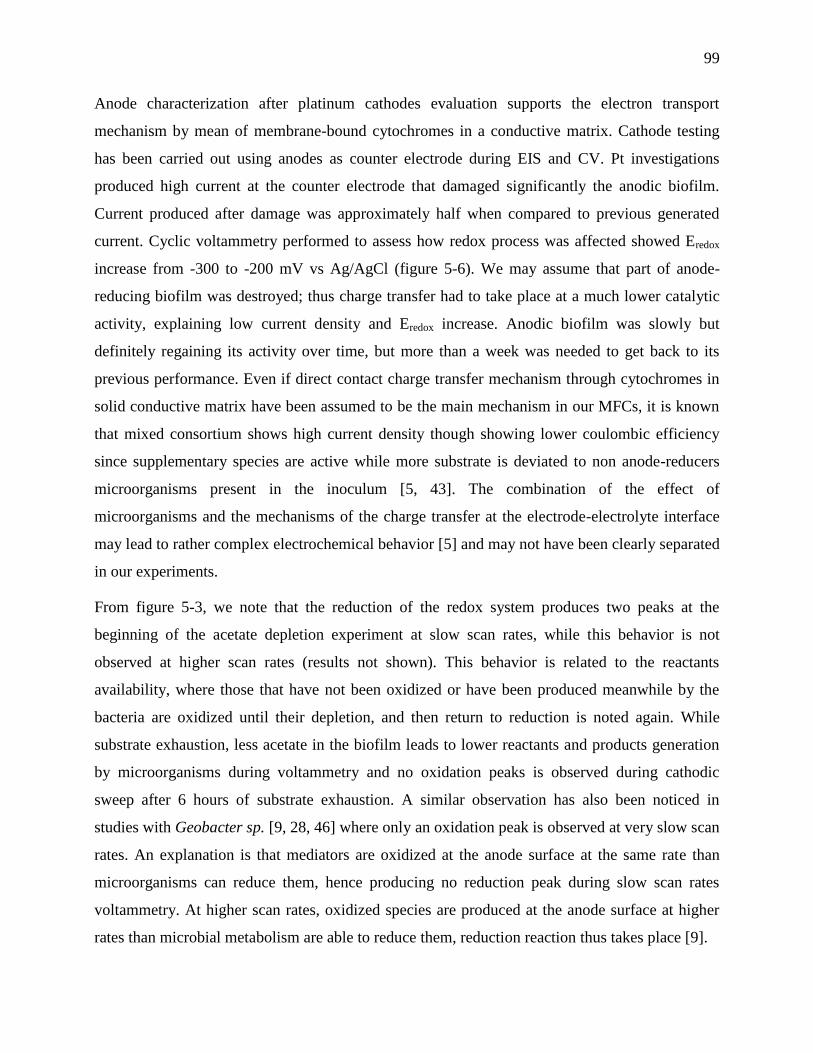
99
Anode characterization after platinum cathodes evaluation supports the electron transport
mechanism by mean of membrane-bound cytochromes in a conductive matrix. Cathode testing
has been carried out using anodes as counter electrode during EIS and CV. Pt investigations
produced high current at the counter electrode that damaged significantly the anodic biofilm.
Current produced after damage was approximately half when compared to previous generated
current. Cyclic voltammetry performed to assess how redox process was affected showed Eredox
increase from -300 to -200 mV vs Ag/AgCl (figure 5-6). We may assume that part of anode-
reducing biofilm was destroyed; thus charge transfer had to take place at a much lower catalytic
activity, explaining low current density and Eredox increase. Anodic biofilm was slowly but
definitely regaining its activity over time, but more than a week was needed to get back to its
previous performance. Even if direct contact charge transfer mechanism through cytochromes in
solid conductive matrix have been assumed to be the main mechanism in our MFCs, it is known
that mixed consortium shows high current density though showing lower coulombic efficiency
since supplementary species are active while more substrate is deviated to non anode-reducers
microorganisms present in the inoculum [5, 43]. The combination of the effect of
microorganisms and the mechanisms of the charge transfer at the electrode-electrolyte interface
may lead to rather complex electrochemical behavior [5] and may not have been clearly separated
in our experiments.
From figure 5-3, we note that the reduction of the redox system produces two peaks at the
beginning of the acetate depletion experiment at slow scan rates, while this behavior is not
observed at higher scan rates (results not shown). This behavior is related to the reactants
availability, where those that have not been oxidized or have been produced meanwhile by the
bacteria are oxidized until their depletion, and then return to reduction is noted again. While
substrate exhaustion, less acetate in the biofilm leads to lower reactants and products generation
by microorganisms during voltammetry and no oxidation peaks is observed during cathodic
sweep after 6 hours of substrate exhaustion. A similar observation has also been noticed in
studies with Geobacter sp. [9, 28, 46] where only an oxidation peak is observed at very slow scan
rates. An explanation is that mediators are oxidized at the anode surface at the same rate than
microorganisms can reduce them, hence producing no reduction peak during slow scan rates
voltammetry. At higher scan rates, oxidized species are produced at the anode surface at higher
rates than microbial metabolism are able to reduce them, reduction reaction thus takes place [9].
100
Figure 5-6: Cyclic voltammograms of MFC3 before and after biofilm damage caused by high
cathodic counter current generation (scan rate of 5 mV s-1
)
In our study we have found that a significant decrease in the scan rate causes an important
increase of the effect of returning back to the oxidation state and some reduction peaks were
always observed (figure 5-6, before damage). This suggests that our MFCs are working with
biofilms possessing a lower catalytic activity than pure Geobacter sp. biofilm. On the other hand,
this behavior may as well be explained by an enhancement of the proton accumulation in the
biofilm influencing the anode behavior: higher scan rates causes a significant increase of the
current generation, leading to a higher proton accumulation in the biofilm which hampers acetate
uptake. Thus, a decrease of anode-reducers activity would as well result in no oxidation peak
apparition during cathodic sweeping.
5.6 Conclusion
The present work showed that multiple electrochemical techniques can be used to evaluate
properly the MFCs performance and limitations with respect to organic load rates, external load
and electrolyte conductivity. Main limitations observed at the anode were caused by the presence
101
of a secondary electrochemical process linked to the electrolyte salts that increases its resistance,
and to the concentration losses most likely caused by acetate uptake hindering because of
enhanced protons production at high current densities. The increase in the electrolyte buffering
capacity accompanied by a better anode design (multiple anodes with lower thickness, superior
flow-through anode) may improve proton diffusion out of biofilm and will decrease the
concentration losses, thus generating higher MFCs current and power densities.
5.7 Acknoledgement
This work was supported by NSERC and NRC Canada (NRC publication no 00000).
5.8 References
[1] Du, Z., Li, H. and Gu, T., A state of the art review on microbial fuel cells: A promising
technology for wastewater treatment and bioenergy. Biotechnology Advances, 2007. 25(5): p.
464-482.
[2] Logan, B.E., Microbial fuel cells. 2008, Hoboken, New Jersey: John Wiley & Sons, Inc. 200.
[3] Rismani-Yazdi, H., Carver, S.M., Christy, A.D. and Tuovinen, O.H., Cathodic limitations in
microbial fuel cells: An overview. Journal of Power Sources, 2008. 180(2): p. 683-694.
[4] Zhao, F., Harnisch, F., Schroder, U., Scholz, F., Bogdanoff, P. and Herrmann, I., Challenges
and Constraints of Using Oxygen Cathodes in Microbial Fuel Cells. Environmental Science &
Technology, 2006. 40(17): p. 5193-5199.
[5] Schroder, U., Anodic electron transfer mechanisms in microbial fuel cells and their energy
efficiency. Physical Chemistry Chemical Physics, 2007. 9(21): p. 2619-2629.
[6] Pham, T.H., Aelterman, P. and Verstraete, W., Bioanode performance in bioelectrochemical
systems: recent improvements and prospects. Trends in Biotechnology, 2009. 27(3): p. 168-178.
[7] Min, B., Román, Ó. and Angelidaki, I., Importance of temperature and anodic medium
composition on microbial fuel cell (MFC) performance. Biotechnology Letters, 2008. 30(7): p.
1213-1218.
102
[8] Nam, J.-Y., Kim, H.-W., Lim, K.-H., Shin, H.-S. and Logan, B.E., Variation of power
generation at different buffer types and conductivities in single chamber microbial fuel cells.
Biosensors and Bioelectronics, 2010. 25(5): p. 1155-1159.
[9] Richter, H., Nevin, K.P., Jia, H., Lowy, D.A., Lovley, D.R. and Tender, L.M., Cyclic
voltammetry of biofilms of wild type and mutant Geobacter sulfurreducens on fuel cell anodes
indicates possible roles of OmcB, OmcZ, type IV pili, and protons in extracellular electron
transfer. Energy & Environmental Science, 2009. 2(5): p. 506-516.
[10] Torres, C., I. , Marcus, A.K. and Rittmann, B., E., Proton transport inside the biofilm limits
electrical current generation by anode-respiring bacteria. Biotechnology and Bioengineering,
2008. 100(5): p. 872-881.
[11] Borole, A., P. , Hamilton, C., Y. , Aaron, D., S. and Tsouris, C., Investigating microbial fuel
cell bioanode performance under different cathode conditions. Biotechnology Progress, 2009.
25(6): p. 1630-1636.
[12] Mohan, S.V., Raghavulu, S.V., Peri, D. and Sarma, P.N., Integrated function of microbial
fuel cell (MFC) as bio-electrochemical treatment system associated with bioelectricity generation
under higher substrate load. Biosensors and Bioelectronics, 2009. 24(7): p. 2021-2027.
[13] Aelterman, P., Versichele, M., Marzorati, M., Boon, N. and Verstraete, W., Loading rate and
external resistance control the electricity generation of microbial fuel cells with different three-
dimensional anodes. Bioresource Technology, 2008. 99(18): p. 8895-902.
[14] Manohar, A.K., Bretschger, O., Nealson, K.H. and Mansfeld, F., The use of electrochemical
impedance spectroscopy (EIS) in the evaluation of the electrochemical properties of a microbial
fuel cell. Bioelectrochemistry, 2008. 72(2): p. 149-154.
[15] He, Z. and Mansfeld, F., Exploring the use of electrochemical impedance spectroscopy (EIS)
in microbial fuel cell studies. Energy & Environmental Science, 2009. 2(2): p. 215-219.
[16] Manohar, A.K., Bretschger, O., Nealson, K.H. and Mansfeld, F., The polarization behavior
of the anode in a microbial fuel cell. Electrochimica Acta, 2008. 53(9): p. 3508-3513.
[17] Logan, B.E., Hamelers, B., Rozendal, R., Schroder, U., Keller, J., Freguia, S., Aelterman, P.,
Verstraete, W. and Rabaey, K., Microbial Fuel Cells: Methodology and Technology. Environ.
Sci. Technol., 2006. 40(17): p. 5181-5192.
103
[18] Clauwaert, P., Aelterman, P., Pham, T., De Schamphelaire, L., Carballa, M., Rabaey, K. and
Verstraete, W., Minimizing losses in bio-electrochemical systems: the road to applications.
Applied Microbiology and Biotechnology, 2008. 79(6): p. 901-913.
[19] Debabov, V., Electricity from microorganisms. Microbiology, 2008. 77(2): p. 123-131.
[20] Manohar, A.K. and Mansfeld, F., The internal resistance of a microbial fuel cell and its
dependence on cell design and operating conditions. Electrochimica Acta, 2009. 54(6): p. 1664-
1670.
[21] Jadhav, G.S. and Ghangrekar, M.M., Performance of microbial fuel cell subjected to
variation in pH, temperature, external load and substrate concentration. Bioresource Technology,
2009. 100(2): p. 717-723.
[22] Gil, G.-C., Chang, I.-S., Kim, B.H., Kim, M., Jang, J.-K., Park, H.S. and Kim, H.J.,
Operational parameters affecting the performance of a mediator-less microbial fuel cell.
Biosensors and Bioelectronics, 2003. 18(4): p. 327-334.
[23] Martin, E., Savadogo, O., Guiot, S.R. and Tartakovsky, B., The influence of operational
conditions on the performance of a microbial fuel cell seeded with mesophilic anaerobic sludge.
Biochemical Engineering Journal, 2010. 51(3): p. 132-139.
[24] Tartakovsky, B. and Guiot, S.R., A Comparison of Air and Hydrogen Peroxide Oxygenated
Microbial Fuel Cell Reactors. Biotechnology Progress, 2006. 22(1): p. 241-246.
[25] Barsoukov, E. and Macdonald, J.R., Impedance Spectroscopy - Theory, Experiment, and
Applications. 2005, Hoboken, New Jersey: John Wiley & Sons, Inc. 595.
[26] Gabrielli, C., Identification of electrochemical processes by frequency response analysis.
1998, Solartron Analytical.
[27] Bard, A.J. and Faulkner, L.R., Electrochemical Methods: Fundamentals and Applications.
2nd ed. 2001, Toronto: John Wiley & Sons, Inc. 833.
[28] Fricke, K., Harnisch, F. and Schroder, U., On the use of cyclic voltammetry for the study of
anodic electron transfer in microbial fuel cells. Energy & Environmental Science, 2008. 1: p.
144-147.
104
[29] Freguia, S., Rabaey, K., Yuan, Z. and Keller, J.r., Electron and Carbon Balances in
Microbial Fuel Cells Reveal Temporary Bacterial Storage Behavior During Electricity
Generation. Environmental Science & Technology, 2007. 41(8): p. 2915-2921.
[30] Fan, Y., Sharbrough, E. and Liu, H., Quantification of the Internal Resistance Distribution of
Microbial Fuel Cells. Environmental Science & Technology, 2008. 42(21): p. 8101-8107.
[31] Ramasamy, R.P., Ren, Z., Mench, M.M. and Regan, J., Microbial Fuel Cells for Wastewater
Treatment. ECS Transactions, 2008. 11(32): p. 115-125.
[32] Ramasamy, R., P., Ren, Z., Mench, M., M. and Regan, J., M. , Impact of initial biofilm
growth on the anode impedance of microbial fuel cells. Biotechnology and Bioengineering, 2008.
101(1): p. 101-108.
[33] Ramasamy, R., P. , Gadhamshetty, V., Nadeau, L., J. and Johnson, G., R. , Impedance
spectroscopy as a tool for non-intrusive detection of extracellular mediators in microbial fuel
cells. Biotechnology and Bioengineering, 2009. 104(5): p. 882-891.
[34] Liang, P., Huang, X., Fan, M.-Z., Cao, X.-X. and Wang, C., Composition and distribution of
internal resistance in three types of microbial fuel cells. Applied Microbiology and
Biotechnology, 2007. 77(3): p. 551-558.
[35] Mudliar, S., Banerjee, S., Vaidya, A. and Devotta, S., Steady state model for evaluation of
external and internal mass transfer effects in an immobilized biofilm. Bioresource Technology,
2008. 99(9): p. 3468-3474.
[36] ter Heijne, A., Hamelers, H.V.M., Saakes, M. and Buisman, C.J.N., Performance of non-
porous graphite and titanium-based anodes in microbial fuel cells. Electrochimica Acta, 2008.
53(18): p. 5697-5703.
[37] Cheng, K.Y., Ho, G. and Cord-Ruwisch, R., Affinity of Microbial Fuel Cell Biofilm for the
Anodic Potential. Environmental Science & Technology, 2008. 42(10): p. 3828-3834.
[38] Lee, H.-S., Torres, C.s.I. and Rittmann, B.E., Effects of Substrate Diffusion and Anode
Potential on Kinetic Parameters for Anode-Respiring Bacteria. Environmental Science &
Technology, 2009. 43(19): p. 7571-7577.
105
[39] Aelterman, P., Freguia, S., Keller, J., Verstraete, W. and Rabaey, K., The anode potential
regulates bacterial activity in microbial fuel cells. Applied Microbiology and Biotechnology,
2008. 78(3): p. 409-418.
[40] Franks, A.E., Nevin, K.P., Jia, H., Izallalen, M., Woodard, T.L. and Lovley, D.R., Novel
strategy for three-dimensional real-time imaging of microbial fuel cell communities: monitoring
the inhibitory effects of proton accumulation within the anode biofilm. Energy & Environmental
Science, 2009. 2(1): p. 113-119.
[41] Torres, C., I. , Marcus, A.K., Lee, H.-S., Parameswaran, P., Krajmalnik-Brown, R. and
Rittmann, B., E. , A kinetic perspective on extracellular electron transfer by anode-respiring
bacteria. FEMS Microbiology Reviews, 2009. 34(1): p. 3-17.
[42] Lovley, D.R., The microbe electric: conversion of organic matter to electricity. Current
Opinion in Biotechnology, 2008. 19(6): p. 564-571.
[43] Ishii, S.i., Watanabe, K., Yabuki, S., Logan, B.E. and Sekiguchi, Y., Comparison of
Electrode Reduction Activities of Geobacter sulfurreducens and an Enriched Consortium in an
Air-Cathode Microbial Fuel Cell. Appl. Environ. Microbiol., 2008. 74(23): p. 7348-7355.
[44] Bond, D.R. and Lovley, D.R., Electricity Production by Geobacter sulfurreducens attached
to Electrodes. Appl. Environ. Microbiol., 2003. 69(3): p. 1548-1555.
[45] Reguera, G., Nevin, K.P., Nicoll, J.S., Covalla, S.F., Woodard, T.L. and Lovley, D.R.,
Biofilm and Nanowire Production Leads to Increased Current in Geobacter sulfurreducens Fuel
Cells. Appl. Environ. Microbiol., 2006. 72(11): p. 7345-7348.
[46] Srikanth, S., Marsili, E., Flickinger, M., C. and Bond, D., R. , Electrochemical
characterization of Geobacter sulfurreducens cells immobilized on graphite paper electrodes.
Biotechnology and Bioengineering, 2008. 99(5): p. 1065-1073.
[47] Liu, Y., Harnisch, F., Fricke, K., Schröder, U., Climent, V. and Feliu, J.M., The study of
electrochemically active microbial biofilms on different carbon-based anode materials in
microbial fuel cells. Biosensors and Bioelectronics, 2010. 25(9): p. 2167-2171.
106
CHAPITRE 6 CATHODE MATERIALS EVALUATION IN MICROBIAL
FUEL CELLS: A COMPARISON OF CARBON, Mn2O3, Fe2O3 AND
PLATINUM MATERIALS
Article soumis à Electrochimica Acta en février 2011
Auteurs : Edith Martin, Boris Tartakovsky et Oumarou Savadogo
6.1 Abstract
In this work the oxygen reduction reaction (ORR) catalytic activity of Fe2O3 and Mn2O3
nanopowders, and carbon black powder were compared and their activity evaluated against that
of a Pt-cathode in an air-cathode microbial fuel cell (MFC) using several electrochemical
techniques. Cathodic total resistances determined by impedance spectroscopy were 9,6, 7,8, 7,6
and 21,6 Ω for Pt, Mn2O3, Fe2O3 and C, respectively. Although the Mn2O3 cathode had the
lowest resistance, the highest power output in polarization tests was observed for Pt, followed by
Mn2O3, Fe2O3 and C. The corresponding volumetric power outputs were 90, 32, 15 and 8 W/m3.
The ORR onset potentials determined using cyclic voltammetry have shown values of 783, 844,
696 and 562 mV vs Ag/AgCl for Pt, Mn2O3, Fe2O3 and C, respectively. Therefore, Mn2O3
exhibited the best ORR potential, whereas Pt exhibited the best volumetric power output. All
MFCs showed a performance decline with time, most likely due to the loss of the catalyst,
catalyst deactivation, or parasitic reactions. The C cathodes showed the most stable behavior. In
all tests, a microbially catalyzed ORR (biocathode) was not observed. The Mn2O3 electrode
appeared to be the most promising non-noble cathode catalyst material, however its high
overpotential (activation loss) should be circumvented in order to increase significantly the power
generation.
Keywords : microbial fuel cell, cathode materials, Mn2O3, C, Fe2O3
6.2 Introduction
Microbial fuel cells provide an alternative method for simultaneous energy production and
wastewater treatment. In a MFC consumption of organic compounds by microorganisms at the
anode is accompanied by electron transfer to the anode and proton release. The protons flow
107
through the electrolyte and the electrons flow through the external circuit to reach the cathode,
where they are used along with protons to accomplish oxygen reduction to water [1, 2].
The oxygen reduction reaction (ORR) is an energetically costly reaction because of a high
overpotential barrier when performed on carbon or graphite electrodes, implying the need for
catalysts like platinum (Pt). In a MFC, Pt can lose a lot of its activity due to side reactions and
other losses [3-8]. Several alternatives have been proposed to replace Pt : manganese oxides [9,
10], polypyrrole (Ppy) [11], iron phthalocyanine (FePc) [12, 13], cobalt and iron-copper
phthalocyanine (CoPc and FeCuPc) [13], cobalt tetramethoxyphenylporphyrin (CoTMPP) [12,
13], iron-cobalt tetramethoxyphenylporphyrin (FeCoTMPP) [13], Fe3+
cathode made with ferric
sulfate [14], high surface area graphite-granules cathodes [8], and activated carbon [15-17].
Although manganese oxides, Ppy, FePc and CoTMPP show slightly less power generation than
Pt, the low cost of these materials makes them a good replacement of Pt. Some carbon/graphite
electrodes also exhibit a good performance as cathode materials, which also make them suitable
alternatives as they are inexpensive in comparison to other noble and non-noble materials.
Various cathode-oxidizing microorganisms are known to be capable of electron transfer from
cathodes to either nitrate (denitrification) [18, 19] or chromium (Cr4+
) [20, 21]. Oxygen and
protons are other potential electron acceptors and a wide variety of microorganisms have
demonstrated their ability to use it [22]. However the effect of microorganisms on the oxygen
reduction reaction (ORR) requires further clarification [23], although cytochromes, hydrogenase
enzymes and mediators are assumed to participate in this reaction [24]. Cathodic biofilms were
observed to catalyze the ORR [25]. Mn4+
and Fe3+
reduction is an important part of biocathodic
activity [2, 23]. Mn4+
reduction and Mn2+
oxidation is accomplished through several steps. The
first step is the abiotic MnO2 reduction to MnOOH by accepting one electron followed by the
reduction of MnOOH to Mn2+
in solution by accepting a second electron. Mn2+
is then oxidized
into MnO2 by microorganisms that release two electrons to oxygen. Fe3+
reduction and Fe2+
oxidation is thought to work in a similar way as biological manganese transformation [20, 23].
Mn2+
and Fe2+
oxidation is a rate-limiting process [26, 27], however it could be accelerated due to
microbial activity. Also, the materials used in this case may exhibit oxygen reduction to produce
water using reactions similar to those with Pt catalyst [8, 28]. This work is aimed at studying
cathode materials (e.g. C, Mn2O3 and Fe2O3) suitable for MFC applications.
108
6.3 Materials and methods
6.3.1 Cathode preparation
Catalysts based on Pt, Mn2O3 and Fe2O3 were supported using carbon powder. Pt nanoparticles
supported on carbon (EC-20-PTC) were purchased from ElectroChem, Inc, Woburn, MA, USA.
Mn2O3 and Fe2O3 nanopowders with purity of 98,5 and >98% respectively were obtained from
Nanostructured & Amorphous Materials, Inc., Houston, TX, USA and the Vulcan XC-72 carbon
black powder was from Cabot Corporation, Boston, MA, USA. The Mn2O3 and Fe2O3 structures
have been confirmed by X-ray diffraction (XRD) and thermogravimetric (TGA) analyses. The
carbon-supported Pt catalyst had a nominal Pt loading of 20 wt%. Manganese and iron oxide
nanopowders had respective average particles sizes of 30-60 and 20-50nm and were both
separately mixed with Vulcan powder to obtain an individual ratio of 20 wt% Mn2O3 and Fe2O3.
The catalyst inks were prepared from Pt/C, pure Vulcan carbon powder, Mn2O3/C or Fe2O3/C
powders and mixed with a Nafion® NR 005 solution (DuPont, Wilmington, DE, USA) to obtain
loadings of 1 mg cm-2
with a catalyst : Nafion (dry weight) ratio of 65:35 wt%. Mixtures were
sonicated (B5500-A-MTH, VWR, West Chester, PA, USA) for one hour prior to their brush
painting on 11 x 6 cm2 , 175 µm-thick carbon fiber papers treated with a PTFE hydrophobic
coating (AvCarbTM
P50T, Fuel Cell Store, San Diego, CA, USA). Cathodes were then air dried.
At least 2 samples of 1 cm2 were also made for each catalyst type in order to make half-cell
electrochemical experiments.
6.3.2 MFC design and operation
A schematic diagram of the MFCs used for cathode testing is shown in Fig. 6-1. The anodes were
made of 5 x 10 cm2, 5 mm-thick carbon felt (Speer Canada, Kitchener, ON, Canada). The
electrodes were separated with J-cloth® providing a spacing of approximately 1 mm. The anode
and cathode were connected through an external load (Rext). A data acquisition card (LabJack
U12, LabJack Corporation, Colorado, USA) was used to record MFC voltage. More details of
MFC design and operation can be found elsewhere [29].
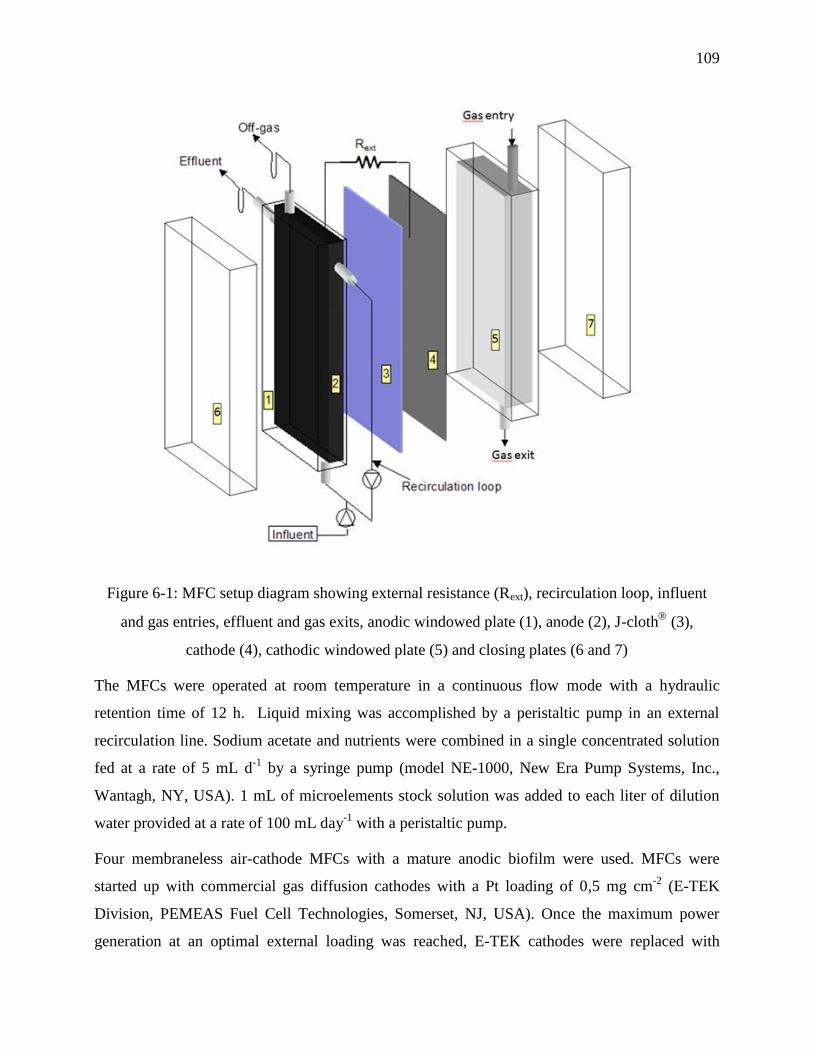
109
Figure 6-1: MFC setup diagram showing external resistance (Rext), recirculation loop, influent
and gas entries, effluent and gas exits, anodic windowed plate (1), anode (2), J-cloth
(3),
cathode (4), cathodic windowed plate (5) and closing plates (6 and 7)
The MFCs were operated at room temperature in a continuous flow mode with a hydraulic
retention time of 12 h. Liquid mixing was accomplished by a peristaltic pump in an external
recirculation line. Sodium acetate and nutrients were combined in a single concentrated solution
fed at a rate of 5 mL d-1
by a syringe pump (model NE-1000, New Era Pump Systems, Inc.,
Wantagh, NY, USA). 1 mL of microelements stock solution was added to each liter of dilution
water provided at a rate of 100 mL day-1
with a peristaltic pump.
Four membraneless air-cathode MFCs with a mature anodic biofilm were used. MFCs were
started up with commercial gas diffusion cathodes with a Pt loading of 0,5 mg cm-2
(E-TEK
Division, PEMEAS Fuel Cell Technologies, Somerset, NJ, USA). Once the maximum power
generation at an optimal external loading was reached, E-TEK cathodes were replaced with
110
laboratory-made cathodes and the MFCs were operated for two weeks to one month. Testing has
been done in triplicate for each material type. In some tests the cathodic chamber was saturated
with pure nitrogen for 24 hours and then with pure oxygen for 48 hours after MFC operation
under the atmosphere of air.
6.3.3 Inoculum and media composition
The MFCs were inoculated with the effluent of another working MFC previously inoculated with
homogenized anaerobic mesophilic sludge (VSS = 50 g L-1
, A. Lassonde Inc., Rougemont,
Quebec, Canada). The stock solution of microelements contained (in g L-1
): FeCl24H2O (2),
H3BO3 (0,05), ZnCl2 (0,05), CuCl2 (0,03), MnCl24H2O (0,5), (NH4)6Mo7O244H2O (0,05), AlCl3
(0,05), CoCl26H2O (0,05), NiCl2 (0,05), EDTA (0,5) and HCl (1µL). The feed stock solution
contained (in g L-1
): yeast extract (0,83), NH4Cl (18,68), KCl (148,09), K2HPO4 (64,04), KH2PO4
(40,69), and anhydrous sodium acetate (54,67).
6.3.4 Electrochemical measurements
The electrochemical impedance spectroscopy (EIS) tests were performed with a frequency
response analyzer (FRA) (Model 1260A, Solartron Analytical, Hampshire, UK) connected to a
potentiostat (Solartron 1470, Solartron Analytical, Hampshire, UK). ZPlot and ZView software
(Solartron Analytical, Hampshire, UK) were used as potentiostat and FRA controller and for data
analysis respectively. EIS experiments were carried out in a three-electrode mode, the cathode as
the working electrode, the anode as the counter electrode and a 1 molar Ag/AgCl electrode (222
mV vs NHE) as the reference. The measurements were performed at cathode working potentials
while MFCs were operated at a constant Rext in order to study the cathode behavior during MFC
operation. EIS tests were performed at an AC signal of 5 mV of amplitude, at 37 logarithmic
frequency steps between 100 kHz and 5 mHz (duration of approximately 30 minutes).
The acquired EIS spectra of cathodes showed a three-time-constant model (three semi-circles).
The low-frequency semi-circle is attributed to a cathodic charge transfer (ct) while the high-
frequency semi-circles may be attributed to other various causes related to the electrolyte
composition, or diffusion of the oxygen or protons in the electrolyte, or diffusion through a
biofilm (oth 1 and 2). Hence, the electrical equivalent circuit presented in figure 6-2 was used to
fit the data. Here, RS is the solution resistance, Roth
is the resistances of further redox processes
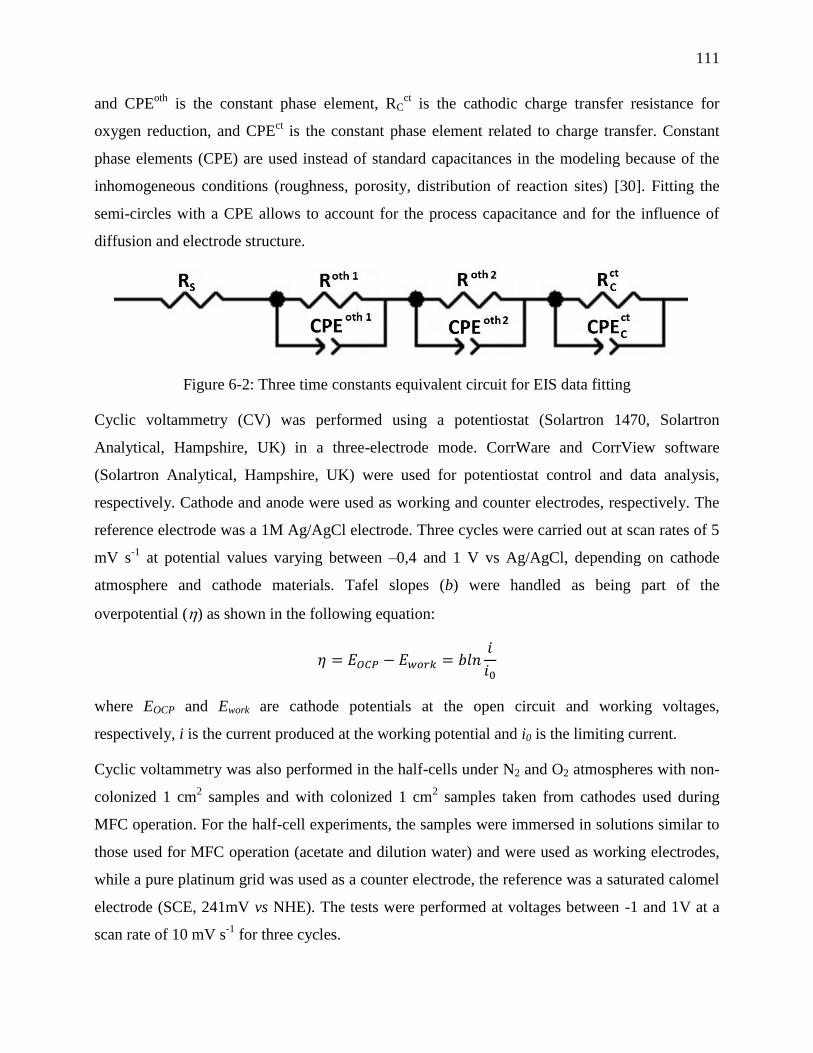
111
and CPEoth
is the constant phase element, RCct is the cathodic charge transfer resistance for
oxygen reduction, and CPEct is the constant phase element related to charge transfer. Constant
phase elements (CPE) are used instead of standard capacitances in the modeling because of the
inhomogeneous conditions (roughness, porosity, distribution of reaction sites) [30]. Fitting the
semi-circles with a CPE allows to account for the process capacitance and for the influence of
diffusion and electrode structure.
Figure 6-2: Three time constants equivalent circuit for EIS data fitting
Cyclic voltammetry (CV) was performed using a potentiostat (Solartron 1470, Solartron
Analytical, Hampshire, UK) in a three-electrode mode. CorrWare and CorrView software
(Solartron Analytical, Hampshire, UK) were used for potentiostat control and data analysis,
respectively. Cathode and anode were used as working and counter electrodes, respectively. The
reference electrode was a 1M Ag/AgCl electrode. Three cycles were carried out at scan rates of 5
mV s-1
at potential values varying between –0,4 and 1 V vs Ag/AgCl, depending on cathode
atmosphere and cathode materials. Tafel slopes (b) were handled as being part of the
overpotential () as shown in the following equation:
where EOCP and Ework are cathode potentials at the open circuit and working voltages,
respectively, i is the current produced at the working potential and i0 is the limiting current.
Cyclic voltammetry was also performed in the half-cells under N2 and O2 atmospheres with non-
colonized 1 cm2 samples and with colonized 1 cm
2 samples taken from cathodes used during
MFC operation. For the half-cell experiments, the samples were immersed in solutions similar to
those used for MFC operation (acetate and dilution water) and were used as working electrodes,
while a pure platinum grid was used as a counter electrode, the reference was a saturated calomel
electrode (SCE, 241mV vs NHE). The tests were performed at voltages between -1 and 1V at a
scan rate of 10 mV s-1
for three cycles.
112
Linear polarization and power curves were acquired with a potentiostat (Solartron 1470,
Solartron Analytical, Hampshire, UK) controlling the cell voltage (EMFC) while measuring the
generated current (I), from open circuit voltage (OCV) to short circuit at a scan rate of 0,5mV/s.
The anode was employed as the working electrode while the cathode was used as the counter and
reference electrode. Anode and cathode potentials were measured against 1M Ag/AgCl
references via a data acquisition card (LabJack U12, LabJack Corporation, Colorado, USA).
Power (P) was calculated as P = EMFC * I. MFC voltage and power were plotted against current,
to evaluate the MFC internal resistance (Rint) as the slope of the linear part of the polarization
curve (EMFC vs I), and the maximum power output (Pmax) in the power curve. Anode and cathode
potentials were also plotted against the current, which allowed for estimating anode and cathode
resistances (RA and RC respectively) from the linear part of corresponding curves.
The cyclic voltammetry and polarization tests were periodically performed starting from the first
day of cathode installation in MFCs to evaluate the cathode performance. Except for the first day
of each test, the order of the electrochemical tests was as follows: EIS measurements at a
working cathodic potential (Vapp) was followed by voltage monitoring at open-circuit for one
hour before carrying out cyclic voltammetry. The MFCs were then left in open-circuit again for
one hour before performing the linear polarization test. The half-cell testing sequence consisted
of: 1) solution flushing with N2 for one hour at an open circuit potential (OCP); 2) performing
100 activation cycles at a scan rate of 100 mV s-1
prior to carrying out cyclic voltammetry tests;
and 3) O2 flushing for 2 hours at OCP before repeating the CV tests.
6.3.5 Analytical methods and calculations
The acetic acid concentration in the effluent was measured by gas chromatography (GC) using an
Agilent 6890 (Wilmington, DE) with a detection limit of 0,2 mg L-1
. Manganese and iron
concentrations have been determined in MFC effluent and in half-cell test solutions by atomic
absorption spectroscopy (AAnalyst 200, Perkin-Elmer, Waltham, MA, USA).
The apparent Coulombic efficiency (CEA) calculation can be seen in a previous work [29]. The
degradation efficiency was evaluated by calculating the chemical oxygen demand (COD)
removal with the following formula:
113
%100)(
)()((%)
stockin
outoutstockin
in
outin
CF
CFCF
M
MM
where Fin and Fout are respectively the stock solution and the effluent flow rates (L s-1
), and Cstock
and Cout are the acetate concentration in stock solution and acetate concentration in effluent,
respectively (g L-1
).
The efficiency of cathodes under ambient air and saturated O2 atmospheres
(
) was evaluated by measuring maximum power generation at each atmosphere and
comparing these values with platinum performance in air ( ) one day after cathode
installation. The following equation was used:
6.4 Results
Table 6.1 shows parameters obtained from electrochemical tests (EIS, CV and polarization tests)
for all tested cathode materials and under different cathode atmospheres (air and O2). Cathode
performance is reported after approximately 1 and 10 days of electrode installation in the MFC.
After installing new C, Fe2O3, Mn2O3 and Pt cathodes, a slight decrease in overall MFC
performance was observed (Pmax and ORR decrease, and Rint, RC augmentation). Since MFCs
under nitrogen cathodic atmosphere showed negligible current (parasitic current), these results
are not shown. When results of EIS measurements were used to estimate charge transfer (RCct)
and total (RCtotal
) resistances of different cathode materials, it was noted that after 10 days of
cathode operation carbon exhibits the highest resistance (21,6 Ω), while other materials show
lower resistances between 7,6 to 9,6 Ω. Pt has a higher resistance than the oxides tested. Also,
impedance tests demonstrate the positive effect of O2 on cathode resistance. When N2 is
introduced in the cathode chamber, the cathode resistance increases significantly. From figure 6-
3, we note a solution resistance varying between 1,5 and 2 Ω (where EIS spectra intersect with
the abscissa in a high-frequency region). Further side processes account for approximately 0,6 to
1 Ω in the total cathodic resistance.
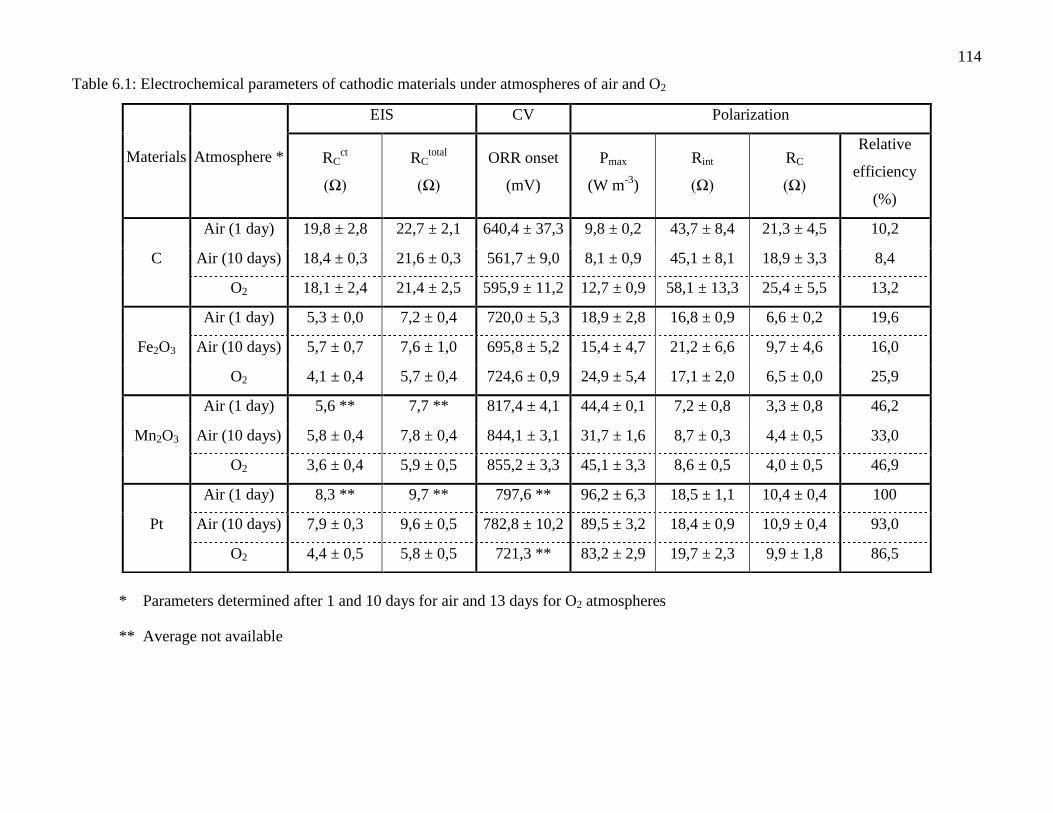
114
Table 6.1: Electrochemical parameters of cathodic materials under atmospheres of air and O2
* Parameters determined after 1 and 10 days for air and 13 days for O2 atmospheres
** Average not available
Materials Atmosphere *
EIS CV Polarization
RCct
(Ω)
RCtotal
(Ω)
ORR onset
(mV)
Pmax
(W m-3
)
Rint
(Ω)
RC
(Ω)
Relative
efficiency
(%)
C
Air (1 day) 19,8 ± 2,8 22,7 ± 2,1 640,4 ± 37,3 9,8 ± 0,2 43,7 ± 8,4 21,3 ± 4,5 10,2
Air (10 days) 18,4 ± 0,3 21,6 ± 0,3 561,7 ± 9,0 8,1 ± 0,9 45,1 ± 8,1 18,9 ± 3,3 8,4
O2 18,1 ± 2,4 21,4 ± 2,5 595,9 ± 11,2 12,7 ± 0,9 58,1 ± 13,3 25,4 ± 5,5 13,2
Fe2O3
Air (1 day) 5,3 ± 0,0 7,2 ± 0,4 720,0 ± 5,3 18,9 ± 2,8 16,8 ± 0,9 6,6 ± 0,2 19,6
Air (10 days) 5,7 ± 0,7 7,6 ± 1,0 695,8 ± 5,2 15,4 ± 4,7 21,2 ± 6,6 9,7 ± 4,6 16,0
O2 4,1 ± 0,4 5,7 ± 0,4 724,6 ± 0,9 24,9 ± 5,4 17,1 ± 2,0 6,5 ± 0,0 25,9
Mn2O3
Air (1 day) 5,6 ** 7,7 ** 817,4 ± 4,1 44,4 ± 0,1 7,2 ± 0,8 3,3 ± 0,8 46,2
Air (10 days) 5,8 ± 0,4 7,8 ± 0,4 844,1 ± 3,1 31,7 ± 1,6 8,7 ± 0,3 4,4 ± 0,5 33,0
O2 3,6 ± 0,4 5,9 ± 0,5 855,2 ± 3,3 45,1 ± 3,3 8,6 ± 0,5 4,0 ± 0,5 46,9
Pt
Air (1 day) 8,3 ** 9,7 ** 797,6 ** 96,2 ± 6,3 18,5 ± 1,1 10,4 ± 0,4 100
Air (10 days) 7,9 ± 0,3 9,6 ± 0,5 782,8 ± 10,2 89,5 ± 3,2 18,4 ± 0,9 10,9 ± 0,4 93,0
O2 4,4 ± 0,5 5,8 ± 0,5 721,3 ** 83,2 ± 2,9 19,7 ± 2,3 9,9 ± 1,8 86,5
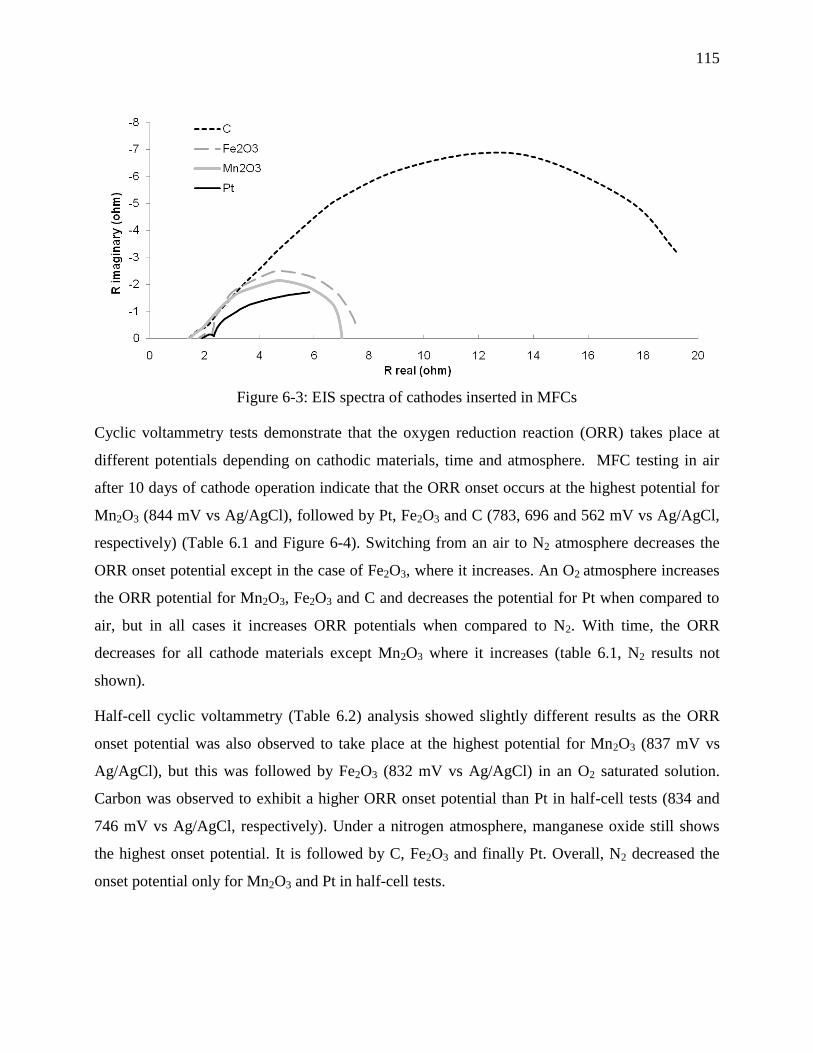
115
Figure 6-3: EIS spectra of cathodes inserted in MFCs
Cyclic voltammetry tests demonstrate that the oxygen reduction reaction (ORR) takes place at
different potentials depending on cathodic materials, time and atmosphere. MFC testing in air
after 10 days of cathode operation indicate that the ORR onset occurs at the highest potential for
Mn2O3 (844 mV vs Ag/AgCl), followed by Pt, Fe2O3 and C (783, 696 and 562 mV vs Ag/AgCl,
respectively) (Table 6.1 and Figure 6-4). Switching from an air to N2 atmosphere decreases the
ORR onset potential except in the case of Fe2O3, where it increases. An O2 atmosphere increases
the ORR potential for Mn2O3, Fe2O3 and C and decreases the potential for Pt when compared to
air, but in all cases it increases ORR potentials when compared to N2. With time, the ORR
decreases for all cathode materials except Mn2O3 where it increases (table 6.1, N2 results not
shown).
Half-cell cyclic voltammetry (Table 6.2) analysis showed slightly different results as the ORR
onset potential was also observed to take place at the highest potential for Mn2O3 (837 mV vs
Ag/AgCl), but this was followed by Fe2O3 (832 mV vs Ag/AgCl) in an O2 saturated solution.
Carbon was observed to exhibit a higher ORR onset potential than Pt in half-cell tests (834 and
746 mV vs Ag/AgCl, respectively). Under a nitrogen atmosphere, manganese oxide still shows
the highest onset potential. It is followed by C, Fe2O3 and finally Pt. Overall, N2 decreased the
onset potential only for Mn2O3 and Pt in half-cell tests.
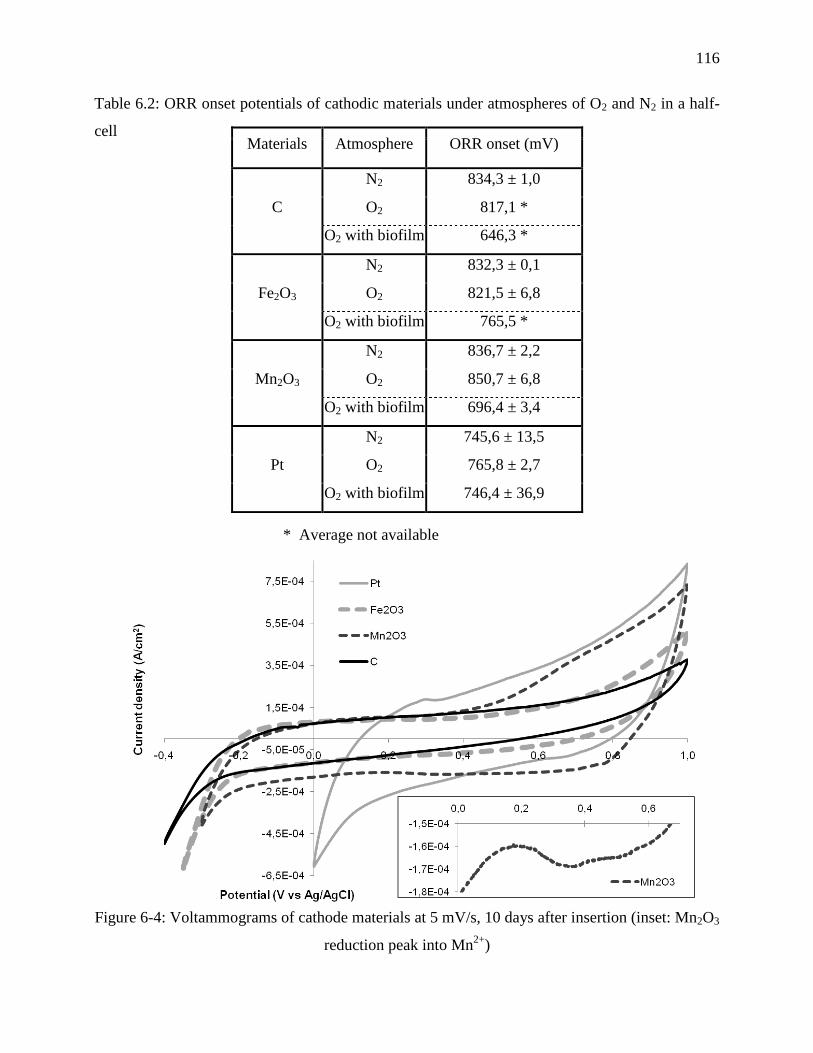
116
Table 6.2: ORR onset potentials of cathodic materials under atmospheres of O2 and N2 in a half-
cell
* Average not available
Figure 6-4: Voltammograms of cathode materials at 5 mV/s, 10 days after insertion (inset: Mn2O3
reduction peak into Mn2+
)
Materials Atmosphere ORR onset (mV)
C
N2 834,3 ± 1,0
O2 817,1 *
O2 with biofilm 646,3 *
Fe2O3
N2 832,3 ± 0,1
O2 821,5 ± 6,8
O2 with biofilm 765,5 *
Mn2O3
N2 836,7 ± 2,2
O2 850,7 ± 6,8
O2 with biofilm 696,4 ± 3,4
Pt
N2 745,6 ± 13,5
O2 765,8 ± 2,7
O2 with biofilm 746,4 ± 36,9
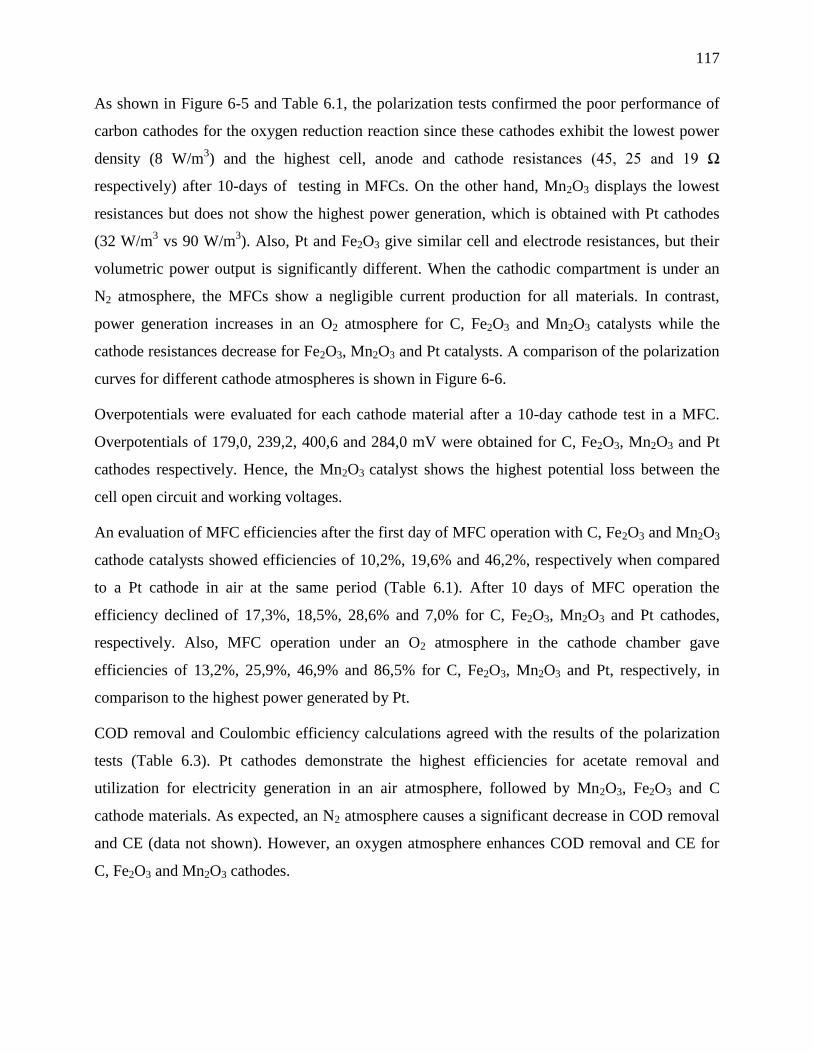
117
As shown in Figure 6-5 and Table 6.1, the polarization tests confirmed the poor performance of
carbon cathodes for the oxygen reduction reaction since these cathodes exhibit the lowest power
density (8 W/m3) and the highest cell, anode and cathode resistances (45, 25 and 19 Ω
respectively) after 10-days of testing in MFCs. On the other hand, Mn2O3 displays the lowest
resistances but does not show the highest power generation, which is obtained with Pt cathodes
(32 W/m3 vs 90 W/m
3). Also, Pt and Fe2O3 give similar cell and electrode resistances, but their
volumetric power output is significantly different. When the cathodic compartment is under an
N2 atmosphere, the MFCs show a negligible current production for all materials. In contrast,
power generation increases in an O2 atmosphere for C, Fe2O3 and Mn2O3 catalysts while the
cathode resistances decrease for Fe2O3, Mn2O3 and Pt catalysts. A comparison of the polarization
curves for different cathode atmospheres is shown in Figure 6-6.
Overpotentials were evaluated for each cathode material after a 10-day cathode test in a MFC.
Overpotentials of 179,0, 239,2, 400,6 and 284,0 mV were obtained for C, Fe2O3, Mn2O3 and Pt
cathodes respectively. Hence, the Mn2O3 catalyst shows the highest potential loss between the
cell open circuit and working voltages.
An evaluation of MFC efficiencies after the first day of MFC operation with C, Fe2O3 and Mn2O3
cathode catalysts showed efficiencies of 10,2%, 19,6% and 46,2%, respectively when compared
to a Pt cathode in air at the same period (Table 6.1). After 10 days of MFC operation the
efficiency declined of 17,3%, 18,5%, 28,6% and 7,0% for C, Fe2O3, Mn2O3 and Pt cathodes,
respectively. Also, MFC operation under an O2 atmosphere in the cathode chamber gave
efficiencies of 13,2%, 25,9%, 46,9% and 86,5% for C, Fe2O3, Mn2O3 and Pt, respectively, in
comparison to the highest power generated by Pt.
COD removal and Coulombic efficiency calculations agreed with the results of the polarization
tests (Table 6.3). Pt cathodes demonstrate the highest efficiencies for acetate removal and
utilization for electricity generation in an air atmosphere, followed by Mn2O3, Fe2O3 and C
cathode materials. As expected, an N2 atmosphere causes a significant decrease in COD removal
and CE (data not shown). However, an oxygen atmosphere enhances COD removal and CE for
C, Fe2O3 and Mn2O3 cathodes.
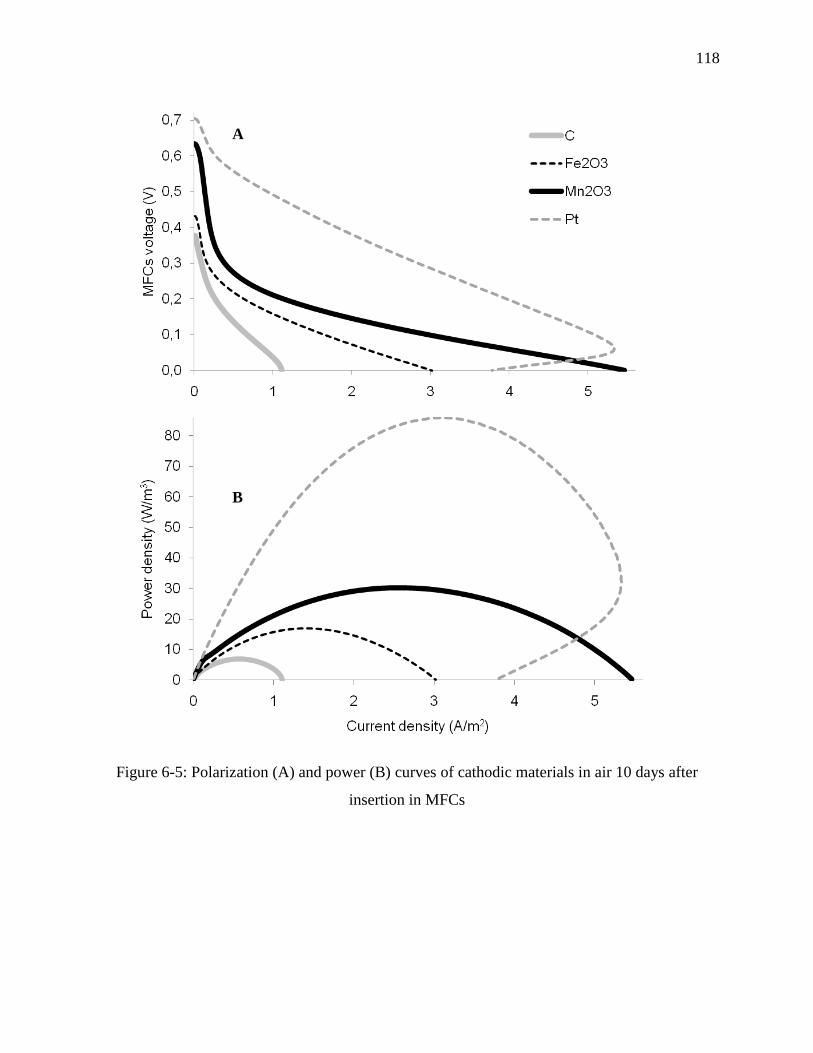
118
Figure 6-5: Polarization (A) and power (B) curves of cathodic materials in air 10 days after
insertion in MFCs
A
B
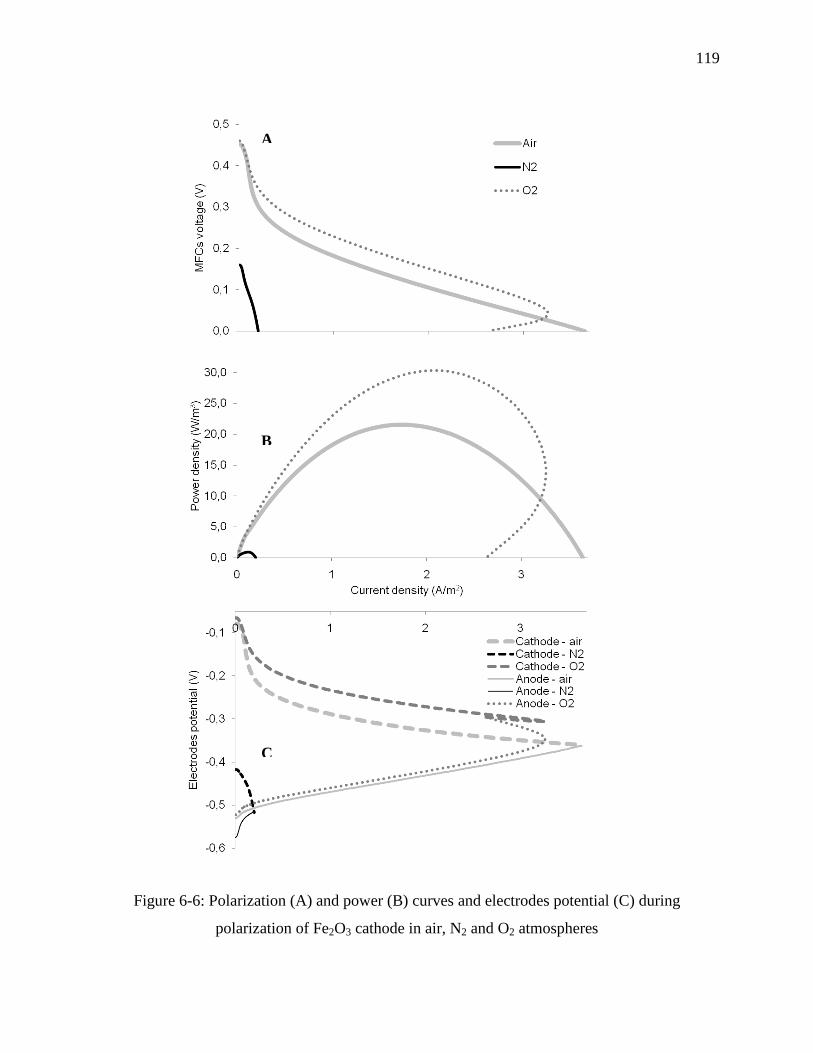
119
Figure 6-6: Polarization (A) and power (B) curves and electrodes potential (C) during
polarization of Fe2O3 cathode in air, N2 and O2 atmospheres
A
B
C
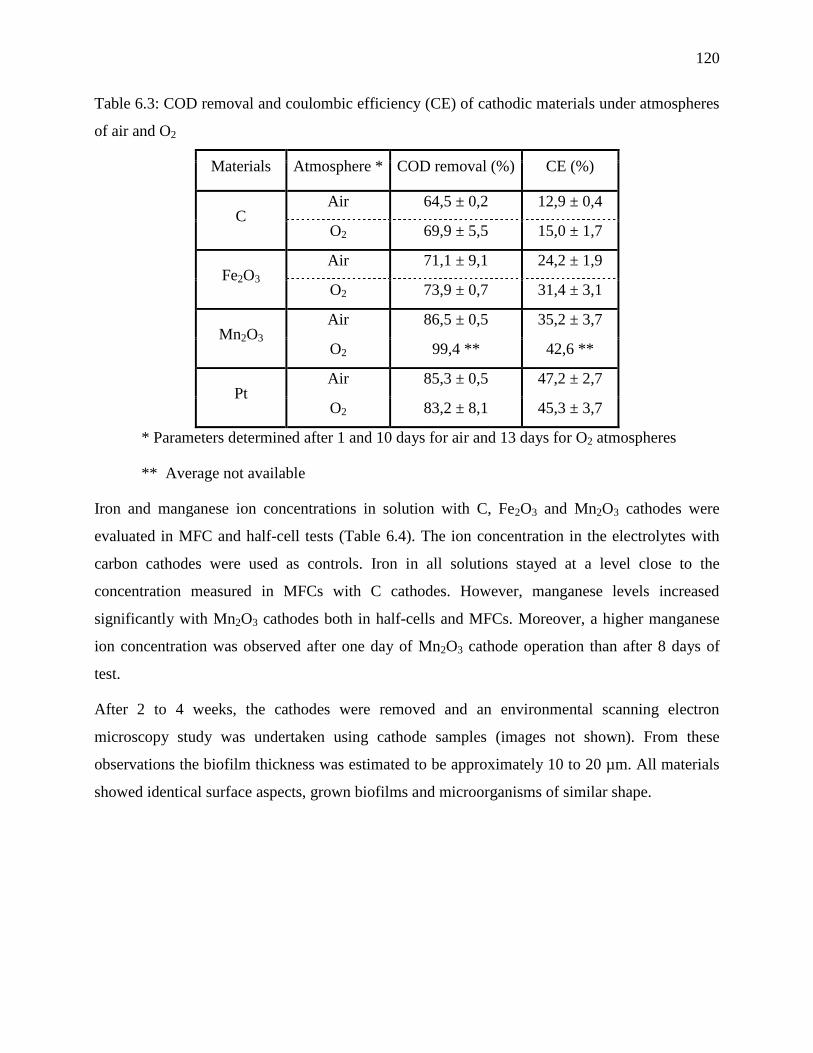
120
Table 6.3: COD removal and coulombic efficiency (CE) of cathodic materials under atmospheres
of air and O2
Materials Atmosphere * COD removal (%) CE (%)
C Air 64,5 ± 0,2 12,9 ± 0,4
O2 69,9 ± 5,5 15,0 ± 1,7
Fe2O3
Air 71,1 ± 9,1 24,2 ± 1,9
O2 73,9 ± 0,7 31,4 ± 3,1
Mn2O3 Air 86,5 ± 0,5 35,2 ± 3,7
O2 99,4 ** 42,6 **
Pt Air 85,3 ± 0,5 47,2 ± 2,7
O2 83,2 ± 8,1 45,3 ± 3,7
* Parameters determined after 1 and 10 days for air and 13 days for O2 atmospheres
** Average not available
Iron and manganese ion concentrations in solution with C, Fe2O3 and Mn2O3 cathodes were
evaluated in MFC and half-cell tests (Table 6.4). The ion concentration in the electrolytes with
carbon cathodes were used as controls. Iron in all solutions stayed at a level close to the
concentration measured in MFCs with C cathodes. However, manganese levels increased
significantly with Mn2O3 cathodes both in half-cells and MFCs. Moreover, a higher manganese
ion concentration was observed after one day of Mn2O3 cathode operation than after 8 days of
test.
After 2 to 4 weeks, the cathodes were removed and an environmental scanning electron
microscopy study was undertaken using cathode samples (images not shown). From these
observations the biofilm thickness was estimated to be approximately 10 to 20 µm. All materials
showed identical surface aspects, grown biofilms and microorganisms of similar shape.
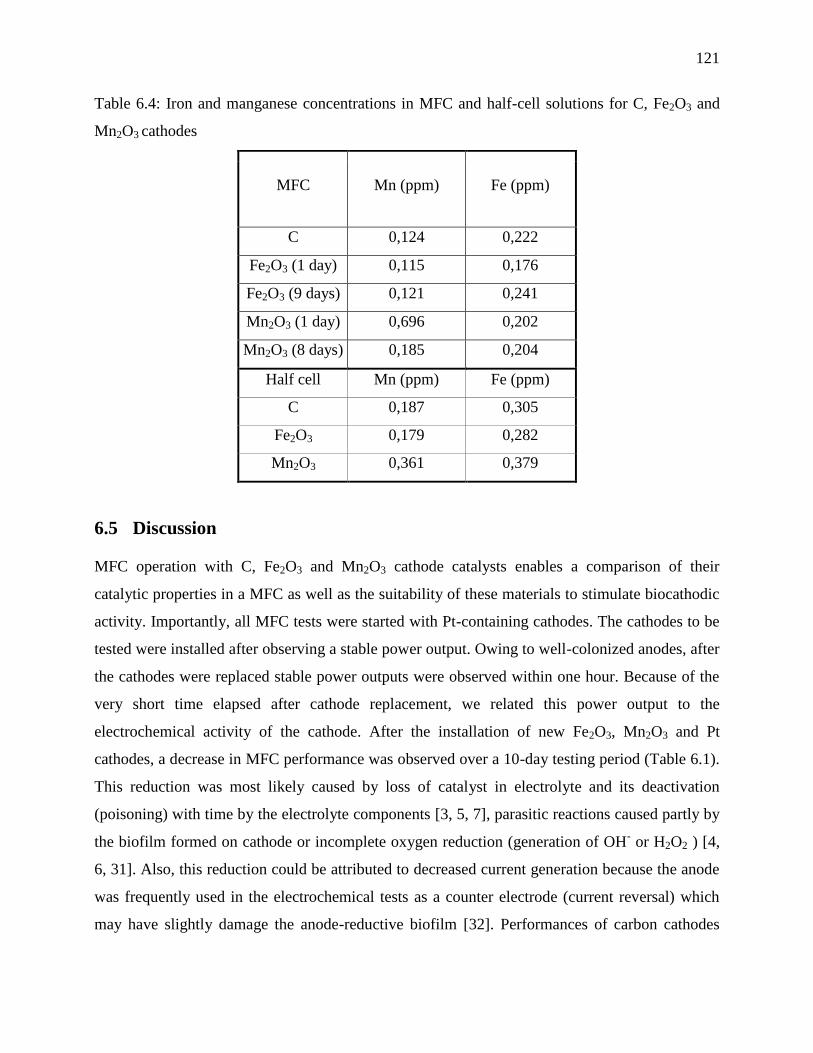
121
Table 6.4: Iron and manganese concentrations in MFC and half-cell solutions for C, Fe2O3 and
Mn2O3 cathodes
6.5 Discussion
MFC operation with C, Fe2O3 and Mn2O3 cathode catalysts enables a comparison of their
catalytic properties in a MFC as well as the suitability of these materials to stimulate biocathodic
activity. Importantly, all MFC tests were started with Pt-containing cathodes. The cathodes to be
tested were installed after observing a stable power output. Owing to well-colonized anodes, after
the cathodes were replaced stable power outputs were observed within one hour. Because of the
very short time elapsed after cathode replacement, we related this power output to the
electrochemical activity of the cathode. After the installation of new Fe2O3, Mn2O3 and Pt
cathodes, a decrease in MFC performance was observed over a 10-day testing period (Table 6.1).
This reduction was most likely caused by loss of catalyst in electrolyte and its deactivation
(poisoning) with time by the electrolyte components [3, 5, 7], parasitic reactions caused partly by
the biofilm formed on cathode or incomplete oxygen reduction (generation of OH- or H2O2 ) [4,
6, 31]. Also, this reduction could be attributed to decreased current generation because the anode
was frequently used in the electrochemical tests as a counter electrode (current reversal) which
may have slightly damage the anode-reductive biofilm [32]. Performances of carbon cathodes
MFC Mn (ppm) Fe (ppm)
C 0,124 0,222
Fe2O3 (1 day) 0,115 0,176
Fe2O3 (9 days) 0,121 0,241
Mn2O3 (1 day) 0,696 0,202
Mn2O3 (8 days) 0,185 0,204
Half cell Mn (ppm) Fe (ppm)
C 0,187 0,305
Fe2O3 0,179 0,282
Mn2O3 0,361 0,379
122
were the most stable over the testing period since no catalyst can leach or be poisoned and the
current generated by this material is not high enough to damage the anodic biofilm when the
anode is used as a counter electrode.
The development of biocatalytic activity was anticipated at least on C cathodes [33-35], however
their performance did not increase with time, which should happen with the growth of an active
cathodic biofilm. Therefore, it was concluded that carbon only showed standard electrochemical
behavior with a high cathodic overpotential for ORR. Other tested materials worked as
electrochemical catalysts since their performance declined significantly with time. These
conclusions are supported by cyclic voltammograms (Figure 6-4) showing that the ORR starts at
105, -235, -225 and -255 mV vs Ag/AgCl for Pt, Mn2O3, Fe2O3 and C, respectively. These values
correspond to the cathodic working potentials measured during MFC operation, assuming that the
oxygen reduction reaction takes place at the material surface in all cases. Moreover, a change in
activation losses has not been observed during the testing period on each material, indicating that
it might not have been any increase in the active bacterial population at the cathode and/or no
improvement of the cathodic reaction. Although biofilm formation at the cathode surface was
visually observed and confirmed by scanning microscopy, a significant increase in the cathodic
activity was not observed with time. This suggests that biofilm formation alone at the cathode is
not a sufficient condition for observing biocathodic activity, but that the proliferation of
electrochemically active population is required.
EIS measurements (Table 6.1) showed that the resistances related to the electrolyte and
secondary reactions accounted for a maximum of 3 Ω, which may be slightly influenced by a
minor solution composition change and a reference electrode displacement between
measurements. Thus approximately 10 to 25 % of total cathodic resistance is a source of power
loss related to solution resistance and other processes on cathode materials. From the shapes of
the EIS spectra shown in Figure 6-3, we can assume that the Pt-cathode behavior can be mostly
attributed to a limited diffusion process since its charge transfer reaction is a more flattened semi-
circle than those of the other tested cathodes. This conclusion is supported by a CPE parameter
fitting and by the decrease of the charge transfer resistance (RCct) in the presence of the saturated
O2 atmosphere and the increase of the diffusion limitations that still appear on the EIS spectra.
123
The Mn2O3 cyclic voltammograms (Fig. 6-4 insert) show reduction peaks occurring at potentials
between 0,25 and 0,55 V vs Ag/AgCl, which most likely corresponds to Mn2+
release into
solution [23, 27, 36]. This reduction peak is more pronounced at the beginning of cathode
operation and then it decreases considerably. These results are supported by atomic absorption
analysis (Table 6.4), indicating a high manganese ion release in solution. This phenomenon was
not observed for Fe2O3 or other materials. Since this reduction takes place at a potential much
higher than the cathode working potential for Mn2O3, we believe that during normal MFC
operation, a significant amount of Mn2+
ions would not be released, a release that would stimulate
the development and the activity of an ORR active cathodic biofilm. However, a cathodic
reaction improvement was not observed in our MFCs with high Mn2+
release during
voltammetry, even in a MFC that was operated for more than three months (results not shown).
The cathodic activity not improving over time is consistent with a previous study, where an
improvement of biocathode power generation with manganese oxide deposition onto the cathode
was not observed, although an increase of active cathodic biofilm formation was noticed [37].
From half-cell tests with 1 cm2 non-colonized and colonized cathode samples, a negative effect of
the biofilm on the ORR potentials was observed in all cases. The electrodes ORR onset potential
decreased in the presence of bacteria. The ORR onset potentials also decreased over time (14
days to one month) in MFCs, confirming the negative impact of biofilm on ORR. The biofilm
observed on the cathodes surface was expected to be ORR active. We may assume the negative
effect of the biofilm formed on the cathode’s catalyst (ex.: catalyst poisoning) or by parasitic
activity. We did not observe a significant electrode resistance change during the early stages of
biofilm growth (14 days to one month), despite observing a decreasing ORR onset potential and
catalytic activity. This observation thus differs from the results obtained by Yang et al [38],
where electrode resistance was observed to be negatively affected by the cathodic biofilm.
In general, it is considered that a high OCV (open circuit voltage) is correlated to a good MFC
performance. Platinum and Mn2O3 possess the two highest OCVs, 705 and 634 mV, respectively,
as can be seen from Figure 6-5. However, the power generated by Pt cathodes is almost 3-times
higher than that generated by Mn2O3 and 5 and 11 times higher than the power generated by
Fe2O3 and C cathodes respectively. The OCV is only partially related to the performance of the
MFC. The activity of the oxide can also be related to the availability of the released metallic ions
of the oxide, which may improve the ORR. In the case of Mn2O3, its high cathodic overpotential
124
(400 mV) is most likely the cause of its lower than expected power generation. On the other
hand, iron ions are highly insoluble at a pH higher than 2,5 [6, 36] and Fe2O3 is a particularly
stable oxide, which may explain its poor performance for ORR. It is well-known [6, 8] that
carbon electrodes exhibit a very poor ORR because of its inertia for this reaction, its elevated
overpotential and low activity. This explains the EIS and polarization results in this work that
demonstrate a higher total cathodic resistance for C cathodes when compared to other materials.
From Figure 6-5A, we can note that the activation losses of Pt, Mn2O3, Fe2O3 and C cathodes
decrease their MFC potential of approximately 100, 300, 125 and 150 mV respectively. By
taking the slope of the first linear part of the polarization curves the activation losses of different
materials can be compared. Pt, Mn2O3, Fe2O3 and C cathodes have respective slopes of 96, 271,
183 and 169 Ω. These results illustrate why Mn2O3 shows a high overpotential and low power
output despite exhibiting a relatively high OCP. Platinum is the best catalyst among the four
materials. This is due to the well known excellent electrocatalytic properties of Pt for the ORR
[6].
Carbon cathodes used in this work exhibit a volumetric power generation of 8,1 W/m3, which is
lower than the volumetric power production reached in some other studies [34, 37], where power
densities of 15 and 65 W/m3 were obtained using graphite felt biocathodes. Power densities of
24,7 and 68,4 W/m3 were achieved with biocathodes based on graphite fiber brushes [35, 39].
Differences in power densities can be attributed to the operation conditions, MFC design and
cathode surface area. A higher cathode area will increase power generation [40], while cathode
active thickness in our tests did not exceed 0,1 mm with a surface area of 50 cm2. However, even
lower power outputs were observed in some other studies with a large surface area, between 2,6
and 4,4 W m-3
[8, 33, 41].
Our experimental results in this work also show that MFCs based on Mn2O3 exhibit a power
density of 31,7 W m-3
(imax of 5,5 A m-2
) (figure 6-5). This is the highest performance of a MFC
based on manganese cathodes until now. Few studies have previously been performed with MnO2
cathodes [9, 10] that have indicated power densities of 3,8 W/m3 (imax of 0,1 A/m
2) [10] and 1,3
W/m3 (imax of 1,1 A/m
2) [9]. In our study, an open circuit potential (OCP) of 635 mV was
obtained whereas OCPs of 565 [10] and 715 mV [9] were obtained with MnO2 cathodes. A
systematic comparison of these results is difficult because of the differences in the oxide
125
composition and loading (0,2 mg cm-2
in our study vs 0,8 mg cm-2
in [9] and 8 mg cm-2
in [10]).
Even with this significant difference in oxide loading, our catalyst, which has the lowest oxide
loading, exhibits the highest power density. These differences in performance might also be
attributed to the difference in the electrolyte composition, the contamination of the electrode
surface by the biofilm composition and the MFC design. In particular, such improvements in
MFC design, as the absence of a PEM, the use of air-breezing cathodes, minimal distance
between the electrodes might decrease MFC internal resistance and lead to a higher power
density.
The results we obtained for the first time with Fe2O3 based cathode indicated that their
performance in an MFC is less than those of the Mn2O3 based cathode, but more active than the
carbon cathode (Table 6.1, Figure 6-5).
Replacement of air with pure oxygen in the cathode compartment might have several effects on
MFC performance as high oxygen levels could affect both cathode and anode performance.
Because of O2 diffusion to the anode, the use of pure O2 could inhibit anaerobic electricigenic
microorganisms and provide an alternative electron acceptor thus reducing the current and
decreasing MFC efficiency. On the contrary, the presence of the oxygen at the cathode should
improve the ORR. In particular, it should increase the cathode OCP, and contribute to decreasing
activation loss and/or improve ORR at reactive sites because of increased oxygen availability [6,
35]. This explains the results obtained during the oxygen tests with C, Fe2O3 and Mn2O3 materials
using EIS and polarization tests (Table 6.1) and COD removal and CE (Table 6.3).
Although Pt cathodes have demonstrated the highest catalytic activity for ORR, the COD
removal and the CE are similar if oxygen or air is used as the oxidant (Table 6.3). This constant
performance can be explained by the availability of the electrons coming to the cathode from the
anode. In the case of a classical hydrogen/oxygen PEM fuel cell, the Pt oxygen cathode is
relatively efficient for the ORR because the hydrogen oxidation is very fast at the anode, which
provides sufficient electrons to the cathode for the ORR. The rate of the ORR is 3 to 4 orders of
magnitude smaller than those of the anode reaction. Accordingly, the cathodic reaction limits the
overall performance of the H2/O2 PEM cell. On the contrary, in the MFC the cathode
performance could be higher than the anode performance. This effect is illustrated in figure 6-6C
where the anode potential decreases abruptly under cathodic O2 atmosphere at a higher current
126
density (maximal produced current), a behavior that is not observed when the cathode is exposed
to air. This statement is supported by evaluated anodic overpotentials, where an anodic
overpotential of 150 mV is observed for a Pt-based MFC working on oxygen in the cathodic
compartment, while anodic overpotentials are between 80 and 100 mV for the three other
materials. This is as well supported by the EIS and polarization measurements (Table 6.1), which
indicate that a low cathode resistance and high internal resistance are obtained. Thus both cathode
and anode activity could be rate limiting in a MFC, but limited anode activity is assumed to be
the reason for Pt cathode limitation under O2.
The results presented above show that the Mn2O3 based cathodes might be of interest for
developing MFCs with an inexpensive non-noble cathode catalyst. It should be emphasized that
in this study Mn2O3 cathodes were not optimized and their performance might be further
improved. In particular, the activation losses could be decreased by increasing the catalyst
loading to values similar to those used in previous studies performed with Mn-oxide based
cathodes for MFC applications [9, 26]. Another possibility is the modification of the crystalline
structure that may enhance its catalytic activity for the ORR [28].
6.6 Conclusion
Four different cathode materials, C, Fe2O3 and Mn2O3 and Pt have been tested in this work in
order to evaluate their behavior and suitability as ORR catalysts in MFCs. Based on the results
obtained in this work, the ORR activity in a classical electrochemical cell with the C, Fe2O3 and
Mn2O3 based cathodes is higher than the ORR activity with the same materials in a MFC. Despite
the observation of biofilm formation on the cathode surface, biocathodic activity has not been
proven, at least for the duration of the tests in this study (1-2 months). Therefore, it was
concluded that biocathodes might exhibit significantly lower ORR activity in MFCs and high-
efficiency MFCs might rely on metal catalysts for ORR. Nevertheless, the good performance of
the manganese oxides cathode obtained in this work and elsewhere [9, 10, 42] for the ORR in
MFCs is an indication that inexpensive non-noble cathode catalysts could be successfully
developed.
127
6.7 Acknowledgements
Funding for this study was provided by NSERC and NRC Canada (NRC publication no 00000).
The authors would like to thank Manon Leduc for her technical analyses as well as Huimin Tian
for her experimental assistance.
6.8 References
[1] Logan, B.E., Hamelers, B., Rozendal, R., Schroder, U., Keller, J., Freguia, S., Aelterman, P.,
Verstraete, W. and Rabaey, K., Microbial Fuel Cells: Methodology and Technology. Environ.
Sci. Technol., 2006. 40(17): p. 5181-5192.
[2] Lovley, D.R., The microbe electric: conversion of organic matter to electricity. Current
Opinion in Biotechnology, 2008. 19(6): p. 564-571.
[3] Clauwaert, P., Aelterman, P., Pham, T., De Schamphelaire, L., Carballa, M., Rabaey, K. and
Verstraete, W., Minimizing losses in bio-electrochemical systems: the road to applications.
Applied Microbiology and Biotechnology, 2008. 79(6): p. 901-913.
[4] Harnisch, F., Wirth, S. and Schröder, U., Effects of substrate and metabolite crossover on the
cathodic oxygen reduction reaction in microbial fuel cells: Platinum vs. iron(II) phthalocyanine
based electrodes. Electrochemistry Communications, 2009. 11(11): p. 2253-2256.
[5] Niessen, J., Schröder, U., Rosenbaum, M. and Scholz, F., Fluorinated polyanilines as superior
materials for electrocatalytic anodes in bacterial fuel cells. Electrochemistry communications
2004. 6: p. 5.
[6] Rismani-Yazdi, H., Carver, S.M., Christy, A.D. and Tuovinen, O.H., Cathodic limitations in
microbial fuel cells: An overview. Journal of Power Sources, 2008. 180(2): p. 683-694.
[7] Zhao, F., Harnisch, F., Schroder, U., Scholz, F., Bogdanoff, P. and Herrmann, I., Challenges
and Constraints of Using Oxygen Cathodes in Microbial Fuel Cells. Environmental Science &
Technology, 2006. 40(17): p. 5193-5199.
[8] Tran, H.-T., Ryu, J.-H., Jia, Y.-H., Oh, S.-J., Choi, J.-Y., Park, D.-H. and Ahn, D.-H.,
Continuous bioelectricity production and sustainable wastewater treatment in a microbial fuel cell
constructed with non-catalyzed granular graphite electrodes and permeable membrane. Water
Science & Technology, 2010. 61(7): p. 1819-1827.
128
[9] Roche, I., Katuri, K. and Scott, K., A microbial fuel cell using manganese oxide oxygen
reduction catalysts. Journal of Applied Electrochemistry, 2010. 40(1): p. 13-21.
[10] Zhang, L., Liu, C., Zhuang, L., Li, W., Zhou, S. and Zhang, J., Manganese dioxide as an
alternative cathodic catalyst to platinum in microbial fuel cells. Biosensors and Bioelectronics,
2009. 24(9): p. 2825-2829.
[11] Yuan, Y., Zhou, S. and Zhuang, L., Polypyrrole/carbon black composite as a novel oxygen
reduction catalyst for microbial fuel cells. Journal of Power Sources, 2010. 195(11): p. 3490-
3493.
[12] Zhao, F., Harnisch, F., Schröder, U., Scholz, F., Bogdanoff, P. and Herrmann, I.,
Application of pyrolysed iron(II) phthalocyanine and CoTMPP based oxygen reduction catalysts
as cathode materials in microbial fuel cells. Electrochemistry Communications, 2005. 7(12): p.
1405-1410.
[13] HaoYu, E., Cheng, S., Scott, K. and Logan, B., Microbial fuel cell performance with non-Pt
cathode catalysts. Journal of Power Sources, 2007. 171(2): p. 275-281.
[14] Park, D.H. and Zeikus, J.G., Improved fuel cell and electrode designs for producing
electricity from microbial degradation. Biotechnology and Bioengineering, 2003. 81(3): p. 348-
355.
[15] Duteanu, N., Erable, B., Senthil Kumar, S.M., Ghangrekar, M.M. and Scott, K., Effect of
chemically modified Vulcan XC-72R on the performance of air-breathing cathode in a single-
chamber microbial fuel cell. Bioresource Technology, 2010. 101(14): p. 5250-5255.
[16] Erable, B., Duteanu, N., Kumar, S.M.S., Feng, Y., Ghangrekar, M.M. and Scott, K., Nitric
acid activation of graphite granules to increase the performance of the non-catalyzed oxygen
reduction reaction (ORR) for MFC applications. Electrochemistry Communications, 2009. 11(7):
p. 1547-1549.
[17] Zhang, F., Cheng, S., Pant, D., Bogaert, G.V. and Logan, B.E., Power generation using an
activated carbon and metal mesh cathode in a microbial fuel cell. Electrochemistry
Communications, 2009. 11(11): p. 2177-2179.
129
[18] Lefebvre, O., Al-Mamun, A., Ooi, W.K., Tang, Z., Chua, D.H.C. and Ng, H.Y., An insight
into cathode options for microbial fuel cells. Water Science & Technology, 2008. 57(12): p.
2031-2037.
[19] Clauwaert, P., Rabaey, K., Aelterman, P., De Schamphelaire, L., Pham, T.H., Boeckx, P.,
Boon, N. and Verstraete, W., Biological Denitrification in Microbial Fuel Cells. Environmental
Science & Technology, 2007. 41(9): p. 3354-3360.
[20] Ehrlich, H.L., How microbes influence mineral growth and dissolution. Chemical Geology,
1996. 132(1-4): p. 5-9.
[21] Tandukar, M., Huber, S.J., Onodera, T. and Pavlostathis, S.G., Biological Chromium(VI)
Reduction in the Cathode of a Microbial Fuel Cell. Environmental Science & Technology, 2009.
43(21): p. 8159-8165.
[22] Cournet, A., Délia, M.-L., Bergel, A., Roques, C. and Bergé, M., Electrochemical reduction
of oxygen catalyzed by a wide range of bacteria including Gram-positive. Electrochemistry
Communications, 2010. 12(4): p. 505-508.
[23] He, Z. and Angenent, L., Application of Bacterial Biocathodes in Microbial Fuel Cells.
Electroanalysis, 2006. 18(19-20): p. 2009-2015.
[24] Rosenbaum, Aulenta, F., Villano, M. and Angenent, L.T., Cathodes as electron donors for
microbial metabolism: Which extracellular electron transfer mechanisms are involved?
Bioresource Technology, 2010. 102(1): p. 324-333.
[25] Erable, B., Vandecandelaere, I., Faimali, M., Delia, M.-L., Etcheverry, L., Vandamme, P.
and Bergel, A., Marine aerobic biofilm as biocathode catalyst. Bioelectrochemistry, 2010. 78(1):
p. 51-56.
[26] Calegaro, M.L., Lima, F.H.B. and Ticianelli, E.A., Oxygen reduction reaction on nanosized
manganese oxide particles dispersed on carbon in alkaline solutions. Journal of Power Sources,
2006. 158(1): p. 735-739.
[27] Huheey, J.E., Keiter, E.A. and Keiter, R.L., Inorganic Chemistry: Principles of structure and
reactivity. 4th ed. 1993, New York: Harper & Row. 964.
130
[28] Mao, L., Zhang, D., Sotomura, T., Nakatsu, K., Koshiba, N. and Ohsaka, T., Mechanistic
study of the reduction of oxygen in air electrode with manganese oxides as electrocatalysts.
Electrochimica acta, 2003. 48(8): p. 1015-1021.
[29] Martin, E., Savadogo, O., Guiot, S.R. and Tartakovsky, B., The influence of operational
conditions on the performance of a microbial fuel cell seeded with mesophilic anaerobic sludge.
Biochemical Engineering Journal, 2010. 51(3): p. 132-139.
[30] Barsoukov, E. and Macdonald, J.R., Impedance Spectroscopy - Theory, Experiment, and
Applications. 2005, Hoboken, New Jersey: John Wiley & Sons, Inc. 595.
[31] Bergel, A., Féron, D. and Mollica, A., Catalysis of oxygen reduction in PEM fuel cell by
seawater biofilm. Electrochemistry Communications, 2005. 7(9): p. 900-904.
[32] Oh, S.E., Kim, J.R., Joo, J.H. and Logan, B.E., Effects of applied voltages and dissolved
oxygen on sustained power generation by microbial fuel cells. Water Sci. Technol., 2009. 60: p.
7.
[33] Chen, G.-W., Cha, J.-H., Choi, S.-J., Lee, T.-H. and Kim, C.-W., Characterization of an
open biocathode microbial fuel cell for electricity generation and effluent polish. Korean Journal
of Chemical Engineering, 2010. 27(3): p. 828-835.
[34] Rabaey, K., Read, S.T., Clauwaert, P., Freguia, S., Bond, P.L., Blackall, L.L. and Keller, J.,
Cathodic oxygen reduction catalyzed by bacteria in microbial fuel cells. ISME J, 2008. 2(5): p.
519-527.
[35] Zhang, J.-N., Zhao, Q.-L., Aelterman, P., You, S.-J. and Jiang, J.-Q., Electricity generation
in a microbial fuel cell with a microbially catalyzed cathode. Biotechnology Letters, 2008.
30(10): p. 1771-1776.
[36] Logan, B.E., Microbial fuel cells. 2008, Hoboken, New Jersey: John Wiley & Sons, Inc.
200.
[37] Clauwaert, P., van der Ha, D., Boon, N., Verbeken, K., Verhaege, M., Rabaey, K. and
Verstraete, W., Open Air Biocathode Enables Effective Electricity Generation with Microbial
Fuel Cells. Environmental Science & Technology, 2007. 41(21): p. 7564-7569.
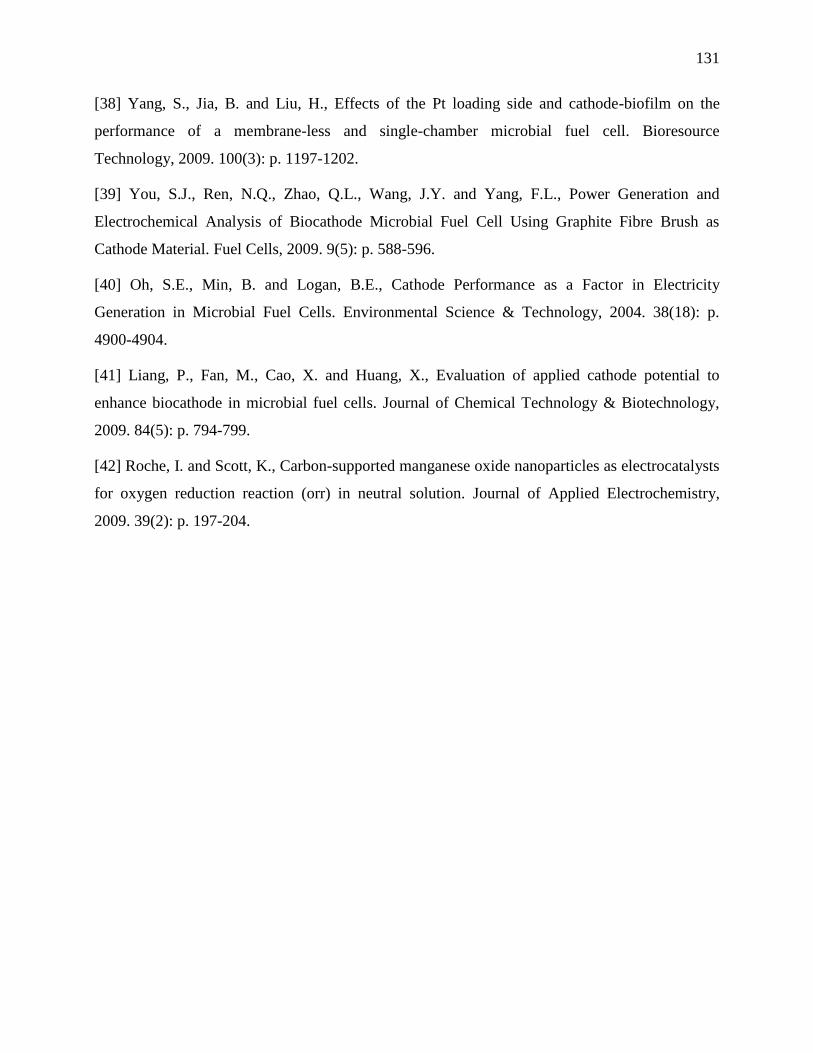
131
[38] Yang, S., Jia, B. and Liu, H., Effects of the Pt loading side and cathode-biofilm on the
performance of a membrane-less and single-chamber microbial fuel cell. Bioresource
Technology, 2009. 100(3): p. 1197-1202.
[39] You, S.J., Ren, N.Q., Zhao, Q.L., Wang, J.Y. and Yang, F.L., Power Generation and
Electrochemical Analysis of Biocathode Microbial Fuel Cell Using Graphite Fibre Brush as
Cathode Material. Fuel Cells, 2009. 9(5): p. 588-596.
[40] Oh, S.E., Min, B. and Logan, B.E., Cathode Performance as a Factor in Electricity
Generation in Microbial Fuel Cells. Environmental Science & Technology, 2004. 38(18): p.
4900-4904.
[41] Liang, P., Fan, M., Cao, X. and Huang, X., Evaluation of applied cathode potential to
enhance biocathode in microbial fuel cells. Journal of Chemical Technology & Biotechnology,
2009. 84(5): p. 794-799.
[42] Roche, I. and Scott, K., Carbon-supported manganese oxide nanoparticles as electrocatalysts
for oxygen reduction reaction (orr) in neutral solution. Journal of Applied Electrochemistry,
2009. 39(2): p. 197-204.
132
CHAPITRE 7 DISCUSSION GÉNÉRALE
Ce chapitre expose les différents résultats présentés dans les quatre articles de cette thèse afin de
démontrer leur importance dans l’amélioration de la performance des piles à combustible
microbiennes utilisées dans ce projet, plusieurs des résultats acquis pouvant être aussi appliqués à
toutes piles microbiennes. Certains de ces résultats sont inédits alors que d’autres viennent plutôt
appuyés des observations faites auparavant par différents groupes de recherche. Ce chapitre sera
divisé en trois sections, la première abordant les diverses conditions d’opération évaluées, soit la
charge organique, le pH, la température, la charge externe, la conductivité, de même que
l’influence de la configuration de la pile sur son efficacité et sa puissance générée. Les réactions
siégeant aux électrodes ainsi que l’effet des différents matériaux testés tant à l’anode qu’à la
cathode seront ensuite traités. Finalement, une synthèse des résultats sera faite, comparant les
performances des piles utilisées dans cette étude avec celles d’autres groupes de recherche tant au
niveau de la performance générale de la pile que des différents matériaux de cathode testés.
7.1 Conditions d’opération et configuration des piles
Divers paramètres d’opération ont été variés dans le cadre de cette thèse, soit la charge organique,
le pH, la température, la charge externe et la conductivité. Dans le premier cas, la charge
organique de glucose et d’acétate est variée afin d’évaluer son influence sur les diverses espèces
microbiennes présentes au sein du réacteur et aussi d’identifier les limitations qu’une
concentration trop faible ou trop élevée de matières organiques peut causer. Le tableau 7.1
présente la puissance, le taux de méthane produit et l’efficacité obtenus dans de tels cas, où LA
représente le volume du compartiment anodique de la pile, en litre. Il est à noter que les deux
substrats ont été testés dans des piles à combustible microbiennes dont la configuration était
différente. Quoique la charge organique cause une grande génération de méthane, celle-ci
augmentant avec l’augmentation de la disponibilité du substrat, il ressort de ces résultats qu’une
charge optimale de 2 à 4 g LA-1
jour-1
(correspondant à une concentration de substrat dans le
liquide anodique de 200-250 mg L-1
) entraîne une puissance supérieure, caractéristique clé des
piles microbiennes. L’efficacité coulombique a tendance à diminuer avec une charge organique
croissante, donc moins de substrat est consacré à la production d’électricité. Toutefois, le taux
d’enlèvement de la charge organique demeure supérieur à 80% à la charge organique optimale,
133
démontrant une bonne efficacité de traitement des eaux usées couplée à la puissance maximale
générée.
Tableau 7.1 : Puissance, taux de méthane produit et efficacité obtenus en variant la charge
organique dans deux types de piles à combustible microbiennes
L’étude de la relation entre la concentration de substrat et la puissance d’une pile à combustible
microbienne a été faite par le passé, la plupart du temps au sein de piles opérées en cuvée, ou
encore à des concentrations modérées (Gil et al., 2003; Jadhav & Ghangrekar, 2009; Moon et al.,
2005) mais sans étudier la cinétique de consommation de substrat par les espèces électricigènes et
méthanogènes. Dans notre étude, il est montré clairement que le ratio électricité/méthane peut
être optimisé en réduisant le taux de charge organique dans la pile. Les microorganismes
méthanogènes possèdent une affinité pour le substrat plus faible que les espèces électricigènes et
sont très peu actifs à faible concentration de substrat. L’affinité supérieure des espèces
électricigènes à faible charge organique leur attribue la consommation considérable du substrat,
ceci expliquant une efficacité coulombique et un taux d’enlèvement de la charge organique
élevés. Toutefois, une concentration faible d’acétate amènera une limitation de substrat à l’anode,
tel qu’il a été évoqué dans le chapitre 5 «Electrochemical study of the effect of the anodic biofilm
limitations on the performances of microbial fuel cells » par les tests d’impédance
Substrat
Charge
organique
(g LA-1
jr-1
)
Pmax
(W m-3
)
CH4 produit
(L LA-1
jr-1
)
Efficacité
coulombique
(%)
Enlèvement de la
charge organique
(%)
Glucose
0,19 4,0 0,01 42,1 92,7
0,47 4,8 0,02 23,1 89,7
0,93 9,8 0,11 15,3 87,1
1,86 10,8 0,26 7,0 87,9
3,72 10,6 0,49 4,1 82,3
7,44 7,8 0,66 2,0 74,3
Acétate
2 37,8
nd
60,5 98,1
4 92,4 32,9 90,9
8 80,8 27,5 52,9
134
électrochimique. Cette observation explique la puissance nettement inférieure malgré une plus
grande disponibilité du substrat pour les espèces électricigènes.
D’un autre côté, une concentration de substrat élevée cause l’inhibition de l’activité des espèces
électricigènes. Cette affirmation a été soulevée dans le premier article au chapitre 3 « The
influence of operational conditions on the performance of a microbial fuel cell seeded with
mesophilic anaerobic sludge », mais le chapitre 5 lève le voile sur l’influence des protons sur
cette limitation en évaluant la limitation par la diffusion par voltammétrie cyclique en fonction de
la charge organique. En effet, lors de la consommation des substrats, les microorganismes
électricigènes génèrent des protons qui migrent par la suite pour être utilisés dans la réduction de
l’oxygène à la cathode. Toutefois, la diffusion des protons hors du biofilm est un processus
dépendant de la conductivité de la solution, et l’accumulation des protons aux environs des
microorganismes électricigènes peut diminuer le pH environnant de même que les conditions
d’oxydoréduction locales, freinant ainsi le métabolisme de consommation de substrats des
espèces électricigènes causant la baisse de puissance des piles. Cette observation d’acidification
locale et de baisse d’activité des organismes électricigènes par l’accumulation de protons a aussi
été constatée ou supposée par des études différentes, soit en variant la concentration de
phosphates dans l’électrolyte (Torres et al., 2008), soit en étudiant les différentes étapes du
transfert de charge à l’anode de Geobacter sp. mutantes par voltammétrie cyclique (Richter et al.,
2009) ou encore en développant un système sensible de mesure du gradient de pH au sein du
biofilm anodique (Franks et al., 2009).
Au tableau 7.1, on peut voir une amélioration significative de la puissance générée par une pile
microbienne dont la configuration a été modifiée (cas de l’acétate). La diminution substantielle
de la distance séparant les électrodes décroît la résistance interne en minimisant la distance à être
parcourue par les protons dans l’électrolyte avant d’atteindre la cathode. Cette observation avait
déjà fait l’objet d’autres recherches (Cheng et al., 2006b; Fan et al., 2007). L’augmentation de la
puissance de la pile est aussi reliée à la baisse de moitié du volume de celle-ci, ce changement
étant non négligeable lors du calcul de la puissance volumique. De plus, la nature du substrat est
différente, l’utilisation d’acétate ne génère pas de sous-produits de fermentation comme dans le
cas du glucose, ceci augmentant aussi l’efficacité coulombique et d’enlèvement de la charge
organique de la pile. Toutefois, il est difficile de quantifier individuellement la contribution de
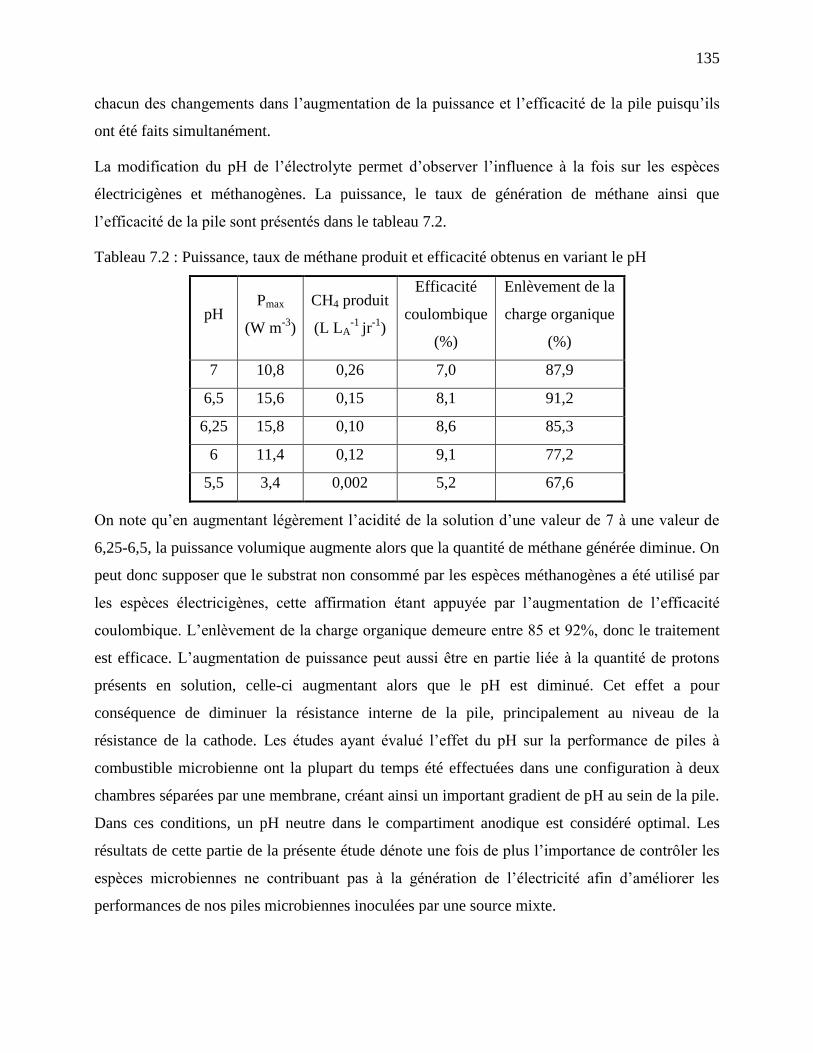
135
chacun des changements dans l’augmentation de la puissance et l’efficacité de la pile puisqu’ils
ont été faits simultanément.
La modification du pH de l’électrolyte permet d’observer l’influence à la fois sur les espèces
électricigènes et méthanogènes. La puissance, le taux de génération de méthane ainsi que
l’efficacité de la pile sont présentés dans le tableau 7.2.
Tableau 7.2 : Puissance, taux de méthane produit et efficacité obtenus en variant le pH
pH Pmax
(W m-3
)
CH4 produit
(L LA-1
jr-1
)
Efficacité
coulombique
(%)
Enlèvement de la
charge organique
(%)
7 10,8 0,26 7,0 87,9
6,5 15,6 0,15 8,1 91,2
6,25 15,8 0,10 8,6 85,3
6 11,4 0,12 9,1 77,2
5,5 3,4 0,002 5,2 67,6
On note qu’en augmentant légèrement l’acidité de la solution d’une valeur de 7 à une valeur de
6,25-6,5, la puissance volumique augmente alors que la quantité de méthane générée diminue. On
peut donc supposer que le substrat non consommé par les espèces méthanogènes a été utilisé par
les espèces électricigènes, cette affirmation étant appuyée par l’augmentation de l’efficacité
coulombique. L’enlèvement de la charge organique demeure entre 85 et 92%, donc le traitement
est efficace. L’augmentation de puissance peut aussi être en partie liée à la quantité de protons
présents en solution, celle-ci augmentant alors que le pH est diminué. Cet effet a pour
conséquence de diminuer la résistance interne de la pile, principalement au niveau de la
résistance de la cathode. Les études ayant évalué l’effet du pH sur la performance de piles à
combustible microbienne ont la plupart du temps été effectuées dans une configuration à deux
chambres séparées par une membrane, créant ainsi un important gradient de pH au sein de la pile.
Dans ces conditions, un pH neutre dans le compartiment anodique est considéré optimal. Les
résultats de cette partie de la présente étude dénote une fois de plus l’importance de contrôler les
espèces microbiennes ne contribuant pas à la génération de l’électricité afin d’améliorer les
performances de nos piles microbiennes inoculées par une source mixte.
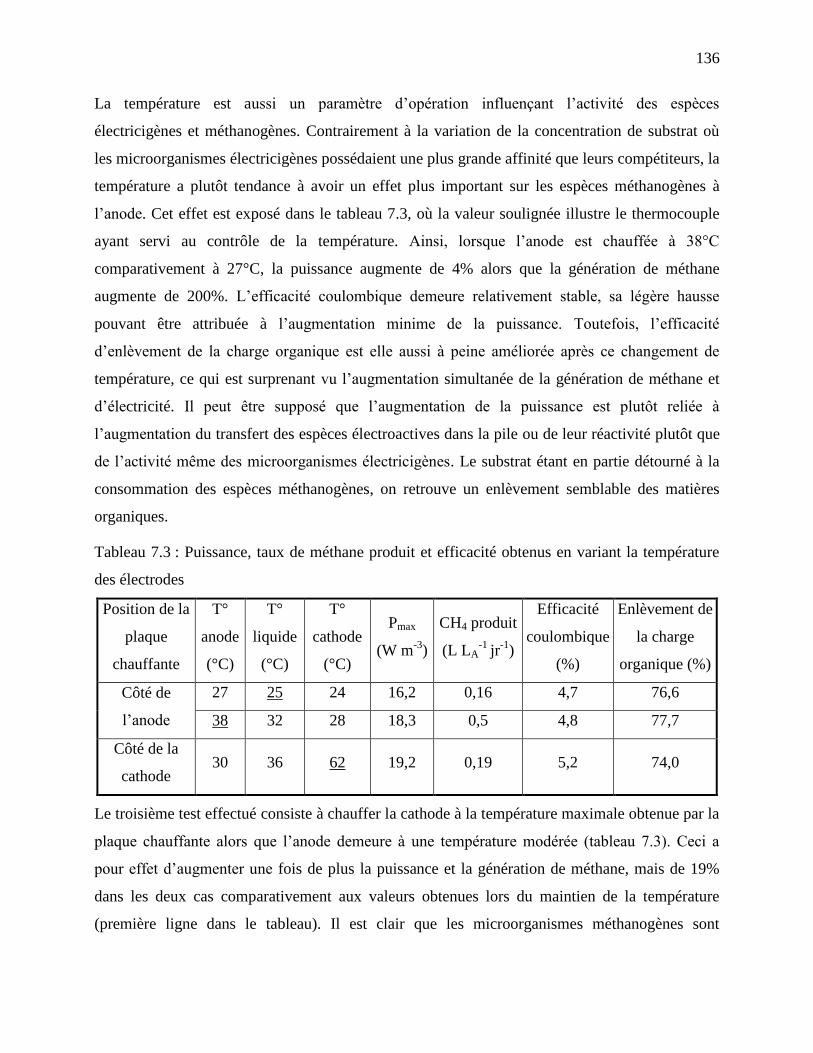
136
La température est aussi un paramètre d’opération influençant l’activité des espèces
électricigènes et méthanogènes. Contrairement à la variation de la concentration de substrat où
les microorganismes électricigènes possédaient une plus grande affinité que leurs compétiteurs, la
température a plutôt tendance à avoir un effet plus important sur les espèces méthanogènes à
l’anode. Cet effet est exposé dans le tableau 7.3, où la valeur soulignée illustre le thermocouple
ayant servi au contrôle de la température. Ainsi, lorsque l’anode est chauffée à 38°C
comparativement à 27°C, la puissance augmente de 4% alors que la génération de méthane
augmente de 200%. L’efficacité coulombique demeure relativement stable, sa légère hausse
pouvant être attribuée à l’augmentation minime de la puissance. Toutefois, l’efficacité
d’enlèvement de la charge organique est elle aussi à peine améliorée après ce changement de
température, ce qui est surprenant vu l’augmentation simultanée de la génération de méthane et
d’électricité. Il peut être supposé que l’augmentation de la puissance est plutôt reliée à
l’augmentation du transfert des espèces électroactives dans la pile ou de leur réactivité plutôt que
de l’activité même des microorganismes électricigènes. Le substrat étant en partie détourné à la
consommation des espèces méthanogènes, on retrouve un enlèvement semblable des matières
organiques.
Tableau 7.3 : Puissance, taux de méthane produit et efficacité obtenus en variant la température
des électrodes
Position de la
plaque
chauffante
T°
anode
(°C)
T°
liquide
(°C)
T°
cathode
(°C)
Pmax
(W m-3
)
CH4 produit
(L LA-1
jr-1
)
Efficacité
coulombique
(%)
Enlèvement de
la charge
organique (%)
Côté de
l’anode
27 25 24 16,2 0,16 4,7 76,6
38 32 28 18,3 0,5 4,8 77,7
Côté de la
cathode 30 36 62 19,2 0,19 5,2 74,0
Le troisième test effectué consiste à chauffer la cathode à la température maximale obtenue par la
plaque chauffante alors que l’anode demeure à une température modérée (tableau 7.3). Ceci a
pour effet d’augmenter une fois de plus la puissance et la génération de méthane, mais de 19%
dans les deux cas comparativement aux valeurs obtenues lors du maintien de la température
(première ligne dans le tableau). Il est clair que les microorganismes méthanogènes sont
137
grandement influencés par une hausse de température, aussi minime soit-elle. D’autre part,
malgré l’augmentation de la puissance et la quantité de CH4 produit, l’enlèvement de la charge
organique est cette fois-ci diminué. Il apparaît donc, tel que supposé précédemment, que
l’amélioration de la génération d’électricité est plutôt amélioré par le transport des espèces
électroactives de même que l’augmentation importante de l’activité catalytique de la cathode. Il
pourrait également être présumé que les microorganismes électricigènes peuplant l’anode
réagissent plutôt négativement à une augmentation de température. Dans tous les cas, la
comparaison de la génération de méthane et d’électricité sous diverses variations de température
aux deux électrodes, qui n’a pas été observée dans d’autres études, démontre encore la possibilité
d’optimiser la performance des piles à combustible microbiennes en contrôlant la température
durant leur opération.
La conductivité permet le transport efficace des espèces électroactives au sein de la pile à
combustible microbienne. En diminuant grandement la teneur de chlorures et phosphates en
solution, la diffusion du substrat et des protons au sein du biofilm et de l’électrolyte est restreinte.
Ainsi, au chapitre 5 on a constaté par impédance électrochimique la limitation de l’atteinte du
substrat à la surface de l’anode causée par la diffusion. Aussi, tel que mentionné précédemment,
la baisse significative de conductivité peut influencer la diffusion des protons hors du biofilm,
augmentant la résistance du transport de ceux-ci vers la cathode. L’augmentation des pertes
associées au transport du substrat et des protons augmente la résistance interne de la pile, causant
une diminution de la puissance pouvant être générée par la pile (voir le tableau 7.4). De plus, le
manque de substrat cause la diminution de l’activité des espèces électricigènes, celle-ci étant
reflétée en partie par la baisse de puissance, mais surtout par l’efficacité coulombique qui est très
faible. Toutefois, l’enlèvement de la charge organique a été maximal sous ces conditions, laissant
supposer que les espèces méthanogènes de même que certaines espèces microbiennes plutôt
latentes tirent profit de la baisse de concentration de chlorures et de phosphates et ont augmenté
leur croissance/activité. De façon générale, une conductivité relativement élevée telle que celle
régnant dans nos piles microbiennes doit être maintenue afin de minimiser les limitations causées
par le transport du substrat et des protons en solution, tel que suggéré par Torres et al. (2008).
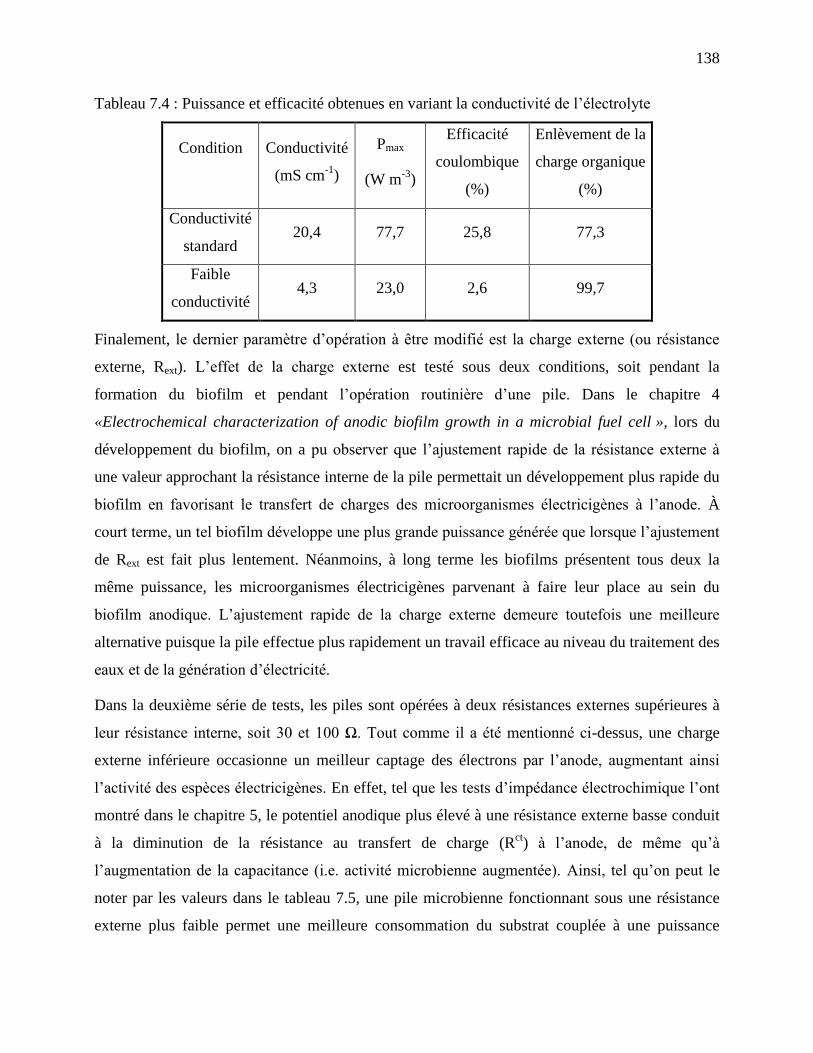
138
Tableau 7.4 : Puissance et efficacité obtenues en variant la conductivité de l’électrolyte
Condition
Conductivité
(mS cm-1
)
Pmax
(W m-3
)
Efficacité
coulombique
(%)
Enlèvement de la
charge organique
(%)
Conductivité
standard 20,4 77,7 25,8 77,3
Faible
conductivité 4,3 23,0 2,6 99,7
Finalement, le dernier paramètre d’opération à être modifié est la charge externe (ou résistance
externe, Rext). L’effet de la charge externe est testé sous deux conditions, soit pendant la
formation du biofilm et pendant l’opération routinière d’une pile. Dans le chapitre 4
«Electrochemical characterization of anodic biofilm growth in a microbial fuel cell », lors du
développement du biofilm, on a pu observer que l’ajustement rapide de la résistance externe à
une valeur approchant la résistance interne de la pile permettait un développement plus rapide du
biofilm en favorisant le transfert de charges des microorganismes électricigènes à l’anode. À
court terme, un tel biofilm développe une plus grande puissance générée que lorsque l’ajustement
de Rext est fait plus lentement. Néanmoins, à long terme les biofilms présentent tous deux la
même puissance, les microorganismes électricigènes parvenant à faire leur place au sein du
biofilm anodique. L’ajustement rapide de la charge externe demeure toutefois une meilleure
alternative puisque la pile effectue plus rapidement un travail efficace au niveau du traitement des
eaux et de la génération d’électricité.
Dans la deuxième série de tests, les piles sont opérées à deux résistances externes supérieures à
leur résistance interne, soit 30 et 100 Ω. Tout comme il a été mentionné ci-dessus, une charge
externe inférieure occasionne un meilleur captage des électrons par l’anode, augmentant ainsi
l’activité des espèces électricigènes. En effet, tel que les tests d’impédance électrochimique l’ont
montré dans le chapitre 5, le potentiel anodique plus élevé à une résistance externe basse conduit
à la diminution de la résistance au transfert de charge (Rct) à l’anode, de même qu’à
l’augmentation de la capacitance (i.e. activité microbienne augmentée). Ainsi, tel qu’on peut le
noter par les valeurs dans le tableau 7.5, une pile microbienne fonctionnant sous une résistance
externe plus faible permet une meilleure consommation du substrat couplée à une puissance
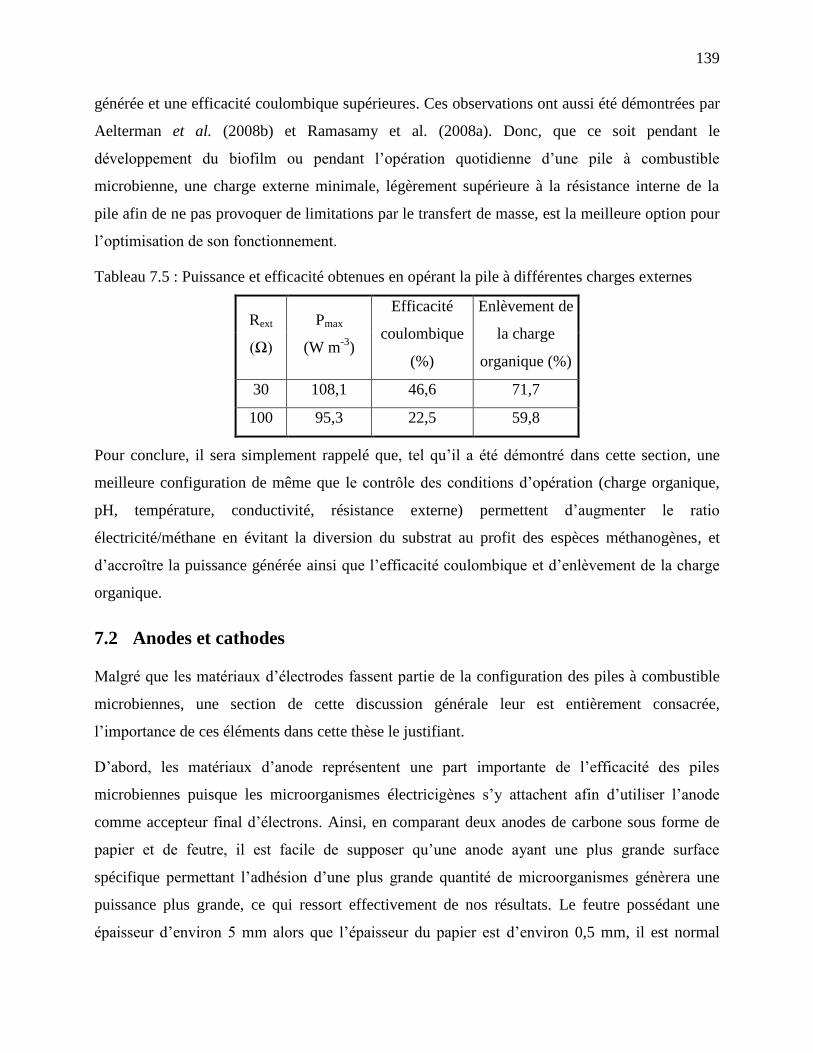
139
générée et une efficacité coulombique supérieures. Ces observations ont aussi été démontrées par
Aelterman et al. (2008b) et Ramasamy et al. (2008a). Donc, que ce soit pendant le
développement du biofilm ou pendant l’opération quotidienne d’une pile à combustible
microbienne, une charge externe minimale, légèrement supérieure à la résistance interne de la
pile afin de ne pas provoquer de limitations par le transfert de masse, est la meilleure option pour
l’optimisation de son fonctionnement.
Tableau 7.5 : Puissance et efficacité obtenues en opérant la pile à différentes charges externes
Rext
(Ω)
Pmax
(W m-3
)
Efficacité
coulombique
(%)
Enlèvement de
la charge
organique (%)
30 108,1 46,6 71,7
100 95,3 22,5 59,8
Pour conclure, il sera simplement rappelé que, tel qu’il a été démontré dans cette section, une
meilleure configuration de même que le contrôle des conditions d’opération (charge organique,
pH, température, conductivité, résistance externe) permettent d’augmenter le ratio
électricité/méthane en évitant la diversion du substrat au profit des espèces méthanogènes, et
d’accroître la puissance générée ainsi que l’efficacité coulombique et d’enlèvement de la charge
organique.
7.2 Anodes et cathodes
Malgré que les matériaux d’électrodes fassent partie de la configuration des piles à combustible
microbiennes, une section de cette discussion générale leur est entièrement consacrée,
l’importance de ces éléments dans cette thèse le justifiant.
D’abord, les matériaux d’anode représentent une part importante de l’efficacité des piles
microbiennes puisque les microorganismes électricigènes s’y attachent afin d’utiliser l’anode
comme accepteur final d’électrons. Ainsi, en comparant deux anodes de carbone sous forme de
papier et de feutre, il est facile de supposer qu’une anode ayant une plus grande surface
spécifique permettant l’adhésion d’une plus grande quantité de microorganismes génèrera une
puissance plus grande, ce qui ressort effectivement de nos résultats. Le feutre possédant une
épaisseur d’environ 5 mm alors que l’épaisseur du papier est d’environ 0,5 mm, il est normal
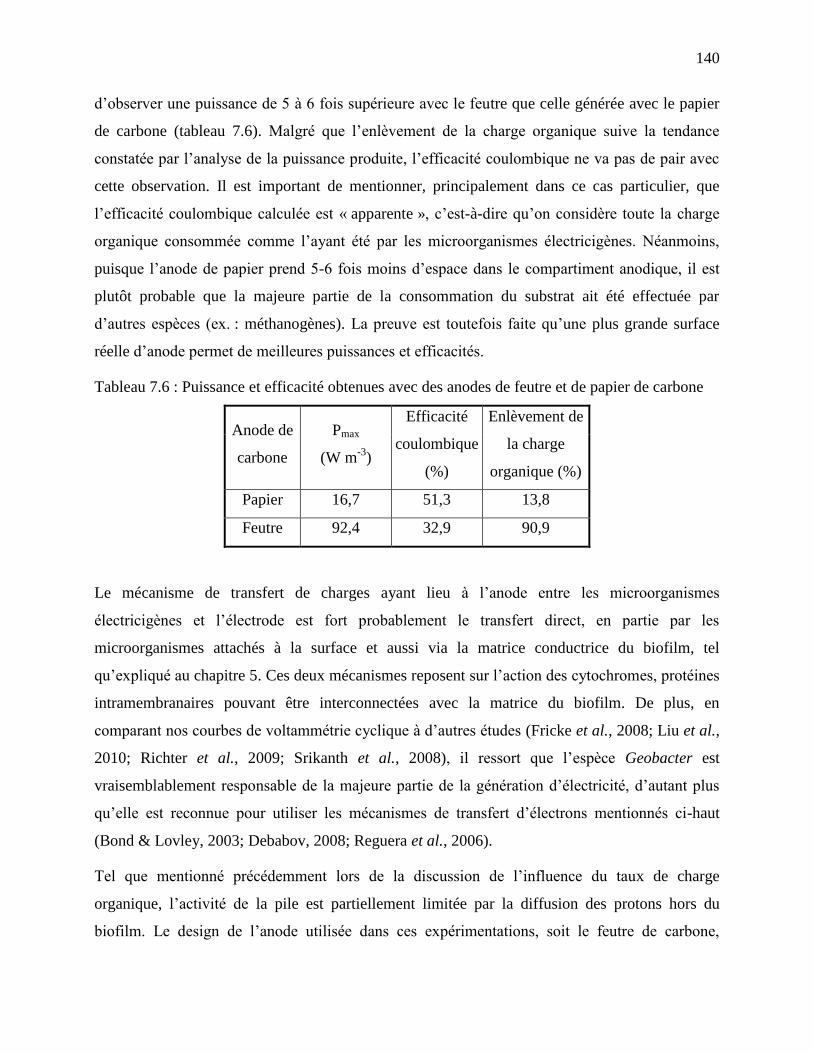
140
d’observer une puissance de 5 à 6 fois supérieure avec le feutre que celle générée avec le papier
de carbone (tableau 7.6). Malgré que l’enlèvement de la charge organique suive la tendance
constatée par l’analyse de la puissance produite, l’efficacité coulombique ne va pas de pair avec
cette observation. Il est important de mentionner, principalement dans ce cas particulier, que
l’efficacité coulombique calculée est « apparente », c’est-à-dire qu’on considère toute la charge
organique consommée comme l’ayant été par les microorganismes électricigènes. Néanmoins,
puisque l’anode de papier prend 5-6 fois moins d’espace dans le compartiment anodique, il est
plutôt probable que la majeure partie de la consommation du substrat ait été effectuée par
d’autres espèces (ex. : méthanogènes). La preuve est toutefois faite qu’une plus grande surface
réelle d’anode permet de meilleures puissances et efficacités.
Tableau 7.6 : Puissance et efficacité obtenues avec des anodes de feutre et de papier de carbone
Anode de
carbone
Pmax
(W m-3
)
Efficacité
coulombique
(%)
Enlèvement de
la charge
organique (%)
Papier 16,7 51,3 13,8
Feutre 92,4 32,9 90,9
Le mécanisme de transfert de charges ayant lieu à l’anode entre les microorganismes
électricigènes et l’électrode est fort probablement le transfert direct, en partie par les
microorganismes attachés à la surface et aussi via la matrice conductrice du biofilm, tel
qu’expliqué au chapitre 5. Ces deux mécanismes reposent sur l’action des cytochromes, protéines
intramembranaires pouvant être interconnectées avec la matrice du biofilm. De plus, en
comparant nos courbes de voltammétrie cyclique à d’autres études (Fricke et al., 2008; Liu et al.,
2010; Richter et al., 2009; Srikanth et al., 2008), il ressort que l’espèce Geobacter est
vraisemblablement responsable de la majeure partie de la génération d’électricité, d’autant plus
qu’elle est reconnue pour utiliser les mécanismes de transfert d’électrons mentionnés ci-haut
(Bond & Lovley, 2003; Debabov, 2008; Reguera et al., 2006).
Tel que mentionné précédemment lors de la discussion de l’influence du taux de charge
organique, l’activité de la pile est partiellement limitée par la diffusion des protons hors du
biofilm. Le design de l’anode utilisée dans ces expérimentations, soit le feutre de carbone,
141
restreint en partie la circulation de l’électrolyte au travers de l’anode par ses fibres relativement
resserrées. Ainsi, il est pensé qu’une amélioration du design de l’anode ou de la circulation de
l’électrolyte pourrait réduire ou éliminer efficacement cette limitation.
Par les tests d’impédance électrochimique, on constate des réactions parasites causées par la
présence d’acétate, de chlorures et/ou de phosphates dans l’électrolyte ayant lieu à la surface de
l’anode et de la cathode, celles-ci augmentant substantiellement la résistance des deux électrodes.
Malgré tous les tests électrochimiques ayant été effectués, il demeure toutefois ardu de
démystifier complètement le rôle de chaque constituant de la solution. Toutefois, l’acétate
influence grandement la présence de ces réactions parasites et la conductivité influence le
déplacement des espèces en jeu qui sont mues par la diffusion (voir chapitre 5). La réaction
d’oxydation et/ou de réduction des sels en solution a été constatée dans une seule autre étude
(Ramasamy et al., 2009) malgré l’utilisation grandissante de la technique de spectroscopie
d’impédance électrochimique.
En plus des réactions parasitiques, on observe sur les matériaux de cathodes testés au chapitre 6
« Cathode materials evaluation in microbial fuel cells : A comparison of carbon, Mn2O3, Fe2O3
and platinum materials » la présence d’une tierce boucle sur les spectres d’impédance
électrochimique qu’on suppose être causée soit par la diffusion de l’oxygène ou des protons dans
l’électrolyte et/ou le biofilm. En effet, quoique les matériaux d’électrodes évalués dans ce
chapitre aient été choisis pour leur potentialité à stimuler le développement d’une biocathode,
ceux-ci ont plutôt démontré une réactivité face à la réduction de l’oxygène durant la période de
test. Donc, entrant en jeu dans la réaction cathodique, la résistance due au transport de l’oxygène
gazeux et/ou des protons au sein de la pile peut être observée par les tests de spectroscopie
d’impédance électrochimique.
Le tableau 7.7 présente la puissance et l’efficacité obtenues lors de l’évaluation de la performance
des cathodes de carbone, Fe2O3, Mn2O3 et Pt. On note que l’activité catalytique des matériaux va
en augmentant du carbone à l’oxyde de fer, suivi de l’oxyde de manganèse pour terminer avec le
platine dont l’excellente réactivité est reconnue. De plus, on note que la puissance et l’efficacité
coulombique vont de pair, et que l’efficacité de l’enlèvement de la charge organique suit
généralement cette tendance. En présence d’oxygène dans le compartiment cathodique, la
performance des piles microbiennes augmente généralement, sauf dans le cas du platine. Cette
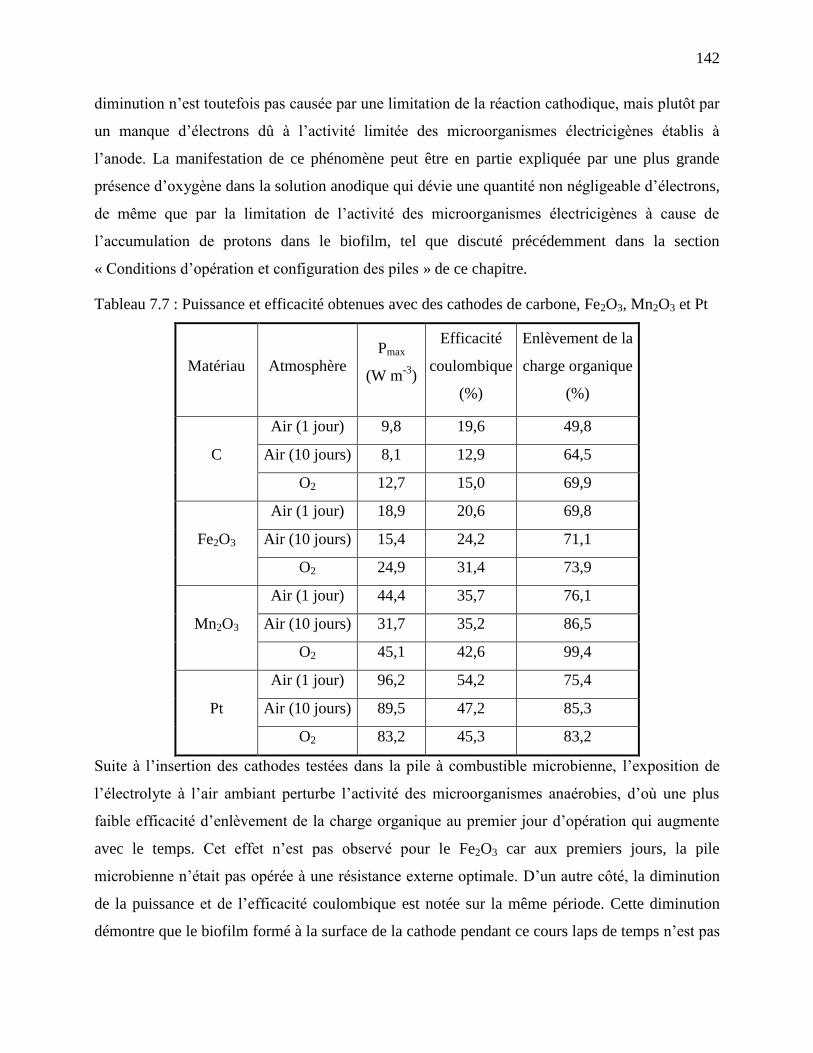
142
diminution n’est toutefois pas causée par une limitation de la réaction cathodique, mais plutôt par
un manque d’électrons dû à l’activité limitée des microorganismes électricigènes établis à
l’anode. La manifestation de ce phénomène peut être en partie expliquée par une plus grande
présence d’oxygène dans la solution anodique qui dévie une quantité non négligeable d’électrons,
de même que par la limitation de l’activité des microorganismes électricigènes à cause de
l’accumulation de protons dans le biofilm, tel que discuté précédemment dans la section
« Conditions d’opération et configuration des piles » de ce chapitre.
Tableau 7.7 : Puissance et efficacité obtenues avec des cathodes de carbone, Fe2O3, Mn2O3 et Pt
Matériau Atmosphère Pmax
(W m-3
)
Efficacité
coulombique
(%)
Enlèvement de la
charge organique
(%)
C
Air (1 jour) 9,8 19,6 49,8
Air (10 jours) 8,1 12,9 64,5
O2 12,7 15,0 69,9
Fe2O3
Air (1 jour) 18,9 20,6 69,8
Air (10 jours) 15,4 24,2 71,1
O2 24,9 31,4 73,9
Mn2O3
Air (1 jour) 44,4 35,7 76,1
Air (10 jours) 31,7 35,2 86,5
O2 45,1 42,6 99,4
Pt
Air (1 jour) 96,2 54,2 75,4
Air (10 jours) 89,5 47,2 85,3
O2 83,2 45,3 83,2
Suite à l’insertion des cathodes testées dans la pile à combustible microbienne, l’exposition de
l’électrolyte à l’air ambiant perturbe l’activité des microorganismes anaérobies, d’où une plus
faible efficacité d’enlèvement de la charge organique au premier jour d’opération qui augmente
avec le temps. Cet effet n’est pas observé pour le Fe2O3 car aux premiers jours, la pile
microbienne n’était pas opérée à une résistance externe optimale. D’un autre côté, la diminution
de la puissance et de l’efficacité coulombique est notée sur la même période. Cette diminution
démontre que le biofilm formé à la surface de la cathode pendant ce cours laps de temps n’est pas
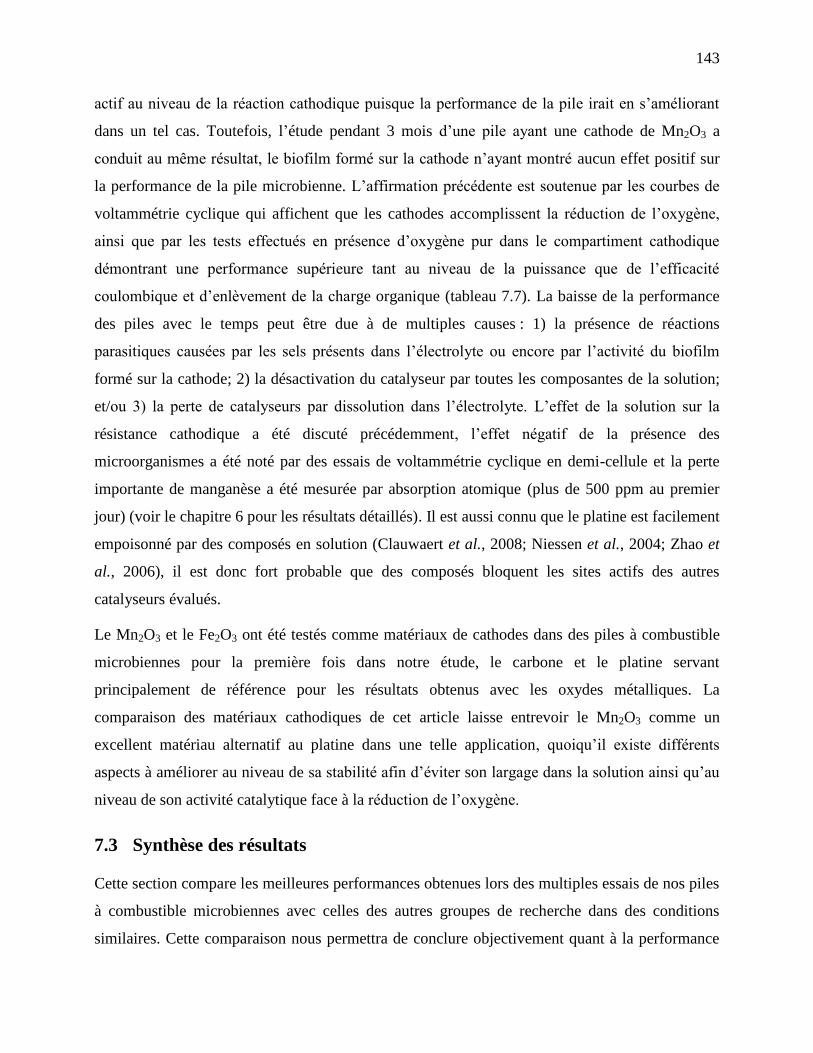
143
actif au niveau de la réaction cathodique puisque la performance de la pile irait en s’améliorant
dans un tel cas. Toutefois, l’étude pendant 3 mois d’une pile ayant une cathode de Mn2O3 a
conduit au même résultat, le biofilm formé sur la cathode n’ayant montré aucun effet positif sur
la performance de la pile microbienne. L’affirmation précédente est soutenue par les courbes de
voltammétrie cyclique qui affichent que les cathodes accomplissent la réduction de l’oxygène,
ainsi que par les tests effectués en présence d’oxygène pur dans le compartiment cathodique
démontrant une performance supérieure tant au niveau de la puissance que de l’efficacité
coulombique et d’enlèvement de la charge organique (tableau 7.7). La baisse de la performance
des piles avec le temps peut être due à de multiples causes : 1) la présence de réactions
parasitiques causées par les sels présents dans l’électrolyte ou encore par l’activité du biofilm
formé sur la cathode; 2) la désactivation du catalyseur par toutes les composantes de la solution;
et/ou 3) la perte de catalyseurs par dissolution dans l’électrolyte. L’effet de la solution sur la
résistance cathodique a été discuté précédemment, l’effet négatif de la présence des
microorganismes a été noté par des essais de voltammétrie cyclique en demi-cellule et la perte
importante de manganèse a été mesurée par absorption atomique (plus de 500 ppm au premier
jour) (voir le chapitre 6 pour les résultats détaillés). Il est aussi connu que le platine est facilement
empoisonné par des composés en solution (Clauwaert et al., 2008; Niessen et al., 2004; Zhao et
al., 2006), il est donc fort probable que des composés bloquent les sites actifs des autres
catalyseurs évalués.
Le Mn2O3 et le Fe2O3 ont été testés comme matériaux de cathodes dans des piles à combustible
microbiennes pour la première fois dans notre étude, le carbone et le platine servant
principalement de référence pour les résultats obtenus avec les oxydes métalliques. La
comparaison des matériaux cathodiques de cet article laisse entrevoir le Mn2O3 comme un
excellent matériau alternatif au platine dans une telle application, quoiqu’il existe différents
aspects à améliorer au niveau de sa stabilité afin d’éviter son largage dans la solution ainsi qu’au
niveau de son activité catalytique face à la réduction de l’oxygène.
7.3 Synthèse des résultats
Cette section compare les meilleures performances obtenues lors des multiples essais de nos piles
à combustible microbiennes avec celles des autres groupes de recherche dans des conditions
similaires. Cette comparaison nous permettra de conclure objectivement quant à la performance
144
du système utilisé. Comme il a été mentionné dans la première section de cette discussion
générale, la variété de différences existant entre les multiples piles microbiennes ne permet pas
une comparaison systématique, principalement lorsque les conditions d’opération sont variées.
Dans ce cas précis, une comparaison doit plutôt être effectuée avec des conditions contrôles dans
le même type de réacteur.
Dans cette optique, le tableau 7.8 présente la puissance générée par diverses piles microbiennes
étudiées dans différents groupes de recherche. Cette comparaison, quoique toujours ardue
d’interprétation, nous démontre la performance très intéressante du système utilisé dans cette
thèse. En effet, la puissance maximale observée dans nos expérimentations se situe au-dessus de
plusieurs travaux de recherche. Néanmoins, on voit que certains progrès peuvent être effectués
pour améliorer significativement la performance, par exemple en procédant à une modification de
surface de l’anode ou encore du design de la pile. Cette dernière option a été discutée
précédemment lorsqu’il a été question d’améliorer le transport des protons au sein du biofilm
formé à l’anode afin d’augmenter l’activité des microorganismes électricigènes, soit en modifiant
le design de l’anode ou encore l’écoulement de l’électrolyte dans le réacteur. Il est à noter que la
puissance de l’étude de Fan et al. (2007) a été recalculée afin d’être évaluée en fonction du
volume total du compartiment anodique plutôt que du volume du compartiment empli de liquide
(volume vide de matériaux d’électrodes) comme il avait été fait. Aussi, la puissance importante
produite par ces piles peut être attribuée en partie au fait que les piles de petits volumes
démontrent toujours de meilleures performances.
Les comparaisons sont faites exclusivement sur la puissance pouvant être générée par les
différentes piles, cette caractéristique étant très représentative de la performance des piles au
niveau de l’efficience de la production d’électricité. L’efficacité coulombique est très variable
selon le substrat utilisé de même que la diversité des microorganismes en présence. De plus,
l’efficacité d’enlèvement de la charge organique, quoique étant un paramètre très important pour
caractériser le rendement des piles microbiennes, est la plupart du temps relativement élevé et
convenable (soit plus de 80%).
Il est intéressant de mentionner ici que pour être compétitive avec le traitement conventionnel par
digestion anaérobie produisant du méthane, il est estimé que la pile à combustible microbienne
devrait pouvoir produire 400 W m-3
(Clauwaert et al., 2008).
145
Tableau 7.8 : Comparaison de la puissance de piles à combustible microbiennes
Configuration de
pile
Mode
opératoire
Distance
entre les
électrodes
Matériau
d’anode
Matériau
de cathode
Pmax
(W m-3
) Référence
Une chambre sans
membrane En cuvée 4 cm
Papier de
carbone Platine 12,7
(Liu et al.,
2005b)
Deux chambres
avec membrane
En
continu
Inconnu
(minimiale)
Granules de
graphite K3Fe(CN)6 48
(Rabaey et
al., 2005b)
Une chambre sans
membrane
En
continu 1 cm
Papier de
carbone Platine 51
(Cheng et
al., 2006b)
Une chambre sans
membrane En cuvée 1 cm
Brosse de
carbone CoTMPP 73
(Logan et
al., 2007)
Une chambre sans
membrane En cuvée 2 cm
Feutre de
carbone traité
à l’acide
Platine 96 (Zhu et al.,
2010)
Une chambre sans
membrane
En
continu < 1 mm
Feutre de
carbone Platine
De 77,7
à 108,1 Cette étude
Une chambre sans
membrane En cuvée 2 cm
Papier de
carbone traité
à NH3
Platine 115
(Cheng &
Logan,
2007b)
Une chambre sans
membrane
En
continu 0,6 mm
Tissu de
carbone Platine 362
(Fan et al.,
2007)
La comparaison des matériaux de cathodes évalués dans notre étude, soit le carbone, les oxydes
de fer et de manganèse et le platine, avec des matériaux semblables étudiés par d’autres groupes
de recherche est tout aussi complexe puisque non seulement les matériaux de cathodes peuvent
influencer les performances des différents types de piles microbiennes, mais leur configuration et
conditions d’opération peuvent tout autant en limiter la puissance générée. Toutefois, les tableaux
7.9 à 7.12 présentent diverses puissances obtenues dans différentes études utilisant des matériaux
similaires. Il est important de noter que la puissance exposée dans ces tableaux pour les
matériaux de cathodes testés dans la présente étude est prise après 10 jours d’insertion dans la
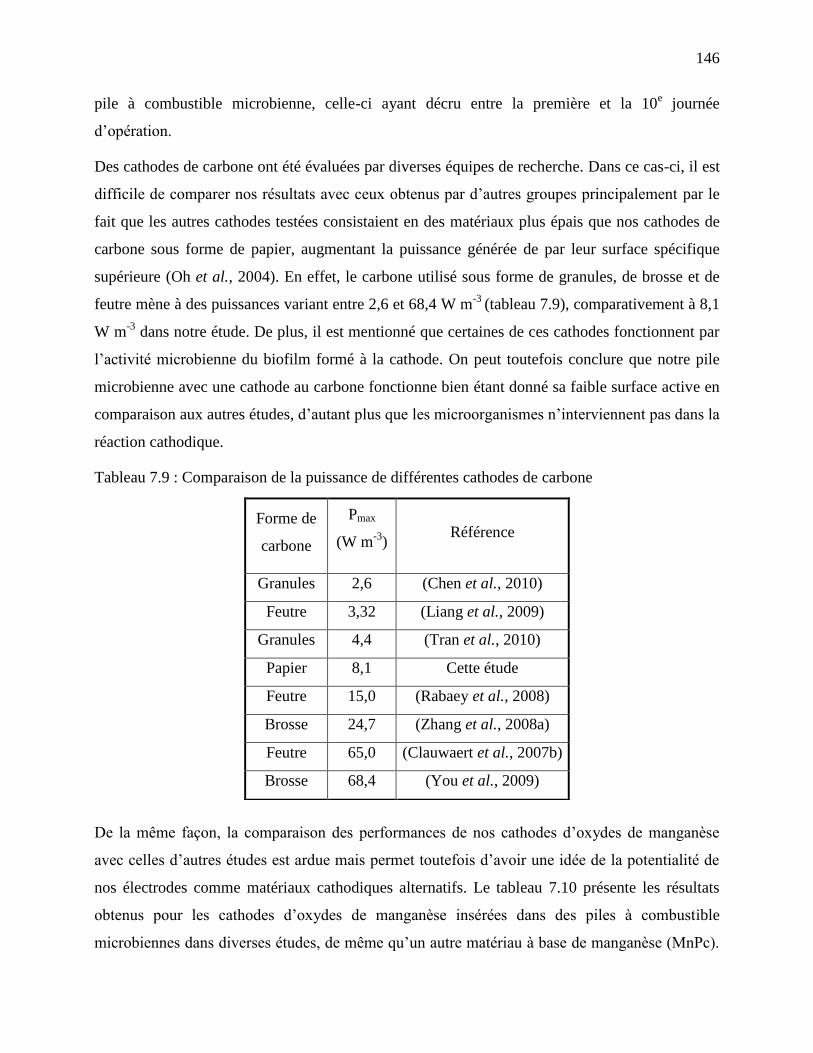
146
pile à combustible microbienne, celle-ci ayant décru entre la première et la 10e journée
d’opération.
Des cathodes de carbone ont été évaluées par diverses équipes de recherche. Dans ce cas-ci, il est
difficile de comparer nos résultats avec ceux obtenus par d’autres groupes principalement par le
fait que les autres cathodes testées consistaient en des matériaux plus épais que nos cathodes de
carbone sous forme de papier, augmentant la puissance générée de par leur surface spécifique
supérieure (Oh et al., 2004). En effet, le carbone utilisé sous forme de granules, de brosse et de
feutre mène à des puissances variant entre 2,6 et 68,4 W m-3
(tableau 7.9), comparativement à 8,1
W m-3
dans notre étude. De plus, il est mentionné que certaines de ces cathodes fonctionnent par
l’activité microbienne du biofilm formé à la cathode. On peut toutefois conclure que notre pile
microbienne avec une cathode au carbone fonctionne bien étant donné sa faible surface active en
comparaison aux autres études, d’autant plus que les microorganismes n’interviennent pas dans la
réaction cathodique.
Tableau 7.9 : Comparaison de la puissance de différentes cathodes de carbone
De la même façon, la comparaison des performances de nos cathodes d’oxydes de manganèse
avec celles d’autres études est ardue mais permet toutefois d’avoir une idée de la potentialité de
nos électrodes comme matériaux cathodiques alternatifs. Le tableau 7.10 présente les résultats
obtenus pour les cathodes d’oxydes de manganèse insérées dans des piles à combustible
microbiennes dans diverses études, de même qu’un autre matériau à base de manganèse (MnPc).
Forme de
carbone
Pmax
(W m-3
) Référence
Granules 2,6 (Chen et al., 2010)
Feutre 3,32 (Liang et al., 2009)
Granules 4,4 (Tran et al., 2010)
Papier 8,1 Cette étude
Feutre 15,0 (Rabaey et al., 2008)
Brosse 24,7 (Zhang et al., 2008a)
Feutre 65,0 (Clauwaert et al., 2007b)
Brosse 68,4 (You et al., 2009)
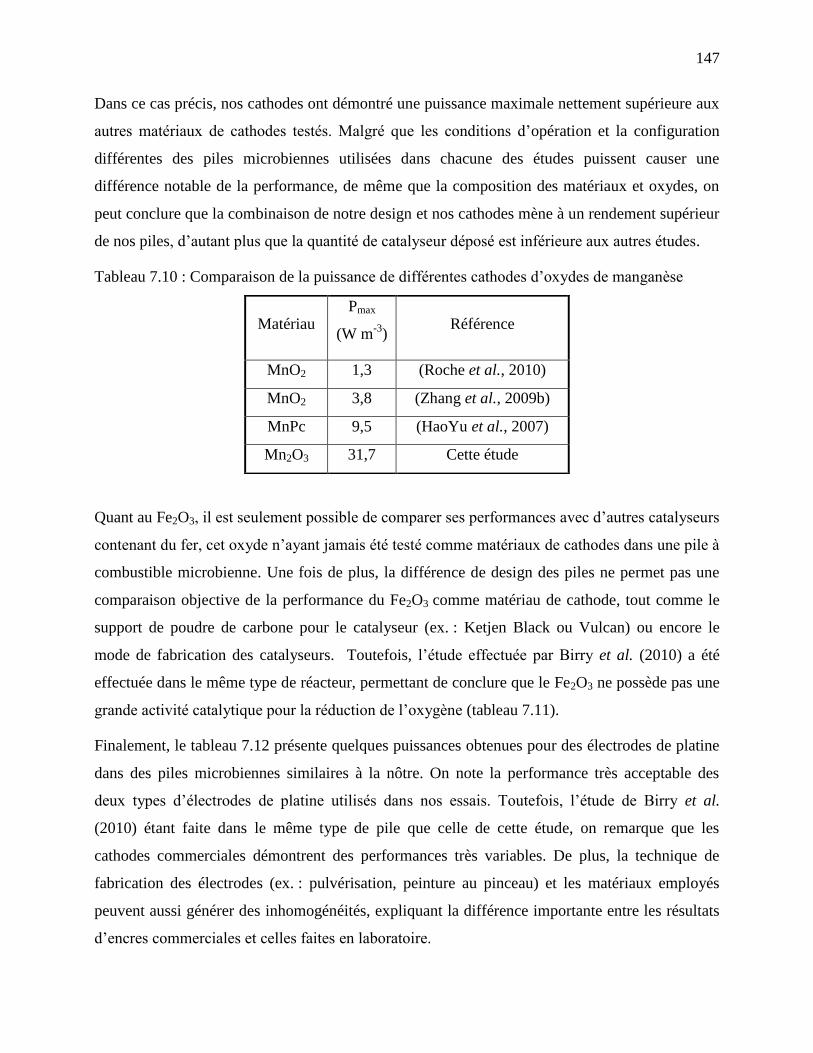
147
Dans ce cas précis, nos cathodes ont démontré une puissance maximale nettement supérieure aux
autres matériaux de cathodes testés. Malgré que les conditions d’opération et la configuration
différentes des piles microbiennes utilisées dans chacune des études puissent causer une
différence notable de la performance, de même que la composition des matériaux et oxydes, on
peut conclure que la combinaison de notre design et nos cathodes mène à un rendement supérieur
de nos piles, d’autant plus que la quantité de catalyseur déposé est inférieure aux autres études.
Tableau 7.10 : Comparaison de la puissance de différentes cathodes d’oxydes de manganèse
Quant au Fe2O3, il est seulement possible de comparer ses performances avec d’autres catalyseurs
contenant du fer, cet oxyde n’ayant jamais été testé comme matériaux de cathodes dans une pile à
combustible microbienne. Une fois de plus, la différence de design des piles ne permet pas une
comparaison objective de la performance du Fe2O3 comme matériau de cathode, tout comme le
support de poudre de carbone pour le catalyseur (ex. : Ketjen Black ou Vulcan) ou encore le
mode de fabrication des catalyseurs. Toutefois, l’étude effectuée par Birry et al. (2010) a été
effectuée dans le même type de réacteur, permettant de conclure que le Fe2O3 ne possède pas une
grande activité catalytique pour la réduction de l’oxygène (tableau 7.11).
Finalement, le tableau 7.12 présente quelques puissances obtenues pour des électrodes de platine
dans des piles microbiennes similaires à la nôtre. On note la performance très acceptable des
deux types d’électrodes de platine utilisés dans nos essais. Toutefois, l’étude de Birry et al.
(2010) étant faite dans le même type de pile que celle de cette étude, on remarque que les
cathodes commerciales démontrent des performances très variables. De plus, la technique de
fabrication des électrodes (ex. : pulvérisation, peinture au pinceau) et les matériaux employés
peuvent aussi générer des inhomogénéités, expliquant la différence importante entre les résultats
d’encres commerciales et celles faites en laboratoire.
Matériau Pmax
(W m-3
) Référence
MnO2 1,3 (Roche et al., 2010)
MnO2 3,8 (Zhang et al., 2009b)
MnPc 9,5 (HaoYu et al., 2007)
Mn2O3 31,7 Cette étude
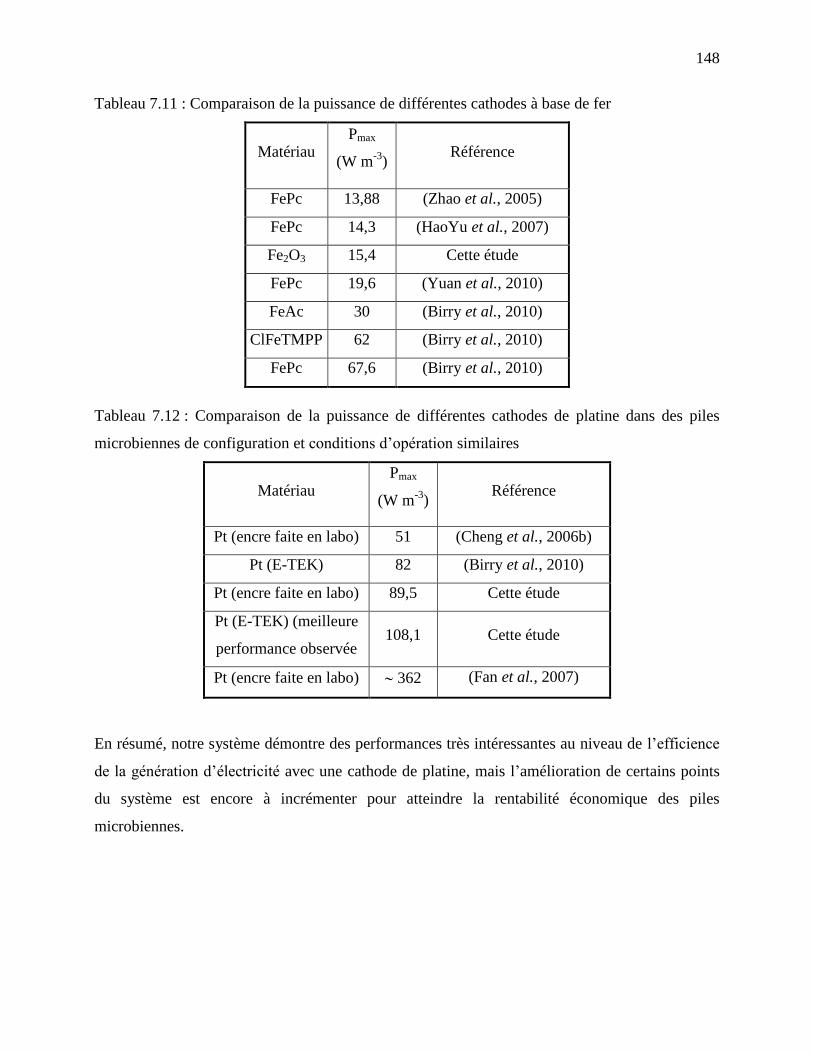
148
Tableau 7.11 : Comparaison de la puissance de différentes cathodes à base de fer
Matériau Pmax
(W m-3
) Référence
FePc 13,88 (Zhao et al., 2005)
FePc 14,3 (HaoYu et al., 2007)
Fe2O3 15,4 Cette étude
FePc 19,6 (Yuan et al., 2010)
FeAc 30 (Birry et al., 2010)
ClFeTMPP 62 (Birry et al., 2010)
FePc 67,6 (Birry et al., 2010)
Tableau 7.12 : Comparaison de la puissance de différentes cathodes de platine dans des piles
microbiennes de configuration et conditions d’opération similaires
Matériau Pmax
(W m-3
) Référence
Pt (encre faite en labo) 51 (Cheng et al., 2006b)
Pt (E-TEK) 82 (Birry et al., 2010)
Pt (encre faite en labo) 89,5 Cette étude
Pt (E-TEK) (meilleure
performance observée 108,1 Cette étude
Pt (encre faite en labo) 362 (Fan et al., 2007)
En résumé, notre système démontre des performances très intéressantes au niveau de l’efficience
de la génération d’électricité avec une cathode de platine, mais l’amélioration de certains points
du système est encore à incrémenter pour atteindre la rentabilité économique des piles
microbiennes.
149
CONCLUSION ET RECOMMANDATIONS
En conclusion, il est important de rappeler que les objectifs fixés dans le cadre de cette thèse ont
été atteints. Ainsi, les réactions électrochimiques siégeant à l’anode et la cathode, de même que la
performance du système utilisé dans le cadre de cette thèse ont été évaluées afin d’identifier les
limitations des piles et les améliorations pouvant y être apportées. En effet, une optimisation de la
conductivité de la solution et de la charge organique de même que le contrôle systématique du pH
et de la température de la pile en chauffant du côté cathodique peuvent d’abord conduire à une
meilleure génération d’électricité en augmentant le ratio électricité/méthane et le transport des
espèces actives en solution. De plus, le suivi étroit du développement du biofilm lors du
démarrage de la pile mène plus rapidement à l’atteinte de performances supérieures en favorisant
la prolifération des espèces électricigènes. Aussi, un écoulement d’électrolyte différent ou un
design d’anode autre pourrait diminuer la limitation de courant causée par l’accumulation des
protons dans le biofilm anodique. Toutes ces évaluations et optimisations permettent d’augmenter
la puissance totale pouvant être générée par la pile à combustible microbienne.
L’application de traitements de surface sur l’anode a montré dans d’autres études une
amélioration des performances des piles, une voie qui pourrait être explorée ou tout simplement
appliquée dans nos piles pour en augmenter la puissance. Toutefois, le problème le plus limitant
noté dans cette thèse est plutôt situé au niveau du développement de matériaux de cathodes
n’utilisant pas de métaux précieux mais générant une puissance raisonnable. L’oxyde de
manganèse a su montré des performances acceptables, mais beaucoup de travail doit être fait à ce
niveau afin d’en augmenter l’activité catalytique tout en diminuant les pertes associées à ce
matériau. Un travail futur pourrait donc consister à tester divers traitements (ex. : activation à
l’acide) ou encore modifier la structure de l’oxyde, lui octroyant ainsi une grande stabilité pour
éviter sa dissolution, ceci couplé à une activité catalytique de réduction de l’oxygène améliorée.
Aussi, un aspect non étudié ici mais étant souvent mis de l’avant comme étant une limitation
majeure à l’implémentation de tels systèmes dans l’industrie est la production de piles
microbiennes de grande dimension. En effet, l’agrandissement de notre système reste à être mis à
l’étude car il a été souvent noté que les piles de grand volume présentent des performances
inférieures à celles de petit volume. Une étude a analysé cet effet comme étant causé par la
résistance interne de la pile, celle-ci étant reliée au volume rempli par les électrodes et
150
l’électrolyte (Clauwaert et al., 2008). Il a aussi été montré que la puissance générée par une pile
microbienne dont on augmentait la taille de l’anode n’était pas proportionnelle à la surface de
l’anode, mais bien au logarithme de sa surface (Dewan, Beyenal & Lewandowski, 2008). Dans
cette optique, une étude a conclu que l’agrandissement peut être plus efficace si l’empilement de
plusieurs petites piles est effectué plutôt qu’en élargissant une pile individuelle (Ieropoulos et al.,
2008). Ainsi, une autre possibilité de développement de notre système est d’étudier son
empilement en conservant le volume actuel, ou en l’augmentant très peu.
Les piles à combustible microbiennes démontrent trois avantages concrets comparativement au
traitement aérobie conventionnel : 1) la production d’un produit utile (électricité); 2) l’aération de
la solution n’est pas utile donc un besoin en électricité de moins; et 3) la réduction de la
formation de biomasse dont on doit se débarrasser (Logan, 2009). Toutefois, une analyse de cycle
de vie comparant le traitement anaérobie conventionnel et les piles à combustible microbiennes a
démontré que ces dernières ne sont pas l’option apportant un bénéfice significatif de l’impact
environnemental comparativement au traitement anaérobie. De plus, cette étude a utilisé des
valeurs de performance n’étant toujours pas atteintes encore aujourd’hui et qui demeurent un
défi, surtout lorsqu’il est question d’augmenter la taille des réacteurs. Toutefois, cette étude
soutient que les perspectives et impacts positifs de ces systèmes justifient de pousser la recherche
dans ce domaine (Foley, Rozendal, Hertle, Lant & Rabaey, 2010).
Cette étude précise que la meilleure option consiste à développer les piles à électrolyse
microbiennes, celles-ci étant issues de simples modifications des piles à combustible
microbiennes et générant des sous-produits utiles tel le peroxyde d’hydrogène, l’hydrogène ou
encore le méthane à la cathode (Cheng & Logan, 2007a; Foley et al., 2010; Tartakovsky, Manuel,
Wang & Guiot, 2009). Ces piles à électrolyse microbiennes sont ainsi une autre option
intéressante de la modification du système utilisé dans cette étude à être validée. De plus, il peut
être intéressant du point de vue économique pour certaines entreprises d’effectuer l’enlèvement
cathodique de certains métaux dans leurs effluents, tels l’uranium ou le cuivre.
Dans les deux types de piles microbiennes, il est essentiel de réduire le coût des cathodes et de
développer des matériaux catalytiques sans métal précieux pour produire des systèmes à grande
échelle pratiques et surtout économiques. Toutefois, il est trop tôt pour déterminer si et quand ces
systèmes deviendront des méthodes efficaces et avantageuses pour le traitement des eaux usées et
151
le recouvrement d’énergie (Logan, 2009). Ainsi, d’autres options économiques envisageables à
court terme pourraient consister au couplage d’une pile à combustible microbienne immergée
directement dans un réacteur de traitement d’eaux usées aérobie (Cha, Choi, Yu, Kim & Kim,
2010) ou anaérobie (Min & Angelidaki, 2008). Ces alternatives nécessitent toutefois certaines
adaptations et les infrastructures (digesteurs) pour être étudiées.
Pour résumer et conclure, cette étude a permis de mettre à jour diverses améliorations au niveau
du design et des électrodes qui ont été apportées et d’autres devant être considérées, ces
modifications ayant toutes pour résultat l’amélioration notable de la génération d’électricité de
tels systèmes. Toutefois, de multiples avenues se dressent quant aux possibilités futures
d’investigation et d’implémentation des piles à combustible microbiennes afin que celles-ci
puissent être commercialisées: étudier de nouveaux catalyseurs cathodiques ou des réactions
cathodiques autres que la réduction de l’oxygène dont la catalyse est très coûteuse
énergétiquement, développer des piles de grand volume ou un empilement de piles, ou encore
déployer des systèmes permettant leur insertion dans des installations existantes. Toutes les
recherches effectuées dans ces domaines conduiront à une compréhension accrue du sujet,
permettant d’avoir bon espoir de voir apparaître de tels systèmes dans notre environnement dans
quelques années.
152
RÉFÉRENCES
Aelterman, P., Freguia, S., Keller, J., Verstraete, W., & Rabaey, K. (2008a). The anode potential
regulates bacterial activity in microbial fuel cells. Applied Microbiology and
Biotechnology, 78(3), 409-418.
Aelterman, P., Rabaey, K., Pham, H. T., Boon, N., & Verstraete, W. (2006). Continuous
Electricity Generation at High Voltages and Currents Using Stacked Microbial Fuel Cells.
Environmental Science & Technology, 40(10), 3388-3394.
Aelterman, P., Versichele, M., Genettello, E., Verbeken, K., & Verstraete, W. (2009). Microbial
fuel cells operated with iron-chelated air cathodes. Electrochimica acta, 54(24), 5754-
5760.
Aelterman, P., Versichele, M., Marzorati, M., Boon, N., & Verstraete, W. (2008b). Loading rate
and external resistance control the electricity generation of microbial fuel cells with
different three-dimensional anodes. Bioresource Technology, 99(18), 8895-8902.
Aldrovandi, A., Marsili, E., Stante, L., Paganin, P., Tabacchioni, S., & Giordano, A. (2009).
Sustainable power production in a membrane-less and mediator-less synthetic wastewater
microbial fuel cell. Bioresource Technology, 100(13), 3252-3260.
Bard, A. J., & Faulkner, L. R. (2001). Electrochemical Methods: Fundamentals and Applications
(2nd ed.). Toronto: John Wiley & Sons, Inc.
Barsoukov, E., & Macdonald, J. R. (2005). Impedance Spectroscopy - Theory, Experiment, and
Applications. Hoboken, New Jersey: John Wiley & Sons, Inc.
Behera, M., Jana, P. S., More, T. T., & Ghangrekar, M. M. (2010). Rice mill wastewater
treatment in microbial fuel cells fabricated using proton exchange membrane and earthen
pot at different pH. Bioelectrochemistry, 79(2), 228-233.
Beliaev, A. S., Klingeman, D. M., Klappenbach, J. A., Wu, L., Romine, M. F., Tiedje, J. M., et
al. (2005). Global Transcriptome Analysis of Shewanella oneidensis MR-1 Exposed to
Different Terminal Electron Acceptors. J. Bacteriol., 187(20), 7138-7145.
153
Bennetto, H. P., Delaney, G. M., Mason, J. R., Roller, S. D., Stirling, J. L., & Thurston, C. F.
(1985). The sucrose fuel cell: efficient biomass conversion using a microbial catalyst.
Biotechnology Letters, 7(10), 699-704.
Bergel, A., Féron, D., & Mollica, A. (2005). Catalysis of oxygen reduction in PEM fuel cell by
seawater biofilm. Electrochemistry Communications, 7(9), 900-904.
Biffinger, J.C., Byrd, J. N., Dudley, B. L., & Ringeisen, B. R. (2008). Oxygen exposure promotes
fuel diversity for Shewanella oneidensis microbial fuel cells. Biosensors and
Bioelectronics, 23(6), 820-826.
Biffinger, J.C., Ray, R., Little, B., & Ringeisen, B. R. (2007). Diversifying Biological Fuel Cell
Designs by Use of Nanoporous Filters. Environ. Sci. Technol., 41(4), 1444-1449.
Birry, L., Mehta, P., Jaouen, F., Dodelet, J. P., Guiot, S. R., & Tartakovsky, B. (2010).
Application of iron-based cathode catalysts in a microbial fuel cell. Electrochimica Acta,
56(3), 1505-1511.
Bond, D. R., & Lovley, D. R. (2003). Electricity production by Geobacter sulfurreducens
attached to electrodes. Appl. Environ. Microbiol., 69(3), 1548-1555.
Borole, A., P. , Hamilton, C., Y. , Aaron, D., S. , & Tsouris, C. (2009). Investigating microbial
fuel cell bioanode performance under different cathode conditions. Biotechnology
Progress, 25(6), 1630-1636.
Borole, A. P., Aaron, D., Hamilton, C. Y., & Tsouris, C. (2010). Understanding Long-Term
Changes in Microbial Fuel Cell Performance Using Electrochemical Impedance
Spectroscopy. Environmental Science & Technology, 44(7), 2740-2745.
Busalmen, J., P. , Esteve-Núñez, A., Berná, A., & Feliu, J. M. (2008). C-Type Cytochromes Wire
Electricity-Producing Bacteria to Electrodes. Angewandte Chemie, 120(26), 4952-4955.
Calegaro, M. L., Lima, F. H. B., & Ticianelli, E. A. (2006). Oxygen reduction reaction on
nanosized manganese oxide particles dispersed on carbon in alkaline solutions. Journal of
Power Sources, 158(1), 735-739.
Catal, T., Li, K., Bermek, H., & Liu, H. (2008a). Electricity production from twelve
monosaccharides using microbial fuel cells. Journal of Power Sources, 175(1), 196-200.
154
Catal, T., Xu, S., Li, K., Bermek, H., & Liu, H. (2008b). Electricity generation from polyalcohols
in single-chamber microbial fuel cells. Biosensors and Bioelectronics, 24(4), 849-854.
Cercado-Quezada, B., Delia, M.-L., & Bergel, A. (2010). Testing various food-industry wastes
for electricity production in microbial fuel cell. Bioresource Technology, 101(8), 2748-
2754.
Cha, J., Choi, S., Yu, H., Kim, H., & Kim, C. (2010). Directly applicable microbial fuel cells in
aeration tank for wastewater treatment. Bioelectrochemistry, 78(1), 72-79.
Chae, K.-J., Choi, M.-J., Kim, K.-Y., Ajayi, F. F., Chang, I.-S., & Kim, I. S. (2010). Selective
inhibition of methanogens for the improvement of biohydrogen production in microbial
electrolysis cells. International Journal of Hydrogen Energy, 35(24), 13379-13386.
Chaparro, A. M., Gallardo, B., Folgado, M. A., Martín, A. J., & Daza, L. (2009). PEMFC
electrode preparation by electrospray: Optimization of catalyst load and ionomer content.
Catalysis Today, 143(3-4), 237-241.
Chaudhuri, S. K., & Lovley, D. R. (2003). Electricity generation by direct oxidation of glucose in
mediatorless microbial fuel cells. Nat Biotech, 21(10), 1229-1232.
Chen, G.-W., Cha, J.-H., Choi, S.-J., Lee, T.-H., & Kim, C.-W. (2010). Characterization of an
open biocathode microbial fuel cell for electricity generation and effluent polish. Korean
Journal of Chemical Engineering, 27(3), 828-835.
Chen, G.-W., Choi, S.-J., Lee, T.-H., Lee, G.-Y., Cha, J.-H., & Kim, C.-W. (2008). Application
of biocathode in microbial fuel cells: cell performance and microbial community. Applied
Microbiology and Biotechnology, 79(3), 379-388.
Cheng, K.Y., Ho, G., & Cord-Ruwisch, R. (2008). Affinity of Microbial Fuel Cell Biofilm for the
Anodic Potential. Environ. Sci. Technol., 42(10), 3828-3834.
Cheng, S., Liu, H., & Logan, B. E. (2006a). Increased performance of single-chamber microbial
fuel cells using an improved cathode structure. Electrochemistry Communications, 8(3),
489-494.
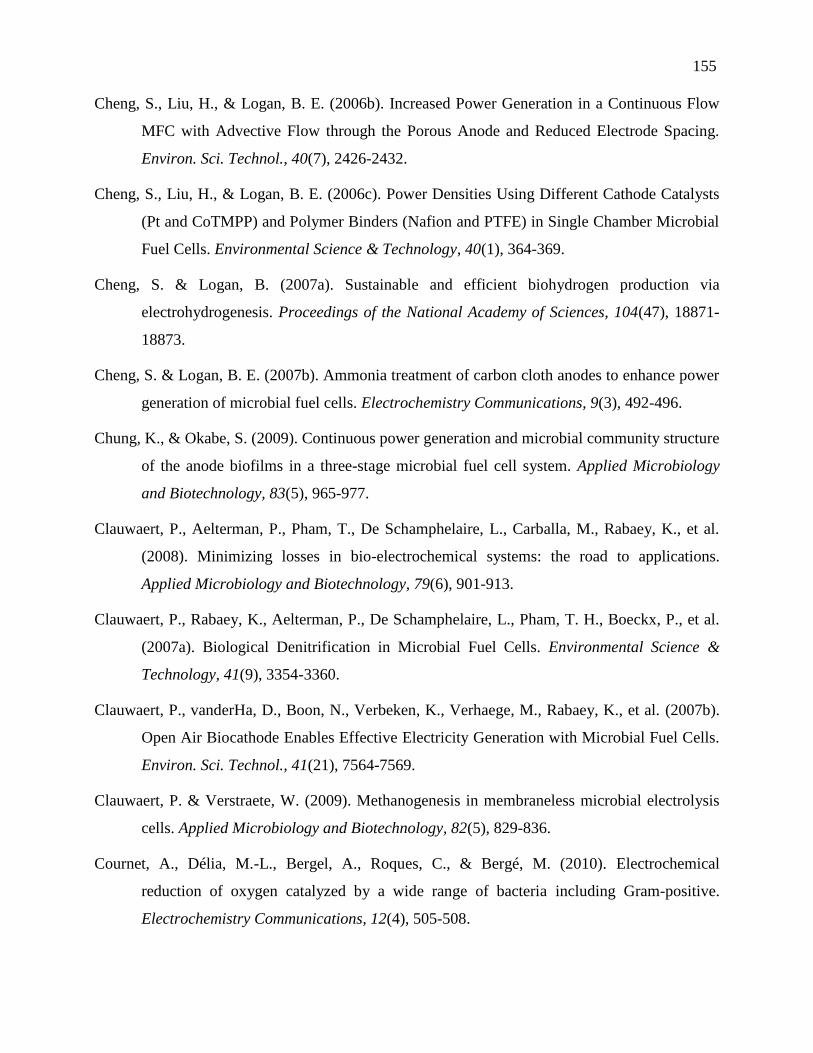
155
Cheng, S., Liu, H., & Logan, B. E. (2006b). Increased Power Generation in a Continuous Flow
MFC with Advective Flow through the Porous Anode and Reduced Electrode Spacing.
Environ. Sci. Technol., 40(7), 2426-2432.
Cheng, S., Liu, H., & Logan, B. E. (2006c). Power Densities Using Different Cathode Catalysts
(Pt and CoTMPP) and Polymer Binders (Nafion and PTFE) in Single Chamber Microbial
Fuel Cells. Environmental Science & Technology, 40(1), 364-369.
Cheng, S. & Logan, B. (2007a). Sustainable and efficient biohydrogen production via
electrohydrogenesis. Proceedings of the National Academy of Sciences, 104(47), 18871-
18873.
Cheng, S. & Logan, B. E. (2007b). Ammonia treatment of carbon cloth anodes to enhance power
generation of microbial fuel cells. Electrochemistry Communications, 9(3), 492-496.
Chung, K., & Okabe, S. (2009). Continuous power generation and microbial community structure
of the anode biofilms in a three-stage microbial fuel cell system. Applied Microbiology
and Biotechnology, 83(5), 965-977.
Clauwaert, P., Aelterman, P., Pham, T., De Schamphelaire, L., Carballa, M., Rabaey, K., et al.
(2008). Minimizing losses in bio-electrochemical systems: the road to applications.
Applied Microbiology and Biotechnology, 79(6), 901-913.
Clauwaert, P., Rabaey, K., Aelterman, P., De Schamphelaire, L., Pham, T. H., Boeckx, P., et al.
(2007a). Biological Denitrification in Microbial Fuel Cells. Environmental Science &
Technology, 41(9), 3354-3360.
Clauwaert, P., vanderHa, D., Boon, N., Verbeken, K., Verhaege, M., Rabaey, K., et al. (2007b).
Open Air Biocathode Enables Effective Electricity Generation with Microbial Fuel Cells.
Environ. Sci. Technol., 41(21), 7564-7569.
Clauwaert, P. & Verstraete, W. (2009). Methanogenesis in membraneless microbial electrolysis
cells. Applied Microbiology and Biotechnology, 82(5), 829-836.
Cournet, A., Délia, M.-L., Bergel, A., Roques, C., & Bergé, M. (2010). Electrochemical
reduction of oxygen catalyzed by a wide range of bacteria including Gram-positive.
Electrochemistry Communications, 12(4), 505-508.
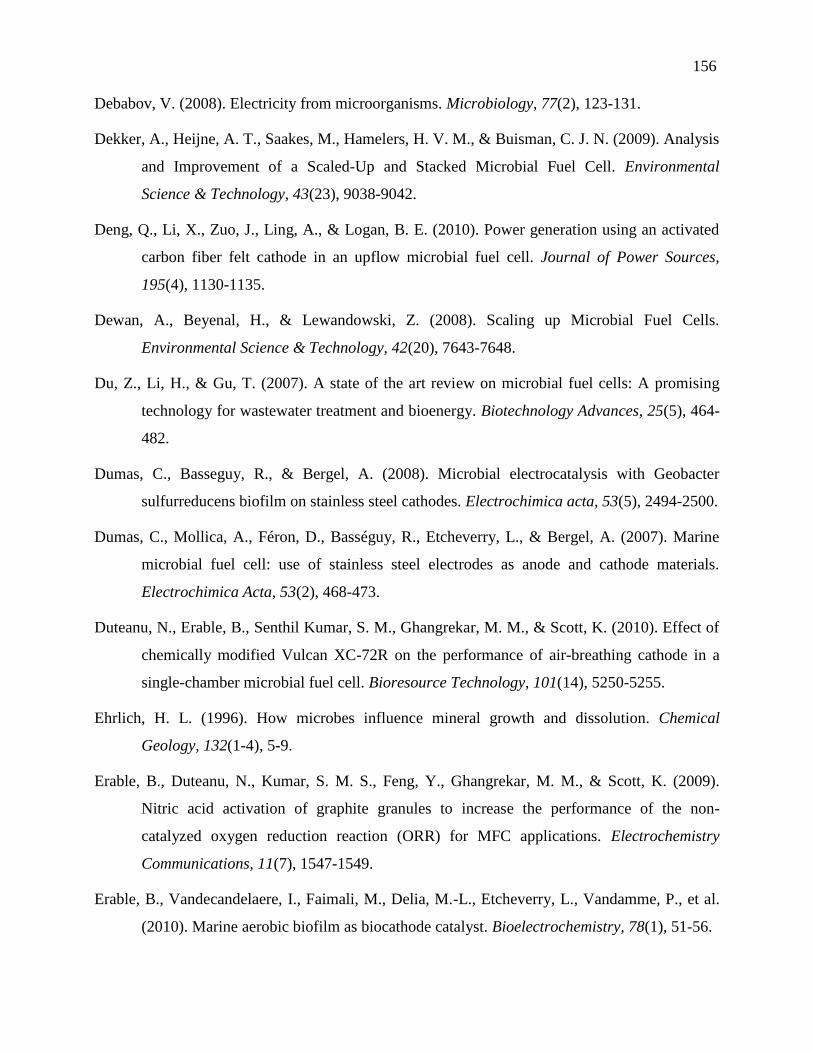
156
Debabov, V. (2008). Electricity from microorganisms. Microbiology, 77(2), 123-131.
Dekker, A., Heijne, A. T., Saakes, M., Hamelers, H. V. M., & Buisman, C. J. N. (2009). Analysis
and Improvement of a Scaled-Up and Stacked Microbial Fuel Cell. Environmental
Science & Technology, 43(23), 9038-9042.
Deng, Q., Li, X., Zuo, J., Ling, A., & Logan, B. E. (2010). Power generation using an activated
carbon fiber felt cathode in an upflow microbial fuel cell. Journal of Power Sources,
195(4), 1130-1135.
Dewan, A., Beyenal, H., & Lewandowski, Z. (2008). Scaling up Microbial Fuel Cells.
Environmental Science & Technology, 42(20), 7643-7648.
Du, Z., Li, H., & Gu, T. (2007). A state of the art review on microbial fuel cells: A promising
technology for wastewater treatment and bioenergy. Biotechnology Advances, 25(5), 464-
482.
Dumas, C., Basseguy, R., & Bergel, A. (2008). Microbial electrocatalysis with Geobacter
sulfurreducens biofilm on stainless steel cathodes. Electrochimica acta, 53(5), 2494-2500.
Dumas, C., Mollica, A., Féron, D., Basséguy, R., Etcheverry, L., & Bergel, A. (2007). Marine
microbial fuel cell: use of stainless steel electrodes as anode and cathode materials.
Electrochimica Acta, 53(2), 468-473.
Duteanu, N., Erable, B., Senthil Kumar, S. M., Ghangrekar, M. M., & Scott, K. (2010). Effect of
chemically modified Vulcan XC-72R on the performance of air-breathing cathode in a
single-chamber microbial fuel cell. Bioresource Technology, 101(14), 5250-5255.
Ehrlich, H. L. (1996). How microbes influence mineral growth and dissolution. Chemical
Geology, 132(1-4), 5-9.
Erable, B., Duteanu, N., Kumar, S. M. S., Feng, Y., Ghangrekar, M. M., & Scott, K. (2009).
Nitric acid activation of graphite granules to increase the performance of the non-
catalyzed oxygen reduction reaction (ORR) for MFC applications. Electrochemistry
Communications, 11(7), 1547-1549.
Erable, B., Vandecandelaere, I., Faimali, M., Delia, M.-L., Etcheverry, L., Vandamme, P., et al.
(2010). Marine aerobic biofilm as biocathode catalyst. Bioelectrochemistry, 78(1), 51-56.
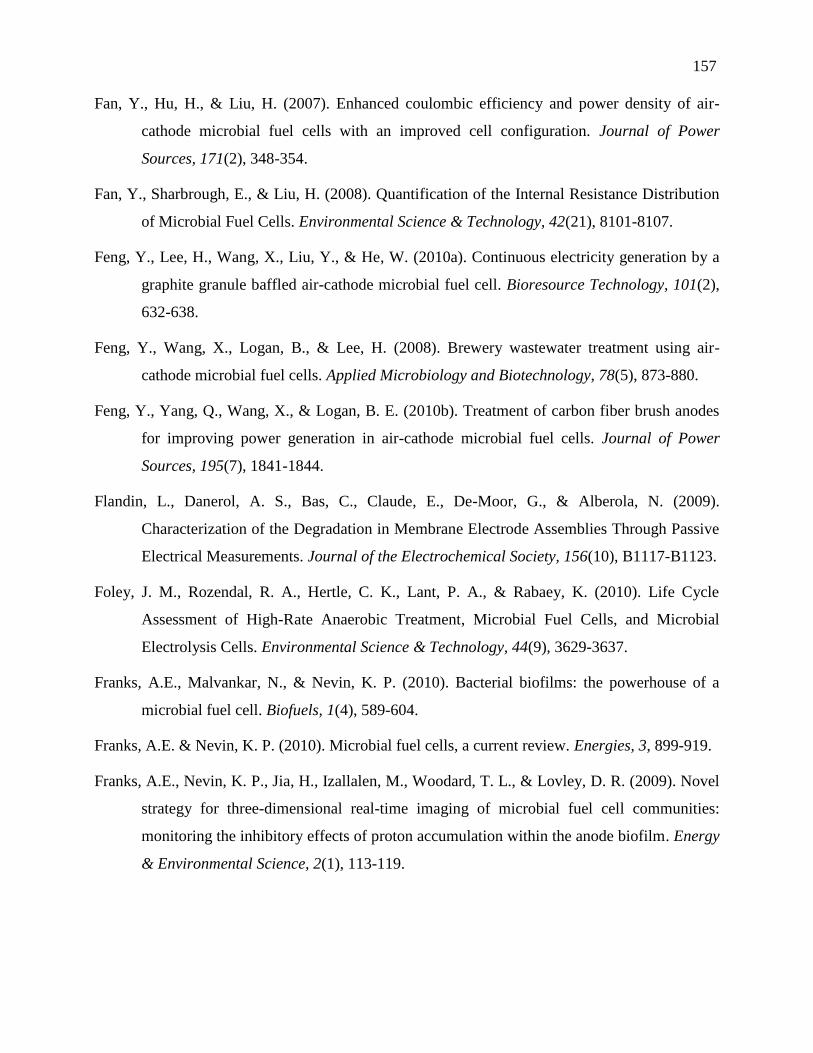
157
Fan, Y., Hu, H., & Liu, H. (2007). Enhanced coulombic efficiency and power density of air-
cathode microbial fuel cells with an improved cell configuration. Journal of Power
Sources, 171(2), 348-354.
Fan, Y., Sharbrough, E., & Liu, H. (2008). Quantification of the Internal Resistance Distribution
of Microbial Fuel Cells. Environmental Science & Technology, 42(21), 8101-8107.
Feng, Y., Lee, H., Wang, X., Liu, Y., & He, W. (2010a). Continuous electricity generation by a
graphite granule baffled air-cathode microbial fuel cell. Bioresource Technology, 101(2),
632-638.
Feng, Y., Wang, X., Logan, B., & Lee, H. (2008). Brewery wastewater treatment using air-
cathode microbial fuel cells. Applied Microbiology and Biotechnology, 78(5), 873-880.
Feng, Y., Yang, Q., Wang, X., & Logan, B. E. (2010b). Treatment of carbon fiber brush anodes
for improving power generation in air-cathode microbial fuel cells. Journal of Power
Sources, 195(7), 1841-1844.
Flandin, L., Danerol, A. S., Bas, C., Claude, E., De-Moor, G., & Alberola, N. (2009).
Characterization of the Degradation in Membrane Electrode Assemblies Through Passive
Electrical Measurements. Journal of the Electrochemical Society, 156(10), B1117-B1123.
Foley, J. M., Rozendal, R. A., Hertle, C. K., Lant, P. A., & Rabaey, K. (2010). Life Cycle
Assessment of High-Rate Anaerobic Treatment, Microbial Fuel Cells, and Microbial
Electrolysis Cells. Environmental Science & Technology, 44(9), 3629-3637.
Franks, A.E., Malvankar, N., & Nevin, K. P. (2010). Bacterial biofilms: the powerhouse of a
microbial fuel cell. Biofuels, 1(4), 589-604.
Franks, A.E. & Nevin, K. P. (2010). Microbial fuel cells, a current review. Energies, 3, 899-919.
Franks, A.E., Nevin, K. P., Jia, H., Izallalen, M., Woodard, T. L., & Lovley, D. R. (2009). Novel
strategy for three-dimensional real-time imaging of microbial fuel cell communities:
monitoring the inhibitory effects of proton accumulation within the anode biofilm. Energy
& Environmental Science, 2(1), 113-119.
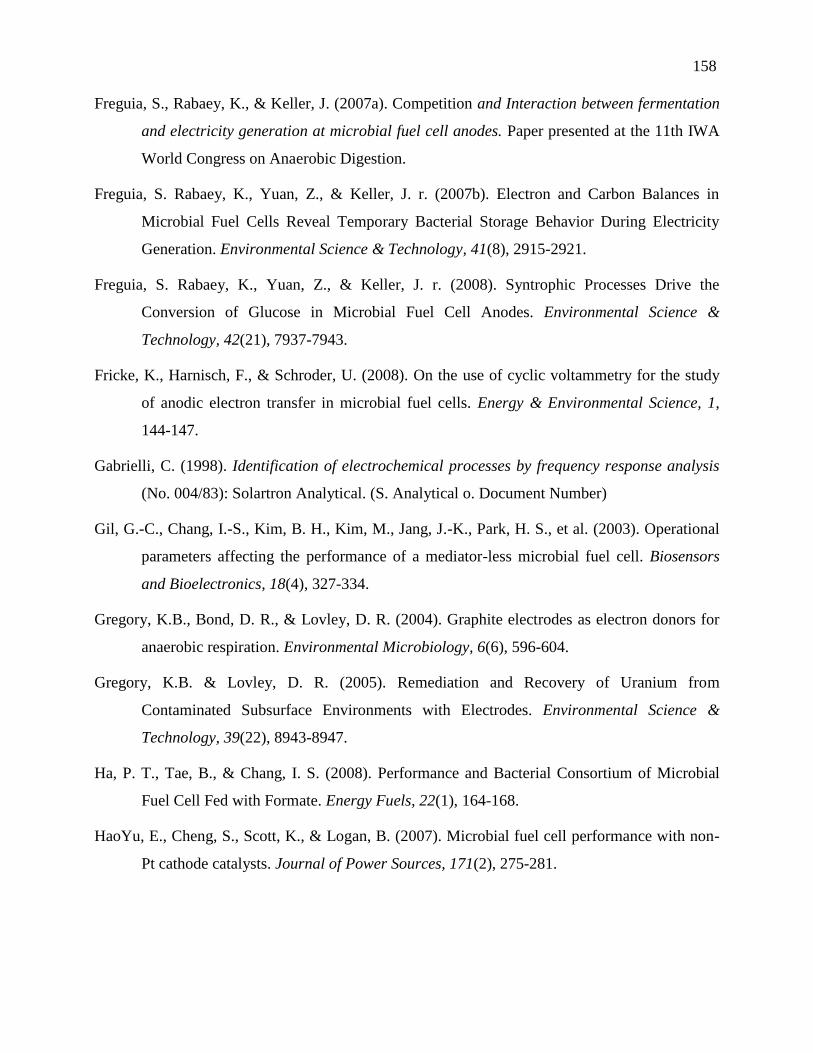
158
Freguia, S., Rabaey, K., & Keller, J. (2007a). Competition and Interaction between fermentation
and electricity generation at microbial fuel cell anodes. Paper presented at the 11th IWA
World Congress on Anaerobic Digestion.
Freguia, S. Rabaey, K., Yuan, Z., & Keller, J. r. (2007b). Electron and Carbon Balances in
Microbial Fuel Cells Reveal Temporary Bacterial Storage Behavior During Electricity
Generation. Environmental Science & Technology, 41(8), 2915-2921.
Freguia, S. Rabaey, K., Yuan, Z., & Keller, J. r. (2008). Syntrophic Processes Drive the
Conversion of Glucose in Microbial Fuel Cell Anodes. Environmental Science &
Technology, 42(21), 7937-7943.
Fricke, K., Harnisch, F., & Schroder, U. (2008). On the use of cyclic voltammetry for the study
of anodic electron transfer in microbial fuel cells. Energy & Environmental Science, 1,
144-147.
Gabrielli, C. (1998). Identification of electrochemical processes by frequency response analysis
(No. 004/83): Solartron Analytical. (S. Analytical o. Document Number)
Gil, G.-C., Chang, I.-S., Kim, B. H., Kim, M., Jang, J.-K., Park, H. S., et al. (2003). Operational
parameters affecting the performance of a mediator-less microbial fuel cell. Biosensors
and Bioelectronics, 18(4), 327-334.
Gregory, K.B., Bond, D. R., & Lovley, D. R. (2004). Graphite electrodes as electron donors for
anaerobic respiration. Environmental Microbiology, 6(6), 596-604.
Gregory, K.B. & Lovley, D. R. (2005). Remediation and Recovery of Uranium from
Contaminated Subsurface Environments with Electrodes. Environmental Science &
Technology, 39(22), 8943-8947.
Ha, P. T., Tae, B., & Chang, I. S. (2008). Performance and Bacterial Consortium of Microbial
Fuel Cell Fed with Formate. Energy Fuels, 22(1), 164-168.
HaoYu, E., Cheng, S., Scott, K., & Logan, B. (2007). Microbial fuel cell performance with non-
Pt cathode catalysts. Journal of Power Sources, 171(2), 275-281.
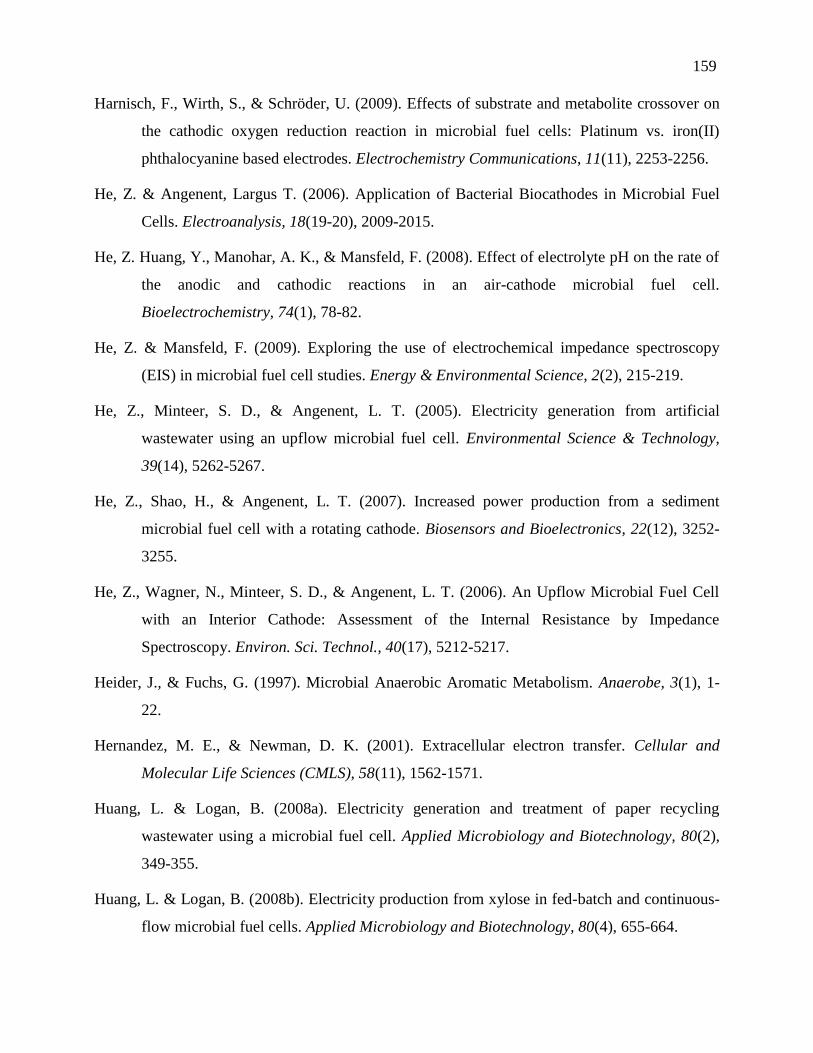
159
Harnisch, F., Wirth, S., & Schröder, U. (2009). Effects of substrate and metabolite crossover on
the cathodic oxygen reduction reaction in microbial fuel cells: Platinum vs. iron(II)
phthalocyanine based electrodes. Electrochemistry Communications, 11(11), 2253-2256.
He, Z. & Angenent, Largus T. (2006). Application of Bacterial Biocathodes in Microbial Fuel
Cells. Electroanalysis, 18(19-20), 2009-2015.
He, Z. Huang, Y., Manohar, A. K., & Mansfeld, F. (2008). Effect of electrolyte pH on the rate of
the anodic and cathodic reactions in an air-cathode microbial fuel cell.
Bioelectrochemistry, 74(1), 78-82.
He, Z. & Mansfeld, F. (2009). Exploring the use of electrochemical impedance spectroscopy
(EIS) in microbial fuel cell studies. Energy & Environmental Science, 2(2), 215-219.
He, Z., Minteer, S. D., & Angenent, L. T. (2005). Electricity generation from artificial
wastewater using an upflow microbial fuel cell. Environmental Science & Technology,
39(14), 5262-5267.
He, Z., Shao, H., & Angenent, L. T. (2007). Increased power production from a sediment
microbial fuel cell with a rotating cathode. Biosensors and Bioelectronics, 22(12), 3252-
3255.
He, Z., Wagner, N., Minteer, S. D., & Angenent, L. T. (2006). An Upflow Microbial Fuel Cell
with an Interior Cathode: Assessment of the Internal Resistance by Impedance
Spectroscopy. Environ. Sci. Technol., 40(17), 5212-5217.
Heider, J., & Fuchs, G. (1997). Microbial Anaerobic Aromatic Metabolism. Anaerobe, 3(1), 1-
22.
Hernandez, M. E., & Newman, D. K. (2001). Extracellular electron transfer. Cellular and
Molecular Life Sciences (CMLS), 58(11), 1562-1571.
Huang, L. & Logan, B. (2008a). Electricity generation and treatment of paper recycling
wastewater using a microbial fuel cell. Applied Microbiology and Biotechnology, 80(2),
349-355.
Huang, L. & Logan, B. (2008b). Electricity production from xylose in fed-batch and continuous-
flow microbial fuel cells. Applied Microbiology and Biotechnology, 80(4), 655-664.
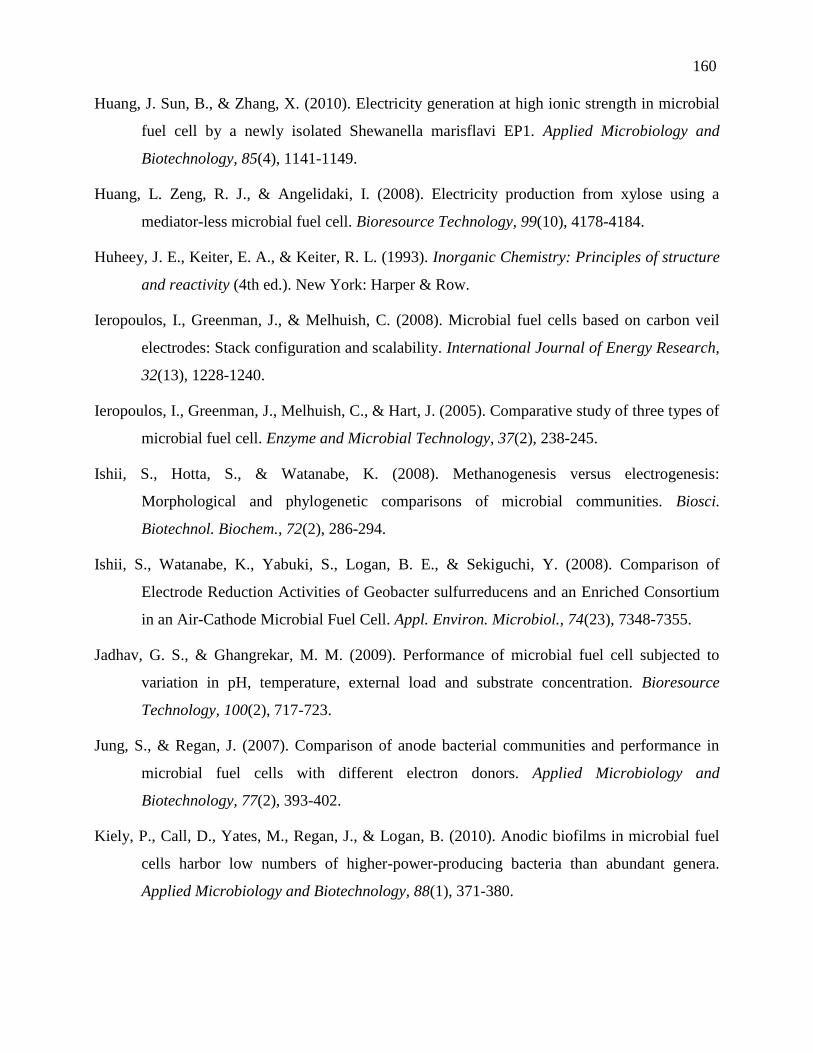
160
Huang, J. Sun, B., & Zhang, X. (2010). Electricity generation at high ionic strength in microbial
fuel cell by a newly isolated Shewanella marisflavi EP1. Applied Microbiology and
Biotechnology, 85(4), 1141-1149.
Huang, L. Zeng, R. J., & Angelidaki, I. (2008). Electricity production from xylose using a
mediator-less microbial fuel cell. Bioresource Technology, 99(10), 4178-4184.
Huheey, J. E., Keiter, E. A., & Keiter, R. L. (1993). Inorganic Chemistry: Principles of structure
and reactivity (4th ed.). New York: Harper & Row.
Ieropoulos, I., Greenman, J., & Melhuish, C. (2008). Microbial fuel cells based on carbon veil
electrodes: Stack configuration and scalability. International Journal of Energy Research,
32(13), 1228-1240.
Ieropoulos, I., Greenman, J., Melhuish, C., & Hart, J. (2005). Comparative study of three types of
microbial fuel cell. Enzyme and Microbial Technology, 37(2), 238-245.
Ishii, S., Hotta, S., & Watanabe, K. (2008). Methanogenesis versus electrogenesis:
Morphological and phylogenetic comparisons of microbial communities. Biosci.
Biotechnol. Biochem., 72(2), 286-294.
Ishii, S., Watanabe, K., Yabuki, S., Logan, B. E., & Sekiguchi, Y. (2008). Comparison of
Electrode Reduction Activities of Geobacter sulfurreducens and an Enriched Consortium
in an Air-Cathode Microbial Fuel Cell. Appl. Environ. Microbiol., 74(23), 7348-7355.
Jadhav, G. S., & Ghangrekar, M. M. (2009). Performance of microbial fuel cell subjected to
variation in pH, temperature, external load and substrate concentration. Bioresource
Technology, 100(2), 717-723.
Jung, S., & Regan, J. (2007). Comparison of anode bacterial communities and performance in
microbial fuel cells with different electron donors. Applied Microbiology and
Biotechnology, 77(2), 393-402.
Kiely, P., Call, D., Yates, M., Regan, J., & Logan, B. (2010). Anodic biofilms in microbial fuel
cells harbor low numbers of higher-power-producing bacteria than abundant genera.
Applied Microbiology and Biotechnology, 88(1), 371-380.
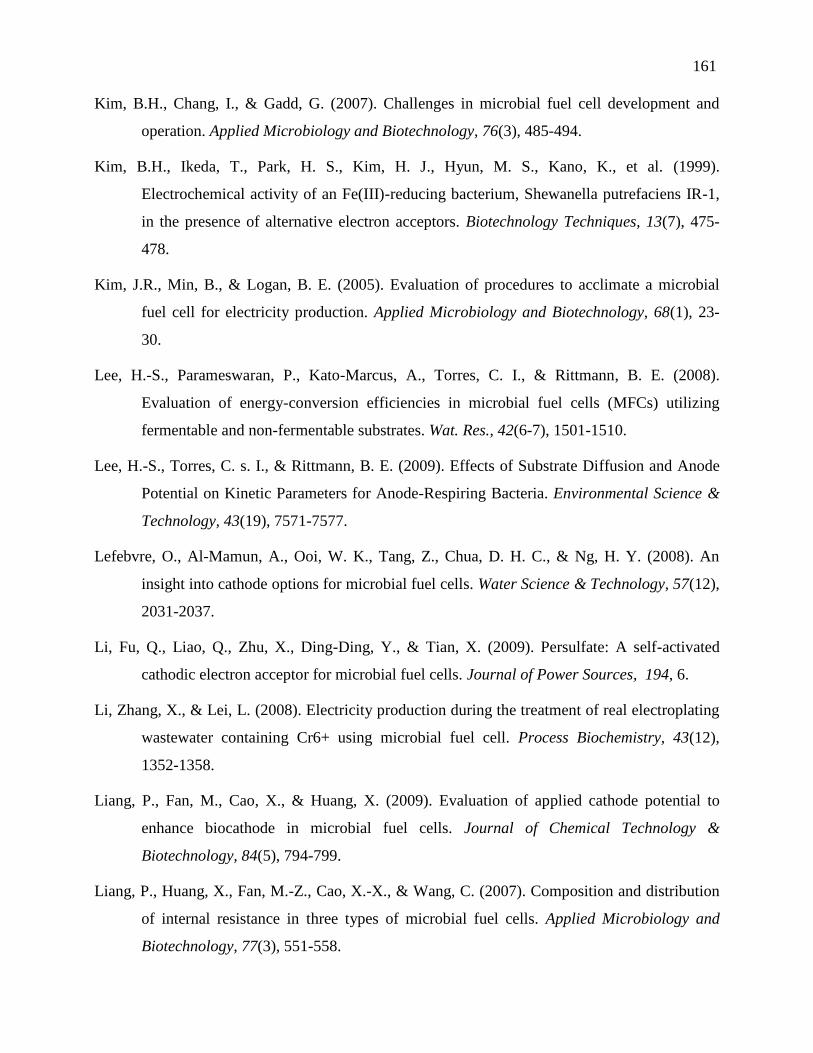
161
Kim, B.H., Chang, I., & Gadd, G. (2007). Challenges in microbial fuel cell development and
operation. Applied Microbiology and Biotechnology, 76(3), 485-494.
Kim, B.H., Ikeda, T., Park, H. S., Kim, H. J., Hyun, M. S., Kano, K., et al. (1999).
Electrochemical activity of an Fe(III)-reducing bacterium, Shewanella putrefaciens IR-1,
in the presence of alternative electron acceptors. Biotechnology Techniques, 13(7), 475-
478.
Kim, J.R., Min, B., & Logan, B. E. (2005). Evaluation of procedures to acclimate a microbial
fuel cell for electricity production. Applied Microbiology and Biotechnology, 68(1), 23-
30.
Lee, H.-S., Parameswaran, P., Kato-Marcus, A., Torres, C. I., & Rittmann, B. E. (2008).
Evaluation of energy-conversion efficiencies in microbial fuel cells (MFCs) utilizing
fermentable and non-fermentable substrates. Wat. Res., 42(6-7), 1501-1510.
Lee, H.-S., Torres, C. s. I., & Rittmann, B. E. (2009). Effects of Substrate Diffusion and Anode
Potential on Kinetic Parameters for Anode-Respiring Bacteria. Environmental Science &
Technology, 43(19), 7571-7577.
Lefebvre, O., Al-Mamun, A., Ooi, W. K., Tang, Z., Chua, D. H. C., & Ng, H. Y. (2008). An
insight into cathode options for microbial fuel cells. Water Science & Technology, 57(12),
2031-2037.
Li, Fu, Q., Liao, Q., Zhu, X., Ding-Ding, Y., & Tian, X. (2009). Persulfate: A self-activated
cathodic electron acceptor for microbial fuel cells. Journal of Power Sources, 194, 6.
Li, Zhang, X., & Lei, L. (2008). Electricity production during the treatment of real electroplating
wastewater containing Cr6+ using microbial fuel cell. Process Biochemistry, 43(12),
1352-1358.
Liang, P., Fan, M., Cao, X., & Huang, X. (2009). Evaluation of applied cathode potential to
enhance biocathode in microbial fuel cells. Journal of Chemical Technology &
Biotechnology, 84(5), 794-799.
Liang, P., Huang, X., Fan, M.-Z., Cao, X.-X., & Wang, C. (2007). Composition and distribution
of internal resistance in three types of microbial fuel cells. Applied Microbiology and
Biotechnology, 77(3), 551-558.
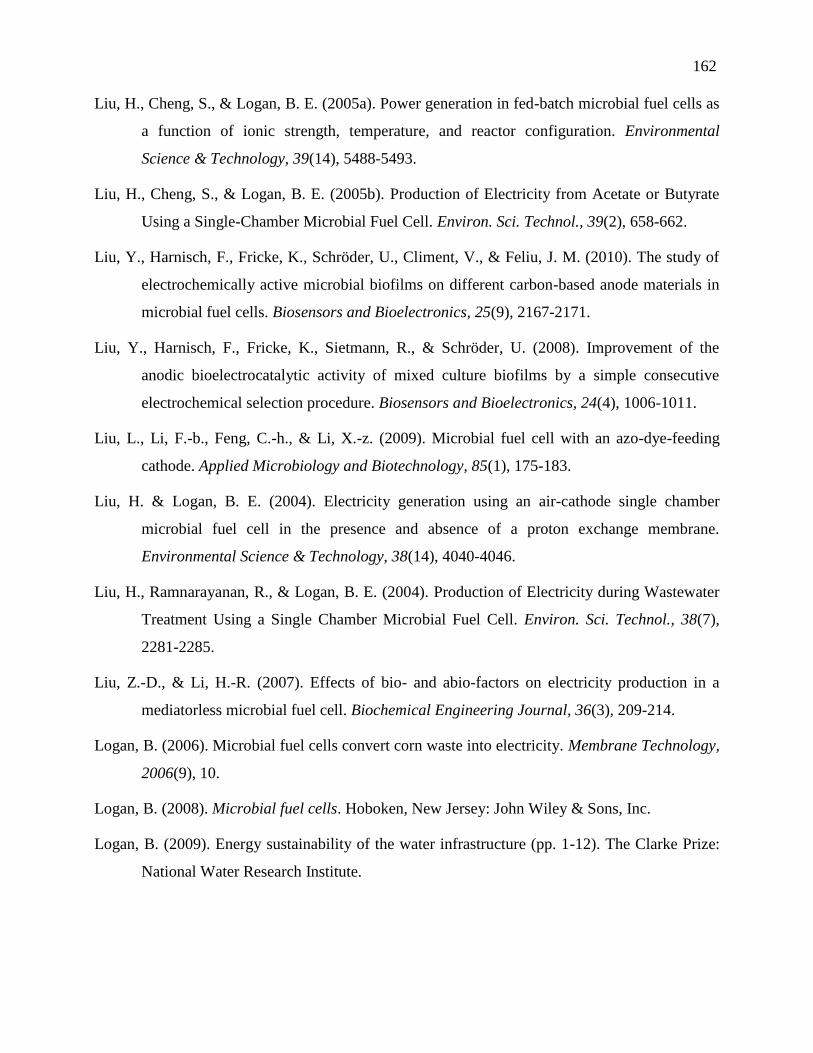
162
Liu, H., Cheng, S., & Logan, B. E. (2005a). Power generation in fed-batch microbial fuel cells as
a function of ionic strength, temperature, and reactor configuration. Environmental
Science & Technology, 39(14), 5488-5493.
Liu, H., Cheng, S., & Logan, B. E. (2005b). Production of Electricity from Acetate or Butyrate
Using a Single-Chamber Microbial Fuel Cell. Environ. Sci. Technol., 39(2), 658-662.
Liu, Y., Harnisch, F., Fricke, K., Schröder, U., Climent, V., & Feliu, J. M. (2010). The study of
electrochemically active microbial biofilms on different carbon-based anode materials in
microbial fuel cells. Biosensors and Bioelectronics, 25(9), 2167-2171.
Liu, Y., Harnisch, F., Fricke, K., Sietmann, R., & Schröder, U. (2008). Improvement of the
anodic bioelectrocatalytic activity of mixed culture biofilms by a simple consecutive
electrochemical selection procedure. Biosensors and Bioelectronics, 24(4), 1006-1011.
Liu, L., Li, F.-b., Feng, C.-h., & Li, X.-z. (2009). Microbial fuel cell with an azo-dye-feeding
cathode. Applied Microbiology and Biotechnology, 85(1), 175-183.
Liu, H. & Logan, B. E. (2004). Electricity generation using an air-cathode single chamber
microbial fuel cell in the presence and absence of a proton exchange membrane.
Environmental Science & Technology, 38(14), 4040-4046.
Liu, H., Ramnarayanan, R., & Logan, B. E. (2004). Production of Electricity during Wastewater
Treatment Using a Single Chamber Microbial Fuel Cell. Environ. Sci. Technol., 38(7),
2281-2285.
Liu, Z.-D., & Li, H.-R. (2007). Effects of bio- and abio-factors on electricity production in a
mediatorless microbial fuel cell. Biochemical Engineering Journal, 36(3), 209-214.
Logan, B. (2006). Microbial fuel cells convert corn waste into electricity. Membrane Technology,
2006(9), 10.
Logan, B. (2008). Microbial fuel cells. Hoboken, New Jersey: John Wiley & Sons, Inc.
Logan, B. (2009). Energy sustainability of the water infrastructure (pp. 1-12). The Clarke Prize:
National Water Research Institute.
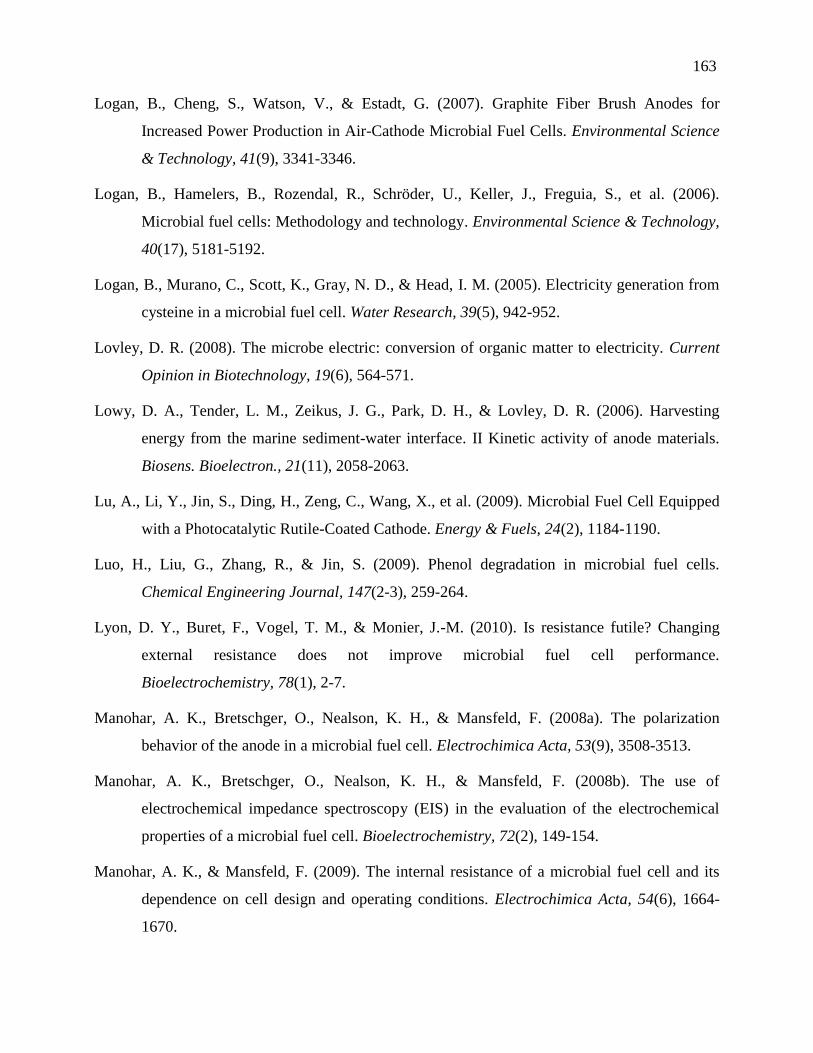
163
Logan, B., Cheng, S., Watson, V., & Estadt, G. (2007). Graphite Fiber Brush Anodes for
Increased Power Production in Air-Cathode Microbial Fuel Cells. Environmental Science
& Technology, 41(9), 3341-3346.
Logan, B., Hamelers, B., Rozendal, R., Schröder, U., Keller, J., Freguia, S., et al. (2006).
Microbial fuel cells: Methodology and technology. Environmental Science & Technology,
40(17), 5181-5192.
Logan, B., Murano, C., Scott, K., Gray, N. D., & Head, I. M. (2005). Electricity generation from
cysteine in a microbial fuel cell. Water Research, 39(5), 942-952.
Lovley, D. R. (2008). The microbe electric: conversion of organic matter to electricity. Current
Opinion in Biotechnology, 19(6), 564-571.
Lowy, D. A., Tender, L. M., Zeikus, J. G., Park, D. H., & Lovley, D. R. (2006). Harvesting
energy from the marine sediment-water interface. II Kinetic activity of anode materials.
Biosens. Bioelectron., 21(11), 2058-2063.
Lu, A., Li, Y., Jin, S., Ding, H., Zeng, C., Wang, X., et al. (2009). Microbial Fuel Cell Equipped
with a Photocatalytic Rutile-Coated Cathode. Energy & Fuels, 24(2), 1184-1190.
Luo, H., Liu, G., Zhang, R., & Jin, S. (2009). Phenol degradation in microbial fuel cells.
Chemical Engineering Journal, 147(2-3), 259-264.
Lyon, D. Y., Buret, F., Vogel, T. M., & Monier, J.-M. (2010). Is resistance futile? Changing
external resistance does not improve microbial fuel cell performance.
Bioelectrochemistry, 78(1), 2-7.
Manohar, A. K., Bretschger, O., Nealson, K. H., & Mansfeld, F. (2008a). The polarization
behavior of the anode in a microbial fuel cell. Electrochimica Acta, 53(9), 3508-3513.
Manohar, A. K., Bretschger, O., Nealson, K. H., & Mansfeld, F. (2008b). The use of
electrochemical impedance spectroscopy (EIS) in the evaluation of the electrochemical
properties of a microbial fuel cell. Bioelectrochemistry, 72(2), 149-154.
Manohar, A. K., & Mansfeld, F. (2009). The internal resistance of a microbial fuel cell and its
dependence on cell design and operating conditions. Electrochimica Acta, 54(6), 1664-
1670.
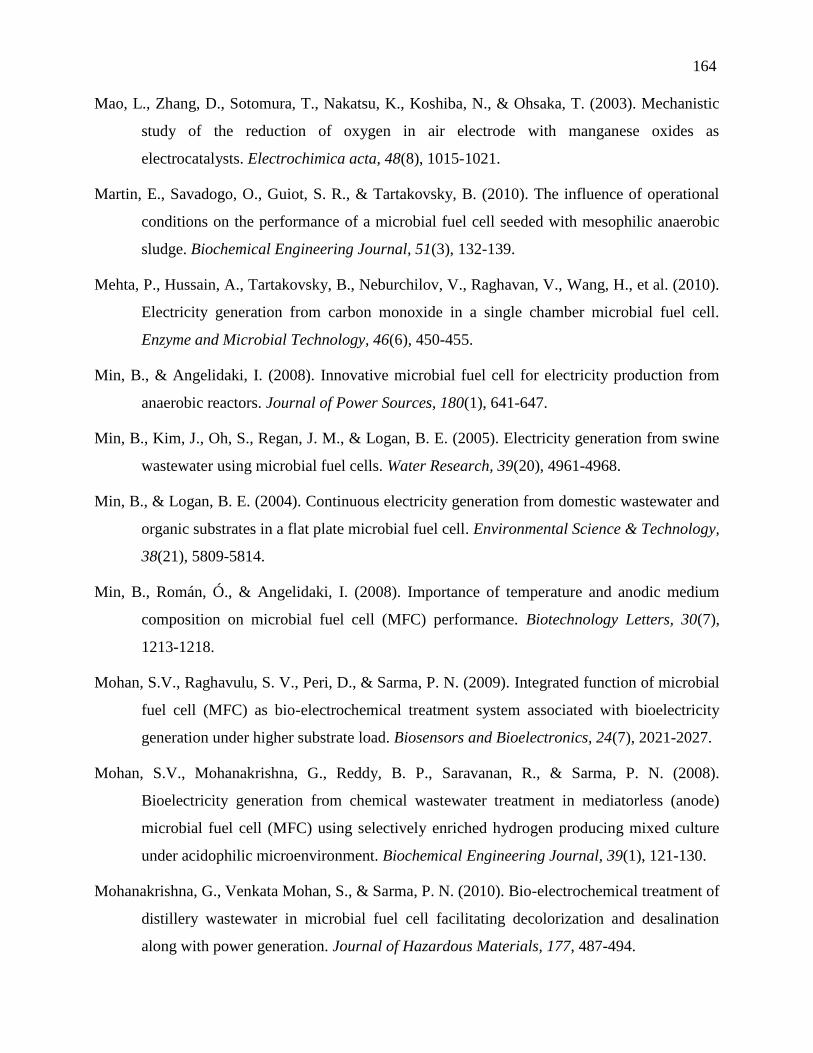
164
Mao, L., Zhang, D., Sotomura, T., Nakatsu, K., Koshiba, N., & Ohsaka, T. (2003). Mechanistic
study of the reduction of oxygen in air electrode with manganese oxides as
electrocatalysts. Electrochimica acta, 48(8), 1015-1021.
Martin, E., Savadogo, O., Guiot, S. R., & Tartakovsky, B. (2010). The influence of operational
conditions on the performance of a microbial fuel cell seeded with mesophilic anaerobic
sludge. Biochemical Engineering Journal, 51(3), 132-139.
Mehta, P., Hussain, A., Tartakovsky, B., Neburchilov, V., Raghavan, V., Wang, H., et al. (2010).
Electricity generation from carbon monoxide in a single chamber microbial fuel cell.
Enzyme and Microbial Technology, 46(6), 450-455.
Min, B., & Angelidaki, I. (2008). Innovative microbial fuel cell for electricity production from
anaerobic reactors. Journal of Power Sources, 180(1), 641-647.
Min, B., Kim, J., Oh, S., Regan, J. M., & Logan, B. E. (2005). Electricity generation from swine
wastewater using microbial fuel cells. Water Research, 39(20), 4961-4968.
Min, B., & Logan, B. E. (2004). Continuous electricity generation from domestic wastewater and
organic substrates in a flat plate microbial fuel cell. Environmental Science & Technology,
38(21), 5809-5814.
Min, B., Román, Ó., & Angelidaki, I. (2008). Importance of temperature and anodic medium
composition on microbial fuel cell (MFC) performance. Biotechnology Letters, 30(7),
1213-1218.
Mohan, S.V., Raghavulu, S. V., Peri, D., & Sarma, P. N. (2009). Integrated function of microbial
fuel cell (MFC) as bio-electrochemical treatment system associated with bioelectricity
generation under higher substrate load. Biosensors and Bioelectronics, 24(7), 2021-2027.
Mohan, S.V., Mohanakrishna, G., Reddy, B. P., Saravanan, R., & Sarma, P. N. (2008).
Bioelectricity generation from chemical wastewater treatment in mediatorless (anode)
microbial fuel cell (MFC) using selectively enriched hydrogen producing mixed culture
under acidophilic microenvironment. Biochemical Engineering Journal, 39(1), 121-130.
Mohanakrishna, G., Venkata Mohan, S., & Sarma, P. N. (2010). Bio-electrochemical treatment of
distillery wastewater in microbial fuel cell facilitating decolorization and desalination
along with power generation. Journal of Hazardous Materials, 177, 487-494.
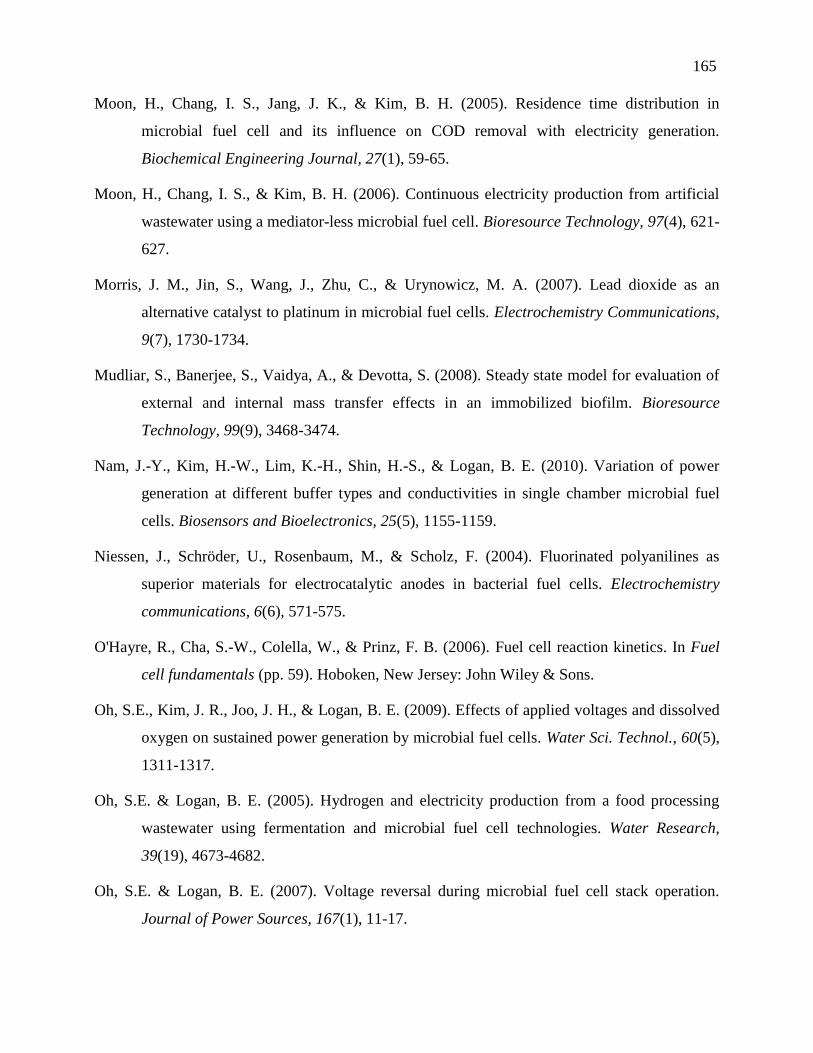
165
Moon, H., Chang, I. S., Jang, J. K., & Kim, B. H. (2005). Residence time distribution in
microbial fuel cell and its influence on COD removal with electricity generation.
Biochemical Engineering Journal, 27(1), 59-65.
Moon, H., Chang, I. S., & Kim, B. H. (2006). Continuous electricity production from artificial
wastewater using a mediator-less microbial fuel cell. Bioresource Technology, 97(4), 621-
627.
Morris, J. M., Jin, S., Wang, J., Zhu, C., & Urynowicz, M. A. (2007). Lead dioxide as an
alternative catalyst to platinum in microbial fuel cells. Electrochemistry Communications,
9(7), 1730-1734.
Mudliar, S., Banerjee, S., Vaidya, A., & Devotta, S. (2008). Steady state model for evaluation of
external and internal mass transfer effects in an immobilized biofilm. Bioresource
Technology, 99(9), 3468-3474.
Nam, J.-Y., Kim, H.-W., Lim, K.-H., Shin, H.-S., & Logan, B. E. (2010). Variation of power
generation at different buffer types and conductivities in single chamber microbial fuel
cells. Biosensors and Bioelectronics, 25(5), 1155-1159.
Niessen, J., Schröder, U., Rosenbaum, M., & Scholz, F. (2004). Fluorinated polyanilines as
superior materials for electrocatalytic anodes in bacterial fuel cells. Electrochemistry
communications, 6(6), 571-575.
O'Hayre, R., Cha, S.-W., Colella, W., & Prinz, F. B. (2006). Fuel cell reaction kinetics. In Fuel
cell fundamentals (pp. 59). Hoboken, New Jersey: John Wiley & Sons.
Oh, S.E., Kim, J. R., Joo, J. H., & Logan, B. E. (2009). Effects of applied voltages and dissolved
oxygen on sustained power generation by microbial fuel cells. Water Sci. Technol., 60(5),
1311-1317.
Oh, S.E. & Logan, B. E. (2005). Hydrogen and electricity production from a food processing
wastewater using fermentation and microbial fuel cell technologies. Water Research,
39(19), 4673-4682.
Oh, S.E. & Logan, B. E. (2007). Voltage reversal during microbial fuel cell stack operation.
Journal of Power Sources, 167(1), 11-17.
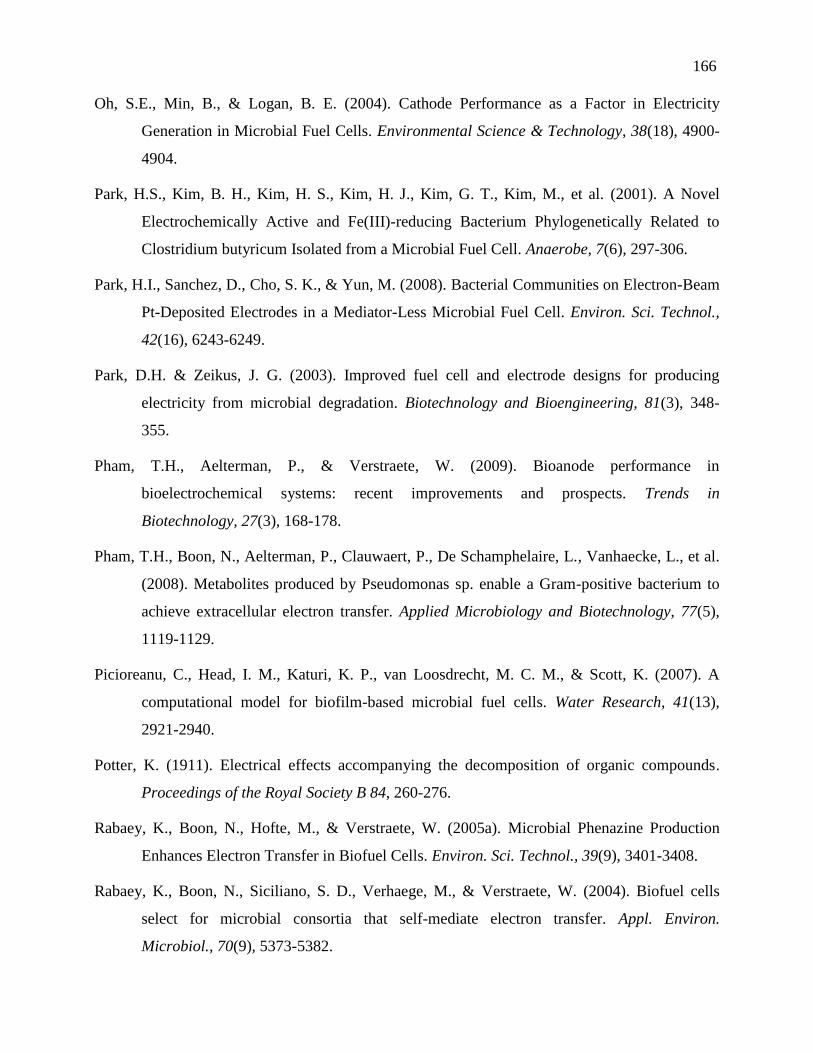
166
Oh, S.E., Min, B., & Logan, B. E. (2004). Cathode Performance as a Factor in Electricity
Generation in Microbial Fuel Cells. Environmental Science & Technology, 38(18), 4900-
4904.
Park, H.S., Kim, B. H., Kim, H. S., Kim, H. J., Kim, G. T., Kim, M., et al. (2001). A Novel
Electrochemically Active and Fe(III)-reducing Bacterium Phylogenetically Related to
Clostridium butyricum Isolated from a Microbial Fuel Cell. Anaerobe, 7(6), 297-306.
Park, H.I., Sanchez, D., Cho, S. K., & Yun, M. (2008). Bacterial Communities on Electron-Beam
Pt-Deposited Electrodes in a Mediator-Less Microbial Fuel Cell. Environ. Sci. Technol.,
42(16), 6243-6249.
Park, D.H. & Zeikus, J. G. (2003). Improved fuel cell and electrode designs for producing
electricity from microbial degradation. Biotechnology and Bioengineering, 81(3), 348-
355.
Pham, T.H., Aelterman, P., & Verstraete, W. (2009). Bioanode performance in
bioelectrochemical systems: recent improvements and prospects. Trends in
Biotechnology, 27(3), 168-178.
Pham, T.H., Boon, N., Aelterman, P., Clauwaert, P., De Schamphelaire, L., Vanhaecke, L., et al.
(2008). Metabolites produced by Pseudomonas sp. enable a Gram-positive bacterium to
achieve extracellular electron transfer. Applied Microbiology and Biotechnology, 77(5),
1119-1129.
Picioreanu, C., Head, I. M., Katuri, K. P., van Loosdrecht, M. C. M., & Scott, K. (2007). A
computational model for biofilm-based microbial fuel cells. Water Research, 41(13),
2921-2940.
Potter, K. (1911). Electrical effects accompanying the decomposition of organic compounds.
Proceedings of the Royal Society B 84, 260-276.
Rabaey, K., Boon, N., Hofte, M., & Verstraete, W. (2005a). Microbial Phenazine Production
Enhances Electron Transfer in Biofuel Cells. Environ. Sci. Technol., 39(9), 3401-3408.
Rabaey, K., Boon, N., Siciliano, S. D., Verhaege, M., & Verstraete, W. (2004). Biofuel cells
select for microbial consortia that self-mediate electron transfer. Appl. Environ.
Microbiol., 70(9), 5373-5382.
167
Rabaey, K., Clauwaert, P., Aelterman, P., & Verstraete, W. (2005b). Tubular Microbial Fuel
Cells for Efficient Electricity Generation. Environ. Sci. Technol., 39(20), 8077-8082.
Rabaey, K., Lissens, G., Siciliano, S. D., & Verstraete, W. (2003). A microbial fuel cell capable
of converting glucose to electricity at high rate and efficiency. Biotechnology Letters,
25(18), 1531-1535.
Rabaey, K., Ossieur, W., Verhaege, M., & Verstraete, W. (2005c). Continuous microbial fuel
cells convert carbohydrates to electricity. Water Science and Technology, 52(1-2), 515-
523.
Rabaey, K., Read, S. T., Clauwaert, P., Freguia, S., Bond, P.L., Blackall, L.L., et al. (2008).
Cathodic oxygen reduction catalyzed by bacteria in microbial fuel cells. ISME J, 2(5),
519-527.
Rabaey, K. & Verstraete, W. (2005). Microbial fuel cells: novel biotechnology for energy
generation. Trends in Biotechnology, 23(6), 291-298.
Ramasamy, R.P., Gadhamshetty, V., Nadeau, L., J. , & Johnson, G., R. . (2009). Impedance
spectroscopy as a tool for non-intrusive detection of extracellular mediators in microbial
fuel cells. Biotechnology and Bioengineering, 104(5), 882-891.
Ramasamy, R.P., Ren, Z., Mench, M. M., & Regan, J. (2008a). Microbial Fuel Cells for
Wastewater Treatment. ECS Transactions, 11(32), 115-125.
Ramasamy, R.P., Ren, Z., Mench, M. M., & Regan, J. M. (2008b). Impact of initial biofilm
growth on the anode impedance of microbial fuel cells. Biotechnology and
Bioengineering, 101(1), 101-108.
Reguera, G., McCarthy, K. D., Mehta, T., Nicoll, J. S., Tuominen, M. T., & Lovley, D. R.
(2005). Extracellular electron transfer via microbial nanowires. Nature, 435(7045), 1098-
1101.
Reguera, G., Nevin, K. P., Nicoll, J. S., Covalla, S. F., Woodard, T. L., & Lovley, D. R. (2006).
Biofilm and Nanowire Production Leads to Increased Current in Geobacter sulfurreducens
Fuel Cells. Appl. Environ. Microbiol., 72(11), 7345-7348.
168
Reimers, C. E., Girguis, P., Stecher, H. A., Tender, L. M., Ryckelynck, N., & Whaling, P. (2006).
Microbial fuel cell energy from an ocean cold seep. Geobiology, 4(2), 123-136.
Ren, Z., Ward, T. E., & Regan, J. M. (2007). Electricity Production from Cellulose in a Microbial
Fuel Cell Using a Defined Binary Culture. Environ. Sci. Technol., 41(13), 4781-4786.
Rezaei, F., Richard, T. L., & Logan, B. E. (2008). Enzymatic hydrolysis of cellulose coupled
with electricity generation in a microbial fuel cell. Biotechnology and Bioengineering,
101(6), 1163-1169.
Richter, H., Nevin, K. P., Jia, H., Lowy, D. A., Lovley, D. R., & Tender, L. M. (2009). Cyclic
voltammetry of biofilms of wild type and mutant Geobacter sulfurreducens on fuel cell
anodes indicates possible roles of OmcB, OmcZ, type IV pili, and protons in extracellular
electron transfer. Energy & Environmental Science, 2(5), 506-516.
Rismani-Yazdi, H., Carver, S. M., Christy, A. D., & Tuovinen, O. H. (2008). Cathodic
limitations in microbial fuel cells: An overview. Journal of Power Sources, 180(2), 683-
694.
Rismani-Yazdi, H., Christy, A. D., Dehority, B. A., Morrison, M., Yu, Z., & Tuovinen, O. H.
(2007). Electricity generation from cellulose by rumen microorganisms in microbial fuel
cells. Biotechnology and Bioengineering, 97(6), 1398-1407.
Roche, I., Katuri, K., & Scott, K. (2010). A microbial fuel cell using manganese oxide oxygen
reduction catalysts. Journal of Applied Electrochemistry, 40(1), 13-21.
Roche, I., & Scott, K. (2009). Carbon-supported manganese oxide nanoparticles as
electrocatalysts for oxygen reduction reaction (orr) in neutral solution. Journal of Applied
Electrochemistry, 39(2), 197-204.
Rodriguez, J., Batstone, D. J., Yuan, Z., & Rabaey, K. (2007). A comprehensive model to
investigate microbial fuel cells. Paper presented at the 11th IWA World Congress on
Anaerobic Digestion.
Rosenbaum, M., Aulenta, F., Villano, M., & Angenent, L. T. (2010a). Cathodes as electron
donors for microbial metabolism: Which extracellular electron transfer mechanisms are
involved? Bioresource Technology, 102(1), 324-333.
169
Rosenbaum, M., Cotta, M. A., & Angenent, L. T. (2010b). Aerated Shewanella oneidensis in
continuously fed bioelectrochemical systems for power and hydrogen production.
Biotechnology and Bioengineering, 105(5), 880-888.
Rozendal, R. A., Jeremiasse, A. W., Hamelers, H. V. M., & Buisman, C. J. N. (2007). Hydrogen
Production with a Microbial Biocathode. Environmental Science & Technology, 42(2),
629-634.
Schroder, U. (2007). Anodic electron transfer mechanisms in microbial fuel cells and their energy
efficiency. Physical Chemistry Chemical Physics, 9(21), 2619-2629.
SGL Group. (2010). Soft Felts for Thermal Insulation made of SIGRATHERM. Products, SGL
Group. Consulté le 25 novembre 2010, tiré de http://www.sglgroup.com/
Shukla, A. K., Suresh, P., Berchmans, S., & Rajendran, A. (2004). Biological fuel cells and their
applications. Current Science, 87(4), 455-468.
Srikanth, S., Marsili, E., Flickinger, M., C., & Bond, D., R. . (2008). Electrochemical
characterization of Geobacter sulfurreducens cells immobilized on graphite paper
electrodes. Biotechnology and Bioengineering, 99(5), 1065-1073.
Strycharz, S. M., Woodard, T. L., Johnson, J. P., Nevin, K. P., Sanford, R. A., Loffler, F. E., et al.
(2008). Graphite Electrode as a Sole Electron Donor for Reductive Dechlorination of
Tetrachlorethene by Geobacter lovleyi. Appl. Environ. Microbiol., 74(19), 5943-5947.
Sun, J., Hu, Y., Bi, Z., & Cao, Y. (2009). Improved performance of air-cathode single-chamber
microbial fuel cell for wastewater treatment using microfiltration membranes and multiple
sludge inoculation. Journal of Power Sources, 187(2), 471-479.
Sun, J.J., Zhao, H.-Z., Yang, Q.-Z., Song, J., & Xue, A. (2010). A novel layer-by-layer self-
assembled carbon nanotube-based anode: preparation, characterization, and application in
microbial fuel cell. Electrochimica Acta, 55, 3041-3047.
Tandukar, M., Huber, S. J., Onodera, T., & Pavlostathis, S. G. (2009). Biological Chromium(VI)
Reduction in the Cathode of a Microbial Fuel Cell. Environmental Science & Technology,
43(21), 8159-8165.
170
Tartakovsky, B., & Guiot, S. R. (2006). A comparison of air and hydrogen peroxide oxygenated
microbial fuel cell reactors. Biotechnology Progress, 22(1), 241-246.
Tartakovsky, B., Manuel, M. F., Wang, H., & Guiot, S. R. (2009). High rate membrane-less
microbial electrolysis cell for continuous hydrogen production. International Journal of
Hydrogen Energy, 34(2), 672-677.
ter Heijne, A., Hamelers, H. V. M., Saakes, M., & Buisman, C. J. N. (2008). Performance of non-
porous graphite and titanium-based anodes in microbial fuel cells. Electrochimica Acta,
53(18), 5697-5703.
Thygesen, A., Poulsen, F. W., Min, B., Angelidaki, I., & Thomsen, A. B. (2009). The effect of
different substrates and humic acid on power generation in microbial fuel cell operation.
Bioresource Technology, 100(3), 1186-1191.
Torres, C., I. , Marcus, A. K., Lee, H.-S., Parameswaran, P., Krajmalnik-Brown, R., & Rittmann,
B., E. . (2009). A kinetic perspective on extracellular electron transfer by anode-respiring
bacteria. FEMS Microbiology Reviews, 34(1), 3-17.
Torres, C., I. , Marcus, A. K., & Rittmann, B., E. (2008). Proton transport inside the biofilm
limits electrical current generation by anode-respiring bacteria. Biotechnology and
Bioengineering, 100(5), 872-881.
Tran, H.-T., Ryu, J.-H., Jia, Y.-H., Oh, S.-J., Choi, J.-Y., Park, D.-H., et al. (2010). Continuous
bioelectricity production and sustainable wastewater treatment in a microbial fuel cell
constructed with non-catalyzed granular graphite electrodes and permeable membrane.
Water Science & Technology, 61(7), 1819-1827.
Tsai, H.-Y., Wu, C.-C., Lee, C.-Y., & Shih, E. P. (2009). Microbial fuel cell performance of
multiwall carbon nanotubes on carbon cloth as electrodes. Journal of Power Sources,
194(1), 199-205.
Veer Raghavulu, S., Venkata Mohan, S., Venkateswar, M., Mohanakrishna, G., & Sarma, P. N.
(2009). Behavior of single chambered mediatorless microbial fuel cell (MFC) at
acidophilic, neutral and alkaline microenvironments during chemical wastewater
treatment. International Journal of Hydrogen Energy, 34, 7547-7554.
171
Virdis, B., Rabaey, K., Yuan, Z., & Keller, J. (2008). Microbial fuel cells for simultaneous
carbon and nitrogen removal. Water Research, 42(12), 3013-3024.
Walker, A. L., & Walker, J. C. W. (2006). Biological fuel cell and an application as a reserve
power source. Journal of Power Sources, 160(1), 123-129.
Wang, B. (2005). Recent development of non-platinum catalysts for oxygen reduction reaction.
Journal of Power Sources, 152, 1-15.
Wang, X., Feng, Y. J., & Lee, H. (2008). Electricity production from beer brewery wastewater
using single chamber microbial fuel cell. Water Science and Technology, 57(7), 1117-
1121.
Wang, G., Huang, L., & Zhang, Y. (2008). Cathodic reduction of hexavalent chromium [Cr(VI)]
coupled with electricity generation in microbial fuel cells. Biotechnology Letters, 30(11),
1959-1966.
Wang, Z., Lim, B., Lu, H., Fan, J., & Choi, C. (2010). Cathodic reduction of Cu2+ and electric
power generation using a microbial fuel cell. Bull. Korean Chem. Soc., 31(7), 2025-2030.
Wen, Q., Kong, F., Ma, F., Ren, Y., & Pan, Z. (2011). Improved performance of air-cathode
microbial fuel cell through additional Tween 80. Journal of Power Sources, 196(3), 899-
904.
Woodward, L., Perrier, M., Srinivasan, B., Pinto, R. P., & Tartakovsky, B. (2010). Comparison
of real-time methods for maximizing power output in microbial fuel cells. AIChE Journal,
56(10), 2742-2750.
Woodward, L., Tartakovsky, B., Perrier, M., & Srinivasan, B. (2009). Maximizing power
production in a stack of microbial fuel cells using multiunit optimization method.
Biotechnology Progress, 25(3), 676-682.
Yang, S., Jia, B., & Liu, H. (2009). Effects of the Pt loading side and cathode-biofilm on the
performance of a membrane-less and single-chamber microbial fuel cell. Bioresource
Technology, 100(3), 1197-1202.
172
You, S.J., Ren, N. Q., Zhao, Q. L., Wang, J. Y., & Yang, F. L. (2009). Power Generation and
Electrochemical Analysis of Biocathode Microbial Fuel Cell Using Graphite Fibre Brush
as Cathode Material. Fuel Cells, 9(5), 588-596.
You, S., Zhao, Q., Zhang, J., Jiang, J., Wan, C., Du, M., et al. (2007). A graphite-granule
membrane-less tubular air-cathode microbial fuel cell for power generation under
continuously operational conditions. Journal of Power Sources, 173(1), 172-177.
You, S., Zhao, Q., Zhang, J., Jiang, J., & Zhao, S. (2006). A microbial fuel cell using
permanganate as the cathodic electron acceptor. Journal of Power Sources, 162(2), 1409-
1415.
Yuan, Y., Zhou, S., & Zhuang, L. (2010). Polypyrrole/carbon black composite as a novel oxygen
reduction catalyst for microbial fuel cells. Journal of Power Sources, 195(11), 3490-3493.
Zhang, F., Cheng, S., Pant, D., Bogaert, G. V., & Logan, B. E. (2009a). Power generation using
an activated carbon and metal mesh cathode in a microbial fuel cell. Electrochemistry
Communications, 11(11), 2177-2179.
Zhang, L., Liu, C., Zhuang, L., Li, W., Zhou, S., & Zhang, J. (2009b). Manganese dioxide as an
alternative cathodic catalyst to platinum in microbial fuel cells. Biosensors and
Bioelectronics, 24(9), 2825-2829.
Zhang, P.Y. & Liu, Z.-L. (2010). Experimental study of the microbial fuel cell internal resistance.
Journal of Power Sources, 195(24), 8013-8018.
Zhang, Y., Min, B., Huang, L., & Angelidaki, I. (2011). Electricity generation and microbial
community response to substrate changes in microbial fuel cell. Bioresource Technology,
102(2), 1166-1173.
Zhang, E., Xu, W., Diao, G., & Shuang, C. (2006). Electricity generation from acetate and
glucose by sedimentary bacterium attached to electrode in microbial-anode fuel cells.
Journal of Power Sources, 161(2), 820-825.
Zhang, J.N., Zhao, Q.-L., Aelterman, P., You, S.-J., & Jiang, J.-Q. (2008a). Electricity generation
in a microbial fuel cell with a microbially catalyzed cathode. Biotechnology Letters,
30(10), 1771-1776.
173
Zhang, L., Zhou, S., Zhuang, L., Li, W., Zhang, J., Lu, N., et al. (2008b). Microbial fuel cell
based on Klebsiella pneumoniae biofilm. Electrochemistry Communications, 10, 1641-
1643.
Zhao, F., Harnisch, F., Schroder, U., Scholz, F., Bogdanoff, P., & Herrmann, I. (2006).
Challenges and Constraints of Using Oxygen Cathodes in Microbial Fuel Cells.
Environmental Science & Technology, 40(17), 5193-5199.
Zhao, F., Harnisch, F., Schröder, U., Scholz, F., Bogdanoff, P., & Herrmann, I. (2005).
Application of pyrolysed iron(II) phthalocyanine and CoTMPP based oxygen reduction
catalysts as cathode materials in microbial fuel cells. Electrochemistry Communications,
7(12), 1405-1410.
Zhao, F., Rahunen, N., Varcoe, J. R., Roberts, A. J., Avignone-Rossa, C., Thumser, A. E., et al.
(2009). Factors affecting the performance of microbial fuel cells for sulfur pollutants
removal. Biosensors and Bioelectronics, 24(7), 1931-1936.
Zhao, Y., Watanabe, K., Nakamura, R., Mori, S., Liu, H., Ishii, K., et al. (2010). Three-
dimensional conductive nanowire networks for maximizing anode performance in
microbial fuel cells. Chem.Eur.J., 16, 4982-4985.
Zhu, N., Chen, X., Zhang, T., Wu, P., Li, P., & Wu, J. (2010). Improved performance of
membrane free single-chamber air-cathode microbial fuel cells with nitric acid and
ethylenediamine surface modified activated carbon fiber felt anodes. Bioresource
Technology, 102(1), 422-426.


![AgriElec: Piles àcombustible microbiennes pour la ... · La 1 er souche pour la réduction de O ... Cathode microbienne Biofilm formé en eau de mer à -0.2 V/SCE 1.3 A/m 2 [O 2]](https://img.pdfslide.fr/doc/110x75/5b98a71509d3f2085f8c015d/agrielec-piles-acombustible-microbiennes-pour-la-la-1-er-souche-pour-la.jpg)