Embed Size (px)
Citation preview
Unbounded number line estimation:
A purer measure of numerical estimation?
Dissertation
der Mathematisch-Naturwissenschaftlichen Fakultät
der Eberhard Karls Universität Tübingen
zur Erlangung des Grades eines
Doktors der Naturwissenschaften
(Dr. rer. nat.)
vorgelegt von
Dipl.-Psych. Regina Miriam Reinert
aus Stuttgart
Tübingen
2020

Gedruckt mit Genehmigung der Mathematisch-Naturwissenschaftlichen Fakultät der Eberhard Karls
Universität Tübingen.
Tag der mündlichen Qualifikation: 17.12.2020
Stellvertretender Dekan: Prof. Dr. József Fortágh
1. Berichterstatter: Prof. Dr. Korbinian Möller
2. Berichterstatter: Prof. Dr. Caterina Gawrilow
I
Abstract Recently, a new unbounded version of the number line estimation task has been introduced by Cohen
and Blanc-Goldhammer (2011). The authors suggested the task to provide a purer measure of the rep-
resentation of numerical magnitude than the traditional bounded number line estimation task. The pre-
sent dissertation considers various factors influencing estimation strategies to solve the unbounded num-
ber line estimation task with the aim at evaluating the claims associated with its validity more appropri-
ately. This question was pursued in three studies that (1) systematically evaluate similarities and differ-
ences between symbolic and non-symbolic estimation with the bounded and unbounded number line
estimation task with a closer association of non-symbolic with unbounded than bounded number line
estimation, (2) examine eye-fixation behaviour in these two task versions by an expected decrease of
the numbers of fixations with increasing target size on the unbounded number line, and (3) investigate
sex differences in the aforementioned tasks with solution strategies applied respectively.
The first study drew on the conceptual similarity between unbounded number line estimation and the
renowned analogue non-symbolic numerosity estimation task to generalize systematic biases of under-
and overestimation (for the perception vs. production version of the task, respectively) observed in the
latter to the unbounded number line estimation task. The same pattern of systematic biases of under-
and overestimation in numerosity estimation was also found in the unbounded but not in the bounded
number line estimation task.
The second study was conducted to investigate solution strategies in bounded and unbounded number
line estimation by contrasting participants´ estimation performance with their corresponding eye-fixa-
tion behaviour. Results substantiated the use of reference points in the bounded version of the task and
suggested the location of the very first fixation on the number line to be a reliable predictor of the final
estimation.
The third study addressed sex differences in number line estimation focussing on differences in solution
strategies in terms of differences between males and females in approaching unconventional problems.
As women tend more strongly to use (classroom-)learnt procedures as compared to estimation, they
were found to be at a disadvantage in unbounded number line estimation as it does not allow to apply
leant strategies such as proportion judgement in bounded number line estimation, but requires numerical
estimations.
In summary, the results of all three experiments support the claim that unbounded number line estima-
tion might indeed provide a more pure and valid measure of number magnitude representation. This
conclusion was particularly supported by i) comparable estimation biases as observed in non-symbolical
numerosity estimation, ii) fewer fixations on reference points, and iii) sex differences associated with
applying specific solution strategies. Nevertheless, the findings of the current dissertation also suggest
that unbounded number line estimation task is not independent of specific estimation strategies.
II
Zusammenfassung Kürzlich präsentierten Cohen und Blanc-Goldhammer (2011) eine neue, unbounded Version der Zah-
lenstrahl-Schätzaufgabe. Die Autoren gehen davon aus, dass diese Aufgabe ein reineres Maß als die
traditionelle bounded Zahlenstrahl-Schätzaufgabe darstellt, um die zugrunde liegende Zahlenrepräsen-
tation zu messen. In der vorliegenden Dissertation werden verschiedene Einflussfaktoren auf Schätz-
strategien betrachtet, die beim Lösen angewendet werden, mit dem Ziel, deren Validität genauer zu
beurteilen. Diese Fragestellung wurde in drei Studien näher überprüft, welche (1) die Ähnlichkeit sowie
Unterschiede zwischen symbolischen und nicht-symbolischen Schätzungen mit der bounded wie auch
unbounded Zahlenstrahl-Schätzaufgabe systematisch untersuchten, wobei eine stärkere Assoziation
zwischen der nicht-symbolischen und unbounded im Vergleich zur bounded Aufgabe bestehen soll, (2)
Augenbewegungen in beiden Aufgabenversionen untersuchen und eine Abnahme an Fixationen mit
grösser werdenden Targets bei der unbounded Version erwartet wurde und (3) Geschlechterunterschiede
in beiden genannten Aufgaben erforschen sowie die jeweils angewandten Lösungsstrategien.
Die erste Studie stützte sich auf die konzeptionelle Ähnlichkeit zwischen der unbounded Zahlenstrahl-
Schätzaufgabe und der bewährten analogen nicht-symbolischen Numerositäts-Aufgabe, um systemati-
sche Verzerrungen von Unter- und Überschätzung (in der Wahrnehmungs- und Produktionsversion der
Aufgabe), welche in letzterer beobachtet wurden, auf die unbounded Aufgabe zu verallgemeinern. Das-
selbe Muster systematischer Unter- und Überschätzung bei Numerositäts-Schätzungen wurde auch bei
der unbounded, jedoch nicht bei der bounded Zahlenstrahl-Schätzaufgabe gefunden.
Die zweite Studie wurde durchgeführt, um Lösungsstrategien in der bounded und unbounded Zahlen-
strahl-Schätzaufgabe zu erforschen, indem die Schätzleistung der Teilnehmer den dazugehörigen Au-
genbewegungsmustern gegenübergestellt wurde. Die Ergebnisse untermauern die Verwendung von Re-
ferenzpunkten in der bounded Aufgabe und deuten darauf hin, dass diejenige Stelle, welche zuerst auf
dem Zahlenstrahl fixiert wurde, ein zuverlässiger Prädiktor der endgültigen Schätzung darstellt.
Die dritte Studie befasste sich mit Geschlechterunterschieden bei Zahlenstrahl-Schätzungen, wobei Un-
terschiede zwischen Männern und Frauen beim Anwenden unkonventioneller Lösungsstrategien im Fo-
kus standen. Da Frauen eher dazu tendieren, Methoden anzuwenden, welche sie (in der Schule) gelernt
haben, wurde festgestellt, dass sie bei der unbounded Aufgabe im Nachteil sind, da in dieser keine spe-
zifisch bekannten Strategien anwendbar sind, sondern numerisches Größenschätzen notwendig ist.
Insgesamt stützen die Ergebnisse aller drei Experimente die Annahme, dass die unbounded Zahlen-
strahl-Schätzaufgabe tatsächlich ein reineres und valideres Maß zur Erfassung der Zahlenrepräsentation
darstellt. Diese Schlussfolgerung wurde insbesondere bekräftigt i) durch ähnliche Schätzverzerrungen,
wie sie bei der nicht-symbolischen Numerositäts-Aufgabe beobachtet wurden, ii) weniger Fixierungen
auf Referenzpunkten und iii) Geschlechterunterschieden bei der Anwendung spezifischer Lösungsstra-
tegien. Allerdings legen die Ergebnisse der vorliegenden Dissertation nahe, dass auch die unbounded
Zahlenstrahl-Schätzaufgabe nicht frei von spezifischen Schätzstrategien ist.
III
TABLE OF CONTENTS I. GENERAL INTRODUCTION ................................................................................ 1 1. Introduction ..................................................................................................................................... 2
2. Research Aims ................................................................................................................................. 7
II. EMPIRICAL STUDIES ........................................................................................ 11 STUDY 1: Unbounded number line estimation as a measure of numerical estimation ......... 13
1.1 Abstract ........................................................................................................................................................ 14 1.2 Introduction .................................................................................................................................................. 15
1.2.1 Number line estimation tasks ............................................................................................................... 15 1.2.2 Numerosity estimation .......................................................................................................................... 16
1.3 The present study ......................................................................................................................................... 19 1.4 Methods ........................................................................................................................................................ 21
1.4.1 Participants .......................................................................................................................................... 21 1.4.2 Stimuli and procedure .......................................................................................................................... 21 1.4.3 Analyses ................................................................................................................................................ 25
1.5 Results .......................................................................................................................................................... 26 1.6 Discussion .................................................................................................................................................... 29
1.6.1 Further evidence for the bi-directional mapping hypothesis ............................................................... 30 1.6.2 Limitations and perspectives ................................................................................................................ 31
1.7 Conclusions .................................................................................................................................................. 32
STUDY 2: Strategies in unbounded number line estimation? Evidence from eye-tracking . 33
2.1 Abstract ........................................................................................................................................................ 34 2.2 Introduction .................................................................................................................................................. 35 2.3 Method ......................................................................................................................................................... 36
2.3.1 Participants .......................................................................................................................................... 36 2.3.2 Stimuli and Design ............................................................................................................................... 36 2.3.3 Apparatus ............................................................................................................................................. 36 2.3.4 Procedure ............................................................................................................................................. 37 2.3.5 Analysis ................................................................................................................................................ 37
2.4 Results .......................................................................................................................................................... 37 2.4.1 Absolute Estimation Errors .................................................................................................................. 37 2.4.2 Fixation Pattern ................................................................................................................................... 38 2.4.3 First fixation location ........................................................................................................................... 39
2.5 Discussion .................................................................................................................................................... 39 2.6 Conclusions .................................................................................................................................................. 40
IV
STUDY 3: Sex differences in number line estimation: The role of numerical estimation ..... 41
3.1 Abstract ........................................................................................................................................................ 42 3.2 Introduction .................................................................................................................................................. 43 3.3 Method ......................................................................................................................................................... 47
3.3.1 Participants .......................................................................................................................................... 47 3.3.2 Stimuli and Design ............................................................................................................................... 47 3.3.3 Procedure ............................................................................................................................................. 48
3.4 Results .......................................................................................................................................................... 48 3.5 Discussion .................................................................................................................................................... 55 3.6 Conclusion ................................................................................................................................................... 58
III. GENERAL DISCUSSION .................................................................................. 59 General Discussion ............................................................................................................................ 60
1. Research Aims ............................................................................................................................................... 60 1.1 The validity of the newly introduced unbounded number line estimation task ....................................... 60 1.2 Divers factors that affect estimation strategies to complete the unbounded number line estimation task ....................................................................................................................................................................... 61
2. Literature Search and Definition of Inclusion and Exclusion Criteria .......................................................... 63 2.1 Studies using the unbounded number line estimation task ..................................................................... 65 2.2 Systematic overview of the unbounded number line estimation task ...................................................... 71
3. A Taxonomy of Magnitude Estimation Tasks ............................................................................................... 76 4. Limitations and Future Perspectives .............................................................................................................. 79 5. Overall Conclusion ........................................................................................................................................ 82
REFERENCES ..................................................................................................................................... 83 ERKLÄRUNG ...................................................................................................................................... 97
V
LIST OF FIGURES
Study 1
Figure 1. Schematic illustration of Crollen et al.’s (2011) bi-directional mapping processes (in a percep-tion vs. production task). …………………………………………………….…………..…………… 18
Figure 2. Expected error patterns in the three different types of estimation tasks. ...………………… 21
Figure 3. Schematic illustration of an example of the unbounded and bounded number line estimation task. ..…………..………………...…………………………………………………………………… 24
Figure 4. Estimation patterns and estimation error variability for numerosity estimation, unbounded number line estimation and bounded number line estimation. …………………….……….……… 26/27
Figure 5. Mean percent relative estimation error for the three magnitude estimation tasks separated for perception and production task type. …………………………………………..……….……….…… 29
Study 2
Figure 6. Estimation patterns in the unbounded and bounded number line estimation task. ………… 38
Study 3
Figure 7. Example of an unbounded and bounded number line estimation. …...………………...….... 46
Figure 8. Marginal means of absolute estimation error for bounded and unbounded number line estima-tion separated for male and female participants. ………………………….………………..…………. 50
Figure 9. Absolute estimation error for each unit separated for male and female participants. ...……. 54
GENERAL DISCUSSION
Figure 10. PRISMA flow diagram ………………………………………………………………...…. 65
Figure 11. A taxonomy of magnitude estimation tasks ………………………….………………….... 76
Figure 12. The structure of the universal number line ……………………………………………….. 77
Figure 13. Non-symbolic version of an unbounded number line estimation task ……………………. 80
VI
LIST OF TABLES
GENERAL INTRODUCTION
Table 1. Overall overview of the topics, research subjects, and methods of this dissertation. …...….. 10
Study 3
Table 2. Significant differences between the units. …...…………………………………………….... 53
Table 3. Sex differences separated for the units. …...…………………………………………...……. 54
GENERAL DISCUSSION
Table 4. Overview of empirical studies investigating the unbounded NLE task. ...……………...… 74/75

VII
LIST OF ABBREVIATIONS
AEE Absolute Estimation Error
AIC Akaike Information Criterion
ANOVA Analysis of Variance
cf. Compare
CRR Cued Retrospective Reporting
EBSCOhost Elton B. Stephens Company
e.g. Exempli Gratia/For Example
ER Error Rate
et al. Et Alii
GG Greenhouse-Geisser coefficient
i.e. Id Est/That Is
LMM Linear Mixed Models
ms Milliseconds
NA Not Available
NLE Number Line Estimation
OM Operational Momentum
px Pixels
PAE Percentage Absolute Error
PRISMA Preferred Reporting Items for Systematic Reviews and Meta-Analyses
PubMed Medical Publications
R The R Project for Statistical Computing
REE Relative Estimation Error
SE Standard Error
SEM Standard Error of the Mean
SD Standard Deviation
SNARC Spatial-Numerical Association of Response Codes
VIII
Bibliography of the studies incorporated in the present thesis Study 1: Reinert, R. M., Hartmann, M., Huber, S., & Moeller, K. (2019). Unbounded
number line estimation as a measure of numerical estimation. PLoS ONE 14(3): e0213102.
doi:10.1371/journal.pone.0213102
Study 2: Reinert, R. M., Huber, S., Nuerk, H.-C., & Moeller, K. (2015). Strategies in unbounded
number line estimation? Evidence from eye-tracking. Cognitive Processing, 16(1), 359-363.
doi:10.1007/s10339-015-0675-z
Study 3: Reinert, R. M., Huber, S., Nuerk, H.-C., & Moeller, K. (2017). Sex differences in
number line estimation: The role of numerical estimation. British Journal of Psychology,
108(2), 334-350. doi:10.1111/bjop.12203

IX

X

1
I. GENERAL INTRODUCTION
2
1. Introduction In the past two decades, a wide range of research on numerical cognition using various types of tasks
has been carried out to investigate the mental representation of number magnitude. In order to measure
the characteristics of children´s psychological representation of numbers, one of the most commonly
applied tools is the so called number line estimation (NLE) task (see, e.g., Ashcraft & Moore, 2012;
Berteletti, Lucangeli, Piazza, Dehaene, & Zorzi, 2010; Friso-van den Bos et al., 2015; Geary, Hoard,
Nugent, & Byrd-Craven, 2008; Laski & Siegler, 2007; LeFevre, Jimenez Lira, Sowinski, Cankaya,
Kamawar, & Skwarchuk, 2013; Link, Huber, Nuerk, & Moeller, 2014; Moeller, Pixner, Kaufmann, &
Nuerk, 2009; Opfer & Martens, 2012; Peeters, Sekeris, Verschaffel, & Luwel, 2017; Ramani & Siegler,
2008; Sasanguie, De Smedt, Defever, & Reynvoet, 2012; Schneider, Grabner, & Paetsch, 2009; Siegler
& Opfer, 2003; Thompson & Opfer, 2008; Thompson & Siegler, 2010; White & Szűcs, 2012; Yuan,
Prather, Mix, & Smith, 2019). There are different versions of this task. In the most popular bounded
production version (number-to-position, after Siegler & Opfer, 2003) of the NLE task, a horizontal,
empty number line with only start and end point labeled is presented showing the minimum and maxi-
mum numerical values of the range (e.g., 0 and 100). Additionally, participants are displayed a target
number on every trial – usually in the form of Arabic numerals (e.g., 72) – and requested to mark the
spatial position corresponding to this probed number on the respective number line. In the original pa-
per-pencil version, the estimated position is indicated with a pen and on the other hand, in the computer-
based version of the task, participants make their estimates by a mouse click.
This ´standard´ bounded version of the NLE task rests on the idea of the metaphor of a mental number
line (Buckley & Gilman, 1974; Dehaene, Bossini, & Gireaux, 1993; Moyer & Landauer, 1967; Restle,
1970), which supposes that individuals represent magnitudes along an internal continuum being referred
to mental number line. This horizontal number line is assumed to be organized spatially with numbers
in ascending order from left to right (Dehaene, 2011; Dehaene, Piazza, Pinel, & Cohen, 2003; Galton,
1880; Hubbard, Piazza, Pinel, & Dehaene, 2005). Correspondingly, smaller magnitudes are systemati-
cally related to the left-hand side of space, while larger ones are spatially associated with the right (e.g.,
Dehaene et al., 1993; Dehaene, 2011; Zorzi, Priftis, Meneghello, Marenzi, & Umiltà, 2006; see also de
Hevia, Girelli, & Macchi-Cassia, 2012, for an overview). The particular direction of this representation
“seems to be determined by the direction of writing” (Dehaene et al., 1993, p. 394) and reading in one’s
native language and is therefore right to left in Hebrew, Arabic, Urdu, and Farsi (see Göbel, Shaki, &
Fischer, 2011, for a review on cultural and linguistic influences on the development of number pro-
cessing).
This mental number line hypothesis is corroborated by distinct types of evidence such as for example
the SNARC (Spatial-Numerical Association of Response Codes) or the OM (operational momentum)
effect (see Fischer, 2001, 2003, for other effects; Fischer & Shaki, 2014): the former effect describes
that individuals tend to respond faster with a left button-press when presented with relatively smaller
numbers (e.g., 1 or 2). Conversely, when they are given larger numbers (e.g., 8 or 9), right side responses
3
are instead consistently facilitated (e.g., Dehaene et al., 1993; Dehaene, Dupoux, & Mehler, 1990;
Fischer, Warlop, Hill, & Fias, 2004; Nuerk, Wood, & Willmes, 2005; Wood, Willmes, Nuerk, &
Fischer, 2008, for a meta-analysis). On the other hand, the OM effect indicates a spatial bias found for
mental arithmetic when participants have to solve additions and/or subtractions (e.g., McCrink,
Dehaene, & Dehaene-Lambertz, 2007). In the original experiment, participants were presented moving
dot patterns being added or subtracted from one another and they had to indicate whether the final set
of dots was the correct outcome. The operational momentum effect indicates that addition problems
tended to result in overestimation whereas subtraction problems rather led to underestimation of the
correct result. McCrink and colleagues (2007) interpreted this error pattern as an overshoot of the in-
tended magnitude while moving towards the target position on the mental number line. Accordingly,
mental calculations were speculated to be equivalent to movements along the spatial-numerical contin-
uum of the mental number line and reflecting participants´ tendency to move “too far” (see also Linde-
mann & Tira, 2011; Pinhas & Fischer, 2008). In sum, both effects provide convincing evidence support-
ing the mental number line hypothesis and are possibly resulting from cultural immersion as well as
spatially directional habits such as reading or finger counting (see Fischer & Shaki, 2014, for a review).
In a recent review on the relevance of number magnitude understanding, Siegler (2016) stressed that
numerical magnitude can be regarded “the common core of numerical development” (p. 341) as well as
the most relevant measure of the mental representation of numbers. In particular, there is compelling
evidence showing fairly strong associations between arithmetic proficiency and estimation performance
in NLE (see e.g., Ashcraft & Moore, 2012; Booth & Siegler, 2008; Cowan & Powell, 2014; Gunderson,
Ramirez, Beilock, & Levin, 2012; LeFevre, Jiménez Lira, Sowinski, Cankaya, Kamawar et al., 2013).
Furthermore, performance on the NLE task also represents a powerful predictor of broader mathematical
outcomes with high correlations between estimation accuracy and scores of math achievement tests that
are measured concurrently or in the future (see also Booth & Siegler, 2006; Geary et al., 2008; Laski &
Siegler, 2007; Sasanguie et al., 2012; Sella, Berteletti, Brazzolotto, Luncageli, & Zorzi, 2013). For in-
stance, Torbeyns and colleagues (2015) found consistent strong correlations between fraction magnitude
understanding of sixth and eighth graders from different cultures measured by the bounded NLE task
and their mathematical achievement scores. Additionally, these observations seems even more remark-
able as the associations remain significant even when controlling for influences of more general cogni-
tive measures such as working memory, reading achievement, intelligence, but also family education
and income, gender, race, as well as non-symbolic numerical knowledge and so on (e.g., Bailey, Siegler,
& Geary, 2014; Cowan & Powell, 2014; Fazio, Bailey, Thompson, & Siegler, 2014).
The observed associations of NLE with math achievement but also more general cognitive constructs
further indicate that research on basic numerical abilities such as number magnitude understanding may
also have practical significance. For instance, Ritchie and Bates (2013) found in a large, population-
representative, longitudinal sample collected in the United Kingdom that number magnitude understand-
ing at age 7 significantly determines attained socio-economic status by age 42 (p. 1301). Moreover, a
4
meta-analysis of six large longitudinal studies in the U.K., U.S. as well as Canada conducted by Duncan
et al. (2007) confirmed this fact showing that early math skills have the greatest predictive power of
later academic performance – followed by reading ability and attention skills – even after controlling
for various relevant variables (see also Siegler & Braithwaite, 2017). Moreover, it was found that the
associations between basic numerical abilities and later mathematical achievement were of particular
importance as they were stronger than for other relevant measures such as socioemotional behavior and
social skills (Duncan et al., 2007). In turn, Parson and Bynner (2005) found that considerable negative
consequences of poor numeracy were even more detrimental than those of low levels of literacy skills.
Additionally, poor numeracy was also found to lead to considerable difficulties for life prospects in
different areas (e.g., higher likelihood to be unemployed or have experienced depression, lower hourly
rates of pay and economic well-being) and represents a specific problem in our modern knowledge
societies (Parsons & Bynner, 2005, p. 36). Therefore, it seems crucial to have a valid and reliable meas-
ure capturing the mental representation of numerical magnitude such as the NLE task.
In recent years, however, there is growing evidence suggesting that it may not be warranted to draw
conclusions about the mental representation of number magnitude from individuals’ estimation perfor-
mance on the ́ standard´ bounded task version as it may not only capture pure numerical estimation (e.g.,
Barth & Paladino, 2011; Chesney & Matthews, 2013; Cohen & Blanc-Goldhammer, 2011; Cohen &
Quinlan, 2018; Cohen & Sarnecka, 2014; Link, Nuerk, & Moeller, 2014; Rouder & Geary, 2014;
Slusser, Santiago, & Barth, 2013; White & Szűcs, 2012).
Initially, it was the prevailing view that children’s (as well as adults’) mental representations of number
magnitude develop with experience and age from an originally less accurate logarithmic representation
to a more precise and linear one (see Barth & Paladino, 2011; Booth & Siegler, 2006, 2008; Laski &
Siegler, 2007; Opfer & Siegler, 2012; Opfer, Thompson, & Kim, 2016; Siegler & Opfer, 2003). This
shift from logarithmic to linear representations has been reflected in participants’ estimation perfor-
mance when they had to indicate the spatial position of a given target number on the line. Younger
children usually display less accurate estimation patterns better fitted by logarithmic functions whereas
older children as well as adults produce more and more linear estimation patterns.
Even though this result pattern was quite robust across numerous studies, it remains unclear whether the
explanation of a logarithmic-to-linear representational shift is the most appropriate (see Barth & Pala-
dino, 2011). Presently, there is increasing evidence indicating that individuals may apply specific pro-
portion-judgement strategies while completing the traditional bounded task version (Ashcraft & Moore,
2012; Barth & Paladino, 2011; Dackermann, Kroemer, Nuerk, Moeller, & Huber, 2018; Hollands &
Dyre, 2000; Spence, 1990; Sullivan, Juhasz, Slattery, & Barth, 2011; Zax, Slusser, & Barth, 2019). As
such, individuals seem to convert target numbers into proportions of the whole using reference marks
on the number line like the start-, mid- or end point. For example, to estimate the spatial position of the
target ´72´ on a 0 to 100 number line, they may first consider the reference point ´50´ which is halfway
between the start point 0 and the end point 100 (rather than directly estimate 72, which is 72 units to the
5
right, see Cohen & Blanc-Goldhammer, 2011) and continue to quarter the line. In a next step, they
decide whether the probed number is smaller or larger than a quarter and compute the distance from this
chosen reference point and then put their estimate for 72 somewhat to the left (see also Dackermann,
Huber, Bahnmueller, Nuerk, & Moeller, 2015). Such a proportion-based solution strategy results in a
specific M-shaped error pattern with smaller and less variant estimation errors at and around reference
marks.
Respective evidence against the representational shift hypothesis (see, for instance, Opfer & Siegler,
2007; Siegler & Ramani, 2006; Siegler, Thompson, & Opfer, 2009) – suggesting the change from a
logarithmically to a more linearly spaced underlying representation of number magnitude described
above – was argued by Barth and Paladino (2011) who identified that the systematically biased estima-
tion patterns arising in bounded NLE cannot be accounted for by the log-to-linear shift hypothesis. In
particular, the authors argue that above described result pattern mirrors consideration of specific refer-
ence points such as the origin, mid and end point of a given number line. In doing so, participants cannot
just ignore the two boundaries, they have to make a rough estimate of a part relative to the size of the
whole number line, instead. This argument is corroborated by results indicating that estimates in the
bounded task version follow cyclical power functions (see Hollands & Dyre, 2000; Slusser et al., 2013)
being characteristic for proportion judgement. In this generalized form of a power function, the pattern
of over- and underestimation is repeating between every pair of reference points used and is thereby
similar to predictions by Spence (1990) of S-shaped or reverse S-shaped curves. Consequently, individ-
uals have to consider part-whole relations and thus estimate two magnitudes: first the whole (100) and
afterwards the part (72). Hence, Barth and Paladino (2011) inferred that the result patterns found in
bounded NLE cannot be construed as a direct measure of individuals’ underlying mental representation
of number magnitude.
Moreover, Slusser and colleagues (2013) as well as Rouder and Geary (2014) also shared this critical
view regarding the validity of conclusions drawn from NLE on the underlying number magnitude rep-
resentation. In addition, this is further emphasized by the study by Cohen and Quinlan (2018) running
computer simulations. Based on the assumption that participant´s response function to the bounded NLE
task serves as a “direct window on their psychological understanding of quantities” (p. 448) which they
termed the direct response strategy, the authors simulated an underlying quantity representation for
number magnitudes within the range of the upper and lower boundaries of the bounded number line.
For each target number, they sampled an estimate from the corresponding quantity distribution. Apply-
ing this procedure of computer simulations, they affirmed that the constraints of this standard bounded
NLE task produce logarithmic-linear response functions when individuals use the direct response strat-
egy. Thus, the authors showed that this task version does not provide a transparent window onto the
underlying representations of number magnitude.
Taken together, effective performance on the bounded NLE task seems to involve the deployment of
particular cognitive strategies and is hence contaminated “by the effects of truncation” (see Cohen &
6
Quinlan, 2018, p. 453). This constraint is reflected by the fact that typical bounded NLE task is largely
similar to proportion estimation tasks (e.g., Slusser et al., 2013). As a result of this, the direction and
extent of the resulting estimation errors are limited by the lower as well as upper bounds: under- and
overestimation of small and large magnitudes is constrained by the two end points respectively (see
Barth & Paladino, 2011; Cohen & Blanc-Goldhammer, 2011). These proportion judgements, in turn,
result in typical estimation patterns (for an overview of proportion estimation see also Cohen, Ferrell,
& Johnson, 2002) which can lead to misinterpretations and therefore remain contested.
In an effort to reduce this response bias inherent in the bounded NLE task, Cohen and Blanc-Gold-
hammer (2011) introduced a new task version that does not require an upper end point and termed it
unbounded NLE task. In this task version, individuals were given just a standard line segment as a start
point which denotes a measurement unit of usually 1 (e.g., two vertical lines that represent the distance
of one unit) but no labeled end point was presented to prevent them using systematic reference marks
and proportion-judgement strategies. They were then requested to reproduce a target magnitude based
on the respective unit length. The observed estimation patterns were considerably different as compared
to those found in the standard bounded version of the task. For example, estimation errors linearly in-
creased with the magnitude of the target number in contrast to the M-shaped error pattern which is
obtained in the bounded task version. Considering the distribution of error patterns in the unbounded
NLE task – but also from additional evidence such as the accelerating perceived distance function –, the
authors inferred that this task version constitutes a purer and more unbiased measure of the underlying
representation of number magnitude (Cohen & Blanc-Goldhammer, 2011). Hence, this newly intro-
duced task may overcome the limitations of the standard bounded task version outlined previously (see
also Cohen & Quinlan, 2018) when implemented correctly (Cohen & Ray, 2020).
Nonetheless, the authors observed that participants seem to use other strategies such as the dead-reck-
oning strategy to complete this task. Applying this strategy, “participants first moved a unit on the num-
ber line, then estimated the position of the next unit based on this current position, and so on” (Cohen
& Blanc-Goldhammer, p. 335). The use of multiples of a quantity then results in estimation patterns of
repetitive scallops. A subsequent study conducted by Reinert, Huber, Nuerk, and Moeller (2015a) fur-
ther investigated the processes that drive the estimation performance. Therefore, they adapted the task
varying unit sizes ranging from 1 to 10 to assess influences of the unit size as well as multiples of it on
individuals’ estimation performance. Interestingly, they found that participants’ estimates were more
accurate the larger the unit size – probably because fewer steps had to be taken on the number line.
Besides, the working window of numbers – a term also introduced by Cohen and Blanc-Goldhammer
(2011) describing the range of “multiples of a small quantity (about ten)” (p. 335) that individuals use
to estimate target numbers and that emerges from the use of the dead-reckoning strategy – was observed
to be fix at about 10 for every unit size, participants did not adapt it to the respective unit size and was
therefore not influenced by the manipulation of unit size. These results show influences different than
7
those found in bounded NLE. However, little is known about the use of specific strategies in bounded
NLE task so far.
Therefore, in the current doctoral thesis, I further examined the newly introduced unbounded NLE task
in three empirical studies with the aim to evaluate the claim that unbounded NLE provides a purer
measure of number magnitude representation. In particular, I was interested in identifying and quanti-
fying influences of aspects beyond number magnitude representation, such as strategy use, sex, and
estimation biases in a conceptually similar numerosity estimation task. Furthermore, the present disser-
tation was intended to provide new insights with regard to the general validity of this new task version
as well as the interpretation of the estimation patterns observed in it. In the next section, more specific
research questions will be identified breaking down this overall goal of this thesis and the main research
aims will be derived thereof.
2. Research Aims Altogether, the findings of the studies outlined in the general introduction provide support for the claim
that the unbounded NLE task indeed provides a purer measure of the underlying number magnitude
representation (but see Kim & Opfer, 2017, 2020, for a different view). Nonetheless, for a better under-
standing of (i) the general validity of this measure of number magnitude representation and (ii) potential
solution strategies used to complete this task, it requires additional research on various aspects of un-
bounded NLE. To close this gap in the literature, the two overarching research aims that I pursued in
the present dissertation will be specified in the next section and related to the three empirical studies
that were carried out therefore:
Research aim 1: Evaluating the general validity of the newly introduced unbounded num-ber line estimation task.
Study 1 of the current dissertation aimed to assess the validity of the unbounded NLE task in more detail.
As recommended by Ebersbach, Luwel, and Verschaffel (2013), I primarily intended “to systematically
manipulate the methodological aspects […] in magnitude estimation tasks” (p. 3) to gain new insights.
In particular, following this suggestion might provide additional evidence on the mental representation
of number magnitude as well as on the generalizability of estimation patterns observed in unbounded
NLE. Therefore, I compared the performance in unbounded as well as bounded number line with that
shown in a well-established non-symbolic numerosity estimation task. On the one hand, employing non-
symbolic numerosity estimation as a tool that is conceptually quite similar to unbounded NLE as well
as evaluating its differential associations with both unbounded as well as bounded NLE, may improve
our knowledge on the general validity of this new instrument. When the same estimation patterns can
8
be observed in both non-symbolic numerosity as well as unbounded NLE, the latter might also be a
reliable and valid measure of number magnitude representation.
Following the bi-directional mapping hypothesis postulated by Crollen, Castronovo, and Seron (2011),
I aimed at analyzing systematic patterns of under- and overestimation applying both perception and
production versions of the respective tasks (see also Castronovo & Seron, 2007; Crollen et al., 2011;
Crollen, Grade, Pesenti, & Dormal, 2013; Crollen & Seron, 2012; Mandler & Shebo, 1982). In the per-
ception version of the task, participants are given non-symbolic stimuli (e.g., collections of dots) and
are asked to estimate their numerosity by producing symbolic outputs such as Arabic or verbal numerals.
According to the bi-directional mapping hypothesis, the numerical estimation process is assumed to go
from a position on a representation of non-symbolic magnitudes that is logarithmically compressed to
its corresponding linearly spaced representation of symbolic number magnitude which leads to system-
atic underestimation. In contrast, in the production version of the task, participants have to produce non-
symbolic numerosities such as collections of dots that correspond to a symbolic stimuli they were pre-
sented with (e.g., Arabic digits). The mapping process here starts from a position on the linear symbolic
representation of numbers and goes to its associated analogue, logarithmically compressed numerical
representation on the subjective non-symbolic number line. As the objective magnitude is smaller here,
the transcoding process results in systematic overestimation. In line with the literature claiming un-
bounded NLE to be a purer measure of number magnitude representation, I expected that estimation
performance in the unbounded NLE task should show the same systematic biases of overestimation in
the production and underestimation in the perception version as in the non-symbolic numerosity esti-
mation task which is agreed to represent a reliable measure of the mental representation of number
magnitude.
Research aim 2: Identifying various factors that affect solution strategies to complete the
new unbounded number line estimation task.
In addition to examining the validity of the newly introduced unbounded task version as a valid measure
of number magnitude representation, Studies 2 and 3 of the current thesis mainly explored factors which
may affect solution strategies applied in both unbounded as well as bounded NLE by considering par-
ticipants’ eye-fixation behaviour (Study 2) and sex differences (Study 3) regarding the performance
shown in this task. Furthermore, I will take into account results of a prior study by Reinert and colleagues
(2015a) to further examine factors that affect estimation performance in unbounded NLE.
In particular, Study 2 of the present dissertation was supposed to provide new insights into solution
strategies – like for instance the consideration of possible reference points – deployed by participants in
the unbounded NLE task. To do so, I analyzed individuals´ estimation accuracy as well as their corre-
sponding eye-fixation behaviour similar to the procedure used by Sullivan, Juhasz, Slattery, and Barth´s
(2011) study on bounded NLE. As previously discovered by Cohen and Blanc-Goldhammer (2011), I
9
evaluated processes that underlie the dead-reckoning strategy in unbounded NLE more closely in Study
2 which follows up on the recent study by Reinert and colleagues (2015a). Systematically varying unit
size from 1 to 10, Reinert et al. (2015a) confirmed that the size of participants’ working window of
numbers actually seemed to be about 10 and independent of the actual unit size. In an attempt to gain
deeper insights into solution strategies possibly applied by individuals or additional predictors of esti-
mation performance observed in these tasks, Study 2 of this thesis was conducted.
On the one hand, I assumed that eye-fixation behaviour in the unbounded task version would not reflect
consideration of typical reference points as reflected by more frequent fixations at specific regions of
the number line (see Sullivan et al., 2011, for findings on bounded NLE). In contrast, I hypothesized a
constant decrease of fixations along the unbounded number line as the numerical size of the target num-
bers increases. On the other hand, for unbounded NLE I expected increased numbers of fixations at and
around the start, mid and end point which implies the use of proportion-based estimation strategies
specifically considering these reference points. Obtaining such a result pattern would provide further
evidence for the assumption that estimation performance in the unbounded NLE task is not driven by
proportion judgement strategies.
Finally, in Study 3 of this dissertation I investigated whether estimation performance in both the
bounded and unbounded NLE task is influenced by participants’ sex as an additional contributing vari-
able. In particular, I intended to evaluate whether differences in the use of solution strategies between
females and males – as known for mathematical/arithmetical tasks – generalize to these two basic nu-
merical tasks in a similar manner. Usually, women tend to be more prone to use procedures learnt in
school while men are assumed to be more inclined to apply individually developed strategies (including
estimation) when solving numerical problems (e.g., Gallagher, 1998; Kessel & Linn, 1996). Lately, a
further study indicated that spatial numerical associations might differ between sexes and showed sev-
eral sex disparities in a series of experiments (such as for example equity, color as well as magnitude
decisions, and bounded NLE; see Bull, Cleland, & Mitchell, 2013). Hence, I aimed at extending our
understanding on how sex differences effect solution strategies applied in numerical estimation in Study
3 of this thesis.
In particular, as previous studies indicated that men indeed employ estimation strategies more flexibly
in numerical problem solving, I expected them to outperform women – who rather adhere to well-known
learnt strategies – in the new unbounded task version. In contrast, there should be no sex-related dispar-
ity in the bounded task version because this can be completed by specific strategies such as proportion
judgement. Obtaining such a result pattern would constitute additional evidence suggesting that un-
bounded NLE is less confounded by the application of proportion-based solution strategies (see Cohen
& Blanc-Goldhammer, 2011). Moreover, it would point to the fact that this new task version represents
indeed a purer measure of number magnitude representation whereas individuals` estimation patterns in
the bounded NLE task version may also reflect specifically applied solution strategies used to complete
this task version.
10
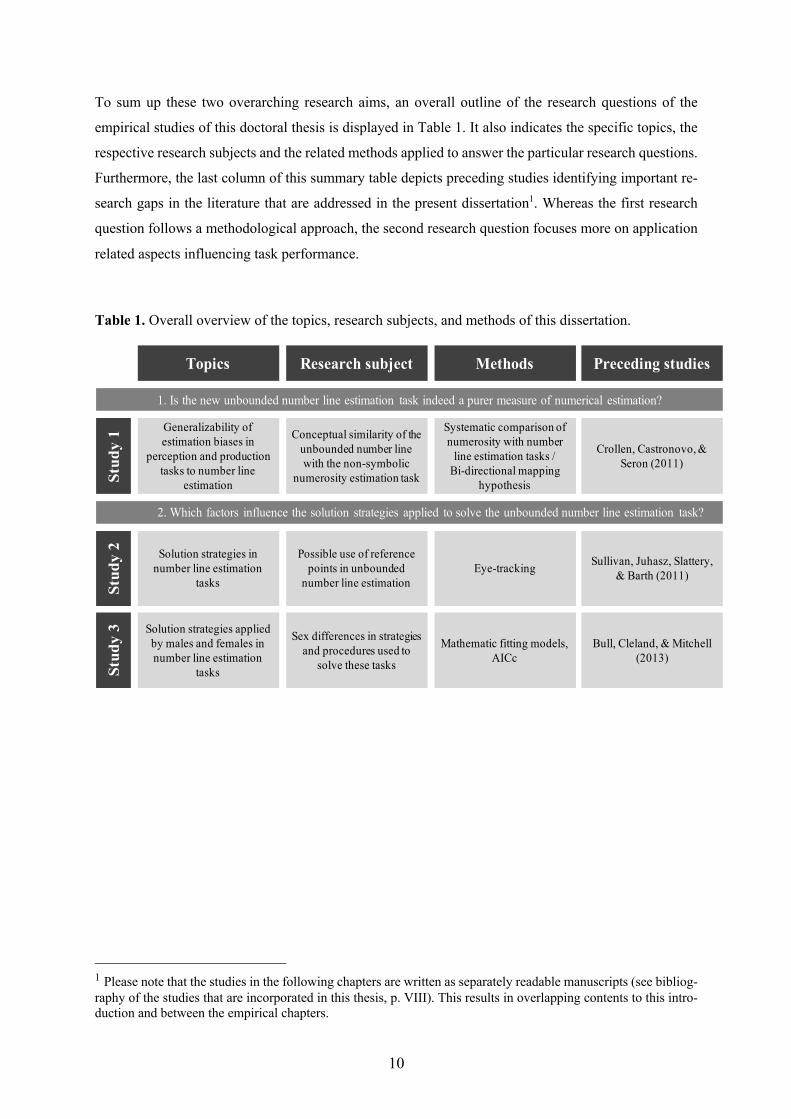
To sum up these two overarching research aims, an overall outline of the research questions of the
empirical studies of this doctoral thesis is displayed in Table 1. It also indicates the specific topics, the
respective research subjects and the related methods applied to answer the particular research questions.
Furthermore, the last column of this summary table depicts preceding studies identifying important re-
search gaps in the literature that are addressed in the present dissertation1. Whereas the first research
question follows a methodological approach, the second research question focuses more on application
related aspects influencing task performance.
Table 1. Overall overview of the topics, research subjects, and methods of this dissertation.
1 Please note that the studies in the following chapters are written as separately readable manuscripts (see bibliog-raphy of the studies that are incorporated in this thesis, p. VIII). This results in overlapping contents to this intro-duction and between the empirical chapters.
Topics
Stud
y 2
Stud
y 3
Stud
y 1
Solution strategies in number line estimation
tasks
Solution strategies applied by males and females in number line estimation
tasks
Generalizability of estimation biases in
perception and production tasks to number line
estimation
Methods
Eye-tracking
Preceding studies
Sullivan, Juhasz, Slattery, & Barth (2011)
Mathematic fitting models, AICc
Systematic comparison of numerosity with number
line estimation tasks / Bi-directional mapping
hypothesis
Bull, Cleland, & Mitchell (2013)
Crollen, Castronovo, & Seron (2011)
Research subject
Possible use of reference points in unbounded
number line estimation
Sex differences in strategies and procedures used to
solve these tasks
Conceptual similarity of the unbounded number line with the non-symbolic
numerosity estimation task
1. Is the new unbounded number line estimation task indeed a purer measure of numerical estimation?
2. Which factors influence the solution strategies applied to solve the unbounded number line estimation task?

11
II. EMPIRICAL STUDIES

12
13
STUDY 1: Unbounded number line estimation as a
measure of numerical estimation
Authors: Regina M. Reinert, Matthias Hartmann, Stefan Huber &
Korbinian Moeller
Individual contribution: I was mainly responsible for the conceptualization, planning,
data generation, analyses as well as paper writing.
Contribution of co-authors: Matthias Hartmann was involved in the conceptualization, data
generation as well as in the software development and paper
review. Stefan Huber created the stimulus sets and prepared the
data for the analyses. Korbinian Moeller was also responsible
for the conceptualization and planning, supervision and paper
review & editing.
Current stage: Accepted for publication in PLoS ONE
Citation: Reinert RM, Hartmann M, Huber S, Moeller K (2019) Un-
bounded number line estimation as a measure of numerical es-
timation. PLoS ONE 14(3): e0213102.
https://doi.org/10.1371/journal.pone.0213102
14
1.1 Abstract Number magnitude estimation has been investigated over the last decades using different tasks including
non-symbolic numerosity but also number line estimation tasks. Recently, a bi-directional mapping pro-
cess was suggested for numerosity estimation accounting for underestimation in a perception version of
the task (i.e., indicating the number of non-symbolic dots in a set) and overestimation in the correspond-
ing production task (i.e., produce the number of dots indicated by a symbolic number). In the present
study, we evaluated the generalizability of these estimation biases in perception and production tasks to
bounded and unbounded number line estimation. Importantly, target numbers were underesti-
mated/overestimated by participants in the perception/production version of numerosity estimation as
well as unbounded number line estimation. However, this pattern was reversed for bounded number line
estimation. Thereby, the present data indicate a conceptual similarity of unbounded number line estima-
tion and the established non-symbolic numerosity estimation task as a measure of numerical estimation.
Accordingly, this corroborates the notion that unbounded number line estimation may reflect a purer
measure of number magnitude representation than the bounded task version. Furthermore, our findings
strengthen the bi-directional mapping hypothesis for numerical estimation by providing evidence for its
generalizability to unbounded number line estimation for the first time.
Keywords: numerical estimation biases, underestimation, overestimation, numerical mapping process,
symbolic and non-symbolic magnitudes, number line estimation tasks.
15
1.2 Introduction Magnitude estimation tasks are typically employed to investigate numerical cognition. On the one hand,
non-symbolic stimuli like collections of dots or sequences of sounds are used to assess the underlying
representation of number magnitude. Usually, participants have to estimate their numerosity producing
symbolic outputs such as Arabic or oral verbal numerals (e.g., Barth, Kanwisher, & Spelke, 2003; Man-
dler & Shebo, 1982). On the other hand, the (spatial) representation of number magnitude is often in-
vestigated using symbolic stimuli in tasks such as number line estimation (e.g., Siegler & Opfer, 2003).
So far, however, similarities and differences in performance patterns for non-symbolic numerosity esti-
mation and number line estimation have hardly been investigated. Therefore, the current study set off
to evaluate whether results on non-symbolic numerosity estimation (e.g., Crollen, Castronovo, & Seron,
2011) can be generalized to bounded (e.g., Siegler & Opfer, 2003) as well as unbounded number line
estimation (e.g., Cohen & Blanc-Goldhammer, 2011). Generalizable patterns of results would provide
further evidence that bounded and/or unbounded number line estimation indeed rely on number magni-
tude estimation processes. In the following, we will first elaborate on the specifics of number line esti-
mation and non-symbolic numerosity estimation before outlining the details of the present study.
1.2.1 Number line estimation tasks The traditional version of this task is the bounded number line estimation task in which participants have
to indicate the spatial position of a target number (e.g., 45) on a number line with a given start and
endpoint (e.g., 0 to 100; e.g., Berteletti, Lucangeli, Piazza, Dehaene, & Zorzi, 2010; Booth & Siegler,
2006; Moeller, Pixner, Kaufmann, & Nuerk, 2009; Nuerk, Moeller, Klein, Willmes, & Fischer,
2011; Siegler & Booth, 2004; Siegler & Opfer, 2003). The observed estimation pattern is then used to
infer on the nature of the underlying representation of number magnitude.
However, it has been controversially debated in recent years whether this task indeed allows for infer-
ences on the spatial layout of the underlying mental number line representation (e.g., Siegler & Opfer,
2003) or rather task-specific strategies that participants apply while they solve the task (Hollands &
Dyre, 2000; Slusser, Santiago, & Barth, 2013; Sullivan, Juhasz, Slattery, & Barth, 2011). Barth and
Paladino (2011) were the first to argue that the observed estimation pattern in this task may not reflect
pure numerical estimation but the use of proportion-judgement strategies (see also Ashcraft & Moore,
2012; Cohen & Blanc-Goldhammer, 2011; Sullivan et al., 2011). Support for the assumption of the use
of such task-specific strategies comes from the observation that participants’ estimates are biased to-
wards specific reference points (e.g., start and endpoint of the scale as well as the middle) with estima-
tions being relatively more accurate near these reference points.
Recently, Cohen and Blanc-Goldhammer (2011) presented a new unbounded version of the number line
estimation task and argued that this version provides a purer measurement of numerical estimation than
the original bounded version. In this task version, only the start point and a scaling unit, but no endpoint
16
of the number line is given. The observed estimation patterns led the authors to the conclusion that the
bounded number line estimation task may be an invalid measure of number magnitude representation.
Importantly, the results observed in this unbounded number line estimation task differed from the typical
error pattern found in the bounded version of the task: Instead of estimations being more accurate around
reference points, the authors found an error pattern that was consistent with scalar variance (see Gibbon,
1977; Gibbon & Church, 1981; Meck & Church, 1983; Whalen, Gallistel, & Gelman, 1999), this means
that estimation errors increased linearly with the size of the target number (see also Reinert, Huber,
Nuerk, & Moeller, 2015). Interestingly, this nicely reflects the pattern of results usually observed in
estimation tasks in which, for instance, the number of dots in a given set has to be indicated (e.g., Crollen
et al., 2011; Castronovo & Seron, 2007; Crollen & Seron, 2012).
So far, however, this potential conceptual similarity between unbounded number line estimation and the
estimation of the magnitude of non-symbolic stimuli has not been investigated yet. Instead, the argument
that unbounded number line estimation reflects a purer measure of numerical estimation has primarily
been made based on comparisons of estimation performance in unbounded and bounded number line
estimation. This seems surprising because non-symbolic numerosity estimation tasks are generally
agreed to reflect a reliable measure of numerical estimation. Therefore, the current study set out to sys-
tematically evaluate similarities and differences between non-symbolic estimation and unbounded as
well as bounded number line estimation. We expected a closer association of non-symbolic estimation
with unbounded than with bounded number line estimation.
1.2.2 Numerosity estimation To do so, we followed the suggestion of Crollen, Castronovo, and Seron (2011; see also Ebersbach,
Luwel, & Verschaffel, 2013) for a taxonomy of paradigms of studies on magnitude estimation) and
specifically investigated differences between production and perception type of the respective estima-
tion tasks. For tasks using numbers of dots as non-symbolic targets, Crollen et al. (2011) showed op-
posing biases for the different types of the tasks (i.e., production and perception version). In their nu-
merosity perception task, participants estimated the numerosity of collections of dots and expressed their
estimates via symbolic Arabic numerals. In contrast, in their numerosity production task, symbolic stim-
uli in terms of an Arabic number were presented to participants who then had to estimate the denoted
magnitude by non-symbolic output, this means, by adjusting the numerosity of a dot pattern so that it
reflected the magnitude of the presented Arabic numeral. Depending on task type, the authors observed
opposing patterns of performance: The numerosity of a dot set was systematically underestimated in the
perception task, whereas the numerosity produced in the production task was overestimated significantly
(see also Castronovo & Seron, 2007). The authors accounted for these systematic biases of under- and
overestimation by the bi-directional mapping-hypothesis (see also Brooke & MacRae, 1977; Cohen,
Ferrell, & Johnson, 2002; Shepard, 1981; Slusser & Barth, 2017) that is based on three assumptions: (1)
17
There are different numerical representations. In the present context, the first assumption refers to the
differentiation between symbolic (e.g., 3) and non-symbolic (e.g., •••) representations of numerical mag-
nitude. (2) Transcoding routes between these representations are assumed that allow for translating mag-
nitude information from one representation to the other (i.e., symbolic to non-symbolic and non-sym-
bolic to symbolic). Moreover, it is supposed that (3) precision differs between different numerical rep-
resentations. The non-symbolic representation is assumed to be less precise as it is logarithmically com-
pressed resulting in decreasing differences between adjacent numbers with increasing magnitude (e.g.,
Buckley & Gillman, 1974; Holloway & Ansari, 2009; Piazza, Pinel, Le Bihan, & Dehaene, 2007).
Based on these three assumptions, the opposing biases observed in numerosity perception and produc-
tion in terms of under- and overestimation are assumed to stem from biases in transcoding between
symbolic representations and their corresponding analogue (non-symbolic) magnitude representations.
In the perception task, the numerical estimation process goes from a position on the logarithmically
compressed representation of non-symbolic magnitudes to its associated linear symbolic numerical rep-
resentation. Accordingly, the subjective magnitude is constantly larger compared to the objective one,
and the perceived numerosity is therefore underestimated by participants. In contrast, in the production
task, the mapping process starts from a position on the linear symbolic numerical representation and
goes to its corresponding analogue but logarithmically compressed magnitude representation on the
subjective non-symbolic number line. In this case, the objective magnitude is smaller than the subjective
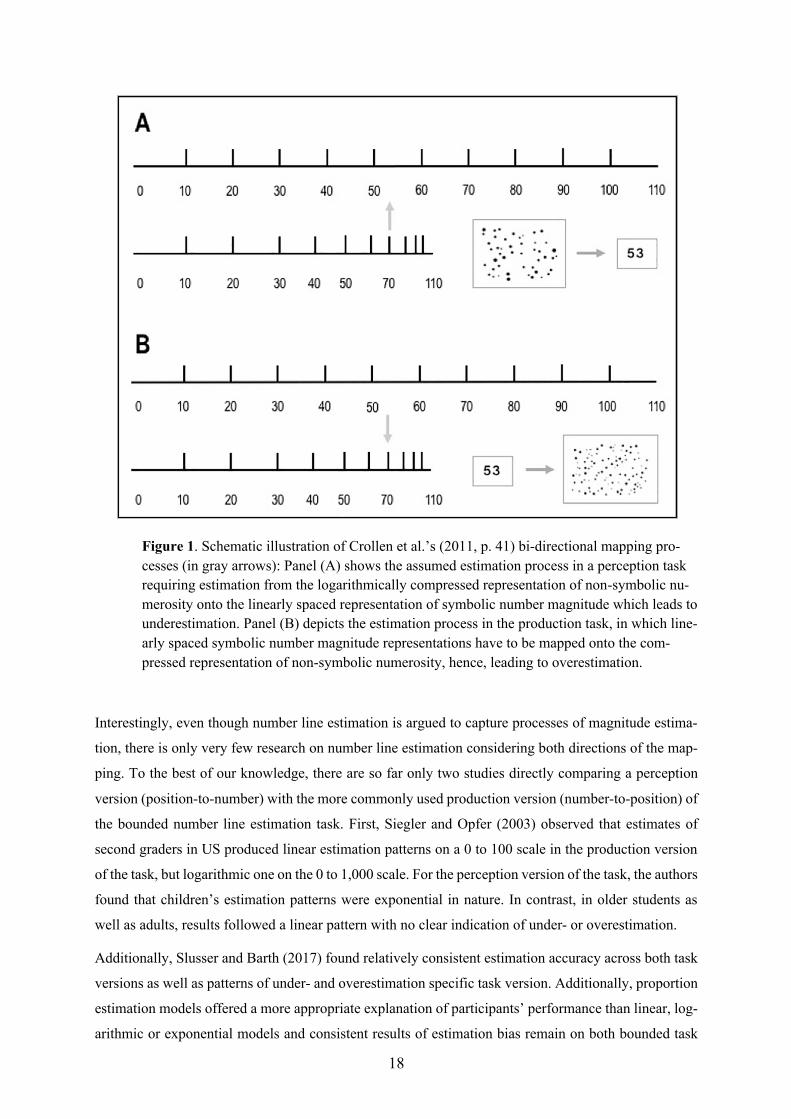
one. Hence, this leads to an overestimation of the target magnitude (see Figure 1a).
18
Figure 1. Schematic illustration of Crollen et al.’s (2011, p. 41) bi-directional mapping pro-cesses (in gray arrows): Panel (A) shows the assumed estimation process in a perception task requiring estimation from the logarithmically compressed representation of non-symbolic nu-merosity onto the linearly spaced representation of symbolic number magnitude which leads to underestimation. Panel (B) depicts the estimation process in the production task, in which line-arly spaced symbolic number magnitude representations have to be mapped onto the com-pressed representation of non-symbolic numerosity, hence, leading to overestimation.
Interestingly, even though number line estimation is argued to capture processes of magnitude estima-
tion, there is only very few research on number line estimation considering both directions of the map-
ping. To the best of our knowledge, there are so far only two studies directly comparing a perception
version (position-to-number) with the more commonly used production version (number-to-position) of
the bounded number line estimation task. First, Siegler and Opfer (2003) observed that estimates of
second graders in US produced linear estimation patterns on a 0 to 100 scale in the production version
of the task, but logarithmic one on the 0 to 1,000 scale. For the perception version of the task, the authors
found that children’s estimation patterns were exponential in nature. In contrast, in older students as
well as adults, results followed a linear pattern with no clear indication of under- or overestimation.
Additionally, Slusser and Barth (2017) found relatively consistent estimation accuracy across both task
versions as well as patterns of under- and overestimation specific task version. Additionally, proportion
estimation models offered a more appropriate explanation of participants’ performance than linear, log-
arithmic or exponential models and consistent results of estimation bias remain on both bounded task
19
versions over the course of development. These findings indicate that the different task versions of the
bounded number line estimation task induce people to apply different solution strategies calling into
question whether this task is a valid measure of mental number representation. Besides, only little work
has been done applying the perception version of a number line estimation task (cf. Ashcraft & Moore,
2012; Iuculano & Butterworth, 2011).
For unbounded number line estimation, there is currently no study investigating similarities and differ-
ences between the production and perception version of the task. In fact, we are not aware that the latter
was ever used in research before. Furthermore, there is currently no study evaluating the conceptual
similarity of bounded and unbounded number line estimation to with analogue (non-symbolic) numer-
osity estimation.
1.3 The present study In the present study, we therefore aimed at investigating the conceptual similarity of unbounded and
bounded number line estimation with non-symbolic numerosity estimation. In line with previous results,
we generally expected to replicate the previous findings of Crollen and colleagues (2011) in terms of
underestimation in our numerosity perception task and overestimation in our numerosity production
task.
Furthermore, in line with the argument that unbounded number line estimation reflects a measure of
numerical estimation (e.g., Cohen & Blanc-Goldhammer, 2011), we hypothesized that estimation per-
formance in the two versions of the unbounded number line estimation task should follow the pattern of
under- and overestimation observed in the perception and production version of the numerosity estima-
tion task. In the perception version of unbounded number line estimation, participants should systemat-
ically underestimate numerical magnitudes whereas we expected them to overestimate numerical mag-
nitude in the production version. So far, a perception version of this task has never been described in the
literature, only the production version.
The single unit distance at the origin of the number line as well as the hatch mark at the position to be
estimated in the perception task of the unbounded number line estimation task are assumed to activate
the non-symbolic, analogue representation of numbers. When estimating the corresponding Arabic num-
ber reflecting the spatial position on the number line, participants have to transcode from the logarith-
mically compressed analogue to the symbolic linear Arabic representation. Accordingly, corresponding
values of the target number are always smaller and participants are expected to underestimate the re-
spective numerical magnitude. The other way round, in the production task, we expect that the magni-
tude of the spatial position of the target number on the number line is overestimated by participants as
the numerical estimation process is based on symbolic to non-symbolic mapping. In particular, in this
version of the task, the target number is presented as an Arabic number that has to be transcoded into an
analogue representation of numerosity. Therefore, the estimation process starts from a position on the
20
symbolic linear numerical representation to its associated magnitude on the logarithmically compressed
subjective number line. As such, objective magnitude seems smaller than its subjective counterpart and
participants should overestimate the respective magnitude. Observation of such a result pattern would
provide additional evidence for the assumption that the unbounded number line estimation task reflects
a more unbiased measure of the mental number line representation as compared to the bounded number
line estimation task.
Because bounded number line estimation was supposed to entail proportion-based judgments, we ex-
pected a more task-specific result pattern. With regard to over- and underestimation in the production
and perception task version Siegler and Opfer (2003, see also Slusser & Barth, 2017) found inconsistent
result patterns for their children and adult participants. Therefore, we had no specific expectations with
respect to the pattern of over- and underestimation in bounded number line estimation.
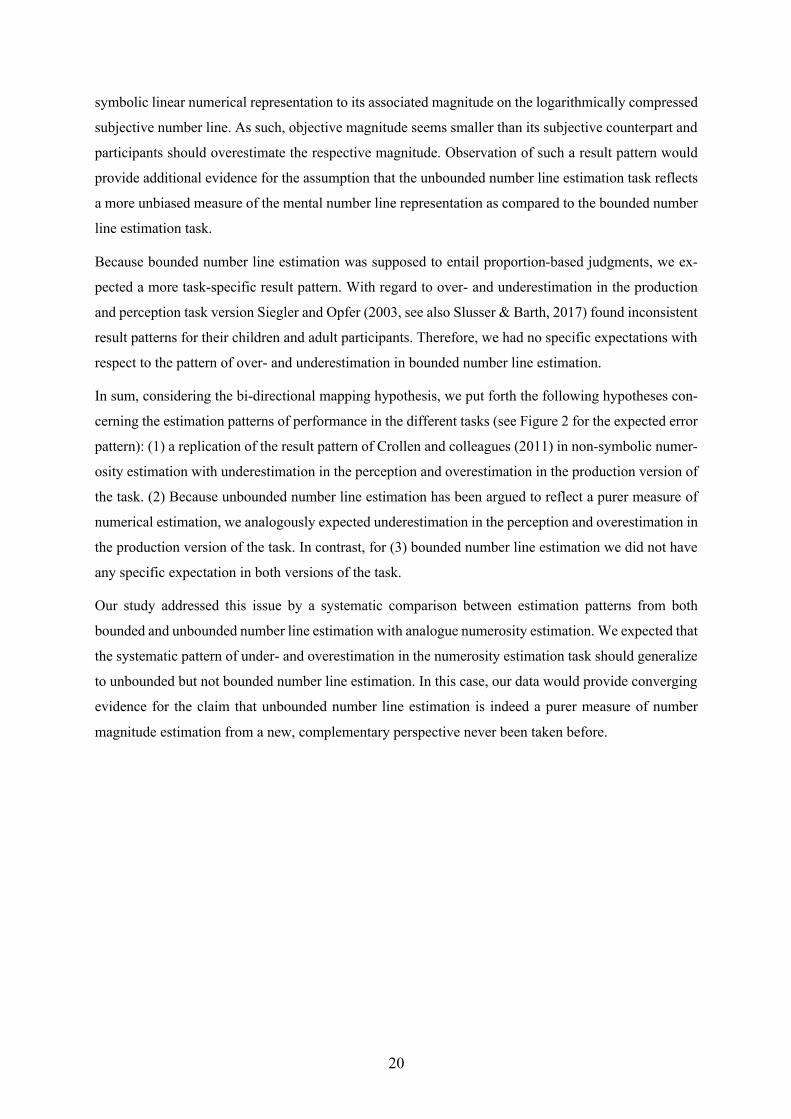
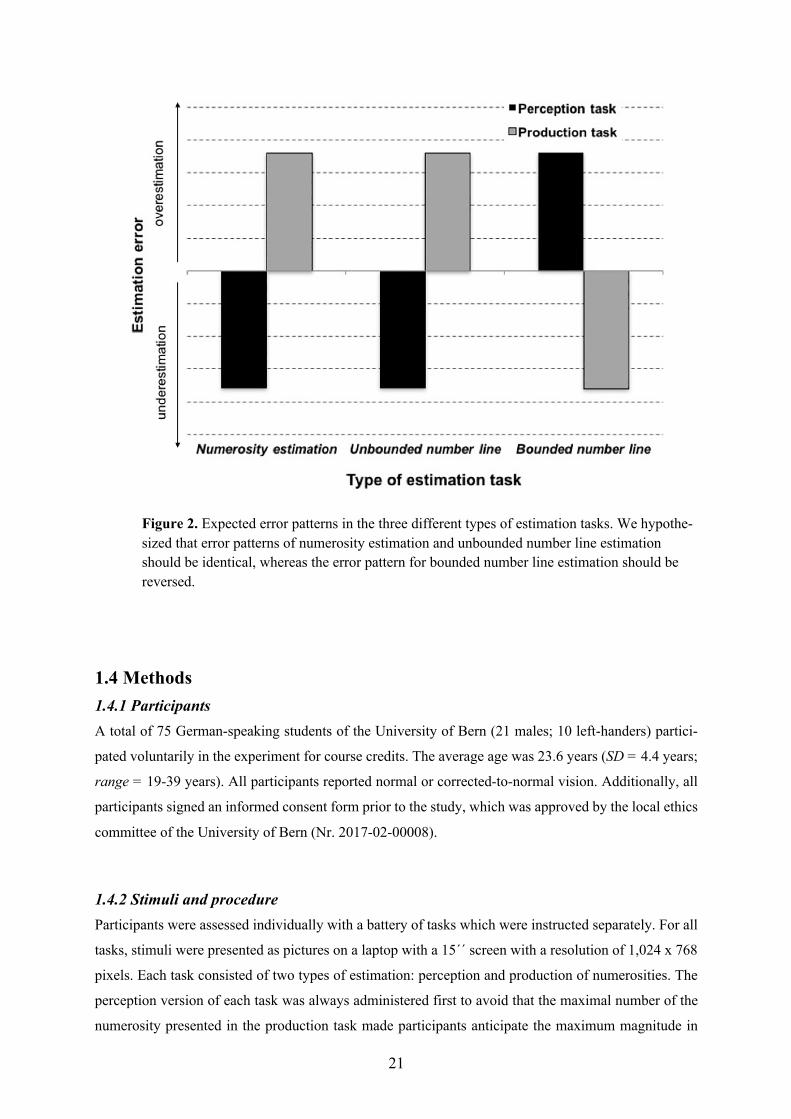
In sum, considering the bi-directional mapping hypothesis, we put forth the following hypotheses con-
cerning the estimation patterns of performance in the different tasks (see Figure 2 for the expected error
pattern): (1) a replication of the result pattern of Crollen and colleagues (2011) in non-symbolic numer-
osity estimation with underestimation in the perception and overestimation in the production version of
the task. (2) Because unbounded number line estimation has been argued to reflect a purer measure of
numerical estimation, we analogously expected underestimation in the perception and overestimation in
the production version of the task. In contrast, for (3) bounded number line estimation we did not have
any specific expectation in both versions of the task.
Our study addressed this issue by a systematic comparison between estimation patterns from both
bounded and unbounded number line estimation with analogue numerosity estimation. We expected that
the systematic pattern of under- and overestimation in the numerosity estimation task should generalize
to unbounded but not bounded number line estimation. In this case, our data would provide converging
evidence for the claim that unbounded number line estimation is indeed a purer measure of number
magnitude estimation from a new, complementary perspective never been taken before.
21
Figure 2. Expected error patterns in the three different types of estimation tasks. We hypothe-sized that error patterns of numerosity estimation and unbounded number line estimation should be identical, whereas the error pattern for bounded number line estimation should be reversed.
1.4 Methods 1.4.1 Participants A total of 75 German-speaking students of the University of Bern (21 males; 10 left-handers) partici-
pated voluntarily in the experiment for course credits. The average age was 23.6 years (SD = 4.4 years;
range = 19-39 years). All participants reported normal or corrected-to-normal vision. Additionally, all
participants signed an informed consent form prior to the study, which was approved by the local ethics
committee of the University of Bern (Nr. 2017-02-00008).
1.4.2 Stimuli and procedure Participants were assessed individually with a battery of tasks which were instructed separately. For all
tasks, stimuli were presented as pictures on a laptop with a 15´´ screen with a resolution of 1,024 x 768
pixels. Each task consisted of two types of estimation: perception and production of numerosities. The
perception version of each task was always administered first to avoid that the maximal number of the
numerosity presented in the production task made participants anticipate the maximum magnitude in
22
the production task. Moreover, participants received no information about the range of numerosities
being presented and no feedback was provided. Items were presented in randomized order for each
participant individually.
Tasks were administered in the following order: First, two different numerosity perception tasks were
presented to participants whereas the order of both versions was counterbalanced. Half of the partici-
pants started with a version in which all presented dots had the same size whereas the other half began
with the version in which overall area covered by the presented dots was matched (see next section for
details). These tasks were directly followed by the numerosity production task. Second, perception and
production versions of the unbounded number line estimation task were administered prior to the two
respective versions of the bounded number line estimation tasks. Thereby, the task which explicitly
defines a number range (i.e., bounded number line estimation) was administered last to avoid partici-
pants building up expectations about the number ranges used in the tasks. For both, numerosity estima-
tion as well as unbounded number line estimation the upper bound of the number range covered by the
tasks is not specified to participants, and thus they may not use a given upper bound as an additional
reference point. As the bounded number line estimation task explicitly defines a number range by its
upper bound, it was conducted last to prevent participants to assume a similar number range for numer-
osity and unbounded number line estimation.
Two additional control tasks were given last: one task in which participants had to estimate proportions
of areas like triangles, circles, squares and rectangles and the Berlin Numeracy Task (Cokely, Galesic,
Schulz, Ghazal, & Garcia-Retamero, 2012). These were administered to investigate a research question
different from the one described in the present study. Therefore, results for these two tasks will not be
considered in the present study. In sum, the experiment took approximately 45 min.
Numerosity estimation:
Twenty-four different numerosities were used to create the target sets of dots that ranged from 30 to
100. Two different target sets were developed: one for the two perception tasks (30, 34, 39, 41, 43, 46,
48, 52, 55, 57, 60, 64, 65, 69, 70, 75, 78, 82, 83, 86, 87, 91, 94, 99), and an additional one for the
production task (31, 35, 38, 40, 42, 47, 49, 53, 54, 56, 62, 63, 66, 67, 71, 76, 77, 80, 84, 85, 89, 92, 93,
98). Target numbers were chosen to have the same mean problem size for the overall number range as
well as numbers within each decade (i.e. 31-39, 41-49, etc.). Furthermore, we developed two different
versions of stimuli for the perception task to control for perceptive parameters such as total occupied
area and dot size. In one stimuli set, all dots had the same size and therefore the area covered by the
array increased with increasing numerosity. In the other set, the sum of the area of all the dots on the
screen was kept constant.
Each trial in the numerosity perception task started with a centrally presented black fixation cross pre-
sented for 1,000 ms against a white background followed by a pattern of dots that was flashed on the
23
screen for 250 ms. Afterwards, the sign “=” was displayed and replaced after 500 ms by the Arabic
numeral “1”. Participants’ task was to indicate as quickly and accurately as possible the numerosity of
presented dots as an Arabic number. To give their answers, they had to scroll the mouse wheel up
through the sequence of Arabic numbers (or down to go back to correct the answer) and press the “Enter”
button to finish their estimation. No information about the number range and feedback concerning their
performance were provided.
In the numerosity production task, participants were required to produce a dot pattern that was equiva-
lent to the presented Arabic number magnitude. Each trial started with the presentation of a black fixa-
tion cross (for 1,000 ms) in the middle of the screen against a white background, followed by the two-
digit target Arabic numeral for 250 ms. Then, the sign “=” was displayed (500 ms) and the production
phase began with a single dot on the screen at a randomly determined position. Participants then had to
start dots production by scrolling the mouse wheel up to increase the number of dots that appear on the
screen and down to decrease the number of dots. When they had the impression that the numerosity of
dots corresponded to the requested number, they pressed the “Enter” button. The maximum number of
dots that participants could produce was limited to 254 (cf. Experiment 2 of Crollen et al., 2011).
Number line estimation:
In the production version of both unbounded and bounded number line estimation tasks, participants
were instructed to indicate as accurately and as fast as possible the spatial position of the given target
number on the number line using the mouse to click at the estimated position (upper panels of Figure 3a
and b). In the perception version of the tasks, participants had to insert the Arabic number specifying
the spatial location already indicated on the number line by using the keyboard. The number lines as
well as target numbers were presented in black colour against a white background (see Figure 3).
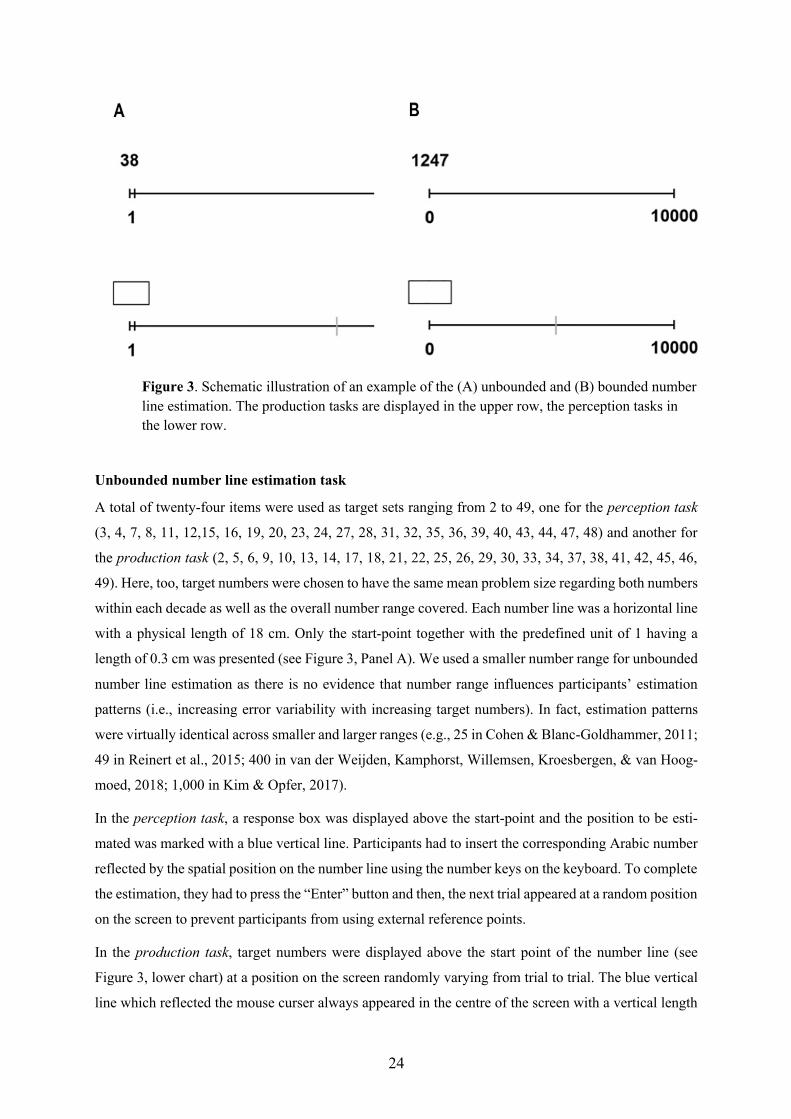
24
Figure 3. Schematic illustration of an example of the (A) unbounded and (B) bounded number line estimation. The production tasks are displayed in the upper row, the perception tasks in the lower row.
Unbounded number line estimation task
A total of twenty-four items were used as target sets ranging from 2 to 49, one for the perception task
(3, 4, 7, 8, 11, 12,15, 16, 19, 20, 23, 24, 27, 28, 31, 32, 35, 36, 39, 40, 43, 44, 47, 48) and another for
the production task (2, 5, 6, 9, 10, 13, 14, 17, 18, 21, 22, 25, 26, 29, 30, 33, 34, 37, 38, 41, 42, 45, 46,
49). Here, too, target numbers were chosen to have the same mean problem size regarding both numbers
within each decade as well as the overall number range covered. Each number line was a horizontal line
with a physical length of 18 cm. Only the start-point together with the predefined unit of 1 having a
length of 0.3 cm was presented (see Figure 3, Panel A). We used a smaller number range for unbounded
number line estimation as there is no evidence that number range influences participants’ estimation
patterns (i.e., increasing error variability with increasing target numbers). In fact, estimation patterns
were virtually identical across smaller and larger ranges (e.g., 25 in Cohen & Blanc-Goldhammer, 2011;
49 in Reinert et al., 2015; 400 in van der Weijden, Kamphorst, Willemsen, Kroesbergen, & van Hoog-
moed, 2018; 1,000 in Kim & Opfer, 2017).
In the perception task, a response box was displayed above the start-point and the position to be esti-
mated was marked with a blue vertical line. Participants had to insert the corresponding Arabic number
reflected by the spatial position on the number line using the number keys on the keyboard. To complete
the estimation, they had to press the “Enter” button and then, the next trial appeared at a random position
on the screen to prevent participants from using external reference points.
In the production task, target numbers were displayed above the start point of the number line (see
Figure 3, lower chart) at a position on the screen randomly varying from trial to trial. The blue vertical
line which reflected the mouse curser always appeared in the centre of the screen with a vertical length
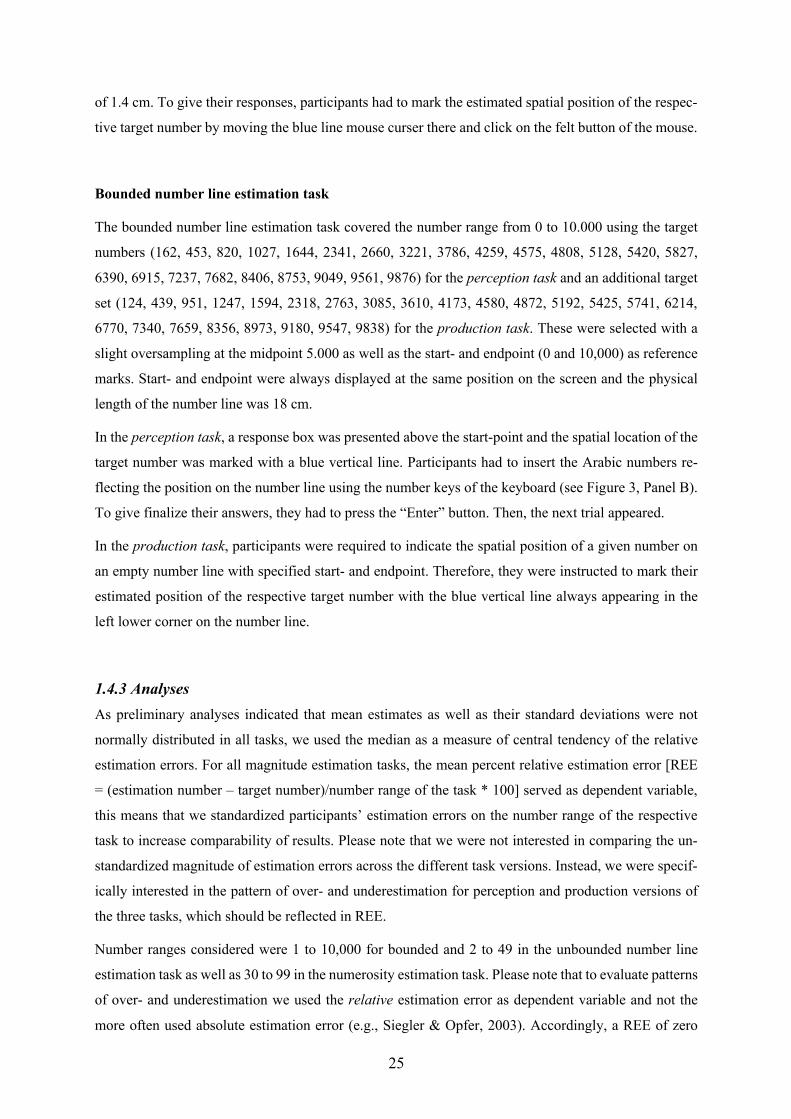
25
of 1.4 cm. To give their responses, participants had to mark the estimated spatial position of the respec-
tive target number by moving the blue line mouse curser there and click on the felt button of the mouse.
Bounded number line estimation task
The bounded number line estimation task covered the number range from 0 to 10.000 using the target
numbers (162, 453, 820, 1027, 1644, 2341, 2660, 3221, 3786, 4259, 4575, 4808, 5128, 5420, 5827,
6390, 6915, 7237, 7682, 8406, 8753, 9049, 9561, 9876) for the perception task and an additional target
set (124, 439, 951, 1247, 1594, 2318, 2763, 3085, 3610, 4173, 4580, 4872, 5192, 5425, 5741, 6214,
6770, 7340, 7659, 8356, 8973, 9180, 9547, 9838) for the production task. These were selected with a
slight oversampling at the midpoint 5.000 as well as the start- and endpoint (0 and 10,000) as reference
marks. Start- and endpoint were always displayed at the same position on the screen and the physical
length of the number line was 18 cm.
In the perception task, a response box was presented above the start-point and the spatial location of the
target number was marked with a blue vertical line. Participants had to insert the Arabic numbers re-
flecting the position on the number line using the number keys of the keyboard (see Figure 3, Panel B).
To give finalize their answers, they had to press the “Enter” button. Then, the next trial appeared.
In the production task, participants were required to indicate the spatial position of a given number on
an empty number line with specified start- and endpoint. Therefore, they were instructed to mark their
estimated position of the respective target number with the blue vertical line always appearing in the
left lower corner on the number line.
1.4.3 Analyses As preliminary analyses indicated that mean estimates as well as their standard deviations were not
normally distributed in all tasks, we used the median as a measure of central tendency of the relative
estimation errors. For all magnitude estimation tasks, the mean percent relative estimation error [REE
= (estimation number – target number)/number range of the task * 100] served as dependent variable,
this means that we standardized participants’ estimation errors on the number range of the respective
task to increase comparability of results. Please note that we were not interested in comparing the un-
standardized magnitude of estimation errors across the different task versions. Instead, we were specif-
ically interested in the pattern of over- and underestimation for perception and production versions of
the three tasks, which should be reflected in REE.
Number ranges considered were 1 to 10,000 for bounded and 2 to 49 in the unbounded number line
estimation task as well as 30 to 99 in the numerosity estimation task. Please note that to evaluate patterns
of over- and underestimation we used the relative estimation error as dependent variable and not the
more often used absolute estimation error (e.g., Siegler & Opfer, 2003). Accordingly, a REE of zero
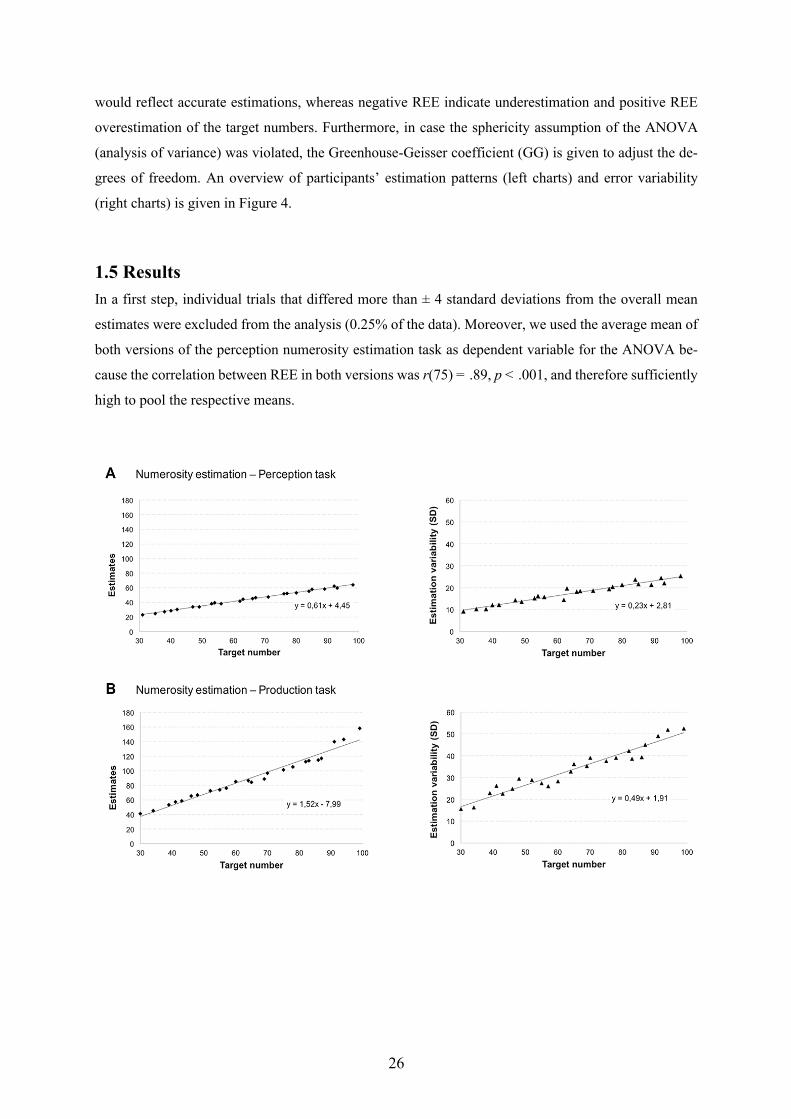
26
would reflect accurate estimations, whereas negative REE indicate underestimation and positive REE
overestimation of the target numbers. Furthermore, in case the sphericity assumption of the ANOVA
(analysis of variance) was violated, the Greenhouse-Geisser coefficient (GG) is given to adjust the de-
grees of freedom. An overview of participants’ estimation patterns (left charts) and error variability
(right charts) is given in Figure 4.
1.5 Results In a first step, individual trials that differed more than ± 4 standard deviations from the overall mean
estimates were excluded from the analysis (0.25% of the data). Moreover, we used the average mean of
both versions of the perception numerosity estimation task as dependent variable for the ANOVA be-
cause the correlation between REE in both versions was r(75) = .89, p < .001, and therefore sufficiently
high to pool the respective means.
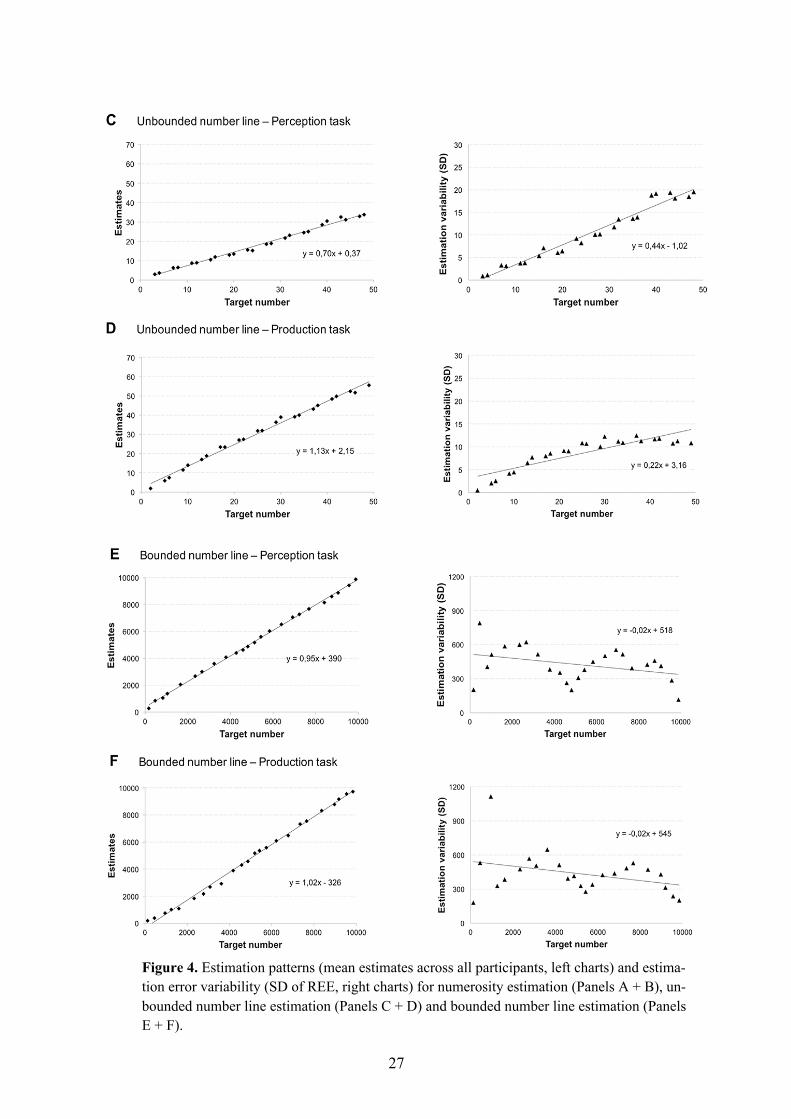
27
Figure 4. Estimation patterns (mean estimates across all participants, left charts) and estima-tion error variability (SD of REE, right charts) for numerosity estimation (Panels A + B), un-bounded number line estimation (Panels C + D) and bounded number line estimation (Panels E + F).
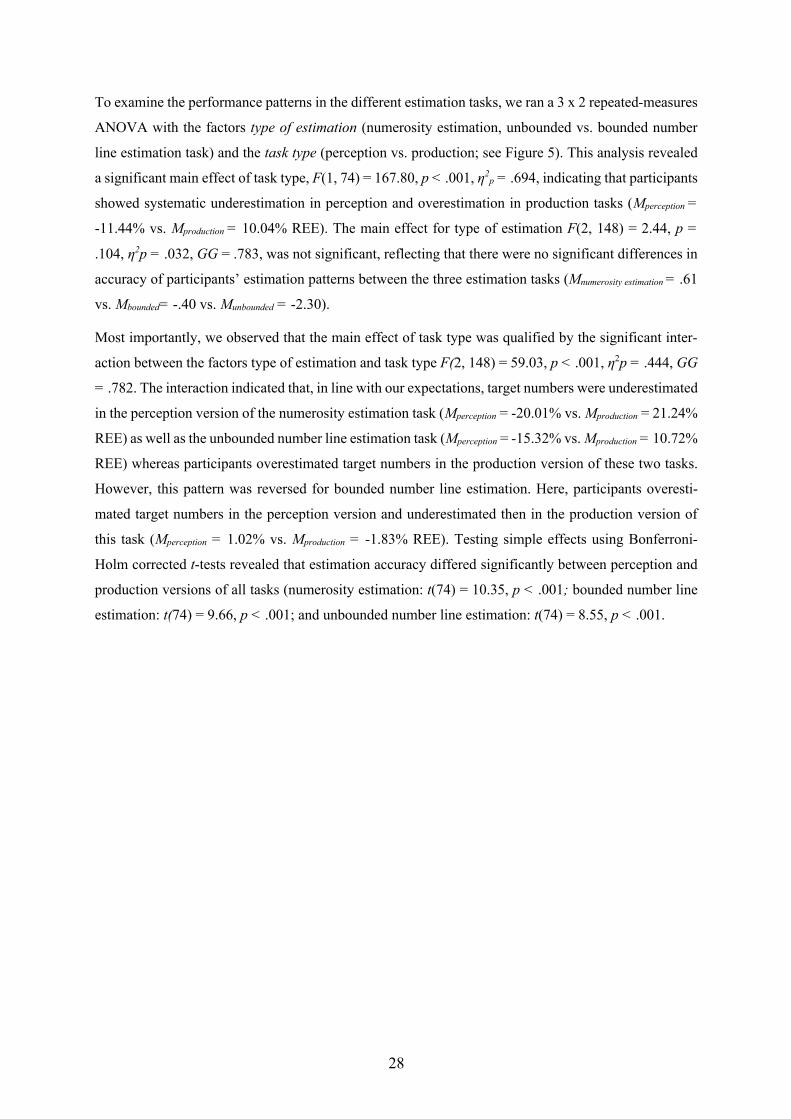
28
To examine the performance patterns in the different estimation tasks, we ran a 3 x 2 repeated-measures
ANOVA with the factors type of estimation (numerosity estimation, unbounded vs. bounded number
line estimation task) and the task type (perception vs. production; see Figure 5). This analysis revealed
a significant main effect of task type, F(1, 74) = 167.80, p < .001, η2p = .694, indicating that participants
showed systematic underestimation in perception and overestimation in production tasks (Mperception =
-11.44% vs. Mproduction = 10.04% REE). The main effect for type of estimation F(2, 148) = 2.44, p =
.104, η2p = .032, GG = .783, was not significant, reflecting that there were no significant differences in
accuracy of participants’ estimation patterns between the three estimation tasks (Mnumerosity estimation = .61
vs. Mbounded= -.40 vs. Munbounded = -2.30).
Most importantly, we observed that the main effect of task type was qualified by the significant inter-
action between the factors type of estimation and task type F(2, 148) = 59.03, p < .001, η2p = .444, GG
= .782. The interaction indicated that, in line with our expectations, target numbers were underestimated
in the perception version of the numerosity estimation task (Mperception = -20.01% vs. Mproduction = 21.24%
REE) as well as the unbounded number line estimation task (Mperception = -15.32% vs. Mproduction = 10.72%
REE) whereas participants overestimated target numbers in the production version of these two tasks.
However, this pattern was reversed for bounded number line estimation. Here, participants overesti-
mated target numbers in the perception version and underestimated then in the production version of
this task (Mperception = 1.02% vs. Mproduction = -1.83% REE). Testing simple effects using Bonferroni-
Holm corrected t-tests revealed that estimation accuracy differed significantly between perception and
production versions of all tasks (numerosity estimation: t(74) = 10.35, p < .001; bounded number line
estimation: t(74) = 9.66, p < .001; and unbounded number line estimation: t(74) = 8.55, p < .001.
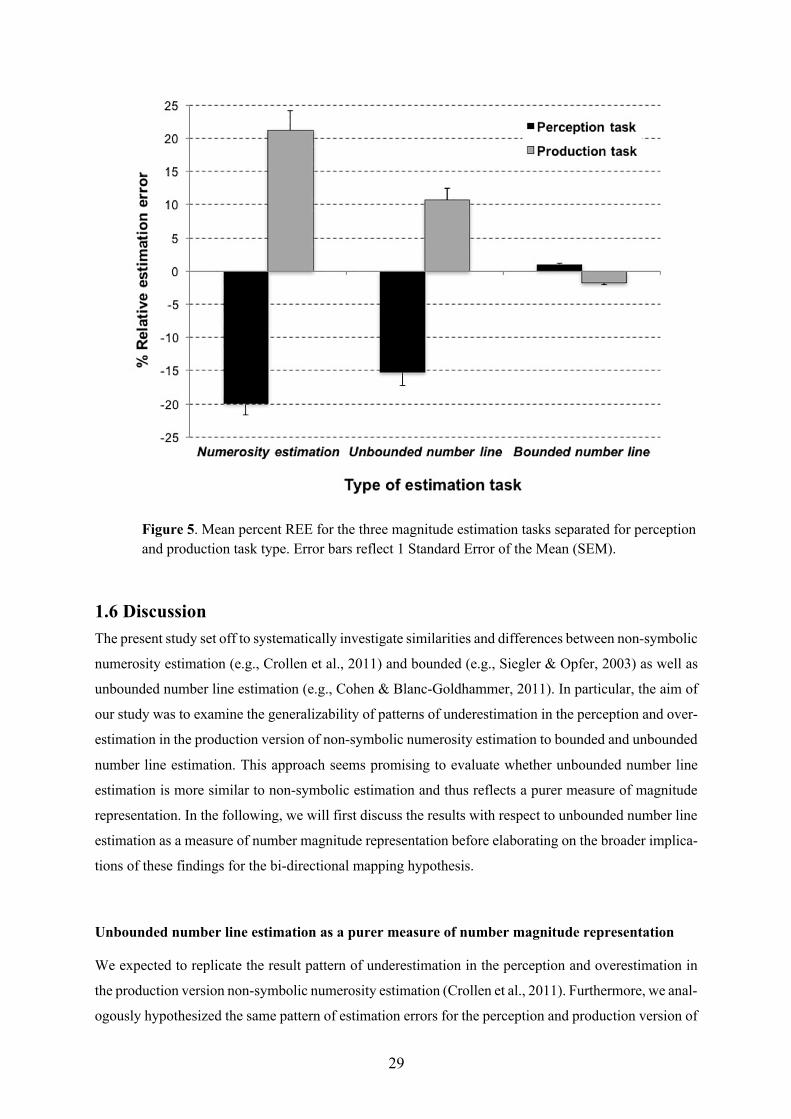
29
Figure 5. Mean percent REE for the three magnitude estimation tasks separated for perception and production task type. Error bars reflect 1 Standard Error of the Mean (SEM).
1.6 Discussion The present study set off to systematically investigate similarities and differences between non-symbolic
numerosity estimation (e.g., Crollen et al., 2011) and bounded (e.g., Siegler & Opfer, 2003) as well as
unbounded number line estimation (e.g., Cohen & Blanc-Goldhammer, 2011). In particular, the aim of
our study was to examine the generalizability of patterns of underestimation in the perception and over-
estimation in the production version of non-symbolic numerosity estimation to bounded and unbounded
number line estimation. This approach seems promising to evaluate whether unbounded number line
estimation is more similar to non-symbolic estimation and thus reflects a purer measure of magnitude
representation. In the following, we will first discuss the results with respect to unbounded number line
estimation as a measure of number magnitude representation before elaborating on the broader implica-
tions of these findings for the bi-directional mapping hypothesis.
Unbounded number line estimation as a purer measure of number magnitude representation
We expected to replicate the result pattern of underestimation in the perception and overestimation in
the production version non-symbolic numerosity estimation (Crollen et al., 2011). Furthermore, we anal-
ogously hypothesized the same pattern of estimation errors for the perception and production version of
30
unbounded number line estimation. The current data corroborated these two hypotheses by revealing
that systematic estimation biases were identical for non-symbolic numerosity and unbounded number
line estimation. For both estimation tasks, we observed that participants systematically underestimated
target numbers in the perception, and overestimated them in the production version.
Importantly, our data provide additional evidence for the argument of Cohen and Blanc-Goldhammer
(2011) that unbounded number line estimation might be a purer measure of the (spatial) representation
of number magnitude than bounded number line estimation (see also Barth & Paladino, 2011; Slusser
et al., 2013). So far, the argument that unbounded number line estimation represents a more valid meas-
ure of number magnitude representation originally came from comparisons of estimation performance
in bounded and unbounded number line estimation. Here, we showed its similarity with non-symbolic
numerosity estimation that is commonly agreed on to constitute a reliable measure of number magnitude
representation.
Additionally, the observation of a reversed estimation pattern of overestimation in the perception and
under estimation in the production version for bounded number line estimation further corroborates this
interpretation. These findings are in line with our expectations and seems to reflect previous findings of
Siegler and Opfer (2003) who observed a systematic pattern of overestimation in the perception task, at
least in children. Additionally, for the production version of the task Booth and Siegler (2006) observed
evidence for underestimation in the production version of the task. This pattern of under- and overesti-
mation clearly differed for that found for numerosity estimation and unbounded number line estimation.
Therefore, these data provide converging evidence for the notion that bounded number line estimation
may not only measure numerical estimation but also task-specific strategies (see Barth & Paladino,
2011; Slusser et al., 2013; Sullivan et al., 2011).
In sum, our results seem to substantiate claims that unbounded number line estimation may be more
suitable to draw inferences on adults´ (spatial) representation of number magnitude (see also Link, Hu-
ber, Nuerk, & Moeller, 2014; Siegler & Booth, 2004). Importantly, however, these data are not only
relevant for our understanding of unbounded number line estimation but also for the bi-directional map-
ping hypothesis on non-symbolic magnitude estimation.
1.6.1 Further evidence for the bi-directional mapping hypothesis For the first time, we investigated perception and production versions for all non-symbolic, unbounded
as well as bounded estimation tasks. As expected, we observed that the characteristic pattern of overes-
timation in the production and underestimation in the perception version of numerosity estimation
(Crollen et al., 2011) as well as the unbounded number line estimation task. Importantly, this is in line
with the postulates of the model on the mapping between symbolic and non-symbolic representations
proposed by Izard and Dehaene (2008). They suggested different mapping processes from non-symbolic
31
input to symbolic output and symbolic input to non-symbolic output, leading participants to systemati-
cally under- and overestimate the respective target magnitudes, respectively.
In the perception version of numerosity estimation as well as unbounded number line estimation, the
estimation process goes from the logarithmically compressed representation of non-symbolic numer-
osity to the linearly spaced representation of symbolic number magnitude resulting in the observed un-
derestimation. In the perception version of unbounded number line estimation, the unit distance given
at the origin of the number line as well as the hatch mark at the position to be estimated activated a non-
symbolic, analogue representation of the respective target numbers. When estimating the corresponding
Arabic number based on predefined spatial position on the number line, participants had to transcode
from the non-symbolic analogue into the symbolic Arabic number form. Consequently, the correspond-
ing values of the target numbers are always smaller and participants underestimate numerical magnitude.
In contrast, in the production version of unbounded number line estimation, a linearly spaced represen-
tations of symbolic number magnitude had to be mapped onto the logarithmically compressed represen-
tation of non-symbolic numerosity, which, in turn, led to the observed pattern of overestimation (see
Figure 1). These findings for unbounded number line estimation further strengthen the bi-directional
mapping hypothesis (Castronovo & Seron, 2007) by providing convergent evidence from perception
and production versions for the first time.
1.6.2 Limitations and perspectives There are aspects to keep in mind when interpreting the current results. On a methodological level it
should be acknowledged that to get an accurate measure of estimation errors in unbounded number line
estimation, it is critical to allow enough room for participants to express errors. In the current task, the
number line had a length of 50 units and target numbers up to 49 had to be estimated. Therefore, the end
of the number line may have acted as a boundary that participants will likely not extend their answer
past. This might have influenced estimation errors for target numbers approaching 49. However, the
overall pattern of estimation errors we observed in the unbounded task was more or less identical to the
patterns observed in previous studies (e.g., Cohen & Blanc-Goldhammer, 2011; Link et al., 2014).
Therefore, we are confident that this should not have biased results. Nevertheless, it may be desirable
for future studies to allow more space between the largest target number and the end of the number line
so that implicit boundaries are so far beyond the participant's likely response that they will not influence
it.
On the theoretical level, it is important to note that the bi-directional mapping hypothesis implicitly
assumes a logarithmically compressed non-symbolic representation of number magnitude representa-
tion in comparison to a linear one for symbolic magnitudes. In this context, it should be considered that
there is a long-lasting scientific debate about the layout of number magnitude representations (i.e., log-
arithmically compressed vs. linear, e.g., Cantlon, Cordes, Libertus, & Brannon, 2009; see also Beran,
32
Johnson-Pynn, & Ready, 2008; Gibbon & Church, 1981). However, it was not at the heart of this study
to evaluate this. Instead, we only considered the predictions of the bi-directional mapping hypothesis,
which reflect specific assumptions on logarithmic non-symbolic and linear symbolic magnitude repre-
sentations. As such, the observation of identical patterns of over and underestimation in the perception
vs. production version of numerosity and unbounded number line estimation might imply a similar log-
arithmic layout of the representation of non-symbolic magnitude in unbounded number line estimation.
However, further research is needed addressing this question more specifically.
Finally, as also noted by Crollen and colleagues (2011), the investigation of the mapping process be-
tween symbolic and non-symbolic magnitude representations is only in its early stages with very few
research directly addressing this question. More precise and general conclusions will become possible
when taking a closer look at the development of the numerical mapping abilities in children (see also
Link et al., 2014; Lipton & Spelke, 2006; Mundy & Gilmore, 2009). Future studies should therefore
further investigate the model of bi-directional mapping by exploring data of children. It would be inter-
esting whether the same pattern of under- and overestimation would be replicated in such a sample.
1.7 Conclusions Taken together, to the best of our knowledge, the present study is the first to systematically assess dif-
ferent types of estimation tasks (i.e., numerosity, as well as bounded and unbounded number line esti-
mation) in both their perception and production version in adults to evaluate similarities and differences
between these tasks. We replicated the pattern of systematic biases of under- and overestimation for
numerosity estimation and also found that this pattern generalized to unbounded but not bounded num-
ber line estimation. Therefore, our results indicated conceptual similarity of unbounded number line and
non-symbolic numerosity estimation. As such, these findings provide converging evidence from results
of an established magnitude estimation task that unbounded number line estimation might be a purer
and more valid measure of (spatial) number magnitude representation as compared to bounded number
line estimation.
33
STUDY 2: Strategies in unbounded number line estimation?
- Evidence from eye-tracking
Authors: Regina M. Reinert, Stefan Huber, Hans-Christoph Nuerk &
Korbinian Moeller Individual contribution: I was mainly responsible for the scientific ideas, conceptualiza-
tion, data generation, introduction, methods and discussion part
of the paper.
Contribution of co-authors: Stefan Huber run the analyses and wrote the results part of the
paper. Hans-Christoph Nuerk was involved in the conceptual-
ization of the study. Korbinian Moeller was also responsible
for the conceptualization, data analyses, supervision and paper
review and editing.
Presentation: This paper was presented at the 6th International Conference on
Spatial Cognition: "Space and Situated Cognition" in Septem-
ber 2015 in Rome, Italy.
Current stage: Accepted for publication in Cognitive Processing
Cite this article: Reinert, R.M., Huber, S., Nuerk, HC. et al. Strategies in un-
bounded number line estimation? Evidence from eye-tracking.
Cogn Process 16, 359–363 (2015).
https://doi.org/10.1007/s10339-015-0675-z
34
2.1 Abstract For bounded number line estimation recent studies indicated influences of proportion-based strategies
as documented by eye-tracking data. In the current study, we investigated solution strategies in bounded
and unbounded number line estimation by directly comparing participants' estimation performance as
well as their corresponding eye-fixation behaviour. For bounded number line estimation increased num-
bers of fixations at and around reference points (i.e., start-, middle, and endpoint) confirmed the prom-
inent use of proportion-based strategies. In contrast, in unbounded number line estimation the number
of fixations on the number line decreased continuously of with increasing magnitude of the target num-
ber. Additionally, we observed that in bounded and unbounded number line estimation participants’ first
fixation on the number line was a valid predictor of the location of the target number. In sum, these data
corroborate the idea that unbounded number line estimation is not influenced by proportion-based esti-
mation strategies not directly related to numerical estimations.
Keywords: unbounded number line estimations, eye-fixation behaviour, solution strategies.
35
2.2 Introduction The representation of number magnitude is often described as a mental number line upon which magni-
tudes are arranged spatially in ascending order. A common task proposed to assess this spatial represen-
tation of number magnitude is the number line estimation task. It requires participants to indicate the
spatial position of a target number on a given number line (e.g. the position of 68 on a 0-to-100 number
line; e.g., Siegler & Opfer, 2003).
However, there is a controversial debate on the question of what is actually assessed by this task: the
spatial layout of the underlying mental number line representation (e.g., Berteletti et al., 2010; Siegler
& Opfer, 2003) or rather strategies applied by participants to solve the task. In particular, Barth and
Paladino (2011; see also Slusser, Santiago, & Barth, 2013) argued that estimation performance in the
bounded number line task reflects application of proportion judgement strategies as indicated by the
systematic use of reference points. This claim was supported by superior model fits of proportion judg-
ment models as well as the evaluation of participants’ eye-fixation patterns. For instance, Sullivan,
Juhasz, Slattery and Barth (2011) evaluated eye-fixation behaviour of children while solving a bounded
number line estimation task on the 0-to-1,000 scale. The participants’ eye-fixation pattern clearly indi-
cated an explicit preference to fixate on reference points (i.e., the start, mid, and endpoint of the number
line). Thereby, these findings discourage the claim that the bounded number line estimation task pro-
vides a measure of the underlying spatial representation of number magnitude.
However, the eye-tracking results of Sullivan et al. (2011) also revealed another interesting aspect. The
authors observed that the magnitude of the target number influenced the location of the very first fixation
on the number line – with larger target numbers being associated with first fixations further to the left.
This indicated some kind of internal scaling of participants’ first saccade onto the number line by the
magnitude of the target number. Furthermore, the location of the first fixation was predictive of partic-
ipants` final estimate indicating that there are early processes of numerical estimation in the bounded
number line estimation task before proportion judgement strategies become dominant.
Recently, Cohen and Blanc-Goldhammer (2011) introduced a new unbounded number line estimation
task, which they claimed to provide a “purer” measure of numerical estimation. In the unbounded ver-
sion of the task, only the start point and a scaling unit, but no end point is given. Therefore, Cohen and
Blanc-Goldhammer (2011) argued that participants cannot use reference points and thus, proportion
judgement strategies, but have to actually estimate the spatial location of the target numbers. This argu-
ment was supported by the fact that estimation errors increased linearly with the magnitude of the target
numbers. Synced with model fitting evidence, this argues against the reliance on reference points and
thus, the application of proportion judgement strategies in unbounded number line estimation. However,
different from bounded number line estimation, there is currently no independent evidence from – for
instance eye-tracking – corroborating this claim.
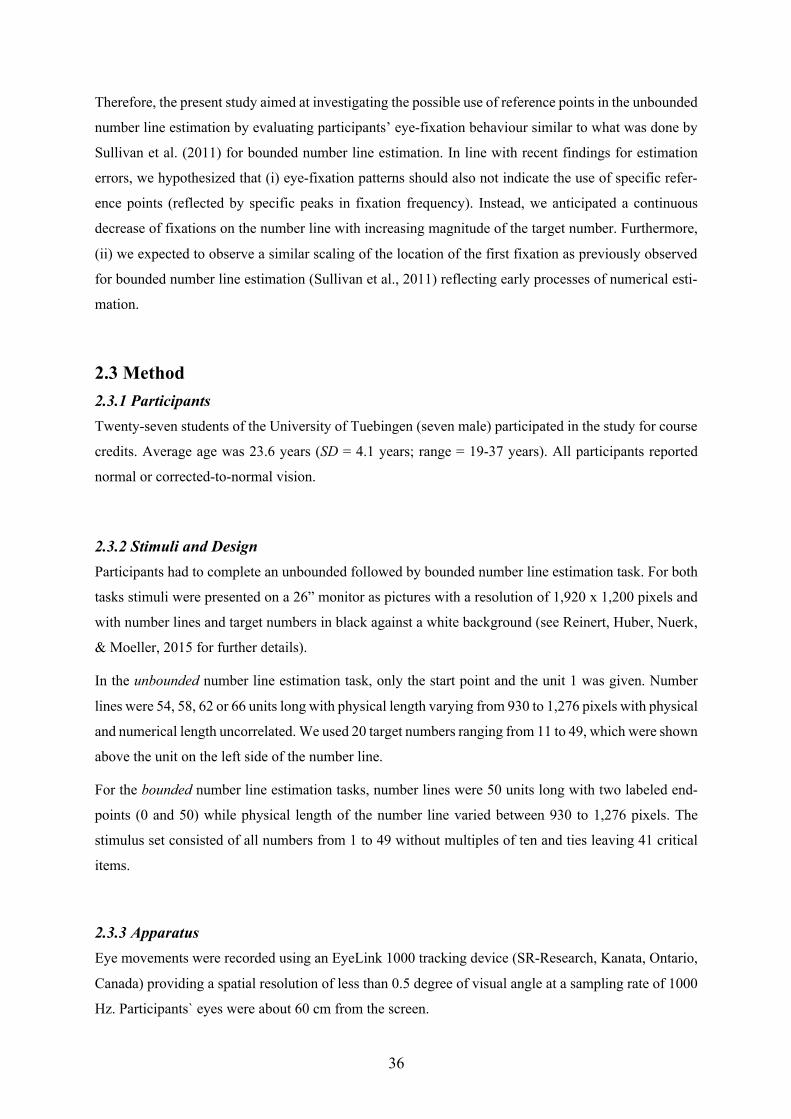
36
Therefore, the present study aimed at investigating the possible use of reference points in the unbounded
number line estimation by evaluating participants’ eye-fixation behaviour similar to what was done by
Sullivan et al. (2011) for bounded number line estimation. In line with recent findings for estimation
errors, we hypothesized that (i) eye-fixation patterns should also not indicate the use of specific refer-
ence points (reflected by specific peaks in fixation frequency). Instead, we anticipated a continuous
decrease of fixations on the number line with increasing magnitude of the target number. Furthermore,
(ii) we expected to observe a similar scaling of the location of the first fixation as previously observed
for bounded number line estimation (Sullivan et al., 2011) reflecting early processes of numerical esti-
mation.
2.3 Method 2.3.1 Participants Twenty-seven students of the University of Tuebingen (seven male) participated in the study for course
credits. Average age was 23.6 years (SD = 4.1 years; range = 19-37 years). All participants reported
normal or corrected-to-normal vision.
2.3.2 Stimuli and Design Participants had to complete an unbounded followed by bounded number line estimation task. For both
tasks stimuli were presented on a 26” monitor as pictures with a resolution of 1,920 x 1,200 pixels and
with number lines and target numbers in black against a white background (see Reinert, Huber, Nuerk,
& Moeller, 2015 for further details).
In the unbounded number line estimation task, only the start point and the unit 1 was given. Number
lines were 54, 58, 62 or 66 units long with physical length varying from 930 to 1,276 pixels with physical
and numerical length uncorrelated. We used 20 target numbers ranging from 11 to 49, which were shown
above the unit on the left side of the number line.
For the bounded number line estimation tasks, number lines were 50 units long with two labeled end-
points (0 and 50) while physical length of the number line varied between 930 to 1,276 pixels. The
stimulus set consisted of all numbers from 1 to 49 without multiples of ten and ties leaving 41 critical
items.
2.3.3 Apparatus Eye movements were recorded using an EyeLink 1000 tracking device (SR-Research, Kanata, Ontario,
Canada) providing a spatial resolution of less than 0.5 degree of visual angle at a sampling rate of 1000
Hz. Participants` eyes were about 60 cm from the screen.
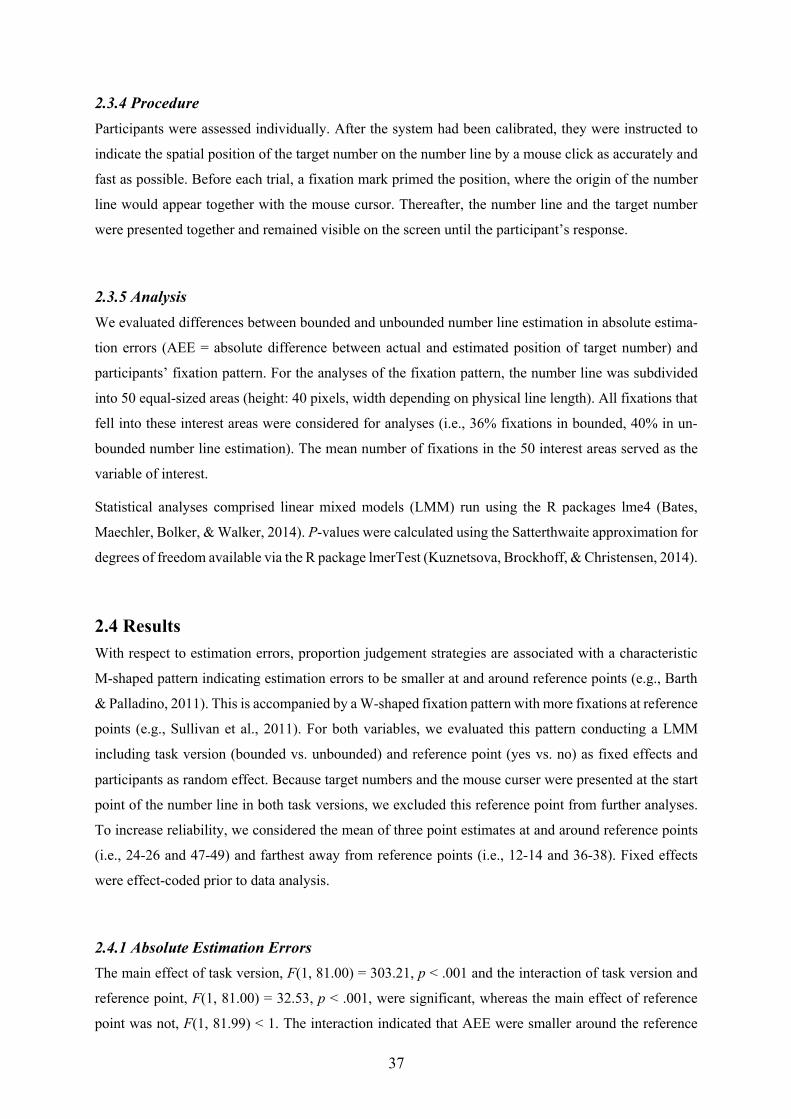
37
2.3.4 Procedure Participants were assessed individually. After the system had been calibrated, they were instructed to
indicate the spatial position of the target number on the number line by a mouse click as accurately and
fast as possible. Before each trial, a fixation mark primed the position, where the origin of the number
line would appear together with the mouse cursor. Thereafter, the number line and the target number
were presented together and remained visible on the screen until the participant’s response.
2.3.5 Analysis We evaluated differences between bounded and unbounded number line estimation in absolute estima-
tion errors (AEE = absolute difference between actual and estimated position of target number) and
participants’ fixation pattern. For the analyses of the fixation pattern, the number line was subdivided
into 50 equal-sized areas (height: 40 pixels, width depending on physical line length). All fixations that
fell into these interest areas were considered for analyses (i.e., 36% fixations in bounded, 40% in un-
bounded number line estimation). The mean number of fixations in the 50 interest areas served as the
variable of interest.
Statistical analyses comprised linear mixed models (LMM) run using the R packages lme4 (Bates,
Maechler, Bolker, & Walker, 2014). P-values were calculated using the Satterthwaite approximation for
degrees of freedom available via the R package lmerTest (Kuznetsova, Brockhoff, & Christensen, 2014).
2.4 Results With respect to estimation errors, proportion judgement strategies are associated with a characteristic
M-shaped pattern indicating estimation errors to be smaller at and around reference points (e.g., Barth
& Palladino, 2011). This is accompanied by a W-shaped fixation pattern with more fixations at reference
points (e.g., Sullivan et al., 2011). For both variables, we evaluated this pattern conducting a LMM
including task version (bounded vs. unbounded) and reference point (yes vs. no) as fixed effects and
participants as random effect. Because target numbers and the mouse curser were presented at the start
point of the number line in both task versions, we excluded this reference point from further analyses.
To increase reliability, we considered the mean of three point estimates at and around reference points
(i.e., 24-26 and 47-49) and farthest away from reference points (i.e., 12-14 and 36-38). Fixed effects
were effect-coded prior to data analysis.
2.4.1 Absolute Estimation Errors The main effect of task version, F(1, 81.00) = 303.21, p < .001 and the interaction of task version and
reference point, F(1, 81.00) = 32.53, p < .001, were significant, whereas the main effect of reference
point was not, F(1, 81.99) < 1. The interaction indicated that AEE were smaller around the reference
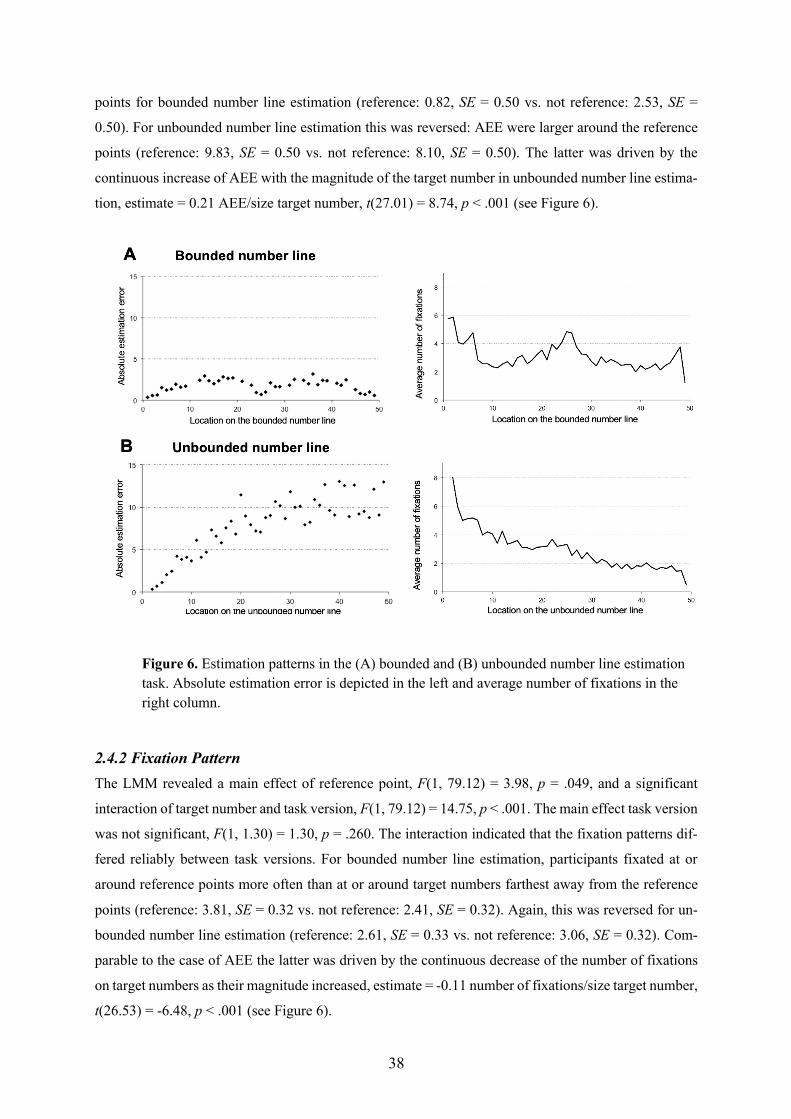
38
points for bounded number line estimation (reference: 0.82, SE = 0.50 vs. not reference: 2.53, SE =
0.50). For unbounded number line estimation this was reversed: AEE were larger around the reference
points (reference: 9.83, SE = 0.50 vs. not reference: 8.10, SE = 0.50). The latter was driven by the
continuous increase of AEE with the magnitude of the target number in unbounded number line estima-
tion, estimate = 0.21 AEE/size target number, t(27.01) = 8.74, p < .001 (see Figure 6).
Figure 6. Estimation patterns in the (A) bounded and (B) unbounded number line estimation task. Absolute estimation error is depicted in the left and average number of fixations in the right column.
2.4.2 Fixation Pattern The LMM revealed a main effect of reference point, F(1, 79.12) = 3.98, p = .049, and a significant
interaction of target number and task version, F(1, 79.12) = 14.75, p < .001. The main effect task version
was not significant, F(1, 1.30) = 1.30, p = .260. The interaction indicated that the fixation patterns dif-
fered reliably between task versions. For bounded number line estimation, participants fixated at or
around reference points more often than at or around target numbers farthest away from the reference
points (reference: 3.81, SE = 0.32 vs. not reference: 2.41, SE = 0.32). Again, this was reversed for un-
bounded number line estimation (reference: 2.61, SE = 0.33 vs. not reference: 3.06, SE = 0.32). Com-
parable to the case of AEE the latter was driven by the continuous decrease of the number of fixations
on target numbers as their magnitude increased, estimate = -0.11 number of fixations/size target number,
t(26.53) = -6.48, p < .001 (see Figure 6).
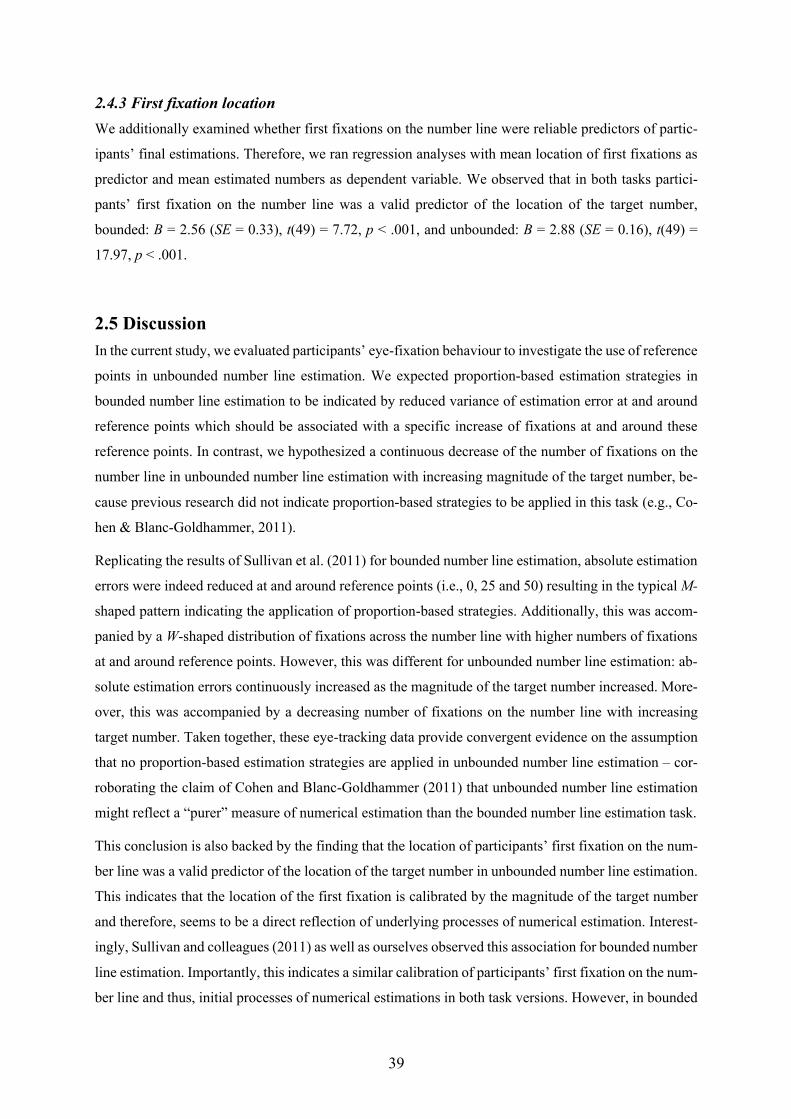
39
2.4.3 First fixation location We additionally examined whether first fixations on the number line were reliable predictors of partic-
ipants’ final estimations. Therefore, we ran regression analyses with mean location of first fixations as
predictor and mean estimated numbers as dependent variable. We observed that in both tasks partici-
pants’ first fixation on the number line was a valid predictor of the location of the target number,
bounded: B = 2.56 (SE = 0.33), t(49) = 7.72, p < .001, and unbounded: B = 2.88 (SE = 0.16), t(49) =
17.97, p < .001.
2.5 Discussion In the current study, we evaluated participants’ eye-fixation behaviour to investigate the use of reference
points in unbounded number line estimation. We expected proportion-based estimation strategies in
bounded number line estimation to be indicated by reduced variance of estimation error at and around
reference points which should be associated with a specific increase of fixations at and around these
reference points. In contrast, we hypothesized a continuous decrease of the number of fixations on the
number line in unbounded number line estimation with increasing magnitude of the target number, be-
cause previous research did not indicate proportion-based strategies to be applied in this task (e.g., Co-
hen & Blanc-Goldhammer, 2011).
Replicating the results of Sullivan et al. (2011) for bounded number line estimation, absolute estimation
errors were indeed reduced at and around reference points (i.e., 0, 25 and 50) resulting in the typical M-
shaped pattern indicating the application of proportion-based strategies. Additionally, this was accom-
panied by a W-shaped distribution of fixations across the number line with higher numbers of fixations
at and around reference points. However, this was different for unbounded number line estimation: ab-
solute estimation errors continuously increased as the magnitude of the target number increased. More-
over, this was accompanied by a decreasing number of fixations on the number line with increasing
target number. Taken together, these eye-tracking data provide convergent evidence on the assumption
that no proportion-based estimation strategies are applied in unbounded number line estimation – cor-
roborating the claim of Cohen and Blanc-Goldhammer (2011) that unbounded number line estimation
might reflect a “purer” measure of numerical estimation than the bounded number line estimation task.
This conclusion is also backed by the finding that the location of participants’ first fixation on the num-
ber line was a valid predictor of the location of the target number in unbounded number line estimation.
This indicates that the location of the first fixation is calibrated by the magnitude of the target number
and therefore, seems to be a direct reflection of underlying processes of numerical estimation. Interest-
ingly, Sullivan and colleagues (2011) as well as ourselves observed this association for bounded number
line estimation. Importantly, this indicates a similar calibration of participants’ first fixation on the num-
ber line and thus, initial processes of numerical estimations in both task versions. However, in bounded
40
number line estimation these initial processes of numerical estimation are then overridden by propor-
tion-based estimation strategies which might be more precise and less resource demanding than numer-
ical estimation.
2.6 Conclusions The present study evaluated participants’ eye-fixation behaviour to investigate strategies in unbounded
number line estimation. We observed that the number of fixations on the number line decreased linearly
with the magnitude of the target number in unbounded number line estimation. Additionally, the location
of participants’ first fixation on the number line was associated with their later estimated position of the
target number. These findings corroborate the claim that unbounded compared to bounded number line
estimation is not influenced by proportion-based estimation strategies which are not directly related to
numerical estimations. Therefore, the unbounded number line estimation task might indeed measure
numerical estimation more “purely”.
41
STUDY 3: Sex differences in number line estimation:
The role of numerical estimation
Authors: Regina M. Reinert, Stefan Huber, Hans-Christoph Nuerk &
Korbinian Moeller
Individual contribution: I was mainly responsible for conceptualization, data generation,
analyses and paper writing.
Contribution of co-authors: Stefan Huber developed the stimulus sets and ran the formal anal-
yses. Hans-Christoph Nuerk was involved in the conceptualization
and reviewed the paper draft. Korbinian Moeller was also responsible
for the conceptualization, supervision and paper review & editing.
Presentation: A prior version of this paper was presented as a poster at the
Workshop
Educational Neuroscience of Mathematics 2014 in Tübingen,
Germany. The title was “Sex differences in number line estimation
depend on solution strategies applied”.
Current stage: Accepted for publication in the British Journal of Psychology
Cite this article: Reinert, R.M., Huber, S., Nuerk, H.‐C. and Moeller, K. (2017), Sex
differences in number line estimation: The role of numerical estima-
tion. Br J Psychol, 108: 334-350. https://doi.org/10.1111/bjop.12203
42
3.1 Abstract Sex differences in mathematical performance have frequently been examined over the last decades in-
dicating an advantage for males especially when numerical problems cannot be solved by (classroom-
)learnt strategies and/or estimation. Even in basic numerical tasks such as number line estimation, males
were found to outperform females – with sex differences argued to emerge from different solution strat-
egies applied by males and females. We evaluated the latter using two versions of the number line esti-
mation task: a bounded and an unbounded task version. Assuming that women tend more strongly to
apply known procedures, we expected them to be at a particular disadvantage in the unbounded number
line estimation task which is less prone to be solved by specific strategies such as proportion judgement
but requires numerical estimation. Results confirmed more pronounced sex differences for unbounded
number line estimation with males performing significantly more accurately in this task version. This
further adds to recent evidence suggesting that estimation performance in the bounded task version may
reflect solution strategies rather than numerical estimation. Additionally, it indicates that sex differences
regarding the spatial representation of number magnitude may not be universal, but associated with
spatial–numerical estimations in particular.
Keywords: unbounded number line estimation task, sex-related differences, efficient estimating.
43
3.2 Introduction Sex differences have been reported for many content domains like verbal and mathematical abilities
(Benbow, 1988; Geary, 1996, 2000; Halpern, 1986; Hyde, 2014; Hyde, Fennema, & Lamon, 1990; Hyde
& Linn, 1988; Linn & Hyde, 1989; see also Lindberg, Hyde, Petersen, & Linn, 2010 for a review; Linn
& Hyde, 1989) as well as in technical aptitude (Pereira & Miller, 2012; Schmidt, 2011), spatial abilities
(Casey, Nuttall, & Pezaris, 2001; Cutmore, Hine, Maberly, Langford, & Hawgood, 2000; Levine, Va-
silyeva, Lourenco, Newcombe, & Huttenlocher, 2005; Linn & Petersen, 1985; Maeda & Yoon, 2013;
Voyer, 2011), and many other skills (Hyde, 1981; Johnson, 1996). Usually, girls and women tend to
score higher on tests of verbal ability (Backman, 1972; Coie & Dorval, 1973; Hyde, 2014; Reilly, 2012),
whereas boys and men generally achieve higher test scores in physical science and in many aspects of
mathematics (Ceci & Williams, 2010; Halpern et al., 2007; Johnson, 1996; Spelke, 2005).
However, recent evidence indicates that sex-related differences in mathematics performance may have
declined over the years and are at most small to moderate in size favouring males on average, but not in
every content domain (Beller & Gafni, 1996; Else-Quest, Hyde, & Linn, 2010; Hedges & Nowell, 1995;
Hyde, 2014; Zhu, 2007). In one of the first meta-analysis on this topic, Hyde, Fennema and Lamon
(1990) indicated that men did not outperform women in understanding of mathematics concepts or com-
putational ability, but did excel them in advanced problem-solving (Kimura, 2000) at high school and
college levels (cf. Spencer, Steele, & Quinn, 1999). More recent studies also reported no consistent sex
differences across grade levels (Hyde, 2014; Hyde, Lindberg, Linn, Ellis, & Williams, 2008) and nations
(Else-Quest et al., 2010). Interestingly, current data of the Programme for International Student Assess-
ment (PISA) showed that sex differences in favour of boys for mathematics are three times smaller than
sex differences in favour of girls for reading. However, the former were observed consistently across
nations. Additionally, boys were found to excel girls at the highest levels of mathematics ability in
particular (Reilly, Neumann, & Andrews, 2015; Stoet & Geary, 2013). In contrast, Lindberg and col-
leagues observed similar mathematical performance in males and females (Hyde, 2014; Lindberg et al.,
2010). Consequently, it can be stated that sex differences in mathematics are not consistent across age,
culture, content domains, etc. (Linn & Hyde, 1989). However, when sex differences are found, males
tend to outperform females in quickly solving complex mathematical tasks under unfamiliar conditions
(Gallagher et al., 2000). Note that these studies might even underestimate actual sex differences in math-
ematics, as the performance in solving mathematical tasks not only depends on mathematical compe-
tency but also on general cognitive ability. Importantly, Brunner, Krauss, and Martignon (2011) ob-
served even larger sex differences in mathematics favouring males when considering influences of gen-
eral cognitive ability. The origin of this male advantage has seen diverse explanations ranging from
computational fluency to solution strategies applied (Casey, Nuttall, & Pezaris, 1997; Geary, Saults,
Liu, & Hoard, 2000; Royer, Tronsky, Chan, Jackson, & Marchant, 1999; see Zhu, 2007 for a recent
review). On the one hand, Royer et al. (1999) found that male participants were in general faster than
female participants on math-fact retrieval tasks suggesting that speed of fact retrieval in mathematics
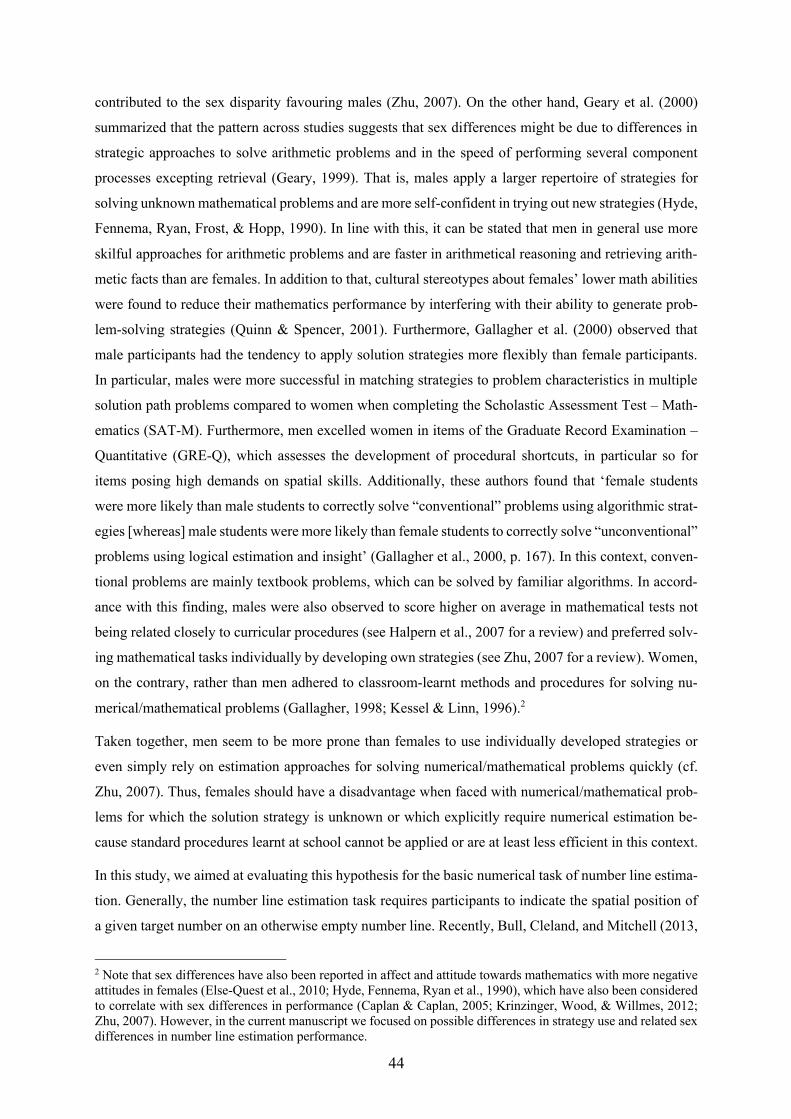
44
contributed to the sex disparity favouring males (Zhu, 2007). On the other hand, Geary et al. (2000)
summarized that the pattern across studies suggests that sex differences might be due to differences in
strategic approaches to solve arithmetic problems and in the speed of performing several component
processes excepting retrieval (Geary, 1999). That is, males apply a larger repertoire of strategies for
solving unknown mathematical problems and are more self-confident in trying out new strategies (Hyde,
Fennema, Ryan, Frost, & Hopp, 1990). In line with this, it can be stated that men in general use more
skilful approaches for arithmetic problems and are faster in arithmetical reasoning and retrieving arith-
metic facts than are females. In addition to that, cultural stereotypes about females’ lower math abilities
were found to reduce their mathematics performance by interfering with their ability to generate prob-
lem-solving strategies (Quinn & Spencer, 2001). Furthermore, Gallagher et al. (2000) observed that
male participants had the tendency to apply solution strategies more flexibly than female participants.
In particular, males were more successful in matching strategies to problem characteristics in multiple
solution path problems compared to women when completing the Scholastic Assessment Test – Math-
ematics (SAT-M). Furthermore, men excelled women in items of the Graduate Record Examination –
Quantitative (GRE-Q), which assesses the development of procedural shortcuts, in particular so for
items posing high demands on spatial skills. Additionally, these authors found that ‘female students
were more likely than male students to correctly solve “conventional” problems using algorithmic strat-
egies [whereas] male students were more likely than female students to correctly solve “unconventional”
problems using logical estimation and insight’ (Gallagher et al., 2000, p. 167). In this context, conven-
tional problems are mainly textbook problems, which can be solved by familiar algorithms. In accord-
ance with this finding, males were also observed to score higher on average in mathematical tests not
being related closely to curricular procedures (see Halpern et al., 2007 for a review) and preferred solv-
ing mathematical tasks individually by developing own strategies (see Zhu, 2007 for a review). Women,
on the contrary, rather than men adhered to classroom-learnt methods and procedures for solving nu-
merical/mathematical problems (Gallagher, 1998; Kessel & Linn, 1996).2
Taken together, men seem to be more prone than females to use individually developed strategies or
even simply rely on estimation approaches for solving numerical/mathematical problems quickly (cf.
Zhu, 2007). Thus, females should have a disadvantage when faced with numerical/mathematical prob-
lems for which the solution strategy is unknown or which explicitly require numerical estimation be-
cause standard procedures learnt at school cannot be applied or are at least less efficient in this context.
In this study, we aimed at evaluating this hypothesis for the basic numerical task of number line estima-
tion. Generally, the number line estimation task requires participants to indicate the spatial position of
a given target number on an otherwise empty number line. Recently, Bull, Cleland, and Mitchell (2013,
2 Note that sex differences have also been reported in affect and attitude towards mathematics with more negative attitudes in females (Else-Quest et al., 2010; Hyde, Fennema, Ryan et al., 1990), which have also been considered to correlate with sex differences in performance (Caplan & Caplan, 2005; Krinzinger, Wood, & Willmes, 2012; Zhu, 2007). However, in the current manuscript we focused on possible differences in strategy use and related sex differences in number line estimation performance.
45
see also Thompson & Opfer, 2008 for sex differences in children) observed a male advantage in number
line estimation for adults and attributed it to differences in the solution strategies applied to solve the
task. In particular, they argued ‘that men are […] more likely to use a spatial representation of number
as a strategy for performing tasks’ (p. 188). However, as they only used the traditional bounded version
of the number line estimation task (with the start point and end point of the number range within which
the respective number has to be located are given; e.g., 0–100, see Figure 7a, e.g., Siegler & Opfer,
2003), this conclusion may be premature. Originally, estimation performance in the bounded number
line estimation task was regarded to allow for a direct assessment of the underlying mental number line
representation (Berteletti, Lucangeli, Piazza, Dehaene, & Zorzi, 2010; Booth & Siegler, 2006, 2008;
Siegler & Opfer, 2003). Based on changes in children’s estimation patterns, Siegler and colleagues ar-
gued for a shift from a logarithmically compressed to a linearly spaced mental number line with age and
experience (Booth & Siegler, 2006; Siegler & Booth, 2004). However, in recent years evidence accu-
mulated that estimation performance in the bounded number line estimation task may not reflect pure
number line estimation but is susceptible to influences of specific solution strategies. Barth and Paladino
(2011) were the first to argue that the observed estimation pattern may reflect the use of proportion
judgement strategies (see also Ashcraft & Moore, 2012; Cohen & Blanc-Goldhammer, 2011; Sullivan,
Juhasz, Slattery, & Barth, 2011). Thereby, participants make use of specific reference points (e.g., start
point and end point of the scale but also its middle) and orient their positioning of the target numbers at
these reference points. Importantly, no indications for such proportion-based strategies were observed
in a recently proposed unbounded number line estimation task (with only the start point and a unit are
given, e.g., 0 as the start point and the length of the unit 1, see Figure 7b, e.g., Cohen & Blanc-Gold-
hammer, 2011; Cohen & Sarnecka, 2014; Link, Huber, Nuerk, & Moeller, 2014; Link, Nuerk, &
Moeller, 2014). Based on this criticism, Cohen and Blanc-Goldhammer (2011) considered the un-
bounded number line estimation task to be a more pure measure of number line estimation.
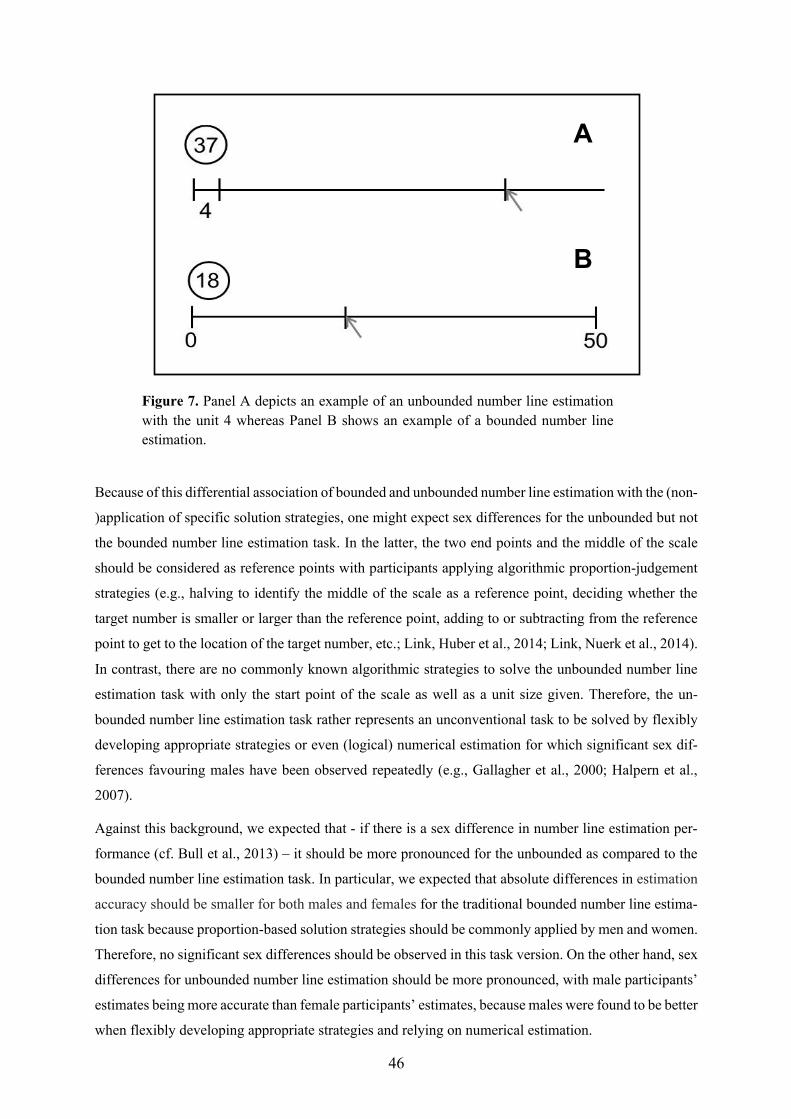
46
Figure 7. Panel A depicts an example of an unbounded number line estimation with the unit 4 whereas Panel B shows an example of a bounded number line estimation.
Because of this differential association of bounded and unbounded number line estimation with the (non-
)application of specific solution strategies, one might expect sex differences for the unbounded but not
the bounded number line estimation task. In the latter, the two end points and the middle of the scale
should be considered as reference points with participants applying algorithmic proportion-judgement
strategies (e.g., halving to identify the middle of the scale as a reference point, deciding whether the
target number is smaller or larger than the reference point, adding to or subtracting from the reference
point to get to the location of the target number, etc.; Link, Huber et al., 2014; Link, Nuerk et al., 2014).
In contrast, there are no commonly known algorithmic strategies to solve the unbounded number line
estimation task with only the start point of the scale as well as a unit size given. Therefore, the un-
bounded number line estimation task rather represents an unconventional task to be solved by flexibly
developing appropriate strategies or even (logical) numerical estimation for which significant sex dif-
ferences favouring males have been observed repeatedly (e.g., Gallagher et al., 2000; Halpern et al.,
2007).
Against this background, we expected that - if there is a sex difference in number line estimation per-
formance (cf. Bull et al., 2013) – it should be more pronounced for the unbounded as compared to the
bounded number line estimation task. In particular, we expected that absolute differences in estimation
accuracy should be smaller for both males and females for the traditional bounded number line estima-
tion task because proportion-based solution strategies should be commonly applied by men and women.
Therefore, no significant sex differences should be observed in this task version. On the other hand, sex
differences for unbounded number line estimation should be more pronounced, with male participants’
estimates being more accurate than female participants’ estimates, because males were found to be better
when flexibly developing appropriate strategies and relying on numerical estimation.
A
B
47
3.3 Method 3.3.1 Participants Thirty eight students (18 males and 20 females) of a University in Germany participated in the study in
exchange for course credit. Mean age was 22.8 years with a standard deviation (SD) of 3.7 years (range:
18–37 years). Average age of male (21.9 years) and female participants (23.6 years) did not differ sig-
nificantly, t(1, 36) = 1.42, p = .165, dif = 1.66. All participants reported normal or corrected-to-normal
vision.
3.3.2 Stimuli and Design The study comprised two distinct number line estimation tasks which were separated into two consecu-
tive runs both requiring the participants to indicate the correct position of a presented target number on
a number line. All stimuli were shown on a 26″ monitor as pictures with a resolution of 1,920 x 1,200
pixels displaying the number lines in both versions of the number line estimation task as well as target
numbers in black against a white background (see Figure 7a, b). To prevent the use of external reference
points (e.g., the position of the left edge or the centre of the screen), the position of the number line on
the screen was varied randomly across trials with the constraint that number lines did not reach into an
area 200 pixels wide at all four edges of the monitor. Additionally, white tape at the edges of the screen
should conceal potential landmarks.
First, participants had to complete an unbounded number line estimation task with only the start point
and a variable unit ranging from 1 to 10 given (cf. Cohen & Blanc-Goldhammer, 2011; see Figure 7a).
Number lines had lengths of 54, 58, 62 and 66 units with physical length varying from 930 to 1,276
pixels. Thereby, numerical and physical lengths were uncorrelated. Target numbers were presented
above the unit on the left side of the number line. Target numbers ranged from 11 to 49 and were chosen
with the constraint of matching problem size over all unit sizes for both targets within each decade (i.e.,
11 - 19, 31 - 39) as well as overall. For each unit, twenty target numbers were given (i.e., five targets
per decade) summing up to a total of 200 critical trials. The stimulus set used in the present study was
identical to the one used by Reinert, Huber, Nuerk, and Moeller (2015, see appendix of their article for
details on the stimuli set).
Second, participants had to indicate the position of target numbers in a bounded number line estimation
task with the start point and end point given (e.g., Siegler & Opfer, 2003). Number lines had a constant
length of 50 units long with two end points labelled 0 (left end point) and 50 (right end point; see Figure
7b). Comparable to the unbounded number line estimation task physical length of the number line varied
from 930 to 1,276 pixels. The stimulus set included all numbers from 1 to 49 with multiples of ten as
well as ties excluded leaving 41 critical items.
48
3.3.3 Procedure Participants were tested individually in a dimly-lit room sitting approximately 60 cm away from the
monitor. They all started with the unbounded number line estimation task followed by the bounded
number line estimation task to avoid that the end point ‘50’ given in the bounded number line estimation
task biased estimations in the unbounded number line estimation task. In particular, we wanted to avoid
that the end point ‘50’ given in the bounded number line estimation task made participants anticipate
that the unbounded number line might also cover the range from 0 to 50. Participants were not informed
about the number range covered by the unbounded task prior to performing it. This procedure is in line
with two recent studies employing the same order of the two tasks for exactly the same reasons (Cohen
& Sarnecka, 2014; Link, Huber et al., 2014; Link, Nuerk et al., 2014). Comparable to Cohen and Sar-
necka (2014), we also found that estimation performance in the two tasks was not correlated reliably (r
= .16, p = .34) indicating no transfer effects from the bounded to the unbounded task version. Partici-
pants were instructed to indicate as fast and as accurately as possible the spatial position of the target
number on the number line by using the mouse to click at the estimated position.
Each trial started with a fixation mark priming the position on the monitor where the origin of the num-
ber line would be displayed together with the mouse cursor. Then, the number line together with the
target number was presented and remained visible on the monitor until the participant gave her/his an-
swer with a mouse click, immediately followed by the fixation mark of the consecutive trial.
In the unbounded number line task items were presented in ten blocks with unit size (i.e., 1-10) held
constant within the same block to avoid the necessity of recalibration processes by each trial. Block
order was randomized across participants. The 41 target numbers of the bounded number line estimation
task were separated into two blocks of 20 and 21 items with the procedure being identical to that of the
unbounded number line estimation task. After finishing the two tasks, participants were asked to indicate
their last mathematics grade. Unfortunately, it was not possible to obtain the mathematics grades from
three participants. In total, the study took approximately 30 min.
3.4 Results The data of one female participant were excluded from the analysis as she did not adhere to task instruc-
tions and solved the unbounded number line estimation task using a counting strategy. This was also
reflected by her mean reaction time (14,207 ms) being more than three SD longer than the mean reaction
time over all participants (4,933 ms; SD = 2,516 ms). Subsequent analyses will focus on absolute esti-
mation error reflecting the absolute deviation of the estimated position of a target number from the actual
position of the respective target number on the number line. While the absolute estimation error may be
considered a crude measure of task performance, it is nevertheless the standard dependent variable used
in studies on number line estimation (Ashcraft & Moore, 2012; Barth & Paladino, 2011; Berteletti et al.,
2010; Booth & Siegler, 2006; Cohen & Blanc-Goldhammer, 2011; Geary et al., 2000; Laski & Siegler,
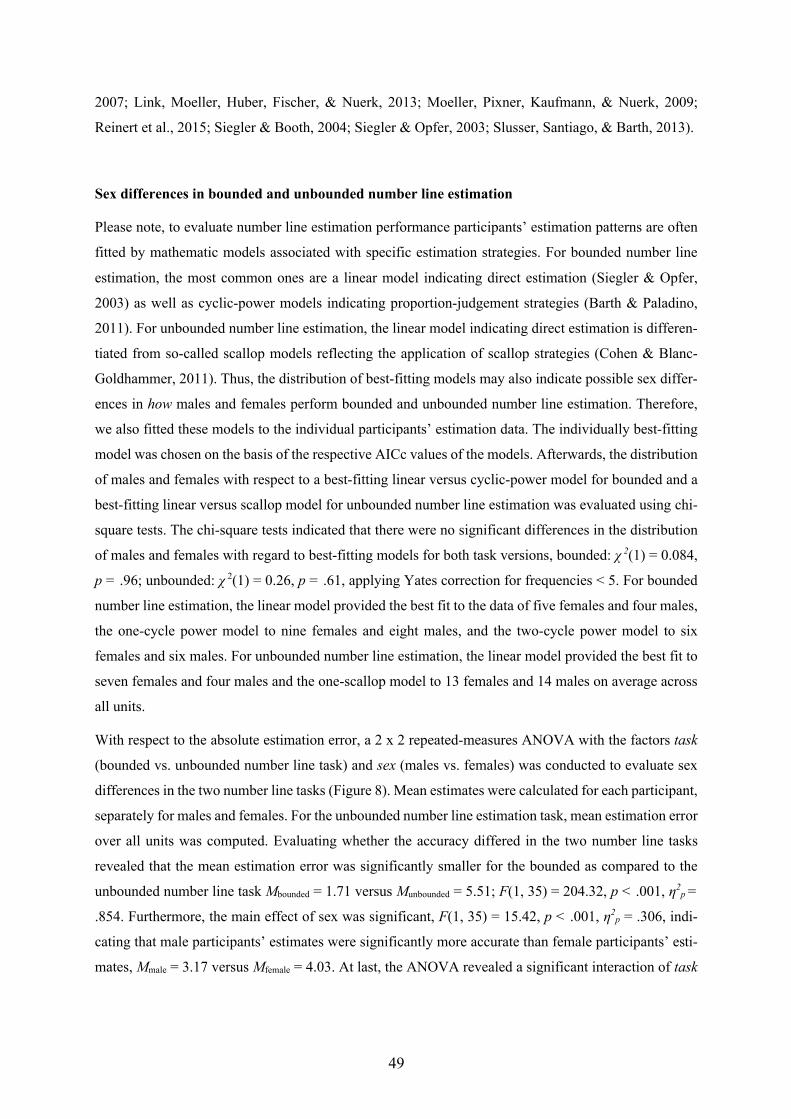
49
2007; Link, Moeller, Huber, Fischer, & Nuerk, 2013; Moeller, Pixner, Kaufmann, & Nuerk, 2009;
Reinert et al., 2015; Siegler & Booth, 2004; Siegler & Opfer, 2003; Slusser, Santiago, & Barth, 2013).
Sex differences in bounded and unbounded number line estimation
Please note, to evaluate number line estimation performance participants’ estimation patterns are often
fitted by mathematic models associated with specific estimation strategies. For bounded number line
estimation, the most common ones are a linear model indicating direct estimation (Siegler & Opfer,
2003) as well as cyclic-power models indicating proportion-judgement strategies (Barth & Paladino,
2011). For unbounded number line estimation, the linear model indicating direct estimation is differen-
tiated from so-called scallop models reflecting the application of scallop strategies (Cohen & Blanc-
Goldhammer, 2011). Thus, the distribution of best-fitting models may also indicate possible sex differ-
ences in how males and females perform bounded and unbounded number line estimation. Therefore,
we also fitted these models to the individual participants’ estimation data. The individually best-fitting
model was chosen on the basis of the respective AICc values of the models. Afterwards, the distribution
of males and females with respect to a best-fitting linear versus cyclic-power model for bounded and a
best-fitting linear versus scallop model for unbounded number line estimation was evaluated using chi-
square tests. The chi-square tests indicated that there were no significant differences in the distribution
of males and females with regard to best-fitting models for both task versions, bounded: χ 2(1) = 0.084,
p = .96; unbounded: χ 2(1) = 0.26, p = .61, applying Yates correction for frequencies < 5. For bounded
number line estimation, the linear model provided the best fit to the data of five females and four males,
the one-cycle power model to nine females and eight males, and the two-cycle power model to six
females and six males. For unbounded number line estimation, the linear model provided the best fit to
seven females and four males and the one-scallop model to 13 females and 14 males on average across
all units.
With respect to the absolute estimation error, a 2 x 2 repeated-measures ANOVA with the factors task
(bounded vs. unbounded number line task) and sex (males vs. females) was conducted to evaluate sex
differences in the two number line tasks (Figure 8). Mean estimates were calculated for each participant,
separately for males and females. For the unbounded number line estimation task, mean estimation error
over all units was computed. Evaluating whether the accuracy differed in the two number line tasks
revealed that the mean estimation error was significantly smaller for the bounded as compared to the
unbounded number line task Mbounded = 1.71 versus Munbounded = 5.51; F(1, 35) = 204.32, p < .001, η2p =
.854. Furthermore, the main effect of sex was significant, F(1, 35) = 15.42, p < .001, η2p = .306, indi-
cating that male participants’ estimates were significantly more accurate than female participants’ esti-
mates, Mmale = 3.17 versus Mfemale = 4.03. At last, the ANOVA revealed a significant interaction of task
50
and sex, F(1, 35) = 7.04, p = .012, η2p =.167, indicating that the sex difference in estimation error be-
tween males and females was significantly smaller for the bounded as compared to the unbounded num-
ber line estimation task (0.17 vs. 1.57, respectively).3
Inspection of the simple effects indicated that estimation accuracy did not differ between males and
females for the bounded number line task, Mmale = 1.63 versus Mfemale = 1.80; t(35) < 1, p = .396, η2p =
.021. A Bayesian analysis substantiated this result as the posterior probability for the null hypothesis
was P(H0|D) = .81, which – according to Raftery (1995) – indicates positive evidence in favour of the
null hypothesis that there is no difference between males and females. In contrast, male participants’
estimates were significantly more accurate in the unbounded number line task as compared to female
participants’ estimates, Mmale = 4.70 versus Mfemale = 6.27; t(35) = 3.51, p = .001, η2p = .261.
Figure 8. Marginal means of absolute estimation error for bounded and unbounded number line estimation separated for male and female participants. Error bars reflect 1 Standard Error of the Mean (SEM).
3 Note that the observed interaction between sex (female vs. male) and task version (bounded vs. unbounded) prevailed significant even in case a trimming procedure was applied which excluded individual estimates deviating more than three, F(1,36) = 5.16, p < .05, or two standard deviations from the individual’s mean estimation error, F(1, 36) = 5.16, p < .05. This indicates that the interaction is not driven by potential outliers.
0,00
1,00
2,00
3,00
4,00
5,00
6,00
7,00
Bounded Unbounded
Abs
olut
e es
timat
ion
erro
r
Number line task
males females
51
Specific analyses for bounded and unbounded number line estimation
Bounded number line task: contour analysis
Additionally, we conducted a contour analysis in line with the procedure suggested by Ashcraft and
Moore (2012). Therein, we directly contrasted mean estimation errors of target numbers at and around
reference points (i.e., start point: target numbers 1, 2, 3; midpoint: target numbers 24, 25, 26; end point:
target numbers 47, 48, 49) with those farthest away from reference points (i.e., target numbers 12, 13,
14, 36, 37, 38, and 39, reflect numbers ±1.5 around 12.5 and 37.5 please note, however, that 11 was not
included in the stimulus set as it is a tie number).
A 2 x 2 ANOVA discerning the within-subject factor target at reference point (yes vs. no) and the
between-subject factor sex (female vs. male) indicated a significant main effect of target at reference
point, F(1, 35) = 75.06, p < .001, η2p = .682. In line with our expectation, target numbers at or around
reference points were estimated more accurately than target numbers farthest away from reference points
(0.70 vs. 2.40, respectively). The non-significant main effect of sex, F(1, 35) < 1, η2p =.005, replicated
the lack of sex differences in bounded number line estimation. Furthermore, the nonsignificant interac-
tion between sex and target at reference point, F(1, 35) < 1, η2p = .021, indicates that the increase in
estimation error for target numbers farthest away from reference points was comparable across sexes.
This implies that both males and females relied on proportion-based solution strategies considering ref-
erence points when solving the bounded number line estimation task. A Bayesian analysis substantiated
this claim as the posterior probability for the null hypothesis was P(H0|D) = .84. According to Raftery
(1995), this indicates positive evidence in favour of the null hypothesis that there is no difference be-
tween males and females.
Unbounded number line task: influence of unit size
Because the overall estimation error in the unbounded number line estimation score is a composite score
averaging across different units, we also had a closer look on whether sex differences in estimation
accuracy between male and female participants were moderated by unit size. Therefore, we first com-
puted the mean absolute estimation error separately for all units and for male and female participants
(Figure 9). A repeated measures ANOVA with the factors unit size (1, 2, 3, 4, 5, 6, 7, 8, 9 vs. 10) and
sex (male vs. female) was conducted to evaluate sex differences. As expected, a significant main effect
of sex was observed F(1, 35) = 12.34, p = .001, η2p =.261, with male participants’ estimates being more
accurate than female participants’ estimates (Mmale = 4.70 vs. Mfemale = 6.27). Moreover, the main effect
of units was significant, F(9, 315) = 32.13, p < .001, η2p = .479, Greenhouse–Geisser coefficient (GG)
to correct df for violation of sphericity: .474, indicating that the absolute estimation errors differed be-
tween units (see Table 2 for significant differences between units). Importantly, a significant linear trend
for the estimation error over the units, F(1, 35) = 103.05, p < .001, η2p = .746, indicated that the estima-
tion error decreased with increasing unit size (cf. Reinert et al., 2015). Moreover, the interaction of units
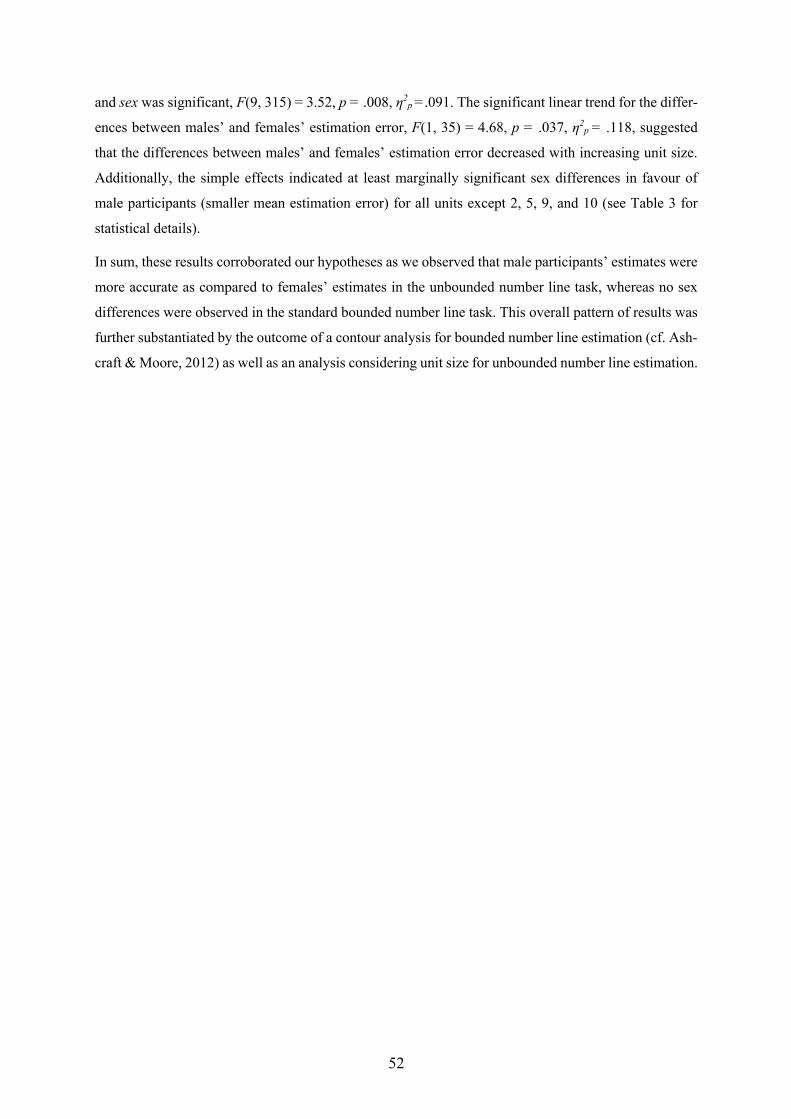
52
and sex was significant, F(9, 315) = 3.52, p = .008, η2p =.091. The significant linear trend for the differ-
ences between males’ and females’ estimation error, F(1, 35) = 4.68, p = .037, η2p = .118, suggested
that the differences between males’ and females’ estimation error decreased with increasing unit size.
Additionally, the simple effects indicated at least marginally significant sex differences in favour of
male participants (smaller mean estimation error) for all units except 2, 5, 9, and 10 (see Table 3 for
statistical details).
In sum, these results corroborated our hypotheses as we observed that male participants’ estimates were
more accurate as compared to females’ estimates in the unbounded number line task, whereas no sex
differences were observed in the standard bounded number line task. This overall pattern of results was
further substantiated by the outcome of a contour analysis for bounded number line estimation (cf. Ash-
craft & Moore, 2012) as well as an analysis considering unit size for unbounded number line estimation.
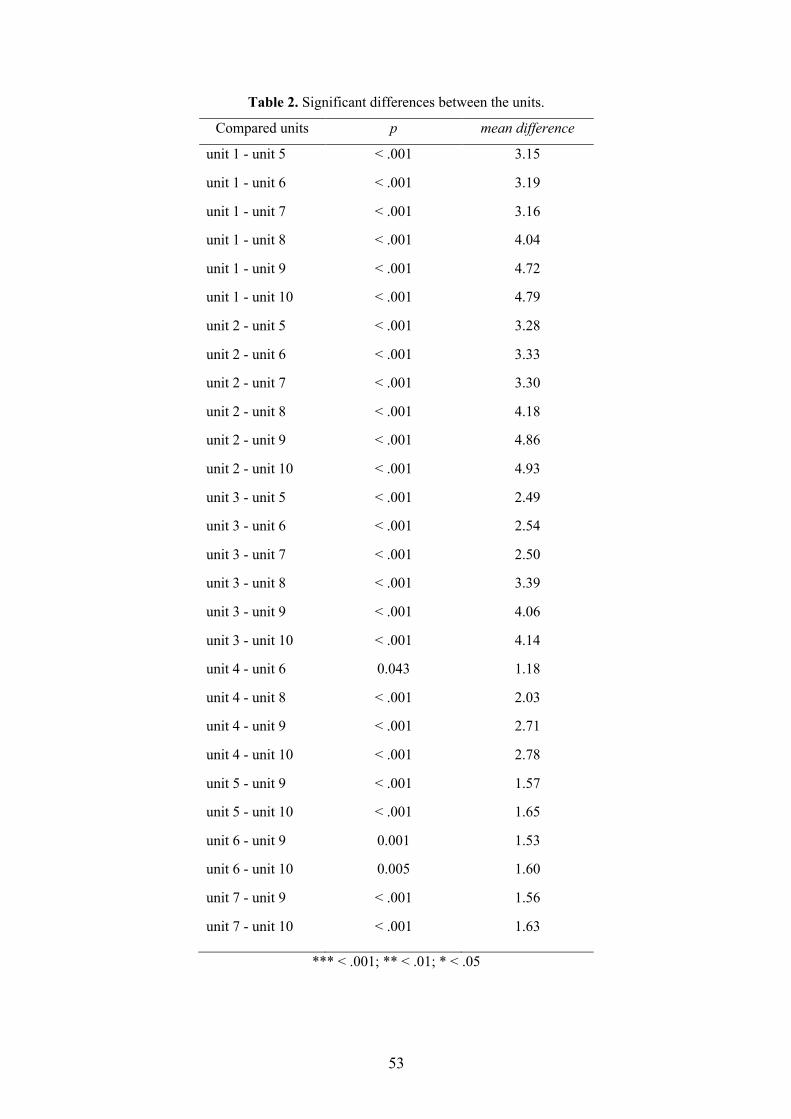
53
Table 2. Significant differences between the units.
Compared units p mean difference
unit 1 - unit 5 < .001 3.15
unit 1 - unit 6 < .001 3.19
unit 1 - unit 7 < .001 3.16
unit 1 - unit 8 < .001 4.04
unit 1 - unit 9 < .001 4.72
unit 1 - unit 10 < .001 4.79
unit 2 - unit 5 < .001 3.28
unit 2 - unit 6 < .001 3.33
unit 2 - unit 7 < .001 3.30
unit 2 - unit 8 < .001 4.18
unit 2 - unit 9 < .001 4.86
unit 2 - unit 10 < .001 4.93
unit 3 - unit 5 < .001 2.49
unit 3 - unit 6 < .001 2.54
unit 3 - unit 7 < .001 2.50
unit 3 - unit 8 < .001 3.39
unit 3 - unit 9 < .001 4.06
unit 3 - unit 10 < .001 4.14
unit 4 - unit 6 0.043 1.18
unit 4 - unit 8 < .001 2.03
unit 4 - unit 9 < .001 2.71
unit 4 - unit 10 < .001 2.78
unit 5 - unit 9 < .001 1.57
unit 5 - unit 10 < .001 1.65
unit 6 - unit 9 0.001 1.53
unit 6 - unit 10 0.005 1.60
unit 7 - unit 9 < .001 1.56
unit 7 - unit 10 < .001 1.63
*** < .001; ** < .01; * < .05
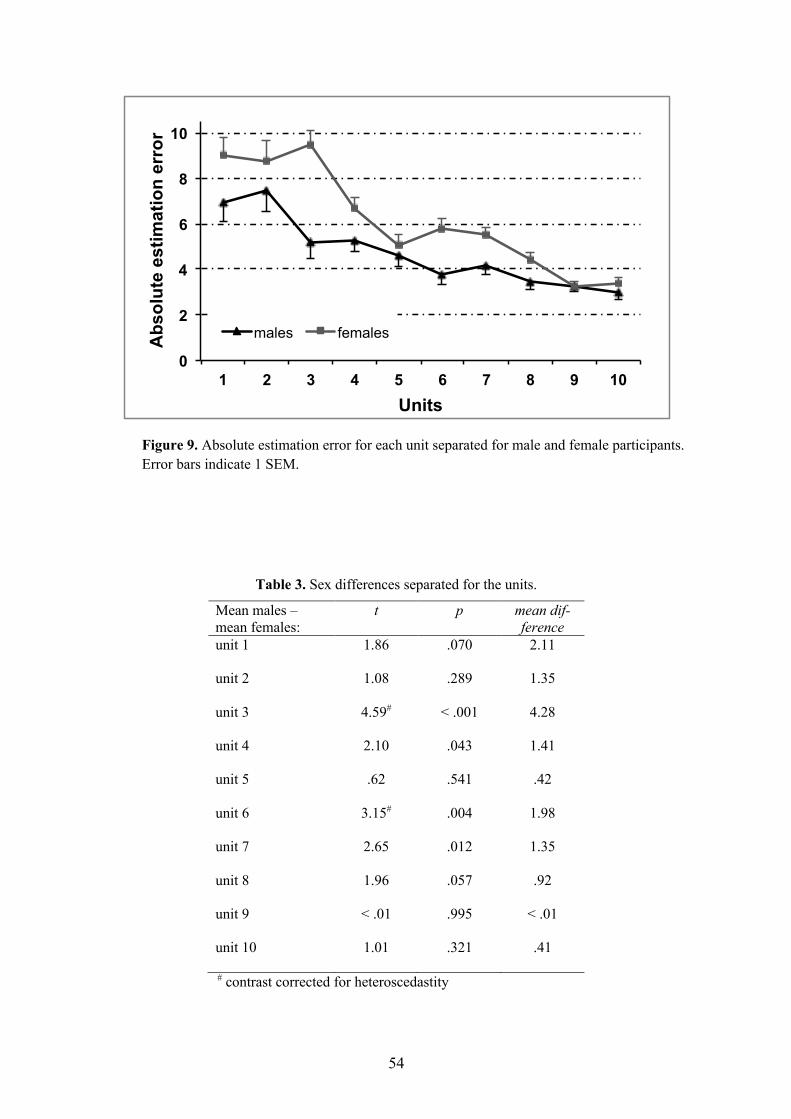
54
Figure 9. Absolute estimation error for each unit separated for male and female participants. Error bars indicate 1 SEM.
Table 3. Sex differences separated for the units.
Mean males – mean females:
t p mean dif-ference
unit 1 1.86 .070 2.11
unit 2 1.08 .289 1.35
unit 3 4.59# < .001 4.28
unit 4 2.10 .043 1.41
unit 5 .62 .541 .42
unit 6 3.15# .004 1.98
unit 7 2.65 .012 1.35
unit 8 1.96 .057 .92
unit 9 < .01 .995 < .01
unit 10 1.01 .321 .41
# contrast corrected for heteroscedastity
0
2
4
6
8
10
1 2 3 4 5 6 7 8 9 10
Abs
olut
e es
timat
ion
erro
r
Units
males females
55
3.5 Discussion In the present study, we were interested in sex differences in number line estimation. More specifically,
we hypothesized differential effects for two different versions of the number line estimation task (i.e.,
the standard bounded, Siegler & Opfer, 2003; and a new unbounded number line estimation task, Cohen
& Blanc-Goldhammer, 2011): Sex differences in number line estimation should be more pronounced in
the unbounded as compared to the bounded number line estimation task. Only in the latter overlearnt
strategies such as proportion judgement should generally be applied by both men and women. On the
other hand, unbounded number line estimation has been argued to be a more pure measure of numerical
estimation and thus should not be subject to the application of specific solution strategies. Therefore,
males should be at an advantage in this task version because they were observed to outperform women
in unconventional numerical tasks relying on numerical estimation more strongly (Gallagher et al., 2000;
Halpern et al., 2007). Generally, the present data corroborated these hypotheses. As expected, sex dif-
ferences were more pronounced for the unbounded as compared to the bounded number line estimation
task. This was further corroborated by the specific results of a contour analysis for bounded number line
estimation (cf. Ashcraft & Moore, 2012) and an analysis considering unit size for unbounded number
line estimation. In the following, we will first discuss these results with respect to sex differences in
strategy use in number processing before elaborating on broader implications of these findings.
Strategy use as a cause for sex differences
The present data indicated a male advantage in unbounded but not in bounded number line estimation.
Considering the broad literature on differences in strategy use in numerical tasks between the sexes, we
argue that these sex difference favouring males in the unbounded number line estimation task may stem
from differences in strategy use to estimate the respective position on the number line and in their dif-
ferential applicability to the two task versions. While participants can successfully apply overlearnt
strategies such as proportion-based judgments using halving, quartering, etc. in the bounded number
line estimation task, this is not possible in the unbounded number line estimation task. The latter was
argued to reflect a more pure measure of numerical estimation (Cohen & Blanc-Goldhammer, 2011)
and thus seems to reflect an unconventional problem, which requires (1) numerical estimation and (2)
more flexibility in the development and application of solution strategies. On both of these aspects,
males have been argued to outperform females (e.g., Zhu, 2007 for a review). This theoretical argument
is in line with our empirical data. As expected, males showed no advantage over females in the bounded
number line estimation task. In contrast, and corroborating our hypothesis, males performed better com-
pared to females (i.e., their estimates were more accurate) in the unbounded number line task.
In accordance with earlier findings, this corroborates the assumption that males may be more successful
in (1) developing their own strategies in unfamiliar circumstances and (2) numerical estimations in par-
ticular (Gallagher et al., 2000; Zhu, 2007). This interpretation is further substantiated by the contour
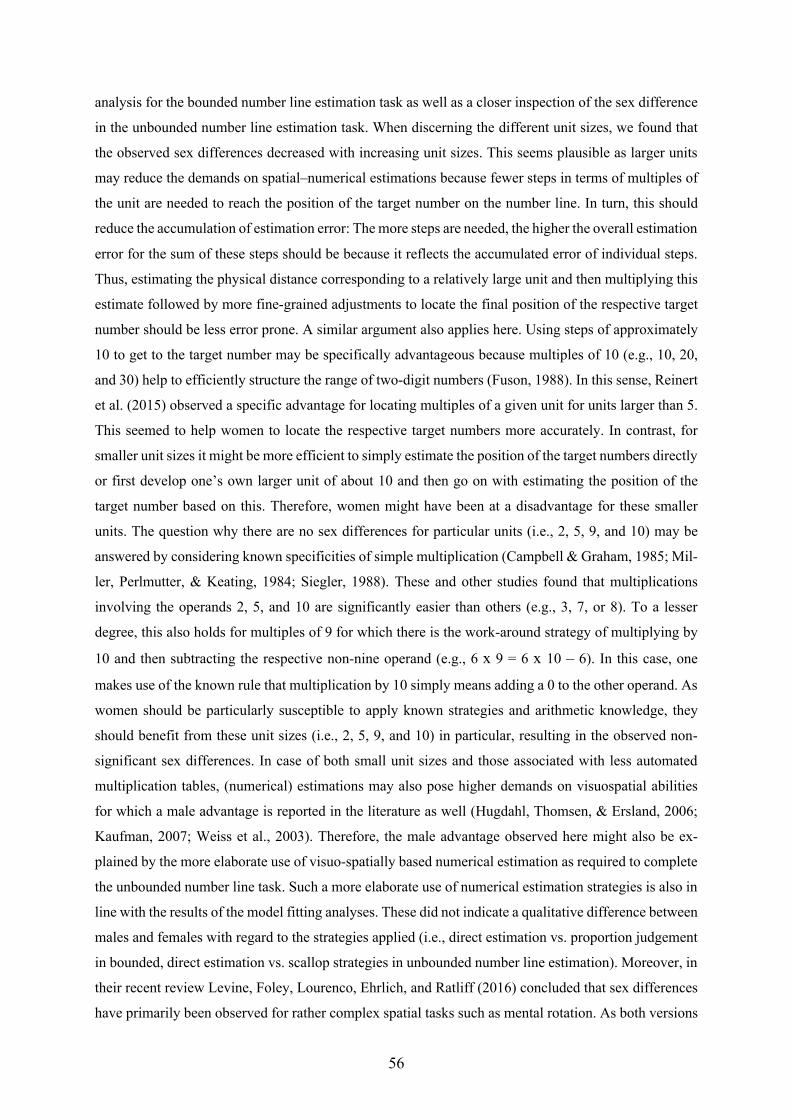
56
analysis for the bounded number line estimation task as well as a closer inspection of the sex difference
in the unbounded number line estimation task. When discerning the different unit sizes, we found that
the observed sex differences decreased with increasing unit sizes. This seems plausible as larger units
may reduce the demands on spatial–numerical estimations because fewer steps in terms of multiples of
the unit are needed to reach the position of the target number on the number line. In turn, this should
reduce the accumulation of estimation error: The more steps are needed, the higher the overall estimation
error for the sum of these steps should be because it reflects the accumulated error of individual steps.
Thus, estimating the physical distance corresponding to a relatively large unit and then multiplying this
estimate followed by more fine-grained adjustments to locate the final position of the respective target
number should be less error prone. A similar argument also applies here. Using steps of approximately
10 to get to the target number may be specifically advantageous because multiples of 10 (e.g., 10, 20,
and 30) help to efficiently structure the range of two-digit numbers (Fuson, 1988). In this sense, Reinert
et al. (2015) observed a specific advantage for locating multiples of a given unit for units larger than 5.
This seemed to help women to locate the respective target numbers more accurately. In contrast, for
smaller unit sizes it might be more efficient to simply estimate the position of the target numbers directly
or first develop one’s own larger unit of about 10 and then go on with estimating the position of the
target number based on this. Therefore, women might have been at a disadvantage for these smaller
units. The question why there are no sex differences for particular units (i.e., 2, 5, 9, and 10) may be
answered by considering known specificities of simple multiplication (Campbell & Graham, 1985; Mil-
ler, Perlmutter, & Keating, 1984; Siegler, 1988). These and other studies found that multiplications
involving the operands 2, 5, and 10 are significantly easier than others (e.g., 3, 7, or 8). To a lesser
degree, this also holds for multiples of 9 for which there is the work-around strategy of multiplying by
10 and then subtracting the respective non-nine operand (e.g., 6 x 9 = 6 x 10 – 6). In this case, one
makes use of the known rule that multiplication by 10 simply means adding a 0 to the other operand. As
women should be particularly susceptible to apply known strategies and arithmetic knowledge, they
should benefit from these unit sizes (i.e., 2, 5, 9, and 10) in particular, resulting in the observed non-
significant sex differences. In case of both small unit sizes and those associated with less automated
multiplication tables, (numerical) estimations may also pose higher demands on visuospatial abilities
for which a male advantage is reported in the literature as well (Hugdahl, Thomsen, & Ersland, 2006;
Kaufman, 2007; Weiss et al., 2003). Therefore, the male advantage observed here might also be ex-
plained by the more elaborate use of visuo-spatially based numerical estimation as required to complete
the unbounded number line task. Such a more elaborate use of numerical estimation strategies is also in
line with the results of the model fitting analyses. These did not indicate a qualitative difference between
males and females with regard to the strategies applied (i.e., direct estimation vs. proportion judgement
in bounded, direct estimation vs. scallop strategies in unbounded number line estimation). Moreover, in
their recent review Levine, Foley, Lourenco, Ehrlich, and Ratliff (2016) concluded that sex differences
have primarily been observed for rather complex spatial tasks such as mental rotation. As both versions
57
of the number line estimation task only require spatial processing on the left-to-right dimension and no
active manipulation of information (such as rotations), sex differences should be small. Therefore, we
suggest that the less accurate estimation performance of females in unbounded number line estimation
might be due to a specific female disadvantage in numerical estimation – which is the primary solution
strategy in unbounded number line estimation.
This argument is also in line with a recent study of Bull et al. (2013) on sex differences in number line
estimation. The authors also suggest that men and women may apply different strategies and resources
to solve math tasks. In particular, they claim that males generally use spatial representations of numbers
(aka the mental number line) more often as a successful strategy to perform numerical tasks – even when
it is not required. In contrast to our data, however, Bull et al. (2013) observed small sex differences in
bounded number line estimation. However, it is important to note that they used the number range from
0 to 1,000 in their experiment. Thus, the stimuli used in the present study differ considerably in the
number line length from only 0 to 50, that is a much smaller and more familiar number range. Therefore,
proportion-based solution strategies might be even more prominent in our study than in that of Bull et
al. (2013) explaining why we did not observe a significant sex difference in bounded number line esti-
mation. Future studies evaluating the dependency of sex differences on the number range used in a
particular bounded number line estimation would be desirable. Following the argument of the present
study, we would predict sex differences to increase when the range covered is more difficult. However,
as proportion-judgement strategies can be applied quite universally to basically every number range
(e.g., 0 to 10 but also 0 to 100,000) sex differences in bounded number line estimation should be most
pronounced in case the end points are not 0 and multiples of 10 (e.g., 173 to 829), for instance.
Importantly, our interpretation of sex differences being due to differences in strategy use and application
are also consistent with the results of Brunner et al. (2011) discussed above. These authors observed
that considering the influence of general intelligence on sex differences in mathematics led to even
larger differences favouring males. Thus, one might argue that potential differences in the bounded
number line estimation task due to differences in spatial–numerical cognition may even be masked by
efficient strategies applied such as proportion-judgement strategies in the case of bounded number line
estimation. In turn, it might be that sex differences in number line estimation as observed in the present
study even underestimate actual sex differences in spatial–numerical cognition.
Finally, one might speculate that the present results are influenced by rather general differences in math
achievement found between males and females. However, this seems unlikely due to at least two rea-
sons. First, a recent review on this by Reilly et al. (2015) indicates stable but only small sex differences
in math achievement (d = .1). In contrast, the interaction effect in the present study indicating sex dif-
ferences in unbounded number line estimation to be significantly more pronounced than in bounded
number line estimation was much larger with a d of .89. Moreover, to address this point more directly,
we asked participants to report their last mathematics grade on a voluntary basis. Thirty-five (18 fe-
males) of the 38 participants did so. We then reran the analyses with last reported math grade as a
58
covariate to control for possible general differences in math achievement between males and females in
our sample. Even though the reported math grades of males were significantly better than that of fe-
males, t(33) = 2.41, p = .021, the interaction between sex and task version did not change substantially
and was still significant, F(1, 32) = 5.12, p = .031. This indicates that even after controlling for general
differences in math achievement, sex differences were more pronounced for unbounded than for
bounded number line estimation. These results are hard to reconcile with the claim that the present
findings are influenced by general sex differences in math achievement. Instead, they corroborate our
interpretation of specific differences in solution strategies applied seem to drive the observed sex dif-
ferences.
3.6 Conclusion In the present study, we hypothesized sex differences in number line estimation to be more pronounced
in the unbounded as compared to the bounded number line estimation task. A male advantage was ex-
pected because males were argued to outperform females when it comes to the processing of unconven-
tional problems requiring (1) numerical estimation and (2) more flexibility in the development and ap-
plication of solution strategies (Gallagher et al., 2000; Halpern et al., 2007). The observed male ad-
vantage in unbounded but not bounded number line estimation corroborated our hypothesis and – in line
with recent data – indicates that males seem to be at an advantage when there are no learnt solution
strategies to be applied, but responses require spatial–numerical estimations in particular.

59
III. GENERAL DISCUSSION
60
General Discussion The last part of this thesis first discusses the key research findings of the three empirical studies in
general and summarizes its main results along the two overarching research aims. Following up on this,
I will integrate my new insights on unbounded NLE with the existing literature in terms of a systematic
literature review considering all empirical studies carried out so far employing an unbounded NLE task.
Subsequently, I will propose an updated taxonomy of magnitude estimation tasks on this basis that en-
ables a simplified and more comprehensive classification of present as well as future approaches meas-
uring magnitude estimation. Afterwards, I will outline potential limitations of studies conducted in this
dissertation and possible ways to address these constraints in future research. Finally, the last paragraph
will close with an overall conclusion concerning the validity of unbounded NLE reiterating the most
relevant findings.
1. Research Aims At the end of the general introduction, I identified two overarching research aims to-be-pursued in the
present dissertation: (i) Evaluating the validity of the unbounded NLE task as a measure of number
magnitude representation in general as well as (ii) identifying possible factors which may affect perfor-
mance shown in this task. The obtained findings of all three empirical studies presented in this thesis
were meaningful to both research questions and I will discuss these with respect to the two research
aims in the next paragraphs.
1.1 The validity of the newly introduced unbounded number line estimation task As described in the general introduction, an increasing body of evidence over a number of studies carried
out in the last decade indicated that the newly introduced unbounded NLE task might reflect a purer
measure of the mental representation of number magnitude as compared to the standard bounded task
version. Altogether, all three empirical studies included in the present dissertation substantiated this
claim first made by Cohen and Blanc-Goldhammer (2011). In particular, findings of Study 1 provided
additional evidence for this assumption using a non-symbolic numerosity estimation task. As this task
is widely agreed on to represent a reliable measure of the underlying number magnitude representation,
it was chosen to appraise its conceptual similarity with the unbounded NLE task. As expected, estima-
tion patterns of overestimation of target numbers in the production as well as underestimation in the
perception version were found for both non-symbolic numerosity estimation as well as unbounded but
not bounded NLE. These generalizable patterns of systematic biases from non-symbolic numerosity
estimation to symbolic unbounded – but not bounded – NLE provides converging evidence for the claim
that the new unbounded task version might indeed reflect a purer measure of number magnitude repre-
sentation (see Barth & Paladino, 2011; Slusser et al., 2013).
61
Moreover, data of eye-fixation behavior in Study 2 further corroborated this interpretation: In the un-
bounded task version, the number of fixations on the number line declined constantly as the magnitude
of the target number increased. In contrast, a typical pattern of increased numbers of fixations in regions
around possible reference marks – such as the start-, mid- and end point – for the bounded counterpart
indicated that this task version “is fundamentally a proportion-judgement task” (see Barth & Paladino,
2011, p. 134). These results replicated those from Sullivan et al. (2011), as expected, with a lower esti-
mation error at and around reference points. Additionally, I did not observe the specific M-shaped error
pattern which is characteristic for proportion judgement strategies in the unbounded but, as expected, in
the traditional bounded NLE task version.
Hence, the present thesis provides further evidence that unbounded NLE recently proposed by Cohen
and Blanc-Goldhammer (2011) might in fact reflect a more valid picture of the internal representation
of numbers. Nevertheless, there are still factors affecting estimation performance in this unbounded task
version, which will be discussed in the following paragraph.
1.2 Divers factors that affect estimation strategies to complete the unbounded number line estimation task With respect to the aim of determining influencing factors, which may affect solution strategies when
participants solve the new unbounded NLE task version, Studies 2 and 3 of this thesis revealed that
individuals did not use proportion judgement strategies (see also Link et al., 2014b), but that there are
nonetheless factors beyond number magnitude processing influencing estimation performance in this
task version. Regarding my second research objective, I aimed at addressing some promising factors
such as eye-fixation behaviour or the sex of participants affecting estimation patterns.
First, I showed that eye-tracking data in Study 2 of the current dissertation did also not indicate the
application of specific reference marks such as the origin-, mid- and end point in the unbounded NLE
task reflected by more frequent peaks in fixation. As described in the section above, this finding provides
further evidence that unbounded NLE seems to be less affected by proportional judgement. Importantly,
prior research by Reinert et al. (2015a) allows for further insights into potential solution strategies used
in this new task version. Their findings suggest that multiples of a given unit benefited from multiplica-
tion fact knowledge in terms of faster (but not more accurate) estimations compared to non-multiples.
This implicates that the location of the target is reached faster as there seems to be no need to adjust the
initial estimate to either the left or right which is the case of non-multiples of the units. Accordingly, a
possible strategy that participants adopt to complete an unbounded NLE task is using multiples of the
unit which Cohen and Blanc-Goldhammer (2011) termed the dead-reckoning strategy. More specifi-
cally, the authors found that individuals had a fixed working window of numbers which did not depend
on the unit size they had manipulated. Making their estimates, participants generally chose scallops of
about 10. Hence, the data suggest that a possible solution strategy in the unbounded task version might
62
be to proceed in bigger junks such as steps of the unit given and/or overarchingly in steps of 10 to make
their estimates on the number line most efficiently.
Second, I expected that women would be excelled by men in unbounded but not in bounded NLE be-
cause males are supposed to have a special advantage in solving numerical problems without (class-
room-)learnt strategies or pure estimation. In fact, findings of Study 3 substantiated this assumption: No
sex difference was found in traditional bounded NLE. However, men actually performed more accu-
rately in the unbounded task version as compared to women, as expected. In the former, both sexes were
assumed to use overlearnt solution strategies (e.g., proportion judgement like halving, quartering, etc.)
in a similar way. In contrast, I expected that no commonly applicable solution strategies are involved in
the unbounded NLE task version that has been suggested to provide a more valid measure of the under-
lying magnitude representation of numbers. Consequently, men outperformed women in Study 3 as they
are supposed to find solutions and develop strategies (incl. estimation) for unconventional numerical
problems more flexibly (see Gallagher et al., 2000; Halpern et al., 2007). In turn, these findings further
corroborate the assumption that unbounded NLE is not completed by the use of particular solution strat-
egies drawing on overlearnt procedures.
Taken together, data of all three empirical studies of the present thesis suggest that participants perform-
ing the unbounded NLE task (see Cohen & Blanc-Goldhammer, 2011) indeed did not seem to use spe-
cific solution strategies such as proportion judgements as it is the case in its bounded counterpart. They
rather seemed to refer to “rough” estimation (see also Huber, Bloechle, Dackermann, Scholl, Sassen-
berg, & Moeller, 2017). Nevertheless, I also identified factors such as the sex of participants or multiples
of the unit given as well as the working window of numbers influencing estimation performance shown
here (see also Reinert et al., 2015a). These results add to prior findings and shed light on further factors
that affect performance in unbounded NLE and provide compelling evidence for the claim that it repre-
sents a purer and more valid measure of the underlying number magnitude representation. Altogether,
the present dissertation suggests that this task is a valuable assessment tool being at least less biased
than its standard bounded counterpart.
The next section provides a summative review of all empirical studies employing unbounded NLE that
have been published so far to gain an overview of the current state of research. The purpose of this
systematic literature review is to locate the findings of the present dissertation within the context of
existing prior literature and discuss how my studies contribute to better understand processes and rep-
resentations underlying performance in unbounded NLE. After systematically integrating my findings
in a chronological order, I will propose a new taxonomy of magnitude estimation tasks in the subsequent
section based on this review of existing studies. Finally, I will identify possible future perspectives in
the research on unbounded NLE.
63
2. Literature Search and Definition of Inclusion and Exclusion Criteria Even though the limitations of the ´standard´ bounded NLE task (cf. Siegler & Opfer, 2003) discussed
in the general introduction are known, it seems to persist within research into numerical cognition as a
popular measure allowing insights into how children understand the “relationship of integers with each
other” (see Honour, 2020, p. 7). Compared to the bounded task version, remarkably few studies have
been conducted employing unbounded NLE to explore the underlying mental representation of numer-
ical magnitude (see also Schneider et al., 2018a). This seems surprising as this field of research is fairly
young but quickly expanding (Schneider et al., 2018a) and this new version has gained more and more
popularity (see also Cohen & Ray, 2020). To the best of my knowledge, there is currently no systematic
review that integrates results of all studies that employed unbounded NLE so far. Lately, Cohen and
Ray (2020) commented on the only study reporting uncommon findings (Kim & Opfer, 2017) that are
opposite of all other results found generally. A first systematic summary of certain features across ten
studies employing unbounded NLE is provided in Kim and Opfer’s (2020) reply to Cohen and Ray’s
(2020) comment. However, this table overview just focusses on some of the major methodological and
analytic differences among these studies, but there is no comprehensive outline of all research articles
yet.
For a complete overview of the present state of research on unbounded NLE, and in order to evaluate
other study results and how they used that new measure, I conducted a systematic literature review. This
will form the basis for the integration of the empirical results of my dissertation as well as the subsequent
proposition of a taxonomy of magnitude estimation tasks. Searches for publications employing un-
bounded NLE were performed in two different electronical databases, (1) PubMed as well as (2) EB-
SCOhost (Elton B. Stephens Company). Therefore, I followed the procedure of the most recent meta-
analysis performed by Schneider and colleagues (2018a) that systematically reviews the literature on
associations of NLE performance with mathematical competence. In July 2020, I used the search terms
and keywords “unbounded number line”, “unbounded number line estimation”, “unbounded* numerical
cognition”, “unbounded* numerical magnitude”, “unbounded* numerical representation”, “unbounded
and bounded* numerical estimation” as well as “unbounded number to position”. In total, this initial
search returned 57 hits, including papers of other disciplines (e.g., physics, mathematics, biology or
pharmacology). Articles were selected in accordance with the Preferred Reporting Items for Systematic
Reviews and Meta-Analyses (PRISMA) guidelines (see Moher et al., 2015; Shamseer et al., 2015). After
a first screening process based on abstract and method section, I identified 12 publications from these
two databases that met my inclusion criteria. Moreover, I screened the reference lists of these papers to
identify further articles.
In a second step, I additionally scanned the 125 titles on Google Scholar in a separate search that cite
the pioneering article published by Cohen and Blanc-Goldhammer (2011) introducing the unbounded
NLE task. For this systematic review, I examined title, abstract, keywords as well as the method section
64
of these 125 studies and just took into consideration articles that fulfilled all of the following selection
criteria:
1. The study was published in English language in a peer-reviewed journal (publications in any
language other than English were excluded).
2. It referenced Cohen and Blanc-Goldhammers’ (2011) pioneering study and the manuscript was
hence published after 2011.
3. The authors employed an unbounded NLE task and collected empirical data in their experiment
(e.g., neither reviews or comments, nor re-analysis of findings – such as computer simulations
– that have already been reported).
Altogether, this search procedure in three different electronic databases yielded 15 relevant studies using
the unbounded task version that met the eligible criteria containing original data [1. Cohen & Blanc-
Goldhammer, 2011; 2. Cohen, Blanc-Goldhammer, & Quinlan, 2018; 3. Cohen & Sarnecka, 2014; 4.
Dackermann, Fischer, Huber, & Moeller, 2016; 5. Ebersbach, Luwel, & Verschaffel, 2015; 6. Jung,
Roesch, Klein, Dackermann, Heller, & Moeller, 2020; 7. Kim & Opfer, 2017; 8. Kim & Opfer, 2020;
9. Link, Huber, Nuerk, & Moeller, 2014; 10. Link, Nuerk, & Moeller, 2014; 11. Reinert, Hartmann,
Huber, & Moeller, 2019; 12. Reinert, Huber, Nuerk, & Moeller, 2015a; 13. Reinert, Huber, Nuerk, &
Moeller, 2015b; 14. Reinert, Huber, Nuerk, & Moeller, 2017; 15. van der Weijden, Kamphorst, Wil-
lemsen, Kroesbergen, & van Hoogmoed, 2018].
The meta-analysis by Schneider and colleagues reported 10 articles in 2018 which roughly confirms this
number of pertinent studies published in the literature (2018a, p. 1473). Since then, a further five studies
on the subject have been published. Besides, some unpublished reports – such as proceeding papers or
master theses – employing the unbounded NLE task were not publicly available and therefore excluded
from this literature review (see, e.g., Olver, 2013; Qin, Kim, & Opfer, 2017; van Wijk, 2017). Moreover,
duplicates, citations and articles that did not apply an unbounded NLE task were also excluded (e.g.,
Cohen & Quinlan, 2018; Cohen & Ray, 2020; Huber et al., 2017). See Figure 10 for the PRISMA flow
diagram summarizing my search procedure. Brief summaries of the included 15 studies are outlined in
chronological order in the following (see also Table 4 for an overview).
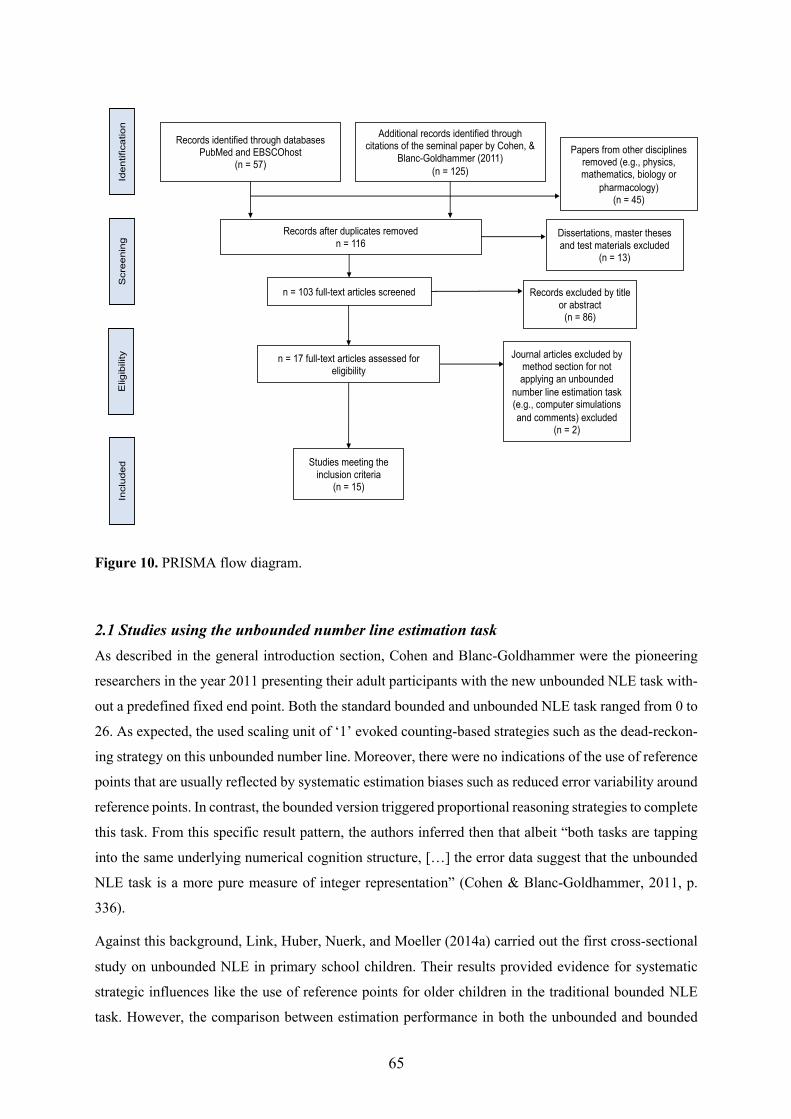
65
Figure 10. PRISMA flow diagram.
2.1 Studies using the unbounded number line estimation task As described in the general introduction section, Cohen and Blanc-Goldhammer were the pioneering
researchers in the year 2011 presenting their adult participants with the new unbounded NLE task with-
out a predefined fixed end point. Both the standard bounded and unbounded NLE task ranged from 0 to
26. As expected, the used scaling unit of ‘1’ evoked counting-based strategies such as the dead-reckon-
ing strategy on this unbounded number line. Moreover, there were no indications of the use of reference
points that are usually reflected by systematic estimation biases such as reduced error variability around
reference points. In contrast, the bounded version triggered proportional reasoning strategies to complete
this task. From this specific result pattern, the authors inferred then that albeit “both tasks are tapping
into the same underlying numerical cognition structure, […] the error data suggest that the unbounded
NLE task is a more pure measure of integer representation” (Cohen & Blanc-Goldhammer, 2011, p.
336).
Against this background, Link, Huber, Nuerk, and Moeller (2014a) carried out the first cross-sectional
study on unbounded NLE in primary school children. Their results provided evidence for systematic
strategic influences like the use of reference points for older children in the traditional bounded NLE
task. However, the comparison between estimation performance in both the unbounded and bounded
Records identified through databases PubMed and EBSCOhost
(n = 57)
Additional records identified through citations of the seminal paper by Cohen, &
Blanc-Goldhammer (2011) (n = 125)
Records after duplicates removedn = 116
Studies meeting the inclusion criteria
(n = 15)
Papers from other disciplines removed (e.g., physics, mathematics, biology or
pharmacology) (n = 45)
Identif
icatio
nS
creenin
gE
ligib
ility
Incl
uded
Records excluded by title or abstract
(n = 86)
n = 103 full-text articles screened
n = 17 full-text articles assessed for eligibility
Dissertations, master theses and test materials excluded
(n = 13)
Journal articles excluded by method section for not applying an unbounded
number line estimation task (e.g., computer simulations and comments) excluded
(n = 2)
66
task versions showed neither evidence of such strategic influences nor a decrease of error variability at
and around specific reference points for the unbounded NLE task. As such, these data support Cohen
and Blanc-Goldhammers’ (2011) conclusion that the unbounded task version actually constitutes a more
valid measure of number magnitude representation as compared to the traditional bounded task version.
Furthermore, their results revealed a qualitative change in performance for bounded but not unbounded
NLE as age of students increased. This clearly indicated the application of proportion judgement in the
traditional bounded version in older children whereas younger ones did not employ this strategy yet.
Contrary to the findings of Schneider and colleagues (2009) as well as Slusser et al. (2013) indicating
an application of proportion judgement strategies in children from the age of seven, the study of Link
and colleagues (2014) showed that from third grade on pupils seemed to start using external (such as
the start or end point) and internal (e.g., mid-point) benchmarks on the number line. Nevertheless, for
first- and second-graders, the authors found similar estimation patterns for unbounded and bounded
NLE. Hence, they speculated that both task versions might assess the same mental representation of
number magnitude in younger children.
In another study, Cohen and Sarnecka (2014) compared unbounded with bounded NLE in 3.5- to 8-
year-old children and argued that age-related changes in estimation performance on the latter may not
reflect developments to their internal magnitude representation but rather improvements in young chil-
dren’s mensuration skills particularly the ability to scaling numbers to the line length by using complex
calculation-based strategies involving subtraction or division. In addition, the negatively accelerating
error pattern only in bounded NLE looking like a logarithmic curve was interpreted to be the result of
lacking mensuration skills. Therefore, the authors inferred that unbounded NLE requires less sophisti-
cated measuring skills (e.g., repeated addition or counting) and measures the representation of number
magnitude more precisely, especially in those children with weaker subtraction competencies. Bounded
NLE, in contrast, was interpreted to reflect the development of advanced mensuration skills requiring
mastery of subtraction and/or division rather than changes in representations of number magnitude.
In a further study, Link, Nuerk, and Moeller (2014b) investigated the association between performance
in unbounded as well as bounded NLE and various basic numerical as well as arithmetic competencies
(such as addition/subtraction and number magnitude comparison). However, neither did they find cor-
relations between either arithmetic or numerical abilities and estimation performance in the unbounded
NLE task, nor evidence for the use of proportion-based strategies in this task version (see also Cohen &
Sarnecka, 2014). Significant correlations were only observed between other numerical and arithmetic
competencies and performance in the traditional bounded NLE task. The authors interpreted this differ-
ential result for these two distinct NLE tasks as additional evidence for the claim that they do not capture
the mental representation of numerical magnitude in exactly the same way. Importantly, this finding
suggests that arithmetic and numerical processes are required to apply proportion-based strategies in the
bounded NLE task (e.g., calculate reference marks, evaluate through number comparison whether the
probed number is smaller or larger than the benchmark, then compute the difference from this chosen
67
reference point and the target number and so on). This, again, seems to be driven by the fact that using
proportion judgement strategies needs other basic numerical operations such as adding or subtracting
magnitudes from reference points. Hence, the purer estimation performance in unbounded NLE may not
be associated to arithmetic skills such as addition or subtraction.
Extending the original study design, Reinert, Huber, Nuerk, and Moeller (2015a) adapted the unbounded
NLE task by varying the size of the scaling unit using all magnitudes from 1 to 10 to examine influences
of (1) the size of a predefined unit, on the one hand, as well as (2) multiples of the units as target numbers
on the estimation pattern of individuals, on the other. As expected, they found that estimation accuracy
improved as unit size increased, probably as a result of fewer steps needed to make on the number line
reducing the accumulation of estimation error. In addition, varied unit sizes did not affect individuals´
‘working window of numbers’, it rather seemed fix at about a size of 10 irrespective of the given unit
size. This might indicate that the more the unit size approached the working window of participants, the
more accurate and faster their estimations got. Moreover, as hypothesized, multiples of a predefined
unit benefited from multiplication fact knowledge with regard to faster but not more accurate estimations
which argues for a task inclusive recruitment of different numerical representations (see Reinert et al.,
2015a).
Ebersbach, Luwel, and Verschaffel (2015) examined whether the variability and accuracy of kinder-
gartners, first- as well as second-graders’ NLEs were affected by their familiarity with numbers, their
age group as well as the presence or absence of an upper endpoint of the number line (i.e., bounded vs.
unbounded). All three age groups were given numbers on number lines being represented by a three-
dimensional bar with a length of 100 cm. In the unbounded NLE task, only two reference points were
marked in the form of a given scaling unit from 1 to 10 – but not the position of the upper end point 100.
However, in the bounded condition, this additional third reference point at the position of 100 was given.
The authors found that estimations were less variable as well as more accurate in older children as
compared to younger ones as well as in those who were familiar with a larger number range. However,
the presence of an upper endpoint in the bounded condition did neither affect the variability nor the
accuracy of children’s estimations. This rather unexpected finding is consistent with the results found
by Link and colleagues (2014a) in which only third-graders performed differently in both task condi-
tions. The authors concluded that familiarity with larger numbers is associated with a more precise men-
tal number line representation (see also Dehaene et al., 2008) and hence facilitates more effective esti-
mation strategies that give individuals a general advantage in both the unbounded as well as the bounded
task version.
In a follow-up study, Reinert and colleagues (2015b) carried out the first eye-tracking experiment to
explore solution strategies employed in unbounded in direct comparison with bounded NLE. Using the
eye-tracking methodology permitted to investigate the possible consideration of reference points in both
task versions by examining individuals´ eye-fixation behavior – in a similar way as in the study by
Sullivan and colleagues (2011) for bounded NLE. Interestingly, Reinert and colleagues (2015b) found
68
that numbers of fixations at and around reference marks were increased (e.g., origin, end- and mid-
point) in the bounded NLE task, supporting the idea of the prominent use of proportion-based strategies.
In contrast, they observed for the unbounded task version that the number of fixations on the number
line continuously decreased as target number magnitude increased. As such, these results indicated that
unbounded NLE might be less influenced by proportion judgement strategies as compared to bounded
NLE.
Following an embodied training approach, Dackermann, Fischer, Huber, Nuerk, and Moeller (2016)
aimed to train second-grade children to walk a given distance with equally spaced steps on a number
line that was taped to the floor. This served to train the principle of equidistant spacing of adjacent
numbers with a full-body response. Compared to the control training where children had to separate a
given line into equally sized segments on a tablet PC, specific training gains were more pronounced
after the embodied training. However, training effects were quite inconsistent for unbounded and
bounded NLE: Children only improved their performance in unbounded – but not bounded – NLE after
the embodied training increasing their understanding of equidistance. However, without whole-body
movements, more favorable performance improvements were only observed in subtraction and bounded
NLE after the control training. Thus, these data suggest that the training effects of the embodied training
might originate from different cognitive mechanisms that are involved in the respective training condi-
tions. These processes include children’s flexible adjustment to the spatial orientation or the change of
their perspectives on the training task (walking on the line) combined with bodily experiences. The full-
body movement might have helped them realizing its congruency with the spatial dimension of the
trained concept.
A further study by Reinert, Huber, Nuerk, and Moeller (2017) evaluated potential sex differences in
performing unbounded and bounded NLE. In the latter, no sex differences were observed whereas in
unbounded NLE women were outperformed by men who achieved more accurate estimates. Observing
this male advantage in unbounded, but not bounded NLE, suggests that unbounded NLE may not be
solved applying specific strategies learnt at school like proportional judgement. Instead, it may rely
more heavily on processes of numerical estimation for which an advantage for men has been reported.
Moreover, this finding shows that the advantage for males emerges from solution strategies employed
while completing this task.
However, the only inconsistent findings reporting result patterns opposite to those found in the initial
studies by Cohen and colleagues (Cohen & Blanc-Goldhammer, 2011; Cohen & Sarnecka, 2014) and
more generally were reported by Kim and Opfer (2017, see also 2020): Investigating children’s un-
bounded and bounded NLE as well as addition and subtraction, the authors found even more logarithmic
estimates in the unbounded than bounded task version. Moreover, the results for both the bounded as
well as the unbounded NLE task showed that the more logarithmic children’s estimates were, the worse
was their performance in arithmetic tests. This result was interpreted as evidence for a unified frame-
work for numerical estimation supported by the logarithmic-to-linear shift theory. According to this,
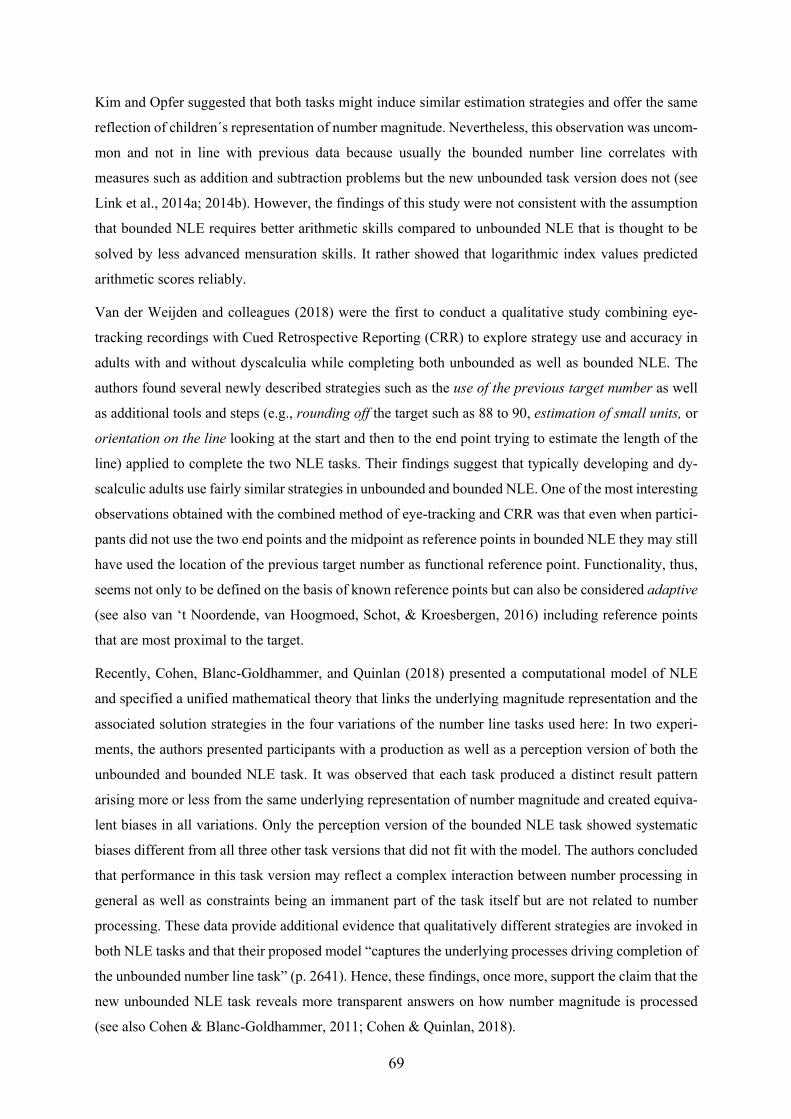
69
Kim and Opfer suggested that both tasks might induce similar estimation strategies and offer the same
reflection of children´s representation of number magnitude. Nevertheless, this observation was uncom-
mon and not in line with previous data because usually the bounded number line correlates with
measures such as addition and subtraction problems but the new unbounded task version does not (see
Link et al., 2014a; 2014b). However, the findings of this study were not consistent with the assumption
that bounded NLE requires better arithmetic skills compared to unbounded NLE that is thought to be
solved by less advanced mensuration skills. It rather showed that logarithmic index values predicted
arithmetic scores reliably.
Van der Weijden and colleagues (2018) were the first to conduct a qualitative study combining eye-
tracking recordings with Cued Retrospective Reporting (CRR) to explore strategy use and accuracy in
adults with and without dyscalculia while completing both unbounded as well as bounded NLE. The
authors found several newly described strategies such as the use of the previous target number as well
as additional tools and steps (e.g., rounding off the target such as 88 to 90, estimation of small units, or
orientation on the line looking at the start and then to the end point trying to estimate the length of the
line) applied to complete the two NLE tasks. Their findings suggest that typically developing and dy-
scalculic adults use fairly similar strategies in unbounded and bounded NLE. One of the most interesting
observations obtained with the combined method of eye-tracking and CRR was that even when partici-
pants did not use the two end points and the midpoint as reference points in bounded NLE they may still
have used the location of the previous target number as functional reference point. Functionality, thus,
seems not only to be defined on the basis of known reference points but can also be considered adaptive
(see also van ‘t Noordende, van Hoogmoed, Schot, & Kroesbergen, 2016) including reference points
that are most proximal to the target.
Recently, Cohen, Blanc-Goldhammer, and Quinlan (2018) presented a computational model of NLE
and specified a unified mathematical theory that links the underlying magnitude representation and the
associated solution strategies in the four variations of the number line tasks used here: In two experi-
ments, the authors presented participants with a production as well as a perception version of both the
unbounded and bounded NLE task. It was observed that each task produced a distinct result pattern
arising more or less from the same underlying representation of number magnitude and created equiva-
lent biases in all variations. Only the perception version of the bounded NLE task showed systematic
biases different from all three other task versions that did not fit with the model. The authors concluded
that performance in this task version may reflect a complex interaction between number processing in
general as well as constraints being an immanent part of the task itself but are not related to number
processing. These data provide additional evidence that qualitatively different strategies are invoked in
both NLE tasks and that their proposed model “captures the underlying processes driving completion of
the unbounded number line task” (p. 2641). Hence, these findings, once more, support the claim that the
new unbounded NLE task reveals more transparent answers on how number magnitude is processed
(see also Cohen & Blanc-Goldhammer, 2011; Cohen & Quinlan, 2018).
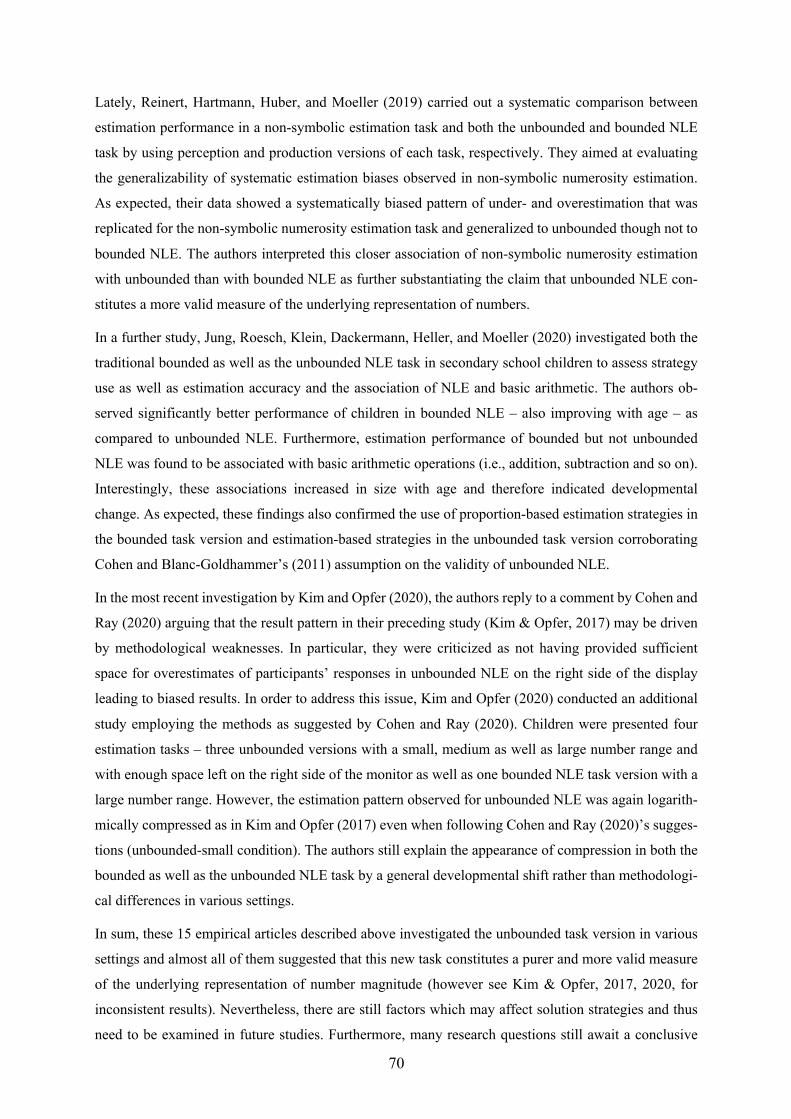
70
Lately, Reinert, Hartmann, Huber, and Moeller (2019) carried out a systematic comparison between
estimation performance in a non-symbolic estimation task and both the unbounded and bounded NLE
task by using perception and production versions of each task, respectively. They aimed at evaluating
the generalizability of systematic estimation biases observed in non-symbolic numerosity estimation.
As expected, their data showed a systematically biased pattern of under- and overestimation that was
replicated for the non-symbolic numerosity estimation task and generalized to unbounded though not to
bounded NLE. The authors interpreted this closer association of non-symbolic numerosity estimation
with unbounded than with bounded NLE as further substantiating the claim that unbounded NLE con-
stitutes a more valid measure of the underlying representation of numbers.
In a further study, Jung, Roesch, Klein, Dackermann, Heller, and Moeller (2020) investigated both the
traditional bounded as well as the unbounded NLE task in secondary school children to assess strategy
use as well as estimation accuracy and the association of NLE and basic arithmetic. The authors ob-
served significantly better performance of children in bounded NLE – also improving with age – as
compared to unbounded NLE. Furthermore, estimation performance of bounded but not unbounded
NLE was found to be associated with basic arithmetic operations (i.e., addition, subtraction and so on).
Interestingly, these associations increased in size with age and therefore indicated developmental
change. As expected, these findings also confirmed the use of proportion-based estimation strategies in
the bounded task version and estimation-based strategies in the unbounded task version corroborating
Cohen and Blanc-Goldhammer’s (2011) assumption on the validity of unbounded NLE.
In the most recent investigation by Kim and Opfer (2020), the authors reply to a comment by Cohen and
Ray (2020) arguing that the result pattern in their preceding study (Kim & Opfer, 2017) may be driven
by methodological weaknesses. In particular, they were criticized as not having provided sufficient
space for overestimates of participants’ responses in unbounded NLE on the right side of the display
leading to biased results. In order to address this issue, Kim and Opfer (2020) conducted an additional
study employing the methods as suggested by Cohen and Ray (2020). Children were presented four
estimation tasks – three unbounded versions with a small, medium as well as large number range and
with enough space left on the right side of the monitor as well as one bounded NLE task version with a
large number range. However, the estimation pattern observed for unbounded NLE was again logarith-
mically compressed as in Kim and Opfer (2017) even when following Cohen and Ray (2020)’s sugges-
tions (unbounded-small condition). The authors still explain the appearance of compression in both the
bounded as well as the unbounded NLE task by a general developmental shift rather than methodologi-
cal differences in various settings.
In sum, these 15 empirical articles described above investigated the unbounded task version in various
settings and almost all of them suggested that this new task constitutes a purer and more valid measure
of the underlying representation of number magnitude (however see Kim & Opfer, 2017, 2020, for
inconsistent results). Nevertheless, there are still factors which may affect solution strategies and thus
need to be examined in future studies. Furthermore, many research questions still await a conclusive
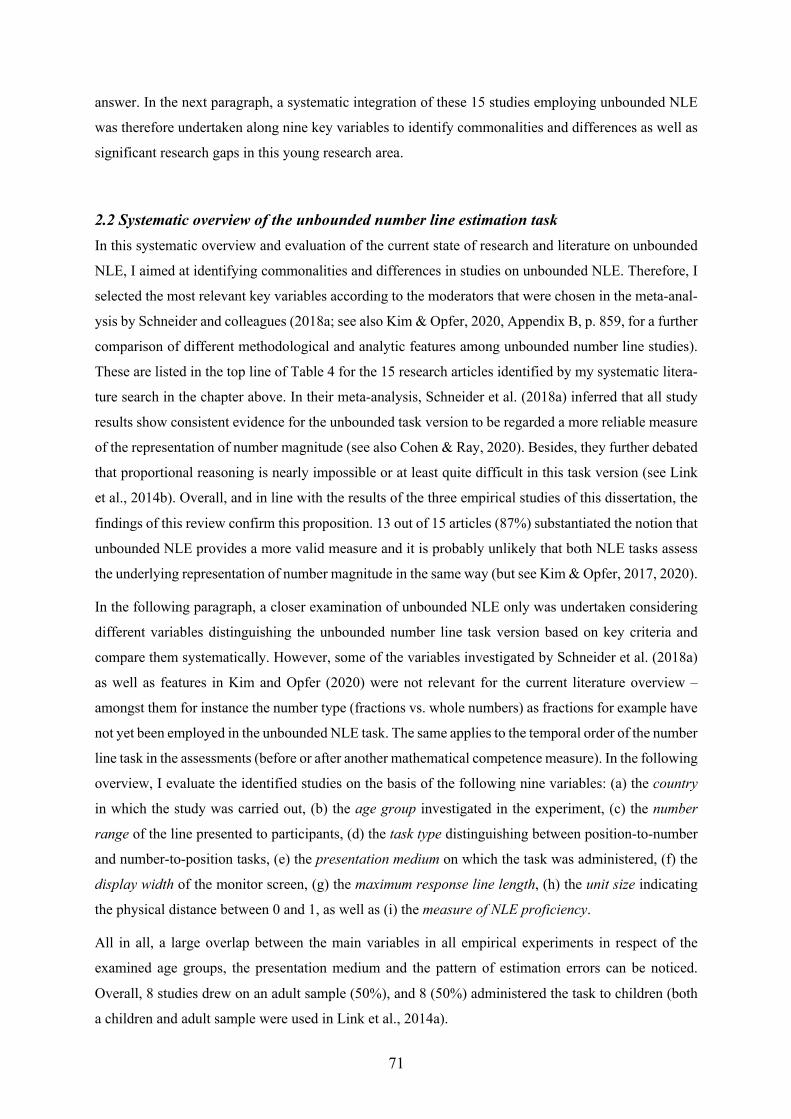
71
answer. In the next paragraph, a systematic integration of these 15 studies employing unbounded NLE
was therefore undertaken along nine key variables to identify commonalities and differences as well as
significant research gaps in this young research area.
2.2 Systematic overview of the unbounded number line estimation task In this systematic overview and evaluation of the current state of research and literature on unbounded
NLE, I aimed at identifying commonalities and differences in studies on unbounded NLE. Therefore, I
selected the most relevant key variables according to the moderators that were chosen in the meta-anal-
ysis by Schneider and colleagues (2018a; see also Kim & Opfer, 2020, Appendix B, p. 859, for a further
comparison of different methodological and analytic features among unbounded number line studies).
These are listed in the top line of Table 4 for the 15 research articles identified by my systematic litera-
ture search in the chapter above. In their meta-analysis, Schneider et al. (2018a) inferred that all study
results show consistent evidence for the unbounded task version to be regarded a more reliable measure
of the representation of number magnitude (see also Cohen & Ray, 2020). Besides, they further debated
that proportional reasoning is nearly impossible or at least quite difficult in this task version (see Link
et al., 2014b). Overall, and in line with the results of the three empirical studies of this dissertation, the
findings of this review confirm this proposition. 13 out of 15 articles (87%) substantiated the notion that
unbounded NLE provides a more valid measure and it is probably unlikely that both NLE tasks assess
the underlying representation of number magnitude in the same way (but see Kim & Opfer, 2017, 2020).
In the following paragraph, a closer examination of unbounded NLE only was undertaken considering
different variables distinguishing the unbounded number line task version based on key criteria and
compare them systematically. However, some of the variables investigated by Schneider et al. (2018a)
as well as features in Kim and Opfer (2020) were not relevant for the current literature overview –
amongst them for instance the number type (fractions vs. whole numbers) as fractions for example have
not yet been employed in the unbounded NLE task. The same applies to the temporal order of the number
line task in the assessments (before or after another mathematical competence measure). In the following
overview, I evaluate the identified studies on the basis of the following nine variables: (a) the country
in which the study was carried out, (b) the age group investigated in the experiment, (c) the number
range of the line presented to participants, (d) the task type distinguishing between position-to-number
and number-to-position tasks, (e) the presentation medium on which the task was administered, (f) the
display width of the monitor screen, (g) the maximum response line length, (h) the unit size indicating
the physical distance between 0 and 1, as well as (i) the measure of NLE proficiency.
All in all, a large overlap between the main variables in all empirical experiments in respect of the
examined age groups, the presentation medium and the pattern of estimation errors can be noticed.
Overall, 8 studies drew on an adult sample (50%), and 8 (50%) administered the task to children (both
a children and adult sample were used in Link et al., 2014a).
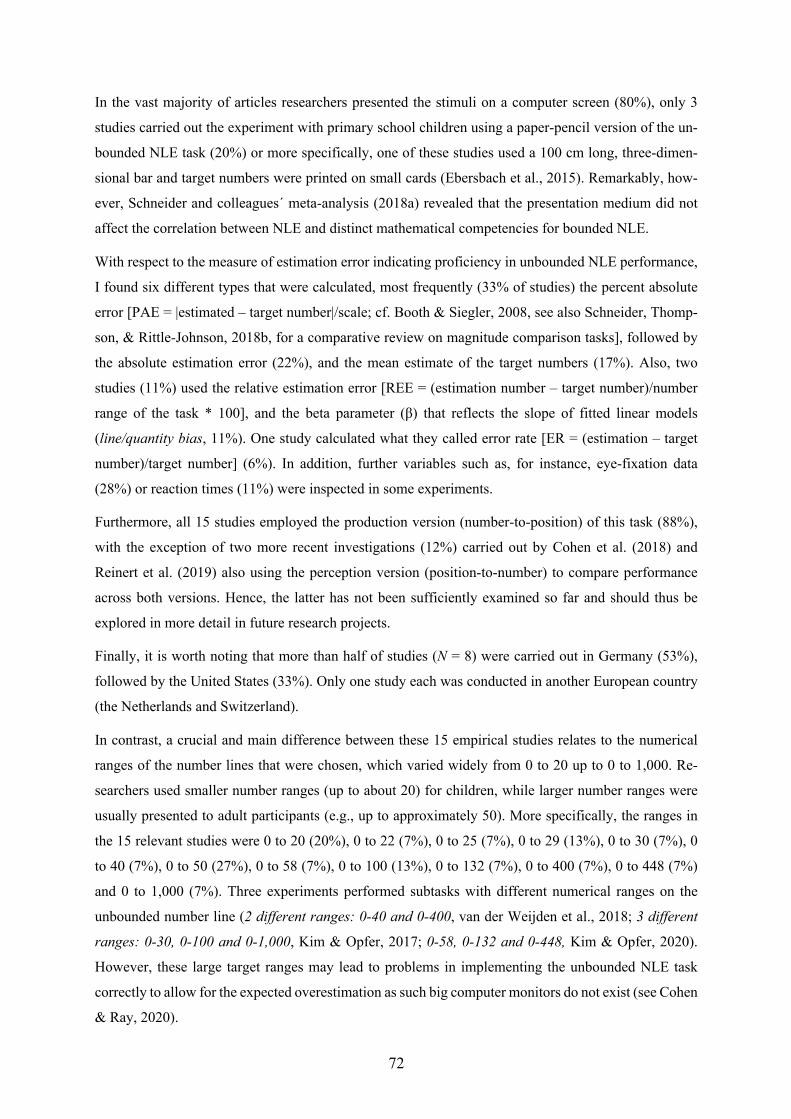
72
In the vast majority of articles researchers presented the stimuli on a computer screen (80%), only 3
studies carried out the experiment with primary school children using a paper-pencil version of the un-
bounded NLE task (20%) or more specifically, one of these studies used a 100 cm long, three-dimen-
sional bar and target numbers were printed on small cards (Ebersbach et al., 2015). Remarkably, how-
ever, Schneider and colleagues´ meta-analysis (2018a) revealed that the presentation medium did not
affect the correlation between NLE and distinct mathematical competencies for bounded NLE.
With respect to the measure of estimation error indicating proficiency in unbounded NLE performance,
I found six different types that were calculated, most frequently (33% of studies) the percent absolute
error [PAE = |estimated – target number|/scale; cf. Booth & Siegler, 2008, see also Schneider, Thomp-
son, & Rittle-Johnson, 2018b, for a comparative review on magnitude comparison tasks], followed by
the absolute estimation error (22%), and the mean estimate of the target numbers (17%). Also, two
studies (11%) used the relative estimation error [REE = (estimation number – target number)/number
range of the task * 100], and the beta parameter (β) that reflects the slope of fitted linear models
(line/quantity bias, 11%). One study calculated what they called error rate [ER = (estimation – target
number)/target number] (6%). In addition, further variables such as, for instance, eye-fixation data
(28%) or reaction times (11%) were inspected in some experiments.
Furthermore, all 15 studies employed the production version (number-to-position) of this task (88%),
with the exception of two more recent investigations (12%) carried out by Cohen et al. (2018) and
Reinert et al. (2019) also using the perception version (position-to-number) to compare performance
across both versions. Hence, the latter has not been sufficiently examined so far and should thus be
explored in more detail in future research projects.
Finally, it is worth noting that more than half of studies (N = 8) were carried out in Germany (53%),
followed by the United States (33%). Only one study each was conducted in another European country
(the Netherlands and Switzerland).
In contrast, a crucial and main difference between these 15 empirical studies relates to the numerical
ranges of the number lines that were chosen, which varied widely from 0 to 20 up to 0 to 1,000. Re-
searchers used smaller number ranges (up to about 20) for children, while larger number ranges were
usually presented to adult participants (e.g., up to approximately 50). More specifically, the ranges in
the 15 relevant studies were 0 to 20 (20%), 0 to 22 (7%), 0 to 25 (7%), 0 to 29 (13%), 0 to 30 (7%), 0
to 40 (7%), 0 to 50 (27%), 0 to 58 (7%), 0 to 100 (13%), 0 to 132 (7%), 0 to 400 (7%), 0 to 448 (7%)
and 0 to 1,000 (7%). Three experiments performed subtasks with different numerical ranges on the
unbounded number line (2 different ranges: 0-40 and 0-400, van der Weijden et al., 2018; 3 different
ranges: 0-30, 0-100 and 0-1,000, Kim & Opfer, 2017; 0-58, 0-132 and 0-448, Kim & Opfer, 2020).
However, these large target ranges may lead to problems in implementing the unbounded NLE task
correctly to allow for the expected overestimation as such big computer monitors do not exist (see Cohen
& Ray, 2020).
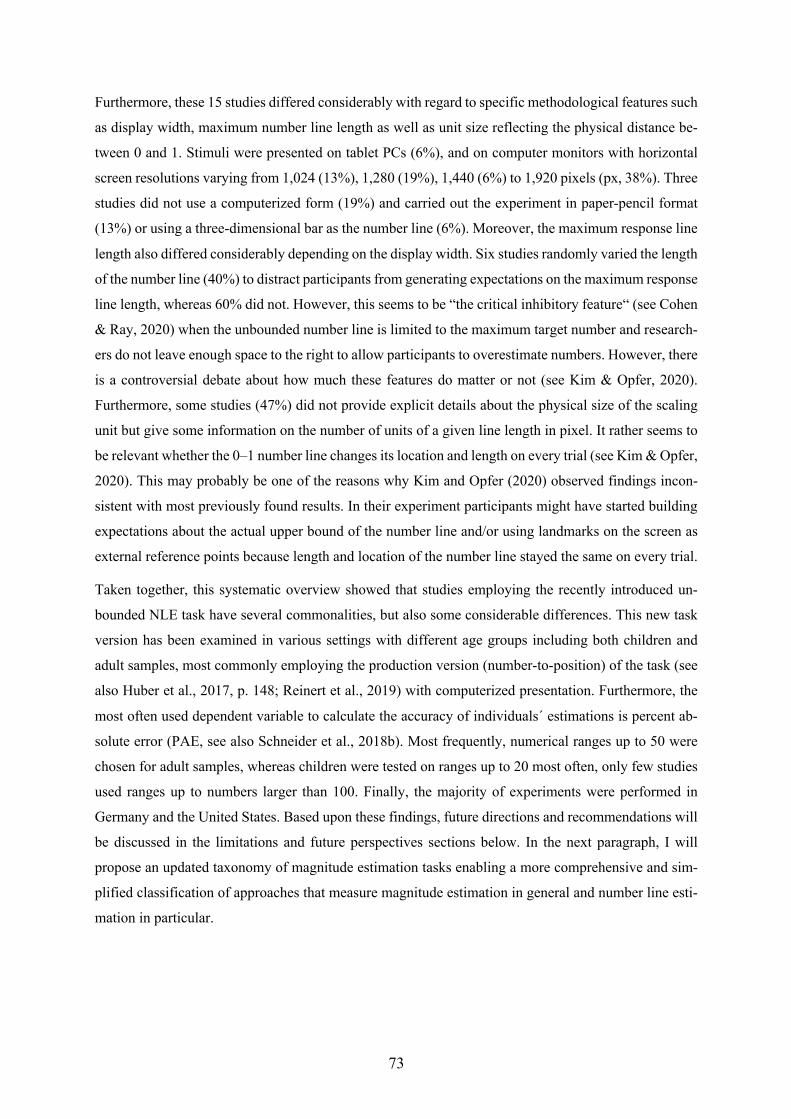
73
Furthermore, these 15 studies differed considerably with regard to specific methodological features such
as display width, maximum number line length as well as unit size reflecting the physical distance be-
tween 0 and 1. Stimuli were presented on tablet PCs (6%), and on computer monitors with horizontal
screen resolutions varying from 1,024 (13%), 1,280 (19%), 1,440 (6%) to 1,920 pixels (px, 38%). Three
studies did not use a computerized form (19%) and carried out the experiment in paper-pencil format
(13%) or using a three-dimensional bar as the number line (6%). Moreover, the maximum response line
length also differed considerably depending on the display width. Six studies randomly varied the length
of the number line (40%) to distract participants from generating expectations on the maximum response
line length, whereas 60% did not. However, this seems to be “the critical inhibitory feature“ (see Cohen
& Ray, 2020) when the unbounded number line is limited to the maximum target number and research-
ers do not leave enough space to the right to allow participants to overestimate numbers. However, there
is a controversial debate about how much these features do matter or not (see Kim & Opfer, 2020).
Furthermore, some studies (47%) did not provide explicit details about the physical size of the scaling
unit but give some information on the number of units of a given line length in pixel. It rather seems to
be relevant whether the 0–1 number line changes its location and length on every trial (see Kim & Opfer,
2020). This may probably be one of the reasons why Kim and Opfer (2020) observed findings incon-
sistent with most previously found results. In their experiment participants might have started building
expectations about the actual upper bound of the number line and/or using landmarks on the screen as
external reference points because length and location of the number line stayed the same on every trial.
Taken together, this systematic overview showed that studies employing the recently introduced un-
bounded NLE task have several commonalities, but also some considerable differences. This new task
version has been examined in various settings with different age groups including both children and
adult samples, most commonly employing the production version (number-to-position) of the task (see
also Huber et al., 2017, p. 148; Reinert et al., 2019) with computerized presentation. Furthermore, the
most often used dependent variable to calculate the accuracy of individuals´ estimations is percent ab-
solute error (PAE, see also Schneider et al., 2018b). Most frequently, numerical ranges up to 50 were
chosen for adult samples, whereas children were tested on ranges up to 20 most often, only few studies
used ranges up to numbers larger than 100. Finally, the majority of experiments were performed in
Germany and the United States. Based upon these findings, future directions and recommendations will
be discussed in the limitations and future perspectives sections below. In the next paragraph, I will
propose an updated taxonomy of magnitude estimation tasks enabling a more comprehensive and sim-
plified classification of approaches that measure magnitude estimation in general and number line esti-
mation in particular.
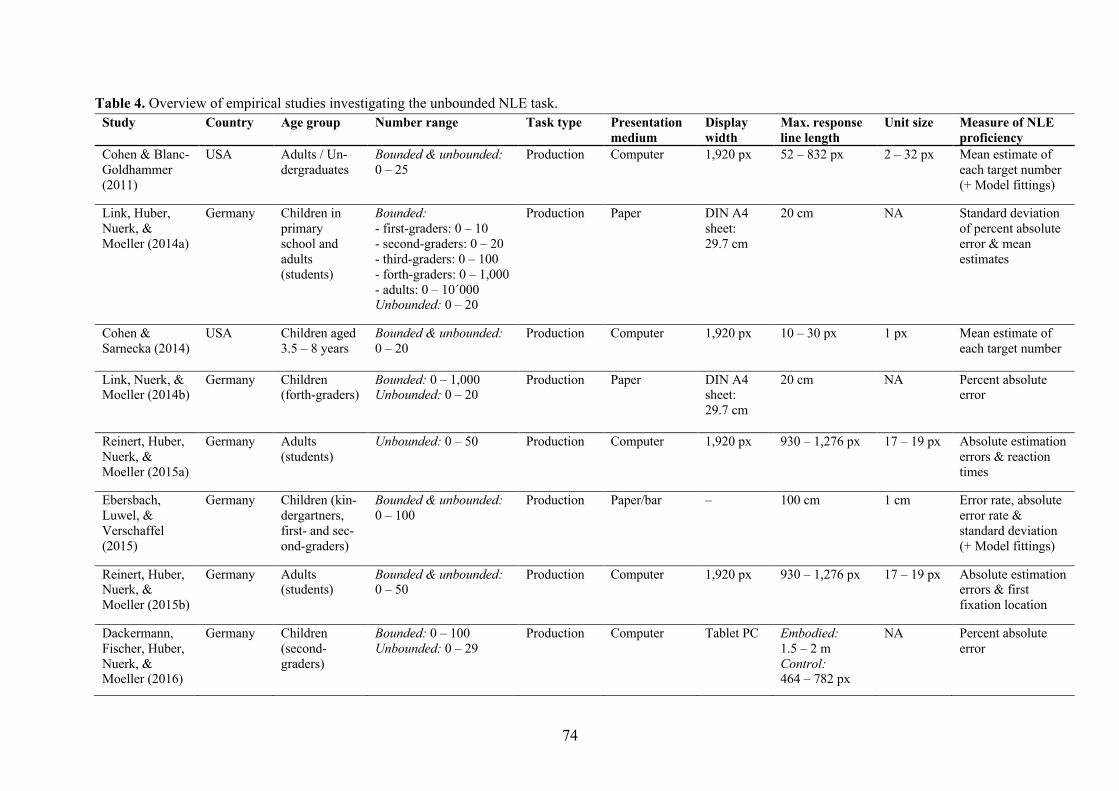
74
Table 4. Overview of empirical studies investigating the unbounded NLE task. Study Country Age group Number range Task type Presentation
medium Display width
Max. response line length
Unit size Measure of NLE proficiency
Cohen & Blanc-Goldhammer (2011)
USA Adults / Un-dergraduates
Bounded & unbounded: 0 – 25
Production Computer 1,920 px 52 – 832 px 2 – 32 px
Mean estimate of each target number (+ Model fittings)
Link, Huber, Nuerk, & Moeller (2014a)
Germany Children in primary school and adults (students)
Bounded: - first-graders: 0 – 10 - second-graders: 0 – 20 - third-graders: 0 – 100 - forth-graders: 0 – 1,000 - adults: 0 – 10´000 Unbounded: 0 – 20
Production Paper DIN A4 sheet: 29.7 cm
20 cm NA Standard deviation of percent absolute error & mean estimates
Cohen & Sarnecka (2014)
USA Children aged 3.5 – 8 years
Bounded & unbounded: 0 – 20
Production Computer 1,920 px 10 – 30 px 1 px
Mean estimate of each target number
Link, Nuerk, & Moeller (2014b)
Germany Children (forth-graders)
Bounded: 0 – 1,000 Unbounded: 0 – 20
Production Paper DIN A4 sheet: 29.7 cm
20 cm NA Percent absolute error
Reinert, Huber, Nuerk, & Moeller (2015a)
Germany Adults (students)
Unbounded: 0 – 50
Production Computer 1,920 px 930 – 1,276 px 17 – 19 px Absolute estimation errors & reaction times
Ebersbach, Luwel, & Verschaffel (2015)
Germany Children (kin-dergartners, first- and sec-ond-graders)
Bounded & unbounded: 0 – 100
Production Paper/bar – 100 cm 1 cm Error rate, absolute error rate & standard deviation (+ Model fittings)
Reinert, Huber, Nuerk, & Moeller (2015b)
Germany Adults (students)
Bounded & unbounded: 0 – 50
Production Computer 1,920 px 930 – 1,276 px 17 – 19 px Absolute estimation errors & first fixation location
Dackermann, Fischer, Huber, Nuerk, & Moeller (2016)
Germany Children (second- graders)
Bounded: 0 – 100 Unbounded: 0 – 29
Production Computer Tablet PC Embodied: 1.5 – 2 m Control: 464 – 782 px
NA Percent absolute error
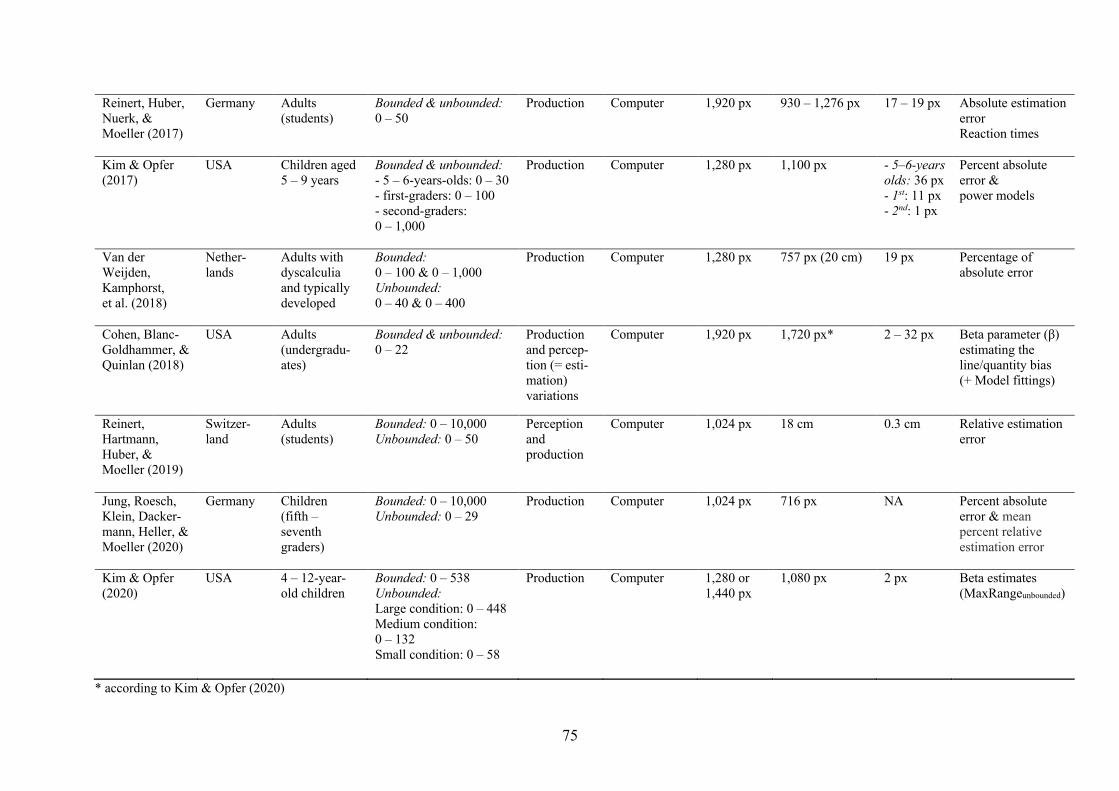
75
Reinert, Huber, Nuerk, & Moeller (2017)
Germany Adults (students)
Bounded & unbounded: 0 – 50
Production Computer 1,920 px 930 – 1,276 px 17 – 19 px Absolute estimation error Reaction times
Kim & Opfer (2017)
USA Children aged 5 – 9 years
Bounded & unbounded: - 5 – 6-years-olds: 0 – 30 - first-graders: 0 – 100 - second-graders: 0 – 1,000
Production Computer 1,280 px 1,100 px - 5–6-years olds: 36 px - 1st: 11 px - 2nd: 1 px
Percent absolute error & power models
Van der Weijden, Kamphorst, et al. (2018)
Nether-lands
Adults with dyscalculia and typically developed
Bounded: 0 – 100 & 0 – 1,000 Unbounded: 0 – 40 & 0 – 400
Production Computer 1,280 px 757 px (20 cm) 19 px Percentage of absolute error
Cohen, Blanc-Goldhammer, & Quinlan (2018)
USA Adults (undergradu-ates)
Bounded & unbounded: 0 – 22
Production and percep-tion (= esti-mation) variations
Computer 1,920 px 1,720 px* 2 – 32 px
Beta parameter (β) estimating the line/quantity bias (+ Model fittings)
Reinert, Hartmann, Huber, & Moeller (2019)
Switzer-land
Adults (students)
Bounded: 0 – 10,000 Unbounded: 0 – 50
Perception and production
Computer 1,024 px 18 cm 0.3 cm Relative estimation error
Jung, Roesch, Klein, Dacker-mann, Heller, & Moeller (2020)
Germany Children (fifth – seventh graders)
Bounded: 0 – 10,000 Unbounded: 0 – 29
Production Computer 1,024 px 716 px NA Percent absolute error & mean percent relative estimation error
Kim & Opfer (2020)
USA 4 – 12-year-old children
Bounded: 0 – 538
Unbounded: Large condition: 0 – 448 Medium condition: 0 – 132 Small condition: 0 – 58
Production Computer 1,280 or 1,440 px
1,080 px 2 px Beta estimates (MaxRangeunbounded)
* according to Kim & Opfer (2020)
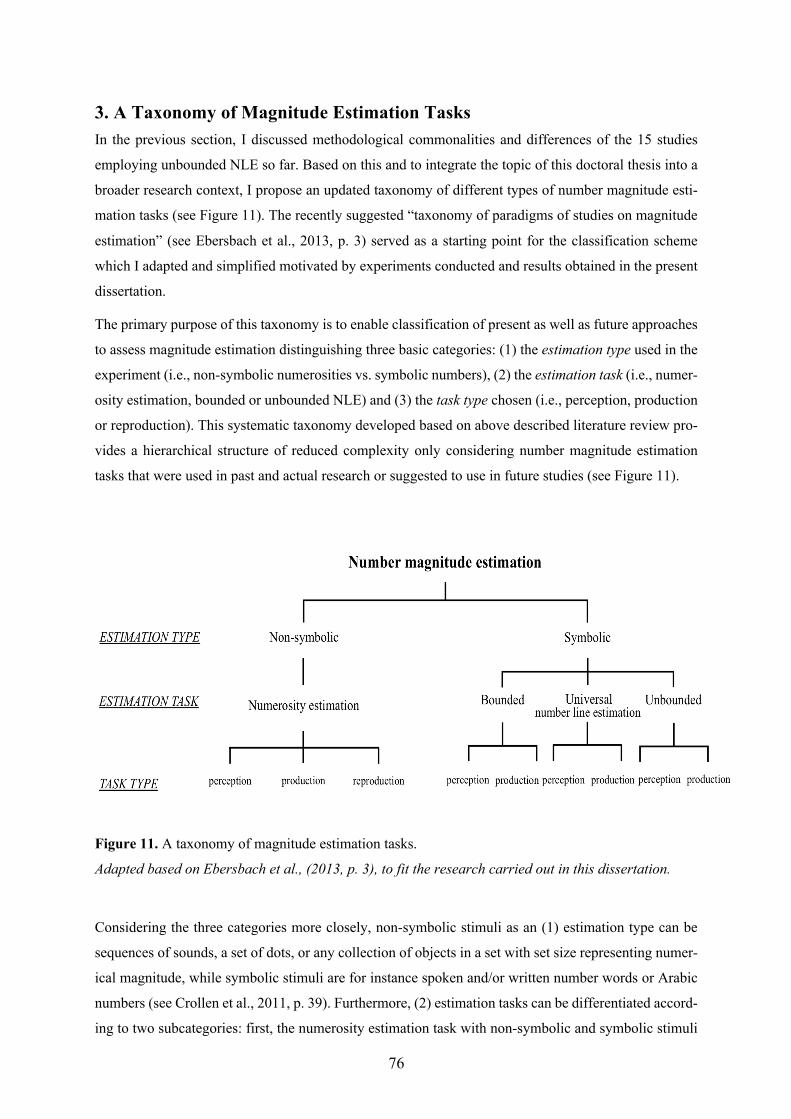
76
3. A Taxonomy of Magnitude Estimation Tasks In the previous section, I discussed methodological commonalities and differences of the 15 studies
employing unbounded NLE so far. Based on this and to integrate the topic of this doctoral thesis into a
broader research context, I propose an updated taxonomy of different types of number magnitude esti-
mation tasks (see Figure 11). The recently suggested “taxonomy of paradigms of studies on magnitude
estimation” (see Ebersbach et al., 2013, p. 3) served as a starting point for the classification scheme
which I adapted and simplified motivated by experiments conducted and results obtained in the present
dissertation.
The primary purpose of this taxonomy is to enable classification of present as well as future approaches
to assess magnitude estimation distinguishing three basic categories: (1) the estimation type used in the
experiment (i.e., non-symbolic numerosities vs. symbolic numbers), (2) the estimation task (i.e., numer-
osity estimation, bounded or unbounded NLE) and (3) the task type chosen (i.e., perception, production
or reproduction). This systematic taxonomy developed based on above described literature review pro-
vides a hierarchical structure of reduced complexity only considering number magnitude estimation
tasks that were used in past and actual research or suggested to use in future studies (see Figure 11).
Figure 11. A taxonomy of magnitude estimation tasks. Adapted based on Ebersbach et al., (2013, p. 3), to fit the research carried out in this dissertation.
Considering the three categories more closely, non-symbolic stimuli as an (1) estimation type can be
sequences of sounds, a set of dots, or any collection of objects in a set with set size representing numer-
ical magnitude, while symbolic stimuli are for instance spoken and/or written number words or Arabic
numbers (see Crollen et al., 2011, p. 39). Furthermore, (2) estimation tasks can be differentiated accord-
ing to two subcategories: first, the numerosity estimation task with non-symbolic and symbolic stimuli
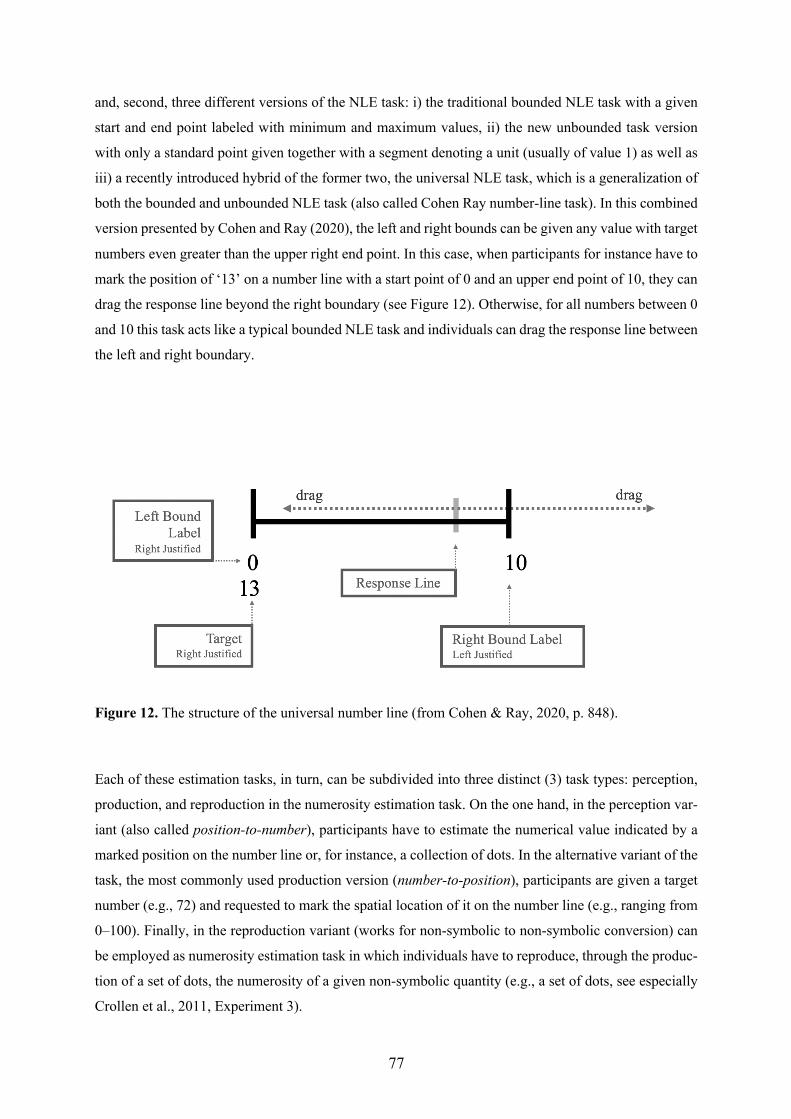
77
and, second, three different versions of the NLE task: i) the traditional bounded NLE task with a given
start and end point labeled with minimum and maximum values, ii) the new unbounded task version
with only a standard point given together with a segment denoting a unit (usually of value 1) as well as
iii) a recently introduced hybrid of the former two, the universal NLE task, which is a generalization of
both the bounded and unbounded NLE task (also called Cohen Ray number-line task). In this combined
version presented by Cohen and Ray (2020), the left and right bounds can be given any value with target
numbers even greater than the upper right end point. In this case, when participants for instance have to
mark the position of ‘13’ on a number line with a start point of 0 and an upper end point of 10, they can
drag the response line beyond the right boundary (see Figure 12). Otherwise, for all numbers between 0
and 10 this task acts like a typical bounded NLE task and individuals can drag the response line between
the left and right boundary.
Figure 12. The structure of the universal number line (from Cohen & Ray, 2020, p. 848).
Each of these estimation tasks, in turn, can be subdivided into three distinct (3) task types: perception,
production, and reproduction in the numerosity estimation task. On the one hand, in the perception var-
iant (also called position-to-number), participants have to estimate the numerical value indicated by a
marked position on the number line or, for instance, a collection of dots. In the alternative variant of the
task, the most commonly used production version (number-to-position), participants are given a target
number (e.g., 72) and requested to mark the spatial location of it on the number line (e.g., ranging from
0–100). Finally, in the reproduction variant (works for non-symbolic to non-symbolic conversion) can
be employed as numerosity estimation task in which individuals have to reproduce, through the produc-
tion of a set of dots, the numerosity of a given non-symbolic quantity (e.g., a set of dots, see especially
Crollen et al., 2011, Experiment 3).

78
In the current dissertation, I particularly focused on the branch on the very right side of this systematic
taxonomy that provides a simplified but also more comprehensive classification of paradigms used in
studies employing unbounded NLE tasks. In addition, it serves as a comprehensive overview of the
present state of research on magnitude estimation tasks considering crucial methodological aspects.
Taking into account several of these factors, the three empirical studies conducted in this thesis substan-
tiated that unbounded NLE indeed seems to be a valid and more pure measure for the underlying repre-
sentation of number magnitude compared to traditional bounded NLE. Finally, this taxonomy suggests
perspectives for future research raising and identifying unexplored research questions and may bring
new insights into research of the field of numerical magnitude and unbounded NLE, which will partly
be discussed in the next section.
79
4. Limitations and Future Perspectives Unbounded NLE is still a fairly young research objective. Nevertheless, there is robust evidence sug-
gesting that this new task version provides a more unbiased measure of the mental number magnitude
representation. The findings of the current thesis support this claim in many respects. However, these
studies are not without limitations and there are some points that have to be considered when interpreting
the results obtained and/or need to be further investigated in future studies. The following paragraph
reviews general limitations of the present and develops suggestions for future research.
First, a limitation identified by Cohen and Ray (2020) also applied to Study 1 of the present thesis. I
might have allowed only limited room for overestimation for larger target numbers. For instance, on the
unbounded number line with a length of 50 units and target numbers up to 49, it was not possible to
measure overestimations of the larger target numbers properly (e.g., typically about 15-20% overesti-
mation which corresponds to an optimal line length of about 57 to 60 units for this target number range).
In case of presenting varying number lines with a length of about 54 to 66 units as implemented in
Studies 2 and 3 of this thesis, this should be unproblematic. In future studies, the length of an unbounded
number line should give enough space for larger target numbers to avoid that participants use this upper
end point as an implicit boundary or reference point. Cohen and colleagues found that the space required
to measure a positively accelerating bias is around β = 1.2 (Cohen & Ray, 2020). This would ensure that
estimates are not biased by task specific constraints.
Furthermore, as also mentioned by Crollen and colleagues (2011), research on the mapping process
between symbolic and non-symbolic magnitude representations is still in its infancy and should be pur-
sued further to directly investigate different types of numerical estimation tasks as well as different
mapping routes in children (see also Mundy & Gilmore, 2009). Additional studies would be desirable
to take a closer look at the development of numerical mapping abilities in younger children such as
kindergartners or first graders to further examine the bi-directional mapping hypothesis (Crollen et al.,
2011). Such data would offer interesting insights into whether the observed biases of under- and over-
estimation would be similar or different in children as compared to those in adults.
In addition, Study 3 showed no significant sex differences for bounded NLE in contrast to what was
observed by Bull and colleagues (2013). To investigate this inconsistency more closely, one might use
bounded number lines with end points different from 0 or multiples of 10 in future studies such as 259
to 643 (see also Booth & Newton, 2012; Di Lonardo, Huebner, Newman, & LeFevre, 2020; Hurst, Leigh
Monahan, Heller, & Cordes, 2014, for findings on atypical endpoints). Maybe, straight numbers as end
points of the number line would increase task difficulty which might in turn increase the possibility of
differential effects, in particular in adults who perform very well in bounded NLE. On the other hand,
number ranges covered should be more difficult in further studies, not only in the bounded (e.g.,
100,000), but also in the unbounded NLE task (e.g., ranging up to 100 or 500 at least). In both cases,
error variance in general as well as sex differences in particular are supposed to increase as men were
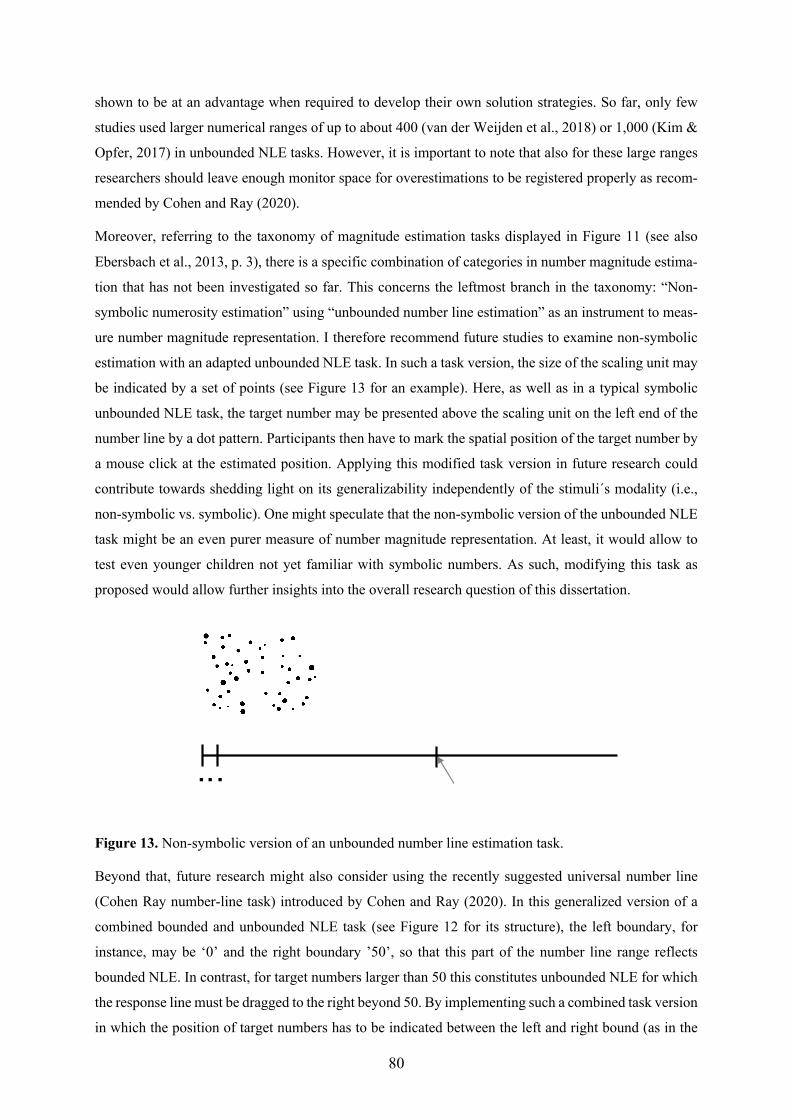
80
shown to be at an advantage when required to develop their own solution strategies. So far, only few
studies used larger numerical ranges of up to about 400 (van der Weijden et al., 2018) or 1,000 (Kim &
Opfer, 2017) in unbounded NLE tasks. However, it is important to note that also for these large ranges
researchers should leave enough monitor space for overestimations to be registered properly as recom-
mended by Cohen and Ray (2020).
Moreover, referring to the taxonomy of magnitude estimation tasks displayed in Figure 11 (see also
Ebersbach et al., 2013, p. 3), there is a specific combination of categories in number magnitude estima-
tion that has not been investigated so far. This concerns the leftmost branch in the taxonomy: “Non-
symbolic numerosity estimation” using “unbounded number line estimation” as an instrument to meas-
ure number magnitude representation. I therefore recommend future studies to examine non-symbolic
estimation with an adapted unbounded NLE task. In such a task version, the size of the scaling unit may
be indicated by a set of points (see Figure 13 for an example). Here, as well as in a typical symbolic
unbounded NLE task, the target number may be presented above the scaling unit on the left end of the
number line by a dot pattern. Participants then have to mark the spatial position of the target number by
a mouse click at the estimated position. Applying this modified task version in future research could
contribute towards shedding light on its generalizability independently of the stimuli´s modality (i.e.,
non-symbolic vs. symbolic). One might speculate that the non-symbolic version of the unbounded NLE
task might be an even purer measure of number magnitude representation. At least, it would allow to
test even younger children not yet familiar with symbolic numbers. As such, modifying this task as
proposed would allow further insights into the overall research question of this dissertation.
Figure 13. Non-symbolic version of an unbounded number line estimation task.
Beyond that, future research might also consider using the recently suggested universal number line
(Cohen Ray number-line task) introduced by Cohen and Ray (2020). In this generalized version of a
combined bounded and unbounded NLE task (see Figure 12 for its structure), the left boundary, for
instance, may be ‘0’ and the right boundary ’50’, so that this part of the number line range reflects
bounded NLE. In contrast, for target numbers larger than 50 this constitutes unbounded NLE for which
the response line must be dragged to the right beyond 50. By implementing such a combined task version
in which the position of target numbers has to be indicated between the left and right bound (as in the
∙∙∙
81
bounded) as well as beyond the right boundary (as in the unbounded NLE task), hypotheses of both task
versions may be tested at the same time.
Finally, future studies – as also recommended by Schneider and colleagues (2018a) – will have to focus
more specifically on components such as training elements of NLE like for example magnitude com-
parison or adding numbers before participants have to indicate the position of the sum on a number line
(see also Fuchs et al., 2013; Honoré & Noël, 2016; Thompson & Opfer, 2016). In particular, it remained
unclear in all previous studies whether these training effects in the NLE arise as a result of the number
line or rather other training components (e.g., more accurate memory recall of learners or simply an
improvement of memory by receiving feedback, domain-general cognitive resources, as well as other
cognitive mechanisms). Honoré and Noël (2016), for instance, recommended to investigate the specific
role of specific components of the respective trainings (e.g., number line positioning, or the magnitude
comparison task) by contrasting their isolated training effects. Thereby, different training effects as well
as mechanisms being involved and transfer from one task to another might be evaluated.
Moreover, as suggested by Ebersbach and colleagues (2013), various methodological aspects of magni-
tude estimation tasks (e.g., shape, variability, and accuracy of magnitude estimations) should be sys-
tematically manipulated in further studies and could be compared thus with other features and findings
of other tasks. Furthermore, it is necessary for the purpose of achieving comparability that all researchers
provide exact details of the size of certain features in pixels such as for example a single unit size, the
horizontal screen resolution as well as the largest possible bias (bmax).
In sum, there are still numerous research questions that need to be addressed in future research to answer
the overarching question whether the unbounded NLE is indeed a more valid measure of number mag-
nitude representation than the bounded task version. Notably, a larger number range as well as a modi-
fication of the stimulus modality or use of the new universal (Cohen Ray) NLE task may help to gain
additional insights into this question and close some of the gaps described above and in the literature.
Nevertheless, the empirical findings of the present thesis are meaningful in providing converging evi-
dence to the claim that the unbounded NLE task captures the underlying representation of number mag-
nitude more purely as compared to the standard bounded task version (see also Cohen & Blanc-Gold-
hammer, 2011).
82
5. Overall Conclusion In the last few years, it has been debated controversially whether the traditional bounded NLE task in
fact allows for inferences on the underlying representation of number magnitude (e.g., Barth & Paladino,
2011; Cohen & Blanc-Goldhammer, 2011; Cohen & Quinlan, 2018; Rouder & Geary, 2014; Slusser et
al., 2013). Surprisingly few studies have been conducted employing the newly introduced unbounded
task version – but gaining more and more popularity – although it seems to provide a more pure measure
of number magnitude representation. Except the results of Kim and Opfer (2017, 2020), a total of 13
empirical studies largely substantiated this claim. Three of these studies are part of this thesis and broad-
ened our understanding of the validity of unbounded NLE.
As an overall conclusion of the studies presented in the current dissertation, it can be noted that all
results obtained here suggest that the new unbounded compared to the bounded NLE task is less influ-
enced by the application of (proportion-judgement) strategies that do not directly reflect numerical es-
timation processes. As such, these findings clearly support the notion that unbounded NLE might actu-
ally be a valid and more “purely” measure of number magnitude representation. Going beyond previous
investigations, the current dissertation provided converging evidence from (1) a comparison with non-
symbolic numerosity estimation, (2) eye-fixation behavior as well as (3) sex differences in NLE. Con-
sidering similarities and differences with numerosity estimation revealed conceptual similarity of un-
bounded (but not bounded) number line and non-symbolic numerosity estimation, which is widely
agreed on to be a reliable measure of number magnitude representation. The systematic patterns of un-
derestimation of target numbers in the perception as well as overestimation in the production version in
the unbounded number line and non-symbolic numerosity estimation corroborated this argument. Sec-
ond, evaluating participants´ eye-fixation behavior while solving the unbounded as well as bounded
NLE task confirmed that the former measures number magnitude representation more “purely”. In par-
ticular, linearly decreasing numbers of fixations on the number line with increasing target number mag-
nitude and no increase of numbers of fixations at or around reference points indicated that unbounded
NLE is less influenced by proportion-based estimation strategies not directly related to numerical esti-
mation. Finally, sex differences observed for unbounded but not bounded NLE further corroborated that
no learnt solution strategies are to be applied to solve the former, but responses may specifically require
numerical estimations for which an advantage for males was reported previously. All in all, the findings
of this dissertation clearly suggest that the newly introduced unbounded NLE task might indeed be a
purer measure of the underlying representation of number magnitude.
83
REFERENCES Ashcraft, M. H., & Moore, A. M. (2012). Cognitive processes of numerical estimation in children. Jour-
nal of Experimental Child Psychology, 111(2), 246-267. doi:10.1016/j.jecp.2011.08.005
Backman, M. E. (1972). Patterns of mental abilities: Ethnic, socioeconomic, and sex differences. Amer-
ican Educational Research Journal, 9(1), 1-12. doi:10.3102/00028312009001001
Bailey, D. H., Siegler, R. S., & Geary, D. C. (2014). Early predictors of middle school fraction
knowledge. Developmental Science, 17(5), 775-785. doi:10.1111/desc.12155
Barth, H., Kanwisher, N., & Spelke, E. (2003). The construction of large number representations in
adults. Cognition, 86(3), 201-221. doi:10.1016/S0010-0277(02)00178-6
Barth, H. C., & Paladino, A. M. (2011). The development of numerical estimation: Evidence against a
representational shift. Developmental Science, 14(1), 125-135.
doi:10.1111/j.1467-7687.2010.00962.x
Bates, D., Maechler, M., Bolker, B., & Walker, S. (2014). lme4: Linear mixed-effects models using
Eigen and S4. R package version 1.0-6. Retrieved from http://CRAN.R-
project.org/package=lme4
Beller, M., & Gafni, N. (1996). The 1991 international assessment of educational progress in mathe-
matics and sciences: The gender differences perspective. Journal of Educational Psychology,
88(2), 365-377. doi:10.1037/0022-0663.88.2.365
Benbow, C. P. (1988). Sex differences in mathematical reasoning ability in intellectually talented pre-
adolescents: Their nature, effects, and possible causes. Behavioral and Brain Sciences, 11(2),
169-232. doi:10.1017/S0140525X00049244
Beran, M. J., Johnson-Pynn, J. S., & Ready, C. (2008). Quantity representation in children and rhesus
monkeys: Linear versus logarithmic scales. Journal of Experimental Child Psychology, 100(3),
225-233. doi:10.1016/j.jecp.2007.10.003
Berteletti, I., Lucangeli, D., Piazza, M., Dehaene, S., & Zorzi, M. (2010). Numerical estimation in pre-
schoolers. Developmental Psychology, 46(2), 545-551. doi:10.1037/a0017887
Booth, J. L., & Newton, K. J. (2012). Fractions: Could they really be the gatekeeper’s doorman?. Con
temporary Educational Psychology, 37(4), 247-253. doi:10.1016/j.cedpsych.2012.07.001
Booth, J. L., & Siegler, R. S. (2006). Developmental and individual differences in pure numerical
estimation. Developmental Psychology, 42(1), 189-201. doi:10.1037/0012-1649.41.6.189
Booth, J. L., & Siegler, R. S. (2008). Numerical magnitude representations influence arithmetic learning.
Child Development, 79(4), 1016-1031. doi:10.1111/j.1467-8624.2008.01173.x
Brooke, J. B., & MacRae, A. W. (1977). Error patterns in the judgment and production of numerical
proportions. Perception & Psychophysics, 21(4), 336-340. doi:10.3758/BF03199483
Brunner, M., Krauss, S., & Martignon, L. (2011). Eine alternative Modellierung von
Geschlechtsunterschieden in Mathematik. Journal für Mathematik-Didaktik, 32(2), 179-204.
doi:10.1007/s13138-011-0026-2
84
Buckley, P. B., & Gillman, C. B. (1974). Comparisons of digits and dot patterns. Journal of
Experimental Psychology, 103(6), 1131-1136. doi:10.1037/h0037361
Bull, R., Cleland, A. A., & Mitchell, T. (2013). Sex differences in the spatial representation of number.
Journal of Experimental Psychology: General, 142(1), 181-192. doi:10.1037/a0028387
Campbell, J. I., & Graham, D. J. (1985). Mental multiplication skill: Structure, process, and
acquisition. Canadian Journal of Psychology/Revue canadienne de psychologie, 39(2), 338-
366. doi:10.1037/h0080065
Cantlon, J. F., Cordes, S., Libertus, M. E., & Brannon, E. M. (2009). Comment on "Log or linear?
Distinct intuitions of the number scale in western and amazonian indigene cultures". Sci-
ence, 323(5910). doi:10.1126/science.1164773
Caplan, J. B., & Caplan, P. J. (2005). The perseverative search for sex differences in mathematics abil-
ities. In A. M. Gallagher & J. C. Kaufman (eds.) Gender Differences in Mathematics: An Inte-
grative Psychological Approach. Cambridge: Cambridge University Press.
Casey, M. B., Nuttall, R. L., & Pezaris, E. (1997). Mediators of gender differences in mathematics col-
lege entrance test scores: A comparison of spatial skills and internalized beliefs and anxieties.
Developmental Psychology, 33(4), 669-680. doi:10.1037/0012-1649.33.4.669
Casey, M. B., Nuttall, R. L., & Pezaris, E. (2001). Spatial-mechanical reasoning skills versus mathe-
matics self-confidence as mediators of gender differences on mathematics subtests using cross-
national gender-based items. Journal for Research in Mathematics Education, 32(1), 28-57.
doi:10.2307/749620
Castronovo, J., & Seron, X. (2007). Numerical estimation in blind subjects: Evidence of the impact of
blindness and its following experience. Journal of Experimental Psychology: Human Percep-
tion and Performance, 33(5), 1089-1106. doi:10.1037/0096-1523.33.5.1089
Ceci, S. J., & Williams, W. M. (2010). Sex differences in math-intensive fields. Current Directions in
Psychological Science, 19(5), 275-279. doi:10.1177/0963721410383241
Chesney, D. L., & Matthews, P. G. (2013). Knowledge on the line: Manipulating beliefs about the
magnitudes of symbolic affects the linearity of line estimation tasks. Psychonomic Bulletin &
Review, 20(6), 1146-1153. doi:10.3758/s13423-013-0446-8
Cohen, D. J., & Blanc-Goldhammer, D. (2011). Numerical bias in bounded and unbounded number line
tasks. Psychonomic Bulletin & Review, 18(2), 331-338. doi:10.3758/s13423-011-0059-z
Cohen, D. J., Blanc‐Goldhammer, D., & Quinlan, P. T. (2018). A mathematical model of how people
solve most variants of the number‐line task. Cognitive Science, 42(8), 2621-2647.
doi:10.1111/cogs.12698
Cohen, D. J., Ferrell, J. M., & Johnson, N. (2002). What very small numbers mean. Journal of
Experimental Psychology: General, 131(3), 424-442. doi:10.1037/0096-3445.131.3.424
85
Cohen, D. J., & Quinlan, P. T. (2018). The log–linear response function of the bounded number-line
task is unrelated to the psychological representation of quantity. Psychonomic Bulletin & Re-
view, 25(1), 447-454. doi:10.3758/s13423-017-1290-z
Cohen, D. J., & Ray, A. (2020). Experimental bias in number-line tasks and how to avoid them:
Comment on Kim and Opfer (2017) and the introduction of the Cohen Ray number-line task.
Developmental Psychology, 56(4), 846-852. doi:10.1037/dev0000761
Cohen, D. J., & Sarnecka, B. W. (2014). Children’s number-line estimation shows development of
measurement skills (not number representations). Developmental Psychology, 50(6), 1640-
1652. doi:10.1037/a0035901
Coie, J. D., & Dorval, B. (1973). Sex differences in the intellectual structure of social interaction skills.
Developmental Psychology, 8(2), 261-267. doi:10.1037/h0034142
Cokely, E. T., Galesic, M., Schulz, E., Ghazal, S., & Garcia-Retamero, R. (2012). Measuring risk
literacy: The Berlin numeracy test. Judgment and Decision Making, 7(1), 25-47.
doi:10.1037/t45862-000
Cowan, R., & Powell, D. (2014). The contributions of domain-general and numerical factors to third-
grade arithmetic skills and mathematical learning disability. Journal of Educational Psychol-
ogy, 106(1), 214-229. doi:10.1037/a0034097
Crollen, V., Castronovo, J., & Seron, X. (2011). Under- and over-estimation. Experimental
Psychology, 58(1), 39-49. doi:10.1027/1618-3169/a000064
Crollen, V., Grade, S., Pesenti, M., & Dormal, V. (2013). A common metric magnitude system for the perception and production of numerosity, length, and duration. Frontiers in Psychology, 4: 449. doi:10.3389/fpsyg.2013.00449
Crollen, V., & Seron, X. (2012). Over-estimation in numerosity estimation tasks: More than an
attentional bias?. Acta Psychologica, 140(3), 246-251. doi:10.1016/j.actpsy.2012.05.003
Cutmore, T. R., Hine, T. J., Maberly, K. J., Langford, N. M., & Hawgood, G. (2000). Cognitive and
gender factors influencing navigation in a virtual environment. International Journal of Human-
Computer Studies, 53(2), 223-249. doi:10.1006/ijhc.2000.0389
Dackermann, T., Fischer, U., Huber, S., Nuerk, H. C., & Moeller, K. (2016). Training the equidistant
principle of number line spacing. Cognitive Processing, 17(3), 243-258.
doi:10.1007/s10339-016-0763-8
Dackermann, T., Huber, S., Bahnmueller, J., Nuerk, H. C., & Moeller, K. (2015). An integration of
competing accounts on children’s number line estimation. Frontiers in Psychology, 6, 884.
doi:10.3389/fpsyg.2015.00884
Dackermann, T., Kroemer, L., Nuerk, H. C., Moeller, K., & Huber, S. (2018). Influences of
presentation format and task instruction on children’s number line estimation. Cognitive De-
velopment, 47, 53-62. doi:10.1016/j.cogdev.2018.03.001
86
de Hevia, M. D., Girelli, L., & Macchi Cassia, V. (2012). Minds without language represent number
through space: Origins of the mental number line. Frontiers in Psychology, 3: 466.
doi:10.3389/fpsyg.2012.00466
Dehaene, S. (2011). The number sense: How the mind creates mathematics. New York: Oxford
University Press.
Dehaene, S., Bossini, S., & Giraux, P. (1993). The mental representation of parity and number
magnitude. Journal of Experimental Psychology: General, 122(3), 371-396.
doi:10.1037/0096-3445.122.3.371
Dehaene, S., Dupoux, E., & Mehler, J. (1990). Is numerical comparison digital? Analogical and
symbolic effects in two-digit number comparison. Journal of Experimental Psychology: Hu-
man Perception and Performance, 16(3), 626-641. doi:10.1037/0096-1523.16.3.626
Dehaene, S., Piazza, M., Pinel, P., & Cohen, L. (2003). Three parietal circuits for number
processing. Cognitive Neuropsychology, 20(3-6), 487-506. doi:10.1080/02643290244000239
Di Lonardo, S. M., Huebner, M. G., Newman, K., & LeFevre, J. A. (2020). Fixated in unfamiliar
territory: Mapping estimates across typical and atypical number lines. Quarterly Journal of
Experimental Psychology, 73(2), 279-294. doi:10.1177/1747021819881631
Duncan, G. J., Dowsett, C. J., Claessens, A., Magnuson, K., Huston, A. C., Klebanov, P., ... & Sexton,
H. (2007). School readiness and later achievement. Developmental Psychology, 43(6), 1428-
1446. doi:10.1037/0012-1649.43.6.1428
Ebersbach, M., Luwel, K., & Verschaffel, L. (2013). Comparing apples and pears in studies on
magnitude estimations. Frontiers in Psychology, 4, 332, 1-6. doi:10.3389/fpsyg.2013.00332
Ebersbach, M., Luwel, K., & Verschaffel, L. (2015). The relationship between children’s familiarity
with numbers and their performance in bounded and unbounded number line estimations.
Mathematical Thinking and Learning, 17(2-3), 136-154. doi:10.1080/10986065.2015.1016813
Else-Quest, N. M., Hyde, J. S., & Linn, M. C. (2010). Cross-national patterns of gender differences in
mathematics: a meta-analysis. Psychological Bulletin, 136(1), 103-127. doi:10.1037/a0018053
Fazio, L. K., Bailey, D. H., Thompson, C. A., & Siegler, R. S. (2014). Relations of different types of
numerical magnitude representations to each other and to mathematics achievement. Journal
of Experimental Child Psychology, 123, 53-72. doi:10.1016/j.jecp.2014.01.013
Fischer, M. H. (2001). Number processing induces spatial performance biases. Neurology, 57(5), 822-
826. doi:10.1212/WNL.57.5.822
Fischer, M. H. (2003). Spatial representations in number processing--evidence from a pointing task.
Visual Cognition, 10(4), 493-508. doi:10.1080/13506280244000186
Fischer, M. H., & Shaki, S. (2014). Spatial associations in numerical cognition – From single digits to
arithmetic. The Quarterly Journal of Experimental Psychology, 67(8), 1461-1483.
doi:10.1080/17470218.2014.927515
87
Fischer, M. H., Warlop, N., Hill, R. L., & Fias, W. (2004). Oculomotor bias induced by number
perception. Experimental Psychology, 51(2), 91-97. doi:10.1027/1618-3169.51.2.91
Friso-van den Bos, I., Kroesbergen, E. H., van Luit, J. E. H., Xenidou-Dervou, I., Jonkman, L. M.,
van der Schoot, M., & van Lieshout, E. C. D. M. (2015). Longitudinal development of number
line estimation and mathematics performance in primary school children. Journal of Experi-
mental Child Psychology, 134, 12-29. doi:10.1016/j.jecp.2015.02.002
Fuchs, L. S., Schumacher, R. F., Long, J., Namkung, J., Hamlett, C. L., Cirino, P. T., & Changas, P.
(2013). Improving at-risk learners’ understanding of fractions. Journal of Educational Psy-
chology, 105(3), 683-700. doi:10.1037/a0032446
Fuson, K. (1988). Children’s counting and concepts of cumber. New York: Springer.
Gallagher, A. M. (1998). Gender and antecedents of performance in mathematics testing. Teachers
College Record, 100(2), 297-314.
Gallagher, A. M., De Lisi, R., Holst, P. C., McGillicuddy-De Lisi, A. V., Morely, M., & Cahalan, C.
(2000). Gender differences in advanced mathematical problem solving. Journal of Experimental
Child Psychology, 75(2), 165-190. doi:10.1006/jecp.1999.2532
Galton, F. (1880). Statistics of mental imagery. Mind, 5(19), 301-318. (Reprinted at
http://psychclassics.yorku.ca/Galton/imagery.htm.) doi:10.1093/mind/os-V.19.301
Geary, D. C. (1996). Sexual selection and sex differences in mathematical abilities. Behavioral and
Brain Sciences, 19(2), 229-284. doi:10.1017/S0140525X00042400
Geary, D. C. (1999). Sex differences in mathematical abilities: Commentary on the math-fact retrieval
hypothesis. Contemporary Educational Psychology, 24(3), 267-274.
doi:10.1006/ceps.1999.1007
Geary, D. C. (2000). Evolution and proximate expression of human paternal investment. Psychological
Bulletin, 126(1), 55-77. doi:10.1037//0033-2909.126.1.55
Geary, D. C., Hoard, M. K., Nugent, L., & Byrd-Craven, J. (2008). Development of number line
representations in children with mathematical learning disability. Developmental Neuropsy-
chology, 33(3), 277-299. doi:10.1080/ 87565640801982361
Geary, D. C., Saults, S. J., Liu, F., & Hoard, M. K. (2000). Sex differences in spatial cognition, compu-
tational fluency, and arithmetical reasoning. Journal of Experimental Child Psychology, 77(4),
337-353. doi:10.1006/jecp.2000.2594
Gibbon, J. (1977). Scalar expectancy theory and Weber's law in animal timing. Psychological
Review, 84(3), 279-325. doi:10.1037/0033-295X.84.3.279
Gibbon, J., & Church, R. M. (1981). Time left: linear versus logarithmic subjective time. Journal of
Experimental Psychology: Animal Behavior Processes, 7(2), 87-108.
doi:10.1037/0097-7403.7.2.87
88
Göbel, S. M., Shaki, S., & Fischer, M. H. (2011). The cultural number line: A review of cultural and
linguistic influences on the development of number processing. Journal of Cross-Cultural
Psychology, 42(4), 543-565. doi:10.1177/0022022111406251
Gunderson, E. A., Ramirez, G., Beilock, S. L., & Levine, S. C. (2012). The relation between spatial
skill and early number knowledge: The role of the linear number line. Developmental Psychol-
ogy, 48(5), 1229-1241. doi:10.1037/a0027433
Halpern, D., F. (1986). Sex differences in cognitive abilities. Hillsdale, NJ: Erlbaum.
Halpern, D. F., Benbow, C. P., Geary, D. C., Gur, R. C., Hyde, J. S., & Gernsbacher, M. A.
(2007). The science of sex differences in science and mathematics. Psychological Science in the
Public Interest, 8(1), 1-51. doi:10.1111/j.1529-1006.2007.00032.x.
Hedges, L. V., & Nowell, A. (1995). Sex differences in mental scores, variability, and numbers of high-
scoring individuals. Science, 269(5220), 41-45. doi:10.1126/science.7604277
Hollands, J. G., & Dyre, B. P. (2000). Bias in proportion judgments: The cyclical power model.
Psychological Review, 107(3), 500-524. doi:10.1037/0033-295X.107.3.500
Holloway, I. D., & Ansari, D. (2009). Mapping numerical magnitudes onto symbols: The numerical
distance effect and individual differences in children’s mathematics achievement. Journal of
Experimental Child Psychology, 103(1), 17-29. doi:10.1016/j.jecp.2008.04.001
Honoré, N., & Noël, M.-P. (2016). Improving preschoolers’ arithmetic through number magnitude
training: The impact of non-symbolic and symbolic training. PLoS ONE, 11, e0166685.
doi:10.1371/jour nal.pone.0166685
Honour, L. A. (2020). Children's mental representation of number, their number line estimations and
maths achievement: exploring the role of 3D mental rotation skills (Doctoral dissertation, Uni-
versity of Southampton).
Hubbard, E. M., Piazza, M., Pinel, P., & Dehaene, S. (2005). Interactions between number and space
in parietal cortex. Nature Reviews Neuroscience, 6(6), 435-448. doi:10.1038/nrn1684
Huber, S., Bloechle, J., Dackermann, T., Scholl, A., Sassenberg, K., & Moeller, K. (2017). Magnitude
estimation is influenced by social power. Journal of Numerical Cognition, 3(2), 147-163.
doi:10.5964/jnc.v3i2.52
Hugdahl, K., Thomsen, T., & Ersland, L. (2006). Sex differences in visuo-spatial processing:
An fMRI study of mental rotation. Neuropsychologia, 44(9), 1575-1583.
doi:10.1016/j.neuropsychologia.2006.01.026
Hurst, M., Leigh Monahan, K., Heller, E., & Cordes, S. (2014). 123s and ABCs: Developmental shifts
in logarithmic-to-linear responding reflect fluency with sequence values. Developmental Sci-
ence, 17(6), 892-904. doi:10.1111/desc.12165
Hyde, J. S. (1981). How large are cognitive gender differences? A meta-analysis using! w² and d.. Amer-
ican Psychologist, 36(8), 892-901. doi:10.1037/0003-066X.36.8.892
89
Hyde, J. S. (2014). Gender similarities and differences. Annual Review of Psychology, 65, 373-398.
doi:10.1146/annurev-psych-010213-115057
Hyde, J. S., Fennema, E., & Lamon, S. J. (1990a). Gender differences in mathematics performance: A
meta-analysis. Psychological Bulletin, 107(2), 139-155. doi:10.1037/0033-2909.107.2.139
Hyde, J. S., Fennema, E., Ryan, M., Frost, L. A., & Hopp, C. (1990b). Gender comparisons of mathe-
matics attitudes and affect. Psychology of Women Quarterly, 14(3), 299-324.
doi:10.1111/j.1471-6402.1990.tb00022.x
Hyde, J. S., Lindberg, S. M., Linn, M. C., Ellis, A. B., & Williams, C. C. (2008). Gender similarities
characterize math performance. Science, 321(5888), 494-495. doi:10.1126/science.1160364
Hyde, J. S., & Linn, M. C. (1988). Gender differences in verbal ability. A meta-analysis. Psychological
Bulletin, 104(1), 53-69. doi:10.1037/0033-2909.104.1.53
Iuculano, T., & Butterworth, B. (2011). Rapid communication: Understanding the real value of
fractions and decimals. Quarterly Journal of Experimental Psychology, 64(11), 2088-2098.
doi:10.1080/17470218.2011.604785
Izard, V., & Dehaene, S. (2008). Calibrating the mental number line. Cognition, 106(3), 1221-1247.
doi:10.1016/j.cognition.2007.06.004
Johnson, S. (1996). The contribution of large scale assessment programmes to research on gender dif-
ferences. Educational Research and Evaluation, 2(1), 25-49.
doi:10.1080/1380361960020102
Jung, S., Roesch, S., Klein, E., Dackermann, T., Heller, J., & Moeller, K. (2020). The strategy matters:
Bounded and unbounded number line estimation in secondary school children. Cognitive De-
velopment, 53, 100839. doi:10.1016/j.cogdev.2019.100839
Kaufman, S. B. (2007). Sex differences in mental rotation and spatial visualization ability:
Can they be accounted for by differences in working memory capacity? Intelligence, 35(3), 211-
223. doi:10.1016/j.intell.2006.07.009
Kessel, C., & Linn, M. C. (1996). Grades or scores: predicting future college mathematics
performance. Educational Measurement: Issues and Practice, 15(4), 10-14.
doi:10.1111/j.1745-3992.1996.tb00573.x
Kim, D., & Opfer, J. E. (2017). A unified framework for bounded and unbounded numerical
estimation. Developmental Psychology, 53(6), 1088-1097. doi:10.1037/dev0000305
Kim, D., & Opfer, J. E. (2020). Compression is evident in children’s unbounded and bounded numerical
estimation: Reply to Cohen and Ray (2020). Developmental Psychology, 56(4), 853-860.
doi:10.1037/dev0000886
Kimura, D. (2000). Sex and cognition. Cambridge, MA: MIT Press.
Krinzinger, H., Wood, G., & Willmes, K. (2012). What accounts for individual and gender differences
in the multi-digit number processing of primary school children? Zeitschrift für Psychologie,
220(2), 78-89. doi:10.1027/2151-2604/a000099
90
Kuznetsova, A., Brockhoff, P.B., & Christensen, R.H. (2014). lmerTest: Tests for random and fixed
effects for linear mixed effect models (lmer objects of lme4 package). R package version 2.0-6.
Retrieved from http://CRAN.R-project.org/package=lmerTest Laski, E. V., & Siegler, R. S. (2007). Is 27 a big number? Correlational and causal connections among
numerical categorization, number line estimation, and numerical magnitude comparison. Child
Development, 78(6), 1723-1743. doi:10.1111/j.1467-8624.2007.01087.x
LeFevre, J., Jimenez Lira, C., Sowinski, C., Cankaya, O., Kamawar, D. et al. (2013). Charting the role
of the number line in mathematical development. Frontiers in Psychology, 4, 1-9.
doi:10.3389/fpsyg.2013.00641
Levine, S. C., Foley, A., Lourenco, S., Ehrlich, S., & Ratliff, K. (2016). Sex differences in spatial
cognition: Advancing the conversation. Wiley Interdisciplinary Reviews: Cognitive Sci-
ence, 7(2), 127-155. doi:10.1002/wcs.1380
Levine, S. C., Vasilyeva, M., Lourenco, S. F., Newcombe, N. S., & Huttenlocher, J. (2005). Socioeco-
nomic status modifies the sex difference in spatial skill. Psychological Science, 16(11), 841-
845. doi:10.1111/j.1467-9280.2005.01623.x
Lindberg, S. M., Hyde, J. S., Petersen, J. L., & Linn, M. C. (2010). New trends in gender and mathe-
matics performance: A meta-analysis. Psychological Bulletin, 136(6), 1123-1135.
doi:10.1037/a0021276
Lindemann, O., & Tira, M. D. (2015). Operational momentum in numerosity production judgments of
multi-digit number problems. Zeitschrift für Psychologie/Journal of Psychology, 219(1), 50-
57. doi:10.1027/2151-2604/a000046
Link, T., Huber, S., Nuerk, H.-C., & Moeller, K. (2014). Unbounding the mental number line – New
evidence on children’s spatial representation of numbers. Frontiers in Psychology, 4:1021.
doi:10.3389/fpsyg.2013.01021
Link, T., Moeller, K., Huber, S., Fischer, U., & Nuerk, H. C. (2013). Walk the number line – An
embodied training of numerical concepts. Trends in Neuroscience and Education, 2(2), 74-84.
doi:10.1016/j.tine.2013.06.005
Link, T., Nuerk, H. C., & Moeller, K. (2014). On the relation between the mental number line and
arithmetic competencies. The Quarterly Journal of Experimental Psychology, 67(8), 1597-
1613. doi:10.1080/17470218.2014.892517
Linn, M. C., & Hyde, J. S. (1989). Gender, mathematics, and science. Educational Researcher, 18(8),
17-27. doi:10.2307/1176462
Linn, M. C., & Petersen, A. C. (1985). Emergence and characterization of sex differences in spatial
ability: A meta-analysis. Child development, 56(6), 1479-1498. doi:10.2307/1130467
Lipton, J. S., & Spelke, E. S. (2006). Preschool children master the logic of number word
meanings. Cognition, 98(3), B57-B66. doi:10.1016/j.cognition.2004.09.013
91
Maeda, Y., & Yoon, S. Y. (2013). A meta-analysis on gender differences in mental rotation ability
measured by the Purdue Spatial Visualization Tests: Visualization of rotations (PSVT:R). Edu-
cational Psychology Review, 25(1), 69-94. doi:10.1007/s10648-012-9215-x
Mandler, G., & Shebo, B. J. (1982). Subitizing: An analysis of its component processes. Journal of
Experimental Psychology: General, 111(1), 1-22. doi:10.1037/0096-3445.111.1.1
McCrink, K., Dehaene, S., & Dehaene-Lambertz, G. (2007). Moving along the number line:
Operational momentum in nonsymbolic arithmetic. Perception & Psychophysics, 69(8), 1324-
1333. doi:10.3758/BF03192949
Meck, W. H., & Church, R. M. (1983). A mode control model of counting and timing
processes. Journal of Experimental Psychology: Animal Behavior Processes, 9(3), 320-344.
doi:10.1037/0097-7403.9.3.320
Miller, K., Perlmutter, M., & Keating, D. (1984). Cognitive arithmetic: Comparison of
operations. Journal of Experimental Psychology: Learning, Memory, and Cognition, 10(1),
46-60. doi:10.1037/0278-7393.10.1.46
Moeller, K., Pixner, S., Kaufmann, L., & Nuerk, H.-C. (2009). Children’s early mental number line:
Logarithmic or rather decomposed linear? Journal of Experimental Child Psychology, 103(4),
503-515. doi:10.1016/j.jecp.2009.02.006
Moher, D., Shamseer, L., Clarke, M., Ghersi, D., Liberati, A., Petticrew, M., et al. (2015). Preferred
reporting items for systematic review and meta-analysis protocols (PRISMA-P) 2015 state-
ment. Systematic Review, 4:1. doi:10.1186/2046-4053-4-1
Moyer, R. S., & Landauer, T. K. (1967). Time required for judgements of numerical inequality.
Nature, 215(5109), 1519-1520. doi:10.1038/2151519a0
Mundy, E., & Gilmore, C. K. (2009). Children’s mapping between symbolic and nonsymbolic
representations of number. Journal of Experimental Child Psychology, 103(4), 490-502.
doi:10.1016/j.jecp.2009.02.003
Nuerk, H.-C., Moeller, K., Klein, E., Willmes, K., & Fischer, M. H. (2011). Extending the mental
number line - A review of multi-digit number processing. Journal of Psychology, 219, 3-22.
doi:10.1027/2151-2604/a000041
Nuerk, H. C., Wood, G., & Willmes, K. (2005). The universal SNARC effect: The association
between number magnitude and space is amodal. Experimental Psychology, 52(3), 187-194.
doi:10.1027/1618-3169.52.3.187
Olver, A. (2013). Investigating Early Spatial and Numerical Skills in Junior Kindergarten Children
Learning in an Inquiry-and Play-based Environment (Master thesis). Toronto: University of
Toronto.
Opfer, J. E., & Martens, M. A. (2012). Learning without representational change: Development of
numerical estimation in individuals with Williams syndrome. Developmental Science, 15(6),
863-875. doi:10.1111/j.1467-7687.2012.01187.x
92
Opfer, J. E., & Siegler, R. S. (2007). Representational change and children's numerical estimation. Cog-
nitive Psychology, 55(3), 169-195. doi:10.1016/j.cogpsych.2006.09.002
Opfer, J. E., & Siegler, R. S. (2012). Development of quantitative thinking. In K. J. Holyoak & R. G.
Morrison (Eds.), Oxford handbook of thinking and reasoning (pp. 1684-1689). Oxford, UK:
Oxford University Press.
Opfer, J. E., Thompson, C. A., & Kim, D. (2016). Free versus anchored numerical estimation: A
unified approach. Cognition, 149, 11-17. doi:10.1016/j.cognition.2015.11.015
Parsons, S., & Bynner, J. (2005). Does numeracy matter more? National Research and Development
Centre for Adult Literacy and Numeracy, London, UK.
Peeters, D., Sekeris, E., Verschaffel, L., & Luwel, K. (2017). Evaluating the effect of labeled
benchmarks on children’s number line estimation performance and strategy use. Frontiers in
Psychology, 8: 1082. doi:10.3389/fpsyg.2017.01082
Pereira, A. L., & Miller, M. H. (2012). Gender comparisons of mechanical aptitude, prior experiences,
and engineering attitudes for mechanical engineering students. Journal of Women and Minori-
ties in Science and Engineering, 18(3), 255-271. doi:10.1615/JWomenMi-
norScienEng.2013003830
Piazza, M., Pinel, P., Le Bihan, D., & Dehaene, S. (2007). A magnitude code common to numerosities
and number symbols in human intraparietal cortex. Neuron, 53(2), 293-305.
doi:10.1016/j.neuron.2006.11.022
Pinhas, M., & Fischer, M. H. (2008). Mental movements without magnitude? A study of spatial biases
in symbolic arithmetic. Cognition, 109(3), 408-415. doi:10.1016/j.cognition.2008.09.003
Qin, J., Kim, D., & Opfer, J. E. (2017). Varieties of numerical estimation: A unified framework. In G.
Gunzelmann, A. Howes, T. Tenbrink, & E. J. Davelaar (Eds.). Proceedings of the 39th annual
meeting of the cognitive science society (pp. 2943-2948). Austin, TX: Cognitive Science Soci-
ety.
Quinn, D. M., & Spencer, S. J. (2001). The interference of stereotype threat with women's generation
of mathematical problem‐solving strategies. Journal of Social Issues, 57(1), 55-71.
doi:10.1111/0022-4537.00201
Raftery, A. E. (1995). Bayesian model selection in social research. Sociological Methodology, 25,
111-163. doi:10.2307/271063
Ramani, G. B., & Siegler, R. S. (2008). Promoting broad and stable improvements in low‐income
children’s numerical knowledge through playing number board games. Child Develop-
ment, 79(2), 375-394. doi:10.1111/j.1467-8624.2007.01131.x
R Development Core Team. (2014). R: A Language and Environment for Statistical Computing. Vienna,
Austria: R Foundation for Statistical Computing. Retrieved from http://www.R-project.org/
Reilly, D. (2012). Gender, culture, and sex-typed cognitive abilities. PLoS ONE 7(7): e39904.
doi:10.1371/journal.pone.0039904
93
Reilly, D., Neumann, D. L., & Andrews, G. (2015). Sex differences in mathematics and science
achievement: A meta-analysis of National Assessment of Educational Progress assessments.
Journal of Educational Psychology, 107(3), 645-662. doi:10.1037/edu0000012
Reinert, R. M., Hartmann, M., Huber, S., & Moeller, K. (2019). Unbounded number line estimation as
a measure of numerical estimation. PLoS ONE 14(3): e0213102.
doi:10.1371/journal.pone.0213102
Reinert, R. M., Huber, S., Nuerk, H. C., & Moeller, K. (2015a). Multiplication facts and the mental
number line: evidence from unbounded number line estimation. Psychological Research, 79(1),
95-103. doi:10.1007/s00426-013-0538-0
Reinert, R. M., Huber, S., Nuerk, H.-C., & Moeller, K. (2015b). Strategies in unbounded number line
estimation? Evidence from eye-tracking. Cognitive Processing, 16(1), 359-363.
doi:10.1007/s10339-015-0675-z
Reinert, R. M., Huber, S., Nuerk, H.-C., & Moeller, K. (2017). Sex differences in number line
estimation: The role of numerical estimation. British Journal of Psychology, 108(2), 334-350.
doi:10.1111/bjop.12203
Restle, F. (1970). Speed of adding and comparing numbers. Journal of Experimental Psychology, 83,
274-278. doi:10.1037/h0028573
Ritchie, S. J., & Bates, T. C. (2013). Enduring links from childhood mathematics and reading
achievement to adult socioeconomic status. Psychological Science, 24(7), 1301-1308.
doi:10.1177/0956797612466268
Rouder, J. N., & Geary, D. C. (2014). Children's cognitive representation of the mathematical number
line. Developmental Science, 17(4), 525-536. doi:10.1111/desc.12166
Royer, J. M., Tronsky, L. N., Chan, Y., Jackson, S. J., & Marchant, H., I. (1999). Math-fact retrieval as
the cognitive mechanism underlying gender differences in math test performance. Contempo-
rary Educational Psychology, 24(3), 181-266. doi:10.1006/ceps.1999.1004
Sasanguie, D., De Smedt, B., Defever, E., & Reynvoet, B. (2012). Association between basic
numerical abilities and mathematics achievement. British Journal of Developmental Psychol-
ogy, 30(2), 344-357. doi:10.1111/j.2044-835X.2011.02048.x
Schmidt, F. L. (2011). A theory of sex differences in technical aptitude and some supporting evidence.
Perspectives on Psychological Science, 6(6), 560-573. doi:10.1177/1745691611419670
Schneider, M., Grabner, R. H., & Paetsch, J. (2009). Mental number line, number line estimation, and
mathematical school achievement: Their interrelations in Grades 5 and 6. Journal of Educa-
tional Psychology, 101(2), 359-372. doi:10.1037/a0013840
Schneider, M., Merz, S., Stricker, J., De Smedt, B., Torbeyns, J., Verschaffel, L., & Luwel, K. (2018a).
Associations of number line estimation with mathematical competence: A meta‐analysis. Child
Development, 89(5), 1467-1484. doi:10.1111/cdev.13068
94
Schneider, M., Thompson, C. A., & Rittle-Johnson, B. (2018b). Associations of magnitude comparison
and number line estimation with mathematical competence: A comparative review. In P. Le-
maire (Ed.), Cognitive development from a strategy perspective: A festschrift for Robert Siegler
(pp. 100-119). London, UK: Routledge.
Sella, F., Berteletti, I., Brazzolotto, M., Luncageli, D., & Zorzi, M. (2013). Number line estimation in
children with developmental dyscalculia. Learning Disabilties: A Contemporary Journal,
11(2), 41-49.
Shamseer, L., Moher, D., Clarke, M., Ghersi, D., Liberati, A., Petticrew, M., et al. (2015). Preferred
reporting items for systematic review and meta-analysis protocols (PRISMA-P) 2015: Elabo-
ration and explanation. The British Medical Journal 350:g7647. doi:10.1136/bmj.g7647
Shepard, R. N. (1981). Psychological relations and psychophysical scales: On the status of “direct”
psychophysical measurement. Journal of Mathematical Psychology, 24(1), 21-57.
doi:10.1016/0022-2496(81)90034-1
Siegler, R. S. (1988). Strategy choice procedures and the development of multiplication skill. Journal
of Experimental Psychology: General, 117(3), 258-275. doi:10.1037/0096-3445.117.3.258
Siegler, R. S. (2016). Magnitude knowledge: The common core of numerical development. Develop-
mental Science, 19(3), 341-361. doi:10.1111/desc.12395
Siegler, R. S., & Booth, J. L. (2004). Development of numerical estimation in young children. Child
Development, 75(2), 428-444. doi:10.1111/j.1467-8624.2004.00684.x
Siegler, R. S., & Braithwaite, D. W. (2017). Numerical development. Annual Review of Psychology,
68, 187-213. doi:10.1146/annurev-psych-010416-044101
Siegler, R. S. & Opfer, J. E. (2003). The development of numerical estimation: Evidence for multiple
representations of numerical quantity. Psychological Science, 14(3), 237-243.
doi:10.1111/1467-9280.02438
Siegler, R. S., & Ramani, G. B. (2006). Early development of estimation skills. APS Observer, 19(5),
34–44.
Siegler, R. S., Thompson, C. A., & Opfer, J. E. (2009). The logarithmic‐to‐linear shift: One learning
sequence, many tasks, many time scales. Mind, Brain, and Education, 3(3), 143-150.
doi:10.1111/j.1751-228X.2009.01064.x
Slusser, E. B., & Barth, H. C. (2017). Intuitive proportion judgment in number-line estimation:
Converging evidence from multiple tasks. Journal of Experimental Child Psychology, 162, 181-
198. doi:10.1016/j.jecp.2017.04.010
Slusser, E. B., Santiago, R. T., & Barth, H. C. (2013). Developmental change in numerical estimation.
Journal of Experimental Psychology: General, 142(1), 193-208. doi:10.1037/a0028560
Spelke, E. S. (2005). Sex differences in intrinsic aptitude for mathematics and science? A critical review.
American Psychologist, 60(9), 950-958. doi:10.1037/0003-066X.60.9.950
95
Spence, I. (1990). Visual psychophysics of simple graphical elements. Journal of Experimental Psy-
chology: Human Perception and Performance, 16(4), 683-692.
doi:10.1037//0096-1523.16.4.683
Spencer, S. J., Steele, C. M., & Quinn, D. M. (1999). Stereotype threat and women’s math performance.
Journal of Experimental Social Psychology, 35(1), 4-28. doi:10.1006/jesp.1998.1373
Stoet, G., & Geary, D. C. (2013). Sex differences in mathematics and reading achievement are
inversely related: Within-and across-nation assessment of 10 years of PISA data. PloS ONE,
8(3): e57988. doi:10.1371/journal.pone.0057988
Sullivan, J. L., Juhasz, B. J., Slattery, T. J., & Barth, H. C. (2011). Adults’ number-line estimation
strategies: Evidence from eye movements. Psychonomic Bulletin & Review, 18(3), 557-563.
doi:10.3758/s13423-011-0081-1
Thompson, C. A., & Opfer, J. E. (2008). Costs and benefits of representational change: Effects of
context on age and sex differences in symbolic magnitude estimation. Journal of Experimental
Child Psychology, 101(1), 20-51. doi:10.1016/j.jecp.2008.02.003
Thompson, C. A., & Opfer, J. E. (2016). Learning linear spatial-numeric associations improves
accuracy of memory for numbers. Frontiers in Psychology, 7, 24.
doi:10.3389/fpsyg.2016.00024
Thompson, C. A., & Siegler, R. S. (2010). Linear numerical-magnitude representations aid children’s
memory for numbers. Psychological Science, 21(9), 1274-1281.
doi:10.1177.0956797610378309
Torbeyns, J., Schneider, M., Xin, Z. & Siegler, R. S. (2015). Bridging the gap: Fraction understanding
is central to mathematics achievement in students from three different continents. Learning and
Instruction, 37, 5-13. doi:10.1016/j.learninstruc.2014.03.002
van ‘t Noordende, J. E., van Hoogmoed, A. H., Schot, W. D., & Kroesbergen, E. H. (2016). Number
line estimation strategies in children with mathematical learning difficulties measured by eye
tracking. Psychological Research, 80(3), 368-378. doi:10.1007/s00426-015-0736-z
van der Weijden, F. A., Kamphorst, E., Willemsen, R. H., Kroesbergen, E. H., & van Hoogmoed,
A. H. (2018). Strategy use on bounded and unbounded number lines in typically developing
adults and adults with dyscalculia: An eye-tracking study. Journal of Numerical Cognition,
4(2), 337-359. doi:10.5964/jnc.v4i2.115
van Wijk, D. R. (2017). Unbounded Number Line Estimation Task: Quantity estimations of children
with and without mathematical learning disabilities (Unpublished master thesis). Utrecht:
Universiteit Utrecht.
Voyer, D. (2011). Time limits and gender differences on paper-and-pencil tests of mental rotation: A
meta-analysis. Psychonomic Bulletin & Review, 18(2), 267-277.
doi:10.3758/s13423-010-0042-0
96
Weiss, E., Siedentopf, C. M., Hofer, A., Deisenhammer, E. A., Hoptman, M. J., Kremser, C.,
Golaszewski, S., Felber, S., Fleischhacker, W. W., & Delazer, M. (2003). Sex differences in
brain activation pattern during a visuospatial cognitive task: a functional magnetic resonance
imaging study in healthy volunteers. Neuroscience Letters, 344(3), 169-172.
doi:10.1016/s0304-3940(03)00406-3
Whalen, J., Gallistel, C. R., & Gelman, R. (1999). Nonverbal counting in humans: The psychophysics
of number representation. Psychological Science, 10(2), 130-137.
doi:10.1111/1467-9280.00120 White, S. L. J., & Szűcs, D. (2012). Representational change and strategy use in children's number line
estimation during the first years of primary school. Behavioral and Brain Functions, 8(1): 1.
doi:10.1186/1744-9081-8-1 Wood, G., Wilmes, K., Nuerk, H.-C., & Fischer, M. H. (2008). On the cognitive link between space
and number: A meta-analysis of the SNARC effect. Psychology Science Quarterly, 50(4),
489-525. doi:10.1027/1618-3169.52.3.187
Yuan, L., Prather, R., Mix, K. S., & Smith, L. B. (2019). Number representations drive number-line
estimates. Child Development, 91(4), e952-e967. Advance online publication.
doi:10.1111/cdev.13333
Zax, A., Slusser, E., & Barth, H. (2019). Spontaneous partitioning and proportion estimation in
children’s numerical judgments. Journal of Experimental Child Psychology, 185, 71-94.
doi:10.1016/j.jecp.2019.04.004
Zhu, Z. (2007). Gender differences in mathematical problem solving patterns: A review of
literature. International Education Journal, 8(2), 187-203. Zorzi, M., Priftis, K., Meneghello, F., Marenzi, R., & Umiltà, C. (2006). The spatial representation of
numerical and non-numerical sequences: Evidence from neglect. Neuropsychologia, 44(7),
1061-1067. doi:10.1016/j.neuropsychologia.2005.10.025
97
ERKLÄRUNG
Hiermit erkläre ich, dass ich die vorliegende Arbeit selbstständig und ohne Benutzung anderer als der
angegebenen Hilfsmittel anfertigt habe. Alle Stellen, die wörtlich oder sinngemäß aus veröffentlichten
oder nicht veröffentlichten Schriften entnommen wurden, sind als solche kenntlich gemacht. Die Arbeit
ist in gleicher oder Form oder auszugsweise in einer anderen Prüfung noch nicht vorgelegt worden; auch
wurde mit dieser Arbeit oder einer anderen Dissertation noch kein Promotionsversuch unternommen.
Regina Reinert
Bern, 31.08.2020