Embed Size (px)
Citation preview
UNIVERSITÉ DE MONTRÉAL
OPTIMIZATION OF LAL ASSAY IN PLATE READER AND METHODS TO REDUCE
INTERFERENCE IN CHITOSAN FOR ENDOTOXIN DETECTION
ALMAS SIDDIQUI
INSTITUT DE GÉNIE BIOMÉDICAL
ÉCOLE POLYTECHNIQUE DE MONTRÉAL
MÉMOIRE PRÉSENTÉ EN VUE DE L’OBTENTION
DU DIPLÔME DE MAÎTRISE ÈS SCIENCES APPLIQUÉES
(GÉNIE BIOMÉDICAL)
DÉCEMBRE 2016
© Almas Siddiqui, 2016.
UNIVERSITÉ DE MONTRÉAL
ÉCOLE POLYTECHNIQUE DE MONTRÉAL
Ce mémoire intitulé:
OPTIMIZATION OF LAL ASSAY IN PLATE READER AND METHODS TO REDUCE
INTERFERENCE IN CHITOSAN FOR ENDOTOXIN DETECTION
présenté par : SIDDIQUI Almas
en vue de l’obtention du diplôme de : Maîtrise ès Sciences Appliquées
a été dûment accepté par le jury d’examen constitué de :
M. L’HOCINE Yahia, Ph. D, président
M BUSCHMANN Michael, Ph. D, membre et directeur de recherche
M. BARALLET Jake, Ph. D, membre

iii
DEDICATION
For my father in heaven, my mother, uncle, brother and husband,
For my friends and family in both the continents.

iv
ACKNOWLEDGEMENTS
I would like to thank Professor Michael Buschmann, my supervisor for his excellent guidance
and support throughout the course of my M.Sc. A program. For granting me this opportunity to
showcase my abilities and explore the inter-disciplinary fields of chemistry and biology.
I would also like to equally thank Dr. Vincent Darras and Dr. Marc Lavertu who have been
integral part of my project and guided me along the way for successful completion of my thesis.
The discussions I had with them were very helpful.
Next, I would like to thank my colleague and friend Mohamad Gabriel Alameh for his rigor and
guidance through difficult parts of my project. I am very grateful for his continuous support and
encouragement.
I am also grateful for the support of my friends at polytechnique Garima Dwivedi, Yuan Chang,
Colleen Mathieu, Genevieve Picard, Leili Ghazizadeh, Ashkan Tavakoli and others.
v
RÉSUMÉ
Le lipopolysaccharide (LPS) ou endotoxine est un composant essentiel de la face externe de la
membrane externe des bactéries à Gram négatif qui provoque, après administration, des
symptômes dangereux chez les humains tel le choc septique et la mort.
La contamination des matériaux cliniques par les endotoxines pendant les étapes de fabrication
est courant, ce qui rend les ingrédients pharmaceutiques actifs non utilisables. Avant de
commercialiser le produit final sur le marché, les compagnies pharmaceutiques réalisent des tests
LAL (lysat d'amibocytes de Limulus polyphemus) approuvés par la FDA afin de déterminer la
concentration en endotoxines. L’évaluation de la contamination des matériaux de départ à partir
de chitosane pour la fabrication de nanoparticules injectables CD-ARNsi et des échafaudages
CS/HA par des endotoxines est compliqué du fait des interactions positives avec les endotoxines.
Un résultat faussement négatif lors du test LAL peut entrainer l’approbation du matériel mais
provoquer un choc cytokinique lorsqu’il est injecté dans le corps humain.
Nous avons d’abord déterminé la quantité d’endotoxines dans le chitosane de départ par des
essais de gels coagulés sur LAL, une méthode semi-quantitative qui permet d’estimer la quantité
d’endotoxines. Nous avons trouvé une valeur inférieure à 0.3 EU/mg pour des chitosanes de
degré de désacétylation de 92% avec une grande ou petite masse molaire (10 kDa), ce qui est en
dessous des limites. Si les valeurs obtenues par les essais de gels coagulés sont considérées
comme absolue par la pharmacopée américaine, cette quantité limite représente un risque
significatif lors de l’administration de doses plus fortes lors des tests cliniques. Cela conduit donc
à utiliser des essais LAL plus sensibles, tel les tests LAL cinétiques par turbidité ou chromogène,
afin d’obtenir des valeurs plus précises d’endotoxines.
Dans la seconde partie, nous avons développé les essais cinétiques où des étalons sont utilisés
afin d’établir une courbe d’étalonnage. La détermination de l’équation de la régression linéaire de
la courbe d’étalonnage log (concentration) en fonction log (time) est déterminée, le temps reporté
étant le temps nécessaire pour que l’absorbance à 405 nm atteigne une valeur prédéterminée,
typiquement 0.1 pour les tests par turbidité et 0.2 pour les tests chromogènes. A cause de la
nature biologique de l’enzyme LAL, la variabilité autorisée par la pharmacopée américaine est de
± 2 fois la valeur théorique, ce qui veut dire que la valeur quantifiée peut avoir une variation de
50 à 200%. Du fait de l’utilisation d’un lecteur de plaques pour effectuer les essais, différents
vi
paramètres techniques, tel la longueur du chemin optique, l’identification du taux d’évaporation
dans les puits de la plaque 96 puits, le prétraitement des échantillons et la gamme de
concentration de la courbe d’étalonnage ont été optimisés afin d’obtenir des équations de courbes
d’étalonnage répétables.
Dans la troisième partie des essais cinétiques, la quantification des endotoxines par des tests de
turbidité dans un chitosane de degré de désacétylation de 92% et de grande et petite masse
molaire (10 kDa) ont été développés. A cause de l’interaction entre le chitosane et les
endotoxines, il a été observé une inhibition de la détection des endotoxines, appelé interférence
d’inhibition. Dans le but de réduire cette inhibition, plusieurs prétraitements du chitosane ont été
testés, tel le traitement par NaOH, digestion par des chitosanases aussi bien que la
dépolymérisation par acide nitreux ou encore le traitement par de l’acide chlorhydrique
concentré, traitement recommandé par la pharmacopée américaine. Nous avons trouvé que tous
ces traitements sont délétères pour l’endotoxine libre et entrainent une réduction de la détection
d’endotoxines mais nous avons découvert que le chitosane jouait un rôle de protecteur, ce qui
permet d’obtenir un taux acceptable mais non total de recouvrement en endotoxines ajoutées. A
partir de ces résultats, l’utilisation d’un agent neutre est préconisé afin de dissoudre le chitosane
sans détruire les endotoxines libres ainsi que les libérer du chitosane pour les doser. L’utilisation
d’agents dispersants, détergents ainsi que des cations afin d’affaiblir les liaisons entre le
chitosanes et les endotoxines sont aussi recommandés pour les prochaines études.
vii
ABSTRACT
Endotoxin or Lipopolysaccharide (LPS) is a component of gram-negative bacteria cell
wall, which causes hazardous symptoms in humans such as septic shock and death after
administration. Endotoxin contamination in clinically administered materials/ nanoparticles is
prevalent, typically introduced during production and processing steps, which renders the active
pharmaceutical Ingredient (API) unsuitable for use. Before releasing the end product in the
market, the companies perform endotoxin detection by FDA approved LAL (Limulus
Amoebocyte Lysate) tests. Evaluation of endotoxin contamination in chitosan raw materials used
for the production of injectable Chitosan-siRNA nanoparticles and Chitosan/Hyaluronic Acid
scaffolds in vivo is complicated due to its positive interaction with endotoxin. A false negative
result by the LAL test may lead to approval, but may cause the release of life-threatening
cytokines such as interferons when injected in human body.
We first determined the amount of endotoxin in the chitosan raw material(s) by gel-clot
LAL assay, a semi-quantitative assay, which provided an estimated value of endotoxin
contamination. We found values <0.3 EU/mg for chitosan with 92% DDA at high and low
(10kDa) molar mass, which is under the acceptable limit. If the gel-clot derived endotoxin value
are considered as absolute by USP, then this limit amount represents significant risk going into
the clinical phase with the higher administration doses. This leads to the use of more sensitive
LAL assays for the accurate and absolute quantification of endotoxin, such as kinetic
turbidimetric and kinetic chromogenic LAL assays.
In the second part, we developed the kinetics assays, where standards are used to establish
a standard curve. A linear regression equation of a Log conc. vs. log onset time standard curve is
then determined, the onset time being obtained when the measured absorbance at 405nm of each
calibrator reaches a threshold O.D., typically 0.1 in turbidimetric and 0.2 for chromogenic LAL
assay. Because of the biological origin of LAL enzyme, the inherent variability in the assay is set
as + 2-fold defined by the USP, i.e. a quantified value may have a variation of 50-200%. Because
of the use of a plate reader to perform the assay, different technical parameters, such as
pathlength correction, identification of wells with high evaporation in 96 well plates, pre-
treatment of samples and calibration range were then optimized in order to obtained repeatable
standard curves equation.
viii
In the third part of the kinetic assay, the endotoxin titration in chitosan with 92% DDA at high
and low molecular weight by kinetic turbidimetric LAL assay were developed. Because of
interaction between chitosan and endotoxin, inhibition of detection of endotoxin called as
inhibition interference was observed. In order to reduce this interaction, various pre-treatments
were tested, such as NaOH treatment, chitosanase enzyme digestion as well as chemical
depolymerisation of chitosan by nitrous acid and chemical treatment by concentrated
hydrochloric acid as recommended by USP. We found that all these treatments were deleterious
for the free endotoxin and lead to reduced detection, but a protective effect of chitosan on
endotoxin was discovered which allowed good but not total recovery of spiked endotoxin. Based
on this, the use of a neutral reagent is recommended for dissolving chitosan that does not
disintegrate free endotoxin and also releases the bound endotoxin. The use of dispersing agents,
detergents and cations to weaken the bonds between chitosan and endotoxin are also
recommended for future use.
ix
TABLE OF CONTENTS
DEDICATION .............................................................................................................................. III
ACKNOWLEDGEMENTS .......................................................................................................... IV
RÉSUMÉ ........................................................................................................................................ V
ABSTRACT .................................................................................................................................VII
TABLE OF CONTENTS .............................................................................................................. IX
LIST OF TABLES .......................................................................................................................XII
LIST OF FIGURES .................................................................................................................... XVI
LIST OF EQUATIONS .............................................................................................................. XX
LIST OF SYMBOLS AND ABBREVIATIONS....................................................................... XXI
CHAPTER 1 INTRODUCTION ............................................................................................... 1
CHAPTER 2 CRITICAL LITERATURE REVIEW ................................................................ 3
2.1 Endotoxin ......................................................................................................................... 3
2.1.1 Structure and function of LPS ...................................................................................... 3
2.1.2 Immune induction by LPS............................................................................................ 6
2.1.3 Importance of endotoxin detection ............................................................................. 11
2.1.4 Methods of endotoxin detection ................................................................................. 12
2.2 Chitosan as a gene delivery vector and tissue regeneration scaffold ............................. 22
2.2.1 Degree of Deacetylation (DDA) ................................................................................ 22
2.2.2 Molecular Weight (MW) ............................................................................................ 23
2.2.3 Binding affinity of chitosan ........................................................................................ 23
2.2.4 Preparation and treatment of chitin for production of chitosan and resulting
endotoxin removal .................................................................................................................. 25
CHAPTER 3 THESIS OBJECTIVES AND HYPOTHESIS .................................................. 28
x
3.1 Overall Objectives .......................................................................................................... 28
3.1.1 Specific objectives for obtaining repeatable ranges of standard curves for chitosan
endotoxin quantification ......................................................................................................... 28
3.1.2 Specific Hypotheses of this study .............................................................................. 29
3.1.3 Specific objectives for identification and reduction of interference in endotoxin
detection by chitosan Pre-treatments ...................................................................................... 29
3.1.4 Specific hypotheses of this study ............................................................................... 30
CHAPTER 4 OPTIMIZATION OF PARAMETERS TO OBTAIN REPEATABLE LAL
STANDARD CURVE ................................................................................................................... 31
4.1 Introduction .................................................................................................................... 31
4.2 Materials and Methods ................................................................................................... 32
4.2.1 Estimation of Chitosan Endotoxin value by Gel-Clot LAL assay ............................. 32
4.2.2 Simulation of chitosan injected dose in animals to Human Equivalent Dose (HED)
and estimation of endotoxin conc........................................................................................... 33
4.2.3 Use of more sensitive kinetic LAL assays for chitosan endotoxin determination ..... 35
4.2.4 Testing of various standard curve ranges for establishing a repeatable range ........... 37
4.2.5 Optimization of parameters to obtain repeatable LAL standard curve and equivalent
reactivity in plate reader as tube reader .................................................................................. 38
4.2.6 Post-optimization of parameters: Repeatable standard curve ranges for Turbidimetric
LAL assay .............................................................................................................................. 43
4.3 Results ............................................................................................................................ 44
4.3.1 Estimation of chitosan endotoxin value by Gel clot assay ......................................... 44
4.3.2 Calculation of EU conc. of injected chitosan dose simulated to Human Equivalent
Dose (HED) ............................................................................................................................ 48
4.3.3 Rationale of using sensitive kinetic assays for chitosan EU determination ............... 52
4.3.4 Turbidimetric LAL assay ........................................................................................... 53
xi
4.3.5 Optimization of parameters to obtain repeatable standard curves ............................. 58
4.3.6 Post-optimization of parameters: Repeatable standard curve ranges for Turbidimetric
LAL assay .............................................................................................................................. 67
4.3.7 Conclusion .................................................................................................................. 68
4.4 Discussion ...................................................................................................................... 68
CHAPTER 5 QUANTIFICATION OF CHITOSAN ENDOTOXIN; IDENTIFICATION OF
INTERFERENCES AND METHODS TO REDUCE CHITOSAN INTERFERENCE WITH
ENDOTOXIN.................................................................................................................................70
5.1 Introduction .................................................................................................................... 70
5.2 Materials and Methods ................................................................................................... 71
5.2.1 Quantitative measurement of chitosan endotoxin conc. by kinetic LAL assay
according to USP 85 ............................................................................................................... 71
5.2.2 Pre-treatment of chitosan for removal of interference ............................................... 75
5.3 Results ............................................................................................................................ 82
5.3.1 Determination of Chitosan EU conc. by Turbidimetric assay according to USP 85 . 82
5.3.2 Pre-Treatment of chitosan using different methods for removal of interference ....... 89
5.3.3 Determination of optimum chitosan dissolving/reconstitution reagent to improve
endotoxin recovery and reduce interference .......................................................................... 95
5.3.4 Discussion of this study ............................................................................................ 102
CHAPTER 6 GENERAL DISCUSSION .............................................................................. 105
CONCLUSION AND RECOMMENDATIONS ........................................................................ 107
BIBLIOGRAPHY ....................................................................................................................... 110
xii
LIST OF TABLES
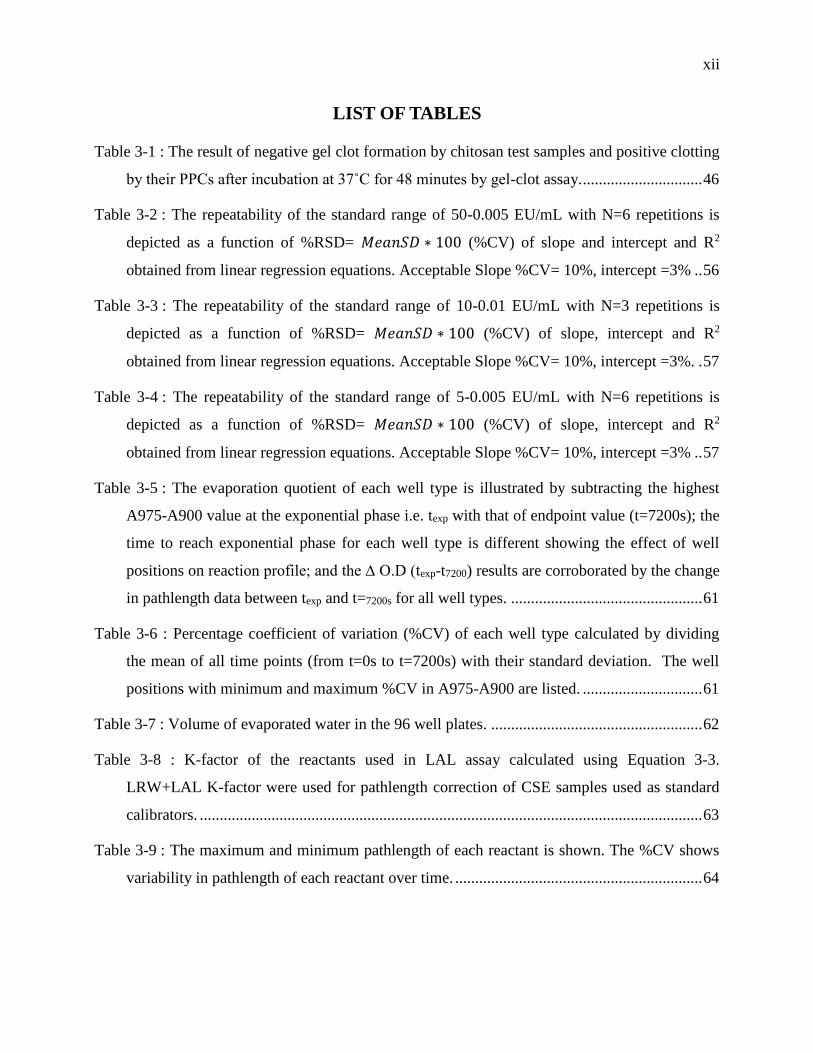
Table 3-1 : The result of negative gel clot formation by chitosan test samples and positive clotting
by their PPCs after incubation at 37˚C for 48 minutes by gel-clot assay. .............................. 46
Table 3-2 : The repeatability of the standard range of 50-0.005 EU/mL with N=6 repetitions is
depicted as a function of %RSD= 𝑀𝑒𝑎𝑛𝑆𝐷 ∗ 100 (%CV) of slope and intercept and R2
obtained from linear regression equations. Acceptable Slope %CV= 10%, intercept =3% .. 56
Table 3-3 : The repeatability of the standard range of 10-0.01 EU/mL with N=3 repetitions is
depicted as a function of %RSD= 𝑀𝑒𝑎𝑛𝑆𝐷 ∗ 100 (%CV) of slope, intercept and R2
obtained from linear regression equations. Acceptable Slope %CV= 10%, intercept =3%. . 57
Table 3-4 : The repeatability of the standard range of 5-0.005 EU/mL with N=6 repetitions is
depicted as a function of %RSD= 𝑀𝑒𝑎𝑛𝑆𝐷 ∗ 100 (%CV) of slope, intercept and R2
obtained from linear regression equations. Acceptable Slope %CV= 10%, intercept =3% .. 57
Table 3-5 : The evaporation quotient of each well type is illustrated by subtracting the highest
A975-A900 value at the exponential phase i.e. texp with that of endpoint value (t=7200s); the
time to reach exponential phase for each well type is different showing the effect of well
positions on reaction profile; and the ∆ O.D (texp-t7200) results are corroborated by the change
in pathlength data between texp and t=7200s for all well types. ................................................ 61
Table 3-6 : Percentage coefficient of variation (%CV) of each well type calculated by dividing
the mean of all time points (from t=0s to t=7200s) with their standard deviation. The well
positions with minimum and maximum %CV in A975-A900 are listed. .............................. 61
Table 3-7 : Volume of evaporated water in the 96 well plates. ..................................................... 62
Table 3-8 : K-factor of the reactants used in LAL assay calculated using Equation 3-3.
LRW+LAL K-factor were used for pathlength correction of CSE samples used as standard
calibrators. .............................................................................................................................. 63
Table 3-9 : The maximum and minimum pathlength of each reactant is shown. The %CV shows
variability in pathlength of each reactant over time. .............................................................. 64
xiii
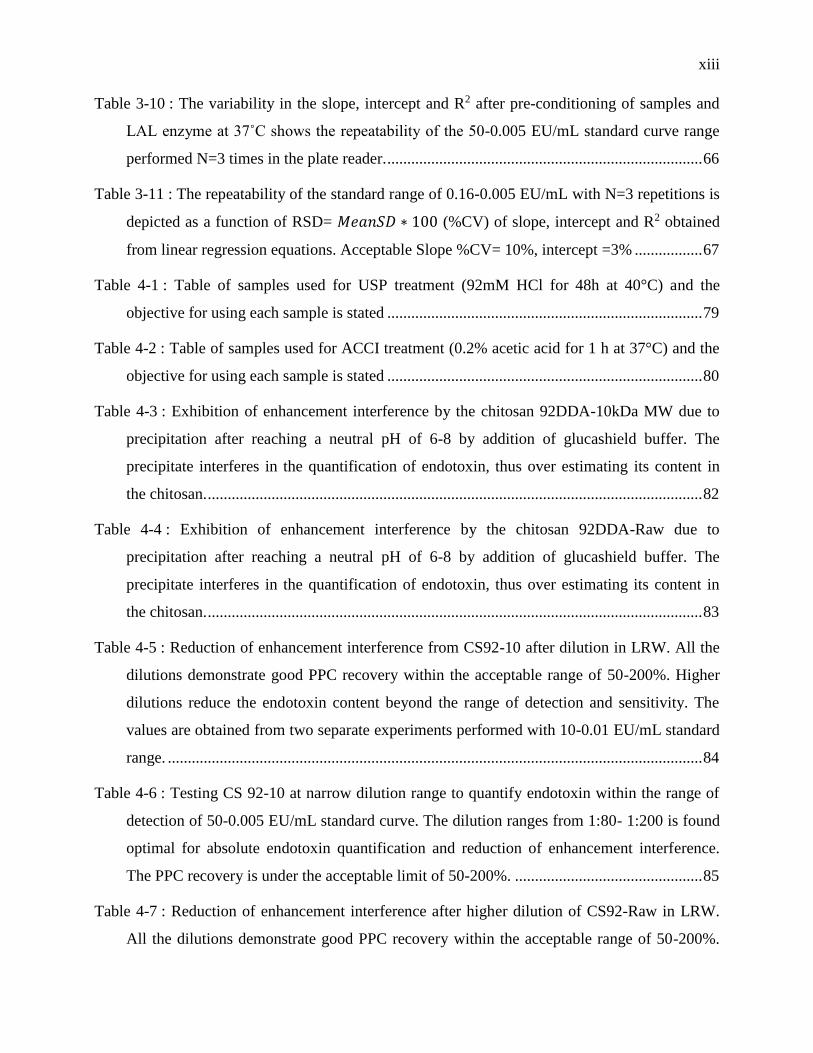
Table 3-10 : The variability in the slope, intercept and R2 after pre-conditioning of samples and
LAL enzyme at 37˚C shows the repeatability of the 50-0.005 EU/mL standard curve range
performed N=3 times in the plate reader. ............................................................................... 66
Table 3-11 : The repeatability of the standard range of 0.16-0.005 EU/mL with N=3 repetitions is
depicted as a function of RSD= 𝑀𝑒𝑎𝑛𝑆𝐷 ∗ 100 (%CV) of slope, intercept and R2 obtained
from linear regression equations. Acceptable Slope %CV= 10%, intercept =3% ................. 67
Table 4-1 : Table of samples used for USP treatment (92mM HCl for 48h at 40°C) and the
objective for using each sample is stated ............................................................................... 79
Table 4-2 : Table of samples used for ACCI treatment (0.2% acetic acid for 1 h at 37°C) and the
objective for using each sample is stated ............................................................................... 80
Table 4-3 : Exhibition of enhancement interference by the chitosan 92DDA-10kDa MW due to
precipitation after reaching a neutral pH of 6-8 by addition of glucashield buffer. The
precipitate interferes in the quantification of endotoxin, thus over estimating its content in
the chitosan. ............................................................................................................................ 82
Table 4-4 : Exhibition of enhancement interference by the chitosan 92DDA-Raw due to
precipitation after reaching a neutral pH of 6-8 by addition of glucashield buffer. The
precipitate interferes in the quantification of endotoxin, thus over estimating its content in
the chitosan. ............................................................................................................................ 83
Table 4-5 : Reduction of enhancement interference from CS92-10 after dilution in LRW. All the
dilutions demonstrate good PPC recovery within the acceptable range of 50-200%. Higher
dilutions reduce the endotoxin content beyond the range of detection and sensitivity. The
values are obtained from two separate experiments performed with 10-0.01 EU/mL standard
range. ...................................................................................................................................... 84
Table 4-6 : Testing CS 92-10 at narrow dilution range to quantify endotoxin within the range of
detection of 50-0.005 EU/mL standard curve. The dilution ranges from 1:80- 1:200 is found
optimal for absolute endotoxin quantification and reduction of enhancement interference.
The PPC recovery is under the acceptable limit of 50-200%. ............................................... 85
Table 4-7 : Reduction of enhancement interference after higher dilution of CS92-Raw in LRW.
All the dilutions demonstrate good PPC recovery within the acceptable range of 50-200%.
xiv
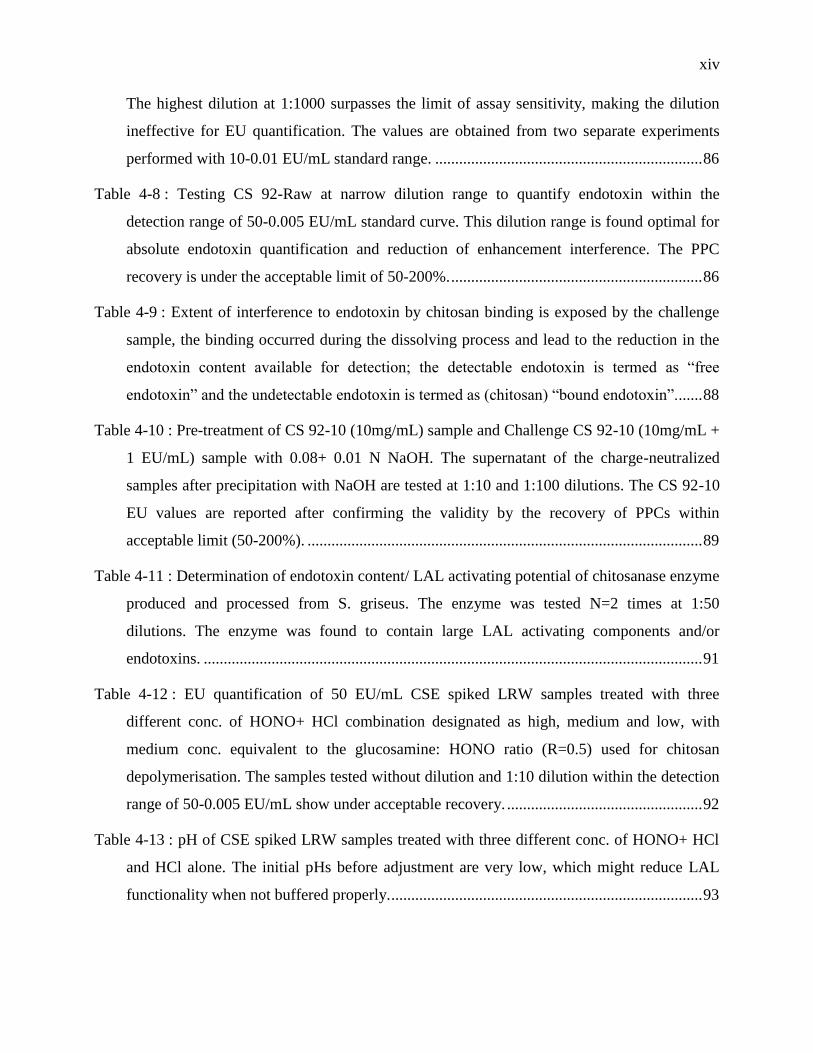
The highest dilution at 1:1000 surpasses the limit of assay sensitivity, making the dilution
ineffective for EU quantification. The values are obtained from two separate experiments
performed with 10-0.01 EU/mL standard range. ................................................................... 86
Table 4-8 : Testing CS 92-Raw at narrow dilution range to quantify endotoxin within the
detection range of 50-0.005 EU/mL standard curve. This dilution range is found optimal for
absolute endotoxin quantification and reduction of enhancement interference. The PPC
recovery is under the acceptable limit of 50-200%. ............................................................... 86
Table 4-9 : Extent of interference to endotoxin by chitosan binding is exposed by the challenge
sample, the binding occurred during the dissolving process and lead to the reduction in the
endotoxin content available for detection; the detectable endotoxin is termed as “free
endotoxin” and the undetectable endotoxin is termed as (chitosan) “bound endotoxin”. ...... 88
Table 4-10 : Pre-treatment of CS 92-10 (10mg/mL) sample and Challenge CS 92-10 (10mg/mL +
1 EU/mL) sample with 0.08+ 0.01 N NaOH. The supernatant of the charge-neutralized
samples after precipitation with NaOH are tested at 1:10 and 1:100 dilutions. The CS 92-10
EU values are reported after confirming the validity by the recovery of PPCs within
acceptable limit (50-200%). ................................................................................................... 89
Table 4-11 : Determination of endotoxin content/ LAL activating potential of chitosanase enzyme
produced and processed from S. griseus. The enzyme was tested N=2 times at 1:50
dilutions. The enzyme was found to contain large LAL activating components and/or
endotoxins. ............................................................................................................................. 91
Table 4-12 : EU quantification of 50 EU/mL CSE spiked LRW samples treated with three
different conc. of HONO+ HCl combination designated as high, medium and low, with
medium conc. equivalent to the glucosamine: HONO ratio (R=0.5) used for chitosan
depolymerisation. The samples tested without dilution and 1:10 dilution within the detection
range of 50-0.005 EU/mL show under acceptable recovery. ................................................. 92
Table 4-13 : pH of CSE spiked LRW samples treated with three different conc. of HONO+ HCl
and HCl alone. The initial pHs before adjustment are very low, which might reduce LAL
functionality when not buffered properly. .............................................................................. 93
xv
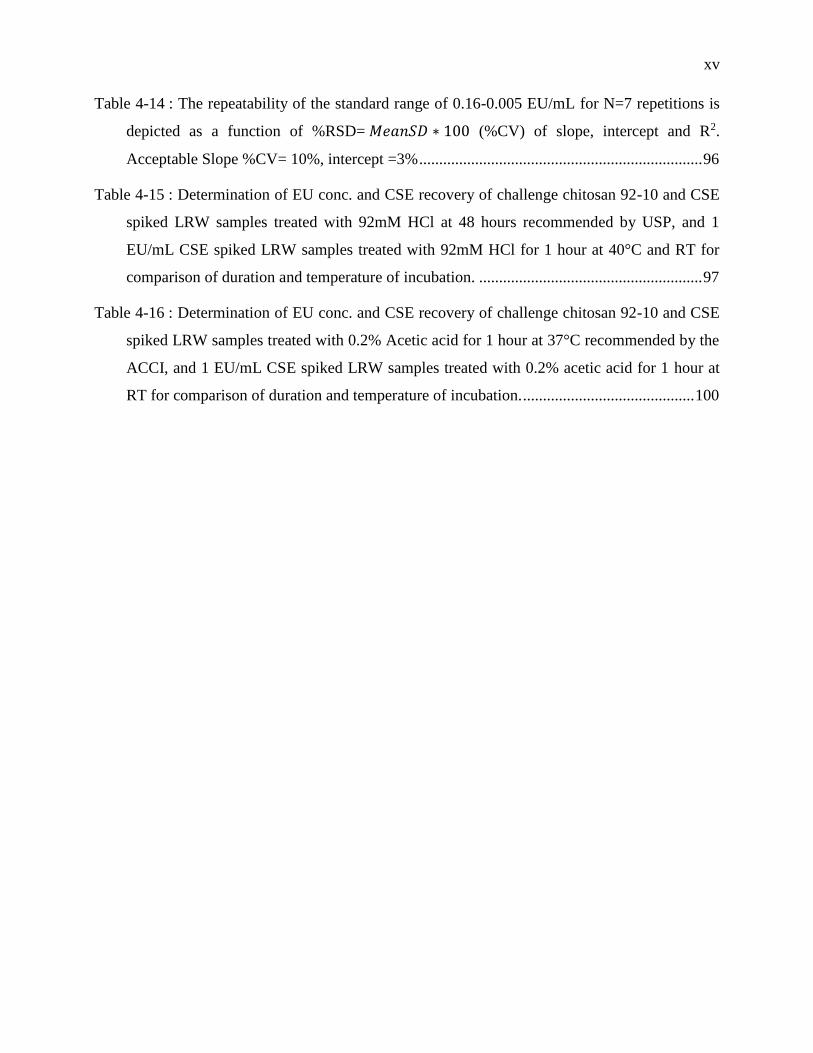
Table 4-14 : The repeatability of the standard range of 0.16-0.005 EU/mL for N=7 repetitions is
depicted as a function of %RSD= 𝑀𝑒𝑎𝑛𝑆𝐷 ∗ 100 (%CV) of slope, intercept and R2.
Acceptable Slope %CV= 10%, intercept =3% ....................................................................... 96
Table 4-15 : Determination of EU conc. and CSE recovery of challenge chitosan 92-10 and CSE
spiked LRW samples treated with 92mM HCl at 48 hours recommended by USP, and 1
EU/mL CSE spiked LRW samples treated with 92mM HCl for 1 hour at 40°C and RT for
comparison of duration and temperature of incubation. ........................................................ 97
Table 4-16 : Determination of EU conc. and CSE recovery of challenge chitosan 92-10 and CSE
spiked LRW samples treated with 0.2% Acetic acid for 1 hour at 37°C recommended by the
ACCI, and 1 EU/mL CSE spiked LRW samples treated with 0.2% acetic acid for 1 hour at
RT for comparison of duration and temperature of incubation. ........................................... 100
xvi
LIST OF FIGURES
Figure 1-1: Structure of E. coli LPS (Maeshima & Fernandez, 2013) ............................................. 4
Figure 1-2 : Conformation of LPS monomer and the resulting supramolecular 3-D aggregate
structure, which determines the pyrogenecity of the LPS (Klaus Brandenburg, 1996). .......... 5
Figure 1-3 : TLR4 signalling pathway induced by recognition of LPS leading to pro-
inflammatory cytokine release (Akira et al., 2006) .................................................................. 7
Figure 1-4 : The extracellular and intracellular mechanism of molecular sensing of bacterial LPS.
The MD2-TLR4 complex formation after activation by LPS results in downstream
signalling and cytokine production (A) The LPS present in the cytosol is internalized by
caspase 11 expressing vacuole and binds to the CARD domain of caspase 11 resulting in
oligomerization and activation of caspase 11. Caspase 11 activation results in assembly of
inflammosome leading to secretion of pro-inflammatory cytokines by activated caspase-1;
the oligomerized caspase 11 also leads to pyroptosis, a special kind of cell death. (B)
(Steimle et al., 2016) ................................................................................................................ 9
Figure 1-5 : LPS shows similar downstream effect of immune stimulation (Judge & MacLachlan,
2008) ....................................................................................................................................... 10
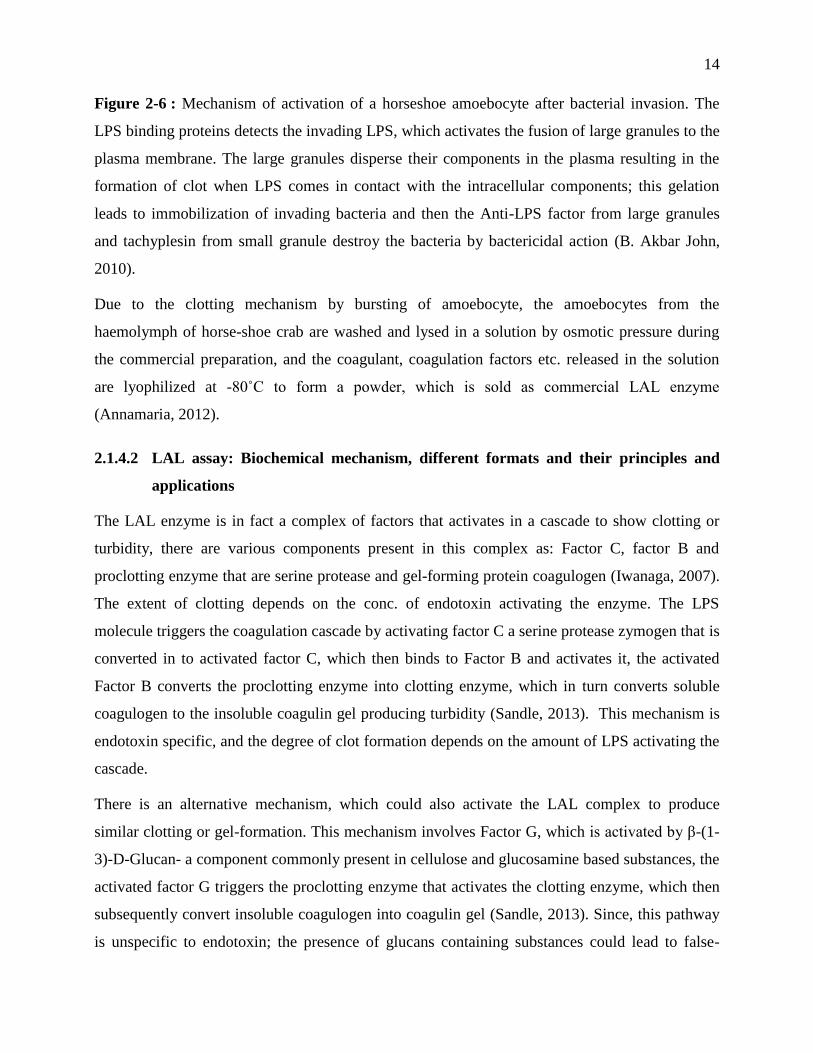
Figure 1-6 : Mechanism of activation of a horseshoe amoebocyte after bacterial invasion. The
LPS binding proteins detects the invading LPS, which activates the fusion of large granules
to the plasma membrane. The large granules disperse their components in the plasma
resulting in the formation of clot when LPS comes in contact with the intracellular
components; this gelation leads to immobilization of invading bacteria and then the Anti-
LPS factor from large granules and tachyplesin from small granule destroy the bacteria by
bactericidal action (B. Akbar John, 2010). ............................................................................. 14
Figure 1-7 : Biochemical mechanism of LAL cascade activation after introduction to endotoxin
(Sandle, 2013), exploited for semi-quantitative and quantitative determination of endotoxin
by the extremely sensitive LAL assays. ................................................................................. 15
Figure 1-8 : Hypothetical polymerization of coagulin monomers for the formation of a coagulin
chain- the basis of turbidity formation in a LAL reactive sample (Hiroko Kawasaki, 2000).
................................................................................................................................................ 16
xvii
Figure 1-9 : Flowchart of the kinetic turbidimetric LAL assay, the development of turbidity and
measurement of turbidity, which is accomplished at 405nm in this thesis (recommended by
ACCI) without any drawbacks, cited from www.lonza.com. ................................................ 18
Figure 1-10 : Flowchart of the kinetic chromogenic assay and development of color after
activation and its measurement at 405nm, cited from www.lonza.com ................................ 19
Figure 1-11 : Decision tree for selecting appropriate LAL method for testing endotoxin
contamination in nanoparticles (a). Different approaches to remove interference are also
shown in part b (Dobrovolskaia et al., 2009). ........................................................................ 21
Figure 1-12 : Structure of E. coli amphiphilic LPS (Ruiz, Kahne, & Silhavy, 2009) present on
outer membrane with hydrophobic Lipid A portion linked to the core oligosaccharides by
the 8-carbon sugar 3-Deoxy-D-manno-octulosonic acid (Kdo). The core oligosaccharides
are the repeat of 6 basic sugars as: Hep (L -glycerol- D -manno-heptose), Glu (Glucose), Gal
(Galactose), Gal-N-Ac (N-acetyl-Galactosamine), GlcN (glucosamine) and GlcNAc (N-
acetylglucosamine). The characteristic of a smooth LPS is the presence of O-antigen, which
contains 5-40 repeats of specific sugars, that varies with different bacterial species (Bagheri,
Keller, & Dathe, 2011). .......................................................................................................... 24
Figure 1-13 : Production of chitin from the raw materials obtained from marine source. The steps
of are illustrated as a flowchart (Buschmann et al., 2013). .................................................... 26
Figure 1-14 : Steps of chitosan production from chitin and its formulation in CS-siRNA
nanoparticles and chitosan scaffolds for the gene delivery and tissue regeneration
applications respectively. Figures adapted from (Liu et al., 2015; Ragelle, Vandermeulen, &
Preat, 2013). ........................................................................................................................... 27
Figure 3-1 : The pathlength in a microplate well varies (A) compared to the fix pathlength in a
cuvette/tube (B) (Bio-One, 2008) ........................................................................................... 39
Figure 3-2: Area of plate used for filling LRW to evaluate the evaporation patterns in different
areas of the plate. .................................................................................................................... 40
Figure 3-3 : Absorption spectrum of water in the near IR area (ThermoSci, 2012). ..................... 41
xviii
Figure 3-4 : The negative control (LRW+LAL) without CSE in the gel-clot LAL assay
demonstrates the lack of gel formation confirmed by inversion, thus fulfilling the acceptance
criteria required for assay validity as outlined by the USP. ................................................... 45
Figure 3-5 : The positive product control with CSE at 2 times the conc. Of sensitivity 2λ +LAL
shows positive gel clotting confirmed after 180° inversions as required by the USP for
validity of gel-clot assay. ....................................................................................................... 46
Figure 3-6 : The positive product controls of chitosan 92DDA-10Mn and CS 92-Raw at 2λ show
positive clotting after incubation at 37˚C for 48 mins, exhibiting the lack of interference by
the samples at 0.1mg/mL conc. after 1:100 dilutions. ........................................................... 47
Figure 3-7 : Chitosan 92DDA-10Mn show negative gel clotting evident from unsettled clot after
inversion indicative of endotoxin contamination below 0.03 EU/mL. .................................. 47
Figure 3-8 : The endotoxin level of chitosan 92DDA-Raw is found below 0.03 EU/mL as the
sample endotoxin was insufficient to activate LAL complex demonstrated from the negative
gel-clot. ................................................................................................................................... 48
Figure 3-9 : Graphical representation of characteristics of standard calibrators and negative
control in turbidimetric LAL assay ........................................................................................ 54
Figure 3-10 : Typical representative linear regression standard curve of turbidimetric LAL assay.
Log endotoxin conc. (EU/mL) is plotted on x-axis and log Onset time (secs) is plotted on y-
axis ......................................................................................................................................... 55
Figure 3-11 : The A975-A900 profile of all the well types are demonstrated, the slope of the
middle wells increases and that of outer wells decreases with time, the red dots denote the
time of reaching exponential phase (A) the ∆O.D values calculated by subtracting the time at
which the A975-A900 reaches the exponential phase by the end point (texp-t=7200s) which is
an indicator of evaporation on positive y-axis and volume expansion on negative y-axis, the
graph shows highest evaporation for outer wells and volume expansion for middle wells (B).
................................................................................................................................................ 60
Figure 3-12 : The absorbance profiles at 975nm and 900nm of LRW (A) LRW+LAL (B) and
LAL (C). The A975-A900nm value at each time point was used for calculating pathlength
by dividing with the K-factor of respective reactant. ............................................................. 64
xix
Figure 3-13 : Effect of temperature on the pathlength of LRW+LAL. The difference in the
temperature of reactants at the time of addition affects the reaction profile and the
pathlength. .............................................................................................................................. 65
Figure 3-14 : Standard curves generated from turbidimetric LAL assay prepared after applying
the optimized parameters like use of inner wells to prevent evaporation, application of
LRW+LAL pathlength and pre-conditioning of enzyme and samples at 37°C to obtain
repeatable standard curve. The CSE samples used are in the range of 50-0.005 EU/mL
prepared at 10-fold dilutions with the intermediate conc. of 20, 10 and 1 EU/mL................ 66
Figure 4-1 : Typical flowchart of processing of raw chitosan for production of specified DDA,
then depolymerisation of raw chitosan to low molecular weight chitosan and then to final
nanoparticle and scaffold formulation. Figures adapted from (Liu et al., 2015; Ragelle et al.,
2013) ....................................................................................................................................... 70
Figure 4-2 : The diagram illustrates the concept of PPC and its role in determining sample EU
concentration at corresponding dilution ................................................................................. 74
Figure 4-3 : Characteristics of absorbance curves against time of the standard calibrators and
negative control in chromogenic LAL assay. ......................................................................... 95
xx
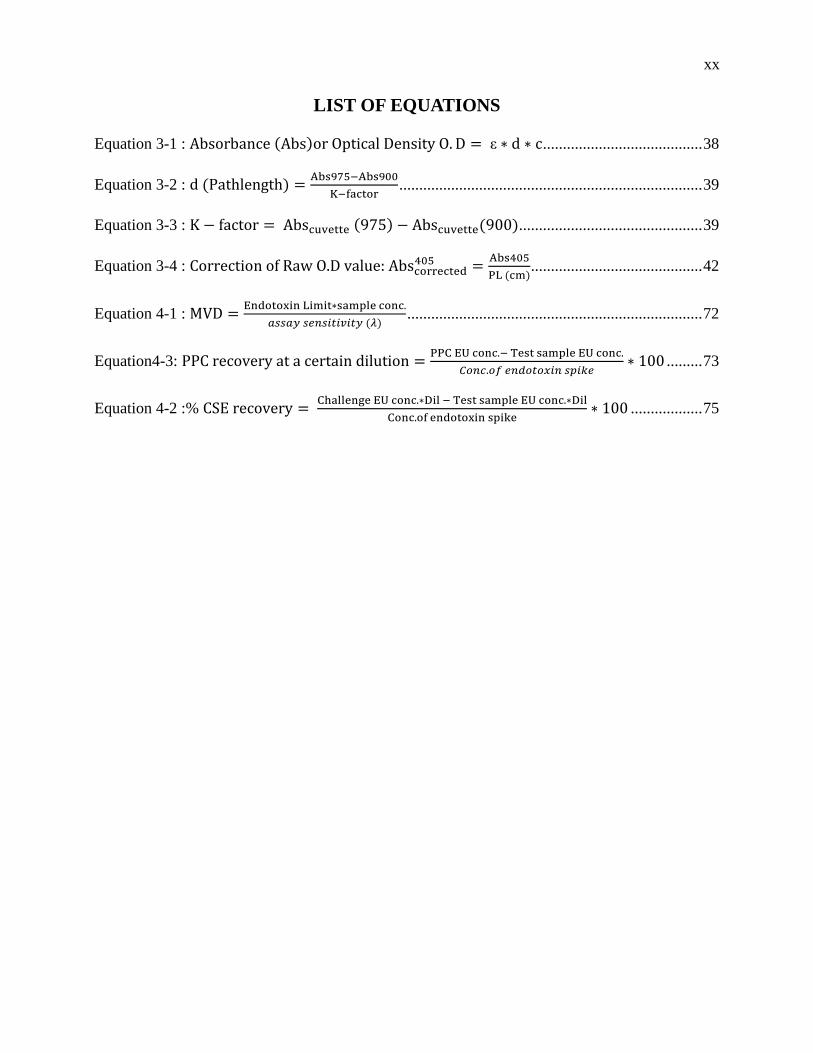
LIST OF EQUATIONS
Equation 3-1 : Absorbance (Abs)or Optical Density O. D = ε ∗ d ∗ c ........................................ 38
Equation 3-2 : d (Pathlength) =Abs975−Abs900
K−factor ............................................................................ 39
Equation 3-3 : K − factor = Abscuvette (975) − Abscuvette(900).............................................. 39
Equation 3-4 : Correction of Raw O.D value: Abscorrected405 =
Abs405
PL (cm) ........................................... 42
Equation 4-1 : MVD =Endotoxin Limit∗sample conc.
𝑎𝑠𝑠𝑎𝑦 𝑠𝑒𝑛𝑠𝑖𝑡𝑖𝑣𝑖𝑡𝑦 (𝜆) .......................................................................... 72
Equation4-3: PPC recovery at a certain dilution =PPC EU conc.− Test sample EU conc.
𝐶𝑜𝑛𝑐.𝑜𝑓 𝑒𝑛𝑑𝑜𝑡𝑜𝑥𝑖𝑛 𝑠𝑝𝑖𝑘𝑒∗ 100 ......... 73
Equation 4-2 :% CSE recovery = Challenge EU conc.∗Dil − Test sample EU conc.∗Dil
Conc.of endotoxin spike∗ 100 .................. 75
xxi
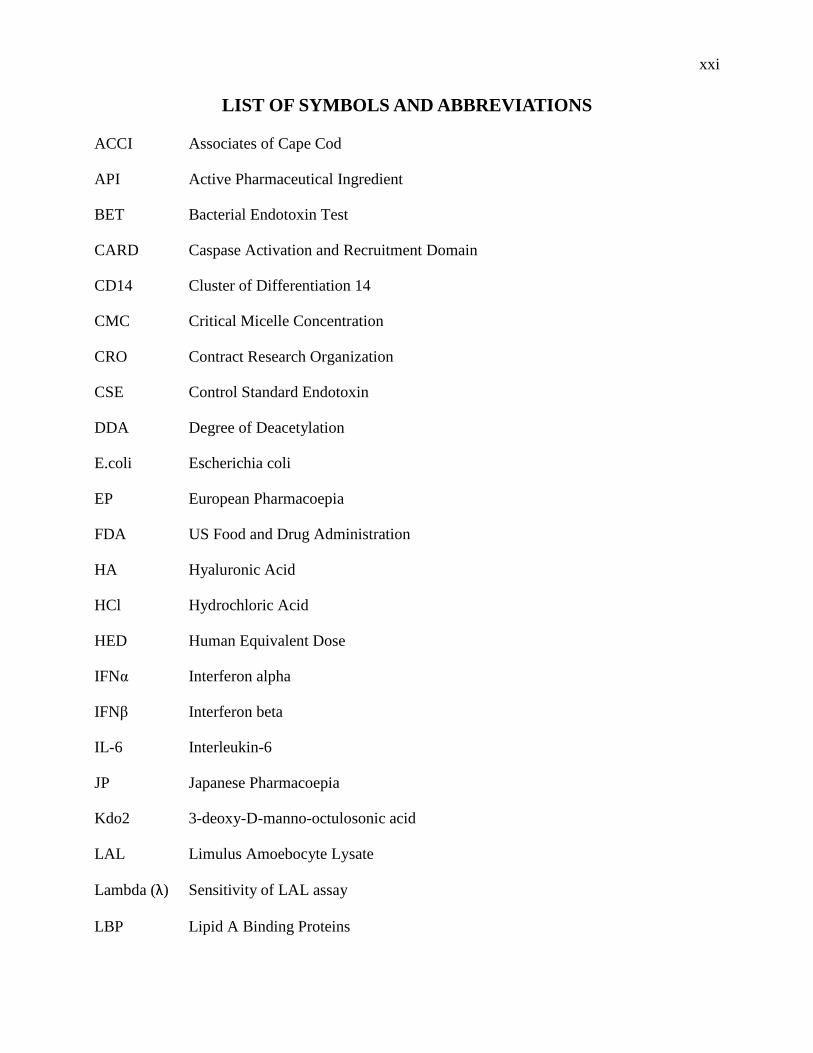
LIST OF SYMBOLS AND ABBREVIATIONS
ACCI Associates of Cape Cod
API Active Pharmaceutical Ingredient
BET Bacterial Endotoxin Test
CARD Caspase Activation and Recruitment Domain
CD14 Cluster of Differentiation 14
CMC Critical Micelle Concentration
CRO Contract Research Organization
CSE Control Standard Endotoxin
DDA Degree of Deacetylation
E.coli Escherichia coli
EP European Pharmacoepia
FDA US Food and Drug Administration
HA Hyaluronic Acid
HCl Hydrochloric Acid
HED Human Equivalent Dose
IFNα Interferon alpha
IFNβ Interferon beta
IL-6 Interleukin-6
JP Japanese Pharmacoepia
Kdo2 3-deoxy-D-manno-octulosonic acid
LAL Limulus Amoebocyte Lysate
Lambda (λ) Sensitivity of LAL assay
LBP Lipid A Binding Proteins
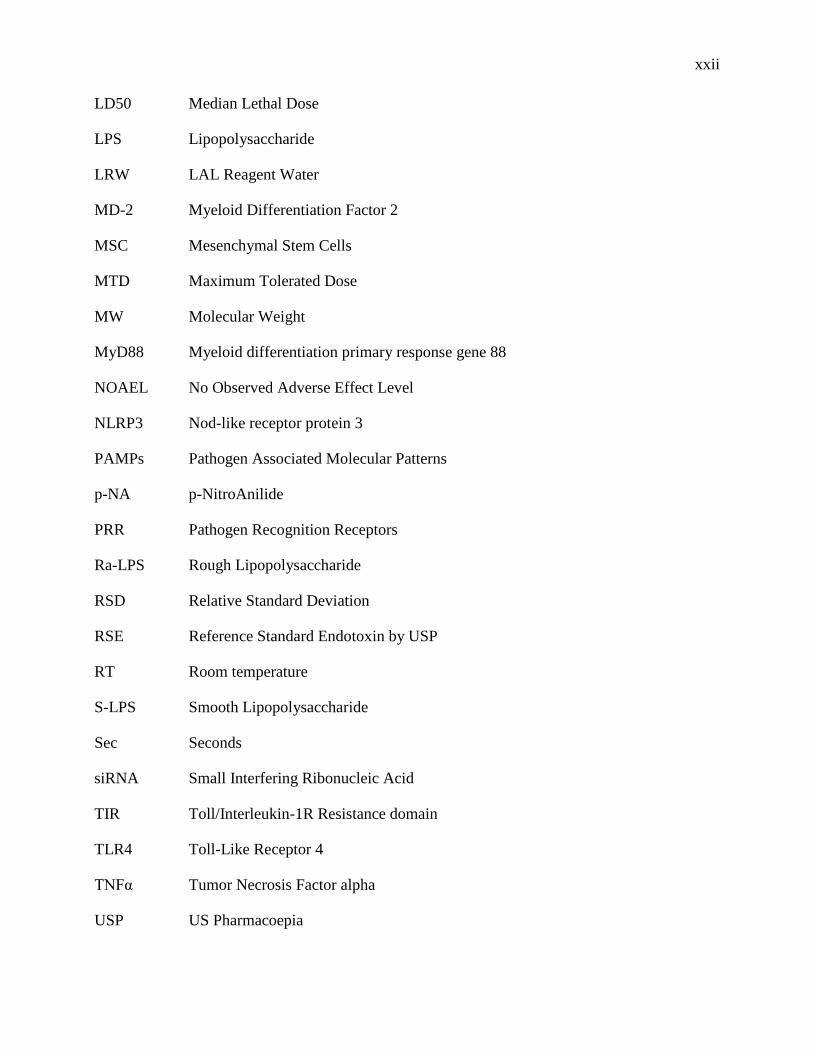
xxii
LD50 Median Lethal Dose
LPS Lipopolysaccharide
LRW LAL Reagent Water
MD-2 Myeloid Differentiation Factor 2
MSC Mesenchymal Stem Cells
MTD Maximum Tolerated Dose
MW Molecular Weight
MyD88 Myeloid differentiation primary response gene 88
NOAEL No Observed Adverse Effect Level
NLRP3 Nod-like receptor protein 3
PAMPs Pathogen Associated Molecular Patterns
p-NA p-NitroAnilide
PRR Pathogen Recognition Receptors
Ra-LPS Rough Lipopolysaccharide
RSD Relative Standard Deviation
RSE Reference Standard Endotoxin by USP
RT Room temperature
S-LPS Smooth Lipopolysaccharide
Sec Seconds
siRNA Small Interfering Ribonucleic Acid
TIR Toll/Interleukin-1R Resistance domain
TLR4 Toll-Like Receptor 4
TNFα Tumor Necrosis Factor alpha
USP US Pharmacoepia
1
CHAPTER 1 INTRODUCTION
Chitosan is a chemically modified biodegradable polymer with application in multiple fields as
food, cosmetics, biomedical and pharmaceutical industries (Rinaudo, 2006). Chitosan is derived
from chitin, a natural polymer extracted from natural sources like crab and shrimp shells,
mushrooms and yeasts. Because of its origin from natural sources, several side products are
removed from chitin during processing, such as lipids, proteins and calcium carbonate (Wooten,
2003). The use of chitosan for its application in pharmaceuticals requires clean products without
contaminants. One of the unwanted contaminants that can hinder chitosan’s application in clinical
and biological processes is endotoxin. Endotoxins or Lipo-polysaccharides are naturally
occurring outer cell wall component of disease causing gram-negative bacteria, and are toxic
pyrogens capable of inducing septic shock when they enter in the human immune system. Due to
the ubiquitous presence of bacteria in the environment; it is very challenging to eliminate
endotoxin from the working stations during chitosan production and the LPS contamination may
be introduced at any of the processing stages.
US, European and Japanese Pharmacoepias (USP, EP and JP) (EP, 2005; JP, 2001; USP, 2005)
have issued guidelines for the bacterial endotoxin test (BET) for endotoxin quantification and
have set out the maximum allowable limit for endotoxin contamination in drugs and medical
devices. The Bacterial Endotoxin tests identified by the pharmacoepias are the three versions of
Limulus Amoebocyte Lysate (LAL test): gel-clot, turbidimetric and chromogenic LAL tests; that
are based on the principle of coagulation of the horseshoe crab blood following its encounter with
bacterial endotoxin.
The high affinity of positively charged chitosan to the negatively charged phosphate and
carboxylic groups respectively in the Lipid A and core region of the LPS along with other weak
interactions such as hydrogen bonding and Vander Waals interaction (I. M. Y. V. N. Davydova*,
V. I. Gorbach, I. N. Krasikova, and T. F. Solov’eva, 2000), makes the endotoxin removal from
chitosan even more challenging.
In order to accurately quantify the endotoxin content, certain pre-treatments of the chitosan have
to be performed as preventative measures for interference and for absolute quantification of
2
endotoxin. Such preventative measures are preeminent in the pursuit of development of a reliable
method for quantification of endotoxin in chitosan by LAL assay.
The nature and structure of endotoxin and the importance of endotoxin detection due to immune
system activation will be discussed in detail in the next chapter. It also entails different types of
assays used for endotoxin determination and mechanism and principle of the LAL assay
functioning.
The characteristics of chitosan and mechanism of chitosan interaction with endotoxin, and
various methods adapted to remove it from the processing steps to the end-product preparation
are also discussed in detail in the critical literature review.
3
CHAPTER 2 CRITICAL LITERATURE REVIEW
2.1 Endotoxin
Endotoxin is a lipopolysaccharide complex component of outer cell walls of gram negative
bacteria that can induces inflammatory responses such as cytokine activation leading to fever,
septic shock and death after introduction to host immune system (Akira, Uematsu, & Takeuchi,
2006). Endotoxins are also called as pyrogens due to their fever inducing property. The term
endotoxin for the unknown pyrogen of bacterial origin was first used by Richard Pfeiffer, one of
Robert Koch’s students in 1892, after he successfully extracted “heat resistant substance” upon
cellular disintegration of Vibrio cholerae bacterium (Williams, 2001).
2.1.1 Structure and function of LPS
Endotoxins or Lipopolysaccharides (LPS) are composed of hydrophilic polysaccharide
part and a hydrophobic Lipid A part. E. coli LPS is widely characterized and used as a model to
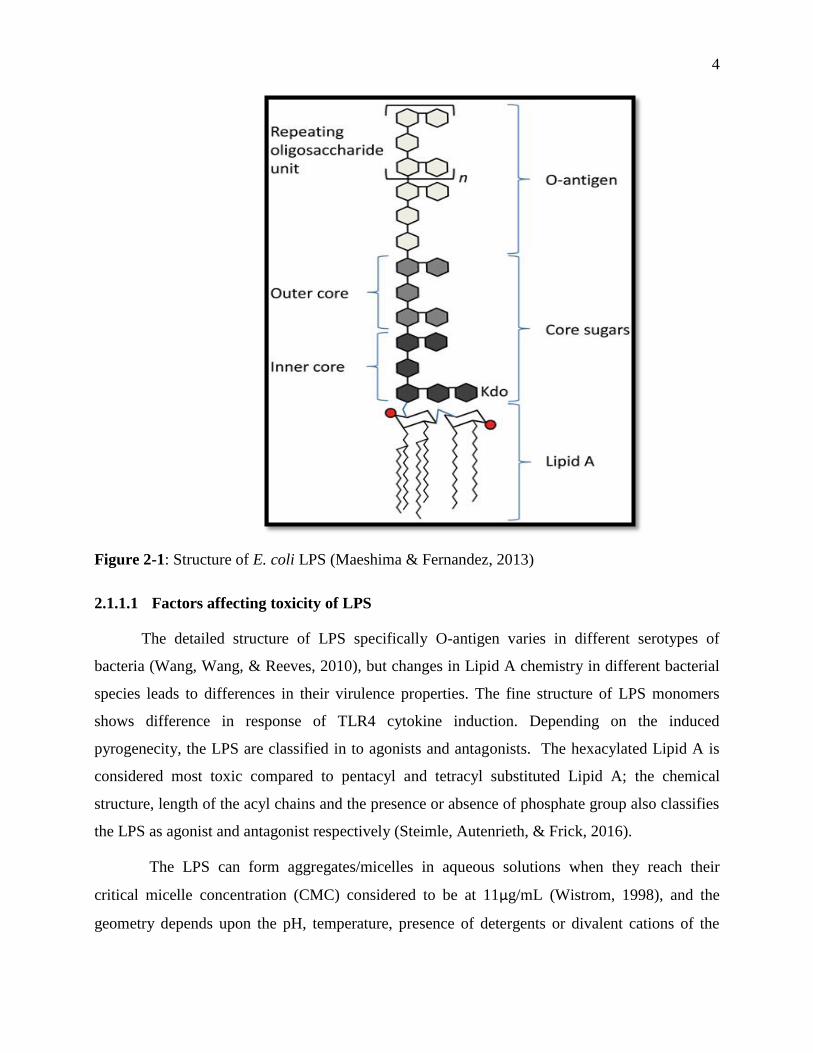
identify the structure of LPS. The structure of E. coli LPS shown in Figure 2-1 below shows the
structural arrangement of Lipid A and hydrophilic core sugars and O-antigen The LPS is located
on the outer membrane of the cell wall of the gram negative bacteria, but synthesized at the
cytoplasmic region of the inner membrane. The structure of LPS is divided in to three parts: 1)
Lipid A 2) core oligosaccharide and 3) O-antigen. The Lipid A is the hydrophobic component,
which resides on the outer membrane, while the core sugars and O-antigen is displayed on the
surface of the bacteria. Lipid A is the widely conserved region in different bacterial species
compared to the core oligosaccharides and O-antigen and is responsible for the toxicity and
virulence of the gram-negative bacteria. Some bacteria contain only Lipid A and core
oligosaccharides known as rough-LPS (Ra-LPS) while others flag O-antigen on their surface,
giving them smoother structural morphology (s-LPS). Lipid A-Kdo2 is the basic structure
required for survival by many bacteria (X. Wang & P. J. Quinn, 2010; Xiaoyuan Wang & Peter J.
Quinn, 2010).
4
Figure 2-1: Structure of E. coli LPS (Maeshima & Fernandez, 2013)
2.1.1.1 Factors affecting toxicity of LPS
The detailed structure of LPS specifically O-antigen varies in different serotypes of
bacteria (Wang, Wang, & Reeves, 2010), but changes in Lipid A chemistry in different bacterial
species leads to differences in their virulence properties. The fine structure of LPS monomers
shows difference in response of TLR4 cytokine induction. Depending on the induced
pyrogenecity, the LPS are classified in to agonists and antagonists. The hexacylated Lipid A is
considered most toxic compared to pentacyl and tetracyl substituted Lipid A; the chemical
structure, length of the acyl chains and the presence or absence of phosphate group also classifies
the LPS as agonist and antagonist respectively (Steimle, Autenrieth, & Frick, 2016).
The LPS can form aggregates/micelles in aqueous solutions when they reach their
critical micelle concentration (CMC) considered to be at 11μg/mL (Wistrom, 1998), and the
geometry depends upon the pH, temperature, presence of detergents or divalent cations of the
5
medium and the charge present on the LPS itself. The divalent cations like Ca2+ and Mg2+
stabilizes the aggregate structure and its conformation (Garidel et al., 2005). Depending upon the
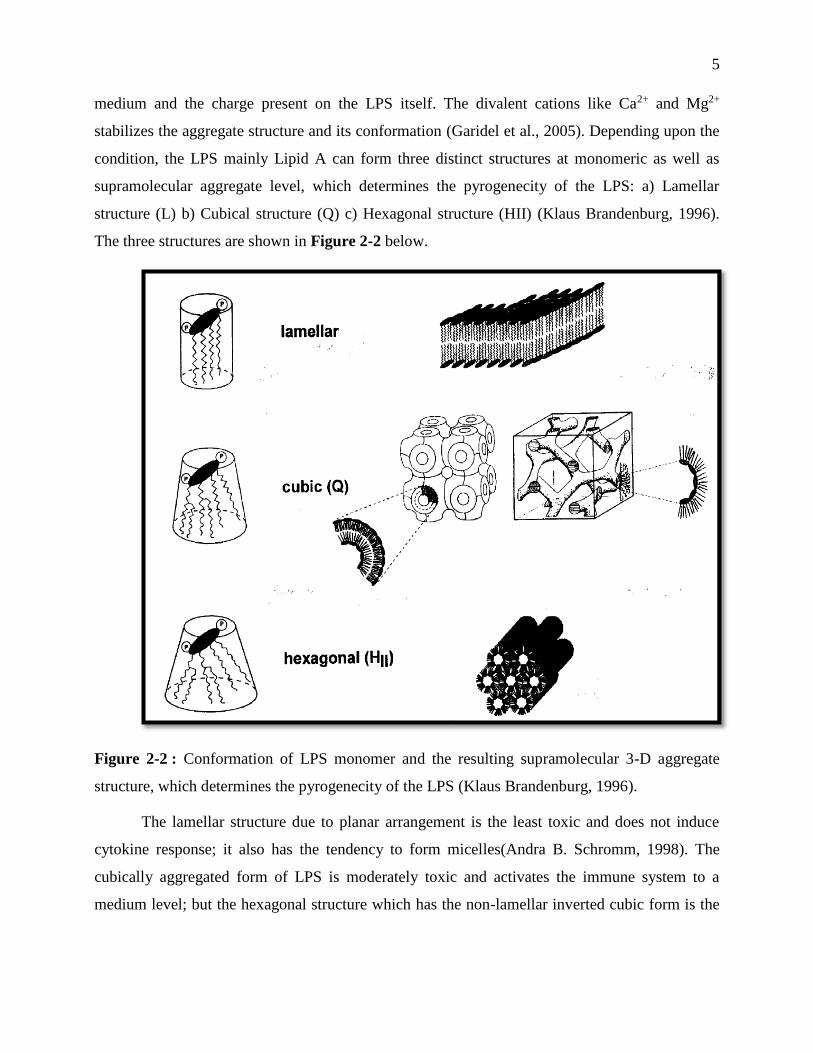
condition, the LPS mainly Lipid A can form three distinct structures at monomeric as well as
supramolecular aggregate level, which determines the pyrogenecity of the LPS: a) Lamellar
structure (L) b) Cubical structure (Q) c) Hexagonal structure (HII) (Klaus Brandenburg, 1996).
The three structures are shown in Figure 2-2 below.
Figure 2-2 : Conformation of LPS monomer and the resulting supramolecular 3-D aggregate
structure, which determines the pyrogenecity of the LPS (Klaus Brandenburg, 1996).
The lamellar structure due to planar arrangement is the least toxic and does not induce
cytokine response; it also has the tendency to form micelles(Andra B. Schromm, 1998). The
cubically aggregated form of LPS is moderately toxic and activates the immune system to a
medium level; but the hexagonal structure which has the non-lamellar inverted cubic form is the
6
most toxic activating the TLR4-MD2 complex and amplifying the cytokine response to a
dangerous extent, with even pico gram levels flaring up the response (Williams, 2001).
2.1.2 Immune induction by LPS
Lipopolysaccharide (LPS) or endotoxins originating from the prokaryotic bacteria are
identified by mammalian immune system as one of the biggest threats. The endotoxin and the
bacteria itself are recognized by the innate immune system of the mammals. The cells of the
innate immune system such as macrophages and dendritic cells recognize the endotoxins by their
pathogen recognition receptors (PRRs). The invading bacteria or endotoxin express specific
pathogen associated molecular patterns (PAMPs) which are recognized by different PRRs that
activate specific signalling pathway. The PRRs in the mammalian immune system that
recognizes pyrogenic Lipid A portion of LPS are the Toll Like Receptor 4 (TLR4) which
activates the signalling pathway and result in the release of pro-inflammatory cytokines (Akira et
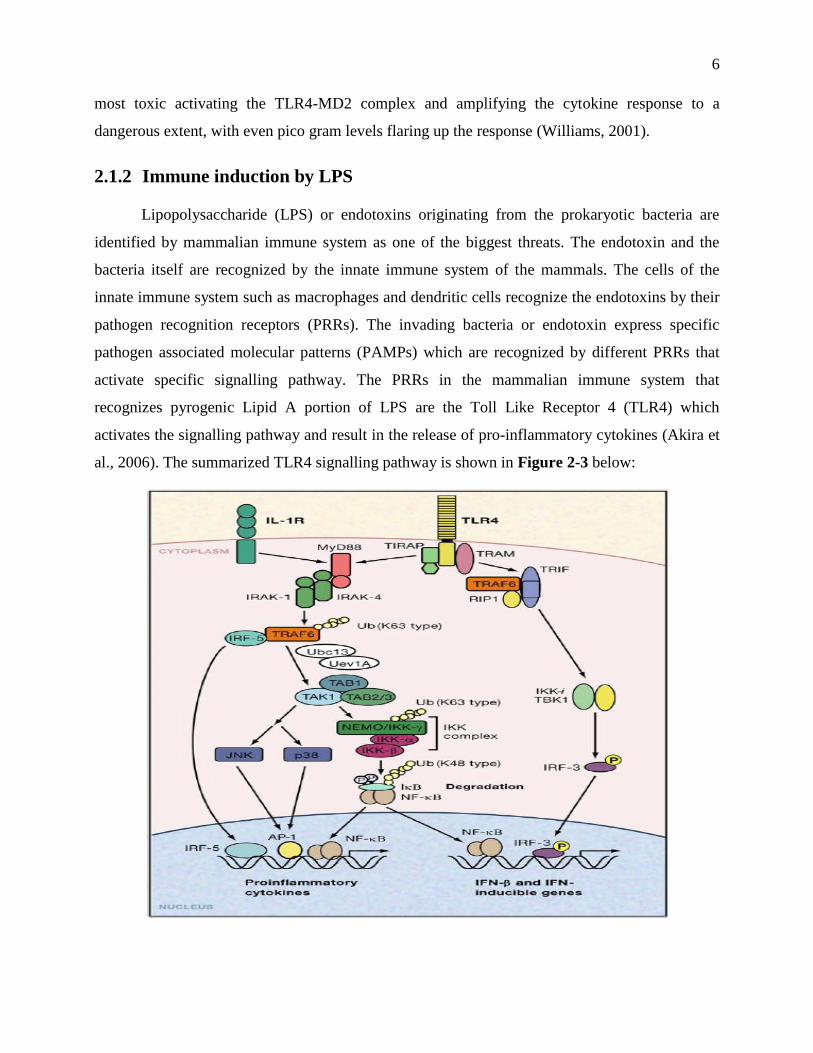
al., 2006). The summarized TLR4 signalling pathway is shown in Figure 2-3 below:
7
Figure 2-3 : TLR4 signalling pathway induced by recognition of LPS leading to pro-
inflammatory cytokine release (Akira et al., 2006)
The TLR 4 is an extracellular recognition receptor lying on the transmembrane of
macrophage or phagocytic cells, the recognition of LPS is aided by the Lipid A binding proteins
(LBP) present in the serum to sense the bacterial presence in the blood (Hansen, Rasmussen,
Niels-Christiansen, & Danielsen, 2009; Vreugdenhil, Snoek, Greve, & Buurman, 2000). LBP
transports the LPS in its monomeric form to CD14- a soluble protein and a membrane anchored
protein of TLR 4 expressing cells, which increases the susceptibility of TLR4 towards LPS by a
factor of 102 to 103 (Wright, 1990). The CD14 then shuttles the LPS to MD-2, which is a TLR4
co-receptor and could be either bound to TLR4 monomer via hydrogen bonds or present as
soluble protein into the cell exterior analogous to CD14. MD-2 dimerizes the TLR4 monomers
and forms a complex with two MD-2 and 2 TLR4 domains. The mechanism of TLR4-MD2
dimerization is that five of the six acyl chains of LPS buries inside a binding grove of MD-2
(Park et al., 2009), the sixth acyl chain exposed on the MD-2 surface in combination with
hydrophobic residues of MD-2 promotes intermolecular interaction with TLR4 (Jin & Lee, 2008;
Ohto, Fukase, Miyake, & Shimizu, 2012). The binding of MD-2 with TLR4 and the resulting
conformational changes leads to the dimerization of c-termini of TLR 4 ecto-domains (Jin & Lee,
2008; Kim et al., 2007; Ohto et al., 2012). This dimerization leads to the dimerization of
cytosolic TIR domains which can induce downstream signalling of cytokine by either Myeloid
differentiation primary response gene 88 (MyD88) or TIR-domain-containing adapter -inducing
interferon-β (TRIF)-dependent downstream signalling (Molinaro et al., 2015). CD14 are
considered to be important for LPS sensing at low LPS concentration, but are indispensable at
high conc. The TLR 4 signalling apart from cytokine activation also result in enhanced
production of chemokines, free radicals and nitric oxide (Ohto et al., 2012; Poltorak, Ricciardi-
Castagnoli, Citterio, & Beutler, 2000) which increases toxicity symptoms like pain and low blood
pressure leading to septic shock and death.
Different signalling pathways for cytokine activation have also been elucidated in recent
research apart from TLR4 pathway. An intracellular signalling pathway including “inflammatory
caspases” also exists for release of cytokines after LPS recognition. The inflammatory caspases
are proteolytically inactive zymogens, activated after proteolytic cleavage mediated by caspase
activation and recruitment domain (CARD) present on the enzyme N-terminal responsible for
8
protein-protein interactions. Intracellular signalling pathway takes place in the cytosol, and
results in the activation of inflammatory caspases 1 termed “inflammosome” leading to the
production of cytokines as well as pyroptosis- a special kind of cell death. Two pathways exist to
activate inflammosomes: 1) Classical or canonical pathway 2) Non-canonical pathway. The
classical pathway activates inflammosomes in a caspase-dependent manner by an assembly of
Nod-like receptor protein 3 (NLRP3) or NLR family CARD domain-containing protein 4
(NLRC4) with intracellular adaptor protein NLR family CARD domain-containing protein 4
(ASC) which leads to activation of caspase 1 resulting in the cleavage of IL-1β and IL-18 and
finally secretion of cytokines (Mariathasan et al., 2006; Martinon, Petrilli, Mayor, Tardivel, &
Tschopp, 2006; Schroder & Tschopp, 2010). The non-canonical pathway includes activation of
caspase 1 by the activation and aggregation of caspase 11, which can directly sense cytosolic
Lipid A independently from TLR4; the activation of Caspase 11 leads to cytokine production as
well as pyroptosis.
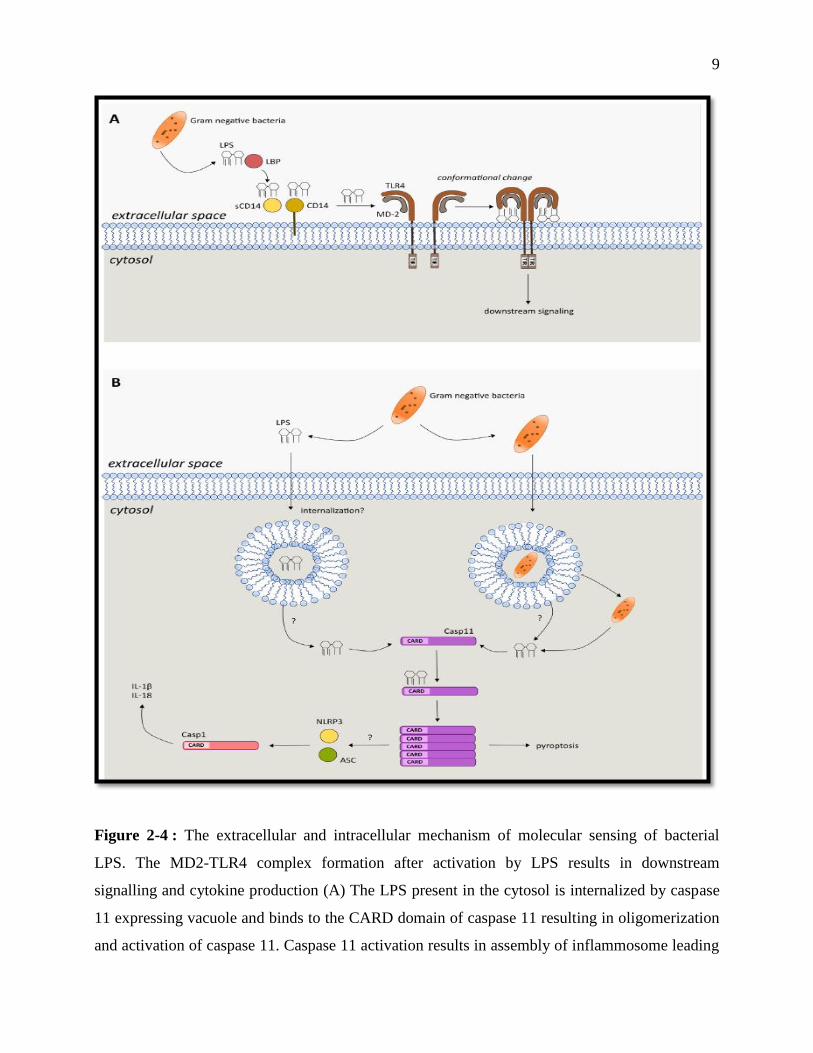
The interaction of Lipid A portion of LPS with the extracellular TLR4 as well as
intracellular cytosolic caspase 11 leading to the production of cytokines is rigorously
demonstrated in Figure 2-4 below:
9
Figure 2-4 : The extracellular and intracellular mechanism of molecular sensing of bacterial
LPS. The MD2-TLR4 complex formation after activation by LPS results in downstream
signalling and cytokine production (A) The LPS present in the cytosol is internalized by caspase
11 expressing vacuole and binds to the CARD domain of caspase 11 resulting in oligomerization
and activation of caspase 11. Caspase 11 activation results in assembly of inflammosome leading
10
to secretion of pro-inflammatory cytokines by activated caspase-1; the oligomerized caspase 11
also leads to pyroptosis, a special kind of cell death. (B) (Steimle et al., 2016)
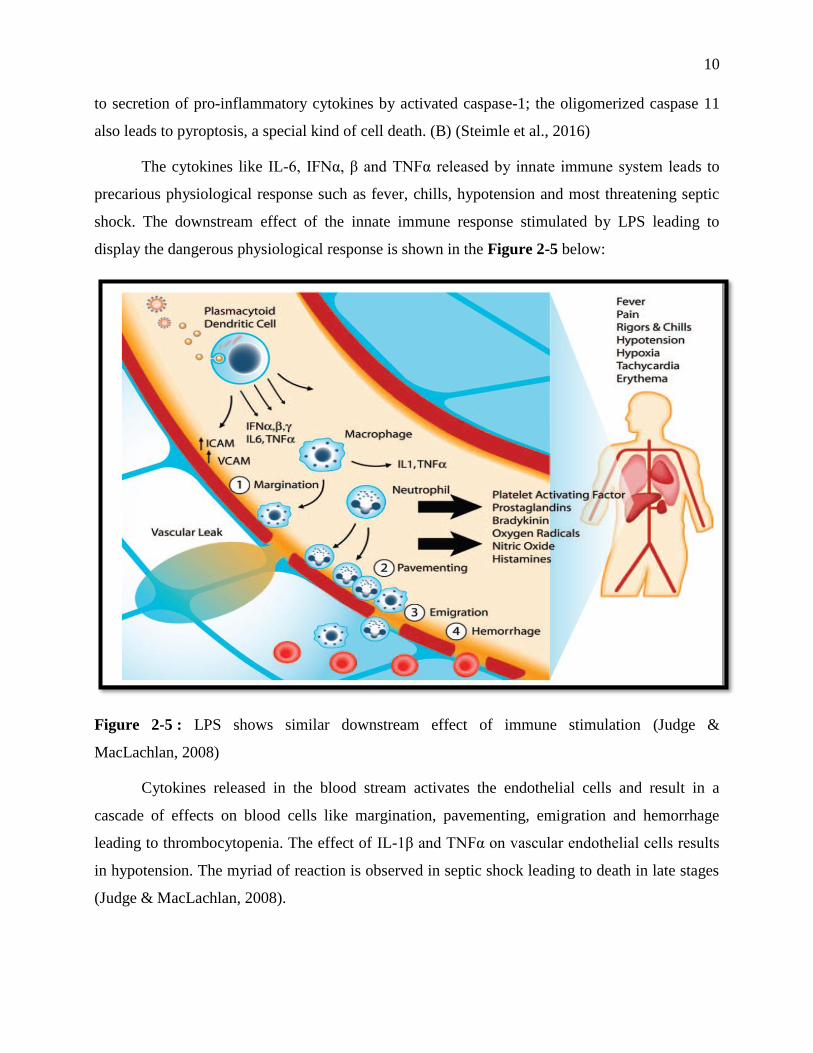
The cytokines like IL-6, IFNα, β and TNFα released by innate immune system leads to
precarious physiological response such as fever, chills, hypotension and most threatening septic
shock. The downstream effect of the innate immune response stimulated by LPS leading to
display the dangerous physiological response is shown in the Figure 2-5 below:
Figure 2-5 : LPS shows similar downstream effect of immune stimulation (Judge &
MacLachlan, 2008)
Cytokines released in the blood stream activates the endothelial cells and result in a
cascade of effects on blood cells like margination, pavementing, emigration and hemorrhage
leading to thrombocytopenia. The effect of IL-1β and TNFα on vascular endothelial cells results
in hypotension. The myriad of reaction is observed in septic shock leading to death in late stages
(Judge & MacLachlan, 2008).
11
Due to such exaggerated response of human immune system after coming in contact with
LPS, it is absolutely essential to eliminate endotoxin from the active pharmaceutical ingredient
(API) and the nano-vectors (chitosan nanoparticles) to ensure the compliance with the accepted
LPS limit of 5 EU/kg/hour issued by the USP before application in humans (USP, 2005).
2.1.3 Importance of endotoxin detection
In the manufacture of parenteral drugs, the control of endotoxin contamination is very
important because of the following aspects: 1) The endotoxin is ubiquitous in nature due to
omnipresence of bacteria, hence it is capable of contaminating any given formulation. 2)
Endotoxins are potent inducers of inflammation compared to any other microbial and non-
microbial pyrogen 3) The stability of the endotoxin after being subjected to extreme conditions
like high heat and changing pH is very high 4) The relative likelihood of the endotoxin
contamination in the parenteral formulations is very high, as they go through multiple production
and manufacturing process (Williams, 2001). Hence, a regular testing of pharmaceutical waters
and in process material for ensuring low endotoxin contamination in the end-product before
releasing is a pre-requisite for any pharmaceutical product. The detection and removal of
endotoxin contamination is one of the predominating concerns in the pharmaceutical
manufacturing industry.
2.1.3.1 Harmonization of endotoxin units [EU/mL] of different species
Typically, the FDA defines 100 picogram LPS as equal to one endotoxin unit (EU) (GmBH,
2013), but the endotoxin units in different species varies depending upon the pyrogenecity of the
LPS which is determined after calibration with the USP Reference Standard Endotoxin (RSE).
The potency of LPS of even the same species from different lots/ batches also varies when
standardized against the RSE (times_CRL, 2006; USP, 2005). The potency of CSE against RSE
is expressed in EU/ng, also known as RSE / CSE ratio. It is not a good practice to convert the EU
values to weight (picogram) as the pyrogenecity also depends upon the molecular weights and
size of LPS; i.e. different molecular weight and sizes of LPS may produce same pyrogenecity
(MJ, 1997).
12
2.1.4 Methods of endotoxin detection
Traditionally the measurement of biological activity of the LPS has been qualitatively determined
by the rabbit pyrogen test (RPT), in which the test article was injected intravenously into the
rabbits and the body temperature was monitored, an increase in body temperature by >0.5°C,
proved the presence of LPS in the test article. The test was performed on 3 animals in the first
phase, if any 1 animal showed an increase in basal body temperature then the test article was
injected in 5 animals in phase 2 (Dobrovolskaia, Germolec, & Weaver, 2009). However, the risk
of false positive always loomed because of the intrinsic pyrogenecity of bio formulations
independent of the LPS. In order to reduce the amount of testing in animals, an in vitro testing
method was recommended by the FDA, which was accurate, sensitive and precise. The in vitro
testing method, which has replaced the RPT in detection of endotoxin approved by FDA, is the
Limulus Amoebocyte Lysate assay. Levin and Bang discovered the limulus amoebocyte lysate
abbreviated as LAL in 1964 during investigation of the effects of gram-negative bacteria on the
blood of horse shoe crab (Limulus Polyphemus) (Levin J, 1964). The blood from the horseshoe
crab was found to be clotting in the presence of gram-negative bacteria due to activation of a
serine-protease zymogen named factor C triggering a clotting cascade.
The LAL clotting was found to be in direct correlation to the amount of endotoxin (FDA, 1987);
this property was utilized to quantify the endotoxin contamination of bio-pharmaceuticals soon
after LAL discovery. LAL testing is an effective method to detect endotoxin contamination in
vitro and it greatly reduces the burden of cost and labour used for the RPT testing (Dobrovolskaia
et al., 2009). The LAL assay was approved for pyrogen testing by the FDA in 1987, owing to its
efficacy and sensitivity in the detection of endotoxin in the pharmaceutical products (FDA,
1987). There are three types of LAL assay used in modern times for the endotoxin detection: Gel-
clot LAL, Turbidimetric LAL and Chromogenic LAL assay. There are other in vitro tests
available that are not approved by the FDA, but are used for detection of endotoxin which utilizes
macrophages, mononuclear cells, whole blood or TLR 4 reporter cells (Haile, Puig, Kelley-
Baker, & Verthelyi, 2015; Smulders et al., 2012; Warren et al., 2010) sensitive to small amounts
of endotoxin, which could be used to qualitatively assess the presence of endotoxins in the test
samples. There are two tests recently approved by the FDA as confirmatory tests to LAL:
Macrophage Activation test (MAT) and Recombinant Factor-C LAL, which qualitatively
confirms the pyrogenecity of the test samples.
13
2.1.4.1 Discovery and origin of LAL enzyme
As mentioned previously, the Limulus Amoebocyte Lysate was discovered by Bang during the
study of coagulation disease in the horseshoe crab Limulus Polyphemus. Initially, it was thought
to be initiated by an invertebrate pathogen, but it was discovered that the Limulus crabs were
showing intravascular coagulation even after injection of endotoxin from gram-negative bacteria
(Williams, 2001). The serum from the haemocytes/ amoebocytes of the crabs when added to the
bacteria produced a stable clot. The formation of the clot was compared to the human fibrinogen
clotting response. The enzyme is extracted commercially by collecting the haemolymph from
horseshoe crab, then the haemolymph is centrifuged and the haemocytes/ amoebocytes are
collected (Annamaria, 2012). The amoeobocytes are 15μm in width and contain small and large
granules; the large granules contain the gel-clotting serine protease and clotting factors along
with a bactericidal anti-LPS factor, which bursts after coming in contact with the bacteria and
forms a clot (B. Akbar John, 2010). The small granules contain antibacterials such as tachyplesin,
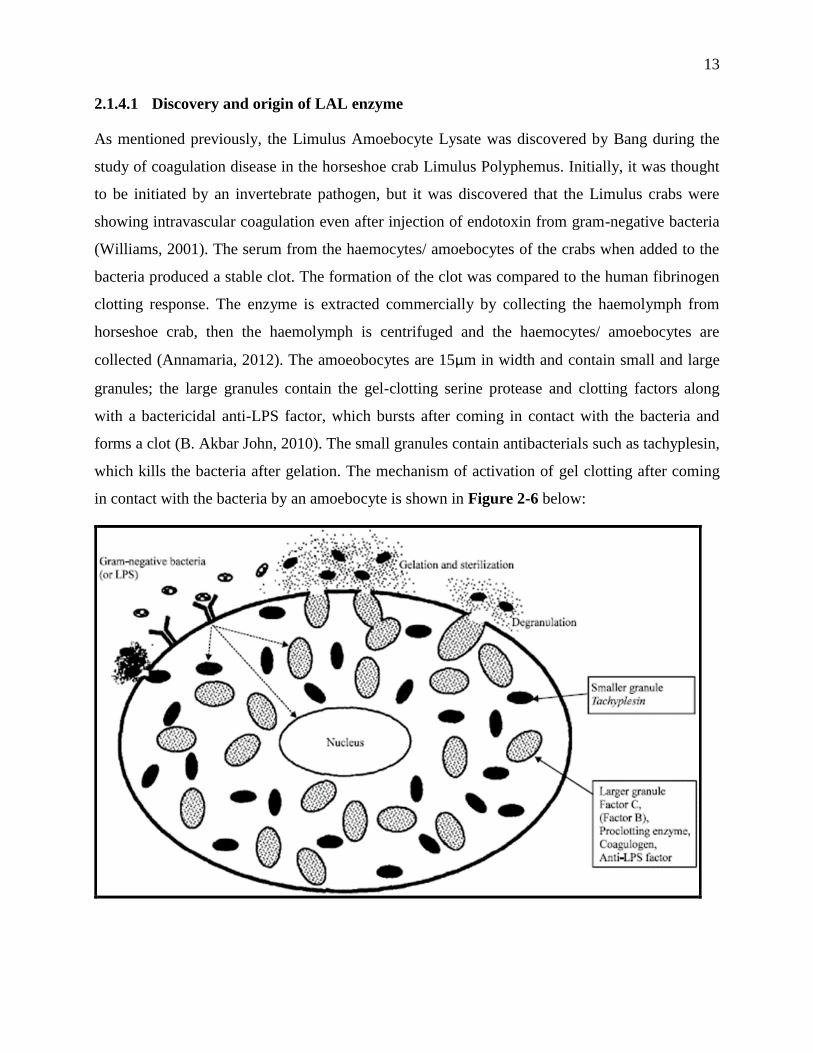
which kills the bacteria after gelation. The mechanism of activation of gel clotting after coming
in contact with the bacteria by an amoebocyte is shown in Figure 2-6 below:
14
Figure 2-6 : Mechanism of activation of a horseshoe amoebocyte after bacterial invasion. The
LPS binding proteins detects the invading LPS, which activates the fusion of large granules to the
plasma membrane. The large granules disperse their components in the plasma resulting in the
formation of clot when LPS comes in contact with the intracellular components; this gelation
leads to immobilization of invading bacteria and then the Anti-LPS factor from large granules
and tachyplesin from small granule destroy the bacteria by bactericidal action (B. Akbar John,
2010).
Due to the clotting mechanism by bursting of amoebocyte, the amoebocytes from the
haemolymph of horse-shoe crab are washed and lysed in a solution by osmotic pressure during
the commercial preparation, and the coagulant, coagulation factors etc. released in the solution
are lyophilized at -80˚C to form a powder, which is sold as commercial LAL enzyme
(Annamaria, 2012).
2.1.4.2 LAL assay: Biochemical mechanism, different formats and their principles and
applications
The LAL enzyme is in fact a complex of factors that activates in a cascade to show clotting or
turbidity, there are various components present in this complex as: Factor C, factor B and
proclotting enzyme that are serine protease and gel-forming protein coagulogen (Iwanaga, 2007).
The extent of clotting depends on the conc. of endotoxin activating the enzyme. The LPS
molecule triggers the coagulation cascade by activating factor C a serine protease zymogen that is
converted in to activated factor C, which then binds to Factor B and activates it, the activated
Factor B converts the proclotting enzyme into clotting enzyme, which in turn converts soluble
coagulogen to the insoluble coagulin gel producing turbidity (Sandle, 2013). This mechanism is
endotoxin specific, and the degree of clot formation depends on the amount of LPS activating the
cascade.
There is an alternative mechanism, which could also activate the LAL complex to produce
similar clotting or gel-formation. This mechanism involves Factor G, which is activated by β-(1-
3)-D-Glucan- a component commonly present in cellulose and glucosamine based substances, the
activated factor G triggers the proclotting enzyme that activates the clotting enzyme, which then
subsequently convert insoluble coagulogen into coagulin gel (Sandle, 2013). Since, this pathway
is unspecific to endotoxin; the presence of glucans containing substances could lead to false-
15
positive results when performing Bacterial Endotoxin Tests (BET). There are commercially
available buffers which inhibit the β-(1-3)-D-Glucans activation of LAL enzyme and makes the
complex specific for endotoxin activation, examples of such buffers include the glucashield
buffer supplied by Associates of Cape Cod and β-G glucan blocker supplied by Lonza, the
ingredient inhibiting the glucans in these buffers are propriety and undisclosed.
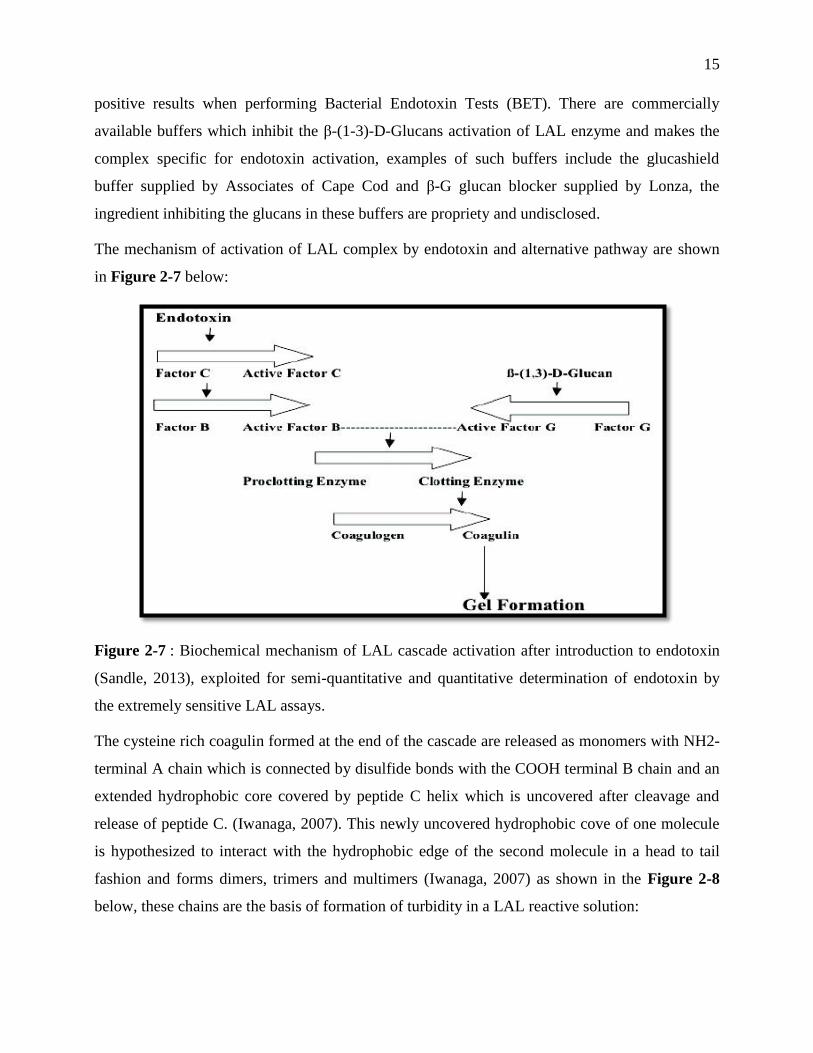
The mechanism of activation of LAL complex by endotoxin and alternative pathway are shown
in Figure 2-7 below:
Figure 2-7 : Biochemical mechanism of LAL cascade activation after introduction to endotoxin
(Sandle, 2013), exploited for semi-quantitative and quantitative determination of endotoxin by
the extremely sensitive LAL assays.
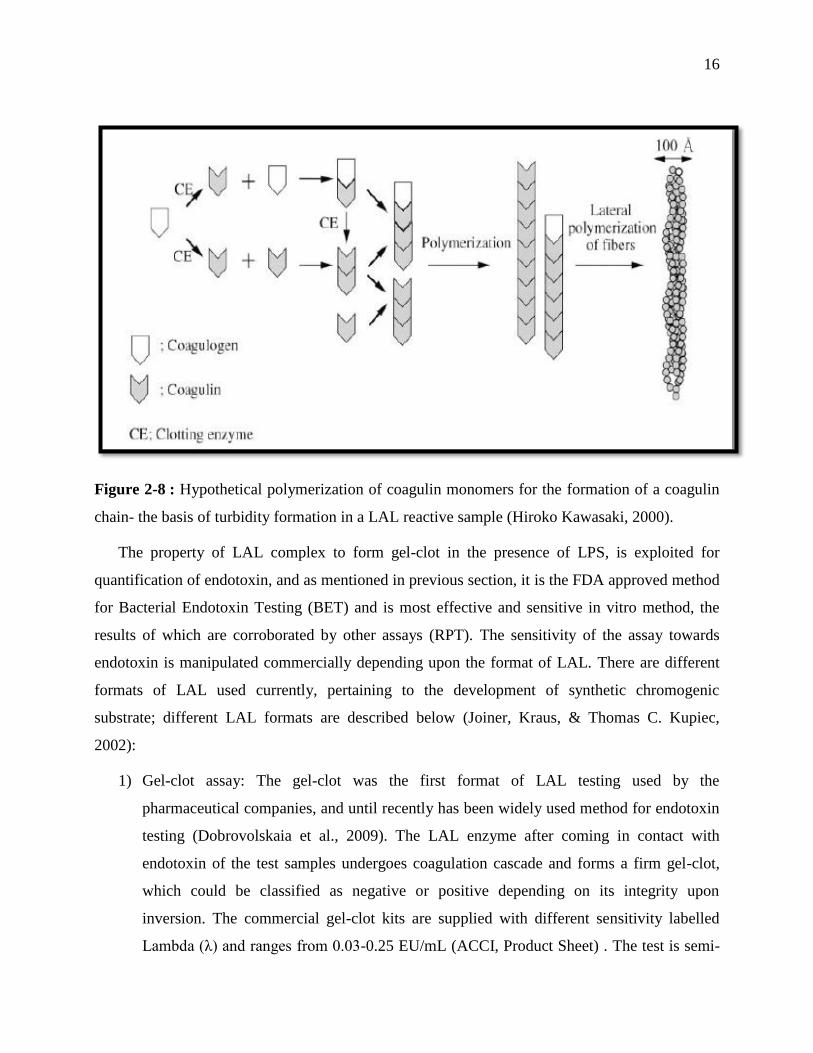
The cysteine rich coagulin formed at the end of the cascade are released as monomers with NH2-
terminal A chain which is connected by disulfide bonds with the COOH terminal B chain and an
extended hydrophobic core covered by peptide C helix which is uncovered after cleavage and
release of peptide C. (Iwanaga, 2007). This newly uncovered hydrophobic cove of one molecule
is hypothesized to interact with the hydrophobic edge of the second molecule in a head to tail
fashion and forms dimers, trimers and multimers (Iwanaga, 2007) as shown in the Figure 2-8
below, these chains are the basis of formation of turbidity in a LAL reactive solution:
16
Figure 2-8 : Hypothetical polymerization of coagulin monomers for the formation of a coagulin
chain- the basis of turbidity formation in a LAL reactive sample (Hiroko Kawasaki, 2000).
The property of LAL complex to form gel-clot in the presence of LPS, is exploited for
quantification of endotoxin, and as mentioned in previous section, it is the FDA approved method
for Bacterial Endotoxin Testing (BET) and is most effective and sensitive in vitro method, the
results of which are corroborated by other assays (RPT). The sensitivity of the assay towards
endotoxin is manipulated commercially depending upon the format of LAL. There are different
formats of LAL used currently, pertaining to the development of synthetic chromogenic
substrate; different LAL formats are described below (Joiner, Kraus, & Thomas C. Kupiec,
2002):
1) Gel-clot assay: The gel-clot was the first format of LAL testing used by the
pharmaceutical companies, and until recently has been widely used method for endotoxin
testing (Dobrovolskaia et al., 2009). The LAL enzyme after coming in contact with
endotoxin of the test samples undergoes coagulation cascade and forms a firm gel-clot,
which could be classified as negative or positive depending on its integrity upon
inversion. The commercial gel-clot kits are supplied with different sensitivity labelled
Lambda (λ) and ranges from 0.03-0.25 EU/mL (ACCI, Product Sheet) . The test is semi-
17
quantitative and helps in estimation of the endotoxin content of the test samples above or
below the labelled sensitivity. If the gel-clot test is positive for a sample, then the
endotoxin conc. can be affirmed more than or equal to the labelled sensitivity or >
Lambda (λ), and if the gel-clot is negative then the endotoxin conc. in a test sample is
designated less than or equal to the labelled sensitivity or < Lambda (λ) (ACCI,
Instruction guide).
2) Kinetic Turbidimetric LAL assay: The kinetic turbidimetric LAL assay is a quantitative
method of endotoxin detection and depends on the formation of turbidity of LAL enzyme
upon coming in contact with endotoxin. The development of turbidity can be observed
kinetically at given time intervals for a specified period of time in a spectrophotometer at
a wavelength of 405nm, this feature prevents false results and aids in interpretation. In
order to quantify the sample endotoxin, a standard of known amount of endotoxin is
constructed from the commercially supplied Control Standard Endotoxin (CSE). The
sample endotoxin conc. is interpolated from the linear equation obtained from the
regression analysis of log conc. vs. log onset time (defined as time to reach a pre-
determined threshold O.D). The sensitivity of kinetic turbidimetric LAL assay is 0.005
EU/mL. The sensitivity of the assay is enhanced by inhibiting the alternative Factor-G
pathway activated by β-D glucan causing false positive results due to activation of
coagulation cascade, this pathway is inhibited by specialized buffers supplied by vendors
Eg; Glucashield Buffer supplied by ACCI. A flowchart of endotoxin quantification by
kinetic turbidimetric LAL assay detailed by Lonza aids in the understanding of the assay
at the bench level:
18
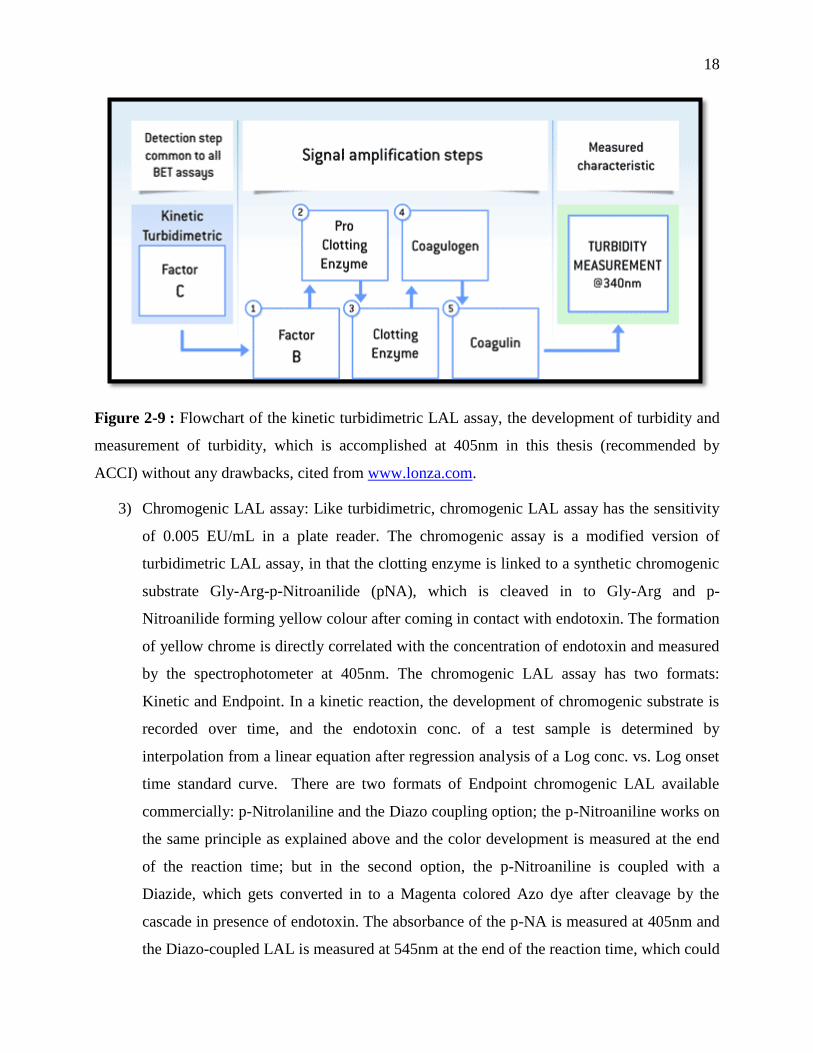
Figure 2-9 : Flowchart of the kinetic turbidimetric LAL assay, the development of turbidity and
measurement of turbidity, which is accomplished at 405nm in this thesis (recommended by
ACCI) without any drawbacks, cited from www.lonza.com.
3) Chromogenic LAL assay: Like turbidimetric, chromogenic LAL assay has the sensitivity
of 0.005 EU/mL in a plate reader. The chromogenic assay is a modified version of
turbidimetric LAL assay, in that the clotting enzyme is linked to a synthetic chromogenic
substrate Gly-Arg-p-Nitroanilide (pNA), which is cleaved in to Gly-Arg and p-
Nitroanilide forming yellow colour after coming in contact with endotoxin. The formation
of yellow chrome is directly correlated with the concentration of endotoxin and measured
by the spectrophotometer at 405nm. The chromogenic LAL assay has two formats:
Kinetic and Endpoint. In a kinetic reaction, the development of chromogenic substrate is
recorded over time, and the endotoxin conc. of a test sample is determined by
interpolation from a linear equation after regression analysis of a Log conc. vs. Log onset
time standard curve. There are two formats of Endpoint chromogenic LAL available
commercially: p-Nitrolaniline and the Diazo coupling option; the p-Nitroaniline works on
the same principle as explained above and the color development is measured at the end
of the reaction time; but in the second option, the p-Nitroaniline is coupled with a
Diazide, which gets converted in to a Magenta colored Azo dye after cleavage by the
cascade in presence of endotoxin. The absorbance of the p-NA is measured at 405nm and
the Diazo-coupled LAL is measured at 545nm at the end of the reaction time, which could
19
be used in the measurement of colored samples with absorbance maxima near 405nm.
Endpoint chromogenic is a faster method and allows absorbance measurement after a
fixed amount of time, but the disadvantage is the high probability of a false positive/ false
negative result at a particular measurement time, these results could occur in a sample
with fluctuating absorbance at different times. Depending upon the type of samples, the
option of kinetic or endpoint must be chosen to detect the endotoxin contamination. The
method of standard construction and result interpolation in kinetic chromogenic assay is
similar to the kinetic turbidimetric assay (Joiner et al., 2002).
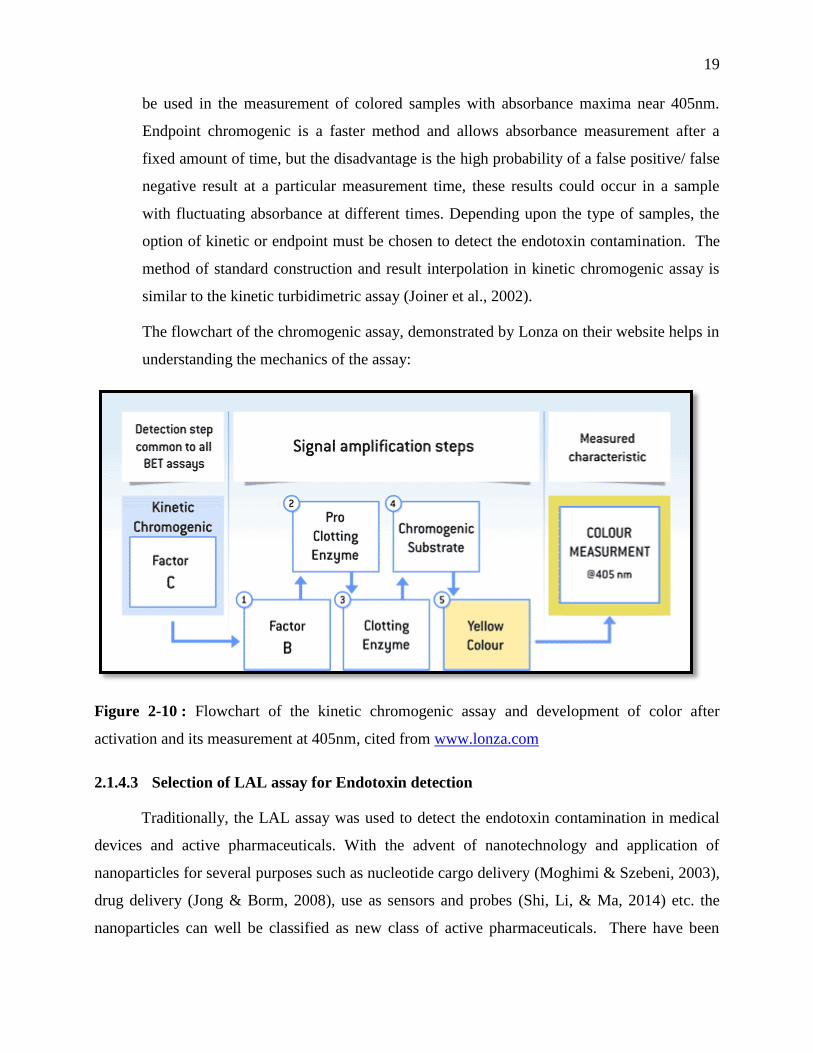
The flowchart of the chromogenic assay, demonstrated by Lonza on their website helps in
understanding the mechanics of the assay:
Figure 2-10 : Flowchart of the kinetic chromogenic assay and development of color after
activation and its measurement at 405nm, cited from www.lonza.com
2.1.4.3 Selection of LAL assay for Endotoxin detection
Traditionally, the LAL assay was used to detect the endotoxin contamination in medical
devices and active pharmaceuticals. With the advent of nanotechnology and application of
nanoparticles for several purposes such as nucleotide cargo delivery (Moghimi & Szebeni, 2003),
drug delivery (Jong & Borm, 2008), use as sensors and probes (Shi, Li, & Ma, 2014) etc. the
nanoparticles can well be classified as new class of active pharmaceuticals. There have been
20
many reports of interference by nanoparticles in the detection of endotoxin by LAL assay
(Smulders et al., 2012) such as quantum dots and metal nanoparticles that are colored and have
an absorbance wavelength at 405nm which interferes with chromogenic LAL assay and
liposomes, emulsions and PLGA nanoparticles that have turbid formulations interfering with
turbidimetric LAL assay (Dobrovolskaia et al., 2009). There are other new materials, previously
uncharacterized that also interact and interfere with the endotoxin detection by LAL assay. The
interfering substances and nanoparticles interfere with endotoxin reactivity, LAL enzyme
cascade/ LAL proteins or the reaction products (turbidity/ chromogenecity) (Neun &
Dobrovolskaia, 2011). These interferences may present as enhancement or inhibition of the
respective endotoxin concentration of a sample; this manifests as false positive and false negative
and may lead to erroneous rejection or acceptance of the sample batch (Neun & Dobrovolskaia,
2011). A false positive result may lead to rejection of nanoparticle or material with good potential
in therapeutics, whereas if the sample with false negative is advanced to clinical application, it
may lead to preposterous immune reaction in higher mammals, leading to septic shock and even
death.
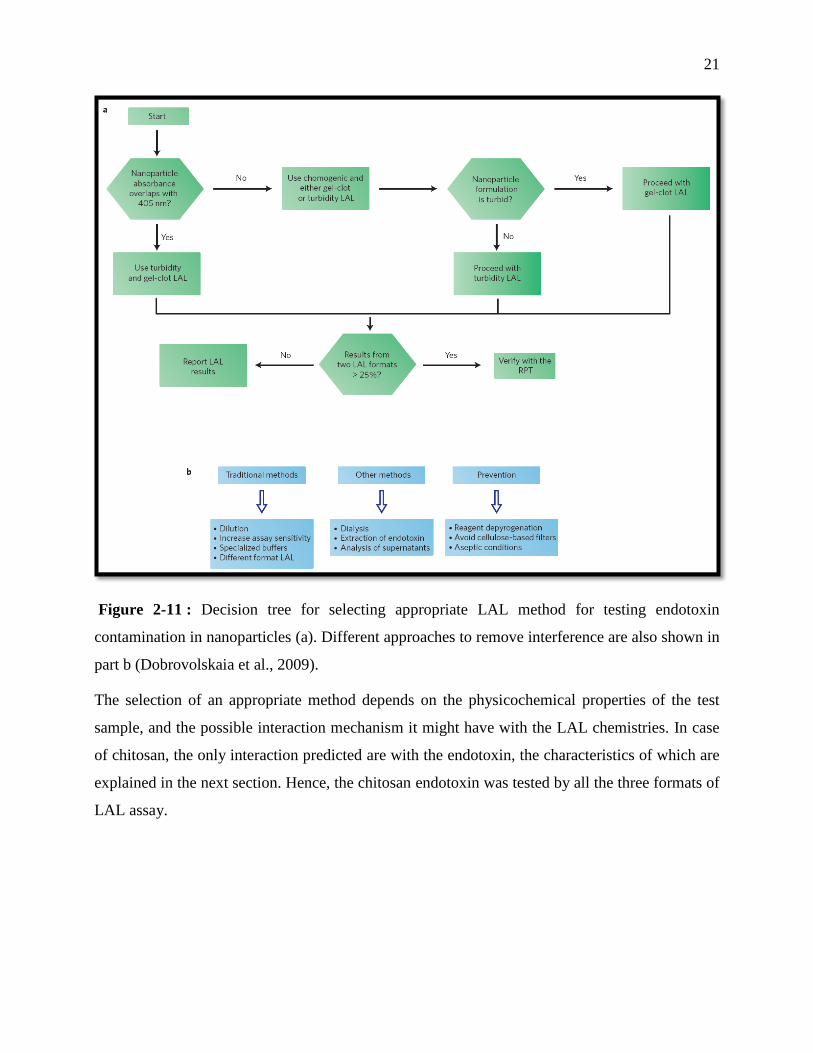
Hence, in order to overcome the interferences and choose the best method for the accurate
and absolute detection of endotoxin contamination of the nanoparticles and/or interference
producing samples, a group from National Institute of Health (NIH) have laid out the guidelines
to follow:
21
Figure 2-11 : Decision tree for selecting appropriate LAL method for testing endotoxin
contamination in nanoparticles (a). Different approaches to remove interference are also shown in
part b (Dobrovolskaia et al., 2009).
The selection of an appropriate method depends on the physicochemical properties of the test
sample, and the possible interaction mechanism it might have with the LAL chemistries. In case
of chitosan, the only interaction predicted are with the endotoxin, the characteristics of which are
explained in the next section. Hence, the chitosan endotoxin was tested by all the three formats of
LAL assay.
22
2.2 Chitosan as a gene delivery vector and tissue regeneration scaffold
Chitosan is a positively charged biodegradable polymer, which has many applications in
biomedical and tissue engineering. Chitosan is most commonly used as natural or artificial
scaffold for cartilage tissue regeneration, due to its property to act as glycosamino glycans
(GAGs) one of the important cartilage components (Fan, 2014). They also find their application
in osteo-arthritic models. The scaffolds are used in combination with growth factors such as
Platelet-Rich Plasma (PRP) (Oktay et al., 2010) and autologous cells such as Mesenchymal Stem
cells (MSCs) (Thomas G. Koch, 2009) or blood to effectively act as a tissue regeneration
scaffold. The scaffolds have been shown to successfully induce the tissue repair in various animal
models such as rabbits (Oktay et al., 2010), sheep and horses (Thomas G. Koch, 2009).
Chitosan also finds application in nanotechnology, where chitosan at high DDA and low
molecular weight (Alameh et al., 2012) are used as vectors for the delivery of nucleic acids such
as siRNA, mRNA and plasmid DNA. Chitosan nanoparticles have established a base in applied
research, and extensive use of Chitosan nanoparticles has been observed from past ten years
(Pubmed citations). The positively charged chitosan forms a complex with negatively charged
nucleic acids, the nanoparticles after intravenous, intraperitoneal or subcutaneous administration
in vivo enter the target cells, where the nucleic acid cargo is released by the action of endosomes
(Wittrup et al., 2015) In our group, the efficiency of Chitosan-siRNA nanoparticles and chitosan-
pDNA nanoparticles have been demonstrated in small animals such as mice (Jean et al., 2012).
Chitosan is derived from chitin, which comes from crustaceans and fungi. Chitin is a
naturally occurring polysaccharide extracted from exoskeleton of marine crustaceans such as
shrimps and crabs or cell walls of fungi. Chitin is deacetylated and depolymerised to produce
chitosan with different degrees of deacetylation (DDA) and molecular weight (MW) having
different potentials for delivery of nucleic acid and performance of scaffolds in vivo (Buschmann
et al., 2013). In order to understand the characteristics of chitosan important for its application as
a scaffold and a delivery vehicle, various characteristics must be understood as discussed below.
2.2.1 Degree of Deacetylation (DDA)
DDA is a very important parameter allowing the knowledge of average amount of amine
and so positive charge available to interact with the negative charge of the nucleic acids. DDA
23
influences the chitosan nanoparticle stability, inflammation and immune modulation in biological
systems (Buschmann et al., 2013) and the degree of biodegradation, healing capacity and
performance of chitosan scaffolds for tissue engineering application (Hoemann et al., 2007). The
importance of DDA in chitosan nanoparticle preparation is emphasized, as the endotoxin
interaction with chitosan mimics that of nucleic acid. The DDA is an important parameter that
can be manipulated to improve the nucleic acid delivery. A wide range of DDA can be produced
by adjusting the time and temperature of alkaline deacetylation reaction of chitin. The release of
acetyl group from chitin exposes the NH2 group, on the glucosamine D-unit, which, after
protonation, binds to the phosphate group of DNA/RNA by ionic linkage. Higher deacetylation
of chitosan leads to elevated toxicity of the chitosan nanoparticle in biological systems, but it is
also dependent on molecular weight and concentration (Buschmann et al., 2013).
Molecular weight (MW) of the chitosan can also be manipulated to improve
biocompatibility and bio distribution of chitosan nanoparticles in in vivo systems.
2.2.2 Molecular Weight (MW)
Molar mass determination of chitosan is also an important characteristic to understand the
average number of monomers per chain and the dispersity related to actual distribution of chain
lengths in the chitosan (Buschmann et al., 2013).This important parameter will influences the
structural properties like size and morphology; and the physicochemical properties of chitosan
polyplexes. Molecular weight also influences chitosan polyplex aggregation, a property that
plays a major role in entrapping endotoxin between the chitosan polyplexes. Aggregate formation
is influenced by acetyl group and degree of ionization (Buschmann et al., 2013; Lavertu, Methot,
Tran-Khanh, & Buschmann, 2006).
2.2.3 Binding affinity of chitosan
Chitosan binds to lipopolysaccharide (LPS) by both electrostatic interaction and hydrogen
bonds. The lipid A portion of LPS is hydrophobic which does not interact with chitosan, but the
core-oligosaccharide and the O-antigen binds to the chitosan due to the negative charge on the
sugars; the chitosan may also interact with the negatively charged phosphate group present on the
Lipid A. The degree of interaction of negatively charged oligosaccharides with the glucosamine
chains of chitosan depends upon the concentration of positively charged amine residues on each
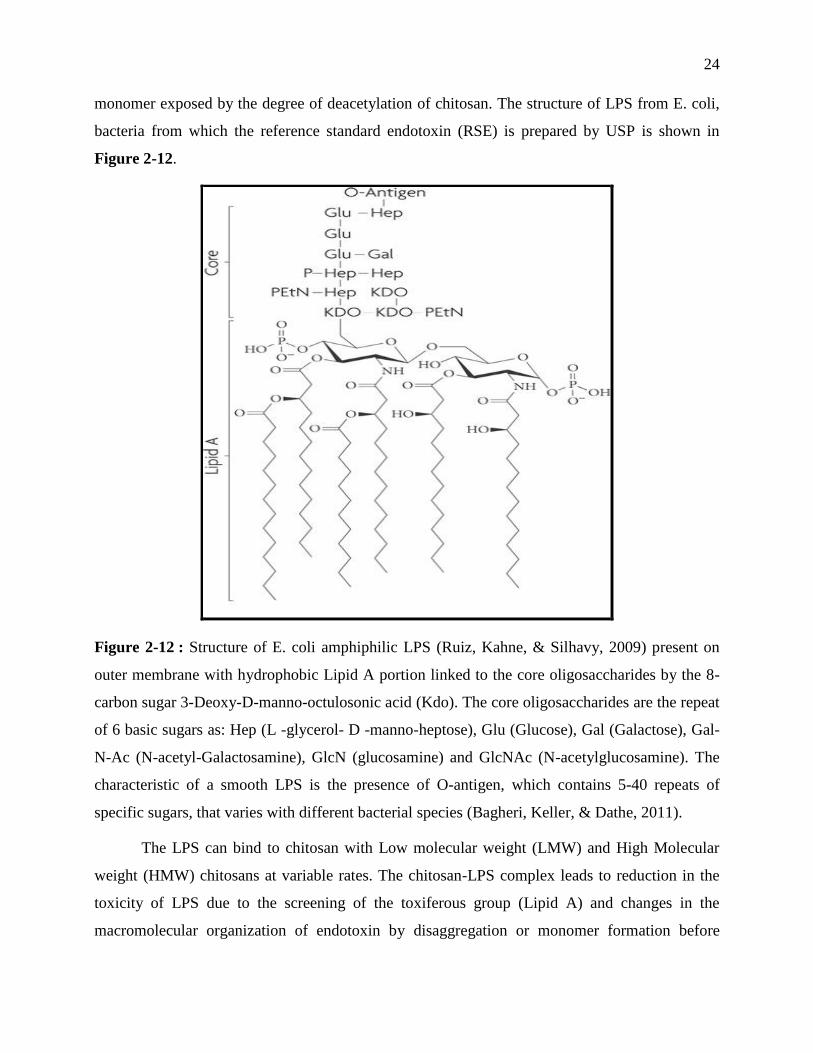
24
monomer exposed by the degree of deacetylation of chitosan. The structure of LPS from E. coli,
bacteria from which the reference standard endotoxin (RSE) is prepared by USP is shown in
Figure 2-12.
Figure 2-12 : Structure of E. coli amphiphilic LPS (Ruiz, Kahne, & Silhavy, 2009) present on
outer membrane with hydrophobic Lipid A portion linked to the core oligosaccharides by the 8-
carbon sugar 3-Deoxy-D-manno-octulosonic acid (Kdo). The core oligosaccharides are the repeat
of 6 basic sugars as: Hep (L -glycerol- D -manno-heptose), Glu (Glucose), Gal (Galactose), Gal-
N-Ac (N-acetyl-Galactosamine), GlcN (glucosamine) and GlcNAc (N-acetylglucosamine). The
characteristic of a smooth LPS is the presence of O-antigen, which contains 5-40 repeats of
specific sugars, that varies with different bacterial species (Bagheri, Keller, & Dathe, 2011).
The LPS can bind to chitosan with Low molecular weight (LMW) and High Molecular
weight (HMW) chitosans at variable rates. The chitosan-LPS complex leads to reduction in the
toxicity of LPS due to the screening of the toxiferous group (Lipid A) and changes in the
macromolecular organization of endotoxin by disaggregation or monomer formation before
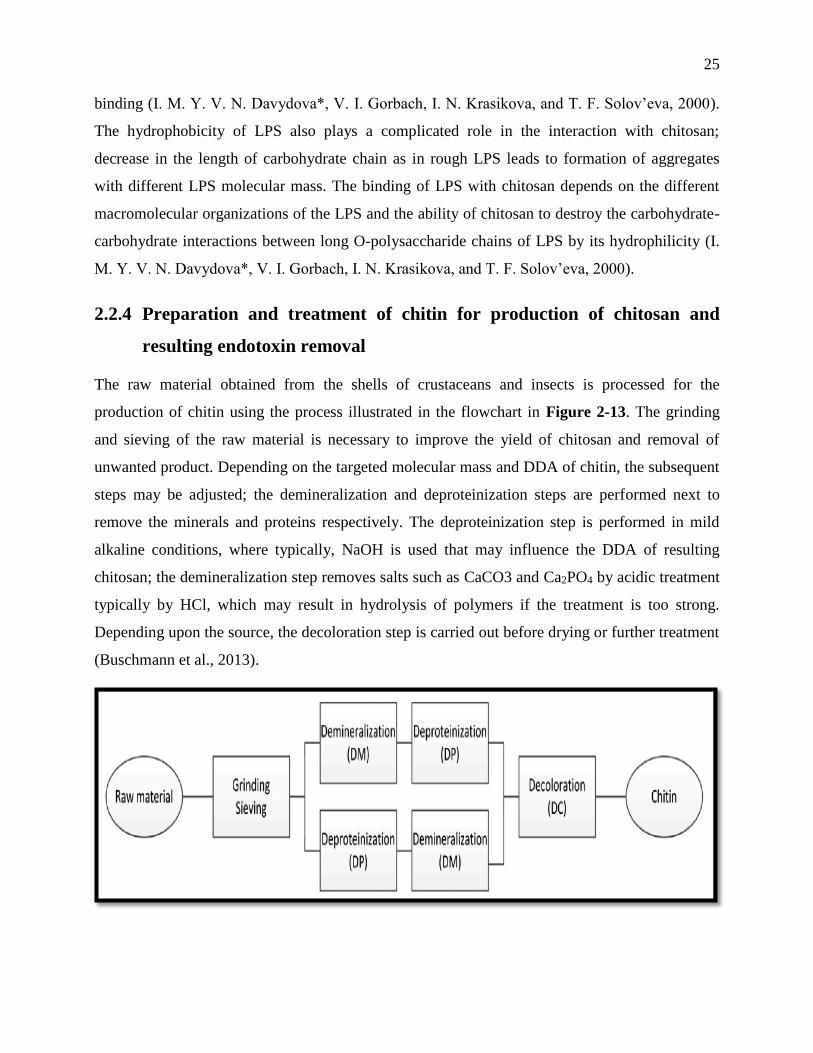
25
binding (I. M. Y. V. N. Davydova*, V. I. Gorbach, I. N. Krasikova, and T. F. Solov’eva, 2000).
The hydrophobicity of LPS also plays a complicated role in the interaction with chitosan;
decrease in the length of carbohydrate chain as in rough LPS leads to formation of aggregates
with different LPS molecular mass. The binding of LPS with chitosan depends on the different
macromolecular organizations of the LPS and the ability of chitosan to destroy the carbohydrate-
carbohydrate interactions between long O-polysaccharide chains of LPS by its hydrophilicity (I.
M. Y. V. N. Davydova*, V. I. Gorbach, I. N. Krasikova, and T. F. Solov’eva, 2000).
2.2.4 Preparation and treatment of chitin for production of chitosan and
resulting endotoxin removal
The raw material obtained from the shells of crustaceans and insects is processed for the
production of chitin using the process illustrated in the flowchart in Figure 2-13. The grinding
and sieving of the raw material is necessary to improve the yield of chitosan and removal of
unwanted product. Depending on the targeted molecular mass and DDA of chitin, the subsequent
steps may be adjusted; the demineralization and deproteinization steps are performed next to
remove the minerals and proteins respectively. The deproteinization step is performed in mild
alkaline conditions, where typically, NaOH is used that may influence the DDA of resulting
chitosan; the demineralization step removes salts such as CaCO3 and Ca2PO4 by acidic treatment
typically by HCl, which may result in hydrolysis of polymers if the treatment is too strong.
Depending upon the source, the decoloration step is carried out before drying or further treatment
(Buschmann et al., 2013).
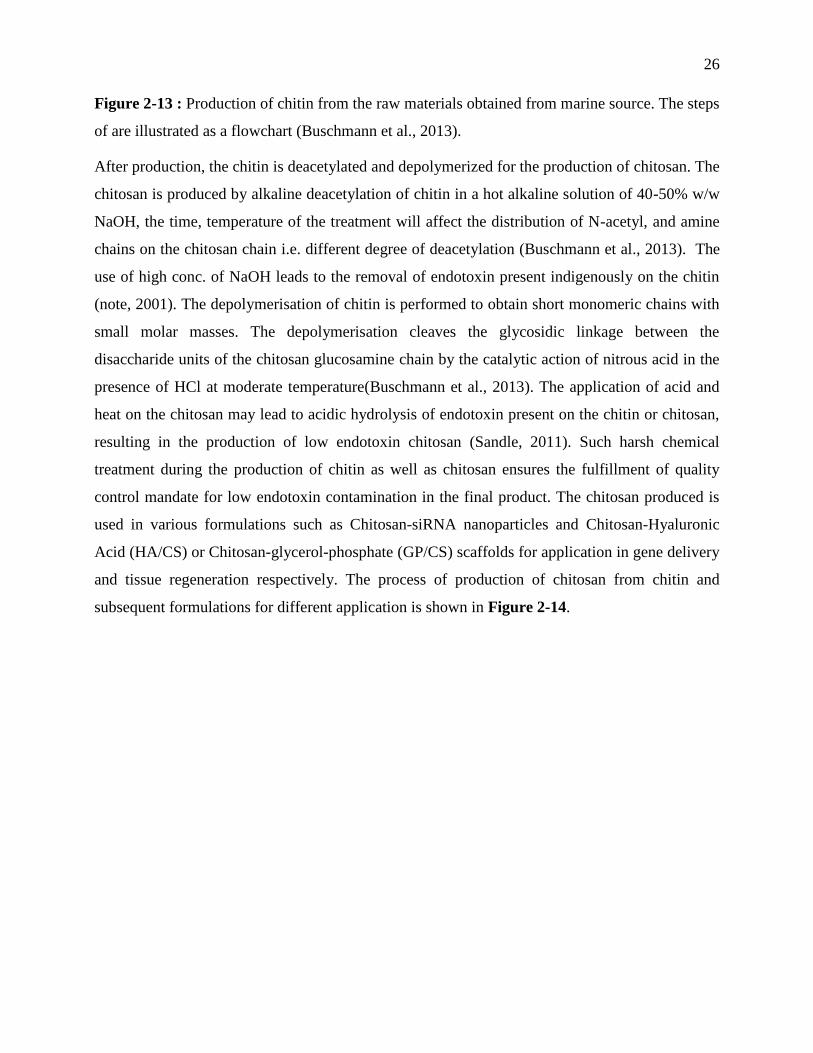
26
Figure 2-13 : Production of chitin from the raw materials obtained from marine source. The steps
of are illustrated as a flowchart (Buschmann et al., 2013).
After production, the chitin is deacetylated and depolymerized for the production of chitosan. The
chitosan is produced by alkaline deacetylation of chitin in a hot alkaline solution of 40-50% w/w
NaOH, the time, temperature of the treatment will affect the distribution of N-acetyl, and amine
chains on the chitosan chain i.e. different degree of deacetylation (Buschmann et al., 2013). The
use of high conc. of NaOH leads to the removal of endotoxin present indigenously on the chitin
(note, 2001). The depolymerisation of chitin is performed to obtain short monomeric chains with
small molar masses. The depolymerisation cleaves the glycosidic linkage between the
disaccharide units of the chitosan glucosamine chain by the catalytic action of nitrous acid in the
presence of HCl at moderate temperature(Buschmann et al., 2013). The application of acid and
heat on the chitosan may lead to acidic hydrolysis of endotoxin present on the chitin or chitosan,
resulting in the production of low endotoxin chitosan (Sandle, 2011). Such harsh chemical
treatment during the production of chitin as well as chitosan ensures the fulfillment of quality
control mandate for low endotoxin contamination in the final product. The chitosan produced is
used in various formulations such as Chitosan-siRNA nanoparticles and Chitosan-Hyaluronic
Acid (HA/CS) or Chitosan-glycerol-phosphate (GP/CS) scaffolds for application in gene delivery
and tissue regeneration respectively. The process of production of chitosan from chitin and
subsequent formulations for different application is shown in Figure 2-14.
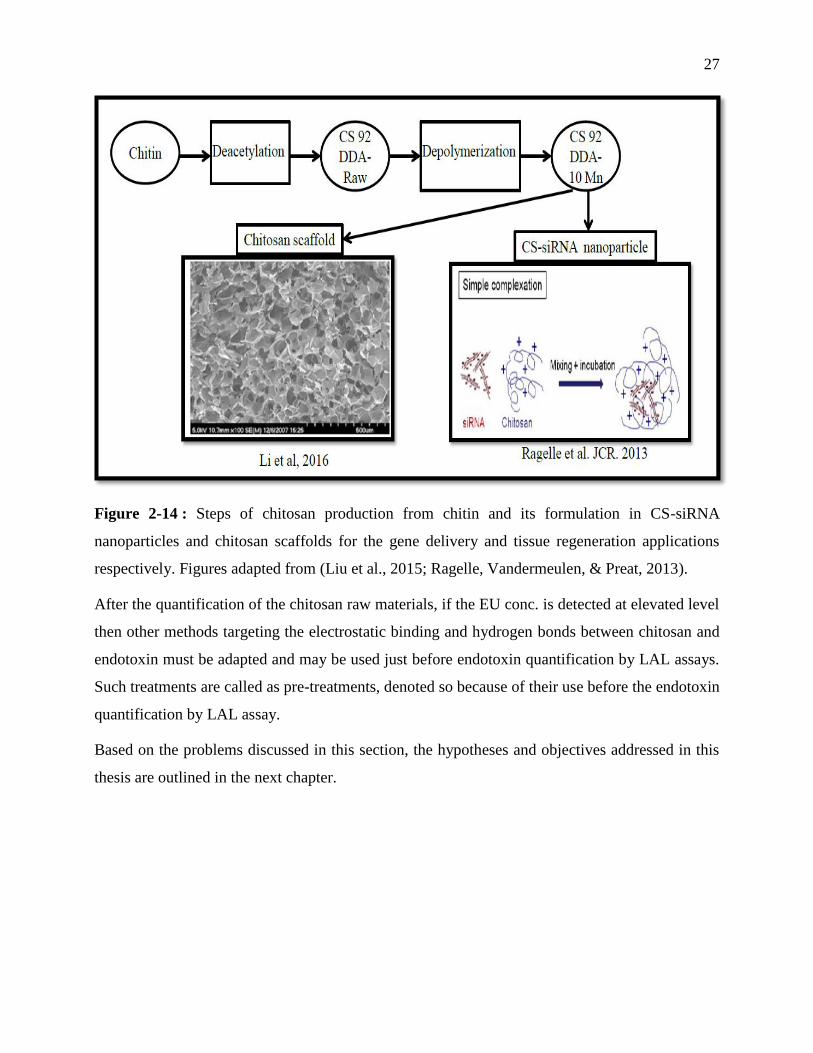
27
Figure 2-14 : Steps of chitosan production from chitin and its formulation in CS-siRNA
nanoparticles and chitosan scaffolds for the gene delivery and tissue regeneration applications
respectively. Figures adapted from (Liu et al., 2015; Ragelle, Vandermeulen, & Preat, 2013).
After the quantification of the chitosan raw materials, if the EU conc. is detected at elevated level
then other methods targeting the electrostatic binding and hydrogen bonds between chitosan and
endotoxin must be adapted and may be used just before endotoxin quantification by LAL assays.
Such treatments are called as pre-treatments, denoted so because of their use before the endotoxin
quantification by LAL assay.
Based on the problems discussed in this section, the hypotheses and objectives addressed in this
thesis are outlined in the next chapter.
28
CHAPTER 3 THESIS OBJECTIVES AND HYPOTHESIS
Due to the ubiquitous nature of endotoxin, it can be naturally found on any surface, solution,
substance and even on human body; however, the contamination of endotoxin during the
production process of an active pharmaceutical ingredient (API) is a nightmare for the quality
control units and without detection may cause life-threatening immune reaction if the API is
administered in humans. With the in vivo use of chitosan and intended application in human
subjects, the chitosan is regarded as an API in this thesis, and the absolute quantification of
endotoxin contamination is essential for controlling the dose of administration of scaffolds and
CS nanoparticles as well as for the verification of the manufacturing process of the chitosan.
Hence, the overall objectives of this thesis are described below:
3.1 Overall Objectives
1) To quantify EU concentration of powdered chitosan raw materials, especially CS with
92% degree of deacetylation with high and low molecular weight (10kDa) used for the
preparation of chitosan scaffolds and CS-siRNA nanoparticles administered in horses and
mice respectively.
2) Obtain a repeatable standard curve range in kinetic LAL assays for absolute
quantification of chitosan endotoxin.
3) Reduce the interference of chitosan in endotoxin detection by performing chitosan pre-
treatments for absolute quantification of chitosan endotoxin.
4) Provide recommendations for future endotoxin testing in chitosan.
3.1.1 Specific objectives for obtaining repeatable ranges of standard curves
for chitosan endotoxin quantification
Objective 1: To investigate the endotoxin conc. of chitosan raw materials by gel-clot LAL
assay to obtain an estimation of contamination and test different ranges to establish the most
repeatable and less variable standard curve for absolute quantification of chitosan endotoxin.
29
Objective 2: To investigate the technical parameters such as reagent evaporation and
pathlength contributing to standard curve variability and mitigation of variation by optimization
of these parameters.
3.1.2 Specific Hypotheses of this study
Hypothesis 1: A repeatable range of standard curve with minimum allowable variation
will be determined after examination and optimization of all parameters prone to variation.
Hypothesis 2: Adopting a small range of standard curve after optimization matching the
estimated value of chitosan endotoxin will be highly repeatable.
After the reduction of the variation accounted by different parameters and their
optimization, and establishing a standard curve range with lowest variation and high
repeatability, the absolute quantification of chitosan will be performed.
However, chitosan is known to interact efficiently with the LPS due to the presence of
negative charge and hydrogen bonds, similar to the mechanism observed with nucleic acids. This
interaction signifies the interference of chitosan in the detection of endotoxin, which may lead to
false negatives having the potential to elicit alarming level of cytokines once administered in
clinical subjects. However, there are certain pre-treatments adopted for reduction of interference
between chitosan and endotoxin for absolute quantification. Therefore, the objective for Chapter
4 is as follows:
3.1.3 Specific objectives for identification and reduction of interference in
endotoxin detection by chitosan Pre-treatments
Objective 1: To identify different types of interference caused by chitosan to endotoxin
and/or LAL by incorporating controls such as challenge samples and spiked water samples.
Objective 2: To reduce the inhibition interference in endotoxin determination by
performing chitosan pre-treatments targeting electrostatic binding and monomer size for absolute
quantification of endotoxin content in chitosan raw materials.
30
3.1.4 Specific hypotheses of this study
Hypothesis 1: The pre-treatment of chitosan will release endotoxin bound to the
positively charged and large glucosamine chains and facilitate absolute quantification of
endotoxin.
Hypothesis 2: The harsh chemical treatment used in depolymerisation reaction will be
deleterious to the endotoxin integrity and reduce detection.
This approach will allow the quantification of otherwise difficult chitosan raw materials’
EU conc. This approach will broaden the understanding of complexities of interaction between
chitosan and endotoxin and carries the potential to provide recommendations for establishing the
quality control process for quantification of endotoxin in chitosan.
31
CHAPTER 4 OPTIMIZATION OF PARAMETERS TO OBTAIN
REPEATABLE LAL STANDARD CURVE
This chapter presents the estimation of chitosan endotoxin values by gel-clot LAL assay,
determination of endotoxin conc. of chitosan nanoparticles and scaffolds dose after simulation to
Human equivalent dose (HED). Testing of various standard curve ranges of the more sensitive
turbidimetric LAL assay for absolute quantification of chitosan endotoxin and optimization of
parameters to obtain a repeatable standard curve in a plate reader for turbidimetric LAL assay.
4.1 Introduction
Due to application of chitosan in various biomedical applications in the form of
nanoparticles and scaffolds, the quantification of endotoxin in raw material is necessary. The
Chitosan (CS) with 92% degree of deacetylation (DDA) with High (Raw) and Low molecular
weight (10kDa) are tested for endotoxin with the gel-clot LAL assay. The gel-clot LAL assay
provides an estimation of endotoxin value above or below the range of its sensitivity. This
estimated value is used for calculation of the endotoxin conc. of clinical/ in vivo doses in
chitosan nanoparticles and scaffolds. Further efforts have been taken to quantify the absolute
conc. of endotoxin present in the chitosan raw materials by the use of highly sensitive
turbidimetric LAL assay. However, the variation of standard curves at different ranges interfered
with absolute endotoxin quantification, but allowed the investigation in to contributing
parameters to variation. A significant problem in quantifying the endotoxin level of any test
article by LAL assay is the non-repeatability of standard curve due to inherent variations
imperative in the biological assays, compared to the chemical assays. The error of a LAL test is
two-fold, which represents a range of 50-200% variation (McCullough, 2010). Various
troubleshooting methods are utilized in this section to produce a repeatable and reliable standard
curve.
32
4.2 Materials and Methods
4.2.1 Estimation of Chitosan Endotoxin value by Gel-Clot LAL assay
The gel-clot assay was performed to estimate the endotoxin contamination of chitosan
92DDA- Raw and chitosan 92 DDA-10kDa MW, the latter was processed from the former and
used in the animal studies. The chitosan samples were dissolved according to the method
recommended by the supplier i.e. Associates of Cape Cod (ACCI) for endotoxin detection in
chitosan in 0.2% acetic acid at 37°C for 1 hour at a conc. of 10mg/mL.
The gel-clot estimation of EU conc. was performed using the Pyrosate kit (Kit# PS14005-
10) obtained from Associates of Cape cod (ACCI); the sensitivity of the kit was labelled at 0.03
EU/mL, denoted as lambda (λ) which is the EU conc. resulting in the formation of a firm clot
unbreakable after inversion, called as positive clot. The kit contained 10 blue capped vials with
lyophilized LAL enzyme for direct dissolution in sample, instead of reconstitution in pH
adjusting glucashield buffer, and 10 red capped Positive Product Control (PPC) vials with the
CSE at EU conc. of 2λ, the PPCs act as the detectors of inhibition or enhancement interference by
the samples to endotoxin during the LAL assay. The samples were diluted 1:100 times to a final
conc. of 0.1mg/mL in the glucashield buffer to adjust the sample pH for optimal LAL reactivity,
then 0.5mL pH adjusted diluted sample was added in duplicate in blue capped vials with LAL
enzyme. The LAL enzyme was mixed in the sample solution by shaking the tube rack for 20-30
seconds and from these vials, half the reconstituted volume of sample+ LAL at 0.25mL was
transferred to the red capped PPC vials and mixed thoroughly with the CSE at a conc. of 2λ [0.06
EU/mL] to prepare the PPCs. Similar procedure was followed for LRW without buffer dilution
to obtain a negative and positive control with blue capped LRW+LAL vials acting as negative
control and red capped LRW+LAL+ 2λ CSE forming the PPCs, the inclusion of positive and
negative control is the pre-requisite for validation of any format of LAL assay. The vials were
then incubated in a non-circulating water bath at 37˚C for the recommended time of 48 minutes
to observe the clot formation, disturbance from the surroundings could lead to misrepresented
results and all the measures were taken to reduce it. The formation of gel clot in the vial was
inspected and the vials with no visible clot were scored as negatives, while the ones with a firm
gel-clot unbreakable by 180˚ inversion of the vial were scored positive. When a vial shows a gel-
33
clot that looked firm, but is disrupted after 180˚ inversion then the sample is deemed to have
endotoxin below sensitivity level, and scored negative.
Validation criteria:
a) The positive control i.e. 2λ CSE+ LRW+ LAL must always have positive clotting for the
assay to be valid.
b) The negative control (LRW +LAL) must always show negative clot in a valid assay.
Interpretation of results:
i) The PPCs of a non-interfering sample will show positive clotting; a negative PPC result
indicates interference by the sample towards endotoxin or LAL enzyme.
ii) In case of negative clotting, the sample EU conc. was reported as less than or equal to
labelled sensitivity <0.03 EU/mL
iii) In case of positive clotting, the sample conc. was reported as greater than or equal to
labelled sensitivity i.e. > 0.03 EU/mL
Based on the estimated value of EU conc. of CS 92-Raw and CS 92-10 samples, the
concentration of endotoxin in the minimum and maximum dose of injected CS-siRNA
nanoparticles was simulated after conversion from mouse to Human Equivalent Dose (HED).
4.2.2 Simulation of chitosan injected dose in animals to Human Equivalent
Dose (HED) and estimation of endotoxin conc.
The most important parameter to regulate in the active pharmaceutical Ingredient (API)
injected in humans is the amount of endotoxin entering the body. As emphasized in the literature
review, even the smallest amount of endotoxin entering the human circulatory system can cause
lethal immune response leading to septic shock and death. Therefore, there are strict limitations
imposed by the USP for the endotoxin content of medical devices and formulations used in
humans. The EU limit for formulations used in intravenous application is 5 EU/kg/hour and 0.2
EU/kg/hour for intrathecal application.
The minimum dose of chitosan-siRNA nanoparticles formulated for estimation of cargo
delivery efficiency and chitosan toxicity in mouse models was 1mg/kg of siRNA; this dose
34
translated to 2.8mg/kg of injected chitosan at an N: P [Amine (N) from CS: Phosphate (P) from
siRNA] ratio of 5. The chitosan was used at five-fold higher conc. than siRNA to increase
polyplex uptake by the cells (Thibault et al, 2011). Both the chitosan and siRNA doses were
converted to the human equivalent dose (HED) using the conversion factor of 12.3 recommended
by the FDA. The HED of chitosan was then multiplied by the estimated EU conc. obtained from
gel-clot assay and that of siRNA was multiplied with the EU conc. obtained from the certificate
of analysis. The additive EU conc. of the HEDs was then compared with the acceptable limit of 5
EU/kg/hour approved by the USP for its suitability as an API formulation for intravenous
injections.
Similarly, the maximum tolerated dose (MTD) of chitosan-siRNA nanoparticles in mice
coated with Hyaluronic acid (HA) to facilitate the uptake, reduce chitosan-induced toxicity and
increase the cargo load was 8 mg/kg of siRNA. The N: P: C ratio [Amine (N) from CS:
Phosphate (P) from siRNA: Carboxylic acid (C) from HA] used for this formulation was 2:1:1.5,
this translated the dose of chitosan to 8.85 mg/kg and that of HA to 15.27 mg/kg. All the siRNA,
chitosan and hyaluronic acid doses were converted to HEDs and the EU conc. in EU/kg of each
component was calculated, for chitosan EU content the estimated EU conc. obtained from gel-
clot assay was used. The suitability of this dose for human application was then confirmed by
comparing the additive HED EU conc. with the acceptable EU limit issued by the USP for
intravenous injection (5 EU/kg/hour).
The endotoxin concentration of the 0.1mg/kg dose of chitosan used as scaffolds in the
intra-articular injection of horses was also calculated by multiplying with the estimated 0.3
EU/mg value of chitosan obtained from gel-clot assay; this dose was not converted into HED,
because the acceptable EU limit for human intra-articular injections is unavailable. The
calculated EU value was then compared to the harmonized limit (0.1 EU/kg) accepted for intra-
articular injection in LPS sensitive horses by different authors (Carregaro et al. 2014 and Lucia et
al. 2013).
35
4.2.3 Use of more sensitive kinetic LAL assays for chitosan endotoxin
determination
As the EU conc. of chitosan samples obtained from the gel-clot is an estimated value, it
was necessary to quantify the absolute concentration of endotoxin in chitosan, because of its
application in LPS sensitive animals like horses and final clinical application in rather sensitive
humans. The harmonized acceptable EU limit for intra-articular injection in horses is very low
(0.1 EU/kg) and in order to have a conservative EU value to avoid an immune response in future
clinical use in humans this value will be further reduced by a safety factor of 10 (Lazar et al,
2009). For a 70 kg human, the upper acceptable limit will be just 0.7 EU, instead of 30 EU for an
average 300kg horse which will lead to rejection of chitosan for use as a pharmaceutical
ingredient based on the calculated EU conc. of chitosan dose (9 EU in 30mg dose) from the
estimated EU value by gel-clot. In order to reach such level of precision with endotoxin
quantification of chitosan used as scaffolds, using an estimated EU value from gel-clot assay
seem very risky.
On the other hand, from the perspective of quality control, the value of 300 EU/g is very
high for a clinically applicable product; the cleanest chitosan available commercially, has an EU
value of 100 EU/g i.e. 3 times lower than our product. In order to compete commercially, it is a
pre-requisite to have the information about absolute EU conc. of the chitosan produced in-house.
If the EU conc. after precise quantification is at a lower limit, then the product specification
would claim lower endotoxin content; but if the absolute EU conc. of in-house chitosan is higher
than the commercial one, then optimization of manufacturing, deacetylation and other
downstream processing may be initiated to produce a chitosan batch with ultra-low endotoxin.
Indeed, it is essential to obtain an accurate and absolute conc. of endotoxin to establish the
product specification of the in-house chitosan batches.
The disadvantage of using an estimated EU value is that it may lead to overestimation of
the chitosan EU conc., which may lead to its rejection before the market release. Hence, in order
to avoid false-positive results, it is extremely important to quantify the absolute EU conc. of
chitosan to help reduce the likelihood of rejection due to the estimated values.
36
4.2.3.1 Principle of LAL assay
In order to accurately quantify the absolute EU conc. of chitosan, the kinetic turbidimetric
and chromogenic assays were used. The kinetic formats of the LAL assays are most sensitive for
quantification of chitosan. The sensitivities of both the assays are 0.005 EU/mL, which could
easily validate or reject the EU value estimated from gel-clot assay. As shown in Chapter 1
section 2.1.4.2, the principle of quantification by turbidimetric LAL assay relies upon the
development of turbidity following activation of enzyme cascade by endotoxin. The formation of
insoluble coagulin protein from the soluble coagulogen after activation of Factor C cascade
results in direct correlation with the amount of endotoxin present in the test solution. Similarly, in
the chromogenic LAL assay, the clotting enzyme is conjugated with a protein-dye substrate i.e.
Gly-Arg-p-Nitroaniline, which when cleaved releases the yellow colored p-Nitroaniline substrate.
The quantity of this chromogenic substrate is directly proportional to the actively pyrogenic
endotoxin in the sample.
4.2.3.2 Generating standard curves from raw data
The development of turbidity or development of yellow color is quantified over a 2-hour
time period at a wavelength of 405nm at a specified time interval (30s- 100s) by a
spectrophotometer or plate reader. An absorbance (O.D) vs. time graph is obtained after
completion of a run.
The vital information extracted from the originated data is the onset time of the standard
calibrators and test samples, the onset time refers to the number of seconds it took a sample to
reach a pre-set threshold O.D. Depending on the raw data of each assay, the threshold O.D is set
either at 0.1 or 0.2 from the starting O.D of each calibrator, to remove excess background for the
analysis. The samples with high endotoxin conc. reach the threshold O.D of 0.1 in shorter time
and the ones with lower conc. reach the mark in longer time resulting in small and high onset
times respectively. For plotting the standard curve, a linear regression of the log of onset times
and log of corresponding endotoxin concentrations is plotted, the linear equation in the form of
y= mx + b is used for calculating the sample endotoxin concentration. The acceptance criteria set
out by USP for the standard curve is that it must have minimum of three standard calibrators and
a correlation coefficient of >0.98. The validity of the assay is also measured by observing the
recovery of a CSE control sample, which is LRW+ spike of known amount of endotoxin between
37
75-125% (STE-1.4, 2015; USP, 2005). If these acceptance criteria were unmet, the assay was
considered invalid and was repeated.
4.2.4 Testing of various standard curve ranges for establishing a repeatable
range
For valid quantification of chitosan EU conc. various standard curve ranges were tested to
match the expected and estimated EU conc. of chitosan and also to establish the most repeatable
range for future use in endotoxin detection. The variation arises due to the inherent 2-fold error in
the assay, technical and manual errors. A 1000 EU/mL CSE stock was used to prepare the
standard curve ranges. The standard curve ranges tested were: -
a) 50-0.005 EU/mL- This range was tested based on the certificate of compliance issued
by the supplier (Associates of Cape Cod) suggested for use of this range in a plate
reader and because of its widespread use by another eminent supplier Lonza (Lonza,
2014). No. of repetitions (N) = six.
b) 10-0.01 EU/mL- Due to the use of chitosan raw material with 92% DDA, which
might have high EU contamination. Because of the recommendation from another
major LAL supplier Charles River Laboratories (CRL), that states that a test of four-
log of assay sensitivity (log 0.005 *4) standard curve from 10-0.005 EU/mL that may
be suitable for the in process and raw materials testing (CRL, 2006); for the initial
quantification of absolute chitosan EU conc. this range was applied. No. of repetitions
(N) = three.
c) 5-0.005 EU/mL- Higher calibrator was reduced 2-fold for testing. No. of repetitions
(N) = six.
The variation in the repeatability of each range was calculated by comparing the relative standard
deviation %RSD (%CV) = |𝑀𝑒𝑎𝑛|
𝑆𝐷∗ 100 for slope and intercept of the linear equations of each
range with the acceptable percentage coefficient of variation (%CV) value of slope and intercept
issued at 10% and 3% respectively for all the ranges by the lysate supplier i.e. ACCI.
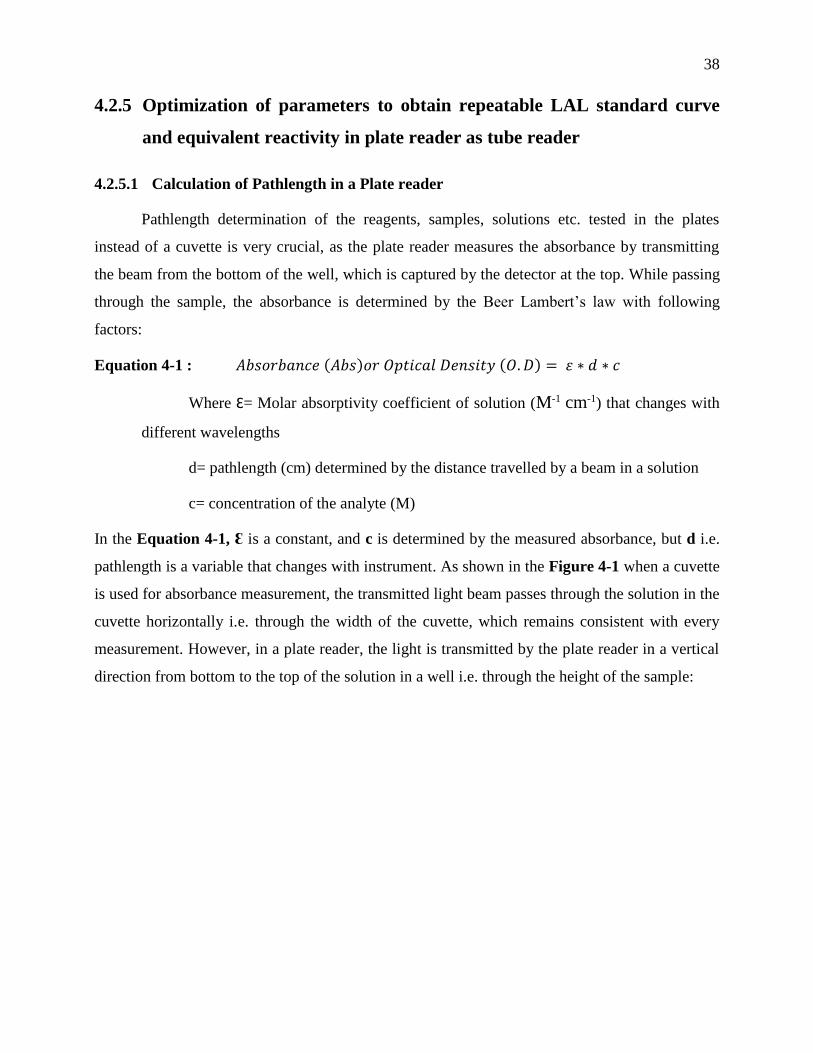
38
4.2.5 Optimization of parameters to obtain repeatable LAL standard curve
and equivalent reactivity in plate reader as tube reader
4.2.5.1 Calculation of Pathlength in a Plate reader
Pathlength determination of the reagents, samples, solutions etc. tested in the plates
instead of a cuvette is very crucial, as the plate reader measures the absorbance by transmitting
the beam from the bottom of the well, which is captured by the detector at the top. While passing
through the sample, the absorbance is determined by the Beer Lambert’s law with following
factors:
Equation 4-1 : 𝐴𝑏𝑠𝑜𝑟𝑏𝑎𝑛𝑐𝑒 (𝐴𝑏𝑠)𝑜𝑟 𝑂𝑝𝑡𝑖𝑐𝑎𝑙 𝐷𝑒𝑛𝑠𝑖𝑡𝑦 (𝑂. 𝐷) = 𝜀 ∗ 𝑑 ∗ 𝑐
Where Ɛ= Molar absorptivity coefficient of solution (M-1 cm-1) that changes with
different wavelengths
d= pathlength (cm) determined by the distance travelled by a beam in a solution
c= concentration of the analyte (M)
In the Equation 4-1, Ɛ is a constant, and c is determined by the measured absorbance, but d i.e.
pathlength is a variable that changes with instrument. As shown in the Figure 4-1 when a cuvette
is used for absorbance measurement, the transmitted light beam passes through the solution in the
cuvette horizontally i.e. through the width of the cuvette, which remains consistent with every
measurement. However, in a plate reader, the light is transmitted by the plate reader in a vertical
direction from bottom to the top of the solution in a well i.e. through the height of the sample:
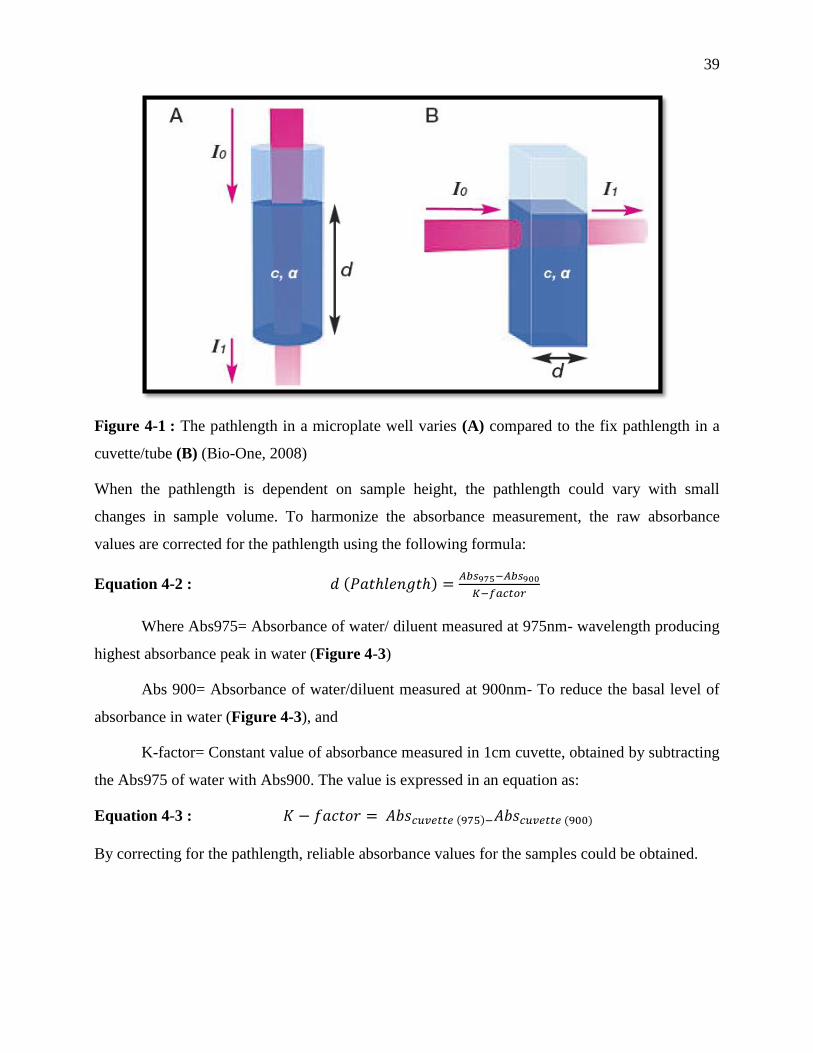
39
Figure 4-1 : The pathlength in a microplate well varies (A) compared to the fix pathlength in a
cuvette/tube (B) (Bio-One, 2008)
When the pathlength is dependent on sample height, the pathlength could vary with small
changes in sample volume. To harmonize the absorbance measurement, the raw absorbance
values are corrected for the pathlength using the following formula:
Equation 4-2 : 𝑑 (𝑃𝑎𝑡ℎ𝑙𝑒𝑛𝑔𝑡ℎ) =𝐴𝑏𝑠975−𝐴𝑏𝑠900
𝐾−𝑓𝑎𝑐𝑡𝑜𝑟
Where Abs975= Absorbance of water/ diluent measured at 975nm- wavelength producing
highest absorbance peak in water (Figure 4-3)
Abs 900= Absorbance of water/diluent measured at 900nm- To reduce the basal level of
absorbance in water (Figure 4-3), and
K-factor= Constant value of absorbance measured in 1cm cuvette, obtained by subtracting
the Abs975 of water with Abs900. The value is expressed in an equation as:
Equation 4-3 : 𝐾 − 𝑓𝑎𝑐𝑡𝑜𝑟 = 𝐴𝑏𝑠𝑐𝑢𝑣𝑒𝑡𝑡𝑒 (975)−𝐴𝑏𝑠𝑐𝑢𝑣𝑒𝑡𝑡𝑒 (900)
By correcting for the pathlength, reliable absorbance values for the samples could be obtained.
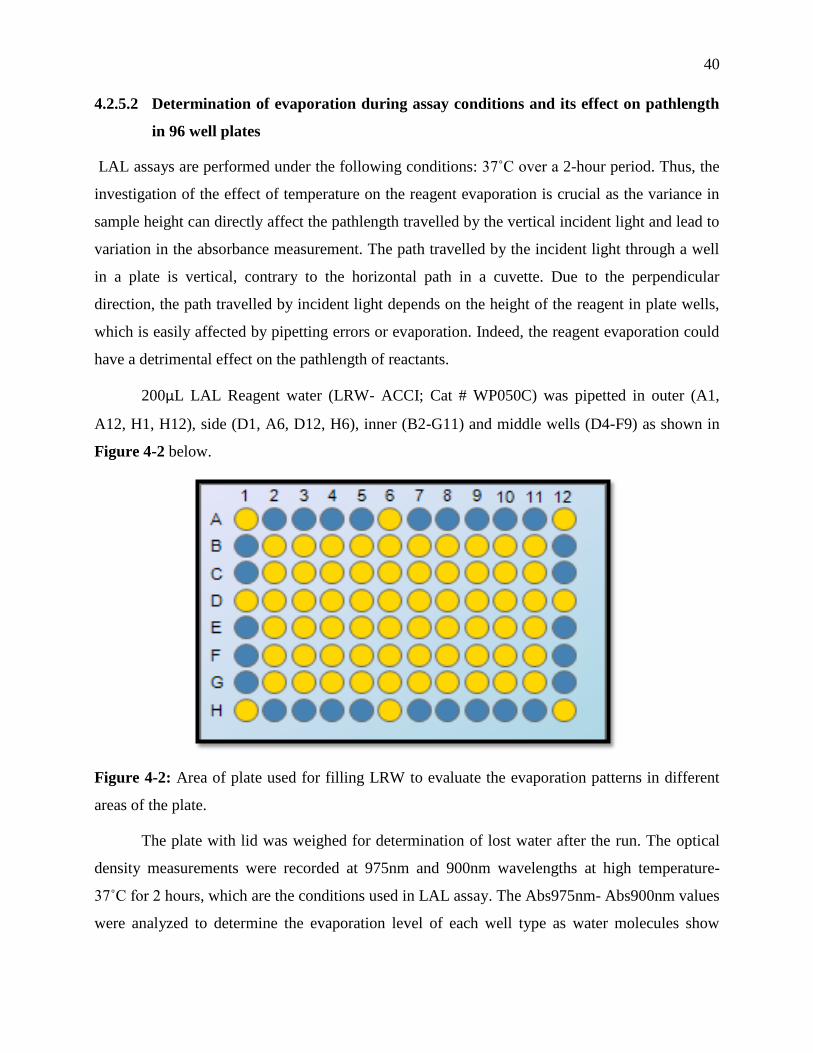
40
4.2.5.2 Determination of evaporation during assay conditions and its effect on pathlength
in 96 well plates
LAL assays are performed under the following conditions: 37˚C over a 2-hour period. Thus, the
investigation of the effect of temperature on the reagent evaporation is crucial as the variance in
sample height can directly affect the pathlength travelled by the vertical incident light and lead to
variation in the absorbance measurement. The path travelled by the incident light through a well
in a plate is vertical, contrary to the horizontal path in a cuvette. Due to the perpendicular
direction, the path travelled by incident light depends on the height of the reagent in plate wells,
which is easily affected by pipetting errors or evaporation. Indeed, the reagent evaporation could
have a detrimental effect on the pathlength of reactants.
200μL LAL Reagent water (LRW- ACCI; Cat # WP050C) was pipetted in outer (A1,
A12, H1, H12), side (D1, A6, D12, H6), inner (B2-G11) and middle wells (D4-F9) as shown in
Figure 4-2 below.
Figure 4-2: Area of plate used for filling LRW to evaluate the evaporation patterns in different
areas of the plate.
The plate with lid was weighed for determination of lost water after the run. The optical
density measurements were recorded at 975nm and 900nm wavelengths at high temperature-
37˚C for 2 hours, which are the conditions used in LAL assay. The Abs975nm- Abs900nm values
were analyzed to determine the evaporation level of each well type as water molecules show
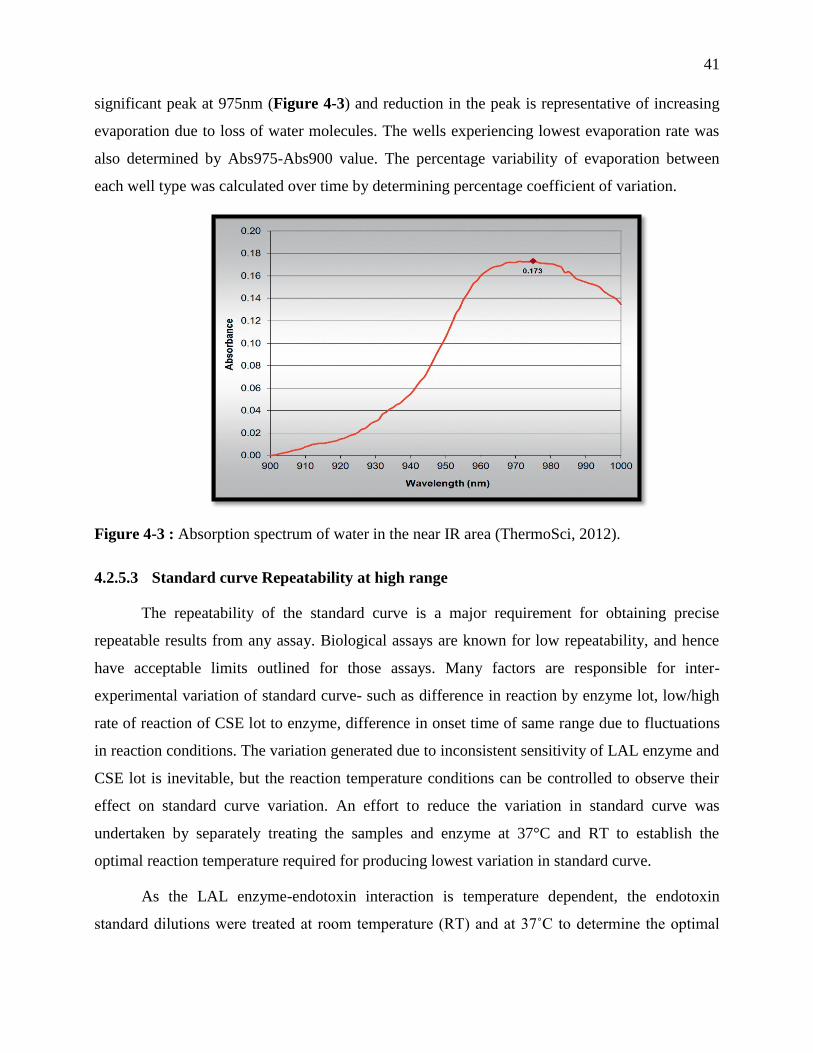
41
significant peak at 975nm (Figure 4-3) and reduction in the peak is representative of increasing
evaporation due to loss of water molecules. The wells experiencing lowest evaporation rate was
also determined by Abs975-Abs900 value. The percentage variability of evaporation between
each well type was calculated over time by determining percentage coefficient of variation.
Figure 4-3 : Absorption spectrum of water in the near IR area (ThermoSci, 2012).
4.2.5.3 Standard curve Repeatability at high range
The repeatability of the standard curve is a major requirement for obtaining precise
repeatable results from any assay. Biological assays are known for low repeatability, and hence
have acceptable limits outlined for those assays. Many factors are responsible for inter-
experimental variation of standard curve- such as difference in reaction by enzyme lot, low/high
rate of reaction of CSE lot to enzyme, difference in onset time of same range due to fluctuations
in reaction conditions. The variation generated due to inconsistent sensitivity of LAL enzyme and
CSE lot is inevitable, but the reaction temperature conditions can be controlled to observe their
effect on standard curve variation. An effort to reduce the variation in standard curve was
undertaken by separately treating the samples and enzyme at 37°C and RT to establish the
optimal reaction temperature required for producing lowest variation in standard curve.
As the LAL enzyme-endotoxin interaction is temperature dependent, the endotoxin
standard dilutions were treated at room temperature (RT) and at 37˚C to determine the optimal
42
conditions for standard curve repeatability. The endotoxin standard dilutions were prepared from
1000EU/mL Control Standard Endotoxin (CSE) vial (ACCI Cat # E0005-1; Lot # 147) at a range
of 50-0.005 EU/mL with 10-fold dilution. For RT treatment (N=2), the endotoxin dilutions and
LAL enzyme reagent (Pyrotell T ACCI; Cat # T0051-5; Lot # 515-10-757-T) reconstituted in β-
D glucan blocker -Glucashield buffer supplied by ACCI (Cat # GB051-5), were prepared at room
temperature, pipetted in a 96 well plate (125μL sample +125μL LAL) and placed in the
spectrophotometer for measurements at 37˚C for kinetic turbidimetric LAL reaction. For 37˚C
treatment (N=3), the endotoxin dilutions and LAL enzyme reagent were prepared and incubated
at 37˚C and then placed in the Tecan spectrophotometer (Tecan infinite- M200) for kinetic
measurement of absorbance at 405nm of LAL-Endotoxin interaction at 37˚C for 2 hours every
60sec or higher. For the correction of Absorbance at 405nm of each sample by pathlength of
LRW (sample diluent) + LAL, the absorbance at 975nm and 900nm was also measured. The
pathlength of LRW+ LAL was calculated following Equation 4-2, and the Abs405 of each
sample was corrected as follows:
Equation 4-4 : Correction of Raw O.D value: 𝐴𝑏𝑠405𝑐𝑜𝑟𝑟𝑒𝑐𝑡𝑒𝑑 =
𝐴𝑏𝑠405
𝑃𝐿 (𝑐𝑚)
At the end of measurements, the standard curve for each temperature condition was
plotted following linear regression curve of Log endotoxin concentration [EU/mL] vs. Log Onset
time (sec); the onset time for each standard dilution was calculated by taking the average of
𝐴𝑏𝑠405𝑐𝑜𝑟𝑟𝑒𝑐𝑡𝑒𝑑 recorded at first 3 time points (t=0 to t=120s-200s) and adding the threshold O.D§ of
0.1 to the average 𝐴𝑏𝑠405𝑐𝑜𝑟𝑟𝑒𝑐𝑡𝑒𝑑 value. The repeatability of the standard curves was determined by
calculating the percentage coefficient of variation (%CV) of the intercept, slope and R2 of each
linear equation.
The difference in pathlength of LRW and LRW+LAL enzyme was observed. The
Pathlength vs. temperature correlation for each reactant was also observed with time.
§ Threshold O.D value was set at a level, which reduced the background from each
standard dilution.
43
4.2.6 Post-optimization of parameters: Repeatable standard curve ranges for
Turbidimetric LAL assay
4.2.6.1 Turbidimetric: Use of smaller curve range of 0.16-0.005 EU/mL to obtain
repeatable standard curve and match expected values in chitosan
After encountering multitude of challenges with the repeatability of the standard curve
with a degree of ambiguity in the quantified EU values of chitosan simultaneously tested with
variable standard curves, a small range of standard curve was used with highest calibrator at 0.16
EU/mL after applying all the optimized parameters. This tested range provided good repeatability
and also enclosed the values of chitosan EU conc. obtained from gel-clot LAL assay i.e. 0.03
EU/mL perfectly within its detection range. Additionally, a smaller range provided flexibility in
assay manipulation due to extended reaction time between sample and LAL enzyme Eg; the
average onset time for 0.16 EU/mL is 1280 sec as compared to 300 secs for 50 EU/mL. An
intermediate solution of 20 EU/mL was prepared from 1000 EU/mL by 50-fold dilution in LRW,
subsequently followed by 6.25 times dilution for another intermediate solution of 3.2 EU/mL,
this solution was then serially diluted 10-folds to prepare third intermediate solution at 0.32
EU/mL. The calibrators were then prepared by 2-fold dilution from 0.16 EU/mL, 0.08 EU/mL,
0.04 EU/mL, 0.02 EU/mL, 0.01 EU/mL and finally 0.005 EU/mL. The calibrators were pipetted
in triplicate in a 96 well plate, and placed in a plate reader for incubation at 37°C for 20 mins to
equilibrate the sample for rapid endotoxin detection after addition of pyotell lysate (LAL
enzyme). The LAL enzyme made sensitive for endotoxin detection by reconstituting in glucan
inhibiting glucashield buffer, and after the incubation time was added on top of each calibrator.
Within 5 minutes of LAL addition, the absorbance measurement was started at 405nm for 2 hours
at an interval of 1min 25 sec by the Magellan software; the absorbance at 975nm and 900 nm was
also recorded for pathlength correction simultaneously. After the completion of run, the standard
curve and onset times of calibrators were produced by software; the standard curve was plotted as
log EU conc. vs. Log onset times by a linear regression function. The linear equation obtained as
y= mx+ b was consequently used for the calculation of chitosan EU conc., which were prepared
along with standard curves, but shown in chapter 4, for the purpose of clarity. This range of
standard curve was repeated N= 3 times, and the linearity of each standard curve was observed to
be > 0.98 as per USP requirement, more importantly the repeatability of this range was
44
determined by calculating the percentage variability in the slope and intercept values between the
three linear equations and compared with the acceptable limit of slope %CV= 10% and intercept
%CV= 3% issued by ACCI.
4.3 Results
4.3.1 Estimation of chitosan endotoxin value by Gel clot assay
Gel clot is a semi-quantitative assay used for the estimation of endotoxin value in a
sample. It is considered an official referee test by the Pharmacopeias if turbidimetric and
chromogenic LAL gives indeterminate results. The results are classified negative or positive
based on the formation of gel-clot, the negative control must show no clot and the positive
control must show a firm clot for the test to be valid. If any test sample have a tendency of
interference with endotoxin, then the Inhibition/Enhancement controls i.e. Positive product
controls (PPCs) show negative clotting. A test sample with enhancement interference will show a
positive clot in the test tube. The kits come with specified sensitive levels labelled “λ (lambda)”
which is the lowest concentration of endotoxin required to produce a positive test result, the
lowest sensitivity of 0.03 EU/mL was tested. A positive test result is when the enzyme is
activated by the sample to form a clot, which does not break after inverting 180˚. The chitosans
with 92% degree of deacetylation at low molecular weight and the raw material at high molecular
weight were tested to estimate the endotoxin conc. by gel-clot LAL assay. Samples were
prepared at a conc. of 10 mg/mL in 0.2% acetic acid after dissolution for 1 hour at 37°C
according to ACCI method. For each sample, an interference control called positive product
control (PPC) was tested which is included in the kit at twice the Control Standard Endotoxin
(CSE) concentration required for producing a positive test result i.e. 0.06 EU/mL or 2λ.
According to the USP 85, the validity of gel-clot assay is demonstrated when duplicate vials of
negative control i.e. LRW+LAL show negative clot, and the positive control (LRW+CSE
2λ+LAL) demonstrate a positive clot after a recommended incubation time (48 mins) at 37˚C.
According to Figure 4-4 and Figure 4-5, this criterion was met by the test.
Negative control
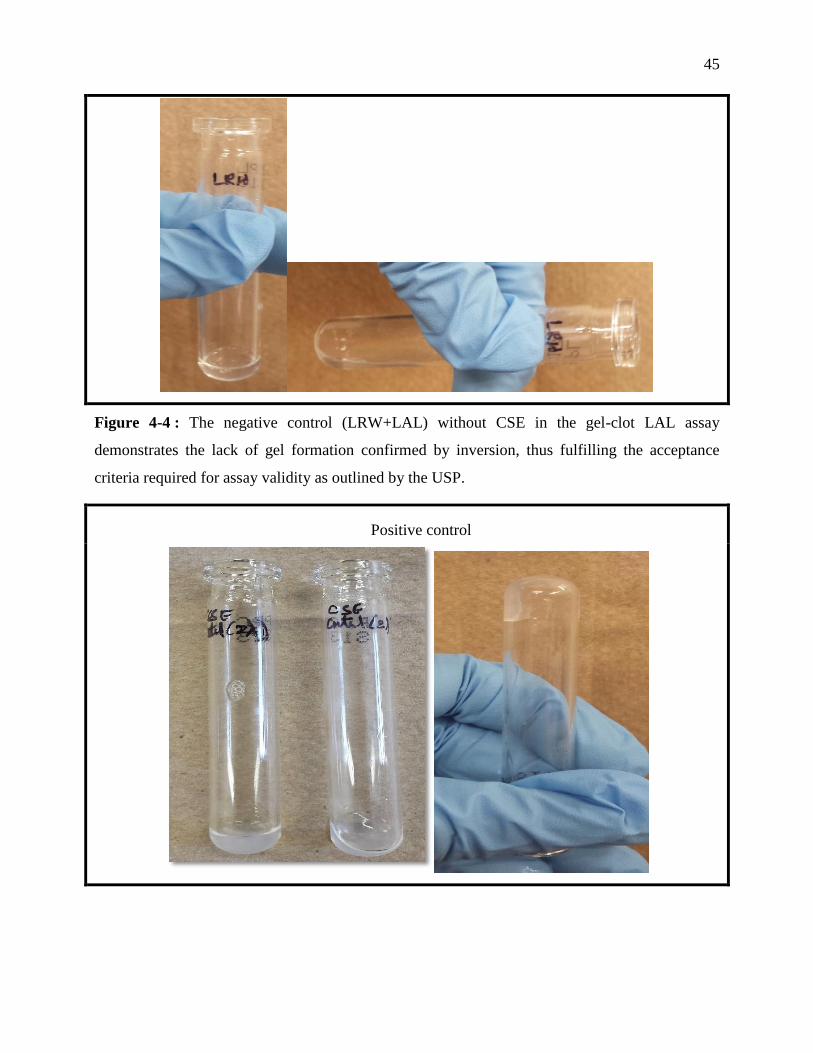
45
Figure 4-4 : The negative control (LRW+LAL) without CSE in the gel-clot LAL assay
demonstrates the lack of gel formation confirmed by inversion, thus fulfilling the acceptance
criteria required for assay validity as outlined by the USP.
Positive control
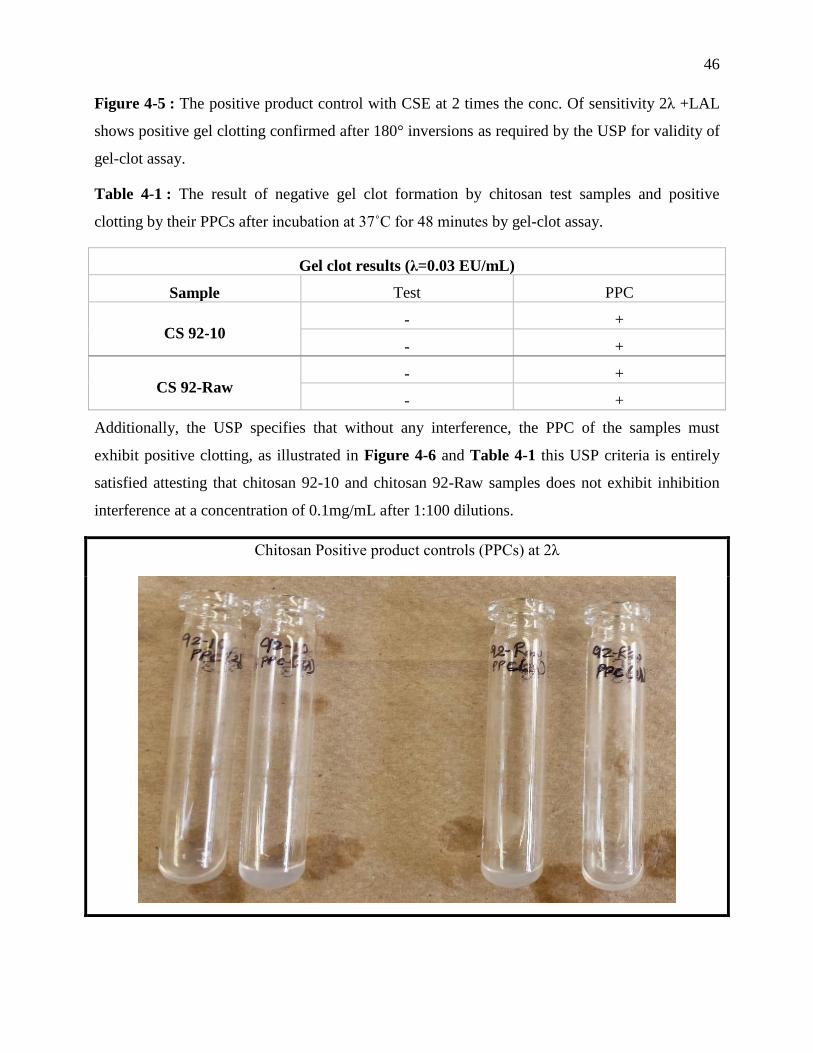
46
Figure 4-5 : The positive product control with CSE at 2 times the conc. Of sensitivity 2λ +LAL
shows positive gel clotting confirmed after 180° inversions as required by the USP for validity of
gel-clot assay.
Table 4-1 : The result of negative gel clot formation by chitosan test samples and positive
clotting by their PPCs after incubation at 37˚C for 48 minutes by gel-clot assay.
Gel clot results (λ=0.03 EU/mL)
Sample Test PPC
CS 92-10 - +
- +
CS 92-Raw - +
- +
Additionally, the USP specifies that without any interference, the PPC of the samples must
exhibit positive clotting, as illustrated in Figure 4-6 and Table 4-1 this USP criteria is entirely
satisfied attesting that chitosan 92-10 and chitosan 92-Raw samples does not exhibit inhibition
interference at a concentration of 0.1mg/mL after 1:100 dilutions.
Chitosan Positive product controls (PPCs) at 2λ
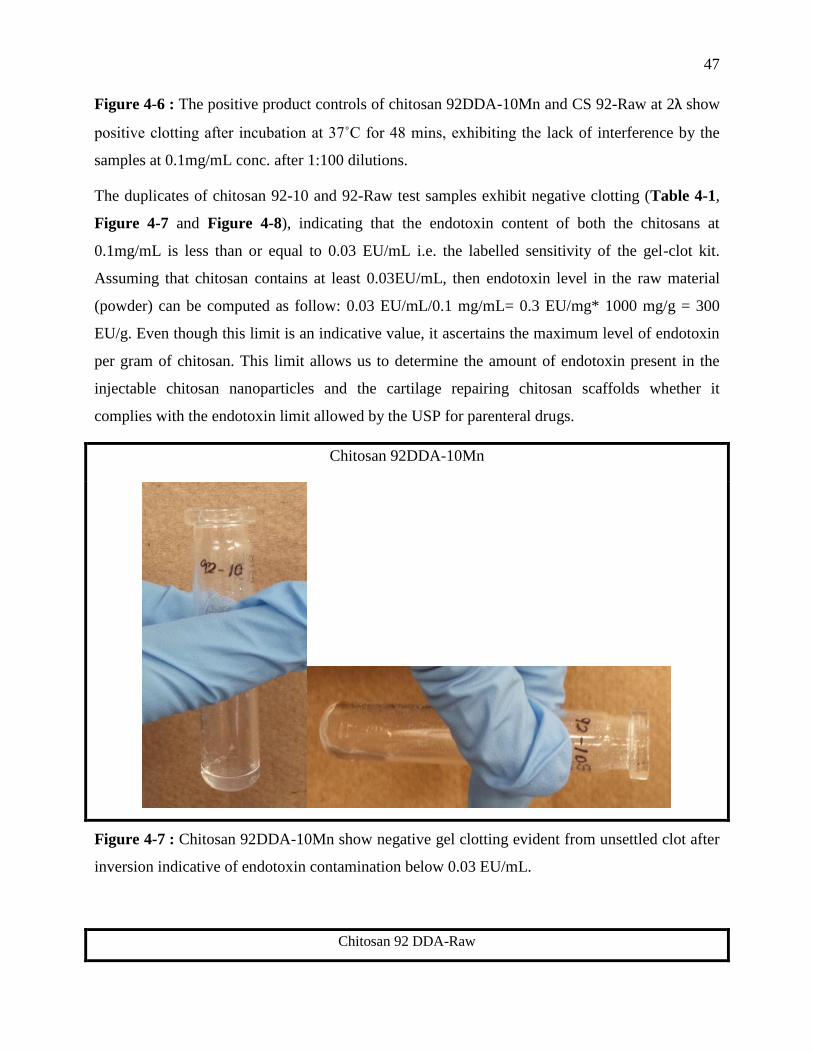
47
Figure 4-6 : The positive product controls of chitosan 92DDA-10Mn and CS 92-Raw at 2λ show
positive clotting after incubation at 37˚C for 48 mins, exhibiting the lack of interference by the
samples at 0.1mg/mL conc. after 1:100 dilutions.
The duplicates of chitosan 92-10 and 92-Raw test samples exhibit negative clotting (Table 4-1,
Figure 4-7 and Figure 4-8), indicating that the endotoxin content of both the chitosans at
0.1mg/mL is less than or equal to 0.03 EU/mL i.e. the labelled sensitivity of the gel-clot kit.
Assuming that chitosan contains at least 0.03EU/mL, then endotoxin level in the raw material
(powder) can be computed as follow: 0.03 EU/mL/0.1 mg/mL= 0.3 EU/mg* 1000 mg/g = 300
EU/g. Even though this limit is an indicative value, it ascertains the maximum level of endotoxin
per gram of chitosan. This limit allows us to determine the amount of endotoxin present in the
injectable chitosan nanoparticles and the cartilage repairing chitosan scaffolds whether it
complies with the endotoxin limit allowed by the USP for parenteral drugs.
Chitosan 92DDA-10Mn
Figure 4-7 : Chitosan 92DDA-10Mn show negative gel clotting evident from unsettled clot after
inversion indicative of endotoxin contamination below 0.03 EU/mL.
Chitosan 92 DDA-Raw
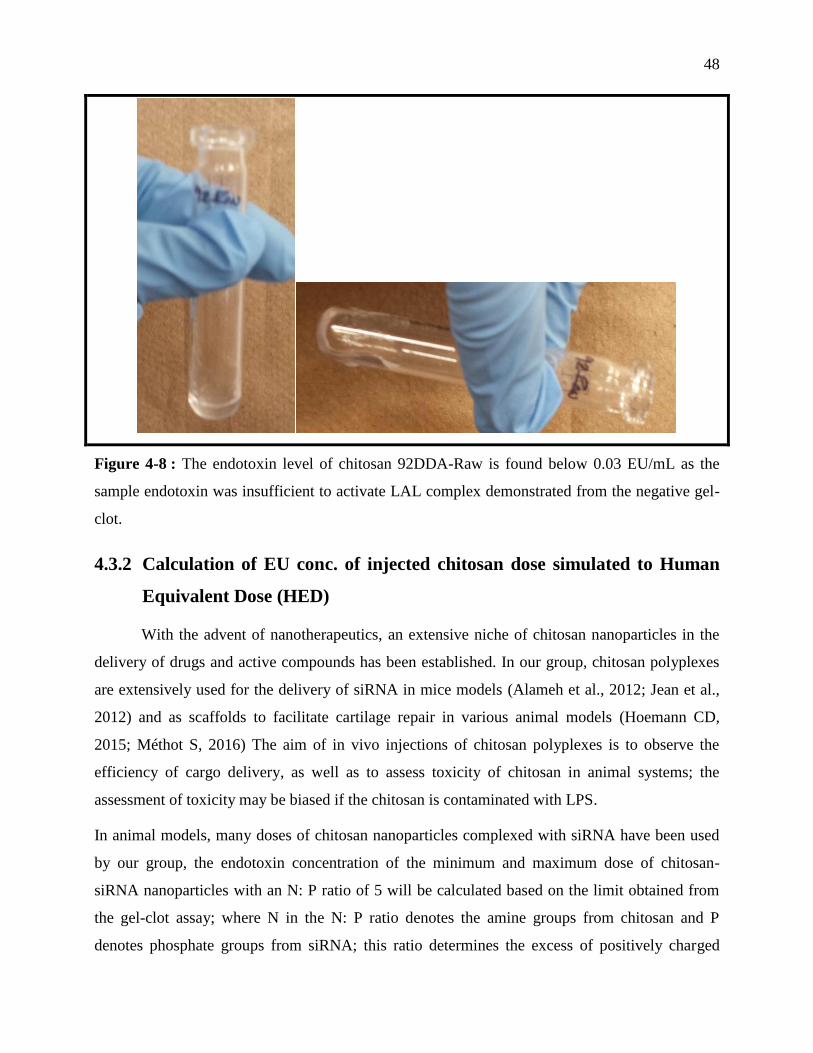
48
Figure 4-8 : The endotoxin level of chitosan 92DDA-Raw is found below 0.03 EU/mL as the
sample endotoxin was insufficient to activate LAL complex demonstrated from the negative gel-
clot.
4.3.2 Calculation of EU conc. of injected chitosan dose simulated to Human
Equivalent Dose (HED)
With the advent of nanotherapeutics, an extensive niche of chitosan nanoparticles in the
delivery of drugs and active compounds has been established. In our group, chitosan polyplexes
are extensively used for the delivery of siRNA in mice models (Alameh et al., 2012; Jean et al.,
2012) and as scaffolds to facilitate cartilage repair in various animal models (Hoemann CD,
2015; Méthot S, 2016) The aim of in vivo injections of chitosan polyplexes is to observe the
efficiency of cargo delivery, as well as to assess toxicity of chitosan in animal systems; the
assessment of toxicity may be biased if the chitosan is contaminated with LPS.
In animal models, many doses of chitosan nanoparticles complexed with siRNA have been used
by our group, the endotoxin concentration of the minimum and maximum dose of chitosan-
siRNA nanoparticles with an N: P ratio of 5 will be calculated based on the limit obtained from
the gel-clot assay; where N in the N: P ratio denotes the amine groups from chitosan and P
denotes phosphate groups from siRNA; this ratio determines the excess of positively charged
49
amine groups for high charge density that dictates the transfection efficiency of the nanoparticles
in the tissues (Thibault et al., 2011).
4.3.2.1 EU limit of minimum intravenous (IV) dose of chitosan nanoparticles
The minimum dose of chitosan-siRNA nanoparticles administered in mouse model at an
N: P ratio of 5 was 1mg/kg body weight; this dose translates to 2.8mg/kg of injected chitosan in
mouse. According to the US FDA, the dose of the therapeutics used in the animals must be
converted to the human equivalent dose (HED) to estimate the maximum safe starting dose for
use in healthy human volunteers. Although currently the use of chitosan nanoparticles in human
volunteers is a distant goal, the simulation of the animal dose of CS-siRNA nanoparticles to HED
is performed for estimating the endotoxin value of chitosan used in intravenous injection, this is
to ensure the compliance of chitosan EU value with the acceptable endotoxin limit of parenteral
drugs used in humans set to 5 EU/kg/hour by the USP. The compliance of 1mg/kg CS-siRNA
nanoparticles to this limit is shown by the calculation below:
Dose of chitosan administration derived from 1mg/kg nanoparticle dose in mouse= 2.8
mg/kg
Conversion of the chitosan dose of 2.8mg/kg in mouse to human equivalent dose (HED)
by dividing with a factor of 12.3 recommended by the FDA (FDA, 2005):
2.8 𝑚𝑔/𝑘𝑔
12.3= 0.227 𝑚𝑔/𝑘𝑔
Ideally, for a 70kg human subject, total injected amount of chitosan= 70𝑘𝑔 ∗0.227𝑚𝑔
𝑘𝑔=
15.93 𝑚𝑔
The endotoxin level of chitosan determined by the gel-clot assay= <300 EU/g or <0.3
EU/mg
To calculate the amount of endotoxin in EU of 15.93mg chitosan, the chitosan endotoxin
value obtained by gel clot was multiplied= 15.93𝑚𝑔 ∗ 0.3𝐸𝑈
𝑚𝑔= 4.78 𝐸𝑈 for entire
human body weight
Calculating the concentration of endotoxin per kg body weight of human for comparison
with the acceptable endotoxin limit: 4.78 𝐸𝑈
70 𝑘𝑔= 0.068 𝐸𝑈/𝑘𝑔
50
The chitosan endotoxin value of <0.068 EU/kg is under the endotoxin limit of 5 EU/kg issued for
parenteral drugs by the USP; the EU value for the lot of siRNA used in animal study is declared
at <0.05 EU/mg by the supplier that translates to <0.004 EU/kg for 1mg/kg injected siRNA dose.
The additive EU conc. of 1mg/kg CS-siRNA nanoparticles is <0.072 EU/kg signifying that the
lowest dose of chitosan nanoparticle injection is safe for future use in humans.
4.3.2.2 Upper EU limit of maximum tolerated dose (MTD) of intravenously (IV) injected
chitosan nanoparticles
The maximum tolerated dose (MTD) of uncoated chitosan-siRNA nanoparticles in mouse
is 2.5mg/kg, but in order to increase the siRNA dose and target specificity, the chitosan-siRNA
nanoparticles were coated with Hyaluronic acid (HA), which rendered the nanoparticles less toxic
and enabled the administration of 8mg/kg HA-CS-siRNA nanoparticles dose in the mouse model
at an N: P: C ratio of 2: 1: 1.5 (where C in N:P:C ratio stands for the carboxylic group of HA);
this dose translates to 8.85 mg/kg of injected chitosan in mouse. The 8mg/kg dose of HA CS-
siRNA nanoparticles translates to individual dose of 15.27 mg/kg hyaluronic acid (HA), 8.85
mg/kg chitosan and 8mg/kg siRNA which dictates the injection dose in animals. As 8 mg/kg
nanoparticle dose is MTD and may be designated a No Observed Adverse Effect Level (NOAEL)
in mouse model, the human equivalent dose (HED) is derived by dividing the NOAEL with a
conversion factor of 12.3 according to the US FDA recommendations. So, the 8.85 mg/kg
chitosan dose in mouse is divided by 12.3 to obtain the HED. The compliance of 8 mg/kg CS-
siRNA nanoparticles to the endotoxin limit of 5 EU/kg per human parenteral dose is shown by
the following calculation:
Dose of chitosan administration derived from 8mg/kg nanoparticle dose in mouse= 8.85
mg/kg
Conversion of the chitosan dose of 8.85 mg/kg in mouse to the human equivalent dose
(HED) by dividing with a factor of 12.3 recommended by the FDA:
8.85 𝑚𝑔/𝑘𝑔
12.3= 0.72 𝑚𝑔/𝑘𝑔
For a 70kg human subject, total injected amount of chitosan= 70𝑘𝑔 ∗0.72𝑚𝑔
𝑘𝑔= 50.4 𝑚𝑔
The endotoxin level of chitosan determined by the gel-clot assay= <300 EU/g or <0.3
EU/mg
51
To calculate the amount of endotoxin in EU of 50.4 mg injected chitosan, the chitosan
endotoxin upper limit value obtained by gel clot was multiplied= 50.4𝑚𝑔 ∗ 0.3𝐸𝑈
𝑚𝑔=
15.12 𝐸𝑈 for entire human body weight
Calculating the concentration of endotoxin per kg body weight of human for comparison
with the acceptable endotoxin limit: 15.12 𝐸𝑈
70 𝑘𝑔= 0.216 𝐸𝑈/𝑘𝑔.
The chitosan endotoxin value of <0.216 EU/kg is well below the endotoxin limit set at 5 EU/kg
for the human parenteral drugs by the USP, also the EU value of 8mg/kg siRNA used for
injection translates to <0.0325 EU/kg derived using the <0.05 EU/mg value obtained from the
supplier. The EU value of 15.27 mg/kg HA used for the CS-siRNA polyplex coating for targeted
delivery to CD44 expressing cells and reduced toxicity is <0.0012 EU/kg derived from the
<0.001 EU/mg value obtained from the certificate of analysis of 1000 kDa Hyaluronic acid. The
additive EU value of 8mg/kg HA coated CS-siRNA nanoparticles is <0.245 EU/kg, indicating
that even at highest dose the nanoparticle will not induce immune-toxicity initiated by endotoxins
in human subjects.
4.3.2.3 EU limit of intra-articular chitosan dose administered in horses
The chitosan scaffolds used in cartilage repair are injected intra-articularly in the horses at
a conc. of 1%w/w at a total volume of 3mL. This intra-articular dose injected in the horse joints
totals 30mg chitosan. The chitosan dose calculated per kg body weight of 300kg horses is
30mg/300kg= 0.1mg/kg. The endotoxin level for the intra-articular joints in horses used by
(Carregaro, Freitas, Ribeiro, Xavier, & Doria, 2014) and (J.L Lucia, 2014) which shows minimal
inflammation, is 0.1 EU/kg; this limit is used for the harmonization of the chitosan dose used by
our group.
Chitosan dose used for the horse intra-articular injection = 30mg
The endotoxin level of chitosan determined by the gel-clot assay= <300 EU/g or <0.3
EU/mg
To calculate the EU conc. of 30 mg injected chitosan, multiply with the endotoxin upper limit
value of chitosan obtained by gel clot = 30𝑚𝑔 ∗0.3𝐸𝑈
𝑚𝑔= 9 𝐸𝑈 for entire body weight of horse.
52
Calculating the concentration of endotoxin per kg of horse body weight for comparison with the
endotoxin limit determined for harmonization: 9 𝐸𝑈
300 𝑘𝑔= 0.03 EU/kg
The chitosan endotoxin value of <0.03 EU/kg is lower than the endotoxin limit harmonized at 0.1
EU/kg for the horses, indicating that the chitosan dose used for intra-articular injection shouldn’t
induce an inflammatory response in the joints in horses. However, the <0.03 EU/kg value is close
to the harmonized 0.1 EU/kg limit, indicating that if the chitosan dose is increased in further
studies, it may lead to joint effusion in 300kg average weighed horses.
4.3.3 Rationale of using sensitive kinetic assays for chitosan EU determination
As evident from the calculation of endotoxin in chitosan doses, the maximum allowable
endotoxin limit of chitosan depends on a lot of factors, such as: weight of the animal/human, dose
modification according to LD50 in different animals, route of administration and difference in
EU conc. of different chitosan batches based on handling and processing. These factors may
rapidly change and may result in the endotoxin conc. of chitosan to surmount the acceptable
endotoxin limit, which may lead to the rejection and withdrawal of the chitosan therapeutics from
the marketplace. Additionally, the endotoxin level of the chitosan therapeutics is always affected
by that of excipients that may have high endotoxin content; hence, the determination of absolute
endotoxin content of chitosan is a strict requirement. Furthermore, the EU limit for the intra-
articular administration is not harmonized by the USP; hence, it is very risky to use an estimated
value to calculate the endotoxin content of the chitosan injected in the horses. Similarly, humans
are very sensitive to varying ranges of endotoxin, eliciting immune response in the presence of
even 1pg [0.01 EU/mL] extra endotoxin than the approved level coming in contact with blood
proteins or cerebrospinal fluids.
The current specification of our chitosan product is 100 EU/g, which could not be specifically
quantified by the semi-quantitative gel-clot assay, as the lowest estimated value possible from
gel-clot is <300 EU/g. The resolution of EU values between less than 300 EU/g and equal to 300
EU/g will determine the clinical applicability of the chitosan. The EU conc. calculated for intra-
articular chitosan dose in horses is close to the harmonized EU limit hence in order to reduce the
risk of overriding the acceptable endotoxin limit by using a semi-quantified estimate of endotoxin
value generated by gel-clot assay; it is certainly rational to quantify the absolute endotoxin conc.
53
of the chitosan by using more sensitive methods. The remarkably sensitive assays approved for
the accurate endotoxin measurement by USP are the two other formats of the LAL assay:
1) Turbidimetric LAL assay: It functions on the same principle of formation of insoluble
coagulin protein from the soluble coagulogen by activated clotting enzyme after coming
in contact with the endotoxin. It is a quantitative assay in which a standard curve is
plotted with a given range of endotoxin and the sample endotoxin conc. is interpolated
from the generated linear equation. The error of quantification in all the LAL assays is 2-
fold, and is agreed upon by the USP as an inherent variation. This assay can detect
endotoxin at a sensitivity of 0.005 EU/mL, which is 6 fold higher than a gel clot assay.
2) Chromogenic LAL assay: This method has an equivalent sensitivity to turbidimetric LAL
but the difference between turbidimetric and chromogenic assay is that the precursor of
coagulogen (the substance which produces turbidity) is linked to a chromogenic substrate
called Gly-Arg-p-Nitroanilide (pNA). When the enzyme meets endotoxin, the activated
cascade cleaves the Gly-Arg and p-Nitroanilide bonds and the released p-Nitroanilide
produces a yellow color, which is directly correlated to the quantity of endotoxin present
in the sample. The intensity of the chromogenic product is measured by the absorbance
with a spectrophotometer. Analogous to the turbidimetric assay, the unknown endotoxin
conc. is calculated by deriving from the standard linear equation, and have an error rate of
2-fold in quantification.
4.3.4 Turbidimetric LAL assay
4.3.4.1 Raw data
The first step towards computing EU conc. of test samples is obtaining Time vs. O.D raw
data, which represents the assay characteristics of the general LAL reaction with endotoxin over
time. The reaction profile, demonstrates three critical properties of LAL gelation in the presence
of LPS (Lipopolysaccharide /endotoxin):
a) The increase in optical density followed by the coagulation due to increase in the coagulin
proteins.
b) The rate of O.D increase affected by the concentration of LPS.
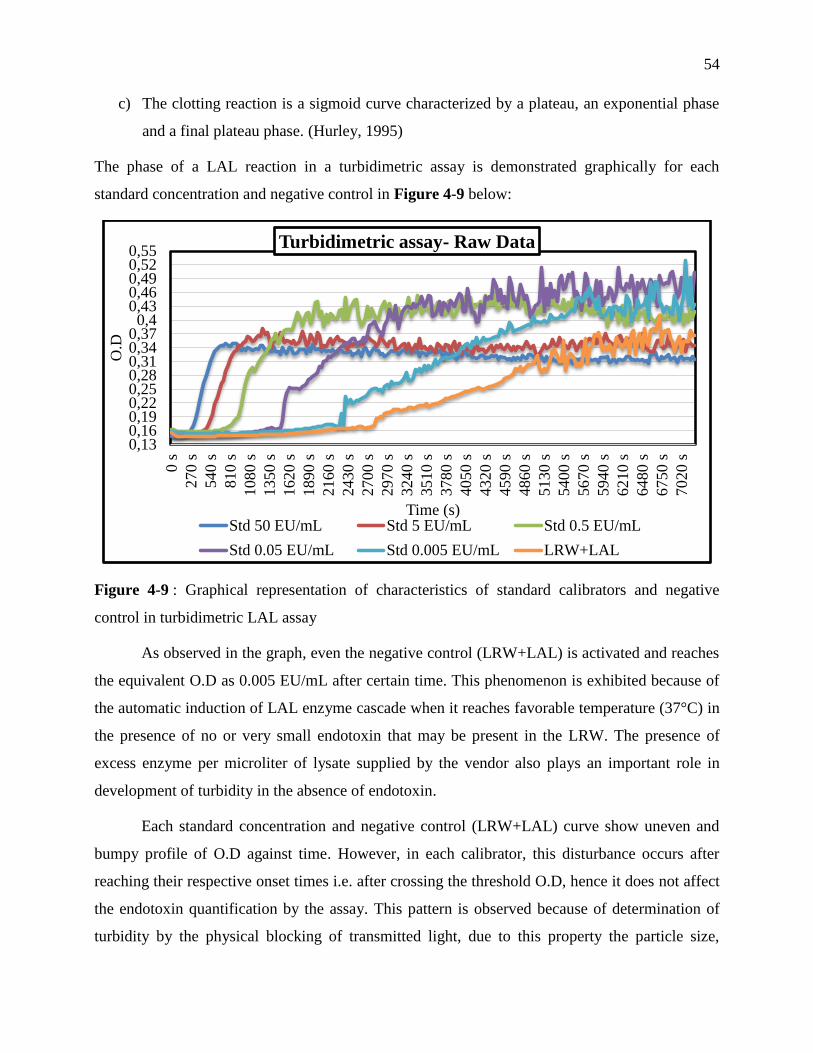
54
c) The clotting reaction is a sigmoid curve characterized by a plateau, an exponential phase
and a final plateau phase. (Hurley, 1995)
The phase of a LAL reaction in a turbidimetric assay is demonstrated graphically for each
standard concentration and negative control in Figure 4-9 below:
Figure 4-9 : Graphical representation of characteristics of standard calibrators and negative
control in turbidimetric LAL assay
As observed in the graph, even the negative control (LRW+LAL) is activated and reaches
the equivalent O.D as 0.005 EU/mL after certain time. This phenomenon is exhibited because of
the automatic induction of LAL enzyme cascade when it reaches favorable temperature (37°C) in
the presence of no or very small endotoxin that may be present in the LRW. The presence of
excess enzyme per microliter of lysate supplied by the vendor also plays an important role in
development of turbidity in the absence of endotoxin.
Each standard concentration and negative control (LRW+LAL) curve show uneven and
bumpy profile of O.D against time. However, in each calibrator, this disturbance occurs after
reaching their respective onset times i.e. after crossing the threshold O.D, hence it does not affect
the endotoxin quantification by the assay. This pattern is observed because of determination of
turbidity by the physical blocking of transmitted light, due to this property the particle size,
0,130,160,190,220,250,280,310,340,37
0,40,430,460,490,520,55
0 s
270 s
540 s
810 s
1080 s
1350 s
1620 s
1890 s
2160 s
2430 s
2700 s
2970 s
3240 s
3510 s
3780 s
4050 s
4320 s
4590 s
4860 s
5130 s
5400 s
5670 s
5940 s
6210 s
6480 s
6750 s
7020 s
O.D
Time (s)
Turbidimetric assay- Raw Data
Std 50 EU/mL Std 5 EU/mL Std 0.5 EU/mL
Std 0.05 EU/mL Std 0.005 EU/mL LRW+LAL
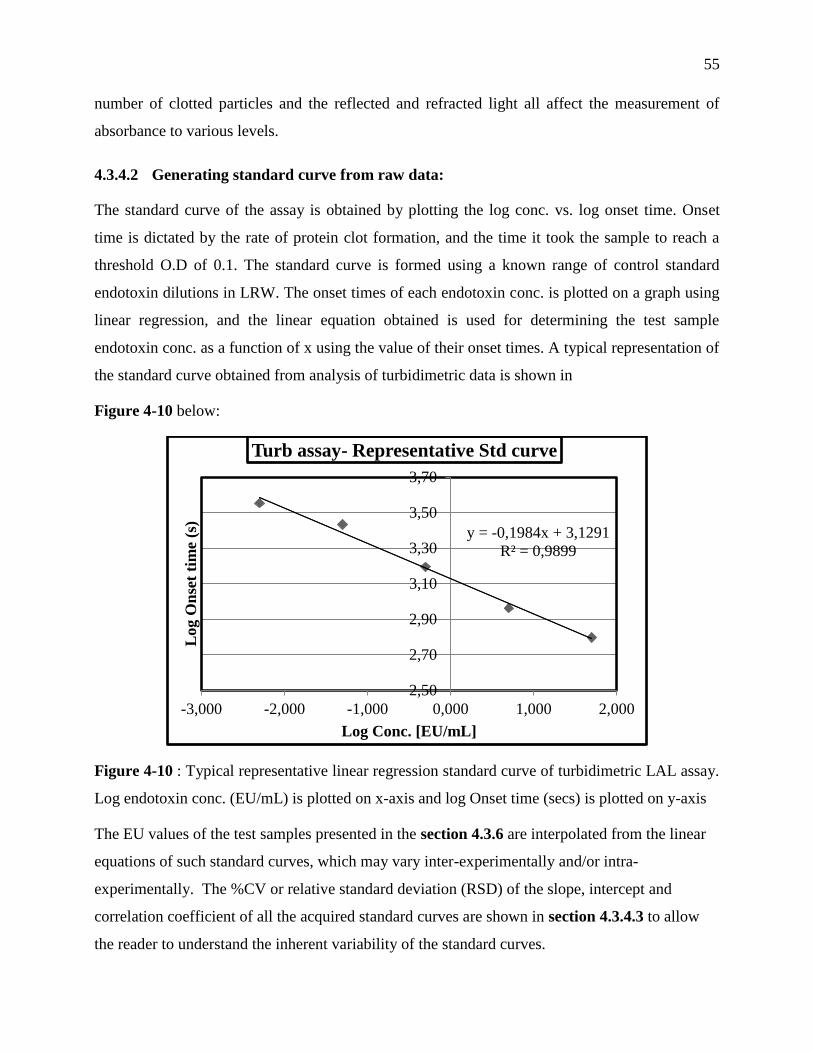
55
number of clotted particles and the reflected and refracted light all affect the measurement of
absorbance to various levels.
4.3.4.2 Generating standard curve from raw data:
The standard curve of the assay is obtained by plotting the log conc. vs. log onset time. Onset
time is dictated by the rate of protein clot formation, and the time it took the sample to reach a
threshold O.D of 0.1. The standard curve is formed using a known range of control standard
endotoxin dilutions in LRW. The onset times of each endotoxin conc. is plotted on a graph using
linear regression, and the linear equation obtained is used for determining the test sample
endotoxin conc. as a function of x using the value of their onset times. A typical representation of
the standard curve obtained from analysis of turbidimetric data is shown in
Figure 4-10 below:
Figure 4-10 : Typical representative linear regression standard curve of turbidimetric LAL assay.
Log endotoxin conc. (EU/mL) is plotted on x-axis and log Onset time (secs) is plotted on y-axis
The EU values of the test samples presented in the section 4.3.6 are interpolated from the linear
equations of such standard curves, which may vary inter-experimentally and/or intra-
experimentally. The %CV or relative standard deviation (RSD) of the slope, intercept and
correlation coefficient of all the acquired standard curves are shown in section 4.3.4.3 to allow
the reader to understand the inherent variability of the standard curves.
y = -0,1984x + 3,1291
R² = 0,9899
2,50
2,70
2,90
3,10
3,30
3,50
3,70
-3,000 -2,000 -1,000 0,000 1,000 2,000
Log O
nse
t ti
me
(s)
Log Conc. [EU/mL]
Turb assay- Representative Std curve
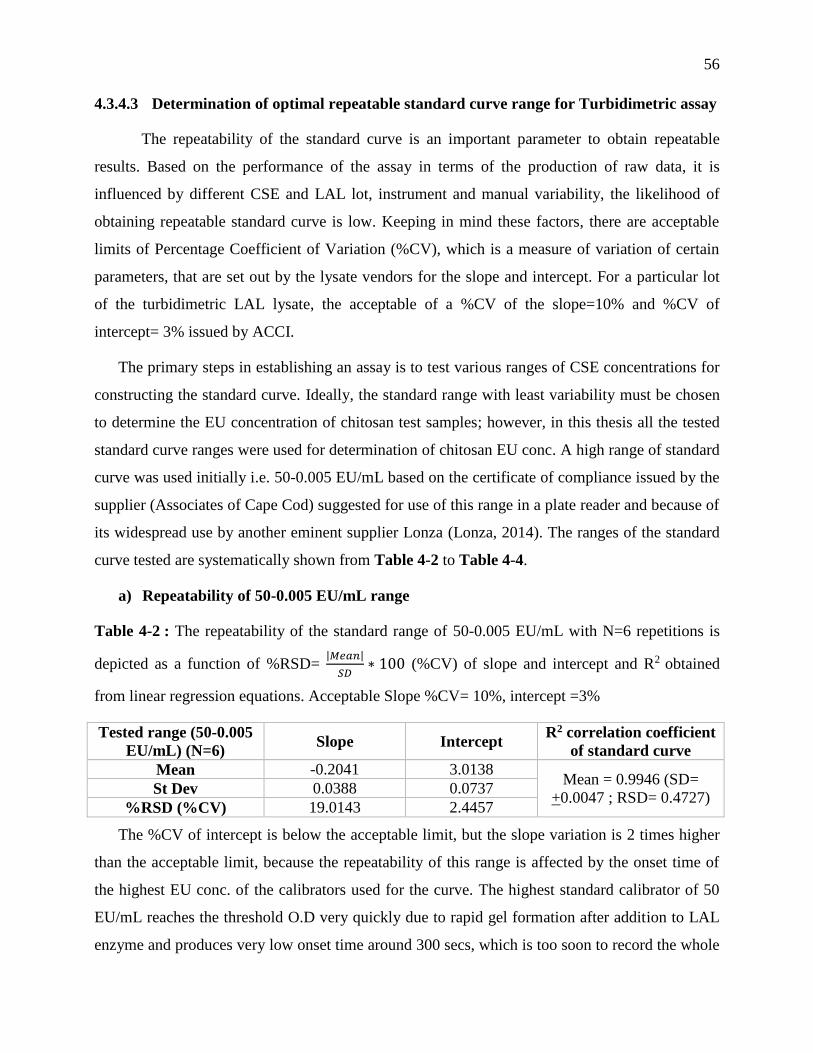
56
4.3.4.3 Determination of optimal repeatable standard curve range for Turbidimetric assay
The repeatability of the standard curve is an important parameter to obtain repeatable
results. Based on the performance of the assay in terms of the production of raw data, it is
influenced by different CSE and LAL lot, instrument and manual variability, the likelihood of
obtaining repeatable standard curve is low. Keeping in mind these factors, there are acceptable
limits of Percentage Coefficient of Variation (%CV), which is a measure of variation of certain
parameters, that are set out by the lysate vendors for the slope and intercept. For a particular lot
of the turbidimetric LAL lysate, the acceptable of a %CV of the slope=10% and %CV of
intercept= 3% issued by ACCI.
The primary steps in establishing an assay is to test various ranges of CSE concentrations for
constructing the standard curve. Ideally, the standard range with least variability must be chosen
to determine the EU concentration of chitosan test samples; however, in this thesis all the tested
standard curve ranges were used for determination of chitosan EU conc. A high range of standard
curve was used initially i.e. 50-0.005 EU/mL based on the certificate of compliance issued by the
supplier (Associates of Cape Cod) suggested for use of this range in a plate reader and because of
its widespread use by another eminent supplier Lonza (Lonza, 2014). The ranges of the standard
curve tested are systematically shown from Table 4-2 to Table 4-4.
a) Repeatability of 50-0.005 EU/mL range
Table 4-2 : The repeatability of the standard range of 50-0.005 EU/mL with N=6 repetitions is
depicted as a function of %RSD= |𝑀𝑒𝑎𝑛|
𝑆𝐷∗ 100 (%CV) of slope and intercept and R2 obtained
from linear regression equations. Acceptable Slope %CV= 10%, intercept =3%
Tested range (50-0.005
EU/mL) (N=6) Slope Intercept
R2 correlation coefficient
of standard curve
Mean -0.2041 3.0138 Mean = 0.9946 (SD=
+0.0047 ; RSD= 0.4727) St Dev 0.0388 0.0737
%RSD (%CV) 19.0143 2.4457
The %CV of intercept is below the acceptable limit, but the slope variation is 2 times higher
than the acceptable limit, because the repeatability of this range is affected by the onset time of
the highest EU conc. of the calibrators used for the curve. The highest standard calibrator of 50
EU/mL reaches the threshold O.D very quickly due to rapid gel formation after addition to LAL
enzyme and produces very low onset time around 300 secs, which is too soon to record the whole
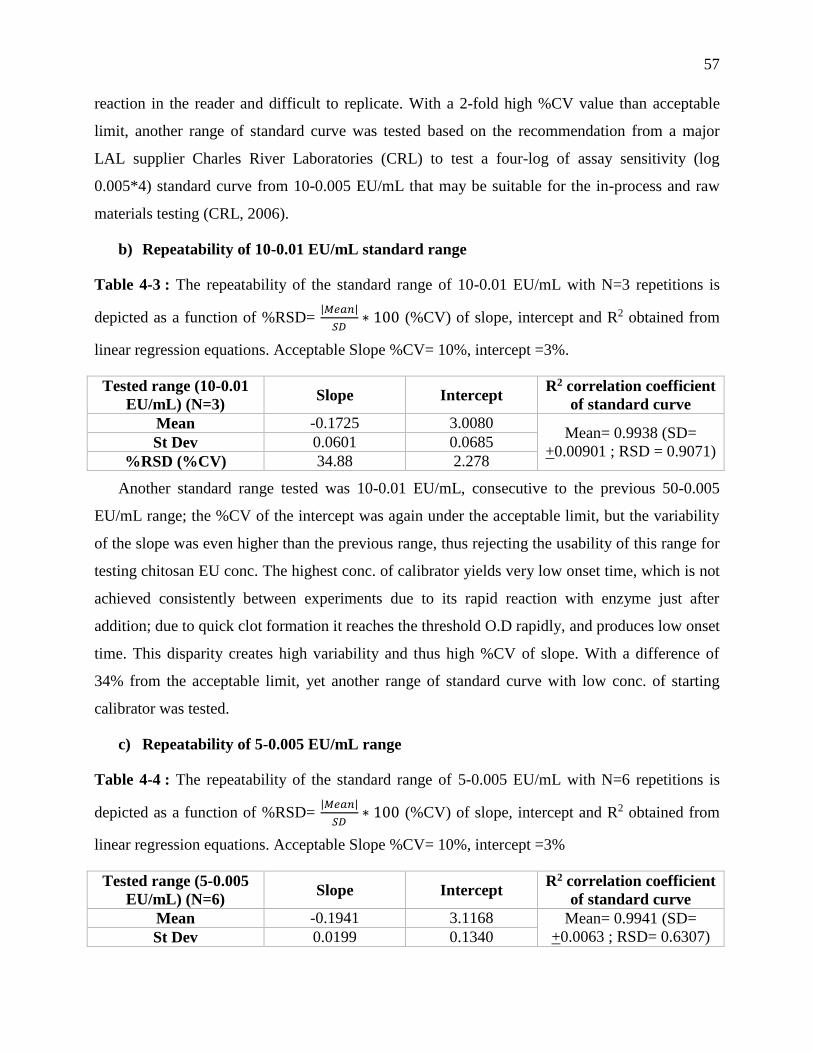
57
reaction in the reader and difficult to replicate. With a 2-fold high %CV value than acceptable
limit, another range of standard curve was tested based on the recommendation from a major
LAL supplier Charles River Laboratories (CRL) to test a four-log of assay sensitivity (log
0.005*4) standard curve from 10-0.005 EU/mL that may be suitable for the in-process and raw
materials testing (CRL, 2006).
b) Repeatability of 10-0.01 EU/mL standard range
Table 4-3 : The repeatability of the standard range of 10-0.01 EU/mL with N=3 repetitions is
depicted as a function of %RSD= |𝑀𝑒𝑎𝑛|
𝑆𝐷∗ 100 (%CV) of slope, intercept and R2 obtained from
linear regression equations. Acceptable Slope %CV= 10%, intercept =3%.
Tested range (10-0.01
EU/mL) (N=3) Slope Intercept
R2 correlation coefficient
of standard curve
Mean -0.1725 3.0080 Mean= 0.9938 (SD=
+0.00901 ; RSD = 0.9071) St Dev 0.0601 0.0685
%RSD (%CV) 34.88 2.278
Another standard range tested was 10-0.01 EU/mL, consecutive to the previous 50-0.005
EU/mL range; the %CV of the intercept was again under the acceptable limit, but the variability
of the slope was even higher than the previous range, thus rejecting the usability of this range for
testing chitosan EU conc. The highest conc. of calibrator yields very low onset time, which is not
achieved consistently between experiments due to its rapid reaction with enzyme just after
addition; due to quick clot formation it reaches the threshold O.D rapidly, and produces low onset
time. This disparity creates high variability and thus high %CV of slope. With a difference of
34% from the acceptable limit, yet another range of standard curve with low conc. of starting
calibrator was tested.
c) Repeatability of 5-0.005 EU/mL range
Table 4-4 : The repeatability of the standard range of 5-0.005 EU/mL with N=6 repetitions is
depicted as a function of %RSD= |𝑀𝑒𝑎𝑛|
𝑆𝐷∗ 100 (%CV) of slope, intercept and R2 obtained from
linear regression equations. Acceptable Slope %CV= 10%, intercept =3%
Tested range (5-0.005
EU/mL) (N=6) Slope Intercept
R2 correlation coefficient
of standard curve
Mean -0.1941 3.1168 Mean= 0.9941 (SD=
+0.0063 ; RSD= 0.6307) St Dev 0.0199 0.1340
58
%RSD (%CV) 10.2432 4.2999
Due to problems in repeatability by using high concentration of standard calibrators, the
concentration of the highest standard calibrator was reduced to 5 EU/mL, although the range was
prepared using the same 10-fold dilutions and spans 2 logs rather than 4 logs above the assay
sensitivity. The variation in slope was at the acceptable limit, but the variation in intercept was
1.4 times higher than the acceptable limit, the effect of 1% intercept variation resonates to 17%
variation in the final EU conc. calculations (data not shown). Thus this standard range was
classified to still have high concentration for calibrators to produce variation.
Due to high variability in standard curve ranges, there were burning questions as to what
technical parameters may be contributing to the variation apart from high EU conc. The
variability of the different standard curve ranges was suspected to have arisen from the use of
plate reader instead of the tube reader which have lower sensitivity and block heating of sample
inhibiting efficient LRW+LAL reaction; the repeatability may be affected by the rate of
evaporation, difference in solution pathlengths and difference in temperature of the reagent and
samples at the time of mixing. All the parameters were optimized to identify the controlling
factors and obtain the repeatable standard curve even with the use of high endotoxin
concentration range.
4.3.5 Optimization of parameters to obtain repeatable standard curves
Due to the use of plate reader instead of tube reader, there were several parameters, which
had to be optimized to obtain repeatable standard curves. The externally controllable factors like
rate of evaporation in the plates, pathlength of reactants and effect of temperature on reactant
pathlengths and standard curves were tested to investigate the underlying causes of standard
curve variability particularly in ranges with high endotoxin conc. The effect of these parameters
on standard curve variability is shown in this section.
4.3.5.1 Use of plate reader for LAL assay
For all the LAL assays (except gel-clot), the plate reader was used because of its
comparable sensitivity with the tube reader (Limit of detection: 0.005 EU/mL vs. 0.001 EU/mL).
Some functional differences in the instruments were:
59
Parameters Plate reader Tube reader
Limit of detection
(Sensitivity) 0.005 EU/mL 0.001 EU/mL
Sample Heating Complete plate in a block
manner Individual tube heating
Running time Fixed Flexible
Pathlength Variable Fixed
Number of samples tested Large Moderate
Cost effectiveness High Medium
Typically, LAL assay is performed in a tube reader, which provides slightly more
sensitivity over plate reader because of individual tube heating and flexible measurement time
depending on the development of LAL turbidity. The plate reader heats the samples in a non-
specific block manner vs. individual heating in tube reader and has a fixed time of measurement
compared to flexible measurement time to reach the onset time of sample with lowest EU conc.;
but the plate reader has an advantage of testing more samples per plate at a given time.
The difference in measurement of absorbance between tube reader and the plate reader originates
from the orientation of absorbance beam. In the tube reader, the light is absorbed by the cuvette
in a horizontal direction and in a vertical direction by the well of a 96 well plate in a plate reader.
This is the basis of difference in pathlength of a plate reader and a tube reader and the pathlength
in each well can fluctuate even by a pipetting error of +10% apart from the factors like extinction
coefficient (Ɛ) and concentration of the solution (c) as explained in section 4.2.5.1 Equation 4-1.
Other factors like evaporation and water/solution expansion may also play a major role in
measurement of sample absorbance in a plate reader, hence the influence of these varying
parameters on the LAL standard curves and endotoxin quantification was observed as shown in
the sections below.
4.3.5.1.1 Evaporation in 96 well plates: Middle and inner wells experience lowest evaporation
To observe pathlength as well as evaporation, absorbance of water is measured at 975nm
because water shows maximum peak at 975nm by absorbing maximum light, the relative value
obtained after subtracting with background absorbance at 900nm is used as an indicator of
evaporation. For each well, the A975-A900 value of water may differ depending on the volume
of water present. The decrease in the absorbance of water at 975nm is a representative of
increasing evaporation (Multiskan, 2010). According to Figure 4-11A & B and Table 4-5, the
outer wells (A1, A12, H1 and H12) experienced the highest rate of evaporation with the constant
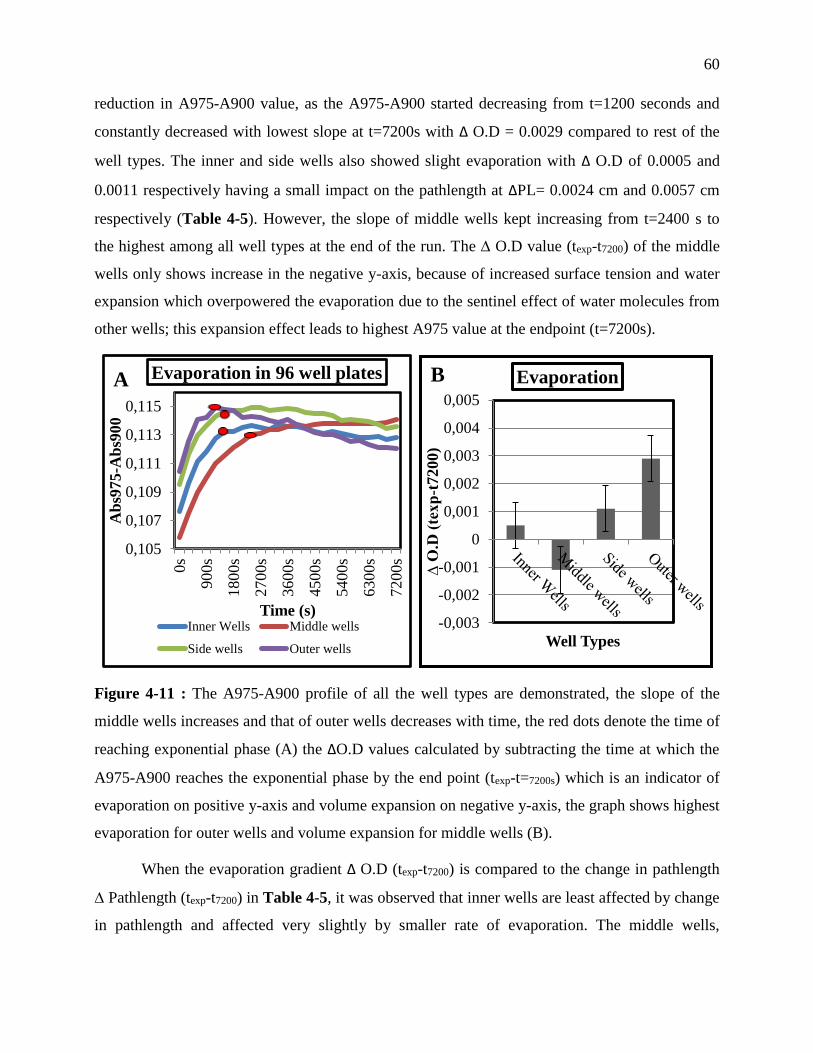
60
reduction in A975-A900 value, as the A975-A900 started decreasing from t=1200 seconds and
constantly decreased with lowest slope at t=7200s with ∆ O.D = 0.0029 compared to rest of the
well types. The inner and side wells also showed slight evaporation with ∆ O.D of 0.0005 and
0.0011 respectively having a small impact on the pathlength at ∆PL= 0.0024 cm and 0.0057 cm
respectively (Table 4-5). However, the slope of middle wells kept increasing from t=2400 s to
the highest among all well types at the end of the run. The ∆ O.D value (texp-t7200) of the middle
wells only shows increase in the negative y-axis, because of increased surface tension and water
expansion which overpowered the evaporation due to the sentinel effect of water molecules from
other wells; this expansion effect leads to highest A975 value at the endpoint (t=7200s).
Figure 4-11 : The A975-A900 profile of all the well types are demonstrated, the slope of the
middle wells increases and that of outer wells decreases with time, the red dots denote the time of
reaching exponential phase (A) the ∆O.D values calculated by subtracting the time at which the
A975-A900 reaches the exponential phase by the end point (texp-t=7200s) which is an indicator of
evaporation on positive y-axis and volume expansion on negative y-axis, the graph shows highest
evaporation for outer wells and volume expansion for middle wells (B).
When the evaporation gradient ∆ O.D (texp-t7200) is compared to the change in pathlength
∆ Pathlength (texp-t7200) in Table 4-5, it was observed that inner wells are least affected by change
in pathlength and affected very slightly by smaller rate of evaporation. The middle wells,
0,105
0,107
0,109
0,111
0,113
0,115
0s
900s
1800s
2700s
3600s
4500s
5400s
6300s
7200s
Ab
s975
-Ab
s900
Time (s)
Evaporation in 96 well plates
Inner Wells Middle wells
Side wells Outer wells
A
-0,003
-0,002
-0,001
0
0,001
0,002
0,003
0,004
0,005
∆ O
.D (
texp
-t7200)
Well Types
EvaporationB
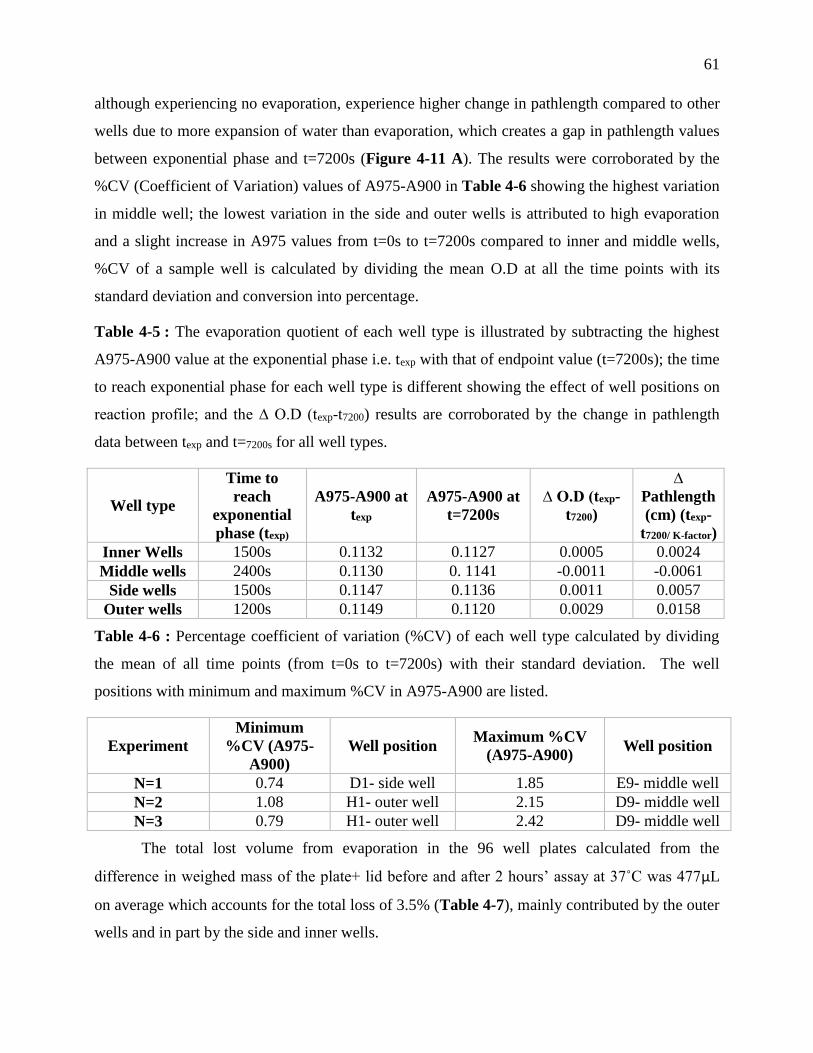
61
although experiencing no evaporation, experience higher change in pathlength compared to other
wells due to more expansion of water than evaporation, which creates a gap in pathlength values
between exponential phase and t=7200s (Figure 4-11 A). The results were corroborated by the
%CV (Coefficient of Variation) values of A975-A900 in Table 4-6 showing the highest variation
in middle well; the lowest variation in the side and outer wells is attributed to high evaporation
and a slight increase in A975 values from t=0s to t=7200s compared to inner and middle wells,
%CV of a sample well is calculated by dividing the mean O.D at all the time points with its
standard deviation and conversion into percentage.
Table 4-5 : The evaporation quotient of each well type is illustrated by subtracting the highest
A975-A900 value at the exponential phase i.e. texp with that of endpoint value (t=7200s); the time
to reach exponential phase for each well type is different showing the effect of well positions on
reaction profile; and the ∆ O.D (texp-t7200) results are corroborated by the change in pathlength
data between texp and t=7200s for all well types.
Well type
Time to
reach
exponential
phase (texp)
A975-A900 at
texp
A975-A900 at
t=7200s
∆ O.D (texp-
t7200)
∆
Pathlength
(cm) (texp-
t7200/ K-factor)
Inner Wells 1500s 0.1132 0.1127 0.0005 0.0024
Middle wells 2400s 0.1130 0. 1141 -0.0011 -0.0061
Side wells 1500s 0.1147 0.1136 0.0011 0.0057
Outer wells 1200s 0.1149 0.1120 0.0029 0.0158
Table 4-6 : Percentage coefficient of variation (%CV) of each well type calculated by dividing
the mean of all time points (from t=0s to t=7200s) with their standard deviation. The well
positions with minimum and maximum %CV in A975-A900 are listed.
Experiment
Minimum
%CV (A975-
A900)
Well position Maximum %CV
(A975-A900) Well position
N=1 0.74 D1- side well 1.85 E9- middle well
N=2 1.08 H1- outer well 2.15 D9- middle well
N=3 0.79 H1- outer well 2.42 D9- middle well
The total lost volume from evaporation in the 96 well plates calculated from the
difference in weighed mass of the plate+ lid before and after 2 hours’ assay at 37˚C was 477μL
on average which accounts for the total loss of 3.5% (Table 4-7), mainly contributed by the outer
wells and in part by the side and inner wells.
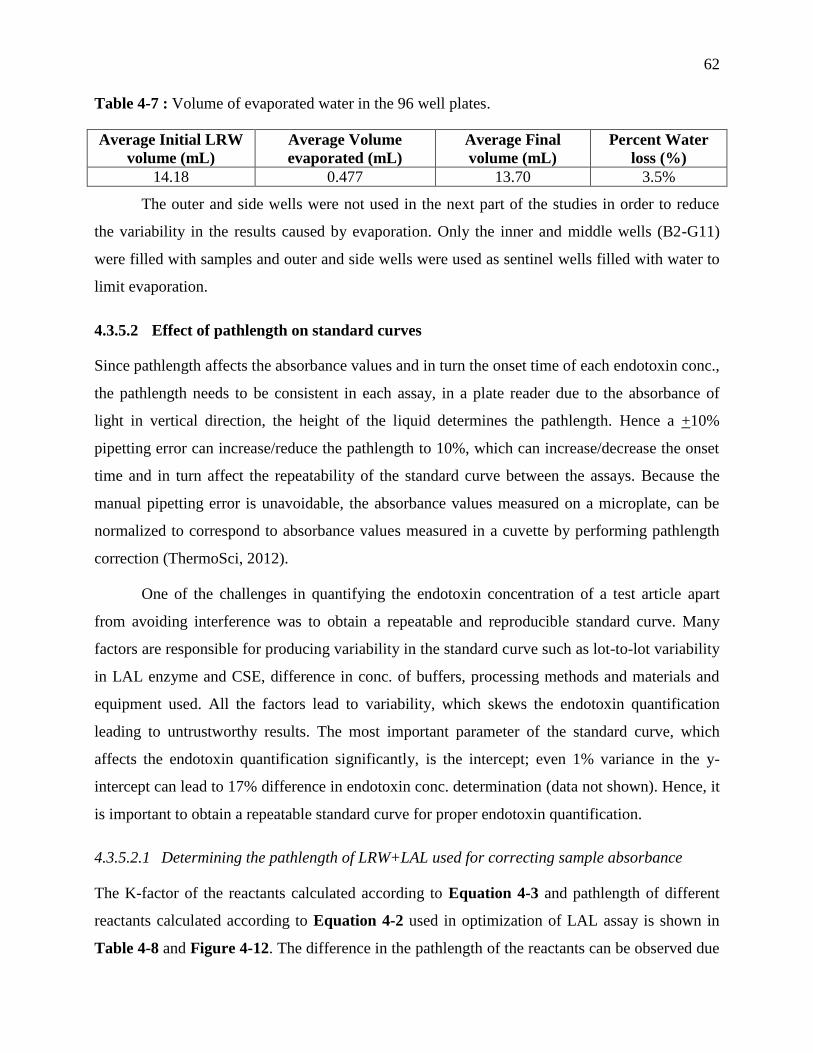
62
Table 4-7 : Volume of evaporated water in the 96 well plates.
Average Initial LRW
volume (mL)
Average Volume
evaporated (mL)
Average Final
volume (mL)
Percent Water
loss (%)
14.18 0.477 13.70 3.5%
The outer and side wells were not used in the next part of the studies in order to reduce
the variability in the results caused by evaporation. Only the inner and middle wells (B2-G11)
were filled with samples and outer and side wells were used as sentinel wells filled with water to
limit evaporation.
4.3.5.2 Effect of pathlength on standard curves
Since pathlength affects the absorbance values and in turn the onset time of each endotoxin conc.,
the pathlength needs to be consistent in each assay, in a plate reader due to the absorbance of
light in vertical direction, the height of the liquid determines the pathlength. Hence a +10%
pipetting error can increase/reduce the pathlength to 10%, which can increase/decrease the onset
time and in turn affect the repeatability of the standard curve between the assays. Because the
manual pipetting error is unavoidable, the absorbance values measured on a microplate, can be
normalized to correspond to absorbance values measured in a cuvette by performing pathlength
correction (ThermoSci, 2012).
One of the challenges in quantifying the endotoxin concentration of a test article apart
from avoiding interference was to obtain a repeatable and reproducible standard curve. Many
factors are responsible for producing variability in the standard curve such as lot-to-lot variability
in LAL enzyme and CSE, difference in conc. of buffers, processing methods and materials and
equipment used. All the factors lead to variability, which skews the endotoxin quantification
leading to untrustworthy results. The most important parameter of the standard curve, which
affects the endotoxin quantification significantly, is the intercept; even 1% variance in the y-
intercept can lead to 17% difference in endotoxin conc. determination (data not shown). Hence, it
is important to obtain a repeatable standard curve for proper endotoxin quantification.
4.3.5.2.1 Determining the pathlength of LRW+LAL used for correcting sample absorbance
The K-factor of the reactants calculated according to Equation 4-3 and pathlength of different
reactants calculated according to Equation 4-2 used in optimization of LAL assay is shown in
Table 4-8 and Figure 4-12. The difference in the pathlength of the reactants can be observed due
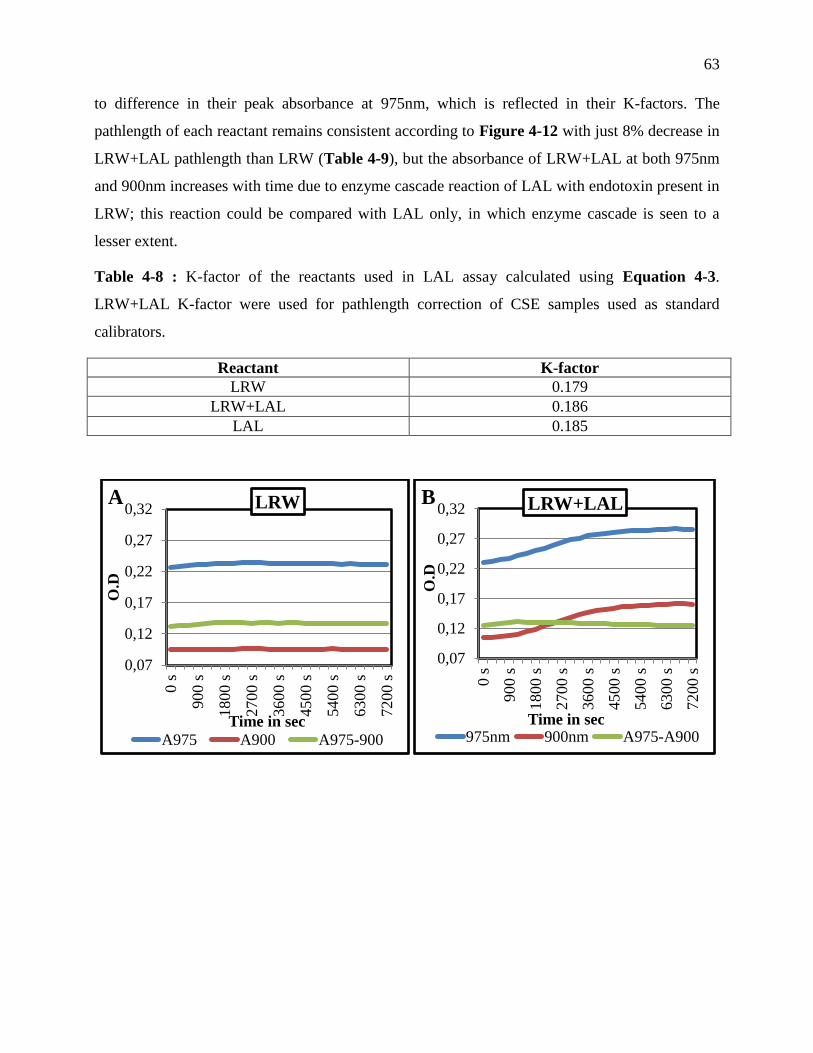
63
to difference in their peak absorbance at 975nm, which is reflected in their K-factors. The
pathlength of each reactant remains consistent according to Figure 4-12 with just 8% decrease in
LRW+LAL pathlength than LRW (Table 4-9), but the absorbance of LRW+LAL at both 975nm
and 900nm increases with time due to enzyme cascade reaction of LAL with endotoxin present in
LRW; this reaction could be compared with LAL only, in which enzyme cascade is seen to a
lesser extent.
Table 4-8 : K-factor of the reactants used in LAL assay calculated using Equation 4-3.
LRW+LAL K-factor were used for pathlength correction of CSE samples used as standard
calibrators.
Reactant K-factor
LRW 0.179
LRW+LAL 0.186
LAL 0.185
0,07
0,12
0,17
0,22
0,27
0,32
0 s
900 s
1800 s
2700 s
3600 s
4500 s
5400 s
6300 s
7200 s
O.D
Time in sec
LRW
A975 A900 A975-900
A
0,07
0,12
0,17
0,22
0,27
0,32
0 s
900 s
1800 s
2700 s
3600 s
4500 s
5400 s
6300 s
7200 s
O.D
Time in sec
LRW+LAL
975nm 900nm A975-A900
B
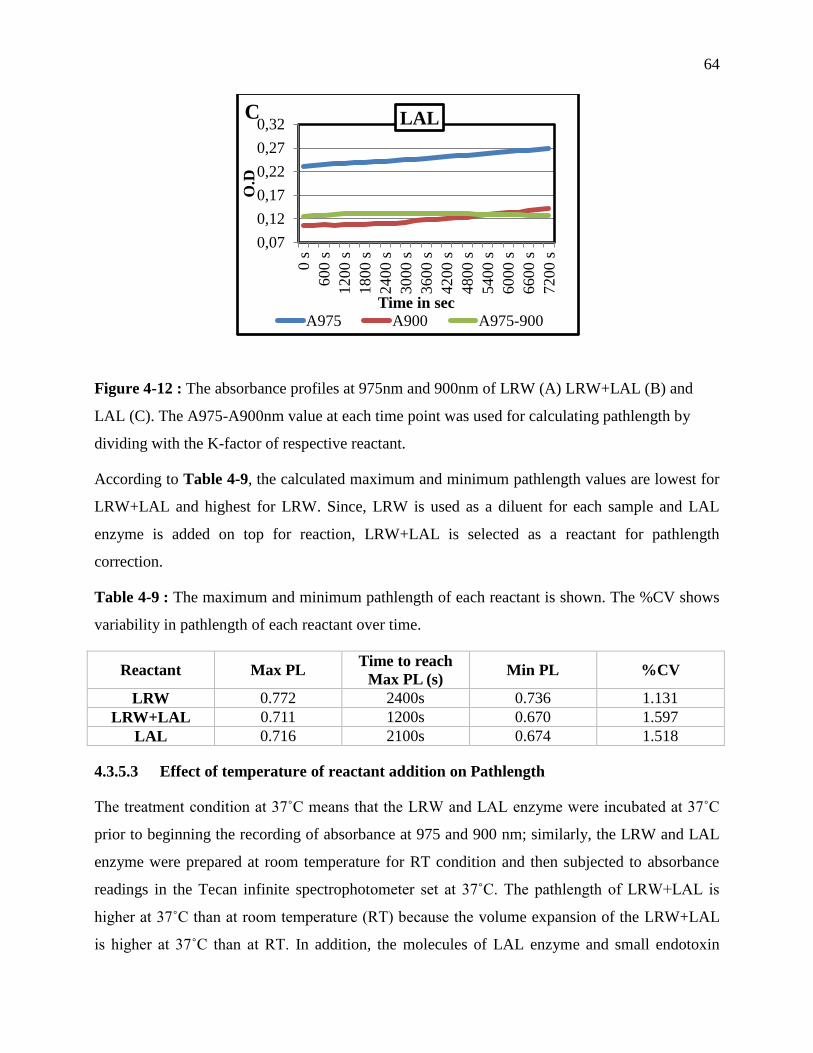
64
Figure 4-12 : The absorbance profiles at 975nm and 900nm of LRW (A) LRW+LAL (B) and
LAL (C). The A975-A900nm value at each time point was used for calculating pathlength by
dividing with the K-factor of respective reactant.
According to Table 4-9, the calculated maximum and minimum pathlength values are lowest for
LRW+LAL and highest for LRW. Since, LRW is used as a diluent for each sample and LAL
enzyme is added on top for reaction, LRW+LAL is selected as a reactant for pathlength
correction.
Table 4-9 : The maximum and minimum pathlength of each reactant is shown. The %CV shows
variability in pathlength of each reactant over time.
Reactant Max PL Time to reach
Max PL (s) Min PL %CV
LRW 0.772 2400s 0.736 1.131
LRW+LAL 0.711 1200s 0.670 1.597
LAL 0.716 2100s 0.674 1.518
4.3.5.3 Effect of temperature of reactant addition on Pathlength
The treatment condition at 37˚C means that the LRW and LAL enzyme were incubated at 37˚C
prior to beginning the recording of absorbance at 975 and 900 nm; similarly, the LRW and LAL
enzyme were prepared at room temperature for RT condition and then subjected to absorbance
readings in the Tecan infinite spectrophotometer set at 37˚C. The pathlength of LRW+LAL is
higher at 37˚C than at room temperature (RT) because the volume expansion of the LRW+LAL
is higher at 37˚C than at RT. In addition, the molecules of LAL enzyme and small endotoxin
0,07
0,12
0,17
0,22
0,27
0,32
0 s
600 s
1200 s
1800 s
2400 s
3000 s
3600 s
4200 s
4800 s
5400 s
6000 s
6600 s
7200 s
O.D
Time in sec
LAL
A975 A900 A975-900
C
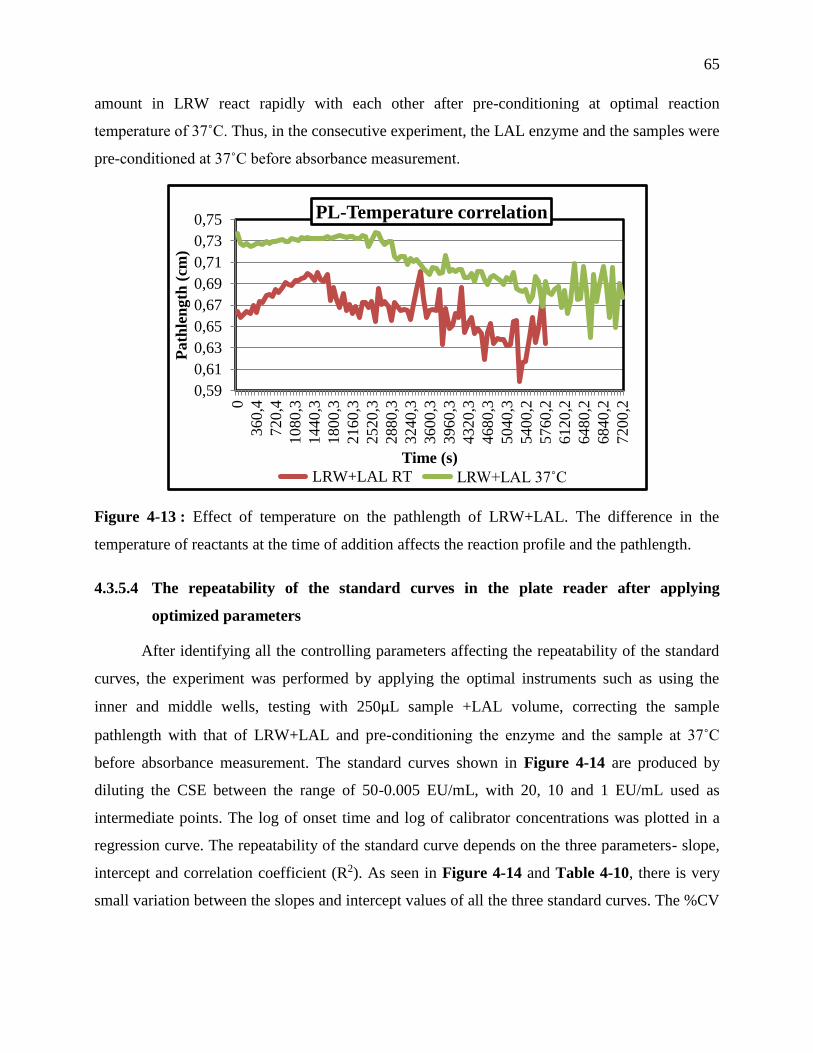
65
amount in LRW react rapidly with each other after pre-conditioning at optimal reaction
temperature of 37˚C. Thus, in the consecutive experiment, the LAL enzyme and the samples were
pre-conditioned at 37˚C before absorbance measurement.
Figure 4-13 : Effect of temperature on the pathlength of LRW+LAL. The difference in the
temperature of reactants at the time of addition affects the reaction profile and the pathlength.
4.3.5.4 The repeatability of the standard curves in the plate reader after applying
optimized parameters
After identifying all the controlling parameters affecting the repeatability of the standard
curves, the experiment was performed by applying the optimal instruments such as using the
inner and middle wells, testing with 250μL sample +LAL volume, correcting the sample
pathlength with that of LRW+LAL and pre-conditioning the enzyme and the sample at 37˚C
before absorbance measurement. The standard curves shown in Figure 4-14 are produced by
diluting the CSE between the range of 50-0.005 EU/mL, with 20, 10 and 1 EU/mL used as
intermediate points. The log of onset time and log of calibrator concentrations was plotted in a
regression curve. The repeatability of the standard curve depends on the three parameters- slope,
intercept and correlation coefficient (R2). As seen in Figure 4-14 and Table 4-10, there is very
small variation between the slopes and intercept values of all the three standard curves. The %CV
0,59
0,61
0,63
0,65
0,67
0,69
0,71
0,73
0,750
360,4
720,4
1080,3
1440,3
1800,3
2160,3
2520,3
2880,3
3240,3
3600,3
3960,3
4320,3
4680,3
5040,3
5400,2
5760,2
6120,2
6480,2
6840,2
7200,2
Path
len
gth
(cm
)
Time (s)
PL-Temperature correlation
LRW+LAL RT LRW+LAL 37˚C
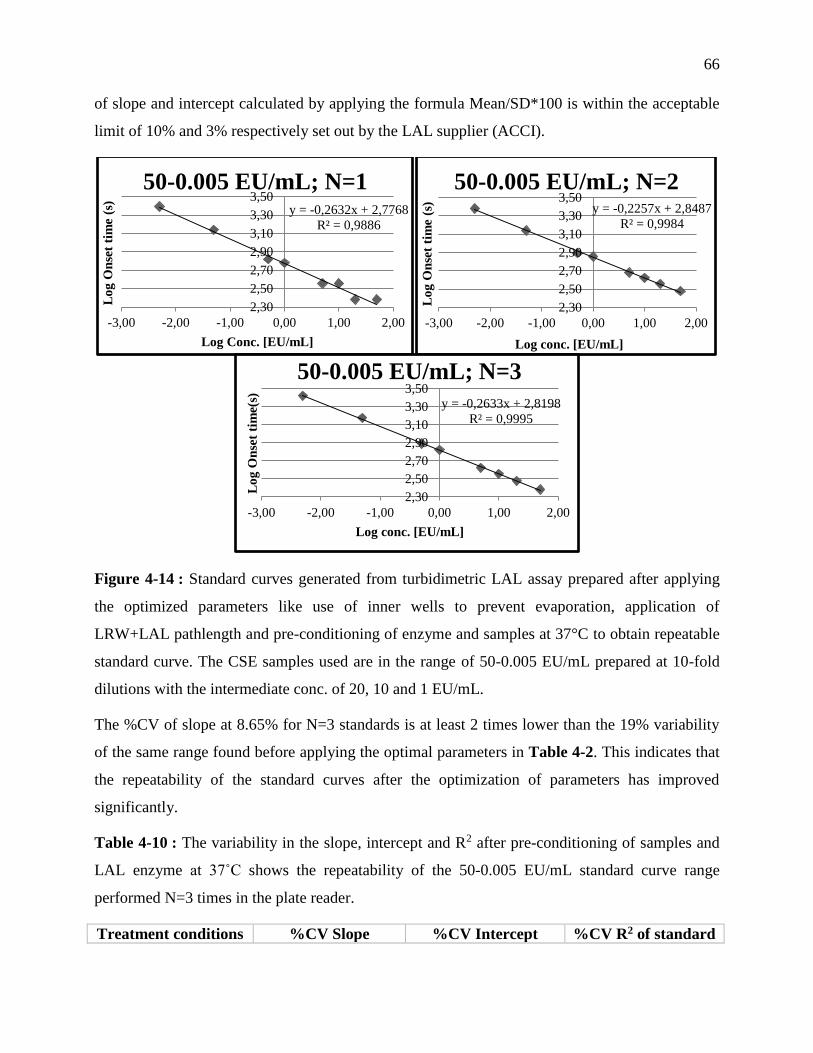
66
of slope and intercept calculated by applying the formula Mean/SD*100 is within the acceptable
limit of 10% and 3% respectively set out by the LAL supplier (ACCI).
Figure 4-14 : Standard curves generated from turbidimetric LAL assay prepared after applying
the optimized parameters like use of inner wells to prevent evaporation, application of
LRW+LAL pathlength and pre-conditioning of enzyme and samples at 37°C to obtain repeatable
standard curve. The CSE samples used are in the range of 50-0.005 EU/mL prepared at 10-fold
dilutions with the intermediate conc. of 20, 10 and 1 EU/mL.
The %CV of slope at 8.65% for N=3 standards is at least 2 times lower than the 19% variability
of the same range found before applying the optimal parameters in Table 4-2. This indicates that
the repeatability of the standard curves after the optimization of parameters has improved
significantly.
Table 4-10 : The variability in the slope, intercept and R2 after pre-conditioning of samples and
LAL enzyme at 37˚C shows the repeatability of the 50-0.005 EU/mL standard curve range
performed N=3 times in the plate reader.
Treatment conditions %CV Slope %CV Intercept %CV R2 of standard
y = -0,2632x + 2,7768
R² = 0,9886
2,30
2,50
2,70
2,90
3,10
3,30
3,50
-3,00 -2,00 -1,00 0,00 1,00 2,00
Lo
g O
nse
t ti
me
(s)
Log Conc. [EU/mL]
50-0.005 EU/mL; N=1y = -0,2257x + 2,8487
R² = 0,9984
2,30
2,50
2,70
2,90
3,10
3,30
3,50
-3,00 -2,00 -1,00 0,00 1,00 2,00
Lo
g O
nse
t ti
me
(s)
Log conc. [EU/mL]
50-0.005 EU/mL; N=2
y = -0,2633x + 2,8198
R² = 0,9995
2,30
2,50
2,70
2,90
3,10
3,30
3,50
-3,00 -2,00 -1,00 0,00 1,00 2,00
Lo
g O
nse
t ti
me(
s)
Log conc. [EU/mL]
50-0.005 EU/mL; N=3
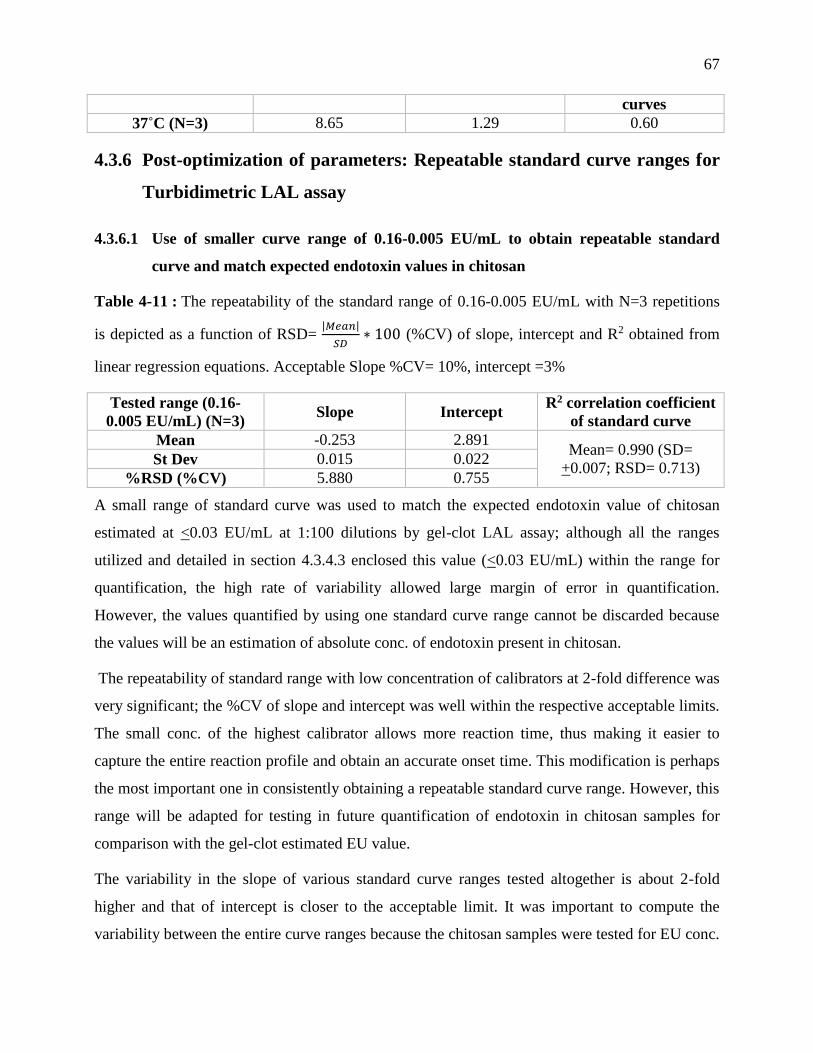
67
curves
37˚C (N=3) 8.65 1.29 0.60
4.3.6 Post-optimization of parameters: Repeatable standard curve ranges for
Turbidimetric LAL assay
4.3.6.1 Use of smaller curve range of 0.16-0.005 EU/mL to obtain repeatable standard
curve and match expected endotoxin values in chitosan
Table 4-11 : The repeatability of the standard range of 0.16-0.005 EU/mL with N=3 repetitions
is depicted as a function of RSD= |𝑀𝑒𝑎𝑛|
𝑆𝐷∗ 100 (%CV) of slope, intercept and R2 obtained from
linear regression equations. Acceptable Slope %CV= 10%, intercept =3%
Tested range (0.16-
0.005 EU/mL) (N=3) Slope Intercept
R2 correlation coefficient
of standard curve
Mean -0.253 2.891 Mean= 0.990 (SD=
+0.007; RSD= 0.713) St Dev 0.015 0.022
%RSD (%CV) 5.880 0.755
A small range of standard curve was used to match the expected endotoxin value of chitosan
estimated at <0.03 EU/mL at 1:100 dilutions by gel-clot LAL assay; although all the ranges
utilized and detailed in section 4.3.4.3 enclosed this value (<0.03 EU/mL) within the range for
quantification, the high rate of variability allowed large margin of error in quantification.
However, the values quantified by using one standard curve range cannot be discarded because
the values will be an estimation of absolute conc. of endotoxin present in chitosan.
The repeatability of standard range with low concentration of calibrators at 2-fold difference was
very significant; the %CV of slope and intercept was well within the respective acceptable limits.
The small conc. of the highest calibrator allows more reaction time, thus making it easier to
capture the entire reaction profile and obtain an accurate onset time. This modification is perhaps
the most important one in consistently obtaining a repeatable standard curve range. However, this
range will be adapted for testing in future quantification of endotoxin in chitosan samples for
comparison with the gel-clot estimated EU value.
The variability in the slope of various standard curve ranges tested altogether is about 2-fold
higher and that of intercept is closer to the acceptable limit. It was important to compute the
variability between the entire curve ranges because the chitosan samples were tested for EU conc.
68
at different standard ranges in parallel to the determination of the optimal curve range, the
evaluated EU conc. of chitosans before and after pre-treatments are computed using the linear
equation from several standard curves and reported in Chapter 5.
4.3.7 Conclusion
The parameters affecting the repeatability of the standard curves, especially with ranges including
high EU concentrations i.e. 50-0.005 EU/mL, were identified and applied for the improvement of
repeatability, which included:
a) The use of inner and middle wells in the 96 well plate to prevent evaporation
b) Correcting the pathlength of the sample and that with appropriate reactant (LRW+LAL)
to reduce variability in onset times and resulting slope and intercept. And;
c) Pre-heating the LAL enzyme and the samples at 37˚C before mixing for efficient catalysis
of reaction cascade.
These parameters act as a guideline for the future assays to obtain repeatable standard curves.
However, the use of small curve range (0.16-0.005 EU/mL) always guarantees high repeatability
of the standard curves.
4.4 Discussion
Determination of endotoxin concentration of chitosan is very important to regulate the dosing for
future clinical applications of chitosan nanoparticles and scaffolds. The scaffold dose application
in the intra-articular injection in horses is specifically sensitive to fluctuating levels of endotoxin,
as the acceptable harmonized limit of injectable endotoxin is very low. The estimated EU value at
<0.3EU/mg generated by gel-clot LAL that can also be accepted in case of discrepancy between
the other two kinetic LAL methods, could be used for simulation of endotoxin content of
currently injected in vivo dose, but for the future applications to avoid the underestimation or
over estimation of endotoxin content, the absolute determination of chitosan endotoxin is
required. The use of sensitive kinetic turbidimetric LAL assay will allow the absolute endotoxin
quantification, but the problem of variation in standard curve deters the significance of quantified
values. The range of variation is 50-200% complemented by variations from other technical
sources. After recognizing and optimizing the sources/parameters causing variations such as
69
evaporation in 96 well plates (Table 4-7), difference in pathlengths of reactants (Figure 4-12)
and effect of pre-conditioning of reagents at optimal temperature on assay performance (Figure
4-13); we were able to prove our first hypothesis that a repeatable range of standard curve with
minimum allowable variation is determined after examination and optimization of all parameters
prone to variation (Table 4-10). Our second hypothesis is proved by adopting a small range of
standard curve matching the gel-clot estimated endotoxin value of chitosan that is repeatable after
N=3 repetitions as shown in Table 4-11 when tested by application of optimized parameters.
Since, the endotoxin conc. of chitosan reported in this thesis are quantified from large standard
curve ranges, the small range of standard curve is recommended for future quantification of
chitosan endotoxin, and must be established for regular use in endotoxin quantification protocols.
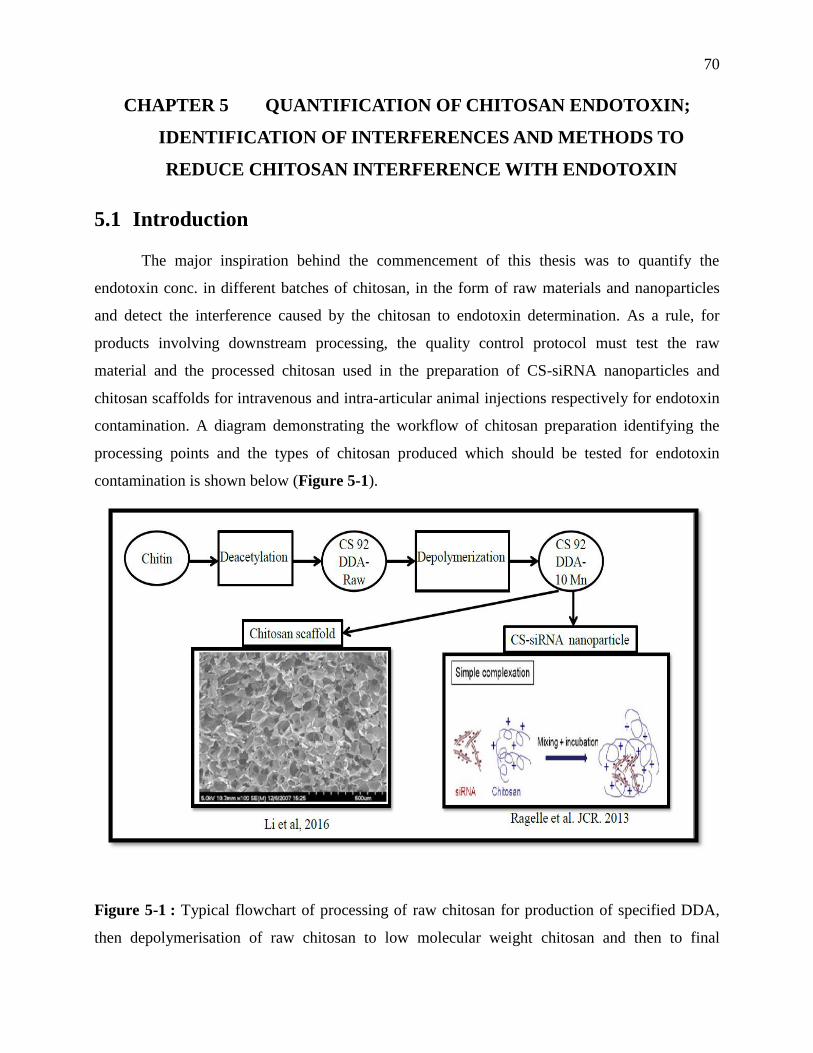
70
CHAPTER 5 QUANTIFICATION OF CHITOSAN ENDOTOXIN;
IDENTIFICATION OF INTERFERENCES AND METHODS TO
REDUCE CHITOSAN INTERFERENCE WITH ENDOTOXIN
5.1 Introduction
The major inspiration behind the commencement of this thesis was to quantify the
endotoxin conc. in different batches of chitosan, in the form of raw materials and nanoparticles
and detect the interference caused by the chitosan to endotoxin determination. As a rule, for
products involving downstream processing, the quality control protocol must test the raw
material and the processed chitosan used in the preparation of CS-siRNA nanoparticles and
chitosan scaffolds for intravenous and intra-articular animal injections respectively for endotoxin
contamination. A diagram demonstrating the workflow of chitosan preparation identifying the
processing points and the types of chitosan produced which should be tested for endotoxin
contamination is shown below (Figure 5-1).
Figure 5-1 : Typical flowchart of processing of raw chitosan for production of specified DDA,
then depolymerisation of raw chitosan to low molecular weight chitosan and then to final
71
nanoparticle and scaffold formulation. Figures adapted from (Liu et al., 2015; Ragelle et al.,
2013)
The quantification of absolute conc. of endotoxin in chitosan raw materials i.e. CS 92-10
and CS 92-Raw is detailed in this section by turbidimetric LAL assay according to specifications
in BET Chapter 85 of USP. It required the use of positive product controls (PPCs) or
Inhibition/Enhancement controls (IEC) to detect the interference by the chitosan or test reagent
during the LAL assay (USP, 2005). Different types of interference caused by chitosan during the
quantification of endotoxin have been identified, and the removal of enhancement interference by
dilution technique is covered. All the chitosan samples and dilutions were tested with different
standard curve ranges with turbidimetric LAL assay. Different types of Pre-treatments to reduce
the inhibition interference of chitosan such as NaOH, chitosanase and nitrous acid treatments
performed before LAL assay are tested for their potential to remove the bound endotoxin from
glucosamine chains. Detection of inhibition interference by chitosan towards endotoxin is
identified by the use of chitosan challenge sample spiked with a known amount of endotoxin
(CSE). Due to the superior accuracy of chromogenic LAL assay in detection of interference by
the challenge sample than turbidimetric LAL and reduced interference by chitosan precipitation,
the chromogenic LAL assay will be used regularly for chitosan endotoxin determination. Finally,
due to deleterious effect of chemical reagents on the endotoxin, the effect of chitosan rehydration/
dissolving agents on endotoxin integrity have been tested.
5.2 Materials and Methods
5.2.1 Quantitative measurement of chitosan endotoxin conc. by kinetic LAL
assay according to USP 85
The turbidimetric LAL assay is typically used for the quantification of endotoxin for the
desired sensitivity of 0.005 EU/mL. The assay depends on the formation of turbidity in the
presence of endotoxin, which is directly proportional to the conc. of endotoxin. Similarly, the
sensitivity of the kinetic chromogenic LAL assay is 0.005 EU/mL, and the amount of endotoxin
in a sample is a function of development of chromogenic substrate after cleavage of enzyme. The
absorbance over time profile of each sample can be observed in kinetic format. In this thesis,
72
typically turbidimetric LAL assay is used for standard curve repeatability test and simultaneous
endotoxin quantification unless otherwise stated.
5.2.1.1 Procedure of endotoxin determination by LAL assay
A standard curve range is prepared by diluting control standard endotoxin (CSE) of
known potency eg, 1000 EU/mL for specific lot of enzyme, this potency is determined against a
reference standard endotoxin (RSE) prepared by US Pharmacoepia (USP) and changes for each
CSE lot due to batch of bacteria and preparation methods. The standard curve range was prepared
from CSE and used for determination of unknown chitosan EU conc. For each test chitosan was
dissolved in HCl at the HCl: glucosamine ratio of 1:1 overnight at room temperature, unless
otherwise stated. The chitosan test sample, show interference in the detection of endotoxin, either
by obstructing enzyme activity or binding with endotoxin, this interference can be reduced by the
diluting the sample several folds and establishing the minimal dilution at which endotoxin can be
detected and interference is eliminated. This method is called Maximum Valid Dilution (MVD)
and is recommended by USP, but typically, this method is used for the samples with fixed
endotoxin limit and an established dose of administration, which is not the case with chitosan
samples. For a controlled pharmaceutical product, the MVD is calculated using the formula
below:
Equation 5-1 : 𝑀𝑉𝐷 =𝐸𝑛𝑑𝑜𝑡𝑜𝑥𝑖𝑛 𝐿𝑖𝑚𝑖𝑡∗𝑠𝑎𝑚𝑝𝑙𝑒 𝑐𝑜𝑛𝑐.
𝑎𝑠𝑠𝑎𝑦 𝑠𝑒𝑛𝑠𝑖𝑡𝑖𝑣𝑖𝑡𝑦 (λ)
Where Endotoxin limit (EL) = Maximum endotoxin limit allowed per dose
Maximum product dose administered per kg body weight per hour Eg ;
5𝐸𝑈
𝑘𝑔
0.5𝑚𝑔
𝑘𝑔/ℎ
= 10 EU/mg
Sample conc. = the stock concentration of the sample prepared for endotoxin detection. Eg,
10mg/mL
Assay sensitivity or λ= Sensitivity of the assay used in the determination of sample endotoxin i.e.
0.005 EU/mL.
73
The MVD of a test sample prepared at 10mg/mL is calculated at 20,000 [(10 EU/mg*
10mg/mL)/0.005 EU/mL]
Samples like chitosan for which no information of clinically applicable dose in humans is
available, the interferences are eliminated by testing several dilutions and determining the
minimal dilution at which precise measurement of endotoxin is achieved and any possible
interference can be eliminated.
5.2.1.1.1 Significance of Positive product control (PPC) or Inhibition/Enhancement control
(IEC)
For each dilution of chitosan test or challenge sample (in section 5.3.3) prepared during
the assay, a known endotoxin amount was spiked that was near or equal to the middle of the
standard curve. This control is called positive product control (PPC) or Inhibition/Enhancement
control (IEC) because it helps in detecting the interference produced by the test sample during the
assay; it was prepared in parallel to all the test sample dilutions. The acceptable recovery of
endotoxin from the PPCs is calculated as
Equation 5-2 : 𝑃𝑃𝐶 𝑟𝑒𝑐𝑜𝑣𝑒𝑟𝑦 𝑎𝑡 𝑎 𝑐𝑒𝑟𝑡𝑎𝑖𝑛 𝑑𝑖𝑙𝑢𝑡𝑖𝑜𝑛 = 𝑃𝑃𝐶 𝐸𝑈 𝑐𝑜𝑛𝑐.− 𝑇𝑒𝑠𝑡 𝑠𝑎𝑚𝑝𝑙𝑒 𝐸𝑈 𝑐𝑜𝑛𝑐.
𝐶𝑜𝑛𝑐.𝑜𝑓 𝑒𝑛𝑑𝑜𝑡𝑜𝑥𝑖𝑛 𝑠𝑝𝑖𝑘𝑒∗ 100
If at any dilution, the recovery of endotoxin from the positive product control was
between acceptable recovery range of 50-200%, then the test sample was considered free of
interference, the dilution of optimal recovery could be attributed equivalent to the maximum
valid dilution, and the absolute endotoxin conc. of the test sample was reported after adjusting for
dilution factor. The process of selecting the MVD, reporting sample EU conc. and role of PPC in
the assay is explicitly represented in Figure 5-2 below:
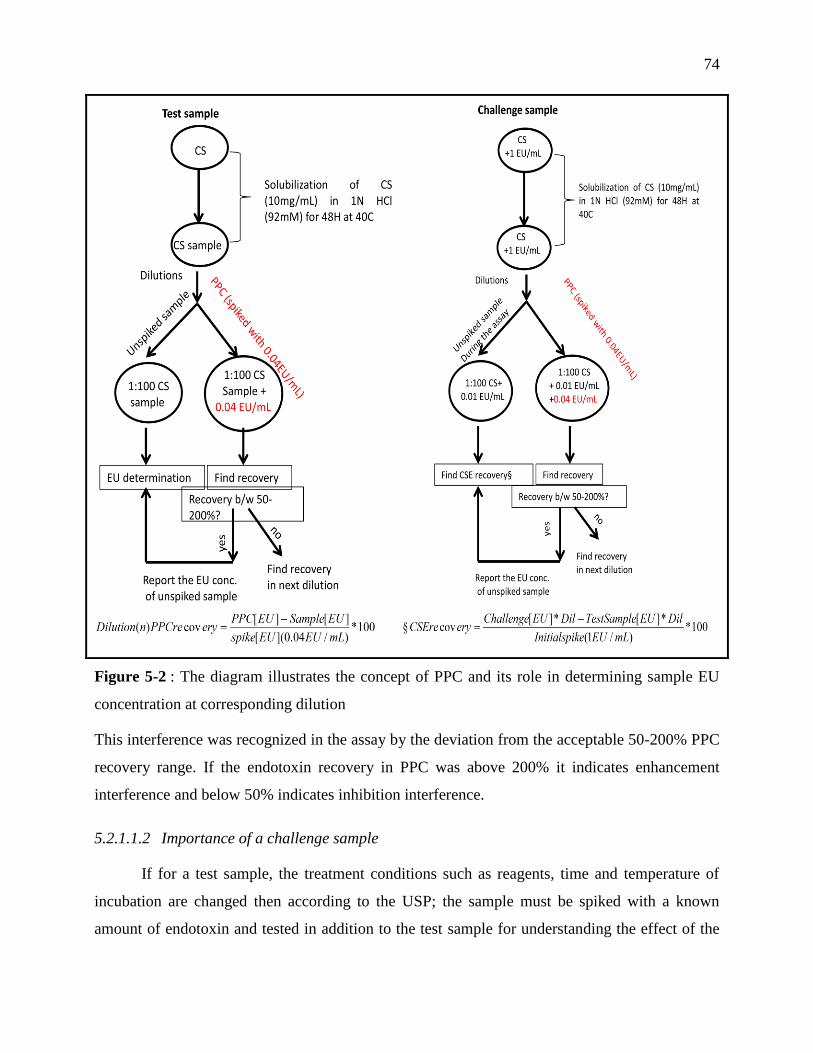
74
Figure 5-2 : The diagram illustrates the concept of PPC and its role in determining sample EU
concentration at corresponding dilution
This interference was recognized in the assay by the deviation from the acceptable 50-200% PPC
recovery range. If the endotoxin recovery in PPC was above 200% it indicates enhancement
interference and below 50% indicates inhibition interference.
5.2.1.1.2 Importance of a challenge sample
If for a test sample, the treatment conditions such as reagents, time and temperature of
incubation are changed then according to the USP; the sample must be spiked with a known
amount of endotoxin and tested in addition to the test sample for understanding the effect of the
75
treatment on the endotoxin integrity; this sample also served to understand the extent of
interference to the endotoxin by the chitosan sample. This sample is called a “Challenge sample”.
Eg; if the treatment of chitosan is changed from HCl to 0.2% acetic acid, then during rehydration/
dissolution in parallel to the test sample, a challenge sample of chitosan with a known endotoxin
spike (1 EU/mL) must also be tested to observe the affect of 0.2% acetic acid on the recovery of
known conc. of endotoxin from chitosan. Even though the Inhibition/Enhancement controls
(IEC) aka PPCs are present for detection of interference by the sample to endotoxin during the
assay, the period of incubation of endotoxin with chitosan is less than 1 hour, which may not be
an accurate indicator of inhibition interference. To determine the magnitude of interference of
chitosan towards endotoxin, the CSE recovery of the challenge sample at any dilution is
calculated using the Equation 5-3:
Equation 5-3 : % 𝐶𝑆𝐸 𝑟𝑒𝑐𝑜𝑣𝑒𝑟𝑦 = 𝐶ℎ𝑎𝑙𝑙𝑒𝑛𝑔𝑒 𝐸𝑈 𝑐𝑜𝑛𝑐.∗𝐷𝑖𝑙 − 𝑇𝑒𝑠𝑡 𝑠𝑎𝑚𝑝𝑙𝑒 𝐸𝑈 𝑐𝑜𝑛𝑐.∗𝐷𝑖𝑙
𝐶𝑜𝑛𝑐.𝑜𝑓 𝑒𝑛𝑑𝑜𝑡𝑜𝑥𝑖𝑛 𝑠𝑝𝑖𝑘𝑒∗ 100
The percent CSE recovery was compared with the 100% initial spike conc. and the value will
help determine the extent of interference demonstrated by the chitosan towards the endotoxin
under the tested treatment conditions and incubation times/ temperature. The acceptable recovery
is within 50-200%.
5.2.2 Pre-treatment of chitosan for removal of interference
To reduce the electrostatic interaction between chitosan and endotoxin- the basis of
inhibition interference by the chitosan samples, several pre-treatment methods were tested
targeting the electrostatic binding by charge neutralization and secondly by reducing the size of
chitosan monomers to limit the interaction with large molecular weight E. coli LPS or its
aggregates. The pre-treatments performed are described below:
5.2.2.1 NaOH treatment of chitosan
The charge neutralization of chitosan by the alkaline reagent was aimed to reduce the
electrostatic charge and release the endotoxin bound to the chitosan in the alkaline solution. This
method has not been used elsewhere, and is accustomed for chitosan samples. For NaOH
treatment, the chitosan 92-10 was dissolved in HCl at HCl: glucosamine ratio of 1:1 at a conc. of
10mg/mL, the challenge CS 92-10 sample at 10mg/mL was spiked at 1 EU/mL and tested
76
alongside the test CS 92-10 sample to observe the CSE recovery and effectiveness of treatment to
remove chitosan bound endotoxin. Both the samples were treated with 1N NaOH by adding 80
+10µL in 1mL sample solution. The pH was also measured and instant precipitation was
observed in both the sample. The samples were then centrifuged at 10000xg for 10 mins and the
supernatant obtained was used for endotoxin quantification by dilution in turbidimetric LAL
assay within the detection range of 50-0.005 EU/mL. The EU content of 0.08N NaOH was also
determined, which was found to be below the range of detection.
5.2.2.2 Chitosanase treatment
The chitosanase enzyme from Streptomyces griseus -a gram positive bacterium was
typically utilized to digest the chitosan glucosamine chains and reduce them into small
monomers; the aim of the test was to reduce the interaction of typically large molecular weight
LPS or its aggregates with chitosan by reducing the size of glucosamine chains. However, before
performing this test, the endotoxin content of the enzyme itself was determined, as a part of
quality control process, because of its origin from a biological source that involved multiple
culturing, extractions and processing steps. The 100U/mL enzyme reconstituted in 50% glycerol
was tested at 1:50 dilution twice by turbidimetric LAL assay within the detection range of 50-
0.005 EU/mL, because of estimation of high endotoxin contamination. The reconstitution reagent
i.e. 50% glycerol was also tested for endotoxin contamination, which was found to be at a very
low range.
5.2.2.3 Nitrous acid (HONO) treatment
With high endotoxin contamination in the chitosanase enzyme, a chemical treatment method with
similar principle as enzymatic digestion was utilized that depolymerizes the chitosan and result in
the production of small sized monomers leading to reduced interaction with high MW LPS or its
aggregates. This is a commonly used method for reducing high molecular weight chitosans into
low molecular weight, but due to harsh acidic and alkaline treatment is considered as the last
resource to reduce interference in chitosan. Hence, the effect of this treatment was observed on
the integrity of endotoxin by treating the endotoxin (CSE) spiked in LAL reagent water (LRW) at
high conc. i.e. 50 EU/mL, because of high probability of reduction in endotoxin content due to
acid hydrolysis. The acid hydrolysis occurs under highly acidic conditions at moderate
temperature, which is supplied in this treatment at 50°C for 3 hours. The nitrous acid (HONO)
77
has a pKa of 3, which is maintained under acidic conditions supplied by HCl. The nitrous acid is
activated in the presence of HCl, hence HCl conc. is constantly maintained 28mM higher than the
conc. of HONO used for any glucosamine: HONO ratio aka RNH2/ HONO used in depolymerisation.
Three different conc. of HONO+ HCl were used to treat 50 EU/mL CSE spiked LRW to obtain
one conc. suitable for endotoxin recovery, 1st conc. equivalent to the glucosamine: HONO ratio
(RNH2/ HONO=0.5) used the depolymerisation of chitosan with 55.91mM HONO+ 83.91mM HCl,
2nd conc. with high HONO+ HCl conc. at R=0.2 with 139.7mM HONO+ 167.7mM HCl and 3rd
conc. with low HONO+ HCl conc. at R=0.9 with 31.06mM HONO+59.06mM HCl; one CSE
spiked LRW sample was treated only with 83.91mM HCl equivalent to R=0.5 without HONO to
observe the effect of HCl on endotoxin integrity at conc. used for depolymerisation of chitosan.
As HONO was activated in the presence of HCl, HCl conc. was always 28mM higher than
HONO to attain excess hydrogen ions for efficient depolymerisation reaction. The treatment was
repeated three times (N=3) for high robustness in the data. The turbidimetric LAL assay was
performed after the completion of 3 hours’ reaction quantified within the range of 50-0.005
EU/mL. The only pH adjustment was at the end of the assay by addition of LAL enzyme
reconstituted in glucashield buffer.
5.2.2.3.1 Chromogenic LAL: Repeatability of 0.16-0.005 EU/mL standard range
Small range of standard curve such as turbidimetric was used for comparability and to test the EU
conc. of chitosan. Chromogenic assay was found to be more sensitive to quantify EU conc. of
chitosan without the elements like interference with LAL proteins impeding the detection due to
different assay chemistry. It could easily detect interference of endotoxin in chitosan challenge
sample, giving reliable results compared to turbidimetric assay. The initial results of chitosan EU
determination and interference detection were performed with turbidimetric assay while the
chromogenic assay was used for determination of optimal reagent for chitosan rehydration.
The standard calibrators were prepared by diluting the CSE stock of 100 EU/mL 5-folds to obtain
an intermediate solution of 20 EU/mL, serially another 3.2 and 0.32 EU/mL intermediate
solutions were prepared to finally begin the preparation of 0.16 EU/mL, 0.08 EU/mL, 0.04
EU/mL, 0.02 EU/mL, 0.01 EU/mL and 0.005 EU/mL standard calibrators. All the samples were
pipetted in triplicate wells of a 96 well plate and inserted in an incubating plate reader at 37°C for
20 mins before beginning the reaction. The pyrochrome lysate (LAL enzyme for chromogenic
78
assay) was reconstituted in glucashield buffer for endotoxin specificity and incubated in a water
bath set at 37°C for approximately 20-30 mins. The temperature equilibrated LAL enzyme was
pipetted on top of the acclimatized samples for reaction to start rapidly; 5 mins within the
pipetting of enzyme, the reaction was allowed to run for 2 hours at 405nm at the absorbance
recording interval of 1 min 25 sec, the absorbance at 975nm and 900nm were also measured to
correct for pathlength in each well. After run completion the onset time was automatically
calculated by the Magellan software and the standard curve was plotted by log onset time vs log
(calibrator) conc. A straight line passing through all the regression points represents the linearity,
which was within the USP acceptable limit of >0.98 for all the three repeated standard curves; the
%RSD (%CV) for slope and the intercept was compared with the issued acceptable limit of 10%
and 3% respectively by the ACCI.
5.2.2.4 Determination of optimal chitosan rehydration method for maximum endotoxin
recovery
Due to the observed interference by 83.91mM HCl in endotoxin detection, and the
probability of low pH unbuffered after the addition of glucashield buffer diluted in LAL enzyme,
the USP method was used which recommends buffering of (chitosan) samples treated with
92mM HCl by β (1-3)-D -glucan blocking buffer commercially named glucashield buffer (from
ACCI) to optimize the pH for efficient endotoxin detection. Since low pH by HCl was a problem,
another reagent used by ACCI to treat and rehydrate chitosan samples was also tested after
buffering to elucidate the effect of different rehydration/ chitosan dissolving agents on the
endotoxin recovery due to their possible endotoxin releasing mechanisms. The high conc. of
endotoxin used for spiking LRW samples in previous tests was also reduced from 50 EU/mL to 1
EU/mL, to increase the accuracy of detection. Both the CSE spiked LRW samples and challenge
chitosan samples were tested in this study.
To choose the optimal method for rehydration of chitosan powder, to enable it to repel
endotoxin and release it from its surface, a study was designed using different standard methods
utilized by the USP for chitosan monograph and the Associates of Cape Cod (ACCI). The USP
recommends dissolving chitosan in 92mM HCl at a concentration of 10mg/mL at 40°C for 48
hours before endotoxin detection by LAL assay. The ACCI is a contract research organization
that specializes in endotoxin detection and a leader from past 40 years in the field. For chitosan,
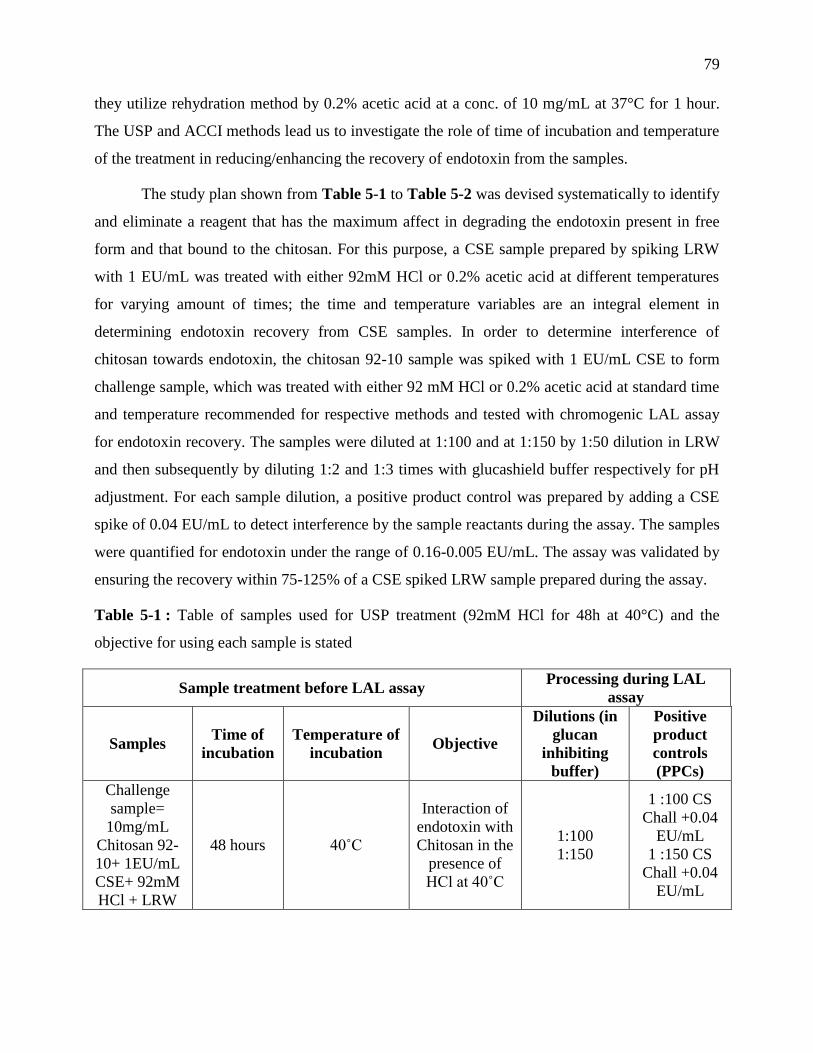
79
they utilize rehydration method by 0.2% acetic acid at a conc. of 10 mg/mL at 37°C for 1 hour.
The USP and ACCI methods lead us to investigate the role of time of incubation and temperature
of the treatment in reducing/enhancing the recovery of endotoxin from the samples.
The study plan shown from Table 5-1 to Table 5-2 was devised systematically to identify
and eliminate a reagent that has the maximum affect in degrading the endotoxin present in free
form and that bound to the chitosan. For this purpose, a CSE sample prepared by spiking LRW
with 1 EU/mL was treated with either 92mM HCl or 0.2% acetic acid at different temperatures
for varying amount of times; the time and temperature variables are an integral element in
determining endotoxin recovery from CSE samples. In order to determine interference of
chitosan towards endotoxin, the chitosan 92-10 sample was spiked with 1 EU/mL CSE to form
challenge sample, which was treated with either 92 mM HCl or 0.2% acetic acid at standard time
and temperature recommended for respective methods and tested with chromogenic LAL assay
for endotoxin recovery. The samples were diluted at 1:100 and at 1:150 by 1:50 dilution in LRW
and then subsequently by diluting 1:2 and 1:3 times with glucashield buffer respectively for pH
adjustment. For each sample dilution, a positive product control was prepared by adding a CSE
spike of 0.04 EU/mL to detect interference by the sample reactants during the assay. The samples
were quantified for endotoxin under the range of 0.16-0.005 EU/mL. The assay was validated by
ensuring the recovery within 75-125% of a CSE spiked LRW sample prepared during the assay.
Table 5-1 : Table of samples used for USP treatment (92mM HCl for 48h at 40°C) and the
objective for using each sample is stated
Sample treatment before LAL assay Processing during LAL
assay
Samples Time of
incubation
Temperature of
incubation Objective
Dilutions (in
glucan
inhibiting
buffer)
Positive
product
controls
(PPCs)
Challenge
sample=
10mg/mL
Chitosan 92-
10+ 1EU/mL
CSE+ 92mM
HCl + LRW
48 hours 40˚C
Interaction of
endotoxin with
Chitosan in the
presence of
HCl at 40˚C
1:100
1:150
1 :100 CS
Chall +0.04
EU/mL
1 :150 CS
Chall +0.04
EU/mL
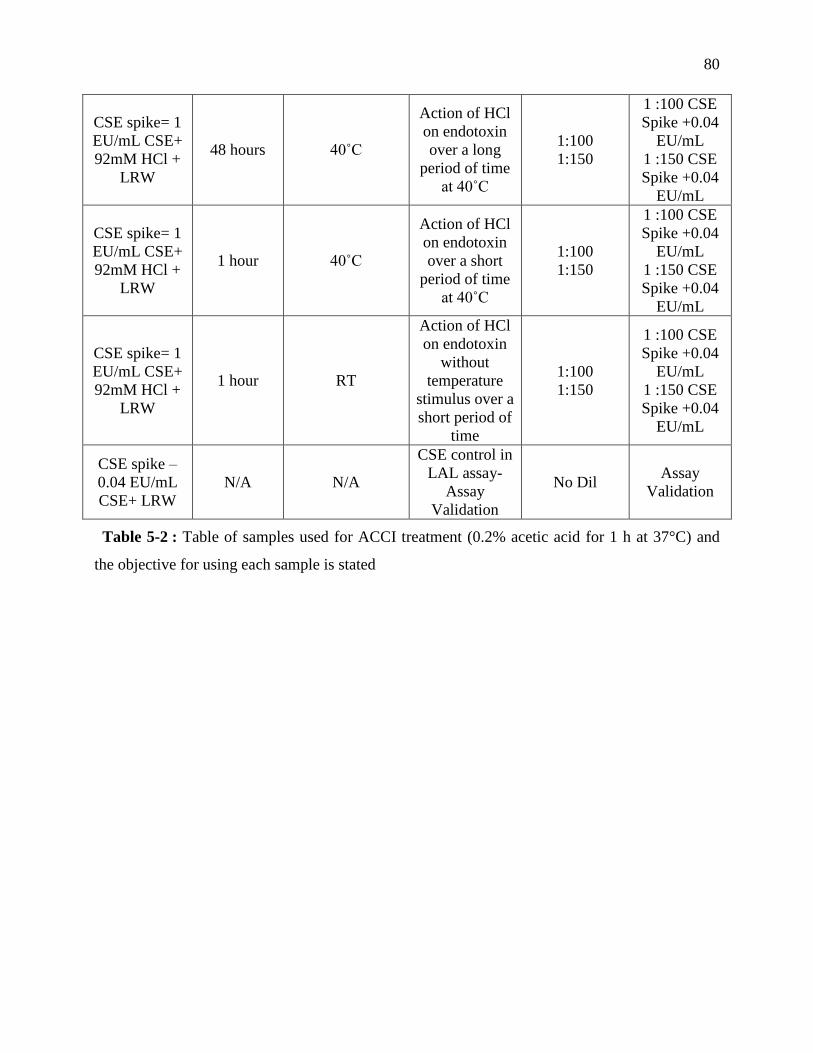
80
CSE spike= 1
EU/mL CSE+
92mM HCl +
LRW
48 hours 40˚C
Action of HCl
on endotoxin
over a long
period of time
at 40˚C
1:100
1:150
1 :100 CSE
Spike +0.04
EU/mL
1 :150 CSE
Spike +0.04
EU/mL
CSE spike= 1
EU/mL CSE+
92mM HCl +
LRW
1 hour 40˚C
Action of HCl
on endotoxin
over a short
period of time
at 40˚C
1:100
1:150
1 :100 CSE
Spike +0.04
EU/mL
1 :150 CSE
Spike +0.04
EU/mL
CSE spike= 1
EU/mL CSE+
92mM HCl +
LRW
1 hour RT
Action of HCl
on endotoxin
without
temperature
stimulus over a
short period of
time
1:100
1:150
1 :100 CSE
Spike +0.04
EU/mL
1 :150 CSE
Spike +0.04
EU/mL
CSE spike –
0.04 EU/mL
CSE+ LRW
N/A N/A
CSE control in
LAL assay-
Assay
Validation
No Dil Assay
Validation
Table 5-2 : Table of samples used for ACCI treatment (0.2% acetic acid for 1 h at 37°C) and
the objective for using each sample is stated
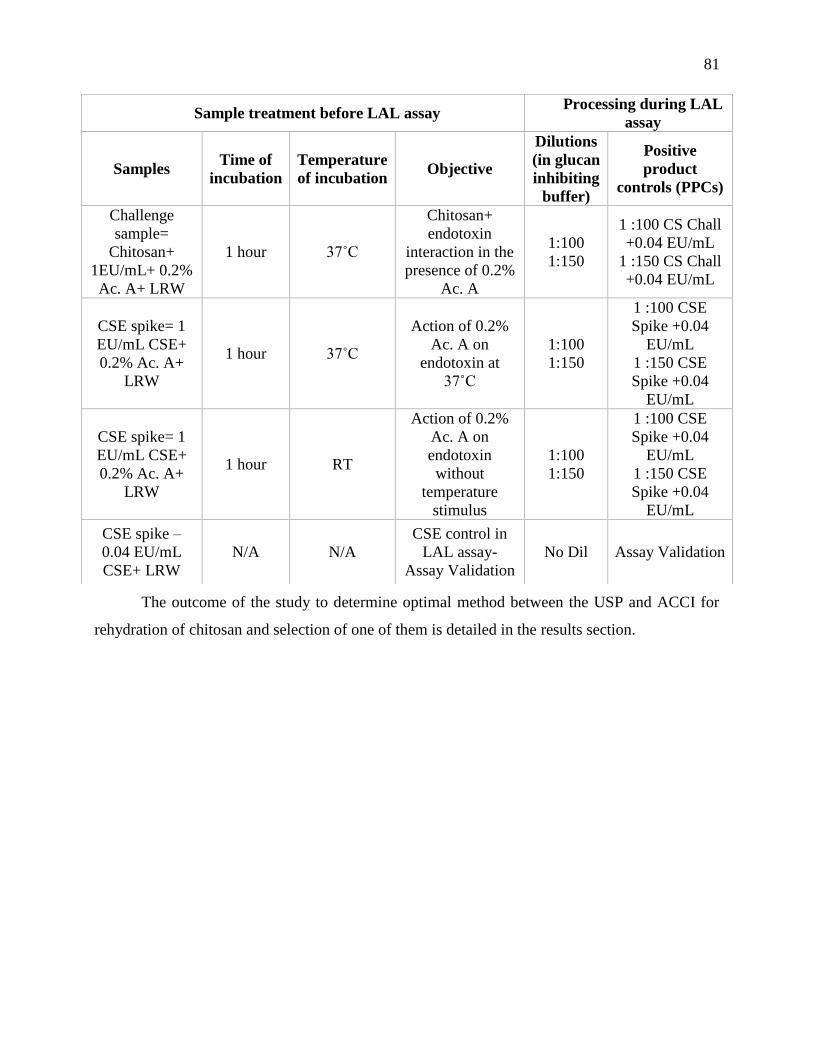
81
The outcome of the study to determine optimal method between the USP and ACCI for
rehydration of chitosan and selection of one of them is detailed in the results section.
Sample treatment before LAL assay Processing during LAL
assay
Samples Time of
incubation
Temperature
of incubation Objective
Dilutions
(in glucan
inhibiting
buffer)
Positive
product
controls (PPCs)
Challenge
sample=
Chitosan+
1EU/mL+ 0.2%
Ac. A+ LRW
1 hour 37˚C
Chitosan+
endotoxin
interaction in the
presence of 0.2%
Ac. A
1:100
1:150
1 :100 CS Chall
+0.04 EU/mL
1 :150 CS Chall
+0.04 EU/mL
CSE spike= 1
EU/mL CSE+
0.2% Ac. A+
LRW
1 hour 37˚C
Action of 0.2%
Ac. A on
endotoxin at
37˚C
1:100
1:150
1 :100 CSE
Spike +0.04
EU/mL
1 :150 CSE
Spike +0.04
EU/mL
CSE spike= 1
EU/mL CSE+
0.2% Ac. A+
LRW
1 hour RT
Action of 0.2%
Ac. A on
endotoxin
without
temperature
stimulus
1:100
1:150
1 :100 CSE
Spike +0.04
EU/mL
1 :150 CSE
Spike +0.04
EU/mL
CSE spike –
0.04 EU/mL
CSE+ LRW
N/A N/A
CSE control in
LAL assay-
Assay Validation
No Dil Assay Validation
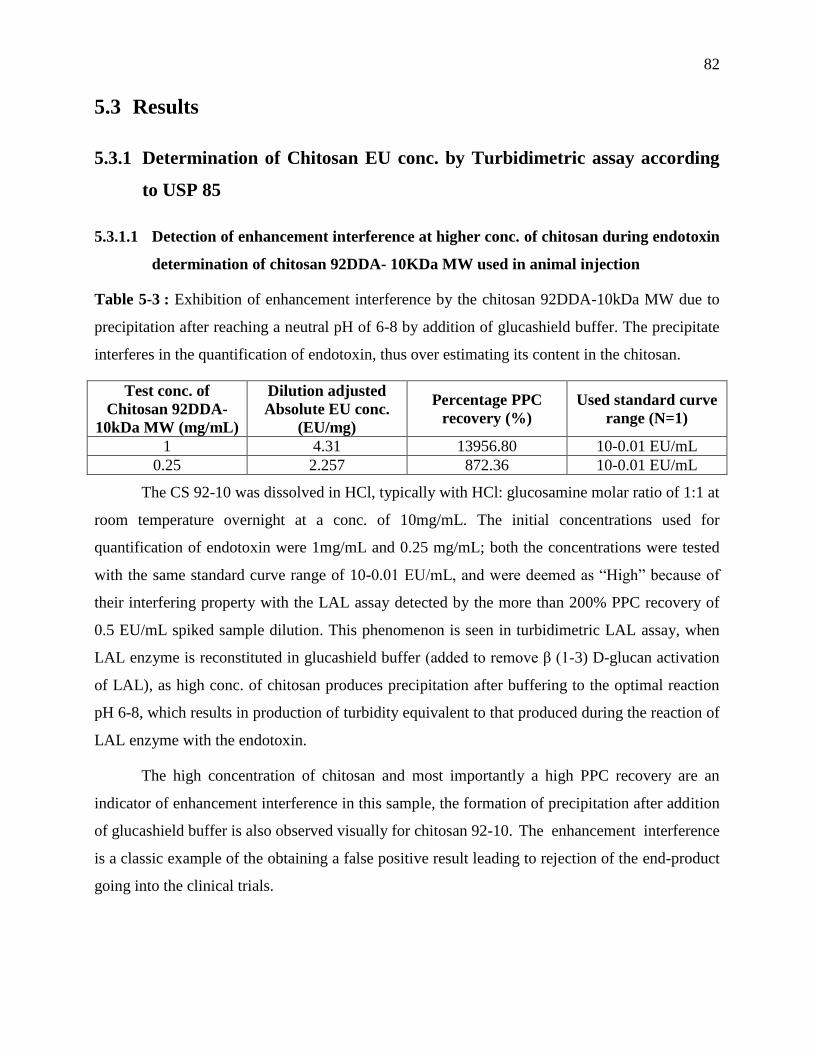
82
5.3 Results
5.3.1 Determination of Chitosan EU conc. by Turbidimetric assay according
to USP 85
5.3.1.1 Detection of enhancement interference at higher conc. of chitosan during endotoxin
determination of chitosan 92DDA- 10KDa MW used in animal injection
Table 5-3 : Exhibition of enhancement interference by the chitosan 92DDA-10kDa MW due to
precipitation after reaching a neutral pH of 6-8 by addition of glucashield buffer. The precipitate
interferes in the quantification of endotoxin, thus over estimating its content in the chitosan.
Test conc. of
Chitosan 92DDA-
10kDa MW (mg/mL)
Dilution adjusted
Absolute EU conc.
(EU/mg)
Percentage PPC
recovery (%)
Used standard curve
range (N=1)
1 4.31 13956.80 10-0.01 EU/mL
0.25 2.257 872.36 10-0.01 EU/mL
The CS 92-10 was dissolved in HCl, typically with HCl: glucosamine molar ratio of 1:1 at
room temperature overnight at a conc. of 10mg/mL. The initial concentrations used for
quantification of endotoxin were 1mg/mL and 0.25 mg/mL; both the concentrations were tested
with the same standard curve range of 10-0.01 EU/mL, and were deemed as “High” because of
their interfering property with the LAL assay detected by the more than 200% PPC recovery of
0.5 EU/mL spiked sample dilution. This phenomenon is seen in turbidimetric LAL assay, when
LAL enzyme is reconstituted in glucashield buffer (added to remove β (1-3) D-glucan activation
of LAL), as high conc. of chitosan produces precipitation after buffering to the optimal reaction
pH 6-8, which results in production of turbidity equivalent to that produced during the reaction of
LAL enzyme with the endotoxin.
The high concentration of chitosan and most importantly a high PPC recovery are an
indicator of enhancement interference in this sample, the formation of precipitation after addition
of glucashield buffer is also observed visually for chitosan 92-10. The enhancement interference
is a classic example of the obtaining a false positive result leading to rejection of the end-product
going into the clinical trials.
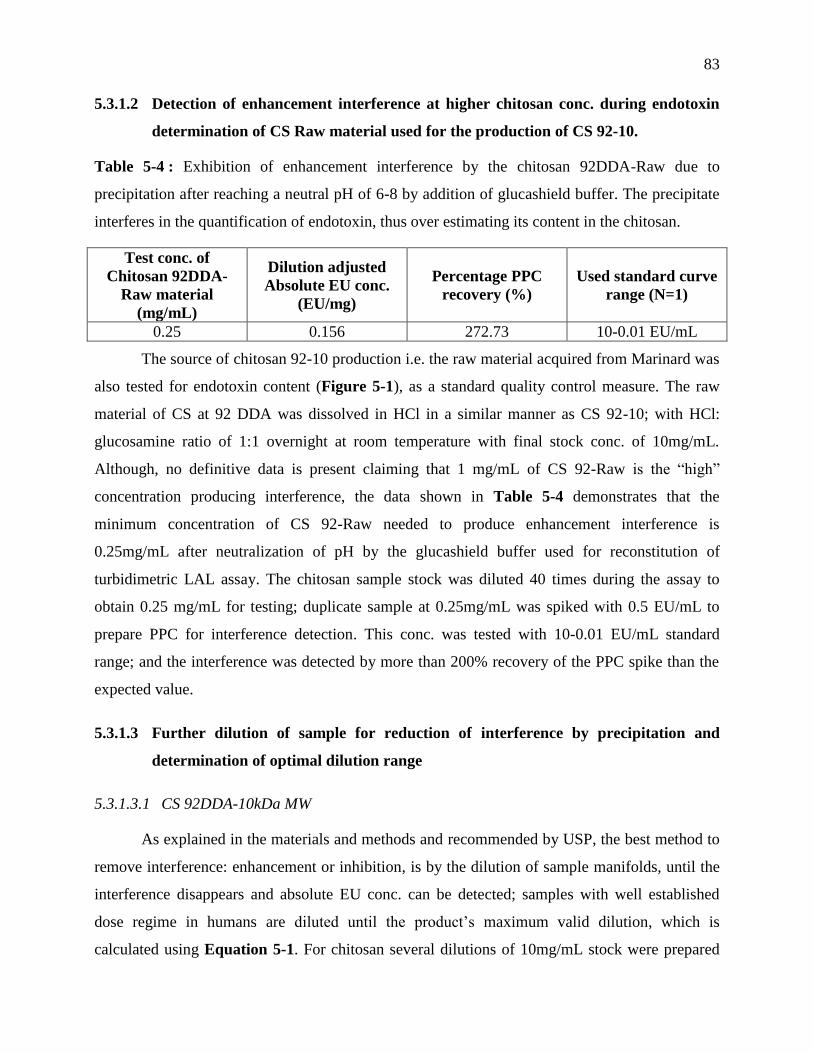
83
5.3.1.2 Detection of enhancement interference at higher chitosan conc. during endotoxin
determination of CS Raw material used for the production of CS 92-10.
Table 5-4 : Exhibition of enhancement interference by the chitosan 92DDA-Raw due to
precipitation after reaching a neutral pH of 6-8 by addition of glucashield buffer. The precipitate
interferes in the quantification of endotoxin, thus over estimating its content in the chitosan.
Test conc. of
Chitosan 92DDA-
Raw material
(mg/mL)
Dilution adjusted
Absolute EU conc.
(EU/mg)
Percentage PPC
recovery (%)
Used standard curve
range (N=1)
0.25 0.156 272.73 10-0.01 EU/mL
The source of chitosan 92-10 production i.e. the raw material acquired from Marinard was
also tested for endotoxin content (Figure 5-1), as a standard quality control measure. The raw
material of CS at 92 DDA was dissolved in HCl in a similar manner as CS 92-10; with HCl:
glucosamine ratio of 1:1 overnight at room temperature with final stock conc. of 10mg/mL.
Although, no definitive data is present claiming that 1 mg/mL of CS 92-Raw is the “high”
concentration producing interference, the data shown in Table 5-4 demonstrates that the
minimum concentration of CS 92-Raw needed to produce enhancement interference is
0.25mg/mL after neutralization of pH by the glucashield buffer used for reconstitution of
turbidimetric LAL assay. The chitosan sample stock was diluted 40 times during the assay to
obtain 0.25 mg/mL for testing; duplicate sample at 0.25mg/mL was spiked with 0.5 EU/mL to
prepare PPC for interference detection. This conc. was tested with 10-0.01 EU/mL standard
range; and the interference was detected by more than 200% recovery of the PPC spike than the
expected value.
5.3.1.3 Further dilution of sample for reduction of interference by precipitation and
determination of optimal dilution range
5.3.1.3.1 CS 92DDA-10kDa MW
As explained in the materials and methods and recommended by USP, the best method to
remove interference: enhancement or inhibition, is by the dilution of sample manifolds, until the
interference disappears and absolute EU conc. can be detected; samples with well established
dose regime in humans are diluted until the product’s maximum valid dilution, which is
calculated using Equation 5-1. For chitosan several dilutions of 10mg/mL stock were prepared
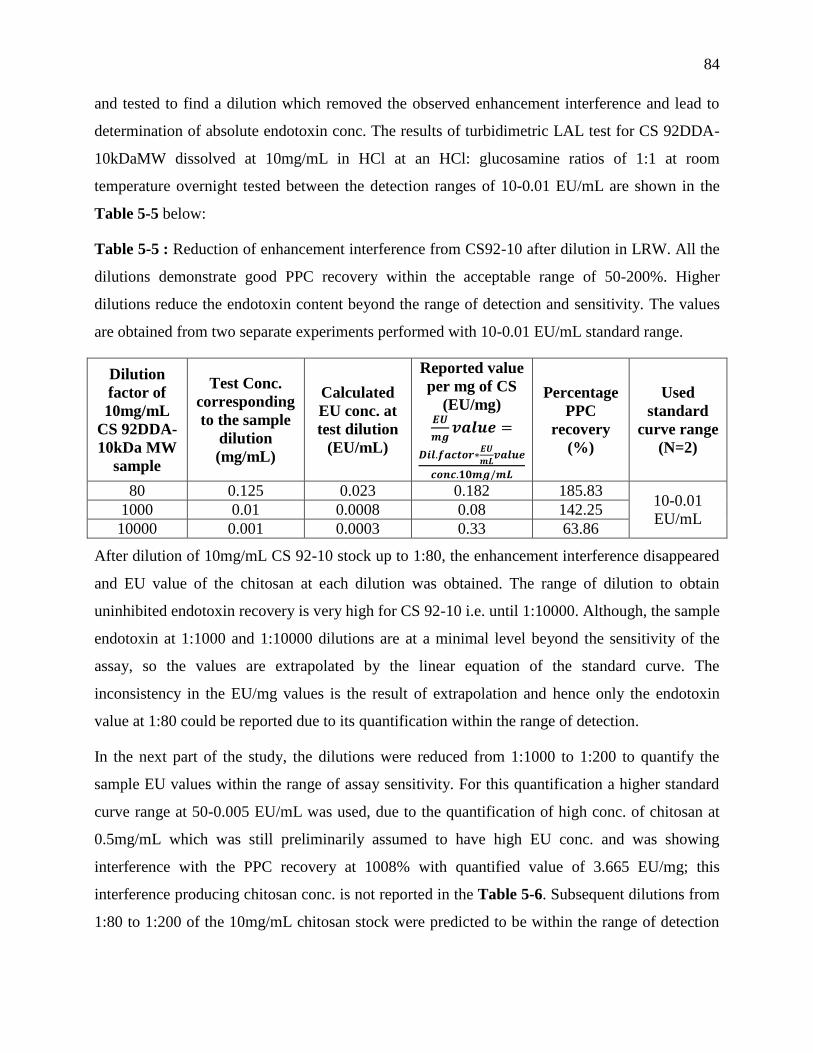
84
and tested to find a dilution which removed the observed enhancement interference and lead to
determination of absolute endotoxin conc. The results of turbidimetric LAL test for CS 92DDA-
10kDaMW dissolved at 10mg/mL in HCl at an HCl: glucosamine ratios of 1:1 at room
temperature overnight tested between the detection ranges of 10-0.01 EU/mL are shown in the
Table 5-5 below:
Table 5-5 : Reduction of enhancement interference from CS92-10 after dilution in LRW. All the
dilutions demonstrate good PPC recovery within the acceptable range of 50-200%. Higher
dilutions reduce the endotoxin content beyond the range of detection and sensitivity. The values
are obtained from two separate experiments performed with 10-0.01 EU/mL standard range.
Dilution
factor of
10mg/mL
CS 92DDA-
10kDa MW
sample
Test Conc.
corresponding
to the sample
dilution
(mg/mL)
Calculated
EU conc. at
test dilution
(EU/mL)
Reported value
per mg of CS
(EU/mg) 𝑬𝑼
𝒎𝒈𝒗𝒂𝒍𝒖𝒆 =
𝑫𝒊𝒍.𝒇𝒂𝒄𝒕𝒐𝒓∗𝑬𝑼
𝒎𝑳𝒗𝒂𝒍𝒖𝒆
𝒄𝒐𝒏𝒄.𝟏𝟎𝒎𝒈/𝒎𝑳
Percentage
PPC
recovery
(%)
Used
standard
curve range
(N=2)
80 0.125 0.023 0.182 185.83 10-0.01
EU/mL 1000 0.01 0.0008 0.08 142.25
10000 0.001 0.0003 0.33 63.86
After dilution of 10mg/mL CS 92-10 stock up to 1:80, the enhancement interference disappeared
and EU value of the chitosan at each dilution was obtained. The range of dilution to obtain
uninhibited endotoxin recovery is very high for CS 92-10 i.e. until 1:10000. Although, the sample
endotoxin at 1:1000 and 1:10000 dilutions are at a minimal level beyond the sensitivity of the
assay, so the values are extrapolated by the linear equation of the standard curve. The
inconsistency in the EU/mg values is the result of extrapolation and hence only the endotoxin
value at 1:80 could be reported due to its quantification within the range of detection.
In the next part of the study, the dilutions were reduced from 1:1000 to 1:200 to quantify the
sample EU values within the range of assay sensitivity. For this quantification a higher standard
curve range at 50-0.005 EU/mL was used, due to the quantification of high conc. of chitosan at
0.5mg/mL which was still preliminarily assumed to have high EU conc. and was showing
interference with the PPC recovery at 1008% with quantified value of 3.665 EU/mg; this
interference producing chitosan conc. is not reported in the Table 5-6. Subsequent dilutions from
1:80 to 1:200 of the 10mg/mL chitosan stock were predicted to be within the range of detection
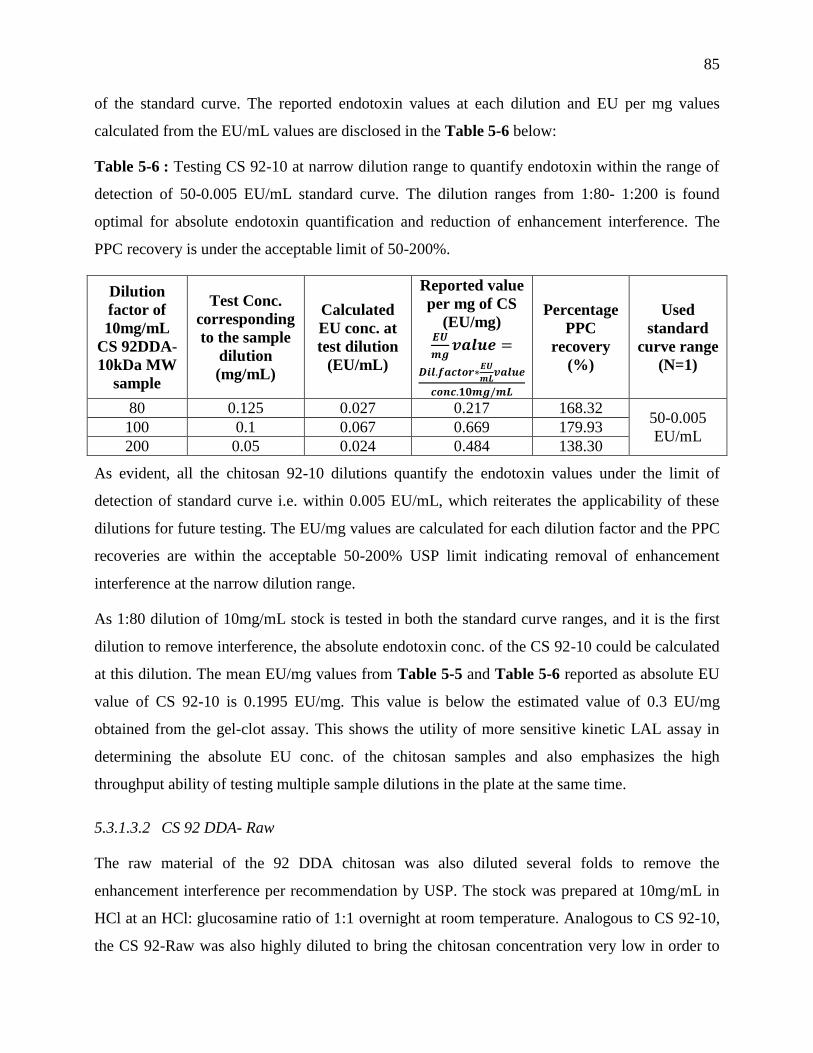
85
of the standard curve. The reported endotoxin values at each dilution and EU per mg values
calculated from the EU/mL values are disclosed in the Table 5-6 below:
Table 5-6 : Testing CS 92-10 at narrow dilution range to quantify endotoxin within the range of
detection of 50-0.005 EU/mL standard curve. The dilution ranges from 1:80- 1:200 is found
optimal for absolute endotoxin quantification and reduction of enhancement interference. The
PPC recovery is under the acceptable limit of 50-200%.
Dilution
factor of
10mg/mL
CS 92DDA-
10kDa MW
sample
Test Conc.
corresponding
to the sample
dilution
(mg/mL)
Calculated
EU conc. at
test dilution
(EU/mL)
Reported value
per mg of CS
(EU/mg) 𝑬𝑼
𝒎𝒈𝒗𝒂𝒍𝒖𝒆 =
𝑫𝒊𝒍.𝒇𝒂𝒄𝒕𝒐𝒓∗𝑬𝑼
𝒎𝑳𝒗𝒂𝒍𝒖𝒆
𝒄𝒐𝒏𝒄.𝟏𝟎𝒎𝒈/𝒎𝑳
Percentage
PPC
recovery
(%)
Used
standard
curve range
(N=1)
80 0.125 0.027 0.217 168.32 50-0.005
EU/mL 100 0.1 0.067 0.669 179.93
200 0.05 0.024 0.484 138.30
As evident, all the chitosan 92-10 dilutions quantify the endotoxin values under the limit of
detection of standard curve i.e. within 0.005 EU/mL, which reiterates the applicability of these
dilutions for future testing. The EU/mg values are calculated for each dilution factor and the PPC
recoveries are within the acceptable 50-200% USP limit indicating removal of enhancement
interference at the narrow dilution range.
As 1:80 dilution of 10mg/mL stock is tested in both the standard curve ranges, and it is the first
dilution to remove interference, the absolute endotoxin conc. of the CS 92-10 could be calculated
at this dilution. The mean EU/mg values from Table 5-5 and Table 5-6 reported as absolute EU
value of CS 92-10 is 0.1995 EU/mg. This value is below the estimated value of 0.3 EU/mg
obtained from the gel-clot assay. This shows the utility of more sensitive kinetic LAL assay in
determining the absolute EU conc. of the chitosan samples and also emphasizes the high
throughput ability of testing multiple sample dilutions in the plate at the same time.
5.3.1.3.2 CS 92 DDA- Raw
The raw material of the 92 DDA chitosan was also diluted several folds to remove the
enhancement interference per recommendation by USP. The stock was prepared at 10mg/mL in
HCl at an HCl: glucosamine ratio of 1:1 overnight at room temperature. Analogous to CS 92-10,
the CS 92-Raw was also highly diluted to bring the chitosan concentration very low in order to
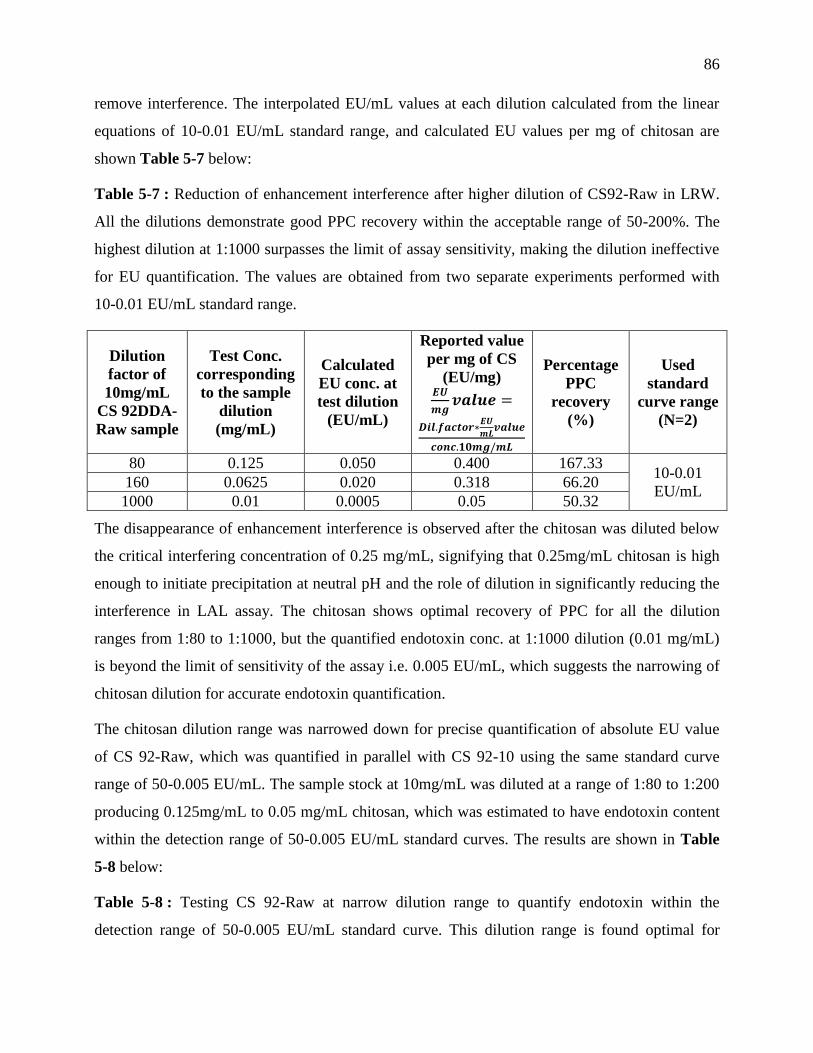
86
remove interference. The interpolated EU/mL values at each dilution calculated from the linear
equations of 10-0.01 EU/mL standard range, and calculated EU values per mg of chitosan are
shown Table 5-7 below:
Table 5-7 : Reduction of enhancement interference after higher dilution of CS92-Raw in LRW.
All the dilutions demonstrate good PPC recovery within the acceptable range of 50-200%. The
highest dilution at 1:1000 surpasses the limit of assay sensitivity, making the dilution ineffective
for EU quantification. The values are obtained from two separate experiments performed with
10-0.01 EU/mL standard range.
Dilution
factor of
10mg/mL
CS 92DDA-
Raw sample
Test Conc.
corresponding
to the sample
dilution
(mg/mL)
Calculated
EU conc. at
test dilution
(EU/mL)
Reported value
per mg of CS
(EU/mg) 𝑬𝑼
𝒎𝒈𝒗𝒂𝒍𝒖𝒆 =
𝑫𝒊𝒍.𝒇𝒂𝒄𝒕𝒐𝒓∗𝑬𝑼
𝒎𝑳𝒗𝒂𝒍𝒖𝒆
𝒄𝒐𝒏𝒄.𝟏𝟎𝒎𝒈/𝒎𝑳
Percentage
PPC
recovery
(%)
Used
standard
curve range
(N=2)
80 0.125 0.050 0.400 167.33 10-0.01
EU/mL 160 0.0625 0.020 0.318 66.20
1000 0.01 0.0005 0.05 50.32
The disappearance of enhancement interference is observed after the chitosan was diluted below
the critical interfering concentration of 0.25 mg/mL, signifying that 0.25mg/mL chitosan is high
enough to initiate precipitation at neutral pH and the role of dilution in significantly reducing the
interference in LAL assay. The chitosan shows optimal recovery of PPC for all the dilution
ranges from 1:80 to 1:1000, but the quantified endotoxin conc. at 1:1000 dilution (0.01 mg/mL)
is beyond the limit of sensitivity of the assay i.e. 0.005 EU/mL, which suggests the narrowing of
chitosan dilution for accurate endotoxin quantification.
The chitosan dilution range was narrowed down for precise quantification of absolute EU value
of CS 92-Raw, which was quantified in parallel with CS 92-10 using the same standard curve
range of 50-0.005 EU/mL. The sample stock at 10mg/mL was diluted at a range of 1:80 to 1:200
producing 0.125mg/mL to 0.05 mg/mL chitosan, which was estimated to have endotoxin content
within the detection range of 50-0.005 EU/mL standard curves. The results are shown in Table
5-8 below:
Table 5-8 : Testing CS 92-Raw at narrow dilution range to quantify endotoxin within the
detection range of 50-0.005 EU/mL standard curve. This dilution range is found optimal for
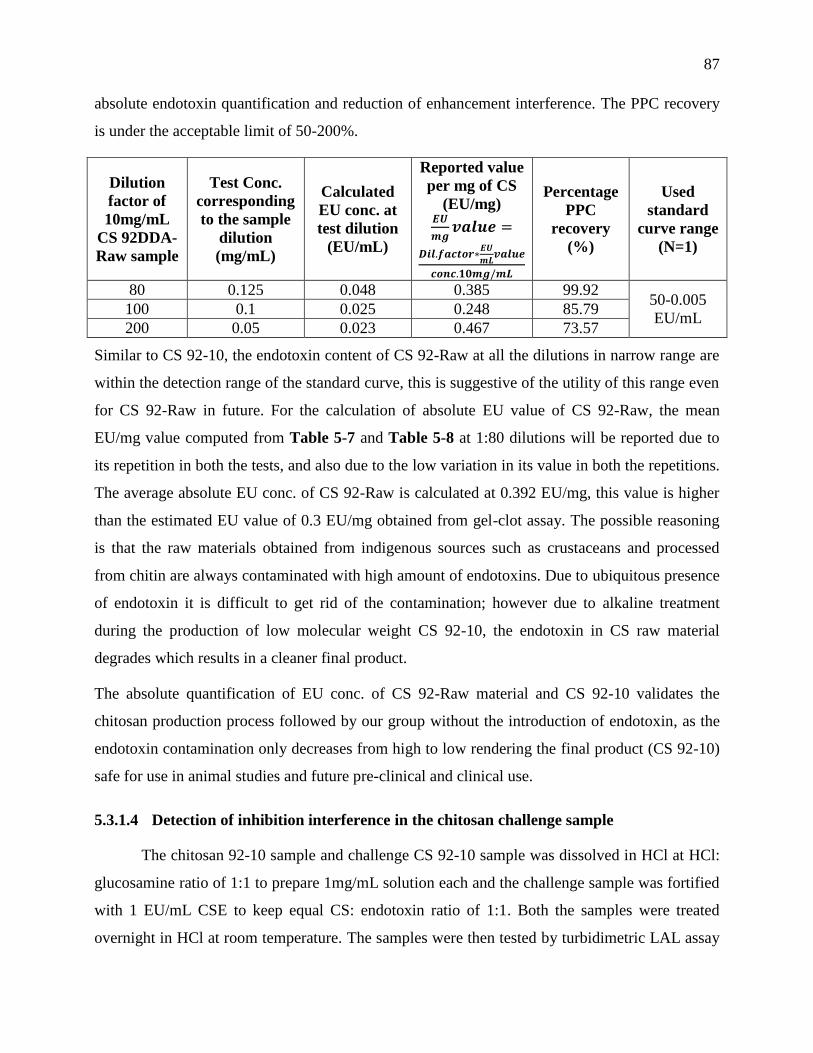
87
absolute endotoxin quantification and reduction of enhancement interference. The PPC recovery
is under the acceptable limit of 50-200%.
Dilution
factor of
10mg/mL
CS 92DDA-
Raw sample
Test Conc.
corresponding
to the sample
dilution
(mg/mL)
Calculated
EU conc. at
test dilution
(EU/mL)
Reported value
per mg of CS
(EU/mg) 𝑬𝑼
𝒎𝒈𝒗𝒂𝒍𝒖𝒆 =
𝑫𝒊𝒍.𝒇𝒂𝒄𝒕𝒐𝒓∗𝑬𝑼
𝒎𝑳𝒗𝒂𝒍𝒖𝒆
𝒄𝒐𝒏𝒄.𝟏𝟎𝒎𝒈/𝒎𝑳
Percentage
PPC
recovery
(%)
Used
standard
curve range
(N=1)
80 0.125 0.048 0.385 99.92 50-0.005
EU/mL 100 0.1 0.025 0.248 85.79
200 0.05 0.023 0.467 73.57
Similar to CS 92-10, the endotoxin content of CS 92-Raw at all the dilutions in narrow range are
within the detection range of the standard curve, this is suggestive of the utility of this range even
for CS 92-Raw in future. For the calculation of absolute EU value of CS 92-Raw, the mean
EU/mg value computed from Table 5-7 and Table 5-8 at 1:80 dilutions will be reported due to
its repetition in both the tests, and also due to the low variation in its value in both the repetitions.
The average absolute EU conc. of CS 92-Raw is calculated at 0.392 EU/mg, this value is higher
than the estimated EU value of 0.3 EU/mg obtained from gel-clot assay. The possible reasoning
is that the raw materials obtained from indigenous sources such as crustaceans and processed
from chitin are always contaminated with high amount of endotoxins. Due to ubiquitous presence
of endotoxin it is difficult to get rid of the contamination; however due to alkaline treatment
during the production of low molecular weight CS 92-10, the endotoxin in CS raw material
degrades which results in a cleaner final product.
The absolute quantification of EU conc. of CS 92-Raw material and CS 92-10 validates the
chitosan production process followed by our group without the introduction of endotoxin, as the
endotoxin contamination only decreases from high to low rendering the final product (CS 92-10)
safe for use in animal studies and future pre-clinical and clinical use.
5.3.1.4 Detection of inhibition interference in the chitosan challenge sample
The chitosan 92-10 sample and challenge CS 92-10 sample was dissolved in HCl at HCl:
glucosamine ratio of 1:1 to prepare 1mg/mL solution each and the challenge sample was fortified
with 1 EU/mL CSE to keep equal CS: endotoxin ratio of 1:1. Both the samples were treated
overnight in HCl at room temperature. The samples were then tested by turbidimetric LAL assay
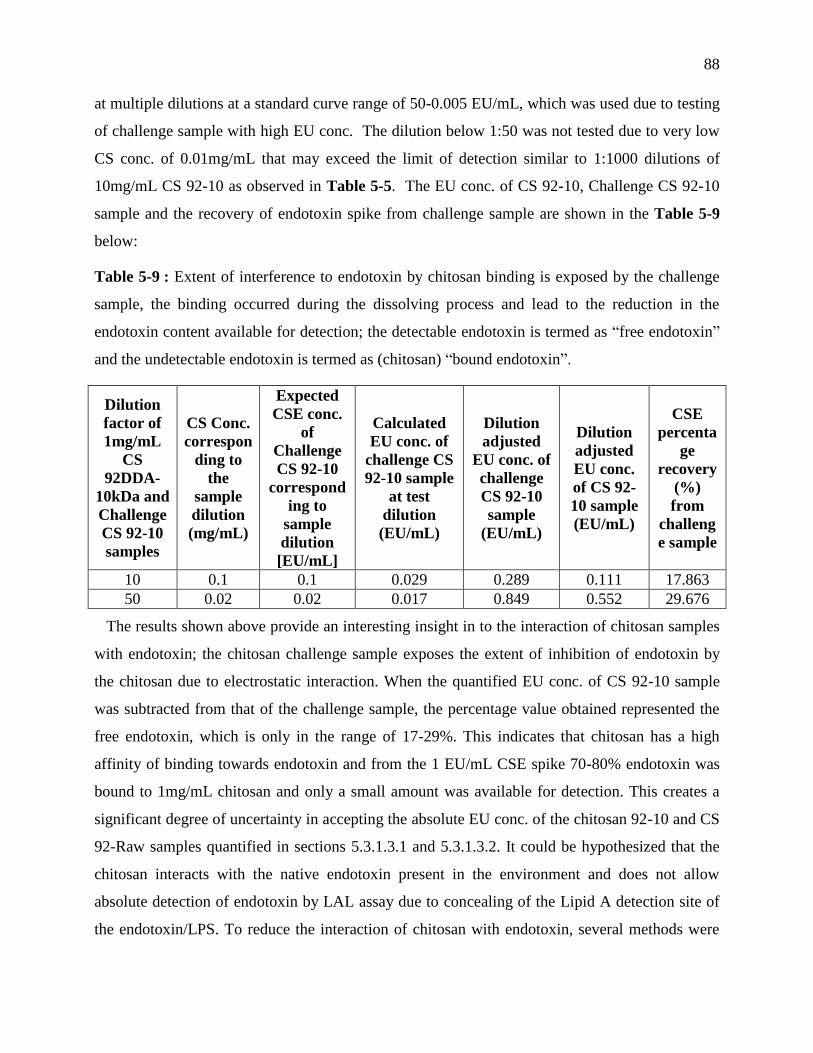
88
at multiple dilutions at a standard curve range of 50-0.005 EU/mL, which was used due to testing
of challenge sample with high EU conc. The dilution below 1:50 was not tested due to very low
CS conc. of 0.01mg/mL that may exceed the limit of detection similar to 1:1000 dilutions of
10mg/mL CS 92-10 as observed in Table 5-5. The EU conc. of CS 92-10, Challenge CS 92-10
sample and the recovery of endotoxin spike from challenge sample are shown in the Table 5-9
below:
Table 5-9 : Extent of interference to endotoxin by chitosan binding is exposed by the challenge
sample, the binding occurred during the dissolving process and lead to the reduction in the
endotoxin content available for detection; the detectable endotoxin is termed as “free endotoxin”
and the undetectable endotoxin is termed as (chitosan) “bound endotoxin”.
Dilution
factor of
1mg/mL
CS
92DDA-
10kDa and
Challenge
CS 92-10
samples
CS Conc.
correspon
ding to
the
sample
dilution
(mg/mL)
Expected
CSE conc.
of
Challenge
CS 92-10
correspond
ing to
sample
dilution
[EU/mL]
Calculated
EU conc. of
challenge CS
92-10 sample
at test
dilution
(EU/mL)
Dilution
adjusted
EU conc. of
challenge
CS 92-10
sample
(EU/mL)
Dilution
adjusted
EU conc.
of CS 92-
10 sample
(EU/mL)
CSE
percenta
ge
recovery
(%)
from
challeng
e sample
10 0.1 0.1 0.029 0.289 0.111 17.863
50 0.02 0.02 0.017 0.849 0.552 29.676
The results shown above provide an interesting insight in to the interaction of chitosan samples
with endotoxin; the chitosan challenge sample exposes the extent of inhibition of endotoxin by
the chitosan due to electrostatic interaction. When the quantified EU conc. of CS 92-10 sample
was subtracted from that of the challenge sample, the percentage value obtained represented the
free endotoxin, which is only in the range of 17-29%. This indicates that chitosan has a high
affinity of binding towards endotoxin and from the 1 EU/mL CSE spike 70-80% endotoxin was
bound to 1mg/mL chitosan and only a small amount was available for detection. This creates a
significant degree of uncertainty in accepting the absolute EU conc. of the chitosan 92-10 and CS
92-Raw samples quantified in sections 5.3.1.3.1 and 5.3.1.3.2. It could be hypothesized that the
chitosan interacts with the native endotoxin present in the environment and does not allow
absolute detection of endotoxin by LAL assay due to concealing of the Lipid A detection site of
the endotoxin/LPS. To reduce the interaction of chitosan with endotoxin, several methods were
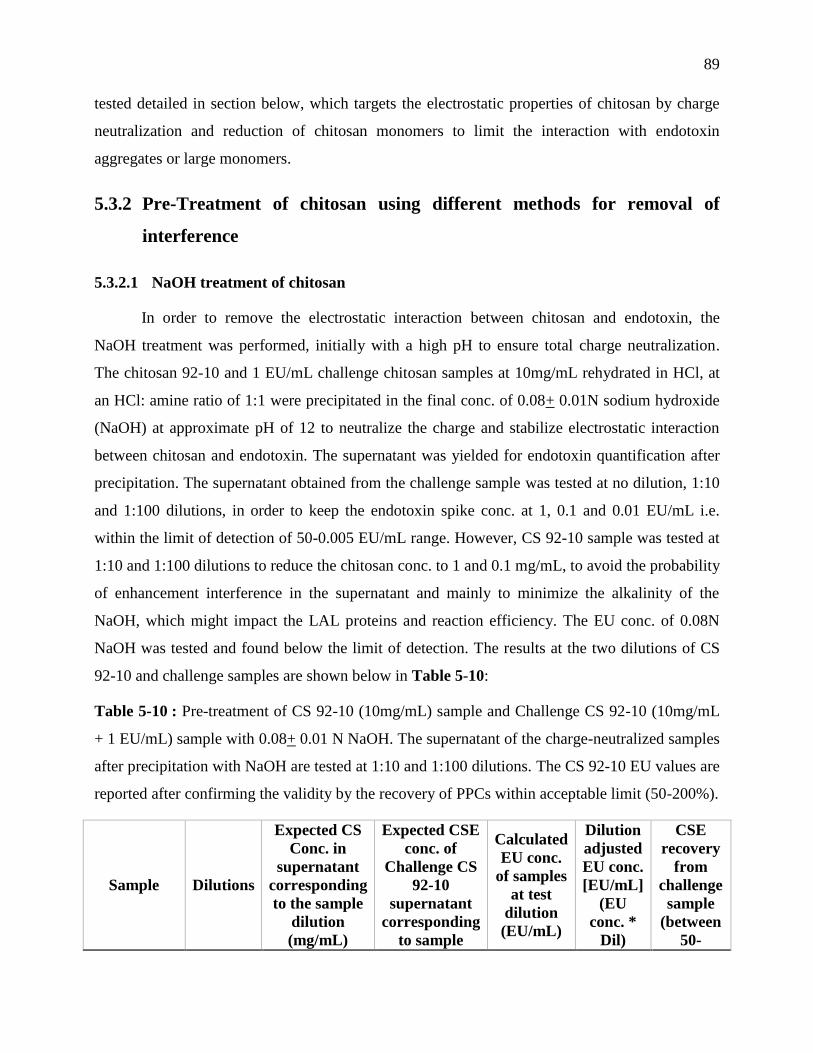
89
tested detailed in section below, which targets the electrostatic properties of chitosan by charge
neutralization and reduction of chitosan monomers to limit the interaction with endotoxin
aggregates or large monomers.
5.3.2 Pre-Treatment of chitosan using different methods for removal of
interference
5.3.2.1 NaOH treatment of chitosan
In order to remove the electrostatic interaction between chitosan and endotoxin, the
NaOH treatment was performed, initially with a high pH to ensure total charge neutralization.
The chitosan 92-10 and 1 EU/mL challenge chitosan samples at 10mg/mL rehydrated in HCl, at
an HCl: amine ratio of 1:1 were precipitated in the final conc. of 0.08+ 0.01N sodium hydroxide
(NaOH) at approximate pH of 12 to neutralize the charge and stabilize electrostatic interaction
between chitosan and endotoxin. The supernatant was yielded for endotoxin quantification after
precipitation. The supernatant obtained from the challenge sample was tested at no dilution, 1:10
and 1:100 dilutions, in order to keep the endotoxin spike conc. at 1, 0.1 and 0.01 EU/mL i.e.
within the limit of detection of 50-0.005 EU/mL range. However, CS 92-10 sample was tested at
1:10 and 1:100 dilutions to reduce the chitosan conc. to 1 and 0.1 mg/mL, to avoid the probability
of enhancement interference in the supernatant and mainly to minimize the alkalinity of the
NaOH, which might impact the LAL proteins and reaction efficiency. The EU conc. of 0.08N
NaOH was tested and found below the limit of detection. The results at the two dilutions of CS
92-10 and challenge samples are shown below in Table 5-10:
Table 5-10 : Pre-treatment of CS 92-10 (10mg/mL) sample and Challenge CS 92-10 (10mg/mL
+ 1 EU/mL) sample with 0.08+ 0.01 N NaOH. The supernatant of the charge-neutralized samples
after precipitation with NaOH are tested at 1:10 and 1:100 dilutions. The CS 92-10 EU values are
reported after confirming the validity by the recovery of PPCs within acceptable limit (50-200%).
Sample Dilutions
Expected CS
Conc. in
supernatant
corresponding
to the sample
dilution
(mg/mL)
Expected CSE
conc. of
Challenge CS
92-10
supernatant
corresponding
to sample
Calculated
EU conc.
of samples
at test
dilution
(EU/mL)
Dilution
adjusted
EU conc.
[EU/mL]
(EU
conc. *
Dil)
CSE
recovery
from
challenge
sample
(between
50-
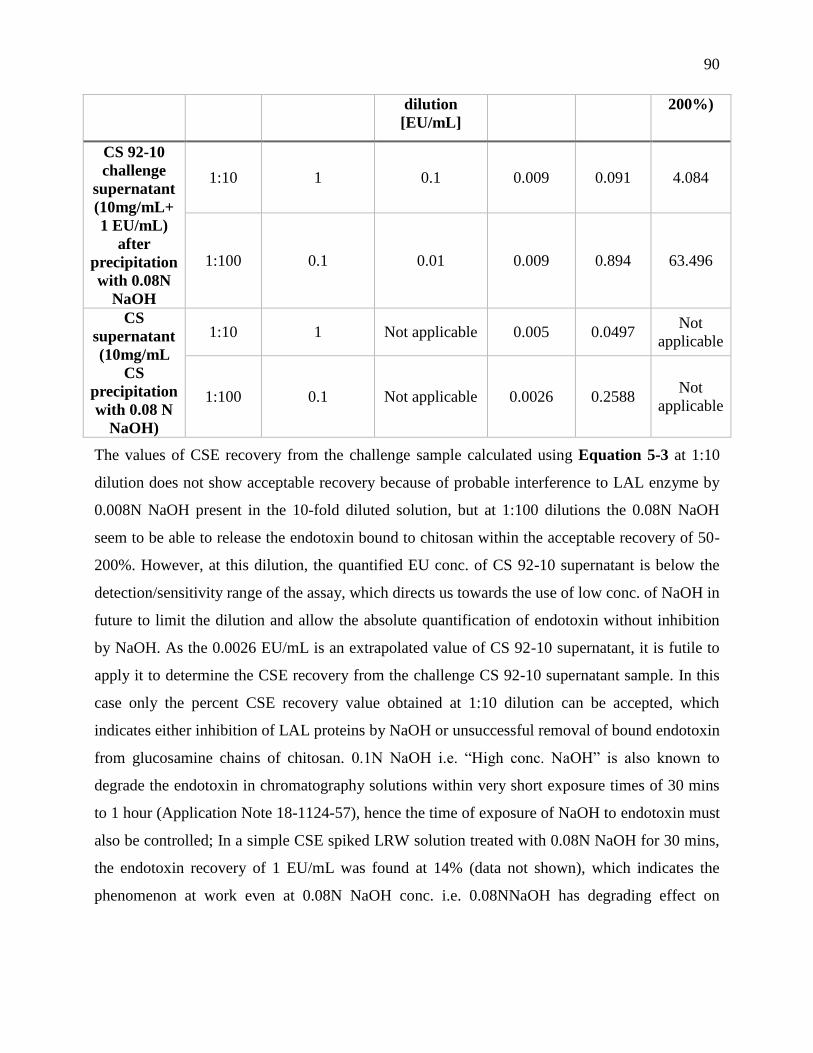
90
dilution
[EU/mL]
200%)
CS 92-10
challenge
supernatant
(10mg/mL+
1 EU/mL)
after
precipitation
with 0.08N
NaOH
1:10 1 0.1 0.009 0.091 4.084
1:100 0.1 0.01 0.009 0.894 63.496
CS
supernatant
(10mg/mL
CS
precipitation
with 0.08 N
NaOH)
1:10 1 Not applicable 0.005 0.0497 Not
applicable
1:100 0.1 Not applicable 0.0026 0.2588 Not
applicable
The values of CSE recovery from the challenge sample calculated using Equation 5-3 at 1:10
dilution does not show acceptable recovery because of probable interference to LAL enzyme by
0.008N NaOH present in the 10-fold diluted solution, but at 1:100 dilutions the 0.08N NaOH
seem to be able to release the endotoxin bound to chitosan within the acceptable recovery of 50-
200%. However, at this dilution, the quantified EU conc. of CS 92-10 supernatant is below the
detection/sensitivity range of the assay, which directs us towards the use of low conc. of NaOH in
future to limit the dilution and allow the absolute quantification of endotoxin without inhibition
by NaOH. As the 0.0026 EU/mL is an extrapolated value of CS 92-10 supernatant, it is futile to
apply it to determine the CSE recovery from the challenge CS 92-10 supernatant sample. In this
case only the percent CSE recovery value obtained at 1:10 dilution can be accepted, which
indicates either inhibition of LAL proteins by NaOH or unsuccessful removal of bound endotoxin
from glucosamine chains of chitosan. 0.1N NaOH i.e. “High conc. NaOH” is also known to
degrade the endotoxin in chromatography solutions within very short exposure times of 30 mins
to 1 hour (Application Note 18-1124-57), hence the time of exposure of NaOH to endotoxin must
also be controlled; In a simple CSE spiked LRW solution treated with 0.08N NaOH for 30 mins,
the endotoxin recovery of 1 EU/mL was found at 14% (data not shown), which indicates the
phenomenon at work even at 0.08N NaOH conc. i.e. 0.08NNaOH has degrading effect on
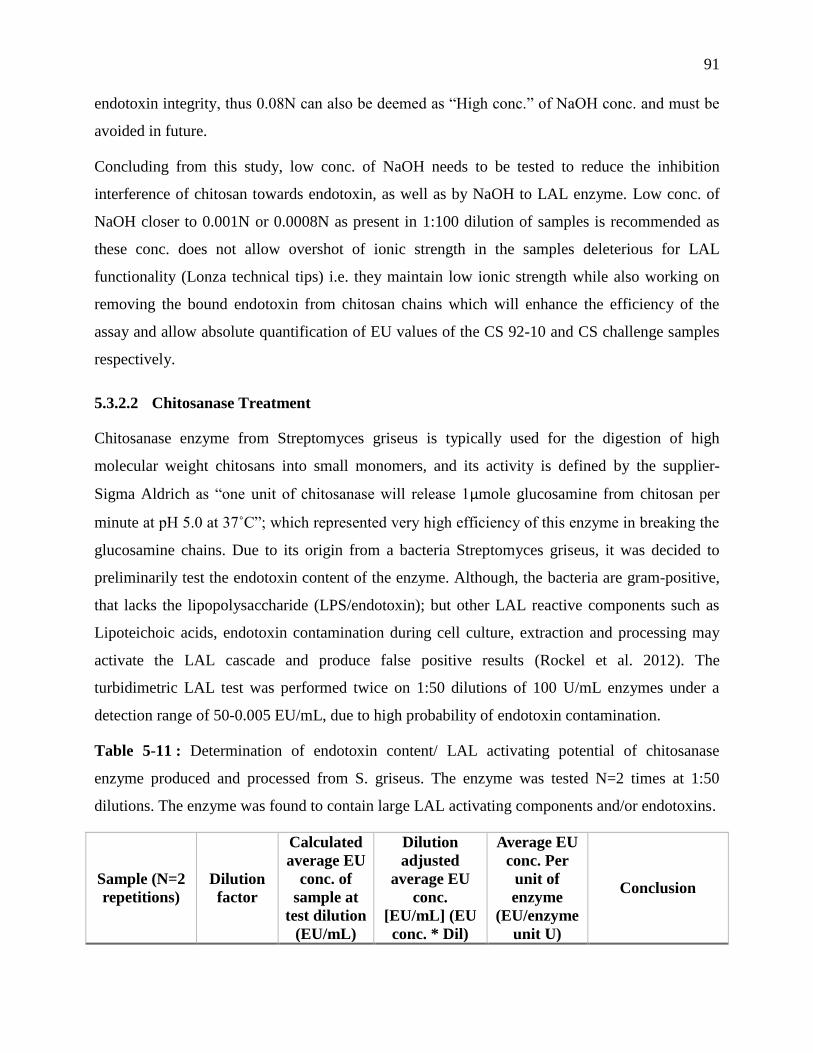
91
endotoxin integrity, thus 0.08N can also be deemed as “High conc.” of NaOH conc. and must be
avoided in future.
Concluding from this study, low conc. of NaOH needs to be tested to reduce the inhibition
interference of chitosan towards endotoxin, as well as by NaOH to LAL enzyme. Low conc. of
NaOH closer to 0.001N or 0.0008N as present in 1:100 dilution of samples is recommended as
these conc. does not allow overshot of ionic strength in the samples deleterious for LAL
functionality (Lonza technical tips) i.e. they maintain low ionic strength while also working on
removing the bound endotoxin from chitosan chains which will enhance the efficiency of the
assay and allow absolute quantification of EU values of the CS 92-10 and CS challenge samples
respectively.
5.3.2.2 Chitosanase Treatment
Chitosanase enzyme from Streptomyces griseus is typically used for the digestion of high
molecular weight chitosans into small monomers, and its activity is defined by the supplier-
Sigma Aldrich as “one unit of chitosanase will release 1μmole glucosamine from chitosan per
minute at pH 5.0 at 37˚C”; which represented very high efficiency of this enzyme in breaking the
glucosamine chains. Due to its origin from a bacteria Streptomyces griseus, it was decided to
preliminarily test the endotoxin content of the enzyme. Although, the bacteria are gram-positive,
that lacks the lipopolysaccharide (LPS/endotoxin); but other LAL reactive components such as
Lipoteichoic acids, endotoxin contamination during cell culture, extraction and processing may
activate the LAL cascade and produce false positive results (Rockel et al. 2012). The
turbidimetric LAL test was performed twice on 1:50 dilutions of 100 U/mL enzymes under a
detection range of 50-0.005 EU/mL, due to high probability of endotoxin contamination.
Table 5-11 : Determination of endotoxin content/ LAL activating potential of chitosanase
enzyme produced and processed from S. griseus. The enzyme was tested N=2 times at 1:50
dilutions. The enzyme was found to contain large LAL activating components and/or endotoxins.
Sample (N=2
repetitions)
Dilution
factor
Calculated
average EU
conc. of
sample at
test dilution
(EU/mL)
Dilution
adjusted
average EU
conc.
[EU/mL] (EU
conc. * Dil)
Average EU
conc. Per
unit of
enzyme
(EU/enzyme
unit U)
Conclusion
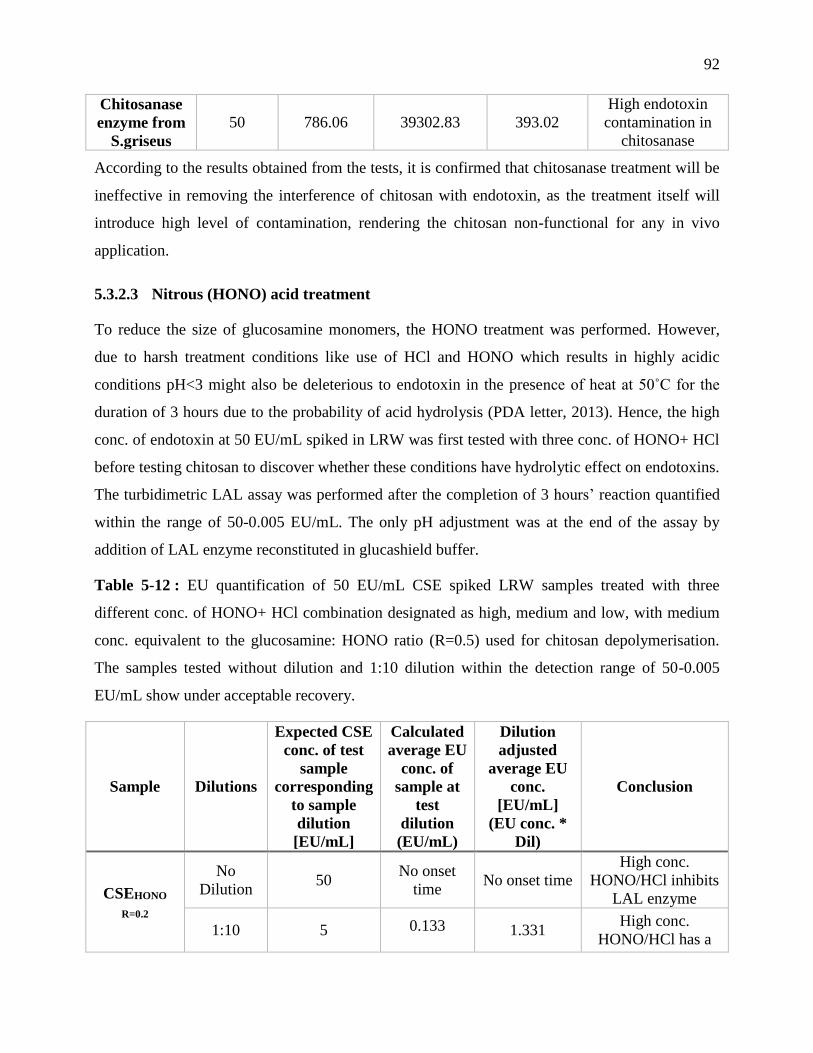
92
Chitosanase
enzyme from
S.griseus
50 786.06 39302.83 393.02
High endotoxin
contamination in
chitosanase
According to the results obtained from the tests, it is confirmed that chitosanase treatment will be
ineffective in removing the interference of chitosan with endotoxin, as the treatment itself will
introduce high level of contamination, rendering the chitosan non-functional for any in vivo
application.
5.3.2.3 Nitrous (HONO) acid treatment
To reduce the size of glucosamine monomers, the HONO treatment was performed. However,
due to harsh treatment conditions like use of HCl and HONO which results in highly acidic
conditions pH<3 might also be deleterious to endotoxin in the presence of heat at 50˚C for the
duration of 3 hours due to the probability of acid hydrolysis (PDA letter, 2013). Hence, the high
conc. of endotoxin at 50 EU/mL spiked in LRW was first tested with three conc. of HONO+ HCl
before testing chitosan to discover whether these conditions have hydrolytic effect on endotoxins.
The turbidimetric LAL assay was performed after the completion of 3 hours’ reaction quantified
within the range of 50-0.005 EU/mL. The only pH adjustment was at the end of the assay by
addition of LAL enzyme reconstituted in glucashield buffer.
Table 5-12 : EU quantification of 50 EU/mL CSE spiked LRW samples treated with three
different conc. of HONO+ HCl combination designated as high, medium and low, with medium
conc. equivalent to the glucosamine: HONO ratio (R=0.5) used for chitosan depolymerisation.
The samples tested without dilution and 1:10 dilution within the detection range of 50-0.005
EU/mL show under acceptable recovery.
Sample Dilutions
Expected CSE
conc. of test
sample
corresponding
to sample
dilution
[EU/mL]
Calculated
average EU
conc. of
sample at
test
dilution
(EU/mL)
Dilution
adjusted
average EU
conc.
[EU/mL]
(EU conc. *
Dil)
Conclusion
CSEHONO
R=0.2
No
Dilution 50
No onset
time No onset time
High conc.
HONO/HCl inhibits
LAL enzyme
1:10 5 0.133 1.331 High conc.
HONO/HCl has a
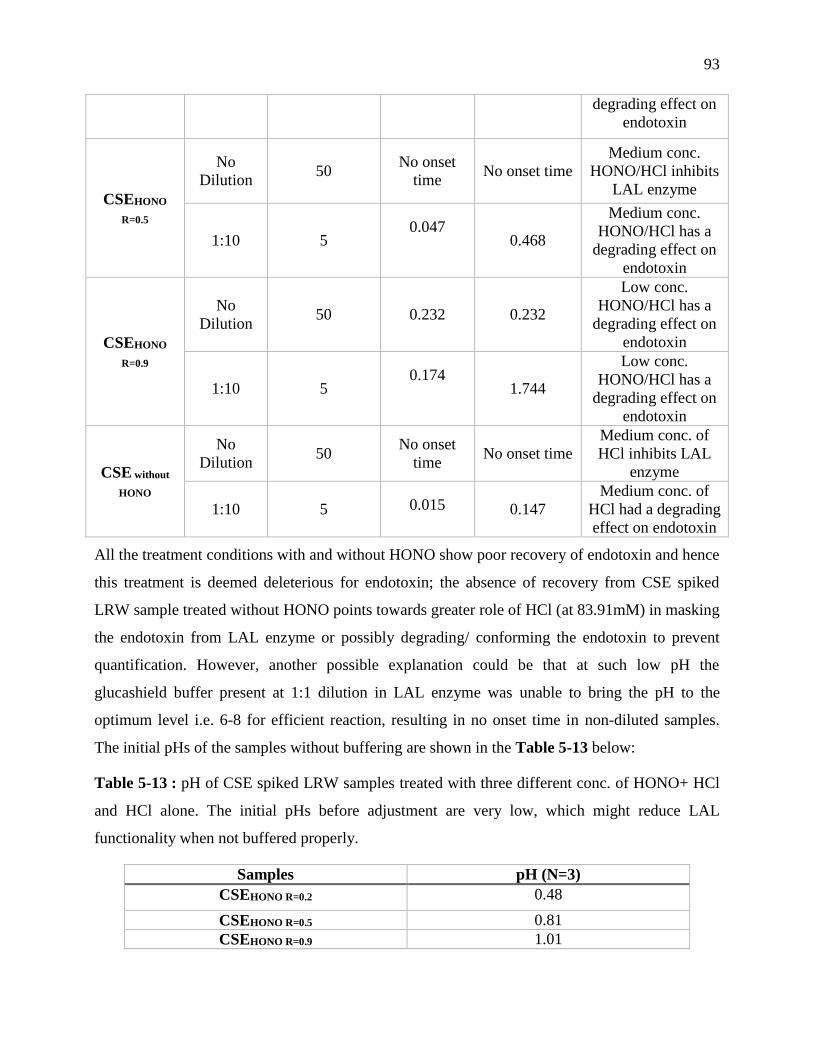
93
degrading effect on
endotoxin
CSEHONO
R=0.5
No
Dilution 50
No onset
time No onset time
Medium conc.
HONO/HCl inhibits
LAL enzyme
1:10 5 0.047
0.468
Medium conc.
HONO/HCl has a
degrading effect on
endotoxin
CSEHONO
R=0.9
No
Dilution 50 0.232 0.232
Low conc.
HONO/HCl has a
degrading effect on
endotoxin
1:10 5 0.174
1.744
Low conc.
HONO/HCl has a
degrading effect on
endotoxin
CSE without
HONO
No
Dilution 50
No onset
time No onset time
Medium conc. of
HCl inhibits LAL
enzyme
1:10 5 0.015 0.147
Medium conc. of
HCl had a degrading
effect on endotoxin
All the treatment conditions with and without HONO show poor recovery of endotoxin and hence
this treatment is deemed deleterious for endotoxin; the absence of recovery from CSE spiked
LRW sample treated without HONO points towards greater role of HCl (at 83.91mM) in masking
the endotoxin from LAL enzyme or possibly degrading/ conforming the endotoxin to prevent
quantification. However, another possible explanation could be that at such low pH the
glucashield buffer present at 1:1 dilution in LAL enzyme was unable to bring the pH to the
optimum level i.e. 6-8 for efficient reaction, resulting in no onset time in non-diluted samples.
The initial pHs of the samples without buffering are shown in the Table 5-13 below:
Table 5-13 : pH of CSE spiked LRW samples treated with three different conc. of HONO+ HCl
and HCl alone. The initial pHs before adjustment are very low, which might reduce LAL
functionality when not buffered properly.
Samples pH (N=3)
CSEHONO R=0.2 0.48
CSEHONO R=0.5 0.81
CSEHONO R=0.9 1.01
94
CSE without HONO 0.80
Although glucashield has a high buffering capacity, it might not be able to bring up the pH of
these acidic samples for efficient reaction. However, it is expected to bring the pH of the sample
treated with lowest HCl conc. at R=0.9 towards optimum and result in absolute quantification of
endotoxin. To eliminate the variation caused by pH a separate test recommended by USP for
treatment of chitosan was performed, that involved the use of 92mM HCl, but a buffering step
before adding the LAL enzyme (also reconstituted in glucashield buffer) which might result in
uninhibited efficient reaction. Another test to increase the sample pH recommended by ACCI
was applied that required the use of 0.2% acetic acid to dissolve the samples; CSE spiked LRW
and challenge chitosan samples were used for both the test to determine the optimum dissolving
agent that exhibit minimum interference with LAL assay and produces optimum endotoxin
recovery.
The conc. of CSE spike might also affect the recovery of endotoxin from HONO treated samples,
50 EU/mL CSE is very high to be detected by the linear range of 50-0.005 EU/mL, as the spike
conc. is detectable at or near the high conc. calibrators. However, the evidence of low recovery at
1:10 dilution, points towards the action of HCl/HONO in inhibiting endotoxin quantification.
Hence, a lower CSE conc. will be used to spike LRW and chitosan for testing the effect of
dissolving/ rehydration reagent on endotoxin recovery. The determination of optimal chitosan
dissolving/ rehydration reagents was performed using chromogenic format of LAL assay.
5.3.2.4 Superiority of chromogenic LAL assay in detection of interference
The functioning of chromogenic LAL assay is based on the measurement of the
absorbance of a colorimetric substrate called p-nitroanilide cleaved from the clotting enzyme
after activation by endotoxin. Because p-nitroanilide only absorbs light at 405nm, instead of
refracting it to cause uneven absorbance curve as in the case of turbidimetric assay; the time vs.
O.D curve of each standard calibrator resolves at high range of absorbance, without disturbances
and portray very smooth profile.
Chromogenic LAL was found to have higher accuracy and reduced error in detection of known
and unknown amount of endotoxin. A well-resolved absorbance profile of each standard
calibrator showed that there were fewer disturbances in the measurement of absorbance as
observed in Figure 5-3 during the chromogen development compared to the turbidity
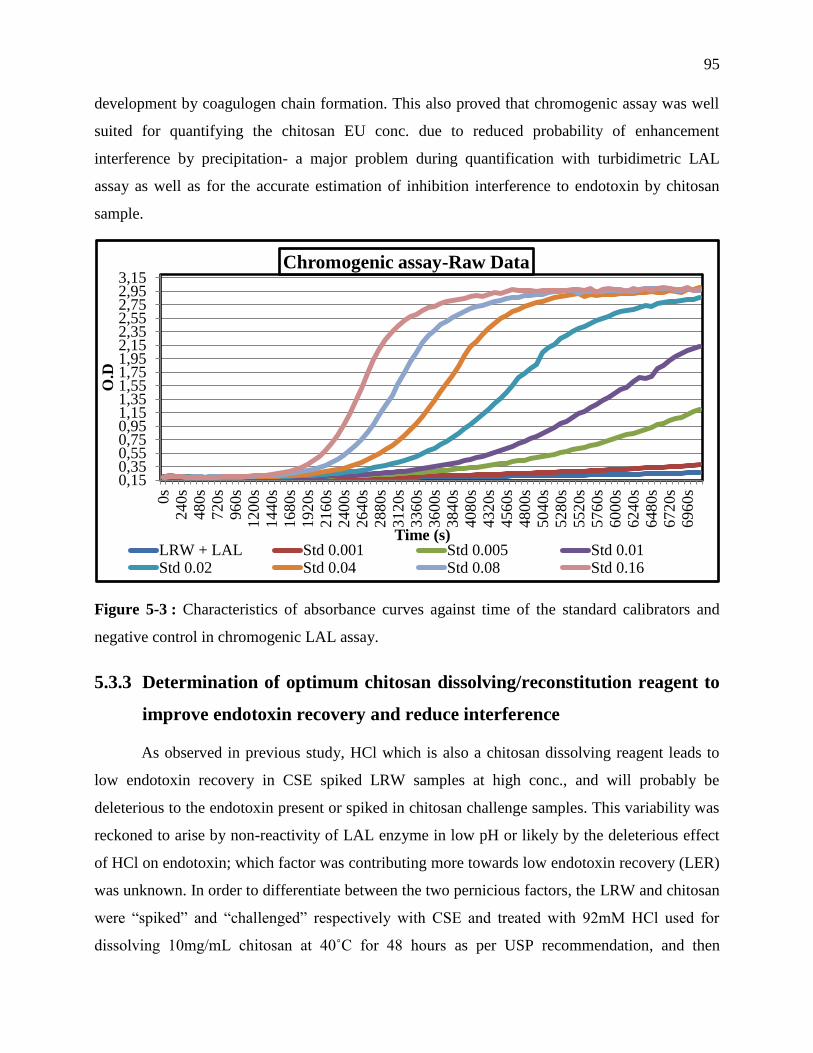
95
development by coagulogen chain formation. This also proved that chromogenic assay was well
suited for quantifying the chitosan EU conc. due to reduced probability of enhancement
interference by precipitation- a major problem during quantification with turbidimetric LAL
assay as well as for the accurate estimation of inhibition interference to endotoxin by chitosan
sample.
Figure 5-3 : Characteristics of absorbance curves against time of the standard calibrators and
negative control in chromogenic LAL assay.
5.3.3 Determination of optimum chitosan dissolving/reconstitution reagent to
improve endotoxin recovery and reduce interference
As observed in previous study, HCl which is also a chitosan dissolving reagent leads to
low endotoxin recovery in CSE spiked LRW samples at high conc., and will probably be
deleterious to the endotoxin present or spiked in chitosan challenge samples. This variability was
reckoned to arise by non-reactivity of LAL enzyme in low pH or likely by the deleterious effect
of HCl on endotoxin; which factor was contributing more towards low endotoxin recovery (LER)
was unknown. In order to differentiate between the two pernicious factors, the LRW and chitosan
were “spiked” and “challenged” respectively with CSE and treated with 92mM HCl used for
dissolving 10mg/mL chitosan at 40˚C for 48 hours as per USP recommendation, and then
0,150,350,550,750,951,151,351,551,751,952,152,352,552,752,953,15
0s
240s
480s
720s
960s
1200s
1440s
1680s
1920s
2160s
2400s
2640s
2880s
3120s
3360s
3600s
3840s
4080s
4320s
4560s
4800s
5040s
5280s
5520s
5760s
6000s
6240s
6480s
6720s
6960s
O.D
Time (s)
Chromogenic assay-Raw Data
LRW + LAL Std 0.001 Std 0.005 Std 0.01Std 0.02 Std 0.04 Std 0.08 Std 0.16
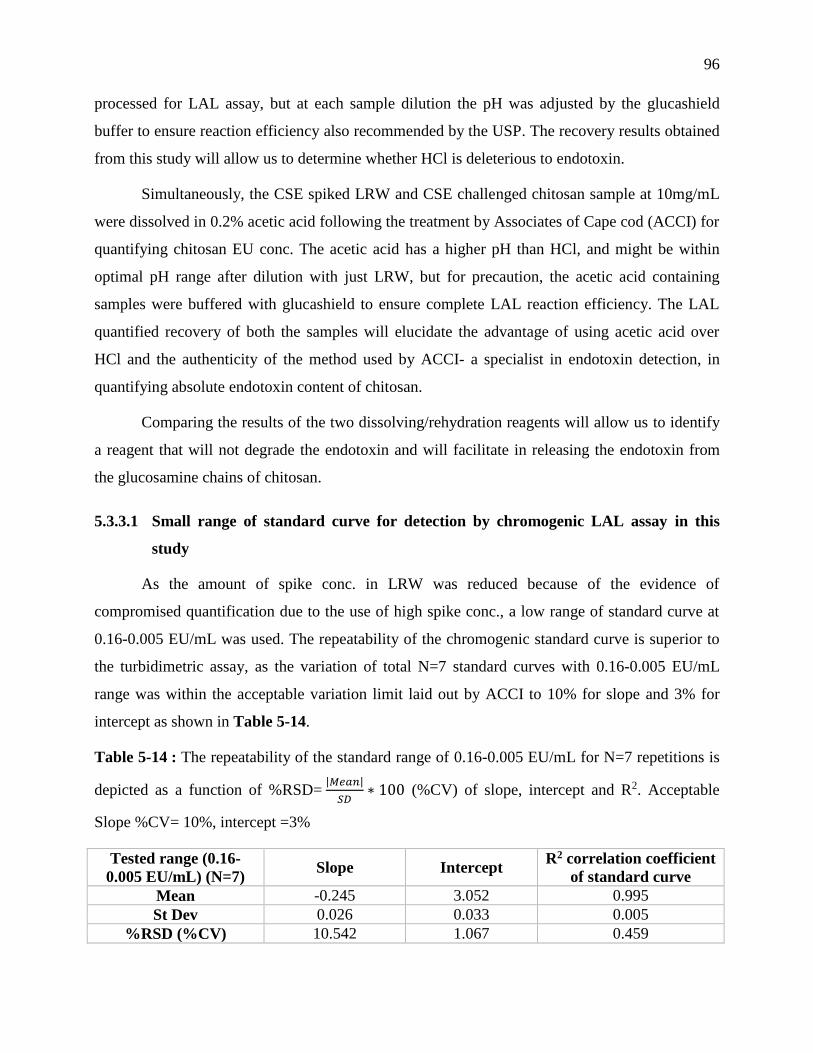
96
processed for LAL assay, but at each sample dilution the pH was adjusted by the glucashield
buffer to ensure reaction efficiency also recommended by the USP. The recovery results obtained
from this study will allow us to determine whether HCl is deleterious to endotoxin.
Simultaneously, the CSE spiked LRW and CSE challenged chitosan sample at 10mg/mL
were dissolved in 0.2% acetic acid following the treatment by Associates of Cape cod (ACCI) for
quantifying chitosan EU conc. The acetic acid has a higher pH than HCl, and might be within
optimal pH range after dilution with just LRW, but for precaution, the acetic acid containing
samples were buffered with glucashield to ensure complete LAL reaction efficiency. The LAL
quantified recovery of both the samples will elucidate the advantage of using acetic acid over
HCl and the authenticity of the method used by ACCI- a specialist in endotoxin detection, in
quantifying absolute endotoxin content of chitosan.
Comparing the results of the two dissolving/rehydration reagents will allow us to identify
a reagent that will not degrade the endotoxin and will facilitate in releasing the endotoxin from
the glucosamine chains of chitosan.
5.3.3.1 Small range of standard curve for detection by chromogenic LAL assay in this
study
As the amount of spike conc. in LRW was reduced because of the evidence of
compromised quantification due to the use of high spike conc., a low range of standard curve at
0.16-0.005 EU/mL was used. The repeatability of the chromogenic standard curve is superior to
the turbidimetric assay, as the variation of total N=7 standard curves with 0.16-0.005 EU/mL
range was within the acceptable variation limit laid out by ACCI to 10% for slope and 3% for
intercept as shown in Table 5-14.
Table 5-14 : The repeatability of the standard range of 0.16-0.005 EU/mL for N=7 repetitions is
depicted as a function of %RSD= |𝑀𝑒𝑎𝑛|
𝑆𝐷∗ 100 (%CV) of slope, intercept and R2. Acceptable
Slope %CV= 10%, intercept =3%
Tested range (0.16-
0.005 EU/mL) (N=7) Slope Intercept
R2 correlation coefficient
of standard curve
Mean -0.245 3.052 0.995
St Dev 0.026 0.033 0.005
%RSD (%CV) 10.542 1.067 0.459
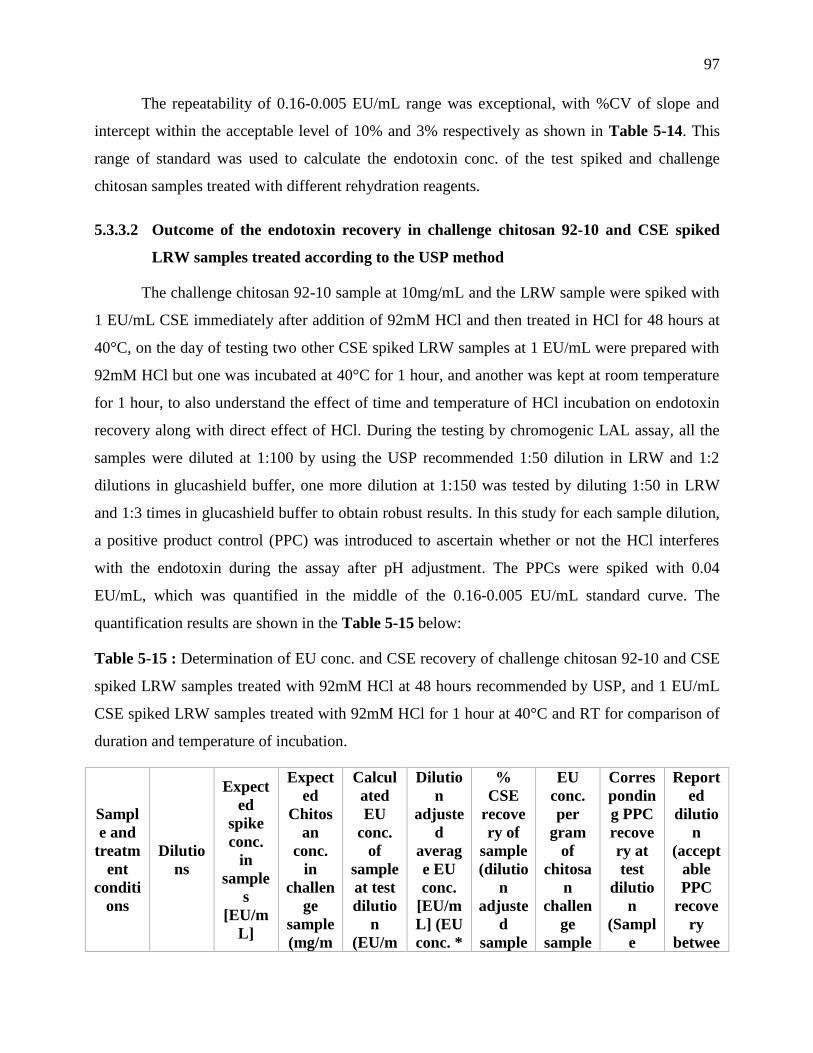
97
The repeatability of 0.16-0.005 EU/mL range was exceptional, with %CV of slope and
intercept within the acceptable level of 10% and 3% respectively as shown in Table 5-14. This
range of standard was used to calculate the endotoxin conc. of the test spiked and challenge
chitosan samples treated with different rehydration reagents.
5.3.3.2 Outcome of the endotoxin recovery in challenge chitosan 92-10 and CSE spiked
LRW samples treated according to the USP method
The challenge chitosan 92-10 sample at 10mg/mL and the LRW sample were spiked with
1 EU/mL CSE immediately after addition of 92mM HCl and then treated in HCl for 48 hours at
40°C, on the day of testing two other CSE spiked LRW samples at 1 EU/mL were prepared with
92mM HCl but one was incubated at 40°C for 1 hour, and another was kept at room temperature
for 1 hour, to also understand the effect of time and temperature of HCl incubation on endotoxin
recovery along with direct effect of HCl. During the testing by chromogenic LAL assay, all the
samples were diluted at 1:100 by using the USP recommended 1:50 dilution in LRW and 1:2
dilutions in glucashield buffer, one more dilution at 1:150 was tested by diluting 1:50 in LRW
and 1:3 times in glucashield buffer to obtain robust results. In this study for each sample dilution,
a positive product control (PPC) was introduced to ascertain whether or not the HCl interferes
with the endotoxin during the assay after pH adjustment. The PPCs were spiked with 0.04
EU/mL, which was quantified in the middle of the 0.16-0.005 EU/mL standard curve. The
quantification results are shown in the Table 5-15 below:
Table 5-15 : Determination of EU conc. and CSE recovery of challenge chitosan 92-10 and CSE
spiked LRW samples treated with 92mM HCl at 48 hours recommended by USP, and 1 EU/mL
CSE spiked LRW samples treated with 92mM HCl for 1 hour at 40°C and RT for comparison of
duration and temperature of incubation.
Sampl
e and
treatm
ent
conditi
ons
Dilutio
ns
Expect
ed
spike
conc.
in
sample
s
[EU/m
L]
Expect
ed
Chitos
an
conc.
in
challen
ge
sample
(mg/m
Calcul
ated
EU
conc.
of
sample
at test
dilutio
n
(EU/m
Dilutio
n
adjuste
d
averag
e EU
conc.
[EU/m
L] (EU
conc. *
%
CSE
recove
ry of
sample
(dilutio
n
adjuste
d
sample
EU
conc.
per
gram
of
chitosa
n
challen
ge
sample
Corres
pondin
g PPC
recove
ry at
test
dilutio
n
(Sampl
e
Report
ed
dilutio
n
(accept
able
PPC
recove
ry
betwee
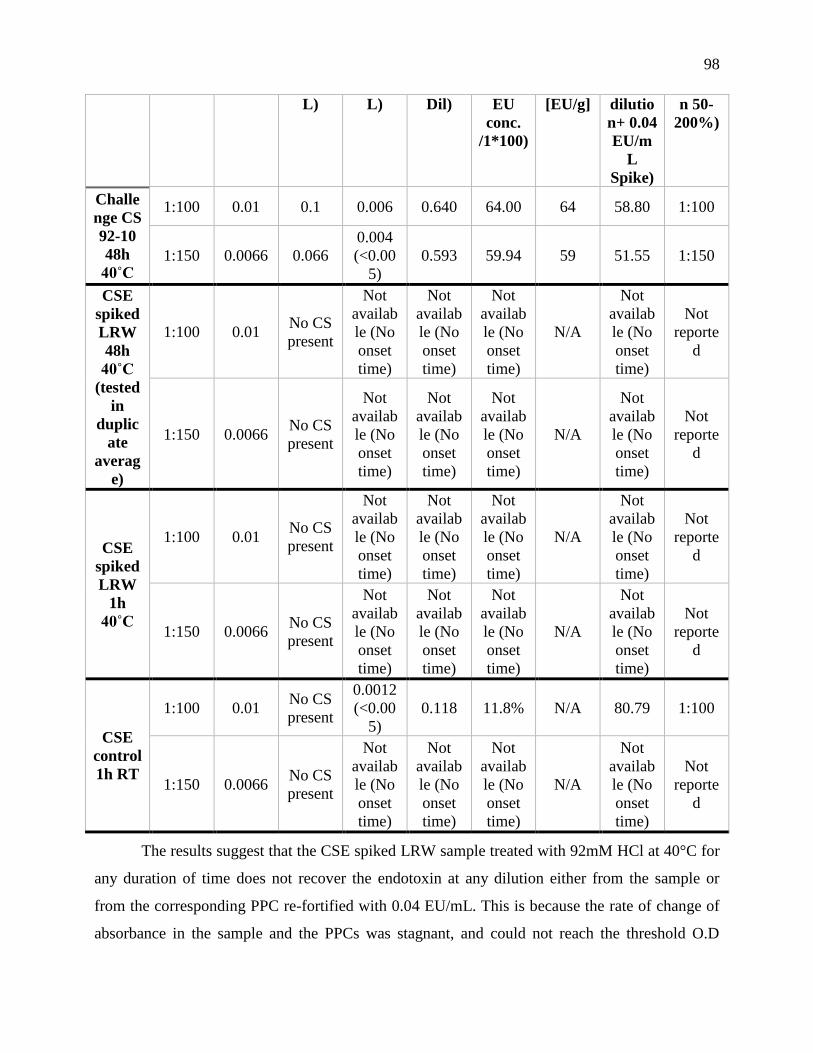
98
L) L) Dil) EU
conc.
/1*100)
[EU/g] dilutio
n+ 0.04
EU/m
L
Spike)
n 50-
200%)
Challe
nge CS
92-10
48h
40˚C
1:100 0.01 0.1 0.006 0.640 64.00 64 58.80 1:100
1:150 0.0066 0.066
0.004
(<0.00
5)
0.593 59.94 59 51.55 1:150
CSE
spiked
LRW
48h
40˚C
(tested
in
duplic
ate
averag
e)
1:100 0.01 No CS
present
Not
availab
le (No
onset
time)
Not
availab
le (No
onset
time)
Not
availab
le (No
onset
time)
N/A
Not
availab
le (No
onset
time)
Not
reporte
d
1:150 0.0066 No CS
present
Not
availab
le (No
onset
time)
Not
availab
le (No
onset
time)
Not
availab
le (No
onset
time)
N/A
Not
availab
le (No
onset
time)
Not
reporte
d
CSE
spiked
LRW
1h
40˚C
1:100 0.01 No CS
present
Not
availab
le (No
onset
time)
Not
availab
le (No
onset
time)
Not
availab
le (No
onset
time)
N/A
Not
availab
le (No
onset
time)
Not
reporte
d
1:150 0.0066 No CS
present
Not
availab
le (No
onset
time)
Not
availab
le (No
onset
time)
Not
availab
le (No
onset
time)
N/A
Not
availab
le (No
onset
time)
Not
reporte
d
CSE
control
1h RT
1:100 0.01 No CS
present
0.0012
(<0.00
5)
0.118 11.8% N/A 80.79 1:100
1:150 0.0066 No CS
present
Not
availab
le (No
onset
time)
Not
availab
le (No
onset
time)
Not
availab
le (No
onset
time)
N/A
Not
availab
le (No
onset
time)
Not
reporte
d
The results suggest that the CSE spiked LRW sample treated with 92mM HCl at 40°C for
any duration of time does not recover the endotoxin at any dilution either from the sample or
from the corresponding PPC re-fortified with 0.04 EU/mL. This is because the rate of change of
absorbance in the sample and the PPCs was stagnant, and could not reach the threshold O.D
99
within the given reaction time of 2 hours, resulting in no onset time. The CSE spike treated with
HCl for 1 hour at room temperature also shows 10 times less recovery than the initial spiked
conc. of 1 EU/mL, which could be attributed to the deleterious action of HCl on endotoxin as it
does not interfere in the endotoxin detection during the assay confirmed by 80% PPC recovery.
Conversely, the chitosan challenge sample treated with 92mM HCl for 48 hours at 40°C shows
61% recovery of the 1EU/mL spiked endotoxin on average, thus showing that the same amount
of HCl could not affect the endotoxin present along with the chitosan.
The slow rate of change of absorbance in CSE spiked LRW samples resulting in no onset time
can be explained as follows: -
a) The high conc. of HCl directly attacks the free endotoxin present in the LRW solution,
reducing its recovery by LAL assay. The mechanism of action is explained by the acid
hydrolysis of endotoxin by as low as 50mM HCl at high temperature in just less than 30
minutes. The HCl can cause the physiological change in LPS by attacking the eight
carbon sugar two-keto-three-deoxyoctonic acid (2.3-KDo) linking the Lipid A to the O-
antigen, the separated Lipid A reduces the pyrogenicity of the LPS (Sandle, 2011). This
phenomenon is completely observed in the CSE samples cooked in 92mM HCl for 48
hours at 40°C, which proves that longer incubation times can also result in
depyrogenization; and partially observed in CSE samples treated with 92mM HCl for 1
hour at ambient temperature, showing that temperature may not be necessary for
hydrolysis of LPS and subsequent depyrogenization.
The optimal recovery of spiked endotoxin in challenge chitosan sample shows that chitosan
protects the endotoxin against the hydrolyzing effect of HCl, possibly by attracting the
negatively charged O-antigen of LPS to the positively charged glucosamine chains protonated
by the high conc. of HCl. This interaction may conceal the 2, 3-KDo chains from the
hydrolyzing effect of HCl, and may not allow the separation of Lipid A entity while
protecting the integrity of LPS and allowing the detection of pyrogen by LAL enzyme.
This observation provides an intriguing insight on the functioning of chitosan and its interaction
with endotoxin.
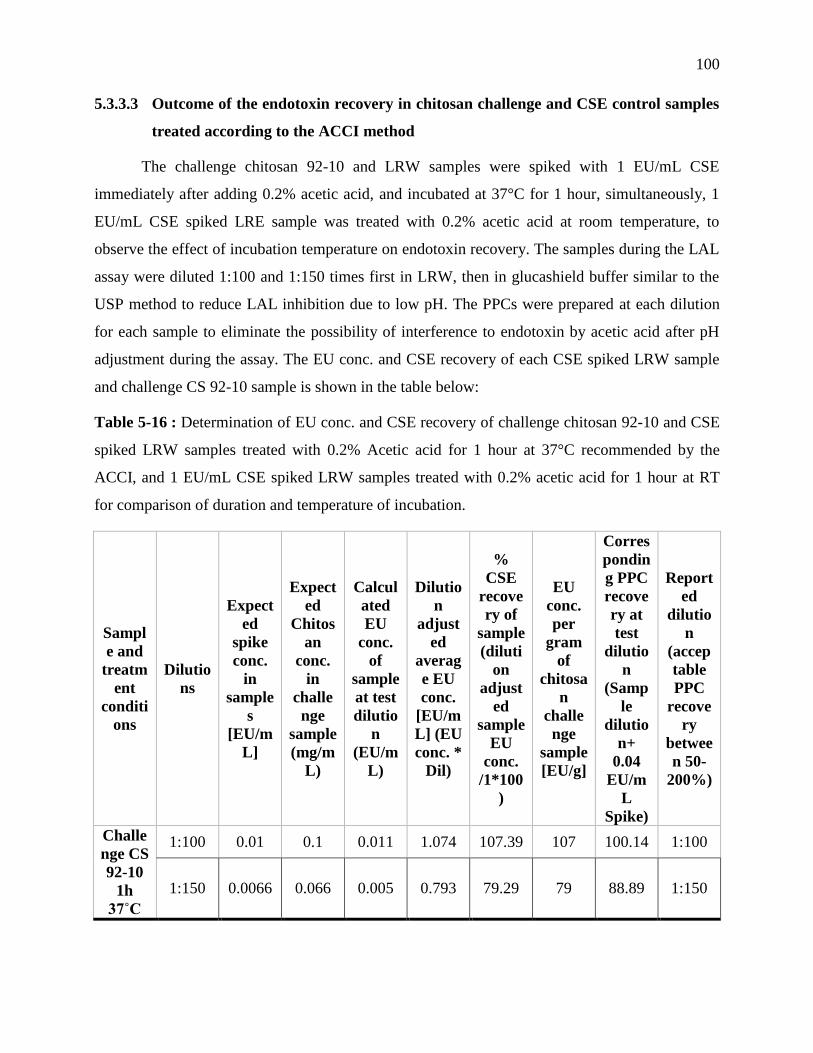
100
5.3.3.3 Outcome of the endotoxin recovery in chitosan challenge and CSE control samples
treated according to the ACCI method
The challenge chitosan 92-10 and LRW samples were spiked with 1 EU/mL CSE
immediately after adding 0.2% acetic acid, and incubated at 37°C for 1 hour, simultaneously, 1
EU/mL CSE spiked LRE sample was treated with 0.2% acetic acid at room temperature, to
observe the effect of incubation temperature on endotoxin recovery. The samples during the LAL
assay were diluted 1:100 and 1:150 times first in LRW, then in glucashield buffer similar to the
USP method to reduce LAL inhibition due to low pH. The PPCs were prepared at each dilution
for each sample to eliminate the possibility of interference to endotoxin by acetic acid after pH
adjustment during the assay. The EU conc. and CSE recovery of each CSE spiked LRW sample
and challenge CS 92-10 sample is shown in the table below:
Table 5-16 : Determination of EU conc. and CSE recovery of challenge chitosan 92-10 and CSE
spiked LRW samples treated with 0.2% Acetic acid for 1 hour at 37°C recommended by the
ACCI, and 1 EU/mL CSE spiked LRW samples treated with 0.2% acetic acid for 1 hour at RT
for comparison of duration and temperature of incubation.
Sampl
e and
treatm
ent
conditi
ons
Dilutio
ns
Expect
ed
spike
conc.
in
sample
s
[EU/m
L]
Expect
ed
Chitos
an
conc.
in
challe
nge
sample
(mg/m
L)
Calcul
ated
EU
conc.
of
sample
at test
dilutio
n
(EU/m
L)
Dilutio
n
adjust
ed
averag
e EU
conc.
[EU/m
L] (EU
conc. *
Dil)
%
CSE
recove
ry of
sample
(diluti
on
adjust
ed
sample
EU
conc.
/1*100
)
EU
conc.
per
gram
of
chitosa
n
challe
nge
sample
[EU/g]
Corres
pondin
g PPC
recove
ry at
test
dilutio
n
(Samp
le
dilutio
n+
0.04
EU/m
L
Spike)
Report
ed
dilutio
n
(accep
table
PPC
recove
ry
betwee
n 50-
200%)
Challe
nge CS
92-10
1h
37˚C
1:100 0.01 0.1 0.011 1.074 107.39 107 100.14 1:100
1:150 0.0066 0.066 0.005 0.793 79.29 79 88.89 1:150
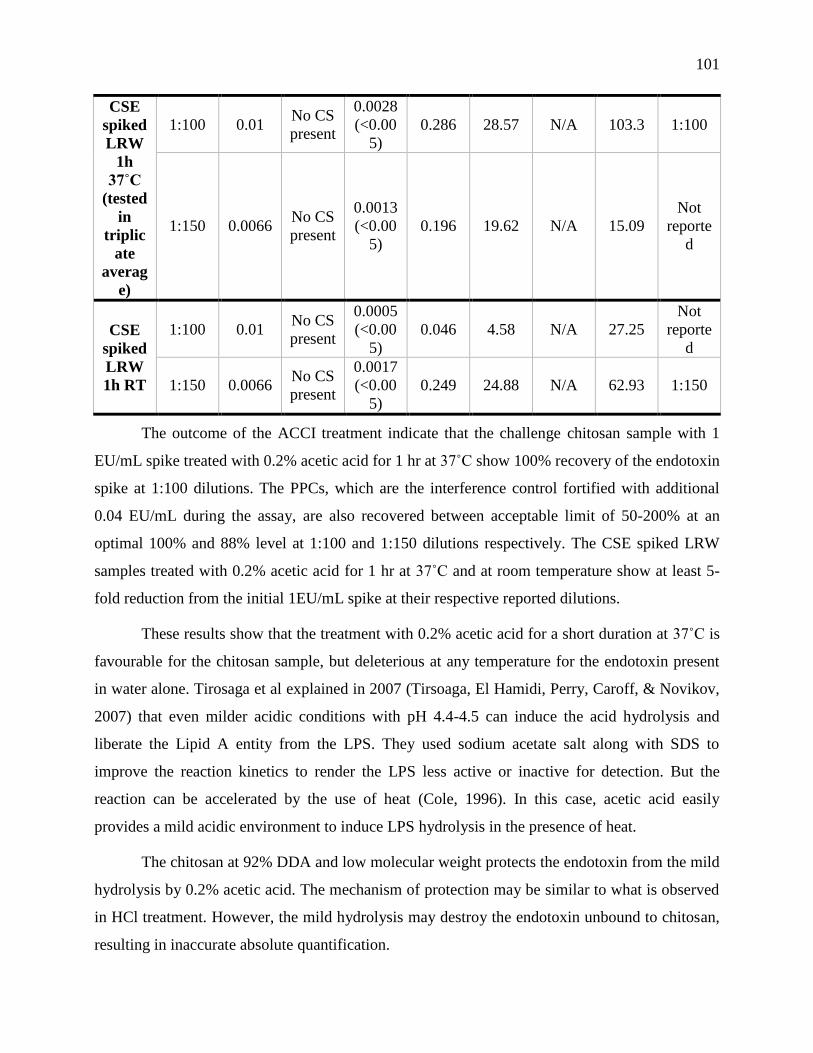
101
CSE
spiked
LRW
1h
37˚C
(tested
in
triplic
ate
averag
e)
1:100 0.01 No CS
present
0.0028
(<0.00
5)
0.286 28.57 N/A 103.3 1:100
1:150 0.0066 No CS
present
0.0013
(<0.00
5)
0.196 19.62 N/A 15.09
Not
reporte
d
CSE
spiked
LRW
1h RT
1:100 0.01 No CS
present
0.0005
(<0.00
5)
0.046 4.58 N/A 27.25
Not
reporte
d
1:150 0.0066 No CS
present
0.0017
(<0.00
5)
0.249 24.88 N/A 62.93 1:150
The outcome of the ACCI treatment indicate that the challenge chitosan sample with 1
EU/mL spike treated with 0.2% acetic acid for 1 hr at 37˚C show 100% recovery of the endotoxin
spike at 1:100 dilutions. The PPCs, which are the interference control fortified with additional
0.04 EU/mL during the assay, are also recovered between acceptable limit of 50-200% at an
optimal 100% and 88% level at 1:100 and 1:150 dilutions respectively. The CSE spiked LRW
samples treated with 0.2% acetic acid for 1 hr at 37˚C and at room temperature show at least 5-
fold reduction from the initial 1EU/mL spike at their respective reported dilutions.
These results show that the treatment with 0.2% acetic acid for a short duration at 37˚C is
favourable for the chitosan sample, but deleterious at any temperature for the endotoxin present
in water alone. Tirosaga et al explained in 2007 (Tirsoaga, El Hamidi, Perry, Caroff, & Novikov,
2007) that even milder acidic conditions with pH 4.4-4.5 can induce the acid hydrolysis and
liberate the Lipid A entity from the LPS. They used sodium acetate salt along with SDS to
improve the reaction kinetics to render the LPS less active or inactive for detection. But the
reaction can be accelerated by the use of heat (Cole, 1996). In this case, acetic acid easily
provides a mild acidic environment to induce LPS hydrolysis in the presence of heat.
The chitosan at 92% DDA and low molecular weight protects the endotoxin from the mild
hydrolysis by 0.2% acetic acid. The mechanism of protection may be similar to what is observed
in HCl treatment. However, the mild hydrolysis may destroy the endotoxin unbound to chitosan,
resulting in inaccurate absolute quantification.
102
5.3.4 Discussion of this study
The endotoxin determination by 10-0.01 EU/mL standard curve range of kinetic turbidimetric
LAL assay, allowed us to identify the two different types of interferences in detection of
endotoxin during LAL assay. The enhancement interference of CS 92-10 and CS 92-Raw was
observed at high chitosan conc. up to 0.25mg/mL, detected by high PPC recovery; this lead us to
conclude that the chitosan interfered with the LAL assay due to precipitation at the neutral pH of
reaction. The precipitation interfered with the turbidity measurement characterized by the
absorbance leading to high conc. of sample and the PPC recovery. The enhancement interference
of chitosan was reduced by diluting the chitosan below the critical conc. of 0.25mg/mL; the
chitosan started showing optimal PPC recovery at 50-200% starting from 0.125mg/mL i.e. 1:80
dilution of 10mg/mL chitosan. Tests performed from 1:80 to higher dilutions up to 1:1000
showed that higher dilutions of chitosans reduced the endotoxin below the undetectable level i.e.
below the assay sensitivity. An optimal dilution range was determined for both CS 92-10 and CS
92-Raw at 10mg/mL from 1:80-1:200 by further testing, which will be used in future testing as
well.
Another type of interference i.e. inhibition interference was recognized which was intuitive to the
nature of chitosan interaction with endotoxin by the use of challenge sample. The challenge
chitosan sample was prepared in parallel to the test sample, and during rehydration spiked with a
known amount of endotoxin to be detected later by LAL assay after rehydration to determine the
CSE recovery within the acceptable 50-200%. The CSE recovery of 1mg/mL chitosan 92-10
Challenge sample was found below the acceptable recovery calculated by subtracting the EU
value of the test sample, which confirmed the existence of inhibition interference in chitosan
samples.
In order to reduce the inhibition interference and release the bound endotoxin from chitosan
chains, some pre-treatments were performed with NaOH, chitosanase and nitrous acid. The
NaOH treatments was aimed at reducing the electrostatic interaction between chitosan and
endotoxin and release the bound endotoxin in the supernatant, the supernatant of 10mg/mL
chitosan 92-10 and 1 EU/mL+ 10mg/mL Challenge CS 92-10 samples treated with 0.08N NaOH
tested by turbidimetric LAL assay showed very low CSE recovery of the challenge sample at the
detectable 1:10 dilution, other dilution at 1:50 presented optimal recovery, but the EU conc. of
103
test sample was out of the detection limit, thus the recovery at 1:50 dilution wasn`t acceptable.
This left us to conclude that the low CSE recovery was either due to interference of LAL enzyme
by NaOH or by degradation of endotoxin at high NaOH conc. Consequently, the use of low
NaOH conc. at 0.001N is recommended for future application in charge neutralization, removal
of bound endotoxin and uninhibited endotoxin detection by LAL.
Another pre-treatment was enzymatic digestion of chitosan monomers in to small chains; the
rationale was to reduce the monomer size up to 1kDa which will not bind to the large molecular
weighted LPS. However, due to the origin of chitosan digesting chitosanase enzyme from a
bacterial source, it was first tested in a pure form endotoxin contamination. The LAL results
suggested very high contamination of the enzyme with 393.0 EU per unit of enzyme. This could
be due to introduction during processing and enzyme manufacturing or due to the presence of
glycans that activates the alternate LAL cascade pathway. Conclusively, the use of chitosanase
enzyme was rejected for reduction of chitosan inhibition interference.
The third pre-treatment was with nitrous acid (HONO) which is commonly used for
depolymerization of high molecular weight chitosan to lower molecular weight. Due to harsh
chemical treatment, the action of HONO which is activated in the presence of high conc. of HCl
was first observed on high endotoxin conc. of 50 EU/mL. Three conc. of HONO+ HCl were
chosen, for selection of the one with optimal endotoxin recovery and least influence on endotoxin
integrity. After the 3 hours’ reaction at 50˚C, the results obtained from turbidimetric LAL assay
demonstrated extremely low endotoxin recovery at 1:10 dilution and the sample did not even
reach the threshold O.D at high CSE conc. suggesting that the nitrous acid treatment is
deleterious to endotoxin. An enhanced role of HCl was observed in reducing the endotoxin
recovery from the sample without nitrous acid. However, the role of pH in reducing the recovery
and high CSE conc. near the highest detectable conc. are also considered to be playing a role in
low recovery.
With the detectable role of HCl in degrading endotoxin, which is a commonly used reagent in
dissolving chitosan, a mild acid i.e. 0.2% acetic acid commonly used by ACCI for chitosan
rehydration was compared with HCl. The procedure utilized by USP for endotoxin determination
in chitosan was utilized to reduce the interference with LAL due to pH issues. The role of
rehydration/ dissolving reagents on the endotoxin recovery was tested under controlled
104
conditions i.e. at low CSE conc. for spike and challenge samples, under different temperature at
different times and pH adjustment with glucashield buffer as per USP. Meanwhile, the efficacy
and accuracy of chromogenic LAL assay was discovered in detecting the sample interferences,
thus the subsequent tests were performed with chromogenic LAL assay. The results of the
comparison between the rehydration reagents showed the superiority of 0.2% acetic acid in
optimal recovery of endotoxin from chitosan challenge sample, but not with CSE spiked LRW
samples. In fact, the spiked water sample showed low recovery in both the reagents, but
interestingly the chitosan challenge sample showed optimum PPC recovery in both HCl and 0.2%
acetic acid showing a protective role of chitosan in preventing endotoxin from degradation. This
intriguing insight leads us to apply the reagents with neutral pH to conserve the integrity of
endotoxin in spiked water but more importantly, to release the endotoxin bound to chitosan.
The analysis of the pre-treatment results leads us to the further investigation of hypothesis 1 that
states that the pre-treatment of chitosan will release endotoxin bound to the positively charged
and large glucosamine chains and facilitate absolute quantification of endotoxin. However, the
low endotoxin recovery in CSE spiked water samples after HCl treatment during
depolymerisation and subsequent test of rehydration reagents allow us to prove our second
hypothesis that states that the harsh chemical treatment used in depolymerisation reaction will be
deleterious to the endotoxin integrity and reduce detection.
105
CHAPTER 6 GENERAL DISCUSSION
The subject of endotoxin contamination in biomaterials is a vital yet overlooked aspect.
Historically the infections introduced during the surgery have been a leading cause of septic
shock death (Schoenberg M. H., 1998) and half of the nosocomial infections are accounted by
medical devices (Peter, Guggenbichler, Assadian2, Boeswald3, & Kramer4, 2011). The medical
devices include prosthetics, ventilator, intravascular catheter etc. that causes bacteraemia and
endotoxemia in the patients and lead to inflammation, multiple organ failure and death.
With the advent of biomedical engineering, several types of biomaterials and nanoparticles are
rapidly progressing towards clinical trials and are used or may soon be used in hospitals for
treatments. For the prosthetics and scaffolds finding applications in Intra-articular (IA) and
nanoparticles through Intravenous (IV) or intrathecal (IT) route, it is necessary to be cognizant of
the level of bacterial and specifically endotoxin contamination because there is no confirmatory
diagnosis available to detect sepsis. Thus, the US FDA has declared a limit of endotoxin for IV
and IT drugs and issued strict regulatory guidelines. It is mandatory to test the level of endotoxin
in medical devices, medical implants and the active pharmaceutical ingredients by LAL assay
before market release and the contamination level must be under the 5 EU/kg/hour limit for
Intravenous drugs and 0.2 EU/kg/hour for Intrathecal drugs (USP, 2005).
From the perspective of nanosafety, many nanoparticles that show toxic/inflammatory properties
may actually be contaminated with endotoxins and its effect may synergize with that of the
nanomaterials to induce toxicity. Hence, many nanoparticles may get rejected before approval
due to unrecognized endotoxin contamination. The endotoxin in nanoparticles can be detected by
the LAL assay, but many nanoparticles interfere with different formats of LAL. According to the
recent findings by Li and Boraschi, 2016 (Li Y, 2016), many commercially available
nanoparticles are contaminated with different levels of endotoxin depending on the variability of
cleanliness during their synthesis process. The nanoparticles adsorb the endotoxin on its surface
to reduce their surface-free energy. The LPS may bind to hydrophobic surfaces through its lipid
106
moiety and its phosphate group can bind to positively charged nanoparticles surfaces, which
leads us to design methods to reduce interference of endotoxin with nanoparticles.
Because of the widespread application of chitosan in the form of scaffolds and nanoparticles,
with projected final application in humans, it was necessary to quantify the endotoxin
concentration of the chitosan raw material. However, Davydova et al, cites that chitosan interacts
with endotoxin by electrostatic binding, hydrogen bonds and Vander Waals interaction, which
also leads to its application in endotoxin removing columns. In order to reduce such strong
interaction between chitosan and endotoxin, sodium hydroxide was used to neutralize the
chitosan surface charge and liberate the bound endotoxin, but high NaOH conc. proved
deleterious to endotoxin. The chitosan also interferes with the LAL proteins consistent with the
properties of other nanoparticles to cause interference with LAL enzyme during endotoxin
detection. However, this interference was reduced by dilution of chitosan below 0.25mg/mL
following the guidelines from USP, which states that the best method to reduce interference is by
adopting the maximum valid dilution method. The effect of chitosan rehydration reagents such as
hydrochloric acid and 0.2% acetic acid on the endotoxin integrity may also impede the absolute
detection of endotoxin in chitosan, which lead us to reduce their concentration during
rehydration. The protective effect of chitosan towards endotoxin points us towards verification of
the interaction mechanism of chitosan with rough LPS (without O-antigen) proposed by (Arabski
et al., 2013) in which the rough-LPS (Ra-LPS) forms inverse micelles with acyl groups pointing
outwards that produces higher pyrogenic response than the smooth-LPS. This finding also leads
us towards the fact that the harsh chemical treatment by rehydration reagents detaches the O-
antigen from the LPS, and leaves only the negatively charged core-sugars, Kdo2 and phosphate
groups of LPS to bind to the chitosan.
This study leads us to provide clear recommendations for future studies and verify the
mechanism of interactions between chitosan and endotoxin.
107
CONCLUSION AND RECOMMENDATIONS
The estimated value of endotoxin conc. in the CS 92-10 and CS 92-Raw samples obtained by
gel-clot could be accepted currently for calculating the EU conc. of in vivo doses, as the methods
to reduce interference are still under progress. The sensitive kinetic LAL assays suffered from the
problems of standard curve repeatability, which has been resolved by optimizing parameters such
as identifying the evaporation areas in 96-well plate, correcting the measurement absorbance at
405nm with pathlength, and pre-conditioning the LAL enzyme and samples at 37°C for rapid
enzyme reaction. However, the major breakthrough was the use of low range from 0.16-0.005
EU/mL that allowed highly repeatable standard curve.
The chitosan samples show enhancement interference up to 0.25 mg/mL, so in future this
conc. must be avoided, a dilution range of 1:80- 1:200 of 10mg/mL chitosan sample was found to
be a non-interfering range suitable for calculating absolute EU conc. With the detection of
inhibition interference by the challenge sample at these dilutions, the pre-treatments of chitosan
92-10 was performed. NaOH pre-treatment was aimed at neutralizing the charge of the chitosan
glucosamine chains and release the endotoxin bound to it in the supernatant of the precipitate.
However, due to high conc. of NaOH the endotoxin integrity was compromised and the test was
inconclusive. For future experiments, low conc. of NaOH around 0.01 or 0.008N will be used, to
have an equilibrium between pH for non-interference with LAL enzyme and to remove the bound
endotoxin from chitosan by charge neutralization while saving endotoxin integrity. The
chitosanase treatment was intended for enzymatic digestion of chitosan glucosamine chains into
monomers; however, due to its origin from a biological source i.e. gram positive bacteria S.
griseus and involvement of multiple processing steps, the endotoxin contamination was found at
an extremely high level in the enzyme, hence the enzymatic digestion of chitosan was aborted. To
cleave the chitosan chains into small monomers, the conventional depolymerisation reaction by
nitrous acid was performed initially on 50 EU/mL CSE spiked water samples to observe the
108
effect of high conc. of HCl in the reaction on endotoxin integrity; the endotoxin recovery was
compromised hypothesized to be due to acid hydrolysis of endotoxin or limited enzyme reactivity
at low pH or less dilution of 50 EU/mL CSE spike exceeding detection limit. Based on these
results, a buffering step was introduced before performing the LAL assay for the samples treated
with high conc. of HCl as recommended by the USP. Hence, the chitosan challenge sample and
CSE spiked water samples were then tested by the USP method at high HCl conc. (92mM) for 48
hours and 40°C along with the testing of time and temperature variables by treating CSE spiked
water sample with HCl at different time (1h) and temperature (RT), the samples were then diluted
in LRW and then buffered in glucashield buffer to optimize the pH for efficient enzyme reaction.
To compare the effect of HCl on the samples, another rehydration reagent i.e. 0.2% acetic acid
was used as utilized by ACCI for their chitosan testing. The chitosan challenge and CSE spiked
LRW samples were treated with 0.2% acetic acid for 1 hour at 37°C and CSE spiked water
sample was also tested at RT in 0.2% acetic acid to test temperature variable. Overall, it was
found that for chitosan challenge sample 0.2% acetic acid was more effective in the recovery of
challenge sample endotoxin than HCl, but for CSE spiked water sample, both the reagents were
showing deleterious effects ranging from no detectable recovery to very low recovery for HCl
and 0.2% acetic acid respectively at all the time and temperature conditions. This lead to the
conclusion that both the reagents cause acid hydrolysis of the endotoxin and results in
degradation, but also a very interesting observation, that chitosan has a protective effect on the
endotoxin, which may make it difficult to remove the endotoxin bound to the chitosan. The
endotoxin content of chitosan challenge sample has to be compared with unspiked chitosan test
sample to determine the absolute CSE recovery from challenge sample and determine the loss of
endotoxin. However, the mild acid hydrolysis may also affect the free/unbound endotoxin present
in chitosan challenge solution; hence, a reduction in the rehydration concentration of 0.2% acetic
acid is recommended for the chitosan sample as well as CSE spiked water samples. Ideally, a
solution with neutral or basic pH (such as glucashield buffer or low conc. NaOH) must be
utilized for chitosan rehydration for maximum reduction of electrostatic interaction between
chitosan and endotoxin and thus it is recommended for future use with chitosan.
In order to reduce the interference of chitosan towards endotoxin and allow absolute endotoxin
quantification in chitosan, there are multiple ways recommended for future testing: -
109
1) Replacement of magnesium ions in the chitosan solution will release the endotoxins
bound to chitosan surface (Tsuchiya, 2013).
2) Treatment of chitosan with a reagent of neutral pH, to reduce protonation and electrostatic
interaction with endotoxin.
3) Treatment of chitosan with detergents like Triton-X to break the aggregated inverted
cubical structure of LPS in to monomers, for reducing the high pyrogenecity and easy
detection with LAL enzyme.
4) A dissociating agent called deoxycholate at 2-3% concentration can be used to reversibly
break LPS aggregates bound to chitosan in to monomers. However, LPS monomers below
an optimal size do not show biological activity and may go undetected by LAL assay.
(Tsuchiya, 2013).
Extraction of LPS bound to chitosan by surface neutralization using NaOH at pH 8 instead of pH
12 and testing the endotoxin in supernatant after precipitate centrifugation must be tried for future
investigations.
110
BIBLIOGRAPHY
ACCI. (Instruction guide). PyrosateI_Limulus Amebocyte Lysate (LAL).
ACCI. (Product Sheet). PyrosateDatasheetPR14-021.
Akira, S., Uematsu, S., & Takeuchi, O. (2006). Pathogen Recognition and Innate Immunity. Cell,
124(4), 783-801. doi: 10.1016/j.cell.2006.02.015
Alameh, M., Dejesus, D., Jean, M., Darras, V., Thibault, M., Lavertu, M., . . . Merzouki, A.
(2012). Low molecular weight chitosan nanoparticulate system at low N:P ratio for
nontoxic polynucleotide delivery. [Research Support, Non-U.S. Gov't]. Int J
Nanomedicine, 7, 1399-1414. doi: 10.2147/IJN.S26571
Andra B. Schromm, K. B., Harald Loppnow,Ulrich Zähringer, Ernst Th. Rietschel, Stephen F.
Carroll, Michel H. J. Koch, Shoichi Kusumoto and Ulrich Seydel. (1998). The Charge of
Endotoxin Molecules Influences Their Conformation and IL-6-Inducing Capacity. The
Journal of Immunology(161), 5464-5471.
Annamaria, B. (2012). Structural characteristics of bacterial endotoxins. University o PECS.
Arabski, M., Lisowska, H., Lankoff, A., Davydova, V. N., Drulis-Kawa, Z., Augustyniak, D., . . .
Kaca, W. (2013). The properties of chitosan complexes with smooth and rough forms of
lipopolysaccharides on CHO-K1 cells. [Research Support, Non-U.S. Gov't]. Carbohydr
Polym, 97(2), 284-292. doi: 10.1016/j.carbpol.2013.05.008
B. Akbar John, K. C. A. J., Y.B. Kamaruzzaman and K. Zaleha. (2010). Mechanism in the Clot
Formation of Horseshoe Crab Blood during Bacterial Endotoxin Invasion. Science Alert.
Bagheri, M., Keller, S., & Dathe, M. (2011). Interaction of W-substituted analogs of cyclo-
RRRWFW with bacterial lipopolysaccharides: the role of the aromatic cluster in
antimicrobial activity. Antimicrob Agents Chemother, 55(2), 788-797. doi:
10.1128/AAC.01098-10
Bio-One, G. (2008). F073041_AN_UV-Spectroscopy. Application Note. Retrieved from
Buschmann, M. D., Merzouki, A., Lavertu, M., Thibault, M., Jean, M., & Darras, V. (2013).
Chitosans for delivery of nucleic acids. [Review]. Adv Drug Deliv Rev, 65(9), 1234-1270.
doi: 10.1016/j.addr.2013.07.005
Carregaro, A. B., Freitas, G. C., Ribeiro, M. H., Xavier, N. V., & Doria, R. G. (2014).
Physiological and analgesic effects of continuous-rate infusion of morphine, butorphanol,
tramadol or methadone in horses with lipopolysaccharide (LPS)-induced carpal synovitis.
[Research Support, Non-U.S. Gov't]. BMC Vet Res, 10, 966. doi: 10.1186/s12917-014-
0299-z
Cole, Y. W. a. R. B. (1996). <Wang_et_al-1996-Acid and Base Hydrolysis of Lipid A.pdf>.
JOURNAL OF MASS SPECTROMETRY,, 31, 138-149.
CRL. (2006). qc_en_n_endosafe_times_august_2006. Endosafe times. Retrieved from
Dobrovolskaia, M. A., Germolec, D. R., & Weaver, J. L. (2009). Evaluation of nanoparticle
immunotoxicity. [Research Support, N.I.H., Extramural]. Nat Nanotechnol, 4(7), 411-
414. doi: 10.1038/nnano.2009.175
111
EP. (2005). BACTERIAL ENDOTOXINS EUROPEAN PHARMACOPOEIA 5.0.
Fan, F.-Y. (2014). Journal of Medical and Biological Engineering, 34(3), 211. doi:
10.5405/jmbe.1516
FDA. (1987). Guideline on validation of the limulus amebocyte lysate as an end-product test for
Human and Animal Parenteral Drugs, Biological Products and Medical Devices.
FDA. (2005). Estimating the Maximum Safe Starting Dose in Initial Clinical Trials for
Therapeutics in Adult Healthy Volunteers.
Garidel, P., Rappolt, M., Schromm, A. B., Howe, J., Lohner, K., Andra, J., . . . Brandenburg, K.
(2005). Divalent cations affect chain mobility and aggregate structure of
lipopolysaccharide from Salmonella minnesota reflected in a decrease of its biological
activity. [Research Support, Non-U.S. Gov't]. Biochim Biophys Acta, 1715(2), 122-131.
doi: 10.1016/j.bbamem.2005.07.013
GmBH, H. (2013). Endotoxin-Compendium
Haile, L. A., Puig, M., Kelley-Baker, L., & Verthelyi, D. (2015). Detection of innate immune
response modulating impurities in therapeutic proteins. [Research Support, U.S. Gov't,
P.H.S.]. PLoS One, 10(4), e0125078. doi: 10.1371/journal.pone.0125078
Hansen, G. H., Rasmussen, K., Niels-Christiansen, L. L., & Danielsen, E. M. (2009).
Lipopolysaccharide-binding protein: localization in secretory granules of Paneth cells in
the mouse small intestine. [Research Support, Non-U.S. Gov't]. Histochem Cell Biol,
131(6), 727-732. doi: 10.1007/s00418-009-0572-6
Hiroko Kawasaki, T. N., Tatsushi Muta, Sadaaki Iwanaga, Yasuyuki Shimohigashi, and Shun-
ichiro Kawabata. (2000). Head-to-Tail Polymerization of Coagulin, a Clottable Protein of
the Horseshoe crab. JBC Papers
Hoemann, C. D., Sun, J., McKee, M. D., Chevrier, A., Rossomacha, E., Rivard, G. E., . . .
Buschmann, M. D. (2007). Chitosan-glycerol phosphate/blood implants elicit hyaline
cartilage repair integrated with porous subchondral bone in microdrilled rabbit defects.
[Research Support, Non-U.S. Gov't]. Osteoarthritis Cartilage, 15(1), 78-89. doi:
10.1016/j.joca.2006.06.015
Hoemann CD, T.-K. N., Chevrier A, Chen G, Lascau-Coman V, Mathieu C, Changoor A,
Yaroshinsky A, McCormack RG, Stanish WD6, Buschmann MD. (2015).
Chondroinduction Is the Main Cartilage Repair Response to Microfracture and
Microfracture With BST-CarGel: Results as Shown by ICRS-II Histological Scoring and
a Novel Zonal Collagen Type Scoring Method of Human Clinical Biopsy Specimens. Am
J Sports Med. , 43(10), 2469-2480.
Hurley, J. C. (1995). Endotoxemia: Methods of Detection and Clinical Correlates. CLINICAL
MICROBIOLOGY REVIEWS, 268–292.
Iwanaga, S. (2007). Biochemical principle of Limulus test for detecting bacterial endotoxins.
Proc. Jpn. Acad. Ser, 83.
J.L Lucia, J. A. C., C. E. Arnold and K.N. Winsco. (2014). Influence of an intra-articular
lipopolysaccharide challenge on makers of inflammation and cartilage metabolism in
112
young horses. American Society of Animal Science, 91, 2963-2969. doi: 10.2527/jas2012-
5981
Jean, M., Alameh, M., De Jesus, D., Thibault, M., Lavertu, M., Darras, V., . . . Merzouki, A.
(2012). Chitosan-based therapeutic nanoparticles for combination gene therapy and gene
silencing of in vitro cell lines relevant to type 2 diabetes. [Comparative Study
Research Support, Non-U.S. Gov't]. Eur J Pharm Sci, 45(1-2), 138-149. doi:
10.1016/j.ejps.2011.10.029
Jin, M. S., & Lee, J. O. (2008). Structures of TLR-ligand complexes. [Research Support, Non-
U.S. Gov't
Review]. Curr Opin Immunol, 20(4), 414-419. doi: 10.1016/j.coi.2008.06.002
Joiner, T. J., Kraus, P. F., & Thomas C. Kupiec, P. (2002). Comparison of Endotoxin Testing
Methods for Pharmaceutical Products. International Journal of Pharmaceutical
Compounding, 6(6).
Jong, W. H. D., & Borm, P. J. (2008). Stealth liposomes and long circulating nanoparticles:
Applications and Hazards. International Journal of Nanomedicine.
JP. (2001). Bacterial Endotoxin Test.
Judge, A., & MacLachlan, I. (2008). Overcoming the innate immune response to small
interfering RNA. [Review]. Hum Gene Ther, 19(2), 111-124. doi: 10.1089/hum.2007.179
Kim, H. M., Park, B. S., Kim, J. I., Kim, S. E., Lee, J., Oh, S. C., . . . Lee, J. O. (2007). Crystal
structure of the TLR4-MD-2 complex with bound endotoxin antagonist Eritoran.
[Research Support, Non-U.S. Gov't]. Cell, 130(5), 906-917. doi:
10.1016/j.cell.2007.08.002
Klaus Brandenburg, U. S., Andra B. Schromm, Harald Loppnow, Michel H.J. Koch, Ernst Th.
Rietschel. (1996). Conformation of lipid A, the endotoxic center of bacterial
lipopolysaccharide. Journal of Endotoxin Research, 3(3), 173-178.
Lavertu, M., Methot, S., Tran-Khanh, N., & Buschmann, M. D. (2006). High efficiency gene
transfer using chitosan/DNA nanoparticles with specific combinations of molecular
weight and degree of deacetylation. [Research Support, Non-U.S. Gov't]. Biomaterials,
27(27), 4815-4824. doi: 10.1016/j.biomaterials.2006.04.029
Levin J, B. F. (1964). THE ROLE OF ENDOTOXIN IN THE EXTRACELLULAR
COAGULATION OF LIMULUS BLOOD. Bull Johns Hopkins Hosp.(115), 265-274.
Li Y, B. D. (2016). Endotoxin contamination: a key element in the interpretation of nanosafety
studies. Nanomedicine, 11(3).
Liu, Y., Zhang, Y., Dong, P., An, R., Xue, C., Ge, Y., . . . Liang, X. (2015). Digestion of Nucleic
Acids Starts in the Stomach. [Research Support, Non-U.S. Gov't]. Sci Rep, 5, 11936. doi:
10.1038/srep11936
Lonza. (2014). Manuals Product Instructions_Kinetic-QCL_Product_Insert.
Maeshima, N., & Fernandez, R. C. (2013). Recognition of lipid A variants by the TLR4-MD-2
receptor complex. [Research Support, Non-U.S. Gov't
113
Review]. Front Cell Infect Microbiol, 3, 3. doi: 10.3389/fcimb.2013.00003
Mariathasan, S., Weiss, D. S., Newton, K., McBride, J., O'Rourke, K., Roose-Girma, M., . . .
Dixit, V. M. (2006). Cryopyrin activates the inflammasome in response to toxins and
ATP. [Research Support, N.I.H., Extramural
Research Support, Non-U.S. Gov't]. Nature, 440(7081), 228-232. doi: 10.1038/nature04515
Martinon, F., Petrilli, V., Mayor, A., Tardivel, A., & Tschopp, J. (2006). Gout-associated uric
acid crystals activate the NALP3 inflammasome. [Research Support, Non-U.S. Gov't].
Nature, 440(7081), 237-241. doi: 10.1038/nature04516
McCullough, K. Z. (2010). Variability-in-the-bacterial-endotoxins-test. MMI Associates.
Méthot S, C. A., Tran-Khanh N, Hoemann CD, Stanish WD, Restrepo A, Shive MS, Buschmann
MD. (2016). Osteochondral Biopsy Analysis Demonstrates That BST-CarGel Treatment
Improves Structural and Cellular Characteristics of Cartilage Repair Tissue Compared
With Microfracture. Cartilage, 7(1), 16-28.
MJ, G. (1997). Performing the LAL gel-clot test in facilities. LAL Update, 15(4).
Moghimi, S. M., & Szebeni, J. (2003). Stealth liposomes and long circulating nanoparticles:
critical issues in pharmacokinetics, opsonization and protein-binding properties. Prog
Lipid Res, 42(6), 463-478. doi: 10.1016/s0163-7827(03)00033-x
Molinaro, A., Holst, O., Di Lorenzo, F., Callaghan, M., Nurisso, A., D'Errico, G., . . . Martin-
Santamaria, S. (2015). Chemistry of lipid A: at the heart of innate immunity. [Research
Support, Non-U.S. Gov't
Review]. Chemistry, 21(2), 500-519. doi: 10.1002/chem.201403923
Multiskan. (2010). Turbidometric Growth Curve Measurements and Liquid Evaporation Studies
with a Microplate Photometer. Application Note. Retrieved from
Neun, B. W., & Dobrovolskaia, M. A. (2011). Detection and quantitative evaluation of endotoxin
contamination in nanoparticle formulations by LAL-based assays. [Comparative Study
Evaluation Studies
Research Support, N.I.H., Extramural]. Methods Mol Biol, 697, 121-130. doi: 10.1007/978-1-
60327-198-1_12
note, A. (2001). Use of sodium hydroxide for cleaning and sanitizing chromatography media and
systems.
Ohto, U., Fukase, K., Miyake, K., & Shimizu, T. (2012). Structural basis of species-specific
endotoxin sensing by innate immune receptor TLR4/MD-2. [Research Support, Non-U.S.
Gov't]. Proc Natl Acad Sci U S A, 109(19), 7421-7426. doi: 10.1073/pnas.1201193109
Oktay, E. O., Demiralp, B., Senel, S., Cevdet Akman, A., Eratalay, K., & Akincibay, H. (2010).
Effects of platelet-rich plasma and chitosan combination on bone regeneration in
experimental rabbit cranial defects. [Comparative Study
Research Support, Non-U.S. Gov't]. J Oral Implantol, 36(3), 175-184. doi: 10.1563/AAID-JOI-
D-09-00023
114
Park, B. S., Song, D. H., Kim, H. M., Choi, B. S., Lee, H., & Lee, J. O. (2009). The structural
basis of lipopolysaccharide recognition by the TLR4-MD-2 complex. [Research Support,
Non-U.S. Gov't]. Nature, 458(7242), 1191-1195. doi: 10.1038/nature07830
Peter, J., Guggenbichler, Assadian2, O., Boeswald3, M., & Kramer4, A. (2011). Incidence and
clinical implication of nosocomial infections associated with implantable biomaterials –
catheters, ventilator-associated pneumonia, urinary tract infections. GMS
Krankenhaushygiene Interdisziplinär, 6.
Poltorak, A., Ricciardi-Castagnoli, P., Citterio, S., & Beutler, B. (2000). Physical contact
between lipopolysaccharide and toll-like receptor 4 revealed by genetic complementation.
Proc Natl Acad Sci U S A, 97(5), 2163-2167. doi: 10.1073/pnas.040565397
Ragelle, H., Vandermeulen, G., & Preat, V. (2013). Chitosan-based siRNA delivery systems.
[Research Support, Non-U.S. Gov't
Review]. J Control Release, 172(1), 207-218. doi: 10.1016/j.jconrel.2013.08.005
Rinaudo, M. (2006). Chitin and chitosan: Properties and applications. Progress in Polymer
Science, 31(7), 603-632. doi: 10.1016/j.progpolymsci.2006.06.001
Ruiz, N., Kahne, D., & Silhavy, T. J. (2009). Transport of lipopolysaccharide across the cell
envelope: the long road of discovery. [Research Support, N.I.H., Extramural
Review]. Nat Rev Microbiol, 7(9), 677-683. doi: 10.1038/nrmicro2184
Sandle, T. (2011). A Practical Approach to Depyrogenation Studies Using Bacterial Endotoxin.
Journal of GXP Compliance.
Sandle, T. (2013). Pharmaceutical Product Impurities: Considering Beta Glucans. American
Pharmaceutical Review.
Schoenberg M. H., W. M., Radermacher P. (1998). Outcome of patients with sepsis and septic
shock after ICU treatment. Langenbeck’s Arch Surg, 383, 44–48.
Schroder, K., & Tschopp, J. (2010). The inflammasomes. [Research Support, Non-U.S. Gov't
Review]. Cell, 140(6), 821-832. doi: 10.1016/j.cell.2010.01.040
Shi, W., Li, X., & Ma, H. (2014). Fluorescent probes and nanoparticles for intracellular sensing
of pH values. Methods and Applications in Fluorescence, 2(4), 042001. doi:
10.1088/2050-6120/2/4/042001
Smulders, S., Kaiser, J. P., Zuin, S., Van Landuyt, K. L., Golanski, L., Vanoirbeek, J., . . . Hoet,
P. H. (2012). Contamination of nanoparticles by endotoxin: evaluation of different test
methods. [Research Support, Non-U.S. Gov't]. Part Fibre Toxicol, 9, 41. doi:
10.1186/1743-8977-9-41
STE-1.4, N. M. (2015). Detection and Quantification of Gram Negative Bacterial Endotoxin
Contamination in Nanoparticle Formulations by
Kinetic Chromogenic LAL Assay NCL Method STE-1.4. Frederick, MD.
Steimle, A., Autenrieth, I. B., & Frick, J. S. (2016). Structure and function: Lipid A modifications
in commensals and pathogens. Int J Med Microbiol, 306(5), 290-301. doi:
10.1016/j.ijmm.2016.03.001
115
ThermoSci. (2012). Microplate Based Pathlength Correction Method for Photometric DNA
Quantifi cation Assay. Application Note. Retrieved from
Thibault, M., Astolfi, M., Tran-Khanh, N., Lavertu, M., Darras, V., Merzouki, A., & Buschmann,
M. D. (2011). Excess polycation mediates efficient chitosan-based gene transfer by
promoting lysosomal release of the polyplexes. [Evaluation Studies
Research Support, Non-U.S. Gov't]. Biomaterials, 32(20), 4639-4646. doi:
10.1016/j.biomaterials.2011.03.010
Thomas G. Koch, L. C. B., Dean H. Betts. (2009). Current and future regenerative medicine —
Principles, concepts, and
therapeutic use of stem cell therapy and tissue engineering in equine
medicine. Can Vet J, 50.
times_CRL, E. (2006). endosafe_times_CRI_august_2006. Retrieved from
Tirsoaga, A., El Hamidi, A., Perry, M. B., Caroff, M., & Novikov, A. (2007). A rapid, small-
scale procedure for the structural characterization of lipid A applied to Citrobacter and
Bordetella strains: discovery of a new structural element. J Lipid Res, 48(11), 2419-2427.
doi: 10.1194/jlr.M700193-JLR200
Tsuchiya, M. (2013). Possible-Mechanism-of-Low-Endotoxin-Recovery-Article. Microbiology.
USP. (2005). BACTERIAL ENDOTOXINS TEST. In U. Inc. (Ed.).
V. N. Davydova*, I. M. Y., V. I. Gorbach, I. N. Krasikova, and T. F. Solov’eva. (2000).
Interaction of Bacterial Endotoxins with Chitosan. Effect of Endotoxin Structure,
Chitosan Molecular Mass, and Ionic Strength of the Solution on the Formation of the
Complex. Biochemistry.
V. N. Davydova*, I. M. Y., V. I. Gorbach, I. N. Krasikova, and T. F. Solov’eva. (2000).
Interaction of Bacterial Endotoxins with Chitosan. Effect of Endotoxin Structure,
Chitosan Molecular Mass, and Ionic Strength of the Solution on the Formation of the
Complex. Biochemistry, 65, 1278-1287.
Vreugdenhil, A. C. E., Snoek, A. M. P., Greve, J. W. M., & Buurman, W. A. (2000).
Lipopolysaccharide-Binding Protein Is Vectorially Secreted and Transported by Cultured
Intestinal Epithelial Cells and Is Present in the Intestinal Mucus of Mice. The Journal of
Immunology, 165(8), 4561-4566. doi: 10.4049/jimmunol.165.8.4561
Wang, L., Wang, Q., & Reeves, P. R. (2010). The variation of O antigens in gram-negative
bacteria Subcell Biochem (2010/07/02 ed., Vol. 53, pp. 123-152).
Wang, X., & Quinn, P. J. (2010). Lipopolysaccharide: Biosynthetic pathway and structure
modification. [Research Support, Non-U.S. Gov't
Review]. Prog Lipid Res, 49(2), 97-107. doi: 10.1016/j.plipres.2009.06.002
Wang, X., & Quinn, P. J. (2010). Lipopolysaccharide: Biosynthetic pathway and structure
modification. Progress in Lipid Research, 49(2), 97-107. doi:
10.1016/j.plipres.2009.06.002
116
Warren, H. S., Fitting, C., Hoff, E., Adib-Conquy, M., Beasley-Topliffe, L., Tesini, B., . . .
Cavaillon, J. M. (2010). Resilience to bacterial infection: difference between species
could be due to proteins in serum. [Comparative Study
Research Support, N.I.H., Extramural
Research Support, Non-U.S. Gov't]. J Infect Dis, 201(2), 223-232. doi: 10.1086/649557
Williams, K. L. (2001). Endotoxins: Pyrogens, LAL Testing and Depyrogenation (2 ed.): Marcel
Dekker.
Wistrom, C. A. A. a. A. O. (1998). Critical Aggregation Concentrations of Gram-Negative
Bacterial Lipopolysaccharides (LPS). Biochemical and Biophysical Research
Communications 253.
Wittrup, A., Ai, A., Liu, X., Hamar, P., Trifonova, R., Charisse, K., . . . Lieberman, J. (2015).
Visualizing lipid-formulated siRNA release from endosomes and target gene knockdown.
[Research Support, N.I.H., Extramural
Research Support, Non-U.S. Gov't]. Nat Biotechnol, 33(8), 870-876. doi: 10.1038/nbt.3298
Wooten. (2003).
Wright, S. D., Ramos, R.A.,Tobias, P.S.,Ulevitch, R.J.,Mathison, J.C. (1990). CD14, a receptor
for complexes of lipopolysaccharide (LPS) and LPS binding protein. Science, 249(4975),
1431-1433.