Embed Size (px)
Citation preview
VOT 72157
SELECTIVE EMULSION LIQUID MEMBRANE EXTRACTION OF SILVER
FROM LIQUID PHOTOGRAPHIC WASTE INDUSTRIES
(PENGEKSTRAKAN EMULSI SELAPUT CECAIR TERPILIH LOGAM PERAK
DARI SISA INDUSTRI FOROGRAFI)
ASSOCIATE PROFESSOR DR. HANAPI BIN MAT
NORASIKIN BINTI OTHMAN
CHAN KIT HIE
CHIONG TUNG
HII KING HUNG
NG KOK SUM
DEPARTMENT OF CHEMICAL ENGINEERING
FACULTY OF CHEMICAL AND NATURAL RESOURCES ENGINEERING
UNIVERSITI TEKNOLOGI MALAYSIA
2006
ii
ACKNOWLEDGEMENTS
The financial support from the Ministry of Science, Technology and Innovation
(MOSTI) on the project (Project No. 08-02-06-0019 EA153/VOT 74032) is
gratefully acknowledged.
iii
ABSTRACT
SELECTIVE EMULSION LIQUID MEMBRANE EXTRACTION OF SILVER FROM PHOTOGRAPHIC WASTE INDUSTRIES
(Keywords: Emulsion liquid membrane, extraction, photographic waste, silver)
The field of liquid membrane technology is currently undergoing a rapid expansion in research as well as its application as an industrial separation process. Liquid membrane can be manipulated to selectively separate a specific solute from a mixture and even to extract a solute against its concentration gradient. A liquid membrane system comprises of three liquid phases; feed phase, liquid membrane organic phase and receiving phase. Liquid membrane can be prepared using support or as emulsion (unsupported) liquid membrane. Emulsion liquid membrane is a liquid membrane in which the membrane phase of an emulsion is dispersed into the feed phase to be treated. This method was investigated as an alternative process for the recovery of silver from photographic waste, which contains various metals ions such as silver, iron, sodium and potassium. The important parameters governing the extraction process of silver such as agitation speed, homogenizer speed, surfactant and carrier concentrations, type of diluents, treat ratio and types of stripping solution were investigated. This process has been conducted in a batch system using a mixer-settler. The results show that the mobile carrier Cyanex 302 is selective towards silver and almost completely extract silver over the other metals that existed in the photographic waste. The optimum silver extraction was obtained by using 0.03 M Cyanex 302, 3 % (w/v) Span 80, 250 rpm stirring speed, 1.0 M thiourea in 1.0 M H2SO4 stripping agent, 1:5 of treat ratio, and kerosene as a diluent. The experimental result also shows that the emulsion liquid membrane system could be recycled twice having 80% of silver was extracted. In addition, theoretical studies show that the developed model could predict the extraction performance of the system understudied as obtained from experimental data.
Key Researchers:
Associate Professor Dr. Hanapi Bin Mat Mrs Norasikin Othman
Ms Chan Kit Hie Ms Chiong Tung
Mr. Hii King Hung Mr. Ng Kok Sum
Email: [email protected]
Tel. No.: +607-5535590 Fax No.: +607-5581463
Vote No.: 74032
iv
ABSTRAK
PENGEKSTRAKAN EMULSI SELAPUT CECAIR TERPILIH LOGAM PERAK DARI SISA INDUSTRI PHOTOGRAFI
(Kata kunci: Emulsi selaput cecair, pengekstrakan, sisa fotografi, logam perak)
Pada masa kini, bidang teknologi membran cecair telah berkembang dengan
pesat di bidang penyelidikan dan juga penggunaannya sebagai proses pemisahan di industri. Membran cecair boleh bertindak memisahkan bahan larut secara terpilih daripada campuran di samping boleh mengekstrak bahan larut melalui kecerunan kepekatan bahan larut tersebut. Sistem membran cecair terdiri daripada tiga fasa cecair; fasa suapan, fasa organik membran cecair dan fasa penerima. Membran cecair boleh disediakan dalam dua bentuk iaitu membran cecair bersokong atau berbentuk emulsi (tanpa sokongan). Sistem emulsi membran cecair adalah merupakan membran cecair dalam mana diserakkan ke dalam fasa suapan yang akan dirawat. Kaedah ini telah dikaji sebagai kaedah alternatif bagi perolehan semula logam perak daripada sisa fotografik yang mengandungi berbagai jenis ion logam seperti perak, besi, natrium dan kalium. Parameter penting yang menentukan kemampuan pengekstrakan logam perak seperti kelajuan penggodakan, kelajuan homogenasi, kepekatan pengemulsi dan pembawa, jenis pelarut organik, nisbah rawatan bagi emulsi kepada fasa suapan dan jenis larutan pelucut dikaji. Proses ini telah dijalankan dengan menggunakan sistem pengaduk-pemisah berkelompok. Keputusan menunjukkan pembawa Cyanex 302 adalah terpilih terhadap logam perak dan hampir mengekstrak sempurna logam perak berbanding logam lain yang terdapat di dalam sisa fotografik. Pengekstrakan optima logam perak diperolehi dengan menggunakan 0.03 M Cyanex 302, 3% (w/v) Span 80, kelajuan pengadukan 250 rpm, agen pelucut 1.0 M thiourea dalam 1.0 M H2SO4, 1:5 nisbah rawatan, dan kerosen sebagai pelarut organik. Keputusan ujikaji juga menunjukkan bahawa membran cecair juga berkebolehan dikitar semula sebanyak dua kali dengan 80% pengekstrakan logam perak. Tambahan lagi, pengkajian secara teori menunjukkan model yang dibangunkan boleh meramalkan prestasi pengekstrakan bagi sistem yang dikaji berasaskan data yang diperolehi dari ujikaji.
Penyelidik Utama:
Profesor Madya Dr. Hanapi Bin Mat Puan Norasikin Othman
Cik Chan Kit Hie Cik Chiong Tung
En. Hii King Hung En. Ng Kok Sum
Email: [email protected]
No.Tel.: +607-5535590 No. Fax: +607-5581463
Vote No.: 74032
v
TABLE OF CONTENTS
CHAPTER TITLE PAGE
TITLE
ACKNOWLEGMENTS
ABSTRACT
ABSTRAK
TABLE OF CONTENTS
LIST OF TABLE
LIST OF FIGURES
LIST OF SYMBOLS AND ABBREVIATIONS
LIST OF APPENDICES
i
ii
iii
iv
v
x
xiii
xvi
xx
1
2
INTRODUCTION
1.1 General Introduction
1.2 Research Background
1.3 Research Scopes and Objectives
1.4 Report Outline
1.5 Summary
LITERATURE STUDY
2.1 The Photographic Industry
2.1.1 Silver in Photographic Processing
2.1.2 Metal Recovery Technology
2.2 Liquid Membrane Technology .
2.2.1 Introduction
2.2.2 Liquid Membrane Process
2.2.3 Liquid Membrane Formulation
2.2.3.1 Carrier
2.2.3.2 Diluents
1
1
2
4
6
6
8
8
10
11
17
17
18
19
19
23
vi
3
2.2.3.3 Emulsifier/Surfactant
2.2.4 Liquid Membrane Mode of Operation
2.2.4.1 Immobilized Liquid Membrane (ILM) or
Supported Liquid Membrane
2.2.4.2 Emulsion Liquid Membrane (ELM) or
Surfactant Liquid Membrane
2.2.5 Mass Transfer Mechanism of Liquid Membrane
2.2.6 Liquid Membrane Application
2.2.7 Demulsification
2.3 Emulsion Liquid Membrane Extraction of Silver
2.3.1 Carrier selection
2.3.2 Parameters Affecting on ELM Extraction Process
2.3.3 Thermodynamics of Extraction
2.3.3.1 Distribution ratio
2.3.3.2 Recovery Efficiency
2.3.3.3 Separation Factor
2.3.4 Modeling of Emulsion Liquid Membrane
Extraction
2.3.4.1 Modeling of Equilibrium Conditions
2.3.4.2 Emulsion Liquid Membrane Extraction
Models
2.3.4.3 Models of Type II ELM Extraction
2.3.5 Engineering Aspect of Process Equipment
MATERIALS AND METHODS
3.1 Solvents and Reagents
3.1.1 Chemical Used in Carrier Screening
3.1.2 Chemical Used in Strip Agent Screening
3.1.3 Membrane Components
3.1.4 Photographic Waste Samples and
Characterization
3.2 Experimental Procedures
3.2.1 Liquid Membrane Component Selection
25
27
28
29
31
34
36
38
38
42
43
44
46
46
47
47
48
51
52
56
56
56
56
58
58
59
59
vii
4
3.2.1.1 Carrier Screening
3.2.1.2 Stripping Agent Screening
3.2.1.3 Stability Test
3.2.2 Emulsion Liquid Membrane Extraction
3.2.2.1 Emulsion Liquid Membrane
Preparation
3.2.2.2 Extraction Study
3.2.2.3 Demulsification Study
3.3 Analytical Procedures
3.3.1 Metal Content Analysis
3.3.2 Anion Content Analysis
3.3.3 pH Measurement
3.3.4 Viscosity Measurement
3.3.5 Density Measurement
3.3.6 Emulsion Drop Size Measurement
LIQUID MEMBRANE COMPONENT SELECTION
4.1 Introduction
4.2 Carrier Screening
4.2.1 Acidic Extractants
4.2.2 Chelating Extractants
4.2.3 Basic Extractants
4.2.4 Solvating Extractants
4.3 Carrier Selection
4.3.1 Cyanex 302
4.3.2 Tetramethylthiuram disulfide (Thiuram)
4.4 Stripping Selection and Screening
4.4.1 Metal loaded Cyanex 302
4.4.2 Metal loaded Tetramethylthiuram Disulfide
4.5 Emulsion Liquid Membrane and Stability
4.5.1 Effect of Surfactant Concentration
4.5.2 Effect of Diluents
4.5.3 Effect of Homogenizer Speed
59
60
60
61
61
62
63
64
64
65
65
65
66
66
67
67
68
69
73
75
76
77
78
82
87
88
91
94
96
99
101
viii
5
4.6 Photographic Wastes Characterizations
4.7 Summary
EMULSION LIQUID MEMBRANE EXTRACTION
5.1 Introduction
5.2 Batch Emulsion Liquid Membrane Extraction - Cyanex
302
5.2.1 Effect of Extraction Time
5.2.2 Effect of Stripping Agent Types and
Concentration
5.2.3 Effect of Carrier Concentration
5.2.4 Effect of Surfactant Concentration
5.2.5 Effect of Agitation Speed
5.2.6 Effect of Treat Ratio (TR)
5.2.7 Effect of Diluents
5.2.8 Effect of Homogenizer Speed in
Emulsification
5.2.9 Metal Selectivity
5.3 Emulsion Liquid Membrane Extraction Using Different
Types of Carrier
5.4 Membrane Breakage and Swelling
5.4.1 Introduction
5.4.2 Effect of Agitation Speed
5.4.3 Effect of Liquid Membrane Composition
5.4.4 Effect of Different Type of Stripping Agent
5.4.5 Effect of Extraction Time
5.5 Emulsion Liquid Membrane Recovery Process
5.5.1 Effect of Carrier Concentration
5.5.2 Effect of Stripping Agent Concentration
5.5.3 Effect of Treat Ratio
5.6 ELM Transport Mechanism of Silver
5.7 Future Prospects of ELM Process
5.7.1 A ELM Recycling Process
103
104
106
106
108
108
109
114
119
122
125
128
131
132
135
140
140
143
144
146
148
150
150
151
152
153
154
154
ix
6
7
5.7.2 A Continuous ELM Operation Process
5.8 Summary
MODELING OF LIQUID MEMBRANE EXTRACTION
OF SILVER
6.1 Introduction
6.2 ELM Batch Extraction Model
6.2.1 Preliminary Study
6.2.2 Mathematical Modeling of Transport Process
6.2.3 Numerical Solution
6.2.4 Model Parameter Estimation
6.2.4.1 Effective Diffusivity and Mass Transfer
Coefficient
6.2.4.2 Emulsion Droplet Sauter Mean
Diameter
6.2.4.3 Equilibrium Constant
6.3 A Comparison of Model and Experimental Data
6.3.1 Effect of Carrier Concentration
6.3.2 Effect of Treat Ratio (TR)
6.3.3 Effect of Stripping Agent Concentration
6.3.4 Effect of Stirring Speed
6.3.5 Effect of Surfactant Concentration
6.3.6 Effect of Emulsion Droplets Size
6.4 Summary
CONCLUSIONS AND RECOMMENDATIONS
7.1 Conclusions
7.2 Recommendations and Future Works
156
159
160
160
160
160
162
168
171
172
173
174
174
175
176
177
178
180
181
182
183
183
186
REFERENCES
APPENDICES
189
210
x
LIST OF TABLES
TABLE NO TITLE PAGE
2.1
2.2
2.3
2.4
3.1
3.2
3.3
3.4
4.1
4.2
4.3
4.4
4.5
4.6
4.7
Relative toxicity of silver compounds in comparison of free
silver ion
Silver recovery methods
Physical properties of various diluents
Extractant used in metals extraction using conventional
solvent extraction (CSE), emulsion liquid membrane (ELM)
and supported liquid membrane (SLM) processes
List of extractants used for silver extraction from photographic
waste
List of stripping agent used in screening process
Properties of Cyanex 302 and Thiuram
Specification of High Voltage Demulsifier
Metal extraction from photographic wastes without pH
adjustment
Metal extraction from photographic wastes without pH
adjustment
Extraction selectivity of silver from photographic wastes using
an acidic extractants
Extraction selectivity of silver from photographic wastes using
chelating extractants
Extraction selectivity of silver from photographic wastes using
a basic extractants
Extraction selectivity of silver from photographic wastes using
solvating extractants
Effect of acid types and concentration on stripping of silver
from loaded Cyanex 302 organic phase
11
13
24
39
57
57
58
64
71
72
73
75
76
77
88
xi
4.8
4.9
4.10
4.11
4.12
4.13
4.14
4.15
4.16
4.17
4.18
4.19
5.1
5.2
5.3
5.4
5.5
5.6
5.7
5.8
5.9
Percentage of silver stripping by 0.5 M Thiourea in different
acid medium at various concentrations
Percentage of silver stripping at various concentrations of
thiourea
Effect of acid types and concentration on stripping of silver
from loaded tetramethylthiuram disulfide organic phase –
photographic wastes
A comparison of stripping agents for metal loaded Thiuram
Effect of surfactant concentration on emulsion stability
Emulsion stability of Thiuram (0.03 M) in Chloroform
Physical properties of diluents used in silver extraction process
Emulsion stability of Cyanex 302 (0.05 M) in different
diluents
Emulsion stability of Thiuram (0.05 M) in different diluents
Effect of homogenizer speed on W/O emulsion stability of
Cyanex 302 (0.05 M) in kerosene
Particle movement versus droplet size
Physical and chemical properties of real photographic wastes
solution
Experimental conditions used for the preparation of ELM
Percentage of silver extraction using different types of
stripping agent
Viscosity of liquid membrane (Cyanex 302 and Span 80 in
kerosene)
Viscosity of liquid membrane (Cyanex 302 and Span 80 in
kerosene)
Effect of treat ratio on emulsion apparent swelling
Selectivity of silver from photographic waste in 20 minutes
ELM extraction
Experimental conditions used for the preparation of ELM
Dependence of viscosity of the organic phase used for
emulsion preparation on surfactant concentration
Effect of Cyanex 302 concentration on silver recovery in ELM
89
90
92
94
98
98
99
100
100
102
102
104
107
111
117
121
127
134
135
138
151
xii
5.10
5.11
5.12
6.1
6.2
system
Effect on stripping agent concentration on silver recovery in
ELM system
Effect of treat ratio on silver recovery in ELM system
Liquid membrane potential in continuous ELM system
Typical parameters of the batch extraction model
Size of emulsion droplets based on Reis and Carvalho (2004)
correlation
152
153
159
171
174
xiii
LIST OF FIGURES
TABLE NO. TITLE PAGE
2.1
2.2
2.3
2.4
2.5
2.6
2.7
2.8
2.9
2.10
4.1
4.2
4.3
4.4
4.5
4.6
4.7
4.8
4.9
4.10
4.11
Photo colour negative process
A schematic diagram of mixer-settler extraction using in
emulsion liquid membrane
The structure of surfactant
Molecular structure of Span 80
A schematic diagram of two types of liquid membranes
The mechanism of couple transport in liquid membrane
A schematic diagram of the advancing front model
The counter-current stirred column
The counter-current spray column
Industrial process using stirred column
Chemical structure of acidic extractant
The chemical structure of diphenylthiocarbazone (dithizone)
Metal extraction from liquid photographic wastes
General effect of pH on metal extraction
Relationship between log D and log [Cyanex 302]
Effect of extractant concentration of metal extraction from
photographic waste without pH adjustment using Cyanex 302
Percentage of metal extraction using 0.03 M
tetramethylthiuram disulfide in Chloroform
Chemical structure of tetramethylthiuram disulfide (Thiuram)
Postulated structure of silver complex with TMTDS (C-shaped
cavity)
Relationship between log D and log [tetramethylthiuram
disulfide]
Effect of extractant concentration of metal extraction from
9
19
26
27
28
32
50
53
54
55
70
73
78
79
81
82
84
84
85
86
87
xiv
4.12
4.13
4.14
4.15
5.1
5.2
5.3
5.4
5.5
5.6
5.7
5.8
5.9
5.10
5.11
5.12
5.13
5.14
5.15
5.16
5.17
5.18
5.19
5.20
photographic waste without pH adjustment using
tetramethylthiuram disulfide in chloroform
Effect of thiourea concentration in 0.3 M H2SO4 on stripping
of silver from loaded Cyanex 302 organic phase
Possible result of the collision of two emulsion droplets in
connection with the droplet-droplet interaction
Effect of emulsifier at liquid/liquid interface
Effect of homogenizer speed on size of W/O emulsion
Effect of extraction time on the extraction of silver
Effect of stripping agent types on the extraction of silver
Effect of stripping agent acidity on the extraction of silver
Effect of thiourea concentration on the extraction of silver
Effect of carrier concentration on silver extraction.
Effect of carrier concentration [Cyanex 302] on silver
extraction
The effect of carrier concentration [Cyanex 302] on the pH of
the system during the extraction process
Effect of surfactant concentration [Span 80] on silver
extraction
Effect of agitation speed on the extraction of silver
Effect of agitation speed on the extraction of silver
Effect of treat ratio on the silver extraction
The effect of varies treat ratio on the pH of the system
Effect of diluents on the silver extraction
Effect of homogenizer speed on the silver extraction
Metal selectivity in ELM extraction process
Effect of agitation speed on the extraction and break-up of
emulsion
Effect of surfactant concentration on the extraction of silver
Extraction of silver from photographic wastes
Effect of agitation speed on silver extraction and break-up of
emulsion
Effect of surfactant concentration and break-up of emulsion
91
96
97
103
109
111
112
113
116
117
118
120
124
124
126
128
130
132
133
137
138
140
144
146
xv
5.21
5.22
5.23
5.24
5.25
5.26
5.27
6.1
6.2
6.3
6.4
6.5
6.6
6.7
Effect of different acid types on apparent swelling of emulsion
Swelling and break-up phenomena in W/O/W emulsion
Effect of extraction time on silver extraction and apparent
swelling
A simultaneous extraction and stripping mechanism in ELM
process
Silver extraction in recycling ELM system
A schematic diagram of proposed continuous ELM extraction
system
A schematic diagram of fresh and used liquid membrane
component
Numerical analysis consideration in emulsion globule
Effect of carrier concentration in the membrane phase
Effect of treat ratio on silver extraction
Effect of stripping solution concentration on silver extraction
Effect of agitation speed on silver extraction
Effect of surfactant concentration in the membrane phase
Effect of homogenizer speed on silver extraction
147
148
149
154
155
157
158
169
176
177
178
179
181
182
xvi
LIST OF SYMBOLS AND ABBREVIATIONS
Ag - Silver [Agext] - Silver concentration in external phase [Agint] - Silver concentration in internal phase [Agmem] - Silver concentration in membrane phase Ce(t) - Concentration of solute in external phase Ceo - Initial concentration of solute in external phase Cex,o - Initial concentration of solute in external phase Cex,f - Final concentration of solute in external phase
Ce/Ceo - Ratio of concentration of silver to initial concentration in external phase IIIAC , - Concentration of solute in the external phase (mol/l). IIIHC , - Concentration of hidrogen in the external phase
cC - Concentration of metal complex at the external-membrane
interface (mol/l).
BC - Concentration of metal complex at the external-membrane interface (mol/l).
cP - Centipoice D - Distribution coefficient D32 - Sauter mean diameter DBM - Diffusion coefficient
ecD - effective diffusivity of solute-carrier complex in emulsion phase (m2/s)
xvii
eBD - effective diffusivity of carrier in emulsion phase (m2/s)
d - Length of small cubic in cubic element (m) E - Recovery efficiency
ELM - Emulsion Liquid Membrane
H - Hidrogen ion HR - Carrier in organic phase
kr and kf - Proportionality constant KE - Equilibrium constants K - Temperature (Kelvin)
ck - Mass transfer coefficient through pheripheral layer of membrane (m2/s).
kB - mass transfer coefficients of B in the peripheral thin oil kC - mass transfer coefficients of C in the peripheral thin oil
BM - Rate of leakage
ppm - Part per million pHeq - pH equilibrium Po - Permeation coefficient
R - Sauter mean radius of an emulsion globules (m)
%R - Recovery percentage rpm - Rotation per minute
R - Radius Ri - Radius of emulsion globule Rµ - Radius of emulsion droplets
sr - rate of stripping
xviii
S’ - sphere area of emulsion droplets %S - Stripping percentage
S - Separation factor SA - Sphere area of globules emulsion
t - time (second) fv - Velocity of forward reaction rv - Velocity of reverse reaction Vm - Volume of emulsion Vext - Volume of external phase Vint - Volume of internal phase Vorg - Volume of membrane phase Vint,f - Final volume of internal phase Vint,o - Initial volume of internal phase VIII - Volume of feed phase VI - Volume of membrane phase VII - Volume of internal phase Vi - Volume of internal phase Vi
o - Initial volume of internal phase
IIIV - Volume of external phase (ml) w/v - Weight per volume ηs,ap - Apparent swelling ratio
Greek letters
φ1 - Ratio of internal volume to emulsion volume β - Parameter for thickness of thin oil layer

xix
δ - Thin oil layer
l - Length of cubic unit element (m)
∞ - Infinity µ - Viscosity µB - Viscosity of the solvent
ρ - Density
xx
LIST OF APPENDICES
APPENDIX TITLE PAGE
A
B
C
D
E
F
Quantitative Analysis Report: Standard of AAS
Data Collection for ELM Extraction Process
Effective Diffusivity
Sauter Mean Diameter
Equilibrium Constant
Programming
210
218
236
242
250
253
CHAPTER 1
INTRODUCTION
1.1 General Introduction
In the near future, the production of hazardous waste from industries will
become a serious problem all over the world. These resources including inorganic
solids or sludge containing metal were generated by many types of industries such as
metal finishing, electronic, electrical, electroplating, machinery and other chemical
industries. The amount of the nonferrous metal waste including minor components
from municipal waste are reported to be about 2.0 million tons annually (Brooks,
1991).
The sources of metal wastes are diverse in nature and in its geographical
distribution. The volumes of all kinds of wastes generated on the nationwide scale
are formidable. In 1984, a national survey under U.S. Resource Conservation and
Recovery Act reported that more than 264 million tons of hazardous wastes were
generated by approximately 14,000 generators (Brooks, 1991). One of the
hazardous waste generators is photographic industry which includes the
manufacturing process, graphic arts, engineering and medicine. In Malaysia out of
417,413 MT total wastes generated in 1994, photographic waste accounted for 843.8
MT per year (Saidi and Ariffin, 1994). Beside silver the waste generated also
contain other heavy metals like iron, zinc, lead, copper, nickel and chromium.
Mainly silver existed in these waste as insoluble halide, soluble silver thiosulfate
complex, silver ion or elemental silver depending on the type and the stage of the
process.
2
One way to reduce environmental impact is through recovery of the valuable
metals from industrial waste effluents. Therefore more efficient techniques for the
recovery process are required. In principal the incentives for recovery are reduction
in the volume and toxicity of the waste effluents, recovery of valuable metals and
reduction of disposal costs. Furthermore, if these wastes were directly discharge
into the natural water system, they will undoubtedly cause a lot of environmental
problems.
Commercially, nonferrous metal that are significant to recycle as scrap are
aluminum, copper and copper-base alloys, chromium, cobalt, cadmium, nickel,
manganese, molybdenum, lead, titanium, zinc and other precious metals. According
to statistics of recovery from U. S. Bureau of Mines Mineral Commodity Summaries
in 1991 for 22 metals, recycling precious metals (except silver) ranges from 70 to 80
% but silver accounts for only 40 % (Brooks, 1991).
1.2 Research Background
Recovery of silver from photographic wastes is interesting because of the
economic value of silver and also from environmental point of view. In
photographic industry, silver is recovered from development and fixing solution,
spent rinse water and scrap films. There are many methods which have been
established commercially to recover silver from photographic wastes; these are
precipitation, electrolysis, ion-exchange, and reductive exchange. Electrolysis is a
commonly used method to recover silver from photographic wastes but it is not
suitable for dilute silver concentration (less than 100 ppm) because the plating
efficiencies are very low. This process requires high initial capital investment and
high operating cost, and critical operating conditions that need to be constantly
supervised. The 100 ppm of silver concentration in effluent is relatively high
compared to recommended allowable discharge level of 0.1 to 1.0 mg/dm3, which
means that further treatment is required before it can be discharged to water stream.
3
The oldest and conventional method of silver recovery, precipitation, could
not achieve the recommended discharge level although it has provided an effective
technique for silver recovery. This is because an industrial effluent contains
complexing agents which might bind to the silver metal. This metal complex is
sometime very stable and not able to be precipitated by precipitation process. To
overcome the problem many researchers found that emulsion liquid membrane
extraction has a great potential and has been reported as an advanced technique for
separating and concentrating metals. This separation technique has been tested in
hydrometallurgy and wastewater treatment. Several pilot plants for recovery of zinc,
copper, chromium, and nickel have proved the technical feasibility of the emulsion
liquid membrane process (Reis and Carvalho, 1993).
In principal, the emulsion liquid membrane processes are a three phase
dispersion system, where primary emulsion consist of organic and stripping phase is
dispersed in the feed or effluent phase, which is the phase to be treated. For the
separation of metals even in very low concentration, the carrier is an organic soluble
extractant, which selectively combines with the solutes to form a metal-carrier
complex. This complex will permeate through the membranes from the outer to the
inner interface. At the inner interface, the complex decomposes by the reversal of
the equilibrium reaction and the metal ion is liberated into the internal phase and the
regenerated carrier goes back into the membrane phase. The advantages of this
process compared to solvent extraction are extraction and stripping occurred
simultaneously in one single step operation and equilibrium limitation can be
removed. It also can reduce the amount of expensive extractant about 10 times (Fan,
1999), high fluxes and high selectivity are possible. Emulsion liquid membrane is
also up to 40% less expensive than solvent extraction process (Noble and Way,
1987).
4
1.3 Research Objectives and Scopes
The main purpose of this study is to determine the possibility of developing
the emulsion liquid membrane system for silver extraction from photographic waste.
In order to successfully design and apply the system a good understanding of the
system is very crucial and needs to be study in order to enlighten the fundamental
understanding of the process as well as to develop a method that is capable of
recovering silver selectively from photographic waste especially at dilute condition.
The studies include the liquid membrane component selection, emulsion liquid
membrane extraction performance and liquid membrane extraction model
development.
First, the study focused on the selection of liquid membrane components,
where experiments were carried out with different types of carrier and
concentrations and the amount of metal extracted were recorded, while the other
parameters were fixed. This screening process will identify a suitable carrier of
silver and determine its selectivity in extraction process. According to the chemical
reactions involved, these carriers were divided into four classes, namely acidic
extractants like D2EHPA, Cyanex 272 and Cyanex 302; chelating extractants like 8-
hydroxy Chinolin, dithizone, and tetramethylthiuram disulfide; basic extractants like
TOA, Adogen 363, and TOMAC; solvation like TBP, Cyanex 471X, and TOPO.
The carrier was reacted with metal to form a metal complex and diffused through the
liquid membrane. On the other hand, these complexes must release the metal into
the stripping solution easily. Several types of stripping solution were tested such as
nitric, hydrochloric, and sulfuric acids, thiourea solution and sodium thiosulfate.
Because extraction and stripping process occurred simultaneously in emulsion liquid
membrane process, the best carrier and strip agent chosen must satisfy the reaction
at external and internal interface of liquid membrane. After the selection of the
carrier and strip agent, emulsion liquid membrane system was constructed. There
are three components of emulsion liquid membrane; internal phase (stripping
solution), external phase (feed phase) and membrane phase (consist of carrier,
diluent and surfactant).
5
In emulsion liquid membrane, the type of emulsifier/surfactant and its
concentrations strongly affect the rate of extraction and emulsion stability. The
stability of the emulsion and the demulsification rate are very important factors in
the extraction process and recovery of metal. Another factor is swelling rate that is
controlled by the choice of surfactant and diluent. Swelling occurs when feed
stream gets into internal phase by either osmotic pressure or physical breakage and
subsequent reformation of the membranes. It will reduce the stripping reagent
concentration in the internal phase which in turn lowers its stripping efficiency.
However, in this study only SPAN 80 was used as emulsifier and type of diluents
such as kerosene, n-dodecane, and toluene were chosen as a diluent in minimizing
the co-transport of water and also depends of solubility of the carrier. All of these
subjects were studied in the first objective.
In order to get a better understanding of emulsion liquid membrane process,
the system potentials and extraction performance were studied based on the kinetics
and thermodynamic aspects. The parameters that affect the silver extractability and
selectivity were identified in the second objective. The parameters such as strip
agent types and acidity that control the mass transfer of solute, volume ratio of
emulsion to external phase that affect the mass transfer area of extraction process;
carrier concentration, type of diluents, swelling, residence time and agitation rate
that control the extraction performance and the break-up rate of emulsion were
studied in this research. In order to obtain the optimum conditions in extraction of
emulsion liquid membrane, one variable is changed whilst the other conditions
remain constant. A high voltage demulsifier was constructed for emulsion breaking.
All the parameters observed were carried out in batch system.
Finally, emulsion liquid membrane extraction model was developed based on
permeation models developed by Kataoka et al. (1989), Lee et al. (1996) and Reis
and Carvalho (2004) with some modification. An immobilized hollow spherical
globule model approach is applied to the extraction process of silver ion through the
ELM system. In order to satisfy the experimental finding some assumption were
made based on the parameters that affect the emulsion liquid membrane extraction.
Several external consideration such as emulsions distribution, uniformity of
emulsion size and boundary conditions were also assumed Finally, this model was
6
verified to perform the validity and stability of model based on existing models.
1.4 Report Outline
This report contains seven chapters. In the first chapter a brief description of
the research backgrounds, research scopes and objectives were presented. Chapter 2
present the literature review about photographic waste and its characteristics, liquid
membrane types and its prospect for silver recovery. In this chapter a brief
description on liquid membrane component selection, parameters affecting emulsion
liquid membrane process and also its theoretical models are discussed. Then, in
Chapter 3, the research methodology including selection of liquid membrane
components, emulsion liquid membrane extraction, emulsion demulsification and
analytical procedures were reported. Afterwards, the results and discussions of
liquid membrane component selection and emulsion stability were discussed in
Chapter 4 followed by Chapter 5, explaining the main advantage of emulsion liquid
membrane in extraction of silver from photographic waste. In this chapter, several
parameters affecting the silver extraction and recovery, breakage and swelling
phenomena during the ELM process were discussed in detail. In Chapter 6, an
emulsion liquid membrane extraction model was developed from the experimental
data obtained. Numerical solution using line procedure method was used to predict
the simulation results.
Chapter 7 stated of the general conclusion and directions for future work.
1.5 Summary
Metal extraction with emulsion liquid membrane process is attractive due to
its high selectivity and could be used for dilute metals system compared to
conventional solvent extraction process. This process is technically favorable
because of low energy consumption is and organic liquid losses are often negligible.
7
The choice of carrier and strip agent is vital for the success of the process and the
choice is based on the conventional liquid-liquid extraction studies. High extraction
efficiency and achievement of optimal system performance will be realized if the
liquid membrane system and operating parameters are properly chosen. Parameters
that influence the performance of emulsion liquid membrane extraction process will
be studied experimentally and theoretically.
CHAPTER 2
LITERATURE STUDY
2.1 The Photographic Industry
Photograph is a permanent record of an image on a light sensitive surface.
The surface is usually a transparent film covered with a layer of silver halide in
gelatin. The most commonly used silver halides in photographic industry are silver
chloride, silver bromide and silver iodide but normally silver iodide is used as a
mixture with silver bromide (Smith and Bonnie, 1977).
There are three stages of manufacturing photographic material, which
include emulsions making, emulsion supports or film and the last stage is film
coating. In making of emulsions, silver halide crystals are formed in the desired size
and the soluble salt are removed by washing then the emulsion is digested in the
presence of special agents. The support of emulsion must meet high standards of
physical properties including high transparency, high rapture and tearing strength,
freedom from curl, stiffness, elasticity, good dimensional stability, and low
coefficient of friction. Commonly the supports used are papers with barium sulfate
or polyethylene coating and plastic films (cellulose triacetate or polyester). The last
stages is coating on the emulsion support. This coat consists of light-sensitive layers
and a number of auxiliary layers to perform the following functions: light filtration
separation of differently sensitized emulsions containing different dye couplers,
antihalation, mechanical protection, noncurl, subbing, antistatic and others. In
addition the gelatin-based emulsion layer must also adhere well to the support
during every stage of use and processing (Keller, 1993).
9
Four steps are involved in a complete photographic processing; exposure of
film to light in order to produce a latent image, image development to produce a
negative, permanent image making or fixing process and the last step is positive
print-out from negative. During the development stage, a silver image and a dye
image are formed in each of emulsion layer. In production of colour image, this
silver must be bleached (oxidized) using oxidizing agents such as the iron (III) –
EDTA complex, hexacyanoferrate (III), or potassium peroxodisulfide along with a
thiosulfate as complexing agent without disturbing the image dye. In fixing step,
white couplers (suitably substituted pyrazolones) will react with developer oxidation
products to form colourless products, before these oxidation products can combine
with the couplers in the emulsion to form non-image dyes.
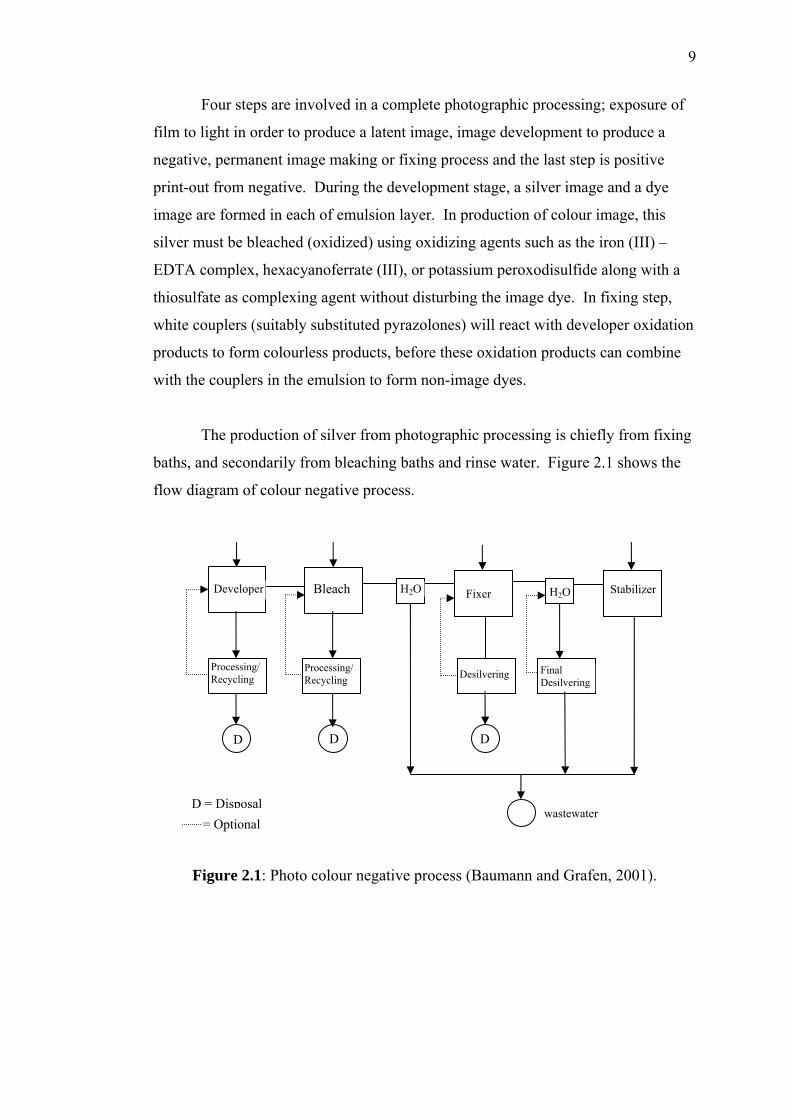
The production of silver from photographic processing is chiefly from fixing
baths, and secondarily from bleaching baths and rinse water. Figure 2.1 shows the
flow diagram of colour negative process.
Figure 2.1: Photo colour negative process (Baumann and Grafen, 2001).
Developer Bleach Fixer H2O
wastewater
D D D
H2O Stabilizer
D = Disposal = Optional
Final Desilvering
DesilveringProcessing/ Recycling
Processing/ Recycling
10
2.1.1 Silver in Photographic Processing
Silver used in photographic processing is a naturally occurring element and a
precious metal. Silver is unique in its ability to react to light and produce images in
applications such as photography and radiography. No other metallic element
possesses these properties. However, silver is classified as an environmentally
hazardous heavy metal in all countries. Silver ion is highly toxic to bacteria and fish
especially free silver ions. Free silver ion occurs in photographic industry only in
emulsion making but not in the downstream production steps, in the photographic
materials or in the processing baths. Waste from photographic processing especially
fixing waste usually contains silver hydroxide complex and silver chloride
associated with suspended particles or present as thiosulfate complexes, thiocyanate,
colloidal silver chloride and sulfide, ferrocyanides, acetate, halides, ammonium and
soluble complex. Silver released from photographic processing are primarily from
fixing baths and secondly from bleaching baths and rinse water (Keller, 1993).
During these stages, silver is removed from the film or paper usually in the form of
silver thiosulfate complex. As much as 80% of the total silver processed for black
and white positives and almost 100% of the silver processed in colour work will end
up in the fixer solution (DEHNR, 2001). If wastes were directly discharged into the
natural water system, they will undoubtedly cause a lot of environmental problems.
Table 2.1 shows the aquatic toxicities of the silver thiosulfate complex, silver sulfide
and silver chloride relative to the free silver ion. Thus, the silver thiosulfate
complex represents the usual soluble form of silver to be recovered and in the molar
ratio of thiosulfate(Th)/Ag greater than 1.0 the system is soluble, making it virtually
impossible for free silver ions to exist in any significant concentration in such
environments (Zouboulis, 1995). However, strict limitations on the discharge of
aqueous silver effluents have been concerned with the total amount of silver, with no
regard to the form in which it occurs.
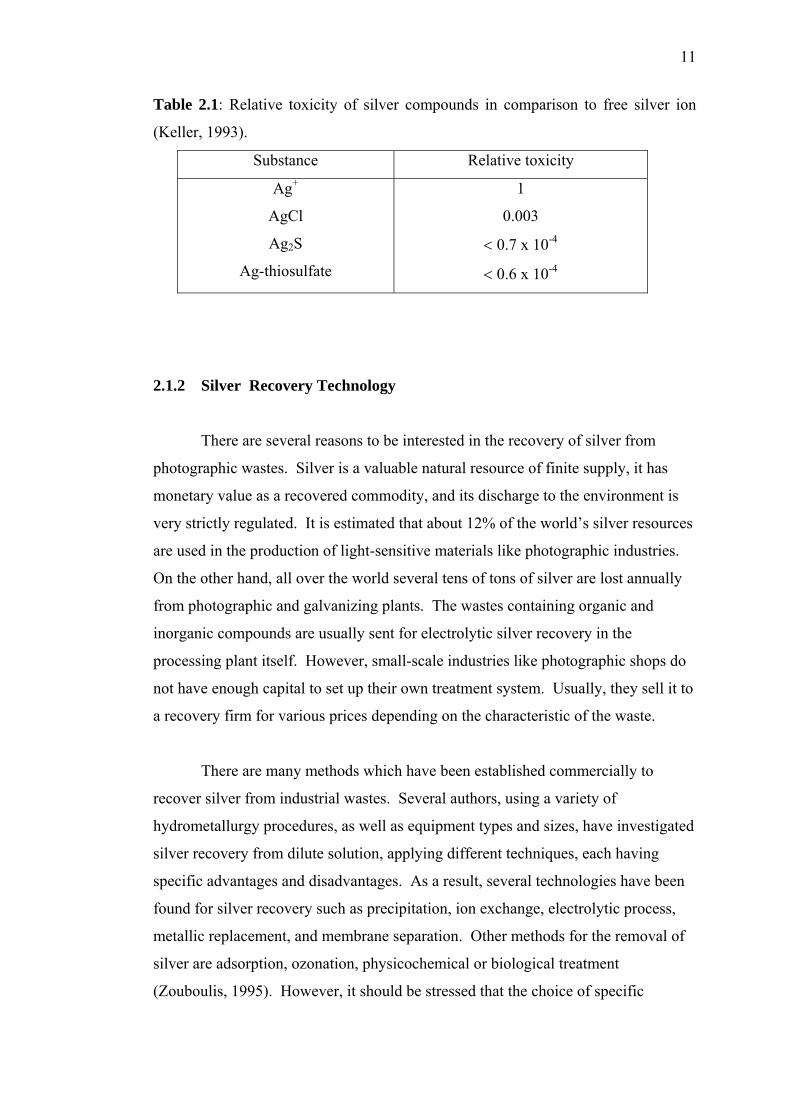
11
Table 2.1: Relative toxicity of silver compounds in comparison to free silver ion
(Keller, 1993).
Substance Relative toxicity
Ag+
AgCl
Ag2S
Ag-thiosulfate
1
0.003
< 0.7 x 10⁻⁴
< 0.6 x 10⁻⁴
2.1.2 Silver Recovery Technology
There are several reasons to be interested in the recovery of silver from
photographic wastes. Silver is a valuable natural resource of finite supply, it has
monetary value as a recovered commodity, and its discharge to the environment is
very strictly regulated. It is estimated that about 12% of the world’s silver resources
are used in the production of light-sensitive materials like photographic industries.
On the other hand, all over the world several tens of tons of silver are lost annually
from photographic and galvanizing plants. The wastes containing organic and
inorganic compounds are usually sent for electrolytic silver recovery in the
processing plant itself. However, small-scale industries like photographic shops do
not have enough capital to set up their own treatment system. Usually, they sell it to
a recovery firm for various prices depending on the characteristic of the waste.
There are many methods which have been established commercially to
recover silver from industrial wastes. Several authors, using a variety of
hydrometallurgy procedures, as well as equipment types and sizes, have investigated
silver recovery from dilute solution, applying different techniques, each having
specific advantages and disadvantages. As a result, several technologies have been
found for silver recovery such as precipitation, ion exchange, electrolytic process,
metallic replacement, and membrane separation. Other methods for the removal of
silver are adsorption, ozonation, physicochemical or biological treatment
(Zouboulis, 1995). However, it should be stressed that the choice of specific
12
technique employed will ultimately depend on such factors as environmental and
ecological processes, the price of silver, the operating and capital cost for its
recovery, practical operational considerations and experience with a particular
removal system. The following section will discuss in detail about the process due
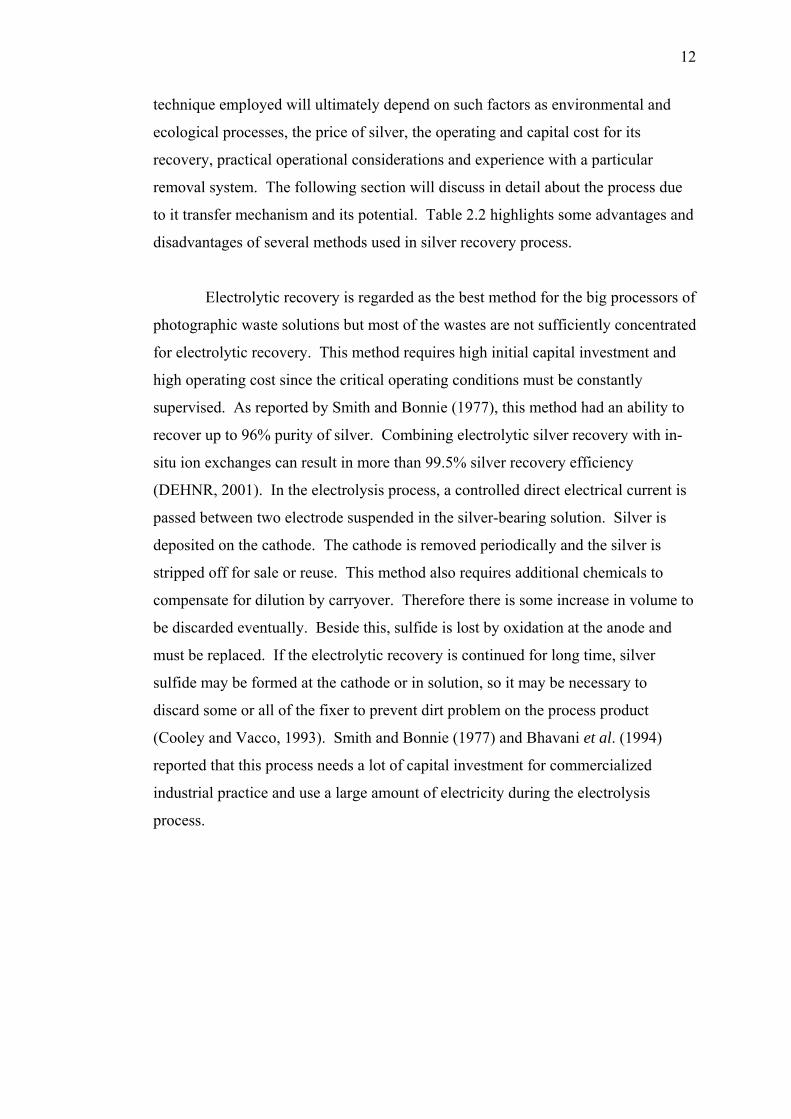
to it transfer mechanism and its potential. Table 2.2 highlights some advantages and
disadvantages of several methods used in silver recovery process.
Electrolytic recovery is regarded as the best method for the big processors of
photographic waste solutions but most of the wastes are not sufficiently concentrated
for electrolytic recovery. This method requires high initial capital investment and
high operating cost since the critical operating conditions must be constantly
supervised. As reported by Smith and Bonnie (1977), this method had an ability to
recover up to 96% purity of silver. Combining electrolytic silver recovery with in-
situ ion exchanges can result in more than 99.5% silver recovery efficiency
(DEHNR, 2001). In the electrolysis process, a controlled direct electrical current is
passed between two electrode suspended in the silver-bearing solution. Silver is
deposited on the cathode. The cathode is removed periodically and the silver is
stripped off for sale or reuse. This method also requires additional chemicals to
compensate for dilution by carryover. Therefore there is some increase in volume to
be discarded eventually. Beside this, sulfide is lost by oxidation at the anode and
must be replaced. If the electrolytic recovery is continued for long time, silver
sulfide may be formed at the cathode or in solution, so it may be necessary to
discard some or all of the fixer to prevent dirt problem on the process product
(Cooley and Vacco, 1993). Smith and Bonnie (1977) and Bhavani et al. (1994)
reported that this process needs a lot of capital investment for commercialized
industrial practice and use a large amount of electricity during the electrolysis
process.
13
Table 2.2: Silver recovery methods (Goshima et al., 1994).
Method Advantages Disadvantages
Metallic replacement - Low investment.
- Low operating cost.
- Effluent contains high
iron.
- Silver recovered as
sludge.
- Effluent has high silver
content unless 2 units are
used in series.
Electrolytic recovery - Silver recovered as
pure metal.
- High silver recovery.
- Sulfide formation
possible.
- Effluent has high silver
content.
Precipitation - Can attain 0.1 mg
silver/liter.
- Low investment.
- Complex to operate.
- Silver recovered as
sludge.
- Treated solution cannot
be reused.
- Potential hydrogen
sulfide released.
Reverse Osmosis
- Also recovers other
chemicals.
- Purified water is
recyclable.
- Concentration requires
further processing.
- High investment.
- High operating cost.
Ion exchange - Can recover 0.1 to 0.2
mg silver/liter.
- Only for diluted
solutions.
- Complex operation.
- High investment.
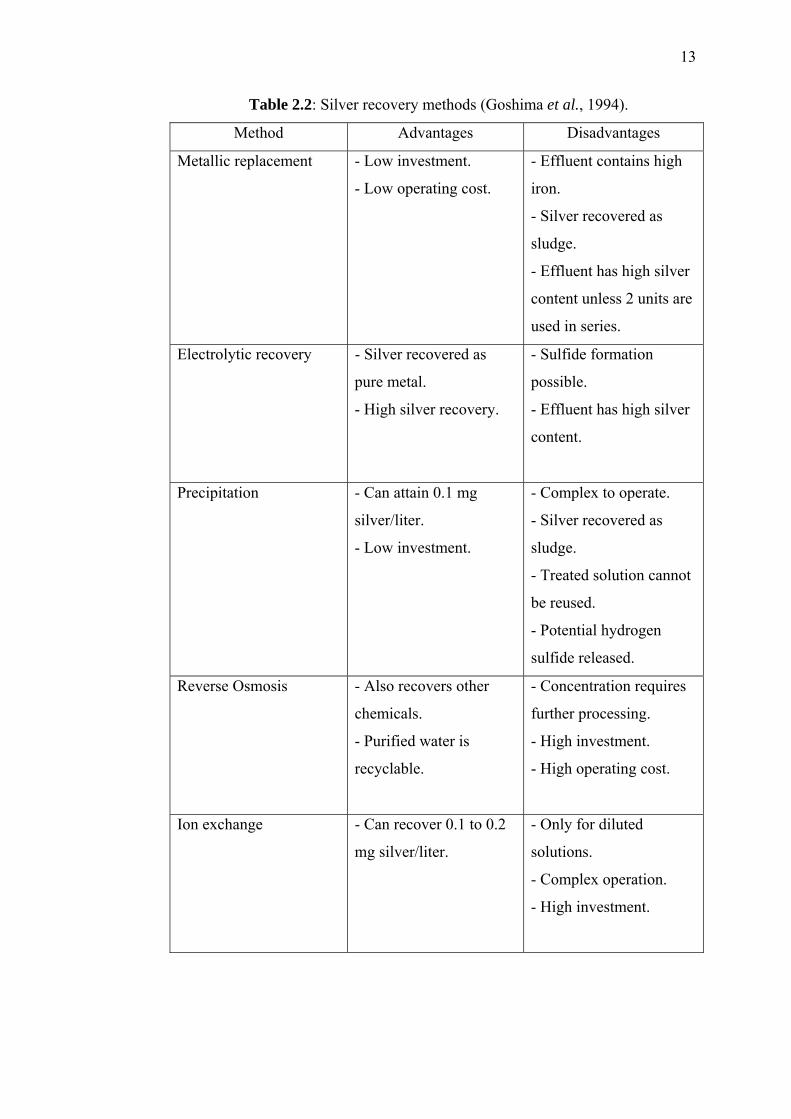
14
The oldest method of silver recovery is precipitating silver by using sulfide
ions but for large-scale the use of sulfide precipitation leads to problems with respect
to solids separation and handling. In order to solve the problems, treatment with
hydrosulfite ion (S2O4)2- yields Ag and Ag2S as compact and settle able precipitates.
However, the process required heat and has high chemical costs (Sittig, 1973).
Chemical methods for precipitating silver from motion-picture photographic waste
solutions require an addition of sodium sulfide. The result was dry sludge
containing 40 to 70 % of silver. By adding sodium hydrosulfite (Na2S2O4), the
sludge contains 85 % Ag as Ag and Ag2S. Precipitation of silver could be also
carried out by adding magnesium sulfate or calcium hydroxide, hydrolyzed sugar
solution, sodium hydroxide, or exhausted developer or boiling to precipitate silver
sulfide. Sittig (1973) reported that the addition of magnesium sulfate and lime could
be carried out to precipitate the silver from the photographic waste solutions as a
mixed sulfate-oxide. The silver was then recovered from the sludge. In this method,
solution that contain silver thiosulfate complex, such as exhausted thiosulfate fixing
solutions, were chlorinated with Cl2 or NaOCl under alkaline conditions to
precipitate a silver-bearing sludge from which silver could be separated.
Ion exchange process has received considerable attention for separation and
concentration of a variety of metals from waste effluents. It is generally used for
effective recovery of silver from rinse water or other dilute solutions of silver. The
ion exchange method involves the exchange of ions in the solution with ions of
similar charge on the resin. The soluble silver thiosulfate complex is exchanged
with the anion on the resin. This is the exhaustion step and is accomplished by
running the solution through a column containing the resin. For large operation, the
next step is the regeneration step in which the silver is removed from the resin
column with a silver complexing agent such as ammonium thiosulphate. This
method are considered uneconomical for silver recovery from photographic waste
but are feasible for low silver concentration in separating waste streams where the
total ionic strength is not much greater than the silver salt concentration (Smith and
Bonnie, 1977). In consequence, ion exchange equipment more resembles a
manufacturing plant than a waste water treatment facility. As a result, ion exchange
has been regarded more as a method to produce pure water than as a method to
purify waste (Heikki, 1999).
15
Another type of silver recovery technology is metallic replacement
(reductive exchange) process. This technology uses equipment commonly referred
to as Chemical Recovery Cartridges, Metal Replacement Cartridges or Passive
Silver Cells (PRO-ACT, 1995). This technology is simple in principle and operation
and it consist of a cartridge filled with steel wool or iron particles connected to the
fixer or rinse bath overflow and the excess solution flows through the unit under
gravity. Metallic replacement involves precipitation of silver onto another metal,
usually zinc or iron, which releases zinc or iron ions in solution. This method is
employed using a less noble metal than silver and is allowed to come into contact
with the exhausted fixer. The silver is deposited as sludge or as a coating,
depending upon the physical form of the metal used and the metal ions pass into the
hypo-solution (Na2S2O3). This method is not suitable for extensive re-use of the
fixer but has been recommended for use by small photographic developing plants.
The Bureau of Mines developed a process that employed steel wool or steel window
screen and a smelting process to recover pure silver from sludge containing 27 to
80% silver (Smith and Bonnie, 1977). If this technology was used properly, it can
reduce silver concentration to below 1 ppm in the effluent at a low cost (PRO-ACT,
1995).
A common method of metals extraction that has been extensively used in
hydrometallurgical operations and more recently in the treatment of wastewaters to
remove soluble metals is solvent extraction. Because salts are usually not soluble in
organic solvents, the process requires the introduction of an extractant that will
combine with the metal ion to form an organic soluble species. The loaded solvent
is then mixed with a suitable aqueous phase, and the metal is transferred from the
organic to the aqueous solution or stripping phase. Most of the general types of
compound available as extractants are dicarboxylic acids, aliphatic amines, aromatic
amines, amino acids, and hydroxyl acids. The biggest disadvantage of solvent
extraction compared with liquid membrane process is that it must always be in
equilibrium conditions. In addition the selectivity of this separation is quite
dependent on pH and maximum advantage must be taken of this parameter in
combination with the type of extraction agent chosen (Preston, 1985).
16
A new promising technology of metal recovery is membrane separation.
There are several types of membrane process used for metal separation such as
reverse osmosis, electrodialysis, ultrafiltration, and several kinds of special liquid
membranes namely emulsion liquid membrane and immobilized liquid membrane.
In electrodialysis cell there are ionic membranes adjacent to the electrodes,
anionically charged (sulfonate exchange resin) for the anode and cationically charge
(quaternary ammonium resin) for the cathode. In reverse osmosis, the pressure
pushes water through a semi-permeable membrane to concentrate the charged metal
species. Ultrafiltration achieves separation based on the filtering effect of the
membrane pores relative to the molecular size of solute species under imposed
hydrostatic pressure (Lacey, 1972).
From the literature, membrane separations have been applied to ten metals
such as Ag, Al, Cd, Co, Cr, Cu, Hg, Mn, Ni, and Zn (Brooks, 1991). The membrane
separation process is most appropriate for dilute solutions such as rinse water. Most
membranes are fragile mechanically and vulnerable to degradation by corrosive and
strongly oxidative systems such as concentrated chromic acid. Separation efficiency
also requires elimination of insoluble and suspended solids, which block the
membrane surfaces except the liquid membrane process.
One type of special liquid membrane consists of interfacial surfactant films
in emulsion is liquid surfactant membrane or emulsion liquid membrane (ELM).
There are several advantages compared to solvent extraction process. However the
concepts of transfer mechanism are the same. Some of these advantages are
simultaneous extraction and stripping process, features that the equilibrium
limitation will removed, reduction of amount extractant used, selective separations
and high fluxes are possible, and reported less expensive than solvent extraction
(Noble and Way, 1987). With these advantages the liquid membrane process
becomes an attractive alternative and a promising technology to apply in research
and industry.
17
2.2 Liquid Membrane Technology
2.2.1 Introduction
Liquid membrane technology is introduced and is identified as a subset of
membrane science. This technology has attracted increasing attention for its
potential capability in the field of separation and has been demonstrated as an
effective tool in many applications. Some review papers on liquid membrane and
facilitated transport have appeared in the literature. Smith et al. (1977) summarized
experimental and theoretical work since 1974 on the facilitated transport, Kimura et
al. (1979) discussed potential industrial applications of facilitated transport
membranes, Goddard (1977) discussed the application of facilitated transport under
reaction equilibrium conditions and Halwachs and Schugerl (1980) presented a
general discussion of liquid membranes and describe some possible industrial
applications. Douglas et al. (1982) surveyed and reviewed the potential of
immobilized liquid membrane and emulsion liquid membrane, its transport
mechanisms and also mathematical modeling and analytical solutions. Several kinds
of liquid membranes have been used in various disciplines, such as chemical
engineering, inorganic chemistry, analytical chemistry, physiology, biotechnology,
and biomedical engineering. Within these disciplines, the method has been applied
to a wide variety of uses, such as gas separation, organic compound removal, metal
ion recovery, pollutant removal and bio-separation. The technology is particularly
attractive when very dilute solutions are involved since the treating ratio between
receiving phase and source phase can be drastically reduced.
Liquid membrane extraction is a three-phase process; two of these are
miscible with each other but separated by the third phase which is the membrane
phase. This membrane can be supported or emulsified and it immiscible with the
other two. Solute extraction is achieved by mass transfer between the two miscible
phases through the membrane phase. For water/oil/water system, it is the
immiscible oil phase separating the two aqueous phases.
18
2.2.2 Liquid Membrane Process
In liquid, different solutes have different solubility and diffusion coefficients.
The product of these two terms is a measure of the permeability. A liquid can yield
selective permeability and therefore separation occurred. Because the diffusion
coefficients in liquids are typically orders of magnitude higher than in polymers, a
larger flux can be obtained.
Liquid membranes can be prepared in two different configurations. A liquid
can be impregnated in the pores of a porous solid for mechanical support. This form
is commonly known as an immobilized liquid membrane (ILM). In the alternate
configuration, the receiving phase is emulsified in an immiscible liquid membrane.
This type of liquid membrane is known as a liquid surfactant or emulsion liquid
membrane (ELM). Liquid membranes also can be performed in two modes, with or
without a chemical carrier. With a chemical carrier, diffusion of permeate species is
increased by diffusion of the reaction product. In process without an active carrier,
the liquid membrane relies on solubility differences and /or diffusion coefficient
differences to separate components. This will be discussed more in related section.
In emulsion liquid membrane application, the emulsion must be demulsified
into two immiscible phases after the extraction step of the process. This is
accomplished by heating, application of electric field, or centrifugation. The liquid
membrane phase containing the surfactant and carrier will be recycled to the
emulsion preparation step while the internal phase of the emulsion containing the
concentrated solute will undergo further purification in the recovery process or
treatment and disposal in the purification process. The metal extraction process
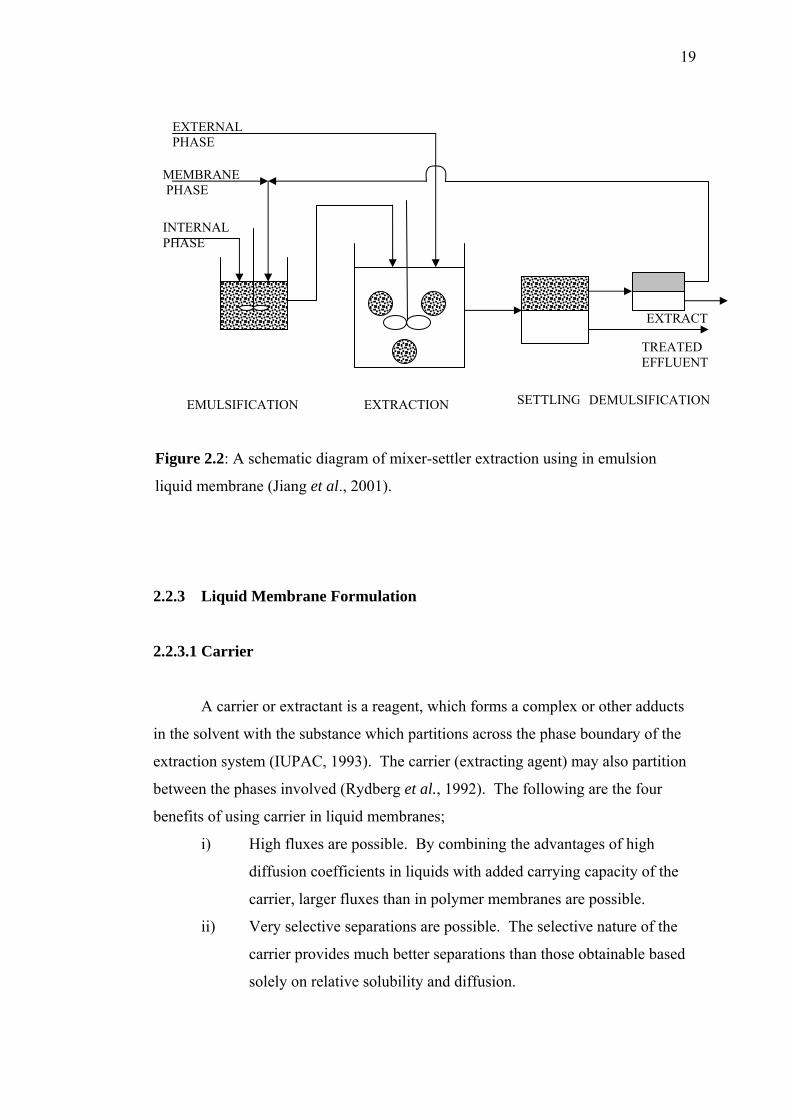
using emulsion liquid membrane extraction process is shown in Figure 2.2.
19
Figure 2.2: A schematic diagram of mixer-settler extraction using in emulsion
liquid membrane (Jiang et al., 2001).
2.2.3 Liquid Membrane Formulation
2.2.3.1 Carrier
A carrier or extractant is a reagent, which forms a complex or other adducts
in the solvent with the substance which partitions across the phase boundary of the
extraction system (IUPAC, 1993). The carrier (extracting agent) may also partition
between the phases involved (Rydberg et al., 1992). The following are the four
benefits of using carrier in liquid membranes;
i) High fluxes are possible. By combining the advantages of high
diffusion coefficients in liquids with added carrying capacity of the
carrier, larger fluxes than in polymer membranes are possible.
ii) Very selective separations are possible. The selective nature of the
carrier provides much better separations than those obtainable based
solely on relative solubility and diffusion.
EXTRACT
EXTERNAL PHASE
MEMBRANE PHASE
INTERNAL PHASE
EMULSIFICATION EXTRACTION SETTLING DEMULSIFICATION
TREATED EFFLUENT
20
iii) Ions can be concentrated. Coupled transport allows one to pump ions
against their concentration gradient.
iv) Expensive extractant can be used. Small amounts of carrier are used
because of the small solvent inventory associated with the membrane
and because of the nonvolatile nature of the carrier.
There are three types of carriers such as extractant involving compound
formation, ion association and solvation. Extractants involving compound
formation can be divided into acidic extractants and chelating extractants. Acidic
extractants, or cation liquid ion exchangers, extract metals by cation-exchange
mechanism, in which hydrogen of the extractant are exchanged for metal ions. The
acidic type extractants, which have been found useful as metal extractants in
commercial operations are organic derivatives of phosphorus acids and
monocaboxylic acids. This group includes esters of orthophosphoric, phosphonic
and phosphinic acids, and similar compounds containing polyfunctional groups.
The active group of these organophosphorus acids is >P (O) OH which is
responsible for their extractive properties. Another extractant are SME 418 and PC-
88A, which is an ester of a phosphonic acid developed by shell and Daihachi,
Chemical (Ritcey and Ashbrook, 1984). Cyanex 272 is a further development in the
alkyl phosphorus reagents. This is a phosphinic acid extractant. It will extract many
metals, depending upon the equilibrium pH. In these reagent sulfate and carbonate
ions form more stable metal-anion complexes in the aqueous phase than do nitrate
ions.
On the other hand, chelating extractants contain donor groups capable of
forming bidentate complexes with metal ions (Baird and Hanson, 1983). In the
majority of chelating extractive system it was observed that whenever the
coordination number of the metal doubles its ionic charge, the chelate formed
satisfies the coordination requirements of the metal and the metal is readily
extractable into both polar and non-polar solvent.
21
Commercially available chelating extractants are limited to two types; LIX
and KELEX (Ritcey and Ashbrook, 1984). The other extractant are SME and
Acorga. The first commercially available is LIX chelating extractant designed
specifically for the selective extraction of copper (Dalton and Price, 1982).
Consequently, in commercial solvent extraction processing, basic extractants
are limited to amines and quaternary halides, primary (RNH2), secondary (R2NH),
tertiary (R3N) amines and quaternary ammonium salts (R4N)+. Rydberg et al.
(1992) reported that the usefulness of amines as extractants is usually considered to
depend essentially on the ability of metal ions to form anionic species in the aqueous
phase, which are extracted by amines in an anion-exchange process. Extraction
metal Mn+ by an amine salt R3N.HA can be represented as an anion exchange
process such as:
−−−
+−− −+↔−+ AnmMAHNRHANRnmMA mnmnm
m )()().)(( 33)( (2.1)
One important factor influencing the extraction of metals by amines is the
aggregation of the amine in the organic phase, which is determined essentially by
the nature of the diluent. Ritcey and Ashbrook (1984) reported that the ease of
extraction of complex metal anionic species from chloride media by amines follows
the order: quaternary > tertiary > secondary > primary. Other factors are the nature
of the carbon chain and also the number of carbon atoms in the chain. Normally,
aliphatic amines are the best extractants; aromatic substituents, especially when
attached to the nitrogen atom.
The main problems associated with the use of amines as metal extractants are
similar to those involving acidic extractants, namely salt effects, aggregation in the
organic phase, third phase formation and solubility. Salt effect generally will
decrease metal extraction by amines in the order of ClO4- > NO3
- > Cl- > SO4- > F-.
The third type of extractant is solvating extractant. This extractant rely on
the power of oxygen-containing organic extractants to solvate inorganic molecules
or complexes. By such solvation the solubility of the inorganic species in the
organic phase is greatly increased. There are two main groups of extractants:
organic reagent containing oxygen bonded to carbon and oxygen or sulfur bonded to
22
phosphorus. Extractants containing oxygen-carbon bond are useful primarily for the
extraction of metal halide complexes but not for metal sulfates.
Extractant containing carbon-oxygen bonds are essentially ethers (C-O-C),
esters ( -COOR ), alcohols ( C-OH ), and ketones ( C=O ). They are all electron
donating reagent but alcohols, being amphoteric, exhibit both donor and acceptor
properties and resemble water in many ways. Only one ketone appears to have been
used commercially for the extraction of metals, namely MIBK (methyl isobutyl
ketone) (Ritcey and Ashbrook, 1984).
Extractant containing phosphorus-oxygen bonds could be considered as the
derivatives of phosphoric acid such as alkyl-phosphate esters ( ≡P=O ). The
extraction mechanism is mainly the same for all of them and it is the oxygen of the
phosphoryl group that is responsible for the coordination bond formed with the
metal. Extractive power of phosphorus-containing extractants increases with
increase in the number of carbon-phosphorus bonds over the series: phosphate –
phosphonate – phosphine oxide.
The most well known and most used of the organophosphorus esters is
undoubtedly try-n-butyl phosphate (TBP). Generally at low acid concentration the
solubility decreases so that increasing salt concentration in aqueous phase will
decrease the solubility of TBP. For TBP, if the acid concentration is increased, the
extraction of metal increases (Rydberg et al., 1992).
Lastly is extractant containing phosphorus-sulfur bond which is
corresponding to sulfur group such as alkylthiophosphoric, alkylthiophosphonic and
alkylthiophosphinic acid esters as well as phosphine sulphides like tri-iso-
butylphosphine sulphide (Cyanex 471X).
23
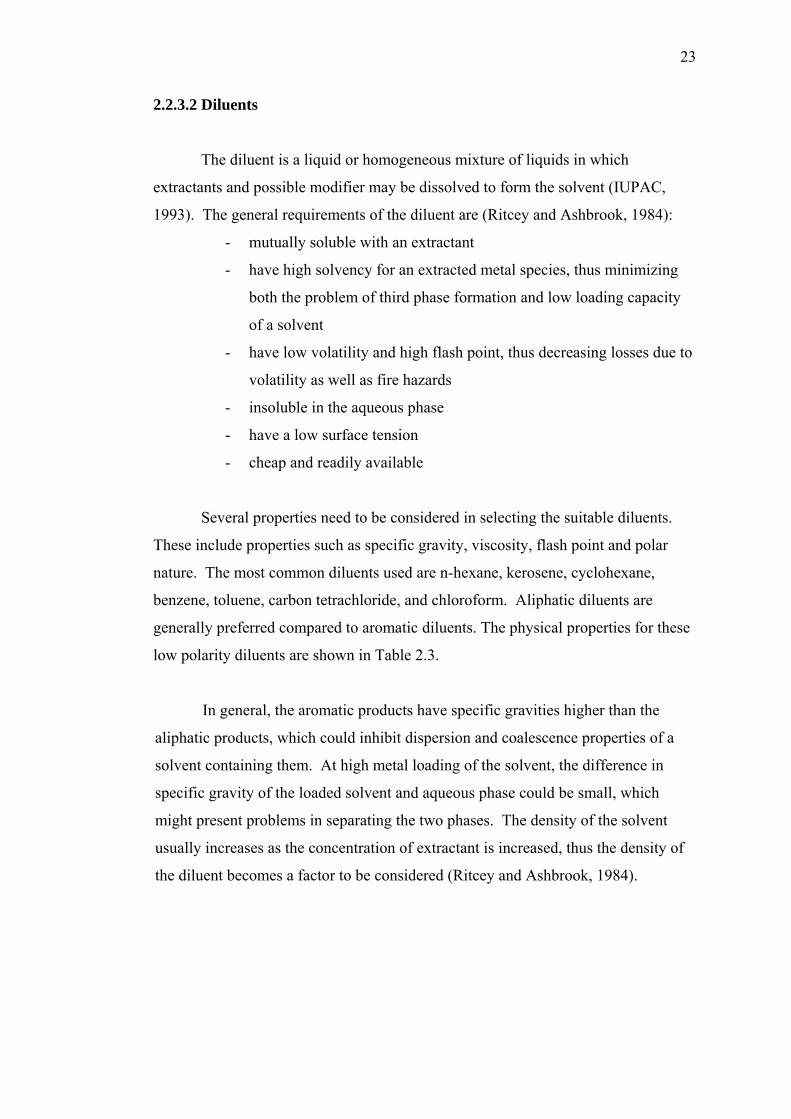
2.2.3.2 Diluents
The diluent is a liquid or homogeneous mixture of liquids in which
extractants and possible modifier may be dissolved to form the solvent (IUPAC,
1993). The general requirements of the diluent are (Ritcey and Ashbrook, 1984):
- mutually soluble with an extractant
- have high solvency for an extracted metal species, thus minimizing
both the problem of third phase formation and low loading capacity
of a solvent
- have low volatility and high flash point, thus decreasing losses due to
volatility as well as fire hazards
- insoluble in the aqueous phase
- have a low surface tension
- cheap and readily available
Several properties need to be considered in selecting the suitable diluents.
These include properties such as specific gravity, viscosity, flash point and polar
nature. The most common diluents used are n-hexane, kerosene, cyclohexane,
benzene, toluene, carbon tetrachloride, and chloroform. Aliphatic diluents are
generally preferred compared to aromatic diluents. The physical properties for these
low polarity diluents are shown in Table 2.3.
In general, the aromatic products have specific gravities higher than the
aliphatic products, which could inhibit dispersion and coalescence properties of a
solvent containing them. At high metal loading of the solvent, the difference in
specific gravity of the loaded solvent and aqueous phase could be small, which
might present problems in separating the two phases. The density of the solvent
usually increases as the concentration of extractant is increased, thus the density of
the diluent becomes a factor to be considered (Ritcey and Ashbrook, 1984).
24
Table 2.3: Physical properties of various diluents (Sekine and Hesegawa, 1977;
Rydberg et al., 1992).
Diluents Chemical
formula
Molecular
weight
(gmol)
Density
(g/mL)
Viscosity
(cP)
Dielectric
constant
n-hexane C6H14 86.17 0.65937 0.23 1.88
Kerosene - - 0.80 0.02 2.0 – 2.2
Cyclohexane C6H12 84.16 0.77855 0.98 2.02
Benzene C6H6 78.11 0.87903 0.65 2.28
Toluene C7H8 92.13 0.86694 0.59 2.24
Carbon
tetrachloride
CCl4 153.82 0.965 0.97 2.24
Chloroform CHCl3 119.38 1.563 0.57 4.81
On the other hand, metal loading affects the viscosity of the solvent. The
viscosity increases with increasing metal loading. It becomes necessary to operate
the solvent extraction system at elevated temperature both to reduce viscosity effects
and to increase the rate of separation of the phases. In considering the suitability of
the diluents the solubility in the aqueous solution and the flash point are important.
The very low flash point-diluent causes environmental problem because it will easily
flash at low temperature operation. Thus, it is advisable to use diluents having much
higher flash point.
The more important factor is the polarity of the diluents. The extractions of
metals decrease with an increase in the polarity of the diluent. Interaction of the
diluent with the extractant can result in lower extraction coefficient for metal ions.
Therefore the diluents with lower dielectric constant were suggested for the highest
extraction.
25
2.2.3.3 Emulsifier/Surfactant
Emulsifier or surface-active agent is a substance that, when present at low
concentration in a system, has the property to adsorb onto the surfaces or interfaces
of the system and of altering to a marked degree the surface or interfacial free
energies of those surface or interfaces. The interfacial free energy is the minimum
amount of work required to create that interface. Due to changes in the amount of
work required to expand those interfaces, surfactants usually act to reduce interfacial
free energy rather than to increase it, although there are occasions when they are
used to increase it.
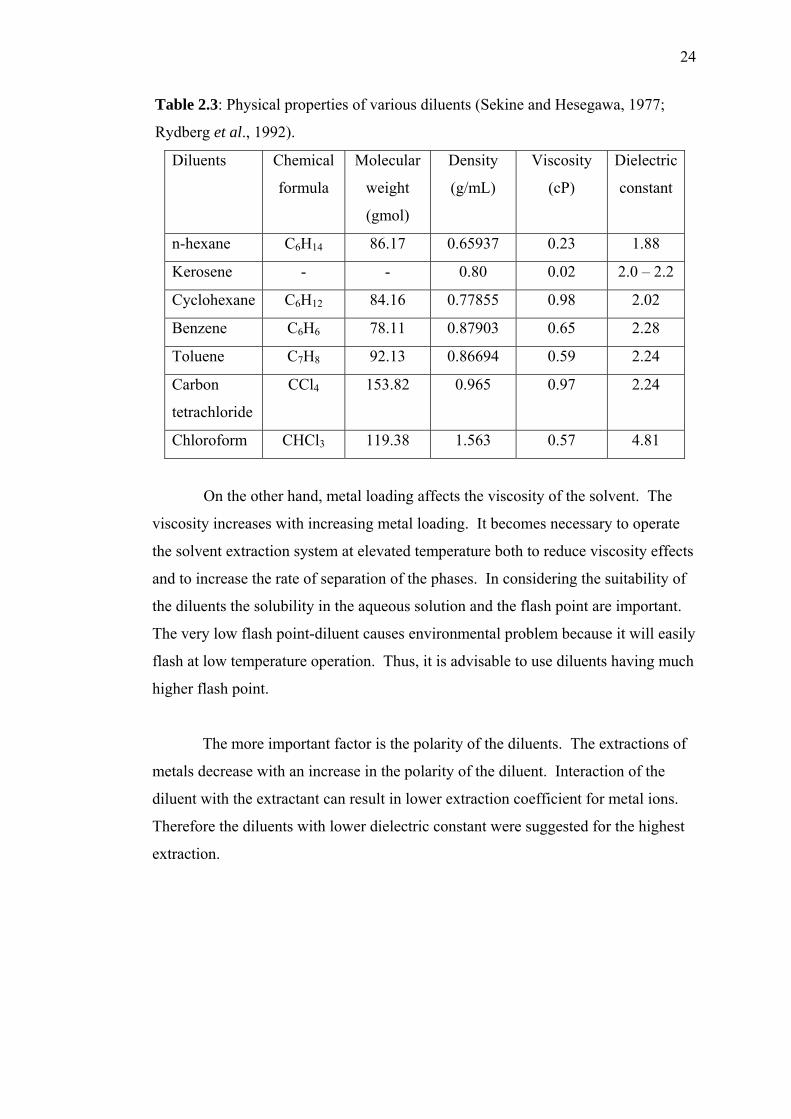
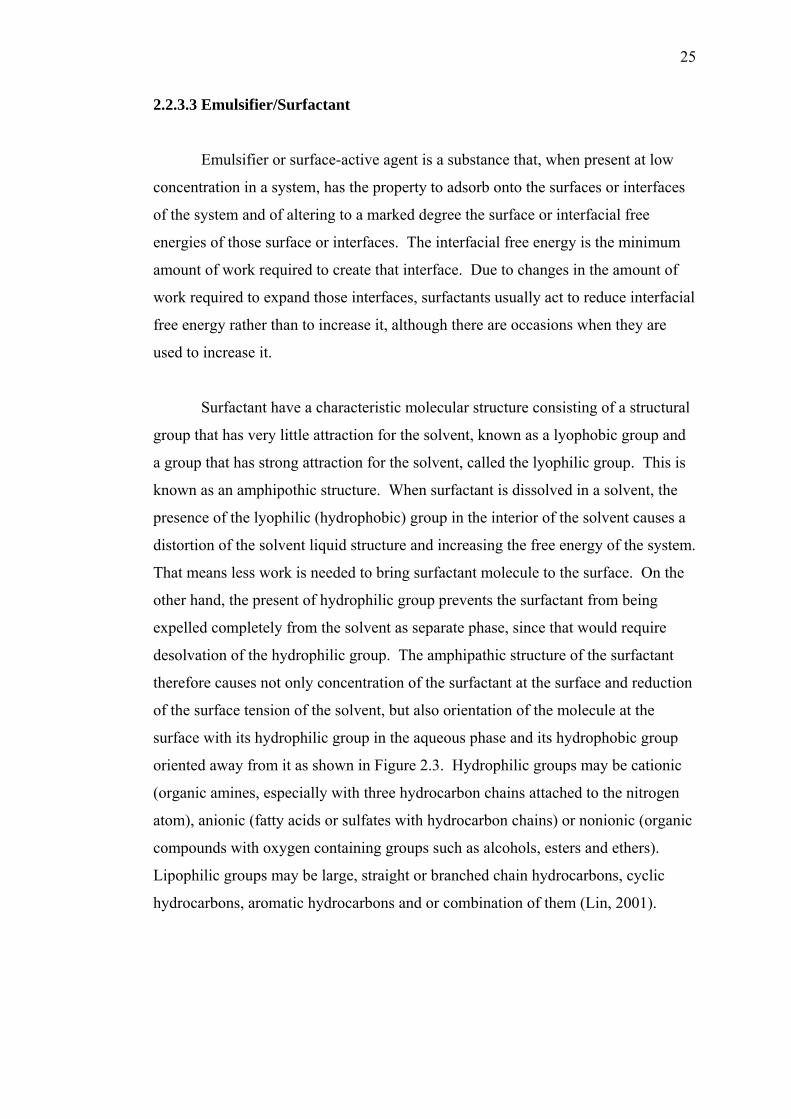
Surfactant have a characteristic molecular structure consisting of a structural
group that has very little attraction for the solvent, known as a lyophobic group and
a group that has strong attraction for the solvent, called the lyophilic group. This is
known as an amphipothic structure. When surfactant is dissolved in a solvent, the
presence of the lyophilic (hydrophobic) group in the interior of the solvent causes a
distortion of the solvent liquid structure and increasing the free energy of the system.
That means less work is needed to bring surfactant molecule to the surface. On the
other hand, the present of hydrophilic group prevents the surfactant from being
expelled completely from the solvent as separate phase, since that would require
desolvation of the hydrophilic group. The amphipathic structure of the surfactant
therefore causes not only concentration of the surfactant at the surface and reduction
of the surface tension of the solvent, but also orientation of the molecule at the
surface with its hydrophilic group in the aqueous phase and its hydrophobic group
oriented away from it as shown in Figure 2.3. Hydrophilic groups may be cationic
(organic amines, especially with three hydrocarbon chains attached to the nitrogen
atom), anionic (fatty acids or sulfates with hydrocarbon chains) or nonionic (organic
compounds with oxygen containing groups such as alcohols, esters and ethers).
Lipophilic groups may be large, straight or branched chain hydrocarbons, cyclic
hydrocarbons, aromatic hydrocarbons and or combination of them (Lin, 2001).
26
Figure 2.3: The structure of surfactant.
Surfactants are characterized according to the balance between the
hydrophilic and lipophilic portions of their molecules. The hydrophilic-lipophilic
balance (HLB) number indicates the polarity of the molecules in an arbitrary range
of 1-40, with the most commonly used emulsifiers having a value between 1 and 20.
The HLB number increases with increasing hydrophilicity. According to the HLB
number, surfactants with HLB values in the range 3-6 promote W/O emulsions
while value between 8 and 18 promote O/W emulsions. Since the primary emulsion
in this research is W/O emulsion, therefore it is important to select the surfactant
within the range of 3-6.
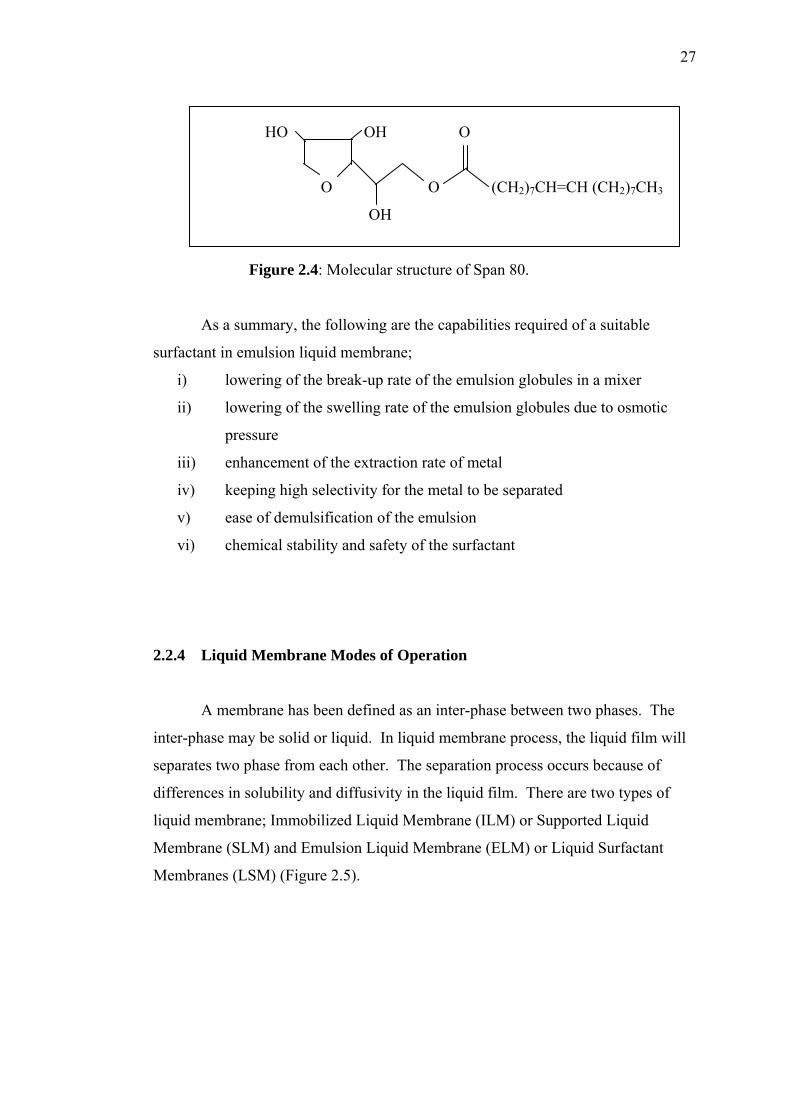
Span 80, also known as sorbitan monooleate, is a nonionic surfactant with a
HLB value of 4.3 and a molecular weight of 428 (Figure 2.4). It is selected as the
surfactant in this research because it is the most popular surfactants used in research
(Table 2.4) and its selection obeys the HLB rules (Kargari et al., 2003). However,
there are some disadvantages of Span 80 mainly its poor chemical stability and it
undergoes hydrolysis reaction in moderate acidic and basic media (Kasaini et al.,
1998). Besides, it is also a carrier of water molecules and it therefore changes
several properties of the W/O emulsion and it could also be destroyed by bacteria
(Kargari et al., 2003). Synthesizing a specialized surfactant which is more stable is
another alternative in the selection of surfactant. However, the synthesis process
takes time and it is not easily available in the market. Therefore, Span 80 becomes a
more practical choice for this research purpose.
Head (polar/ionic)
Tail (nonpolar)
27
HO OH O
O O (CH2)7CH=CH (CH2)7CH3
OH
Figure 2.4: Molecular structure of Span 80.
As a summary, the following are the capabilities required of a suitable
surfactant in emulsion liquid membrane;
i) lowering of the break-up rate of the emulsion globules in a mixer
ii) lowering of the swelling rate of the emulsion globules due to osmotic
pressure
iii) enhancement of the extraction rate of metal
iv) keeping high selectivity for the metal to be separated
v) ease of demulsification of the emulsion
vi) chemical stability and safety of the surfactant
2.2.4 Liquid Membrane Modes of Operation
A membrane has been defined as an inter-phase between two phases. The
inter-phase may be solid or liquid. In liquid membrane process, the liquid film will
separates two phase from each other. The separation process occurs because of
differences in solubility and diffusivity in the liquid film. There are two types of
liquid membrane; Immobilized Liquid Membrane (ILM) or Supported Liquid
Membrane (SLM) and Emulsion Liquid Membrane (ELM) or Liquid Surfactant
Membranes (LSM) (Figure 2.5).
28
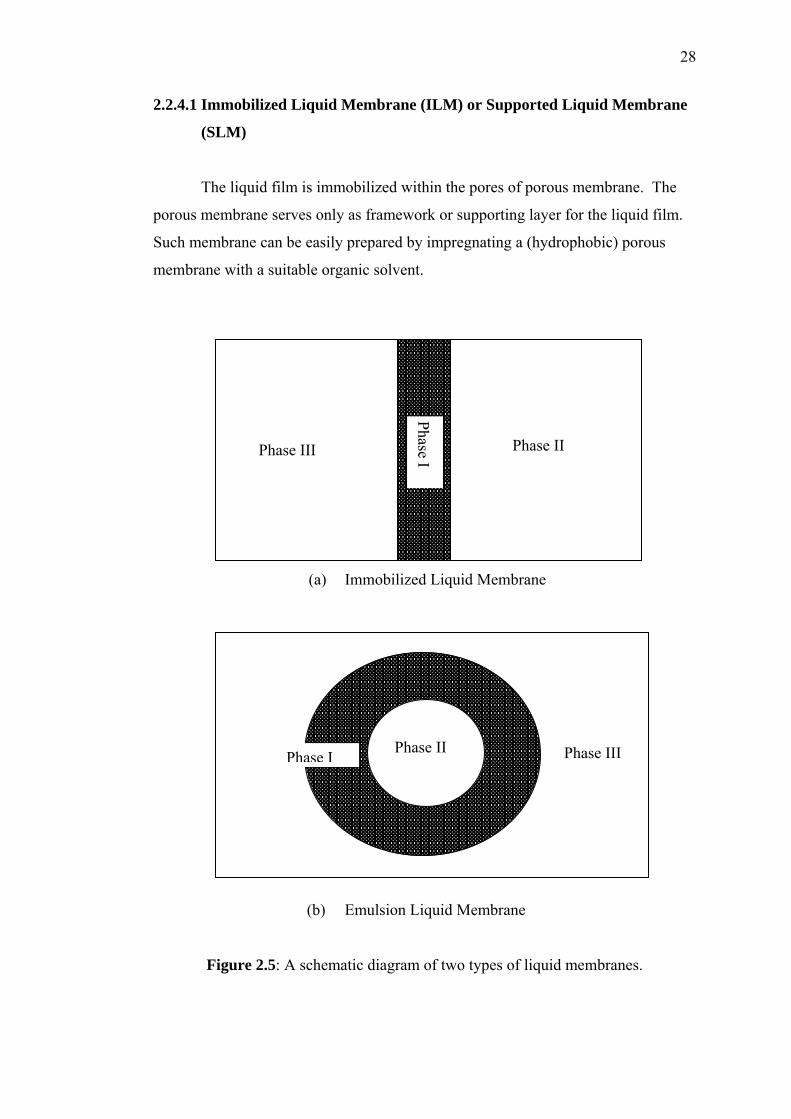
2.2.4.1 Immobilized Liquid Membrane (ILM) or Supported Liquid Membrane
(SLM)
The liquid film is immobilized within the pores of porous membrane. The
porous membrane serves only as framework or supporting layer for the liquid film.
Such membrane can be easily prepared by impregnating a (hydrophobic) porous
membrane with a suitable organic solvent.
(a) Immobilized Liquid Membrane
(b) Emulsion Liquid Membrane
Figure 2.5: A schematic diagram of two types of liquid membranes.
Phase III
Phase I
Phase II
Phase III Phase I Phase II
29
An ILM can be made in at least three different geometries. The first one is
planar or flat geometry which is very useful for laboratory purposes and for
industrial purposes. However a planar geometry is not very effective since the ratio
of surface area to volume is too low. Therefore, hollow fiber and spiral wound
modules can be used to provide high surface area to volume ratio, which approach
10000 m2/m3 for hollow fiber and 1000 m2/m3 for spiral wound modules (Lonsdale,
1982).
There are two primary problems associated with the use of immobilized
liquid membrane, which are solvent and carrier loss. Solvent loss occurred because
of evaporation, dissolution, or large pressure differences forcing solvent out of the
pore support structure. Carrier lost is due to irreversible side reactions or solvent
condensation on one side of the membrane. To overcome the problems, ion
exchange membranes have recently been studied by many researchers.
2.2.4.2 Emulsion Liquid Membrane (ELM) or Surfactant Liquid Membrane.
Emulsion liquid membranes are known as double emulsions system. The
primary emulsions were prepared by emulsifying two immiscible phases of the
stripping solution and organic phase with a surfactant to produce an emulsion. This
primary emulsion is then dispersed in the solution to be treated. Mass transfer takes
place between the feed phase and the internal phase through the membrane phase.
For example, two immiscible phases, water and oil are mixed vigorously and
emulsion droplets are formed, which are stabilized by the addition of surfactant.
This emulsion (water/oil emulsion) is added to a large vessel containing an aqueous
phase where a water/oil/water emulsion is now formed, the oil phase being the liquid
membrane in this concept. The major problem associated with ELMs is emulsion
stability. If the emulsion globules break and the inner droplet phase spill into the
continuous phase the separation is lost. Interfacial shear between the continuous
phase and membrane phase causes the liquid membrane to thin and in some cases,
rapture.
30
Another problem is osmotic swelling although it is rarely mentioned in the
literature. This phenomenon occurs when water in external phases diffuses through
the organic membrane phase and swells the inner aqueous droplet phase. The
increased volume of the internal phase leads to increased breakage and dilution of
the concentrated droplet phase.
Under agitation the emulsion liquid membrane phase separates into spherical
globules of emulsion, which have typical diameters of 10 µm to 1 mm. Each
globule contains many droplets of encapsulated inner or receiving phase with a
typical size of 1 to 10 µm in diameter. Therefore, emulsion will produce large
surface area/volume ratios for very rapid mass transfer (Marr and Kopp, 1982).
The emulsion liquid membrane process consist of three important
components, they are:
i) Internal phase (receiving phase): an aqueous phase, actually made up of
encapsulated droplets, which will receive the solute.
ii) External phase (source phase or feed phase): a continuous aqueous
phase of feed/waste water which is the source of the metal ions.
iii) Membrane phase: an organic phase that separates the internal droplets in
the emulsion from the external phase. It usually consists of three
components.
a) Diluents/organic solvent
b) Surfactant/stabilizer of the system
c) Extractant/ carrier to transfers the metal ion from external to internal
phase.
In order to make this system more promising, Kopp et al. (1978) created a
set of guidelines for the formation of stable water in oil of emulsion liquid
membranes:
i) Organic phase soluble surfactant concentration, 0.1 to 5 wt %;
ii) Organic phase viscosity, 30 to 1000 mPa.s
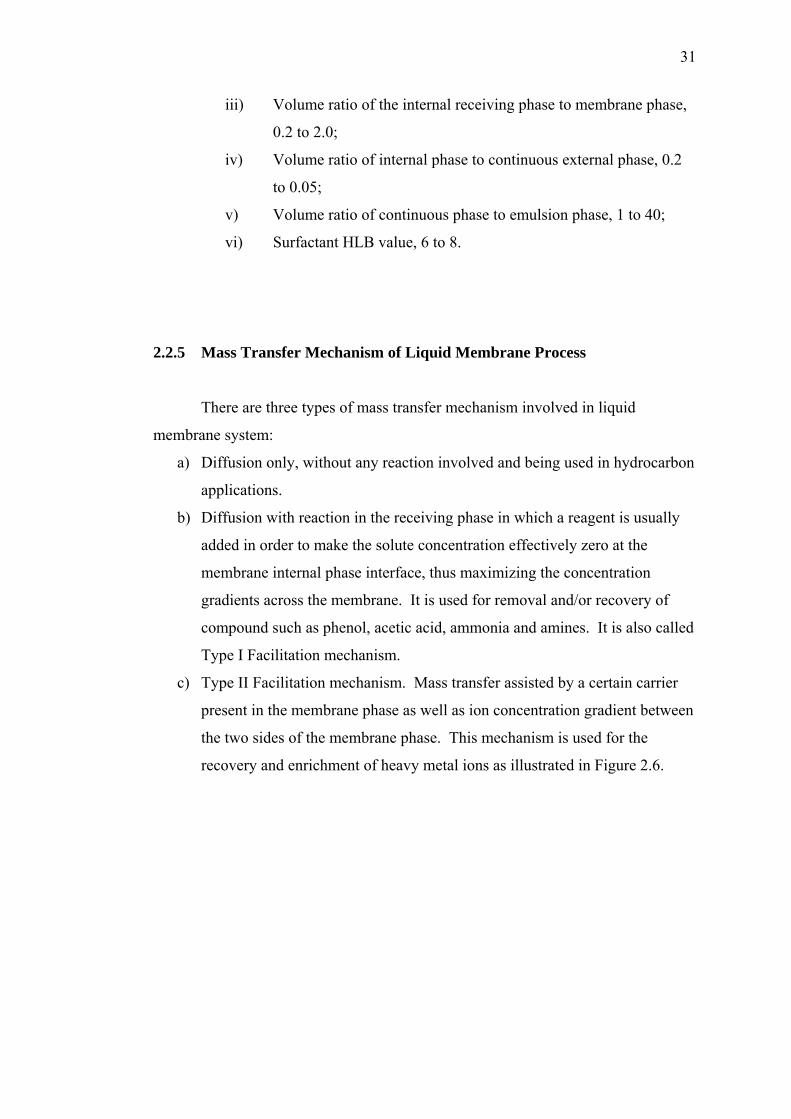
31
iii) Volume ratio of the internal receiving phase to membrane phase,
0.2 to 2.0;
iv) Volume ratio of internal phase to continuous external phase, 0.2
to 0.05;
v) Volume ratio of continuous phase to emulsion phase, 1 to 40;
vi) Surfactant HLB value, 6 to 8.
2.2.5 Mass Transfer Mechanism of Liquid Membrane Process
There are three types of mass transfer mechanism involved in liquid
membrane system:
a) Diffusion only, without any reaction involved and being used in hydrocarbon
applications.
b) Diffusion with reaction in the receiving phase in which a reagent is usually
added in order to make the solute concentration effectively zero at the
membrane internal phase interface, thus maximizing the concentration
gradients across the membrane. It is used for removal and/or recovery of
compound such as phenol, acetic acid, ammonia and amines. It is also called
Type I Facilitation mechanism.
c) Type II Facilitation mechanism. Mass transfer assisted by a certain carrier
present in the membrane phase as well as ion concentration gradient between
the two sides of the membrane phase. This mechanism is used for the
recovery and enrichment of heavy metal ions as illustrated in Figure 2.6.
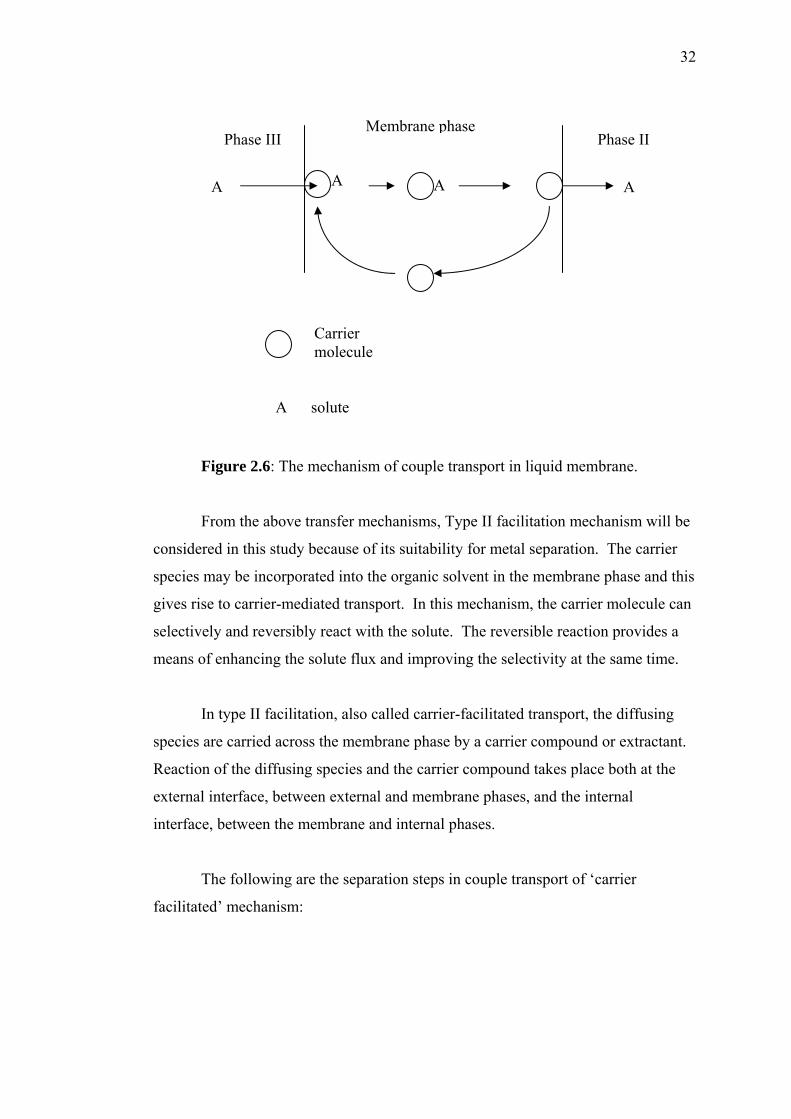
32
Figure 2.6: The mechanism of couple transport in liquid membrane.
From the above transfer mechanisms, Type II facilitation mechanism will be
considered in this study because of its suitability for metal separation. The carrier
species may be incorporated into the organic solvent in the membrane phase and this
gives rise to carrier-mediated transport. In this mechanism, the carrier molecule can
selectively and reversibly react with the solute. The reversible reaction provides a
means of enhancing the solute flux and improving the selectivity at the same time.
In type II facilitation, also called carrier-facilitated transport, the diffusing
species are carried across the membrane phase by a carrier compound or extractant.
Reaction of the diffusing species and the carrier compound takes place both at the
external interface, between external and membrane phases, and the internal
interface, between the membrane and internal phases.
The following are the separation steps in couple transport of ‘carrier
facilitated’ mechanism:
A A
Phase III Phase II
A A
Membrane phase
A solute
Carrier molecule
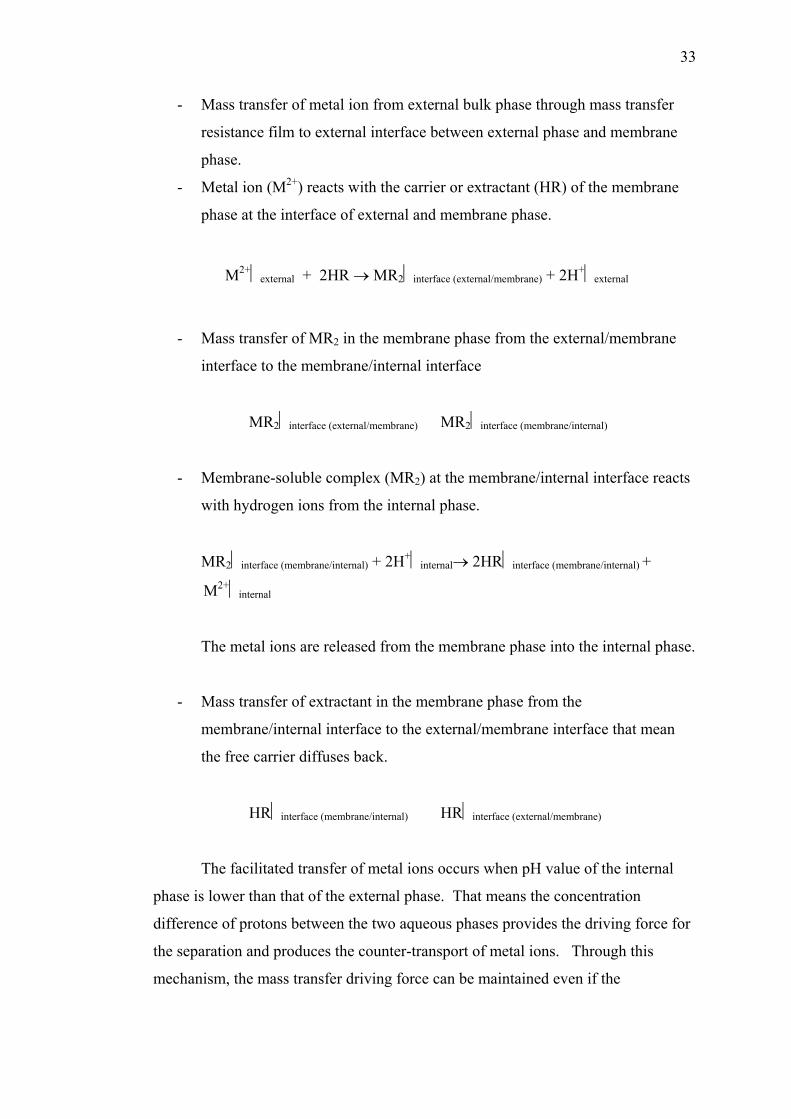
33
- Mass transfer of metal ion from external bulk phase through mass transfer
resistance film to external interface between external phase and membrane
phase.
- Metal ion (M2+) reacts with the carrier or extractant (HR) of the membrane
phase at the interface of external and membrane phase.
M2+⏐external + 2HR → MR2⏐interface (external/membrane) + 2H+⏐external
- Mass transfer of MR2 in the membrane phase from the external/membrane
interface to the membrane/internal interface
MR2⏐interface (external/membrane) MR2⏐interface (membrane/internal)
- Membrane-soluble complex (MR2) at the membrane/internal interface reacts
with hydrogen ions from the internal phase.
MR2⏐interface (membrane/internal) + 2H+⏐internal→ 2HR⏐interface (membrane/internal) +
M2+⏐internal
The metal ions are released from the membrane phase into the internal phase.
- Mass transfer of extractant in the membrane phase from the
membrane/internal interface to the external/membrane interface that mean
the free carrier diffuses back.
HR⏐interface (membrane/internal) HR⏐interface (external/membrane)
The facilitated transfer of metal ions occurs when pH value of the internal
phase is lower than that of the external phase. That means the concentration
difference of protons between the two aqueous phases provides the driving force for
the separation and produces the counter-transport of metal ions. Through this
mechanism, the mass transfer driving force can be maintained even if the
34
concentration of the solute in the receiving phase is higher than in the feed
solution/phase.
2.2.6 Liquid Membrane Application
Since the invention of liquid surfactant membranes by Li in 1968, metal ion
extraction using liquid membranes has received considerable interest. The process
is capable of achieving a higher concentration of metals in fewer stages while
maintaining the high selectivity of solvent extraction.
For the last two decades this method has attracted many studies in the area of
hydrometallurgy such as separation of metal ions either from waste or from ores
(Reis and Carvalho, 1993; Reed et al., 1987; Marr, 1984; Draxler and Marr, 1986;
Babcock et al., 1986). It has been reported recently that emulsion liquid membrane
system has been successfully used to recover copper selectively from waste stream
of mine solutions (Wright et al., 1995).
Separation of metals using emulsion liquid membrane was studied by many
researchers in previous publications (Nakashio, 1993). From the viewpoint of
practical application in hydrometallurgy and waste-water treating processes,
recovery processes for copper (Volkel et al., 1980; Goto et al., 1989a), uranium
(Hayworth et al., 1983) and zinc (Marr, 1984) were examined in test plant. The first
application of emulsion liquid membrane (ELM) on an industrial scale was the
process to remove zinc from waste water at a textile plant in Austria (Draxler and
Marr, 1986).
On the other hand, over the years a number of investigators concentrated on
separation of gases using liquid membrane especially supported liquid membrane.
The mechanism is carrier mediated facilitated transport. Some of the areas in which
this technique has been applied include production of oxygen-enriched air (Johnson
et al., 1987), CO removal by tert-amine macrocyclic (Koval et al., 1985), CO2
35
removal from gas mixture (Saha and Chakma, 1992) and removal of SO2 using
water as carrier (Teramoto et al., 1999).
Liquid membrane can also be used as chemical reactors for the reaction
between two gases in a heterogeneous catalyst system where the reactants are
encapsulated in an aqueous membrane containing catalyst. As the gasses diffuse
through the membrane, the reaction occurs and the products diffuse out into the
external receiving solvent. One application of the process is the catalytic oxidation
of ethylene to acetaldehyde. Others include oxidation of propylene to acetone,
oxidation of acetaldehyde to acetic acid and carbonylation of methanol with CO to
acetic acid.
In biotechnology, liquid membrane system has been used in many
applications of biochemical and biomedical process. In biochemical study this
technology has been used for the extraction of amino acid (Scheper et al., 1987; Itoh
et al., 1990). Scheper et al. (1987) used a quaternary ammonium carrier in emulsion
liquid membrane for enzyme catalyzed preparation of L-amino acids. Kuo and
Gregor (1983) and Kiani et al. (1984) used immobilized liquid membranes to extract
acetic acid from aqueous solution while Friesen et al. (1991) used liquid membrane
for extraction of citric acid.
In biomedical process liquid membrane was used in blood oxygenation and
artificial red blood cells; for extracorporeal oxygenation of blood, bubbles of
gaseous O2, encapsulated in a fluorocarbon liquid membrane are made to contact
oxygen-depleted blood. During the contact, oxygen diffuses from the membrane
into the blood while CO2 diffuses in the opposite direction and is swept out
(Frankenfeld et al., 1978). In preparation of artificial blood cells, liquid membrane
serves as template for the formation of the artificial cells. A liquid membrane
system can also be used to remove phenolic toxins from blood during liver failure
where internal trapping consist of an aqueous solution of the enzymes (Volker et al.,
1982).
36
2.2.7 Demulsification
Demulsification is one of the key processes for emulsion liquid membrane
application. Demulsification is mainly used for removing water and salts from crude
oil in oil industry, and for the recovering the membrane phase including organic
solvent, surfactant, extractant, and valuable solute ions in waste treatment processes.
The common methods of demulsification are centrifugation, sedimentation, thermal
breaking, and the electrostatic method.
Thermal breaking requires a lot of energy to break emulsion droplets and
cannot be applied to all emulsions because of the thermal instability of some
components. Centrifugation involves high mechanical work input and high
investment costs. Systems with very small droplets and little density difference
between the dispersed and the continuous phases are unable to be separated by
conventional breaking methods (Strathman, 2001). In contrast to conventional
methods, electrical emulsion breaking works at room temperature, involves no
moving parts, maintain low energy input and enables the separation of small droplets
from the continuous phase (Byers and Amarnath, 1995; Luo et al., 2001; Strathman,
2001).
The electrostatic method in a high voltage field is one of the most effective
and simplest demulsification methods. Electrostatic forces cause the coalescence of
dispersed water droplets and their growth into larger drops, which then fall readily
due to electric forces or gravity. In DC field, the electrophoretic droplet motion
enhances the probability of coalescence, whereas greater motion in the bulk fluids is
necessary to increase coalescence in an AC field (Byers and Amarnath, 1995;
Ibrahim et al., 2001; Kim et al., 2002; Luo et al., 2001). According to Taylor
(1988), the major effects of exposing dispersed water drops to high-strength AC
fields include drop deformation and drop-drop attraction, resulting from polarization
of the drops. These effects are different when DC fields are applied, establishing
electrophoretic motions, which can lead to an increase in drop-drop collision rate.
Furthermore, Bailes and Larkai (1981) suggested that the varying rates of drops
collision caused by the breaking and formation of drop chains are frequency
dependent.
37
The parameters of the electro demulsification process are voltage, frequency,
temperature, degree of mixing, emulsion shape, and distance of electrodes, density
and viscosity of emulsion, interfacial tension, water drop size, size distribution, hold
up, surfactant concentration in the oil phase, and electrolyte concentration in the
continuous phase (Ibrahim et al., 2001; Ivanov and Kralchevsky, 1997; Kim et al.,
2002; Lu et al., 1997; Strathman, 2001; Wang et al., 1994). The electrostatic
demulsification process is based on the coalescence and precipitation of water
droplets. Although the electrostatic method has a relatively wide application, the
mechanism of electrical coalescence is not well understood because of the
complexity of hydrodynamic and electrical phenomena of interfacial polarization
(Benavente and Jonsson, 2000; Luo et al., 2001; Strathman, 2001). The electric
field acts only at the interface between droplets and the continuous phase rather than
throughout the bulk of the phases (Benavente and Jonsson, 2000). The diameter of
the internal droplets of emulsion has a great influence on both the critical electric
field intensity and the demulsification rate (Lu et al., 1997).
From the above review, generally the coalescence of droplets consists of
three steps:
i) The flocculation step, in which the dispersed droplets of the internal
phase flocculate into some large group, but the drops still exist without
coalescence due to the electrostatic force;
ii) The coalescence step, in which the drops in the group coalesce into a
larger drop, resulting in the decrease in the number of drops;
iii) The sink step, in which the large internal drops sink by gravity to the
interface between oil and water, and coagulate into the water phase,
resulting in the breakdown of emulsion.
The electrical effect primarily affects the first step. This illustrates the
increasing rate of motion of the droplets in an electric field (Harpur et al., 1997;
Ivanov and Kralchevsky, 1997; Lu et al., 1997).
38
2.3 Emulsion Liquid Membrane Extraction of Silver
2.3.1 Carrier Selection
Extractant is the main factor in determining the efficiency of any extraction
process. Therefore, it is very important to develop an efficient mobile carrier for a
target metal ion, and the choice of the carrier often decides the success of the
process. As a suitable carrier of emulsion liquid membrane, the following
conditions are required;
i) High selectivity for metal to be separated
ii) React reversibly with the metal so that the metal can be recovered by a
stripping reaction
iii) high extraction rate at the external interface of the emulsion globules
iv) high stripping rate at the interface of the internal water droplets in the
emulsion.
v) Have a very low solubility in the aqueous phases for economic and
environmental reason.
Based on conventional solvent extraction and liquid membrane processes,
several type of extractant were used in metal extraction as reported in literature and
summarized in Table 2.4.
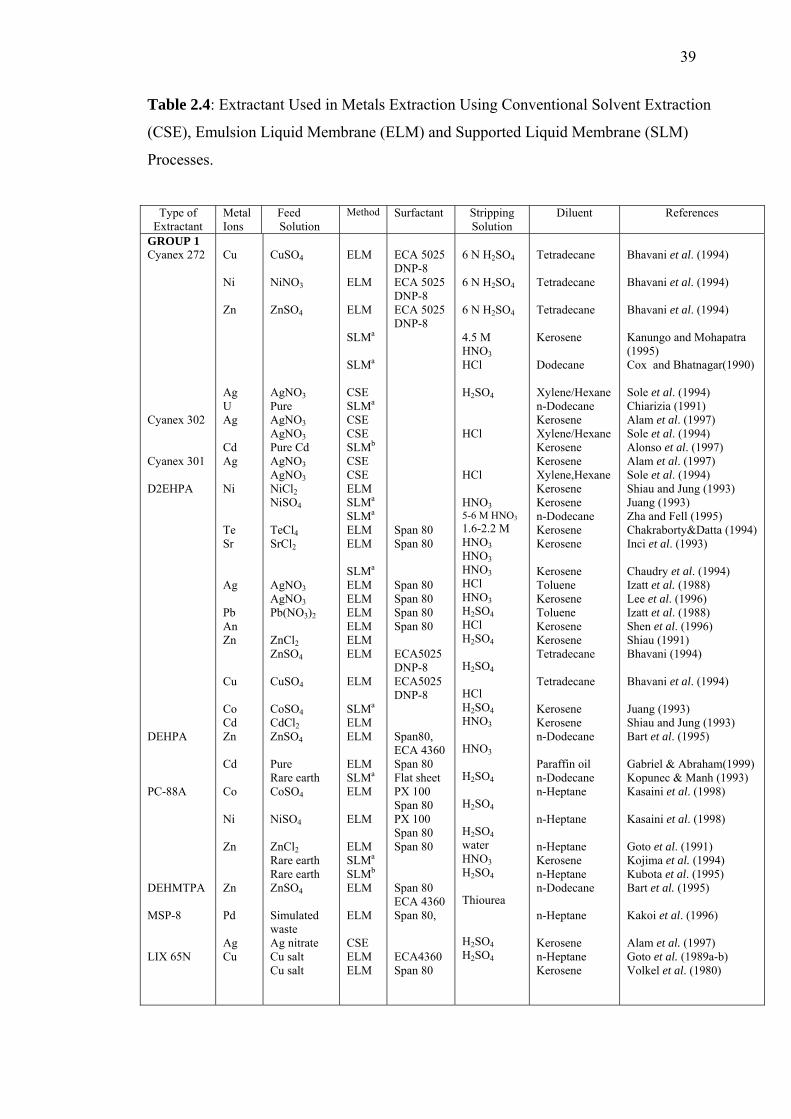
39
Table 2.4: Extractant Used in Metals Extraction Using Conventional Solvent Extraction
(CSE), Emulsion Liquid Membrane (ELM) and Supported Liquid Membrane (SLM)
Processes.
Type of
Extractant Metal Ions
Feed Solution
Method Surfactant Stripping Solution
Diluent References
GROUP 1 Cyanex 272 Cyanex 302 Cyanex 301 D2EHPA DEHPA PC-88A DEHMTPA MSP-8 LIX 65N
Cu Ni Zn Ag U Ag Cd Ag Ni Te Sr Ag Pb An Zn Cu Co Cd Zn Cd Co Ni Zn Zn Pd Ag Cu
CuSO4 NiNO3 ZnSO4 AgNO3 Pure AgNO3 AgNO3 Pure Cd AgNO3 AgNO3 NiCl2 NiSO4 TeCl4 SrCl2 AgNO3 AgNO3 Pb(NO3)2 ZnCl2 ZnSO4 CuSO4 CoSO4 CdCl2 ZnSO4 Pure Rare earth CoSO4 NiSO4 ZnCl2 Rare earth Rare earth ZnSO4 Simulated waste Ag nitrate Cu salt Cu salt
ELM ELM ELM SLMa SLMa CSE SLMa CSE CSE SLMb CSE CSE ELM SLMa SLMa ELM ELM SLMa ELM ELM ELM ELM ELM ELM ELM SLMa ELM ELM ELM SLMa ELM ELM ELM SLMa SLMb ELM ELM CSE ELM ELM
ECA 5025 DNP-8 ECA 5025 DNP-8 ECA 5025 DNP-8 Span 80 Span 80 Span 80 Span 80 Span 80 Span 80 ECA5025 DNP-8 ECA5025 DNP-8 Span80, ECA 4360 Span 80 Flat sheet PX 100 Span 80 PX 100 Span 80 Span 80 Span 80 ECA 4360 Span 80, ECA4360 Span 80
6 N H2SO4 6 N H2SO4 6 N H2SO4 4.5 M HNO3 HCl H2SO4 HCl HCl HNO3 5-6 M HNO3 1.6-2.2 M HNO3 HNO3 HNO3 HCl HNO3 H2SO4 HCl H2SO4 H2SO4 HCl H2SO4 HNO3 HNO3 H2SO4 H2SO4 H2SO4 water HNO3 H2SO4 Thiourea H2SO4 H2SO4
Tetradecane Tetradecane Tetradecane Kerosene Dodecane Xylene/Hexane n-Dodecane Kerosene Xylene/Hexane Kerosene Kerosene Xylene,Hexane Kerosene Kerosene n-Dodecane Kerosene Kerosene Kerosene Toluene Kerosene Toluene Kerosene Kerosene Tetradecane Tetradecane Kerosene Kerosene n-Dodecane Paraffin oil n-Dodecane n-Heptane n-Heptane n-Heptane Kerosene n-Heptane n-Dodecane n-Heptane Kerosene n-Heptane Kerosene
Bhavani et al. (1994) Bhavani et al. (1994) Bhavani et al. (1994) Kanungo and Mohapatra (1995) Cox and Bhatnagar(1990) Sole et al. (1994) Chiarizia (1991) Alam et al. (1997) Sole et al. (1994) Alonso et al. (1997) Alam et al. (1997) Sole et al. (1994) Shiau and Jung (1993) Juang (1993) Zha and Fell (1995) Chakraborty&Datta (1994) Inci et al. (1993) Chaudry et al. (1994) Izatt et al. (1988) Lee et al. (1996) Izatt et al. (1988) Shen et al. (1996) Shiau (1991) Bhavani (1994) Bhavani et al. (1994) Juang (1993) Shiau and Jung (1993) Bart et al. (1995) Gabriel & Abraham(1999) Kopunec & Manh (1993) Kasaini et al. (1998) Kasaini et al. (1998) Goto et al. (1991) Kojima et al. (1994) Kubota et al. (1995) Bart et al. (1995) Kakoi et al. (1996) Alam et al. (1997) Goto et al. (1989a-b) Volkel et al. (1980)
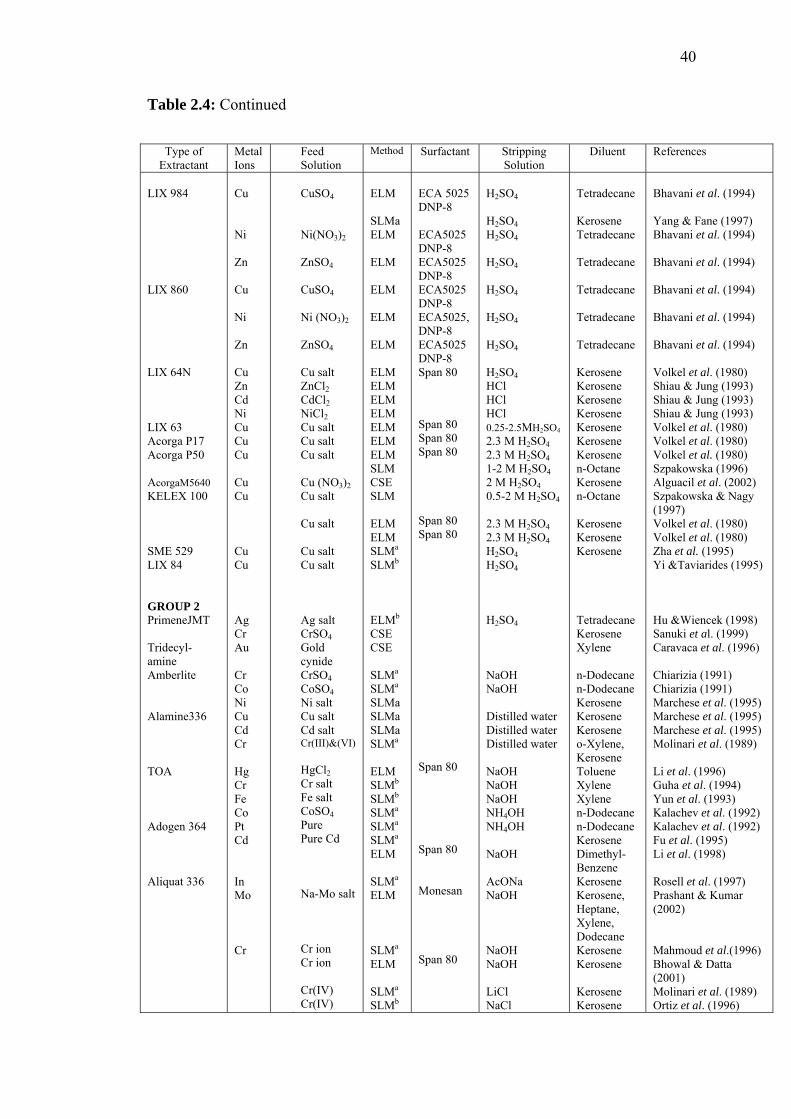
40
Table 2.4: Continued
Type of Extractant
Metal Ions
Feed Solution
Method Surfactant Stripping Solution
Diluent References
LIX 984 LIX 860 LIX 64N LIX 63 Acorga P17 Acorga P50 AcorgaM5640 KELEX 100 SME 529 LIX 84 GROUP 2 PrimeneJMT Tridecyl-amine Amberlite Alamine336 TOA Adogen 364 Aliquat 336
Cu Ni Zn Cu Ni Zn Cu Zn Cd Ni Cu Cu Cu Cu Cu Cu Cu Ag Cr Au Cr Co Ni Cu Cd Cr Hg Cr Fe Co Pt Cd In Mo Cr
CuSO4 Ni(NO3)2 ZnSO4 CuSO4 Ni (NO3)2 ZnSO4 Cu salt ZnCl2 CdCl2 NiCl2 Cu salt Cu salt Cu salt Cu (NO3)2 Cu salt Cu salt Cu salt Cu salt Ag salt CrSO4 Gold cynide CrSO4 CoSO4 Ni salt Cu salt Cd salt Cr(III)&(VI) HgCl2 Cr salt Fe salt CoSO4 Pure Pure Cd Na-Mo salt Cr ion Cr ion Cr(IV) Cr(IV)
ELM SLMa ELM ELM ELM ELM ELM ELM ELM ELM ELM ELM ELM ELM SLM CSE SLM ELM ELM SLMa SLMb ELMb CSE CSE SLMa SLMa SLMa SLMaSLMa SLMa ELM SLMb SLMb SLMa SLMa SLMa ELM SLMa ELM SLMa ELM SLMa SLMb
ECA 5025 DNP-8 ECA5025 DNP-8 ECA5025 DNP-8 ECA5025 DNP-8 ECA5025, DNP-8 ECA5025 DNP-8 Span 80 Span 80 Span 80 Span 80 Span 80 Span 80 Span 80 Span 80 Monesan Span 80
H2SO4 H2SO4 H2SO4 H2SO4 H2SO4 H2SO4 H2SO4 H2SO4 HCl HCl HCl 0.25-2.5MH2SO4 2.3 M H2SO4 2.3 M H2SO4 1-2 M H2SO4 2 M H2SO4 0.5-2 M H2SO4 2.3 M H2SO4 2.3 M H2SO4 H2SO4 H2SO4 H2SO4 NaOH NaOH Distilled water Distilled water Distilled water NaOH NaOH NaOH NH4OH NH4OH NaOH AcONa NaOH NaOH NaOH LiCl NaCl
Tetradecane Kerosene Tetradecane Tetradecane Tetradecane Tetradecane Tetradecane Kerosene Kerosene Kerosene Kerosene Kerosene Kerosene Kerosene n-Octane Kerosene n-Octane Kerosene Kerosene Kerosene Tetradecane Kerosene Xylene n-Dodecane n-Dodecane Kerosene Kerosene Kerosene o-Xylene, Kerosene Toluene Xylene Xylene n-Dodecane n-Dodecane Kerosene Dimethyl- Benzene Kerosene Kerosene, Heptane, Xylene, Dodecane Kerosene Kerosene Kerosene Kerosene
Bhavani et al. (1994) Yang & Fane (1997) Bhavani et al. (1994) Bhavani et al. (1994) Bhavani et al. (1994) Bhavani et al. (1994) Bhavani et al. (1994) Volkel et al. (1980) Shiau & Jung (1993) Shiau & Jung (1993) Shiau & Jung (1993) Volkel et al. (1980) Volkel et al. (1980) Volkel et al. (1980) Szpakowska (1996) Alguacil et al. (2002) Szpakowska & Nagy (1997) Volkel et al. (1980) Volkel et al. (1980) Zha et al. (1995) Yi &Taviarides (1995) Hu &Wiencek (1998) Sanuki et al. (1999) Caravaca et al. (1996) Chiarizia (1991) Chiarizia (1991) Marchese et al. (1995) Marchese et al. (1995) Marchese et al. (1995) Molinari et al. (1989) Li et al. (1996) Guha et al. (1994) Yun et al. (1993) Kalachev et al. (1992) Kalachev et al. (1992) Fu et al. (1995) Li et al. (1998) Rosell et al. (1997) Prashant & Kumar (2002) Mahmoud et al.(1996) Bhowal & Datta (2001) Molinari et al. (1989) Ortiz et al. (1996)
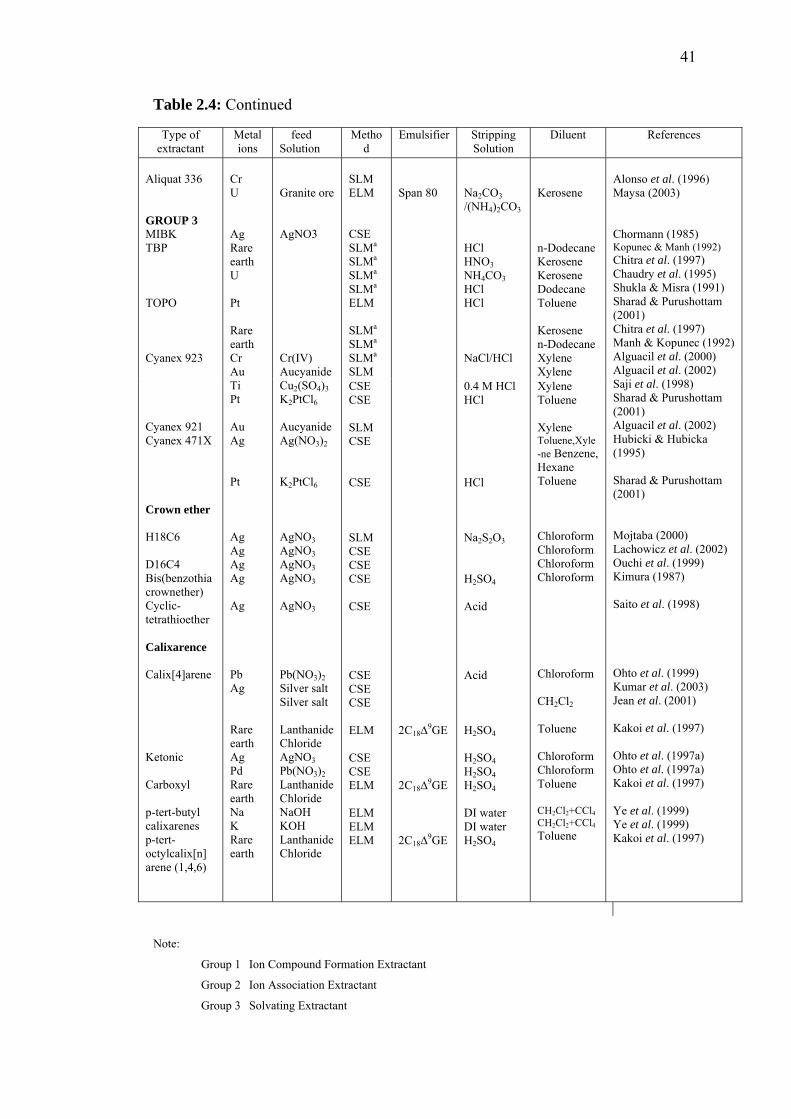
41
Table 2.4: Continued
Type of extractant
Metal ions
feed Solution
Method
Emulsifier Stripping Solution
Diluent References
SLM ELM CSE SLMa SLMa SLMa SLMa ELM SLMa SLMa SLMa SLM
Span 80
Na2CO3 /(NH4)2CO3 HCl HNO3 NH4CO3 HCl HCl NaCl/HCl
Kerosene n-Dodecane Kerosene Kerosene Dodecane Toluene Kerosene n-Dodecane Xylene Xylene
Aliquat 336 GROUP 3 MIBK TBP TOPO Cyanex 923 Cyanex 921 Cyanex 471X Crown ether H18C6 D16C4 Bis(benzothiacrownether) Cyclic-tetrathioether Calixarence Calix[4]arene Ketonic Carboxyl p-tert-butyl calixarenes p-tert-octylcalix[n] arene (1,4,6)
Cr U Ag Rare earth U Pt Rare earth Cr Au Ti Pt Au Ag Pt Ag Ag Ag Ag Ag Pb Ag Rare earth Ag Pd Rare earth Na K Rare earth
Granite ore AgNO3 Cr(IV) Aucyanide Cu2(SO4)3 K2PtCl6 Aucyanide Ag(NO3)2 K2PtCl6 AgNO3 AgNO3 AgNO3 AgNO3
AgNO3 Pb(NO3)2 Silver salt Silver salt Lanthanide Chloride AgNO3 Pb(NO3)2 Lanthanide Chloride NaOH KOH Lanthanide Chloride
CSE CSE SLM CSE CSE SLM CSE CSE CSE CSE CSE CSE CSE ELM CSE CSE ELM ELM ELM ELM
2C18∆9GE 2C18∆9GE 2C18∆9GE
0.4 M HCl HCl HCl Na2S2O3 H2SO4 Acid Acid H2SO4 H2SO4 H2SO4 H2SO4 DI water DI water H2SO4
Xylene Toluene Xylene Toluene,Xyle-ne Benzene, Hexane Toluene Chloroform Chloroform Chloroform Chloroform Chloroform CH2Cl2
Toluene Chloroform Chloroform Toluene CH2Cl2+CCl4 CH2Cl2+CCl4 Toluene
Alonso et al. (1996) Maysa (2003) Chormann (1985) Kopunec & Manh (1992) Chitra et al. (1997) Chaudry et al. (1995) Shukla & Misra (1991) Sharad & Purushottam (2001) Chitra et al. (1997) Manh & Kopunec (1992) Alguacil et al. (2000) Alguacil et al. (2002) Saji et al. (1998) Sharad & Purushottam (2001) Alguacil et al. (2002) Hubicki & Hubicka (1995) Sharad & Purushottam (2001) Mojtaba (2000) Lachowicz et al. (2002) Ouchi et al. (1999) Kimura (1987) Saito et al. (1998) Ohto et al. (1999) Kumar et al. (2003) Jean et al. (2001) Kakoi et al. (1997) Ohto et al. (1997a) Ohto et al. (1997a) Kakoi et al. (1997) Ye et al. (1999) Ye et al. (1999) Kakoi et al. (1997)
Note:
Group 1 Ion Compound Formation Extractant
Group 2 Ion Association Extractant
Group 3 Solvating Extractant
42
2.3.2 Parameters Affecting on ELM Extraction Process
The parameters that affect the extraction rate of the emulsion liquid
membrane are; membrane thickness (Kim et al., 1997); temperature and
concentration of external and internal phase ( Teramoto et al., 1983); volume ratio of
external phase to emulsion liquid membrane (Lin and Long, 1997); volume fraction
of internal phase, surfactant and the carrier (Kakoi et al., 1997; Lee et al., 1997;
Mok and Lee, 1994); and the speed of the agitator (Lin and Long, 1997; Teramoto et
al., 1983).
The other parameter is membrane stability. The stability of the emulsion is
one of the critical issues for extraction processes using emulsion liquid membrane.
If the emulsion liquid membrane is unstable, the emulsion globules are broken,
which will reduce the efficiency of the membrane extraction. The major factors
affecting the emulsion liquid membrane stability are agitation speed, viscosity,
temperature and pH of external phase, volume and concentration of internal phase
and composition of membrane phase (Bechers, 1985; Daneisi et al., 1981;
Szpakowska & Nagy, 1991).
The addition of the surfactant increases the stability of the ELMs and the
membrane thickness, but it decreases the rate of the diffusion process. With an
increase in temperature, the extraction rate also increases. The speed of agitation
affects the extraction rate to a great extent. Initially, the extraction rate increases
due to the increase in the mass transfer coefficient in the aqueous phase; but with
time, the extraction rate decreases due to the hydrodynamic instability of membrane
at a higher agitator speed, leading to the breakage of the membrane.
In liquid membrane technology, the surfactant is the most important
component in the emulsion liquid membrane process. It determines not only the
stability of the emulsion but also influences a lot of other parameters like osmosis
and water solubility and often represents a high mass transfer resistance (Draxler
and Marr, 1986). Commercial surfactants which are commonly used are complex
compounds that have hydrophilic and lipophilic groups, the latter orienting the
molecules towards the organic membrane phase. The ratio of the two groups, called
43
the hydrophilic-lipophilic balance (HLB) determines the kind of emulsion obtained.
If HLB is less than about 10, ‘water-oil-water’ emulsions are obtained; surfactants
with larger HLB values favor ‘oil-water-oil’ emulsion (Patnaik, 1995). Two
commercial surfactants are SPAN 80 and ECA 4360 or a mixture thereof.
There are many papers concerning the effect of surfactant on the behavior of
the emulsion (Goto et al., 1989b; Dreher et al., 1999). Membrane breakage in
emulsion liquid membrane system includes the rapture of the emulsion and the
leakage of the internal reagent and extracted solute through the membrane phase to
the external phase. As a result, the membrane breakage causes a decrease of driving
force for mass transfer and an increase of the raffinate concentration, thereby
lowering the extraction efficiency (Wan and Zhang, 2002). Therefore the type of
surfactant used in emulsion liquid membrane process has very strong effect on
extraction rate (Goto et al. 1991). It has been noted that surfactant influences the
emulsion stability and the transport rate of the solute. By increasing the surfactant
concentration, the emulsion stability will improve; however the extraction rate will
decrease due to the presence of more surfactant molecules at the reaction site
(aqueous-organic interface).
2.3.3 Thermodynamics of Extraction
Thermodynamics is a branch of science dealing with energetic of substances
and process (Rydberg et al., 1992). Thermodynamics determines the driving
potential for a system to change from one state to another such as whether a
chemical reaction will proceed and how far it will proceed (Clifford et al., 1976).
The general extraction reaction of a metal ion (Mn+) with extractant (HR) was
explained by:
++ +↔+ nHMRnHRM n
n (2.2)
44
2.3.3.1 Distribution Ratio
The amount of metal extracted is determined by analysis of the aqueous
(raffinate) after extraction process. The distribution ratio of a metal between an
aqueous phase and organic phase is known as the distribution coefficient, D and is
defined as:
phase aqueous in the metal dunextracte ofion concentratphase organic into metal extracted ofion concentratD = (2.3)
Equation 2.2 can be written as the rate, or velocity at which [Mn+] and [ ]nHR react
and this reaction is proportional to their concentration:
[ ][ ]nHR+= nff Mkv (2.4)
where, vf is the velocity of the forward reaction which produces the reaction
products [ ]nMR and [ ]nH + , and kf is the proportionality constant.
The rate of reverse reaction can be written as following:
[ ][ ]nrr Hkv += nMR (2.5)
where at equilibrium, vf = vr
[ ][ ]nHR+= nff Mkv = [ ][ ]nrr Hkv += nMR (2.6)
From Equation 2.6, the equilibrium constant (KE) is defined as:
[ ][ ]
[ ][ ] r
fn
n
nE kk
HR
HM
K =⋅=+
+nMR
(2.7)
So, equilibrium constant, KE can be written as;
45
[ ][ ]
n
E HRHDK ⎟⎟
⎠
⎞⎜⎜⎝
⎛=
+
(2.8)
[ ][ ]
n
E HHRKD ⎟⎟
⎠
⎞⎜⎜⎝
⎛= + (2.9)
From Equations 2.7, 2.8 and 2.9 it is clear that the extraction of metal in these
systems is mostly dependent on the concentration of the extractant in the organic
phase and on the pH of the aqueous phase, and is independent on the total metal ion
concentration.
Taking logarithms of Equation 2.9, the following equation will obtain:
[ ] [ ]+−+= HnHRnKD E loglogloglog (2.10)
Equation 2.10 can also write as:
[ ] )(logloglog pHHRnKD E ++= (2.11)
The plots of log D versus (log [ ]HR + pH) will give a straight line of slope n and the
intercept is equal to log KE. An expression involving pH can be explained by the
following equations:
[ ] pHHRKn
Dn E ++= loglog1log1 (2.12)
or
[ ]HRKn
Dn
pH E loglog1log1−−= (2.13)
If the aqueous / organic ratio is 1, this means if 50% of metal is extracted into the
organic phase, therefore D = 1 and log D = 0, Equation 2.13 will give;
46
[ ]HRKn
pH E loglog1−−= (2.14)
The pH given in Equation 2.14 is known as pH0.5 or pH50. The increase in extractant
concentration will result in decrease in pH0.5.
2.3.3.2 Recovery Efficiency, E
The recovery efficiency is defined as:
( ) ( )eo
e
CtC
tE −= 1 (2.15)
where;
( )tCe = Concentration of solute in the external phase (mol/l)
eoC = Initial concentration of solute in the external phase (mol/l)
By rearranging Equation 2.15 and equating in terms of the equilibrium constant of
Equation 2.9, the following equation will get;
[ ][ ]n
n
EH
HRKE
ED+
=−
=1 (2.16)
2.3.3.3 Separation factor
Separation factor (2M
MiS ) of any system containing metal (1) and metal (2)
can be defined as:
47
2
12
1 DDS
MM = (2.17)
where, D1 and D2 represent two extraction coefficients of metals (1) and (2)
respectively. This indicates the degree to which the two metals can be separated.
Generally the higher the separation factor, the higher the performance of metal
separation. In multi component system, separation factor of metal (1) to other metal
can defined as:
∑=
= n
ii
MiM
D
DS
2
11 (2.18)
2.3.4 Modeling of Emulsion Liquid Membrane Extraction
2.3.4.1 Modeling of Equilibrium Conditions
Mathematical modeling of extraction processes using liquid membranes are
based on either membrane approach or integral approach. For the first it is assumed
that the total resistance of the transfer process is on the liquid membrane phase. In
this case the processes occurring in the other two phases are not considered. In the
integral approach the extraction system is assumed to be an integrated closed system
of three interacting liquids. The concentration gradients and volume changes in the
three phases are thus taken into account.
Whatever the approach used, the equilibrium conditions at the two interfaces
are usually described by the distribution coefficient of the solute between the
organic and aqueous phase as discussed in Section 2.3.3.1, which is assumed to be
constant if the extraction/stripping process is operated in a continuous mode, leading
to small changes in the concentration during the process (Coelhoso et al., 1997).
However, if the system is operated in a batch mode of operation, there will be a
48
large variation of solute concentration in each phase leading, in some cases, to a
high variation of the distribution coefficient.
This dependency of the distribution coefficient on the solute concentration
must be considered as it affects the driving force for mass transfer and consequently
the corresponding mass transfer coefficient. If there is a variation of the distribution
coefficient with solute concentration, then the solute flux and mass transfer
coefficients must be included in the kinetic model in order to correctly evaluate the
mass transfer coefficients. The distribution coefficient, D, can only be considered
constant if Ke = 1 or if the change of the aqueous solute concentration during the
extraction (or the stripping) process is in the linear region of the equilibrium curve.
The deviation between the values of the mass transfer coefficients calculated by
using either a variable distribution coefficient or a constant distribution coefficient
depends on the region of the equilibrium curve considered. The higher deviations
on the mass transfer coefficients take place when the equilibrium curve diverges
from linearity.
On the other hand, reactive metal extraction depends on both the kinetics of
chemical reactions taking place in the system and the rates of mass transfer of the
species between the two liquid phases. If the extraction rate is diffusion-controlled,
it will depend on the interfacial area and the concentration of the slow-diffusion
species. When the extraction rate is chemically controlled, it is necessary to
ascertain the location of the rate-controlling chemical reaction.
2.3.4.2 Emulsion Liquid Membrane Extraction Models
Most investigations on liquid membrane mass transfer concentrate on the
facilitated transport within the emulsion globule (i.e. permeation with chemical
reaction or carrier transport with reaction). Hence several mathematical models
have been proposed on the basis of these grounds to predict mass-transfer rate and
separation efficiency. Usually, the emulsion liquid membrane separation systems
have been analyzed on the basis of the different configurations of the emulsion
49
globule, depending on the degree of sophisticated in handling the permeation
mechanism.
Based on the disposition of the interfacial resistances to mass transfer in the
system, these models can be classified into two different groups.
i) Models without Radial Profile of Concentration
It is assumed that all the fine droplets within the emulsion are coalesced
into a single large droplet, and this droplet is encapsulated in a membrane film.
Mass transfer of the solute takes place by diffusion across a flat membrane of
constant thickness into an internal interface, where it reacts with the reagent.
Mass transfer is proportional to the average concentration difference between the
external continuous and the internal phases. According to the membrane
geometry, two different models have been developed in the literature: Uniform
flat-sheet model (Kremesec, 1981; Kremesec and Slattery, 1982) and hollow-
sphere model (Matulevicius and Li, 1975; Hochhauser and Cussler, 1975).
ii) Models with Radial Profile of Concentration
A microscopic view of the liquid membrane system shows two key
features that must be adequately described in a realistic model of transport and
the reaction in the system. The first is the emulsion heterogeneity resulting from
the presence of the droplets of internal reagent dispersed in the emulsion
globules, while the second is the non-uniform size distribution of the globules
themselves.
The solute diffuses through the external phase to the aqueous/membrane
interface, where it reacts with the carrier. The formed complex diffuses through
the oil membrane of the emulsion globule into the encapsulated aqueous phase
that is immobilized due to the presence of surfactant, the internal circulation
being negligible within the globules where the complexes react instantaneously
with the internal reagent. Two different approaches have been reported.
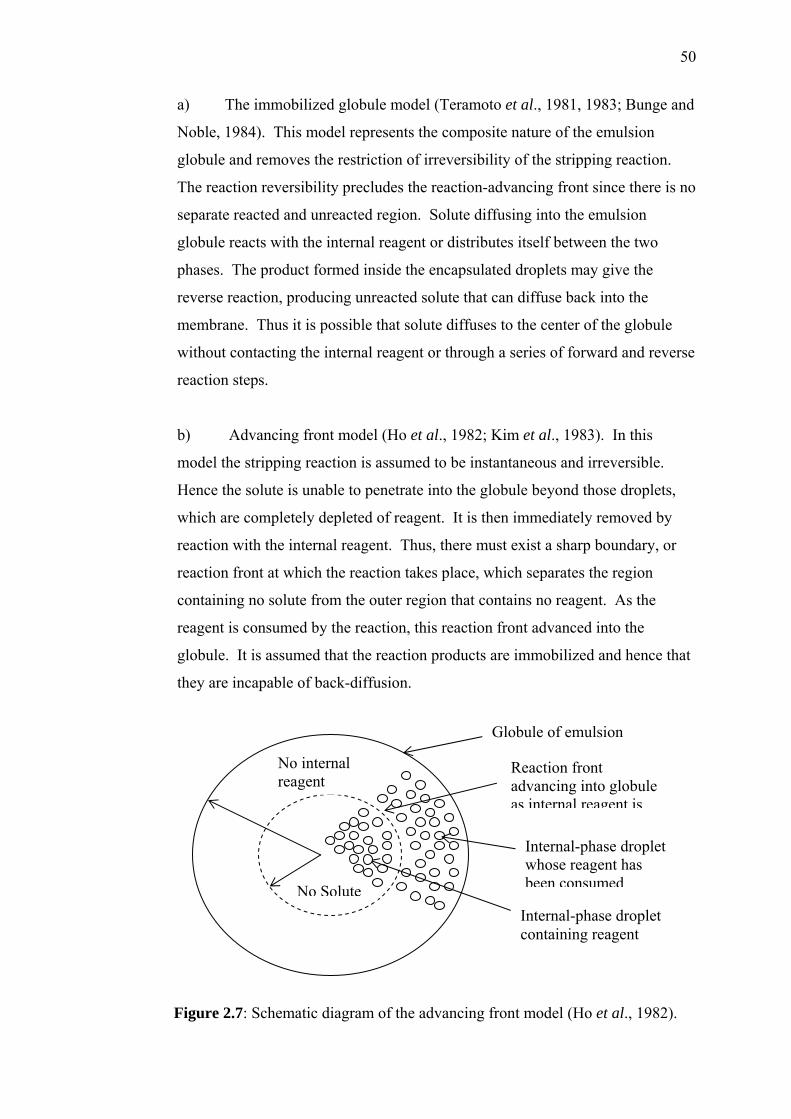
50
a) The immobilized globule model (Teramoto et al., 1981, 1983; Bunge and
Noble, 1984). This model represents the composite nature of the emulsion
globule and removes the restriction of irreversibility of the stripping reaction.
The reaction reversibility precludes the reaction-advancing front since there is no
separate reacted and unreacted region. Solute diffusing into the emulsion
globule reacts with the internal reagent or distributes itself between the two
phases. The product formed inside the encapsulated droplets may give the
reverse reaction, producing unreacted solute that can diffuse back into the
membrane. Thus it is possible that solute diffuses to the center of the globule
without contacting the internal reagent or through a series of forward and reverse
reaction steps.
b) Advancing front model (Ho et al., 1982; Kim et al., 1983). In this
model the stripping reaction is assumed to be instantaneous and irreversible.
Hence the solute is unable to penetrate into the globule beyond those droplets,
which are completely depleted of reagent. It is then immediately removed by
reaction with the internal reagent. Thus, there must exist a sharp boundary, or
reaction front at which the reaction takes place, which separates the region
containing no solute from the outer region that contains no reagent. As the
reagent is consumed by the reaction, this reaction front advanced into the
globule. It is assumed that the reaction products are immobilized and hence that
they are incapable of back-diffusion.
Figure 2.7: Schematic diagram of the advancing front model (Ho et al., 1982).
No internal reagent
Globule of emulsion
Reaction front advancing into globule as internal reagent is
Internal-phase droplet whose reagent has been consumed
Internal-phase droplet containing reagent
No Solute
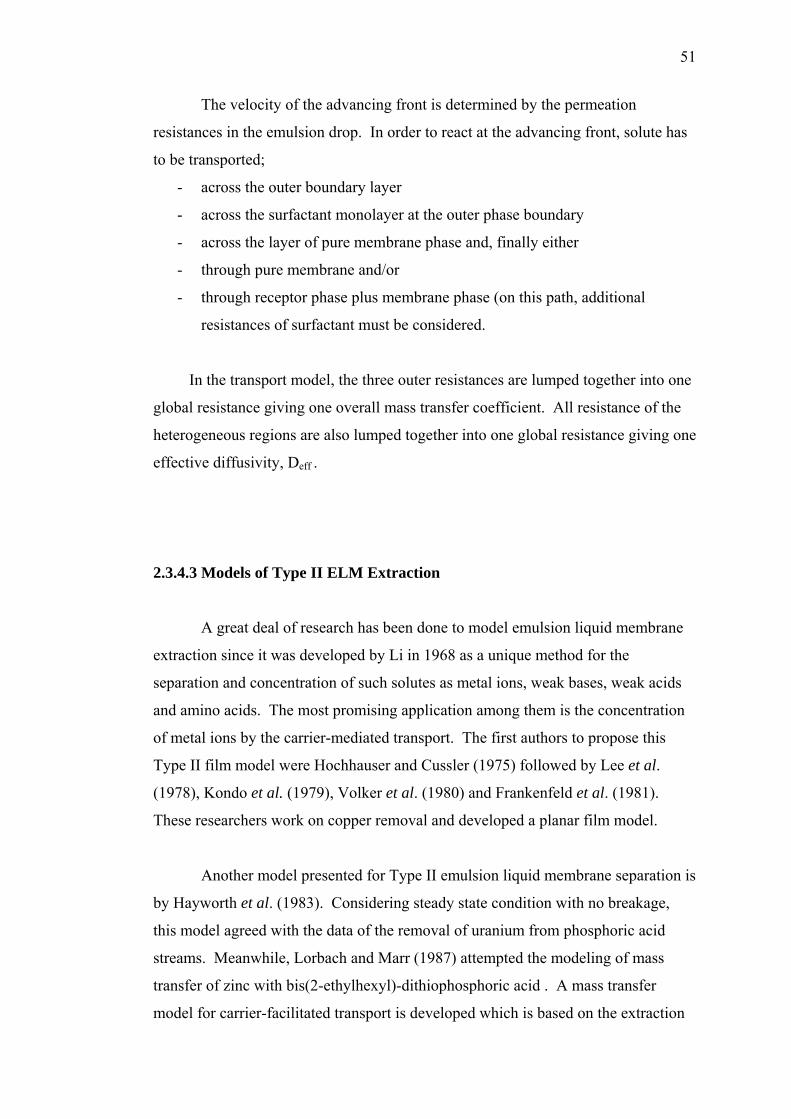
51
The velocity of the advancing front is determined by the permeation
resistances in the emulsion drop. In order to react at the advancing front, solute has
to be transported;
- across the outer boundary layer
- across the surfactant monolayer at the outer phase boundary
- across the layer of pure membrane phase and, finally either
- through pure membrane and/or
- through receptor phase plus membrane phase (on this path, additional
resistances of surfactant must be considered.
In the transport model, the three outer resistances are lumped together into one
global resistance giving one overall mass transfer coefficient. All resistance of the
heterogeneous regions are also lumped together into one global resistance giving one
effective diffusivity, Deff .
2.3.4.3 Models of Type II ELM Extraction
A great deal of research has been done to model emulsion liquid membrane
extraction since it was developed by Li in 1968 as a unique method for the
separation and concentration of such solutes as metal ions, weak bases, weak acids
and amino acids. The most promising application among them is the concentration
of metal ions by the carrier-mediated transport. The first authors to propose this
Type II film model were Hochhauser and Cussler (1975) followed by Lee et al.
(1978), Kondo et al. (1979), Volker et al. (1980) and Frankenfeld et al. (1981).
These researchers work on copper removal and developed a planar film model.
Another model presented for Type II emulsion liquid membrane separation is
by Hayworth et al. (1983). Considering steady state condition with no breakage,
this model agreed with the data of the removal of uranium from phosphoric acid
streams. Meanwhile, Lorbach and Marr (1987) attempted the modeling of mass
transfer of zinc with bis(2-ethylhexyl)-dithiophosphoric acid . A mass transfer
model for carrier-facilitated transport is developed which is based on the extraction
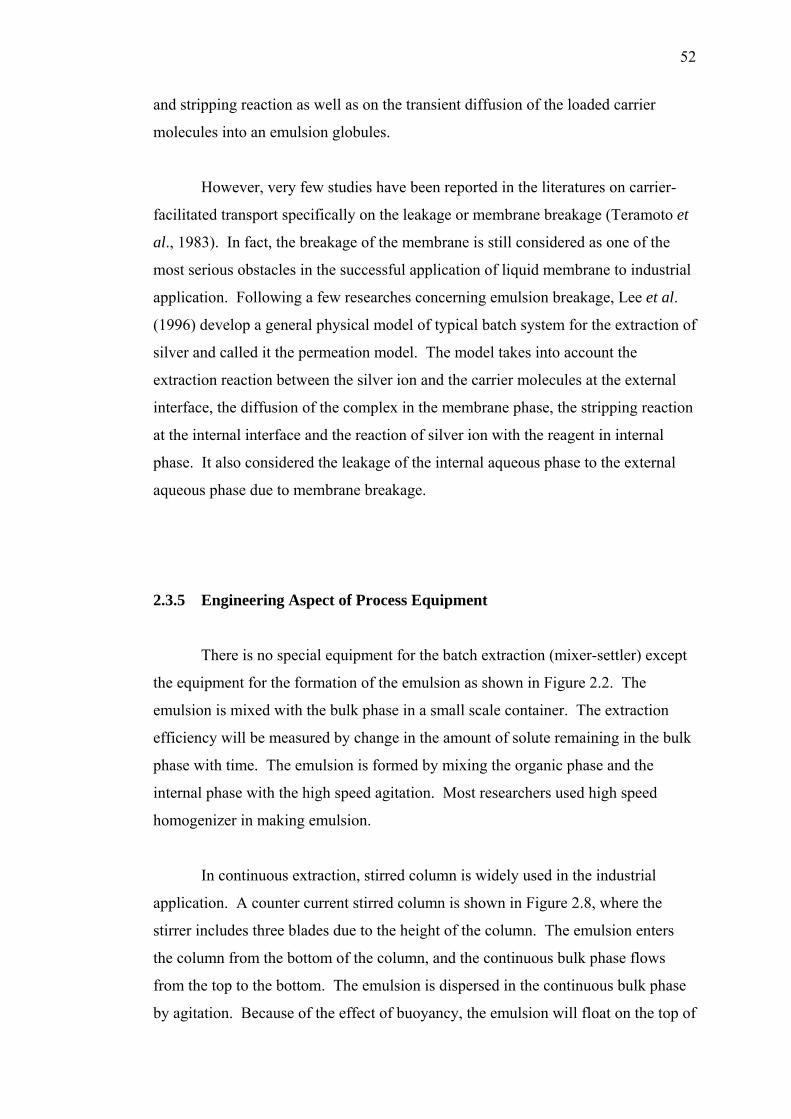
52
and stripping reaction as well as on the transient diffusion of the loaded carrier
molecules into an emulsion globules.
However, very few studies have been reported in the literatures on carrier-
facilitated transport specifically on the leakage or membrane breakage (Teramoto et
al., 1983). In fact, the breakage of the membrane is still considered as one of the
most serious obstacles in the successful application of liquid membrane to industrial
application. Following a few researches concerning emulsion breakage, Lee et al.
(1996) develop a general physical model of typical batch system for the extraction of
silver and called it the permeation model. The model takes into account the
extraction reaction between the silver ion and the carrier molecules at the external
interface, the diffusion of the complex in the membrane phase, the stripping reaction
at the internal interface and the reaction of silver ion with the reagent in internal
phase. It also considered the leakage of the internal aqueous phase to the external
aqueous phase due to membrane breakage.
2.3.5 Engineering Aspect of Process Equipment
There is no special equipment for the batch extraction (mixer-settler) except
the equipment for the formation of the emulsion as shown in Figure 2.2. The
emulsion is mixed with the bulk phase in a small scale container. The extraction
efficiency will be measured by change in the amount of solute remaining in the bulk
phase with time. The emulsion is formed by mixing the organic phase and the
internal phase with the high speed agitation. Most researchers used high speed
homogenizer in making emulsion.
In continuous extraction, stirred column is widely used in the industrial
application. A counter current stirred column is shown in Figure 2.8, where the
stirrer includes three blades due to the height of the column. The emulsion enters
the column from the bottom of the column, and the continuous bulk phase flows
from the top to the bottom. The emulsion is dispersed in the continuous bulk phase
by agitation. Because of the effect of buoyancy, the emulsion will float on the top of
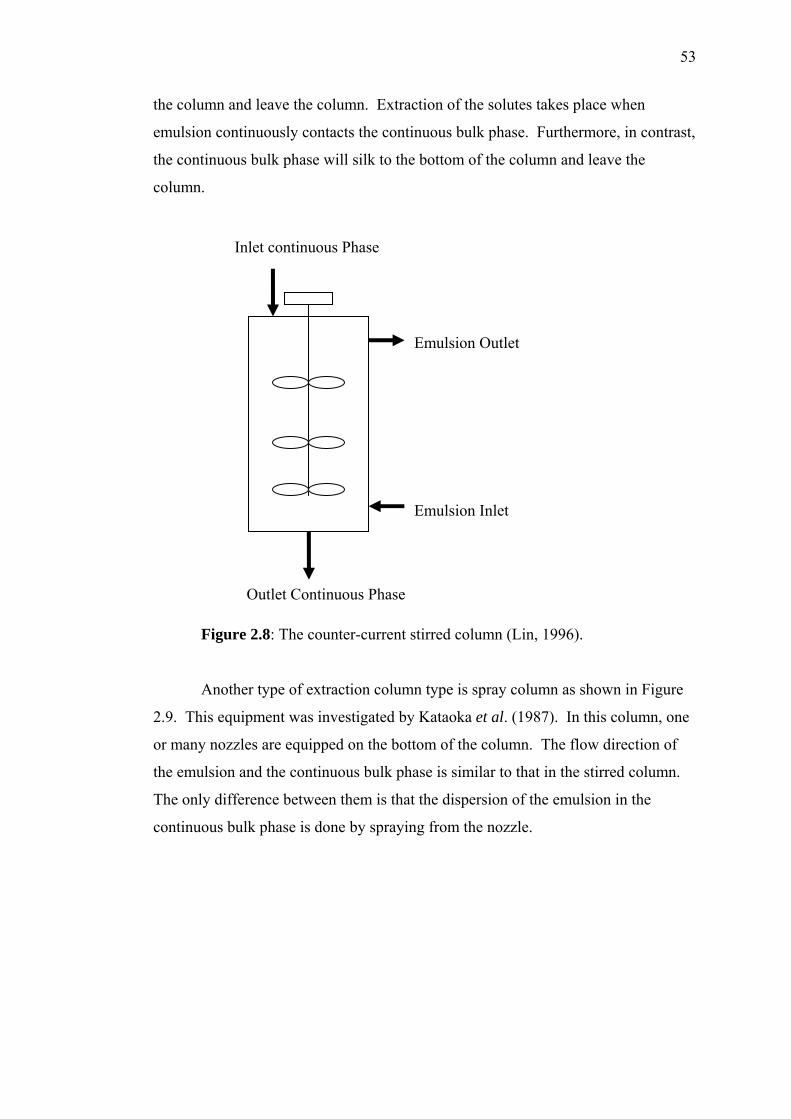
53
the column and leave the column. Extraction of the solutes takes place when
emulsion continuously contacts the continuous bulk phase. Furthermore, in contrast,
the continuous bulk phase will silk to the bottom of the column and leave the
column.
Figure 2.8: The counter-current stirred column (Lin, 1996).
Another type of extraction column type is spray column as shown in Figure
2.9. This equipment was investigated by Kataoka et al. (1987). In this column, one
or many nozzles are equipped on the bottom of the column. The flow direction of
the emulsion and the continuous bulk phase is similar to that in the stirred column.
The only difference between them is that the dispersion of the emulsion in the
continuous bulk phase is done by spraying from the nozzle.
Emulsion Outlet
Emulsion Inlet
Inlet continuous Phase
Outlet Continuous Phase
54
Figure 2.9: The counter-current spray column (Kataoka et al., 1987).
The industrial process using the stirred column is shown in Figure 2.10. The
industrial emulsion liquid membrane system includes four important basic units:
emulsification, extraction, settling, and demulsification. The demulsifier is used to
break the emulsion and the organic phase is recycled to the emulsification unit.
Outlet continuous Bulk Phase
Inlet Emulsion
Inlet Continuous Bulk Phase
Outlet Emulsion
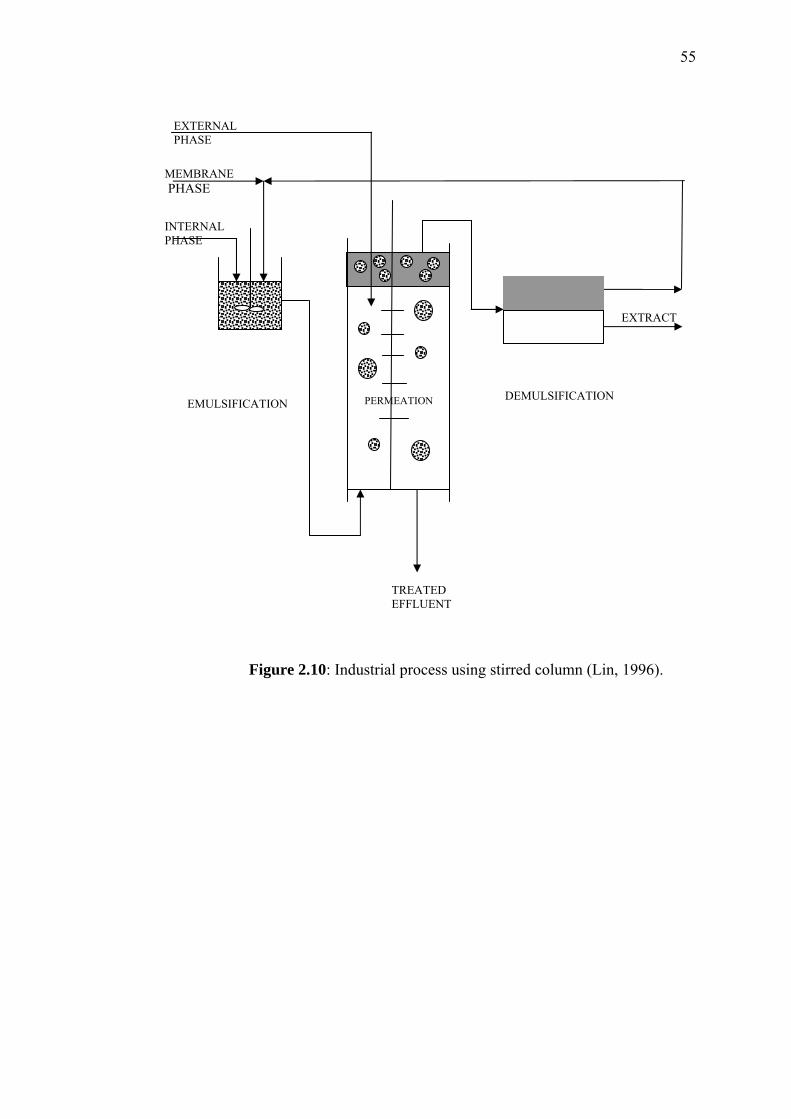
55
Figure 2.10: Industrial process using stirred column (Lin, 1996).
PERMEATION
EXTRACT
EXTERNAL PHASE
MEMBRANE PHASE
INTERNAL PHASE
EMULSIFICATION DEMULSIFICATION
TREATED EFFLUENT
CHAPTER 3
MATERIALS AND METHODS
3.1 Solvents and Reagents
3.1.1 Chemical Used in Carriers Screening
The extractants used were ordered from various suppliers as shown in Table
3.1. All the extractants were dissolved either in kerosene, toluene or chloroform as
diluents and were obtained from Fluka Chemika, Merck (M) Sdn. Bhd. and
Surcchem Products LTD respectively. All extractant and diluents are manufacture
grade and used as received.
3.1.2 Chemical Used in Stripping Agents Screening
Hydrochloric, nitric, and sulfuric acids, thiourea and sodium thiosulphate
were used as stripping agents. All chemical used are analytical grade and used as
received.
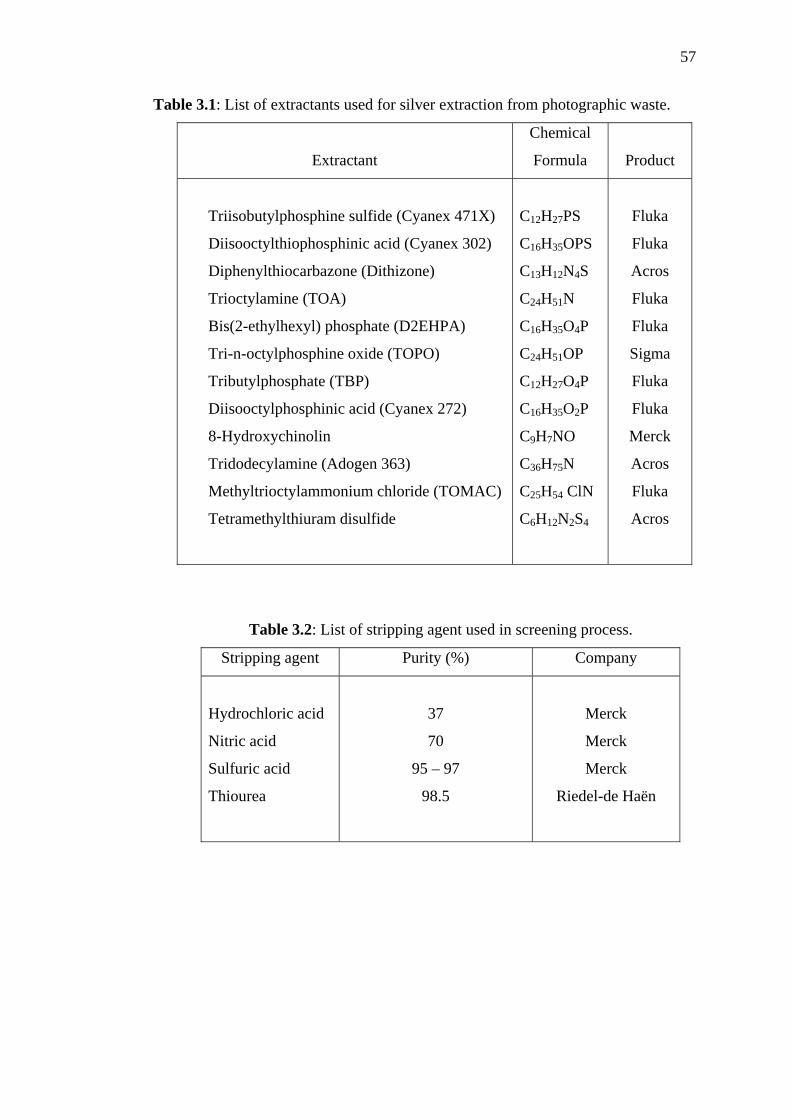
57
Table 3.1: List of extractants used for silver extraction from photographic waste.
Extractant
Chemical
Formula
Product
Triisobutylphosphine sulfide (Cyanex 471X)
Diisooctylthiophosphinic acid (Cyanex 302)
Diphenylthiocarbazone (Dithizone)
Trioctylamine (TOA)
Bis(2-ethylhexyl) phosphate (D2EHPA)
Tri-n-octylphosphine oxide (TOPO)
Tributylphosphate (TBP)
Diisooctylphosphinic acid (Cyanex 272)
8-Hydroxychinolin
Tridodecylamine (Adogen 363)
Methyltrioctylammonium chloride (TOMAC)
Tetramethylthiuram disulfide
C12H27PS
C16H35OPS
C13H12N4S
C24H51N
C16H35O4P
C24H51OP
C12H27O4P
C16H35O2P
C9H7NO
C36H75N
C25H54 ClN
C6H12N2S4
Fluka
Fluka
Acros
Fluka
Fluka
Sigma
Fluka
Fluka
Merck
Acros
Fluka
Acros
Table 3.2: List of stripping agent used in screening process.
Stripping agent Purity (%) Company
Hydrochloric acid
Nitric acid
Sulfuric acid
Thiourea
37
70
95 – 97
98.5
Merck
Merck
Merck
Riedel-de Haën
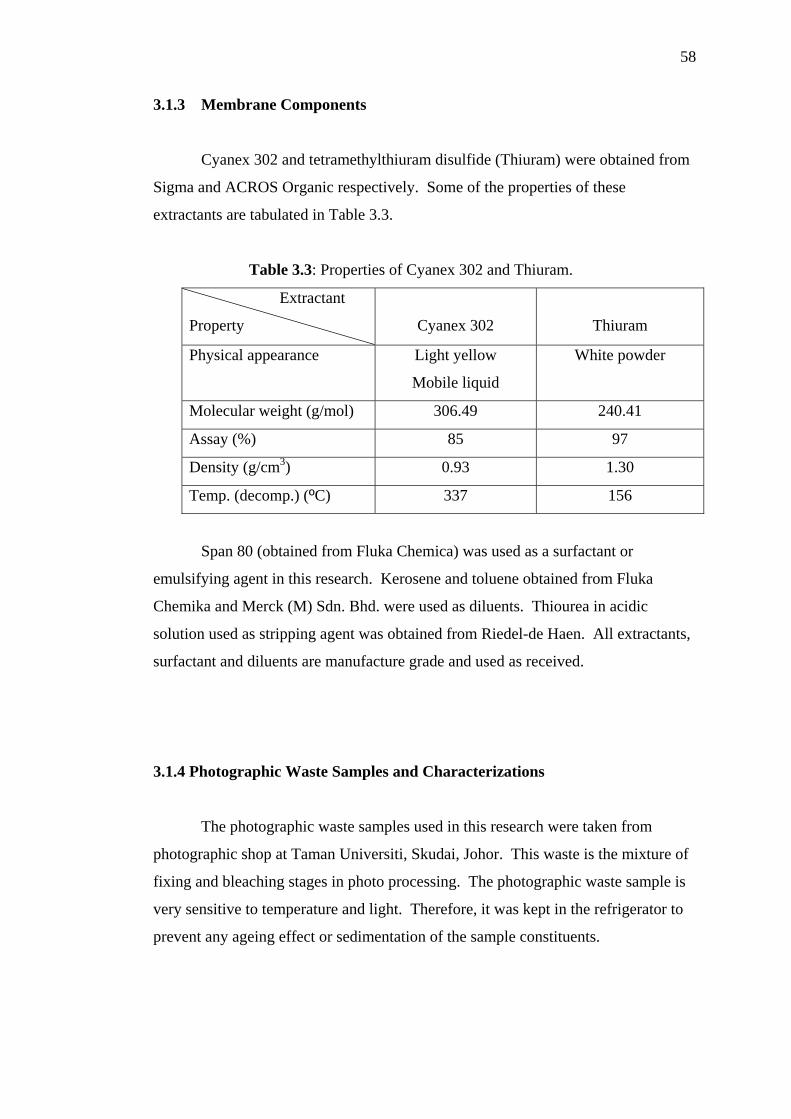
58
3.1.3 Membrane Components
Cyanex 302 and tetramethylthiuram disulfide (Thiuram) were obtained from
Sigma and ACROS Organic respectively. Some of the properties of these
extractants are tabulated in Table 3.3.
Table 3.3: Properties of Cyanex 302 and Thiuram.
Extractant
Property
Cyanex 302
Thiuram
Physical appearance Light yellow
Mobile liquid
White powder
Molecular weight (g/mol) 306.49 240.41
Assay (%) 85 97
Density (g/cm3) 0.93 1.30
Temp. (decomp.) (ºC) 337 156
Span 80 (obtained from Fluka Chemica) was used as a surfactant or
emulsifying agent in this research. Kerosene and toluene obtained from Fluka
Chemika and Merck (M) Sdn. Bhd. were used as diluents. Thiourea in acidic
solution used as stripping agent was obtained from Riedel-de Haen. All extractants,
surfactant and diluents are manufacture grade and used as received.
3.1.4 Photographic Waste Samples and Characterizations
The photographic waste samples used in this research were taken from
photographic shop at Taman Universiti, Skudai, Johor. This waste is the mixture of
fixing and bleaching stages in photo processing. The photographic waste sample is
very sensitive to temperature and light. Therefore, it was kept in the refrigerator to
prevent any ageing effect or sedimentation of the sample constituents.
59
The metal contents in the photographic wastes were measured using the
Atomic Absorption Spectrophotometer (AAS). The anion contents in the
photographic waste samples were measured using Ion Chromatography model LC
20 with electric chemical detector model ED40. The pH measurements were carried
out using pH meter model Cyberscan 100. The determination of the kinematics
viscosity, v was carried out by using Programmable Rheometer Brookfield Model
DV-III at room temperature. The density ( )ρ of the photographic waste samples
was measured using hydrometer.
3.2 Experimental Procedures
3.2.1 Liquid Membrane Component Selection
Liquid membranes consist of four main components such as carrier, stripping
agent, diluents, and surfactant. Several types of carrier and stripping agent as
reported in literature were chosen to screen out the potential components in
extracting silver in emulsion liquid membrane process.
3.2.1.1 Carrier Screening
Carrier screening experiments are intended to choose the appropriate carrier
to recover silver. The main parameter of interest is the amount of silver extracted.
Therefore the suitable carrier must have high tendency to form complexes with
silver ion and also easy to strip out with stripping agent. The affecting parameters
such as the effect of carrier concentrations and initial pH were studied in this
research.
The extraction process was carried out by mixing an equal volume (20ml) of
aqueous photographic wastes and organic solutions using a mechanical shaker with
60
rotation at 250 rpm for a period of one day (24 hours). Then, the mixture is
carefully poured into separation funnel. After the phase separations (around 15-30
minutes), an aqueous phase was carefully separated from the organic phase. The pH
equilibrium is measured. The procedures are repeated for different carrier types.
The concentration of silver in the aqueous phase after extraction is measured by
using AAS. The concentration of silver extracted in the organic phase is calculated
based on mass balance principle. All experiments were carried out at room
temperature (26 ºC).
3.2.1.2 Stripping Agent Screening
This experiment is designed to identify the types and optimum strip agent
concentration required to strip silver from silver loaded organic solution. Stripping
process is the reverse extraction step. Therefore, organic phase (silver loaded
organic phase) is taken from extraction process from Section 3.2.1.1. An equal
volume of strip agent at specified concentration and silver loaded organic phase
were mixed by using mechanical shaker for 18 hours at 250 rpm and then carefully
poured into a separation funnel and left for phase separation for about 15-30
minutes. After phase separation is completed, the aqueous phase was carefully
separated to avoid any contamination by the organic phase and concentration of
silver stripped were measure by AAS. The stripping procedures are repeated for
other strip agents and concentrations.
3.2.1.3 Stability Test
The intension of this experiment is to choose an appropriate emulsifier
concentration to stabilize the emulsion during the experiments. Stability test were
conducted on surfactant, Span 80, where each compound differs in the amount in
organic phase. Equal volume of organic and stripping phases was mixed by using
high speed homogenizer (13500 rpm) for 5 minutes. After that, this white emulsion
61
was transfer to graduated test tubes to measure the volumes of free oil, emulsion and
water for a few days. These tests were conducted at room temperature, 26ºC. The
same procedures were repeated for different speed of homogenizer, type of diluents
in organic phase and type of carriers.
3.2.2 Emulsion Liquid Membrane Extraction
3.2.2.1 Emulsion Liquid Membrane Preparation
The formulation of emulsion liquid membrane consists of four important
components such as diluent, carrier, emulsifier/surfactant, and stripping solution.
The organic phase (diluent, carrier, and emulsifier) is prepared by dissolving
required concentration of carriers and surfactant with appropriate diluents. The
selective carrier of silver from Section 3.2.1.1 was dissolved in diluent at 0.05 M
concentration and 5 % (w/v) of Span 80 as surfactant was added to the solution to
form an organic phase or membrane phase.
The emulsion was prepared by emulsifying aqueous solutions (stripping
phase) of certain acidity (from Section 3.2.2.1) with formulated organic phase. An
equal volume of 5 ml portions of organic and aqueous solutions was stirred
continuously at 13500 rpm using motor driven homogenizer for 5 minutes to obtain
a stable white emulsion liquid membrane. After that, the emulsion is cold down to
room temperature and is ready for the extraction study. The average mean diameter
of emulsion is measured using a microscope with camera. The emulsion must be
freshly prepared each time before the extraction experiment.
62
3.2.2.2 Extraction Study
The external phase, shown in dark brown colour in Figure 3.1, was prepared
by using real photographic waste without any pre-treatment. The prepared emulsion
is then dispersed into the agitated vessel with the external solution in a volume ratio
of emulsion to feed phase of 1 to 5. The three-phase dispersion was stirred for 20
minutes. After that, the samples were quickly introduced into a separation funnel
and left for phase separation. The aqueous phase was filtered in order to remove any
entrainment and this phase was analyzed by using AAS.
The loaded emulsion phase was demulsified in electrostatic coalescer by
applying a certain value of voltage. After all the emulsion broke down, the solution
were left for phase separation in separation funnel. The metal concentrations in
aqueous phase are measured using AAS and the organic phase is ready for the
recycle process. The same procedures were repeated for different agitation speeds,
and different liquid membrane formulation including type of diluents, carriers and
emulsifier concentration.
For emulsion breakage study, the three phase mixture was run separately at
different time of extraction such as 1, 3, 5, 7.5, 10, 15 and 20 minutes. The
procedures are the same as the extraction study. After extraction, the samples are
quickly introduced into the separation funnel to separate the emulsion from the
aqueous feed phase. After phase separation, an emulsion phase was introduced into
graduated test tubes to measure the volume of emulsion phase. The emulsion
breakage was calculated by the difference of emulsion volume at initial and after
extraction.
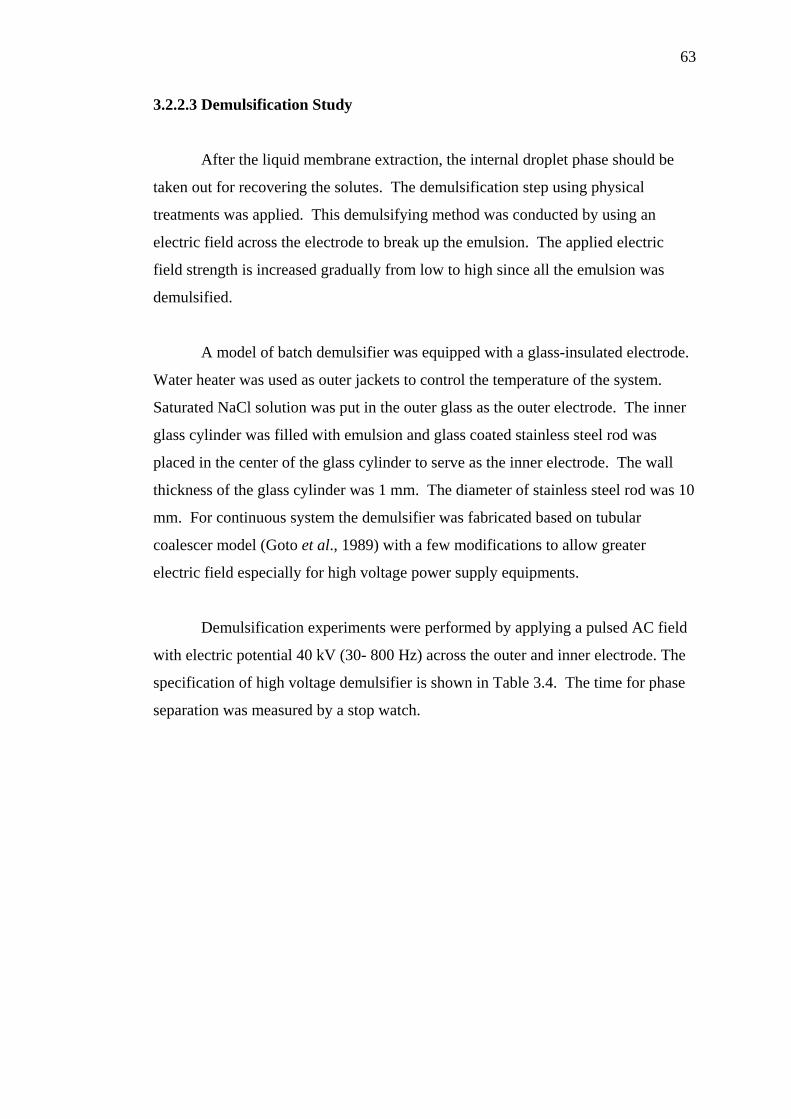
63
3.2.2.3 Demulsification Study
After the liquid membrane extraction, the internal droplet phase should be
taken out for recovering the solutes. The demulsification step using physical
treatments was applied. This demulsifying method was conducted by using an
electric field across the electrode to break up the emulsion. The applied electric
field strength is increased gradually from low to high since all the emulsion was
demulsified.
A model of batch demulsifier was equipped with a glass-insulated electrode.
Water heater was used as outer jackets to control the temperature of the system.
Saturated NaCl solution was put in the outer glass as the outer electrode. The inner
glass cylinder was filled with emulsion and glass coated stainless steel rod was
placed in the center of the glass cylinder to serve as the inner electrode. The wall
thickness of the glass cylinder was 1 mm. The diameter of stainless steel rod was 10
mm. For continuous system the demulsifier was fabricated based on tubular
coalescer model (Goto et al., 1989) with a few modifications to allow greater
electric field especially for high voltage power supply equipments.
Demulsification experiments were performed by applying a pulsed AC field
with electric potential 40 kV (30- 800 Hz) across the outer and inner electrode. The
specification of high voltage demulsifier is shown in Table 3.4. The time for phase
separation was measured by a stop watch.
64
Table 3.4: Specification of High Voltage Demulsifier.
Power Supply
Input : 240 V Output : 0-22 V Current : 6 Amp Frequency : 60 Hz
High Voltage Power Supply
Input : 0-22 V Output : 0-40 kV Frequency : 30 – 800 Hz
Accessories Oscilloscope High voltage probe
3.3 Analytical Procedures
3.3.1 Metal Content Analysis
Analysis of the metal content is performed to characterize the photographic
wastes as well as to determine the metal concentration in the aqueous phase after
extraction and stripping process and also ELM recovery process. The metals were
determined by using Atomic Absorption Spectrophotometer (AAS) model Philips
PU9200X. AAS is principal tool for measuring metallic elements at ppm level. A
liquid sample is sucked through a plastic tube into a flame, and then the flame
evaporates all liquid, breaks all molecules into atoms, and excites many atoms into
high energy states. The concentration of elements was measured by absorption of
light from atoms in flame. In most cases, for silver analysis the samples were
diluted to the concentration of between 2 – 8 ppm in order to bring it to within the
linear working range of the equipment sensitivity. All data presented in this thesis
were an average of triplicates results.
65
3.3.2 Anion Content Analysis
The anion contents in the photographic waste samples were measured using
Ion Chromatographic model LC 20 with electric chemical detector model ED40.
Since the anion concentration in the waste is high, the samples were diluted using
distilled water. This procedure is very important to avoid any blocking in the
column. This ion Chromatography is very sensitive especially for most common
inorganic strong acid anions such as chloride, nitrate, phosphate, and sulphate. All
measurements were carried out in triplicates and all data presented are average
values.
3.3.3 pH Measurement
PH of every samples and photographic waste were measured using pH meter
(Ecomet P25 Bench pH/mV/TEMP meter, Istek, INC). The pH meter was calibrated
with a three point calibration using purchased buffer solutions. All measurements
were carried out at room temperature.
3.3.4 Viscosity Measurement
The viscosity of the membrane phases was determined for experiments
where it was necessary to estimate the diffusivities of various membrane
components. Viscosity determinations were made on a Programmable Rheometer
Brookfield Model DV-III at room temperature. Viscosity was measured by taking
the rate of change of shear stress versus strain. A spindle type 18 was used to test the
viscosity and motor speed at 100 rpm.
66
3.3.5 Density Measurement
Density ( ρ ) measurements were made of aqueous solutions, pure membrane
components, blended membrane phase, diluents for particle size measurements and
emulsions. All the density measurements were conducted at 30 ± 1°C using
hydrometer.
3.3.6 Emulsion Drop Size Measurement
The drop size of emulsion was measured using a microscope with camera
and directly connected to Video Structure Image Analyzer. One drop of emulsion
was placed on glass slide and by using microscope with camera a few photo were
captured. The photo was analyzed and an average diameter of emulsion droplets
was calculated.
CHAPTER 4
LIQUID MEMBRANE COMPONENT SELECTION
4.1 Introduction
In finding a good formulation of liquid membrane, detail observation in
choosing a potential carrier of silver and stripping agent must be carried out in a
batch emulsion liquid membrane process. As we know, silver in photographic waste
is widely available for recovery. However the selective extraction of silver(I) from
thiosulfate solutions has not been exhaustively investigated due to the tight bonding
between silver and thiosulfate ions. So far, work performed on evaluating solvent
extraction techniques for thiosulfate solution is limited to amine extractants
(Strestrom, 1992) and tetramethylthiuram disulfide (Mendoza and Kamata, 1996).
In order to find a good carrier of silver from thiosulfate medium, several types of
extractant were screened based on the conventional solvent extraction process.
Solvent extraction is a process that involves the transfer of a solute from one
liquid phase to another liquid phase. The two liquid phases must be immiscible to
each other. In the context of metal recovery from photographic wastes, the metal-
bearing aqueous feed solution is brought into contact with the solvent containing
certain extractant for a sufficient period of time. The metal of interest which is
initially insoluble in the organic phase is transferred from the aqueous phase into the
organic phase through the formation of an uncharged species that is soluble in the
organic phase with certain mechanism (Chapman, 1987).
68
The metal loaded organic phase is then mixed with an aqueous phase to
undergo the stripping process. The stripping process is actually the reverse reaction
of extraction. The metal of interest is stripped from the organic phase by suitable
aqueous solution. The extractant in the organic phase can thus be recovered and
reused for the extraction process (Freiser, 1973).
The effectiveness of an extraction process is influenced by some typical
factors, such as types of carrier/extractant and its concentration, pH and selectivity
of extractant. As for stripping process, the types of stripping agent used and their
concentrations are of paramount concern. Hence, these parameters are studied in
this research to examine their effects on silver extraction from photographic wastes.
On the other hand, the main process condition in emulsion liquid membranes must
be considered thoroughly in term of emulsion stability and extraction capacity.
4.2 Carrier Screening
The factors that need to be considered in metal selectivity and capacity of
extraction are the selection of carrier types and its concentration. High selectivity
and capacity can only be achieved by selecting the right carrier and its concentration
for target metal ions. An increase in carrier concentration will increase the
extraction capacity, but to what extent needs to be optimized to avoid excessive use
of carrier that is normally very costly.
From the above point of view a few experiments have been carried out to
select the suitable carrier in liquid membrane formulation. The carriers to be
assessed consist of acidic, chelating, basic and solvating extractants.
69
4.2.1 Acidic Extractants
Three types of acidic extractants such as Cyanex 272, Cyanex 302, and
D2EHPA were examined in term of their capability and selectivity in extracting
metals from photographic wastes. The chemical structures of these extractants are
shown in Figure 4.1. Table 4.1 and Table 4.2 show the extraction performance of
metals using 0.005 M and 0.05 M extractant concentration. The result indicates that
extractant containing P=S functional groups (Cyanex 302) provide a higher
extraction towards silver than other metals that existed in the photographic waste
compared to Cyanex 272 and D2EHPA. The extractions of silver with Cyanex 302
are 18% and 97% when using 0.005 M and 0.05 M respectively. This finding is
inline with reports by Alam et al. (1997), who investigated the extraction of silver
with some commercial sulfur-containing extractant like MSP-8, Cyanex 301,
Cyanex 302 and SFI-6R. On the other hand, Cyanex 272 and D2EHPA also exhibit
good metal extraction but it is only selective to iron for Cyanex 272 and no
significant selectivity for D2EHPA.
The result also shows that there is no significant difference in pH equilibrium
of each extractant even though the amount of metal-complexes formation depends
on the types of extractant. As reported in literatures, acidic extractants are
monobasic in nature and thus release one hydrogen ion for every molecule which
combines with a metal while the number of molecules of extractant involved in the
formation depends on the oxidation state or coordination number of the metal ions
(Tait, 1993; Sole and Hiskey, 1995; Sole et al., 1994; Alam et al., 1997; Almela and
Elizalde, 1995). However silver extraction from photographic wastes occurred at a
relatively higher equilibrium pH. This may be caused by the buffering effect of
metals and organic compounds present in the photographic waste.
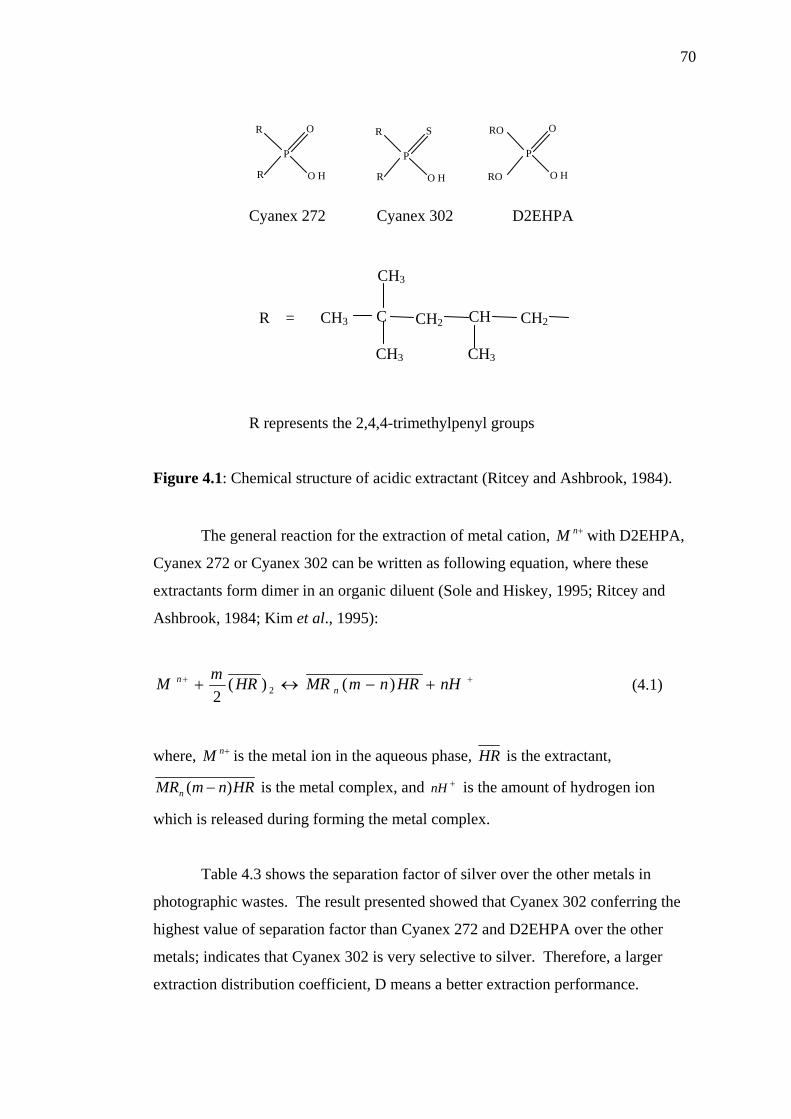
70
Cyanex 272 Cyanex 302 D2EHPA
R represents the 2,4,4-trimethylpenyl groups
Figure 4.1: Chemical structure of acidic extractant (Ritcey and Ashbrook, 1984).
The general reaction for the extraction of metal cation, +nM with D2EHPA,
Cyanex 272 or Cyanex 302 can be written as following equation, where these
extractants form dimer in an organic diluent (Sole and Hiskey, 1995; Ritcey and
Ashbrook, 1984; Kim et al., 1995):
++ +−↔+ nHHRnmMRHRmM nn )()(
2 2 (4.1)
where, +nM is the metal ion in the aqueous phase, HR is the extractant,
HRnmMRn )( − is the metal complex, and +nH is the amount of hydrogen ion
which is released during forming the metal complex.
Table 4.3 shows the separation factor of silver over the other metals in
photographic wastes. The result presented showed that Cyanex 302 conferring the
highest value of separation factor than Cyanex 272 and D2EHPA over the other
metals; indicates that Cyanex 302 is very selective to silver. Therefore, a larger
extraction distribution coefficient, D means a better extraction performance.
CH3
CH2 R =
CH3
CH3
CH2 CHCCH3
O H
O
R
R
P
O H
O
RO
RO
P
O H
S
R
R
P
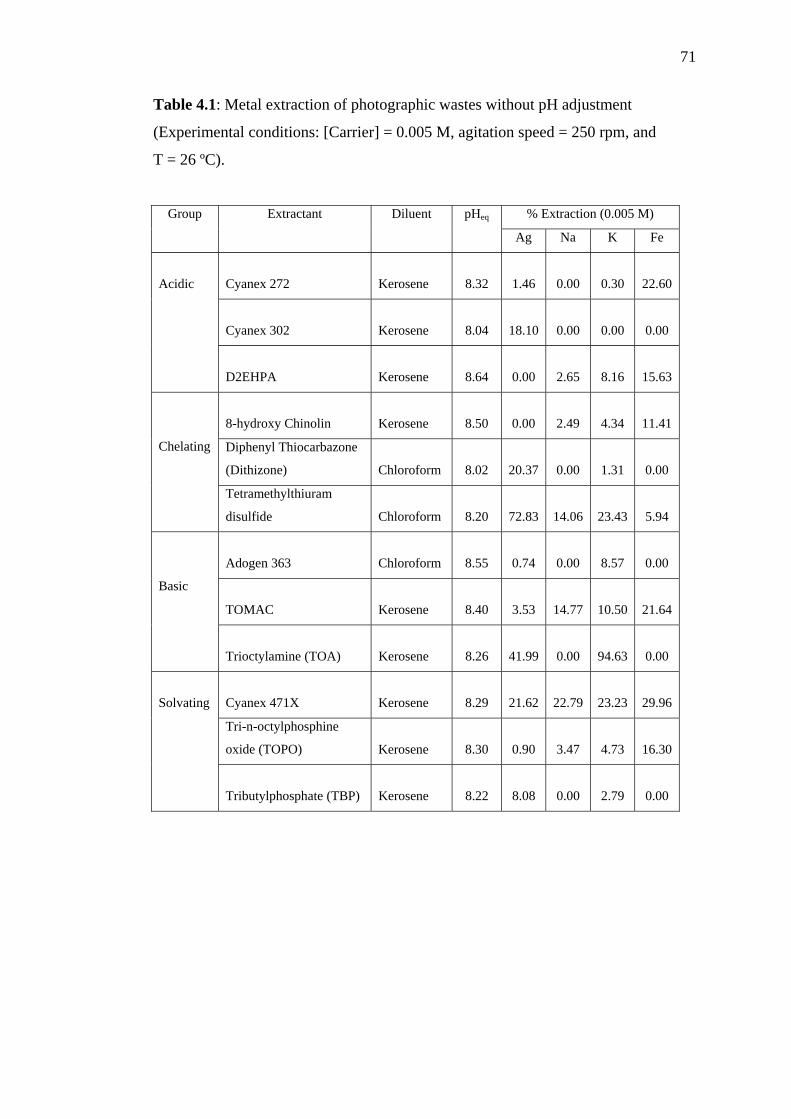
71
Table 4.1: Metal extraction of photographic wastes without pH adjustment
(Experimental conditions: [Carrier] = 0.005 M, agitation speed = 250 rpm, and
T = 26 ºC).
% Extraction (0.005 M) Group Extractant Diluent pHeq
Ag Na K Fe
Cyanex 272 Kerosene 8.32 1.46 0.00 0.30 22.60
Cyanex 302 Kerosene 8.04 18.10 0.00 0.00 0.00
Acidic
D2EHPA Kerosene 8.64 0.00 2.65 8.16 15.63
8-hydroxy Chinolin Kerosene 8.50 0.00 2.49 4.34 11.41
Diphenyl Thiocarbazone
(Dithizone) Chloroform 8.02 20.37 0.00 1.31 0.00
Chelating
Tetramethylthiuram
disulfide Chloroform 8.20 72.83 14.06 23.43 5.94
Adogen 363 Chloroform 8.55 0.74 0.00 8.57 0.00
TOMAC Kerosene 8.40 3.53 14.77 10.50 21.64
Basic
Trioctylamine (TOA) Kerosene 8.26 41.99 0.00 94.63 0.00
Cyanex 471X Kerosene 8.29 21.62 22.79 23.23 29.96
Tri-n-octylphosphine
oxide (TOPO) Kerosene 8.30 0.90 3.47 4.73 16.30
Solvating
Tributylphosphate (TBP) Kerosene 8.22 8.08 0.00 2.79 0.00
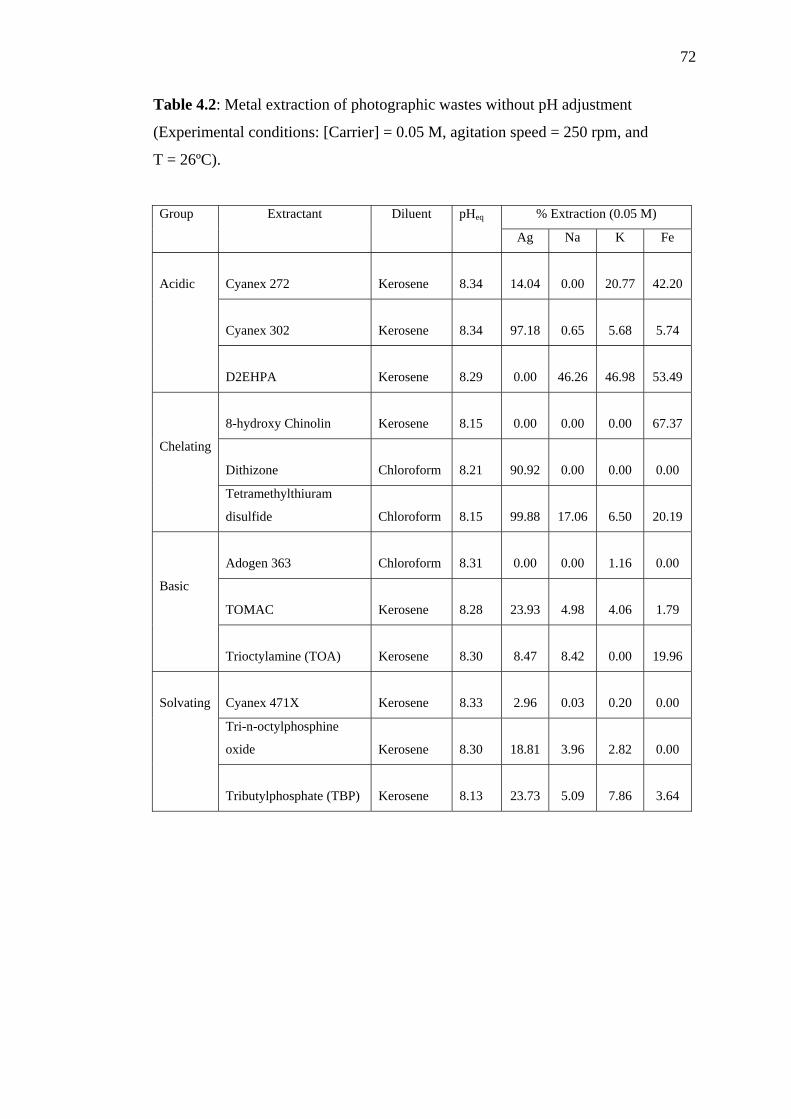
72
Table 4.2: Metal extraction of photographic wastes without pH adjustment
(Experimental conditions: [Carrier] = 0.05 M, agitation speed = 250 rpm, and
T = 26ºC).
% Extraction (0.05 M) Group Extractant Diluent pHeq
Ag Na K Fe
Cyanex 272 Kerosene 8.34 14.04 0.00 20.77 42.20
Cyanex 302 Kerosene 8.34 97.18 0.65 5.68 5.74
Acidic
D2EHPA Kerosene 8.29 0.00 46.26 46.98 53.49
8-hydroxy Chinolin Kerosene 8.15 0.00 0.00 0.00 67.37
Dithizone Chloroform 8.21 90.92 0.00 0.00 0.00
Chelating
Tetramethylthiuram
disulfide Chloroform 8.15 99.88 17.06 6.50 20.19
Adogen 363 Chloroform 8.31 0.00 0.00 1.16 0.00
TOMAC Kerosene 8.28 23.93 4.98 4.06 1.79
Basic
Trioctylamine (TOA) Kerosene 8.30 8.47 8.42 0.00 19.96
Cyanex 471X Kerosene 8.33 2.96 0.03 0.20 0.00
Tri-n-octylphosphine
oxide Kerosene 8.30 18.81 3.96 2.82 0.00
Solvating
Tributylphosphate (TBP) Kerosene 8.13 23.73 5.09 7.86 3.64
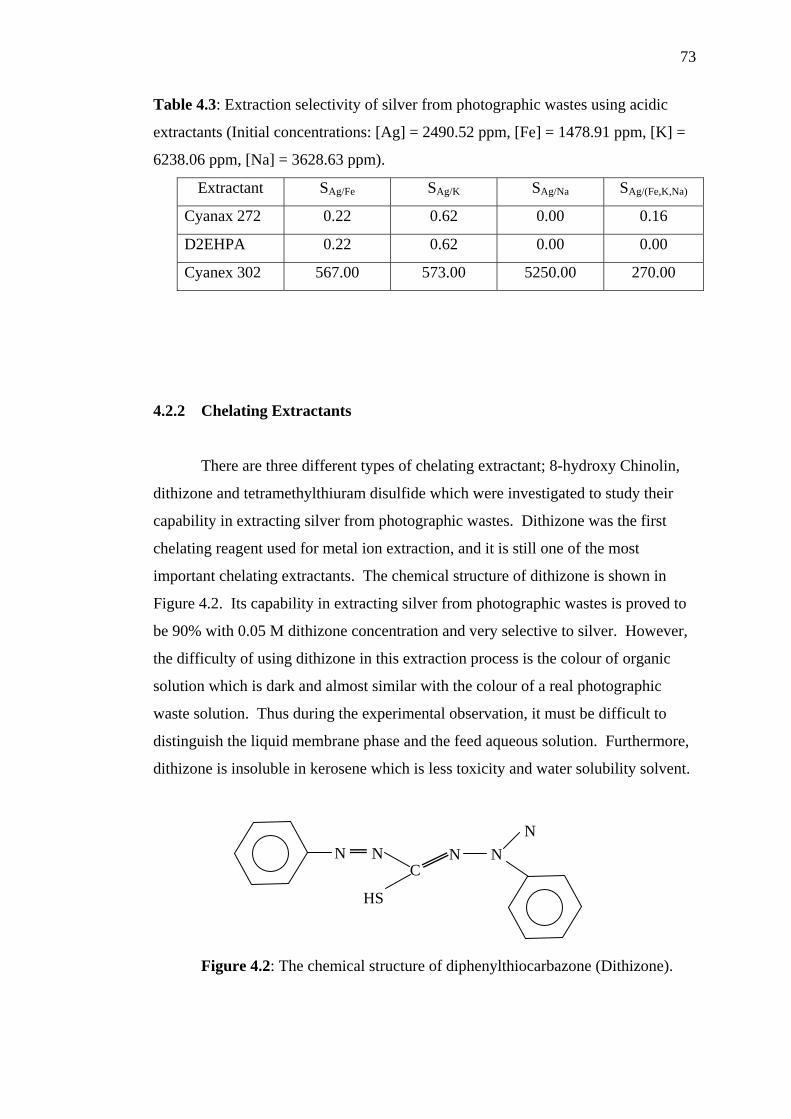
73
Table 4.3: Extraction selectivity of silver from photographic wastes using acidic
extractants (Initial concentrations: [Ag] = 2490.52 ppm, [Fe] = 1478.91 ppm, [K] =
6238.06 ppm, [Na] = 3628.63 ppm).
Extractant SAg/Fe SAg/K SAg/Na SAg/(Fe,K,Na)
Cyanax 272 0.22 0.62 0.00 0.16
D2EHPA 0.22 0.62 0.00 0.00
Cyanex 302 567.00 573.00 5250.00 270.00
4.2.2 Chelating Extractants
There are three different types of chelating extractant; 8-hydroxy Chinolin,
dithizone and tetramethylthiuram disulfide which were investigated to study their
capability in extracting silver from photographic wastes. Dithizone was the first
chelating reagent used for metal ion extraction, and it is still one of the most
important chelating extractants. The chemical structure of dithizone is shown in
Figure 4.2. Its capability in extracting silver from photographic wastes is proved to
be 90% with 0.05 M dithizone concentration and very selective to silver. However,
the difficulty of using dithizone in this extraction process is the colour of organic
solution which is dark and almost similar with the colour of a real photographic
waste solution. Thus during the experimental observation, it must be difficult to
distinguish the liquid membrane phase and the feed aqueous solution. Furthermore,
dithizone is insoluble in kerosene which is less toxicity and water solubility solvent.
Figure 4.2: The chemical structure of diphenylthiocarbazone (Dithizone).
N NC
HS
N NN
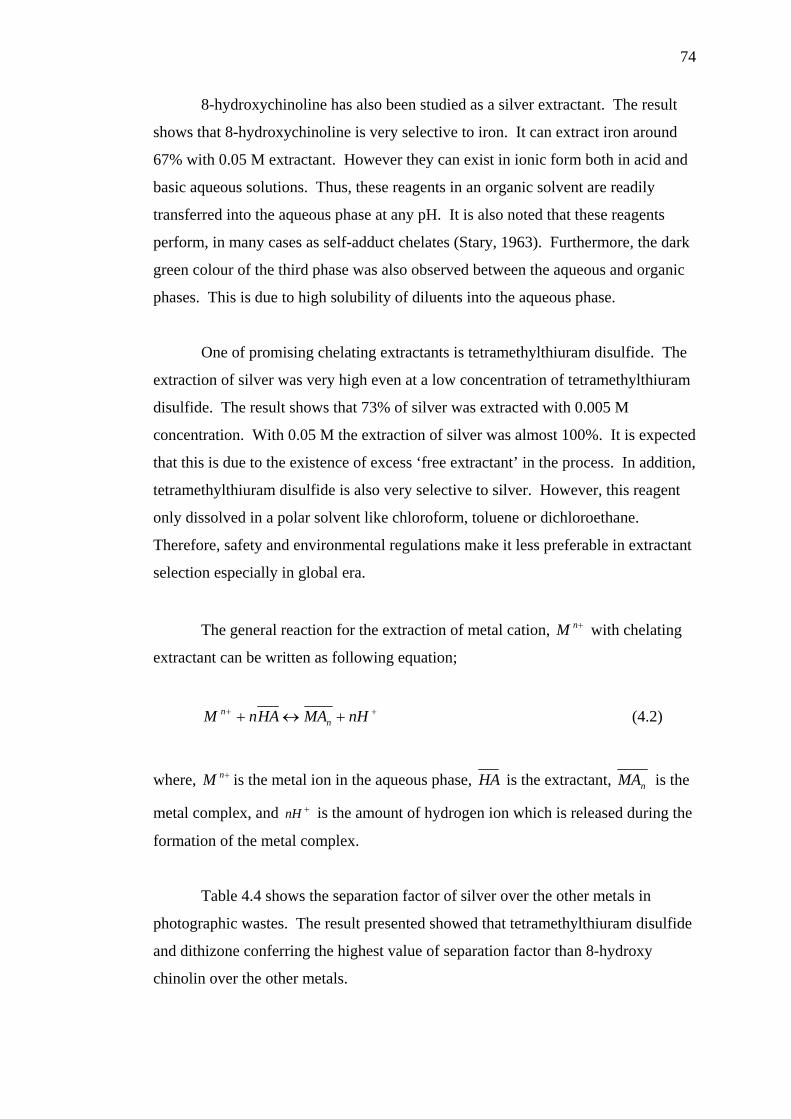
74
8-hydroxychinoline has also been studied as a silver extractant. The result
shows that 8-hydroxychinoline is very selective to iron. It can extract iron around
67% with 0.05 M extractant. However they can exist in ionic form both in acid and
basic aqueous solutions. Thus, these reagents in an organic solvent are readily
transferred into the aqueous phase at any pH. It is also noted that these reagents
perform, in many cases as self-adduct chelates (Stary, 1963). Furthermore, the dark
green colour of the third phase was also observed between the aqueous and organic
phases. This is due to high solubility of diluents into the aqueous phase.
One of promising chelating extractants is tetramethylthiuram disulfide. The
extraction of silver was very high even at a low concentration of tetramethylthiuram
disulfide. The result shows that 73% of silver was extracted with 0.005 M
concentration. With 0.05 M the extraction of silver was almost 100%. It is expected
that this is due to the existence of excess ‘free extractant’ in the process. In addition,
tetramethylthiuram disulfide is also very selective to silver. However, this reagent
only dissolved in a polar solvent like chloroform, toluene or dichloroethane.
Therefore, safety and environmental regulations make it less preferable in extractant
selection especially in global era.
The general reaction for the extraction of metal cation, +nM with chelating
extractant can be written as following equation;
++ +↔+ nHMAHAnM n
n (4.2)
where, +nM is the metal ion in the aqueous phase, HA is the extractant, nMA is the
metal complex, and +nH is the amount of hydrogen ion which is released during the
formation of the metal complex.
Table 4.4 shows the separation factor of silver over the other metals in
photographic wastes. The result presented showed that tetramethylthiuram disulfide
and dithizone conferring the highest value of separation factor than 8-hydroxy
chinolin over the other metals.
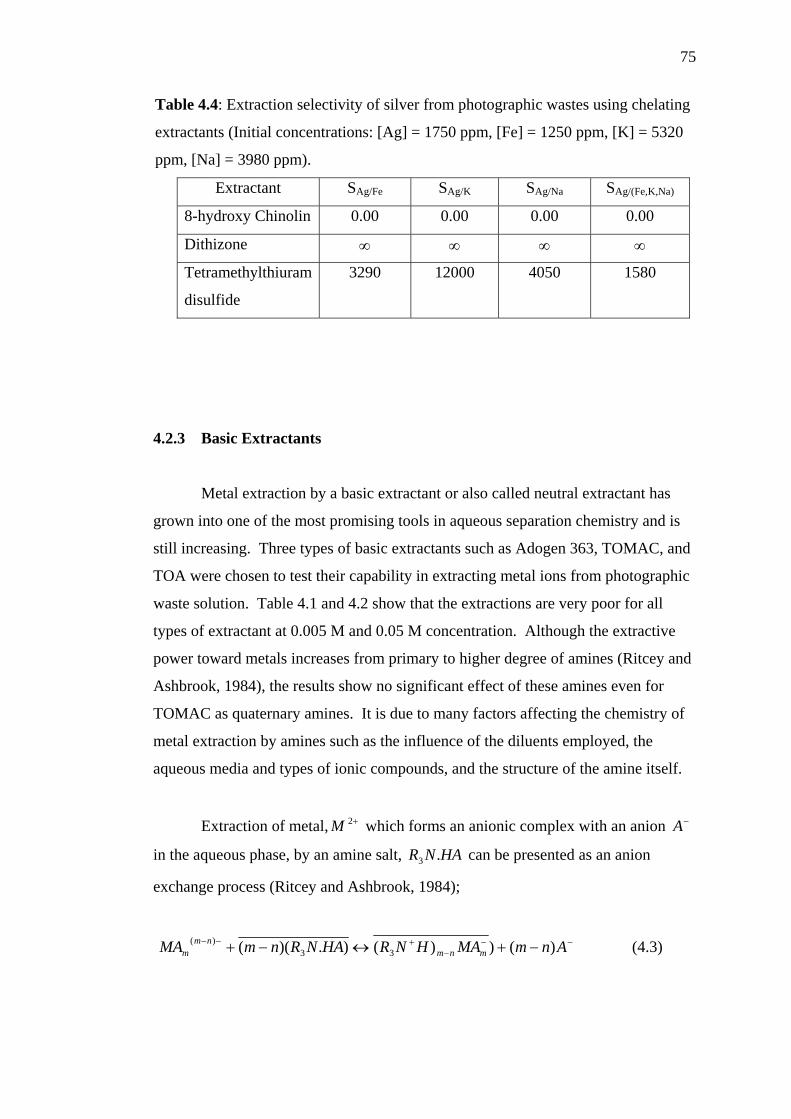
75
Table 4.4: Extraction selectivity of silver from photographic wastes using chelating
extractants (Initial concentrations: [Ag] = 1750 ppm, [Fe] = 1250 ppm, [K] = 5320
ppm, [Na] = 3980 ppm).
Extractant SAg/Fe SAg/K SAg/Na SAg/(Fe,K,Na)
8-hydroxy Chinolin 0.00 0.00 0.00 0.00
Dithizone ∞ ∞ ∞ ∞
Tetramethylthiuram
disulfide
3290 12000 4050 1580
4.2.3 Basic Extractants
Metal extraction by a basic extractant or also called neutral extractant has
grown into one of the most promising tools in aqueous separation chemistry and is
still increasing. Three types of basic extractants such as Adogen 363, TOMAC, and
TOA were chosen to test their capability in extracting metal ions from photographic
waste solution. Table 4.1 and 4.2 show that the extractions are very poor for all
types of extractant at 0.005 M and 0.05 M concentration. Although the extractive
power toward metals increases from primary to higher degree of amines (Ritcey and
Ashbrook, 1984), the results show no significant effect of these amines even for
TOMAC as quaternary amines. It is due to many factors affecting the chemistry of
metal extraction by amines such as the influence of the diluents employed, the
aqueous media and types of ionic compounds, and the structure of the amine itself.
Extraction of metal, +2M which forms an anionic complex with an anion −A
in the aqueous phase, by an amine salt, HANR .3 can be presented as an anion
exchange process (Ritcey and Ashbrook, 1984);
−−
−+−− −+↔−+ AnmMAHNRHANRnmMA mnm
nmm )())().)(( 33
)( (4.3)
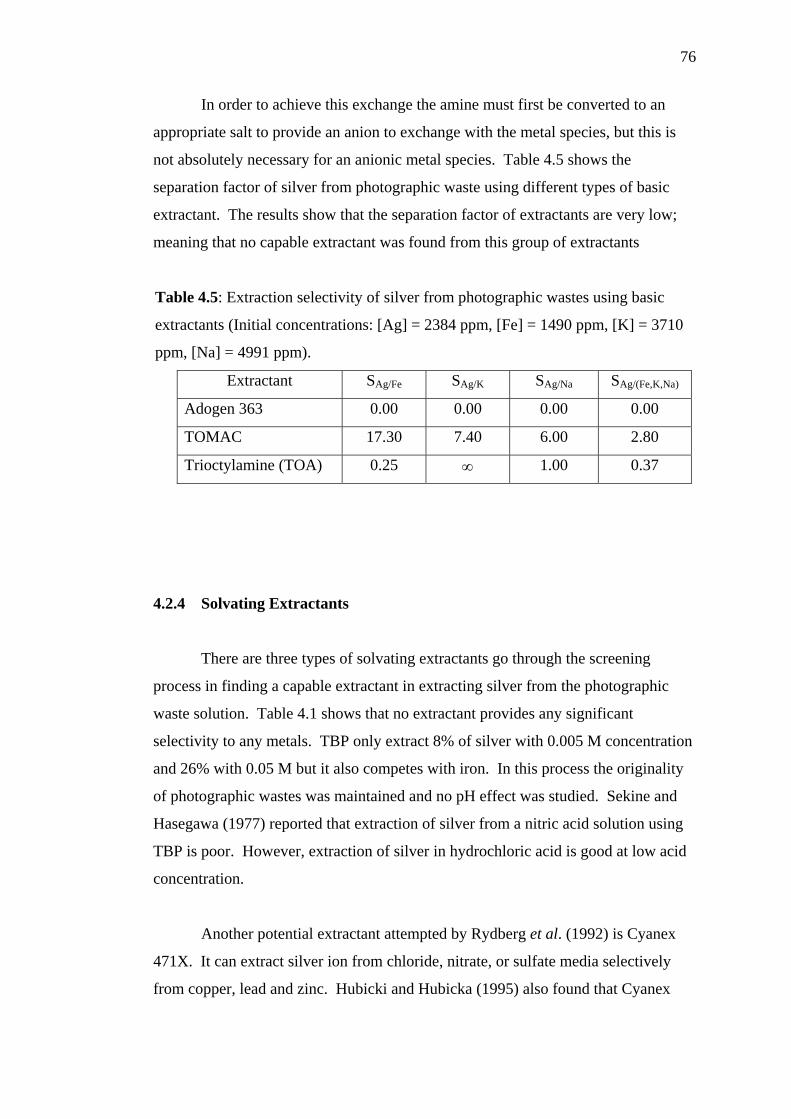
76
In order to achieve this exchange the amine must first be converted to an
appropriate salt to provide an anion to exchange with the metal species, but this is
not absolutely necessary for an anionic metal species. Table 4.5 shows the
separation factor of silver from photographic waste using different types of basic
extractant. The results show that the separation factor of extractants are very low;
meaning that no capable extractant was found from this group of extractants
Table 4.5: Extraction selectivity of silver from photographic wastes using basic
extractants (Initial concentrations: [Ag] = 2384 ppm, [Fe] = 1490 ppm, [K] = 3710
ppm, [Na] = 4991 ppm).
Extractant SAg/Fe SAg/K SAg/Na SAg/(Fe,K,Na)
Adogen 363 0.00 0.00 0.00 0.00
TOMAC 17.30 7.40 6.00 2.80
Trioctylamine (TOA) 0.25 ∞ 1.00 0.37
4.2.4 Solvating Extractants
There are three types of solvating extractants go through the screening
process in finding a capable extractant in extracting silver from the photographic
waste solution. Table 4.1 shows that no extractant provides any significant
selectivity to any metals. TBP only extract 8% of silver with 0.005 M concentration
and 26% with 0.05 M but it also competes with iron. In this process the originality
of photographic wastes was maintained and no pH effect was studied. Sekine and
Hasegawa (1977) reported that extraction of silver from a nitric acid solution using
TBP is poor. However, extraction of silver in hydrochloric acid is good at low acid
concentration.
Another potential extractant attempted by Rydberg et al. (1992) is Cyanex
471X. It can extract silver ion from chloride, nitrate, or sulfate media selectively
from copper, lead and zinc. Hubicki and Hubicka (1995) also found that Cyanex
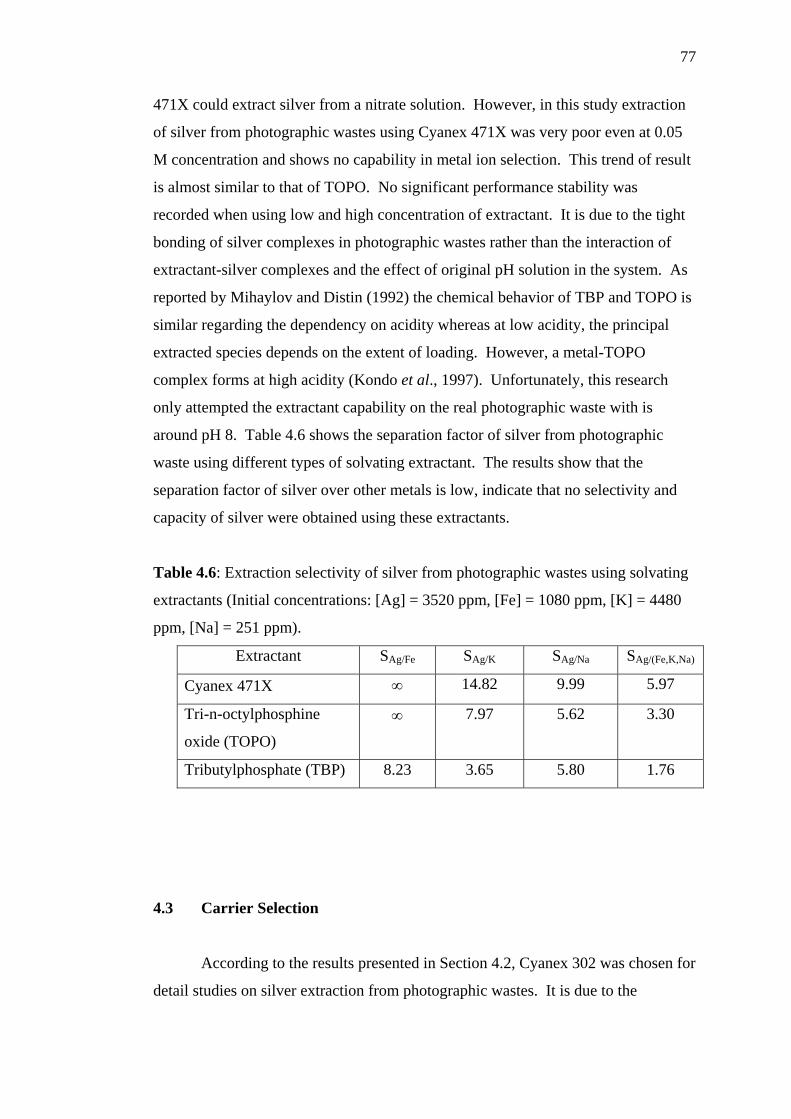
77
471X could extract silver from a nitrate solution. However, in this study extraction
of silver from photographic wastes using Cyanex 471X was very poor even at 0.05
M concentration and shows no capability in metal ion selection. This trend of result
is almost similar to that of TOPO. No significant performance stability was
recorded when using low and high concentration of extractant. It is due to the tight
bonding of silver complexes in photographic wastes rather than the interaction of
extractant-silver complexes and the effect of original pH solution in the system. As
reported by Mihaylov and Distin (1992) the chemical behavior of TBP and TOPO is
similar regarding the dependency on acidity whereas at low acidity, the principal
extracted species depends on the extent of loading. However, a metal-TOPO
complex forms at high acidity (Kondo et al., 1997). Unfortunately, this research
only attempted the extractant capability on the real photographic waste with is
around pH 8. Table 4.6 shows the separation factor of silver from photographic
waste using different types of solvating extractant. The results show that the
separation factor of silver over other metals is low, indicate that no selectivity and
capacity of silver were obtained using these extractants.
Table 4.6: Extraction selectivity of silver from photographic wastes using solvating
extractants (Initial concentrations: [Ag] = 3520 ppm, [Fe] = 1080 ppm, [K] = 4480
ppm, [Na] = 251 ppm).
Extractant SAg/Fe SAg/K SAg/Na SAg/(Fe,K,Na)
Cyanex 471X ∞ 14.82 9.99 5.97
Tri-n-octylphosphine
oxide (TOPO) ∞ 7.97 5.62 3.30
Tributylphosphate (TBP) 8.23 3.65 5.80 1.76
4.3 Carrier Selection
According to the results presented in Section 4.2, Cyanex 302 was chosen for
detail studies on silver extraction from photographic wastes. It is due to the
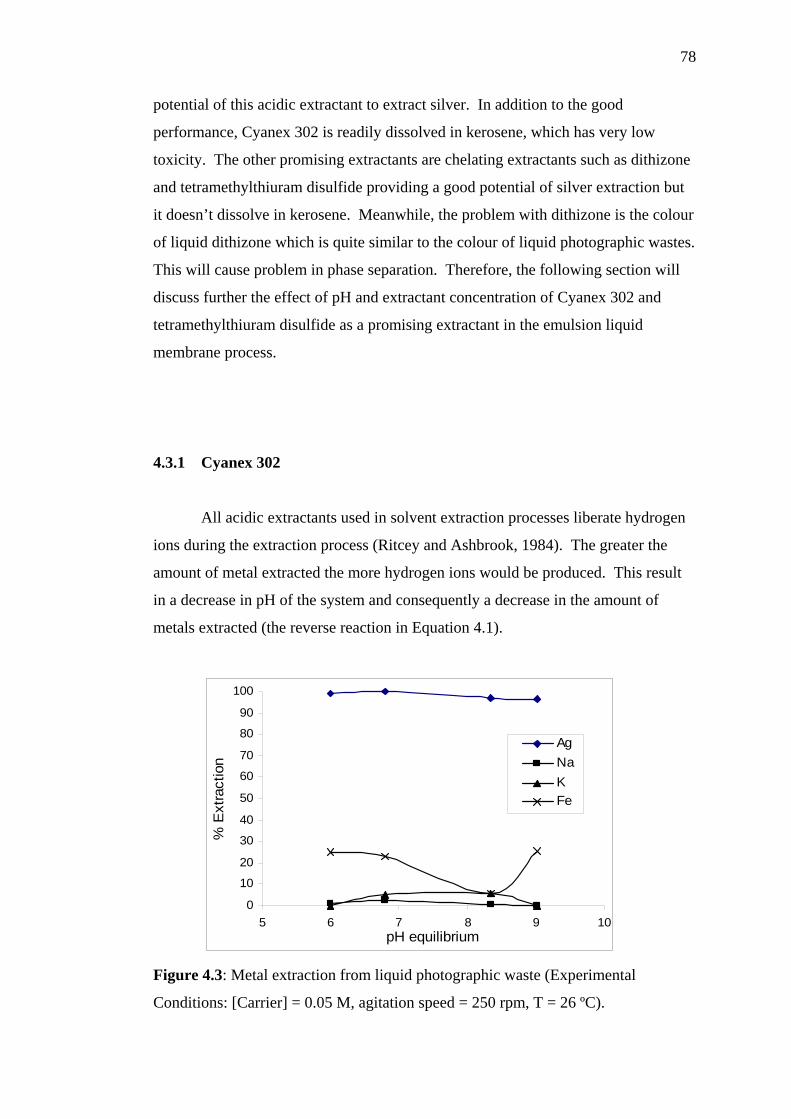
78
potential of this acidic extractant to extract silver. In addition to the good
performance, Cyanex 302 is readily dissolved in kerosene, which has very low
toxicity. The other promising extractants are chelating extractants such as dithizone
and tetramethylthiuram disulfide providing a good potential of silver extraction but
it doesn’t dissolve in kerosene. Meanwhile, the problem with dithizone is the colour
of liquid dithizone which is quite similar to the colour of liquid photographic wastes.
This will cause problem in phase separation. Therefore, the following section will
discuss further the effect of pH and extractant concentration of Cyanex 302 and
tetramethylthiuram disulfide as a promising extractant in the emulsion liquid
membrane process.
4.3.1 Cyanex 302
All acidic extractants used in solvent extraction processes liberate hydrogen
ions during the extraction process (Ritcey and Ashbrook, 1984). The greater the
amount of metal extracted the more hydrogen ions would be produced. This result
in a decrease in pH of the system and consequently a decrease in the amount of
metals extracted (the reverse reaction in Equation 4.1).
0
10
20
30
40
50
60
70
80
90
100
5 6 7 8 9 10pH equilibrium
% E
xtra
ctio
n
AgNaKFe
Figure 4.3: Metal extraction from liquid photographic waste (Experimental
Conditions: [Carrier] = 0.05 M, agitation speed = 250 rpm, T = 26 ºC).
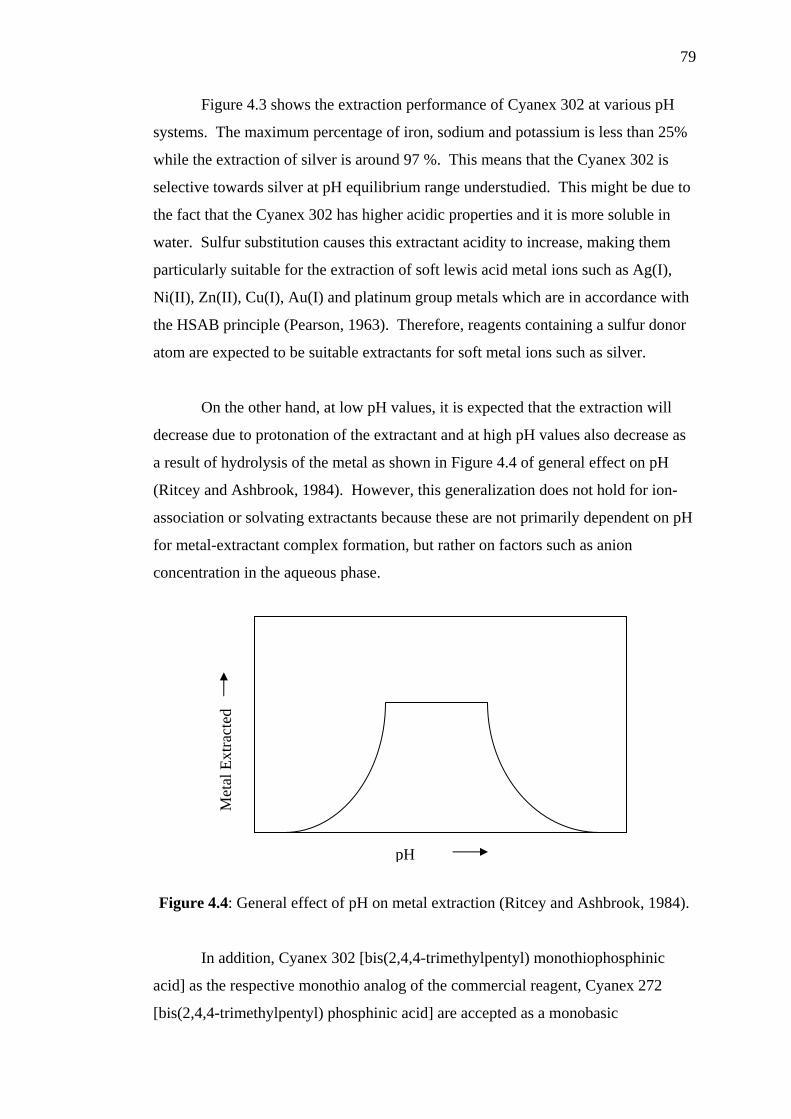
79
Figure 4.3 shows the extraction performance of Cyanex 302 at various pH
systems. The maximum percentage of iron, sodium and potassium is less than 25%
while the extraction of silver is around 97 %. This means that the Cyanex 302 is
selective towards silver at pH equilibrium range understudied. This might be due to
the fact that the Cyanex 302 has higher acidic properties and it is more soluble in
water. Sulfur substitution causes this extractant acidity to increase, making them
particularly suitable for the extraction of soft lewis acid metal ions such as Ag(I),
Ni(II), Zn(II), Cu(I), Au(I) and platinum group metals which are in accordance with
the HSAB principle (Pearson, 1963). Therefore, reagents containing a sulfur donor
atom are expected to be suitable extractants for soft metal ions such as silver.
On the other hand, at low pH values, it is expected that the extraction will
decrease due to protonation of the extractant and at high pH values also decrease as
a result of hydrolysis of the metal as shown in Figure 4.4 of general effect on pH
(Ritcey and Ashbrook, 1984). However, this generalization does not hold for ion-
association or solvating extractants because these are not primarily dependent on pH
for metal-extractant complex formation, but rather on factors such as anion
concentration in the aqueous phase.
Figure 4.4: General effect of pH on metal extraction (Ritcey and Ashbrook, 1984).
In addition, Cyanex 302 [bis(2,4,4-trimethylpentyl) monothiophosphinic
acid] as the respective monothio analog of the commercial reagent, Cyanex 272
[bis(2,4,4-trimethylpentyl) phosphinic acid] are accepted as a monobasic
Met
al E
xtra
cted
pH
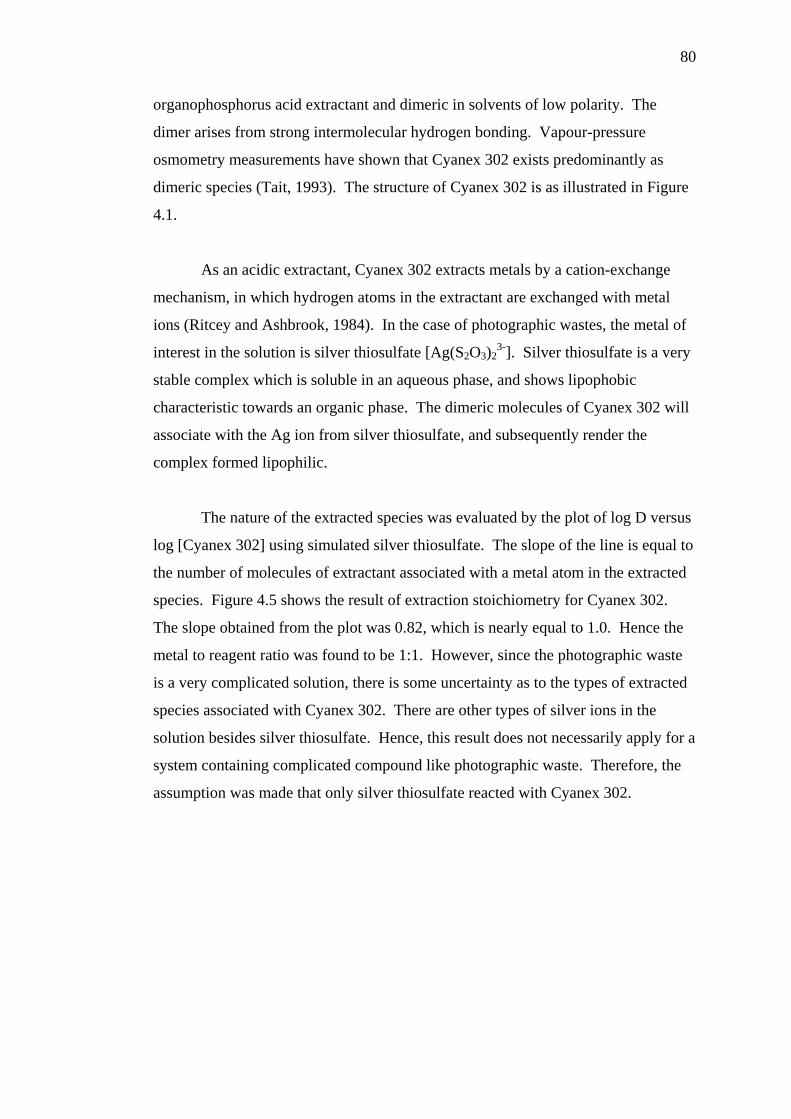
80
organophosphorus acid extractant and dimeric in solvents of low polarity. The
dimer arises from strong intermolecular hydrogen bonding. Vapour-pressure
osmometry measurements have shown that Cyanex 302 exists predominantly as
dimeric species (Tait, 1993). The structure of Cyanex 302 is as illustrated in Figure
4.1.
As an acidic extractant, Cyanex 302 extracts metals by a cation-exchange
mechanism, in which hydrogen atoms in the extractant are exchanged with metal
ions (Ritcey and Ashbrook, 1984). In the case of photographic wastes, the metal of
interest in the solution is silver thiosulfate [Ag(S2O3)23-]. Silver thiosulfate is a very
stable complex which is soluble in an aqueous phase, and shows lipophobic
characteristic towards an organic phase. The dimeric molecules of Cyanex 302 will
associate with the Ag ion from silver thiosulfate, and subsequently render the
complex formed lipophilic.
The nature of the extracted species was evaluated by the plot of log D versus
log [Cyanex 302] using simulated silver thiosulfate. The slope of the line is equal to
the number of molecules of extractant associated with a metal atom in the extracted
species. Figure 4.5 shows the result of extraction stoichiometry for Cyanex 302.
The slope obtained from the plot was 0.82, which is nearly equal to 1.0. Hence the
metal to reagent ratio was found to be 1:1. However, since the photographic waste
is a very complicated solution, there is some uncertainty as to the types of extracted
species associated with Cyanex 302. There are other types of silver ions in the
solution besides silver thiosulfate. Hence, this result does not necessarily apply for a
system containing complicated compound like photographic waste. Therefore, the
assumption was made that only silver thiosulfate reacted with Cyanex 302.
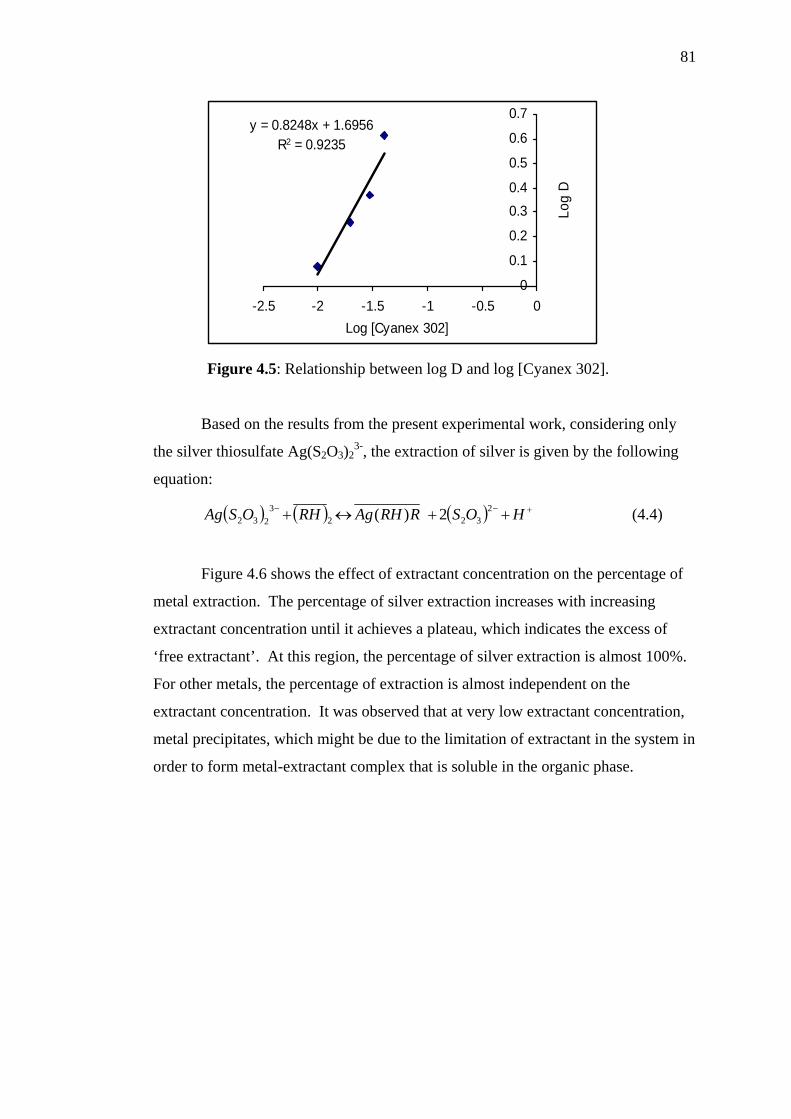
81
y = 0.8248x + 1.6956R2 = 0.9235
0
0.1
0.2
0.30.4
0.5
0.6
0.7
-2.5 -2 -1.5 -1 -0.5 0Log [Cyanex 302]
Log
D
Figure 4.5: Relationship between log D and log [Cyanex 302].
Based on the results from the present experimental work, considering only
the silver thiosulfate Ag(S2O3)23-, the extraction of silver is given by the following
equation:
( ) ( ) ( ) +−− ++↔+ HOSRRHAgRHOSAg 2322
3232 2)( (4.4)
Figure 4.6 shows the effect of extractant concentration on the percentage of
metal extraction. The percentage of silver extraction increases with increasing
extractant concentration until it achieves a plateau, which indicates the excess of
‘free extractant’. At this region, the percentage of silver extraction is almost 100%.
For other metals, the percentage of extraction is almost independent on the
extractant concentration. It was observed that at very low extractant concentration,
metal precipitates, which might be due to the limitation of extractant in the system in
order to form metal-extractant complex that is soluble in the organic phase.
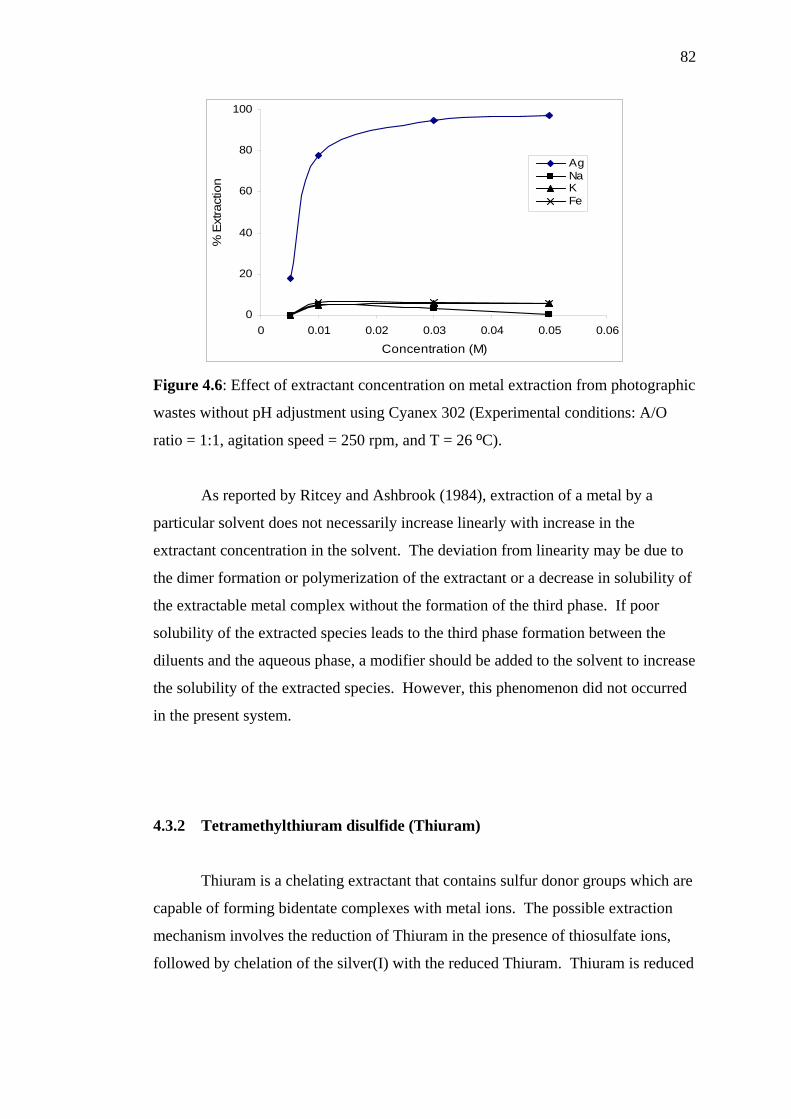
82
0
20
40
60
80
100
0 0.01 0.02 0.03 0.04 0.05 0.06
Concentration (M)
% E
xtra
ctio
n
AgNaKFe
Figure 4.6: Effect of extractant concentration on metal extraction from photographic
wastes without pH adjustment using Cyanex 302 (Experimental conditions: A/O
ratio = 1:1, agitation speed = 250 rpm, and T = 26 ºC).
As reported by Ritcey and Ashbrook (1984), extraction of a metal by a
particular solvent does not necessarily increase linearly with increase in the
extractant concentration in the solvent. The deviation from linearity may be due to
the dimer formation or polymerization of the extractant or a decrease in solubility of
the extractable metal complex without the formation of the third phase. If poor
solubility of the extracted species leads to the third phase formation between the
diluents and the aqueous phase, a modifier should be added to the solvent to increase
the solubility of the extracted species. However, this phenomenon did not occurred
in the present system.
4.3.2 Tetramethylthiuram disulfide (Thiuram)
Thiuram is a chelating extractant that contains sulfur donor groups which are
capable of forming bidentate complexes with metal ions. The possible extraction
mechanism involves the reduction of Thiuram in the presence of thiosulfate ions,
followed by chelation of the silver(I) with the reduced Thiuram. Thiuram is reduced
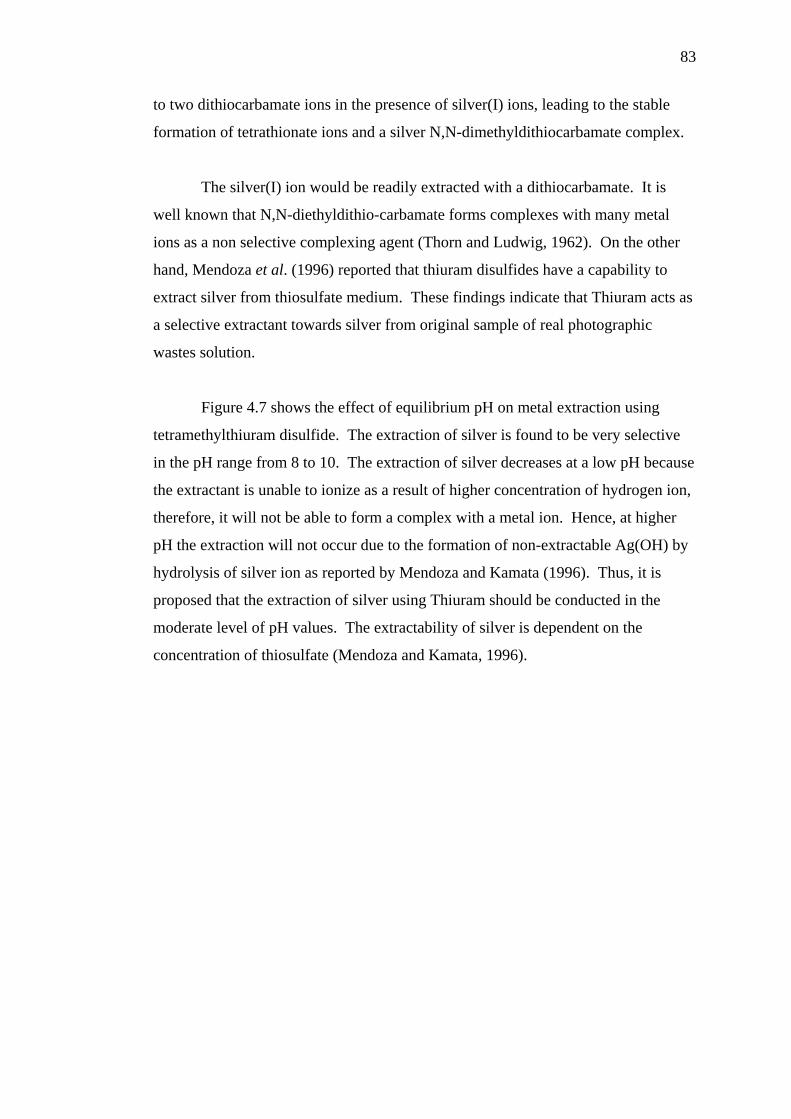
83
to two dithiocarbamate ions in the presence of silver(I) ions, leading to the stable
formation of tetrathionate ions and a silver N,N-dimethyldithiocarbamate complex.
The silver(I) ion would be readily extracted with a dithiocarbamate. It is
well known that N,N-diethyldithio-carbamate forms complexes with many metal
ions as a non selective complexing agent (Thorn and Ludwig, 1962). On the other
hand, Mendoza et al. (1996) reported that thiuram disulfides have a capability to
extract silver from thiosulfate medium. These findings indicate that Thiuram acts as
a selective extractant towards silver from original sample of real photographic
wastes solution.
Figure 4.7 shows the effect of equilibrium pH on metal extraction using
tetramethylthiuram disulfide. The extraction of silver is found to be very selective
in the pH range from 8 to 10. The extraction of silver decreases at a low pH because
the extractant is unable to ionize as a result of higher concentration of hydrogen ion,
therefore, it will not be able to form a complex with a metal ion. Hence, at higher
pH the extraction will not occur due to the formation of non-extractable Ag(OH) by
hydrolysis of silver ion as reported by Mendoza and Kamata (1996). Thus, it is
proposed that the extraction of silver using Thiuram should be conducted in the
moderate level of pH values. The extractability of silver is dependent on the
concentration of thiosulfate (Mendoza and Kamata, 1996).
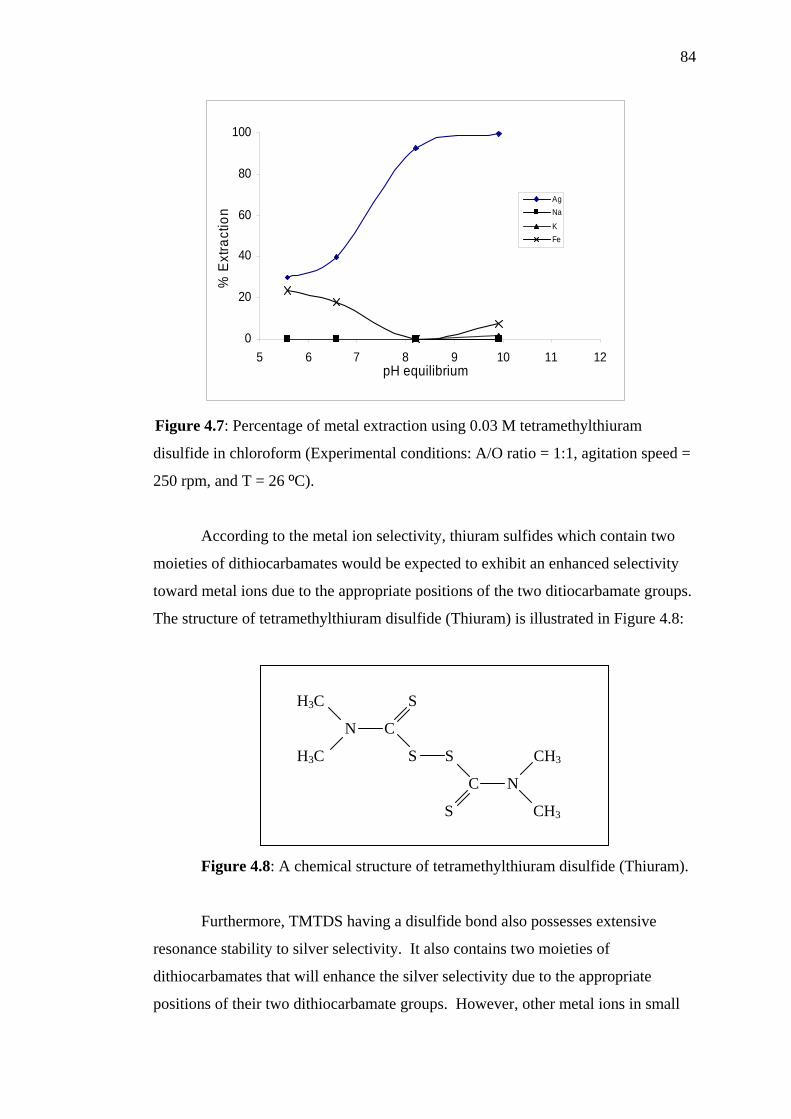
84
0
20
40
60
80
100
5 6 7 8 9 10 11 12pH equilibrium
% E
xtra
ctio
n
AgNa
KFe
Figure 4.7: Percentage of metal extraction using 0.03 M tetramethylthiuram
disulfide in chloroform (Experimental conditions: A/O ratio = 1:1, agitation speed =
250 rpm, and T = 26 ºC).
According to the metal ion selectivity, thiuram sulfides which contain two
moieties of dithiocarbamates would be expected to exhibit an enhanced selectivity
toward metal ions due to the appropriate positions of the two ditiocarbamate groups.
The structure of tetramethylthiuram disulfide (Thiuram) is illustrated in Figure 4.8:
H3C S
N C
H3C S S CH3
C N
S CH3
Figure 4.8: A chemical structure of tetramethylthiuram disulfide (Thiuram).
Furthermore, TMTDS having a disulfide bond also possesses extensive
resonance stability to silver selectivity. It also contains two moieties of
dithiocarbamates that will enhance the silver selectivity due to the appropriate
positions of their two dithiocarbamate groups. However, other metal ions in small
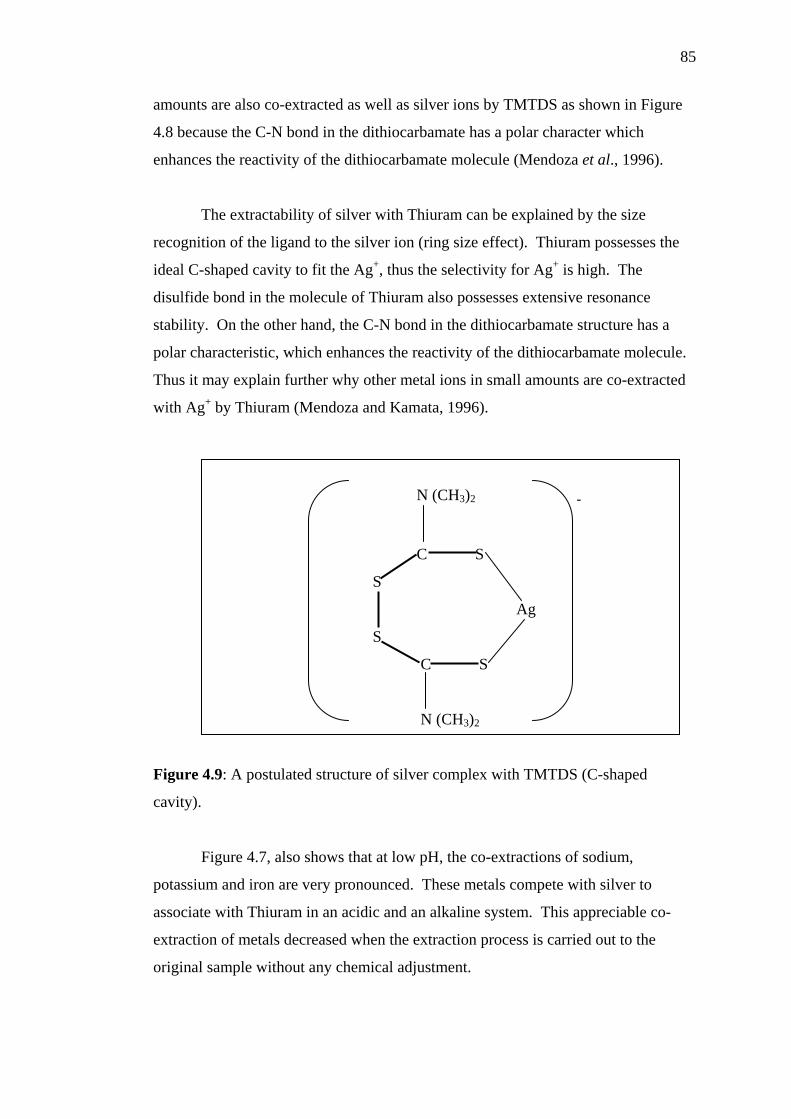
85
amounts are also co-extracted as well as silver ions by TMTDS as shown in Figure
4.8 because the C-N bond in the dithiocarbamate has a polar character which
enhances the reactivity of the dithiocarbamate molecule (Mendoza et al., 1996).
The extractability of silver with Thiuram can be explained by the size
recognition of the ligand to the silver ion (ring size effect). Thiuram possesses the
ideal C-shaped cavity to fit the Ag+, thus the selectivity for Ag+ is high. The
disulfide bond in the molecule of Thiuram also possesses extensive resonance
stability. On the other hand, the C-N bond in the dithiocarbamate structure has a
polar characteristic, which enhances the reactivity of the dithiocarbamate molecule.
Thus it may explain further why other metal ions in small amounts are co-extracted
with Ag+ by Thiuram (Mendoza and Kamata, 1996).
N (CH3)2 -
C S
S
Ag
S
C S
N (CH3)2
Figure 4.9: A postulated structure of silver complex with TMTDS (C-shaped
cavity).
Figure 4.7, also shows that at low pH, the co-extractions of sodium,
potassium and iron are very pronounced. These metals compete with silver to
associate with Thiuram in an acidic and an alkaline system. This appreciable co-
extraction of metals decreased when the extraction process is carried out to the
original sample without any chemical adjustment.
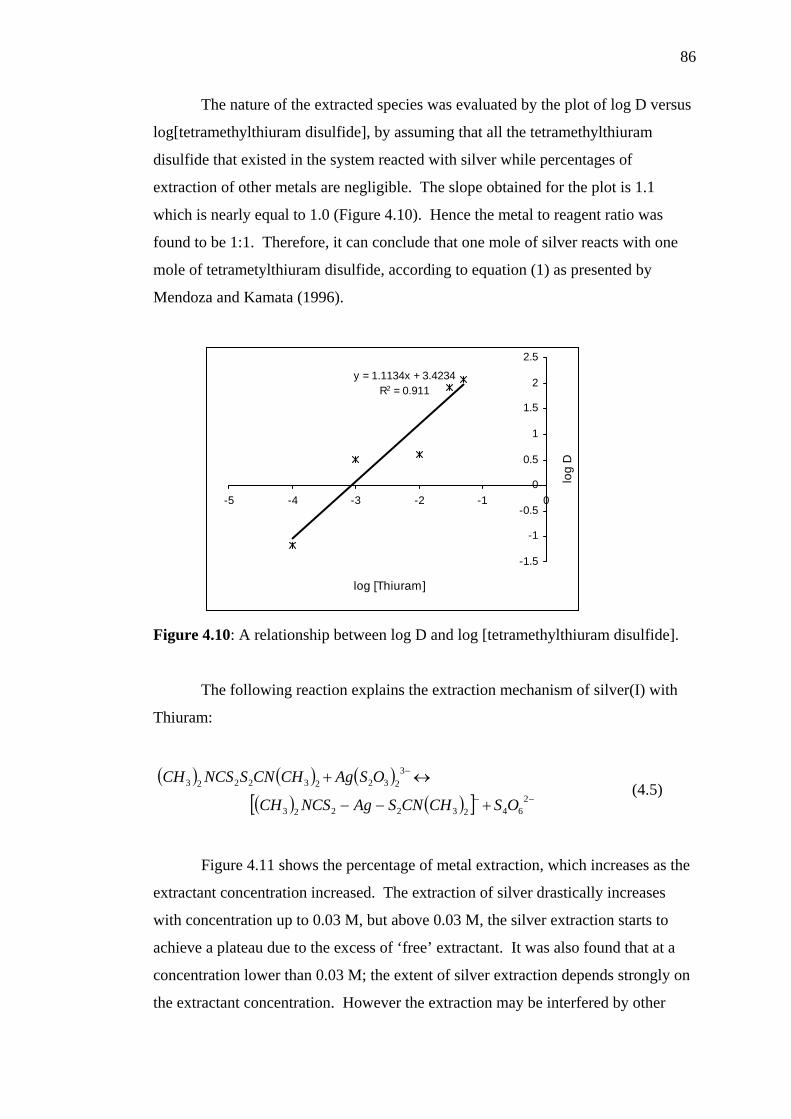
86
The nature of the extracted species was evaluated by the plot of log D versus
log[tetramethylthiuram disulfide], by assuming that all the tetramethylthiuram
disulfide that existed in the system reacted with silver while percentages of
extraction of other metals are negligible. The slope obtained for the plot is 1.1
which is nearly equal to 1.0 (Figure 4.10). Hence the metal to reagent ratio was
found to be 1:1. Therefore, it can conclude that one mole of silver reacts with one
mole of tetrametylthiuram disulfide, according to equation (1) as presented by
Mendoza and Kamata (1996).
y = 1.1134x + 3.4234R2 = 0.911
-1.5
-1
-0.5
0
0.5
1
1.5
2
2.5
-5 -4 -3 -2 -1 0
log [Thiuram]lo
g D
Figure 4.10: A relationship between log D and log [tetramethylthiuram disulfide].
The following reaction explains the extraction mechanism of silver(I) with
Thiuram:
( ) ( ) ( )( ) ( )[ ] −−
−
+−−
↔+2
64232223
3232232223
OSCHCNSAgNCSCH
OSAgCHCNSNCSCH (4.5)
Figure 4.11 shows the percentage of metal extraction, which increases as the
extractant concentration increased. The extraction of silver drastically increases
with concentration up to 0.03 M, but above 0.03 M, the silver extraction starts to
achieve a plateau due to the excess of ‘free’ extractant. It was also found that at a
concentration lower than 0.03 M; the extent of silver extraction depends strongly on
the extractant concentration. However the extraction may be interfered by other
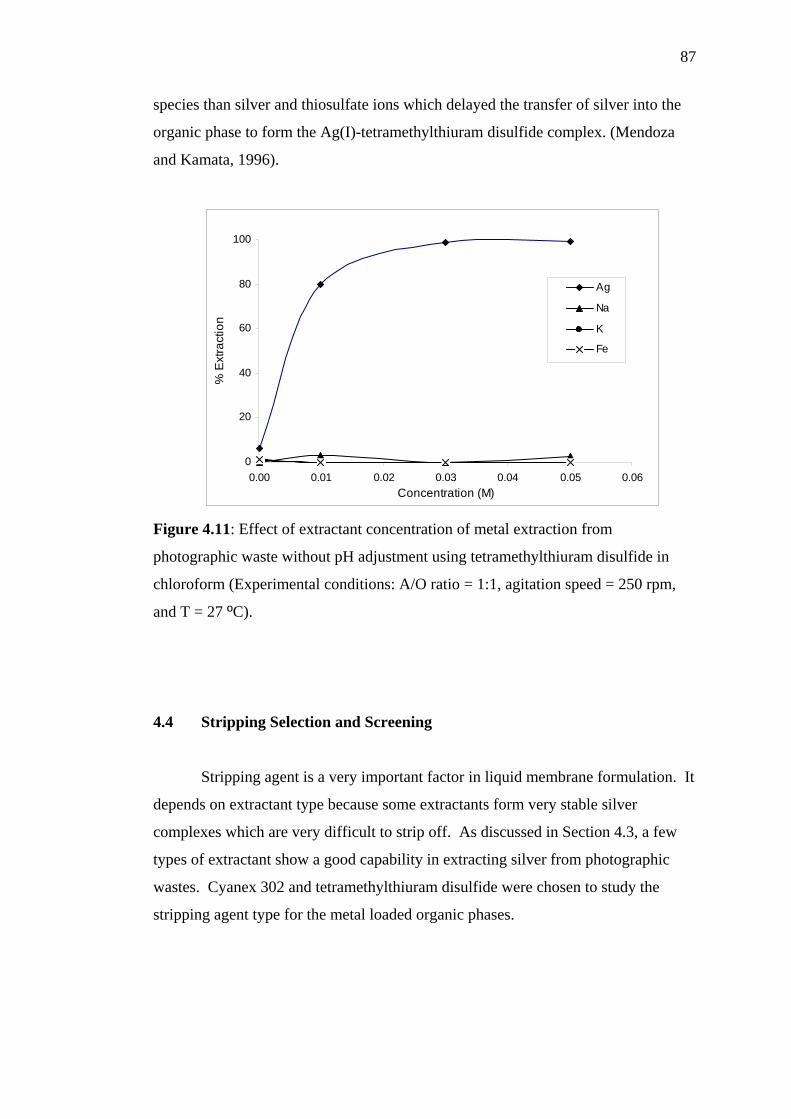
87
species than silver and thiosulfate ions which delayed the transfer of silver into the
organic phase to form the Ag(I)-tetramethylthiuram disulfide complex. (Mendoza
and Kamata, 1996).
0
20
40
60
80
100
0.00 0.01 0.02 0.03 0.04 0.05 0.06Concentration (M)
% E
xtra
ctio
n
Ag
Na
K
Fe
Figure 4.11: Effect of extractant concentration of metal extraction from
photographic waste without pH adjustment using tetramethylthiuram disulfide in
chloroform (Experimental conditions: A/O ratio = 1:1, agitation speed = 250 rpm,
and T = 27 ºC).
4.4 Stripping Selection and Screening
Stripping agent is a very important factor in liquid membrane formulation. It
depends on extractant type because some extractants form very stable silver
complexes which are very difficult to strip off. As discussed in Section 4.3, a few
types of extractant show a good capability in extracting silver from photographic
wastes. Cyanex 302 and tetramethylthiuram disulfide were chosen to study the
stripping agent type for the metal loaded organic phases.
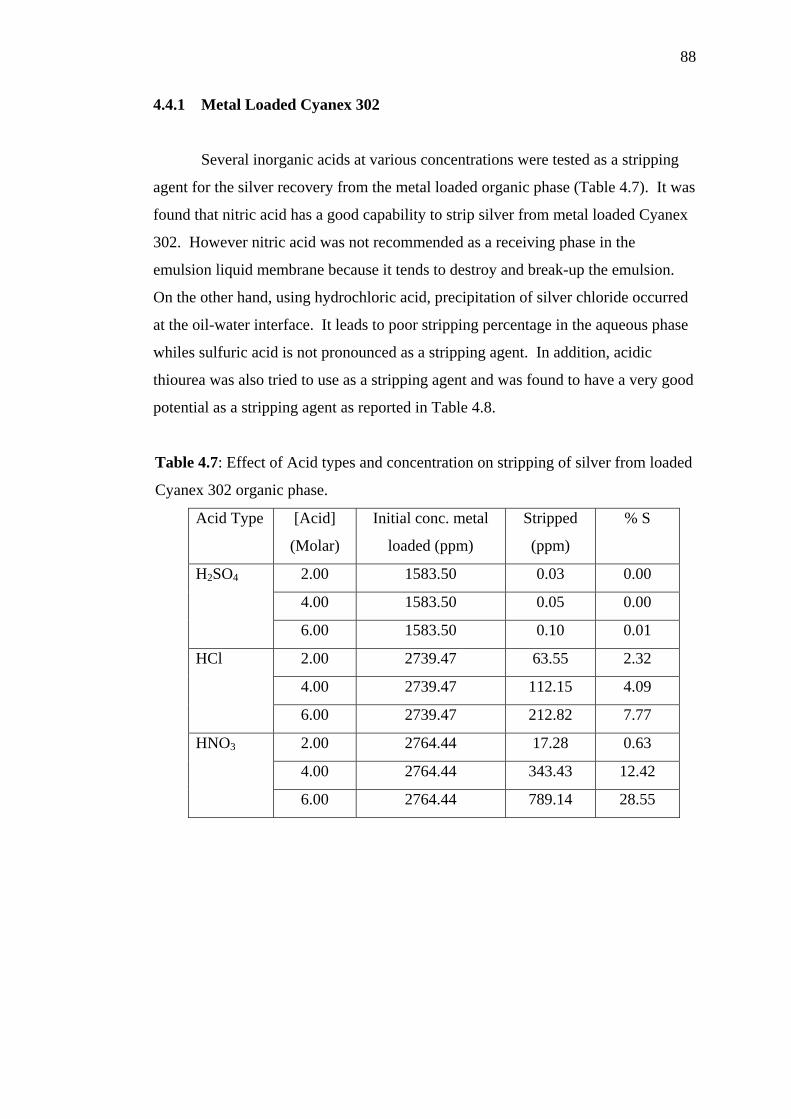
88
4.4.1 Metal Loaded Cyanex 302
Several inorganic acids at various concentrations were tested as a stripping
agent for the silver recovery from the metal loaded organic phase (Table 4.7). It was
found that nitric acid has a good capability to strip silver from metal loaded Cyanex
302. However nitric acid was not recommended as a receiving phase in the
emulsion liquid membrane because it tends to destroy and break-up the emulsion.
On the other hand, using hydrochloric acid, precipitation of silver chloride occurred
at the oil-water interface. It leads to poor stripping percentage in the aqueous phase
whiles sulfuric acid is not pronounced as a stripping agent. In addition, acidic
thiourea was also tried to use as a stripping agent and was found to have a very good
potential as a stripping agent as reported in Table 4.8.
Table 4.7: Effect of Acid types and concentration on stripping of silver from loaded
Cyanex 302 organic phase.
Acid Type [Acid]
(Molar)
Initial conc. metal
loaded (ppm)
Stripped
(ppm)
% S
2.00 1583.50 0.03 0.00
4.00 1583.50 0.05 0.00
H2SO4
6.00 1583.50 0.10 0.01
2.00 2739.47 63.55 2.32
4.00 2739.47 112.15 4.09
HCl
6.00 2739.47 212.82 7.77
2.00 2764.44 17.28 0.63
4.00 2764.44 343.43 12.42
HNO3
6.00 2764.44 789.14 28.55
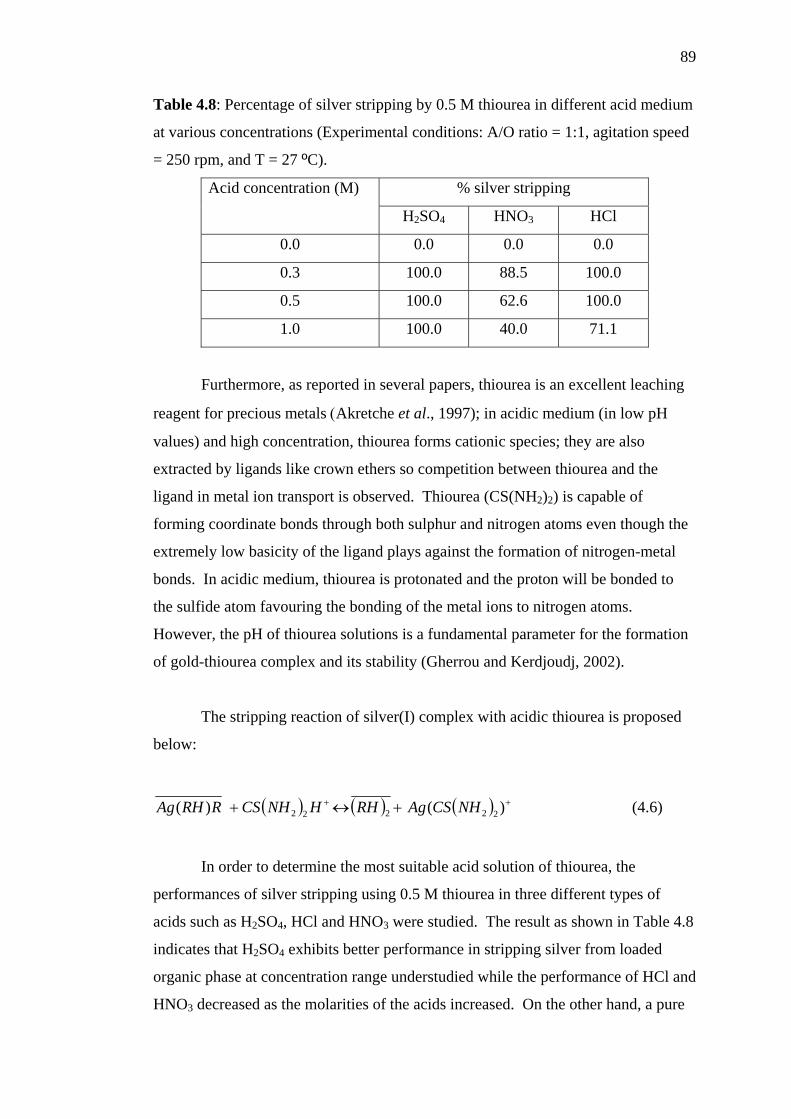
89
Table 4.8: Percentage of silver stripping by 0.5 M thiourea in different acid medium
at various concentrations (Experimental conditions: A/O ratio = 1:1, agitation speed
= 250 rpm, and T = 27 ºC).
% silver stripping Acid concentration (M)
H2SO4 HNO3 HCl
0.0 0.0 0.0 0.0
0.3 100.0 88.5 100.0
0.5 100.0 62.6 100.0
1.0 100.0 40.0 71.1
Furthermore, as reported in several papers, thiourea is an excellent leaching
reagent for precious metals (Akretche et al., 1997); in acidic medium (in low pH
values) and high concentration, thiourea forms cationic species; they are also
extracted by ligands like crown ethers so competition between thiourea and the
ligand in metal ion transport is observed. Thiourea (CS(NH2)2) is capable of
forming coordinate bonds through both sulphur and nitrogen atoms even though the
extremely low basicity of the ligand plays against the formation of nitrogen-metal
bonds. In acidic medium, thiourea is protonated and the proton will be bonded to
the sulfide atom favouring the bonding of the metal ions to nitrogen atoms.
However, the pH of thiourea solutions is a fundamental parameter for the formation
of gold-thiourea complex and its stability (Gherrou and Kerdjoudj, 2002).
The stripping reaction of silver(I) complex with acidic thiourea is proposed
below:
( ) ( ) ( ) ++ +↔+ )()( 22222 NHCSAgRHHNHCSRRHAg (4.6)
In order to determine the most suitable acid solution of thiourea, the
performances of silver stripping using 0.5 M thiourea in three different types of
acids such as H2SO4, HCl and HNO3 were studied. The result as shown in Table 4.8
indicates that H2SO4 exhibits better performance in stripping silver from loaded
organic phase at concentration range understudied while the performance of HCl and
HNO3 decreased as the molarities of the acids increased. On the other hand, a pure
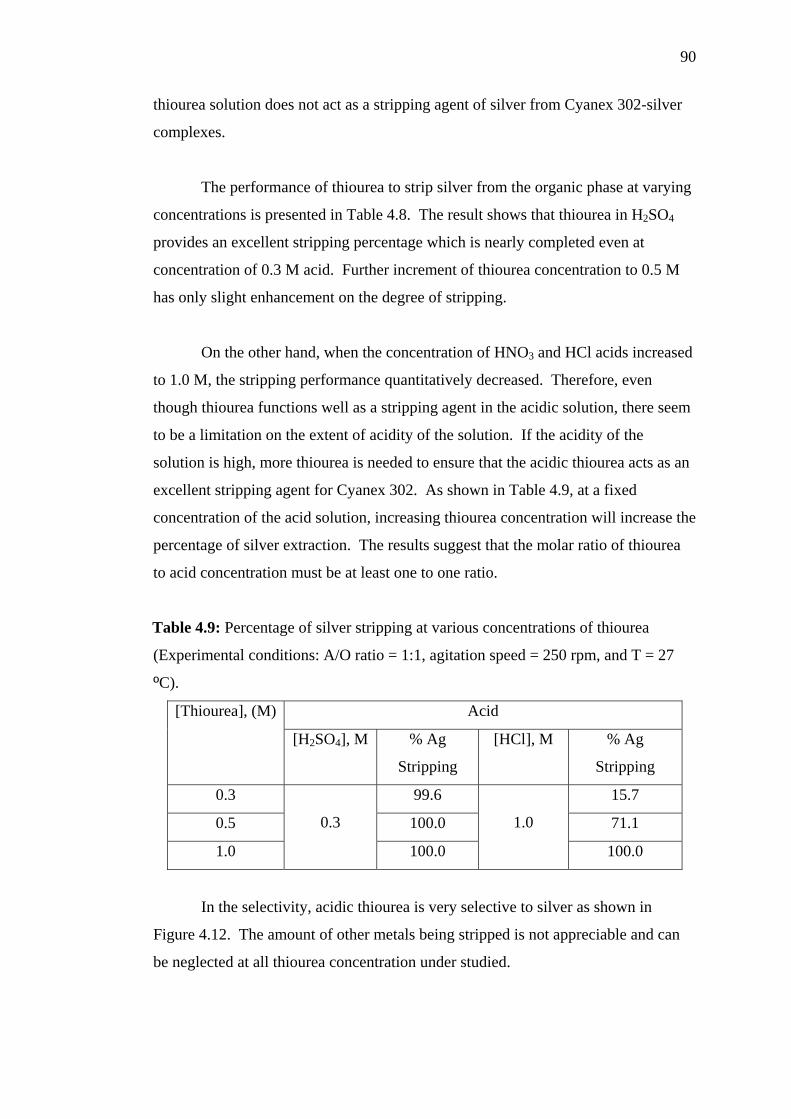
90
thiourea solution does not act as a stripping agent of silver from Cyanex 302-silver
complexes.
The performance of thiourea to strip silver from the organic phase at varying
concentrations is presented in Table 4.8. The result shows that thiourea in H2SO4
provides an excellent stripping percentage which is nearly completed even at
concentration of 0.3 M acid. Further increment of thiourea concentration to 0.5 M
has only slight enhancement on the degree of stripping.
On the other hand, when the concentration of HNO3 and HCl acids increased
to 1.0 M, the stripping performance quantitatively decreased. Therefore, even
though thiourea functions well as a stripping agent in the acidic solution, there seem
to be a limitation on the extent of acidity of the solution. If the acidity of the
solution is high, more thiourea is needed to ensure that the acidic thiourea acts as an
excellent stripping agent for Cyanex 302. As shown in Table 4.9, at a fixed
concentration of the acid solution, increasing thiourea concentration will increase the
percentage of silver extraction. The results suggest that the molar ratio of thiourea
to acid concentration must be at least one to one ratio.
Table 4.9: Percentage of silver stripping at various concentrations of thiourea
(Experimental conditions: A/O ratio = 1:1, agitation speed = 250 rpm, and T = 27
ºC).
Acid [Thiourea], (M)
[H2SO4], M % Ag
Stripping
[HCl], M % Ag
Stripping
0.3 99.6 15.7
0.5 100.0 71.1
1.0
0.3
100.0
1.0
100.0
In the selectivity, acidic thiourea is very selective to silver as shown in
Figure 4.12. The amount of other metals being stripped is not appreciable and can
be neglected at all thiourea concentration under studied.
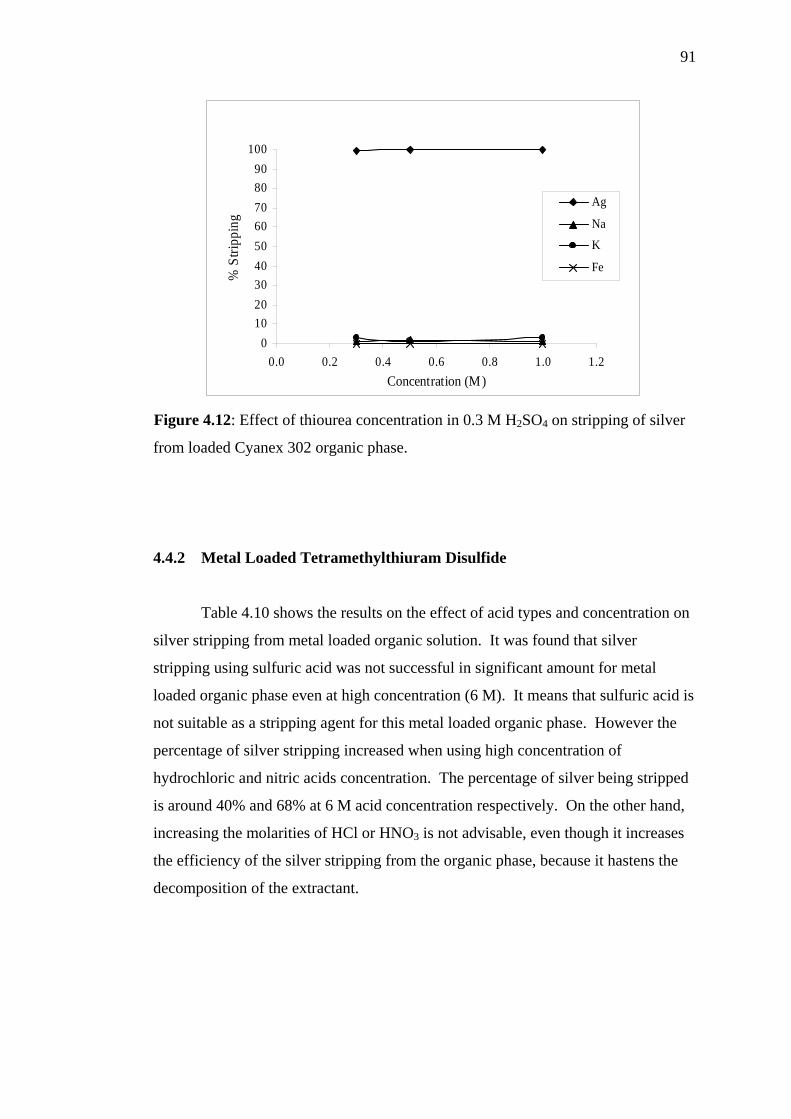
91
0102030405060708090
100
0.0 0.2 0.4 0.6 0.8 1.0 1.2Concentration (M)
% S
tripp
ing
Ag
NaK
Fe
Figure 4.12: Effect of thiourea concentration in 0.3 M H2SO4 on stripping of silver
from loaded Cyanex 302 organic phase.
4.4.2 Metal Loaded Tetramethylthiuram Disulfide
Table 4.10 shows the results on the effect of acid types and concentration on
silver stripping from metal loaded organic solution. It was found that silver
stripping using sulfuric acid was not successful in significant amount for metal
loaded organic phase even at high concentration (6 M). It means that sulfuric acid is
not suitable as a stripping agent for this metal loaded organic phase. However the
percentage of silver stripping increased when using high concentration of
hydrochloric and nitric acids concentration. The percentage of silver being stripped
is around 40% and 68% at 6 M acid concentration respectively. On the other hand,
increasing the molarities of HCl or HNO3 is not advisable, even though it increases
the efficiency of the silver stripping from the organic phase, because it hastens the
decomposition of the extractant.
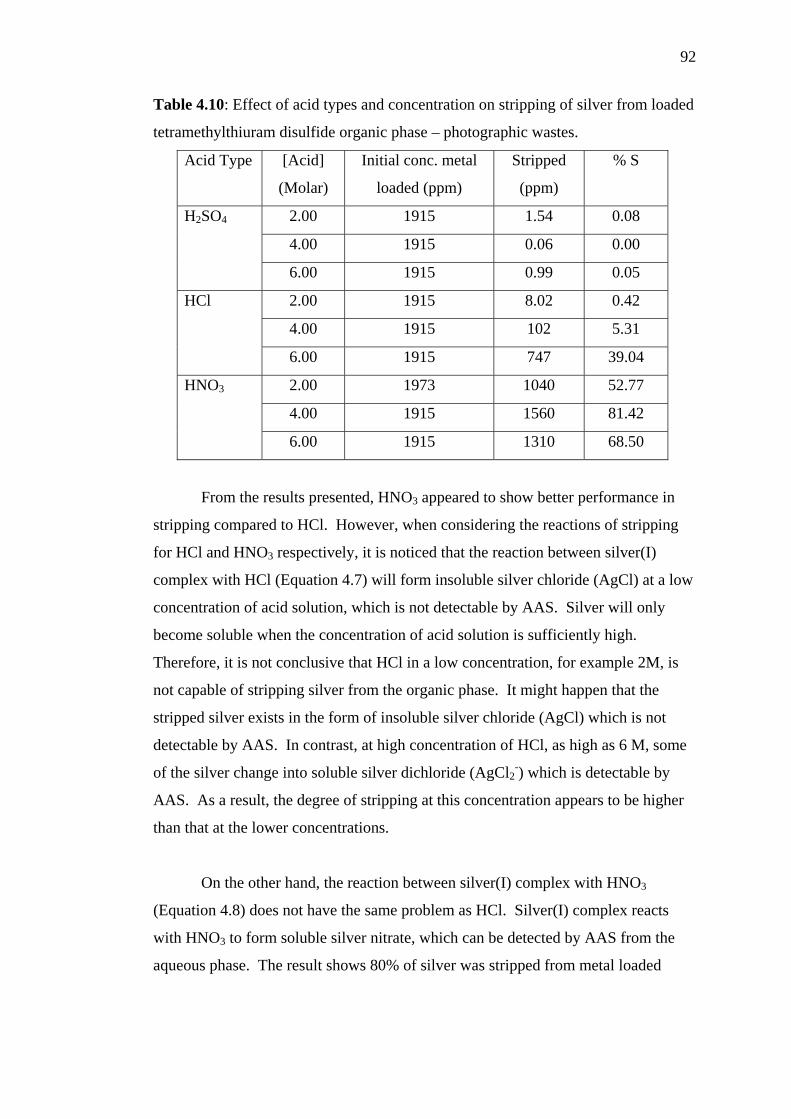
92
Table 4.10: Effect of acid types and concentration on stripping of silver from loaded
tetramethylthiuram disulfide organic phase – photographic wastes.
Acid Type [Acid]
(Molar)
Initial conc. metal
loaded (ppm)
Stripped
(ppm)
% S
2.00 1915 1.54 0.08
4.00 1915 0.06 0.00
H2SO4
6.00 1915 0.99 0.05
2.00 1915 8.02 0.42
4.00 1915 102 5.31
HCl
6.00 1915 747 39.04
2.00 1973 1040 52.77
4.00 1915 1560 81.42
HNO3
6.00 1915 1310 68.50
From the results presented, HNO3 appeared to show better performance in
stripping compared to HCl. However, when considering the reactions of stripping
for HCl and HNO3 respectively, it is noticed that the reaction between silver(I)
complex with HCl (Equation 4.7) will form insoluble silver chloride (AgCl) at a low
concentration of acid solution, which is not detectable by AAS. Silver will only
become soluble when the concentration of acid solution is sufficiently high.
Therefore, it is not conclusive that HCl in a low concentration, for example 2M, is
not capable of stripping silver from the organic phase. It might happen that the
stripped silver exists in the form of insoluble silver chloride (AgCl) which is not
detectable by AAS. In contrast, at high concentration of HCl, as high as 6 M, some
of the silver change into soluble silver dichloride (AgCl2-) which is detectable by
AAS. As a result, the degree of stripping at this concentration appears to be higher
than that at the lower concentrations.
On the other hand, the reaction between silver(I) complex with HNO3
(Equation 4.8) does not have the same problem as HCl. Silver(I) complex reacts
with HNO3 to form soluble silver nitrate, which can be detected by AAS from the
aqueous phase. The result shows 80% of silver was stripped from metal loaded
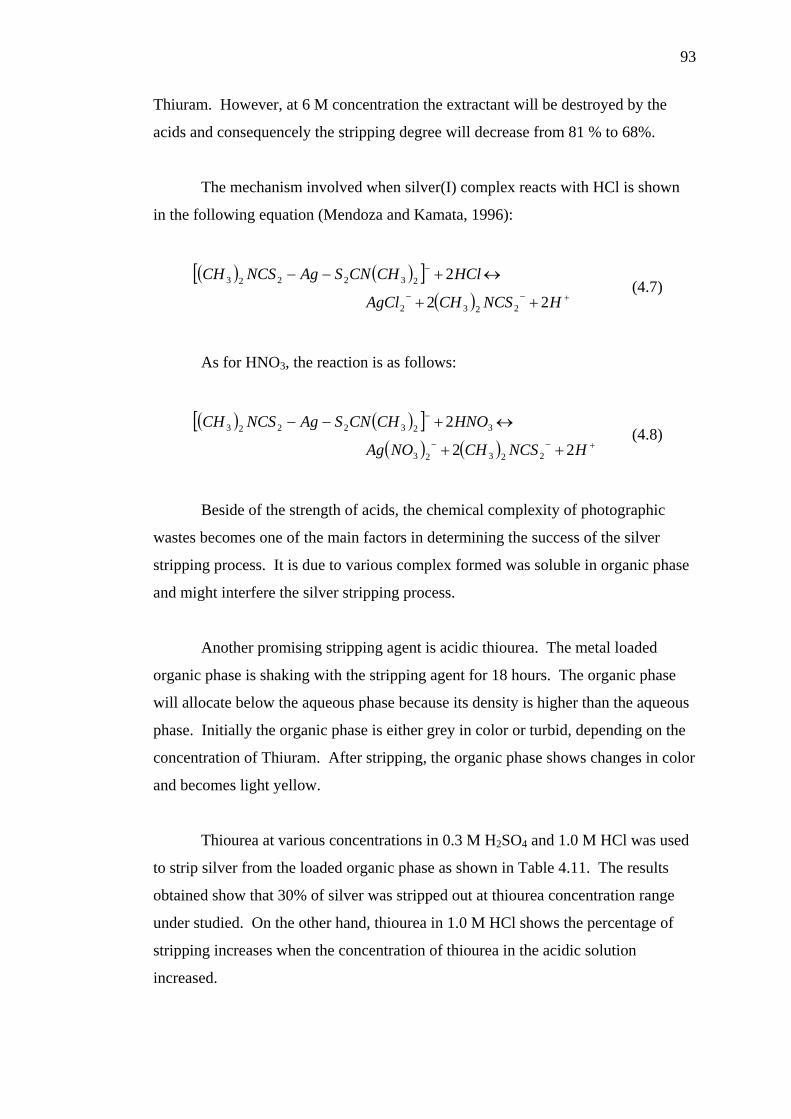
93
Thiuram. However, at 6 M concentration the extractant will be destroyed by the
acids and consequencely the stripping degree will decrease from 81 % to 68%.
The mechanism involved when silver(I) complex reacts with HCl is shown
in the following equation (Mendoza and Kamata, 1996):
( ) ( )[ ]( ) +−−
−
++
↔+−−
HNCSCHAgCl
HClCHCNSAgNCSCH
22
2
2232
232223 (4.7)
As for HNO3, the reaction is as follows:
( ) ( )[ ]( ) ( ) +−−
−
++
↔+−−
HNCSCHNOAg
HNOCHCNSAgNCSCH
22
2
22323
3232223 (4.8)
Beside of the strength of acids, the chemical complexity of photographic
wastes becomes one of the main factors in determining the success of the silver
stripping process. It is due to various complex formed was soluble in organic phase
and might interfere the silver stripping process.
Another promising stripping agent is acidic thiourea. The metal loaded
organic phase is shaking with the stripping agent for 18 hours. The organic phase
will allocate below the aqueous phase because its density is higher than the aqueous
phase. Initially the organic phase is either grey in color or turbid, depending on the
concentration of Thiuram. After stripping, the organic phase shows changes in color
and becomes light yellow.
Thiourea at various concentrations in 0.3 M H2SO4 and 1.0 M HCl was used
to strip silver from the loaded organic phase as shown in Table 4.11. The results
obtained show that 30% of silver was stripped out at thiourea concentration range
under studied. On the other hand, thiourea in 1.0 M HCl shows the percentage of
stripping increases when the concentration of thiourea in the acidic solution
increased.
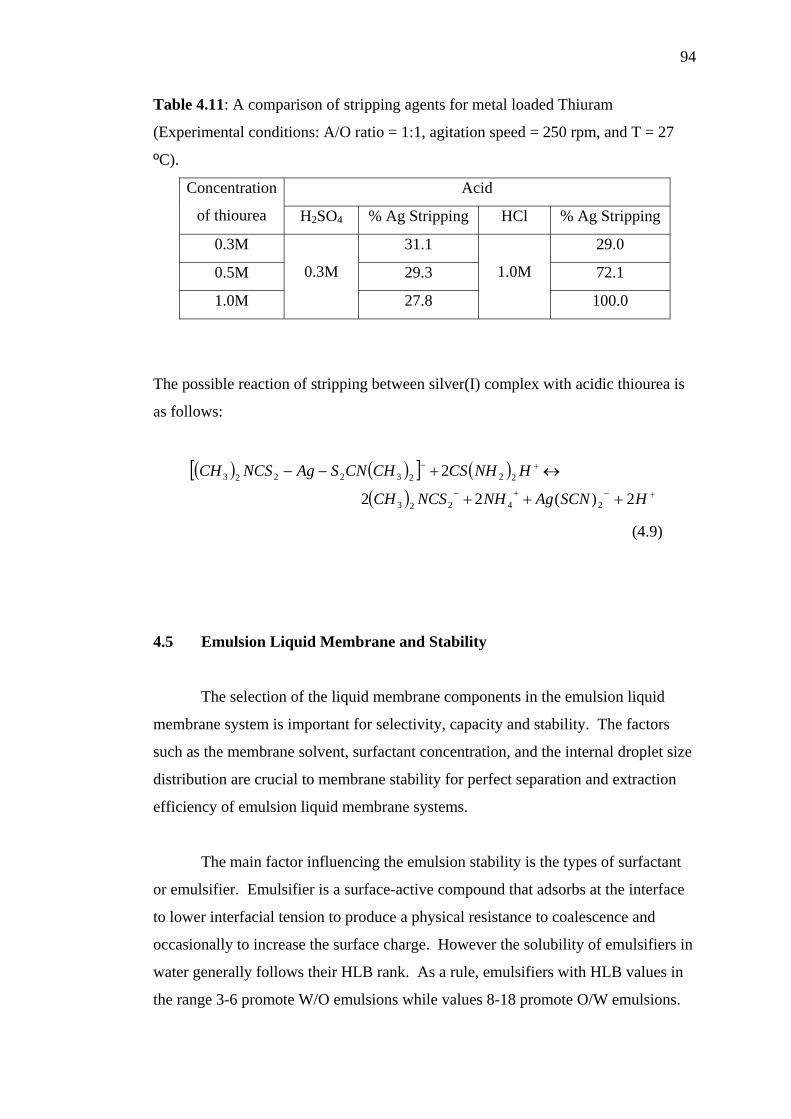
94
Table 4.11: A comparison of stripping agents for metal loaded Thiuram
(Experimental conditions: A/O ratio = 1:1, agitation speed = 250 rpm, and T = 27
ºC).
Acid Concentration
of thiourea H2SO4 % Ag Stripping HCl % Ag Stripping
0.3M 31.1 29.0
0.5M 29.3 72.1
1.0M
0.3M
27.8
1.0M
100.0
The possible reaction of stripping between silver(I) complex with acidic thiourea is
as follows:
( ) ( )[ ] ( )( ) +−+−
+−
+++
↔+−−
HSCNAgNHNCSCH
HNHCSCHCNSAgNCSCH
2)(22
2
24223
22232223
(4.9)
4.5 Emulsion Liquid Membrane and Stability
The selection of the liquid membrane components in the emulsion liquid
membrane system is important for selectivity, capacity and stability. The factors
such as the membrane solvent, surfactant concentration, and the internal droplet size
distribution are crucial to membrane stability for perfect separation and extraction
efficiency of emulsion liquid membrane systems.
The main factor influencing the emulsion stability is the types of surfactant
or emulsifier. Emulsifier is a surface-active compound that adsorbs at the interface
to lower interfacial tension to produce a physical resistance to coalescence and
occasionally to increase the surface charge. However the solubility of emulsifiers in
water generally follows their HLB rank. As a rule, emulsifiers with HLB values in
the range 3-6 promote W/O emulsions while values 8-18 promote O/W emulsions.
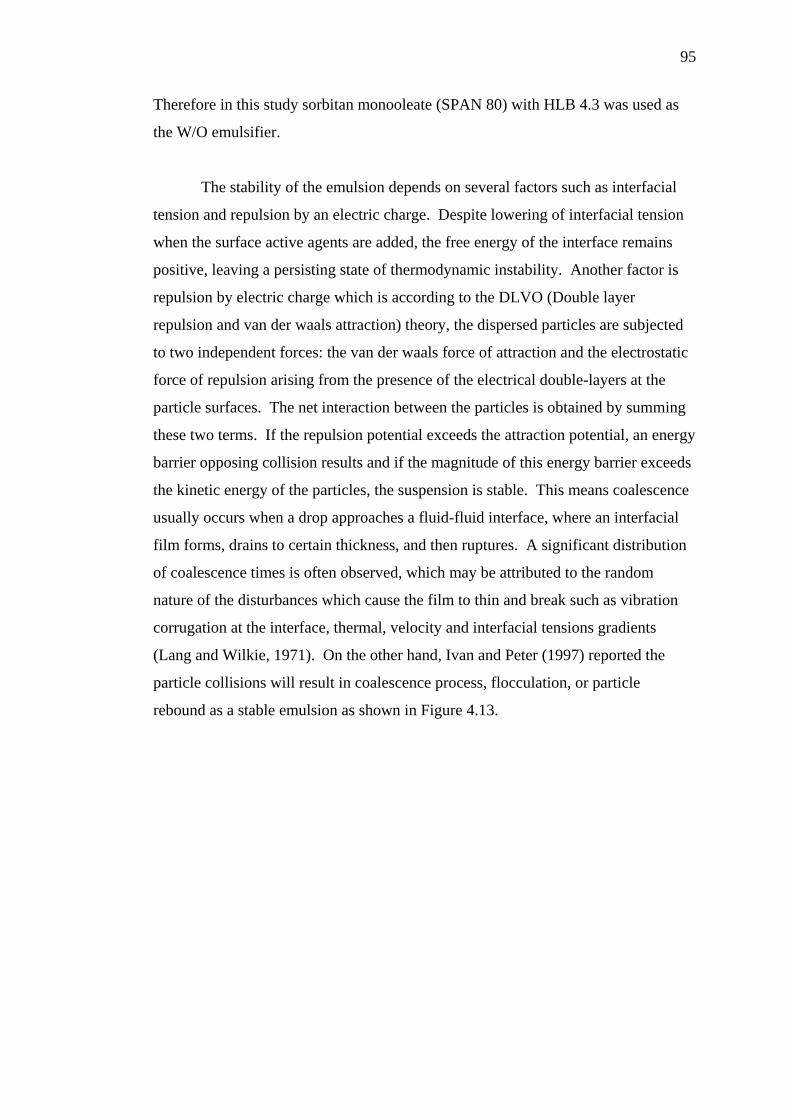
95
Therefore in this study sorbitan monooleate (SPAN 80) with HLB 4.3 was used as
the W/O emulsifier.
The stability of the emulsion depends on several factors such as interfacial
tension and repulsion by an electric charge. Despite lowering of interfacial tension
when the surface active agents are added, the free energy of the interface remains
positive, leaving a persisting state of thermodynamic instability. Another factor is
repulsion by electric charge which is according to the DLVO (Double layer
repulsion and van der waals attraction) theory, the dispersed particles are subjected
to two independent forces: the van der waals force of attraction and the electrostatic
force of repulsion arising from the presence of the electrical double-layers at the
particle surfaces. The net interaction between the particles is obtained by summing
these two terms. If the repulsion potential exceeds the attraction potential, an energy
barrier opposing collision results and if the magnitude of this energy barrier exceeds
the kinetic energy of the particles, the suspension is stable. This means coalescence
usually occurs when a drop approaches a fluid-fluid interface, where an interfacial
film forms, drains to certain thickness, and then ruptures. A significant distribution
of coalescence times is often observed, which may be attributed to the random
nature of the disturbances which cause the film to thin and break such as vibration
corrugation at the interface, thermal, velocity and interfacial tensions gradients
(Lang and Wilkie, 1971). On the other hand, Ivan and Peter (1997) reported the
particle collisions will result in coalescence process, flocculation, or particle
rebound as a stable emulsion as shown in Figure 4.13.
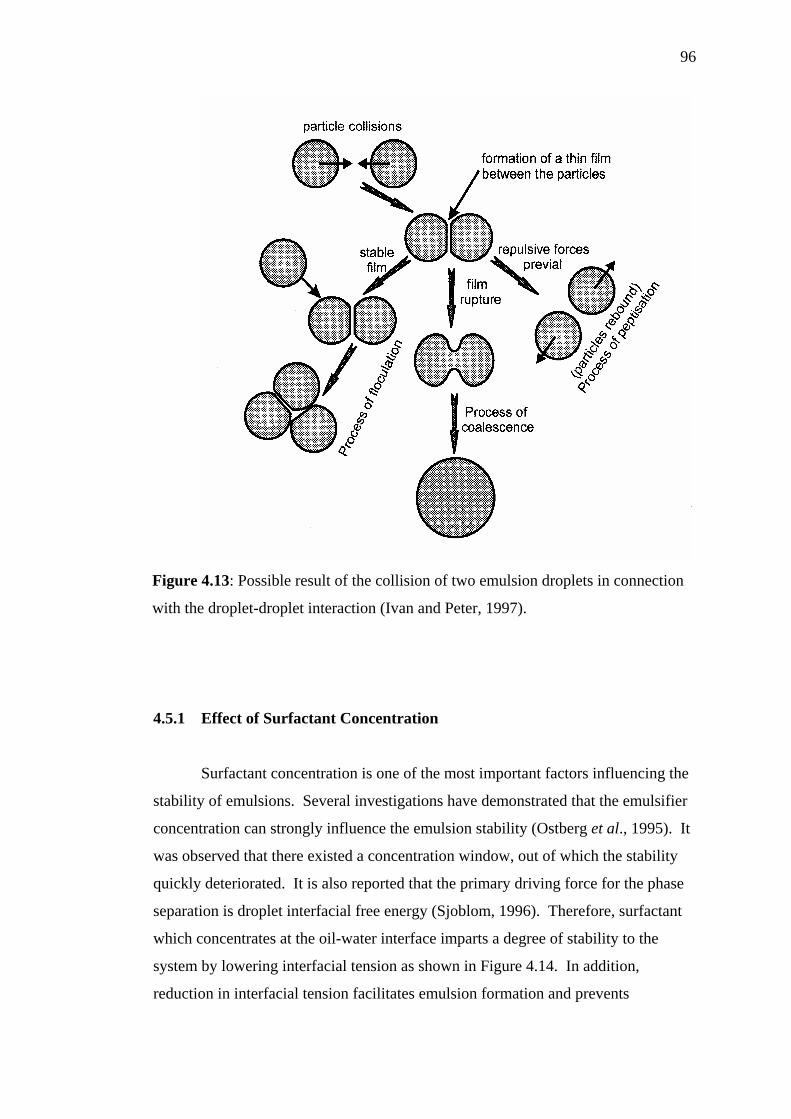
96
Figure 4.13: Possible result of the collision of two emulsion droplets in connection
with the droplet-droplet interaction (Ivan and Peter, 1997).
4.5.1 Effect of Surfactant Concentration
Surfactant concentration is one of the most important factors influencing the
stability of emulsions. Several investigations have demonstrated that the emulsifier
concentration can strongly influence the emulsion stability (Ostberg et al., 1995). It
was observed that there existed a concentration window, out of which the stability
quickly deteriorated. It is also reported that the primary driving force for the phase
separation is droplet interfacial free energy (Sjoblom, 1996). Therefore, surfactant
which concentrates at the oil-water interface imparts a degree of stability to the
system by lowering interfacial tension as shown in Figure 4.14. In addition,
reduction in interfacial tension facilitates emulsion formation and prevents
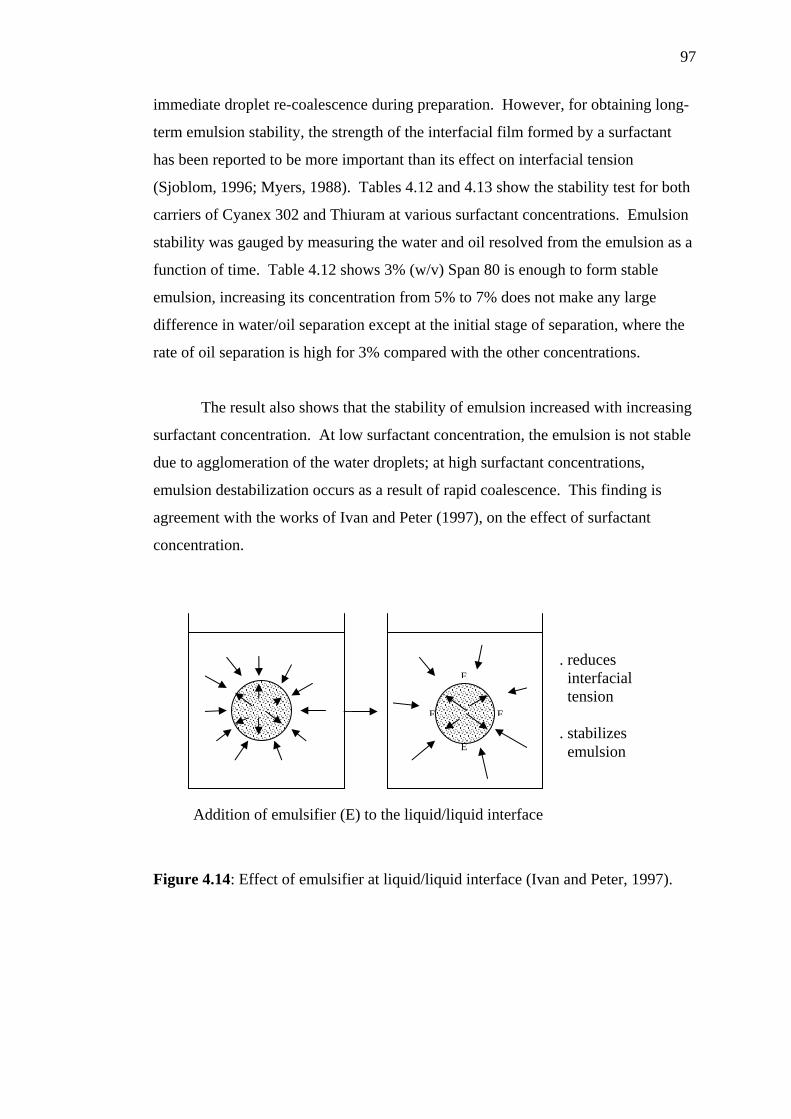
97
immediate droplet re-coalescence during preparation. However, for obtaining long-
term emulsion stability, the strength of the interfacial film formed by a surfactant
has been reported to be more important than its effect on interfacial tension
(Sjoblom, 1996; Myers, 1988). Tables 4.12 and 4.13 show the stability test for both
carriers of Cyanex 302 and Thiuram at various surfactant concentrations. Emulsion
stability was gauged by measuring the water and oil resolved from the emulsion as a
function of time. Table 4.12 shows 3% (w/v) Span 80 is enough to form stable
emulsion, increasing its concentration from 5% to 7% does not make any large
difference in water/oil separation except at the initial stage of separation, where the
rate of oil separation is high for 3% compared with the other concentrations.
The result also shows that the stability of emulsion increased with increasing
surfactant concentration. At low surfactant concentration, the emulsion is not stable
due to agglomeration of the water droplets; at high surfactant concentrations,
emulsion destabilization occurs as a result of rapid coalescence. This finding is
agreement with the works of Ivan and Peter (1997), on the effect of surfactant
concentration.
Figure 4.14: Effect of emulsifier at liquid/liquid interface (Ivan and Peter, 1997).
E
E
E
E
Addition of emulsifier (E) to the liquid/liquid interface
. reduces interfacial tension . stabilizes emulsion
98
Table 4.12: Effect of surfactant concentration on emulsion stability (Experimental
conditions: [Cyanex 302] = (0.05 M), homogenizer speed = 13500 rpm, mixing time
= 5 min, stripping phase = 1.0 M thiourea in 1.0 M H2SO4, and temperature = 26
ºC).
3% 5% 7% [Span 80]
Day Oil Water Oil Water Oil Water
1 1.0 0.0 1.0 0.0 1.0 0.0
2 1.7 0.0 1.5 0.0 1.5 0.0
3 2.0 0.0 2.0 0.0 1.8 0.0
4 2.4 0.0 2.4 0.0 2.0 0.0
5 2.5 0.0 2.5 0.0 2.2 0.0
6 2.7 0.4 2.7 0.0 2.4 0.0
7 2.8 0.7 2.8 0.0 2.5 0.0
8 3.0 1.5 2.9 0.0 2.7 0.0
9 3.3 2.3 3.0 0.3 2.7 0.0
10 3.5 2.5 3.1 0.7 2.8 0.0
11 3.9 3.0 3.2 1.5 3.0 0.0
12 4.1 3.3 3.3 2.3 3.0 0.1
13 4.3 3.5 3.6 2.6 3.0 0.5
Table 4.13: Emulsion stability of Thiuram (0.03 M) in Chloroform (Experimental
conditions: homogenizer speed = 13500 rpm, mixing time = 5 min, stripping phase =
1.0 M thiourea in 1.0 M HCl, and temperature = 26 ºC).
3% (w/v) 5% (w/v) 7% (w/v) [Span 80]
Day Oil Water Oil Water Oil Water
1 5.0 3.5 3.5 0.0 3.0 0.0
2 5.0 4.0 4.0 0.0 3.5 0.0
3 5.0 4.3 4.2 0.0 4.0 0.0
4 5.0 4.5 4.5 0.5 4.2 0.5
5 5.0 5.0 4.3 1.0 4.3 1.0
6 5.0 5.0 4.8 1.5 4.8 1.5
7 5.0 5.0 5.0 3.0 5.0 3.5
8 5.0 5.0 5.0 4.0 5.0 4.5
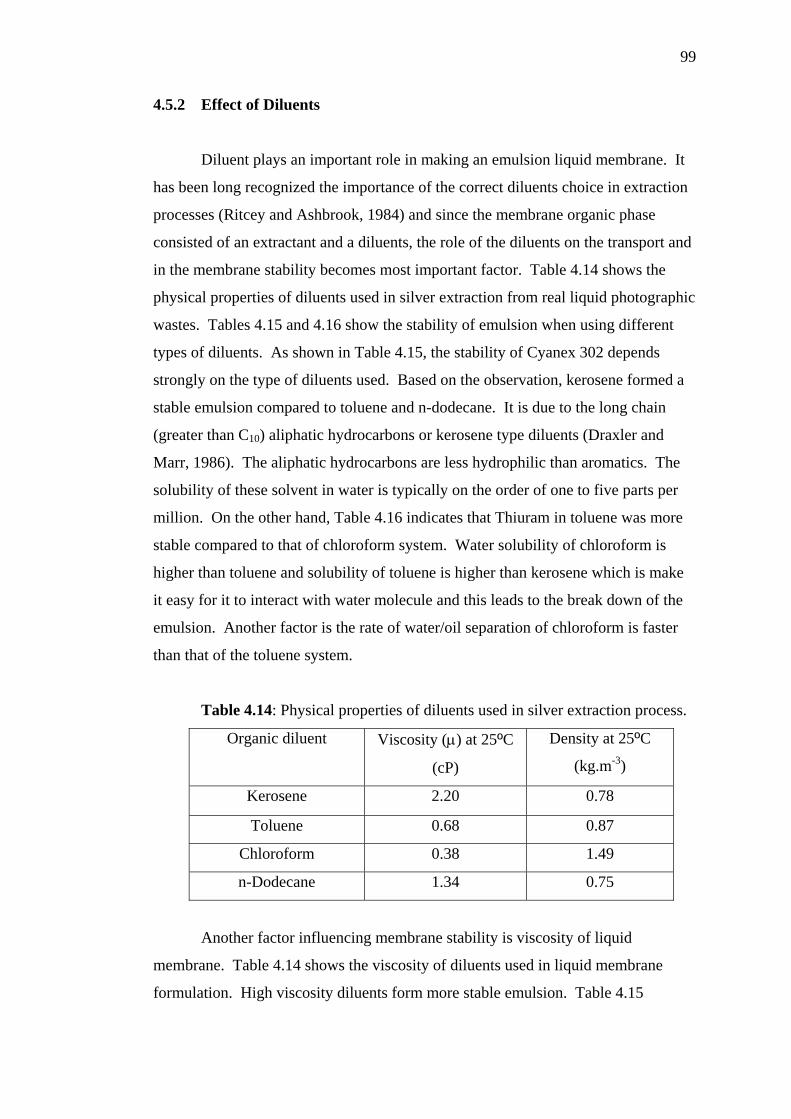
99
4.5.2 Effect of Diluents
Diluent plays an important role in making an emulsion liquid membrane. It
has been long recognized the importance of the correct diluents choice in extraction
processes (Ritcey and Ashbrook, 1984) and since the membrane organic phase
consisted of an extractant and a diluents, the role of the diluents on the transport and
in the membrane stability becomes most important factor. Table 4.14 shows the
physical properties of diluents used in silver extraction from real liquid photographic
wastes. Tables 4.15 and 4.16 show the stability of emulsion when using different
types of diluents. As shown in Table 4.15, the stability of Cyanex 302 depends
strongly on the type of diluents used. Based on the observation, kerosene formed a
stable emulsion compared to toluene and n-dodecane. It is due to the long chain
(greater than C10) aliphatic hydrocarbons or kerosene type diluents (Draxler and
Marr, 1986). The aliphatic hydrocarbons are less hydrophilic than aromatics. The
solubility of these solvent in water is typically on the order of one to five parts per
million. On the other hand, Table 4.16 indicates that Thiuram in toluene was more
stable compared to that of chloroform system. Water solubility of chloroform is
higher than toluene and solubility of toluene is higher than kerosene which is make
it easy for it to interact with water molecule and this leads to the break down of the
emulsion. Another factor is the rate of water/oil separation of chloroform is faster
than that of the toluene system.
Table 4.14: Physical properties of diluents used in silver extraction process.
Organic diluent Viscosity (µ) at 25ºC
(cP)
Density at 25ºC
(kg.m-3)
Kerosene 2.20 0.78
Toluene 0.68 0.87
Chloroform 0.38 1.49
n-Dodecane 1.34 0.75
Another factor influencing membrane stability is viscosity of liquid
membrane. Table 4.14 shows the viscosity of diluents used in liquid membrane
formulation. High viscosity diluents form more stable emulsion. Table 4.15
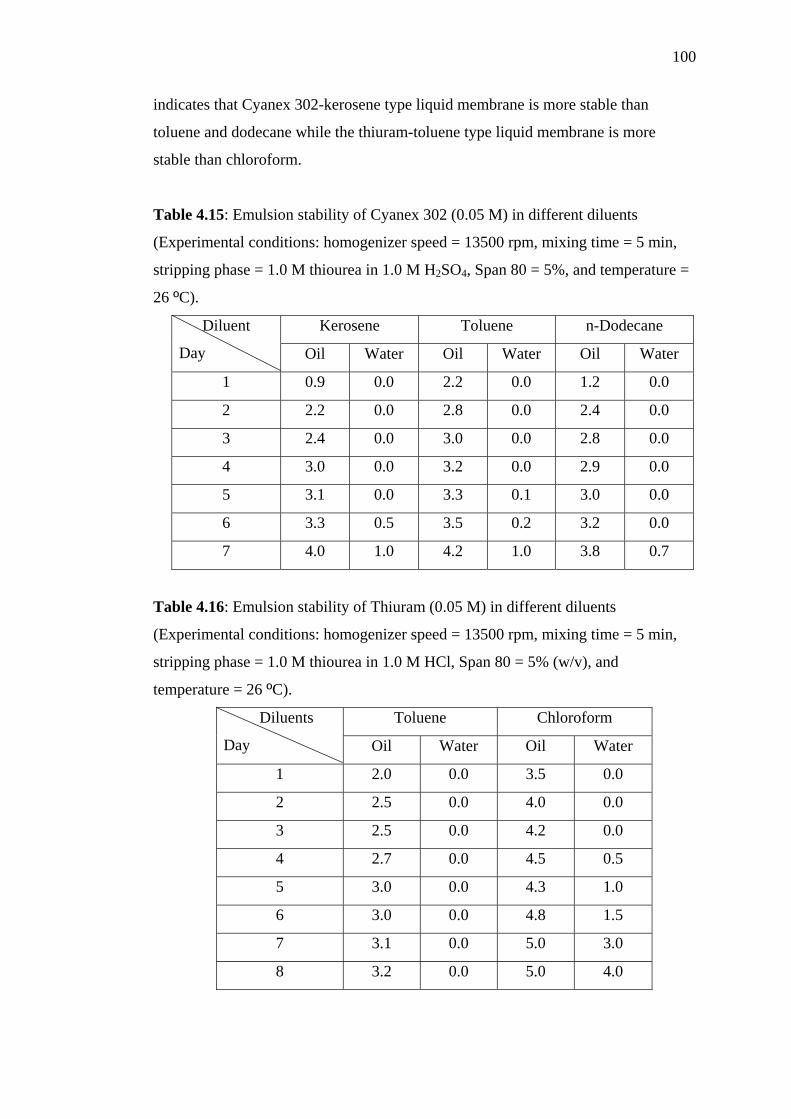
100
indicates that Cyanex 302-kerosene type liquid membrane is more stable than
toluene and dodecane while the thiuram-toluene type liquid membrane is more
stable than chloroform.
Table 4.15: Emulsion stability of Cyanex 302 (0.05 M) in different diluents
(Experimental conditions: homogenizer speed = 13500 rpm, mixing time = 5 min,
stripping phase = 1.0 M thiourea in 1.0 M H2SO4, Span 80 = 5%, and temperature =
26 ºC).
Kerosene Toluene n-Dodecane Diluent
Day Oil Water Oil Water Oil Water
1 0.9 0.0 2.2 0.0 1.2 0.0
2 2.2 0.0 2.8 0.0 2.4 0.0
3 2.4 0.0 3.0 0.0 2.8 0.0
4 3.0 0.0 3.2 0.0 2.9 0.0
5 3.1 0.0 3.3 0.1 3.0 0.0
6 3.3 0.5 3.5 0.2 3.2 0.0
7 4.0 1.0 4.2 1.0 3.8 0.7
Table 4.16: Emulsion stability of Thiuram (0.05 M) in different diluents
(Experimental conditions: homogenizer speed = 13500 rpm, mixing time = 5 min,
stripping phase = 1.0 M thiourea in 1.0 M HCl, Span 80 = 5% (w/v), and
temperature = 26 ºC).
Toluene Chloroform Diluents
Day Oil Water Oil Water
1 2.0 0.0 3.5 0.0
2 2.5 0.0 4.0 0.0
3 2.5 0.0 4.2 0.0
4 2.7 0.0 4.5 0.5
5 3.0 0.0 4.3 1.0
6 3.0 0.0 4.8 1.5
7 3.1 0.0 5.0 3.0
8 3.2 0.0 5.0 4.0
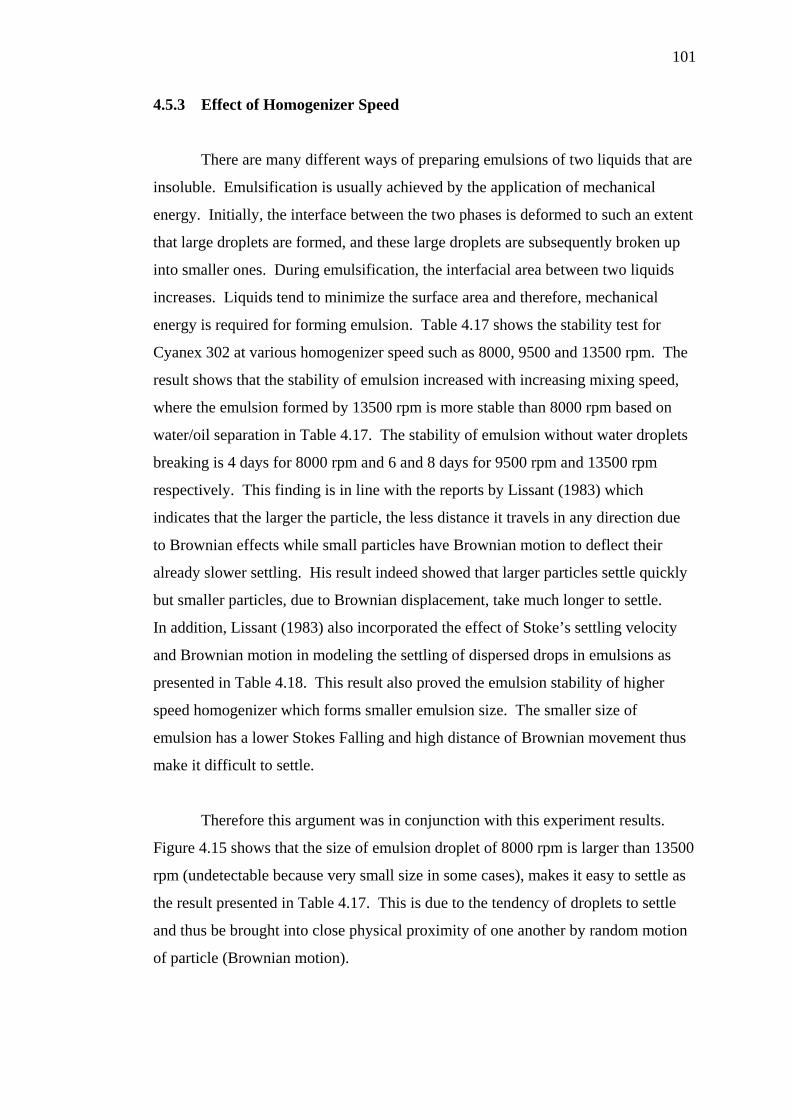
101
4.5.3 Effect of Homogenizer Speed
There are many different ways of preparing emulsions of two liquids that are
insoluble. Emulsification is usually achieved by the application of mechanical
energy. Initially, the interface between the two phases is deformed to such an extent
that large droplets are formed, and these large droplets are subsequently broken up
into smaller ones. During emulsification, the interfacial area between two liquids
increases. Liquids tend to minimize the surface area and therefore, mechanical
energy is required for forming emulsion. Table 4.17 shows the stability test for
Cyanex 302 at various homogenizer speed such as 8000, 9500 and 13500 rpm. The
result shows that the stability of emulsion increased with increasing mixing speed,
where the emulsion formed by 13500 rpm is more stable than 8000 rpm based on
water/oil separation in Table 4.17. The stability of emulsion without water droplets
breaking is 4 days for 8000 rpm and 6 and 8 days for 9500 rpm and 13500 rpm
respectively. This finding is in line with the reports by Lissant (1983) which
indicates that the larger the particle, the less distance it travels in any direction due
to Brownian effects while small particles have Brownian motion to deflect their
already slower settling. His result indeed showed that larger particles settle quickly
but smaller particles, due to Brownian displacement, take much longer to settle.
In addition, Lissant (1983) also incorporated the effect of Stoke’s settling velocity
and Brownian motion in modeling the settling of dispersed drops in emulsions as
presented in Table 4.18. This result also proved the emulsion stability of higher
speed homogenizer which forms smaller emulsion size. The smaller size of
emulsion has a lower Stokes Falling and high distance of Brownian movement thus
make it difficult to settle.
Therefore this argument was in conjunction with this experiment results.
Figure 4.15 shows that the size of emulsion droplet of 8000 rpm is larger than 13500
rpm (undetectable because very small size in some cases), makes it easy to settle as
the result presented in Table 4.17. This is due to the tendency of droplets to settle
and thus be brought into close physical proximity of one another by random motion
of particle (Brownian motion).
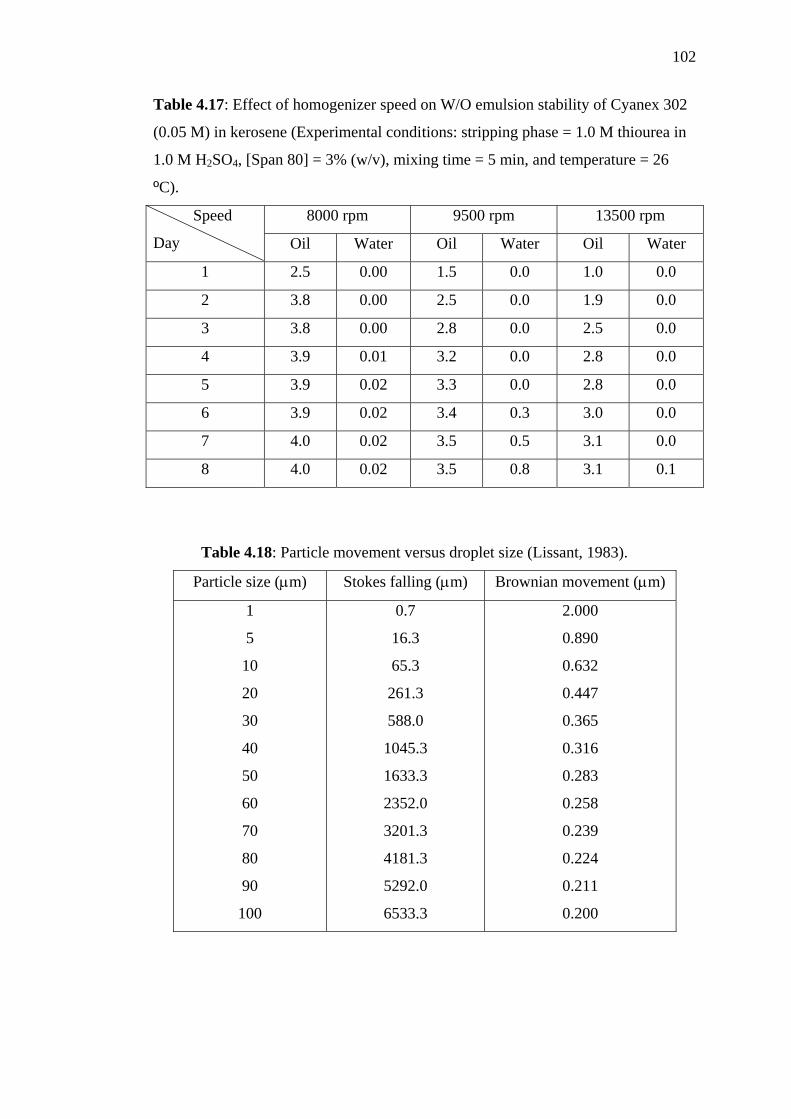
102
Table 4.17: Effect of homogenizer speed on W/O emulsion stability of Cyanex 302
(0.05 M) in kerosene (Experimental conditions: stripping phase = 1.0 M thiourea in
1.0 M H2SO4, [Span 80] = 3% (w/v), mixing time = 5 min, and temperature = 26
ºC).
8000 rpm 9500 rpm 13500 rpm Speed
Day Oil Water Oil Water Oil Water
1 2.5 0.00 1.5 0.0 1.0 0.0
2 3.8 0.00 2.5 0.0 1.9 0.0
3 3.8 0.00 2.8 0.0 2.5 0.0
4 3.9 0.01 3.2 0.0 2.8 0.0
5 3.9 0.02 3.3 0.0 2.8 0.0
6 3.9 0.02 3.4 0.3 3.0 0.0
7 4.0 0.02 3.5 0.5 3.1 0.0
8 4.0 0.02 3.5 0.8 3.1 0.1
Table 4.18: Particle movement versus droplet size (Lissant, 1983).
Particle size (µm) Stokes falling (µm) Brownian movement (µm)
1
5
10
20
30
40
50
60
70
80
90
100
0.7
16.3
65.3
261.3
588.0
1045.3
1633.3
2352.0
3201.3
4181.3
5292.0
6533.3
2.000
0.890
0.632
0.447
0.365
0.316
0.283
0.258
0.239
0.224
0.211
0.200
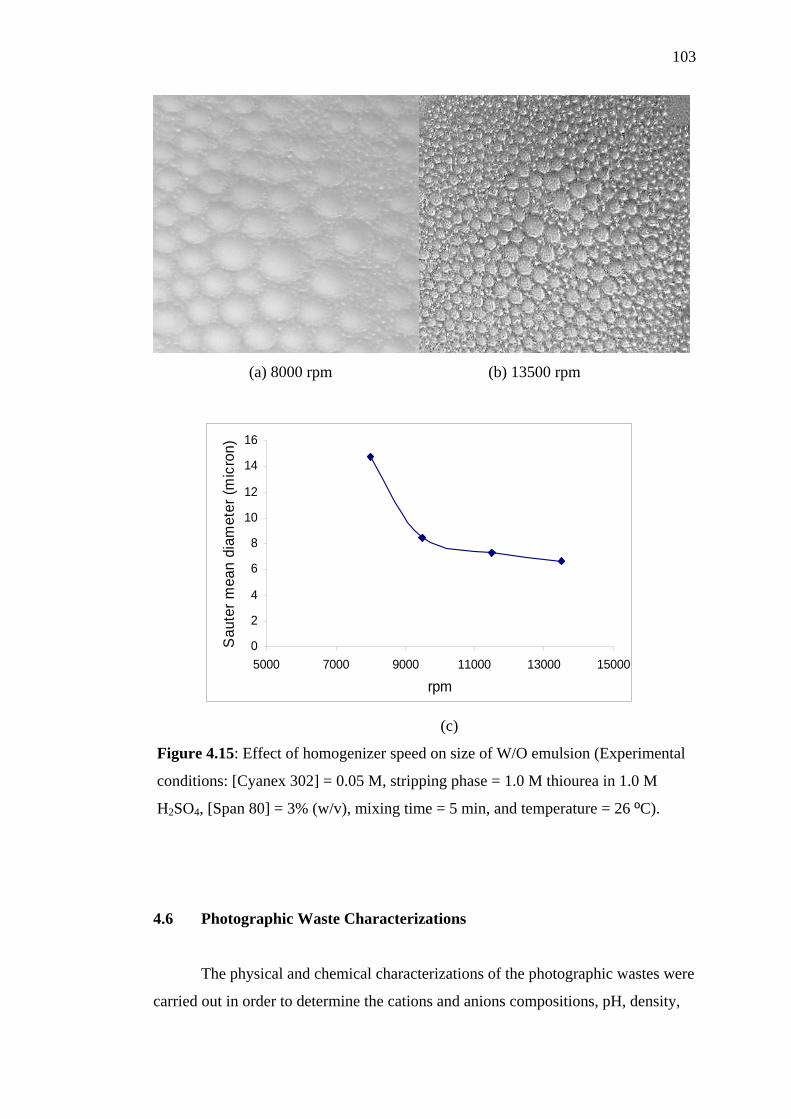
103
(a) 8000 rpm (b) 13500 rpm
0
2
4
6
8
10
12
14
16
5000 7000 9000 11000 13000 15000
rpm
Sau
ter m
ean
diam
eter
(mic
ron)
(c)
Figure 4.15: Effect of homogenizer speed on size of W/O emulsion (Experimental
conditions: [Cyanex 302] = 0.05 M, stripping phase = 1.0 M thiourea in 1.0 M
H2SO4, [Span 80] = 3% (w/v), mixing time = 5 min, and temperature = 26 ºC).
4.6 Photographic Waste Characterizations
The physical and chemical characterizations of the photographic wastes were
carried out in order to determine the cations and anions compositions, pH, density,
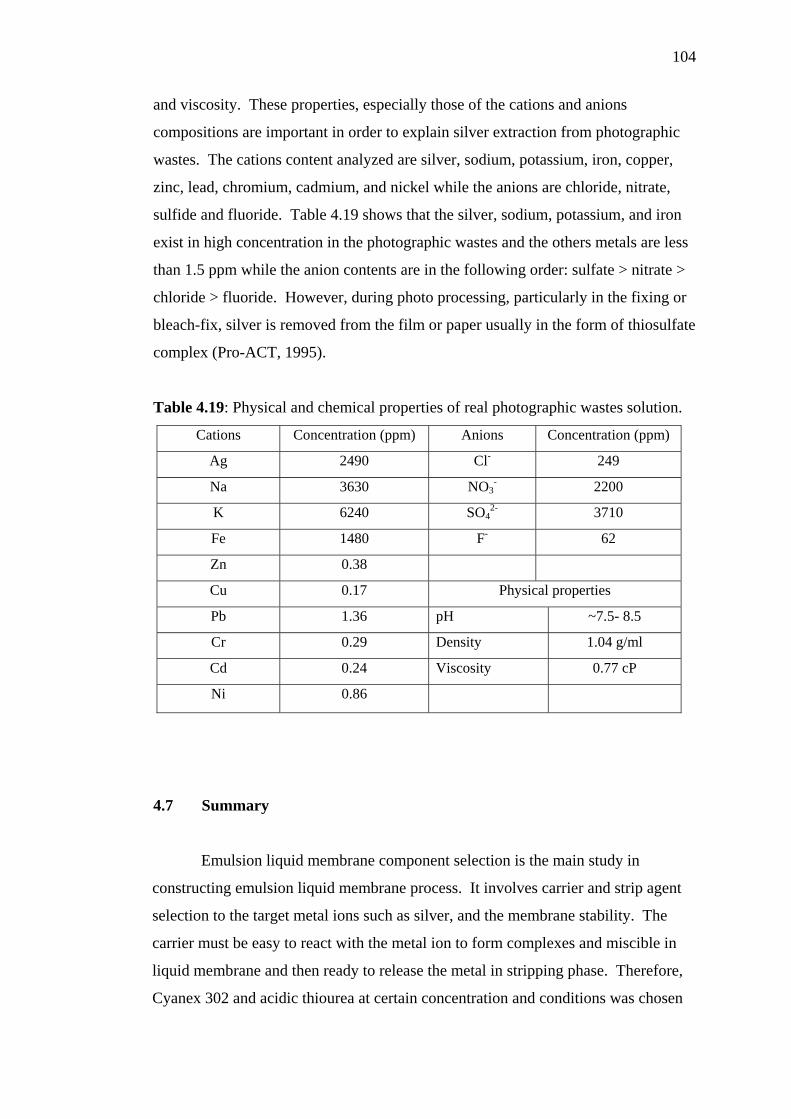
104
and viscosity. These properties, especially those of the cations and anions
compositions are important in order to explain silver extraction from photographic
wastes. The cations content analyzed are silver, sodium, potassium, iron, copper,
zinc, lead, chromium, cadmium, and nickel while the anions are chloride, nitrate,
sulfide and fluoride. Table 4.19 shows that the silver, sodium, potassium, and iron
exist in high concentration in the photographic wastes and the others metals are less
than 1.5 ppm while the anion contents are in the following order: sulfate > nitrate >
chloride > fluoride. However, during photo processing, particularly in the fixing or
bleach-fix, silver is removed from the film or paper usually in the form of thiosulfate
complex (Pro-ACT, 1995).
Table 4.19: Physical and chemical properties of real photographic wastes solution.
Cations Concentration (ppm) Anions Concentration (ppm)
Ag 2490 Cl- 249
Na 3630 NO3- 2200
K 6240 SO42- 3710
Fe 1480 F- 62
Zn 0.38
Cu 0.17 Physical properties
Pb 1.36 pH ~7.5- 8.5
Cr 0.29 Density 1.04 g/ml
Cd 0.24 Viscosity 0.77 cP
Ni 0.86
4.7 Summary
Emulsion liquid membrane component selection is the main study in
constructing emulsion liquid membrane process. It involves carrier and strip agent
selection to the target metal ions such as silver, and the membrane stability. The
carrier must be easy to react with the metal ion to form complexes and miscible in
liquid membrane and then ready to release the metal in stripping phase. Therefore,
Cyanex 302 and acidic thiourea at certain concentration and conditions was chosen
105
as promising carrier and strip agent of silver from photographic wastes. The main
factor in ELM process is emulsion stability. In making stable emulsion a few factors
must be considered such as emulsifier types and concentration, diluents, conditions
of emulsion making and also experimental conditions during extraction process.
When all the criteria are satisfied the possibility of emulsion liquid membrane to
extract silver from photographic wastes will be realized.
CHAPTER 5
EMULSION LIQUID MEMBRANE EXTRACTION
5.1 Introduction
Since the advantage of ELM method is potentially very large, it is selected in
this study as the separation method for silver from the photographic waste. The
principle of ELM process is mass transfer of solute from a waste solution into an
internal aqueous phase, suited for an irreversible capture of transported solutions.
Thus, the process parameters such as carrier and receiving agent impose the mass
transfer direction of the system. Other process parameters that have pronounced
effect on the ELM process are the selection of surfactant, treat ratio of emulsion to
feed phase, diluents, and agitation speed.
This thesis will explain and highlight the effects of systematic changes in the
process parameters of emulsion liquid membrane system performance on silver
extraction. These effects were determined through the amount of metal extracted,
the net change in the interior phase volume, the swell and breakage experienced by
the system. The batch experiment with mixer settler was examined and will be
discussed in this chapter. For the initial studies of the emulsion liquid membrane
system, the standard formulations listed in Table 5.1 are being used, unless
otherwise stated.
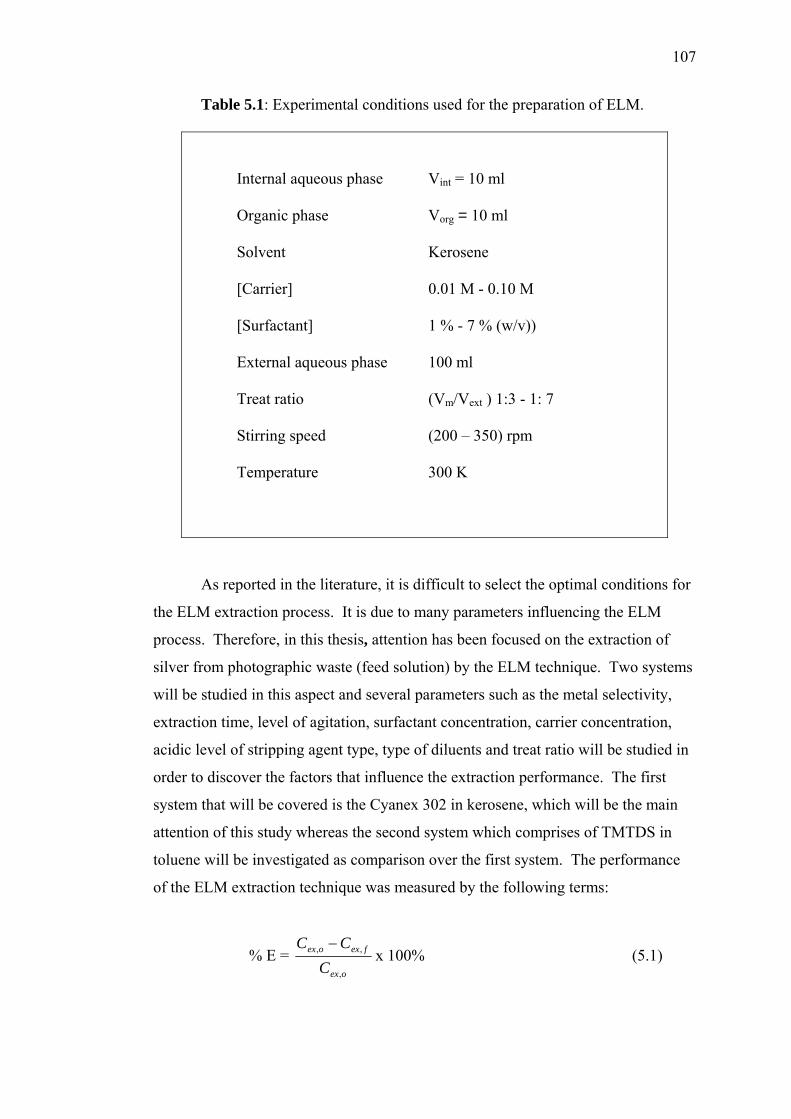
107
Table 5.1: Experimental conditions used for the preparation of ELM.
Internal aqueous phase Vint = 10 ml
Organic phase Vorg = 10 ml
Solvent Kerosene
[Carrier] 0.01 M - 0.10 M
[Surfactant] 1 % - 7 % (w/v))
External aqueous phase 100 ml
Treat ratio (Vm/Vext ) 1:3 - 1: 7
Stirring speed (200 – 350) rpm
Temperature 300 K
As reported in the literature, it is difficult to select the optimal conditions for
the ELM extraction process. It is due to many parameters influencing the ELM
process. Therefore, in this thesis, attention has been focused on the extraction of
silver from photographic waste (feed solution) by the ELM technique. Two systems
will be studied in this aspect and several parameters such as the metal selectivity,
extraction time, level of agitation, surfactant concentration, carrier concentration,
acidic level of stripping agent type, type of diluents and treat ratio will be studied in
order to discover the factors that influence the extraction performance. The first
system that will be covered is the Cyanex 302 in kerosene, which will be the main
attention of this study whereas the second system which comprises of TMTDS in
toluene will be investigated as comparison over the first system. The performance
of the ELM extraction technique was measured by the following terms:
% E = oex
fexoex
CCC
,
,, −x 100% (5.1)
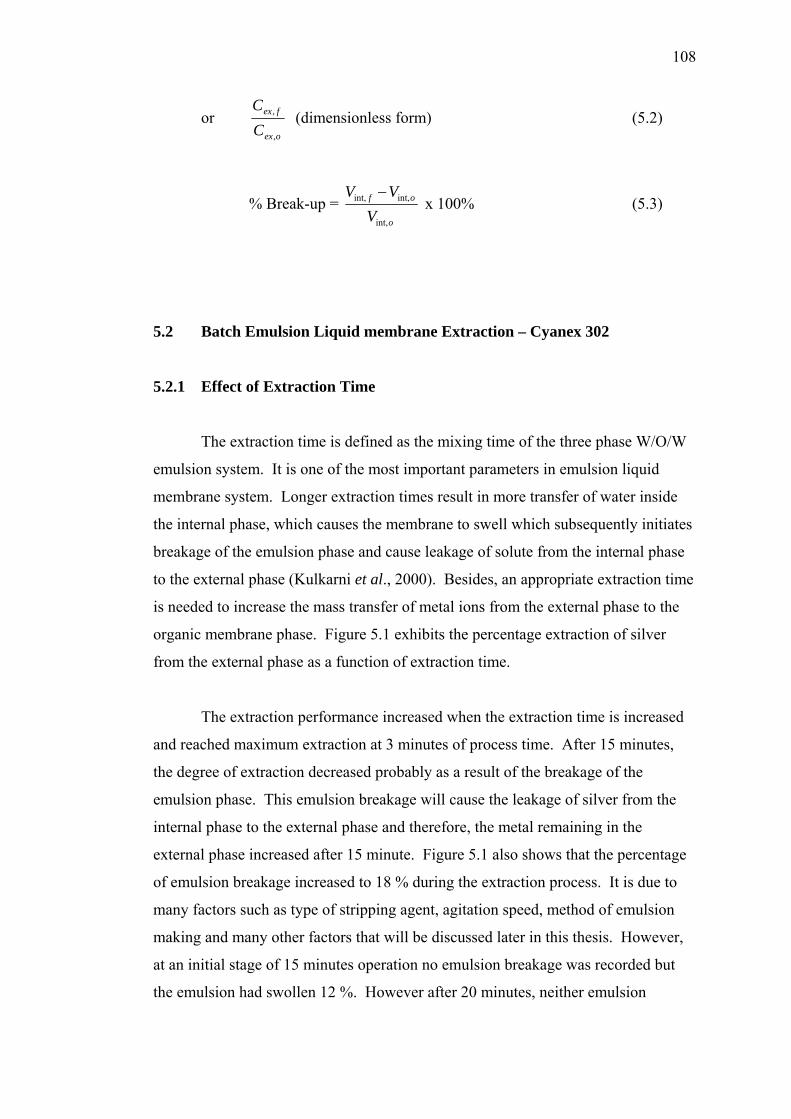
108
or oex
fex
CC
,
, (dimensionless form) (5.2)
% Break-up = o
of
VVV
int,
int,int, − x 100% (5.3)
5.2 Batch Emulsion Liquid membrane Extraction – Cyanex 302
5.2.1 Effect of Extraction Time
The extraction time is defined as the mixing time of the three phase W/O/W
emulsion system. It is one of the most important parameters in emulsion liquid
membrane system. Longer extraction times result in more transfer of water inside
the internal phase, which causes the membrane to swell which subsequently initiates
breakage of the emulsion phase and cause leakage of solute from the internal phase
to the external phase (Kulkarni et al., 2000). Besides, an appropriate extraction time
is needed to increase the mass transfer of metal ions from the external phase to the
organic membrane phase. Figure 5.1 exhibits the percentage extraction of silver
from the external phase as a function of extraction time.
The extraction performance increased when the extraction time is increased
and reached maximum extraction at 3 minutes of process time. After 15 minutes,
the degree of extraction decreased probably as a result of the breakage of the
emulsion phase. This emulsion breakage will cause the leakage of silver from the
internal phase to the external phase and therefore, the metal remaining in the
external phase increased after 15 minute. Figure 5.1 also shows that the percentage
of emulsion breakage increased to 18 % during the extraction process. It is due to
many factors such as type of stripping agent, agitation speed, method of emulsion
making and many other factors that will be discussed later in this thesis. However,
at an initial stage of 15 minutes operation no emulsion breakage was recorded but
the emulsion had swollen 12 %. However after 20 minutes, neither emulsion
109
swelling nor breaking was observed, indicated the rate of swelling and emulsion
breaking were equal. Then, further extraction will cause emulsion break-up.
For further study, 20 minutes total operation time was selected since the
ELM process performed under the typical conditions of Table 5.1 reached
equilibrium in this time of period.
-40
-20
0
20
40
60
80
100
0 10 20 30 40 50
Extraction time (min)
Per
cent
age
(%)
% Ce/Co
% Apparent sw elling
Figure 5.1: Effect of extraction time on the silver extraction (Experimental
conditions: TR = 1:5, [Span 80] = 5% (w/v), [Cyanex 302] = 0.05 M, speed = 250
rpm, feed phase = real liquid photographic waste, stripping phase= 1 M thiourea in 1
M H2SO4; and diluents = kerosene).
5.2.2 Effect of Stripping Agent Types and Concentration
The type of stripping agent plays an important role in silver recovery and
minimizing the co-transport of water in the extraction process. Its concentration as
well as the internal phase volume fraction cannot be changed or increased
indefinitely. If the concentration of the internal reagent is beyond a limiting value, it
will be harmful to the stability of the membrane and will increase water permeability
in the membrane. This will lead to obvious swelling due to the high osmotic
pressure gradient between the internal and external phases. Different types of
110
thiourea solution were tested as a stripping agent of silver from photographic wastes.
The result indicated the concentration of thiourea and types of acid used play an
important role in obtaining the better emulsion liquid membrane system. Thiourea
in H2SO4 solution provides better extraction compared to thiourea in HCl and HNO3
solution. Silver is completely extracted using 1.0 M thiourea in the H2SO4 solution
as shown in Table 5.2. The result also shows that by decreasing thiourea
concentration, the silver extraction also decreased. Similar effect was found when
lowering the acid solution concentration.
To study the experience of using different types of acid solution during the
ELM process, a few experiments were carried out. Figure 5.2 shows the silver
extraction performance using 1.0 M Thiourea in 1.0 M H2SO4 and HCl acid
solution. The result shows that the extraction rate using the sulfuric acid solution
system is more momentous than that using the hydrochloric acid solution especially
at the initial stage of the process. It is due to high hydrogen ion gradient at the initial
stage acting as a driving force. The flux gradually decreased as the driving force
decreased until the maximum extraction was achieved. At this stage, further
extraction will lead to membrane instability and other metals will be extracted from
the photographic wastes. Some reports also indicate that the presence of salt in the
receiving phase results in interfacial film breakdown which leads to membrane
leakage (Oza and Frank, 1989). The formation of chloride salt in the receiving
phase could explain the reduction in silver extraction when HCl was used.
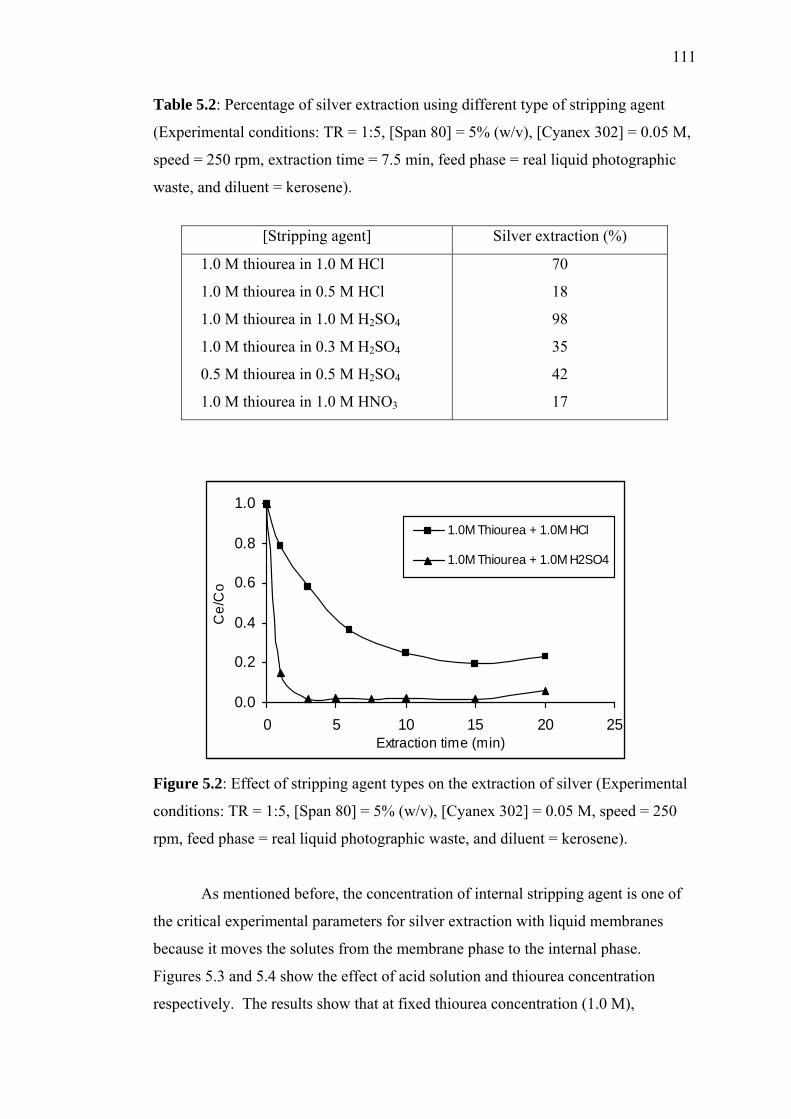
111
Table 5.2: Percentage of silver extraction using different type of stripping agent
(Experimental conditions: TR = 1:5, [Span 80] = 5% (w/v), [Cyanex 302] = 0.05 M,
speed = 250 rpm, extraction time = 7.5 min, feed phase = real liquid photographic
waste, and diluent = kerosene).
0.0
0.2
0.4
0.6
0.8
1.0
0 5 10 15 20 25Extraction time (min)
Ce/
Co
1.0M Thiourea + 1.0M HCl
1.0M Thiourea + 1.0M H2SO4
Figure 5.2: Effect of stripping agent types on the extraction of silver (Experimental
conditions: TR = 1:5, [Span 80] = 5% (w/v), [Cyanex 302] = 0.05 M, speed = 250
rpm, feed phase = real liquid photographic waste, and diluent = kerosene).
As mentioned before, the concentration of internal stripping agent is one of
the critical experimental parameters for silver extraction with liquid membranes
because it moves the solutes from the membrane phase to the internal phase.
Figures 5.3 and 5.4 show the effect of acid solution and thiourea concentration
respectively. The results show that at fixed thiourea concentration (1.0 M),
[Stripping agent] Silver extraction (%)
1.0 M thiourea in 1.0 M HCl
1.0 M thiourea in 0.5 M HCl
1.0 M thiourea in 1.0 M H2SO4
1.0 M thiourea in 0.3 M H2SO4
0.5 M thiourea in 0.5 M H2SO4
1.0 M thiourea in 1.0 M HNO3
70
18
98
35
42
17
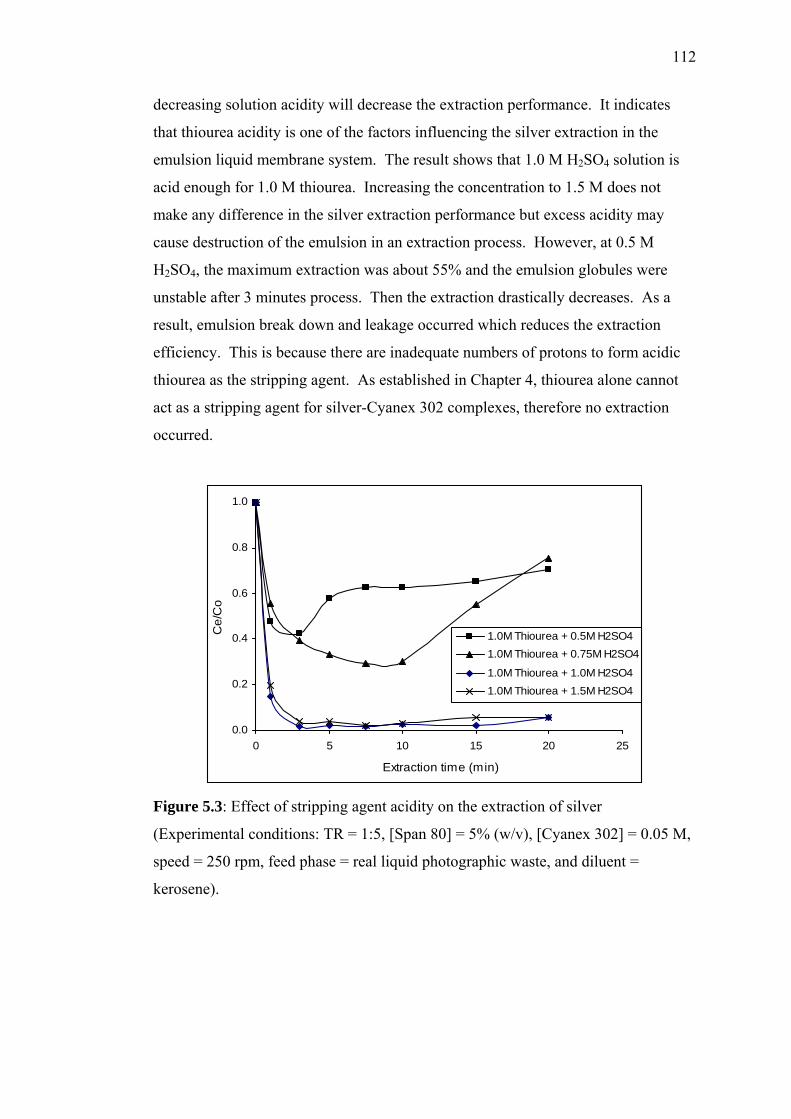
112
decreasing solution acidity will decrease the extraction performance. It indicates
that thiourea acidity is one of the factors influencing the silver extraction in the
emulsion liquid membrane system. The result shows that 1.0 M H2SO4 solution is
acid enough for 1.0 M thiourea. Increasing the concentration to 1.5 M does not
make any difference in the silver extraction performance but excess acidity may
cause destruction of the emulsion in an extraction process. However, at 0.5 M
H2SO4, the maximum extraction was about 55% and the emulsion globules were
unstable after 3 minutes process. Then the extraction drastically decreases. As a
result, emulsion break down and leakage occurred which reduces the extraction
efficiency. This is because there are inadequate numbers of protons to form acidic
thiourea as the stripping agent. As established in Chapter 4, thiourea alone cannot
act as a stripping agent for silver-Cyanex 302 complexes, therefore no extraction
occurred.
0.0
0.2
0.4
0.6
0.8
1.0
0 5 10 15 20 25
Extraction time (min)
Ce/
Co
1.0M Thiourea + 0.5M H2SO41.0M Thiourea + 0.75M H2SO4
1.0M Thiourea + 1.0M H2SO41.0M Thiourea + 1.5M H2SO4
Figure 5.3: Effect of stripping agent acidity on the extraction of silver
(Experimental conditions: TR = 1:5, [Span 80] = 5% (w/v), [Cyanex 302] = 0.05 M,
speed = 250 rpm, feed phase = real liquid photographic waste, and diluent =
kerosene).
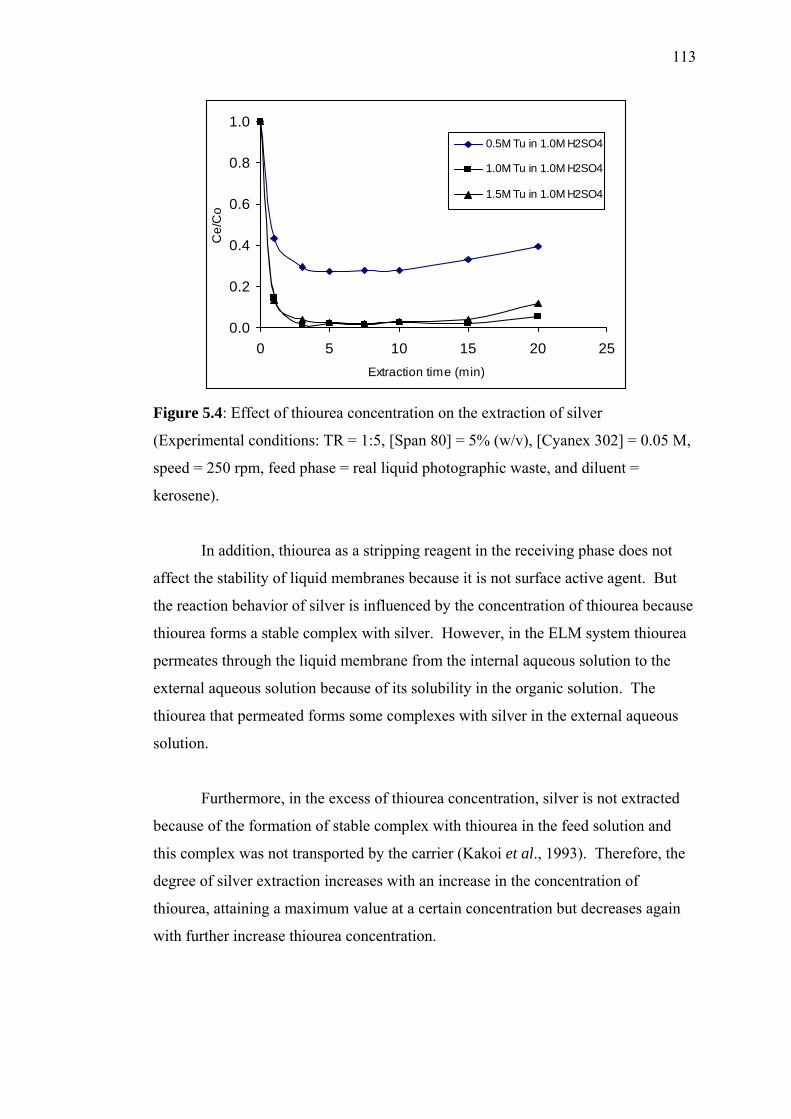
113
0.0
0.2
0.4
0.6
0.8
1.0
0 5 10 15 20 25Extraction time (min)
Ce/
Co
0.5M Tu in 1.0M H2SO4
1.0M Tu in 1.0M H2SO4
1.5M Tu in 1.0M H2SO4
Figure 5.4: Effect of thiourea concentration on the extraction of silver
(Experimental conditions: TR = 1:5, [Span 80] = 5% (w/v), [Cyanex 302] = 0.05 M,
speed = 250 rpm, feed phase = real liquid photographic waste, and diluent =
kerosene).
In addition, thiourea as a stripping reagent in the receiving phase does not
affect the stability of liquid membranes because it is not surface active agent. But
the reaction behavior of silver is influenced by the concentration of thiourea because
thiourea forms a stable complex with silver. However, in the ELM system thiourea
permeates through the liquid membrane from the internal aqueous solution to the
external aqueous solution because of its solubility in the organic solution. The
thiourea that permeated forms some complexes with silver in the external aqueous
solution.
Furthermore, in the excess of thiourea concentration, silver is not extracted
because of the formation of stable complex with thiourea in the feed solution and
this complex was not transported by the carrier (Kakoi et al., 1993). Therefore, the
degree of silver extraction increases with an increase in the concentration of
thiourea, attaining a maximum value at a certain concentration but decreases again
with further increase thiourea concentration.
114
On the other hand, increasing the thiourea concentration from 0.5 M to 1.5 M
in the 1.0 M H2SO4 solution increased the extraction performance but at 1.5 M
concentration the extraction exceeds the limiting value at which no significant
increment was observed as shown in Figure 5.4. This means that there was excess
of thiourea in the system but at 0.5 M thiourea the silver extraction only around 70%
because of inadequate amount of acidic thiourea available to strip silver from the
silver-Cyanex 302 complex. However, after 10 minutes of process time the
extraction decreased due to the emulsion swelling thus providing potential for
breakup over a long extraction time. In addition, the result also shows that the
degree of break-up is not very dependent but the degree of recovery of silver is
strongly dependent on the concentration of thiourea based on the measured
extraction performance.
5.2.3 Effect of Carrier Concentration
Carrier types and its concentration plays an important role in emulsion liquid
membrane formulation. It must be very selective in both external and internal
aqueous phases or in metal extraction and stripping steps. Sekine and Hasegawa
(1977) found that metal ion will react with extractant-containing N, O, F, P, S, and
Cl. According to the Hard-Soft Acid-Base concept, silver is classified as a soft acid
and soft lewis base extractant with a sulfur containing reagent paramount makes a
complex with high selectivity to silver ion. So that, to what concentration must be
investigate to get high extraction performance of silver in the ELM system.
The carrier concentration is closely connected with the reaction rate. When
the metal ion easily reacts with the carrier to form a complex, the carrier
concentration has a significant effect on the extraction rate. Shiau and Jung (1993)
reported that increasing carrier (LIX 64N) concentration has great advantage in the
increase of selective separation of Zn and Cd from Ni but not for selective
separation of Zn and Cd because of close equilibrium values of the two with the
carrier. Reis and Carvalho (1993) reported the percentage of carrier in solvent for
possible extraction is between 3 – 7 %. In contrast, the extracting agent (D2EHPA)
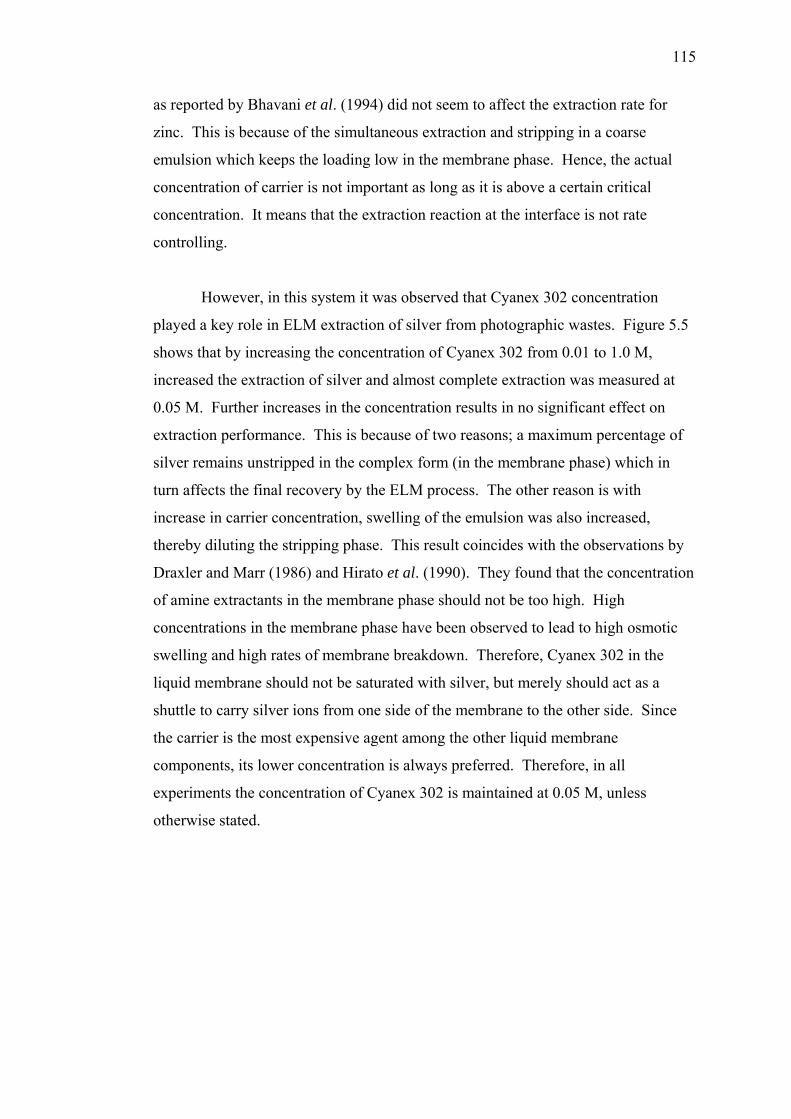
115
as reported by Bhavani et al. (1994) did not seem to affect the extraction rate for
zinc. This is because of the simultaneous extraction and stripping in a coarse
emulsion which keeps the loading low in the membrane phase. Hence, the actual
concentration of carrier is not important as long as it is above a certain critical
concentration. It means that the extraction reaction at the interface is not rate
controlling.
However, in this system it was observed that Cyanex 302 concentration
played a key role in ELM extraction of silver from photographic wastes. Figure 5.5
shows that by increasing the concentration of Cyanex 302 from 0.01 to 1.0 M,
increased the extraction of silver and almost complete extraction was measured at
0.05 M. Further increases in the concentration results in no significant effect on
extraction performance. This is because of two reasons; a maximum percentage of
silver remains unstripped in the complex form (in the membrane phase) which in
turn affects the final recovery by the ELM process. The other reason is with
increase in carrier concentration, swelling of the emulsion was also increased,
thereby diluting the stripping phase. This result coincides with the observations by
Draxler and Marr (1986) and Hirato et al. (1990). They found that the concentration
of amine extractants in the membrane phase should not be too high. High
concentrations in the membrane phase have been observed to lead to high osmotic
swelling and high rates of membrane breakdown. Therefore, Cyanex 302 in the
liquid membrane should not be saturated with silver, but merely should act as a
shuttle to carry silver ions from one side of the membrane to the other side. Since
the carrier is the most expensive agent among the other liquid membrane
components, its lower concentration is always preferred. Therefore, in all
experiments the concentration of Cyanex 302 is maintained at 0.05 M, unless
otherwise stated.
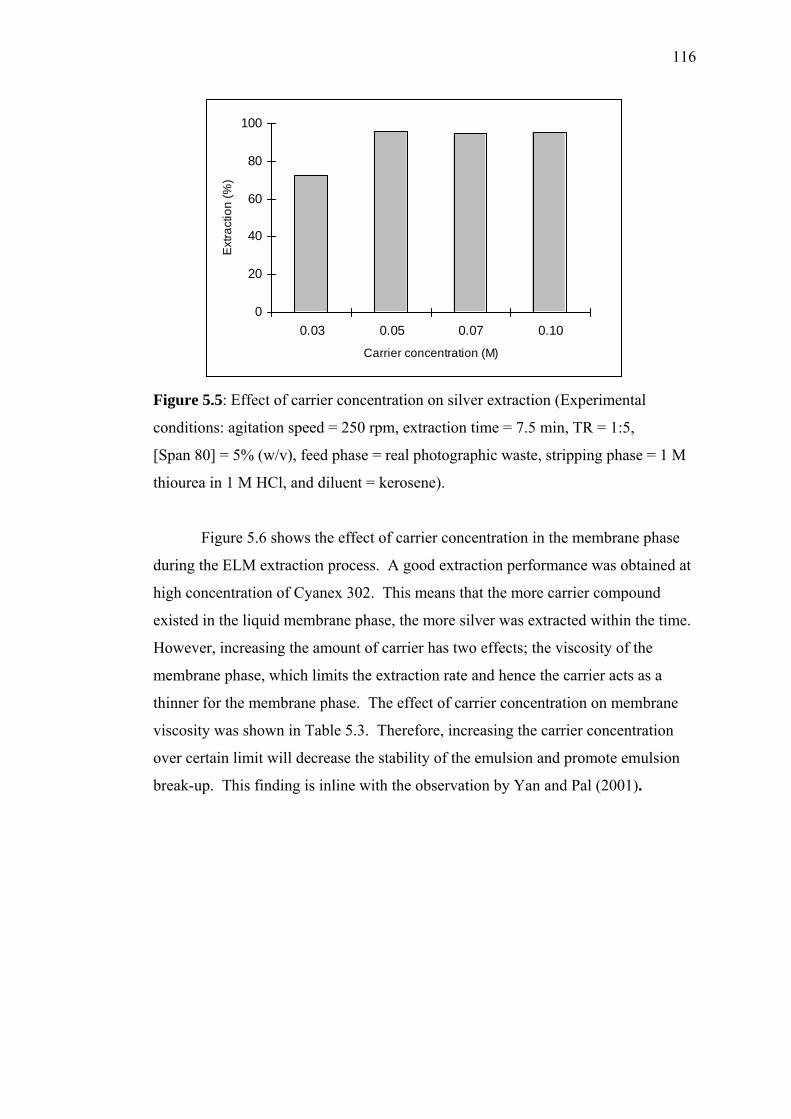
116
0
20
40
60
80
100
0.03 0.05 0.07 0.10
Carrier concentration (M)
Ext
ract
ion
(%)
Figure 5.5: Effect of carrier concentration on silver extraction (Experimental
conditions: agitation speed = 250 rpm, extraction time = 7.5 min, TR = 1:5,
[Span 80] = 5% (w/v), feed phase = real photographic waste, stripping phase = 1 M
thiourea in 1 M HCl, and diluent = kerosene).
Figure 5.6 shows the effect of carrier concentration in the membrane phase
during the ELM extraction process. A good extraction performance was obtained at
high concentration of Cyanex 302. This means that the more carrier compound
existed in the liquid membrane phase, the more silver was extracted within the time.
However, increasing the amount of carrier has two effects; the viscosity of the
membrane phase, which limits the extraction rate and hence the carrier acts as a
thinner for the membrane phase. The effect of carrier concentration on membrane
viscosity was shown in Table 5.3. Therefore, increasing the carrier concentration
over certain limit will decrease the stability of the emulsion and promote emulsion
break-up. This finding is inline with the observation by Yan and Pal (2001).
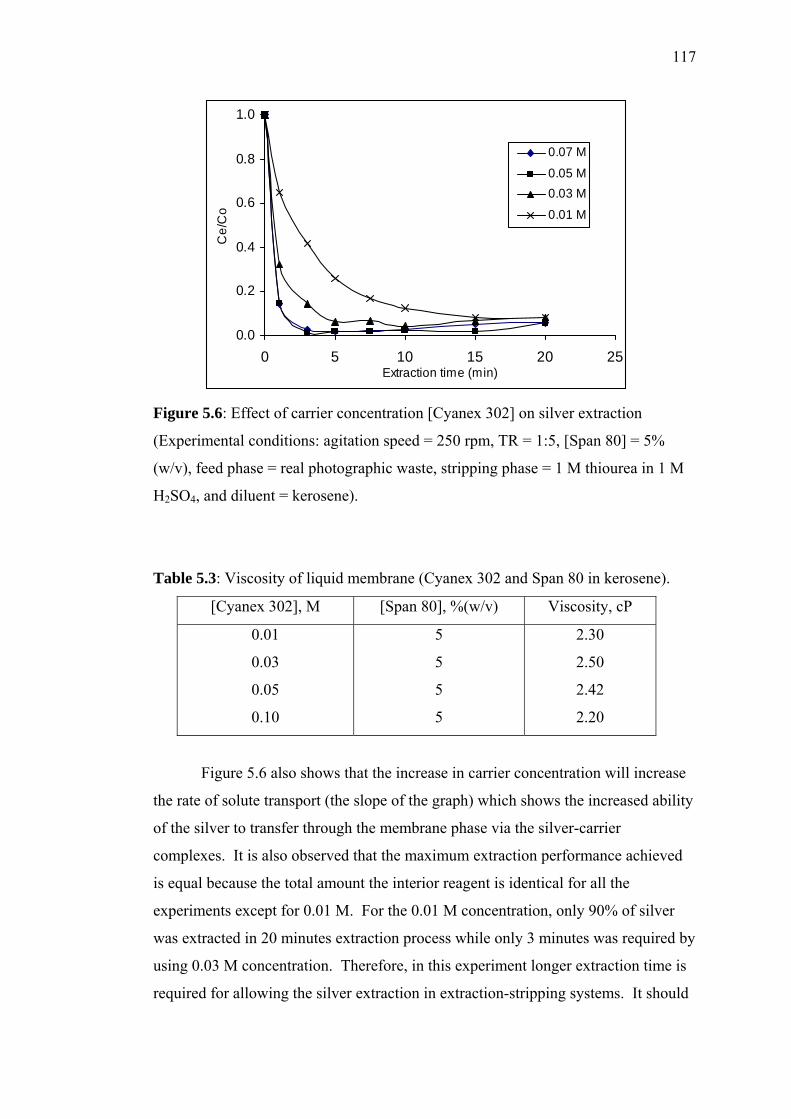
117
0.0
0.2
0.4
0.6
0.8
1.0
0 5 10 15 20 25Extraction time (min)
Ce/
Co
0.07 M
0.05 M0.03 M
0.01 M
Figure 5.6: Effect of carrier concentration [Cyanex 302] on silver extraction
(Experimental conditions: agitation speed = 250 rpm, TR = 1:5, [Span 80] = 5%
(w/v), feed phase = real photographic waste, stripping phase = 1 M thiourea in 1 M
H2SO4, and diluent = kerosene).
Table 5.3: Viscosity of liquid membrane (Cyanex 302 and Span 80 in kerosene).
[Cyanex 302], M [Span 80], %(w/v) Viscosity, cP
0.01
0.03
0.05
0.10
5
5
5
5
2.30
2.50
2.42
2.20
Figure 5.6 also shows that the increase in carrier concentration will increase
the rate of solute transport (the slope of the graph) which shows the increased ability
of the silver to transfer through the membrane phase via the silver-carrier
complexes. It is also observed that the maximum extraction performance achieved
is equal because the total amount the interior reagent is identical for all the
experiments except for 0.01 M. For the 0.01 M concentration, only 90% of silver
was extracted in 20 minutes extraction process while only 3 minutes was required by
using 0.03 M concentration. Therefore, in this experiment longer extraction time is
required for allowing the silver extraction in extraction-stripping systems. It should
118
be noted that further increase in the extraction time is indicative of membrane
breakage and will be discussed in detail in the next section.
On the other hand, during the ELM extraction process, the pH reduces
gradually in the external phase as shown in Figure 5.7. As reported, the
performance of ELM operation shows better results as extraction time increased
according to Figure 5.6. However, after 10 minutes process the extraction
performance reduced a little bit contradict with the value of the pH system which is
gradually decreased. It is due to the effect of emulsion breakage which leads to
hydrogen transfer from internal phase to external phase. This finding was also
observed experimentally by Zhou (1996) on strontium extraction. The experimental
curve shows that when hydrogen ion concentration increases in the external phase
the values of extraction distribution coefficient is decreased.
2
4
6
8
0 5 10 15 20 25Extraction time (min)
pH
0.01 M
0.03 M0.05 M
0.07 M
Figure 5.7: The effect of carrier concentration [Cyanex 302] on the pH of the
system during the extraction process (Experimental conditions: agitation speed =
250 rpm, TR = 1:5, [Span 80] = 5% (w/v), feed phase = real photographic waste,
stripping phase = 1 M thiourea in 1 M H2SO4, and diluent = kerosene).
The best value of the carrier concentration was found to be about 0.05 M
based on the stability of the emulsion phase in the experiments. However, 0.03 M
Cyanex 302 was taken to be the most appropriate concentration since the extraction
percentage started to achieve its steady state after 10 minutes process time. Lower
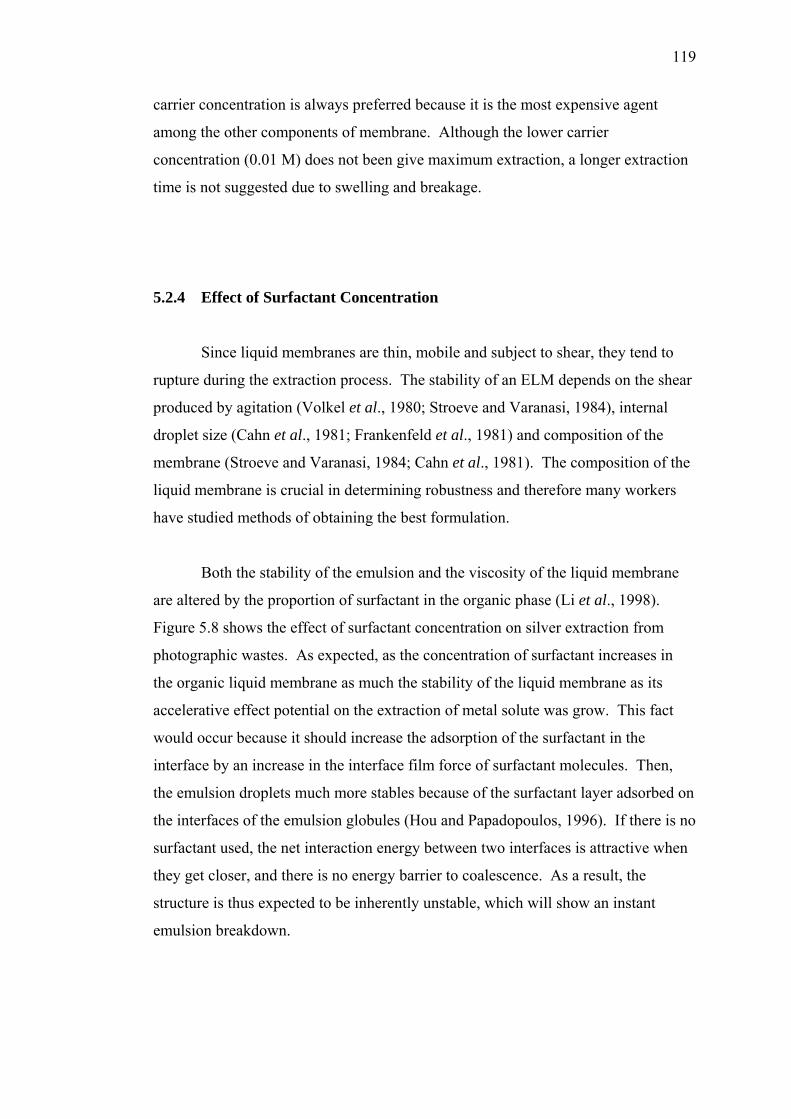
119
carrier concentration is always preferred because it is the most expensive agent
among the other components of membrane. Although the lower carrier
concentration (0.01 M) does not been give maximum extraction, a longer extraction
time is not suggested due to swelling and breakage.
5.2.4 Effect of Surfactant Concentration
Since liquid membranes are thin, mobile and subject to shear, they tend to
rupture during the extraction process. The stability of an ELM depends on the shear
produced by agitation (Volkel et al., 1980; Stroeve and Varanasi, 1984), internal
droplet size (Cahn et al., 1981; Frankenfeld et al., 1981) and composition of the
membrane (Stroeve and Varanasi, 1984; Cahn et al., 1981). The composition of the
liquid membrane is crucial in determining robustness and therefore many workers
have studied methods of obtaining the best formulation.
Both the stability of the emulsion and the viscosity of the liquid membrane
are altered by the proportion of surfactant in the organic phase (Li et al., 1998).
Figure 5.8 shows the effect of surfactant concentration on silver extraction from
photographic wastes. As expected, as the concentration of surfactant increases in
the organic liquid membrane as much the stability of the liquid membrane as its
accelerative effect potential on the extraction of metal solute was grow. This fact
would occur because it should increase the adsorption of the surfactant in the
interface by an increase in the interface film force of surfactant molecules. Then,
the emulsion droplets much more stables because of the surfactant layer adsorbed on
the interfaces of the emulsion globules (Hou and Papadopoulos, 1996). If there is no
surfactant used, the net interaction energy between two interfaces is attractive when
they get closer, and there is no energy barrier to coalescence. As a result, the
structure is thus expected to be inherently unstable, which will show an instant
emulsion breakdown.
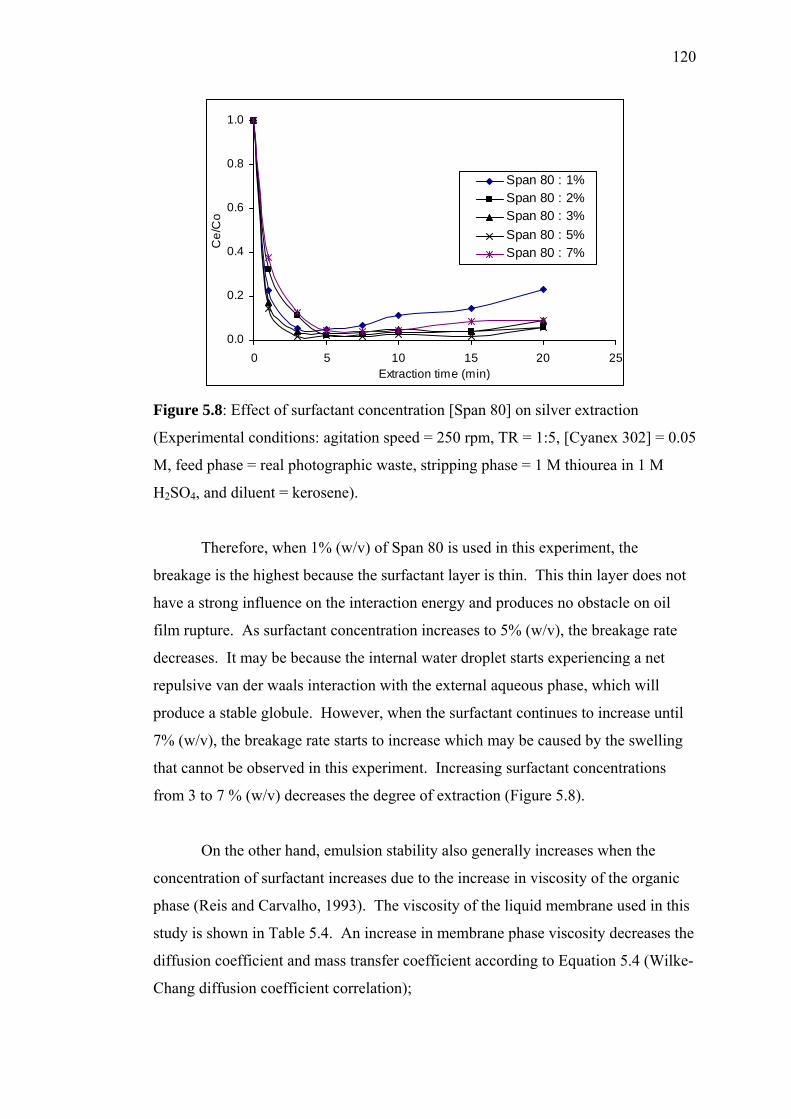
120
0.0
0.2
0.4
0.6
0.8
1.0
0 5 10 15 20 25Extraction time (min)
Ce/
Co
Span 80 : 1%Span 80 : 2%Span 80 : 3%Span 80 : 5%Span 80 : 7%
Figure 5.8: Effect of surfactant concentration [Span 80] on silver extraction
(Experimental conditions: agitation speed = 250 rpm, TR = 1:5, [Cyanex 302] = 0.05
M, feed phase = real photographic waste, stripping phase = 1 M thiourea in 1 M
H2SO4, and diluent = kerosene).
Therefore, when 1% (w/v) of Span 80 is used in this experiment, the
breakage is the highest because the surfactant layer is thin. This thin layer does not
have a strong influence on the interaction energy and produces no obstacle on oil
film rupture. As surfactant concentration increases to 5% (w/v), the breakage rate
decreases. It may be because the internal water droplet starts experiencing a net
repulsive van der waals interaction with the external aqueous phase, which will
produce a stable globule. However, when the surfactant continues to increase until
7% (w/v), the breakage rate starts to increase which may be caused by the swelling
that cannot be observed in this experiment. Increasing surfactant concentrations
from 3 to 7 % (w/v) decreases the degree of extraction (Figure 5.8).
On the other hand, emulsion stability also generally increases when the
concentration of surfactant increases due to the increase in viscosity of the organic
phase (Reis and Carvalho, 1993). The viscosity of the liquid membrane used in this
study is shown in Table 5.4. An increase in membrane phase viscosity decreases the
diffusion coefficient and mass transfer coefficient according to Equation 5.4 (Wilke-
Chang diffusion coefficient correlation);
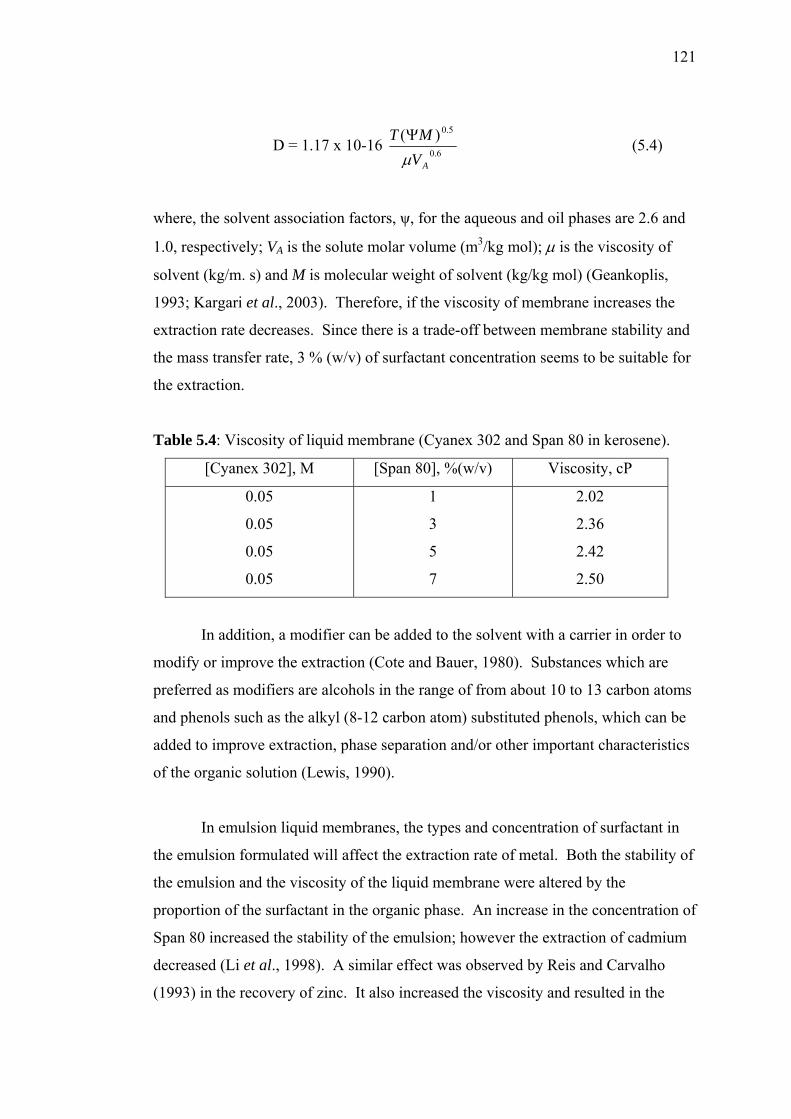
121
D = 1.17 x 10⁻¹⁶ 6.0
5.0)(
AVMT
µΨ (5.4)
where, the solvent association factors, ψ, for the aqueous and oil phases are 2.6 and
1.0, respectively; VA is the solute molar volume (m3/kg mol); µ is the viscosity of
solvent (kg/m. s) and M is molecular weight of solvent (kg/kg mol) (Geankoplis,
1993; Kargari et al., 2003). Therefore, if the viscosity of membrane increases the
extraction rate decreases. Since there is a trade-off between membrane stability and
the mass transfer rate, 3 % (w/v) of surfactant concentration seems to be suitable for
the extraction.
Table 5.4: Viscosity of liquid membrane (Cyanex 302 and Span 80 in kerosene).
[Cyanex 302], M [Span 80], %(w/v) Viscosity, cP
0.05
0.05
0.05
0.05
1
3
5
7
2.02
2.36
2.42
2.50
In addition, a modifier can be added to the solvent with a carrier in order to
modify or improve the extraction (Cote and Bauer, 1980). Substances which are
preferred as modifiers are alcohols in the range of from about 10 to 13 carbon atoms
and phenols such as the alkyl (8-12 carbon atom) substituted phenols, which can be
added to improve extraction, phase separation and/or other important characteristics
of the organic solution (Lewis, 1990).
In emulsion liquid membranes, the types and concentration of surfactant in
the emulsion formulated will affect the extraction rate of metal. Both the stability of
the emulsion and the viscosity of the liquid membrane were altered by the
proportion of the surfactant in the organic phase. An increase in the concentration of
Span 80 increased the stability of the emulsion; however the extraction of cadmium
decreased (Li et al., 1998). A similar effect was observed by Reis and Carvalho
(1993) in the recovery of zinc. It also increased the viscosity and resulted in the
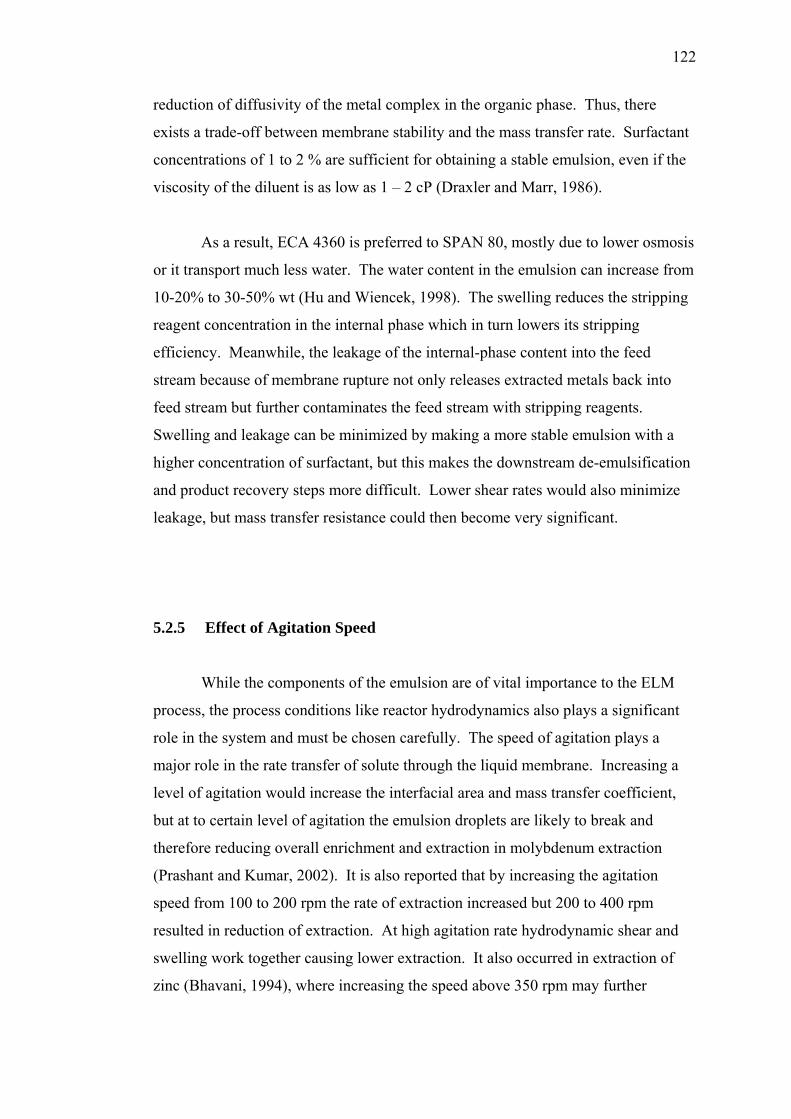
122
reduction of diffusivity of the metal complex in the organic phase. Thus, there
exists a trade-off between membrane stability and the mass transfer rate. Surfactant
concentrations of 1 to 2 % are sufficient for obtaining a stable emulsion, even if the
viscosity of the diluent is as low as 1 – 2 cP (Draxler and Marr, 1986).
As a result, ECA 4360 is preferred to SPAN 80, mostly due to lower osmosis
or it transport much less water. The water content in the emulsion can increase from
10-20% to 30-50% wt (Hu and Wiencek, 1998). The swelling reduces the stripping
reagent concentration in the internal phase which in turn lowers its stripping
efficiency. Meanwhile, the leakage of the internal-phase content into the feed
stream because of membrane rupture not only releases extracted metals back into
feed stream but further contaminates the feed stream with stripping reagents.
Swelling and leakage can be minimized by making a more stable emulsion with a
higher concentration of surfactant, but this makes the downstream de-emulsification
and product recovery steps more difficult. Lower shear rates would also minimize
leakage, but mass transfer resistance could then become very significant.
5.2.5 Effect of Agitation Speed
While the components of the emulsion are of vital importance to the ELM
process, the process conditions like reactor hydrodynamics also plays a significant
role in the system and must be chosen carefully. The speed of agitation plays a
major role in the rate transfer of solute through the liquid membrane. Increasing a
level of agitation would increase the interfacial area and mass transfer coefficient,
but at to certain level of agitation the emulsion droplets are likely to break and
therefore reducing overall enrichment and extraction in molybdenum extraction
(Prashant and Kumar, 2002). It is also reported that by increasing the agitation
speed from 100 to 200 rpm the rate of extraction increased but 200 to 400 rpm
resulted in reduction of extraction. At high agitation rate hydrodynamic shear and
swelling work together causing lower extraction. It also occurred in extraction of
zinc (Bhavani, 1994), where increasing the speed above 350 rpm may further
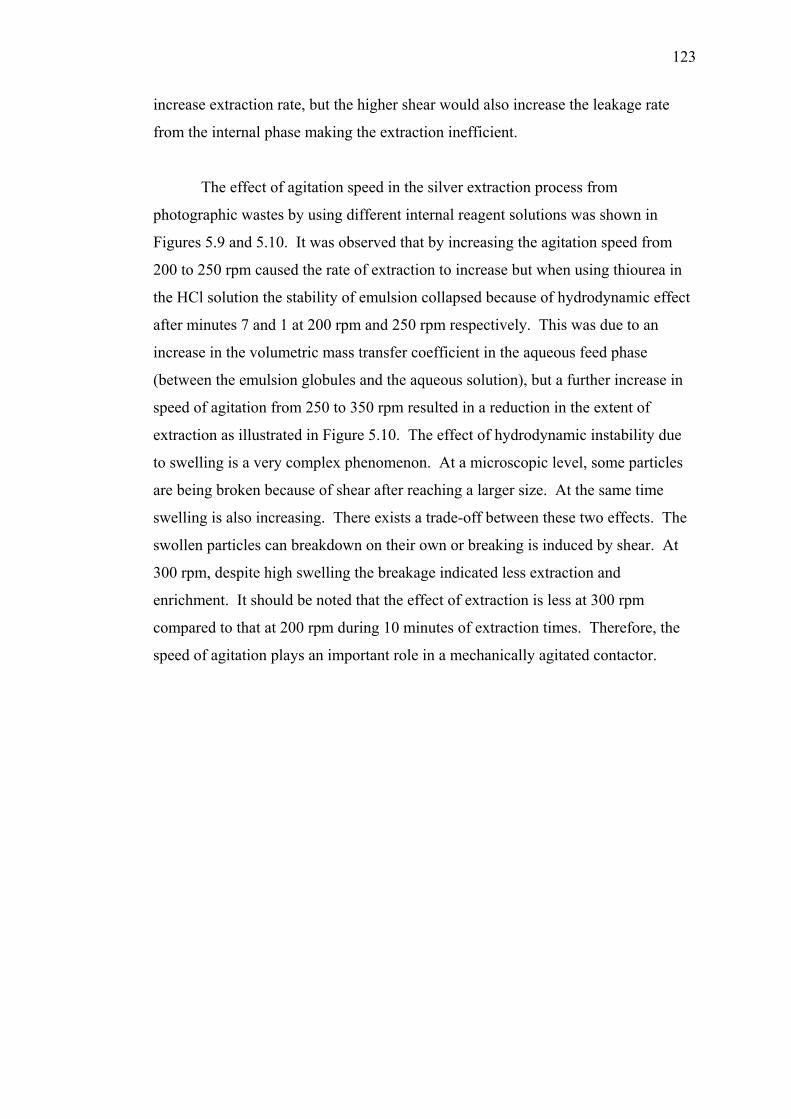
123
increase extraction rate, but the higher shear would also increase the leakage rate
from the internal phase making the extraction inefficient.
The effect of agitation speed in the silver extraction process from
photographic wastes by using different internal reagent solutions was shown in
Figures 5.9 and 5.10. It was observed that by increasing the agitation speed from
200 to 250 rpm caused the rate of extraction to increase but when using thiourea in
the HCl solution the stability of emulsion collapsed because of hydrodynamic effect
after minutes 7 and 1 at 200 rpm and 250 rpm respectively. This was due to an
increase in the volumetric mass transfer coefficient in the aqueous feed phase
(between the emulsion globules and the aqueous solution), but a further increase in
speed of agitation from 250 to 350 rpm resulted in a reduction in the extent of
extraction as illustrated in Figure 5.10. The effect of hydrodynamic instability due
to swelling is a very complex phenomenon. At a microscopic level, some particles
are being broken because of shear after reaching a larger size. At the same time
swelling is also increasing. There exists a trade-off between these two effects. The
swollen particles can breakdown on their own or breaking is induced by shear. At
300 rpm, despite high swelling the breakage indicated less extraction and
enrichment. It should be noted that the effect of extraction is less at 300 rpm
compared to that at 200 rpm during 10 minutes of extraction times. Therefore, the
speed of agitation plays an important role in a mechanically agitated contactor.
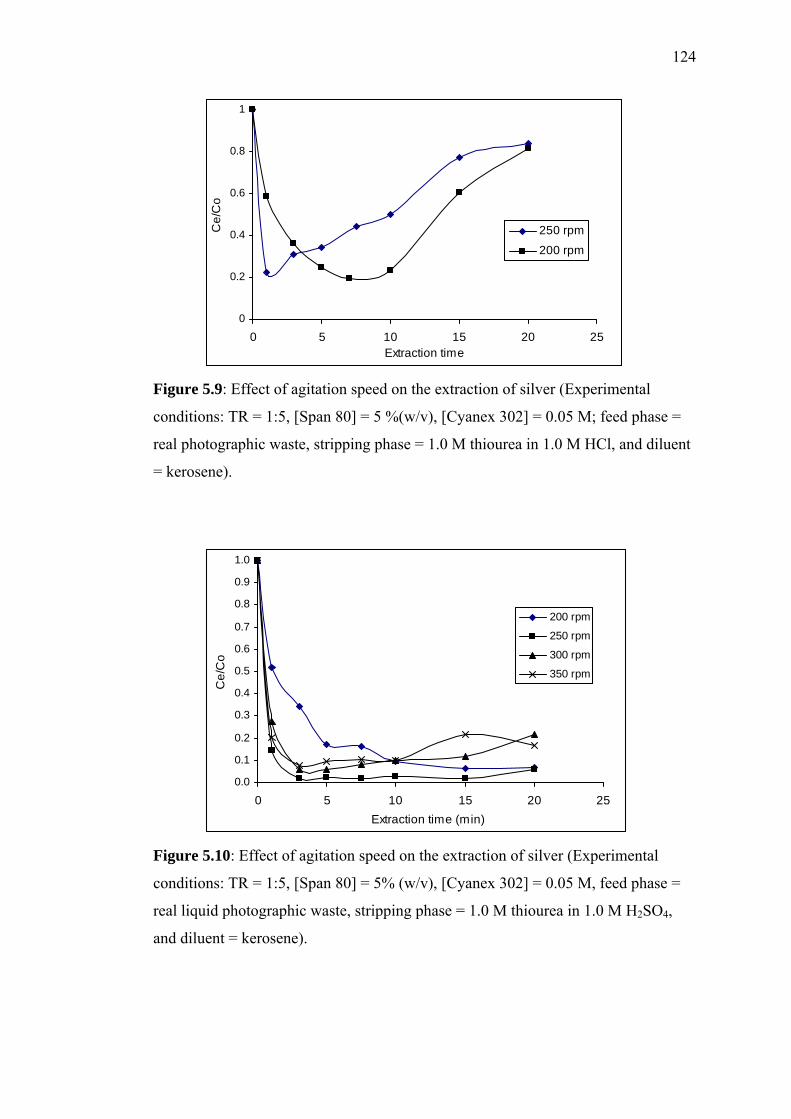
124
0
0.2
0.4
0.6
0.8
1
0 5 10 15 20 25Extraction time
Ce/
Co
250 rpm
200 rpm
Figure 5.9: Effect of agitation speed on the extraction of silver (Experimental
conditions: TR = 1:5, [Span 80] = 5 %(w/v), [Cyanex 302] = 0.05 M; feed phase =
real photographic waste, stripping phase = 1.0 M thiourea in 1.0 M HCl, and diluent
= kerosene).
0.0
0.1
0.2
0.3
0.4
0.5
0.6
0.7
0.8
0.9
1.0
0 5 10 15 20 25Extraction time (min)
Ce/
Co
200 rpm
250 rpm
300 rpm
350 rpm
Figure 5.10: Effect of agitation speed on the extraction of silver (Experimental
conditions: TR = 1:5, [Span 80] = 5% (w/v), [Cyanex 302] = 0.05 M, feed phase =
real liquid photographic waste, stripping phase = 1.0 M thiourea in 1.0 M H2SO4,
and diluent = kerosene).
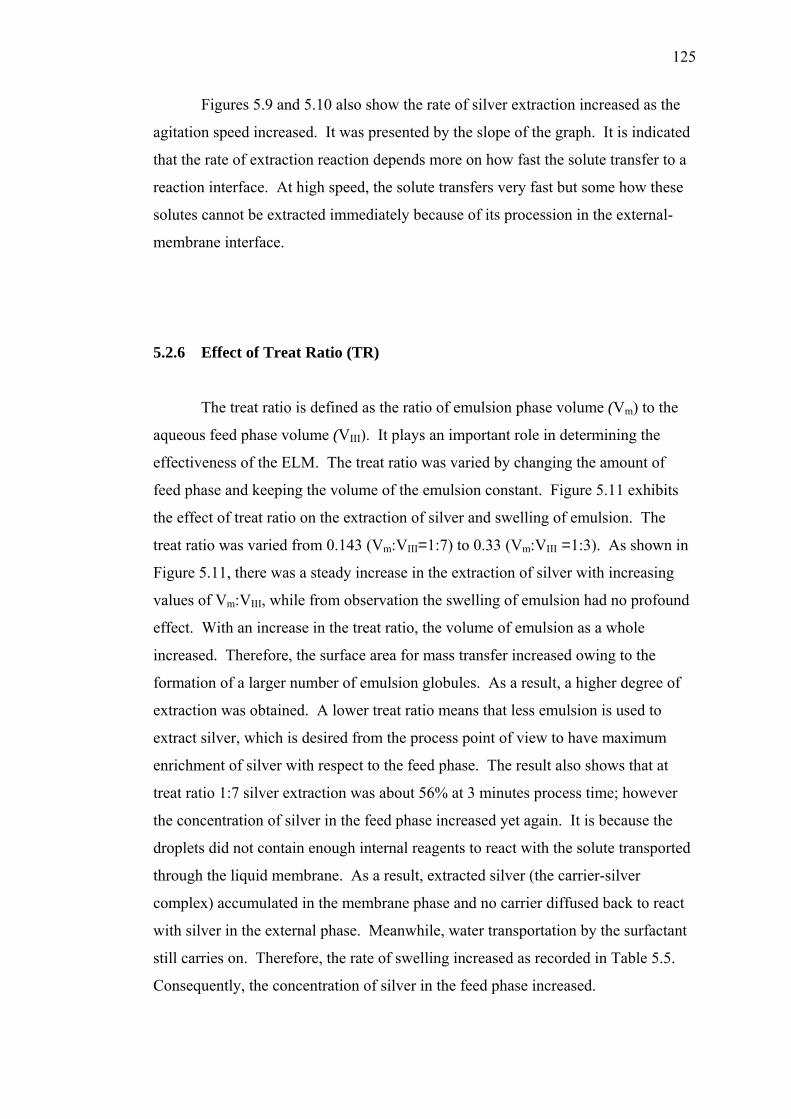
125
Figures 5.9 and 5.10 also show the rate of silver extraction increased as the
agitation speed increased. It was presented by the slope of the graph. It is indicated
that the rate of extraction reaction depends more on how fast the solute transfer to a
reaction interface. At high speed, the solute transfers very fast but some how these
solutes cannot be extracted immediately because of its procession in the external-
membrane interface.
5.2.6 Effect of Treat Ratio (TR)
The treat ratio is defined as the ratio of emulsion phase volume (Vm) to the
aqueous feed phase volume (VIII). It plays an important role in determining the
effectiveness of the ELM. The treat ratio was varied by changing the amount of
feed phase and keeping the volume of the emulsion constant. Figure 5.11 exhibits
the effect of treat ratio on the extraction of silver and swelling of emulsion. The
treat ratio was varied from 0.143 (Vm:VIII=1:7) to 0.33 (Vm:VIII =1:3). As shown in
Figure 5.11, there was a steady increase in the extraction of silver with increasing
values of Vm:VIII, while from observation the swelling of emulsion had no profound
effect. With an increase in the treat ratio, the volume of emulsion as a whole
increased. Therefore, the surface area for mass transfer increased owing to the
formation of a larger number of emulsion globules. As a result, a higher degree of
extraction was obtained. A lower treat ratio means that less emulsion is used to
extract silver, which is desired from the process point of view to have maximum
enrichment of silver with respect to the feed phase. The result also shows that at
treat ratio 1:7 silver extraction was about 56% at 3 minutes process time; however
the concentration of silver in the feed phase increased yet again. It is because the
droplets did not contain enough internal reagents to react with the solute transported
through the liquid membrane. As a result, extracted silver (the carrier-silver
complex) accumulated in the membrane phase and no carrier diffused back to react
with silver in the external phase. Meanwhile, water transportation by the surfactant
still carries on. Therefore, the rate of swelling increased as recorded in Table 5.5.
Consequently, the concentration of silver in the feed phase increased.
126
0.0
0.2
0.4
0.6
0.8
1.0
0 5 10 15 20 25Extraction time (min)
Ce/
Co
TR 1:3TR 1:5TR 1:6TR 1:7
Figure 5.11: Effect of treat ratios on the silver extraction (Experimental conditions:
agitation speed = 250 rpm, [Span 80] = 5 %(w/v), [Cyanex 302] = 0.05 M, feed
phase = real photographic waste, stripping phase = 1 M thiourea in 1 M H2SO4, and
diluent = kerosene).
Furthermore, the extraction performance increases with increasing the treat
ratio because the total interfacial area between the external phase and emulsion
drops, and the capacity of internal phase for trapping silver increases
simultaneously. This has been attributed to shorter diffusion lengths as the packing
of the droplets becomes tighter. However, further increase in the treat ratio is not
feasible because of the increase in water transport to the interior phase, which
strongly influences on emulsion swelling. Table 5.5 shows the effect of apparent
swelling with treat ratio. Similar effect was reported by Li et al. (1996) and Reis
and Carvalho (1993) in mercury and zinc separation respectively.
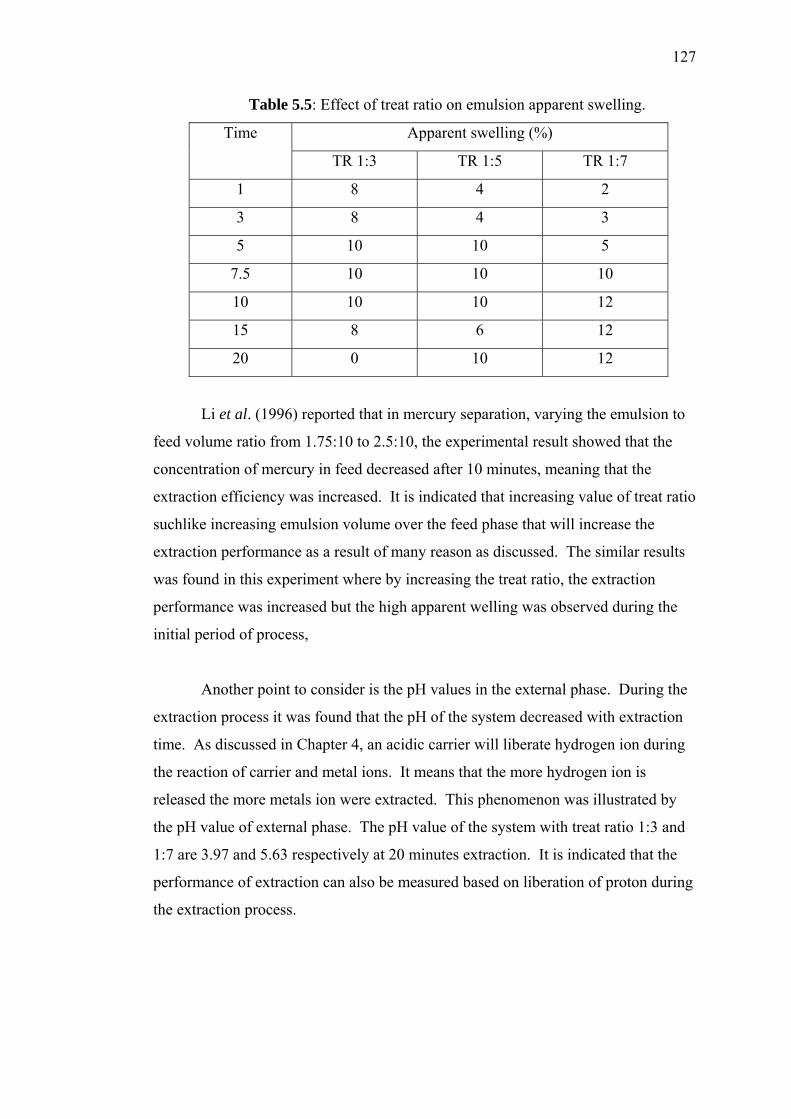
127
Table 5.5: Effect of treat ratio on emulsion apparent swelling.
Apparent swelling (%) Time
TR 1:3 TR 1:5 TR 1:7
1 8 4 2
3 8 4 3
5 10 10 5
7.5 10 10 10
10 10 10 12
15 8 6 12
20 0 10 12
Li et al. (1996) reported that in mercury separation, varying the emulsion to
feed volume ratio from 1.75:10 to 2.5:10, the experimental result showed that the
concentration of mercury in feed decreased after 10 minutes, meaning that the
extraction efficiency was increased. It is indicated that increasing value of treat ratio
suchlike increasing emulsion volume over the feed phase that will increase the
extraction performance as a result of many reason as discussed. The similar results
was found in this experiment where by increasing the treat ratio, the extraction
performance was increased but the high apparent welling was observed during the
initial period of process,
Another point to consider is the pH values in the external phase. During the
extraction process it was found that the pH of the system decreased with extraction
time. As discussed in Chapter 4, an acidic carrier will liberate hydrogen ion during
the reaction of carrier and metal ions. It means that the more hydrogen ion is
released the more metals ion were extracted. This phenomenon was illustrated by
the pH value of external phase. The pH value of the system with treat ratio 1:3 and
1:7 are 3.97 and 5.63 respectively at 20 minutes extraction. It is indicated that the
performance of extraction can also be measured based on liberation of proton during
the extraction process.
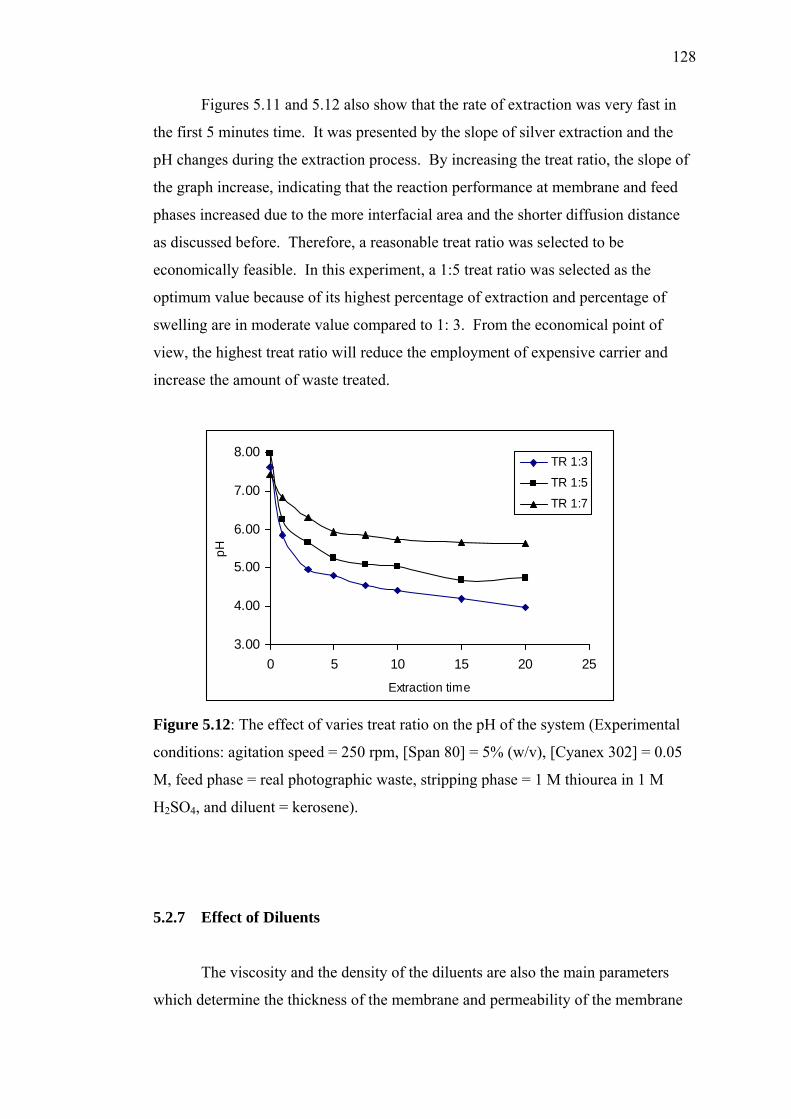
128
Figures 5.11 and 5.12 also show that the rate of extraction was very fast in
the first 5 minutes time. It was presented by the slope of silver extraction and the
pH changes during the extraction process. By increasing the treat ratio, the slope of
the graph increase, indicating that the reaction performance at membrane and feed
phases increased due to the more interfacial area and the shorter diffusion distance
as discussed before. Therefore, a reasonable treat ratio was selected to be
economically feasible. In this experiment, a 1:5 treat ratio was selected as the
optimum value because of its highest percentage of extraction and percentage of
swelling are in moderate value compared to 1: 3. From the economical point of
view, the highest treat ratio will reduce the employment of expensive carrier and
increase the amount of waste treated.
3.00
4.00
5.00
6.00
7.00
8.00
0 5 10 15 20 25
Extraction time
pH
TR 1:3
TR 1:5
TR 1:7
Figure 5.12: The effect of varies treat ratio on the pH of the system (Experimental
conditions: agitation speed = 250 rpm, [Span 80] = 5% (w/v), [Cyanex 302] = 0.05
M, feed phase = real photographic waste, stripping phase = 1 M thiourea in 1 M
H2SO4, and diluent = kerosene).
5.2.7 Effect of Diluents
The viscosity and the density of the diluents are also the main parameters
which determine the thickness of the membrane and permeability of the membrane
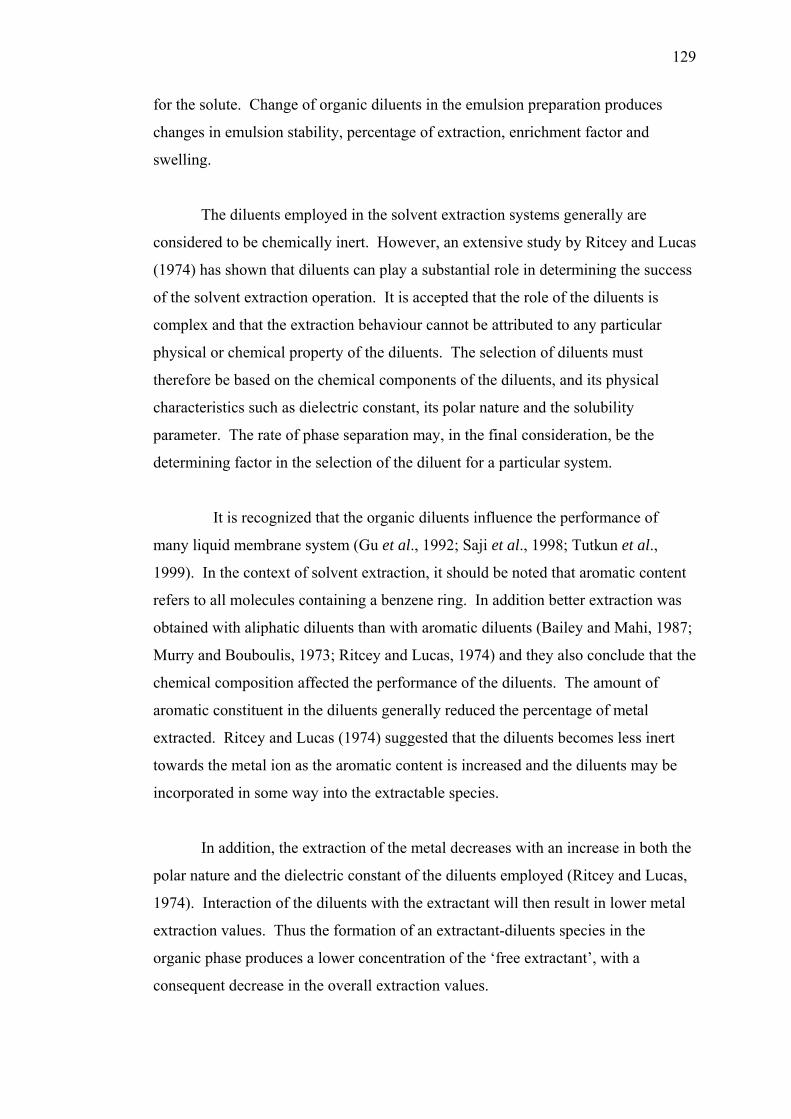
129
for the solute. Change of organic diluents in the emulsion preparation produces
changes in emulsion stability, percentage of extraction, enrichment factor and
swelling.
The diluents employed in the solvent extraction systems generally are
considered to be chemically inert. However, an extensive study by Ritcey and Lucas
(1974) has shown that diluents can play a substantial role in determining the success
of the solvent extraction operation. It is accepted that the role of the diluents is
complex and that the extraction behaviour cannot be attributed to any particular
physical or chemical property of the diluents. The selection of diluents must
therefore be based on the chemical components of the diluents, and its physical
characteristics such as dielectric constant, its polar nature and the solubility
parameter. The rate of phase separation may, in the final consideration, be the
determining factor in the selection of the diluent for a particular system.
It is recognized that the organic diluents influence the performance of
many liquid membrane system (Gu et al., 1992; Saji et al., 1998; Tutkun et al.,
1999). In the context of solvent extraction, it should be noted that aromatic content
refers to all molecules containing a benzene ring. In addition better extraction was
obtained with aliphatic diluents than with aromatic diluents (Bailey and Mahi, 1987;
Murry and Bouboulis, 1973; Ritcey and Lucas, 1974) and they also conclude that the
chemical composition affected the performance of the diluents. The amount of
aromatic constituent in the diluents generally reduced the percentage of metal
extracted. Ritcey and Lucas (1974) suggested that the diluents becomes less inert
towards the metal ion as the aromatic content is increased and the diluents may be
incorporated in some way into the extractable species.
In addition, the extraction of the metal decreases with an increase in both the
polar nature and the dielectric constant of the diluents employed (Ritcey and Lucas,
1974). Interaction of the diluents with the extractant will then result in lower metal
extraction values. Thus the formation of an extractant-diluents species in the
organic phase produces a lower concentration of the ‘free extractant’, with a
consequent decrease in the overall extraction values.
130
The experimental results obtained agree with the work of other researchers.
Figure 5.13 shows that the extraction performance of silver decreased in the
following order:
kerosene > n-dodecane > toluene.
0.0
0.2
0.4
0.6
0.8
1.0
0 5 10 15 20 25Extraction time (min)
Ce/
Co
Kerosene
Toluene
Dodecane
Figure 5.13: Effect of diluents on the silver extraction (Experimental conditions:
agitation speed = 250 rpm, [Span 80] = 5% (w/v), [Cyanex 302] = 0.05 M, feed
phase = real photographic wastes, and stripping phase = 1 M thiourea in 1 M
H2SO4).
It was indicated that aliphatic diluents are generally preferred because of the
lower solubility in water and better emulsion stability. The performance of silver
extraction was almost stable during the 20 minutes process when using kerosene as
diluents. The same trend was expected for emulsion stability due to less transport of
water. This result contradicts with toluene and n-dodecane where extraction started
to decrease after 5 minutes. This was indeed the case and this process has
membrane stability in the same order. These observations are in line with those by
Kinugasa et al. (1989) which examined the effect of several organic solvents on the
membrane stability. Further, compared to the paraffinic diluent, the aromatic diluent
tends to readily break down under shearing conditions. Therefore extraction was
found to be decreased in the following order: kerosene > n-dodecane > toluene.
This clearly indicates that kerosene has a higher viscosity organic phase which
produces higher extraction and lower percentage of swelling than the others. The
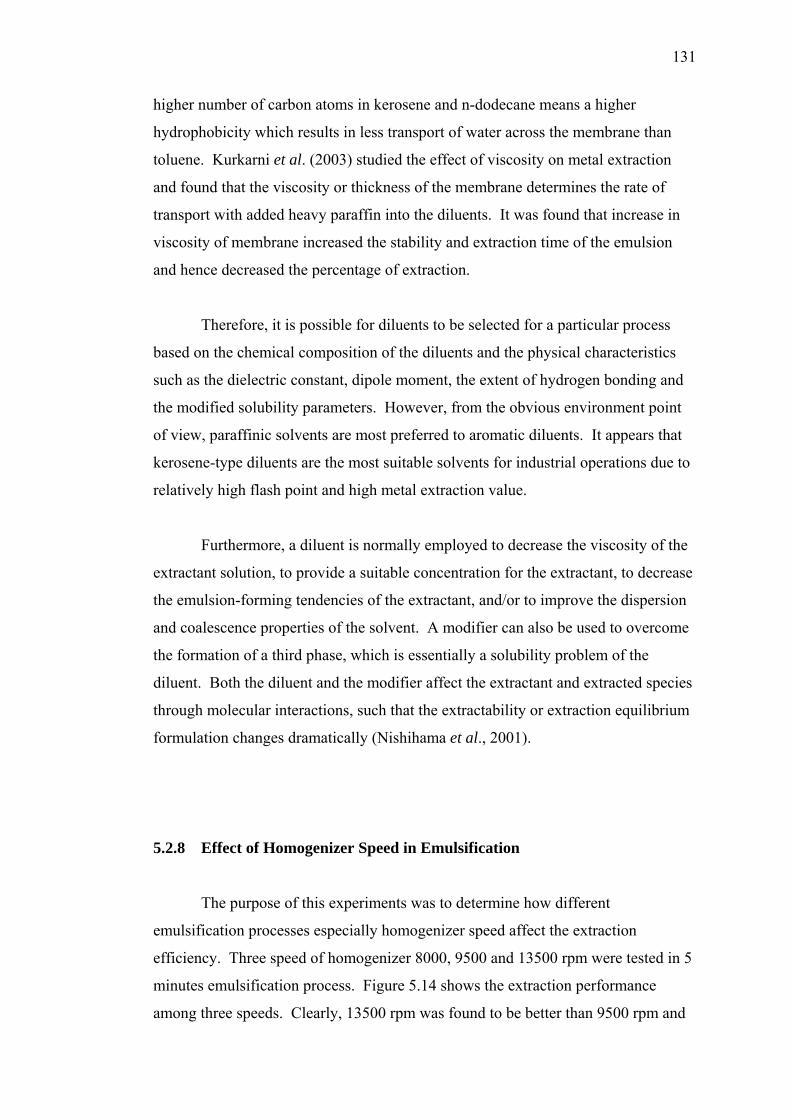
131
higher number of carbon atoms in kerosene and n-dodecane means a higher
hydrophobicity which results in less transport of water across the membrane than
toluene. Kurkarni et al. (2003) studied the effect of viscosity on metal extraction
and found that the viscosity or thickness of the membrane determines the rate of
transport with added heavy paraffin into the diluents. It was found that increase in
viscosity of membrane increased the stability and extraction time of the emulsion
and hence decreased the percentage of extraction.
Therefore, it is possible for diluents to be selected for a particular process
based on the chemical composition of the diluents and the physical characteristics
such as the dielectric constant, dipole moment, the extent of hydrogen bonding and
the modified solubility parameters. However, from the obvious environment point
of view, paraffinic solvents are most preferred to aromatic diluents. It appears that
kerosene-type diluents are the most suitable solvents for industrial operations due to
relatively high flash point and high metal extraction value.
Furthermore, a diluent is normally employed to decrease the viscosity of the
extractant solution, to provide a suitable concentration for the extractant, to decrease
the emulsion-forming tendencies of the extractant, and/or to improve the dispersion
and coalescence properties of the solvent. A modifier can also be used to overcome
the formation of a third phase, which is essentially a solubility problem of the
diluent. Both the diluent and the modifier affect the extractant and extracted species
through molecular interactions, such that the extractability or extraction equilibrium
formulation changes dramatically (Nishihama et al., 2001).
5.2.8 Effect of Homogenizer Speed in Emulsification
The purpose of this experiments was to determine how different
emulsification processes especially homogenizer speed affect the extraction
efficiency. Three speed of homogenizer 8000, 9500 and 13500 rpm were tested in 5
minutes emulsification process. Figure 5.14 shows the extraction performance
among three speeds. Clearly, 13500 rpm was found to be better than 9500 rpm and
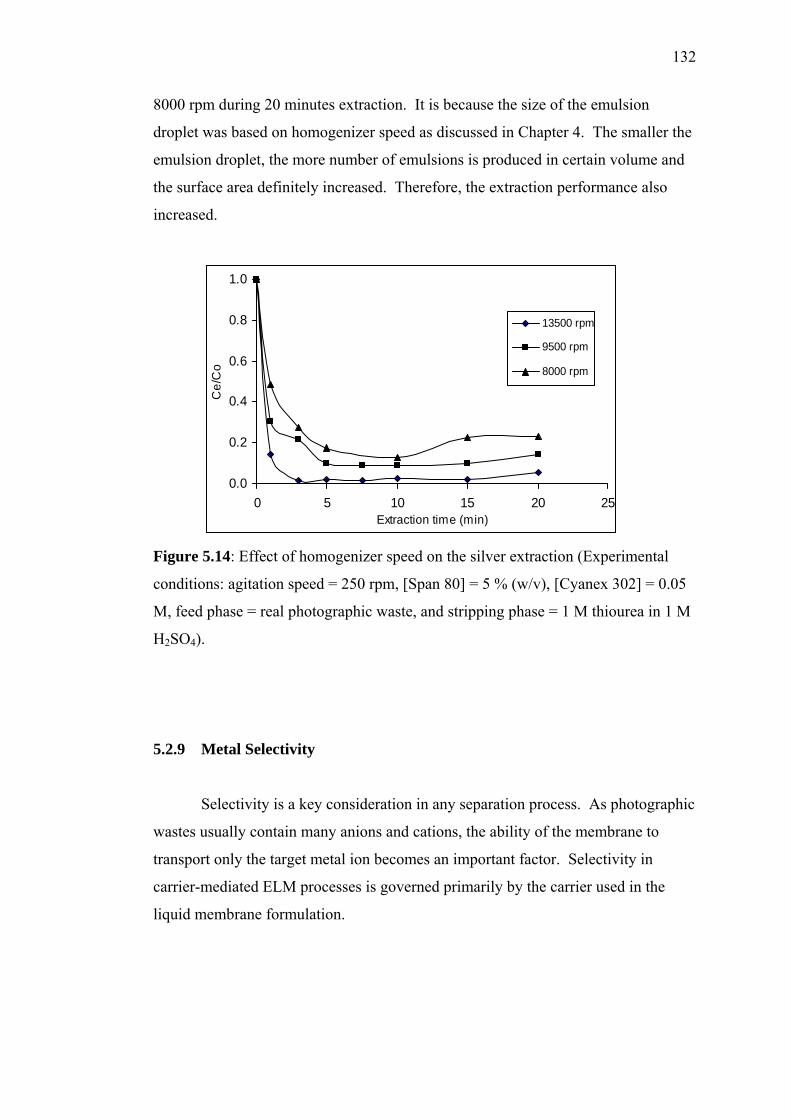
132
8000 rpm during 20 minutes extraction. It is because the size of the emulsion
droplet was based on homogenizer speed as discussed in Chapter 4. The smaller the
emulsion droplet, the more number of emulsions is produced in certain volume and
the surface area definitely increased. Therefore, the extraction performance also
increased.
0.0
0.2
0.4
0.6
0.8
1.0
0 5 10 15 20 25Extraction time (min)
Ce/
Co
13500 rpm
9500 rpm
8000 rpm
Figure 5.14: Effect of homogenizer speed on the silver extraction (Experimental
conditions: agitation speed = 250 rpm, [Span 80] = 5 % (w/v), [Cyanex 302] = 0.05
M, feed phase = real photographic waste, and stripping phase = 1 M thiourea in 1 M
H2SO4).
5.2.9 Metal Selectivity
Selectivity is a key consideration in any separation process. As photographic
wastes usually contain many anions and cations, the ability of the membrane to
transport only the target metal ion becomes an important factor. Selectivity in
carrier-mediated ELM processes is governed primarily by the carrier used in the
liquid membrane formulation.
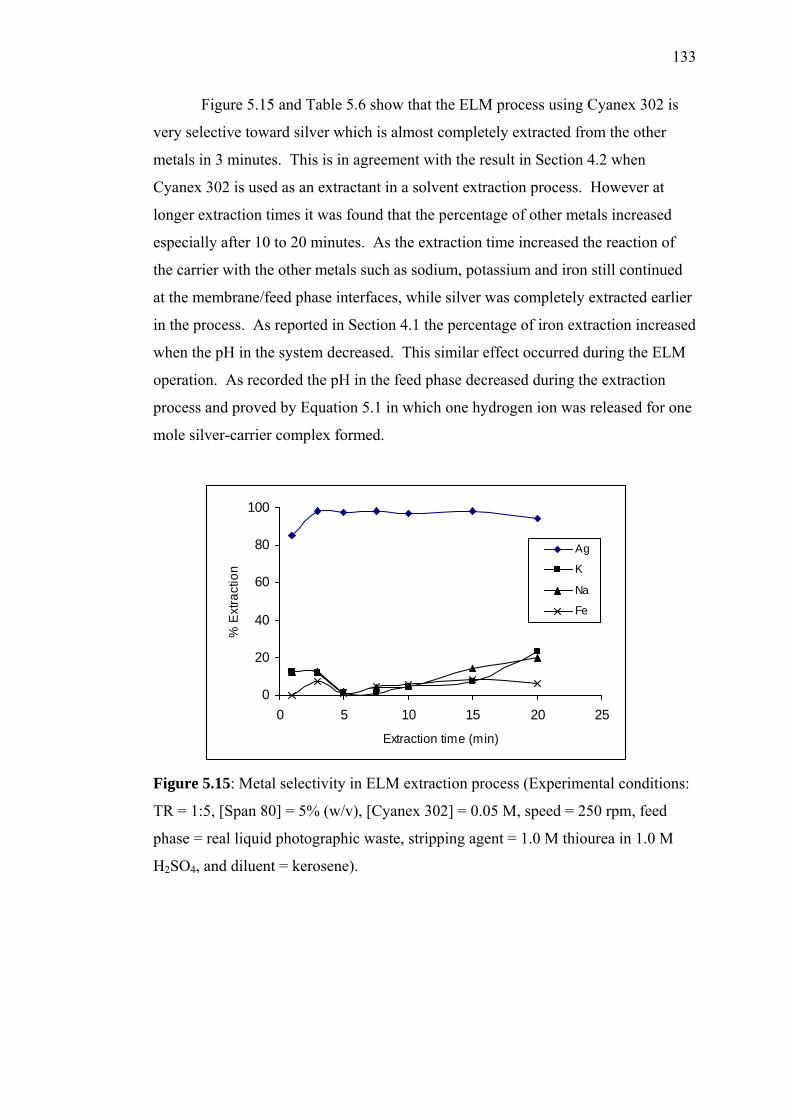
133
Figure 5.15 and Table 5.6 show that the ELM process using Cyanex 302 is
very selective toward silver which is almost completely extracted from the other
metals in 3 minutes. This is in agreement with the result in Section 4.2 when
Cyanex 302 is used as an extractant in a solvent extraction process. However at
longer extraction times it was found that the percentage of other metals increased
especially after 10 to 20 minutes. As the extraction time increased the reaction of
the carrier with the other metals such as sodium, potassium and iron still continued
at the membrane/feed phase interfaces, while silver was completely extracted earlier
in the process. As reported in Section 4.1 the percentage of iron extraction increased
when the pH in the system decreased. This similar effect occurred during the ELM
operation. As recorded the pH in the feed phase decreased during the extraction
process and proved by Equation 5.1 in which one hydrogen ion was released for one
mole silver-carrier complex formed.
0
20
40
60
80
100
0 5 10 15 20 25
Extraction time (min)
% E
xtra
ctio
n
Ag
K
Na
Fe
Figure 5.15: Metal selectivity in ELM extraction process (Experimental conditions:
TR = 1:5, [Span 80] = 5% (w/v), [Cyanex 302] = 0.05 M, speed = 250 rpm, feed
phase = real liquid photographic waste, stripping agent = 1.0 M thiourea in 1.0 M
H2SO4, and diluent = kerosene).
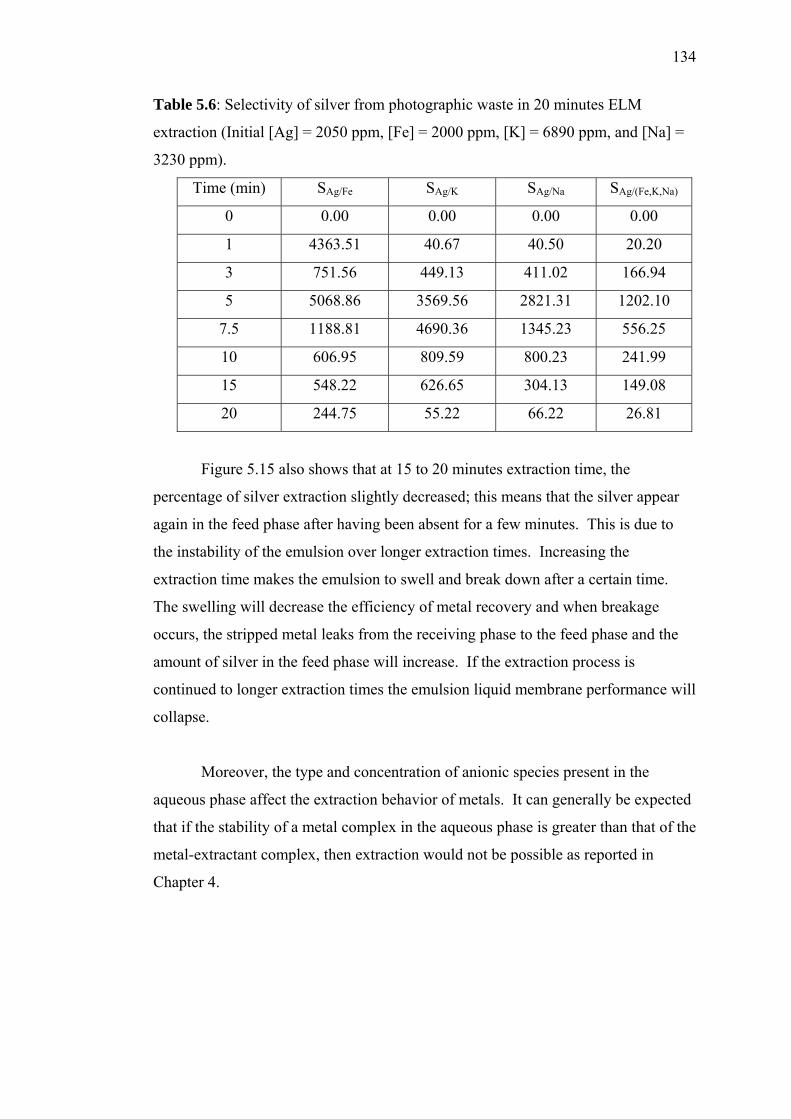
134
Table 5.6: Selectivity of silver from photographic waste in 20 minutes ELM
extraction (Initial [Ag] = 2050 ppm, [Fe] = 2000 ppm, [K] = 6890 ppm, and [Na] =
3230 ppm).
Time (min) SAg/Fe SAg/K SAg/Na SAg/(Fe,K,Na)
0 0.00 0.00 0.00 0.00
1 4363.51 40.67 40.50 20.20
3 751.56 449.13 411.02 166.94
5 5068.86 3569.56 2821.31 1202.10
7.5 1188.81 4690.36 1345.23 556.25
10 606.95 809.59 800.23 241.99
15 548.22 626.65 304.13 149.08
20 244.75 55.22 66.22 26.81
Figure 5.15 also shows that at 15 to 20 minutes extraction time, the
percentage of silver extraction slightly decreased; this means that the silver appear
again in the feed phase after having been absent for a few minutes. This is due to
the instability of the emulsion over longer extraction times. Increasing the
extraction time makes the emulsion to swell and break down after a certain time.
The swelling will decrease the efficiency of metal recovery and when breakage
occurs, the stripped metal leaks from the receiving phase to the feed phase and the
amount of silver in the feed phase will increase. If the extraction process is
continued to longer extraction times the emulsion liquid membrane performance will
collapse.
Moreover, the type and concentration of anionic species present in the
aqueous phase affect the extraction behavior of metals. It can generally be expected
that if the stability of a metal complex in the aqueous phase is greater than that of the
metal-extractant complex, then extraction would not be possible as reported in
Chapter 4.
135
5.3 Emulsion Liquid Membrane Extraction Using Different Types of
Carrier
As reported in Chapter 4, another potential type of carrier is
tetramethylthiuram disulfide (TMTDS). Tetramethylthiuram disulfide (TMTDS) is
used as the mobile carrier because it is an efficient extractant reagent for silver in
thiosulfate media based on the screening test using solvent extraction technique.
TMTDS, as a chelating extractant is incorporated in the membrane phase to increase
the mass transfer rate due to the large interfacial area. Span 80, a nonionic
surfactant is added to form a stabilized liquid membrane.
In W/O/W systems, the nature and the properties of the organic phase are
very important because it acts as a semi permeable membrane separating two
aqueous phases. Hence, non-polar or medium polar diluents are recommended for
the formulation of W/O/W emulsions. Toluene is used as the diluent for TMTDS
because it is a non-polar aromatic hydrocarbon which has a density of 0.86 g/cm3
and a viscosity of 0.68 centistokes at 30 ˚C. It is preferred in the formation of
organic phase due to its hydrophobicity which results in less transport of water
across the membrane. Table 5.7 shows the experimental condition for this study.
Table 5.7: Experimental conditions used for the preparation of ELM.
Parameters Conditions
[TMTDS] 0.01-0.07 M in toluene
[Span 80] 3-7 % (w/v)
Treat Ratio 1:3, 1:5, 1:7
Stirring speed 200-350 rpm
Organic phase Vorg = 5 mL
Internal aqueous phase Vi = 5 mL
Stripping agent 1 M thiourea in 0.01-0.1 M HCl
The effect of agitation speed was studied in the range of 200-350 rpm.
Theoretically, increasing the agitation speed will increase the extraction
performance due to reduction of the emulsion globule size thereby providing a high
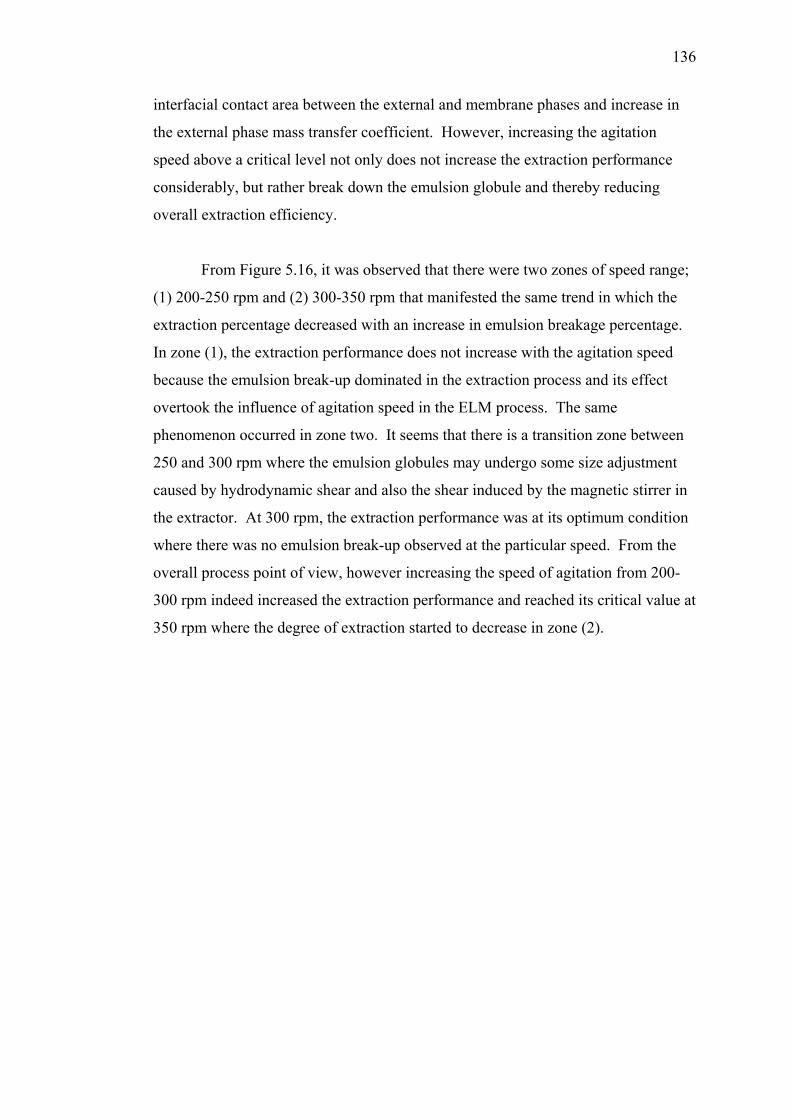
136
interfacial contact area between the external and membrane phases and increase in
the external phase mass transfer coefficient. However, increasing the agitation
speed above a critical level not only does not increase the extraction performance
considerably, but rather break down the emulsion globule and thereby reducing
overall extraction efficiency.
From Figure 5.16, it was observed that there were two zones of speed range;
(1) 200-250 rpm and (2) 300-350 rpm that manifested the same trend in which the
extraction percentage decreased with an increase in emulsion breakage percentage.
In zone (1), the extraction performance does not increase with the agitation speed
because the emulsion break-up dominated in the extraction process and its effect
overtook the influence of agitation speed in the ELM process. The same
phenomenon occurred in zone two. It seems that there is a transition zone between
250 and 300 rpm where the emulsion globules may undergo some size adjustment
caused by hydrodynamic shear and also the shear induced by the magnetic stirrer in
the extractor. At 300 rpm, the extraction performance was at its optimum condition
where there was no emulsion break-up observed at the particular speed. From the
overall process point of view, however increasing the speed of agitation from 200-
300 rpm indeed increased the extraction performance and reached its critical value at
350 rpm where the degree of extraction started to decrease in zone (2).
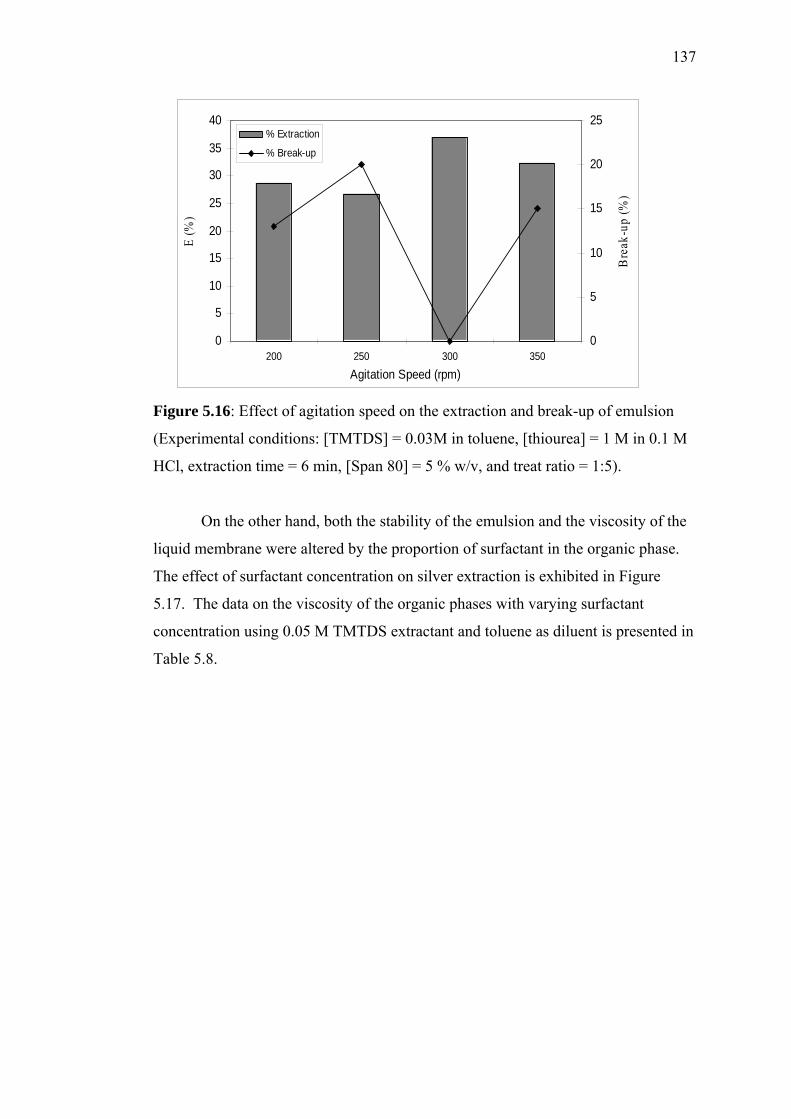
137
0
5
10
15
20
25
30
35
40
200 250 300 350
Agitation Speed (rpm)
E (%
)
0
5
10
15
20
25
Bre
ak-u
p (%
)
% Extraction
% Break-up
Figure 5.16: Effect of agitation speed on the extraction and break-up of emulsion
(Experimental conditions: [TMTDS] = 0.03M in toluene, [thiourea] = 1 M in 0.1 M
HCl, extraction time = 6 min, [Span 80] = 5 % w/v, and treat ratio = 1:5).
On the other hand, both the stability of the emulsion and the viscosity of the
liquid membrane were altered by the proportion of surfactant in the organic phase.
The effect of surfactant concentration on silver extraction is exhibited in Figure
5.17. The data on the viscosity of the organic phases with varying surfactant
concentration using 0.05 M TMTDS extractant and toluene as diluent is presented in
Table 5.8.
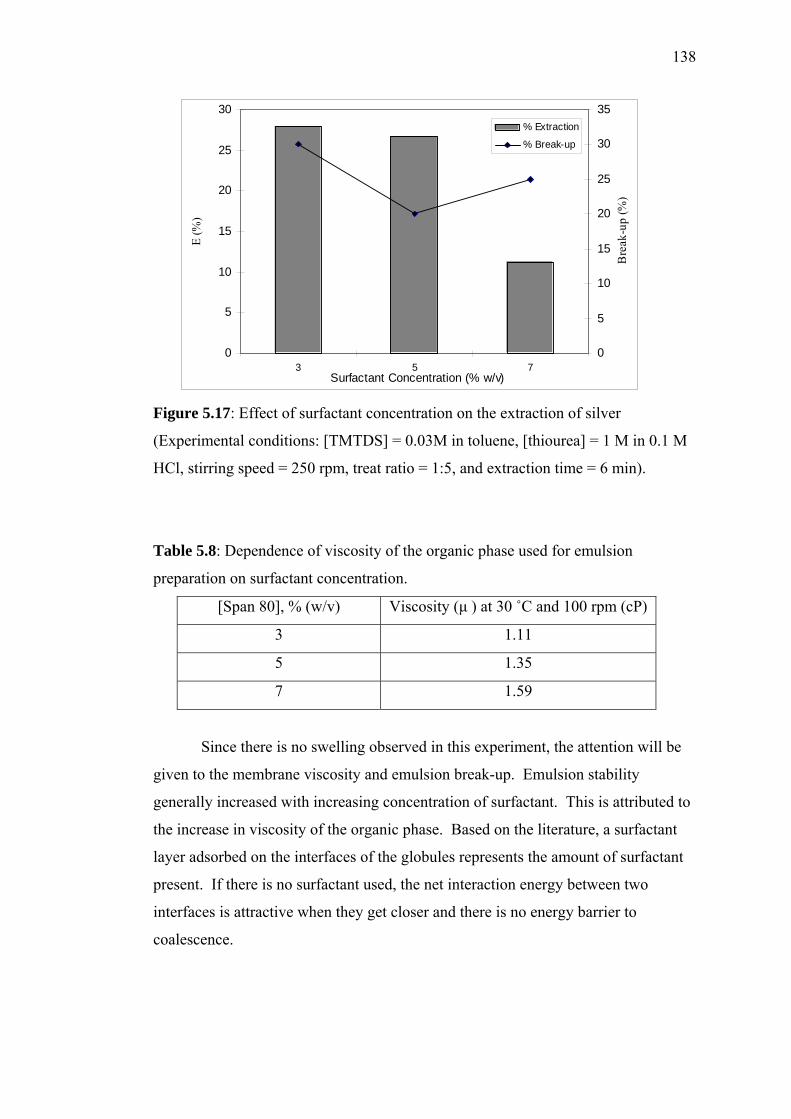
138
0
5
10
15
20
25
30
3 5 7Surfactant Concentration (% w/v)
E (%
)
0
5
10
15
20
25
30
35
Bre
ak-u
p (%
)
% Extraction
% Break-up
Figure 5.17: Effect of surfactant concentration on the extraction of silver
(Experimental conditions: [TMTDS] = 0.03M in toluene, [thiourea] = 1 M in 0.1 M
HCl, stirring speed = 250 rpm, treat ratio = 1:5, and extraction time = 6 min).
Table 5.8: Dependence of viscosity of the organic phase used for emulsion
preparation on surfactant concentration.
[Span 80], % (w/v) Viscosity (µ ) at 30 ˚C and 100 rpm (cP)
3 1.11
5 1.35
7 1.59
Since there is no swelling observed in this experiment, the attention will be
given to the membrane viscosity and emulsion break-up. Emulsion stability
generally increased with increasing concentration of surfactant. This is attributed to
the increase in viscosity of the organic phase. Based on the literature, a surfactant
layer adsorbed on the interfaces of the globules represents the amount of surfactant
present. If there is no surfactant used, the net interaction energy between two
interfaces is attractive when they get closer and there is no energy barrier to
coalescence.
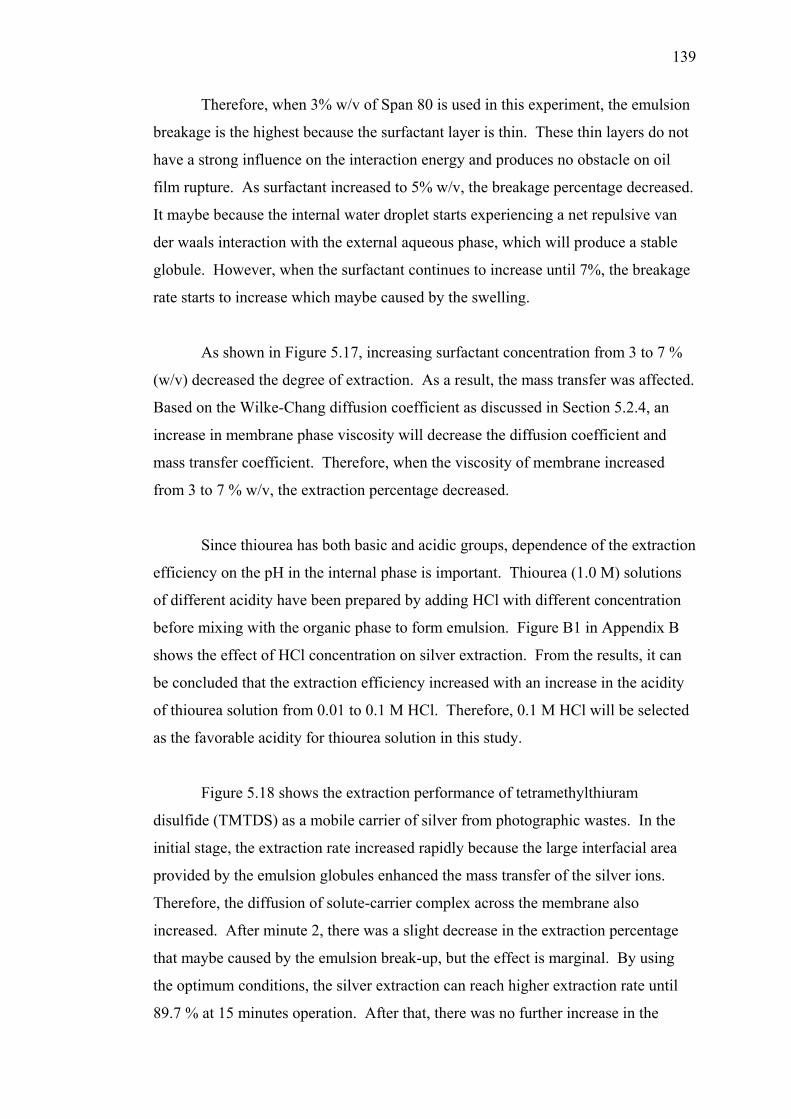
139
Therefore, when 3% w/v of Span 80 is used in this experiment, the emulsion
breakage is the highest because the surfactant layer is thin. These thin layers do not
have a strong influence on the interaction energy and produces no obstacle on oil
film rupture. As surfactant increased to 5% w/v, the breakage percentage decreased.
It maybe because the internal water droplet starts experiencing a net repulsive van
der waals interaction with the external aqueous phase, which will produce a stable
globule. However, when the surfactant continues to increase until 7%, the breakage
rate starts to increase which maybe caused by the swelling.
As shown in Figure 5.17, increasing surfactant concentration from 3 to 7 %
(w/v) decreased the degree of extraction. As a result, the mass transfer was affected.
Based on the Wilke-Chang diffusion coefficient as discussed in Section 5.2.4, an
increase in membrane phase viscosity will decrease the diffusion coefficient and
mass transfer coefficient. Therefore, when the viscosity of membrane increased
from 3 to 7 % w/v, the extraction percentage decreased.
Since thiourea has both basic and acidic groups, dependence of the extraction
efficiency on the pH in the internal phase is important. Thiourea (1.0 M) solutions
of different acidity have been prepared by adding HCl with different concentration
before mixing with the organic phase to form emulsion. Figure B1 in Appendix B
shows the effect of HCl concentration on silver extraction. From the results, it can
be concluded that the extraction efficiency increased with an increase in the acidity
of thiourea solution from 0.01 to 0.1 M HCl. Therefore, 0.1 M HCl will be selected
as the favorable acidity for thiourea solution in this study.
Figure 5.18 shows the extraction performance of tetramethylthiuram
disulfide (TMTDS) as a mobile carrier of silver from photographic wastes. In the
initial stage, the extraction rate increased rapidly because the large interfacial area
provided by the emulsion globules enhanced the mass transfer of the silver ions.
Therefore, the diffusion of solute-carrier complex across the membrane also
increased. After minute 2, there was a slight decrease in the extraction percentage
that maybe caused by the emulsion break-up, but the effect is marginal. By using
the optimum conditions, the silver extraction can reach higher extraction rate until
89.7 % at 15 minutes operation. After that, there was no further increase in the
140
extraction percentage because the local reaction at the external interface between the
external and the membrane phases is in equilibrium. From the observation, the
overall break-up rate is less than 10%. As a conclusion, TMTDS is an effective
extractant that can be used in the ELM process in order to extract silver ions from
photographic waste. Further studies on the parameters effect is discussed in Section
5.2.
0.0
0.2
0.4
0.6
0.8
1.0
0 5 10 15 20 25
Extraction time (min)
Ce/
Co
Figure 5.18: Extraction of silver from photographic wastes (Experimental
conditions: [TMTDS] = 0.05 M in toluene, [thiourea] = 1M in 0.1 M HCl, agitation
speed = 300 rpm, [Span 80] = 5% w/v, treat ratio = 1:5).
5.4 Membrane Breakage and Swelling
5.4.1 Introduction
The integrity of the membrane or more specifically the lack of membrane
breakage and swelling is vitally important to the efficiency of the ELM-mediated
separation. Membrane breakage can occur through hydrodynamic shear (Stroeve
and Varanasi, 1984), emulsion composition (Stroeve and Varanasi, 1984; Takahashi
et al., 1981) and emulsion preparation (Hanna and Larson, 1985). In the formation
of ELM process, water transported into the inner aqueous phase results in swelling
141
of emulsion. Significant swelling will dilute the concentration of the substances
concentrated in the inner aqueous phase, lower the selectivity of separation, changes
the viscosity of the system and the dispersity of emulsion, and affects separation of
the W/O emulsion from the external phase and demulsification process. It was
reported by Matsumoto et al., (1980) that the entering of water in the inner aqueous
phase is due to an osmotic gradient. However some researchers have proposed
several different mechanisms to explain the swelling of ELM globules. The
proposed mechanisms are:
i) Molecular diffusion (Colinart et al., 1984) of water from external aqueous
phase to internal aqueous droplets;
ii) Micelle assisted transport of water from the external aqueous phase to
internal water droplets (Garti et al., 1985) accordingly; water transport is
facilitated through the membrane (oil) phase by reverse micelles of
surfactant present in the membrane phase;
iii) Transfer of water from the external aqueous phase to internal water droplets
via hydration of surfactant molecules (Colinart et al., 1984) ; and
iv) Entrainment and emulsification of the external aqueous phase in the
emulsion globules due to excess surfactant present in the primary
emulsification step (Kinugasa et al., 1989; Ding and Xie, 1991; Skelland,
1999; Itoh et al., 1990).
The first three mechanisms predominate in most situations although swelling
can also take place due to the fourth mechanism. It is important to realize that for
water transport (swelling) to take place by the first three mechanisms, the presence
of the osmotic pressure gradient between the external and internal aqueous phases is
necessary. In ELM extraction processes, the osmotic pressure gradient between the
external and internal aqueous phases is generally present as the concentration of the
solute is different in the two phases.
Water transport through the ELM can be measured in a variety of ways,
depending on the particular experiment being run. For batch experiments that
examined the effects of process parameters, swelling was determined by mass
balances at the end of the experiment. For continuous experiments, swell was
evaluated by using a non-reactive tracer and for swelling experiments when no
142
carrier was present in the membrane phase, the degree of swelling was calculated
using densitometry (Thien and Hatton, 1988). Matsumoto et al. (1980) was the first
to study the permeation of water in W/O/W membranes using optical microscopy.
The permeation of water was characterized in terms of the permeation coefficient at
the beginning of swelling, P0. The permeation coefficient at the beginning of
shrinkage, P0 was determined from the droplet size data of ELM globules. A
coulter–counter technique was used to measure the diameter of ELM globules as a
function of time. With the increase in the surfactant concentration of the membrane
phase, Garti et al. (1985) found a significant increase in the permeation coefficient.
This contradicts the observation of Matsumoto et al. (1980) that P0 decreases with
the increase in surfactant concentration.
Furthermore, emulsion swelling is a phenomenon that occurs during the
dispersion operation, leading to changes in the volume of emulsion and internal
phase. Obviously, both emulsion swelling and membrane breakage occur
simultaneously during the operation, and both cause the change in the volume of the
internal phase. Therefore, the calculation of emulsion swelling ratio is simply based
on the final volume of emulsion or the internal phase after operation in most of the
papers published (Wan and Zhang, 2002). This implies the combined effect of both
emulsion swelling and membrane breakage, and thus Wan & Zhang (2002) call it
‘apparent swelling’ which is discussed in this section while the emulsion swelling
caused by the osmosis and entrainment is called ‘actual swelling’ that is measured
by internal phase droplet size variation method (Li and Shi, 1993; Garti et al., 1985;
Collinart et al., 1984) was not considered. Therefore, in this study, the volume
difference in the internal phase was measured as an indicator of ‘apparent swelling’
in the process based on Wan and Zhang (2002) theory. Thus, the apparent swelling
ratio )( ,apsη in this study is expressed by the following equation:
%100, xV
VVo
i
oii
aps−
=η (5.5)
where, iV is the volume of the internal phase after operation and 0iV is the initial
volume of the internal phase.
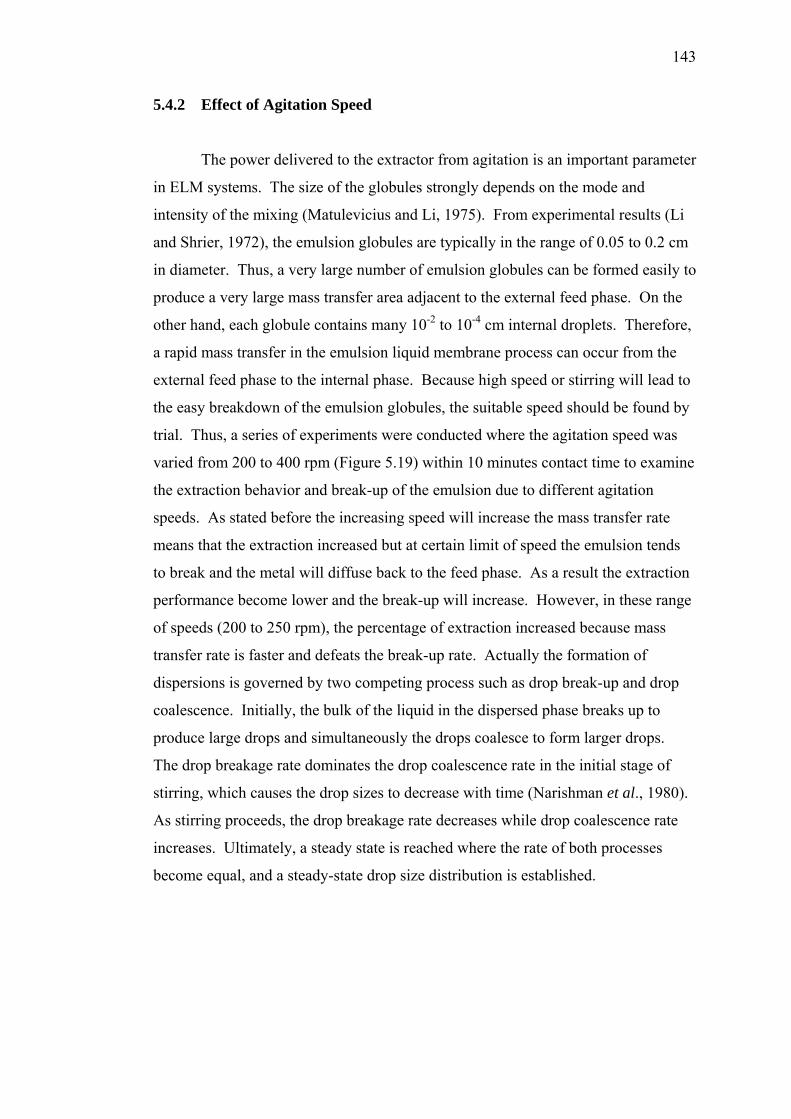
143
5.4.2 Effect of Agitation Speed
The power delivered to the extractor from agitation is an important parameter
in ELM systems. The size of the globules strongly depends on the mode and
intensity of the mixing (Matulevicius and Li, 1975). From experimental results (Li
and Shrier, 1972), the emulsion globules are typically in the range of 0.05 to 0.2 cm
in diameter. Thus, a very large number of emulsion globules can be formed easily to
produce a very large mass transfer area adjacent to the external feed phase. On the
other hand, each globule contains many 10-2 to 10-4 cm internal droplets. Therefore,
a rapid mass transfer in the emulsion liquid membrane process can occur from the
external feed phase to the internal phase. Because high speed or stirring will lead to
the easy breakdown of the emulsion globules, the suitable speed should be found by
trial. Thus, a series of experiments were conducted where the agitation speed was
varied from 200 to 400 rpm (Figure 5.19) within 10 minutes contact time to examine
the extraction behavior and break-up of the emulsion due to different agitation
speeds. As stated before the increasing speed will increase the mass transfer rate
means that the extraction increased but at certain limit of speed the emulsion tends
to break and the metal will diffuse back to the feed phase. As a result the extraction
performance become lower and the break-up will increase. However, in these range
of speeds (200 to 250 rpm), the percentage of extraction increased because mass
transfer rate is faster and defeats the break-up rate. Actually the formation of
dispersions is governed by two competing process such as drop break-up and drop
coalescence. Initially, the bulk of the liquid in the dispersed phase breaks up to
produce large drops and simultaneously the drops coalesce to form larger drops.
The drop breakage rate dominates the drop coalescence rate in the initial stage of
stirring, which causes the drop sizes to decrease with time (Narishman et al., 1980).
As stirring proceeds, the drop breakage rate decreases while drop coalescence rate
increases. Ultimately, a steady state is reached where the rate of both processes
become equal, and a steady-state drop size distribution is established.
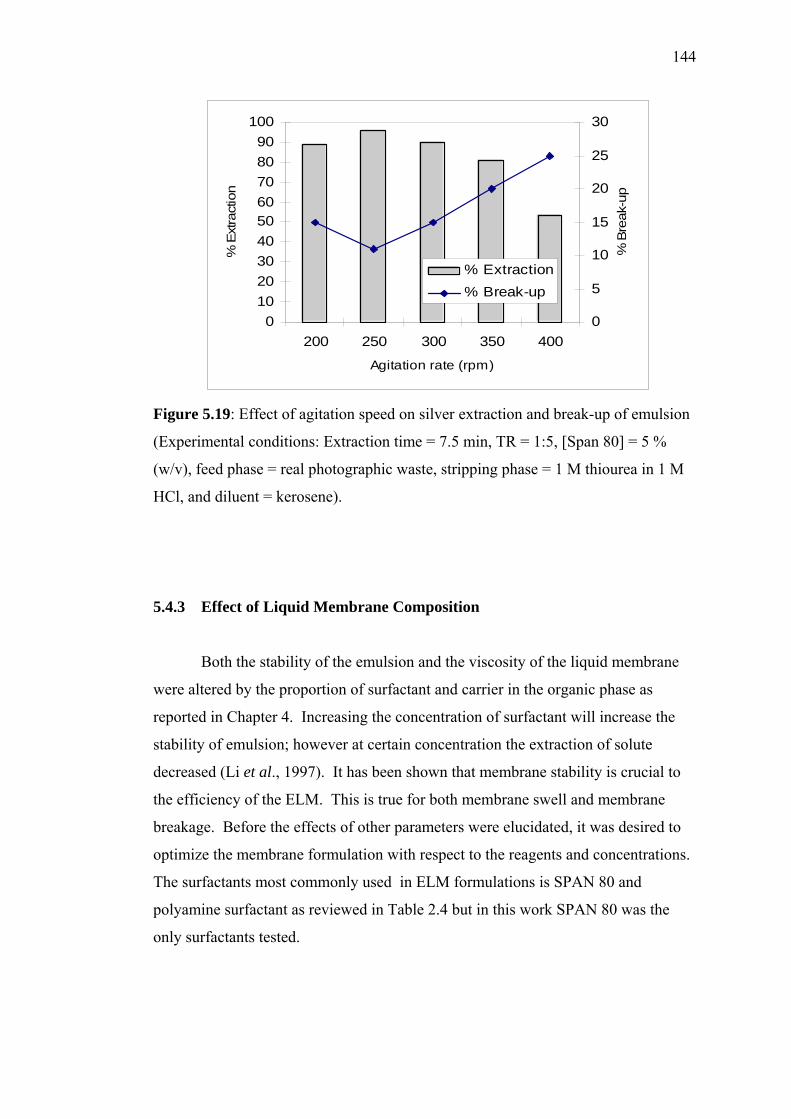
144
0102030405060708090
100
200 250 300 350 400
Agitation rate (rpm)
% E
xtra
ctio
n
0
5
10
15
20
25
30
% B
reak
-up
% Extraction% Break-up
Figure 5.19: Effect of agitation speed on silver extraction and break-up of emulsion
(Experimental conditions: Extraction time = 7.5 min, TR = 1:5, [Span 80] = 5 %
(w/v), feed phase = real photographic waste, stripping phase = 1 M thiourea in 1 M
HCl, and diluent = kerosene).
5.4.3 Effect of Liquid Membrane Composition
Both the stability of the emulsion and the viscosity of the liquid membrane
were altered by the proportion of surfactant and carrier in the organic phase as
reported in Chapter 4. Increasing the concentration of surfactant will increase the
stability of emulsion; however at certain concentration the extraction of solute
decreased (Li et al., 1997). It has been shown that membrane stability is crucial to
the efficiency of the ELM. This is true for both membrane swell and membrane
breakage. Before the effects of other parameters were elucidated, it was desired to
optimize the membrane formulation with respect to the reagents and concentrations.
The surfactants most commonly used in ELM formulations is SPAN 80 and
polyamine surfactant as reviewed in Table 2.4 but in this work SPAN 80 was the
only surfactants tested.
145
Simple batch experiments were conducted in which only the concentration of
surfactant was changed. At the end of each experiment (7.5 minutes contact time)
the percent of silver extracted and the change in emulsion volume were calculated.
It was observed that increasing the concentration of surfactant, decreases the rate of
emulsion breakage but no swelling was observed which indicates that the rate of
emulsion breakage is higher than the rate of swelling during the extraction process.
Although no quantitative conclusion can be drawn from the data, several
qualitative observations can be made. The negative net change in emulsion volume
for essentially all concentration of SPAN 80 indicates a significant breakage of the
membrane, as a result of very high swelling and breakage rate. This breakage
results in uniformly poor separations.
However, as expected the degree of break-up will approach a constant value
due to the saturation of surfactants at the interface. It is also well-known that a
surfactant significantly affects the extraction rate of metal ions by ELMs because the
complex formation between a carrier and metal ions takes place on the surface of
emulsion globules where surfactants adsorb. On the basis of the results in Figure
5.20, the extraction rate of silver is found to decrease with increasing surfactant
concentration from 5% to 7% because the adsorption of carrier at the reaction
interface inhibits the mass transfer and the effective concentration of carrier for
reacting with silver decreases.
146
0102030405060708090
100
1 3 5 7
Surfactant concentration (w/v)
% s
ilver
ext
ract
ion
05101520253035404550
% B
reak
-up
silver extraction% Break-up
Figure 5.20: Effect of surfactant concentration and break-up of emulsion
(Experimental conditions: agitation speed = 250 rpm, TR = 1:5, [Span 80] = 5%
(w/v), feed phase = real photographic waste, extraction time = 7.5 min, stripping
phase = 1 M thiourea in 1 M HCl, and diluent = kerosene).
5.4.4 Effect of Different Type of Stripping Agent
As discussed in the above section, the main factor in emulsion liquid
membrane applicability is stability of emulsion. Apart from agitation speed, carrier
and surfactant concentration another parameter is stripping agent types. Figure 5.21
shows the effect of different acid type of thiourea solution on emulsion swelling and
breakage. The results indicate that acid sulfuric is more preferable in making acidic
thiourea solution where the emulsion is almost stable during the extraction process
and no breakage was observed. However the swelling increases with time within 10
minutes, but after that some of emulsion globules start to break-up while the water
transport still arise to the others emulsion droplets. This phenomenon was
illustrated in Figure 5.22. One globule consists of several tens of droplets. After a
few minutes, the droplets size increased as illustrated in Figure 5.22(b), caused by
water transport from the external to inside the emulsion droplets. According to
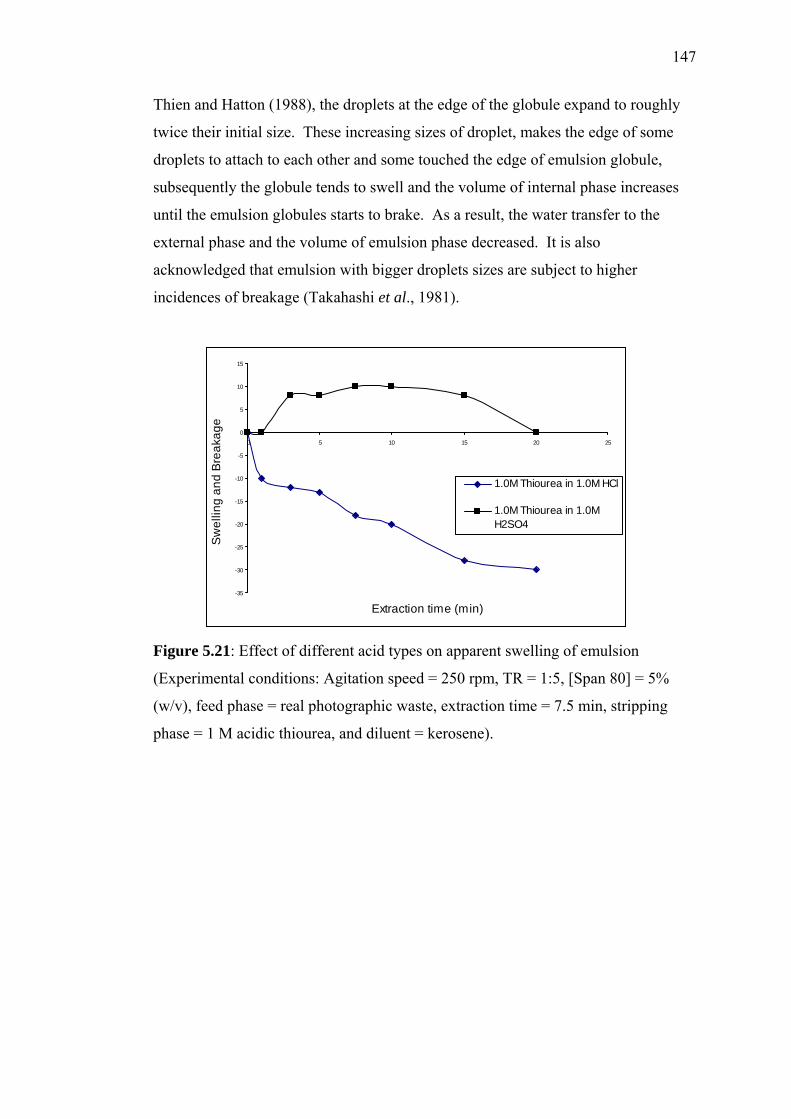
147
Thien and Hatton (1988), the droplets at the edge of the globule expand to roughly
twice their initial size. These increasing sizes of droplet, makes the edge of some
droplets to attach to each other and some touched the edge of emulsion globule,
subsequently the globule tends to swell and the volume of internal phase increases
until the emulsion globules starts to brake. As a result, the water transfer to the
external phase and the volume of emulsion phase decreased. It is also
acknowledged that emulsion with bigger droplets sizes are subject to higher
incidences of breakage (Takahashi et al., 1981).
-35
-30
-25
-20
-15
-10
-5
0
5
10
15
0 5 10 15 20 25
Extraction time (min)
Sw
ellin
g an
d B
reak
age
1.0M Thiourea in 1.0M HCl
1.0M Thiourea in 1.0MH2SO4
Figure 5.21: Effect of different acid types on apparent swelling of emulsion
(Experimental conditions: Agitation speed = 250 rpm, TR = 1:5, [Span 80] = 5%
(w/v), feed phase = real photographic waste, extraction time = 7.5 min, stripping
phase = 1 M acidic thiourea, and diluent = kerosene).
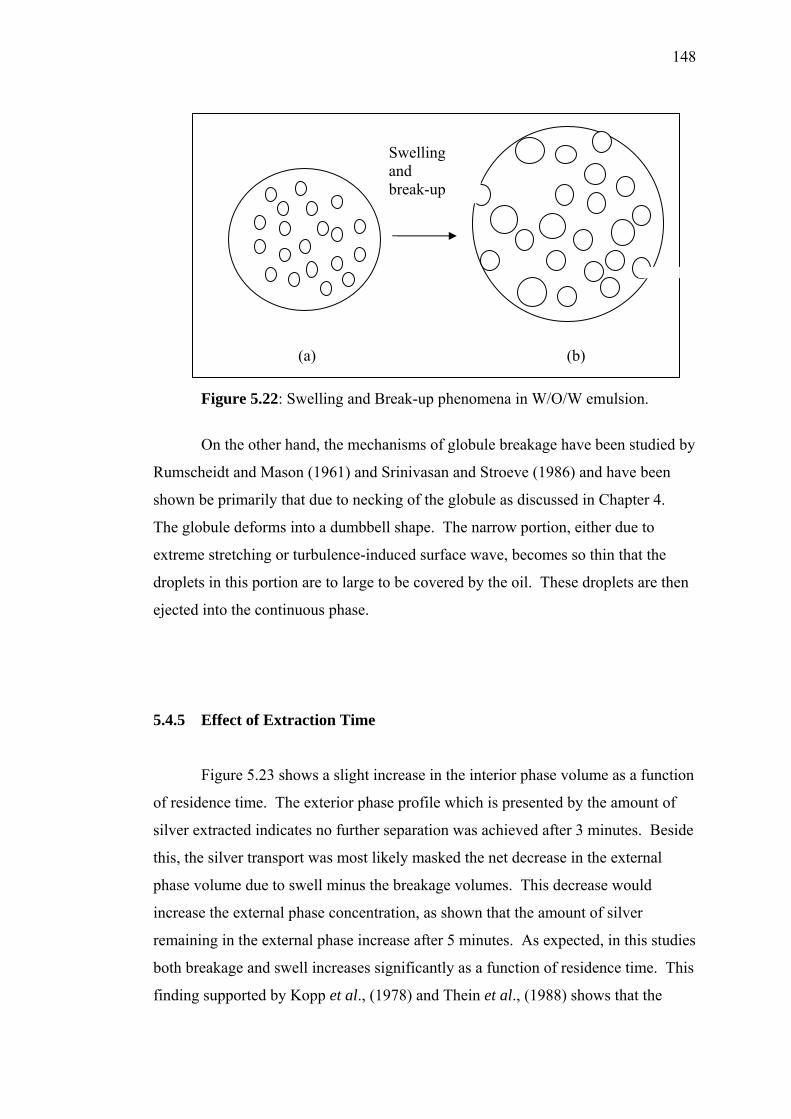
148
Figure 5.22: Swelling and Break-up phenomena in W/O/W emulsion.
On the other hand, the mechanisms of globule breakage have been studied by
Rumscheidt and Mason (1961) and Srinivasan and Stroeve (1986) and have been
shown be primarily that due to necking of the globule as discussed in Chapter 4.
The globule deforms into a dumbbell shape. The narrow portion, either due to
extreme stretching or turbulence-induced surface wave, becomes so thin that the
droplets in this portion are to large to be covered by the oil. These droplets are then
ejected into the continuous phase.
5.4.5 Effect of Extraction Time
Figure 5.23 shows a slight increase in the interior phase volume as a function
of residence time. The exterior phase profile which is presented by the amount of
silver extracted indicates no further separation was achieved after 3 minutes. Beside
this, the silver transport was most likely masked the net decrease in the external
phase volume due to swell minus the breakage volumes. This decrease would
increase the external phase concentration, as shown that the amount of silver
remaining in the external phase increase after 5 minutes. As expected, in this studies
both breakage and swell increases significantly as a function of residence time. This
finding supported by Kopp et al., (1978) and Thein et al., (1988) shows that the
(a) (b)
Swelling and break-up
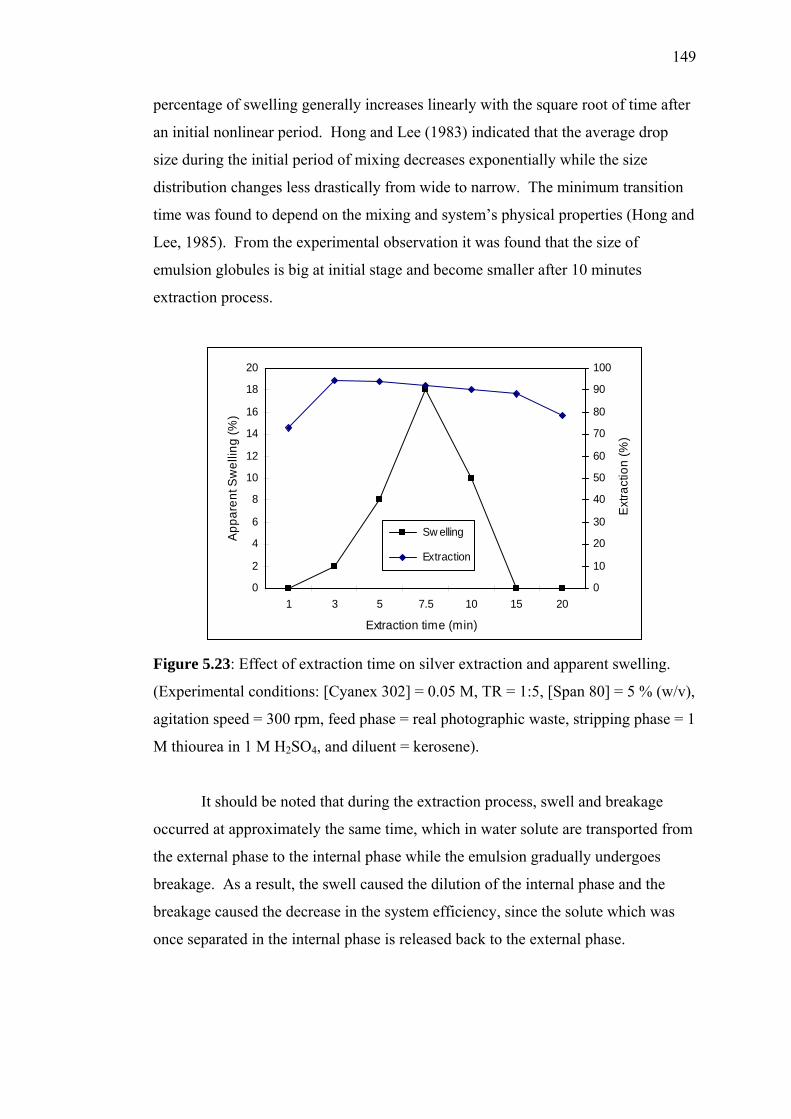
149
percentage of swelling generally increases linearly with the square root of time after
an initial nonlinear period. Hong and Lee (1983) indicated that the average drop
size during the initial period of mixing decreases exponentially while the size
distribution changes less drastically from wide to narrow. The minimum transition
time was found to depend on the mixing and system’s physical properties (Hong and
Lee, 1985). From the experimental observation it was found that the size of
emulsion globules is big at initial stage and become smaller after 10 minutes
extraction process.
0
2
4
6
8
10
12
14
16
18
20
1 3 5 7.5 10 15 20
Extraction time (min)
App
aren
t Sw
ellin
g (%
)
0
10
20
30
40
50
60
70
80
90
100
Ext
ract
ion
(%)
Sw elling
Extraction
Figure 5.23: Effect of extraction time on silver extraction and apparent swelling.
(Experimental conditions: [Cyanex 302] = 0.05 M, TR = 1:5, [Span 80] = 5 % (w/v),
agitation speed = 300 rpm, feed phase = real photographic waste, stripping phase = 1
M thiourea in 1 M H2SO4, and diluent = kerosene).
It should be noted that during the extraction process, swell and breakage
occurred at approximately the same time, which in water solute are transported from
the external phase to the internal phase while the emulsion gradually undergoes
breakage. As a result, the swell caused the dilution of the internal phase and the
breakage caused the decrease in the system efficiency, since the solute which was
once separated in the internal phase is released back to the external phase.
150
The result also shows that the swell increased with the increase in the total
contact time until it reached the critical point at minute 5, then the swollen emulsion
was spill out. As a result the volume of internal phase decreased at 7.5 minutes. It
means the mass volume was transfer from the internal to the external phase.
5.5 Emulsion Liquid Membrane Recovery Process
One benefit of ELM processes is recyclable liquid membrane, which means
the emulsion must be demulsified back for product recovery and also liquid
membrane recycling. In this system of silver recovery from photographic wastes, a
few parameters have been studied on their effect of recovery process such as carrier
concentration, stripping agent concentration and treat ratio. The demulsification
process of emulsion liquid membrane was done by using batch high voltage
demulsifier system. This emulsion demulsified until organic and aqueous phases
were clearly separated.
5.5.1 Effect of Carrier Concentration
Carrier concentration plays an important role in the silver recovery process.
As discussed, the carrier-metal complexes will release the metal at membrane-
internal interface and it will diffuse back to the external-membrane interface. This
task illustrates that only a little carrier is required for transporting the metal. Table
5.9 shows that by increasing Cyanex 302 concentration from 0.01 M to 0.04 M, the
percentage of silver recovery increased to 100% but further increase to 0.05 M the
percentage drop down to 38%. It is because the membrane was concentrated with
metal-carrier complexes and does not release it to the internal phase. This crowding
will affect resist metal transport process that lead to a decrease in the percentage of
stripping process. On the other hand, high concentration of Cyanex 302 will reduce
the liquid membrane viscosity and affect the stability of emulsion as discuss before.
This effect is deduced by the amount of silver remaining in the external phase.
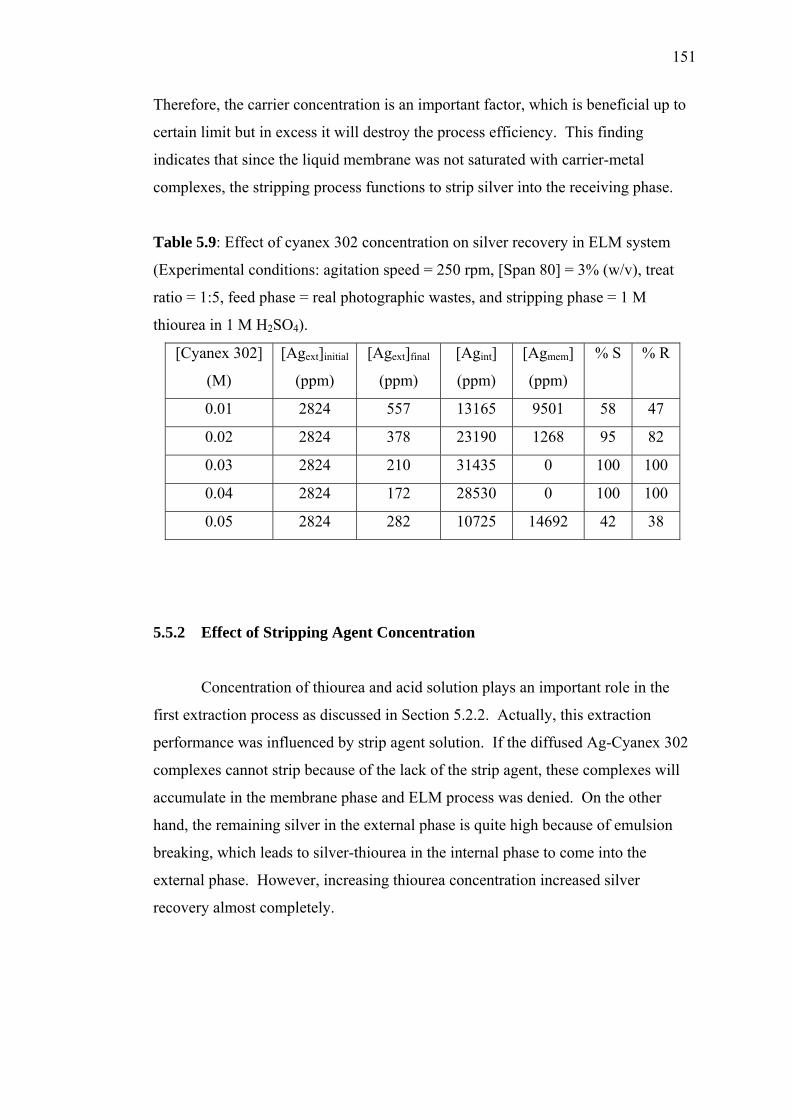
151
Therefore, the carrier concentration is an important factor, which is beneficial up to
certain limit but in excess it will destroy the process efficiency. This finding
indicates that since the liquid membrane was not saturated with carrier-metal
complexes, the stripping process functions to strip silver into the receiving phase.
Table 5.9: Effect of cyanex 302 concentration on silver recovery in ELM system
(Experimental conditions: agitation speed = 250 rpm, [Span 80] = 3% (w/v), treat
ratio = 1:5, feed phase = real photographic wastes, and stripping phase = 1 M
thiourea in 1 M H2SO4).
[Cyanex 302]
(M)
[Agext]initial
(ppm)
[Agext]final
(ppm)
[Agint]
(ppm)
[Agmem]
(ppm)
% S % R
0.01 2824 557 13165 9501 58 47
0.02 2824 378 23190 1268 95 82
0.03 2824 210 31435 0 100 100
0.04 2824 172 28530 0 100 100
0.05 2824 282 10725 14692 42 38
5.5.2 Effect of Stripping Agent Concentration
Concentration of thiourea and acid solution plays an important role in the
first extraction process as discussed in Section 5.2.2. Actually, this extraction
performance was influenced by strip agent solution. If the diffused Ag-Cyanex 302
complexes cannot strip because of the lack of the strip agent, these complexes will
accumulate in the membrane phase and ELM process was denied. On the other
hand, the remaining silver in the external phase is quite high because of emulsion
breaking, which leads to silver-thiourea in the internal phase to come into the
external phase. However, increasing thiourea concentration increased silver
recovery almost completely.
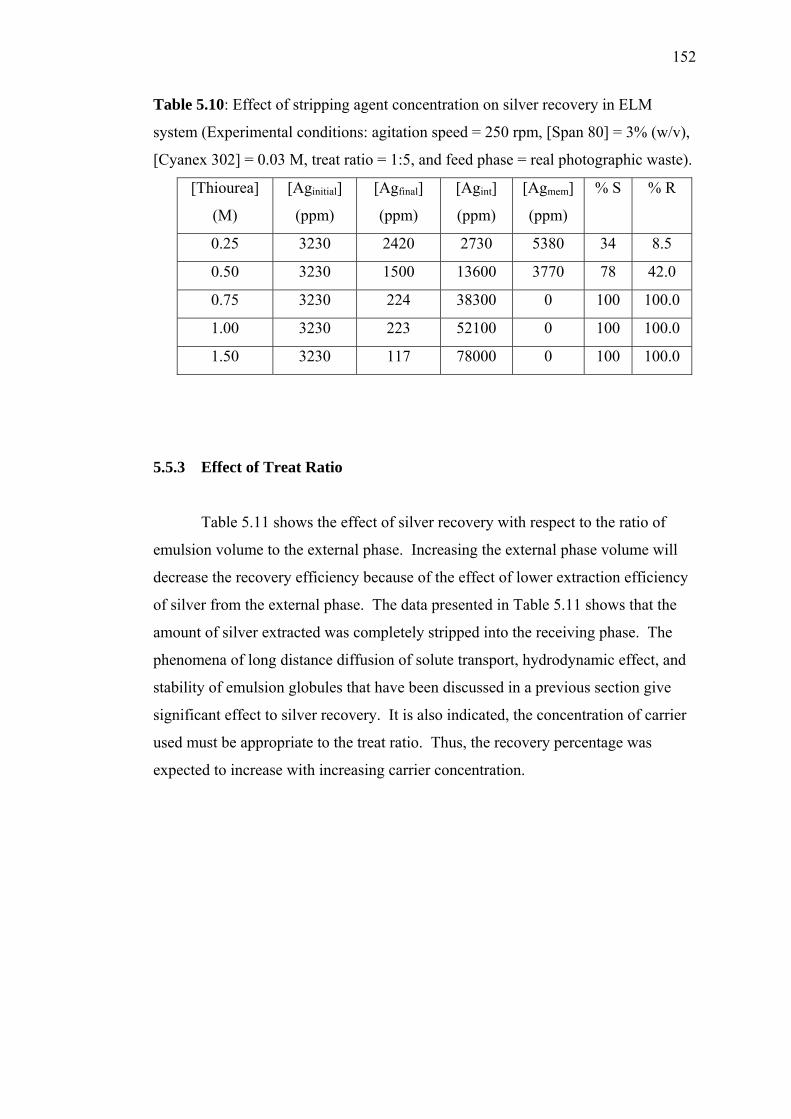
152
Table 5.10: Effect of stripping agent concentration on silver recovery in ELM
system (Experimental conditions: agitation speed = 250 rpm, [Span 80] = 3% (w/v),
[Cyanex 302] = 0.03 M, treat ratio = 1:5, and feed phase = real photographic waste).
[Thiourea]
(M)
[Aginitial]
(ppm)
[Agfinal]
(ppm)
[Agint]
(ppm)
[Agmem]
(ppm)
% S % R
0.25 3230 2420 2730 5380 34 8.5
0.50 3230 1500 13600 3770 78 42.0
0.75 3230 224 38300 0 100 100.0
1.00 3230 223 52100 0 100 100.0
1.50 3230 117 78000 0 100 100.0
5.5.3 Effect of Treat Ratio
Table 5.11 shows the effect of silver recovery with respect to the ratio of
emulsion volume to the external phase. Increasing the external phase volume will
decrease the recovery efficiency because of the effect of lower extraction efficiency
of silver from the external phase. The data presented in Table 5.11 shows that the
amount of silver extracted was completely stripped into the receiving phase. The
phenomena of long distance diffusion of solute transport, hydrodynamic effect, and
stability of emulsion globules that have been discussed in a previous section give
significant effect to silver recovery. It is also indicated, the concentration of carrier
used must be appropriate to the treat ratio. Thus, the recovery percentage was
expected to increase with increasing carrier concentration.
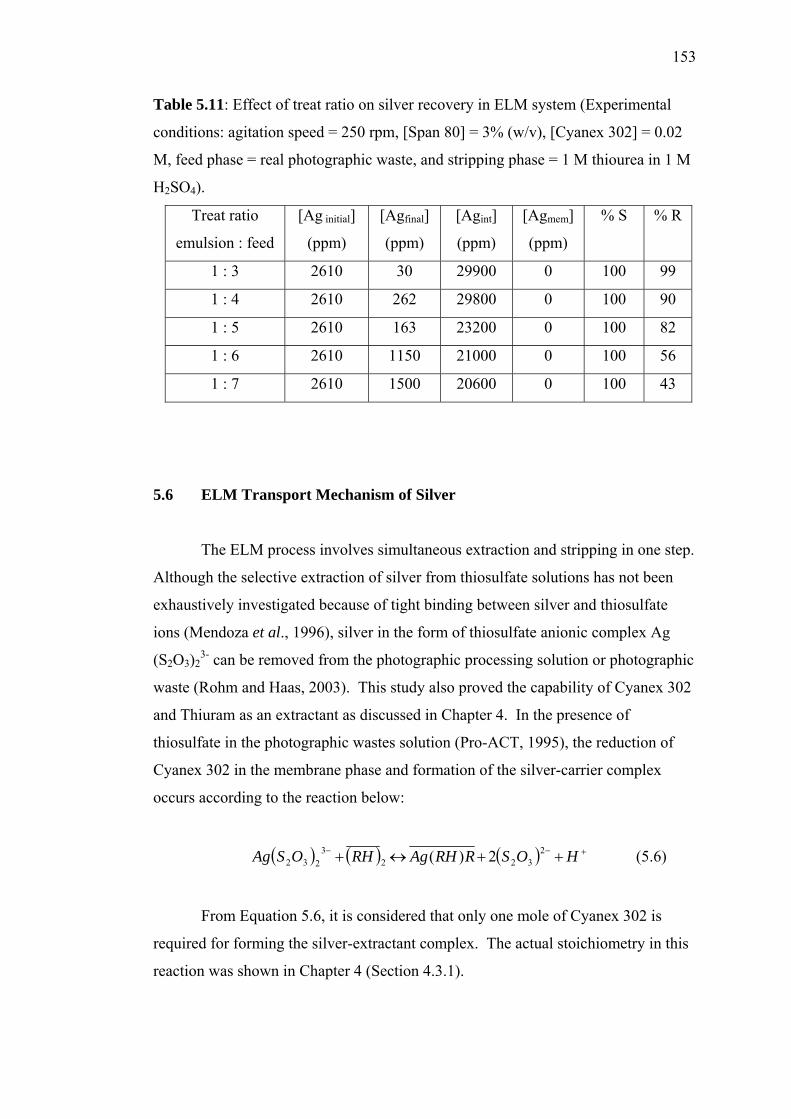
153
Table 5.11: Effect of treat ratio on silver recovery in ELM system (Experimental
conditions: agitation speed = 250 rpm, [Span 80] = 3% (w/v), [Cyanex 302] = 0.02
M, feed phase = real photographic waste, and stripping phase = 1 M thiourea in 1 M
H2SO4).
Treat ratio
emulsion : feed
[Ag initial]
(ppm)
[Agfinal]
(ppm)
[Agint]
(ppm)
[Agmem]
(ppm)
% S % R
1 : 3 2610 30 29900 0 100 99
1 : 4 2610 262 29800 0 100 90
1 : 5 2610 163 23200 0 100 82
1 : 6 2610 1150 21000 0 100 56
1 : 7 2610 1500 20600 0 100 43
5.6 ELM Transport Mechanism of Silver
The ELM process involves simultaneous extraction and stripping in one step.
Although the selective extraction of silver from thiosulfate solutions has not been
exhaustively investigated because of tight binding between silver and thiosulfate
ions (Mendoza et al., 1996), silver in the form of thiosulfate anionic complex Ag
(S2O3)23- can be removed from the photographic processing solution or photographic
waste (Rohm and Haas, 2003). This study also proved the capability of Cyanex 302
and Thiuram as an extractant as discussed in Chapter 4. In the presence of
thiosulfate in the photographic wastes solution (Pro-ACT, 1995), the reduction of
Cyanex 302 in the membrane phase and formation of the silver-carrier complex
occurs according to the reaction below:
( ) ( ) ( ) +−− ++↔+ HOSRRHAgRHOSAg 2322
3232 2)( (5.6)
From Equation 5.6, it is considered that only one mole of Cyanex 302 is
required for forming the silver-extractant complex. The actual stoichiometry in this
reaction was shown in Chapter 4 (Section 4.3.1).
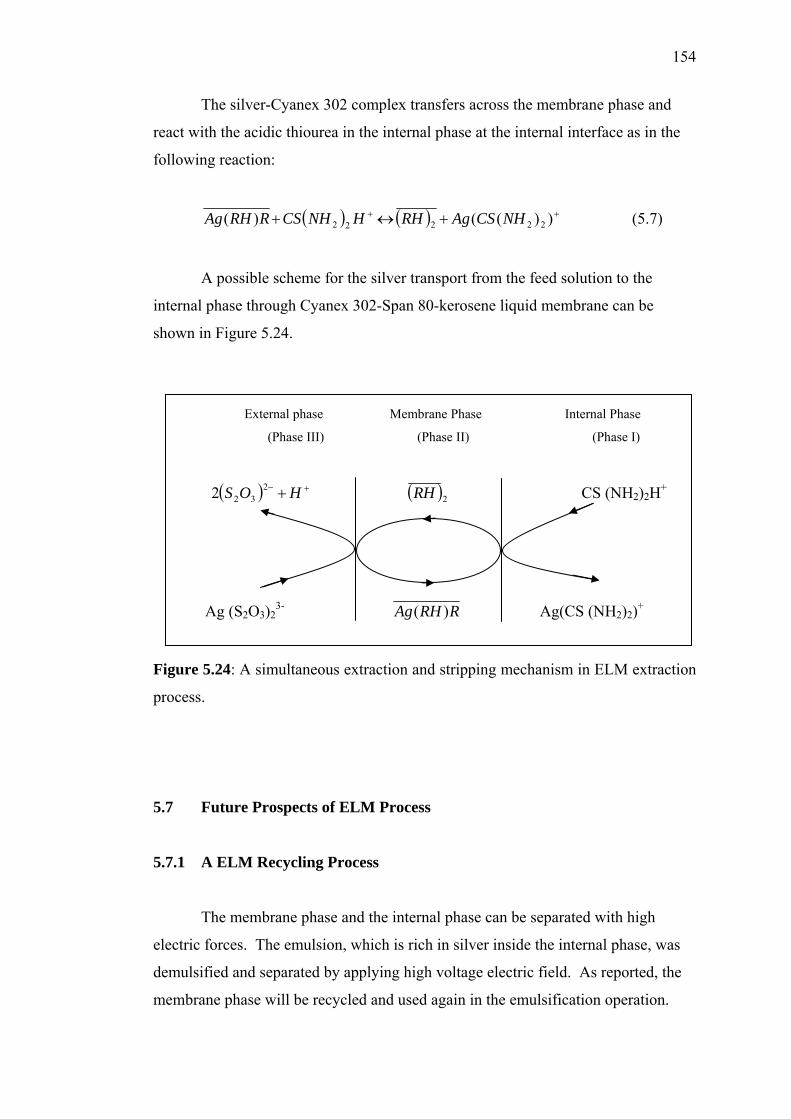
154
The silver-Cyanex 302 complex transfers across the membrane phase and
react with the acidic thiourea in the internal phase at the internal interface as in the
following reaction:
( ) ( ) ++ +↔+ ))(()( 22222 NHCSAgRHHNHCSRRHAg (5.7)
A possible scheme for the silver transport from the feed solution to the
internal phase through Cyanex 302-Span 80-kerosene liquid membrane can be
shown in Figure 5.24.
External phase Membrane Phase Internal Phase
(Phase III) (Phase II) (Phase I)
( ) +− +HOS 2322 ( )2RH CS (NH2)2H+
Ag (S2O3)23- RRHAg )( Ag(CS (NH2)2)+
Figure 5.24: A simultaneous extraction and stripping mechanism in ELM extraction
process.
5.7 Future Prospects of ELM Process
5.7.1 A ELM Recycling Process
The membrane phase and the internal phase can be separated with high
electric forces. The emulsion, which is rich in silver inside the internal phase, was
demulsified and separated by applying high voltage electric field. As reported, the
membrane phase will be recycled and used again in the emulsification operation.
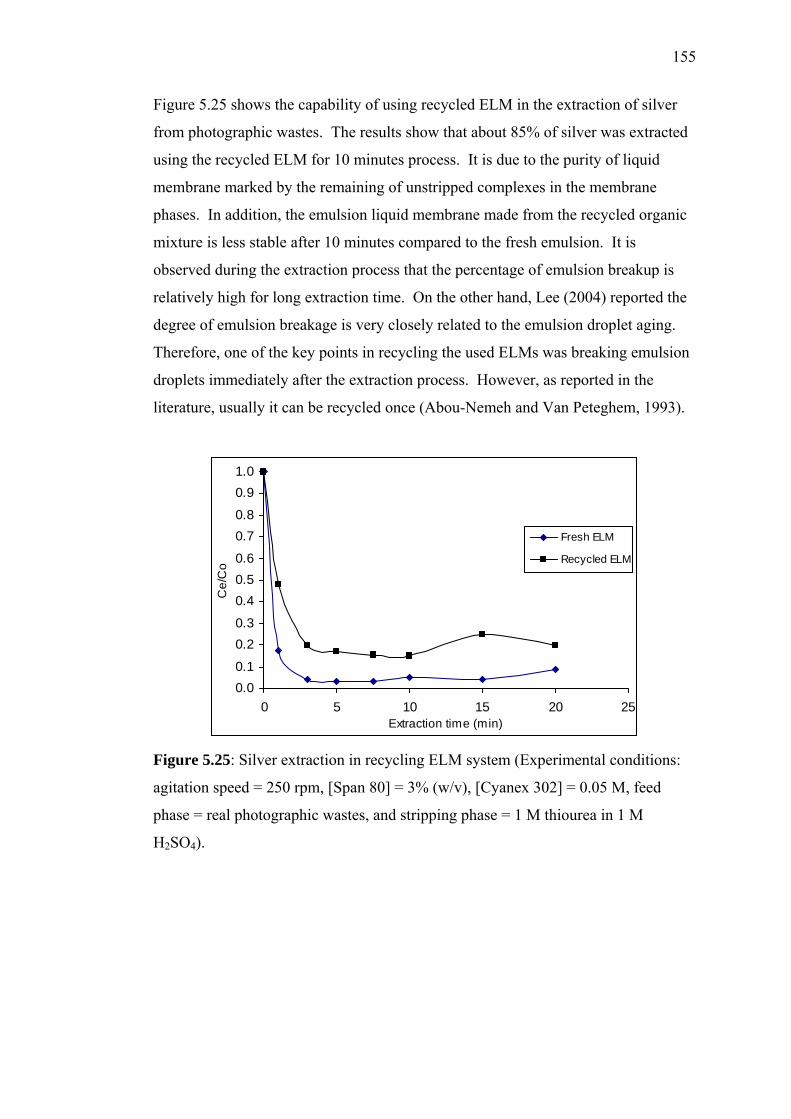
155
Figure 5.25 shows the capability of using recycled ELM in the extraction of silver
from photographic wastes. The results show that about 85% of silver was extracted
using the recycled ELM for 10 minutes process. It is due to the purity of liquid
membrane marked by the remaining of unstripped complexes in the membrane
phases. In addition, the emulsion liquid membrane made from the recycled organic
mixture is less stable after 10 minutes compared to the fresh emulsion. It is
observed during the extraction process that the percentage of emulsion breakup is
relatively high for long extraction time. On the other hand, Lee (2004) reported the
degree of emulsion breakage is very closely related to the emulsion droplet aging.
Therefore, one of the key points in recycling the used ELMs was breaking emulsion
droplets immediately after the extraction process. However, as reported in the
literature, usually it can be recycled once (Abou-Nemeh and Van Peteghem, 1993).
0.00.1
0.20.3
0.40.50.6
0.70.8
0.91.0
0 5 10 15 20 25Extraction time (min)
Ce/
Co
Fresh ELM
Recycled ELM
Figure 5.25: Silver extraction in recycling ELM system (Experimental conditions:
agitation speed = 250 rpm, [Span 80] = 3% (w/v), [Cyanex 302] = 0.05 M, feed
phase = real photographic wastes, and stripping phase = 1 M thiourea in 1 M
H2SO4).
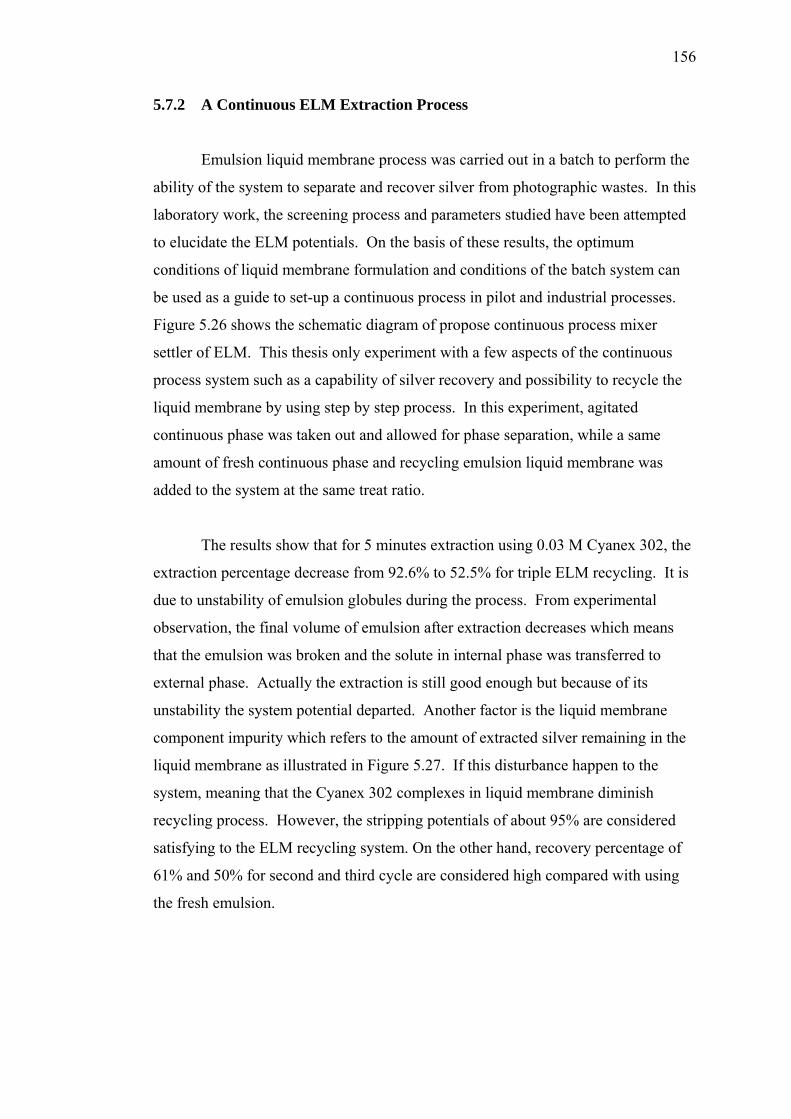
156
5.7.2 A Continuous ELM Extraction Process
Emulsion liquid membrane process was carried out in a batch to perform the
ability of the system to separate and recover silver from photographic wastes. In this
laboratory work, the screening process and parameters studied have been attempted
to elucidate the ELM potentials. On the basis of these results, the optimum
conditions of liquid membrane formulation and conditions of the batch system can
be used as a guide to set-up a continuous process in pilot and industrial processes.
Figure 5.26 shows the schematic diagram of propose continuous process mixer
settler of ELM. This thesis only experiment with a few aspects of the continuous
process system such as a capability of silver recovery and possibility to recycle the
liquid membrane by using step by step process. In this experiment, agitated
continuous phase was taken out and allowed for phase separation, while a same
amount of fresh continuous phase and recycling emulsion liquid membrane was
added to the system at the same treat ratio.
The results show that for 5 minutes extraction using 0.03 M Cyanex 302, the
extraction percentage decrease from 92.6% to 52.5% for triple ELM recycling. It is
due to unstability of emulsion globules during the process. From experimental
observation, the final volume of emulsion after extraction decreases which means
that the emulsion was broken and the solute in internal phase was transferred to
external phase. Actually the extraction is still good enough but because of its
unstability the system potential departed. Another factor is the liquid membrane
component impurity which refers to the amount of extracted silver remaining in the
liquid membrane as illustrated in Figure 5.27. If this disturbance happen to the
system, meaning that the Cyanex 302 complexes in liquid membrane diminish
recycling process. However, the stripping potentials of about 95% are considered
satisfying to the ELM recycling system. On the other hand, recovery percentage of
61% and 50% for second and third cycle are considered high compared with using
the fresh emulsion.
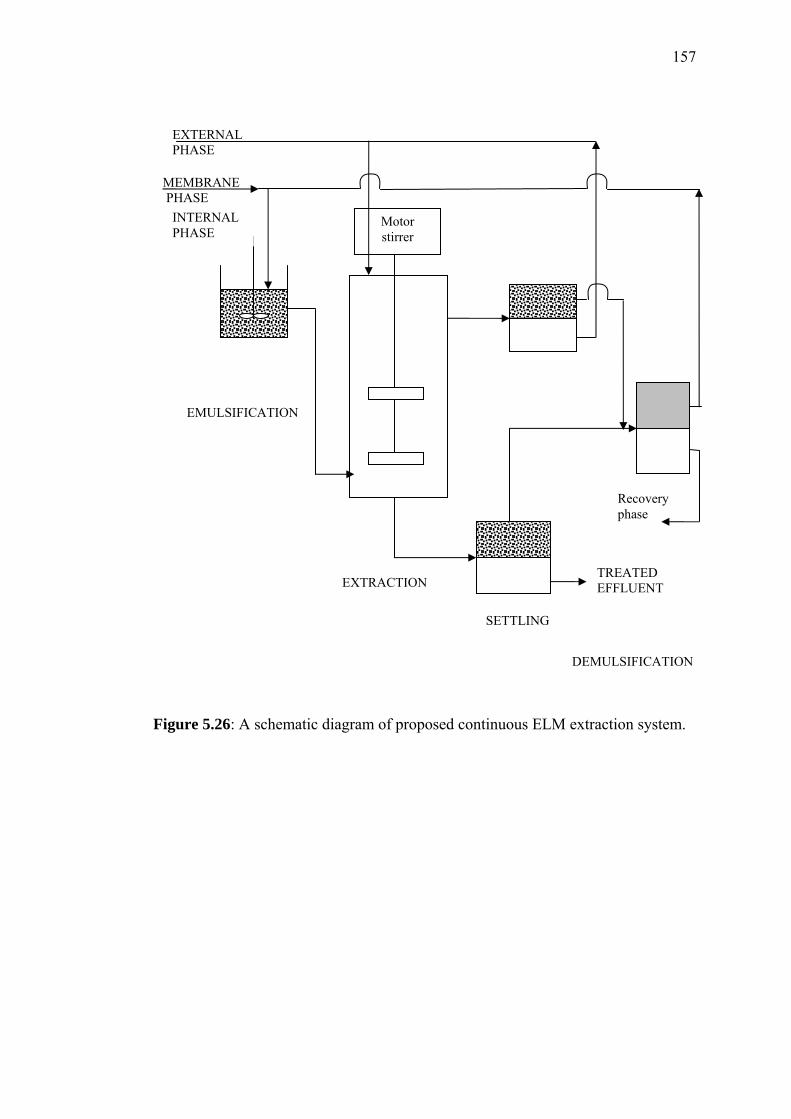
157
Figure 5.26: A schematic diagram of proposed continuous ELM extraction system.
Motor stirrer
EXTERNAL PHASE
MEMBRANE PHASE
EMULSIFICATION
EXTRACTION
SETTLING
TREATED EFFLUENT
DEMULSIFICATION
Recovery phase
INTERNAL PHASE
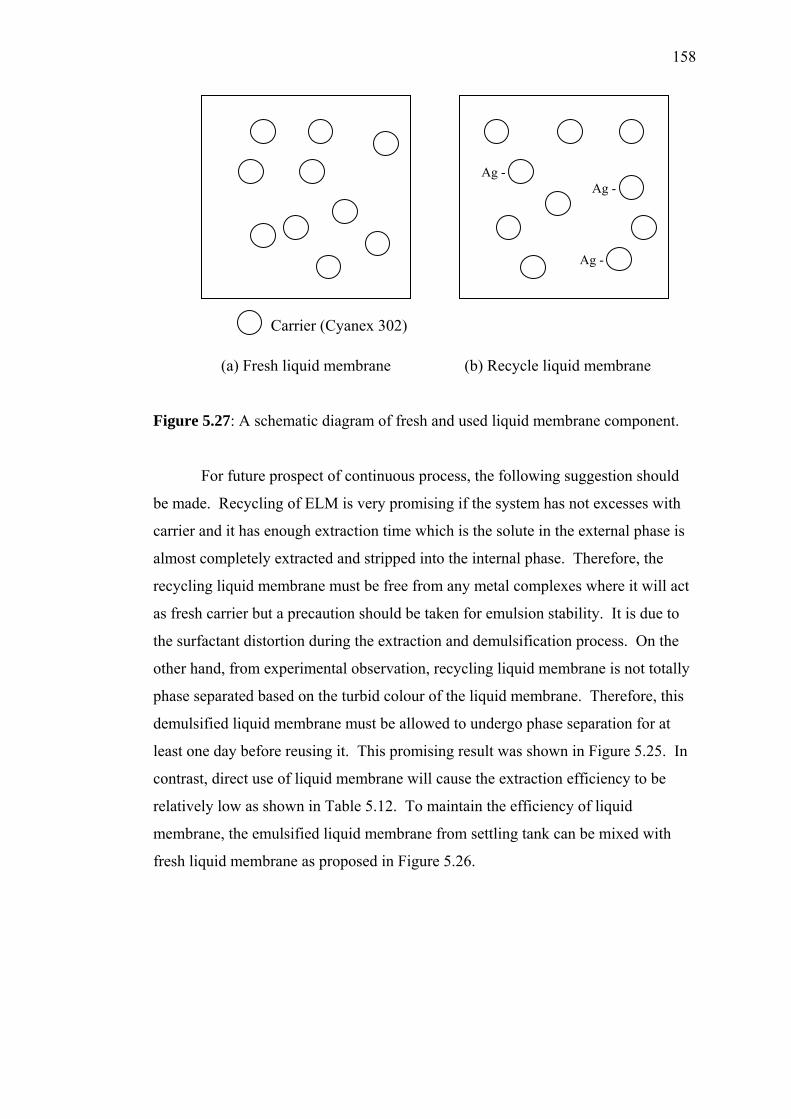
158
(a) Fresh liquid membrane (b) Recycle liquid membrane
Figure 5.27: A schematic diagram of fresh and used liquid membrane component.
For future prospect of continuous process, the following suggestion should
be made. Recycling of ELM is very promising if the system has not excesses with
carrier and it has enough extraction time which is the solute in the external phase is
almost completely extracted and stripped into the internal phase. Therefore, the
recycling liquid membrane must be free from any metal complexes where it will act
as fresh carrier but a precaution should be taken for emulsion stability. It is due to
the surfactant distortion during the extraction and demulsification process. On the
other hand, from experimental observation, recycling liquid membrane is not totally
phase separated based on the turbid colour of the liquid membrane. Therefore, this
demulsified liquid membrane must be allowed to undergo phase separation for at
least one day before reusing it. This promising result was shown in Figure 5.25. In
contrast, direct use of liquid membrane will cause the extraction efficiency to be
relatively low as shown in Table 5.12. To maintain the efficiency of liquid
membrane, the emulsified liquid membrane from settling tank can be mixed with
fresh liquid membrane as proposed in Figure 5.26.
Ag -
Ag -
Ag -
Carrier (Cyanex 302)
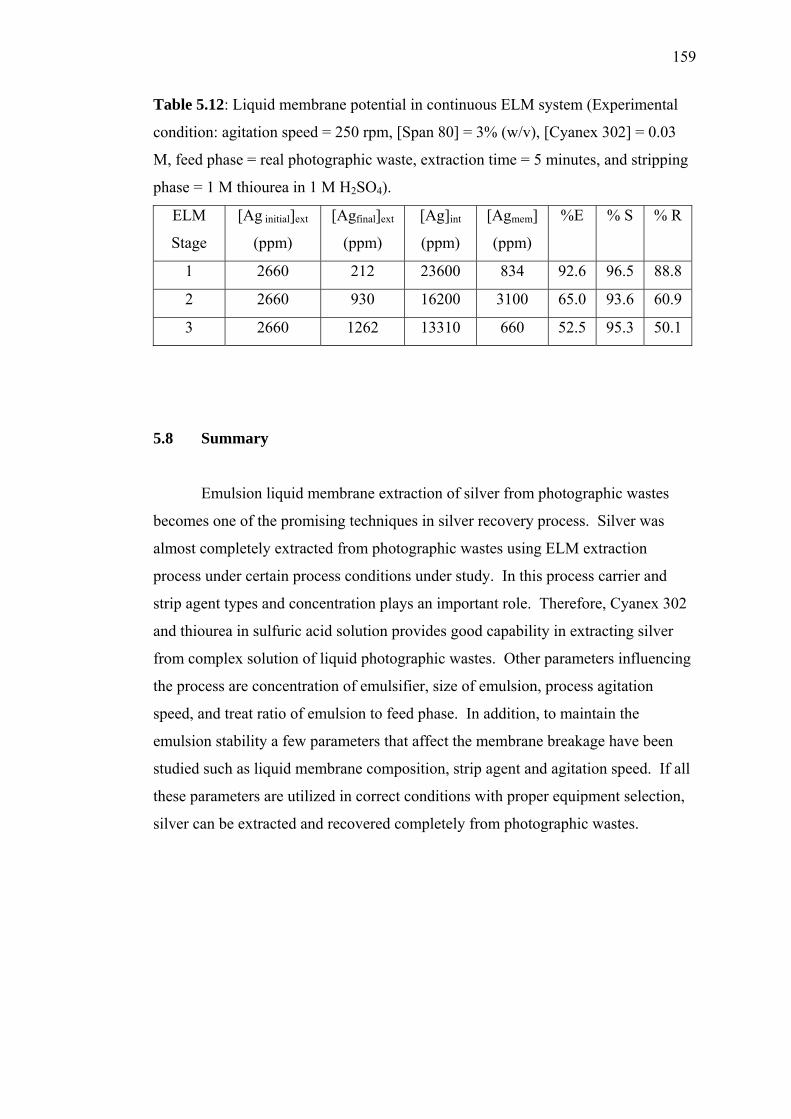
159
Table 5.12: Liquid membrane potential in continuous ELM system (Experimental
condition: agitation speed = 250 rpm, [Span 80] = 3% (w/v), [Cyanex 302] = 0.03
M, feed phase = real photographic waste, extraction time = 5 minutes, and stripping
phase = 1 M thiourea in 1 M H2SO4).
ELM
Stage
[Ag initial]ext
(ppm)
[Agfinal]ext
(ppm)
[Ag]int
(ppm)
[Agmem]
(ppm)
%E % S % R
1 2660 212 23600 834 92.6 96.5 88.8
2 2660 930 16200 3100 65.0 93.6 60.9
3 2660 1262 13310 660 52.5 95.3 50.1
5.8 Summary
Emulsion liquid membrane extraction of silver from photographic wastes
becomes one of the promising techniques in silver recovery process. Silver was
almost completely extracted from photographic wastes using ELM extraction
process under certain process conditions under study. In this process carrier and
strip agent types and concentration plays an important role. Therefore, Cyanex 302
and thiourea in sulfuric acid solution provides good capability in extracting silver
from complex solution of liquid photographic wastes. Other parameters influencing
the process are concentration of emulsifier, size of emulsion, process agitation
speed, and treat ratio of emulsion to feed phase. In addition, to maintain the
emulsion stability a few parameters that affect the membrane breakage have been
studied such as liquid membrane composition, strip agent and agitation speed. If all
these parameters are utilized in correct conditions with proper equipment selection,
silver can be extracted and recovered completely from photographic wastes.
CHAPTER 6
MODELING OF LIQUID MEMBRANE EXTRACTION OF SILVER
6.1 Introduction
An emulsion liquid membrane system has been shown to successfully extract
silver from liquid photographic wastes. A mathematical model will established to
simulate the extraction of silver in order to compare with the experimental results. A
mathematical model will be developed based on general ELM model with a few
assumptions and modification. Usually, the Type 2 facilitated transport can be
introduced based on either spherical shell or emulsion globules models as discussed
in Chapter 2. However, the emulsion globule approach is more appropriate
compared to spherical shell approach. Therefore, in developing silver extraction
model, it will consider emulsion globule approach and this model also will consider
the emulsion breakage during the ELMs process. In this study, ELMs model will be
developed and solved numerically.
6.2 ELM Batch Extraction Model
6.2.1 Preliminary Study
The theory of ELM extraction modeling has been investigated by many
workers. Lorbach and Marr (1987) developed a model of zinc extraction for Type 2
facilitation transport mechanism. In this model they took into account the diffusion
161
of carrier and carrier-solute complex in the membrane globules and the reversible
reactions at the external and internal interfaces. Although some simplifications have
been made on constant summation of free and complex carrier, constant pH in the
external phase and eliminated resistance for the peripheral thin membrane, based on
Teramoto et al. (1983) and Kataoka (1989) model, there were still four parameters
dealing with extraction and stripping equilibrium that are quite difficult to determine
correctly in this study.
Lee et al. (1996) developed a general physical model which is good for silver
extraction. However, it made a simplification that the mass transfer resistances of
silver and hydrogen ions in the external aqueous phase were neglected. Wang
(1984) showed that the external phase resistances cannot be neglected. However, it
is reported that for ELM system with adequate mixing speed which produced well
mixed globules, the external mass transfer resistance is not significant compared
with the resistance from the diffusion of the solute/carrier complex (Stroeve and
Varanasi, 1984). Since the agitation rate in this system was quite high, external
resistance was assumed insignificant and can be neglected. On the other hand, it is
interesting to know that Rajdip et al. (1998) developed a new model of batch-
extraction in emulsion liquid membrane considering interaction of globules for the
Type I facilitation mechanism but will not be considered in this model.
This model will consider the leakage of the internal aqueous phase to the
external phase due to the membrane breakage and this model also tried to adapt Lee
et al. (1996) model to make it more flexible. In order to simplify the model, the
following assumptions should be made;
i) The diameters of emulsion globules and internal droplets are uniform and
can be expressed as the Sauter mean diameter.
ii) The internal aqueous phase droplets are immobile and so there is no
circulation of the droplets within the emulsion drop.
iii) The ionic form of the solute existing in the external phase is insoluble in
the membrane phase, so that extraction by non-facilitated transport and
diffusion by complexes itself without carrier is negligible.
162
iv) The physical properties of all the phases and the diffusion coefficient of
the solute-carrier complex through the membrane phase are constant
throughout the extraction process.
v) The main mechanism of leakage is the mechanical rupture of internal
phase droplets at the globule interface.
vi) The volume change of the emulsion liquid membrane phase and the
external phase due to leakage can be neglected.
vii) Reaction at external and internal interface a rapidly compared to
diffusion rate.
viii) Tank is well mixed at constant temperature conditions
ix) The local reaction at the external interface between the external and the
membrane phases is in equilibrium.
x) The mass transfer resistance in the internal aqueous phase is neglected
because of very small size of the droplets.
6.2.2 Mathematical Modeling of Transport Process
The model of carrier mediated transport is much more complicated than that
of diffusion limited type because extracting reaction and stripping reaction of the
solute occur on two liquid-liquid interfaces in the emulsion liquid membrane system.
Lorbach and Marr (1987) developed a model of carrier transport type for extraction
of zinc with many variables. In order to adopt this model for extraction of silver
from photographic wastes some transport mechanism assumptions should be made
as the following:
i) diffusion of ion Ag to the surface of the emulsion globules
ii) reaction of ion Ag with carrier at the external interface
iii) diffusion of the silver-loaded carrier into the emulsion globules
iv) stripping of the loaded carrier at the internal interface between the
membrane phase and the internal droplet phase
v) back diffusion of the carrier to the interface between the external
phase and membrane phase.
163
Modification of Lorbach and Marr (1987) and Lee et al. (1996) models considering
membrane breakage during the extraction process was studied in this thesis. The
governing equations for the extraction processes are:
a) Mass balance equation in external aqueous phase:
RirIABRircRrcAcIIIA
III CMCCSkdt
dCV
===−−=− ,
, )( (6.1)
RirIHBRircRrcAcIIIH
III CMCCSkdt
dCV
===+−= ,
, )( (6.2)
Where,
IIIAC , : Concentration of solute in the external phase (mol/l).
IIIHC , : Concentration hydrogen ion in the external phase (mol/l).
cC : Concentration of metal complex at the external-membrane interface
(mol/l).
ck :Mass transfer coefficient through pheripheral layer of membrane
(m2/s).
IIIV : Volume of external phase (ml)
R : Sauter mean radius of an emulsion globules (m)
BM : Rate of leakage
SA : Sphere area of globules emulsion
b) Mass balance of solute-carrier complex (C) within emulsion
globules iRr ≤≤0
Interfacial area between membrane and internal droplets;
24' µπRS = (6.3)
164
3
34 µπRVI = (6.4)
Dividing Equation 6.3 with Equation 6.4;
µµ
µ
π
πRR
RVS
I
3
344'
3
2
== (6.5)
IVR
Sµ
3'= (6.6)
( ) sIc
eciIIIc
II rRV
rC
rrr
DVVt
CV
µ
31 22 −⎟⎟
⎠
⎞⎜⎜⎝
⎛⎟⎠⎞
⎜⎝⎛
∂∂
∂∂
+=∂∂
(6.7)
( ) sIcc
eciIIIc
II rRV
rC
rrC
DVVt
CV
µ
322
−⎟⎟⎠
⎞⎜⎜⎝
⎛⎟⎠⎞
⎜⎝⎛
∂∂
+∂
∂+=
∂∂
(6.8)
c) Analogically, mass balance of carrier (B) within emulsion globules
iRr ≤≤0 can be expressed by using the effective diffusivities of carrier,
eBD .
( ) sIBB
eBiIIIB
II rRV
rC
rrCDVV
tCV
µ
322
+⎟⎟⎠
⎞⎜⎜⎝
⎛⎟⎠⎞
⎜⎝⎛
∂∂
+∂
∂+=
∂∂
(6.9)
Where,
IV : Volume of internal phase (ml)
IIV : Volume of liquid membrane phase (ml)
ecD : effective diffusivity of solute-carrier complex in emulsion
phase (m2/s)
eBD : effective diffusivity of carrier in emulsion phase (m2/s)
165
BC : Concentration of metal complex at the external-membrane
interface (mol/l).
sr : Rate of stripping
S’ : Sphere area of emulsion droplets
Volume ratio of emulsion globules:
( )( )III
iIIIi
VVVV
RR
++
=3
3
3/43/4ππ
( )( )III
iIIIi
VVVV
RR
++
=⎟⎟⎠
⎞⎜⎜⎝
⎛3
(6.10)
Lets β is a parameter for the thickness of the thin oil layer given by the
following equation:
⎟⎠⎞
⎜⎝⎛−=
RRi1β (6.11)
β−=⎟⎠⎞
⎜⎝⎛ 1
RRi (6.12)
So Equation 6.10 becomes:
( ) =− 31 β ( )( )III
iIII
VVVV++
(6.13)
( ) ( )( )31 β−+=+ IIIiIII VVVV (6.14)
166
Divide Equations 6.8 and 6.9 by iIII VV )( + :
( )( ) ( )( ) sI
III
ccec
c
III
II rRV
VVrC
rrC
Dt
CVV
V
µββ3
112
1 3
2
3 −+−⎟⎟
⎠
⎞⎜⎜⎝
⎛⎟⎠⎞
⎜⎝⎛
∂∂
+∂
∂=
∂∂
−+
(6.15)
( )( ) ( )( ) sI
III
BBeB
B
III
II rRV
VVrC
rrCD
tC
VVV
µββ3
112
1 3
2
3 −++⎟⎟
⎠
⎞⎜⎜⎝
⎛⎟⎠⎞
⎜⎝⎛
∂∂
+∂
∂=
∂∂
−+
(6.16)
Lets 1φ is the volume fraction of the internal phase in emulsion drop, VI/(VI+VII) and 1'φ is equal to 1φ /(1-β)3, Equations 6.15 and 6.16 become:
( ) sB
eBB r
RrCrD
rrtC
µ
φφ 12
21'31'1 +⎟
⎠⎞
⎜⎝⎛
∂∂
∂∂
=∂∂
− (6.17)
( ) sC
eCC r
RrC
rDrrt
C
µ
φφ 12
21'31'1 −⎟
⎠⎞
⎜⎝⎛
∂∂
∂∂
=∂∂
− (6.18)
d) Mass balance of solute (A) in the internal phase;
sIIA
I rVRdt
dCV
µ
3, = (6.19)
sIA r
RdtdC
µ
φφ 1,
1'3' =⎟⎟
⎠
⎞⎜⎜⎝
⎛ (6.20)
where 3 1'φ /Rµ corresponds to the interfacial area between the membrane
phase and the internal phase per unit volume of the (W/O) emulsion phase.
In addition, the following relation holds in the internal phase and is assumed
to be equivalent to ELM silver extraction system:
167
IHIAIHIA CeCCeC ,,
0,
0, +=+ (6.21)
Initial and boundary conditions (ICs, BCs) are respectively expressed as
follows:
Initial conditions(IC):
For t = 0: oIIIHIIIH
oIIIAIIIA CCCC ,,,, , ==
For t = 0, iRr ≤≤0 : oIHIH
oIAIAC
oBB CCCCCCC ,,,, ,,0, ==== (6.22)
Boundary conditions (BC);
For 0r0,t =≥ : 0,0 =∂∂
=∂∂
rC
rC cB (6.23)
For iRr0,t =≥ : Rir
sB
eB rr
CD
=⎟⎟⎠
⎞⎜⎜⎝
⎛+⎟
⎠⎞
⎜⎝⎛∂∂
− 3/21φ (6.24)
= Rir
sB
eC rr
CD
=⎟⎟⎠
⎞⎜⎜⎝
⎛+⎟
⎠⎞
⎜⎝⎛∂∂ 3/2
1φ
= ( )RrBRirBB CCk
==−
= ( )RirCRrCC CCk
==−
= Rrfr =
where,
kB and kC are the mass transfer coefficients of B and C in the peripheral thin
oil layer respectively. φ1 is the volume ratio of the internal phase in the
emulsion drop.
e) Recovery efficiency, E
168
The recovery efficiency is defined as:
( ) ( )eo
e
CtC
tE −= 1 (6.25)
6.2.3 Numerical Solution
The above set of basic equations (Section 6.2.2) results in a non-linear partial
difference equation system, which was solved by the numerical method of lines
approach. This technique is based on discretisation of the spatial derivative
transforming each partial differential equation into a system of ordinary differential
equations. Figure 6.1 shows the radius of the emulsion globules is separated into n
intervals or (n+1) points. Based of this illustration, Equations 6.15 and 6.16 were
derived numerically as the following using centered finite difference method.
( )
( )
rjr
CCrr
CCCr
D
rCC
rCCC
rD
rC
rrCD
jijijijijieB
jijijijijieB
BBeB
∆=
⎥⎦⎤
⎢⎣⎡ −
∆++−
∆=
⎥⎦
⎤⎢⎣
⎡∆
−++−
∆=
⎟⎟⎠
⎞⎜⎜⎝
⎛⎟⎠⎞
⎜⎝⎛
∂∂
+∂
∂
−+−+
−+−+
)(121
2)(221
2
1,1,1,,1,2
1,1,1,,1,2
2
( ) ⎥⎦
⎤⎢⎣
⎡−
∆++−
∆= −+−+ )(121
1,1,21,,1,2 jijijijijieB CCrj
CCCr
D (6.26)
where,
i = 0,1, 2, 3 …N
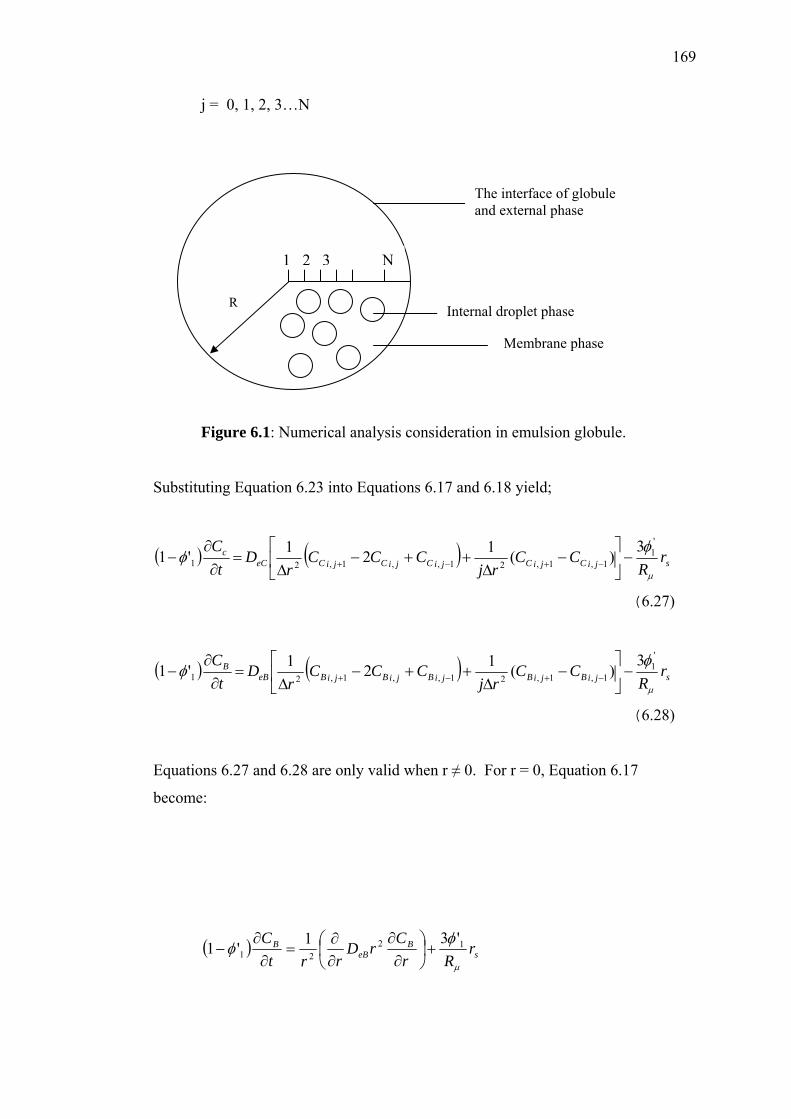
169
j = 0, 1, 2, 3…N
Figure 6.1: Numerical analysis consideration in emulsion globule.
Substituting Equation 6.23 into Equations 6.17 and 6.18 yield;
( ) ( ) sjiCjiCjiCjiCjiCeCc r
RCC
rjCCC
rD
tC
µ
φφ
'1
1,1,21,,1,213
)(121'1 −⎥⎦
⎤⎢⎣
⎡−
∆++−
∆=
∂∂
− −+−+
(6.27)
( ) ( ) sjiBjiBjiBjiBjiBeBB r
RCC
rjCCC
rD
tC
µ
φφ
'1
1,1,21,,1,213
)(121'1 −⎥⎦
⎤⎢⎣
⎡−
∆++−
∆=
∂∂
− −+−+
(6.28)
Equations 6.27 and 6.28 are only valid when r ≠ 0. For r = 0, Equation 6.17
become:
( ) sB
eBB r
RrCrD
rrtC
µ
φφ 12
21'31'1 +⎟
⎠⎞
⎜⎝⎛
∂∂
∂∂
=∂∂
−
1 2 3 N
R
The interface of globule and external phase
Internal droplet phase
Membrane phase
170
= sB
eB rRr
CD
µ
φ 12
2 '33 +⎟⎟
⎠
⎞⎜⎜⎝
⎛∂∂
= 0,1
20,1, '36 s
BBeB r
RrCC
Dµ
φ+⎟⎟
⎠
⎞⎜⎜⎝
⎛∆
− (6.29)
For r = 0, Equations 6.18 become:
( ) sC
eCC r
RrC
rDrrt
C
µ
φφ 12
21'31'1 −⎟
⎠⎞
⎜⎝⎛
∂∂
∂∂
=∂∂
−
= 0,1
20,1, '36 s
CCeC r
RrCC
Dµ
φ−⎟⎟
⎠
⎞⎜⎜⎝
⎛∆
− (6.30)
On the other hand, the equations at the boundaries would have to be
modified according to the boundary conditions in Equation 6.24.
Rir
B
rC
=
⎟⎠⎞
⎜⎝⎛∂∂ = ( )RirBRrB
eB
B CCDk
== − = ( )1,1,21
−+ −∆ NBNB CC
r
( ) 1,1,2
−==+ +−∆
= NBRirBRrBeB
BNB CCC
DrkC (6.31)
Rir
C
rC
=
⎟⎠⎞
⎜⎝⎛∂∂
= ( )RirCRrCeC
C CCDk
== − = ( )1,1,21
−+ −∆ NCNC CC
r
( ) 1,1,2
−==+ +−∆
= NCRirCRrCeC
CNC CCC
Drk
C (6.32)
where r = Ri = N = the point at the radius of inner core of W/O emulsion
drop. RrBC = and RrCC = can be calculated by the equilibrium relation at the
external interface between the external aqueous phase and the membrane
phase.
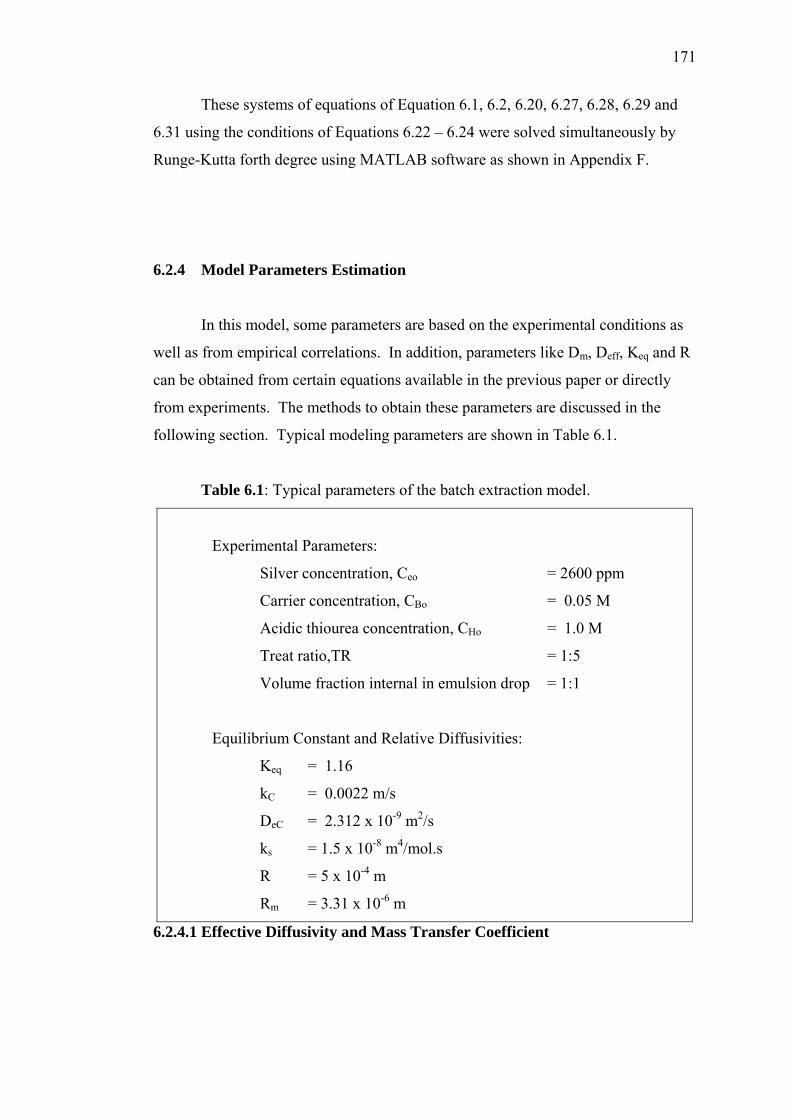
171
These systems of equations of Equation 6.1, 6.2, 6.20, 6.27, 6.28, 6.29 and
6.31 using the conditions of Equations 6.22 – 6.24 were solved simultaneously by
Runge-Kutta forth degree using MATLAB software as shown in Appendix F.
6.2.4 Model Parameters Estimation
In this model, some parameters are based on the experimental conditions as
well as from empirical correlations. In addition, parameters like Dm, Deff, Keq and R
can be obtained from certain equations available in the previous paper or directly
from experiments. The methods to obtain these parameters are discussed in the
following section. Typical modeling parameters are shown in Table 6.1.
Table 6.1: Typical parameters of the batch extraction model.
Experimental Parameters:
Silver concentration, Ceo = 2600 ppm
Carrier concentration, CBo = 0.05 M
Acidic thiourea concentration, CHo = 1.0 M
Treat ratio,TR = 1:5
Volume fraction internal in emulsion drop = 1:1
Equilibrium Constant and Relative Diffusivities:
Keq = 1.16
kC = 0.0022 m/s
DeC = 2.312 x 10⁻⁹ m2/s
ks = 1.5 x 10⁻⁸ m4/mol.s
R = 5 x 10⁻⁴ m
Rm = 3.31 x 10⁻⁶ m
6.2.4.1 Effective Diffusivity and Mass Transfer Coefficient
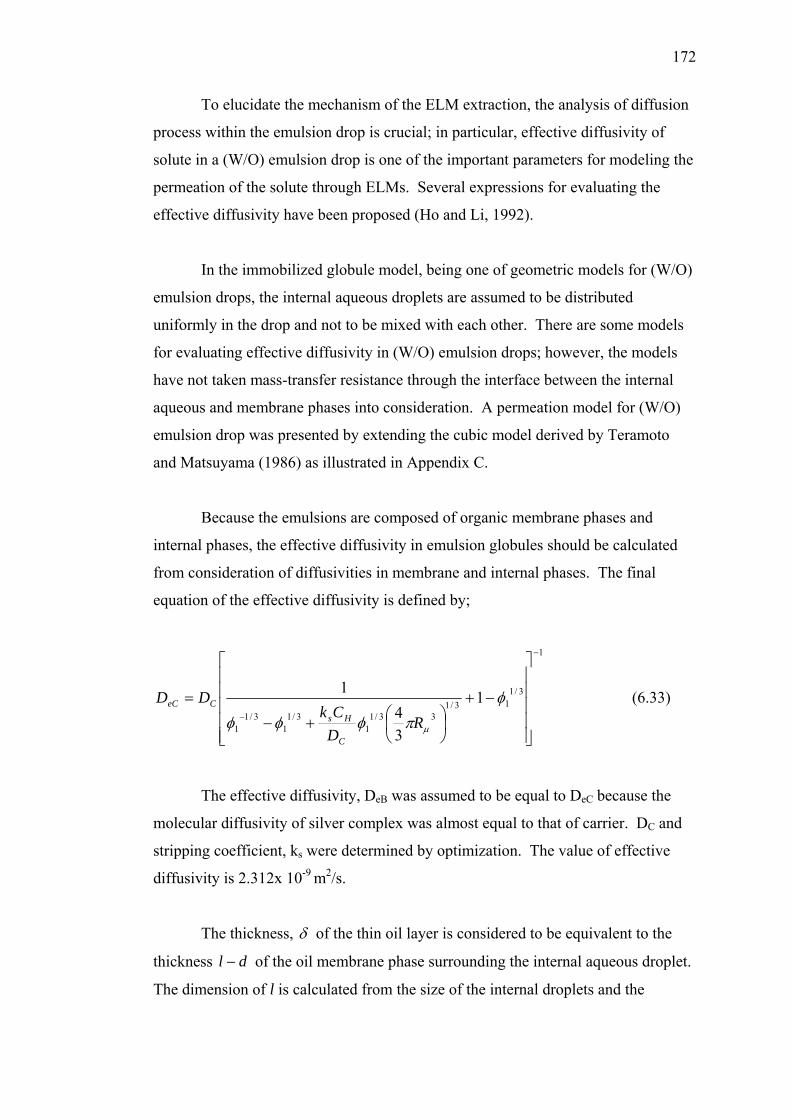
172
To elucidate the mechanism of the ELM extraction, the analysis of diffusion
process within the emulsion drop is crucial; in particular, effective diffusivity of
solute in a (W/O) emulsion drop is one of the important parameters for modeling the
permeation of the solute through ELMs. Several expressions for evaluating the
effective diffusivity have been proposed (Ho and Li, 1992).
In the immobilized globule model, being one of geometric models for (W/O)
emulsion drops, the internal aqueous droplets are assumed to be distributed
uniformly in the drop and not to be mixed with each other. There are some models
for evaluating effective diffusivity in (W/O) emulsion drops; however, the models
have not taken mass-transfer resistance through the interface between the internal
aqueous and membrane phases into consideration. A permeation model for (W/O)
emulsion drop was presented by extending the cubic model derived by Teramoto
and Matsuyama (1986) as illustrated in Appendix C.
Because the emulsions are composed of organic membrane phases and
internal phases, the effective diffusivity in emulsion globules should be calculated
from consideration of diffusivities in membrane and internal phases. The final
equation of the effective diffusivity is defined by;
1
3/113/1
33/11
3/11
3/11
1
34
1
−
−
⎥⎥⎥⎥⎥
⎦
⎤
⎢⎢⎢⎢⎢
⎣
⎡
−+
⎟⎠⎞
⎜⎝⎛+−
= φπφφφ µR
DCk
DD
C
HsCeC (6.33)
The effective diffusivity, DeB was assumed to be equal to DeC because the
molecular diffusivity of silver complex was almost equal to that of carrier. DC and
stripping coefficient, ks were determined by optimization. The value of effective
diffusivity is 2.312x 10⁻⁹ m2/s.
The thickness, δ of the thin oil layer is considered to be equivalent to the
thickness dl − of the oil membrane phase surrounding the internal aqueous droplet.
The dimension of l is calculated from the size of the internal droplets and the
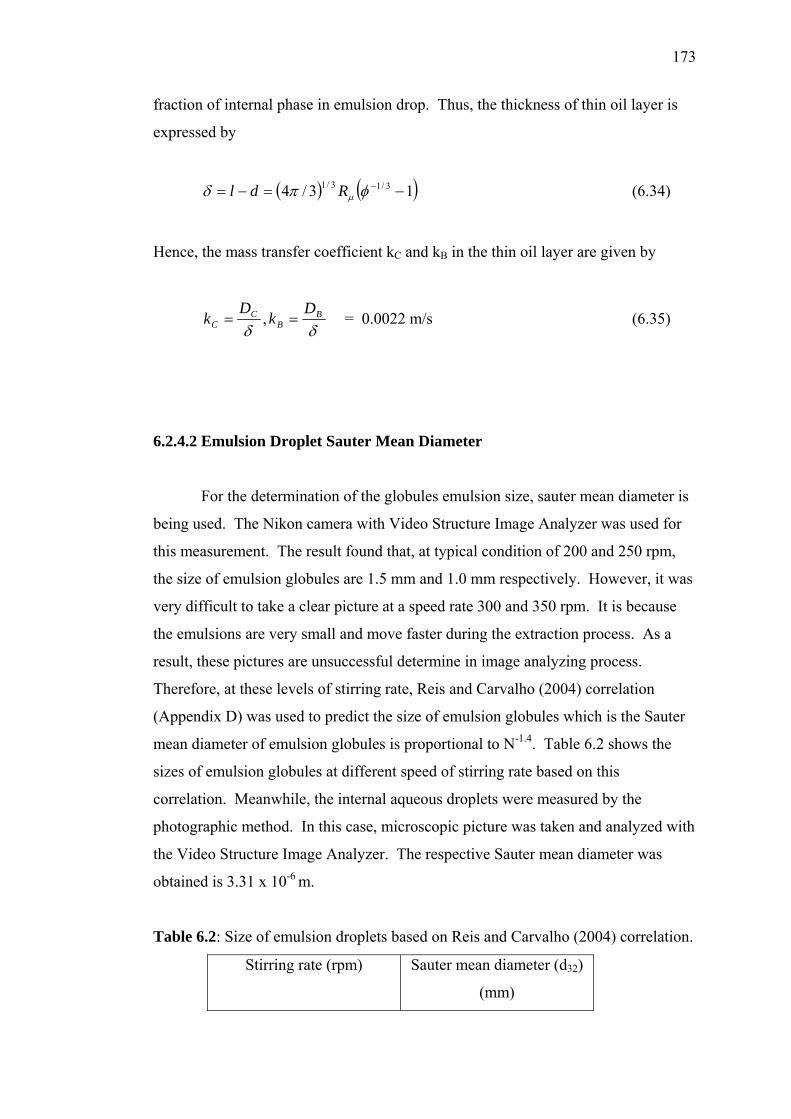
173
fraction of internal phase in emulsion drop. Thus, the thickness of thin oil layer is
expressed by
( ) ( )13/4 3/13/1 −=−= −φπδ µRdl (6.34)
Hence, the mass transfer coefficient kC and kB in the thin oil layer are given by
δδB
BC
CDk
Dk == , = 0.0022 m/s (6.35)
6.2.4.2 Emulsion Droplet Sauter Mean Diameter
For the determination of the globules emulsion size, sauter mean diameter is
being used. The Nikon camera with Video Structure Image Analyzer was used for
this measurement. The result found that, at typical condition of 200 and 250 rpm,
the size of emulsion globules are 1.5 mm and 1.0 mm respectively. However, it was
very difficult to take a clear picture at a speed rate 300 and 350 rpm. It is because
the emulsions are very small and move faster during the extraction process. As a
result, these pictures are unsuccessful determine in image analyzing process.
Therefore, at these levels of stirring rate, Reis and Carvalho (2004) correlation
(Appendix D) was used to predict the size of emulsion globules which is the Sauter
mean diameter of emulsion globules is proportional to N-1.4. Table 6.2 shows the
sizes of emulsion globules at different speed of stirring rate based on this
correlation. Meanwhile, the internal aqueous droplets were measured by the
photographic method. In this case, microscopic picture was taken and analyzed with
the Video Structure Image Analyzer. The respective Sauter mean diameter was
obtained is 3.31 x 10⁻⁶ m.
Table 6.2: Size of emulsion droplets based on Reis and Carvalho (2004) correlation.
Stirring rate (rpm) Sauter mean diameter (d32)
(mm)
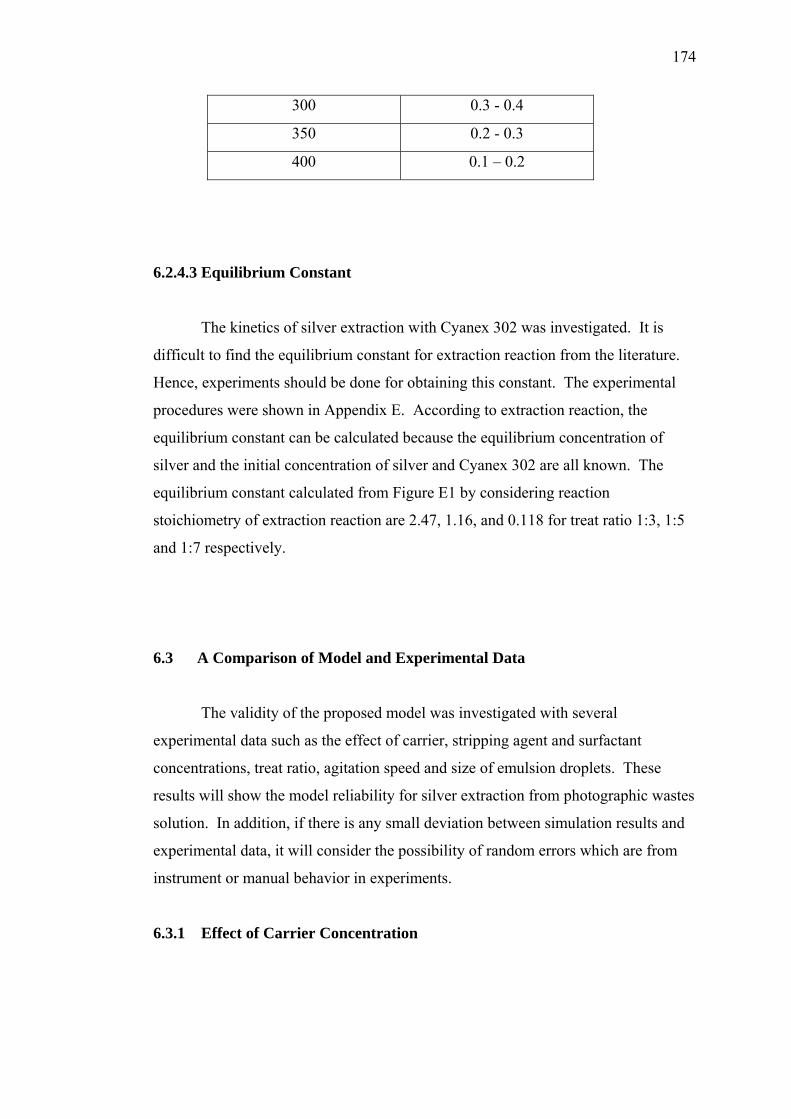
174
300 0.3 - 0.4
350 0.2 - 0.3
400 0.1 – 0.2
6.2.4.3 Equilibrium Constant
The kinetics of silver extraction with Cyanex 302 was investigated. It is
difficult to find the equilibrium constant for extraction reaction from the literature.
Hence, experiments should be done for obtaining this constant. The experimental
procedures were shown in Appendix E. According to extraction reaction, the
equilibrium constant can be calculated because the equilibrium concentration of
silver and the initial concentration of silver and Cyanex 302 are all known. The
equilibrium constant calculated from Figure E1 by considering reaction
stoichiometry of extraction reaction are 2.47, 1.16, and 0.118 for treat ratio 1:3, 1:5
and 1:7 respectively.
6.3 A Comparison of Model and Experimental Data
The validity of the proposed model was investigated with several
experimental data such as the effect of carrier, stripping agent and surfactant
concentrations, treat ratio, agitation speed and size of emulsion droplets. These
results will show the model reliability for silver extraction from photographic wastes
solution. In addition, if there is any small deviation between simulation results and
experimental data, it will consider the possibility of random errors which are from
instrument or manual behavior in experiments.
6.3.1 Effect of Carrier Concentration
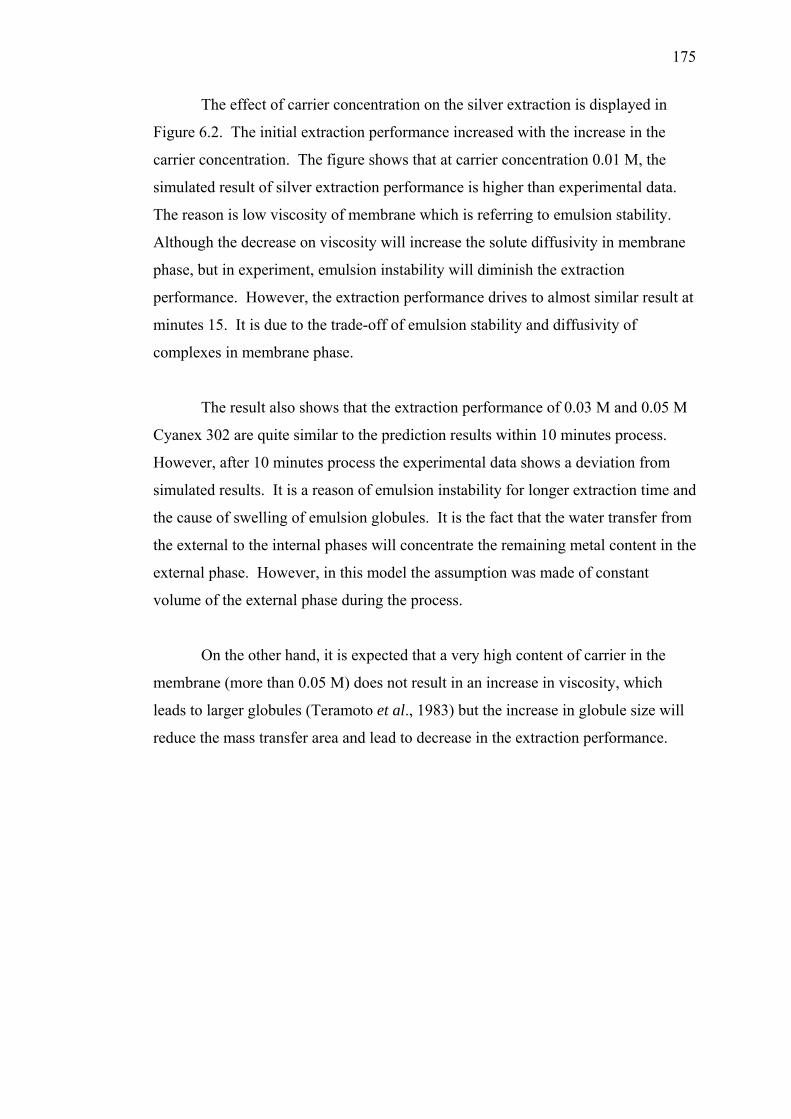
175
The effect of carrier concentration on the silver extraction is displayed in
Figure 6.2. The initial extraction performance increased with the increase in the
carrier concentration. The figure shows that at carrier concentration 0.01 M, the
simulated result of silver extraction performance is higher than experimental data.
The reason is low viscosity of membrane which is referring to emulsion stability.
Although the decrease on viscosity will increase the solute diffusivity in membrane
phase, but in experiment, emulsion instability will diminish the extraction
performance. However, the extraction performance drives to almost similar result at
minutes 15. It is due to the trade-off of emulsion stability and diffusivity of
complexes in membrane phase.
The result also shows that the extraction performance of 0.03 M and 0.05 M
Cyanex 302 are quite similar to the prediction results within 10 minutes process.
However, after 10 minutes process the experimental data shows a deviation from
simulated results. It is a reason of emulsion instability for longer extraction time and
the cause of swelling of emulsion globules. It is the fact that the water transfer from
the external to the internal phases will concentrate the remaining metal content in the
external phase. However, in this model the assumption was made of constant
volume of the external phase during the process.
On the other hand, it is expected that a very high content of carrier in the
membrane (more than 0.05 M) does not result in an increase in viscosity, which
leads to larger globules (Teramoto et al., 1983) but the increase in globule size will
reduce the mass transfer area and lead to decrease in the extraction performance.
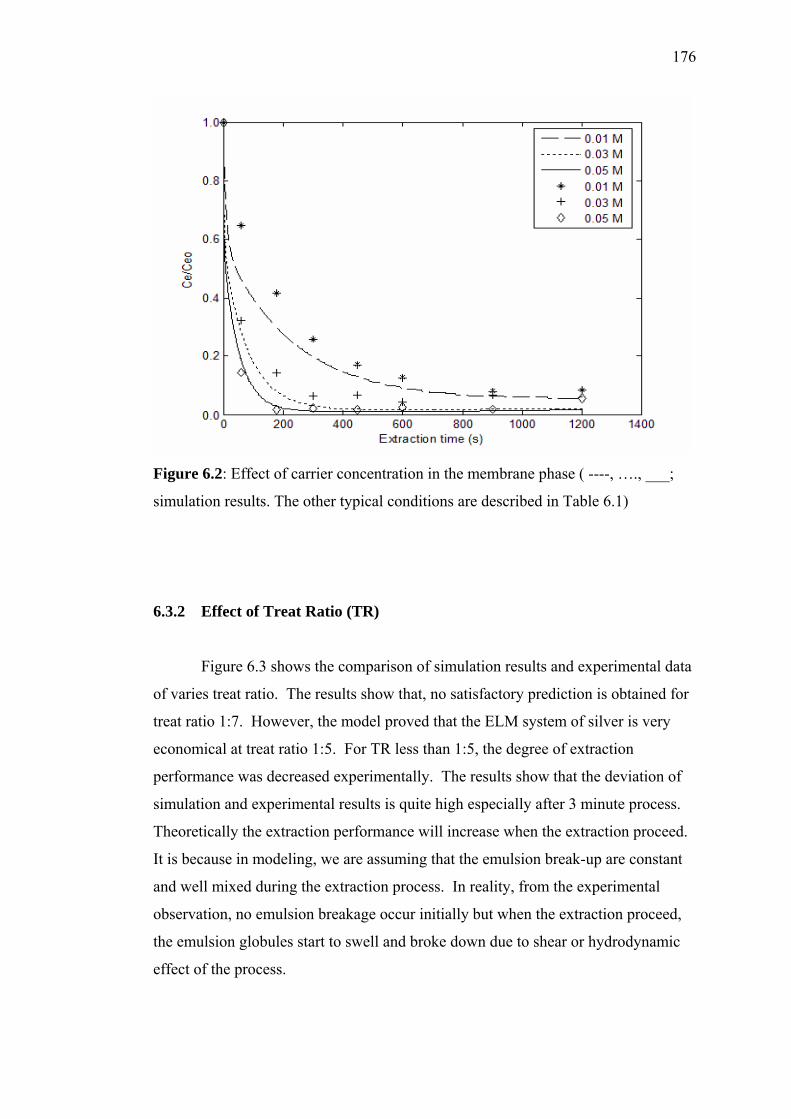
176
Figure 6.2: Effect of carrier concentration in the membrane phase ( ----, …., ___;
simulation results. The other typical conditions are described in Table 6.1)
6.3.2 Effect of Treat Ratio (TR)
Figure 6.3 shows the comparison of simulation results and experimental data
of varies treat ratio. The results show that, no satisfactory prediction is obtained for
treat ratio 1:7. However, the model proved that the ELM system of silver is very
economical at treat ratio 1:5. For TR less than 1:5, the degree of extraction
performance was decreased experimentally. The results show that the deviation of
simulation and experimental results is quite high especially after 3 minute process.
Theoretically the extraction performance will increase when the extraction proceed.
It is because in modeling, we are assuming that the emulsion break-up are constant
and well mixed during the extraction process. In reality, from the experimental
observation, no emulsion breakage occur initially but when the extraction proceed,
the emulsion globules start to swell and broke down due to shear or hydrodynamic
effect of the process.
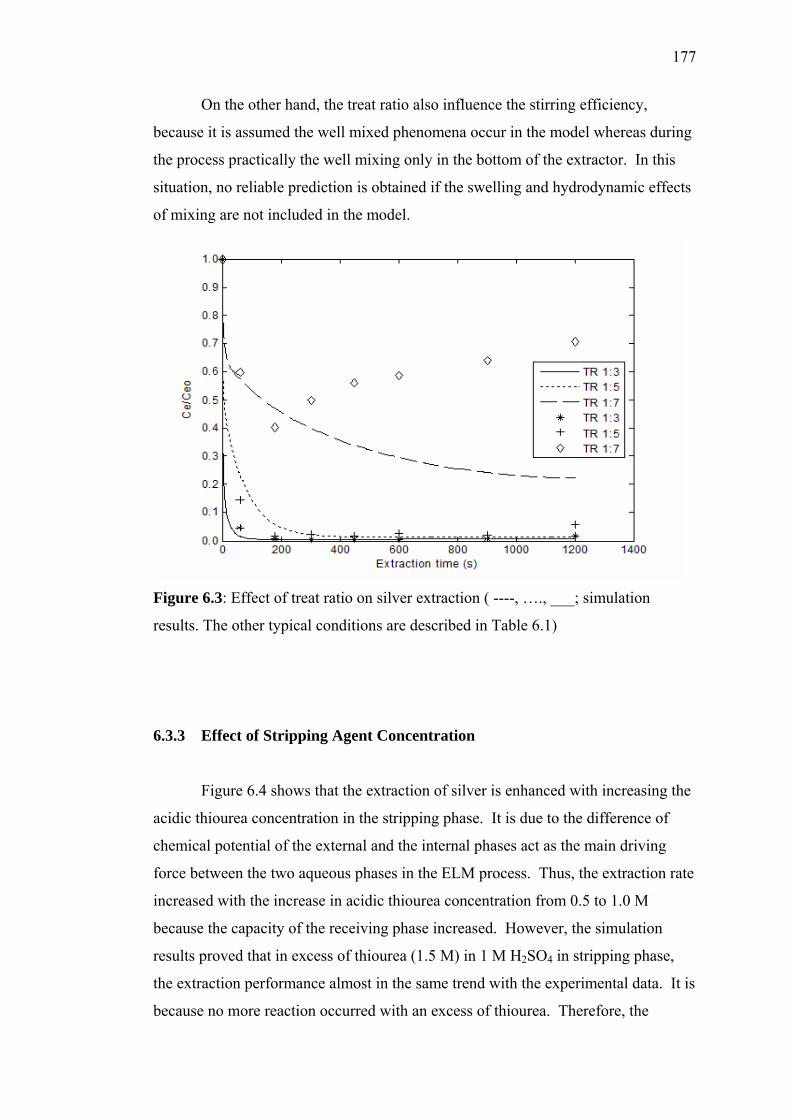
177
On the other hand, the treat ratio also influence the stirring efficiency,
because it is assumed the well mixed phenomena occur in the model whereas during
the process practically the well mixing only in the bottom of the extractor. In this
situation, no reliable prediction is obtained if the swelling and hydrodynamic effects
of mixing are not included in the model.
Figure 6.3: Effect of treat ratio on silver extraction ( ----, …., ___; simulation
results. The other typical conditions are described in Table 6.1)
6.3.3 Effect of Stripping Agent Concentration
Figure 6.4 shows that the extraction of silver is enhanced with increasing the
acidic thiourea concentration in the stripping phase. It is due to the difference of
chemical potential of the external and the internal phases act as the main driving
force between the two aqueous phases in the ELM process. Thus, the extraction rate
increased with the increase in acidic thiourea concentration from 0.5 to 1.0 M
because the capacity of the receiving phase increased. However, the simulation
results proved that in excess of thiourea (1.5 M) in 1 M H2SO4 in stripping phase,
the extraction performance almost in the same trend with the experimental data. It is
because no more reaction occurred with an excess of thiourea. Therefore, the
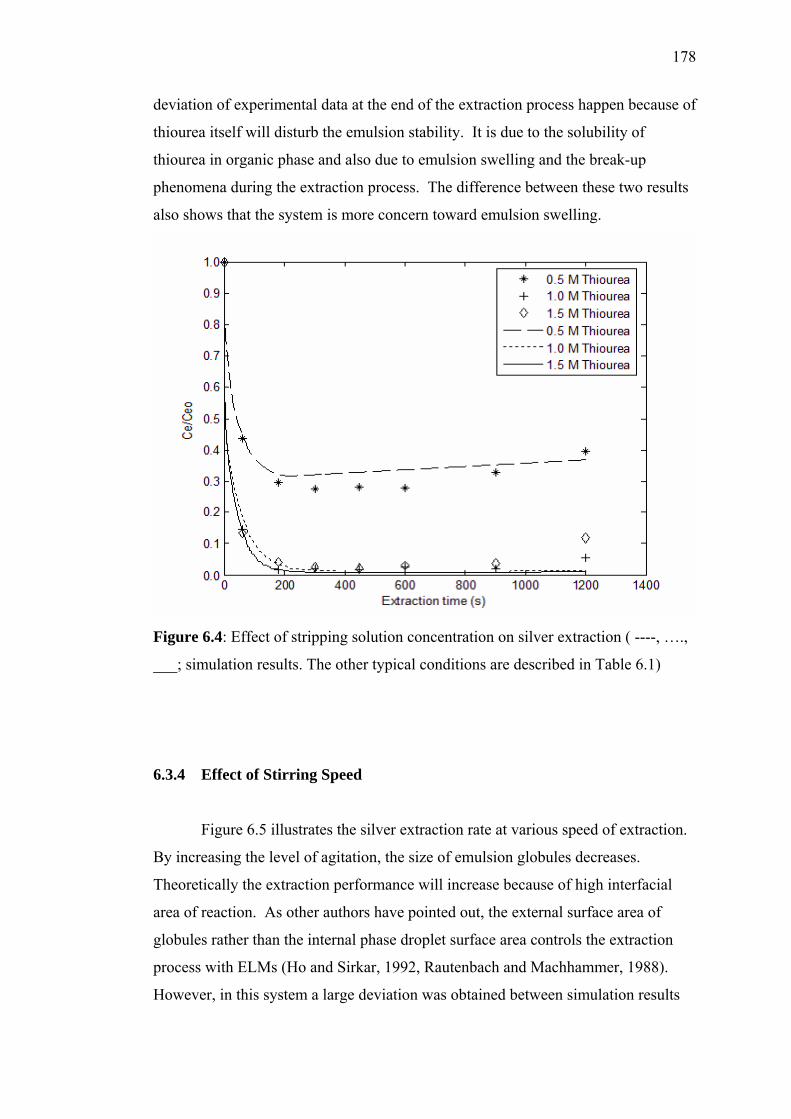
178
deviation of experimental data at the end of the extraction process happen because of
thiourea itself will disturb the emulsion stability. It is due to the solubility of
thiourea in organic phase and also due to emulsion swelling and the break-up
phenomena during the extraction process. The difference between these two results
also shows that the system is more concern toward emulsion swelling.
Figure 6.4: Effect of stripping solution concentration on silver extraction ( ----, ….,
___; simulation results. The other typical conditions are described in Table 6.1)
6.3.4 Effect of Stirring Speed
Figure 6.5 illustrates the silver extraction rate at various speed of extraction.
By increasing the level of agitation, the size of emulsion globules decreases.
Theoretically the extraction performance will increase because of high interfacial
area of reaction. As other authors have pointed out, the external surface area of
globules rather than the internal phase droplet surface area controls the extraction
process with ELMs (Ho and Sirkar, 1992, Rautenbach and Machhammer, 1988).
However, in this system a large deviation was obtained between simulation results
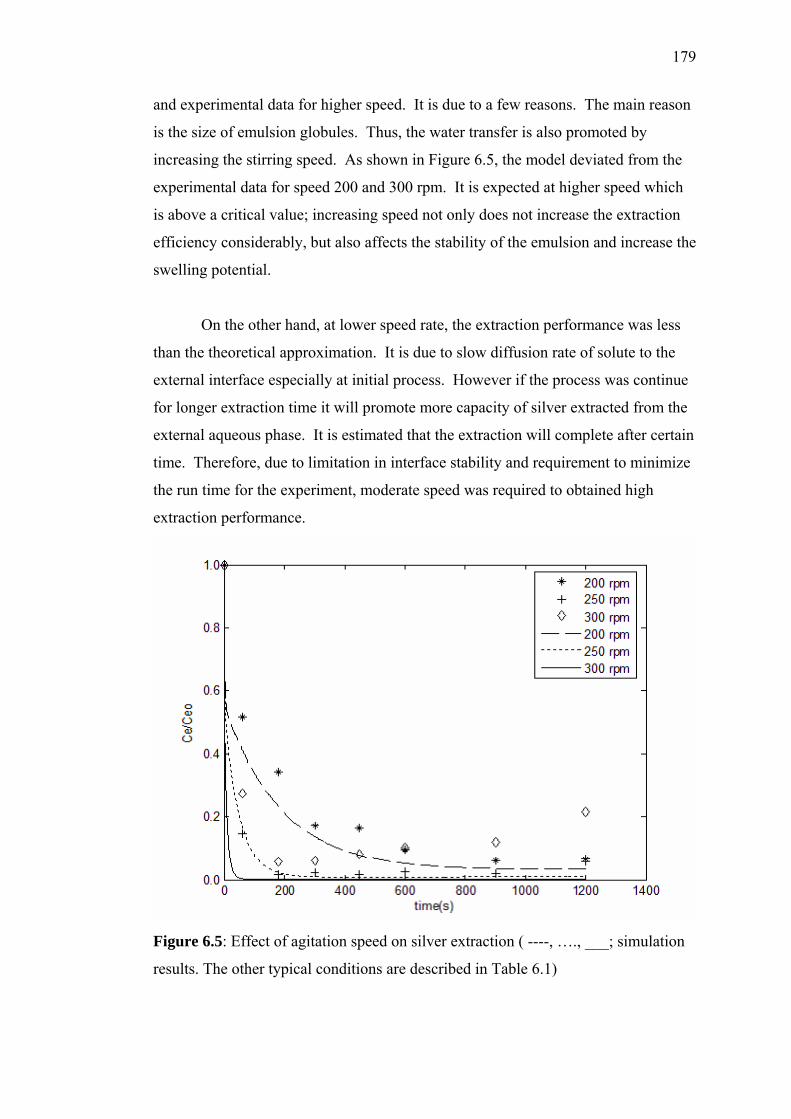
179
and experimental data for higher speed. It is due to a few reasons. The main reason
is the size of emulsion globules. Thus, the water transfer is also promoted by
increasing the stirring speed. As shown in Figure 6.5, the model deviated from the
experimental data for speed 200 and 300 rpm. It is expected at higher speed which
is above a critical value; increasing speed not only does not increase the extraction
efficiency considerably, but also affects the stability of the emulsion and increase the
swelling potential.
On the other hand, at lower speed rate, the extraction performance was less
than the theoretical approximation. It is due to slow diffusion rate of solute to the
external interface especially at initial process. However if the process was continue
for longer extraction time it will promote more capacity of silver extracted from the
external aqueous phase. It is estimated that the extraction will complete after certain
time. Therefore, due to limitation in interface stability and requirement to minimize
the run time for the experiment, moderate speed was required to obtained high
extraction performance.
Figure 6.5: Effect of agitation speed on silver extraction ( ----, …., ___; simulation
results. The other typical conditions are described in Table 6.1)
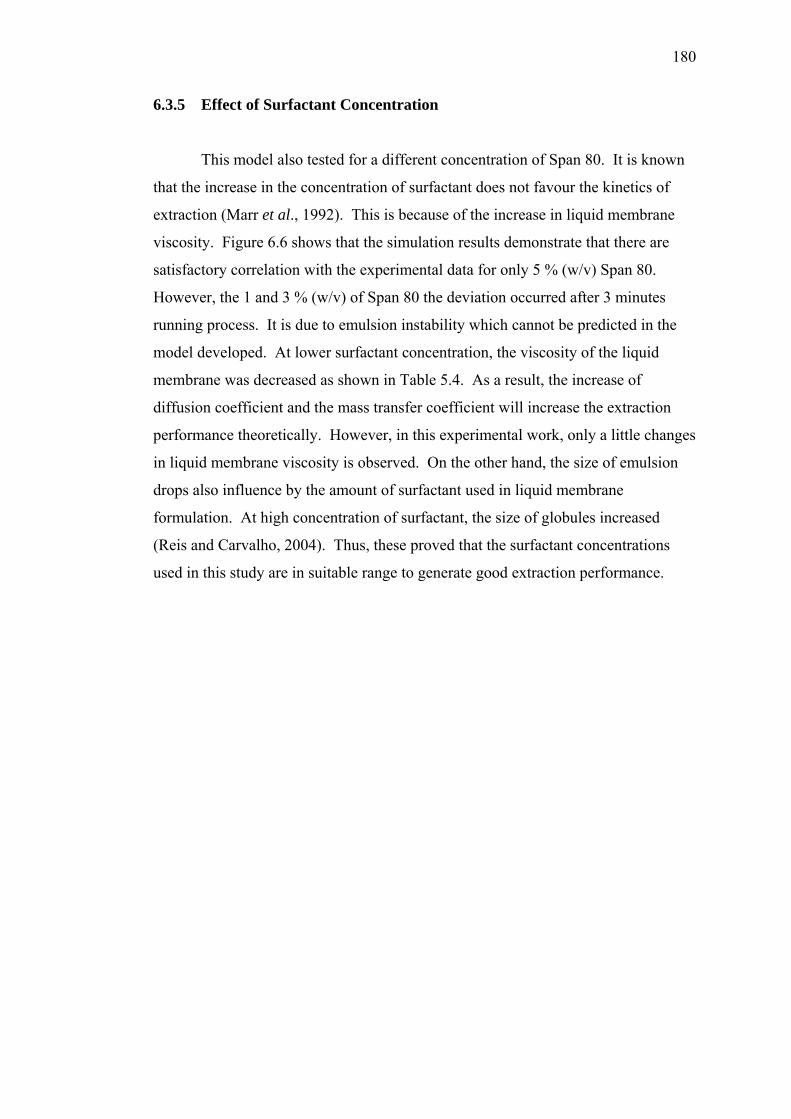
180
6.3.5 Effect of Surfactant Concentration
This model also tested for a different concentration of Span 80. It is known
that the increase in the concentration of surfactant does not favour the kinetics of
extraction (Marr et al., 1992). This is because of the increase in liquid membrane
viscosity. Figure 6.6 shows that the simulation results demonstrate that there are
satisfactory correlation with the experimental data for only 5 % (w/v) Span 80.
However, the 1 and 3 % (w/v) of Span 80 the deviation occurred after 3 minutes
running process. It is due to emulsion instability which cannot be predicted in the
model developed. At lower surfactant concentration, the viscosity of the liquid
membrane was decreased as shown in Table 5.4. As a result, the increase of
diffusion coefficient and the mass transfer coefficient will increase the extraction
performance theoretically. However, in this experimental work, only a little changes
in liquid membrane viscosity is observed. On the other hand, the size of emulsion
drops also influence by the amount of surfactant used in liquid membrane
formulation. At high concentration of surfactant, the size of globules increased
(Reis and Carvalho, 2004). Thus, these proved that the surfactant concentrations
used in this study are in suitable range to generate good extraction performance.
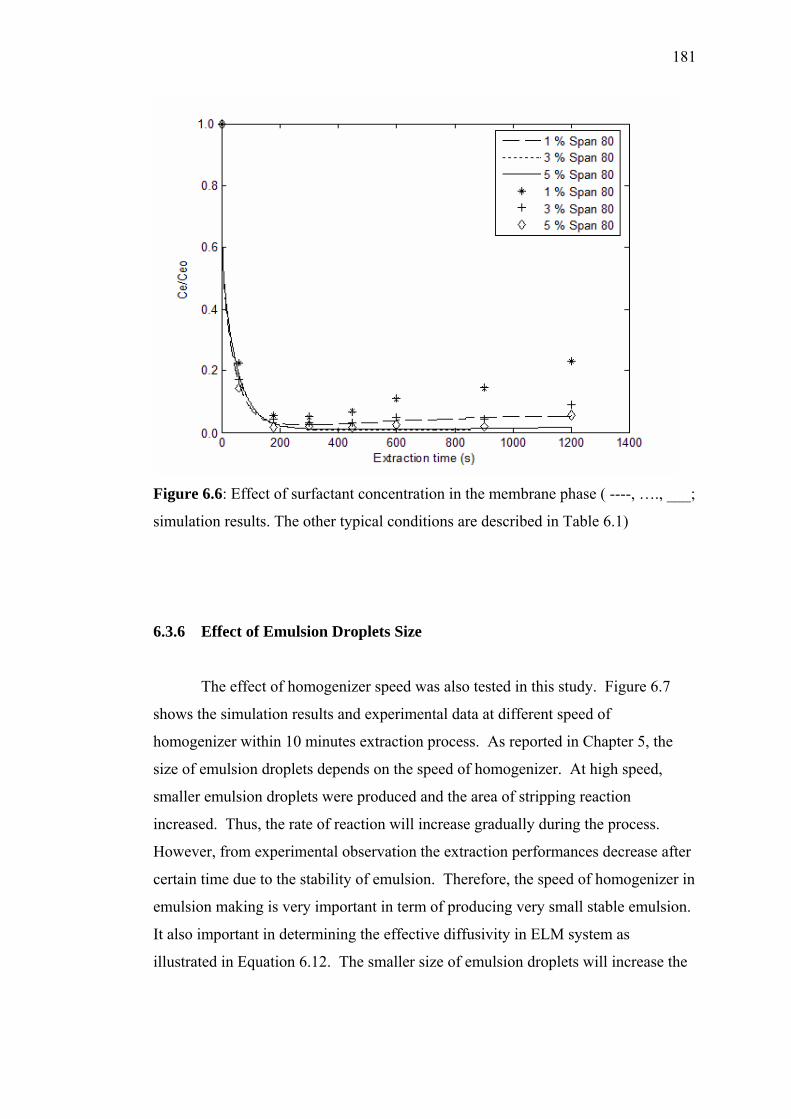
181
Figure 6.6: Effect of surfactant concentration in the membrane phase ( ----, …., ___;
simulation results. The other typical conditions are described in Table 6.1)
6.3.6 Effect of Emulsion Droplets Size
The effect of homogenizer speed was also tested in this study. Figure 6.7
shows the simulation results and experimental data at different speed of
homogenizer within 10 minutes extraction process. As reported in Chapter 5, the
size of emulsion droplets depends on the speed of homogenizer. At high speed,
smaller emulsion droplets were produced and the area of stripping reaction
increased. Thus, the rate of reaction will increase gradually during the process.
However, from experimental observation the extraction performances decrease after
certain time due to the stability of emulsion. Therefore, the speed of homogenizer in
emulsion making is very important in term of producing very small stable emulsion.
It also important in determining the effective diffusivity in ELM system as
illustrated in Equation 6.12. The smaller size of emulsion droplets will increase the
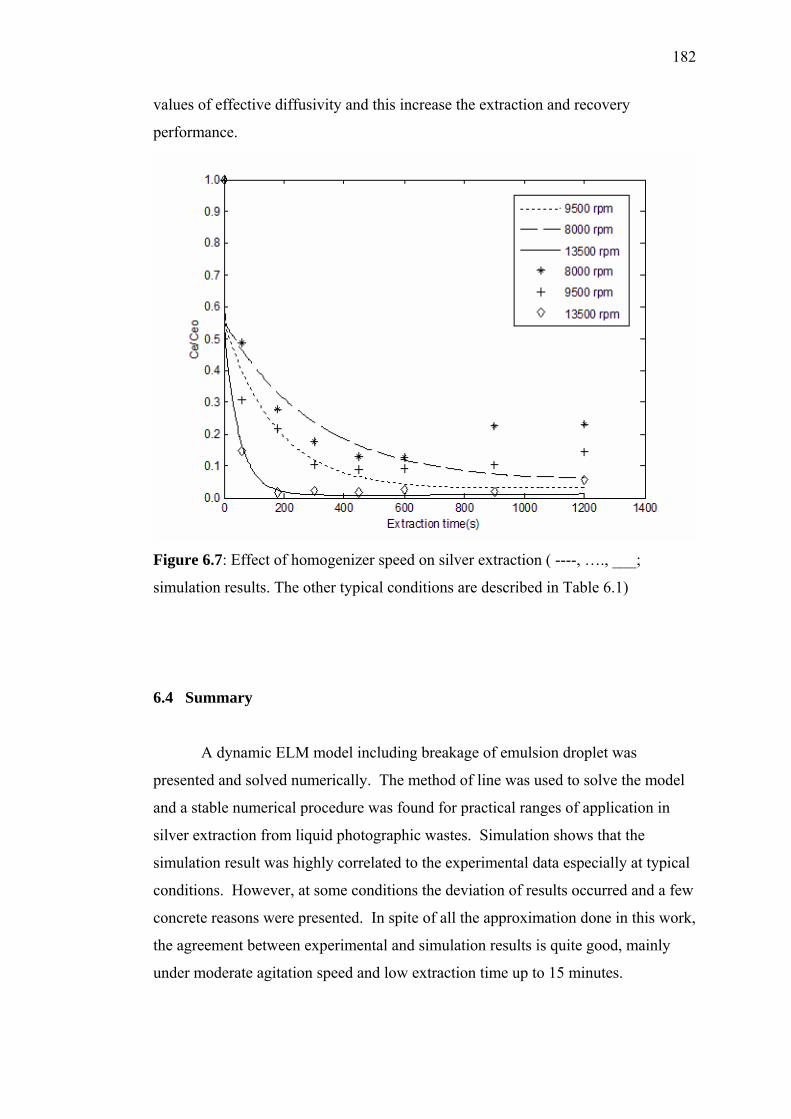
182
values of effective diffusivity and this increase the extraction and recovery
performance.
Figure 6.7: Effect of homogenizer speed on silver extraction ( ----, …., ___;
simulation results. The other typical conditions are described in Table 6.1)
6.4 Summary
A dynamic ELM model including breakage of emulsion droplet was
presented and solved numerically. The method of line was used to solve the model
and a stable numerical procedure was found for practical ranges of application in
silver extraction from liquid photographic wastes. Simulation shows that the
simulation result was highly correlated to the experimental data especially at typical
conditions. However, at some conditions the deviation of results occurred and a few
concrete reasons were presented. In spite of all the approximation done in this work,
the agreement between experimental and simulation results is quite good, mainly
under moderate agitation speed and low extraction time up to 15 minutes.
CHAPTER 7
CONCLUSIONS AND RECOMMENDATIONS
7.1 Conclusions
The feasibility of ELM extraction of silver from real liquid photographic
wastes was studied in this research. It was demonstrated that the ELM technique was
very promising in extracting and recovering silver from photographic wastes.
In order to achieve the objectives, various carrier and strip agent were tested
in determining the suitable liquid membrane component in ELM process. It was
found that Cyanex 302 and acidic thiourea provide very attractive results as carrier
and stripping agent to silver as a target metal ion. It also gives high selectivity to
silver over the other metals. On the other hand, kerosene was chosen as an organic
media for liquid membrane because it is less toxic and has low solubility in water
and also provides high emulsion stability compared to toluene and n-dodecane
systems. Beside, tetramethylthiuram disulfide in toluene also shows good capability
in extracting silver. It provides good emulsion stability as Cyanex 302.
Since the key factor that influence the ELM process was the liquid membrane
components, further investigation was carried out to study the effect of various
concentrations of carrier, surfactant, and stripping agent, agitation speed and
emulsion droplets size. The general conclusions of these effects are as follows:
i) The most suitable Cyanex 302 concentration is 0.03 M in kerosene which
provided high extraction and recovery efficiency of silver in receiving phase.
184
Increasing the carrier concentration exceeding the critical value will cause
liquid membrane contamination with unstripped metal-carrier complex
during the ELM process. It is known that, ELM with carrier mediated mass
transfer is a process where carriers act as a shuttle to carry solute from
external phase into internal phase. Therefore, only a little concentration is
needed to let this system running. However, appropriate concentration is
needed to make shortest extraction time due to emulsion breakage and
stability during the process.
ii) The ratio of emulsion to external phase volume can significantly affect the
extraction efficiency. The incomplete extraction of silver from the external
phase occurred if the treat ratio is less than 1:5 at presented formulation of
internal phase reagent. The smallest treat ratio means that less amount of
emulsion to extract silver into receiving phase while an increase treat ratio
over certain limit will lead to swelling phenomena due to water transfer from
external to internal phases. Therefore, a favorable treat ratio in this ELM
system is 1:5.
iii) The internal phase extraction efficiency is the best with the 1.0 M thiourea in
1.0 M H2SO4 solution which gives high extraction and recovery performance.
The decrease of silver extraction efficiency is caused by excess of thiourea or
solution acidity. Therefore, no more thiourea is permitted in certain
equivalent solution acidity and the other way of.
iv) The suitable surfactant used in liquid membrane component is 3% (w/v) Span
80 that provides good emulsion stability during the ELM process. The
increase of surfactant concentration will affect the recovery efficiency. An
excess of surfactant will lead to increase in thickness of resistance layer
around the emulsion and this diminished the reaction and mass transfer of
solute into receiving phase.
v) Size of emulsion globules plays an important role in ELM process. The
adequate speed should be used to produce high mass transfer rate and at the
same time emulsion breakage caused by shear and hydrodynamic effect must
185
be avoided. Therefore the extractor must be designed properly including the
size of extractor, impeller type and size and others consideration about motor
stirrer and speed. In this study the most suitable speed is 250 rpm with
magnetic stirrer.
vi) The size of emulsion droplet also plays an important factor in producing high
stripping efficiency. The smallest size will provide high interfacial area of
stripping efficiency. Therefore, 13500 rpm homogenizer speed in 5 minutes
time should be used in emulsion preparation.
vii) The preliminary study of using tetramethylthiuram disulfide as a carrier show
that it is also good in extracting silver from photographic waste solution in
ELM process. However, it only dissolved in certain diluent especially in
polar diluent therefore it is not recommended in ELM process in term of
emulsion stability.
Furthermore, membrane breakage and swelling (apparent swelling) have also
encountered during the ELM extraction process. The results show that many factors
influencing this study such as concentrations of Span 80 and Cyanex 302, agitation
speed and types of stripping agent used. It was found that from the experimental
results, the breakage ratio of the emulsion is very small because the ratio of external
phase concentration, Ce/Ceo curve with time does not oscillate very much except for
longer extraction time. However, at certain condition the breakage was high such as
at low treat ratio, system in excess acidity and thiourea concentration in internal
phase, bigger size of emulsion droplets and also low concentration of surfactant.
In addition, the feasibility study of the prospect of ELM continuous process is
also covered in this thesis. The result shows that this liquid membrane can be
recycled but the efficiency of extraction decreased. Therefore, to maintain the
extraction performance, this recycling liquid membrane should be mixed with fresh
liquid membrane with certain ratio before homogenizing process. The proposed
schematic diagram of the continuous process is shown in Figure 5.25. On the other
hand, like the new emulsion liquid membrane process, this system is expected can
easily be applied in industry. Because the extraction time of this system is very
186
short, around 15 minutes, the height of the extraction tower for the scale-up plant
should also be short.
The model of ELM silver extraction was established which considering mass
balances in emulsion globules and the external phase. This model also took into
account the leakage of membrane phase. The effective diffusivity Deff , is based on
membrane phase concentration and emulsion globules size. The instantaneous
equilibrium for extraction reaction is considered on the surface of emulsion globules
and local phase equilibrium which always exists for the whole emulsion globules due
to the fast stripping reaction. This model was successfully solved numerically using
MATLAB software. The model predictions match with the experimental data very
closely especially at typical conditions. However, at certain parameters deviation of
the model from the experimental data was observed. It is due to the assumptions and
some experimental factors not considered in the model such as the moving boundary
condition and swelling rate.
7.2 Recommendations and Future Works
This work stumbled upon a few interesting problems which can be subjected
for future research. Therefore, further studies in a number of aspects related to the
present investigation could be carried out to comprehend various issues.
i) The main issues in ELM application is emulsion stability. Although the
stability of emulsion produced in this study is good enough to extract silver
from photographic wastes, it cannot stand long extraction time. Therefore the
use of surfactant that can stabilize and transport less water during the process
should be used like polyamine surfactant instead of using Span 80.
ii) To avoid the agglomeration of emulsion droplets, a device to disperse the
emulsion should be designed properly to enhance extraction efficiency. To
produce well mixed emulsion globules during the extraction process, the use
of magnetic stirrer for high volume treatment was not allowed. Therefore the
187
extractor must be designed properly for well mixed process during the
extraction time. The design should be also consider the type of impeller, size
and it position.
iii) To elucidate more detail about swelling phenomena, the used of microscopic
camera is required to measure the changes of emulsion globules size during
the extraction process. Therefore, the rate of swelling can be determined
correctly instead of measuring the emulsion volumes. To study the swelling
caused by water transfer into W/O emulsion, Karl Fisher method can be used
to measure the water content in liquid membrane during the extraction
process.
iv) Emulsion breakage can be measured more accurately using tracer. This
method can be carried out by putting a tracer in the internal phase and
measuring the amount of tracer that appears in the external phase during the
extraction process.
v) Demulsification process is a very important part in the final ELM process to
recover solute (silver) in the receiving phase and liquid membrane recycling
process. Therefore the use of high voltage demulsifier with high frequency
(>800 Hz) was suggested to let emulsion break rapidly. Bailes and Larkai
(1982) and Yan et al. (1990) found that under the constant voltage, a critical
frequency existed was enhanced with increasing frequency. Moreover, high
voltage was suggested but it must be noted that excessive high voltages
should not be applied because the high voltage is liable to damage the
insulating layer and thus cause sparking. Concerning this effect, Hsu and Li
(1985) found that the insulation material having a dielectric constant above 4
offered better demulsification performance. Therefore, detail research should
be made in order to design more sophisticated and reliable demulsifier to
demulsify any emulsion system.
In order to develop this ELM system for industrial use, these studies have
some beneficial advantages. There are the tendencies of silver recovery with high
188
selectivity to silver and also the recycling of liquid membrane. As a result, the
continuous process is very promising in extending to pilot scale study.
In addition for all listed conclusions and suggestions above, it is known that
ELM is related much with emulsion stability. The effectiveness of ELM extraction
of silver from photographic wastes depends more on this matter. In order to solve
this problem the use of hollow fiber contactor (HFC) in ELM process was suggested.
Hu (1997) shows that the use of hollow fiber contactors in copper extraction reduces
swelling and leakage of liquid membrane and the stability of ELM are less crucial
when combined with HFC. Therefore, it would be interesting to set-up this rig for
future studies.
189
REFERENCES
Abou-Nemeh, I. and Van Peteghem, A.P. (1993). Membrane Recycling in the
Surfactant Membrane Process. Ind. Eng. Chem. Res. 32:1431-1437.
Akretche, D-E., Gherrou, A., and Kerdjoudj, H. (1997). Electrodialysis of Solutions
Obtained by Elution of Cyanide Complexes from Anionic Exchange Resin by
Means of Acidic Thiourea. Hydrometallurgy. 46: 287-301
Alam, M. S., Inoue, K., Yoshizuka, K., Dong, Y., and Zhang, P. (1997). Solvent
Extraction of Silver from Chloride Media With Some Commercial Sulfur-
Containing Extractants. Hydrometallurgy. 44(1-2): 245-254.
Alguacil F. J., Coedo A. G., and Dorado M. T. (2000), Transport of chromium(VI)
through a Cyanex 923-xylene flat-sheet supported liquid membrane,
Hydrometallurgy. 57: 51-56.
Alguacil, F. J. (1999). Solvent Extraction of Indium (III) by LIX 973N.
Hydrometallurgy. 51: 97-102.
Alguacil, F. J., Cobo, A., and Alonso, M. (2002). Copper Separation from
Nitrate/Nitric Acid Media Using Acorga M5640 Extractant. Part I: Solvent
extraction Study. Chem. Eng. J. 85: 259-263.
Almela, A. and Elizalde, M.P. (1995). Solvent Extraction of Cadmium(II) from
Acidic Media by Cyanex 302. Hydrometallurgy. 37: 47-57.
Alonso, A. I. and Pantelides, C. C. (1996). Modelling and Simulation of Integrated
Membrane Processes for Recovery of Cr(VI) with Aliquat 336. J. Membr. Sci.
110: 151-167.
Alonso, A.I., Urtiaga, A. M., Zamacona, S., and Ortiz, I. I. (1997). Kinetic Modeling
of Cadmium Removal from Phosphoric Acid by Non-dispersive Solvent
Extraction. J. Membr. Sci. 130: 193-203.
Babcock, W.C., Friesen, D. T., and Lachapelle, E.D. (1986). Liquid Membranes for
Separating Uranium from Vanadium and Uranium from Molybdenum. J. Membr.
Sci. 26(3): 303-312.
190
Babcock, W.C., Baker, R.W., Lachapelle, E.D., and Smith, K.L. (1980). The
mechanism of uranium transport with a tertiary amine. J. Membr. Sci. 7(1): 71-
87.
Bailes, P.J. and Larkai, S.K.L. (1981). An Experimental Investigation into the use of
High Voltage D.C. Fields for Liquid Phase Separation. Trans. I. Chem. E. 59(4):
229-237.
Bailes, P.J. and Larkai, S.K.L. (1982). Liquid Phase Separation in Pulsed DC Fields.
Trans. I. Chem. E. 60: 115-121.
Bailey, T. and Mahi, P. (1987). The Effect of Diluents on The Metal Extracted and
Phase Separation in the Extraction of Aluminium With Monononyl Phosphoric
Acid. Hydrometallurgy. 18: 351-365.
Baird, I.H.M. and Hanson, C. (1983). Handbook of Solvent Extraction. New York:
John Wiley and Sons.
Bart, H. J., Jungling, H., Ramaseder, N., and Marr, R. (1995). Water and Solute
Solubilization and Transport in Emulsion Liquid Membranes. J. Membr. Sci.
102: 103-112.
Baumann, W. and Grafen, M. (2001). Emission Scenario Document Photographic
Industry IC-10. Institute for Environmental Research University Dortmund
(INFU).
Becher, P. (1985). (Ed.). Encyclopedia of Emulsion Technology. New York: Marcel
Dekker.
Benavente, J. and Jonsson, G. (2000). Electro Kinetic Characterization of Composite
Membranes: Estimation of Different Electrical Contributions in Pressure Induced
Potential Measured Across Reverse Osmosis Membrane. J. Membr. Sci. 172:
189-197.
Bhavani, R., Neena, T., and John, W. (1994). Emulsion Liquid Membranes for
Wastewater Treatment: Equilibrium Models for Some Typical Metal-extractant
Systems. Environ. Sci. Technol. 28: 1090-1098.
Bhowal, A. and Datta, S. (2001). Studies on Transport Mechanism of Cr(VI)
Extraction from Acidic Solution Using LSM. J. Membr. Sci. 188: 1-8.
Brooks, C.S. (1991). Metal Recovery from Industrial Waste. Michigan: Lewis
Publishers Inc.
Bunge, A.L. and Noble, R.D. (1984). A Diffusion Model for Reversible
Consumption in Emulsion Liquid Membrane. J. Membr. Sci. 21: 55-71.
191
Byers, C.H. and Amarnath, A. (1995). Understand the Potential of Electro-
Separations. Chem. Eng. Progress. 2: 63-69.
Cahn, R. P., Frankenfeld, J. W., Norman, N. Li, Naden, D., and Subramanian, K. N.
(1981). Extraction of Copper By Liquid Membranes. In: Norman N. Li. ed.
Recent Developments in Separation Science. Volume VI. Boca Raton, Florida:
CRC Press, Inc. 51-64.
Caravaca, C., Alquacil, F. J., Sastre, A., and Martinez, M. (1996). Extraction of
Gold(I) Cyanide by the Primary Amine Tridecylamine. Hydrometallurgy. 40: 89-
97.
Chapman, T. W. (1987). Extraction-Metals Processing. In: Rousseau, R. W. ed.
Handbook of Separation Process Technology. United States of America: John
Wiley & Sons, Inc.
Chakraborty, R. and Datta, S. (1994). Transport of Te4+ Through Liquid Surfactant
Membrane Using D2EHPA as the Carrier. J. Membr. Sci. 96: 233-240.
Chaudry, M.A., Ul-Islam, N., and Ahmad I. (1994). Extaction and Stripping Study of
Strontium Ions Across D2EHPA-TBP-Kerosene Oil Based Supported Liquid
Membranes. J. Radioanal. Nucl. Chem. 185(2): 369.
Chaudry, M.A., Ul-Islam, N., Ur-Rehman, N., and Yasin Z. (1995). Nitrate Ion
Transport Across TBP-Kerosene Oil Supported Liquid Membranes Coupled
With Uranyl Ions. J. Radioanal. Nucl. Chem. 189(2): 207.
Chiarizia, R. (1991). Application of Supported Liquid Membranes for Removal of
Nitrate, Technetium(VII) and Chromium(VI) from Groundwater. J. Membr. Sci.
55: 65-77.
Chiarizia, R., Horwitz, E. P., Rickert, P.G., and Hodgson, K. M. (1990). Application
of Supported Liquid Membranes for Removal of Uranium from Groundwater.
Sep. Sci. Technol. 25(13-15): 1571-1586.
Chitra, K. R., Gaikwad, A. G., Surender, G. D., and Damodaran, A. D. (1997).
Studies on Ion Transport of Some Rare Earth Elements Through Solvating
Extractants Immobilized on Supported Liquid Membranes. J. Membr. Sci. 125:
257-268.
Chormann, F. H., Mary, Jo Spencer Jr. , Berry Lyons Wm., and Mayewski, P. A.
(1985), A Solvent Extraction Technique for Determining Concentrations of Gold
and Silver in Natural Waters. Chemical Geology. 53(1-2): 25-30.
192
Clifford, A. H. and Gessner G. H. (1976). Glossary of Chemical Trems. New York:
Van Nostrand Reinhold Company.
Coelhoso, I. M., Crespo, J.P.S.G., and Carrondo, M.J.T. (1997). Kinetics of Liquid
Membrane Extraction in Systems with Variable Distribution Coefficient. J.
Membr. Sci. 127: 141-152.
Coelhoso, I. M., Moura, T. F., Crespo J.P.S.G., and Carrondo, M.J.T. (1995).
Transport Mechanisms in Liquid Membranes with Ion Exchange Carriers. J.
Membr. Sci. 108: 231-244.
Colinart, P., Delepine, S., Trouve, G., and Renon, H. (1984). Water Transfer in
Emulsified Liquid Membrane Processes. J. Membr. Sci. 20: 167-187.
Cook, F.L. and Szmokaluk, V. (1971). Proceeding International Solvent Extraction
Conference. The Hague: Pub. Soc. Chem. Ind.: 145-151.
Cooley, A. and Vacco, D. (1993). Factors Limiting the Recovery, Regeneration and
Reuse of Photographic Processing Solution. J. Imag. Sci. Technol. 37(6): 603-
606.
Cote, G. and Bauer, D. (1980). Liquid-Liquid Extraction of Germanium with Oxine
Derivatives. Hydrometallurgy. 5: 149-160.
Cox, F. A. and Bhatnagar, A. (1990). Analytical Utility of Coupled Transport Across
a Supported Liquid Membrane; Selective Preconcentration of Zinc. Talanta.
37(11): 1037-1041.
Dalton, H.E. and Price, M.G. (1982). Science Technology of Tributyl Phosphate.
Vol. 3. Boca Reton: CRC Press.
Daneisi, P.R., Horwitz, E.P., and Vandergrift, G.F. (1981). Mass Transfer Rate
Through Liquid Membranes: Interfacial Chemical Reactions and Diffusion as
Simultaneous Permeability Controlling Factors. Sep. Sci. Technol. 16: 201-211.
Deparment of Environment, Health, and Natural Resources (DEHNR) (2001). Silver
Recovery Systems and Waste Reduction in Photoprocessing. North Carolina
Division of Pollution and Environmental Assistance: Waste Reduction Fact
Sheet.
Ding, X.C. and Xie, F.Q. (1991). Study of the Swelling Phenomena of Liquid
Surfactant Membrane. J. Membr. Sci. 59: 183-188.
Douglas, Way, J., Richard, D. N., Thomas, M. F., and Dendy, S. E. (1982). Liquid
Membrane Transport: A Survey. J. Membr. Sci. 12: 239-259.
193
Draxler, J. and Marr, R. (1986). Emulsion Liquid Membranes. Part I : Phenomenon
and Industrial Application. Chem. Eng. Process. 20: 319-329.
Dreher, T. M., Glass, J., O’Connor, A. J., and Stevens, G. W. (1999). Effect of
Rheology on Coalescence Rates and Emulsion Stability. AIChE J. 45: 1182-
1190.
Frankenfeld, J.W., Asher, W.J., and Li N.N. (1978). Recent Developments in
Separation Science; N.N. Li, Ed. Chemical Rubber Co. 4: 39-52.
Frankenfeld, J.W., Chan, R.P., and Li, N.N. (1981). Extraction of copper by liquid
membranes. Sep. Sci. Technol. 16(4): 385-402.
Freiser, H. (1973). Solvent Extraction. In. Karger, B. L., Synder, L. R., and Horvath,
C. ed. An Introduction to Separation Science. Canada: John Wiley & Sons, Inc.
Friesen, D. T., Babcock, W. C., Brose, D. J., and. Chambers, A. R. (1991). Recovery
of citric acid from fermentation beer using supported-liquid membranes. J.
Membr. Sci. 56(2): 127-141
Fu, J., Nakamura, S., and Akiba, K. (1995). Extraction of Platinum(IV) with
Trioctylamine and its Application to Liquid Membrane Transport. Sep. Sci.
Technol. 30(4): 609-617.
Gabriel, S., and Abraham, M. (1999). Cadmium Removal from Aqueous Solutions
by a Emulsion Liquid Membrane- The Effect of Resistance to Mass Transfer at
the Outer Oil-Water Interface. Colloids Surf. A: Physicochemical and
Engineering Aspects. 151: 77-83.
Garti, N., Magdassi, S., and Whitehill, D. (1985). Transfer Phenomena Across the
Oil Phase in Water-Oil-Water Multiple Emulsions Evaluated by Coulter-
Counter. J. Coll. Interf. Sci. 104: 587-595.
Geankoplis, C. J. (1993). Transport Processes and Unit Operation. 3rd ed. New
Jersey: Prentice Hall International Inc. 399-402.
Gherrou, A. and Kerdjoudj, H. (2002). Removal of Gold as Au(Tu)2+ complex with a
Supported Liquid Membrane Containing Macrocyclic Polyethers Ligands as
Carriers. Desalination. 144: 231-236.
Goddard, J. D. (1977). Further Application of Carrier-Mediated Transport Theory –
A survey. Chem. Eng. Sci. 32: 795-809.
Goshima, T., Hori, K., and Yamamoto, A. (1994). Recovery of Silver from
Radiographic Fixer. Oral Surgery Oral Medicine Pathology. 77: 684-688.
194
Goto, M., Kondo, K., and Nakashio, F. (1989a). Acceleration Effect of Anionic
Surfactants on Extraction Rate of Copper with Liquid Surfactant Membrane
Containing LIX65N and Nonionic Surfactant. J. Chem. Eng. Jpn. 22: 79-98.
Goto, M., Kondo, K., and Nakashio, F. (1989b). Extraction Kinetic of Copper with
Liquid Surfactant Membrane Containing LIX65N and Nonionic Surfactant. J.
Chem. Eng. Jpn. 22: 71-78.
Goto, M., Yamamoto, H., Kondo K., and Nakashio F. (1991). Effect of New
Surfactant on Zinc Extraction with Liquid Surfactant Membranes. J. Membr. Sci.
57: 161-174.
Gu, Z., Winston, Ho, W.S., and Li, N.N. (1992). Design Consideration. In: Winston
Ho W.S., Sirkar K.K. (Eds.), Membrane Handbook. Chapman Hall, New York.
656-700.
Guha, A. K., Yun, C. H., Basu, R., and Sirkar, K. K. (1994). Heavy Metal Removal
and Recovery by Contained Liquid Membrane Permeator. AIChE J. 40(7): 1223-
1237.
Halwachs, W. and Schugerl, R. (1980). The Liquid Membrane Technique –A
Promising Extraction Process. Int. Chem. Eng. 20: 519-528.
Hanna, G.J. and Larson K.M. (1985). Influence of Preparation Parameters on
Internal Droplet Size Distribution of Emulsion Liquid Membrane. Ind. Eng.
Chem. Res. Dev. 24: 269-274.
Hanson, C. (1971). Recent Advances in Liquid-Liquid Extraction. Oxford, England:
Pergamon Press.
Harpur, I.G., Wayth, N.J., Thew, M.T., Williams, T.J., and Urdahl, O. (1997).
Destabilisation of Water-in-Oil Emulsions under the Influence of an A.C.
Electric Field: Experimental Assessment of Performance. J. Electrostatic.
40&41: 135-140.
Hayworth, H.C., Ho, W.S., Burns Jr., W.A., and Li, N.N. (1983). Extraction of
Uranium from Wet Process Phosphoric Acid by Liquid Membranes. Sep. Sci.
Technol. 18(6): 493-521.
Heikki, L. (1999). Removal of Harmful Metals from Metal Plating Wastewaters
Using Selective Ion Exchangers. University of Helsinki: Academic dissertation.
Hirato, T., Koyama, K., Awakura, Y., and Majima, H. (1990). Concentration of
Mo(VI) from Aqueous Sulfuric Acid Solution by an Emulsion Type Liquid
Membrane Process. Material Transactions. JIM. 31(3): 213-218.
195
Ho, W. S., Hatton, T. A., Lightfoot, E. N., and Li, N. N. (1982). Batch Extraction
with Liquid Surfactant Membranes: A diffusion controlled model. AIChE J.
28(4): 662-670.
Ho, W.S. and Li, N.N. (1992). Theory. In: Ho, W.S. and Sirkar, K.K. eds. Membrane
Handbook. New York: Van Nostrand Reinhold. 611-655.
Hochhauser, A. M. and Cussler, E. L. (1975). Concentrating Chromium with Liquid
Surfactant Membranes. AIChE Symp. Ser. 71(152): 136-142.
Hong, P.O. and Lee, J.M. (1983). Unsteady-State Liquid-Liquid Dispersions in
Agitated Vessels. Ind. Eng. Chem., Process Design and Development. 22: 130-
135.
Hong, P.O. and Lee, J.M. (1985). Changes of the Average Drop Sizes During the
Initial Period of Liquid-Liquid Dispersions in Agitated Vessels. Ind. Eng. Chem.
Process Design and Development. 24: 868-872.
Hou, W. and Papadopoulos K.D. (1996). Stability of Water-in-Oil-in-Water Type
Globules. Chem. Eng. Sci. 51(22): 5043-5051.
Hou,W. Q. and Papadopoulos, K. D. (1996). Stability of Water-In-Oil-In-Water
Type Globules. Chem. Eng. Sci. 51(22): 5043-5051.
Hu, S-Y. B. and Wiencek, J. M. (1998). Emulsion Liquid Membrane Extraction of
Copper Using a Hollow Fiber Contactor. AIChE J. 44(3): 570-581.
Hubicki, Z. and Hubicka, H. (1995). Studies of Extraction of Removal Of Silver (I)
from Nitrate Solutions by Cyanex 471X. Hydrometallurgy. 37: 209-219.
Hsu, E.C. and Li, N.N. (1985). Membrane Recovery in Liquid Membrane Separation
Processes. Sep. Sci. Technol. 20(2-3):115-130.
Ibrahim, M.Y., Mostafa, R., Fahmy, M.F.M., and Hafez, A.I. (2001). Utilization of
Electroflotation in Remediation of Oily Wastewater. Sep. Sci. Technol. 36: 3749-
3762.
Inci, E., Rahmi, K., and Gungor, G. (1993). Extraction of Strontium Ions with
Emulsion Liquid Membrane Technique. J. Membr. Sci. 80: 319-325.
Inoue, K., Baba, Y., Oka, T., Takagi, M., and Dohtsu, K. (1987). A Solvent
Extraction Study of Silver(I), Palladium(II) and Mercury(II) with 2-tert-
dodecylthiopyridine. Hydrometallurgy. 18: 265-272.
Irving, H.M.N.H. (1977). Dithizone in Analytical Science Monographs. London: The
Chemical Society.
196
Itoh, H., Thein, M.P., Hatton, T.A., Wang, D.I.C. (1990). A Liquid Emulsion
Membrane Process for the Separation of Amino Acid. Biotech. and Bioeng. 35:
853-860.
Itoh, H., Thein, M.P., Hatton, T.A., and Wang, D.I.C. (1990). Water Transport
Mechanism in Liquid Membrane Process for the Separation of Amino Acids. J.
Membr. Sci. 51: 309-322.
IUPAC (1993). Nomerature for Liquid-Liquid Distribution (solvent extraction). Pure
and Appl. Chem. 65(11): 2373-2396.
Ivanov, I.B. and Kralchevsky, P.A. (1997). Stability of Emulsion Under Equilibrium
and Dynamic Conditions. Colloids Surf. 128: 155-175.
Izatt, R. M., Lindh, G. C., Bruening, R. L. Peter, H., McDaniel, C. W., Bradshaw, J.
S., and Christensen, J. J. (1988). Separation of Silver from Other Metal Cations
Using Pyridine and Triazole Macrocycles in Liquid Membrane Systems. Analy.
Chem. 60: 1694-1699.
Jean-Bernard Regnouf-de-Vains, Jean-Olivier Dalbavic, Roger Larnartine, Fenet B.
(2001). Quantitative Solvent Extraction from Neutral Aqueous Nitrate Media of
Silver(I) against Lead(II) with a New Calyx[4]arene-based Bipyridine Podand.
Tetrahedron Letters. 42: 2681-2684.
Jiang, Y., Wang, F., Kim, D.H., and Lim, M.S. (2001). Modeling of the Permeation
Swelling of Emulsion During Lactic Acid Extraction by Liquid Surfactant
Membranes. J. Membr. Sci. 191: 215-223.
Johnson, B.M., Baker, R.W., Matson, S.L., Smith, K.L., Roman, I.C., Tuttle, M.E.,
and Lonsdale, H.K. (1987). Liquid Membranes for the Production of Oxygen-
Enriched Air: II. Facilitated-Transport Membranes. J. Membr. Sci. 31(1): 31-67.
Juang, R. (1993). Modelling of the Competitive Permeation of Cobalt and Nickel in
a di(2-ethylhexyl)phosphoric Acid Supported Liquid Membrane Process. J.
Membr. Sci. 85: 157-166.
Kakoi, T., Goto, M., Kondo, K. and Nakashio, F. (1993). Extraction of Palladium by
Liquid Surfactant Membranes using New Surfactants. J. Membr. Sci. 84: 249-
258.
Kakoi, T., Horinouchi, N., Goto, M., and Nakashio, F. (1996). Selective Recovery of
Palladium from a Simulated Industrial Waste Water by Liquid Surfactant
Membrane Process. J. Membr. Sci. 118: 63-71.
197
Kakoi, T., Nishiyori, T., Oshima, T., Kubota, F., Goto, M., Shinkai, S., and
Nakashio, F. (1997). Extraction of Rare Earth Metals by Liquid Surfactant
Membranes Containing a Novel Cyclic Carrier. J. Membr. Sci. 136: 261-271.
Kalachev, A. A., Kardivarenko, L. M., Plate, N. A., and Bagreev, V. V. (1992).
Facilitated Diffusion in Immobilized Liquid Membranes: Experimental
Verification of the ‘jumping’ Mechanism and Percolation Threshold in
Membrane Transport. J. Membr. Sci. 75: 1-5.
Kanungo, S. B. and Mohapatra, R. (1995). Coupled transport of Zn(II) Through a
Supported Liquid Membrane Containing Bis(2,4,4-trimethylpantyl) Phosphinic
Acid in Kerosene, I. A Model for Therate Process Involving Binary and Ternary
Complex Species. J. Membr. Sci. 105: 217-226.
Kargari, A., Kaghazchi, T., and Soleimani, M. (2003). Role of Emulsifier in the
Extraction of Gold (III) Ions from Aqueous Solutions Using the Emulsion Liquid
Membrane Technique. Desalination. 162 (2004): 237-247.
Kasaini, H., Nakashio, F., and Goto M. (1998). Application of Emulsion Liquid
Membranes to Recover Cobalt ions from a Dual-Component Sulphate Solution
Containing Nickel Ions. J. Membr. Sci. 146: 159-168.
Kataoka, T., Nishiki, T., Kimura, S., and Tomioka, Y. (1989). Batch Permeation of
Metal Ions Using Liquid Surfactant Membranes. J. Membr. Sci. 46: 67-80.
Kataoka, T., Nishiki, T., Yamauchi, M., and Zhong, Y. (1987). A Simulation for
Liquid Surfactant Membrane Permeation in a Continuous Counter-Current
Column. J. Chem. Eng. Jpn. 20(4): 410-415.
Keller, K. (1993). Science and Technology of Photography. New York: VCH
Publisher.
Kiani, A., Bhave, R. R., and Sirkar, K. K. (1984). Solvent Extraction with
Immobilized Interfaces in a Microporous Hydrophobic Membrane. J. Membr.
Sci. 20: 125-145.
Kim, B., Moon, J.H., Yang, S., and Kim, J. (2002). Demulsification of Water-in-
Crude oil Emulsions by a Continuous Electrostatic Dehydrator. Sep. Sci.
Technol. 37: 1307-1320.
Kim, D. H., Wainwright, M. S., Chang, K. S., and Ma, G. (1996). Analytical and
Numerical Solution of Fixed and Moving Boundary Problems for Liquid
Surfactant Membrane Processes. Chem. Eng. Sci. 51(11): 3059-3064.
198
Kim, K., Choi, S., and Ihm, S. (1983). Simulation of Phenol Removal from Waste
Water by Liquid Membrane Emulsion. I&EC Fund. 22: 167-172.
Kim, S-G, Lee, H-Y., Oh, J-K., and Lee, E-C. (1995). Stoichiometric Relation for
the Extraction of the Gold-Thiourea Complex with D2EHPA. Hydrometallurgy.
38: 7-13.
Kim, S.J., Kim, S.C., and Kawasaki, J. (1997). Separation of Hydrocarbons by
Liquid Surfactant Membrane with a Batch Stirred Vessel. Sep. Sci. Technol. 32:
1209-1221.
Kimura, K. and Shono, T. (1987). Liquid-liquid Extraction of Silver Ion with
Benzothiacrown ether Derivatives. Anal. Chim. Acta. 194: 293-298.
Kimura, S. G., Matson, S.L., and Ward, W. J. (1979). Industrial Application of
Facilitated Transport, In: Li, N. N. (Ed). Recent Development in Separation
Science. Vol.5. Cleveland, Ohio: CRC Press.
Kinugasa, T., Watanabe, K., and Takeuchi H. (1989). Effect of Organic Solvents on
Stability of Liquid Surfactant Membranes. J. Chem. Eng. Jpn. 22: 593-597.
Kojima, T., Nakayama, C., and Uemiya, S. (1994). Analysis of the Mechanism of
Rare Earth Metal Permeation Through a Liquid Membrane with a Chelating
Agent in the Feed Phase. Can. J. Chem. Eng. 72: 72--77.
Kondo, K., Kita, K., Koida, I., Irie, J., and Nakashio, F. (1979). Extraction of Copper
with Liquid Surfactant Membranes Containing Benzoylacetone. J. Chem. Eng.
Jpn. 12(3): 203-209.
Kondo, K., Yamamoto, Y., and Matsumoto, M. (1997). Separation of Indium(III)
and Gallium(III) by Supported Liquid Membrane Containing
Diisostearylphosphoric acid as a Carrier. J. Membr. Sci. 137: 9-15.
Kopp, A. G., Marr, R. J., and Moser, F. E. (1978). A New Concept for Mass
Transfer in Liquid Surfactant Membranes without Carriers and with Carriers
That Pump, Inter. Chem. Eng. Symp. Ser. 54: 279.
Kopunec, R. and Manh, T. N. (1992). Carrier-Medieted Transport of Rare Earth
Elements Through Liquid Membranes; IV. Transport of Sc, Y, Ce, Eu, Gd, Tm,
Yb Through a Supported Liquid Membrane Containing TBP. J. Radioanal. Nucl.
Chem. 163(1): 131-144.
Kopunec, R. and Manh, T. N. (1993). Carrier-Medieted Transport of Rare Earth
Elements Through Liquid Membranes; III. Transport of Sc, Y, Ce, Eu, Gd, Tm,
199
Yb Through a Supported Liquid Membrane Containing DEHPA. J. Radioanal.
Nucl. Chem. 170(1): 51-66.
Koval, C.A., Noble, R.D., Way, J.D., Louie, B., Reyes, A., Horn, G., and Reed, D.
(1985). Selective Transport of Gaseous CO Through Liquid Membrane Using an
Iron(III) Macrocycle Complex. Inorganic Chem. 24: 1147-1152.
Kremesec, V. J. (1981). Modelling of Dispersed Emulsion Separation Systems. Sep.
Purif. Methods. 10: 117-157.
Kremesec, V. J. and Slattery, J. C. (1982). Analysis of Batch Dispersed-Emulsion
Separation Systems. AIChE J. 28: 492-500.
Kubota, F., Goto, M., Nakashio, F., and Hano, T. (1995). Extraction Kinetics of Rare
Earth Metals with 2-ethylhexyl Phosphonic Acid Mono-2-ethylhexyl Ester Using
a Hollow Fiber Membrane Extractor. Sep. Sci. Technol. 30(5): 777-792.
Kulkarni, P. S. (2003). Recovery of Uranium(VI) from Acidic Wastes Using Tri-n-
octylphosphine Oxide and Sodium Carbonate Based Liquid Membrane. Chem.
Eng. J. 92: 209-214.
Kulkarni, P.S., and Mahajani, V.V. (2002). Application of ELM Process for
Enrichment of Molybdenum from Aqueous Solutions. J. Membr. Sci. 201: 123-
135.
Kulkarni, P.S., Tiwari, K.K., and Mahajani, V.V. (2000). Membrane Stability and
Enrichment of Nickel in Liquid Emulsion Membrane Process. J. Chem. Technol.
Biotechnol. 75(7): 553-560.
Kumar, M., Sharma nee Bhalla, V., and Babu, J. N. (2003). Synthesis and Binding
Studies of New bis-calix[4]arene Aromatic and Heteroaromatic Units.
Tetrahedron. 59: 3267-3273.
Kuo, Y. and Gregor, H. P. (1983). Acetic Acid Extraction by Solvent Membrane.
Sep. Sci. Technol. 18(15): 421-440.
Lacey, D.G. (1972). Ion Exchange and Solvent Extraction of Metals. Chinester:
Wiley-Interscience.
Lacey, R.E. (1972). Membrane Separation Processes. Chem. Eng. 56-74
Lachowicz, E., Rozanska, B., Teixidor, F., Meliani, H., Barboiu, M., and Hovnanian,
N. (2002). Comparison of Sulphur and Sulphur-Oxygen Ligands as Ionphores for
Liquid-Liquid Extraction and Facilitated Transport of Silver and Palladium. J.
Membr. Sci. 210: 279-290.
200
Lang, S.B. and Wilkie, C.R. (1971). A Hydrodynamic Mechanism for the
Coalescence of the Liquid Drops: I. Theory of Coalescence at a Planar Interface.
Ind. Eng. Chem. Fundam. 10: 329.
Lee, J-M. and Lim, K-H. (2004). Changes in Morphology of Three-phase Emulsions
with Temperature in Ternary Amphiphile/Oil/Water Systems. Colloids Surf. A:
Physicochem. Engng. Aspects. 248(1-3): 57-65
Lee, K-H., Evans, D.F., and Cussler, E.L. (1978). Selective Copper Recovery with
two Types of Liquid Membranes. AIChE J. 24: 860-868.
Lee, S. C., Ahn, B. S., and Lee, W.K. (1996). Mathematical Modeling of Silver
Extraction by an Emulsion Liquid Membrane Process. J. Membr. Sci. 114: 171-
185.
Lee, S.C., Lee, K.H., Hyun, G.H., and Lee, W.K. (1997). Continuous Extraction of
Penicilin G by an Emulsion Liquid Membrane in a Countercurrent Extraction
Column. J. Membr. Sci. 124: 43-51.
Lewis, R.G. (1990). Process of Extraction of Gallium from Aqueous Solutions
Thereof. US Patent 4,965,054, Oct 23.
Li, N. N., US Pat. 3410794 (November, 12 1968)
Li, N.N. and Shrier, A.L. (1972). Liquid Membrane Water Treating. Recent Dev. In
Sep. Sci., ed. N.N. Li. Baca Raton, FL: CRC Press. 1: 163-174.
Li, Q-M., Liu, Q., and Wei, X-J. (1996). Separation Study of Mercury Through an
Emulsion Liquid Membrane. Talanta. 43: 1837-1842.
Li, Q-M., Liu, Q., Li, K., and Tong, S. (1997). Separation Study of Cadmium
Through an Emulsion Liquid Membrane. Talanta, 44: 657-662.
Li, Q-M., Liu, Q., Zhang,Q-F., Wei, X-J., and Guo, J-Z.. (1998). Separation Study of
Cadmium through an Emulsion Liquid Membrane Using Triisooctylamine as
Mobile Carrier. Talanta. 46: 927-932.
Li, W.X. and Shi Y.J. (1993). Water-Permeation Swelling of Emulsion Liquid
Membrane. Sep. Sci. Technol. 28: 241-254.
Lin, C.C. and Long, R.L. (1997). Removal of Nitric Acid by Emulsion Liquid
Membrane: Experimental Results and Model Prediction. J. Membr. Sci. 134: 33-
45.
Lin, C.C. (1996). Batch and Column Extraction by Emulsion Liquid Membrane
Systems. New Mexico State University: PhD Dissertation.
201
Lin, Z. W. (2001). Surfactants as Applied to Penetrant Testing. The American
Society for Nondestructive Testing.
Lissant, K.J. (1983). Demulsification: Industrial Application: Surfactant Science
Series, Vol. 13: Chapter 1. New York: Marcel Dekker Pub. 1-38.
Lo, T. C., Baird, M. H. I, and Hanson, C. (1983). Handbook of Solvent Extraction,
Part IIIA and IIIB: John Wiley. 517-629.
Long, R. L. and Lin, C. C. (1995). Numerical Simulation and Design for Continuous
Flow Extraction of Emulsion Liquid Membrane. Dev. Chem. Eng. Mini. Proc.
3(3/4): 177-186.
Lonsdale, H. K. (1982). The Growth of Membrane Technology. J. Membr. Sci. 10:
81-181.
Lorbach, D. and Marr, R. (1987). Emulsion Liquid Membranes Part II: Modelling
Mass Transfer of Zinc with Bis(2-ethylhexyl)dithiophosphoric Acid. Chem. Eng.
Process. 21: 83-93.
Lu, G., Lu, Q., and Li, P. (1997). Break-down of Liquid Membrane Emulsion under
High Electric Field. J. Membr. Sci. 128: 1-6.
Luo, G.S., Pan, S., Liu, J.G., and Dai, Y.Y. (2001). Liquid-liquid Phase Equilibrium
under External Electric Fields. Sep. Sci. Technol. 36: 2799-2809.
Mahmoud, M.H. H., Nakamura, S., and Akiba, K. (1996). Separation of
Molybdenum(VI) and Tungsten(VI) Through a Supported Liquid Membrane
Impregnated with Trioctylammonium Chloride. Sep. Sci. Technol. 31(20): 2763-
2775.
Mahn, T. N. and Kopunec, R. (1992). Carrier-Mediated Transport of Rare Earth
Elements Through Liquid Membranes: Transport of Sc, Y, Ce, Eu, Gd, Tm, Yb
Through Supported Liquid Membrane Containing TOPO in n-dodecane. J.
Radioanal. Nucl. Chem. 159(2): 219-231.
Makryaleas, K., Scheper, T., Schugerl, K., and Kula, M.R. (1985). Chem. Ing. Tech.
57: 362-363.
Marchese, J., Campderros, M. E., and Acosta, A. (1995). Transport and Separation
of Cobalt, Nickel and Copper Ions with Alamine Liquid Membranes. J. Chem.
Technol. Biotechnol. 64: 293.
Marr, R. (1984). Pilot Plant Studies of Liquid Membrane Separation. Proceeding of
Eng. Found. Conf. On New Directions in Separation technology. Davos,
Switzerland.
202
Marr, R. and Kopp, A. (1982). Liquid Membrane Technology – A Survey of
Phenomena, Mechanisms and Models. Int. Chem. Eng. 22(1): 44-60.
Marr, R.J. and Draxler, J. (1992). Applications. In: W.S. Winston Ho, K.K. Sirkar
Eds. Membrane Handbook. New York: Van Nostrand Reinhold. 701-717.
Mason, L.F.A. (1979). Photographic Processing Chemistry. 3th Edi. London: Focal
Press.
Matsumoto, S. and Kohda, M. (1980). The Viscosity of W/O/W Emulsion: An
Attempt to estimate the Water Permeation Coefficient of the Oil Layer from the
Viscosity Changes in Diluted Systems on Aging Under Osmotic Pressure
Gradient, J. Coll. Interf. Sci. 73: 13-20
Matsumoto, S., Inoue, T., and Kohda, M. (1980). Water Permeability of Oil Layer in
W/O/W Emulsion under Osmotic Pressure Gradients. J. Coll. Interf. Sci. 77:
555-563.
Matulevicius, E. S. and Li, N. N. (1975). Facilitated Transport Through Liquid
Membranes. Sep. Purif. Methods. 4: 73-96.
Maysa, S. E. S. (2003). Uranium Extraction from Gattar Sulfate Leach Liquor Using
Aliquat-336 in a Liquid Emulsion Membrane Process. Hydrometallurgy. 68(1-3):
51-56.
Mendoza, C. S. and Kamata, S. (1996). Silver Extraction for Pollution Control of
Photographic Fixing Solution with Tetramethylthiuram Disulfide. Bull. Chem.
Soc. Jpn. 69: 3499-3504.
Mendoza, S., Kamata, S. and Sodeyama, K. (1996). Thiuram Sulfides as a Reagent
for the Solvent Extraction of Silver. Analy. Sci.. 12: 969-972.
Mihaylov, I. and Distin, P.A. (1992). Gallium Solvent Extraction in
Hydrometallurgy: An Overview. Hydrometallurgy. 28: 13-27.
Mojtaba, S. and Mohammad, H. M. (2000). Highly Efficient and Selective
Membrane Transport of Silver(I) Using Hexathia-18-crown-6 as a Specific Ion
Carrier. Sep. Purif. Technol. 20: 147-153.
Mok, Y.S. and Lee, W.K. (1994). Water Transport in Water-Oil-Water Liquid
Emulsion Membrane System for the Separation of Latic Acid. Sep. Sci. Technol.
29: 743-764.
Molinari, R., Drioli, E., and Pantano, G. (1989). Stability and Effect of Diluents in
Supported Liquid Membranes for Cr(III), Cr(VI), and Cd(II) Recovery. Sep. Sci.
Technol. 24: 1015-1032.
203
Murry K.J. and Bouboulis C.J. (1973), Eng. Min. J. 174(7): 74-79.
Myers, D. (1988). Surfactant science and Technology. New York: VCH Publishers.
Nakashio, F. (1993). Recent Advances in Separation of Metals by Liquid Surfactant
Membranes. J. Chem. Eng. Jpn. 26: 123-133.
Narishman, G., Ramkrihna, D., and Gupta, G.P. (1980). Analysis of Drop Size
Distribution in Lean Liquid-Liquid Dispersions. AIChE. J. 26(6): 991-1000.
Nishihama, S., Hirai, T., and Komasawa, I. (2001). Review of Advanced Liquid-
Liquid Extraction Systems for the Separation of Metals by a Combination of
Conversion of the Metal Species with Chemical Reaction. Ind. Eng. Chem. Res.
40: 3085-3091.
Noble, R.D. and Way, J.D. (1987). Liquid Membranes, Theory and Applications.
ACS Symposium Series. Washington, DC: ACS.
Ohto, K., Fujimoto, Y., and Inoue, K. (1999). Stepwise Extraction of Two Lead Ions
with a Single Molecule of calyx[4]arene tetracarboxylic Acid. Anal. Chim. Acta.
387: 61-69.
Ohto, K., Murakami, E., Shinohara, T., Shiratsuchi, K., Inoue, K., and Iwasaki, M.
(1997a). Selective Extraction of Silver(I) Over Palladium(II) with Ketonic
Derivatives of Calixarenes from Highly Concentrated HNO3. Anal. Chim. Acta.
341: 275-283.
Ohto, K., Yamaga, H., Murakami, E., and Inoue, K. (1997b). Specific Extraction
Behavior of Amide Derivative of Calyx [4] arene for Silver (I) and Gold (III)
Ions from Highly Acidic Chloride Media. Talanta. 44: 1123-1130.
Ortiz, I., Galan, B., and Irabien, A. (1996). Kinetic Analysis of the Simultaneous
Non-dispersive Extraction and Back-extraction of Chromium(VI). Ind. Eng.
Chem. Res. 35: 1369-1377.
Ostberg, G., Bergenstahl, B., and Hulden, M. (1995). Influence of Emulsifier on the
Formation of Alkyd Emulsions, A. Physicochemical and Engineering Aspects.
Colloids Surf. 94(2-3): 161-171.
Ouchi, M., Shibutani, Y., Yakabe, K., Shono, T., Shintani, H.,Yoneda, A., Hakushi,
T., and Weber, E. (1999). Silver and Thallium(I) Complexation with Dibenzo-
16-crown-4. Bioorganic & Medicinal Chemistry. 7(6): 1123-1126.
Oza, K. P. and Frank, S.G. (1989). Drug Release from Emulsions Stabilized by
colloidal Microcrystalline Cellulose. J. Disper. Sci. Technol. 10(2): 187-210.
204
Paiva, A. P. (1993). Solvent Extraction and Related Studies on Silver Recovery
From Aqueous Solutions. Sep. Sci. Technol. 28(4): 947-1008.
Patnaik, P. R. (1995). Liquid Emulsion Membranes: Principles, Problems and
Application in Fermentation Processes. Biotechnology Advances. 13(2): 175-208.
Pearson, R. G. (1963). Hard and soft acids and bases. J. Am. Chem. Soc. 85: 3533-
3543.
Preston, J.S. (1985). Solvent Extraction of Metal by Carboxylic Acids.
Hydrometallurgy. 14: 171-188.
PRO-ACT (1995). Fact sheet of Silver Recovery from Photographic and Imaging
Wastes: Technical Report.
Rajdip, B., Avijit, B., Siddartha, D., and Shyamal, K. S. (1998). A New Model of
Batch-Extraction in Emulsion Liquid Membrane: Simulation of Globule–Globule
Interaction and Leakage. Chem. Eng. Sci. 53(15): 2799-2807.
Rautenbach, R. and Machhammer, O. (1988). Modeling of Liquid membrane
Separation Processes. J. Membr. Sci. 36: 425-444.
Reed, D. L., Bunge, A. L., and Noble, R. D. (1987). Influence of Reaction
Reversibility on Continuous-Flow Extraction by Emulsion Liquid Membrane. In:
Liquid Membranes: Theory and Applications. Noble R. D., Way J. D., Eds.
Washington D. C.: American Chemical Society.
Reis, M. T. A. and Carvalho, J.M.R. (2004). Modeling of Zinc Extraction from
Sulphate Solutions with Bis(2-ethylhexyl)thiophosphoric Acid by Emulsion
Liquid Membranes. J. Membr. Sci. 237: 97-107.
Reis, M.T.A. and Carvalho, J.M.R. (1993). Recovery of Zinc from Industrial
Effluent by Emulsion Liquid Membranes. J. Membr. Sci. 84: 201-211.
Ritcey, G.M. and Ashbrook, A.W. (1984). Solvent Extraction: Principles and
Applications to Process Metallurgy. Part I. Amsterdam: Elsevier Science
Publisher B.V.
Ritcey, G.M. and Lucas, B.H. (1974). Proceedings International Solvent Extraction
Conference ISEC’74. Soc. Chem. Ind. London. 3: 2438.
Rohm and Haas: A Specialty Chemical Company (2003). Ion Exchange Resins-
Industrial Process-Silver Recovery from Photographic Baths.
Rosell, A., Palet, C., and Valiente, M. (1997). Selective Separation and
Concentration of Vanadium(V) by a Chemical Pumping Hollow-Fiber Supported
Liquid Membrane. Anal. Chim. Acta. 349(1-3): 171.
205
Rosen, M.J. (1978). Surfactant and Interfacial Phenomena. New York: Wiley-
Interscience Publication.
Rumscheidt, F.D. and Mason, S.G. (1961). Particle Motions in Sheared Suspentions:
XI. Internal Circulation in Fluid Droplets. J. Coll. Interf. Sci. 16: 210-237.
Rydberg, J., Musikas, C., and Choppin, G.R. (1992). Principles and Practices of
Solvent Extraction. New York: Macel Dekker Inc.
Saha, S. and Chakma, A. (1992). Separation of CO2 from Gas Mixtures with Liquid
Membranes. Energy Conversion and Management. 33(5-8): 413-420.
Saidi, H. and Ariffin, A. (1994). Reduction of Waste from Photographic Shops.
Universiti Teknologi Malaysia: Technical Report.
Saito, K., Taninaka, I., Murakami, S., and Muromatsu, A. (1998). Extraction
Behaviour of Copper(II) and Silver(I) with a Thiacrown ether carboxylic Acid 2-
(3,6,10,13-tetrathiacyclotetradec-1-oxy)hexanoic Acid. Talanta. 46(5): 1187-
1194.
Saji, J., Rao, T.P, Iyer, C. S. P., and Reddy, M. L. P. (1998). Extraction of Iron (III)
from Acidic Chloride Solutions by Cyanex 923. Hydrometallurgy. 49: 289-296.
Sanuki, S., Yata, M., and Majima, H. (1999). Stripping of Silver from Primene JMT
Loaded with Silver Thiocyanate Complexes. Hydrometallurgy. 52(2): 123-135.
Scheper, T., Likidis, Z., Makryaleas, K., Nowottny, Ch., and Schügerl, K. (1987).
Three Different Examples of Enzymatic Bioconversion in Liquid Membrane
Reactors. Enzyme Microbial Technol. 9(10): 625-631
Sekine, T. and Hasegawa, Y. (1977). Solvent Extraction Chemistry, Fundamental
and Application. New York: Marcel Dekker Inc.
Sharad, N.D., and Purushottam, M.D. (2001). Comparative Study of the
Determination of Platinum by Extraction with Cyanex 923 and Cyanex 471X
from Bromide media. J. Chem. Tech. Biotechnol. 76: 1227-1234.
Shen, J. Q., Yin, W. P., Zhao, Y. X., and Yu, L. J. (1996). Extraction of Alanine
Using Emulsion Liquid Membranes Featuring a Cationic Carrier. J. Membr. Sci.
120: 45-53.
Shiau, C-Y. (1991). Analysis of Transport Rate of Zinc Extraction Through Liquid
Surfactant Membrane. Sep. Sci. Technol. 26: 1519-1530.
Shiau, C-Y. and Jung, S-W. (1993). Selective Extraction of Metal Ions Through
Liquid Surfactant Membranes. J. Chem. Tech. Biotechnol. 56: 27-33.
206
Shukla, J. P. and Misra, S. K. (1991). Carrier-mediated Transport of Uranyl Ions
across Tributyl phosphate-Dodecane Liquid Membranes. J. Membr. Sci. 64: 93-
102.
Sittig, M. (1980). Metal and Inorganic Waste Reclaiming Encyclopedia. Park Ridge,
NJ: Noyes Data Corporation.
Sittig, M. (1973). Pollutant Removal Handbook. Park Ridge, NJ: Noyes Data
Corporation.
Sjoblom, A. J. (1996). Emulsion and Emulsion Stability. Marcel Dekker.
Skelland, A.H.P. (1999). Non-newtonian Conversion Solves Problems of Stability,
Permeability, and Swelling in Emulsion Liquid Membrane. J. Membr. Sci. 158:
1-15.
Smith, D. R., Lander, R. J., and Quinn, J. A. (1977). Carrier-Mediated Transport in
Synthetic Membranes. In: Li, N. N. (Ed). Recent Development in Separation
Science. Vol.3, Cleveland, Ohio: CRC Press.
Smith, I.C. and Bonnie, L.C. (1977). ‘Silver’, in Trace Metal in the Environment.
Vol. 2. Michigan: Ann Arbor Science Publisher Inc.
Sole, K. C. and Hiskey, J. B. (1995). Solvent extraction of copper by Cyanex 272,
Cyanex 302 and Cyanex 301. Hydrometallurgy. 37: 129-147.
Sole, K. C., Ferguson, T. L., and Hiskey, J.B. (1994). Solvent Extraction of Silver by
Cyanex 272, Cyanex 302 and Cyanex 301. Solv. Extr. Ion Exch. 12(5): 1033-
1050.
Srinivasan, M.P. and Stroeve, P. (1986). Sub drop Ejection from Double Emulsion
Drops in Shear Flow. J. Memb. Sci. 26: 231-236.
Stary, J. (1963). The Solvent of Metal Chetales. New York: Pergamon Press.
Strathman, H. (2001). Membrane Separation Processes: Current Relevance and
Future Opportunities. AIChE J. 47: 1077-1087.
Strestrom, S. (1992). Solvent Extraction Conference 1990. Ed by T. Sekine. New
York: Elsevier Science Publishers. 943-948.
Stroeve, P. and Varanasi, P.P. (1984). An Experimental study on Double Emulsion
Drop Breakup in Uniform Shear Flow. J. Coll. Interf. Sci. 99(2): 360-373.
Sanuki, S., Yata, M., and Majima, H. (1999). Stripping of Silver from Primene JMT
Loaded with Silver Thiocyanate Complexes. Hydrometallurgy. 52( 2): 123-135.
Szpakowska, M. and Nagy, O. B. (1997). Stability of Supported Liquid Membranes
Containing Acorga P-50 as Carrier. J. Membr. Sci. 129: 251-261.
207
Szpakowska, M. (1996). Coupled Transport of Copper Through Different Types of
Liquid Membranes Containing Acorga P-50 as Carrier. J. Membr. Sci. 109: 77-
86.
Szpakowska, M. and Nagy, O.B. (1991). Membrane Material Effect on Copper
Coupled Transport Through Liquid Membranes. J. Membr. Sci. 64: 129-143.
Tait, B. K. (1993). Cobalt-Nickel Separation: The Extraction of Cobalt (II) and
Nickel (II) by Cyanex 301, Cyanex 302 and Cyanex 272. Hydrometallurgy. 32:
365-372.
Takahashi, K. Ohtsubo, F., and Takeuchi, H. (1981). A Study of the Stability of
(W/O/W) Type Emulsion Using a Tracer Technique. J. Chem. Eng. Jpn. 14: 416-
418.
Takeo, A. and Hiroshi, T. (1990). Liquid Membranes: Chemical Applications. Boca
Raton, Florida: CRC Press, Inc.
Taylor, S.E. (1988). Investigation into the Electrical and Coalescence Behaviour of
Water-in-Crude Oil Emulsions in High Voltage Gradients. Colloids Surf. 29: 29-
51.
Teramoto, M. and Matsuyama, H. (1986). Effect of Facilitated Diffusion in Internal
Aqueous Droplets on Effective Diffusivity and Extraction Rate of Phenol in
Emulsion Liquid Membranes. J. Chem. Eng. Jpn. 19(5): 469-472.
Teramoto, M., Qiangfa, H., Taisuke, M., and Hideto, M. (1999). Facilitated
Transport of SO2 Through Supported Liquid Membrane using Water as a Carrier.
Sep. Purif. Technol. 16(2): 109-118.
Teramoto, M., Sakai, T., Yanagawa, K., Ohsuga, M., and Miyake Y. (1983).
Modeling of the Permeation of Copper through Liquid Surfactant Membrane.
Sep. Sci. Technol. 18: 735-764.
Teramoto, M., Takihana, H., Shibutani, M., Yuasa, T., Miyake, Y., and Teranishi, H.
(1981). Extraction of Amine by W/O/W Emulsion. J. Chem. Eng. Jpn. 14: 122-
128.
Teramoto, M., Takihana, H., Shibutani, M., Yussa, T., and Hara, N. (1983).
Extraction of Phenol and Cresol by Liquid Surfactant Membranes. Sep. Sci.
Technol. 18: 397-420.
Thien, M.P. and Hatton, T.A. (1988). Liquid Emulsion Membrane and Their
Applications in Biochemical Processing. Sep. Sci. Technol. 23: 819.
208
Thien, M.P., Hatton, T.A., and Wang, D.I.C (1988). Separation and Concentration of
Amino Acids using Liquid Emulsion Membranes. Biotechnol. Bioeng. 32: 604-
615.
Thorn, G.D. and Ludwig, R.A. (1962). The Dithiocarbamates and Related
Compounds. Amsterdam-New York: Elsevier Publishing Co. 43-271.
Tutkun, O., Demircan, N., and Kumbasar, R.A. (1999). Extraction of Germanium
from Acidic Leach Solutions by Liquid Membrane Technique. Clean Prod.
Processes. 1: 148-153.
Volkel, W., Halwachs, W., and Schugerl, K. (1980). Copper Extraction by Means of
a Liquid Surfactant Membrane Process. J. Membr. Sci. 6: 19-31.
Volkel, W., Poppe, W., Halwachs, W., and Schugerl, K. (1982). Extraction of Free
Phenols from Blood by a Liquid Membrane Enzyme Reactor. J. Membr. Sci. 11:
333-347.
Wan, Y. and Zhang, X. (2002). Swelling Determination of W/O/W Emulsion Liquid
Membrane. J. Membr. Sci. 196: 185-201.
Wang, K. C. (1984). Mathematical Modeling of Carrier Mediated Mass Transfer
Through Liquid Membrane Systems. New Jersey Institute of Technology: PhD.
Thesis.
Wang, S.S., Lee, C.J., and Chan, C.C. (1994). Demulsification of Water-in-Oil
Emulsions by Use of a High Voltage A.C. Field. Sep. Sci. Technol. 29: 159-170.
Wright, J. B., Nilsen, D. N., Hundley, G., and Galvan, G. J. (1995). Field Test of
Liquid Emulsion Membrane Technique for Copper Recovery from Mine
Solutions. Min. Eng. 8: 549-556.
Yan, J. and Pal, R. (2001). Osmotic Swelling Behavior of Globules of W/O/W
Emulsion Liquid Membranes. J. Membr. Sci. 190: 79-91.
Yan, Z., Li, S-Y., Wang, L-C., and Yang, F-Y. (1990). Demulsification of Liquid
Membranes in Electric Fields. Water Treatment. 5: 1-6.
Yang, X. and Fane, T. (1997). Effect of Membrane Preparation on the Life-time of
Supported Liquid Membranes. J. Membr. Sci. 133: 269-273.
Ye, Z.F., Wang, Y.P., Liu, Y.S., Jiang, Z.L., Shen, X., Zhu, L.G., and Shi, X.F.
(1999). Transport of Na+, K+ Ions in a Bubbling Pseudo-Emulsion Liquid
Membrane System with P-tert-butylcalixarenes as carrier. J. Membr. Sci. 163:
367-372.
209
Yi, J. and Taviarides, L. L. (1995). Modeling Chemically Active Liquid Membranes
in Tubular Inorganic Supports. AIChE J. 41(6): 1403-1415.
Yun, C. H., Prasad, R., Guha, A. K., and Sirkar, K. K. (1993). Hollow Fiber Solvent
Extraction Removal of Toxic Heavy Metals from Aqueous Waste Streams. Ind.
Eng. Chem. Res. 32(6): 1186-1195.
Zha, F. F. and Fell, C.J.D. (1995). Effect of Surface Tension Gradients on Stability
of Supported Liquid Membranes. J. Membr. Sci. 107: 75-86.
Zha, F. F., Fane, A. G., and Fell, C.J.D. (1995). Instability Mechanisms of Supported
Liquid Membranes in Phenol Transport Process. J. Membr. Sci. 107: 59-74.
Zhou, D.W. (1996). Emulsion Liquid Membrane Removal of Arsenic and Strontium
from Wastewater. New Jersey Institute of Technology: PhD dissertation.
Zouboulis, A. I. (1995). Silver Recovery from Aqueous Streams using Ion Flotation,
Min. Eng. 8(12): 1477-1488.
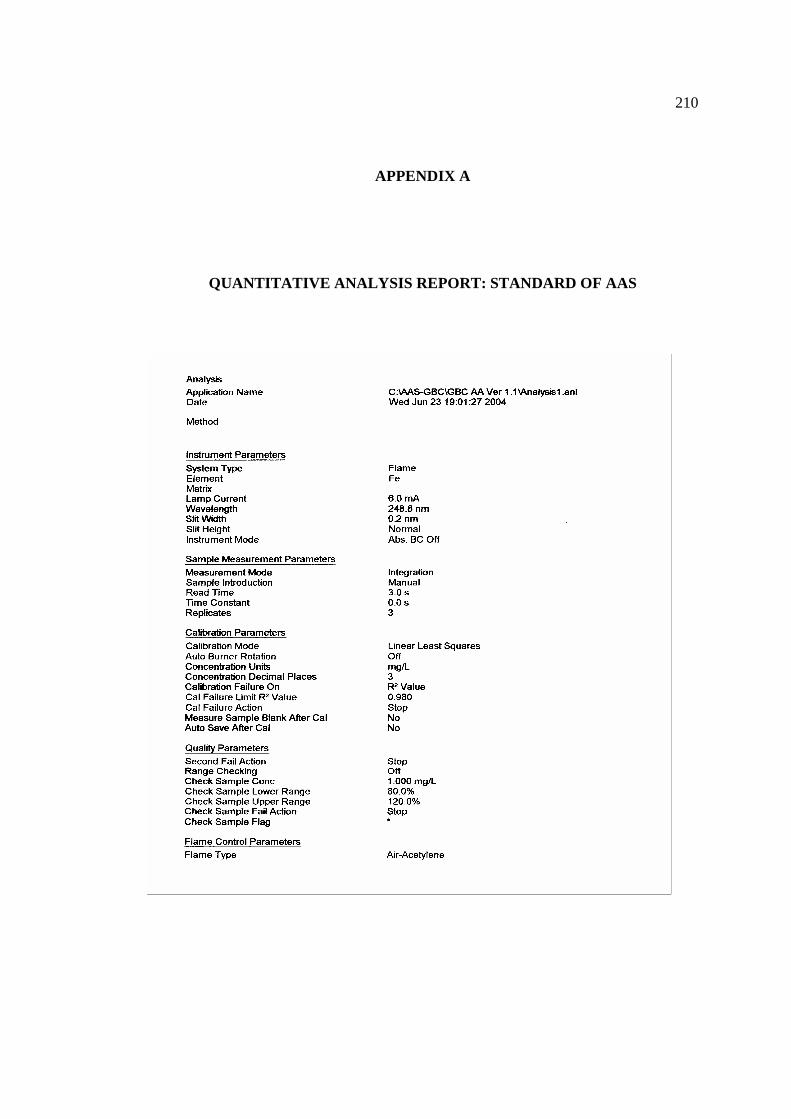
210
APPENDIX A
QUANTITATIVE ANALYSIS REPORT: STANDARD OF AAS
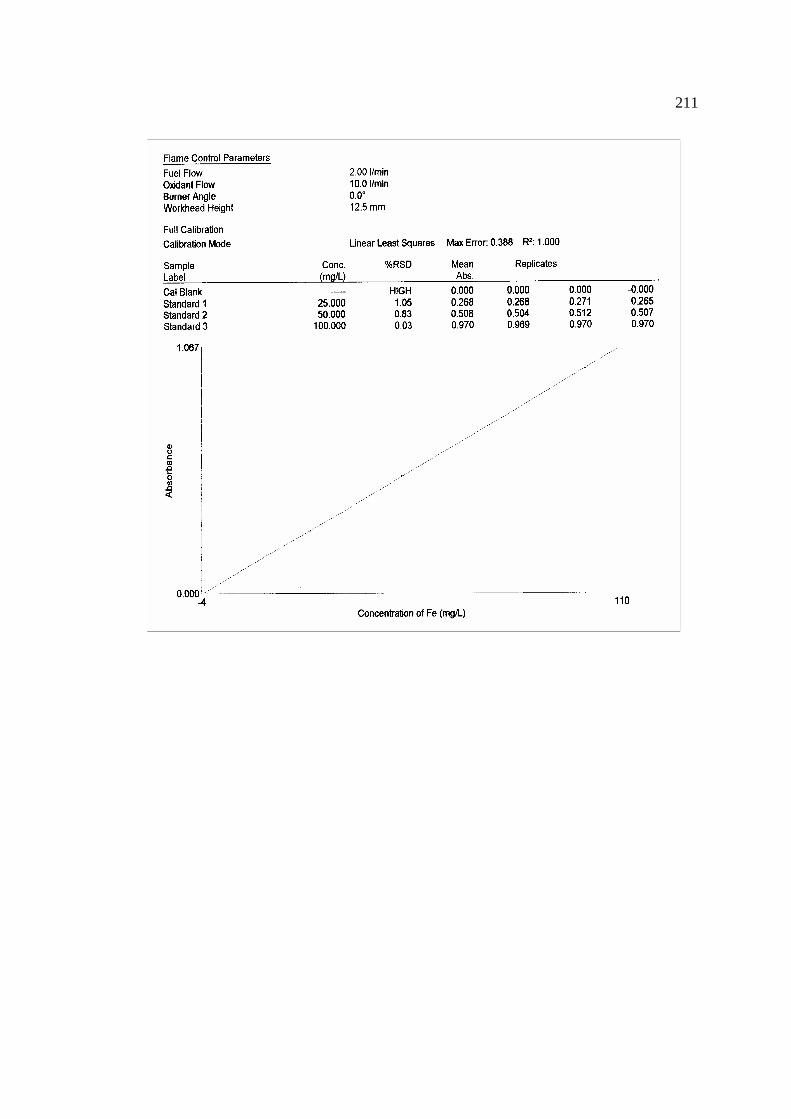
211
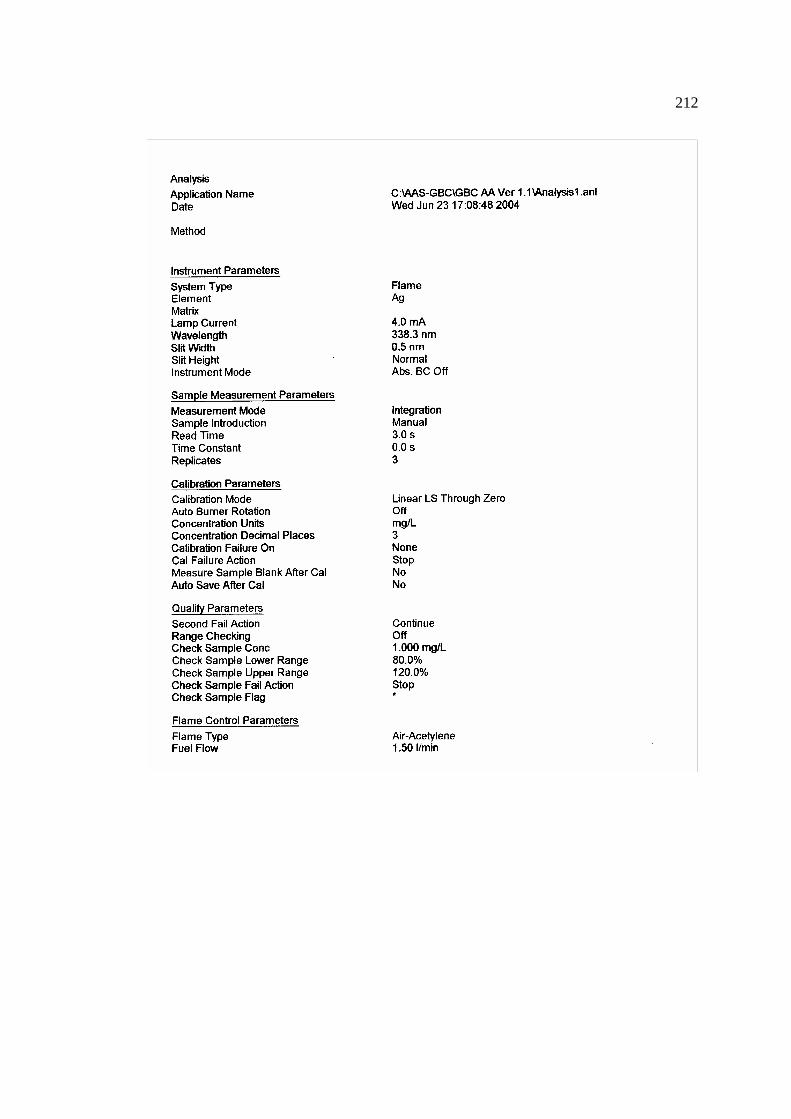
212
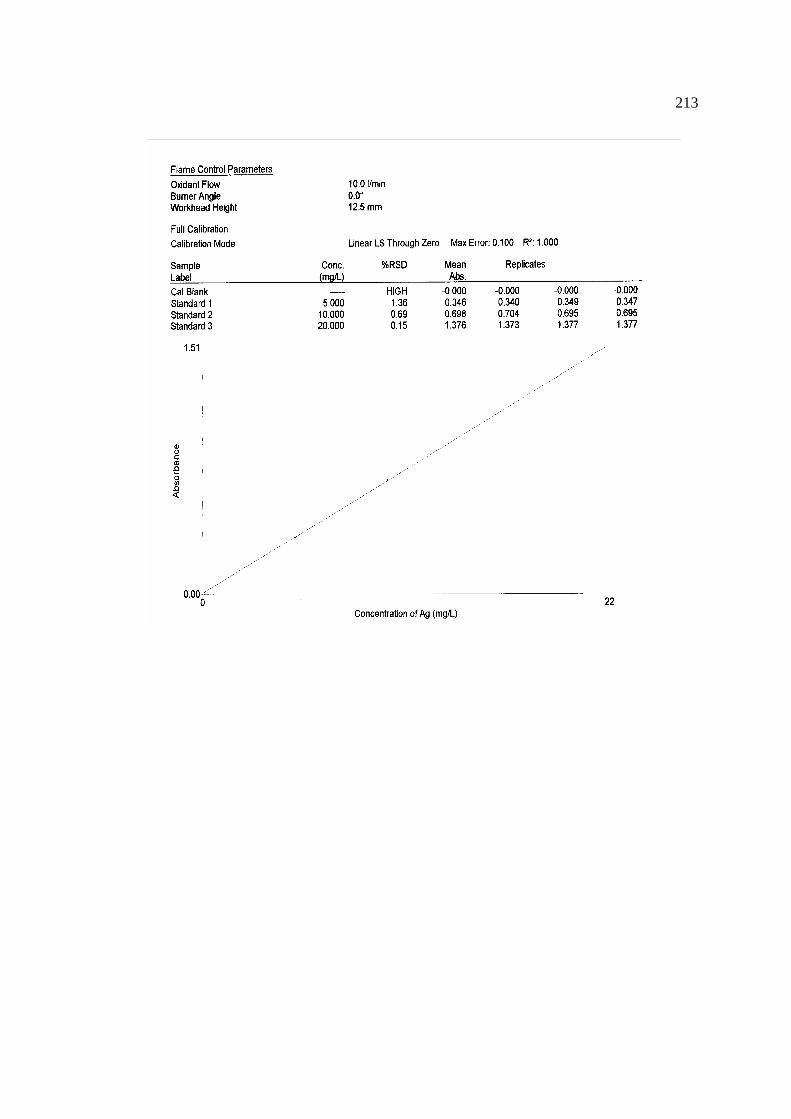
213
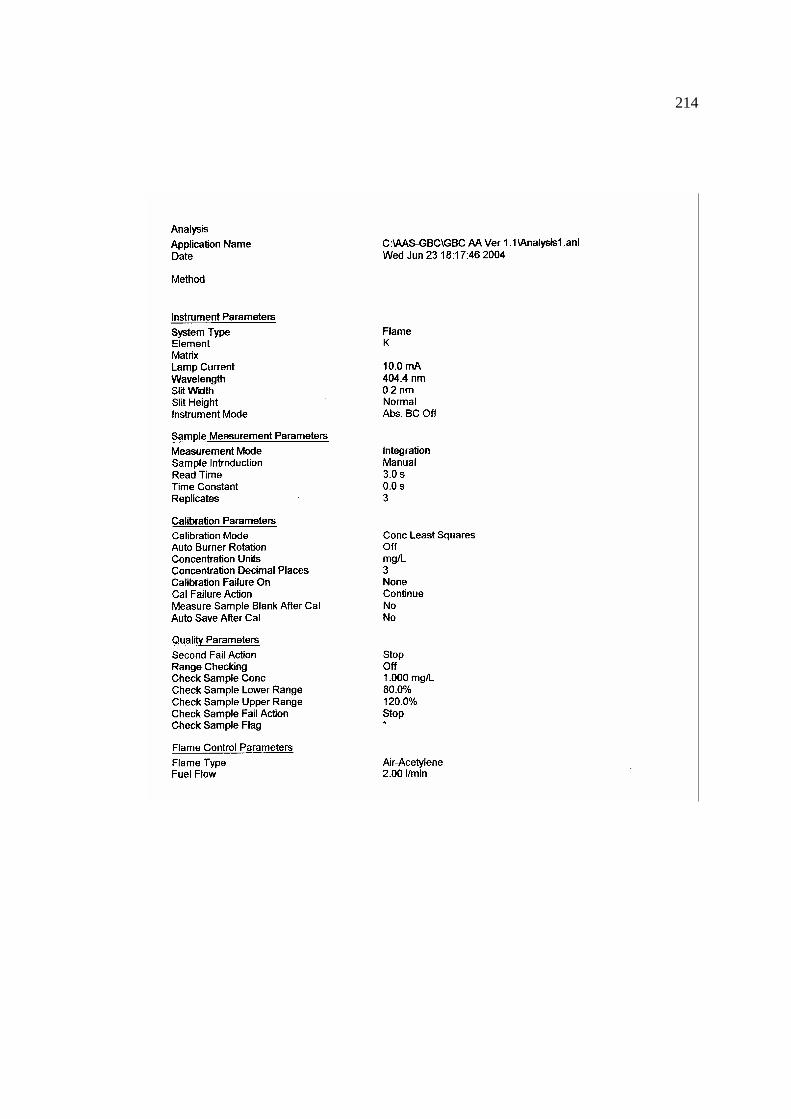
214
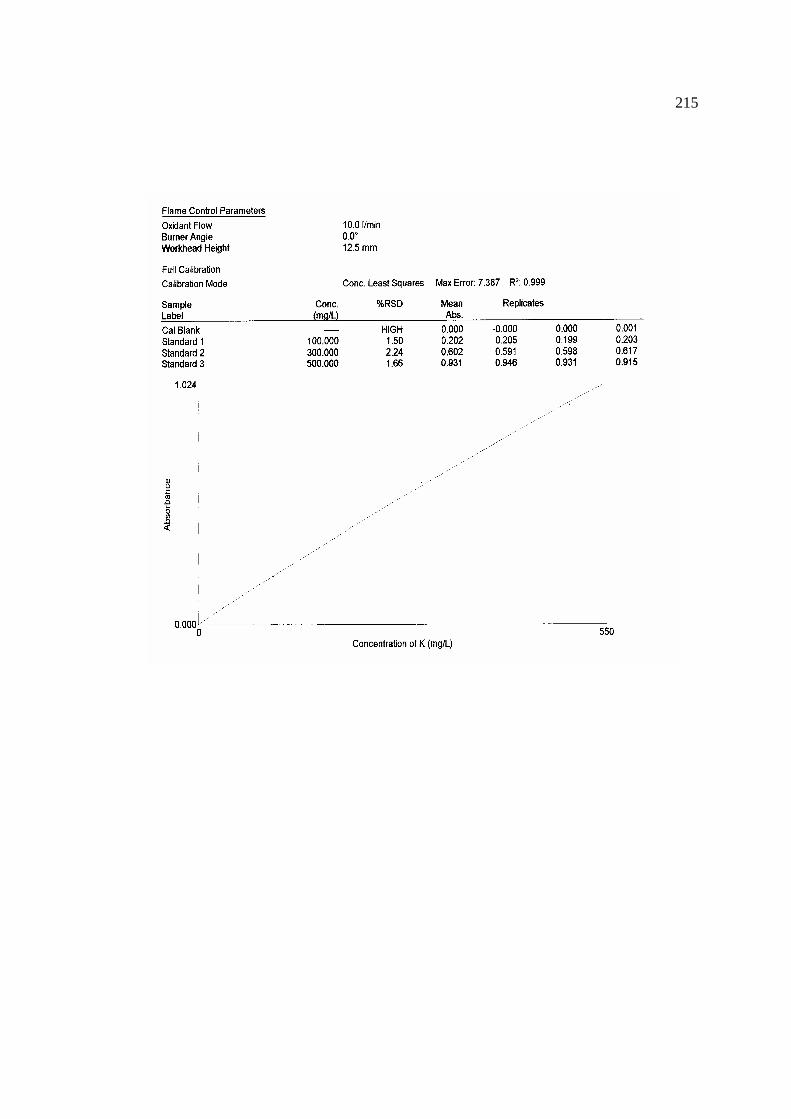
215
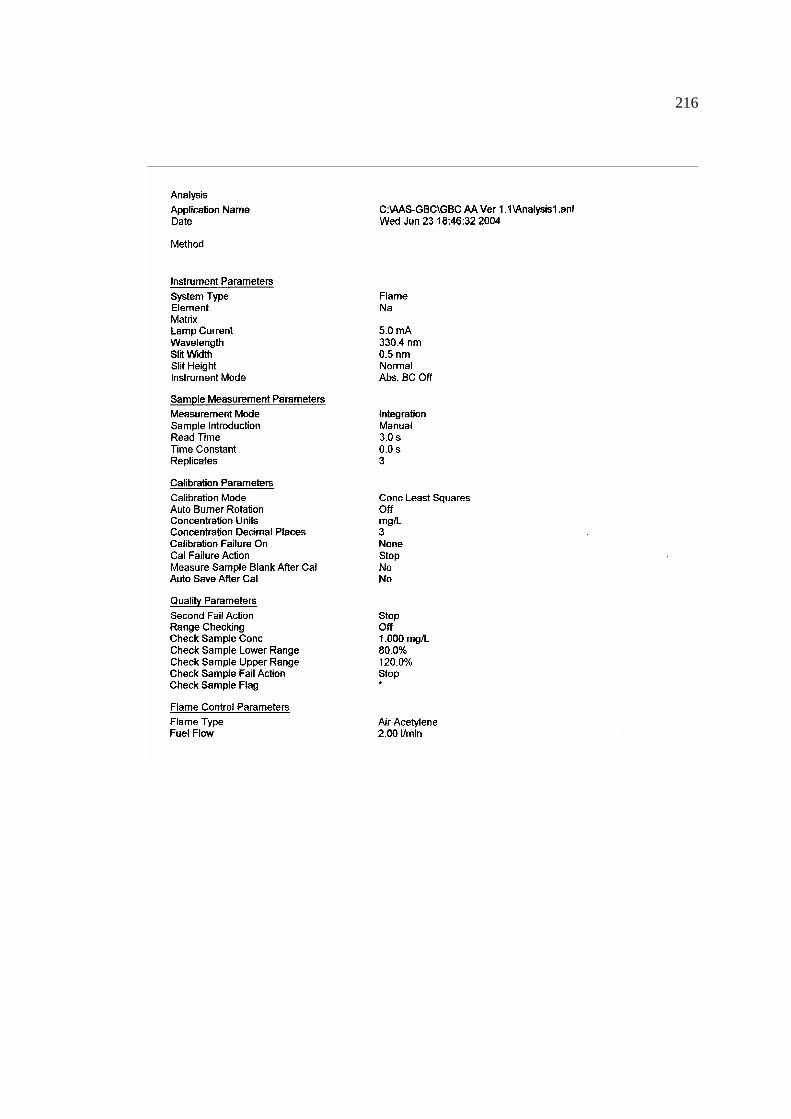
216
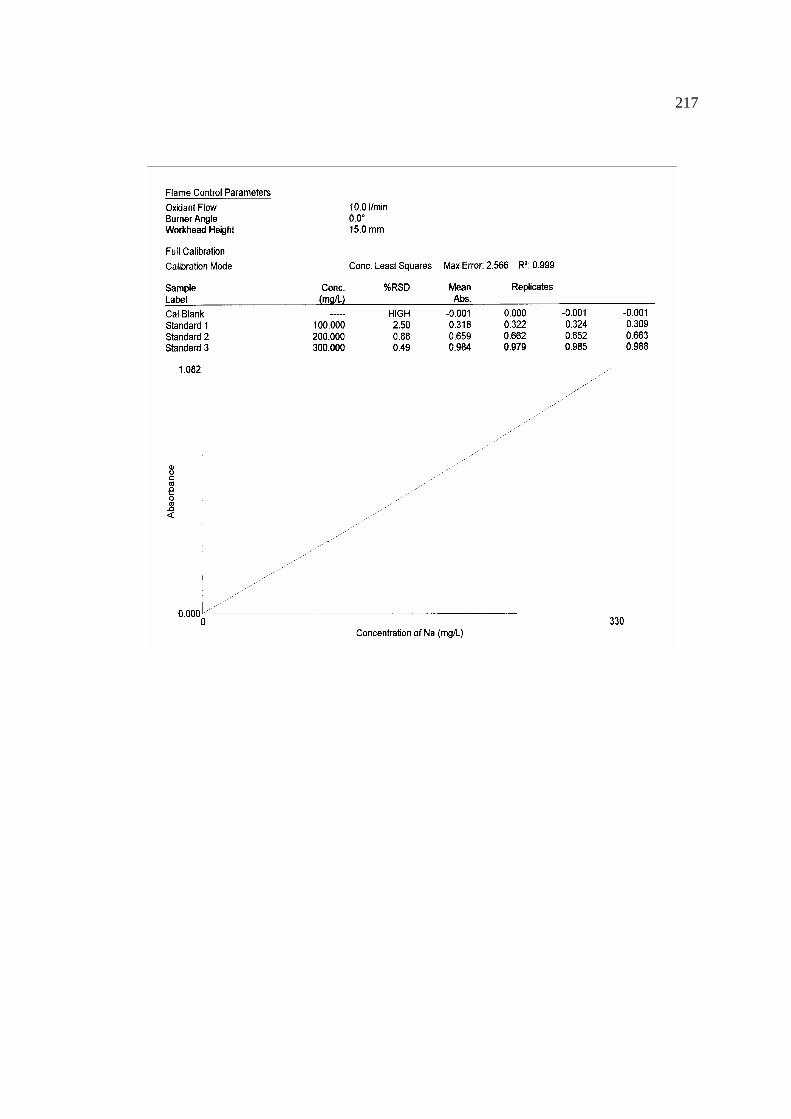
217
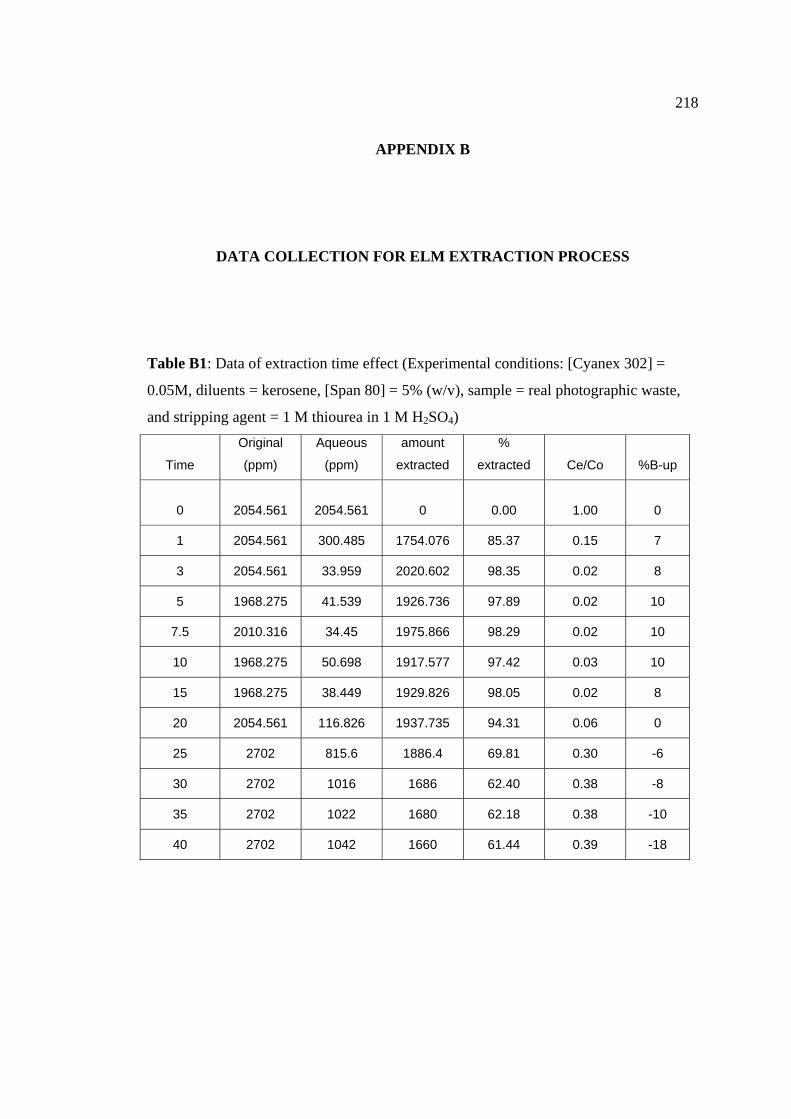
218
APPENDIX B
DATA COLLECTION FOR ELM EXTRACTION PROCESS
Table B1: Data of extraction time effect (Experimental conditions: [Cyanex 302] =
0.05M, diluents = kerosene, [Span 80] = 5% (w/v), sample = real photographic waste,
and stripping agent = 1 M thiourea in 1 M H2SO4)
Time
Original
(ppm)
Aqueous
(ppm)
amount
extracted
%
extracted Ce/Co %B-up
0 2054.561 2054.561 0 0.00 1.00 0
1 2054.561 300.485 1754.076 85.37 0.15 7
3 2054.561 33.959 2020.602 98.35 0.02 8
5 1968.275 41.539 1926.736 97.89 0.02 10
7.5 2010.316 34.45 1975.866 98.29 0.02 10
10 1968.275 50.698 1917.577 97.42 0.03 10
15 1968.275 38.449 1929.826 98.05 0.02 8
20 2054.561 116.826 1937.735 94.31 0.06 0
25 2702 815.6 1886.4 69.81 0.30 -6
30 2702 1016 1686 62.40 0.38 -8
35 2702 1022 1680 62.18 0.38 -10
40 2702 1042 1660 61.44 0.39 -18
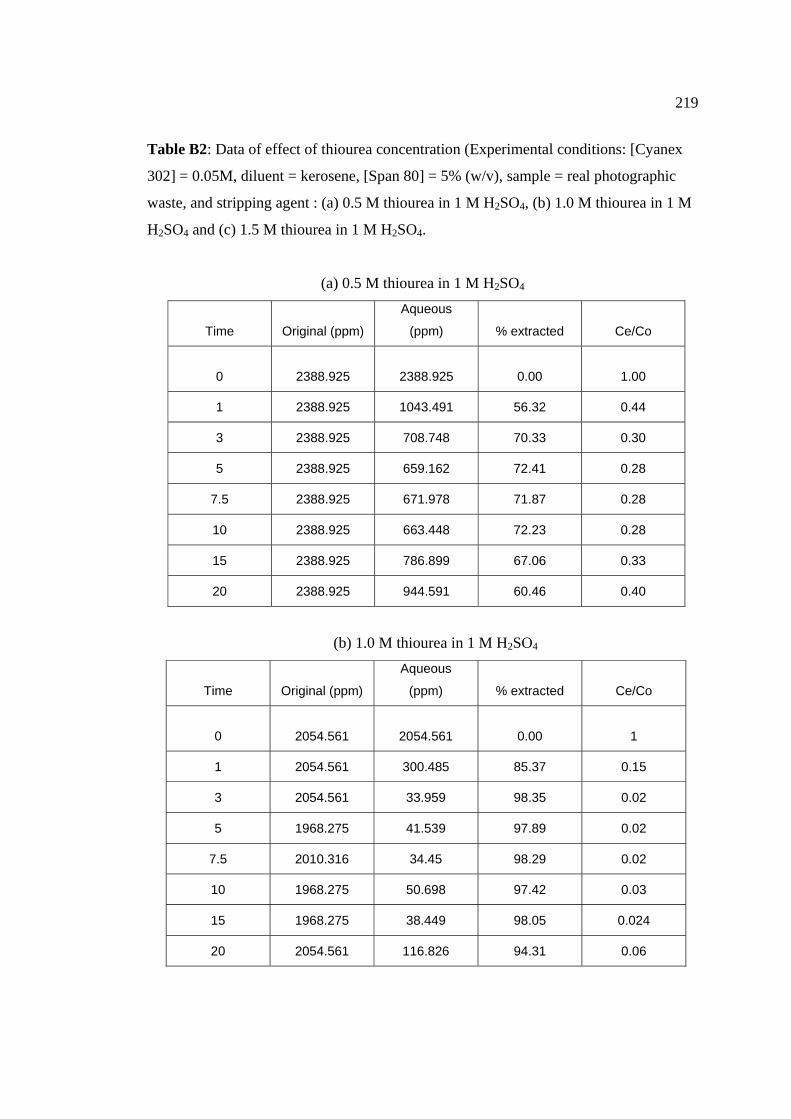
219
Table B2: Data of effect of thiourea concentration (Experimental conditions: [Cyanex
302] = 0.05M, diluent = kerosene, [Span 80] = 5% (w/v), sample = real photographic
waste, and stripping agent : (a) 0.5 M thiourea in 1 M H2SO4, (b) 1.0 M thiourea in 1 M
H2SO4 and (c) 1.5 M thiourea in 1 M H2SO4.
(a) 0.5 M thiourea in 1 M H2SO4
Time Original (ppm)
Aqueous
(ppm) % extracted Ce/Co
0 2388.925 2388.925 0.00 1.00
1 2388.925 1043.491 56.32 0.44
3 2388.925 708.748 70.33 0.30
5 2388.925 659.162 72.41 0.28
7.5 2388.925 671.978 71.87 0.28
10 2388.925 663.448 72.23 0.28
15 2388.925 786.899 67.06 0.33
20 2388.925 944.591 60.46 0.40
(b) 1.0 M thiourea in 1 M H2SO4
Time Original (ppm)
Aqueous
(ppm) % extracted Ce/Co
0 2054.561 2054.561 0.00 1
1 2054.561 300.485 85.37 0.15
3 2054.561 33.959 98.35 0.02
5 1968.275 41.539 97.89 0.02
7.5 2010.316 34.45 98.29 0.02
10 1968.275 50.698 97.42 0.03
15 1968.275 38.449 98.05 0.024
20 2054.561 116.826 94.31 0.06
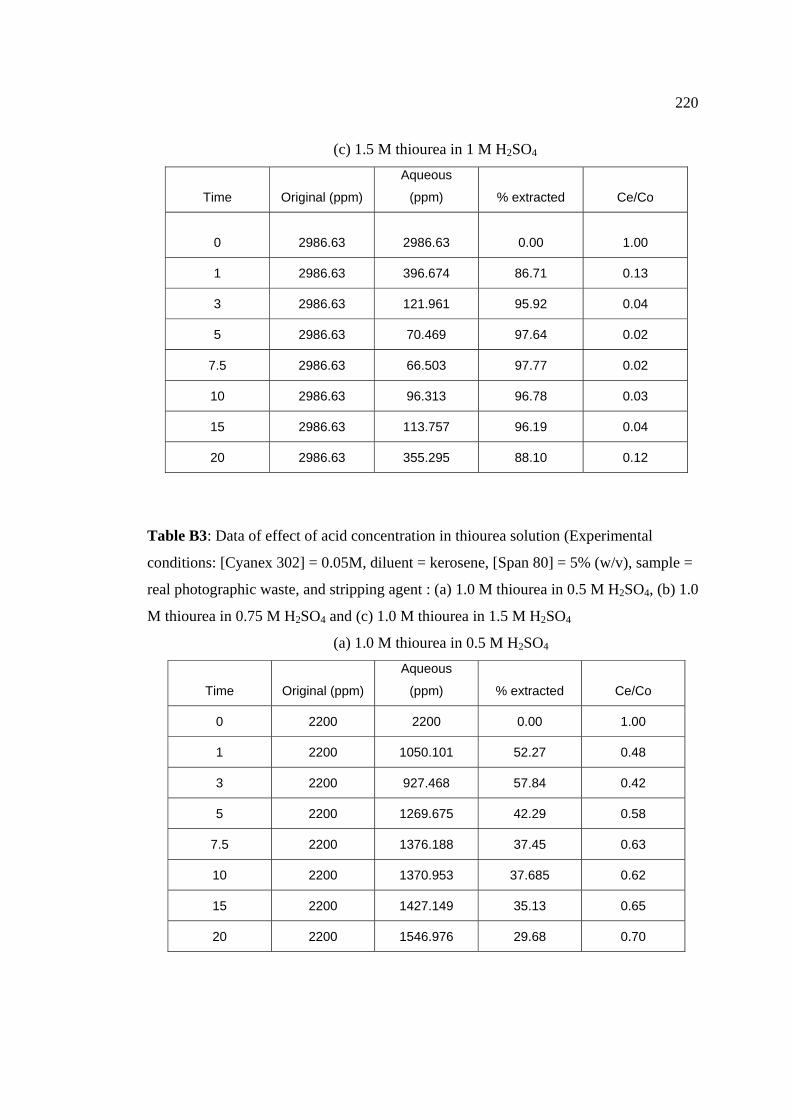
220
(c) 1.5 M thiourea in 1 M H2SO4
Time Original (ppm)
Aqueous
(ppm) % extracted Ce/Co
0 2986.63 2986.63 0.00 1.00
1 2986.63 396.674 86.71 0.13
3 2986.63 121.961 95.92 0.04
5 2986.63 70.469 97.64 0.02
7.5 2986.63 66.503 97.77 0.02
10 2986.63 96.313 96.78 0.03
15 2986.63 113.757 96.19 0.04
20 2986.63 355.295 88.10 0.12
Table B3: Data of effect of acid concentration in thiourea solution (Experimental
conditions: [Cyanex 302] = 0.05M, diluent = kerosene, [Span 80] = 5% (w/v), sample =
real photographic waste, and stripping agent : (a) 1.0 M thiourea in 0.5 M H2SO4, (b) 1.0
M thiourea in 0.75 M H2SO4 and (c) 1.0 M thiourea in 1.5 M H2SO4
(a) 1.0 M thiourea in 0.5 M H2SO4
Time Original (ppm)
Aqueous
(ppm) % extracted Ce/Co
0 2200 2200 0.00 1.00
1 2200 1050.101 52.27 0.48
3 2200 927.468 57.84 0.42
5 2200 1269.675 42.29 0.58
7.5 2200 1376.188 37.45 0.63
10 2200 1370.953 37.685 0.62
15 2200 1427.149 35.13 0.65
20 2200 1546.976 29.68 0.70
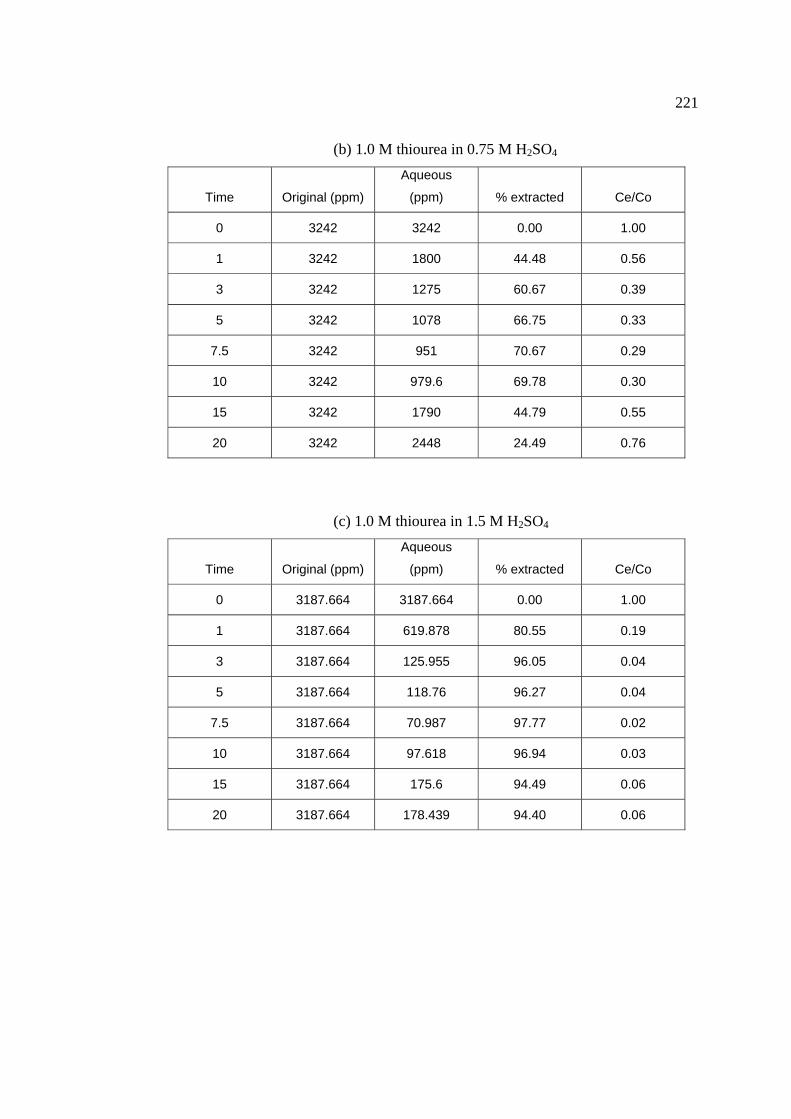
221
(b) 1.0 M thiourea in 0.75 M H2SO4
Time Original (ppm)
Aqueous
(ppm) % extracted Ce/Co
0 3242 3242 0.00 1.00
1 3242 1800 44.48 0.56
3 3242 1275 60.67 0.39
5 3242 1078 66.75 0.33
7.5 3242 951 70.67 0.29
10 3242 979.6 69.78 0.30
15 3242 1790 44.79 0.55
20 3242 2448 24.49 0.76
(c) 1.0 M thiourea in 1.5 M H2SO4
Time Original (ppm)
Aqueous
(ppm) % extracted Ce/Co
0 3187.664 3187.664 0.00 1.00
1 3187.664 619.878 80.55 0.19
3 3187.664 125.955 96.05 0.04
5 3187.664 118.76 96.27 0.04
7.5 3187.664 70.987 97.77 0.02
10 3187.664 97.618 96.94 0.03
15 3187.664 175.6 94.49 0.06
20 3187.664 178.439 94.40 0.06
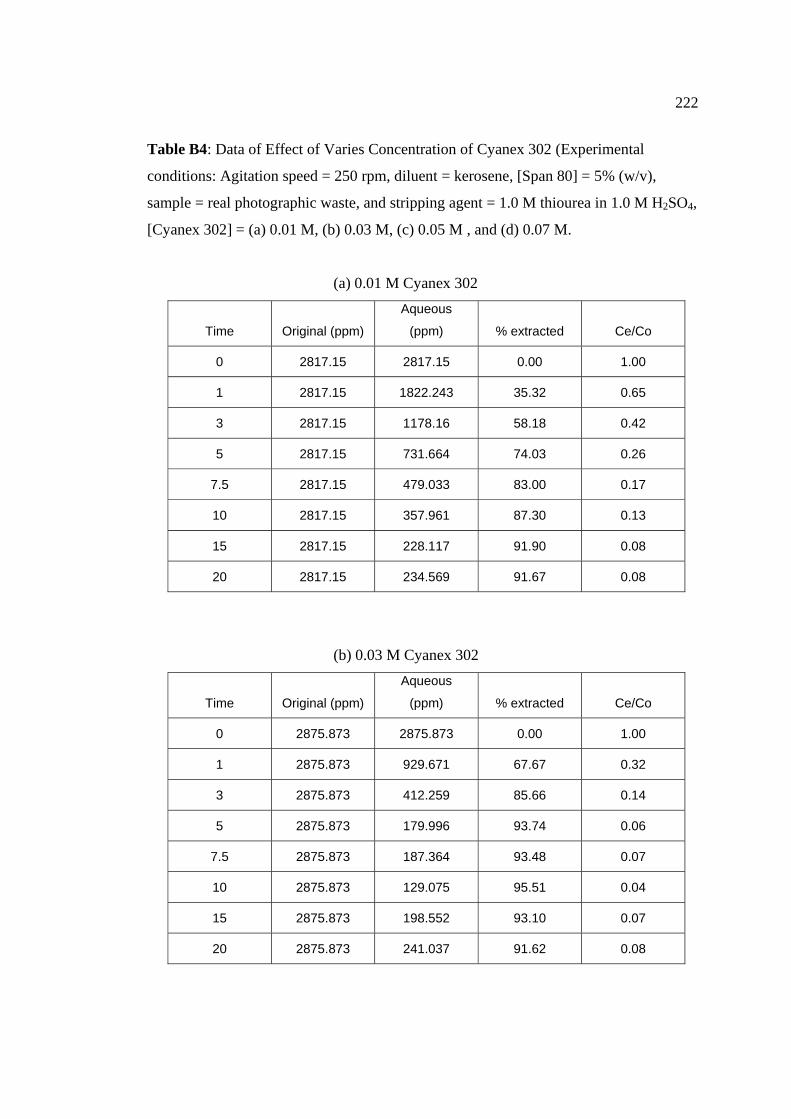
222
Table B4: Data of Effect of Varies Concentration of Cyanex 302 (Experimental
conditions: Agitation speed = 250 rpm, diluent = kerosene, [Span 80] = 5% (w/v),
sample = real photographic waste, and stripping agent = 1.0 M thiourea in 1.0 M H2SO4,
[Cyanex 302] = (a) 0.01 M, (b) 0.03 M, (c) 0.05 M , and (d) 0.07 M.
(a) 0.01 M Cyanex 302
Time Original (ppm)
Aqueous
(ppm) % extracted Ce/Co
0 2817.15 2817.15 0.00 1.00
1 2817.15 1822.243 35.32 0.65
3 2817.15 1178.16 58.18 0.42
5 2817.15 731.664 74.03 0.26
7.5 2817.15 479.033 83.00 0.17
10 2817.15 357.961 87.30 0.13
15 2817.15 228.117 91.90 0.08
20 2817.15 234.569 91.67 0.08
(b) 0.03 M Cyanex 302
Time Original (ppm)
Aqueous
(ppm) % extracted Ce/Co
0 2875.873 2875.873 0.00 1.00
1 2875.873 929.671 67.67 0.32
3 2875.873 412.259 85.66 0.14
5 2875.873 179.996 93.74 0.06
7.5 2875.873 187.364 93.48 0.07
10 2875.873 129.075 95.51 0.04
15 2875.873 198.552 93.10 0.07
20 2875.873 241.037 91.62 0.08
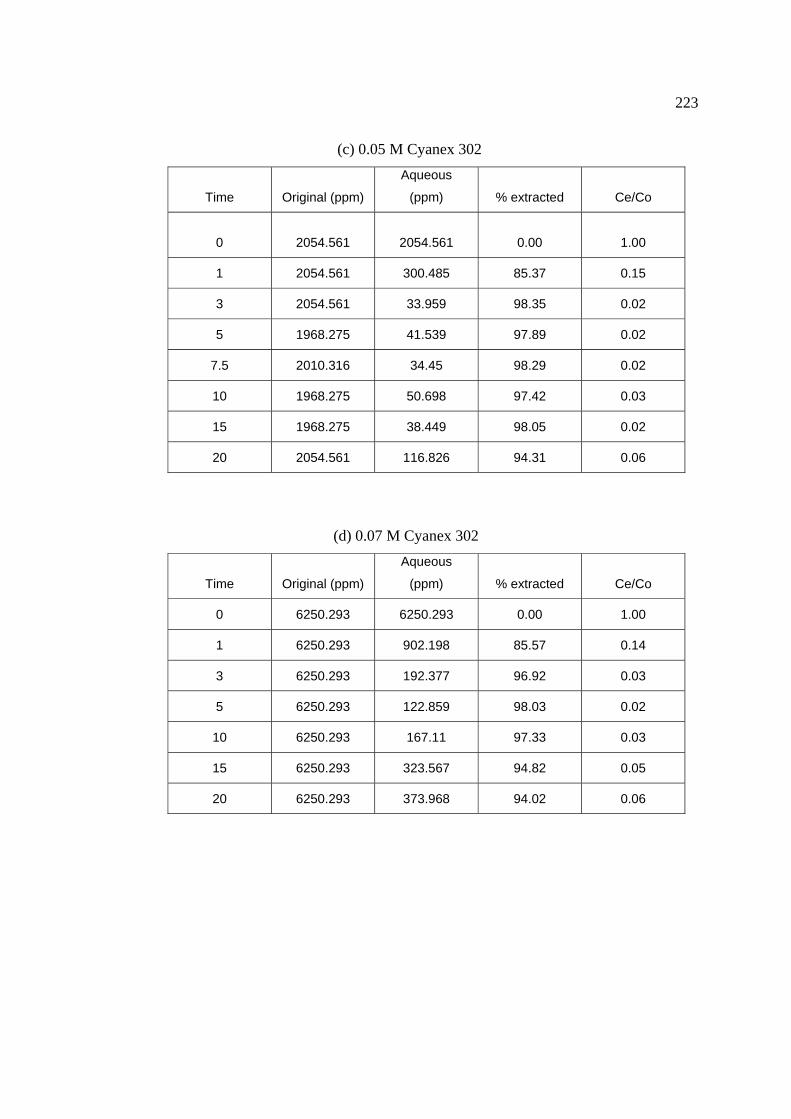
223
(c) 0.05 M Cyanex 302
Time Original (ppm)
Aqueous
(ppm) % extracted Ce/Co
0 2054.561 2054.561
0.00 1.00
1 2054.561 300.485 85.37 0.15
3 2054.561 33.959 98.35 0.02
5 1968.275 41.539 97.89 0.02
7.5 2010.316 34.45 98.29 0.02
10 1968.275 50.698 97.42 0.03
15 1968.275 38.449 98.05 0.02
20 2054.561 116.826 94.31 0.06
(d) 0.07 M Cyanex 302
Time Original (ppm)
Aqueous
(ppm) % extracted Ce/Co
0 6250.293 6250.293 0.00 1.00
1 6250.293 902.198 85.57 0.14
3 6250.293 192.377 96.92 0.03
5 6250.293 122.859 98.03 0.02
10 6250.293 167.11 97.33 0.03
15 6250.293 323.567 94.82 0.05
20 6250.293 373.968 94.02 0.06
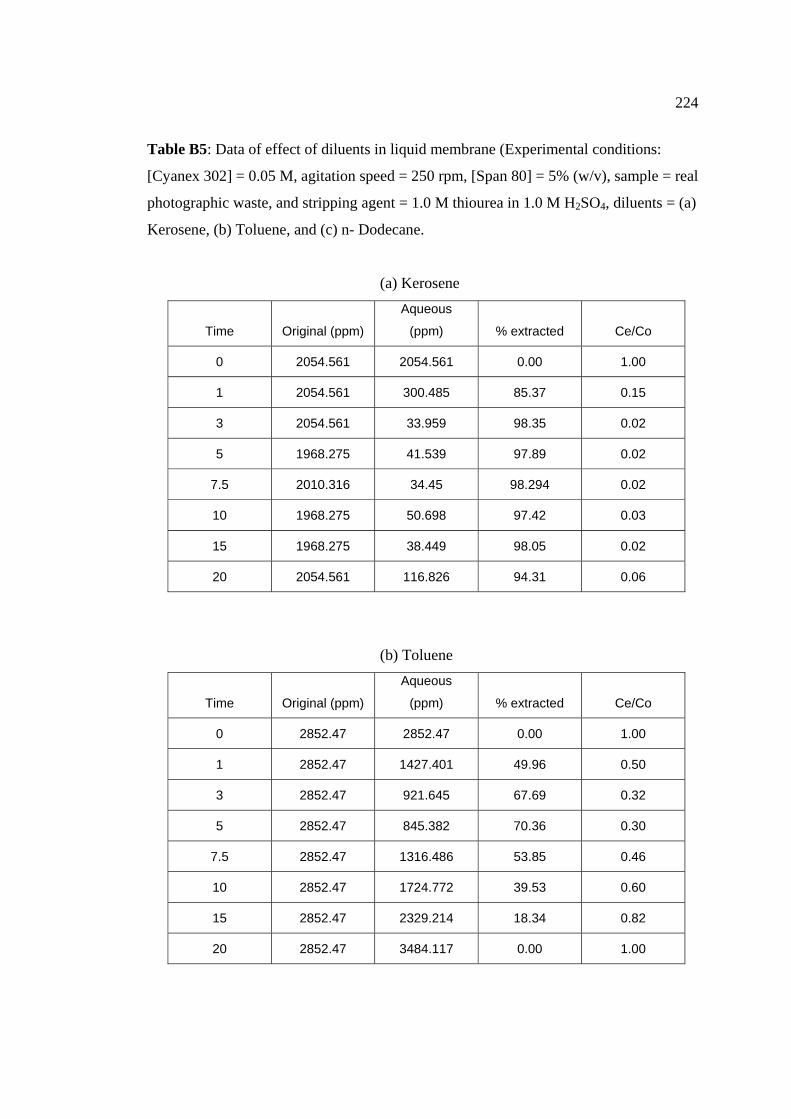
224
Table B5: Data of effect of diluents in liquid membrane (Experimental conditions:
[Cyanex 302] = 0.05 M, agitation speed = 250 rpm, [Span 80] = 5% (w/v), sample = real
photographic waste, and stripping agent = 1.0 M thiourea in 1.0 M H2SO4, diluents = (a)
Kerosene, (b) Toluene, and (c) n- Dodecane.
(a) Kerosene
Time Original (ppm)
Aqueous
(ppm) % extracted Ce/Co
0 2054.561 2054.561 0.00 1.00
1 2054.561 300.485 85.37 0.15
3 2054.561 33.959 98.35 0.02
5 1968.275 41.539 97.89 0.02
7.5 2010.316 34.45 98.294 0.02
10 1968.275 50.698 97.42 0.03
15 1968.275 38.449 98.05 0.02
20 2054.561 116.826 94.31 0.06
(b) Toluene
Time Original (ppm)
Aqueous
(ppm) % extracted Ce/Co
0 2852.47 2852.47 0.00 1.00
1 2852.47 1427.401 49.96 0.50
3 2852.47 921.645 67.69 0.32
5 2852.47 845.382 70.36 0.30
7.5 2852.47 1316.486 53.85 0.46
10 2852.47 1724.772 39.53 0.60
15 2852.47 2329.214 18.34 0.82
20 2852.47 3484.117 0.00 1.00
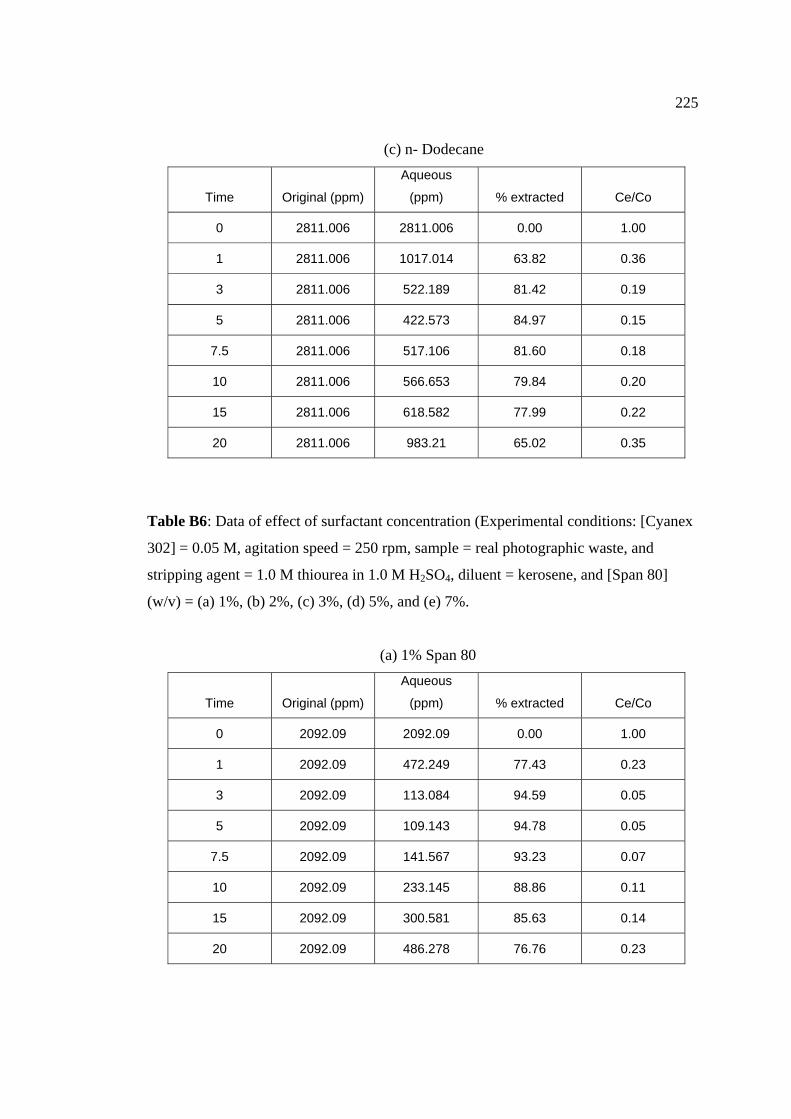
225
(c) n- Dodecane
Time Original (ppm)
Aqueous
(ppm) % extracted Ce/Co
0 2811.006 2811.006 0.00 1.00
1 2811.006 1017.014 63.82 0.36
3 2811.006 522.189 81.42 0.19
5 2811.006 422.573 84.97 0.15
7.5 2811.006 517.106 81.60 0.18
10 2811.006 566.653 79.84 0.20
15 2811.006 618.582 77.99 0.22
20 2811.006 983.21 65.02 0.35
Table B6: Data of effect of surfactant concentration (Experimental conditions: [Cyanex
302] = 0.05 M, agitation speed = 250 rpm, sample = real photographic waste, and
stripping agent = 1.0 M thiourea in 1.0 M H2SO4, diluent = kerosene, and [Span 80]
(w/v) = (a) 1%, (b) 2%, (c) 3%, (d) 5%, and (e) 7%.
(a) 1% Span 80
Time Original (ppm)
Aqueous
(ppm) % extracted Ce/Co
0 2092.09 2092.09 0.00 1.00
1 2092.09 472.249 77.43 0.23
3 2092.09 113.084 94.59 0.05
5 2092.09 109.143 94.78 0.05
7.5 2092.09 141.567 93.23 0.07
10 2092.09 233.145 88.86 0.11
15 2092.09 300.581 85.63 0.14
20 2092.09 486.278 76.76 0.23
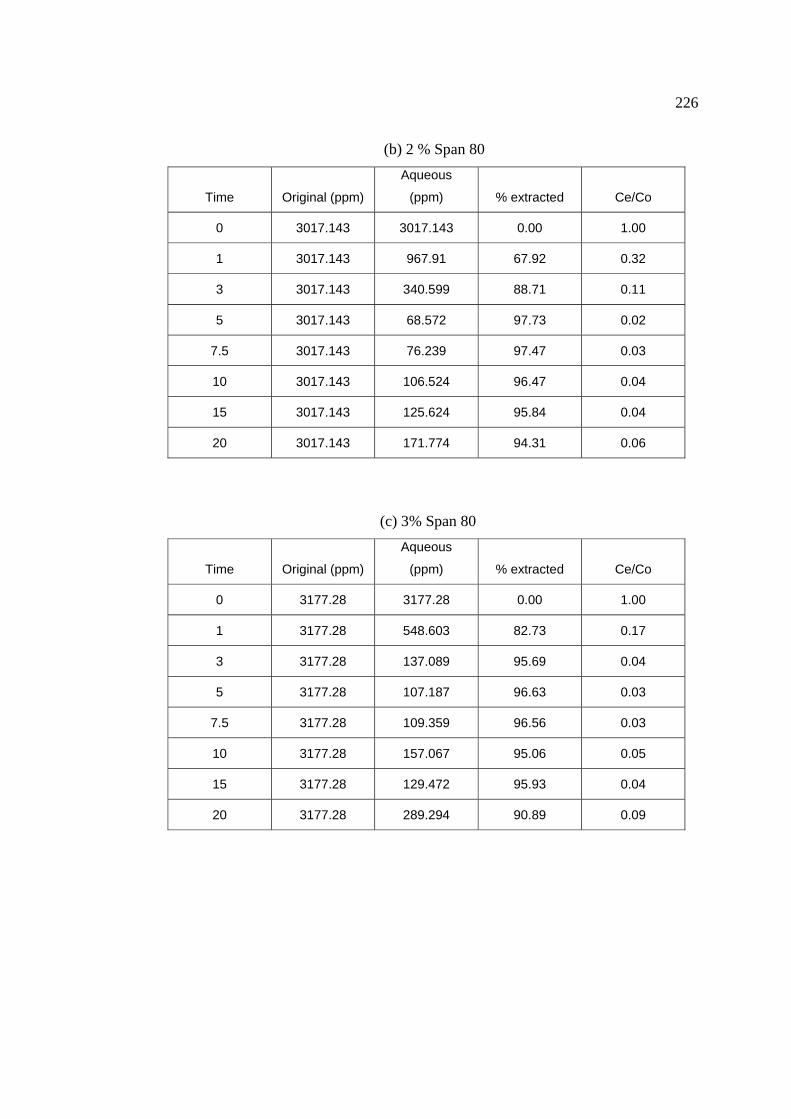
226
(b) 2 % Span 80
Time Original (ppm)
Aqueous
(ppm) % extracted Ce/Co
0 3017.143 3017.143 0.00 1.00
1 3017.143 967.91 67.92 0.32
3 3017.143 340.599 88.71 0.11
5 3017.143 68.572 97.73 0.02
7.5 3017.143 76.239 97.47 0.03
10 3017.143 106.524 96.47 0.04
15 3017.143 125.624 95.84 0.04
20 3017.143 171.774 94.31 0.06
(c) 3% Span 80
Time Original (ppm)
Aqueous
(ppm) % extracted Ce/Co
0 3177.28 3177.28 0.00 1.00
1 3177.28 548.603 82.73 0.17
3 3177.28 137.089 95.69 0.04
5 3177.28 107.187 96.63 0.03
7.5 3177.28 109.359 96.56 0.03
10 3177.28 157.067 95.06 0.05
15 3177.28 129.472 95.93 0.04
20 3177.28 289.294 90.89 0.09
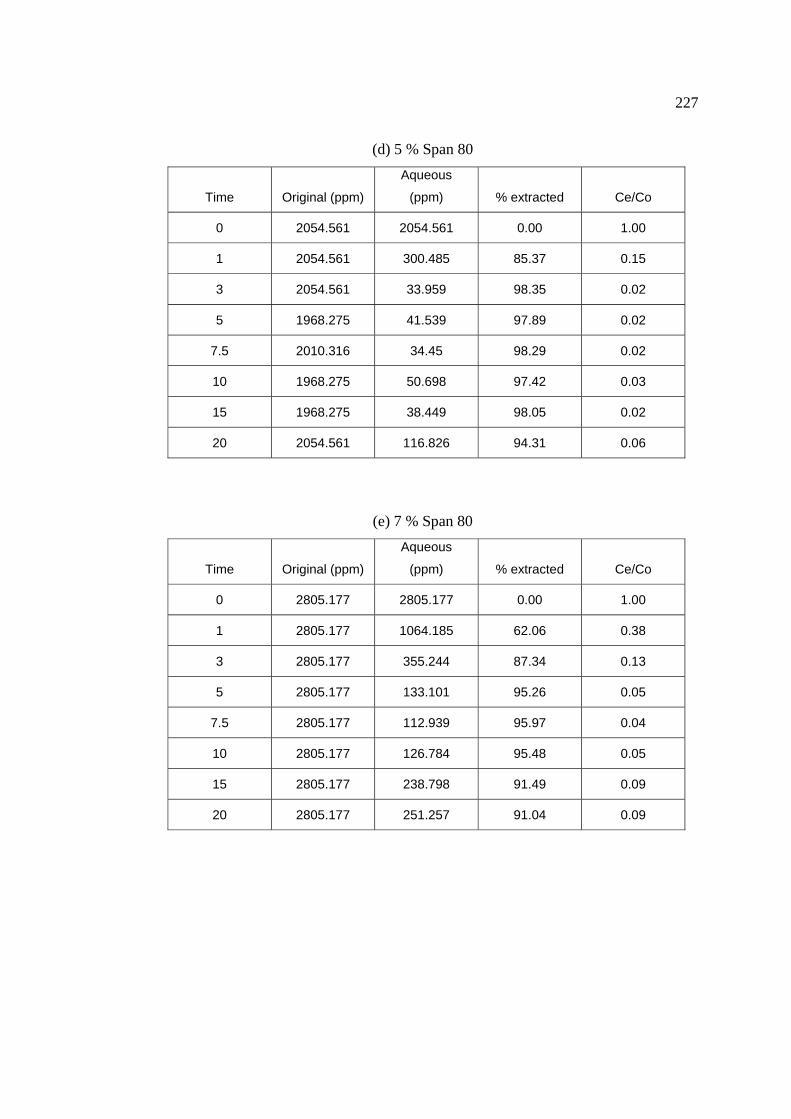
227
(d) 5 % Span 80
Time Original (ppm)
Aqueous
(ppm) % extracted Ce/Co
0 2054.561 2054.561 0.00 1.00
1 2054.561 300.485 85.37 0.15
3 2054.561 33.959 98.35 0.02
5 1968.275 41.539 97.89 0.02
7.5 2010.316 34.45 98.29 0.02
10 1968.275 50.698 97.42 0.03
15 1968.275 38.449 98.05 0.02
20 2054.561 116.826 94.31 0.06
(e) 7 % Span 80
Time Original (ppm)
Aqueous
(ppm) % extracted Ce/Co
0 2805.177 2805.177 0.00 1.00
1 2805.177 1064.185 62.06 0.38
3 2805.177 355.244 87.34 0.13
5 2805.177 133.101 95.26 0.05
7.5 2805.177 112.939 95.97 0.04
10 2805.177 126.784 95.48 0.05
15 2805.177 238.798 91.49 0.09
20 2805.177 251.257 91.04 0.09
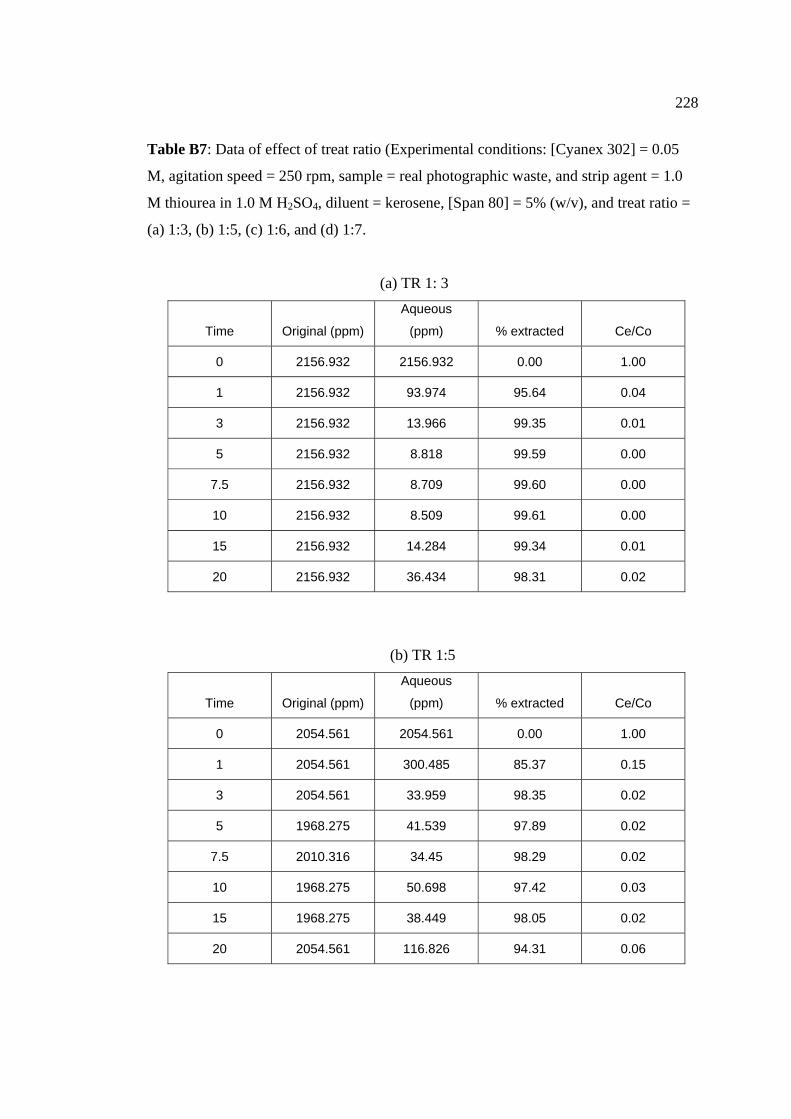
228
Table B7: Data of effect of treat ratio (Experimental conditions: [Cyanex 302] = 0.05
M, agitation speed = 250 rpm, sample = real photographic waste, and strip agent = 1.0
M thiourea in 1.0 M H2SO4, diluent = kerosene, [Span 80] = 5% (w/v), and treat ratio =
(a) 1:3, (b) 1:5, (c) 1:6, and (d) 1:7.
(a) TR 1: 3
Time Original (ppm)
Aqueous
(ppm) % extracted Ce/Co
0 2156.932 2156.932 0.00 1.00
1 2156.932 93.974 95.64 0.04
3 2156.932 13.966 99.35 0.01
5 2156.932 8.818 99.59 0.00
7.5 2156.932 8.709 99.60 0.00
10 2156.932 8.509 99.61 0.00
15 2156.932 14.284 99.34 0.01
20 2156.932 36.434 98.31 0.02
(b) TR 1:5
Time Original (ppm)
Aqueous
(ppm) % extracted Ce/Co
0 2054.561 2054.561 0.00 1.00
1 2054.561 300.485 85.37 0.15
3 2054.561 33.959 98.35 0.02
5 1968.275 41.539 97.89 0.02
7.5 2010.316 34.45 98.29 0.02
10 1968.275 50.698 97.42 0.03
15 1968.275 38.449 98.05 0.02
20 2054.561 116.826 94.31 0.06
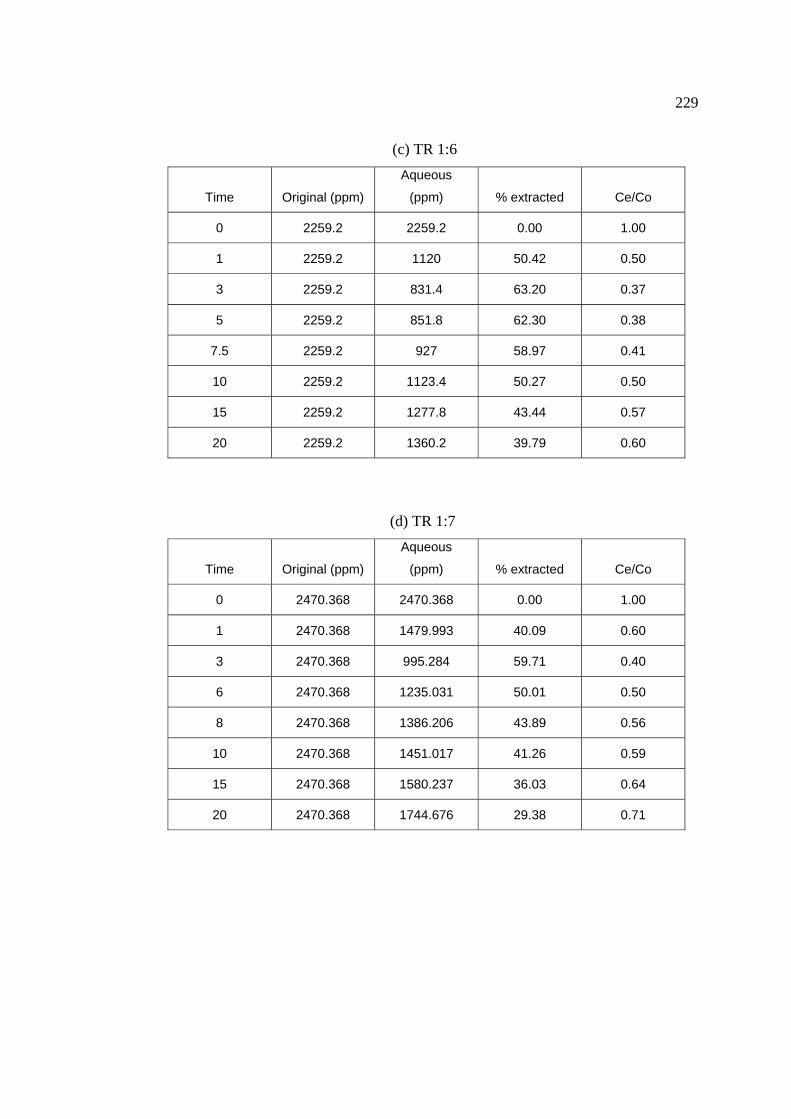
229
(c) TR 1:6
Time Original (ppm)
Aqueous
(ppm) % extracted Ce/Co
0 2259.2 2259.2 0.00 1.00
1 2259.2 1120 50.42 0.50
3 2259.2 831.4 63.20 0.37
5 2259.2 851.8 62.30 0.38
7.5 2259.2 927 58.97 0.41
10 2259.2 1123.4 50.27 0.50
15 2259.2 1277.8 43.44 0.57
20 2259.2 1360.2 39.79 0.60
(d) TR 1:7
Time Original (ppm)
Aqueous
(ppm) % extracted Ce/Co
0 2470.368 2470.368 0.00 1.00
1 2470.368 1479.993 40.09 0.60
3 2470.368 995.284 59.71 0.40
6 2470.368 1235.031 50.01 0.50
8 2470.368 1386.206 43.89 0.56
10 2470.368 1451.017 41.26 0.59
15 2470.368 1580.237 36.03 0.64
20 2470.368 1744.676 29.38 0.71
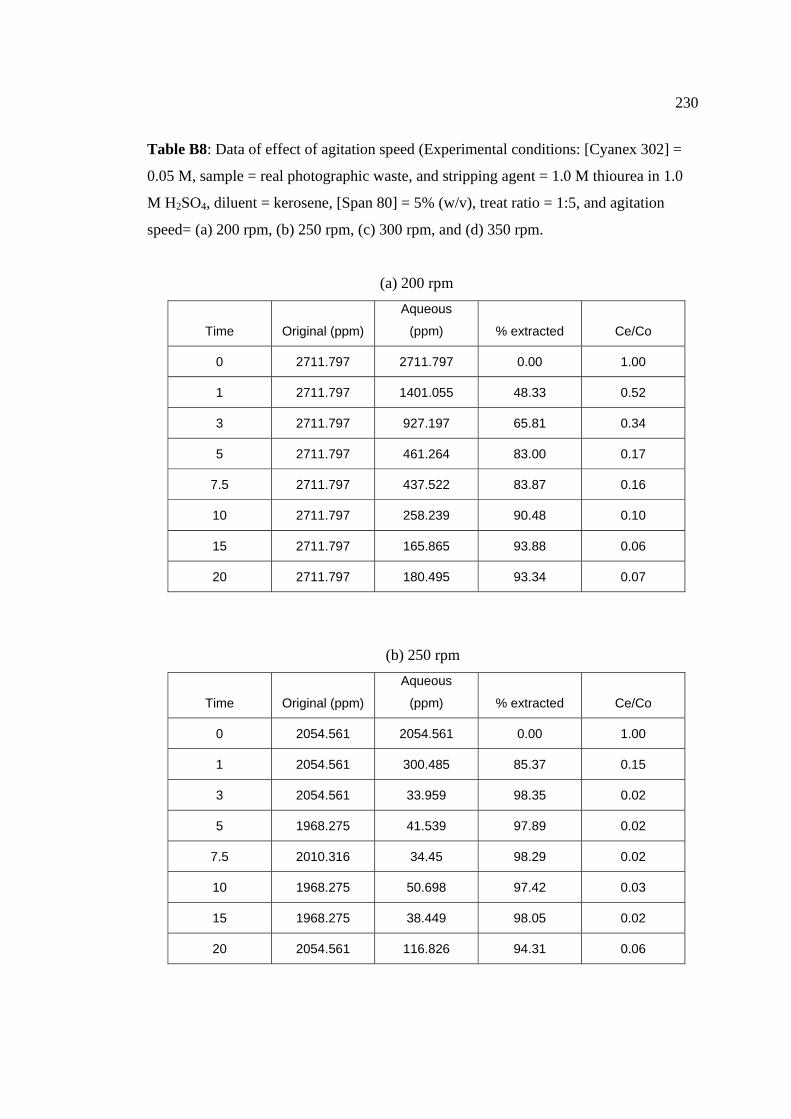
230
Table B8: Data of effect of agitation speed (Experimental conditions: [Cyanex 302] =
0.05 M, sample = real photographic waste, and stripping agent = 1.0 M thiourea in 1.0
M H2SO4, diluent = kerosene, [Span 80] = 5% (w/v), treat ratio = 1:5, and agitation
speed= (a) 200 rpm, (b) 250 rpm, (c) 300 rpm, and (d) 350 rpm.
(a) 200 rpm
Time Original (ppm)
Aqueous
(ppm) % extracted Ce/Co
0 2711.797 2711.797 0.00 1.00
1 2711.797 1401.055 48.33 0.52
3 2711.797 927.197 65.81 0.34
5 2711.797 461.264 83.00 0.17
7.5 2711.797 437.522 83.87 0.16
10 2711.797 258.239 90.48 0.10
15 2711.797 165.865 93.88 0.06
20 2711.797 180.495 93.34 0.07
(b) 250 rpm
Time Original (ppm)
Aqueous
(ppm) % extracted Ce/Co
0 2054.561 2054.561 0.00 1.00
1 2054.561 300.485 85.37 0.15
3 2054.561 33.959 98.35 0.02
5 1968.275 41.539 97.89 0.02
7.5 2010.316 34.45 98.29 0.02
10 1968.275 50.698 97.42 0.03
15 1968.275 38.449 98.05 0.02
20 2054.561 116.826 94.31 0.06
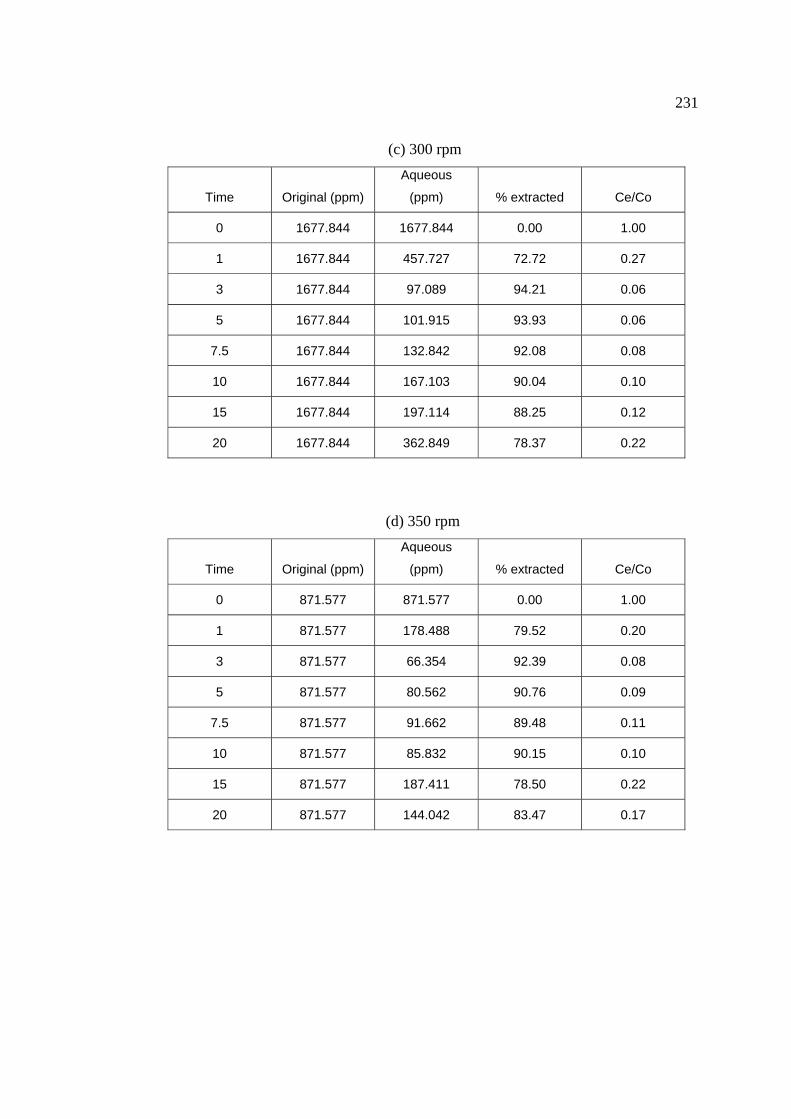
231
(c) 300 rpm
Time Original (ppm)
Aqueous
(ppm) % extracted Ce/Co
0 1677.844 1677.844 0.00 1.00
1 1677.844 457.727 72.72 0.27
3 1677.844 97.089 94.21 0.06
5 1677.844 101.915 93.93 0.06
7.5 1677.844 132.842 92.08 0.08
10 1677.844 167.103 90.04 0.10
15 1677.844 197.114 88.25 0.12
20 1677.844 362.849 78.37 0.22
(d) 350 rpm
Time Original (ppm)
Aqueous
(ppm) % extracted Ce/Co
0 871.577 871.577 0.00 1.00
1 871.577 178.488 79.52 0.20
3 871.577 66.354 92.39 0.08
5 871.577 80.562 90.76 0.09
7.5 871.577 91.662 89.48 0.11
10 871.577 85.832 90.15 0.10
15 871.577 187.411 78.50 0.22
20 871.577 144.042 83.47 0.17
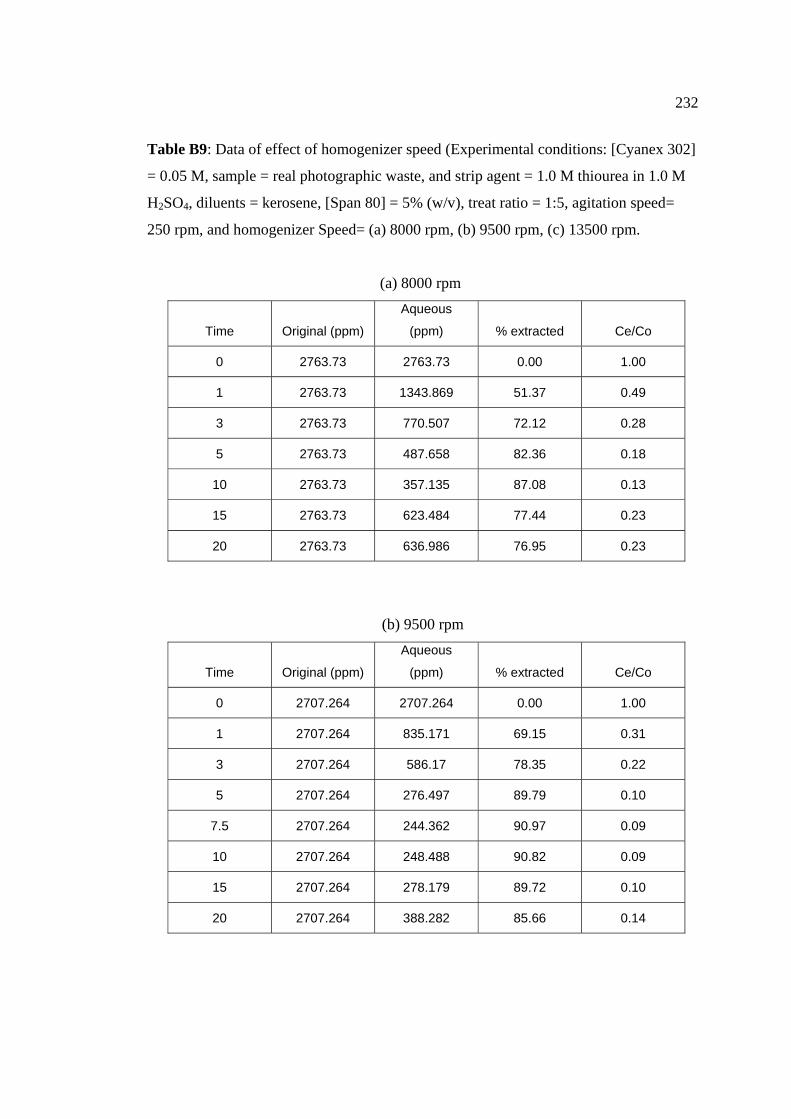
232
Table B9: Data of effect of homogenizer speed (Experimental conditions: [Cyanex 302]
= 0.05 M, sample = real photographic waste, and strip agent = 1.0 M thiourea in 1.0 M
H2SO4, diluents = kerosene, [Span 80] = 5% (w/v), treat ratio = 1:5, agitation speed=
250 rpm, and homogenizer Speed= (a) 8000 rpm, (b) 9500 rpm, (c) 13500 rpm.
(a) 8000 rpm
Time Original (ppm)
Aqueous
(ppm) % extracted Ce/Co
0 2763.73 2763.73 0.00 1.00
1 2763.73 1343.869 51.37 0.49
3 2763.73 770.507 72.12 0.28
5 2763.73 487.658 82.36 0.18
10 2763.73 357.135 87.08 0.13
15 2763.73 623.484 77.44 0.23
20 2763.73 636.986 76.95 0.23
(b) 9500 rpm
Time Original (ppm)
Aqueous
(ppm) % extracted Ce/Co
0 2707.264 2707.264 0.00 1.00
1 2707.264 835.171 69.15 0.31
3 2707.264 586.17 78.35 0.22
5 2707.264 276.497 89.79 0.10
7.5 2707.264 244.362 90.97 0.09
10 2707.264 248.488 90.82 0.09
15 2707.264 278.179 89.72 0.10
20 2707.264 388.282 85.66 0.14
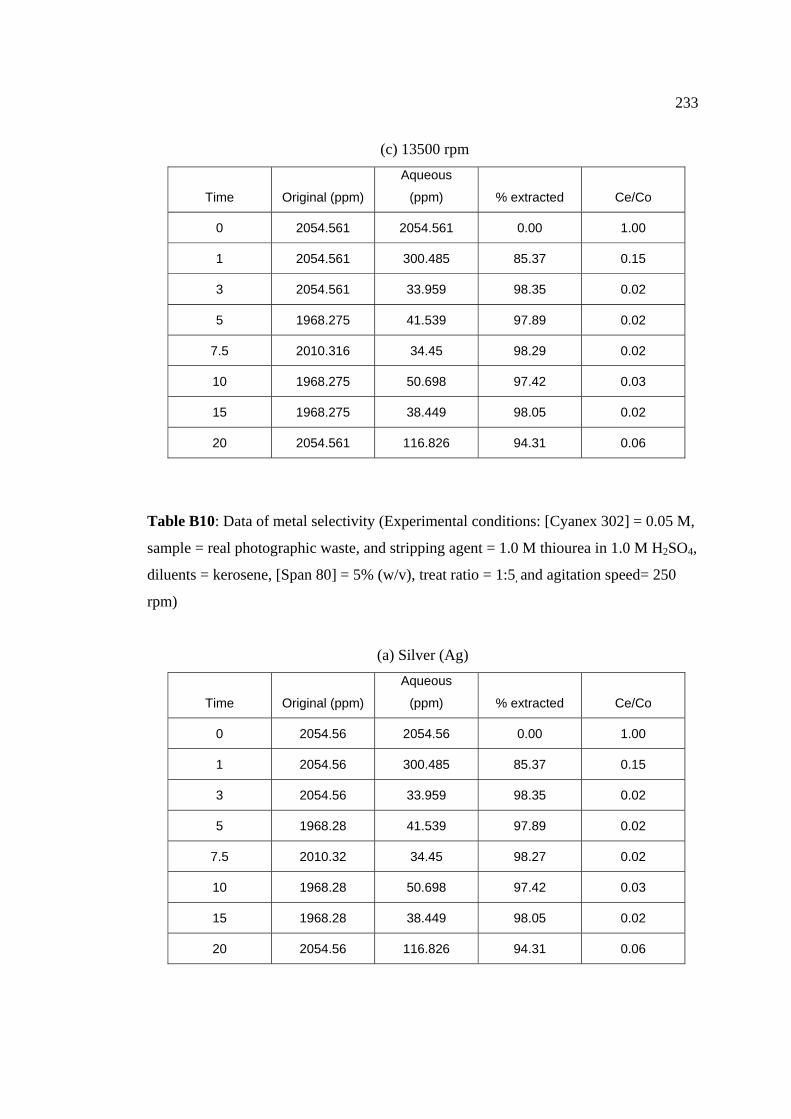
233
(c) 13500 rpm
Time Original (ppm)
Aqueous
(ppm) % extracted Ce/Co
0 2054.561 2054.561 0.00 1.00
1 2054.561 300.485 85.37 0.15
3 2054.561 33.959 98.35 0.02
5 1968.275 41.539 97.89 0.02
7.5 2010.316 34.45 98.29 0.02
10 1968.275 50.698 97.42 0.03
15 1968.275 38.449 98.05 0.02
20 2054.561 116.826 94.31 0.06
Table B10: Data of metal selectivity (Experimental conditions: [Cyanex 302] = 0.05 M,
sample = real photographic waste, and stripping agent = 1.0 M thiourea in 1.0 M H2SO4,
diluents = kerosene, [Span 80] = 5% (w/v), treat ratio = 1:5, and agitation speed= 250
rpm)
(a) Silver (Ag)
Time Original (ppm)
Aqueous
(ppm) % extracted Ce/Co
0 2054.56 2054.56 0.00 1.00
1 2054.56 300.485 85.37 0.15
3 2054.56 33.959 98.35 0.02
5 1968.28 41.539 97.89 0.02
7.5 2010.32 34.45 98.27 0.02
10 1968.28 50.698 97.42 0.03
15 1968.28 38.449 98.05 0.02
20 2054.56 116.826 94.31 0.06
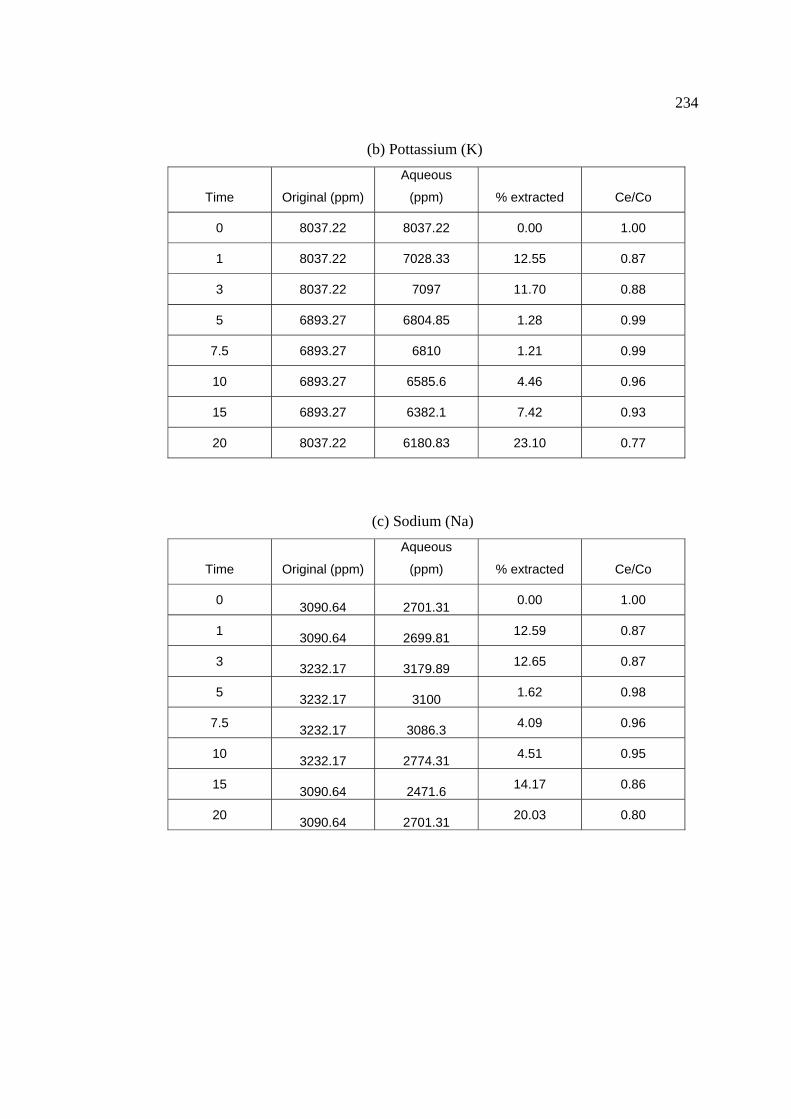
234
(b) Pottassium (K)
Time Original (ppm)
Aqueous
(ppm) % extracted Ce/Co
0 8037.22 8037.22 0.00 1.00
1 8037.22 7028.33 12.55 0.87
3 8037.22 7097 11.70 0.88
5 6893.27 6804.85 1.28 0.99
7.5 6893.27 6810 1.21 0.99
10 6893.27 6585.6 4.46 0.96
15 6893.27 6382.1 7.42 0.93
20 8037.22 6180.83 23.10 0.77
(c) Sodium (Na)
Time Original (ppm)
Aqueous
(ppm) % extracted Ce/Co
0 3090.64 2701.31 0.00 1.00
1 3090.64 2699.81 12.59 0.87
3 3232.17 3179.89 12.65 0.87
5 3232.17 3100 1.62 0.98
7.5 3232.17 3086.3 4.09 0.96
10 3232.17 2774.31 4.51 0.95
15 3090.64 2471.6 14.17 0.86
20 3090.64 2701.31 20.03 0.80
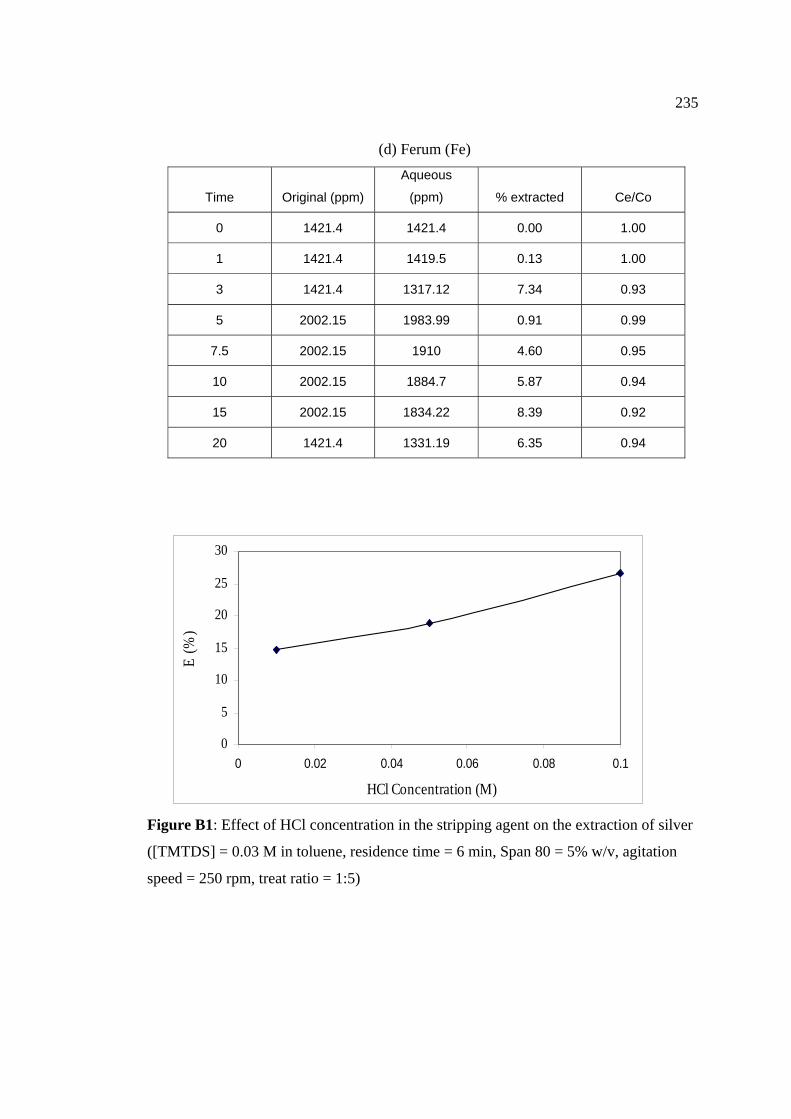
235
(d) Ferum (Fe)
Time Original (ppm)
Aqueous
(ppm) % extracted Ce/Co
0 1421.4 1421.4 0.00 1.00
1 1421.4 1419.5 0.13 1.00
3 1421.4 1317.12 7.34 0.93
5 2002.15 1983.99 0.91 0.99
7.5 2002.15 1910 4.60 0.95
10 2002.15 1884.7 5.87 0.94
15 2002.15 1834.22 8.39 0.92
20 1421.4 1331.19 6.35 0.94
0
5
10
15
20
25
30
0 0.02 0.04 0.06 0.08 0.1
HCl Concentration (M)
E (%
)
Figure B1: Effect of HCl concentration in the stripping agent on the extraction of silver
([TMTDS] = 0.03 M in toluene, residence time = 6 min, Span 80 = 5% w/v, agitation
speed = 250 rpm, treat ratio = 1:5)
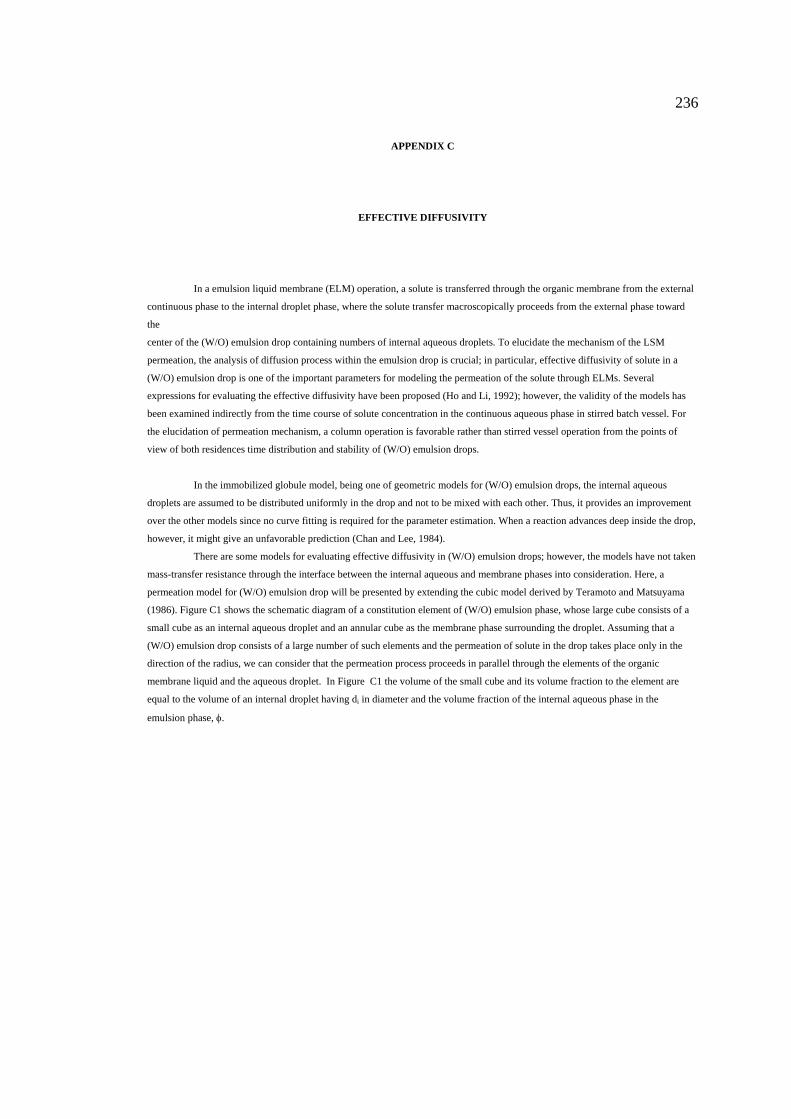
236
APPENDIX C
EFFECTIVE DIFFUSIVITY
In a emulsion liquid membrane (ELM) operation, a solute is transferred through the organic membrane from the external
continuous phase to the internal droplet phase, where the solute transfer macroscopically proceeds from the external phase toward
the
center of the (W/O) emulsion drop containing numbers of internal aqueous droplets. To elucidate the mechanism of the LSM
permeation, the analysis of diffusion process within the emulsion drop is crucial; in particular, effective diffusivity of solute in a
(W/O) emulsion drop is one of the important parameters for modeling the permeation of the solute through ELMs. Several
expressions for evaluating the effective diffusivity have been proposed (Ho and Li, 1992); however, the validity of the models has
been examined indirectly from the time course of solute concentration in the continuous aqueous phase in stirred batch vessel. For
the elucidation of permeation mechanism, a column operation is favorable rather than stirred vessel operation from the points of
view of both residences time distribution and stability of (W/O) emulsion drops.
In the immobilized globule model, being one of geometric models for (W/O) emulsion drops, the internal aqueous
droplets are assumed to be distributed uniformly in the drop and not to be mixed with each other. Thus, it provides an improvement
over the other models since no curve fitting is required for the parameter estimation. When a reaction advances deep inside the drop,
however, it might give an unfavorable prediction (Chan and Lee, 1984).
There are some models for evaluating effective diffusivity in (W/O) emulsion drops; however, the models have not taken
mass-transfer resistance through the interface between the internal aqueous and membrane phases into consideration. Here, a
permeation model for (W/O) emulsion drop will be presented by extending the cubic model derived by Teramoto and Matsuyama
(1986). Figure C1 shows the schematic diagram of a constitution element of (W/O) emulsion phase, whose large cube consists of a
small cube as an internal aqueous droplet and an annular cube as the membrane phase surrounding the droplet. Assuming that a
(W/O) emulsion drop consists of a large number of such elements and the permeation of solute in the drop takes place only in the
direction of the radius, we can consider that the permeation process proceeds in parallel through the elements of the organic
membrane liquid and the aqueous droplet. In Figure C1 the volume of the small cube and its volume fraction to the element are
equal to the volume of an internal droplet having di in diameter and the volume fraction of the internal aqueous phase in the
emulsion phase, φ.
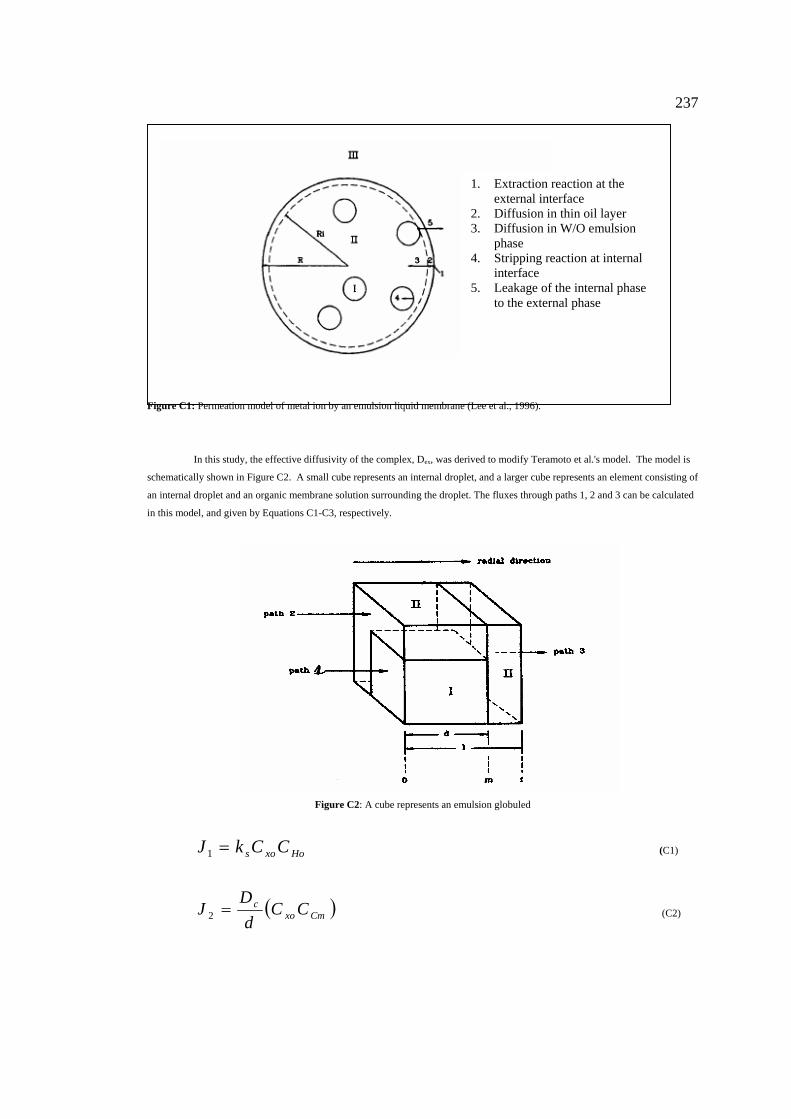
237
Figure C1: Permeation model of metal ion by an emulsion liquid membrane (Lee et al., 1996).
In this study, the effective diffusivity of the complex, Dex, was derived to modify Teramoto et al.'s model. The model is
schematically shown in Figure C2. A small cube represents an internal droplet, and a larger cube represents an element consisting of
an internal droplet and an organic membrane solution surrounding the droplet. The fluxes through paths 1, 2 and 3 can be calculated
in this model, and given by Equations C1-C3, respectively.
Figure C2: A cube represents an emulsion globuled
Hoxos CCkJ =1 (C1)
( )Cmxoc CC
dD
J =2 (C2)
1. Extraction reaction at the external interface
2. Diffusion in thin oil layer 3. Diffusion in W/O emulsion
phase 4. Stripping reaction at internal
interface 5. Leakage of the internal phase
to the external phase
238
( )CfCmc CCd
DJ −
−=
13 (C3)
Where the subscripts, o, m and f, represent the position in the model of Figure C2. Initially, Cco : ~ Ccm , and the contribution of J1 on
total mass transfer decreases rapidly with time. Also, CHo in Equation D1 is equal to CH, average hydrogen ion concentration in a
small cube, because the size of internal droplet is very small. So, Jl can be written as follows:
( )CmCoHs CCCkJ −=1 (C4)
Dc is the lumped parameter for the diffusivity of the silver-carrier complex in the membrane phase. This involves the circulating
effect of the internal aqueous droplets inside the emulsion drop. In reality, at low surfactant concentration like in the present
experimental conditions, the internal aqueous droplets are mobile to some degree inside the emulsion drop because of the low
viscosity of the membrane phase. Such mobility
corresponds to the increase in the diffusion rate of the complex in the membrane phase. From the model, the continuity of silver
complex at steady state is expressed by
( ) 32
222
122 JlJdlJdJl =−+= (C5)
and the effective diffusivity is defined by
( )CfCoeCC
eC CCl
Dr
CDJ −=
∂∂
= (C6)
From Equations C2-C5, the flux of the complex is obtained:
( )
( ) CHsC
CfCo
DRCkD
lCCJ 3/1
3/133/13/13/1
1
34
1/
φ
πφφφ µ
−+
⎟⎠⎞
⎜⎝⎛+−
−=
−
(C7)
where φ is the volume fraction of internal aqueous phase in an emulsion drop. Finally, the reciprocal of the denominator of
Equation C7 corresponds to DeC.
1
3/13/1
33/13/13/1
1
34
1
−
−
⎥⎥⎥⎥⎥
⎦
⎤
⎢⎢⎢⎢⎢
⎣
⎡
−+
⎟⎠⎞
⎜⎝⎛+−
= φπφφφ µR
DCk
DD
C
HsCeC (C8)
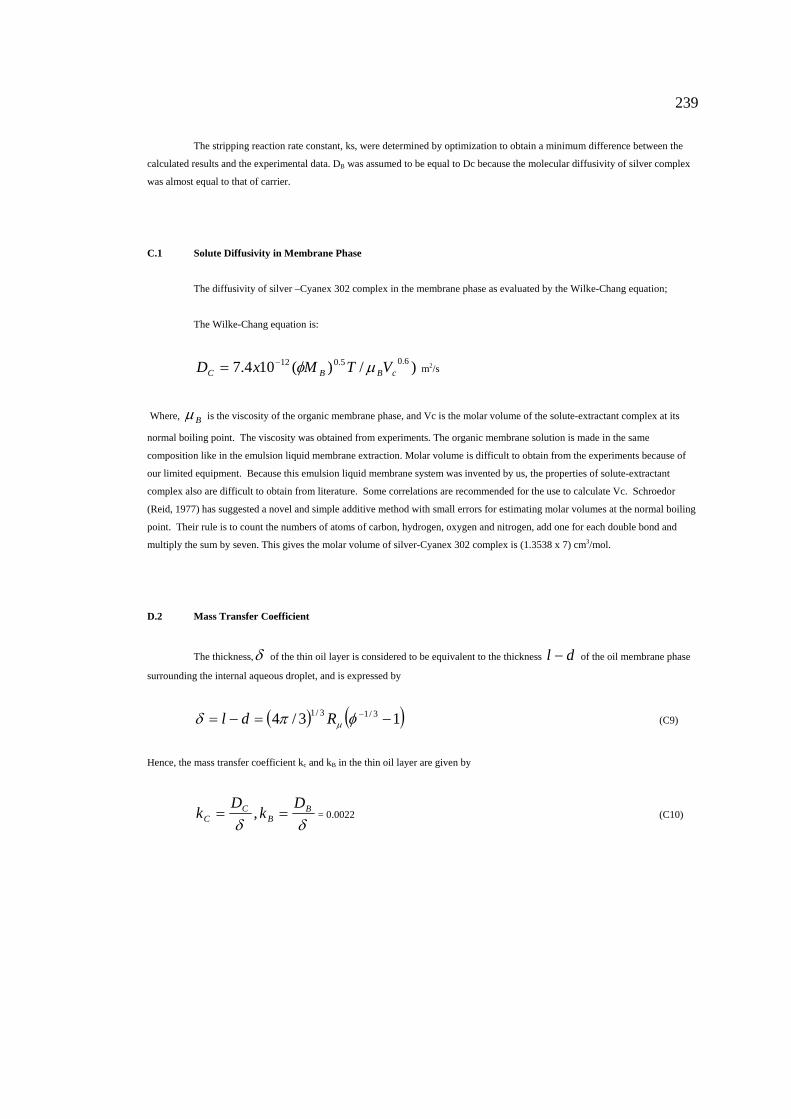
239
The stripping reaction rate constant, ks, were determined by optimization to obtain a minimum difference between the
calculated results and the experimental data. DB was assumed to be equal to Dc because the molecular diffusivity of silver complex
was almost equal to that of carrier.
C.1 Solute Diffusivity in Membrane Phase
The diffusivity of silver –Cyanex 302 complex in the membrane phase as evaluated by the Wilke-Chang equation;
The Wilke-Chang equation is:
)/)(104.7 6.05.012cBBC VTMxD µφ−= m2/s
Where, Bµ is the viscosity of the organic membrane phase, and Vc is the molar volume of the solute-extractant complex at its
normal boiling point. The viscosity was obtained from experiments. The organic membrane solution is made in the same
composition like in the emulsion liquid membrane extraction. Molar volume is difficult to obtain from the experiments because of
our limited equipment. Because this emulsion liquid membrane system was invented by us, the properties of solute-extractant
complex also are difficult to obtain from literature. Some correlations are recommended for the use to calculate Vc. Schroedor
(Reid, 1977) has suggested a novel and simple additive method with small errors for estimating molar volumes at the normal boiling
point. Their rule is to count the numbers of atoms of carbon, hydrogen, oxygen and nitrogen, add one for each double bond and
multiply the sum by seven. This gives the molar volume of silver-Cyanex 302 complex is (1.3538 x 7) cm3/mol.
D.2 Mass Transfer Coefficient
The thickness,δ of the thin oil layer is considered to be equivalent to the thickness dl − of the oil membrane phase
surrounding the internal aqueous droplet, and is expressed by
( ) ( )13/4 3/13/1 −=−= −φπδ µRdl (C9)
Hence, the mass transfer coefficient kc and kB in the thin oil layer are given by
δδB
BC
CD
kD
k == , = 0.0022 (C10)
240
APPENDIX D
SAUTER MEAN DIAMETER
In emulsion liquid membrane extraction, the emulsions are dispersed in the
external aqueous phase by agitation to disperse heterogeneous phases. A size
distribution of the emulsion globules is formed with mixing. The size distribution of
these emulsion globules depends on the mixer and the properties of emulsion. Many
trial, which include different compositions of the emulsion and mixing speeds are
required to find the size of emulsion droplets and globules at optimum condition of
emulsion liquid membrane system. However, only a few pictures were satisfy to analyze
using image analyzer.
The Sauter mean diameter is defined as follows:
( ) ( )∑∑= 2332 3/3 pp DDD (D1)
where Dp is the diameter of each droplet. When the emulsion liquid membrane is in the
extractor, the size of the emulsion globules in the extractor can be obtained by
photography. Then, Sauter mean diameter is calculated by its definition. The size of
emulsion globules at 250 rpm is 0.5 mm. However, for other speed the Reis and
Carvalho (2004) correlation was used to predict the size of emulsion globules.
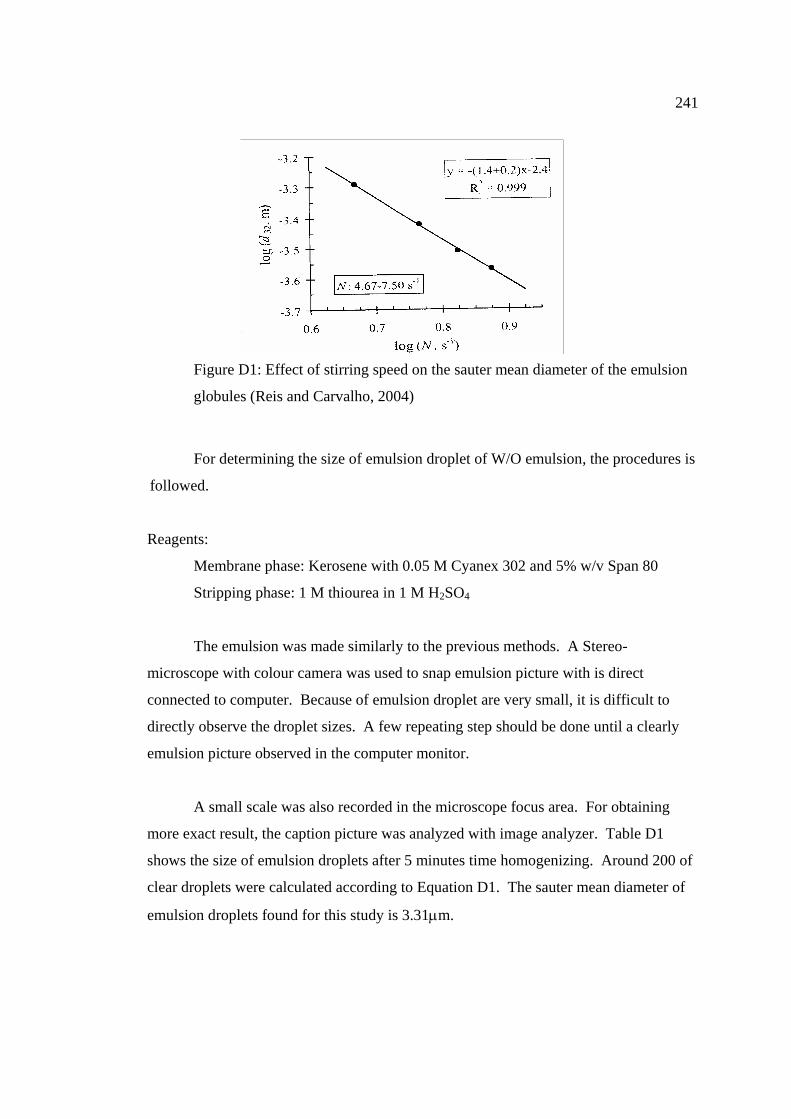
241
Figure D1: Effect of stirring speed on the sauter mean diameter of the emulsion
globules (Reis and Carvalho, 2004)
For determining the size of emulsion droplet of W/O emulsion, the procedures is
followed.
Reagents:
Membrane phase: Kerosene with 0.05 M Cyanex 302 and 5% w/v Span 80
Stripping phase: 1 M thiourea in 1 M H2SO4
The emulsion was made similarly to the previous methods. A Stereo-
microscope with colour camera was used to snap emulsion picture with is direct
connected to computer. Because of emulsion droplet are very small, it is difficult to
directly observe the droplet sizes. A few repeating step should be done until a clearly
emulsion picture observed in the computer monitor.
A small scale was also recorded in the microscope focus area. For obtaining
more exact result, the caption picture was analyzed with image analyzer. Table D1
shows the size of emulsion droplets after 5 minutes time homogenizing. Around 200 of
clear droplets were calculated according to Equation D1. The sauter mean diameter of
emulsion droplets found for this study is 3.31µm.
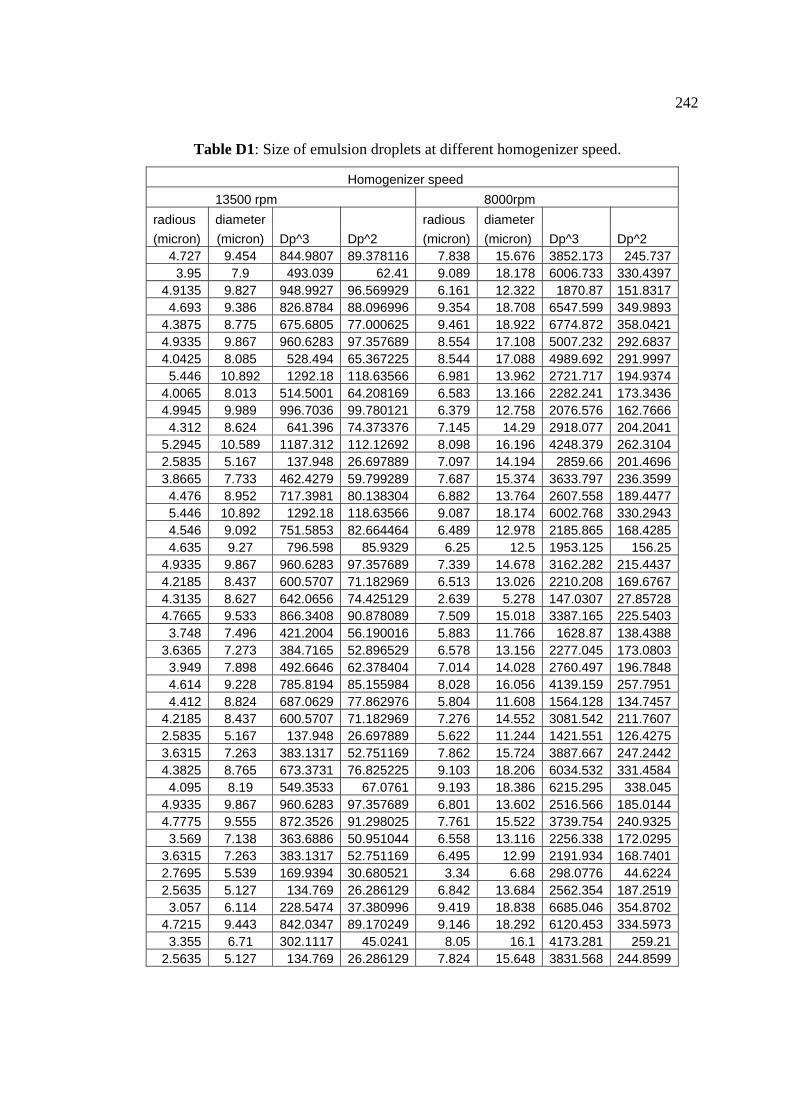
242
Table D1: Size of emulsion droplets at different homogenizer speed.
Homogenizer speed 13500 rpm 8000rpm radious diameter radious diameter (micron) (micron) Dp^3 Dp^2 (micron) (micron) Dp^3 Dp^2
4.727 9.454 844.9807 89.378116 7.838 15.676 3852.173 245.7373.95 7.9 493.039 62.41 9.089 18.178 6006.733 330.4397
4.9135 9.827 948.9927 96.569929 6.161 12.322 1870.87 151.83174.693 9.386 826.8784 88.096996 9.354 18.708 6547.599 349.9893
4.3875 8.775 675.6805 77.000625 9.461 18.922 6774.872 358.04214.9335 9.867 960.6283 97.357689 8.554 17.108 5007.232 292.68374.0425 8.085 528.494 65.367225 8.544 17.088 4989.692 291.99975.446 10.892 1292.18 118.63566 6.981 13.962 2721.717 194.9374
4.0065 8.013 514.5001 64.208169 6.583 13.166 2282.241 173.34364.9945 9.989 996.7036 99.780121 6.379 12.758 2076.576 162.76664.312 8.624 641.396 74.373376 7.145 14.29 2918.077 204.2041
5.2945 10.589 1187.312 112.12692 8.098 16.196 4248.379 262.31042.5835 5.167 137.948 26.697889 7.097 14.194 2859.66 201.46963.8665 7.733 462.4279 59.799289 7.687 15.374 3633.797 236.35994.476 8.952 717.3981 80.138304 6.882 13.764 2607.558 189.44775.446 10.892 1292.18 118.63566 9.087 18.174 6002.768 330.29434.546 9.092 751.5853 82.664464 6.489 12.978 2185.865 168.42854.635 9.27 796.598 85.9329 6.25 12.5 1953.125 156.25
4.9335 9.867 960.6283 97.357689 7.339 14.678 3162.282 215.44374.2185 8.437 600.5707 71.182969 6.513 13.026 2210.208 169.67674.3135 8.627 642.0656 74.425129 2.639 5.278 147.0307 27.857284.7665 9.533 866.3408 90.878089 7.509 15.018 3387.165 225.54033.748 7.496 421.2004 56.190016 5.883 11.766 1628.87 138.4388
3.6365 7.273 384.7165 52.896529 6.578 13.156 2277.045 173.08033.949 7.898 492.6646 62.378404 7.014 14.028 2760.497 196.78484.614 9.228 785.8194 85.155984 8.028 16.056 4139.159 257.79514.412 8.824 687.0629 77.862976 5.804 11.608 1564.128 134.7457
4.2185 8.437 600.5707 71.182969 7.276 14.552 3081.542 211.76072.5835 5.167 137.948 26.697889 5.622 11.244 1421.551 126.42753.6315 7.263 383.1317 52.751169 7.862 15.724 3887.667 247.24424.3825 8.765 673.3731 76.825225 9.103 18.206 6034.532 331.45844.095 8.19 549.3533 67.0761 9.193 18.386 6215.295 338.045
4.9335 9.867 960.6283 97.357689 6.801 13.602 2516.566 185.01444.7775 9.555 872.3526 91.298025 7.761 15.522 3739.754 240.93253.569 7.138 363.6886 50.951044 6.558 13.116 2256.338 172.0295
3.6315 7.263 383.1317 52.751169 6.495 12.99 2191.934 168.74012.7695 5.539 169.9394 30.680521 3.34 6.68 298.0776 44.62242.5635 5.127 134.769 26.286129 6.842 13.684 2562.354 187.25193.057 6.114 228.5474 37.380996 9.419 18.838 6685.046 354.8702
4.7215 9.443 842.0347 89.170249 9.146 18.292 6120.453 334.59733.355 6.71 302.1117 45.0241 8.05 16.1 4173.281 259.21
2.5635 5.127 134.769 26.286129 7.824 15.648 3831.568 244.8599
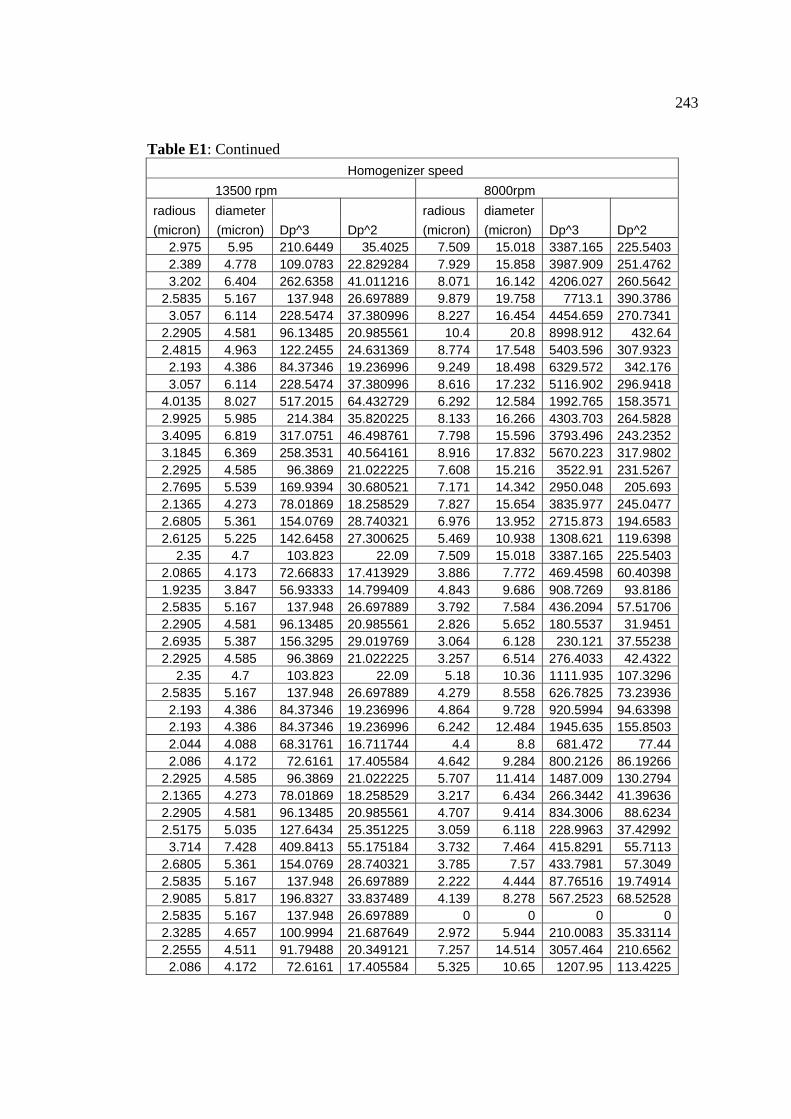
243
Table E1: Continued Homogenizer speed 13500 rpm 8000rpm radious diameter radious diameter (micron) (micron) Dp^3 Dp^2 (micron) (micron) Dp^3 Dp^2
2.975 5.95 210.6449 35.4025 7.509 15.018 3387.165 225.54032.389 4.778 109.0783 22.829284 7.929 15.858 3987.909 251.47623.202 6.404 262.6358 41.011216 8.071 16.142 4206.027 260.5642
2.5835 5.167 137.948 26.697889 9.879 19.758 7713.1 390.37863.057 6.114 228.5474 37.380996 8.227 16.454 4454.659 270.7341
2.2905 4.581 96.13485 20.985561 10.4 20.8 8998.912 432.642.4815 4.963 122.2455 24.631369 8.774 17.548 5403.596 307.93232.193 4.386 84.37346 19.236996 9.249 18.498 6329.572 342.1763.057 6.114 228.5474 37.380996 8.616 17.232 5116.902 296.9418
4.0135 8.027 517.2015 64.432729 6.292 12.584 1992.765 158.35712.9925 5.985 214.384 35.820225 8.133 16.266 4303.703 264.58283.4095 6.819 317.0751 46.498761 7.798 15.596 3793.496 243.23523.1845 6.369 258.3531 40.564161 8.916 17.832 5670.223 317.98022.2925 4.585 96.3869 21.022225 7.608 15.216 3522.91 231.52672.7695 5.539 169.9394 30.680521 7.171 14.342 2950.048 205.6932.1365 4.273 78.01869 18.258529 7.827 15.654 3835.977 245.04772.6805 5.361 154.0769 28.740321 6.976 13.952 2715.873 194.65832.6125 5.225 142.6458 27.300625 5.469 10.938 1308.621 119.6398
2.35 4.7 103.823 22.09 7.509 15.018 3387.165 225.54032.0865 4.173 72.66833 17.413929 3.886 7.772 469.4598 60.403981.9235 3.847 56.93333 14.799409 4.843 9.686 908.7269 93.81862.5835 5.167 137.948 26.697889 3.792 7.584 436.2094 57.517062.2905 4.581 96.13485 20.985561 2.826 5.652 180.5537 31.94512.6935 5.387 156.3295 29.019769 3.064 6.128 230.121 37.552382.2925 4.585 96.3869 21.022225 3.257 6.514 276.4033 42.4322
2.35 4.7 103.823 22.09 5.18 10.36 1111.935 107.32962.5835 5.167 137.948 26.697889 4.279 8.558 626.7825 73.239362.193 4.386 84.37346 19.236996 4.864 9.728 920.5994 94.633982.193 4.386 84.37346 19.236996 6.242 12.484 1945.635 155.85032.044 4.088 68.31761 16.711744 4.4 8.8 681.472 77.442.086 4.172 72.6161 17.405584 4.642 9.284 800.2126 86.19266
2.2925 4.585 96.3869 21.022225 5.707 11.414 1487.009 130.27942.1365 4.273 78.01869 18.258529 3.217 6.434 266.3442 41.396362.2905 4.581 96.13485 20.985561 4.707 9.414 834.3006 88.62342.5175 5.035 127.6434 25.351225 3.059 6.118 228.9963 37.429923.714 7.428 409.8413 55.175184 3.732 7.464 415.8291 55.7113
2.6805 5.361 154.0769 28.740321 3.785 7.57 433.7981 57.30492.5835 5.167 137.948 26.697889 2.222 4.444 87.76516 19.749142.9085 5.817 196.8327 33.837489 4.139 8.278 567.2523 68.525282.5835 5.167 137.948 26.697889 0 0 0 02.3285 4.657 100.9994 21.687649 2.972 5.944 210.0083 35.331142.2555 4.511 91.79488 20.349121 7.257 14.514 3057.464 210.65622.086 4.172 72.6161 17.405584 5.325 10.65 1207.95 113.4225
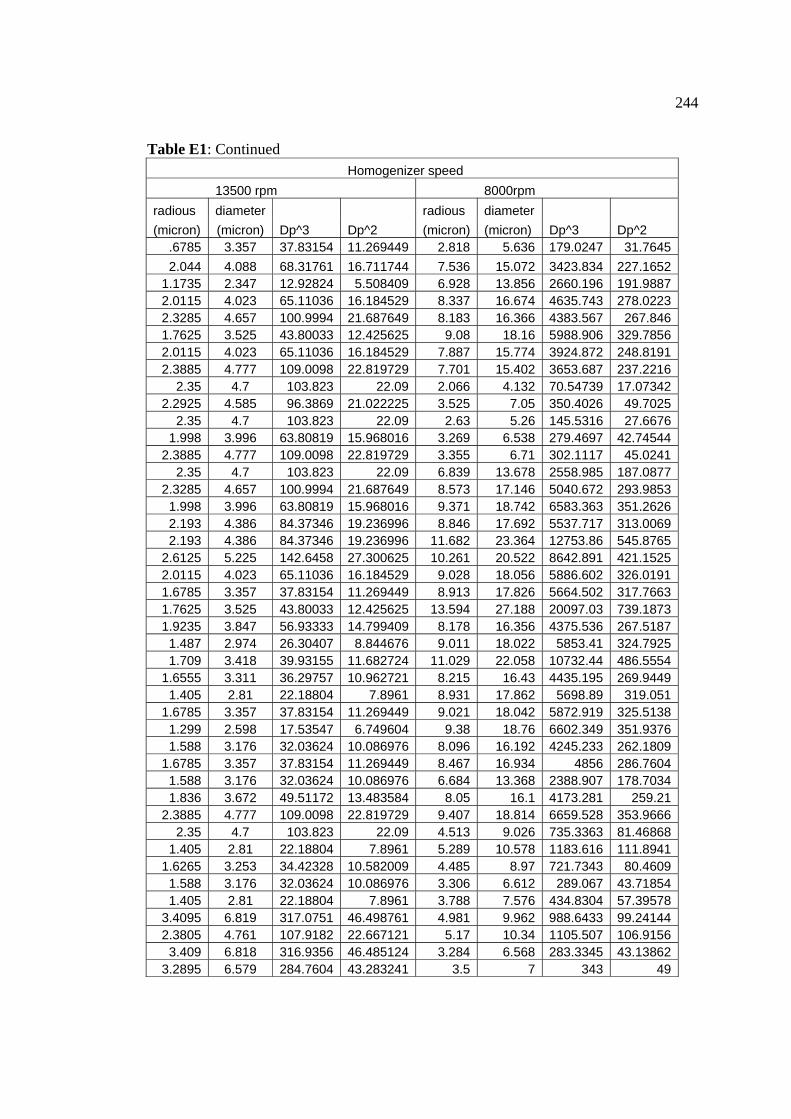
244
Table E1: Continued Homogenizer speed 13500 rpm 8000rpm radious diameter radious diameter (micron) (micron) Dp^3 Dp^2 (micron) (micron) Dp^3 Dp^2
.6785 3.357 37.83154 11.269449 2.818 5.636 179.0247 31.76452.044 4.088 68.31761 16.711744 7.536 15.072 3423.834 227.1652
1.1735 2.347 12.92824 5.508409 6.928 13.856 2660.196 191.98872.0115 4.023 65.11036 16.184529 8.337 16.674 4635.743 278.02232.3285 4.657 100.9994 21.687649 8.183 16.366 4383.567 267.8461.7625 3.525 43.80033 12.425625 9.08 18.16 5988.906 329.78562.0115 4.023 65.11036 16.184529 7.887 15.774 3924.872 248.81912.3885 4.777 109.0098 22.819729 7.701 15.402 3653.687 237.2216
2.35 4.7 103.823 22.09 2.066 4.132 70.54739 17.073422.2925 4.585 96.3869 21.022225 3.525 7.05 350.4026 49.7025
2.35 4.7 103.823 22.09 2.63 5.26 145.5316 27.66761.998 3.996 63.80819 15.968016 3.269 6.538 279.4697 42.74544
2.3885 4.777 109.0098 22.819729 3.355 6.71 302.1117 45.02412.35 4.7 103.823 22.09 6.839 13.678 2558.985 187.0877
2.3285 4.657 100.9994 21.687649 8.573 17.146 5040.672 293.98531.998 3.996 63.80819 15.968016 9.371 18.742 6583.363 351.26262.193 4.386 84.37346 19.236996 8.846 17.692 5537.717 313.00692.193 4.386 84.37346 19.236996 11.682 23.364 12753.86 545.8765
2.6125 5.225 142.6458 27.300625 10.261 20.522 8642.891 421.15252.0115 4.023 65.11036 16.184529 9.028 18.056 5886.602 326.01911.6785 3.357 37.83154 11.269449 8.913 17.826 5664.502 317.76631.7625 3.525 43.80033 12.425625 13.594 27.188 20097.03 739.18731.9235 3.847 56.93333 14.799409 8.178 16.356 4375.536 267.51871.487 2.974 26.30407 8.844676 9.011 18.022 5853.41 324.79251.709 3.418 39.93155 11.682724 11.029 22.058 10732.44 486.5554
1.6555 3.311 36.29757 10.962721 8.215 16.43 4435.195 269.94491.405 2.81 22.18804 7.8961 8.931 17.862 5698.89 319.051
1.6785 3.357 37.83154 11.269449 9.021 18.042 5872.919 325.51381.299 2.598 17.53547 6.749604 9.38 18.76 6602.349 351.93761.588 3.176 32.03624 10.086976 8.096 16.192 4245.233 262.1809
1.6785 3.357 37.83154 11.269449 8.467 16.934 4856 286.76041.588 3.176 32.03624 10.086976 6.684 13.368 2388.907 178.70341.836 3.672 49.51172 13.483584 8.05 16.1 4173.281 259.21
2.3885 4.777 109.0098 22.819729 9.407 18.814 6659.528 353.96662.35 4.7 103.823 22.09 4.513 9.026 735.3363 81.46868
1.405 2.81 22.18804 7.8961 5.289 10.578 1183.616 111.89411.6265 3.253 34.42328 10.582009 4.485 8.97 721.7343 80.46091.588 3.176 32.03624 10.086976 3.306 6.612 289.067 43.718541.405 2.81 22.18804 7.8961 3.788 7.576 434.8304 57.39578
3.4095 6.819 317.0751 46.498761 4.981 9.962 988.6433 99.241442.3805 4.761 107.9182 22.667121 5.17 10.34 1105.507 106.91563.409 6.818 316.9356 46.485124 3.284 6.568 283.3345 43.13862
3.2895 6.579 284.7604 43.283241 3.5 7 343 49
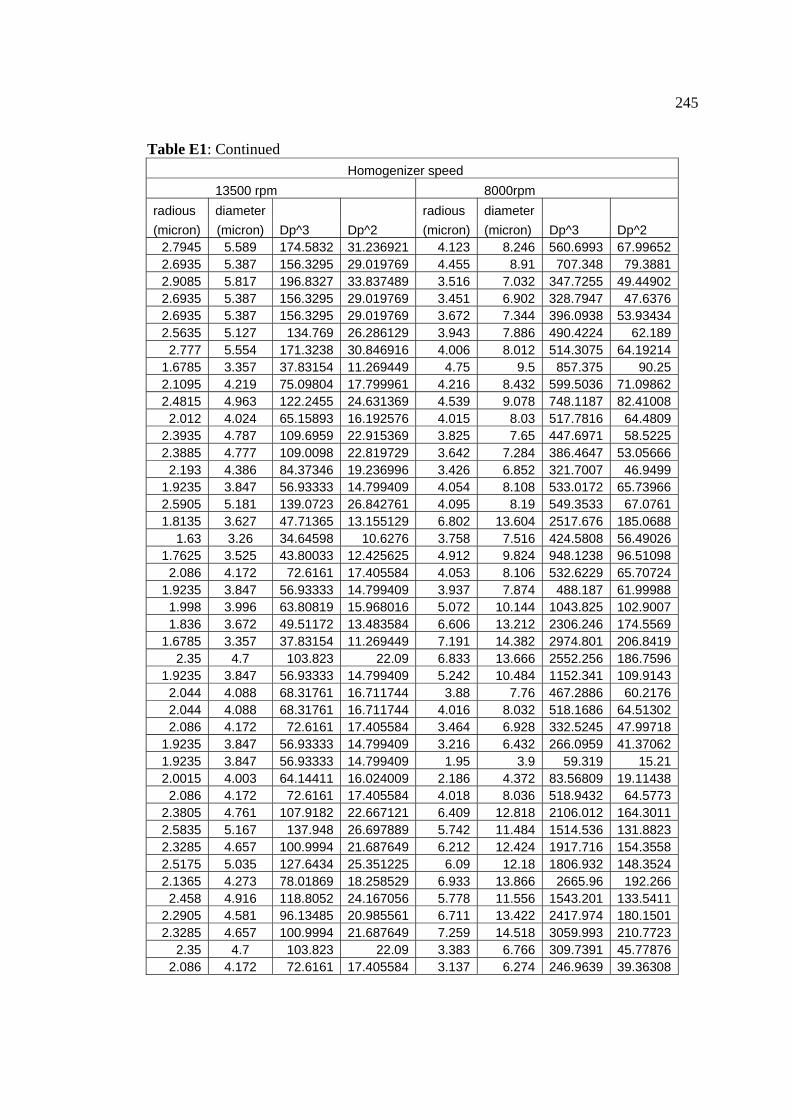
245
Table E1: Continued Homogenizer speed 13500 rpm 8000rpm radious diameter radious diameter (micron) (micron) Dp^3 Dp^2 (micron) (micron) Dp^3 Dp^2
2.7945 5.589 174.5832 31.236921 4.123 8.246 560.6993 67.996522.6935 5.387 156.3295 29.019769 4.455 8.91 707.348 79.38812.9085 5.817 196.8327 33.837489 3.516 7.032 347.7255 49.449022.6935 5.387 156.3295 29.019769 3.451 6.902 328.7947 47.63762.6935 5.387 156.3295 29.019769 3.672 7.344 396.0938 53.934342.5635 5.127 134.769 26.286129 3.943 7.886 490.4224 62.1892.777 5.554 171.3238 30.846916 4.006 8.012 514.3075 64.19214
1.6785 3.357 37.83154 11.269449 4.75 9.5 857.375 90.252.1095 4.219 75.09804 17.799961 4.216 8.432 599.5036 71.098622.4815 4.963 122.2455 24.631369 4.539 9.078 748.1187 82.410082.012 4.024 65.15893 16.192576 4.015 8.03 517.7816 64.4809
2.3935 4.787 109.6959 22.915369 3.825 7.65 447.6971 58.52252.3885 4.777 109.0098 22.819729 3.642 7.284 386.4647 53.056662.193 4.386 84.37346 19.236996 3.426 6.852 321.7007 46.9499
1.9235 3.847 56.93333 14.799409 4.054 8.108 533.0172 65.739662.5905 5.181 139.0723 26.842761 4.095 8.19 549.3533 67.07611.8135 3.627 47.71365 13.155129 6.802 13.604 2517.676 185.0688
1.63 3.26 34.64598 10.6276 3.758 7.516 424.5808 56.490261.7625 3.525 43.80033 12.425625 4.912 9.824 948.1238 96.510982.086 4.172 72.6161 17.405584 4.053 8.106 532.6229 65.70724
1.9235 3.847 56.93333 14.799409 3.937 7.874 488.187 61.999881.998 3.996 63.80819 15.968016 5.072 10.144 1043.825 102.90071.836 3.672 49.51172 13.483584 6.606 13.212 2306.246 174.5569
1.6785 3.357 37.83154 11.269449 7.191 14.382 2974.801 206.84192.35 4.7 103.823 22.09 6.833 13.666 2552.256 186.7596
1.9235 3.847 56.93333 14.799409 5.242 10.484 1152.341 109.91432.044 4.088 68.31761 16.711744 3.88 7.76 467.2886 60.21762.044 4.088 68.31761 16.711744 4.016 8.032 518.1686 64.513022.086 4.172 72.6161 17.405584 3.464 6.928 332.5245 47.99718
1.9235 3.847 56.93333 14.799409 3.216 6.432 266.0959 41.370621.9235 3.847 56.93333 14.799409 1.95 3.9 59.319 15.212.0015 4.003 64.14411 16.024009 2.186 4.372 83.56809 19.114382.086 4.172 72.6161 17.405584 4.018 8.036 518.9432 64.5773
2.3805 4.761 107.9182 22.667121 6.409 12.818 2106.012 164.30112.5835 5.167 137.948 26.697889 5.742 11.484 1514.536 131.88232.3285 4.657 100.9994 21.687649 6.212 12.424 1917.716 154.35582.5175 5.035 127.6434 25.351225 6.09 12.18 1806.932 148.35242.1365 4.273 78.01869 18.258529 6.933 13.866 2665.96 192.2662.458 4.916 118.8052 24.167056 5.778 11.556 1543.201 133.5411
2.2905 4.581 96.13485 20.985561 6.711 13.422 2417.974 180.15012.3285 4.657 100.9994 21.687649 7.259 14.518 3059.993 210.7723
2.35 4.7 103.823 22.09 3.383 6.766 309.7391 45.778762.086 4.172 72.6161 17.405584 3.137 6.274 246.9639 39.36308
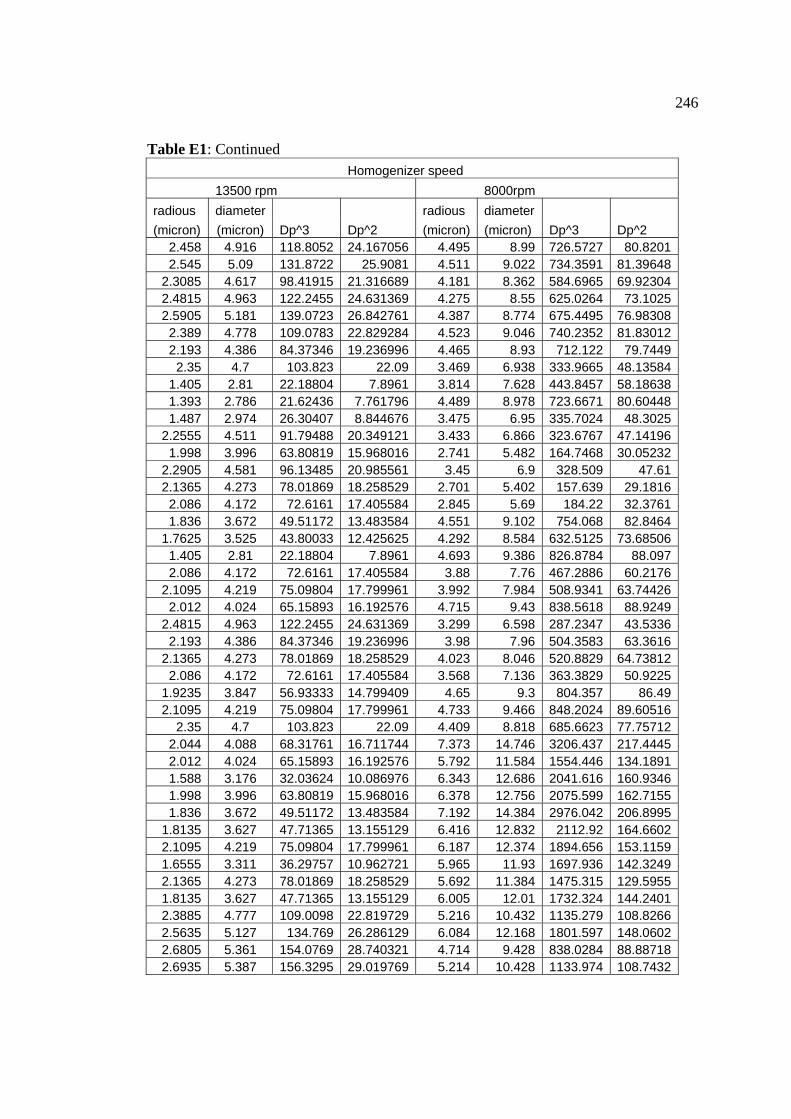
246
Table E1: Continued Homogenizer speed 13500 rpm 8000rpm radious diameter radious diameter (micron) (micron) Dp^3 Dp^2 (micron) (micron) Dp^3 Dp^2
2.458 4.916 118.8052 24.167056 4.495 8.99 726.5727 80.82012.545 5.09 131.8722 25.9081 4.511 9.022 734.3591 81.39648
2.3085 4.617 98.41915 21.316689 4.181 8.362 584.6965 69.923042.4815 4.963 122.2455 24.631369 4.275 8.55 625.0264 73.10252.5905 5.181 139.0723 26.842761 4.387 8.774 675.4495 76.983082.389 4.778 109.0783 22.829284 4.523 9.046 740.2352 81.830122.193 4.386 84.37346 19.236996 4.465 8.93 712.122 79.7449
2.35 4.7 103.823 22.09 3.469 6.938 333.9665 48.135841.405 2.81 22.18804 7.8961 3.814 7.628 443.8457 58.186381.393 2.786 21.62436 7.761796 4.489 8.978 723.6671 80.604481.487 2.974 26.30407 8.844676 3.475 6.95 335.7024 48.3025
2.2555 4.511 91.79488 20.349121 3.433 6.866 323.6767 47.141961.998 3.996 63.80819 15.968016 2.741 5.482 164.7468 30.05232
2.2905 4.581 96.13485 20.985561 3.45 6.9 328.509 47.612.1365 4.273 78.01869 18.258529 2.701 5.402 157.639 29.18162.086 4.172 72.6161 17.405584 2.845 5.69 184.22 32.37611.836 3.672 49.51172 13.483584 4.551 9.102 754.068 82.8464
1.7625 3.525 43.80033 12.425625 4.292 8.584 632.5125 73.685061.405 2.81 22.18804 7.8961 4.693 9.386 826.8784 88.0972.086 4.172 72.6161 17.405584 3.88 7.76 467.2886 60.2176
2.1095 4.219 75.09804 17.799961 3.992 7.984 508.9341 63.744262.012 4.024 65.15893 16.192576 4.715 9.43 838.5618 88.9249
2.4815 4.963 122.2455 24.631369 3.299 6.598 287.2347 43.53362.193 4.386 84.37346 19.236996 3.98 7.96 504.3583 63.3616
2.1365 4.273 78.01869 18.258529 4.023 8.046 520.8829 64.738122.086 4.172 72.6161 17.405584 3.568 7.136 363.3829 50.9225
1.9235 3.847 56.93333 14.799409 4.65 9.3 804.357 86.492.1095 4.219 75.09804 17.799961 4.733 9.466 848.2024 89.60516
2.35 4.7 103.823 22.09 4.409 8.818 685.6623 77.757122.044 4.088 68.31761 16.711744 7.373 14.746 3206.437 217.44452.012 4.024 65.15893 16.192576 5.792 11.584 1554.446 134.18911.588 3.176 32.03624 10.086976 6.343 12.686 2041.616 160.93461.998 3.996 63.80819 15.968016 6.378 12.756 2075.599 162.71551.836 3.672 49.51172 13.483584 7.192 14.384 2976.042 206.8995
1.8135 3.627 47.71365 13.155129 6.416 12.832 2112.92 164.66022.1095 4.219 75.09804 17.799961 6.187 12.374 1894.656 153.11591.6555 3.311 36.29757 10.962721 5.965 11.93 1697.936 142.32492.1365 4.273 78.01869 18.258529 5.692 11.384 1475.315 129.59551.8135 3.627 47.71365 13.155129 6.005 12.01 1732.324 144.24012.3885 4.777 109.0098 22.819729 5.216 10.432 1135.279 108.82662.5635 5.127 134.769 26.286129 6.084 12.168 1801.597 148.06022.6805 5.361 154.0769 28.740321 4.714 9.428 838.0284 88.887182.6935 5.387 156.3295 29.019769 5.214 10.428 1133.974 108.7432
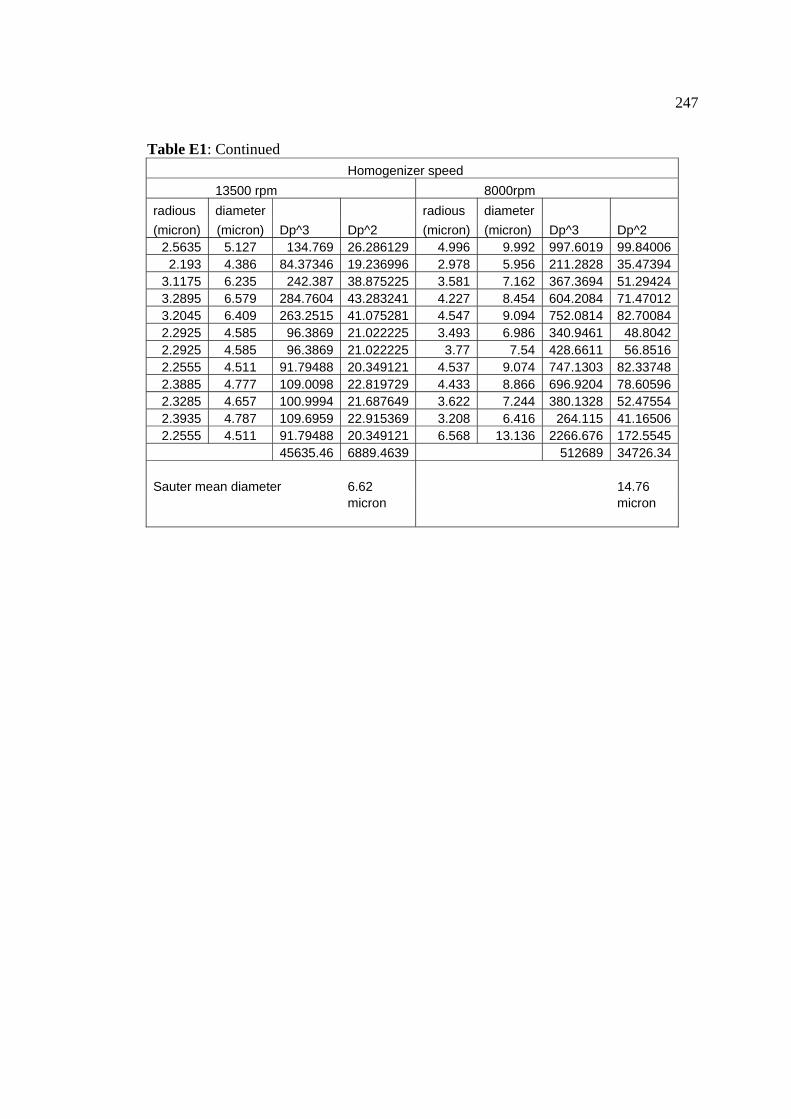
247
Table E1: Continued Homogenizer speed 13500 rpm 8000rpm radious diameter radious diameter (micron) (micron) Dp^3 Dp^2 (micron) (micron) Dp^3 Dp^2
2.5635 5.127 134.769 26.286129 4.996 9.992 997.6019 99.840062.193 4.386 84.37346 19.236996 2.978 5.956 211.2828 35.47394
3.1175 6.235 242.387 38.875225 3.581 7.162 367.3694 51.294243.2895 6.579 284.7604 43.283241 4.227 8.454 604.2084 71.470123.2045 6.409 263.2515 41.075281 4.547 9.094 752.0814 82.700842.2925 4.585 96.3869 21.022225 3.493 6.986 340.9461 48.80422.2925 4.585 96.3869 21.022225 3.77 7.54 428.6611 56.85162.2555 4.511 91.79488 20.349121 4.537 9.074 747.1303 82.337482.3885 4.777 109.0098 22.819729 4.433 8.866 696.9204 78.605962.3285 4.657 100.9994 21.687649 3.622 7.244 380.1328 52.475542.3935 4.787 109.6959 22.915369 3.208 6.416 264.115 41.165062.2555 4.511 91.79488 20.349121 6.568 13.136 2266.676 172.5545
45635.46 6889.4639 512689 34726.34 Sauter mean diameter 6.62 14.76 micron micron
248
APPENDIX E
EQUILIBRIUM CONSTANT
It is difficult to find the equilibrium constant for extraction reaction by searching
literature. Hence, experiments should be done for obtaining this constant.
The extraction reaction occurring on the surface of the emulsion globules is as follow:
( ) ( ) ( ) +−− ++↔+ HOSRRHAgRHOSAg 2322
3232 2)(
Where ( )2RH and RRHAg )( represent extractant and solute-extractant complex
respectively, and both are them exist in the organic phase.
Material and Experiments
Reagents
Solute : Photographic wastes
Extractant: Cyanex 302
Organic diluents: Kerosene
Experiments:
For obtaining as close an extraction reaction as that in emulsion liquid membrane, the
external phase and Cyanex 302 in kerosene are the same as those in emulsion liquid
membrane.
Preparation of the solutions:
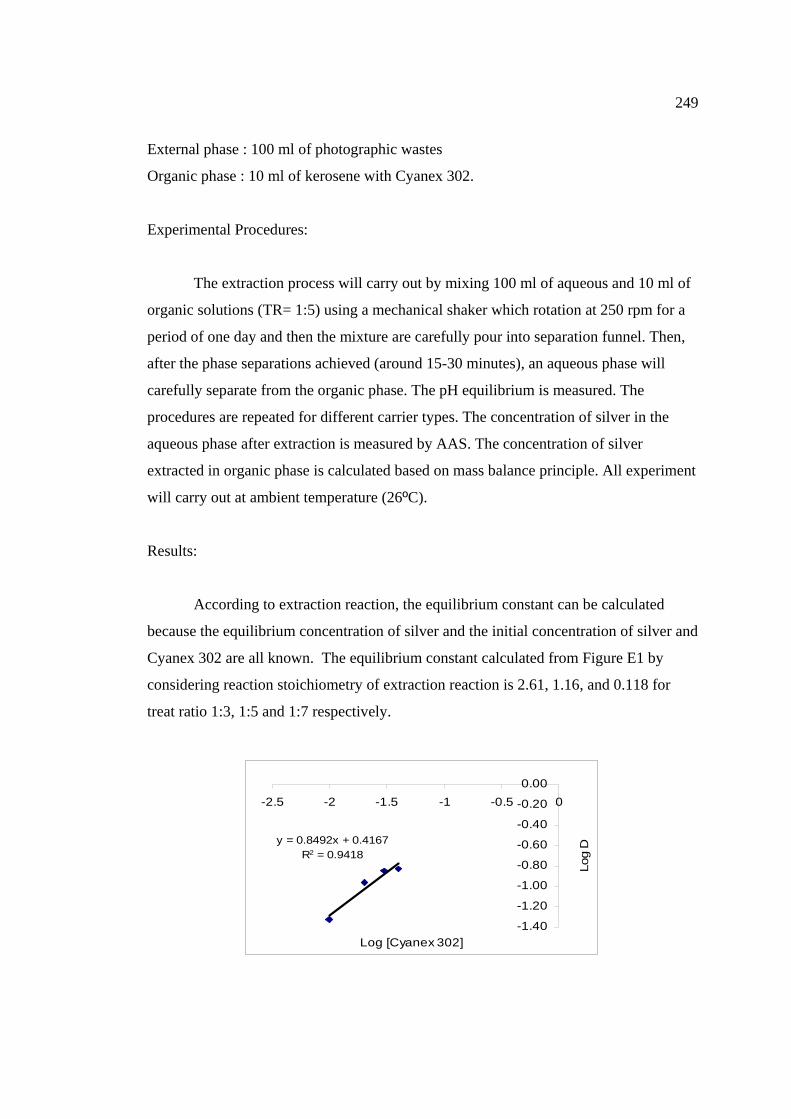
249
External phase : 100 ml of photographic wastes
Organic phase : 10 ml of kerosene with Cyanex 302.
Experimental Procedures:
The extraction process will carry out by mixing 100 ml of aqueous and 10 ml of
organic solutions (TR= 1:5) using a mechanical shaker which rotation at 250 rpm for a
period of one day and then the mixture are carefully pour into separation funnel. Then,
after the phase separations achieved (around 15-30 minutes), an aqueous phase will
carefully separate from the organic phase. The pH equilibrium is measured. The
procedures are repeated for different carrier types. The concentration of silver in the
aqueous phase after extraction is measured by AAS. The concentration of silver
extracted in organic phase is calculated based on mass balance principle. All experiment
will carry out at ambient temperature (26ºC).
Results:
According to extraction reaction, the equilibrium constant can be calculated
because the equilibrium concentration of silver and the initial concentration of silver and
Cyanex 302 are all known. The equilibrium constant calculated from Figure E1 by
considering reaction stoichiometry of extraction reaction is 2.61, 1.16, and 0.118 for
treat ratio 1:3, 1:5 and 1:7 respectively.
y = 0.8492x + 0.4167R2 = 0.9418
-1.40
-1.20
-1.00
-0.80
-0.60
-0.40
-0.20
0.00-2.5 -2 -1.5 -1 -0.5 0
Log [Cyanex 302]
Log
D
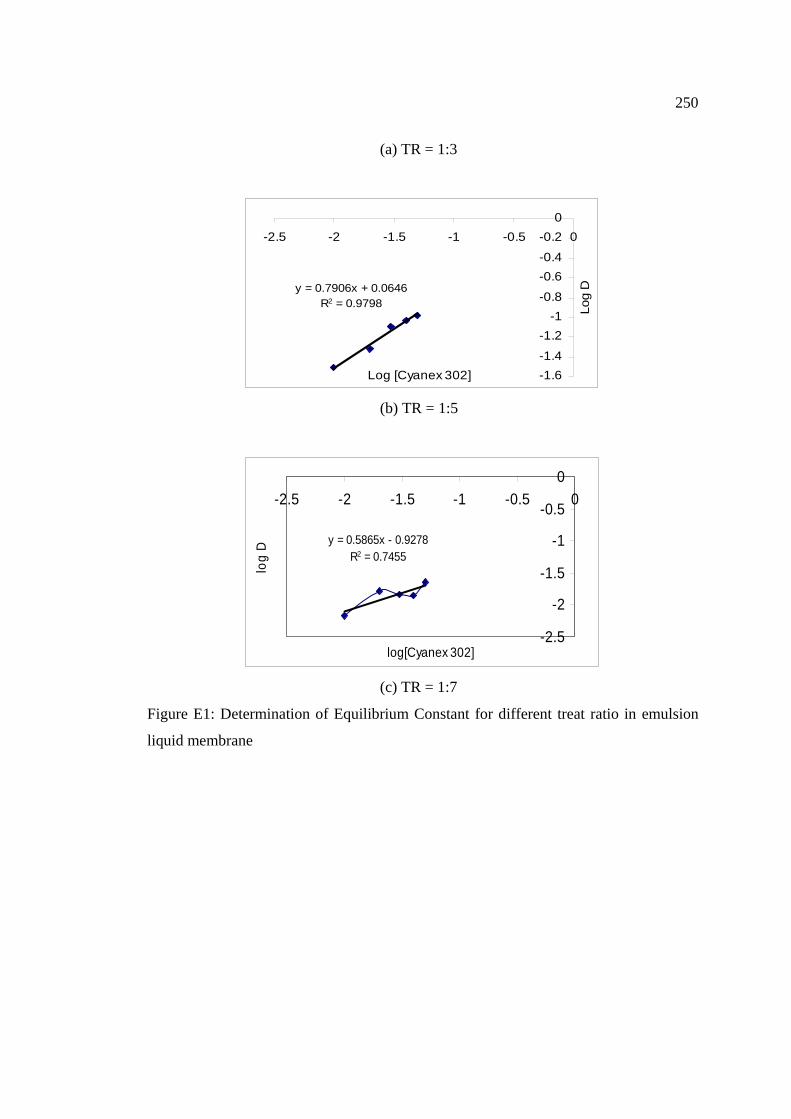
250
(a) TR = 1:3
y = 0.7906x + 0.0646R2 = 0.9798
-1.6-1.4
-1.2-1
-0.8
-0.6-0.4
-0.20
-2.5 -2 -1.5 -1 -0.5 0
Log [Cyanex 302]
Log
D
(b) TR = 1:5
y = 0.5865x - 0.9278R2 = 0.7455
-2.5
-2
-1.5
-1
-0.5
0-2.5 -2 -1.5 -1 -0.5 0
log[Cyanex 302]
log
D
(c) TR = 1:7
Figure E1: Determination of Equilibrium Constant for different treat ratio in emulsion
liquid membrane

251
APPENDIX F
PROGRAMMING
F.1 Methods of Solving the ELM Model
The mathematical model of the metal extraction by an emulsion liquid
membrane process consists of a combination of parabolic partial differential equations
(PDEs), ordinary differential equations (ODEs) and algebraic equations. These
equations must be solved simultaneously either using analytical method or numerical
method. However, it is very tedious or almost impossible to solve these equations
analytically. So, numerical method will be applied to solve these equations. This
section is some reviews done on the numerical methods that can be used to solve these
equations, especially PDEs and ODEs.
F.1.1 Partial Differential Equations (PDEs)
There are two broad categories of numerical methods that used to solve partial
differential equations: (1) finite-difference approaches and (2) finite-element
approaches. In the finite-difference methods, the solution domain is divided into a grid
of discrete points or nodes. The PDE is then written for each node and its derivatives
replaced by finite-divided differences. In contrast to finite-difference techniques, the
finite-element method divides the solution domain into simply shaped regions, or
“elements”. An approximate solution for the PDE can be developed for each of these
elements. The total solution is then generated by linking together, or “assembling” the
252
individual solutions taking care to ensure continuity at the inter-element boundaries.
Thus, the PDE is satisfied in a piecewise fashion (Chapra and Canale, 2003).
The finite-difference approaches will be discussed more detail in the following
due to its simplicity. There are basically three methods in finite-difference approaches:
(1) Explicit methods, (2) Implicit methods and (3) method of lines (Chapra and Canale,
2003).
Reis and Carvalho (2004) used numerical method of lines to solve the partial
differential equation system. This technique is based on discretisation of the spatial
derivative transforming each partial differential equation into a system of ordinary
differential equations (Reis and Carvalho, 2004). A general parabolic partial differential
equation is shown in Equation (G.1):
2
2
xu
tu
∂∂
=∂∂ α (F1)
Constantinides and Mostoufi (1999) showed how to transfer Equation F1 into a
set of ordinary differential equations by discretizing only the spatial derivatives using
finite differences and leaving the time derivatives unchanged. This concept applied to
Equation F1 results in:
( )112 2 −+ +−∆
= iiii uuu
xdtdu α (F2)
Constantinides and Mostoufi (1999) also stated that there will be as many of
these ordinary differential equations as there are grid points in the x-direction. The two
equations at the boundaries would have to be modified according to the boundary
conditions that are specified in the particular problem (Constantinides and Mostoufi,
1999).
253
The Equation F2 is the basic for transforming a partial differential equation into
a set of ordinary differential equations. However, the partial differential equations in the
model are more complex than Equation F1, because they are parabolic equations in
three spatial dimensions. Moreover, these parabolic equations involve the circular
boundaries. Smith (1974) suggested that finite-difference problems involving circular
boundaries can usually be more conveniently in polar coordinates than Cartesian
coordinates because they avoid the use of awkward differentiation formulae near the
curved boundary. Smith (1974) showed the non-dimensional form of the equation of
heat conduction (or diffusion) in three dimensions in spherical polar form:
2
2
222
2
22
22
sin11cot2
A
ur
ur
urr
urr
uutu
φθθθθ
∂∂
+∂∂
+∂∂
+∂∂
+∂∂
=∇=∂∂ (F3)
If the problem is symmetrical with respect to the origin, it is independent of θ
and Aφ , so Equation F3 becomes:
ru
rruu
tu
∂∂
+∂∂
=∇=∂∂ 2
2
22 (F4)
with ru ∂∂ / zero at r = 0.
Smith (1974) also showed that at r = 0:
2
22 3
ruu
tu
∂∂
=∇=∂∂ (F5)

254
F.1.2 Ordinary Differential Equations (ODEs)
There are a lot of methods can be used to solve a set of ordinary differential
equations (ODEs), for examples, Euler’s method, Heun’s method, midpoint method and
Runge-Kutta (RK) methods (Chapra and Canale, 2003). In general, these methods use
numerical method to approximate the slope, then, the slope estimate is used to
extrapolate from an old value to a new value.
Since Runge-Kutta (RK) methods are the most popular and accurate methods for
solving ordinary differential equations (ODEs), these methods will be discussed in
detail. Runge-Kutta (RK) methods achieve the accuracy of a Taylor series approach
without requiring the calculation of higher derivatives. Many variations exist but all can
be cast in the generalized form of Equation F6 (Chapra and Canale, 2003).
( )hhyxgyy iiii ,,1 +=+ (F6)
where ( )hyxg ii ,, is called an increment function, which can be interpreted as a
representative slope over the interval. The increment function can be written in general
form as: (Chapra and Canale, 2003)
nnkakakag +++= ...2211 (F7)
where the a’s are constants and the k’s are
( )ii yxfk ,1 =
( )hkqyhpxfk ii 11112 , ++=
( )hkqhkqyhpxfk ii 22212123 , +++=
.
.
.
( )hkqhkqhkqyhpxfk nnnnninin 11,122,111,11 ..., −−−−−− +++++= (F8)
255
where p’s and q’s are constants. Notice that the k’s are recurrence relationships. That
is, k1 appears in the equation for k2, which appears in the equation for k3, and so forth.
Because each k is a functional evaluation, this recurrence makes RK methods efficient
for computer calculations. (Chapra and Canale, 2003)
Various types of Runge-Kutta methods can be devised by employing different
numbers of terms in the increment function as specified by n. The first-order RK
method with n=1 is, in fact, Euler’s method. Once n is chosen, values for the a’s, p’s,
q’s are evaluated by setting Equation F6 equal to terms in a Taylor series expansion.
Thus, at least for the lower-order versions, the number of terms, n, usually represents the
order of the approach. (Chapra and Canale, 2003)
The most popular RK methods are fourth order. There are actually an infinite
number of versions for the fourth-order RK method. The following is the most
commonly used form, and therefore it is called the classical fourth-order RK method:
(Chapra and Canale, 2003)
( )hkkkkyy ii 43211 2261
++++=+ (F9)
where
( )ii yxfk ,1 =
⎟⎠⎞
⎜⎝⎛ ++= hkyhxfk ii 12 2
1,21
⎟⎠⎞
⎜⎝⎛ ++= hkyhxfk ii 23 2
1,21
( )hkyhxfk ii 34 , ++= (F10)
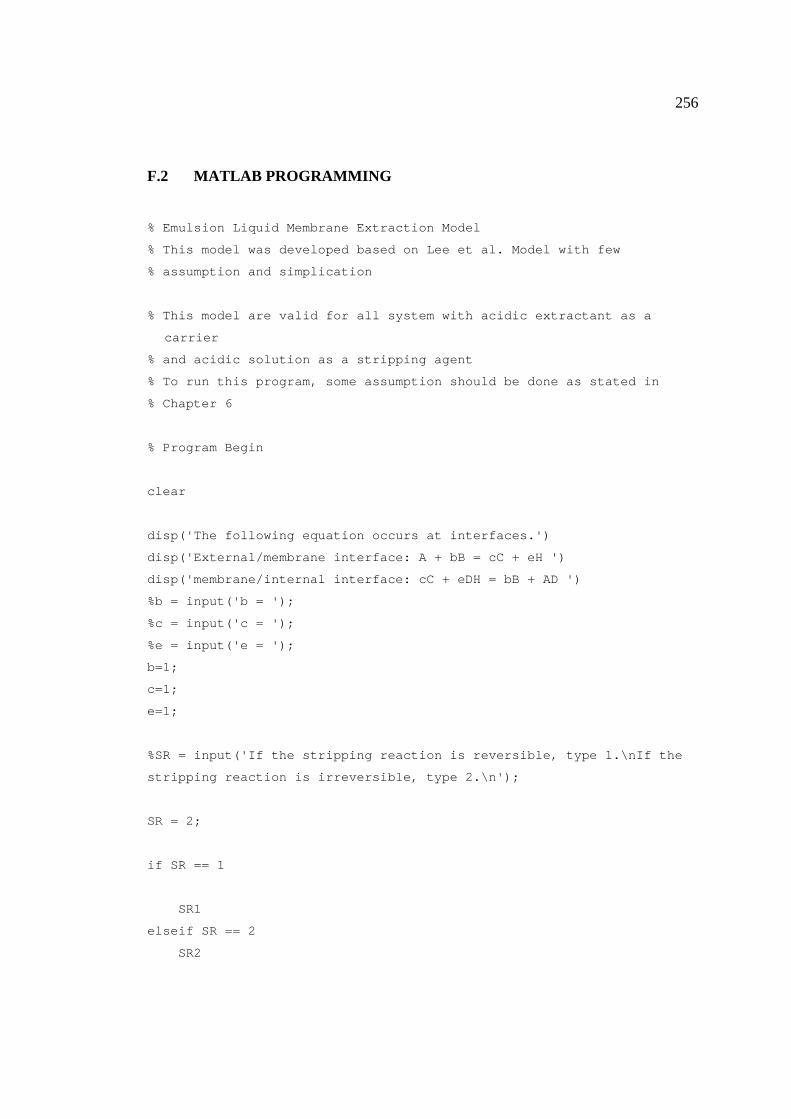
256
F.2 MATLAB PROGRAMMING
% Emulsion Liquid Membrane Extraction Model
% This model was developed based on Lee et al. Model with few
% assumption and simplication
% This model are valid for all system with acidic extractant as a
carrier
% and acidic solution as a stripping agent
% To run this program, some assumption should be done as stated in
% Chapter 6
% Program Begin
clear
disp('The following equation occurs at interfaces.')
disp('External/membrane interface: A + bB = cC + eH ')
disp('membrane/internal interface: cC + eDH = bB + AD ')
%b = input('b = ');
%c = input('c = ');
%e = input('e = ');
b=1;
c=1;
e=1;
%SR = input('If the stripping reaction is reversible, type 1.\nIf the
stripping reaction is irreversible, type 2.\n');
SR = 2;
if SR == 1
SR1
elseif SR == 2
SR2
257
else
disp('Please choose between 1 and 2')
end
% external = input('If mass transfer resistances of ions in the
external aqueous phase are negligible, type 1.\nElse type 2')
external = 1;
if external == 1;
%koB = input('koB = ');
%koC = input('koC = ');
koB=0.188;
koC=0.188;
elseif external == 2;
%koB = input('koB = ');
%koC = input('koC = ');
koB=0.188;
koC=0.188;
kwA = input('kwA = ');
kwH = input('kwH = ');
else
disp('Please choose between 1 and 2')
end
%z = input('If fi1 and fi2 are known, type 1.\nIf VI, VII and VIII are
known, type 2.\n');
z=2;
if z == 1
fi1 = input('fi1 = ');
%fi1 = volume fraction of internal phase in emulsion drop
fi2 = input('fi2 = ');
258
%fi2 = volume ratio of emulsion phase to the total volume
elseif z == 2
%VI = input('VI = ');
%VII = input('VII = ');
%VIII = input('VIII = ');
VI=5E-5;
VII=5E-5;
VIII=.6E-3;
fi1 = VI/(VI+VII);
%fi1 = volume fraction of internal phase in emulsion drop
fi2 = (VI+VII)/(VI+VII+VIII);
%fi2 = volume ratio of emulsion phase to the total volume
else
disp('Please choose between 1 and 2')
end
%Rmu = input('Rmu = ');
%R = input('R = ');
R = 7.135E-5;
Rmu = 2.74E-6;
Ri = R - (4*pi/3)^(1/3)*Rmu*(fi1^(-1/3)-1);
delta = R - Ri;
beta = 1 - Ri/R;
fi1_prime = fi1/(1-beta)^3;
%n = input('number of grid points for method of lines = ');
%H_III0 = input('H_III0 = ');
%A_III0 = input('A_III0 = ');
%B0 = input('B0 = ');
%C0 = input('C0 = ');
%H_I0 = input('H_I0 = ');
%A_I0 = input('A_I0 = ');
n=6;
H_I0 = 45;
A_I0 = 0;
259
H_III0 = 2.5E-3;
A_III0 = 4.6;
B0 = 5;
C0 = 0;
%Keq = input('Keq = ');
Keq=0.0995;
delta_r = R/(n-1);
H_III = H_III0;
A_III = A_III0;
B = ones(1,n)*B0;
C = ones(1,n)*C0;
A_I = ones(1,n)*A_I0;
H_I = ones(1,n)*H_I0;
H_III_R = H_III0;
A_III_R = A_III0;
B_R = B0;
C_R = C0;
%DeB = input('DeB = ');
%DeC = input('DeC = ');
DeB = 9.187E-8;
DeC = 9.187E-8;
%ML = input('ML = ');
ML_prime=2.093E-9;
ML = ML_prime/(VI+VII+VIII);
t=0;
% time_stop = input('Stop when t = ');
time_stop = 10;
% step_size = input('Step size = ');
step_size = 1E-3;
graph_step_size = 1;
260
if external == 1 & b == 1 & c == 1 & e == 1
for j=0:graph_step_size:time_stop
while t < j
h = step_size; %step size
RK_NBO
end
result = [t A_III/A_III0]
tt(j+1)=t;
xx(j+1)=A_III/A_III0;
end
else
end
plot(tt,xx)
xlabel('time(s)')
ylabel('Ce/Ceo')
261
% slope (method of lines, RUNGE KUTTA)
for RK = 1:4
if RK == 1
A_IIIk = A_III;
H_IIIk = H_III;
Bk = B;
Ck = C;
A_Ik = A_I;
H_Ik = H_I;
ext_rxn_1_hkh
stripping_rxn_1_hkh
elseif RK == 2 & 3
Bk(n+1) = [];
Ck(n+1) = [];
A_IIIk = A_III + 1/2*dA_III(RK-1,:)*h;
% concentration of A in the external phase at t
H_IIIk = H_III + 1/2*dH_III(RK-1,:)*h;
% concentration of H in the external phase at t
Bk = B + 1/2*dB(RK-1,:)*h;
% concentration of B in the emulsion phase for 0 <= r <= Ri at t
Ck = C + 1/2*dC(RK-1,:)*h;
% concentration of C in the emulsion phase for 0 <= r <= Ri at t
A_Ik = A_I + 1/2*dA_I(RK-1,:)*h;
% concentration of A in the internal phase for 0 <= r <= Ri at t
H_Ik = e*A_I0*ones(1,n)+H_I0*ones(1,n)-e*A_Ik;
ext_rxn_1_hkh
stripping_rxn_1_hkh
else
262
Bk(n+1) = [];
Ck(n+1) = [];
A_IIIk = A_III + dA_III(RK-1,:)*h;
% concentration of A in the external phase at t
H_IIIk = H_III + dH_III(RK-1,:)*h;
% concentration of H in the external phase at t
Bk = B + dB(RK-1,:)*h;
% concentration of B in the emulsion phase for 0 <= r <= Ri at t
Ck = C + dC(RK-1,:)*h;
% concentration of C in the emulsion phase for 0 <= r <= Ri at t
A_Ik = A_I + dA_I(RK-1,:)*h;
% concentration of A in the internal phase for 0 <= r <= Ri at t
H_Ik = e*A_I0*ones(1,n)+H_I0*ones(1,n)-e*A_Ik;
ext_rxn_1_hkh
stripping_rxn_1_hkh
end
dA_IIIk = -1/(1-fi2)*(3*fi2/R*koC*(C_R-Ck(n))/c-ML*A_Ik(n));
dH_IIIk = 1/(1-fi2)*(3*fi2/R*koC*(C_R-Ck(n))*e/c+ML*H_Ik(n));
dA_III(RK,1) = dA_IIIk;
dH_III(RK,1) = dH_IIIk;
Ck(n+1) = 2*delta_r*koC*(C_R-Ck(n))/DeC + Ck(n-1);
% imaginary point
Bk(n+1) = 2*delta_r*koB*(B_R-Bk(n))/DeB + Bk(n-1);
% imaginary point
for p = 1:n
if p == 1
dBpk = 1/(1-fi1_prime)*(DeB*6*(Bk(p+1)-
Bk(p))/delta_r^2+3*fi1_prime/Rmu*b*rri(p));
dCpk = 1/(1-fi1_prime)*(DeC*6*(Ck(p+1)-Ck(p))/delta_r^2-
3*fi1_prime/Rmu*c*rri(p));
263
else
dBpk = 1/(1-fi1_prime)*(DeB*(1/delta_r^2*(Bk(p+1)-
2*Bk(p)+Bk(p-1))+1/(p-1)/delta_r^2*(Bk(p+1)-Bk(p-
1)))+3*fi1_prime/Rmu*b*rri(p));
dCpk = 1/(1-fi1_prime)*(DeC*(1/delta_r^2*(Ck(p+1)-
2*Ck(p)+Ck(p-1))+1/(p-1)/delta_r^2*(Ck(p+1)-Ck(p-
1)))-3*fi1_prime/Rmu*c*rri(p));
end
dB(RK,p) = dBpk;
dC(RK,p) = dCpk;
end
dA_Ik = 3/Rmu*rri;
dA_I(RK,:) = dA_Ik;
end
t = t+h;
A_III = A_III +
1/6*(dA_III(1,:)+2*dA_III(2,:)+2*dA_III(3,:)+dA_III(4,:))*h;
% concentration of A in the external phase at t
H_III = H_III +
1/6*(dH_III(1,:)+2*dH_III(2,:)+2*dH_III(3,:)+dH_III(4,:))*h;
% concentration of H in the external phase at t
B = B + 1/6*(dB(1,:)+2*dB(2,:)+2*dB(3,:)+dB(4,:))*h;
% concentration of B in the emulsion phase for 0 <= r <= Ri at t
C = C + 1/6*(dC(1,:)+2*dC(2,:)+2*dC(3,:)+dC(4,:))*h;
% concentration of C in the emulsion phase for 0 <= r <= Ri at t
A_I = A_I + 1/6*(dA_I(1,:)+2*dA_I(2,:)+2*dA_I(3,:)+dA_I(4,:))*h;
% concentration of A in the internal phase for 0 <= r <= Ri at t
H_I = e*A_I0*ones(1,n)+H_I0*ones(1,n)-e*A_I;
264
disp('The reverse reaction rate or stripping reaction rate is:')
disp('rr = kr.*(A_I.^a1).*(B.^b1).*(C.^c1).*(H_I.^e1)')
disp('Please insert value of a1, b1, c1, e1 and kr')
%a1 = input('a1 = ');
%b1 = input('b1 = ');
%c1 = input('c1 = ');
%e1 = input('e1 = ');
%kr = input('kr = ');
a1=0;
b1=0;
c1=1;
e1=1;
kr=1.225E-8;
rr = inline('kr.*(A_I.^a1).*(B.^b1).*(C.^c1).*(H_I.^e1)');
% stripping reaction for irreversible process
rri = rr(A_Ik,Bk,Ck,H_Ik,a1,b1,c1,e1,kr);
%interfacial values for b=1,c=1,e=1 and no aqueous mass transfer
resistance
C_R = Keq*A_IIIk*B0/(H_IIIk + Keq*A_IIIk); % concentration of complex
at r=R
B_R = B0 - C_R; % concentration of carrier at
r=R

265