Embed Size (px)
Citation preview
Economic Watch BBVA EAGLEs
Madrid, April 2014
Economic Analysis
Emerging Economies Chief Economist Alicia García-Herrero [email protected]
Cross-Country Emerging Markets Analysis Chief Economist Álvaro Ortiz Vidal-Abarca [email protected] Senior Economist David Martínez Turégano [email protected]
The multifaceted world of exports: How to differentiate between export-driven strategies Measuring the quality of export strategies
In this note we introduce a synthetic index that offers a snapshot view of the quality of a country’s export strategy both in terms of its spill-overs into the domestic economy and its sustainability. We consider four groups of characteristics, which account for the following dimensions: 1) the economic relevance of exports, 2) the amount of value-added retained, 3) the exposure to external shocks; and 4) the technological content and thereby the relevance of exports for upgrading of the economic structure.
Relevance of exports differs between countries: greater in Asia Small and medium-sized East Asian economies lead on trade openness among emerging countries, while China outperforms in terms of the domestic connection of exports (i.e. related production generated by other industries). Latin American economies are below-average in terms of openness, with Mexico additionally showing a very limited connectivity of trade, which is also the case of Indonesia. Poland outperforms in Emerging Europe as a more open exporter than Turkey and with better domestic connections than Russia.
Manufacturers aspire to retain more value at home Domestic value-added in exports represents around 50% in manufactured goods, while this ratio is much higher for other activities, in which domestic natural resources, intermediation and labour intensity play a very important role. Among emerging economies, East Asian countries lag significantly behind in aggregate value-retention, while some commodity producers import a high share of final goods, which eventually drain the value-added generated at home due to the lack of manufacturing industries.
Diversification is the way for smaller economies Product concentration is high for commodity exporters, as well as for specialised manufacturers, while China is the only emerging country with the global capacity to fix market conditions (not only from the supply side but also from the demand side). Saudi Arabia has that ability too for one very important sector: oil. In the case of small economies, for which world market power is much more limited, diversification is the remaining option for shelter from external turbulence.
Apparent technological content is not enough for success Many emerging manufacturing countries have a significant share of exports with technological content rated as medium or high. However, none of them has a genuine surplus, as the majority of economies either also import a significant share of these products or just copy the technology or play an assembly role. On the other hand, India records a surplus in tech trade, with exports mainly comprising computer services.
China stands out as the leading emerging exporter According to our synthetic measure, China ranks at the top together with Japan, although China faces significant challenges on value-retention and technological content. These are precisely India’s strengths, which is in turn a less open economy and with more limited domestic export connections. Brazil and Thailand also outperform and compete with developed market standards. Finally, Turkey ranks better than the other manufacturers and Saudi Arabia better than the other commodity producers.
Economic Watch Madrid, April 2014
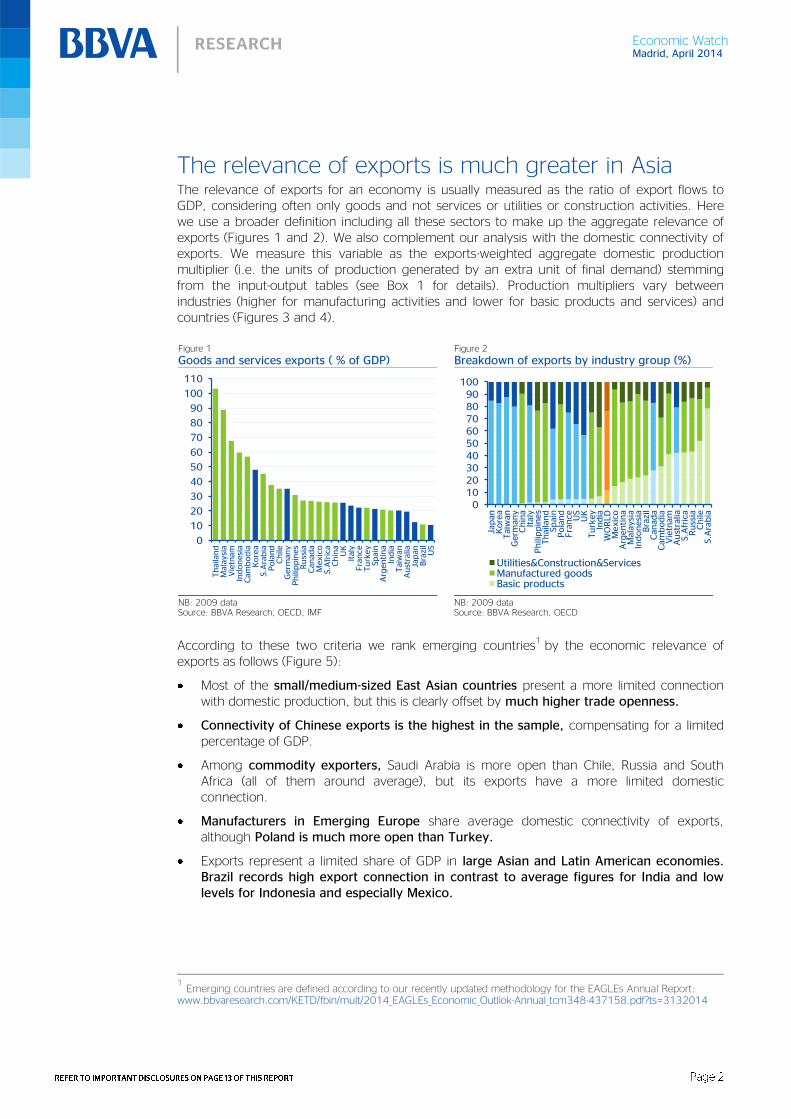
The relevance of exports is much greater in Asia The relevance of exports for an economy is usually measured as the ratio of export flows to GDP, considering often only goods and not services or utilities or construction activities. Here we use a broader definition including all these sectors to make up the aggregate relevance of exports (Figures 1 and 2). We also complement our analysis with the domestic connectivity of exports. We measure this variable as the exports-weighted aggregate domestic production multiplier (i.e. the units of production generated by an extra unit of final demand) stemming from the input-output tables (see Box 1 for details). Production multipliers vary between industries (higher for manufacturing activities and lower for basic products and services) and countries (Figures 3 and 4).
According to these two criteria we rank emerging countries1 by the economic relevance of
exports as follows (Figure 5):
Most of the small/medium-sized East Asian countries present a more limited connection with domestic production, but this is clearly offset by much higher trade openness.
Connectivity of Chinese exports is the highest in the sample, compensating for a limited percentage of GDP.
Among commodity exporters, Saudi Arabia is more open than Chile, Russia and South Africa (all of them around average), but its exports have a more limited domestic connection.
Manufacturers in Emerging Europe share average domestic connectivity of exports, although Poland is much more open than Turkey.
Exports represent a limited share of GDP in large Asian and Latin American economies. Brazil records high export connection in contrast to average figures for India and low levels for Indonesia and especially Mexico.
1 Emerging countries are defined according to our recently updated methodology for the EAGLEs Annual Report:
www.bbvaresearch.com/KETD/fbin/mult/2014_EAGLEs_Economic_Outllok-Annual_tcm348-437158.pdf?ts=3132014
Figure 1
Goods and services exports ( % of GDP) Figure 2
Breakdown of exports by industry group (%)
NB: 2009 data Source: BBVA Research, OECD, IMF
NB: 2009 data Source: BBVA Research, OECD
0
10
20
30
40
50
60
70
80
90
100
110
Thaila
nd
Mala
ysi
aV
ietn
am
Indonesi
aC
am
bodia
Kore
aS.A
rabia
Pola
nd
Chile
Germ
any
Phili
ppin
es
Russ
iaC
anada
Mexic
oS.A
fric
aC
hin
aU
KIt
aly
Fra
nce
Turk
ey
Spain
Arg
entina
India
Taiw
an
Aust
ralia
Japan
Bra
zil
US
0102030405060708090
100
Japan
Kore
aTaiw
an
Germ
any
Chin
aIt
aly
Phili
ppin
es
Thaila
nd
Spain
Pola
nd
Fra
nce US
UK
Turk
ey
India
WO
RLD
Mexic
oA
rgentina
Mala
ysi
aIn
donesi
aBra
zil
Canada
Cam
bodia
Vie
tnam
Aust
ralia
S.A
fric
aR
uss
iaC
hile
S.A
rabia
Utilities&Construction&ServicesManufactured goodsBasic products
Economic Watch Madrid, April 2014
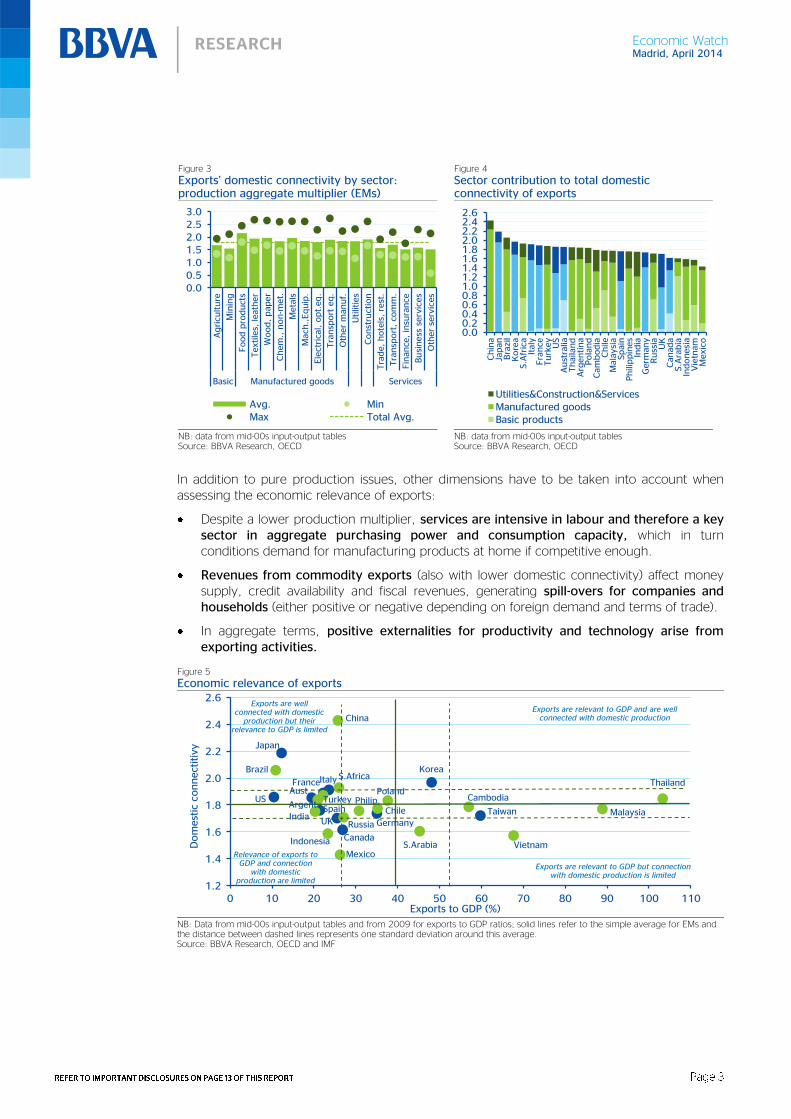
In addition to pure production issues, other dimensions have to be taken into account when assessing the economic relevance of exports:
Despite a lower production multiplier, services are intensive in labour and therefore a key sector in aggregate purchasing power and consumption capacity, which in turn conditions demand for manufacturing products at home if competitive enough.
Revenues from commodity exports (also with lower domestic connectivity) affect money supply, credit availability and fiscal revenues, generating spill-overs for companies and households (either positive or negative depending on foreign demand and terms of trade).
In aggregate terms, positive externalities for productivity and technology arise from exporting activities.
Figure 5
Economic relevance of exports
NB: Data from mid-00s input-output tables and from 2009 for exports to GDP ratios; solid lines refer to the simple average for EMs and the distance between dashed lines represents one standard deviation around this average. Source: BBVA Research, OECD and IMF
1.2
1.4
1.6
1.8
2.0
2.2
2.4
2.6
0 10 20 30 40 50 60 70 80 90 100 110
Dom
est
ic c
onnect
itiv
y
Exports to GDP (%)
Exports are well connected with domestic
production but their relevance to GDP is limited
Exports are relevant to GDP and are well connected with domestic production
Relevance of exports to GDP and connection
with domestic production are limited
Exports are relevant to GDP but connection with domestic production is limited
Taiwan
China
Cambodia
Vietnam
Brazil
Russia
S.AfricaKorea
Thailand
MalaysiaArgent.
PolandPhilip.
Chile
Mexico
India
Turkey
Indonesia S.Arabia
Japan
US
Canada
UK
Spain
Germany
FranceItalyAust.
Figure 3
Exports’ domestic connectivity by sector: production aggregate multiplier (EMs)
Figure 4
Sector contribution to total domestic connectivity of exports
NB: data from mid-00s input-output tables Source: BBVA Research, OECD
NB: data from mid-00s input-output tables Source: BBVA Research, OECD
0.00.51.01.52.02.53.0
Agri
culture
Min
ing
Food p
roduct
s
Textile
s, leath
er
Wood,
paper
Chem
., n
on-m
et.
Meta
ls
Mach
.,Equip
.
Ele
ctri
cal, o
pt.
eq.
Tra
nsp
ort
eq.
Oth
er
manuf.
Utilit
ies
Const
ruct
ion
Tra
de,
hote
ls,
rest
.
Tra
nsp
ort
, co
mm
.
Fin
ance
, in
sura
nce
Busi
ness
serv
ices
Oth
er
serv
ices
Basic Manufactured goods Services
Avg. MinMax Total Avg.
0.00.20.40.60.81.01.21.41.61.82.02.22.42.6
Chin
aJa
pan
Bra
zil
Kore
aS.A
fric
aIt
aly
Fra
nce
Turk
ey
US
Aust
ralia
Thaila
nd
Arg
entina
Pola
nd
Cam
bodia
Chile
Mala
ysi
aSpain
Phili
ppin
es
India
Germ
any
Russ
iaU
KC
anada
S.A
rabia
Indonesi
aV
ietn
am
Mexic
o
Utilities&Construction&ServicesManufactured goodsBasic products
Economic Watch Madrid, April 2014
Box 1: Details on variables
Domestic connectivity of exports
The starting point is the accounting identity for domestic production (Y):
Y = IC + FD, where:
IC = intermediate consumption, which under the Leontief scheme could be expressed by IC = A x Y, where ‘A’ is a matrix of technical coefficients representing the production process,
and FD = final demand, which is composed by FD = C + I + X, with C = consumption, I = investment (gross fixed capital formation) and X = exports.
If we arrange the first equation we get to Y = A x Y + FD and finally to Y = (I – A)
-1 x FD, where ‘I’ is an
identity matrix (ones on the main diagonal and zeros elsewhere).
Coefficients in domestic matrix (I – A)-1 are
interpreted as domestic production multipliers of final demand; i.e. the units of production generated in an industry ‘i’ by an extra unit of final demand in industry ‘k’.
We have named the domestic connectivity of exports to the vertical sum of multipliers for industry ‘i’ in country ‘j’. The aggregate index is exports-weighted.
Data for this variable have been obtained from the input-output tables collated by the OECD Structural Analysis (STAN) database.
Countries available and included in this analysis are the following: Australia, Canada, Chile, France, Germany, Italy, Japan, Korea, Mexico, Poland, Spain, Turkey, the UK, the US, Argentina, Brazil, China, Taiwan, India, Indonesia, Russia, South Africa and Vietnam.
All the references correspond to the mid-00s period, except for Argentina (mid-90s), Russia (early 00s) and Vietnam (early 00s).
We have used the simple average of the multipliers in emerging markets to compute the domestic connectivity exports for the Philippines, Thailand, Cambodia and Saudi Arabia.
We then have to be careful when interpreting data both on the age of the input-output references (in some cases a decade ago) and on generalisation of the multiplier to countries for which we have no data.
Embodied value-added of exports in foreign final demand
Exports are usually measured in gross terms, but the net final impact is a much broader concept including value-added at home and foreign value-added (either direct or indirect in each case).
Our interest in this note is on how much value is really exported on aggregate compared to the gross figures.
For that purpose, we use the concept of ‘domestic value-added embodied in foreign final demand’ used by the OECD in its Trade in Value Added (TiVA) database and defined as:
“Value-Added embodied in Foreign Final Domestic Demand shows how industries export value both through direct final exports and via indirect exports of intermediates through other countries to foreign final consumers (households, charities, government, and as investment). They reflect how industries (upstream in a value-chain) are connected to consumers in other countries, even where no direct trade relationship exists. The indicator illustrates therefore the full upstream impact of final demand in foreign markets to domestic output. It can most readily be interpreted as ‘exports of value-added’.”
We compute the ratio to gross exports for each industry ‘i’ and then the country aggregate on export-weighted terms.
Industry ratios can be above 100% in cases where the indirect channel is strong (e.g. services).
OECD data are available for countries in the sample and refer to 2009 in all cases.
Economic Watch Madrid, April 2014
Diversification index
The first step is to calculate the revealed comparative advantage of each country ‘j’ in each product ‘i’ (RCAi,j), which is equal to the share of exports of ‘i’ in country ‘j’ divided by the share of exports of ‘i’ in the world.
Data are available also at the OECD Trade in Value Added (TiVA) database.
We then build an exports-weighted revealed comparative advantage for country ‘j’.
Finally, the diversification index (DI) is defined as the inverse of this aggregate:
DIj = 1 / [ i (X i,j /X j) x RCAi,j]
Industry groups
We have developed our analysis for 18 economic activities as defined by the OECD Trade in Value Added (TiVA) database.
These activities correspond to groups of industries according to the NACE classification.
For those variables for which we have more disaggregated information we compute the exports-weighted value for the 18 economic reference activities.
REFER TO IMPORTANT DISCLOSURES ON PAGE 13 OF THIS REPORT Page 6
Economic Watch Madrid, April 2014
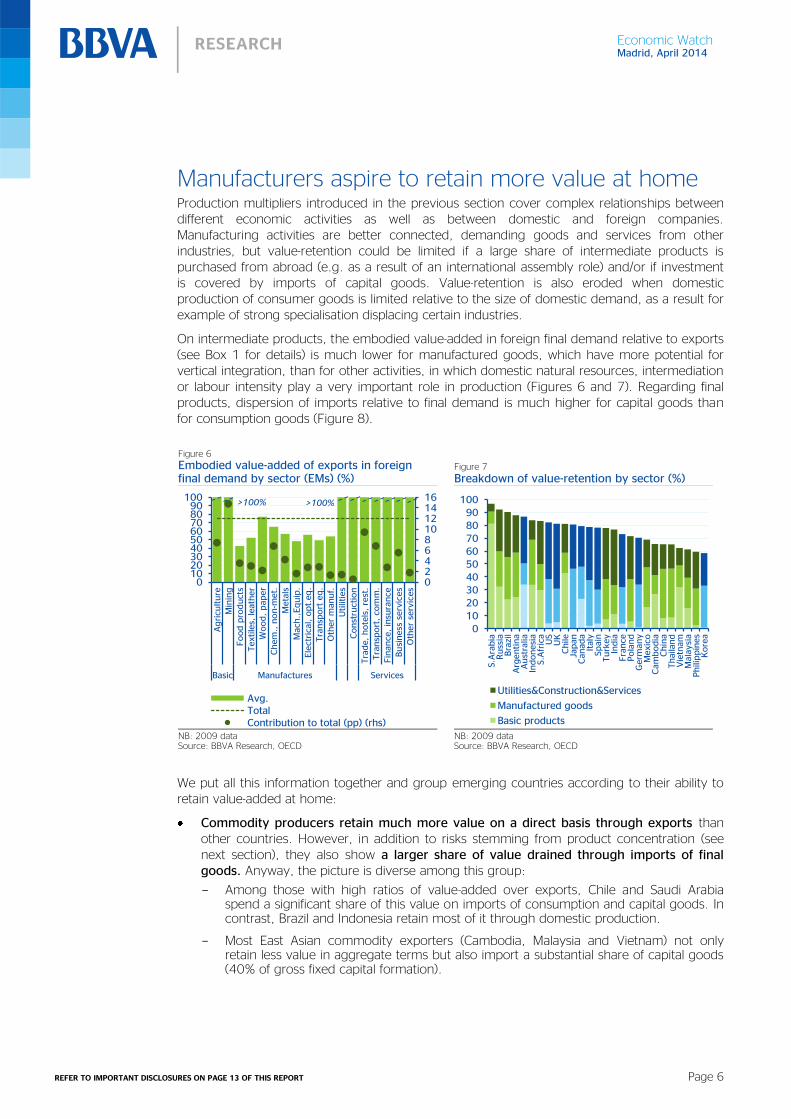
Manufacturers aspire to retain more value at home Production multipliers introduced in the previous section cover complex relationships between different economic activities as well as between domestic and foreign companies. Manufacturing activities are better connected, demanding goods and services from other industries, but value-retention could be limited if a large share of intermediate products is purchased from abroad (e.g. as a result of an international assembly role) and/or if investment is covered by imports of capital goods. Value-retention is also eroded when domestic production of consumer goods is limited relative to the size of domestic demand, as a result for example of strong specialisation displacing certain industries.
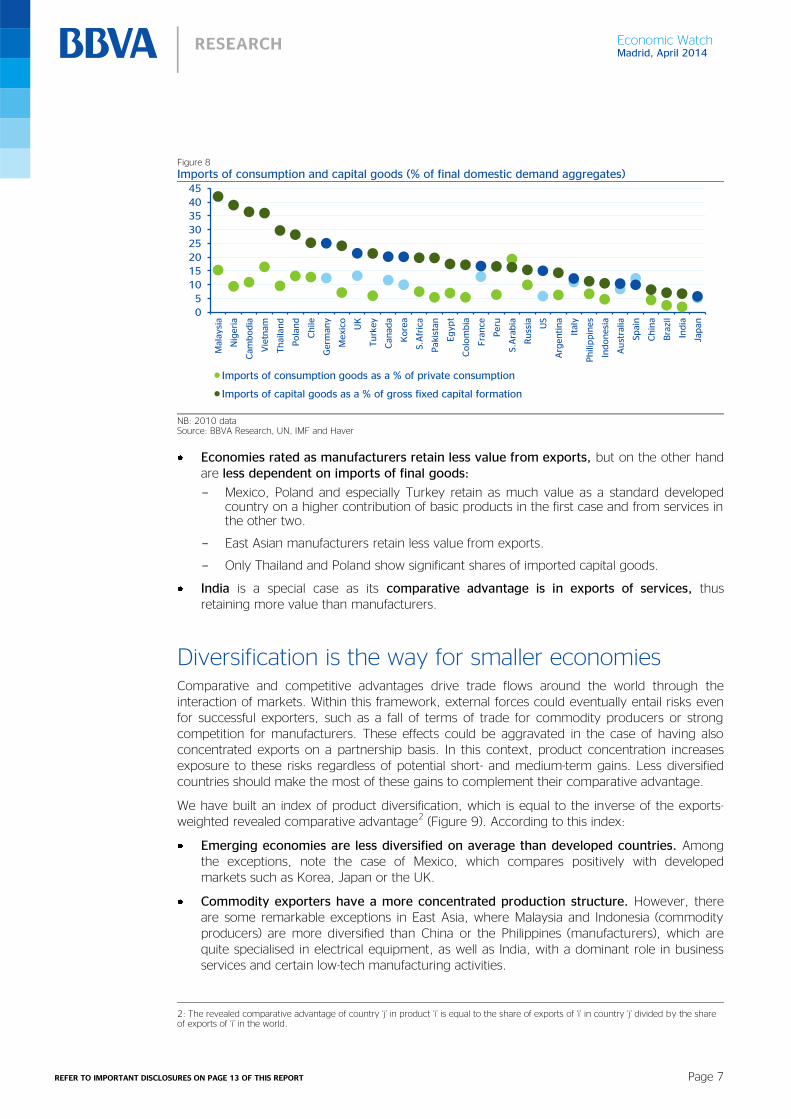
On intermediate products, the embodied value-added in foreign final demand relative to exports (see Box 1 for details) is much lower for manufactured goods, which have more potential for vertical integration, than for other activities, in which domestic natural resources, intermediation or labour intensity play a very important role in production (Figures 6 and 7). Regarding final products, dispersion of imports relative to final demand is much higher for capital goods than for consumption goods (Figure 8).
We put all this information together and group emerging countries according to their ability to retain value-added at home:
Commodity producers retain much more value on a direct basis through exports than other countries. However, in addition to risks stemming from product concentration (see next section), they also show a larger share of value drained through imports of final goods. Anyway, the picture is diverse among this group:
Among those with high ratios of value-added over exports, Chile and Saudi Arabia spend a significant share of this value on imports of consumption and capital goods. In contrast, Brazil and Indonesia retain most of it through domestic production.
Most East Asian commodity exporters (Cambodia, Malaysia and Vietnam) not only retain less value in aggregate terms but also import a substantial share of capital goods (40% of gross fixed capital formation).
Figure 6
Embodied value-added of exports in foreign final demand by sector (EMs) (%)
Figure 7
Breakdown of value-retention by sector (%)
NB: 2009 data Source: BBVA Research, OECD
NB: 2009 data Source: BBVA Research, OECD
0246810121416
0102030405060708090
100
Agri
culture
Min
ing
Food p
roduct
s
Textile
s, leath
er
Wood,
paper
Chem
., n
on-m
et.
Meta
ls
Mach
.,Equip
.
Ele
ctri
cal, o
pt.
eq.
Tra
nsp
ort
eq.
Oth
er
manuf.
Utilit
ies
Const
ruct
ion
Tra
de,
hote
ls,
rest
.
Tra
nsp
ort
, co
mm
.
Fin
ance
, in
sura
nce
Busi
ness
serv
ices
Oth
er
serv
ices
Basic Manufactures Services
Avg.TotalContribution to total (pp) (rhs)
>100% >100%
0102030405060708090
100S.A
rabia
Russ
iaBra
zil
Arg
entina
Aust
ralia
Indonesi
aS.A
fric
aU
SU
KC
hile
Japan
Canada
Italy
Spain
Turk
ey
India
Fra
nce
Pola
nd
Germ
any
Mexic
oC
am
bodia
Chin
aThaila
nd
Vie
tnam
Mala
ysi
aPhili
ppin
es
Kore
a
Utilities&Construction&Services
Manufactured goods
Basic products
REFER TO IMPORTANT DISCLOSURES ON PAGE 13 OF THIS REPORT Page 7
Economic Watch Madrid, April 2014
Figure 8
Imports of consumption and capital goods (% of final domestic demand aggregates)
NB: 2010 data Source: BBVA Research, UN, IMF and Haver
Economies rated as manufacturers retain less value from exports, but on the other hand are less dependent on imports of final goods:
Mexico, Poland and especially Turkey retain as much value as a standard developed country on a higher contribution of basic products in the first case and from services in the other two.
East Asian manufacturers retain less value from exports.
Only Thailand and Poland show significant shares of imported capital goods.
India is a special case as its comparative advantage is in exports of services, thus retaining more value than manufacturers.
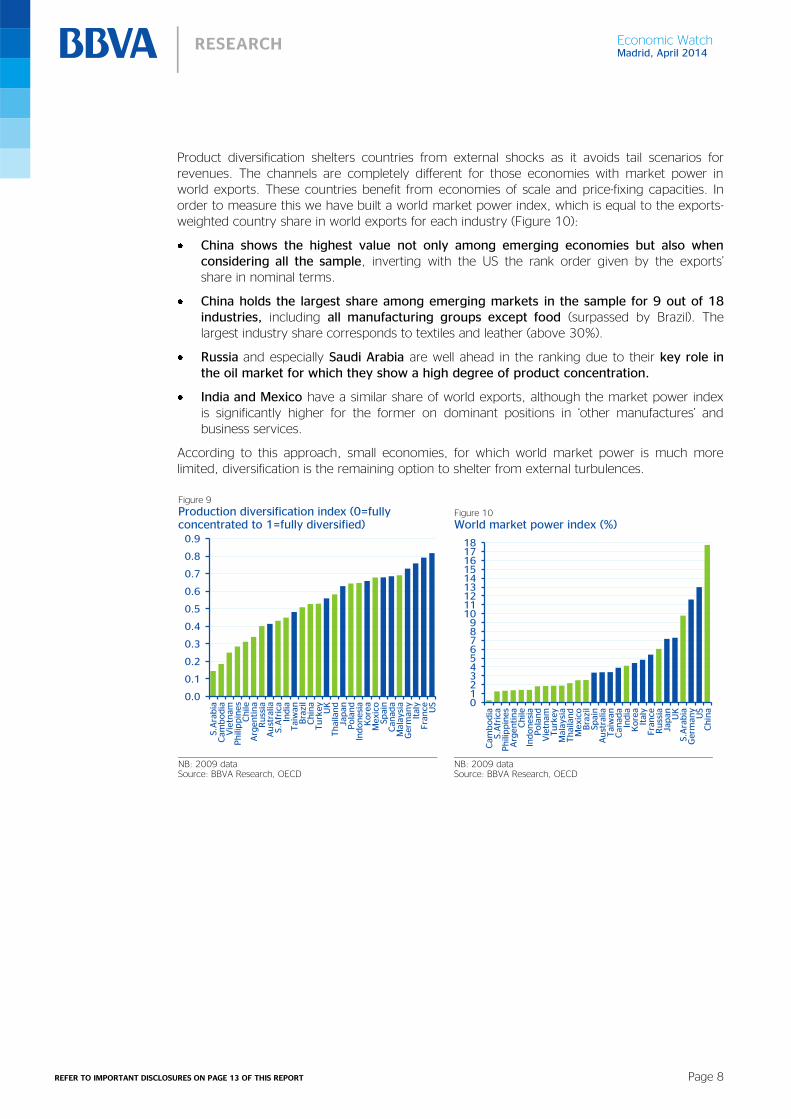
Diversification is the way for smaller economies Comparative and competitive advantages drive trade flows around the world through the interaction of markets. Within this framework, external forces could eventually entail risks even for successful exporters, such as a fall of terms of trade for commodity producers or strong competition for manufacturers. These effects could be aggravated in the case of having also concentrated exports on a partnership basis. In this context, product concentration increases exposure to these risks regardless of potential short- and medium-term gains. Less diversified countries should make the most of these gains to complement their comparative advantage.
We have built an index of product diversification, which is equal to the inverse of the exports-weighted revealed comparative advantage
2 (Figure 9). According to this index:
Emerging economies are less diversified on average than developed countries. Among the exceptions, note the case of Mexico, which compares positively with developed markets such as Korea, Japan or the UK.
Commodity exporters have a more concentrated production structure. However, there are some remarkable exceptions in East Asia, where Malaysia and Indonesia (commodity producers) are more diversified than China or the Philippines (manufacturers), which are quite specialised in electrical equipment, as well as India, with a dominant role in business services and certain low-tech manufacturing activities.
2: The revealed comparative advantage of country ‘j’ in product ‘i’ is equal to the share of exports of ‘i’ in country ‘j’ divided by the share of exports of ‘i’ in the world.
0
5
10
15
20
25
30
35
40
45
Mala
ysi
a
Nig
eri
a
Cam
bodia
Vie
tnam
Thaila
nd
Pola
nd
Chile
Germ
any
Mexic
o
UK
Turk
ey
Canada
Kore
a
S.A
fric
a
Pakis
tan
Egypt
Colo
mbia
Fra
nce
Peru
S.A
rabia
Russ
ia US
Arg
entina
Italy
Phili
ppin
es
Indonesi
a
Aust
ralia
Spain
Chin
a
Bra
zil
India
Japan
Imports of consumption goods as a % of private consumption
Imports of capital goods as a % of gross fixed capital formation
REFER TO IMPORTANT DISCLOSURES ON PAGE 13 OF THIS REPORT Page 8
Economic Watch Madrid, April 2014
Product diversification shelters countries from external shocks as it avoids tail scenarios for revenues. The channels are completely different for those economies with market power in world exports. These countries benefit from economies of scale and price-fixing capacities. In order to measure this we have built a world market power index, which is equal to the exports-weighted country share in world exports for each industry (Figure 10):
China shows the highest value not only among emerging economies but also when considering all the sample, inverting with the US the rank order given by the exports’ share in nominal terms.
China holds the largest share among emerging markets in the sample for 9 out of 18 industries, including all manufacturing groups except food (surpassed by Brazil). The largest industry share corresponds to textiles and leather (above 30%).
Russia and especially Saudi Arabia are well ahead in the ranking due to their key role in the oil market for which they show a high degree of product concentration.
India and Mexico have a similar share of world exports, although the market power index is significantly higher for the former on dominant positions in ‘other manufactures’ and business services.
According to this approach, small economies, for which world market power is much more limited, diversification is the remaining option to shelter from external turbulences.
Figure 9
Production diversification index (0=fully concentrated to 1=fully diversified)
Figure 10
World market power index (%)
NB: 2009 data Source: BBVA Research, OECD
NB: 2009 data Source: BBVA Research, OECD
0.0
0.1
0.2
0.3
0.4
0.5
0.6
0.7
0.8
0.9
S.A
rabia
Cam
bodia
Vie
tnam
Phili
ppin
es
Chile
Arg
entina
Russ
iaA
ust
ralia
S.A
fric
aIn
dia
Taiw
an
Bra
zil
Chin
aTurk
ey
UK
Thaila
nd
Japan
Pola
nd
Indonesi
aK
ore
aM
exic
oSpain
Canada
Mala
ysi
aG
erm
any
Italy
Fra
nce US 0
123456789
101112131415161718
Cam
bodia
S.A
fric
aPhili
ppin
es
Arg
entina
Chile
Indonesi
aPola
nd
Vie
tnam
Turk
ey
Mala
ysi
aThaila
nd
Mexic
oBra
zil
Spain
Aust
ralia
Taiw
an
Canada
India
Kore
aIt
aly
Fra
nce
Russ
iaJa
pan
UK
S.A
rabia
Germ
any
US
Chin
a
REFER TO IMPORTANT DISCLOSURES ON PAGE 13 OF THIS REPORT Page 9
Economic Watch Madrid, April 2014
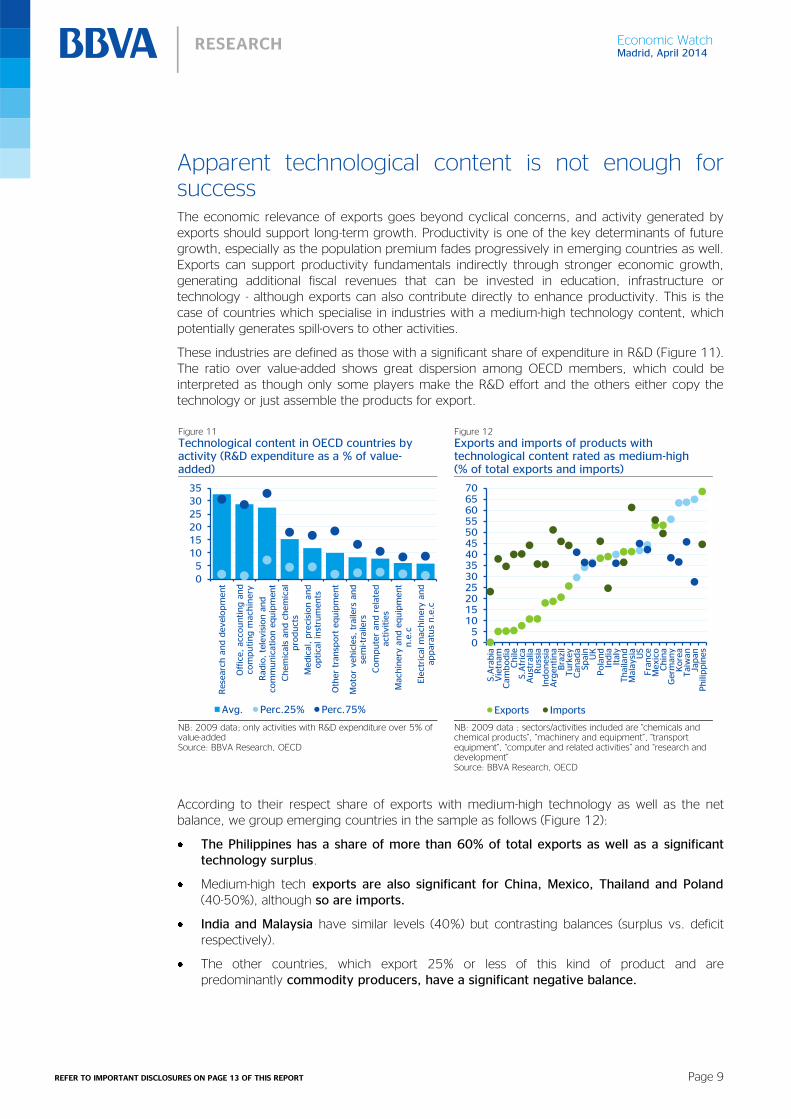
Apparent technological content is not enough for success The economic relevance of exports goes beyond cyclical concerns, and activity generated by exports should support long-term growth. Productivity is one of the key determinants of future growth, especially as the population premium fades progressively in emerging countries as well. Exports can support productivity fundamentals indirectly through stronger economic growth, generating additional fiscal revenues that can be invested in education, infrastructure or technology - although exports can also contribute directly to enhance productivity. This is the case of countries which specialise in industries with a medium-high technology content, which potentially generates spill-overs to other activities.
These industries are defined as those with a significant share of expenditure in R&D (Figure 11). The ratio over value-added shows great dispersion among OECD members, which could be interpreted as though only some players make the R&D effort and the others either copy the technology or just assemble the products for export.
According to their respect share of exports with medium-high technology as well as the net balance, we group emerging countries in the sample as follows (Figure 12):
The Philippines has a share of more than 60% of total exports as well as a significant technology surplus.
Medium-high tech exports are also significant for China, Mexico, Thailand and Poland (40-50%), although so are imports.
India and Malaysia have similar levels (40%) but contrasting balances (surplus vs. deficit respectively).
The other countries, which export 25% or less of this kind of product and are predominantly commodity producers, have a significant negative balance.
Figure 11
Technological content in OECD countries by activity (R&D expenditure as a % of value-added)
Figure 12
Exports and imports of products with technological content rated as medium-high (% of total exports and imports)
NB: 2009 data; only activities with R&D expenditure over 5% of value-added Source: BBVA Research, OECD
NB: 2009 data ; sectors/activities included are “chemicals and chemical products”, “machinery and equipment”, “transport equipment”, “computer and related activities” and “research and development” Source: BBVA Research, OECD
05
101520253035
Rese
arc
h a
nd d
evelo
pm
ent
Off
ice,
acc
ounting a
nd
com
puting m
achin
ery
Radio
, te
levis
ion a
nd
com
munic
ation e
quip
ment
Chem
icals
and c
hem
ical
pro
duct
s
Medic
al, p
reci
sion a
nd
optica
l in
stru
ments
Oth
er
transp
ort
equip
ment
Moto
r vehic
les,
tra
ilers
and
sem
i-tr
aile
rs
Com
pute
r and r
ela
ted
act
ivitie
s
Mach
inery
and e
quip
ment
n.e
.c
Ele
ctri
cal m
ach
inery
and
appara
tus
n.e
.c
Avg. Perc.25% Perc.75%
05
10152025303540455055606570
S.A
rabia
Vie
tnam
Cam
bodia
Chile
S.A
fric
aA
ust
ralia
Russ
iaIn
donesi
aA
rgentina
Bra
zil
Turk
ey
Canada
Spain
UK
Pola
nd
India
Italy
Thaila
nd
Mala
ysi
aU
SFra
nce
Mexic
oC
hin
aG
erm
any
Kore
aTaiw
an
Japan
Phili
ppin
es
Exports Imports
REFER TO IMPORTANT DISCLOSURES ON PAGE 13 OF THIS REPORT Page 10
Economic Watch Madrid, April 2014
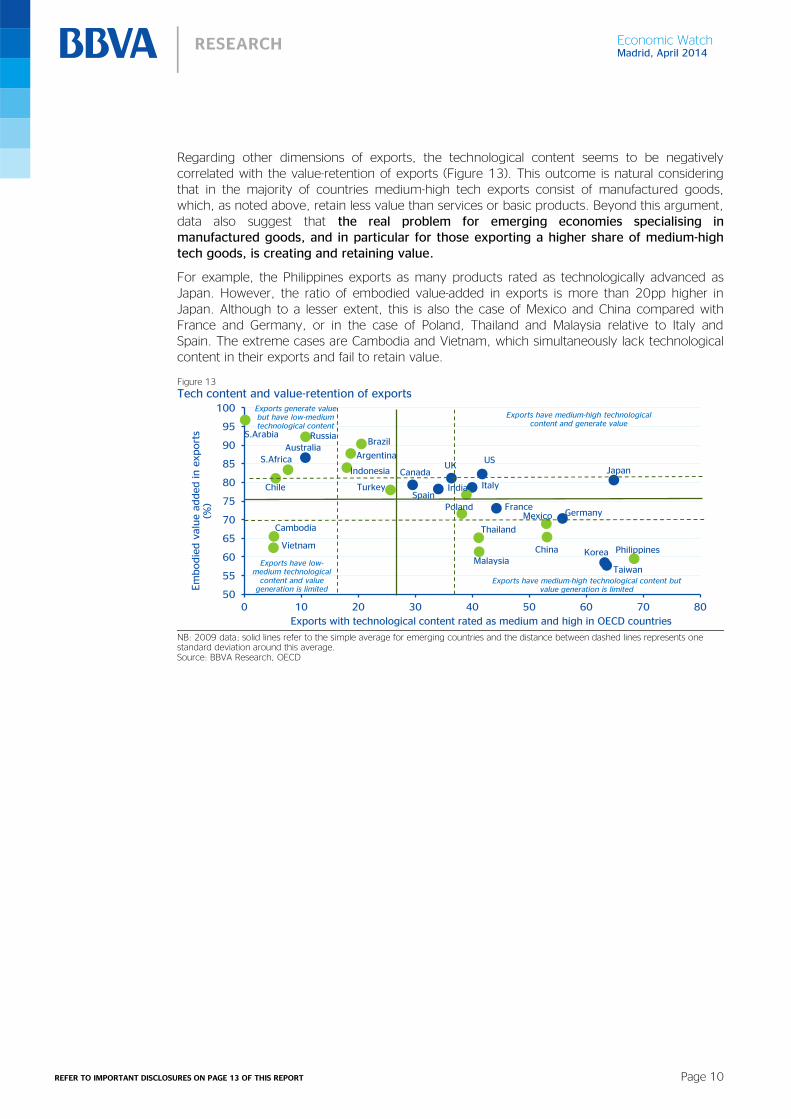
Regarding other dimensions of exports, the technological content seems to be negatively correlated with the value-retention of exports (Figure 13). This outcome is natural considering that in the majority of countries medium-high tech exports consist of manufactured goods, which, as noted above, retain less value than services or basic products. Beyond this argument, data also suggest that the real problem for emerging economies specialising in manufactured goods, and in particular for those exporting a higher share of medium-high tech goods, is creating and retaining value.
For example, the Philippines exports as many products rated as technologically advanced as Japan. However, the ratio of embodied value-added in exports is more than 20pp higher in Japan. Although to a lesser extent, this is also the case of Mexico and China compared with France and Germany, or in the case of Poland, Thailand and Malaysia relative to Italy and Spain. The extreme cases are Cambodia and Vietnam, which simultaneously lack technological content in their exports and fail to retain value.
Figure 13
Tech content and value-retention of exports
NB: 2009 data; solid lines refer to the simple average for emerging countries and the distance between dashed lines represents one standard deviation around this average. Source: BBVA Research, OECD
50
55
60
65
70
75
80
85
90
95
100
0 10 20 30 40 50 60 70 80
Em
bodie
d v
alu
e a
dded in e
xport
s (%
)
Exports with technological content rated as medium and high in OECD countries
Exports generate value but have low-medium technological content
Exports have medium-high technological content and generate value
Exports have low-medium technological
content and value generation is limited
Exports have medium-high technological content but value generation is limited
China
Cambodia
Vietnam
Indonesia
BrazilRussiaS.Arabia
Korea
Thailand
Malaysia
Argentina
Poland
Philippines
Chile
Mexico
IndiaTurkey
S.Africa
Taiwan
Japan
Australia
Germany
US
ItalySpain
UKCanada
France
REFER TO IMPORTANT DISCLOSURES ON PAGE 13 OF THIS REPORT Page 11
Economic Watch Madrid, April 2014
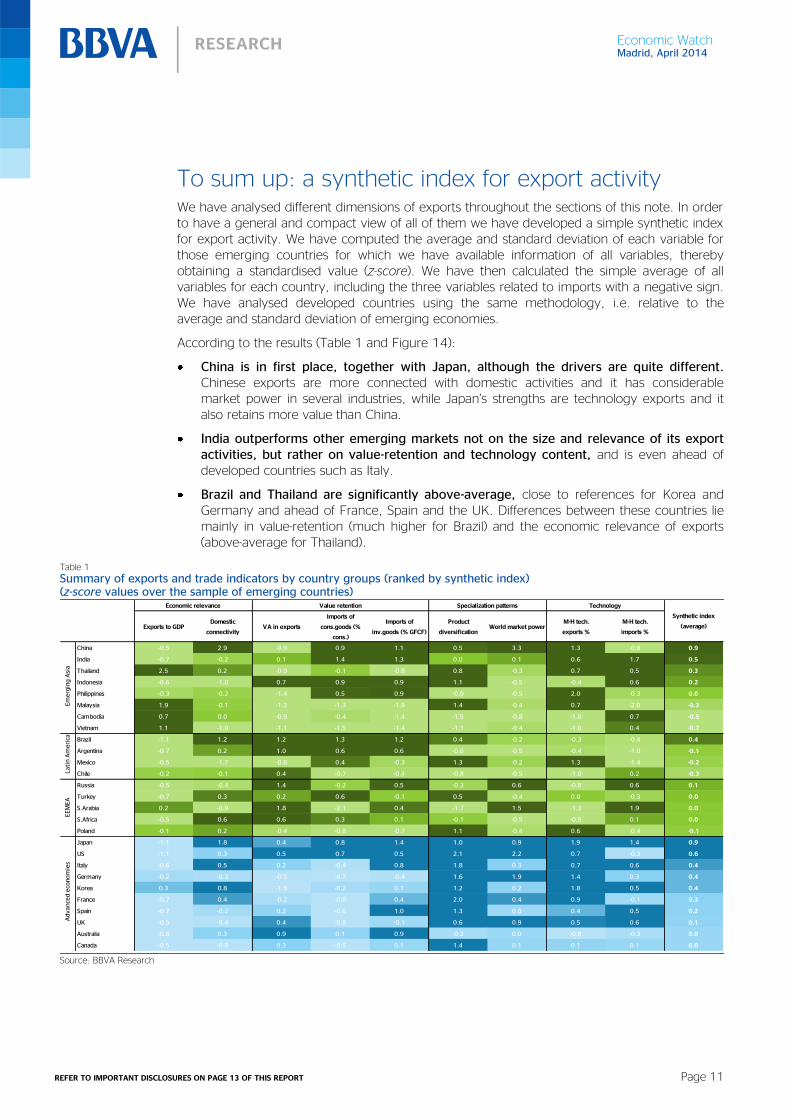
To sum up: a synthetic index for export activity We have analysed different dimensions of exports throughout the sections of this note. In order to have a general and compact view of all of them we have developed a simple synthetic index for export activity. We have computed the average and standard deviation of each variable for those emerging countries for which we have available information of all variables, thereby obtaining a standardised value (z-score). We have then calculated the simple average of all variables for each country, including the three variables related to imports with a negative sign. We have analysed developed countries using the same methodology, i.e. relative to the average and standard deviation of emerging economies.
According to the results (Table 1 and Figure 14):
China is in first place, together with Japan, although the drivers are quite different. Chinese exports are more connected with domestic activities and it has considerable market power in several industries, while Japan’s strengths are technology exports and it also retains more value than China.
India outperforms other emerging markets not on the size and relevance of its export activities, but rather on value-retention and technology content, and is even ahead of developed countries such as Italy.
Brazil and Thailand are significantly above-average, close to references for Korea and Germany and ahead of France, Spain and the UK. Differences between these countries lie mainly in value-retention (much higher for Brazil) and the economic relevance of exports (above-average for Thailand).
Table 1
Summary of exports and trade indicators by country groups (ranked by synthetic index) (z-score values over the sample of emerging countries)
Source: BBVA Research
Exports to GDPDomestic
connectivityVA in exports
Imports of
cons.goods (%
cons.)
Imports of
inv.goods (% GFCF)
Product
diversificationWorld market power
M-H tech.
exports %
M-H tech.
imports %
China -0.5 2.9 -0.9 0.9 1.1 0.5 3.3 1.3 -0.8 0.9
India -0.7 -0.2 0.1 1.4 1.3 0.0 0.1 0.6 1.7 0.5
Thailand 2.5 0.2 -0.9 -0.1 -0.8 0.8 -0.3 0.7 0.5 0.3
Indonesia -0.6 -1.0 0.7 0.9 0.9 1.1 -0.5 -0.4 0.6 0.2
Philippines -0.3 -0.2 -1.4 0.5 0.9 -0.9 -0.5 2.0 -0.3 0.0
Malaysia 1.9 -0.1 -1.2 -1.3 -1.9 1.4 -0.4 0.7 -2.0 -0.3
Cambodia 0.7 0.0 -0.9 -0.4 -1.4 -1.5 -0.8 -1.0 0.7 -0.5
Vietnam 1.1 -1.0 -1.1 -1.5 -1.4 -1.1 -0.4 -1.0 0.4 -0.7
Brazil -1.1 1.2 1.2 1.3 1.2 0.4 -0.2 -0.3 -0.4 0.4
Argentina -0.7 0.2 1.0 0.6 0.6 -0.6 -0.5 -0.4 -1.0 -0.1
Mexico -0.5 -1.7 -0.6 0.4 -0.3 1.3 -0.2 1.3 -1.4 -0.2
Chile -0.2 -0.1 0.4 -0.7 -0.4 -0.8 -0.5 -1.0 0.2 -0.3
Russia -0.5 -0.4 1.4 -0.2 0.5 -0.3 0.6 -0.8 0.6 0.1
Turkey -0.7 0.3 0.2 0.6 -0.1 0.5 -0.4 0.0 -0.3 0.0
S.Arabia 0.2 -0.9 1.8 -2.1 0.4 -1.7 1.5 -1.3 1.9 0.0
S.Africa -0.5 0.6 0.6 0.3 0.1 -0.1 -0.5 -0.9 0.1 0.0
Poland -0.1 0.2 -0.4 -0.8 -0.7 1.1 -0.4 0.6 -0.4 -0.1
Japan -1.1 1.8 0.4 0.8 1.4 1.0 0.9 1.9 1.4 0.9
US -1.1 0.3 0.5 0.7 0.5 2.1 2.2 0.7 -0.3 0.6
Italy -0.6 0.5 0.2 -0.4 0.8 1.8 0.3 0.7 0.6 0.4
Germany -0.2 -0.3 -0.5 -0.7 -0.4 1.6 1.9 1.4 0.3 0.4
Korea 0.3 0.8 -1.5 -0.2 0.1 1.2 0.2 1.8 0.5 0.4
France -0.7 0.4 -0.2 -0.8 0.4 2.0 0.4 0.9 -0.1 0.3
Spain -0.7 -0.2 0.2 -0.6 1.0 1.3 0.0 0.4 0.5 0.2
UK -0.5 -0.4 0.4 -0.8 -0.1 0.6 0.9 0.5 0.6 0.1
Australia -0.8 0.3 0.9 0.1 0.9 -0.2 0.0 -0.8 -0.3 0.0
Canada -0.5 -0.8 0.3 -0.5 0.1 1.4 0.1 0.1 0.1 0.0
Economic relevance Value retention Specialization patterns Technology
Synthetic index
(average)
Em
erg
ing A
sia
Lati
n A
meri
caEEM
EA
Advance
d e
conom
ies
REFER TO IMPORTANT DISCLOSURES ON PAGE 13 OF THIS REPORT Page 12
Economic Watch Madrid, April 2014
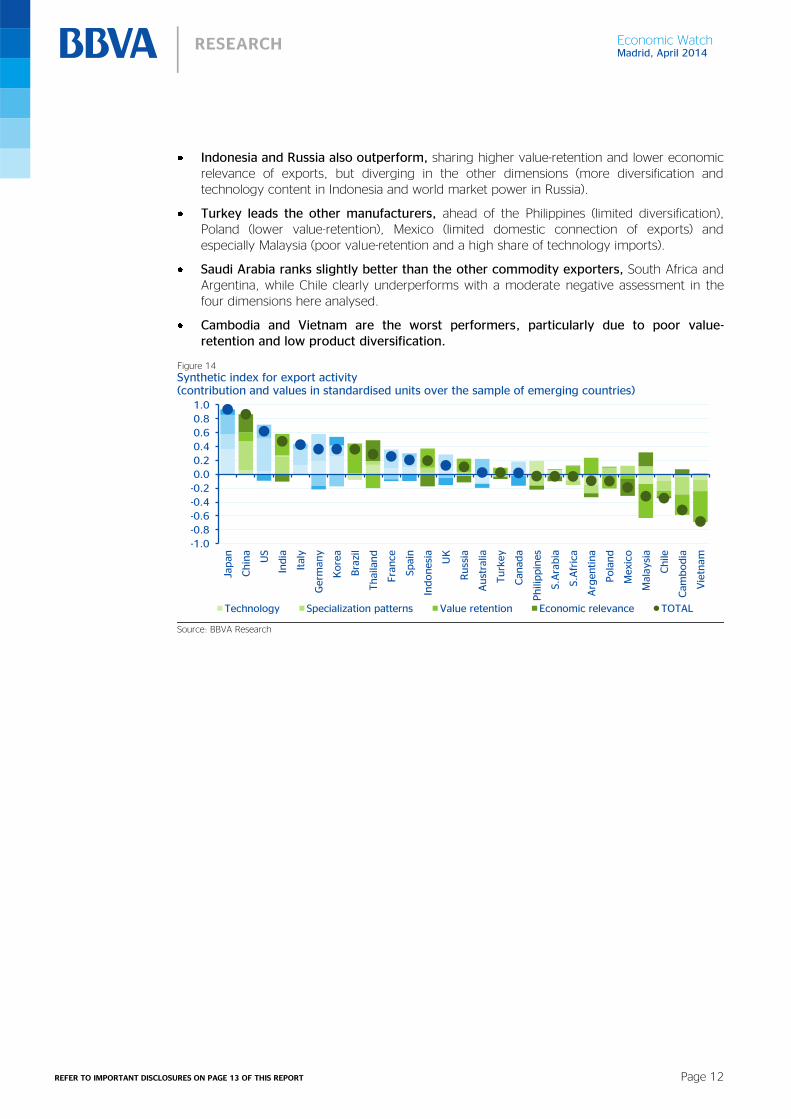
Indonesia and Russia also outperform, sharing higher value-retention and lower economic relevance of exports, but diverging in the other dimensions (more diversification and technology content in Indonesia and world market power in Russia).
Turkey leads the other manufacturers, ahead of the Philippines (limited diversification), Poland (lower value-retention), Mexico (limited domestic connection of exports) and especially Malaysia (poor value-retention and a high share of technology imports).
Saudi Arabia ranks slightly better than the other commodity exporters, South Africa and Argentina, while Chile clearly underperforms with a moderate negative assessment in the four dimensions here analysed.
Cambodia and Vietnam are the worst performers, particularly due to poor value-retention and low product diversification.
Figure 14
Synthetic index for export activity (contribution and values in standardised units over the sample of emerging countries)
Source: BBVA Research
-1.0
-0.8
-0.6
-0.4
-0.2
0.0
0.2
0.4
0.6
0.8
1.0
Japan
Chin
a
US
India
Italy
Germ
any
Kore
a
Bra
zil
Thaila
nd
Fra
nce
Spain
Indonesi
a
UK
Russ
ia
Aust
ralia
Turk
ey
Canada
Phili
ppin
es
S.A
rabia
S.A
fric
a
Arg
entina
Pola
nd
Mexic
o
Mala
ysi
a
Chile
Cam
bodia
Vie
tnam
Technology Specialization patterns Value retention Economic relevance TOTAL
Economic Watch Madrid, April 2014
DISCLAIMER
This document has been prepared by BBVA Research Department, it is provided for information purposes only and expresses data, opinions or estimations regarding the date of issue of the report, prepared by BBVA or obtained from or based on sources we consider to be reliable, and have not been independently verified by BBVA. Therefore, BBVA offers no warranty, either express or implicit, regarding its accuracy, integrity or correctness.
Estimations this document may contain have been undertaken according to generally accepted methodologies and should be considered as forecasts or projections. Results obtained in the past, either positive or negative, are no guarantee of future performance.
This document and its contents are subject to changes without prior notice depending on variables such as the economic context or market fluctuations. BBVA is not responsible for updating these contents or for giving notice of such changes.
BBVA accepts no liability for any loss, direct or indirect, that may result from the use of this document or its contents.
This document and its contents do not constitute an offer, invitation or solicitation to purchase, divest or enter into any interest in financial assets or instruments. Neither shall this document nor its contents form the basis of any contract, commitment or decision of any kind.
In regard to investment in financial assets related to economic variables this document may cover, readers should be aware that under no circumstances should they base their investment decisions in the information contained in this document. Those persons or entities offering investment products to these potential investors are legally required to provide the information needed for them to take an appropriate investment decision.
The content of this document is protected by intellectual property laws. It is forbidden its reproduction, transformation, distribution, public communication, making available, extraction, reuse, forwarding or use of any nature by any means or process, except in cases where it is legally permitted or expressly authorized by BBVA.