Embed Size (px)
Citation preview
1-661 J9QUJ9AON
NOI1VU1SININQV NOLLVINUOdNI A9H3N3
AO^HNH
1661
'98902 00 'uoi6mi|SEM 'MS 'anuaAV aouapuadspui QOOl 'IG2-I3 'UOJIBJISIUILUPV UOIJBIUJOJUI'yoo/jno Xfi/eu3 uuaj_-no^s o; sa6ueiJO ssejppe puas :yaiSVlNlSOd 'saojjjo BUIUBUI iBuomppe pus '8666-99002 OO 'uoiBingsEM
JB p|Bd sBeisod ssep-puooag -(soiiou aouBApe >noni!/« a6uBi|o oj joafqns soud) jseA jed 00>L$ J J snas pus 'gggos 00 'uoj6u!MSBM 'MS 'enuoAV eouepuedepui oOOI-'uoiJBJisiuiijupv UOUBUUOJUI ABjaug agj Aq A|jaiJBnb pagsnqnd S] (t?090-Ct'/0 NSSl)^ooWO A6JSU3 UUB±-)JOLJS aqj.
1-661 '9 JOqiiieAON :6u!iuud JQJ p8SB9|9u
-j-|AJ '8UIII UJ8JSB8 "LU'd S - 'WE 9
18U-989 (202) ^'8lUI}UJaiSE8 "Urd g- 'WE 8 3MJ J 0)
2LS-202-LXVd 0088-989(202)8E2E-E8/ (202) 98902 DO 'uo}6u|L|SBM
QQ 'uo;6u|L|SEy\/y SfrO-dL ujooy 'Buipiing IBJSSJJOJ6ui}uud lueujuj6AOQ 'S'f| uoj)ej)SjUjiupv
s}uaiunooQ )o luapuajuusdng I.B3-I3 'J
:s/v\o||oj SB ajB sjnoi) PUB 'sjaqujnu auoqdaiaj 'sassajppv 'peJiBdoi! BuuBaq aqi jo^ ao|Aap suoijEomnujujooaiaj JQ 'auoL(daiaj 'IIBLU Aq jajuaQ am oj pa;o8J|p aq p|noL|S SOIISJJEJS ABjaua uo suojjsano 'jajuao UOIJBLUJOIUI Afijaug IBUOJIEN s,vi3 JO aoijio Buijuud JU8LUUJ8A09 am oiojj paujEjqo aq ABLU suojjBoiiqnd (VI3) UOIIBJISIUJLUPV UOIIBUJJOJUI ABjaug JBLIJO JQ SILJJ joj UOIIBUJJO) -u| BuiSBtiojnd 'soi^o Bunuud juauJUjaAOQ 5 n 'siuaiunooa jo juapuajuuadns am LUOJJ pasEqojnd aq ABLU uojjBonqnd

09Z8-98S (202) uoi)BJiS|uiiupv UOIJBW.IOJUI XBjaug
sapnpuoQ aauajajuoQ
'junoy\| Bpuoy jo XjjSjeAjun 'B|BppByv '
VI3 'o||ejsoo PIAEQ
|uauido|aA8Q japow ABjaug uijai-uoqs
NOUN3 'WE.QS eorug uoijEpossy SBQ uBoueiuv '6uiiiu6H eorug ejn)i]su| qojBesey SEQ 'snj/ejg 'v |eiuBQ
VI3 'enbrg euBjQ
saojJd SBQ lejniefv) 6unseoajoj
so|uiouoo3 |BuoijEUjeju| joj ejnjjisui '
ejnjijsui oupe|3 'je>|oni nessny !2 'uoe6jndg (
ji|6r|
sanssi
'SJUB6BJBX AilBf
'o|e6uv9Q PJABQ VI3 'Ja|zjn|H
eojauuuioo pue X6J8U3
o|Jloai3>|eajgqouir|
jo esnon 'S'fl
OO:L
:s)si|auedj
'1
: jeMeads atouAax sf :o t
ou| ooouoo 'JenBs ui|op 's|edej» P (M pjB/vvpg
seojnosey joi 'AeuuBf esv 3OQ 'uojjBniBAg pus AOHOJ
:s)S!iaue,j :jo|ejapon V|3 ' uqop
MO Buuseoejod =266l.-l66t
VI3 'esn P"3 PUB X6jeu3 jo eoy^o 'j
s;sX|6UV uoj6u!t|SEM '^VI3 'jqo>|epoy ->\rew
BufieBoejoj /^
luejjnouoosuoissnosia tx-z
pejej OuusBoejoj ABjeug MOHVI3 'J
6uiuado
pue
oo:e
00:9
uoissas 3umjo|/\|
90B|d B 9AJ9S9J 0\ 90UBAPB U| 9PBLU 9q JSOLU SUOJJBAJ9S9J jnq '99JJ S| LUPlSOdluAs 9qi JOJ 90UBPU9UV 'S}SE09JOJ pUB SjSX|BUB
A6J9U9 ujJ9)-poqs ep|AOjd 01 JJBIS VI3 to X)!|i.qB pus Buipueisjapun em eoueijua HIM suadxe episjno LUOJJ induj JBHJ pgiBdpijuB s| \\ yooiino ABjau^ aua±-)jOLis J9yBnb ijynoj 9i|j u| pajuesejd suojioefojd QH\ qjJM
9JEdiuoo PUB spogjgiu 6u|jsBOjoj jjem ssnosjp HJM Aj)snpu| PUB juaujujeAoB LUOJJ sj9>|E9ds -sjsA|BUE X6j8ue wjei-ijoqs uo pedoi! ue OUJABLI sanssi BujBjauje PUB S)U9iudo|3A9p 19HJBUJ
A6J3U9 BujoSuo o)uj s)i|6isuj 8Aj)BUJ3)|B SB ||9AA SB A6o|opoi|)3LU BujisBoajoj ssnosjp 0) sjaqoiauu I^BIS VI3 PUB >/oo/;no A6jdU3 ujj3±-voys 9Mt J sjasn joj Xjjunvjoddo UB apjAOjd o\ s\ uunjsodiuAs 9^ jo snooj 941
VA 'ABM91BO (BISAJO
1661 '(
ABjaug uo uinjSodiuAs
gounouuB o\ pasB9|d uo!iBiujo)U|

DOE/EIA-0202(91/4Q) Distribution Category UC-98
Short-Term Energy Outlook
Quarterly Projections
Fourth Quarter 1991
Energy Information AdministrationOffice of Energy Markets and End Use
U.S. Department of EnergyWashington, DC 20585
This report was prepared by the Energy Information Administration, the independent statistical and analytical agency within the Department of Energy. The information contained herein should not be construed as advocating or reflecting any policy position of the Department of Energy or any other organization.

L66L Jepeno MJJnoj *)|OO|)no ABwug uuej.-vioqs /uoiteJisjuiuipv UOIJBUIJOJUI ABjeua
•sjanj a^Biuajiv PUB aujaajg 'jBapn^ 'JBCQ joVIH am )° lle — (S9£fi-frfi3/ZOZ) Suoj^ OOQ SunXg Xq papiAcud ajB s^aodxa pue 's}joduii 'uopDnpoad JBOD pue
il3Bqua\|Diay uiqoy Xq papiAoad BIB s3piiPnuou u10^ sasBqaind XjpuiDap pus 'syoduii X^piflDaja ouiDapoapXq '(06W-W2/ZOZ) U3H9XD ^s}3fl ^ papiAoad si uopBjausS X^piflDap jBapn^ 1 p°°M 'H
uqof jo uoisiAaadns a\\) aapun 's^yjo PP!d SBHBQ VI3 31P ^ papiAoad aoB saanSy uoipnpojd [jo apiuD Dp
(Z98Z-98S/ZOZ) IP^IH '3(ZZZZ-98S/ZOZ) uosuqof
(09Z8-98S/ZOZ) MIMMaui(Z/Z/-98e/203) uosuqof SBijg •••••••••• uopBjSajui/Xiddng
(66H-98S/302) sixioj^ pBqDi^j .................. Spueuraa(81VZ-98S/ZQZ) UOSUIB3 IPN •••••••••••••••• saauj pnpoaj(SSH-98S/ZOZ) MII^S 'V
(Z/S9-98S/Z03) loitl^O peqaij^ • vunaiooiaj iBuopBiuaiui/saDuj JIQ
:sjsXiBUB SUIMOHOJ am jo (89frl-98S/20Z) OIPISO^ PIABQ en passaapps aq XBUI suopsanb
XjuaSupuo^ PUB SupSEoaacy uuax-JJOijs aqj jo piiQ '(17ZS9-98S/ZOZ) 0463 ptuaQ JO fuoisiAiQ uopBuuojuj PUB qa^iBi^ XSiaug jo joiDaaiQ '(l^l-98S/Z03) uasaapuy Jnqyy 'fl3WH J° Jopajja '(/191-98S/Z03) ^ -yv\ 0} paaaajaji aq XBUI jaodaa am p ;uaiuoD am Sunuaouoa suopsanb jBaaua^ '(n3N3) ^fl PU3 PUB
sja^jB]^ XSjaug jo aay^o '(VI3) uopBiisuiiuipy uopBuiJo^uj XSaaug am Xq pajBdaad si ^OO/JWQ ^J9W3 wtwj,-^oj/s auj,
!!! |.66t JepeiD MMnoj *)|oo|)no ABjoug uuoj.-iJOi|s /uojiBjjsiujiupv uoiieuuojui
•(l6)ZOZOVIH/HOa 'mi J»«MwpMns pmuuySuiuaooqiaoj aqi ui aiqEiiBAE aq HIM SdLLS 91P °1 siuauaaAoaduai iBDiSoiopoqjaui aaqio pue
asaqj uo uopBuaaoaui aaoy»j -spuEuaap pnj nssoJI uo qj^voaS Xapujoap jo peduii papafoad aqi jo Xjiuqisuajap pue ssauajqBuosBaa am saAoadun qotqM papps uaaq SEq uoiSaa Xq saoBqs pnj Xajipn oupap joj aAjos cq aupnoa Mau y
•sisXjBue A^iAflisuas ui s;uauiaAOui aoudjo uopB^uasaadaj apsjiBaa aaoui B joj MOIJE qaiqM suiia) uop^Bja^ui Xiddns/puBiuap )ue)joduii apni^ui 04 papBoSdn uaaq aABq (pnj ajBijpsip PUB auipsBS joioui joj) suopBnba aaud pnpoad uinaioflad Xa^ '1661 XjrenuBf 'j uinajoflaj [euopBixi aq; jo ^joda^j ssaupaaBdaaj XouaSaauig uy ,/suopDafojj puB sanssj jo uopBuiuiBxg uy vunaiooiaj uuaj, woqs,, ui paqs;iqnd aaaM MdiAaj aqj jo siinsaa aqj, 'ipuno^ uinaioo^aj [BuopeN aq? Xq \ye) SdLLS aiD J° MaiAaj B uodn MOHOJ qoiqM pa;uaiua[duii uaaq aABq saSuBqD iB^iSoiopoqpui lepiut auios 'yoojjnQ siqi uj
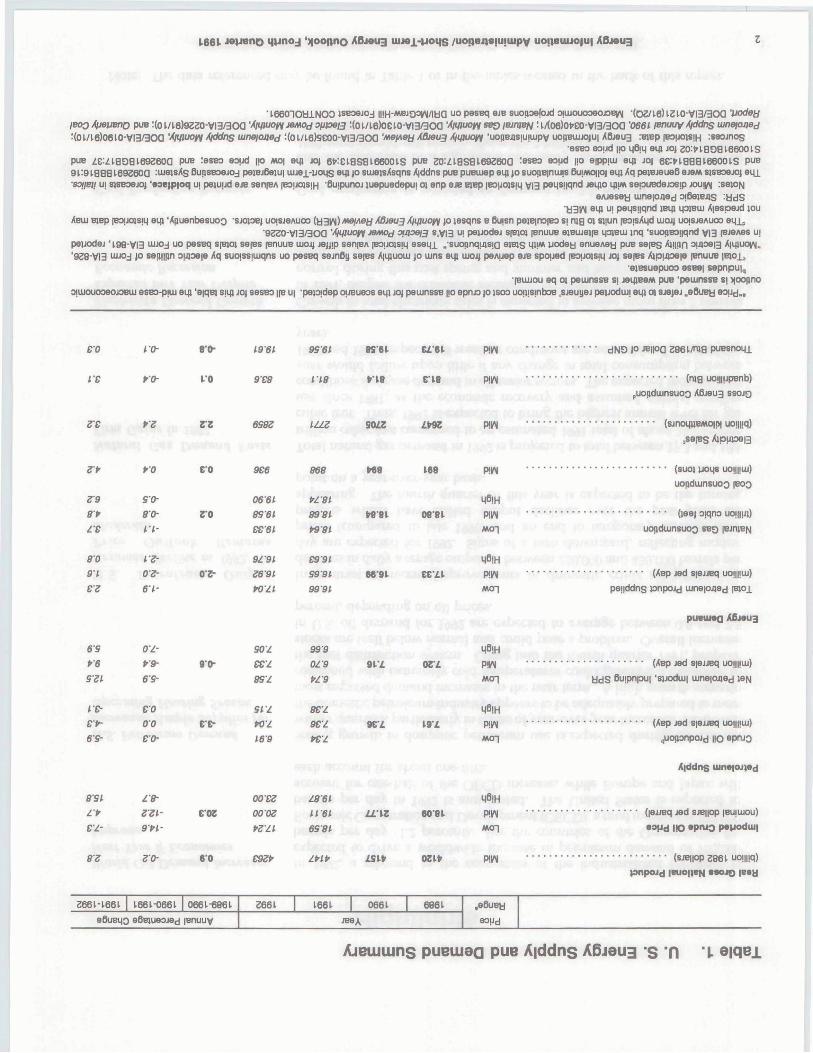
aqj ui pa;p saaquinu papunoj XUB uioxf uBqi jaqjBa sa[qBi aqi ui saniBA aq^ uioji) paiB[nDiB3 aaB saSuBqD aSB^uaoaad uy -Suipunoa juapuadapui 04 anp ajB j/oo/jnQ siqi ui E|Bp (BDuoisiq aq^ puB suopB3i[qnd asoq; ui B^Bp aqj uaaAvjaq sapuBdaoDSip JOUIJAI -suopBOi[qnd yjg jaqio puB '/I/I/^UO^Y d\ddn§ uinspjtfd 'maiaa^i (8*3113 himuoyq aqi ui paqsijqnd B;BP yjg uo pasBq aas BiBp {BDuoisp4 PUB sasBD aqx
uopBuuojui jBatuqaax leuopBfsj aq^ uiojj ads; aainduioD uosi ppoui yjg aqj,) '^oonno aiuiouooaojDBui aq^ ^DajjB XBUI qatqM suouduinsse jaqio puB 'saaud pnpoad
XSaaua 'no apnoo jo aoud PIJOM aq^ ^noqB suopdumssB yjg paijaj 04 yjg Xq pa}snfpE aas jnq /H!H-ME-ID::)W/IHa Xq paonpoad ajB sajBuipsa DauouoDaojDBjAj uaqjBaM )o XjiaaAas aq> inoqs suopduinssB PUB 'suopduinssB aoud jio PIJOM 'saiqBUBA aniiouooaojjBiu Xa^ jo saiBuipsa :s4ndui ao suopdiunssB jo sjas SUIMOJIOJ aqi Xq Xj[Bdpuud uaAup si ppoui SdlLS 3UJL '(SdllS) uiaisXs SupSBoaaoj paiBoSaiui uijax-yoqs aqi Suisn paonpojd aaB sasB3
aaq^EaM ;uaoaa uo passqaaE sa^Biupsa puBuiap XiptpDap auios 'ajduasxa aoj) aiqBireAB uopBuiaooui snouaSoxa ;sa;Bj aqj Suisn suopE[nuiis ppoui iBuaajui uioaj paAiaap aaB ao (jjotfejf supis tunajaipd ApfsaM 31U u^o^ SDpspE^s uo pasBq aaB sa^Euipsa uina[ox}ad auios 'aiduiBxa aoi) sajEuapsa yjg XoEuiuiipad aaB 1551 jo aa;aEnb paiq; aqi aoj BiEp auiog 7661 J° aa;aBnb q^inoji aq^ qSnooq; ;66l )O aa^aBnb qjanoj aq; uioaj spuajxa ^oo^nQ aq^ jo anssi siqj aoj pouad ^SBDaaoj aqj,
•}uauauaaAoS puB Xaisnpui a^EAiad uiXSaaua PUE saaSEUEui aaE ^OO/JMQ 3in J° saasn jEdpuud aqj, ('3020-VI3/HOQ '}U3ui3]ddn$ januuy
uu3£-}Mi{s aag) 'sja^aBui XSaaua uuaHJoqs aq; 01 paiBpa SDidoj juaaano sasstusip puB 'saoiAaas aaqjo ao asoqj qijM sasE3 juaaaa saaBduioo 's^SBDaaoj snopvaad ao aouEuaaojaad aq; sazXjEUE ^uauiajddns [Bnuue uy -(yoounQ) yooynQ f\Sjaiv^ UU3^-]M\{^ aq} ui aaquiaAOM PUE '^snSny 'XEj^ 'XaBnaqaj ui uopBDjiqnd aoj saoud PUB 'puBuiap 'Xiddns XSaaua uuaj-jaoqs XjaajaBnb ao sasB3 aarpiu siuasaad (yjg) uopEoisiupaipy uopBuaaoiuj XSaaug

6
I
L66L Jeweno MJ-inoj *)|oo|ino A6jeug tujoi-ijoqs /uoiieJisjiijuipv UOIIBUIJOJUI
sajojyi PUB
QZ ••••••••••••••••••••••••••••••••••••••••••••••••••••••••••••••••••••6t ••••••••••••••••••••••••••••••••••••••••••••••••••••••••••••••••••••61 ••••••••••••••••••••••••••••••••••••••••••••••••••••••••••••••••••••6t ••••••••••••••••••••••••••••••••••••••••••••••••••••• saDjmog XSaaug jofsyyi jaq^D JOj
fil ........................................................ ̂ oopno spnj aa;uiM 36-1661
€1 £1
II •••••••••••••••••••••••••••••••••••••••••••••••••••••••••••• ins um3[oa;3j01 ••••••••••••.•..•.••••••............•• sapiApisuag uoponpoaj pus pa^ddng pnpoaj6 ••••••••••••••••••••••••••••••••-••••••••••••••••••••••••••••••••••
. Sa3jjj pnpojj uina[OJ)dj
£ ••""•••••••••••••••••••••••••••••••••••••••••••••••••••••••••••• saouj nog •••••••••••••••••••••••••••••••••••••••••••••••••••••••••••••••••••••••••• suopdumssy

(.661- Mireno qjjnoj '>|oo|ino ABjeug UUMJ.-MOIIS /uo!iej)*iuiuipv uojieuuo|U|
02 ........................................................... jojoag Xq02 .................................................. uopdumsucQ [B(r) ui aSuEiQ jenuuv '£161 •••••••••••••••••••••••••••••••••••••••••••••••••••••••••••••••• S^DOJS SBS iB-irnBN -21$1 ••••••••••••••••••••••••••••••••••••••••• XjpedB3 PUB puBuiaQ pnj jaf ui aSucio iBnuuy 'll£1 ........................................................ sajBqg JB^JBJ^ auijosB^ JO40j\ -Ql21 ••••••••••••••••••••••••••••••••••• sjuauoduicQ puBiuaQ auiioss^ jcqoj^j ut aSuBq^ iBnuuy '6
01 ••••••••••••••••••••••••••••••••••••••••••••••••••••••••••• uoipnpojj iiQ apoQ 'S'n 'LQl •••••••••••••••••••••••••••••••••••••••••••••••••••••••••••• PUBUISQ uinaioxjaj JEJOJ, -98 ••••••••••••••••••••••••••••••••••••••••••••.•• S9DUJ SB3 iBaniBN PUB IJQ ^4!IPH ^W^IS 'S/ ........................................................ S8Duj pnpojj PUB JIQ aptu^ ^9 •••••••••••••••••••••••••••••••••••••• Xi^aa^ 1661 'saouj ;ods uinajoflaj aoqjBH vo\ M3^ •£g ••••••••••••••••••••••••••••••• pnpoij IBUOIJBX ssoaj) pay jo siuauodtucr} ui aSuBij^ [Bnuuy 'Z£ ••••••••••••••••••••••••••••••••••••••••••••••••••••••••••••••••••• saDuj no
aouj JIQ PIJOM pij^ :X^pujoa[3 jo uopisodsiQ PUB Xjddng '21 ££ ................................. asg-j ^jjj JIQ PJJOM PIW U^D P uopisodsiQ puB X[ddns 'UZ£ ••••••••••••••••••••••••••• ass;) aouj IIQ PI^OM P!W :^D FJmBM jo uopisodsiQ PUB X(ddns '01t£ ••••••••••••••••••••••••••••••••••••••••••••• s^uauoduio^ isBaajoj uopjnpoaj \]Q apru^ '6l£ ....................................................... sapiApisuag puBuiaQ uina(Oijaj -g0£ •••••••••••••••••••••••••••• asB3 aouj HO PHOM M^IH :uinaioj4aj jo uopisodsiQ pus Xjddng Y62 ••••••••••••••••••••••••••••• asB-j 33UJ JIQ ppoM PM :uinaioj;aj jo uopisodsiQ PUB X[ddns '982 ••••••••••••••••••••••••••••• asB^ aouj IIQ P^OM M°l :uinaio^aj jo uopisodsiQ PUB Xjddns -gIZ ••••••••••••••••••••••••••••••••••••••••••••••••••••••••••••••••••••• saDuj XSaaug -^92 ••••••••••••••••••••••••••••••••• asB3 aDuj ijo PI-IOM P!W :30UB[Bg uinaiojqaj iBuopBuja^uj •£22 ••••••••••••..•••••••••••••...•••••••••••••••• suopduinssy Jau^Ba^\ PUB DiuiouoaaoaaBj^ ~zZ ••••••••••••••••••••••••••••••••••••••••••••• XaBuiumg pusiuaQ puB X(ddng XSaaug 'S'n 'I
1.661 Jepeno iflJnoj ')(oo|jno ABjeug UIMJ.-IJOIIS /uoiiejisiuiuipy UOIJBUJJOJUI
)joddj siq) jo ypvq aq) ui pa)&:x)[ sajqe) aq) ui jo \ aiqBj, ui punoj aq XBUI paouaaapj B)Bp sqj, :a)Ofsj
I -I . . J t•S)jodxa PUB puBuiap aaqSiq q)iM jBaA" )xau )uaajad £z asu O) pa)3adxa si uoponpoad JBO^ -pAaj uo) uoijiiq \ aq) aAoqB uiEuiai jjps pjnoqs jB)O) \fo\ aqj, '0661 u! dn-pjmq >pO)S XjEpuoaas )UB3ijiu3is B jo q)Buua)jE aq) PUB uopdumsuoa J3MOI jo asnEDaq X[UIBUI 'pA3[ paoaaa s7jB3X )SE[ o) pajeduioo 1661 J° IIG JOJ luaoaad £•£ Xq asEajoap o) pa^Dadxa si uoponpoad
•punoaBsvurq AuiouoDa aqi ji 355^ ui aseaooui osje pjnoqs puBiuap X^puioai^ '0661 Jaj-ienb manoj pijui aip ui ireip IJB.J SUUUOD sjm aaqSiq aq 01 pauihssB ajB siuauiaambaj Supeaq PUB jauuuns pus Suuds }SBd snp Suunp JBUIJOU
ajaM S3Jtt(ejaduiai asnBoaq 'uoissaDaj Diuiouoaa aqj a^idsap 't66l u} UBIJJ aaoui a§BjaAB oj papadxa si sajBS Xipiflaap IBJO; ui
siq) jo )S3J 3q) JOj [BUIJOU 3JE suopipuoo jaqieaM ji pspadxa) \fa\ puB Q661 uaaA\)aq uopduinsuoD IB)O) ui 3SuEqD XUB ji ap)i| uodn MOHOJ p[noM jBaX ixau asBdJoui pa)3adxa aqx -sao)oas JO(BUI UB ui puBuiap asEajoui suopipuoa
IBUUOU paiunssE puB XjaAODaa Diuiouoaa aq) SB '1861 a^uis asn aoj pAai iBnuuB )saq9iq aq) Suuq o) papadxa si Z661 'snqj, -)aaj Diqno
!l )noqB jo JBJO) ^661 psieuipsa UB o) paaBduiOD )aaj aiqno uo;i[U) Z661 * 6'6l PUB £'61 uaaM)aq jB)O) o) pa)Da[ojd si Z661 UI puBuiap SB9 [Bjn)BU 16)0^ sfsoj puvu&Q s»g
•siSBq jBaX-jaAO-jsaX B uo )uiodSuiuin) aq) aq o) pa)oadxa si JEaX siq) jo Jd)JBnb qynoj aqj, -SuuEaddE ajB 'JBaX )SBc( aq) JSAO sauij^op )nd)no pa){Bq 3ABq qoiqM s)?a[ojd uiojj s)ijaudq XjBjoduia) o) pua UB PUB (0661 91El °) pdJBduuoo) sa^ud )sapoui Supoaijaj 'PJBMUMOP uan) B jo suSig '3661 loi pa)3adxa ajB Xsp aad spiiBq QOO'OEf' P116 OOO'OEZ uaaAV)sq jo )nd)no 3§BaaAB XIIBP ui sauiioap sy 'Z661 'uoponpcud [io apruD Dpsouiop ui s)uauiaAoaduii ;ua^aj O) )SBj)uc» uj
[io uo Suipuadap') £•3 pus g'O uaaA\)3q a§EjaAE o) p3)oadx3 SJB 2661 JOJ( puBuiap ijo 'g'Q uiS3SB3J3UI HBJ3AO 'UiaiqOjd B aSOd pjnOO pUB [BUUOU MOl3q IpM 3JB S^3O)S
suBdoad '1661 Jaysnb q)anoj aq) O)ui Suiof) '013)5X3 uopnqu)sip pnj aq) o) aSuanEqD B a)Bjaua3 p[noD sajn)Bjaduia) p\Q3 Xpuiaijxa q)iM pauiquaoo oueuaDs \$MOjS qSiq y 'uu3) JBBU aq) ui sasEaaaui puBuiap pa)33dxs )soui )aaui o) pajBdajd Xp)BnbapB aq o) sjBaddB Xj)snpui uinajoflad Dps3uiop 3q) uosvsg Suijvajj Suituoydji'J3A3MOH 'SaSBajDUl JBaX-J3AO-JBaX JO SUU3) Ul X[JBinDpaEd 'SJ3)JBnb J3)UI/
3q) Suunp papadxa si asn umaioj)ad Dpsauiop ui
•q)ju-auo )noqB joj )unoDDB qDB3 puB 3dojng SIP^M 'asBaaaui QD3O aiP J° Jl^q-auo aoj
OOO'OSS )° 9SB3JDUI [B)O) B '(Q3HO) ^uauidopASQ puB uopBaadoo^ onuouoDg aoj uopBziuBSjo 3m }° sau)unoo aq) joj *()u33J3d z'l) ^eP J3d sjaxiBq OOO'OSZ J° puBuiap uinaioflad ui assajDui spiMpjaoM B aAup o) papadxa si sa;j)unoD pazi[BU)snpui aq) jo saiuiouooa aq) ui punoqaa B '3661 UI S9svy&ui puau&Q
1661 *)|oonnQ UIMJ.-IIOIIS /uoflBJi»|ii|uipy uo||BuuofU| ABjaug
•16601OHJ.NOO ISEoejoj |l!H-»BJ30w/lUa "° P»SBq BJE suoiioefoxJ oiuiouooeojOBW -(02/16)1210^13/300 ' PUB :(o l/ie)9220-VI3ac>a 'X/<fl"°*V .«"««y aupee :(Ol/l6)oeiO-VI3aoa 'A/<fluo»v seg /a/nje/v : lA06)0*eo-VI3aOO '0
:(OlA6)06l.O-VI3/3Oa X(ifl"°)¥ X/<**1S uineicujed :(oi/l6)seOO-VI3/3OCJ Vwe.Mflu Xfl»U3 <</<flu°*Y 'uoREJisiuiUJpv uopBUJJOjui Xfljeug•esBO eojjd ||O u6m em joj 20:H898t6600lS
pus it'iiaOS 1692600 P"B IBSBO BOjjd |K3 Mq Bifl xij 6*:E 198816600 IS P"« 30:^18891692600 ^eseo eoud no e|pp|Ui eifl JO) 66*1888 16600 LS pue 9i:9 L888 t69260Q :uie;sAs Supseoejoj pe)Bj6eiu| uuex-iioqs 8LR jo siueisAsqns A|ddns puB pueujep em jo sucxieinujis 6uiMO(to| aqi Aq pejejeueB OJSM siseoexD) em •soiiBji U| siseoejoj 'eae)p|oq ui peiuud SJB san|BA (EOUOISJH 'Buipunoj luepuedapui o) enp aje ejep |eouo)siu| yi3 peqs;iqnd jeipo ipiM sepuedejosip jou^ :s
u! P«4S!iqnd jBip HOJBUJ A|eapejd iou XBIU Biep |BO(joisiL| eip 'Apuenbesuoo 'SxnoB) uoisjeAuoa (H9W) Mowey ABjeuj //ifluofy )O issqns e 6u|sn peiB|m|BO si njg 01 sijun [BotsAi)d 0104 uqsjeAuoo eqxp
"9220-VI3/3OO '4mu°W J&*Od 349013 6.VI3 u| peuodej SJBIOJ IBRUUB 8iBui8i|B tpiBiu jnq 'suopeonqnd VI3 IBJSASS uipeuodej '198-VI3 ^JOd uo peseq spjoi saps [enuue 0104 jejjip senpA |BoiJO}siq aseqx .'sufflinqiflsia BIBJS M1|M nodey enueAau puB sa|BS A)i|Qn OJAOSB A|L(ILKYJ,( '9Z8-VI3 >^Jod 1° S8S!l!ln ouiaeje Xq suo|SS|aiqns uo pesBq sejnfiy se|es Ximuouj jo iuns am LUOJJ peAuep BIB spotted (EOIJOISIM K>( saps Aipjipeie pnuue IBIOI,
•eiBSuepuoa asee| sepnpui,•JBUIJOU aq oj peuinssB s\ JSLPBBM DUB 'peoirrese s] ^oopno
oiuiouooeojoeuj esBO-piiu eqi 'etqB) Sjip joj sasec p U| 'pepjdep OIJEUSOS am joj paiunsse no eprua jo jsoo uojijsinboB .sjeuyej pauodiiij euj c» sjejej .eBuBy eotJd..
£f
8-0
re- ofl'S-
ei-
S'O-
8'0- »•*-
rz-O'Z-
6'S-
(TO E'O-
i'9-
Z'O-
CO- B'O- W6L W6* 8S'8l Wei Pin ............. ,jNO»°JB|l°a286l/niaPUBsnom
KO- I'O 9'C8 f<0 ri8 ri8 PIW ........................... (nig uoinijpenb)pUORdwnsuoo XBjeug SSOJQ
r? rz ess? */<j? soiz zwz pin ...................
ro fo gee 868 m tea Pin ......................... (8UOI ^^ w\\iw)
06'6l t>i'8l MB|H ' '*'9'L fd '
Z'O SS'6* 89'fft W81 OB'81 Pin ......................... (,8B( 0^m uo|||U])GC'6( W9* MO~| uopduinsuoo 6BQ |Bjn)Efg
S9'9t M'9l ee'AI- Pin ..................... ^^ ̂ g^jjeq UOIHJUJ)
99 '91 MO~| pa||ddns pnpojj iune|Ofl8d (eioi
,i , .^ putu»Q ARieua
SO'^ 99'9 M6|H9'0- CC'^ Oi'9 WL OZ'i PW ..................... j^pp JB(J s^jjeq UOJIHUJ)
ffS'^ K'9 MO-] HdS Bu|pnpu| 'spoduj| uin8|OJied IBN
sr/ 8C'^ MBlH6"6- W^ 9C'^ 9E'Z I9'i Pin ••••••••••••••••••••• (^gp j8(j s|8JJBq uO{||{ui)
16'9 Wi MO-| ^uopanpojd IIO epnjQ
fWi^; TT" "•.» i
OO'G? Zff'6( M^IH 6'OZ OO'O? »'6t lt'« aO'81 Pin .................... (|ejjBq J8d SJBIIOP IBUILUOU)
K't.1 6S'8l *«n
e'o e&t in* zsi» om Pin j
266t-t66l- | 1661-0661 | 0661--696I.|Bnuuy
2661 1661 | 066k 6861JB8A
.86UBU
Ajeiuiuns pueuiaa pue A|ddns ms '{\ 'I
Assumptions
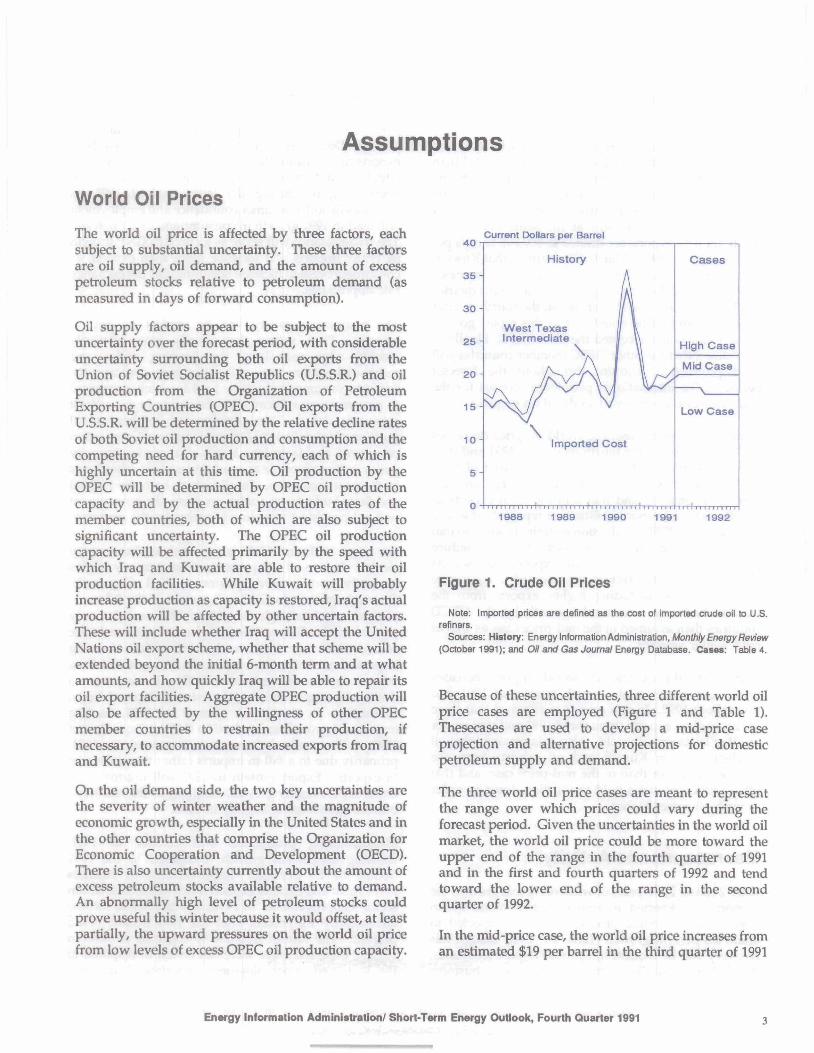
World Oil Prices ' :The world oil price is affected by three factors, each subject to substantial uncertainty. These three factors are oil supply, oil demand, and the amount of excess petroleum stocks relative to petroleum demand (as measured in days of forward consumption).
Oil supply factors appear to be subject to the most uncertainty over the forecast period, with considerable uncertainty surrounding both oil exports from the Union of Soviet Socialist Republics (U.S.S.R.) and oil production from the Organization of Petroleum Exporting Countries (OPEC). Oil exports from the U.S.S.R. will be determined by the relative decline rates of both Soviet oil production and consumption and the competing need for hard currency, each of which is highly uncertain at this time. Oil production by the OPEC will be determined by OPEC oil production capacity and by the actual production rates of the member countries, both of which are also subject to significant uncertainty. The OPEC oil production capacity will be affected primarily by the speed with which Iraq and Kuwait are able to restore their oil production facilities. While Kuwait will probably increase production as capacity is restored, Iraq's actual production will be affected by other uncertain factors. These will include whether Iraq will accept the United Nations oil export scheme, whether that scheme will be extended beyond the initial 6-month term and at what amounts, and how quickly Iraq will be able to repair its oil export facilities. Aggregate OPEC production will also be affected by the willingness of other OPEC member countries to restrain their production, if necessary, to accommodate increased exports from Iraq and Kuwait.
On the oil demand side, the two key uncertainties are the severity of winter weather and the magnitude of economic growth, especially in the United States and in the other countries that comprise the Organization for Economic Cooperation and Development (OECD). There is also uncertainty currently about the amount of excess petroleum stocks available relative to demand. An abnormally high level of petroleum stocks could prove useful this winter because it would offset, at least partially, the upward pressures on the world oil price from low levels of excess OPEC oil production capacity.
. 40Current Dollars per Barrel
West Texas Intermediate
1988 1989 1990 1991 1992
Figure 1. Crude Oil Prices
Note: Imported prices are defined as the cost of imported crude oil to U.S. refiners.
Sources: History: Energy Information Administration, Montiily Energy Review (October 1991); and Oil and Gas Journal Energy Database. Casos: Table 4.
Because of these uncertainties, three different world oil price cases are employed (Figure 1 and Table 1). Thesecases are used to develop a mid-price case projection and alternative projections for domestic petroleum supply and demand.
The three world oil price cases are meant to represent the range over which prices could vary during the forecast period. Given the uncertainties in the world oil market, the world oil price could be more toward the upper end of the range in the fourth quarter of 1991 and in the first and fourth quarters of 1992 and tend toward the lower end of the range in the second quarter of 1992.
In the mid-price case, the world oil price increases from an estimated $19 per barrel in the third quarter of 1991
Energy Information Administration/ Short-Term Energy Outlook, Fourth Quarter 1991

to $20 in the fourth quarter and throughout 1992. This case is based on the following assumptions. First, oil exports from the U.S.S.R. are assumed to be 20 percent lower in the fourth quarter of 1991 than in the same period of 1990 and about 25 percent lower in 1992 than in 1991. Second, it is assumed that Iraq accepts the United Nations oil export scheme, that Iraqi exports begin in January 1992, and that the scheme is extended for an additional 6 months at the same rate. As a result, Iraqi oil exports are limited to 500,000 barrels per day throughout 1992. Third, it is assumed that Kuwaiti oil production (excluding the Neutral Zone) increases from about 150,000 barrels per day in the third quarter of 1991 to 800,000 barrels per day in the fourth quarter of 1992. It should be noted that as this report goes to press, Iraq has not accepted the UN. terms. Finally, it is assumed that the other OPEC member countries will exert production restraint throughout the forecast period. (The international petroleum forecast for the mid-price case is discussed in detail on page 5.)
In the low oil price case, the world oil price decreases to $18 per barrel in the fourth quarter of 1991 and then decreases further to $17 in the second quarter of 1991. In this case, it is assumed that the embargo on Iraqi exports is removed and that Iraq increases exports as rapidly as its oil export facilities are repaired. It is also assumed that OPEC production restraint is weak so that other OPEC member countries do not reduce production as Iraqi and Kuwaiti exports increase. At the same time, other factors are assumed to contribute to lower prices, including higher exports from the U.S.S.R. and lower economic growth by the OECD countries than assumed in the mid-price case, as well as mild winter weather.
In the high oil price case, the world oil price increases to $23 per barrel in the fourth quarter of 1991 and throughout 1992. In this case, it is assumed that there are no Iraqi oil exports throughout 1992 and that winter weather is abnormally cold. Also, it is assumed that oil production from Kuwait and oil exports from the U.S.S.R. are lower than in the mid-price case, and that other OPEC countries hold production down in order to push oil prices higher.
Macroeconomic ActivityAfter 2 consecutive years of weak economic growth, the economy is expected to recover, albeit modestly, in 1992. Gross national product (GNP) is expected to attain 2.8 percent growth (Table 2). Even though this recovery will be modest in contrast to past recoveries, it will have a similar pattern. Increases in business
investment will begin the 1992 growth of the economy. Investment spending will rebound, increasing by 13 percent, compared to the previous year's decline of 8 percent. Decreases in interest rates and growth in both exports and consumption will increase investments in late 1991 and early 1992. Consumer spending will begin to grow during the latter part of 1991, as increases in both consumer confidence and employment will lead to 1992 growth in consumption of 2.1 percent. The trade balance will serve as a check to GNP growth in 1992. Imports will increase more than exports, as consumers begin to increase spending and the exchange rate appreciates.
The economic recovery will be modest for several reasons. First, sectors that usually grow relatively quickly after recessions, the housing sector and residential construction, still suffer from overcapacity. Second, consumption will be held in check, compared to past recoveries, because of remaining high levels of consumer debt. Third, because of weaker capital positions, higher Federal Deposit Insurance Corporation premiums, and large loan losses, changes in monetary policy will not provide as much investment stimulus as in the past recoveries. Finally, since both the Federal and State budgets are under pressure, the government will not provide a spending stimulus for the economy.
For all of 1991, real GNP is expected to show a very modest decline of 0.2 percent. The recovery begins modestly in the third quarter of 1991 (Figure 2). Quarterly growth in GNP will remain in the 2.8- to 3- percent range through the rest of 1991 and the early part of 1992. Consumption begins to increase in the second half of 1991 with investment showing improvement in the third quarter in response to falling interest rates. Interest rates, falling in response to declines in output and slack investment demand, begin to increase in the fourth quarter of 1991, leading investment growth to level off in the last 2 quarters of 1992. The trade balance has improved in 1991, primarily due to a fall in imports rather than increases in exports. Export growth in 1992 will improve, but imports post higher growth, resulting in the real trade balance deteriorating slightly in 1992.
Manufacturing production will recover in 1992, showing 4.4-percent growth, compared to the 1991 decline of 1.9 percent. Improvements in business investment and exports explain much of the production sector's improvement. In 1992, real disposable income increases by 1.9 percent after the 1991 decline of 0.5 percent. The rate of inflation is expected to slow in 1992 as expected wage increases lessen in response to the increased unemployment experienced in 1991.
Energy Information Administration/ Short-Tarm Energy Outlook, Fourth Quarter 1991

L661 ')|oo|ino uo!ieuuo|U| ABMUJ
jo SMau uau.M pjjBq jad Q0'l$ Jnoqs Xq padumf 'H'S'S'fl 3m u! iduiawB dnoD pajrej 13 isnSny
Xq papajje Xyauq Xjuo ajaM saaud \io apiuo
seoud
jad spjJBq uoinjui i - i uem ajoui Xq uopDnpcud a)eSao33e SUISEOJDUI 33JQ u? uopanpojd 33dOuou u! auipap siuj, 'H'S'S'fl a XBP aad spjJBq uoinyui \ jo assajoap jamjnj B Xq uMop uaAup 'Xsp jad spaaeq QOO'OSS inoqe Xq auijDsp o; pa^oadxa si uopDnpoad jio 03JOUON '^BP J8^ spajeq OOO'OZZ ^<1 aseaooui oj paioadxa si uoponpcud \io PIJOM 'Z661 UI 'saLqunoo aDHOuou -raipo aip pue 'oopcay\i 'D3JO 'saiflunoD QD3O 31W UIOJLJ sasBajoui ^sapoui
ajoui 01 paiDadxa si •H'S'S'fl 31P '"O-'J jad spjjeq uoinyui i jaAo jo auiioap uoponpojd
aAissBiu v >81 EJ 0661 am woif XBp jad sjaajeq 000'09Z i° aseajoap B 'XBp jad spjjeq uoiijou 3-99
01 paiaadxa si uoponpoad jio PJJOM '
- i 'H'S'STl am mojj puBuiap ui auipap panupuoD B Xq UMop ppq qiMOiS ipiM 'luaDaad g'O Jo 'Xsp jad spajeq GOO'033 ^<l asBajDui o^ papadxa si saiflunoo aD3Ouou 3m ^ puBuiap uinajoxiad '2661 ui 'Bisy ui asoq; XjiBiDadsa 'saiflunoo Q33O-uou jaqio am pus BUIVD UJQJJ sasBaj^ui Xq lasjjo uem ajoui aq HIM 'adojng aDHOuou PUB 'H'S'S'A a*D *"O-9 pusuiap ui sauqDaa 'a^Bj Q661 aifl "^o-y '^uaojad g-Q JO jad spjJBq OOO'OSl ^n '1661 uj ^BP Jad sjajJBq 2- 83 uBip ajoui jo a^BjaAB UB o; asBajDui o^ papadxa si saiflunoo CDHOUOU 81P u! pvreuiap uinajoxjaj
•mju-auo ;noqB JGJ }unoaDB ipBa IJIM uedef PUB adoang aii^M 'asBajoui QD3O 3VW J° JIBi{-auo JGJ ;un(»oB o; papadxa si sajBjg pa^niQ auj, -;uaaiad ft jo 'Xsp jad spjJBq QOO'OSS J° pusuiap uina[OJ)ad QD3O ui asB3J3ui UB o^ a}nqifluo3 \\\M '\un\ ui 'siuj, -^ L'Z Ji° mMOJS oiuiouooa QD3O u! MnS si 'uBdBf )da?xa 'suoiSaj Q33Q IIB ^o saiuiouo^a am ui punoqaj djeqs B '^661 UI 'sa|Bis P3?tufi
uiojj puBuiap ui aui^Dap am Xq lasijo XpSjBi aq HIM sup ln£l '1661 u? puBUjap uina[oj)ad ui asBajoui
am jo }soui JQJ iunoD3B o^ paiDadxa BJB adoang 0330 pue uBdBf -(z aiqBj,) ;66l «! luaojad Q'l Xjuo jo a^BJ B JB Moj8 niM saiuiouoaa 0330 3m *BIP uopduinssB am uo pasBq si pueuiap jo pAaj siuj, -a^Bj Q661 am uiojj 'jua:)jad i'Q JO 'Xsp jad spjJBq QOO'09 ^Iuo dn '1661 ui XBP jad spjJBq uoinnu 6'^e aSejaAB o} papadxa s! (QD3O) luauidopASQ PUB uopBjadoo^ Di
"T satrjunoo am Xq puBuiap
'l -«o 'XBp jad spxieq OOO'OZZ oj papadxa si puBuiap 'Z661 UI '(£ aWBJ
0661 am UJQJJ 'juaDjad e'O -"o 'XBp jad spjJBq QOO'OtZ dn 't66l u! ^BP J3d spjJBq uoi[jnu ^99 jo aSsjaAB UB 01 asBajDui o) papadxa si spnpojd uinajoxiad joj pueuiap PIJOM *asB3 aaud-piui am payaj )Bm suja^ed pueuiap PUB X]ddns sasn )SB3ajoj uinajoflad [Buopeujaiui auj.
asB3asBq am Mojaq PUB aAoqe juiod aSejuaDjad i 'mMOjS iND ^° puBq B aiejodjODui sasB3 oiuiouoaa MOI PUB uSiq am 'ijnsaj B sy 'pueuiap XSjaua 3unjiB[dxa ui )UBuiuua)ap JO(BUI B si Diuiouooa 'uopippB ui 'sajqBUBA jououoDa jo aSuBip jo apiuiuSBui am SuipjeSaj Xiureyaoun si ajam a^uis sa)BJ mMOJS Diuiouooa pajDafojd jo a3uBj B apiAOjd sasBD mMOjS onuouoDaojoBui MOI PUB M^W 3M1
i aSeM jaMO[ PUB pueuiap ypv\s o) spuodsaj i SB '3661 ui juaojad 9-9 Xq asBajoui uam '1661
u; )ua^jad £•£ asu o; papadxa aje saoud
:tuo|pa(ojd '(1661 jeqiueides) sseusng juauno to Xaunsjo rreejng 'ecjeuuiuoo )0
' pnpoid |euoi)BN SSOJQ jo sjueuodiuoo ui eOuego tenuuv 'Z
zee i oeet

1-661. qiinoj uuej,-|Joi|s /uof|Bj)siuiuipv UOJ|BIIIJO|U|
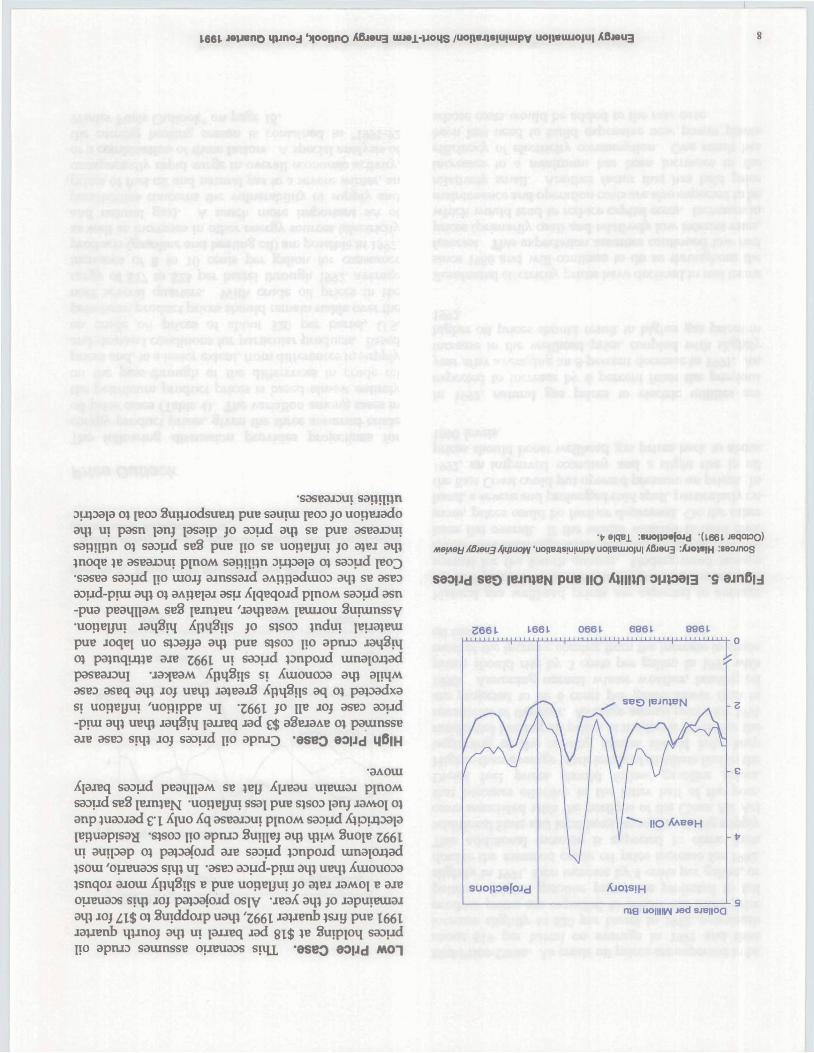
2 jxau am JBAO saaAooaj )nd)no jaMod oinoap ji dn ypid punoqs (saoud pnj pus) asn pnj nss°J ^lHPn I6".! SuiXidiui 'ajnjnj JBSU am joj pauoisiAua iou ajB adXj snp jo sjuauiaAoadun jaqunj t-siSBq aSBJdAB jBuopeu B uo 'Xjnf ui juaojad jg jo ajBj uopBznyin XjpsdBo pjooaj B paqosaj pue suoiSaj }soiu ui jBaX jsBi cq pajBduioo JBaX snp jo jauBnb puooas aip ui paAOjduu qomu SBM uopejauaS jaMod jBapnjyj -jaMod leapnu o; asn pnj Xiijpn 3upa[a ut saieqs pappiX SABU. ([BOD pue) seS puc no 'aauiuins puc Suuds UIJBM AJ9A B Xq papajje XpApisod Suiaq UIGJJ JBJ )Bip d)ou cq Supsaaa^ui si n -(g ajnSij) rug uoi[[ivu jad Q0'2$ °? asop spAaj ;B jaqio UDBD xpiM aiaduioD o; panupuoD BABU. jio pry jBnpjsaj pue seS JBJTVIBU moq jo/ saoud pnj A^rjpn 'jsaX siiu jo jdjjBnb puo»s aip uj
3jaM£'isn8nv
snp saDud )sn3ny 'jeaX snoiAaad avp ui UBUJ jaMoj s;uao 9 ;noqe aiB saoud ' snp qSnoipiv z'3Dud jsnSny aad sjuao £t Xq asoj saoud iods 'aaquiajdas uj jBau am ut SBS (Bjn)Bu 10} sasBdJDUi aoud ajqissod a;BDipui (3661 upjej^i qSnojip 1661 JaquiaAOjsj) uossas Supeaq aip aoj saoud saarqn.) jaqSiq PUB s]uauidAOUi aoud }ods luaoaj 'jaAaMOH 'saoud ssS jaduiBu. oj panupuoD aABij XuiouoDa ^BBM B PUB MOJ B ui saa^uiM UIJBM [BjaAag -Q661 jo MMBJ^ aauis puao) pjBMUA\op B uo uaaq aABq saoud jods peampM ssS IBJHIBN
•saDud \\o apnao ui asu aip ipiM ajBjnsuauauoD 'aunf aouis pxiBq aad
B Xq papunoqaj aABij Xaqx -uAvop saoud BABIJ saoud SB8 [B-injEu passaadap PUB
'pj-req aad 6C'Zl$ IB jno Sunuo^oq spAaj jsaMO[ jpm paqDBaj aunf ui (sjuajuoo jo aSsaaAB) saoud [to pnj [Bnpisaj
SJB[iop{BnpisaiXuiouooa9861 jnjjns
•oapuiBuiaa aip joj ^UHODDB judy a^uis sypcus \io pnj a)B([psip uSn{ XuBnsnun a[iiiM 'aSuBip aip jo }\v\{ UBIJ; ajoui JQJ juno;»B suia^jBd aaiad (BuosBas IBUUOJSI •uoiiBS jad sjuaD Ql inoqB Xq uajjEj aABq vpiqM s;so3 Ijo apnaD ui auijoap Suipuodsaoaoa aip O} si dojp snp jo pjnp-auo ireip ajoj\ - sjuao Q€ ^<l SuiSBajoap Xjnf qSnonp XjBnuBf uioaj ipuoui ipsa ua[[Bj aABq saoud jio SupBaq
•pasBaiDui3ABIJ S3pO}S aUflOSBS SB UO[IBS J3d S}U30 M8J B U3IJBJ
SBI{ aoud 3§BJ3AB aip 'aunf 3ouig -(g aanSij) sauojuaAui MO[ Xj3A o; asuodsaj ui spA3( judy J3AO sjuao g Suiquiip 'ui UOHB§ jad QZ'l$ paupesa saoud '3unf PUB XBP^J ipoq ui -(fr aanSij) sisu3 jjn^ UBISJSJ aip jo juSpu. 3ip Suunp XjBnuBf ui UOHB§ asd 0£'l$ snp joj pa^ead saoud auiiosB§ jo]oui
1-661 JOQJBH HJOA MON '£
•(L661 '02 Jequieides) uodey srms uinepjied ApieeM 'uojjejisiuiiupv uopeiuiqu) Afijeua :seojnos
tods
Bnv |np unp' ' ' I ' ' ' I ' ' ' 1 ' ' ' I ' ' ' I ' ' ' I ' ' ' I ' ' ' I 0
no
S
-01
-Si
-OZ
-9Z
oe
jed SJBIIOQse
3ABq Xsipluaoaa ui pasBajoui
'J3quia;das ui uA\op saoud }ods iqSnojq uossas SuiAup aip jo
pua auj, •(£ aanSij) UOSBSS SutjBsq aip jo uopBdptjuB aip PUB ipBd aoud jio apnoo aip SUIMOIJOJ Suuds a^B[ dip aouis Suisu uaaq 3ABi{ jio pnj [Bnpisaj puB i;o pnj 3)B(ipsip aoj saoud ^ods '[BjauaS \i\ ui ssS iearu)6u jo )n{3 psnupuoo aip o; pire apiMpuoM ajBnbapB 01 anp pa^osjjBun XpSaBi saoud ;ods no pnj jBnpisaj 'jaAaMOj^ 'dnoo aip 04 asuodsaj ui saoud [io apnjo pajoiiiui 'jio pnj a^Bnpsip pire aujiosBS jo^oui XuBinopjBd 's^onpojd uinajonad pauijai aoj saoud iods 'SJBaX Maj ISBJ aip aaAO 'a'S'S'fl aip SuinSB[d uaaq SBq )Bip uoponpojd pasBaooap SuipaeSaj oiaouoo auios uaaq SBU. aaaip 'uopippB uj -JBaX B XuBau JQJ qsiSSnjs uaaq SBU. qoniM Xuiouooa PUOM aip in luauiaAOjduii 'MOIS ipqn? '[BjauaS B o) PUB ja^uiM Suiuioodn aip joj jio joj pueuiap P[JOM a\ asuodsaj ui Suissaaoui 'XjiBnpBoS qSnoip ' uaaq ssq aoud jio apnjo PUOM aip 'aaAaMoq 'aunf aouig •papABJun Xpiomb dnoo aqi SB 'sXsp MSJ B unpiM spAdi dnoo-ajd o) UMOP ^OBq pasBa uaq) ;nq ';i
166L 'i|OO|ino ABjeug uuei-uoqs /uoj)ej|8juiuipv uojieuuo|U|
•asBq a;Ba am o; pappe aq pinoM s;soo asoqM s;uEid jaMod Mau dAisuadxa pjmq o; paau ssaj uaaq SBq ;{nsaa auQ 'uopdumsuoo Xjpupap jo Xouapyp aip ui sasBaooui uaaq seq uinuitutui e o; sasBaooui aoud ppq seii JBl# aopBj aaq;ouy 'H^uis XpApBjaa aq o; pa;oadxa ospj are s;soo uopBaado PUB aouBua;uiBiu ui sasBaaouj -s;soo jB;idBO aonpaa o; pua; pjnoM qoiqM 'sa;Ba ;saaa;ui MOJ XpApBpa PUB (IBOD XiuBuiud) saoud pnj MOI panupuoo saumsse uopB;oadxa siqj, •iseaajoj aqi inoqSnoiq} os op o^ anupuoa HIM puc 9^61 aDU!s suua; jBaa ui pauipap aABq saoud AjpLqoap (Bpuapisa^
•Z661ui saoud sv2 jaqSrq ui ;jnsaj p[noqs saoud II XimSip q^iM pajdnoD 'aaud pBaqjpM atp ui UV '1661 u! asBaaaap luaojad-g UB SuiSBaaAB snoiAaad auj UIOJLJ luaoaad 9 Xq aseaooui o^ pa^aadxa ajB sapfipn DiflDap cq saaud SBS IBJIUBU 'Z661 UI
0661inoqe o> ypvq saoud SBS pBaqipM isooq pinoqs saoud IIQ ui asu ;q9;is B PUB XuiouoDa paAOjduii UB '^661 uj -saoud uo aanssaad pjBMdn ^nd pinco ISBO^ issg aqi
'nads ppa paSuoioad PUB ajaAas B 'pueq aq^ UQ 'passajdap jaqiaiu aq pinoa saoud 'ajoui
aauo piyui si aaqjBaM aa^uiM am j\ -|jBjaAO JBJJ uaaq t66l u! SBS 10} pUBiuap aijqM qSiq uaaq BABU. spAai
punooSaapufi uaiJBnb vpjnoj am JQJ (EUIJOU si jaipeaM ^i 1661 u! spAai Q661 Moiaq juaoaad g jnoqB
01 pa^oadxa ajB saoud pBampM SB3
libapiuo ui asB3£)ui am IUOJLJ Suauoa aseaoaui axp jo ^soui m^ Z661 ui uo[iB3 aad s^uaa £ Xq asu pinous saotad lio SupBaq 'aameaM uajuiM IBUUOU Suniinssy '0661 ui uem J3MOf UOIIB§ aad sjuao 9 aq o) papafojd aae 1661 *°) saDud iBnuuB aSsjaAy 'JBaX am jo japuiBuiaj am 10} spAai ajejapoui IB saDud ijo SupBaq [Bpuapisaj
dpq pjnoqs uosBas Supeaq aq; jo SuiuuiSaqui pnj a;Biipsip jo spAai ypo^s aSBjaAB-uBm
auiiossS MOHOJ ppioqs saoud pry aq; }o jjBq ja;;Bi aq; ui aApoajja sauicoaq ;Bq;
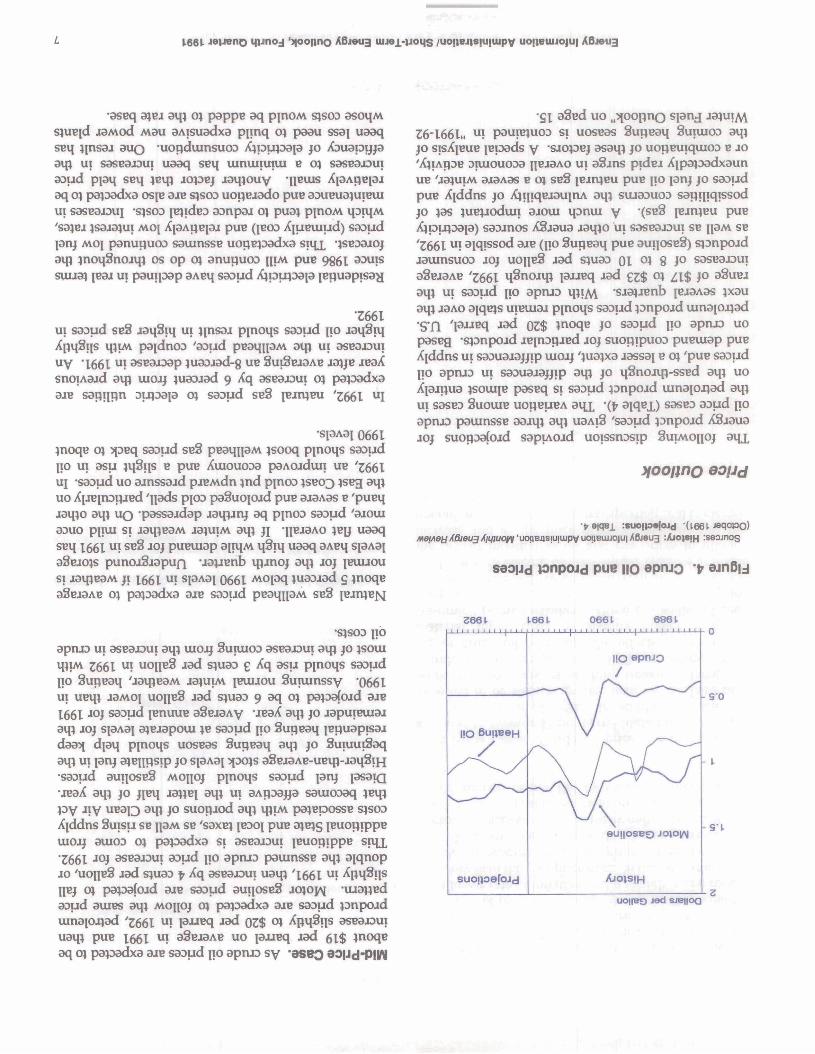
J!V UB^D aifl J° suopjod aq; \$UA pa;BpossB S;SOD Xiddns Suisu SB ipM SB 'saxs; IB^OI pire a;B;s iBuopippe uiojj auioD o; pa;3ddxa si aseaaoui iBuopippB siqj, 'Z661 JOJ asBaaoui aoud jio apruD pauinssB aq; ajqnop jo 'uonBS jad s;uao ^ Xq aseaoDui uaq; '1661 u! ^PM^iis HBj o; pa;oa[oad ajB saoud auijoseS jo;oj^ -uaa;;Bd aoud auiBS aq; MOJIOJ o; pa;3adxa ajB saoud pnpoad uinajoxiad '1^61 ui pjJBq jad o^$ o; XpqSijs asBaiout uaq; PUB 1661 UI sSeoaAB uo pjJBq aad gi$ inoqB aq o; papadxa ajB saoud no apao sy 'aseo
•gi a3Bd uo ^oopno spnj 36-1661.. u! paure;uoD si uoseas Supeaq SUIUIOD aq; jo sisXiBUB [Bpads v 'saopEj asaq; jo uopBuiquioo B jo 'X;iApoB aiuiouoDa nBaaAO ui aSjns pidBJ Xipa;oadxaun UB 'ja;uiM ajaAas B o; seS learqeu PUB jio pnj jo saoud PUB Xiddns jo X;ijiqEjauinA aq; sxuaouoo sapqiqissod jo ;as ;uBuodun aaoui qonui y '(SB^ ISJnjBu PUB X}pix)Dap) ssDjnos XSjaua aaq;o ui ssseaaoui SB ipM SB 'Z661 u! aiqissod ajB (110 Supsaq PUB auijosBS) s;Dnpoad jauinsuoa joj uojiBS aad s;uao oi o; g )° sasBaooui aSsaaAB '^661 qSnoaq; paaBq aad £3$ o; £i$ jo aSuBa aq; ui saoud 110 apnao q;;M 'saa;aBnb paaAas ;xau aq; aaAO a[qe;s uiBiuaa pinoqs saoiad pnpoad um3[oi}ad 'S'fl 'P-"Bq Jad QZ$ inoqB 40 saoud 110 apnoo uo pasBg -s;onpoad aBjnopaBd aoj suopipuoo puBuaap PUB Xjddns ui saouaaajjip UIGJJ ';ua;xa aassa[ B o; 'pue saoud \io apnao ui saouaaajjip aq; jo qSnooqvssBd aq) uo Xpapua ;SOUIIB pasBq si saoud pnpoad uinapflad aq; ui sasBO SUOUIB UOPBUBA auj, •($ aiqsj,) sasBO aoud 110 apnoo pauinssB aaoq; aq; uaAiS 'saoud pnpoad XSaaua aoj suopoafoad sapiAoad uoissnosip SUIMOHOJ aqj.
:«uo|p«(oid -(1661.:se3jnog
pnpcud pue no epnjQ •
1.66 L 0661 6861L J I I I I I T | I I I I 1 ] 1 J J J I _l .I.-LJ_|_J fill lilt t_||llill]_ _ Q
- S'O
\eilj|OSB£) JOJO^
1 - : . . , ,
AJOJSIH
S'l
1661 J»V»no qynoj ARwug uoi)«ujjoju| ABwig
•S3SB3JDUIIBOD Supjodsueo) pus S3UIUI [BOD jo uopBJddo
ui pasn ]3nj jasaip jo 3Dud sqj SB PUB asEarmi S33ud se§ pue jio SB uope|jui jo 3)BJ am
)noqe ;B asB30Dui pinoM sat)ii9n oupsp o; saoud•S3SB3 saoud [io uiooj aanssaad aAppaduioo 34) SB aoud-ptui aq} o; aApBjaa asu Xiqsqojd pjnoM saaud asn-pus pedmidM seS iBjrvjeu 'aaipeaM JBUUOU Suruinssy•uopByui J3ij8iii XpijSiis jo S^SOD ;ndui PUB joqBi uo S)33jj3 3ip puB S^SOD ijo 3poiD
3JB ^661 u! saoud pnpoad iuna[OX)ad35(B3M Xpq8l|S SI XUIOUOD3 a
asBq 344 Joj uBqi aa^BaoS Xpq§;is aq 04 si uopBuui 'uopippc uj '3661 }° IP -K>J 3SB3-piui am uBip JaqStq pJJBq jad £$ aSBjdAB o) pauinsse3JB 3SB3 Slip JOJ S3Dud JIO 3pIU3 'eSBQ 83|Jd ljD|H
seo
:«uo|p*(ajd '(1661:seojnos
pue no Ainun o|Jpei3 '9
2661 1661. 0661 6861 8861.
'3AOUI
saoud pBaqipM SB ^BJJ X^JBSU ureuiaj pjnoMS3DIjd SBS IBJttJBJSJ 'UOflBlJUI SS3J pUB S^SOD J3HJ 13MO\ O^
3np ̂ uaojad pi X[uo Xq asBajDui pjnoM saaud Xipujoaia IBpuapisay -S;SOD [io sprua SUJUBJ 3m VPfAv SUOIB ui auijDap o^ paioafojd SJB sdoud pnpoad ui4SOUI 'OUBU33S Sim UJ '3SBD aDud-pIUI 3qj UBq; XUIOUOD3
}snqoj 3joui X^qSijs e pus uopByui jo S)BJ J3MO[ B aaB ouBuaDS sim JOJ pai3a(ojd osjv 'JB3X 3m jo japuieuiaj 3»B *°) Zl$ o? Suiddoap uam '3661 Ja^cnb isau pus 1661 aaiJBnb q)jnoj 3m ui (3JJBq asd gl$ IB Suippq saoudJIO 3pIUD S3UinSSB OUBU3DS SIXJJ, -8SBO 00|Jd MOT
suoijoefojd
- z
-e
me

U.S. Petroleum Outlook
OverviewSince last fall, much has happened concerning domestic and world petroleum markets. The war in the Persian Gulf has been fought and won. The economic recession has continued, but guarded optimism that recovery is underway seems to hold sway among economic analysts. The fourth quarter of this year offers to bring several changes in the pattern of domestic petroleum demand and supply that have characterized the first 3 quarters. Petroleum demand is expected to rise in the fourth quarter of 1991, compared to a decline a year-ago, as the economy is expected to be on its way to recovery and a normal pattern of colder weather is assumed to appear. While remaining moderate throughout most of 1991, crude oil prices this fall are expected to average $10 per barrel below fourth quarter 1990 levels in the mid-price case. Domestic crude oil production, which remained stable for the first 9 months of 1991 or actually increased compared to 1990 levels, is expected to decline slightly in the fourth quarter and to slip further for the remainder of the forecast. As a result of these developments, total net imports of crude oil and petroleum products in the mid-price case are expected to increase by more than 1 million barrels per day in the fourth quarter of this year compared to the same period in 1990. An average decline of more than 1 million barrels per day in total net imports characterized the first three quarters of this year.
Total DemandDespite the obvious differences expected in the overall domestic petroleum market balance from a year ago, a relatively tranquil scene for the winter is envisioned in the mid-price case, barring any extremely severe weather patterns. The situation for petroleum (and other fuels markets) in the case of a severe winter is examined in "1991-92 Winter Fuels Outlook" on page 15. In the mid-price case, petroleum demand for the fourth quarter of 1991 is expected to average 17.06 million barrels per day, up 350,000 barrels per day from the fourth quarter 1990, but still well below the remarkably high level of shipments in the fourth quarter 1989. Even this increase for the winter could be in serious doubt if the expected recovery does not develop. Signs are not uniformly positive regarding the
onset of steady, moderate economic growth at this time.5 If crude oil prices remain stable or low, it is expected that year-over-year increases in petroleum demand will continue throughout the forecast. In 1992, domestic demand is expected to increase by about 270,000 barrels per day compared to average 1991 levels. Much of that anticipated growth is in the first quarter 1992, as the effects of normally cold weather will contrast sharply with the mild conditions in early 1991. Accordingly, some of the largest gains in shipments will be in the distillate and residual fuel oil sectors. Despite the recovery expected for 1992, demand next year is still likely to fall below 1990 levels.
The uncertainty surrounding the mid-price case is principally a function of the uncertainty surrounding crude oil prices and macroeconomic growth, in addition to the uncertainty surrounding weather conditions. The uncertainty surrounding crude oil prices is not insignificant, but is relatively small compared to the possibilities which arise when alternatives are considered for macroeconomic growth and weather. Tables 5 through 7 detail the range of domestic petroleum demand and supply results when a mid-case economic scenario is combined with normal weather and the range of oil prices shown in Figure 1. Figure 6 overlays expected alternative petroleum demand paths when extreme weather and macroeconomic assumptions are incorporated. Figures 7 and 8 provide a view of petroleum supply and imports variability under various world oil price assumptions.
An extreme weather case, particularly if combined with a very high economic growth scenario for the winter, could lead to petroleum demand in the first quarter of next year of 17.78 million barrels per day, 1.35 million barrels per day above the same period in 1990. The question of whether or not this scenario could pose a problem for domestic petroleum supply at peak periods during the winter is addressed in some detail in the "1991-92 Winter Fuels Outlook" on page 15. The factors which seem to be working against such a situation occurring probably outweigh the factors which might foster it. In particular, the apparently low probability of the economy accelerating at a rate much above the mid-price case, significant conversions to natural gas from heating oil since 1989,6 and the generally ample supplies of natural gas (which would tend to lessen the likelihood of gas interruptions creating severe additional pressure on supply and prices of fuel oil), all
Energy Information Administration/ Short-Term Energy Outlook, Fourth Quarter 1991
20Million Barrels per Day
19 -
18
17 -
16
15
14 -
13 -
12 -
11
0
HistoryHigh GNP Growth,
Low Oil Price, Severe Weather
Mid GNP Growth,Low to High Oil Price,
Normal Weather
Low GNP Growth, High Oil Price, Mild Weather
Projections
1989 1990 1991 1992
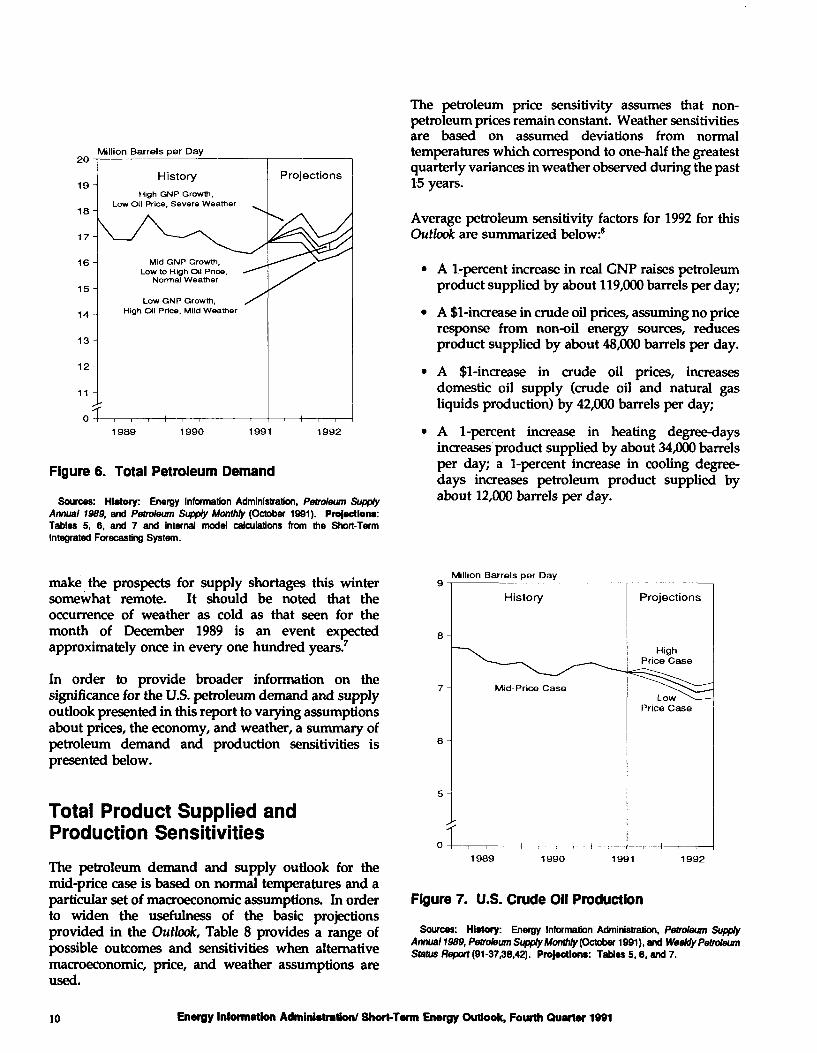
Figure 6. Total Petroleum Demand
Sources: History: Energy Information Administration, Petroleum Supply Annual 1989, and Petroleum Supply Monthly (October 1991). Projection*: Tables 5, 6, and 7 and internal model calculations from the Short-Term Integrated Forecasting System.
The petroleum price sensitivity assumes that non- petroleum prices remain constant. Weather sensitivities are based on assumed deviations from normal temperatures which correspond to one-half the greatest quarterly variances in weather observed during the past 15 years.
Average petroleum sensitivity factors for 1992 for this Outlook are summarized below:8
• A 1-percent increase in real GNP raises petroleum product supplied by about 119,000 barrels per day;
• A $1-increase in crude oil prices, assuming no price response from non-oil energy sources, reduces product supplied by about 48,000 barrels per day.
• A $l-increase in crude oil prices, increases domestic oil supply (crude oil and natural gas liquids production) by 42,000 barrels per day;
• A 1-percent increase in heating degree-days increases product supplied by about 34,000 barrels per day; a 1-percent increase in cooling degree- days increases petroleum product supplied by about 12,000 barrels per day.
make the prospects for supply shortages this winter somewhat remote. It should be noted that the occurrence of weather as cold as that seen for the month of December 1989 is an event expected approximately once in every one hundred years.7
In order to provide broader information on the significance for the U.S. petroleum demand and supply outlook presented in this report to varying assumptions about prices, the economy, and weather, a summary of petroleum demand and production sensitivities is presented below.
Total Product Supplied and Production SensitivitiesThe petroleum demand and supply outlook for the mid-price case is based on normal temperatures and a particular set of macroeconomic assumptions. In order to widen the usefulness of the basic projections provided in the Outlook, Table 8 provides a range of possible outcomes and sensitivities when alternative macroeconomic, price, and weather assumptions are used.
Million Barrels per Day
7-
6
5 J
0 - —
History
Mid-Price Case
Projections
High Price Case
1989 1990 1991 1992
Figure 7. U.S. Crude Oil Production
Sources: History: Energy Information Administration, Petroleum Supply Annual 1989. Petroleum Supply Monthly (October 1991), and Weekly Petroleum Status Report (91-37.38,42). Projection*: Tables 5,6, and 7.
10 Energy Information Administration/ Short-Term Energy Outlook, Fourth Quarter 1991

Million Barrels per Day
8 -
7 -
History Projections
Low Price Case
High Price Case
1989 1990 1991 1992
Figure 8. Total Net Petroleum Imports
Note: Crude oil production includes lease condensate.Sources: History: Energy Information Administration, Petroleum Supply
Annual 1989, Petroleum Supply Monthly (October 1991). Weekly Petroleum Status Report (91-37,38,42). Projections: Tables 5,6, and 7.
Total Petroleum Supply
In the base case, domestic crude oil production is expected to drop off slightly in the fourth quarter of 1991, leaving the expected annual production level for 1991 essentially unchanged from the 1990 level, with a drop of 320,000 barrels per day expected for 1992 (Table 6 and Figure 7). In 1991, Alaskan production increased enough to offset a small decline in the lower-48 States. This increase was caused by expanded gas handling facilities in the Prudhoe Bay field in the latter part of 1990, allowing higher rates of oil production to be achieved by the end of the year. Production from this field has apparently begun to decline again, but the higher level of output achieved in late 1990 and early 1991 has resulted in an expected higher annual average in 1991. In 1992, the lower-48 States are expected to show a greater decline than in 1991, and Alaskan production is expected to fall below 1.7 million barrels per day. According to the Baker-Hughes rotary rig count, the total rotary rigs in operation fell below 900 in April of 1991, and averaged just over 800 in August. For the mid-price case of $20 per barrel for crude oil,
the rig count for 1991 and 1992 is expected to be below the 1990 level.
Domestic crude oil production could fall as low as 6.91 million barrels per day in 1992 under the low world oil price case (Table 5), or could average 7.15 million barrels per day in 1992 in the high world oil price case (Table 7). These estimates contain an element of uncertainty which goes beyond expected outcomes for various price ranges. This uncertainty, associated with both the current production level and with the timing of expected events, accounts for approximately 47 percent of the range of production in the fourth quarter of 1992 between the low and the high oil price cases (Tables 5 and 7). The difference between low and high price projections of 290,000 barrels per day in the fourth quarter .of 1992 contains 150,000 barrels per day attributable to the price impact (Table 9).
Throughout the summer, the domestic refining industry has been geared to supplying the seasonal demand for motor gasoline. Primary stocks of finished motor gasoline were only slightly above 170 million barrels at the end of the first quarter of this year, due to a lack of the usual winter motor gasoline stock build. With two different kinds of gasoline quality regulation taking effect during the course of the year (the summer Reid Vapor Pressure limitations and the winter oxygenates restrictions in some locales), this much flatter stock profile appears to be the new seasonal pattern for the near future. According to the most recent data from the EIA Petroleum Supply Monthly, the amount of liquefied petroleum gases, pentanes plus, and other motor gasoline blending components blended to motor gasoline was 760,000 barrels per day from October 1990 through January 1991 and 550,000 barrels per day from February through July 1991. With less crude oil and unfinished oil, refinery inputs for the first 4 months of this period (13.49 million barrels per day in October through January, versus 14.15 otherwise), a different formulation of motor gasoline product emerges in the winter when compared to the summer. Refinery yields (the portions of refinery output going to particular products expressed as a percent of crude oil and unfinished oil refinery inputs), still turn from motor gasoline to distillate fuel oil in the winter. However, the amount of distillate fuel oil produced is more a function of the level of refinery inputs than of altering the product mix. As a result, product stocks of distillate are currently plentiful, as refinery inputs have been high during the summer, and demand for distillate has generally been weak.
With refinery outputs accounting for most of the domestic petroleum product supply, there is less need
Energy Information Administration/ Short-Term Energy Outlook, Fourth Quarter 1991 11

for petroleum product imports, and in fact, a greater amount of products have lately been exported. Thus, the forecast for net imports of petroleum products continues to remain low, near 1.1 million barrels per day in 1992 in the base case. Net crude oil imports increase in 1992 as demand rises and domestic production falls, increasing net import dependence to just under 42 percent in 1992, after falling back to 40 percent in 1991.
Motor Gasoline
Demand for motor gasoline in the mid-price case is projected to decline by 0.3 percent in 1991 and in 1992 (Table 6). Through September 1991, demand fell by an average of 1.3 percent. Anticipation of a noticeable year-to-year increase in the fourth quarter follows the expectation of sharply lower prices for gasoline and the onset of an economic recovery. Last year's decline reflects the combined impact of the slowing economy and the fuel price hikes brought about by the Persian Gulf conflict. In 1990, highway travel activity grew by 2.0 percent, less than half the growth rate of the previous year and the smallest increase since the recession of the early 1980's. Apparent fuel efficiency increased by a substantial 3.3 percent in 1990 (Figure 9), more than offsetting the impact of the increase in highway travel. In that year, however, shipments were apparently depressed by large drawdowns in secondary stocks. As a result, data on product supplied for 1990 may have understated actual consumption, thereby overstating underlying fuel efficiency increases.
In 1991, the decline in economic activity as well as continued efficiency gains are expected to bring about another annual decline in gasoline demand (Figure 9). For the mid-price case, vehicle-miles traveled, which remained flat for the first 7 months of the year compared to the same period last year, are projected to rise only 1 percent for the year. Fuel efficiencies are projected to rise a more moderate 1.3 percent. Secondary stocks, which were drawn down substantially during the previous 2 years, were replenished earlier this year, indicating that the decline in actual consumption may be even greater than implied by the deliveries data. As a result, fuel economy growth based on actual consumption may be somewhat greater than indicated by primary shipments. Motor gasoline shipments are expected to decline slightly in 1992. The projected efficiency increase of 2.4 percent is expected to offset the impact of a 2.1-percent increase in highway travel activity on motor gasoline demand.
Percent
Demand laig-l Travel I I Etti
1990 1991 1992
Figure 9. Annual Change in Motor Gasoline Demand Components
Sources: History: Energy Information Administration, Petroleum Supply Monthly (October 1991); and Federal Highway Administration, Traffic Volume Trends. Projection*: Table 6 and internal calculations from the Short-Term Integrated Forecasting System.
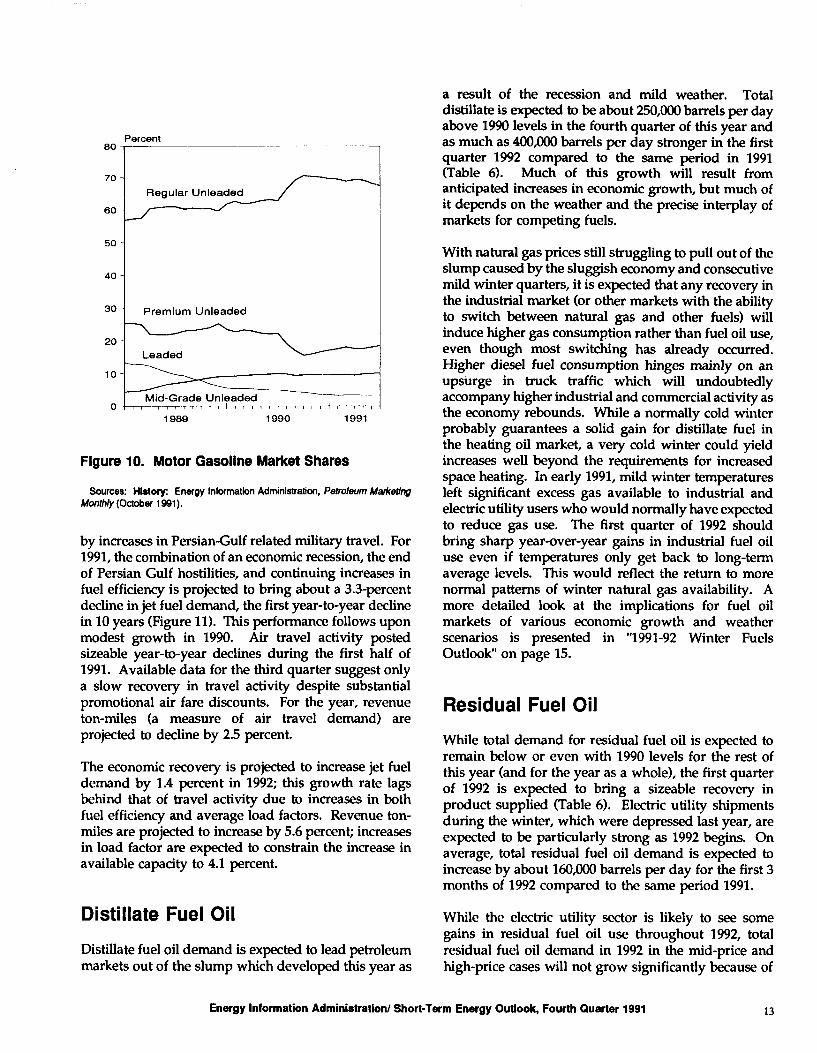
Fuel shares by gasoline grade continue to respond slowly to the decline in prices resulting from the end of Persian Gulf hostilities (Figure 10). As a result, regular unleaded gasoline's share, which reached a record 71 percent of the market last October, has gradually fallen to 67 percent by July, somewhat above the pre-Gulf crisis level of 63 percent. Premium gasoline's share, which had slid from 23 percent before the Persian Gulf conflict to 17 percent by January, recovered slightly to 19 percent. Midgrade gasoline's market share, having remained stable for several months, has displayed small increases, reaching a record 10.3 percent in July. Regular leaded gasoline's share, whose rate of decline has slowed markedly since the beginning of 1990, continues to hold just over 3 percent of the domestic gasoline market.
Jet Fuel
Jet fuel demand rose by an average rate of 2.2 percent in 1990 from that of the previous year. A sharp slowdown in civilian air travel growth was partly offset
12 Energy Information Administration/ Short-Term Energy Outlook, Fourth Quarter 1991
80Percent
7O -
60
50
40 -
30-
20
10
Regular Unleaded
Premium Unleaded
Mid-Grade Unleaded
1989 1990 1991
Figure 10. Motor Gasoline Market Shares
Sources: History: Energy Information Administration, Petroleum Marketing Monthly (October 1991).
by increases in Persian-Gulf related military travel. For 1991, the combination of an economic recession, the end of Persian Gulf hostilities, and continuing increases in fuel efficiency is projected to bring about a 3.3-percent decline in jet fuel demand, the first year-to-year decline in 10 years (Figure 11). This performance follows upon modest growth in 1990. Air travel activity posted sizeable year-to-year declines during the first half of 1991. Available data for the third quarter suggest only a slow recovery in travel activity despite substantial promotional air fare discounts. For the year, revenue ton-miles (a measure of air travel demand) are projected to decline by 2.5 percent.
The economic recovery is projected to increase jet fuel demand by 1.4 percent in 1992; this growth rate lags behind that of travel activity due to increases in both fuel efficiency and average load factors. Revenue ton- miles are projected to increase by 5.6 percent; increases in load factor are expected to constrain the increase in available capacity to 4.1 percent.
Distillate Fuel OilDistillate fuel oil demand is expected to lead petroleum markets out of the slump which developed this year as
a result of the recession and mild weather. Total distillate is expected to be about 250,000 barrels per day above 1990 levels in the fourth quarter of this year and as much as 400,000 barrels per day stronger in the first quarter 1992 compared to the same period in 1991 (Table 6). Much of this growth will result from anticipated increases in economic growth, but much of it depends on the weather and the precise interplay of markets for competing fuels.
With natural gas prices still struggling to pull out of the slump caused by the sluggish economy and consecutive mild winter quarters, it is expected that any recovery in the industrial market (or other markets with the ability to switch between natural gas and other fuels) will induce higher gas consumption rather than fuel oil use, even though most switching has already occurred. Higher diesel fuel consumption hinges mainly on an upsurge in truck traffic which will undoubtedly accompany higher industrial and commercial activity as the economy rebounds. While a normally cold winter probably guarantees a solid gain for distillate fuel in the heating oil market, a very cold winter could yield increases well beyond the requirements for increased space heating. In early 1991, mild winter temperatures left significant excess gas available to industrial and electric utility users who would normally have expected to reduce gas use. The first quarter of 1992 should bring sharp year-over-year gains in industrial fuel oil use even if temperatures only get back to long-term average levels. This would reflect the return to more normal patterns of winter natural gas availability. A more detailed look at the implications for fuel oil markets of various economic growth and weather scenarios is presented in "1991-92 Winter Fuels Outlook" on page 15.
Residual Fuel OilWhile total demand for residual fuel oil is expected to remain below or even with 1990 levels for the rest of this year (and for the year as a whole), the first quarter of 1992 is expected to bring a sizeable recovery in product supplied (Table 6). Electric utility shipments during the winter, which were depressed last year, are expected to be particularly strong as 1992 begins. On average, total residual fuel oil demand is expected to increase by about 160,000 barrels per day for the first 3 months of 1992 compared to the same period 1991.
While the electric utility sector is likely to see some gains in residual fuel oil use throughout 1992, total residual fuel oil demand in 1992 in the mid-price and high-price cases will not grow significantly because of
Energy Information Administration/ Short-Term Energy Outlook, Fourth Quarter 1991 13

Other Petroleum Products
Percent
Demand ESKI Available Ton-Miles
1990 1991 1992
Figure 11. Annual Change In Jet Fuel Demand and Travel
Sources: History: Energy Information Administration, Petroleum Supply Monthly (October 1991); and Federal Aviation Administration, Form 41. Projections: Table 6 and internal calculations from the Short-Term Integrated Forecasting System.
efficiency trends and the continuing substitution of other fuels, especially in the nonutility sector. For the low price case, demand is expected to rise somewhat in 1992 (Table 5). Driving this increase in demand is the lower, and therefore more competitive, residual fuel oil price against natural gas and coal.
Demand for minor petroleum products declined by 0.6 percent in 1990 (Table 6). The impact of increases in industrial and petrochemical activity was offset by the milder-than-average weather in the first quarter of the year. In addition, demand for liquefied petroleum gases (LPG) in 1990 was dampened by price shifts during the first half of the year when oil prices declined, boosting demand for oil-based feedstocks.
In 1991, other petroleum products' demand is projected to decline by 3.0 percent in the mid-price case (Table 6). LPG demand, however, is projected to rise 7.3 percent despite the mild first quarter. That substantial increase is brought about by a recovery in petrochemical activity that started earlier in the year and a sizeable replenishment of secondary stocks from primary inventories, which has contributed to the recent dampening of the normal seasonal buildup of primary stocks. In addition, the decline of oil prices from their Persian Gulf-related peaks of the previous year is expected to boost demand for oil-based feedstocks in 1991. Increases in LPG and feedstock demand, however, are more than offset by a projected 10.8- percent decline in miscellaneous products consumption. Among the factors accounting for that decline are: declines in still gas output due to reduced refinery runs, reduced asphalt and road oil demand stemming from budgetary constraints as well as a weak housing market, and reduced kerosene demand due to mild weather.
The assumed return to normal weather patterns and the onset of an economic recovery are expected to boost demand for minor petroleum products in 1992 by 3.4 percent in the mid-price case. LPG demand is projected to rise by 2.0 percent; oil-based feedstocks are expected to rise by 2.4 percent, and miscellaneous products are projected to rise by 4.3 percent.
14 Energy Information Administration/ Short-Term Energy Outlook, Fourth Quarter 1991
1991-92 Winter Fuels Outlook
Supplies of heating oil and natural gas are expected to meet the anticipated winter peak demand. Propane, however, may pose a problem because stocks are low as the heating season approaches. The assumption of normal weather is projected to bring about an increase in demand for heating fuels from that of last winter, which was substantially warmer than normal. Nonetheless, heating oil and natural gas supplies would be able to meet the demand of a colder-than-average winter. Propane inventories, however, are lower than those of last year. They would therefore pose a potential problem should a cold snap similar to that of December 1989 reoccur. The resulting tightness in supply would be especially acute if increases in domestic production and imports are insufficient to meet the high demand for propane.
Heating Oil
Demand for distillate fuel oil is projected to increase by 330,000 barrels per day, or 9.2 percent, to 3.36 million barrels per day during the winter season, defined as the period from October 1, 1991, to March 31, 1992. The assumption of normal weather patterns, which contrasts with a season that was 9.2 percent warmer than normal in 1990-91, accounts for part of the increase, including about 80,000 barrels per day in the residential/commercial sector, despite continued erosion of market share to natural gas. Transportation and industrial demand is expected to increase by about 240,000 barrels per day as a result of the ongoing recovery in industrial production as well as a substantial decline in fuel prices from last season's high levels brought about by events in the Persian Gulf.
Domestic refinery production is expected to account for 3.07 million barrels per day, or 91.1 percent of winter distillate requirements, compared to 2.89 million barrels per day during the same period last year. This is based on a refinery utilization rate of 88.5 percent and an average distillate yield of 22.3 percent. These rates contrast with last winter's rates of 83.4 and 21.5 percent, respectively. Net imports are projected to average 97,000 barrels per day, or 2.9 percent of demand, compared to net exports of 65,000 barrels per day last winter. Primary inventory drawdown is projected to account for 202,000 barrels per day, or 6.0 percent of winter demand, similar to last year's stock draw of 207,000 barrels per day.
A severe winter could be met by additional supplies from each of the three sources: production, imports, and inventories. "Severe" refers to a winter whose heating-degree days for each month equal the 10-year high for that month. In such a winter, heating-degree days would be 18.7 percent higher than normal, resulting in an additional 235,000 barrels-per-day, or 7.8 percent, increase in total winter distillate requirements. In previous winters, refinery utilization and yields for any given winter quarter have been as high as 86.5 percent and 23.8 percent, respectively. Since these would be regarded as indicators of sustainable refinery distillate production for an entire winter, refinery output could reach 3.275 million barrels per day, sufficient to meet 92.3 percent of the requirements of a severe winter and 98.9 percent of normal demand. Moreover, short-term, or monthly, refinery production has exceeded those estimates, indicating that refineries can produce additional quantities to meet unanticipated peak requirements.
Even though refineries are able to respond quickly to meet additional demand, imports have usually provided the bulk of additional requirements brought about by severe winter weather. Net imports of distillate have averaged as much as 314,000 barrels per day in previous winter quarters. In addition, it is estimated that more than three-quarters of the exports (or 120,000 barrels per day projected for this season) could be diverted to domestic consumption.
Inventories are an additional source of distillate requirements, especially in the short term. The end-of- September estimate for primary inventories is 140 million barrels, 4 million barrels more than a year ago. Although a stock draw of 202,000 barrels per day is projected during the winter months, a withdrawal rate averaging 301,000 barrels per day can be sustained without inventories falling below the threshold of 85 million barrels regarded as the minimum required to avoid spot shortages.
The table, "Winter 1991-92 Distillate Supply/Demand Balances," summarizes the relevant range of heating oil availability by major source for the upcoming winter season. It shows that availability would be more than sufficient to meet the requirements of a severe winter.
Energy Information Administration/ Short-Term Energy Outlook, Fourth Quarter 1991 15
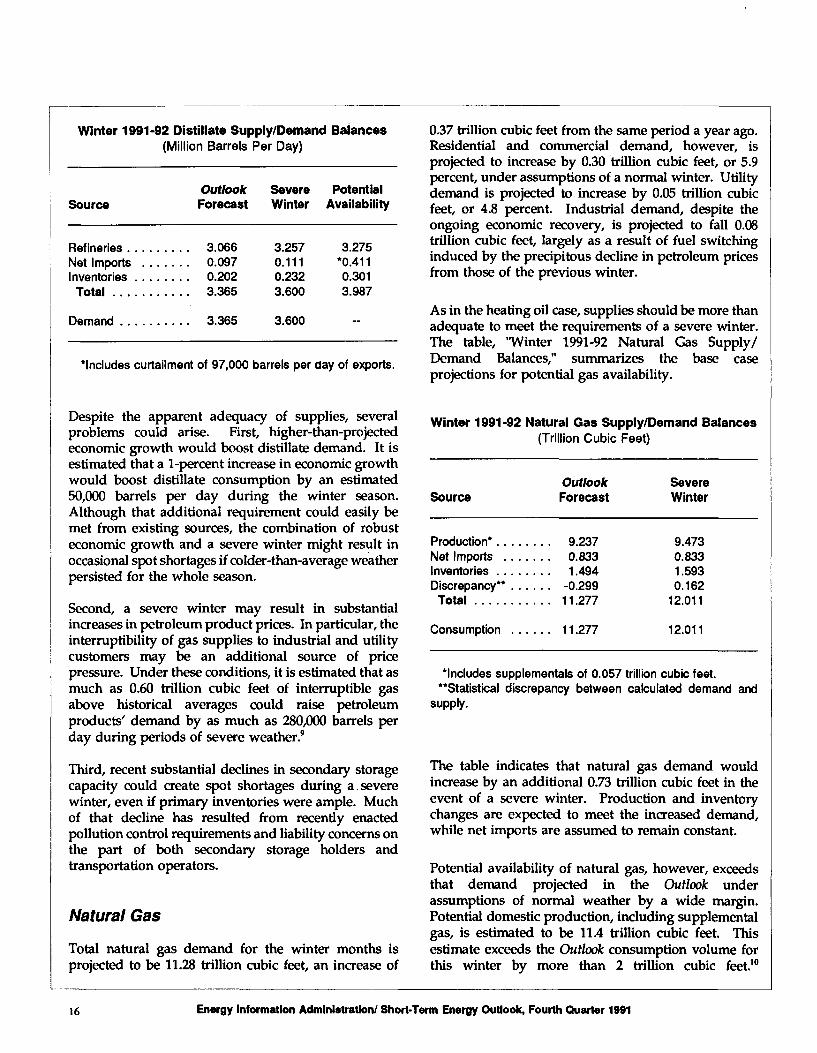
Winter 1991-92 Distillate Supply/Demand Balances(Million Barrels Per Day)
SourceOutlook Severe Potential Forecast Winter Availability
Refineries ......... 3.066 3.257 3.275Net Imports ....... 0.097 0.111 *0.411Inventories ........ 0.202 0.232 0.301
Total ........... 3.365 3.600 3.987
Demand .......... 3.365 3.600
Includes curtailment of 97,000 barrels per day of exports.
0.37 trillion cubic feet from the same period a year ago. Residential and commercial demand, however, is projected to increase by 0.30 trillion cubic feet, or 5.9 percent, under assumptions of a normal winter. Utility demand is projected to increase by 0.05 trillion cubic feet, or 4.8 percent. Industrial demand, despite the ongoing economic recovery, is projected to fall 0.08 trillion cubic feet, largely as a result of fuel switching induced by the precipitous decline in petroleum prices from those of the previous winter.
As in the heating oil case, supplies should be more than adequate to meet the requirements of a severe winter. The table, "Winter 1991-92 Natural Gas Supply/ Demand Balances," summarizes the base case projections for potential gas availability.
Despite the apparent adequacy of supplies, several problems could arise. First, higher-than-projected economic growth would boost distillate demand. It is estimated that a 1-percent increase in economic growth would boost distillate consumption by an estimated 50,000 barrels per day during the winter season. Although that additional requirement could easily be met from existing sources, the combination of robust economic growth and a severe winter might result in occasional spot shortages if colder-than-average weather persisted for the whole season.
Second, a severe winter may result in substantial increases in petroleum product prices. In particular, the interruptibility of gas supplies to industrial and utility customers may be an additional source of price pressure. Under these conditions, it is estimated that as much as 0.60 trillion cubic feet of interruptible gas above historical averages could raise petroleum products' demand by as much as 280,000 barrels per day during periods of severe weather.9
Third, recent substantial declines in secondary storage capacity could create spot shortages during a severe winter, even if primary inventories were ample. Much of that decline has resulted from recently enacted pollution control requirements and liability concerns on the part of both secondary storage holders and transportation operators.
Natural Gas
Total natural gas demand for the winter months is projected to be 11.28 trillion cubic feet, an increase of
Winter 1991-92 Natural Gas Supply/Demand Balances(Trillion Cubic Feet)
SourceOutlook Forecast
Severe Winter
Production*........ 9.237Net Imports ....... 0.833Inventories ........ 1.494Discrepancy" ...... -0.299
Total ........... 11 .277
Consumption ...... 11.277
9.4730.8331.5930.162
12.011
12.011
'Includes supplemental of 0.057 trillion cubic feet. "Statistical discrepancy between calculated demand and
supply.
The table indicates that natural gas demand would increase by an additional 0.73 trillion cubic feet in the event of a severe winter. Production and inventory changes are expected to meet the increased demand, while net imports are assumed to remain constant.
Potential availability of natural gas, however, exceeds that demand projected in the Outlook under assumptions of normal weather by a wide margin. Potential domestic production, including supplemental gas, is estimated to be 11.4 trillion cubic feet. This estimate exceeds the Outlook consumption volume for this winter by more than 2 trillion cubic feet.10
16 Energy Information Administration/ Short-Term Energy Outlook, Fourth Quarter 1991

Supplying this volume to end-users depends on both avoiding a recurrence of production problems that may arise under severe weather conditions, and the ability of the transmission and distribution network to move the gas from the production fields. In severe circumstances, higher flows of net imports are probable, but a specific estimate of incremental supplies is highly uncertain because the conditions affecting the availability of additional supplies from foreign sources may vary greatly in any likely scenario.
Supplies from net imports (including interruptible exports) could increase significantly depending on the circumstances. For the first 7 months of 1991, total net imports of natural gas increased by 10.4 percent compared to the same period a year ago.11 However, because it is possible that cold weather conditions could negatively affect availability of Canadian imports, it is assumed that little or no availability from imports above the base case level would exist in any severe weather situation. While under 1.6 trillion cubic feet of winter gas supplies from primary storage is anticipated for the winter even in a severe weather case, much more gas from inventories could theoretically be made available.
The maximum potential primary stock draw for the whole winter would be 3.42 trillion cubic feet assuming a complete drawdown of working gas during the winter from end-of-September levels. It is unlikely that the maximum draw rate would be observed. It should be noted that the distribution system accommodated a monthly record withdrawal of 0.821 trillion cubic feet in December 1989.12 This indicates that a drawdown of working gas storage to levels below the previous low of 157 trillion cubic feet recorded in the first quarter of 1984 represents a substantial source of additional potential supply if needed.
Propane
Liquefied petroleum gas (LPG) demand for the winter months is projected to be 1.87 million barrels per day, an increase of 70,000 barrels per day, or 3.9 percent, from that of the previous winter. Although the Outlook does not provide separate projections for each LPG product, it is assumed that propane accounts for the bulk of weather-related fluctuations in LPG demand.
It is estimated that a severe winter would result in an increase of 130,000 barrels per day in propane demand. Increases in domestic refinery throughput as a result of cold weather would boost crude oil-related propane production by as much as 70,000 barrels per day. In addition, increases in gas plant processing supplies would boost potential propane supplies from that source by as much as 50,000 barrels per day. Although net imports have declined in recent years (averaging just over 50,000 barrels per day in 1991), they were a record 142,000 barrels per day during the first quarter of 1990, having reached 186,000 barrels per day in January of that year.
Inventories, however, are the most problematical source of propane availability. The end-of-September primary inventories are estimated to be 53 million barrels, 4.3 million barrels below that of the previous year. The traditional seasonal buildup of inventories was constrained by higher-than-expected petrochemical demand due to propane's favorable economics resulting from low natural gas prices and by lower imports. The cold temperatures in December 1989 highlighted the vulnerability of propane inventories to an unanticipated increase in demand. Although inventories were considered to be adequate at the beginning of that winter season, the conditions in December revealed limits to the deliverability of the distribution system that may be a constraint on inventory supplies if additional supplies from domestic production and imports are not forthcoming.
Energy Information Administration/ Short-Term Energy Outlook, Fourth Quarter 1991 17


Outlook for Other Major Energy Sources
Natural GasNatural gas consumption in 1991 is expected to be 18.7 trillion cubic feet in the mid-price case, somewhat lower than the 1990 level, due mainly to the effects of mild weather in first quarter 1991 and the economic recession. Residential and commercial sector demand increases due to the assumed return to normal winter weather patterns in fourth quarter 1991 serve to counterbalance declining demand in the industrial and electric utility sectors. In 1992, however, total natural gas demand is projected to rise by 4.6 percent to 19.6 trillion cubic feet, the highest annual level for gas use since 1981, as economic recovery increases demand in all major sectors (Table 10).
Lower industrial gas use in 1991 follows from weaker industrial output and rising gas prices by late 1991. With significant recovery in the industrial sector not expected until late this year, and with stable prices and plentiful supplies of fuel oil expected for the rest of 1991, industrial gas use should not improve again until second quarter 1992. In 1992, the economic recovery causes overall industrial gas use to rise by 4.7 percent. Electric utility demand for gas in 1992 increases by 3.2 percent as electricity output increases and as available non-fossil fuel electric power sources level off. Residential and commercial sector demand rises faster in 1992 as higher heating degree-days push up demand for gas for heating.
The continuing weakness in natural gas prices is due to a combination of low residual fuel oil prices, abnormally mild winter weather for the past 2 years, and resulting high gas inventories. Natural gas prices in 1991 are expected to remain below 1990 levels as gas in storage is at a 6-year high, keeping downward pressure on prices (Figure 12). The abnormally mild weather in first quarter 1991 has served to reinforce this situation by restricting inventory drawdown. Gas prices at the wellhead are expected to recover by more than 4 percent in 1992, however, as the economic recovery spurs demand.
CoalCoal production in 1991 is expected to decrease from last year's record level by 2.3 percent (Table 11), but
3.6Trillion Cubic Feet
J FMAMJ J ASOND
Figure 12. Natural Gas Stocks
Source: Energy Information Administration, Natural Gas Monthly (October 1991).
should still remain above the 1 billion ton level. Lowernonutility consumption, reduced exports, and a significant secondary stock build in 1990 contribute to the expected decline in production in 1991. Increases in demand in all sectors lead to a production increase of 2.7 percent in 1992.
Although demand other than electric utility use decreases by roughly 5 percent, total coal consumption will remain virtually flat in 1991 (Table 11). The economic growth projected for 1992 will foster growth in all sectors. Total consumption is expected to increase by 4.2 percent in 1992.
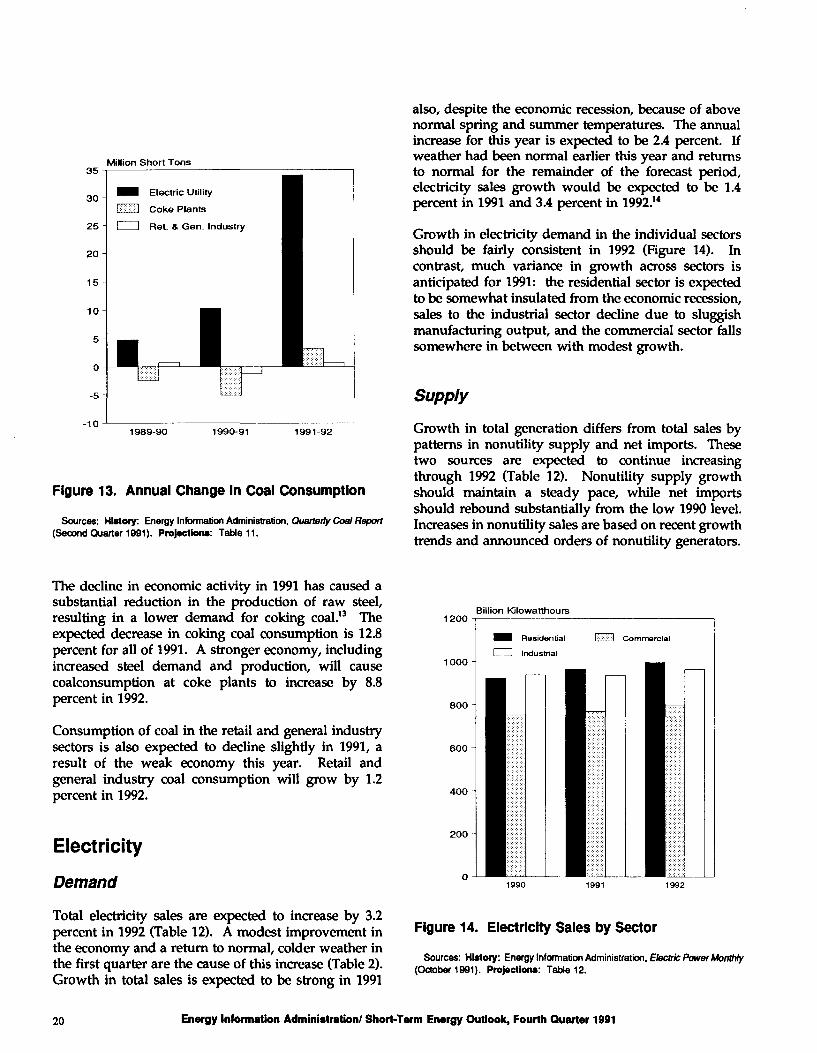
Coal consumption at electric utilities has grown slowly this year and is projected to post a 1.3-percent growth rate for 1991 (Figure 13). In 1992, a stronger economy and declining nuclear generation will cause electric utility coal demand to increase by 4.3 percent.
Energy information Administration/ Short-Term Energy Outlook, Fourth Quarter 1991 19
35
30
25
20
15-
10
5
0
-5 -
-10
Million Short Tons
Electric Utility
Coke PlantsI I Ret. & Gen. Industry
1989-90 1990-91 1991-92
Figure 13. Annual Change In Coal Consumption
Sources: History: Energy Information Administration, Quarterly Coal Report (Second Quarter 1991). Projections: Table 11.
also, despite the economic recession, because of above normal spring and summer temperatures. The annual increase for this year is expected to be 2.4 percent. If weather had been normal earlier this year and returns to normal for the remainder of the forecast period, electricity sales growth would be expected to be 1.4 percent in 1991 and 3.4 percent in 1992.14
Growth in electricity demand in the individual sectors should be fairly consistent in 1992 (Figure 14). In contrast, much variance in growth across sectors is anticipated for 1991: the residential sector is expected to be somewhat insulated from the economic recession, sales to the industrial sector decline due to sluggish manufacturing output, and the commercial sector falls somewhere in between with modest growth.
Supply
Growth in total generation differs from total sales by patterns in nonutility supply and net imports. These two sources are expected to continue increasing through 1992 (Table 12). Nonutility supply growth should maintain a steady pace, while net imports should rebound substantially from the low 1990 level. Increases in nonutility sales are based on recent growth trends and announced orders of nonutility generators.
The decline in economic activity in 1991 has caused a substantial reduction in the production of raw steel, resulting in a lower demand for coking coal." The expected decrease in coking coal consumption is 12.8 percent for all of 1991. A stronger economy, including increased steel demand and production, will cause coalconsumption at coke plants to increase by 8.8 percent in 1992.
Consumption of coal in the retail and general industry sectors is also expected to decline slightly in 1991, a result of the weak economy this year. Retail and general industry coal consumption will grow by 1.2 percent in 1992.
Electricity
Demand
1200Billion Kilowatthours
1000 -
800 -
600 -
400 -
200 -
1990
Total electricity sales are expected to increase by 3.2 percent in 1992 (Table 12). A modest improvement in the economy and a return to normal, colder weather in the first quarter are the cause of this increase (Table 2). Growth in total sales is expected to be strong in 1991
Figure 14. Electricity Sales by Sector
Sources: History: Energy Information Administration. Electric Power Monthly (October 1991). Projections: Table 12.
20 Energy Information Administration/ Short-Term Energy Outlook, Fourth Quarter 1991

Imports are not expected to rise as rapidly in 1992 as previously thought. This change is caused by the cancellation of a new contract between Central Maine Power and New Brunswick Electric Power Commission and expected lower demand for imported power, particularly in the Northeast where the economy has slowed considerably.
Increases in generation in 1992 are expected to come primarily from coal. One reason for this is that additional coal capacity is expected to come on line.15 Nuclear power is expected to decline, and oil and gas are expected to pick up only some of the additional electricity demand. Hydroelectric power is expected to increase in 1992 (based on the assumption of normal precipitation), as regions continue to recover from dry conditions. However, because of the severity of the drought in a number of regions, such as California, it will take a number of years of normal rainfall or significantly higher than normal rainfall in 1991 before water conditions fully recover. The expected decline in nuclear power is caused by normal refueling and
maintenance shutdowns which allow for fewer hours of operation in 1992 than in 1991. This is also reflected in the capacity factors, which were at historical highs during 1991 but are assumed to be slightly lower in 1992.
This situation is somewhat of a contrast to that expected for 1991. Lower expectations for total electricity should put less demand on all sources of generation. Nuclear availability was 68 percent during the first half of 1991, on average. Hydroelectric power availability is expected to increase modestly in 1991 as a number of regions of the country continue to recover from low water conditions. However, because below normal water conditions exist in the Northeast, the Great Plains, and the West, hydroelectric generation will not have reached its full potential. Coal generation should pick up the remaining demand. Thus, the more expensive alternatives, oil and natural gas, are not needed and are expected to decline from 1990 levels in 1991.
Energy Information Administration/ Short-Term Energy Outlook, Fourth Quarter 1991 21

References and Notes1. Energy Information Administration. Weeldy Petroleum Status Report. DOE/EIA-0208(91-45). (Washington, DC.)
Table 13.
2. "Spot Market Report." Natural Gas Intelligence. (Washington, DC, September 23,1991.) Page 4.
3. "Spot Market Report." Natural Gas Intelligence. (Washington, DC, September 23,1991.) Page 4.
4. Energy Information Administration. Form EIA-759. (October 1991.)
5. In August, real personal income fell by 0.2 percent, following recent gains. Housing starts were up sharply in August, while retail sales faltered. Consumer confidence dipped in August after falling in July. Finally, the index of offending economic indicators was flat in August after rising from February through July. (Source: The Economic Bulletin, Board of the U.S. Department of Commerce, Summary Table of Current Business Conditions.)
6. Energy Report. (August 26, 1991.)
7. The deviation from the average December heating degree-days for the Northeast in December 1989 was 2.32 times the standard deviation for December. Assuming a normal distribution, this implies a probability of equalling or exceeding the December 1989 record of about 1 percent.
8. The oil demand sensitivity factors were derived from internal calculations of the Demand Models of the Short- Term Integrated Forecasting System. The oil supply sensitivity was derived implicitly from Tables 5 and 7 and includes uncertainty components not strictly related to price variation.
9. Based on information provided in the following service report. Energy Information Administration. "Effects of Interruptible Natural Gas Service: Winter 1989-1990." DOE/EIA-SR/OG 791-01. (Washington, DC, July 1991.)
10. Energy Information Administration. Natural Gas Productive Capacity for the Lower 48 States, 1980 through 1991. DOE/EIA-0542. (Washington, DC, January 1991.) Table 2. The estimate includes 0.110 and 0.057 trillion cubic feet for Alaskan and supplemental production, respectively, to facilitate comparison with the supply/demand balances presented in the table.
11. Energy Information Administration. Monthly Energy Review. DOE/EIA-0035. (Washington, DC.) Table 4.2.
12. Energy Information Administration. Natural Gas Monthly. DOE/EIA-0130. (Washington, DC, various issues.) Table 2.
13. Steel production forecasts are produced by a sub-model in the Coking Coal Demand Model of the Short-Term Integrated Forecasting System.
14. Based on internal calculations from the Electricity Model of the Short-Term Integrated Forecasting System.
15. Based on internal calculations from the Electricity Model of the Short-Term Integrated Forecasting System.
Energy Information Administration/ Short-Term Energy Outlook, Fourth Quarter 1991 23

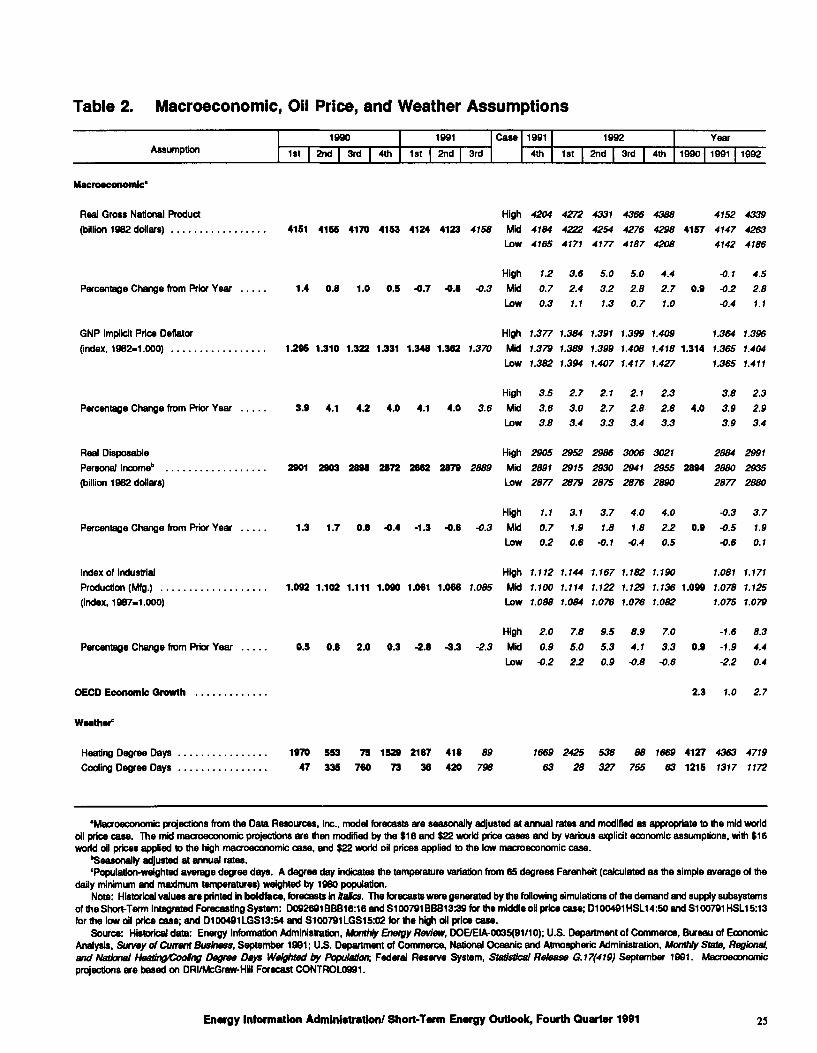
Table 2. Macroeconomic, Oil Price, and Weather Assumptions
Assumption1990
1st | 2nd | 3rd | 4th1991
1st | 2nd | 3rdCase 1991
4th1992
1st | 2nd | 3rd | 4thYear
1990 | 1991 | 1992
Macroeconomic*
Real Gross National Product (billion 1982 dollars) ......
Percentage Change from Prior Year
GNP Implicit Price Deflator (index, 1982-1.000) .....
Percentage Change from Prior Year
Real Disposable Personal Income11 . (billion 1982 dollars)
Percentage Change from Prior Year
Index of Industrial Production (Mfg.) .. (index, 1987-1.000)
Percentage Change from Prior Year
High4151 4155 4170 4153 4124 4123 4158 Mid
Low
High1.4 0.8 1.0 0.5 -0.7 -0.8 -0.3 Mid
Low
High1.295 1.310 1.322 1.331 1.348 1.362 1.370 Mid
Low
High
3.9 4.1 4.2 4.0 4.1 4.0 3.6 MidLow
High2901 2903 2898 2872 2862 2879 2889 Mid
Low
High1.3 1.7 0.8 -0.4 -1.3 -0.8 -0.3 Mid
Low
High1.092 1.102 1.111 1.090 1.061 1.066 1.085 Mid
Low
High0.5 0.8 2.0 0.3 -2.8 -3.3 -2.3 Mid
Low
4204
4184
4165
1.2
0.7
0.3
1.377
1.379
1.382
3.5
3.6
3.8
2905
2891
2877
1.1
0.7
0.2
1.112
1.100
1.088
2.0
0.9-0.2
4272
4222
4171
3.6
2.4
1.1
1.384
1.389
1.394
2.7
3.0
3.4
2952
2915
2879
3.1
1.9
0.6
1.144
1.114
1.084
7.8
5.0
2.2
4331
4254
4177
5.0
3.2
1.3
1.391
1.399
1.407
2.1
2.7
3.3
2986
2930
2875
3.7
1.8-0.1
1.167
1.122
1.076
9.5
5.3
0.9
4366
4276
4187
5.0
2.8
0.7
1.399
1.408
1.417
2.1
2.8
3.4
3006
2941
2876
4.0
1.8-0.4
1.182
1.129
1.076
8.9
4.1-0.8
4388
4298 41574208
4.4
2.7 0.91.0
1.409
1.418 1.3141.427
2.3
2.8 4.03.3
30212955 28942890
4.0
2.2 0.90.5
1.190
1.136 1.0991.082
7.03.3 0.9-0.6
4152
4147
4142
-0.1
-0.2
•0.4
1.364
1.365
1.365
3.8
3.9
3.9
2884
2880
2877
-0.3
-0.5
-0.6
1.081
1.078
1.075
-1.6
•1.9
-2.2
4339
4263
4186
4.5
2.8
1.1
1.396
1.404
1.411
2.3
2.9
3.4
2991
2935
2880
3.7
1.9
0.1
1.171
1.125
1.079
8.3
4.4
0.4
OECD Economic Growth 2.3 1.0 2.7
Heating Degree Days Cooling Degree Days
1970 553 75 1529 2187 418 89 1669 2425 536
47 335 760 73 36 420 798 63 28 327
88 1669 4127 4363 4719755 63 1215 1317 1172
•Macroeconomic projections from the Data Resources, Inc., model forecasts are seasonally adjusted at annual rates and modified as appropriate to the mid world oil price case. The mid macroeconomic projections are then modified by the $16 and $22 world price cases and by various explicit economic assumptions, with $16 world oil prices applied to the high macroeconomic case, and $22 world oil prices applied to the low macroeconomic case.
''Seasonally adjusted at annual rates.'Population-weighted average degree days. A degree day indicates the temperature variation from 65 degrees Farenheit (calculated as the simple average of the
daily minimum and maximum temperatures) weighted by I960 population.Note: Historical values are printed in bo4dface, forecasts in /talcs. The forecasts were generated by the following simulations of the demand and supply subsystems
of the Short-Term Integrated Forecasting System: D092691BBB16:16 and S100791BBB1339 for the middle oil price case; D100491HSL14:50 and S100791HSL15:13 for the low oil price case; and D100491LGS13:54 and S100791LGS15:02 for the high oil price case.
Source: Historical data: Energy Information Administration, Monthly Energy Review, DOE/EIA-0035(91/10); U.S. Department of Commerce, Bureau of Economic Analysis, Survey of Current Business, September 1991; U.S. Department of Commerce, National Oceanic and Atmospheric Administration, Monthly State, Regional, and National Heating/Cooing Degree Days Weighted by Population; Federal Reserve System, Statistical Release G. 17(419) September 1991. Macroeconomic projections are based on DRI/McGraw-Hill Forecast CONTROL0991.
Energy Information Administration/ Short-Term Energy Outlook, Fourth Quarter 1991 25
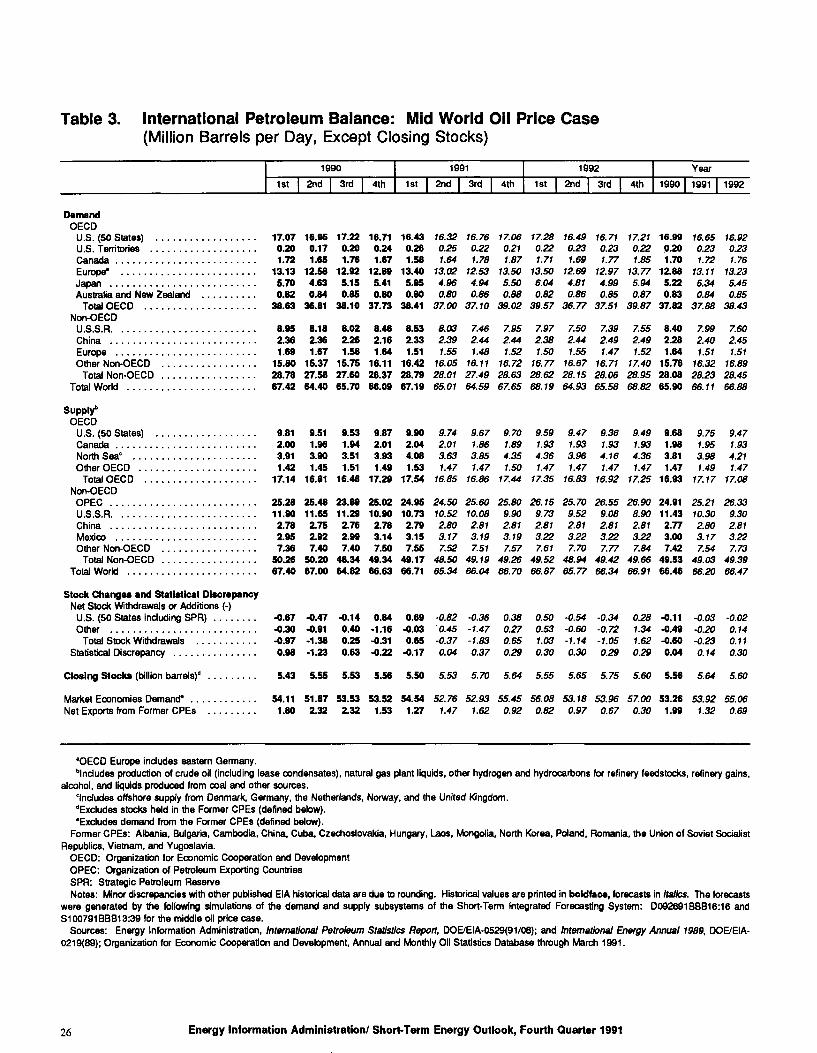
Table 3. International Petroleum Balance: Mid World Oil Price Case(Million Barrels per Day, Except Closing Stocks)
1990
1st | 2nd | 3rd | 4th
1991
1st | 2nd | 3rd | 4th1992
1st | 2nd | 3rd | 4thYear
1990 | 1991 1992
DemandOECD
U.S. (50 States) .................. 17.07U.S. Territories ................... 0.20Canada ......................... 1.72Europe' ........................ 13.13Japan .......................... 5.70Australia and New Zealand .......... 0.82
Total OECD .................... 38.63Non-OECD
U.S.S.R. ........................ 8.95China .......................... 2.36Europe ......................... 1.69Other Non-OECD ................. 15.80
Total Non-OECD ................. 28.78Total World ....................... 67.42
16.95 17.220.17 0.201.65 1.76
12.58 12.924.63 5.150.84 0.85
36.81 38.10
8.18 8.022.36 2.261.67 1.58
15.37 15.7527.58 27.6064.40 65.70
16.71 16.430.24 0.261.67 1.58
12.89 13.405.41 5.950.80 0.80
37.73 38.41
16.32 16.760.25 0.221.64 1.78
13.02 12.534.96 4.940.80 0.86
37.00 37.10
17.06 17.280.21 0.221.87 1.71
13.50 13.505.50 6.040.88 0.82
39.02 39.57
16.49 16.710.23 0.231.69 1.77
12.69 12.974.81 4.990.86 0.85
36.77 37.51
17.21 16.990.22 0.201.85 1.70
13.77 12.885.94 5.220.87 0.83
39.87 37.82
16.65 16.920.23 0.231.72 1.76
13.11 13.235.34 5.450.84 0.85
37.88 38.43
Supply"OECD
U.S. (50 States) .Canada ........North Seac .....Other OECD ....
Total OECD .. . Non-OECD
OPEC .........U.S.S.R. .......China .........Mexico ........Other Non-OECD
Total Non-OECD Total World ......
9.812.003.911.42
17.14
25.2811.90
2.782.957.36
50.2667.40
9.511.963.901.45
16.81
25.4811.652.752.927.40
50.2067.00
9.531.943.511.51
16.48
23.8911.29
2.762.997.40
48.3464.82
8.46 8.53 8.03 7.46 7.95 7.97 7.50 7.39 7.55 8.40 7.99 7.602.16 2.33 2.39 2.44 2.44 2.38 2.44 2.49 2.49 2.28 2.40 2.451.64 1.51 1.55 1.48 1.52 1.50 1.55 1.47 1.52 1.64 1.51 1.51
16.11 16.42 16.05 16.11 16.72 16.77 16.67 16.71 17.40 15.76 16.32 16.8926.37 28.79 28.01 27.49 28.63 28.62 28.15 28.06 28.95 28.08 28.23 28.4566.09 67.19 65.01 64.59 67.65 68.19 64.93 65.58 68.82 65.90 66. 11 66.88
9.87 9.90 9.74 9.67 9.70 9.59 9.47 9.36 9.49 9.68 9.75 9.472.01 2.04 2.01 1.86 1.89 1.93 1.93 1.93 1.93 1.98 1.95 1.933.93 4.08 3.63 3.85 4.35 4.36 3.96 4.16 4.36 3.81 3.98 4.211.49 1.53 T.47 1.47 1.50 1.47 1.47 1.47 1.47 1.47 T.49 T.47
17.29 17.54 16.85 16.86 17.44 17.35 16.83 16.92 17.25 16.93 17.17 17.08
25.02 24.9510.90 10.73
2.78 2.793.14 3.157.50 7.55
49.34 49.1766.63 66.71
24.50 25.6010.52 10.082.80 2.813.17 3.197.52 7.51
48.50 49.1965.34 66.04
25.80 26.159.90 9.732.81 2.813.19 3.227.57 7.61
49.26 49.5266.70 66.87
25.70 26.559.52 9.082.81 2.813.22 3.227.70 7.77
48.94 49.4265.77 66.34
26.90 24.918.90 11.432.81 2.773.22 3.007.84 7.42
49.66 49.5366.91 66.46
25.21 26.3310.30 9.302.803.17
2.813.227.73
49.03 49.3966.20 66.47
7.54
Stock Changes and Statistical DiscrepancyNet Stock Withdrawals or Additions (-)
U.S. (50 States including SPR) ........ -0.67 -0.47 -0.14 0.84 0.69 -0.82 -0.36 0.38 0.50 -0.54 -0.34 0.28 -0.11 -0.03 -0.02Other .......................... -0.30 -0.91 0.40 -1.16 -0.03 0.45 -1.47 0.27 0.53 -0.60 -0.72 1.34 -0.49 -0.20 0.14
Total Stock Withdrawals ........... -0.97 -1.38 0.25 -0.31 0.65 -0.37 -1.83 0.65 1.03 -1.14 -1.05 1.62 -0.60 -0.23 0.11Statistical Discrepancy ............... 0.98 -1.23 0.63 -0.22 -0.17 0.04 0.37 0.29 0.30 0.30 0.29 0.29 0.04 0.14 0.30
Closing Stocks (billion barrels)" 5.43 5.55 5.53 5.56 5.50 5.53 5.70 5.64 5.55 5.65 5.75 5.60 5.56 5.64 5.60
Market Economies Demand* ............ 54.11 51.87 53.53 53.52 54.54 52.76 52.93 55.45 56.08 53.18 53.96 57.00 53.26 53.92 55.06Net Exports from Former CPEs ......... 1.80 2.32 2.32 1.53 1.27 f.47 1.62 0.92 0.82 0.97 0.67 0.30 1.99 1.32 0.69
'OECD Europe includes eastern Germany.Includes production of crude oil (including lease condensates), natural gas plant liquids, other hydrogen and hydrocarbons for refinery feedstocks, refinery gains,
alcohol, and liquids produced from coal and other sources.'Includes offshore supply from Denmark, Germany, the Netherlands, Norway, and the United Kingdom. 'Excludes stocks held in the Former CPEs (defined below). •Excludes demand from the Former CPEs (defined below).
Former CPEs: Albania, Bulgaria, Cambodia, China, Cuba, Czechoslovakia, Hungary, Laos, Mongolia, North Korea, Poland, Romania, the Union of Soviet Socialist Republics, Vietnam, and Yugoslavia.
OECD: Organization for Economic Cooperation and Development OPEC: Organization of Petroleum Exporting Countries SPR: Strategic Petroleum ReserveNotes: Minor discrepancies with other published EIA historical data are due to rounding. Historical values are printed in boldface, forecasts in italics. The forecasts
were generated by the following simulations of the demand and supply subsystems of the Short-Term Integrated Forecasting System: D09269188816:16 and 310079188813:39 for the middle oil price case.
Sources: Energy Information Administration, International Petroleum Statistics Report, DOE/EIA-0529(9V08); and International Energy Annual 1989, DOE/EIA- 0219(89); Organization for Economic Cooperation and Development, Annual and Monthly Oil Statistics Database through March 1991.
26 Energy Information Administration/ Short-Term Energy Outlook, Fourth Quarter 1991
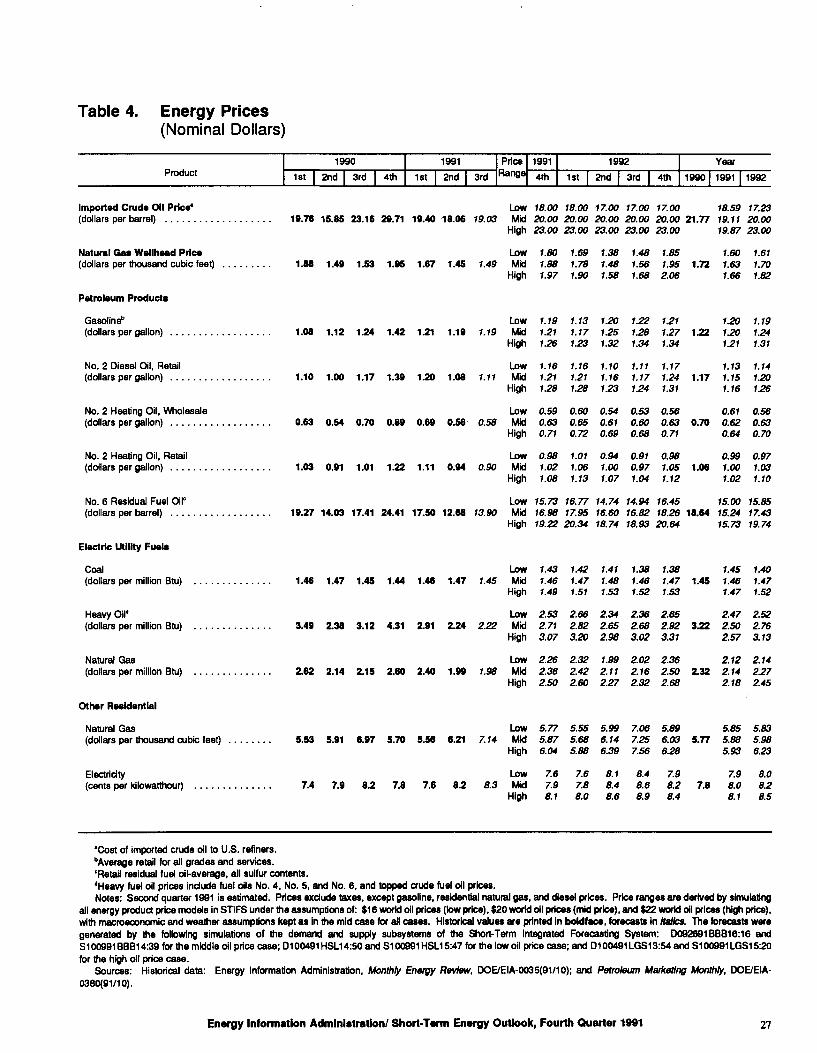
Table 4. Energy Prices(Nominal Dollars)
Product1990
1st 3rd 4th1991
1st 3rd
Price Range
1991
4th1992
1st 2nd 3rd 4th
Year
1990 1992
Imported Crude Oil Price" Low 18.00 18.00 17.00 17.00 17.00 18.59 17.23(dollars per barrel) ................... 19.76 15.85 23.16 29.71 19.40 18.06 19.03 Mid 20.00 20.00 20.00 20.00 20.00 21.77 19.11 20.00
High 23.00 23.00 23.00 23.00 23.00 79.87 23.00
Natural Gas Wellhead Price Low 1.80 1.69 1.38 1.48 1.85 1.60 1.61(dollars per thousand cubic feet) ......... 1.88 1.49 1.53 1.95 1.67 1.45 1.49 Mid 1.88 1.78 1.48 1.56 1.95 1.72 7.63 7.70
High 7.97 7.90 7.58 7.68 2.06 7.66 7.82
Petroleum Product*
Gasoline6 Low 7.79 7.73 7.20 7.22 7.27 7.20 7.79(dollars per gallon) .................. 1.08 1.12 1.24 1.42 1.21 1.19 7.79 Mid 7.27 7.77 7.25 7.28 7.27 1.22 7.20 7.24
High 7.26 7.23 7.32 7.34 7.34 7.27 7.37
No. 2 Diesel Oil, Retail Low 7.76 7.76 7.70 7.77 7.77 7.73 7.74(dollars per gallon) .................. 1.10 1.00 1.17 1.39 1.20 1.08 7.77 Mid 7.27 7.27 7.76 7.77 7.24 1.17 7.75 7.20
High 7.28 7.28 7.23 7.24 7.37 7.76 7.26
No. 2 Heating Oil. Wholesale Low 0.59 0.60 0.54 0.53 0.56 0.67 0.56(dollars per gallon) .................. 0.63 0.54 0.70 0.89 0.69 0.56 0.58 Mid 0.63 0.65 0.67 0.60 0.63 0.70 0.62 0.63
High 0.77 0.72 0.69 0.68 0.77 0.64 0.70
No. 2 Heating Oil. Retail Low 0.98 7.07 0.94 0.97 0.98 0.99 0.97(dollars per gallon) .................. 1.03 0.91 1.01 1.22 1.11 0.94 0.90 Mid 7.02 7.06 7.00 0.97 7.05 1.06 7.00 7.03
High 7.08 7.73 7.07 7.04 7.72 7.02 7.70
No. 6 Residual Fuel Oil0 Low 15.73 16.77 14.74 14.94 76.45 75.00 75.85(dollars per barrel) .................. 19.27 14.03 17.41 24.41 17.50 12.68 73.90 Mid 76.98 77.95 76.60 76.82 78.26 16.64 75.24 77.43
High 79.22 20.34 78.74 78.93 20.64 75.73 79.74
Electric Utility Fuels
Coal Low 7.43 7.42 7.47 7.38 7.38 7.45 7.40(dollars per million Btu) .............. 1.46 1.47 1.45 1.44 1.46 1.47 7.45 Mid 7.46 7.47 7.48 7.46 7.47 1.45 7.46 7.47
High 7.49 7.57 7.53 7.52 7.53 7.47 7.52
Heavy Oil* Low 2.53 2.66 2.34 2.36 2.65 2.47 2.52(dollars per million Btu) .............. 3.49 2.38 3.12 4.31 2.91 2.24 2.22 Mid 2.77 2.82 2.65 2.68 2.92 3.22 2.50 2.76
High 3.07 3.20 2.98 3.02 3.37 2.57 3.73
Natural Gas Low 2.26 2.32 7.99 2.02 2.36 2.72 2.74(dollars per million Btu) .............. 2.62 2.14 2.15 2.60 2.40 1.99 7.98 Mid 2.36 2.42 2.77 2.76 2.50 2.32 2.74 2.27
High 2.50 2.60 2.27 2.32 2.68 2.78 2.45
Other Residential
Natural Gas Low 5.77 5.55 5.99 7.06 5.89 5.85 5.83(dollars per thousand cubic feet) ........ 5.53 5.91 6.97 5.70 5.56 6.21 7.74 Mid 5.87 5.68 6.74 7.25 6.03 5.77 5.88 5.98
High 6.04 5.88 6.39 7.56 6.28 5.93 6.23
Electricity Low 7.6 7.6 8.7 8.4 7.9 7.9 8.0(cents per kilowatthour) .............. 7.4 7.9 8.2 7.8 7.6 8.2 8.3 Mid 7.9 7.8 8.4 8.6 8.2 7.8 8.0 8.2
High 8.7 8.0 8.6 8.9 8.4 8.7 8.5
•Cost of imported crude oil to U.S. refiners."Average retail for all grades and services.'Retail residual fuel oil-average, all sulfur contents.'Heavy fuel oil prices include fuel oils No. 4, No. 5, and No. 6, and topped crude fuel oil prices.Notes: Second quarter 1991 is estimated. Prices exclude taxes, except gasoline, residential natural gas, and diesel prices. Price ranges are derived by simulating
all energy product price models in STIFS under the assumptions of: $16 world oil prices (low price), $20 world oil prices (mid price), and $22 world oil prices (high price), with macroeconomic and weather assumptions kept as in the mid case for all cases. Historical values are printed in boldface, forecasts in italics. The forecasts were generated by the following simulations of the demand and supply subsystems of the Short-Term Integrated Forecasting System: D092691BBB16:16 and S100991BBB14:39 for the middle oil price case; 0100491HSL14:50 and S100991HSL15:47 for the low oil price case; and D100491 LGS13:54 and S100991LGS15:20 for the high oil price case.
Sources: Historical data: Energy Information Administration, Monthly Energy Review, DOE/EIA-0035(91/10); and Petroleum Marketing Monthly, DOE/EIA- 0380(91/10).
Energy Information Administration/ Short-Term Energy Outlook, Fourth Quarter 1991 27
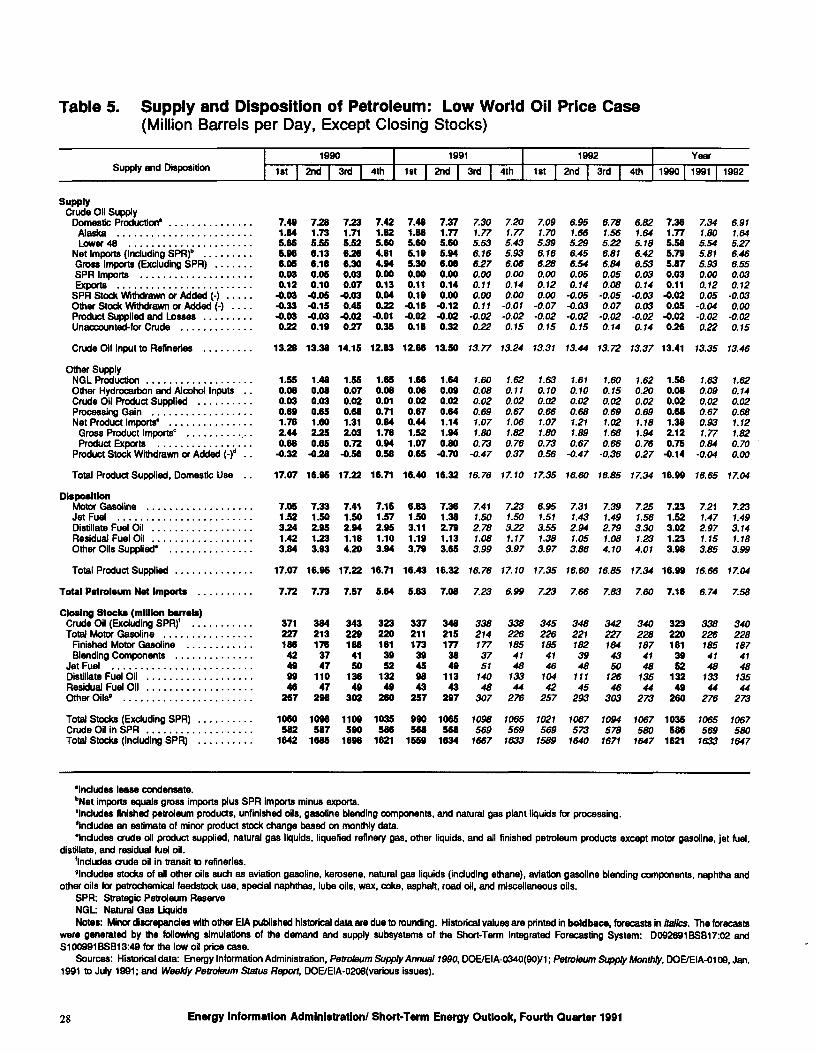
Table 5. Supply and Disposition of Petroleum: Low World Oil Price Case(Million Barrels per Day, Except Closing Stocks)
Supply and Disposition1990
1st | 2nd | 3rd 4th1991
1st | 2nd | 3rd | 4th
1992
1st | 2nd | 3rd 4thYear
1990 | 1991 | 1992
SupplyCrude Oil Supply
Domestic Production* ...........Alaska ....................Lower 48 ..................
Net Imports (Including SPR)bGross Imports (Excluding SPR) ...SPR Imports ................Exports ....................
SPR Stock Withdrawn or Added (-) . Other Stock Withdrawn or Added (-) Product Supplied and Losses Unaccounted-for Crude .........
7.491.845.655.966.050.030.12
-0.03-0.33-0.030.22
7.281.735.556.136.180.050.10
-0.05-0.15-0.030.19
7.231.715.526.266.300.030.07
-0.030.45
-0.020.27
7.421.825.604.814.940.000.130.040.22
-0.010.35
7.481.885.605.195.300.000.110.19
-0.16-0.020.18
7.371.775.605.946.080.000.140.00
-0.12-0.020.32
7.307.775.536.766.270.000.770.000.77
-0.020.22
7.201.775.435.936.060.000.140.00
-0.01-0.020.15
7.091.705.396.166.280.000.120.00
-0.07-0.020.15
6.951.665.296.456.540.050.74
-0.05-0.03-0.020.75
6.707.565.226.816.840.050.08
-0.050.07
-0.020.14
6.821.645.706.426.530.030.74
-0.030.03
-0.020.74
7.361.775.585.795.870.030.11
-0.020.05
-0.020.26
7.347.005.545.075.930.000.720.05
-0.04-0.020.22
6.911.645.276.466.550.030.12
-0.030.00
-0.020.15
Crude Oil Input to Refineries 13.28 13.38 14.15 12.83 12.86 13.50 13.77 13.24 13.31 13.44 13.72 13.37 13.41 (3.35 (3.46
Other Supply NGL Production .................Other Hydrocarbon and Alcohol Inputs Crude Oil Product Supplied ........Processing Gain ................Net Product Imports" .............
Gross Product Imports0 ..........Product Exports ...............
Product Stock Withdrawn or Added (-)"
Total Product Supplied, Domestic Use
DispositionMotor Gasoline .................Jet Fuel ......................Distillate Fuel Oil ................Residual Fuel Oil ................Other Oils Supplied* .............
1.55 1.480.08 0.080.03 0.030.69 0.651.76 1.602.44 2.250.68 0.65
-0.32 -0.28
1.550.070.020.681.312.030.72
-0.56
1.650.080.010.710.841.780.940.58
1.660.080.020.670.441.521.070.65
1.640.090.020.641.141.940.80
-0.70
1.600.080.020.691.071.800.73
-0.47
1.620.110.020.671.061.820.760.37
1.630.100.020.661.071.800.730.56
1.610.100.020.681.211.890.67
-0.47
1.600.150.020.691.021.680.66
-0.36
1.62 1.560.20 0.080.02 0.020.69 0.681.18 1.381.94 2.120.76 0.750.27 -0.14
1.63 1.620.09 0.140.02 0.020.67 0.680.93 1.121.77 1.820.84 0.70
-0.04 0.00
17.07 16.95 17.22 16.71 16.40 16.32 76.76 17.10 17.35 16.60 16.85 17.34 16.99 76.65 77.04
7.05 7.33 7.41 7.15 6.83 7.361.52 1.50 1.50 1.57 1.50 1.383.24 2.95 2.94 2.95 3.11 2.791.42 1.23 1.18 1.10 1.19 1.133.84 3.93 4.20 3.94 3.79 3.65
7.41 7.23 6.95 7.31 7.39 7.25 7.23 7.21 7.237.50 7.50 7.57 7.43 7.49 7.56 1.52 7.47 7.492.78 3.22 3.55 2.94 2.79 3.30 3.02 2.97 3.741.08 1.17 1.38 1.05 1.08 1.23 1.23 7.75 7.783.99 3.97 3.97 3.06 4.70 4.07 3.98 3.05 3.99
Total Product Supplied ...
Total Petroleum Nat Imports
17.07 16.95 17.22 16.71 16.43 16.32 76.76 77.70 77.35 76.60 76.05 77.34 16.99 76.66 77.04
7.72 7.73 7.57 5.64 5.63 7.08 7.23 6.99 7.23 7.66 7.83 7.60 7.16 6.74 7.50
Closing Stocks (million barrels)Crude Oil (Excluding SPR)' ... Total Motor Gasoline ........
Finished Motor Gasoline ....Blending Components ......
Jet Fuel .................Distillate Fuel Oil ...........Residual Fuel Oil ...........Other Oils' ...............
371 384227 213186 176
42 3749 4799 11046 47
267 298
343229188
4150
13649
302
323220181
3952
13249
260
337211173
39459843
257
348215177
3849
11343
297
338 338 345214 226 226177 185 18537 4151 48
140 13348 44
4146
10442
3482211823948
11145
342 340 323227 228 220754 707 181
47 3948 52
735 13244 49
4350
12646
3382261854148
13344
3402281874148
13544
Total Stocks (Excluding SPR) Crude Oil in SPR .........Total Stocks (Including SPR)
1060 1098 1109 1035 990 1065582 587 590 586 568 568
1642 1685 1698 1621 1559 1634
307 276 257 293 303 273 260 276 273
7090 7065 7027 7067 7094 7067 1035 7065 7067569 569 569 573 570 500 586 569 500
7667 7633 7509 7640 7677 7647 1621 7633 7647
'Includes lease condensate.bNet imports equals gross imports plus SPR imports minus exports.'Includes finished petroleum products, unfinished oils, gasoline blending components, and natural gas plant liquids for processing.'Includes an estimate of minor product stock change based on monthly data.•Includes crude oil product supplied, natural gas liquids, liquefied refinery gas, other liquids, and all finished petroleum products except motor gasoline, jet fuel,
distillate, and residual fuel oil.'Includes crude oil in transit to refineries.'Includes stocks of all other oils such as aviation gasoline, kerosene, natural gas liquids (including ethane), aviation gasoline blending components, naphtha and
other oils for petrochemical feedstock use, special naphthas, lube oils, wax, coke, asphalt, road oil, and miscellaneous oils.SPR: Strategic Petroleum ReserveNGL Natural Gas LiquidsNotes: Minor discrepancies with other EIA published historical data are due to rounding. Historical values are printed in boldbace, forecasts in italics. The forecasts
were generated by the following simulations of the demand and supply subsystems of the Short-Term Integrated Forecasting System: D092691BSB17:02 and S100991BSB13:49 for the low oil price case.
Sources: Historical data: Energy Information Administration, Petroleum Supply Annual 1990, DOE/EIA-0340(90)/1; Petroleum Supply Monthly, DOE/EIA-0109, Jan. 1991 to July 1991; and Weekly Petroleum Status Report, DOE/EIA-0208(various issues).
28 Energy Information Administration/ Short-Term Energy Outlook, Fourth Quarter 1991
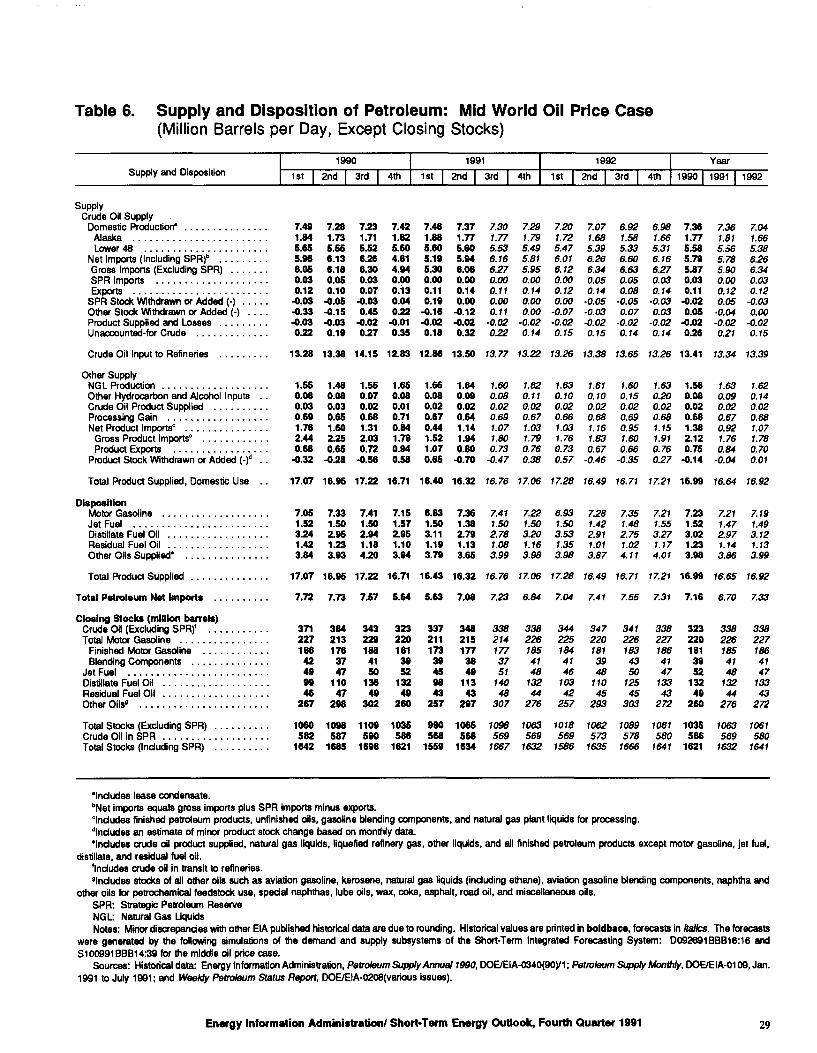
Table 6. Supply and Disposition of Petroleum: Mid World Oil Price Case(Million Barrels per Day, Except Closing Stocks)
Supply and Disposition1990
1st | 2nd | 3rd | 4th1991
1st | 2nd | 3rd | 4th1992
1st | 2nd | 3rd | 4thYear
1990 1991 | 1992
SupplyCrude OH Supply
Domestic Production* ...........Alaska ....................Lower 48 ..................
Net Imports (Including SPR)bGross Imports (Excluding SPR) . . .SPR Imports ................Exports ....................
SPR Stock Withdrawn or Added (-) . Other Stock Withdrawn or Added (-) Product Supplied and Losses Unaccounted-for Crude .........
7.491.845.655.966.050.030.12
-0.03-0.33-0.030.22
7.281.735.556.136.180.050.10
-0.05-0.15-0.030.19
7.231.715.526.266.300.030.07
•0.030.45
-0.020.27
7.421.825.604.814.940.000.130.040.22
-0.010.35
7.481.885.605.195.300.000.110.19
-0.16-0.020.18
7.371.775.605.946.080.000.140.00
-0.12-0.020.32
7.307.775.536.166.270.000.110.000.11
-0.020.22
7.291.795.495.815.950.000.140.000.00
-0.020.14
7.201.725.476.016.120.000.120.00
-0.07-0.020.15
7.071.685.396.266.340.050.14
-0.05-0.03-0.020.15
6.921.585.336.606.630.050.08
-0.050.07
-0.020.14
6.981.665.316.166.270.030.14
-0.030.03
-0.020.14
7.361.775.585.795.870.030.11
-0.020.05
-0.020.26
7.361.815.o65.785.900.000.120.05
-0.04-0.020.21
7.041.665.386.266.340.030.12
-0.030.00
-0.020.15
Crude Oil Input to Refineries 13.28 13.38 14.15 12.83 12.86 13.50 13.77 13.22 13.26 13.38 13.65 13.26 13.41 13.34 13.39
Other Supply NGL Production ................Other Hydrocarbon and Alcohol Inputs Crude Oil Product Supplied ........Processing Gain ...............Net Product Imports0 ............
Gross Product Imports" .........Product Exports ...............
Product Stock Withdrawn or Added (-)"
Total Product Supplied, Domestic Use
DispositionMotor Gasoline ................Jet Fuel .....................Distillate Fuel Oil ...............Residual Fuel Oil ...............Other Oils Supplied* ............
1.550.080.030.691.762.440.68
-0.32
1.480.080.030.651.602.250.65
-0.28
1.550.070.020.681.312.030.72
-0.56
1.650.060.010.710.841.780.940.58
1.660.080.020.670.441.521.070.65
1.640.090.020.641.141.940.80
-0.70
1.600.080.020.691.071.800.73
-0.47
1.620.110.020.671.031.790.760.38
1.630.100.020.661.031.760.730.57
1.610.100.020.681.161.830.67
-0.46
1.600.150.020.690.951.600.66
-0.35
1.63 1.560.20 0.080.02 0.020.69 0.687.75 1.381.91 2.120.76 0.750.27 -0.14
1.63 0.09 0.02 0.67 0.92 1.76 0.84
-0.04
1.620.140.020.681.071.780.700.01
17.07 16.95 17.22 16.71 16.40 16.32 76.76 77.06 17.28 16.49 16.71 17.21 16.99 16.64 16.92
7.05 7.33 7.411.52 1.50 1.503.24 2.95 2.941.42 1.23 1.183.84 3.93 4.20
7.15 6.831.57 1.502.95 3.111.10 1.193.94 3.79
7.361.382.791.133.65
7.41 7.22 6.93 7.281.50 1.50 1.50 1.422.78 3.20 3.53 2.911.08 1.16 1.35 1.01
7.35 7.21 7.23 7.21 7.191.48 1.55 1.52 1.47 1.492.75 3.27 3.02 2.97 3.121.02 1.17 1.23 1.14 1.13
3.99 3.98 3.98 3.87 4.11 4.01 3.98 3.86 3.99
Total Product Supplied .. .
Total Petroleum Net Imports
17.07 16.95 17.22 16.71 16.43 16.32 76.76 77.06 17.28 16.49 16.71 17.21 16.99 76.65 76.92
7.72 7.73 7.57 5.64 5.63 7.08 7.23 6.84 7.04 7.41 7.55 7.31 7.16 6.70 7.33
Closing Stocks (million barrels)Crude Oil (Excluding SPR)' ... Total Motor Gasoline ........
Finished Motor Gasoline ....Blending Components ......
Jet Fuel .................Distillate Fuel Oil ...........Residual Fuel Oil ...........Other Oils' ...............
Total Stocks (Excluding SPR) Crude Oil in SPR .........Total Stocks (Including SPR)
371 384 343 323 337 348227 213 229 220 211 215186 176 188 181 173 177
42 37 41 39 39 3849 47 50 52 45 4999 110 136 132 96 11346 47 49 49 43 43267 298 302 260 257 297
1060 1096 1109 1035 990 1065582 587 590 586 568 5681642 1685 1698 1621 1559 1634
330274777375114048
307
338226185414813244
276
344225184414610342257
347220181394811045
293
341226183435012545
303
338227186414713343272
323220181395213249
260
7090 7063 7070 7062569 569 569 5737667 1632 1586 1635
1089 1061 1035570 500 586
7666 7647 1621
3302261854148
13244
276
1063569
1632
3382271864147
13343
272
1061580
1641
'Includes lease condensate."Net imports equals gross imports plus SPR imports minus exports.Includes finished petroleum products, unfinished oils, gasoline blending components, and natural gas plant liquids for processing.'Includes an estimate of minor product stock change based on monthly data.•Includes crude oil product supplied, natural gas liquids, liquefied refinery gas, other liquids, and all finished petroleum products except motor gasoline, jet fuel,
distillate, and residual fuel oil.'Includes crude oil in transit to refineries.'Includes stocks of all other oils such as aviation gasoline, kerosene, natural gas liquids (including ethane), aviation gasoline blending components, naphtha and
other oils for petrochemical feedstock use, special naphthas, lube oils, wax, coke, asphalt, road oil, and miscellaneous oils.SPR: Strategic Petroleum ReserveNGL Natural Gas LiquidsNotes: Minor discrepancies with other EIA published historical data are due to rounding. Historical values are printed in boldbac*. forecasts in italics. The forecasts
were generated by the following simulations of the demand and supply subsystems of the Short-Term Integrated Forecasting System: D092691BBB16:16 and S100991BBB14:39 for the middle oil price case.
Sources: Historical data: Energy Information Administration, Petroleum Supply Annual 1990, DOE/EIA-0340(90)/1; Petroleum Supply Monthly, DOE/EIA-0109, Jan. 1991 to July 1991; and Weekly Petroleum Status Report, DOE/EIA-0208(various issues).
Energy Information Administration/ Short-Term Energy Outlook, Fourth Quarter 1991 29
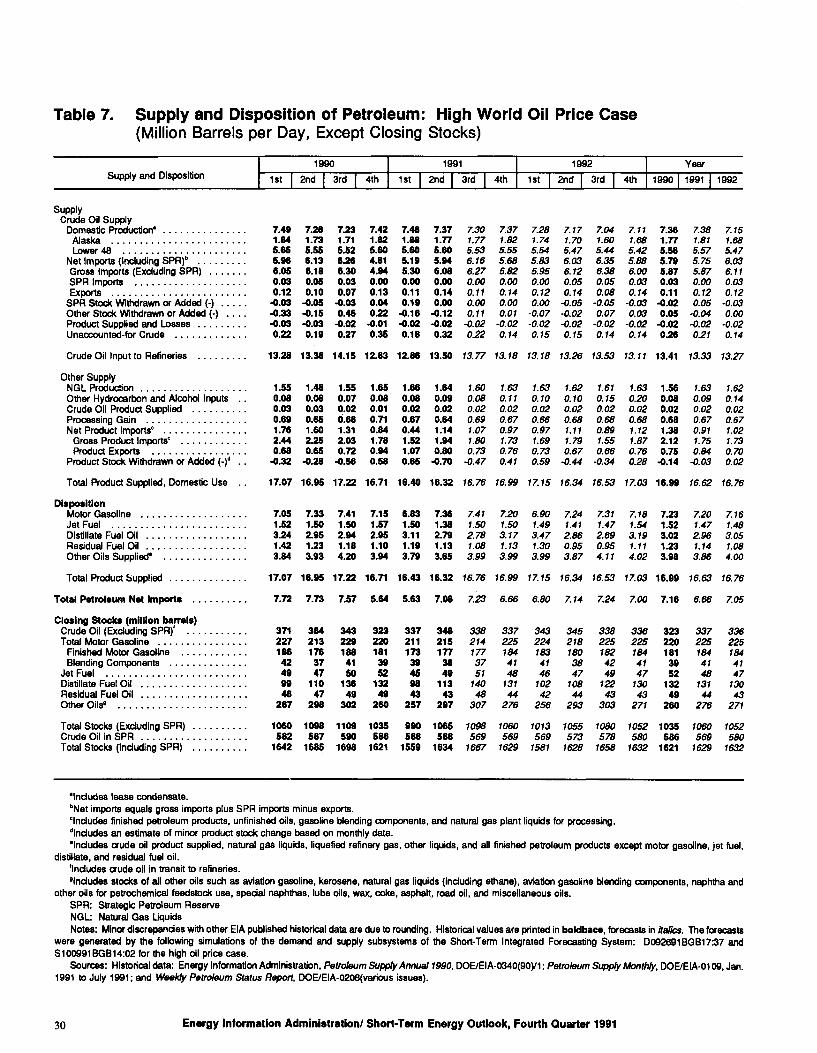
Table 7. Supply and Disposition of Petroleum: High World Oil Price Case(Million Barrels per Day, Except Closing Stocks)
Supply and Disposition1990
1st | 2nd | 3rd | 4th1991
1st 2nd | 3rd | 4th1992
1st | 2nd | 3rd | 4thYear
1990 | 1991 | 1992
SupplyCrude Oil Supply
Domestic Production* ...........Alaska ....................Lower 48 ..................
Net Imports (Including SPR)bGross Imports (Excluding SPR) ...SPR Imports ................Exports ....................
SPR Stock Withdrawn or Added (-) . Other Stock Withdrawn or Added (-) Product Supplied and Losses Unaccounted-for Crude .........
7.491.845.655.966.050.030.12
-0.03-0.33-0.030.22
7.281.735.556.136.180.050.10
-0.05-0.15-0.030.19
7.231.715.526.266.300.030.07
-0.030.45
-0.020.27
7.421.825.604.814.940.000.130.040.22
-0.010.35
7.481.885.605.195.300.000.110.19
-0.16-0.020.18
7.371.775.605.946.080.000.140.00
-0.12-0.020.32
7.301.775.536.166.270.000.110.000.11
-0.020.22
7.371.825.555.695.820.000.140.000.01
-0.020.14
7.281.745.545.835.950.000.120.00
-0.07-0.020.15
7.171.705.476.036.120.050.14
-0.05-0.02-0.020.15
7.041.605.446.356.380.050.08
-0.050.07
-0.020.14
7.111.685.425.886.000.030.14
-0.030.03
-0.020.14
7.361.775.585.795.870.030.11
-0.020.05
-0.020.26
7.381.815.575.755.870.000.120.05
-0.04-0.020.21
7.151.685.476.036.110.030.12
-0.030.00
-0.020.14
Crude Oil Input to Refineries 13.28 13.38 14.15 12.83 12.86 13.50 13.77 13.18 13.18 13.26 13.53 13.11 13.41 13.33 13.27
Other Supply NGL Production .................Other Hydrocarbon and Alcohol Inputs Crude Oil Product Supplied ........Processing Gain ................Net Product Imports' .............
Gross Product Imports" ..........Product Exports ...............
Product Stock Withdrawn or Added (-)"
Total Product Supplied, Domestic Use
DispositionMotor Gasoline .................Jet Fuel ......................Distillate Fuel Oil ................Residual Fuel Oil ................Other Oils Supplied* .............
1.550.080.030.691.762.440.68
-0.32
1.480.080.030.651.602.250.65
-0.28
1.550.070.020.681.312.030.72
-0.56
1.650.080.010.710.841.780.940.58
1.660.080.020.670.441.521.070.65
1.640.090.020.641.141.940.80
-0.70
1.600.080.020.691.071.800.73
-0.47
1.630.110.020.670.971.730.760.41
1.63 1.62 1.610.10 0.10 0.150.02 0.02 0.020.66 0.68 0.680.97 1.11 0.891.69 1.79 1.550.73 0.67 0.660.59 -0.44 -0.34
1.63 1.560.20 0.080.02 0.020.68 0.681.12 1.381.87 2.120.76 0.750.28 -0.14
7.630.090.020.670.911.750.84
-0.03
1.620.140.020.671.021.730.700.02
17.07 16.95 17.22 16.71 16.40 16.32 16.76 76.99 17.15 16.34 16.53 17.03 16.99 16.62 16.76
7.05 7.33 7.411.52 1.50 1.503.24 2.95 2.941.42 1.23 1.183.84 3.93 4.20
7.15 6.83 7.36 7.41 7.20 6.90 7.24 7.311.57 1.50 1.38 1.50 1.50 1.49 1.41 1.472.95 3.11 2.79 2.78 3.17 3.47 2.86 2.691.10 1.19 1.13 1.08 1.13 1.30 0.95 0.953.94 3.79 3.65 3.99 3.99 3.99 3.87 4.11
7.18 7.23 7.20 7.161.54 1.52 1.47 1.483.19 3.02 2.96 3.051.11 1.23 1.14 1.084.02 3.98 3.86 4.00
Total Product Supplied
Total Pstrolaum Not Imports
17.07 16.95 17.22 16.71 16.43 16.32 76.76 76.99 77.75 76.34 76.53 77.03 16.99 76.63 76.76
7.72 7.73 7.57 5.64 5.63 7.08 7.23 6.66 6.80 7.14 7.24 7.00 7.16 6.66 7.05
Closing Stocks (million barrels)Crude Oil (Excluding SPR)' ... Total Motor Gasoline ........
Finished Motor Gasoline ....Blending Components ......
Jet Fuel .................Distillate Fuel Oil ...........Residual Fuel Oil ...........Other Oils" ...............
Total Stocks (Excluding SPR) Crude Oil in SPR .........Total Stocks (Including SPR)
371 384 343 323 337 348227 213 229 220 211 215186 176 188 181 173 17742 37 41 39 39 3849 47 50 52 45 4999 110 136 132 98 11346 47 49 49 43 43267 298 302 260 257 297
1060 1098 1109 1035 990 1065582 587 590 586 568 5661642 1685 1696 1621 1559 1634
338274777375714048307
337225184414813144
276
343224183414610242256
1098 1060 1013569 569 569
1667 1629 1581
3452181803847
10844
293
1055573
1628
3382251824249
12243
303
1080578
1658
3362251844147
13043
271
3232201813952
13249
260
7052 1035580 586
7632 1621
3372251844148
13144
276
1060569
1629
3362251844147
13043
271
1052580
1632
•Includes lease condensate.bNet imports equals gross imports plus SPR imports minus exports.'Includes finished petroleum products, unfinished oils, gasoline blending components, and natural gas plant liquids for processing."Includes an estimate of minor product stock change based on monthly data.•Includes crude oil product supplied, natural gas liquids, liquefied refinery gas, other liquids, and all finished petroleum products except motor gasoline, jet fuel,
distillate, and residual fuel oil.'Includes crude oil in transit to refineries.'Includes stocks of all other oils such as aviation gasoline, kerosene, natural gas liquids (including ethane), aviation gasoline blending components, naphtha and
other oils for petrochemical feedstock use, special naphthas, lube oils, wax, coke, asphalt, road oil, and miscellaneous oils.SPR: Strategic Petroleum ReserveNGL: Natural Gas LiquidsNotes: Minor discrepancies with other EIA published historical data are due to founding. Historical values are printed in boldbacs, forecasts in italics. The forecasts
were generated by the following simulations of the demand and supply subsystems of the Short-Term Integrated Forecasting System: D092691BGB17:37 and S100991BGB14:02 for the high oil price case.
Sources: Historical data: Energy Information Administration, Petroleum Supply Annual 7990, DOE/EIA-0340(9oyi; Petroleum Supply Monthly, DOE/EIA-0109, Jan. 1991 to July 1991; and Weekly Petroleum Status Report, DOE/EIA-0208(various issues).
30 Energy Information Administration/ Short-Term Energy Outlook, Fourth Quarter 1991

Table 8. Petroleum Demand Sensitivities
Demand Determinant
1991
One Quarter
1992
Four Quarters
Economic Activity
Level of GNP* ....................Resulting Petroleum Demand Difference*
4.164 -4,203 0.1
4,186-4,339
0.43
Energy Prices
Crude Oif= .......................Resulting Petroleum Demand Difference6
All Energy Prices Change .........Only Oil Prices Change ...........
$18 - $23
.06
.12
$17.25 - $23
.18
.28
Weather
Heating Degree Days' ..............Cooling Degree Days'1 ..............
Resulting Petroleum Demand Difference"
1,371 - 2,043
49-87
.46
3,969 - 5,645
991 - 1,411.39
'Real gross national product, in billions of 1982 dollars per year.bPetroleum demand ranges associated with varying each demand determinant (or set of demand determinants), holding other things equal, in million barrels per
day.'Refiners' acquisition cost of import oil, In current dollars per barrel.dHeating and cooling degree days shown are national population-weighted.Source: Energy Information Administration, Office of Energy Markets and End Use, Short-Term Integrated Forecasting System.
Table 9. Crude Oil Production Forecast Components(Million Barrels per Day)
High Price Case
Low Price Case
Difference
Total Uncertainty Price Impact
United State* .................Lower 48 StatesAlaska
....... 7.11
5421 68
6.82
5.18
1.64
.28
.24
.04
.13
.11
.02
.15
.13
.02
Note: Components provided are for the fourth quarter 1992 from tables 5 and 7. Totals may not add to sum of components due to independent rounding. Source: Energy Information Administration, Office of Oil and Gas, Reserves and Natural Gas Division.
Energy Information Administration/ Short-Term Energy Outlook, Fourth Quarter 1991 31
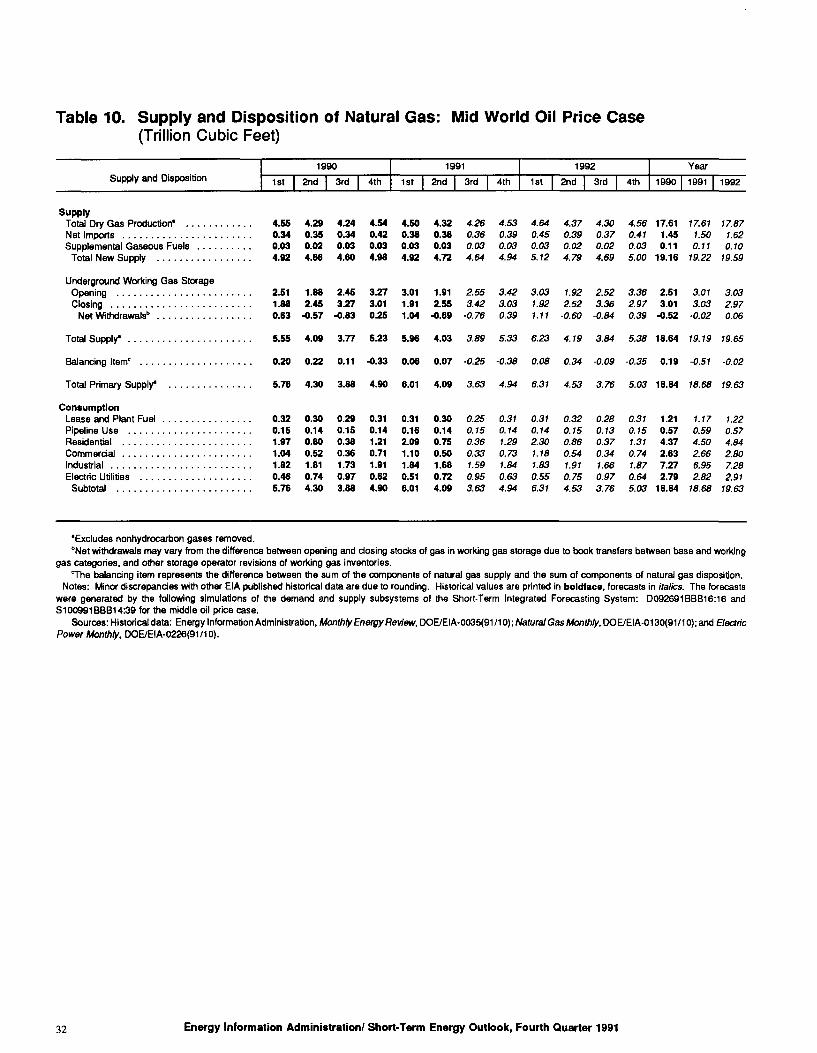
Table 10. Supply and Disposition of Natural Gas: Mid World Oil Price Case(Trillion Cubic Feet)
Supply and Disposition1990
1st | 2nd | 3rd | 4th
1991
1st | 2nd | 3rd | 4th1992
1st 2nd | 3rd | 4th
Year
1990 | 1991 1992
SupplyTotal Dry Gas Production' .. Net Imports .............Supplemental Gaseous Fuels
Total New Supply .......
Underground Working Gas Storage Opening ..................Closing ...................
Net Withdrawals" ...........
Total Supply* ......
Balancing Item1 ....
Total Primary Supply*
ConsumptionLease and Plant Fuel Pipeline Use ......Residential .......Commercial .......Industrial .........Electric Utilities ....
Subtotal ........
4.55 4.29 4.24 4.540.34 0.35 0.34 0.420.03 0.02 0.03 0.034.92 4.66 4.60 4.98
2.51 1.88 2.45 3.271.88 2.45 3.27 3.010.63 -0.57 -0.83 0.25
5.55 4.09 3.77 5.23
0.20 0.22 0.11 -0.33
5.76 4.30 3.88 4.90
0.32 0.30 0.29 0.310.15 0.14 0.15 0.141.97 0.80 0.38 1.211.04 0.52 0.36 0.711.82 1.81 1.73 1.910.46 0.74 0.97 0.625.76 4.30 3.88 4.90
4.50 4.32 4.26 4.53 4.64 4.37 4.30 4.56 17.61 17.61 17.870.38 0.38 0.36 0.39 0.45 0.39 0.37 0.41 1.45 1.50 1.620.03 0.03 0.03 0.03 0.03 0.02 0.02 0.03 0.11 0.11 0.104.92 4.72 4.64 4.94 5.12 4.79 4.69 5.00 19.16 19.22 19.59
3.01 1.91 2.55 3.42 3.03 1.92 2.52 3.36 2.51 3.01 3.031.91 2.55 3.42 3.03 1.92 2.52 3.36 2.97 3.01 3.03 2.971.04 -0.69 -0.76 0.39 1.11 -0.60 -0.84 0.39 -0.52 -0.02 0.06
5.96 4.03 3.89 5.33 6.23 4.19 3.84 5.38 18.64 19.79 19.65
0.06 0.07 -0.25 -0.38 0.08 0.34 -0.09 -0.35 0.19 -0.51 -0.02
6.01 4.09 3.63 4.94 6.31 4.53 3.76 5.03 18.84 78.68 79.63
0.31 0.30 0.25 0.37 0.37 0.32 0.28 0.37 1.21 7.77 7.220.16 0.14 0.75 0.74 0.74 0.75 0.73 0.75 0.57 0.59 0.572.09 0.75 0.36 7.29 2.30 0.86 0.37 7.37 4.37 4.50 4.841.10 0.50 0.33 0.73 7.78 0.54 0.34 0.74 2.63 2.66 2.801.84 1.68 7.59 7.84 7.83 7.97 7.66 7.87 7.27 6.95 7.280.51 0.72 0.95 0.63 0.55 0.75 0.97 0.64 2.79 2.82 2.976.01 4.09 3.63 4.94 6.37 4.53 3.76 5.03 18.84 78.68 79.63
'Excludes nonhydrocarbon gases removed."Net withdrawals may vary from the difference between opening and closing stocks of gas in working gas storage due to book transfers between base and working
gas categories, and other storage operator revisions of working gas inventories.cThe balancing item represents the difference between the sum of the components of natural gas supply and the sum of components of natural gas disposition.
Notes: Minor discrepancies with other EIA published historical data are due to round ing. Historical values are printed in boldface, forecasts in italics. The forecasts were generated by the following simulations of the demand and supply subsystems of the Short-Term Integrated Forecasting System: D092691BBB16:16 and S100991BBB14:39 for the middle oil price case.
Sources: Historical data: Energy Information Administration, Monthly Energy flewetv, DOE/EIA-0035(91/10);Nafura/ Gas Mom/)iy,DOE/EIA-0130(91/10);ande8cfric Power Monthly, DOE/EIA-0226(91/10).
32 Energy Information Administration/ Short-Term Energy Outlook, Fourth Quarter 1991
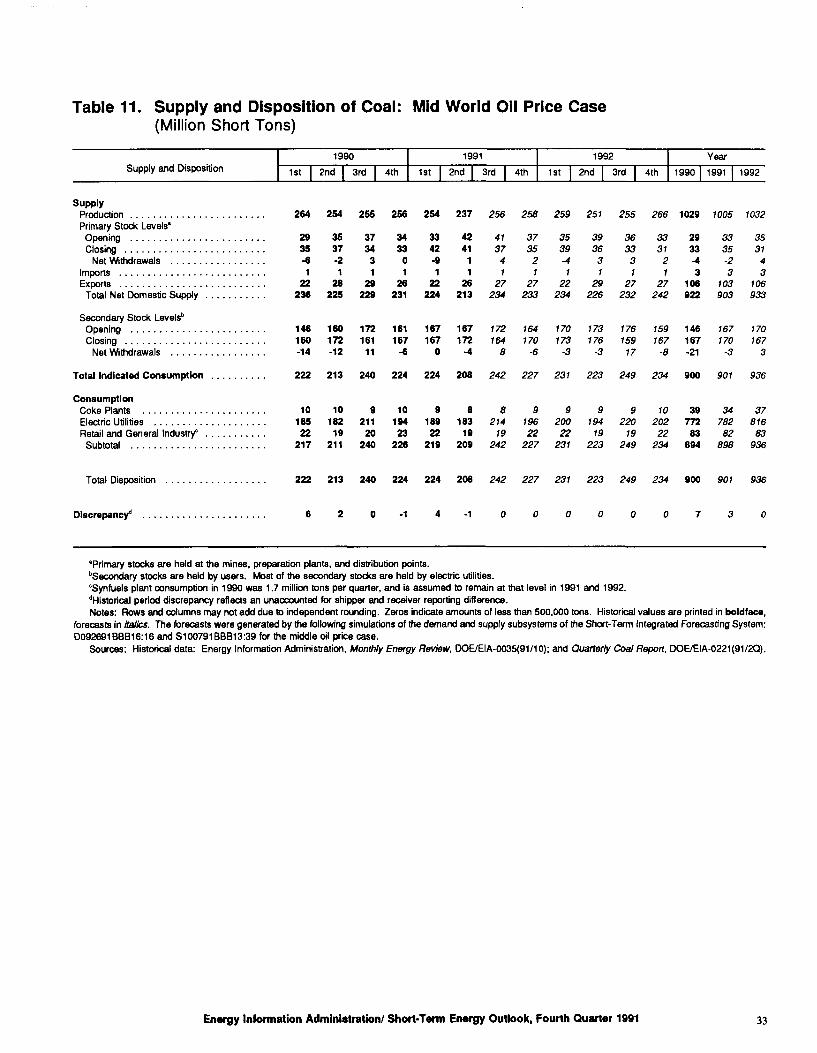
Table 11. Supply and Disposition of Coal: Mid World Oil Price Case(Million Short Tons)
Supply and Disposition1990
1st 2nd | 3rd | 4th1991
1st | 2nd | 3rd | 4th1992
1st | 2nd 3rd | 4thYear
1990 1991 1992
SupplyProduction .............Primary Stock Levels"
Opening .............Closing ..............
Net Withdrawals ......Imports ...............Exports ...............
Total Net Domestic Supply
Secondary Stock Levels" Opening .............Closing ..............
Net Withdrawals ......
Total Indicated Consumption
ConsumptionCoke Plants ............Electric Utilities ..........Retail and General Industry0 .
Subtotal ..............
264 254 255 256 254 237 256 258 259 251 255 266 1029 1005 1032
2935-6
122
236
146 160 -14
1018522
217
3537-2
128
225
160 172 -12
10182
19211
3734
31
29229
172161
11
3433
01
26231
161167
-6
3342-9
122
224
167167
0
4241
11
26213
167172
-4
413741
27234
373521
27233
3539-41
22234
393631
29226
363331
27232
333121
27242
2933-43
106922
9211
20240
1019423
226
918922
219
18319
209
8214
19242
919622
227
920022
231
9194
19223
9220
19249
1020222
234
39772
83894
3335-23
103 903
222 213 240 224 224 208 242 227 231 223 249 234 900 907
3478282
898
3531
43
106933
172 164 170 173 176 159 146 167 170164 170 173 176 159 167 167 170 167
8 -6 -3 -3 17 -8 -21 -3 3
936
37816
83936
Total Disposition 222 213 240 224 224 208 242 227 231 223 249 234 900 901 936
Discrepancy* 0-1 4-1
'Primary stocks are held at the mines, preparation plants, and distribution points."Secondary stocks are held by users. Most of the secondary stocks are held by electric utilities."Synfuels plant consumption in 1990 was 1.7 million tons per quarter, and is assumed to remain at that level in 1991 and 1992.d Historical period discrepancy reflects an unaccounted for shipper and receiver reporting difference.Notes: Rows and columns may not add due to independent rounding. Zeros indicate amounts of less than 500,000 tons. Historical values are printed in boldface,
forecasts in italics. The forecasts were generated by the following simulations of the demand and supply subsystems of the Short-Term Integrated Forecasting System: D092691BBB16:16 and S100791BBB13:39 for the middle oil price case.
Sources: Historical data: Energy Information Administration, Monthly Energy Review, DOE/EIA-0035(91/10); and Quarterly Coal Report, DOE/EIA-0221(91/2Q).
Energy Information Administration/ Short-Term Energy Outlook, Fourth Quarter 1991 33
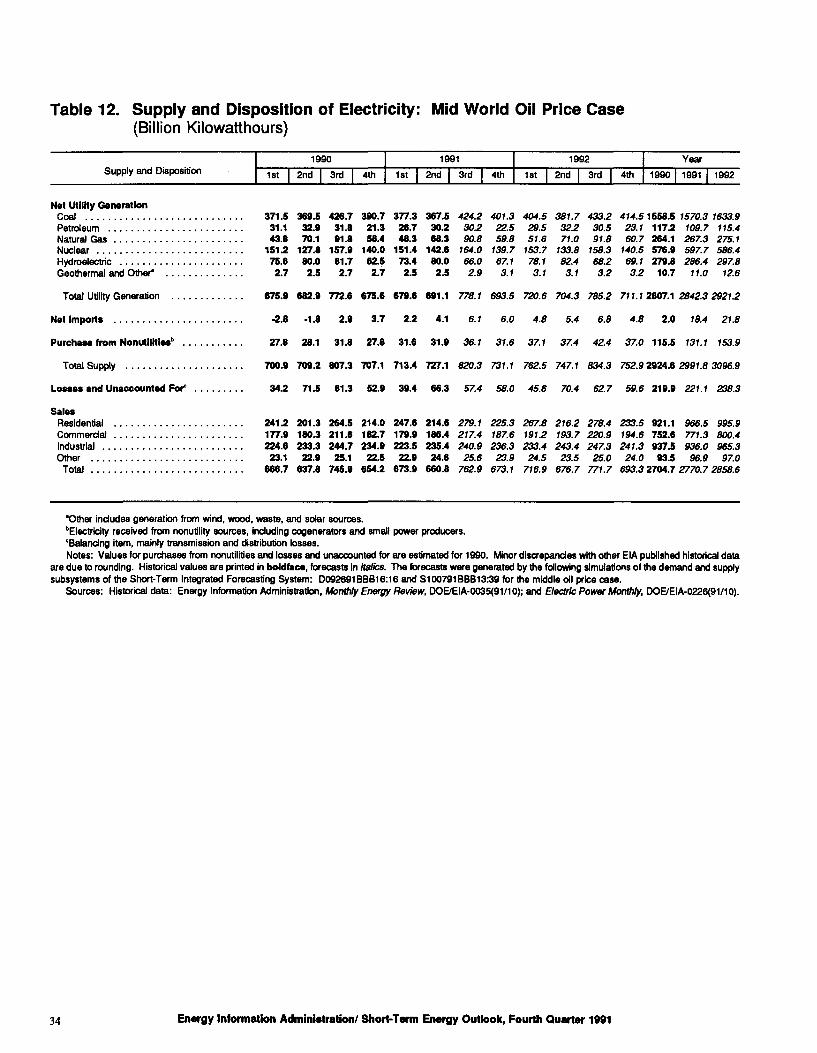
Table 12. Supply and Disposition of Electricity: Mid World Oil Price Case(Billion Kilowatthours)
Supply and Disposition1990
1st | 2nd | 3rd | 4th1991
1st | 2nd | 3rd | 4th1992
1st | 2nd | 3rd | 4thYear
1990 1991 | 1992
Nat Utility GenerationCoal .............Petroleum .........Natural Gas ........Nuclear ...........Hydroelectric .......Geothermal and Other*
Total Utility Generation
Net Imports ..............
Purchase from NonutlHties" ..
Total Supply ............
Losses and Unaccounted For*
SalesResidential ..............Commercial ..............Industrial ................Other ..................
Total ..................
371.5 369.S31.1 32.943.8 70.1
151.2 127.875.6 80.02.7 2.S
675.9 682.9
-2.6 -1.8
27.8 28.1
700.9 709.2
34.2 71.5
426.7 390.731.8 21.391.8 58.4
157.9 140.061.7 62.52.7 2.7
772.6 675.6
2.9 3.7
31.8 27.8
807.3 707.1
61.3 52.9
377.326.748.3
151.473.42.5
679.6
2.2
31.6
713.4
39.4
367.530.268.3
142.680.0
2.5
691.1
4.1
31.9
727.1
66.3
424.230.290.8
164.066.02.9
778.1
6.1
36.1
820.3
57.4
401.322.559.8
139.767.13.1
693.5
6.0
31.6
731.1
58.0
404.529.551.6
153.778.13.1
720.6
4.8
37.1
762.5
45.6
381.7 433.232.2 30.571.0 91.8
133.8 158.382.4 68.2
3.1 3.2
414.5 1556.5 23.1 117.2 60.7 264.1
140.5 576.969. r 279.83.2 10.7
1570.3 1633.9109.7 115.4267.3 275.1597.7 586.4286.4 297.8
11.0 12.6
704.3 785.2 711.12*07.12842.32921.2
5.4 6.8 4.8 2.0 18.4 21.8
37.4 42.4 37.0 115.5 131.1 153.9
747.1 834.3 752.9 2924.6 299 1.8 3096.9
70.4 62.7 59.6 219.9 221.1 238.3
241.2 201.3 264.5 214.0 247.6 214.6 279.1 225.3 267.8 216.2 278.4 233.5 921.1 966.5 995.9177.9 180.3 211.6 162.7 179.9 186.4 217.4 187.6 191.2 193.7 220.9 194.6 752.6 771.3 800.4224.6 233.3 244.7 234.9 223.5 235.4 240.9 236.3 233.4 243.4 247.3 241.3 937.5 936.0 965.3
23.1 22.9 25.1 22.5 22.9 24.6 25.6 23.9 24.5 23.5 25.0 24.0 93.5 96.9 97.0666.7 637.8 745.9 654.2 673.9 660.8 762.9 673.1 716.9 676.7 771.7 693.3 2704.7 2770.7 2858.6
'Other includes generation from wind, wood, waste, and solar sources."Electricity received from nonutility sources, including cogenerators and small power producers.'Balancing item, mainly transmission and distribution losses.Notes: Values for purchases from nonutilities and losses and unaccounted for are estimated for 1990. Minor discrepancies with other EIA published historical data
are due to rounding. Historical values are printed in boldface, forecasts in italics. The forecasts were generated by the following simulations of the demand and supply subsystems of the Short-Term Integrated Forecasting System: D092691BBB16:16 and S100791BBB13:39 for the middle oil price case.
Sources: Historical data: Energy Information Administration, Monthly Energy Review, DOE/EIA-0035(91/10); and Electric Power Monthly, DOE/EIA-0226(91/10).
34 Energy Information Administration/ Short-Term Energy Outlook, Fourth Quarter 1991

Information from the Federal Govern ment on subjects ranging from agricul ture to zoology is available at Depository Libraries across the nation.
You can visit these libraries and use the Depository collections without charge.
To find one in your area, contact your local library or write: Federal Depository Library Program, Office of the Public Printer, Washington, DC 20401.
Federal Depository Library Program

SUIAES JJBJS OJ J9A9 UV\\] .19] JEWS S ]{ •UOI]POnp9 JOJ 99J] XBJ MOfJ1N3W1S3ANI 3H1
SGNO8 SONMVS *S*
au/ /foe

NSSIA9U3N3 dO lN3WlBVd3a S'fl
S33d « 39ViSOd SS\nO-QNO03S
OOG$ 380 31VAIdd UOd AllVNSdsssNisna
S8S02 00 'u
'S*n uoijeiujojui ABJ3U3


![AO Calendriers 2013[1]](https://img.pdfslide.fr/doc/110x75/5572009149795991699fa974/ao-calendriers-20131.jpg)


![s [S]ao uSSuei [S]ao uSSuei [Z]ao u Suei [Z]ao u Suei Mots Phrases](https://img.pdfslide.fr/doc/110x75/551d9da2497959293b8d244e/s-sao-ussuei-sao-ussuei-zao-u-suei-zao-u-suei-mots-phrases.jpg)