Embed Size (px)
Citation preview
Methodology for the preparation of
GEO Cities Reports
Published with �nancial assistance from Belgian Government
United Nations Environment Programme Regional Office for Latin America and the CaribbeanAvenida Morse, Edificio 103. Clayton, Ciudad del Saber - Corregimiento de AncónPanama City, PanamaTel. (+502) 305-3100 Fax: (+507) 305-3105Internet site: www.pnuma.org/deat1/ Email: [email protected] UNEP UNEP
www.unep.orgUnited Nations Environment Programme P. O. Box 30552 - 00100 Nairobi, Kenya
Tel.: + 254 20 762 1234Fax.: + 254 20 762 3927
e-mail: [email protected]
Training ManualVersion 3
BelgianDevelopment Cooperation
Methodology for the preparation of
GEO Cities Reports
Training ManualVersion 3

3
Met
hod
olog
y fo
r th
e p
rep
arat
ion
of G
EO C
itie
s Re
por
ts
In collaboration with:
Published by the United Nations Environment Programme
Regional Office for Latin America and the Caribbean
Copyright © 2009, United Nations Environment Programme and Consorcio Parceria 21
This publication may be reproduced in whole or in part and in any form for educational or non-profit purposes without special permission from the copyright holder, provided acknowledgement of the source is made. UNEP would appreciate receiving a copy of
any publication that uses this publication as a source.
No use of this publication may be made for resale or for any other commercial purpose whatsoever without prior permission in writing from the United Nations Environment
Programme and Consorcio Parceria 21.
DISCLAIMER
The contents of this publication do not necessarily reflect the views or policies of UNEP or contributory organizations concerning the legal status of any country, territory, city or
area or its authorities, or concerning the delimitation of its frontiers or boundaries.
For further information and details of how to obtain copies of this publication please contact:
United Nations Environment Programme
Division of Early Warning and Assessment
Regional Office for Latin America and the Caribbean
Avenida Morse, Edificio 103. Clayton, Ciudad del Saber - Corregimiento de Ancón
Panama City, Panama
Tel. (+502) 305-3100 Fax: (+507) 305-3105
Internet site: www.pnuma.org/deat1/
Email: [email protected]
ISBN 978-9962-8942-0-9
UNEP
4
Me
tho
do
log
y fo
r th
e p
rep
ara
tio
n o
f G
EO
Cit
ies
Re
po
rts
Acknowledgements
Like all GEO products, developing the Methodology for the Preparation of GEO Cities
Reports was a collective effort. UNEP is grateful for the work of Consorcio Parceria 21,
an association of three Brazilian Non-Governmental Organizations with broad experience
on matters relating to the environment and urbanization, for leading the technical
development of the fi rst version of this manual, and to the Ministry of the Environment of
the Government of Brazil for its fi nancial support. We are also grateful for the collaboration
of experts from institutions and governments who contributed to preparing this report
with their observations during the “Urban Environmental Assessment Workshop: GEO
Cities”, organized by UNEP and the government of Mexico City, held in November 2001,
and in the workshops in Lima, Peru, in November 2003, and in Havana, in May 2005 (list
of experts attached).
We also express our thanks to our colleagues in UN-HABITAT whose experience of
almost 15 years in preparing environmental profi les of cities provided inputs to develop
this third version of the manual, and for joining forces with UNEP to help cities, by using
this methodology, to develop their integrated environmental assessments (IEA) or GEO
reports.
Team of collaborators
United Nations Environment ProgrammeRegional Offi ce for Latin America and the Caribbean
Division of Early Warning and Assessment
María Eugenia Arreola
Emilio Guzmán Molina
Graciela Metternicht
Kakuko Nagatani-Yoshida
United Nations Centre for Human Settlements (UN-HABITAT)
Jean-Christophe Adrian Principal Reviewer
Consorcio Parceria 21
ISER Instituto de Estudos da Religião (Institute of Religious Studies)
IBAM Instituto Brasileiro de Administração Municipal(Brazilian Institute
for Municipal Administration)
REDEH Rede de Desenvolvimento Humano (Human Development Network)
5
Me
tho
do
log
y fo
r th
e p
rep
ara
tio
n o
f G
EO
Cit
ies
Re
po
rts
Coordination
Samyra Crespo ISER
Ana Lucia Nadalutti La RovereI IBAM
Thecnical Team
Napoleão Miranda ISER
Alberto Costa Lopes IBAM
Laura Valente de Macedo ISER
Luiz Penna Franca Consultant
Estela Neves Consultant
Contributors and Reviewers
Rosario Gómez
Elsa Galarza
Anna Zucchetti
Genovenva de Mahieu
Revision and preparation of the third version of the Manual
Napoleão Miranda ISER
The english version of the manual was coordinated by:
Graciela Metternicht, Regional Coordinator Division of Early Warning
Assessment, UNEP, Regional Offi ce for Latin America and the Caribbean
(ROLAC).
Johanna Zisky Granados Alcalá, UNEP, Production Coordination
Phil Linehan. Translation into English
Rocío Milena Marmolejo Cumbe. Editorial Design
6
Met
hod
olog
y fo
r th
e p
rep
arat
ion
of G
EO C
itie
s Re
por
ts
Table of contentsPreface ...............................................................................................11
I. Introduction ...................................................................................13
II. GEO Cities methodology ..............................................................16
1.. Focus of the analysis: urban development and its effect on the environment .....17
2.. Analytical framework: DPSIR matrix ................................................................17
3.. GEO Cities report structure .............................................................................20
Chapter 1: Introduction to the City ............................................................24
1.1 Location and relation to other cities ..................................................24
1.2 Geography and topography ..............................................................24
1.3 Ecosystem and climate .....................................................................24
Chapter 2: Socio-economic and political context (DRIVING FORCES and PRESSURES) ..................................24
2.1 Description of local political and administrative structure ...................25
2.1.1 Local public authority administrative structure .........................25
2.1.2 Characteristics and role of civil society organizations ...............26
2.1.3 The local private sector ...........................................................26
2.2 Analysis of local socio–economic factors ..........................................27
2.2.1 Urbanization and territorial occupation dynamics .....................27
2.2.2 Demographic dynamics ...........................................................30
2.2.3 Social dynamics ......................................................................31
2.2.4 Economic dynamics ................................................................32
a) Dynamics of economics ......................................................33
b) Use of environmental resources ..........................................34
c) Impact of activity sector on environmental resources ..........34
d) Agriculture ..........................................................................35
e) Commerce and services .....................................................35
2.2.5 Consumption of resources ......................................................36
a) Energy consumption ..........................................................36
b) Water consumption ............................................................36
2.2.6 Atmospheric emissions ...........................................................37
7
Me
tho
do
log
y fo
r th
e p
rep
ara
tio
n o
f G
EO
Cit
ies
Re
po
rts
2.2.7 Waste production ....................................................................37
2.2.8 Sewage treatment and sanitation ............................................39
2.3 Chapter synthesis .............................................................................40
Chapter 3: State of the environment (STATE) ............................................40
3.1 Local ecosystems .............................................................................41
3.2 Analysis of the state of the environment’s natural resources ..............42
3.2.1 Atmosphere .............................................................................42
3.2.2 Water ......................................................................................43
3.2.3 Land ........................................................................................44
3.2.4 Marine and coastal resources ..................................................44
3.2.5 Biodiversity ..............................................................................45
3.2.6 Forests and green areas ..........................................................45
3.2.7 Built-up environment ...............................................................46
3.3 Chapter synthesis .............................................................................47
Chapter 4: Impacts of the state of the environment (IMPACT) ................47
4.1 Impact on ecosystems ......................................................................48
4.2 Impact on quality of life and human health (inequality and poverty) ....49
4.3 Impact on urban economy (external causes) .....................................50
4.4 Impact on built-up environment (human settlements) ........................51
4.5 Impact at political and institutional level .............................................52
4.6 Socio-environmental vulnerability ......................................................53
Chapter 5: Urban environmental management policies and
instruments (responses)...........................................................55
5.1 Political-administrative instruments ....................................................57
5.2 Economic instruments ......................................................................58
5.3 Technological instruments .................................................................59
5.4 Physical intervention instruments (public investments) .......................60
5.5 Socio-cultural, educational and public communication instruments ...61
Chapter 6: Future outlooks (SCENARIOS) .................................................61
6.1 Defi nition of emerging themes ...........................................................62
6.2 Building scenarios: local trends (inertia, the best and worst cases) .. 64
8
Me
tho
do
log
y fo
r th
e p
rep
ara
tio
n o
f G
EO
Cit
ies
Re
po
rts
III. GEO Cities Process ......................................................................70
Stage 1: Institutional .............................................................112
1.1 Installation activities ...........................................................................71
1.1.1 Identifying and appointing the local technical team ..................75
a) Training the work group or local technical team ...................76
b) Defi ning the basic agenda ...................................................79
1.1.2 Training the local team .............................................................80
Stage 2: Identifying indicators and information sources ......80
2.1 Urban-environmental indicators .........................................................80
2.1.1 Indicators: What are they? How should they be used? ..........81
2.1.2 Brief defi nition ..........................................................................81
2.1.3 Criteria to select indicators ......................................................82
2.1.4 DPSIR matrix indicators ...........................................................83
2.1.5 Indicator categories .................................................................83
a) Core indicators ....................................................................83
b) Substitute (proxies) indicators ..............................................83
c) Local indicators ...................................................................84
d) New indicators ....................................................................85
e) Transversal indicators ..........................................................85
2.1.6 Territorial dimension of indicators .............................................85
a) GEO Cities assessment and the rural theme ........................86
b) Matrix of GEO Cities report basic indicators .......................86
2.2 Data collection and analysis ..............................................................90
2.2.1 Identify primary data sources and available information ............90
2.2.2 Systematize information ...........................................................93
2.2.3 Establish a local environmental database .................................95
Stage 3: Preparing the GEO Cities Report .............................95
3.1 Data and information analysis ............................................................95
3.1.1 Identify environmental priorities ................................................96
3.1.2 Assess the state of the local environment ................................97
9
Me
tho
do
log
y fo
r th
e p
rep
ara
tio
n o
f G
EO
Cit
ies
Re
po
rts
3.1.3 Assess responses by government and society ........................97
3.1.4 Identify emerging themes and scenarios ..................................97
3.1.5 Build scenarios: local trends (inertia, best case, worst case) ....97
3.1.6 Conclusions and recommendations .......................................100
3.1.7 Statistical annexes .................................................................100
3.1.8 Bibliography ..........................................................................101
3.1.9 Glossary ................................................................................101
Stage 4: Disseminating and applying policies ....................102
4.1 Dissemination strategies .................................................................102
4.2 Infl uencing policies .........................................................................103
Stage 5: Continuing the GEO Cities process ......................103
Annexes ............................................................................................104
Annex 1: Indicators ..............................................................................105
Annex 2: Guide to managing bibliographical references .......................162
Annex 3: Questions guide to prepare the GEO Cities report .................164
Annex 4: Work guide for the GEO Cities report workshop ....................170
Annex 5: Example of indicators used in GEO Cities reports ..................184
Annex 6: List of participants at workshops on preparing GEO Cities
Methodology, version 3 .........................................................190
Annex 7: Impact strategy and communication activities .......................193
Bibliography .....................................................................................198
10
Met
hod
olog
y fo
r th
e p
rep
arat
ion
of G
EO C
itie
s Re
por
ts
List of Acronyms
CAMISEA Natural Gas Project in Peruvian Amazon
CEROI Cities Environment Report on the Internet
CONICET National Council of Scientific and Technical Research (Argentina) Consejo Nacional de Investigaciones Científicas y Técnicas (Argentina)
ECLAC Economic Commission for Latin America and the Caribbean
CONAM National Environment Council (Peru) Consejo Nacional del Ambiente (Perú)
FTA Free Trade Agreement
FTAA Free Trade Area of the Americas
GEO Global Environment Outlook
IBAMA Brazilian Institute of Environment and Natural Renewable Resources Instituto Brasileiro do Meio Ambiente y de los recursos naturales
renovables
IEA Integrated Environmental Assessment
IISD International Institute for Sustainable Development
IMAE Environment and Ecology Institute (Argentina) Instituto de Medio Ambiente y Ecología (Argentina)
IPCC Intergovernmental Panel on Climate Change
MMA Environment Ministry (Brazil) Ministério do Meio Ambiente (Brasil)
NGO Non Government Organization
OECD Organization for Economic Co-operation and development
PARC21 Consorcio Parceria 21
RMSP Sao Paulo Metropolitan Region
ROLAC Regional Office for Latin America and the Caribbean
SCOPE Scientific Committee on Problems of the Environment
SEDAPAL Lima´s Drinking Water and Sewerage Services Servicio de Agua Potable y Alcantarillado de Lima
UN HABITAT United Nations Human Settlement Programme
UNDP United Nations Development Programme
UNEP United Nations Environmental Programme
UNESCO United Nations Educational Scientific and Cultural Organization
UNSCD United Nations Commission for Sustainable Development
11
Me
tho
do
log
y fo
r th
e p
rep
ara
tio
n o
f G
EO
Cit
ies
Re
po
rts
Preface
The GEO Cities Project is part of the GEO (Global Environment Outlook) series of
reports of the United Nations Environment Programme (UNEP); the series was initiated
in 1995 with periodic reports being published on the state of the environment at global,
regional, sub-regional, national and urban levels. This initiative led to an important group
of reference documents being prepared on the environment including: at global level,
Global Environment Outlook (GEO 1, GEO 2, GEO 3, and GEO 4); at regional level,
Global Environment Outlook for Latin America and the Caribbean (GEO LAC 2000, GEO
LAC 2003 and GEO LAC 2009); at sub-regional level, (GEO Andean, GEO Caribbean,
GEO Central American) and at national level (GEO Peru, GEO Costa Rica, GEO Chile,
GEO Brazil, GEO Barbados, GEO Nicaragua, GEO Panama, GEO Bahamas, GEO Cuba,
GEO Guatemala and GEO Mexico, among others). Also published are thematic reports:
GEO Amazonia and GEO for Youth in Latin America and the Caribbean, a document
designed to promote environmental awareness among young people.
The fundamental objective of the GEO Cities Project is to promote better understanding
of the interaction between urban development and the environment, providing the
region’s local governments, scientists, policy-makers and the general public with reliable
and up-to-date information to help them improve urban environmental planning and
management. The GEO Cities Project publishes assessments to provide information
on the state of the environment, the main factors for change, policies affecting the
environment and emerging themes.
This Project is a response to Agenda 21, decisions of the UNEP Governing Council,
the Malmö Ministerial Declaration adopted by the Global Forum of Ministers of the
Environment (May 2000), the Latin American and Caribbean Initiative for Sustainable
Development passed by a Special Session of the Forum of Ministers of the Environment
of Latin America and the Caribbean at the World Summit on Sustainable Development
in Johannesburg in 2002, and the Millennium Development Goals, especially Goal 7 “To
ensure environmental sustainability”.
1 Consorcio Parceria 21 comprises the following organizations: Brazilian Institute of City Administration (IBAM), Institute of Religious Studies
(ISER) and the Human Development Network (REDEH), all very active locally and nationally on matters concerning the environment and urban
development.
Me
tho
do
log
y fo
r th
e p
rep
ara
tio
n o
f G
EO
Cit
ies
Re
po
rts
12
GEO Cities Project - Background
The 13th meeting of the Forum of Minister •
of the Environment of Latin America and the
Caribbean (LAC) (October 2001) requested
UNEP to prepare integrated Environment
Assessments on urban zones.
In 2001 the Ministry of the Environment of •
Brazil (MMA) proposed that the Integrated
Environmental Assessment (IEA) / GEO
methodology be adapted at city level.
In November 2001 the fi rst workshop was •
held in Mexico City to offi cially put into
effect the GEO Cities Project.
The fi rst phase of the project began in 2001 •
with 7 pilot cities: Rio de Janeiro, Manaus,
Mexico City, Buenos Aires, Santiago, Bogotá
and Havana.
In November 2003 the second regional •
GEO Cities workshop was held in Lima,
Peru, with 10 new cities participating.
In 2003 the fi rst version of the Methodology •
to prepare GEO Cities reports was
published in Spanish
In February 2004 UNEP’s Regional Offi ce •
for Latin America and the Cafribbean
(ROLAC) and UN-HABITAT/ROLAC signed
the Environmental-Urban Strategy for Latin
America and the Caribbean.
In May 2005 the Third Regional GEO Cities •
Workshop was held in Havana, Cuba, with
28 cities participating.
In June 2005 UNEP participated with GEO •
Cities at the World Meeting on Sustainable
Cities and Local Agendas 21 organized by
UN-HABITAT in Havana, Cuba.
In 2005 an English version of the •
Methodology to prepare GEO Cities
reports was prepared.
In August 2005 the GEO Cities Project was •
presented at the Fourth Environmental
Urban Fair of the Latin American
Environmental Authorities.
In June 2006 the regional offi ces of UNEP •
and UN-HABITAT jointly organized the
panel on Urban Environmental Planning at
the Third World Forum held in Vancouver,
Canada.
Since it started with 7 pilot cities, 37 •
additional cities have been added, making
a total of 44 cities.
In November 2007 the GEO Cities Project •
was presented in Santiago, Chile, at the
Sixth Seminar of RED (The Network for
Environmental Management in Latin
America and the Caribbean).
In 2008 the third version of the Methodology •
to prepare GEO Cities reports was
published.
The methodology to prepare GEO Cities •
reports is an integral part of the GEO
Cities Project, initiated by UNEP with
technical support provided by Consorcio
Parceria 211, and with fi nancial backing
by the Ministry of the Environment of
the Government of Brazil (MMA) and the
governments of Belgium, Norway and The
Netherlands

13
Me
tho
do
log
y fo
r th
e p
rep
ara
tio
n o
f G
EO
Cit
ies
Re
po
rts
I. IntroductionIntroduction
14
Me
tho
do
log
y fo
r th
e p
rep
ara
tio
n o
f G
EO
Cit
ies
Re
po
rts
In Latin America and the Caribbean the concentration of the population in urban
areas has intensifi ed in recent decades, making it the developing world’s most urbanized
region with three quarters of its population living in cities. Five of the most populated
cities in the world are in Latin America: Buenos Aires, Sao Paulo, Rio de Janeiro, Mexico
City and Lima.
Cities make a signifi cant contribution to a country’s socio-economic development.
They are, at all levels, important centres of productive activity and economic growth,
playing a primordial social development role. They offer basic services such as drinking
water and sanitation, education, health and housing. They are spaces of progress,
culture, knowledge and political leadership. However, the speed at which they are
expanding has negative effects on the quality of the urban environment and puts at risk
their contribution to a country’s socio-economic development.
There has been a marked deterioration of urban environmental conditions in terms of
pollution of springs and aquifers, air pollution, defi cient urban waste management, and of
green areas and others that put the population’s health at risk. To this is added the high
incidence of natural phenomena that regularly affect the region (hurricanes, cyclones,
earthquakes, volcanic eruptions and droughts), all of which have serious implications
on how their human settlements are confi gured. The recurrence of these phenomena,
combined with economic conditions and institutions so structured that they have limited
capacity to prevent and mitigate their consequences, have converted extensive regions
and their urban centres into extremely vulnerable zones, both physically and socially.
The confl uence of all these elements results in urban vulnerability and strikes especially
hard at the poorest communities that are forced to occupy areas with most physical and
environmental risks.
Effective management of the environment and natural resources requires a fi rm
information base about the state of the environment. At the beginning of 2003 the
Methodology for GEO Cities reports was prepared as a guide for our partners and to
help with training on how to successfully develop Integrated Environment Assessments
(IEAs) in cities. The GEO Cities reports are based on the GEO Cities methodology that
focuses on the environmental tensions inherent in the dynamics of urban development.
The GEO Cities methodology, available as an application manual, is a very useful
tool that will strengthen institutional capacities to prepare environmental assessments
and reports on cities and that, over the long term, will lead to better urban environmental
management and improve the quality of life of their inhabitants.
Based on the IEA / Global Environment Outlook (GEO) reports, the GEO Cities
Methodology provides the local GEO technical teams with a guideline on how to use
information to assess the state of the urban environment. The purpose of this manual is
for the local team to:
Learn the meaning of and how to use the integrated environmental assessment •
and prepare a report
Become familiar, both in theory and practice, with their components and •
structure
Learn and practise how to organize and manage evaluation processes and •
reporting
15
Me
tho
do
log
y fo
r th
e p
rep
ara
tio
n o
f G
EO
Cit
ies
Re
po
rts
Exchange views with colleagues through exercises and informal discussions•
Know what tools are available to carry out this task•
The emphasis of this methodology is on understanding the DPSIR (Driving forces,
Pressure, State, Impact, Response) matrix that organizes the way in which the information
to prepare the report is analysed.
The methodology takes for granted that sustainable development places new
demands on the assessment and on the report, including how to:
Recognise the interactions between environmental conditions and human •
activities, especially those related to urban development.
Highlight the need for a long-term outlook.•
Consider gender equality, and equality among and between different •
generations.
Encourage all sectors of society to participate in decision making•
The specifi c objectives of the GEO Cities manual and the training workshops are to:
Serve as a guide for the local technical team to prepare the urban-environmental •
integrated assessment.
Direct the technical team in their search for scientifi c facts and data about •
the environment in cities, as well as to communicate with society to promote
better management of the locality’s natural resources and about environmental
vulnerabilities.
Train the technical team to assess the state of the local environment by analysing •
the determining factors of urban development and their relationship with
ecosystems and natural resources, and about environmental vulnerabilities.
Establish an urban-environmental database to permit continuous follow-up of the •
state of the environment, based on appropriate urban-environment indicators.
Make it possible to formulate preventive strategies and programmes to help cities •
deal with environmental risks.
Establish a consensus about the most critical environmental problems in each •
city by holding a permanent dialogue between the different social stakeholders,
including specialists on environmental subjects that involve the local government
and society.
Contribute to building technical capacities to prepare and disseminate an •
integrated assessment of the state of the environment.
Build capacity on how to assess the impact of urban development on different •
ecosystems.
These objectives are dealt with in each chapter of this document. The idea is that,
at the end of the process, the local teams will be able to assess the state of their cities’
environment and point out how to solve problems highlighted in the report.
It is hoped that, over the long term, the evaluations will support better informed
decision making as well as better urban-environmental planning and management to
improve the quality of life of those who live in the region’s cities.
Me
tho
do
log
y fo
r th
e p
rep
ara
tio
n o
f G
EO
Cit
ies
Re
po
rts
16 II. GEOGEO Cities Methodology
Me
tho
do
log
y fo
r th
e p
rep
ara
tio
n o
f G
EO
Cit
ies
Re
po
rts
17
1. Focus of the analysis; urban development and its effect on the environment
The main point of the methodology is urban development action on the environment from
the point of view of sustainability. In the GEO Cities assessment the interaction between urban
development and the environment is analysed by using the Driving forces-Pressure-State-
Impact-Response matrix. The purpose of preparing the assessment is to learn how urbanization
affects the environment because of factors that put pressure on local natural resources and
ecosystems and leading to a determined state of the environment – with impacts on the quality
of life of cities and causing specifi c responses by the government and local society.
The analysis, therefore, brings together the social, economic, policy and territorial
characteristics of the urban development process and its interaction with the environment.
In this respect, it is important to know the characteristics of the municipality’s main economic
activities, the structure of the city’s social inequality, the main determining factors of land
occupation, the local institutional structure with emphasis on public bodies that defend the
environment and social participation mechanisms in preparing public policies, among others.
2. Analytical framework: DPSIR matrix
The analytical framework used in the GEO Cities assessments is the Driving forces-
Pressure-State-Impact-Response (DPSIR) matrix that defi nes and relates the group of
factors that determine the characteristics infl uencing the environment at any territorial level
whether local, regional national or global. The DPSIR matrix must be seen as an analytical
instrument to direct the work of analysing the interactions between what is urban and what
is environmental. Also seeks to establish a logical link between its components to direct the
assessment of the state of the environment from the factors that exert pressure on natural
resources, and that should be considered as the “causes” of the present state so that each
locality’s responses serve to confront its own environmental problems. The matrix, therefore,
is a model to organize the work of assessing the state of the local environment and does not
pretend to be a faithful copy of the true characteristics between what is urban and what is
environmental which, as we are aware, cannot be entirely known.
The matrix’s components respond to the following basic questions, whatever territorial
scale is considered:
1. What is happening to the environment? (State)
2. Why is this happening? (Driving forces and pressure)
3. What is the impact? (Impact)
4. What are we doing? (Response)
5. What will happen if we do not take action now? (Future outlook)
6. What can we do to reverse the present situation?
These questions relate to the different processes analysed in the GEO Cities assessments
including devising future outlooks for the local environment, as well as preparing an integrated
environmental report that goes beyond the usual methods of assessing the state of the
environment; it is a “process of producing and communicating information on interactions, the
point where the natural environment and society meet” 2.
2 UNEP, IISD and Ecologist International, 2000, Training on integrated environment assessment and preparing reports ”Report Assessment
Process” Training manual , second edition, p. 5
Me
tho
do
log
y fo
r th
e p
rep
ara
tio
n o
f G
EO
Cit
ies
Re
po
rts
18
Defi ned below are the DPSIR matrix components:
Driving forces: Driving forces are sometimes referred to as indirect or underlying forces.
They relate to society’s fundamental processes that promote activities having an indirect impact
on the environment. Key forces include: the population’s demography; consumption and
production behaviour; scientifi c and technological innovation; economic demand; market and
trade; distribution patterns; institutional and socio-political frameworks; and value systems.
The characteristics and importance of each driving force show substantial changes from
one region to another, between regions and between nations. For example: in the area of
population dynamics, most developing countries’ populations are still growing, while developed
countries have stable and ageing populations. There is unequal distribution of resources
and opportunities within and between regions. These and other socio-political factors have
reinforced the principle of common, but differentiated, responsibility in the area of international
environmental governance.
Pressure: This refers to underlying economic and social forces such as population growth,
consumption or poverty. From the policy point of view, pressure is the starting point from which
to confront environmental problems. Because it comes from socio-economic databases,
information on pressure tends to be more readily available. Awareness of pressure factors
seeks to respond to the question: Why is this happening?
State: refers to the condition of the environment resulting from pressure; for example, the
level of air pollution, soil erosion or deforestation. Information on the state of the environment
responds to the question: What is happening to the environment?
Impact: is the effect produced by the state of the environment on aspects such as quality
of life and human health, on the environment itself, on the built-up environment and on the local
urban economy. For example, an increase in soil erosion will have one or more consequences:
reduced food production, increased food imports, more use of fertilizers, and malnutrition.
Responses relate to collective or individual actions that lessen or prevent negative
environmental impacts, correct damage caused to the environment, conserve natural resources
or help to improve the quality of life of the local population. Responses may include activities
on regulation, environmental or research costs, public opinion and consumer preferences,
changes in administrative strategies and providing information about the environment. To
measure how society responds requires the local team to do more analysis and interpretation
work3. The instruments included in this matrix category attempt to answer the question: What
are we doing?
Responses to the: What will happen if we do not act now? attempts to direct the analysis
of future outlooks on the local environment by assessing its present state. The underlying logic
of the DPSIR matrix allows links to be established to project future manifestations of present
environmental conditions encouraging analyses to be made of the possible consequences
of present actions. This raises the possibility of strategic action being taken to change the
direction of each locality’s environmental problems.
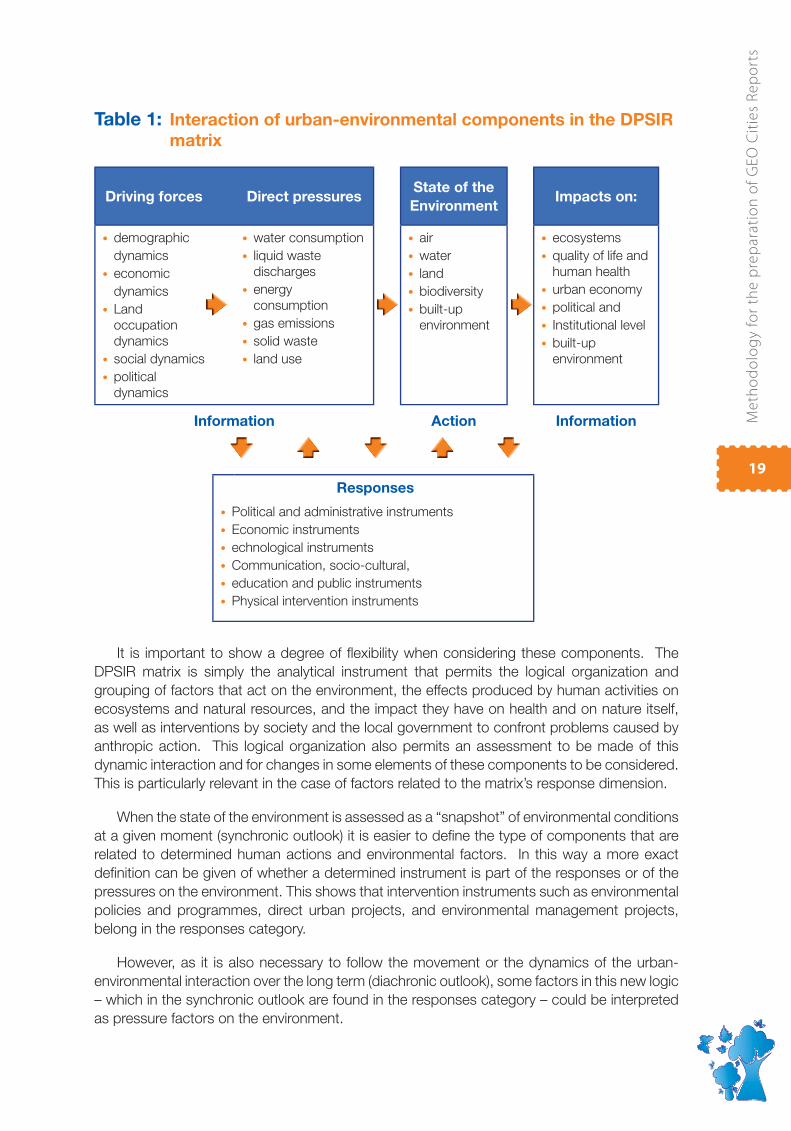
Table 1 shows the principal elements of each of the matrix’s categories and the relationship
between them. As can be seen, the DPSIR matrix seeks to exactly defi ne possible relationship
patterns between different anthropic actions and the environment and applied, in this case,
to relations between what is urban and what is environmental.
3 UNEP, IISD and Ecologistics, 2000
Me
tho
do
log
y fo
r th
e p
rep
ara
tio
n o
f G
EO
Cit
ies
Re
po
rts
19
Table 1: Interaction of urban-environmental components in the DPSIR
matrix
Driving forces Direct pressuresState of the
EnvironmentImpacts on:
demographic•
dynamics
economic•
dynamics
Land•
occupation
dynamics
social dynamics•
political •
dynamics
water consumption•
liquid waste •
discharges
energy •
consumption
gas emissions•
solid waste•
land use•
air•
water•
land•
biodiversity•
built-up •
environment
ecosystems•
quality of life and •
human health
urban economy•
political and •
Institutional level•
built-up •
environment
Information Action Information
Responses
Political and administrative instruments•
Economic instruments•
echnological instruments•
Communication, socio-cultural,•
education and public instruments•
Physical intervention instruments•
It is important to show a degree of fl exibility when considering these components. The
DPSIR matrix is simply the analytical instrument that permits the logical organization and
grouping of factors that act on the environment, the effects produced by human activities on
ecosystems and natural resources, and the impact they have on health and on nature itself,
as well as interventions by society and the local government to confront problems caused by
anthropic action. This logical organization also permits an assessment to be made of this
dynamic interaction and for changes in some elements of these components to be considered.
This is particularly relevant in the case of factors related to the matrix’s response dimension.
When the state of the environment is assessed as a “snapshot” of environmental conditions
at a given moment (synchronic outlook) it is easier to defi ne the type of components that are
related to determined human actions and environmental factors. In this way a more exact
defi nition can be given of whether a determined instrument is part of the responses or of the
pressures on the environment. This shows that intervention instruments such as environmental
policies and programmes, direct urban projects, and environmental management projects,
belong in the responses category.
However, as it is also necessary to follow the movement or the dynamics of the urban-
environmental interaction over the long term (diachronic outlook), some factors in this new logic
– which in the synchronic outlook are found in the responses category – could be interpreted
as pressure factors on the environment.
Me
tho
do
log
y fo
r th
e p
rep
ara
tio
n o
f G
EO
Cit
ies
Re
po
rts
20
Actually, when processes are mentioned such as those found in the urban-environmental
relationship, a fl ow of interactions over time is always assumed. This implies that, at a later
date, the factors that belong to the responses category may be considered to be part of the
pressure mechanisms on the environment. This happens both in the “positive” sense, for
example when they function as limiting factors to the amount of pressure the population or
business places on natural resources or ecosystems, and as “negative” when they cannot
reverse the trend of pressure detected earlier, or if they unintentionally place more pressure on
the environment.
Finally, the importance must be stressed of the integrated and sequential assessment of
the environment suggested by the matrix in table 1.
One purpose of the GEO Cities assessment is to help in decision making and formulating
public policies; it is important, therefore, to be aware of the factors that correspond to each of
its components. Such awareness will allow an assessment to be made of how the responses
are adapted to the environmental problems detected, and the measures suggested in this
document to be either corrected or projected for future action. Adopting this outlook will make
it easier to detect diffi culties in implementing the responses given at local level, delimiting the
different degrees of responsibility of each of the social agents that act in the locality (federal,
state or local governments, businesses, civil society organizations, local population, among
others).
3. GEO Cities report structure
Using the DPSIR matrix as a guide to collecting, organizing and analysing information will
allow the local team to construct, step by step, the report on the state of the environment.
It is also important to defi ne the structure of the report on the basis of each city’s priorities
and needs, observing their physical-geographic, institutional, economic and social peculiarities
(see the proposed structure on p. 22)
Urban-environmental components of the DPSIR matrix
Interaction between urban and environmental components is the key to preparing the GEO
Cities reports. To do so, account should be taken of:
The urbanization process components needed to understand the pressure exerted on •
the environment, and
The factors that make up the environment whose state, qualitative and quantitative, will •
be the report’s objective.
We fi nd three main components in the urbanization process: demographic dynamics,
economic dynamics, and territorial occupation dynamics. These components are the driving
forces that propel urban development: population, economic activities, and the territorial basis
on which economic activities are developed.
These factors, even though they must be classifi ed as a central part of the process of
interacting with the environment, are only presented indirectly in the matrix suggested. They
are included in the matrix by means of different indicators, selected to allow an assessment to
be made of the state of the local environment.
Me
tho
do
log
y fo
r th
e p
rep
ara
tio
n o
f G
EO
Cit
ies
Re
po
rts
21
To analyse the environment two components were considered: natural resources, from a
broad perspective that includes water, air, soil and biodiversity; and ecosystems, considered
as the result of the interaction of natural resources.
Concerning ecosystems, account must be taken of local delimitations for each one, given the
variations in terminology and concepts used to defi ne them (how many and which ecosystems in
each locality). It is suggested that more attention be paid to the most relevant ecosystems in each
city, according to their importance for the environment’s equilibrium and the local population’s quality
of life.
Applying the DPSIR matrix is a useful instrument which, together with the use of urban-
environmental indicators, is capable of expressing the behaviour of the relevant factors and
trends over time. The theme of indicators will be dealt with in the chapter on producing
information to prepare the report.
Me
tho
do
log
y fo
r th
e p
rep
ara
tio
n o
f G
EO
Cit
ies
Re
po
rts
22
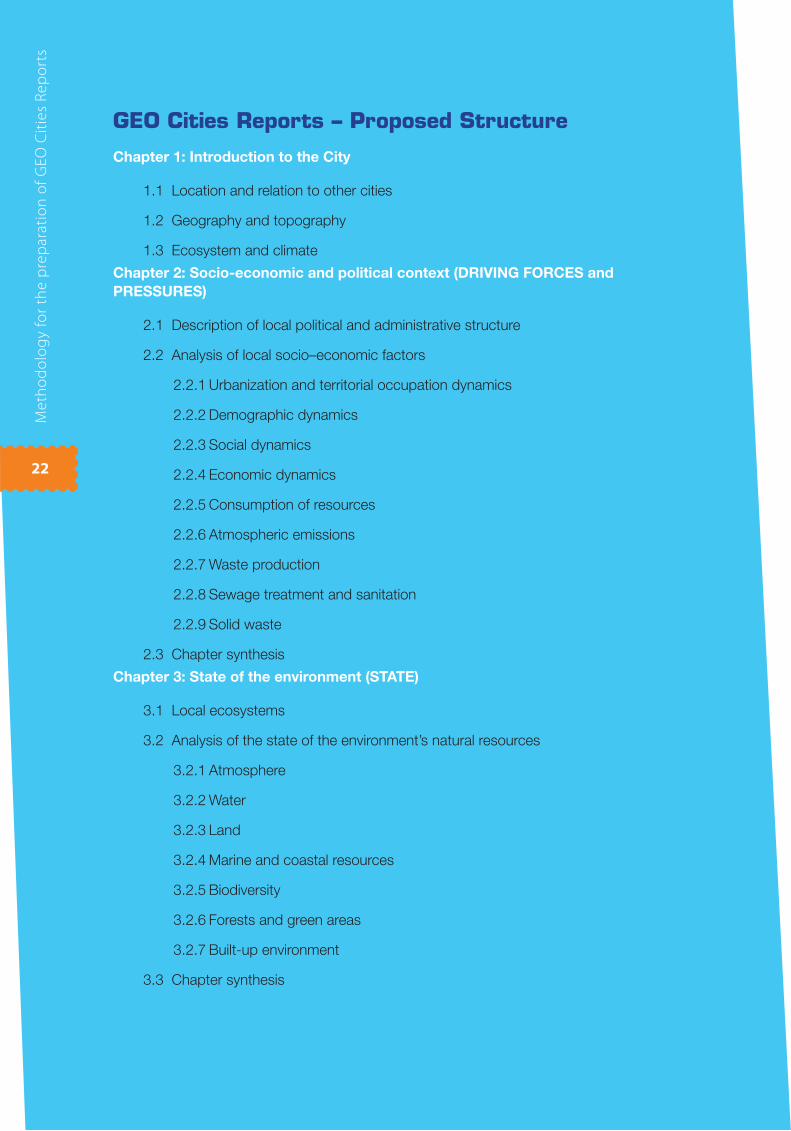
GEO Cities Reports – Proposed Structure
Chapter 1: Introduction to the City
1.1 Location and relation to other cities
1.2 Geography and topography
1.3 Ecosystem and climate
Chapter 2: Socio-economic and political context (DRIVING FORCES and
PRESSURES)
2.1 Description of local political and administrative structure
2.2 Analysis of local socio–economic factors
2.2.1 Urbanization and territorial occupation dynamics
2.2.2 Demographic dynamics
2.2.3 Social dynamics
2.2.4 Economic dynamics
2.2.5 Consumption of resources
2.2.6 Atmospheric emissions
2.2.7 Waste production
2.2.8 Sewage treatment and sanitation
2.2.9 Solid waste
2.3 Chapter synthesis
Chapter 3: State of the environment (STATE)
3.1 Local ecosystems
3.2 Analysis of the state of the environment’s natural resources
3.2.1 Atmosphere
3.2.2 Water
3.2.3 Land
3.2.4 Marine and coastal resources
3.2.5 Biodiversity
3.2.6 Forests and green areas
3.2.7 Built-up environment
3.3 Chapter synthesis
Me
tho
do
log
y fo
r th
e p
rep
ara
tio
n o
f G
EO
Cit
ies
Re
po
rts
23
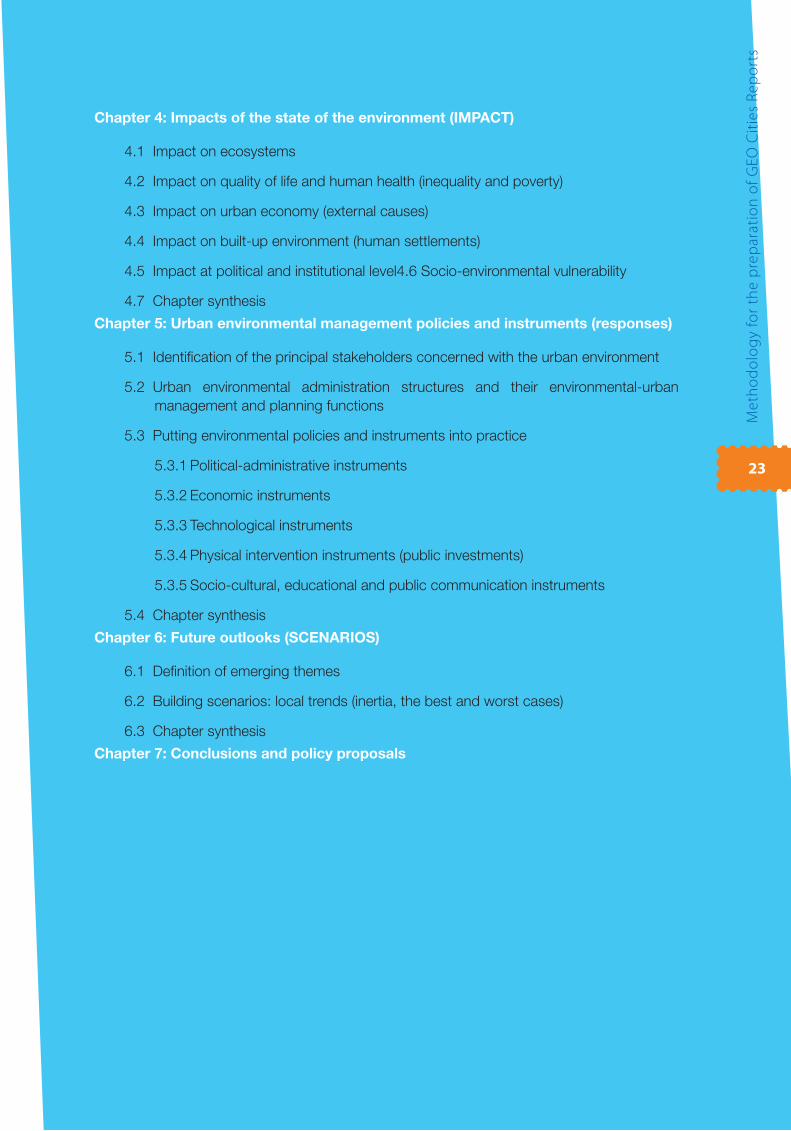
Chapter 4: Impacts of the state of the environment (IMPACT)
4.1 Impact on ecosystems
4.2 Impact on quality of life and human health (inequality and poverty)
4.3 Impact on urban economy (external causes)
4.4 Impact on built-up environment (human settlements)
4.5 Impact at political and institutional level4.6 Socio-environmental vulnerability
4.7 Chapter synthesis
Chapter 5: Urban environmental management policies and instruments (responses)
5.1 Identifi cation of the principal stakeholders concerned with the urban environment
5.2 Urban environmental administration structures and their environmental-urban
management and planning functions
5.3 Putting environmental policies and instruments into practice
5.3.1 Political-administrative instruments
5.3.2 Economic instruments
5.3.3 Technological instruments
5.3.4 Physical intervention instruments (public investments)
5.3.5 Socio-cultural, educational and public communication instruments
5.4 Chapter synthesis
Chapter 6: Future outlooks (SCENARIOS)
6.1 Defi nition of emerging themes
6.2 Building scenarios: local trends (inertia, the best and worst cases)
6.3 Chapter synthesis
Chapter 7: Conclusions and policy proposals
Me
tho
do
log
y fo
r th
e p
rep
ara
tio
n o
f G
EO
Cit
ies
Re
po
rts
24
Chapter 1: Introduction to the City,
The presentation of the GEO Cities report must begin with a general introduction about the
city to make it known to readers of the report. To do so, it is proposed to analyse the following
themes:
Principal physical and geographic characteristics,
To better understand the themes developed in the chapters that follow, this chapter should
present context information; to do so it is important to present the relevant and signifi cant facts
or characteristics of the theme being analysed, that is to say, the pressures on the environment,
the state, the impacts and the responses.
The analysis of this point should include a brief description of factors such as:
1.1 Location and relation to other cities
The city’s location in the national territory and its relation with the network of surrounding cities,
that is to say, its function in the context of the urban network and its surroundings; for example,
whether it is a capital city or the dominant city in a metropolitan area, or a dormitory city.
1.2 Geography and topography
Its geography and topography present the factors that geographically characterize the
city, such as its hydrology (rivers, lakes, water basins, etc.), the main orography components
(principal elevations, average altitude), dominant soil types (sandy, rocky, etc.), dominant
vegetation (wooded areas, pastureland, etc.),
1.3 Ecosystem and climate
Its ecosystem and climate, describing dominant ecosystems (tropical forests, mangroves,
beaches, etc.), rainfall regime, pluviometry, average annual temperatures, microclimates,
principal fauna and fl ora, etc.
Note: Given that the GEO Cities report is intended for different readers (politicians,
academics, students and the general public), as far as it is possible to do so, technical terms
should be avoided. If they must be included, it is suggested that a glossary explaining them be
included as an annex, or each term be explained in a footnote.
Chapter 2: Socio-economic and political context (DRIVING FORCES and PRESSURES)
This chapter’s objective is to historically contextualize local urban development so that
factors that condition the present characteristics of the interaction between the city and its
environment can be understood.
The analysis made in this chapter is of great importance in so far as it will be used by the
local technical team to identify local dynamics and the social stakeholders who exert pressure
on the natural resources, causing a determined state of the local environment.
Me
tho
do
log
y fo
r th
e p
rep
ara
tio
n o
f G
EO
Cit
ies
Re
po
rts
25
On the other hand, once the reasons are identifi ed that explain the state of the environment,
the elements will be available to analyse whether the already-existing responses to these
problems are adequate, and what other action should be taken to reduce the pressure on
natural resources, improve the environment and the quality of life of the population.
To do this, it is proposed to analyse the following themes:
1. Political-institutional dynamics
2. Urbanization and territorial occupation dynamics (land occupation and land use over time)
3. Demographic dynamics
4. Social dynamics
5. Economic dynamics
6. Resource consumption
Extending the details of these factors will depend on the availability of information for
each city and the importance of each factor in relation to the urban area and surrounding
ecosystems.
It is important that those using this methodology make analyses that allow them to:
Understand the propelling forces, trends and problems related to local urbanization.•
Use it as a reference when making decisions about the growth of cities, investing public •
resources and formulating public policies.
2.1 Description of local political and administrative structure
This topic seeks to indicate the elements necessary to analyse the local political, social
and administrative elements necessary to have a broader understanding of the context of local
urbanization and how it effects the environment.
2.1.1 Local public authority administrative structure
Characterizing the local political-institutional structure is a very signifi cant factor when
considering the importance of action taken by the local government concerning rules and
regulations, norms and control, as well as controlling urban growth and protecting the
environment.
The growth of cities and their infl uence on local ecosystems is determined, to a great
extent, by the characteristics, scope, intervention capacity and constitution of the local
government apparatus, as well as by the dynamics of their relationship with other relevant
social stakeholders (civil society and business).
Processes that have a dual determination in territorial occupation are: natural resources use;
distribution of people and activities in the urban space; characteristics of urban constructions;
defi nition of the local transport structure; construction of water supply and sanitation systems;
and the defi nition of the population benefi ting from such services. These processes respond to
the economic and political interests of the different local-level groups and social stakeholders
who want to exercise their strategic and relationship resources to broaden/improve their relative
positions in the urban space, and are the object of a permanent regulatory and normative
dynamics expressed in the set of laws, norms, regulations, tax system and control practices
adopted by the local government and now by society.
Me
tho
do
log
y fo
r th
e p
rep
ara
tio
n o
f G
EO
Cit
ies
Re
po
rts
26
For this reason, we need to know about the local political-institutional structure as an aid
to identifying instruments now available, or that will be needed to confront problems detected
in the urban-environmental interaction in each city.
References to describe the local political and institutional structure: >
a) Th e local governmental and administrative structure underlining administrative bodies
related to environmental and urbanization matters; ministries or secretariats, public
bodies to collect waste, collect/distribute water, environmental sanitation, etc.
b) Th e existence of Master Urban Plans, urban development induction/regulation instruments
with their desired characteristics.
c) Th e existence and description of Environmental Administration and Local Environmental
Legislation Plans, as well as Protected Areas Plans.
d) Funds available in the municipal budget for projects to protect and conserve the
environment.
2.1.2 Characteristics and role of civil society organizations
The end of the twentieth century saw civil society being strengthened as social stakeholders
actively participated in formulating, managing, implementing and following up public policies.
In the new scenario of democracy and participation, non-governmental organizations (NGOs)
stand out, as do community representatives, professional associations and churches, among
other social stakeholders in this sector.
Today, these organizations are a fundamental counterbalance to the political power of local
government agents and the private sector. This makes it important to be aware of them so
as to analyse their present or possible contributions to understanding the state of the local
environment and to solve the problems it poses.
Topics for analysing civil society organizations: >
a) Th e number of organizations/associations working on social and ecological themes;
b) Th e area of performance, the principal public objective, projects that develop institutional
capacity, and the number of people working on them; whether there are joint environmental
and social projects with local government or business;
c) Whether such entities have participation mechanisms to defi ne, administer and assess
local public policies; if they do not, including civil society stakeholders in public sector
decision making is not, and will not be, eff ective;
d) Whether such organizations participate in implementing Local Agenda 21 processes or
other sustainable development projects;
e) Th e principal existing social and environmental confl icts in the locality and the stakeholders
and interests involved, as well as the position each of them adopts. How these confl icts
aff ect the city and its surroundings.
2.1.3 The local private sector
To complete the study of this chapter, it is important to analyse the main characteristics
of the local private sector which, mainly because of its economic activities, is one of the most
important stakeholders where putting pressure on the environment is concerned.
Me
tho
do
log
y fo
r th
e p
rep
ara
tio
n o
f G
EO
Cit
ies
Re
po
rts
27
The theme of entrepreneurs is, almost by defi nition, controversial since economic activities
are very often associated with environmental degradation, whether through deforestation
caused by different activities, by air, soil and water pollution, by land building speculation,
among many other reasons.
On the other hand, taking into account that, in general, the predominant logic in economic
activities is short term, or immediate gain without much concern for the sustainability of the
natural resources on which their activity and the collective wellbeing are based, it can be
understood how important it is, when preparing the GEO Cities assessment, to analyse
business behaviour in each city.
Topics for local private sector analysis >
• Th e principal characteristics of local business organizations (number, business sectors
represented);
• Th eir infl uence on urban-environmental themes in the city, their participation in public
forums related to these themes;
• Th e positions taken by the business sector on the city’s environmental urban management
themes.
2.2 Analysis of local socio-economic factors
The interaction between the dynamics of urbanization (demographic, economic and territorial
occupation) is complex and has an effect on the social structure at all levels; this defi nes its
characteristics and, to a great extent, determines the signifi cance and consequences of the
urban-environmental relationship.
To analyse the present interest in urbanization pressures4 a description must be given of
each element and how it has to be related to its corresponding indicators.
2.2.1 Urbanization and territorial occupation dynamics
Indicators:
Area and population of legal and ilegal human settlements•
Total volume of untreated domestic sewage•
Modal transport distribution•
Motorization index•
Land use change from non-urban to urban•
Vegetal Cover reduction•
Others
% of urban area and its grow rate•
Extension of the urban area and its grow rate•
Land occupation is the material/environmental expression resulting from the interaction of
demography and economic activity.
It is the adaptation and progressive incorporation of the territory’s environmental resources
to expand the urban area, which implies a certain degree of destruction and threats to the
ecosystems’ integrity.
4 Existing pressure: set of dynamics that act to determine the state of the environment. The elements mentioned above are the historic
inheritance of local
Me
tho
do
log
y fo
r th
e p
rep
ara
tio
n o
f G
EO
Cit
ies
Re
po
rts
28
Urbanization necessarily implies territorial occupation to have a physical basis for the
following activities:
Housing construction •
Opening streets and avenues •
Building industrial plants •
Warehouses•
Hotels and stores•
Preparing land for agricultural production to meet the needs of urban consumers•
Building places of worship and of entertainment•
Health and education•
Building drainage, water supply and energy infrastructure•
The determining factors of land occupation are:
The degree and characteristics of social inequity•
The characteristics of the economy•
How the local government is structured and acts•
How civil society organizations act•
The territory’s physical and natural characteristics•
Including the city in the international network of cities•
The following factors should be highlighted when making the analysis:
Distribution of the population and activities within the territory•
Occupation/production in vulnerable areas and use•
Construction and use of the infrastructure•
Water consumption (source, volume, spatial social distribution, uses)•
Access to drainage services (volume, social and spatial distribution, types of •
treatment).
Production of solid wastes (volume, type, fi nal disposal, principal sources)•
Local energy consumption (main sources, origin of the energy, measuring consumption, •
and others).
Me
tho
do
log
y fo
r th
e p
rep
ara
tio
n o
f G
EO
Cit
ies
Re
po
rts
29
Determining factors of territorial occupation >
If the pressure exerted on nature is inevitable, there are many diff erent forms of territorial
occupation with equally diff erent environmental results.
Th is diff erence is due to the degree and the characteristics of local social inequality that helps
to determine the distribution of urban zone population, the characteristics of urbanization
(presence of lost cities/run-down areas, signifi cant occupation of sites, deterioration of
ecosystems due to disorganized urbanization) and of population risks and pressure on the
environment. Social inequality is also a central component in diff erences of having access
to services.
Th e characteristics of the local economic dynamics defi ne the rhythm of urban growth, zones
of expansion, degree of attraction of the population of each city and, to a large extent, the
confi guration of how the territory is occupied.
How the local government is structured and acts, in particular the existence of bodies
and legislation to defend the environment, as well as control and follow-up action by
public and private agents. Public intervention instruments such as Urban Master Plans
and Environmental Management Plans are important to defi ne the limits and desirable
characteristics of urban growth and how the social stakeholders and sectors interaction with
the environment.
Th e degree of organization and qualifi cation of civil society organizations and the extent to
which their participation is institutionalized in defi ning the local environmental agenda will
establish the local control possibilities in formulating, managing, following up and assessing
public policy in that area
Th e physical-environmental characteristics of the city’s locality may determine how vulnerable
the ecosystem is during anthropic action; this, for example, is the case of the greater fragility
of mangroves and reefs.
Th ere are other factors that combine the above elements, such as public insecurity (due to
violence and crime) and the dynamics of the local property market, that are the result of
the interaction of economic dynamics, social inequality and how the local government acts.
Th ese factors may exert pressure to create exclusive spaces such as the gated condominiums
so common in Latin America and built on the city’s urban zone outskirts and that expand in
the direction of still unoccupied natural areas.
Local insertion in the international structure of cities, united by economic globalization
of production processes, stimulates urban expansion. Th is is relevant for large cities and/
or those in the most important metropolitan areas where large international enterprises
operate and demand spaces to develop their activities and attract other enterprises
Me
tho
do
log
y fo
r th
e p
rep
ara
tio
n o
f G
EO
Cit
ies
Re
po
rts
30
2.2.2 Demographic dynamics
Indicators
Population growth•
Area and population of legal and illegal human settlements•
Natural population growth and the fl ow of population towards a specifi c point of the territory
are two of the most important factors in understanding how urbanization infl uences the growth
of society and, as a consequence, the urban-environmental relationship. Some natural and
social processes are of particular importance.
The fi rst, concerning demography, is the natural dimension of the birth rate and mortality.
In fact, the population’s natural growth and renovation are based on the interaction between
some central processes.
There are objective and subjective elements with respect to the relationship between the
number of live births (birth rate) and deaths per year (death rate). Among the objective elements
mention may be made of: the family’s economic income, the structure of the public health
system and infrastructure services, including women in the labour market, medical scientifi c
knowledge. Among the subjective elements are: the family’s educational level, religion, local
culture and customs, the use of birth control methods, activities of social movements that
defend reproductive rights. These processes are not only natural; they change because of
transformations in the structure of contemporary society. However, the situation is very different
in societies were stakeholders are organized around more traditional cultural values.
For example, the infant death rate is a measure of the population’s conditions and quality of
life. It varies according to economic income levels, level of education, and access to essential
urban services such as: water supply and drainage, and the public health system. Therefore,
it refl ects poverty and social inequality, air pollution, the lack of investments in public health and
lack of sanitation. This case shows the infl uence exerted by environmental conditions such as
how the quality of water affects the quality of life.
The second process – migration – is also an important factor in growing city urbanization.
Migration is generally related to the concentration of economic activities in a determined area.
At present half of humanity now lives in cities, and within the next two decades, 60 per cent
of the world’s people will reside in urban areas. Urban development in Latin America and the
Caribbean, the most urbanized region in the developing world, is also characterized by a
high degree of urban primacy with one-fi fth of the region’s urban residents living in cities with
populations of 5 million or more.
However, one of the most distinctive features of urbanization in the region is the rapid
growth of small cities, which are home to nearly 40 per cent of the region’s urban population.
Another distinctive characteristic of the region is that urban growth is often the result of people
moving from one city to another, and not from rural areas to urban areas5.
Migration dynamics: emigration (people leave) and immigration (people arrive) may be of
the following types:
Rural-urban migration•
Urban-rural migration•
Pendular migration (due to activities such as: tourism, daily fl ow of workers, fl ow of •
vehicles, cultural events, etc.)
5 UN-HABITAT,2008
Me
tho
do
log
y fo
r th
e p
rep
ara
tio
n o
f G
EO
Cit
ies
Re
po
rts
31
Each one has particular effects on urbanization and on pressure on the environment.
Population growth as the result of such natural variants and growth caused by migration
(social process), will determine the interaction between the demographic dynamics and the
environment, exerting pressure on natural resources such as soil, water, vegetal cover, etc.
This information may be easily obtained from national and regional statistics institutes and
public health services in each city or state.
Graphic presentation of data >
To present demographic data, it is recommended that graphic instruments be employed:
tables, graphs, charts, maps, satellite images to help visualize the information and the
analysis made in the text.
One of the instruments is the “population pyramid” that allows population distribution to be
represented by ages (at fi ve-year intervals) and by gender, facilitating the graphic evaluation
of characteristics such as, for example, the proportion of young people or of third age adults
in the population.
Another instrument is the projection of the population’s future behaviour: the global trends
(growth rate, absolute numbers) and particular characteristics (growth rate of the percentage
of young people and of third age adults, expected diff erences in the number of men and
women, among others).
2.2.3 Social dynamics
Indicators
The GINI Index (social inequality)•
Others
% of the population living in poverty•
% of the population living in extreme poverty•
% of the population or housing units with drinking water service, by principal •
zones
% of the population or housing units with sanitary service (drainage), by principal •
zones
% of the population or housing units with electricity, by principal zones•
For the GEO Cities assessments, social inequality goes beyond the income differences
between social classes, even though they are central to its classifi cation. Social inequality is
also assessed by the inhabitants’ access to urban services essential for a good quality of life,
such as drinking water supply, drainage system and domestic waste collection, and to urban
land suitable for housing.
The failure to provide services to marginalized citizens puts pressure on the local environment,
contributes to water and soil pollution and damages fl ora and fauna (plants, trees, animals).
Marginalized groups are generally the fi rst to be affected by environmental degradation such as
the proliferation of malaria-transmitting mosquitoes, yellow fever and dengue fever, that have a
serious impact on human health and the quality of life, and causing the problems denounced
by the environmental justice movement6.
6 For more information about the environmental justice movement, consult:
- http://www.scorecard.org/community/es/ej-index.tcl,
- http://jades.socioeco.org/es/, and the book,
- Environmental rights and sustainable development: the access to environmental justice in Latin America, Mexico, UNEP, 2000, p. 227
Me
tho
do
log
y fo
r th
e p
rep
ara
tio
n o
f G
EO
Cit
ies
Re
po
rts
32
For their part, the richest social groups put pressure on the environment by, for example,
building condominiums in environmental protection areas. On the other hand, civil construction
industries and companies discharge polluting substances and, in coastal cities, occupy local
fauna natural reproduction areas such as mangroves and reefs.
The following should be analysed:
1. Local income distribution, specifying how it affects places where people live in cities.
2. Social and territorial distribution of essential urban services, how they interact and how
they are affected by local income.
3. The social groups and areas producing most environmental degradation and pollution,
or that suffer from the most negative effects of environmental problems, to establish the
relationship between them and the supply of urban services.
4. The principal local housing market characteristics.
5. The relationship between social inequality and the local transport system, with emphasis
on time spent travelling from home to work, transport availability and conditions.
6. The local population’s access to education, specifying average years of study, the distribution
of students in formal education and the number and frequency of dropouts.
Signs of social inequality in cities >
If we observe the growth of urbanization in Latin America and the Caribbean in the last
two centuries it is evident that, from the territorial occupation point of view, even today
the poorest sectors of the population always tend to occupy the cities’ outlying or run-down
areas which, in general, have the fewest urban services. Th is means these sectors almost
always suff er from insuffi ciencies, in quantity and quality, of:
• Drinking water supply normally associated with serious infant diseases such as diarrhoea
caused by water pollution and resulting in high infant death rates in countries in the
continent.
• No access to drainage systems so that, on the one hand, they dump their waters into
bodies of water such as nearby rivers and lakes, adding to the pollution and environmental
degradation of these aquatic systems and, on the other hand, they suff er from more water-
borne diseases than the other local social groups facing the same pollution.
• Local waste collection, due both to the lack of attention by the public sector and bodies
responsible for providing this type of service to the city areas occupied by social groups
with the fewest resources, both because of the usual diffi culties on land they occupy --
heavily sloping ground, hillsides, etc. – and the characteristics of the land: unplanned,
with narrow streets and with no space for transport or room for collection vehicles to
move, among others.
2.2.4 Economic dynamics
In most cases the economy is the determining factor of a country’s urban development and
places heavy pressure on the environment.
Me
tho
do
log
y fo
r th
e p
rep
ara
tio
n o
f G
EO
Cit
ies
Re
po
rts
33
Economic activities demand natural resources and interact with the environment by:
Consuming raw materials•
Using land for agricultural production, constructions, highways and streets, storage, •
and others
Disposing of solid and liquid wastes•
Different types of polluting gas emissions•
In most cases, few attempts are made to adapt agriculture, industry, business and services
to the environment; as a result destructive effects are caused such as pollution and the
extinction of fl ora and fauna.
The ecological crisis is, to a large extent, the result of an economic production model. With
the passage of time it becomes unsustainable because of the environmental degradation it
causes. That model is based on overexploiting natural resources, in particular non-renewable
resources, or those with a very long-term replenishment cycle.
Nature provides all the goods consumed by society so it is inevitable that economic activity
puts pressure on the environment. Hence it is important to identify and assess the type and
scale of different activities that use natural resources and have an impact on the environment,
and to analyse how they interact with the urban environment. The prevailing model usually
overexploits resources, degrades the environment or puts ecosystems at risk, thus endangering
biodiversity.
An activity sector is defi ned as a group of organizations and people engaged in the same
general economic activity; that is to say, a development activity category within the city. Each
activity sector will include groups and organizations with broadly similar interests and needs,
and a similar relationship with development and the urban environment7.
Because the situation is different in each city, there is no fi xed rule for identifying and
categorizing activity sectors. As local circumstances will be refl ected in the list of activity
sectors, it is important to identify activities that help to understand the situation, for example:
environmental administration, mining, industry, housing, transport, agriculture, etc.
Each activity sector will be described separately; each description should concentrate on
the sector as a whole without describing individual enterprises or subgroups.
In some cases, for example the industrial sector, it is very useful to describe the most
important sub-sectors (chemical, pharmaceutical, steel); in particular if they are ones that cause
a great impact on environmental resources. It is recommended that precise descriptions be
given; a small statistical table may be the best way of transmitting key information. At least
for the main activity sectors, their geographic distribution should be illustrated with a simple
map.
Once the city’s activity sectors have been satisfactorily identifi ed, the following information
should be presented in the order mentioned and individually.
7 UNCHS-UNEP. Preparing the SCP Environmental Profi le. The SCP Source Book Series: Volume 1, 1999
Me
tho
do
log
y fo
r th
e p
rep
ara
tio
n o
f G
EO
Cit
ies
Re
po
rts
34
a) Characteristics of the activity sector
Give a brief description of the nature and characteristics of the activity sector including,
where appropriate, the following information:
General types of activities in the sector •
Approximate number of people working in the sector; where applicable, separately for •
the formal and informal sub-sectors
Recent growth or decline, employment, etc., in the sector (and sub-sectors, if any)•
Important links, if any, to other activity sectors•
Identify groups, institutions, companies, individuals, ministries or secretariats, sector
representative bodies, etc. that are important in organizing how the sector operates. Describe
any special arrangements made to link the sector with environmental administration activities
in the city.
b) Use of environmental resources
Give a general description of the use of environmental resources by this activity sector, in
both quantitative and qualitative terms:
What specifi c resources are used (water, air, land, minerals, trees, etc.) that are essential •
to the activity?
What is the amount or approximate scale of the use of these resources?•
What has been the recent trend in the sector’s consumption of resources? What are •
likely future consumption patterns?
Energy consumption differs according to the activity and the support needed; the production
industry is very greedy. In addition to electric energy, a large part of the energy for industrial
use comes from fossil fuels: petroleum, natural gas and mineral carbon; thermo-electrics that
employ fossil fuels and carbon mineral; and, to a lesser extent, nuclear, solar and wind energy.
The last two are considered to be clean energy sources.
Describe the availability of these environmental resources for the sector according to:
What are the main supply sources for these resources? In particular, identify input •
sources found in the city or its surroundings.
Are there specifi c shortages of certain resources or problems in obtaining the quality or •
quantity needed?
How readily available are the resources used by the sector? What special measures •
have been taken to expand available supplies or to protect existing supplies?
Does this sector compete directly for supplies with other activity sectors?•
Are any particular initiatives being taken in response to the shortage?•
c) Impact of the activity sector on environmental resources
Describe in general terms the impact of the activity sector on different environmental
resources, that is, on degradation and/or depletion.
What are the activity sector’s main pollution effects and how do they affect different •
environmental resources?
Does the activity sector’s use of resources cause any observable depletion of any •
environmental resource?
Me
tho
do
log
y fo
r th
e p
rep
ara
tio
n o
f G
EO
Cit
ies
Re
po
rts
35
Have any projects or programmes been undertaken to alleviate the impact of this sector •
on different resources?
Civil construction and transport activities in urban centres exert direct pressure on the
environment: they require space for urban expansion, occupying and building in important
ecosystem areas, threatening local biodiversity and freeing polluting chemical products.
Analysing industrial pressure on the environment >
Energy consumption characteristics: sources of energy consumed, location of industries,
price of energy, shortage, population’s access.
• Acid rain producing gas emissions cause the greenhouse eff ect and/or deplete the
atmosphere’s ozone layer (types, sources, volume);
• Discharge of industrial waste/effl uents into bodies of water (types, sources, volume);
• Solid wastes (types, volume, fi nal destination);
• Industrial wastes (toxic, non-toxic and inert).
Liquid and solid wastes also cause pressure on the environment. Nowadays, much
environmental pollution is caused by indiscriminate elimination of industrial activity sub-
products, for example: atmospheric emissions (gases and particles); liquid wastes/effl uents
that contain toxic or polluting chemical products; and industrial wastes (solid) dumped into
rivers, lagoons and seas.
d) Agriculture
In urban centres, in particular near medium-size cities, agriculture has lost ground to other
activities.
Where agriculture continues to be important, a description should be given of its main
characteristics to calculate the pressure it exerts on the environment. These characteristics
include: the number of people employed, types of products, destination of products, area
occupied, use of pesticides, growth of the occupied area, production techniques, rate
of expansion of the municipal area used, etc. Attention must be paid to such matters as:
deforestation resulting from using new land for agriculture; soil and water pollution caused by
using agricultural toxins; forest fi res to clear land for cultivation; and threats to springs from
deforestation and pollution.
e) Commerce and services
The relationship between commerce and services and the environment is less direct These
two aspects require the construction of buildings, stores and shopping centres, and so on, and
also produce solid and liquid wastes that pollute the soil and water and damage biodiversity.
Some of these pose particular threats to the environment; for example, pollution caused
by pathological agents in hospital waste which, when freed untreated into the atmosphere,
become biological and chemical vectors that may easily spread diseases and pollute both the
soil and water, threatening the environment and human health.
Tourism involves the hotel and other related sectors. It puts pressure on space by building
hotels and, perhaps, intruding on still-preserved environmental spaces; it produces solid and
liquid wastes and consumes energy.
Me
tho
do
log
y fo
r th
e p
rep
ara
tio
n o
f G
EO
Cit
ies
Re
po
rts
36
2.2.5 Consumption of resources
a) Energy consumption:
Indicator
Annual per capita energy consumption•
Urban energy consumption in Latin America and the Caribbean is linked to development,
health and the quality of life of citizens, and it has serious repercussions on the national and
global environment. Energy production in these countries involves the use of soil and, therefore,
affects the environmental equilibrium. There are indications that other sources, less clean from
the point of view of climate change, will have to be used to satisfy the growing demand for
energy over the short and medium term.
Prospects are promising for further strengthening renewable sources; however, large
investments will be needed. In the urban context, for the coming decades a source with great
investment potential is methane gas (CH4) from landfi lls. In most cases the gas is burnt as
fl ares to avoid explosions.
However, its controlled burning may provide energy to supply local networks although not
large cities. The practice would also help to reduce greenhouse gas emissions which would be
in the spirit of the Kyoto Protocol that encourages the use of low-impact alternative energies.
Building hydroelectric plants produces regional environmental impacts with repercussions
on urban areas. Flooding in areas where barriers are built affects local fl ora and fauna. Some
impacts are: loss of cultivable land; imbalances in wetlands; displaced populations; and a
deterioration of water quality during construction. From the economic point of view, transmitting
this type of energy is very costly and, because of the possible diffi culty of access to the areas
it is hoped to supply, it is also limited.
In Latin America and the Caribbean many cities and communities are not interconnected to
regional hydroelectric networks; in these cases energy is obtained by using fi rewood and coal.
Other isolated communities use diesel to generate energy.
The energy consumption indicator should differentiate between the use of electricity and
fossil fuels by public and private transport; this is to make a clear distinction between the
impact on local air quality and human health by tracing a direct link between transport and the
industrial sector and the impacts, both regional and local, of emissions of gases that cause
greenhouse effects and acidifi cation.
This indicator should also be associated with the urban transport distribution model and
motorization index. Local and regional air quality is also traced by intersecting these indicators
in the analysis.
b) Water consumption
Indicators
Total water consumption•
Total volume of untreated domestic sewage•
Me
tho
do
log
y fo
r th
e p
rep
ara
tio
n o
f G
EO
Cit
ies
Re
po
rts
37
As a natural resource, water is essential for almost all human activities and is an indispensable
part of the entire planet’s ecosystems; it is central to the analysis made to assess the state
of the environment all over the world. Freshwater is also indispensable for all terrestrial
ecosystems.
As the population and economic and social activities grow so does the demand for water
that has to be brought from ever more distant sources, making it more costly to collect, treat
and distribute. Also, as pollution increases and springs are affected, water becomes scarce
and confl icts arise about who owns it and its use. This endangers both the quantity and quality
of available freshwater.
Much of the world faces serious water shortage problems, pollution of water sources,
unequal distribution between different social groups and confl icts about its multiple uses:
domestic and sanitary, agricultural, industrial, urban development, energy generation, fi shing,
transport, recreation, etc. That is why water is one of the two principal themes on the world
public agenda on the environment.
The steady supply of clean water and sanitary services plays an important role in efforts to protect
the environment, improve the population’s health and counteract poverty in urban centres.
2.2.6 Atmospheric emissions
Indicators
Atmospheric emissions•
Modal transport distribution•
Motorization Index•
Emission gases producing acid rain•
Urban centres produce the most polluting gases in the atmosphere. An analysis must
be made of the pressure on air quality from pollution sources in cities. Motor car, bus and
truck exhausts are main sources of the greenhouse gases responsible for the planet’s global
warming. Gases that make the biggest contribution to this phenomenon result from burning
fossil fuels: carbon monoxide (CO); carbon dioxide (CO2); nitrous oxide (NOx), one of the ozone
gases, (O3); and sulphur dioxide (SO2)8.
Consideration must also be given to emissions from fi xed sources, especially industry9
and, in some cases, from agriculture by burning grassland for planting. Besides greenhouse
gases (CO, CO2, NOx), industrial activity, for example mining in urban centres, also emits
substances that deplete the ozone layer, in particular chlorofl uorocarbons (CFCs) and diverse
particle material (PM).
2.2.7 Waste production
Indicators
Solid waste production •
Solid waste disposal•
8 Gas emissions may be harmful to human health (cardiorespiratory diseases) or have negative effects on fl ora, fauna and ecosystems
Because the wind disperses gases over cities, such effects are felt not only at the place of origin but also in other places, perhaps hundreds of
kilometres away. These emissions also contribute to climate change and global warming9 In industry the emission of greenhouse gases is due to the use of what is known as dirty energy because it comes from burning fossil fuels that
free pollutants into the air
Me
tho
do
log
y fo
r th
e p
rep
ara
tio
n o
f G
EO
Cit
ies
Re
po
rts
38
Accelerated population growth, the exponential increase in all types of consumption, the lack
of fi nancial and technical resources to collect and fi nally dispose of waste, as well as depositing
it in the wrong places, are some of the factors that make the waste problem a matter of great
concern.
It is calculated that urban centres produce an average of 1 kg/per capita/per day of waste,
with some variations between the wealthiest people and the poor in each society and between
the inhabitants of developed and developing countries. The quality of domestic waste is also
a problem because of growing amounts of non-biodegradable products such as plastic,
aluminium and glass, as well as a vast array of substances hazardous to the environment and
to human health: toxic, corrosive, radioactive, infl ammable, reactive or infectious substances.
Diffi culties in disposing of waste in each country are added to those in applying existing legal
norms.
Infrastructure for waste treatment is not always adequate to handle the volume and types
of urban waste. There are usually problems in collecting and disposing of very large objects
like motor vehicles, furniture and domestic electric appliances. These types of wastes are
often dumped into bodies of water, increasing environmental degradation and the cost of
collecting and treating water. It may also cause biodiversity loss.
Most solid waste is disposed of untreated in open-air dumps and, by polluting the soil and
aquifers, causes serious damage to the environment and to the quality of human life. A small
proportion of the waste is taken to sanitary landfi lls where it may be separated according to
type and properly stored, thus controlling its impact on the environment10.
Principal solid waste fi nal disposal sites >
In general, authorities in poor countries dispose of untreated solid waste by using conventional
methods such as open-air dumps or deposits.
Local dumps are unhealthy, sources of urban pests (rats, cockroaches and mosquitoes);
they are unsafe, attract garbage collectors, including children, looking for a way to survive.
Grease contaminates the soil and bodies of water. Another recurrent risk is the clandestine
disposal of toxic waste from industry, agriculture (pesticides), minerals such as lead and from
hospitals (infected or hazardous material). Th ese dumps produce methane gas that could
cause explosions and worsen the situation.
Th e solution most used by controlled systems is sanitary landfi ll with a protection system
consisting of:
• a waterproof layer to avoid grease contamination,
• draining and treating the grease,
• collecting, burning and storing methane gas.
For safety reasons, sanitary landfi lls should be located far from areas with springs and
close to clayey soils. Burning is another alternative in cities with little available space, or
for hospital waste. Th is is done at high temperatures, above 1200°C, and fi lters should be
used for particle material. Th ere is a risk that toxic substances (dioxins, furans and heavy
metals) will be freed into the atmosphere and there is also uncertainty about the content
of the emissions. Th e ashes are toxic and the fi lters of doubtful performance. Th is is a very
expensive process.
10 See “GEO Latin America and the Caribbean” op.cit. p.51-53
Me
tho
do
log
y fo
r th
e p
rep
ara
tio
n o
f G
EO
Cit
ies
Re
po
rts
39
2.2.8 Sewage treatment and sanitation
Indicators:
Total volume of untreated domestic sewage•
Quality of water supply, measured by the biological demand for oxygen, DBO and •
the concentration of faecal material
In developing countries, the lack of sanitation is one of the most frequent urban-environmental
problems.
Although many cities have solved the problem of accessing the resource, it is a different
matter when the focus is on areas with no water or sewage treatment. The most serious
problems are contamination caused by untreated domestic drains, disposal of industrial wastes
and effl uents in bodies of water, salinity and erosion.
As a consequence, having information on freshwater quality and availability is very
important for urban environmental administration, particularly in coastal zones, on riversides
and in mangroves, and in ecosystems that shelter urban populations and are directly sensitive
to water quality.
Disposing of untreated domestic effl uents into bodies of water is a serious source of
biological contamination that could affect human health. In that case the most frequent example
in Latin American and Caribbean countries is infant death caused by water-borne diseases
due to water contaminated with faecal material.
Indicators of water quality, already internationally established, may be applied with complete
confi dence to all human settlements.
Other third type (local) indicators must be identifi ed locally based on the administrator’s
need to attend the city’s specifi c needs, its activities and ecosystems. For example, in the
case of marine ecosystems (costal zones and islands) the indicators must be broadened to
measure the degree of pollution on beaches and of salinity.
Diffi culties associated with domestic and industrial effl uents are similar to those related to
solid wastes.
Serious environmental damage is caused by discharging untreated urban effl uents into
bodies of water and harming people’s health. One of the most common damages is that
caused by polluting springs, surface and groundwater, rivers and oceans; this is a serious
threat to human health, especially among the poorest people living in cities.
Problems related to effl uents also include limited urban drainage and sewer system
coverage, not enough treatment stations for the volume of effl uents produced, poor collection
system distribution in cities at both the territorial and social levels; in developing countries there
are fi nancial limitations on expanding the service in cities where the urban growth rate outpaces
the capacity of local governments’ budgets and there is limited national and international
fi nancing for these services.
The diffi culties mentioned are still more severe in the poorest countries where the most
marginalized populations may become even more socially disadvantaged.
Me
tho
do
log
y fo
r th
e p
rep
ara
tio
n o
f G
EO
Cit
ies
Re
po
rts
40
Untreated effl uents most frequently dumped into bodies of water are:
Domestic or sewage water discharging organic material that pollutes and alters the •
ecological balance;
Industrial effl uents and chemical substances resulting from production processes; •
these are mainly oil-combustibles:
Hospital waste with a high potential to pollute and transmit diseases to the •
population.
The growing world shortage of freshwater highlights the importance of analysing effl uents
for each sector of activity.
2.3 Chapter synthesis
It is suggested that each chapter end with a synthesis of its most notable points to allow the
reader or decision-maker to concentrate on what is most important in each chapter. However,
it is not meant to make an early presentation of the conclusions, but simply to give a brief
summary of the main points dealt with.
Chapter 3: State of the environment (STATE)
This section analyses the state of the local environment with respect to priority themes
including, among others: water, air, soil, biodiversity and the built-up environment. By using
concrete examples and indicators, it should give a comprehensive picture or a synthesis of
each city’s environment and the state of its ecosystems. This will help to answer the question:
What is happening to the environment?
This section is at the centre of the GEO Cities assessment. The analysis presents a defi nition
of the essential points to assess the different environmental sectors and their respective
indicators.
To begin with, the analysis must take into account the development model of the local
society being considered. Although the methodology proposed is designed to assess the state
of the environment resulting from human pressure, it also includes elements needed to analyse
overall urban development.
In this context, indicators of state will help to describe and analyse the ecosystems in
which the cities are located, including their conditions and support capacity which, as a result,
refl ect development models and their elements. For example, sources of natural resources or
deposits for the waste produced by urban processes.
The result of this process may be seen in the quality and quantity of local ecosystems that
extend beyond their bioregional limits. It is important, when observing how the state of the local
environment evolves, to consider the region according to the ecosystem and the element in
question.
Although actions taken are centred on human beings, the analysis is of benefi t to
environmental indicators that include: water resources in their different manifestations (bodies
of water, springs, groundwater, surface water and sea water. etc.); air; local, regional or global
atmospheric resources; soil; geomorphology; land use and occupation, biodiversity, fauna
Me
tho
do
log
y fo
r th
e p
rep
ara
tio
n o
f G
EO
Cit
ies
Re
po
rts
41
(native, exotic, type, presence and quantity); and the built-up environment that is characteristic
of the artifi cial urban environment: housing; urban infrastructure; equipment; buildings and
architecture. This analysis also includes the vulnerability of urban areas and the effect it has on
the people living in these zones at risk of natural disasters.
The assessment of the state of the environment should be both quantitative and qualitative.
The relation between both types of variables is quite close and they are both determining
factors. Therefore, an assessment of the state of the environment basically seeks to determine
quality in terms of its elements and those of its ecosystems. To reach this objective, defi ned
and accepted national and international parameters can serve as an assessment reference.
Such parameters are quantitative indicators of, for example: the number of faecal coliforms
considered acceptable in water for human consumption taken from a specifi c river; above
that number, water is not considered fi t for use unless it is treated to reduce the number of
coliforms according to water quality references. Another example is to determine how many
species of fl ora and fauna survive in a given ecosystem, taking into account the wealth and
complexity of the local biodiversity.
The examples can be multiplied for all natural resources considered in this methodology,
indicating the qualitative effects that result from the quantitative behaviour of the variables
chosen to prepare the GEO Cities assessment. It is important to understand that, since they
are complementary, there is no contradiction between the quantitative data and the qualitative
analysis.
3.1 Local ecosystems
To begin the state of the environment assessment process (analysis), it is important to
defi ne the fi eld of analysis and the variables to be taken into account when establishing the
assessment’s priorities, without disregarding the notion of an inter-related system.
The ecosystems to be analysed should be identifi ed by marking the territorial boundaries
set for this study, whether a municipality or a metropolitan area, that do not always coincide
with natural boundaries such as water courses or the region’s specifi c geomorphological
characteristics. Account should also be taken of natural systems which, while outside the
context being studied, are associated with or linked to the ecosystems analysed.
In each city the description of local ecosystems should take into account its most important
ecosystems based on their contribution to:
Recycling the environment’s natural resources: water, air, biodiversity, etc.•
Environmental services they provide to improve the local population’s quality of life: •
water supply, regulating the local temperature, etc.
Economic activities that make local urban life sustainable.•
It is hoped that the data on ecosystems will give a better understanding of how the life
support systems represented by ecosystems in general contribute to the quality of urban life.
The focus on ecosystems should take account of the natural resources available in habitats
that are of signifi cance for the life of the species that contribute to each locality’s economic
activities.
Me
tho
do
log
y fo
r th
e p
rep
ara
tio
n o
f G
EO
Cit
ies
Re
po
rts
42
For example, in a coastal zone where fi shing is the preponderant activity, good quality
estuary systems are essential if the sustainability of the local economy and its inhabitants
is to be guaranteed to ensure the environmental conditions are appropriate for the fi sh to
reproduce.
Elements to characterize local ecosystems >
• Quantitative and qualitative description of the main features of the municipality’s
predominant ecosystems from the point of view of their physical environments and
resources, including existing biological diversity and the habitats they occupy.
• Hydraulic resources and the distribution of bodies of water.
• Climate: rain, relative air humidity, etc.
• Urban fauna: native and exotic.
• Urban fl ora: forests, green areas, type and quantity.
• Land: type, use and area.
• Vulnerability to disasters, both natural and human-induced.
• Type of occupation in risk areas
In addition to the indicators proposed in the methodology, the analysis should describe
in detail how the ecosystems can support urban development policies. By separating the
environment into different sectors the environmental impacts of urban development may be
quantifi ed and qualifi ed; however, the assessment cannot be confi ned to this point.
3.2 Analysis of the state of the environment’s natural resources
The reductionist method should be used to begin assessing the state of the local environment;
that is to say, each of the natural resources should be analysed separately. Afterwards, the
assessment will be more general and comprehensive.
The natural resources in the urban development/environment cycle can be included in
different ways, for example as raw material, as an urban waste sink, or as territorial support.
Therefore, qualitative and quantitative information on the state of the resources will show
the result of this interaction from the environmental point of view, as well as the quality of life of
the population that depends on these resources.
3.2.1 Atmosphere
Indicators:
Air Quality•
Concentrations of (CO, CO• 2, NOx, SOx, PM10, PM 2.5, lead)
Sources of atmospheric emissions (composition of the vehicular fl eet, size of the •
fl eet, length of time operating, number of polluting industries)
Sulphur content of fuels•
Number of daily journeys•
Emissions of greenhouse gases•
No other natural resource is less limited to a locality than the atmosphere: however, measuring
local air quality11 is essential when assessing urban environmental quality and the inhabitants
11 That is to say, emissions originating on land (exhaust pipes or industrial chimneys and their geographic location). Air quality also includes
regional and global plans to measure the presence of pollutants emitted by transport and industry and causing acid rain and concentrations of
gases that may later have some effect
Me
tho
do
log
y fo
r th
e p
rep
ara
tio
n o
f G
EO
Cit
ies
Re
po
rts
43
quality of life. A drop in air quality has environmental, social and economic implications with
long-term, and perhaps irreversible, consequences such as the loss of biodiversity or the
impact on the health of children and third-age adults; for example, respiratory infections that
may even be fatal.
Although air pollution is one of the most serious signs of poor environmental quality, in Latin
American and Caribbean cities it is a secondary priority, with the exception of some megacities
such as Mexico City, Santiago, and Sao Paulo,
The simplest way to obtain direct data on air quality in cities is to measure the concentration
of particle material and motor vehicle emissions. In recent decades industries have reduced
their emissions of polluting substances into their locality’s atmosphere by using improved
production technologies and changing urban activities, especially in the services sector.
Vehicular emissions bear much of the responsibility for air pollution.
Depending on local conditions, other indexes may be added; for example, emissions of
ozone-depleting gases, measured by production and consumption of the fl uorocarbon family
of gases (CFCs) or the concentration of tropospheric ozone that has a direct impact on human
health.
3.2.2 Water
Indicators
Quality of water supply•
Water shortage (frecuency, extension, duration)•
Others
Total volume of untreated domestic, industrial and mining sewage•
Volume of leachates fi ltering into aquifers•
Drinking water demand compared to production•
Drinking water consumption•
Water is an essential element for the life of species, ecosystems and cities. As a resource,
its main uses are domestic, industrial, energy generation transport and even recreation. For
the environment it is a vital resource for natural cycles of ecosystem renovation12.
The complexity of urban environmental management is made more evident when the state
of water is analysed. Many populations in non-industrialized countries are threatened by water
shortages. Although in Latin America and the Caribbean there is an abundance of water, there
are doubts about how it is distributed and managed.
Urban demand for water is mostly for industrial and domestic use. To assess the resource,
consideration must be given to the quality of the water supply, its availability and accessibility,
as well as to the replenishment capacity of bodies of water. The analysis assesses the source
(surface or groundwater), the type (freshwater, brackish or salty), and the ecosystem (coastal
zones, mangroves, lakes, rivers, etc.).
Freshwater is the main source of supply in Latin America and the Caribbean. Analysing
salty and brackish water is also important to indicate the state of the general ecosystem that
not only supports the survival of species, but is essential for the most important economic
activities in many cities in the region, in particular coastal cities.
12 Water resources management has repercussions on all types of territories and is related to environmental themes such as climate change,
biodiversity, human health and land use changes
Me
tho
do
log
y fo
r th
e p
rep
ara
tio
n o
f G
EO
Cit
ies
Re
po
rts
44
3.2.3 Land
Indicators:
Percentage of geological unstable (risk areas) areas occupied •
Polluted sites•
From the urban development point of view, land problems are revealed by how the land is
used, its distribution, degree of permeability, level of solid waste pollution and eroded areas.
As a natural resource, the land provides raw material and support for other biosphere systems
and environmental services, such as drainage, and for agriculture and urban development.
Changes in land use for urbanization can have serious environmental, social and economic
impacts. As human settlements expand uncontrollably towards natural areas adjacent to
cities, the quality of the land deteriorates together with other ecosystem elements, and causes
landslides, erosion and pollution of bodies of water.
The most frequent changes in the state of the land relate to:
a) Increased vulnerability to natural disaster risks such as landslides and fl oods due to its
basic physical-chemical structure (gradient, porosity and compaction) as well as the loss
of vegetation as this removes an important containment element.
b) Pollution from chemical products either disposed of directly or as the fi nal result of grease-
producing solid waste (effect of decomposing organic material in waste without proper fi nal
disposal).
c) Loss of biodiversity directly related to uncontrolled land occupation and linked to
deforestation, reduction of vegetation and pollution.
To assess the condition of urban land, consideration is given to the most relevant aspects
of the “basic basket” of indicators, including information on occupied unstable or risk areas
and contaminated sites. In this case, providing data on such occupied and polluted areas
gives the municipal administrator a panorama that includes the city’s social, environmental
and economic characteristics and points out its demands in terms of urban-environmental
management.
This helps to prepare a more in-depth analysis on themes such as poverty, social inequality,
civil defence and the health system’s response capacity.
3.2.4 Marine and coastal resources13
The Latin American and Caribbean coastal zone extends over 64 000 km, with a marine
territory of 16 million km2 14 . Human activities have caused its transformation by changing
land use for urbanization, tourism and agriculture.
Human intervention disturbs the hydrological cycle, destroys natural breeding grounds,
and alters coastal systems’ morphology with constructions and by discharging industrial and
domestic waste.
Pressure is put on these ecosystems by human activities, both economic and physical,
especially such economic activities as marine fi shing and tourism. Ecosystems are being
degraded, both directly and indirectly, by the expansion of maritime transport.
13 Since this type natural resource is found in ecosystems in certain cities, the local team should introduce and analyse the indicators to
assess the state of such resources
14 Ibid, pp 39-45
Me
tho
do
log
y fo
r th
e p
rep
ara
tio
n o
f G
EO
Cit
ies
Re
po
rts
45
Cities add to the degradation of coastal zones by occupying mangroves, coral reefs and
estuaries and damaging their ecosystems’ environmental services. Coastal areas such as
bays, beaches, and estuaries protect against fl ooding, storms and erosion, fi lter bodies of
freshwater fl owing into the sea, inhibit salinization, store and circulate nutrients and support
the survival of innumerable marine and aquatic species that provide subsistence for the same
communities.
Vulnerability to natural disasters increases when risk areas are occupied and human
activities take place; the risk increases when urban populations settle in such areas.
Urban activities that degrade the environment, such as deforestation to make room for
urbanization, cause soil erosion and produce sediments that are frequently deposited in coastal
zones. In Latin American and Caribbean coastal cities it is a common practice to discharge
untreated sewage through the drainage system that runs directly into the sea.
3.2.5 Biodiversity
Indicator
Extinct or endangered species/known species, measured by the number of known •
endangered species in the local environment. It is a transversal indicator that will
help the impact and response analysis
Biological diversity is one of the principal resources in Latin America and the Caribbean
where there are very particular ecosystems as well as most of the world’s tropical forests.
Biological diversity is associated with the survival of urban communities and centres. In
fi shing, for example, quality depends on the guaranteed environmental biological diversity of
mangroves and coastal ecosystems.
Although it is nationally, regionally and globally that biodiversity conservation is most
important, fragmenting natural forest areas (restricting species and limiting their sustainability)
also begins with urbanization.
Urbanization poses a threat to biological biodiversity because of: deforestation (see next
topic), overfi shing, introducing exotic species, polluting air and water, occupying risk areas and
making endangered species more vulnerable
3.2.6 Forests and green areas
Transversal indicator
Vegetal Cover•
Others
Reduction of vegetation•
Number of m• 2 of green areas per inhabitant
Destroying natural habitats not only damages resources but, as a chain reaction, it also
harms all the region’s systems. Deforestation increases erosion, puts rivers at risk, disturbs the
hydrological cycle, and causes the loss of fl ora and fauna.
The use of forest resources is, in certain regions and cities, an important economic factor for
activities such as the timber industry, energy generation, the iron and steel industry, recreation
and spare time activities. For cities where forests are a signifi cant economic resource, it is
important to pay attention to how they are used and to how their use affects the state of the
local environment.
Me
tho
do
log
y fo
r th
e p
rep
ara
tio
n o
f G
EO
Cit
ies
Re
po
rts
46
Some 66 per cent of the global forest cover loss from 2000 to 2005 occurred in Latin
America, while the region contains over 23 per cent of the world’s forest cover (FAO 2005).
South America suffered the largest net loss (almost 43 000 km2/ year), of which 73 per cent
occurred in Brazil (FAO 2005). Because of urbanization, in many areas of the continent such
as the Brazilian Atlantic Mata region, ecosystems are fragmented.
Removing vegetation and waterproofi ng the soil harms the microclimate and makes it more
likely that fl ooding, landslides on gradients and loss of biodiversity will occur.
Green areas directly regulate air quality, temperature and noise. The size of green areas per
inhabitant is a parameter of the quality of life and human health: the World Health Organization
recommends that cities should have 12 m2 of green areas per inhabitant.
How to make forestry and urban systems compatible is a challenge to the administration.
Therefore, the GEO Cities reports assess the state of vegetation in urban centres (forests,
planting trees in urban zones, green areas and native species).
So that the indicator effectively refl ects the quality of urban life, a check should be made of
how the existing vegetable mass is distributed. Most of the city’s remaining vegetation tends
to be concentrated in the wealthiest urban areas.
3.2.7 Built-up environment
Indicator:
Percentage of deteriorated areas (historic centres or buildings) in relation to built-up •
urban areas.
This indicator refers to urban areas with buildings of great historic or architectural importance.
It is a negative indicator that assumes recognition of the state of degradation of what is
considered to be a patrimony; it is important, therefore, to consider other indicators for an
overall analysis so that this indicator is assigned its proper place in the general assessment.
Important themes concerning the built-up environment are:
Quality of built-up environment, shown by the state of conservation of the urban •
landscape and its buildings.
Cultural, architectural and historic patrimony of buildings and groups of buildings.•
Quality of housing, especially for the city’s poorest population.•
Urban infrastructure and services.•
It is important to clarify that the information to which this last-mentioned element refers is
related only to the state of the urban infrastructure and how it is distributed in the city’s urban
zone and not to any other attributes; it is a theme that should be dealt with in the chapter on
pressures on the local environment. It is important to know whether, for example, there are
no breakages in the basic sanitary network to anticipate the impact on the environment and
the local population’s health. The same happens with the quality of asphalt paving, the local
communications structure and other components of how the city normally functions.
Because it involves the economy (historic patrimony deterioration), social inequity (migration)
and quality of life (urban landscape and effi cient basic infrastructure) analysing the built-up
environment is complex.
Me
tho
do
log
y fo
r th
e p
rep
ara
tio
n o
f G
EO
Cit
ies
Re
po
rts
47
Neglecting this aspect in Latin America and the Caribbean creates characterless cities
whose inhabitants are out of touch with the environment. Cities that invest in maintaining or
rescuing the quality of the built-up environment are in contact with the inhabitants who not only
are more able to identify with the quality of urban life, but are more interested in environmental
themes related to local urban development.
3.3 Chapter synthesis
At this stage of the analysis a summary should be presented on the general local
environment conditions, assessing each element and the relations between ecosystems and
urban activities.
It is important to use transversal indicators to establish these relations, both between the
urban environment elements and between the different levels of analysis within the driving
forces-pressure-state-impact-response structure.
This assessment will be the instrument that combines public sectorial policies and
demonstrates the consequences that partial measures have on the city as a whole. It will help
to take an integrated approach to environmental management.
Chapter 4: Impacts of the state of the environment (IMPACT)
Chapter 4 includes information about the impacts the state of the environment causes on
natural ecosystems and their constitutive elements of water, air, soil, biodiversity; on the quality
of life of citizens; on the built-up environment, buildings, urban infrastructure, and so on; and
on economic activities that stimulate the city’s development.
This information will help to answer the question: What is the impact of the state of the
environment?
It should be stressed here that one of the central points when analysing the impact of
the state of the environment refers to the theme of urban-environmental vulnerability that is
responsible for many problems in Latin American and Caribbean cities, as well as in other parts
of the world. As can be seen in the section concerning this theme, environmental vulnerability
is keeping up with the times because of the planet’s climate changes, as well as the social
inequality that has a signifi cant effect on the poorest urban population sectors and threatens
their quality of life.
Impact indicators are of help when making a strategic analysis where decisions identify
the action and investment priorities taken by local decision-makers. Information on impacts,
included to make the general analysis, is intended to estimate economic and social aspects;
this could help legislators to calculate environmental damages caused by external infl uences.
Quantitative information is organized according to subject: ecosystem, quality of life, urban
economy, political and institutional level, and urban vulnerability. Data give a more qualitative
assessment when analysing quality of life impacts.
For this assessment the following, mostly transversal, impact indicators should be used:
Biodiversity loss.•
Me
tho
do
log
y fo
r th
e p
rep
ara
tio
n o
f G
EO
Cit
ies
Re
po
rts
48
Costs, including water collection and treatment•
Frequency of fl oods and landslides•
Cost of work to prevent and contain environmental risks•
Property value depreciation •
Deterioration of historic centres•
Incidence of water-borne diseases•
Microclimate changes•
Public health costs of water-borne diseases•
Cost of repairing monuments and restoring historic centres•
Frequency of diseases caused by poisoning and contamination: skin, eyes, etc.•
Loss of urban attraction •
Juvenile crime rate•
Incidence of cardiorespiratory diseases•
Loss of tax revenue•
The impact assessment will be as detailed as the administrator requires. Whenever
possible, to ensure that the analysis gives a comparative view, also to be considered should
be data from national and international sources.
Impact on ecosystems•
Impact on quality of life and human health•
Impact on the urban economy•
Impact on the built-up environment (urban vulnerability)•
Impact at political-institutional level•
4.1 Impact on ecosystems
Indicators:
Biodiversity loss•
Microclimate changes •
Occupation of natural areas, cleared and levelled to allow for urbanization, land use change
from agricultural to urban, dumping waste and polluting products into the environment, and
consuming natural resources such as water, minerals, plants and animals, make the growth of
cities a vector of environmental impacts.
One impact on the ecosystem is the immediate or progressive destruction of native fl ora
and fauna by removing vegetation, introducing exotic species, levelling land in restricted areas,
clearing hillsides of trees, and dredging rivers and lakes. In smaller communities, economic
activities like extracting forest products, overfi shing, and illegally settling on environmentally
protected areas also have a direct impact on ecosystems. Another cause of damage and soil
pollution is dumping domestic or hazardous waste into water courses and unsuitable sites
without any sanitary control. The local urban population’s demand for food causes natural
areas to be changed into cropland.
Me
tho
do
log
y fo
r th
e p
rep
ara
tio
n o
f G
EO
Cit
ies
Re
po
rts
49
In urban areas modifying ecosystems causes natural areas to be fragmented and changes to
occur in the natural dynamics and original food chain; this leads to loss of fl ora and fauna15 .
To show the impact of urban growth on the local environment, the local analysis should
include all the relevant factors to be taken into account; the conclusions should point out the
priority problems local authorities have to deal with.
4.2 Impact on quality of life and human health (inequality and poverty)
Indicators
Incidence of water-borne diseases •
Incidence of cardiorespiratory diseases•
Incidence of diseases caused by poisoning and pollution•
Juvenile delinquency index•
The quality of life impact indicators mainly assess the health and well-being conditions of
city inhabitants.
How human pressure affects the population is expressed in the incidence of environment-
related diseases. As a consequence, the negative effects on labour (weakening workers’
physical capacity, making it more diffi cult to join in recreational activities and sports linked
to environmental resources) and the spread of urban inequality and poverty are central to
assessing the state of the environment impact.
Foremost among diseases that harm the quality of life are those related to poor sanitation
and urban cleanliness: for example, water-borne diseases; in cases of cardiorespiratory
diseases, those caused by air pollution.
Determining factors in water-borne diseases are drinking water quality (may be contaminated
by bacteria causing diarrhoea), the condition of basic sanitation to which people have access,
the existence of sewage ditches and polluted water currents.
Water-borne diseases appear, above all, among people with few resources and living in
degraded areas, or with no proper urban infrastructure; they may live in illegal settlements, small
overcrowded tenements, or shelters where precarious building or environmental conditions
help spread infectious disease vectors. In developing countries, recurrent environmental
diseases such as diarrhoea, yellow fever, dengue fever, intestinal infections, tuberculosis, as
well as dehydration, are directly associated with the poverty and social inequity closely linked
to environmental degradation.
The main cause of these diseases is the lack of basic sanitary services in the cities poorest
areas. Due to the absence of garbage collection services, of drinking water distribution systems
and drains, most of the settlements inhabitants have no choice but to dispose waste into the
open air, into streams or clandestine connections to the rainwater network; they have to use
community latrines and septic tank systems that pollute water deposits and put the population
at risk of consuming products such as fi sh and fruit contaminated with faecal material
This leads to diseases for which the cost has to be covered by public health services and
that cause a drop in productivity, low school attendance and high rates of infant mortality.
15 An example of a conventional urban biodiversity indicator is the number of birds or bird species present. This is an important measurement of
the city’s environment quality
Me
tho
do
log
y fo
r th
e p
rep
ara
tio
n o
f G
EO
Cit
ies
Re
po
rts
50
Chemical soil pollution also harms human health. This type of pollution may originate in
industrial chemical effl uents, grease contained in waste matter or landfi lls, or clandestine toxic
waste deposits. Improper handling threatens the quality of urban life16.
Industries are responsible for heavy metals contamination because there is no control
on how they deposit waste and effl uents. That practice harms the health of the low income
groups living close to industries where they look for work and where illegal plots cost very little;
they consume products polluted by heavy metals, for example contaminated fi sh from rivers,
lagoons or polluted coastal regions.
Finally, the effects of urban development on the environment in relation to the quality of
local life also include the deterioration of urban environmental quality, shown in pockets of
warm spots and in fl oods that result from the high extent to which urban land is waterproofed,
in pollution in areas with springs and in air pollution.
4.3 Impact on the urban economy (external causes)
Indicators
Quality of water supply•
Public health costs due to incidence of water-borne diseases•
Water collection and treatment cost•
Cost of containing and preventing environmental risks.•
Cost of rehabilitating monuments and restoring historic centres.•
Other
Public health costs due to diseases caused by pollution of air and soil.•
The state of the environment causes impacts on the urban economy and on productivity in
general. This is shown, for example, by how urban functions and living conditions in the most
vulnerable zones cause environmental degradation (fl oods, erosion or soil pollution in water
basins, pollution of air basins, warm spots) or by worsening risks to housing.
Health problems resulting from by air and water pollution or environmental disasters reduce
labour productivity because of absenteeism due to illness, thus affecting the cities’ economy.
They also increase public health costs that could be avoided if preventive measures and
proper socio-environmental policies were adopted. In Peru in 1991, in the cholera epidemic
on urban outskirts, 2 600 died and, because of the drop in exports of agricultural and fi shery
products17, damages were close to US$1 000 million.
In the specifi c case of water, the impact of heightened demand and poor water quality
increase collection and treatment costs that could be avoided with the right policies on
prevention, environmental education and waste control. Concerning the water supply, the
pressure of population growth and increased economic activities place demands on the
natural resource and on the response by the local government, obliging it to invest in collecting
water from ever more distant sources. In many large cities, treated water ends up being used
for purposes other than human consumption, and meaning that much of it is wasted. As
to sewage water treatment, more users mean higher treatment costs. An economic saving
would be the result for the water authorities if they introduced proper management to reduce
pollution at its origin.
16 Families who live on dumps and separate toxic, harmful or organic waste is one of the most serious social problems. UNICEF promotes a
campaign to get children away from the dumps. Even garbage collection in those countries may cause problems because usually toxic,
harmful or organic waste is not separated. The lack of sanitary control over the destination of the garbage encourages improper or clandestine
disposal, perhaps causing a resurgence of infectious diseases or diseases due to poisoning.
17 Velásquez, L.S., 2001, Urban management indicators for sustainable development, Urban-territorial observatories for sustainable development.
Manizales, Colombia. Environment and Development series, Economic Commission for Latin America and the Caribbean. ECLAC. Santiago,
Chile.
Me
tho
do
log
y fo
r th
e p
rep
ara
tio
n o
f G
EO
Cit
ies
Re
po
rts
51
The urban economy is also harmed by loss of attraction and competition between cities
whose economic activity depends on natural resources, as happens with touristic cities. Such
reductions in the city’s economic activity imply, in turn, a loss of tax revenue due to lower tax
rates and reducing the capacity of municipalities to provide the services the public expects.
Information for the transversal indicator that measures the attraction of urban zones is specifi c
to the locality being studied and is based on its economy.
When it comes to the economic impact of biodiversity loss, recovering degraded areas
or those prone to disasters such as fl oods and landslides, it is a question of environmental
engineering costs such as building contention barriers, drainage ditches and others. These
stop-gap measures end up consuming resources that could be used to prevent such
damages.
In developing countries, the low-income marginalized urban population can only inhabit
risk areas close to hazardous industries or on unstable land, such as outlying or hillside
areas subject to fl ooding or landslides; they become more vulnerable to urban risks and in
emergencies have less access to support services. The most developed countries are those
least vulnerable to the impact of disasters and have more effective conservation and recovery
measures. 18
Although natural disasters cannot be avoided, their impact may be mitigated by preventive
action. The incidence of fl oods, landslides and other disasters indicates how vulnerable the
population is to risks that have social causes. Budgets for health, civil defence, environmental
recovery work and others that may be applied to preventive action and urban improvement are
used to remedy situations that could have been avoided.
4.4 Impact on built-up environment (human settlements)
Indicators:
Loss of urban attraction •
Property depreciation•
Incidence of fl oods,landslides etc•
Others
Deterioration of historic centres•
The built-up part of a city has physical and structural functions and is a basic reference
for its inhabitants and their activities. This environment consists of buildings, architectural
combinations and monuments, of the infrastructure itself, and of urban installations in general
that must be considered when assessing its state.
The impact on the built-up environment refers to general living conditions in the city, how
it functions, and its urban landscape; these conditions are affected by events such as fl oods,
erosion or soil pollution and by hydrographic and air basins.
Degradation of human settlements includes destroying and abandoning buildings and failure
to conserve such urban infrastructure as water supply and energy networks. One expression of
the impact on the built-up environment is how the historic, cultural and architectural patrimony
of the city deteriorates, apart from the depreciation of historic buildings in some urban areas
because of health risks due to soil or air pollution, or to excessive noise on the busiest city
streets.
18 In Latin America and the Caribbean natural disasters are part of the inhabitants’ daily life because, after Asia, it is the region in the World
where disasters are most frequent. According to the GEO report Latin America and the Caribbean 2000, in the past 30 years the annual
cost of disasters in the region was between $700 million and $3 300 million U.S. dollars. In the last 30 years alone, there were 45 000
deaths, without counting the medium-and long-term economic impacts.
Me
tho
do
log
y fo
r th
e p
rep
ara
tio
n o
f G
EO
Cit
ies
Re
po
rts
52
In this case, impact indicators should be locally defi ned and serve as a complement to other
specifi c urban environment indicators in making a general analysis of the city. The defi nition
criteria will be monuments of historic, cultural and architectural patrimony, whether national or
local; if there are no national criteria the UNESCO principles may be observed.
The impact on the urban infrastructure is now shown in costs such as maintaining and
repairing networks, in data on the property market that may indicate the loss of real estate
market value in some city areas. Other important impacts are: loss of urban attraction;
diffi culty of attracting private investment; or an infl ux of business or tourism that stimulates
local economic growth.
In Latin America and the Caribbean tourism is one of the main economic activities.
Although natural areas are the main attraction, cities directly depend on environmental quality
to guarantee the activity will continue. Cities may also be tourist attractions or they may
support sustainable tourism; however, if poor urban environmental management means they
lose their attraction, the result is likely to be negative. From the economic and social point of
view, the analysis should take account of job losses, a reduction in trade and the loss of an
economically active population.
4.5 Impact on the political-institutional level
Indicator:
Loss of tax revenue•
The above-mentioned impact may have an apparently secondary effect but one which,
since it may affect the capacity to regulate and intervene on a political-institutional level, tends
to become central in urban dynamics.
If so far the central government has left environmental matters in second place now,
prompted by the political need to create conditions for urban centres to develop economically,
attract foreign investment, provide jobs and increase taxation in the locality, it is under pressure
to include such matters as a mainstay of its public policies; that is provided it does not affect
its capacity to properly guide local development.
Environmental themes will not only become part of the public agenda with growing political
weight but, because of the need to consider the importance of these problems in relation to local
public management capacity, they could also seriously affect local and urban administration
Environmental problems increase public health sector spending to: combat diseases
caused by poor quality water and air and by the lack of sanitation; contain occupied unstable
hillsides and risk areas; prevent or combat socio-environmental effects that cause fl oods; and
environmental engineering works meant to solve contamination and deforestation problems.
They also cause a loss of public income due to fewer rates and taxes being collected because
of the downturn in economic activities such as tourism and services, industry and trade,
affecting the local government’s capacity to take action on sustainable urban-environmental
management.
In spite of the possible diffi culty of properly assessing this impact, and in view of the need
to develop clearer measuring instruments, this must be evaluated and be made a permanent
part of the process of assessing the state of the local environment.
Me
tho
do
log
y fo
r th
e p
rep
ara
tio
n o
f G
EO
Cit
ies
Re
po
rts
53
4.6 Socio-environmental vulnerability
Indicators:
The percentage of geologically unstable areas (risk areas) occupied. •
Percentage of risk areas occupied and subject to fl ooding•
Population living in vulnerable urban areas•
Vulnerability to environmental disasters is now associated with global climate change with
repercussions on human society19 , although other natural factors, such as areas subject to
seismic events, as well as social factors like human occupation of areas at environment risk,
must also be considered.
Brown Agenda20 themes in developing countries have become more important since the
picture has been darkened by the accumulative effects of environmental degradation that goes
hand in hand with human poverty. During natural disasters, the lack of support infrastructure,
transport, hospitals, shelter and food, causes more than the expected number of victims.
Urban vulnerability may be accentuated due to:
Economic and social concentration or discrimination; concentration of socially and •
economically vulnerable groups;
The complexity and interconnection of urban systems; dependence on the infrastructure •
and its integration into urban systems;
The location of settlements in unstable or critical areas;•
Accelerated urban environment degradation; •
Irregular, inadequate and precarious buildings and infrastructure;•
Lack of political and institutional will;•
Lack of effective regulatory instruments and control mechanisms on land use and •
occupation, and on activities harmful to the environment.21
Poverty increases vulnerability to natural disasters. Most affected by disasters are the
poorest groups living in run-down housing; this population is being pushed towards areas
unsuited for occupation, economically marginalized, vulnerable and polluted, with no proper
infrastructure and are those most affected by fl oods and landslides caused by rain.
Natural disasters are happenings whose danger level is associated with natural causes
such as fl oods, fi res, earthquakes, tropical storms, and volcanic eruptions.
To the effects of natural events may be added disasters caused by human beings; for
example, environmental degradation, polluting or harming strategic natural systems that help
to maintain urban environmental quality and reduce their capacity to resist disasters while
making it more likely that such events will occur, and increasing the potential magnitude of
natural disasters.
Table 2 summarizes the clearest indications of urban and environmental vulnerability in the
countries and regions of Latin America and the Caribbean
19 Developing countries are especially vulnerable due to fi nancial, human and technological limitations to prevent and recover from the impact of
climate change, as stipulated by the International Panel on Climate Change (IPCC) in its third report (IPCC, TAR – WGI, 2001.
20 The terms “Brown Agenda”, “Green Agenda” and “Blue Agenda” refer to important themes on the world’s public agenda on conserving and
protecting the environment and deal with themes related to environmental pollution, forests and deforestation, as well as the quality and
quantity of the planet’s water resources
21 Cf. Velásquez. 2001:13
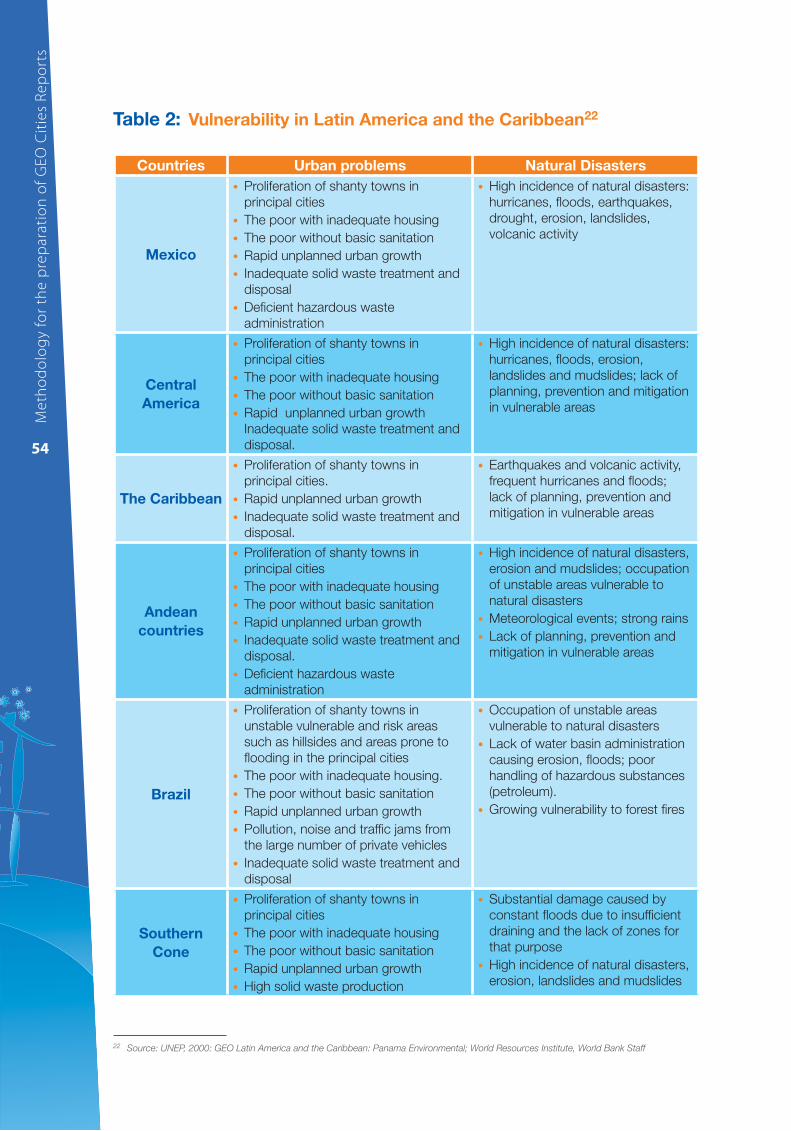
Me
tho
do
log
y fo
r th
e p
rep
ara
tio
n o
f G
EO
Cit
ies
Re
po
rts
54
Table 2: Vulnerability in Latin America and the Caribbean22
Countries Urban problems Natural Disasters
Mexico
Proliferation of shanty towns in •
principal cities
The poor with inadequate housing•
The poor without basic sanitation•
Rapid unplanned urban growth•
Inadequate solid waste treatment and •
disposal
Defi cient hazardous waste •
administration
High incidence of natural disasters: •
hurricanes, fl oods, earthquakes,
drought, erosion, landslides,
volcanic activity
Central
America
Proliferation of shanty towns in •
principal cities
The poor with inadequate housing•
The poor without basic sanitation•
Rapid unplanned urban growth•
Inadequate solid waste treatment and
disposal.
High incidence of natural disasters: •
hurricanes, fl oods, erosion,
landslides and mudslides; lack of
planning, prevention and mitigation
in vulnerable areas
The Caribbean
Proliferation of shanty towns in •
principal cities.
Rapid unplanned urban growth•
Inadequate solid waste treatment and •
disposal.
Earthquakes and volcanic activity, •
frequent hurricanes and fl oods;
lack of planning, prevention and
mitigation in vulnerable areas
Andean
countries
Proliferation of shanty towns in •
principal cities
The poor with inadequate housing•
The poor without basic sanitation•
Rapid unplanned urban growth•
Inadequate solid waste treatment and •
disposal.
Defi cient hazardous waste •
administration
High incidence of natural disasters, •
erosion and mudslides; occupation
of unstable areas vulnerable to
natural disasters
Meteorological events; strong rains•
Lack of planning, prevention and •
mitigation in vulnerable areas
Brazil
Proliferation of shanty towns in •
unstable vulnerable and risk areas
such as hillsides and areas prone to
fl ooding in the principal cities
The poor with inadequate housing.•
The poor without basic sanitation•
Rapid unplanned urban growth•
Pollution, noise and traffi c jams from •
the large number of private vehicles
Inadequate solid waste treatment and •
disposal
Occupation of unstable areas •
vulnerable to natural disasters
Lack of water basin administration •
causing erosion, fl oods; poor
handling of hazardous substances
(petroleum).
Growing vulnerability to forest fi res•
Southern
Cone
Proliferation of shanty towns in •
principal cities
The poor with inadequate housing•
The poor without basic sanitation•
Rapid unplanned urban growth•
High solid waste production •
Substantial damage caused by •
constant fl oods due to insuffi cient
draining and the lack of zones for
that purpose
High incidence of natural disasters, •
erosion, landslides and mudslides
22 Source: UNEP, 2000: GEO Latin America and the Caribbean: Panama Environmental; World Resources Institute, World Bank Staff
Me
tho
do
log
y fo
r th
e p
rep
ara
tio
n o
f G
EO
Cit
ies
Re
po
rts
55
Chapter 5: Urban environmental management policies and instruments (RESPONSES)
Chapter 5 of the GEO Cities report attempts to answer the question: What are we doing
now?
That means assessing the intervention instruments created by the different sectors taking
action in the city to promote changes in pressure on the environment dynamics to reduce or
eliminate their possible negative impact on the environmental resources under consideration,
either taken separately or integrated into the ecosystems, and on the quality of life of the local
population.
The response instruments adopted have different formats, are meant for different social
stakeholders, respond to the city’s different environmental problems, use particular tools and
have determined consequences in the urban-environmental interaction process.
This manual’s presentation is general, considering that how these instruments are used
in each city tends to be quite specifi c due to a series of factors (economic, social, political
and cultural) particular of each one. The local technical team should consider and analyse
the peculiarities of each instrument, as well as how effi cient it is in redirecting the actions
(pressures) that social agents exert on the environment.
This section, therefore, should only take a general approach to the city administration,
concentrating its attention on specifi c aspects related to city urban-environmental management,
bearing in mind that the administration’s most general elements should have already been
analysed in Chapter 2 of the report in the section on “Description of local political and
administrative structure”.
The purpose of the chapter on responses is, therefore, to highlight actions or proposals
being implemented to solve some of the diffi culties identifi ed earlier in chapters 2, 3 and 4
regarding all the factors involved in the state of the local environment.
With this in mind, the report should contemplate analysing the responses or actions being
taken by different sectors of society – local government, civil society, and private economic
sector23 to deal with local environmental problems.
For that reason the report examines the composition of social stakeholders with a bearing
on the dynamics of the city; that is to say, political, social, administrative and management
organizations and activities that determine how the city confronts its environmental and
development affairs24 . Chapter 5 is, therefore, divided into three sections:
1. Identifi cation of key stakeholders related to the urban environment.
2. Urban environmental management structures and how they function.
3. Implementing environmental policies.
Identifi cation of key stakeholders related to the urban environment
This section identifi es the key local participants and interest groups – the people and
organizations with important roles to play concerning environmental resources; collectively, they
are called key actors or stakeholders. The purpose is to see the full range of stakeholders in
23 The main characteristics of these sectors should have already been analysed in the chapter on the context of the city’s socio-economic and
political urbanization process and they need not be repeated; it s enough to refer to them to help support this segment’s analysis
24 UNCHS-UNEP, 1999
Me
tho
do
log
y fo
r th
e p
rep
ara
tio
n o
f G
EO
Cit
ies
Re
po
rts
56
the city and to understand the ways in which they now, or might later, affect urban development
and environmental management processes. This section will include key stakeholders in the
public sector as well as those in private business, NGOs, communities and elsewhere.
When describing the various key stakeholders it is useful to discuss briefl y their activities
and roles in relation to the following three aspects of urban development and environmental
management:
a) Information, knowledge, technical expertise.
This concerns the information, specialized knowledge, and technical expertise that different
key actors may possess or have access to. It is important to be aware that relevant and useful
knowledge is much more than simply the technical skills of trained professionals; informal
knowledge and practical experience are often as useful as academic knowledge.
b) Decision making, policy formulation and policy coordination.
This depends on the extent to which various key stakeholders are involved in designing
policies and in the different stages of the decision making process. Even if public organizations
are the main actors in this respect, private sector and community key stakeholders can have
signifi cant infl uence and an important role to play in formulating policies and in decision
making.
c) Policy implementation.
This concerns the roles different key stakeholders play in the city’s development and in
environmental policies, programmes and projects. Their involvement may be formal, as in
the case of key stakeholders in the public sector with legal implementation responsibilities, or
informal as in the case of the roles played by communities, NGOs and private sector groups
which, while not so explicit, can be very important.
Urban environmental management structures and how they function
This section should focus on the city’s urban environmental management and explain its
administrative structure. An overview should be given of the city’s organizational structure,
explaining each department’s responsibilities and how they are related. In addition, a
dynamic description should be given to explain how the administration functions in practice,
how the system actually works, and how the departments and organizations cooperate and
coordinate.
Therefore, this section should focus on four key factors:
a) Organization and structure.
This means the basic structure and organization of the city’s urban-environmental
management; in other words, the institutions and groups responsible for the different aspects
of local urban-environmental administration.
b) Information, knowledge and technical expertise.
This refers to organizations and groups responsible for collecting, distributing, analysing,
managing, and using information and specialized knowledge. It means having access to
information and the main areas of technical expertise available to city management.
c) Decision making, policy formulation and policy coordination.
Me
tho
do
log
y fo
r th
e p
rep
ara
tio
n o
f G
EO
Cit
ies
Re
po
rts
57
Identify those involved in formulating urban-environmental policies, and the main
organizations and groups with decision making power. Explain how these policies are
coordinated individually and with others and implemented at local level (for example with a
policy to encourage tourism), who is responsible and how this is done and, in particular, how
policies and decisions are coordinated.
d) Policy implementation.
Explain which organizations are mainly responsible for implementing public policies in the
different sectors and areas of study.
In describing this section it should be borne in mind that there are dimensions or levels of
activity in making policy decisions and in formulating and implementing them; these levels may
be described generally as:
Political•
Management/administrative•
Operational/technical•
Implementing environmental policies
This section discusses current initiatives and efforts to strengthen the cities’ urban
environmental management systems so as to improve local capacities to plan, coordinate
and administer sustainable urban development. This section should only deal with the city
administration in general rather than going into details about management arrangements for
specifi c activity sectors, specifi c environmental resources, or specifi c environmental hazards,
as was done in chapter 3.
The purpose is to highlight actions or proposals being taken to solve some of the diffi culties
already identifi ed in chapters 2 and 3.
This means an assessment is needed of the instruments being used to reduce pressure
on the environment, so to lessen any negative impact such pressure places on environmental
resources. These response instruments have different formats, are designed for different
social stakeholders, use specifi c tools and have determined consequences when interacting
between urban surroundings and the environment.
The local technical team must consider and analyse each instrument, as well as its
effectiveness in helping to protect environmental resources and improve urban environmental
management.
5.1 Political-administrative instruments
Indicators
Urban master plan in place•
Legislation to protect springs in place•
Regulation on controlling emissions from mobile and fi xed sources in place•
Local Agenda 21 activities•
Environmental education programmes•
Number of environmental NGOs•
Me
tho
do
log
y fo
r th
e p
rep
ara
tio
n o
f G
EO
Cit
ies
Re
po
rts
58
Local government uses the policy and administrative instruments to defi ne:
Rules on using urban and non-urban space; for example, by establishing acceptable •
building norms and objectives in urban environmental conservation areas and within
city limits.
Allocating public resources; that is to say, establishing priority areas for positive action •
(investing in new works and maintaining and rehabilitating urban and environmental
sites, as well as providing the local population with services) and areas of what might
be called negative action (supervision, follow-up, control and regulations), establishing
limits for action taken by the different social sectors and society in general.
In the ideal city, the environment, the method and type of development (economic, •
social and environmental) that it is hoped to establish in the locality is made by setting
objectives, goals, and indicators, by designing mechanisms and instruments and
estimating the budget needed.
Political-administrative instruments are mechanisms, usually mandatory, that drive the •
actions of interested local public and private stakeholders. Such instruments indicate
that the public sector is aware of the different urban demands, needs and problems,
and how they are related to the local environment.
Their use and the way in which they are employed suggest that, if the local government
really wants to get results, it should invite the sectors interested in or affected by the policy in
question to participate, to a greater or lesser extent as required. If there are no such instruments,
or they are ineffi cient, it may be concluded that the local government and/or groups of society
are not, or were not, capable of creating the proper mechanisms to deal with the problems
putting pressure on the environment.
These instruments include a broad range of initiatives, such as:
Policies: environmental protection, urban development, transport, environmental •
pollution control, health.
Normative/legislative: norms, regulations, laws, local, national, regional and global •
urban-environmental laws that have a local effect, such as assigning environmental
commitment terms and applying ISO 14000 criteria.
Institutional: creating ministries or other environmental agencies, programmes, projects •
and institutional action, multilateral agreements.
Follow-up and control: control mechanisms to reinforce standards, laws and public •
policies, urban-environmental supervision and control instruments.
Presence of Local Agenda 21: bodies linked to Agenda 21, social participation projects, •
programmes and related activities, resources allocated, participating organizations.
Territorial planning: urban master plans, environmental management plans, land use •
laws, distribution of zones according to economic and ecological characteristics,
environmental protection areas.
5.2 Economic instruments
Indicators
Tax system based on the polluter/payer or user/payer principle in place•
Preventive warnings and fi nes for violating waste disposal standards•
Economic instruments are very important in promoting behavioural changes. They are
needed to improve the state of the local environment if, on the one hand, account is taken of
Me
tho
do
log
y fo
r th
e p
rep
ara
tio
n o
f G
EO
Cit
ies
Re
po
rts
59
their capacity to intervene in economic activity and the interested private stakeholders profi ts
and, on the other, the possibility is considered of imposing charges on the economic and other
sectors of society (including government agencies and individuals).
Economic instruments are generally associated with local government and its capacity to
impose taxes on society, but they may also originate in the private sector.
The ISO 14000 standard, for example, was created in the private sector to assess the
suitability of businesses and groups interested in environmental conservation and sustainability
activities. Although this is a voluntary instrument and does not impose any direct economic
cost on interested economic or government groups, the lack of an ISO 14000 certifi cate may
imply indirect costs since it would signify the loss of markets, or make it diffi cult for companies
to obtain fi nancing for a project from government institutions or bodies.
Therefore, one way for the local government to use the ISO 14000 standard is to adopt it as
a precondition for contracting engineering services and thus encourage changes in production
models and make companies more aware of the environment.
The analysis of economic instruments is divided into:
Financial: funds for activities to protect and/or conserve the environment, subsidies •
for territorial occupation and for other activities that do not damage or that protect the
environment. Budget resources.
Taxes: ecological ICMS• 25 , taxes, fi scal instruments.
Others: fi nes.•
5.3. Technological instruments
Indicator
Investments in solid waste management•
Technological instruments are also important when assessing responses about the state
of the environment.
Pressure to acquire new technologies is greater on private enterprises because of
market competition that demands the constant addition of new technologies, or because of
government environmental control measures. However, also to be considered is the adoption
of new technologies by the public sector that may be positive when defi ning new ways to
assess environmental pressure caused by different urban activities.
The analysis should focus on technological advances adopted by the public or private
sector that may be able to change environmental conditions through:
Processes: new technologies, solid and liquid waste treatment, pollution from industrial
gas emissions, recovered or degraded areas, recycled material.
Products: industrial fi lters, automobile catalysers, CFC-free sprays, unleaded gasoline .26
To make the most appropriate assessment of these technologies they should be related to
cases where the processes are induced by local legislation, regulations or standards that will
25 The ecological ICMS is a differentiated sharing in the distribution of increased resources among municipalities. In Brazil it refers to the status
after charging a tax on the circulation of goods and services. The states or municipalities that can demonstrate they have taken action
to protect or conserve the environment receive a bigger contribution than the federal government. Because it is an economic stimulus,
municipalities include environmental protection policies in their own policies.
26 With respect to Brazil, in addition to extracting lead, alcohol is added to gasoline to reduce the environmental effects of using fossil fuels
Me
tho
do
log
y fo
r th
e p
rep
ara
tio
n o
f G
EO
Cit
ies
Re
po
rts
60
also allow an assessment to be made of the effectiveness of the State’s policy-administrative
instruments.
An indication must also be given as to whether information is available about to what
extent pressure on the environment was reduced thanks to the introduction of industrial fi lters,
automobile catalysers or CFC-free sprays. This information will permit an assessment to be
made of the new technology’s effectiveness in improving the state of the local environment.
5.4 Physical intervention instruments (public investments)
Indicators:
Total rehabilitated areas in relation to total degraded areas•
Investment in green areas •
Investment in environmental recovery •
Investment in public transport•
Investment in water supply and drainages systems•
Investments in waste management•
Access to and quality of local infrastructure services•
Others
Household connections•
The principal mechanisms to improve the local environment include physical measures
used by society, in particular the local government, to reduce the pressure urban activities
place on the environment.
These are generally sanitary engineering works such as building drainage networks or
networks to collect, treat and distribute water, or other works designed to correct socio-
environmental problems caused by uncontrolled land occupation of, for example, areas at risk
of landslides or subject to fl ooding.
If no account is taken of the conditions in the ecosystem in which they are applied, these
measures also run the risk of putting pressure on the environment.
The following engineering operations and works should be analysed:
Increasing access to public health services; building, expanding and improving •
infrastructure, connecting to drainage networks, collecting and treating solid waste,
decontaminating rivers and other water courses.
Creating and reclaiming green areas, parks, gardens, environmentally protected areas, •
even when fi nance alone is not a good indicator of whether the response is effective.
Water supply system; fi nancing, source, socio-spatial distribution supply/demand •
relation.
Drainage systems; fi nancing, source, socio-spatial distribution, supply/demand •
relation.
Final disposal of solid waste; fi nancing, source, type of treatment, location of garbage •
deposits, socio-spatial distribution.
Reducing areas subject to landslides; number of areas benefi ted, contention areas, •
resources, distribution in the urban area, population benefi ted.
Channelling rivers, clearing water courses, protecting springs within the municipality, •
conserving river banks; resources employed, areas benefi ted distribution in the urban
zone, population benefi ted.
Me
tho
do
log
y fo
r th
e p
rep
ara
tio
n o
f G
EO
Cit
ies
Re
po
rts
61
In areas subject to fl ooding; types of operations, resources, areas and population •
benefi ted.
5.5 Socio-cultural, educational and public communication instruments
Indicators
Environmental education•
Local agenda 21•
Instruments that try to promote changes in how individuals, companies and government
bodies behave are increasingly used to deal with problems threatening the environment.
This practice is the result of understanding that, if social stakeholders do not change their
positions with relation to the proper and sustainable use of natural resources, using other
response instruments will have a very limited effect.
Environmental organizations, local government bodies involved in protecting and conserving
the environment, and national and international development organizations, have now reached
a consensus on the central role of environmental education and communication in halting
irresponsible use of the environment.
The success and continuity of contemporary production and consumption models are
supported by the constant use of advertising and marketing resources. In this respect, in recent
years a wide range of instruments have been used to change consumption practices that are
incompatible with the natural cycle of replenishing environmental resources; they are also used
to make people more aware of the interactions between society and the environment.
Such instruments include mechanisms that encourage greater social participation in
formulating, managing and following up on local public policies, and on decision making on
urban-environmental concerns about quality of life, whether of the entire population or certain
sectors of it.
In analysing the type of response the focus should be on:
Civil society participation, incentives to participate in social organizations, in decision •
making and in implementing public policies on the environment, state/civil, society/private
sector projects, participating in electing organizations that prepare environmental audits
Educational programmes and services; environmental education, campaigns on the •
use of natural resources, selective collection of waste, recycling material.
Use of information technology to promote environmental communication, making •
environmental information available on the Internet, radio and television programmes.
Chapter 6: Future outlook (SCENARIOS)
The objective of this chapter is to build a future picture of the city’s urban-environmental
evolution so that the different social stakeholders can formulate public policies and take action;
such policies and action may serve as responses not only about the present state of the
environment but also about how it might evolve in future. In doing so account should be taken
of the analysis made and of how the data and information are presented in the GEO report.
Me
tho
do
log
y fo
r th
e p
rep
ara
tio
n o
f G
EO
Cit
ies
Re
po
rts
62
The chapter deals with two important components: Emerging Themes and Future Scenarios
of the city’s urban-environmental development.
6.1 Defi nition of emerging themes27
One of the purposes of the IEA/GEO report is to prepare a strategic panorama to serve as
a guide for action taken by the public authority and local society in terms of the city’s urban-
environmental management. To do this the local technical team must identify the emerging
themes that will be important when defi ning future urban and environmental policies.
In defi ning the IEA/GEO methodology28 , emerging themes are those relevant to urban-
environmental management that will have an impact over the medium and the long term.
These themes also include environmental changes caused by short-term human activity with
long-term effects.
It should also be considered that emerging themes are not only problems; they could
also be opportunities that may appear in the future and would have a positive impact on the
environment. However, whether problems or opportunities, a common characteristic is that
they are surrounded by uncertainty and controversy.
Environmental changes caused by human activities, and apparently of little or no
importance, may have accumulative effects over time and sometimes appear after more than
two generations. It is diffi cult, therefore, to recognize changes in the global scene over a period
of one generation’s life expectancy or a government term; accordingly, there is always the
possibility of uncertainty and controversy about which emerging themes should be considered
important when making the analysis.
It is impossible to predict all the variables infl uencing changes in the environment; however,
scientifi c uncertainty does not justify failure to take measures to protect the environment29 .
Therefore, the strategy employed to identify critical points and to plan and execute preventive
measures, is based on the precaution principle that recommends the public administrator be
on the look out for, and anticipates, future environmental effects of the city’s present dynamics,
and act so as to prevent or reduce such effects.
The IEA/GEO methodology identifi es three categories of environmental material that could,
perhaps, be very important in the 21st century:
a) Unexpected events and scientifi c discoveries. For example, links between climate changes
and health, the use of Genetically Modifi ed Organisms (GMOs), biodiversity and health, the
use of pesticides and health.
b) Unexpected changes in long-established themes. For example, trade and environment,
competition and local development limits because of environmental liabilities.
c) Changes in known themes that now have the right responses but whose consequences
over the medium and long term are unknown. For example, leachates, CFCs, cloning and
cancer.
There are various advantages in taking account of emerging themes in urban-environmental
management: fi rst of all, raising awareness among citizens about the inter-relationships between
the local and global environment. Second, taking early action to ensure adaptation and avoid a
27 In defi ning the IEA/GEO methodology (consult Pinter, Zahedi and Cressman, 2000:101) the “emerging theme” concept presupposes a notion
of medium and long term
28 UNEP, IISD and Ecologistics International, 2000. Training to prepare integrated environment assessments and reports, Training manual
29 This is a recent concept that was recognized in the last decade to implement inter-media or public environment policies. The United Nations
Framework Convention on Climate Change, 1992, serves as a legal basis for international agreements, such as the Kyoto Protocol, that seek
to reduce the effect of greenhouse gases.

Me
tho
do
log
y fo
r th
e p
rep
ara
tio
n o
f G
EO
Cit
ies
Re
po
rts
63
crisis. Third, providing better guidance about research and systematic data collection. Fourth,
promoting understanding about how human activities and the environment are connected.
And, fi nally, making scientifi c knowledge available to the public administration.
In the not very distant future emerging themes will be part of the public agenda that takes
account of as yet unsolved accumulated environmental problems (environmental liabilities) that
generally go hand in hand with urban development and the growth of cities. The following are
some matters that have to be faced.
Polluted locations or old industrial zones and their impact on the health of ecosystems. •
Environmental confl icts related to economic losses and damage to health and quality
of life caused by environmental pollution.
Environmental compensation for pollution caused by industrial activities in the locality.•
Environmental responsibility related to creating environmental liabilities.•
Advantages of and limits to compensation and local development resulting from each •
locality’s environmental liabilities.
Urban vulnerability and environmental disasters; the effect on our planet’s present climate •
change due to local industries emitting greenhouse gases into the atmosphere.
Emerging themes will depend on the specifi c relation of the local urban situation to the
territory’s natural resources and ecosystems. This stage, together with that on recommendations,
is a dual resource that should help local public policy decision making.
The defi nition of emerging themes also permits an assessment to be made of the responses
given to the city’s main urban-environmental problems. Such responses, therefore, should be
assessed on two levels: already existing problems, and emerging future themes.
Table 3. GEO Lima and Callao emerging themes
1. Confl icts over water shortages.
2. Confl icts over territorial demarcation and land use.
3. Water basin management and payment for ambulatory services.
4. Use of alternative fuels.
5. Business social responsibility.
6. Youth participation in environmental policies.
7. Environmental impacts of the Free Trade Agreement
An explanation will shortly be given about the scope of some of them.
Confl ict over water shortages: Th e city of Lima and Callao faces a critical situation be-
tween the growing demand for water and ever more polluted supplies. A debate has recently
begun about the new Water Law and privatizing SEDAPAL, the water and sewage services
company, as an option to increase investments in the costly infrastructure needed to meet
the needs of 100% of the citizens of Lima and Callao; Th ey, however, are not convinced of
the benefi ts of privatization. Th e international debate about water confl icts and the human
right to water, privatization agendas and the real daily diffi culties faced by those who do not
have a water service, intensify confl icts about the resource in the capital.
Confl icts over territorial demarcation and land use: Th e debate about territorial de-
marcation and land use will soon be reopened due to attempts to invade coveted land on
Me
tho
do
log
y fo
r th
e p
rep
ara
tio
n o
f G
EO
Cit
ies
Re
po
rts
64
urban outskirts, such as the zone bordering the Pachacamac Sanctuary, the Ventanilla sands
or the San Bartolo pampas; debated also are structural changes induced by decentralization,
economic-ecological zoning regulations and the new land use proposal for Metropolitan
Lima. Th e eff ectiveness of land use instruments and public consultation mechanisms will
be put to the test and there will be no lack of pressure from land speculators, large property
interests and citizens concerned about the quality of life in the city.
Water basin management and payment for ambulatory services: In Peru, and in Lima
and Callao, a new land management for development model is being promoted. Th is new
management with a territorial focus is being tried out by an initiative called Rio Lurin Pi-
lot Project (PROCUENCA-Lurín), with local stakeholders active participation in building the
democratic governability, economic development and social well-being of the basin’s popula-
tion. Th is programme could become a new territorial management model for other urban
basins in the country. In addition, it will revive the debate about the search for recognition
mechanisms and payment for the environmental services the basin provides to the city.
6.2 Building scenarios: local trends (inertia, the best and worst cases)
The other important component of this chapter concerns formulating scenarios.
Besides being stimulating, building scenarios is an important exercise because it makes
us think about how the city’s dynamics should evolve and the consequences for the local
environment; it considers certain trends that may now be detected and, amplifi ed, will allow us
to build different scenarios to be used in urban-environmental management.
Important: Scenarios are not predictions but they suggest a range of options to reduce the
uncertainty surrounding policy options. It is not expected that in future they will perform
exactly as foreseen in the diff erent scenarios proposed in the IEA/GEO report. However,
formulating public policies and action based on these possible scenarios allows us to anticipate
problems and be better prepared to face them.
For sustainability to be feasible in cities, long-term processes and the projection of scenarios
must refl ect responses, given by both the public authority and civil society, to environmental
problems caused by urban development.
With the help of the simulation study, administrators will assess the purposes and progress
of urban environmental policies according to their objectives and availability.
Defi nition
Scenarios are portrayals of the future based on suppositions told with words and numbers;
they present a coherent and multidimensional view of how events occur. They are developed
to help decision-makers to foresee future situations with different degrees of probability and,
thus, direct events along sustainable paths and avoid adverse consequences.
The description includes, among others, qualitative elements such as behaviour, values,
cultural infl uences, and changes; there are also quantitative elements that provide greater
precision and details about possible results and make the scenario more consistent and
rigorous.30
30 Kartha, Sivan. (2005) SEI Presentations. In Workshop on National
Me
tho
do
log
y fo
r th
e p
rep
ara
tio
n o
f G
EO
Cit
ies
Re
po
rts
65
Preparing scenarios implies putting into effect possible future visions using present options;
building them requires qualitative and quantitative information. Some trends will be easier to
outline than others.
The result will be a mixture of indicators, trends and potential goals, with explanatory texts
explaining how the history evolved. Information on costs and benefi ts is also relevant since
it permits the analysis to determine how feasible is each scenario’s economy and fi nancial
needs.
Scenarios are built by considering three types of trends.
The inertia trend
This trend considers the possibility that no responses are formulated to confront the
environmental problems detected, that such responses are not adequate, or that the conditions
to implement them do not favour achieving the objectives. In this case the future scenario will
project an increase in, or even worsening of, environmental problems detected.
In this case, it could happen that:
No response has been formulated to confront environmental problems detected.•
The responses are inadequate.•
Implementation conditions do not favour achieving the objectives.•
The best case trend
This is situation where local government and society would give perfectly adequate
responses to the problems and there would be no impediments to putting such responses into
effect. In this case, the scenarios will project the overall improvement in the local environment,
or in the sectors in which social agents intervene.
In this case:
Responses by local government and society will be quite adequate to tackle the •
problems.
There are no impediments to implementing the responses.•
The worst case trend
This is where there is no response to the problems, or where the conditions to put the
responses into effect either do not help, they place hard-to-overcome obstacles in the way, or
mistaken decisions made by social agents worsen or amplify factors that put pressure on the
environment.
The future scenario will project a serious worsening of environmental problems.
In this case:
There is no response to the problems encountered.•
Implementation conditions do not help or put hard-to-overcome obstacles in the way.•
Wrong decisions worsen or amplify factors that put pressure on the environment.•
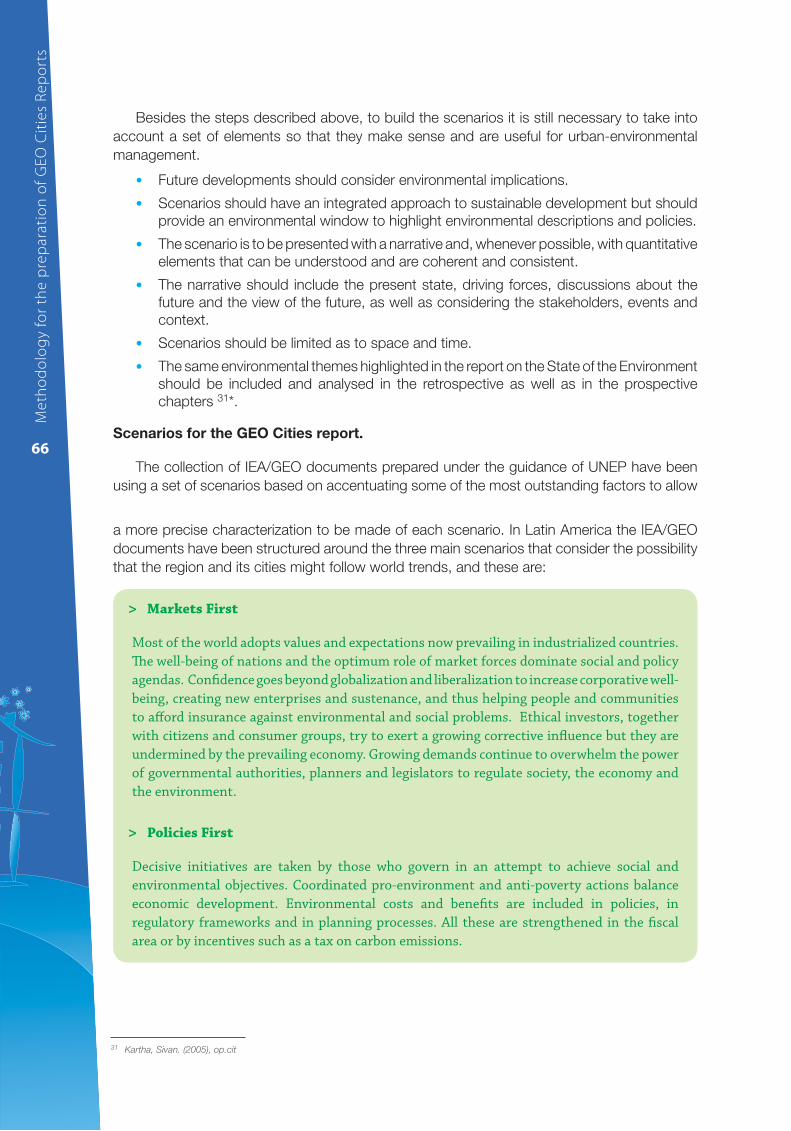
Me
tho
do
log
y fo
r th
e p
rep
ara
tio
n o
f G
EO
Cit
ies
Re
po
rts
66
Besides the steps described above, to build the scenarios it is still necessary to take into
account a set of elements so that they make sense and are useful for urban-environmental
management.
Future developments should consider environmental implications.•
Scenarios should have an integrated approach to sustainable development but should •
provide an environmental window to highlight environmental descriptions and policies.
The scenario is to be presented with a narrative and, whenever possible, with quantitative •
elements that can be understood and are coherent and consistent.
The narrative should include the present state, driving forces, discussions about the •
future and the view of the future, as well as considering the stakeholders, events and
context.
Scenarios should be limited as to space and time.•
The same environmental themes highlighted in the report on the State of the Environment •
should be included and analysed in the retrospective as well as in the prospective
chapters 31*.
Scenarios for the GEO Cities report.
The collection of IEA/GEO documents prepared under the guidance of UNEP have been
using a set of scenarios based on accentuating some of the most outstanding factors to allow
a more precise characterization to be made of each scenario. In Latin America the IEA/GEO
documents have been structured around the three main scenarios that consider the possibility
that the region and its cities might follow world trends, and these are:
Markets First >
Most of the world adopts values and expectations now prevailing in industrialized countries.
Th e well-being of nations and the optimum role of market forces dominate social and policy
agendas. Confi dence goes beyond globalization and liberalization to increase corporative well-
being, creating new enterprises and sustenance, and thus helping people and communities
to aff ord insurance against environmental and social problems. Ethical investors, together
with citizens and consumer groups, try to exert a growing corrective infl uence but they are
undermined by the prevailing economy. Growing demands continue to overwhelm the power
of governmental authorities, planners and legislators to regulate society, the economy and
the environment.
Policies First >
Decisive initiatives are taken by those who govern in an attempt to achieve social and
environmental objectives. Coordinated pro-environment and anti-poverty actions balance
economic development. Environmental costs and benefi ts are included in policies, in
regulatory frameworks and in planning processes. All these are strengthened in the fi scal
area or by incentives such as a tax on carbon emissions.
31 Kartha, Sivan. (2005), op.cit
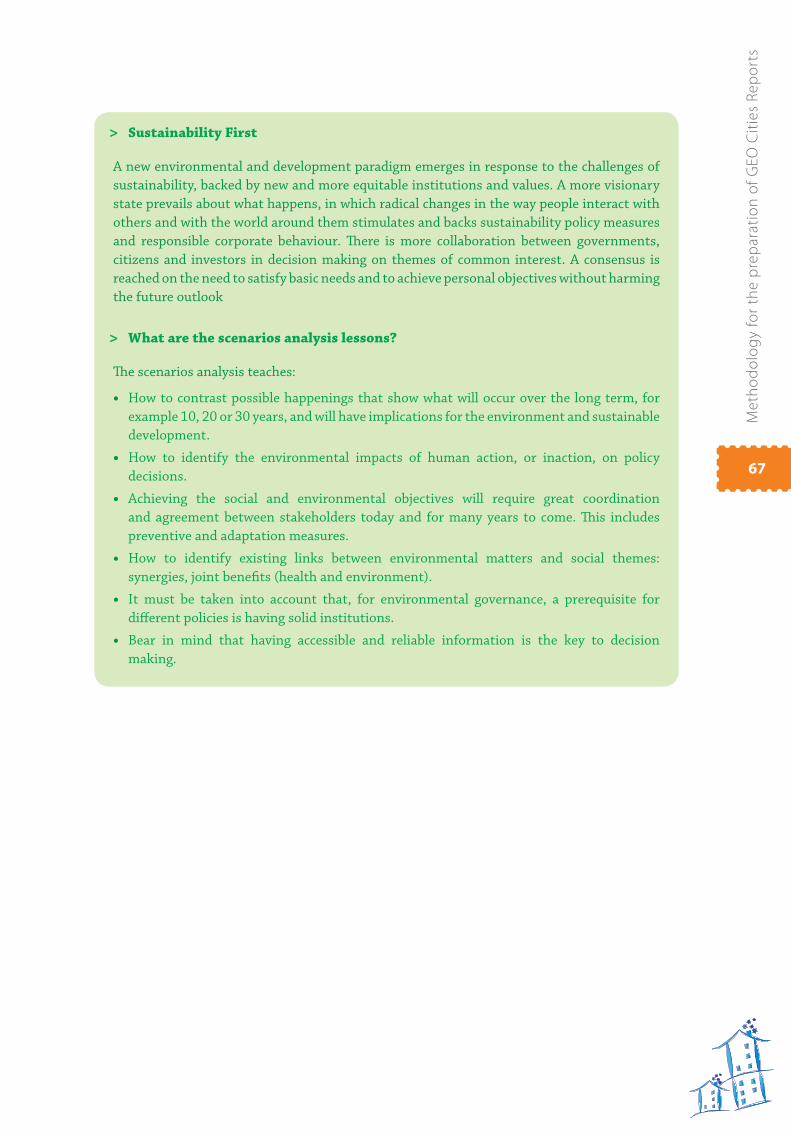
Me
tho
do
log
y fo
r th
e p
rep
ara
tio
n o
f G
EO
Cit
ies
Re
po
rts
67
Sustainability First >
A new environmental and development paradigm emerges in response to the challenges of
sustainability, backed by new and more equitable institutions and values. A more visionary
state prevails about what happens, in which radical changes in the way people interact with
others and with the world around them stimulates and backs sustainability policy measures
and responsible corporate behaviour. Th ere is more collaboration between governments,
citizens and investors in decision making on themes of common interest. A consensus is
reached on the need to satisfy basic needs and to achieve personal objectives without harming
the future outlook
What are the scenarios analysis lessons? >
Th e scenarios analysis teaches:
• How to contrast possible happenings that show what will occur over the long term, for
example 10, 20 or 30 years, and will have implications for the environment and sustainable
development.
• How to identify the environmental impacts of human action, or inaction, on policy
decisions.
• Achieving the social and environmental objectives will require great coordination
and agreement between stakeholders today and for many years to come. Th is includes
preventive and adaptation measures.
• How to identify existing links between environmental matters and social themes:
synergies, joint benefi ts (health and environment).
• It must be taken into account that, for environmental governance, a prerequisite for
diff erent policies is having solid institutions.
• Bear in mind that having accessible and reliable information is the key to decision
making.
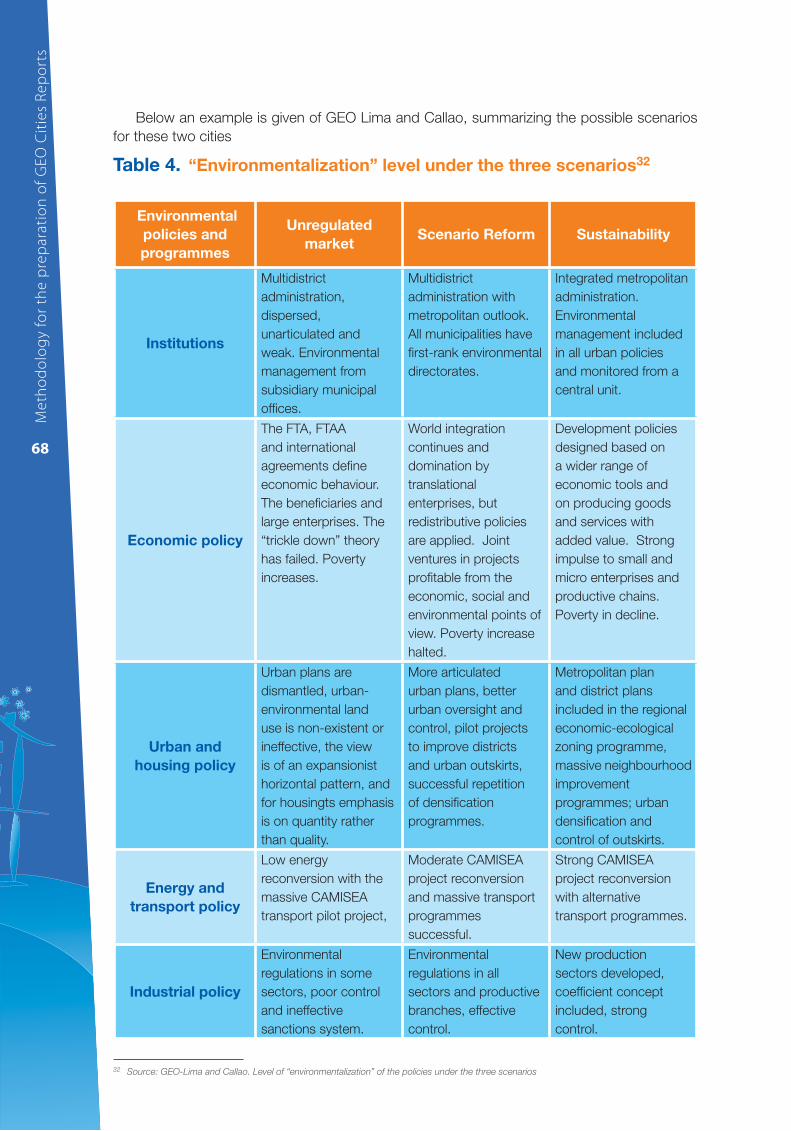
Me
tho
do
log
y fo
r th
e p
rep
ara
tio
n o
f G
EO
Cit
ies
Re
po
rts
68
Below an example is given of GEO Lima and Callao, summarizing the possible scenarios
for these two cities
Table 4. “Environmentalization” level under the three scenarios32
Environmental
policies and
programmes
Unregulated
marketScenario Reform Sustainability
Institutions
Multidistrict
administration,
dispersed,
unarticulated and
weak. Environmental
management from
subsidiary municipal
offi ces.
Multidistrict
administration with
metropolitan outlook.
All municipalities have
fi rst-rank environmental
directorates.
Integrated metropolitan
administration.
Environmental
management included
in all urban policies
and monitored from a
central unit.
Economic policy
The FTA, FTAA
and international
agreements defi ne
economic behaviour.
The benefi ciaries and
large enterprises. The
“trickle down” theory
has failed. Poverty
increases.
World integration
continues and
domination by
translational
enterprises, but
redistributive policies
are applied. Joint
ventures in projects
profi table from the
economic, social and
environmental points of
view. Poverty increase
halted.
Development policies
designed based on
a wider range of
economic tools and
on producing goods
and services with
added value. Strong
impulse to small and
micro enterprises and
productive chains.
Poverty in decline.
Urban and
housing policy
Urban plans are
dismantled, urban-
environmental land
use is non-existent or
ineffective, the view
is of an expansionist
horizontal pattern, and
for housingts emphasis
is on quantity rather
than quality.
More articulated
urban plans, better
urban oversight and
control, pilot projects
to improve districts
and urban outskirts,
successful repetition
of densifi cation
programmes.
Metropolitan plan
and district plans
included in the regional
economic-ecological
zoning programme,
massive neighbourhood
improvement
programmes; urban
densifi cation and
control of outskirts.
Energy and
transport policy
Low energy
reconversion with the
massive CAMISEA
transport pilot project,
Moderate CAMISEA
project reconversion
and massive transport
programmes
successful.
Strong CAMISEA
project reconversion
with alternative
transport programmes.
Industrial policy
Environmental
regulations in some
sectors, poor control
and ineffective
sanctions system.
Environmental
regulations in all
sectors and productive
branches, effective
control.
New production
sectors developed,
coeffi cient concept
included, strong
control.
32 Source: GEO-Lima and Callao. Level of “environmentalization” of the policies under the three scenarios
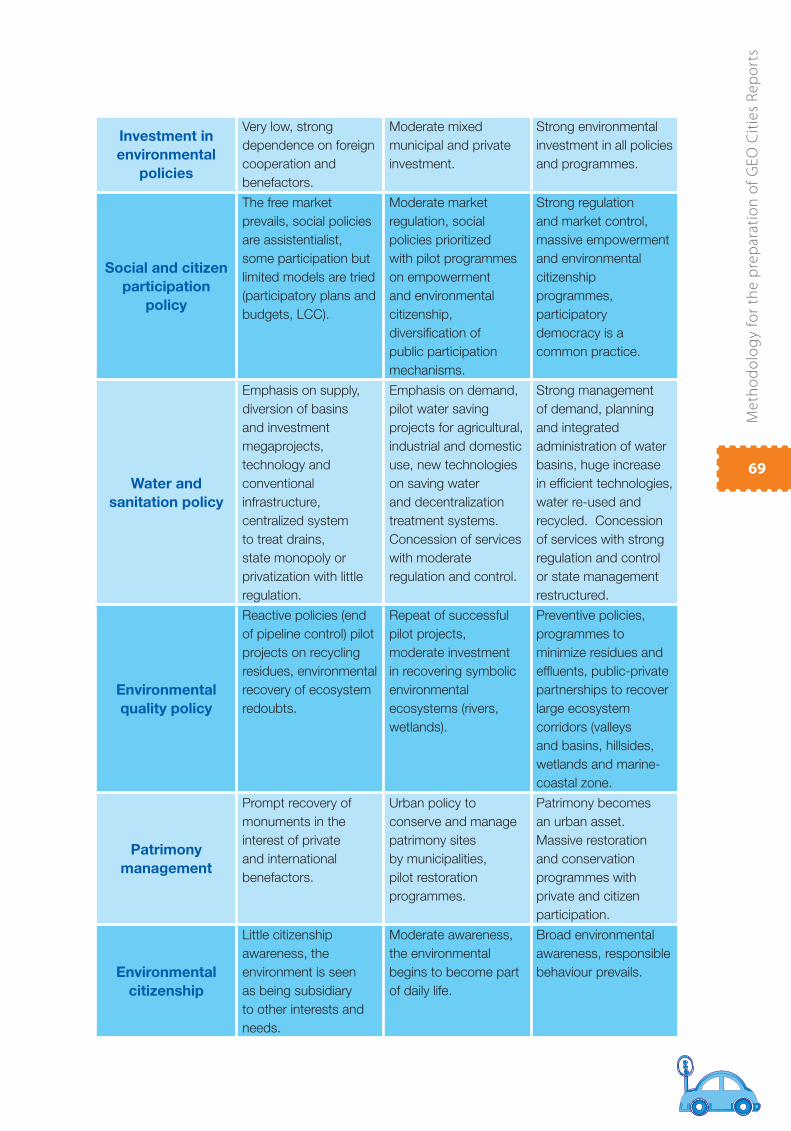
Me
tho
do
log
y fo
r th
e p
rep
ara
tio
n o
f G
EO
Cit
ies
Re
po
rts
69
Investment in
environmental
policies
Very low, strong
dependence on foreign
cooperation and
benefactors.
Moderate mixed
municipal and private
investment.
Strong environmental
investment in all policies
and programmes.
Social and citizen
participation
policy
The free market
prevails, social policies
are assistentialist,
some participation but
limited models are tried
(participatory plans and
budgets, LCC).
Moderate market
regulation, social
policies prioritized
with pilot programmes
on empowerment
and environmental
citizenship,
diversifi cation of
public participation
mechanisms.
Strong regulation
and market control,
massive empowerment
and environmental
citizenship
programmes,
participatory
democracy is a
common practice.
Water and
sanitation policy
Emphasis on supply,
diversion of basins
and investment
megaprojects,
technology and
conventional
infrastructure,
centralized system
to treat drains,
state monopoly or
privatization with little
regulation.
Emphasis on demand,
pilot water saving
projects for agricultural,
industrial and domestic
use, new technologies
on saving water
and decentralization
treatment systems.
Concession of services
with moderate
regulation and control.
Strong management
of demand, planning
and integrated
administration of water
basins, huge increase
in effi cient technologies,
water re-used and
recycled. Concession
of services with strong
regulation and control
or state management
restructured.
Environmental
quality policy
Reactive policies (end
of pipeline control) pilot
projects on recycling
residues, environmental
recovery of ecosystem
redoubts.
Repeat of successful
pilot projects,
moderate investment
in recovering symbolic
environmental
ecosystems (rivers,
wetlands).
Preventive policies,
programmes to
minimize residues and
effl uents, public-private
partnerships to recover
large ecosystem
corridors (valleys
and basins, hillsides,
wetlands and marine-
coastal zone.
Patrimony
management
Prompt recovery of
monuments in the
interest of private
and international
benefactors.
Urban policy to
conserve and manage
patrimony sites
by municipalities,
pilot restoration
programmes.
Patrimony becomes
an urban asset.
Massive restoration
and conservation
programmes with
private and citizen
participation.
Environmental
citizenship
Little citizenship
awareness, the
environment is seen
as being subsidiary
to other interests and
needs.
Moderate awareness,
the environmental
begins to become part
of daily life.
Broad environmental
awareness, responsible
behaviour prevails.
Me
tho
do
log
y fo
r th
e p
rep
ara
tio
n o
f G
EO
Cit
ies
Re
po
rts
70 III. GEO Cities GEO Cities Process Process
Me
tho
do
log
y fo
r th
e p
rep
ara
tio
n o
f G
EO
Cit
ies
Re
po
rts
71
Preparing the GEO Cities report implies a series of stages that must be thought through to
allow the local technical team to produce the document while keeping in mind principles and
experience already acquired, not only in Latin America and the Caribbean but in other parts of
the world as well.
To prepare the assessment and the GEO Cities report, a technical team offi cially backed
by the local public authority is needed, information must be collected, an extensive analysis
made of the state of the environment, and solutions developed or suggested for the different
problems detected.
This manual describes each stage of the process. It seeks to encourage participation by
different sectors in preparing the report and to demonstrate the importance of communicating
the results and proposals to the greatest possible number of interested social stakeholders,
both in local government and society.
At each stage of producing the assessment activities must be carried out with relative
interdependence and, according to local circumstances, in a different order than that proposed
in this manual, based on what best suits the political and institutional situation in each city.
Stage 1 Institutional
The fi rst, or institutional stage, is where important decisions are made about preparing the
institutional conditions to produce the report. This is also the stage where the local technical
team is defi ned, stakeholders identifi ed who will be invited to contribute to the document,
training will be given on the GEO Cities methodology, and responsibilities will be established
for the report’s production.
An institutional collaboration and organization framework will be established: in order to
pinpoint common points of interest, this will identify and make contact with different institutions
with a mandate or an interest in environmental themes. Discussions will be held and agreement
reached on the objectives and responsibilities in preparing the GEO Cities report.
1.1. Installation activities33
Why is the process important?
As we have seen, the objectives of an integrated environmental assessment report are
broader than those of traditional environmental reports; therefore, they should be made known
to the public and to organizations.
The technical team members come from different disciplines, organizations and even
different social strata; they probably have different outlooks, all legitimate, about the environment
and the economy. Learning opportunities are brought to light when interaction among them
produces new information.
Sequence is the order of the key questions (table 5) that guide the process. First, we need
to know what is happening to the environment in order to understand why it is happening. To
be able to discuss what action to take, or the consequences of not taking action, we also need
to understand the driving forces and the main causes.
33 This section is completely based on the chapter “Assessment and producing reports” in Section 1 of the UNEP, IISD and Ecologistics
international Training Manual, 2000, Training to prepare Integrated Environment Assessments and Reports.
Me
tho
do
log
y fo
r th
e p
rep
ara
tio
n o
f G
EO
Cit
ies
Re
po
rts
72
Cooperation depends on the capacity of the team to work together. Integrated environmental
assessment requires linking information and insight usually scattered across a wide variety of
disciplines and organizations. Therefore, it also requires bringing together organizations and
people who usually do not work as a team; in this respect there is a high potential for tension
along professional, bureaucratic, religious or political lines. Confi dence, trust and cooperation
between key organizations and individuals are vital for success.
Appropriation. The objective of this report is to increase knowledge about the interaction
between society and the environment so that needed changes can be made. The best way
to ensure that the report’s observations and recommendations infl uence decision making is by
involving people whose task this is, as well as those who might be affected by the results.
Clarity. It is important that, from the beginning, uncertainties and suppositions about
how the report is to be prepared should be clarifi ed so that groups with different interests can
participate throughout the process; the participants might see this as a challange.
One of the main characteristics of the GEO Cities process is its perspective based on three
basic principles: it is participatory, multidisciplinary and multisectorial. Participatory means
that the different stakeholders in an interactive process promote exchange of knowledge and
information, as well as helping to clarify their positions and interests about a given problem.
Involving different stakeholders will give a better understanding of the themes and improve
both the process and the quality of policy decisions. Multidisciplinary means that to make an
integrated environmental assessment it is crucial to have the support of different branches of
scientifi c knowledge. Discussion, construction and analysis by the different disciplines all help
to enhance the quality of the assessment. Finally, it is multisectorial because environmental
questions have links to economic and social themes. In this outlook it is necessary for the
different sectors (public and private) to participate in preparing a satisfactory assessment,
as well as ensuring that the assessment will result in responses being given and appropriate
action taken.
Another attribute of the GEO process is that it is associated with the production of a
family of multiproducts as a means to reach a wider audience. Such products range from
preparing simple posters, dissemination tables, leafl ets, CD roms, and gathering data for the
GEO Cities report to preparing executive summaries.
The most important conditions to ensure the success of the GEO Cities report process
include the political will of the local public authority and the commitment of local civil society,
in particular of those in each city who are directly involved with environmental themes. This
signifi es that the possibility of having a successful GEO Cities outcome depends on receiving
effective support from the municipal authority, or its subordinate bodies, in making available
human, technical and fi nancial resources for the work; they should also allow access to the
information needed to analyse urban-environmental questions concerning the locality. On the
other hand, it is essential that civil society sectors involved with the work make a commitment
to continue with it in spite of any diffi culties that might crop up along the way.
For these reasons, the institutional stage of the GEO Cities process is of vital importance
given that material conditions will be created to enable the entire work to develop. This stage
merits special attention by all those involved, the public authority in particular.
The other components of this stage are analysed below.
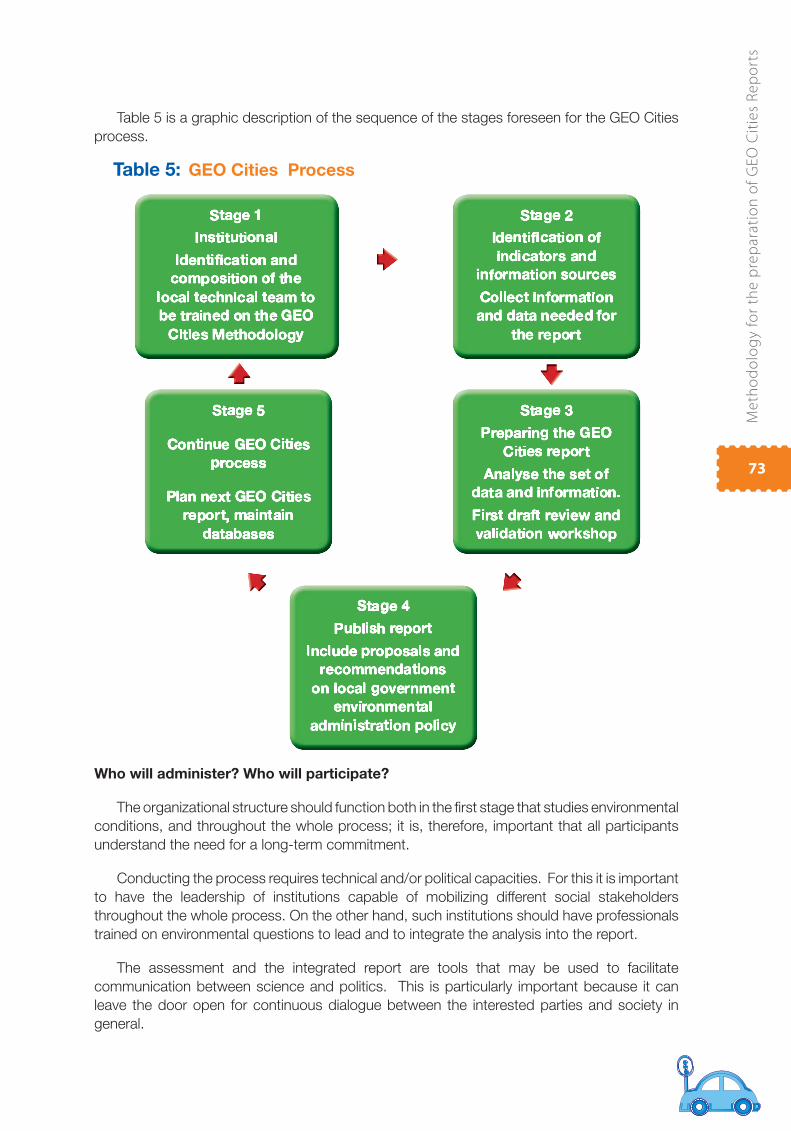
Me
tho
do
log
y fo
r th
e p
rep
ara
tio
n o
f G
EO
Cit
ies
Re
po
rts
73
Table 5: GEO Cities Process
Who will administer? Who will participate?
The organizational structure should function both in the fi rst stage that studies environmental
conditions, and throughout the whole process; it is, therefore, important that all participants
understand the need for a long-term commitment.
Conducting the process requires technical and/or political capacities. For this it is important
to have the leadership of institutions capable of mobilizing different social stakeholders
throughout the whole process. On the other hand, such institutions should have professionals
trained on environmental questions to lead and to integrate the analysis into the report.
The assessment and the integrated report are tools that may be used to facilitate
communication between science and politics. This is particularly important because it can
leave the door open for continuous dialogue between the interested parties and society in
general.
Table 5 is a graphic description of the sequence of the stages foreseen for the GEO Cities
process.
Me
tho
do
log
y fo
r th
e p
rep
ara
tio
n o
f G
EO
Cit
ies
Re
po
rts
74
A participatory process should result in linking science and politics. However, if the report’s
preparation is to be handled properly, then the number of participants must be limited.
In which institutional environment?
In recent years public organizations, non-governmental organizations and institutions have
published environmental assessments34 However, so that the report and the assessment
are not dominated by the outlooks or interests of local governments, social groups must be
guaranteed a more important role.
Nevertheless, as this programme deals mainly with government reports that inform the public
about outlooks which, while different, are also pertinent, these efforts should be considered as
being synergetic rather than competitive. It is important that the report’s institutional context
be consistent with the broader institutional framework of the city or the country. Some cities
have experience of scientifi c research and of systematic data gathering and planning; in these
cases information on the environment may be well developed and organized. In other cities
information may be scattered and the report may appear uncoordinated.
As there are no fi xed rules, many variations may be found in the institutional framework.
Some countries have had successful results for processes of this type with different institutional
models; for example, that shown in Table 6.35
Local governments may:
Use an existing government department.•
Establish an independent agency responsible for information on the environment, and •
for preparing assessments and reports.
Hire a non-governmental organization or a university to prepare the GEO Cities report.•
It is important to keep in mind that, while the framework or institutional environment used
when preparing the GEO Cities report may be quite fl exible, its form must be very clearly
defi ned in accordance with each city’s institutional conditions
34 UNEP, IISD and Ecologistics international, 2000, Training to prepare Integrated Environment Assessments and Reports. Training manual.
35 Training manual. UNEP, IISD and Ecologistics international Ltd. Op. cit
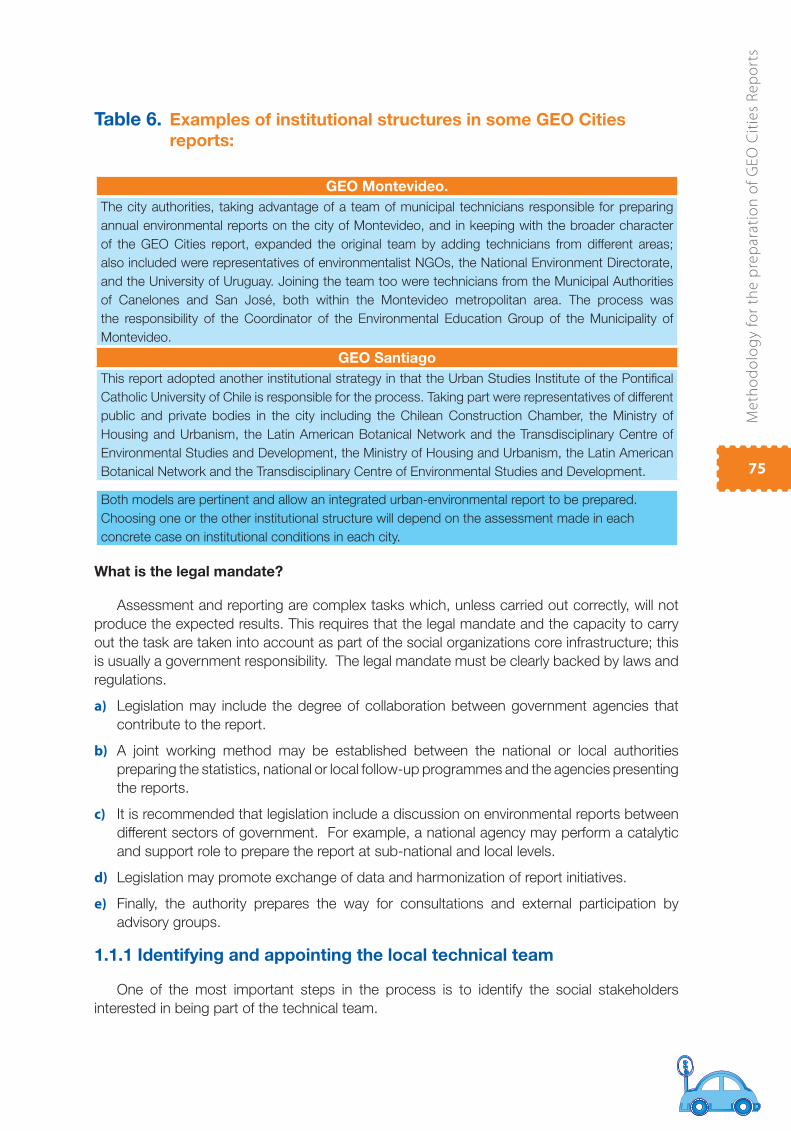
Me
tho
do
log
y fo
r th
e p
rep
ara
tio
n o
f G
EO
Cit
ies
Re
po
rts
75
Table 6. Examples of institutional structures in some GEO Cities
reports:
GEO Montevideo.
The city authorities, taking advantage of a team of municipal technicians responsible for preparing
annual environmental reports on the city of Montevideo, and in keeping with the broader character
of the GEO Cities report, expanded the original team by adding technicians from different areas;
also included were representatives of environmentalist NGOs, the National Environment Directorate,
and the University of Uruguay. Joining the team too were technicians from the Municipal Authorities
of Canelones and San José, both within the Montevideo metropolitan area. The process was
the responsibility of the Coordinator of the Environmental Education Group of the Municipality of
Montevideo.
GEO Santiago
This report adopted another institutional strategy in that the Urban Studies Institute of the Pontifi cal
Catholic University of Chile is responsible for the process. Taking part were representatives of different
public and private bodies in the city including the Chilean Construction Chamber, the Ministry of
Housing and Urbanism, the Latin American Botanical Network and the Transdisciplinary Centre of
Environmental Studies and Development, the Ministry of Housing and Urbanism, the Latin American
Botanical Network and the Transdisciplinary Centre of Environmental Studies and Development.
Both models are pertinent and allow an integrated urban-environmental report to be prepared.
Choosing one or the other institutional structure will depend on the assessment made in each
concrete case on institutional conditions in each city.
What is the legal mandate?
Assessment and reporting are complex tasks which, unless carried out correctly, will not
produce the expected results. This requires that the legal mandate and the capacity to carry
out the task are taken into account as part of the social organizations core infrastructure; this
is usually a government responsibility. The legal mandate must be clearly backed by laws and
regulations.
a) Legislation may include the degree of collaboration between government agencies that
contribute to the report.
b) A joint working method may be established between the national or local authorities
preparing the statistics, national or local follow-up programmes and the agencies presenting
the reports.
c) It is recommended that legislation include a discussion on environmental reports between
different sectors of government. For example, a national agency may perform a catalytic
and support role to prepare the report at sub-national and local levels.
d) Legislation may promote exchange of data and harmonization of report initiatives.
e) Finally, the authority prepares the way for consultations and external participation by
advisory groups.
1.1.1 Identifying and appointing the local technical team
One of the most important steps in the process is to identify the social stakeholders
interested in being part of the technical team.
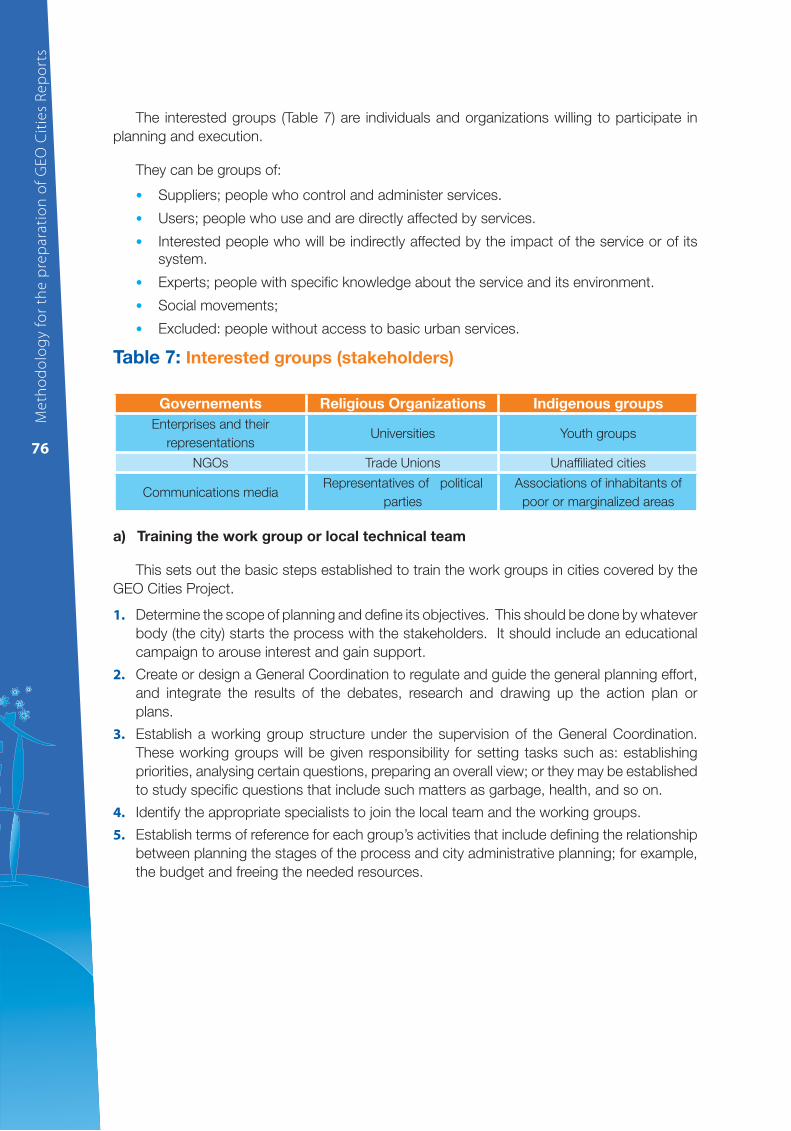
Me
tho
do
log
y fo
r th
e p
rep
ara
tio
n o
f G
EO
Cit
ies
Re
po
rts
76
The interested groups (Table 7) are individuals and organizations willing to participate in
planning and execution.
They can be groups of:
Suppliers; people who control and administer services.•
Users; people who use and are directly affected by services.•
Interested people who will be indirectly affected by the impact of the service or of its •
system.
Experts; people with specifi c knowledge about the service and its environment.•
Social movements;•
Excluded: people without access to basic urban services.•
Table 7: Interested groups (stakeholders)
Governements Religious Organizations Indigenous groups
Enterprises and their
representationsUniversities Youth groups
NGOs Trade Unions Unaffi liated cities
Communications mediaRepresentatives of political
parties
Associations of inhabitants of
poor or marginalized areas
a) Training the work group or local technical team
This sets out the basic steps established to train the work groups in cities covered by the
GEO Cities Project.
1. Determine the scope of planning and defi ne its objectives. This should be done by whatever
body (the city) starts the process with the stakeholders. It should include an educational
campaign to arouse interest and gain support.
2. Create or design a General Coordination to regulate and guide the general planning effort,
and integrate the results of the debates, research and drawing up the action plan or
plans.
3. Establish a working group structure under the supervision of the General Coordination.
These working groups will be given responsibility for setting tasks such as: establishing
priorities, analysing certain questions, preparing an overall view; or they may be established
to study specifi c questions that include such matters as garbage, health, and so on.
4. Identify the appropriate specialists to join the local team and the working groups.
5. Establish terms of reference for each group’s activities that include defi ning the relationship
between planning the stages of the process and city administrative planning; for example,
the budget and freeing the needed resources.
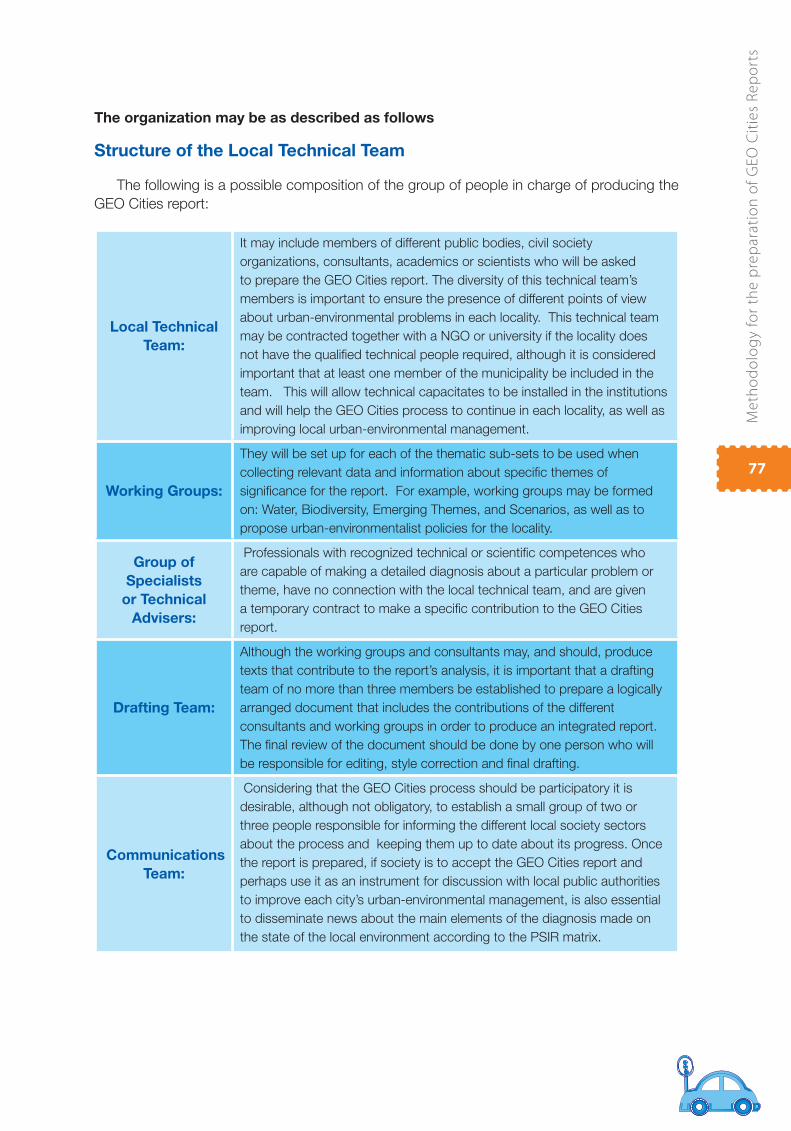
Me
tho
do
log
y fo
r th
e p
rep
ara
tio
n o
f G
EO
Cit
ies
Re
po
rts
77
The organization may be as described as follows
Structure of the Local Technical Team
The following is a possible composition of the group of people in charge of producing the
GEO Cities report:
Local Technical
Team:
It may include members of different public bodies, civil society
organizations, consultants, academics or scientists who will be asked
to prepare the GEO Cities report. The diversity of this technical team’s
members is important to ensure the presence of different points of view
about urban-environmental problems in each locality. This technical team
may be contracted together with a NGO or university if the locality does
not have the qualifi ed technical people required, although it is considered
important that at least one member of the municipality be included in the
team. This will allow technical capacitates to be installed in the institutions
and will help the GEO Cities process to continue in each locality, as well as
improving local urban-environmental management.
Working Groups:
They will be set up for each of the thematic sub-sets to be used when
collecting relevant data and information about specifi c themes of
signifi cance for the report. For example, working groups may be formed
on: Water, Biodiversity, Emerging Themes, and Scenarios, as well as to
propose urban-environmentalist policies for the locality.
Group of
Specialists
or Technical
Advisers:
Professionals with recognized technical or scientifi c competences who
are capable of making a detailed diagnosis about a particular problem or
theme, have no connection with the local technical team, and are given
a temporary contract to make a specifi c contribution to the GEO Cities
report.
Drafting Team:
Although the working groups and consultants may, and should, produce
texts that contribute to the report’s analysis, it is important that a drafting
team of no more than three members be established to prepare a logically
arranged document that includes the contributions of the different
consultants and working groups in order to produce an integrated report.
The fi nal review of the document should be done by one person who will
be responsible for editing, style correction and fi nal drafting.
Communications
Team:
Considering that the GEO Cities process should be participatory it is
desirable, although not obligatory, to establish a small group of two or
three people responsible for informing the different local society sectors
about the process and keeping them up to date about its progress. Once
the report is prepared, if society is to accept the GEO Cities report and
perhaps use it as an instrument for discussion with local public authorities
to improve each city’s urban-environmental management, is also essential
to disseminate news about the main elements of the diagnosis made on
the state of the local environment according to the PSIR matrix.
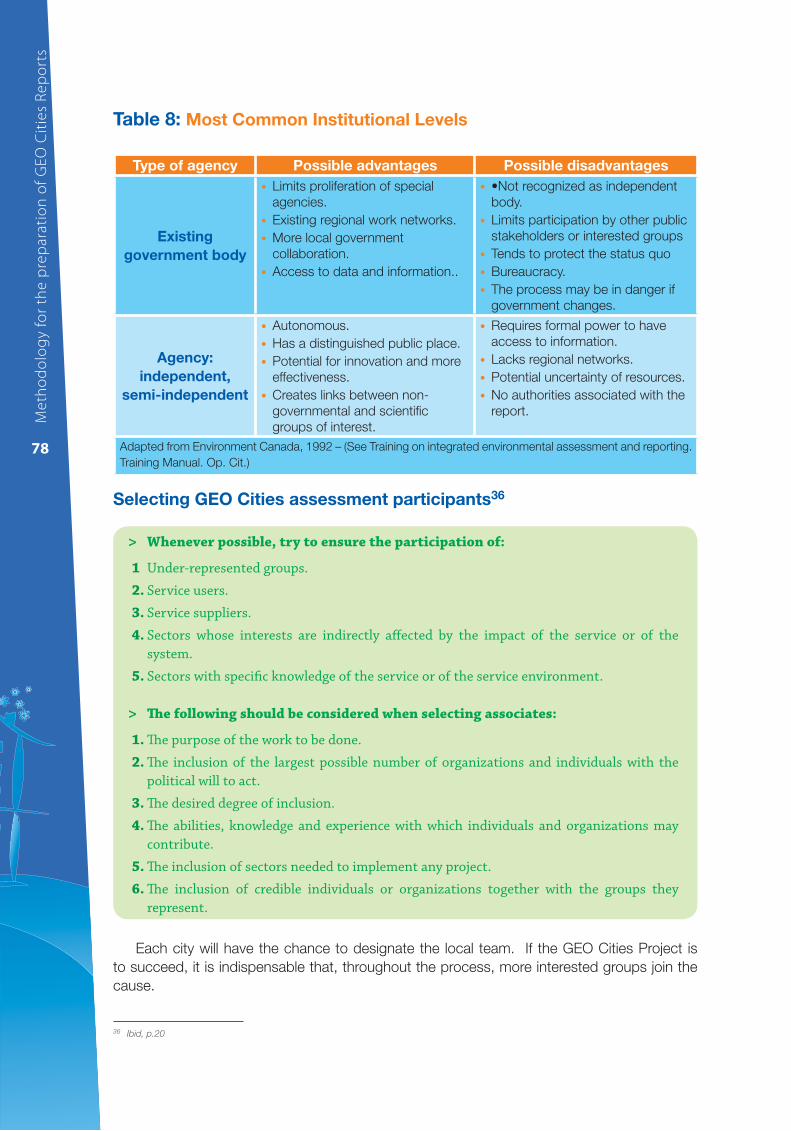
Me
tho
do
log
y fo
r th
e p
rep
ara
tio
n o
f G
EO
Cit
ies
Re
po
rts
78
Table 8: Most Common Institutional Levels
Type of agency Possible advantages Possible disadvantages
Existing
government body
Limits proliferation of special •
agencies.
Existing regional work networks.•
More local government •
collaboration.
Access to data and information..•
•Not recognized as independent •
body.
Limits participation by other public •
stakeholders or interested groups
Tends to protect the status quo•
Bureaucracy.•
The process may be in danger if •
government changes.
Agency:
independent,
semi-independent
Autonomous.•
Has a distinguished public place.•
Potential for innovation and more •
effectiveness.
Creates links between non-•
governmental and scientifi c
groups of interest.
Requires formal power to have •
access to information.
Lacks regional networks.•
Potential uncertainty of resources.•
No authorities associated with the •
report.
Adapted from Environment Canada, 1992 – (See Training on integrated environmental assessment and reporting.
Training Manual. Op. Cit.)
Selecting GEO Cities assessment participants36
Whenever possible, try to ensure the participation of: >
1 Under-represented groups.
2. Service users.
3. Service suppliers.
4. Sectors whose interests are indirectly aff ected by the impact of the service or of the
system.
5. Sectors with specifi c knowledge of the service or of the service environment.
Th e following should be considered when selecting associates: >
1. Th e purpose of the work to be done.
2. Th e inclusion of the largest possible number of organizations and individuals with the
political will to act.
3. Th e desired degree of inclusion.
4. Th e abilities, knowledge and experience with which individuals and organizations may
contribute.
5. Th e inclusion of sectors needed to implement any project.
6. Th e inclusion of credible individuals or organizations together with the groups they
represent.
Each city will have the chance to designate the local team. If the GEO Cities Project is
to succeed, it is indispensable that, throughout the process, more interested groups join the
cause.
36 Ibid, p.20

Me
tho
do
log
y fo
r th
e p
rep
ara
tio
n o
f G
EO
Cit
ies
Re
po
rts
79
b) Defi ning the basic agenda
One way of reconciling the contributions of the different social stakeholders is to defi ne a
basic agenda which should include:
Preparing terms of reference and of commitment
Once the scope is determined, the social structures defi ned and identifi ed, the next step is
to use the terms of reference to defi ne roles, responsibilities and commitments.
The terms of reference include:
Joint activities.•
Participants’ roles, including specifi c activities to be carried out.•
Information to be provided and the programme of contributions.•
Rules on sharing information used in the process, including confi dentiality •
agreements.
Decision methods, including settling confl icts.•
Resources that each participant may provide.•
Agreements on how to integrate the results of the process in the city’s planning •
activities.
These terms of reference should be assigned by the local team members and periodically
reviewed to ensure they are being complied with and are up to date.
Programme of activities
Plans the work and monitors progress. Should include all the stages and indicate the type
and content of activities with their respective tasks and the time needed to carry them out.
It is very important to be as precise as possible with respect to the time required. If the
estimated time is very long, for example more than a year and a half, participation will be
diffi cult and it will add to the project’s costs. Furthermore, the time required could have a
negative effect on the quality of the work and cause tensions within the group.
Defi nition of goals (products and processes)
The goals and the programme of activities are the team’s guidelines; they describe expected
results and how to obtain them.
The goals may be intermediate or fi nal; give a precise description of the type of assistance
needed to reach a fi nal result and ensure the work will continue.
An intermediate goal could be to hold technical discussions and methodology workshops
for the team members and participating consultants.
The fi nal goal is to establish a continuous city assessment process and publish a GEO Cities
report to be presented at a seminar where the material will be made known to the public.
Me
tho
do
log
y fo
r th
e p
rep
ara
tio
n o
f G
EO
Cit
ies
Re
po
rts
80
1.1.2 Training the local team
The GEO Cities report methodology requires an apprenticeship to learn what it is and how
to apply it to assess the state of the local environment. There are two approaches to training
in this methodology:
a) Technical training and public policy workshops
By defi nition, the technical team has a wide range of knowledge and experience of
environmental problems and this demands a minimum of conceptual standardization.
The training workshops ensure a basic level of understanding of the factors involved in the
interaction between urban development and the environment and the features and range of
the GEO Cities report.
Training has four components:
Managing the GEO Cities methodology including the use of the DPSIR matrix and the •
indicators.
Managing techniques to collect and analyse data and information for the report.•
Establishing a strategy to involve different sectors in the process.•
Discussing the process of formulating, managing and following up public policies, •
especially on themes related to urban areas and the environment.
b) Production and distribution of publications.
To prepare the report properly, all members of the team need to have access to information
on their fi elds of interest including: GEO reports, GEO Cities methodology and specifi c studies
on themes relating to local environmental assessment.
Making information readily available to all members of the technical helps them to work as
a unit and improves their ability to produce the report
Stage 2. Identifying indicators and information sources
2.1 Urban environmental indicators
The GEO Cities Project uses indicators as the basis for analysis. These indicators can be
seen as scientifi c instruments that allow a description to be given of the characteristics of a
phenomenon or its performance in time and space to be assessed.
The type of indicators to be selected depends on what is being assessed. The indicators
used in the GEO Cities Project, and taken from the pre-established group of urban-environmental
indicators, will depend on the objectives defi ned for each technical team.
Table 10 presents this group of indicators according to the conceptual defi nition of their
components and the stage of the process in which they are to be used.

Me
tho
do
log
y fo
r th
e p
rep
ara
tio
n o
f G
EO
Cit
ies
Re
po
rts
81
In there is a detailed description of each indicator, the justifi cation for using it and the proper
way to measure it.
2.1.1 Indicators: What are they? How should they be used?
There is a wide range of literature on the indicators originally created by such organizations
as the United Nations Commission for Sustainable Development (UNCSD) and the Organization
for Economic Cooperation and Development (OECD). The advantage these have over other
indicators, like those proposed by independent researchers, is that as they are adopted by
global institutions, they cover a broader range of environmental situations; they are applied
regularly and systematically and, because they have a better degree of comparison, are more
reliable. That is why some are proposed here as instruments to be used in preparing the GEO
Cities report.
The importance of including indicators in environmental assessments was strongly backed
by the recommendation in Chapter 40 of Agenda 21 on the need to create sustainable
development indicators capable of measuring the advances made towards an environmentally,
socially and economically fair and balanced society.
Agenda 21 functioned as the impelling force in identifying environmental themes and
problems that, in turn, provided the impetus for international organizations and government
agencies to produce indicators to assess the sustainability of policies, programmes, actions
and processes for economic, urban and social development and that have an impact on the
environment.
2.1.2 Brief defi nition
Indicators are essential components for assessments of a sustainable development
programme. Desirable indicators are variables that summarize or simplify relevant information,
point out phenomena of interest and quantify, measure and communicate important information.
The main functions of indicators, as defi ned in the publication SCOPE, are to:
Assess conditions and trends. •
Compare places and situations.•
Assess conditions and trends in relationto goals and objectives.•
Provide early warning information.•
Anticipate future conditions and trends.•
Indicators are packets of information that help us to understand the complex interaction
between different phenomena37. By organizing and synthesizing information, indicators perform
a variety of functions that help to reach the different objectives applicable to science, to politics
and to daily life. Furthermore, indicators are indispensable for well-informed decision making
and for urban development planning and environmental administration.
Indicators provide society as a whole, as well as certain social sectors, with statistical,
scientifi c and technical information; they also inform about public policy objectives and goals
and the features and trends of urban, environmental, economic, and social matters. They are
most useful in showing how effectively public bodies perform.
37 Scientifi c Committee on Problems of the Environment (SCOPE), 1997: Sustainability Indicators: Report of the Project on Indicators for
Sustainable Development B. Moldan & S. Billharz eds., 1997, Wiley, UK
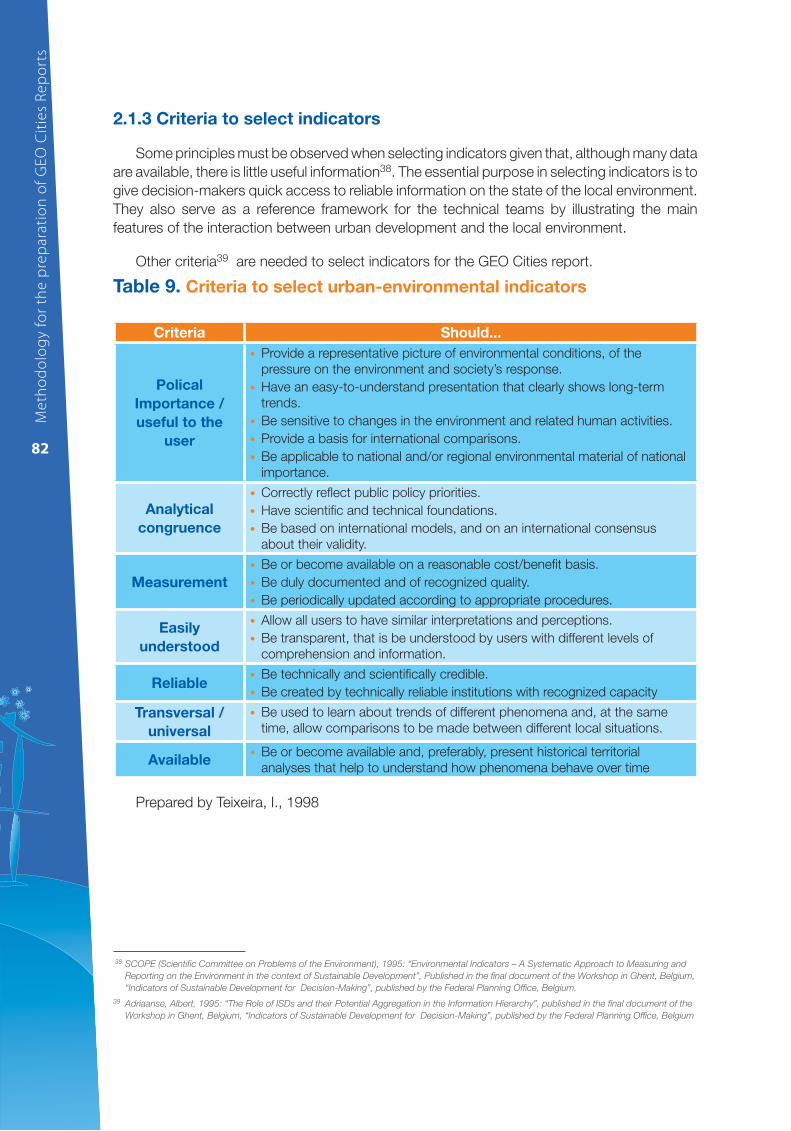
Me
tho
do
log
y fo
r th
e p
rep
ara
tio
n o
f G
EO
Cit
ies
Re
po
rts
82
2.1.3 Criteria to select indicators
Some principles must be observed when selecting indicators given that, although many data
are available, there is little useful information38. The essential purpose in selecting indicators is to
give decision-makers quick access to reliable information on the state of the local environment.
They also serve as a reference framework for the technical teams by illustrating the main
features of the interaction between urban development and the local environment.
Other criteria39 are needed to select indicators for the GEO Cities report.
Table 9. Criteria to select urban-environmental indicators
Criteria Should...
Polical
Importance /
useful to the
user
Provide a representative picture of environmental conditions, of the •
pressure on the environment and society’s response.
Have an easy-to-understand presentation that clearly shows long-term •
trends.
Be sensitive to changes in the environment and related human activities.•
Provide a basis for international comparisons.•
Be applicable to national and/or regional environmental material of national •
importance.
Analytical
congruence
Correctly refl ect public policy priorities.•
Have scientifi c and technical foundations.•
Be based on international models, and on an international consensus •
about their validity.
Measurement
Be or become available on a reasonable cost/benefi t basis.•
Be duly documented and of recognized quality.•
Be periodically updated according to appropriate procedures.•
Easily
understood
Allow all users to have similar interpretations and perceptions.•
Be transparent, that is be understood by users with different levels of •
comprehension and information.
ReliableBe technically and scientifi cally credible.•
Be created by technically reliable institutions with recognized capacity•
Transversal /
universal
Be used to learn about trends of different phenomena and, at the same •
time, allow comparisons to be made between different local situations.
AvailableBe or become available and, preferably, present historical territorial •
analyses that help to understand how phenomena behave over time
Prepared by Teixeira, I., 1998
38 SCOPE (Scientifi c Committee on Problems of the Environment), 1995: “Environmental Indicators – A Systematic Approach to Measuring and
Reporting on the Environment in the context of Sustainable Development”, Published in the fi nal document of the Workshop in Ghent, Belgium,
“Indicators of Sustainable Development for Decision-Making”, published by the Federal Planning Offi ce, Belgium.
39 Adriaanse, Albert, 1995: “The Role of ISDs and their Potential Aggregation in the Information Hierarchy”, published in the fi nal document of the
Workshop in Ghent, Belgium, “Indicators of Sustainable Development for Decision-Making”, published by the Federal Planning Offi ce, Belgium
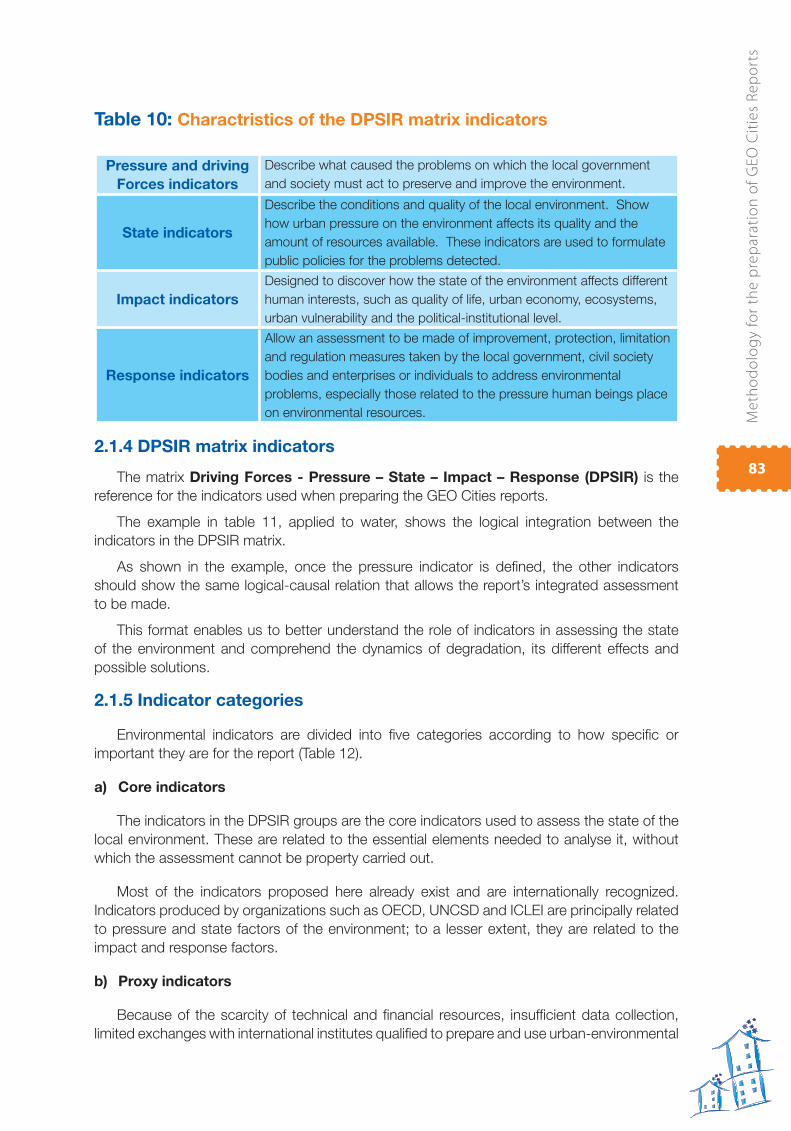
Me
tho
do
log
y fo
r th
e p
rep
ara
tio
n o
f G
EO
Cit
ies
Re
po
rts
83
Table 10: Charactristics of the DPSIR matrix indicators
Pressure and driving
Forces indicators
Describe what caused the problems on which the local government
and society must act to preserve and improve the environment.
State indicators
Describe the conditions and quality of the local environment. Show
how urban pressure on the environment affects its quality and the
amount of resources available. These indicators are used to formulate
public policies for the problems detected.
Impact indicators
Designed to discover how the state of the environment affects different
human interests, such as quality of life, urban economy, ecosystems,
urban vulnerability and the political-institutional level.
Response indicators
Allow an assessment to be made of improvement, protection, limitation
and regulation measures taken by the local government, civil society
bodies and enterprises or individuals to address environmental
problems, especially those related to the pressure human beings place
on environmental resources.
2.1.4 DPSIR matrix indicators
The matrix Driving Forces - Pressure – State – Impact – Response (DPSIR) is the
reference for the indicators used when preparing the GEO Cities reports.
The example in table 11, applied to water, shows the logical integration between the
indicators in the DPSIR matrix.
As shown in the example, once the pressure indicator is defi ned, the other indicators
should show the same logical-causal relation that allows the report’s integrated assessment
to be made.
This format enables us to better understand the role of indicators in assessing the state
of the environment and comprehend the dynamics of degradation, its different effects and
possible solutions.
2.1.5 Indicator categories
Environmental indicators are divided into fi ve categories according to how specifi c or
important they are for the report (Table 12).
a) Core indicators
The indicators in the DPSIR groups are the core indicators used to assess the state of the
local environment. These are related to the essential elements needed to analyse it, without
which the assessment cannot be property carried out.
Most of the indicators proposed here already exist and are internationally recognized.
Indicators produced by organizations such as OECD, UNCSD and ICLEI are principally related
to pressure and state factors of the environment; to a lesser extent, they are related to the
impact and response factors.
b) Proxy indicators
Because of the scarcity of technical and fi nancial resources, insuffi cient data collection,
limited exchanges with international institutes qualifi ed to prepare and use urban-environmental
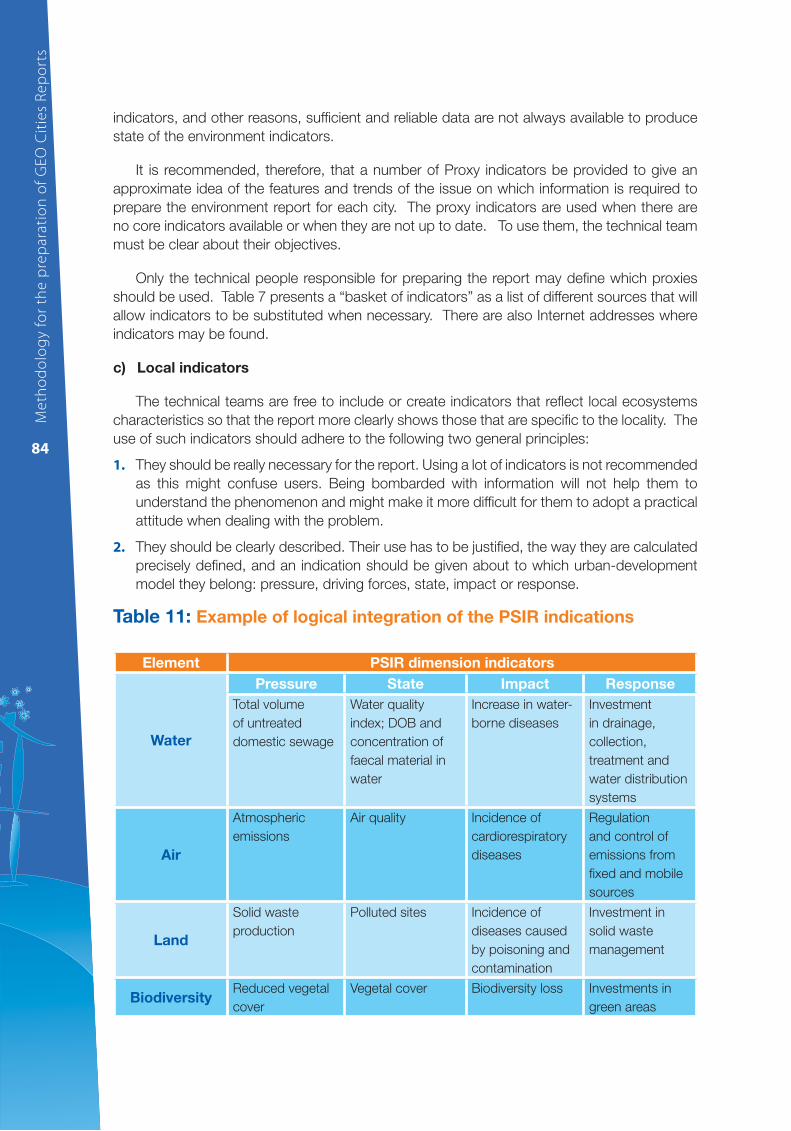
Me
tho
do
log
y fo
r th
e p
rep
ara
tio
n o
f G
EO
Cit
ies
Re
po
rts
84
indicators, and other reasons, suffi cient and reliable data are not always available to produce
state of the environment indicators.
It is recommended, therefore, that a number of Proxy indicators be provided to give an
approximate idea of the features and trends of the issue on which information is required to
prepare the environment report for each city. The proxy indicators are used when there are
no core indicators available or when they are not up to date. To use them, the technical team
must be clear about their objectives.
Only the technical people responsible for preparing the report may defi ne which proxies
should be used. Table 7 presents a “basket of indicators” as a list of different sources that will
allow indicators to be substituted when necessary. There are also Internet addresses where
indicators may be found.
c) Local indicators
The technical teams are free to include or create indicators that refl ect local ecosystems
characteristics so that the report more clearly shows those that are specifi c to the locality. The
use of such indicators should adhere to the following two general principles:
1. They should be really necessary for the report. Using a lot of indicators is not recommended
as this might confuse users. Being bombarded with information will not help them to
understand the phenomenon and might make it more diffi cult for them to adopt a practical
attitude when dealing with the problem.
2. They should be clearly described. Their use has to be justifi ed, the way they are calculated
precisely defi ned, and an indication should be given about to which urban-development
model they belong: pressure, driving forces, state, impact or response.
Table 11: Example of logical integration of the PSIR indications
Element PSIR dimension indicators
Water
Pressure State Impact Response
Total volume
of untreated
domestic sewage
Water quality
index; DOB and
concentration of
faecal material in
water
Increase in water-
borne diseases
Investment
in drainage,
collection,
treatment and
water distribution
systems
Air
Atmospheric
emissions
Air quality Incidence of
cardiorespiratory
diseases
Regulation
and control of
emissions from
fi xed and mobile
sources
Land
Solid waste
production
Polluted sites Incidence of
diseases caused
by poisoning and
contamination
Investment in
solid waste
management
BiodiversityReduced vegetal
cover
Vegetal cover Biodiversity loss Investments in
green areas
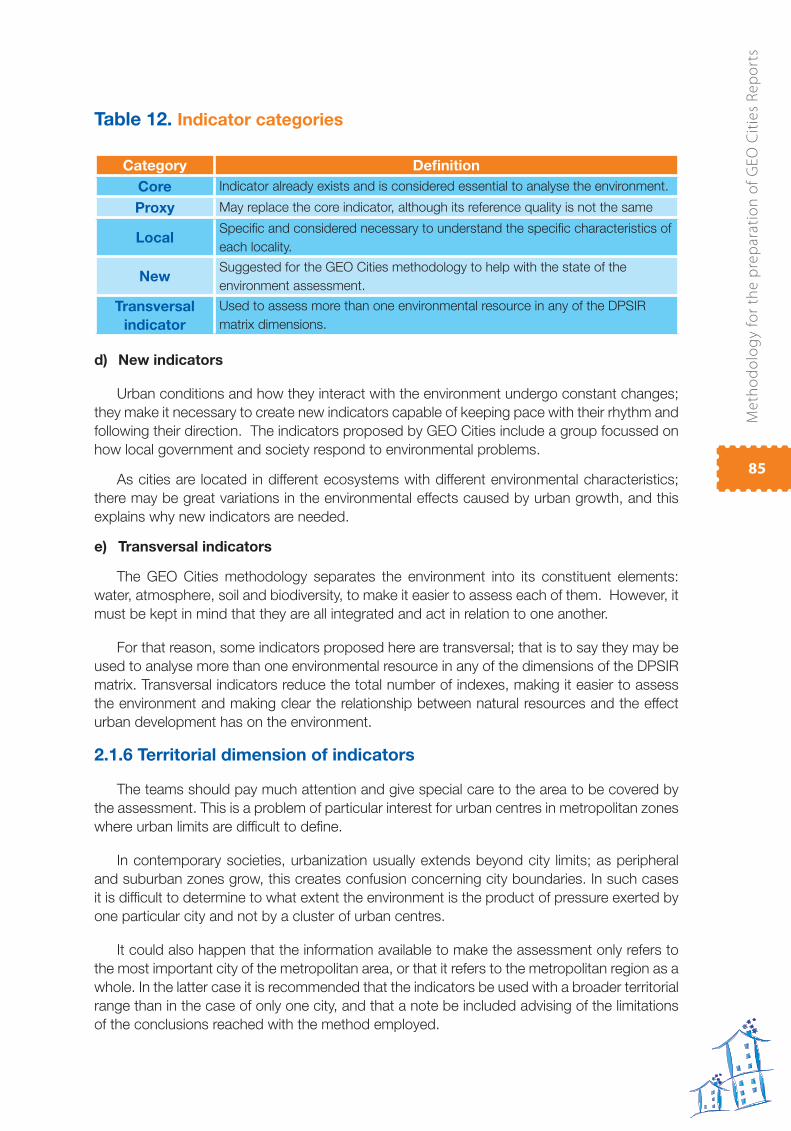
Me
tho
do
log
y fo
r th
e p
rep
ara
tio
n o
f G
EO
Cit
ies
Re
po
rts
85
Table 12. Indicator categories
Category Defi nition
Core Indicator already exists and is considered essential to analyse the environment.
Proxy May replace the core indicator, although its reference quality is not the same
LocalSpecifi c and considered necessary to understand the specifi c characteristics of
each locality.
NewSuggested for the GEO Cities methodology to help with the state of the
environment assessment.
Transversal
indicator
Used to assess more than one environmental resource in any of the DPSIR
matrix dimensions.
d) New indicators
Urban conditions and how they interact with the environment undergo constant changes;
they make it necessary to create new indicators capable of keeping pace with their rhythm and
following their direction. The indicators proposed by GEO Cities include a group focussed on
how local government and society respond to environmental problems.
As cities are located in different ecosystems with different environmental characteristics;
there may be great variations in the environmental effects caused by urban growth, and this
explains why new indicators are needed.
e) Transversal indicators
The GEO Cities methodology separates the environment into its constituent elements:
water, atmosphere, soil and biodiversity, to make it easier to assess each of them. However, it
must be kept in mind that they are all integrated and act in relation to one another.
For that reason, some indicators proposed here are transversal; that is to say they may be
used to analyse more than one environmental resource in any of the dimensions of the DPSIR
matrix. Transversal indicators reduce the total number of indexes, making it easier to assess
the environment and making clear the relationship between natural resources and the effect
urban development has on the environment.
2.1.6 Territorial dimension of indicators
The teams should pay much attention and give special care to the area to be covered by
the assessment. This is a problem of particular interest for urban centres in metropolitan zones
where urban limits are diffi cult to defi ne.
In contemporary societies, urbanization usually extends beyond city limits; as peripheral
and suburban zones grow, this creates confusion concerning city boundaries. In such cases
it is diffi cult to determine to what extent the environment is the product of pressure exerted by
one particular city and not by a cluster of urban centres.
It could also happen that the information available to make the assessment only refers to
the most important city of the metropolitan area, or that it refers to the metropolitan region as a
whole. In the latter case it is recommended that the indicators be used with a broader territorial
range than in the case of only one city, and that a note be included advising of the limitations
of the conclusions reached with the method employed.
Me
tho
do
log
y fo
r th
e p
rep
ara
tio
n o
f G
EO
Cit
ies
Re
po
rts
86
It should be emphasized that it is the city and municipal authorities, together with the local
technical team, that determine the territorial area to be covered by the GEO Cities assessment.
This is because its territorial range may vary depending on the urban-environmental interests
in question in each locality. The assessment and its report should, therefore, cover the areas
necessary to support the municipal authority in its activities during the urban development
process.
a) GEO Cities assessment and the rural theme
An important question to be considered is the notable urban-environmental bias in the
GEO Cities assessment. This places the problem of how to prepare the report for localities
with an important rural area within the framework of their socio-economic and environmental
dynamics.
For many municipalities in Latin America and the Caribbean, as well as in other regions
of the world, their urban areas do not necessarily coincide with what are considered, from
an administrative point of view, to be the city’s territorial boundaries. This is because many
municipalities have a rural area signifi cantly larger than the urban area and, therefore, this
has to be considered in the GEO Cities assessment when making an analysis of the urban-
environmental interaction.
When that is the case, it is suggested that the local technical team include in their analysis
the corresponding themes and indicators needed to include in the GEO Cities assessment the
locality’s rural dynamics as they relate to its urban-environmental dynamics. In this respect,
among other possible elements for analysis considered in the assessment should be themes
such as: the rural population dynamics (growth and migration); the structure of land ownership
(degree of concentration, size of holdings); principal products and how they are related to
the natural resources (demand for water and land, their effect on vegetal cover, their impact
on biodiversity, the use of agricultural inputs – fertilizers, defensives, etc.); their relationship
with markets (local, national, regional or international); and social confl icts. In the absence of
reliable and up-to-date quantitative information, it is suggested that the technical team at least
make an analysis based on qualitative data to leave evidence of the most important questions
concerning the rural theme and the effect on the locality’s urban-environmental problem.
In Annex 1 a detailed description is given of the indicators suggested to prepare the
integrated urban-environmental assessment within the context of the GEO Cities Project. Also
included is a brief discussion on the importance of each indicator, the calculating method
suggested or adopted, the urban-environmental relationship model referred to and its level.
b) Matrix of GEO Cities report basic indicators
The basic indicators to develop the GEO Cities reports are summarized in Tables 13-a,
13-b and 13-c.
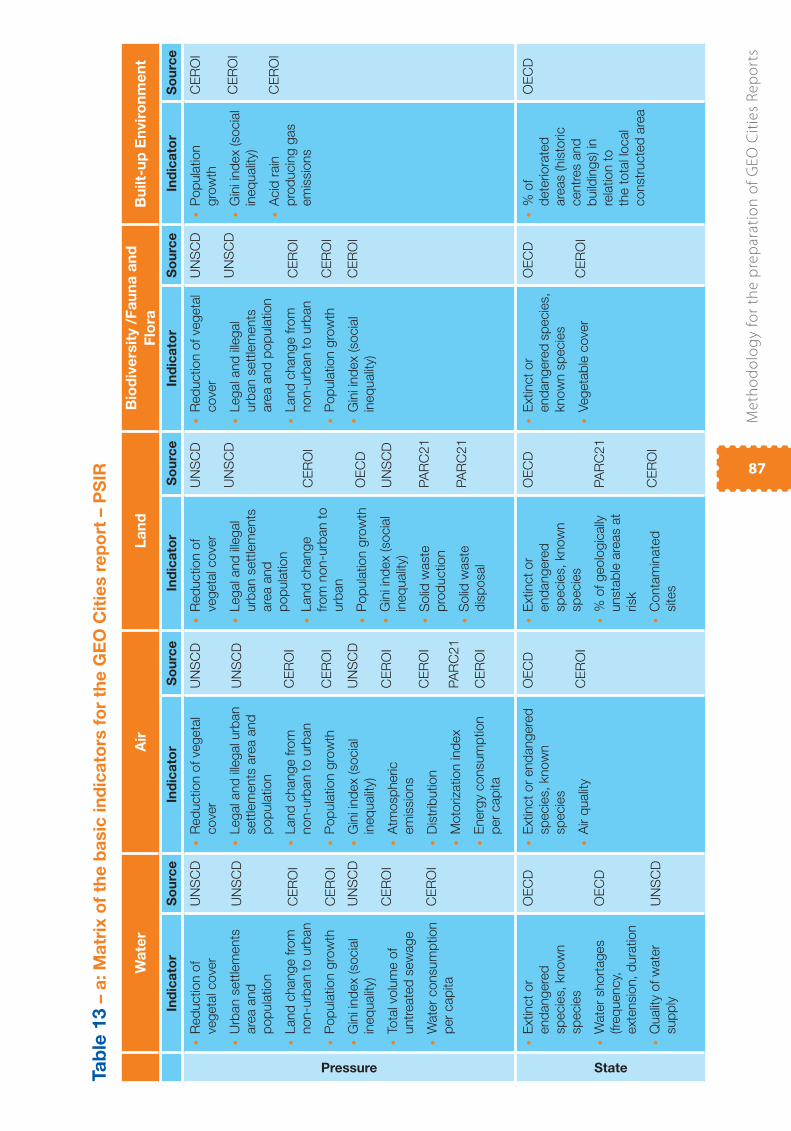
Me
tho
do
log
y fo
r th
e p
rep
ara
tio
n o
f G
EO
Cit
ies
Re
po
rts
87
Wa
ter
Air
La
nd
Bio
div
ers
ity /
Fa
un
a a
nd
Flo
raB
uilt-
up
En
vir
on
me
nt
Ind
ica
tor
So
urc
eIn
dic
ato
rS
ou
rce
Ind
ica
tor
So
urc
eIn
dic
ato
rS
ou
rce
Ind
ica
tor
So
urc
e
Pressure
Red
uction o
f •
vegeta
l cove
r
Urb
an s
ett
lem
ents
•
are
a a
nd
pop
ula
tion
Land
change fro
m
•
non-u
rban t
o u
rban
Pop
ula
tion g
row
th•
Gin
i ind
ex (socia
l •
ineq
ualit
y)
Tota
l volu
me o
f •
untr
eate
d s
ew
age
Wate
r consum
ption
•
per
cap
ita
UN
SC
D
UN
SC
D
CE
RO
I
CE
RO
I
UN
SC
D
CE
RO
I
CE
RO
I
Red
uction o
f ve
geta
l •
cove
r
Legal a
nd
ille
gal u
rban
•
sett
lem
ents
are
a a
nd
pop
ula
tion
Land
change fro
m
•
non-u
rban t
o u
rban
Pop
ula
tion g
row
th•
Gin
i ind
ex (socia
l •
ineq
ualit
y)
Atm
osp
heric
•
em
issio
ns
Dis
trib
ution
•
Moto
riza
tion in
dex
•
Energ
y consum
ption
•
per
cap
ita
UN
SC
D
UN
SC
D
CE
RO
I
CE
RO
I
UN
SC
D
CE
RO
I
CE
RO
I
PA
RC
21
CE
RO
I
Red
uction o
f •
vegeta
l cove
r
Legal a
nd
ille
gal
•
urb
an s
ett
lem
ents
are
a a
nd
pop
ula
tion
Land
change
•
from
non-u
rban t
o
urb
an
Pop
ula
tion g
row
th•
Gin
i ind
ex (socia
l •
ineq
ualit
y)
Solid
waste
•
pro
duction
Solid
waste
•
dis
posal
UN
SC
D
UN
SC
D
CE
RO
I
OE
CD
UN
SC
D
PA
RC
21
PA
RC
21
Red
uction o
f ve
geta
l •
cove
r
Legal a
nd
ille
gal
•
urb
an s
ett
lem
ents
are
a a
nd
pop
ula
tion
Land
change fro
m
•
non-u
rban t
o u
rban
Pop
ula
tion g
row
th•
Gin
i ind
ex (socia
l •
ineq
ualit
y)
UN
SC
D
UN
SC
D
CE
RO
I
CE
RO
I
CE
RO
I
Pop
ula
tion
•
gro
wth
Gin
i ind
ex (socia
l •
ineq
ualit
y)
Acid
rain
•
pro
ducin
g g
as
em
issio
ns
CE
RO
I
CE
RO
I
CE
RO
I
State
Extinct
or
•
end
angere
d
sp
ecie
s, know
n
sp
ecie
s
Wate
r short
ag
es
•
(fre
quency,
exte
nsio
n, d
ura
tion
Qualit
y of w
ate
r •
sup
ply
OE
CD
OE
CD
UN
SC
D
Extinct
or
end
angere
d
•
sp
ecie
s, know
n
sp
ecie
s
Air q
ualit
y•
OE
CD
CE
RO
I
Extinct
or
•
end
angere
d
sp
ecie
s, know
n
sp
ecie
s
% o
f geolo
gic
ally
•
unsta
ble
are
as a
t
risk
Conta
min
ate
d
•
sites
OE
CD
PA
RC
21
CE
RO
I
Extinct
or
•
end
angere
d s
pecie
s,
know
n s
pecie
s
Vegeta
ble
cove
r •
OE
CD
CE
RO
I
% o
f •
dete
riora
ted
are
as (his
toric
centr
es a
nd
build
ings) in
rela
tion t
o
the t
ota
l local
constr
ucte
d a
rea
OE
CD
Ta
ble
13 –
a: M
atr
ix o
f th
e b
asic
in
dic
ato
rs f
or
the
GE
O C
itie
s r
ep
ort
– P
SIR
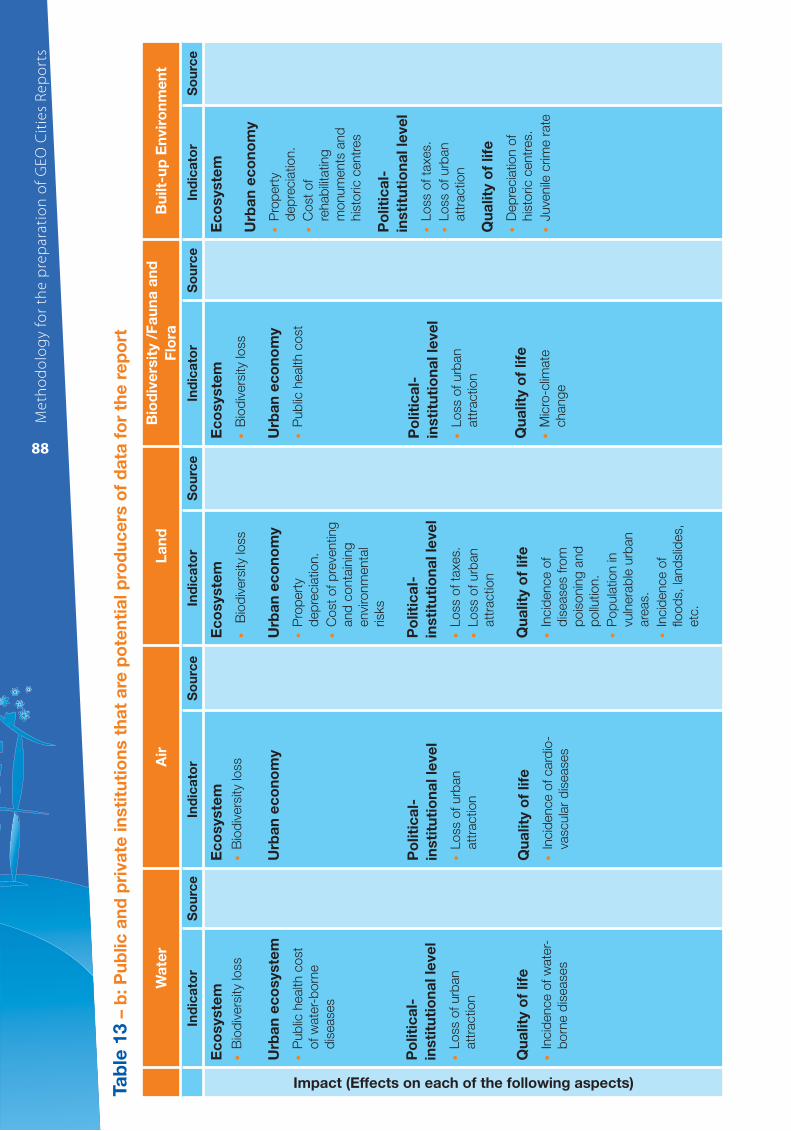
Me
tho
do
log
y fo
r th
e p
rep
ara
tio
n o
f G
EO
Cit
ies
Re
po
rts
88
Wa
ter
Air
La
nd
Bio
div
ers
ity /
Fa
un
a a
nd
Flo
raB
uilt-
up
En
vir
on
me
nt
Ind
ica
tor
So
urc
eIn
dic
ato
rS
ou
rce
Ind
ica
tor
So
urc
eIn
dic
ato
rS
ou
rce
Ind
ica
tor
So
urc
e
Impact (Effects on each of the following aspects)
Ec
osyste
m
Bio
div
ers
ity
loss
• Urb
an
ec
osyste
m
Pub
lic h
ealth c
ost
•
of w
ate
r-b
orn
e
dis
eases
Po
liti
ca
l-
insti
tuti
on
al le
ve
l
Loss o
f urb
an
•
att
raction
Qu
ality
of
life
Incid
ence o
f w
ate
r-•
born
e d
iseases
Ec
osyste
m
Bio
div
ers
ity
loss
• Urb
an
ec
on
om
y
Po
liti
ca
l-
insti
tuti
on
al le
ve
l
Loss o
f urb
an
•
att
raction
Qu
ality
of
life
Incid
ence o
f card
io-
•
vascula
r d
iseases
Ec
osyste
m
Bio
div
ers
ity
loss
• Urb
an
ec
on
om
y
Pro
pert
y •
dep
recia
tion.
Cost
of p
reve
nting
•
and
conta
inin
g
envi
ronm
enta
l
risks
Po
liti
ca
l-
insti
tuti
on
al le
ve
l
Loss o
f ta
xes.
•
Loss o
f urb
an
•
att
raction
Qu
ality
of
life
Incid
ence o
f •
dis
eases fro
m
pois
onin
g a
nd
pollu
tion.
Pop
ula
tion in
•
vuln
era
ble
urb
an
are
as.
Incid
ence o
f •
fl ood
s, la
nd
slid
es,
etc
.
Ec
osyste
m
Bio
div
ers
ity
loss
• Urb
an
ec
on
om
y
Pub
lic h
ealth c
ost
• Po
liti
ca
l-
insti
tuti
on
al le
ve
l
Loss o
f urb
an
•
att
raction
Qu
ality
of
life
Mic
ro-c
limate
•
change
Ec
osyste
m
Urb
an
ec
on
om
y
Pro
pert
y •
dep
recia
tion.
Cost
of
•
rehab
ilita
ting
monum
ents
and
his
toric c
entr
es
Po
liti
ca
l-
insti
tuti
on
al le
ve
l
Loss o
f ta
xes.
•
Loss o
f urb
an
•
att
raction
Qu
ality
of
life
Dep
recia
tion o
f •
his
toric c
entr
es.
Juve
nile
crim
e r
ate
•
Ta
ble
13 –
b: P
ub
lic
an
d p
riva
te in
sti
tuti
on
s t
ha
t a
re p
ote
nti
al p
rod
uc
ers
of
da
ta f
or
the
re
po
rt
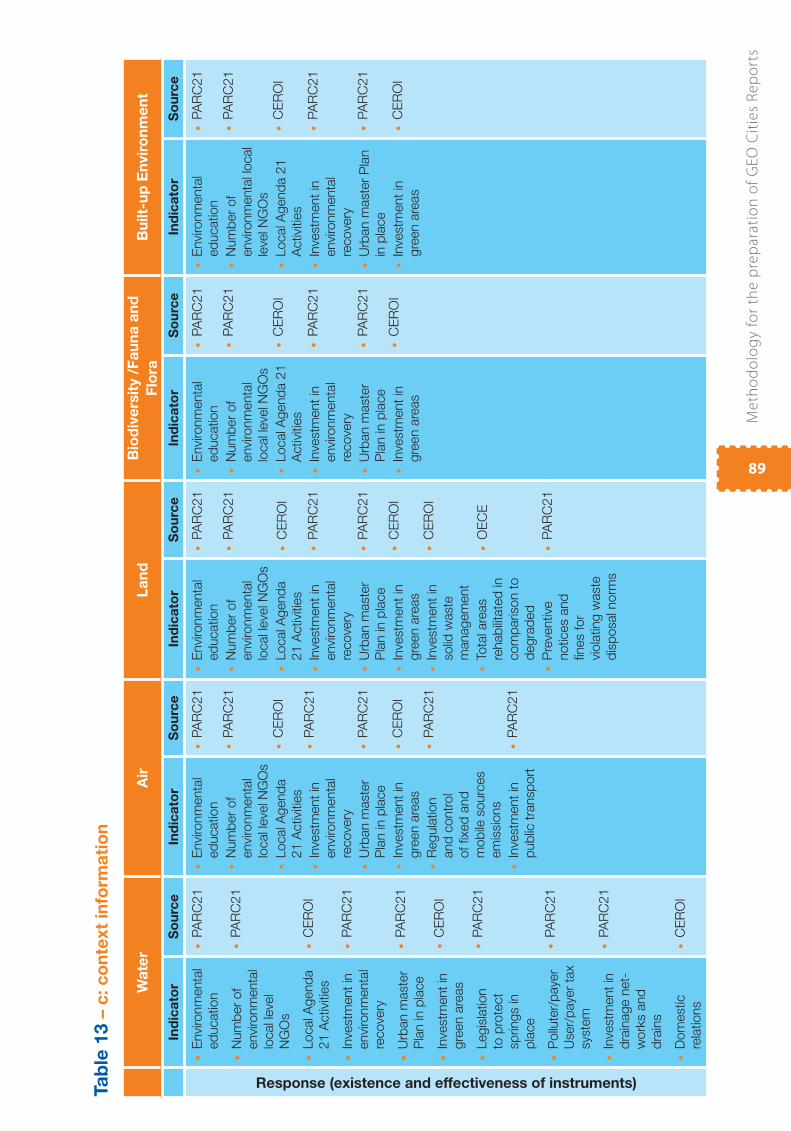
Me
tho
do
log
y fo
r th
e p
rep
ara
tio
n o
f G
EO
Cit
ies
Re
po
rts
89
Wa
ter
Air
La
nd
Bio
div
ers
ity /
Fa
un
a a
nd
Flo
raB
uilt-
up
En
vir
on
me
nt
Ind
ica
tor
So
urc
eIn
dic
ato
rS
ou
rce
Ind
ica
tor
So
urc
eIn
dic
ato
rS
ou
rce
Ind
ica
tor
So
urc
e
Response (existence and effectiveness of instruments)
Envi
ronm
enta
l •
ed
ucation
Num
ber
of
•
envi
ronm
enta
l
local l
eve
l
NG
Os
Local A
gend
a
•
21 A
ctivi
ties
Inve
stm
ent
in
•
envi
ronm
enta
l
recove
ry
Urb
an m
aste
r •
Pla
n in
pla
ce
Inve
stm
ent
in
•
gre
en a
reas
Legis
lation
•
to p
rote
ct
sp
rings in
pla
ce
Pollu
ter/
paye
r •
User/
paye
r ta
x
sys
tem
Inve
stm
ent
in
•
dra
inage n
et-
work
s a
nd
dra
ins
Dom
estic
•
rela
tions
PA
RC
21
•
PA
RC
21
•
CE
RO
I•
PA
RC
21
•
PA
RC
21
•
CE
RO
I•
PA
RC
21
•
PA
RC
21
•
PA
RC
21
•
CE
RO
I•
Envi
ronm
enta
l •
ed
ucation
Num
ber
of
•
envi
ronm
enta
l
local l
eve
l NG
Os
Local A
gend
a
•
21 A
ctivi
ties
Inve
stm
ent
in
•
envi
ronm
enta
l
recove
ry
Urb
an m
aste
r •
Pla
n in
pla
ce
Inve
stm
ent
in
•
gre
en a
reas
Regula
tion
•
and
contr
ol
of fi x
ed
and
mob
ile s
ourc
es
em
issio
ns
Inve
stm
ent
in
•
pub
lic t
ransp
ort
PA
RC
21
•
PA
RC
21
•
CE
RO
I•
PA
RC
21
•
PA
RC
21
•
CE
RO
I•
PA
RC
21
•
PA
RC
21
•
Envi
ronm
enta
l •
ed
ucation
Num
ber
of
•
envi
ronm
enta
l
local l
eve
l NG
Os
Local A
gend
a
•
21 A
ctivi
ties
Inve
stm
ent
in
•
envi
ronm
enta
l
recove
ry
Urb
an m
aste
r •
Pla
n in
pla
ce
Inve
stm
ent
in
•
gre
en a
reas
Inve
stm
ent
in
•
solid
waste
managem
ent
Tota
l are
as
•
rehab
ilita
ted
in
com
parison t
o
degra
ded
Pre
ventive
•
notices a
nd
fi nes for
viola
ting w
aste
dis
posal n
orm
s
PA
RC
21
•
PA
RC
21
•
CE
RO
I•
PA
RC
21
•
PA
RC
21
•
CE
RO
I•
CE
RO
I•
OE
CE
•
PA
RC
21
•
Envi
ronm
enta
l •
ed
ucation
Num
ber
of
•
envi
ronm
enta
l
local l
eve
l NG
Os
Lo
cal A
gend
a 2
1
•
Activi
ties
Inve
stm
ent
in
•
envi
ronm
enta
l
recove
ry
Urb
an m
aste
r •
Pla
n in
pla
ce
Inve
stm
ent
in
•
gre
en a
reas
PA
RC
21
•
PA
RC
21
•
CE
RO
I•
PA
RC
21
•
PA
RC
21
•
CE
RO
I•
Envi
ronm
enta
l •
ed
ucation
Num
ber
of
•
envi
ronm
enta
l local
leve
l NG
Os
Local A
gend
a 2
1
•
Activi
ties
Inve
stm
ent
in
•
envi
ronm
enta
l
recove
ry
Urb
an m
aste
r P
lan
•
in p
lace
Inve
stm
ent
in
•
gre
en a
reas
PA
RC
21
•
PA
RC
21
•
CE
RO
I•
PA
RC
21
•
PA
RC
21
•
CE
RO
I•
Ta
ble
13 –
c: c
on
text
info
rma
tio
n
Me
tho
do
log
y fo
r th
e p
rep
ara
tio
n o
f G
EO
Cit
ies
Re
po
rts
90
2.2 Data collection and analysis
Preparing an assessment and its GEO Cities report implies managing an enormous amount
of information. It is necessary, therefore, to:
Identify sources. •
Systematize information. •
Create a database.•
2.2.1 Identify primary data sources and available information
As the information needed to prepare the report is most likely dispersed among different
institutions, the fi rst task is to collect and organize it in a database so that the local technical
team has a permanent source to consult.
Except in special cases, the technical team is not expected to produce primary data,
that is to say, new information that was not available when the proposal was evaluated. Due
to limitations of time and resources, and technical diffi culties in gathering primary data, the
material to be analysed will consist of secondary data that have already been prepared by
institutions in each locality and/or country.
The fi rst step to guarantee the quality of the work is to identify available information sources.
These information sources may be classifi ed according to the territorial range of the data
produced or the institutional character of each of them, as set out below:
GEO Sao Paulo – Example of information gathering experience >
Mention is made of the general diffi culties in obtaining secondary data and information from
government agencies as well as from private entities and non-governmental organizations;
this is the case even when they are predisposed to assist and most of them collaborate.
Problems were encountered when most of the data was unavailable because it was not
physically accessible or had not been organized. Another point to be mentioned is that much
information is available only on the area of the Sao Paulo Metropolitan Region (RMSP); that
is to say, for a context where data about the municipality of Sao Paul need to be separated.
Th e precarious and disperse manner in which a large part of information on the environment
is kept, as well as the various obstacles set by some agencies’ operational procedures in
allowing public access to it, shows there is still a long way to go before better exchange and
dissemination of information among public bodies and society in general can be achieved.
In this context it is important to stress that, even though the GEO Cities report intends to
use mainly secondary data, lack of information thought to be essential for the work (or even
having other information that is unclassifi ed or insuffi cient) requires that some primary
data be obtained and produced [this allowed the Sao Paulo GEO technical team to prepare
what can be considered to be a pertinent report]
Range – local, national, regional and international institutions
Information with which to formulate, manage and assess policies has become an instrument
that enables local governments and society to intervene in formulating necessary urban-
environmental management laws. Some institutions have experience in producing data that
qualifi es them as sources from which to obtain the information needed to prepare the GEO
Cities report.
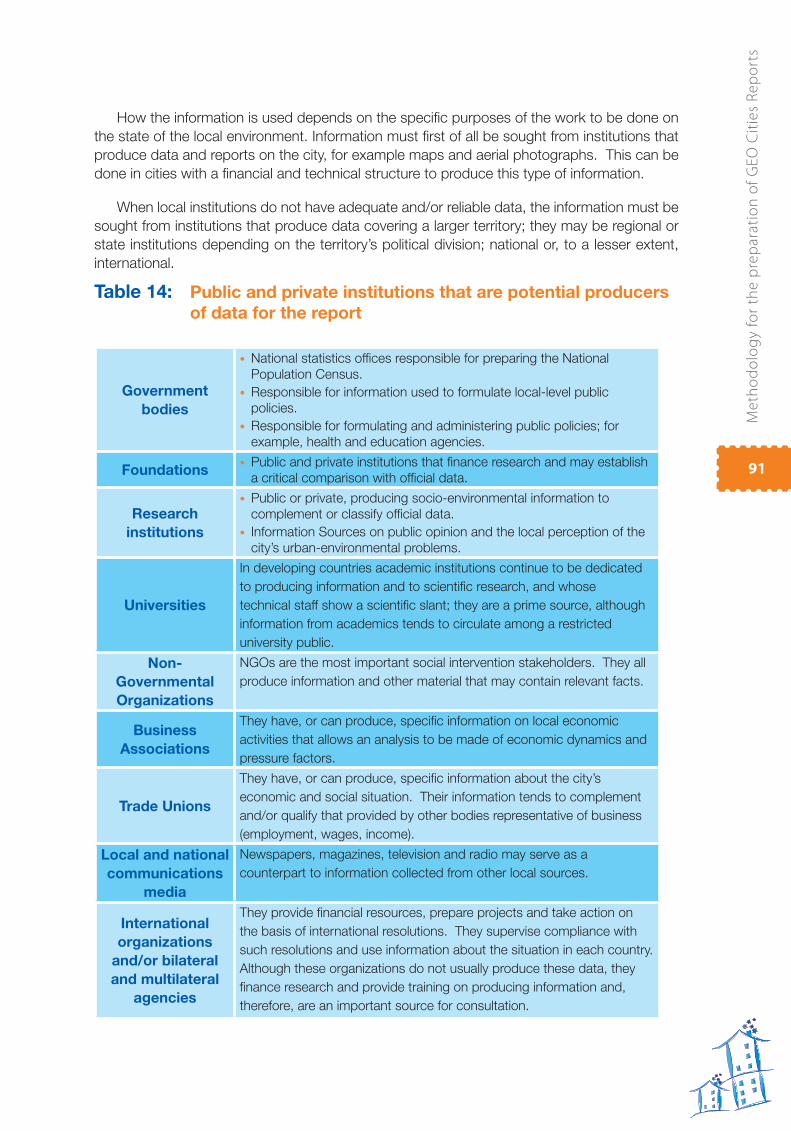
Me
tho
do
log
y fo
r th
e p
rep
ara
tio
n o
f G
EO
Cit
ies
Re
po
rts
91
How the information is used depends on the specifi c purposes of the work to be done on
the state of the local environment. Information must fi rst of all be sought from institutions that
produce data and reports on the city, for example maps and aerial photographs. This can be
done in cities with a fi nancial and technical structure to produce this type of information.
When local institutions do not have adequate and/or reliable data, the information must be
sought from institutions that produce data covering a larger territory; they may be regional or
state institutions depending on the territory’s political division; national or, to a lesser extent,
international.
Table 14: Public and private institutions that are potential producers
of data for the report
Government
bodies
National statistics offi ces responsible for preparing the National •
Population Census.
Responsible for information used to formulate local-level public •
policies.
Responsible for formulating and administering public policies; for •
example, health and education agencies.
FoundationsPublic and private institutions that fi nance research and may establish •
a critical comparison with offi cial data.
Research
institutions
Public or private, producing socio-environmental information to •
complement or classify offi cial data.
Information Sources on public opinion and the local perception of the •
city’s urban-environmental problems.
Universities
In developing countries academic institutions continue to be dedicated
to producing information and to scientifi c research, and whose
technical staff show a scientifi c slant; they are a prime source, although
information from academics tends to circulate among a restricted
university public.
Non-
Governmental
Organizations
NGOs are the most important social intervention stakeholders. They all
produce information and other material that may contain relevant facts.
Business
Associations
They have, or can produce, specifi c information on local economic
activities that allows an analysis to be made of economic dynamics and
pressure factors.
Trade Unions
They have, or can produce, specifi c information about the city’s
economic and social situation. Their information tends to complement
and/or qualify that provided by other bodies representative of business
(employment, wages, income).
Local and national
communications
media
Newspapers, magazines, television and radio may serve as a
counterpart to information collected from other local sources.
International
organizations
and/or bilateral
and multilateral
agencies
They provide fi nancial resources, prepare projects and take action on
the basis of international resolutions. They supervise compliance with
such resolutions and use information about the situation in each country.
Although these organizations do not usually produce these data, they
fi nance research and provide training on producing information and,
therefore, are an important source for consultation.
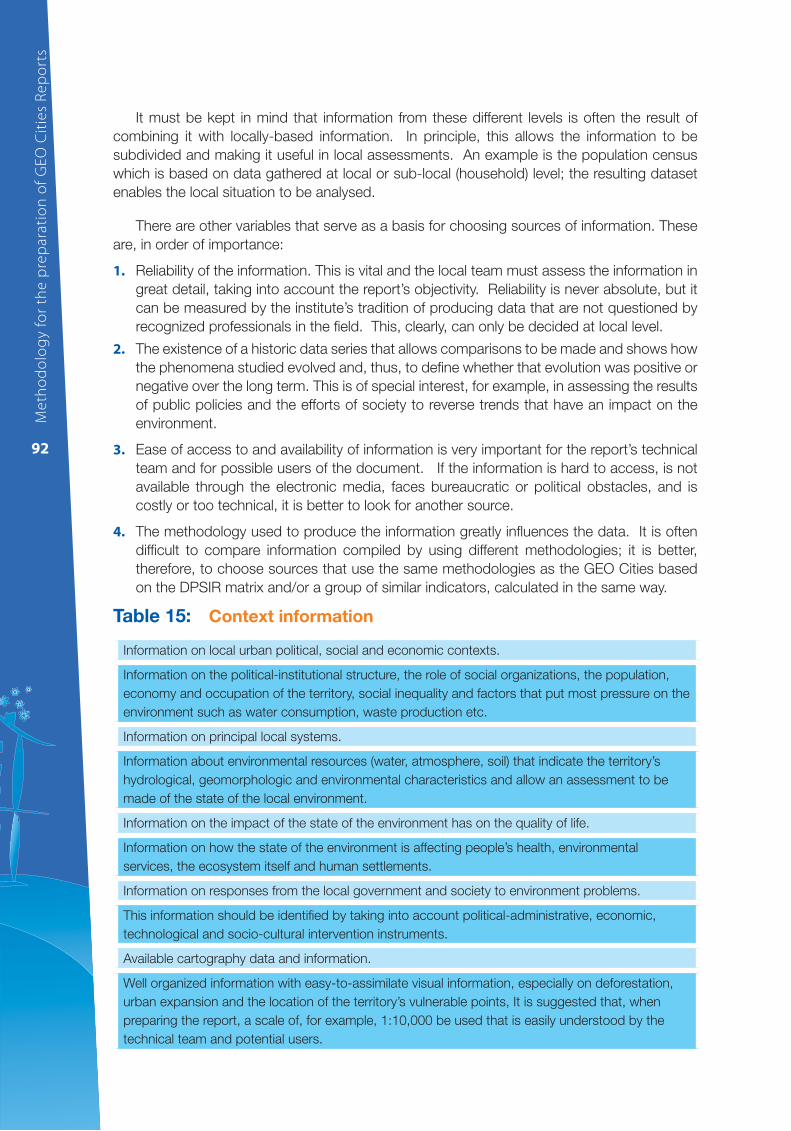
Me
tho
do
log
y fo
r th
e p
rep
ara
tio
n o
f G
EO
Cit
ies
Re
po
rts
92
It must be kept in mind that information from these different levels is often the result of
combining it with locally-based information. In principle, this allows the information to be
subdivided and making it useful in local assessments. An example is the population census
which is based on data gathered at local or sub-local (household) level; the resulting dataset
enables the local situation to be analysed.
There are other variables that serve as a basis for choosing sources of information. These
are, in order of importance:
1. Reliability of the information. This is vital and the local team must assess the information in
great detail, taking into account the report’s objectivity. Reliability is never absolute, but it
can be measured by the institute’s tradition of producing data that are not questioned by
recognized professionals in the fi eld. This, clearly, can only be decided at local level.
2. The existence of a historic data series that allows comparisons to be made and shows how
the phenomena studied evolved and, thus, to defi ne whether that evolution was positive or
negative over the long term. This is of special interest, for example, in assessing the results
of public policies and the efforts of society to reverse trends that have an impact on the
environment.
3. Ease of access to and availability of information is very important for the report’s technical
team and for possible users of the document. If the information is hard to access, is not
available through the electronic media, faces bureaucratic or political obstacles, and is
costly or too technical, it is better to look for another source.
4. The methodology used to produce the information greatly infl uences the data. It is often
diffi cult to compare information compiled by using different methodologies; it is better,
therefore, to choose sources that use the same methodologies as the GEO Cities based
on the DPSIR matrix and/or a group of similar indicators, calculated in the same way.
Table 15: Context information
Information on local urban political, social and economic contexts.
Information on the political-institutional structure, the role of social organizations, the population,
economy and occupation of the territory, social inequality and factors that put most pressure on the
environment such as water consumption, waste production etc.
Information on principal local systems.
Information about environmental resources (water, atmosphere, soil) that indicate the territory’s
hydrological, geomorphologic and environmental characteristics and allow an assessment to be
made of the state of the local environment.
Information on the impact of the state of the environment has on the quality of life.
Information on how the state of the environment is affecting people’s health, environmental
services, the ecosystem itself and human settlements.
Information on responses from the local government and society to environment problems.
This information should be identifi ed by taking into account political-administrative, economic,
technological and socio-cultural intervention instruments.
Available cartography data and information.
Well organized information with easy-to-assimilate visual information, especially on deforestation,
urban expansion and the location of the territory’s vulnerable points, It is suggested that, when
preparing the report, a scale of, for example, 1:10,000 be used that is easily understood by the
technical team and potential users.
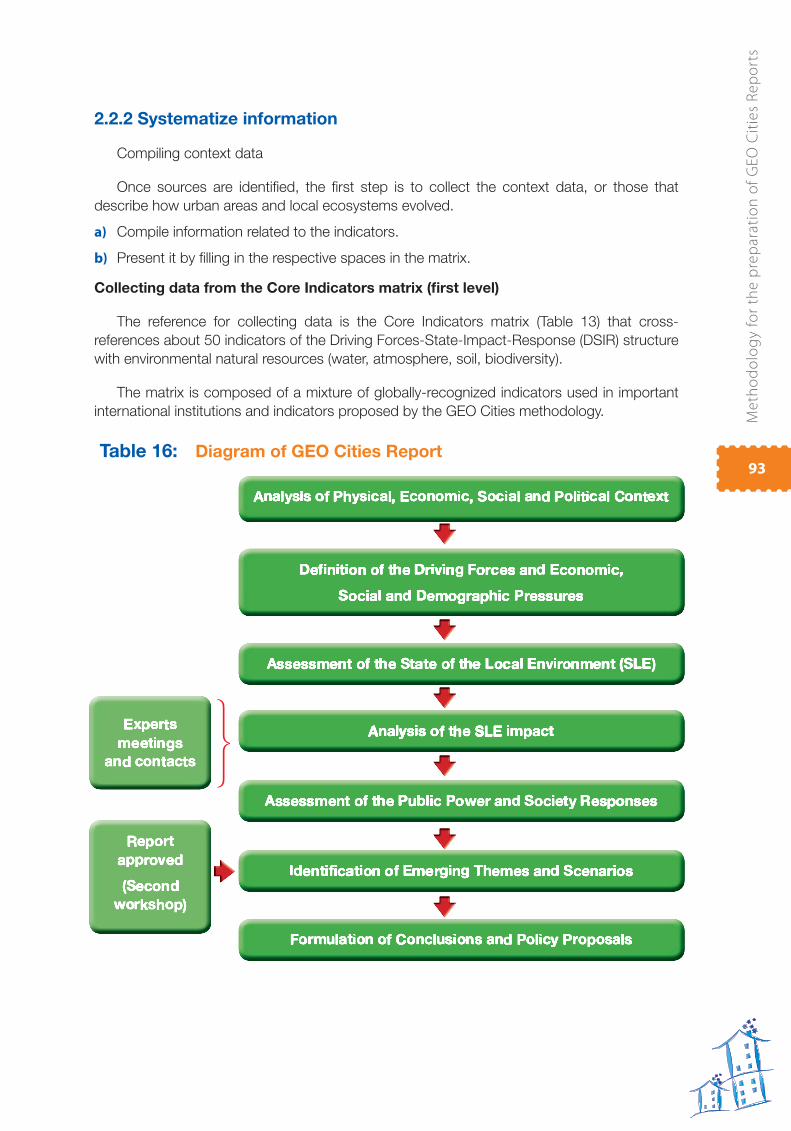
Me
tho
do
log
y fo
r th
e p
rep
ara
tio
n o
f G
EO
Cit
ies
Re
po
rts
93
2.2.2 Systematize information
Compiling context data
Once sources are identifi ed, the fi rst step is to collect the context data, or those that
describe how urban areas and local ecosystems evolved.
a) Compile information related to the indicators.
b) Present it by fi lling in the respective spaces in the matrix.
Collecting data from the Core Indicators matrix (fi rst level)
The reference for collecting data is the Core Indicators matrix (Table 13) that cross-
references about 50 indicators of the Driving Forces-State-Impact-Response (DSIR) structure
with environmental natural resources (water, atmosphere, soil, biodiversity).
The matrix is composed of a mixture of globally-recognized indicators used in important
international institutions and indicators proposed by the GEO Cities methodology.
Table 16: Diagram of GEO Cities Report
Me
tho
do
log
y fo
r th
e p
rep
ara
tio
n o
f G
EO
Cit
ies
Re
po
rts
94
Compiling proxy indicators (second level)
The information on the GEO Cities indicators will not always be found at local level; at times
the indicator will not be produced by local institutions; at others, the way it is produced will
differ from that described here. In these cases the technical team will use the proxy indicators;
these make it possible to arrive at a fair approximation of what is being analysed, although it is
not exactly the same as the original indicators.
The proxy indicators may be produced locally; however, the local team must check the
documents and electronic sites of the producing institutions to assess whether they are the
most appropriate substitutes. Whatever the solution, the technical team must point out the
indicators used as proxies and present the source and methodology used in the defi nition that
results from using them. In that case, it will be necessary to specify the source of the data, the
methodology used and the degree of reliability of the indicators.
Selecting and compiling local indicators (third level)
The GEO Cities report also seeks to encourage the technical teams in each city, when
assessing the state of the environment, to use information and data specifi c to the locality.
Besides the already-mentioned indicators, this will provide the opportunity to include information
typical of each city, so that its particular features appear in the fi nal document. The technical
team may choose local indicators to do this
Two methods may be used to select the local indicators:
1. Consult local sources
Local institutions are to be preferred because, as they have local experience and knowledge,
their information is more likely to be reliable.
2. Public consultation
Social groups may be interested in a process such as the GEO Cities. For a public
consultation to be feasible it is recommended that a participatory methodology be applied that
combines the use of focus groups, such as joining relevant urban-environmental groups with
specialists, and holding public meetings; doing so will validate the indicator and facilitate fi nal
acceptance of the document.
Defi ning and compilating data relating to the new indicators
Finally, data corresponding to the indicators suggested by the technical team itself, even
if not intended for publication, should be compiled. In this case, the team should be assisted
by professionals with experience in producing indicators and combining data, as well as with
enough relevant knowledge to generate new references.
As already mentioned, a description should be given of the source of the data, the
methodology used, the possible degree of reliability of the new indicators, and the objective it
is hoped to reach by including them in the state of the local environment assessment.
2.2.3 Establish a local environmental database
The database organizes information, according to the different themes, in the format
proposed for the report. The data should be arranged according to the document’s chapters
so as to enable the technical team to follow up on collecting the information to facilitate later
analyses.
Me
tho
do
log
y fo
r th
e p
rep
ara
tio
n o
f G
EO
Cit
ies
Re
po
rts
95
With programmes such as Excel and Access, if the data identifi ed can be quantifi ed, the
database may be transformed into a data bank, making it possible to prepare graphs and
tables. This also allows an assessment to be made of the future outlook for cities, indicating
the main risks and emerging themes concerning improving the state of the environment.
After this has been done, the technical team can begin drafting the report.
Stage 3. Preparing the GEO Cities Report
3.1 Data and information analysis
The analysis of the data and information compiled in the previous stage should meet fi ve
objectives:
Identifying environmental priorities;•
Preparing the assessment on the state of the local environment and the impacts of that •
state;
Assessing the responses of government and society;•
Defi ning emerging themes;•
Building future scenarios.•
Chapter 2 contains a detailed description of the methodology of this analysis and its
contents.
3.1.1 Identify environmental priorities
The report should help to identify the most signifi cant environmental priorities in each city, as
well as the opportunities most likely to be successful for short- and medium-term intervention by
local government and society. It should also seek to lead environmental bodies and institutions
towards creating early warning mechanisms for local government and society.
One of the expected results is to set priorities to deal with the city’s environmental problems.
To begin with, the proposal is to focus on the most relevant and immediate action taken by
the different sectors. Defi ning priorities does not mean jettisoning less urgent decisions on
promoting improvements to the environment. Perhaps the best strategy to follow is to keep in
mind the local government’s economic and human resources limits.
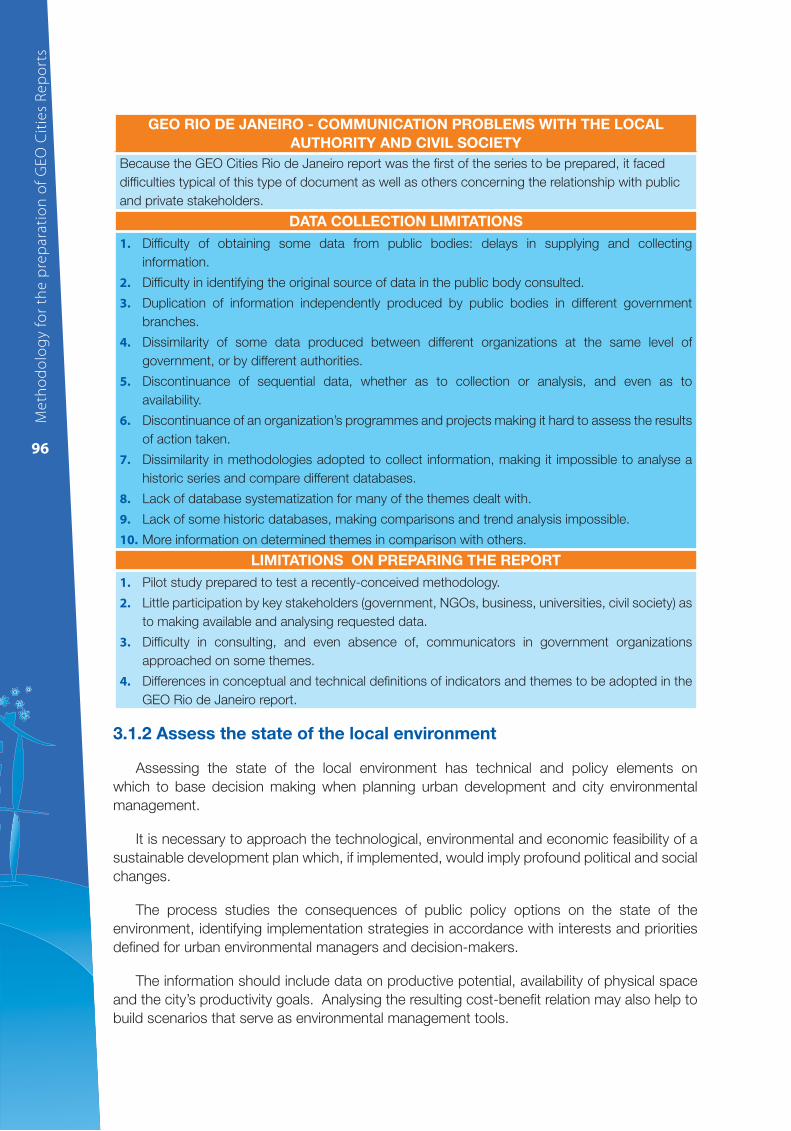
Me
tho
do
log
y fo
r th
e p
rep
ara
tio
n o
f G
EO
Cit
ies
Re
po
rts
96
GEO RIO DE JANEIRO - COMMUNICATION PROBLEMS WITH THE LOCAL
AUTHORITY AND CIVIL SOCIETY
Because the GEO Cities Rio de Janeiro report was the fi rst of the series to be prepared, it faced
diffi culties typical of this type of document as well as others concerning the relationship with public
and private stakeholders.
DATA COLLECTION LIMITATIONS
1. Diffi culty of obtaining some data from public bodies: delays in supplying and collecting
information.
2. Diffi culty in identifying the original source of data in the public body consulted.
3. Duplication of information independently produced by public bodies in different government
branches.
4. Dissimilarity of some data produced between different organizations at the same level of
government, or by different authorities.
5. Discontinuance of sequential data, whether as to collection or analysis, and even as to
availability.
6. Discontinuance of an organization’s programmes and projects making it hard to assess the results
of action taken.
7. Dissimilarity in methodologies adopted to collect information, making it impossible to analyse a
historic series and compare different databases.
8. Lack of database systematization for many of the themes dealt with.
9. Lack of some historic databases, making comparisons and trend analysis impossible.
10. More information on determined themes in comparison with others.
LIMITATIONS ON PREPARING THE REPORT
1. Pilot study prepared to test a recently-conceived methodology.
2. Little participation by key stakeholders (government, NGOs, business, universities, civil society) as
to making available and analysing requested data.
3. Diffi culty in consulting, and even absence of, communicators in government organizations
approached on some themes.
4. Differences in conceptual and technical defi nitions of indicators and themes to be adopted in the
GEO Rio de Janeiro report.
3.1.2 Assess the state of the local environment
Assessing the state of the local environment has technical and policy elements on
which to base decision making when planning urban development and city environmental
management.
It is necessary to approach the technological, environmental and economic feasibility of a
sustainable development plan which, if implemented, would imply profound political and social
changes.
The process studies the consequences of public policy options on the state of the
environment, identifying implementation strategies in accordance with interests and priorities
defi ned for urban environmental managers and decision-makers.
The information should include data on productive potential, availability of physical space
and the city’s productivity goals. Analysing the resulting cost-benefi t relation may also help to
build scenarios that serve as environmental management tools.
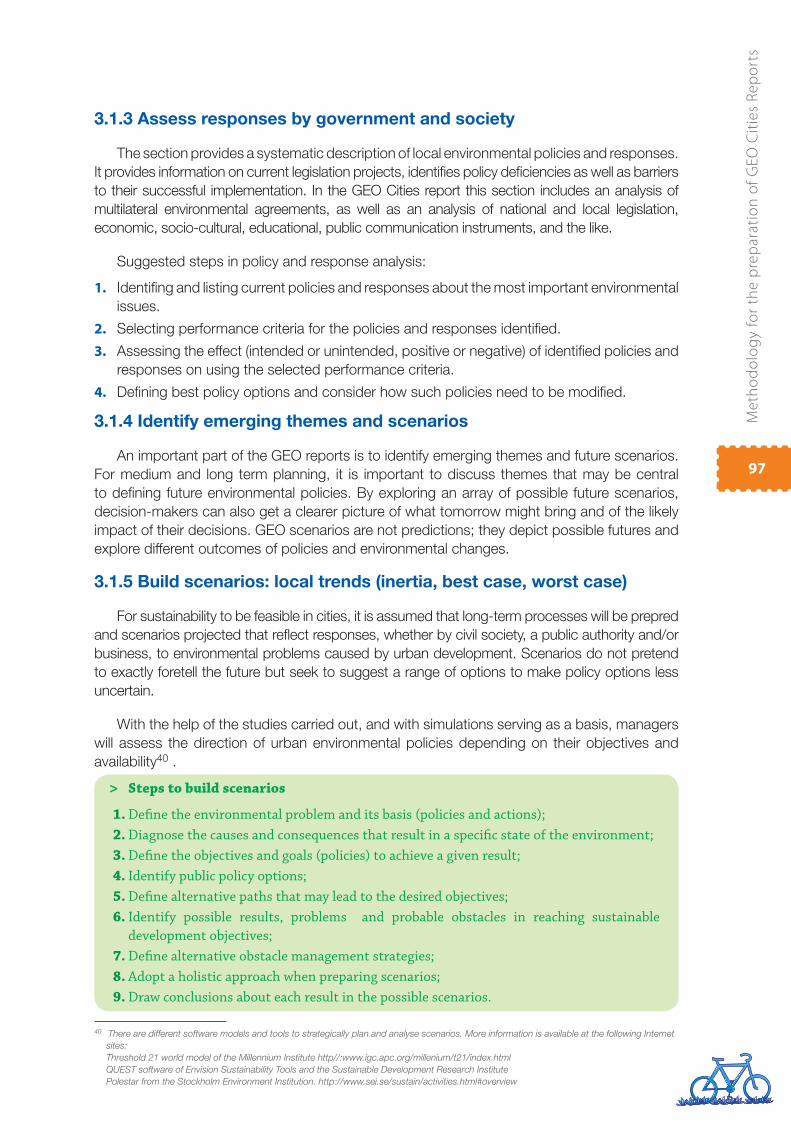
Me
tho
do
log
y fo
r th
e p
rep
ara
tio
n o
f G
EO
Cit
ies
Re
po
rts
97
3.1.3 Assess responses by government and society
The section provides a systematic description of local environmental policies and responses.
It provides information on current legislation projects, identifi es policy defi ciencies as well as barriers
to their successful implementation. In the GEO Cities report this section includes an analysis of
multilateral environmental agreements, as well as an analysis of national and local legislation,
economic, socio-cultural, educational, public communication instruments, and the like.
Suggested steps in policy and response analysis:
1. Identifi ng and listing current policies and responses about the most important environmental
issues.
2. Selecting performance criteria for the policies and responses identifi ed.
3. Assessing the effect (intended or unintended, positive or negative) of identifi ed policies and
responses on using the selected performance criteria.
4. Defi ning best policy options and consider how such policies need to be modifi ed.
3.1.4 Identify emerging themes and scenarios
An important part of the GEO reports is to identify emerging themes and future scenarios.
For medium and long term planning, it is important to discuss themes that may be central
to defi ning future environmental policies. By exploring an array of possible future scenarios,
decision-makers can also get a clearer picture of what tomorrow might bring and of the likely
impact of their decisions. GEO scenarios are not predictions; they depict possible futures and
explore different outcomes of policies and environmental changes.
3.1.5 Build scenarios: local trends (inertia, best case, worst case)
For sustainability to be feasible in cities, it is assumed that long-term processes will be prepred
and scenarios projected that refl ect responses, whether by civil society, a public authority and/or
business, to environmental problems caused by urban development. Scenarios do not pretend
to exactly foretell the future but seek to suggest a range of options to make policy options less
uncertain.
With the help of the studies carried out, and with simulations serving as a basis, managers
will assess the direction of urban environmental policies depending on their objectives and
availability40 .
Steps to build scenarios >
1. Defi ne the environmental problem and its basis (policies and actions);
2. Diagnose the causes and consequences that result in a specifi c state of the environment;
3. Defi ne the objectives and goals (policies) to achieve a given result;
4. Identify public policy options;
5. Defi ne alternative paths that may lead to the desired objectives;
6. Identify possible results, problems and probable obstacles in reaching sustainable
development objectives;
7. Defi ne alternative obstacle management strategies;
8. Adopt a holistic approach when preparing scenarios;
9. Draw conclusions about each result in the possible scenarios.
40 There are different software models and tools to strategically plan and analyse scenarios. More information is available at the following Internet
sites:
Threshold 21 world model of the Millennium Institute http//:www.igc.apc.org/millenium/t21/index.html
QUEST software of Envision Sustainability Tools and the Sustainable Development Research Institute
Polestar from the Stockholm Environment Institution. http://www.sei.se/sustain/activities.html#overview

Me
tho
do
log
y fo
r th
e p
rep
ara
tio
n o
f G
EO
Cit
ies
Re
po
rts
98
Preparing scenarios implies setting in motion possible views of the future based on present
options. Building them demands the use of both qualitative and quantitative information.
The description of some trends may be less uncertain and, in this case, quantitative
information is more useful.
The result will be a mixture of potential indicators, trends and goals with explanatory historic
texts. To be effective in decision making, these analyses should be simple but plausible.
Information on costs and benefi ts is also relevant because it allows the analysis to determine
how feasible is the economy, and the fi nancial needs of each scenario.
The scenarios are built on three types of trends:
The inertia trend• is considered as the possibility that there will be no responses about
how to confront detected environmental problems; that any such responses will not
be the right ones; or that conditions to implement them will not help to reach the
objectives. In this case, the future scenario will project that the environmental problems
detected will become worse.
The best case trend• is where the responses by local government and society would
be perfectly adequate for the problems and there are no obstacles to prevent them
from being implemented. In this case, the scenario will project an improvement in the
state of the local environment in all sectors that might suffer from intervention by social
agents.
The worst case trend• is where there is no response to the problems confronted,
or where conditions to implement the responses make no contribution or even put
hard-to-overcome obstacles in the way, or where mistaken decisions by social agents
worsen or increase pressure factors on the environment.
These scenarios should help decision-makers to assess the impact of the action they take,
or fail to take, on the city’s environmental problems.
GEO BUENOS AIRES – PREPARING THE REPORT >
Because of the need for collective refl ections in preparing this report, a number of meetings
and workshops were held with members of the Environment and Ecology Institute (IMAE),
and with external specialists and special guests, namely:
• Eight general meetings to discuss the methodology and how to present the partial reports
by speciality, supported by documents prepared by IMAE, based on the GEO methodology
contained in the “Training Manual on Integrated Environmental Assessment and
Reporting" (Pinter and others, 2000).
• Four interdisciplinary meetings to work on the proposal for the indicators. Environmental
problems analysed at these meetings were: drinking water supply, fl oods, riverside
vulnerability, soil and solid waste.
• Two work days to discuss the relationship between the central themes of pressure and
state of the environment (air, water, soil, local ecosystems, biodiversity and built-up
environment: urban patrimony).
• Th ree micro-workshops on the following themes: "Local ecosystems, biodiversity and
forests", "Urban patrimony" and "Impacts of urban sprawl expansion". Th e objective of
Me
tho
do
log
y fo
r th
e p
rep
ara
tio
n o
f G
EO
Cit
ies
Re
po
rts
99
these workshops was to agree on recommendations about how to respond to the principal
problems seen in the city and revise existing environmental policies. Government
technical experts and specialists from diff erent institutions concerned with the themes
dealt with were invited from: the Central Society of Architects; the University of Buenos
Aires (UBA); the National Academy of Medicine of Buenos Aires; and the University of
Salvador. Also invited were members of the CONICET Research degree course from the
National University of Lujan.
• Two meetings to assess environmental policies related to the themes of air, water, soil,
biodiversity, local ecosystems locales and the built-up environment: urban patrimony.
Responses received were assessed as to achievements and/or strengths, obstacles and/or
weaknesses and future priority action.
• Finally, UNEP-ROLAC, with IMAE collaboration, organized the "GEO City of Buenos Aires
Workshop: Integrated Environmental Assessment of the City of Buenos Aires" to bring
together experts to review and validate a draft report on which to base the fi nal report.
Th e workshop was attended by relevant city stakeholders, and others from governmental
and non-governmental spheres who debated, made comments and presented up-to-date
information. Th e workshop was supported by the Secretariat of the Environment and
Urban Planning and the Strategic Plan of the Government of the City of Buenos Aires.
It was arranged by the Fundación Cambio Democrático (Th e Foundation for Democratic
Change), a NGO whose mission is to prevent and solve confl icts by promoting a culture of
peace and participation. It also prepared the methodological document and the workshop’s
fi nal report.
Th ese workshops and meetings were a contribution to consolidate the methodology for the
GEO Buenos Aires project. Considering that the documents prepared for this report are
technical proposals in support of environmental management, if the undertaking is to be a
success, it is essential that the community and those responsible for environmental policies
participate
3.1.6 Conclusions and recommendations
Once the four objectives of information and data analysis have been met, the technical
team will be ready to draft recommendations and conclusions to guide decision-makers.
The conclusions should:
Identify the principal factors of urban pressure on environmental resources and the •
most signifi cant features of the state of the local environment.
Describe the impact of the responses, and of how they were adapted to the problems •
detected.
Assess the conditions that either assisted or impeded the technical and political •
effectiveness of the responses given.
Include a brief analysis of trends detected, indicating the consequences if the problems •
are dealt with, or if they are ignored.
The conclusions include a synthetic view of the origins and features of the city’s existing
environmental problems, their impact and responses and the policies proposed to deal with
them. The conclusions may be organized by following the chapters of the report or of the work
as a whole.
Me
tho
do
log
y fo
r th
e p
rep
ara
tio
n o
f G
EO
Cit
ies
Re
po
rts
100
As a result of the joint consultation between interested social stakeholders, a list should be
prepared of urban-environmental policy proposals designed to change conditions that affect
the local environment. The proposals should establish objectives and goals; they should also
describe action, instruments and institutional and fi nancial resources needed to execute the
policies described in the report.
It should be shown that the policies proposed are directly related to the report’s analysis,
indicating how applying them will help to change environmental conditions and the impact they
will have on the quality of life, the ecosystem and the urban economy. The expected responses
to pressure factors, environmental conditions and impacts should always be included.
Furthermore, recommendations should be made to facilitate or create institutional, fi nancial,
social, policy and cultural conditions suitable to apply the suggested policies.
These recommendations may include:
The need to provide better technical training for interested social stakeholders.•
How the local government budget will be spent on socio-environmental action.•
The creation of specifi c urban-environmental intervention bodies.•
Ensuring civil society participation in formulating public policies.•
The need for exchanges with national or international bodies or institutions to broaden •
the local government’s technical range and thus inform its urban-environmental efforts
3.1.7 Statistical annexes
In the section on annexes the report should include the statistical information on which the
analyses are based. To this effect, while it is being drafted, because of their importance, ease
of understanding or level of inclusion, data presented in the body of the report as tables or
charts, should be separated from those that may make the report harder to understand. There
is no need to reproduce all the information collected; the technical team should only include
the most important data in the statistical information.
For ease of use and linkage, it is recommended that the statistics be presented in the same
sequence as the chapters of the report. The methodology used should also be included to
produce the most up-to-date data on the subject, as well as its history, if any.
3.1.8 Bibliography
The bibliography will inform the reader where to fi nd the data and information presented; it
should include the complete name of the author or the institution, the title, publisher, the city
or country, the year of publication, the city or country of origin of the book in question and its
edition number.
It is important to include all information sources for the data consulted to help those who
wish to do further research on a theme (see Annex 2).
3.1.9 Glossary
Technical language may be an obstacle to understanding the report; therefore the inclusion
of a glossary of technical terms, acronyms and concepts may make it easier for the reader to
understand. A review of the document by third parties can help to identify any obstacles to
understanding and to preparing the glossary.
Me
tho
do
log
y fo
r th
e p
rep
ara
tio
n o
f G
EO
Cit
ies
Re
po
rts
101
Advice on improving the report: >
• End every chapter with a table summarizing the main indicators mentioned in that
chapter. Th is may then become a tool to quickly consult data.
• Suggest a minimum basket of environmental indicators that may be systematically
monitored by the municipality and/or university/NGO to show the state of the environment
at a glance.
• Highlight the theme of poverty and analyse social indicators in view of the Millennium
Development Goals (MDG); how the city under study should be classifi ed according to
the themes given priority in the MDG. Many international and national policies are
conditioned and measured.
• Provide graphs comparing the city with other cities of similar size in the country or the
region (e.g. as to indicators of human development, poverty, coverage of services, quality
of air and water, etc). Th at is to say, to make a kind of benchmarking to help to defi ne
the city in comparative terms. Th is serves for purposes of communication and public
awareness.
• To provide an informative and analytical basis that is suffi cient to make recommendations,
it is suggested that an analysis be made of environmental problems.
• Make a SWOT41 analysis of the environmental management system.
• In view of the uncertainties associated with the quality of offi cial information, it is
suggested a section be included on the quality and availability of information, comparing
offi cial information with that from unoffi cial but rigorous and recognized sources.
Stage 4 Disseminating and applying policies
4.1. Dissemination strategies
The report may be a catalyst for social mobilization on the question of the environment
and sustainable development. For this to be the case, strategies must be defi ned on how to
disseminate it, stimulating its broadest possible use by citizens and public bodies not directly
involved in its preparation.
A document like GEO Cities needs mechanisms to confi rm the legitimacy of its analyses
and proposals, and to increase the likelihood that its recommendations will be adopted.
Media to employ include: dissemination seminars, collective interviews, television and
radio interviews, distributing copies to public and private bodies, to civil society organizations,
universities and trade unions, the local parliament, national and international agencies, public
and private schools, as well as making the report available on the Internet.
The following boxes present the structure of the GEO report communication process used
by the technical team responsible for the GEO Lima and Callao report and the GEO City of
Mexico team.
41 Strengths, Weaknesses, Opportunities, and threats
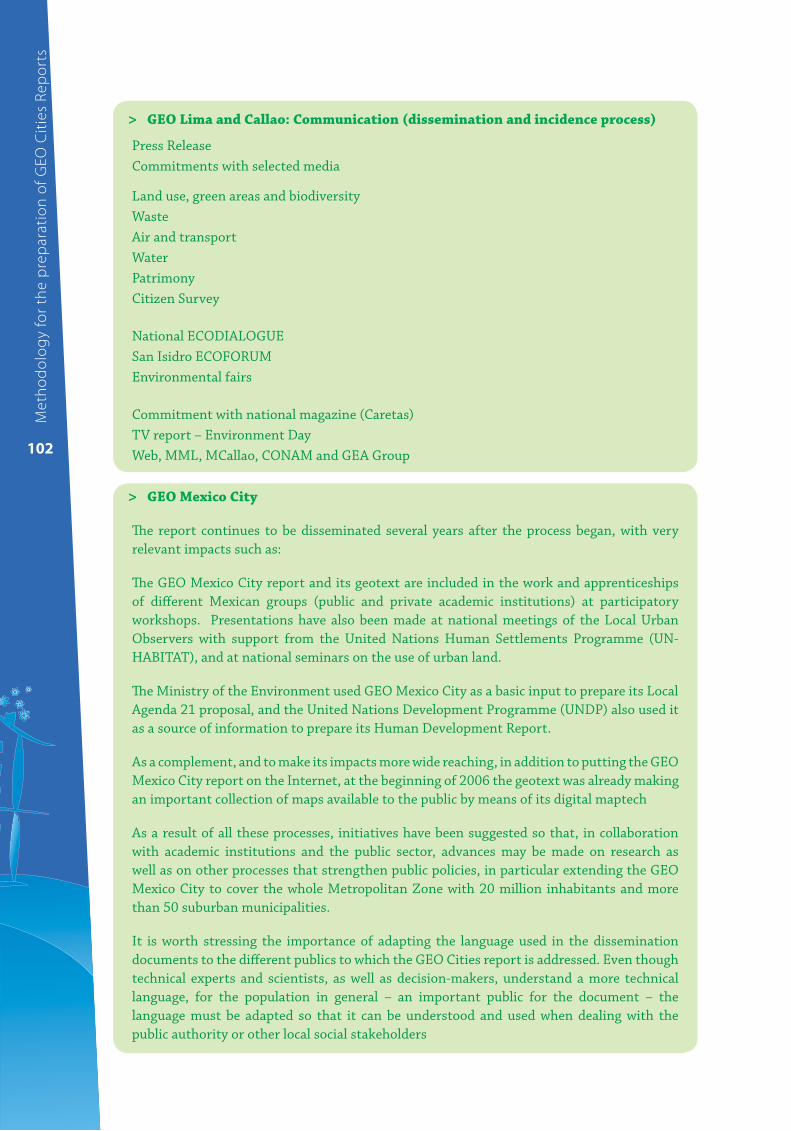
Me
tho
do
log
y fo
r th
e p
rep
ara
tio
n o
f G
EO
Cit
ies
Re
po
rts
102
GEO Lima and Callao: Communication (dissemination and incidence process) >
Press Release
Commitments with selected media
Land use, green areas and biodiversity
Waste
Air and transport
Water
Patrimony
Citizen Survey
National ECODIALOGUE
San Isidro ECOFORUM
Environmental fairs
Commitment with national magazine (Caretas)
TV report – Environment Day
Web, MML, MCallao, CONAM and GEA Group
GEO Mexico City >
Th e report continues to be disseminated several years after the process began, with very
relevant impacts such as:
Th e GEO Mexico City report and its geotext are included in the work and apprenticeships
of diff erent Mexican groups (public and private academic institutions) at participatory
workshops. Presentations have also been made at national meetings of the Local Urban
Observers with support from the United Nations Human Settlements Programme (UN-
HABITAT), and at national seminars on the use of urban land.
Th e Ministry of the Environment used GEO Mexico City as a basic input to prepare its Local
Agenda 21 proposal, and the United Nations Development Programme (UNDP) also used it
as a source of information to prepare its Human Development Report.
As a complement, and to make its impacts more wide reaching, in addition to putting the GEO
Mexico City report on the Internet, at the beginning of 2006 the geotext was already making
an important collection of maps available to the public by means of its digital maptech
As a result of all these processes, initiatives have been suggested so that, in collaboration
with academic institutions and the public sector, advances may be made on research as
well as on other processes that strengthen public policies, in particular extending the GEO
Mexico City to cover the whole Metropolitan Zone with 20 million inhabitants and more
than 50 suburban municipalities.
It is worth stressing the importance of adapting the language used in the dissemination
documents to the diff erent publics to which the GEO Cities report is addressed. Even though
technical experts and scientists, as well as decision-makers, understand a more technical
language, for the population in general – an important public for the document – the
language must be adapted so that it can be understood and used when dealing with the
public authority or other local social stakeholders
Me
tho
do
log
y fo
r th
e p
rep
ara
tio
n o
f G
EO
Cit
ies
Re
po
rts
103
It is, therefore, particularly relevant to use the different communications media to disseminate
the report, each of them with their own public in mind, thus making it a more powerful social
participation instrument when it comes to local urban-environmental management
4.2. Infl uencing policies
The GEO Cities process ends with the inclusion of local government environmental
management policies. This task is not usually the responsibility of the technical team unless its
political government decides otherwise.
For that reason, the technical team should establish a collaboration strategy with those
responsible for public policies and decision making about the state of the local environment.
This measure can promote a fruitful exchange among decision makers and socio-environmental
specialists, and thus extend the reach of the proposals; these possibilities obviously depend
on each city’s political and institutional circumstances
Stage 5 Continuing the GEO Cities process
UNEP’s GEO Cities Project intends to use this report to defi ne how the state of the
environment is assessed, and also as a basis to prepare periodic state of the environment
reports that use a harmonized methodology and a set of indicators for decision making by the
public authority and other local stakeholders. This stage is also beyond the responsibility of
the technical team. To follow up on how the cities are administering the environment, it is very
important to recommend to decision-makers that the GEO Cities reports be prepared every
two or three years.
To do so, it is recommended that, whenever possible, the revision of the GEO Cities
assessment be done at the same time as decisions are made about local urban-environmental
management as, for example, when a revision is made of the local Urban Master Plan, a
central instrument in city management.
By doing this, the GEO Cities report could become a stimulus for a change in attitude by
the government and local society on environmental questions and about the impact urban
development has on ecosystems and natural resources.
Continuity will help when creating archives on environmental city assessments and,
therefore, will allow an analysis to be made of sustainability, the effect of action taken and of
the evolution of the link that exists between pressure factors and the local environment.
Me
tho
do
log
y fo
r th
e p
rep
ara
tio
n o
f G
EO
Cit
ies
Re
po
rts
104
I. Introduction
Annexes
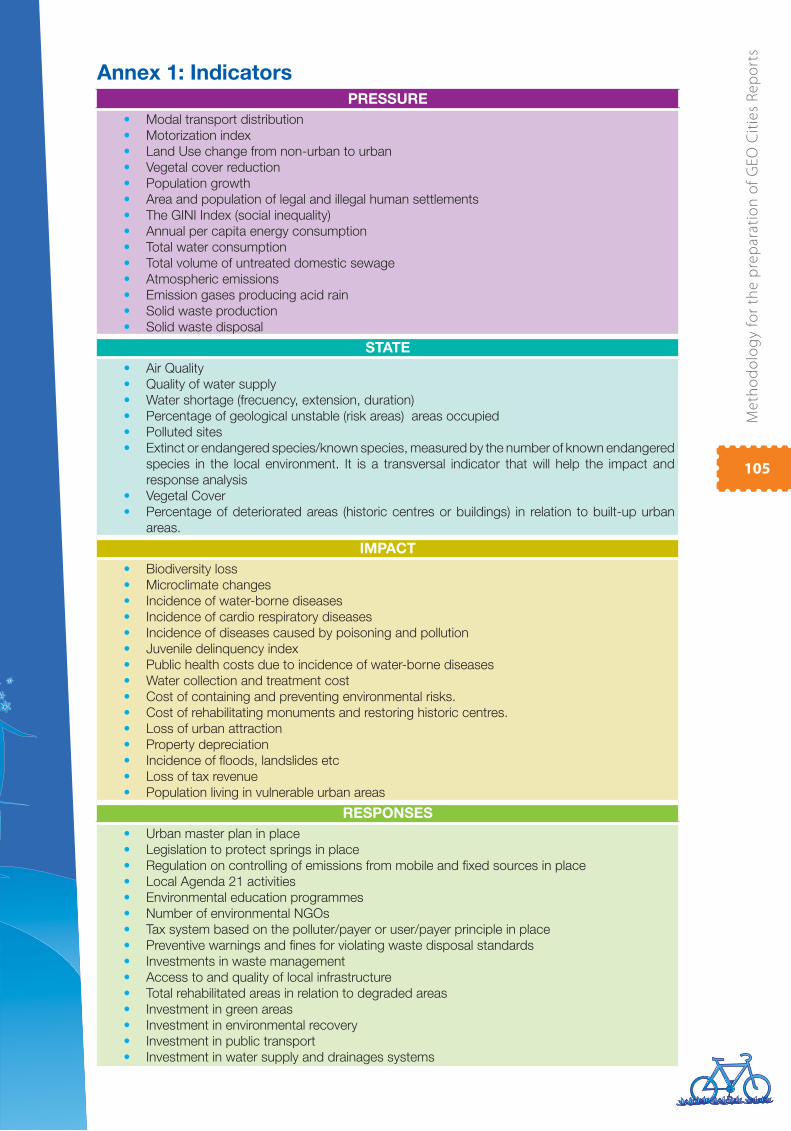
Me
tho
do
log
y fo
r th
e p
rep
ara
tio
n o
f G
EO
Cit
ies
Re
po
rts
105
PRESSURE
Modal transport distribution•
Motorization index•
Land Use change from non-urban to urban •
Vegetal cover reduction•
Population growth•
Area and population of legal and illegal human settlements •
The GINI Index (social inequality)•
Annual per capita energy consumption•
Total water consumption•
Total volume of untreated domestic sewage•
Atmospheric emissions•
Emission gases producing acid rain•
Solid waste production •
Solid waste disposal•
STATE
Air Quality•
Quality of water supply•
Water shortage (frecuency, extension, duration)•
Percentage of geological unstable (risk areas) areas occupied •
Polluted sites•
Extinct or endangered species/known species, measured by the number of known endangered •
species in the local environment. It is a transversal indicator that will help the impact and
response analysis
Vegetal Cover•
Percentage of deteriorated areas (historic centres or buildings) in relation to built-up urban •
areas.
IMPACT
Biodiversity loss•
Microclimate changes •
Incidence of water-borne diseases •
Incidence of cardio respiratory diseases•
Incidence of diseases caused by poisoning and pollution•
Juvenile delinquency index•
Public health costs due to incidence of water-borne diseases•
Water collection and treatment cost•
Cost of containing and preventing environmental risks.•
Cost of rehabilitating monuments and restoring historic centres.•
Loss of urban attraction•
Property depreciation•
Incidence of fl oods, landslides etc•
Loss of tax revenue•
Population living in vulnerable urban areas•
RESPONSES
Urban master plan in place•
Legislation to protect springs in place•
Regulation on controlling of emissions from mobile and fi xed sources in place•
Local Agenda 21 activities•
Environmental education programmes•
Number of environmental NGOs•
Tax system based on the polluter/payer or user/payer principle in place•
Preventive warnings and fi nes for violating waste disposal standards•
Investments in waste management•
Access to and quality of local infrastructure•
Total rehabilitated areas in relation to degraded areas•
Investment in green areas •
Investment in environmental recovery •
Investment in public transport•
Investment in water supply and drainages systems•
Annex 1: Indicators

106
Me
tho
do
log
y fo
r th
e p
rep
ara
tio
n o
f G
EO
Cit
ies
Re
po
rts
PRESSURE INDICATORS
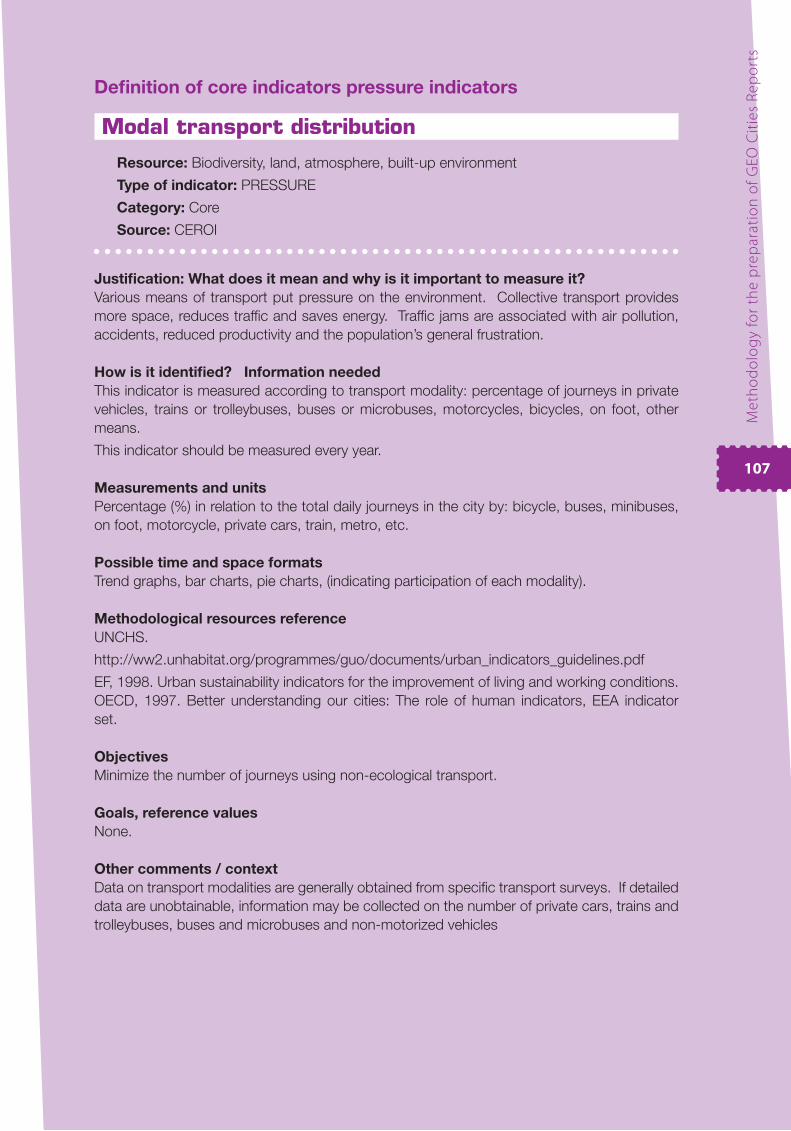
Me
tho
do
log
y fo
r th
e p
rep
ara
tio
n o
f G
EO
Cit
ies
Re
po
rts
107
Defi nition of core indicators pressure indicators
Modal transport distribution
Resource: Biodiversity, land, atmosphere, built-up environment
Type of indicator: PRESSURE
Category: Core
Source: CEROI
Justifi cation: What does it mean and why is it important to measure it?
Various means of transport put pressure on the environment. Collective transport provides
more space, reduces traffi c and saves energy. Traffi c jams are associated with air pollution,
accidents, reduced productivity and the population’s general frustration.
How is it identifi ed? Information needed
This indicator is measured according to transport modality: percentage of journeys in private
vehicles, trains or trolleybuses, buses or microbuses, motorcycles, bicycles, on foot, other
means.
This indicator should be measured every year.
Measurements and units
Percentage (%) in relation to the total daily journeys in the city by: bicycle, buses, minibuses,
on foot, motorcycle, private cars, train, metro, etc.
Possible time and space formats
Trend graphs, bar charts, pie charts, (indicating participation of each modality).
Methodological resources reference
UNCHS.
http://ww2.unhabitat.org/programmes/guo/documents/urban_indicators_guidelines.pdf
EF, 1998. Urban sustainability indicators for the improvement of living and working conditions.
OECD, 1997. Better understanding our cities: The role of human indicators, EEA indicator
set.
Objectives
Minimize the number of journeys using non-ecological transport.
Goals, reference values
None.
Other comments / context
Data on transport modalities are generally obtained from specifi c transport surveys. If detailed
data are unobtainable, information may be collected on the number of private cars, trains and
trolleybuses, buses and microbuses and non-motorized vehicles
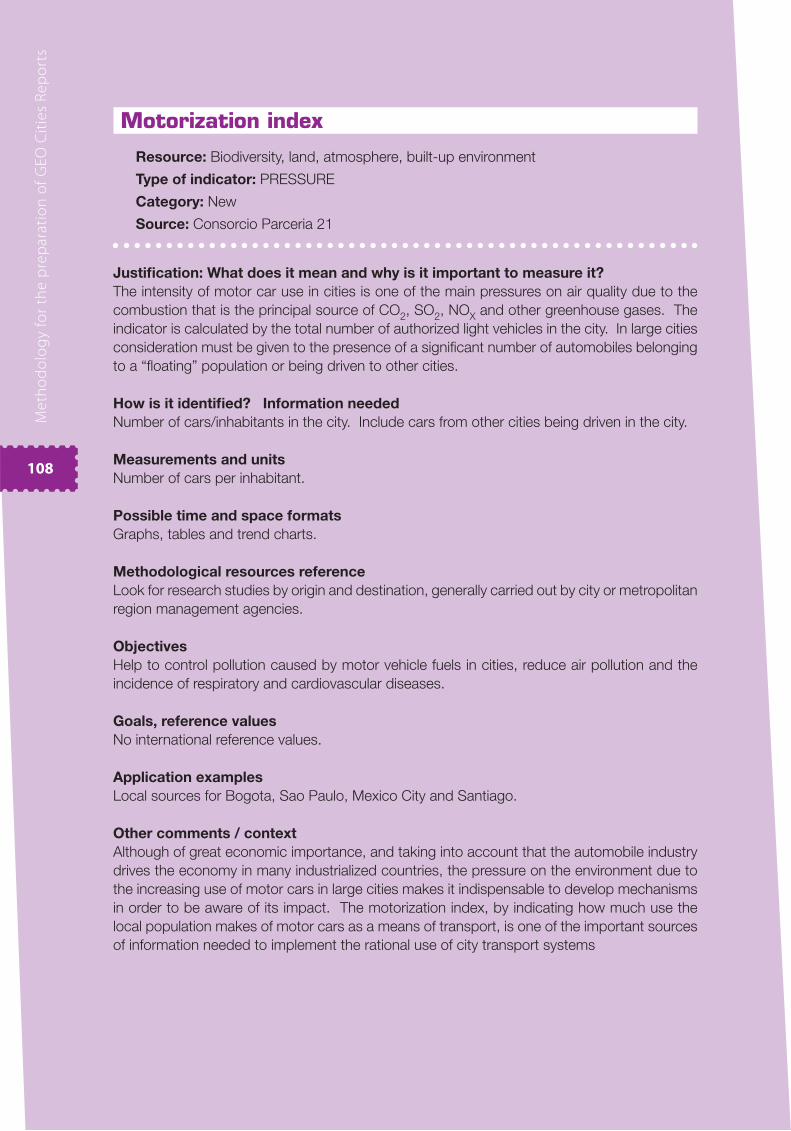
Me
tho
do
log
y fo
r th
e p
rep
ara
tio
n o
f G
EO
Cit
ies
Re
po
rts
108
Motorization index
Resource: Biodiversity, land, atmosphere, built-up environment
Type of indicator: PRESSURE
Category: New
Source: Consorcio Parceria 21
Justifi cation: What does it mean and why is it important to measure it?
The intensity of motor car use in cities is one of the main pressures on air quality due to the
combustion that is the principal source of CO2, SO2, NOX and other greenhouse gases. The
indicator is calculated by the total number of authorized light vehicles in the city. In large cities
consideration must be given to the presence of a signifi cant number of automobiles belonging
to a “fl oating” population or being driven to other cities.
How is it identifi ed? Information needed
Number of cars/inhabitants in the city. Include cars from other cities being driven in the city.
Measurements and units
Number of cars per inhabitant.
Possible time and space formats
Graphs, tables and trend charts.
Methodological resources reference
Look for research studies by origin and destination, generally carried out by city or metropolitan
region management agencies.
Objectives
Help to control pollution caused by motor vehicle fuels in cities, reduce air pollution and the
incidence of respiratory and cardiovascular diseases.
Goals, reference values
No international reference values.
Application examples
Local sources for Bogota, Sao Paulo, Mexico City and Santiago.
Other comments / context
Although of great economic importance, and taking into account that the automobile industry
drives the economy in many industrialized countries, the pressure on the environment due to
the increasing use of motor cars in large cities makes it indispensable to develop mechanisms
in order to be aware of its impact. The motorization index, by indicating how much use the
local population makes of motor cars as a means of transport, is one of the important sources
of information needed to implement the rational use of city transport systems
Me
tho
do
log
y fo
r th
e p
rep
ara
tio
n o
f G
EO
Cit
ies
Re
po
rts
109
Land use change from non-urban to urban
Resource: All
Type of indicator: PRESSURE
Category: New, transversal
Source: Consorcio Parceria 21
Justifi cation: What does it mean and why is it important to measure it?
One of the principal pressures on the environment in cities is the change in land use from
non-urban to urban. This is the result of human activities, legal and illegal, on the land (dividing
plots, building, constructing engineering infrastructure, etc.). It would be of interest to obtain
a set of data every year on all new land occupancy showing the non-urban area (green areas,
agricultural land without artifi cial human intervention) replaced by human occupation that tends
to affect the environment’s balance.
How is it identifi ed? Information needed
Area (km2) included in the urban area in the past year, compared to the total urban area.
Measurements and units
Area in km2.
Possible time and space formats
Graphs, maps, aerial photos, high-resolution satellite images and trend charts.
Methodological resources reference
An approximate example of this indicator may be found in Europe’s Environment “the Dobris
Assessment” htt://reports.eea.europa.eu/92-826-5409-5/en
Objectives
Determine the pressure exerted on the environment and its resources due to the growth of the
urban area by the addition of non-urban land.
Goals, reference values
No reference values or defi ned goals.
Other comments / context
This is considered as a transversal indicator, useful to analyse the pressure of urban activities
on the different environmental resources considered in the GEO Cities assessment
Me
tho
do
log
y fo
r th
e p
rep
ara
tio
n o
f G
EO
Cit
ies
Re
po
rts
110
Vegetal cover reduction
Resource: Biodiversity, land, water
Type of indicator: PRESSURE
Category: New, transversal
Source: Consorcio Parceria 21
Justifi cation: What does it mean and why is it important to measure it?
The land’s vegetal cover has an important function in the environment because it covers a
complex and varied fl ora and fauna biodiversity; it helps to conserve springs and the soil; fi lters
different pollutants and infl uences the local temperature. Reducing the area occupied by woods
and other types of natural vegetation is one of the main consequences of urban development
and becomes an important indicator of the pressure cities place on the environment.
This indicator is directly related to the indicator on the state of vegetal cover.
How is it identifi ed? Information needed
Wooded area (km2) or other type of natural vegetation deforested in a determined period (or
year or any other period).
Measurements and units
Area in km2.
Possible time and space formats
Graphs, maps, aerial photos, high-resolution satellite imagines and trend charts.
Methodological resources reference
An approximate example of this indicator may be found in the document “Indicators of
Sustainable Development, Framework and Methodologies”, available for consultation at www.
un.org/esa/sustdev
Objectives
Help to protect and conserve natural resources by controlling the destruction of forests and
other forms of vegetation threatened by human development.
Goals, reference values
No goals or reference value for this indicator.
Other comments / context
Controlling the reduction of vegetal cover in each city is one of the main measures to reduce
the pressure of urban activities on the environment. As a very broad range of environmental
services is obtained from vegetal cover, it is of the utmost importance that account be taken
of the degree of reduction when calculating the effects on the environment and the impacts on
the quality of life in cities.
Me
tho
do
log
y fo
r th
e p
rep
ara
tio
n o
f G
EO
Cit
ies
Re
po
rts
111
Population growth
Resource: All
Type of indicator: PRESSURE
Category: Core, transversal
Source: CEROI
Justifi cation: What does it mean and why is it important to measure it?
Urban population, as well as population density, is an indicator that measures pressure on
the environment including the exploitation of natural resources such as water and soil, the
contamination of a city and its surroundings and air pollution due to transport and industries.
Over time, the increase or decrease in pressure on the urban environment accompanies the
growth of population.
How is it identifi ed? Information needed
Number of cities over a determined period (2-10 years recommended).
Measurements and units
Total number of inhabitants.
Possible time and space formats
Graphs showing trends, maps.
Methodological resources reference
UNCHS http://ww2.unhabitat.org/programmes/guo/urban_indicators.asp
WB, 1998. Sustainable Development Indicators.
OECD, 1997. Better Understanding Our Cities: The Role of Urban Indicators. EEA Indicator
Set. UNEP, 2007. GEO-4: Global Environment Outlook.
Objectives
Harmonize a city’s annual growth with its environment and, in general, the situation of human
settlements.
Goals, reference values,
No international references.
Application examples
Prague population:
Other comments / context
A recent report mentions that the world’s population continues to grow but at a slower rate
than a decade ago. The average annual growth rate was 1.3% for 1997–2007 compared with
1.6% for 1987–1997. There are large regional differences in growth rates. (WHO 2009)
GEO 4 scenarios estimate that global population will continue growing, and it will reach its
highest level, around 9.7 billion by 2050 in the scenario called Security fi rst.(UNEP 2007)
Me
tho
do
log
y fo
r th
e p
rep
ara
tio
n o
f G
EO
Cit
ies
Re
po
rts
112
Area and population of legal and illegal human settlements
Resource: All
Type of indicator: PRESSURE
Category: Core, transversal.
Source: UNCSD
Justifi cation: What does it mean and why is it important to measure it?
Settlements characterized as illegal land possession with unauthorized buildings are generally
marginalized and precarious and do not meet basic human needs. Settlements on the outskirts
of cities are overcrowded and land use is inadequate and totally uncontrolled; this puts strong
pressure on natural resources and the environment, deforesting wooded areas, polluting
springs and occupying very vulnerable areas without such basic services as drainage, health
centres and garbage collection. However, it should be made clear that not only poor and
marginalized people live in these areas; there are also better-off groups in the same situation
on unauthorized territories without services such as drainage.
How is it identifi ed? Information needed
Urban residential area in km2 occupied by legal and illegal settlements and the number of
inhabitants.
Measurements and units
km2, number of inhabitants.
Possible time and space formats
Graphs, tables, maps, trend charts.
Methodological resources reference
This indicator comes from the United Nations Human Settlements Centre (UN-HABITAT), and
specifi cally the Urban Indicator Programme (UIP) and the Local Urban Observatory. It may be
consulted at: http://ww2.unhabitat.org/programmes/guo/urban_indicators.asp
Objectives
Allows a measurement to be made of the level of marginalization of living conditions of large
population groups, as well as of the pressure these settlements exert on the various local
environment resources.
Goals, reference values
No reference values for this indicator.
Other comments / context
This indicator is a good example of how inequality may have perverse effects on the population
and the environment, even when illegal land occupancy by the wealthiest groups is also taken
into consideration. On the other hand, this is related to other important indicators such as
human life and economic losses from natural disasters, the infant mortality index, the cost of
local government infrastructure, and local health care, among others
Me
tho
do
log
y fo
r th
e p
rep
ara
tio
n o
f G
EO
Cit
ies
Re
po
rts
113
The GINI Index (social inequality)
Recourse: All
Type of indicator: PRESSURE
Category: Core, transversal
Source: UNCSD
Justifi cation: What does it mean and why is it important to measure it?
This indicator is of particular importance to assess sustainable development inequality. Since
income distribution has important consequences on territorial occupation and on pressure on
the environment exerted by the different social classes, population distribution in the locality
must be measured. Although an automatic correlation between poverty and pressure on the
environment cannot be established, as a growth of population indicator an effort must be
made to prove what is undeniable or, in other words, that the poorest areas of large cities are
those that exert the most pressure. Once the locality’s Gini index is known, as well as how the
poorest groups are distributed in the urban zone, a reliable measurement may be made of the
pressure urban development places on the environment.
How is it identifi ed? Information needed
It is an index of the difference between measuring the actual income distribution, consumption
patterns or other related variables, and the hypothetical distribution in which each person
receives the same.
Measurements and units
It is an index without a specifi c dimension, it varies from zero to one where zero represents no
inequality and one represents the maximum possible degree of inequality.
Possible time and space formats
The measurement may be taken locally or nationally, depending on how income is measured.
Depending on income, it may be applied to households, population groups, or consumption
patterns.
Methodological resources reference
Absolutely no international reference. The World Bank provides some reference data
www.worldbank.org/data
Objectives
Measure the population’s income or inequality level.
Goals, reference values
Since it is a compound and relative index, the per capita income, GDP, and other economic
development indicators may be considered.
Application examples
The World Bank uses the Gini index as a reference.
Other comments / context
This index is diffi cult to measure in poor countries. The World Bank develops a reference for
all the countries in southern Africa. The OECD provides information on developed countries’
incomes.
Me
tho
do
log
y fo
r th
e p
rep
ara
tio
n o
f G
EO
Cit
ies
Re
po
rts
114
Annual per capita energy consumption
Resource: Atmosphere
Type of indicator: PRESSURE
Category: Core
Source: UNCSD, OECD, CEROI
Justifi cation: What does it mean and why is it important to measure it?
This indicator measures the average annual consumption of electric energy per person and is
related to the pattern of consumption, development, air quality and atmospheric emissions. It
may be divided according to the sector: industrial, commercial, and household. It is different
from transport energy consumption as it is directly linked to combustion.
How is it identifi ed? Information needed
City population, amount of energy consumed in GWh.
Measurements and units
GWh / per capita / per annum.
Possible time and space formats
To indicate trends, numerical data may be presented in tables or charts.
Methodological resources references
OECD, 1997 Better Understanding our Cities: The Role of Urban Indicators, EEA Indicator
Set.
WB, Development Data Group, 1999. World Development Indicators 1999 on CD-ROM. World
Bank Publications, USA.
Objectives
Reduce the city’s energy consumption.
Goals, reference values
No corresponding international patterns.
Application examples
The Regional Municipality of Hamilton-Wentworth, 1996,
http://www.iisd.org/measure/compendium/DisplayInitiative.aspx?id=1346
Other comments / context
In general, electricity is produced by burning fossil fuels, although this use has a smaller share
in the energy matrix in Latin America and the Caribbean countries. Electricity generation
based on fossil fuels, such as mineral carbon, natural gas and petroleum derivatives, produces
greenhouse gas emissions such as carbon dioxide (CO2). Electricity consumption is linked to
productive activities that cause the emissions. Even when, as in Brazil, the matrix is based on
hydroelectricity, energy consumption may reach an unsustainable level and, putting pressure
on hydraulic resources.
To assess energy consumption, this information must be compared with consumption data in
the transport sector, to give a more precise assessment of the cities’ global contribution to air
quality.
For the indicator to be effective in measuring local air pollution, the analysis must describe the
energy source used.
Me
tho
do
log
y fo
r th
e p
rep
ara
tio
n o
f G
EO
Cit
ies
Re
po
rts
115
Total water consumption
Resource: Water
Type of indicator: PRESSURE
Category: Core
Source: CEROI
Justifi cation: What does it mean and why is it important to measure it?
Per capital water consumption depends on availability price, climate and uses (human
consumption, hygiene, laundry, gardening, etc.). Water consumption, like other forms of
consumption, is much higher in cities in high-income countries. This may be an indicator
related to the quality of the city’s supply system; total consumption generally includes losses
of drinking water, paid for by the consumer.
How is it identifi ed? Information needed
By relating annual domestic water consumption to the number of inhabitants connected to the
supply network. The result is divided by the number of days in a year.
Measurements and units
Average water consumption (litres / day / person).
Possible time and space formats
Trend charts, graphs.
Methodological resources references
OECD, 1997. Better Understanding Our Cities: The Role of Urban Indicators, EEA Indicator
Set. UNCHS, 1995. Monitoring Human Settlements: A Bridged Survey, Indicator Programme.
ICLEI, http://www.iclei.org
EF, 1998. Urban Sustainability Indicators for the Improvement of Living and Working
Conditions.
Objectives
Harmonize water consumption with available water resources.
Goals, reference values
Local programme goals.
Application examples
Percentage of water consumed by different sectors in Arendal (Norway).
http://www.ceroi.net
City of Targoviste, Rumania: Production and consumption patterns.
http://www.bestpractices.org/database/bp_display_best_practice.php?best_practice_
id=591
Other comments / context
http://ceroi.net/ind/display.asp?indID=20
On average, people in developed countries use 272 litres of water per day; in Africa 53 litres.
In North America average city use is 7 times higher than in Africa. It is estimated that lack of
water and sanitation in urban areas in Brazil causes approximately 8 500 premature deaths
every year
Me
tho
do
log
y fo
r th
e p
rep
ara
tio
n o
f G
EO
Cit
ies
Re
po
rts
116
Total volume of untreated domestic sewage
Resource: Water, biodiversity
Type of indicator: PRESSURE
Category: New
Source: Consorcio Parceria 21
Justifi cation: What does it mean and why is it important to measure it?
Untreated sewage and rain water are generally drained off into water basins by the effects of
gravity, and pollute surface, groundwater and sea water. This pollution has a serious impact on
the environment and quality of life, as well as on the population’s health, causing water-borne
diseases, the proliferation of toxic algae, and increasing the cost of treating water for domestic
consumption; therefore, the pressure on natural resources in the cities must be measured.
How is it identifi ed? Information needed
On average, 50% of all the water consumed per capita becomes sewage. This indicator
may be calculated by considering the population without sewage collection and treatment
services, from information about the total consumption of water for domestic use in each city.
Alternatively, account may be taken of any information available on the average annual volume
of sewage per person. The indicator may be expressed as the total volume of untreated
sewage and the percentage of the total volume of sewage produced in the city.
Measurements and units
Volume of sewage disposed of in a given period, by day, by month or by year: m3/day, m3/
month, or year: m3/day, m3/month, m3/year.
Percentage of total volume of drained sewage.
Possible time and space formats
Graphs, tables, maps and trend charts.
Methodological resources references
Other approximate uses of this indicator may be found in:
www.ceroi.net: Wastewater Treatment.
www.iclei.org: Volume of Sewage http://ww2.unhabitat.org/programmes/guo/guo_databases.
asp Treated Sewage
Objectives
Measure the pollution in bodies of water caused by the lack of proper treatment, or not having
access to the local drainage network.
Goals, reference values
No reference values for this indicator.
Other comments / context
Being aware of the degree of organic contamination is the fi rst step in reducing pollution from
sewage.
Me
tho
do
log
y fo
r th
e p
rep
ara
tio
n o
f G
EO
Cit
ies
Re
po
rts
117
Atmospheric emissions
Resource: Atmosphere
Type of indicator: PRESSURE
Category: Core
Source: CEROI
Justifi cation: What does it mean and why is it important to measure it?
Air Pollution affects human health (acutely and chronically), vegetation, buildings, construction
materials, monuments and historic patrimony sites. It is caused by emissions from mobile and
fi xed sources directly linked to energy consumption, environmental policies, urban density,
motor vehicle transport, and to the concentration of industries.
How is it identifi ed? Information needed
Total emissions in tonnes per capita per year of a) SO2; b) NOx; c) CO2. The inventory of
emissions is usually divided by the main mobile and fi xed sources of emissions.
Measurements and units
CO2 (tonnes / per capita / per year). NOx (tonnes / per capita / per year). SO2 (tonnes / per
capita / per year).
Possible time and space formats
Graphs, trend charts, column graphs.
Methodological resources references
UNCHS, http://ww2.unhabitat.org/programmes/guo/documents/urban_indicators_guidelines.
EC, Directorate General Environment, Working Group of the Expert Group on the Urban
Environment, 2000. Towards a Local Sustainability Profi le – European Common Indicators.
http://www.sustainable-cities.org/ indicators/
EF, 1998. Urban Sustainability Indicators for the Improvement of Living and Working
conditions.
Objectives
Reduce emissions to the minimum.
Goals, reference values
The Kyoto Protocol goals for natural emissions (no city goals have been established).
Kyoto Protocol with the United Nations Framework Convention on Climate Change.
Reduce the total of emissions caused by humans in equivalents of carbon dioxide and
greenhouse gases by at least 5% below the 1990 levels, for the period 2008-2012.
Application examples
The World Bank programme “Clean Air Initiative in Latin American Cities” developed an
instrument to prevent new emissions and to restore air quality in urban areas in Latin America
and the Caribbean. http://www.worldbank.org/wbi/cleanair/infocenter/index.htm
Me
tho
do
log
y fo
r th
e p
rep
ara
tio
n o
f G
EO
Cit
ies
Re
po
rts
118
Emission gases producing acid rain
Resource; Atmosphere
Type of indicator: PRESSURE
Category: Core
Source: CEROI
Justifi cation: What does it mean and why is it important to measure it?
Sulphur oxides (SOx), nitrogenous oxide (NOx) and ammonium (NH3), are examples of acid
substances released into the atmosphere. Emissions from fi xed and mobile sources put
pressure on the quality of urban air. The polluting gases SOx, NOx and NH3 produce acid rain
and changes in the chemical composition of the soil and in surface waters, and they also affect
fl ora and fauna.
How is it identifi ed? Information needed
To calculate emissions per capita, the total emissions of: (a) SOx, (b) NOx y (c) NH3 as well
as the total population, must be known. Acid substances may be measured as an acidity
equivalent; (Aeq = total acidity caused by acid components and deposited per hectare).
Measurements and units
Total emissions per capita and per hectare of NH3 (tonnes vs. capita, Aeq, deposit of SO2, NO2
and NH3 per hectare)
Total emissions per capita and per hectare of NOx (tonnes vs. capita, Aeq, deposit of SO2, NO2
and NH3 per hectare)
Total emissions per capita and per hectare of SOx (tonnes vs. capita, Aeq, deposit of SO2, NO2
and NH3 per hectare)
Possible time and space formats
Graphs, trend charts, column graphs.
Methodological resources references
UNCHS, Urban Indicators Guidelines: Better Information for Better Cities, EEA Indicator Set.
EF, 1998. Urban Sustainability Indicators for the Improvement of Living and Working Conditions.
EEA, 1998. Europeans Environment: The Second Assessment.
Objectives
Reduce emissions from fi xed and mobile sources to comply with the demand for clean air
quality.
Goals, reference values
Reduce to the minimum sources of pollution and improve air quality. Goals established by
WHO may be taken as references.
Application examples
Arendal, Norway: http://www.ceroi.net/reports/arendal/
Me
tho
do
log
y fo
r th
e p
rep
ara
tio
n o
f G
EO
Cit
ies
Re
po
rts
119
Solid waste production
Resource: Soil, water
Type of indicator: PRESSURE
Category: Core
Source: CEROI
Justifi cation: What does it mean and why is it important to measure it?
Solid waste production increases annually due to the growing population, defi cient services
and unsustainable lifestyles. Solid waste is produced by economic and domestic sectors such
as industry, commerce, health installations, tourism, transport, and family units.
How is it identifi ed? Information needed
Whenever possible, this indicator should be measured by weight and volume. To calculate the
amount produced per capita, the total number of inhabitants must be known. The indicator
should be measured annually.
Measurements and units
Total solid waste produced (tonnes / inhabitant / year).
Solid waste produced (m3 / inhabitant / year).
Possible time and space formats
Graphs, tables and trend charts.
Methodological resources references
OECD, 1997. Better Understanding Our Cities: The Role of Urban Indicators, EEA Indicator
Set. UNCHS, 1995. Monitoring Human Settlements: A Bridged Survey, Indicator Programme.
Objectives
Reduce the amount of waste.
Goals, reference values
No reference values.
Application examples
Jacksonville, Florida, “Per Capita Tons of Solid Waste Deposited in City Landfi lls”. http://www.
jcci.org
Other comments / context
The indicator only considers solid waste.
Management of solid waste in developing countries has shown there are many social and
health benefi ts to be had when the community participates
Me
tho
do
log
y fo
r th
e p
rep
ara
tio
n o
f G
EO
Cit
ies
Re
po
rts
120
Solid waste disposal
Resource: Soil, water
Type of indicator: PRESSURE
Category: Core
Source: CEROI, Consorcio Parceria 21
Justifi cation: What does it mean and why is it important to measure it?
Solid waste disposal is one of principal urban problems. Mitigating its negative impact is
directly associated with the city’s capacity to properly dispose of garbage. Improper solid
waste disposal puts great polluting pressure on the land; it contaminates aquifers and is
harmful to humans.
How is it identifi ed? Information needed
The indicator may be calculated from the total waste produced and disposed of (or not
disposed of) in different ways divided between the total number of inhabitants. Units of weight
or volume may be used and the percentage of the total of weight produced.
Measurements and units
Solid waste collected and disposed of in sanitary landfi lls (tonnes / inhabitant; m3/habitante,
% of total waste produced). Solid waste collected and improperly disposed of in garbage
dumps and otherwise (tonnes/inhabitant; m3/inhabitant, % of total waste produced). Solid
waste collected or recycled (tonnes/inhabitant; m3/inhabitant, % of total waste produced).
Uncollected and improperly disposed of (tonnes / inhabitant; m3 / inhabitant, % of total waste
produced).
Possible time and space formats
Graphs, maps, trend charts.
Methodological resources references
OECD, 1997. Better Understanding Our Cities: The Role of Urban Indicators, EEA Indicator
Set. UNCHS, 1995. Monitoring Human Settlements: A Bridged Survey, Indicator Programme.
ICLEI, http://www.iclei.org
EF, 1998. Urban Sustainability Indicators for the Improvement of Living and Working
Conditions.
Objectives
To prevent atmospheric, water and soil pollution by poor solid waste disposal and reduce
the incidence of disease by decreasing production at source and encouraging recycling and
reuse.
Goals, reference values
No reference values.
Application examples
Good practices: Waste and urban clearing in Barcelona. http://www.mediambient.bcn.es
Other comments / comments /
Even though there are strict laws about disposal of industrial waste, specifi cally hazardous
waste, they are often ignored and a signifi cant part of the waste is disposed of in open-air
dumps or close to inhabited areas. Control and management are some of the most important
instruments for reducing the pressure of urban centres on the environment.

STATE INDICATORS
121
Me
tho
do
log
y fo
r th
e p
rep
ara
tio
n o
f G
EO
Cit
ies
Re
po
rts
Me
tho
do
log
y fo
r th
e p
rep
ara
tio
n o
f G
EO
Cit
ies
Re
po
rts
122
3.4 Defi nition of core indicators: State indicators
Air Quality
Resource: Atmosphere
Type of indicator: STATE
Category: Core
Source: CEROI
Justifi cation: What does it mean and why is it important to measure it?
Air quality is negatively affected by emissions from fi xed and mobile sources and is directly
linked to energy consumption, environmental policies, urban density, motor vehicle transport
and concentration of industries. Concentrations of pollutants have series effects on human
health, vegetation, constructions, monuments and cultural patrimony.
How is it identifi ed? Information needed
Number of days in which the World Health Organization (WHO) or local standards are exceeded
as to de SO2, O3, CO, NO2, black smoke, suspended particles (MP) and lead (Pb). This indicator
should be calculated every year.
Measurements and units
Number of days per year when the air quality standard monitored in the city does not meet
each standard in the above-mentioned list (number of yearly violations of the standard).
Possible time and space and space formats
Graph and trend charts
Methodological resources references
UNCHS. http://ww2.unhabitat.org/programmes/guo/documents/urban_indicators_guidelines.
WHO, 1997. Healthy Cities Indicators: Analysis of Data from Cities across Europe.
EEA, 1998. Assessment and Management of Urban Air Quality in Europe.
OECD, 1999. Advanced Air Quality Indicators and Reporting: Methodological Study and
Assessment.
EC, Directorate General Environment, Working Group of the Expert Group on the Urban
Environment, 2000.
Towards a Local Sustainability Profi le – European Common Indicators. http://www.sustainable-
cities.org/indicators/
Objectives
Reduce atmospheric pollution and its harmful effects on health, water and soil.
Goals reference values
WHO Guidelines for Europe 2005
NO2 (200 ug/m3, 1 hour), CO (30 mg/m3, 1 hour, 10 mg/m3,8 hours), SO2 (20 ug/m3, 24 hours
mean, 500 ug/m3 10 minutes), O3 (100 ug/m3 8-hour mean), lead (0.5 mg/m3, 1 year).
More information on WHO guidelines available at:
http://www.who.int/mediacentre/factsheets/fs313/en/index.html
Me
tho
do
log
y fo
r th
e p
rep
ara
tio
n o
f G
EO
Cit
ies
Re
po
rts
123
Me
tho
do
log
y fo
r th
e p
rep
ara
tio
n o
f G
EO
Cit
ies
Re
po
rts
123
Quality of water supply
Resource: Water
Type of indicator: STATE
Category: Core
Source: UNCSD, CEROI
Justifi cation: What does it mean and why is it important to measure it?
Percentage of freshwater with concentrations of faecal material bacteria above the levels
recommended by the World Health Organization (WHO). The indicator assesses the quality of
water supplied to communities to meet their basic needs. It identifi es localities where faecal
pollution in the water or the supply network signifi es a health threat.
How is it identifi ed? Information needed
Microbiological testing of water to detect Escherichia coli and streptococcus bacteria. The
results are generally found in the competent authorities’ laboratory records or in those kept by
authorized testing agencies and institutions. The microbiological quality of water is measured
as a relation between the number of water analyses made and the results of faecal material/100
ml above zero and the total number of samples analysed.
Measurements and units
Microbiological quality: (% of samples analysed with the results of faecal material). Number of
days when standards are exceeded.
Possible time and space formats
Graphs, trend charts.
Methodological resources references
World Health Organization (WHO).
United Nations Centre for Human Developments for Human settlements (UN-Habitat).
Food and Health Organization of the United Nations (FAO).
Objectives
Combat drinking water pollution and damage to health (infant mortality due to diarrhoea) and
the environment.
Goals, reference values
WHO; national standards.
Application examples
Quality of water supply in Prague: http://www.ceroi.net/reports/prague/issues/Water/state.
htm
Other comments / context
Although reference is made to drinking water, faecal material pollution is also found in oceans
and seas that are usually important sources of recreation and food supply for coastal cities.
Therefore, the same indicator used to assess the state of the environment in these cities may
be applied in analysing salt water quality
Me
tho
do
log
y fo
r th
e p
rep
ara
tio
n o
f G
EO
Cit
ies
Re
po
rts
124
Water shortage (frequency, extension, duration)
Resource: Water
Type of indicator: STATE
Category: Core
Source: OECD Consorcio Parceria 21
Justifi cation: What does it mean and why is it important to measure it?
The main concern about hydric resources in the urban environment is the ineffi cient use of
water and its consequences: shortages, salinization in coastal areas, droughts and the impact
on human health.
To guarantee sustainable administration it is essential to avoid overexploitation and degradation
of water resources in cities.
How is it identifi ed? Information needed
To assess the state of water in terms of quantity and availability, account is taken of the frequency,
intensity and duration of water shortages. The indicator depends on the relation to supply
sources, including those outside the urban territory, and information may be obtained from
the local or regional water supply authority. It is also refl ected in how authorities responsible
for administration perform and users behave. Water supply policies and how they are applied
over a given period show how much water is available for the city. Although quantitative, this
information should be associated with pressure and response indicators that assess water
quality, the population with access to water supply and treatment, intensity of use and the size
of the local water supply basin. Charges for water should also be considered when analysing
this resource.
Measurements and units
Index calculated on the basis of annual water shortages; duration in number of days per year
and percentage of the population affected by supply measured over a given period.
Possible time and space formats
Tables and graphs to indicate changes over time, from year to year.
Methodological resources references
OECD, Key Environmental Indicators,2001.
Objectives
The objective is to guarantee sustainable management of the resource, implying reducing
waste and the ineffi cient use of supply and treatment technology, recycling effl uents and
integrated water basin administration. The OECD recommends the polluter-payer principle for
water use be applied.
Goals reference values
Agenda 21, chapter 18; WHO, data on water supply and consumption per capita; local
reference values available from local and regional water supply agencies.
Application examples
No systematized examples for the urban environment.
Other comments / context
Water use also depends on cultural characteristics, habits and customs. The natural availability
of the resource, according to geographic and climate conditions, varies greatly from region to
region and from city to city. The most important reference is local, although perhaps it will be
necessary to consider some global values
Me
tho
do
log
y fo
r th
e p
rep
ara
tio
n o
f G
EO
Cit
ies
Re
po
rts
125
Me
tho
do
log
y fo
r th
e p
rep
ara
tio
n o
f G
EO
Cit
ies
Re
po
rts
125
Percentage of geologically unstable areas (risk areas) occupied
Resource: Land, water, biodiversity, built-up environment
Type of indicator: STATE
Category: New
Source: UNCSD, Consorcio Parceria 21
Justifi cation: What does it mean and why is it important to measure it?
Accelerated urban growth with high levels of social inequality, is usually accompanied by
occupation of risk areas, that is to say, areas that are very vulnerable to destructive natural
events such as landslides and fl oods, putting the lives of the inhabitants at risk. The indicator,
therefore, may give an idea of the existing natural and social risks in a given locality. It may also
be used to asses the vulnerability risks of natural disasters in the locality.
How is it identifi ed? Information needed
Aerial photography is an important instrument to defi ne risk areas in each city: If this type of
information is not available, geological maps of the city may also be a good sauce of information
for this indicator.
Measurements and units
% of risk areas measured in km2.
Possible time and space formats
Maps, graphs and trend charts.
Methodological resources references
UNCSD – Consult indicators that measure similar problems.
Human and economic losses caused by natural disasters.
Area and population of authorized and unauthorized urban settlements.
Objectives
Cooperate to reduce social and environmental vulnerability in the city’s risk areas.
Goals, reference values
No reference values established; new indicator.
Other comments / context
Reducing social and environmental risks by lowering the occupation rate in areas vulnerable
to natural disasters is an important contribution to reducing social inequality and to build
sustainable development in urban centres
Me
tho
do
log
y fo
r th
e p
rep
ara
tio
n o
f G
EO
Cit
ies
Re
po
rts
126
Polluted sites
Resource: Water
Type of indicator: STATE
Category: Core
Source: UNCSD, CEROI
Justifi cation: What does it mean and why is it important to measure it?
The indicator shows, even though indirectly, the level of pollution in the environment. Pollution
affects human health and the environment itself and causes biodiversity impoverishment.
How is it identifi ed? Information needed
Number and area of spaces recognized as polluted (total, new and rehabilitated).
Measurements and units
Polluted spaces (total, new and rehabilitated, number of spaces, area).
Possible time and space formats
Trend charts, maps, graphs.
Methodological resources references
New South Wales Environment Protection Authority, NSW State of the Environment
http://www.environment.gov.au/soe/2001/publications/theme-reports/settlements/appendix.
html
Objectives
Decontaminate spaces and improve the environment.
Goals, reference values
In Europe dispositions in force in this respect are meant to: implement an integrated and
effective network of waste disposal installations (Dir. – Table, art. 5); separately dispose of
batteries containing hazardous substances (Dir. 91/157, art. 6); ensure combustion is free
of residual oils and, when that is not feasible, ensure their safe destruction or storage (Dir..
75/439, art. 4); prohibit the disposal of printed circuits in any way not environmentally safe.
Other comments / context
As polluted spaces may cause serious problems they must be continuously monitored.
Indicators on the number of spaces and cleaning programmes say little about the problem
of soil and environmental contamination. Pressures are diffi cult to distinguish considering the
broad range of sources and types of existing pollution; it might still be helpful to measure the
use of pesticides as an indirect pollution indicator.
Me
tho
do
log
y fo
r th
e p
rep
ara
tio
n o
f G
EO
Cit
ies
Re
po
rts
127
Me
tho
do
log
y fo
r th
e p
rep
ara
tio
n o
f G
EO
Cit
ies
Re
po
rts
127
Extinct or endangered species/known species
Resource: Biodiversity
Type of indicator: STATE
Category: Core, transversal
Source: UNCSD, OECD, CEROI, Consorcio Parceria 21
Justifi cation: What does it mean and why is it important to measure it?
Number of endangered species as a percentage of known local species. Species diversity is
one of the three main levels of biodiversity; the others are ecosystems diversity and genetic
diversity. Birds in cities are good indicators of biological diversity.
How is it identifi ed? Information needed
A selection must be made of all the local species whose number known (or can be estimated)
and whose state is periodically monitored or assessed. For each class, a calculation has
to be made of local endangered species and the information compared with the number of
corresponding local species. The indicator refers to species of fl ora and fauna.
Calculations should be made of:
a) Percentage of endangered species of plants; total of all classes.
b) Percentage of endangered species of each class of plants.
c) Percentage of vertebrate species; total of all classes.
d) Percentage of each class of endangered vertebrate species.
Sub-indicators a) and c) provide a general view of the situation of plants and animals. Sub-
indicators b) and d) show the most endangered classes.
Measurements and units
Percentage of local endangered fauna and fl ora species, every 5 or 10 years. Total number of
local fl ora and fauna species.
Possible time and space formats
Graphs, tables and trend charts.
Methodological resources references
World Conservation Union (IUCN)
World Resources Institute (WRI)
OECD, 1997. Better Understanding Our Cities: The Role of Urban Indicators, EEA Indicator Set
Objectives
Reduce the danger of fl ora and fauna species disappearing as a result of urban environmental
pressure.
Goals, reference values
No specifi c international goals or reference values. References are established regionally or
locally.
United Nations Convention on Biodiversity (Rio, 1992) EEA, 1997. Indicators for Sustainable
Urban Development: Indicators of Urban Patterns. International Institute for Urban
Environment.
Other comments / context
According to the World Conservation Union defi nitions endangered species are understood to
be those threatened with extinction and are classifi ed as those in danger, vulnerable, rare and
undetermined
Me
tho
do
log
y fo
r th
e p
rep
ara
tio
n o
f G
EO
Cit
ies
Re
po
rts
128
Vegetal cover
Resource: Biodiversity, land, water, atmosphere
Type of indicator: STATE
Category: Core, transversal
Source: UNCSD, CEROI, Consorcio Parceria 21
Justifi cation: What does it mean and why is it important to measure it?
Forests with natural or planted vegetation, parks, green areas and spaces, perform a primary
urban environment role. In tropical countries, green areas adjacent to or within the urban
district provide an essential environmental service by making the microclimate more agreeable,
fi ltering and retaining rainwater, placing a natural control on fl oods, and providing the habitat
for a varied urban fauna.
How is it identifi ed? Information needed
Surface (ha) and percentage of the total city area in each category of vegetal cover. In some
cities with signifi cant extensions of natural forest, a distinction may be made among the existing
ecosystems (for example: rainforests, mangroves, savannahs).
Measurements and units
Surface (ha) and percentage of the total city area in each category of vegetal cover.
Possible time and space formats
Graphs, tables, and trend charts.
Methodological resources references
World Conservation Union (IUCN)
World Resources Institute (WRI)
OECD, 1997. Better Understanding Our Cities: The Role of Urban Indicators, EEA Indicator
Set
Objectives
Provide the number and possible extension of a city’s green areas.
Goals, reference values
No specifi c international goals or reference values.
Application examples
“The Green City of Seville”, Spain: http://www.bestpractices.org
Other comments / context
Green spaces in urban areas are extremely important for recreation and, in general, to improve
the inhabitants’ quality of life. Pressure on biodiversity comes from different interrelated sources,
mainly land use changes, pollution, and the introduction of exotic species
Me
tho
do
log
y fo
r th
e p
rep
ara
tio
n o
f G
EO
Cit
ies
Re
po
rts
129
Me
tho
do
log
y fo
r th
e p
rep
ara
tio
n o
f G
EO
Cit
ies
Re
po
rts
129
Percentage of deteriorated areas (historic centres or buildings) in relation to built-up urban area
Resource: Built-up environment, land
Type of indicator: STATE
Category: New
Source: Consorcio Parceria 21
Justifi cation: What does it mean and why is it important to measure it?
Defi nition of the percentage of the built-up area in poor condition because of lack of maintenance
by the inhabitants and the local authorities and the type of activities in cities. It is important to
be aware of the degree of deterioration of buildings and infrastructure so that action may be
taken to improve conditions and the quality of life of urban centres’ inhabitants.
How is it identifi ed? Information needed
Percentage of deteriorated built-up area; if infrastructure is included it will serve as a basis
to calculate land and property taxes. These data may be obtained by consulting available
local urban development plans, from censuses carried out by the local administration or from
research undertaken by academic or institutional sources responsible for preparing general
urban socio-economic information.
Measurements and units
% of the area (km2 deteriorated and total built-up).
% constructions (relative number and total number)
Possible time and space formats
Graphs, maps, trend charts.
Objectives
Reduce deterioration of the built-up environment and help to improve the urban population’s
quality of life.
Goals, reference values
No established reference values
Other comments / context
It is most important to include in the assessment on the quality of urban life the aesthetic and
functional elements affected by the deterioration of buildings and infrastructure.
130
Me
tho
do
log
y fo
r th
e p
rep
ara
tio
n o
f G
EO
Cit
ies
Re
po
rts
IMPACT INDICATORS
Me
tho
do
log
y fo
r th
e p
rep
ara
tio
n o
f G
EO
Cit
ies
Re
po
rts
131
4.7. Defi nition of core indicators: Impact indicators
Biodiversity loss
Resource: Biodiversity
Sphere: Ecosystem
Type of indicator: IMPACT
Category: New, transversal
Source: Consorcio Parceria 21
Justifi cation: What does it mean and why is it important to measure it?
The risk to biodiversity is an excellent indicator of environmental quality. Consequently, the loss
of biodiversity (number and variety of fl ora and fauna species in the environment) allows an
assessment to be made of each ecosystem’s sustainability.
How is it identifi ed? Information needed
The indicator refers to a number of the local environment’s fl ora and fauna species not found at
the moment the assessment is made compared to earlier periods for which a record has been
kept. The concept of biodiversity loss as it is used here does not only refer to the extinction of
species; it is also their signifi cant reduction or disappearance without being extinct.
To make this calculation the number and variety of the city’s species of fl ora and fauna, both
past and present must be known.
Measurements and units
Number of species of fl ora and fauna.
Possible time and space formats
Graphs and localization maps.
Methodological resources reference
This indicator is an approximation of the number of extinct and known species given in earlier
state indicators and is commonly employed by the United Nations Sustainable Development
Commission (UNSDC).
Objectives
Reduce the impact and threat of urban development to local biodiversity.
Goals, reference values
No established reference values; the indicator is new and adapts to the local environment’s
characteristics.
Other comments / context
This is an important instrument to assess the quality of the environment following urbanization.
Although there is no experience in making this measurement at local level, it is important to
begin collecting data to give the public authority and local society enough information to take
measures to protect local biodiversity.
132
Me
tho
do
log
y fo
r th
e p
rep
ara
tio
n o
f G
EO
Cit
ies
Re
po
rts
Me
tho
do
log
y fo
r th
e p
rep
ara
tio
n o
f G
EO
Cit
ies
Re
po
rts
132
Microclimate change
Resource: Biodiversity
Sphere: Quality of life
Type of indicator: IMPACT
Category: New
Source: Consorcio Parceria 21
Justifi cation: What does it mean and why is it important to measure it?
Public perception about the climate is important because people relate their quality of life
directly to the environment. The quality of urban life, linked to a city’s microclimate, is directly
affected by emissions of polluting gases from industry and motor vehicles, by the lack of green
areas and by soil waterproofi ng.
How is it identifi ed? Information needed
By monitoring the temperature in different parts of the city differences are seen that may be
associated with the quality of the local physical environment. Rainfall, temperature and relative
air humidity indexes are data collected locally that should be recorded over time and may help
when analysing microclimate changes.
Measurements and units
Temperature variation in °C and relative air humidity.
Possible time and space formats
Graphs and tables showing variation over time during similar periods in different years. When
making an environmental quality analysis of the city, they should be associated with data on
green areas, built-up and paved areas, and episodes of fl ooding.
Methodological resources reference
None.
Objectives
Make the public more aware of the impact the environment has on the quality of urban life.
Make the authorities more sensitive to the need to improve the urban environment by, for
example, planning green areas and encouraging the use of environmentally friendly building
materials.
Goals, reference values
None.
Other comments / context
Although the data may be objective, such as temperature or degree of humidity, the notion of
environmental comfort is subjective. The use of these indicators in analysing environmental
quality in a city should be associated with other indicators, such as the motorization and air
pollution index
Me
tho
do
log
y fo
r th
e p
rep
ara
tio
n o
f G
EO
Cit
ies
Re
po
rts
133
Me
tho
do
log
y fo
r th
e p
rep
ara
tio
n o
f G
EO
Cit
ies
Re
po
rts
133
Incidence of water-borne diseases
Resource: Water
Sphere: Quality of life
Type of indicator: IMPACT
Category: New, transversal
Source: Consorcio Parceria 21
Justifi cation: What does it mean and why is it important to measure it?
The state of water has immediate effects on the local population’s quality of life and health. Water
polluted by organic material, specifi cally faecal material, and used for domestic consumption,
is one of the principal water-borne disease vectors with a negative impact on the quality of
urban life. One of its main manifestations is infant mortality associated with diseases caused
by polluted water. Therefore, it is important to follow up, at local level, the increase in borne-
borne diseases so that measures may be taken to improve the quality of life and, indirectly, to
improve the condition of the locality’s water supply.
How is it identifi ed? Information needed
Data provided by local public health agencies, classifi ed by the type of disease and the affected
population.
Measurements and units
Number of people affected by water-borne diseases according to disease types and dates
when they appeared.
Possible time and space formats
Trend charts, tables and localization maps.
Methodological resources reference
No references to other methodological resources; new indicator.
Objectives
Improve the population’s quality of life.
Goals, reference values
No reference values; in the case of infant mortality, reference is made to World Health
Organization standards.
Other comments / context
Water-borne diseases refl ect the socio-economic inequality between different population
groups. The most marginalized groups live in unhealthy conditions with limited access to a
supply of drinking water and to drainage, almost always implying pollution of alternative water
sources and children coming in contact with polluted water, thus increasing the incidence of
water-borne diseases. Investments in good quality water supply and drainage systems to
combat these diseases would help to reduce social inequality and improve the quality of life of
the poorest population groups.
134
Me
tho
do
log
y fo
r th
e p
rep
ara
tio
n o
f G
EO
Cit
ies
Re
po
rts
Me
tho
do
log
y fo
r th
e p
rep
ara
tio
n o
f G
EO
Cit
ies
Re
po
rts
134
Incidence of cardiorespiratory diseases
Resource: Water
Sphere: Quality of life
Type of indicator: IMPACT
Category: New, transversal
Source: Consorcio Parceria 21
Justifi cation: What does it mean and why is it important to measure it?
It is now known that air pollution has repercussions on the health and quality of life of city
inhabitants. Frequent exposure to elements such as carbon monoxide and carbon dioxide,
nitrous oxide, ozone and others, brings with it an increase in cardiorespiratory diseases, mainly
in the elderly and children.
How is it identifi ed? Information needed
Information about the number of different cardiorespiratory diseases and their increase due to
air pollution may be obtained from public health agencies.
Measurements and units
Number of people affected by cardiorespiratory diseases, indicating the type of disease, the
age of those affected, and the connection with increased air pollution.
Possible time and space formats
Trend charts and tables.
Methodological resources reference
No references from other methodological resources; new indicator.
Objectives
Reduce the impact of air pollution on the local population’s quality of life and health.
Goals, reference values
Consult the World Health Organization’s reference values.
Other comments / context
The impact of air pollution goes beyond the immediate effect on the inhabitants’ quality of
life and health; climate changes caused by rising temperatures indicate the importance of
controlling their causes. Nevertheless, since such changes are accumulative and only become
evident after many years, their effect on human life is even greater
Me
tho
do
log
y fo
r th
e p
rep
ara
tio
n o
f G
EO
Cit
ies
Re
po
rts
135
Me
tho
do
log
y fo
r th
e p
rep
ara
tio
n o
f G
EO
Cit
ies
Re
po
rts
135
Incidence of diseases caused by poisoning and pollution
Resource: Land
Sphere: Quality of life
Type of indicator: IMPACT
Category: Core
Source: CEROI, Consorcio Parceria 21
Justifi cation: What does it mean and why is it important to measure it?
This indicator provides basic information on the population’s health in relation to the physical
environment. Cases of diseases caused by pollution and poisoning due to soil and water
pollution indicate the quality of urban planning and management.
How is it identifi ed? Information needed
Number of cases of poisonings per 100 000 identifi ed as being due to soil pollution. This
indicator may be subdivided to relate to specifi c types of illnesses. It is very unusual for soil
pollution to cause death; however, it can occur from caesium poisoning, as has happened in
the state of Goias in Brazil.
Measurements and units
Number of cases of diseases per 100 000 inhabitants in a given period.
Possible time and space formats
Trend charts.
Methodological resources reference
SEPA 2000. Environmental Indicators in Community Planning: A Presentation of the
Literature.
Objectives
Reduce the risk of disease by improving living conditions by means of urban environmental
planning.
Goals, reference values
No international reference values.
Application examples
None.
Other comments / context
Cases of soil pollution are generally episodic (see Bhopal, India, 1984 and the case of Love
Canal in the United States in the 1960s). In Brazil, the case of caesium pollution in a garbage
dump was detected because of the number of deaths it caused in the local population from
cancer.
“The Global Burden of Disease” (GBD) http://www.hsph.harvard.edu/burdenofdisease/
136
Me
tho
do
log
y fo
r th
e p
rep
ara
tio
n o
f G
EO
Cit
ies
Re
po
rts
Me
tho
do
log
y fo
r th
e p
rep
ara
tio
n o
f G
EO
Cit
ies
Re
po
rts
136
Juvenile delinquency index
Resource: Built-up environment
Sphere: Quality of life
Type of indicator: IMPACT
Category: New
Source: Consorcio Parceria 21
Justifi cation: What does it mean and why is it important to measure it?
The juvenile delinquency index reveals a community’s state of social health and its degree
of security. Poverty, drugs and environmental degradation are contributing factors to a poor
quality of life which, in turn, leads to urban violence. Families without a strong structure, a lack
of schools and suffering from hunger, also cause an increase in juvenile delinquency.
How is it identifi ed? Information needed
Juvenile delinquency refers to offences committed by people less than 18 years of age.
Statistical information is offi cial and provided by local authorities and the police. Such offences
may be classifi ed as serious or minor; these data and the information on the relevant population
are collected annually.
Measurements and units
Number of cases per year of juvenile delinquency over a given period (2-10 years).
Possible time and space formats
Graphs, tables y trend charts.
Methodological resources reference
Sustainable Seattle, 1998. Indicators of Sustainable Community. http://www.scn.org
Objectives
To reduce the number of juvenile delinquency cases per year in a given community.
Goals, reference values
None.
Application examples
Some international organizations like UNICEF provide comparative data on valence.
Sustainable Seattle, 1998. Indicators of Sustainable Community, page 52
http://www.scn.org
Other comments / context
Juvenile delinquency indexes also indicate future scenarios about a community’s safety.
Violence affects the quality of life of all the inhabitants and is identifi ed by citizens as one of
most serious urban, political and social problems. Although the quality of the environment
is related to violence, this is linked to a set of social, cultural and economic factors (such as
inequality, the illiteracy index, unemployment and the population in unauthorized settlements)
so that the authorities must take an integrated approach to deal with the problem. To adopt
violent crime as a reference may reduce the distortion margin for comparative effects
Me
tho
do
log
y fo
r th
e p
rep
ara
tio
n o
f G
EO
Cit
ies
Re
po
rts
137
Me
tho
do
log
y fo
r th
e p
rep
ara
tio
n o
f G
EO
Cit
ies
Re
po
rts
137
Public health costs due to incidence of water-borne diseases
Resource: Water
Sphere: Urban economy
Type of indicator: IMPACT
Category: New
Source: Consorcio Parceria 21
Justifi cation: What does it mean and why is it important to measure it?
The state of the environment may cost municipal administrations and business signifi cant
economic losses because of the impact on the local population’s health. This indicator seeks
to identify, in the case of the water resource, losses from water-borne diseases that result from
different types of water pollution. If the public authority is to confront this problem, measures
must be taken such as increasing medical consultations or supplying medicines for sicknesses
such as diarrhoea or leptospirosis, as well as providing more tests to defi ne the type of sickness;
this implies increasing health sector resources.
For their part businesses, and other economic activities in the city, also suffer losses
due to days lost through sickness.
How is it identifi ed? Information needed
The indicator is based on following how the public authority’s local health costs evolve in
relation to the presence or increase of the city’s water-borne diseases. This means, therefore,
knowing how the local budget is divided under different headings when the calculation is being
made.
These data are more diffi cult to obtain because costs of this type are not usually reported.
However, it is important to make an effort in this respect, together with associations representing
business interests, to obtain these data and calculate losses due to diseases.
Measurements and units
The objective is to increase the budgets of the public authorities and of business to fi ght these
diseases; the unit of measurement is the local currency which is converted into U.S. dollars for
international comparison.
Possible time and space formats
Graphs, tables and time charts.
Methodological resources reference
No references of other methodological resources; new indicator.
Objectives
To contribute to the resources of the local economy by showing the economic weight
represented by the negative impact of the state of water.
Goals, reference values
No established reference values; new indicator.
Other comments / context
This indicator, adapted for different impacts, should be used for air and water resources
138
Me
tho
do
log
y fo
r th
e p
rep
ara
tio
n o
f G
EO
Cit
ies
Re
po
rts
Me
tho
do
log
y fo
r th
e p
rep
ara
tio
n o
f G
EO
Cit
ies
Re
po
rts
138
Water collection and treatment costs
Resource: Water
Sphere: Urban economy
Type of indicator: IMPACT
Category: New
Source: Consorcio Parceria 21
Justifi cation: What does it mean and why is it important to measure it?
Water pollution, its wasteful or improper use, and the constantly increasing demand for the
resource, together with the growth of the urban population, shows the need to increase local
availability of good quality water and to guarantee a suffi cient supply. This demands large
amounts of fi nancing because, for many cities, water is not available from nearby sources but
must be brought from aquifers at long distances or to which access is diffi cult; because water
courses are generally polluted, the water must be treated for human consumption. All these
factors require large investments if the quality of life and the health of the population are to be
preserved, and if a large number of economic activities are to be made possible.
How is it identifi ed? Information needed
In principle, the data needed for this indicator should be available from public water supply,
control and monitoring bodies and, where the local water system is privatized, from private
enterprises.
Measurements and units
Increased costs in local currency.
Possible time and space formats
Trend charts and tables; the costs are compared in 5-10 year periods.
Methodological resources reference
Other indicators that may give an approximate idea of the problem can be found in:
www.ceroi.net : Investment in water supply systems (response indicator)
www.iclei.org : Volume of water available (pressure indicator)
Objectives
Reduce the loss of resources invested in water collection and treatment by controlling leaks,
rationalizing water use and improving its quality.
Goals, reference values
No reference values; new indicator.
Other comments / context
It is important to indicate, in local public fi nances, the impact caused by improper use, by the
growth of demand and by water pollution
Me
tho
do
log
y fo
r th
e p
rep
ara
tio
n o
f G
EO
Cit
ies
Re
po
rts
139
Me
tho
do
log
y fo
r th
e p
rep
ara
tio
n o
f G
EO
Cit
ies
Re
po
rts
139
Cost of containing and preventing environmental risks
Resource: Biodiversity
Sphere: Urban economy
Type of indicator: IMPACT
Category: New
Source: Consorcio Parceria 21
Justifi cation: What does it mean and why is it important to measure it?
Because of the lack of land use planning and an institutional incapacity to control illegal
occupation of risk areas in cities, spending on engineering work to prevent and contain risks
is only a temporary solution; these contention measures are, for example: work on gradients,
channelling ravines, building landfi lls and dams.
How is it identifi ed? Information needed
Budget information from competent local and regional authorities.
Measurements and units
Absolute values and percentage of costs in the budget for environmental work.
Possible time and space formats
Tables of annual spending, graphs to show long-term trends over a given time period.
Methodological resources reference
None.
Objectives
Reduce costs related to temporary solutions and report environmental, social and economic
costs due to lack of planning on the use and occupation of urban land.
Goals, reference values
None.
Other comments / context
This is a local indicator to compare data with local references that depend on a follow-up the
period covered by the analysis.
140
Me
tho
do
log
y fo
r th
e p
rep
ara
tio
n o
f G
EO
Cit
ies
Re
po
rts
Me
tho
do
log
y fo
r th
e p
rep
ara
tio
n o
f G
EO
Cit
ies
Re
po
rts
140
Cost of rehabilitating monuments and historic centres
Resource: Built-up environment
Sphere: Urban economy
Type of indicator: IMPACT
Category: New
Source: Consorcio Parceria 21, CEROI
Justifi cation: What does it mean and why is it important to measure it?
Population growth worsens the impact on the built-up and natural environment. In cities,
deterioration of monuments and historic centres reveals the lack of environmental quality
and institutional capacity to administer land occupation and use. This indicator is related to
deterioration of urban property due to corrosion caused by acid rain, or the growing disorder
and urban land tremors due, for example, to the increase in the number of buses, motor cars
and trucks in certain areas of the city.
How is it identifi ed? Information needed
Number of historic buildings, annual cost of repairing monuments and restoring historic centres,
local administration’s budget.
Measurements and units
Variation of recovery costs in relation to the budget, in absolute values and percentages.
Possible time and space formats
Graphs, tables and maps.
Methodological resources reference
Local Government Management Board, 1994. The Sustainability Indicators Research Project:
Indicators for Local Agenda 21 – A Summary. United Kingdom.
UNESCO.
Objectives
Conserve and protect monuments and historic centres to reduce the number of buildings at
risk and improve environmental quality
Goals, reference values
No international goals.
Application examples
The historic centre of Salzburg: http://whc.unesco.org/en/list/784
Historic centre of Havana, Cuba;
Parati and Ouro Preto, Brazil.
Other comments / context
Cities and towns on the World Heritage List: http://www.unesco.org
Me
tho
do
log
y fo
r th
e p
rep
ara
tio
n o
f G
EO
Cit
ies
Re
po
rts
141
Me
tho
do
log
y fo
r th
e p
rep
ara
tio
n o
f G
EO
Cit
ies
Re
po
rts
141
Loss of urban attraction
Resource: Land
Sphere: Political-institutional
Type of indicator: IMPACT
Category: New
Source: Consorcio Parceria 21
Justifi cation: What does it mean and why is it important to measure it?
Property supply and demand and changes in property prices may refl ect the change of vocation
of a given city or zone. These are qualitative indicators that measure the relation between
economic activity and land use. They affect the social, environmental and economic quality of
life in a given locality.
How is it identifi ed? Information needed
Data may be found on the local property market in local and regional trade associations and
through direct surveys.
Measurements and units
The number of properties for sale in relation to the number of property operations in a year
over a given period.
Possible time and space formats
Tables and trend charts.
Methodological resources reference
No international references.
Objectives
Relate the change of activity and the space characteristic of a given area which, in turn, has
poor environmental quality and loses economic value.
Goals, reference values
None.
Other comments / context
This indicator may be divided to assess districts or zones within an urban parameter. Its
application is local and depends on national economic reference values
142
Me
tho
do
log
y fo
r th
e p
rep
ara
tio
n o
f G
EO
Cit
ies
Re
po
rts
Me
tho
do
log
y fo
r th
e p
rep
ara
tio
n o
f G
EO
Cit
ies
Re
po
rts
142
Property depreciation
Resource: Land
Sphere: Urban economy
Type of indicator: IMPACT
Category: New
Source: Consorcio Parceria 21
Justifi cation: What does it mean and why is it important to measure it?
Property speculation, added to the lack of urban planning, leads to frenzied and predatory
urbanization and harms the inhabitants’ quality of life by overburdening the urban infrastructure
and destroying work areas and resources. Property price indicators, as well as differences in
price per square metre, depending to the area, may refl ect the city’s environmental degradation.
These are qualitative indicators that measure the economic relation between land use and
quality of life in a given locality.
How is it identifi ed? Information needed
The indicator comes from an analysis over a period of time of a given area considering such
matters as traffi c and noise that affect the quality of city life. The information depends on the
history of how prices per square metre differ in selected areas.
Measurements and units
Variation in percentages of the relative cost per square metre ($/m2) of urban plots.
Possible time and space formats
Consideration should be given to time periods of 10 years, or according to the specifi c situation
where prices have changed signifi cantly because of land use changes.
Methodological resources reference
No international references.
Objectives
Relate the loss of economic value to poor environmental quality.
Goals, reference values
None.
Other comments / context
This indicator may be subdivided to assess districts or regions within the urban parameter. Its
application is local and depends on national economic reference values
Me
tho
do
log
y fo
r th
e p
rep
ara
tio
n o
f G
EO
Cit
ies
Re
po
rts
143
Me
tho
do
log
y fo
r th
e p
rep
ara
tio
n o
f G
EO
Cit
ies
Re
po
rts
143
Incidence of fl oods, landslides, etc.
Resource: Land
Sphere: Urban vulnerability
Type of indicator: IMPACT
Category: New
Source: Consorcio Parceria 21
Justifi cation: What does it mean and why is it important to measure it?
Floods and landslides on gradients following heavy rains have direct, indirect and secondary
impacts for the poorest people. Losses are immediate and direct, medium and long term,
harmful to human health and cause indirect environmental losses. Natural phenomena
generally have consequences in inverse proportion to how much planning and preparation is
undertaken by the authorities.
How is it identifi ed? Information needed
Data obtained from local authorities, civil defence and public works departments.
Measurements and units
Number of accidents in risk areas per year, measured over a given time period.
Possible time and space formats
Tables, maps and graphs.
Methodological resources reference
None.
Objectives
Reduce the number of victims and consequences of disasters whose impacts could be
prevented with proper planning and administration.
Goals, reference values
None.
Other comments / context
This indicator is directly associated with the pressure indicator on the relation between
authorized and unauthorized settlements and with the social inequality indicators. The state
indicators on water and response linked to protecting areas with springs are also related to
human vulnerability
144
Me
tho
do
log
y fo
r th
e p
rep
ara
tio
n o
f G
EO
Cit
ies
Re
po
rts
Me
tho
do
log
y fo
r th
e p
rep
ara
tio
n o
f G
EO
Cit
ies
Re
po
rts
144
Loss of tax revenue
Resource: Land
Sphere: Political-institutional
Type of indicator: IMPACT
Category: New
Source: Consorcio Parceria 21
Justifi cation: What does it mean and why is it important to measure it?
The loss of tax revenue is the result of a structural defi ciency in urban management, as well
as of the change in the profi le of activities or spatial characteristics of the given city or region.
When there is much informal commercial activity, besides prejudicing public administration it
also harms legal trade, resulting in bankruptcies or in owners abandoning their businesses.
The lack of infrastructure, maintenance and poor environmental quality may also lead to urban
degradation and consequent loss of tax revenue.
How is it identifi ed? Information needed
Budget information provided by local authorities.
Measurements and units
Percentage of taxes from the predominant activity, tourism for example, from year to year in a
given city or area.
Possible time and space formats
Trend chart.
Methodological resources reference
None.
Objectives
Revitalize degraded areas by showing the damage caused by urban deterioration.
Goals, reference values
None.
Application examples
Look for urban revitalization examples (Puerto Madero, Argentina; Harlem, USA, Havana,
Cuba Pelourinho, Brazil).
Other comments / context
The objective data on the municipal budget are used in the analysis to show the existence of
external environmental and urban factors.
Me
tho
do
log
y fo
r th
e p
rep
ara
tio
n o
f G
EO
Cit
ies
Re
po
rts
145
Me
tho
do
log
y fo
r th
e p
rep
ara
tio
n o
f G
EO
Cit
ies
Re
po
rts
145
Population living in vulnerable urban areas
Resource: Land
Sphere: Quality of life
Type of indicator: IMPACT
Category: New
Source: Consorcio Parceria 21
Justifi cation: What does it mean and why is it important to measure it?
Urban vulnerability is associated with the city’s physical, social and economic conditions.
There is a clear relationship between vulnerability and its impact and economic development.
Identifying risk situations, assessing their impacts and institutional responses, may help to
avoid the more serious consequences of vulnerability.
How is it identifi ed? Information needed
Number of people living in risk localities such as on gradients and in polluted sites. These data
are obtained from local authorities.
Measurements and units
Absolute number of inhabitants in risk situations in relation to the total population in a given
year, and how these numbers vary over time in a given period (2-10 years).
Possible time and space formats
Graphs, maps and tables.
Methodological resources reference
World Bank, UNCHS and UNDP for national and regional data.
Objectives
Reduce urban vulnerability to natural or human-induced disasters.
Goals, reference values
None.
Application examples
None.
Other comments / context
http://www.unhabitat.org/downloads/docs/5883_19704_Cities%20and%20Climate%20
Change%20Adaptation.pdf
More than half of the world’s population now lives within 60 km of the sea, while three quarters
of all large cities are located on the coast. Most of the world’s urban population resides in
vulnerable areas which are ill-equipped for adaptation, with 1 billion living in slums, and likely
to become environmental refugees. It is estimated that in addition to sea level rise, 3 to 4 of
every 10 non-permanent houses in cities in developing countries are located in areas prone to
fl oods, landslides and other natural disasters – further exacerbated by climate change.

146
Me
tho
do
log
y fo
r th
e p
rep
ara
tio
n o
f G
EO
Cit
ies
Re
po
rts
PRESSURE INDICATORS
Me
tho
do
log
y fo
r th
e p
rep
ara
tio
n o
f G
EO
Cit
ies
Re
po
rts
147
Defi nition of core indicators: response indicators
Urban master plan in place
Resource: All
Type of indicator: RESPONSE
Category: New, transversal
Source: Consorcio Parceria 21
Justifi cation: What does it mean and why is it important to measure it?
The Urban Master Plan presupposes a concern for regulating already institutionalized land
use and occupation. Meanwhile, it should be associated with other responses to specify
environmental resources.
How is it identifi ed? Information needed
Local authority and national legislation.
Measurements and units
This is a qualitative indicator to be used when diagnosing the urban environment.
Possible time and space formats
Information about the existence and date of local implementation.
Methodological resources reference
None.
Objectives
Guarantee planned urban development that includes questions about the environment
Me
tho
do
log
y fo
r th
e p
rep
ara
tio
n o
f G
EO
Cit
ies
Re
po
rts
148
Legislation to protect springs in place
Resource: Water
Type of indicator: RESPONSE
Category: New
Source: Consorcio Parceria 21
Justifi cation: What does it mean and why is it important to measure it?
The existence of national and local regulations and how they are applied has a direct impact
on the city’s environmental and natural resources quality.
How is it identifi ed? Information needed
Information on legislation and on competent environmental control authorities.
Measurements and units
This is a qualitative indicator in diagnosing the urban environment.
Possible time and space formats
Information about the date of national, regional and local implementation.
Maps and geographical information systems
Methodological resources reference.
Objectives
Guarantee quality of urban water supply, as well as preserving biodiversity, air and soil quality
by controlling occupation in areas with springs.
Goals, reference values
The existence of standards and controls does not alone constitute a reference value.
Other comments / context
This indicator should be associated with indicators on illegal occupation and settlement, and
on quality and quantity of water and how effl uents are treated
Me
tho
do
log
y fo
r th
e p
rep
ara
tio
n o
f G
EO
Cit
ies
Re
po
rts
149
Me
tho
do
log
y fo
r th
e p
rep
ara
tio
n o
f G
EO
Cit
ies
Re
po
rts
149
Regulation on controlling emissions from mobile and fi xed sources in place
Resource: Air
Type of indicator: RESPONSE
Category: New
Source: Consorcio Parceria 21
Justifi cation: What does it mean and why is it important to measure it?
The existence of local and national regulations and how they are applied have direct
repercussions on city air quality.
How is it identifi ed? Information needed
Information on legislation and on competent environmental control bodies and authorities.
Measurements and units
This is a qualitative indicator to diagnose the urban environment.
Possible time and space formats
Information about dates of national, regional and local implementation.
Objectives
Guarantee urban air quality by controlling industrial and transport emissions.
Goals, reference values
The existence of standards and control measures alone is not a reference value. Air quality
must be measured according to national and international standards
Me
tho
do
log
y fo
r th
e p
rep
ara
tio
n o
f G
EO
Cit
ies
Re
po
rts
150
Local Agenda 21 activities
Resource: All
Type of indicator: RESPONSE
Category: Core, transversal
Source: CEROI
Justifi cation: What does it mean and why is it important to measure it?
Local Agenda 21 (LA21) is an agenda for the 21st century in which the local government, the
community and interested groups are involved environmentally, economically and socially to
focus on a plan, programme or set of long-term sustainable activities. This long-term effort
includes setting specifi c goals, implementing measures, following up and making assessments
(such as audits, indicators and objectives).
How is it identifi ed? Information needed
Record the city’s local activities. May be defi ned in the LA21 table as a LA21 activity.
Measurements and units
Number of activities.
Possible time and space formats
Tables and graphs.
Methodological resources reference
ICLEI, 1998. www.iclei.org
Objectives
Implement the LA21 process in the city and its local communities.
Goals, reference values
The Rio Conference of 1992 decided that LA21 processes should be implemented globally at
local level.
Application examples
A21L en Durban: http://ceroi.net/reports/durban/index.htm
Sustainable cities and local government: http://www.unchs.org
Other comments / context
In June 1992 UNCSD adopted Agenda 21 as a global sustainable development action for the
21st century. The plan includes a special mandate for authorities to act, beginning in 1996,
on implementing LA21.
LA21 document: http://www.iisd.org/rio+5/agenda/agenda21.htm
Me
tho
do
log
y fo
r th
e p
rep
ara
tio
n o
f G
EO
Cit
ies
Re
po
rts
151
Me
tho
do
log
y fo
r th
e p
rep
ara
tio
n o
f G
EO
Cit
ies
Re
po
rts
151
Environmental education programmes
Resource: All
Type of indicator: RESPONSE
Category: New, transversal
Source: Consorcio Parceria 21
Justifi cation: What does it mean and why is it important to measure it?
Environmental education is the key to good environmental management so long as the
responsibility for environmental quality is shared between government and citizens. The
existence of environmental education mechanisms and actions shows how the subject has
been integrated into public policies and the daily life of the city’s inhabitants.
How is it identifi ed? Information needed
Local, regional and national authorities have data on legislation, standards and action on
environmental education such as campaigns, movements and environmental themes included
in the formal school curriculum.
Measurements and units
This is a qualitative indicator useful in making an analysis associated with other state and
response indicators.
Possible time and space formats
Existing long-term activities expressed in graphs and tables.
Objectives
Stimulate environmental awareness and public participation in the city’s environmental
management.
Other comments / context
That the subject is institutionalized does not mean it has been included in local public policies.
The subject must be associated with action, behaviour and attitudes which are, in turn,
detected in the state of the environment as time passes
Me
tho
do
log
y fo
r th
e p
rep
ara
tio
n o
f G
EO
Cit
ies
Re
po
rts
152
Number of environmental NGOs
Resource: All
Type of indicator: RESPONSE
Category: Core, transversal
Source: CEROI
Justifi cation: What does it mean and why is it important to measure it?
Society’s participation and interest are important for local democracy and transparency in
decision making, as they are also vital for successful Local Agenda 21 processes. The number
of NGOs is an indicator of public participation and commitment.
How is it identifi ed? Information needed
Number of groups, divided in groups of 10 000 people, involved in local government.
Measurements and units
NGOs / 10 000 people
Possible time and space formats
Trend chart, graphs, tables.
Methodological resources reference
ICLEI, 1998. www.iclei.org
Objectives
Increase participation in and transparency of decision making processes.
Other comments / context
Genuine participation by and interest of all social groups in the decisions are fundamental
when implementing all the Agenda 21 objectives, directives and mechanisms (Agenda 21 UN,
Chap. 23).
Me
tho
do
log
y fo
r th
e p
rep
ara
tio
n o
f G
EO
Cit
ies
Re
po
rts
153
Me
tho
do
log
y fo
r th
e p
rep
ara
tio
n o
f G
EO
Cit
ies
Re
po
rts
153
Tax system based on the polluter-payer/user-payer principle in place
Resource: Water
Type of indicator: RESPONSE
Category: Core
Source: CEROI, Consorcio Parceria 21
Justifi cation: What does it mean and why is it important to measure it?
The application of preventive measures includes a tax system based on the polluter-payer
principle. Legislation and tax collection show the importance of applying the tax and how
effective it is. It serves to internalize the environmental cost of pollution and to stimulate the use
of clean processes and technologies.
How is it identifi ed? Information needed
Data are obtained from municipalities and competent environmental control authorities.
Measurements and units
Local “green” tax system (percentage).
Possible time and space formats
Graphs and tables.
Methodological resources reference
ICLEI, 1998. Global Tomorrow Coalition, 1993. Walter Corsao: Measuring Urban Sustainability.
USA.
Objectives
Increase the cost of polluting to encourage the adoption of clean technologies and
processes
Me
tho
do
log
y fo
r th
e p
rep
ara
tio
n o
f G
EO
Cit
ies
Re
po
rts
154
Preventive warnings and fi nes for violating the waste disposal standard
Resource: Land
Type of indicator: RESPONSE
Category: New
Source: Consorcio Parceria 21
Justifi cation: What does it mean and why is it important to measure it?
The existence of waste disposal control mechanisms implies institutionalizing them and joint
responsibility.
How is it identifi ed? Information needed
Data obtained from local environmental control authorities.
Measurements and units
Number of events per year.
Possible time and space formats
Graphs and tables.
Objectives
Reduce solid waste production, minimize and reduce risks of environmental pollution from
solid waste.
Me
tho
do
log
y fo
r th
e p
rep
ara
tio
n o
f G
EO
Cit
ies
Re
po
rts
155
Me
tho
do
log
y fo
r th
e p
rep
ara
tio
n o
f G
EO
Cit
ies
Re
po
rts
155
Investments in waste management
Resource: Land, water and biodiversity
Type of indicator: RESPONSE
Category: Core
Source: UNCSD
Justifi cation: What does it mean and why is it important to measure it?
Urban domestic waste management is local authorities’ responsibility. The cost of managing
waste is an important factor that defi nes the municipality’s commitment to urban sustainable
development; poor management causes a signifi cant worsening of health, quality of life and
the environment, adds to the loss of productivity, harms the economy and puts urban attraction
at risk.
How is it identifi ed? Information needed
In general, the cost of waste management includes the total spent on public and private
services to collect and dispose of the city’s garbage. This indicator does not include managing
industrial hazardous waste as this is the responsibility of the sources themselves.
The indicator is calculated as the total investment in waste management services in relation to
the city’s income and to the total volume of waste handled.
Measurements and units
Investments in waste management (total value, unit value = total value / total volume of waste
managed, percentage of municipal income).
Possible time and space formats
Graphs, tables and trend charts.
Methodological resources reference
OECD, 1997. Better understanding our cities: The Role of Urban Indicators. EEA Indicator
Set.
UNCHS, 1995. Monitoring Human Settlements: A Bridged Survey.
EF, 1998. Urban Sustainability Indicators for the Improvement of Living and Working
Conditions.
Objectives
Improve the municipal waste management system.
Application examples
Good practices: waste and urban street cleaning in Barcelona. http://www.mediambient.bcn.es
Other comments / context
Possible investments to improve the management system may include programmes, on
different scales, on selective collection, recycling, environmental education, support for
initiatives linked to recycling and other activities related to waste management innovations and
training. Investments in these areas, as well as being included in the total value, should be
listed separately
Me
tho
do
log
y fo
r th
e p
rep
ara
tio
n o
f G
EO
Cit
ies
Re
po
rts
156
Access to and quality of local infrastructure services
Resource: All
Type of indicator: RESPONSE
Category: Core, transversal
Source: CEROI
Justifi cation: What does it mean and why is it important to measure it?
Local services quality and reliability are normally assured in industrialized countries, but in
developing countries limited access or the poor quality of infrastructure services can be a
serious impediment to productivity and cause frustration in national users.
How is it identifi ed? Information needed
Percentage of services provided to households through the water supply network, drains and
garbage collection.
Measurements and units
Households connected to the water supply network (total number of households). Garbage
collection from households (total number and percentage of households).
Possible time and space formats
Trend charts and maps.
Objectives
Let the urban population become less frustrated.
Application examples
Household connection, in Prague, Czech Republic. http://www.ceroi.net/reports/prague/
issues/housing/state.htm
Me
tho
do
log
y fo
r th
e p
rep
ara
tio
n o
f G
EO
Cit
ies
Re
po
rts
157
Me
tho
do
log
y fo
r th
e p
rep
ara
tio
n o
f G
EO
Cit
ies
Re
po
rts
157
Total rehabilitated areas in relation to total degraded areas
Resource: Land
Type of indicator: RESPONSE
Category: Core
Source: CEROI
Justifi cation: What does it mean and why is it important to measure it?
Degraded city areas being reurbanized for other uses.
How is it identifi ed? Information needed
Area in km2, percentage of total urban surface.
Measurements and units
Area rehabilitated (km2).
Area rehabilitated (percentage of total city surface).
Possible time and space formats
Maps, trend charts, graphs.
Methodological resources reference
EEA, 1997. Sustainable Urban Development Indicators: Urban Patterns Indicators.
International
Institute for the Urban Environment.
Objectives
Restore affected spaces and buildings.
Goals, reference values
No reference values
Me
tho
do
log
y fo
r th
e p
rep
ara
tio
n o
f G
EO
Cit
ies
Re
po
rts
158
Investments in green areas
Resource: All
Type of indicator: RESPONSE
Category: Core, transversal
Source: CEROI
Justifi cation: What does it mean and why is it important to measure it?
Investments must be made to maintain and improve green areas, parks and public gardens
for the city’s environmental quality. These are important for recreation that has an effect on the
inhabitants’ quality of life.
How is it identifi ed? Information needed
Investment made in maintaining green areas in relation to the city’s GDP. It should be measured
annually and a 2-10 year period should be taken into account for a long-term assessment.
Measurements and units
Percentage (%) of annual investment in relation to total municipal budget.
Possible time and space formats
Graphs, tables and trend charts.
Objectives
Improve green areas and public parks in cities.
Goals, reference values
No goals or quantitative reference values, but access to green areas is considered important
for the communities’ health and for urban sustainability. The WHO recommends 12m2 of
green area per city inhabitant.
Other comments / context
It is important to guarantee that spaces are preserved and maintained, and to ensure they are
not replaced by built-up or waterproofed areas.
Me
tho
do
log
y fo
r th
e p
rep
ara
tio
n o
f G
EO
Cit
ies
Re
po
rts
159
Me
tho
do
log
y fo
r th
e p
rep
ara
tio
n o
f G
EO
Cit
ies
Re
po
rts
159
Investments in environmental recuperation
Resource: All
Type of indicator: RESPONSE
Category: Core, transversal
Source: CEROI, Consorcio Parceria 21
Justifi cation: What does it mean and why is it important to measure it?
Investments in degraded urban areas and those being rehabilitated for sustainable use.
How is it identifi ed? Information needed
Data obtained from the municipality and reclamation investment programmes; total values that
may be compared with the city’s budget. May also include private initiative investments.
Measurements and units
Value of investments in local currency or in U.S. dollars in a given year.
Possible time and space formats
Graphs, maps and tables.
Objectives
Reduce the number of degraded areas and recover the quality of environmental resources.
Goals, reference values
EEA, 1997. Sustainable Urban Development Indicators: Urban Patterns Indicators.
International
Institute for the Urban Environment.
Other comments / context
The United Kingdom Brownfi eld programme, that basically seeks to rehabilitate commercial
spaces and abandoned industries, has created more than 6 400 jobs; in addition, the pilot
communities had an economic impact of more than US$2 000 million
Me
tho
do
log
y fo
r th
e p
rep
ara
tio
n o
f G
EO
Cit
ies
Re
po
rts
160
Investments in public transport
Resource: All
Type of indicator: RESPONSE
Category: Core
Source: CEROI
Justifi cation: What does it mean and why is it important to measure it?
The impact on the urban environment caused by traffi c is directly related to air pollution and
human health problems. Investments in public transport show what is being done to reduce
these pressures.
How is it identifi ed? Information needed
Investments in public transport in relation to the total spent on public roads.
Measurements and units
Investments in public transport (total value, percentage of value spent on public roads,
percentage of municipal income).
Possible time and space formats
Trend charts, tables and graphs.
Methodological resources reference
Local Government Management Board, 1994. The Sustainability Indicators Research Project:
Indicators for Local Agenda 21 – A Summary. United Kingdom.
Objectives
Improve users’ access to public transport and the quality of the services provided.
Application examples
Strasburg tramway: http://www.eaue.de/winuwd/76.htm
Other comments / context
A recent report analyses 245 cities that are experiencing the fastest growth in the developing
world. It shows very clearly that spatial infl uences of macroeconomic and industrial policies
and related investments (or economic development), are the main drivers of city growth in 78
per cent of the cities analyzed. Investments in transport infrastructure (roads, ports, airports)
were by and large the most important contributor to city growth. Forty per cent of the cities
analyzed experienced high growth rates as a direct result of the diversifi cation, expansion or
improvement of regional or urban transport infrastructure (UN HABITAT 2009)
Me
tho
do
log
y fo
r th
e p
rep
ara
tio
n o
f G
EO
Cit
ies
Re
po
rts
161
Me
tho
do
log
y fo
r th
e p
rep
ara
tio
n o
f G
EO
Cit
ies
Re
po
rts
161
Investments in water supply and drainage systems
Resource: Water
Type of indicator: RESPONSE
Category: Core
Source: CEROI, Consorcio Parceria 21
Justifi cation: What does it mean and why is it important to measure it?
Providing basic sanitary systems that include water supply, collection and treatment of sewage
is the municipality’s responsibility. Supplying drinking water with no danger of pollution from
sewage is an absolute necessity for life and health. This indicator measures the importance
the city places on improving its water supply and drainage systems.
How is it identifi ed? Information needed
Investment in water supply and drainage in relation to each city’s federal income. This indicator
should be measured every year.
Measurements and units
Investment in water supply (total value, incremental value = total value / number of additional
households served, percentage of municipal income).
Investment in drainage system (collection and treatment systems) (total value, cost of collection
network increase = total value / number of households served by the network, unit cost of
treatment = cost of treatment system / population served, percentage of municipal income).
Possible time and space formats
Trend charts, graphs.
Objectives
Improve municipal water supply and drainage systems.
Goals, reference values
No international references.
Application examples
Increasing access to water and sanitary services in marginalized urban areas by private
investment: El Alto Project in La Paz, Bolivia http://www.bpdws.org/spanish/prj_lapaz.htm
Other comments / context
Throughout the world it is mainly the task of women to collect and handle water. They are
also responsible for household chores, hygiene, the family’s health and sanitary arrangements.
Women should, therefore, take a full and active part in water supply and sanitation
programmes

Me
tho
do
log
y fo
r th
e p
rep
ara
tio
n o
f G
EO
Cit
ies
Re
po
rts
162
Annex 2: Guide to managing bibliographic references42
A. Managing bibliographic references in the body of the document
The system will be used where the reference is made with the surname and year. For
example: (Schuldt 2004), (Velarde and Rodríguez 2001) or, “Schuldt (2004) maintains that...”;
“Velarde and Rodríguez (2001) conclude...”
When a document has been written by three authors, the three surnames are included
in the reference (Morón, Casas and Carranza 2002). If there are more than three authors (for
example: Rodríguez, Seminario, Astorne and Molina), it is preferable to quote it as follows:
Rodríguez and others.
When works by an author published in the same year are quoted, they should be
distinguished as follows: Chacaltana 2003a and Chacaltana 2003b.
Each bibliographic reference should include at least the following information:
Name and surname of the author or authors. If it was authored by an institution, the •
complete name should appear and not only the abbreviation or acronym.
The reference title must appear in italics if it is a complete publication; between inverted •
commas if it is a document, report or presentation that has not been published. When
the reference is to an article or chapter, the title of the publication in which it appears
should be given, as well as the name of the author or editor. When the title of a work or
an article is quoted, only the fi rst word of the title appears in capital letters; for example:
Ensayos sobre la economía peruana. If the work has been written in English then that
language’s spelling is respected; for example: A Decade of Economic Change. The
Chilean Experience.
Other information that should be included is the name of the publisher, the year and •
place of publication. If a newspaper article is being quoted, please include the name of
the author, the date of publication and the title of the article, the name of the newspaper
in italics, and the pages on which the article appears.
B. Presentation of texts in the Bibliography
Below are some examples of how to present information in the bibliography:
When it is a book:
Schuldt, Jürgen (2004). Bonanza macroeconómica y malestar microeconómico. Apuntes
para el estudio del caso peruano, 1988-2004. Lima: University of the Pacifi c Research
Centre.
When an article published in an academic magazine is quoted:
Gorton, Gary and George Pennacchi (1990). “Financial Intermediaries and Liquidity
Creation”, in The Journal of Finance. Vol. 45. Nº 1. Pp. 49-71.
When an article or chapter of a book written by several authors is quoted:
Bonifaz, José Luis y Luis A. Bonifaz (2004). “Servicio universal en telecomunicaciones: el
caso del Fondo de Inversión en Telecomunicaciones en el Perú”, in Fernández-Baca, Jorge
42 Guide by the Fondo Editorial of the University of the Pacifi c Research Centre
Me
tho
do
log
y fo
r th
e p
rep
ara
tio
n o
f G
EO
Cit
ies
Re
po
rts
163
(ed.). Experiencias de regulación en el Perú. Lima: University of the Pacifi c Research Centre.
When the quote is from an author or publisher previously quoted:
Jaramillo, Miguel (2003). “Políticas de recursos humanos para la agricultura comercial
costeña”, in García, Norberto (ed.). Políticas de empleo en Perú. Lima: Consorcio de
Investigación Económica y Social y Red de Políticas de Empleo.
-------- (1999). El potencial de generación de empleo de la agricultura peruana. Working
document. Lima: International Labour Organization.
When they are unpublished conference or seminar documents:
Domínguez, R. and P. Salinas (1992). “Las ventajas del libre comercio”. Article presented at
the Second International Conference on Foreign Trade, Atlanta, Georgia, United States.
When they are unedited documents:
Meller, P. and A. Solimano (1984). “Inestabilidad fi nanciera, burbujas especulativas y tasas
de interés”. Santiago, Chile. Mimeo.
When the fi gure or table was prepared by the GEO technical team for this specifi c
document:
Source: Prepared in house FAU-UNT, 2005.
When the fi gure or table was prepared on the basis of a document consulted by the
GEO team:
Prepared in house FAU-UNT, 2005. Based on the Municipality of San Miguel de Tucumán,
2003. (Make reference to the title of the text or document in the fi nal bibliography)
When the fi gure or table was prepared specifi cally for this document by a professional
or expert invited by GEO Cities.
Source: Prepared by Ceballos for FAU-UNT, 2005.
When the fi gure or table was prepared based on a document consulted by a
professional or expert invited by GEO:
Source: Prepared by Ceballos for FAU-UNT, 2005. Based on INDEC, 2001.
(In this case the title of the INDEDC document consulted must have complete reference in
the fi nal bibliography).
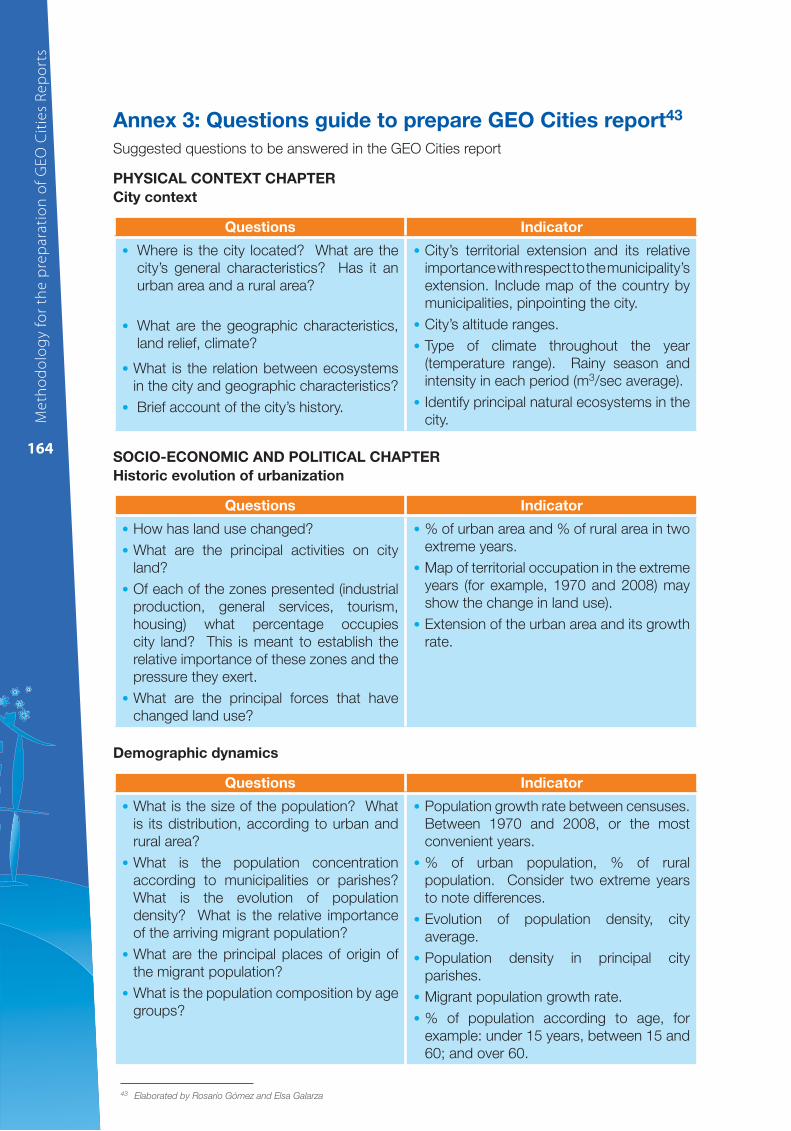
Me
tho
do
log
y fo
r th
e p
rep
ara
tio
n o
f G
EO
Cit
ies
Re
po
rts
164
Annex 3: Questions guide to prepare GEO Cities report43
Suggested questions to be answered in the GEO Cities report
PHYSICAL CONTEXT CHAPTER
City context
Questions Indicator
Where is the city located? What are the •
city’s general characteristics? Has it an
urban area and a rural area?
What are the geographic characteristics, •
land relief, climate?
What is the relation between ecosystems •
in the city and geographic characteristics?
Brief account of the city’s history.•
City’s territorial extension and its relative •
importance with respect to the municipality’s
extension. Include map of the country by
municipalities, pinpointing the city.
City’s altitude ranges.•
Type of climate throughout the year •
(temperature range). Rainy season and
intensity in each period (m3/sec average).
Identify principal natural ecosystems in the •
city.
SOCIO-ECONOMIC AND POLITICAL CHAPTER
Historic evolution of urbanization
Questions Indicator
How has land use changed?•
What are the principal activities on city •
land?
Of each of the zones presented (industrial •
production, general services, tourism,
housing) what percentage occupies
city land? This is meant to establish the
relative importance of these zones and the
pressure they exert.
What are the principal forces that have •
changed land use?
% of urban area and % of rural area in two •
extreme years.
Map of territorial occupation in the extreme •
years (for example, 1970 and 2008) may
show the change in land use).
Extension of the urban area and its growth •
rate.
Demographic dynamics
Questions Indicator
What is the size of the population? What •
is its distribution, according to urban and
rural area?
What is the population concentration •
according to municipalities or parishes?
What is the evolution of population
density? What is the relative importance
of the arriving migrant population?
What are the principal places of origin of •
the migrant population?
What is the population composition by age •
groups?
Population growth rate between censuses. •
Between 1970 and 2008, or the most
convenient years.
% of urban population, % of rural •
population. Consider two extreme years
to note differences.
Evolution of population density, city •
average.
Population density in principal city •
parishes.
Migrant population growth rate.•
% of population according to age, for •
example: under 15 years, between 15 and
60; and over 60.
43 Elaborated by Rosario Gómez and Elsa Galarza
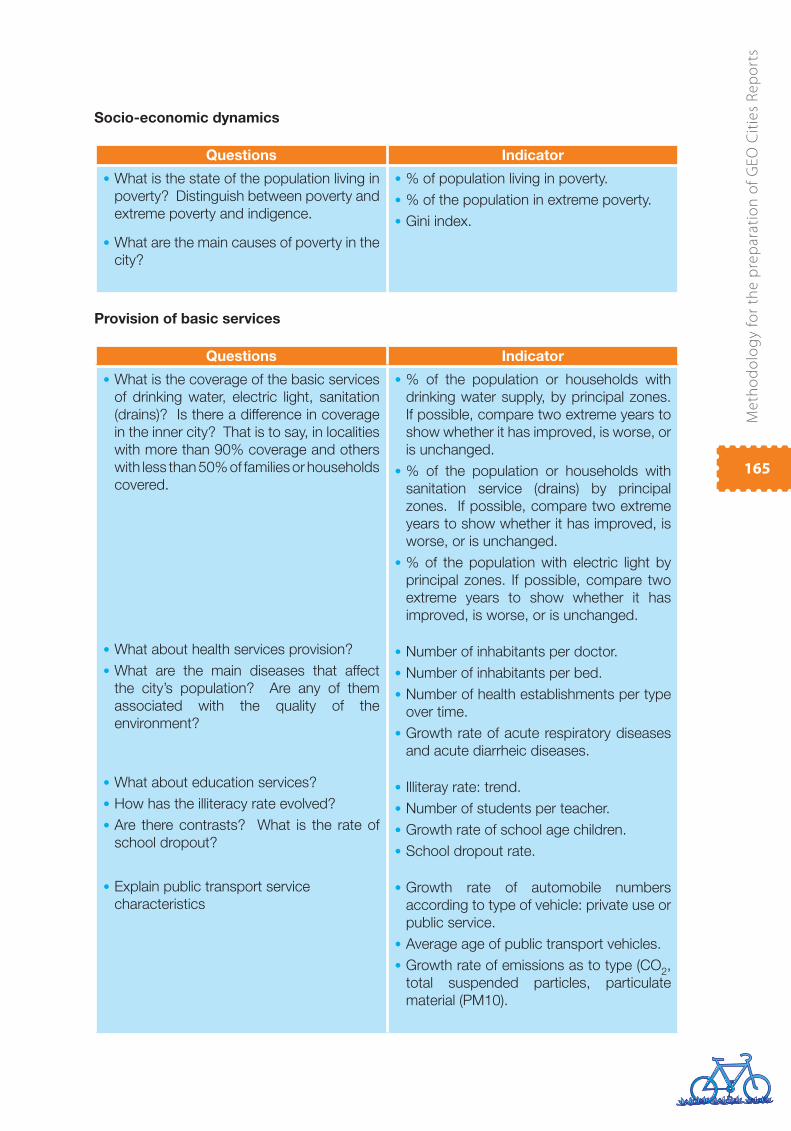
Me
tho
do
log
y fo
r th
e p
rep
ara
tio
n o
f G
EO
Cit
ies
Re
po
rts
165
Socio-economic dynamics
Questions Indicator
What is the state of the population living in •
poverty? Distinguish between poverty and
extreme poverty and indigence.
What are the main causes of poverty in the •
city?
% of population living in poverty.•
% of the population in extreme poverty.•
Gini index.•
Provision of basic services
Questions Indicator
What is the coverage of the basic services •
of drinking water, electric light, sanitation
(drains)? Is there a difference in coverage
in the inner city? That is to say, in localities
with more than 90% coverage and others
with less than 50% of families or households
covered.
What about health services provision?•
What are the main diseases that affect •
the city’s population? Are any of them
associated with the quality of the
environment?
What about education services?•
How has the illiteracy rate evolved?•
Are there contrasts? What is the rate of •
school dropout?
Explain public transport service •
characteristics
% of the population or households with •
drinking water supply, by principal zones.
If possible, compare two extreme years to
show whether it has improved, is worse, or
is unchanged.
% of the population or households with •
sanitation service (drains) by principal
zones. If possible, compare two extreme
years to show whether it has improved, is
worse, or is unchanged.
% of the population with electric light by •
principal zones. If possible, compare two
extreme years to show whether it has
improved, is worse, or is unchanged.
Number of inhabitants per doctor.•
Number of inhabitants per bed.•
Number of health establishments per type •
over time.
Growth rate of acute respiratory diseases •
and acute diarrheic diseases.
Illiteray rate: trend.•
Number of students per teacher.•
Growth rate of school age children.•
School dropout rate.•
Growth rate of automobile numbers •
according to type of vehicle: private use or
public service.
Average age of public transport vehicles.•
Growth rate of emissions as to type (CO• 2,
total suspended particles, particulate
material (PM10).
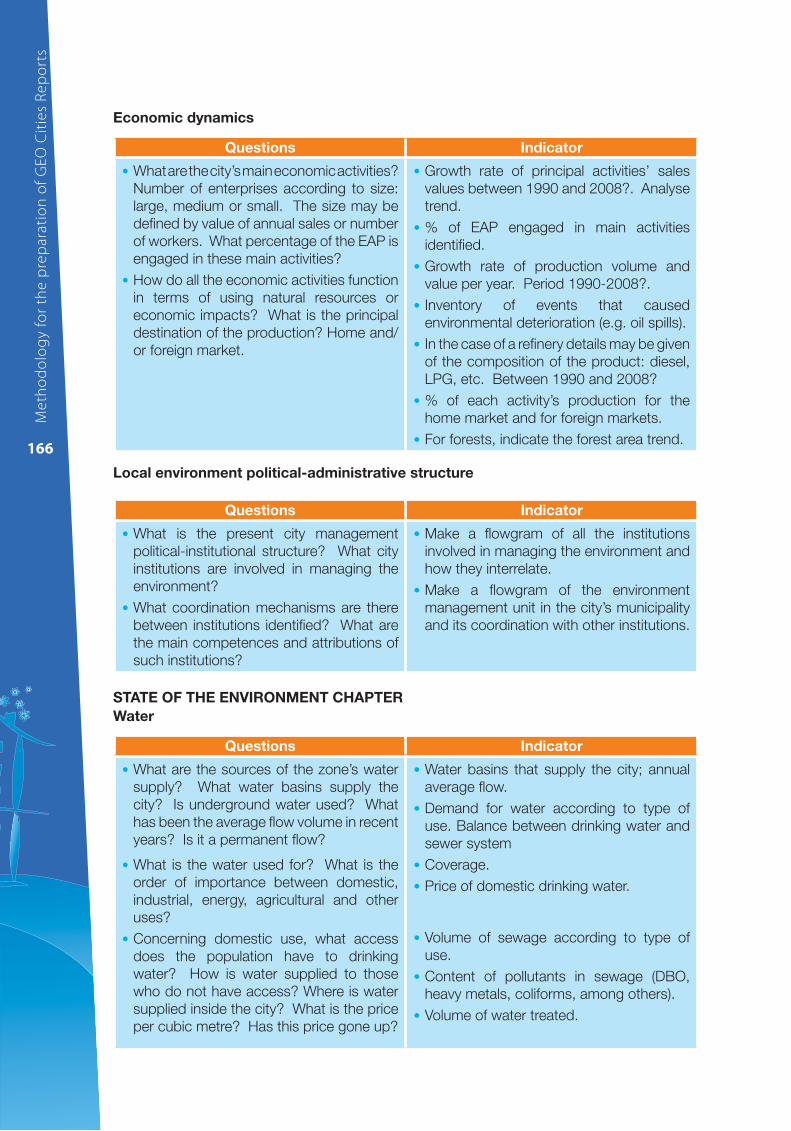
Me
tho
do
log
y fo
r th
e p
rep
ara
tio
n o
f G
EO
Cit
ies
Re
po
rts
166
Economic dynamics
Questions Indicator
What are the city’s main economic activities? •
Number of enterprises according to size:
large, medium or small. The size may be
defi ned by value of annual sales or number
of workers. What percentage of the EAP is
engaged in these main activities?
How do all the economic activities function •
in terms of using natural resources or
economic impacts? What is the principal
destination of the production? Home and/
or foreign market.
Growth rate of principal activities’ sales •
values between 1990 and 2008?. Analyse
trend.
% of EAP engaged in main activities •
identifi ed.
Growth rate of production volume and •
value per year. Period 1990-2008?.
Inventory of events that caused •
environmental deterioration (e.g. oil spills).
In the case of a refi nery details may be given •
of the composition of the product: diesel,
LPG, etc. Between 1990 and 2008?
% of each activity’s production for the •
home market and for foreign markets.
For forests, indicate the forest area trend.•
Local environment political-administrative structure
Questions Indicator
What is the present city management •
political-institutional structure? What city
institutions are involved in managing the
environment?
What coordination mechanisms are there •
between institutions identifi ed? What are
the main competences and attributions of
such institutions?
Make a fl owgram of all the institutions •
involved in managing the environment and
how they interrelate.
Make a fl owgram of the environment •
management unit in the city’s municipality
and its coordination with other institutions.
STATE OF THE ENVIRONMENT CHAPTER
Water
Questions Indicator
What are the sources of the zone’s water •
supply? What water basins supply the
city? Is underground water used? What
has been the average fl ow volume in recent
years? Is it a permanent fl ow?
What is the water used for? What is the •
order of importance between domestic,
industrial, energy, agricultural and other
uses?
Concerning domestic use, what access •
does the population have to drinking
water? How is water supplied to those
who do not have access? Where is water
supplied inside the city? What is the price
per cubic metre? Has this price gone up?
Water basins that supply the city; annual •
average fl ow.
Demand for water according to type of •
use. Balance between drinking water and
sewer system
Coverage.•
Price of domestic drinking water.•
Volume of sewage according to type of •
use.
Content of pollutants in sewage (DBO, •
heavy metals, coliforms, among others).
Volume of water treated.•
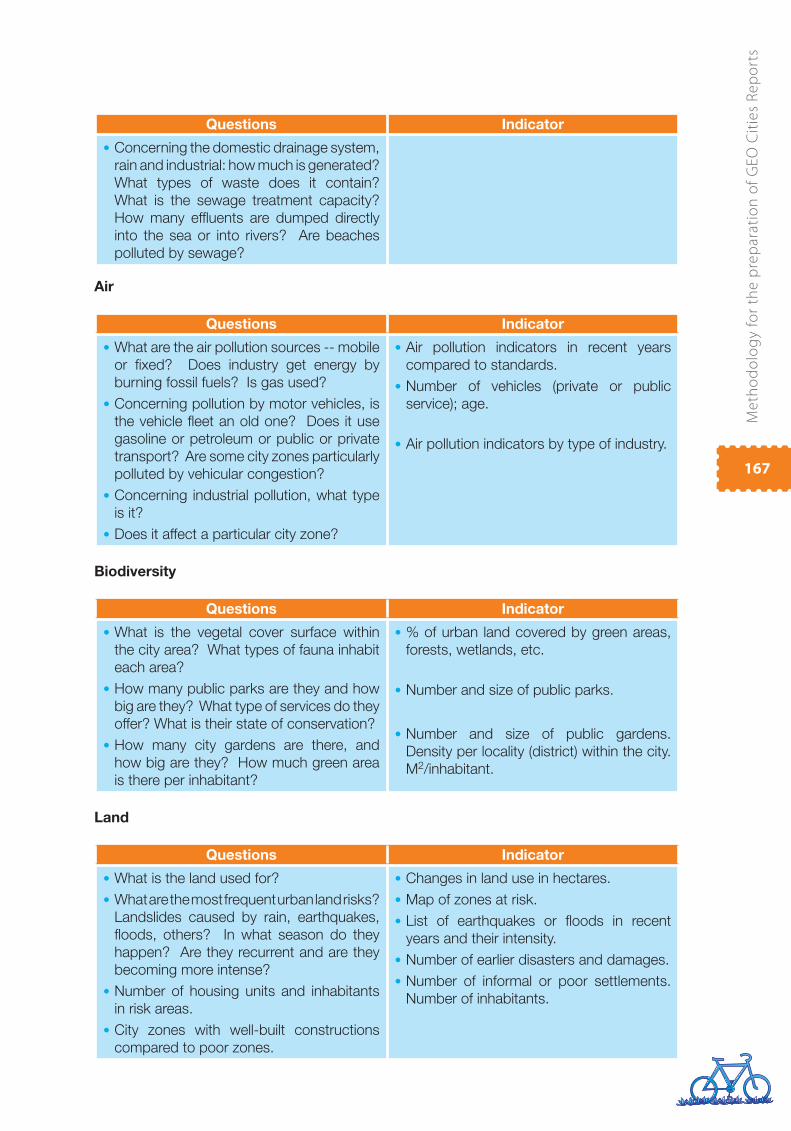
Me
tho
do
log
y fo
r th
e p
rep
ara
tio
n o
f G
EO
Cit
ies
Re
po
rts
167
Questions Indicator
Concerning the domestic drainage system, •
rain and industrial: how much is generated?
What types of waste does it contain?
What is the sewage treatment capacity?
How many effl uents are dumped directly
into the sea or into rivers? Are beaches
polluted by sewage?
Air
Questions Indicator
What are the air pollution sources -- mobile •
or fi xed? Does industry get energy by
burning fossil fuels? Is gas used?
Concerning pollution by motor vehicles, is •
the vehicle fl eet an old one? Does it use
gasoline or petroleum or public or private
transport? Are some city zones particularly
polluted by vehicular congestion?
Concerning industrial pollution, what type •
is it?
Does it affect a particular city zone?•
Air pollution indicators in recent years •
compared to standards.
Number of vehicles (private or public •
service); age.
Air pollution indicators by type of industry.•
Biodiversity
Questions Indicator
What is the vegetal cover surface within •
the city area? What types of fauna inhabit
each area?
How many public parks are they and how •
big are they? What type of services do they
offer? What is their state of conservation?
How many city gardens are there, and •
how big are they? How much green area
is there per inhabitant?
% of urban land covered by green areas, •
forests, wetlands, etc.
Number and size of public parks.•
Number and size of public gardens. •
Density per locality (district) within the city.
M2/inhabitant.
Land
Questions Indicator
What is the land used for?•
What are the most frequent urban land risks? •
Landslides caused by rain, earthquakes,
fl oods, others? In what season do they
happen? Are they recurrent and are they
becoming more intense?
Number of housing units and inhabitants •
in risk areas.
City zones with well-built constructions •
compared to poor zones.
Changes in land use in hectares.•
Map of zones at risk.•
List of earthquakes or fl oods in recent •
years and their intensity.
Number of earlier disasters and damages.•
Number of informal or poor settlements. •
Number of inhabitants.
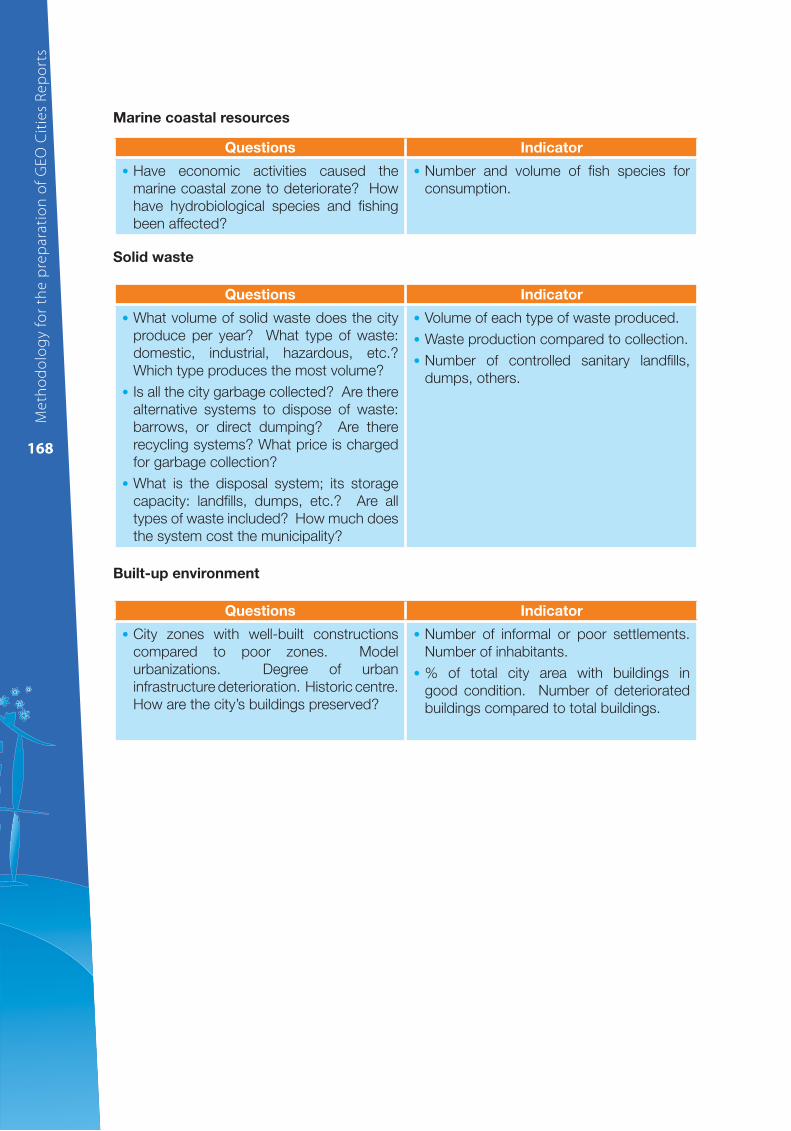
Me
tho
do
log
y fo
r th
e p
rep
ara
tio
n o
f G
EO
Cit
ies
Re
po
rts
168
Marine coastal resources
Questions Indicator
Have economic activities caused the •
marine coastal zone to deteriorate? How
have hydrobiological species and fi shing
been affected?
Number and volume of fi sh species for •
consumption.
Solid waste
Questions Indicator
What volume of solid waste does the city •
produce per year? What type of waste:
domestic, industrial, hazardous, etc.?
Which type produces the most volume?
Is all the city garbage collected? Are there •
alternative systems to dispose of waste:
barrows, or direct dumping? Are there
recycling systems? What price is charged
for garbage collection?
What is the disposal system; its storage •
capacity: landfi lls, dumps, etc.? Are all
types of waste included? How much does
the system cost the municipality?
Volume of each type of waste produced.•
Waste production compared to collection.•
Number of controlled sanitary landfi lls, •
dumps, others.
Built-up environment
Questions Indicator
City zones with well-built constructions •
compared to poor zones. Model
urbanizations. Degree of urban
infrastructure deterioration. Historic centre.
How are the city’s buildings preserved?
Number of informal or poor settlements. •
Number of inhabitants.
% of total city area with buildings in •
good condition. Number of deteriorated
buildings compared to total buildings.
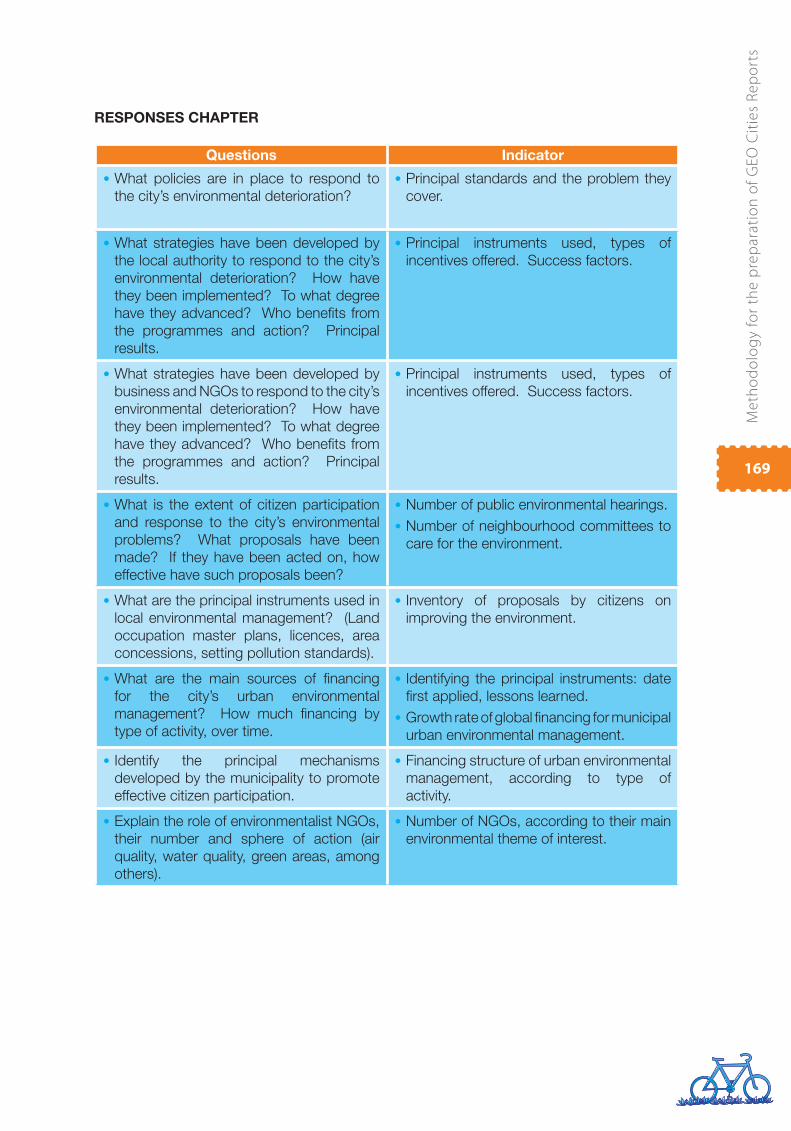
Me
tho
do
log
y fo
r th
e p
rep
ara
tio
n o
f G
EO
Cit
ies
Re
po
rts
169
RESPONSES CHAPTER
Questions Indicator
What policies are in place to respond to •
the city’s environmental deterioration?
Principal standards and the problem they •
cover.
What strategies have been developed by •
the local authority to respond to the city’s
environmental deterioration? How have
they been implemented? To what degree
have they advanced? Who benefi ts from
the programmes and action? Principal
results.
Principal instruments used, types of •
incentives offered. Success factors.
What strategies have been developed by •
business and NGOs to respond to the city’s
environmental deterioration? How have
they been implemented? To what degree
have they advanced? Who benefi ts from
the programmes and action? Principal
results.
Principal instruments used, types of •
incentives offered. Success factors.
What is the extent of citizen participation •
and response to the city’s environmental
problems? What proposals have been
made? If they have been acted on, how
effective have such proposals been?
Number of public environmental hearings.•
Number of neighbourhood committees to •
care for the environment.
What are the principal instruments used in •
local environmental management? (Land
occupation master plans, licences, area
concessions, setting pollution standards).
Inventory of proposals by citizens on •
improving the environment.
What are the main sources of fi nancing •
for the city’s urban environmental
management? How much fi nancing by
type of activity, over time.
Identifying the principal instruments: date •
fi rst applied, lessons learned.
Growth rate of global fi nancing for municipal •
urban environmental management.
Identify the principal mechanisms •
developed by the municipality to promote
effective citizen participation.
Financing structure of urban environmental •
management, according to type of
activity.
Explain the role of environmentalist NGOs, •
their number and sphere of action (air
quality, water quality, green areas, among
others).
Number of NGOs, according to their main •
environmental theme of interest.
Me
tho
do
log
y fo
r th
e p
rep
ara
tio
n o
f G
EO
Cit
ies
Re
po
rts
170
Annex 4: Work guide for the GEO Cities report workshop44
Assessment of the environmental indicators proposal
1- The proposal on indicators for GEO reports
The distinctive characteristic of the IEA/GEO (Global Environment Outlook) reports is that
they go beyond a traditional state of the environment report and, as an integral part of decision
making on sustainable development, they include an assessment of policies and emerging
themes.
The objective of the IEA/GEO report is to promote effective action to achieve sustainable
development. This report is produced as a participatory effort involving the principal
stakeholders as well as experts in different disciplines related to development. The aim is to
build a consensus about priority actions and questions resulting from a dialogue between
stakeholders, politicians and scientists.
GEO is an integrated report because not only does it observe the links between socio-
economic, environmental and policy questions, it also attempts to imagine future options and
policy priorities based on past and present experiences. GEO uses a scenarios approach by
examining a series of potential future results of possible policy decisions that may be taken
today. Environmental questions in GEO are analysed by using a systemic approach and a
conceptual pressure-state-response framework.
What is an integrated environmental assessment?
Traditional reports on the state of the environment have been very useful in indicating
environmental conditions. However, these reports need to include an assessment of policies
that have an infl uence on the environment. It is important to include this assessment because
the consequences of policies, whether intentional or unintentional, may be dispersed over time
and could also be the causes of environmental problems.
GEO Cities reports are based on the GEO Cities methodology and respond to six basic
questions, according to the Methodology for the Preparation of GEO Cities Reports manual.
Given that the GEO methodology is constantly being applied on its different levels (global,
regional, national, local), it is continuously being enriched and improved. Its dynamics and
constant improvement have resulted in additions being made to the conceptual framework
and these are being applied nationally and globally.
Below an outline of the new conceptual framework is presented with a brief explanation of
the elements that are defi ned in most detail (see outline). These are, basically, driving forces
and the pressures that interact with the other elements.
44 Prepared on the basis of Pinter, L., Zahedi, K., and Cressman, D (2000): Training Manual on Integrated Environmental Assessment and
Reporting.
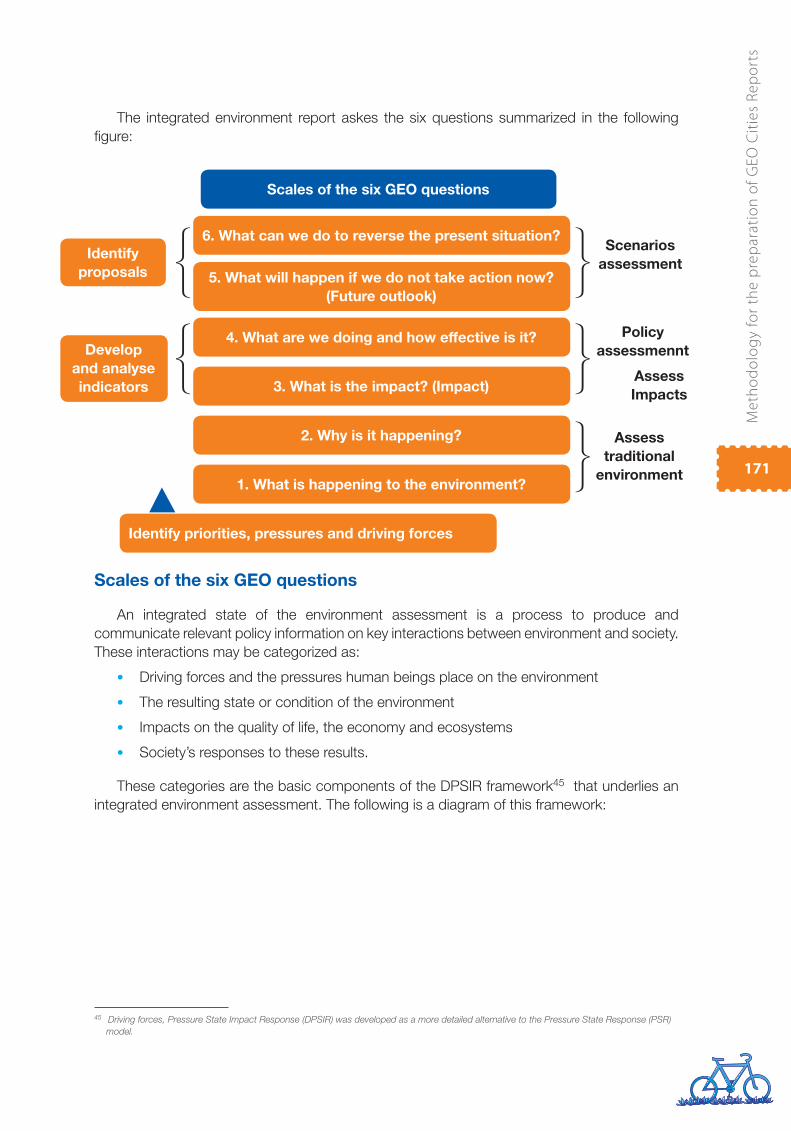
Me
tho
do
log
y fo
r th
e p
rep
ara
tio
n o
f G
EO
Cit
ies
Re
po
rts
171
The integrated environment report askes the six questions summarized in the following
fi gure:
Scales of the six GEO questions
An integrated state of the environment assessment is a process to produce and
communicate relevant policy information on key interactions between environment and society.
These interactions may be categorized as:
Driving forces and the pressures human beings place on the environment•
The resulting state or condition of the environment •
Impacts on the quality of life, the economy and ecosystems•
Society’s responses to these results.•
These categories are the basic components of the DPSIR framework45 that underlies an
integrated environment assessment. The following is a diagram of this framework:
Scales of the six GEO questions
6. What can we do to reverse the present situation?
5. What will happen if we do not take action now?
(Future outlook)
4. What are we doing and how effective is it?
3. What is the impact? (Impact)
2. Why is it happening?
1. What is happening to the environment?
Identify priorities, pressures and driving forces
Identify
proposals
Develop
and analyse
indicators
Scenarios
assessment
Policy
assessmennt
Assess
Impacts
Assess
traditional
environment
45 Driving forces, Pressure State Impact Response (DPSIR) was developed as a more detailed alternative to the Pressure State Response (PSR)
model.
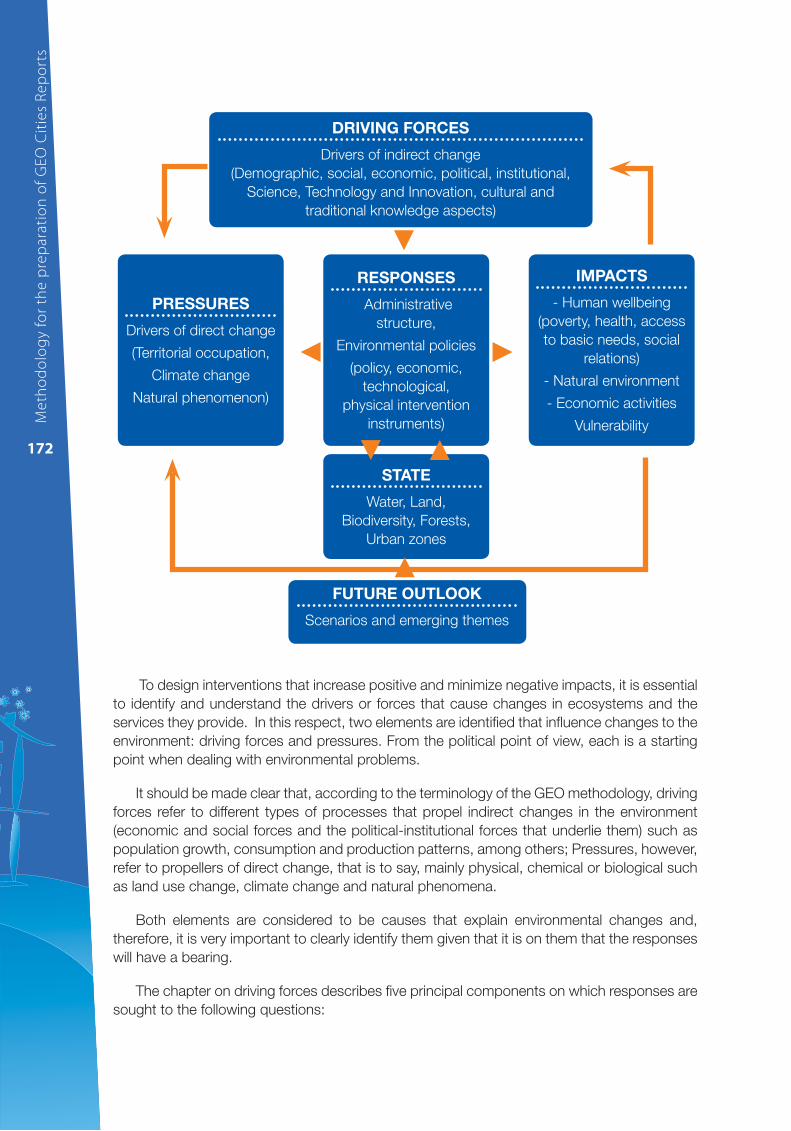
Me
tho
do
log
y fo
r th
e p
rep
ara
tio
n o
f G
EO
Cit
ies
Re
po
rts
172
To design interventions that increase positive and minimize negative impacts, it is essential
to identify and understand the drivers or forces that cause changes in ecosystems and the
services they provide. In this respect, two elements are identifi ed that infl uence changes to the
environment: driving forces and pressures. From the political point of view, each is a starting
point when dealing with environmental problems.
It should be made clear that, according to the terminology of the GEO methodology, driving
forces refer to different types of processes that propel indirect changes in the environment
(economic and social forces and the political-institutional forces that underlie them) such as
population growth, consumption and production patterns, among others; Pressures, however,
refer to propellers of direct change, that is to say, mainly physical, chemical or biological such
as land use change, climate change and natural phenomena.
Both elements are considered to be causes that explain environmental changes and,
therefore, it is very important to clearly identify them given that it is on them that the responses
will have a bearing.
The chapter on driving forces describes fi ve principal components on which responses are
sought to the following questions:
DRIVING FORCES
Drivers of indirect change
(Demographic, social, economic, political, institutional,
Science, Technology and Innovation, cultural and
traditional knowledge aspects)
STATE
Water, Land,
Biodiversity, Forests,
Urban zones
FUTURE OUTLOOK
Scenarios and emerging themes
PRESSURES
Drivers of direct change
(Territorial occupation,
Climate change
Natural phenomenon)
RESPONSES
Administrative
structure,
Environmental policies
(policy, economic,
technological,
physical intervention
instruments)
IMPACTS
- Human wellbeing
(poverty, health, access
to basic needs, social
relations)
- Natural environment
- Economic activities
Vulnerability
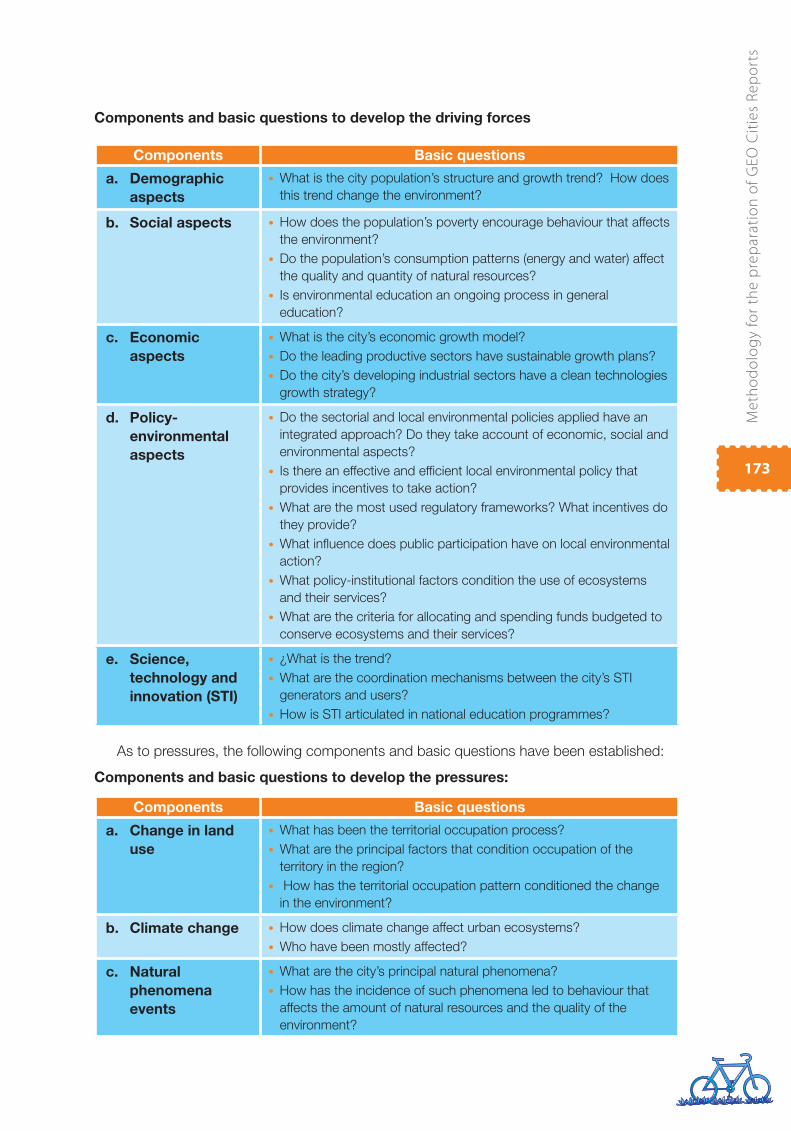
Me
tho
do
log
y fo
r th
e p
rep
ara
tio
n o
f G
EO
Cit
ies
Re
po
rts
173
Components and basic questions to develop the driving forces
Components Basic questions
a. Demographic
aspects
What is the city population’s structure and growth trend? How does •
this trend change the environment?
b. Social aspects How does the population’s poverty encourage behaviour that affects •
the environment?
Do the population’s consumption patterns (energy and water) affect •
the quality and quantity of natural resources?
Is environmental education an ongoing process in general •
education?
c. Economic
aspects
What is the city’s economic growth model?•
Do the leading productive sectors have sustainable growth plans?•
Do the city’s developing industrial sectors have a clean technologies •
growth strategy?
d. Policy-
environmental
aspects
Do the sectorial and local environmental policies applied have an •
integrated approach? Do they take account of economic, social and
environmental aspects?
Is there an effective and effi cient local environmental policy that •
provides incentives to take action?
What are the most used regulatory frameworks? What incentives do •
they provide?
What infl uence does public participation have on local environmental •
action?
What policy-institutional factors condition the use of ecosystems •
and their services?
What are the criteria for allocating and spending funds budgeted to •
conserve ecosystems and their services?
e. Science,
technology and
innovation (STI)
¿What is the trend?•
What are the coordination mechanisms between the city’s STI •
generators and users?
How is STI articulated in national education programmes?•
As to pressures, the following components and basic questions have been established:
Components and basic questions to develop the pressures:
Components Basic questions
a. Change in land
use
What has been the territorial occupation process?•
What are the principal factors that condition occupation of the •
territory in the region?
How has the territorial occupation pattern conditioned the change •
in the environment?
b. Climate change How does climate change affect urban ecosystems?•
Who have been mostly affected?•
c. Natural
phenomena
events
What are the city’s principal natural phenomena?•
How has the incidence of such phenomena led to behaviour that •
affects the amount of natural resources and the quality of the
environment?
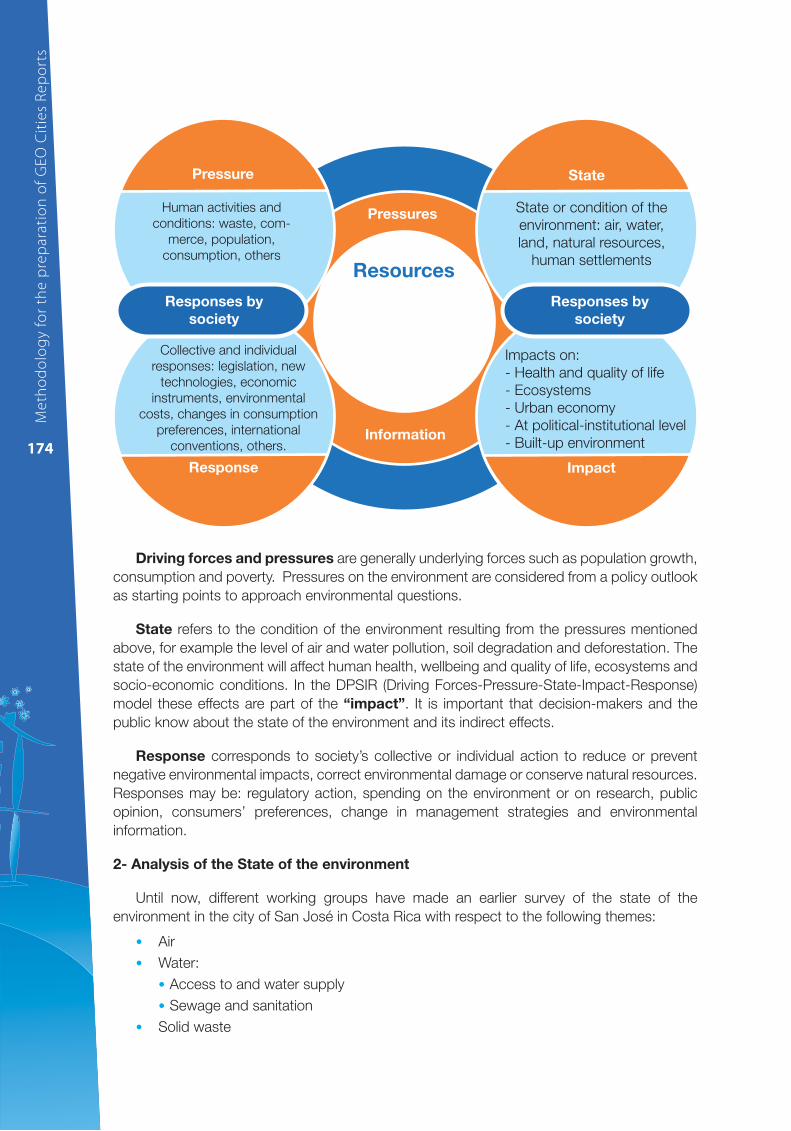
Me
tho
do
log
y fo
r th
e p
rep
ara
tio
n o
f G
EO
Cit
ies
Re
po
rts
174
Driving forces and pressures are generally underlying forces such as population growth,
consumption and poverty. Pressures on the environment are considered from a policy outlook
as starting points to approach environmental questions.
State refers to the condition of the environment resulting from the pressures mentioned
above, for example the level of air and water pollution, soil degradation and deforestation. The
state of the environment will affect human health, wellbeing and quality of life, ecosystems and
socio-economic conditions. In the DPSIR (Driving Forces-Pressure-State-Impact-Response)
model these effects are part of the “impact”. It is important that decision-makers and the
public know about the state of the environment and its indirect effects.
Response corresponds to society’s collective or individual action to reduce or prevent
negative environmental impacts, correct environmental damage or conserve natural resources.
Responses may be: regulatory action, spending on the environment or on research, public
opinion, consumers’ preferences, change in management strategies and environmental
information.
2- Analysis of the State of the environment
Until now, different working groups have made an earlier survey of the state of the
environment in the city of San José in Costa Rica with respect to the following themes:
Air•
Water:•
Access to and water supply•
Sewage and sanitation•
Solid waste•
Pressure
Pressures
State
Human activities and
conditions: waste, com-
merce, population,
consumption, others
Responses by
society
Responses by
society
Collective and individual
responses: legislation, new
technologies, economic
instruments, environmental
costs, changes in consumption
preferences, international
conventions, others.
Response
Resources
Information
State or condition of the
environment: air, water,
land, natural resources,
human settlements
Impacts on:
- Health and quality of life
- Ecosystems
- Urban economy
- At political-institutional level
- Built-up environment
Impact
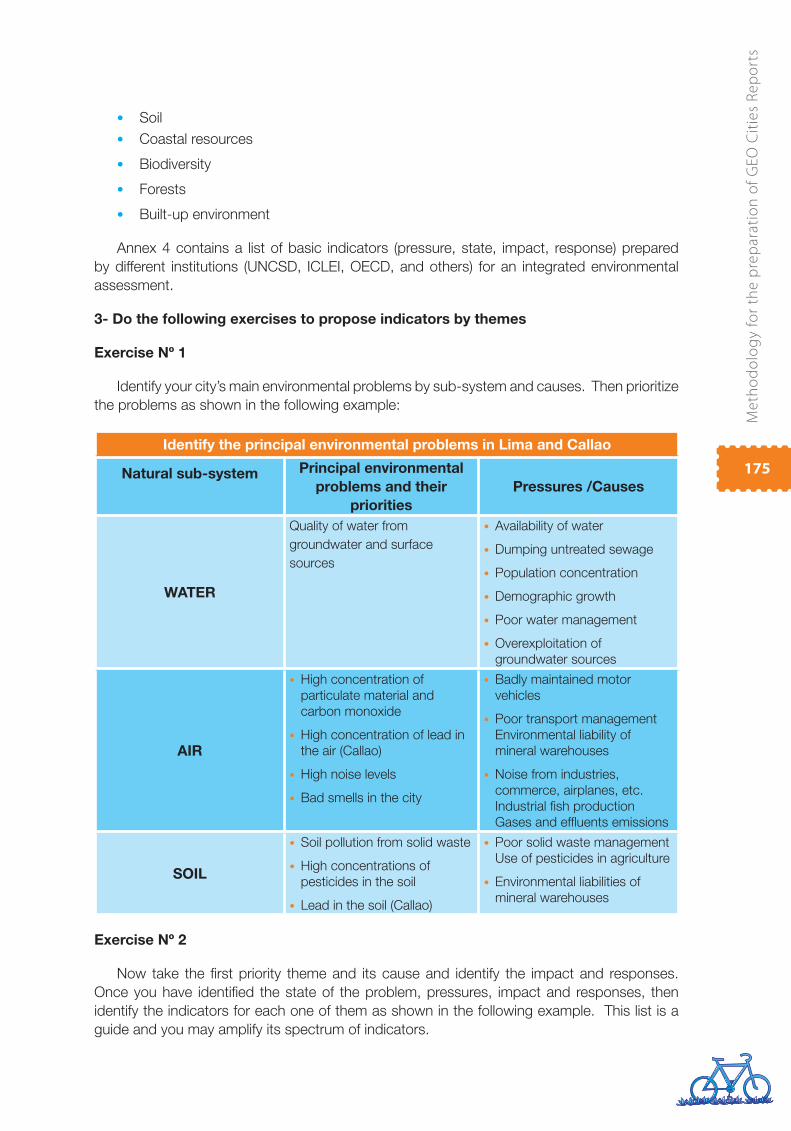
Me
tho
do
log
y fo
r th
e p
rep
ara
tio
n o
f G
EO
Cit
ies
Re
po
rts
175
Soil•
Coastal resources•
Biodiversity•
Forests•
Built-up environment•
Annex 4 contains a list of basic indicators (pressure, state, impact, response) prepared
by different institutions (UNCSD, ICLEI, OECD, and others) for an integrated environmental
assessment.
3- Do the following exercises to propose indicators by themes
Exercise Nº 1
Identify your city’s main environmental problems by sub-system and causes. Then prioritize
the problems as shown in the following example:
Identify the principal environmental problems in Lima and Callao
Natural sub-system Principal environmental
problems and their
priorities
Pressures /Causes
WATER
Quality of water from
groundwater and surface
sources
Availability of water•
Dumping untreated sewage•
Population concentration•
Demographic growth •
Poor water management•
Overexploitation of •
groundwater sources
AIR
High concentration of •
particulate material and
carbon monoxide
High concentration of lead in •
the air (Callao)
High noise levels •
Bad smells in the city•
Badly maintained motor •
vehicles
Poor transport management •
Environmental liability of
mineral warehouses
Noise from industries, •
commerce, airplanes, etc.
Industrial fi sh production
Gases and effl uents emissions
SOIL
Soil pollution from solid waste•
High concentrations of •
pesticides in the soil
Lead in the soil (Callao)•
Poor solid waste management •
Use of pesticides in agriculture
Environmental liabilities of •
mineral warehouses
Exercise Nº 2
Now take the fi rst priority theme and its cause and identify the impact and responses.
Once you have identifi ed the state of the problem, pressures, impact and responses, then
identify the indicators for each one of them as shown in the following example. This list is a
guide and you may amplify its spectrum of indicators.
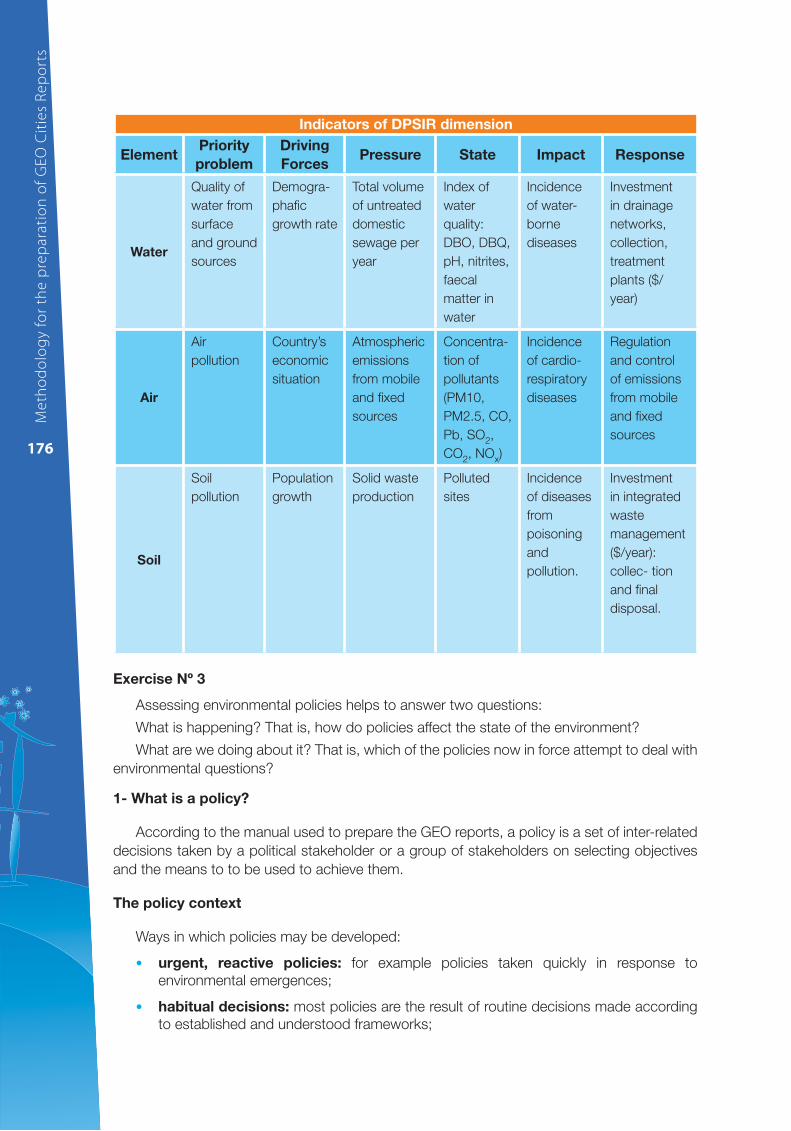
Me
tho
do
log
y fo
r th
e p
rep
ara
tio
n o
f G
EO
Cit
ies
Re
po
rts
176
Indicators of DPSIR dimension
ElementPriority
problem
Driving
ForcesPressure State Impact Response
Water
Quality of
water from
surface
and ground
sources
Demogra-
phafi c
growth rate
Total volume
of untreated
domestic
sewage per
year
Index of
water
quality:
DBO, DBQ,
pH, nitrites,
faecal
matter in
water
Incidence
of water-
borne
diseases
Investment
in drainage
networks,
collection,
treatment
plants ($/
year)
Air
Air
pollution
Country’s
economic
situation
Atmospheric
emissions
from mobile
and fi xed
sources
Concentra-
tion of
pollutants
(PM10,
PM2.5, CO,
Pb, SO2,
CO2, NOx)
Incidence
of cardio-
respiratory
diseases
Regulation
and control
of emissions
from mobile
and fi xed
sources
Soil
Soil
pollution
Population
growth
Solid waste
production
Polluted
sites
Incidence
of diseases
from
poisoning
and
pollution.
Investment
in integrated
waste
management
($/year):
collec- tion
and fi nal
disposal.
Exercise Nº 3
Assessing environmental policies helps to answer two questions:
What is happening? That is, how do policies affect the state of the environment?
What are we doing about it? That is, which of the policies now in force attempt to deal with
environmental questions?
1- What is a policy?
According to the manual used to prepare the GEO reports, a policy is a set of inter-related
decisions taken by a political stakeholder or a group of stakeholders on selecting objectives
and the means to to be used to achieve them.
The policy context
Ways in which policies may be developed:
urgent, reactive policies:• for example policies taken quickly in response to
environmental emergences;
habitual decisions:• most policies are the result of routine decisions made according
to established and understood frameworks;
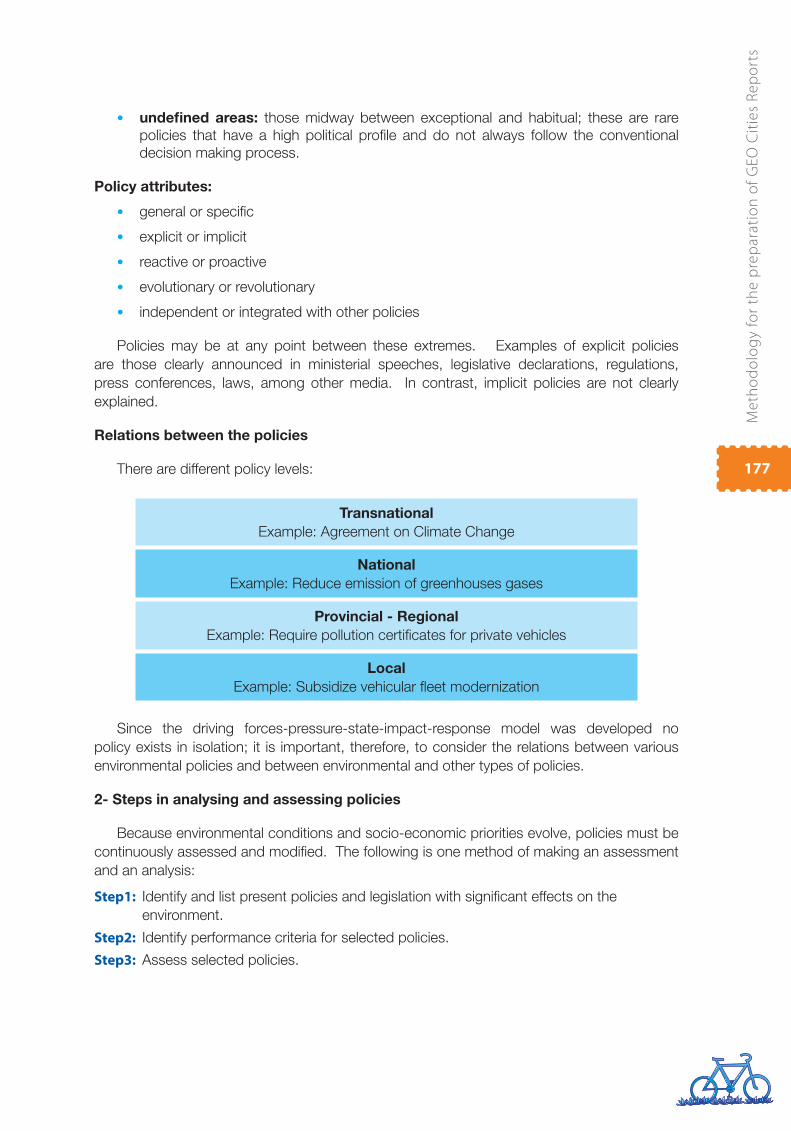
Me
tho
do
log
y fo
r th
e p
rep
ara
tio
n o
f G
EO
Cit
ies
Re
po
rts
177
undefi ned areas:• those midway between exceptional and habitual; these are rare
policies that have a high political profi le and do not always follow the conventional
decision making process.
Policy attributes:
general or specifi c•
explicit or implicit•
reactive or proactive•
evolutionary or revolutionary •
independent or integrated with other policies•
Policies may be at any point between these extremes. Examples of explicit policies
are those clearly announced in ministerial speeches, legislative declarations, regulations,
press conferences, laws, among other media. In contrast, implicit policies are not clearly
explained.
Relations between the policies
There are different policy levels:
Transnational
Example: Agreement on Climate Change
National
Example: Reduce emission of greenhouses gases
Provincial - Regional
Example: Require pollution certifi cates for private vehicles
Local
Example: Subsidize vehicular fl eet modernization
Since the driving forces-pressure-state-impact-response model was developed no
policy exists in isolation; it is important, therefore, to consider the relations between various
environmental policies and between environmental and other types of policies.
2- Steps in analysing and assessing policies
Because environmental conditions and socio-economic priorities evolve, policies must be
continuously assessed and modifi ed. The following is one method of making an assessment
and an analysis:
Step1: Identify and list present policies and legislation with signifi cant effects on the
environment.
Step2: Identify performance criteria for selected policies.
Step3: Assess selected policies.
Me
tho
do
log
y fo
r th
e p
rep
ara
tio
n o
f G
EO
Cit
ies
Re
po
rts
178
Step 1: Identify and list present policies and legislation with signifi cant effects on the environment:
What types of policies are there and which of them should be analysed?
Diagnosing the state of the environment is the basis for assessing policies currently in
place and, at this stage, the purpose is to identify and assess the main present environmental,
economic and social policies that seek to respond to the most critical environmental problems.
Many policies that appear to be unrelated to the theme of the environment have the potential
to create adverse environmental effects, while others might have unexpected but benefi cial
effects. It is important, therefore, to be aware of policy implications.
In this analysis, to be practical, we should select a relatively small number of policies.
Different categories of policies are:
a) International mechanisms: bilateral or multilateral agreements; commercial agreements;
regional environmental and sustainable development groups or organizations; international
environmental laws.
b) National sustainable development policies: may be government decisions obliging
departments to provide reports on how sustainable development strategies are executed;
the establishment of national advisory groups dedicated to implementing sustainable
development and giving them support; and helping to prepare a set of national sustainable
development indicators.
c) National fi scal and Treasury Department policies: allocating budget and other government
resources for the environment, green taxes.
d) Legal instruments: environmental legislation, the obligation to assess environmental impact,
standards, prohibitions, limits, licences (for example, control and leadership or extreme
measures).
e) Economic instruments: taxes, subsidies, tariffs (for example, user tariffs) and fi nes, systems
to assign responsibilities, fi nancial instruments (for example, loans to environmental funds),
systems to guarantee deposits and their later return, price structure, ecological labelling.
f) Raising awareness about education policies: public consultations, measures directed
at vulnerable groups (for example: women, youth or indigenous groups), environmental
journalism, conferences and seminars, environmental curricula, information and database
networks (national and regional).
g) Standards and voluntary instruments: local Agenda 21, ISO 14 000, responsible care,
better administrative practices.
h) Social policies: labour laws, sanitary and work safety regulations, support for public
participation, rules and regulations related to gender equality.
Criteria to select policies for inclusion in the analysis
Relevance for the public and for decision-makers;•
Link with environmental priorities identifi ed in the diagnosis;•
Affecting the health, income and wellbeing of a large number of people;•
Me
tho
do
log
y fo
r th
e p
rep
ara
tio
n o
f G
EO
Cit
ies
Re
po
rts
179
Responding to a physically severe environmental situation that change rapidly and/or •
are irreversible;
Are related to the country’s international obligations; •
Have the potential to cause disorder or confl ict;•
Provide easy and feasible solutions;•
Originality of the policy initiative.•
Step 2: Identify performance criteria for selected policies.
Once a number of high priority policies are identifi ed, the next step is to determine the criteria
that help to assess the results from an environmental and sustainable development point of
view. Policies are generally designed without precise objectives or with criteria unrelated to the
variables.
Criteria (of performance) may range from “general and descriptive” (for example if the policy
complies with general principles) to “specifi c and quantitative” (for example when the objectives
relate to specifi c indicators or defi ned periods). In essence, these criteria provide a basis for
comparison between the planned or desired achievement and the actual achievement. Some
examples of criteria categories are:
Benchmark: Comparison of a variable in my jurisdiction, with the best performance
documented for the same variable in another jurisdiction. Example: the highest percentage of
households connected to the sanitary system in sub-section X, compared to the variable in
another sub-section.
Limits: bear in mind the value of a key variable that causes a fundamental and irreversible
change in how a system behaves. A policy is assessed according to its capacity to bring a
system to the limit or beyond. Example: a fi shery’s maximum sustainable performance. A
rule defi ned in a general way and often formally accepted. If the defi nition of the principle does
not include a specifi c performance measurement, the assessor should obtain a mandate to
identify this relevant performance measurement as part of the assessment. Example: the
policy should help to raise the level of knowledge about the environment.
Standards: Properties and regulations, accepted nationally and/or internationally,
concerning environmental procedures or characteristics. A policy is successful if it helps to
keep the performance within certain established limits. Example: quality standards for different
uses.
Goals related to policies that include those stipulated in legal agreements:
Determined by a policy and/or technical process that takes account of past performance and
desired results. Example: offi cial development assistance will be 0.4 per cent of GDP.
Step 3: Assess selected policies
The fi nal objective of assessing policies is to infl uence decision making and initiate policy
changes where and whenever needed. It is easier to adopt a recommendation for political
changes if those who are to implement them are involved in preparing the analysis, from
identifying crucial environmental themes, selecting the indicators and criteria and creating the
link with specifi c policies.
Me
tho
do
log
y fo
r th
e p
rep
ara
tio
n o
f G
EO
Cit
ies
Re
po
rts
180
Assessing policies centres on comparing the actual performance and what is expected
of a given policy based on relevant performance criteria. Neither environmental themes nor
policies can exist in isolation; any environmental trend will be the result of the combination
of how policies and natural factors interact, some of which cannot be controlled by human
beings. A policy may be good with a particular environmental impact or criterion but not with
another.
3- Do the following exercises to identify and assess environmental policies in your
thematic area:
Exercise Nº 1
Identify three policies being developed locally or regionally (Metropolitan Area) that seek to
respond to the problem you are investigating. List other policies that may affect the result of
those mentioned.
Exercise Nº 2
Identify the factors that facilitate and those that hinder the implementation of the policies
mentioned above.
Exercise Nº 3
Propose three alternative local or regional policies (Metropolitan Area) to respond to the
problem you are investigating.

Me
tho
do
log
y fo
r th
e p
rep
ara
tio
n o
f G
EO
Cit
ies
Re
po
rts
181
Exercise Nº 4
Complete the action impact matrix based on the example in Annex 2 that relates to your
area of study. To do this, you should chose three pressures that are affecting the environment,
and three policies that have affected the state of the environment or that are suggested as
responses to that state. Determine the original intention of these policies, identify their impact
on three other key environmental conditions, and assess the impacts (Benefi cial (+) or Harmful
(-); High intensity (H) or Moderate intensity (M).
Exercise Nº 5
In relation to the policies selected in the above exercise, identify their main successes and
failures.
Based on the response to the previous exercise, what priority action would you
recommend?
In the specifi c area you are working on, do you think the responses to the present state of
the environment can be treated independently?
Me
tho
do
log
y fo
r th
e p
rep
ara
tio
n o
f G
EO
Cit
ies
Re
po
rts
182
With what other aspects (social, economic, environmental) would you relate these
responses?
In the specifi c case of services, with what other regions of the country is their supply
linked? Can the impacts be limited to the city?
Concerning the specifi c theme you are working on, what stakeholders would be involved
in the DPSIR Driving Force-Pressure–State–Impact-Response model (government, private
sector, NGOs, communications media, religious organizations, universities, trade unions, youth
groups, indigenous groups, political parties).
Me
tho
do
log
y fo
r th
e p
rep
ara
tio
n o
f G
EO
Cit
ies
Re
po
rts
183
Other questions to complement the exercise
Institutional
Have local public institutions created new environmental management units?
Is there coordination between these units? What mechanisms are used?
Are public personnel trained to manage these units?
How does the local government establish strategies to improve urban-environmental
management? How are they implemented?
Local urban-environmental regulations
Identify the normative gaps that prevent effi cient environment management.
Which existing standards have actively encouraged urban environment management?
Do the norms concentrate on control instruments (supervision and fi nes) or economic
instruments (tax incentives)?
Is there harmony between national and local urban environment norms?
Citizen participation
Are there norms that encourage citizen participation? What are the principal mechanisms
(public hearings), principal contributions?
Are there coordination mechanisms with the private business sector? What are they? Are
they effective? Which are the principal contributions?
Information
Is there an urban environment information system? How is information organized?
How is information disseminated? Who uses it and for what?
Identify and assess the city’s environment policies.
Business social responsibility
Principal activities (link with the locality to mitigate damage to the environment) Develop
and apply innovations
Relation between private and public sectors. Coordination mechanisms.
Investment in environmental management
Principal programmes and projects, and amounts allocated.
Use of clean technologies.
Origin of investment funds.
Environmental education
Educational programmes
Awareness campaigns (solid waste, water quality)
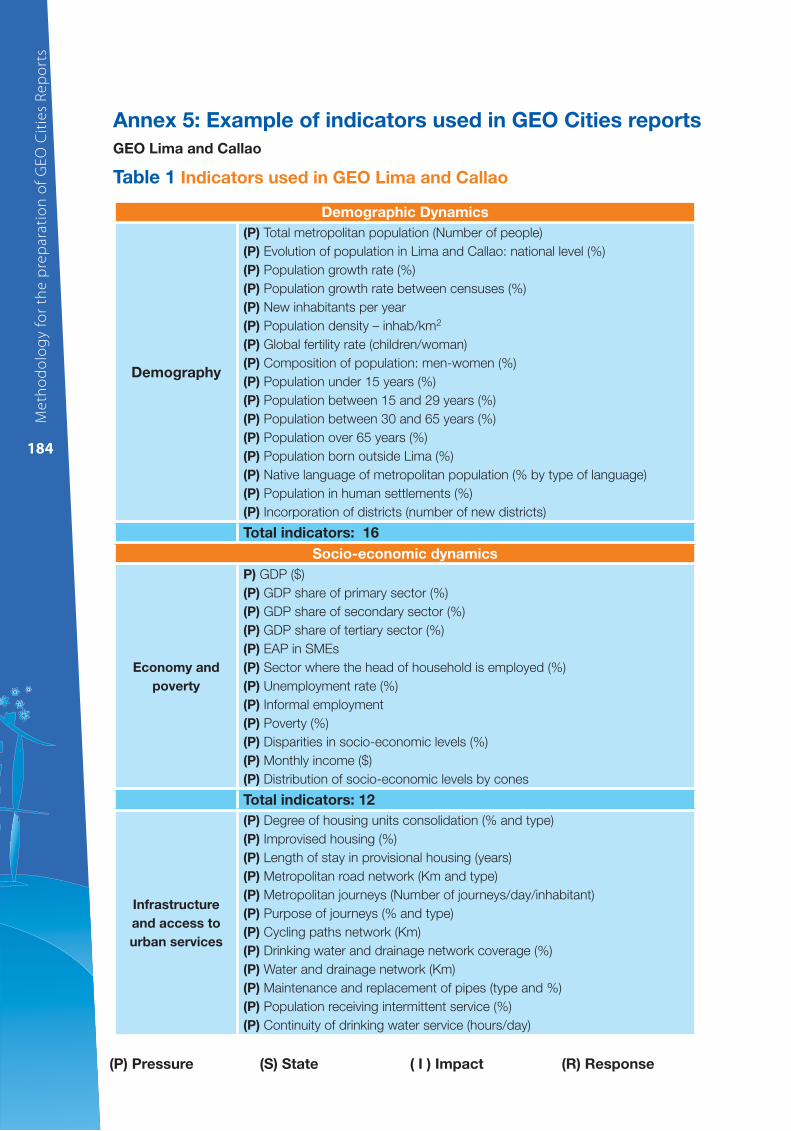
Me
tho
do
log
y fo
r th
e p
rep
ara
tio
n o
f G
EO
Cit
ies
Re
po
rts
184
Annex 5: Example of indicators used in GEO Cities reports
GEO Lima and Callao
Table 1 Indicators used in GEO Lima and Callao
Demographic Dynamics
Demography
(P) Total metropolitan population (Number of people)
(P) Evolution of population in Lima and Callao: national level (%)
(P) Population growth rate (%)
(P) Population growth rate between censuses (%)
(P) New inhabitants per year
(P) Population density – inhab/km2
(P) Global fertility rate (children/woman)
(P) Composition of population: men-women (%)
(P) Population under 15 years (%)
(P) Population between 15 and 29 years (%)
(P) Population between 30 and 65 years (%)
(P) Population over 65 years (%)
(P) Population born outside Lima (%)
(P) Native language of metropolitan population (% by type of language)
(P) Population in human settlements (%)
(P) Incorporation of districts (number of new districts)
Total indicators: 16
Socio-economic dynamics
Economy and
poverty
P) GDP ($)
(P) GDP share of primary sector (%)
(P) GDP share of secondary sector (%)
(P) GDP share of tertiary sector (%)
(P) EAP in SMEs
(P) Sector where the head of household is employed (%)
(P) Unemployment rate (%)
(P) Informal employment
(P) Poverty (%)
(P) Disparities in socio-economic levels (%)
(P) Monthly income ($)
(P) Distribution of socio-economic levels by cones
Total indicators: 12
Infrastructure
and access to
urban services
(P) Degree of housing units consolidation (% and type)
(P) Improvised housing (%)
(P) Length of stay in provisional housing (years)
(P) Metropolitan road network (Km and type)
(P) Metropolitan journeys (Number of journeys/day/inhabitant)
(P) Purpose of journeys (% and type)
(P) Cycling paths network (Km)
(P) Drinking water and drainage network coverage (%)
(P) Water and drainage network (Km)
(P) Maintenance and replacement of pipes (type and %)
(P) Population receiving intermittent service (%)
(P) Continuity of drinking water service (hours/day)
(P) Pressure (S) State ( I ) Impact (R) Response
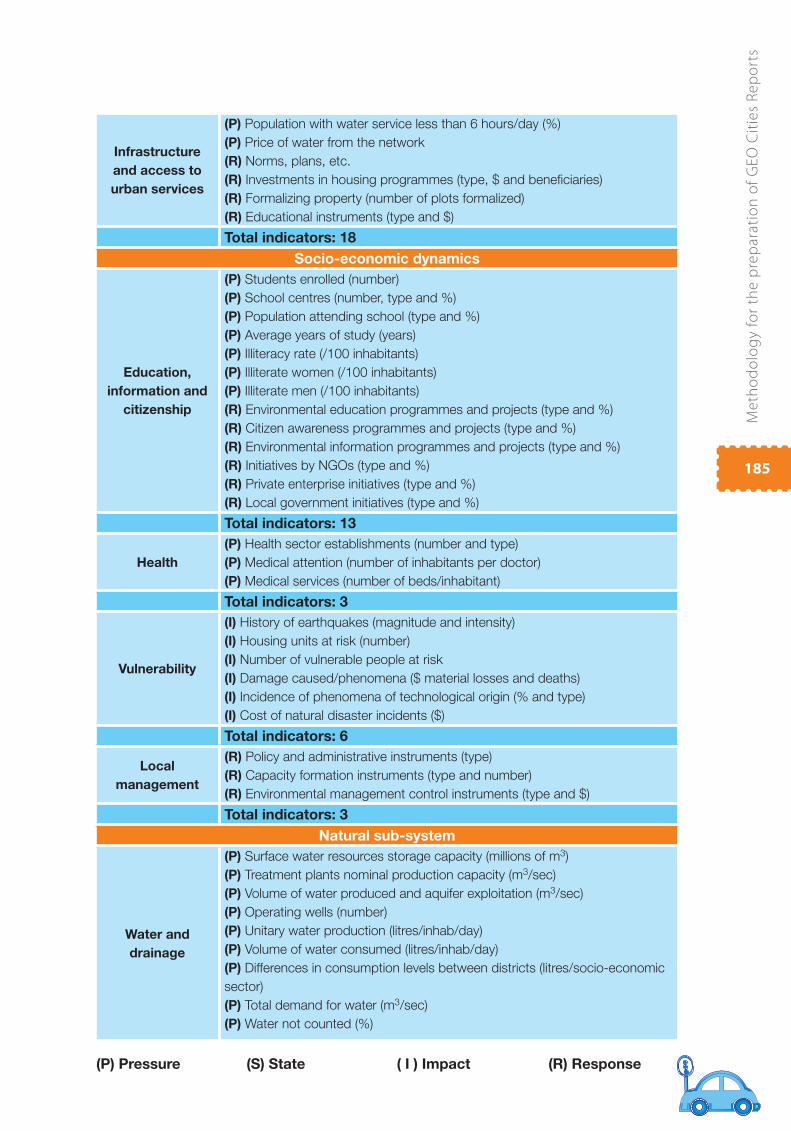
Me
tho
do
log
y fo
r th
e p
rep
ara
tio
n o
f G
EO
Cit
ies
Re
po
rts
185
Infrastructure
and access to
urban services
(P) Population with water service less than 6 hours/day (%)
(P) Price of water from the network
(R) Norms, plans, etc.
(R) Investments in housing programmes (type, $ and benefi ciaries)
(R) Formalizing property (number of plots formalized)
(R) Educational instruments (type and $)
Total indicators: 18
Socio-economic dynamics
Education,
information and
citizenship
(P) Students enrolled (number)
(P) School centres (number, type and %)
(P) Population attending school (type and %)
(P) Average years of study (years)
(P) Illiteracy rate (/100 inhabitants)
(P) Illiterate women (/100 inhabitants)
(P) Illiterate men (/100 inhabitants)
(R) Environmental education programmes and projects (type and %)
(R) Citizen awareness programmes and projects (type and %)
(R) Environmental information programmes and projects (type and %)
(R) Initiatives by NGOs (type and %)
(R) Private enterprise initiatives (type and %)
(R) Local government initiatives (type and %)
Total indicators: 13
Health
(P) Health sector establishments (number and type)
(P) Medical attention (number of inhabitants per doctor)
(P) Medical services (number of beds/inhabitant)
Total indicators: 3
Vulnerability
(I) History of earthquakes (magnitude and intensity)
(I) Housing units at risk (number)
(I) Number of vulnerable people at risk
(I) Damage caused/phenomena ($ material losses and deaths)
(I) Incidence of phenomena of technological origin (% and type)
(I) Cost of natural disaster incidents ($)
Total indicators: 6
Local
management
(R) Policy and administrative instruments (type)
(R) Capacity formation instruments (type and number)
(R) Environmental management control instruments (type and $)
Total indicators: 3
Natural sub-system
Water and
drainage
(P) Surface water resources storage capacity (millions of m3)
(P) Treatment plants nominal production capacity (m3/sec)
(P) Volume of water produced and aquifer exploitation (m3/sec)
(P) Operating wells (number)
(P) Unitary water production (litres/inhab/day)
(P) Volume of water consumed (litres/inhab/day)
(P) Differences in consumption levels between districts (litres/socio-economic
sector)
(P) Total demand for water (m3/sec)
(P) Water not counted (%)
(P) Pressure (S) State ( I ) Impact (R) Response
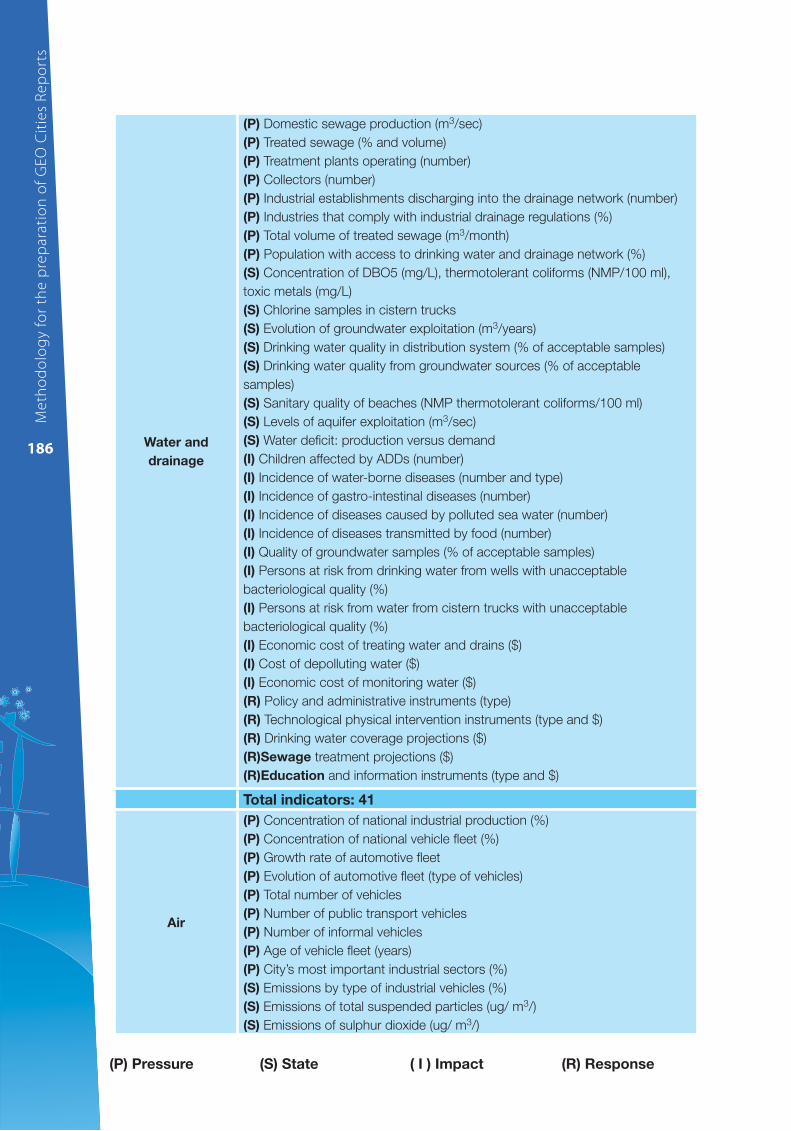
Me
tho
do
log
y fo
r th
e p
rep
ara
tio
n o
f G
EO
Cit
ies
Re
po
rts
186 Water and
drainage
(P) Domestic sewage production (m3/sec)
(P) Treated sewage (% and volume)
(P) Treatment plants operating (number)
(P) Collectors (number)
(P) Industrial establishments discharging into the drainage network (number)
(P) Industries that comply with industrial drainage regulations (%)
(P) Total volume of treated sewage (m3/month)
(P) Population with access to drinking water and drainage network (%)
(S) Concentration of DBO5 (mg/L), thermotolerant coliforms (NMP/100 ml),
toxic metals (mg/L)
(S) Chlorine samples in cistern trucks
(S) Evolution of groundwater exploitation (m3/years)
(S) Drinking water quality in distribution system (% of acceptable samples)
(S) Drinking water quality from groundwater sources (% of acceptable
samples)
(S) Sanitary quality of beaches (NMP thermotolerant coliforms/100 ml)
(S) Levels of aquifer exploitation (m3/sec)
(S) Water defi cit: production versus demand
(I) Children affected by ADDs (number)
(I) Incidence of water-borne diseases (number and type)
(I) Incidence of gastro-intestinal diseases (number)
(I) Incidence of diseases caused by polluted sea water (number)
(I) Incidence of diseases transmitted by food (number)
(I) Quality of groundwater samples (% of acceptable samples)
(I) Persons at risk from drinking water from wells with unacceptable
bacteriological quality (%)
(I) Persons at risk from water from cistern trucks with unacceptable
bacteriological quality (%)
(I) Economic cost of treating water and drains ($)
(I) Cost of depolluting water ($)
(I) Economic cost of monitoring water ($)
(R) Policy and administrative instruments (type)
(R) Technological physical intervention instruments (type and $)
(R) Drinking water coverage projections ($)
(R)Sewage treatment projections ($)
(R)Education and information instruments (type and $)
Total indicators: 41
Air
(P) Concentration of national industrial production (%)
(P) Concentration of national vehicle fl eet (%)
(P) Growth rate of automotive fl eet
(P) Evolution of automotive fl eet (type of vehicles)
(P) Total number of vehicles
(P) Number of public transport vehicles
(P) Number of informal vehicles
(P) Age of vehicle fl eet (years)
(P) City’s most important industrial sectors (%)
(S) Emissions by type of industrial vehicles (%)
(S) Emissions of total suspended particles (ug/ m3/)
(S) Emissions of sulphur dioxide (ug/ m3/)
(P) Pressure (S) State ( I ) Impact (R) Response
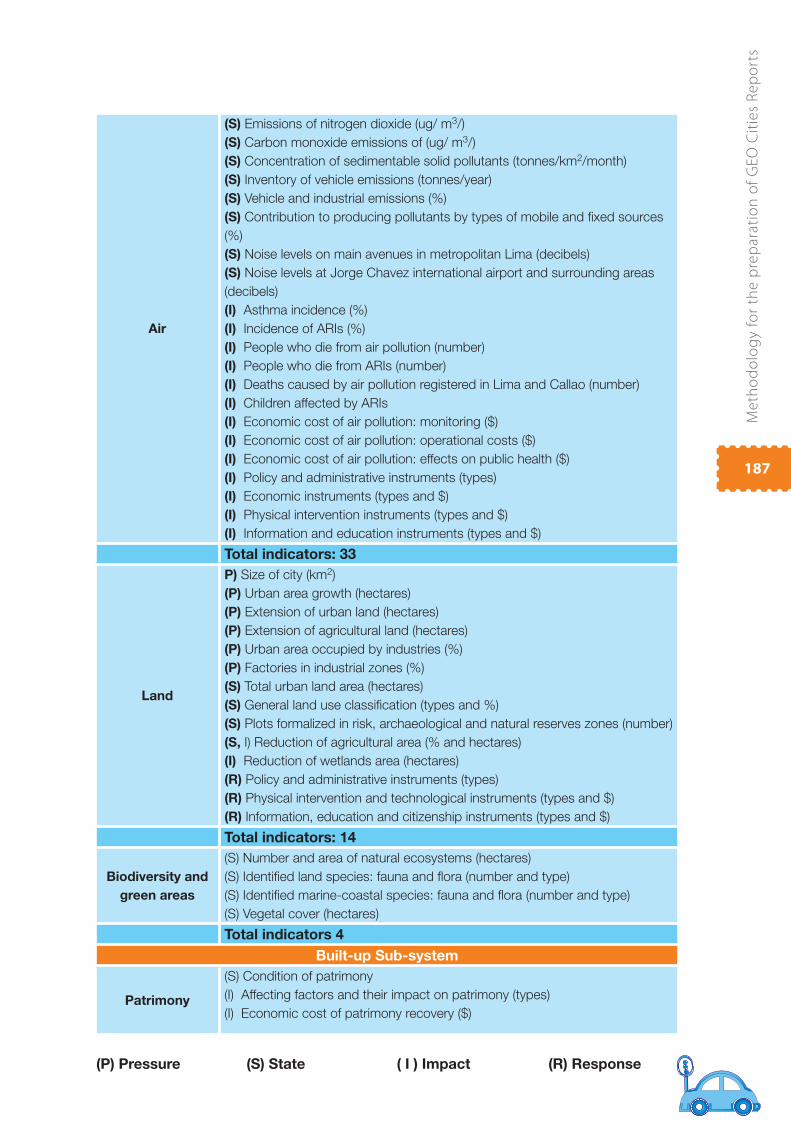
Me
tho
do
log
y fo
r th
e p
rep
ara
tio
n o
f G
EO
Cit
ies
Re
po
rts
187
Air
(S) Emissions of nitrogen dioxide (ug/ m3/)
(S) Carbon monoxide emissions of (ug/ m3/)
(S) Concentration of sedimentable solid pollutants (tonnes/km2/month)
(S) Inventory of vehicle emissions (tonnes/year)
(S) Vehicle and industrial emissions (%)
(S) Contribution to producing pollutants by types of mobile and fi xed sources
(%)
(S) Noise levels on main avenues in metropolitan Lima (decibels)
(S) Noise levels at Jorge Chavez international airport and surrounding areas
(decibels)
(I) Asthma incidence (%)
(I) Incidence of ARIs (%)
(I) People who die from air pollution (number)
(I) People who die from ARIs (number)
(I) Deaths caused by air pollution registered in Lima and Callao (number)
(I) Children affected by ARIs
(I) Economic cost of air pollution: monitoring ($)
(I) Economic cost of air pollution: operational costs ($)
(I) Economic cost of air pollution: effects on public health ($)
(I) Policy and administrative instruments (types)
(I) Economic instruments (types and $)
(I) Physical intervention instruments (types and $)
(I) Information and education instruments (types and $)
Total indicators: 33
Land
P) Size of city (km2)
(P) Urban area growth (hectares)
(P) Extension of urban land (hectares)
(P) Extension of agricultural land (hectares)
(P) Urban area occupied by industries (%)
(P) Factories in industrial zones (%)
(S) Total urban land area (hectares)
(S) General land use classifi cation (types and %)
(S) Plots formalized in risk, archaeological and natural reserves zones (number)
(S, I) Reduction of agricultural area (% and hectares)
(I) Reduction of wetlands area (hectares)
(R) Policy and administrative instruments (types)
(R) Physical intervention and technological instruments (types and $)
(R) Information, education and citizenship instruments (types and $)
Total indicators: 14
Biodiversity and
green areas
(S) Number and area of natural ecosystems (hectares)
(S) Identifi ed land species: fauna and fl ora (number and type)
(S) Identifi ed marine-coastal species: fauna and fl ora (number and type)
(S) Vegetal cover (hectares)
Total indicators 4
Built-up Sub-system
Patrimony
(S) Condition of patrimony
(I) Affecting factors and their impact on patrimony (types)
(I) Economic cost of patrimony recovery ($)
(P) Pressure (S) State ( I ) Impact (R) Response
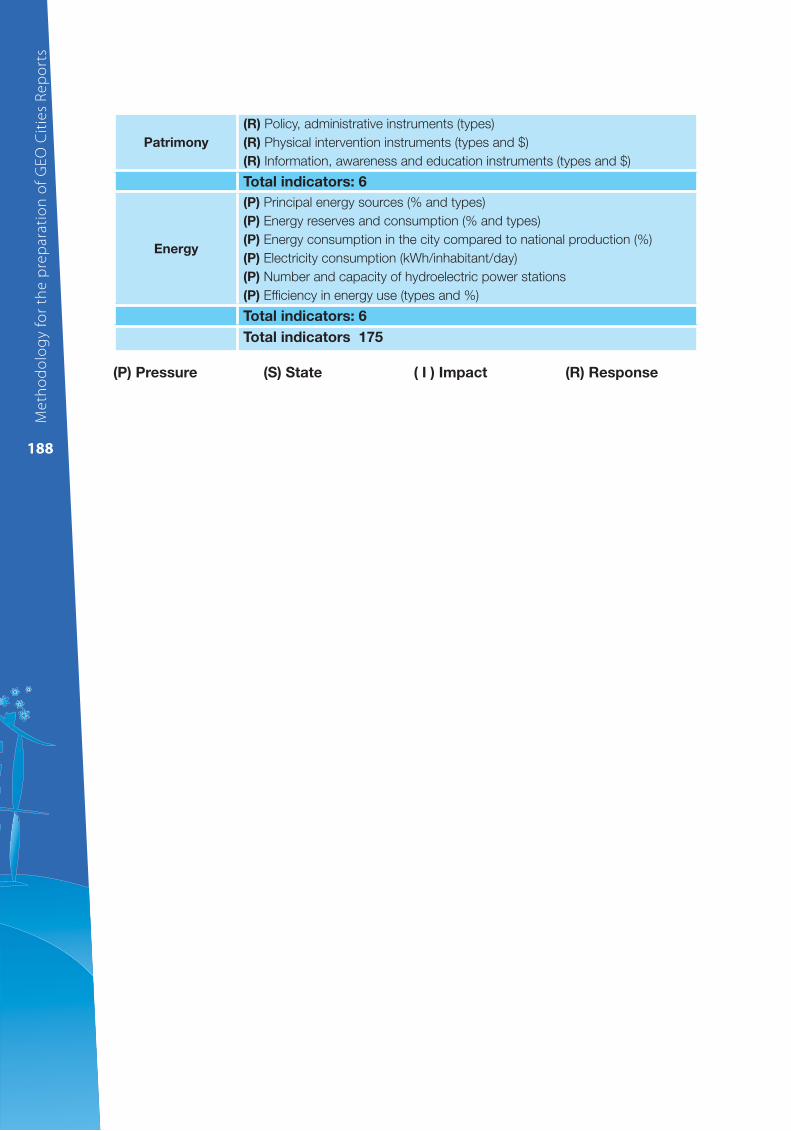
Me
tho
do
log
y fo
r th
e p
rep
ara
tio
n o
f G
EO
Cit
ies
Re
po
rts
188
Patrimony
(R) Policy, administrative instruments (types)
(R) Physical intervention instruments (types and $)
(R) Information, awareness and education instruments (types and $)
Total indicators: 6
Energy
(P) Principal energy sources (% and types)
(P) Energy reserves and consumption (% and types)
(P) Energy consumption in the city compared to national production (%)
(P) Electricity consumption (kWh/inhabitant/day)
(P) Number and capacity of hydroelectric power stations
(P) Effi ciency in energy use (types and %)
Total indicators: 6
Total indicators 175
(P) Pressure (S) State ( I ) Impact (R) Response
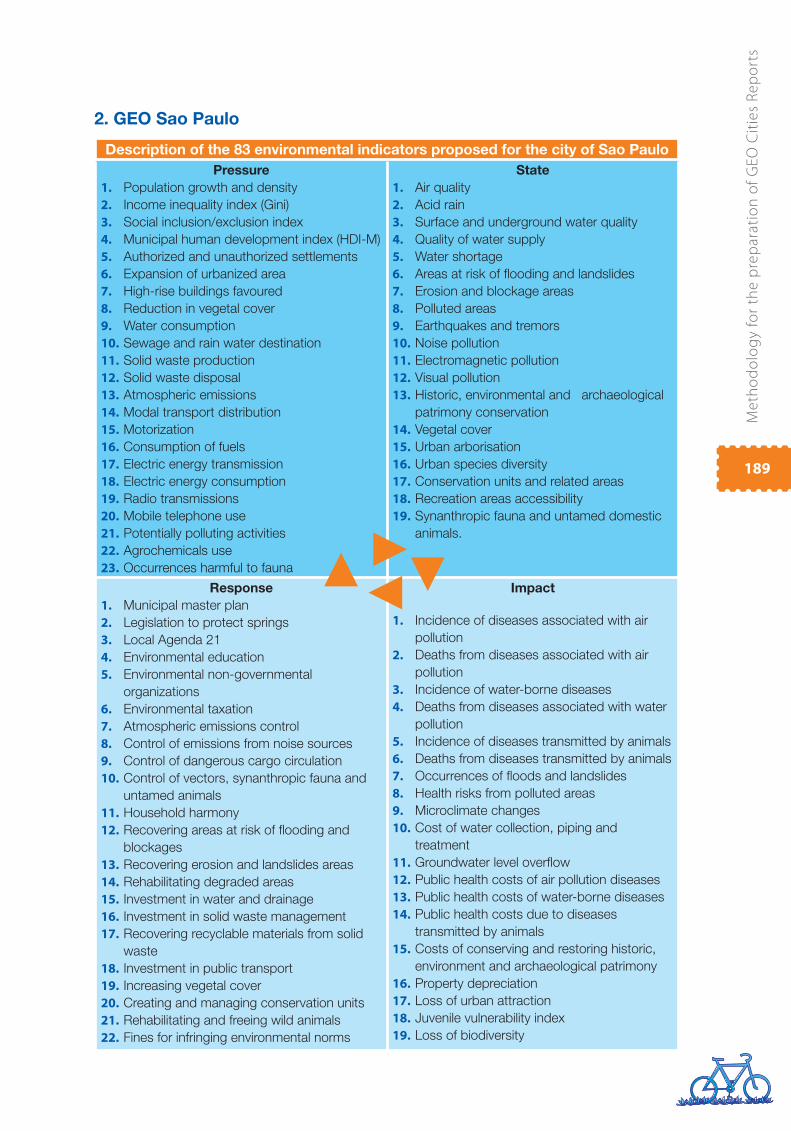
Me
tho
do
log
y fo
r th
e p
rep
ara
tio
n o
f G
EO
Cit
ies
Re
po
rts
189
2. GEO Sao Paulo
Description of the 83 environmental indicators proposed for the city of Sao Paulo
Pressure
1. Population growth and density
2. Income inequality index (Gini)
3. Social inclusion/exclusion index
4. Municipal human development index (HDI-M)
5. Authorized and unauthorized settlements
6. Expansion of urbanized area
7. High-rise buildings favoured
8. Reduction in vegetal cover
9. Water consumption
10. Sewage and rain water destination
11. Solid waste production
12. Solid waste disposal
13. Atmospheric emissions
14. Modal transport distribution
15. Motorization
16. Consumption of fuels
17. Electric energy transmission
18. Electric energy consumption
19. Radio transmissions
20. Mobile telephone use
21. Potentially polluting activities
22. Agrochemicals use
23. Occurrences harmful to fauna
State
1. Air quality
2. Acid rain
3. Surface and underground water quality
4. Quality of water supply
5. Water shortage
6. Areas at risk of fl ooding and landslides
7. Erosion and blockage areas
8. Polluted areas
9. Earthquakes and tremors
10. Noise pollution
11. Electromagnetic pollution
12. Visual pollution
13. Historic, environmental and archaeological
patrimony conservation
14. Vegetal cover
15. Urban arborisation
16. Urban species diversity
17. Conservation units and related areas
18. Recreation areas accessibility
19. Synanthropic fauna and untamed domestic
animals.
Response
1. Municipal master plan
2. Legislation to protect springs
3. Local Agenda 21
4. Environmental education
5. Environmental non-governmental
organizations
6. Environmental taxation
7. Atmospheric emissions control
8. Control of emissions from noise sources
9. Control of dangerous cargo circulation
10. Control of vectors, synanthropic fauna and
untamed animals
11. Household harmony
12. Recovering areas at risk of fl ooding and
blockages
13. Recovering erosion and landslides areas
14. Rehabilitating degraded areas
15. Investment in water and drainage
16. Investment in solid waste management
17. Recovering recyclable materials from solid
waste
18. Investment in public transport
19. Increasing vegetal cover
20. Creating and managing conservation units
21. Rehabilitating and freeing wild animals
22. Fines for infringing environmental norms
Impact
1. Incidence of diseases associated with air
pollution
2. Deaths from diseases associated with air
pollution
3. Incidence of water-borne diseases
4. Deaths from diseases associated with water
pollution
5. Incidence of diseases transmitted by animals
6. Deaths from diseases transmitted by animals
7. Occurrences of fl oods and landslides
8. Health risks from polluted areas
9. Microclimate changes
10. Cost of water collection, piping and
treatment
11. Groundwater level overfl ow
12. Public health costs of air pollution diseases
13. Public health costs of water-borne diseases
14. Public health costs due to diseases
transmitted by animals
15. Costs of conserving and restoring historic,
environment and archaeological patrimony
16. Property depreciation
17. Loss of urban attraction
18. Juvenile vulnerability index
19. Loss of biodiversity
Me
tho
do
log
y fo
r th
e p
rep
ara
tio
n o
f G
EO
Cit
ies
Re
po
rts
190
Annex 6: List of participants at workshops on preparing
GEO Cities methodology, version 3
Mexico City, 27-29 November 2001.
List of participants
Mr. Orlando Altamirano, Director
Construambiente
Mr. Federico S. Burone, Regional Director
International Development Research Center (IDRC)
Regional Offi ce LAC
Mr. Alejandro Mohar
Centro de investigación en Geografía y Geomática “Ing. Jorge L. Tamayo”, A.C.
Centrogeo
Miss María Nájera
Centro de investigación en Geografía y Geomática “Ing. Jorge L. Tamayo”, A.C.
Centrogeo
Miss Julieta Velasco
Centro de investigación en Geografía y Geomática “Ing. Jorge L. Tamayo”, A.C.
Mrs. Mercedes Costa Rodríguez
Vicepresidente de la Asamblea Municipal del
Poder Popular de Arroyo Naranjo (Vice Alcaldesa)
La Habana, Cuba
Mr. Oscar Emilio Flores Alonso,
Jefe de la Unidad Técnica de la Subgerencia de Saneamiento Ambiental
Alcaldía de San Salvador
San Salvador, El Salvador
Dr. Sergio Galilea Ocón
Intendente del Gobierno Regional Metropolitano de Santiago
Santiago de Chile, Chile
Mr. Hugo César Guzmán
Director General de Acuerdos y Cooperación International
Secretaría de Medio Ambiente y Recursos Naturales Mexico, D.F. Mexico
Mrs. Ana Lucia Nadalutti La Rovere
Directora de Desarrillo Urbano y Medio Ambiente. Rio de Janeiro, Brazil
Mr. Alberto Costa Lopes
Instituto Brasileiro de Administracao Municipal (IBAM)
Me
tho
do
log
y fo
r th
e p
rep
ara
tio
n o
f G
EO
Cit
ies
Re
po
rts
191
Mrs. Samyra Crespo
Parceria 21
Mr. Napoleao Miranda
Parceria 21
Mrs. Laura Valente de Macedo
ISER – Instituto de Estudios de la Religión. Rio de Janeiro, Brazil
Dr. Genoveva de Mahieu, Director
Instituto de Medio Ambiente y Ecología (IMAE), Vicerrectorado de Investigación y Desarrollo
Universidad del Salvador
Mr. Iván Moscoso
Instituto para el Desarrollo, AC. Mexico D.F, Mexico
Mr. José Roque Nunes Marques
Manaus City Government
Secretario Municipal de Desenvolvimiento e Meio Ambiente SEDEMA. Manaus, Brazil
Mr. Fernando Patiño
UN-HABITAT – Regional Offi ce for Latin America and the Caribbean. Rio de Janeiro, Brazil
Dr. Augusto Paz
Government of City of Buenos Aires, Buenos Aires, Argentina
Dr. László Pintér
Senior Project Manager
International Institute for Sustainable Development (IISD). Winnipeg, Manitoba, Canadá
Mrs. Irene Pisanty
Coordinator of Presidential Advisors
Instituto Nacional de Ecología. Mexico D.F, Mexico
Mrs. Sonia Reyes
Instituto de Estudios Urbanos de la Pontifi cia Universidad Católica de Chile. Santiago de Chile,
Chile
Mr. José Luis Samaniego
CEIBA. Mexico D.F., Mexico
Ing. Jesús Miguel Sepúlveda
City of Bogota Mayor’s Offi ce
Profesional de la Subdirección Ambiental Sectorial
del Departamento Administrativo del Medio Ambiente (DAMA). Bogota, Colombia
Mrs. Izabella Teixeira, Director
Secretaria de Qualidade Ambiental nos Assentamentos Humanos, MMA. Brasilia, Brazil
Me
tho
do
log
y fo
r th
e p
rep
ara
tio
n o
f G
EO
Cit
ies
Re
po
rts
192
Dr. Claudia Sheinbaum
Secretaria del Medio Ambiente. Mexico D.F, Mexico
Mr. Roberto Fernández
Miss Luz Elena González
Dirección Ejecutiva de Coordinación Institucional
Miss María Cristina Ruiz Ramírez
Dirección General de Gestión Ambiental del Aire. Mexico
Arq. Miguel Angel Téllez Trevilla
Dirección de Impact Ambiental y Riesgo. Mexico
United Nations Environmental Programme
Dr. Nickolai B. Denisov, Programme Manager
UNEP / GRID Arendal
Mr. Morten Wasstol
CEROI Project Manager
UNEP / GRID Arendal
Regional Offi ce for Latin America and the Caribbean (UNEP/ ROLAC)
Mr. Kaveh Zahedi
Regional Coordinador, Division of Early Warning and Assessment
Mrs. María Eugenia Arreola
Division of Early Warning and Assessment

Me
tho
do
log
y fo
r th
e p
rep
ara
tio
n o
f G
EO
Cit
ies
Re
po
rts
193
Annex 7: Impact strategy and communication activities
What is an impact strategy?
An impact strategy consists of steps taken to ensure the work done will result in real
progress being made on key aspects or concerns. By defi nition it is proactive with respect to
public policies where government or citizen priorities may change or undergo modifi cations. It
is a dynamic process that identifi es and anticipates desired changes in the IEA/GEO process,
for example in GEO Cities.
Why?
In many cities/countries, IEA/GEO reports are a constitutional mandate; in others they are
a voluntary government initiative and, in some cases, part of a broader central government
monitoring and assessment programme.
In each of these cases it is important to know about any previous initiatives of the same
type that may have failed, learn from the errors made and make suggestions for the report
being prepared. Then the following questions must be kept in mind:
Why was the assessment made?
What happened to earlier assessments?
Who is participating in the assessment?
What relevant events are happening in the city/country?
When?
The impact strategy should be applied from the beginning of the IEA process (institutional
arrangement) and undergo constant monitoring and assessment. The local coordinator,
together with the local team, will be responsible for applying this impact strategy.
Difference between impact strategy and communication activities
Impact strategy Communication activities
Purpose
It is meant to cause change and
identify its role as an agent for
change
To ensure people understand the
fi ndings and recommendations
Audience
Small group of key stakeholders
and those who have access to
other stakeholders
Mass audiences
Period
Developed at the beginning of
the assessment process, and
then monitored and adjusted as
it progresses
As it is part of an impact strategy,
it is usually implemented almost
at the end of the strategy when
fi ndings and recommendations are
known

Me
tho
do
log
y fo
r th
e p
rep
ara
tio
n o
f G
EO
Cit
ies
Re
po
rts
194
Steps in an impact strategy
There are fi ve main steps in preparing an impact strategy, as can be seen in the following
fi gure:
1. Creating a premise for change. What should be the assessment’s impact?
2. Managing relationships. Identify key stakeholders you wish to infl uence and look for
opportunities to contact them.
3. Managing knowledge. Collect and analyse information for the assessment.
4. Managing opportunities. Make this knowledge available to those who need to be
infl uenced.
5. Monitoring and improving. Determine whether the impact strategy is working and
adjust if necessary.
Step 1
Changes you wish the
assessment to make
Step 5
External Monitor,
environmental policyassess
Other infl uences on
decisions and improve
and decision-makers
Step 2 (Who?)
Identify connections,
decision-makers.infl uences,
media, people working with
NGOs, etc.
Step 4 (How?)
What opportunities are
there? Publications,
conferences and
workshops, news articles,
etc.
What are the key messages?
What are the presssing themes?
Step 3 (What?)
Know-how to be acquired
from the assessment and
how it will be made
Who is involved in the
process? Are they adding
importance, legitimacy
and credibility to the
assessment?
Me
tho
do
log
y fo
r th
e p
rep
ara
tio
n o
f G
EO
Cit
ies
Re
po
rts
195
Target groups
As a part of communication activities target groups must be defi ned, key stakeholders who
have to be infl uenced and who receive key messages from the GEO process. In this respect,
it is suggested that you:
Differentiate between users of information and those who transmit it•
Prepare specifi c messages for each group•
Analyse the audience’s characteristics•
Consider its reach and credibility. Those who transmit messages should also be •
considered in this analysis. Are you the person best suited to reach a certain target
group?
Consider spokespersons•
Examples of other more common target groups:
Government planners•
Politicians•
Researchers and analysts•
Non-governmental organizations (NGOs)•
General Public•
Schools and universities•
Industry and business•
Indigenous groups•
Media•
Communication effectiveness and effi ciency
In this respect, in the communication and subsequent impact process, a difference must
be made between the concepts of effectiveness and effi ciency.
Effectiveness of communication: The messages should be received by the target audience, correctly
interpreted, remembered for a long time, and should trigger appropriate action.
Effi ciency of communication: This obeys the concept of reaching the maximum number of people per
unit cost.
In short:
Communication = Signifi cance + Number
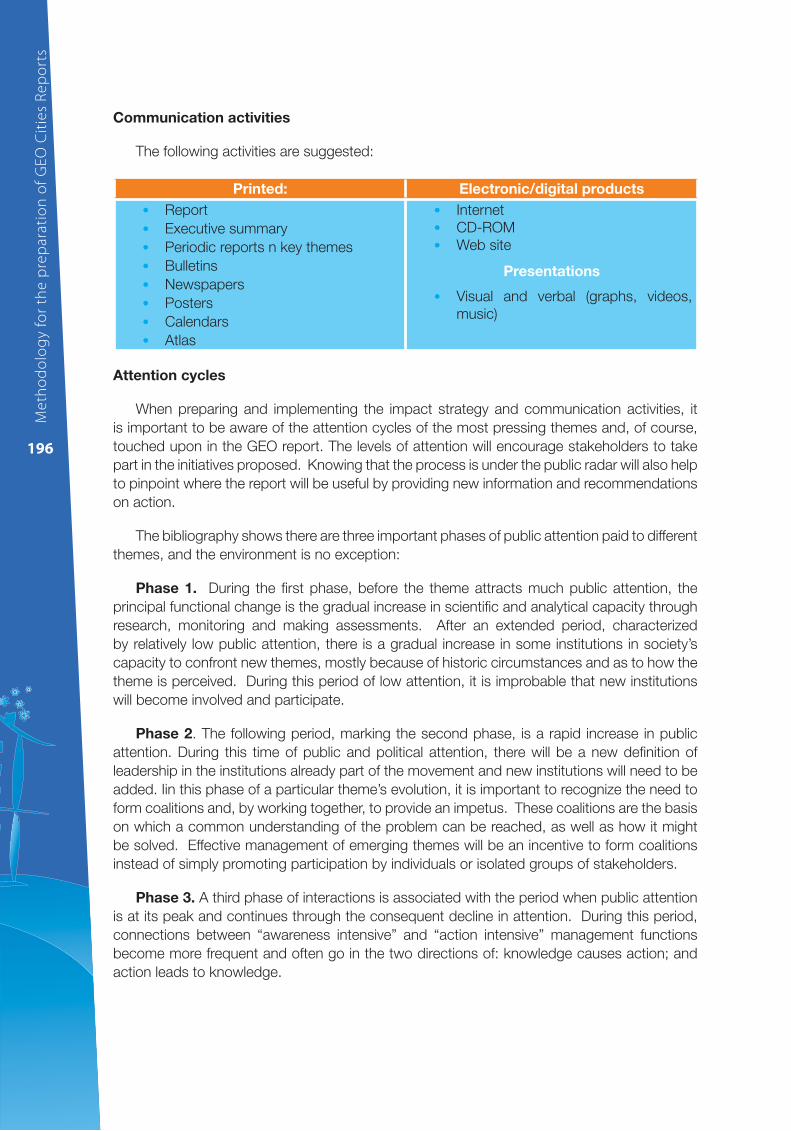
Me
tho
do
log
y fo
r th
e p
rep
ara
tio
n o
f G
EO
Cit
ies
Re
po
rts
196
Communication activities
The following activities are suggested:
Printed: Electronic/digital products
• Report
Executive summary•
Periodic reports n key themes•
Bulletins•
Newspapers•
Posters•
Calendars•
Atlas•
Internet•
CD-ROM•
Web site•
Presentations
Visual and verbal (graphs, videos, •
music)
Attention cycles
When preparing and implementing the impact strategy and communication activities, it
is important to be aware of the attention cycles of the most pressing themes and, of course,
touched upon in the GEO report. The levels of attention will encourage stakeholders to take
part in the initiatives proposed. Knowing that the process is under the public radar will also help
to pinpoint where the report will be useful by providing new information and recommendations
on action.
The bibliography shows there are three important phases of public attention paid to different
themes, and the environment is no exception:
Phase 1. During the fi rst phase, before the theme attracts much public attention, the
principal functional change is the gradual increase in scientifi c and analytical capacity through
research, monitoring and making assessments. After an extended period, characterized
by relatively low public attention, there is a gradual increase in some institutions in society’s
capacity to confront new themes, mostly because of historic circumstances and as to how the
theme is perceived. During this period of low attention, it is improbable that new institutions
will become involved and participate.
Phase 2. The following period, marking the second phase, is a rapid increase in public
attention. During this time of public and political attention, there will be a new defi nition of
leadership in the institutions already part of the movement and new institutions will need to be
added. Iin this phase of a particular theme’s evolution, it is important to recognize the need to
form coalitions and, by working together, to provide an impetus. These coalitions are the basis
on which a common understanding of the problem can be reached, as well as how it might
be solved. Effective management of emerging themes will be an incentive to form coalitions
instead of simply promoting participation by individuals or isolated groups of stakeholders.
Phase 3. A third phase of interactions is associated with the period when public attention
is at its peak and continues through the consequent decline in attention. During this period,
connections between “awareness intensive” and “action intensive” management functions
become more frequent and often go in the two directions of: knowledge causes action; and
action leads to knowledge.
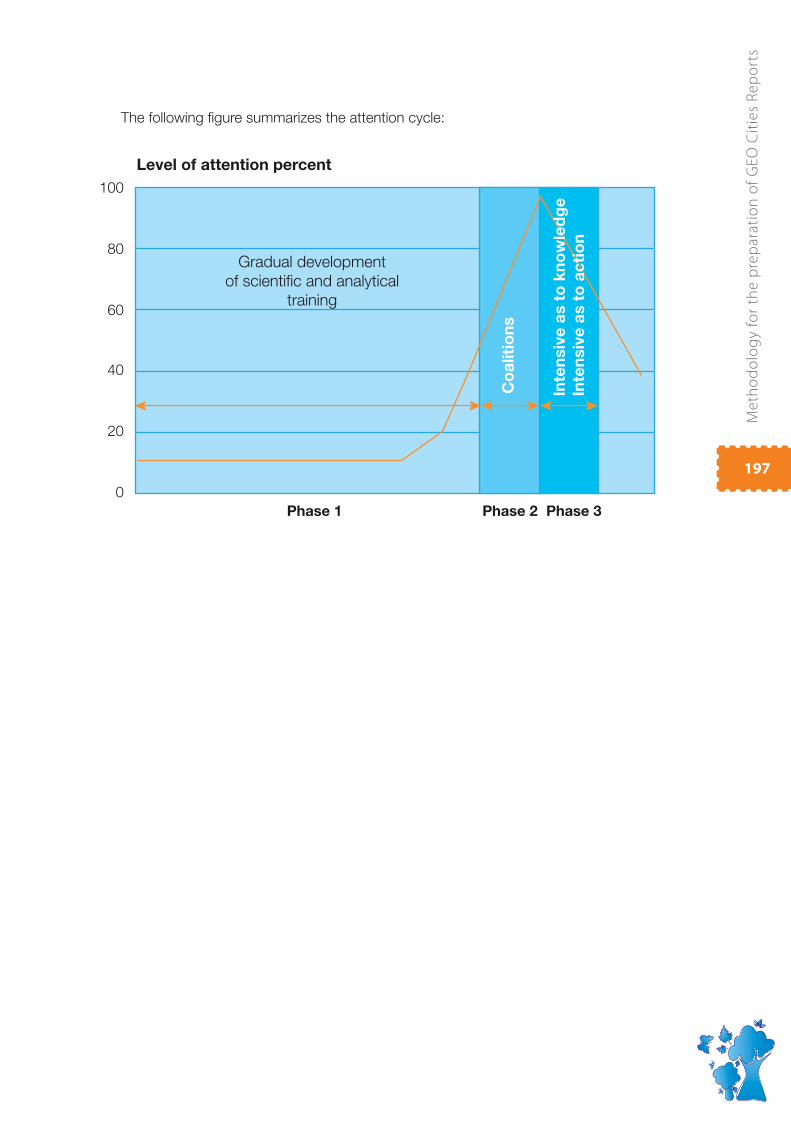
Me
tho
do
log
y fo
r th
e p
rep
ara
tio
n o
f G
EO
Cit
ies
Re
po
rts
197
The following fi gure summarizes the attention cycle:
Level of attention percent
100
80
60
40
20
0
Gradual development
of scientific and analytical
training
Phase 1 Phase 2 Phase 3C
oa
liti
on
s
Inte
nsiv
e a
s t
o k
no
wle
dg
e
Inte
nsiv
e a
s t
o a
cti
on
Me
tho
do
log
y fo
r th
e p
rep
ara
tio
n o
f G
EO
Cit
ies
Re
po
rts
198
Bibliography
Adriaanse, Albert, 1995: “The Role of ISDs and their Potential Aggregation in the Information
Hierarchy”, published in the fi nal document of the Ghent, Belgium, Workshop on “Indicators for
Sustainable Development for Decision-Making”, Federal Planning Offi ce, Belgium.
Fernández, R., 2002, Gestión ambiental de las ciudades – Teoría crítica y apoyos
metodológicos,United Nations Environment Programme – UNEP – Regional Offi ce for Latin
America and the Caribbean, Mexico D.F., Mexico.
Fundación Centro de Información y Datos de Río de Janeiro (2002) – Índice de calidad de los
municipios – verde (IQM – Verde) CIDE: Río de Janeiro, Brazil.
Gilbert, A. and Gugler, J. (1992, 1997) Cities, Poverty and Development – Urbanization in the
Third World, Second Edition, Oxford University Press, Oxford, United Kingdom.
Guerra, J. A. T. y Baptista, S.C. (organizes) (2001) Problemas environmental urbanos en Brazil,
Bertrand Brazil Editores. Río de Janeiro, Brazil.
Hammond, A. and others 1995, Environmental Indicators: A Systematic Approach to Measuring
and Reporting on Environmental Policy Performance in the context of sustainable development,
Washington: World Resources Institute – WRI, Washington D.C., United States
Herculano, S., Porto, M.F. de Souza, Freitas. C.M. de (organizers) (2000) Calidad de vida y
riesgos environmental, Niteroi: EdUFF.
ICLEI (International Council for Local Environmental Initiatives), 1996: “The Local Agenda 21
Planning Guide”, Toronto, Canadá.
Inoguchi, T., Newman, E. and Paoletto G. (eds.) (1999) Cities and the Environment – New
Approaches for Eco-Societies New York: United Nations University Press, Nueva York.
Lowe, M.D., 1991: Shaping Cities: The Environmental and Human Dimensions, Worldwatch
Paper 105, Worldwatch Institute, Washington D.C., United States.
Mac Donald, J. and Simioni, D., 2001: Urban Consensus. Contributions from the Latin
American and the Caribbean Regional Plan of Action on Human Settlements, Environment
and Development Series No. 21, Economic Commission for Latin America and the Caribbean
(ECLAC) United Nations, ECLAC. Santiago, Chile.
Secretaría de Medio Ambiente, Consorcio Parceria 21 e Instituto Brasileño de Medio Ambiente
y de Recursos Naturales Renovables – IBAMA, 2002: Ciudades Sustentables – Subsidios
para la Elaboración de la Agenda 21 Brasileña, Ministry of the Environment, Brasilia, Brasil.
Partidario, M.R., 1990, 2000: Indicadores de Calidad del Ambiente Urbano – Colección
Estudios 4, Dirección General de Orden Territorial y Desarrollo Urbano, DGOTDU, Lisbon,
Portugal.
Me
tho
do
log
y fo
r th
e p
rep
ara
tio
n o
f G
EO
Cit
ies
Re
po
rts
199
Scientifi c Committee on Problems of the Environment (SCOPE), 1995: “Environmental Indicators
– A Systematic Approach to Measuring and Reporting on the Environment in The Context of
Sustainable Development”, Published in the fi nal document Taller de Ghent, Bélgica, “Indicators
of Sustainable Development for Decision- Making”, published by the Federal Planning Offi ce,
Belgium.
Scientifi c Committee on Problems of the Environment (SCOPE), 1997: Sustainability Indicators:
report of the project on Indicators for Sustainable Development B. Moldan & S. Billharz eds.,
1997, Wiley, United Kingdom.
Serageldin, I., Cohen, M., Sivaramakrishnan, K.C., 1995: International Conference on
Environmentally Sustainable Development, Second Edition, 1994, World Bank, the Human
Face of the Urban Environment: Proceedings of the Second Annual World Bank Conference
on Environmentally Sustainable Development held at the National Academy of Sciences, 19-
21 September 1994, Washington, D.C., United States.
Smith, M., Whitelegg, J. y Williams, N., 1998 Greening the Built Environment, Earthscan
Publications Ltd., Londres, United Kingdom.
UNCED (United Nations Conference on Environment and Development), 1992: Federal Senate
Translation (1997) of Agenda 21 Brasilia.
UNCHS (The United Nations Centre for Human Settlements), 1996: Final Document of the
Second Conference of United Nations on Human Settlements, UN–Habitat II – Istanbul,
Turkey.
UNCHS, UNEP, 1999: Preparing the SCP Environmental Profi le. The SCP Source Book Series:
Volume 1. Velásquez, L.S., 2001, Indicadores de gestión urbana. Los observatorios urbano-
territoriales para el desarrollo sostenible. Manizales, Colombia. Environment and Development
Series No. 30: Economic Comisión for Latin America and the Caribbean, United Nations,
ECLAC. Santiago, Chile
UNDP (United Nations Development Programme), 1996: Human Development Report. First
edition, Ediciones Mundi-Prensa, Madrid, Spain.
UNDP Human Development Report, 1998, Trinova Editora, Lisbon, Portugal.
UNEP, 2000: GEO Latin America and the Caribbean: Global Environment Outlook 2000, UNEP,
Regional Offi ce for Latin America and the Caribbean, Mexico D.F. Mexico.
UNEP (United Nations Environmental Program), IISD (International Institute for Sustainable
Development, and Ecologistics International, 2000: Capacity Building for Integrated
Environmental Assessment and Reporting. Training Manual. Second Edition, Canada.
UNEP (United Nations Environment Programme), 1999: Global Environment Outlook 2000,
Earthscan Publication Ltd. Londres, United Kingdom

Me
tho
do
log
y fo
r th
e p
rep
ara
tio
n o
f G
EO
Cit
ies
Re
po
rts
200
UN-HABITAT (United Nations Human Settlements Programme) ,2008: State of the
World’s Cities 2008/2009, Harmonious Cities. http://www.un-habitat.org/pmss/getPage.
asp?page=bookView&book=2562
UNEP (United Nations Environmental Programme), 2007. Global Environment Outlook GEO 4.
Environment for Development, Progress Press . Valletta. Malta
Wackernagel, M. & Rees, W. 1996: “Our Ecological Footprint. Reducing Human Impact on
Earth” New Society Publishers, Canada.
WHO (World Health Organization ), 2009, World Health Statistics 2009. http://www.who.int/
whosis/whostat/2009/en/index.html

Methodology for the preparation of
GEO Cities Reports
Belgian Government
UNEP UNEP
www.unep.orgUnited Nations Environment Programme P. O. Box 30552 - 00100 Nairobi, Kenya
Tel.: + 254 20 762 1234Fax.: + 254 20 762 3927
e-mail: [email protected]
Training ManualVersion 3
BelgianDevelopment Cooperation
United Nations Environment ProgrammeDivision of Early Warning and AssessmentRegional Office for Latin America and the CaribbeanClayton, Ciudad del Saber Avenida Morse, Edificio 103. Corregimiento de AncónPanama City, PanamaTel. (+502) 305-3100 Fax: (+507) 305-3105Internet site: www.pnuma.org/deat1/Email: [email protected] 978-9962-8942-0-9