Embed Size (px)
DESCRIPTION
cisaillement
Citation preview
N° d’ordre : 2829
THESE
Présentée
DEVANT L’UNIVERSITE DE RENNES 1
pour obtenir
Le grade de DOCTEUR DE L’UNIVERSITE DE RENNES 1
Mention Sciences de la Terre
Par
Charles GUMIAUX
Équipe d’accueil : Géosciences Rennes École doctorale Sciences de la Matière Composante universitaire UFR Structure et Propriétés de la Matière
Titre de la thèse :
MODELISATION DU CISAILLEMENT HERCYNIEN DE BRETAGNE CENTRALE : DEFORMATION CRUSTALE ET IMPLICATIONS
LITHOSPHERIQUES
Soutenue le 4 avril 2003 devant la commission d’Examen
Peter Robert COBBOLD Président Jean-Marc LARDEAUX Rapporteur Christian TEYSSIER Rapporteur Sierd CLOETINGH Examinateur Catherine TRUFFERT Examinatrice Denis GAPAIS Directeur de Thèse Jean-Pierre BRUN Directeur de Thèse


à Maman
et avec vous tous. Merci.

Table des matières
Avant propos 9
Chapitre 1 Introduction générale : la Bretagne Centrale dans la chaîne hercynienne 13
PREMIERE PARTIE DONNEES STRUCTURALES DE TERRAIN : ANALYSE GEOSTATISTIQUE ET MODELISATION
Chapitre 2 Analyse géostatistique appliquée à l'interpolation des données de directions 33
Chapitre 3 Modélisation cinématique de la déformation en Bretagne Centrale 61
DEUXIEME PARTIE STRUCTURE CRUSTALE : SISMIQUE, MAGNETISME, GRAVIMETRIE
Chapitre 4 Imagerie sismique 97
Chapitre 5 Analyse du champ magnétique 119
Chapitre 6 Modélisation gravimétrique 3D à l'échelle de la croûte 157 TROISIEME PARTIE LE CISAILLEMENT HERCYNIEN DE BRETAGNE CENTRALE, DE LA CROUTE A LA LITHOSPHERE
Chapitre 7 Le cisaillement Hercynien de Bretagne Centrale : synthèse structurale et histoire
tectonique 177
Chapitre 8 Données tomographiques : la déformation à l'échelle lithosphérique 221
Chapitre 9 Synthèse & Conclusions 233
Bibliographie 243

9
Avant propos Dans les chaînes de collision, l'allure des structures d'échelle régionale est contrôlée, au
premier ordre, par la forme des marges des plaques lithosphériques impliquées et les déplacements qui
leur sont imposés. A l'échelle de la croûte, l'accommodation du raccourcissement global peut être
guidée par les contrastes rhéologiques existant entre les différents domaines, et par la présence de
structure crustales, héritées d'une histoire géodynamique plus précoce.
Sur le terrain, les études structurales des domaines ductiles profonds concernent le plus
souvent les grandes structures (zones de cisaillement) où la déformation est localisée et montre une
intensité particulièrement forte, par rapport aux domaines adjacents. Parallèlement, si l'on veut
analyser les processus tectoniques à l'échelle de la croûte, voire de la lithosphère, il est nécessaire
d'imager le champ de déformation continu à l'échelle de domaines suffisamment larges. Cependant, les
données de surface sont parfois soumises à de fortes variations locales, en intensité et en direction, des
contraintes et déformations associées. L'image du champ de la déformation finie, obtenue à l'échelle
d'une région entière, est de ce fait "bruitée" et ne reflète pas toujours directement les tendances
d'échelle régionale. De plus, ces données ne fournissent qu'une image cartographique de la
déformation à partir de laquelle l'extrapolation en profondeur est souvent délicate.
Afin de palier ces limitations, deux moyens peuvent être utilisés pour l'aide à l'analyse de la
déformation à grande échelle : (a) l'analyse géostatistique permet de filtrer les valeurs d'une variable
mesurée en surface et de mettre en évidence les variations d'échelle régionale par rapport aux
variations plus locales, (b) l'imagerie et la modélisation des données géophysiques peuvent être utilisés
en tant que marqueurs 3D de la déformation de toute la croûte, voire même de la lithosphère.
Le Massif Armoricain est un segment de la chaîne de collision continentale hercynienne datant
du Paléozoïque supérieur. Ce massif constitue une des branches de la syntaxe reconnue à l'Ouest de
l'Europe, dont la formation au cours de la collision induit des mouvements décrochants importants, qui
se superposent ou se combinent aux structures antérieures, d'épaississement puis d'amincissement, plus
typiques des chaînes de collision. En complément des bases de données géologiques, géochimiques et
géophysiques issues de très nombreuses études antérieures, les données géophysiques nouvelles
acquises dans le cadre du projet Armor2 (programme Géofrance 3D, BRGM-CNRS) conduisent à
reconsidérer certains aspects importants de l'évolution de la déformation hercynienne du Massif
Armoricain, dans ce contexte géodynamique fortement non cylindrique. Le travail présenté dans ce
mémoire s'appuie sur une analyse couplée de données géophysiques et de données structurales et leur
modélisation. Il aboutit à un modèle de déformation de la croûte continentale, en Bretagne Centrale, et
discute son extension à l'ensemble de la lithosphère.


C h a p i t r e 1 Introduction générale : la Bretagne Centrale dans la chaîne hercynienne

CHAPITRE 1 – Introduction générale : la Bretagne Centrale dans la chaîne hercynienne 15
1. La Chaîne hercynienne d’Europe de l’Ouest
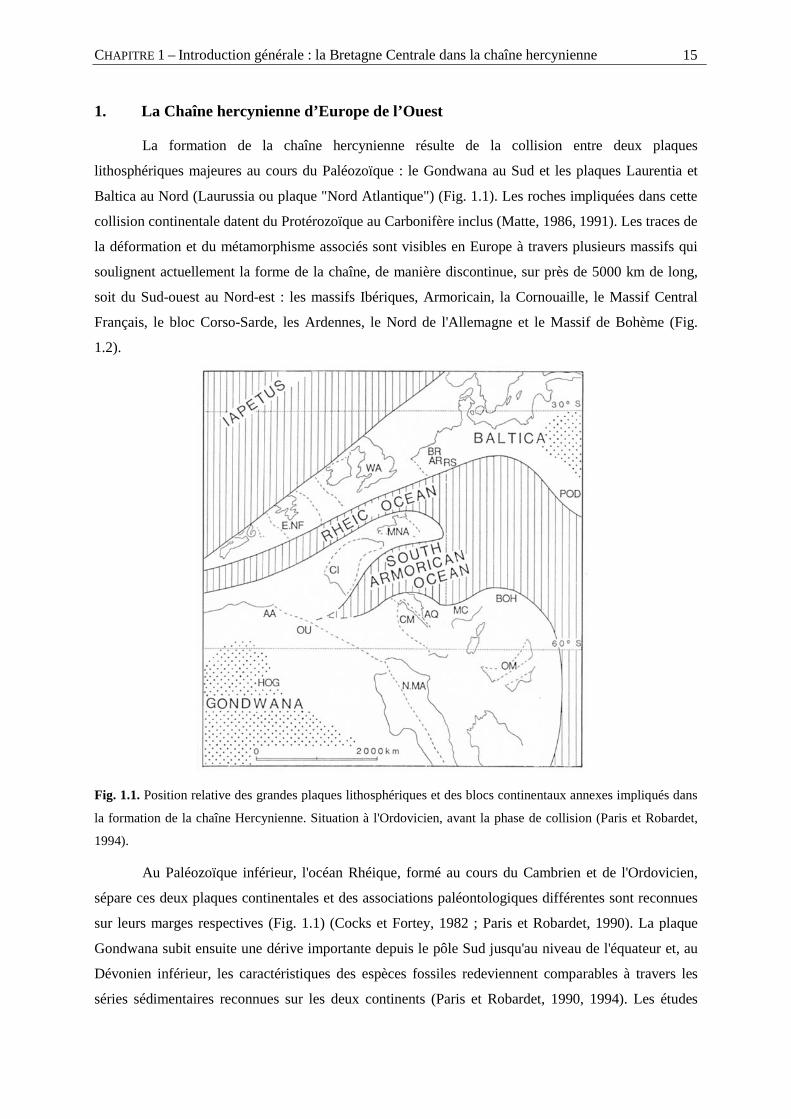
La formation de la chaîne hercynienne résulte de la collision entre deux plaques
lithosphériques majeures au cours du Paléozoïque : le Gondwana au Sud et les plaques Laurentia et
Baltica au Nord (Laurussia ou plaque "Nord Atlantique") (Fig. 1.1). Les roches impliquées dans cette
collision continentale datent du Protérozoïque au Carbonifère inclus (Matte, 1986, 1991). Les traces de
la déformation et du métamorphisme associés sont visibles en Europe à travers plusieurs massifs qui
soulignent actuellement la forme de la chaîne, de manière discontinue, sur près de 5000 km de long,
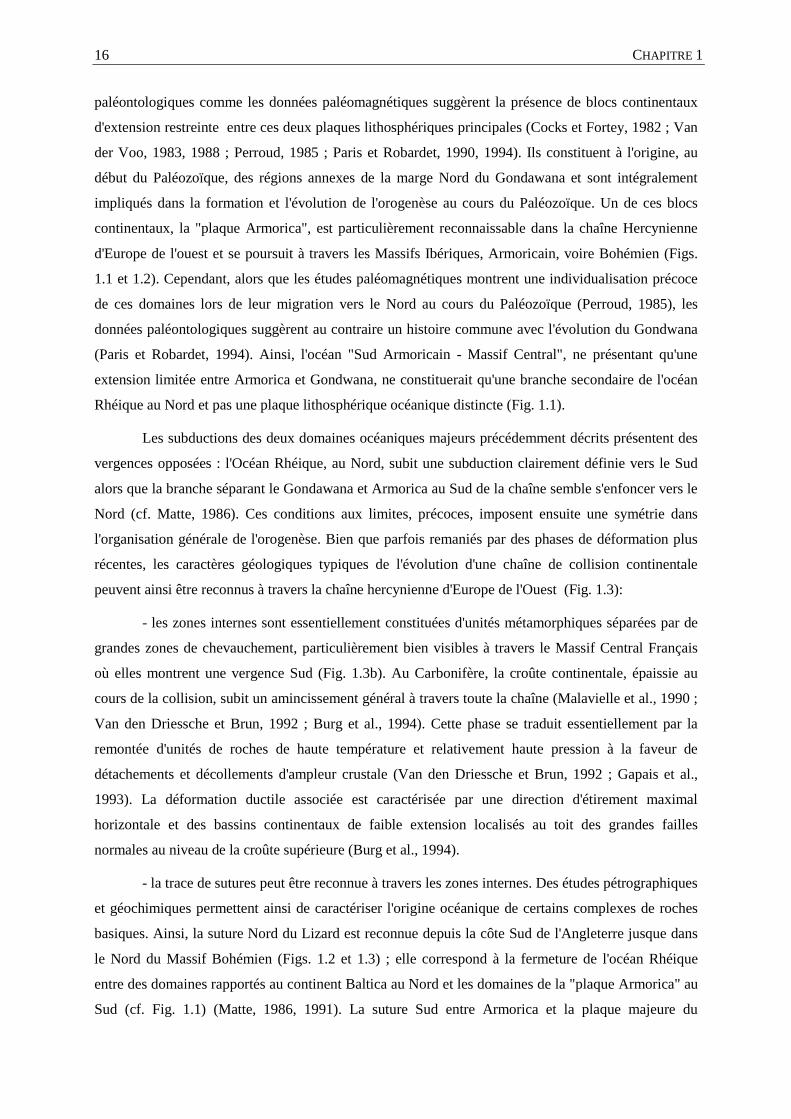
soit du Sud-ouest au Nord-est : les massifs Ibériques, Armoricain, la Cornouaille, le Massif Central
Français, le bloc Corso-Sarde, les Ardennes, le Nord de l'Allemagne et le Massif de Bohème (Fig.
1.2).
Fig. 1.1. Position relative des grandes plaques lithosphériques et des blocs continentaux annexes impliqués dans
la formation de la chaîne Hercynienne. Situation à l'Ordovicien, avant la phase de collision (Paris et Robardet,
1994).
Au Paléozoïque inférieur, l'océan Rhéique, formé au cours du Cambrien et de l'Ordovicien,
sépare ces deux plaques continentales et des associations paléontologiques différentes sont reconnues
sur leurs marges respectives (Fig. 1.1) (Cocks et Fortey, 1982 ; Paris et Robardet, 1990). La plaque
Gondwana subit ensuite une dérive importante depuis le pôle Sud jusqu'au niveau de l'équateur et, au
Dévonien inférieur, les caractéristiques des espèces fossiles redeviennent comparables à travers les
séries sédimentaires reconnues sur les deux continents (Paris et Robardet, 1990, 1994). Les études
CHAPITRE 1 16
paléontologiques comme les données paléomagnétiques suggèrent la présence de blocs continentaux
d'extension restreinte entre ces deux plaques lithosphériques principales (Cocks et Fortey, 1982 ; Van
der Voo, 1983, 1988 ; Perroud, 1985 ; Paris et Robardet, 1990, 1994). Ils constituent à l'origine, au
début du Paléozoïque, des régions annexes de la marge Nord du Gondawana et sont intégralement
impliqués dans la formation et l'évolution de l'orogenèse au cours du Paléozoïque. Un de ces blocs
continentaux, la "plaque Armorica", est particulièrement reconnaissable dans la chaîne Hercynienne
d'Europe de l'ouest et se poursuit à travers les Massifs Ibériques, Armoricain, voire Bohémien (Figs.
1.1 et 1.2). Cependant, alors que les études paléomagnétiques montrent une individualisation précoce
de ces domaines lors de leur migration vers le Nord au cours du Paléozoïque (Perroud, 1985), les
données paléontologiques suggèrent au contraire un histoire commune avec l'évolution du Gondwana
(Paris et Robardet, 1994). Ainsi, l'océan "Sud Armoricain - Massif Central", ne présentant qu'une
extension limitée entre Armorica et Gondwana, ne constituerait qu'une branche secondaire de l'océan
Rhéique au Nord et pas une plaque lithosphérique océanique distincte (Fig. 1.1).
Les subductions des deux domaines océaniques majeurs précédemment décrits présentent des
vergences opposées : l'Océan Rhéique, au Nord, subit une subduction clairement définie vers le Sud
alors que la branche séparant le Gondawana et Armorica au Sud de la chaîne semble s'enfoncer vers le
Nord (cf. Matte, 1986). Ces conditions aux limites, précoces, imposent ensuite une symétrie dans
l'organisation générale de l'orogenèse. Bien que parfois remaniés par des phases de déformation plus
récentes, les caractères géologiques typiques de l'évolution d'une chaîne de collision continentale
peuvent ainsi être reconnus à travers la chaîne hercynienne d'Europe de l'Ouest (Fig. 1.3):
- les zones internes sont essentiellement constituées d'unités métamorphiques séparées par de
grandes zones de chevauchement, particulièrement bien visibles à travers le Massif Central Français
où elles montrent une vergence Sud (Fig. 1.3b). Au Carbonifère, la croûte continentale, épaissie au
cours de la collision, subit un amincissement général à travers toute la chaîne (Malavielle et al., 1990 ;
Van den Driessche et Brun, 1992 ; Burg et al., 1994). Cette phase se traduit essentiellement par la
remontée d'unités de roches de haute température et relativement haute pression à la faveur de
détachements et décollements d'ampleur crustale (Van den Driessche et Brun, 1992 ; Gapais et al.,
1993). La déformation ductile associée est caractérisée par une direction d'étirement maximal
horizontale et des bassins continentaux de faible extension localisés au toit des grandes failles
normales au niveau de la croûte supérieure (Burg et al., 1994).
- la trace de sutures peut être reconnue à travers les zones internes. Des études pétrographiques
et géochimiques permettent ainsi de caractériser l'origine océanique de certains complexes de roches
basiques. Ainsi, la suture Nord du Lizard est reconnue depuis la côte Sud de l'Angleterre jusque dans
le Nord du Massif Bohémien (Figs. 1.2 et 1.3) ; elle correspond à la fermeture de l'océan Rhéique
entre des domaines rapportés au continent Baltica au Nord et les domaines de la "plaque Armorica" au
Sud (cf. Fig. 1.1) (Matte, 1986, 1991). La suture Sud entre Armorica et la plaque majeure du
CHAPITRE 1 – Introduction générale : la Bretagne Centrale dans la chaîne hercynienne 17
Gondwana n'est pas aussi clairement définie : elle est soulignée par la présence de roches
métamorphiques de haute pression et de relativement basse température (éclogites, schistes bleus)
reconnues à travers les unités chevauchantes symptomatiques de la phase de collision (Fig. 1.3)
(Matte, 1986).
Fig. 1.2. Localisation des massifs Hercyniens à travers l'Europe de l'Ouest (Matte, 1991).
- le front Nord de la chaîne, ou "Front Varisque", est souligné par des chevauchements à
vergence Nord et des décollements qui s'étendent depuis le sud de l'Irlande jusqu'au Nord de
l'Allemagne (Fig. 1.3). La limite la plus au Sud de la chaîne, bien définie en Bohème, semble
beaucoup plus difficile à identifier dans le reste de l'Europe (Fig. 1.3). Ceci traduit certainement une
évolution plus complexe entre les différents blocs impliqués dans la collision le long de la marge nord
du Gondwana ainsi que le remaniement plus récent de ces roches, dans les chaînes de collision
Alpines notamment (Matte, 1986).
- les parties les plus externes de la chaîne correspondent à des bassins d'avant pays ne
présentant pas de métamorphisme associé à l'orogenèse hercynienne (Fig. 1.3). Les sédiments qui les
composent datent du Dévonien et du Carbonifère, ce qui fixe une gamme minimale pour l'âge du
fonctionnement des chevauchements frontaux.
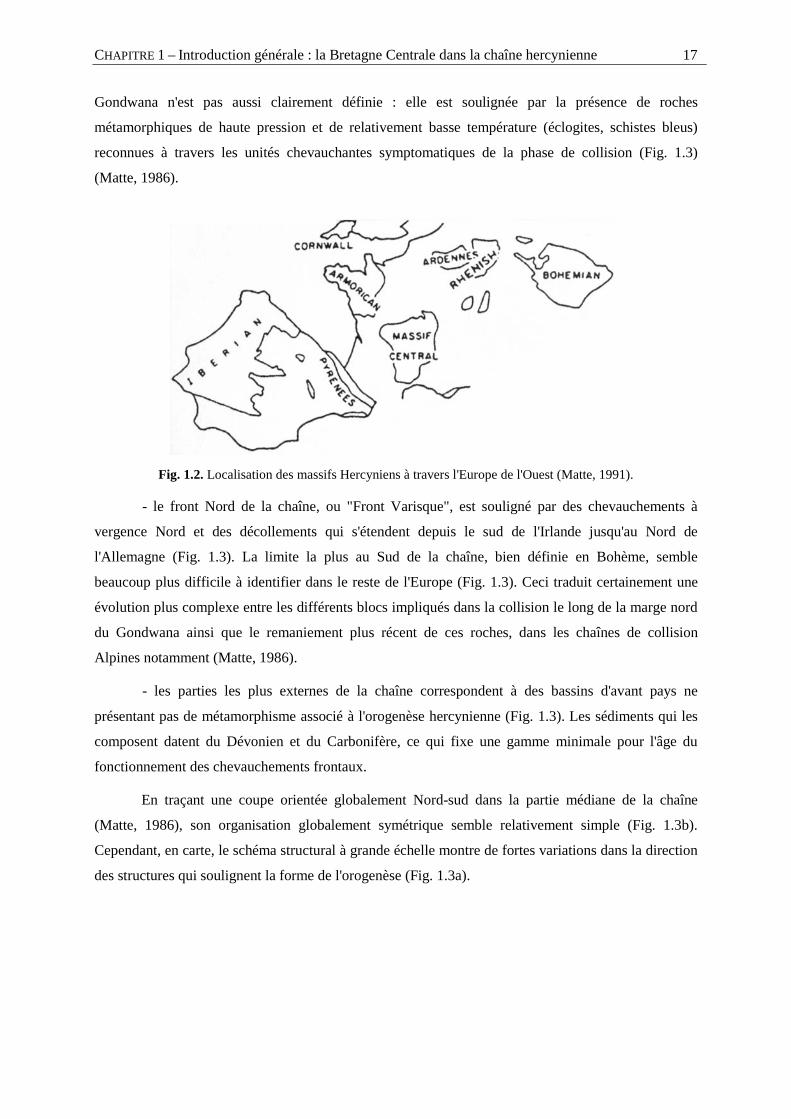
En traçant une coupe orientée globalement Nord-sud dans la partie médiane de la chaîne
(Matte, 1986), son organisation globalement symétrique semble relativement simple (Fig. 1.3b).
Cependant, en carte, le schéma structural à grande échelle montre de fortes variations dans la direction
des structures qui soulignent la forme de l'orogenèse (Fig. 1.3a).
CHAPITRE 1 18
Fig. 1.3. (a) Schéma structural à grande échelle de la chaîne Hercynienne d'Europe de l'Ouest. Les unités
métamorphiques des zones internes et les traces des sutures sont figurées en gris sur la carte. La position de la
coupe illustrée sur le figure 1.4 est reportée sur la carte (Matte, 1986). (b) Coupe générale de la chaîne dans sa
partie centrale la plus étendue; tronçon Ardennes - Sud du Massif Central. La vergence opposée des
chevauchements dans les zones internes et aux fronts de la chaîne souligne la forme globalement symétrique de
cet orogenèse (Matte, 1986).
CHAPITRE 1 – Introduction générale : la Bretagne Centrale dans la chaîne hercynienne 19
� De plus,
pendant toute l'histoire de la collision et les phases d'extension plus tardives, de
nombreux décrochements et zones de cisaillement d'échelle régionale recoupent la
chaîne en individualisant différents domaines. Ainsi, au Nord-ouest du Massif de
Bohème, les structures sont recoupées et décalées par une série de failles orientées
NW-SE ; la trace des structures est décalée par un mouvement dextre vers le Sud-est
(Fig. 1.3a ; Matte, 1986).
Ces structures tardives se retrouvent à travers tous les Massifs et les plus importants
sont localisés à l'Ouest, au niveau de la syntaxe (arc ou virgation) Ibéro-Armoricaine
(Fig. 1.3a).
2. L'arc Ibéro-Armoricain La continuité des structures géologiques entre le Massif Armoricain et la plaque Ibérique a
depuis longtemps été remarquée et a fait l'objet de publications spécifiquement dédiées à cette partie
Ouest de la chaîne hercynienne (Brun et Burg, 1982 ; Matte, 1986 ; Ribeiro et al., 1990 ; Dias et
Ribeiro, 1995). En particulier, Ballèvre et al. (1992) montrent des similarités quasi parfaites entre les
unités métamorphiques d'une part, et les corrélations bio-stratigraphiques fines d'autre part ; le
complexe de roches soulignant la trace de la suture en Bretagne Sud, dans la région de Champtoceaux,
correspondant aux unités éclogitiques de Malpica-Tuy en Galice. La succession sédimentaire ainsi que
l'organisation spatiale des dépôts observées à travers le domaine paléogéographique médio-nord
Armoricain du Massif Armoricain sont latéralement équivalentes à celles des formations du domaine
Centre Ibérique (Paris et Robardet, 1977). Les similarités sont particulièrement flagrantes entre
l'extrémité Ouest de la Bretagne (presqu'île de Crozon) et le Portugal (Buçaco). Après la restauration
de l'ouverture du golfe de Gascogne au Crétacé (cf. Olivet, 1996), les traces de la collision montrent
une courbure particulièrement importante qui souligne la forme d'arc ou "virgation" de cette région. La
déformation associée à la mise en place des nappes pendant la phase de collision présente des
mouvements apparents globalement opposés soit vers l'WSW dans le Sud du Massif Armoricain et
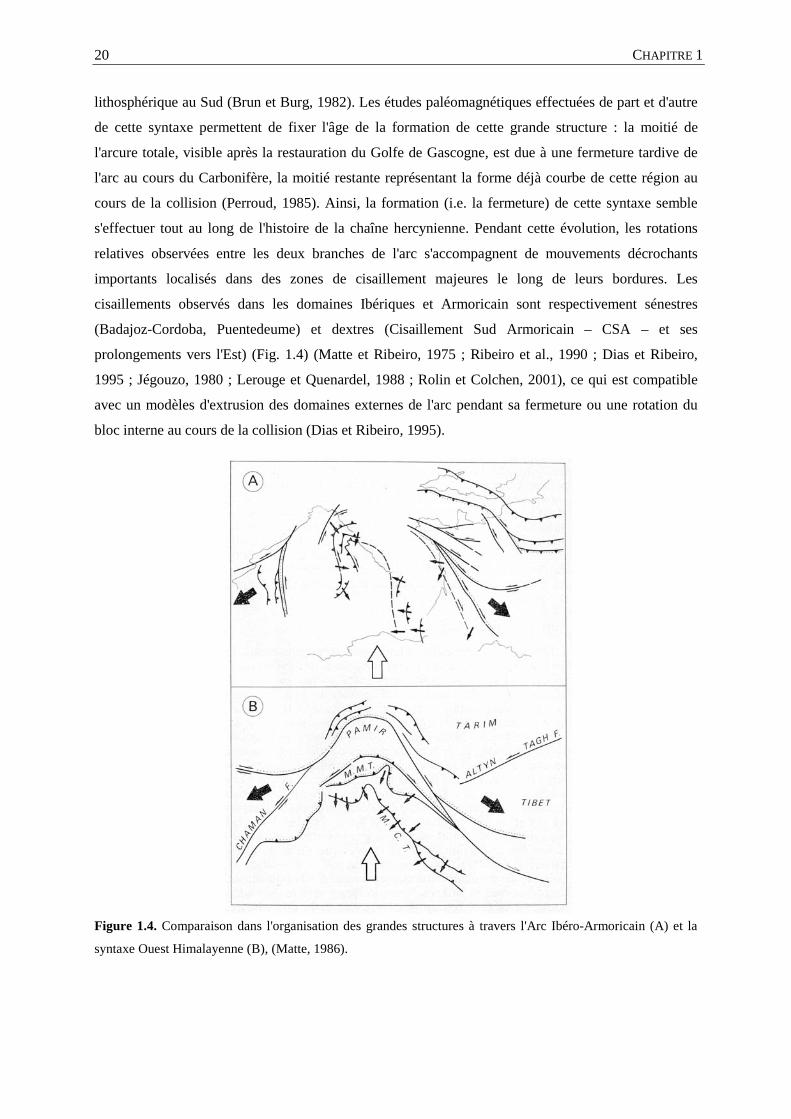
vers l' ENE au Nord de l'Espagne (Matte, 1986) (Fig. 1.4). La disposition et l'ampleur des structures
qui soulignent cet arc sont très comparables à ceux observés à l'extrémité Ouest de la chaîne
Himalayenne (Matte, 1986) (Fig. 1.4).
L'arc Ibéro-Armoricain peut ainsi être considéré comme une syntaxe au cours de l'orogenèse
hercynienne et sa formation a pu être rapportée à deux principaux mécanismes différents : (1)
l'indentation d'un poinçon depuis la partie interne de l'arc vers l'extérieur (Matte, 1986 ; et voir
Tapponier, 1982) pouvant subir des rotations substantielles au cours de la collision (Dias et Ribeiro,
1995) (2) un effet de coin se développant pendant la collision au niveau de la marge Nord de la plaque
CHAPITRE 1 20
lithosphérique au Sud (Brun et Burg, 1982). Les études paléomagnétiques effectuées de part et d'autre
de cette syntaxe permettent de fixer l'âge de la formation de cette grande structure : la moitié de
l'arcure totale, visible après la restauration du Golfe de Gascogne, est due à une fermeture tardive de
l'arc au cours du Carbonifère, la moitié restante représentant la forme déjà courbe de cette région au
cours de la collision (Perroud, 1985). Ainsi, la formation (i.e. la fermeture) de cette syntaxe semble
s'effectuer tout au long de l'histoire de la chaîne hercynienne. Pendant cette évolution, les rotations
relatives observées entre les deux branches de l'arc s'accompagnent de mouvements décrochants
importants localisés dans des zones de cisaillement majeures le long de leurs bordures. Les
cisaillements observés dans les domaines Ibériques et Armoricain sont respectivement sénestres
(Badajoz-Cordoba, Puentedeume) et dextres (Cisaillement Sud Armoricain – CSA – et ses
prolongements vers l'Est) (Fig. 1.4) (Matte et Ribeiro, 1975 ; Ribeiro et al., 1990 ; Dias et Ribeiro,
1995 ; Jégouzo, 1980 ; Lerouge et Quenardel, 1988 ; Rolin et Colchen, 2001), ce qui est compatible
avec un modèles d'extrusion des domaines externes de l'arc pendant sa fermeture ou une rotation du
bloc interne au cours de la collision (Dias et Ribeiro, 1995).
Figure 1.4. Comparaison dans l'organisation des grandes structures à travers l'Arc Ibéro-Armoricain (A) et la
syntaxe Ouest Himalayenne (B), (Matte, 1986).
CHAPITRE 1 – Introduction générale : la Bretagne Centrale dans la chaîne hercynienne 21
� Ainsi,
les déformations décrochantes localisées sur les structures d'échelle régionale
s'accompagnent à travers toute la syntaxe d'une déformation moins marquée mais
continue à l'intérieur des différents domaines individualisés (Gapais et Le Corre,
1980 ; Percevault et Cobbold, 1982 ; Dias et Ribeiro, 1994). Ces domaines
relativement étendus sont globalement affectés par des cisaillements qui induisent des
réorientations importantes des structures et modifient fortement l'organisation du
schéma structural à l'échelle régionale. Afin de mieux comprendre l'évolution de ces
grandes structures pendant la fermeture de la syntaxe, au cours de la collision, il est
nécessaire de mieux considérer les mouvements cisaillants dans les modèles de
déformation à l'échelle régionale.
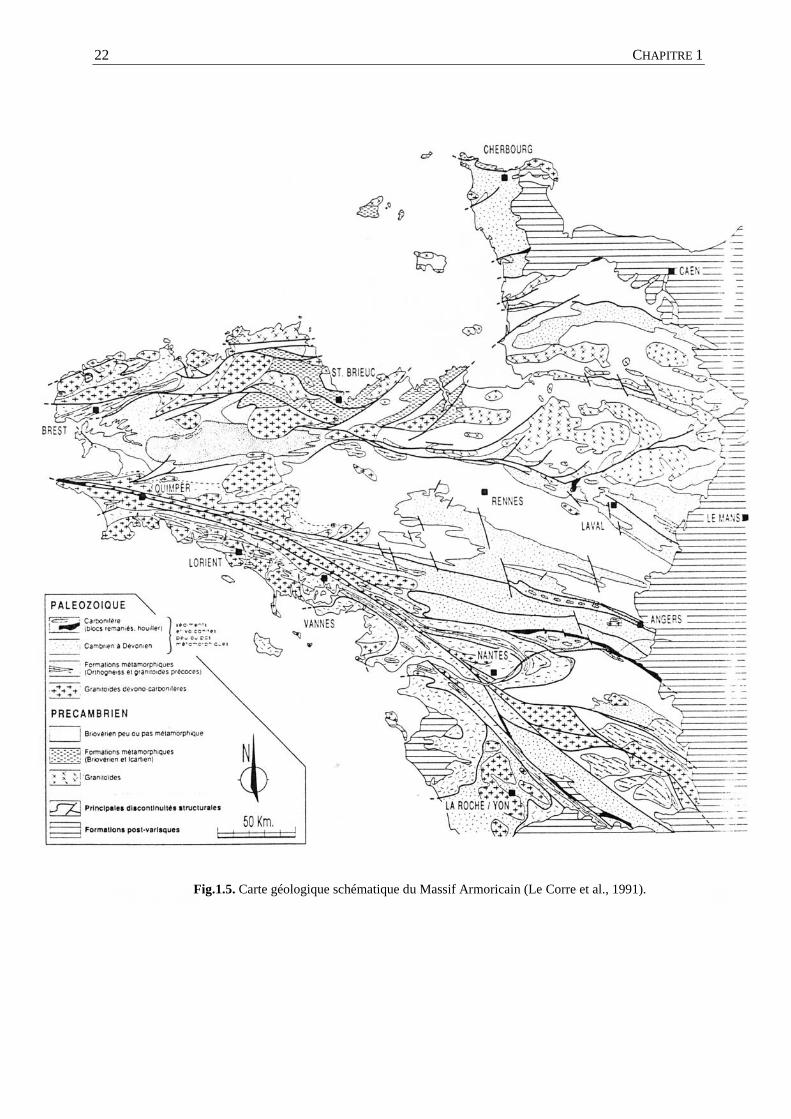
3. Le Massif Armoricain Trois grands cisaillements sont reconnus à travers le Massif Armoricain ; le Cisaillement Nord
Armoricain au Nord (Watts et Williams, 1979 ; Goré et Le Corre, 1987) et les branches Nord et Sud
du Cisaillement Sud Armoricain au Sud (Jégouzo, 1980) (Fig. 1.5). Ces cisaillements dextres sont
jalonnés de granites syn-cinématiques qui fixent l'âge de la déformation associée au Carbonifère
(Berthé et al., 1979a, 1979b ; Bernard-Griffiths et al., 1985a). Ils sont orientés E-W à NW-SE au Sud
et traversent de part en part les unités Paléozoïques à travers tout le Massif Armoricain (Fig. 1.5).
Dans la partie Ouest, les deux branches du CSA sont confondues et localisées le long d'une bande
étroite orientée N105°, montrant le développement de mylonites et de cataclasites (Jégouzo, 1980).
Vers le Sud, en Vendée, la branche Sud du cisaillement se répartit sur plusieurs zones, le cisaillement
total étant réparti sur chacune de ces branches (Fig. 1.5) (Rolin et Colchen, 2001).
Ces grands cisaillements fonctionnent encore pendant l'histoire tardive de la collision. Ils
recoupent les structures plus précoces et de grands domaines ainsi individualisés ont été reconnus
depuis longtemps à travers les études cartographiques du Massif Armoricain (cf. Le Corre et al., 1991
pour une revue exhaustive).
CHAPITRE 1 22
Fig.1.5. Carte géologique schématique du Massif Armoricain (Le Corre et al., 1991).
CHAPITRE 1 – Introduction générale : la Bretagne Centrale dans la chaîne hercynienne 23
3.1 Le Domaine Nord Armoricain
Au nord du Cisaillement Nord Armoricain (CNA) la déformation ductile des unités du
Domaine Nord Armoricain date pour l'essentiel de l'histoire orogénique Cadomienne (fin de
l’orogenèse Pan-Africaine, 750-540 Ma). La collision continentale s.s. succède à une période de
subduction océanique vers le sud-est et des structures de direction N40° - N50° accommodent un
raccourcissement oblique orienté environ NNE-SSW (Fig. 1.5) (cf. Brun et al., 2001 et références
incluses). Les unités précoces de l’arc et du bassin arrière arc, propres à la phase de subduction,
chevauchent la marge continentale vers le Sud-Est en impliquant un métamorphisme tardif de haute
température et de basse pression. La fin de l'histoire Cadomienne est marquée dans la partie Est du
Domaine par le dépôt d'une épaisse série terrigène associée à l'érosion rapide de la chaîne (Briovérien)
ainsi que par la mise en place de granites qui scellent à 540 Ma la fin de la déformation ductile du
Domaine Cadomien (Graviou et al., 1988). Au cours de la collision Hercynienne, ce socle Cadomien,
en position supra-crustale, se comporte de manière globalement résistante par rapport aux domaines
adjacents et une déformation essentiellement fragile, concentrée le long des structures héritées, affecte
ces unités.
3.2 Le Domaine Centre Armoricain
Ce domaine est presque exclusivement constitué de roches sédimentaires. Les dépôts les plus
anciens datent du Protérozoïque supérieur (Briovérien) et proviennent de l'érosion de la chaîne
Cadomienne située au Nord (Chantraine et al., 1988 ; Le Corre et al., 1991). Dès le Cambrien au Nord,
et au cours de l'Ordovicien, une phase d'extension affecte l'ensemble du Massif Armoricain. Dans le
Domaine Centre Armoricain, ceci se traduit par le dépôt de sédiments continentaux localisés dans des
structures en blocs basculés (Brun et al., 1991). La discordance souvent observée à la base de la série
Paléozoïque post-Cambrienne n'est pas associée à une phase de déformation plus précoce des
sédiments Briovériens (Le Corre, 1978), et le développement de la sédimentation progressive au cours
de la phase d'extension Ordovicienne peut rendre compte de cette discontinuité stratigraphique
importante. La série sédimentaire est ensuite presque continue jusqu'au Dévonien (Guillocheau et
Rolet, 1982 ; Robardet et al., 1994). A travers tout le domaine, les dépôts présentent les faciès
homogènes d'une sédimentation de plate-forme peu profonde caractéristique de la marge Nord du
Gondwana (Robardet et al., 1994 ; Paris et Robardet, 1994). A partir du Dévonien Supérieur, les
sédiments préservés sont plus rares et souvent alignés le long des grands cisaillements. Au
Carbonifère, des déformations décrochantes dextres sont localisées sur les structures d'échelle
régionale. La sédimentation est confinée dans des bassins qui se développent le long de ces structures
(Pelhate et al., 1994), dans les parties externes du domaine, et des leucogranites synchrones du
cisaillement se mettent en place dans la série sédimentaire (Berthé et al., 1979a et b).
CHAPITRE 1 24
3.3 Le Domaine Ligérien
Il est situé entre la branche Nord du CSA au nord et la faille de Nort-sur-Erdre. Les faciès
sédimentaires de la série de cette région s'individualisent par rapport au Domaine Centre Armoricain à
partir de l'Ordovicien (Robardet et al., 1994) et peut-être dès le début du Paléozoïque (Pivette, 1977 ;
Ledru et al., 1986). La bordure constituée par la branche nord du CSA et l'orthogneiss de Lanvaux a
ainsi été reconnue comme une limite paléogéographique majeure au cours du Paléozoïque (Robardet
et al., 1994). Cette bordure sépare également deux domaines présentant une évolution différente de la
déformation au Carbonifère : alors que le Domaine Centre Armoricain montre une déformation
pénétrative relativement continue, notamment dans sa partie orientale, celle-ci est plus localisée le
long de failles orientées WNW-ESE dans le Domaine Ligérien, et des unités y sont ainsi
individualisées.
3.4 Le Domaine de Champtoceaux
Le Domaine de Champtoceaux est composé d'unités présentant des faciès métamorphiques et
des déformations très contrastées. Le complexe plissé de Champtoceaux montre un empilement
d'unités métamorphiques à la faveur de chevauchements ductiles identifiés par des différences
d'évolutions métamorphiques entre les unités (Ballèvre et al., 1989). Ces roches correspondent
globalement à une portion de croûte continentale préalablement amincie au cours de l'extension
Ordovicienne (Ballèvre et al., 2002). Les pressions maximales estimées, de l'ordre de 15-20 kbar,
témoignent d'un enfouissement important de ces roches au cours de la collision vers 360-370 Ma, suivi
d'une exhumation rapide, en partie contemporaine de la phase de raccourcissement, à 350-345 Ma
environ (Bosse et al., 2000). Après leur exhumation, ces unités métamorphiques sont impliquées dans
un plissement de grande amplitude qui affecte tous les contacts précoces ainsi que les structures
associée à la déformation ductile (Fig. 1.5b). Au cœur de ce pli, les micaschistes de Mauves-sur-Loire
constituent l'autochtone relatif du complexe en "nappes" de Champtoceaux. Une faille normale
majeure, datant de la phase d'exhumation, est localisée – et aussi plissée – au toit des unités de haute
pression (Marchand et al., 1966). Le bassin adjacent d'Ancenis est situé au Nord-Est de cette structure,
et le dépôt de sédiments d'âge Carbonifère Inférieur qu'on y observe montre le synchronisme entre son
développement et la remontée des roches métamorphiques (Fig. 1.5b). Vers l'Ouest, les sédiments
d'âge Carbonifère présentent des contours cartographiques mal définis et semblent coincés entre la
bordure Nord des unités métamorphiques et la faille de Nort-sur-Erdre (Fig. 1.5b). Toute la partie Est
du domaine, appartenant au toit de la grande faille normale pendant l'exhumation du complexe de
Champtoceaux, est composée de micaschistes peu métamorphiques (Unité ou groupe des Mauges). Au
sud, des sédiments Cambriens non déformés se sont déposés en discordance sur les micaschistes des
Mauges (Cavet et al., 1966 ; Wyns et Le Métour, 1983); de plus, des roches magmatiques se mettent
en place dans cette unité et scellent la déformation ductile pénétrative des micaschistes vers 520 Ma,
soit avant la formation de la chaîne Hercynienne (Thiéblemont et al., 2001).
CHAPITRE 1 – Introduction générale : la Bretagne Centrale dans la chaîne hercynienne 25
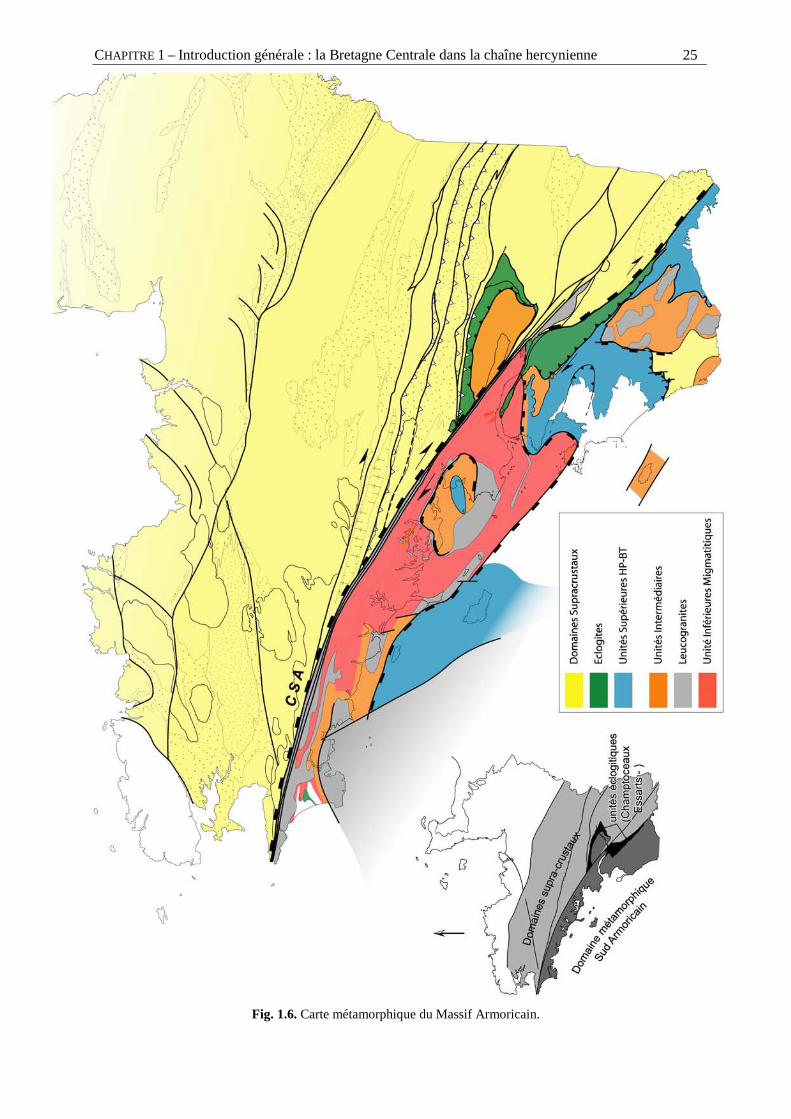
Fig. 1.6. Carte métamorphique du Massif Armoricain.
CHAPITRE 1 26
3.4 Le Domaine Sud Armoricain
Le Domaine Sud Armoricain fait partie des zones internes de la Chaîne hercynienne. Il s'étend
au Sud de la branche Sud du CSA (Fig. 1.5b) et est essentiellement composé de roches
métamorphiques présentant une déformation ductile intense. En Vendée, le complexe métamorphique
de haut grade des Essarts forme la limite Nord-est de ce domaine. Ce complexe longe la trace d'une
des branches du CSA dans cette région, et un contraste fort de métamorphisme est très bien marqué
entre ces unités éclogitiques et le bassin Paléozoïque de Chantonay, au Nord (Fig. 1.6). A travers le
Domaine Sud Armoricain proprement dit, les roches peuvent être corrélées à l'échelle régionale. Elles
présentent une organisation globale sous la forme d'une pile d'unités soit, du haut vers le bas
(Fig. 1.6) :
− Les unités supérieures (en bleu, Fig. 1.6) sont caractérisées par un métamorphisme
commun de type HP-BT.
− Les unités intermédiaires (orange, Fig. 1.6) sont essentiellement composées de
micaschistes présentant un métamorphisme allant du faciès des Schistes Verts au faciès
des Amphibolites (Audren, 1987 ; Triboulet et Audren, 1988 ; Goujou, 1992).
− Les unités inférieures (rouge, Fig. 1.6) contiennent essentiellement des roches
migmatitiques et des granites d'anatexie (Cogné, 1953 ; Audren, 1987).
Ces unités sont toutes séparées par des contacts plats ou peu pentés, qui présentent en carte des
contours très sinueux à travers le domaine (Fig. 1.6).
Dernièrement, des études pétrologique et géochronologique ont permis de préciser l'histoire de
l'évolution tectonique de ces unités métamorphiques et deux phases principales peuvent être
reconnues :
− L'épaississement crustal précoce de ce domaine pendant la collision est visible à travers
les unités supérieures présentant des conditions métamorphiques de haute pression et de
relativement basse température. Ces unités comprennent des schistes bleus (Ile de Groix,
Bois de Céné) qui présentent des conditions métamorphiques maximales de 18 kbar et
500-550°C (Bosse et al., 2002) ainsi que l'unité des Porphyroïdes (7-9 kbar ; 350-400°C,
Le Hébel et al., 2002) que l'on trouve affleurante sur de grandes surfaces à travers tout le
domaine. L'évolution métamorphique de ces roches caractérise un enfouissement dans un
contexte de gradient géothermique faible qui correspond à une phase de subduction de la
croûte continentale suivie d'une exhumation synchrone de la convergence. Ces deux
groupes de roches montrent un pic des conditions métamorphiques à 360-370 Ma et une
phase d'exhumation datée autour de 350 Ma (Bosse et al., 2000 ; Le Hébel et al., 2002).
CHAPITRE 1 – Introduction générale : la Bretagne Centrale dans la chaîne hercynienne 27
− L'amincissement du Domaine Sud Armoricain est visible à travers les structures internes
et les relations entre les unités inférieures et intermédiaires.
1) Dans les micaschistes (unités intermédiaires, orange), la déformation ductile intense est
caractérisée par une foliation à pendage faible et un ellipsoïde de déformation finie moyen
montrant un régime d'aplatissement. Une linéation d'étirement orientée N110° en moyenne est
visible dans ces roches et le raccourcissement vertical de ces unités à l'échelle régionale est
marqué par un télescopage des isogrades reconnus dans les séries Barroviennes précoces
(Goujou, 1992 ; Cagnard et al., in press).
(2) Les unités inférieures (en rouge) se présentent sous la forme dômes métamorphiques
composés de migmatitiques de moyenne pression - haute température (Brown et Dallmeyer,
1996), de granites d'anatexie, avec quelques niveaux isolés de granulites.
(3) Les contacts entre les unités intermédiaires et inférieures peuvent se présenter sous deux
formes principales. En Vendée, une série Barrovienne continue a été reconnue sur la côte et le
passage des unités intermédiaires vers les faciès migmatitiques est progressif (Fig. 1.6)
(Goujou, 1992). Dans d'autres régions (Golfe du Morbihan), des détachements se localisent
parfois au toit des dômes migmatitiques des unités inférieures. Des leucogranites
syncinématiques se mettent alors en place le long de ces contacts, au toit des unités inférieures
(Gapais et al., 1993).
La datation des différents faciès de ces unités fixe l'âge de l'amincissement du Domaine Sud
Armoricain au Carbonifère Supérieur : en Vendée, les datations Ar-Ar faites dans les roches de la série
Barrovienne montrent un refroidissement aux environs de 310 Ma (Goujou, 1992). La remontée et le
refroidissement des roches migmatitiques inférieures se fait entre 320 et 300 Ma (Gapais et al., 1993 ;
Brown &Dallmeyer, 1996). Enfin, la datation des leucogranites syncinématiques fixe l'âge de
l'extension localisée sur les détachements à 310-300 Ma (Bernard-Griffiths et al., 1985 ; Goujou,
1992 ; Le Hébel et al., 2002). Au Nord et au Nord-est du Domaine Sud Armoricain, les unités
métamorphiques qui le composent sont séparées des autres domaines du Massif Armoricain par la
branche Sud du CSA (Fig. 1.6). Les intrusions syncinématiques qui jalonnent le bord Sud du CSA
fixent l'âge du cisaillement dextre localisé au Carbonifère Supérieur (Bernard-Griffiths et al., 1985). A
l'échelle régionale, l'amincissement et l'extension des zones internes du Massif Armoricain, au Sud, se
font de manière synchrone d'un cisaillement majeur localisé le long de la bordure du domaine
métamorphique (Fig. 1.6).
CHAPITRE 1 28
� Ainsi,
L'ensemble de l'histoire de la collision continentale peut être décrite à travers
les données métamorphiques et géochronologiques du Domaine Sud Armoricain.
Dans ces roches, les structures observées peuvent potentiellement être rapportées à
trois grands régimes de déformation qui se sont succédés, ou combinés, pendant
cette histoire, ce qui explique sans doutes la complexité de la déformation notée à
travers ce domaine : des structures précoces semblent pouvoir être associées à
l'enfouissement et à la superposition des unités pendant la phase de collision (370-
350 Ma) (Ballèvre et Pitra, 2002), des structures typiques d'une extension sont
associées à la phase d'amincissement du domaine à l'échelle de la croûte (320-300
Ma), enfin, ces dernières peuvent se combiner à des effets du cisaillement dextre qui
se localise plus particulièrement le long du CSA au cours du Carbonifère Supérieur.
A l'échelle de l'ensemble du Massif Armoricain, la carte tectono-
métamorphique (Fig. 1.6) montre que la limite d'extension N-E des unités
métamorphiques se situe globalement au niveau des unités montrant les faciès de
plus haut grade métamorphique. Ces unités éclogitiques marquent ainsi une zone de
suture majeure entre les domaines métamorphiques internes de la chaîne au Sud-
ouest (Domaine Sud Armoricain) et les domaines n'ayant pas subit d'épaississement
notable au cours de la collision (en jaune, Fig. 1.6). Ces domaines supra-crustaux
s'étendent à travers la Bretagne Centrale "élargie" et comprennent la partie Est du
Domaine de Champtoceaux, les Domaines Ligérien et Centre Armoricain (Fig. 1.6).
Au cours du Carbonifère, ces régions subissent une déformation cisaillante associée
au fonctionnement des cisaillements localisés sur le CNA et surtout le CSA. Au
Nord, le Domaine "Cadomien" Nord Armoricain fait également partie de ces
domaines supra-crustaux hercyniens mais ce dernier ne subit pendant la collision
qu'une déformation fragile limitée à l'échelle régionale (cf. Figs. 1.5 et 1.6).
4. La Bretagne Centrale, présentation des données utilisées Contrairement au caractère complexe de la déformation observée dans les unités
métamorphiques au Sud, les domaines supra-crustaux situés au N et NE du CSA et de la zone de
suture montre une déformation plus simple et mono-phasée (Gapais et Le Corre, 1980 ; Le Corre et al.,
1991). L'étude de la déformation des domaines supra-crustaux de la Bretagne Centrale élargie semble
donc constituer une cible privilégiée pour modéliser l'évolution géodynamique du Massif Armoricain
pendant le fonctionnement des grands cisaillements dextres au Carbonifère. De nombreuses données
CHAPITRE 1 – Introduction générale : la Bretagne Centrale dans la chaîne hercynienne 29
sont actuellement disponibles à travers ces domaines et la déformation peut être caractérisée depuis la
surface, à travers les observations de terrain, jusqu'à la base de la lithosphère grâce aux données
géophysiques.
4.1 Observations et mesures structurales en surface La cartographie géologique a été entreprise à travers le Massif Armoricain dès le début du
XXème siècle. Malgré le manque de relief marqué à travers ce massif hercynien, et la couverture
végétale parfois importante, la cartographie des régions centrales de la Bretagne est relativement
homogène et des structures continues à l'échelle régionale ont pu être rapidement mises en évidence
(Barrois, 1930). Des études structurales locales, effectuées notamment au cours de travaux de thèse,
ont également fourni de nombreuses observations et il en résulte par exemple un nombre très
important de mesures d'orientation des plans de schistosité à travers les roches sédimentaires de
Bretagne Centrale. Ces données sur la déformation couvrent une zone assez étendue ; leur analyse peut
ainsi fournir des résultats intéressants quant au comportement de ces domaines pendant la phase de
déformation qui affecte toute la région. Cependant, les orientations de la schistosité ne reflètent que
l'orientation locale du champ de déformation finie. Ce champ peut être soumis à des variations
d'intensité ainsi qu'à de fortes variations de direction et ce, même à petite échelle (cf. réfraction de la
schistosité dans un niveau stratigraphique plus compétent, accommodation des contraintes autour d'un
niveau boudiné, etc.).
Afin de traiter ce grand nombre de données ponctuelles disponibles et d'en faire ressortir les
paramètres de variation du champ de déformation plus global, une méthode d'analyse géostatistique
appliquée à des données directionnelles a été développée. Ce travail préliminaire permet en effet
d'analyser les variations spatiales d'une variable régionalisée donnée et ainsi de mieux contraindre la
valeur des paramètres à appliquer au cours de la phase d'interpolation à travers la zone considérée.
Dans le cas de la Bretagne Centrale, cette méthode d'analyse a été appliquée aux valeurs de directions
de la schistosité.
Les variations régionales de la direction de la schistosité fournissent une image des variations
régionales des directions principales de déformation finie. A partir des données interpolées en
Bretagne Centrale, un modèle cinématique a pu être calculé et appliqué à toute la zone de Bretagne
Centrale orientale.
4.2 La croûte continentale : les données géophysiques. Récemment, dans le cadre du Projet Armor2 (programme Géofrance 3D, BRGM-CNRS), des
données géophysiques ont été acquises à travers le Massif Armoricain. Un profil de sismique réflexion
orienté globalement Nord-sud a été enregistré sur 65 km de long à travers le Domaine Ligérien et les
unités métamorphiques de la suture, dans la région de Champtoceaux. Ce profil qui présente des

CHAPITRE 1 30
réflectivités claires jusqu'au Moho fournit une image très précise de la géométrie des structures en
profondeur.
Une campagne aéroportée nous a fourni en carte la mesure continue du champ magnétique
dans la partie Est et Sud des domaines supra-crustaux. L'analyse de l'anomalie du champ total est ici
faite en carte pour facilement la comparer aux données géologiques de surface. De plus, une analyse
par la transformée en ondelettes a été appliquée au profil de l'anomalie extrait le long de la trace du
profil sismique et le pointé des discontinuités de sources en profondeur est confronté au résultat du
pointé des réflecteurs sismiques.
Afin d'étendre l'interprétation des structures profondes en trois dimensions, une modélisation
du champ gravimétrique a été entreprise à l'échelle de la croûte, dans la région des unités de
Champtoceaux. L'utilisation de l'Editeur Géologique (3Dweg), logiciel développé par le BRGM
(CDG-MA, Orléans), a permis d'intégrer toutes les informations géologiques et géophysique
disponibles, en carte ou en coupe, pendant la construction du modèle 3D. La comparaison du champ
gravimétrique calculé par le modèle avec les données mesurées nous permet d'obtenir une géométrie
finale à la fois compatible avec les données géologiques (cartographie, mesures structurales) et
géophysique (sismique, champ gravimétrique).
4.3 La lithosphère : les données tomographiques sous le Massif Armoricain. Dans le cadre du projet Armor2, deux expériences d'écoute sismologique passive ont été
menées à travers le Massif Armoricain. A partir d'un modèle d'inversion tomographique (Judenherc,
2000 ; Judenherc et al., 2002), les données ont permis d'imager la structure profonde de la lithosphère.
Des variations latérales notables de vitesse des ondes sismiques sont observées dans le manteau,
jusqu'à 200 km de profondeur. Dans cette région, aucun évènement géodynamique ou thermique
majeur ne s'est déroulé depuis la fin de l'histoire de la collision hercynienne. Ces anomalies peuvent
donc être rapportées à des variations latérales de composition associées à la collision hercynienne
(Judenherc et al., 2002). Nous avons donc à travers ces données une image en trois dimensions de la
structure du Massif Armoricain à l'échelle de la lithosphère. Elles seront utilisées dans le cadre de cette
étude comme marqueur de la déformation à cette échelle et confrontées au modèle de déformation
construit à partir des données de surface et des structures crustales imagées par les données
géophysiques.
L'intégration des différentes données géologiques et géophysiques permettant de mieux
contraindre le comportement cinématique de la croûte au cours des déformations de grande échelle, un
modèle d'évolution tectonique sera proposé pour l'ensemble des domaines supra-crustaux de Bretagne
Centrale. Les implications du modèle de déformation de la Bretagne Centrale seront ensuite
confrontées aux données structurales locales dans les domaines adjacents. Enfin, une application de
cette modélisation aux anomalies tomographiques sismologiques permettra de discuter du
comportement de l'ensemble de la lithosphère continentale au cours de la déformation régionale.
P R E M I E R E P A R T I E DONNEES STRUCTURALES DE TERRAIN : ANALYSE GEOSTATISTIQUE ET MODELISATION

C h a p i t r e 2 Analyse géostatistique appliquée à l'interpolation des données de directions

CHAPITRE 2 – Analyse géostatistique appliquée aux directions 35
Geostatistics applied to best-fit interpolation of orientation data
C.Gumiaux, D.Gapais, J.P. Brun
Géosciences Rennes, UMR 6118 CNRS, Université de Rennes 1, 35042 Rennes cedex, France
Tectonophysics – 2003 – in press/sous presse
Abstract
Automatic methods used in Geosciences to interpolate between orientation data have often
limited applicability and strength, in particular where large ranges of orientations occur. In this paper,
we show that geostatistical methods yield rather strong and powerful results when applied to
directional data. The procedure involves the calculation of variograms, followed by a kriging
interpolation of the data. In order to free from the circular property of directional data, the treatment of
initial angular data sets is performed using scalar values provided by the direction cosines of doubled
angle values. The strength and application of the method are demonstrated by the analysis of
theoretical and natural data sets. Natural examples are focused on the calculation and the analysis of
cleavage trajectory maps.
1. Introduction
The analysis of the spatial distribution of directional data can have various applications in
Earth Sciences, including structural geology (e.g. construction of cleavage trajectory maps) (Ramsay
and Graham, 1970; Cobbold, 1979; Barbotin, 1987; Cobbold and Barbotin, 1988), sedimentology (e.g.
analysis of paleo-currents) (Potter and Pettitjohn, 1977), geomorphology (e.g. analysis of maximum
slope orientations), paleomagnetism (e.g. analysis of principal directions of anisotropy of magnetic
susceptibility), geophysics (e.g. construction of stress trajectory maps) (see Lee and Angelier, 1994),
or geodesy (e.g. analysis of movement directions from GPS data).
Two main applications of the statistical analysis of orientation data are (1) the calculation of mean
principal directions from a data population, and (2) the analysis of variations of data in space (e.g. on
maps or cross-sections). Many automatic methods have been developed to extract best principal
CHAPITRE 2 36
directions from a population of orientation data (calculation of eigenvectors and eigenvalues, see
Angelier, 1994, and references therein), or to detect structural preferred orientations (e.g. Panozzo,
1984). Developments also exist for the automatic analysis of spatial variations of orientation data in
Geosciences (Young, 1987; Cobbold and Barbotin, 1988; Lee and Angelier, 1994; Xu, 1996; Lajaunie
et al., 1997). The treatment of directional data to analyse their variations in space requires
interpolation between local measurements, and this raises two main problems. First, directional data
are circular, i.e. they can vary between 0° and 360°. Consequently, classical statistics, as used for
algebraic data sets, cannot be straightforward applied to directional data (see Upton and Fingleton,
1989). Second, one can be interested in studying variations correlated at regional scale and this can
induce a difficult “scale problem” between the weight given to individual data and the degree of data
filtering required. For example, most interpolation techniques tend to respect as best as possible the
original data, and this may fail if one wants to extract regional-scale trends.
Data interpolation using geostatistics was first introduced by Matheron (1962) to estimate ore
volume in mining engineering. Recently, this technique became more common in Geosciences, with
various applications, such as the interpolation between scalar values, like strain ellipticity (Mukul,
1988) or soil properties (Bourennane, 1997). Further particular applications have been developed like
the treatment of vectors (Young, 1987; Lajaunie et al., 1997), or the analysis of curvilinear geometries
(Xu, 1996). In particular, Lajaunie et al. (1997) have described the use of kriging interpolation to
define the 3D geometry of geological surfaces (e.g. lithological boundaries or foliation envelopes). In
this paper, we develop a geostatistical approach, with particular reference to the analysis of structural
data. We emphasize that the method can solve problems classically encountered in the spatial analysis
of orientation data, provided a careful preliminary analysis of the data set is made before proceeding to
an interpolation. The general technique is first presented and then tested using both theoretical and
natural examples.
2. Methodology
A set of orientation data distributed throughout a given domain can be regarded as a
representative sample of a continuous regionalized variable defined for the whole area. This
regionalized variable is a deterministic function relative to the chosen reference frame. However, data
may also contain non-negligible random and insignificant contributions. The Kriging method
developed by Matheron (1962) allows to interpolate between data points, taking into account the
different contributions involved in data values. The method has been described as an “optimal
prediction” for the interpolation of a variable between its location and neighbouring scattered data
points (Cressie, 1990). Detailed descriptions of kriging techniques can be found in Isaaks and
Srivastava (1989), Deutsch (1991), Deutsch and Journel (1992), or Wackernagel, (1998). The general
CHAPITRE 2 – Analyse géostatistique appliquée aux directions 37
principle is to consider the regionalized variable as one possible outcome of a random function
attached to the location of the considered data point. One random function is thus defined for each data
point. The problem is then reduced to the analysis of the variations of the parameters defining these
random functions, in order to estimate the spatially-dependent part of the data, which is equivalent to
the contribution of the regionalized variable.
The geostatistical approach is here applied to the analysis and modelling of spatially scattered
local directional data. After building a geo-referenced data-base, the procedure used comprises two
main steps, as follows (see Appendix).
2.1. Quantification of spatial variations of the data set
For spatial interpolation purposes, it is often admitted that two close data points may have a
more similar value than two distant ones. Common techniques, such as inverse distance weighting, are
based on this hypothesis. The main problems with this approach are (1) to determine the maximum
distance for which data values show significant mutual dependence, (2) to estimate how and how fast
this dependence decreases with increasing distance, and (3) to take into account the effects of possible
anisotropies in the spatial variations of the data. The quantification of such parameters can be provided
by the computation of experimental variograms.
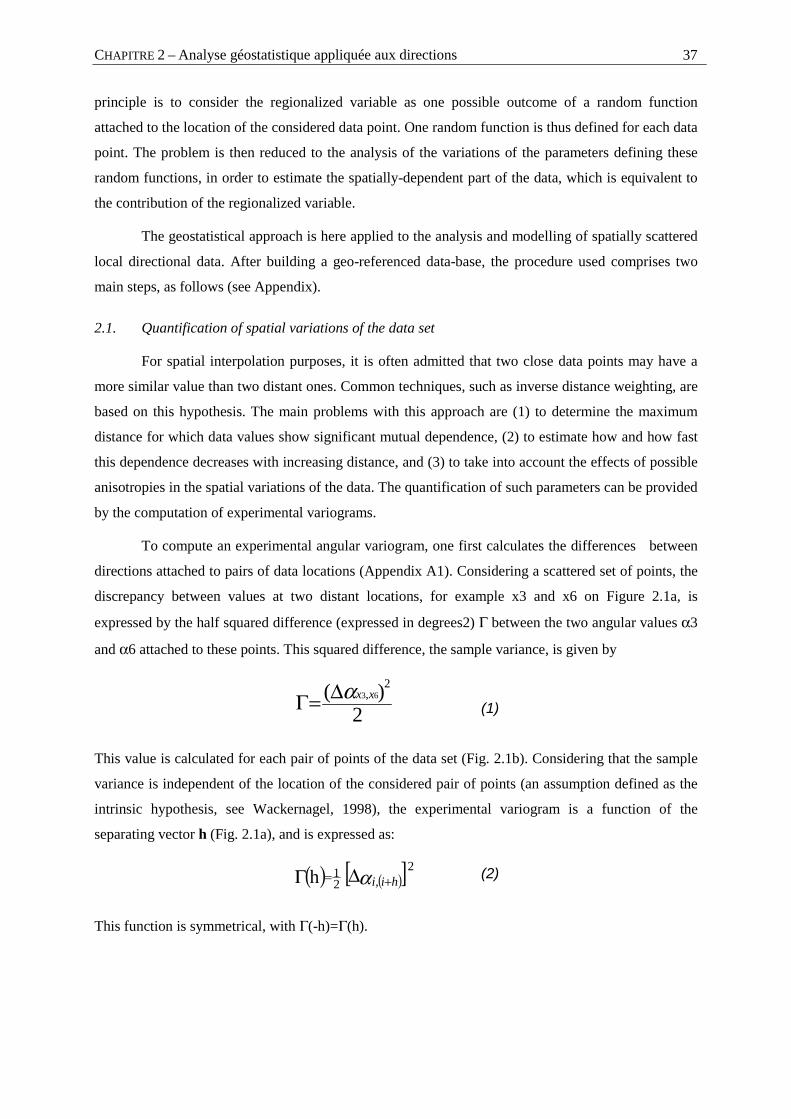
To compute an experimental angular variogram, one first calculates the differences between
directions attached to pairs of data locations (Appendix A1). Considering a scattered set of points, the
discrepancy between values at two distant locations, for example x3 and x6 on Figure 2.1a, is
expressed by the half squared difference (expressed in degrees2) Γ between the two angular values α3
and α6 attached to these points. This squared difference, the sample variance, is given by
2)( 63,
2xxα∆=Γ (1)
This value is calculated for each pair of points of the data set (Fig. 2.1b). Considering that the sample
variance is independent of the location of the considered pair of points (an assumption defined as the
intrinsic hypothesis, see Wackernagel, 1998), the experimental variogram is a function of the
separating vector h (Fig. 2.1a), and is expressed as:
( ) ( )[ ]α hii += ∆Γ ,2
21h (2)
This function is symmetrical, with Γ(-h)=Γ(h).
h3-6
x2
x1
x3
x4
x6
x7
x8
x9
x10x5
|h3-6|
distance |h|
vario
gram
Γ
H1 H5 H10 H15 H20
Sill
Nugget
distance |h|
vario
gram
Γ
H1 H5 H10 H15 H20
Ran
ge
lines joining data pairs (c) and (e).
lines joining data pairs fitting the chosen range of distance (c) or direction (e)
a)
x2
x1
x3
x4
x5
x6
x7
x8
x9
x10
c)
b)
d)
Hk class
x2
x1
x3
x4
x5
x6
x7
x8
x9
x10
chosenrange of directione)
cc 0
CHAPITRE 2 38
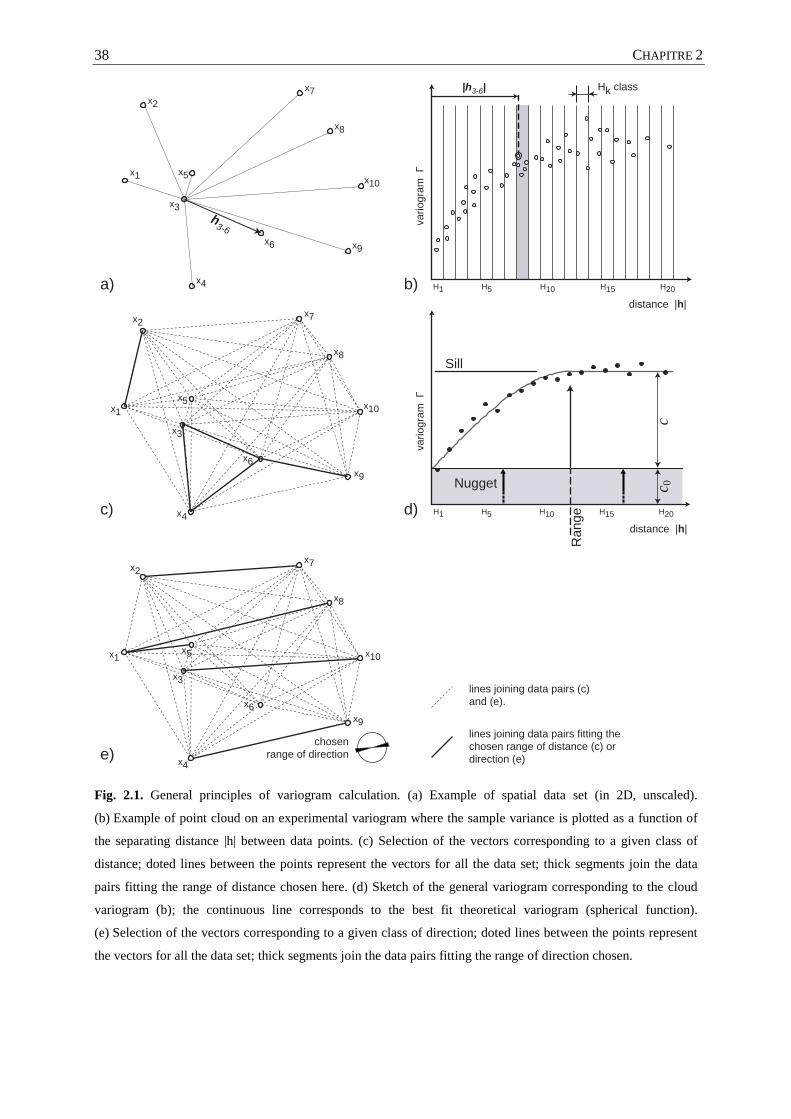
Fig. 2.1. General principles of variogram calculation. (a) Example of spatial data set (in 2D, unscaled).
(b) Example of point cloud on an experimental variogram where the sample variance is plotted as a function of
the separating distance |h| between data points. (c) Selection of the vectors corresponding to a given class of
distance; doted lines between the points represent the vectors for all the data set; thick segments join the data
pairs fitting the range of distance chosen here. (d) Sketch of the general variogram corresponding to the cloud
variogram (b); the continuous line corresponds to the best fit theoretical variogram (spherical function).
(e) Selection of the vectors corresponding to a given class of direction; doted lines between the points represent
the vectors for all the data set; thick segments join the data pairs fitting the range of direction chosen.

CHAPITRE 2 – Analyse géostatistique appliquée aux directions 39
Assuming that data variations are isotropic, a general variogram can be simply imaged as the
plot of the half squared differences against the separating distance |h| between all the pair of points
(Fig. 2.1b). In order to improve the analysis of the variogram, it is sliced in classes of distance Hk and
the values calculated for data pairs fitting a given class are averaged (see class H8 on Fig. 2.1b and the
corresponding fitting vectors on Fig. 2.1c). The equation of the general variogram (Fig. 2.1d)
becomes:
( ) ( )[ ]∑ ∆Γ +=n
hiink
k
1,
2.21
kH α (3)
where i and j correspond to data points separated by a distance |h| ∈ Hk, and nk is the number of data
pairs fitting the class Hk.
The experimental variogram defines a curve representing the increasing discrepancy (i.e. the
decreasing of mutual dependence) between data, as a function of their degree of proximity |h|
(Fig. 2.1d). The minimum width of classes of distance Hk, and the maximum distance of computation
are imposed by the minimum and maximum distances between data points, respectively. When
approaching highest distances, the number of data pairs fitting the classes can be low (Fig. 2.1b) and
the corresponding part of the variogram is thus poorly constrained.
Four important statistical parameters come up from an experimental variogram (Fig. 2.1d) (Matheron,
1962).
- The variogram can reach a constant value, classically defined as the sill, with increasing
distance of calculation. This means that the variations of the variable are correlated up to
distances smaller than the total size of the studied domain.
- The maximum correlation distance for which the variogram reaches the sill is defined as the
range. For distances larger than the range, data are no longer correlated.
- The variogram can show a non zero ordinate at the origin. From a theoretical point of view,
this value comprises the random part of the random functions defined for the studied domain.
It thus corresponds to the non-regionalized part of data values (in grey on Fig. 2.1d), which
can include background noise, as well as local effects that can be significant at a scale much
smaller than that of the study area. For mining purpose, Matheron (1962) defined this ordinate
at the origin as the nugget. The regionalized part of the data is the difference between the sill
and the nugget.
- The experimental trend of the variogram indicates the way the variance increases with
increasing distance within the data set. It can be fitted to a theoretical function, classically
CHAPITRE 2 40
chosen as spherical (Fig. 2.1d), exponential, gaussian or power function, which depends on the
values of the range, sill and nugget (see Wackernagel, 1998).
For a given data set, the range of data variations can change according to the considered space
direction. Such anisotropy in data variance can be detected by calculating variograms along particular
space directions. The procedure is the same as for omni-directional variograms, except that the overall
computation space is sliced into orientation classes for which individual variograms are calculated. For
each class, the calculation uses the data pairs separated by a vector h whose orientation is comprised in
the orientation range of the class (Fig. 2.1e). During calculation, the number of orientation classes
must be large enough to reveal the anisotropy, but not too large, so that the number of data pairs used
for each variogram remains sufficiently large.
2.2. Interpolation between data
As for general statistical studies, geostatistics cannot be directly performed on angular values.
The kriging interpolation is therefore made using direction cosines (Appendix A2). Each individual
directional data is thus expressed by its two direction cosines. The variogram analysis can then be
performed on the sums of the two direction cosines (Young, 1987) or on each set of direction cosines
(this study) (For the examples presented in this paper, both techniques yield similar results). Detailed
descriptions of the calculation procedure can be found in Cressie (1991) or Wackernagel (1998), and a
brief summary is given below.
As for other weighted moving average techniques, the interpolation is made along a regular
grid covering the whole studied area. At each nod location, ordinary Kriging is performed using all
adjacent data points p located inside a given search circle (Fig. 2.2). The radius of the search circle
corresponds to the range estimated from the variogram analysis. From the theoretical function deduced
from the variogram, covariance values are calculated between all involved data points. A set of p
equations relating covariance values to distances between data points, including the considered grid
nod, define the ordinary kriging system. At each point p, the direction cosines are weighted according
to the solution of the corresponding equation. A weighted mean of direction cosines is then computed,
and attributed to the grid nod. Finally, these latter values are re-converted into angular values
(Appendix A2, Fig. 2.12).
From the interpolated grid, various types of representation of the distribution and variations of
directional data can be made. These are in particular trajectory maps or contour maps. To draw
trajectories, we used the algorithm proposed by Lee and Angelier (1994, p. 165).
CHAPITRE 2 – Analyse géostatistique appliquée aux directions 41
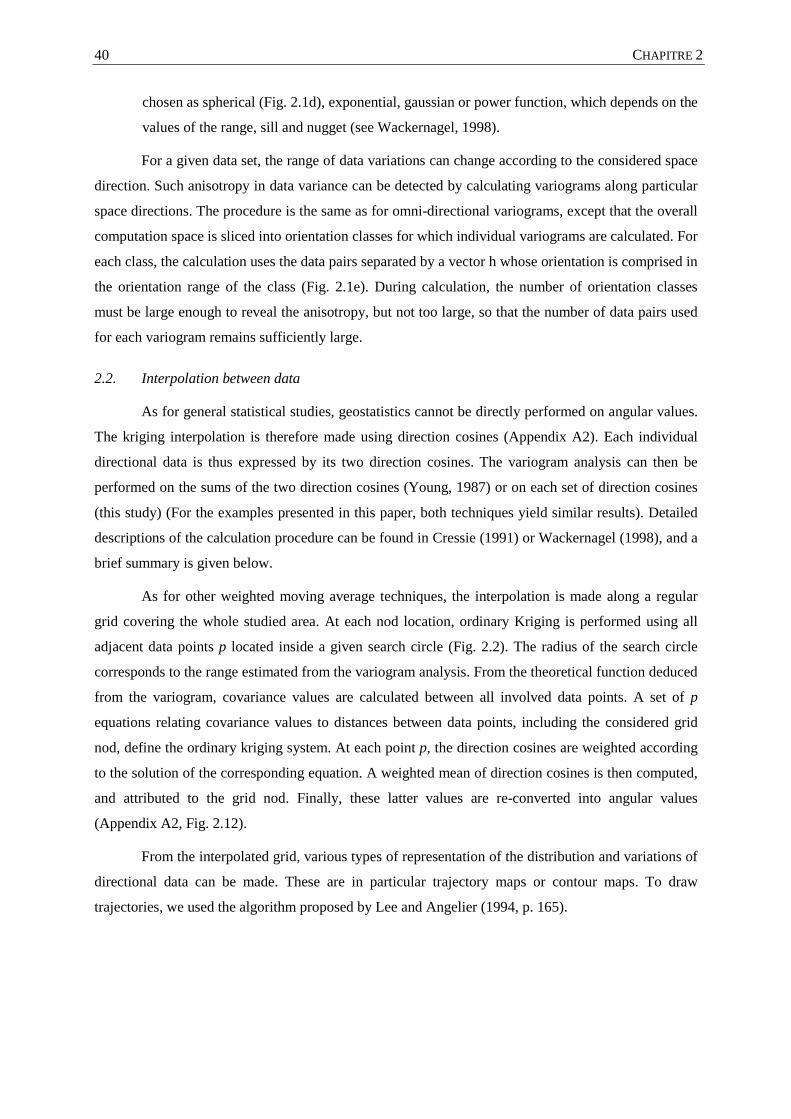
Fig. 2.2. Illustration of data interpolation along a regular grid. For a given nod of the grid (thick cross), a circular
neighbourhood is given around this point. The radius of the circle is defined by the range deduced from the
variogram analysis. All data values located in the circle (black points) are implied in the calculation of the
interpolated value attached to the given nod (modified after Wackernagel, 1998).
3. Examples of variogram modelling and kriging of directional data
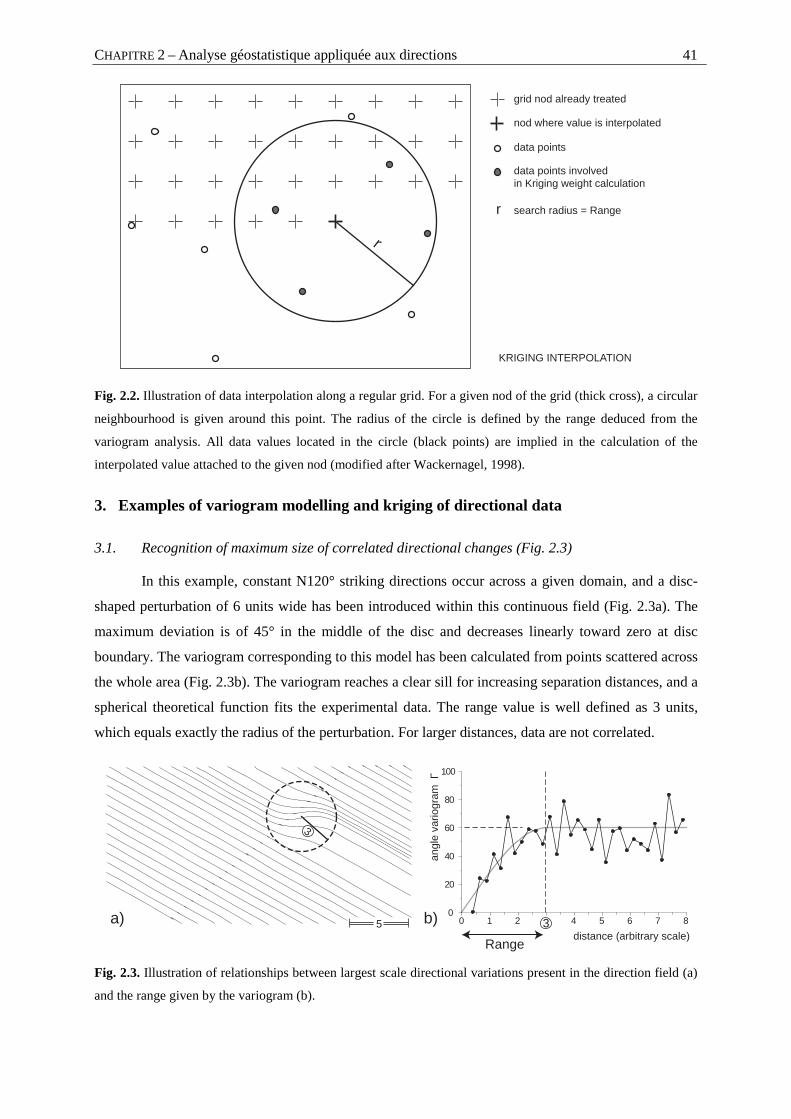
3.1. Recognition of maximum size of correlated directional changes (Fig. 2.3)
In this example, constant N120° striking directions occur across a given domain, and a disc-
shaped perturbation of 6 units wide has been introduced within this continuous field (Fig. 2.3a). The
maximum deviation is of 45° in the middle of the disc and decreases linearly toward zero at disc
boundary. The variogram corresponding to this model has been calculated from points scattered across
the whole area (Fig. 2.3b). The variogram reaches a clear sill for increasing separation distances, and a
spherical theoretical function fits the experimental data. The range value is well defined as 3 units,
which equals exactly the radius of the perturbation. For larger distances, data are not correlated.
Fig. 2.3. Illustration of relationships between largest scale directional variations present in the direction field (a)
and the range given by the variogram (b).
grid nod already treated
nod where value is interpolated
search radius = Range
r
data points
data points involvedin Kriging weight calculation
r
KRIGING INTERPOLATION
0 1 2 3 4 5 6 7 80
20
40
60
80
100
distance (arbitrary scale)
angl
e va
riogr
am Γ
Range
3
a) b)5
CHAPITRE 2 42
The maximum distance of spatial correlation between directional data has already been
considered as an important parameter for interpolation (Lee and Angelier, 1994). The example shown
here emphasizes that this parameter can be directly constrained from the variogram before performing
interpolation.
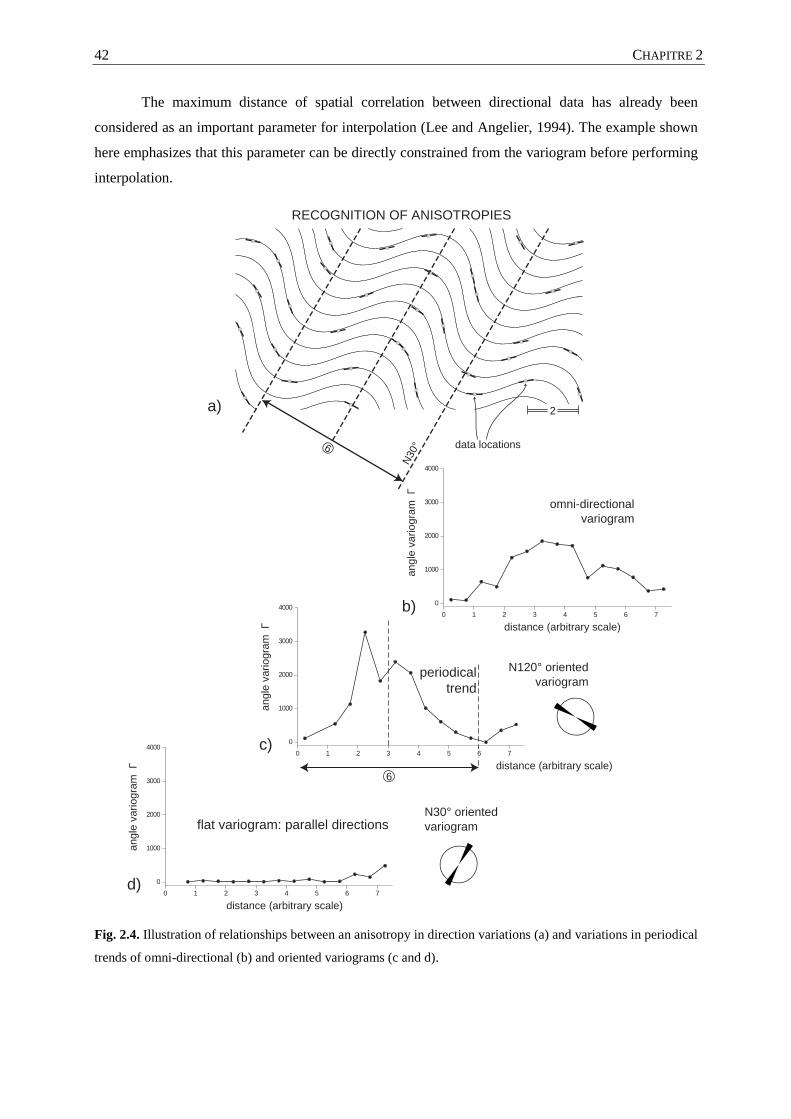
Fig. 2.4. Illustration of relationships between an anisotropy in direction variations (a) and variations in periodical
trends of omni-directional (b) and oriented variograms (c and d).
N120° orientedvariogram
periodicaltrend
6
0 1 2 3 4 5 6 7
0
1000
2000
3000
4000
distance (arbitrary scale)
angl
e va
riogr
am Γ
N30° orientedvariogramflat variogram: parallel directions
0 1 2 3 4 5 6 7
0
1000
2000
3000
4000
distance (arbitrary scale)
angl
e va
riogr
am Γ
omni-directionalvariogram
0 1 2 3 4 5 6 7
0
1000
2000
3000
4000
distance (arbitrary scale)
angl
e va
riogr
am Γ
N30° data locations6
a)
b)
c)
d)
RECOGNITION OF ANISOTROPIES
2
CHAPITRE 2 – Analyse géostatistique appliquée aux directions 43
3.2. Recognition of anisotropies (Fig. 2.4)
Directional data can present strong anisotropies in their variation trends. To illustrate
relationships between anisotropy and variograms, a regular fold-shaped pattern has been drawn, with
axial planes striking N30° (Fig. 2.4a). The direction of the folded trajectories has been digitized for
few localities (Fig. 2.4a) and variograms have been calculated from this data set. The omni-directional
variogram shows a bell-shaped envelope, with a maximum half-variance of about 2000 degrees2 for
separation distances of about the half of the total model size (Fig. 2.4b). This suggests some periodical
distribution. Consistently, a periodical trend appears clearly in oriented variograms approaching a
WNW-ESE direction, and a maximum ratio between the amplitude and the wavelength of the signal is
observed on the N120° oriented variogram (Fig. 2.4c). This direction actually corresponds to the one
along which changes in data attitude are maximum (Fig. 2.4a). In contrast, the perpendicularly N30°
oriented variogram is flat, with rather low values (Fig. 2.4d). This feature means that directions remain
constant along any given N30° striking line (Fig. 2.4a).
This example emphasizes that oriented variogram are powerful tools to detect anisotropies in
orientation distributions. Furthermore, the wavelength of the periodicity of the oriented variograms
provides an estimate of the wavelength of the anisotropy. Indeed, for ideal situations, these two values
should be equal (6 units, Fig. 2.4a and c).
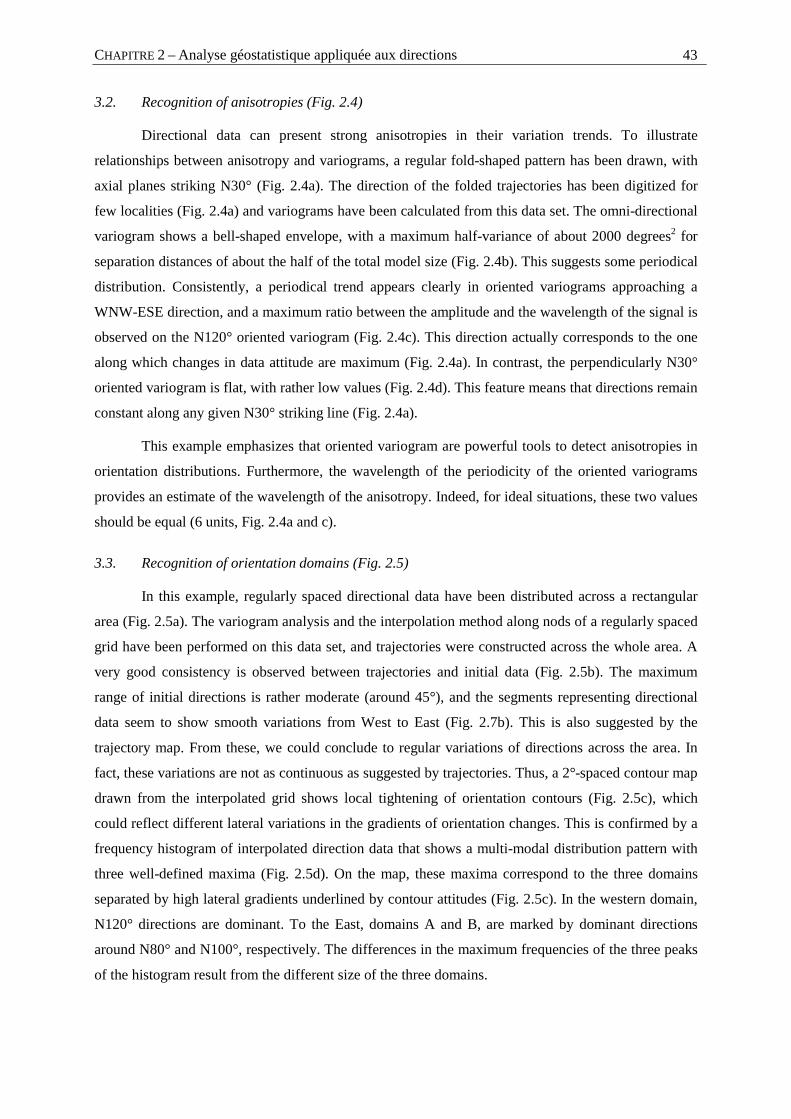
3.3. Recognition of orientation domains (Fig. 2.5)
In this example, regularly spaced directional data have been distributed across a rectangular
area (Fig. 2.5a). The variogram analysis and the interpolation method along nods of a regularly spaced
grid have been performed on this data set, and trajectories were constructed across the whole area. A
very good consistency is observed between trajectories and initial data (Fig. 2.5b). The maximum
range of initial directions is rather moderate (around 45°), and the segments representing directional
data seem to show smooth variations from West to East (Fig. 2.7b). This is also suggested by the
trajectory map. From these, we could conclude to regular variations of directions across the area. In
fact, these variations are not as continuous as suggested by trajectories. Thus, a 2°-spaced contour map
drawn from the interpolated grid shows local tightening of orientation contours (Fig. 2.5c), which
could reflect different lateral variations in the gradients of orientation changes. This is confirmed by a
frequency histogram of interpolated direction data that shows a multi-modal distribution pattern with
three well-defined maxima (Fig. 2.5d). On the map, these maxima correspond to the three domains
separated by high lateral gradients underlined by contour attitudes (Fig. 2.5c). In the western domain,
N120° directions are dominant. To the East, domains A and B, are marked by dominant directions
around N80° and N100°, respectively. The differences in the maximum frequencies of the three peaks
of the histogram result from the different size of the three domains.
CHAPITRE 2 44
Fig. 2.5. Example of detection of domainal distributions. Example data set (a) and interpolated trajectories (b)
showing apparently rather moderate and smooth directional variations. Direction contour map (c) and frequency
diagram (d) outlining the occurrence of three distinct directional domains.
In this model example, the computed trajectories are in good agreement with the initial
directional data and outline well the overall trend of direction variation at regional scale. It also points
out that other representations of the data and additional statistical calculations (e.g. lateral gradients,
frequency analysis, profile extractions) can be useful to better describe regional trends. In our
example, a domainal distribution of data is outlined, a feature that was not clearly detectable by the
simple trajectory map.
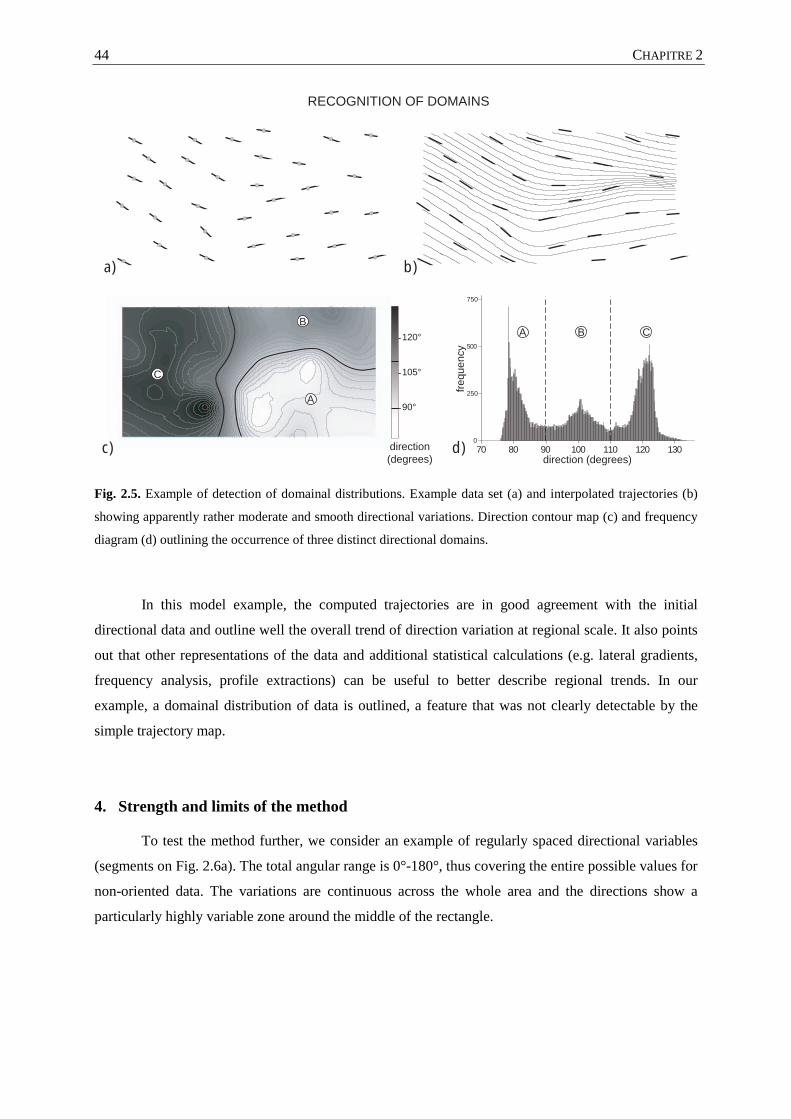
4. Strength and limits of the method
To test the method further, we consider an example of regularly spaced directional variables
(segments on Fig. 2.6a). The total angular range is 0°-180°, thus covering the entire possible values for
non-oriented data. The variations are continuous across the whole area and the directions show a
particularly highly variable zone around the middle of the rectangle.
70 80 90 100 110 120 1300
250
500
750
frequ
ency
direction (degrees)
C
B
A
A B C120°
105°
direction(degrees)
90°
RECOGNITION OF DOMAINS
a) b)
c) d)
CHAPITRE 2 – Analyse géostatistique appliquée aux directions 45
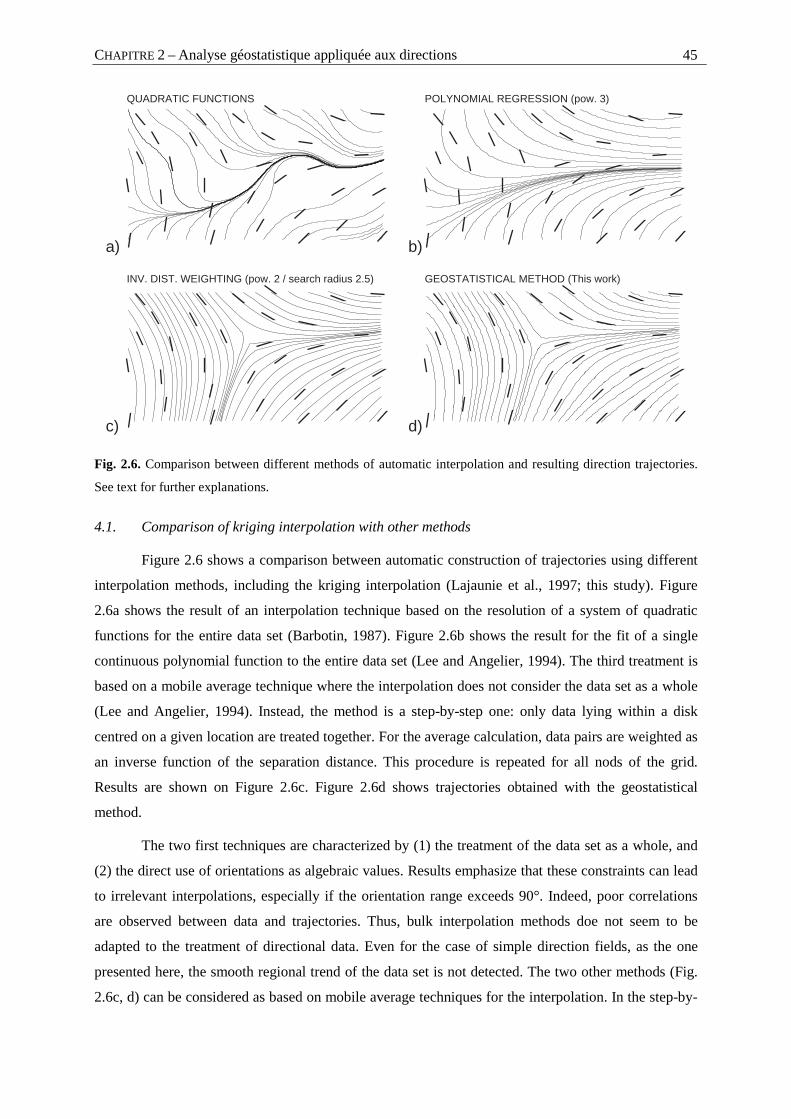
Fig. 2.6. Comparison between different methods of automatic interpolation and resulting direction trajectories.
See text for further explanations.
4.1. Comparison of kriging interpolation with other methods
Figure 2.6 shows a comparison between automatic construction of trajectories using different
interpolation methods, including the kriging interpolation (Lajaunie et al., 1997; this study). Figure
2.6a shows the result of an interpolation technique based on the resolution of a system of quadratic
functions for the entire data set (Barbotin, 1987). Figure 2.6b shows the result for the fit of a single
continuous polynomial function to the entire data set (Lee and Angelier, 1994). The third treatment is
based on a mobile average technique where the interpolation does not consider the data set as a whole
(Lee and Angelier, 1994). Instead, the method is a step-by-step one: only data lying within a disk
centred on a given location are treated together. For the average calculation, data pairs are weighted as
an inverse function of the separation distance. This procedure is repeated for all nods of the grid.
Results are shown on Figure 2.6c. Figure 2.6d shows trajectories obtained with the geostatistical
method.
The two first techniques are characterized by (1) the treatment of the data set as a whole, and
(2) the direct use of orientations as algebraic values. Results emphasize that these constraints can lead
to irrelevant interpolations, especially if the orientation range exceeds 90°. Indeed, poor correlations
are observed between data and trajectories. Thus, bulk interpolation methods doe not seem to be
adapted to the treatment of directional data. Even for the case of simple direction fields, as the one
presented here, the smooth regional trend of the data set is not detected. The two other methods (Fig.
2.6c, d) can be considered as based on mobile average techniques for the interpolation. In the step-by-
INV. DIST. WEIGHTING (pow. 2 / search radius 2.5)
QUADRATIC FUNCTIONS POLYNOMIAL REGRESSION (pow. 3)
GEOSTATISTICAL METHOD (This work)
a)
c)
b)
d)
CHAPITRE 2 46
step technique proposed by Lee and Angelier (1994), the circularity of directions is taken into account.
Indeed, data used are angles, but the reference frame is adapted to a convenient orientation with
respect to the considered data set averaged at each nod of the grid (see "acute angle" technique of Lee
and Angelier, 1994). In the present analysis, this particular problem is treated by means of the
direction cosines. In the previous study of Lajaunie et al. (1997), the interpolation technique used
partial derivatives of orientation data. For the example presented, marked by rather smooth local
variations of direction, the two methods yield very satisfying results. The resulting trajectories are
nearly the same and the regional trend of the directions is well respected. In particular, both methods
detect a singular point (triple point, or neutral point) in the middle part of the map. Looking at initial
data, hand-made trajectories would have drawn this singular feature.
4.2. Analysis of strongly disturbed data
Individual data can vary strongly in space, even for close sampling locations. This can be due
to the errors attached to initial measurements. It can also result from mixing of data of different origin
(e.g. data from maps of different type, scale or age), and from subsequent computations (digitization,
calculations). Strong local variations can also reflect very local effects that are not directly linked to
the regional scale tendencies (e.g. see Fig. 2.3).
In order to examine the effect of introducing noise within the data set, we start with the ideal
example presented on Fig. 2.6. The initial data set (Fig. 2.7a) has been combined with a random noise
(Fig. 2.7b). To do this, an angular positive or negative deviation comprised between zero and 40°-50°
was randomly applied to each initial data. Corresponding omni-directional variograms are shown on
Figure 2.7c. The diagram shows that the variogram for the original data has a negligible ordinate at the
origin, i.e. for short separation distances between data points. This reflects the smooth and continuous
variations of directions. The variogram for the disturbed data presents a clear nugget effect of about
800 degrees2, which corresponds to a standard deviation of about 40°. This value is comparable to the
maximum deviation introduced on initial individual data. With increasing distance, both variograms
show more or less linear of evolutions on a relatively large part of the diagram. This comparable trend
suggests that both sets of data record some common regional-scale correlations. The lack of sill on the
variogram for the initial data set indicates that data are correlated at distances larger than the map. In
contrast, a sill around 1200 degrees2 could be present on the variogram for the disturbed data set. This
suggests that the statistical analysis combines regional correlation effects with more local effects.
Indeed, if very local correlations due to the background had completely obliterated the initial
correlations, then only the nugget effect would appear on the variogram. The directions have been
interpolated for the two data maps (Fig. 2.7a and b). The resulting grids are presented in the form of
trajectories (Fig. 2.7d and e). Trajectories are very similar for both maps. This shows that, even for the
highly disturbed data set, regional-scale correlations are strongly favoured with respect to local ones.
CHAPITRE 2 – Analyse géostatistique appliquée aux directions 47
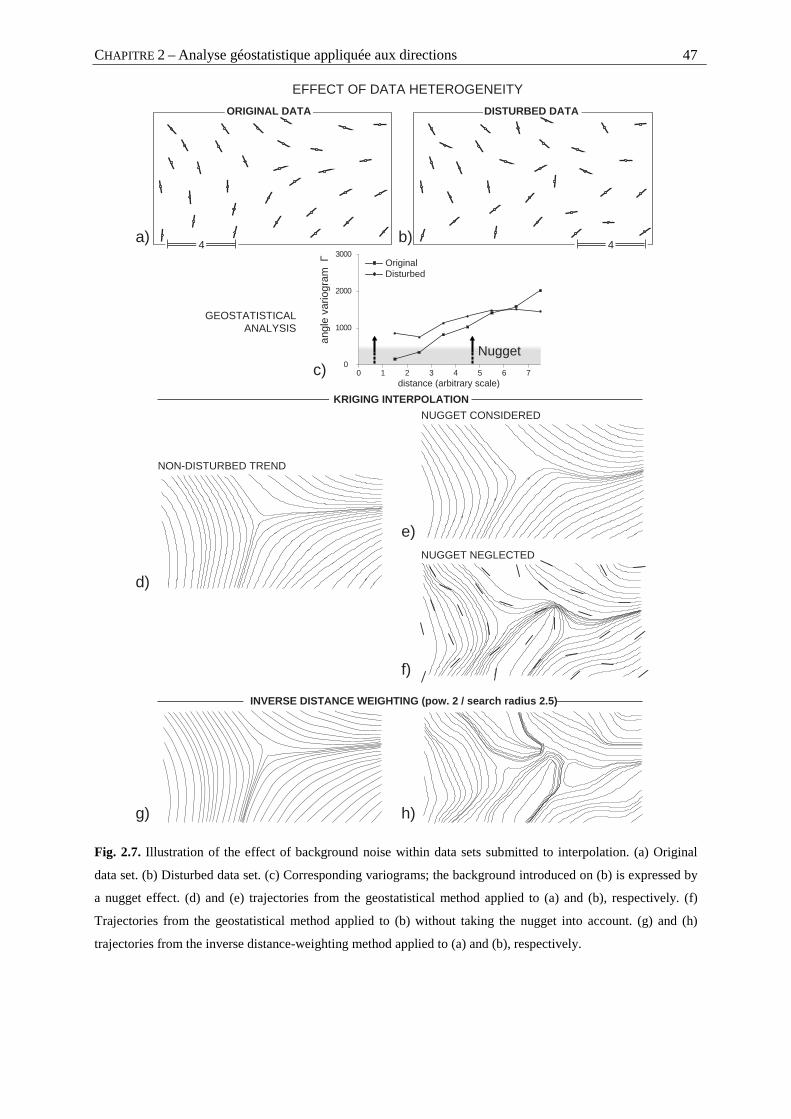
Fig. 2.7. Illustration of the effect of background noise within data sets submitted to interpolation. (a) Original
data set. (b) Disturbed data set. (c) Corresponding variograms; the background introduced on (b) is expressed by
a nugget effect. (d) and (e) trajectories from the geostatistical method applied to (a) and (b), respectively. (f)
Trajectories from the geostatistical method applied to (b) without taking the nugget into account. (g) and (h)
trajectories from the inverse distance-weighting method applied to (a) and (b), respectively.
ORIGINAL DATA DISTURBED DATA
NUGGET CONSIDERED
NUGGET NEGLECTED
Nugget0 1 2 3 4 5 6 7
0
1000
2000
3000 Original Disturbed
distance (arbitrary scale)
angl
e va
riogr
am Γ
GEOSTATISTICALANALYSIS
NON-DISTURBED TREND
a)
c)
d)
f)
b)
INVERSE DISTANCE WEIGHTING (pow. 2 / search radius 2.5)
KRIGING INTERPOLATION
EFFECT OF DATA HETEROGENEITY
e)
g) h)
4 4
CHAPITRE 2 48
This is because the nugget effect has been taken into account in the interpolation processing. If
this effect is neglected, then the interpolation produces a result that strongly fits the original data set at
local scale, and thus favours local correlations with respect to regional ones (Fig. 2.7f). For
comparison, the interpolation method based on the inverse distance-weighting is shown on Figures
2.7g and 2.7h for the undisturbed and disturbed data sets, respectively. Figure 2.7g (same as Fig. 2.6c)
shows consistent trajectories. In contrast, trajectories for the disturbed data set do not reflect the trends
observed for the undisturbed set. The pattern of trajectories is in fact quite similar to the one obtained
by the geostatistics neglecting the nugget effect (Fig. 2.7f). This shows that the inverse-distance
weighting tends to strongly favour local correlations, i.e. individual original data.
This example emphasizes that the geostatistical method, via the variogram analysis, allows to
separate local effects and (or) errors in data from significant regional-scale tendencies.
4.3. Analysis of irregularly spaced data
During field studies, measurements or calculations of directional data can be done from micro-
scale to outcrop-scale, and even up to regional scale (e.g. analysis of satellite images). It is admitted
that a highest density of measurements and a regular distribution of them throughout the studied area
are optimal conditions to constrain the spatial variations of the considered parameters (e.g. Lee and
Angelier, 1994; Mukul, 1998). Unfortunately, data sets are often heterogeneous, because of outcrop
conditions and of logistics.
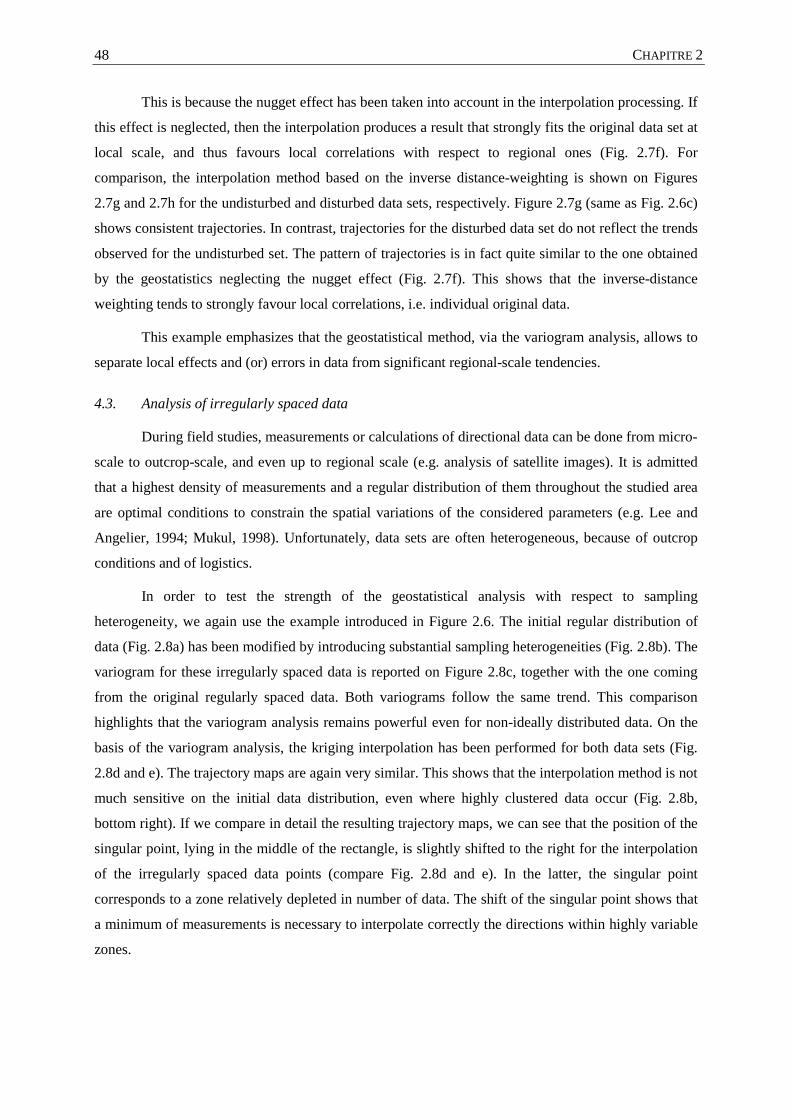
In order to test the strength of the geostatistical analysis with respect to sampling
heterogeneity, we again use the example introduced in Figure 2.6. The initial regular distribution of
data (Fig. 2.8a) has been modified by introducing substantial sampling heterogeneities (Fig. 2.8b). The
variogram for these irregularly spaced data is reported on Figure 2.8c, together with the one coming
from the original regularly spaced data. Both variograms follow the same trend. This comparison
highlights that the variogram analysis remains powerful even for non-ideally distributed data. On the
basis of the variogram analysis, the kriging interpolation has been performed for both data sets (Fig.
2.8d and e). The trajectory maps are again very similar. This shows that the interpolation method is not
much sensitive on the initial data distribution, even where highly clustered data occur (Fig. 2.8b,
bottom right). If we compare in detail the resulting trajectory maps, we can see that the position of the
singular point, lying in the middle of the rectangle, is slightly shifted to the right for the interpolation
of the irregularly spaced data points (compare Fig. 2.8d and e). In the latter, the singular point
corresponds to a zone relatively depleted in number of data. The shift of the singular point shows that
a minimum of measurements is necessary to interpolate correctly the directions within highly variable
zones.
CHAPITRE 2 – Analyse géostatistique appliquée aux directions 49
Fig. 2.8. Illustration of the effect of sampling heterogeneities on interpolation results. (a) Original data set. (b)
Heterogeneous sampling of the same direction field as (a). (c) Corresponding variograms. (d) and (e) trajectories
from data sets (a) and (b), respectively.
5. Examples of application to natural strain fields
5.1. Shear zones
Shear zones are very common structures, where the characterization of strain gradients can be
useful for the analysis of strain patterns and attached kinematics. Across shear zones, increasing shear
strain is marked by the rotation of the principal strain plane (cleavage or foliation), and by a
convergence of strain trajectories (Ramsay and Graham, 1970).
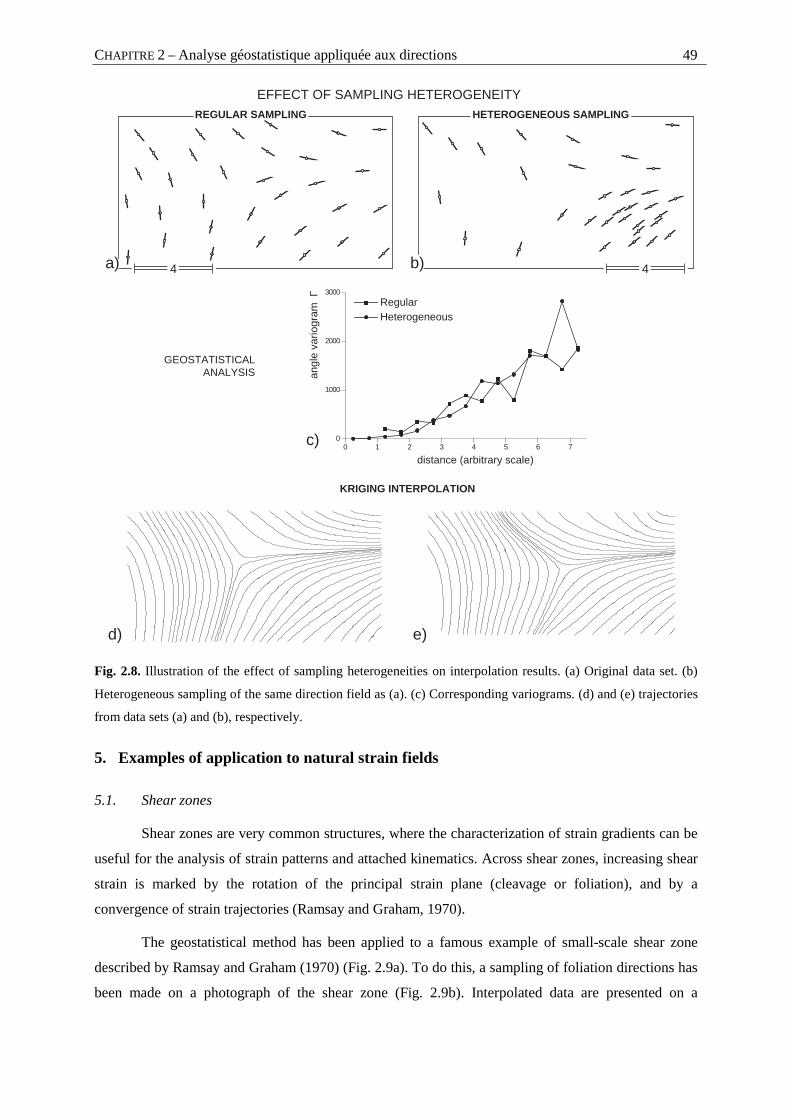
The geostatistical method has been applied to a famous example of small-scale shear zone
described by Ramsay and Graham (1970) (Fig. 2.9a). To do this, a sampling of foliation directions has
been made on a photograph of the shear zone (Fig. 2.9b). Interpolated data are presented on a
REGULAR SAMPLING HETEROGENEOUS SAMPLING
0 1 2 3 4 5 6 70
1000
2000
3000 Regular Heterogeneous
distance (arbitrary scale)
angl
e va
riogr
am Γ
GEOSTATISTICALANALYSIS
KRIGING INTERPOLATION
a) b)
c)
d) e)
EFFECT OF SAMPLING HETEROGENEITY
4 4
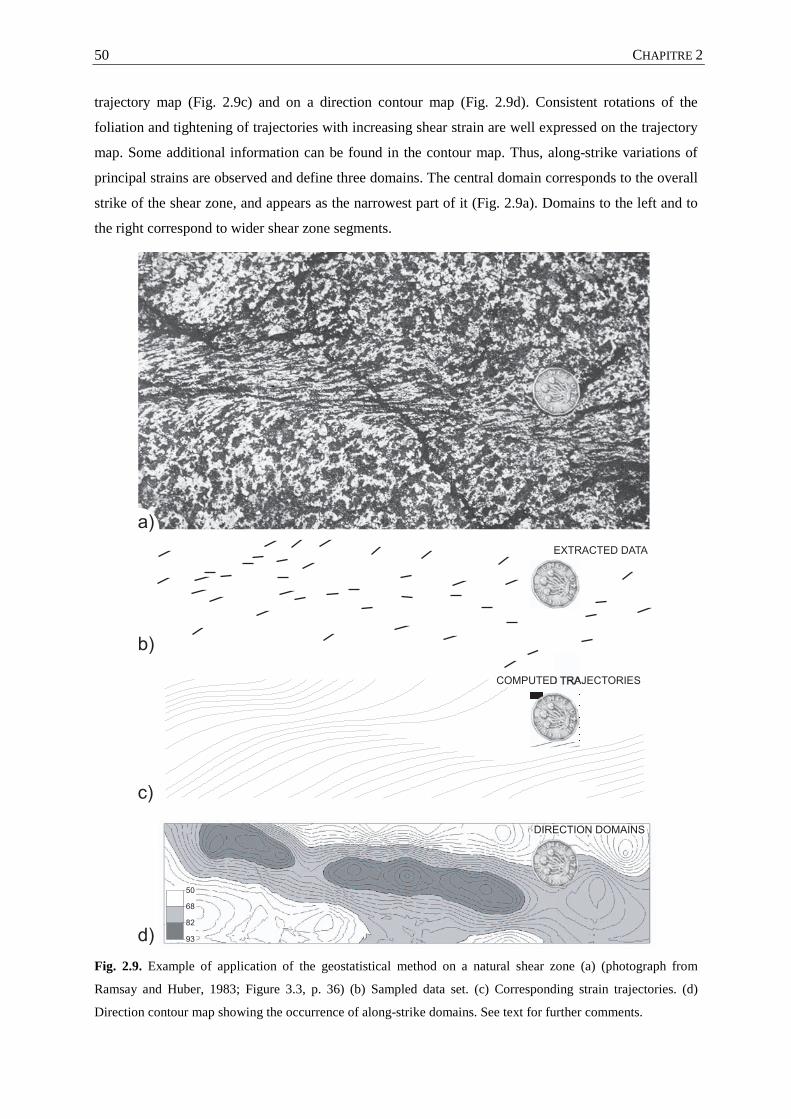
CHAPITRE 2 50
trajectory map (Fig. 2.9c) and on a direction contour map (Fig. 2.9d). Consistent rotations of the
foliation and tightening of trajectories with increasing shear strain are well expressed on the trajectory
map. Some additional information can be found in the contour map. Thus, along-strike variations of
principal strains are observed and define three domains. The central domain corresponds to the overall
strike of the shear zone, and appears as the narrowest part of it (Fig. 2.9a). Domains to the left and to
the right correspond to wider shear zone segments.
Fig. 2.9. Example of application of the geostatistical method on a natural shear zone (a) (photograph from
Ramsay and Huber, 1983; Figure 3.3, p. 36) (b) Sampled data set. (c) Corresponding strain trajectories. (d)
Direction contour map showing the occurrence of along-strike domains. See text for further comments.
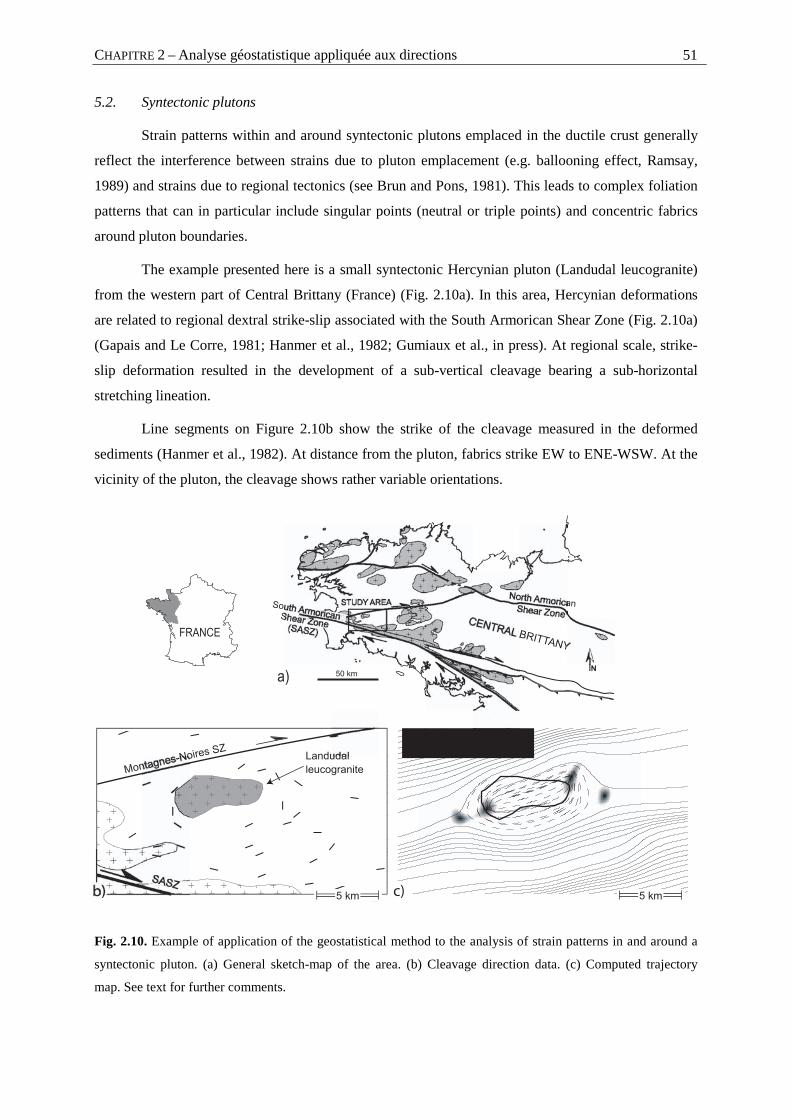
CHAPITRE 2 – Analyse géostatistique appliquée aux directions 51
5.2. Syntectonic plutons
Strain patterns within and around syntectonic plutons emplaced in the ductile crust generally
reflect the interference between strains due to pluton emplacement (e.g. ballooning effect, Ramsay,
1989) and strains due to regional tectonics (see Brun and Pons, 1981). This leads to complex foliation
patterns that can in particular include singular points (neutral or triple points) and concentric fabrics
around pluton boundaries.
The example presented here is a small syntectonic Hercynian pluton (Landudal leucogranite)
from the western part of Central Brittany (France) (Fig. 2.10a). In this area, Hercynian deformations
are related to regional dextral strike-slip associated with the South Armorican Shear Zone (Fig. 2.10a)
(Gapais and Le Corre, 1981; Hanmer et al., 1982; Gumiaux et al., in press). At regional scale, strike-
slip deformation resulted in the development of a sub-vertical cleavage bearing a sub-horizontal
stretching lineation.
Line segments on Figure 2.10b show the strike of the cleavage measured in the deformed
sediments (Hanmer et al., 1982). At distance from the pluton, fabrics strike EW to ENE-WSW. At the
vicinity of the pluton, the cleavage shows rather variable orientations.
Fig. 2.10. Example of application of the geostatistical method to the analysis of strain patterns in and around a
syntectonic pluton. (a) General sketch-map of the area. (b) Cleavage direction data. (c) Computed trajectory
map. See text for further comments.
CHAPITRE 2 52
A variogram analysis and an interpolation have been performed on these direction data (Fig.
2.10c). On the map, the trajectories show that the mean azimuth of the cleavage is around N70°-N80°,
which corresponds to the regional-scale orientation of the cleavage in this part of Central Brittany
(Gumiaux et al., in press). This regional trend is consistent with dextral strike-slip along the South
Armorican Shear Zone. In the middle of the study area, where the pluton is located, the interpolation
procedure calculates elliptical trajectories (dashed lines). Moving away from the pluton, trajectories
tend to wrap around pluton boundaries. At pluton tips, elliptical fabrics (dashed lines) and trajectories
wrapping around the pluton (full lines) define cleavage triple points. This overall pattern of strain
trajectories is consistent with some kind of pluton ballooning during regional shearing.
The occurrence of triple points can be further tested. During Kriging, the direction cosines are
used to calculate the interpolated direction. For a given set of orientation data, the length of the mean
vector defined by the direction cosines is a direct estimate of the local direction variance. This
parameter represents the degree of data concentrations around the mean vector, and has been defined
as the parameter R (see Upton and Fingleton, 1989). When R equals one, all the directions considered
are parallel and the resulting mean is perfectly constrained. With decreasing R value, the resulting
mean angle becomes less constrained, down to undefined when R equals zero. This is what is expected
to occur within a neutral point (triple point) (see Fig. 2.6). On Figure 2.10c, low R values have been
contoured, with increasing grey levels from R equals 0.5 to zero. From numerical models, Brun (1981)
demonstrated that two pairs of neutral zones, inside and outside the pluton, could develop during
syntectonic balloning. These zones are located at pluton tips, at high angle to the regional shortening
direction. This is actually consistent with our interpolation results, which show four zones of low R
values. Two of them are well outside the pluton and are clearly located within the cleavage triple
points defined by cleavage trajectories. The two more internal ones are located at the tips of the area
marked by elliptical trajectories.
Thus, the interpolation method provides consistent results for this complex example where rather few
orientation data are available (Fig. 2.10b).
6. Concluding remarks
This study has emphasized that statistical analysis of directions cannot be made with circular
data. To avoid this problem, the use of direction cosines during automatic data treatment appears a
good solution.
Geostatistics, in particular the analysis of variograms, permit to describe and quantify the
spatial dependences of values from any kind of data set. The method has been here developed for
directional data. The variogram analysis allows (1) to quantify the scale of data correlation, (2) to
CHAPITRE 2 – Analyse géostatistique appliquée aux directions 53
detect and quantify anisotropies in data variations, and (3) to quantify local effects, as well as inherent
errors included within original data, and separate them from regional effects.
Statistical parameters provided by variograms are critical to constrain the way directional data
should be interpolated. Indeed, during interpolation, data weighting depends on the best-fit equation of
the variogram curve. The strength of the interpolation method is outlined by the treatment of non-ideal
theoretical data sets, as follows.
- The influence of data heterogeneity, like a substantial background noise, appears rather
limited. This is because the nugget value obtained from the variogram analysis is taken into
account during interpolation.
- The influence of heterogeneously distributed data appears also limited.
The method is convenient to draw direction trajectories. It can also provide further information. We
have in particular emphasized the followings.
- Contour maps, combined with direction histograms, are convenient to detect domainal
distributions of directions.
- The interpolation leads to quantify the degree of local consistency and of correlation between
neighbouring data. For example, well-oriented domains can be distinguished from less
oriented ones. Thus, in the example of pluton intrusion presented in this paper, cleavage triple
points have been detected.
Compared with other methods of analysis of directional data developed in Geosciences, the
geostatistical method appears particularly efficient, reliable, and can be applied at all scales. We have
focused this paper on the analysis of strain trajectories, but the method could be applied to any kind of
other directional data, like displacement vectors (e.g. from GPS measurements), fault patterns, stress
fields, paleo-currents, topographic data, paleomagnetic data, or directional data extracted from
geophysical maps or cross-sections (e.g. seismics, gravity and magnetic data).
Acknoledgments
This study was made in the course of the research project Armor 2 (“Géofrance 3D” Program,
BRGM-CNRS). Constructive discussions with C. Walter (INRA, Rennes) strongly contributed to the
methodological aspects developed in this paper. C.G. acquired a large part of the bases of the
geostatistic analysis in the on-line lessons provided by D. Marcotte (Ecole polytechnique de Montréal,
http://geo.polymtl.ca/~marcotte/). Reviews by J. Escuder-Viruete and D. Marcotte helped us to
improve the paper.
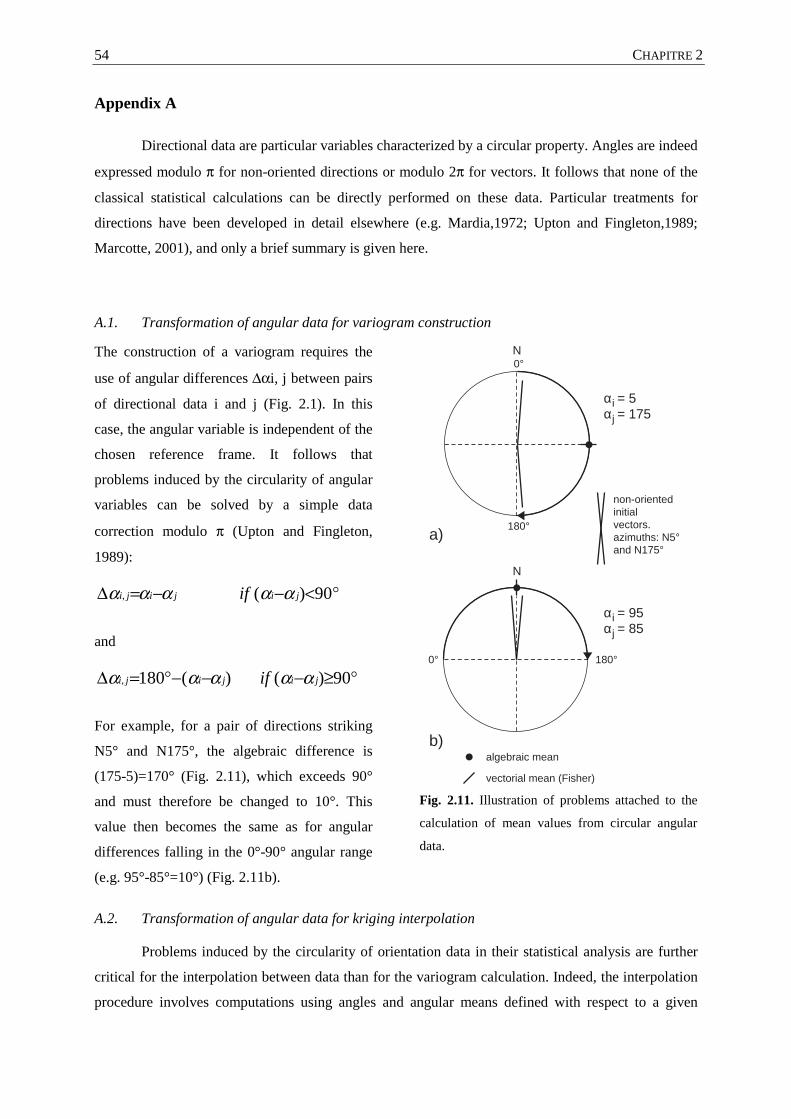
CHAPITRE 2
ααααα
and
°≥−−−°=∆ 90)()(180, jijiji if ααααα
For example, for a pair of directions striking
N5° and N175°, the algebraic difference is
(175-5)=170° (Fig. 2.11), which exceeds 90°
and must therefore be changed to 10°. This
value then becomes the same as for angular
differences falling in the 0°-90° angular range
(e.g. 95°-85°=10°) (Fig. 2.11b).
Fig. 2.11. Illustration of problems attached to the
calculation of mean values from circular angular
data.
A.2. Transformation of angular data for kriging interpolation
Problems induced by the circularity of orientation data in their statistical analysis are further
critical for the interpolation between data than for the variogram calculation. Indeed, the interpolation
procedure involves computations using angles and angular means defined with respect to a given
54
Appendix A
Directional data are particular variables characterized by a circular property. Angles are indeed
expressed modulo π for non-oriented directions or modulo 2π for vectors. It follows that none of the
classical statistical calculations can be directly performed on these data. Particular treatments for
directions have been developed in detail elsewhere (e.g. Mardia,1972; Upton and Fingleton,1989;
Marcotte, 2001), and only a brief summary is given here.
A.1. Transformation of angular data for variogram construction
The construction of a variogram requires the
use of angular differences ∆αi, j between pairs
of directional data i and j (Fig. 2.1). In this
case, the angular variable is independent of the
chosen reference frame. It follows that
problems induced by the circularity of angular
variables can be solved by a simple data
correction modulo π (Upton and Fingleton,
1989):
°<−−=∆ 90)(, jijiji if
algebraic mean
vectorial mean (Fisher)
non-orientedinitialvectors.azimuths: N5°and N175°
0°
180°
0° 180°
N
N
αi = 5αj = 175
αi = 95αj = 85
a)
b)
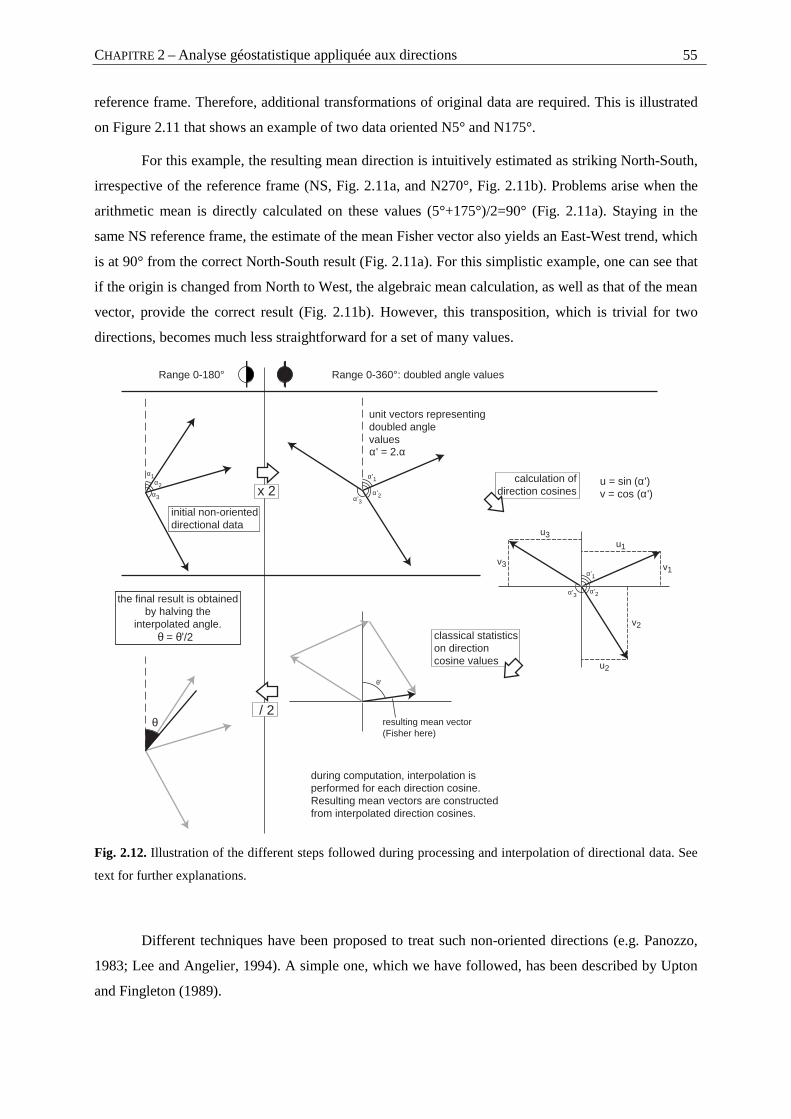
CHAPITRE 2 – Analyse géostatistique appliquée aux directions 55
reference frame. Therefore, additional transformations of original data are required. This is illustrated
on Figure 2.11 that shows an example of two data oriented N5° and N175°.
For this example, the resulting mean direction is intuitively estimated as striking North-South,
irrespective of the reference frame (NS, Fig. 2.11a, and N270°, Fig. 2.11b). Problems arise when the
arithmetic mean is directly calculated on these values (5°+175°)/2=90° (Fig. 2.11a). Staying in the
same NS reference frame, the estimate of the mean Fisher vector also yields an East-West trend, which
is at 90° from the correct North-South result (Fig. 2.11a). For this simplistic example, one can see that
if the origin is changed from North to West, the algebraic mean calculation, as well as that of the mean
vector, provide the correct result (Fig. 2.11b). However, this transposition, which is trivial for two
directions, becomes much less straightforward for a set of many values.
Fig. 2.12. Illustration of the different steps followed during processing and interpolation of directional data. See
text for further explanations.
Different techniques have been proposed to treat such non-oriented directions (e.g. Panozzo,
1983; Lee and Angelier, 1994). A simple one, which we have followed, has been described by Upton
and Fingleton (1989).
α2
α1
α3α'2
α'1
α'3
Range 0-180° Range 0-360°: doubled angle values
unit vectors representingdoubled anglevalues
initial non-orienteddirectional data
the final result is obtainedby halving the
interpolated angle.
x 2
/ 2
α' = 2.α
θ = θ'/2
θ
α'2
α'1
α'3
u3u1
u2
u = sin (α')v = cos (α')
calculation ofdirection cosines
v3
v2
v1
resulting mean vector(Fisher here)
θ'
classical statisticson direction cosine values
during computation, interpolation isperformed for each direction cosine.Resulting mean vectors are constructedfrom interpolated direction cosines.

CHAPITRE 2 56
The first step consists in a preliminary doubling of he algebraic values of the non-oriented
directions (Upton & Fingleton, 1989) (Fig. 2.12). The 0°-180° range of directions is thus enlarged to
the entire 0°-360° range. Each direction is then considered as a unit vector. This vector is projected on
each of the reference axes in order to calculate the corresponding direction cosines (Fig. 2.12). These
latter variables are not circular, and classical calculations can be performed on them. This is for
example illustrated on Figure 2.12 for the estimate of a mean vector. On this basis, the kriging
interpolation is performed, yielding interpolated directional data expressed by their direction cosines.
The last step consists in the calculation of corresponding angles, which are halved in order to reduce
the angular range from 0°-360° to the initial 0°-180° range (Fig. 2.12).
CHAPITRE 2 – Analyse géostatistique appliquée aux directions 57
References
ANGELIER, J. (1994) - "Fault slip analysis and paleostress reconstruction." In: P. Hancock (Ed.),
Continental Deformation. - Pergamon, New York, pp. 53-100.
BARBOTIN, E. (1987) - "Trajectoires de déformation finie et interprétation cinématique. Modèles
numériques et application à des exemples régionaux (Bretagne Centrale et Alpes Penniques)." -
Thèse, Université de Rennes 1, Rennes, 158 pp.
BOURENNANE, H. (1997) - "Etude des lois de distribution spatiale des sols de Petite Beauce." - Thèse,
Université d'Orléans, Orléans, 229 pp.
BRUN, J.-P. (1981) - "Instabilités gravitaire et déformation de la croûte continentale : application au
développement des dômes et des plutons." - Thèse d'état, Université de Rennes 1, Rennes, pp.
BRUN, J.-P. & PONS, J. (1981) - "Strain patterns of pluton emplacement in a crust undergoing non-
coaxial deformation, Sierra Morena, Southern Spain." - Journal of Structural Geology, 3, 219-229.
COBBOLD, P.-R. (1979) - "Removal of finite deformation using strain trajectories." - Journal of
Structural Geology, 1, 67-72.
COBBOLD, P.-R. & DAVY, P. (1988) - "Indentation tectonics in nature and experiment. 2. Central
Asia." - Bull. Geol. Inst. Univ. Uppsla N.S., 14, 143-162.
CRESSIE, N.A.C. (1990) - "The Origins of Kriging." - Mathematical Geology, 22, 239-252.
CRESSIE, N.A.C. (1991) - "Statistics for Spatial Data."- John Wiley & sons, New York, 900 pp.
DEUTSCH, C.V. (1991) "The relationship between universal kriging, kriging with an external drift and
cokriging." - In. SCRF report 4.
DEUTSCH, C.V. & JOURNEL, A.G. (1992) - "GSLIB: Geostatistical Software Library and User's
Guide."- Oxford University Press, New York, 384 pp.
GAPAIS, D. & LE CORRE, C. (1980) - "Is the Hercynian belt of Brittany a major shear zone." - Nature,
288, 574-576.
CHAPITRE 2 58
GUMIAUX, C., BRUN, J.-P. & GAPAIS, D. (in press / sous presse) - "Strain removal within the
Hercynian Shear Belt of Central Brittany (Western France): methodology and tectonic
implications." - Journal of the Geological Society of London Special publication.
HANMER, S., LE CORRE, C. & BERTHE, D. (1982) - "The role of Hercynian granites in the deformation
and metamorphism of Brioverian and Paleozoic rocks of Central Brittany." - Journal of the
Geological Society of London, 139, 85-93.
ISAAKS, E. & SRIVASTAVA, R.M. (1989) - "An introduction to Applied Geostatistics."- Oxford
University Press, New York, 561 pp.
LAJAUNIE, C., COURRIOUX, G. & MANUEL, L. (1997) - "Foliation and 3D Cartography in Geology:
Principles of a Method Based on Potential Interpolation." - Mathematical Geology, 29, 571-584.
LEE, J.-C. & ANGELIER, J. (1994) - "Paleostress trajectory maps based on the results of local
determinations: the "Lissage" program." - Computers and Geosciences, 20(2), 161-191.
MARCOTTE, D. (2001) - "Géologie et géostatistique minières (partie géostatistique)." - Online lessons,
http://geo.polymtl.ca/~marcotte/
MARDIA, K.V. (1972) - "Probability and Mathematical Statistics."- Academic Press, London, 355 pp.
MATHERON, G. (1962) - "Traité de Géostatistique Appliquée."- Technip, Paris, 333 pp.
MUKUL, M. (1998) - "A spatial statistics approach to the quantification of finite strain variation in
penetratively deformed thrust sheets: an example from the Sheeprock Thrust Sheet, Sevier Fold-
and-Thrust belt, Utah." - Journal of Structural Geology, 20(4), 371-384.
PANOZZO, R. (1984) - "Two-dimensional strain from the orientation of lines in a plane." - Journal of
Structural Geology, 6(1-2), 215-221.
POTTER, P.E. & PETTIJOHN, F.J. (1977) - "Paleocurrents and Basin Analysis."- Springer Verlag,
Berlin, 425 pp.
RAMSAY, J.G. & GRAHAM, R.H. (1970) - "Strain variations in shear belts." - Canadian Journal of
Earth Sciences, 7, 786-813.
CHAPITRE 2 – Analyse géostatistique appliquée aux directions 59
RAMSAY, J.G. & HUBER, M.I. (1983) - "The Techniques of Modern Structural Geology, Vol. 1: Strain
Analysis."- Academic Press, London, 307 pp.
RAMSAY, J.G. (1989) - "Emplacement kinematics of a granite diapir: the Chindamora Batholith,
Zimbabwe." - Journal of Structural Geology, 11, 191-209.
UPTON, G.J.G. & FINGLETON, B. (1989) - "Spatial Data Analysis by Example, 2."- John Wiley and
Sons, New York, 416 pp.
WACKERNAGEL, H. (1998) - "Multivariate Geostatistics, 2."- Springer Verlag, Berlin, 291 pp.
XU, W. (1996) - "Conditional curvilinear stochastic simulation using pixel-based algorithms."
- Mathematical Geology, 28(7), 937-949.
YOUNG, D.S. (1987) - "Random vectors and spatial analysis by geostatistics for geotechnical
applications." - Mathematical Geology, 19(6), 467-479.

C h a p i t r e 3 Modélisation cinématique de la déformation en Bretagne Centrale

CHAPITRE 3 – Modélisation cinématique de la déformation en Bretagne Centrale 63
Strain removal within the Hercynian Shear Belt of Central Brittany
(Western France): Methodology and tectonic implications
C.Gumiaux, J.P. Brun, D.Gapais
Géosciences Rennes, UMR 6118 CNRS, Université de Rennes 1, 35042 Rennes cedex, France
Journal of the Geological Society of London Special Publications – 2003 – in press/sous
presse
Abstract
Central Brittany is a major shear belt formed during the Hercynian Orogeny. In this paper, we
present a model for the restoration of the belt, based on an exhaustive compilation of available
structural data. The model uses a geostatistical analysis of cleavage orientation data. The analysis
shows that the eastern part of Central Brittany has been deformed by bulk dextral strike-slip, a feature
that validates previous structural interpretations. It further provides explanations for (1) the strain
patterns observed within and around the restored domain, (2) the nature of domain boundaries and of
associated kinematics, and (3) the occurrence of local superimposed deformations.
1. Introduction
Central Brittany is bounded by the North Armorican Shear Zone (NASZ) to the north, and by
the South Armorican Shear Zone (SASZ) to the south (Fig. 3.1). The SASZ (Jégouzo 1980) is one of
the major tectonic features of the Hercynian belt of Western Europe that separates two domains of
contrasted structural style and deformation history (Fig. 3.1).
Central Brittany is mostly composed of late Proterozoic to upper Palaeozoic sediments
affected by anchizonal to greenschist metamorphism, and deformed during Carboniferous times (see
Le Corre et al. 1991, and references therein). Deformation, which is closely related to shearing along
the South Armorican Shear Zone, corresponds to a regional-scale dextral wrenching (Gapais & Le
Corre 1980). Granitic plutons, which were emplaced during regional shearing (Hanmer et al. 1982;
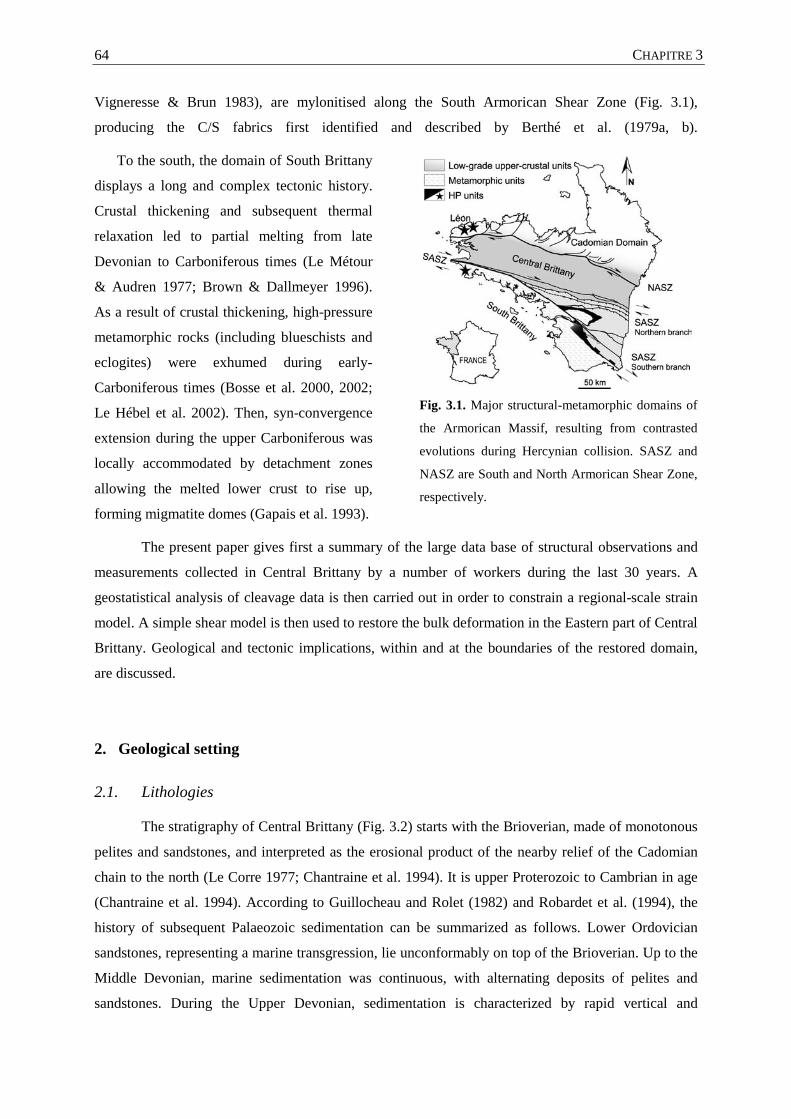
CHAPITRE 3 64
Vigneresse & Brun 1983), are mylonitised along the South Armorican Shear Zone (Fig. 3.1),
producing the C/S fabrics first identified and described by Berthé et al. (1979a, b).
To the south, the domain of South Brittany
displays a long and complex tectonic history.
Crustal thickening and subsequent thermal
relaxation led to partial melting from late
Devonian to Carboniferous times (Le Métour
& Audren 1977; Brown & Dallmeyer 1996).
As a result of crustal thickening, high-pressure
metamorphic rocks (including blueschists and
eclogites) were exhumed during early-
Carboniferous times (Bosse et al. 2000, 2002;
Le Hébel et al. 2002). Then, syn-convergence
extension during the upper Carboniferous was
locally accommodated by detachment zones
allowing the melted lower crust to rise up,
forming migmatite domes (Gapais et al. 1993).
Fig. 3.1. Major structural-metamorphic domains of
the Armorican Massif, resulting from contrasted
evolutions during Hercynian collision. SASZ and
NASZ are South and North Armorican Shear Zone,
respectively.
The present paper gives first a summary of the large data base of structural observations and
measurements collected in Central Brittany by a number of workers during the last 30 years. A
geostatistical analysis of cleavage data is then carried out in order to constrain a regional-scale strain
model. A simple shear model is then used to restore the bulk deformation in the Eastern part of Central
Brittany. Geological and tectonic implications, within and at the boundaries of the restored domain,
are discussed.
2. Geological setting
2.1. Lithologies
The stratigraphy of Central Brittany (Fig. 3.2) starts with the Brioverian, made of monotonous
pelites and sandstones, and interpreted as the erosional product of the nearby relief of the Cadomian
chain to the north (Le Corre 1977; Chantraine et al. 1994). It is upper Proterozoic to Cambrian in age
(Chantraine et al. 1994). According to Guillocheau and Rolet (1982) and Robardet et al. (1994), the
history of subsequent Palaeozoic sedimentation can be summarized as follows. Lower Ordovician
sandstones, representing a marine transgression, lie unconformably on top of the Brioverian. Up to the
Middle Devonian, marine sedimentation was continuous, with alternating deposits of pelites and
sandstones. During the Upper Devonian, sedimentation is characterized by rapid vertical and
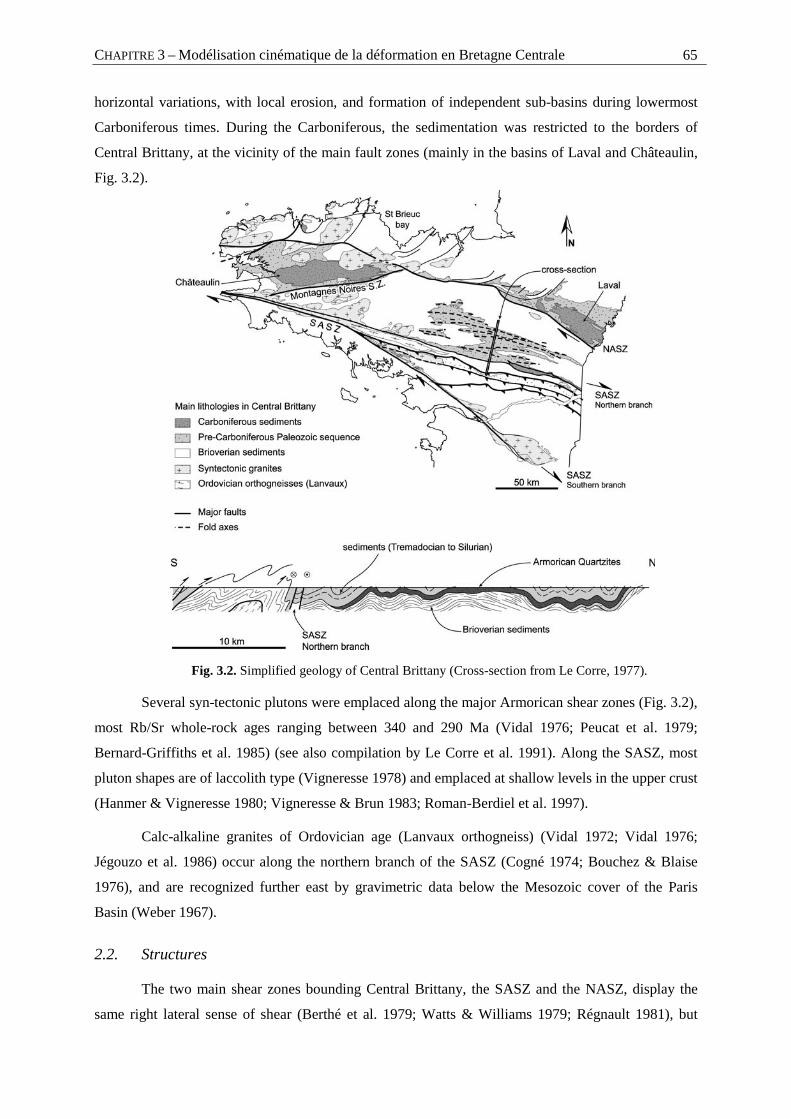
CHAPITRE 3 – Modélisation cinématique de la déformation en Bretagne Centrale 65
horizontal variations, with local erosion, and formation of independent sub-basins during lowermost
Carboniferous times. During the Carboniferous, the sedimentation was restricted to the borders of
Central Brittany, at the vicinity of the main fault zones (mainly in the basins of Laval and Châteaulin,
Fig. 3.2).
Fig. 3.2. Simplified geology of Central Brittany (Cross-section from Le Corre, 1977).
Several syn-tectonic plutons were emplaced along the major Armorican shear zones (Fig. 3.2),
most Rb/Sr whole-rock ages ranging between 340 and 290 Ma (Vidal 1976; Peucat et al. 1979;
Bernard-Griffiths et al. 1985) (see also compilation by Le Corre et al. 1991). Along the SASZ, most
pluton shapes are of laccolith type (Vigneresse 1978) and emplaced at shallow levels in the upper crust
(Hanmer & Vigneresse 1980; Vigneresse & Brun 1983; Roman-Berdiel et al. 1997).
Calc-alkaline granites of Ordovician age (Lanvaux orthogneiss) (Vidal 1972; Vidal 1976;
Jégouzo et al. 1986) occur along the northern branch of the SASZ (Cogné 1974; Bouchez & Blaise
1976), and are recognized further east by gravimetric data below the Mesozoic cover of the Paris
Basin (Weber 1967).
2.2. Structures
The two main shear zones bounding Central Brittany, the SASZ and the NASZ, display the
same right lateral sense of shear (Berthé et al. 1979; Watts & Williams 1979; Régnault 1981), but
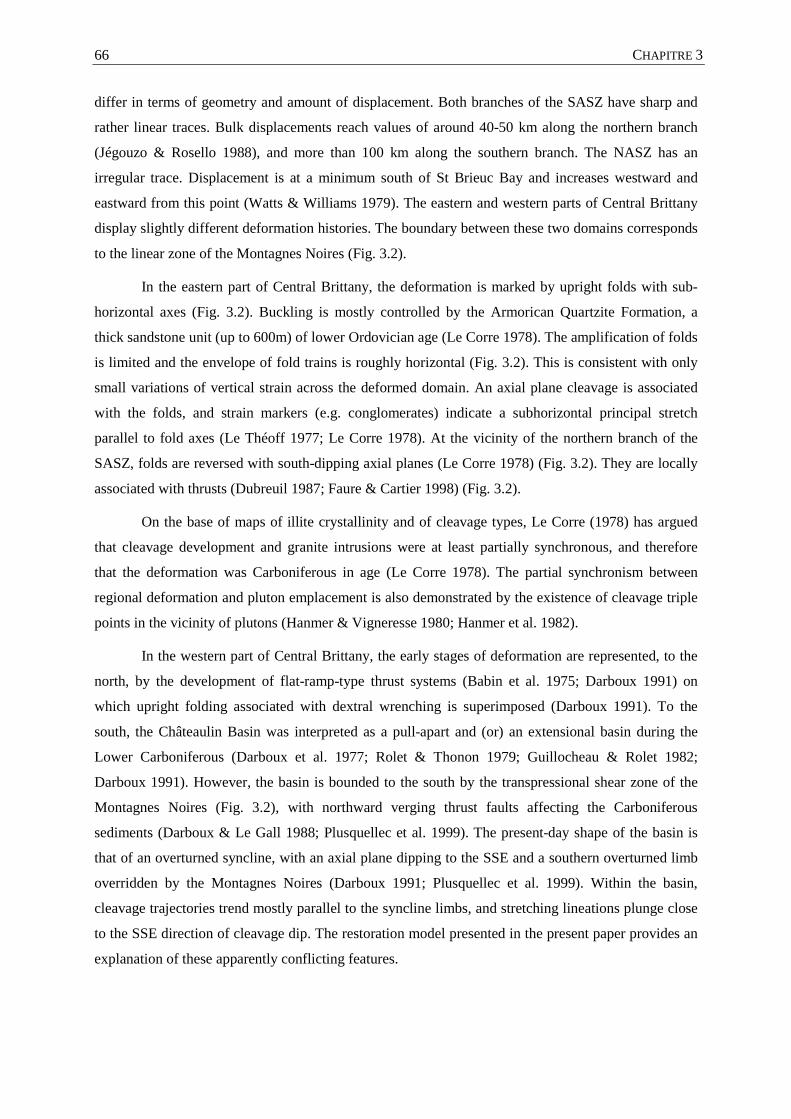
CHAPITRE 3 66
differ in terms of geometry and amount of displacement. Both branches of the SASZ have sharp and
rather linear traces. Bulk displacements reach values of around 40-50 km along the northern branch
(Jégouzo & Rosello 1988), and more than 100 km along the southern branch. The NASZ has an
irregular trace. Displacement is at a minimum south of St Brieuc Bay and increases westward and
eastward from this point (Watts & Williams 1979). The eastern and western parts of Central Brittany
display slightly different deformation histories. The boundary between these two domains corresponds
to the linear zone of the Montagnes Noires (Fig. 3.2).
In the eastern part of Central Brittany, the deformation is marked by upright folds with sub-
horizontal axes (Fig. 3.2). Buckling is mostly controlled by the Armorican Quartzite Formation, a
thick sandstone unit (up to 600m) of lower Ordovician age (Le Corre 1978). The amplification of folds
is limited and the envelope of fold trains is roughly horizontal (Fig. 3.2). This is consistent with only
small variations of vertical strain across the deformed domain. An axial plane cleavage is associated
with the folds, and strain markers (e.g. conglomerates) indicate a subhorizontal principal stretch
parallel to fold axes (Le Théoff 1977; Le Corre 1978). At the vicinity of the northern branch of the
SASZ, folds are reversed with south-dipping axial planes (Le Corre 1978) (Fig. 3.2). They are locally
associated with thrusts (Dubreuil 1987; Faure & Cartier 1998) (Fig. 3.2).
On the base of maps of illite crystallinity and of cleavage types, Le Corre (1978) has argued
that cleavage development and granite intrusions were at least partially synchronous, and therefore
that the deformation was Carboniferous in age (Le Corre 1978). The partial synchronism between
regional deformation and pluton emplacement is also demonstrated by the existence of cleavage triple
points in the vicinity of plutons (Hanmer & Vigneresse 1980; Hanmer et al. 1982).
In the western part of Central Brittany, the early stages of deformation are represented, to the
north, by the development of flat-ramp-type thrust systems (Babin et al. 1975; Darboux 1991) on
which upright folding associated with dextral wrenching is superimposed (Darboux 1991). To the
south, the Châteaulin Basin was interpreted as a pull-apart and (or) an extensional basin during the
Lower Carboniferous (Darboux et al. 1977; Rolet & Thonon 1979; Guillocheau & Rolet 1982;
Darboux 1991). However, the basin is bounded to the south by the transpressional shear zone of the
Montagnes Noires (Fig. 3.2), with northward verging thrust faults affecting the Carboniferous
sediments (Darboux & Le Gall 1988; Plusquellec et al. 1999). The present-day shape of the basin is
that of an overturned syncline, with an axial plane dipping to the SSE and a southern overturned limb
overridden by the Montagnes Noires (Darboux 1991; Plusquellec et al. 1999). Within the basin,
cleavage trajectories trend mostly parallel to the syncline limbs, and stretching lineations plunge close
to the SSE direction of cleavage dip. The restoration model presented in the present paper provides an
explanation of these apparently conflicting features.
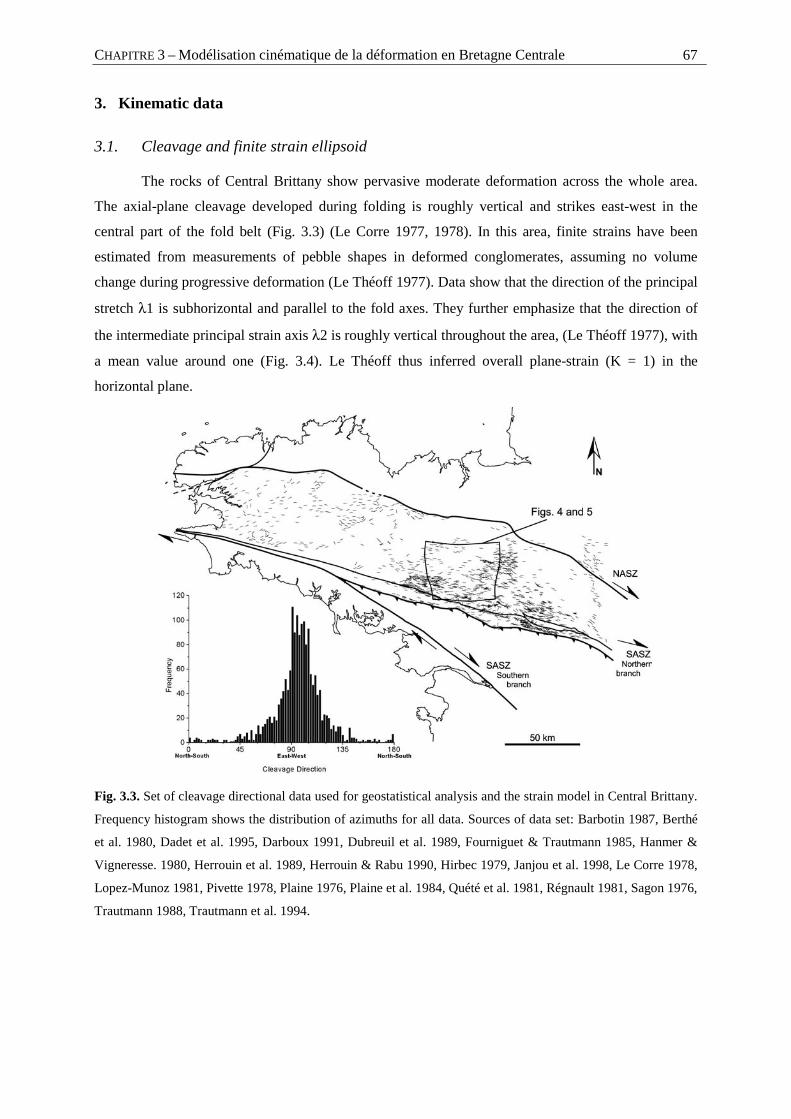
CHAPITRE 3 – Modélisation cinématique de la déformation en Bretagne Centrale 67
3. Kinematic data
3.1. Cleavage and finite strain ellipsoid
The rocks of Central Brittany show pervasive moderate deformation across the whole area.
The axial-plane cleavage developed during folding is roughly vertical and strikes east-west in the
central part of the fold belt (Fig. 3.3) (Le Corre 1977, 1978). In this area, finite strains have been
estimated from measurements of pebble shapes in deformed conglomerates, assuming no volume
change during progressive deformation (Le Théoff 1977). Data show that the direction of the principal
stretch λ1 is subhorizontal and parallel to the fold axes. They further emphasize that the direction of
the intermediate principal strain axis λ2 is roughly vertical throughout the area, (Le Théoff 1977), with
a mean value around one (Fig. 3.4). Le Théoff thus inferred overall plane-strain (K = 1) in the
horizontal plane.
Fig. 3.3. Set of cleavage directional data used for geostatistical analysis and the strain model in Central Brittany.
Frequency histogram shows the distribution of azimuths for all data. Sources of data set: Barbotin 1987, Berthé
et al. 1980, Dadet et al. 1995, Darboux 1991, Dubreuil et al. 1989, Fourniguet & Trautmann 1985, Hanmer &
Vigneresse. 1980, Herrouin et al. 1989, Herrouin & Rabu 1990, Hirbec 1979, Janjou et al. 1998, Le Corre 1978,
Lopez-Munoz 1981, Pivette 1978, Plaine 1976, Plaine et al. 1984, Quété et al. 1981, Régnault 1981, Sagon 1976,
Trautmann 1988, Trautmann et al. 1994.
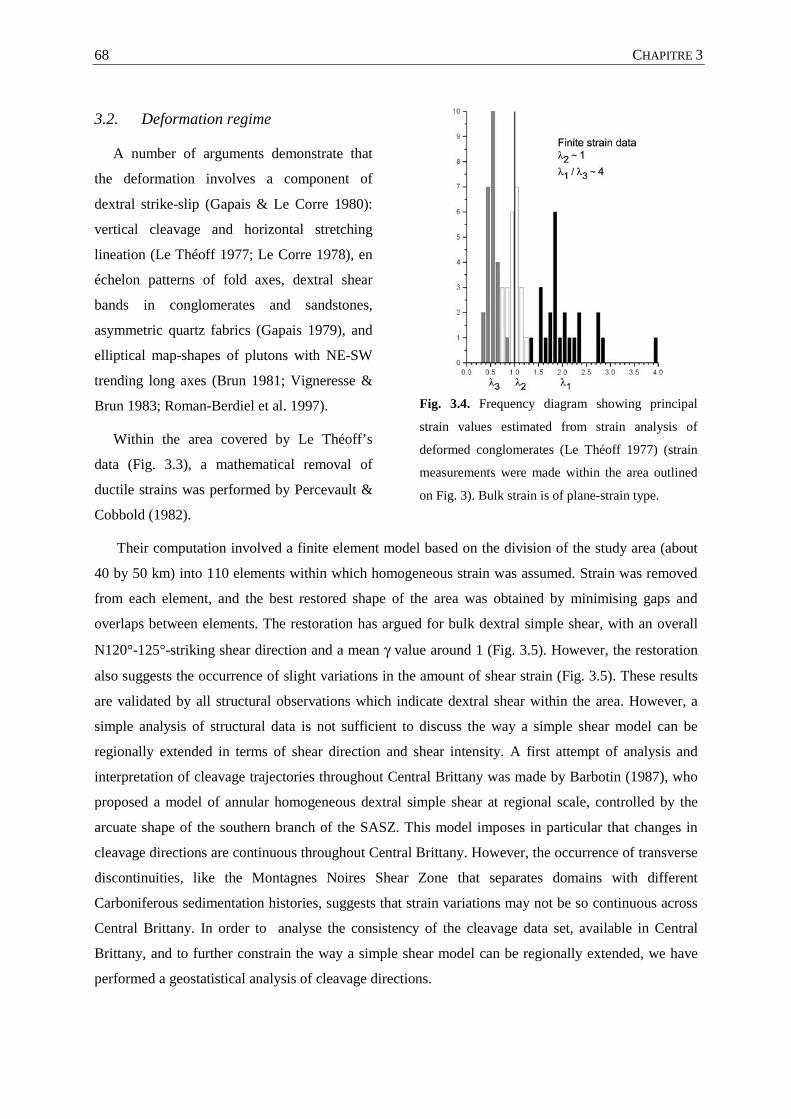
CHAPITRE 3 68
3.2. Deformation regime
A number of arguments demonstrate that
the deformation involves a component of
dextral strike-slip (Gapais & Le Corre 1980):
vertical cleavage and horizontal stretching
lineation (Le Théoff 1977; Le Corre 1978), en
échelon patterns of fold axes, dextral shear
bands in conglomerates and sandstones,
asymmetric quartz fabrics (Gapais 1979), and
elliptical map-shapes of plutons with NE-SW
trending long axes (Brun 1981; Vigneresse &
Brun 1983; Roman-Berdiel et al. 1997).
Within the area covered by Le Théoff’s
data (Fig. 3.3), a mathematical removal of
ductile strains was performed by Percevault &
Cobbold (1982).
Fig. 3.4. Frequency diagram showing principal
strain values estimated from strain analysis of
deformed conglomerates (Le Théoff 1977) (strain
measurements were made within the area outlined
on Fig. 3). Bulk strain is of plane-strain type.
Their computation involved a finite element model based on the division of the study area (about
40 by 50 km) into 110 elements within which homogeneous strain was assumed. Strain was removed
from each element, and the best restored shape of the area was obtained by minimising gaps and
overlaps between elements. The restoration has argued for bulk dextral simple shear, with an overall
N120°-125°-striking shear direction and a mean γ value around 1 (Fig. 3.5). However, the restoration
also suggests the occurrence of slight variations in the amount of shear strain (Fig. 3.5). These results
are validated by all structural observations which indicate dextral shear within the area. However, a
simple analysis of structural data is not sufficient to discuss the way a simple shear model can be
regionally extended in terms of shear direction and shear intensity. A first attempt of analysis and
interpretation of cleavage trajectories throughout Central Brittany was made by Barbotin (1987), who
proposed a model of annular homogeneous dextral simple shear at regional scale, controlled by the
arcuate shape of the southern branch of the SASZ. This model imposes in particular that changes in
cleavage directions are continuous throughout Central Brittany. However, the occurrence of transverse
discontinuities, like the Montagnes Noires Shear Zone that separates domains with different
Carboniferous sedimentation histories, suggests that strain variations may not be so continuous across
Central Brittany. In order to analyse the consistency of the cleavage data set, available in Central
Brittany, and to further constrain the way a simple shear model can be regionally extended, we have
performed a geostatistical analysis of cleavage directions.
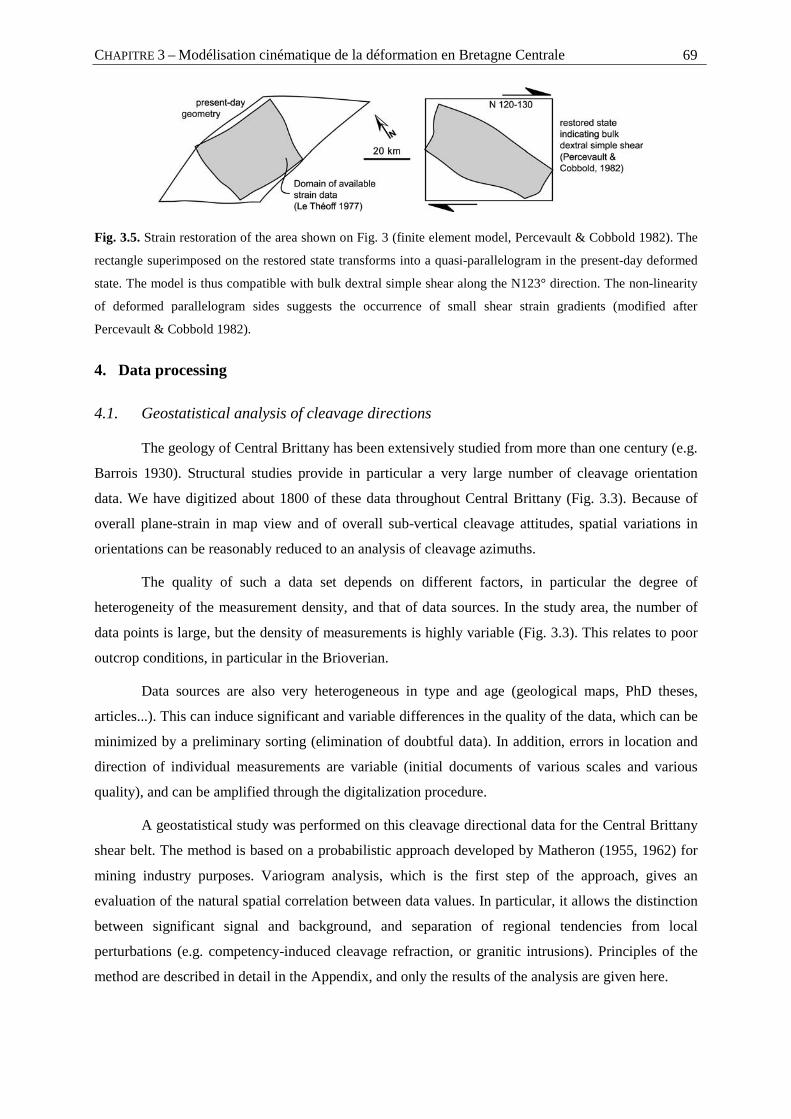
CHAPITRE 3 – Modélisation cinématique de la déformation en Bretagne Centrale 69
Fig. 3.5. Strain restoration of the area shown on Fig. 3 (finite element model, Percevault & Cobbold 1982). The
rectangle superimposed on the restored state transforms into a quasi-parallelogram in the present-day deformed
state. The model is thus compatible with bulk dextral simple shear along the N123° direction. The non-linearity
of deformed parallelogram sides suggests the occurrence of small shear strain gradients (modified after
Percevault & Cobbold 1982).
4. Data processing
4.1. Geostatistical analysis of cleavage directions
The geology of Central Brittany has been extensively studied from more than one century (e.g.
Barrois 1930). Structural studies provide in particular a very large number of cleavage orientation
data. We have digitized about 1800 of these data throughout Central Brittany (Fig. 3.3). Because of
overall plane-strain in map view and of overall sub-vertical cleavage attitudes, spatial variations in
orientations can be reasonably reduced to an analysis of cleavage azimuths.
The quality of such a data set depends on different factors, in particular the degree of
heterogeneity of the measurement density, and that of data sources. In the study area, the number of
data points is large, but the density of measurements is highly variable (Fig. 3.3). This relates to poor
outcrop conditions, in particular in the Brioverian.
Data sources are also very heterogeneous in type and age (geological maps, PhD theses,
articles...). This can induce significant and variable differences in the quality of the data, which can be
minimized by a preliminary sorting (elimination of doubtful data). In addition, errors in location and
direction of individual measurements are variable (initial documents of various scales and various
quality), and can be amplified through the digitalization procedure.
A geostatistical study was performed on this cleavage directional data for the Central Brittany
shear belt. The method is based on a probabilistic approach developed by Matheron (1955, 1962) for
mining industry purposes. Variogram analysis, which is the first step of the approach, gives an
evaluation of the natural spatial correlation between data values. In particular, it allows the distinction
between significant signal and background, and separation of regional tendencies from local
perturbations (e.g. competency-induced cleavage refraction, or granitic intrusions). Principles of the
method are described in detail in the Appendix, and only the results of the analysis are given here.
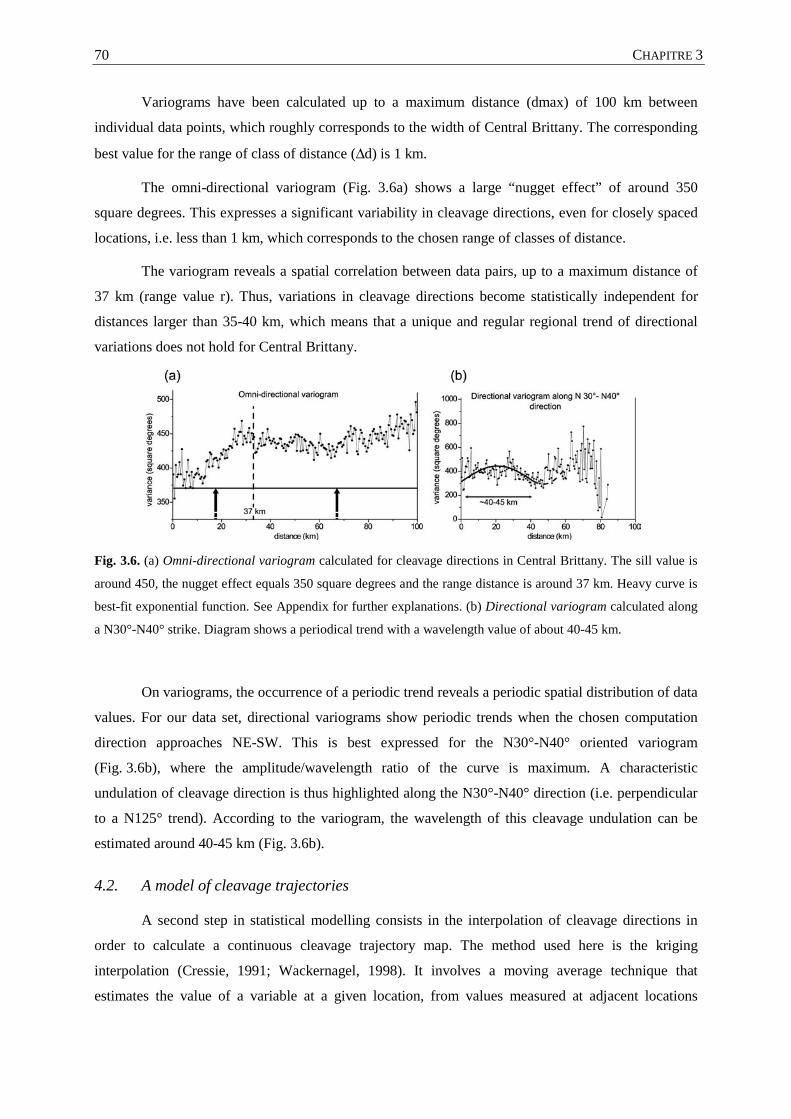
CHAPITRE 3 70
Variograms have been calculated up to a maximum distance (dmax) of 100 km between
individual data points, which roughly corresponds to the width of Central Brittany. The corresponding
best value for the range of class of distance (∆d) is 1 km.
The omni-directional variogram (Fig. 3.6a) shows a large “nugget effect” of around 350
square degrees. This expresses a significant variability in cleavage directions, even for closely spaced
locations, i.e. less than 1 km, which corresponds to the chosen range of classes of distance.
The variogram reveals a spatial correlation between data pairs, up to a maximum distance of
37 km (range value r). Thus, variations in cleavage directions become statistically independent for
distances larger than 35-40 km, which means that a unique and regular regional trend of directional
variations does not hold for Central Brittany.
Fig. 3.6. (a) Omni-directional variogram calculated for cleavage directions in Central Brittany. The sill value is
around 450, the nugget effect equals 350 square degrees and the range distance is around 37 km. Heavy curve is
best-fit exponential function. See Appendix for further explanations. (b) Directional variogram calculated along
a N30°-N40° strike. Diagram shows a periodical trend with a wavelength value of about 40-45 km.
On variograms, the occurrence of a periodic trend reveals a periodic spatial distribution of data
values. For our data set, directional variograms show periodic trends when the chosen computation
direction approaches NE-SW. This is best expressed for the N30°-N40° oriented variogram
(Fig. 3.6b), where the amplitude/wavelength ratio of the curve is maximum. A characteristic
undulation of cleavage direction is thus highlighted along the N30°-N40° direction (i.e. perpendicular
to a N125° trend). According to the variogram, the wavelength of this cleavage undulation can be
estimated around 40-45 km (Fig. 3.6b).
4.2. A model of cleavage trajectories
A second step in statistical modelling consists in the interpolation of cleavage directions in
order to calculate a continuous cleavage trajectory map. The method used here is the kriging
interpolation (Cressie, 1991; Wackernagel, 1998). It involves a moving average technique that
estimates the value of a variable at a given location, from values measured at adjacent locations
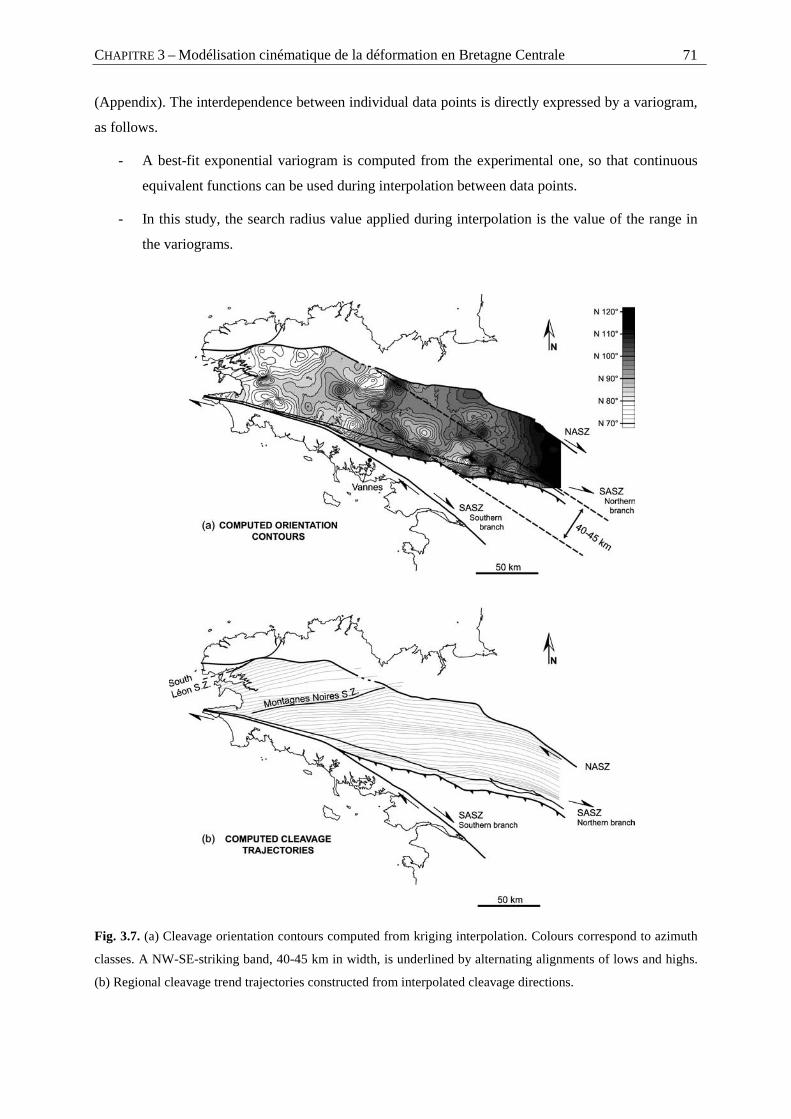
CHAPITRE 3 – Modélisation cinématique de la déformation en Bretagne Centrale 71
(Appendix). The interdependence between individual data points is directly expressed by a variogram,
as follows.
- A best-fit exponential variogram is computed from the experimental one, so that continuous
equivalent functions can be used during interpolation between data points.
- In this study, the search radius value applied during interpolation is the value of the range in
the variograms.
Fig. 3.7. (a) Cleavage orientation contours computed from kriging interpolation. Colours correspond to azimuth
classes. A NW-SE-striking band, 40-45 km in width, is underlined by alternating alignments of lows and highs.
(b) Regional cleavage trend trajectories constructed from interpolated cleavage directions.
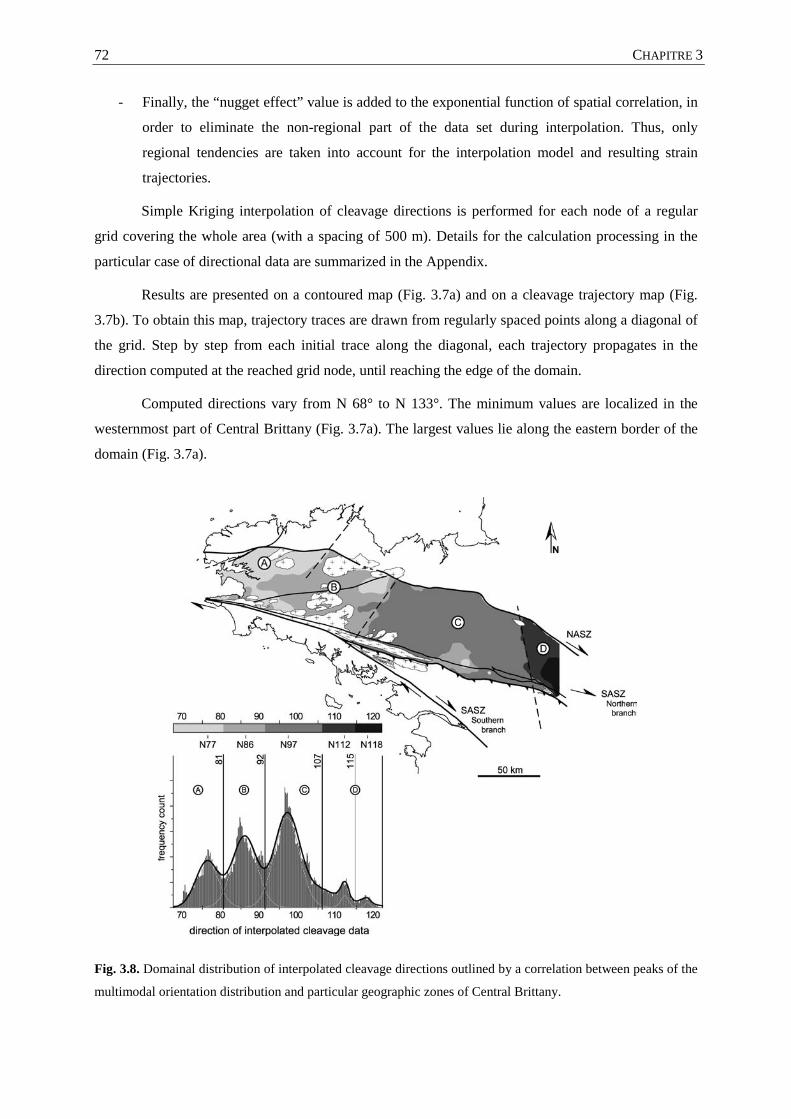
CHAPITRE 3 72
- Finally, the “nugget effect” value is added to the exponential function of spatial correlation, in
order to eliminate the non-regional part of the data set during interpolation. Thus, only
regional tendencies are taken into account for the interpolation model and resulting strain
trajectories.
Simple Kriging interpolation of cleavage directions is performed for each node of a regular
grid covering the whole area (with a spacing of 500 m). Details for the calculation processing in the
particular case of directional data are summarized in the Appendix.
Results are presented on a contoured map (Fig. 3.7a) and on a cleavage trajectory map (Fig.
3.7b). To obtain this map, trajectory traces are drawn from regularly spaced points along a diagonal of
the grid. Step by step from each initial trace along the diagonal, each trajectory propagates in the
direction computed at the reached grid node, until reaching the edge of the domain.
Computed directions vary from N 68° to N 133°. The minimum values are localized in the
westernmost part of Central Brittany (Fig. 3.7a). The largest values lie along the eastern border of the
domain (Fig. 3.7a).
Fig. 3.8. Domainal distribution of interpolated cleavage directions outlined by a correlation between peaks of the
multimodal orientation distribution and particular geographic zones of Central Brittany.
CHAPITRE 3 – Modélisation cinématique de la déformation en Bretagne Centrale 73
With the technique used, the maximum range of interpolated values is much less than that of
the initial directional data (compare histograms on Figs. 3.3 and 3.8). In addition, computed
trajectories can be significantly oblique with respect to local neighbouring original data. This is for
example observed around granites or along main shear zones (e.g. Montagnes Noires) (compare Figs.
3.3 and 3.7b). This illustrates the fact that the rather high value of the “nugget effect” is taken into
account during interpolation, leading to substantial filtering of the data in order to image regional
trends.
4.3. Domainal distribution of cleavage directions
Lateral variations of the mean regional cleavage trend are clearly seen on the trajectory map.
A general increase in cleavage azimuth values occurs from west to east. This feature was already
noted by previous authors for cleavage attitudes (Barbotin 1987), as well as for major structures
(Gapais 1980). However, considering the contoured map (Fig. 3.7a), the variations in cleavage
direction do not seem very continuous, but rather organized into domains separated by tightened
direction contours.
In order to detect and characterize possible domains of cleavage preferred orientation, a
frequency counting has been calculated for the values of all the nodes of the computed grid (Fig. 3.7a).
The histogram shows a multi-modal distribution with three well-marked maxima (N 77°, N 86° and N
97°), and two secondary ones for highest direction values (N 112° and N 118°) (Fig. 3.8). From this,
we infer that direction variations are not continuous across the area. Best-fit Gaussian functions are
reported on the histogram and cutting values are deduced from local lows on the multi-peak Gaussian
curve (vertical lines crossing the diagram, Fig. 3.8). These values are then used to separate the
corresponding zones on the trajectory map (Fig. 3.8). The organization of spatial variations in large
and continuous area confirms the presence of different domains. Domain boundaries actually match
zones of high gradients on the interpolated directional map (Fig. 3.7a). After merging the two
easternmost zones associated with the lowest maxima, four main domains are recognized in Central
Brittany (Fig. 3.8), as follows.
- To the west, domain A lies south of the Léon metamorphic block (Fig. 3.1). In this domain,
the cleavage strikes dominantly parallel to the South Léon Shear Zone (Fig. 3.7b) that
separates the Léon block from western Central Brittany.
- Domain B comprises the Châteaulin Carboniferous basin and most of the Hercynian granites
(Fig. 3.8; see also Fig. 3.2). The mean cleavage direction is sub-parallel to the N80°-N 85°
striking Montagnes Noires Shear Zone (Fig. 3.7b).
- Domain C is the widest domain. It includes most of eastern Central Brittany, where lithologies
are essentially folded Brioverian and pre-Carboniferous Palaeozoic sediments (Fig. 3.2). In
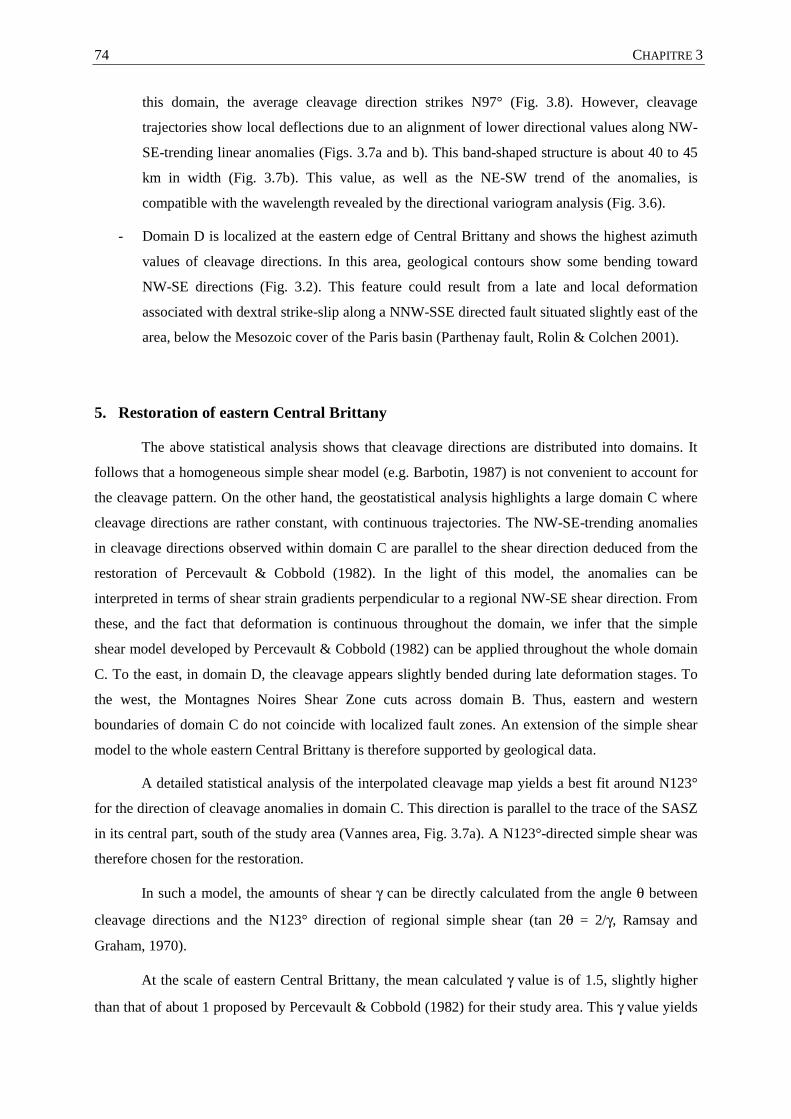
CHAPITRE 3 74
this domain, the average cleavage direction strikes N97° (Fig. 3.8). However, cleavage
trajectories show local deflections due to an alignment of lower directional values along NW-
SE-trending linear anomalies (Figs. 3.7a and b). This band-shaped structure is about 40 to 45
km in width (Fig. 3.7b). This value, as well as the NE-SW trend of the anomalies, is
compatible with the wavelength revealed by the directional variogram analysis (Fig. 3.6).
- Domain D is localized at the eastern edge of Central Brittany and shows the highest azimuth
values of cleavage directions. In this area, geological contours show some bending toward
NW-SE directions (Fig. 3.2). This feature could result from a late and local deformation
associated with dextral strike-slip along a NNW-SSE directed fault situated slightly east of the
area, below the Mesozoic cover of the Paris basin (Parthenay fault, Rolin & Colchen 2001).
5. Restoration of eastern Central Brittany
The above statistical analysis shows that cleavage directions are distributed into domains. It
follows that a homogeneous simple shear model (e.g. Barbotin, 1987) is not convenient to account for
the cleavage pattern. On the other hand, the geostatistical analysis highlights a large domain C where
cleavage directions are rather constant, with continuous trajectories. The NW-SE-trending anomalies
in cleavage directions observed within domain C are parallel to the shear direction deduced from the
restoration of Percevault & Cobbold (1982). In the light of this model, the anomalies can be
interpreted in terms of shear strain gradients perpendicular to a regional NW-SE shear direction. From
these, and the fact that deformation is continuous throughout the domain, we infer that the simple
shear model developed by Percevault & Cobbold (1982) can be applied throughout the whole domain
C. To the east, in domain D, the cleavage appears slightly bended during late deformation stages. To
the west, the Montagnes Noires Shear Zone cuts across domain B. Thus, eastern and western
boundaries of domain C do not coincide with localized fault zones. An extension of the simple shear
model to the whole eastern Central Brittany is therefore supported by geological data.
A detailed statistical analysis of the interpolated cleavage map yields a best fit around N123°
for the direction of cleavage anomalies in domain C. This direction is parallel to the trace of the SASZ
in its central part, south of the study area (Vannes area, Fig. 3.7a). A N123°-directed simple shear was
therefore chosen for the restoration.
In such a model, the amounts of shear γ can be directly calculated from the angle θ between
cleavage directions and the N123° direction of regional simple shear (tan 2θ = 2/γ, Ramsay and
Graham, 1970).
At the scale of eastern Central Brittany, the mean calculated γ value is of 1.5, slightly higher
than that of about 1 proposed by Percevault & Cobbold (1982) for their study area. This γ value yields
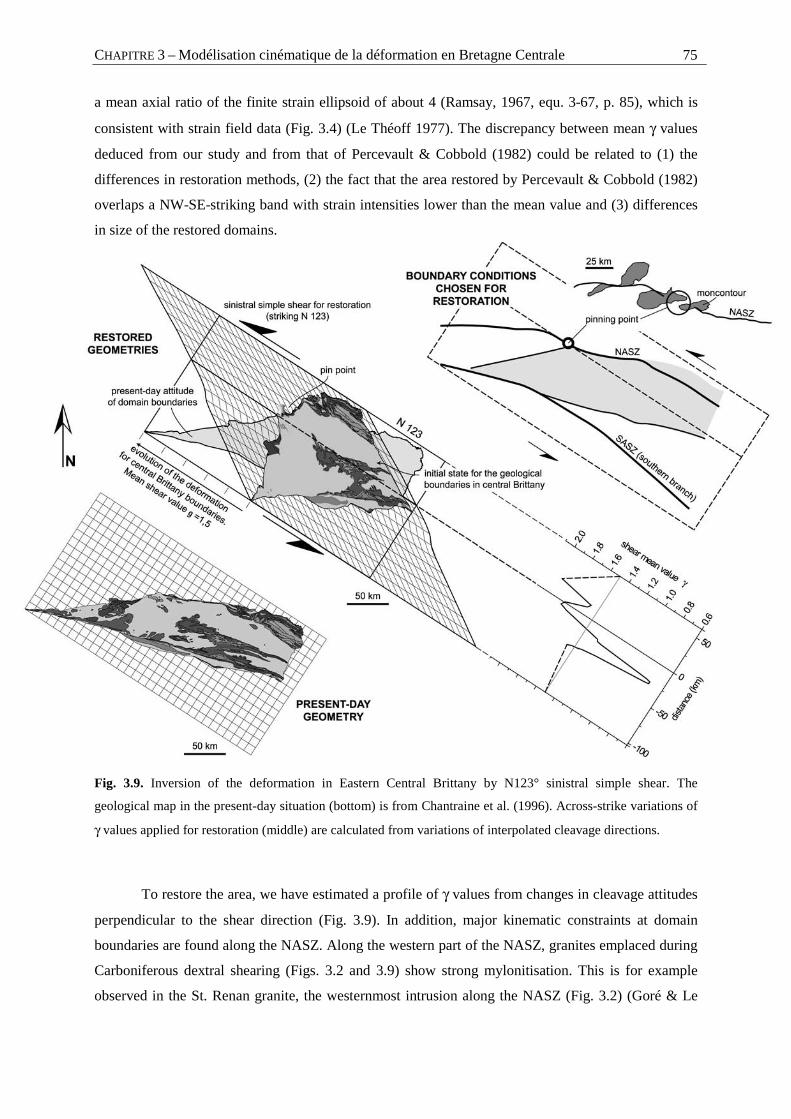
CHAPITRE 3 – Modélisation cinématique de la déformation en Bretagne Centrale 75
a mean axial ratio of the finite strain ellipsoid of about 4 (Ramsay, 1967, equ. 3-67, p. 85), which is
consistent with strain field data (Fig. 3.4) (Le Théoff 1977). The discrepancy between mean γ values
deduced from our study and from that of Percevault & Cobbold (1982) could be related to (1) the
differences in restoration methods, (2) the fact that the area restored by Percevault & Cobbold (1982)
overlaps a NW-SE-striking band with strain intensities lower than the mean value and (3) differences
in size of the restored domains.
Fig. 3.9. Inversion of the deformation in Eastern Central Brittany by N123° sinistral simple shear. The
geological map in the present-day situation (bottom) is from Chantraine et al. (1996). Across-strike variations of
γ values applied for restoration (middle) are calculated from variations of interpolated cleavage directions.
To restore the area, we have estimated a profile of γ values from changes in cleavage attitudes
perpendicular to the shear direction (Fig. 3.9). In addition, major kinematic constraints at domain
boundaries are found along the NASZ. Along the western part of the NASZ, granites emplaced during
Carboniferous dextral shearing (Figs. 3.2 and 3.9) show strong mylonitisation. This is for example
observed in the St. Renan granite, the westernmost intrusion along the NASZ (Fig. 3.2) (Goré & Le
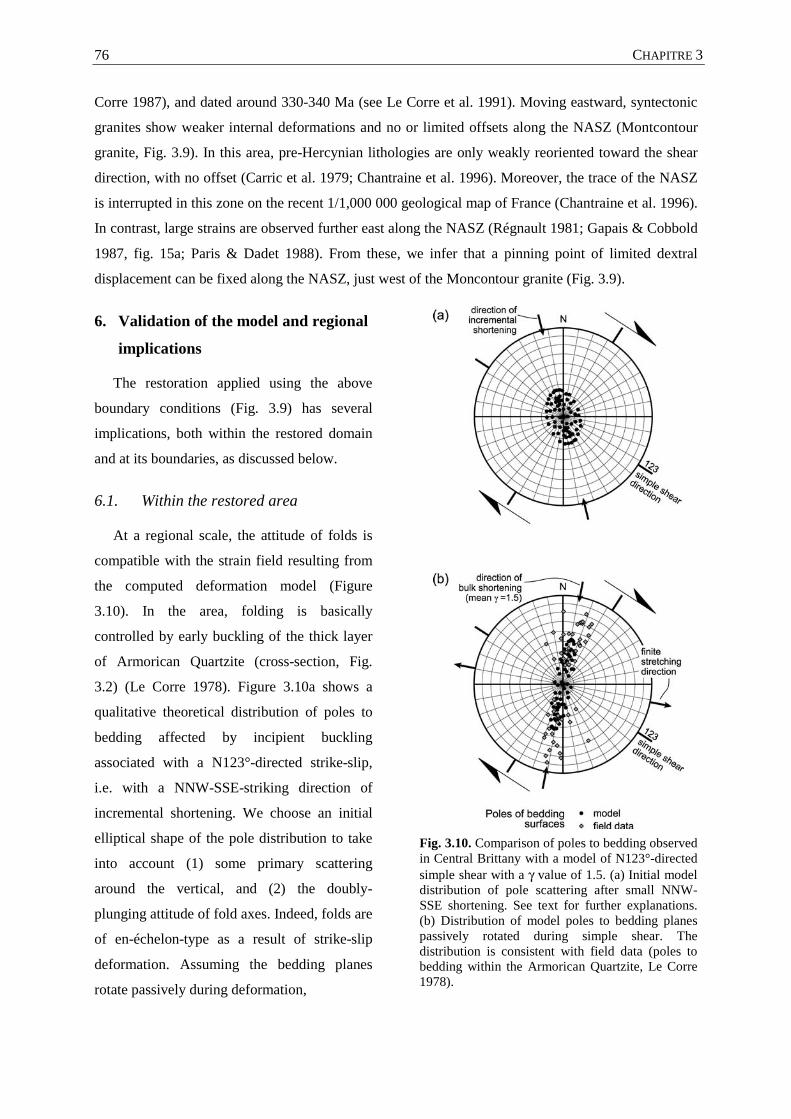
CHAPITRE 3 76
Corre 1987), and dated around 330-340 Ma (see Le Corre et al. 1991). Moving eastward, syntectonic
granites show weaker internal deformations and no or limited offsets along the NASZ (Montcontour
granite, Fig. 3.9). In this area, pre-Hercynian lithologies are only weakly reoriented toward the shear
direction, with no offset (Carric et al. 1979; Chantraine et al. 1996). Moreover, the trace of the NASZ
is interrupted in this zone on the recent 1/1,000 000 geological map of France (Chantraine et al. 1996).
In contrast, large strains are observed further east along the NASZ (Régnault 1981; Gapais & Cobbold
1987, fig. 15a; Paris & Dadet 1988). From these, we infer that a pinning point of limited dextral
displacement can be fixed along the NASZ, just west of the Moncontour granite (Fig. 3.9).
6. Validation of the model and regional
implications
The restoration applied using the above
boundary conditions (Fig. 3.9) has several
implications, both within the restored domain
and at its boundaries, as discussed below.
6.1. Within the restored area
At a regional scale, the attitude of folds is
compatible with the strain field resulting from
the computed deformation model (Figure
3.10). In the area, folding is basically
controlled by early buckling of the thick layer
of Armorican Quartzite (cross-section, Fig.
3.2) (Le Corre 1978). Figure 3.10a shows a
qualitative theoretical distribution of poles to
bedding affected by incipient buckling
associated with a N123°-directed strike-slip,
i.e. with a NNW-SSE-striking direction of
incremental shortening. We choose an initial
elliptical shape of the pole distribution to take
into account (1) some primary scattering
around the vertical, and (2) the doubly-
plunging attitude of fold axes. Indeed, folds are
of en-échelon-type as a result of strike-slip
deformation. Assuming the bedding planes
rotate passively during deformation,
Fig. 3.10. Comparison of poles to bedding observed in Central Brittany with a model of N123°-directed simple shear with a γ value of 1.5. (a) Initial model distribution of pole scattering after small NNW-SSE shortening. See text for further explanations. (b) Distribution of model poles to bedding planes passively rotated during simple shear. The distribution is consistent with field data (poles to bedding within the Armorican Quartzite, Le Corre 1978).
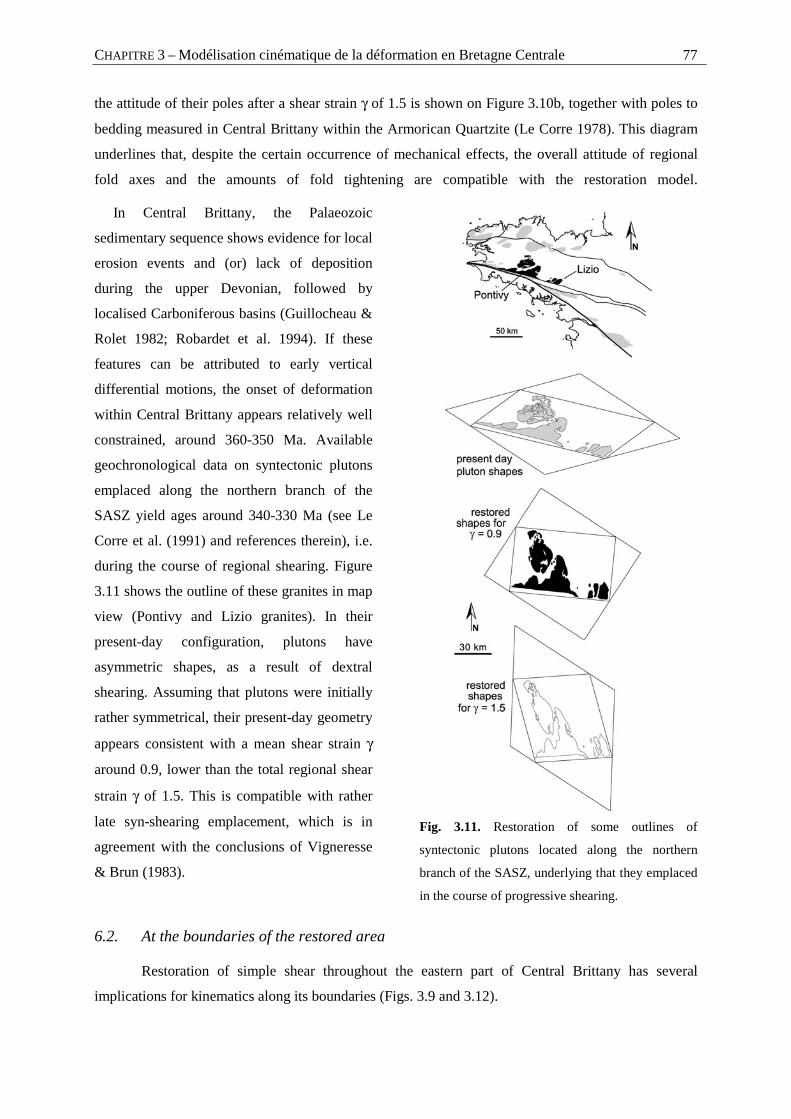
CHAPITRE 3 – Modélisation cinématique de la déformation en Bretagne Centrale 77
the attitude of their poles after a shear strain γ of 1.5 is shown on Figure 3.10b, together with poles to
bedding measured in Central Brittany within the Armorican Quartzite (Le Corre 1978). This diagram
underlines that, despite the certain occurrence of mechanical effects, the overall attitude of regional
fold axes and the amounts of fold tightening are compatible with the restoration model.
In Central Brittany, the Palaeozoic
sedimentary sequence shows evidence for local
erosion events and (or) lack of deposition
during the upper Devonian, followed by
localised Carboniferous basins (Guillocheau &
Rolet 1982; Robardet et al. 1994). If these
features can be attributed to early vertical
differential motions, the onset of deformation
within Central Brittany appears relatively well
constrained, around 360-350 Ma. Available
geochronological data on syntectonic plutons
emplaced along the northern branch of the
SASZ yield ages around 340-330 Ma (see Le
Corre et al. (1991) and references therein), i.e.
during the course of regional shearing. Figure
3.11 shows the outline of these granites in map
view (Pontivy and Lizio granites). In their
present-day configuration, plutons have
asymmetric shapes, as a result of dextral
shearing. Assuming that plutons were initially
rather symmetrical, their present-day geometry
appears consistent with a mean shear strain γ
around 0.9, lower than the total regional shear
strain γ of 1.5. This is compatible with rather
late syn-shearing emplacement, which is in
agreement with the conclusions of Vigneresse
& Brun (1983).
Fig. 3.11. Restoration of some outlines of
syntectonic plutons located along the northern
branch of the SASZ, underlying that they emplaced
in the course of progressive shearing.
6.2. At the boundaries of the restored area
Restoration of simple shear throughout the eastern part of Central Brittany has several
implications for kinematics along its boundaries (Figs. 3.9 and 3.12).
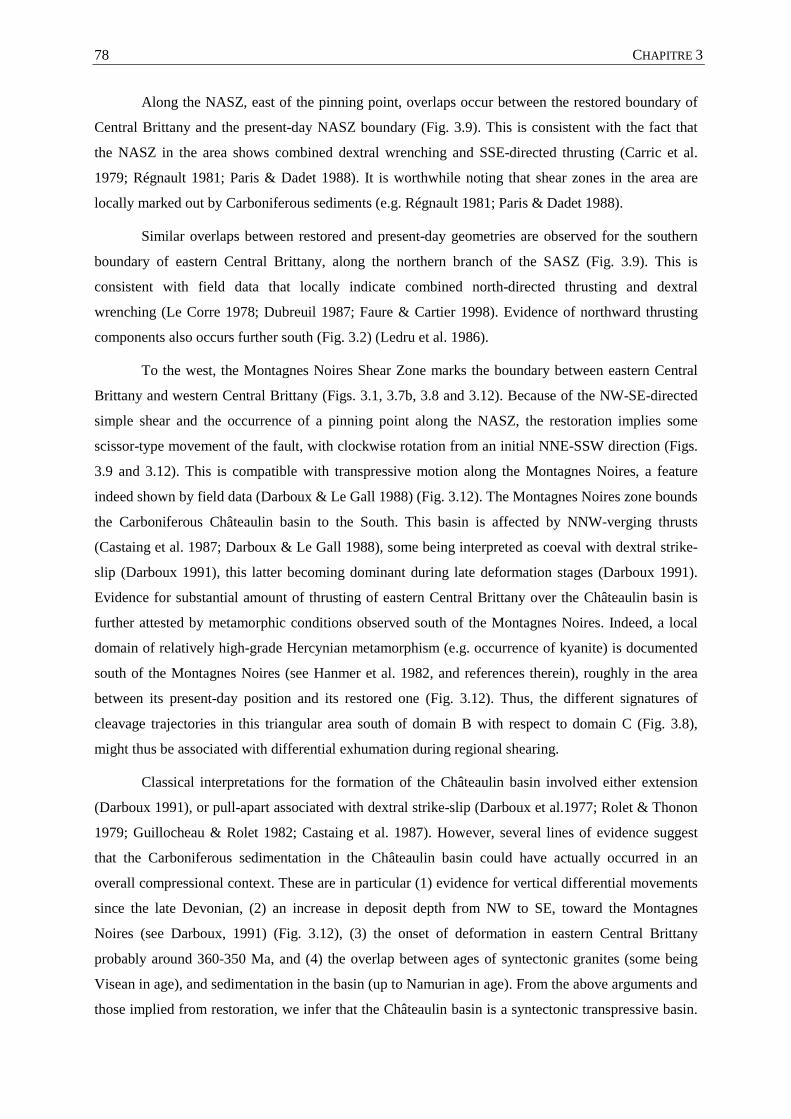
CHAPITRE 3 78
Along the NASZ, east of the pinning point, overlaps occur between the restored boundary of
Central Brittany and the present-day NASZ boundary (Fig. 3.9). This is consistent with the fact that
the NASZ in the area shows combined dextral wrenching and SSE-directed thrusting (Carric et al.
1979; Régnault 1981; Paris & Dadet 1988). It is worthwhile noting that shear zones in the area are
locally marked out by Carboniferous sediments (e.g. Régnault 1981; Paris & Dadet 1988).
Similar overlaps between restored and present-day geometries are observed for the southern
boundary of eastern Central Brittany, along the northern branch of the SASZ (Fig. 3.9). This is
consistent with field data that locally indicate combined north-directed thrusting and dextral
wrenching (Le Corre 1978; Dubreuil 1987; Faure & Cartier 1998). Evidence of northward thrusting
components also occurs further south (Fig. 3.2) (Ledru et al. 1986).
To the west, the Montagnes Noires Shear Zone marks the boundary between eastern Central
Brittany and western Central Brittany (Figs. 3.1, 3.7b, 3.8 and 3.12). Because of the NW-SE-directed
simple shear and the occurrence of a pinning point along the NASZ, the restoration implies some
scissor-type movement of the fault, with clockwise rotation from an initial NNE-SSW direction (Figs.
3.9 and 3.12). This is compatible with transpressive motion along the Montagnes Noires, a feature
indeed shown by field data (Darboux & Le Gall 1988) (Fig. 3.12). The Montagnes Noires zone bounds
the Carboniferous Châteaulin basin to the South. This basin is affected by NNW-verging thrusts
(Castaing et al. 1987; Darboux & Le Gall 1988), some being interpreted as coeval with dextral strike-
slip (Darboux 1991), this latter becoming dominant during late deformation stages (Darboux 1991).
Evidence for substantial amount of thrusting of eastern Central Brittany over the Châteaulin basin is
further attested by metamorphic conditions observed south of the Montagnes Noires. Indeed, a local
domain of relatively high-grade Hercynian metamorphism (e.g. occurrence of kyanite) is documented
south of the Montagnes Noires (see Hanmer et al. 1982, and references therein), roughly in the area
between its present-day position and its restored one (Fig. 3.12). Thus, the different signatures of
cleavage trajectories in this triangular area south of domain B with respect to domain C (Fig. 3.8),
might thus be associated with differential exhumation during regional shearing.
Classical interpretations for the formation of the Châteaulin basin involved either extension
(Darboux 1991), or pull-apart associated with dextral strike-slip (Darboux et al.1977; Rolet & Thonon
1979; Guillocheau & Rolet 1982; Castaing et al. 1987). However, several lines of evidence suggest
that the Carboniferous sedimentation in the Châteaulin basin could have actually occurred in an
overall compressional context. These are in particular (1) evidence for vertical differential movements
since the late Devonian, (2) an increase in deposit depth from NW to SE, toward the Montagnes
Noires (see Darboux, 1991) (Fig. 3.12), (3) the onset of deformation in eastern Central Brittany
probably around 360-350 Ma, and (4) the overlap between ages of syntectonic granites (some being
Visean in age), and sedimentation in the basin (up to Namurian in age). From the above arguments and
those implied from restoration, we infer that the Châteaulin basin is a syntectonic transpressive basin.
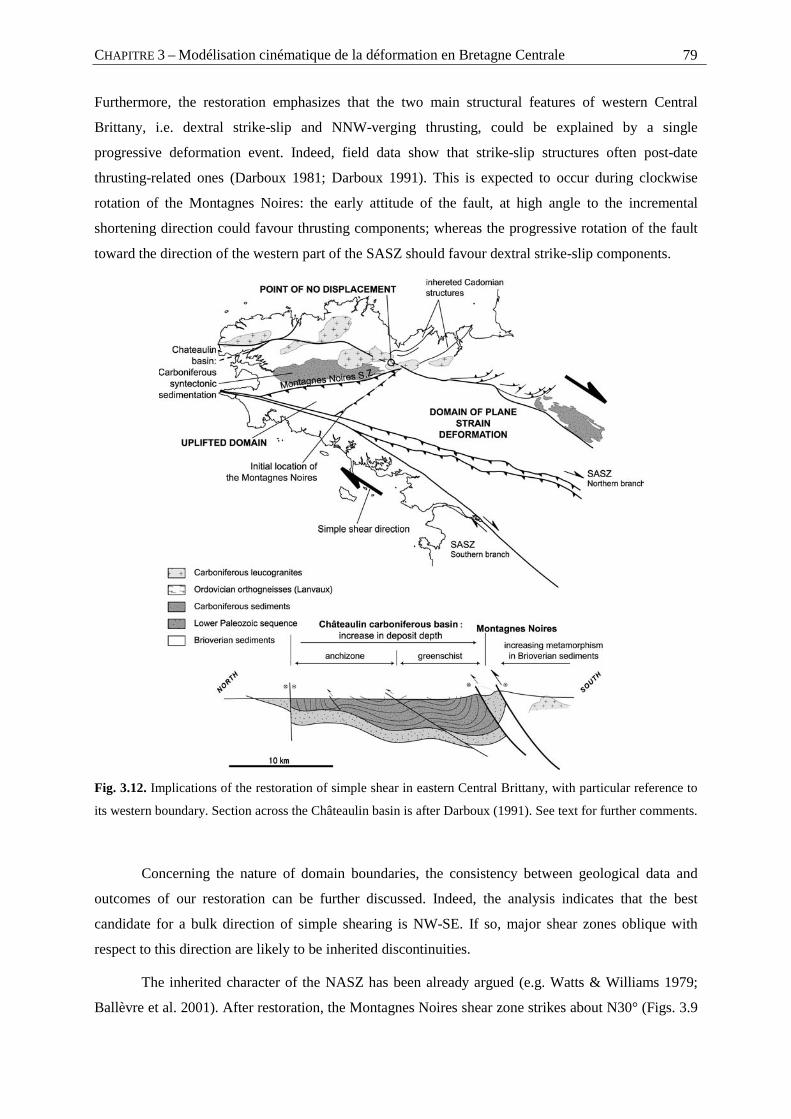
CHAPITRE 3 – Modélisation cinématique de la déformation en Bretagne Centrale 79
Furthermore, the restoration emphasizes that the two main structural features of western Central
Brittany, i.e. dextral strike-slip and NNW-verging thrusting, could be explained by a single
progressive deformation event. Indeed, field data show that strike-slip structures often post-date
thrusting-related ones (Darboux 1981; Darboux 1991). This is expected to occur during clockwise
rotation of the Montagnes Noires: the early attitude of the fault, at high angle to the incremental
shortening direction could favour thrusting components; whereas the progressive rotation of the fault
toward the direction of the western part of the SASZ should favour dextral strike-slip components.
Fig. 3.12. Implications of the restoration of simple shear in eastern Central Brittany, with particular reference to
its western boundary. Section across the Châteaulin basin is after Darboux (1991). See text for further comments.
Concerning the nature of domain boundaries, the consistency between geological data and
outcomes of our restoration can be further discussed. Indeed, the analysis indicates that the best
candidate for a bulk direction of simple shearing is NW-SE. If so, major shear zones oblique with
respect to this direction are likely to be inherited discontinuities.
The inherited character of the NASZ has been already argued (e.g. Watts & Williams 1979;
Ballèvre et al. 2001). After restoration, the Montagnes Noires shear zone strikes about N30° (Figs. 3.9
CHAPITRE 3 80
and 12). This direction joins that of major shear zones of Cadomian age located in the Cadomian
domain of North Brittany (Figs. 3.9 and 3.12) (see Brun et al. 2001). Concerning the northern branch
of the SASZ, the fact that it is marked out by the pre-collision Lanvaux granite argues for a pre-
Hercynian discontinuity. More generally, I-type granitic intrusions, which imply substantial mantle
contributions, occur along and (or) at the vicinity of the eastern part of the SASZ (e.g. Moëlan
orthogneiss), of the Montagnes Noires Shear Zone (e.g. Rostrenen Massif), and of the NASZ (e.g.
Huelgoat Massif).
Implications of our restoration can be further extended to the southern branch of the SASZ. Its
western segment is part of the northern branch, as shown by its EW orientation. Its south-eastern part,
which strikes N130°-N140°, is locally outlined by eclogitic rocks (Fig. 3.1) (Godard 2001), and is a
good candidate to represent a preserved remnant of a major suture zone (Colchen & Rolin 2001). The
segment linking the western and eastern parts of the shear zone, which strikes N120°-N125° (Figs. 3.1
and 3.12), is likely to result from strain localization associated with the reactivation of earlier fault
segments during Carboniferous N123°-directed dextral shearing.
7. Conclusions
The above study leads to the following conclusions
1. The geostatistical method used can be powerful for the analysis of structural data. In the
example studied, the method allowed us to separate local and far-field features, and thus to
extract a regional signal from the set of available orientation data.
2. The interpolation method used further allowed us to compute cleavage trajectories and to
provide constraints for the restoration model of Central Brittany.
3. In particular, the method showed that Central Brittany was marked by a domainal
distribution of cleavage directions, and that therefore a unique restoration model could not
be applied to the entire area.
4. It further showed that deformations in eastern Central Brittany could be interpreted in
terms of regional dextral simple shear, moderately heterogeneous, along a N120°-N125°
direction, and with a mean γ of 1.5. This is consistent with the previous restoration model
performed by Percevault & Cobbold (1982). The simple shear model argued by these
authors on a restricted area can thus be extended to a large part of Central Brittany.
5. Kinematic implications of the restoration model within and around the restored area are
validated by field data, and bring substantial light on their tectonic interpretation.
6. According to the restoration model, major shear zones oblique to the regional shear
direction (Montagnes Noires Shear Zone, northern branch of the SASZ, NASZ) should
show thrust components, as indeed indicated by field data.
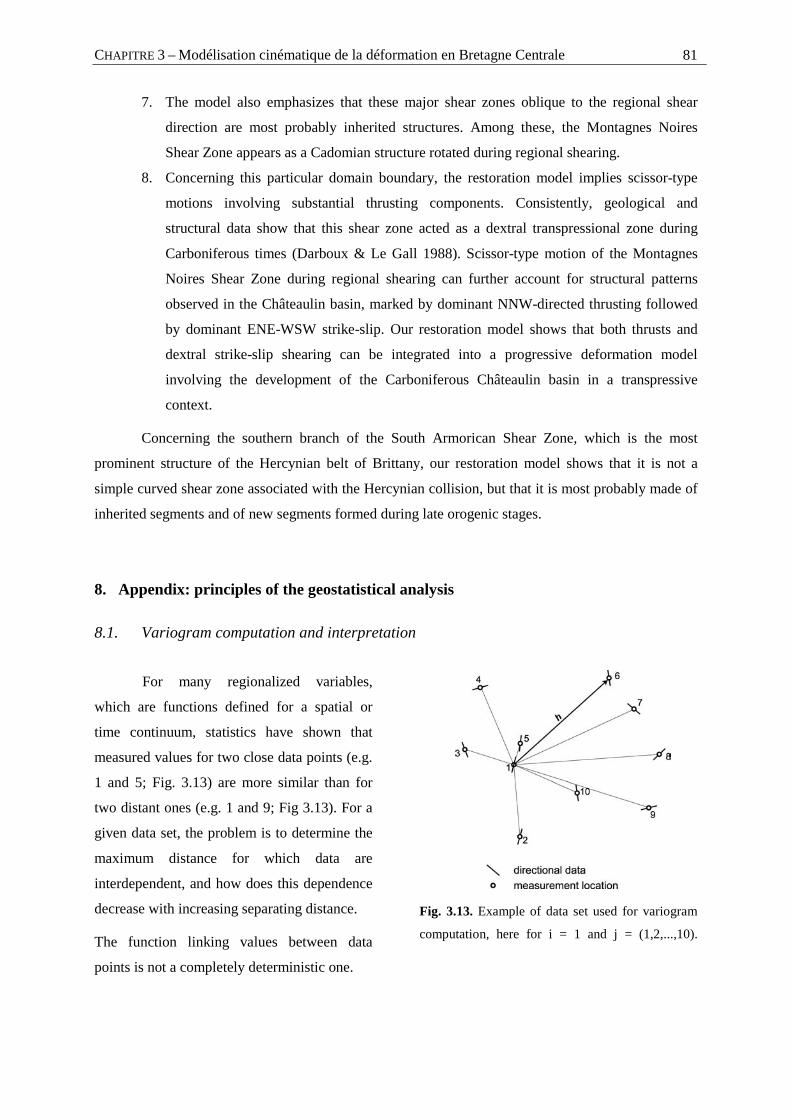
CHAPITRE 3 – Modélisation cinématique de la déformation en Bretagne Centrale 81
7. The model also emphasizes that these major shear zones oblique to the regional shear
direction are most probably inherited structures. Among these, the Montagnes Noires
Shear Zone appears as a Cadomian structure rotated during regional shearing.
8. Concerning this particular domain boundary, the restoration model implies scissor-type
motions involving substantial thrusting components. Consistently, geological and
structural data show that this shear zone acted as a dextral transpressional zone during
Carboniferous times (Darboux & Le Gall 1988). Scissor-type motion of the Montagnes
Noires Shear Zone during regional shearing can further account for structural patterns
observed in the Châteaulin basin, marked by dominant NNW-directed thrusting followed
by dominant ENE-WSW strike-slip. Our restoration model shows that both thrusts and
dextral strike-slip shearing can be integrated into a progressive deformation model
involving the development of the Carboniferous Châteaulin basin in a transpressive
context.
Concerning the southern branch of the South Armorican Shear Zone, which is the most
prominent structure of the Hercynian belt of Brittany, our restoration model shows that it is not a
simple curved shear zone associated with the Hercynian collision, but that it is most probably made of
inherited segments and of new segments formed during late orogenic stages.
8. Appendix: principles of the geostatistical analysis
8.1. Variogram computation and interpretation
For many regionalized variables,
which are functions defined for a spatial or
time continuum, statistics have shown that
measured values for two close data points (e.g.
1 and 5; Fig. 3.13) are more similar than for
two distant ones (e.g. 1 and 9; Fig 3.13). For a
given data set, the problem is to determine the
maximum distance for which data are
interdependent, and how does this dependence
decrease with increasing separating distance.
The function linking values between data
points is not a completely deterministic one.
Fig. 3.13. Example of data set used for variogram
computation, here for i = 1 and j = (1,2,...,10).
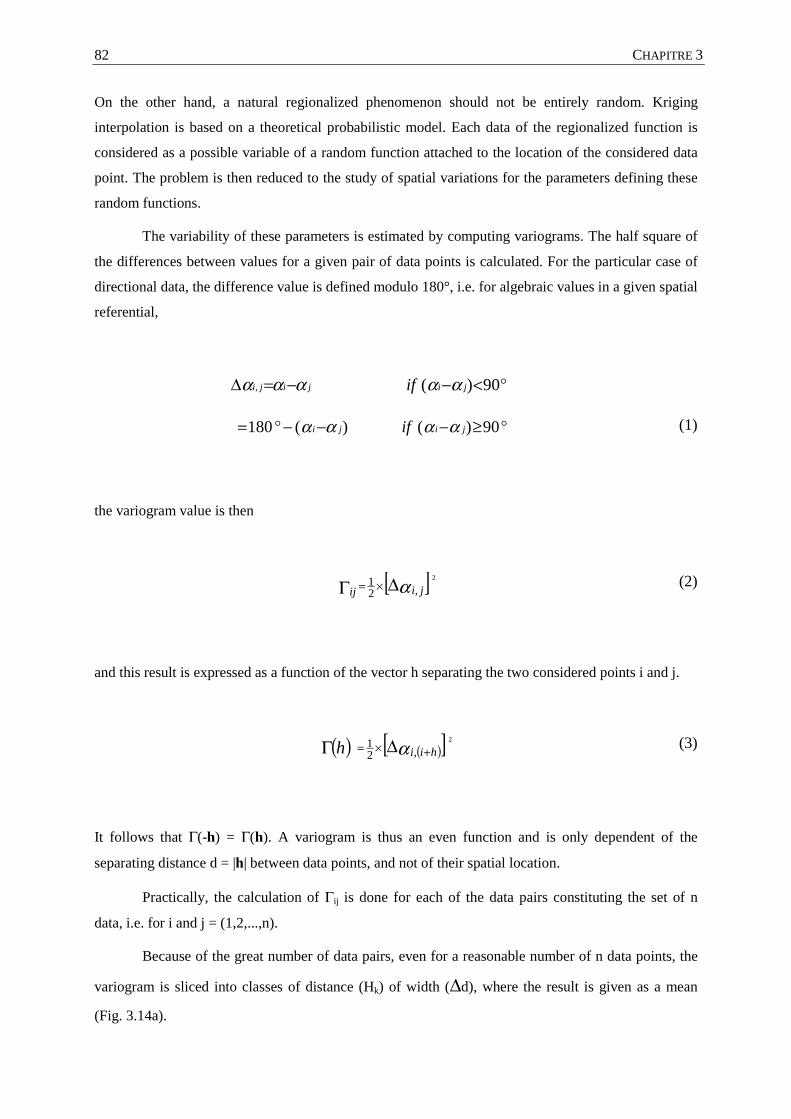
CHAPITRE 3 82
On the other hand, a natural regionalized phenomenon should not be entirely random. Kriging
interpolation is based on a theoretical probabilistic model. Each data of the regionalized function is
considered as a possible variable of a random function attached to the location of the considered data
point. The problem is then reduced to the study of spatial variations for the parameters defining these
random functions.
The variability of these parameters is estimated by computing variograms. The half square of
the differences between values for a given pair of data points is calculated. For the particular case of
directional data, the difference value is defined modulo 180°, i.e. for algebraic values in a given spatial
referential,
°<−−=∆ 90)(, jijiji if ααααα
°≥−−−°= 90)()(180 jiji if αααα (1)
the variogram value is then
[ ]α jiij ,21 2∆Γ ×= (2)
and this result is expressed as a function of the vector h separating the two considered points i and j.
( ) ( )[ ]α hiih +×= ∆Γ ,21 2 (3)
It follows that Γ(-h) = Γ(h). A variogram is thus an even function and is only dependent of the
separating distance d = |h| between data points, and not of their spatial location.
Practically, the calculation of Γij is done for each of the data pairs constituting the set of n
data, i.e. for i and j = (1,2,...,n).
Because of the great number of data pairs, even for a reasonable number of n data points, the
variogram is sliced into classes of distance (Hk) of width (∆d), where the result is given as a mean
(Fig. 3.14a).
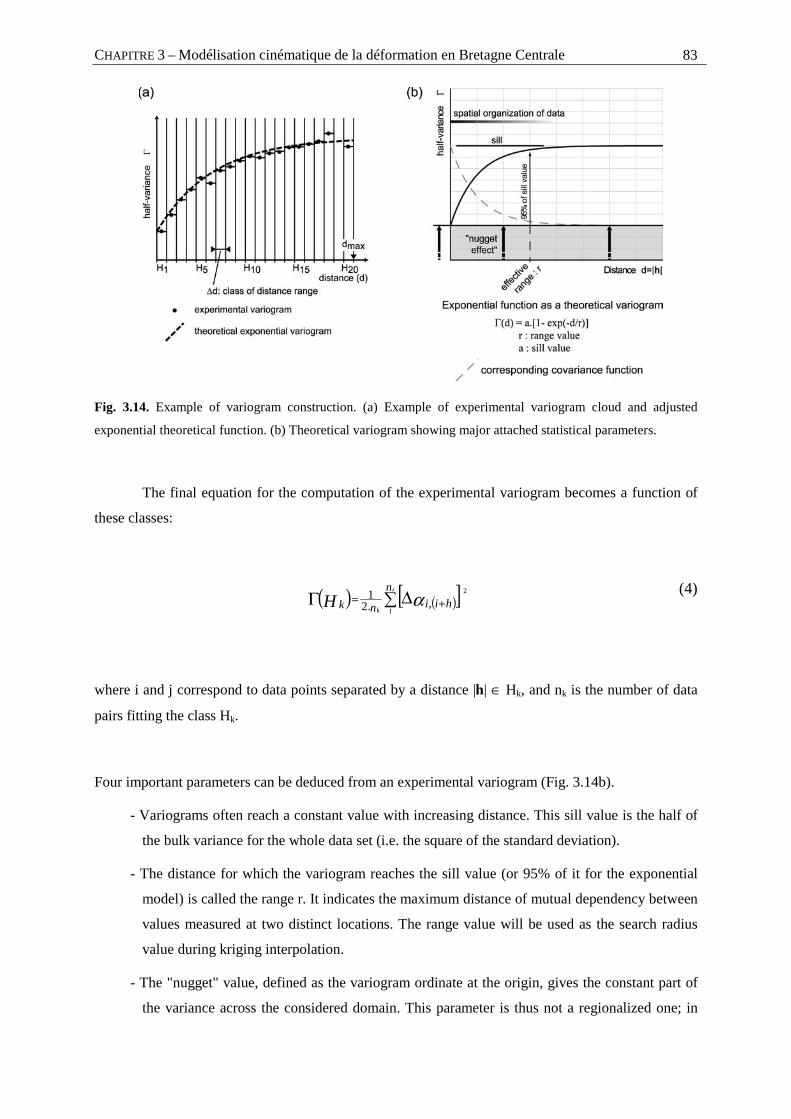
CHAPITRE 3 – Modélisation cinématique de la déformation en Bretagne Centrale 83
Fig. 3.14. Example of variogram construction. (a) Example of experimental variogram cloud and adjusted
exponential theoretical function. (b) Theoretical variogram showing major attached statistical parameters.
The final equation for the computation of the experimental variogram becomes a function of
these classes:
( ) ( )[ ]∑ ∆Γ +=n
hiinkk
kH
1
2
,.21 α
(4)
where i and j correspond to data points separated by a distance |h| ∈ Hk, and nk is the number of data
pairs fitting the class Hk.
Four important parameters can be deduced from an experimental variogram (Fig. 3.14b).
- Variograms often reach a constant value with increasing distance. This sill value is the half of
the bulk variance for the whole data set (i.e. the square of the standard deviation).
- The distance for which the variogram reaches the sill value (or 95% of it for the exponential
model) is called the range r. It indicates the maximum distance of mutual dependency between
values measured at two distinct locations. The range value will be used as the search radius
value during kriging interpolation.
- The "nugget" value, defined as the variogram ordinate at the origin, gives the constant part of
the variance across the considered domain. This parameter is thus not a regionalized one; in
CHAPITRE 3 84
the probabilistic model, it is considered as the purely random part of the random functions for
the entire space. With respect to data analysis, it can be considered as the error value,
including measurement and computation ones, or as very local effects, below the computation
resolution. This latter is equal to the distance class range value. For short distances, it is a
function of the minimum sampling distance in the data set.
- Finally, the trend of the variogram indicates the way how the similarity between data values
decrease with increasing distances. It can be fitted with a theoretical variogram function that is
classically chosen as exponential (present case), spherical, gaussian or power function (Fig.
3.14a). The corresponding theoretical covariance function will be used to determine the
weighting values to apply during kriging interpolation (Fig. 3.14b).
Regionalized variables can show different spatial distributions along different directions in the
considered space. To analyse such possible anisotropies, the variogram can be sliced into classes of
orientations relative to the vector h. During computation, only the data pairs for which the orientation
of the separating vector is included in the range of the considered class are retained for the variogram
calculation, as shown on Fig. 3.15. We obtain as many directional variograms as the number of
orientation classes, this number being chosen large enough to reveal the anisotropy, but not too large,
so that data pairs involved in the calculation are kept to a minimum.
8.2. Kriging interpolation of directional data via direction cosines
Directional data are particular because they
are circular variables, with a periodicity. Thus,
within a given referential frame, a direction
defined by an angle is expressed modulo 360°
(e.g. α = α ± 360°).
Because of this specificity, such variables
cannot be directly processed by standard
statistical techniques (e.g. direct mean
calculation). For statistical analysis, each data
can be considered as a unit vector
characterized by its direction cosines in the
chosen reference frame, each direction cosine
being defined as the vector coordinates along
each reference axis.
Fig. 3.15. Principle of data selection to compute an
oriented variogram.

CHAPITRE 3 – Modélisation cinématique de la déformation en Bretagne Centrale 85
Cleavage directions are expressed modulo 180° and therefore the use of direction cosines for
data treatment cannot be directly applied on azimuths defined, for example, from 0° to 180°. The
procedure is first to transform the data from a 180° range to a 360° range by doubling the algebraic
directional values. Then, these transformed data are treated in terms of direction cosines (Upton &
Fingleton 1989). Final results are obtained by halving the solutions for doubled values.
This computation technique must be used to interpolate between directional data. The kriging
interpolation of the direction cosines is individually performed, and the resulting calculated angles are
halved to obtain the final interpolated direction. This approach ensures the stability of the result,
especially around the reference direction, but also for a data set covering the entire 180° range of non-
oriented directions.
Acknoledgments
S. Treagus and R. Strachan are thanked for their constructive reviews.
CHAPITRE 3 86
References
BABIN, C., DARBOUX, J.R., DUÉE, G., GRAVELLE, P., MORZADEC, P., PLUSQUELLEC, Y. & THONON,
P. (1975) - "Tectoniques tangentielles et tectoniques superposées dans le Dévonien de la rade de
Brest (Nord-Finistère)." - Comptes Rendus de l'Académie des Sciences de Paris, D 280, 259-262.
BALLÈVRE, M., LE GOFF, E. & HÉBERT, R. (2001) - "The tectonothermal evolution of the Cadomian
belt of northern Brittany, France: a Neoproterozoic volcanic arc." - Tectonophysics, 331, 19-43.
BARBOTIN, E. (1987) - "Trajectoires de déformation finie et interprétation cinématique. Modèles
numériques et application à des exemples régionaux (Bretagne Centrale et Alpes Penniques)." -
Thèse, Université de Rennes 1, Rennes, 158 pp.
BARROIS, C. (1930) - "Les grandes lignes de la Bretagne." In: Livre Jubilaire. Centenaire de la Société
géologique de France. - Paris.
BERNARD-GRIFFITHS, J., PEUCAT, J.J., SHEPPART, S. & VIDAL, P. (1985) - "Petrogenesis of Hercynian
leucogranites from the southern Armorican Massif : contribution of REE and isotopic (Sr, Nb, Pb
and O) geochemical data to the study of source rock characteristics and ages." - Earth and
Planetary Science Letters, 74, 235-250.
BERTHÉ, D., CHOUKROUNE, P. & GAPAIS, D. (1979) - "Quartz Fabrics and Progressive Gneissification
of Granites By Simple Shear - Example of the South Armerican Shear Zone." - Bulletin de
Minéralogie, 102(2-3), 265-272.
BERTHÉ, D., CHOUKROUNE, P. & JÉGOUZO, P. (1979) - "Orthogneiss, mylonite and non coaxial
deformation of granites: the example of the South Armorican Shear Zone." - Journal of Structural
Geology, 1(1), 31-42.
BERTHÉ, D. & BRUN, J.P. (1980) - "Evolution of folds during progressive shear in the South-armorican
shear zone, France." - Journal of Structural Geology, 2, 127-133.
BOSSE, V., FERAUD, G., RUFFET, G., BALLÈVRE, M., PEUCAT, J.-J. & DE JONG, K. (2000) - "Late
Devonian subduction and early-orogenic exhumation of eclogite-facies rocks from the
Champtoceaux Complex (Variscan belt, France)." - Geological journal, 35, 297-325.
BOSSE, V., BALLÈVRE, M. & VIDAL, O. (2002) - "Ductile thrusting recorded by the garnet isograd
CHAPITRE 3 – Modélisation cinématique de la déformation en Bretagne Centrale 87
from the blueschist-facies metapelites of the Ile de Groix, Armorican Massif, France." - Journal of
Petrology, 43(3), 485-510.
BOUCHEZ, J.L. & BLAISE, J. (1976) - "Une structure hercynienne liée à un accident ductile : l'anticlinal
de Lanvaux - les-Ponts-de-Cé, aux environs d'Angers (massif Armoricain)." - Bulletin de la Société
Géologique de France, 18(1), 145-157.
BROWN, M. & DALLMEYER, R.D. (1996) - "Rapid Variscan exhumation and the role of magma in core
complex formation : southern Brittany metamorphic belt, France." - Journal of Metamorphic
Geology, 14, 361-379.
BRUN, J.P. (1981) - "Instabilités gravitaire et déformation de la croûte continentale : application au
développement des dômes et des plutons." - Thèse d'état, Université de Rennes 1, Rennes.
BRUN, J.P., GUENNOC, P., TRUFFERT, C., VAIRON, J. & PROGRAM, T.A.W.G.O.T.G.-D. (2001) -
"Cadomian tectonics in northern Brittany: a contribution of 3-D crustal-scale modelling." -
Tectonophysics, 229-246.
CARRIC, G., CHANTRAINE, J., DADET, P., FLAGEOLLET, J.C., SAGON, J.P. & TALBO, H. (1979) -
French Geological map (1/50,000), "Moncontour (279).", BRGM, Orléans.
CASTAING, C., ROLET, J., CHEVREMONT, P., LE CALVEZ, J.Y. & THONON, P. (1987) - "La région de
Huelgoat (Finistère central) dans le contexte géodynamique armoricain." - Géologie de la France,
1, 23-36.
CHANTRAINE, J., CHAUVEL, J.J. & RABU, D. (1994) - "The Cadomian Orogeny in the Armorican
Massif - Lithostratigraphy." In: J. D. Keppie (Ed.), Pre-Mesozoic Geology in France and related
areas. - Springer-Verlag, Berlin.
CHANTRAINE, J., AUTRAN, A. & CAVELIER, C. (1996) - French Geological map (1/1,000,000), BRGM,
Orléans.
COGNÉ, J. (1974) - "Le Massif Armoricain." - Géologie de la France, 1, 105-161.
COLCHEN, M. & ROLIN, P. (2001) - "La chaîne hercynienne en Vendée." - Géologie de la France, 1-2,
53-86.
CHAPITRE 3 88
CRESSIE, N.A.C. (1991) - "Statistics for Spatial Data."- John Wiley & sons, New York, 900 pp.
DADET, P., HERROUIN, Y., BARDY, P., LEBRET, P., TRAUTMANN, F. & CARN, A. (1995) - French
Geological map (1/50,000), "Pipriac (387).", BRGM, Orléans.
DARBOUX, J.R., GRAVELLE, M., PELHATE, A. & ROLET, J. (1977) - "L'évolution tectonique de la
terminaison occidentale du domaine centre-armoricain au Dévonien et au Carbonifère." - Comptes
Rendus de l'Académie des Sciences de Paris, D-284, 1151-1154.
DARBOUX, J.R. (1981) - "Caractérisation du régime cisaillant de la déformation hercynienne dans les
Monts d'Arrée (Massif Armoricain, France)." - Comptes Rendus de l'Académie des Sciences de
Paris, II-232, 1497-1500.
DARBOUX, J.R. & LE GALL, B. (1988) - "Les Montagnes Noires : cisaillement bordier méridional du
bassin carbonifère de Châteaulin (Massif Armoricain, France). Caractéristiques structurales et
métamorphiques." - Geodinamica Acta, 2(3), 121-133.
DARBOUX, J.R. (1991) - "Evolution tectonosédimentaire et structuration synmétamorphe des zones
externes du segment Hercynien Ouest-Européen." - Thèse d'état, Université de Bretagne
Occidentale, Brest, 267 pp.
DUBREUIL, M. (1987) - "Le bassin en décrochement de Saint-Julien-de-Vouvantes-Angers
(Carbonifère inférieur du Sud-Est du Massif armoricain)." - Bulletin de la Société Géologique de
France, 3(2), 215-221.
DUBREUIL, M., CAVET, P., BLAISE, J., ESTÉOULE-CHOUX, J., GRUET, M. & LARDEUX, H. (1989) -
French Geological map (1/50,000), "St-Mars-la-Jaille (421).", BRGM, Orléans.
FAURE, M. & CARTIER, C. (1998) - "Déformations ductiles polyphasées dans l'antiforme
orthogneissique de St-Clément-de-la-Place (Unité de Lanvaux, Massif Armoricain)." - Comptes
Rendus de l'Académie des Sciences de Paris, 326, 795-802.
FOURNIGUET, J. & TRAUTMANN, F. (1985) - French Geological map (1/50,000), "Redon (419).",
BRGM, Orléans.
GAPAIS, D. (1979) - "Déformation progressive d'un quartzite dans une zone plissée (segment
hercynien de Bretagne centrale)." - Bulletin de Minéralogie, 102, 249-264.
CHAPITRE 3 – Modélisation cinématique de la déformation en Bretagne Centrale 89
GAPAIS, D. & LE CORRE, C. (1980) - "Is the Hercynian belt of Brittany a major shear zone?" - Nature,
288, 574-576.
GAPAIS, D. & COBBOLD, P.R. (1987) - "Slip system domains. 2. Kinematic aspects of fabric
development in polycristalline aggregates." - Tectonophysics, 138(2-4), 289-309.
GAPAIS, D., LAGARDE, J.L., LE CORRE, C., AUDREN, C., JÉGOUZO, P., CASAS SAINZ, A. & VAN DEN
DRIESSCHE, J. (1993) - "La zone de cisaillement de Quiberon : témoin d'extension de la chaîne
varisque en Bretagne méridionale au Carbonifère." - Comptes Rendus de l'Académie des Sciences
de Paris, II(316), 1123-1129.
GODARD, G. (2001) - "Les Essarts eclogite-bearing Complex (Vendée)." - Géologie de la France, 1-2,
19-51.
GORÉ, B. & LE CORRE, C. (1987) - "Cinématique hercynienne du cisaillement nord-armoricain à la
bordure du granite syntectonique de Saint Renan-Kersaint (Finistère)." - Bulletin de la Société
Géologique de France, 3(5), 811-819.
GUILLOCHEAU, F. & ROLET, M. (1982) - "La Sédimentation Paléozoïque Ouest-Armoricaine." -
Bulletin de la Société Géologique et Minéralogique de Bretagne, 14(2), 45-62.
HANMER, S. & VIGNERESSE, J.L. (1980) - "Mise en place de diapirs syntectoniques dans la chaîne
hercynienne : exemple des massifs leucogranitiques de Locronan et de Pontivy (Bretagne
Centrale)." - Bulletin de la Société Géologique de France, 22(2), 193-202.
HANMER, S., LE CORRE, C. & BERTHÉ, D. (1982) - "The role of Hercynian granites in the deformation
and metamorphism of Brioverian and Paleozoic rocks of Central Brittany." - Journal of the
Geological Society of London, 139, 85-93.
HERROUIN, Y., DADET, P., GUIGUES, J., LAVILLE, P. & TALBO, H. (1989) - French Geological map
(1/50,000), "Bain-de-Bretagne (388).", BRGM, Orléans.
HERROUIN, Y. & RABU, D. (1990) - French Geological map (1/50,000), "Châteaubriant (389).",
BRGM, Orléans.
HIRBEC, Y. (1979) - "Le complèxe basique de Belle-Isle-en-Terre (Côtes du Nord). Sa place dans
CHAPITRE 3 90
l'évolution géodynamique du nord du Massif Armoricain." - Thèse, Université de Rennes1, Rennes.
JANJOU, D., LARDEUX, H., CHANTRAINE, J., CALLIER, L. & ETIENNE, H. (1988) - French Geological
map (1/50,000), "Segré (422).", BRGM, Orléans.
JÉGOUZO, P. (1980) - "The South Armorican Shear Zone." - Journal of Structural Geology, 2(1-2), 39-
47.
JÉGOUZO, P., PEUCAT, J.J. & AUDREN, C. (1986) - "Caractérisation et signification géodynamique des
orthogneiss calco-alcalins d'âge ordovicien de Bretagne méridionale." - Bulletin de la Société
Géologique de France, 2(5), 839-848.
JÉGOUZO, P. & ROSELLO, E.A. (1988) - "La Branche Nord du Cisaillement Sud-Armoricain (France) :
un essai d'évaluation du déplacement par l'analyse des mylonites." - Comptes Rendus de l'Académie
des Sciences de Paris, II(307), 1825-1831.
LE CORRE, C. (1977) - "Le Briovérien de Bretagne centrale : essai de synthèse lithologique et
structurale." - Bulletin du BRGM, I(3), 219-254.
LE CORRE, C. (1978) - "Approche quantitative des processus synschisteux. L'exemple du segment
Hercynien de Bretagne Centrale." - Etat, Rennes 1, Rennes, 382 pp.
LE CORRE, C., AUVRAY, B., BALLÈVRE, M. & ROBARDET, M. (1991) - "Le Massif Armoricain." -
Scientifical Geological Bulletin, 44(1-2), 31-103.
LE HÉBEL, F., VIDAL, O., KIÉNAST, J.R. & GAPAIS, D. (2002) - "Les "Porphyroïdes" de Bretagne
méridionale : une unité de HP-BT dans la chaîne hercynienne." - Comptes Rendus de Géosciences,
334, 205-211.
LE MÉTOUR, J. & AUDREN, C. (1977) - "Relations structurales entre l'orthogneiss ordovicien de
Roguédas et son encaissant migmatitique. Conséquences sur l'âge des évènements
tectonométamorphiques en Bretagne méridionale." - Bulletin de la Société Géologique et
Minéralogique de Bretagne, 9, 113-123.
LE THÉOFF, B. (1977) - "Marqueurs ellipsoïdaux et déformation finie." - Thèse, Université de
Rennes1, Rennes, 96 pp.
CHAPITRE 3 – Modélisation cinématique de la déformation en Bretagne Centrale 91
LEDRU, P., MAROT, A. & HERROUIN, Y. (1986) - "Le synclinorium de Saint-Georges-sur-Loire : une
unité ligérienne charriée sur le domaine centre armoricain. Découverte de métabasite à
glaucophane sur la bordure sud de cette unité." - Comptes Rendus de l'Académie des Sciences de
Paris, II(303), 963-968.
LOPEZ-MUNOZ, M. (1981) - "Analyse structurale de la partie centrale du synclinorium de Saint Julien
de Vouvantes et de l'axe Lanvaux-les-Ponts-de-Cé (Massif Armoricain)." - Bulletin de la Société
Géologique et Minéralogique de Bretagne, C-13, 117-123.
MATHERON, G. (1955) - "Application des méthodes statistiques à l'évaluation des gisements." -
Annales des Mines, 144, 50-75.
MATHERON, G. (1962) - "Traité de Géostatistique Appliquée."- Technip, Paris, 333 pp.
PARIS, F. & DADET, P. (1988) - French Geological map (1/50,000), "Combourg (282).", BRGM,
Orléans.
PERCEVAULT, M.-N. & COBBOLD, P.R. (1982) - "Mathematical removal of regional ductile strains in
Central Brittany: evidence for wrench tectonics." - Tectonophysics, 82, 317-328.
PEUCAT, J.J., CHARLOT, R., MIDFAL, A., CHANTRAINE, J. & AUTRAN, A. (1979) - "Définition
géochronologique de la phase bretonne en Bretagne Centrale. Etude Rb/Sr de granites du domaine
centre armoricain." - Bulletin du BRGM, 1, 349-356.
PIVETTE, B. (1977) - "Le synclinorium de Saint-Georges sur Loire, Massif Armoricain. Sa place dans
l'évolution géodynamique de la Bretagne méridionale au Paléozoïque." - Thèse, Université de
Rennes 1, Rennes, 108 pp.
PLAINE, J. (1976) - "La bordure sud du synclinorium paléozoïque de Laval." - Thèse, Université de
Rennes1, Rennes.
PLAINE, J., HALLEGOUËT, B. & QUÉTÉ, Y. (1984) - French Geological map (1/50,000), "Questembert
(418).", BRGM, Orléans.
PLUSQUELLEC, Y., ROLET, J. & DARBOUX, J.R. (1999) - French Geological map (1/50,000),
"Châteaulin (310).", BRGM, Orléans.
CHAPITRE 3 92
QUÉTÉ, Y., PLAINE, J. & HALLEGOUËT, B. (1981) - French Geological map (1/50,000), "Malestroit
(386).", BRGM, Orléans.
RAMSAY, J.G. (1967) - "Folding and fracturing rocks."- McGraw-Hill.
RAMSAY, J.-G. & GRAHAM, R.-H. (1970) - "Strain variations in shear belts." - Canadian Journal of
Earth Sciences, 7, 786-813.
RÉGNAULT, S. (1981) - "Stratigraphie et structure du Paléozoïque dans le Ménez-Bélair occidental
(Synclinorium médian armoricain)." - Bulletin de la Société Géologique et Minéralogique de
Bretagne, C-13(1), 1-111.
ROBARDET, M., BONJOUR, J.L., PARIS, F., MORZADEC, P. & RACHEBOEUF, P.R. (1994) - "Ordovician,
Silurian, and Devonian of the Medio-North-Armorican Domain." In: J. D. Keppie (Ed.), Pre-
Mesozoic Geology in France and related areas. - Springer Verlag, Berlin.
ROLET, J. & THONON, P. (1979) - "Mise en évidence de trois complèxes volcano détritiques d'âge
Dévonien inférieur à moyen, Strunien et Viséen inférieur sur la bordure nord du bassin de
Châteaulin (feuille Huelgoat 1/50000, Finistère). Implications paléogéographiques et tectoniques."
- Bulletin du BRGM, 1, 303-315.
ROLIN, P. & COLCHEN, M. (2001) - "Les cisaillements hercyniens de la Vendée au Limousin." -
Géologie de la France, 1-2, 15-44.
ROMAN-BERDIEL, T., GAPAIS, D. & BRUN, J.P. (1997) - "Granite intrusion along strike-slip zones in
experiment and nature." - American Journal of Sciences, 297, 651-678.
SAGON, J.P. (1976) - "Contribution à l'étude géologique de la partie orientale du bassin de Châteaulin.
Stratigraphie, volcanisme, métamorphisme et tectonique." - Thèse d'état, Université Pierre et
Marie Curie, Paris.
TRAUTMANN, F. (1988) - French Geological map (1/50,000), "Nozay (420).", BRGM, Orléans.
TRAUTMANN, F., BECQ-GIRAUDON, J.F. & CARN, A. (1994) - French Geological map (1/50,000),
"Janzé (353).", BRGM, Orléans.
VIDAL, P. (1972) - "L'axe granitique Moëlan-Lanvaux (sud du Massif Armoricain) : mise en évidence
CHAPITRE 3 – Modélisation cinématique de la déformation en Bretagne Centrale 93
par la méthode Rb-Sr de trois épisodes de plutonisme pendant le Paléozoïque Inférieur." - Bulletin
de la Société Géologique et Minéralogique de Bretagne, 4, 75-89.
VIDAL, P. (1976) - "L'évolution polyorogénique du Massif Armoricain. Apport de la géochronologie et
de la géochimie isotopique du strontium." - Thèse d'état, Université de Rennes1, Rennes, 142 pp.
VIGNERESSE, J.L. (1978) - "Gravimétrie et granites armoricains. Structure et mise en place des
granites Hercyniens." - Thèse, Université de Rennes1, Rennes, 98 pp.
VIGNERESSE, J.L. & BRUN, J.P. (1983) - "Les leucogranites armoricains marqueurs de la déformation
régionale : apport de la gravimétrie." - Bulletin de la Société Géologique de France, 25(3), 357-
366.
WACKERNAGEL, H. (1998) - "Multivariate Geostatistics, 2."- Springer Verlag, Berlin, 291 pp.
WATTS, M.S. & WILLIAMS, G.D. (1979) - "Faults rocks as indicators of progressive shear deformation
in the Guingamp region, Brittany." - Journal of Structural Geology, 1, 323-332.
WEBER, C. (1967) - "Le prolongement des granites de Lanvaux d'après la gravimétrie et
l'aéromagnétisme." - Mémoires du BRGM, 52, 83-90.

D E U X I E M E P A R T I E STRUCTURE CRUSTALE : SISMIQUE, MAGNETISME ET GRAVIMETRIE

C h a p i t r e 4 Imagerie sismique

CHAPITRE 4 – Imagerie Sismique 99
Imagerie sismique de la zone de collision hercynienne dans le Sud-est du
Massif Armoricain (Projet Armor2 – Programme Géofrance 3D)
Seismic imaging of the Hercynian collision zone in the South-eastern
Armorican Massif (Armor2 project – Géofrance3D program)
A. Bitria, M. Ballèvreb, J.P. Brunb, J. Chantrainea, D. Gapaisb, P. Guennoca, C. Gumiauxb, C.
Trufferta
a BRGM - CDG/MA, 3, avenue Claude Guillemin, BP 6009, Orléans cedex 2, France
b Géosciences Rennes, UMR 6118 CNRS, Université de Rennes 1, 35042 Rennes cedex,
France
Comptes Rendus Geosciences (2003), 335, 969-979.
Résumé
La structure de la zone de collision Hercynienne dans le sud-est du Massif Armoricain est
illustrée par un profil sismique en écoute longue de 70 km de long, acquis en Septembre 2000. Le
profil met en évidence une structure chevauchante à vergence nord, inconnue jusqu’à présent, qui fait
chevaucher, pendant le Carbonifère, le Domaine de Champtoceaux sur le Domaine Centre Armoricain.
Les déplacements décrochants dextres le long du Cisaillement Sud Armoricain, recoupé à sa base par
le chevauchement, sont au moins en partie synchrones des mouvements chevauchants vers le Nord.
Une discontinuité majeure, oblitérée par le front du chevauchement, est mise en évidence entre le
Domaine de Champtoceaux et le Domaine Centre Armoricain. Ces données nouvelles conduisent à
une profonde ré-interprétation structurale et cinématique de cette portion de la collision Hercynienne.
Abstract
The structure of the Hercynian collision zone in the southeast of the Armorican Massif is
illustrated by a 70 km long deep seismic profile acquired in September 2000. The profile images a
previously unknown south dipping thrust that brought the Champtoceaux Domain on top of the
Central Armorican Domain during Carboniferous times. Dextral strike-slip motions along the South
Armorican Shear Zone, which is downward cut by the thrust zone, are partly coeval with northward
CHAPITRE 4 100
thrusting. A major discontinuity, hidden by the thrust front, is also imaged in the lower crust between
the Champtoceaux area and the Central Armorican Domain. These new data lead to a structural and
kinematic re-interpretation of this part of the Hercynian collision zone.
Abridged version
1. Introduction
The Hercynian belt of Brittany shows three main types of units (Fig. 4.1): (1) Low-grade units
moderately deformed during the Carboniferous, (2) high pressure units, defining a suture zone,
intensely deformed during Devonian thrusting and exhumed during the early Carboniferous and (3)
Barrovian-type metamorphic units related to Devonian-Carboniferous crustal thickening and syn-
convergence Carboniferous extension. Three regional-scale faults cross-cut and displace these units,
giving three major tectonic domains (Fig. 4.1): (1) the Central Armorican Domain which represents
the upper crust during the whole Hercynian evolution, (2) the Champtoceaux Domain which is
constituted by an upper crust section to the East and by HP metamorphic units to the West and (3) the
South Armorican Domain which is dominantly composed of metamorphic units, strongly affected by
syn-convergence extension. The South Armorican Shear Zone (CSA), a major strike slip fault of
Carboniferous age, juxtaposes the Central and South Armorican Domains to the West, and the South
Armorican and Champtoceaux Domains, to the East. The contact between Central Armorican and
Champtoceaux Domains corresponds to the Nort-sur-Erdre Fault, a brittle fault with limited amount of
displacement which does not readily explains the important difference in geological history between
these two domains.
The seismic profile presented here (Armor2 Project/ Géofrance 3D Program BRGM/INSU-
CNRS) cuts through the three Hercynian domains of the Armorican Massif (Fig. 4.1). It reveals the
occurrence of a crustal-scale thrust zone affecting the South Armorican and Champtoceaux Domains
and crosscutting at depth the South Armorican Shear Zone. This discovery claims for significant
reappraisal of the geometry and kinematics of the Hercynian collision in the Area.
CHAPITRE 4 – Imagerie Sismique 101
2.The seismic profile
2.1. Geological setting
The chosen profile is 70 km long and strikes about NS, at high angle to the regional structural
trend. It starts just South of the northern branch of the CSA, and ends at about 20 km South of the
southern branch of the CSA. From North to South, the main geological units found along the profile
are as follows (Fig.4.1).
The Central Armorican Domain is mainly made of upper-Proterozoic to lower-Devonian
sediments affected by low-grade metamorphism (Hanmer et al., 1982). The overall ductile
deformation of the area results from dextral strike-slip of Carboniferous age (Gapais & Le Corre, 1980
; Percevault et Cobbold, 1982). Associated structures are (1) EW-striking upright folds, (2) EW
striking subvertical slaty cleavage, and (3) sub-horizontal stretching lineations (Gapais & Le Corre,
1980 ; Hanmer et al., 1982). Along the northern branch of the CSA, and South of it, folds tend to
become asymmetric as a result of some northward thrusting components, locally marked by minor
thrusts (Hanmer et al., 1982 ; Ledru et al., 1986 ; Faure & Cartier, 1998). The northern part of the
profile cuts across this zone.
The Champtoceaux Domain shows a piling up of strongly deformed eclogite-bearing gneisses
and micaschists (Ballèvre et al., 1989 ; Bosse et al., 2000). After their exhumation in early
Carboniferous times (Bosse et al., 2000), these units were affected by dextral shearing along the CSA,
which produced a km-scale antiformal structure with a steeply dipping axial plane and a steeply
eastward-plunging axis. During exhumation, the high-pressure units were thrust onto lower-grade
units (Mauves unit). To the North and the East, the top of the high-pressure units is marked by a
normal fault zone, folded by the antiform. The hanging wall of this fault zone consists of low-grade
upper-crustal sediments (Ancenis basin and Mauges units). The profile cuts across the western part of
the antiform, where only the northern limb is observed.
The South Armorican Domain shows a complex structural pattern. Upper units are marked
by high-pressure metamorphic histories (Godard, 2001 ; Bosse et al., 2002 ; Le Hébel et al., 2002). In
Vendée, these units are thrust onto low-grade Paleozoic sediments (Iglesias & Brun, 1976). At
regional scale, they show intense shearing deformations, with a flat-lying to gently-dipping pervasive
foliation, and a dominantly E-W to NNW-SSE striking stretching lineation (Brun & Burg, 1982 ;
Gapais et al., 1993). Rocks below the thrust zone show Barrovian metamorphic conditions associated
with large ductile deformations accumulated during crustal thickening (Iglesias & Brun, 1976 ; Cannat
et al., 1986) followed by pervasive syn-convergence extension of Late-Carboniferous age (Geoffroy,
1988 ; Gapais et al., 1993 ; Burg et al., 1994).
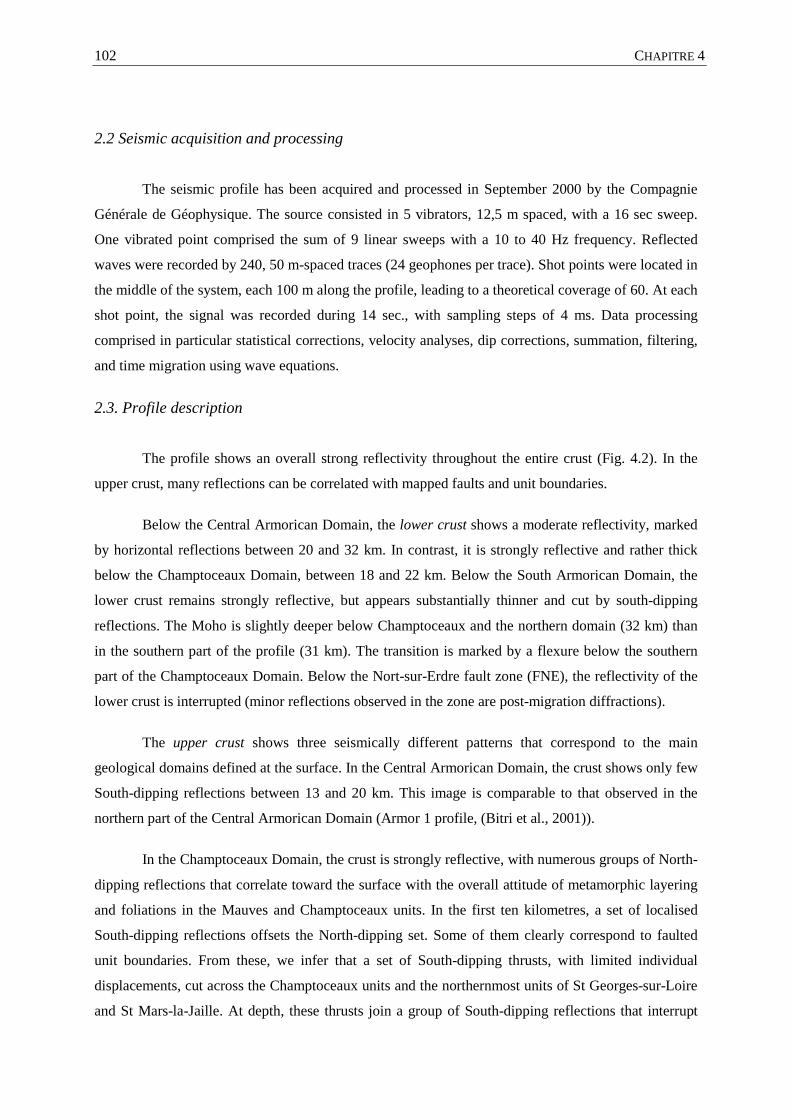
CHAPITRE 4 102
2.2 Seismic acquisition and processing
The seismic profile has been acquired and processed in September 2000 by the Compagnie
Générale de Géophysique. The source consisted in 5 vibrators, 12,5 m spaced, with a 16 sec sweep.
One vibrated point comprised the sum of 9 linear sweeps with a 10 to 40 Hz frequency. Reflected
waves were recorded by 240, 50 m-spaced traces (24 geophones per trace). Shot points were located in
the middle of the system, each 100 m along the profile, leading to a theoretical coverage of 60. At each
shot point, the signal was recorded during 14 sec., with sampling steps of 4 ms. Data processing
comprised in particular statistical corrections, velocity analyses, dip corrections, summation, filtering,
and time migration using wave equations.
2.3. Profile description
The profile shows an overall strong reflectivity throughout the entire crust (Fig. 4.2). In the
upper crust, many reflections can be correlated with mapped faults and unit boundaries.
Below the Central Armorican Domain, the lower crust shows a moderate reflectivity, marked
by horizontal reflections between 20 and 32 km. In contrast, it is strongly reflective and rather thick
below the Champtoceaux Domain, between 18 and 22 km. Below the South Armorican Domain, the
lower crust remains strongly reflective, but appears substantially thinner and cut by south-dipping
reflections. The Moho is slightly deeper below Champtoceaux and the northern domain (32 km) than
in the southern part of the profile (31 km). The transition is marked by a flexure below the southern
part of the Champtoceaux Domain. Below the Nort-sur-Erdre fault zone (FNE), the reflectivity of the
lower crust is interrupted (minor reflections observed in the zone are post-migration diffractions).
The upper crust shows three seismically different patterns that correspond to the main
geological domains defined at the surface. In the Central Armorican Domain, the crust shows only few
South-dipping reflections between 13 and 20 km. This image is comparable to that observed in the
northern part of the Central Armorican Domain (Armor 1 profile, (Bitri et al., 2001)).
In the Champtoceaux Domain, the crust is strongly reflective, with numerous groups of North-
dipping reflections that correlate toward the surface with the overall attitude of metamorphic layering
and foliations in the Mauves and Champtoceaux units. In the first ten kilometres, a set of localised
South-dipping reflections offsets the North-dipping set. Some of them clearly correspond to faulted
unit boundaries. From these, we infer that a set of South-dipping thrusts, with limited individual
displacements, cut across the Champtoceaux units and the northernmost units of St Georges-sur-Loire
and St Mars-la-Jaille. At depth, these thrusts join a group of South-dipping reflections that interrupt
CHAPITRE 4 – Imagerie Sismique 103
the flat reflectors of the lower crust. The aeromagnetic profile along the seismic section shows an
anomaly of more than 700 nT located on the mafic eclogitic units of Champtoceaux. The short
wavelength and the asymmetry of the anomaly is consistent with the interpreted geometry of these
units in the upper 10 km, i.e. steeply northward-dipping units, as a result of thrust induced
superpositions. A magnetic modelling of the area further confirms this interpretation (de Poulpiquet et
al., 2002). On the other hand, the large wavelength of the gravimetric anomaly associated with the
Champtoceaux Domain cannot be explained by local dense sources within the upper 10 km. It fits
better with the occurrence of heavy bodies within the middle crust. This suggests that imbricate thrust
structures involving mafic Champtoceaux units probably occur down to at least 20 km depth.
In the South Armorican Domain, between 2 and 12 km, reflexions image an antiformal
structure bounded by normal faults. These could correspond to the migmatite dome observed further
west, in the Loire Estuary (see Fig. 4.1), and exhumed during Late-Carboniferous extension (Gapais et
al., 1993). Deeper in the crust, between 15 and 20 km, a large group of North-dipping reflexions is
observed. It could correspond to metamorphic units known further South, in the Sables d’Olonne area
(Iglesias & Brun, 1976 ; Brun & Burg, 1982).
3. Discussion
The most striking structure revealed by the profile is a connected set of South-dipping faults in
the upper crust and shear zones in the lower crust that we interpret as crustal-scale thrust system. This
discovery has several important implications.
1. The Champtoceaux Domain is allochtonous and thrust over the southern part of the Central
Armorican Domain. The thrusting event post-dates the exhumation of the High-Pressure
rocks, and thus post-dates the Early-Carboniferous (Bosse et al., 2000).
2. An attempt of pre-thrusting restoration of the High-Pressure units of the Champtoceaux
Domain suggests an overall thrust displacement of at least 20 km (Fig.4.3). The trusting
motion was most probably combined with strike-slip as shown by restoration of deformation
at regional scale (Gumiaux, 2003 ; Gumiaux et al., in press). Indeed, according to surface data,
the direction of the thrust zone must be about EW, parallel to unit boundaries and to the
northern branch of the CSA (Fig. 4.1) where transpression is documented (Hanmer et al.,
1982).
CHAPITRE 4 104
3. The subvertical CSA is of course not imaged by the seismics; but the continuation at depth
from its surface location corresponds to a change in seismic signature in the upper crust.
Deeper, at about 20 km, this vertical continuation is interrupted against the thrust zone. This
geometry could suggest that thrusting post-dates the CSA. However, both structures are of
Carboniferous age. Furthermore, the CSA is marked by the occurrence of (a) relatively late
synkinematic granites (Upper Carboniferous) (Bernard-Griffiths et al., 1985), and (b) late
brittle shear structures (Jégouzo, 1980). The amount of horizontal displacement along the
thrust zone (Fig. 4.3) indicates that if the CSA affects the lithospheric mantle, its downward
prolongation should be located just South of the profile.
4. The major seismic discontinuity observed in the lower crust and the Moho, between the
Champtoceaux Domain and the Central Brittany Domain, is hidden by the thrust front. This
discontinuity corresponds probably to the early sinistral wrench zone that contributed to the
exhumation of the High-Pressure rocks (Brun et al., 2002).
5. The entire South Armoricain Domain imaged by the profile is part of the hanging wall of the
thrust system. In this domain, thickening led to the piling up of metamorphic units with
different tectonic histories. Thrust contacts between these units are offset by normal faults of
Late Carboniferous age. As the offset along the CSA is of the order of 100 km, structures
imaged in the South Armorican Domain are not in continuity with those of the Champtoceaux
Domain, although North-dipping reflections occur on both sides of the CSA. The South
Armorican Domain underwent important vertical uplift during Late Carboniferous extension,
and this was probably partly coeval with wrenching along the CSA and thrusting of the
Champtoceaux Domain. This complex 3D kinematics remains to be quantified.
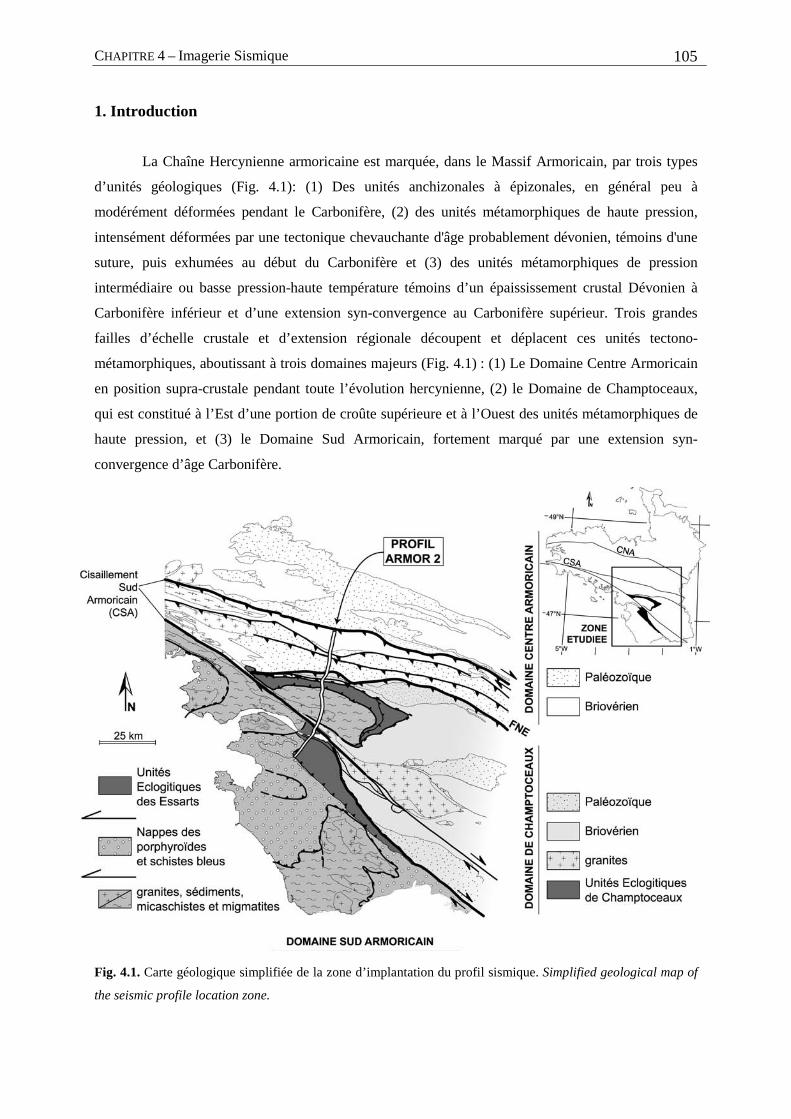
CHAPITRE 4 – Imagerie Sismique 105
1. Introduction
La Chaîne Hercynienne armoricaine est marquée, dans le Massif Armoricain, par trois types
d’unités géologiques (Fig. 4.1): (1) Des unités anchizonales à épizonales, en général peu à
modérément déformées pendant le Carbonifère, (2) des unités métamorphiques de haute pression,
intensément déformées par une tectonique chevauchante d'âge probablement dévonien, témoins d'une
suture, puis exhumées au début du Carbonifère et (3) des unités métamorphiques de pression
intermédiaire ou basse pression-haute température témoins d’un épaississement crustal Dévonien à
Carbonifère inférieur et d’une extension syn-convergence au Carbonifère supérieur. Trois grandes
failles d’échelle crustale et d’extension régionale découpent et déplacent ces unités tectono-
métamorphiques, aboutissant à trois domaines majeurs (Fig. 4.1) : (1) Le Domaine Centre Armoricain
en position supra-crustale pendant toute l’évolution hercynienne, (2) le Domaine de Champtoceaux,
qui est constitué à l’Est d’une portion de croûte supérieure et à l’Ouest des unités métamorphiques de
haute pression, et (3) le Domaine Sud Armoricain, fortement marqué par une extension syn-
convergence d’âge Carbonifère.
Fig. 4.1. Carte géologique simplifiée de la zone d’implantation du profil sismique. Simplified geological map of
the seismic profile location zone.
CHAPITRE 4 106
Le Cisaillement Sud Armoricain (CSA), décrochement dextre d’âge carbonifère, juxtapose en
surface les domaines Centre et Sud Armoricains, à l’Ouest, et les domaines Sud Armoricain et de
Champtoceaux, à l’Est. Le contact entre les domaines de Champtoceaux et Centre Armoricain
correspond en surface à la faille de Nort-sur-Erdre (FNE), rupture fragile ne témoignant pas de
déplacements majeurs et n’expliquant donc pas l’énorme contraste d’histoire tectonique des domaines
qu’elle sépare.
Le profil de sismique profonde présenté ici (Projet Armor2 du Programme Géofrance 3D
BRGM/ INSU-CNRS), qui recoupe ces trois domaines caractéristiques de la tectonique hercynienne
du Massif Armoricain (Fig. 4.1), met en évidence, pour la première fois, une structure chevauchante
d’échelle crustale affectant les Domaines Sud Armoricain et de Champtoceaux et recoupant en
profondeur le Cisaillement Sud Armoricain. Cette découverte conduit à modifier significativement les
conceptions antérieures de la géométrie et de la cinématique de la tectonique hercynienne dans le
Massif Armoricain.
2. Le profil sismique
2.1. Cadre géologique
Le profil a été localisé de manière à recouper orthogonalement la bordure sud du Domaine
Centre Armoricain, le domaine de Champtoceaux, et la partie nord du Domaine Sud Armoricain. Il
débute immédiatement au sud de la branche Nord du CSA et s'arrête à une vingtaine de kilomètres au
sud du CSA proprement dit. On peut schématiser les principales unités tectoniques recoupées comme
suit.
Le Domaine Centre Armoricain est principalement constitué de formations sédimentaires
briovériennes et paléozoïques affectées par un métamorphisme anchizonal à épizonal, localement
associé à des intrusions leucogranitiques (Hanmer et al., 1982). Pendant le Carbonifère, l’ensemble est
affecté par une déformation ductile en cisaillement dextre donnant naissance à des plis droits associés
à une schistosité de flux verticale d’orientation E-W, et à un étirement subhorizontal (Gapais & Le
Corre, 1980 ; Hanmer et al., 1982 ; Percevault & Cobbold, 1982). Dans le Sud, à partir de la branche
nord du CSA, les plis se déversent vers le Nord et sont associés à de petits chevauchements (Hanmer
et al., 1982 ; Ledru et al., 1986 ; Faure & Cartier, 1998). Le profil sismique débute à la bordure sud du
domaine des plis droits et recoupe toute la zone des plis déversés vers le Nord.
Le Domaine de Champtoceaux montre, dans sa partie occidentale, un empilement de gneiss et
micaschistes intensément déformés, contenant des reliques éclogitiques, (15-25 kbar, (Ballèvre et al.,
1989)) affectés par un anticlinal d’ampleur déca-kilométrique, à plan axial raide à axe fortement
CHAPITRE 4 – Imagerie Sismique 107
plongeant vers l’Est. Cette structure d’age carbonifère, cinématiquement associée au fonctionnement
du Décrochement Sud Armoricain, plisse des chevauchements à vergence ouest postérieurs au
métamorphisme de haute pression daté aux environs de 360 Ma (Bosse et al., 2000). Cette pile
métamorphique de haute pression repose sur les Schistes de Mauves, localisés au cœur de l’anticlinal,
et plonge, vers le Nord et l’Est, sous des formations sédimentaires épizonales d’age paléozoïque
(Bassin d’Ancenis) et protérozoïque (Série des Mauges). Une faille normale, également déformée par
l’anticlinal, sépare ces unités faiblement métamorphiques des gneiss et micaschistes de haute pression.
Elle est associée à l’exhumation des unités métamorphiques au Carbonifère inférieur (Bosse et al.,
2000). Le profil recoupe l’anticlinal dans sa partie ouest, où il est réduit à son flanc nord.
Le Domaine Sud Armoricain est un édifice complexe dont le sommet est constitué par des
formations sédimentaires, plutoniques et volcaniques ayant subi un métamorphisme de haute pression
(éclogites des Essarts, 15-20 kbar, 650-700°C, (Godard, 2001); Schistes bleus du Bois de Céné et de
Groix, 15-20 kbar, 500-550°C, (Bosse et al., 2002); Schistes de St Gilles et Porphyroïdes de Vendée et
Bretagne Sud, 8-10 kbar, 350-400°C, (Le Hébel et al., 2002)). Ces unités de haute pression, qui
chevauchent en Vendée des formations paléozoïques peu métamorphiques (Iglesias & Brun, 1976),
ont subi une déformation cisaillante très intense donnant aux schistes bleus et aux porphyroïdes une
foliation à faible pendage et une linéation d’étirement d’orientation dominante NNW-SSE (Brun &
Burg, 1982 ; Gapais et al., 1993). Sous les unités chevauchantes de haute pression, les unités para-
autochtones ont subi un métamorphisme Barrovien synchrone d’une déformation ductile d’abord en
épaississement (Iglesias & Brun, 1976 ; Cannat et al., 1986), puis en extension syn-convergence
pendant le Carbonifère (Geoffroy, 1988 ; Gapais et al., 1993 ; Burg et al., 1994).
2.2. Paramètres d’acquisition
Le profil, d’une longueur totale de 70 km et d’orientation générale nord-sud, a été implanté en
tenant compte de l’orientation sub-équatoriale des structures, de la largeur des unités géologiques et
des contraintes liées à l’occupation du sol. La Compagnie Générale de Géophysique, sélectionnée par
appel d’offre, a assuré l’acquisition des données en septembre 2000, ainsi que leur traitement.
La source vibratoire a été retenue pour des raisons de simplicité de mise en œuvre. Cinq vibrateurs
disposés en ligne et espacés de 12.5 m opéraient simultanément. La longueur du signal source (sweep)
était de 16 secondes. La sommation de 9 sweep linéaires de fréquence de 10 à 40 Hz constitue un point
vibré (PV).
Pour la réception, un dispositif de 240 traces (24 géophones par trace) espacées de 50 m a été
retenu. Les tirs étaient effectués au centre du dispositif (longueur totale 12.150 m) avec une fenêtre de
deux traces. Les points vibrés disposés tous les 100 m ont permis un taux de couverture théorique de
60. Le signal a été enregistré sur 14 secondes avec un pas d’échantillonnage de 4 ms. Tous ces
CHAPITRE 4 108
paramètres ont été établis après deux jours d'essais de terrain. L'acquisition des données a été faite par
le laboratoire de dernière génération Sercel SM408 utilisé pour la première fois en France.
2.3. Traitement
La séquence de traitement appliquée comprend en particulier les corrections statiques,
analyses de vitesses, corrections de pendage (DMO), corrections statiques résiduelles, sommation,
filtrage en temps variable et migration temps par équation d’onde. La section présentée sur la figure
4.2 est convertie en profondeur.
2.4. Description du profil
La section sismique, de qualité remarquable, montre une forte réflectivité au travers de toute la
croûte (fig. 4.2). De nombreuses réflexions dans la croûte supérieure peuvent être corrélées aux unités
géologiques connues en surface, comme le montre la coupe géologique de surface superposée au profil
sismique. Afin de faciliter la lecture du profil, les groupes cohérents de réflexions ont été coloriés en
fonction de leur pendage (Réflexions horizontales : Rouge , à pendage sud : vert , à pendage nord :
bleu). Une forme anticlinale est coloriée en jaune au sud.
La croûte inférieure, sous le Domaine Centre Armoricain, est moyennement réflective,
matérialisée par des réflecteurs horizontaux, entre 20 et 32 km. Sous le Domaine de Champtoceaux,
elle est très réflective et épaisse, de 18 à 22 km. Sous le Domaine Sud Armoricain, bien que très
réflective elle se réduit fortement, recoupée par des réflexions à pendage sud. Le Moho est légèrement
plus profond sous les domaines de Champtoceaux et Centre Armoricain (32 km) que sous le Domaine
Sud Armoricain (31 km). La transition s’effectue par une flexure, sous la partie sud du Domaine de
Champtoceaux. La réflectivité de la croûte inférieure est interrompue, à l’aplomb de la FNE. Les
quelques réflecteurs observés sur la section migrée (figure 4.2) sont des diffractions apparues après
migration.
Fig. 4.2. Profil sismique Armor2, converti en profondeur, avec coupe géologique réalisée à partir des données
géologiques de surface et profils gravimétrique et magnétique. Les principaux groupes de réflexions ont été
coloriés arbitrairement en fonction de leur pendage (rouge/horizontal, vert/pendage sud, bleu/pendage nord). Une
forme anticlinale est coloriée en jaune, au sud du profil.
Depth converted Armor 2 seismic profile, with geological cross-section drawn after surface geological data and
gravimetric and magnetic profiles. The main groups of reflections have been coloured arbitrarily, according to
their dip (red/horizontal, green/south dipping, blue/north dipping). An anticlinal shape is coloured in yellow to
the south.
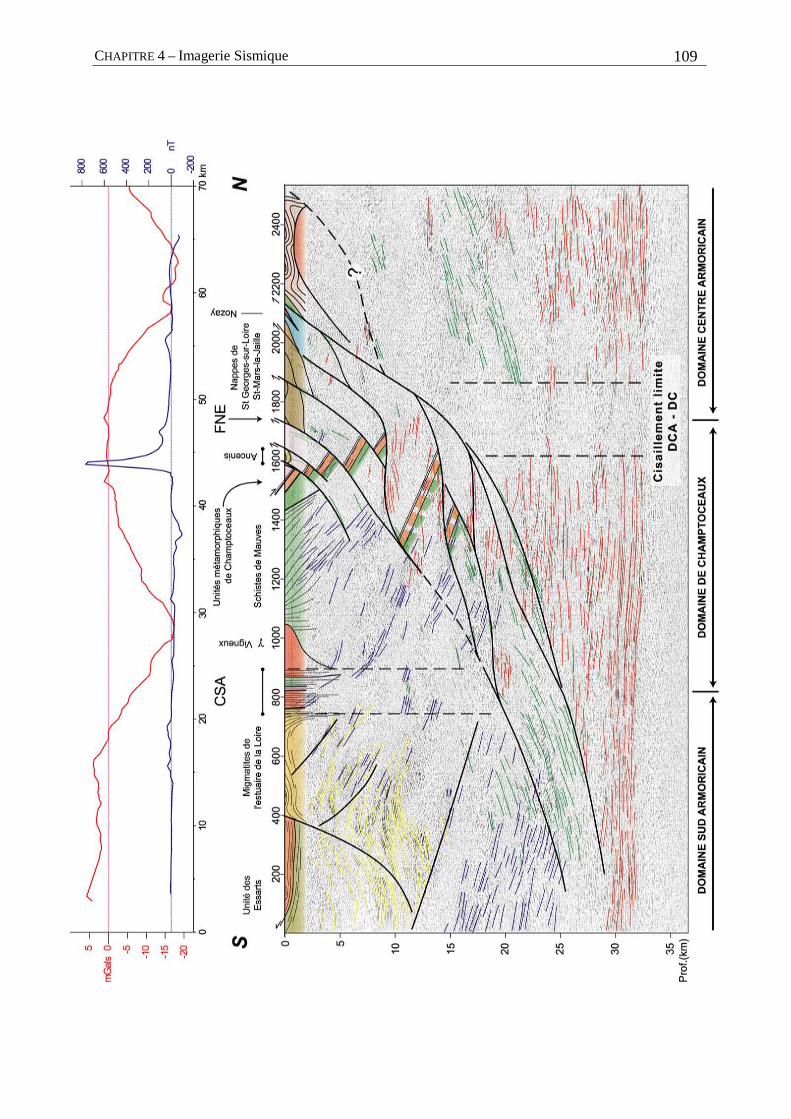
CHAPITRE 4 – Imagerie Sismique 109
CHAPITRE 4 110
La croûte supérieure montre trois domaines dont les signatures sismiques sont clairement
différentes et qui correspondent, en surface, aux Domaines Centre Armoricain, de Champtoceaux, et
Sud Armoricain, respectivement séparés par les accidents CSA et FNE. Dans le Domaine Centre
Armoricain, la croûte supérieure est relativement transparente avec seulement quelques réflexions
inclinées vers le sud entre 13 et 20 km. Cette image s’apparente fortement à celle obtenue dans le
Profil Armor 1 au nord du Domaine Centre Armoricain (Bitri et al., 2001). Dans le Domaine de
Champtoceaux, la croûte supérieure est très réflective avec de nombreux groupes de réflexions pentés
vers le nord qui se corrèlent en surface au litage des Schistes des Mauves et aux foliations des unités
métamorphiques de haute pression. Dans les dix premiers kilomètres supérieurs de la croûte, une série
de réflexions localisées à pendage sud décalent les réflecteurs à pendage nord. Elles correspondent en
surface à des failles juxtaposant des unités géologiques différentes. Il s’agit d’un faisceau de
chevauchements, dont l’amplitude de déplacement est limitée, qui tronçonne les unités
métamorphiques de Champtoceaux ainsi que les nappes de St Georges-sur-Loire/St-Mars-la-Jaille.
Ces chevauchements superficiels se connectent en profondeur au groupe de réflexions à pendage sud
qui recoupe les réflexions de la croûte inférieure. Le profil magnétique superposé à la coupe sismique
montre une anomalie de plus de 700 nT localisée à l’aplomb des unités à reliques éclogitiques de
Champtoceaux. Cette anomalie est , en fait, due à la présence de serpentinites au toit des unités
métamorphiques (Ballèvre et al., 1989). La courte longueur d’onde et la forme asymétrique de
l’anomalie s’accordent bien avec le fait que ces unités à forte rémanence magnétique apparaissent,
dans les 10 km supérieurs de l’image sismique, découpées en écailles, par les chevauchements
superficiels. Une modélisation des sources par une analyse en ondelettes confirme cette interprétation
(de Poulpiquet et al., 2002). L’anomalie gravimétrique de grande longueur d’onde, au niveau du
Domaine de Champtoceaux, ne peut pas s'expliquer seulement par les sources denses superficielles
clairement identifiées par la sismique jusqu’à 10 km de profondeur. Elle témoigne de l’existence d’un
corps lourd à la base de la croûte supérieure. Ceci suggère donc une prolongation de ces écailles en
profondeur au moins jusqu’à 20 km. Dans le Domaine Sud Armoricain, les réflexions dessinent, entre
2 et 12 km, un antiforme sous les lames chevauchantes de haute pression (Orthogneiss et éclogites des
Essarts (Godard, 2001) et Schistes de St Gilles et Porphyroïdes (Le Hébel et al., 2002). Cet anticlinal,
bordé par des failles normales, pourrait correspondre au dôme migmatitique qui affleure à l’ouest du
profil, dans l’estuaire de la Loire. Plus profondément, entre 15 et 20 km, un puissant groupe de
réflexions à pendage nord pourrait correspondre aux unités métamorphiques de Vendée (Séries de
Brétignolles-Les Sables d’Olonne ; Iglesias & Brun, 1976 ; Brun & Burg, 1982). Ces réflexions sont
recoupées vers le bas par le groupe de réflexions à pendage sud qui prolonge dans le Domaine Sud
Armoricain la structure chevauchante identifiée dans le Domaine de Champtoceaux.
CHAPITRE 4 – Imagerie Sismique 111
3. Interprétation - discussion
Un trait structural important, mis en évidence par le profil sismique, est la structure
chevauchante qui, de la base de la croûte au sud, s’élargit en un éventail de failles inverses dans la
croûte supérieure du Domaine de Champtoceaux. L’existence de cette structure chevauchante majeure,
qui affecte à la fois le Domaine Sud Armoricain et le Domaine de Champtoceaux, était restée
insoupçonnable à partir des seules données géologiques de surface. Sa découverte conduit à
reconsidérer les relations entre les trois domaines principaux du Massif Armoricain, telles qu’on
pouvait les percevoir, et change donc significativement la conception que l’on pouvait avoir de la
tectonique Hercynienne dans cette région. Plusieurs implications majeures sont à considerer.
1. Le complexe métamorphique de haute pression de Champtoceaux chevauche la
bordure sud du Domaine Centre Armoricain. Ce chevauchement est nécessairement
post-Carbonifère inférieur, dans la mesure où c'est à cette époque que sont exhumes
les formations métamorphiques de haute pression (Bosse et al., 2000).
2. La segmentation des unités métamorphiques de haute pression de Champtoceaux par
le faisceau de failles affectant la croûte supérieure permet d’évaluer la composante de
raccourcissement total dû au chevauchement à au moins 20 km (Fig. 4.3). Compte
tenu du fait que la direction de ces chevauchements est parallèle à la branche Nord du
CSA (Fig. 4.1.) où des structures à vergence Nord sont localement observées (Le
Corre, 1978), une composante décrochante dextre leur est vraisemblablement associé.
3. Le Cisaillement Sud Armoricain en tant que structure sub-verticale n’est pas imagé
par des réflexions spécifiques, mais le prolongement en profondeur de sa trace en
surface correspond à un changement net de signature sismique. Ce prolongement
arrive en butée sur le chevauchement à une profondeur d’environ 20 km. Cette
configuration géométrique pourrait inciter à conclure que le chevauchement est
postérieur au décrochement. D'un autre côté, ces structures sont toutes deux d'âge
Carbonifère. De plus, la carte géologique indique que les limites d'unités dans le
Domaine de Champtoceaux, dont certaine coïncident avec certains des
chevauchements imagés en sismique (Fig. 4.2.), sont tronquées par le CSA (Fig. 4.1.).
Par ailleurs, les données chronologiques et structurales disponibles le long du CSA
montrent l’existence (a) de granites syncinématiques tardifs, d’âge carbonifère
supérieur (Bernard-Griffiths et al., 1985), et (b) de déformations cisaillantes fragiles
tardives (Jégouzo, 1980).
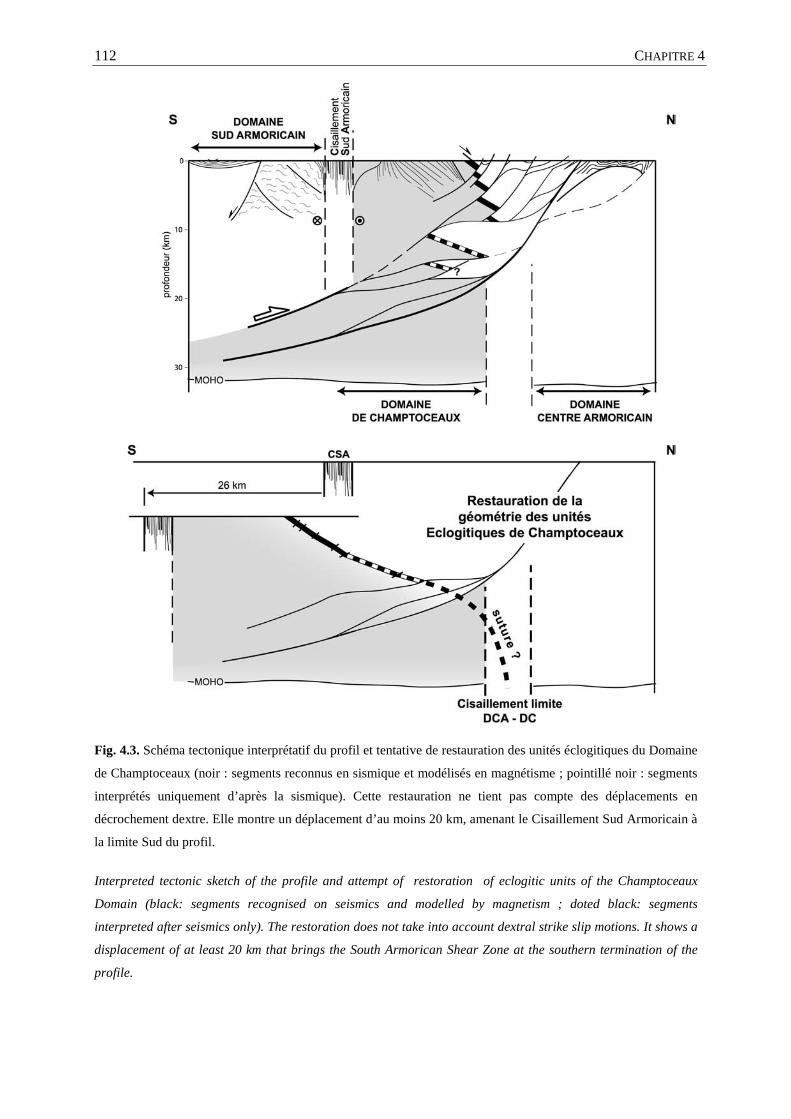
CHAPITRE 4 112
Fig. 4.3. Schéma tectonique interprétatif du profil et tentative de restauration des unités éclogitiques du Domaine
de Champtoceaux (noir : segments reconnus en sismique et modélisés en magnétisme ; pointillé noir : segments
interprétés uniquement d’après la sismique). Cette restauration ne tient pas compte des déplacements en
décrochement dextre. Elle montre un déplacement d’au moins 20 km, amenant le Cisaillement Sud Armoricain à
la limite Sud du profil.
Interpreted tectonic sketch of the profile and attempt of restoration of eclogitic units of the Champtoceaux
Domain (black: segments recognised on seismics and modelled by magnetism ; doted black: segments
interpreted after seismics only). The restoration does not take into account dextral strike slip motions. It shows a
displacement of at least 20 km that brings the South Armorican Shear Zone at the southern termination of the
profile.
CHAPITRE 4 – Imagerie Sismique 113
Ainsi, un synchronisme, au moins partiel, du fonctionnement du CSA et du système
chevauchant est à envisager comme l'a, par ailleurs, montré la restauration de la
déformation hercynienne à l'échelle régionale (Gumiaux, 2003 ; Gumiaux et al., in
press). Compte tenu des déplacements chevauchants déduits de la géométrie des
structures, dans la croûte supérieure et moyenne, la position du CSA dans le manteau
lithosphérique est à rechercher immédiatement au sud du profil.
4. Les déformations extensives observées en Bretagne méridionale sont d’âge
Carbonifère supérieur (Gapais et al., 1993), donc synchrones des déplacements
dextres le long du CSA. Les relations géométriques entre ce dernier et le système
chevauchant imagé par la sismique soulignent ainsi le caractère syn-convergence de
l’extension.
5. La discontinuité majeure de la croûte inférieure et du Moho, mise en évidence entre
les Domaines Centre Armoricain et de Champtoceaux, est oblitérée dans la croûte
supérieure par le front du chevauchement. Cette discontinuité correspond très
probablement à un décrochement précoce dans l’histoire de la collision, synchrone de
l’exhumation des roches de haute pression de Champtoceaux, dont le déplacement
senestre peut être estimé autour de 300 km (Brun et al., 2002). La restauration des
unités éclogitiques (Fig. 4.3) suggère que ce cisaillement à la limite entre Domaine
Centre Armoricain et Domaine de Champtoceaux pourrait correspondre au
prolongement de la suture en profondeur.
6. La totalité du Domaine Sud Armoricain imagé par le profil constitue l’unité
chevauchante. Compte tenu des corrélations qui peuvent être établies avec la géologie
de surface, la structure observée résulte sous toute vraisemblance d'une superposition
tectonique, de haut en bas, des unités métamorphiques précoces de haute pression et
des unités métamorphiques de pression intermédiaire et des migmatites associées. Les
contacts chevauchants entre ces unités sont décalés par des failles normales d’age
Carbonifère. Il est important de noter que, compte tenu du décrochement dextre le
long du CSA, les structures imagées dans le Domaine Sud Armoricain ne sont pas en
continuité directe avec celles du Domaine de Champtoceaux même si les réflexions, à
pendage nord, observées de part et d’autres du CSA semblent le suggérer. D’autre
part, le Domaine Sud Armoricain a subi un soulèvement vertical important pendant
ces mouvements à composantes simultanément décrochantes et chevauchantes. Le
mouvement vertical relatif de part et d'autre du CSA a au moins deux causes. D'une
part, les linéations d'étirement résultant du cisaillement dextre, dans le CSA lui-même,

CHAPITRE 4 114
ont le plus souvent un plongement vers l'Est (Jégouzo, 1980), ce qui indique un
soulèvement du compartiment Sud lors du mouvement décrochant. D'autre part, là où
le CSA est en contact avec les unités migmatitiques du Domaine Sud Armoricain, une
composante de mouvement vertical due à l'exhumation de ces dernières doit être prise
en compte. Une quantification de cette cinématique tridimensionnelle complexe reste
à réaliser.
Remerciements
Les auteurs remercient Messieurs Patrick Ledru et Philippe Matte, respectivement Directeur
de Programme et Président du Conseil Scientifique du Programme Géofrance 3D (BRGM et CNRS-
INSU), pour leur soutien dans la réalisation du Projet Armor2. Nos remerciements s'adressent aussi à
J.-P. Burg et à J.-L. Lagarde pour leurs remarques et critiques constructives.
CHAPITRE 4 – Imagerie Sismique 115
References
BALLEVRE, M., KIENAST, J.R. & PAQUETTE, J. L. (1987). - "Le métamorphisme éclogitique dans la
nappe de Champtoceaux (Massif Armoricain)". – Comptes Rendus de l'Académie des Sciences de
Paris, II - 305, 127-131.
BERNARD-GRIFFITHS, J., PEUCAT, J.J., SHEPPART, S. & VIDAL, P. (1985). - "Petrogenesis of Hercynian
leucogranites from the southern Armorican Massif : contribution of REE and isotopic (Sr, Nb, Pb
and O) geochemical data to the study of source ock characteristics and ages". - Earth and Planetary
Science Letters., 74, 235-250.
BITRI, A., BRUN, J.P., TRUFFERT, C. & GUENNOC, P. (2001). - "Deep seismic imaging of the Cadomian
thrust wedge of Northern Brittany". - Tectonophysics., 331(1-2), 65-80.
BOSSE, V., FERAUD, G., RUFFET, G., BALLEVRE, M., PEUCAT, J.-J. & DE JONG, K. (2000). - "Late
Devonian subduction and early-orogenic exhumation of eclogite-facies rocks from the
Champtoceaux Complex (Variscan belt, France)". - Geological Journal., 35), 297-325.
BOSSE, V., BALLEVRE, M. & VIDAL, O. (2002). - "Ductile thrusting recorded by the garnet isograd
from the blueschist-facies metapelites of the Ile de Groix, Armorican Massif, France". - Journal of
petrology., 43(3), 485-510.
BRUN, J.P. & J.P., B. (1982). - "Combined thrusting and wrenching in the Ibero-Armorican arc : a
corner effect during continental collision". - Earth and Planetary Science Letters., 61, 319-332.
BRUN, J.P., GAPAIS, D., CAPDEVILLA, R., GUMIAUX, C., GRANET, M. & CHANTRAINE, J. (2002). - "La
suture sud de la collision Hercynienne en France : une tentative de restauration.". – Réunion des
Sciences de la Terre, Nantes, France, p.77.
BURG, J.P., VAN DEN DRIESSCHE, J. & BRUN, J.P. (1994). - "Syn- to post-thickening extension in the
Variscan Belt of Western Europe : Modes and structural consequences". - Géologie de la France.,
3), 33-51.
CANNAT, M. & BOUCHEZ, J.L. (1986). - "Linéations N-S et E-W en Vendée littorale (Massif
Armoricain). Episodes tangentiels successifs éo-hercyniens en France occidentale". - Bulletin de la
Société géologique de France., 2(2), 299-310.
CHAPITRE 4 116
FAURE, M. & CARTIER, C. (1998). - "Déformations ductiles polyphasées dans l'antiforme
orthogneissique de St-Clément-de-la-Place (Unité de Lanvaux, Massif Armoricain).". - Comptes
Rendus de l'Académie des Sciences de Paris., 326, 795-802.
GAPAIS, D. & LE CORRE, C. (1980). - "Is the Hercynian belt of Brittany a major shear zone". - Nature.,
288, 574-576.
GAPAIS, D., LAGARDE, J.L., LE CORRE, C., AUDREN, C., JEGOUZO, P., CASAS SAINZ, A. & VAN DEN
DRIESSCHE, J. (1993). - "La zone de cisaillement de Quiberon : témoin d'extension de la chaîne
varisque en Bretagne méridionale au Carbonifère". - Comptes Rendus de l'Académie des Sciences.,
série 2(316), 1123-1129.
GEOFFROY, L. (1988). - "Histoire de la déformation dans les métamorphites de Sauveterre, Vendée
littorale.". - Comptes Rendus de l'Académie des Sciences de Paris II., 307, 277-280.
GODARD, G. (2001). - "Les Essarts eclogite-bearing Complex (Vendée)". - Geology of France.,
Spécial Vendée(1-2), 19-51.
GUMIAUX, C. (2003). - "Modélisation du cisaillement Hercynien de Bretagne Centrale : déformation
crustale et implications lithosphériques". – Thèse, Université de Rennes1, Rennes.
GUMIAUX, C., BRUN, J.P. & GAPAIS, D., (in press). - "Strain removal within the Hercynian Shear Belt
of Central Brittany (Western France): Methodology and tectonic implications". - Journal of the
geological Society of London Special Publication.
IGLESIAS, M. & BRUN, J.P. (1976). - "Signification des variations et anomalies de la déformation dans
un segment de la chaîne hercynienne (les séries cristallophylliennes de la Vendée littorale, Massif
Armoricain).". - Bulletin de la Société Géologique de France., 18, 1443-1452.
JEGOUZO, P. (1980). - "The South Armorican Shear Zone". - Journal of Structural Geology., 2(1-2),
39-47.
LE CORRE, C. (1978). - "Approche quantitative des processus synschisteux. L'exemple du segment
Hercynien de Bretagne Centrale". – Thèse d'état, Université de Rennes1, Rennes.
LE HEBEL, F., VIDAL, O., KIENAST, J.R. & GAPAIS, D. (2002). - "Les "Porphyroïdes" de Bretagne
méridionale : une unité de HP-BT dans la chaîne hercynienne.". - Comptes Rendus Géoscience.,
CHAPITRE 4 – Imagerie Sismique 117
334, 205-211.
LEDRU, P., MAROT, A. & HERROUIN, Y. (1986). - "Le synclinorium de Saint-Georges-sur-Loire : une
unité ligérienne charriée sur le domaine centre armoricain. Découverte de métabasite à
glaucophane sur la bordure sud de cette unité.". - Comptes Rendus de l'Académie des Sciences.,
303-II(10), 963-968.
PERCEVAULT, M.-N. & COBBOLD, P.R. (1982). - "Mathematical removal of regional ductile strains in
Central Brittany: evidence for wrench tectonics". - Tectonophysics., 82), 317-328.
DE POULPIQUET, J., GUMIAUX, C. & TRUFFERT, C. (2002). - "Les anomalies magnétiques associées
aux nappes de Champtoceaux: traitement par transformation de Fourier et transformée en
ondelettes.". – Réunion des Sciences de la Terre, Nantes, France, p.77.

C h a p i t r e 5 Analyse du champ magnétique
Collaborations : Boukerbout, H., de Poulpiquet, J., Truffert, C.

CHAPITRE 5 – Analyse du champ magnétique 121
1. Introduction
Dans le cadre du programme Géofrance 3D – Armor2, de nouvelles cartes de données
magnétiques et radiométriques ont été acquises à travers le Massif Armoricain lors d’un levé
aéroporté (120 m de garde au sol). La région étudiée ici couvre une bande de 75 Km de large environ
depuis la région de Rennes au nord, jusqu’aux Sables-d’Olonnes, en Vendée, au sud. Ces mesures
géophysiques sont continues et denses à travers toute la zone survolée. Les données radiométriques
reflètent les variations chimiques des roches en surface et constituent une aide particulièrement
importante pour la cartographie géologique. L’étude du champ magnétique permet quant à lui
d’appréhender la géométrie des unités et des structures depuis la surface ou la sub-surface jusqu’en
profondeur. La composante régionale a pu être extraite de l’intensité du champ magnétique total et la
carte d’anomalie du champ magnétique ainsi obtenue reflète l’effet des sources comprises dans la
première moitié de la croûte environ. Un traitement supplémentaire, la réduction au pôles, consiste à
recalculer la valeur des anomalies magnétiques telles qu’elles auraient été mesurées, pour des sources
équivalentes, à l’aplomb des pôles magnétiques (où le champ magnétique est vertical). Dans cette
configuration "polaire", où le champ magnétique est vertical, les anomalies se retrouvent
globalement1 situées à l'aplomb de leurs sources sur la carte et l'allure de ces anomalies devient
indépendante de l'orientation des corps en profondeur.
Le lien entre la valeur de l’anomalie du champ magnétique et les caractéristiques de la source
à l’origine de cette anomalie n’est pas direct : c’est à travers l’étude des variations spatiales du signal
mesuré que la forme et la profondeur des unités ou des structures pourront être déterminées. Dans un
premier temps ces variations peuvent être décrites par le contenu fréquentiel global pour l’ensemble
de la carte d'anomalies étudiée. Des gammes de longueurs d’ondes caractéristiques peuvent être
reconnues et utilisées pour effectuer des filtrages du signal en carte ou le long de profils. Les
variations des valeurs des anomalies du champ total peuvent aussi être étudiées à travers le calcul des
gradients du signal. La méthode de la transformée en ondelettes sera appliquée sur un profil extrait le
long de la trace du profil de sismique réflexion en permettant de localiser plus précisément les
bordures et les discontinuités des unités et des structures en profondeur.
1 En considérant que toutes les anomalies mesurées correspondent à des aimantations induites.
CHAPITRE 5 122
2. Présentation des données et premières interprétations
Levé géophysique aéroporté dans le sud-est du Massif Armoricain
(programme GéoFrance3D Armor2) – Magnétisme et radiométrie spectrale
A detailled airborne geophysical survey in south-east Armorican Massif
(GéoFrance3D) programme) – Magnetism and spectral radiometry
C. Truffert1, Ch. Gumiaux2, J. Chantraine 1, J. Perrin1, A. Galdeano3, D. Gapais2,
M. Ballèvre2, A. Asfirane1, P. Guennoc1 & J.P. Brun2
Comptes Rendus de l'Académie des Sciences de Paris (2001), 333, 263-270.
Résumé
Un levé de géophysique aéroporté (magnétisme et radiométrie) a été réalisé dans la zone
d’étude du projet Armor2 (programme GéoFrance3D) en complément du levé d’infrastructure du
Massif armoricain (Ministère de l’Industrie). Ce levé couvre les principaux domaines de la zone de
collision de la chaîne varisque de l’Europe de l’ouest dont l'évolution est contrastée depuis
l'épaississement précoce jusqu'à l'amincissement tardif. Après traitement et interpolation au pas de
250 m des données en ligne de vol espacées de 500 m, une interprétation conjointe de la carte
géologique synthétique au 250 000 et des cartes géophysiques a été menée à l’aide d’un Système
d’Information Géographique. Le principal atout de la couverture géophysique aéroportée haute
résolution réside dans son caractère homogène et dense de l’information, ce qui n’est pas le cas des
observations géologiques dépendantes des conditions d’affleurements. Le détail des cartes
géophysiques permet de lever des indéterminations dans l’interprétation géologique et d’améliorer les
contours. Les structures peuvent être suivies sur des distances plus grandes et sous la couverture
1 BRGM 2 Géosciences Rennes 3 IPGP
CHAPITRE 5 – Analyse du champ magnétique 123
néogène et/ou en mer (cas de la carte magnétique). Les cartes radiométriques accèdent directement à
la composition géochimique en radio-éléments K, Th et U ce qui permet de discriminer entre elles les
formations volcano-plutoniques de composition acide. La carte magnétique renseigne sur le
prolongement en profondeur des structures contraignant l’évolution tectonique de cette zone clé.
Abstract
A detailed geophysical survey has been carried out in the armorican Massif. Magnetic and
radiometric data have been simultaneously recorded. The studied area offers a short cross-section
through the major domains of the Variscan collision belt. Geophysical maps have been correlated
with a regional geological map drawn within the framework of the project (Armor2, GéoFrance 3D).
Geological contours could be revisited and continuity of some structural features are evident.
Radiometric maps allowed to identify the geochemical content of K, U and Th within volcano-
sedimentary units. Magnetic geological formations are followed beneath the neogene sedimentary
cover and offshore.
Magnetism/ spectral radiometry/ Hercynian/ Armorican Massif
Abridged version
The armorican Massif offers a short cross-section through the major domains of the variscan
collision belt. The Armor2 project (GéoFrance3D programme) aims to determine the crustal-scale 3D
geometry of the main variscan structures. An airborne geophysical survey (magnetism and
radiometry) has been carried out by the French Industry Ministry in 1998 (Bonijoly et al., 1999) and
completed within the framework of the Armor2 project.
A 250 000-scale geological map has been established on the basis of the 50 000-scale geological
coverage and original data (Chantraine et al. 1997). From north to south (Fig. 5.1), main units are as
follows.
- The central-armoricain domain corresponds to a sedimentary platform from Proterozoic to lower
Paleozoic in age. This zone is affected by dextral strike-slip tectonics, and is limited to the south by
the northern branch of the south armorican shear zone (Gapais and Le Corre, 1980).
- The Ligérian domain is a marginal basin associated with a volcanic activity of lower paleozoic age
(Ledru et al. 1986). During the Variscan continental convergence, a tangential deformation occurred,
marked by a weak, hy-dipping schistosity.
CHAPITRE 5 124
- The Nantais domain is composed of continental deformed units, Proterozoic in age, which overly
gneissic units including HP-HT relics. These units are interpreted as a thinned margin, deeply burried
during the collision and exhumed during upper-Devonian and Carboniferous times (Bosse et al.,
2000).
- The South-Armorican domain is composed of several gneissic units including eclogites (Essarts
complex) and blue schists (Bois de Cené unit) arranged around huge anatectic domes resulting from a
late extensive phase consecutive to the collision (Gapais et al., 1993).
Magnetic and radiometric data were recorded (see table 1). The positioning system was a differential
GPS. Temporal variations of the earth magnetic field recorded on a fixed base station at Rennes have
been used for diurnal corrections.
The spectrometer recorded gamma emission from the ground (downward principal detector)
and from the air (upward auxiliary detector). Count rates are determined within three windows
corresponding to natural radio-elements K, U and Th. A total count window, characterising
radiogenic activity, has been also extracted. The processing sequence of magnetic data comprises
heading effect correction, diurnal reduction and levelling. The map of the total magnetic field
intensity is obtained. The contribution of deep spatial field variations is evaluated using a low-pass
filtering of 60-75 km wavelength. The removal of the deep component allows to obtain the anomaly
of the total magnetic field intensity. A 250 m spacing grid has been computed. In order to replace
anomalies above sources, a reduction to pole has been made assuming an induced magnetisation
parallel to the present field (inclination, 63°26’ and declination, 3°34’) (Fig. 5.2).
Radiometric data have been recorded and processed according the technical note of IAEA n°
123, 1991. Noise Adjusted Singular Value Decomposition developped by Hovgaard (1997) has been
applied on the whole survey in order to increase the signal to noise ratio.
Potassium, Thorium and Uranium concentration and total count exposure (nGy/h) are
computed and used for the final maps. The radiometric composition of the studied area is illustrated
by a ternary map (U, Th and K) combined with magnetic shading (figure 5.3).
The analysis was conducted using a Geographical Information System (GIS) allowing to
display simultaneously geophysical and geological informations.
Brioverian slates and sandstones, (central armorican domain) (A Fig. 5.2 and 1 Fig. 5.3),
with high Potassium contents, are associated with a weak magnetic anomaly marked by local short
wavelength anomalies, some being attributed to dolerite dykes. The N100 striking Hercynian folding
is recognised on the radiometric and magnetic maps. The Armorican Sandstone, riched in iron,
induces an intense short wavelength anomaly (B Fig. 5.2). The geological Formations involved within
the folding present distinct geochimical compositions, (2 Fig. 5.3).
CHAPITRE 5 – Analyse du champ magnétique 125
Southward, a bimodal magnetic anomaly oriented N170 as the Quessoy fault system (C Fig. 5.2)
suggests a remnant magnetisation. According to its wavelength, this anomaly is probably due to a
buried source (at less than 1 km depth) but its nature is unknown. The Quessoy faults are associated
with short wavelength anomalies suggesting hydrothermal alteration (D Fig. 5.2).
Saint-Mars-la-Jaille and Saint-Georges groups (Ligerian domain) present similar
geophysical signatures but are separated by a short wavelength anomaly of unknown origin (E Fig.
5.2).
Magnetic maps may be useful to revisit the Nantais domain units. For example, the magnetic
signature of the Mauges unit is different west and east of the Loire. Westward, this unit is correlated
with a main intense and short wavelength magnetic anomaly. This unit may be followed northward
beneath the volcano-sedimentary unit of Saint-George/Loire (F Fig. 5.2).
The Ancenis Basin, enriched in Th and K (3 Fig. 5.3), presents a heterogeneous magnetic
signature consistent with the olistostrom interpretation of its infilling (G Fig. 5.2) (Pelhate, 1994).
Leucogranites, located along the southern branch of the CSA, present high K and U contents.
The Essarts complex (south-armoricain domain) is locally associated with a high and short
wavelength magnetic anomaly. The signal heterogeneity may be attributed to surficial alteration. Blue
schists of Bois de Cené unit extend beneath the neogene sedimentary cover and offshore.
High resolution airborne geophysical survey offers homogeneous maps over a given area, in
contrast to field geology which depends on outcrop conditions. In the study area, the excellent
correlation observed between geophysical and geological maps emphasises the powerfulness of
geophysical surveys in poorly exposed or unmapped regions. In the present example, magnetic
geological formations are followed further beneath the sedimentary cover and offshore. The
radiometric data reveal a powerful tool to discriminate acid lithologies, according their geochemical
compositions.
Geological contours of the Nantais and South-Armorican Domains can be revisited using
magnetic and radiometric maps. Future work will include the construction of a 3D geometrical model
of the main geological units, based on geophysical modelling constrained by petrophysical
measurements (susceptibility and remnant magnetization).
CHAPITRE 5 126
2.1 Introduction
L'imagerie des zones de suture des orogènes est cruciale pour la compréhension des processus
tectoniques. Dans le cas de la chaîne varisque, une coupe exceptionnelle à travers une suture de
collision continentale est accessible dans le Massif armoricain, d'un domaine de plate-forme
continentale peu déformé au Nord aux unités métamorphiques éclogitiques et schistes bleus au Sud.
Le projet Armor2 du programme GéoFrance3D a financé, dans l’emprise de la zone d’étude, la
densification des lignes de vol du levé de géophysique aéroporté (magnétisme et radiométrie) réalisé
en 1998 par le BRGM pour le compte du ministère de l’Industrie (Bonijoly et al. 1999). Les cartes
géophysiques sont le reflet de l’extension en surface et en profondeur des unités et des structures
géologiques. Ce niveau d'information supplémentaire ouvre de nouvelles perspectives de
reconstitution de la géométrie 3D de la suture de la chaîne varisque.
2.2 Contexte géologique régional
Une carte géologique conçue à l'échelle du 250 000 synthétise l'ensemble des données
disponibles des cartes au 50 000 et propose une division lithotectonique originale du Massif
armoricain (Chantraine et al., 1997). Sont distingués du Nord au Sud (Fig. 5.1) :
- Le domaine centre-armoricain, qui correspond à une plate forme continentale d'âge
Néoprotérozoïque terminal à Paléozoïque inférieur, à rares intercalations volcaniques, reposant sur un
socle inconnu à l'affleurement. Déformées dans un régime global transcurrent dextre (Gapais et Le
Corre, 1980), les formations sédimentaires sont affectées par des plis en échelon de faible amplitude
et par une foliation de plan axial restant dans le domaine métamorphique épizonal.
- Le domaine ligérien est essentiellement composé d'un ensemble orthogneissique (orthogneiss de
Lanvaux) et de formations volcano-sédimentaires représentant un bassin marginal rapporté au
Paléozoïque inférieur (Ledru et al. 1986). Ces unités sont généralement affectées d'une déformation
pénétrative liée au fonctionnement des accidents décrochants ou à des chevauchements correspondant
à la fermeture du bassin.
- Le domaine Nantais est principalement composé d’un ensemble continental Néoprotérozoïque
tectonisé reposant géométriquement sur un ensemble d'unités gneissiques au sein desquelles les
gneiss de Champtoceaux préservent les reliques d'un stade métamorphique de haute pression. Pour
cette raison, cette unité est interprétée comme une marge amincie, enfouie à grande profondeur au
cours de la collision et exhumée à la limite Dévonien-Carbonifère (Bosse et al., 2000).
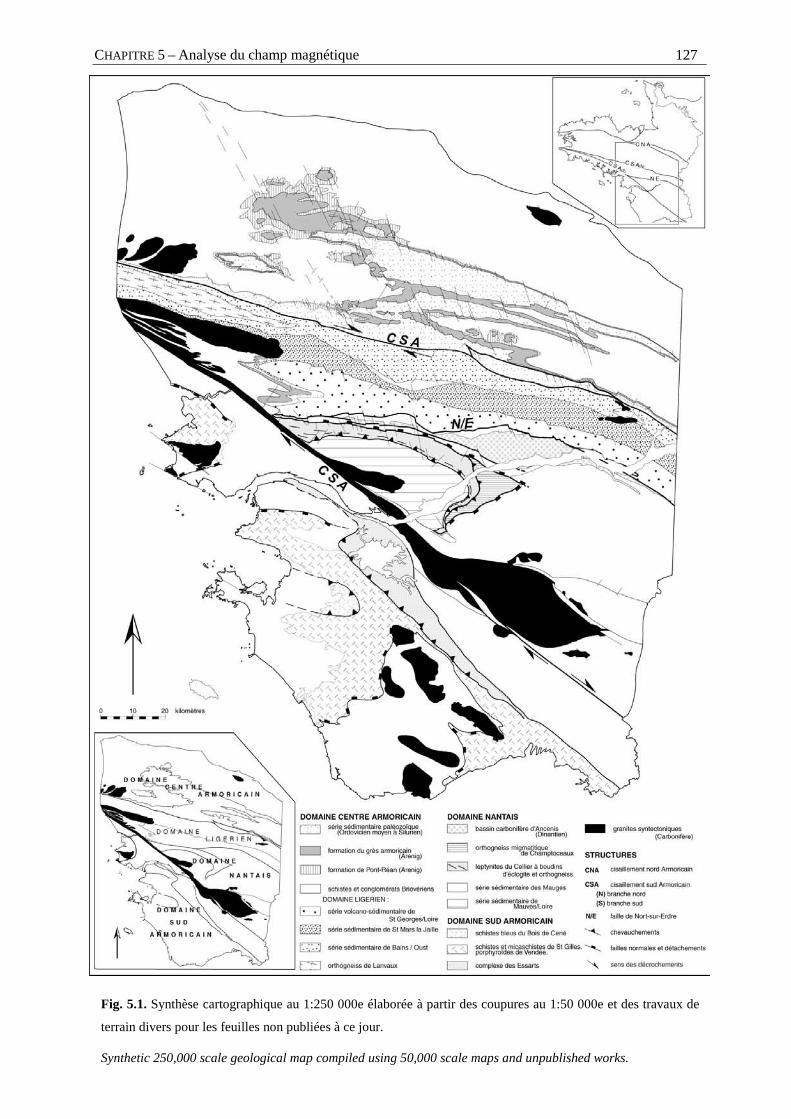
CHAPITRE 5 – Analyse du champ magnétique 127
Fig. 5.1. Synthèse cartographique au 1:250 000e élaborée à partir des coupures au 1:50 000e et des travaux de
terrain divers pour les feuilles non publiées à ce jour.
Synthetic 250,000 scale geological map compiled using 50,000 scale maps and unpublished works.
CHAPITRE 5 128
- Le domaine sud-armoricain comprend des unités gneissiques variées incluant des massifs
éclogitiques (Complexe des Essarts), des schistes bleus (Bois de Cené) et des nappes d'orthogneiss
oeillés (Porphyroïdes de Vendée). Leur disposition autour de vastes dômes à noyau anatectique
résulte d'une phase tardive d'extension, combinant détachement et décollement, et résultant de
l'épaississement crustal (Gapais et al., 1993).
Ces principaux domaines sont séparés par des zones de cisaillement appartenant au faisceau de
failles du cisaillement sud armoricain (CSA) (Gapais et Le Corre, 1980). Les domaines centre-
armoricain et ligérien sont séparés par la branche nord du CSA, de direction E-W, dont le jeu dextre
constitue une référence internationale pour l’analyse des zones de cisaillement (Berthé et al. 1980).
La faille de Nort-sur-Erdre marque la bordure nord du domaine Nantais localement soulignée par le
bassin de démantèlement dinantien d'Ancenis, dont la géométrie suggère une mise en place en "pull-
apart" lors d'un jeu senestre. Enfin, recoupant la faille de Nort-sur-Erdre, la branche la plus
méridionale du CSA est jalonnée de granites syncinématiques d'un jeu majeur dextre daté du
Carbonifère supérieur (Bernard-Griffiths et Cornichet J., 1985).
2.3 Le levé de géophysique aéroporté
L’acquisition
Les vols et les traitements de base ont été assurés par la société canadienne Sander
Geophysics Ltd. Les caractéristiques de vol et d’enregistrements sont résumées dans le tableau 1. La
réalisation du levé a nécessité deux avions bimoteurs équipés de systèmes d’acquisition similaires et
dotés d’une perche de 2.5 m de long à l’extrémité de laquelle était fixé le magnétomètre principal à
vapeur de Césium. Des caissons spéciaux contenant des cristaux de Iodure de Sodium (NaI) étaient
disposés dans la cellule des appareils pour permettre la détection des rayons γ émis par le sol.
L’analyse des spectres des énergies γ conduit à quantifier les teneurs en radio-éléments qui émettent
ces rayonnements (U, K et Th).
Préalablement au levé, une trajectoire tridimensionnelle fut établie selon une surface
théorique de vol qui prend en compte la topographie et les capacités techniques des avions. La
position de l’avion, déterminée à quelques mètres près, a été recalculée en différé par traitement
différentiel des mesures GPS enregistrées à bord de l’avion et sur une station GPS fixe implantée à
Rennes.
Les variations temporelles du champ magnétique étaient enregistrées au sol par des stations
magnétiques fixes implantées à Nantes, à Rennes et à Carhaix mais seuls les enregistrements de la
station de Rennes ont été utilisés pour la réduction des données magnétiques.
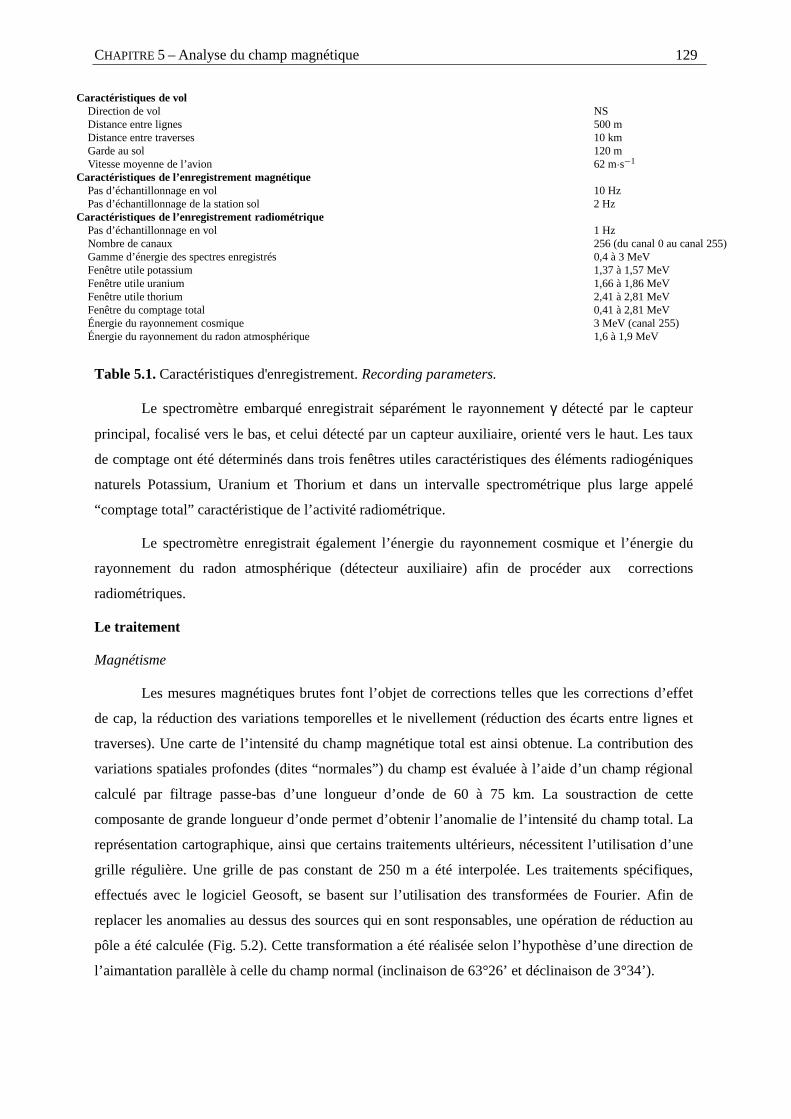
CHAPITRE 5 – Analyse du champ magnétique 129
Table 5.1. Caractéristiques d'enregistrement. Recording parameters.
Le spectromètre embarqué enregistrait séparément le rayonnement γ détecté par le capteur
principal, focalisé vers le bas, et celui détecté par un capteur auxiliaire, orienté vers le haut. Les taux
de comptage ont été déterminés dans trois fenêtres utiles caractéristiques des éléments radiogéniques
naturels Potassium, Uranium et Thorium et dans un intervalle spectrométrique plus large appelé
“comptage total” caractéristique de l’activité radiométrique.
Le spectromètre enregistrait également l’énergie du rayonnement cosmique et l’énergie du
rayonnement du radon atmosphérique (détecteur auxiliaire) afin de procéder aux corrections
radiométriques.
Le traitement
Magnétisme
Les mesures magnétiques brutes font l’objet de corrections telles que les corrections d’effet
de cap, la réduction des variations temporelles et le nivellement (réduction des écarts entre lignes et
traverses). Une carte de l’intensité du champ magnétique total est ainsi obtenue. La contribution des
variations spatiales profondes (dites “normales”) du champ est évaluée à l’aide d’un champ régional
calculé par filtrage passe-bas d’une longueur d’onde de 60 à 75 km. La soustraction de cette
composante de grande longueur d’onde permet d’obtenir l’anomalie de l’intensité du champ total. La
représentation cartographique, ainsi que certains traitements ultérieurs, nécessitent l’utilisation d’une
grille régulière. Une grille de pas constant de 250 m a été interpolée. Les traitements spécifiques,
effectués avec le logiciel Geosoft, se basent sur l’utilisation des transformées de Fourier. Afin de
replacer les anomalies au dessus des sources qui en sont responsables, une opération de réduction au
pôle a été calculée (Fig. 5.2). Cette transformation a été réalisée selon l’hypothèse d’une direction de
l’aimantation parallèle à celle du champ normal (inclinaison de 63°26’ et déclinaison de 3°34’).
Caractéristiques de volDirection de vol NSDistance entre lignes 500 mDistance entre traverses 10 kmGarde au sol 120 mVitesse moyenne de l’avion 62 m·s−1
Caractéristiques de l’enregistrement magnétiquePas d’échantillonnage en vol 10 HzPas d’échantillonnage de la station sol 2 Hz
Caractéristiques de l’enregistrement radiométriquePas d’échantillonnage en vol 1 HzNombre de canaux 256 (du canal 0 au canal 255)Gamme d’énergie des spectres enregistrés 0,4 à 3 MeVFenêtre utile potassium 1,37 à 1,57 MeVFenêtre utile uranium 1,66 à 1,86 MeVFenêtre utile thorium 2,41 à 2,81 MeVFenêtre du comptage total 0,41 à 2,81 MeVÉnergie du rayonnement cosmique 3 MeV (canal 255)Énergie du rayonnement du radon atmosphérique 1,6 à 1,9 MeV
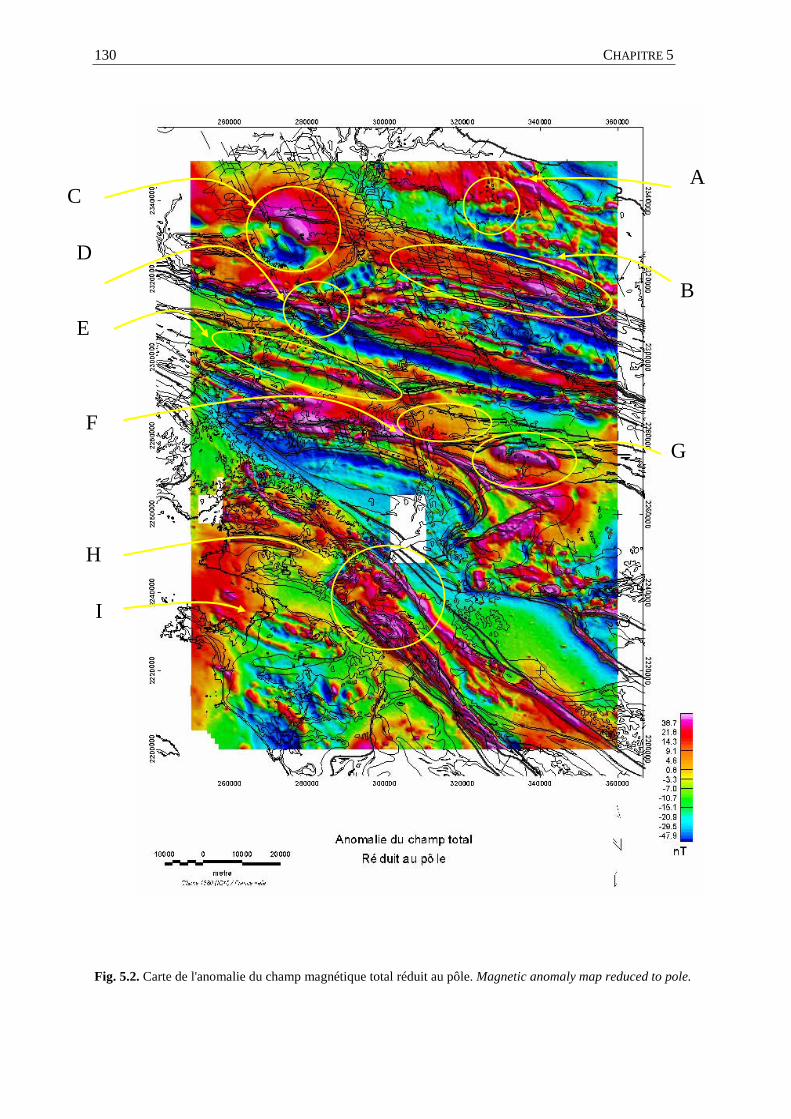
CHAPITRE 5 130
Fig. 5.2. Carte de l'anomalie du champ magnétique total réduit au pôle. Magnetic anomaly map reduced to pole.
CA
D
E
FG
H
I
B
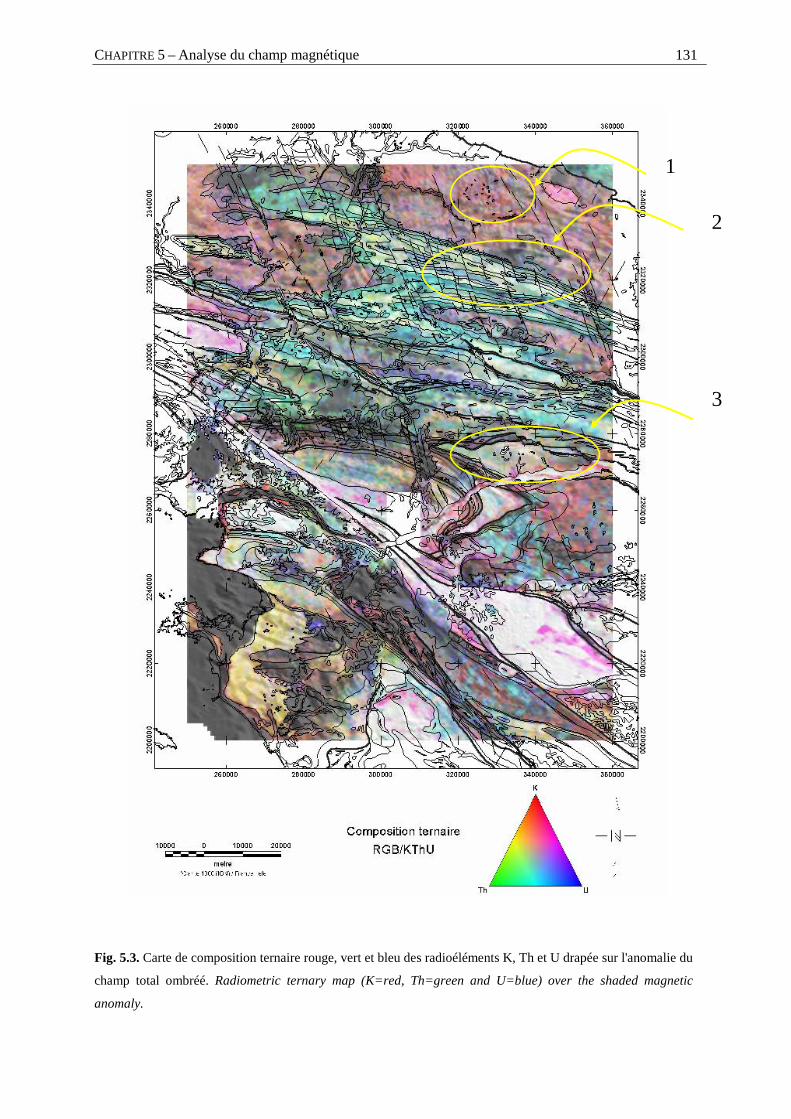
CHAPITRE 5 – Analyse du champ magnétique 131
Fig. 5.3. Carte de composition ternaire rouge, vert et bleu des radioéléments K, Th et U drapée sur l'anomalie du
champ total ombréé. Radiometric ternary map (K=red, Th=green and U=blue) over the shaded magnetic
anomaly.
3
2
1
CHAPITRE 5 132
Radiométrie
Les données spectrométriques ont été acquises et traitées selon la procédure de la note
technique IAEA n°323 (1991) après application d’une méthode statistique d’analyse en composantes
principales de la population des spectres bruts enregistrés sur 256 canaux (méthode NASVD,
Hovgaard 1997). Cette méthode statistique consiste à décomposer les spectres enregistrés en un
certain nombre de composantes (20 dans ce cas) et à les recomposer en n’utilisant que les
composantes similaires à un profil spectral.
La composition ternaire drapée sur l’anomalie du champ réduit au pôle et les contours
géologiques, illustrée Fig. 5.3, permet une interprétation directe de la composition en radioéléments
K, Th et U des formations géologiques en surface. Cette composition colorée, réalisée en affectant
respectivement les couleurs rouge, vert et bleu aux teneurs en K, U et Th, est drapée sur l’anomalie
magnétique ombrée.
2.4 Premières interprétations du levé
L’analyse cartographique a été menée à l'aide d'un Système d’Information Géographique
permettant d’afficher simultanément les contours géologiques renseignés et les cartes géophysiques
établies pour l’étude. Les cartes de l’anomalie du champ total réduit au pôle (Fig. 5.2) et la
composition ternaire des radioéléments U, Th et K (Fig. 5.3) reflètent les contours cartographiques,
les variations de lithologie au sein d’une même formation et éventuellement les pendages.
Les schistes et conglomérats briovériens (Domaine centre-armoricain) (A Fig. 5.2 et 1
Fig. 5.3), de composition à dominante potassique, se superposent à une anomalie magnétique peu
intense criblée de quelques anomalies de courtes longueurs d’onde parfois associées à des filons de
dolérites connus.
Les fermetures périclinales des plissements hercyniens sont nettement marquées par les
anomalies magnétiques de très courte longueur d’onde (inférieure à 1 km) et de forte amplitude des
grès armoricains chargés en fer (B Fig. 5.2). Les différentes formations impliquées dans ce
plissement se discriminent par leur composition géochimique (2 Fig. 5.3).
L’anomalie magnétique de forte intensité et d’orientation N150-N160 (C Fig. 5.2), orientée
parallèlement au faisceau de failles du Quessoy (D Fig. 5.2), présente un caractère bimodal qui
témoigne d’une aimantation rémanente probable. Compte tenu de sa longueur d’onde, cette anomalie
magnétique serait liée à une source non affleurante située à moins d’un kilomètre de profondeur. Des
anomalies de très courtes longueurs d’onde situées le long des failles du Quessoy à proximité des grès
armoricains (D Fig. 5.2) pourraient représenter des zones d’hydrothermalisme.
Les séries sédimentaires et volcano-sédimentaires de Saint-Mars la Jaille et de Saint-Georges
sur Loire (domaine Ligérien) ont des signatures magnétiques et radiométriques peu distinctes, mais
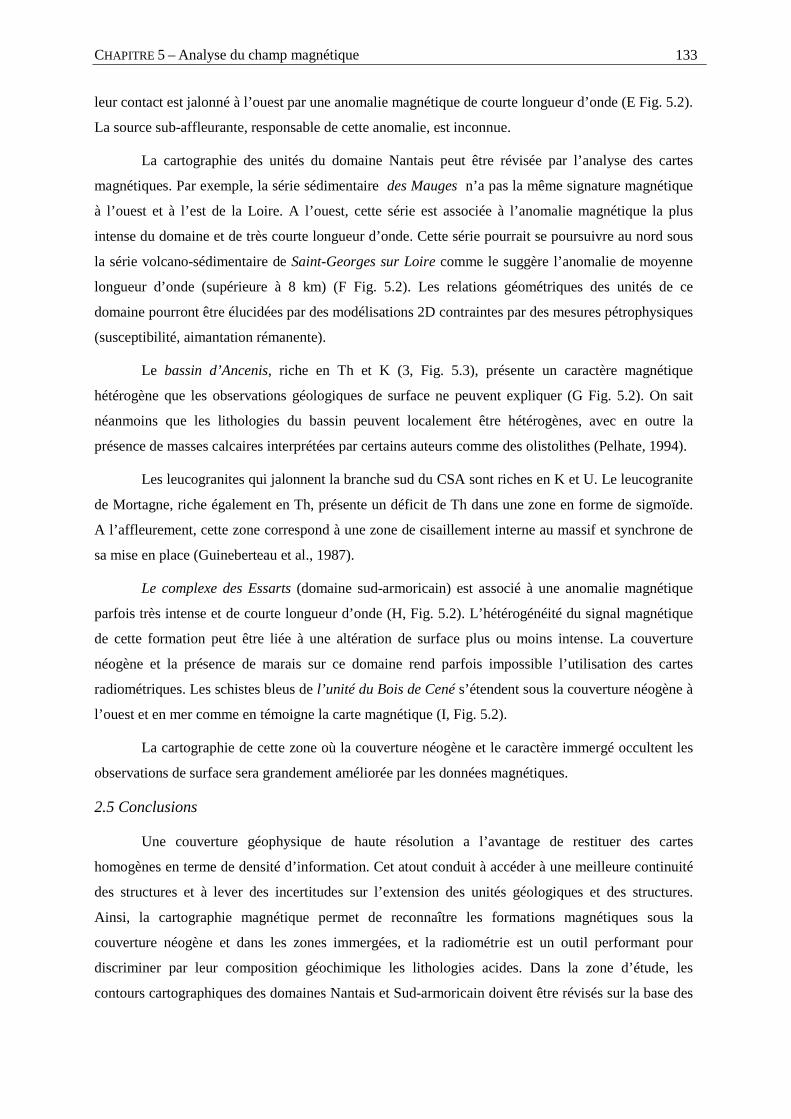
CHAPITRE 5 – Analyse du champ magnétique 133
leur contact est jalonné à l’ouest par une anomalie magnétique de courte longueur d’onde (E Fig. 5.2).
La source sub-affleurante, responsable de cette anomalie, est inconnue.
La cartographie des unités du domaine Nantais peut être révisée par l’analyse des cartes
magnétiques. Par exemple, la série sédimentaire des Mauges n’a pas la même signature magnétique
à l’ouest et à l’est de la Loire. A l’ouest, cette série est associée à l’anomalie magnétique la plus
intense du domaine et de très courte longueur d’onde. Cette série pourrait se poursuivre au nord sous
la série volcano-sédimentaire de Saint-Georges sur Loire comme le suggère l’anomalie de moyenne
longueur d’onde (supérieure à 8 km) (F Fig. 5.2). Les relations géométriques des unités de ce
domaine pourront être élucidées par des modélisations 2D contraintes par des mesures pétrophysiques
(susceptibilité, aimantation rémanente).
Le bassin d’Ancenis, riche en Th et K (3, Fig. 5.3), présente un caractère magnétique
hétérogène que les observations géologiques de surface ne peuvent expliquer (G Fig. 5.2). On sait
néanmoins que les lithologies du bassin peuvent localement être hétérogènes, avec en outre la
présence de masses calcaires interprétées par certains auteurs comme des olistolithes (Pelhate, 1994).
Les leucogranites qui jalonnent la branche sud du CSA sont riches en K et U. Le leucogranite
de Mortagne, riche également en Th, présente un déficit de Th dans une zone en forme de sigmoïde.
A l’affleurement, cette zone correspond à une zone de cisaillement interne au massif et synchrone de
sa mise en place (Guineberteau et al., 1987).
Le complexe des Essarts (domaine sud-armoricain) est associé à une anomalie magnétique
parfois très intense et de courte longueur d’onde (H, Fig. 5.2). L’hétérogénéité du signal magnétique
de cette formation peut être liée à une altération de surface plus ou moins intense. La couverture
néogène et la présence de marais sur ce domaine rend parfois impossible l’utilisation des cartes
radiométriques. Les schistes bleus de l’unité du Bois de Cené s’étendent sous la couverture néogène à
l’ouest et en mer comme en témoigne la carte magnétique (I, Fig. 5.2).
La cartographie de cette zone où la couverture néogène et le caractère immergé occultent les
observations de surface sera grandement améliorée par les données magnétiques.
2.5 Conclusions
Une couverture géophysique de haute résolution a l’avantage de restituer des cartes
homogènes en terme de densité d’information. Cet atout conduit à accéder à une meilleure continuité
des structures et à lever des incertitudes sur l’extension des unités géologiques et des structures.
Ainsi, la cartographie magnétique permet de reconnaître les formations magnétiques sous la
couverture néogène et dans les zones immergées, et la radiométrie est un outil performant pour
discriminer par leur composition géochimique les lithologies acides. Dans la zone d’étude, les
contours cartographiques des domaines Nantais et Sud-armoricain doivent être révisés sur la base des
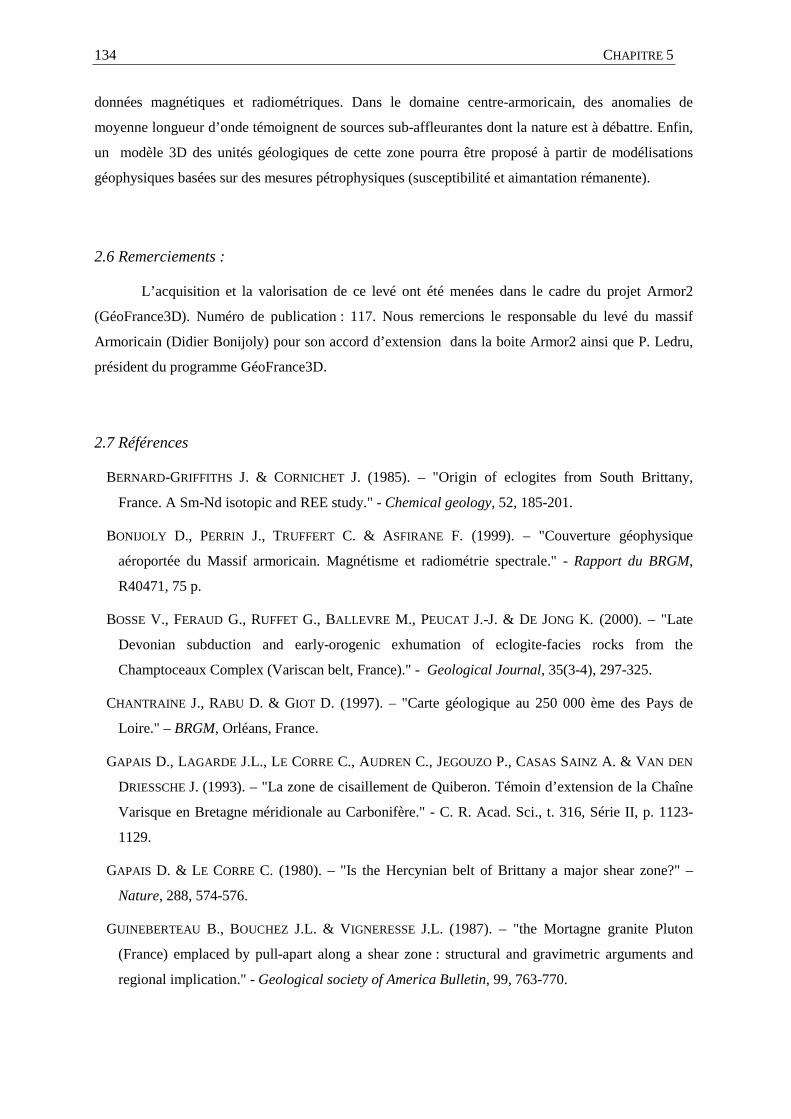
CHAPITRE 5 134
données magnétiques et radiométriques. Dans le domaine centre-armoricain, des anomalies de
moyenne longueur d’onde témoignent de sources sub-affleurantes dont la nature est à débattre. Enfin,
un modèle 3D des unités géologiques de cette zone pourra être proposé à partir de modélisations
géophysiques basées sur des mesures pétrophysiques (susceptibilité et aimantation rémanente).
2.6 Remerciements :
L’acquisition et la valorisation de ce levé ont été menées dans le cadre du projet Armor2
(GéoFrance3D). Numéro de publication : 117. Nous remercions le responsable du levé du massif
Armoricain (Didier Bonijoly) pour son accord d’extension dans la boite Armor2 ainsi que P. Ledru,
président du programme GéoFrance3D.
2.7 Références
BERNARD-GRIFFITHS J. & CORNICHET J. (1985). – "Origin of eclogites from South Brittany,
France. A Sm-Nd isotopic and REE study." - Chemical geology, 52, 185-201.
BONIJOLY D., PERRIN J., TRUFFERT C. & ASFIRANE F. (1999). – "Couverture géophysique
aéroportée du Massif armoricain. Magnétisme et radiométrie spectrale." - Rapport du BRGM,
R40471, 75 p.
BOSSE V., FERAUD G., RUFFET G., BALLEVRE M., PEUCAT J.-J. & DE JONG K. (2000). – "Late
Devonian subduction and early-orogenic exhumation of eclogite-facies rocks from the
Champtoceaux Complex (Variscan belt, France)." - Geological Journal, 35(3-4), 297-325.
CHANTRAINE J., RABU D. & GIOT D. (1997). – "Carte géologique au 250 000 ème des Pays de
Loire." – BRGM, Orléans, France.
GAPAIS D., LAGARDE J.L., LE CORRE C., AUDREN C., JEGOUZO P., CASAS SAINZ A. & VAN DEN
DRIESSCHE J. (1993). – "La zone de cisaillement de Quiberon. Témoin d’extension de la Chaîne
Varisque en Bretagne méridionale au Carbonifère." - C. R. Acad. Sci., t. 316, Série II, p. 1123-
1129.
GAPAIS D. & LE CORRE C. (1980). – "Is the Hercynian belt of Brittany a major shear zone?" –
Nature, 288, 574-576.
GUINEBERTEAU B., BOUCHEZ J.L. & VIGNERESSE J.L. (1987). – "the Mortagne granite Pluton
(France) emplaced by pull-apart along a shear zone : structural and gravimetric arguments and
regional implication." - Geological society of America Bulletin, 99, 763-770.
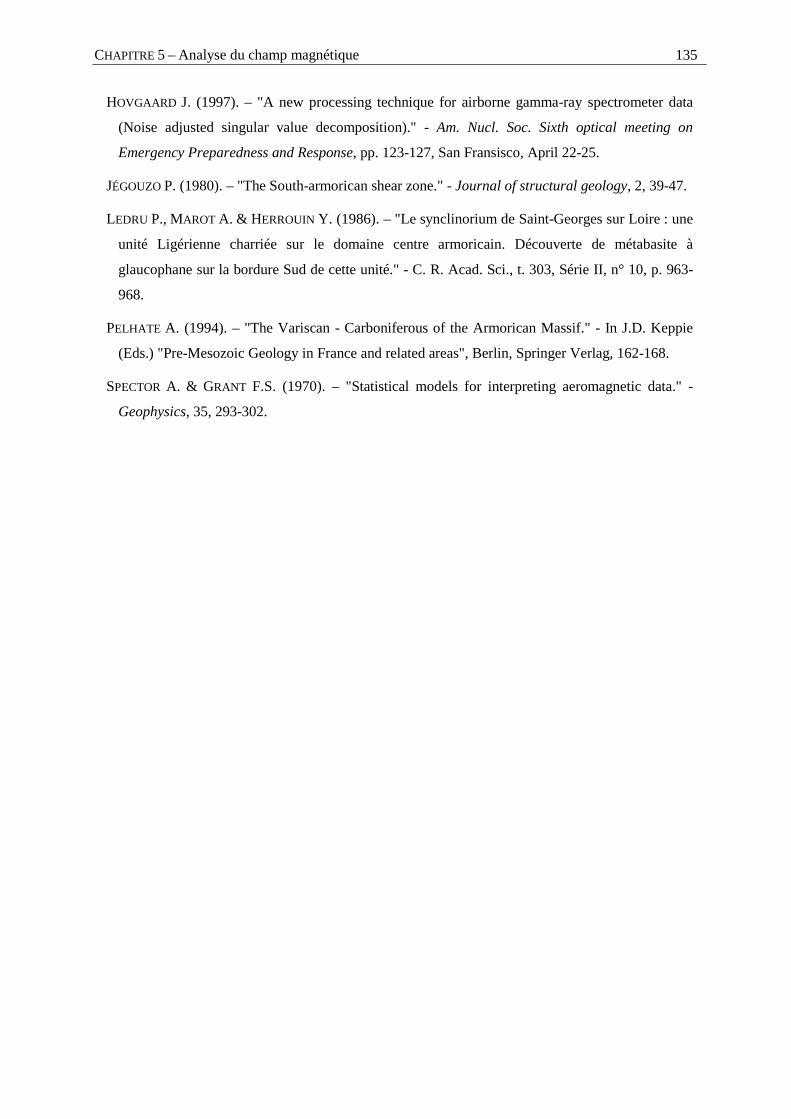
CHAPITRE 5 – Analyse du champ magnétique 135
HOVGAARD J. (1997). – "A new processing technique for airborne gamma-ray spectrometer data
(Noise adjusted singular value decomposition)." - Am. Nucl. Soc. Sixth optical meeting on
Emergency Preparedness and Response, pp. 123-127, San Fransisco, April 22-25.
JÉGOUZO P. (1980). – "The South-armorican shear zone." - Journal of structural geology, 2, 39-47.
LEDRU P., MAROT A. & HERROUIN Y. (1986). – "Le synclinorium de Saint-Georges sur Loire : une
unité Ligérienne charriée sur le domaine centre armoricain. Découverte de métabasite à
glaucophane sur la bordure Sud de cette unité." - C. R. Acad. Sci., t. 303, Série II, n° 10, p. 963-
968.
PELHATE A. (1994). – "The Variscan - Carboniferous of the Armorican Massif." - In J.D. Keppie
(Eds.) "Pre-Mesozoic Geology in France and related areas", Berlin, Springer Verlag, 162-168.
SPECTOR A. & GRANT F.S. (1970). – "Statistical models for interpreting aeromagnetic data." -
Geophysics, 35, 293-302.
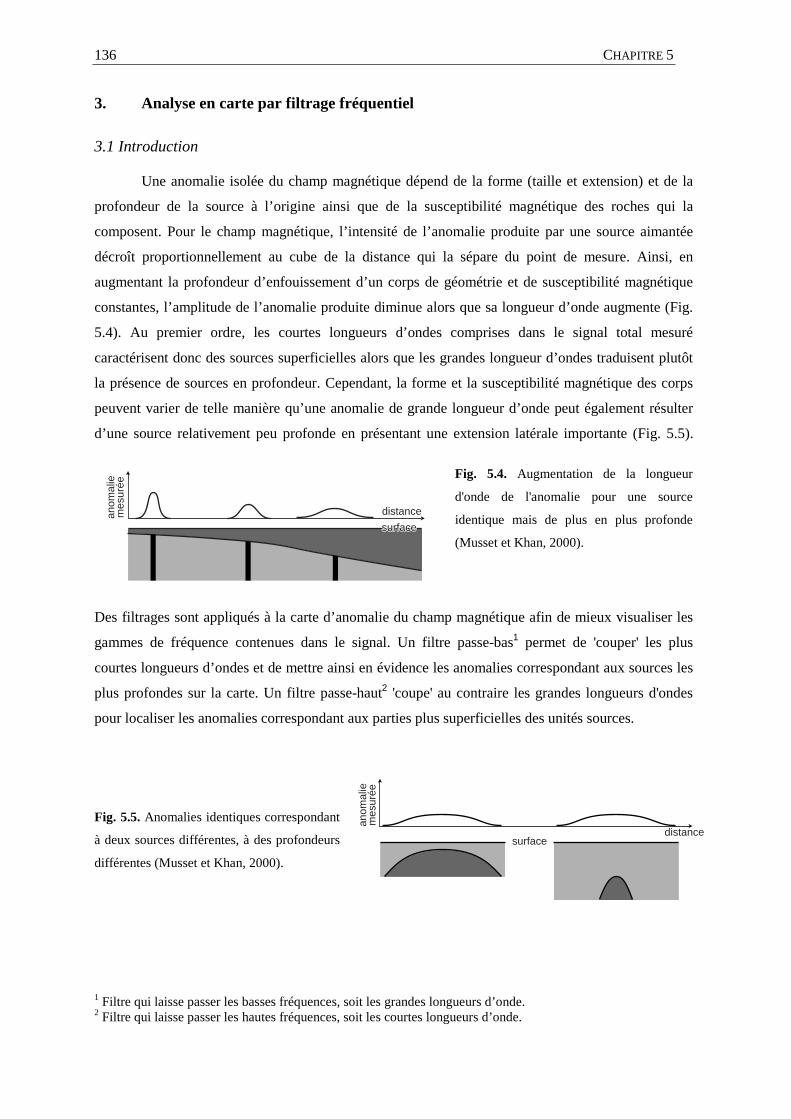
distance
anom
alie
mes
urée
surface
surfacesurfacedistancean
omal
iem
esur
ée
CHAPITRE 5 136
3. Analyse en carte par filtrage fréquentiel
3.1 Introduction
Une anomalie isolée du champ magnétique dépend de la forme (taille et extension) et de la
profondeur de la source à l’origine ainsi que de la susceptibilité magnétique des roches qui la
composent. Pour le champ magnétique, l’intensité de l’anomalie produite par une source aimantée
décroît proportionnellement au cube de la distance qui la sépare du point de mesure. Ainsi, en
augmentant la profondeur d’enfouissement d’un corps de géométrie et de susceptibilité magnétique
constantes, l’amplitude de l’anomalie produite diminue alors que sa longueur d’onde augmente (Fig.
5.4). Au premier ordre, les courtes longueurs d’ondes comprises dans le signal total mesuré
caractérisent donc des sources superficielles alors que les grandes longueur d’ondes traduisent plutôt
la présence de sources en profondeur. Cependant, la forme et la susceptibilité magnétique des corps
peuvent varier de telle manière qu’une anomalie de grande longueur d’onde peut également résulter
d’une source relativement peu profonde en présentant une extension latérale importante (Fig. 5.5).
Fig. 5.4. Augmentation de la longueur
d'onde de l'anomalie pour une source
identique mais de plus en plus profonde
(Musset et Khan, 2000).
Des filtrages sont appliqués à la carte d’anomalie du champ magnétique afin de mieux visualiser les
gammes de fréquence contenues dans le signal. Un filtre passe-bas1 permet de 'couper' les plus
courtes longueurs d’ondes et de mettre ainsi en évidence les anomalies correspondant aux sources les
plus profondes sur la carte. Un filtre passe-haut2 'coupe' au contraire les grandes longueurs d'ondes
pour localiser les anomalies correspondant aux parties plus superficielles des unités sources.
Fig. 5.5. Anomalies identiques correspondant
à deux sources différentes, à des profondeurs
différentes (Musset et Khan, 2000).
1 Filtre qui laisse passer les basses fréquences, soit les grandes longueurs d’onde. 2 Filtre qui laisse passer les hautes fréquences, soit les courtes longueurs d’onde.
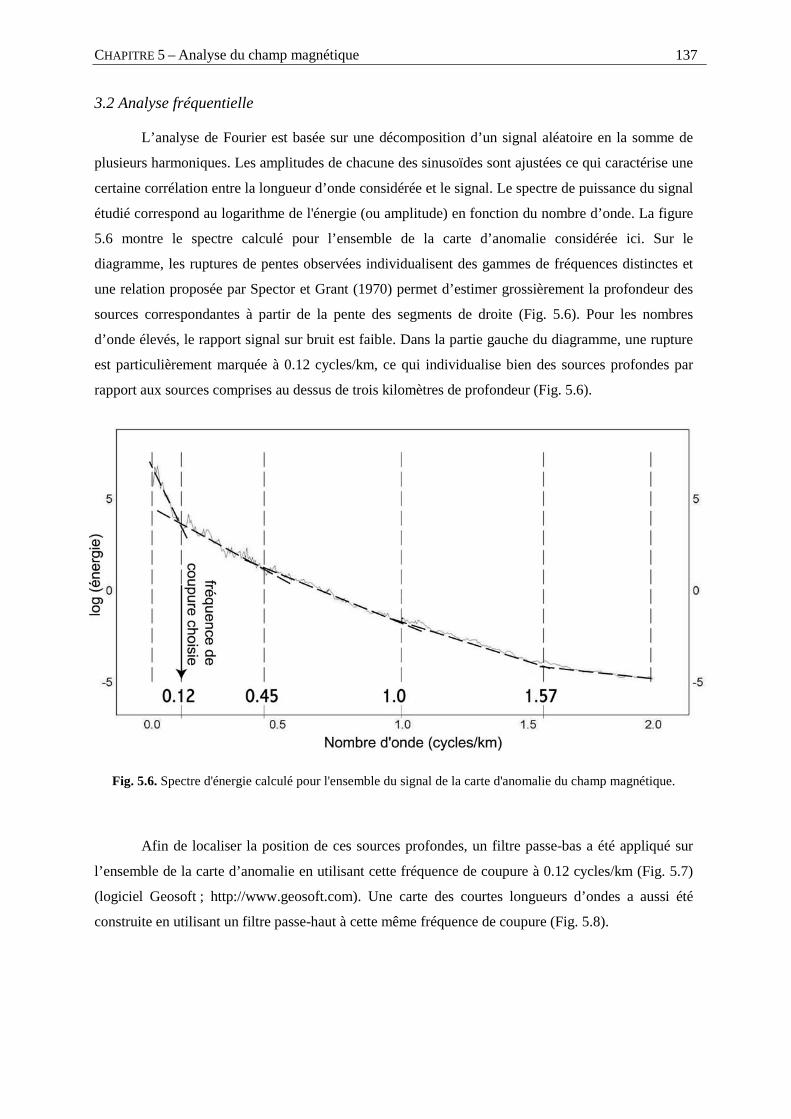
CHAPITRE 5 – Analyse du champ magnétique 137
3.2 Analyse fréquentielle
L’analyse de Fourier est basée sur une décomposition d’un signal aléatoire en la somme de
plusieurs harmoniques. Les amplitudes de chacune des sinusoïdes sont ajustées ce qui caractérise une
certaine corrélation entre la longueur d’onde considérée et le signal. Le spectre de puissance du signal
étudié correspond au logarithme de l'énergie (ou amplitude) en fonction du nombre d’onde. La figure
5.6 montre le spectre calculé pour l’ensemble de la carte d’anomalie considérée ici. Sur le
diagramme, les ruptures de pentes observées individualisent des gammes de fréquences distinctes et
une relation proposée par Spector et Grant (1970) permet d’estimer grossièrement la profondeur des
sources correspondantes à partir de la pente des segments de droite (Fig. 5.6). Pour les nombres
d’onde élevés, le rapport signal sur bruit est faible. Dans la partie gauche du diagramme, une rupture
est particulièrement marquée à 0.12 cycles/km, ce qui individualise bien des sources profondes par
rapport aux sources comprises au dessus de trois kilomètres de profondeur (Fig. 5.6).
Fig. 5.6. Spectre d'énergie calculé pour l'ensemble du signal de la carte d'anomalie du champ magnétique.
Afin de localiser la position de ces sources profondes, un filtre passe-bas a été appliqué sur
l’ensemble de la carte d’anomalie en utilisant cette fréquence de coupure à 0.12 cycles/km (Fig. 5.7)
(logiciel Geosoft ; http://www.geosoft.com). Une carte des courtes longueurs d’ondes a aussi été
construite en utilisant un filtre passe-haut à cette même fréquence de coupure (Fig. 5.8).
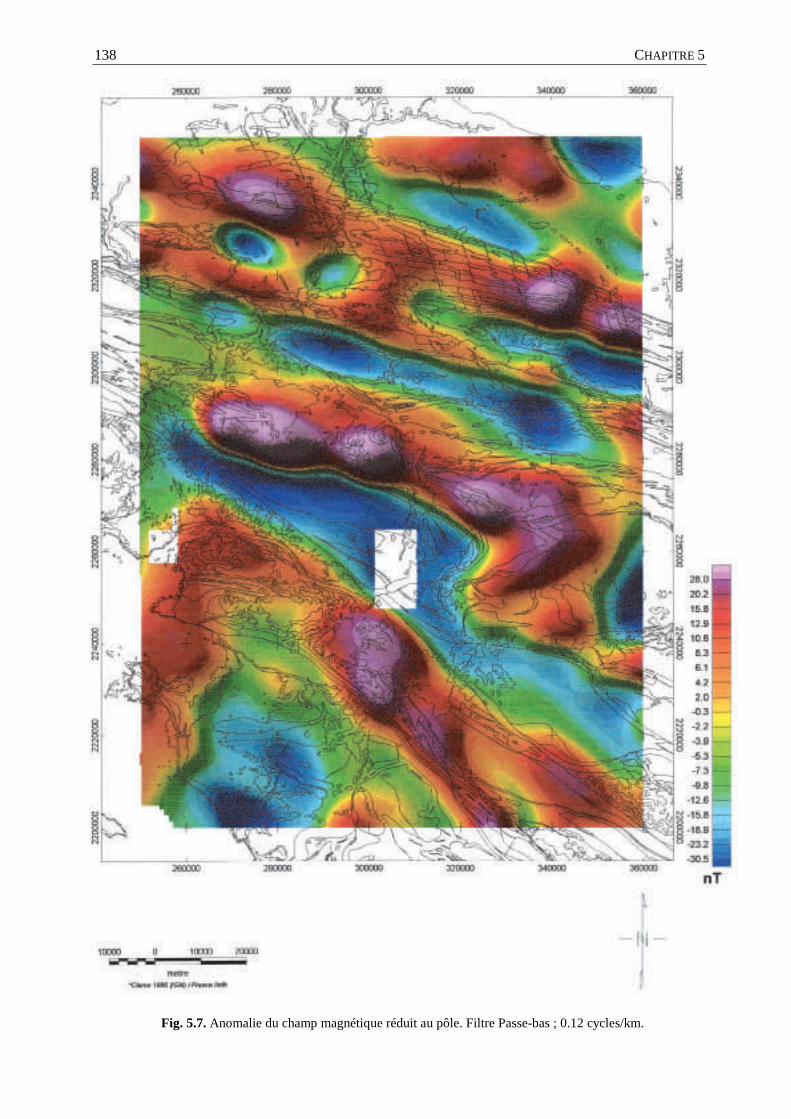
CHAPITRE 5 138
Fig. 5.7. Anomalie du champ magnétique réduit au pôle. Filtre Passe-bas ; 0.12 cycles/km.
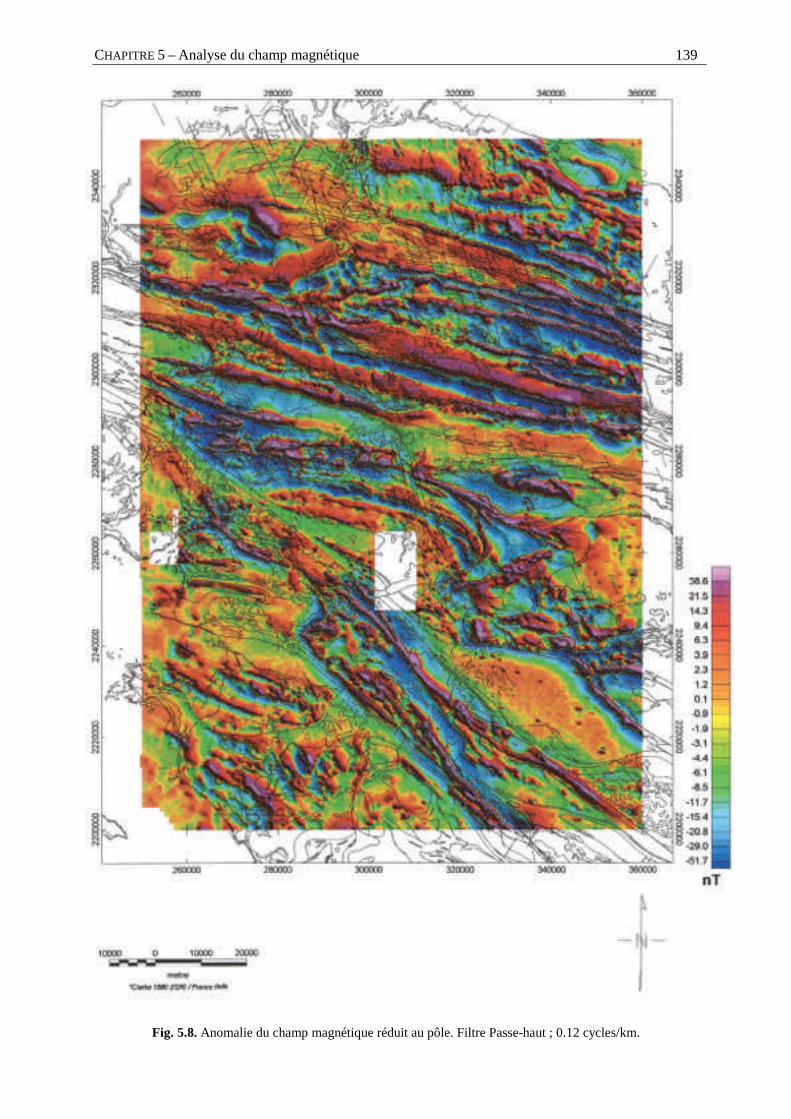
CHAPITRE 5 – Analyse du champ magnétique 139
Fig. 5.8. Anomalie du champ magnétique réduit au pôle. Filtre Passe-haut ; 0.12 cycles/km.
CHAPITRE 5 140
3.3 Carte filtrée passe-bas (Fig. 5.7)
Sur la figure 5.7, la trace des contours cartographiques a été superposée aux anomalies filtrées
du champ magnétique (cf. Fig. 5.1). Trois grandes anomalies linéaires sont visibles à travers la carte :
en Bretagne Centrale, l’anomalie positive, est limitée au nord comme au sud par l’extension
cartographique de la série sédimentaire plissée (série paléozoïque post-ordovicien) (cf. aussi Fig. 5.1).
La formation du Grès Armoricain contient des niveaux de fer ; cette anomalie qui est aussi orientée
parallèlement à la direction moyenne des plis (N95° environ) pourrait ainsi refléter l’extension la plus
profonde de cette formation située à l’extrême base de la série, soit en dessous de trois kilomètres de
profondeur. Cependant, les observations stratigraphiques de terrain montrent que l’épaisseur totale de
cette série ne doit pas dépasser 1 à 1.5 Km. La grande longueur d’onde mise en évidence ici dans ce
domaine sédimentaire doit donc plutôt être attribuée à une forme particulièrement étendue de la
source (cf. Fig. 5.5) soit ici le synclinal d’échelle régionale des niveaux riches en fer contenus dans la
série.
Au sud, dans la région de Champtoceaux et le long de la branche Sud du CSA, les anomalies
positives de grande longueur d’onde se situent à l’aplomb des unités métamorphiques qui contiennent
de nombreux niveaux de roches basiques (éclogites, amphibolites) ce qui témoigne de leur
prolongement en profondeur dans la croûte supérieure (Fig. 5.7). Le long du complexe des Essarts
(Fig. 5.7), l’anomalie suit parfaitement l’orientation N140° des unités en surface. Au nord-ouest,
l’anomalie montre cependant une certaine obliquité par rapport aux contours cartographiques et son
amplitude diminue fortement (Fig. 5.7). A l’aplomb de Champtoceaux, la forme plissée des unités
reconnue à travers les données en surface est aussi visible dans la forme de l’anomalie de grande
longueur d’onde correspondante (Fig. 5.7). Ceci montre un prolongement cohérent de la structure
plissée à travers la croûte supérieure et ceci plus particulièrement dans la partie orientale du
complexe.
3.4 Carte filtrée passe-haut (Fig. 5.8)
La figure 5.8 montre les anomalies de courtes longueurs d’onde extraites du signal total
(fréquence > 0.12 cyc./Km). Elles correspondent aux sources les plus superficielles à travers la région
(< 3 Km environ) et cette carte montre ainsi une concordance forte avec la trace des contours
géologiques qui ont été reportés (Fig. 5.8 et cf. Fig. 5.1). En Bretagne Centrale, la trace des niveaux
riches en fer du Grès Armoricain crée une anomalie claire et continue à travers toute la région (Fig.
5.8). Dans le Domaine Sud Armoricain, les contours de l’unité du Bois de Céné, contenant, comme
sur l’île de Groix, des roches basiques métamorphisées dans le faciès des Schistes Bleus peuvent être
facilement poursuivis sous les formations néogènes à l’ouest et même jusqu’en mer, dans la baie peu
profonde (Fig. 5.8). Autour des complexes métamorphiques des Essarts et de Champtoceaux, ces
anomalies magnétiques de courtes longueurs d’onde se superposent parfaitement aux roches

CHAPITRE 5 – Analyse du champ magnétique 141
basiques : de part et d’autre de l’estuaire de la Loire, les roches amphiboliques au sud et les (pseudo)1
éclogites reconnues par sondage au nord du fleuve présentent une certaine continuité à travers ce
domaine de roches migmatitiques et se biseautent vers le sud-est, le long de la branche Sud du CSA
(Fig. 5.8). Au sud de ces unités, la terminaison périclinale (Godard, 2001) du complexe des Essarts
est particulièrement bien soulignée par les unités Amphiboliques externes. Au cœur des unités
métamorphiques composées majoritairement de gneiss (Godard, 2001), les anomalies montre une
forme allongée de l’ordre du kilomètre dans la direction régionale du complexe, ce qui souligne
précisément la présence des niveaux d’éclogites cartographiés dernièrement par (Fig. 5.8). Dans le
complexe de Champtoceaux, le long des unités métamorphiques au nord, deux anomalies orientées
est-ouest présentent une très forte amplitude. Ponctuellement, ces anomalies se superposent à des
niveaux de Serpentinites qui longent la faille de Nort-sur-Erdre et qui peuvent ainsi être suivies vers
l’est, sous les formations superficielles, jusqu’au niveau de l’Erdre (Fig. 5.8). Au-delà de l’Erdre, ce
sont les unités d’Amphibolites les plus externes dans le complexe de Champtoceaux qui soulignent la
structure plissée régionale (Fig. 5.8). Ces anomalies très continuent sont particulièrement bien
marquées le long de la bordure sud-ouest du bassin carbonifère d’Ancenis ainsi qu’au contact avec
l’unité migmatitique de Champtoceaux, dans la terminaison périclinale de la structure (Fig. 5.8). Des
anomalies positives sont dispersées à travers la partie inférieure du flanc nord du complexe s.s. (Fig.
5.8). Ces anomalies ne présentent pas de continuité mais elles sont toutes alignées dans la direction
moyenne des contacts entre les unités métamorphiques (Fig. 5.8) ; elles soulignent ici, comme dans le
complexe des Essarts, la trace des lentilles d’éclogites et le contraste de leur susceptibilité magnétique
avec les gneiss encaissants.
4. Analyse par la transformée en ondelettes : les unités métamorphiques de
Champtoceaux
4.1 Méthodologie
L’analyse par la méthode de la transformée en ondelettes permet, le long de profils
d’anomalie du champ magnétique, de localiser en profondeur les discontinuités des sources aimantées
dues aux variations rapides de susceptibilité magnétique (Grossmann et al., 1985 ; Mallat et al.,
1992). Ces discontinuités représentent par exemple les contacts ou le toit des sources en profondeur.
Le calcul de la transformée en ondelettes consiste à étudier le signal à différentes échelles, en
dilatation et en translation, en le décomposant en une somme de contributions d’une ondelette
analysante (Meyer et al., 1987). Dans le cas d’un traitement par la transformée de Fourier, le signal
doit être considéré dans sa globalité le long du profil pour être décomposé alors que la transformée en
ondelettes permet l'analyse locale du signal. Cette caractéristique de la transformée en ondelettes
permet d'explorer une large gamme de fréquences contenues dans le signal et ainsi mieux caractériser
1 Cf. Godard (2001).
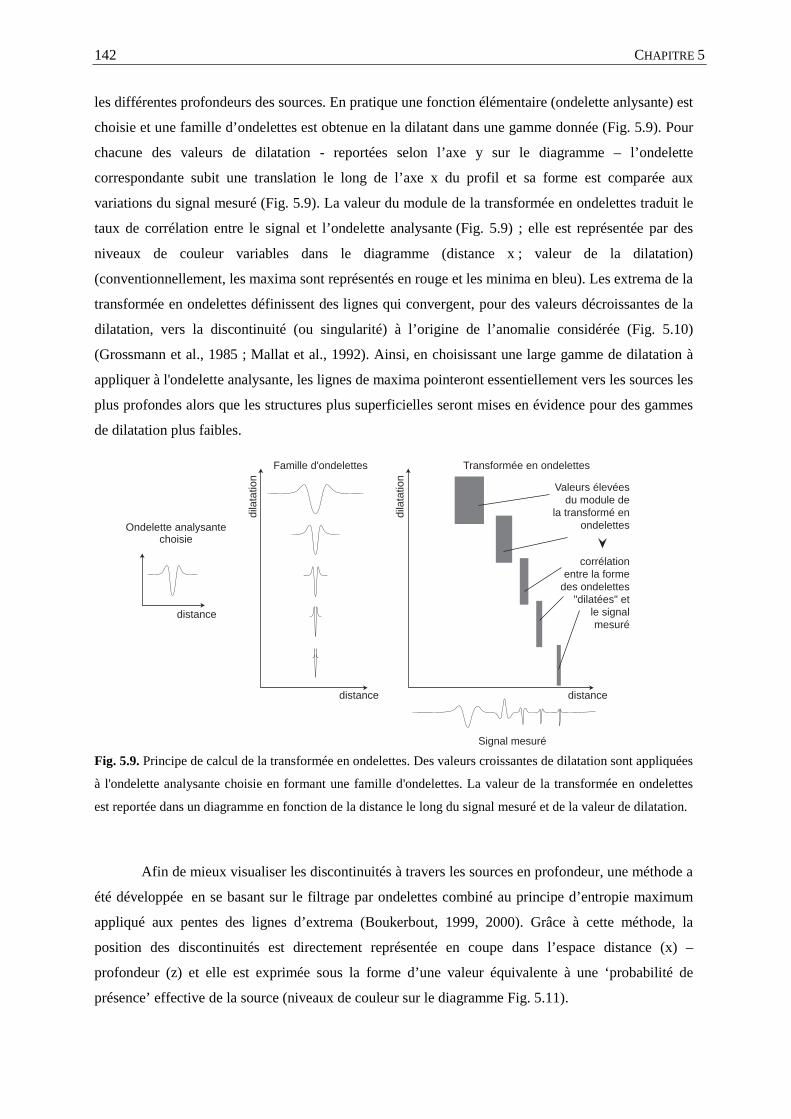
distance
distance
dila
tatio
n
Ondelette analysantechoisie
Famille d'ondelettes
Signal mesuré
distance
corrélationentre la forme
des ondelettes"dilatées" et
le signalmesuré
Transformée en ondelettes
dila
tatio
n
Valeurs élevéesdu module de
la transformé enondelettes
CHAPITRE 5 142
les différentes profondeurs des sources. En pratique une fonction élémentaire (ondelette anlysante) est
choisie et une famille d’ondelettes est obtenue en la dilatant dans une gamme donnée (Fig. 5.9). Pour
chacune des valeurs de dilatation - reportées selon l’axe y sur le diagramme – l’ondelette
correspondante subit une translation le long de l’axe x du profil et sa forme est comparée aux
variations du signal mesuré (Fig. 5.9). La valeur du module de la transformée en ondelettes traduit le
taux de corrélation entre le signal et l’ondelette analysante (Fig. 5.9) ; elle est représentée par des
niveaux de couleur variables dans le diagramme (distance x ; valeur de la dilatation)
(conventionnellement, les maxima sont représentés en rouge et les minima en bleu). Les extrema de la
transformée en ondelettes définissent des lignes qui convergent, pour des valeurs décroissantes de la
dilatation, vers la discontinuité (ou singularité) à l’origine de l’anomalie considérée (Fig. 5.10)
(Grossmann et al., 1985 ; Mallat et al., 1992). Ainsi, en choisissant une large gamme de dilatation à
appliquer à l'ondelette analysante, les lignes de maxima pointeront essentiellement vers les sources les
plus profondes alors que les structures plus superficielles seront mises en évidence pour des gammes
de dilatation plus faibles.
Fig. 5.9. Principe de calcul de la transformée en ondelettes. Des valeurs croissantes de dilatation sont appliquées
à l'ondelette analysante choisie en formant une famille d'ondelettes. La valeur de la transformée en ondelettes
est reportée dans un diagramme en fonction de la distance le long du signal mesuré et de la valeur de dilatation.
Afin de mieux visualiser les discontinuités à travers les sources en profondeur, une méthode a
été développée en se basant sur le filtrage par ondelettes combiné au principe d’entropie maximum
appliqué aux pentes des lignes d’extrema (Boukerbout, 1999, 2000). Grâce à cette méthode, la
position des discontinuités est directement représentée en coupe dans l’espace distance (x) –
profondeur (z) et elle est exprimée sous la forme d’une valeur équivalente à une ‘probabilité de
présence’ effective de la source (niveaux de couleur sur le diagramme Fig. 5.11).
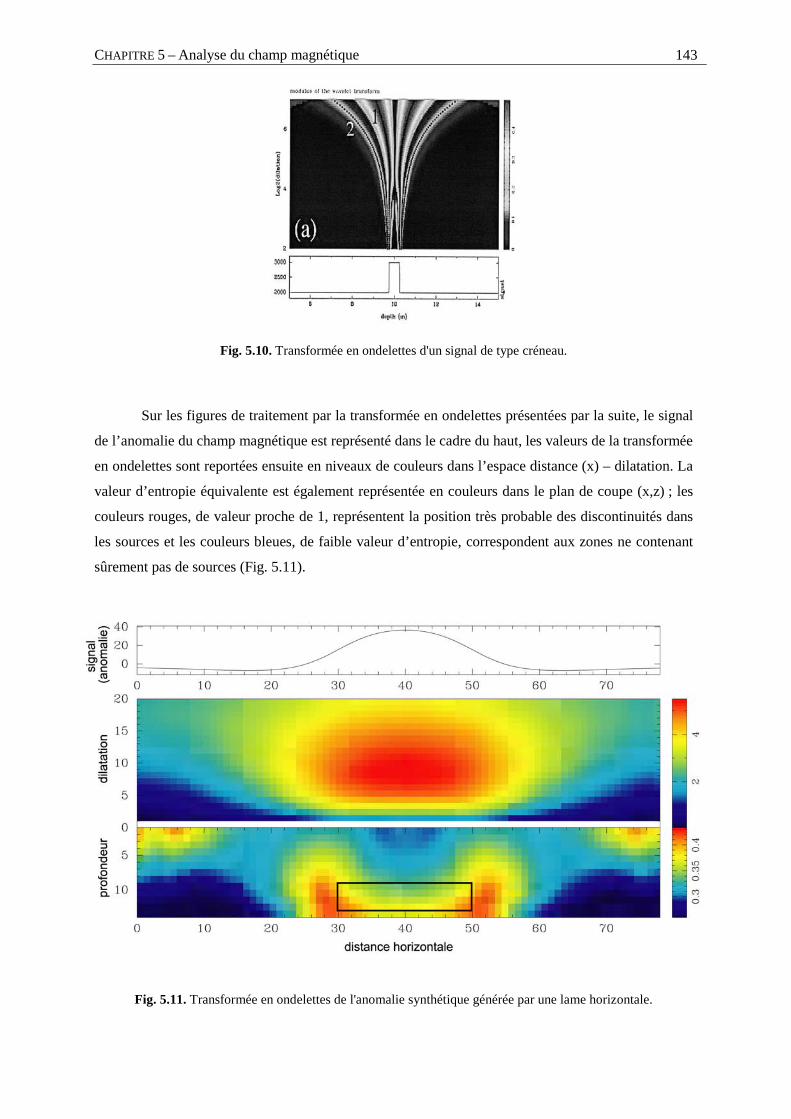
CHAPITRE 5 – Analyse du champ magnétique 143
Fig. 5.10. Transformée en ondelettes d'un signal de type créneau.
Sur les figures de traitement par la transformée en ondelettes présentées par la suite, le signal
de l’anomalie du champ magnétique est représenté dans le cadre du haut, les valeurs de la transformée
en ondelettes sont reportées ensuite en niveaux de couleurs dans l’espace distance (x) – dilatation. La
valeur d’entropie équivalente est également représentée en couleurs dans le plan de coupe (x,z) ; les
couleurs rouges, de valeur proche de 1, représentent la position très probable des discontinuités dans
les sources et les couleurs bleues, de faible valeur d’entropie, correspondent aux zones ne contenant
sûrement pas de sources (Fig. 5.11).
Fig. 5.11. Transformée en ondelettes de l'anomalie synthétique générée par une lame horizontale.
CHAPITRE 5 144
La figure 5.11 représente le traitement d’un cas synthétique. L’anomalie représentée en haut
du diagramme est générée par un polygone de 4 unités d’épaisseur et 20 unités de largeur. La
transformée en ondelettes a été calculée pour ce signal (au centre) et la valeur de l’entropie appliquée
aux pentes des lignes d’extrema est reportée dans le dernier cadre (Fig. 5.11). Sur la coupe, deux
nuages de maximum d’entropie se localisent de part et d’autre du polygone dont la trace est dessinée
(Fig. 5.11). Le polygone présente une forme très allongée et la distance séparant les discontinuités
homogènes est assez importante ici pour que les deux extrémités de la source puissent être bien
individualisées (Fig. 5.11).
Pour une source plus étroite, les effets des discontinuités se cumulent dans le signal mesuré ;
la source se comporte alors comme une discontinuité complexe et le nuage du maximum de l’entropie
se localise le long de sa bordure supérieure.
4.2 Contexte géologique
Le profil considéré ici suit la trace du profil de sismique réflexion depuis le Domaine Sud
Armoricain au sud de la branche sud du CSA jusqu’au Domaine Centre Armoricain au nord
(Fig. 5.12a). Le signal des anomalies couvre une gamme d’amplitude importante depuis -90 nT à plus
de 150 nT. Les courtes longueurs d’ondes se superposent très bien aux unités géologiques
cartographiées en surface et on peut reconnaître (Fig. 5.12 et cf. Fig. 5.8) : dans le Domaine Sud
Armoricain, les Amphibolites et granulites de la Loire sont situées dans le prolongement du complexe
métamorphique des Essarts. Ces roches métamorphiques basiques se présentent sous la forme de
niveaux plus ou moins isolés au milieu de roches migmatitiques sont très étendues à travers cette
région. Le contraste de susceptibilité magnétique est fort entre ces lithologies et le signal présente une
série d’anomalies de très courtes longueurs d’ondes dans cette zone (Fig. 5.12 b). Dans le Domaine
Centre Armoricain, une anomalie positive asymétrique souligne, dans la région de Nozay, le contact
entre les unités de Saint-Georges-sur-Loire et de Lanvaux (Fig. 5.12) : bien qu’aucune lithologie des
roches connues en surface ne semble pouvoir porter une forte susceptibilité magnétique, sa courte
longueur d’onde suggère la présence d’une source peu profonde le long de ce contact. A l’extrémité
nord, une forte anomalie négative borde l’unité de Lanvaux (Fig. 5.12) ; en carte elle est orientée
parallèlement à la branche Nord du CSA (Fig. 5.8) et ses valeurs négatives importantes doivent
traduire une aimantation rémanente non négligeable de la source associée. Le granite de Vigneux est
enraciné le long de la branche Sud du CSA (V, Fig. 5.12 a). Deux anomalies, localisées sur le profil
de part et d’autre du massif, marquent l’effet du métamorphisme de contact pendant sa mise en place
dans la croûte supérieure (voir aussi Fig. 5.8). Sur ce profil magnétique, les anomalies les plus
marquées se situent à l’aplomb des unités métamorphiques de Champtoceaux. Deux unités du
complexe s.s. sont recoupées : au sud, l’unité du Cellier contient des niveaux d’éclogites boudinés
métriques à hectométriques qui se traduisent sur le profil par une suite d’anomalies positives de
courte longueur d’onde. L’unité au nord est majoritairement composée d’orthogneiss et aucune
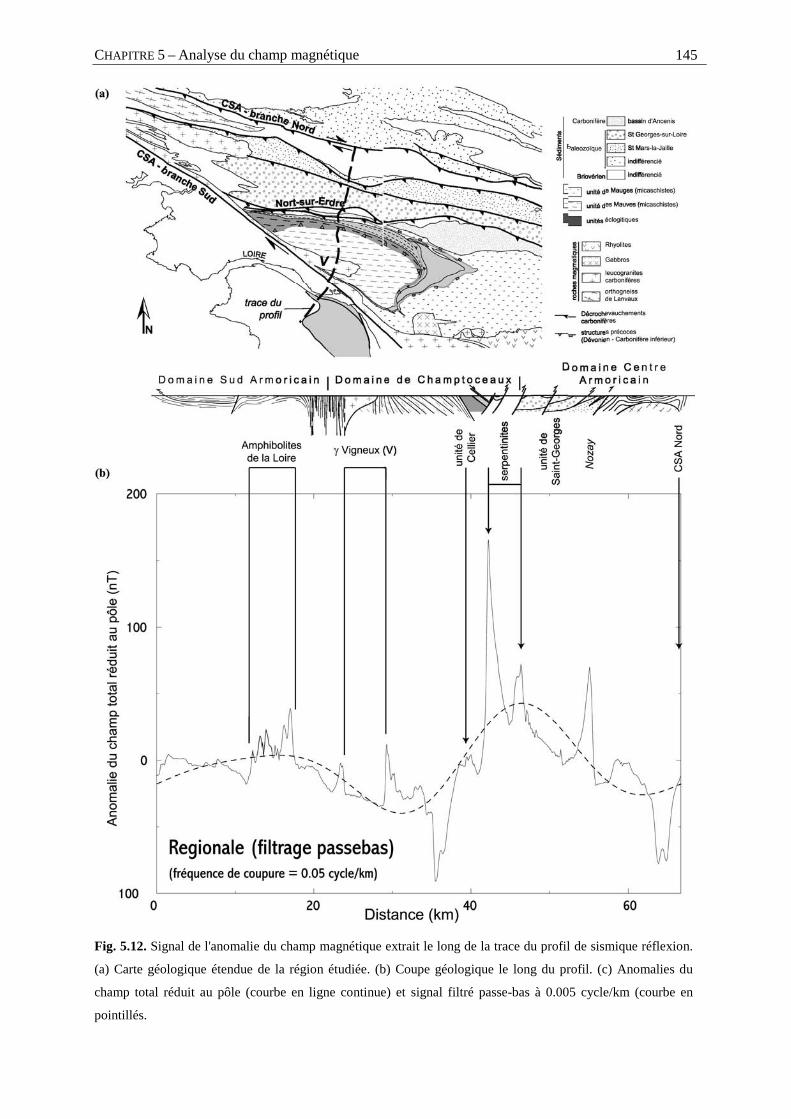
CHAPITRE 5 – Analyse du champ magnétique 145
Fig. 5.12. Signal de l'anomalie du champ magnétique extrait le long de la trace du profil de sismique réflexion.
(a) Carte géologique étendue de la région étudiée. (b) Coupe géologique le long du profil. (c) Anomalies du
champ total réduit au pôle (courbe en ligne continue) et signal filtré passe-bas à 0.005 cycle/km (courbe en
pointillés.
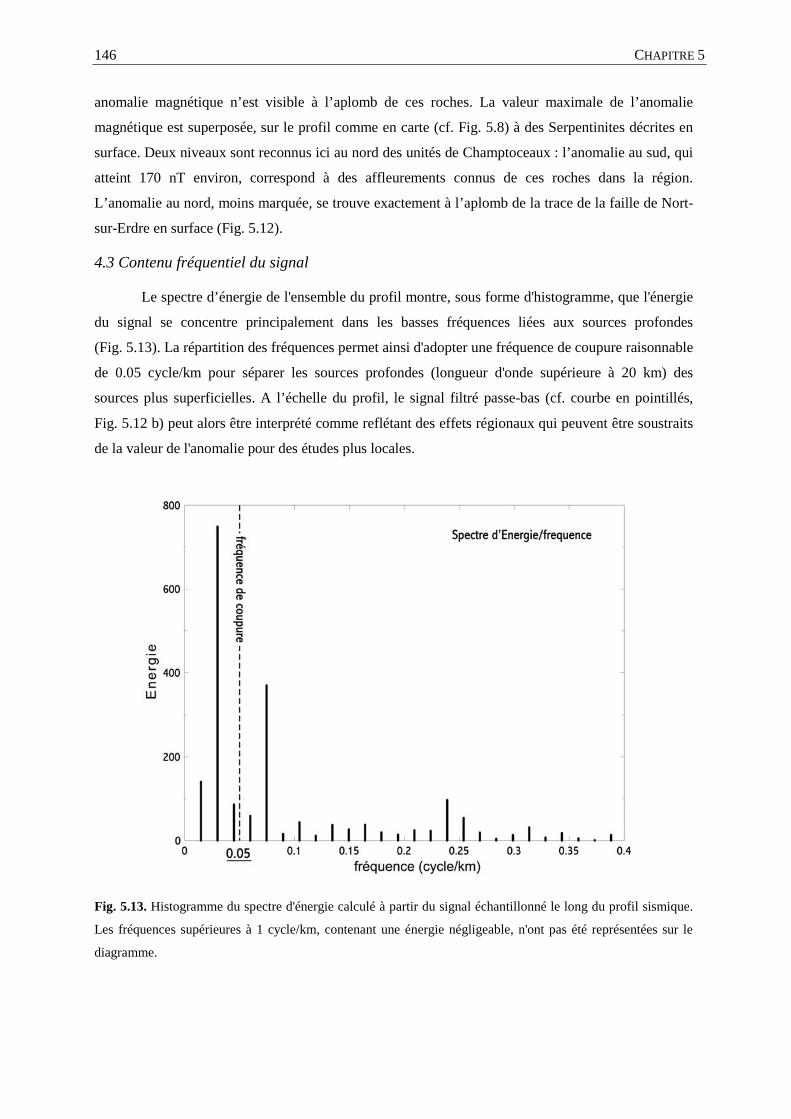
CHAPITRE 5 146
anomalie magnétique n’est visible à l’aplomb de ces roches. La valeur maximale de l’anomalie
magnétique est superposée, sur le profil comme en carte (cf. Fig. 5.8) à des Serpentinites décrites en
surface. Deux niveaux sont reconnus ici au nord des unités de Champtoceaux : l’anomalie au sud, qui
atteint 170 nT environ, correspond à des affleurements connus de ces roches dans la région.
L’anomalie au nord, moins marquée, se trouve exactement à l’aplomb de la trace de la faille de Nort-
sur-Erdre en surface (Fig. 5.12).
4.3 Contenu fréquentiel du signal
Le spectre d’énergie de l'ensemble du profil montre, sous forme d'histogramme, que l'énergie
du signal se concentre principalement dans les basses fréquences liées aux sources profondes
(Fig. 5.13). La répartition des fréquences permet ainsi d'adopter une fréquence de coupure raisonnable
de 0.05 cycle/km pour séparer les sources profondes (longueur d'onde supérieure à 20 km) des
sources plus superficielles. A l’échelle du profil, le signal filtré passe-bas (cf. courbe en pointillés,
Fig. 5.12 b) peut alors être interprété comme reflétant des effets régionaux qui peuvent être soustraits
de la valeur de l'anomalie pour des études plus locales.
Fig. 5.13. Histogramme du spectre d'énergie calculé à partir du signal échantillonné le long du profil sismique.
Les fréquences supérieures à 1 cycle/km, contenant une énergie négligeable, n'ont pas été représentées sur le
diagramme.
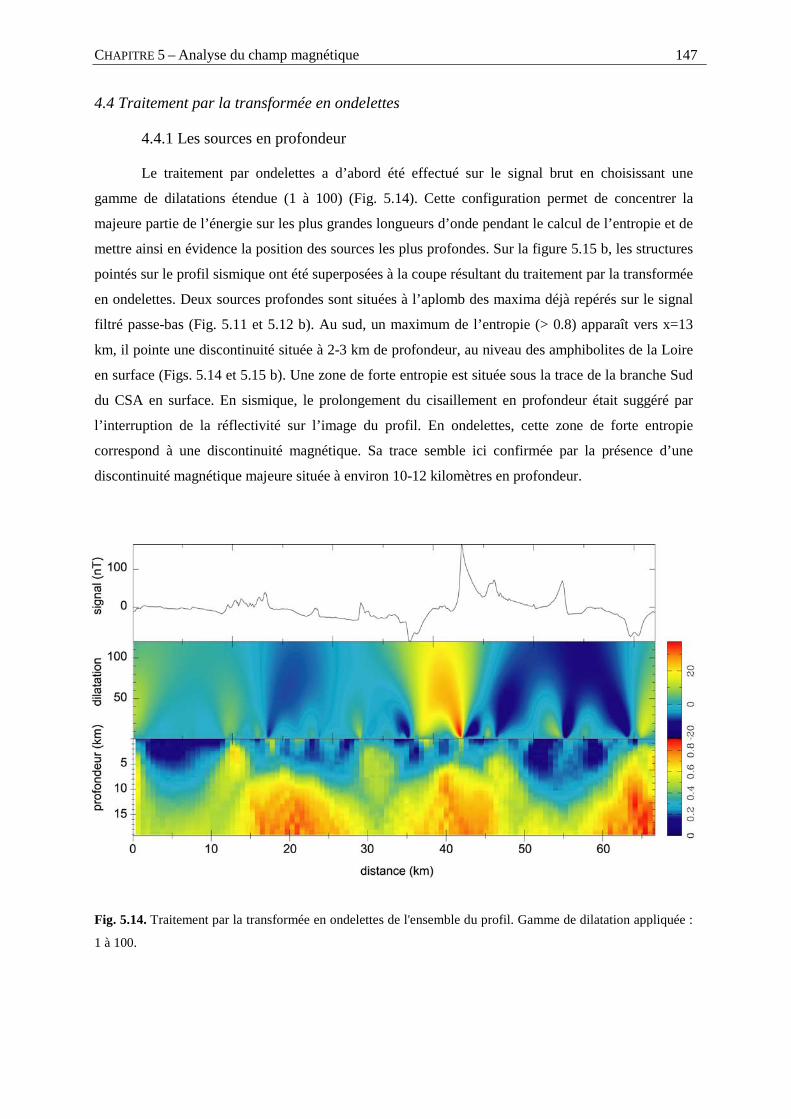
CHAPITRE 5 – Analyse du champ magnétique 147
4.4 Traitement par la transformée en ondelettes
4.4.1 Les sources en profondeur
Le traitement par ondelettes a d’abord été effectué sur le signal brut en choisissant une
gamme de dilatations étendue (1 à 100) (Fig. 5.14). Cette configuration permet de concentrer la
majeure partie de l’énergie sur les plus grandes longueurs d’onde pendant le calcul de l’entropie et de
mettre ainsi en évidence la position des sources les plus profondes. Sur la figure 5.15 b, les structures
pointés sur le profil sismique ont été superposées à la coupe résultant du traitement par la transformée
en ondelettes. Deux sources profondes sont situées à l’aplomb des maxima déjà repérés sur le signal
filtré passe-bas (Fig. 5.11 et 5.12 b). Au sud, un maximum de l’entropie (> 0.8) apparaît vers x=13
km, il pointe une discontinuité située à 2-3 km de profondeur, au niveau des amphibolites de la Loire
en surface (Figs. 5.14 et 5.15 b). Une zone de forte entropie est située sous la trace de la branche Sud
du CSA en surface. En sismique, le prolongement du cisaillement en profondeur était suggéré par
l’interruption de la réflectivité sur l’image du profil. En ondelettes, cette zone de forte entropie
correspond à une discontinuité magnétique. Sa trace semble ici confirmée par la présence d’une
discontinuité magnétique majeure située à environ 10-12 kilomètres en profondeur.
Fig. 5.14. Traitement par la transformée en ondelettes de l'ensemble du profil. Gamme de dilatation appliquée :
1 à 100.
CHAPITRE 5 148
Sous les unités métamorphiques de Champtoceaux, une discontinuité légèrement moins
marquée est pointée vers 7 km de profondeur (x=40 km) ; elle se superpose sur la coupe au pointé le
plus en profondeur du prolongement des unités métamorphiques de Champtoceaux dont la présence
restait incertaine en raison des réflexions multiples visibles dans cette zone. Ici encore, le traitement
par transformation en ondelettes de l’anomalie du champ magnétique semble appuyer la présence de
telles discontinuités sous les unités de Champtoceaux, au-delà de 7 kilomètres de profondeur
(Fig. 5.15 b).
Au nord du profil, un nuage où l’entropie calculée dépasse 0.9 est situé vers 8 km de
profondeur à l’aplomb de l’anomalie négative associée à la branche nord du CSA (Fig. 5.14). La
transformée en ondelettes met ici en évidence le prolongement du cisaillement le long de cette
discontinuité magnétique importante.
4.4.2 Structure de la croûte superficielle à l'aplomb des unités de Champtoceaux
Une étude locale a été effectuée sur une partie extraite du profil (entre 38 et 51 km) en vue de
caractériser plus précisément la géométrie des structures sous les unités métamorphiques de
Champtoceaux. Selon l'approche décrite par Fedi et al. (2002) dans le cas d'une application de la
transformée en ondelettes aux données gravimétriques, le filtrage fréquentiel est utilisé pour séparer
l'anomalie résiduelle de la composante régionale. De la même façon, nous avons ici appliqué un
filtrage passe-haut préalable au signal étudié (cf. Fig. 5.12 b), et le traitement en ondelettes a été
appliqué en choisissant une gamme plus restreinte pour les dilatations (1 à 20) (Fig. 5.15). La coupe
s’étend sur 12 km de long pour 2.5 km de profondeur (Figs. 5.15). Plusieurs nuages d’entropie
supérieure à 0.8 apparaissent et se concentrent en particulier sous l’anomalie positive de plus forte
amplitude qui correspond en surface aux niveaux de serpentinites associées au unités métamorphiques
au nord de Champtoceaux (Figs. 5.15 a et 5.16). Au sud, une discontinuité est mise en évidence au
cœur de l’unité du Cellier (x=1 km) ce qui pourrait correspondre à une zone particulièrement riche en
niveaux d’éclogites. Au nord, la faille de Nort-sur-Erdre est soulignée par une discontinuité
magnétique forte qui se superpose parfaitement au chevauchement reconnu sur le profil sismique
(x=7 km ; Fig. 5.15 a).
Dans la région de Saint-Georges-sur-Loire, entre x=9 et 11 km, des nuages de forte entropie
se singularisent en sub-surface à travers toute l’unité sud des nappes. Ces discontinuités peuvent être
rapportées aux niveaux et/ou blocs de volcanites basiques reconnus en surface et limités à cette zone
ce qui montre l’extension limité en profondeur des sédiments de cette unité (Fig. 5.15 a).
Un maximum de l’entropie, bien marqué mais d’extensions latérale et verticale très limitées, se
superpose aux niveaux de Serpentinites affleurant et notés sur la coupe géologique (x=3.5 km) (Figs.
5.15 a et 5.16). Deux autres nuages sont également visibles, sous les chevauchements, à l’aplomb de
la forte anomalie : le maximum d’entropie y est très élevé et leur position relative, en comparaison
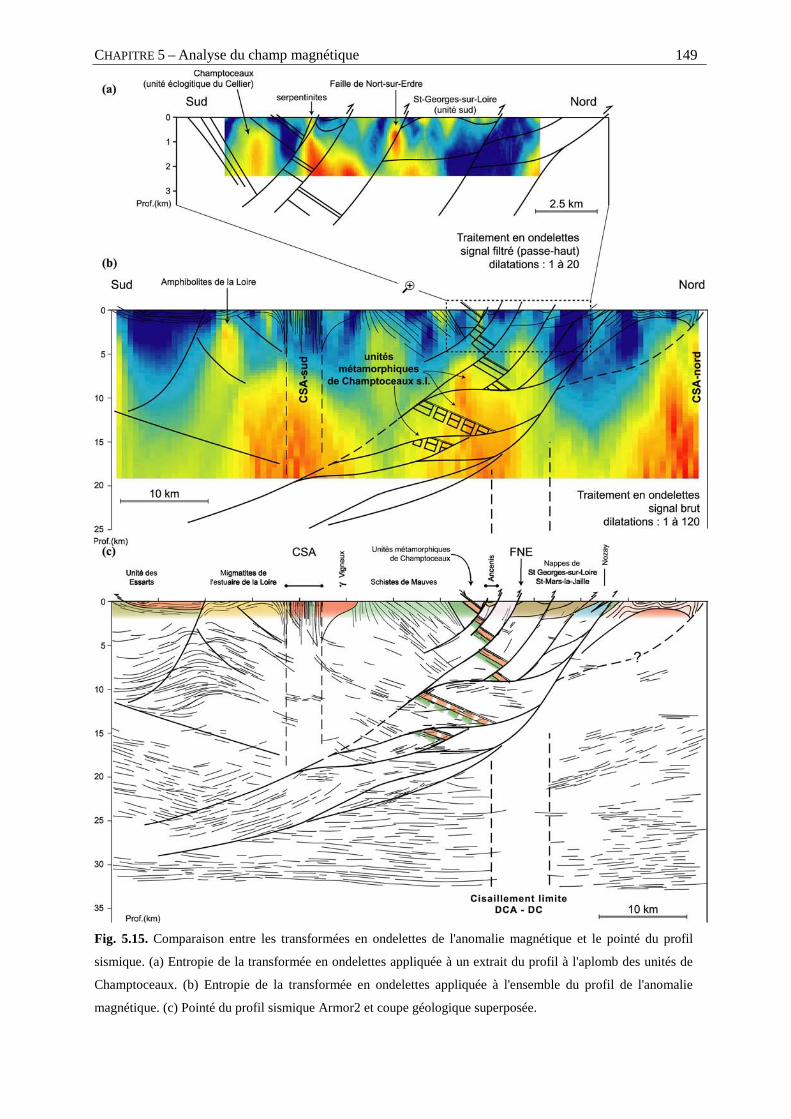
CHAPITRE 5 – Analyse du champ magnétique 149
Fig. 5.15. Comparaison entre les transformées en ondelettes de l'anomalie magnétique et le pointé du profil
sismique. (a) Entropie de la transformée en ondelettes appliquée à un extrait du profil à l'aplomb des unités de
Champtoceaux. (b) Entropie de la transformée en ondelettes appliquée à l'ensemble du profil de l'anomalie
magnétique. (c) Pointé du profil sismique Armor2 et coupe géologique superposée.
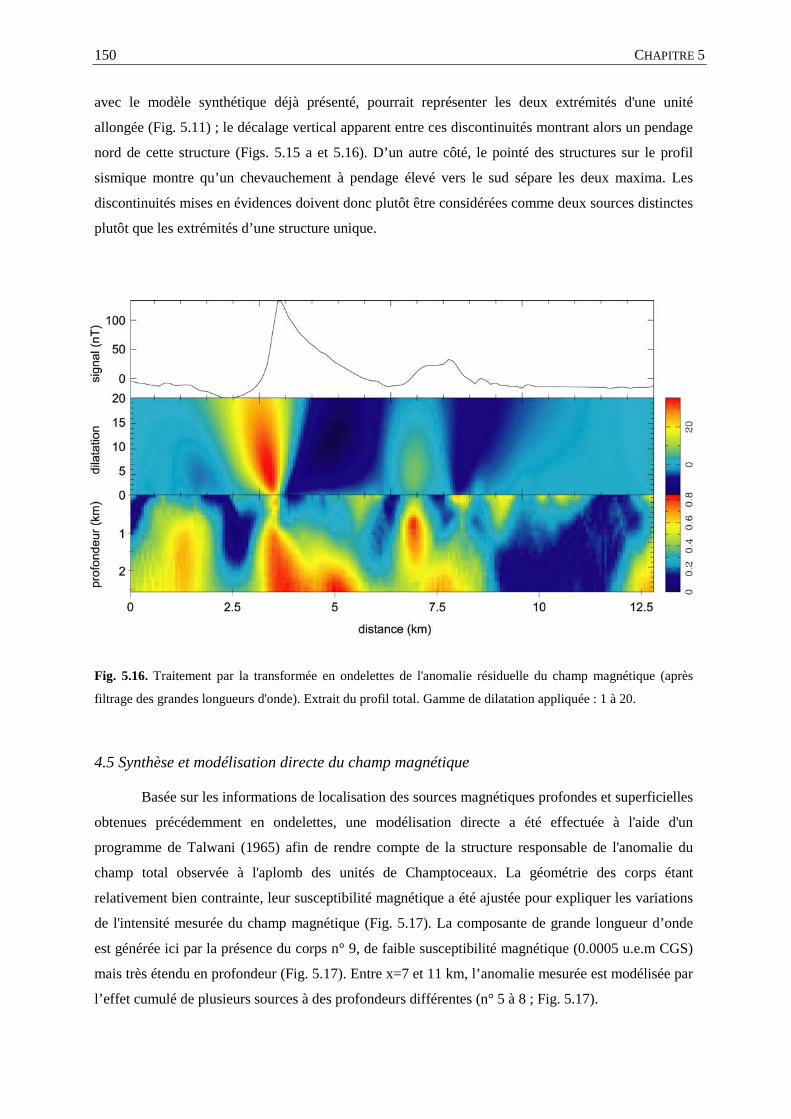
CHAPITRE 5 150
avec le modèle synthétique déjà présenté, pourrait représenter les deux extrémités d'une unité
allongée (Fig. 5.11) ; le décalage vertical apparent entre ces discontinuités montrant alors un pendage
nord de cette structure (Figs. 5.15 a et 5.16). D’un autre côté, le pointé des structures sur le profil
sismique montre qu’un chevauchement à pendage élevé vers le sud sépare les deux maxima. Les
discontinuités mises en évidences doivent donc plutôt être considérées comme deux sources distinctes
plutôt que les extrémités d’une structure unique.
Fig. 5.16. Traitement par la transformée en ondelettes de l'anomalie résiduelle du champ magnétique (après
filtrage des grandes longueurs d'onde). Extrait du profil total. Gamme de dilatation appliquée : 1 à 20.
4.5 Synthèse et modélisation directe du champ magnétique
Basée sur les informations de localisation des sources magnétiques profondes et superficielles
obtenues précédemment en ondelettes, une modélisation directe a été effectuée à l'aide d'un
programme de Talwani (1965) afin de rendre compte de la structure responsable de l'anomalie du
champ total observée à l'aplomb des unités de Champtoceaux. La géométrie des corps étant
relativement bien contrainte, leur susceptibilité magnétique a été ajustée pour expliquer les variations
de l'intensité mesurée du champ magnétique (Fig. 5.17). La composante de grande longueur d’onde
est générée ici par la présence du corps n° 9, de faible susceptibilité magnétique (0.0005 u.e.m CGS)
mais très étendu en profondeur (Fig. 5.17). Entre x=7 et 11 km, l’anomalie mesurée est modélisée par
l’effet cumulé de plusieurs sources à des profondeurs différentes (n° 5 à 8 ; Fig. 5.17).
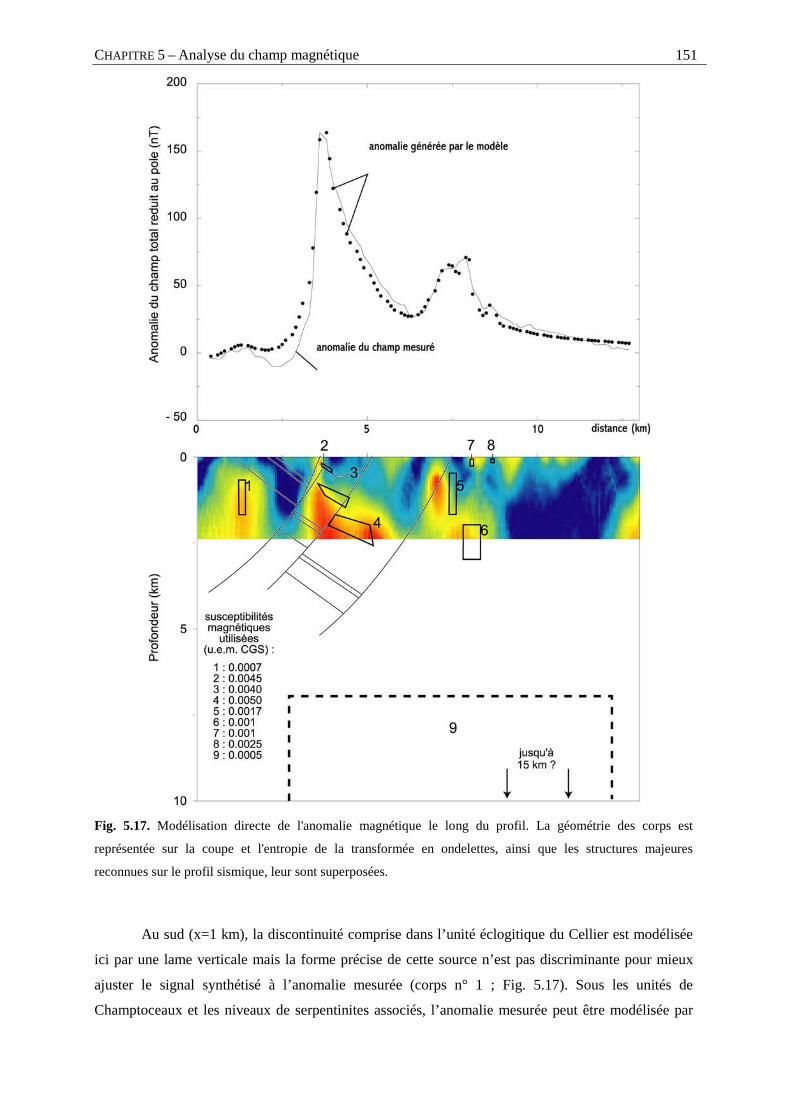
CHAPITRE 5 – Analyse du champ magnétique 151
Fig. 5.17. Modélisation directe de l'anomalie magnétique le long du profil. La géométrie des corps est
représentée sur la coupe et l'entropie de la transformée en ondelettes, ainsi que les structures majeures
reconnues sur le profil sismique, leur sont superposées.
Au sud (x=1 km), la discontinuité comprise dans l’unité éclogitique du Cellier est modélisée
ici par une lame verticale mais la forme précise de cette source n’est pas discriminante pour mieux
ajuster le signal synthétisé à l’anomalie mesurée (corps n° 1 ; Fig. 5.17). Sous les unités de
Champtoceaux et les niveaux de serpentinites associés, l’anomalie mesurée peut être modélisée par

CHAPITRE 5 152
l’effet de trois corps décalés (corps n° 2 à 4) et disposés en échelon dont les sommets se situent au
niveau des maxima d’entropie calculés par la méthode de la transformation en ondelettes (Figs. 5.17
et 5.16). Afin de rendre compte de la forte intensité de l’anomalie positive mesurée dans cette zone,
une susceptibilité variant de 0.0045 à 0.0055 u.e.m. CGS a due être attribuée à chacun de ces trois
corps. Ces valeurs très importantes sont compatibles avec des valeurs mesurées sur des serpentinites
du Massif Armoricain (cf. Baie d'Audierne). Ces trois corps représentent probablement le
prolongement en profondeur des niveaux de serpentinites observés en surface (Fig. 5.17). Le pendage
de ces unités modélisées est concordant avec celui du complexe de Champtoceaux sous-jacent. Ainsi,
les niveaux de serpentinites peuvent être associés à la structure du complexe de Champtoceaux. Ils
pendent systématiquement vers le nord et sont décalés tardivement, comme les unités de hautes
pressions, par les chevauchements d’échelle crustale reconnus sur le profil sismique (Fig. 5.17).
C h a p i t r e 6 Modélisation gravimétrique 3D à l'échelle de la croûte

CHAPITRE 6 – Modélisation gravimétrique 3D à l'échelle de la croûte 155
Integrated 3D geophysical and geological modelling of the Hercynian
Suture Zone in the Champtoceaux area (South Brittany, France)
G.Martelet a, P.Calcagno a, C.Gumiaux b, C.Truffert a, A.Bitri a, D.Gapais b, J.P. Brun b
a B.R.G.M., 3, Av. Claude Guillemin, BP6009, 45060 Orléans cedex 2, France b Géosciences Rennes, UMR 6118 CNRS, Université de Rennes 1, Campus de Beaulieu,
35042 Rennes cedex, France
Tectonophysics – 2003 – accepted/accepté
Abstract
This paper presents a crustal-scale 3D modelling of a segment of the Hercynian suture zone of
Western Europe, in the Champtoceaux area (Brittany, France). The Champtoceaux complex consists
of a stack of metamorphic nappes of gneisses and micaschists, with eclogite-bearing units. The
exhumation of the complex, during early Carboniferous times, was followed by dextral shearing along
the South Armorican Shear Zone, a major dextral strike-slip zone of the Hercynian belt. Dextral
shearing produced a km-scale antiformal structure with a steeply dipping axial plane and a steeply
eastward-plunging axis. A deep-seismic profile recently acquired across the Champtoceaux complex
has revealed that the regional structure was cut by a set of faults with northward thrusting components.
In order to refine and extend in 3D the structures interpreted on the seismic profile, seven radial
gravity profiles have been modelled throughout the Champtoceaux fold. Direct 2D modelling was
performed at crustal-scale, using seismic constraints, geological data, and density data from field and
drill-hole samples. The consistency between the cross-sections, the digitized geological map and the
structural information (foliation dips) is first checked using a geological 3D modeller. From the
surface to the Moho, available 2D information is then interpolated to the whole 3D space using a
geostatistical analysis. Finally, the 3D gravity contribution of the resulting model is computed taking
into account densities for each modelled geological body. The modelled gravity effect is compared to
the measured Bouguer anomaly, which ensures that all complex 3D effects are taken into account and
validates the geological interpretation. The final 3D model is thus compatible with the seismic and
gravity data, as well as with geological data. Main geological results derived from the modelling are
CHAPITRE 6 156
(i) the 3D extension of the south-dipping thrust system interpreted on the seismic profile, (ii) the
overall 3D geometry that emphasizes that northward thrusting and folding of the Champtoceaux
complex was coeval with strike-slip along the South Armorican Shear Zone, (iii) the relatively
shallowly rooted character of the northern limb of the Champtoceaux anticline, a feature which was
not expected from geological data, and (iv) the 3D laccolithic shape of syn-kinematic granitic bodies.
Results emphasize the usefulness of integrated geological and geophysical 3D modelling for the
interpretation of crustal-scale geological systems.
1. Introduction
Geological structures are often non–cylindrical and can result from complex deformation
histories. Therefore, their analysis and tectonic interpretation generally require a 3D structural model.
In most cases, available data are limited to surface geology and interpreted cross-sections. More
favourable situations are those where geophysical data, such as deep seismics, gravity, or magnetics
are also available, allowing a better constraint on the interpretation of geological structures (e.g. Torné
et al., 1989; Truffert et al., 1993; Tsokas and Hansen, 1997).
In the present study, based on such geophysical constraints, we achieve the 3D modelling of a
crustal-scale segment of the Hercynian belt of western Europe: the Champtoceaux complex, South
Brittany, France (Fig. 6.1). This metamorphic complex is part of a major suture zone marked by a
strong deformation history involving burial of continental units down to at least 50 to 60 km (Ballèvre
and Marchand, 1991, Ballèvre et al., 1989, Bosse et al. 2000), exhumation in the upper crust, and
folding associated with wrench-thrust tectonics. This latter event produced a complex non-cylindrical
structure of crustal-scale.
Beside a well-constrained surface geology, available data in the area comprise gravity data,
detailed aeromagnetic data (Truffert et al., 2001), and a deep-seismic reflection profile (Bitri et al.,
2003). From the input data (geological maps and cross-sections, structural dips, 2D geophysical
information, local drill-holes), a geostatiscal interpolation produces a 3D model divided into
geometrical bodies representing different lithologies. Geophysical properties (density, magnetic
susceptibility) can be attributed to each representative lithology and the 3D gravity or magnetic
contributions of the model can then be computed. An interactive comparison between model and
measured potential fields provides a best-fit adjustment of the model geometry. The final model is
therefore compatible with the different sets of input data.
The study (i) emphasizes the usefulness of multidisciplinary approaches in the understanding
of complex geological systems, (ii) shows the feasibility of integrating a multidisciplinary information
into a realistic geological 3D model, (iii) emphasizes the usefulness of 3D modelling to ensure an
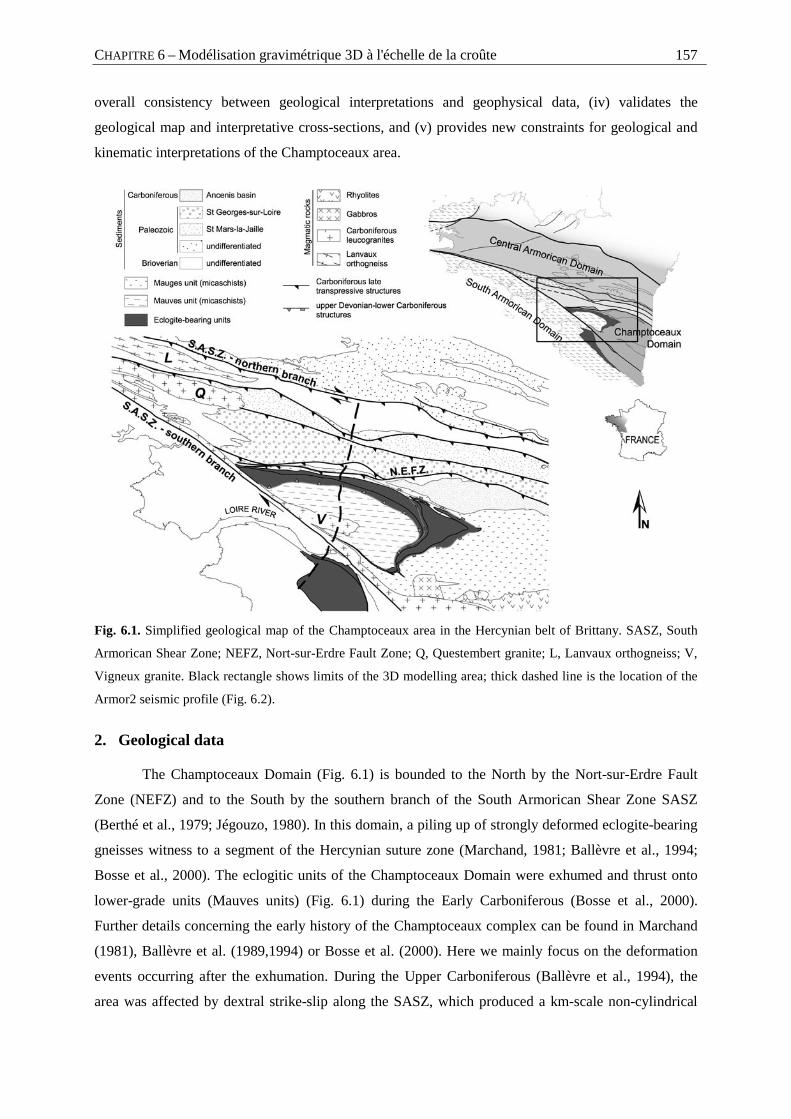
CHAPITRE 6 – Modélisation gravimétrique 3D à l'échelle de la croûte 157
overall consistency between geological interpretations and geophysical data, (iv) validates the
geological map and interpretative cross-sections, and (v) provides new constraints for geological and
kinematic interpretations of the Champtoceaux area.
Fig. 6.1. Simplified geological map of the Champtoceaux area in the Hercynian belt of Brittany. SASZ, South
Armorican Shear Zone; NEFZ, Nort-sur-Erdre Fault Zone; Q, Questembert granite; L, Lanvaux orthogneiss; V,
Vigneux granite. Black rectangle shows limits of the 3D modelling area; thick dashed line is the location of the
Armor2 seismic profile (Fig. 6.2).
2. Geological data
The Champtoceaux Domain (Fig. 6.1) is bounded to the North by the Nort-sur-Erdre Fault
Zone (NEFZ) and to the South by the southern branch of the South Armorican Shear Zone SASZ
(Berthé et al., 1979; Jégouzo, 1980). In this domain, a piling up of strongly deformed eclogite-bearing
gneisses witness to a segment of the Hercynian suture zone (Marchand, 1981; Ballèvre et al., 1994;
Bosse et al., 2000). The eclogitic units of the Champtoceaux Domain were exhumed and thrust onto
lower-grade units (Mauves units) (Fig. 6.1) during the Early Carboniferous (Bosse et al., 2000).
Further details concerning the early history of the Champtoceaux complex can be found in Marchand
(1981), Ballèvre et al. (1989,1994) or Bosse et al. (2000). Here we mainly focus on the deformation
events occurring after the exhumation. During the Upper Carboniferous (Ballèvre et al., 1994), the
area was affected by dextral strike-slip along the SASZ, which produced a km-scale non-cylindrical
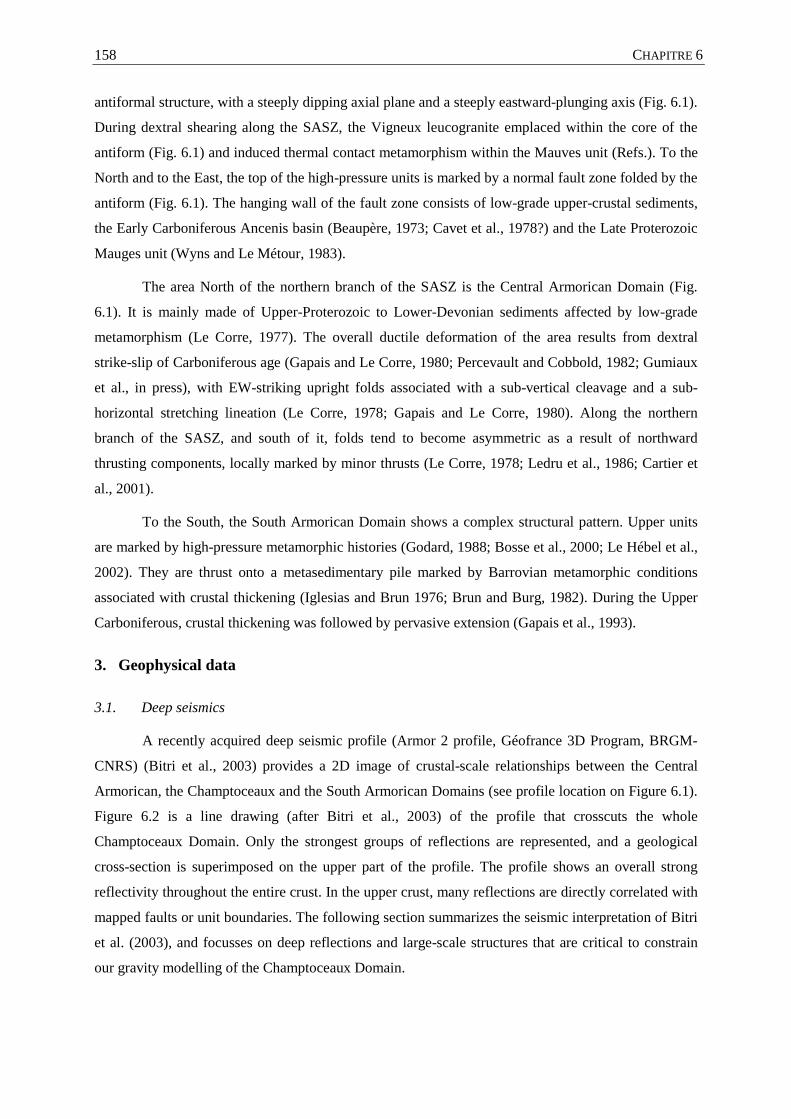
CHAPITRE 6 158
antiformal structure, with a steeply dipping axial plane and a steeply eastward-plunging axis (Fig. 6.1).
During dextral shearing along the SASZ, the Vigneux leucogranite emplaced within the core of the
antiform (Fig. 6.1) and induced thermal contact metamorphism within the Mauves unit (Refs.). To the
North and to the East, the top of the high-pressure units is marked by a normal fault zone folded by the
antiform (Fig. 6.1). The hanging wall of the fault zone consists of low-grade upper-crustal sediments,
the Early Carboniferous Ancenis basin (Beaupère, 1973; Cavet et al., 1978?) and the Late Proterozoic
Mauges unit (Wyns and Le Métour, 1983).
The area North of the northern branch of the SASZ is the Central Armorican Domain (Fig.
6.1). It is mainly made of Upper-Proterozoic to Lower-Devonian sediments affected by low-grade
metamorphism (Le Corre, 1977). The overall ductile deformation of the area results from dextral
strike-slip of Carboniferous age (Gapais and Le Corre, 1980; Percevault and Cobbold, 1982; Gumiaux
et al., in press), with EW-striking upright folds associated with a sub-vertical cleavage and a sub-
horizontal stretching lineation (Le Corre, 1978; Gapais and Le Corre, 1980). Along the northern
branch of the SASZ, and south of it, folds tend to become asymmetric as a result of northward
thrusting components, locally marked by minor thrusts (Le Corre, 1978; Ledru et al., 1986; Cartier et
al., 2001).
To the South, the South Armorican Domain shows a complex structural pattern. Upper units
are marked by high-pressure metamorphic histories (Godard, 1988; Bosse et al., 2000; Le Hébel et al.,
2002). They are thrust onto a metasedimentary pile marked by Barrovian metamorphic conditions
associated with crustal thickening (Iglesias and Brun 1976; Brun and Burg, 1982). During the Upper
Carboniferous, crustal thickening was followed by pervasive extension (Gapais et al., 1993).
3. Geophysical data
3.1. Deep seismics
A recently acquired deep seismic profile (Armor 2 profile, Géofrance 3D Program, BRGM-
CNRS) (Bitri et al., 2003) provides a 2D image of crustal-scale relationships between the Central
Armorican, the Champtoceaux and the South Armorican Domains (see profile location on Figure 6.1).
Figure 6.2 is a line drawing (after Bitri et al., 2003) of the profile that crosscuts the whole
Champtoceaux Domain. Only the strongest groups of reflections are represented, and a geological
cross-section is superimposed on the upper part of the profile. The profile shows an overall strong
reflectivity throughout the entire crust. In the upper crust, many reflections are directly correlated with
mapped faults or unit boundaries. The following section summarizes the seismic interpretation of Bitri
et al. (2003), and focusses on deep reflections and large-scale structures that are critical to constrain
our gravity modelling of the Champtoceaux Domain.
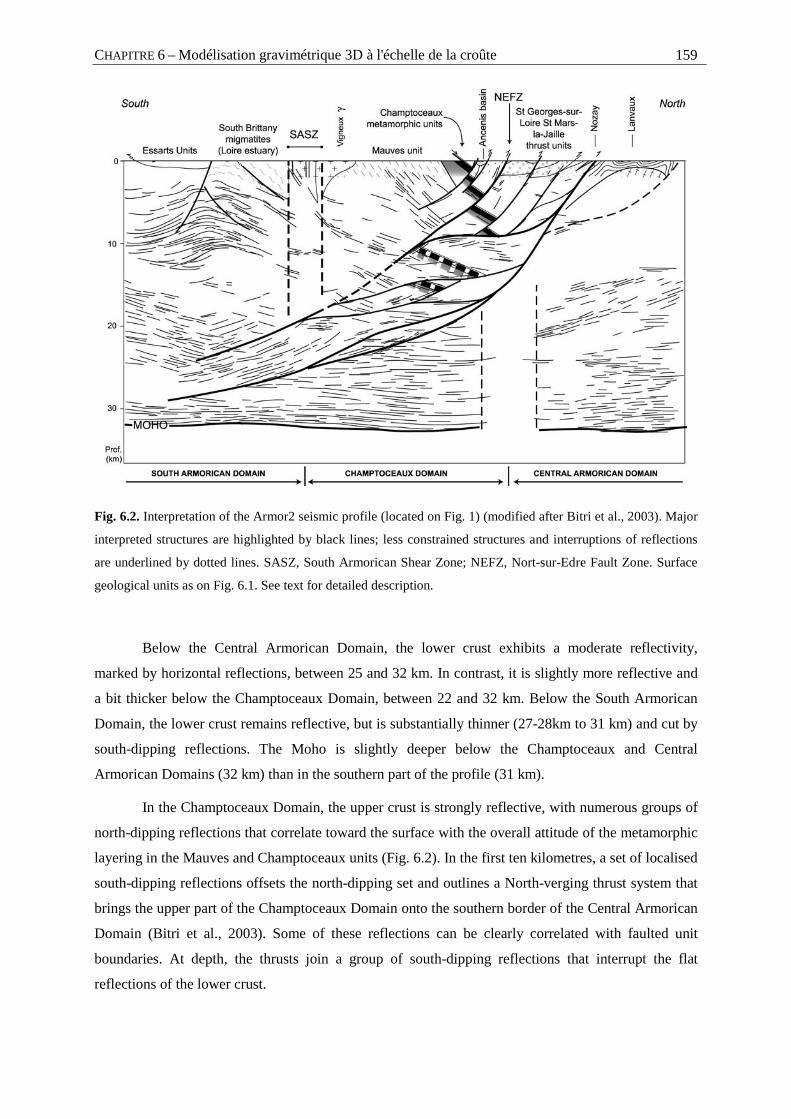
CHAPITRE 6 – Modélisation gravimétrique 3D à l'échelle de la croûte 159
Fig. 6.2. Interpretation of the Armor2 seismic profile (located on Fig. 1) (modified after Bitri et al., 2003). Major
interpreted structures are highlighted by black lines; less constrained structures and interruptions of reflections
are underlined by dotted lines. SASZ, South Armorican Shear Zone; NEFZ, Nort-sur-Edre Fault Zone. Surface
geological units as on Fig. 6.1. See text for detailed description.
Below the Central Armorican Domain, the lower crust exhibits a moderate reflectivity,
marked by horizontal reflections, between 25 and 32 km. In contrast, it is slightly more reflective and
a bit thicker below the Champtoceaux Domain, between 22 and 32 km. Below the South Armorican
Domain, the lower crust remains reflective, but is substantially thinner (27-28km to 31 km) and cut by
south-dipping reflections. The Moho is slightly deeper below the Champtoceaux and Central
Armorican Domains (32 km) than in the southern part of the profile (31 km).
In the Champtoceaux Domain, the upper crust is strongly reflective, with numerous groups of
north-dipping reflections that correlate toward the surface with the overall attitude of the metamorphic
layering in the Mauves and Champtoceaux units (Fig. 6.2). In the first ten kilometres, a set of localised
south-dipping reflections offsets the north-dipping set and outlines a North-verging thrust system that
brings the upper part of the Champtoceaux Domain onto the southern border of the Central Armorican
Domain (Bitri et al., 2003). Some of these reflections can be clearly correlated with faulted unit
boundaries. At depth, the thrusts join a group of south-dipping reflections that interrupt the flat
reflections of the lower crust.
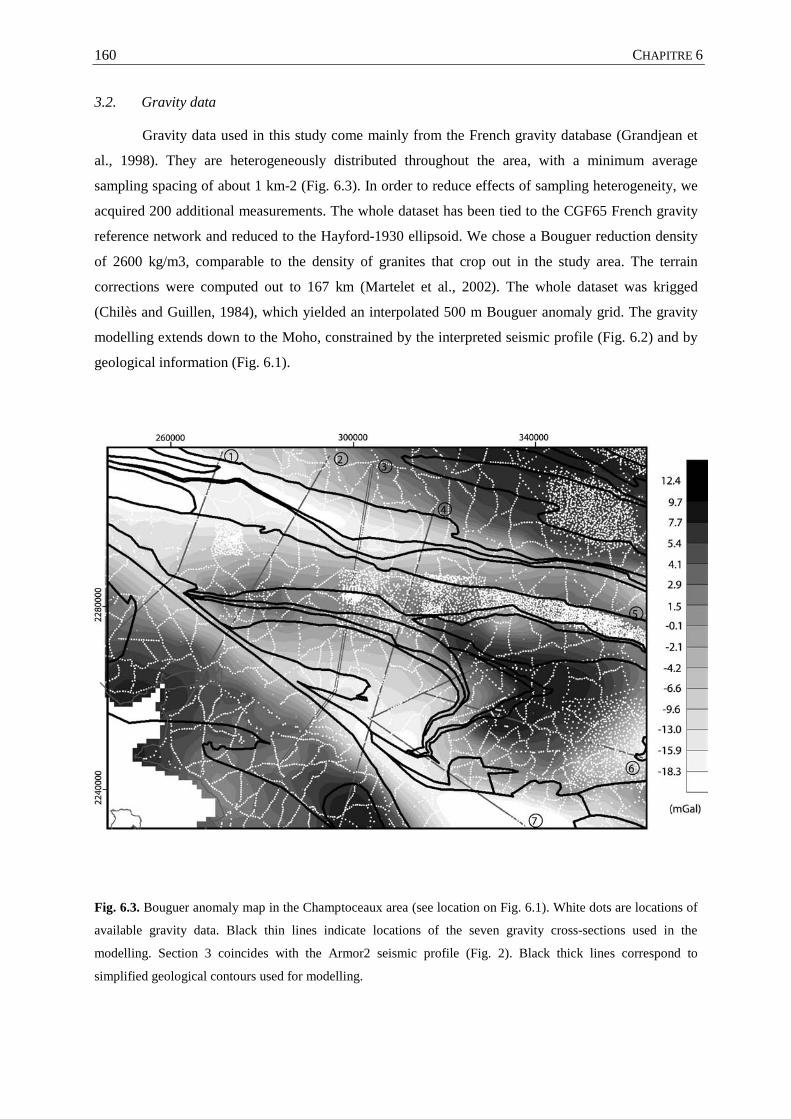
CHAPITRE 6 160
3.2. Gravity data
Gravity data used in this study come mainly from the French gravity database (Grandjean et
al., 1998). They are heterogeneously distributed throughout the area, with a minimum average
sampling spacing of about 1 km-2 (Fig. 6.3). In order to reduce effects of sampling heterogeneity, we
acquired 200 additional measurements. The whole dataset has been tied to the CGF65 French gravity
reference network and reduced to the Hayford-1930 ellipsoid. We chose a Bouguer reduction density
of 2600 kg/m3, comparable to the density of granites that crop out in the study area. The terrain
corrections were computed out to 167 km (Martelet et al., 2002). The whole dataset was krigged
(Chilès and Guillen, 1984), which yielded an interpolated 500 m Bouguer anomaly grid. The gravity
modelling extends down to the Moho, constrained by the interpreted seismic profile (Fig. 6.2) and by
geological information (Fig. 6.1).
Fig. 6.3. Bouguer anomaly map in the Champtoceaux area (see location on Fig. 6.1). White dots are locations of
available gravity data. Black thin lines indicate locations of the seven gravity cross-sections used in the
modelling. Section 3 coincides with the Armor2 seismic profile (Fig. 2). Black thick lines correspond to
simplified geological contours used for modelling.
CHAPITRE 6 – Modélisation gravimétrique 3D à l'échelle de la croûte 161
We further assumed that possible sources located in the asthenosphere induce gravity
anomalies of wavelengths longer than the size of the study area. Therefore, we did not remove any
regional component from the gravity signal and modelled directly the Bouguer anomaly.
The Bouguer anomaly map (Fig. 6.3) displays three main positive anomalies separated by two
elongate gravity lows. The southern gravity low, which trends N125° along the southern branch of the
SASZ, can be attributed to syntectonic leucogranites that mark-out the southern branch of the SASZ
(Fig. 6.1) (Jégouzo, 1980). The northern gravity low trends N105°, parallel to the northern branch of
the SASZ (Fig. 6.1). It is also marked by granitic bodies: the pre-tectonic Lanvaux orthogneiss and the
syntectonic Questembert leucogranite that crop out just West of the study area and are buried at
shallow depth toward the east, south of the northern branch of the SASZ (Weber, 1967). According to
geological data (Fig. 6.1), the three positive gravity anomalies correspond, from South to North to (i)
the South Armorican Domain, marked by the occurrence of migmatites that contain substantial
amounts of amphibolites (Cogné, 1953), (ii) the Champtoceaux Domain with a strong positive
anomaly partly related to the occurrence of mafic eclogites, and (iii) the Central Armorican Domain
which exhibits a positive anomaly of intermediate wavelength and of unknown source.
4. 3D geometrical modelling
4.1. Methodology
The 3D geometrical model is built on the basis of the geological map, cross sections, and a
digital elevation model (DEM). To construct the 3D volumetric bodies, we used the Geological Editor,
an original software developed at the BRGM (French geological survey) (Lajaunie et al., 1997,
Calcagno et al., 2002), and especially devoted to geological modelling. In this software, lithological
units are described by a pseudo-stratigraphic pile, intended to image the geology and structural
relationships as best as possible. Compared with other existing 3D solid modelling approaches (e. g.
Boissonnat, 1988; Bertrand et al., 1992), a major original feature of this modeller is that the 3D
description of the geological space is achieved through a potential field formulation in which
geological boundaries are iso-potential surfaces and their dips are represented by gradients of the
potential. To build the model in a fully geo-referenced system, we took into account (i) a DEM, (ii) a
simplified geological map (lithological contact information), (iii) foliation dips measured within the
different units (local gradient information), and (iv) gravity cross-sections.
The first step was to extend to the Moho a few geological sections across the study area. The
interpretation of the seismic profile has been used to constrain the geometry of the structures at depth.
For each geological cross-section, 2D gravity modelling was used to adjust the geometry of
lithological boundaries. In the next step, 3D integration in the Geological Editor produces consistency
between all cross-sections and the geological map. Based on a specific geostatistical interpolation
CHAPITRE 6 162
procedure (Lajaunie et al., 1997), the Geological Editor allowed us to interpolate the local input data
to the whole 3D space. Finally, using the densities reported in Figure 6.4, the gravity contribution of
the resulting 3D model was computed and compared with the observed Bouguer anomaly. When
discrepancies between computed and observed gravity fields were identified, the geology was locally
reinterpreted, the model being interactively adjusted in 3D. Instead, a 3D stochastic inversion could
have been performed, following the work by Guillen et al., (2000).
4.2. 2D gravity modelling
Gravity modelling has been performed along seven crustal-scale cross-sections sub-
perpendicular to the Champtoceaux structure (locations on Fig. 6.3). The gravity profiles were
extracted along the roads where gravity data have been preferentially collected (data location on
Fig. 6.3). In order to show the real data distribution along the profiles, we plotted the measured data
points along profiles (not the interpolated ones) (Fig. 6.4, upper part). Densities of the outcropping
rocks (Fig. 6.4, lower part) are from sample measurements previously made in the area (e.g. Weber,
1973). Some of them come from well-logging density measurements mainly recorded during a
regional mining survey in the eighties (e.g. Ogier, 1984). For the upper and lower crust, we have
converted RMS velocities of the seismic profile to densities using the empiric law of Nafe and Drake
(1963). A middle and a lower crust have been distinguished according to their different reflectivity
pattern and RMS velocities (i.e. densities). In this paper, only the gravity model of profile n°3
(Fig. 6.4), located along the seismic line, is presented. The three main positive anomalies identified on
the profile correspond to those observed on the gravity map (Fig. 6.3).
In the South Armorican Domain (Fig. 6.4), the southward increase of the gravity anomaly is
related to the southward thickening of the intermediate crust deduced from the occurrence of north-
dipping seismic reflections. Superimposed short-wavelength anomalies are attributed to high-density
material locally present within the high-grade rocks (migmatites) that characterize this domain
(Cogné, 1953). However, for the modelling, we chose to apply a homogeneous density to the South
Armorican Domain.
In the Champtoceaux Domain (Fig. 6.4), the positive anomaly is composed of short and long
wavelengths. The anomaly cannot be entirely explained by a prolongation at depth of the rocks
cropping out in the high-pressure complex. Indeed, the crustal-scale fault system revealed by the
seismic profile limits the extension of the Champtoceaux structure to about 10 km depth. Furthermore,
the local occurrence of Champtoceaux-type mafics at depth would not be sufficient to account for the
observed anomaly. Therefore, the gravity modelling suggests the presence of a dense deep body below
the Champtoceaux complex. Locating the top of this dense body within the thrust system at a depth
around 10 km yields a good fit with the gravity anomaly. This geometry suggests that some lower
crust material could have been thrust into the middle crust.
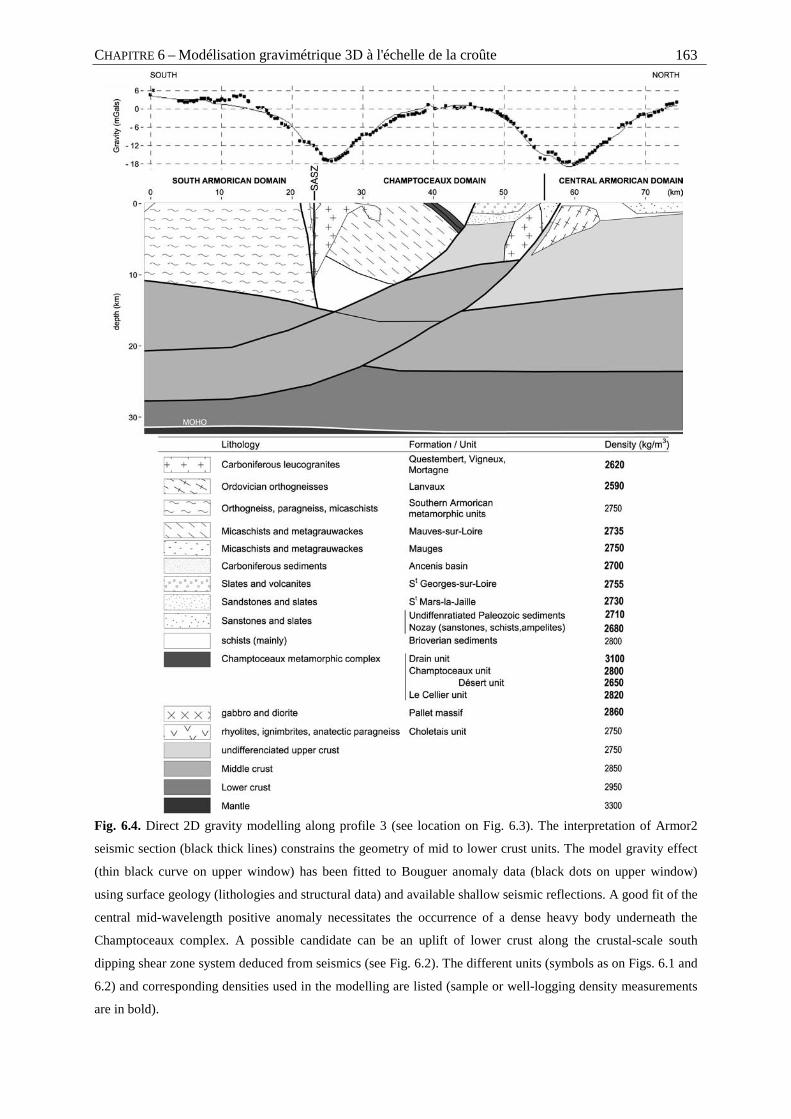
CHAPITRE 6 – Modélisation gravimétrique 3D à l'échelle de la croûte 163
Fig. 6.4. Direct 2D gravity modelling along profile 3 (see location on Fig. 6.3). The interpretation of Armor2
seismic section (black thick lines) constrains the geometry of mid to lower crust units. The model gravity effect
(thin black curve on upper window) has been fitted to Bouguer anomaly data (black dots on upper window)
using surface geology (lithologies and structural data) and available shallow seismic reflections. A good fit of the
central mid-wavelength positive anomaly necessitates the occurrence of a dense heavy body underneath the
Champtoceaux complex. A possible candidate can be an uplift of lower crust along the crustal-scale south
dipping shear zone system deduced from seismics (see Fig. 6.2). The different units (symbols as on Figs. 6.1 and
6.2) and corresponding densities used in the modelling are listed (sample or well-logging density measurements
are in bold).
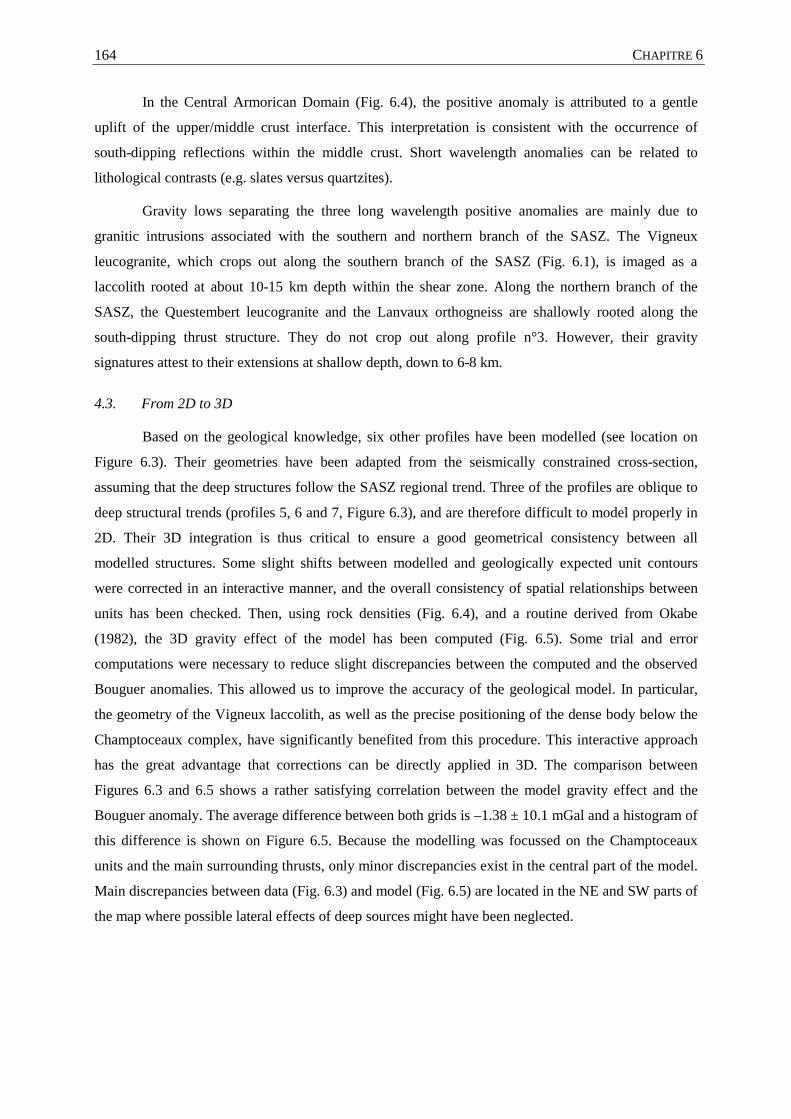
CHAPITRE 6 164
In the Central Armorican Domain (Fig. 6.4), the positive anomaly is attributed to a gentle
uplift of the upper/middle crust interface. This interpretation is consistent with the occurrence of
south-dipping reflections within the middle crust. Short wavelength anomalies can be related to
lithological contrasts (e.g. slates versus quartzites).
Gravity lows separating the three long wavelength positive anomalies are mainly due to
granitic intrusions associated with the southern and northern branch of the SASZ. The Vigneux
leucogranite, which crops out along the southern branch of the SASZ (Fig. 6.1), is imaged as a
laccolith rooted at about 10-15 km depth within the shear zone. Along the northern branch of the
SASZ, the Questembert leucogranite and the Lanvaux orthogneiss are shallowly rooted along the
south-dipping thrust structure. They do not crop out along profile n°3. However, their gravity
signatures attest to their extensions at shallow depth, down to 6-8 km.
4.3. From 2D to 3D
Based on the geological knowledge, six other profiles have been modelled (see location on
Figure 6.3). Their geometries have been adapted from the seismically constrained cross-section,
assuming that the deep structures follow the SASZ regional trend. Three of the profiles are oblique to
deep structural trends (profiles 5, 6 and 7, Figure 6.3), and are therefore difficult to model properly in
2D. Their 3D integration is thus critical to ensure a good geometrical consistency between all
modelled structures. Some slight shifts between modelled and geologically expected unit contours
were corrected in an interactive manner, and the overall consistency of spatial relationships between
units has been checked. Then, using rock densities (Fig. 6.4), and a routine derived from Okabe
(1982), the 3D gravity effect of the model has been computed (Fig. 6.5). Some trial and error
computations were necessary to reduce slight discrepancies between the computed and the observed
Bouguer anomalies. This allowed us to improve the accuracy of the geological model. In particular,
the geometry of the Vigneux laccolith, as well as the precise positioning of the dense body below the
Champtoceaux complex, have significantly benefited from this procedure. This interactive approach
has the great advantage that corrections can be directly applied in 3D. The comparison between
Figures 6.3 and 6.5 shows a rather satisfying correlation between the model gravity effect and the
Bouguer anomaly. The average difference between both grids is –1.38 ± 10.1 mGal and a histogram of
this difference is shown on Figure 6.5. Because the modelling was focussed on the Champtoceaux
units and the main surrounding thrusts, only minor discrepancies exist in the central part of the model.
Main discrepancies between data (Fig. 6.3) and model (Fig. 6.5) are located in the NE and SW parts of
the map where possible lateral effects of deep sources might have been neglected.
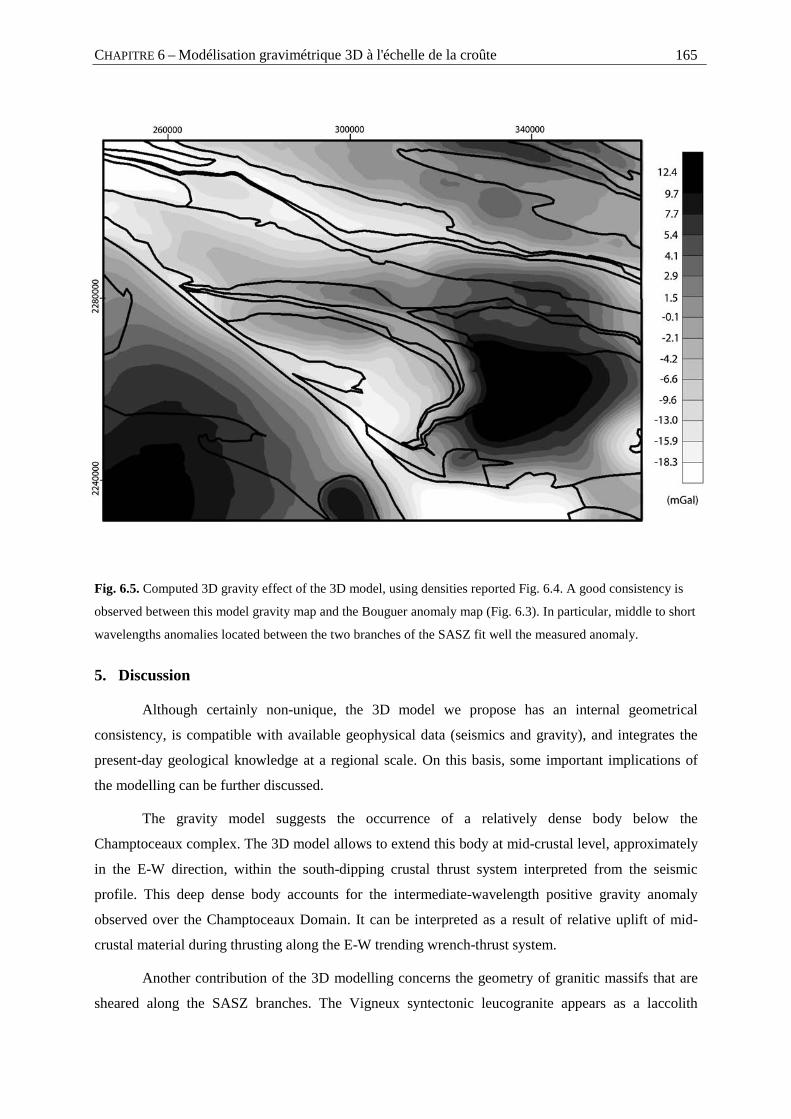
CHAPITRE 6 – Modélisation gravimétrique 3D à l'échelle de la croûte 165
Fig. 6.5. Computed 3D gravity effect of the 3D model, using densities reported Fig. 6.4. A good consistency is
observed between this model gravity map and the Bouguer anomaly map (Fig. 6.3). In particular, middle to short
wavelengths anomalies located between the two branches of the SASZ fit well the measured anomaly.
5. Discussion
Although certainly non-unique, the 3D model we propose has an internal geometrical
consistency, is compatible with available geophysical data (seismics and gravity), and integrates the
present-day geological knowledge at a regional scale. On this basis, some important implications of
the modelling can be further discussed.
The gravity model suggests the occurrence of a relatively dense body below the
Champtoceaux complex. The 3D model allows to extend this body at mid-crustal level, approximately
in the E-W direction, within the south-dipping crustal thrust system interpreted from the seismic
profile. This deep dense body accounts for the intermediate-wavelength positive gravity anomaly
observed over the Champtoceaux Domain. It can be interpreted as a result of relative uplift of mid-
crustal material during thrusting along the E-W trending wrench-thrust system.
Another contribution of the 3D modelling concerns the geometry of granitic massifs that are
sheared along the SASZ branches. The Vigneux syntectonic leucogranite appears as a laccolith
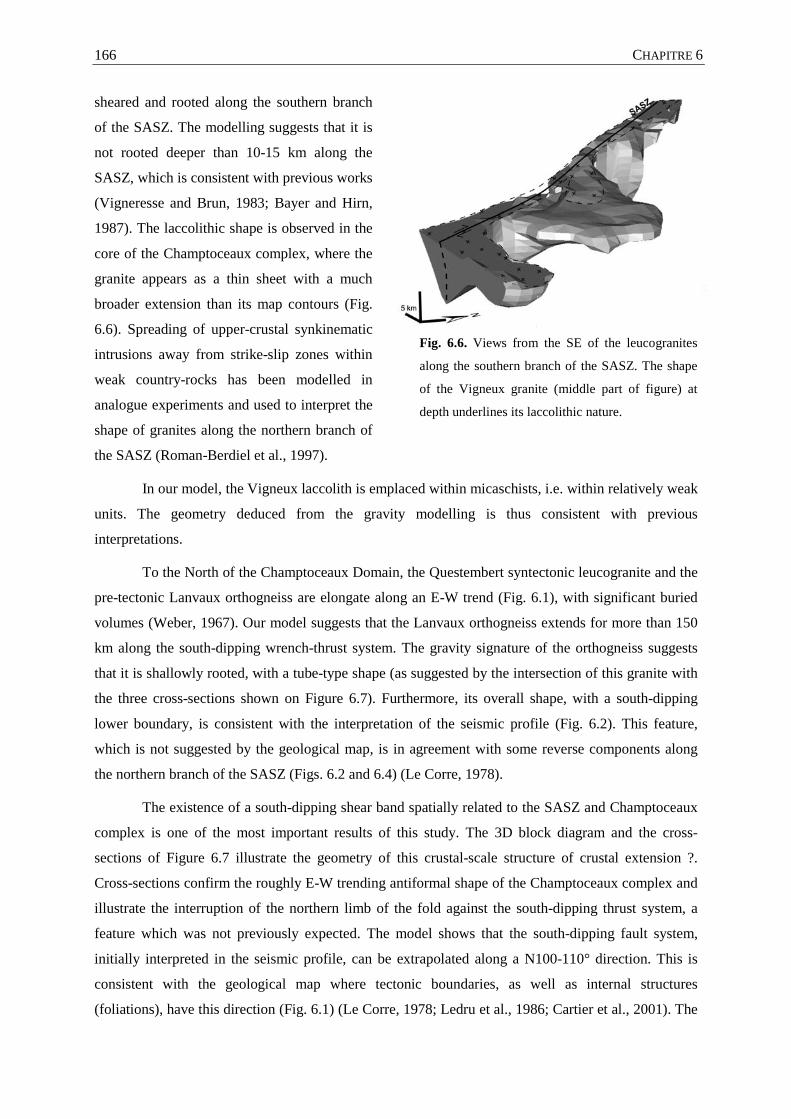
CHAPITRE 6 166
sheared and rooted along the southern branch
of the SASZ. The modelling suggests that it is
not rooted deeper than 10-15 km along the
SASZ, which is consistent with previous works
(Vigneresse and Brun, 1983; Bayer and Hirn,
1987). The laccolithic shape is observed in the
core of the Champtoceaux complex, where the
granite appears as a thin sheet with a much
broader extension than its map contours (Fig.
6.6). Spreading of upper-crustal synkinematic
intrusions away from strike-slip zones within
weak country-rocks has been modelled in
analogue experiments and used to interpret the
shape of granites along the northern branch of
the SASZ (Roman-Berdiel et al., 1997).
Fig. 6.6. Views from the SE of the leucogranites
along the southern branch of the SASZ. The shape
of the Vigneux granite (middle part of figure) at
depth underlines its laccolithic nature.
In our model, the Vigneux laccolith is emplaced within micaschists, i.e. within relatively weak
units. The geometry deduced from the gravity modelling is thus consistent with previous
interpretations.
To the North of the Champtoceaux Domain, the Questembert syntectonic leucogranite and the
pre-tectonic Lanvaux orthogneiss are elongate along an E-W trend (Fig. 6.1), with significant buried
volumes (Weber, 1967). Our model suggests that the Lanvaux orthogneiss extends for more than 150
km along the south-dipping wrench-thrust system. The gravity signature of the orthogneiss suggests
that it is shallowly rooted, with a tube-type shape (as suggested by the intersection of this granite with
the three cross-sections shown on Figure 6.7). Furthermore, its overall shape, with a south-dipping
lower boundary, is consistent with the interpretation of the seismic profile (Fig. 6.2). This feature,
which is not suggested by the geological map, is in agreement with some reverse components along
the northern branch of the SASZ (Figs. 6.2 and 6.4) (Le Corre, 1978).
The existence of a south-dipping shear band spatially related to the SASZ and Champtoceaux
complex is one of the most important results of this study. The 3D block diagram and the cross-
sections of Figure 6.7 illustrate the geometry of this crustal-scale structure of crustal extension ?.
Cross-sections confirm the roughly E-W trending antiformal shape of the Champtoceaux complex and
illustrate the interruption of the northern limb of the fold against the south-dipping thrust system, a
feature which was not previously expected. The model shows that the south-dipping fault system,
initially interpreted in the seismic profile, can be extrapolated along a N100-110° direction. This is
consistent with the geological map where tectonic boundaries, as well as internal structures
(foliations), have this direction (Fig. 6.1) (Le Corre, 1978; Ledru et al., 1986; Cartier et al., 2001). The
CHAPITRE 6 – Modélisation gravimétrique 3D à l'échelle de la croûte 167
model thus emphasises that present-day tectonic boundaries observed at the southern edge of the
Central Armorican Domain are late features that obliterate the primary geometry of the suture zone.
Cross-sections extracted from the 3D model (Fig. 6.7) show that the south-dipping thrust system
becomes vertical toward the West, when approaching the SASZ (Fig. 6.7).
Fig. 6.7. (a) 3D view from the SE of the Champtoceaux area. (b) Middle to lower crustal interfaces beneath the
Champtoceaux complex. The south-dipping crustal-scale shear zone is highlighted by black dotted lines. The
structure becomes sub-vertical at the vicinity of the SASZ (in red). (c) Example of extraction of cross-sections
from the 3D model, outlining the 3D folded shape of the Champtoceaux complex (orange and blue) above the
crustal-scale shear zone (black dots).
CHAPITRE 6 168
This feature outlines that interactions occurred between thrusting along the northern boundary
of the Champtoceaux Domain and wrenching along the SASZ. The geological map shows that unit
boundaries within the Champtoceaux Domain, most corresponding to thrusts imaged on the seismic
profile, are interrupted by the southern branch of the SASZ (compare Figs. 6.1 and 6.2). On the other
hand, the Champtoceaux fold is cut by the thrust system. This led Bitri et al. (2003) to propose that
strike-slip along the SASZ and thrusting of the Champtoceaux Domain should be partly coeval. Our
3D modelling confirms that folding of the Champtoceaux metamorphic complex and its northward
thrusting occurred during strike-slip movement along the SASZ.
6. Concluding remarks
The above study emphasizes the need of 3D modelling in a highly non-cylindrical geological
context such as in Champtoceaux Domain. It also reassesses the need of an integrated geological and
geophysical approach to improve the understanding of crustal-scale tectonic processes. To build a
regional-scale 3D geometrical model, original 2D geophysical and geological data are processed
together and interpolated to the whole 3D space. At any stage during the model construction,
refinements can be interactively introduced to ensure the consistency between original data, so that a
relevant 3D geometry can be produced. In the model, lithological units are volumes to which
geophysical properties (density, susceptibility) are attributed. The 3D gravity or magnetic contribution
of the model can thus be calculated and compared to the measured potential fields for further
interactive adjustment of the model geometry. The result is a 3D model that respects constraints
imposed by geological and geophysical data, and can be further used to interpret and discuss crustal-
scale structures.
Concerning the Champtoceaux Domain, the modelling has shown that tectonic inferences
made from geological data and the seismic profile could be extended to 3D using 2D gravity
modelling. In particular, the primary geometry of the suture zone appears obliterated by a late E-W
striking thrust system that brings the Champtoceaux domain on the southern part of the Central
Armorican Domain. In addition, the modelling emphasizes that the Champtoceaux Domain was
affected by a crustal-scale north-verging thrust system that developed during regional scale strike-slip
along the SASZ. More generally, the consistency observed between the 3D model gravity effect and
the Bouguer anomaly map validates the interpreted geological cross-sections.
CHAPITRE 6 – Modélisation gravimétrique 3D à l'échelle de la croûte 169
Acknoledgments
We thank reviewers J.P. Busby and V. Bosse who allowed us to significantly improve the
original manuscript. Geophysical maps and 2D gravity modelling were achieved using Geosoft - GM-
SYS package. This contribution has benefited from the interpretation of seismic data acquired during
the Armor 2 GeoFrance3D research program (CNRS-BRGM).
References
BALLEVRE, M., PINARDON, J.L., KIENAST, J.R. & VUICHARD, J.P. (1989) - "Reversal of Fe-Mg
partitioning between garnet and staurolite in eclogite-facies metapelites from Champtoceaux Nappe
(Brittany, France)." - Journal of Petrology, 30(6), 1321-1349.
BALLEVRE, M. & MARCHAND, J. (1991) - "Zonation du métamorphisme éclogitique dans la nappe de
Champtoceaux (Massif armoricain, France)." - Comptes Rendus de l'Académie des Sciences de
Paris, 312, 705-711.
BALLEVRE, M., MARCHAND, J., GODARD, G., GOUJOU, J.C. & WYNS, R. (1994) - "Eo-Hercynian
events in the Armorican Massif." In: J. D. Keppie (Ed.), Pre-Mesozoic geology in France and
related areas. - Springer Verlag, Berlin, pp. 183-194.
BAYER, R. & HIRN, A. (1987) - "Données géophysiques sur la structure profonde de la croûte
hercynienne dans l'arc ibéro-armoricain et le Massif Central Français." - Bulletin de la Société
Géologique de France, 3(3), 561-574.
BEAUPERE, C. (1973) - "Contribution à l'étude de la flore fossile du "Culm" du synclinal d'Ancenis." -
Thèse, Université Pierre et Marie Curie, Paris, 111 pp.
BERTHE, D., CHOUKROUNE, P. & JEGOUZO, P. (1979) - "Orthogneiss, mylonite and non coaxial
deformation of granites: the example of the South Armorican Shear Zone." - Journal of Structural
Geology, 1(1), 31-42.
BERTRAND, P., DUFOUR, J.F., FRANÇON, J. & LIENHARDT, P. (1992) - "Modélisation volumique à base
topologique." - Secondery Modélisation volumique à base topologique., 59-74.
CHAPITRE 6 170
BITRI, A., BALLEVRE, M., BRUN, J.P., CHANTRAINE, J., GAPAIS, D., GUENNOC, P., GUMIAUX, C. &
TRUFFERT, C. (2003) - "Imagerie sismique de la zone de collision Hercynienne dans le sud-est du
Massif Armoricain (Projet Armor2 - Programme Geofrance 3D). Seismic imaging of the Hercynian
collision zone in the south-eastern Armorican Massif (Armor2 project - Geofrance 3D program)." -
Comptes Rendus Geoscience, 335, 969-979.
BOISSONNAT, J.D. (1988) - "Shape reconstruction from planar cross-sections." - Computer
Visualisation and Graphical Image Processing, 44, 1-29.
BOSSE, V., FERAUD, G., RUFFET, G., BALLEVRE, M., PEUCAT, J.-J. & DE JONG, K. (2000) - "Late
Devonian subduction and early-orogenic exhumation of eclogite-facies rocks from the
Champtoceaux Complex (Variscan belt, France)." - Geological journal, 35, 297-325.
BRUN, J.P. & BURG, J.P. (1982) - "Combined thrusting and wrenching in the Ibero-Armorican arc : a
corner effect during continental collision." - Earth and Planetary Science Letters, 61, 319-332.
CALCAGNO, P., MARTELET, G. & GUMIAUX, C. (2002) - "Apport de la modélisation géométrique 3D à
l'interprétation géologique du complexe de Champtoceaux (Massif Armoricain)." – Réunion des
Sciences de la Terre, Nantes, France, p.79.
CARTIER, C., FAURE, M. & LARDEUX, H. (2001) - "The Hercynian orogeny in the South Armorican
Massif (Saint-Georges-sur-Loire Unit, Ligerian Domain, France): rifting and welding of
continental stripes." - Terra Nova, 13, 143-149.
CAVET, P. (1978) - French Geological map (1/50,000), "Ancenis (452).", BRGM, Orléans.
CHILES, J.P. & GUILLEN, A. (1984) - "Variogrammes et krigeages pour la gravimétrie et le
magnétisme." - Sciences de la Terre. Série Informatique Géologique, 20, 455-468.
COGNE, J. (1953) - "Schistes cristallins et granites en Bretagne méridionale : l'Anticlinal de
Cornouaille." - Bulletin de la Société Géologique de France, 6(3), 785-806.
GAPAIS, D. & LE CORRE, C. (1980) - "Is the Hercynian belt of Brittany a major shear zone?" - Nature,
288, 574-576.
GAPAIS, D., LAGARDE, J.L., LE CORRE, C., AUDREN, C., JEGOUZO, P., CASAS SAINZ, A. & VAN DEN
DRIESSCHE, J. (1993) - "La zone de cisaillement de Quiberon : témoin d'extension de la chaîne
CHAPITRE 6 – Modélisation gravimétrique 3D à l'échelle de la croûte 171
varisque en Bretagne méridionale au Carbonifère." - Comptes Rendus de l'Académie des Sciences
de Paris, II(316), 1123-1129.
GODARD, G. (1988) - "Petrology of some eclogites in the Hercynides: the eclogites from the Southern
Armorican Massif, France. Eclogites and eclogites-facies rocks." In: D. C. Smith (Ed.), Eclogite
and eclogite-facies rocks. - Amsterdam, pp. 451-519.
GRANDJEAN, G., MENNECHET, C., DEBEGLIA, N. & BONIJOLY, D. (1998) - "Insuring the quality of
gravity data." - EOS Transactions, American Geophysical Union, 79, 217-221.
GUILLEN, A., DELOS, V. & LEDRU, P. (2000) - "A new method to determine lithology and geometry in
depth; 3D litho-inversion of potential fields." – 25th General Assembly, European Geophysical
Society.
GUMIAUX, C., BRUN, J.P. & GAPAIS, D. (in press / sous presse) - "Strain removal within the Hercynian
Shear Belt of Central Brittany (Western France): methodology and tectonic implications." - Journal
of the Geological Society of London Special publication.
IGLESIAS, M. & BRUN, J.P. (1976) - "Signification des variations et anomalies de la déformation dans
un segment de la chaîne hercynienne (les séries cristallophylliennes de la Vendée littorale, Massif
Armoricain)." - Bulletin de la Société Géologique de France, 18, 1443-1452.
JEGOUZO, P. (1980) - "The South Armorican Shear Zone." - Journal of Structural Geology, 2(1-2), 39-
47.
LAJAUNIE, C., COURRIOUX, G. & MANUEL, L. (1997) - "Foliation and 3D Cartography in Geology:
Principles of a Method Based on Potential Interpolation." - Mathematical Geology, 29, 571-584.
LE CORRE, C. (1977) - "Le Briovérien de Bretagne centrale : essai de synthèse lithologique et
structurale." - Bulletin du BRGM, I(3), 219-254.
LE CORRE, C. (1978) - "Approche quantitative des processus synschisteux. L'exemple du segment
Hercynien de Bretagne Centrale." - Thèse d'état, Université de Rennes 1, Rennes, 382 pp.
LE HEBEL, F., VIDAL, O., KIENAST, J.R. & GAPAIS, D. (2002) - "Les "Porphyroïdes" de Bretagne
méridionale : une unité de HP-BT dans la chaîne hercynienne." - Comptes Rendus Geoscience,
334, 205-211.
CHAPITRE 6 172
LEDRU, P., MAROT, A. & HERROUIN, Y. (1986) - "Le synclinorium de Saint-Georges-sur-Loire : une
unité ligérienne charriée sur le domaine centre armoricain. Découverte de métabasite à
glaucophane sur la bordure sud de cette unité." - Comptes Rendus de l'Académie des Sciences de
Paris, II -303, 963-968.
MARCHAND, J. (1981) - "Ecaillage d'un "mélange tectonique" profond : le complexe cristallophyllien
de Champtoceaux (Bretagne méridionale)." - Comptes Rendus de l'Académie des Sciences de
Paris, 293, 223-228.
MARTELET, G., DEBEGLIA, N. & TRUFFERT, C. (2002) - "Homogénéisation et validation des
corrections de terrain gravimétriques jusqu'à la distance de 167 km sur l'ensemble de la France." -
Comptes Rendus Geoscience, 334, 449-454.
NAFE, S.E. & DRAKE, C.L. (1963) - "Physical properties of marine sediments." In: M. N. Hill (Ed.),
The Sea. - New York, pp. 784-819.
OGIER, M. (1984) "Analyse des densités mesurées sur les carottes du sondage SC2 AN PAN de
Pannece (Loire Atlantique)." - In. BRGM, report 86GPH067.
OKABE, M. (1982) - "Analytical expressions for gravity due to homogeneous revolutional
compartments in the Gaussian divergence approach." - Geophysical prospecting, 30, 166-187.
PERCEVAULT, M.-N. & COBBOLD, P.R. (1982) - "Mathematical removal of regional ductile strains in
Central Brittany: evidence for wrench tectonics." - Tectonophysics, 82, 317-328.
ROMAN-BERDIEL, T., GAPAIS, D. & BRUN, J.P. (1997) - "Granite intrusion along strike-slip zones in
experiment and nature." - American Journal of Sciences, 297, 651-678.
TORNE, M., CABISSOLE DE, B., BAYER, R., CASAS, A., DAIGNIERES, M. & RIVEIRO, A. (1989) -
"Gravity constraints on the deep structure of the Pyrenean belt along ECORS profile." -
Tectonophysics, 165, 105-116.
TRUFFERT, C., CHAMOT-ROOKE, N., LALLEMANT, S., DE VOOGT*D, B., HUCHON, P. & LE PICHON, X.
(1993) - "A crustal-scale cross-section of the western Mediterranean Ridge from deep seimic data
and gravity modelling." - Geophysical Journal International, 114, 360-372.
CHAPITRE 6 – Modélisation gravimétrique 3D à l'échelle de la croûte 173
TRUFFERT, C., GUMIAUX, C., CHANTRAINE, J., PERRIN, J., GALDEANO, A., GAPAIS, D., BALLEVRE,
M., ASFIRANE, F., GUENNOC, P. & BRUN, J.P. (2001) - "Levé géophysique aéroporté dans le Sud-
Est du Massif armoricain (programme GéoFrance3D Armor2). Magnétisme et radiométrie
spectrale." - Comptes Rendus de l'Académie des Sciences de Paris, 333, 263-270.
TSOKAS, G. & HANSEN, R. (1997) - "Study of the crustal thickness and subducting lithosphere in
Greece from gravity data." - Journal of Geophysical Research, 102, 20585-20597.
VIGNERESSE, J.L. & BRUN, J.P. (1983) - "Les leucogranites armoricains marqueurs de la déformation
régionale : apport de la gravimétrie." - Bulletin de la Société Géologique de France, 25(3), 357-
366.
WEBER, C. (1967) - "Le prolongement des granites de Lanvaux d'après la gravimétrie et
l'aéromagnétisme." - Mémoires du BRGM, 52, 83-90.
WEBER, C. (1973) - "Le socle antétriasique sous la partie Sud du bassin de Paris." - Bulletin du
BRGM, 3-4, 219-243.
WYNS, R. & LE METOUR, J. (1983) - "Le Précambrien du Massif Vendéen : étude détaillée de deux
coupes de référence (Coupe de l'Evre et coupe de la Divatte) et synthèse des données récentes."-
BRGM, Orléans, 60 pp.

T R O I S I E M E P A R T I E LE CISAILLEMENT HERCYNIEN DE BRETAGNE CENTRALE, DE LA CROUTE A LA LITHOSPHERE

C h a p i t r e 7 Le cisaillement Hercynien de Bretagne Centrale synthèse structurale et histoire tectonique

CHAPITRE 7 – Histoire du cisaillement Hercynien de Bretagne Centrale 179
Tectonic history of the Hercynian Armorican Shear belt (Brittany, France)
C.Gumiaux a, D.Gapais a, J.P. Brun a, J. Chantraine b, G. Ruffet a
a Géosciences Rennes, UMR 6118 CNRS, Université de Rennes 1, 35042 Rennes cedex,
France b Bureau de Recherches Géologiques et Minières - CDG/MA, 3, avenue Claude Guillemin, BP
6009, Orléans cedex 2, France
Geodinamica Acta – 2003 – submitted/soumis
Abstract
The Hercynian Armorican belt is made of different tectonic domains separated by crustal-scale
shear zones. One of these domains, Central Brittany, was deformed by regional pervasive dextral
simple shear during Carboniferous times. This paper examines the implications that the restoration of
ductile strains within Central Brittany has on the deformation history along its boundaries and within
adjacent domains. Data used for the analysis include surface structural features and recently acquired
deep seismic data. A good consistency is observed between model implications and available
geological and structural data. Results lead to a reappraisal of the Carboniferous history of the
Armorican belt, including relationships between tectonics, plutonism and basin development. They
further emphasize the usefulness of restoration for integrated tectonic analysis of crustal-scale
deformation zones.
1. Introduction
Crustal deformations generally combine distributed strains with strain and displacement
localization along large-scale shear zones. The Hercynian belt of Western Europe is marked by the
development of such major shear zones, especially within the Ibero-Armorican syntaxis Arthaud &
Matte, 1975-Dias & Ribeiro, 1995) (Fig. 7.1). Strike-slip components along these zones are often
important and can be associated with substantial pervasive strains within adjacent domains e.g.
(Gapais & Le Corre, 1980; Dias & Ribeiro, 1994).
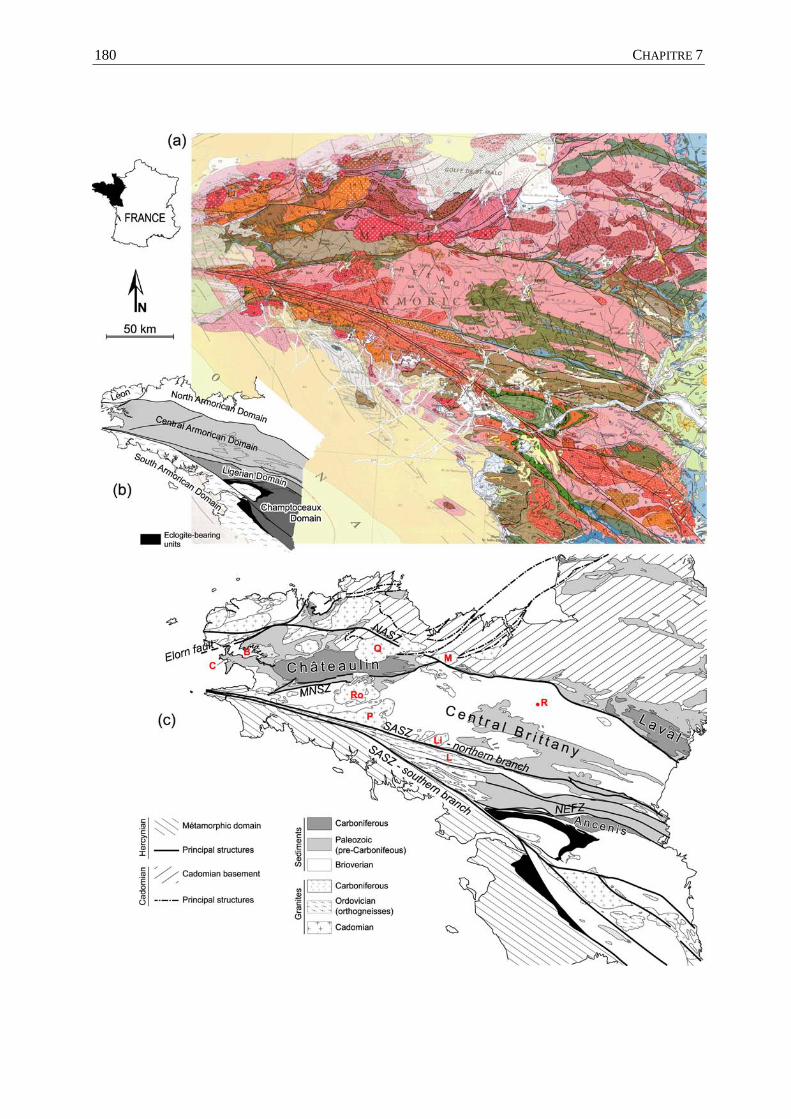
CHAPITRE 7 180
CHAPITRE 7 – Histoire du cisaillement Hercynien de Bretagne Centrale 181
Three major shear zones occur within the Hercynian belt of Brittany. These are, from North to
South, the North Armorican Shear Zone (NASZ), and the northern and southern branches of the South
Armorican Shear Zone (SASZ) (Fig. 7.1a). These zones strike E-W to NW-SE, have dextral strike-slip
components, and separate crustal blocks with contrasting tectonic and metamorphic histories
(Fig. 7.1b). Central Brittany is bounded by the NASZ and by the northern branch of the SASZ. The
Montagnes Noires Shear Zone (MNSZ) (Fig. 7.1c) separates two sub-domains with distinct structural
history, here called Western and Eastern Central Brittany. Eastern Central Brittany shows an overall
continuous deformation of Carboniferous age, without major discontinuities (Le Corre et al., 1991). In
this area, most structures appear compatible with bulk pervasive plane strain, associated with regional
dextral shearing and limited vertical stretching (Gapais & Le Corre, 1980; Percevault & Cobbold,
1982). A geostatistical analysis of cleavage trajectories has shown that the associated deformation
could be modelled as a regional, rather homogeneous, dextral simple shear along an ESE-WNW
direction (Gumiaux et al., in press).
The restoration of simple shear throughout eastern Central Brittany outlines and quantifies
compatibility problems that can be expected along domain boundaries during regional shearing. The
present paper describes and discusses their implications on the kinematic history along the boundaries
of eastern Central Brittany. The analysis emphasizes that the restoration can provide strong and
constructive constraints for the tectonic analysis of a ductilely deformed region. In the studied area, it
leads to a tectonic model that integrates most local structural features that were previously analysed in
an unconnected way, locally leading to erroneous, poorly constrained or missing interpretations.
2. Eastern Central Brittany
2.1. Tectonic settings
The Hercynian belt of Brittany can be divided into different domains separated by crustal-
scale fault zones.
< Fig. 7.1. (a) Geological map of the Armorican Massif extracted from the 1/1,000 000 geological map of
France (scale reduction: 35 %) (Chantraine et al., 1996) (geological captions in Chantraine et al., 1996). (b) Main
different domains forming the Armorican Massif. (c) Structural map showing main features across the Central
Armorican Domain and adjacent areas. R, Rennes town; B, Brest town; C, Crozon peninsula; Ro, Rostrenen
granite; P, Pontivy granite; Li, Lizio granite; Q, Quintin granite; M, Montcontour granite; L, Lanvaux
orthogneiss; SASZ, South Armorican Shear Zone; NASZ, North Armorican Shear Zone; MNSZ, Montagnes
Noires Shear Zone; NEFZ, Nort-sur-Erdre Fault Zone.
CHAPITRE 7 182
North of the NASZ, the North Armorican Domain is mainly made of Cadomian (Proterozoic)
basement, with an overall rigid or brittle behaviour during the Hercynian orogeny (see Brun et al.,
2001).
South of the SASZ, the South Armorican Domain is part of the internal zones of the belt,
marked by two main tectonic and metamorphic events: early, Devonian to lower Carboniferous, burial
and piling up of tectonic units (Matte, 1991; Burg, 1981; Bosse et al., 2000; Le Hébel et al., 2002),
followed by upper Carboniferous regional extension (Gapais et al., 1993). Highest-grade metamorphic
rocks are eclogite-bearing units that mark the northern boundary of the South Armorican Domain
(Fig. 7.1b). These units outline a major suture zone of the belt (Ballèvre et al., 1989; Bitri et al., 2003).
A segment of this zone is presently located just north of the southern branch of the SASZ, within the
Champtoceaux Domain (Fig. 7.1b).
The southern edge of Central Brittany is defined by the northern branch of the SASZ
(Fig. 7.1). To the South, between the two branches of the SASZ, are the Ligerian and Champtoceaux
Domains, separated by the EW-striking Nort-sur-Erdre fault zone (NEFZ). The Ligerian and Central
Armorican Domains are both made of sedimentary rocks of upper Proterozoic to Palaeozoic age. Their
deformation is of Carboniferous age, and marked by limited metamorphism and crustal thickening
(Gapais & Le Corre, 1980; Le Corre et al., 1991).
To the West, the MNSZ separates eastern Central Brittany from the Carboniferous Châteaulin
basin that characterizes western Central Brittany (Fig. 7.1b).
2.2. Pre-Hercynian history
The oldest sediments deposited in Central Brittany consist in a thick detrital rythmic series of
upper Proterozoic (Brioverian) to Cambrian age (Fig. 7.1a) (Le Corre, 1977; Chantraine et al., 1982,
Chauvel & Rabu, 1984). These deposits result from the erosion of the Cadomian Chain to the North.
The Lower Ordovician is marked by a regional extensional event that affects a large part of the
Armorican Massif. In Central Brittany, continental red beds deposited locally above normal faults
cutting across the Brioverian series (Ballard et al., 1986; Brun et al., 1991). To the East of the North
Armorican Domain, the orientation of small Palaeozoic basins suggests that deposits were controlled
by two main sets of normal faults, striking WNW-ESE and NE-SW (area North of the Laval Basin,
Figs. 1a, c). Lower Ordovician extension was accompanied by an important magmatic event, around
480 Ma (Vidal, 1976; Le Métour & Audren, 1977; Jégouzo et al., 1986; Ballèvre et al., 2002). The
Lanvaux orthogneiss, that marks out the southern boundary of Central Brittany (Figs. 1a, c), emplaced
during this event (Vidal, 1976; Jégouzo et al., 1986). After deposition of the red beds, the Armorican
sandstone marks the onset of the marine Palaeozoic transgression that affected the northern margin of
Gondwana (Guillocheau & Rolet, 1982; Robardet et al., 1994). Up to Lower Devonian, regional-scale
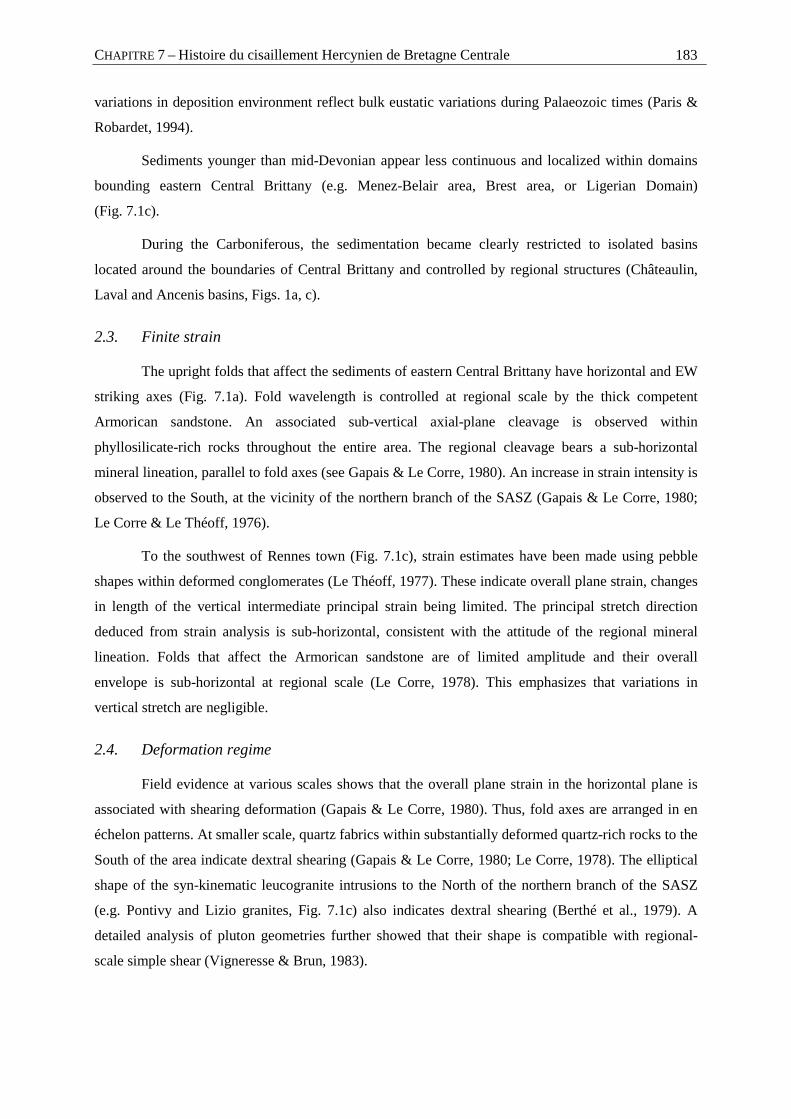
CHAPITRE 7 – Histoire du cisaillement Hercynien de Bretagne Centrale 183
variations in deposition environment reflect bulk eustatic variations during Palaeozoic times (Paris &
Robardet, 1994).
Sediments younger than mid-Devonian appear less continuous and localized within domains
bounding eastern Central Brittany (e.g. Menez-Belair area, Brest area, or Ligerian Domain)
(Fig. 7.1c).
During the Carboniferous, the sedimentation became clearly restricted to isolated basins
located around the boundaries of Central Brittany and controlled by regional structures (Châteaulin,
Laval and Ancenis basins, Figs. 1a, c).
2.3. Finite strain
The upright folds that affect the sediments of eastern Central Brittany have horizontal and EW
striking axes (Fig. 7.1a). Fold wavelength is controlled at regional scale by the thick competent
Armorican sandstone. An associated sub-vertical axial-plane cleavage is observed within
phyllosilicate-rich rocks throughout the entire area. The regional cleavage bears a sub-horizontal
mineral lineation, parallel to fold axes (see Gapais & Le Corre, 1980). An increase in strain intensity is
observed to the South, at the vicinity of the northern branch of the SASZ (Gapais & Le Corre, 1980;
Le Corre & Le Théoff, 1976).
To the southwest of Rennes town (Fig. 7.1c), strain estimates have been made using pebble
shapes within deformed conglomerates (Le Théoff, 1977). These indicate overall plane strain, changes
in length of the vertical intermediate principal strain being limited. The principal stretch direction
deduced from strain analysis is sub-horizontal, consistent with the attitude of the regional mineral
lineation. Folds that affect the Armorican sandstone are of limited amplitude and their overall
envelope is sub-horizontal at regional scale (Le Corre, 1978). This emphasizes that variations in
vertical stretch are negligible.
2.4. Deformation regime
Field evidence at various scales shows that the overall plane strain in the horizontal plane is
associated with shearing deformation (Gapais & Le Corre, 1980). Thus, fold axes are arranged in en
échelon patterns. At smaller scale, quartz fabrics within substantially deformed quartz-rich rocks to the
South of the area indicate dextral shearing (Gapais & Le Corre, 1980; Le Corre, 1978). The elliptical
shape of the syn-kinematic leucogranite intrusions to the North of the northern branch of the SASZ
(e.g. Pontivy and Lizio granites, Fig. 7.1c) also indicates dextral shearing (Berthé et al., 1979). A
detailed analysis of pluton geometries further showed that their shape is compatible with regional-
scale simple shear (Vigneresse & Brun, 1983).
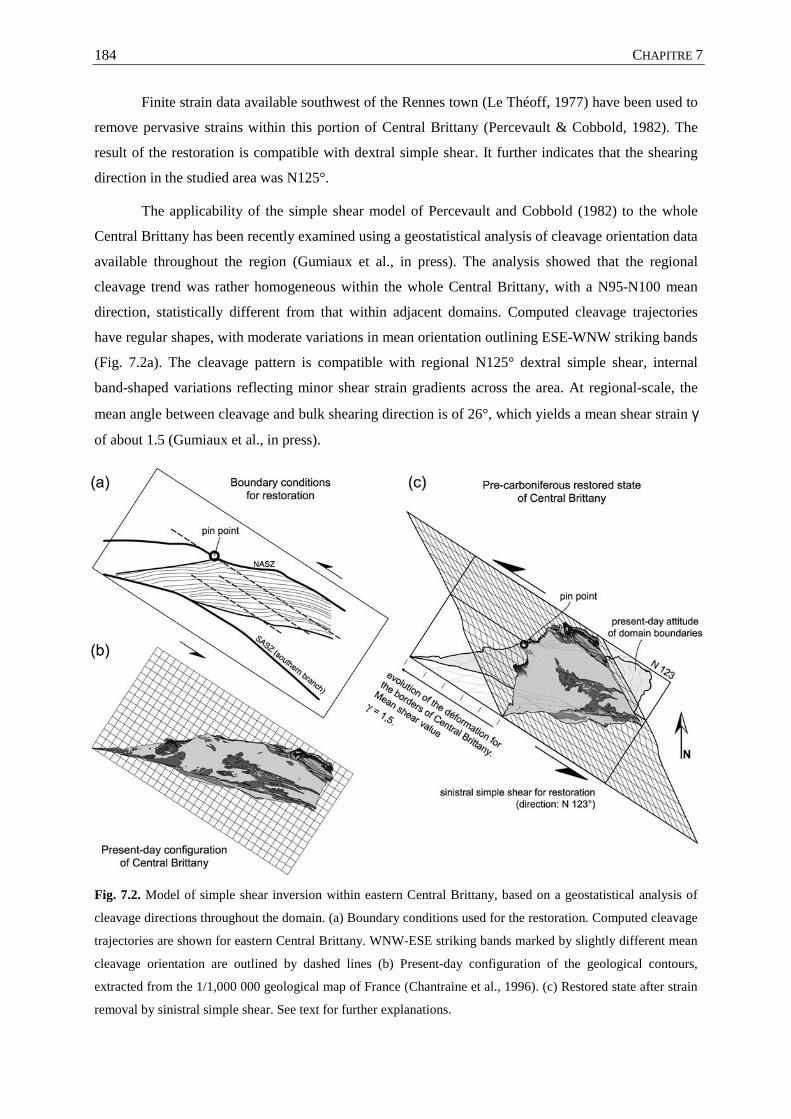
CHAPITRE 7 184
Finite strain data available southwest of the Rennes town (Le Théoff, 1977) have been used to
remove pervasive strains within this portion of Central Brittany (Percevault & Cobbold, 1982). The
result of the restoration is compatible with dextral simple shear. It further indicates that the shearing
direction in the studied area was N125°.
The applicability of the simple shear model of Percevault and Cobbold (1982) to the whole
Central Brittany has been recently examined using a geostatistical analysis of cleavage orientation data
available throughout the region (Gumiaux et al., in press). The analysis showed that the regional
cleavage trend was rather homogeneous within the whole Central Brittany, with a N95-N100 mean
direction, statistically different from that within adjacent domains. Computed cleavage trajectories
have regular shapes, with moderate variations in mean orientation outlining ESE-WNW striking bands
(Fig. 7.2a). The cleavage pattern is compatible with regional N125° dextral simple shear, internal
band-shaped variations reflecting minor shear strain gradients across the area. At regional-scale, the
mean angle between cleavage and bulk shearing direction is of 26°, which yields a mean shear strain γ
of about 1.5 (Gumiaux et al., in press).
Fig. 7.2. Model of simple shear inversion within eastern Central Brittany, based on a geostatistical analysis of
cleavage directions throughout the domain. (a) Boundary conditions used for the restoration. Computed cleavage
trajectories are shown for eastern Central Brittany. WNW-ESE striking bands marked by slightly different mean
cleavage orientation are outlined by dashed lines (b) Present-day configuration of the geological contours,
extracted from the 1/1,000 000 geological map of France (Chantraine et al., 1996). (c) Restored state after strain
removal by sinistral simple shear. See text for further explanations.
CHAPITRE 7 – Histoire du cisaillement Hercynien de Bretagne Centrale 185
Thus, the dextral simple shear model has been extended to the entire eastern Central Brittany
(Gumiaux et al., in press). Several syn-kinematic granite intrusions within eastern Central Brittany
(Pontivy, Lizio, and Bignan granites) yielded Rb/Sr whole rock ages around 345-335 Ma (Bernard-
Griffiths et al., 1985), which provides a minimum time range for the shearing deformation, from
uppermost Tournaisian to lower Visean.
2.5. Result of strain restoration
Ductile strains within Central Brittany have been removed by applying a sinistral simple shear,
along a N125° direction (precisely N123°), and taking into account the computed slight internal shear
strain gradients.
The restoration model has been further constrained by observed horizontal displacements
along the NASZ where several syntectonic Carboniferous granites have emplaced (see Le Corre et al.,
1991, and references therein) (Fig. 7.1a). To the West, granites show intense dextral wrenching with
well-developed mylonites (Goré & Le Corre, 1987; Watts & Williams, 1979). Horizontal
displacements recorded by plutons decrease eastward, between Quintin and Montcontour intrusions (Q
and M, respectively, on figure 1c). Furthermore, the geological map shows that the strike-slip motion
along the NASZ becomes close to zero in the Montcontour area where NE-SW trending Cadomian
structures are not significantly affected by Hercynian E-W dextral strike-slip (Fig. 7.1c) (Carric et al.,
1979). Consistently, the trace of the NASZ is interrupted in this area on the 1/1,000 000 geological
map (Fig. 7.1a) (Chantraine et al., 1996). For the restoration, a pin point has therefore been imposed in
the Montcontour area (Fig. 7.2a).
Figures 2b and 2c show present-day and restored images of Central Brittany, respectively. A
main outcome of the restoration is that, because domain boundaries are all oblique with respect to the
regional shear direction, they undergo rotations and overlaps between Central Brittany and adjacent
domains occur (Fig. 7.2c). These impose that horizontal displacements localized along fault zones
have to combine with scissor-type motions along domain boundaries. Neither localized horizontal
displacements, nor bulk rigid rotations of domains can be quantitatively constrained by the restoration
model of distributed deformations. During progressive shearing, due to the change in angle between
domain boundaries and shear direction, kinematics along them is expected to change with time.
In the followings, we develop a compared analysis of geological data and kinematic
implications of the restoration along the different boundaries of Central Brittany.
CHAPITRE 7 186
3. The Montagnes Noires Shear Zone and the Châteaulin Carboniferous basin
3.1. Geology
Western Central Brittany, in the Châteaulin basin area, shows the most complete sedimentary
sequence, from Brioverian detrital deposits to Visean continental sediments (b2k to h2, Fig. 7.3a).
This area is bounded to the South by the MNSZ and to the North by the Elorn fault zone and segments
of the NASZ (Fig. 7.3b).
The MNSZ is a linear structure that cuts across the entire Central Armorican Domain, from the
Douarnenez orthogneiss along the SASZ, to the Montcontour granite along the NASZ (Figs. 1 and 3).
It consists in several faults striking N80° and affecting sediments up to Devonian in age. The area
South of the MNSZ (Pontivy-Rostrenen area, Figs. 3 and 1) is marked by large surfaces of granitic
rocks, whereas further East granites disappear progressively under the sedimentary series (Le Corre,
1978). This suggests that this area shows a particularly deep erosion level with respect to other parts of
Central Brittany. Consistently, it shows specific relatively high-grade metamorphic conditions
(Hanmer & Vigneresse, 1980; Darboux & Le Gall, 1988) that can reach kyanite and staurolite stability
fields (Darboux & Le Gall, 1988; Fonteilles, 1965).
Since the lowermost Carboniferous, the history of the Châteaulin basin differs from adjacent
areas. At this time, the basin is marked by (1) a shift of the depocenter from NW to SE (Guillocheau &
Rolet, 1982), and (2) a strong increase in basin subsidence (Paris & Robardet, 1994). Thus, a thick
shallow marine homogeneous sequence of lower Tournaisian age is preserved in the northern part of
the basin (Guillocheau & Rolet, 1982; Pelhate, 1994). This series contains olistoliths and debris flows
that indicate the occurrence of substantial slopes along the northern boundary of the basin
(Guillocheau & Rolet, 1982). During the Tournaisian, the sedimentation covers approximately the
present-day basin surface. Debris flows and polygenic conglomerates still attest to the occurrence of
proximate reliefs (Guillocheau & Rolet, 1982). The sedimentary history of the basin ends during the
Upper Visean to Lower Namurian, with the deposit of a thick turbiditic sequence that covers presently
the main part of the basin, down to its southernmost part along the MNSZ.
The Châteaulin basin is strongly asymmetric, with oldest sequences restricted to the northern part,
and Tournaisian to lower Visean series in direct contact with the MNSZ to the South. Sedimentation
depths increase from North to South, in particular during Visean times, with lateral changes from
debris flows along the northern boundary to dark shales along the MNSZ (Darboux, 1991).
The area North of the Châteaulin basin (Brest and Crozon areas, Fig. 7.3b) is mainly
composed of Ordovician to Devonian sediments unconformably deposited on the Brioverian sequence
(Douarnenez Bay, Fig. 7.3a, b). To the North is the Léon Domain characterized by high-grade
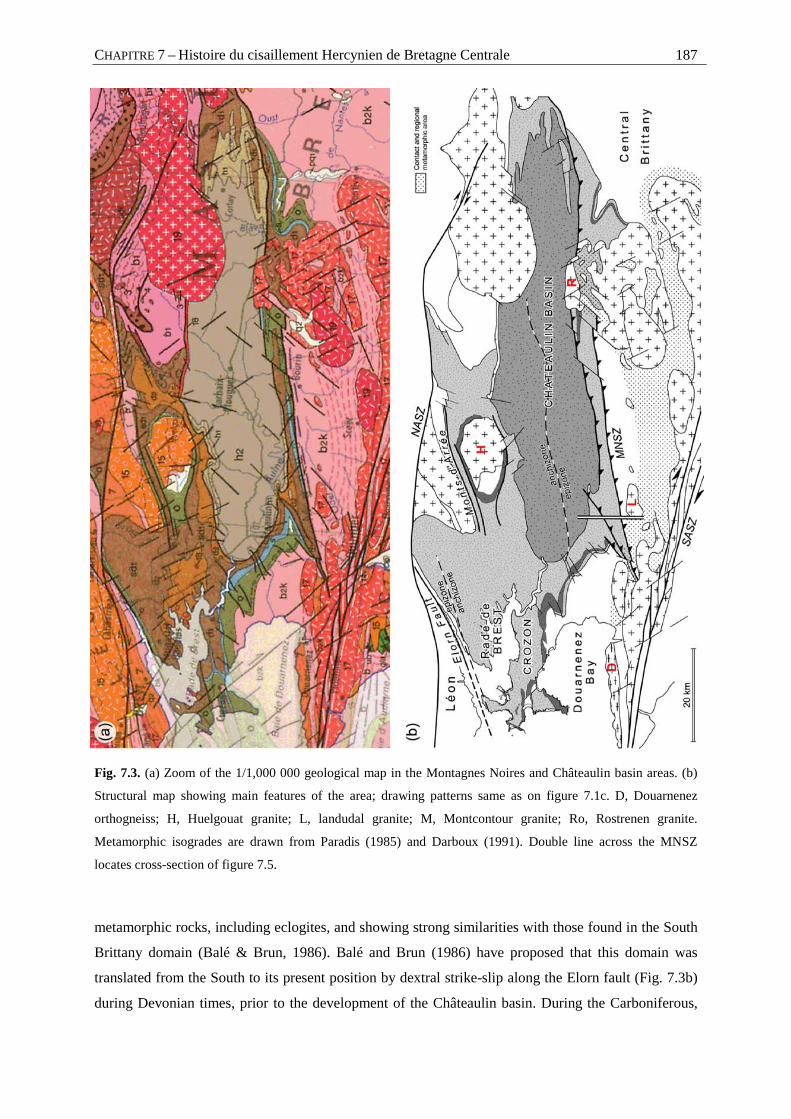
CHAPITRE 7 – Histoire du cisaillement Hercynien de Bretagne Centrale 187
Fig. 7.3. (a) Zoom of the 1/1,000 000 geological map in the Montagnes Noires and Châteaulin basin areas. (b)
Structural map showing main features of the area; drawing patterns same as on figure 7.1c. D, Douarnenez
orthogneiss; H, Huelgouat granite; L, landudal granite; M, Montcontour granite; Ro, Rostrenen granite.
Metamorphic isogrades are drawn from Paradis (1985) and Darboux (1991). Double line across the MNSZ
locates cross-section of figure 7.5.
metamorphic rocks, including eclogites, and showing strong similarities with those found in the South
Brittany domain (Balé & Brun, 1986). Balé and Brun (1986) have proposed that this domain was
translated from the South to its present position by dextral strike-slip along the Elorn fault (Fig. 7.3b)
during Devonian times, prior to the development of the Châteaulin basin. During the Carboniferous,
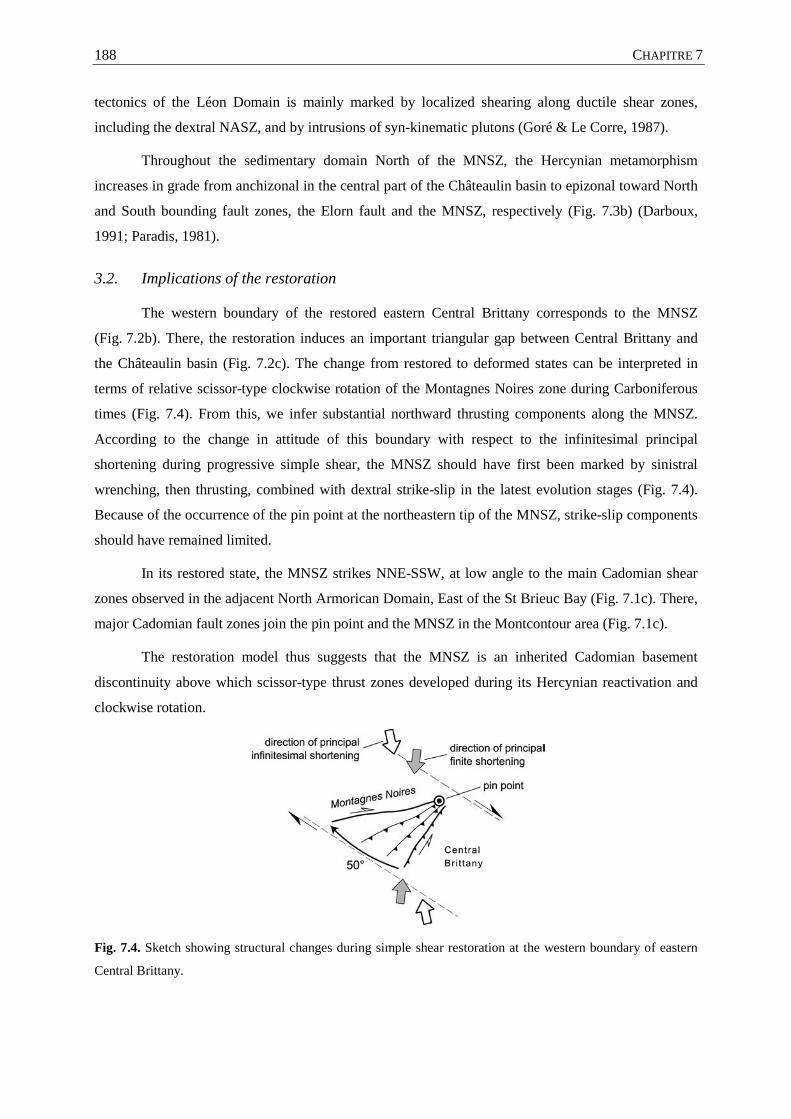
CHAPITRE 7 188
tectonics of the Léon Domain is mainly marked by localized shearing along ductile shear zones,
including the dextral NASZ, and by intrusions of syn-kinematic plutons (Goré & Le Corre, 1987).
Throughout the sedimentary domain North of the MNSZ, the Hercynian metamorphism
increases in grade from anchizonal in the central part of the Châteaulin basin to epizonal toward North
and South bounding fault zones, the Elorn fault and the MNSZ, respectively (Fig. 7.3b) (Darboux,
1991; Paradis, 1981).
3.2. Implications of the restoration
The western boundary of the restored eastern Central Brittany corresponds to the MNSZ
(Fig. 7.2b). There, the restoration induces an important triangular gap between Central Brittany and
the Châteaulin basin (Fig. 7.2c). The change from restored to deformed states can be interpreted in
terms of relative scissor-type clockwise rotation of the Montagnes Noires zone during Carboniferous
times (Fig. 7.4). From this, we infer substantial northward thrusting components along the MNSZ.
According to the change in attitude of this boundary with respect to the infinitesimal principal
shortening during progressive simple shear, the MNSZ should have first been marked by sinistral
wrenching, then thrusting, combined with dextral strike-slip in the latest evolution stages (Fig. 7.4).
Because of the occurrence of the pin point at the northeastern tip of the MNSZ, strike-slip components
should have remained limited.
In its restored state, the MNSZ strikes NNE-SSW, at low angle to the main Cadomian shear
zones observed in the adjacent North Armorican Domain, East of the St Brieuc Bay (Fig. 7.1c). There,
major Cadomian fault zones join the pin point and the MNSZ in the Montcontour area (Fig. 7.1c).
The restoration model thus suggests that the MNSZ is an inherited Cadomian basement
discontinuity above which scissor-type thrust zones developed during its Hercynian reactivation and
clockwise rotation.
Fig. 7.4. Sketch showing structural changes during simple shear restoration at the western boundary of eastern
Central Brittany.
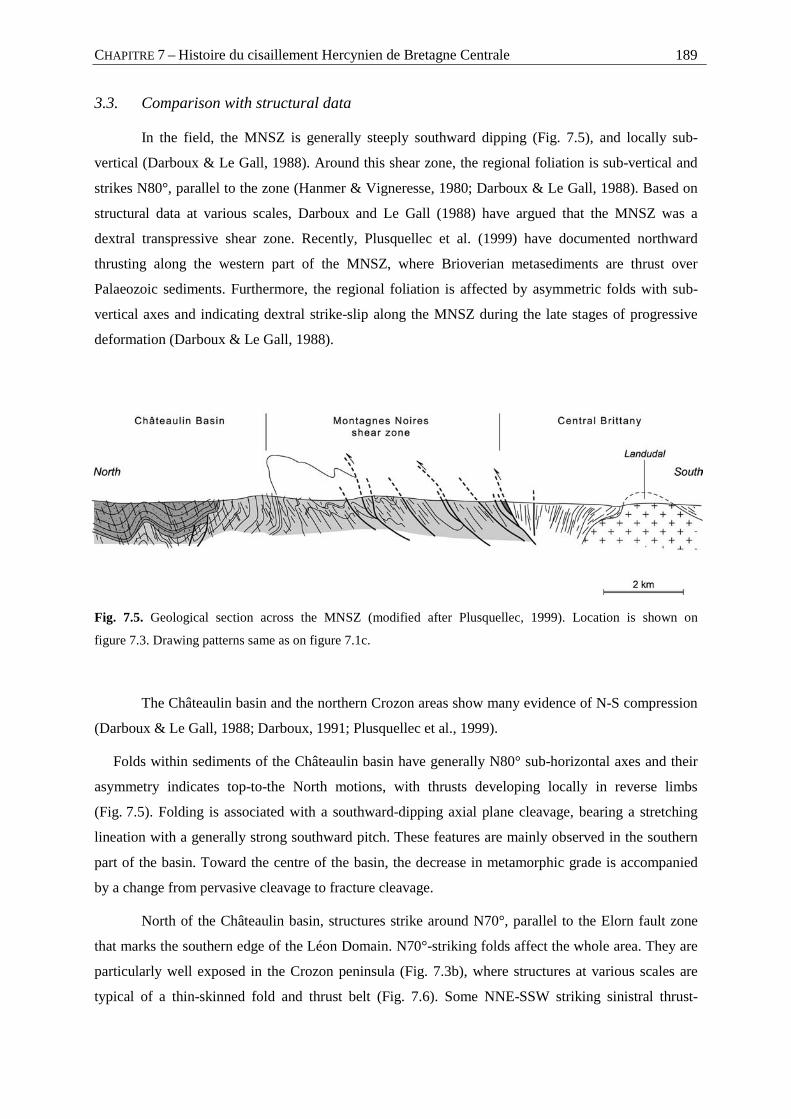
CHAPITRE 7 – Histoire du cisaillement Hercynien de Bretagne Centrale 189
3.3. Comparison with structural data
In the field, the MNSZ is generally steeply southward dipping (Fig. 7.5), and locally sub-
vertical (Darboux & Le Gall, 1988). Around this shear zone, the regional foliation is sub-vertical and
strikes N80°, parallel to the zone (Hanmer & Vigneresse, 1980; Darboux & Le Gall, 1988). Based on
structural data at various scales, Darboux and Le Gall (1988) have argued that the MNSZ was a
dextral transpressive shear zone. Recently, Plusquellec et al. (1999) have documented northward
thrusting along the western part of the MNSZ, where Brioverian metasediments are thrust over
Palaeozoic sediments. Furthermore, the regional foliation is affected by asymmetric folds with sub-
vertical axes and indicating dextral strike-slip along the MNSZ during the late stages of progressive
deformation (Darboux & Le Gall, 1988).
Fig. 7.5. Geological section across the MNSZ (modified after Plusquellec, 1999). Location is shown on
figure 7.3. Drawing patterns same as on figure 7.1c.
The Châteaulin basin and the northern Crozon areas show many evidence of N-S compression
(Darboux & Le Gall, 1988; Darboux, 1991; Plusquellec et al., 1999).
Folds within sediments of the Châteaulin basin have generally N80° sub-horizontal axes and their
asymmetry indicates top-to-the North motions, with thrusts developing locally in reverse limbs
(Fig. 7.5). Folding is associated with a southward-dipping axial plane cleavage, bearing a stretching
lineation with a generally strong southward pitch. These features are mainly observed in the southern
part of the basin. Toward the centre of the basin, the decrease in metamorphic grade is accompanied
by a change from pervasive cleavage to fracture cleavage.
North of the Châteaulin basin, structures strike around N70°, parallel to the Elorn fault zone
that marks the southern edge of the Léon Domain. N70°-striking folds affect the whole area. They are
particularly well exposed in the Crozon peninsula (Fig. 7.3b), where structures at various scales are
typical of a thin-skinned fold and thrust belt (Fig. 7.6). Some NNE-SSW striking sinistral thrust-
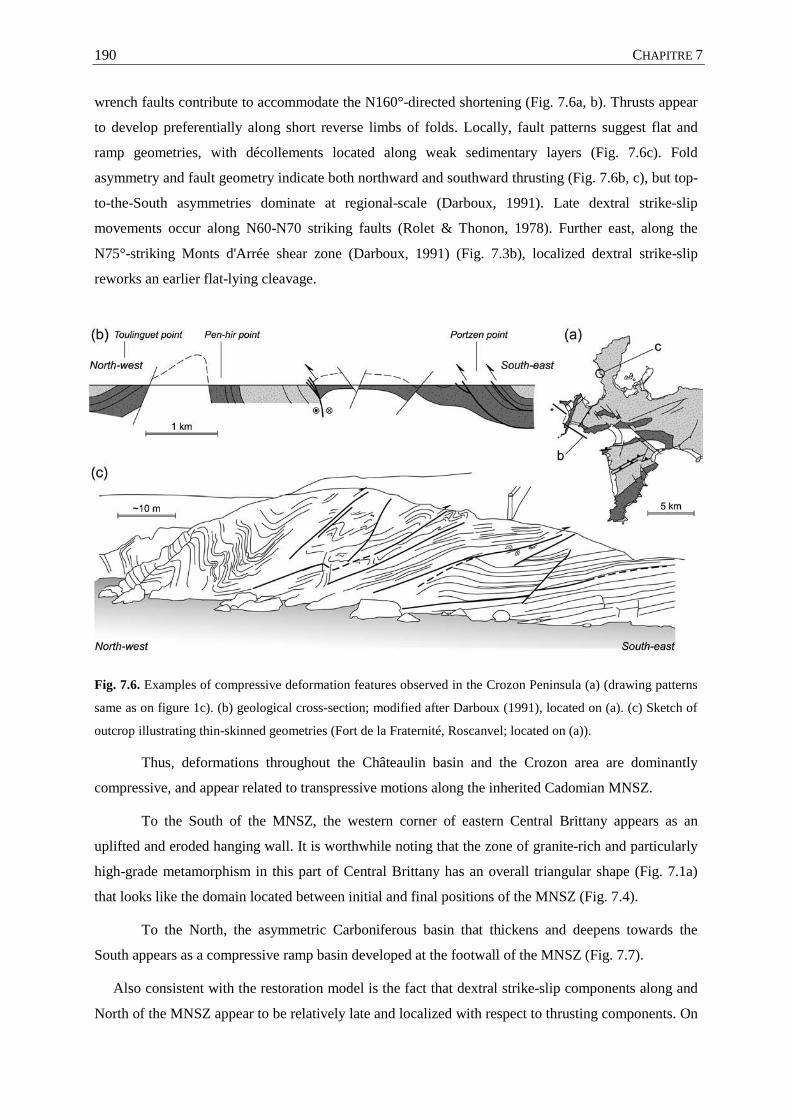
CHAPITRE 7 190
wrench faults contribute to accommodate the N160°-directed shortening (Fig. 7.6a, b). Thrusts appear
to develop preferentially along short reverse limbs of folds. Locally, fault patterns suggest flat and
ramp geometries, with décollements located along weak sedimentary layers (Fig. 7.6c). Fold
asymmetry and fault geometry indicate both northward and southward thrusting (Fig. 7.6b, c), but top-
to-the-South asymmetries dominate at regional-scale (Darboux, 1991). Late dextral strike-slip
movements occur along N60-N70 striking faults (Rolet & Thonon, 1978). Further east, along the
N75°-striking Monts d'Arrée shear zone (Darboux, 1991) (Fig. 7.3b), localized dextral strike-slip
reworks an earlier flat-lying cleavage.
Fig. 7.6. Examples of compressive deformation features observed in the Crozon Peninsula (a) (drawing patterns
same as on figure 1c). (b) geological cross-section; modified after Darboux (1991), located on (a). (c) Sketch of
outcrop illustrating thin-skinned geometries (Fort de la Fraternité, Roscanvel; located on (a)).
Thus, deformations throughout the Châteaulin basin and the Crozon area are dominantly
compressive, and appear related to transpressive motions along the inherited Cadomian MNSZ.
To the South of the MNSZ, the western corner of eastern Central Brittany appears as an
uplifted and eroded hanging wall. It is worthwhile noting that the zone of granite-rich and particularly
high-grade metamorphism in this part of Central Brittany has an overall triangular shape (Fig. 7.1a)
that looks like the domain located between initial and final positions of the MNSZ (Fig. 7.4).
To the North, the asymmetric Carboniferous basin that thickens and deepens towards the
South appears as a compressive ramp basin developed at the footwall of the MNSZ (Fig. 7.7).
Also consistent with the restoration model is the fact that dextral strike-slip components along and
North of the MNSZ appear to be relatively late and localized with respect to thrusting components. On
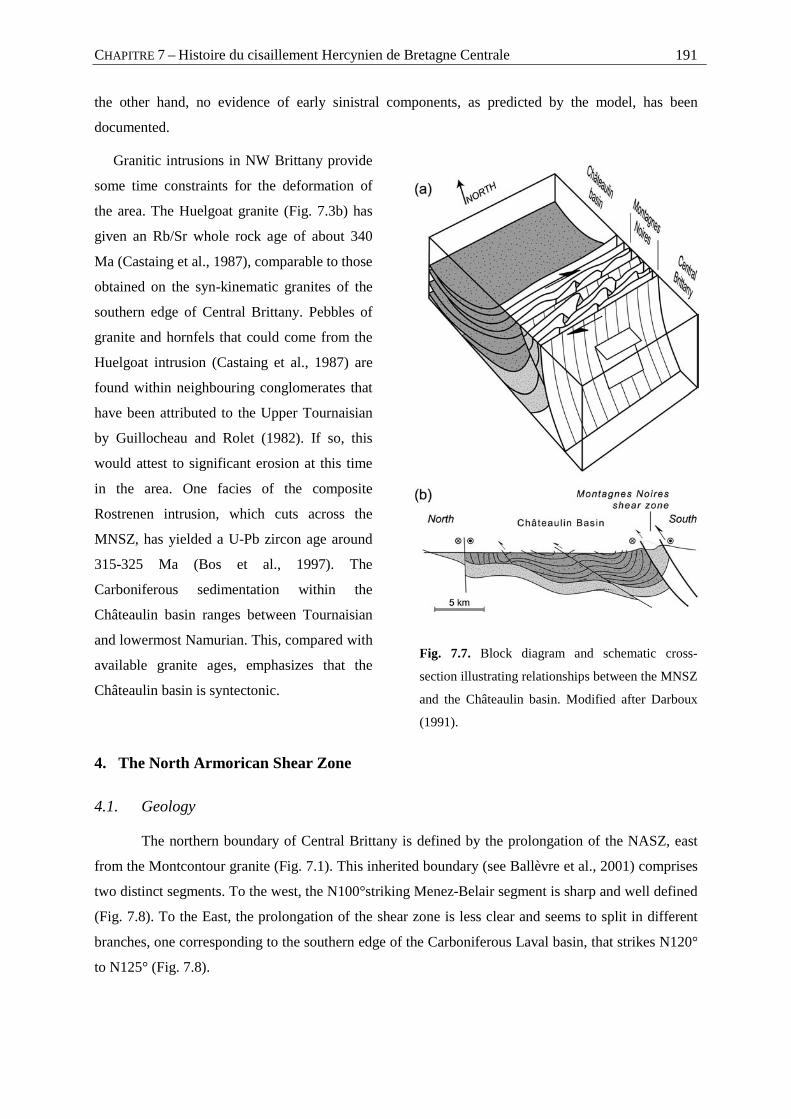
CHAPITRE 7 – Histoire du cisaillement Hercynien de Bretagne Centrale 191
the other hand, no evidence of early sinistral components, as predicted by the model, has been
documented.
Granitic intrusions in NW Brittany provide
some time constraints for the deformation of
the area. The Huelgoat granite (Fig. 7.3b) has
given an Rb/Sr whole rock age of about 340
Ma (Castaing et al., 1987), comparable to those
obtained on the syn-kinematic granites of the
southern edge of Central Brittany. Pebbles of
granite and hornfels that could come from the
Huelgoat intrusion (Castaing et al., 1987) are
found within neighbouring conglomerates that
have been attributed to the Upper Tournaisian
by Guillocheau and Rolet (1982). If so, this
would attest to significant erosion at this time
in the area. One facies of the composite
Rostrenen intrusion, which cuts across the
MNSZ, has yielded a U-Pb zircon age around
315-325 Ma (Bos et al., 1997). The
Carboniferous sedimentation within the
Châteaulin basin ranges between Tournaisian
and lowermost Namurian. This, compared with
available granite ages, emphasizes that the
Châteaulin basin is syntectonic.
Fig. 7.7. Block diagram and schematic cross-
section illustrating relationships between the MNSZ
and the Châteaulin basin. Modified after Darboux
(1991).
4. The North Armorican Shear Zone
4.1. Geology
The northern boundary of Central Brittany is defined by the prolongation of the NASZ, east
from the Montcontour granite (Fig. 7.1). This inherited boundary (see Ballèvre et al., 2001) comprises
two distinct segments. To the west, the N100°striking Menez-Belair segment is sharp and well defined
(Fig. 7.8). To the East, the prolongation of the shear zone is less clear and seems to split in different
branches, one corresponding to the southern edge of the Carboniferous Laval basin, that strikes N120°
to N125° (Fig. 7.8).
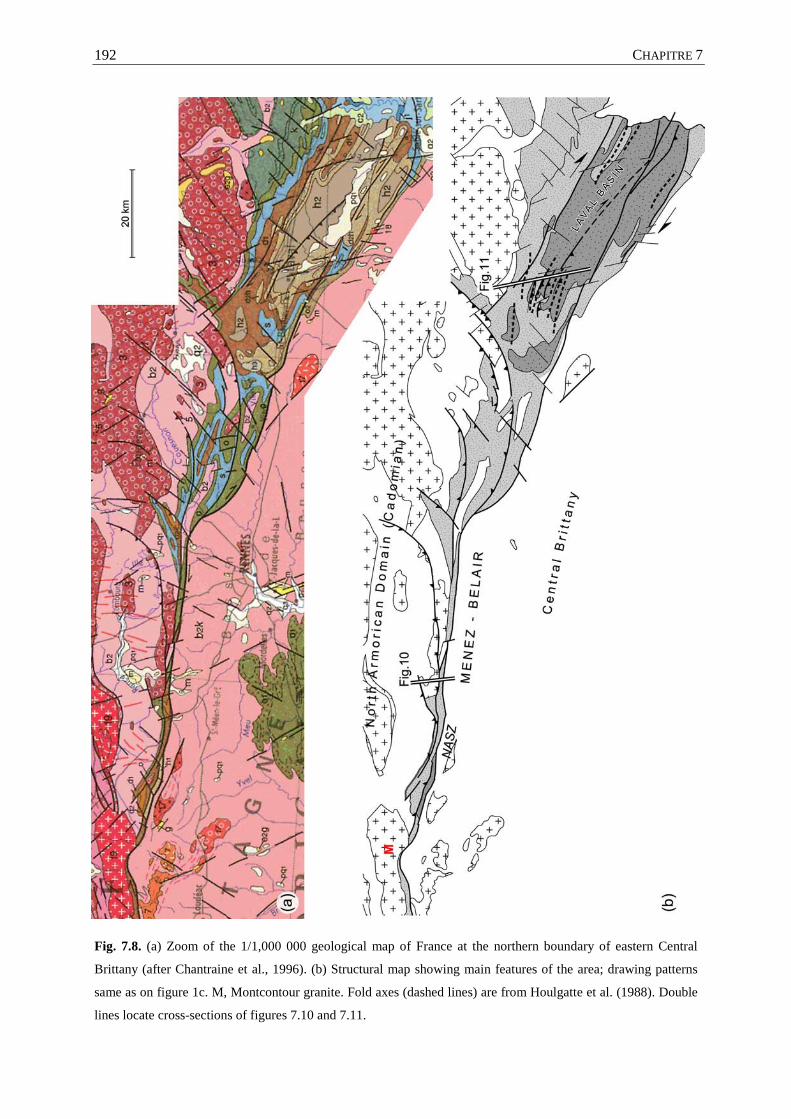
CHAPITRE 7 192
Fig. 7.8. (a) Zoom of the 1/1,000 000 geological map of France at the northern boundary of eastern Central
Brittany (after Chantraine et al., 1996). (b) Structural map showing main features of the area; drawing patterns
same as on figure 1c. M, Montcontour granite. Fold axes (dashed lines) are from Houlgatte et al. (1988). Double
lines locate cross-sections of figures 7.10 and 7.11.
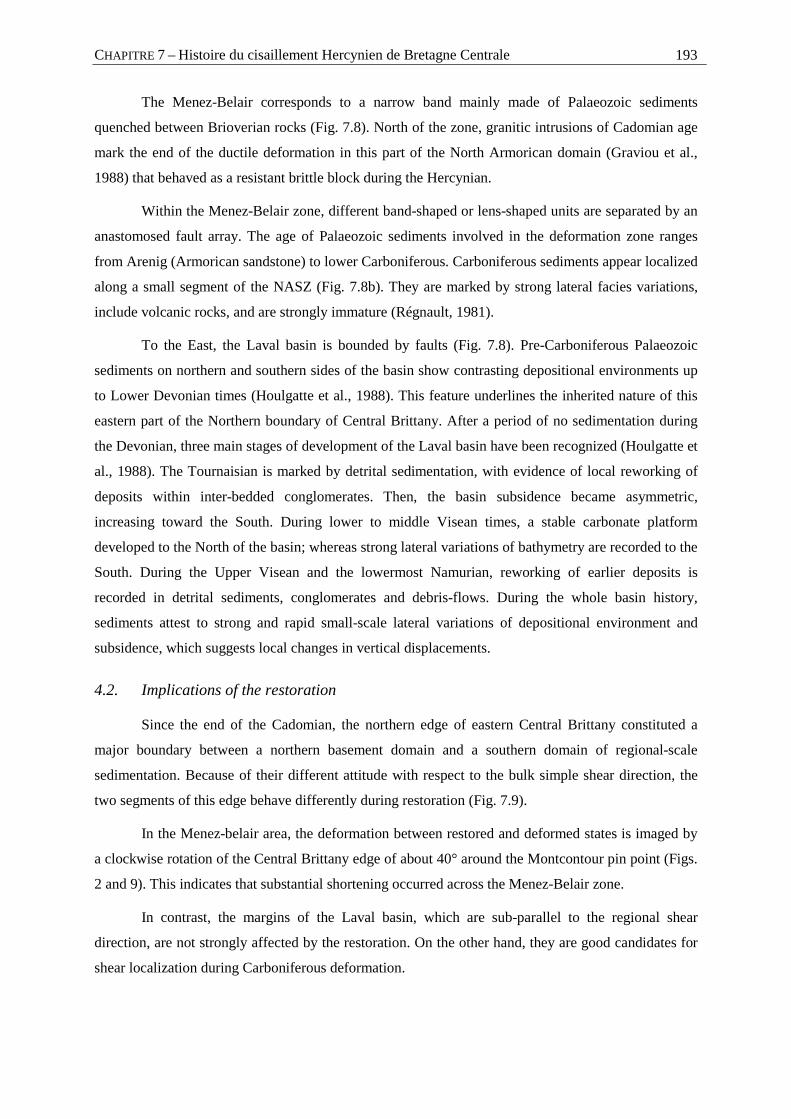
CHAPITRE 7 – Histoire du cisaillement Hercynien de Bretagne Centrale 193
The Menez-Belair corresponds to a narrow band mainly made of Palaeozoic sediments
quenched between Brioverian rocks (Fig. 7.8). North of the zone, granitic intrusions of Cadomian age
mark the end of the ductile deformation in this part of the North Armorican domain (Graviou et al.,
1988) that behaved as a resistant brittle block during the Hercynian.
Within the Menez-Belair zone, different band-shaped or lens-shaped units are separated by an
anastomosed fault array. The age of Palaeozoic sediments involved in the deformation zone ranges
from Arenig (Armorican sandstone) to lower Carboniferous. Carboniferous sediments appear localized
along a small segment of the NASZ (Fig. 7.8b). They are marked by strong lateral facies variations,
include volcanic rocks, and are strongly immature (Régnault, 1981).
To the East, the Laval basin is bounded by faults (Fig. 7.8). Pre-Carboniferous Palaeozoic
sediments on northern and southern sides of the basin show contrasting depositional environments up
to Lower Devonian times (Houlgatte et al., 1988). This feature underlines the inherited nature of this
eastern part of the Northern boundary of Central Brittany. After a period of no sedimentation during
the Devonian, three main stages of development of the Laval basin have been recognized (Houlgatte et
al., 1988). The Tournaisian is marked by detrital sedimentation, with evidence of local reworking of
deposits within inter-bedded conglomerates. Then, the basin subsidence became asymmetric,
increasing toward the South. During lower to middle Visean times, a stable carbonate platform
developed to the North of the basin; whereas strong lateral variations of bathymetry are recorded to the
South. During the Upper Visean and the lowermost Namurian, reworking of earlier deposits is
recorded in detrital sediments, conglomerates and debris-flows. During the whole basin history,
sediments attest to strong and rapid small-scale lateral variations of depositional environment and
subsidence, which suggests local changes in vertical displacements.
4.2. Implications of the restoration
Since the end of the Cadomian, the northern edge of eastern Central Brittany constituted a
major boundary between a northern basement domain and a southern domain of regional-scale
sedimentation. Because of their different attitude with respect to the bulk simple shear direction, the
two segments of this edge behave differently during restoration (Fig. 7.9).
In the Menez-belair area, the deformation between restored and deformed states is imaged by
a clockwise rotation of the Central Brittany edge of about 40° around the Montcontour pin point (Figs.
2 and 9). This indicates that substantial shortening occurred across the Menez-Belair zone.
In contrast, the margins of the Laval basin, which are sub-parallel to the regional shear
direction, are not strongly affected by the restoration. On the other hand, they are good candidates for
shear localization during Carboniferous deformation.
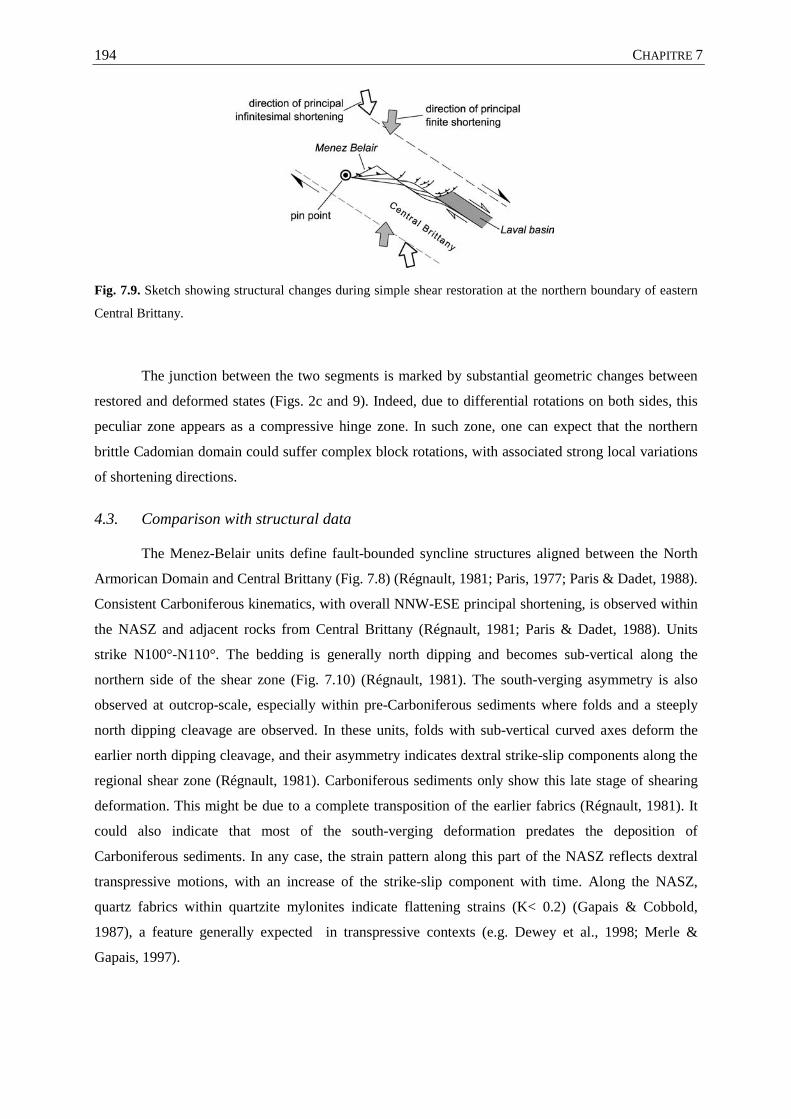
CHAPITRE 7 194
Fig. 7.9. Sketch showing structural changes during simple shear restoration at the northern boundary of eastern
Central Brittany.
The junction between the two segments is marked by substantial geometric changes between
restored and deformed states (Figs. 2c and 9). Indeed, due to differential rotations on both sides, this
peculiar zone appears as a compressive hinge zone. In such zone, one can expect that the northern
brittle Cadomian domain could suffer complex block rotations, with associated strong local variations
of shortening directions.
4.3. Comparison with structural data
The Menez-Belair units define fault-bounded syncline structures aligned between the North
Armorican Domain and Central Brittany (Fig. 7.8) (Régnault, 1981; Paris, 1977; Paris & Dadet, 1988).
Consistent Carboniferous kinematics, with overall NNW-ESE principal shortening, is observed within
the NASZ and adjacent rocks from Central Brittany (Régnault, 1981; Paris & Dadet, 1988). Units
strike N100°-N110°. The bedding is generally north dipping and becomes sub-vertical along the
northern side of the shear zone (Fig. 7.10) (Régnault, 1981). The south-verging asymmetry is also
observed at outcrop-scale, especially within pre-Carboniferous sediments where folds and a steeply
north dipping cleavage are observed. In these units, folds with sub-vertical curved axes deform the
earlier north dipping cleavage, and their asymmetry indicates dextral strike-slip components along the
regional shear zone (Régnault, 1981). Carboniferous sediments only show this late stage of shearing
deformation. This might be due to a complete transposition of the earlier fabrics (Régnault, 1981). It
could also indicate that most of the south-verging deformation predates the deposition of
Carboniferous sediments. In any case, the strain pattern along this part of the NASZ reflects dextral
transpressive motions, with an increase of the strike-slip component with time. Along the NASZ,
quartz fabrics within quartzite mylonites indicate flattening strains (K< 0.2) (Gapais & Cobbold,
1987), a feature generally expected in transpressive contexts (e.g. Dewey et al., 1998; Merle &
Gapais, 1997).
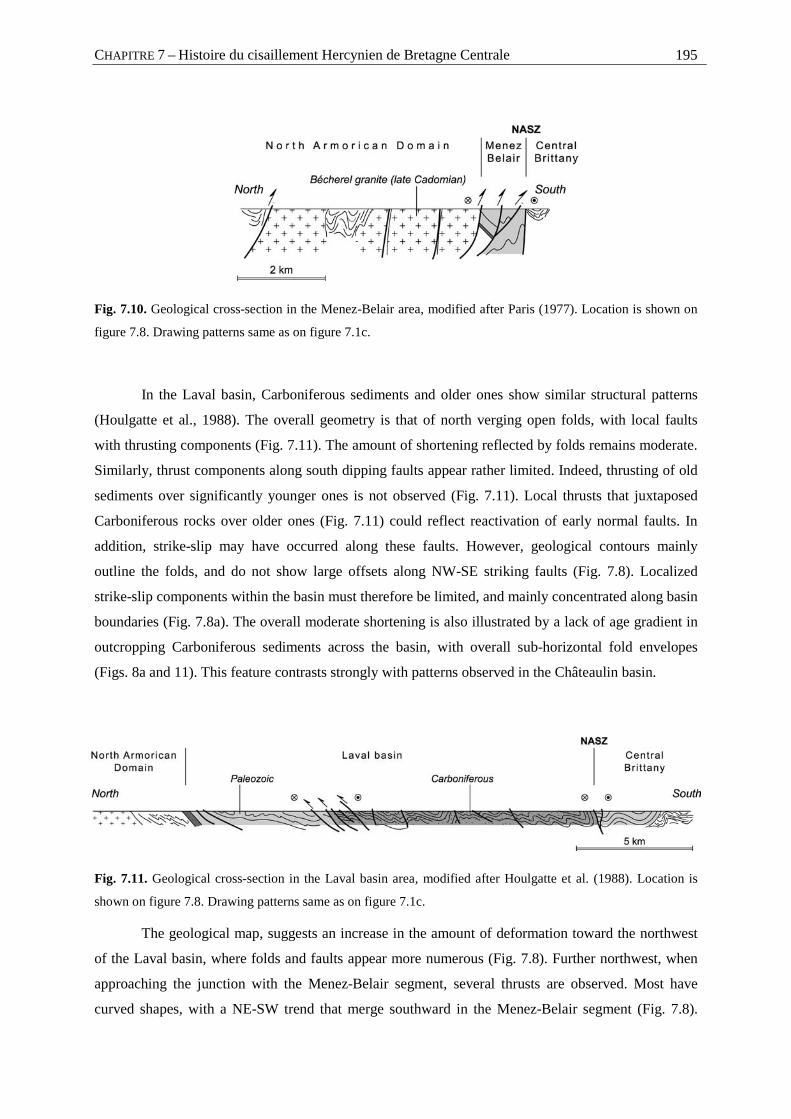
CHAPITRE 7 – Histoire du cisaillement Hercynien de Bretagne Centrale 195
Fig. 7.10. Geological cross-section in the Menez-Belair area, modified after Paris (1977). Location is shown on
figure 7.8. Drawing patterns same as on figure 7.1c.
In the Laval basin, Carboniferous sediments and older ones show similar structural patterns
(Houlgatte et al., 1988). The overall geometry is that of north verging open folds, with local faults
with thrusting components (Fig. 7.11). The amount of shortening reflected by folds remains moderate.
Similarly, thrust components along south dipping faults appear rather limited. Indeed, thrusting of old
sediments over significantly younger ones is not observed (Fig. 7.11). Local thrusts that juxtaposed
Carboniferous rocks over older ones (Fig. 7.11) could reflect reactivation of early normal faults. In
addition, strike-slip may have occurred along these faults. However, geological contours mainly
outline the folds, and do not show large offsets along NW-SE striking faults (Fig. 7.8). Localized
strike-slip components within the basin must therefore be limited, and mainly concentrated along basin
boundaries (Fig. 7.8a). The overall moderate shortening is also illustrated by a lack of age gradient in
outcropping Carboniferous sediments across the basin, with overall sub-horizontal fold envelopes
(Figs. 8a and 11). This feature contrasts strongly with patterns observed in the Châteaulin basin.
Fig. 7.11. Geological cross-section in the Laval basin area, modified after Houlgatte et al. (1988). Location is
shown on figure 7.8. Drawing patterns same as on figure 7.1c.
The geological map, suggests an increase in the amount of deformation toward the northwest
of the Laval basin, where folds and faults appear more numerous (Fig. 7.8). Further northwest, when
approaching the junction with the Menez-Belair segment, several thrusts are observed. Most have
curved shapes, with a NE-SW trend that merge southward in the Menez-Belair segment (Fig. 7.8).
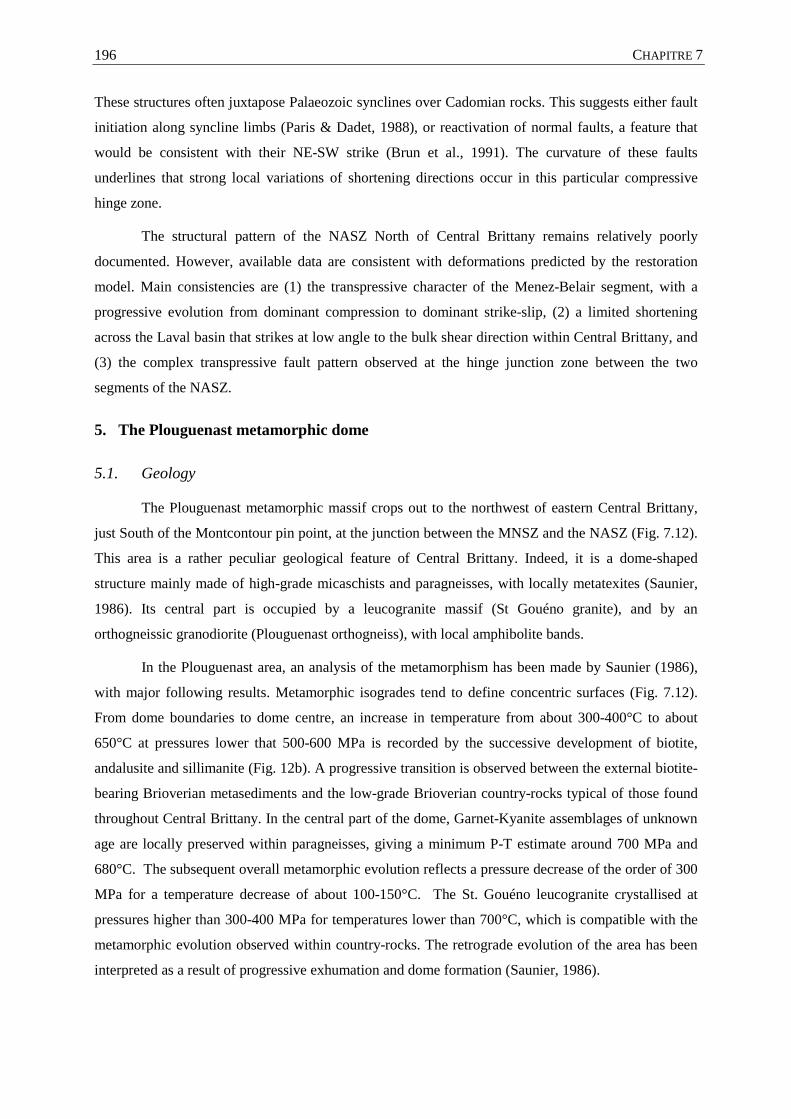
CHAPITRE 7 196
These structures often juxtapose Palaeozoic synclines over Cadomian rocks. This suggests either fault
initiation along syncline limbs (Paris & Dadet, 1988), or reactivation of normal faults, a feature that
would be consistent with their NE-SW strike (Brun et al., 1991). The curvature of these faults
underlines that strong local variations of shortening directions occur in this particular compressive
hinge zone.
The structural pattern of the NASZ North of Central Brittany remains relatively poorly
documented. However, available data are consistent with deformations predicted by the restoration
model. Main consistencies are (1) the transpressive character of the Menez-Belair segment, with a
progressive evolution from dominant compression to dominant strike-slip, (2) a limited shortening
across the Laval basin that strikes at low angle to the bulk shear direction within Central Brittany, and
(3) the complex transpressive fault pattern observed at the hinge junction zone between the two
segments of the NASZ.
5. The Plouguenast metamorphic dome
5.1. Geology
The Plouguenast metamorphic massif crops out to the northwest of eastern Central Brittany,
just South of the Montcontour pin point, at the junction between the MNSZ and the NASZ (Fig. 7.12).
This area is a rather peculiar geological feature of Central Brittany. Indeed, it is a dome-shaped
structure mainly made of high-grade micaschists and paragneisses, with locally metatexites (Saunier,
1986). Its central part is occupied by a leucogranite massif (St Gouéno granite), and by an
orthogneissic granodiorite (Plouguenast orthogneiss), with local amphibolite bands.
In the Plouguenast area, an analysis of the metamorphism has been made by Saunier (1986),
with major following results. Metamorphic isogrades tend to define concentric surfaces (Fig. 7.12).
From dome boundaries to dome centre, an increase in temperature from about 300-400°C to about
650°C at pressures lower that 500-600 MPa is recorded by the successive development of biotite,
andalusite and sillimanite (Fig. 12b). A progressive transition is observed between the external biotite-
bearing Brioverian metasediments and the low-grade Brioverian country-rocks typical of those found
throughout Central Brittany. In the central part of the dome, Garnet-Kyanite assemblages of unknown
age are locally preserved within paragneisses, giving a minimum P-T estimate around 700 MPa and
680°C. The subsequent overall metamorphic evolution reflects a pressure decrease of the order of 300
MPa for a temperature decrease of about 100-150°C. The St. Gouéno leucogranite crystallised at
pressures higher than 300-400 MPa for temperatures lower than 700°C, which is compatible with the
metamorphic evolution observed within country-rocks. The retrograde evolution of the area has been
interpreted as a result of progressive exhumation and dome formation (Saunier, 1986).
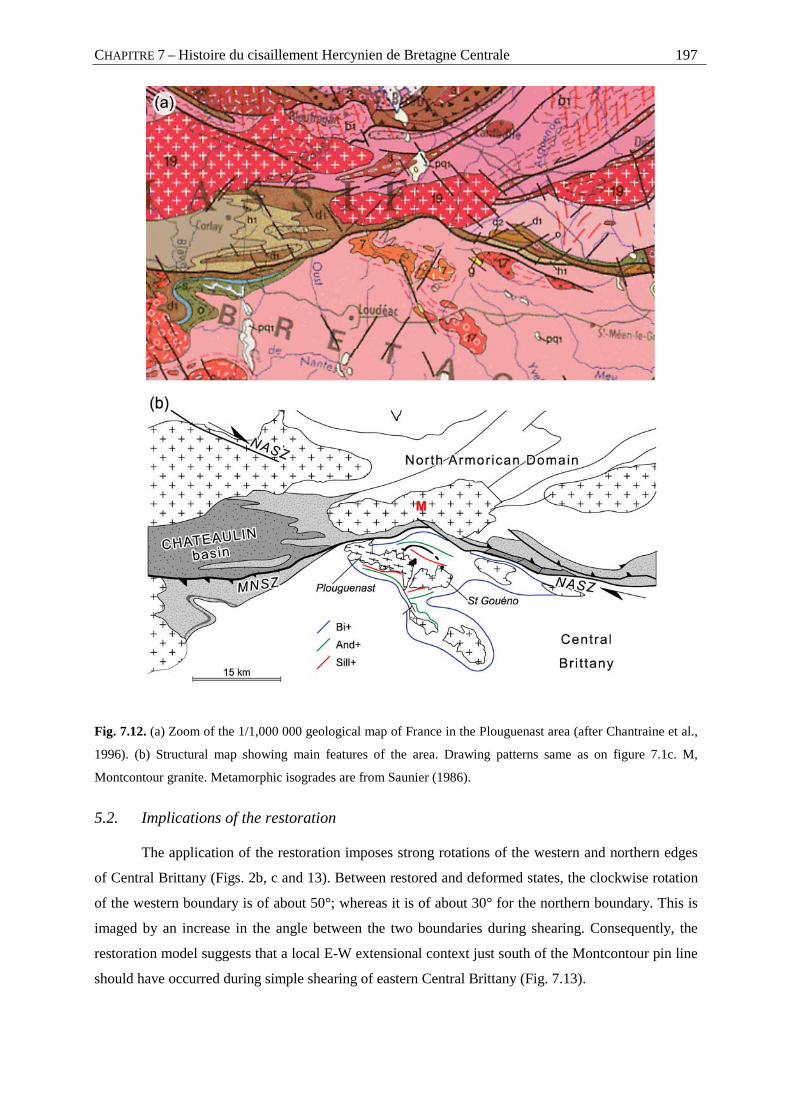
CHAPITRE 7 – Histoire du cisaillement Hercynien de Bretagne Centrale 197
Fig. 7.12. (a) Zoom of the 1/1,000 000 geological map of France in the Plouguenast area (after Chantraine et al.,
1996). (b) Structural map showing main features of the area. Drawing patterns same as on figure 7.1c. M,
Montcontour granite. Metamorphic isogrades are from Saunier (1986).
5.2. Implications of the restoration
The application of the restoration imposes strong rotations of the western and northern edges
of Central Brittany (Figs. 2b, c and 13). Between restored and deformed states, the clockwise rotation
of the western boundary is of about 50°; whereas it is of about 30° for the northern boundary. This is
imaged by an increase in the angle between the two boundaries during shearing. Consequently, the
restoration model suggests that a local E-W extensional context just south of the Montcontour pin line
should have occurred during simple shearing of eastern Central Brittany (Fig. 7.13).
CHAPITRE 7 198
Fig. 7.13. Sketch showing structural changes during simple shear restoration in the Plouguenast area.
5.3. Comparison with structural data
The Plouguenast dome is elongate in a NW-SE direction (Fig. 7.12). According to Saunier
(1986), associated foliations strike E-W to NW-SE, with decreasing dips toward dome centre, and
stretching lineations are about E-W, with variable moderate plunges. Associated dextral shear criteria
(shear bands and asymmetric quartz fabrics) are observed within the orthogneiss (Saunier, 1986). The
fabric intensity increases with increasing metamorphism toward dome centre. Consistently,
microstructures indicate that both events are coeval. In the surrounding Brioverian rocks, cleavage
attitudes suggest wrapping around the dome structure.
Thus, the overall structural pattern suggests that the metamorphic dome developed during
regional tectonics. On the other hand, a Rb/Sr whole rock age of 457±23 Ma has been reported by
Saunier (1986) for the St. Gouéno leucogranite, which does not clearly fit with field observations. In
order to better constrain the timing of metamorphism, new geochronological analyses using the
40Ar/39Ar method have been made on both the orthogneiss and the leucogranite. Results are
described in detail in Appendix 1. For the leucogranite, ages suggest an emplacement at depth during
the lower Carboniferous, followed by a possibly long thermal and (or) deformation and
recrystallisation history, youngest muscovite ages being around 322 Ma. Concerning the orthogneiss,
muscovites yielded an 40Ar/39Ar age of about 330 Ma, suggesting that its exhumation was coeval
with that of the leucogranite.
From the above data, we infer that the emplacement of the Plouguenast dome is Carboniferous
in age. If compared with the ages of syn-tectonic leucogranites of Central Brittany, which are around
335-345 Ma, it turns out that the dome developed during regional Carboniferous shearing. The
particular and local extensional context predicted by the restoration in the Plouguenast area, could
have favoured dome ascent and emplacement.
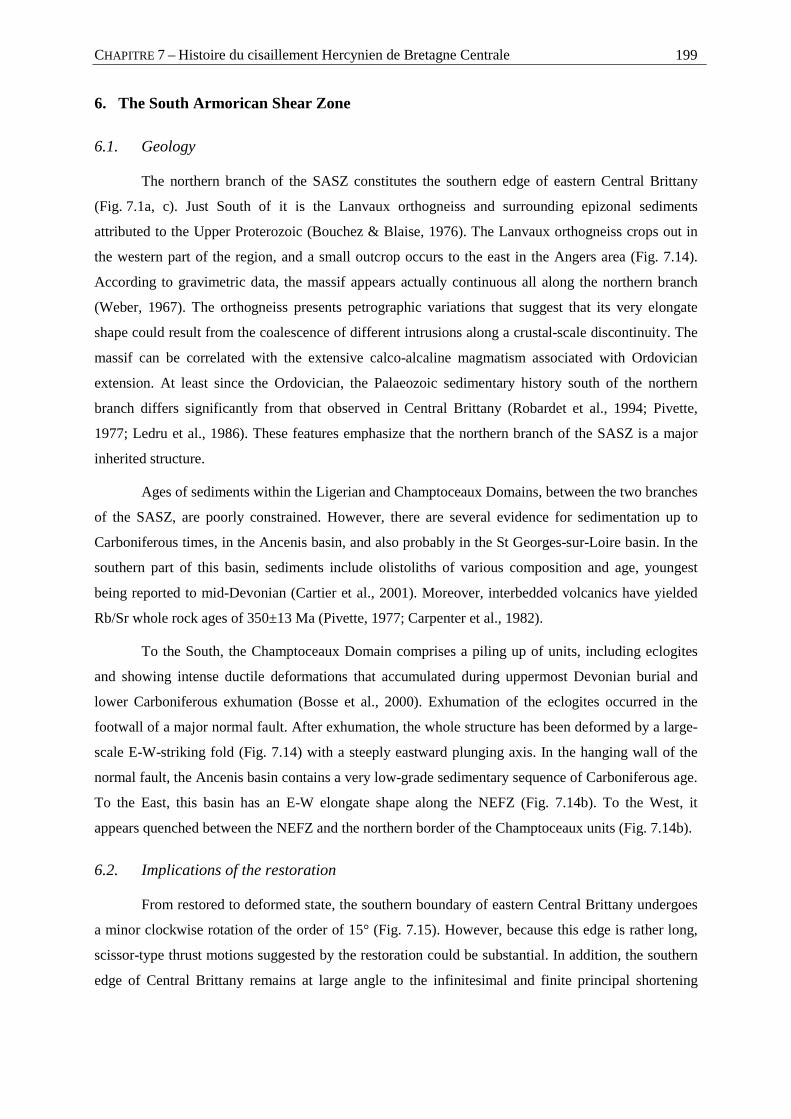
CHAPITRE 7 – Histoire du cisaillement Hercynien de Bretagne Centrale 199
6. The South Armorican Shear Zone
6.1. Geology
The northern branch of the SASZ constitutes the southern edge of eastern Central Brittany
(Fig. 7.1a, c). Just South of it is the Lanvaux orthogneiss and surrounding epizonal sediments
attributed to the Upper Proterozoic (Bouchez & Blaise, 1976). The Lanvaux orthogneiss crops out in
the western part of the region, and a small outcrop occurs to the east in the Angers area (Fig. 7.14).
According to gravimetric data, the massif appears actually continuous all along the northern branch
(Weber, 1967). The orthogneiss presents petrographic variations that suggest that its very elongate
shape could result from the coalescence of different intrusions along a crustal-scale discontinuity. The
massif can be correlated with the extensive calco-alcaline magmatism associated with Ordovician
extension. At least since the Ordovician, the Palaeozoic sedimentary history south of the northern
branch differs significantly from that observed in Central Brittany (Robardet et al., 1994; Pivette,
1977; Ledru et al., 1986). These features emphasize that the northern branch of the SASZ is a major
inherited structure.
Ages of sediments within the Ligerian and Champtoceaux Domains, between the two branches
of the SASZ, are poorly constrained. However, there are several evidence for sedimentation up to
Carboniferous times, in the Ancenis basin, and also probably in the St Georges-sur-Loire basin. In the
southern part of this basin, sediments include olistoliths of various composition and age, youngest
being reported to mid-Devonian (Cartier et al., 2001). Moreover, interbedded volcanics have yielded
Rb/Sr whole rock ages of 350±13 Ma (Pivette, 1977; Carpenter et al., 1982).
To the South, the Champtoceaux Domain comprises a piling up of units, including eclogites
and showing intense ductile deformations that accumulated during uppermost Devonian burial and
lower Carboniferous exhumation (Bosse et al., 2000). Exhumation of the eclogites occurred in the
footwall of a major normal fault. After exhumation, the whole structure has been deformed by a large-
scale E-W-striking fold (Fig. 7.14) with a steeply eastward plunging axis. In the hanging wall of the
normal fault, the Ancenis basin contains a very low-grade sedimentary sequence of Carboniferous age.
To the East, this basin has an E-W elongate shape along the NEFZ (Fig. 7.14b). To the West, it
appears quenched between the NEFZ and the northern border of the Champtoceaux units (Fig. 7.14b).
6.2. Implications of the restoration
From restored to deformed state, the southern boundary of eastern Central Brittany undergoes
a minor clockwise rotation of the order of 15° (Fig. 7.15). However, because this edge is rather long,
scissor-type thrust motions suggested by the restoration could be substantial. In addition, the southern
edge of Central Brittany remains at large angle to the infinitesimal and finite principal shortening
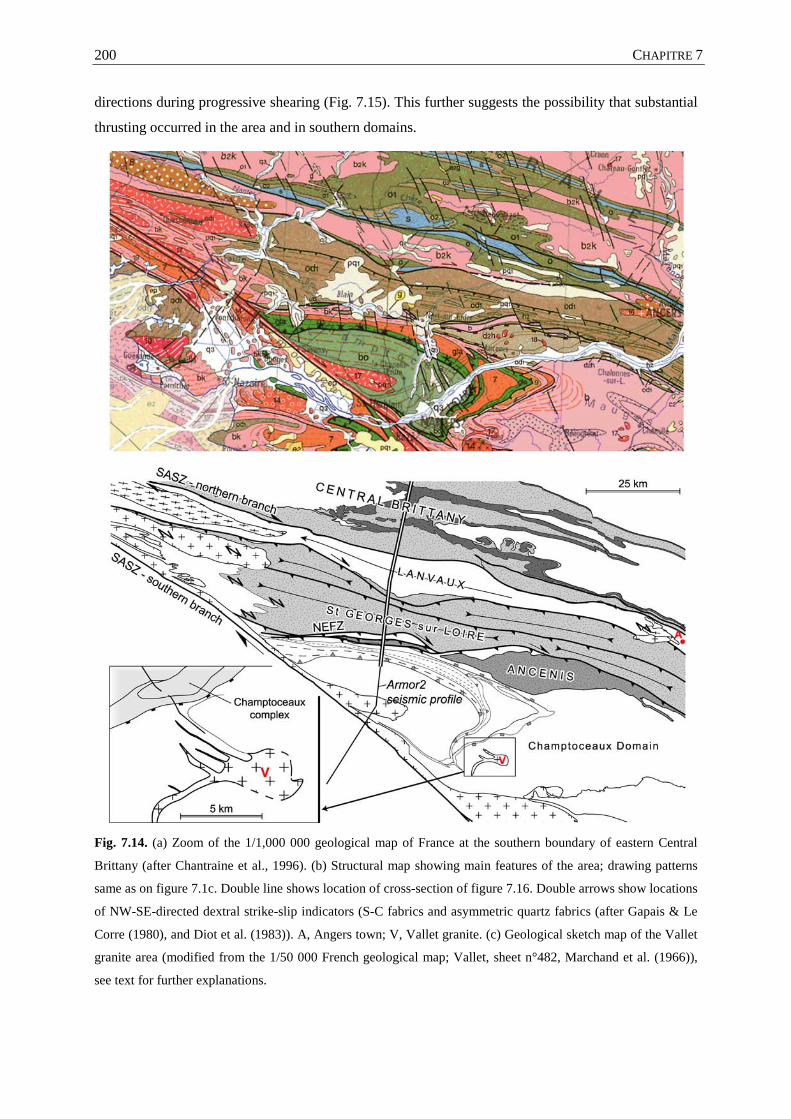
CHAPITRE 7 200
directions during progressive shearing (Fig. 7.15). This further suggests the possibility that substantial
thrusting occurred in the area and in southern domains.
Fig. 7.14. (a) Zoom of the 1/1,000 000 geological map of France at the southern boundary of eastern Central
Brittany (after Chantraine et al., 1996). (b) Structural map showing main features of the area; drawing patterns
same as on figure 7.1c. Double line shows location of cross-section of figure 7.16. Double arrows show locations
of NW-SE-directed dextral strike-slip indicators (S-C fabrics and asymmetric quartz fabrics (after Gapais & Le
Corre (1980), and Diot et al. (1983)). A, Angers town; V, Vallet granite. (c) Geological sketch map of the Vallet
granite area (modified from the 1/50 000 French geological map; Vallet, sheet n°482, Marchand et al. (1966)),
see text for further explanations.
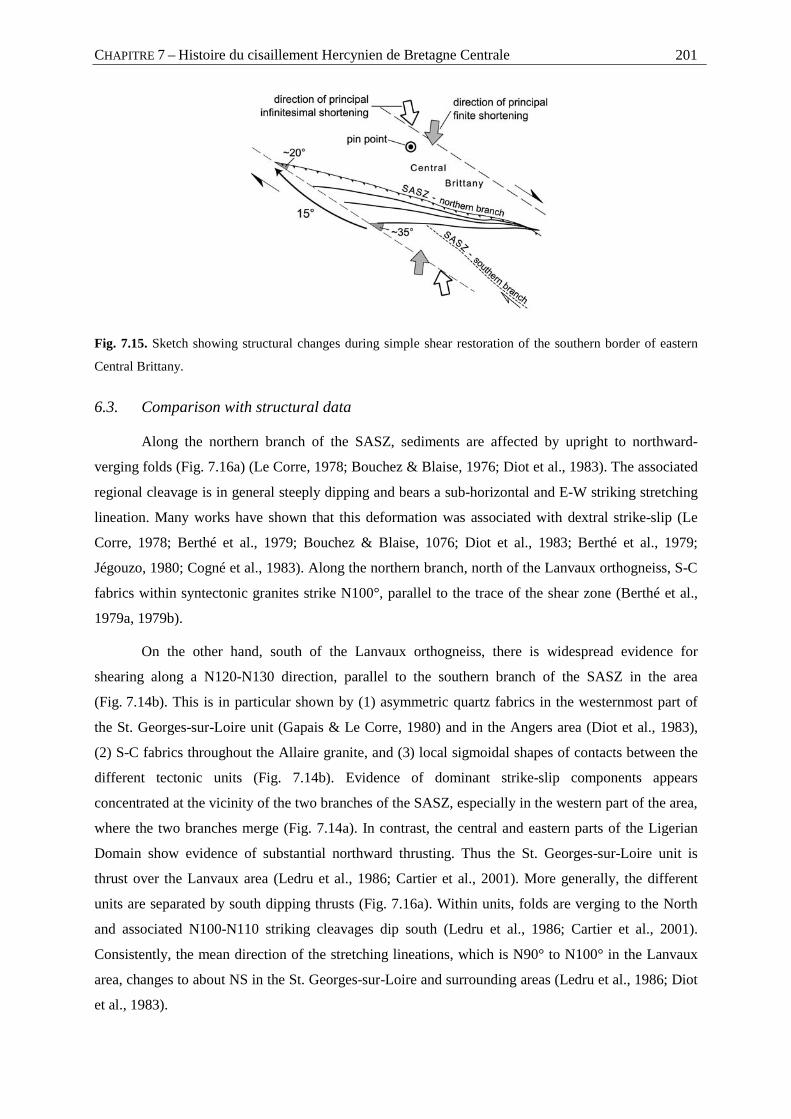
CHAPITRE 7 – Histoire du cisaillement Hercynien de Bretagne Centrale 201
Fig. 7.15. Sketch showing structural changes during simple shear restoration of the southern border of eastern
Central Brittany.
6.3. Comparison with structural data
Along the northern branch of the SASZ, sediments are affected by upright to northward-
verging folds (Fig. 7.16a) (Le Corre, 1978; Bouchez & Blaise, 1976; Diot et al., 1983). The associated
regional cleavage is in general steeply dipping and bears a sub-horizontal and E-W striking stretching
lineation. Many works have shown that this deformation was associated with dextral strike-slip (Le
Corre, 1978; Berthé et al., 1979; Bouchez & Blaise, 1076; Diot et al., 1983; Berthé et al., 1979;
Jégouzo, 1980; Cogné et al., 1983). Along the northern branch, north of the Lanvaux orthogneiss, S-C
fabrics within syntectonic granites strike N100°, parallel to the trace of the shear zone (Berthé et al.,
1979a, 1979b).
On the other hand, south of the Lanvaux orthogneiss, there is widespread evidence for
shearing along a N120-N130 direction, parallel to the southern branch of the SASZ in the area
(Fig. 7.14b). This is in particular shown by (1) asymmetric quartz fabrics in the westernmost part of
the St. Georges-sur-Loire unit (Gapais & Le Corre, 1980) and in the Angers area (Diot et al., 1983),
(2) S-C fabrics throughout the Allaire granite, and (3) local sigmoidal shapes of contacts between the
different tectonic units (Fig. 7.14b). Evidence of dominant strike-slip components appears
concentrated at the vicinity of the two branches of the SASZ, especially in the western part of the area,
where the two branches merge (Fig. 7.14a). In contrast, the central and eastern parts of the Ligerian
Domain show evidence of substantial northward thrusting. Thus the St. Georges-sur-Loire unit is
thrust over the Lanvaux area (Ledru et al., 1986; Cartier et al., 2001). More generally, the different
units are separated by south dipping thrusts (Fig. 7.16a). Within units, folds are verging to the North
and associated N100-N110 striking cleavages dip south (Ledru et al., 1986; Cartier et al., 2001).
Consistently, the mean direction of the stretching lineations, which is N90° to N100° in the Lanvaux
area, changes to about NS in the St. Georges-sur-Loire and surrounding areas (Ledru et al., 1986; Diot
et al., 1983).
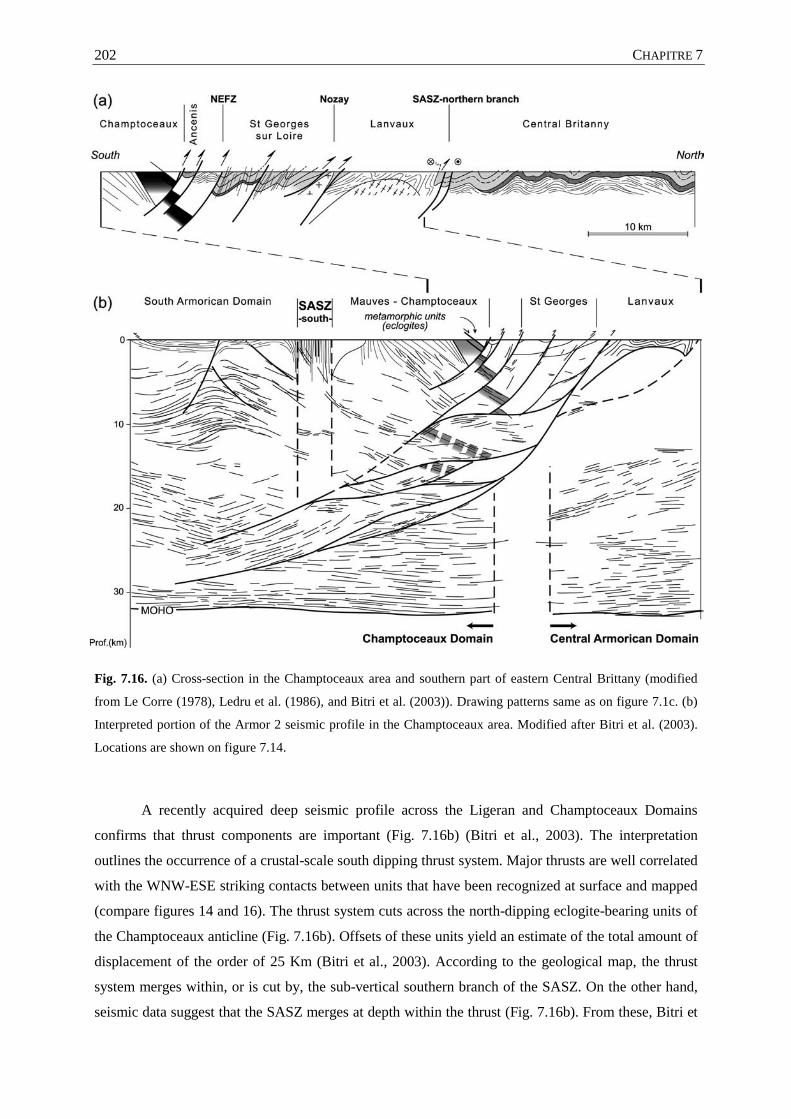
CHAPITRE 7 202
Fig. 7.16. (a) Cross-section in the Champtoceaux area and southern part of eastern Central Brittany (modified
from Le Corre (1978), Ledru et al. (1986), and Bitri et al. (2003)). Drawing patterns same as on figure 7.1c. (b)
Interpreted portion of the Armor 2 seismic profile in the Champtoceaux area. Modified after Bitri et al. (2003).
Locations are shown on figure 7.14.
A recently acquired deep seismic profile across the Ligeran and Champtoceaux Domains
confirms that thrust components are important (Fig. 7.16b) (Bitri et al., 2003). The interpretation
outlines the occurrence of a crustal-scale south dipping thrust system. Major thrusts are well correlated
with the WNW-ESE striking contacts between units that have been recognized at surface and mapped
(compare figures 14 and 16). The thrust system cuts across the north-dipping eclogite-bearing units of
the Champtoceaux anticline (Fig. 7.16b). Offsets of these units yield an estimate of the total amount of
displacement of the order of 25 Km (Bitri et al., 2003). According to the geological map, the thrust
system merges within, or is cut by, the sub-vertical southern branch of the SASZ. On the other hand,
seismic data suggest that the SASZ merges at depth within the thrust (Fig. 7.16b). From these, Bitri et
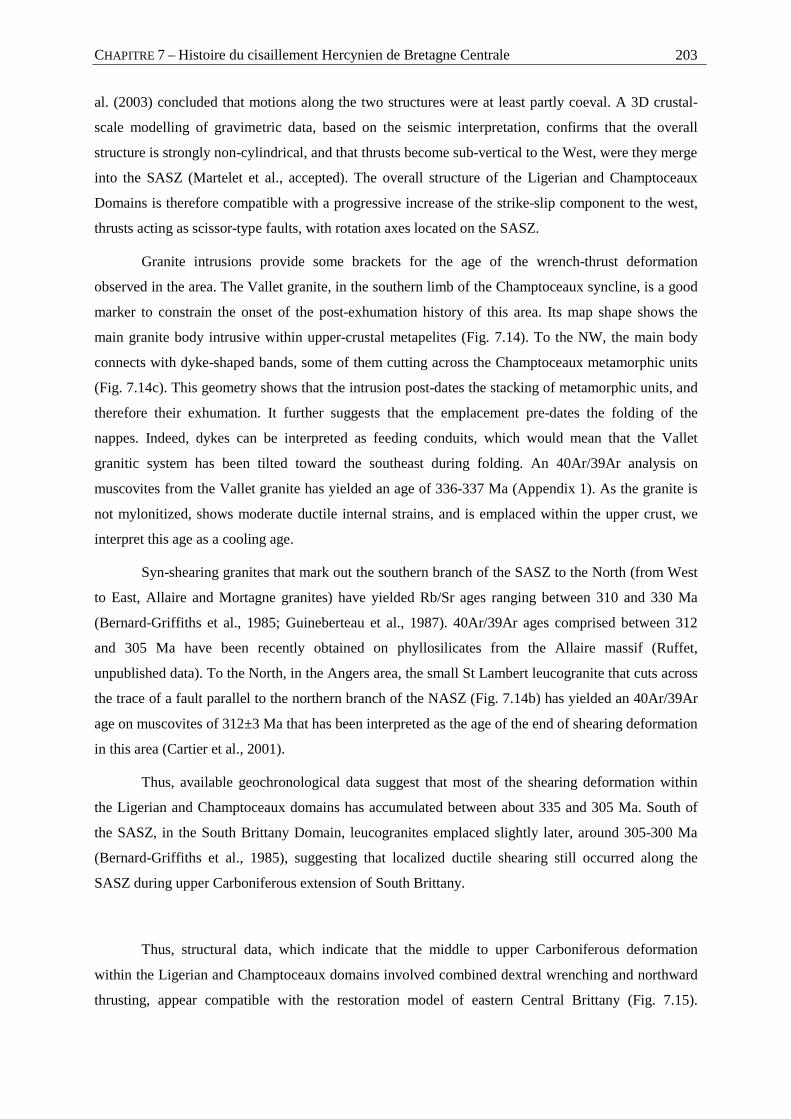
CHAPITRE 7 – Histoire du cisaillement Hercynien de Bretagne Centrale 203
al. (2003) concluded that motions along the two structures were at least partly coeval. A 3D crustal-
scale modelling of gravimetric data, based on the seismic interpretation, confirms that the overall
structure is strongly non-cylindrical, and that thrusts become sub-vertical to the West, were they merge
into the SASZ (Martelet et al., accepted). The overall structure of the Ligerian and Champtoceaux
Domains is therefore compatible with a progressive increase of the strike-slip component to the west,
thrusts acting as scissor-type faults, with rotation axes located on the SASZ.
Granite intrusions provide some brackets for the age of the wrench-thrust deformation
observed in the area. The Vallet granite, in the southern limb of the Champtoceaux syncline, is a good
marker to constrain the onset of the post-exhumation history of this area. Its map shape shows the
main granite body intrusive within upper-crustal metapelites (Fig. 7.14). To the NW, the main body
connects with dyke-shaped bands, some of them cutting across the Champtoceaux metamorphic units
(Fig. 7.14c). This geometry shows that the intrusion post-dates the stacking of metamorphic units, and
therefore their exhumation. It further suggests that the emplacement pre-dates the folding of the
nappes. Indeed, dykes can be interpreted as feeding conduits, which would mean that the Vallet
granitic system has been tilted toward the southeast during folding. An 40Ar/39Ar analysis on
muscovites from the Vallet granite has yielded an age of 336-337 Ma (Appendix 1). As the granite is
not mylonitized, shows moderate ductile internal strains, and is emplaced within the upper crust, we
interpret this age as a cooling age.
Syn-shearing granites that mark out the southern branch of the SASZ to the North (from West
to East, Allaire and Mortagne granites) have yielded Rb/Sr ages ranging between 310 and 330 Ma
(Bernard-Griffiths et al., 1985; Guineberteau et al., 1987). 40Ar/39Ar ages comprised between 312
and 305 Ma have been recently obtained on phyllosilicates from the Allaire massif (Ruffet,
unpublished data). To the North, in the Angers area, the small St Lambert leucogranite that cuts across
the trace of a fault parallel to the northern branch of the NASZ (Fig. 7.14b) has yielded an 40Ar/39Ar
age on muscovites of 312±3 Ma that has been interpreted as the age of the end of shearing deformation
in this area (Cartier et al., 2001).
Thus, available geochronological data suggest that most of the shearing deformation within
the Ligerian and Champtoceaux domains has accumulated between about 335 and 305 Ma. South of
the SASZ, in the South Brittany Domain, leucogranites emplaced slightly later, around 305-300 Ma
(Bernard-Griffiths et al., 1985), suggesting that localized ductile shearing still occurred along the
SASZ during upper Carboniferous extension of South Brittany.
Thus, structural data, which indicate that the middle to upper Carboniferous deformation
within the Ligerian and Champtoceaux domains involved combined dextral wrenching and northward
thrusting, appear compatible with the restoration model of eastern Central Brittany (Fig. 7.15).
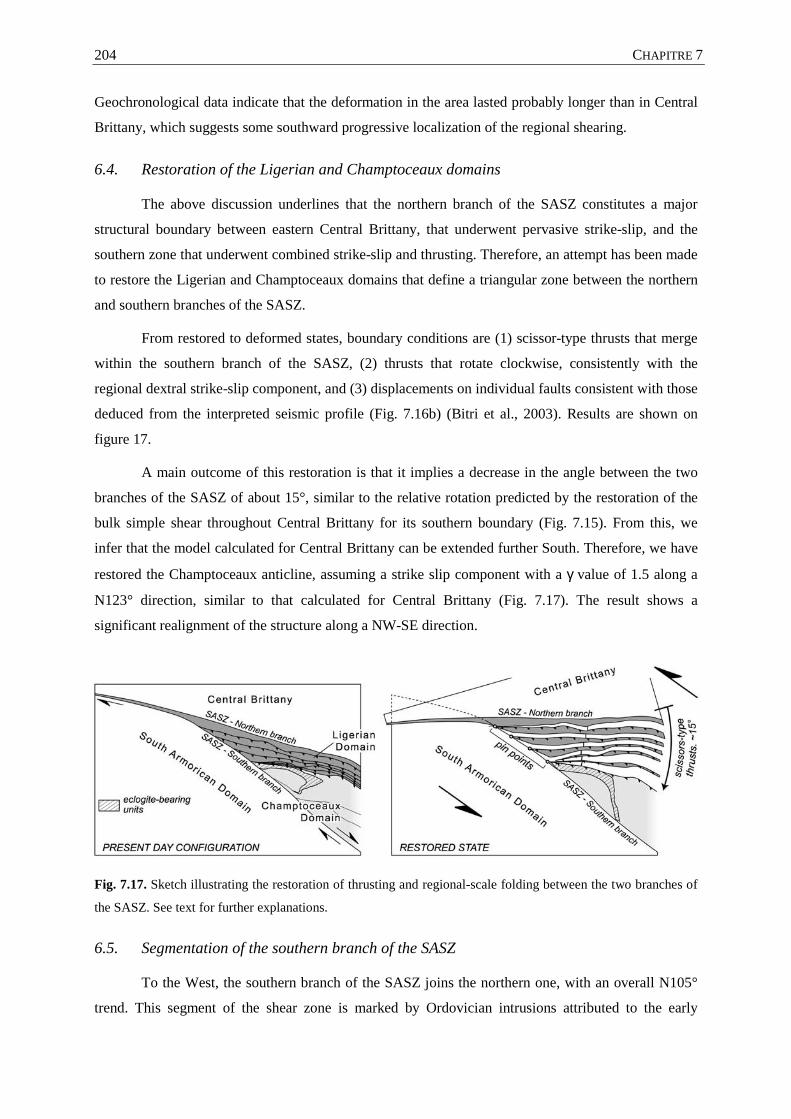
CHAPITRE 7 204
Geochronological data indicate that the deformation in the area lasted probably longer than in Central
Brittany, which suggests some southward progressive localization of the regional shearing.
6.4. Restoration of the Ligerian and Champtoceaux domains
The above discussion underlines that the northern branch of the SASZ constitutes a major
structural boundary between eastern Central Brittany, that underwent pervasive strike-slip, and the
southern zone that underwent combined strike-slip and thrusting. Therefore, an attempt has been made
to restore the Ligerian and Champtoceaux domains that define a triangular zone between the northern
and southern branches of the SASZ.
From restored to deformed states, boundary conditions are (1) scissor-type thrusts that merge
within the southern branch of the SASZ, (2) thrusts that rotate clockwise, consistently with the
regional dextral strike-slip component, and (3) displacements on individual faults consistent with those
deduced from the interpreted seismic profile (Fig. 7.16b) (Bitri et al., 2003). Results are shown on
figure 17.
A main outcome of this restoration is that it implies a decrease in the angle between the two
branches of the SASZ of about 15°, similar to the relative rotation predicted by the restoration of the
bulk simple shear throughout Central Brittany for its southern boundary (Fig. 7.15). From this, we
infer that the model calculated for Central Brittany can be extended further South. Therefore, we have
restored the Champtoceaux anticline, assuming a strike slip component with a γ value of 1.5 along a
N123° direction, similar to that calculated for Central Brittany (Fig. 7.17). The result shows a
significant realignment of the structure along a NW-SE direction.
Fig. 7.17. Sketch illustrating the restoration of thrusting and regional-scale folding between the two branches of
the SASZ. See text for further explanations.
6.5. Segmentation of the southern branch of the SASZ
To the West, the southern branch of the SASZ joins the northern one, with an overall N105°
trend. This segment of the shear zone is marked by Ordovician intrusions attributed to the early
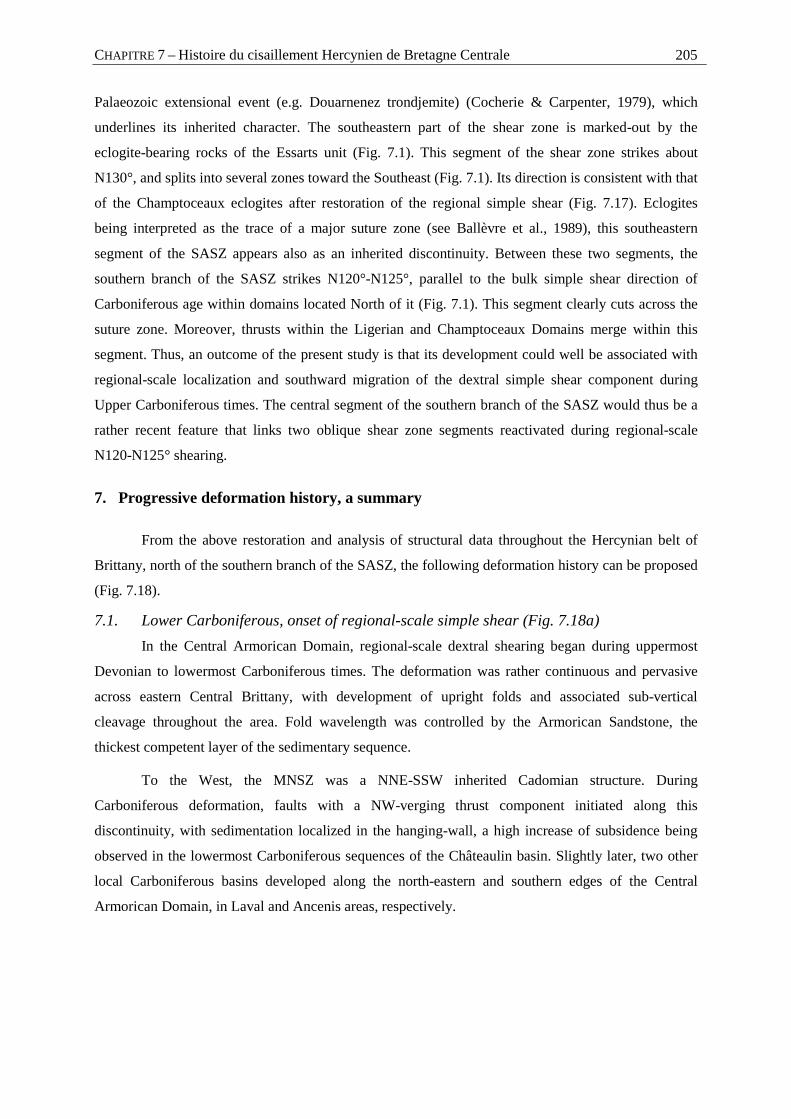
CHAPITRE 7 – Histoire du cisaillement Hercynien de Bretagne Centrale 205
Palaeozoic extensional event (e.g. Douarnenez trondjemite) (Cocherie & Carpenter, 1979), which
underlines its inherited character. The southeastern part of the shear zone is marked-out by the
eclogite-bearing rocks of the Essarts unit (Fig. 7.1). This segment of the shear zone strikes about
N130°, and splits into several zones toward the Southeast (Fig. 7.1). Its direction is consistent with that
of the Champtoceaux eclogites after restoration of the regional simple shear (Fig. 7.17). Eclogites
being interpreted as the trace of a major suture zone (see Ballèvre et al., 1989), this southeastern
segment of the SASZ appears also as an inherited discontinuity. Between these two segments, the
southern branch of the SASZ strikes N120°-N125°, parallel to the bulk simple shear direction of
Carboniferous age within domains located North of it (Fig. 7.1). This segment clearly cuts across the
suture zone. Moreover, thrusts within the Ligerian and Champtoceaux Domains merge within this
segment. Thus, an outcome of the present study is that its development could well be associated with
regional-scale localization and southward migration of the dextral simple shear component during
Upper Carboniferous times. The central segment of the southern branch of the SASZ would thus be a
rather recent feature that links two oblique shear zone segments reactivated during regional-scale
N120-N125° shearing.
7. Progressive deformation history, a summary
From the above restoration and analysis of structural data throughout the Hercynian belt of
Brittany, north of the southern branch of the SASZ, the following deformation history can be proposed
(Fig. 7.18).
7.1. Lower Carboniferous, onset of regional-scale simple shear (Fig. 7.18a) In the Central Armorican Domain, regional-scale dextral shearing began during uppermost
Devonian to lowermost Carboniferous times. The deformation was rather continuous and pervasive
across eastern Central Brittany, with development of upright folds and associated sub-vertical
cleavage throughout the area. Fold wavelength was controlled by the Armorican Sandstone, the
thickest competent layer of the sedimentary sequence.
To the West, the MNSZ was a NNE-SSW inherited Cadomian structure. During
Carboniferous deformation, faults with a NW-verging thrust component initiated along this
discontinuity, with sedimentation localized in the hanging-wall, a high increase of subsidence being
observed in the lowermost Carboniferous sequences of the Châteaulin basin. Slightly later, two other
local Carboniferous basins developed along the north-eastern and southern edges of the Central
Armorican Domain, in Laval and Ancenis areas, respectively.
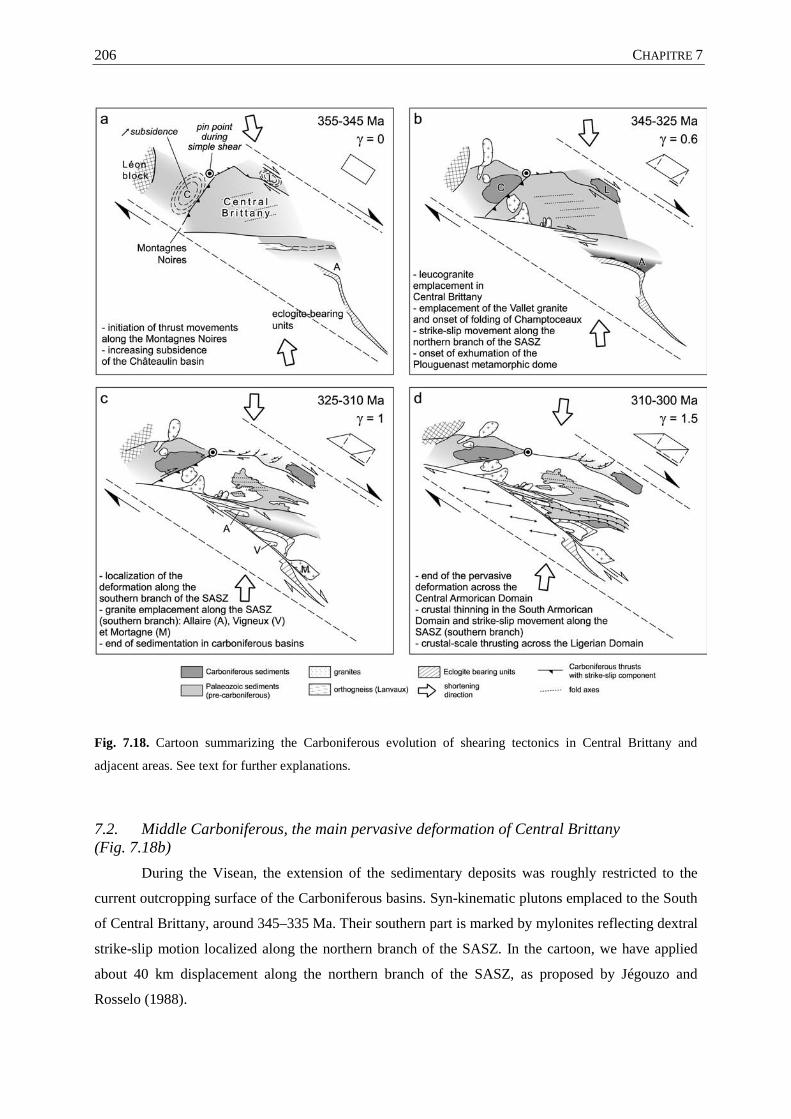
CHAPITRE 7 206
Fig. 7.18. Cartoon summarizing the Carboniferous evolution of shearing tectonics in Central Brittany and
adjacent areas. See text for further explanations.
7.2. Middle Carboniferous, the main pervasive deformation of Central Brittany (Fig. 7.18b)
During the Visean, the extension of the sedimentary deposits was roughly restricted to the
current outcropping surface of the Carboniferous basins. Syn-kinematic plutons emplaced to the South
of Central Brittany, around 345–335 Ma. Their southern part is marked by mylonites reflecting dextral
strike-slip motion localized along the northern branch of the SASZ. In the cartoon, we have applied
about 40 km displacement along the northern branch of the SASZ, as proposed by Jégouzo and
Rosselo (1988).
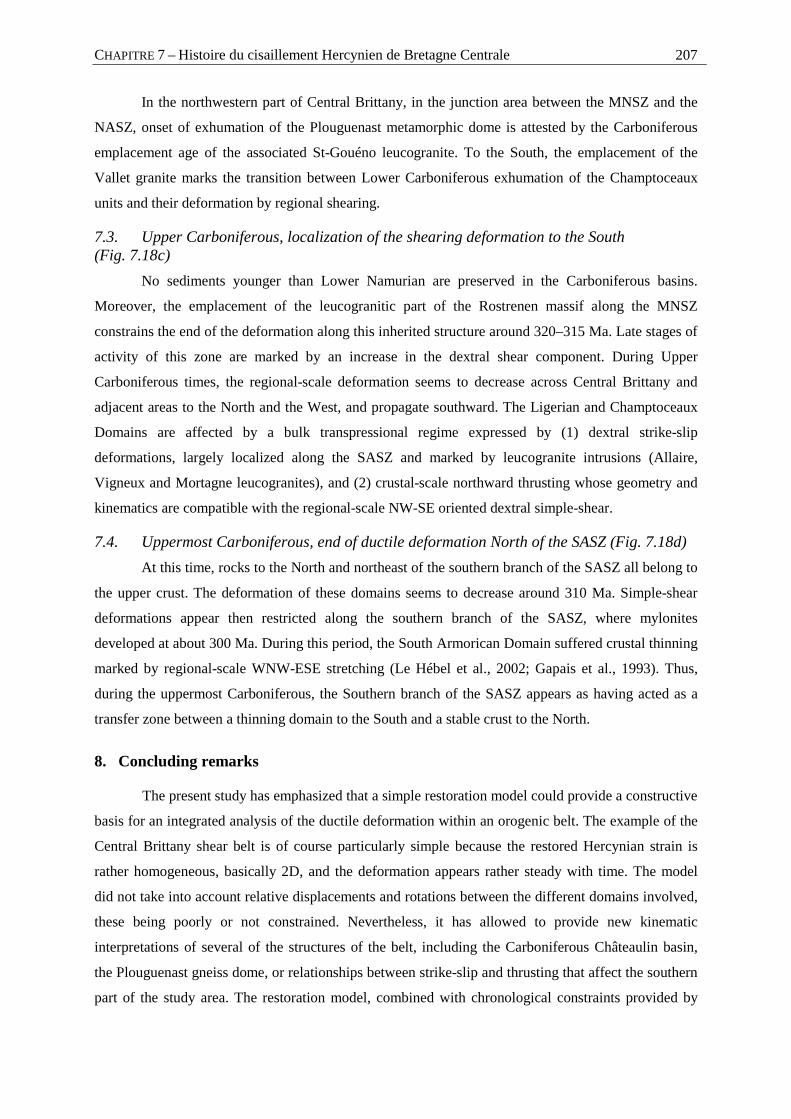
CHAPITRE 7 – Histoire du cisaillement Hercynien de Bretagne Centrale 207
In the northwestern part of Central Brittany, in the junction area between the MNSZ and the
NASZ, onset of exhumation of the Plouguenast metamorphic dome is attested by the Carboniferous
emplacement age of the associated St-Gouéno leucogranite. To the South, the emplacement of the
Vallet granite marks the transition between Lower Carboniferous exhumation of the Champtoceaux
units and their deformation by regional shearing.
7.3. Upper Carboniferous, localization of the shearing deformation to the South (Fig. 7.18c)
No sediments younger than Lower Namurian are preserved in the Carboniferous basins.
Moreover, the emplacement of the leucogranitic part of the Rostrenen massif along the MNSZ
constrains the end of the deformation along this inherited structure around 320–315 Ma. Late stages of
activity of this zone are marked by an increase in the dextral shear component. During Upper
Carboniferous times, the regional-scale deformation seems to decrease across Central Brittany and
adjacent areas to the North and the West, and propagate southward. The Ligerian and Champtoceaux
Domains are affected by a bulk transpressional regime expressed by (1) dextral strike-slip
deformations, largely localized along the SASZ and marked by leucogranite intrusions (Allaire,
Vigneux and Mortagne leucogranites), and (2) crustal-scale northward thrusting whose geometry and
kinematics are compatible with the regional-scale NW-SE oriented dextral simple-shear.
7.4. Uppermost Carboniferous, end of ductile deformation North of the SASZ (Fig. 7.18d) At this time, rocks to the North and northeast of the southern branch of the SASZ all belong to
the upper crust. The deformation of these domains seems to decrease around 310 Ma. Simple-shear
deformations appear then restricted along the southern branch of the SASZ, where mylonites
developed at about 300 Ma. During this period, the South Armorican Domain suffered crustal thinning
marked by regional-scale WNW-ESE stretching (Le Hébel et al., 2002; Gapais et al., 1993). Thus,
during the uppermost Carboniferous, the Southern branch of the SASZ appears as having acted as a
transfer zone between a thinning domain to the South and a stable crust to the North.
8. Concluding remarks
The present study has emphasized that a simple restoration model could provide a constructive
basis for an integrated analysis of the ductile deformation within an orogenic belt. The example of the
Central Brittany shear belt is of course particularly simple because the restored Hercynian strain is
rather homogeneous, basically 2D, and the deformation appears rather steady with time. The model
did not take into account relative displacements and rotations between the different domains involved,
these being poorly or not constrained. Nevertheless, it has allowed to provide new kinematic
interpretations of several of the structures of the belt, including the Carboniferous Châteaulin basin,
the Plouguenast gneiss dome, or relationships between strike-slip and thrusting that affect the southern
part of the study area. The restoration model, combined with chronological constraints provided by
CHAPITRE 7 208
syn-kinematic intrusions, further allowed us to propose an integrated tectonic history for the area
during Carboniferous times. The restoration emphasized the first-order role of inherited crustal-scale
structures on the development of the regional structural pattern. These in particular clearly controlled
local basin development and emplacement of syn-kinematic intrusions. They further acted as zones of
localization of vertical movements between adjacent blocks.
Following earlier works (e.g. Percevault & Cobbold, 1982; Cobbold & Davy, 1988; Rouby et
al., 1993, 2000, 2002; Gratier & Guillier, 1993), this study further emphasizes that restoration is a
rather powerful technique for tectonic analysis.
Acknoledgments
This work was part of the Armor 2 Project (Géofrance 3D Program, BRGM-CNRS).
Appendix: 40Ar/39Ar geochronology
The argon isotope analyses were performed at Nice (UMR Géosciences Azur) on single grains
of muscovite and biotite. The grains extracted from the different samples were sieved in the range
300-600µm. For each sample, about twenty grains were hand-picked under binocular microscope and
packed in an aluminium foil. These packets were stacked with intercalated monitor packets every eight
to ten samples to form a column. The Al-packets are 10x10x0.5mm (maximum thickness). The
column was enclosed in an Al-can and irradiated for 77.2 hours in the McMaster reactor (Hamilton,
Canada). The irradiation flux was calculated using the Hb3gr amphibole (1072 Ma, Roddick, 1983) as
irradiation monitor.
Step-heating analyses were performed with a laser probe using a Coherent Innova 70-4
continuous argon-ion laser with a maximum output power of 6W. The laser beam was about 2.5 times
larger than the analysed grain in order to obtain homogeneous heating. Each degassing experiment
lasted 3 minutes with 1 minute of heating, the extracted gas being purified on a -190°C liquid nitrogen
cold trap and a SAES GP10W getter for the remaining time. The purified gases were introduced in a
VG3600 mass spectrometer and analysed in static mode with a Daly photomultiplier system.
The five argon isotopes and the background baselines were measured in 11 cycles, in peak-
jumping mode. Blanks were performed routinely each first or third run, and subtracted from the
subsequent sample gas fractions. All isotopic measurements are corrected for K and Ca isotopic
interferences, mass discrimination and atmospheric argon contamination. All errors are quoted at the
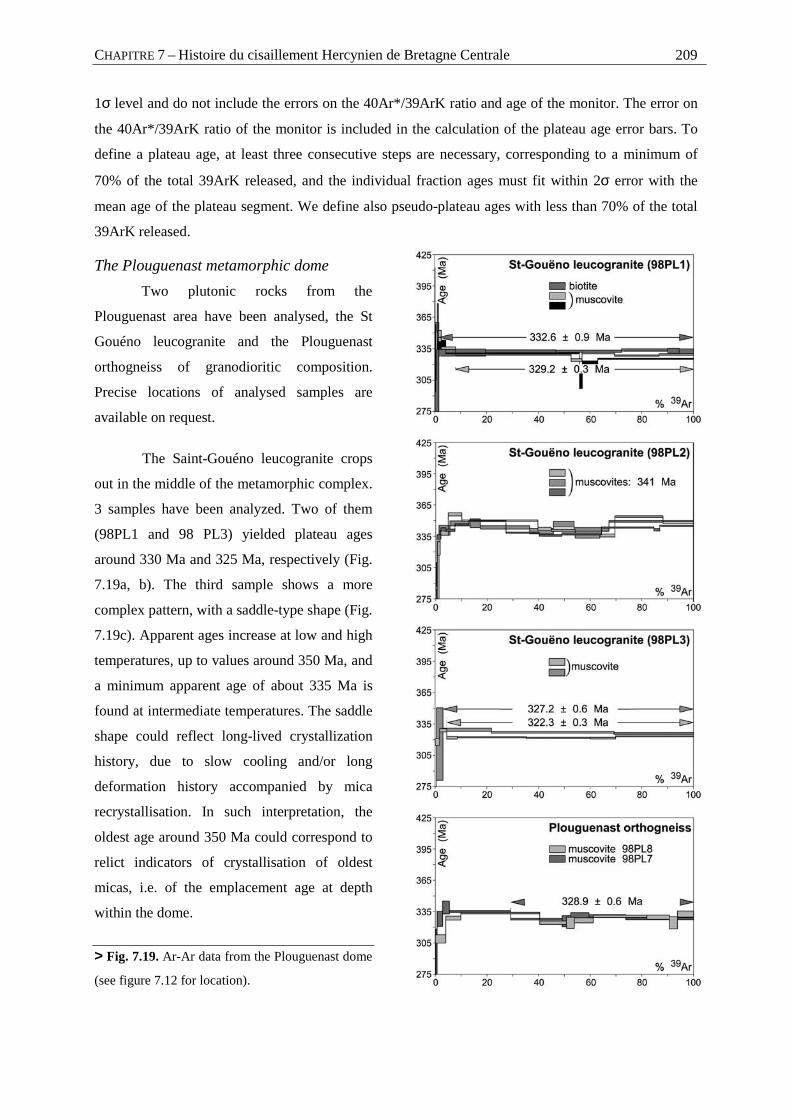
CHAPITRE 7 – Histoire du cisaillement Hercynien de Bretagne Centrale 209
1σ level and do not include the errors on the 40Ar*/39ArK ratio and age of the monitor. The error on
the 40Ar*/39ArK ratio of the monitor is included in the calculation of the plateau age error bars. To
define a plateau age, at least three consecutive steps are necessary, corresponding to a minimum of
70% of the total 39ArK released, and the individual fraction ages must fit within 2σ error with the
mean age of the plateau segment. We define also pseudo-plateau ages with less than 70% of the total
39ArK released.
The Plouguenast metamorphic dome Two plutonic rocks from the
Plouguenast area have been analysed, the St
Gouéno leucogranite and the Plouguenast
orthogneiss of granodioritic composition.
Precise locations of analysed samples are
available on request.
The Saint-Gouéno leucogranite crops
out in the middle of the metamorphic complex.
3 samples have been analyzed. Two of them
(98PL1 and 98 PL3) yielded plateau ages
around 330 Ma and 325 Ma, respectively (Fig.
7.19a, b). The third sample shows a more
complex pattern, with a saddle-type shape (Fig.
7.19c). Apparent ages increase at low and high
temperatures, up to values around 350 Ma, and
a minimum apparent age of about 335 Ma is
found at intermediate temperatures. The saddle
shape could reflect long-lived crystallization
history, due to slow cooling and/or long
deformation history accompanied by mica
recrystallisation. In such interpretation, the
oldest age around 350 Ma could correspond to
relict indicators of crystallisation of oldest
micas, i.e. of the emplacement age at depth
within the dome.
> Fig. 7.19. Ar-Ar data from the Plouguenast dome
(see figure 7.12 for location).
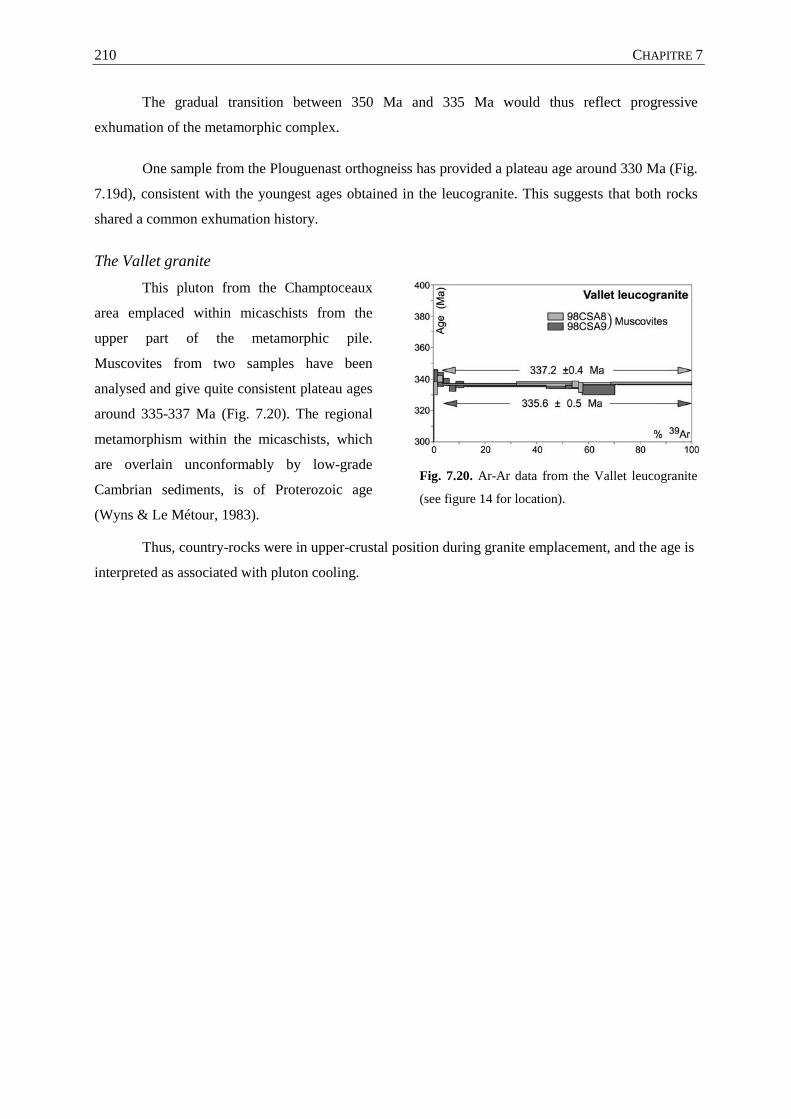
CHAPITRE 7 210
The gradual transition between 350 Ma and 335 Ma would thus reflect progressive
exhumation of the metamorphic complex.
One sample from the Plouguenast orthogneiss has provided a plateau age around 330 Ma (Fig.
7.19d), consistent with the youngest ages obtained in the leucogranite. This suggests that both rocks
shared a common exhumation history.
The Vallet granite This pluton from the Champtoceaux
area emplaced within micaschists from the
upper part of the metamorphic pile.
Muscovites from two samples have been
analysed and give quite consistent plateau ages
around 335-337 Ma (Fig. 7.20). The regional
metamorphism within the micaschists, which
are overlain unconformably by low-grade
Cambrian sediments, is of Proterozoic age
(Wyns & Le Métour, 1983).
Fig. 7.20. Ar-Ar data from the Vallet leucogranite
(see figure 14 for location).
Thus, country-rocks were in upper-crustal position during granite emplacement, and the age is
interpreted as associated with pluton cooling.
CHAPITRE 7 – Histoire du cisaillement Hercynien de Bretagne Centrale 211
References
ARTHAUD, F. & MATTE, P. (1975) - "Les décrochements tardi-hercyniens du Sud-Ouest de l'Europe.
Géométrie et essai de reconstitution des conditions de la déformation." - Tectonophysics, 25(1-2),
139-171.
BALE, P. & BRUN, J.P. (1986) - "Les complexes métamorphiques du Léon (NW Bretagne) : un
segment du domaine éo-hercynien sud armoricain translaté au Dévonien." - Bulletin de la Société
Géologique de France, 2(3), 471-477.
BALLARD, J.F., BRUN, J.P. & DURAND, J. (1986) - "La discordance Briovérien-Paléozoïque inférieur
en Bretagne Centrale : signature d'un épisode de distension ordovicienne." - Comptes Rendus de
l'Académie des Sciences de Paris, II - 303(14), 1327-1332.
BALLEVRE, M., PINARDON, J.L., KIENAST, J.R. & VUICHARD, J.P. (1989) - "Reversal of Fe-Mg
partitioning between garnet and staurolite in eclogite-facies metapelites from Champtoceaux Nappe
(Brittany, France)." - Journal of Petrology, 30(6), 1321-1349.
BALLEVRE, M., LE GOFF, E. & HEBERT, R. (2001) - "The tectonothermal evolution of the Cadomian
belt of northern Brittany, France: a Neoproterozoic volcanic arc." - Tectonophysics, 331, 19-43.
BALLEVRE, M., CAPDEVILLA, R., GUERROT, C. & PEUCAT, J.J. (2002) - "Discovery of an alkaline
orthogneiss in the eclogite-bearing Cellier Unit (Champtoceaux Complex, Armorican Massif): a
new witness of the Ordovician rifting." - Comptes Rendus Geoscience, 334, 303-311.
BERNARD-GRIFFITHS, J., PEUCAT, J.J., SHEPPART, S. & VIDAL, P. (1985) - "Petrogenesis of Hercynian
leucogranites from the southern Armorican Massif : contribution of REE and isotopic (Sr, Nb, Pb
and O) geochemical data to the study of source rock characteristics and ages." - Earth and
Planetary Science Letters, 74, 235-250.
BERTHE, D., CHOUKROUNE, P. & GAPAIS, D. (1979) - "Quartz Fabrics and Progressive Gneissification
of Granites By Simple Shear - Example of the South Armerican Shear Zone." - Bulletin de
Minéralogie, 102(2-3), 265-272.
BERTHE, D., CHOUKROUNE, P. & JEGOUZO, P. (1979) - "Orthogneiss, mylonite and non coaxial
deformation of granites: the example of the South Armorican Shear Zone." - Journal of Structural
Geology, 1(1), 31-42.
CHAPITRE 7 212
BITRI, A., BALLEVRE, M., BRUN, J.P., CHANTRAINE, J., GAPAIS, D., GUENNOC, P., GUMIAUX, C. &
TRUFFERT, C. (2003) - "Imagerie sismique de la zone de collision Hercynienne dans le sud-est du
Massif Armoricain (Projet Armor2 - Programme Geofrance 3D). Seismic imaging of the Hercynian
collision zone in the south-eastern Armorican Massif (Armor2 project - Geofrance 3D program)." -
Comptes Rendus Geoscience, 335, 969-979.
BOS, P., CASTAING, C., CLEMENT, J.P., CHANTRAINE, J. & LEMEILLE, F. (1997) - French Geological
map (1/50,000), "Rostrenen (312).", BRGM, Orléans.
BOSSE, V., FERAUD, G., RUFFET, G., BALLEVRE, M., PEUCAT, J.-J. & DE JONG, K. (2000) - "Late
Devonian subduction and early-orogenic exhumation of eclogite-facies rocks from the
Champtoceaux Complex (Variscan belt, France)." - Geological journal, 35, 297-325.
BOUCHEZ, J.L. & BLAISE, J. (1976) - "Une structure hercynienne liée à un accident ductile : l'anticlinal
de Lanvaux - les-Ponts-de-Cé, aux environs d'Angers (massif Armoricain)." - Bulletin de la Société
Géologique de France, 18(1), 145-157.
BRUN, J.-P., BALLARD, J.-F. & LE CORRE, C. (1991) - "Identification of Ordovician block-tilting in the
Hercynian fold belt of Central Brittany (France) : field evidence and computer models." - Journal
of Structural Geology, 13(4), 419-429.
BRUN, J.P., GUENNOC, P., TRUFFERT, C., VAIRON, J. & PROGRAM, T.A.W.G.O.T.G.-D. (2001) -
"Cadomian tectonics in northern Brittany: a contribution of 3-D crustal-scale modelling." -
Tectonophysics, 331, 229-246.
BURG, J.-P. (1981) - "Tectonique tangentielle hercynienne en Vendée littorale : Signification des
linéations d'étirement E-W dans les porphyroïdes à foliation horizontale." - Comptes Rendus de
l'Académie des Sciences de Paris, 293, 849-854.
CARPENTER, M., PEUCAT, J.J. & PIVETTE, B. (1982) - "Geochemical and geochronological
characteristics of Paleozoic volcanism in the Saint-Georges-sur-Loire synclinorium (S. Armorican
Massif). Evidence for pre-hercynian tectonic evolution." - Bulletin du BRGM, 21, 63-79.
CARRIC, G., CHANTRAINE, J., DADET, P., FLAGEOLLET, J.C., SAGON, J.P. & TALBO, H. (1979) -
French Geological map (1/50,000), "Moncontour (279).", BRGM, Orléans.
CHAPITRE 7 – Histoire du cisaillement Hercynien de Bretagne Centrale 213
CARTIER, C., FAURE, M. & LARDEUX, H. (2001) - "The Hercynian orogeny in the South Armorican
Massif (Saint-Georges-sur-Loire Unit, Ligerian Domain, France): rifting and welding of
continental stripes." - Terra Nova, 13, 143-149.
CASTAING, C., ROLET, J., CHEVREMONT, P., LE CALVEZ, J.Y. & THONON, P. (1987) - "La région de
Huelgoat (Finistère central) dans le contexte géodynamique armoricain." - Géologie de la France,
1, 23-36.
CHANTRAINE, J., CHAUVEL, J.J., DUPRET, L., GATINOT, F., ICART, J.C., LE CORRE, C., RABU, D.,
SAUVAN, P. & VILLEY, M. (1982) - "Inventaire lithologique et structural du Briovérien
(Protérozoïque supérieur) de la Bretagne centrale et du Bocage Normand." - Bulletin du Bureau de
Recherches Géologiques et Minières, 1, 3-17.
CHANTRAINE, J., AUTRAN, A. & CAVELIER, C. (1996) - French Geological map (1/1,000,000), BRGM
Service Géologique National, Orléans.
CHAUVEL, J.J. & RABU, D. (1984) - "Brioverian in Central Brittany." In: V. Zoubek (Ed.),
Precambrian in younger fold belts. - Wiley, New-York, pp. 462-470.
COBBOLD, P.R. & DAVY, P. (1988) - "Indentation tectonics in nature and experiment. 2. Central Asia."
- Bulletin of the Geological Institutions of Upsalla, New series, 14, 143-162.
COCHERIE, A. & CARPENTER, M. (1979) - "Comportement géochimique des terres rares dans la
trondhjémite de Douarnenez : Implications pétrogénétiques." - Géologie de la France, 4, 337-347.
COGNE, J.P., CHOUKROUNE, P. & COGNE, J. (1983) - "Cisaillements varisques superposés dans le
Massif de Lanvaux (Bretagne Centrale)." - Comptes Rendus de l'Académie des Sciences de Paris,
II - 296, 773-776.
DARBOUX, J.R. & LE GALL, B. (1988) - "Les Montagnes Noires : cisaillement bordier méridional du
bassin carbonifère de Châteaulin (Massif Armoricain, France). Caractéristiques structurales et
métamorphiques." - Geodinamica Acta, 2(3), 121-133.
DARBOUX, J.R. (1991) - "Evolution tectonosédimentaire et structuration synmétamorphe des zones
externes du segment Hercynien Ouest-Européen." - Thèse d'état, Université de Bretagne
Occidentale, Brest, 267 pp.
CHAPITRE 7 214
DEWEY, J.F., HOLDSWORTH, R.E. & STRACHAN, R.A. (1998) - "Transpression and transtension
zones." In: R. E. Holdsworth, R. A. Strachan and J. F. Dewey (Ed.), Continental Transpressional
and Transtensional Tectonics. - The Geological Society, London, pp. 1-14.
DIAS, R. & RIBEIRO, A. (1994) - "Constriction in a transpressive regime: example in the Iberian branch
of the Ibero-Armorican arc." - Journal of Structural Geology, 16(11), 1543-1554.
DIAS, R. & RIBEIRO, A. (1995) - "The Ibero-Armorican Arc : A collision effect against an irregular
continent?" - Tectonophysics, 246, 113-128.
DIOT, H., BOUCHEZ, J.L. & BLAISE, J. (1983) - "La bande ductile Lanvaux-Les-Ponts-de-Cé entre
Redon et Angers. Une composante du cisaillement hercynien du Massif Armoricain (France)." -
Bulletin de la Société Géologique de France, 25(2), 155-167.
FONTEILLES, M. (1965) - "Sur la profondeur de formation des veines à disthène géodique de la région
de Baud (Morbihan) et sur la signification des veines à disthène en général." - Bulletin de la Société
Française de Minéralogie et de Cristallographie, 88, 281-289.
GAPAIS, D. (1979) - "Déformation progressive d'un quartzite dans une zone plissée (segment
hercynien de Bretagne centrale)." - Bulletin de Minéralogie, 102, 249-264.
GAPAIS, D. & LE CORRE, C. (1980) - "Is the Hercynian belt of Brittany a major shear zone?" - Nature,
288, 574-576.
GAPAIS, D. & COBBOLD, P.R. (1987) - "Slip system domains. 2. Kinematic aspects of fabric
development in polycristalline aggregates." - Tectonophysics, 138(2-4), 289-309.
GAPAIS, D., LAGARDE, J.L., LE CORRE, C., AUDREN, C., JEGOUZO, P., CASAS SAINZ, A. & VAN DEN
DRIESSCHE, J. (1993) - "La zone de cisaillement de Quiberon : témoin d'extension de la chaîne
varisque en Bretagne méridionale au Carbonifère." - Comptes Rendus de l'Académie des Sciences
de Paris, II(316), 1123-1129.
GORE, B. & LE CORRE, C. (1987) - "Cinématique hercynienne du cisaillement nord-armoricain à la
bordure du granite syntectonique de Saint Renan-Kersaint (Finistère)." - Bulletin de la Société
Géologique de France, 3(5), 811-819.
GRATIER, J.P. & GUILLIER, B. (1993) - "Compatibility constraints on folded and faulted strata and
CHAPITRE 7 – Histoire du cisaillement Hercynien de Bretagne Centrale 215
calculation of total displacement using computational restoration (UNFOLD program)." - Journal
of Structural Geology, 15, 391-402.
GRAVIOU, P., PEUCAT, J.J., AUVRAY, B. & VIDAL, P. (1988) - "The Cadomian Orogeny in the
Northern Armorican Massif: petrological and geochronological constraints on a geodynamic
model." - Hercynica, 4(1), 1-13.
GUILLOCHEAU, F. & ROLET, M. (1982) - "La Sédimentation Paléozoïque Ouest-Armoricaine." -
Bulletin de la Société Géologique et Minéralogique de Bretagne, 14(2), 45-62.
GUINEBERTEAU, B., BOUCHEZ, J.L. & VIGNERESEE, J.L. (1987) - "The Mortagne granite pluton
(France) emplaced by pull-apart along a shear zone: structural and gravimetric arguments and
regional implication." - Geological Society of America Bulletin, 99, 763-770.
GUMIAUX, C., BRUN, J.P. & GAPAIS, D. (in press / sous presse) - "Strain removal within the Hercynian
Shear Belt of Central Brittany (Western France): methodology and tectonic implications." - Journal
of the Geological Society of London Special publication.
HANMER, S. & VIGNERESSE, J.L. (1980) - "Mise en place de diapirs syntectoniques dans la chaîne
hercynienne : exemple des massifs leucogranitiques de Locronan et de Pontivy (Bretagne
Centrale)." - Bulletin de la Société Géologique de France, 22(2), 193-202.
HOULGATTE, E., LE HERISSE, A., PELHATE, A. & ROLET, J. (1988) - "Evolution géodynamique du
Bassin carbonifère de Laval." - Géologie de la France, 1, 27-48.
JEGOUZO, P. (1980) - "The South Armorican Shear Zone." - Journal of Structural Geology, 2(1-2), 39-
47.
JEGOUZO, P., PEUCAT, J.J. & AUDREN, C. (1986) - "Caractérisation et signification géodynamique des
orthogneiss calco-alcalins d'âge ordovicien de Bretagne méridionale." - Bulletin de la Société
Géologique de France, 2(5), 839-848.
JEGOUZO, P. & ROSELLO, E.A. (1988) - "La Branche Nord du Cisaillement Sud-Armoricain (France) :
un essai d'évaluation du déplacement par l'analyse des mylonites." - Comptes Rendus de l'Académie
des Sciences de Paris, II - 307, 1825-1831.
LE CORRE, C. & LE THEOFF, B. (1976) - "Zonéographie de la déformation finie, de la fabrique et du
CHAPITRE 7 216
métamorphisme dans un segment de la chaîne hercynienne armoricaine." - Bulletin de la Société
Géologique de France, 18(6), 1435-1442.
LE CORRE, C. (1977) - "Le Briovérien de Bretagne centrale : essai de synthèse lithologique et
structurale." - Bulletin du BRGM, I(3), 219-254.
LE CORRE, C. (1978) - "Approche quantitative des processus synschisteux. L'exemple du segment
Hercynien de Bretagne Centrale." - Thèse d'état, Université de Rennes 1, Rennes, 382 pp.
LE CORRE, C., AUVRAY, B., BALLEVRE, M. & ROBARDET, M. (1991) - "Le Massif Armoricain." -
Scientifical Geological Bulletin, 44(1-2), 31-103.
LE HEBEL, F., VIDAL, O., KIENAST, J.R. & GAPAIS, D. (2002) - "Les "Porphyroïdes" de Bretagne
méridionale : une unité de HP-BT dans la chaîne hercynienne." - Comptes Rendus Geoscience, 334,
205-211.
LE METOUR, J. & AUDREN, C. (1977) - "Relations structurales entre l'orthogneiss ordovicien de
Roguédas et son encaissant migmatitique. Conséquences sur l'âge des évènements
tectonométamorphiques en Bretagne méridionale." - Bulletin de la Société Géologique et
Minéralogique de Bretagne, 9, 113-123.
LE THEOFF, B. (1977) - "Marqueurs ellipsoïdaux et déformation finie." - Thèse, Université de
Rennes1, Rennes, 96 pp.
LEDRU, P., MAROT, A. & HERROUIN, Y. (1986) - "Le synclinorium de Saint-Georges-sur-Loire : une
unité ligérienne charriée sur le domaine centre armoricain. Découverte de métabasite à
glaucophane sur la bordure sud de cette unité." - Comptes Rendus de l'Académie des Sciences de
Paris, II -303, 963-968.
MARCHAND, J., PERRIN, J. & WEECKSTEEN, G. (1966) - French Geological map (1/50,000), "Vallet
(482).", BRGM, Orléans.
MARTELET, G., CALCAGNO, P., GUMIAUX, C., TRUFFERT, C., BITRI, A., GAPAIS, D. & BRUN, J.P.
(accepted / accepté) - "Integrated 3D geophysical and geological modelling of the Hercynian
Suture Zone in the Champtoceaux area (South Brittany, France)." – Tectonophysics.
MATTE, P. (1991) - "Accretionary history and crustal evolution of the Variscan belt in Western
CHAPITRE 7 – Histoire du cisaillement Hercynien de Bretagne Centrale 217
Europe." - Tectonophysics, 196, 309-337.
MERLE, O. & GAPAIS, D. (1997) - "Strains within thrust-wrench zones." - Journal of Structural
Geology, 19(7), 1011-1014.
PARADIS, S. (1981) - "Le métamorphisme Hercynien dans le Domaine Centre Armoricain occidental :
essai de caractérisation par l'étude des phyllites des formations gréso-pélitiques." - Thèse,
Université de Bretagne Occidentale, Brest, 176 pp.
PARIS, F. (1977) - French Geological map (1/50,000), "Caulnes (281).", BRGM, Orléans.
PARIS, F. & DADET, P. (1988) - French Geological map (1/50,000), "Combourg (282).", BRGM,
Orléans.
PARIS, F. & ROBARDET, M. (1994) - "The Variscan - Paleogeographic Synthesis." In: J. D. Keppie
(Ed.), Pre-Mesozoic Geology in France. - Springer Verlag, Berlin, pp. 173-176.
PELHATE, A. (1994) - "The Variscan - Carboniferous of the Armorican Massif." In: J. D. Keppie (Ed.),
Pre-Mesozoic Geology in France. - Springer Verlag, Berlin, pp. 162-168.
PERCEVAULT, M.-N. & COBBOLD, P.R. (1982) - "Mathematical removal of regional ductile strains in
Central Brittany: evidence for wrench tectonics." - Tectonophysics, 82, 317-328.
PIVETTE, B. (1977) - "Le synclinorium de Saint-Georges sur Loire, Massif Armoricain. Sa place dans
l'évolution géodynamique de la Bretagne méridionale au Paléozoïque." - Thèse, Université de
Rennes 1, Rennes, 108 pp.
PLUSQUELLEC, Y., ROLET, J. & DARBOUX, J.R. (1999) - French Geological map (1/50,000),
"Châteaulin (310).", BRGM, Orléans.
REGNAULT, S. (1981) - "Stratigraphie et structure du Paléozoïque dans le Ménez-Bélair occidental
(Synclinorium médian armoricain)." - Bulletin de la Société Géologique et Minéralogique de
Bretagne, C-13(1), 1-111.
ROBARDET, M., BONJOUR, J.L., PARIS, F., MORZADEC, P. & RACHEBOEUF, P.R. (1994) - "Ordovician,
Silurian, and Devonian of the Medio-North-Armorican Domain." In: J. D. Keppie (Ed.), Pre-
Mesozoic Geology in France and related areas. - Springer Verlag, Berlin, pp. 142-151.
CHAPITRE 7 218
RODDICK, J.C. (1983) - "High precision intercalibration of 40Ar/39Ar standarts." - Geochimica et
Cosmochimica Acta, 47, 887-898.
ROLET, J. & THONON, P. (1978) - "La semelle de charriage hercynien majeur effondrée par un réseau
de fractures en régime coulissant dextre : sa mise en évidence grâce aux marqueurs filoniens de la
Rade de Brest (Massif Armoricain)." - Comptes Rendus de l'Académie des Sciences de Paris, D-
287, 1099-1102.
ROUBY, D., COBBOLD, P.R., SZATMARI, P., DEMERCIAN, S., COELHO, D. & RICI, J.A. (1993) -
"Restoration in plan view of faulted Upper Cretaceous and Oligocene horizons and its bearing on
the history of salt tectonics in the Campos Basin (Brazil)." - Tectonophysics, 228, 435-445.
ROUBY, D., SUPPE, J. & XIAO, H. (2000) - "3D restoration of complexly faulted and folded surfaces
using multiple unfolding mechanisms." - American Association of Petroleum Geology, 84, 805-
829.
ROUBY, D., RAILLARD, S., GUILLOCHEAU, F. & BOURROULLEC, R. (2002) - "Kinematics of a growth
fault/raft system from restoration in 3D (West African Margin)." - Journal of Structural Geology,
24, 783-796.
SAUNIER, J.-F. (1986) - "Un domaine cristallophyllien dans le Protérozoïque Supérieur (Briovérien) de
Bretagne Centrale : le dôme de Plouguenast (Côtes du Nord)." - Thèse, Université de Rennes1,
Rennes, 120 pp.
VIDAL, P. (1976) - "L'évolution polyorogénique du Massif Armoricain. Apport de la géochronologie et
de la géochimie isotopique du strontium." - Thèse d'état, Université de Rennes1, Rennes, 142 pp.
VIGNERESSE, J.L. & BRUN, J.P. (1983) - "Les leucogranites armoricains marqueurs de la déformation
régionale : apport de la gravimétrie." - Bulletin de la Société Géologique de France, 25(3), 357-
366.
WATTS, M.S. & WILLIAMS, G.D. (1979) - "Faults rocks as indicators of progressive shear deformation
in the Guingamp region, Brittany." - Journal of Structural Geology, 1, 323-332.
WEBER, C. (1967) - "Le prolongement des granites de Lanvaux d'après la gravimétrie et
l'aéromagnétisme." - Mémoires du BRGM, 52, 83-90.

CHAPITRE 7 – Histoire du cisaillement Hercynien de Bretagne Centrale 219
WYNS, R. & LE METOUR, J. (1983) - "Le Précambrien du Massif Vendéen : étude détaillée de deux
coupes de référence (Coupe de l'Evre et coupe de la Divatte) et synthèse des données récentes."-
BRGM, Orléans, 60 pp.

C h a p i t r e 8 Données tomographiques : la déformation à l'échelle lithosphérique

CHAPITRE 8 – Implications lithosphériques 223
Tomographic evidence for mantle shearing in the Hercynian belt of
Brittany (Western France)
C.Gumiaux a, S. Judenherc b, J.P. Brun a, D.Gapais a, M. Granet b, G. Poupinet c
a Géosciences Rennes, UMR 6118 CNRS, Université de Rennes 1, 35042 Rennes cedex,
France b Ecole et Observatoire des Sciences de la Terre, UMR 7516 CNRS, 5 rue René Descartes,
67084 Strasbourg cedex , France c Laboratoire de Géophysique interne et de Tectonophysique, UMR 5559 CNRS, 1381 rue de
la piscine, 38041 Grenoble cedex, France
Geology – in review / en revue
Abstract
Tomographic images of the mantle below the Hercynian belt of Brittany display strong
anomalies of P wave travel times that likely represent variations in composition. Differences in
anomaly trends, above and below 130 km, are analyzed in the light of regional-scale distributed strike-
slip strains documented in the overlying crust. The application to mantle images of a restoration
model, developed for the crust, provides arguments for the occurrence of a steeply dipping slab,
interpreted as a remnant of oceanic lithosphere subducted prior to the Hercynian collision.
1. Introduction
Lithosphere deformation in orogenic belts is generally only constrained by the record of
crustal layers, information on the mantle counterpart being either lacking or rather scarce. Recent
progress of lithosphere tomography offers new tools to describe heterogeneities and structures in the
lithospheric mantle, as tomographic images contain information about the mineralogy, anisotropy,
and/or thermal state (e.g. Sobolev et al., 1996, Poupinet et al., 2003).
CHAPITRE 8 224
In old orogenic belts, like the Hercynian belt of Western Europe where subduction and
collisional events are older than 300 Ma, the occurrence of large differences in P wave travel time can
likely reflect variations in composition, mineralogy, and (or) anisotropy. We use here teleseismic P
waves recorded across the Hercynian belt of Brittany by two temporary seismic networks operated in
1997 and 1999 (Judenherc et al., 2002, 2003). In the area, anomalies observed on mantle tomographic
images, calculated down to 200 km, are analyzed in the light of regional-scale strike-slip deformation
that affects the overlying crust.
2. Regional geology
The Hercynian belt of Brittany shows three main types of geological units (Fig. 8.1A). Low-
grade units were moderately deformed during the Carboniferous. High-pressure units, outlining a
suture zone, were strongly deformed during Devonian thrusting and exhumed during the early
Carboniferous. To the South, Barrovian-type metamorphic units are related to Devonian-
Carboniferous crustal thickening and syn-convergence Carboniferous extension. Three major regional-
scale dextral wrench faults cut across and displace these units, giving three major tectonic domains
(Fig. 8.1A). The Central Armorican Domain represents the upper crust during the whole Hercynian
evolution and corresponds to a regional-scale strike-slip shear belt of Carboniferous age (Gapais and
Le Corre, 1980). It is separated from the North Armorican Domain by the North Armorican Shear
Zone (NASZ) . The Champtoceaux Domain is constituted to the East by an upper crust section,
underlain to the West by HP metamorphic units exhumed in early Carboniferous times (Bosse et al.,
2000). The South Armorican Domain is largely composed of HT metamorphic units strongly affected
by syn-convergence extension (Gapais et al., 1993). The South Armorican Shear Zone (SASZ), a
major dextral strike-slip fault of Carboniferous age (Jégouzo, 1980), juxtaposes the Central and South
Armorican Domains to the West, and the South Armorican and Champtoceaux Domains, to the East.
3. The strike-slip shear Belt of Central Brittany: kinematics and restoration model
In the Central Armorican Domain, low-grade metasediments of upper-Proterozoic to
Devonian age are affected by E-W striking upright folds with a subvertical slaty cleavage and a sub-
horizontal stretching lineation, resulting from a dextral strike-slip deformation of Carboniferous age
(Gapais and Le Corre, 1980). In the eastern part of the domain, finite strain estimates from pebble
shapes within deformed conglomerates have shown that the intermediate principal strain axis was
roughly vertical throughout the area, with a mean value around one indicating overall plane-strain in
the horizontal plane. Within the southern part of the Central Armorican Domain (South of Rennes,
Fig. 8.1B), a mathematical removal of ductile strains (Percevault and Cobbold, 1982) has argued for
bulk dextral simple shear, with a mean γ value around 1 along an overall N125° striking shear
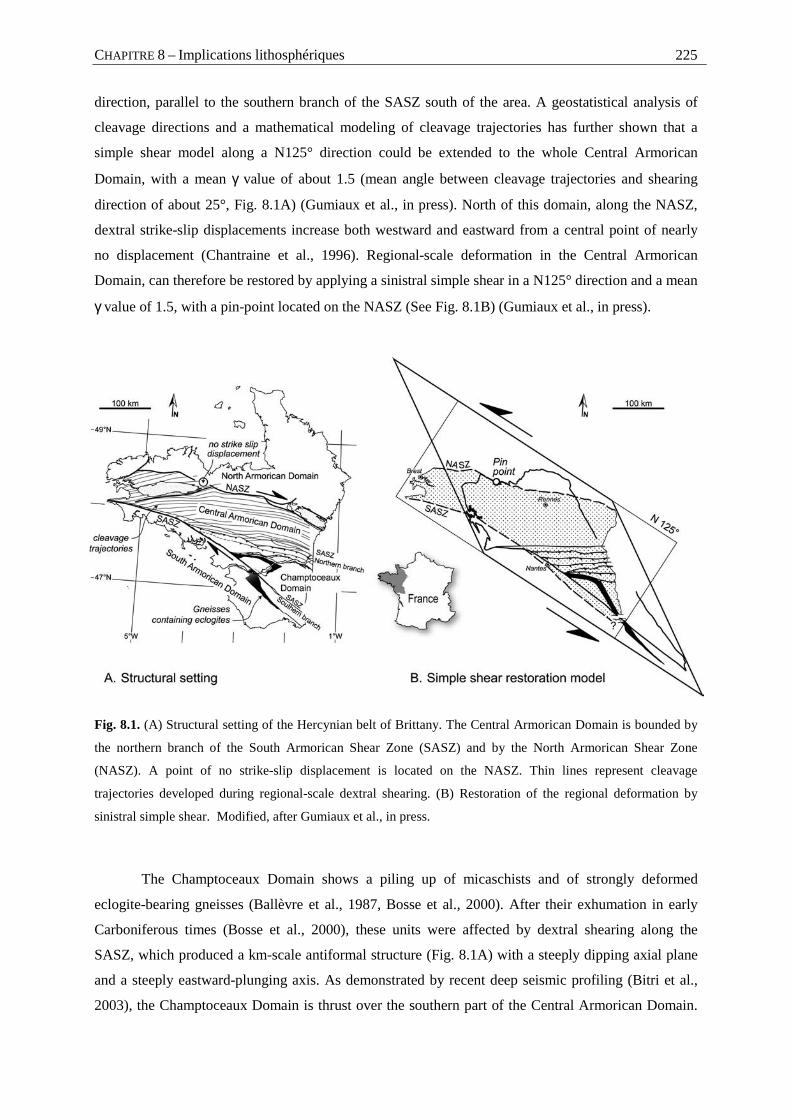
CHAPITRE 8 – Implications lithosphériques 225
direction, parallel to the southern branch of the SASZ south of the area. A geostatistical analysis of
cleavage directions and a mathematical modeling of cleavage trajectories has further shown that a
simple shear model along a N125° direction could be extended to the whole Central Armorican
Domain, with a mean γ value of about 1.5 (mean angle between cleavage trajectories and shearing
direction of about 25°, Fig. 8.1A) (Gumiaux et al., in press). North of this domain, along the NASZ,
dextral strike-slip displacements increase both westward and eastward from a central point of nearly
no displacement (Chantraine et al., 1996). Regional-scale deformation in the Central Armorican
Domain, can therefore be restored by applying a sinistral simple shear in a N125° direction and a mean
γ value of 1.5, with a pin-point located on the NASZ (See Fig. 8.1B) (Gumiaux et al., in press).
Fig. 8.1. (A) Structural setting of the Hercynian belt of Brittany. The Central Armorican Domain is bounded by
the northern branch of the South Armorican Shear Zone (SASZ) and by the North Armorican Shear Zone
(NASZ). A point of no strike-slip displacement is located on the NASZ. Thin lines represent cleavage
trajectories developed during regional-scale dextral shearing. (B) Restoration of the regional deformation by
sinistral simple shear. Modified, after Gumiaux et al., in press.
The Champtoceaux Domain shows a piling up of micaschists and of strongly deformed
eclogite-bearing gneisses (Ballèvre et al., 1987, Bosse et al., 2000). After their exhumation in early
Carboniferous times (Bosse et al., 2000), these units were affected by dextral shearing along the
SASZ, which produced a km-scale antiformal structure (Fig. 8.1A) with a steeply dipping axial plane
and a steeply eastward-plunging axis. As demonstrated by recent deep seismic profiling (Bitri et al.,
2003), the Champtoceaux Domain is thrust over the southern part of the Central Armorican Domain.
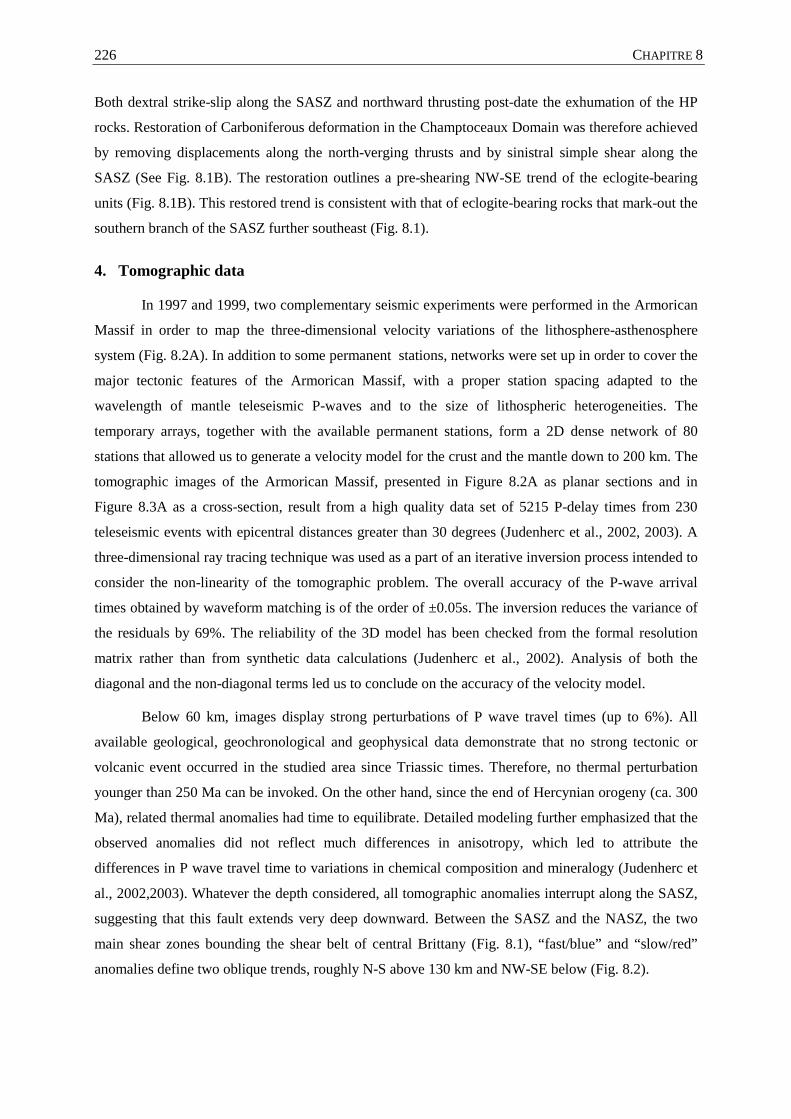
CHAPITRE 8 226
Both dextral strike-slip along the SASZ and northward thrusting post-date the exhumation of the HP
rocks. Restoration of Carboniferous deformation in the Champtoceaux Domain was therefore achieved
by removing displacements along the north-verging thrusts and by sinistral simple shear along the
SASZ (See Fig. 8.1B). The restoration outlines a pre-shearing NW-SE trend of the eclogite-bearing
units (Fig. 8.1B). This restored trend is consistent with that of eclogite-bearing rocks that mark-out the
southern branch of the SASZ further southeast (Fig. 8.1).
4. Tomographic data
In 1997 and 1999, two complementary seismic experiments were performed in the Armorican
Massif in order to map the three-dimensional velocity variations of the lithosphere-asthenosphere
system (Fig. 8.2A). In addition to some permanent stations, networks were set up in order to cover the
major tectonic features of the Armorican Massif, with a proper station spacing adapted to the
wavelength of mantle teleseismic P-waves and to the size of lithospheric heterogeneities. The
temporary arrays, together with the available permanent stations, form a 2D dense network of 80
stations that allowed us to generate a velocity model for the crust and the mantle down to 200 km. The
tomographic images of the Armorican Massif, presented in Figure 8.2A as planar sections and in
Figure 8.3A as a cross-section, result from a high quality data set of 5215 P-delay times from 230
teleseismic events with epicentral distances greater than 30 degrees (Judenherc et al., 2002, 2003). A
three-dimensional ray tracing technique was used as a part of an iterative inversion process intended to
consider the non-linearity of the tomographic problem. The overall accuracy of the P-wave arrival
times obtained by waveform matching is of the order of ±0.05s. The inversion reduces the variance of
the residuals by 69%. The reliability of the 3D model has been checked from the formal resolution
matrix rather than from synthetic data calculations (Judenherc et al., 2002). Analysis of both the
diagonal and the non-diagonal terms led us to conclude on the accuracy of the velocity model.
Below 60 km, images display strong perturbations of P wave travel times (up to 6%). All
available geological, geochronological and geophysical data demonstrate that no strong tectonic or
volcanic event occurred in the studied area since Triassic times. Therefore, no thermal perturbation
younger than 250 Ma can be invoked. On the other hand, since the end of Hercynian orogeny (ca. 300
Ma), related thermal anomalies had time to equilibrate. Detailed modeling further emphasized that the
observed anomalies did not reflect much differences in anisotropy, which led to attribute the
differences in P wave travel time to variations in chemical composition and mineralogy (Judenherc et
al., 2002,2003). Whatever the depth considered, all tomographic anomalies interrupt along the SASZ,
suggesting that this fault extends very deep downward. Between the SASZ and the NASZ, the two
main shear zones bounding the shear belt of central Brittany (Fig. 8.1), “fast/blue” and “slow/red”
anomalies define two oblique trends, roughly N-S above 130 km and NW-SE below (Fig. 8.2).
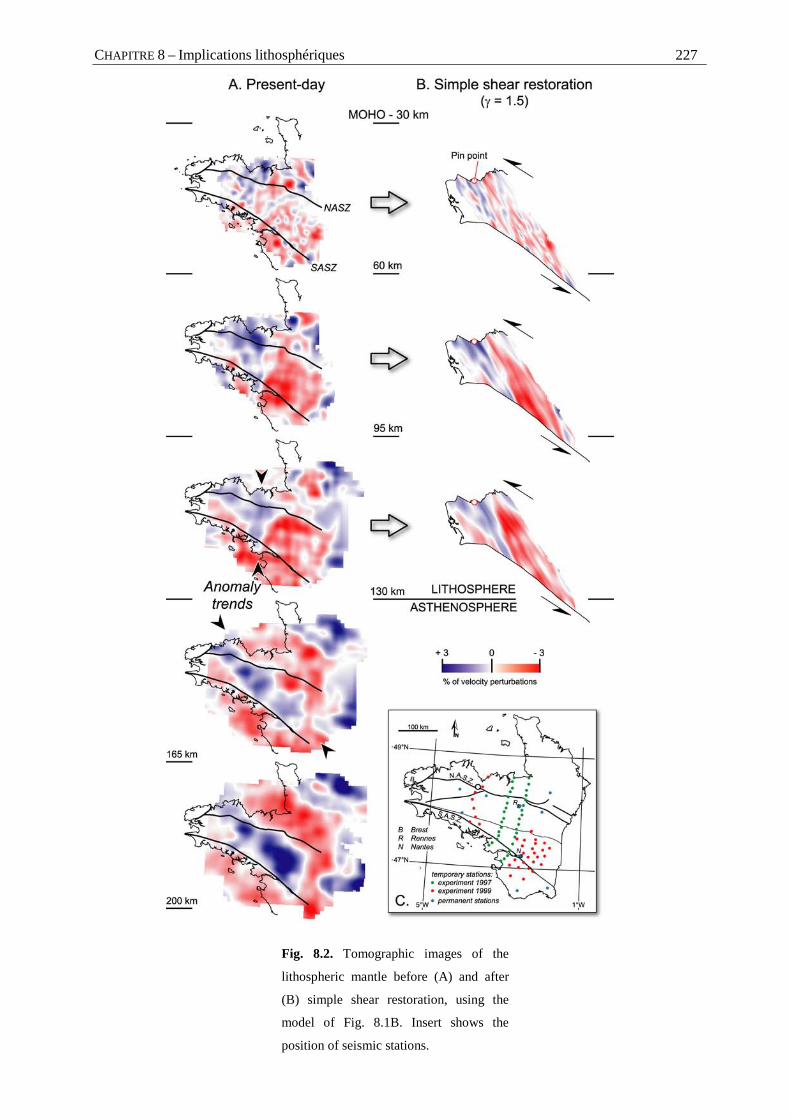
CHAPITRE 8 – Implications lithosphériques 227
Fig. 8.2. Tomographic images of the
lithospheric mantle before (A) and after
(B) simple shear restoration, using the
model of Fig. 8.1B. Insert shows the
position of seismic stations.
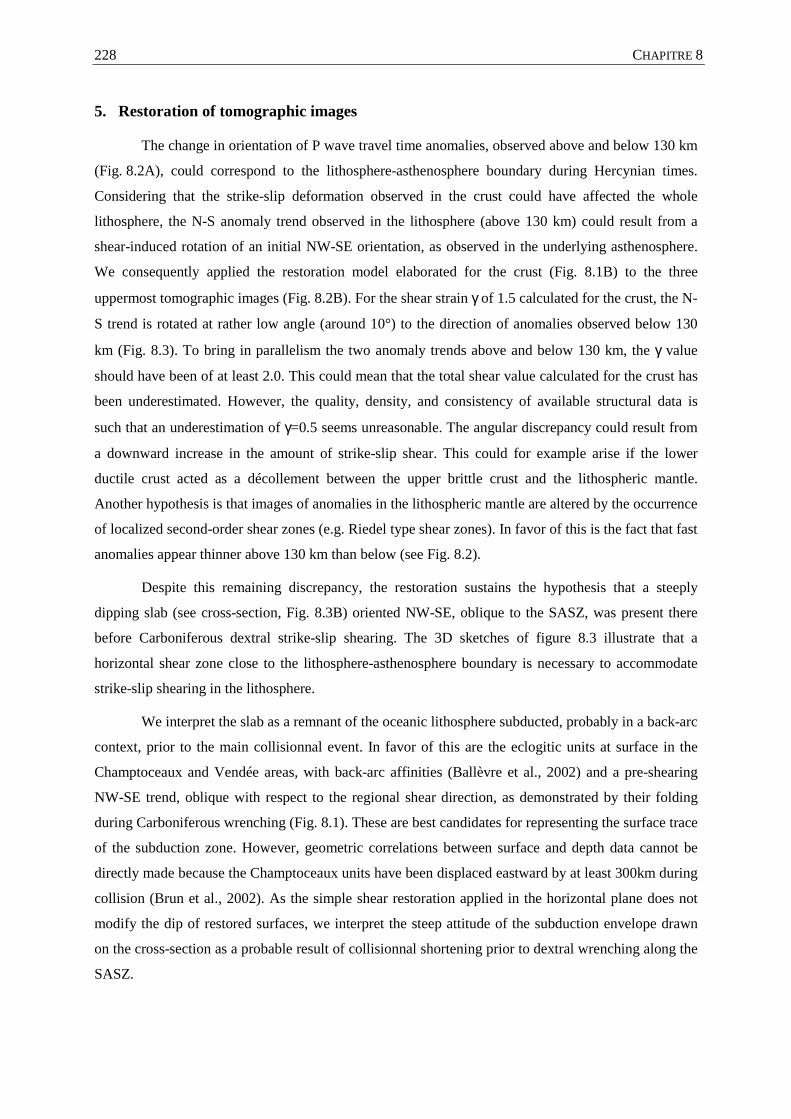
CHAPITRE 8 228
5. Restoration of tomographic images
The change in orientation of P wave travel time anomalies, observed above and below 130 km
(Fig. 8.2A), could correspond to the lithosphere-asthenosphere boundary during Hercynian times.
Considering that the strike-slip deformation observed in the crust could have affected the whole
lithosphere, the N-S anomaly trend observed in the lithosphere (above 130 km) could result from a
shear-induced rotation of an initial NW-SE orientation, as observed in the underlying asthenosphere.
We consequently applied the restoration model elaborated for the crust (Fig. 8.1B) to the three
uppermost tomographic images (Fig. 8.2B). For the shear strain γ of 1.5 calculated for the crust, the N-
S trend is rotated at rather low angle (around 10°) to the direction of anomalies observed below 130
km (Fig. 8.3). To bring in parallelism the two anomaly trends above and below 130 km, the γ value
should have been of at least 2.0. This could mean that the total shear value calculated for the crust has
been underestimated. However, the quality, density, and consistency of available structural data is
such that an underestimation of γ=0.5 seems unreasonable. The angular discrepancy could result from
a downward increase in the amount of strike-slip shear. This could for example arise if the lower
ductile crust acted as a décollement between the upper brittle crust and the lithospheric mantle.
Another hypothesis is that images of anomalies in the lithospheric mantle are altered by the occurrence
of localized second-order shear zones (e.g. Riedel type shear zones). In favor of this is the fact that fast
anomalies appear thinner above 130 km than below (see Fig. 8.2).
Despite this remaining discrepancy, the restoration sustains the hypothesis that a steeply
dipping slab (see cross-section, Fig. 8.3B) oriented NW-SE, oblique to the SASZ, was present there
before Carboniferous dextral strike-slip shearing. The 3D sketches of figure 8.3 illustrate that a
horizontal shear zone close to the lithosphere-asthenosphere boundary is necessary to accommodate
strike-slip shearing in the lithosphere.
We interpret the slab as a remnant of the oceanic lithosphere subducted, probably in a back-arc
context, prior to the main collisionnal event. In favor of this are the eclogitic units at surface in the
Champtoceaux and Vendée areas, with back-arc affinities (Ballèvre et al., 2002) and a pre-shearing
NW-SE trend, oblique with respect to the regional shear direction, as demonstrated by their folding
during Carboniferous wrenching (Fig. 8.1). These are best candidates for representing the surface trace
of the subduction zone. However, geometric correlations between surface and depth data cannot be
directly made because the Champtoceaux units have been displaced eastward by at least 300km during
collision (Brun et al., 2002). As the simple shear restoration applied in the horizontal plane does not
modify the dip of restored surfaces, we interpret the steep attitude of the subduction envelope drawn
on the cross-section as a probable result of collisionnal shortening prior to dextral wrenching along the
SASZ.
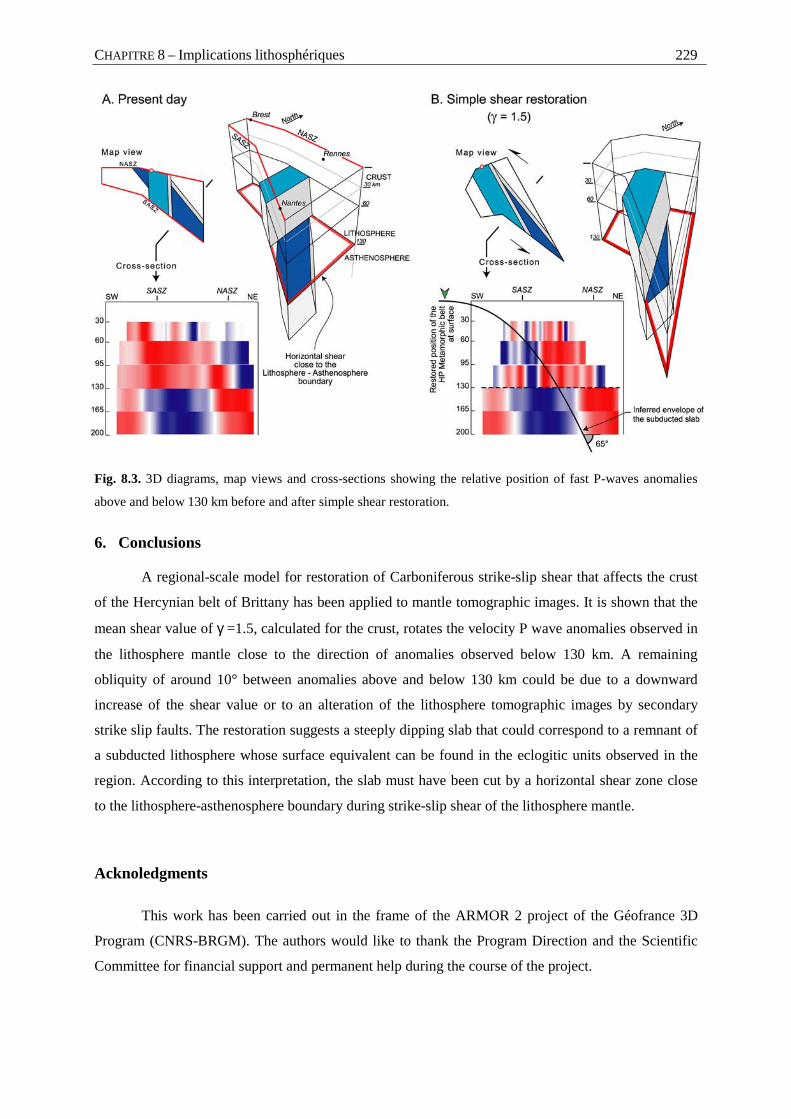
CHAPITRE 8 – Implications lithosphériques 229
Fig. 8.3. 3D diagrams, map views and cross-sections showing the relative position of fast P-waves anomalies
above and below 130 km before and after simple shear restoration.
6. Conclusions
A regional-scale model for restoration of Carboniferous strike-slip shear that affects the crust
of the Hercynian belt of Brittany has been applied to mantle tomographic images. It is shown that the
mean shear value of γ =1.5, calculated for the crust, rotates the velocity P wave anomalies observed in
the lithosphere mantle close to the direction of anomalies observed below 130 km. A remaining
obliquity of around 10° between anomalies above and below 130 km could be due to a downward
increase of the shear value or to an alteration of the lithosphere tomographic images by secondary
strike slip faults. The restoration suggests a steeply dipping slab that could correspond to a remnant of
a subducted lithosphere whose surface equivalent can be found in the eclogitic units observed in the
region. According to this interpretation, the slab must have been cut by a horizontal shear zone close
to the lithosphere-asthenosphere boundary during strike-slip shear of the lithosphere mantle.
Acknoledgments
This work has been carried out in the frame of the ARMOR 2 project of the Géofrance 3D
Program (CNRS-BRGM). The authors would like to thank the Program Direction and the Scientific
Committee for financial support and permanent help during the course of the project.
CHAPITRE 8 230
References
BALLEVRE, M., KIENAST, J.R. & PAQUETTE, J.L. (1987) - "Le métamorphisme éclogitique dans la
nappe hercynienne de Champtoceaux (Massif armoricain)." - Comptes Rendus de l'Académie des
Sciences de Paris, II - 305, 127-131.
BALLEVRE, M., CAPDEVILLA, R., GUERROT, C. & PEUCAT, J.J. (2002) - "Discovery of an alkaline
orthogneiss in the eclogite-bearing Cellier Unit (Champtoceaux Complex, Armorican Massif): a
new witness of the Ordovician rifting." - Comptes Rendus Geoscience, 334, 303-311.
BITRI, A., BALLEVRE, M., BRUN, J.P., CHANTRAINE, J., GAPAIS, D., GUENNOC, P., GUMIAUX, C. &
TRUFFERT, C. (2003) - "Imagerie sismique de la zone de collision Hercynienne dans le sud-est du
Massif Armoricain (Projet Armor2 - Programme Geofrance 3D). Seismic imaging of the Hercynian
collision zone in the south-eastern Armorican Massif (Armor2 project - Geofrance 3D program)." -
Comptes Rendus Geoscience, 335, 969-979.
BOSSE, V., FERAUD, G., RUFFET, G., BALLEVRE, M., PEUCAT, J.-J. & DE JONG, K. (2000) - "Late
Devonian subduction and early-orogenic exhumation of eclogite-facies rocks from the
Champtoceaux Complex (Variscan belt, France)." - Geological journal, 35, 297-325.
BRUN, J.P., GAPAIS, D., CAPDEVILLA, R., GUMIAUX, C., GRANET, M. & CHANTRAINE, J. (2002) - "La
suture sud de la collision Hercynienne en France : une tentative de restauration." - Secondery La
suture sud de la collision Hercynienne en France : une tentative de restauration., 77.
CHANTRAINE, J., AUTRAN, A. & CAVELIER, C. (1996) - French Geological map (1/1,000,000), 1 sheet,
BRGM Service Géologique National, Orléans.
GAPAIS, D. & LE CORRE, C. (1980) - "Is the Hercynian belt of Brittany a major shear zone?" - Nature,
288, 574-576.
GAPAIS, D., LAGARDE, J.L., LE CORRE, C., AUDREN, C., JEGOUZO, P., CASAS SAINZ, A. & VAN DEN
DRIESSCHE, J. (1993) - "La zone de cisaillement de Quiberon : témoin d'extension de la chaîne
varisque en Bretagne méridionale au Carbonifère." - Comptes Rendus de l'Académie des Sciences
de Paris, II(316), 1123-1129.
CHAPITRE 8 – Implications lithosphériques 231
GUMIAUX, C., BRUN, J.P. & GAPAIS, D. (in press / sous presse) - "Strain removal within the Hercynian
Shear Belt of Central Brittany (Western France): methodology and tectonic implications." - Journal
of the Geological Society of London Special publication.
JEGOUZO, P. (1980) - "The South Armorican Shear Zone." - Journal of Structural Geology, 2(1-2), 39-
47.
JUDENHERC, S., GRANET, M., BRUN, J.P., POUPINET, G., PLOMEROVA, J., MOCQUET, A. & ACHAUER,
U. (2002) - "Images of lithospheric heterogeneities in the Armorican segment of the Hercynian
Range in France." - Tectonophysics, 358, 121-134.
JUDENHERC, S., GRANET, M., BRUN, J.P. & POUPINET, G. (2003) - "The Hercynian collision in the
Armorican Massif: evidence of different lithospheric domains inferred from tomography and
anisotropy." - Bulletin de la Société Géologique de France, 174, 45-57.
PERCEVAULT, M.-N. & COBBOLD, P.R. (1982) - "Mathematical removal of regional ductile strains in
Central Brittany: evidence for wrench tectonics." - Tectonophysics, 82, 317-328.
POUPINET, G., ARNDT, N. & VACHER, P. (2003) - "Seismic tomography beneath stable tectonic regions
and the origin and composition of the continental lithospheric mantle." - Earth and Planetary
Science Letters, 212, 89-101.
SOBOLEV, S.V., ZEYEN, H., STOLL, G., WERLING, F., ALTHERR, R. & FUCHS, K. (1996) - "Upper
mantle temperatures from teleseismic tomography of the French Massif Central including effects of
composition, mineral reactions, anharmonicity, anelasticity and partial melt." - Earth and Planetary
Science Letters, 139, 147-163.


C h a p i t r e 9 Synthèse & conclusions

CHAPITRE 9 – Synthèse & Conclusion 235
L'arc Ibéro-Armoricain, à l'Ouest de la chaîne hercynienne d'Europe est souligné par des
structures d'échelle régionale et initié dès les phases précoces de la formation de l'orogenèse. Au cours
de la collision, la syntaxe se referme pendant le Carbonifère induisant de grands décrochements
dextres dans le Massif Armoricain. Ces déformations tardives localisées s'accompagnent d'une
déformation cisaillante distribuée dans l'ensemble du massif. Les domaines supra-crustaux, situés au
Nord-est de la zone de suture de Bretagne méridionale, n'ont enregistré que cette seule phase de
déformation.
L'analyse intégrée des données structurales de terrain et des données géophysiques disponibles
a permis de caractériser le régime de la déformation à l'échelle régionale dans ces domaines.
1. Analyse et modélisation des données structurales de terrain
L'étude du régime de déformation à l'échelle de la croûte, et ses implications à celle de la
lithosphère, a été effectuée à partir des données structurales de surface. L'échelle critique d'observation
doit être d'abord recherchée car le champ de déformation enregistré par les structures des roches peut
être soumis à des variations très locales d'intensité et de direction. Pour pouvoir quantifier les
paramètres caractéristiques de la déformation, il faut d'abord déterminer le "bruit" inhérent aux
méthodes de mesure ou de compilation de données. De plus, la contribution des effets très locaux,
pouvant également être considérés comme du bruit relatif jusqu'à une certaine échelle, doit également
être soustraite aux valeurs mesurées lors de l'interpolation des données à l'échelle de toute la zone. Les
géostatistiques ont été développées dans le but de caractériser et de quantifier les variations spatiales
d'une variable donnée. Une telle méthode d'analyse permet en particulier de faire ressortir la valeur de
la distance maximale de corrélation ainsi que la part du bruit relatif inclus dans les mesures.
A partir de ces principes, nous avons utilisé une méthode d'analyse géostatistique pour traiter
les données de direction de schistosité à travers la Bretagne Centrale. Les données directionnelles font
partie des données dites "circulaires" et la méthode d'analyse géostatistique a du ici être adaptée à ce
cas particulier de variable. L'interpolation des données, mesurées sur toute l'étendue d'une région
considérée, peut être produite par Krigeage en utilisant les paramètres les plus adaptés déduits de
l'étude géostatistique préalable. Pour le cas du traitement des directions de schistosité, qui nous
concerne plus particulièrement dans le cadre de cette étude, le résultat de l'interpolation régionale peut
être représenté sur une carte des trajectoires automatiques (Figs. 9.1a et d). La figure 9.1 montre, sur la
colonne de gauche, le résultat du traitement pour un cas relativement simple de variations spatiales de
directions.
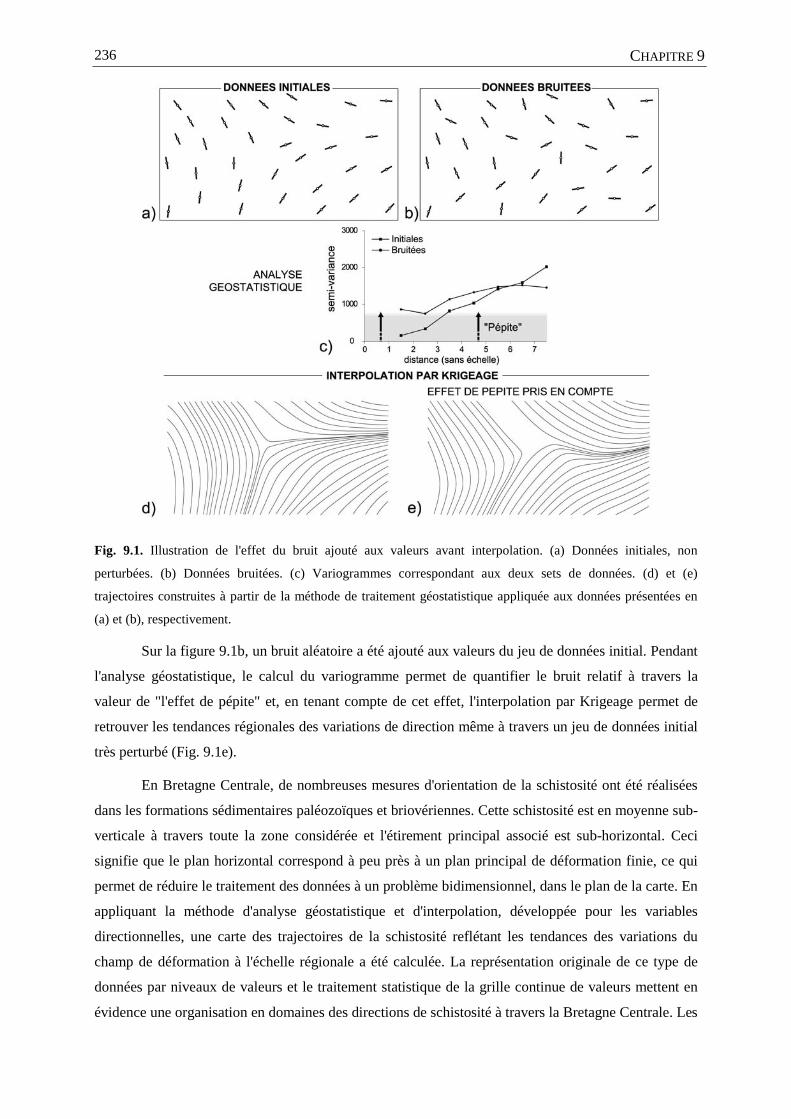
CHAPITRE 9 236
Fig. 9.1. Illustration de l'effet du bruit ajouté aux valeurs avant interpolation. (a) Données initiales, non
perturbées. (b) Données bruitées. (c) Variogrammes correspondant aux deux sets de données. (d) et (e)
trajectoires construites à partir de la méthode de traitement géostatistique appliquée aux données présentées en
(a) et (b), respectivement.
Sur la figure 9.1b, un bruit aléatoire a été ajouté aux valeurs du jeu de données initial. Pendant
l'analyse géostatistique, le calcul du variogramme permet de quantifier le bruit relatif à travers la
valeur de "l'effet de pépite" et, en tenant compte de cet effet, l'interpolation par Krigeage permet de
retrouver les tendances régionales des variations de direction même à travers un jeu de données initial
très perturbé (Fig. 9.1e).
En Bretagne Centrale, de nombreuses mesures d'orientation de la schistosité ont été réalisées
dans les formations sédimentaires paléozoïques et briovériennes. Cette schistosité est en moyenne sub-
verticale à travers toute la zone considérée et l'étirement principal associé est sub-horizontal. Ceci
signifie que le plan horizontal correspond à peu près à un plan principal de déformation finie, ce qui
permet de réduire le traitement des données à un problème bidimensionnel, dans le plan de la carte. En
appliquant la méthode d'analyse géostatistique et d'interpolation, développée pour les variables
directionnelles, une carte des trajectoires de la schistosité reflétant les tendances des variations du
champ de déformation à l'échelle régionale a été calculée. La représentation originale de ce type de
données par niveaux de valeurs et le traitement statistique de la grille continue de valeurs mettent en
évidence une organisation en domaines des directions de schistosité à travers la Bretagne Centrale. Les
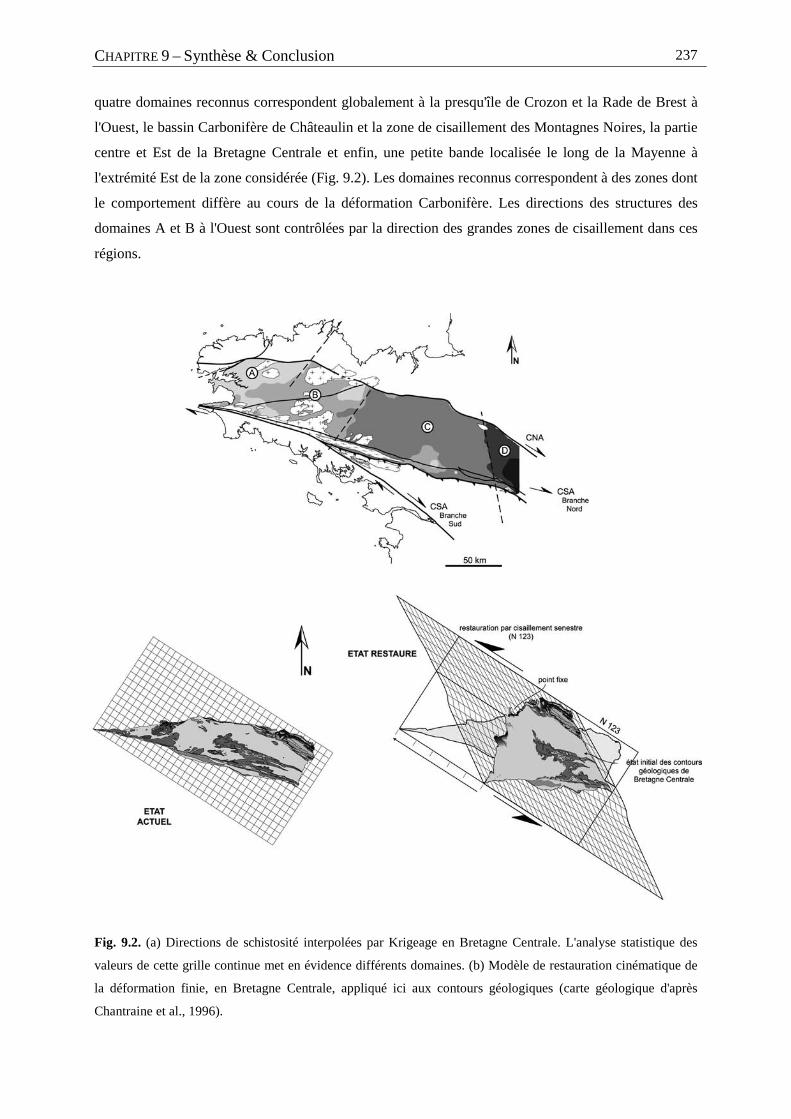
CHAPITRE 9 – Synthèse & Conclusion 237
quatre domaines reconnus correspondent globalement à la presqu'île de Crozon et la Rade de Brest à
l'Ouest, le bassin Carbonifère de Châteaulin et la zone de cisaillement des Montagnes Noires, la partie
centre et Est de la Bretagne Centrale et enfin, une petite bande localisée le long de la Mayenne à
l'extrémité Est de la zone considérée (Fig. 9.2). Les domaines reconnus correspondent à des zones dont
le comportement diffère au cours de la déformation Carbonifère. Les directions des structures des
domaines A et B à l'Ouest sont contrôlées par la direction des grandes zones de cisaillement dans ces
régions.
Fig. 9.2. (a) Directions de schistosité interpolées par Krigeage en Bretagne Centrale. L'analyse statistique des
valeurs de cette grille continue met en évidence différents domaines. (b) Modèle de restauration cinématique de
la déformation finie, en Bretagne Centrale, appliqué ici aux contours géologiques (carte géologique d'après
Chantraine et al., 1996).
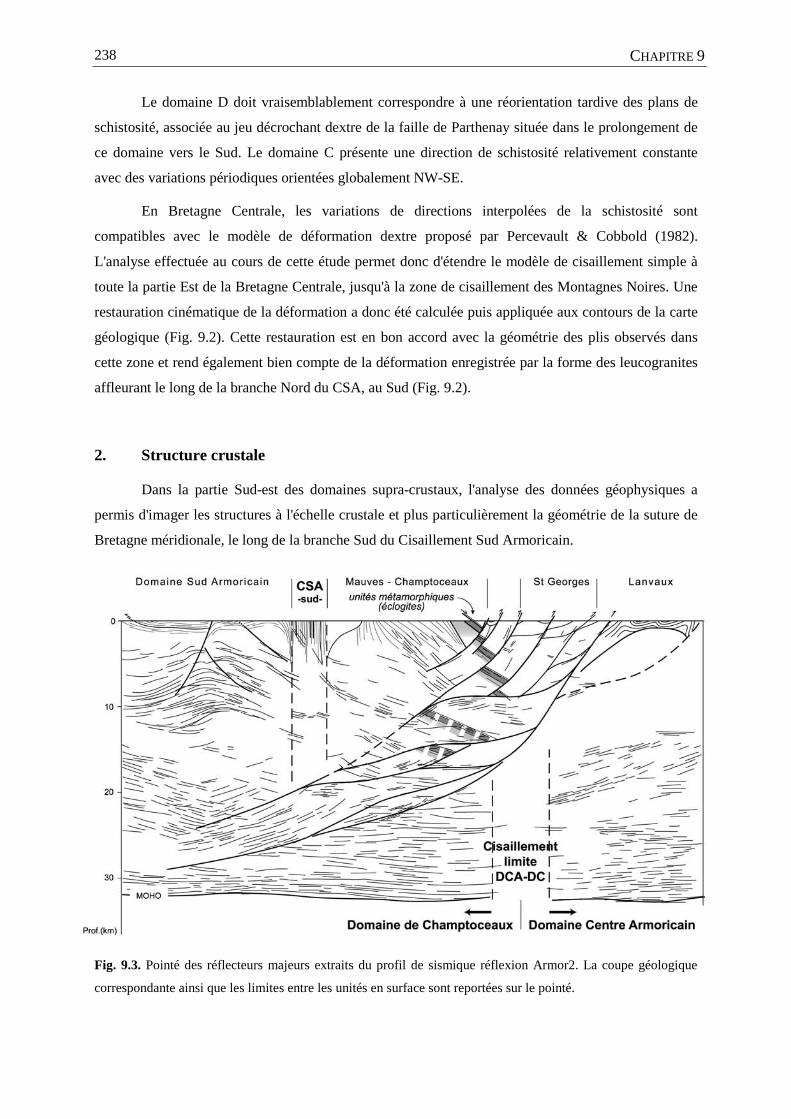
CHAPITRE 9 238
Le domaine D doit vraisemblablement correspondre à une réorientation tardive des plans de
schistosité, associée au jeu décrochant dextre de la faille de Parthenay située dans le prolongement de
ce domaine vers le Sud. Le domaine C présente une direction de schistosité relativement constante
avec des variations périodiques orientées globalement NW-SE.
En Bretagne Centrale, les variations de directions interpolées de la schistosité sont
compatibles avec le modèle de déformation dextre proposé par Percevault & Cobbold (1982).
L'analyse effectuée au cours de cette étude permet donc d'étendre le modèle de cisaillement simple à
toute la partie Est de la Bretagne Centrale, jusqu'à la zone de cisaillement des Montagnes Noires. Une
restauration cinématique de la déformation a donc été calculée puis appliquée aux contours de la carte
géologique (Fig. 9.2). Cette restauration est en bon accord avec la géométrie des plis observés dans
cette zone et rend également bien compte de la déformation enregistrée par la forme des leucogranites
affleurant le long de la branche Nord du CSA, au Sud (Fig. 9.2).
2. Structure crustale
Dans la partie Sud-est des domaines supra-crustaux, l'analyse des données géophysiques a
permis d'imager les structures à l'échelle crustale et plus particulièrement la géométrie de la suture de
Bretagne méridionale, le long de la branche Sud du Cisaillement Sud Armoricain.
Fig. 9.3. Pointé des réflecteurs majeurs extraits du profil de sismique réflexion Armor2. La coupe géologique
correspondante ainsi que les limites entre les unités en surface sont reportées sur le pointé.
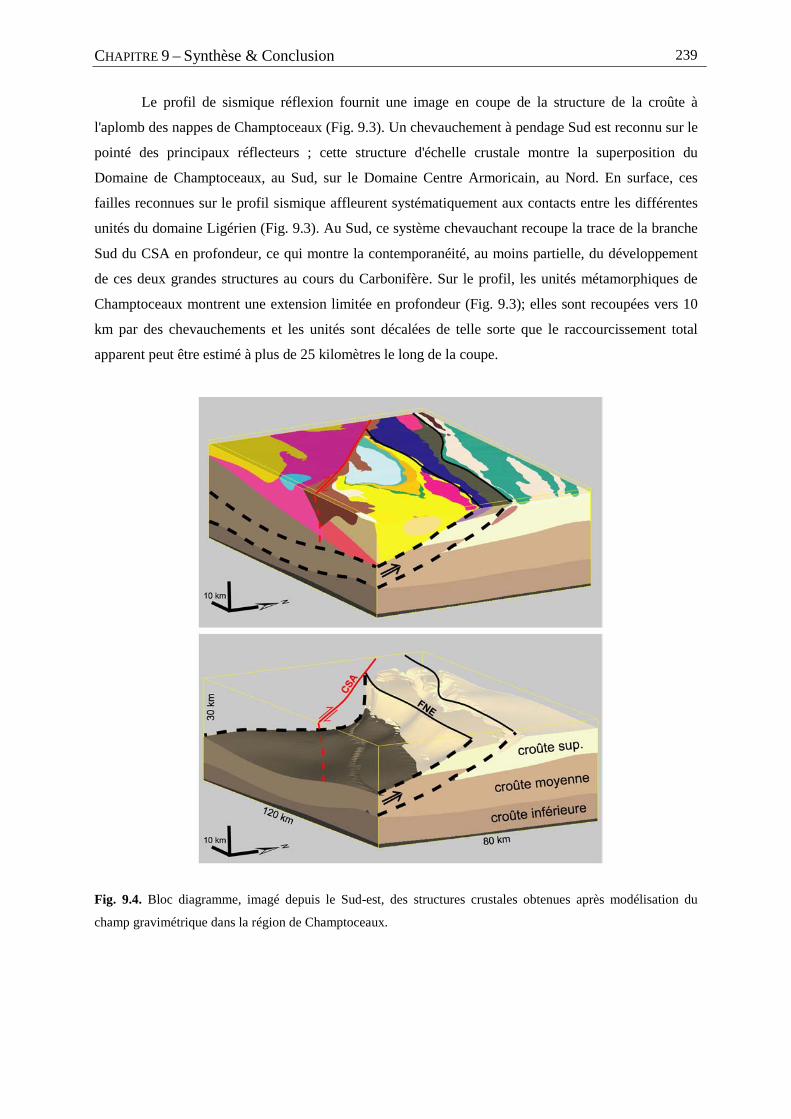
CHAPITRE 9 – Synthèse & Conclusion 239
Le profil de sismique réflexion fournit une image en coupe de la structure de la croûte à
l'aplomb des nappes de Champtoceaux (Fig. 9.3). Un chevauchement à pendage Sud est reconnu sur le
pointé des principaux réflecteurs ; cette structure d'échelle crustale montre la superposition du
Domaine de Champtoceaux, au Sud, sur le Domaine Centre Armoricain, au Nord. En surface, ces
failles reconnues sur le profil sismique affleurent systématiquement aux contacts entre les différentes
unités du domaine Ligérien (Fig. 9.3). Au Sud, ce système chevauchant recoupe la trace de la branche
Sud du CSA en profondeur, ce qui montre la contemporanéité, au moins partielle, du développement
de ces deux grandes structures au cours du Carbonifère. Sur le profil, les unités métamorphiques de
Champtoceaux montrent une extension limitée en profondeur (Fig. 9.3); elles sont recoupées vers 10
km par des chevauchements et les unités sont décalées de telle sorte que le raccourcissement total
apparent peut être estimé à plus de 25 kilomètres le long de la coupe.
Fig. 9.4. Bloc diagramme, imagé depuis le Sud-est, des structures crustales obtenues après modélisation du
champ gravimétrique dans la région de Champtoceaux.
CHAPITRE 9 240
L'analyse de l'anomalie du champ magnétique démontre la présence de sources au niveau de la
croûte moyenne, à l'aplomb des unités basiques métamorphiques du complexe de Champtoceaux.
L'analyse par la méthode de la transformée en ondelettes, le long d'un profil correspondant à la trace
du profil sismique, permet de positionner les discontinuités magnétiques majeures à travers les sources
comprises entre la surface et environ 10 kilomètres de profondeur.Ces discontinuités se superposent
parfois aux structures reconnues sur le pointé du profil sismique et permettent de confirmer la
présence soupçonnée des unités de Champtoceaux vers 10 km de profondeur.Une modélisation directe
du signal mesuré permet de confirmer la position des discontinuités dans la croûte supérieure et de
préciser la géométrie des niveaux de serpentinites associés au complexe métamorphique de
Champtoceaux.
A partir du pointé de ce profil sismique, une modélisation du champ gravimétrique a été
réalisée, à l'échelle de toute la croûte, traversant les Domaines de Champtoceaux et Ligérien. La
modélisation en trois dimensions montre une forme non-cylindrique des chevauchements reconnus sur
le profil sismique (Fig. 9.4). Ils se redressent graduellement vers l'Ouest où ils tangentent la trace
verticale du CSA (Fig. 9.4). Cette structure particulière confirme bien que ces chevauchements se
développent pendant le fonctionnement du cisaillement régional dextre, au cours du Carbonifère.
3. Histoire de la déformation régionale et implications lithosphériques
Le modèle cinématique de restauration de la déformation utilisé en Bretagne Centrale souligne
des problèmes de compatibilités aux limites avec les domaines voisins, au cours du cisaillement
régional. Les déformations prédites par le modèle ont alors été confrontées aux observations
géologiques, et plus particulièrement structurales, sur les bordures du domaine oriental de la Bretagne
Centrale, et dans les régions adjacentes. L'ensemble des structures observées localement, à travers le
Domaine Centre Armoricain s'intègre à l'évolution en cisaillement dextre régional au cours du
Carbonifère (Fig. 9.5). En particulier, les grandes structures, telles que les Montagnes Noires,
subissent des rotations importantes et peuvent être considérées comme des structures héritées de
l'orogenèse Cadomien ou de la phase d'extension qui affecte l'ensemble du Massif Armoricain à
l'Ordovicien. Ces structures héritées jouent un rôle important au cours de la déformation régionale, en
localisant la déformation et en permettant le développement de mouvements chevauchants dans la
couverture sédimentaire Paléozoïque. Au Carbonifère, le bassin de Châteaulin peut ainsi être considéré
comme un bassin compressif développé au front des Montagnes Noires (Fig. 9.5b et c). Le dôme
métamorphique de Plouguenast se situe dans une zone charnière particulière de la Bretagne Centrale, à
la jonction entre le CNA et la zone de cisaillement des Montagnes Noires (Fig. 9.5). Au Sud des
domaines supra-crustaux, dans les Domaines de Champtoceaux et Ligérien, les structures de cette
zone comprise entre les deux branches du CSA montrent une déformation transpressive localisée sur
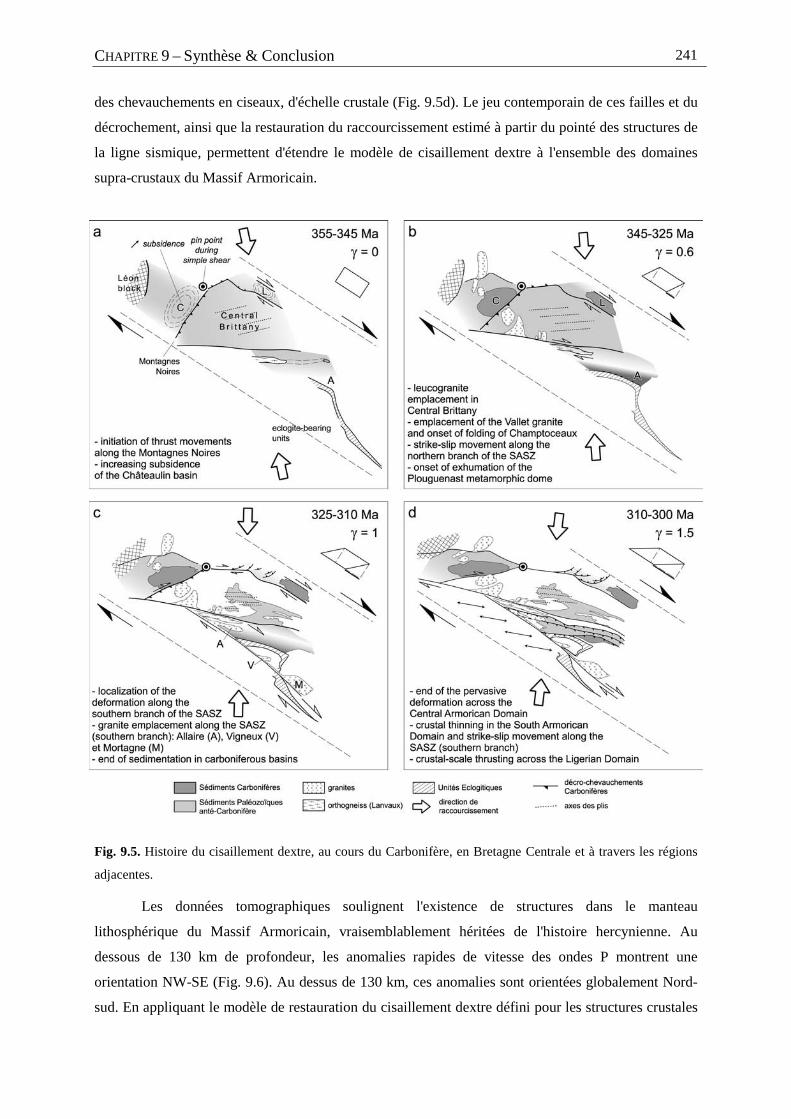
CHAPITRE 9 – Synthèse & Conclusion 241
des chevauchements en ciseaux, d'échelle crustale (Fig. 9.5d). Le jeu contemporain de ces failles et du
décrochement, ainsi que la restauration du raccourcissement estimé à partir du pointé des structures de
la ligne sismique, permettent d'étendre le modèle de cisaillement dextre à l'ensemble des domaines
supra-crustaux du Massif Armoricain.
Fig. 9.5. Histoire du cisaillement dextre, au cours du Carbonifère, en Bretagne Centrale et à travers les régions
adjacentes.
Les données tomographiques soulignent l'existence de structures dans le manteau
lithosphérique du Massif Armoricain, vraisemblablement héritées de l'histoire hercynienne. Au
dessous de 130 km de profondeur, les anomalies rapides de vitesse des ondes P montrent une
orientation NW-SE (Fig. 9.6). Au dessus de 130 km, ces anomalies sont orientées globalement Nord-
sud. En appliquant le modèle de restauration du cisaillement dextre défini pour les structures crustales
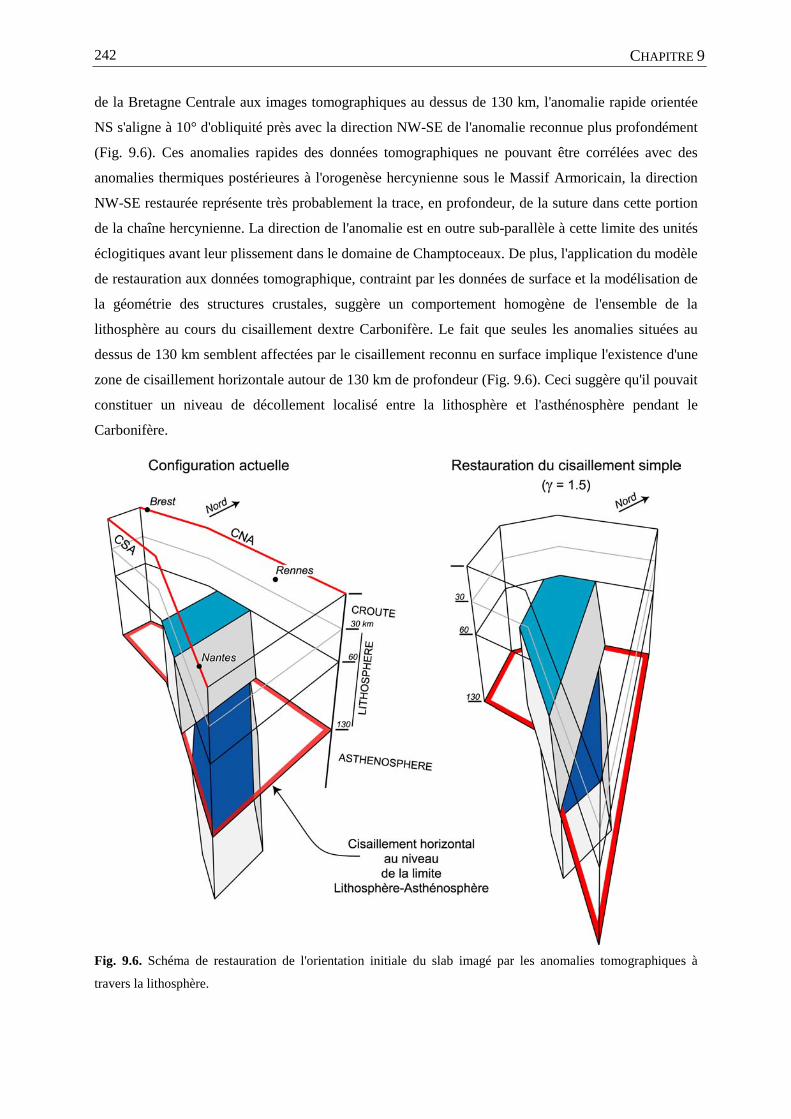
CHAPITRE 9 242
de la Bretagne Centrale aux images tomographiques au dessus de 130 km, l'anomalie rapide orientée
NS s'aligne à 10° d'obliquité près avec la direction NW-SE de l'anomalie reconnue plus profondément
(Fig. 9.6). Ces anomalies rapides des données tomographiques ne pouvant être corrélées avec des
anomalies thermiques postérieures à l'orogenèse hercynienne sous le Massif Armoricain, la direction
NW-SE restaurée représente très probablement la trace, en profondeur, de la suture dans cette portion
de la chaîne hercynienne. La direction de l'anomalie est en outre sub-parallèle à cette limite des unités
éclogitiques avant leur plissement dans le domaine de Champtoceaux. De plus, l'application du modèle
de restauration aux données tomographique, contraint par les données de surface et la modélisation de
la géométrie des structures crustales, suggère un comportement homogène de l'ensemble de la
lithosphère au cours du cisaillement dextre Carbonifère. Le fait que seules les anomalies situées au
dessus de 130 km semblent affectées par le cisaillement reconnu en surface implique l'existence d'une
zone de cisaillement horizontale autour de 130 km de profondeur (Fig. 9.6). Ceci suggère qu'il pouvait
constituer un niveau de décollement localisé entre la lithosphère et l'asthénosphère pendant le
Carbonifère.
Fig. 9.6. Schéma de restauration de l'orientation initiale du slab imagé par les anomalies tomographiques à
travers la lithosphère.

Bibliographie

BILIOGRAPHIE 245
ANGELIER, J. (1994) - "Fault slip analysis and paleostress reconstruction." In: P. Hancock (Ed.),
Continental Deformation. - Pergamon, New York, pp. 53-100.
ARTHAUD, F. & MATTE, P. (1975) - "Les décrochements tardi-hercyniens du Sud-Ouest de l'Europe.
Géométrie et essai de reconstitution des conditions de la déformation." - Tectonophysics, 25(1-2), 139-
171.
AUDREN, C. (1987) - "Evolution structurale de la Bretagne méridionale au Paléozoïque." - Thèse,
Université de Rennes1, Rennes, 365 pp.
BABIN, C., DARBOUX, J.R., DUEE, G., GRAVELLE, P., MORZADEC, P., PLUSQUELLEC, Y. & THONON, P.
(1975) - "Tectoniques tangentielles et tectoniques superposées dans le Dévonien de la rade de Brest
(Nord-Finistère)." - Comptes Rendus de l'Académie des Sciences de Paris, D 280, 259-262.
BALE, P. & BRUN, J.P. (1986) - "Les complexes métamorphiques du Léon (NW Bretagne) : un segment du
domaine éo-hercynien sud armoricain translaté au Dévonien." - Bulletin de la Société Géologique de
France, 2(3), 471-477.
BALLARD, J.F., BRUN, J.P. & DURAND, J. (1986) - "La discordance Briovérien-Paléozoïque inférieur en
Bretagne Centrale : signature d'un épisode de distension ordovicienne." - Comptes Rendus de
l'Académie des Sciences de Paris, II - 303(14), 1327-1332.
BALLEVRE, M., KIENAST, J.R. & PAQUETTE, J.L. (1987) - "Le métamorphisme éclogitique dans la nappe
hercynienne de Champtoceaux (Massif armoricain)." - Comptes Rendus de l'Académie des Sciences de
Paris, II - 305, 127-131.
BALLEVRE, M., PINARDON, J.L., KIENAST, J.R. & VUICHARD, J.P. (1989) - "Reversal of Fe-Mg
partitioning between garnet and staurolite in eclogite-facies metapelites from Champtoceaux Nappe
(Brittany, France)." - Journal of Petrology, 30(6), 1321-1349.
BALLEVRE, M. & MARCHAND, J. (1991) - "Zonation du métamorphisme éclogitique dans la nappe de
Champtoceaux (Massif armoricain, France)." - Comptes Rendus de l'Académie des Sciences de Paris,
312, 705-711.
BIBLIOGRAPHIE 246
BALLEVRE, M., PARIS, F. & ROBARDET, M. (1992) - "Correlations ibero-armoricaines au Paleozoique; une
confrontation des donnees paleobiogeographiques et tectonometamorphiques." - Comptes Rendus de
l'Académie des Sciences de Paris, II - 315(13), 1783-1789.
BALLEVRE, M., MARCHAND, J., GODARD, G., GOUJOU, J.C. & WYNS, R. (1994) - "Eo-Hercynian events in
the Armorican Massif." In: J. D. Keppie (Ed.), Pre-Mesozoic geology in France and related areas. -
Springer Verlag, Berlin, pp. 183-194.
BALLEVRE, M., LE GOFF, E. & HEBERT, R. (2001) - "The tectonothermal evolution of the Cadomian belt
of northern Brittany, France: a Neoproterozoic volcanic arc." - Tectonophysics, 331, 19-43.
BALLEVRE, M., CAPDEVILLA, R., GUERROT, C. & PEUCAT, J.J. (2002) - "Discovery of an alkaline
orthogneiss in the eclogite-bearing Cellier Unit (Champtoceaux Complex, Armorican Massif): a new
witness of the Ordovician rifting." - Comptes Rendus Geoscience, 334, 303-311.
BALLEVRE, M. & PITRA, P. (2002) - "Histoire P-T prograde des schistes bleus de l'Ile de Groix : un
enregistrement de leur subduction." - Réunion des Sciences de la Terre, Nantes, France, p.77.
BARBOTIN, E. (1987) - "Trajectoires de déformation finie et interprétation cinématique. Modèles
numériques et application à des exemples régionaux (Bretagne Centrale et Alpes Penniques)." - Thèse,
Université de Rennes 1, Rennes, 158 pp.
BARROIS, C. (1930) - "Les grandes lignes de la Bretagne." In: (Ed.), Livre Jubilaire. Centenaire de la
Société géologique de France. - Paris.
BAYER, R. & HIRN, A. (1987) - "Données géophysiques sur la structure profonde de la croûte hercynienne
dans l'arc ibéro-armoricain et le Massif Central Français." - Bulletin de la Société Géologique de
France, 3(3), 561-574.
BEAUPERE, C. (1973) - "Contribution à l'étude de la flore fossile du "Culm" du synclinal d'Ancenis." -
Thèse, Université Pierre et Marie Curie, Paris, 111 pp.
BILIOGRAPHIE 247
BERNARD-GRIFFITHS, J. & CORNICHET, J. (1985) - "Origin of eclogites from south Brittany, France : A
Sm-Nd isotopic and REE study." - Chemical Geology, 52, 185-201.
BERNARD-GRIFFITHS, J., PEUCAT, J.J., SHEPPART, S. & VIDAL, P. (1985) - "Petrogenesis of Hercynian
leucogranites from the southern Armorican Massif : contribution of REE and isotopic (Sr, Nb, Pb and
O) geochemical data to the study of source rock characteristics and ages." - Earth and Planetary
Science Letters, 74, 235-250.
BERTHE, D., CHOUKROUNE, P. & GAPAIS, D. (1979) - "Quartz Fabrics and Progressive Gneissification of
Granites By Simple Shear - Example of the South Armerican Shear Zone." - Bulletin de Minéralogie,
102(2-3), 265-272.
BERTHE, D., CHOUKROUNE, P. & JEGOUZO, P. (1979) - "Orthogneiss, mylonite and non coaxial
deformation of granites: the example of the South Armorican Shear Zone." - Journal of Structural
Geology, 1(1), 31-42.
BERTHE, D. & BRUN, J.P. (1980) - "Evolution of folds during progressive shear in the South-armorican
shear zone, France." - Journal of Structural Geology, 2, 127-133.
BERTRAND, P., DUFOUR, J.F., FRANÇON, J. & LIENHARDT, P. (1992) - "Modélisation volumique à base
topologique." – Actes MICAD92, Paris,59-74.
BITRI, A., BRUN, J.P., TRUFFERT, C. & GUENNOC, P. (2001) - "Deep seismic imaging of the Cadomian
thrust wedge of Northern Brittany." - Tectonophysics, 331(1-2), 65-80.
BITRI, A., BALLEVRE, M., BRUN, J.P., CHANTRAINE, J., GAPAIS, D., GUENNOC, P., GUMIAUX, C. &
TRUFFERT, C. (2003) - "Imagerie sismique de la zone de collision Hercynienne dans le sud-est du
Massif Armoricain (Projet Armor2 - Programme Geofrance 3D). Seismic imaging of the Hercynian
collision zone in the south-eastern Armorican Massif (Armor2 project - Geofrance 3D program)." -
Comptes Rendus Geoscience, 335, 969-979.
BOISSONNAT, J.D. (1988) - "Shape reconstruction from planar cross-sections." - Computer Visualisation
and Graphical Image Processing, 44, 1-29.
BIBLIOGRAPHIE 248
BONIJOLY, D., PERRIN, J., TRUFFERT, C. & ASFIRANE, F. (1999) - "Couverture géophysique aéroportée du
Massif Armoricain, magnétisme et radiométrie spectrale."- 75 pp.
BOS, P., CASTAING, C., CLEMENT, J.P., CHANTRAINE, J. & LEMEILLE, F. (1997) - French Geological map
(1/50,000), "Rostrenen (312).", BRGM, Orléans.
BOSSE, V., FERAUD, G., RUFFET, G., BALLEVRE, M., PEUCAT, J.-J. & DE JONG, K. (2000) - "Late
Devonian subduction and early-orogenic exhumation of eclogite-facies rocks from the Champtoceaux
Complex (Variscan belt, France)." - Geological journal, 35, 297-325.
BOSSE, V., BALLEVRE, M. & VIDAL, O. (2002) - "Ductile thrusting recorded by the garnet isograd from
the blueschist-facies metapelites of the Ile de Groix, Armorican Massif, France." - Journal of
Petrology, 43(3), 485-510.
BOUCHEZ, J.L. & BLAISE, J. (1976) - "Une structure hercynienne liée à un accident ductile : l'anticlinal de
Lanvaux - les-Ponts-de-Cé, aux environs d'Angers (massif Armoricain)." - Bulletin de la Société
Géologique de France, 18(1), 145-157.
BOUKERBOUT, H. (1999) "Identification des sources de champs de potentiel à partir de la transformée en
ondelettes : Passage dans le plan (x,z) des profondeurs." – DEA report, Université de Rennes1, Rennes.
BOUKERBOUT, H. (2000) - "Retraitement des données aéromagnétiques de l'Algérie." - Magistère,
Université des Sciences et de la Technologie Houari Boumédiène, Alger, 70 pp.
BOURENNANE, H. (1997) - "Etude des lois de distribution spatiale des sols de Petite Beauce." - Thèse,
Université d'Orléans, Orléans, 229 pp.
BROWN, M. & DALLMEYER, R.D. (1996) - "Rapid Variscan exhumation and the role of magma in core
complex formation : southern Brittany metamorphic belt, France." - Journal of Metamorphic Geology,
14, 361-379.
BRUN, J.-P. (1981) - "Instabilités gravitaire et déformation de la croûte continentale : application au
développement des dômes et des plutons." - Thèse d'état, Université de Rennes 1, Rennes, pp.
BILIOGRAPHIE 249
BRUN, J.-P. & PONS, J. (1981) - "Strain patterns of pluton emplacement in a crust undergoing non-coaxial
deformation, Sierra Morena, Southern Spain." - Journal of Structural Geology, 3, 219-229.
BRUN, J.P. (1981) - "Instabilités gravitaire et déformation de la croûte continentale : application au
développement des dômes et des plutons." - Thèse d'état, Université de Rennes 1, Rennes, pp.
BRUN, J.P. & BURG, J.P. (1982) - "Combined thrusting and wrenching in the Ibero-Armorican arc : a
corner effect during continental collision." - Earth and Planetary Science Letters, 61, 319-332.
BRUN, J.-P., BALLARD, J.-F. & LE CORRE, C. (1991) - "Identification of Ordovician block-tilting in the
Hercynian fold belt of Central Brittany (France) : field evidence and computer models." - Journal of
Structural Geology, 13(4), 419-429.
BRUN, J.P., GUENNOC, P., TRUFFERT, C., VAIRON, J. & PROGRAM, T.A.W.G.O.T.G.-D. (2001) -
"Cadomian tectonics in northern Brittany: a contribution of 3-D crustal-scale modelling." -
Tectonophysics, 331, 229-246.
BRUN, J.P., GAPAIS, D., CAPDEVILLA, R., GUMIAUX, C., GRANET, M. & CHANTRAINE, J. (2002) - "La
suture sud de la collision Hercynienne en France : une tentative de restauration." – Réunion des
Sciences de la Terre Nantes, France, p.77.
BURG, J.-P. (1981) - "Tectonique tangentielle hercynienne en Vendée littorale : Signification des
linéations d'étirement E-W dans les porphyroïdes à foliation horizontale." - Comptes Rendus de
l'Académie des Sciences de Paris, 293, 849-854.
BURG, J.P., VAN DEN DRIESSCHE, J. & BRUN, J.P. (1994) - "Syn- to post-thickening extension in the
Variscan Belt of Western Europe : Modes and structural consequences." - Géologie de la France, 3,
33-51.
CAGNARD, F., GAPAIS, D., BRUN, J.P., GUMIAUX, C. & VAN DEN DRIESSCHE, J. (in press / sous presse) -
"Late-Hercynian pervasive crustal-scale extension in Vendée (Armorican Massif, France)." - Journal
of Structural Geology.
BIBLIOGRAPHIE 250
CALCAGNO, P., MARTELET, G. & GUMIAUX, C. (2002) - "Apport de la modélisation géométrique 3D à
l'interprétation géologique du complexe de Champtoceaux (Massif Armoricain)." – Réunion des
Sciences de la Terre Nantes, France, p.79.
CANNAT, M. & BOUCHEZ, J.L. (1986) - "Linéations N-S et E-W en Vendée littorale (Massif Armoricain).
Episodes tangentiels successifs éo-hercyniens en France occidentale." - Bulletin de la Société
géologique de France, 2(2), 299-310.
CARPENTER, M., PEUCAT, J.J. & PIVETTE, B. (1982) - "Geochemical and geochronological characteristics
of Paleozoic volcanism in the Saint-Georges-sur-Loire synclinorium (S. Armorican Massif). Evidence
for pre-hercynian tectonic evolution." - Bulletin du BRGM, 21, 63-79.
CARRIC, G., CHANTRAINE, J., DADET, P., FLAGEOLLET, J.C., SAGON, J.P. & TALBO, H. (1979) - French
Geological map (1/50,000), "Moncontour (279).", BRGM, Orléans.
CARTIER, C., FAURE, M. & LARDEUX, H. (2001) - "The Hercynian orogeny in the South Armorican Massif
(Saint-Georges-sur-Loire Unit, Ligerian Domain, France): rifting and welding of continental stripes." -
Terra Nova, 13, 143-149.
CASTAING, C., ROLET, J., CHEVREMONT, P., LE CALVEZ, J.Y. & THONON, P. (1987) - "La région de
Huelgoat (Finistère central) dans le contexte géodynamique armoricain." - Géologie de la France, 1,
23-36.
CAVET, P., GRUET, M. & PILLET, J. (1966) - "Sur la présence de Cambrien à paradoxides à Cléré-sur-
Layon (Maine-et-Loire), dans le Nord-est du Bocage vendéen (Massif armoricain)." - Comptes Rendus
de l'Académie des Sciences de Paris, II - 263, 1685-1688.
CAVET, P. (1978) - French Geological map (1/50,000), "Ancenis (452).", BRGM, Orléans.
CHANTRAINE, J., CHAUVEL, J.J., DUPRET, L., GATINOT, F., ICART, J.C., LE CORRE, C., RABU, D.,
SAUVAN, P. & VILLEY, M. (1982) - "Inventaire lithologique et structural du Briovérien (Protérozoïque
supérieur) de la Bretagne centrale et du Bocage Normand." - Bulletin du Bureau de Recherches
Géologiques et Minières, 1, 3-17.
BILIOGRAPHIE 251
CHANTRAINE, J., CHAUVEL, J.J., BALE, P., DENIS, E. & RABU, D. (1988) - "Le Briovérien (Protérozoïque
supérieur à terminal) et l'orogenèse cadomienne en Bretagne (France)." - Bulletin de la Société
Géologique de France, 4(5), 815-829.
CHANTRAINE, J., CHAUVEL, J.J. & RABU, D. (1994) - "The Cadomian Orogeny in the Armorican Massif -
Lithostratigraphy." In: J. D. Keppie (Ed.), Pre-Mesozoic Geology in France and related areas. -
Springer-Verlag, Berlin.
CHANTRAINE, J., AUTRAN, A. & CAVELIER, C. (1996) - French Geological map (1/1,000,000), BRGM
Service Géologique National, Orléans.
CHANTRAINE, J., RABU, D. & GIOT, D. (1997) - Carte géologique au 250 000e des Pays de Loire, BRGM,
Orléans.
CHAUVEL, J.J. & RABU, D. (1984) - "Brioverian in Central Brittany." In: V. Zoubek (Ed.), Precambrian in
younger fold belts. - Wiley, New-York, pp. 462-470.
CHILES, J.P. & GUILLEN, A. (1984) - "Variogrammes et krigeages pour la gravimétrie et le magnétisme." -
Sciences de la Terre. Série Informatique Géologique, 20, 455-468.
COBBOLD, P.-R. (1979) - "Removal of finite deformation using strain trajectories." - Journal of Structural
Geology, 1, 67-72.
COBBOLD, P.R. & DAVY, P. (1988) - "Indentation tectonics in nature and experiment. 2. Central Asia." -
Bulletin of the Geological Institutions of Upsalla, New series, 14, 143-162.
COCHERIE, A. & CARPENTER, M. (1979) - "Comportement géochimique des terres rares dans la
trondhjémite de Douarnenez : Implications pétrogénétiques." - Géologie de la France, 4, 337-347.
COCKS, L.R.M. & FORTEY, R.A. (1982) - "Faunal evidence for oceanic separations in the Paleozoic of
Britain." - Journal of the Geological Society of London, 139, 465-478.
COGNE, J. (1953) - "Schistes cristallins et granites en Bretagne méridionale : l'Anticlinal de Cornouaille." -
Bulletin de la Société Géologique de France, 6(3), 785-806.
BIBLIOGRAPHIE 252
COGNE, J. (1974) - "Le Massif Armoricain." - Géologie de la France, 1, 105-161.
COGNE, J.P., CHOUKROUNE, P. & COGNE, J. (1983) - "Cisaillements varisques superposés dans le Massif
de Lanvaux (Bretagne Centrale)." - Comptes Rendus de l'Académie des Sciences de Paris, II - 296,
773-776.
COLCHEN, M. & ROLIN, P. (2001) - "La chaîne hercynienne en Vendée." - Géologie de la France, 1-2, 53-
86.
CRESSIE, N.A.C. (1990) - "The Origins of Kriging." - Mathematical Geology, 22, 239-252.
CRESSIE, N.A.C. (1991) - "Statistics for Spatial Data."- John Wiley & sons, New York, 900 pp.
DADET, P., HERROUIN, Y., BARDY, P., LEBRET, P., TRAUTMANN, F. & CARN, A. (1995) - French
Geological map (1/50,000), "Pipriac (387).", BRGM, Orléans.
DARBOUX, J.R., GRAVELLE, M., PELHATE, A. & ROLET, J. (1977) - "L'évolution tectonique de la
terminaison occidentale du domaine centre-armoricain au Dévonien et au Carbonifère." - Comptes
Rendus de l'Académie des Sciences de Paris, D-284, 1151-1154.
DARBOUX, J.R. (1981) - "Caractérisation du régime cisaillant de la déformation hercynienne dans les
Monts d'Arrée (Massif Armoricain, France)." - Comptes Rendus de l'Académie des Sciences de Paris,
II-232, 1497-1500.
DARBOUX, J.R. & LE GALL, B. (1988) - "Les Montagnes Noires : cisaillement bordier méridional du
bassin carbonifère de Châteaulin (Massif Armoricain, France). Caractéristiques structurales et
métamorphiques." - Geodinamica Acta, 2(3), 121-133.
DARBOUX, J.R. (1991) - "Evolution tectonosédimentaire et structuration synmétamorphe des zones
externes du segment Hercynien Ouest-Européen." - Thèse d'état, Université de Bretagne Occidentale,
Brest, 267 pp.
BILIOGRAPHIE 253
DEUTSCH, C.V. (1991) "The relationship between universal kriging, kriging with an external drift and
cokriging." - In. SCRF report 4.
DEUTSCH, C.V. & JOURNEL, A.G. (1992) - "GSLIB: Geostatistical Software Library and User's Guide."-
Oxford University Press, New York, 384 pp.
DEWEY, J.F., HOLDSWORTH, R.E. & STRACHAN, R.A. (1998) - "Transpression and transtension zones." In:
R. E. Holdsworth, R. A. Strachan and J. F. Dewey (Ed.), Continental Transpressional and
Transtensional Tectonics. - The Geological Society, London, pp. 1-14.
DIAS, R. & RIBEIRO, A. (1994) - "Constriction in a transpressive regime: example in the Iberian branch of
the Ibero-Armorican arc." - Journal of Structural Geology, 16(11), 1543-1554.
DIAS, R. & RIBEIRO, A. (1995) - "The Ibero-Armorican Arc : A collision effect against an irregular
continent?" - Tectonophysics, 246, 113-128.
DIOT, H., BOUCHEZ, J.L. & BLAISE, J. (1983) - "La bande ductile Lanvaux-Les-Ponts-de-Cé entre Redon
et Angers. Une composante du cisaillement hercynien du Massif Armoricain (France)." - Bulletin de la
Société Géologique de France, 25(2), 155-167.
DUBREUIL, M. (1987) - "Le bassin en décrochement de Saint-Julien-de-Vouvantes-Angers (Carbonifère
inférieur du Sud-Est du Massif armoricain)." - Bulletin de la Société Géologique de France, 3(2), 215-
221.
DUBREUIL, M., CAVET, P., BLAISE, J., ESTEOULE-CHOUX, J., GRUET, M. & LARDEUX, H. (1989) - French
Geological map (1/50,000), "St-Mars-la-Jaille (421).", BRGM, Orléans.
FAURE, M. & CARTIER, C. (1998) - "Déformations ductiles polyphasées dans l'antiforme orthogneissique
de St-Clément-de-la-Place (Unité de Lanvaux, Massif Armoricain)." - Comptes Rendus de l'Académie
des Sciences de Paris, 326, 795-802.
FEDI, M., PRIMICERI, R., QUARTA, T. & VILLANI, A.V. (2002) - "Joint application of continuous and
discrete wavelet transform on gravity data to identify shallow and deep sources." - submitted / soumis.
BIBLIOGRAPHIE 254
FONTEILLES, M. (1965) - "Sur la profondeur de formation des veines à disthène géodique de la région de
Baud (Morbihan) et sur la signification des veines à disthène en général." - Bulletin de la Société
Française de Minéralogie et de Cristallographie, 88, 281-289.
FOURNIGUET, J. & TRAUTMANN, F. (1985) - French Geological map (1/50,000), "Redon (419).", BRGM,
Orléans.
GAPAIS, D. (1979) - "Déformation progressive d'un quartzite dans une zone plissée (segment hercynien de
Bretagne centrale)." - Bulletin de Minéralogie, 102, 249-264.
GAPAIS, D. & LE CORRE, C. (1980) - "Is the Hercynian belt of Brittany a major shear zone." - Nature, 288,
574-576.
GAPAIS, D. & COBBOLD, P.R. (1987) - "Slip system domains. 2. Kinematic aspects of fabric development
in polycristalline aggregates." - Tectonophysics, 138(2-4), 289-309.
GAPAIS, D. & COBBOLD, P.R. (1987) - "Slip system domains. 2. Kinematic aspects of fabric development
in polycristalline aggregates." - Tectonophysics, 138(2-4), 289-309.
GAPAIS, D., LAGARDE, J.L., LE CORRE, C., AUDREN, C., JEGOUZO, P., CASAS SAINZ, A. & VAN DEN
DRIESSCHE, J. (1993) - "La zone de cisaillement de Quiberon : témoin d'extension de la chaîne
varisque en Bretagne méridionale au Carbonifère." - Comptes Rendus de l'Académie des Sciences de
Paris, II(316), 1123-1129.
GEOFFROY, L. (1988) - "Histoire de la déformation dans les métamorphites de Sauveterre, Vendée
littorale." - Comptes Rendus de l'Académie des Sciences de Paris, II - 307, 277-280.
GODARD, G. (1988) - "Petrology of some eclogites in the Hercynides: the eclogites from the Southern
Armorican Massif, France. Eclogites and eclogites-facies rocks." In: D. C. Smith (Ed.), Eclogite and
eclogite-facies rocks. - Amsterdam, pp. 451-519.
GODARD, G. (2001) - "Les Essarts eclogite-bearing Complex (Vendée)." - Géologie de la France, 1-2, 19-
51.
BILIOGRAPHIE 255
GORE, B. & LE CORRE, C. (1987) - "Cinématique hercynienne du cisaillement nord-armoricain à la
bordure du granite syntectonique de Saint Renan-Kersaint (Finistère)." - Bulletin de la Société
Géologique de France, 3(5), 811-819.
GOUJOU, J.C. (1992) - "Analyse pétro-structurale dans un avant-pays métamorphique : influence du
plutonisme tardi-orogénique varisque sur l'encaissant épi à mésozonal de Vendée." - Document du
BRGM, 216.
GRANDJEAN, G., MENNECHET, C., DEBEGLIA, N. & BONIJOLY, D. (1998) - "Insuring the quality of gravity
data." - EOS Transactions, American Geophysical Union, 79, 217-221.
GRATIER, J.P. & GUILLIER, B. (1993) - "Compatibility constraints on folded and faulted strata and
calculation of total displacement using computational restoration (UNFOLD program)." - Journal of
Structural Geology, 15, 391-402.
GRAVIOU, P., PEUCAT, J.J., AUVRAY, B. & VIDAL, P. (1988) - "The Cadomian Orogeny in the Northern
Armorican Massif: petrological and geochronological constraints on a geodynamic model." -
Hercynica, 4(1), 1-13.
GROSSMANN, A., MORLET, J. & PAUL, T. (1985) - "Transforms associated to square integrable group
presentations, I- general results." - J. Math. Phys., 27, 2473-2479.
GUILLEN, A., DELOS, V. & LEDRU, P. (2000) - "A new method to determine lithology and geometry in
depth; 3D litho-inversion of potential fields." - European Geophysical Society, 25th General Assembly,
Katlenburg-Lindau, Federal Republic of Germany.
GUILLOCHEAU, F. & ROLET, M. (1982) - "La Sédimentation Paléozoïque Ouest-Armoricaine." - Bulletin
de la Société Géologique et Minéralogique de Bretagne, 14(2), 45-62.
GUINEBERTEAU, B., BOUCHEZ, J.L. & VIGNERESEE, J.L. (1987) - "The Mortagne granite pluton (France)
emplaced by pull-apart along a shear zone: structural and gravimetric arguments and regional
implication." - Geological Society of America Bulletin, 99, 763-770.
BIBLIOGRAPHIE 256
GUMIAUX, C. (2003) - "Modélisation du cisaillement Hercynien de Bretagne Centrale : déformation
crustale et implications lithosphériques." - Thèse, Université de Rennes1, Rennes, 256 pp.
GUMIAUX, C., BRUN, J.-P. & GAPAIS, D. (in press / sous presse) - "Strain removal within the Hercynian
Shear Belt of Central Brittany (Western France): methodology and tectonic implications." - Journal of
the Geological Society of London Special publication.
HANMER, S. & VIGNERESSE, J.L. (1980) - "Mise en place de diapirs syntectoniques dans la chaîne
hercynienne : exemple des massifs leucogranitiques de Locronan et de Pontivy (Bretagne Centrale)." -
Bulletin de la Société Géologique de France, 22(2), 193-202.
HANMER, S., LE CORRE, C. & BERTHE, D. (1982) - "The role of Hercynian granites in the deformation and
metamorphism of Brioverian and Paleozoic rocks of Central Brittany." - Journal of the Geological
Society of London, 139, 85-93.
HERROUIN, Y., DADET, P., GUIGUES, J., LAVILLE, P. & TALBO, H. (1989) - French Geological map
(1/50,000), "Bain-de-Bretagne (388).", BRGM, Orléans.
HERROUIN, Y. & RABU, D. (1990) - French Geological map (1/50,000), "Châteaubriant (389).", BRGM,
Orléans.
HIRBEC, Y. (1979) - "Le complèxe basique de Belle-Isle-en-Terre (Côtes du Nord). Sa place dans
l'évolution géodynamique du nord du Massif Armoricain." - Thèse, Université de Rennes1, Rennes, pp.
HOULGATTE, E., LE HERISSE, A., PELHATE, A. & ROLET, J. (1988) - "Evolution géodynamique du Bassin
carbonifère de Laval." - Géologie de la France, 1, 27-48.
HOVGAARD, J. (1997) - "A new processing technique for airbone gamma-ray spectrometer data (Noise-
adjusted singular value decomposition)." - 6th Optical Meeting on Emergency Preparedness and
Response,San-Francisco, United States, 123-127.
IGLESIAS, M. & BRUN, J.P. (1976) - "Signification des variations et anomalies de la déformation dans un
segment de la chaîne hercynienne (les séries cristallophylliennes de la Vendée littorale, Massif
Armoricain)." - Bulletin de la Société Géologique de France, 18, 1443-1452.
BILIOGRAPHIE 257
ISAAKS, E. & SRIVASTAVA, R.M. (1989) - "An introduction to Applied Geostatistics."- Oxford University
Press, New York, 561 pp.
JANJOU, D., LARDEUX, H., CHANTRAINE, J., CALLIER, L. & ETIENNE, H. (1988) - French Geological map
(1/50,000), "Segré (422).", BRGM, Orléans.
JEGOUZO, P. (1980) - "The South Armorican Shear Zone." - Journal of Structural Geology, 2(1-2), 39-47.
JEGOUZO, P., PEUCAT, J.J. & AUDREN, C. (1986) - "Caractérisation et signification géodynamique des
orthogneiss calco-alcalins d'âge ordovicien de Bretagne méridionale." - Bulletin de la Société
Géologique de France, 2(5), 839-848.
JEGOUZO, P. & ROSELLO, E.A. (1988) - "La Branche Nord du Cisaillement Sud-Armoricain (France) : un
essai d'évaluation du déplacement par l'analyse des mylonites." - Comptes Rendus de l'Académie des
Sciences de Paris, II - 307, 1825-1831.
JUDENHERC, S. (2000) - "Etude des structures hercyniennes à partir de données sismologiques : le cas du
Massif Armoricain." - Thèse, Université Louis Pasteur, Strasbourg, 148 pp.
JUDENHERC, S., GRANET, M., BRUN, J.P., POUPINET, G., PLOMEROVA, J., MOCQUET, A. & ACHAUER, U.
(2002) - "Images of lithospheric heterogeneities in the Armorican segment of the Hercynian Range in
France." - Tectonophysics, 358, 121-134.
JUDENHERC, S., GRANET, M., BRUN, J.P. & POUPINET, G. (2003) - "The Hercynian collision in the
Armorican Massif: evidence of different lithospheric domains inferred from tomography and
anisotropy." - Bulletin de la Société Géologique de France, 174, 45-57.
LAJAUNIE, C., COURRIOUX, G. & MANUEL, L. (1997) - "Foliation and 3D Cartography in Geology:
Principles of a Method Based on Potential Interpolation." - Mathematical Geology, 29, 571-584.
LE CORRE, C. & LE THEOFF, B. (1976) - "Zonéographie de la déformation finie, de la fabrique et du
métamorphisme dans un segment de la chaîne hercynienne armoricaine." - Bulletin de la Société
Géologique de France, 18(6), 1435-1442.
BIBLIOGRAPHIE 258
LE CORRE, C. (1977) - "Le Briovérien de Bretagne centrale : essai de synthèse lithologique et structurale."
- Bulletin du BRGM, I(3), 219-254.
LE CORRE, C. (1978) - "Approche quantitative des processus synschisteux. L'exemple du segment
Hercynien de Bretagne Centrale." – Thèse d'état, Université de Rennes 1, Rennes, 382 pp.
LE CORRE, C., AUVRAY, B., BALLEVRE, M. & ROBARDET, M. (1991) - "Le Massif Armoricain." -
Scientifical Geological Bulletin, 44(1-2), 31-103.
LE HEBEL, F., VIDAL, O., KIENAST, J.R. & GAPAIS, D. (2002) - "Les "Porphyroïdes" de Bretagne
méridionale : une unité de HP-BT dans la chaîne hercynienne." - Comptes Rendus Geoscience, 334,
205-211.
LE METOUR, J. & AUDREN, C. (1977) - "Relations structurales entre l'orthogneiss ordovicien de Roguédas
et son encaissant migmatitique. Conséquences sur l'âge des évènements tectonométamorphiques en
Bretagne méridionale." - Bulletin de la Société Géologique et Minéralogique de Bretagne, 9, 113-123.
LE THEOFF, B. (1977) - "Marqueurs ellipsoïdaux et déformation finie." - Thèse, Université de Rennes1,
Rennes, 96 pp.
LEDRU, P., MAROT, A. & HERROUIN, Y. (1986) - "Le synclinorium de Saint-Georges-sur-Loire : une unité
ligérienne charriée sur le domaine centre armoricain. Découverte de métabasite à glaucophane sur la
bordure sud de cette unité." - Comptes Rendus de l'Académie des Sciences de Paris, II -303, 963-968.
LEE, J.-C. & ANGELIER, J. (1994) - "Paleostress trajectory maps based on the results of local
determinations: the "Lissage" program." - Computers and Geosciences, 20(2), 161-191.
LEROUGE, G. & QUENARDEL, J.M. (1988) - "Les zones de cisaillement carbonifères dans les plutons
vendéens et leurs prolongations dans le Nord-Ouest du Massif central français." - Bulletin de la Société
Géologique de France, 4(5), 831-838.
LOPEZ-MUNOZ, M. (1981) - "Analyse structurale de la partie centrale du synclinorium de Saint Julien de
Vouvantes et de l'axe Lanvaux-les-Ponts-de-Cé (Massif Armoricain)." - Bulletin de la Société
Géologique et Minéralogique de Bretagne, C-13, 117-123.
BILIOGRAPHIE 259
MALAVIELLE, J., GUIHOT, P., COSTA, S., LARDEAUX, J.M. & GARDIEN, V. (1990) - "Collapse of a
thickened variscan crust in the French Massif Central: Mont Pilat extensional shear zone and St
Etienne upper-Carboniferous basin." - Tectonophysics, 177, 139-149.
MALLAT, S. & WEN LIANG HWANG (1992) - "Singularity detection and processing with wavelets." - IEEE
Transactions on information theory, 38.
MARCHAND, J., PERRIN, J. & WEECKSTEEN, G. (1966) - French Geological map (1/50,000), "Vallet
(482).", BRGM, Orléans.
MARCHAND, J. (1981) - "Ecaillage d'un "mélange tectonique" profond : le complexe cristallophyllien de
Champtoceaux (Bretagne méridionale)." - Comptes Rendus de l'Académie des Sciences de Paris, 293,
223-228.
MARCOTTE, D. (2001) - "Géologie et géostatistique minières (partie géostatistique)." - Online lessons,
http://geo.polymtl.ca/~marcotte/.
MARDIA, K.V. (1972) - "Probability and Mathematical Statistics."- Academic Press, London, 355 pp.
MARTELET, G., DEBEGLIA, N. & TRUFFERT, C. (2002) - "Homogénéisation et validation des corrections de
terrain gravimétriques jusqu'à la distance de 167 km sur l'ensemble de la France." - Comptes Rendus
Geoscience, 334, 449-454.
MARTELET, G., CALCAGNO, P., GUMIAUX, C., TRUFFERT, C., BITRI, A., GAPAIS, D. & BRUN, J.P.
(accepted / accepté) - "Integrated 3D geophysical and geological modelling of the Hercynian Suture
Zone in the Champtoceaux area (South Brittany, France)." – Tectonophysics.
MATHERON, G. (1955) - "Application des méthodes statistiques à l'évaluation des gisements." - Annales
des Mines, 144, 50-75.
MATHERON, G. (1962) - "Traité de Géostatistique Appliquée."- Technip, Paris, 333 pp.
BIBLIOGRAPHIE 260
MATTE, P. & RIBEIRO, A. (1975) - "Forme et orientation de l'ellipsoide de deformation dans la virgation
hercynienne de Galice; Relations avec le plissement et hypotheses sur la genese de l'arc ibero-
armoricain." - Comptes Rendus de l'Académie des Sciences de Paris, D - 280(25), 2825-2828.
MATTE, P. (1986) - "La chaîne Varisque parmi les chaînes Paléozoïques péri atlantiques, modèle
d'évolution et position des grands blocs continentaux au Permo-Carbonifère." - Bulletin de la Société
Géologique de France, 2(1), 9-24.
MATTE, P. (1991) - "Accretionary history and crustal evolution of the Variscan belt in Western Europe." -
Tectonophysics, 196, 309-337.
MERLE, O. & GAPAIS, D. (1997) - "Strains within thrust-wrench zones." - Journal of Structural Geology,
19(7), 1011-1014.
MEYER, Y., JAFFARD, S. & RIOUL, O. (1987) - "L'analyse par ondelettes." - Pour la science, Sept..
MUKUL, M. (1998) - "A spatial statistics approach to the quantification of finite strain variation in
penetratively deformed thrust sheets: an example from the Sheeprock Thrust Sheet, Sevier Fold-and-
Thrust belt, Utah." - Journal of Structural Geology, 20(4), 371-384.
MUSSET, A.E. & KHAN, M.A. (2000) - "Looking into the Earth. An introduction to geological
geophysics."- Cambridge University Press, Cambridge, 470 pp.
NAFE, S.E. & DRAKE, C.L. (1963) - "Physical properties of marine sediments." In: M. N. Hill (Ed.), The
Sea. - New York, pp. 784-819.
OGIER, M. (1984) "Analyse des densités mesurées sur les carottes du sondage SC2 AN PAN de Pannece
(Loire Atlantique)." - In. BRGM, report 86GPH067.
OKABE, M. (1982) - "Analytical expressions for gravity due to homogeneous revolutional compartments
in the Gaussian divergence approach." - Geophysical prospecting, 30, 166-187.
OLIVET, J.L. (1996) - "Kinematics of the Iberian Plate." - Bulletin des Centres de Recherche et
Exploration - Production Elf Aquitaine, 20(1), 131-195.

BILIOGRAPHIE 261
PANOZZO, R. (1984) - "Two-dimensional strain from the orientation of lines in a plane." - Journal of
Structural Geology, 6(1-2), 215-221.
PARADIS, S. (1981) - "Le métamorphisme Hercynien dans le Domaine Centre Armoricain occidental :
essai de caractérisation par l'étude des phyllites des formations gréso-pélitiques." - Thèse, Université de
Bretagne Occidentale, Brest, 176 pp.
PARIS, F. & ROBARDET, M. (1977) - "Paléogéographie et relations ibéro-armoricaines au Paléozoïque
anté-carbonifère." - Bulletin de la Société Géologique de France, 19(5), 1121-1126.
PARIS, F. (1977) - French Geological map (1/50,000), "Caulnes (281).", BRGM, Orléans.
PARIS, F. & DADET, P. (1988) - French Geological map (1/50,000), "Combourg (282).", BRGM, Orléans.
PARIS, F. & ROBARDET, M. (1990) - "Early Paleozoic paleobiogeography of the Variscan regions." -
Tectonophysics, 177, 192-213.
PARIS, F. & ROBARDET, M. (1994) - "The Variscan - Paleogeographic Synthesis." In: J. D. Keppie (Ed.),
Pre-Mesozoic Geology in France. - Springer Verlag, Berlin, pp. 173-176.
PELHATE, A. (1994) - "The Variscan - Carboniferous of the Armorican Massif." In: J. D. Keppie (Ed.),
Pre-Mesozoic Geology in France. - Springer Verlag, Berlin, pp. 162-168.
PERCEVAULT, M.-N. & COBBOLD, P.R. (1982) - "Mathematical removal of regional ductile strains in
Central Brittany: evidence for wrench tectonics." - Tectonophysics, 82, 317-328.
PERROUD, H. (1985) - "Synthèse des résultats paléomagnétiques sur le Massif Armoricain." - Hercynica,
1(1), 65-71.
PEUCAT, J.J., CHARLOT, R., MIDFAL, A., CHANTRAINE, J. & AUTRAN, A. (1979) - "Définition
géochronologique de la phase bretonne en Bretagne Centrale. Etude Rb/Sr de granites du domaine
centre armoricain." - Bulletin du BRGM, 1, 349-356.
BIBLIOGRAPHIE 262
PIVETTE, B. (1977) - "Le synclinorium de Saint-Georges sur Loire, Massif Armoricain. Sa place dans
l'évolution géodynamique de la Bretagne méridionale au Paléozoïque." - Thèse, Université de Rennes
1, Rennes, 108 pp.
PLAINE, J. (1976) - "La bordure sud du synclinorium paléozoïque de Laval." - Thèse, Université de
Rennes1, Rennes, pp.
PLAINE, J., HALLEGOUËT, B. & QUETE, Y. (1984) - French Geological map (1/50,000), "Questembert
(418).", BRGM, Orléans.
PLUSQUELLEC, Y., ROLET, J. & DARBOUX, J.R. (1999) - French Geological map (1/50,000), "Châteaulin
(310).", BRGM, Orléans.
POTTER, P.E. & PETTIJOHN, F.J. (1977) - "Paleocurrents and Basin Analysis."- Springer Verlag, Berlin,
425 pp.
DE POULPIQUET, J., GUMIAUX, C. & TRUFFERT, C. (2002) - "Les anomalies magnétiques associées aux
nappes de Champtoceaux: traitement par transformation de Fourier et transformée en ondelettes." –
Réunion des Sciences de la Terre, Nantes, France, p.77.
POUPINET, G., ARNDT, N. & VACHER, P. (2003) - "Seismic tomography beneath stable tectonic regions
and the origin and composition of the continental lithospheric mantle." - Earth and Planetary Science
Letters, 212, 89-101.
QUETE, Y., PLAINE, J. & HALLEGOUËT, B. (1981) - French Geological map (1/50,000), "Malestroit
(386).", BRGM, Orléans.
RAMSAY, J.G. (1967) - "Folding and fracturing rocks."- McGraw-Hill.
RAMSAY, J.G. & GRAHAM, R.H. (1970) - "Strain variations in shear belts." - Canadian Journal of Earth
Sciences, 7, 786-813.
RAMSAY, J.-G. & GRAHAM, R.-H. (1970) - "Strain variations in shear belts." - Canadian Journal of Earth
Sciences, 7, 786-813.
BILIOGRAPHIE 263
RAMSAY, J.G. & HUBER, M.I. (1983) - "The Techniques of Modern Structural Geology, Vol. 1: Strain
Analysis."- Academic Press, London, 307 pp.
RAMSAY, J.G. (1989) - "Emplacement kinematics of a granite diapir: the Chindamora Batholith,
Zimbabwe." - Journal of Structural Geology, 11, 191-209.
REGNAULT, S. (1981) - "Stratigraphie et structure du Paléozoïque dans le Ménez-Bélair occidental
(Synclinorium médian armoricain)." - Bulletin de la Société Géologique et Minéralogique de Bretagne,
C-13(1), 1-111.
RIBEIRO, A., PEREIRA, E. & DIAS, R. (1990) - "Structure of the Northwest of the Iberian Peninsula." In: D.
Dallmeyer and E. Martinez Garcia (Ed.), Pre-Mesozoic geology of Iberia. - Springer Verlag, Berlin,
pp. 220-236.
ROBARDET, M., BONJOUR, J.L., PARIS, F., MORZADEC, P. & RACHEBOEUF, P.R. (1994) - "Ordovician,
Silurian, and Devonian of the Medio-North-Armorican Domain." In: J. D. Keppie (Ed.), Pre-Mesozoic
Geology in France and related areas. - Springer Verlag, Berlin, pp. 142-151.
RODDICK, J.C. (1983) - "High precision intercalibration of 40Ar/39Ar standarts." - Geochimica et
Cosmochimica Acta, 47, 887-898.
ROLET, J. & THONON, P. (1978) - "La semelle de charriage hercynien majeur effondrée par un réseau de
fractures en régime coulissant dextre : sa mise en évidence grâce aux marqueurs filoniens de la Rade
de Brest (Massif Armoricain)." - Comptes Rendus de l'Académie des Sciences de Paris, D-287, 1099-
1102.
ROLET, J. & THONON, P. (1979) - "Mise en évidence de trois complèxes volcano détritiques d'âge
Dévonien inférieur à moyen, Strunien et Viséen inférieur sur la bordure nord du bassin de Châteaulin
(feuille Huelgoat 1/50000, Finistère). Implications paléogéographiques et tectoniques." - Bulletin du
BRGM, 1, 303-315.
ROLIN, P. & COLCHEN, M. (2001) - "Les cisaillements hercyniens de la Vendée au Limousin." - Géologie
de la France, 1-2, 15-44.
BIBLIOGRAPHIE 264
ROMAN-BERDIEL, T., GAPAIS, D. & BRUN, J.P. (1997) - "Granite intrusion along strike-slip zones in
experiment and nature." - American Journal of Sciences, 297, 651-678.
ROUBY, D., COBBOLD, P.R., SZATMARI, P., DEMERCIAN, S., COELHO, D. & RICI, J.A. (1993) -
"Restoration in plan view of faulted Upper Cretaceous and Oligocene horizons and its bearing on the
history of salt tectonics in the Campos Basin (Brazil)." - Tectonophysics, 228, 435-445.
ROUBY, D., SUPPE, J. & XIAO, H. (2000) - "3D restoration of complexly faulted and folded surfaces using
multiple unfolding mechanisms." - American Association of Petroleum Geology, 84, 805-829.
ROUBY, D., RAILLARD, S., GUILLOCHEAU, F. & BOURROULLEC, R. (2002) - "Kinematics of a growth
fault/raft system from restoration in 3D (West African Margin)." - Journal of Structural Geology, 24,
783-796.
SAGON, J.P. (1976) - "Contribution à l'étude géologique de la partie orientale du bassin de Châteaulin.
Stratigraphie, volcanisme, métamorphisme et tectonique." - Thèse d'état, Université Pierre et Marie
Curie, Paris, pp.
SAUNIER, J.-F. (1986) - "Un domaine cristallophyllien dans le Protérozoïque Supérieur (Briovérien) de
Bretagne Centrale : le dôme de Plouguenast (Côtes du Nord)." - Thèse, Université de Rennes1, Rennes,
120 pp.
SOBOLEV, S.V., ZEYEN, H., STOLL, G., WERLING, F., ALTHERR, R. & FUCHS, K. (1996) - "Upper mantle
temperatures from teleseismic tomography of the French Massif Central including effects of
composition, mineral reactions, anharmonicity, anelasticity and partial melt." - Earth and Planetary
Science Letters, 139, 147-163.
SPECTOR, A. & GRANT, F.S. (1970) - "Statistical models for interpreting aeromagnetic data." -
Geophysics, 35, 293-302.
TALWANI, M. (1965) - "Computation with the help of a digital computer of magnetic anomalies caused by
bodies of arbitrary shape." - Geophysics, 30, 797-817.
TAPPONNIER, P., PELTZER, G., LE DAIN, A.Y., ARMIJO, R. & COBBOLD, P.R. (1982) - "Propagating
BILIOGRAPHIE 265
extension tectonics in Asia: new insights from simple experiments with plasticine." - Geology, 110,
611-616.
THIEBLEMONT, D., GUERROT, C., LE METOUR, J. & JEZEQUEL, P. (2001) - "Le complexe de Cholet-
Thouars : un ensemble volcano-plutonique cambrien moyen au sein de bloc précambrien des Mauges."
- Géologie de la France, 1-2, 7-17.
TORNE, M., CABISSOLE DE, B., BAYER, R., CASAS, A., DAIGNIERES, M. & RIVEIRO, A. (1989) - "Gravity
constraints on the deep structure of the Pyrenean belt along ECORS profile." - Tectonophysics, 165,
105-116.
TRAUTMANN, F. (1988) - French Geological map (1/50,000), "Nozay (420).", BRGM, Orléans.
TRAUTMANN, F., BECQ-GIRAUDON, J.F. & CARN, A. (1994) - French Geological map (1/50,000), "Janzé
(353).", BRGM, Orléans.
TRIBOULET, C. & AUDREN, C. (1988) - "Controls of P-T-t deformation path from amphibole zonation
during progressive metamorphism of basic rocks." - Journal of Metamorphic Geology, 6, 117-133.
TRUFFERT, C., CHAMOT-ROOKE, N., LALLEMANT, S., DE VOOGT*D, B., HUCHON, P. & LE PICHON, X.
(1993) - "A crustal-scale cross-section of the western Mediterranean Ridge from deep seimic data and
gravity modelling." - Geophysical Journal International, 114, 360-372.
TRUFFERT, C., GUMIAUX, C., CHANTRAINE, J., PERRIN, J., GALDEANO, A., GAPAIS, D., BALLEVRE, M.,
ASFIRANE, F., GUENNOC, P. & BRUN, J.P. (2001) - "Levé géophysique aéroporté dans le Sud-Est du
Massif armoricain (programme GéoFrance3D Armor2). Magnétisme et radiométrie spectrale." -
Comptes Rendus de l'Académie des Sciences de Paris, 333, 263-270.
TSOKAS, G. & HANSEN, R. (1997) - "Study of the crustal thickness and subducting lithosphere in Greece
from gravity data." - Journal of Geophysical Research, 102, 20585-20597.
UPTON, G.J.G. & FINGLETON, B. (1989) - "Spatial Data Analysis by Example, 2."- John Wiley and Sons,
New York, 416 pp.
BIBLIOGRAPHIE 266
VAN DEN DRIESHE, J. & BRUN, J.P. (1992) - "Tectonic evolution of the Montagne Noire (French Massif
Central): a model of extensional gneiss dome." - Geodinamica Acta, 5(1-2), 85-89.
VAN DER VOO, R. (1983) - "Paleomagnetic constraints on the assembly of the old red continent." -
Tectonophysics, 91, 273-283.
VIDAL, P. (1972) - "L'axe granitique Moëlan-Lanvaux (sud du Massif Armoricain) : mise en évidence par
la méthode Rb-Sr de trois épisodes de plutonisme pendant le Paléozoïque Inférieur." - Bulletin de la
Société Géologique et Minéralogique de Bretagne, 4, 75-89.
VIDAL, P. (1976) - "L'évolution polyorogénique du Massif Armoricain. Apport de la géochronologie et de
la géochimie isotopique du strontium." - Thèse d'état, Université de Rennes1, Rennes, 142 pp.
VIGNERESSE, J.L. (1978) - "Gravimétrie et granites armoricains. Structure et mise en place des granites
Hercyniens." - Thèse, Université de Rennes1, Rennes, 98 pp.
VIGNERESSE, J.L. & BRUN, J.P. (1983) - "Les leucogranites armoricains marqueurs de la déformation
régionale : apport de la gravimétrie." - Bulletin de la Société Géologique de France, 25(3), 357-366.
WACKERNAGEL, H. (1998) - "Multivariate Geostatistics, 2."- Springer Verlag, Berlin, 291 pp.
WATTS, M.S. & WILLIAMS, G.D. (1979) - "Faults rocks as indicators of progressive shear deformation in
the Guingamp region, Brittany." - Journal of Structural Geology, 1, 323-332.
WEBER, C. (1967) - "Le prolongement des granites de Lanvaux d'après la gravimétrie et
l'aéromagnétisme." - Mémoires du BRGM, 52, 83-90.
WEBER, C. (1973) - "Le socle antétriasique sous la partie Sud du bassin de Paris." - Bulletin du BRGM, 3-
4, 219-243.
WYNS, R. & LE METOUR, J. (1983) - "Le Précambrien du Massif Vendéen : étude détaillée de deux coupes
de référence (Coupe de l'Evre et coupe de la Divatte) et synthèse des données récentes."- BRGM,
Orléans, 60 pp.

BILIOGRAPHIE 267
XU, W. (1996) - "Conditional curvilinear stochastic simulation using pixel-based algorithms." -
Mathematical Geology, 28(7), 937-949.
YOUNG, D.S. (1987) - "Random vectors and spatial analysis by geostatistics for geotechnical
applications." - Mathematical Geology, 19(6), 467-479.