Embed Size (px)
Citation preview
Présenté lors du Congrès du Melon, Medfel * Perpignan 15 Mai 2014
Congrès Euro-Mediterraneen du melon
La production dans le Monde La produzione del melone nel mondo
Luciano Trentini - Areflh
1
Assemblée des régions Européennes Fruitières, légumières et horticoles www.areflh.org
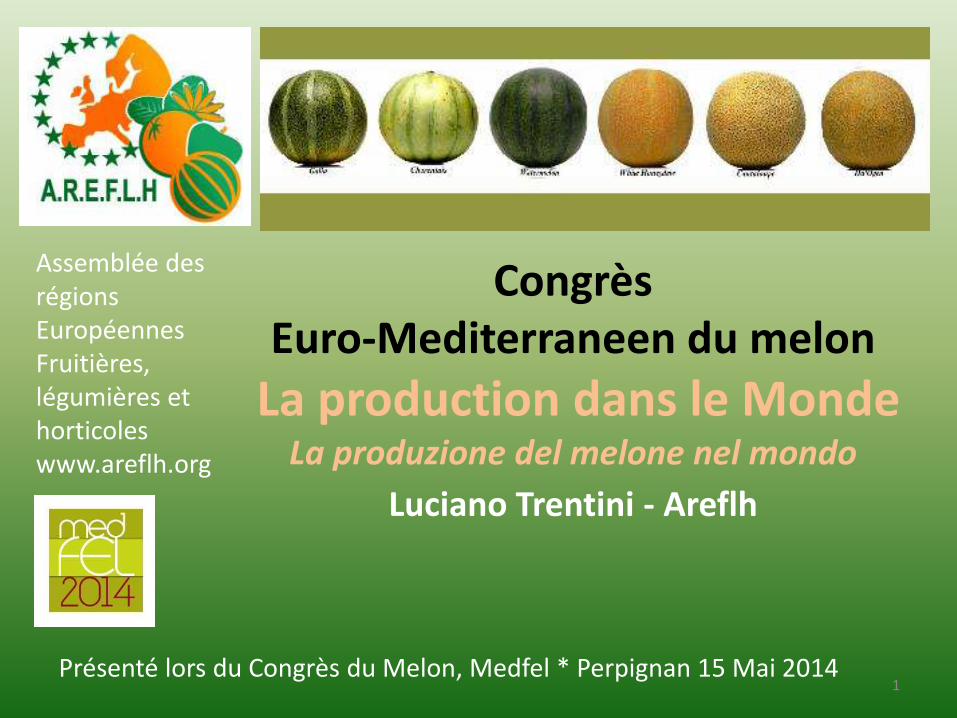
La produzione di Ortofrutta nel Mondo
Production de fruits et légumes dans le monde
(Distribuzione per aree geografiche, esclusa la Cina )
Nord America
7% Europa 17%
Asia 45%
Centro/Sud
America 16%
Africa
15%
Oceania
1%
2
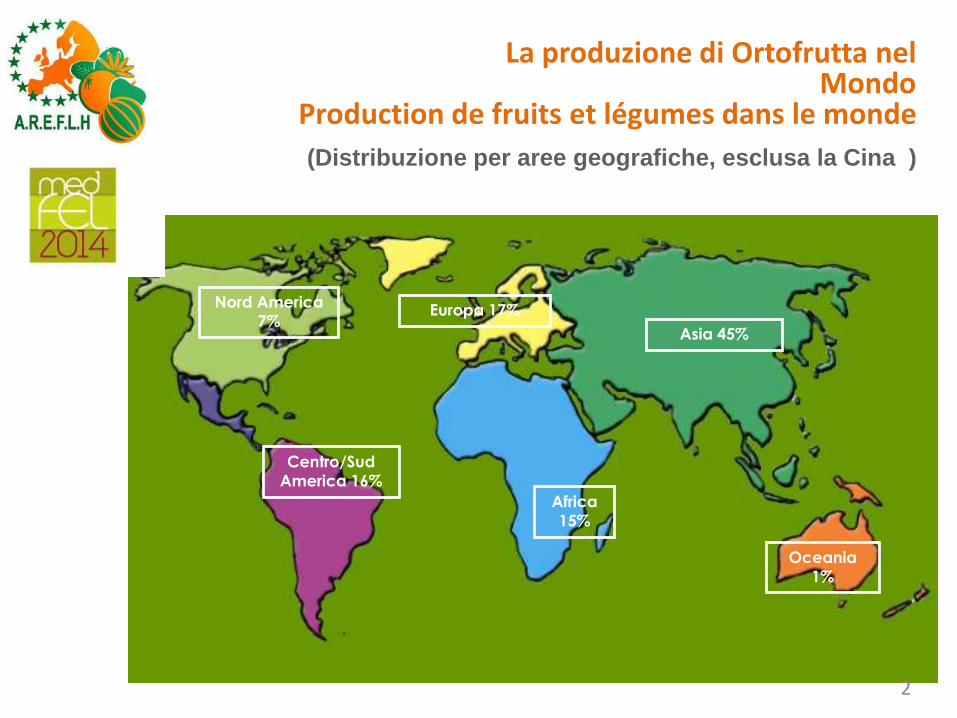
Esportazione di ortaggi nel MONDO Exportation de légumes dans le MONDE
3
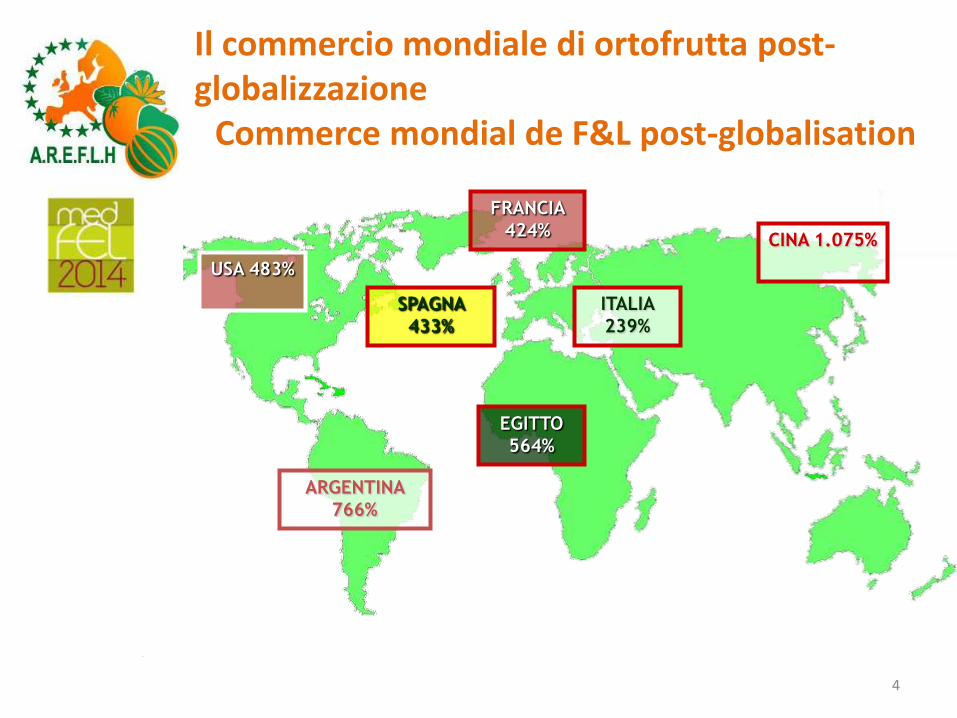
FRANCIA
424% CINA 1.075%
SPAGNA
433%
ITALIA
239%
EGITTO
564%
ARGENTINA
766%
USA 483%
Il commercio mondiale di ortofrutta post-globalizzazione
Commerce mondial de F&L post-globalisation
4
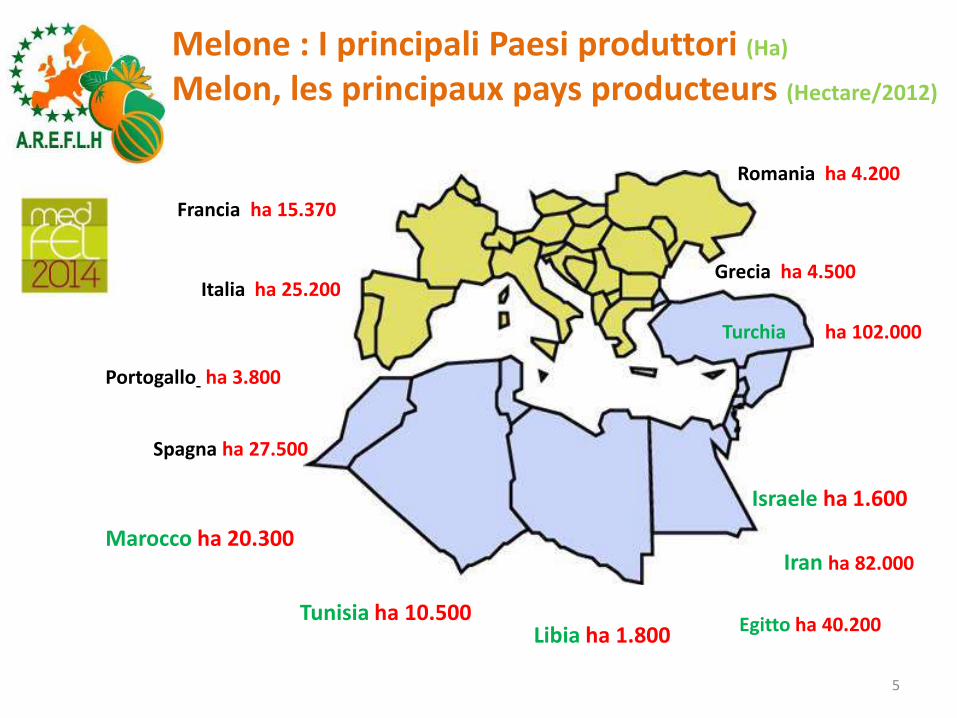
Italia ha 25.200
Melone : I principali Paesi produttori (Ha)
Melon, les principaux pays producteurs (Hectare/2012)
Marocco ha 20.300
Tunisia ha 10.500 Libia ha 1.800 Egitto ha 40.200
Turchia ha 102.000
Grecia ha 4.500
Spagna ha 27.500
Francia ha 15.370
Israele ha 1.600
Romania ha 4.200
Portogallo ha 3.800
Iran ha 82.000
5
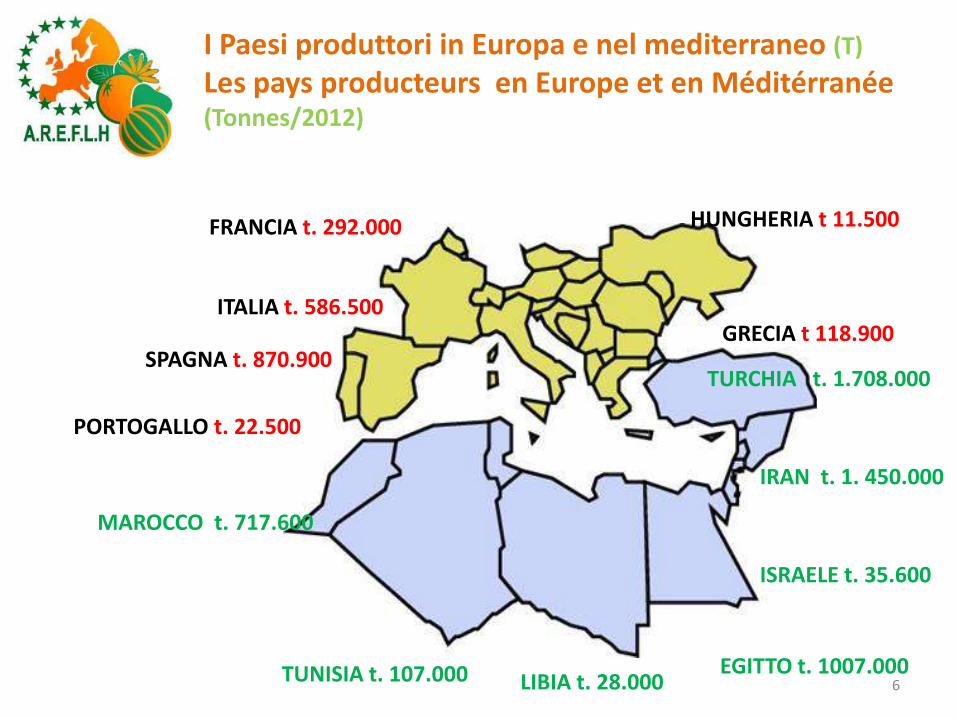
ITALIA t. 586.500
MAROCCO t. 717.600
TUNISIA t. 107.000 EGITTO t. 1007.000
TURCHIA t. 1.708.000
GRECIA t 118.900 SPAGNA t. 870.900
FRANCIA t. 292.000
ISRAELE t. 35.600
PORTOGALLO t. 22.500
HUNGHERIA t 11.500
IRAN t. 1. 450.000
LIBIA t. 28.000 6
I Paesi produttori in Europa e nel mediterraneo (T)
Les pays producteurs en Europe et en Méditérranée (Tonnes/2012)
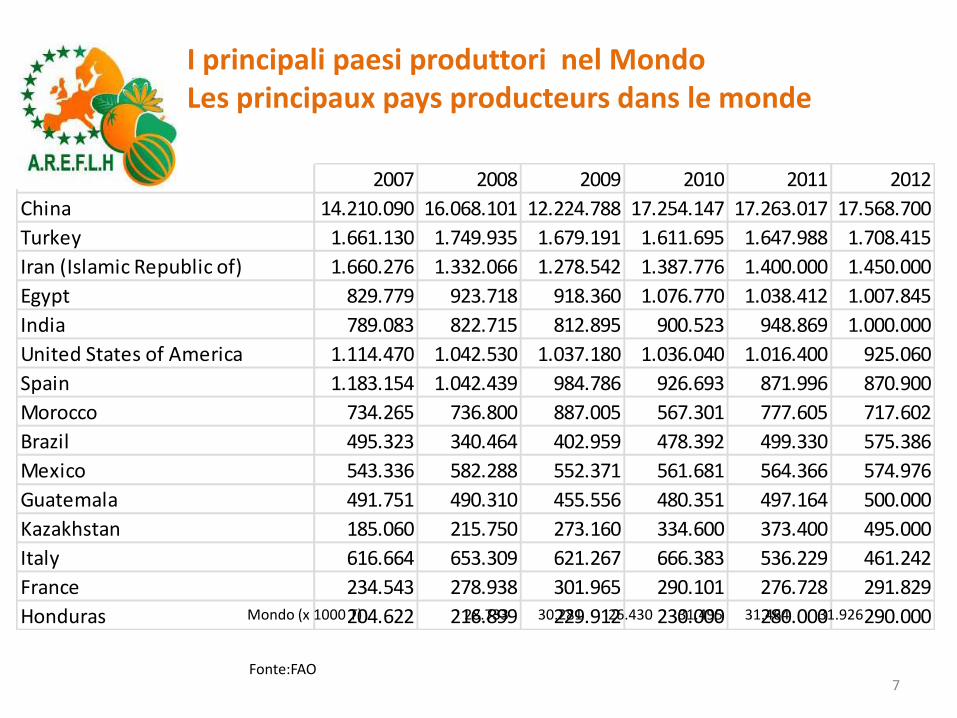
Anno 2007 2008 2009 2010 2011 2012
China 14.210.090 16.068.101 12.224.788 17.254.147 17.263.017 17.568.700
Turkey 1.661.130 1.749.935 1.679.191 1.611.695 1.647.988 1.708.415
Iran (Islamic Republic of) 1.660.276 1.332.066 1.278.542 1.387.776 1.400.000 1.450.000
Egypt 829.779 923.718 918.360 1.076.770 1.038.412 1.007.845
India 789.083 822.715 812.895 900.523 948.869 1.000.000
United States of America 1.114.470 1.042.530 1.037.180 1.036.040 1.016.400 925.060
Spain 1.183.154 1.042.439 984.786 926.693 871.996 870.900
Morocco 734.265 736.800 887.005 567.301 777.605 717.602
Brazil 495.323 340.464 402.959 478.392 499.330 575.386
Mexico 543.336 582.288 552.371 561.681 564.366 574.976
Guatemala 491.751 490.310 455.556 480.351 497.164 500.000
Kazakhstan 185.060 215.750 273.160 334.600 373.400 495.000
Italy 616.664 653.309 621.267 666.383 536.229 461.242
France 234.543 278.938 301.965 290.101 276.728 291.829
Honduras 204.622 216.899 229.912 230.000 280.000 290.000Mondo (x 1000 T) 28.733 30.281 26.430 31.495 31.464 31.926
Fonte:FAO 7
I principali paesi produttori nel Mondo Les principaux pays producteurs dans le monde
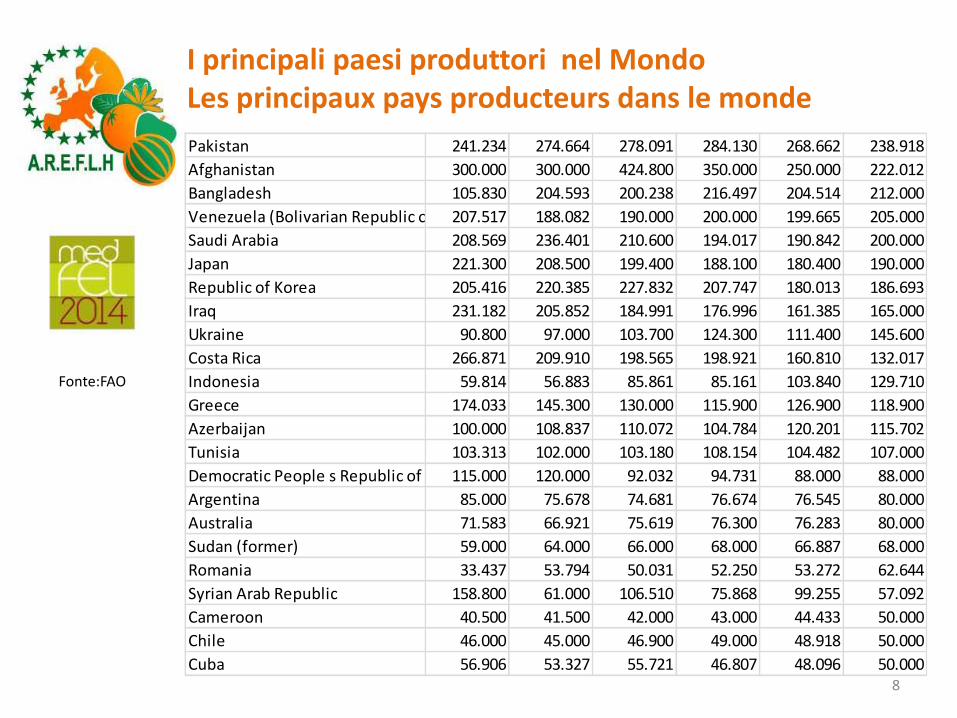
Pakistan 241.234 274.664 278.091 284.130 268.662 238.918
Afghanistan 300.000 300.000 424.800 350.000 250.000 222.012
Bangladesh 105.830 204.593 200.238 216.497 204.514 212.000
Venezuela (Bolivarian Republic of) 207.517 188.082 190.000 200.000 199.665 205.000
Saudi Arabia 208.569 236.401 210.600 194.017 190.842 200.000
Japan 221.300 208.500 199.400 188.100 180.400 190.000
Republic of Korea 205.416 220.385 227.832 207.747 180.013 186.693
Iraq 231.182 205.852 184.991 176.996 161.385 165.000
Ukraine 90.800 97.000 103.700 124.300 111.400 145.600
Costa Rica 266.871 209.910 198.565 198.921 160.810 132.017
Indonesia 59.814 56.883 85.861 85.161 103.840 129.710
Greece 174.033 145.300 130.000 115.900 126.900 118.900
Azerbaijan 100.000 108.837 110.072 104.784 120.201 115.702
Tunisia 103.313 102.000 103.180 108.154 104.482 107.000
Democratic People s Republic of Korea115.000 120.000 92.032 94.731 88.000 88.000
Argentina 85.000 75.678 74.681 76.674 76.545 80.000
Australia 71.583 66.921 75.619 76.300 76.283 80.000
Sudan (former) 59.000 64.000 66.000 68.000 66.887 68.000
Romania 33.437 53.794 50.031 52.250 53.272 62.644
Syrian Arab Republic 158.800 61.000 106.510 75.868 99.255 57.092
Cameroon 40.500 41.500 42.000 43.000 44.433 50.000
Chile 46.000 45.000 46.900 49.000 48.918 50.000
Cuba 56.906 53.327 55.721 46.807 48.096 50.000
Fonte:FAO
8
I principali paesi produttori nel Mondo Les principaux pays producteurs dans le monde
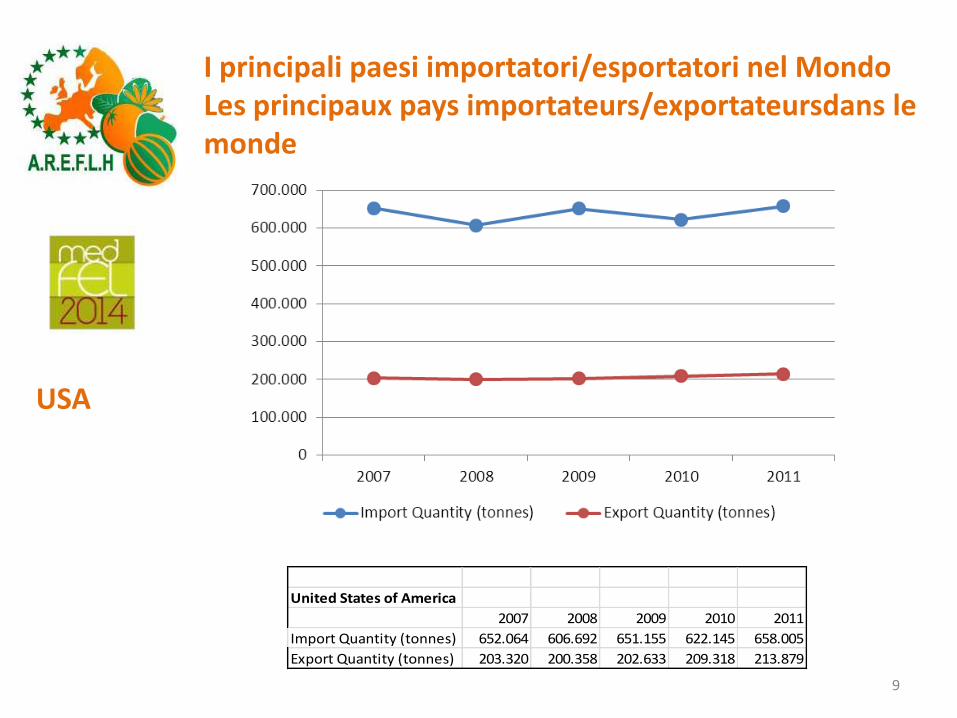
United States of America
2007 2008 2009 2010 2011
Import Quantity (tonnes) 652.064 606.692 651.155 622.145 658.005
Export Quantity (tonnes) 203.320 200.358 202.633 209.318 213.879
9
I principali paesi importatori/esportatori nel Mondo Les principaux pays importateurs/exportateursdans le monde
USA
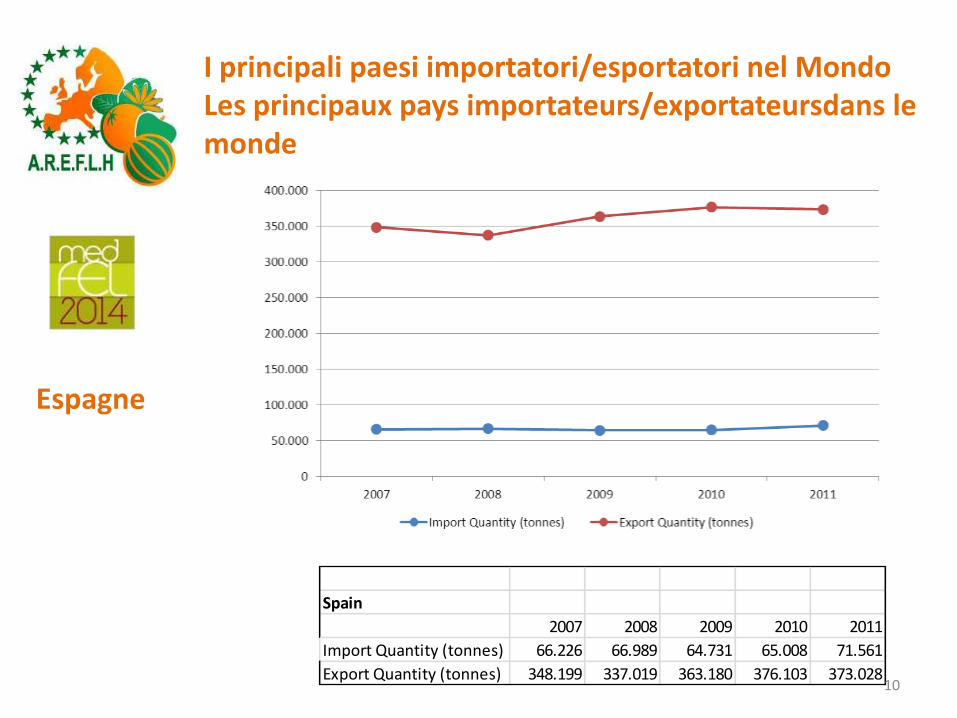
Spain
2007 2008 2009 2010 2011
Import Quantity (tonnes) 66.226 66.989 64.731 65.008 71.561
Export Quantity (tonnes) 348.199 337.019 363.180 376.103 373.02810
I principali paesi importatori/esportatori nel Mondo Les principaux pays importateurs/exportateursdans le monde
Espagne
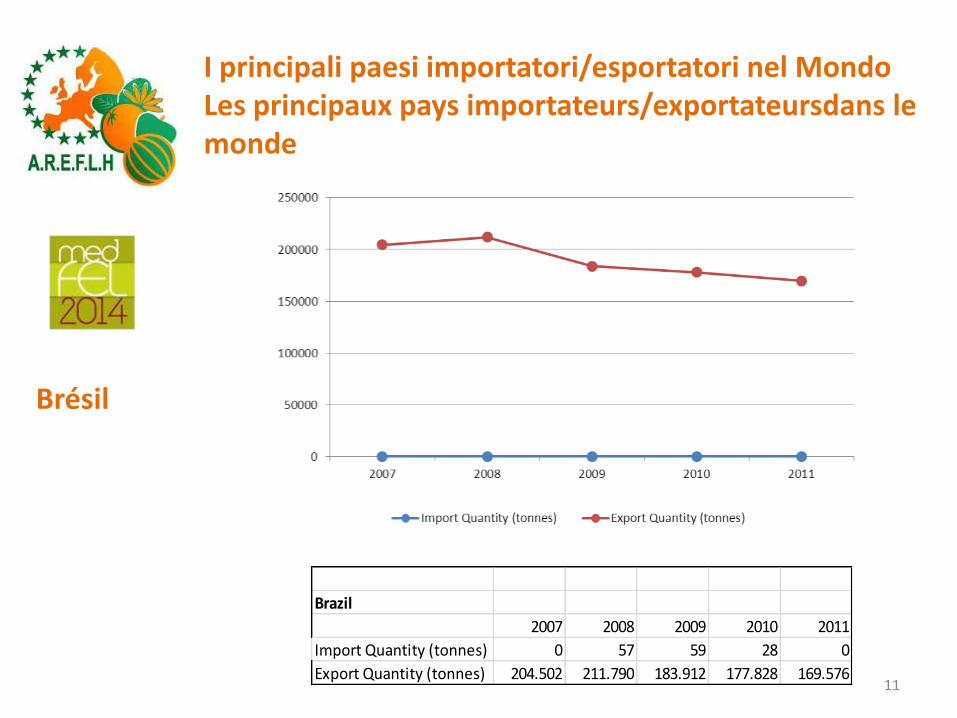
Brazil
2007 2008 2009 2010 2011
Import Quantity (tonnes) 0 57 59 28 0
Export Quantity (tonnes) 204.502 211.790 183.912 177.828 169.57611
I principali paesi importatori/esportatori nel Mondo Les principaux pays importateurs/exportateursdans le monde
Brésil
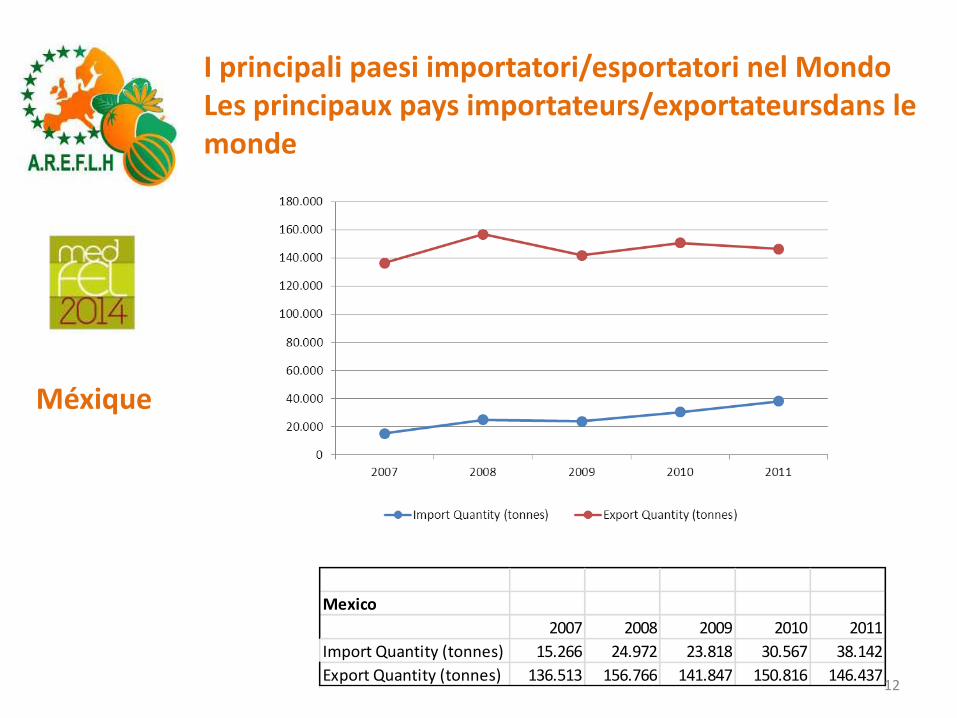
Mexico
2007 2008 2009 2010 2011
Import Quantity (tonnes) 15.266 24.972 23.818 30.567 38.142
Export Quantity (tonnes) 136.513 156.766 141.847 150.816 146.43712
I principali paesi importatori/esportatori nel Mondo Les principaux pays importateurs/exportateursdans le monde
Méxique
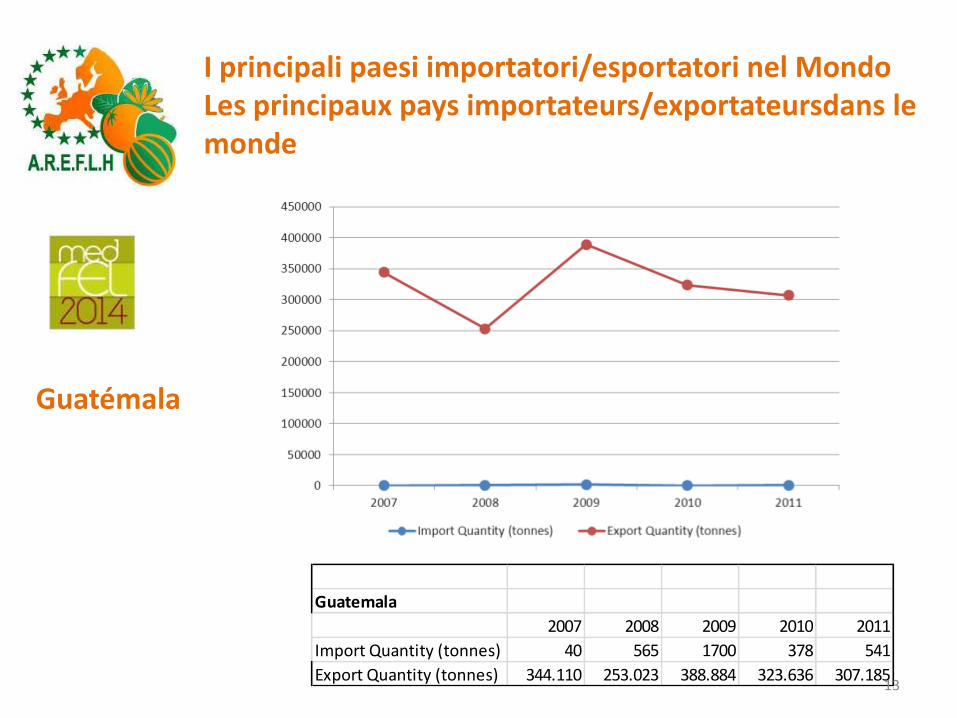
Guatemala
2007 2008 2009 2010 2011
Import Quantity (tonnes) 40 565 1700 378 541
Export Quantity (tonnes) 344.110 253.023 388.884 323.636 307.18513
I principali paesi importatori/esportatori nel Mondo Les principaux pays importateurs/exportateursdans le monde
Guatémala
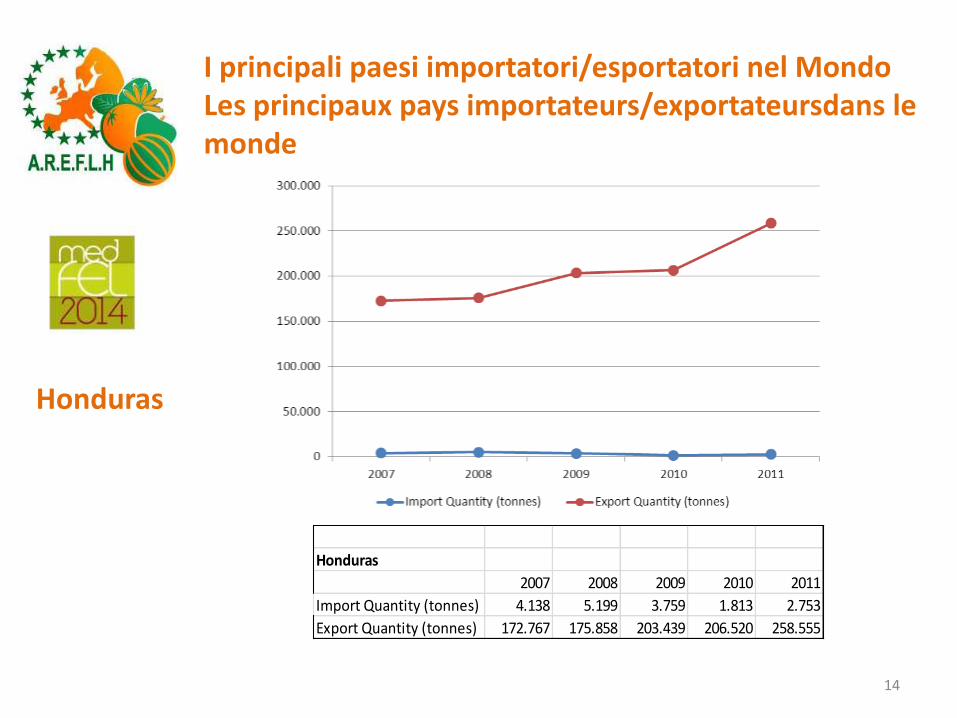
Honduras
2007 2008 2009 2010 2011
Import Quantity (tonnes) 4.138 5.199 3.759 1.813 2.753
Export Quantity (tonnes) 172.767 175.858 203.439 206.520 258.555
14
I principali paesi importatori/esportatori nel Mondo Les principaux pays importateurs/exportateursdans le monde
Honduras
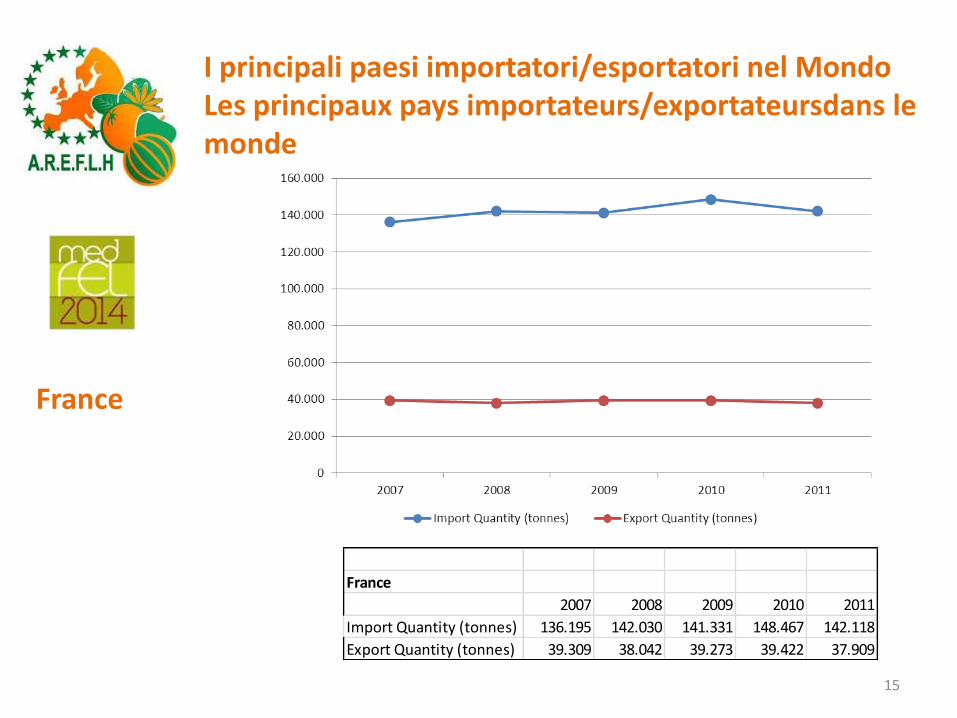
France
2007 2008 2009 2010 2011
Import Quantity (tonnes) 136.195 142.030 141.331 148.467 142.118
Export Quantity (tonnes) 39.309 38.042 39.273 39.422 37.909
15
I principali paesi importatori/esportatori nel Mondo Les principaux pays importateurs/exportateursdans le monde
France
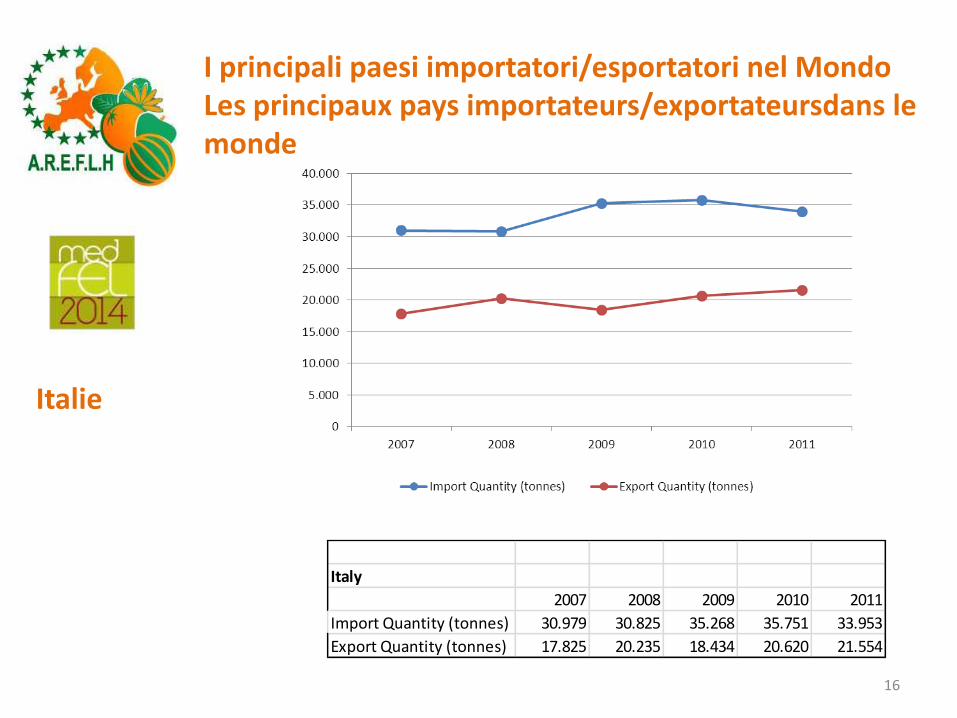
Italy
2007 2008 2009 2010 2011
Import Quantity (tonnes) 30.979 30.825 35.268 35.751 33.953
Export Quantity (tonnes) 17.825 20.235 18.434 20.620 21.554
16
Italie
I principali paesi importatori/esportatori nel Mondo Les principaux pays importateurs/exportateursdans le monde
Morocco
2007 2008 2009 2010 2011
Import Quantity (tonnes) 113 121 99 101 85
Export Quantity (tonnes) 43.277 56.490 55.925 55.081 52.683
17
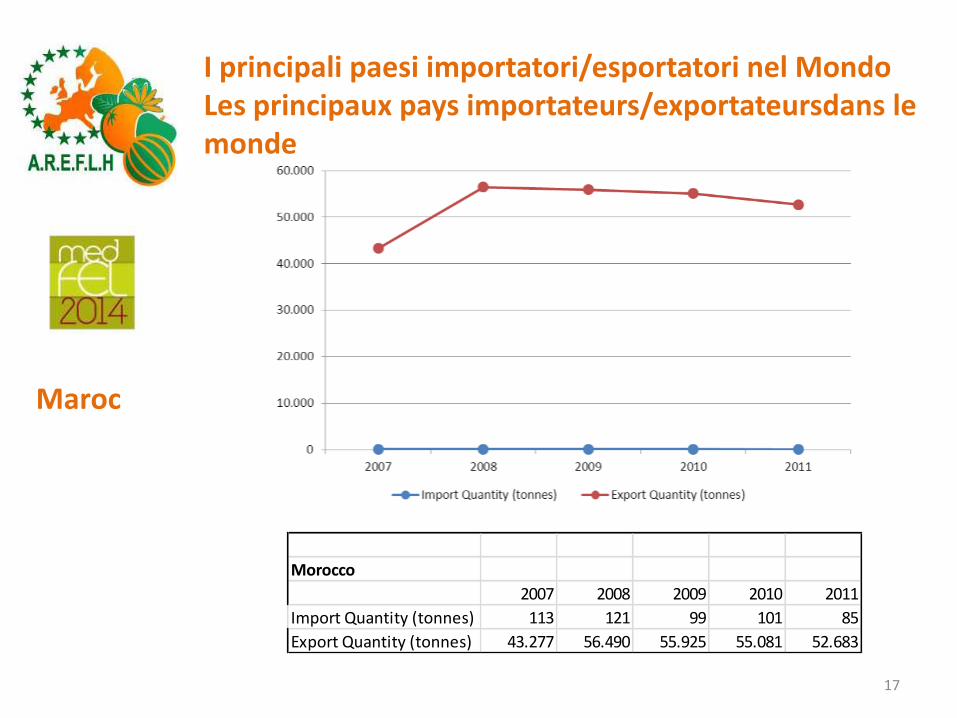
Maroc
I principali paesi importatori/esportatori nel Mondo Les principaux pays importateurs/exportateursdans le monde
Iran (Islamic Republic of)
2007 2008 2009 2010 2011
Import Quantity (tonnes) 0 0 0 3 0
Export Quantity (tonnes) 38.195 32.029 2.209 67.354 46.034
18
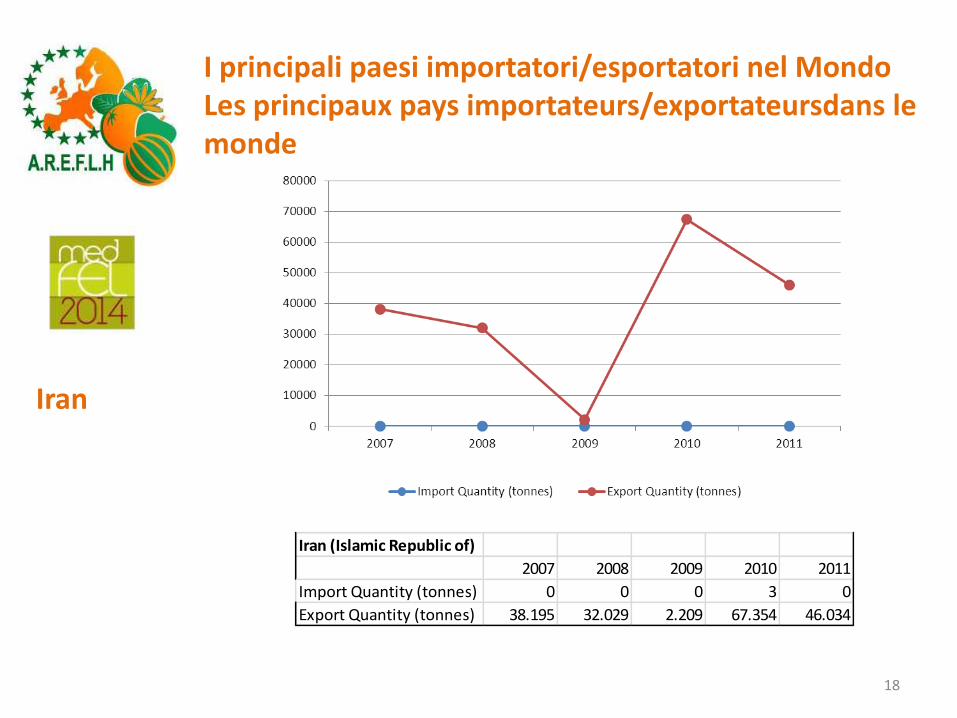
Iran
I principali paesi importatori/esportatori nel Mondo Les principaux pays importateurs/exportateursdans le monde
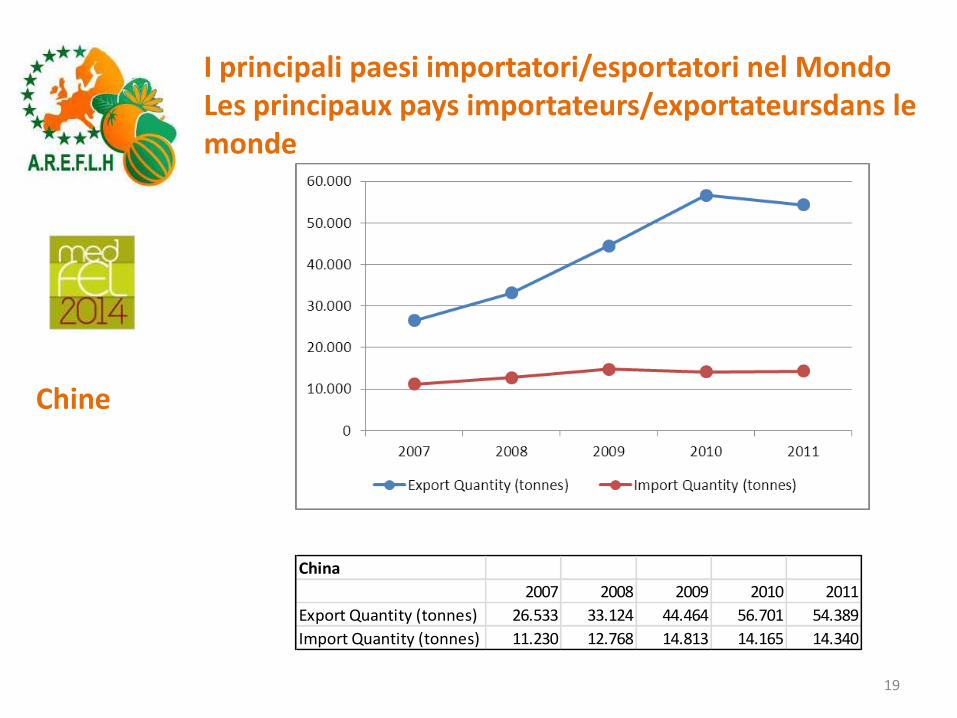
China
2007 2008 2009 2010 2011
Export Quantity (tonnes) 26.533 33.124 44.464 56.701 54.389
Import Quantity (tonnes) 11.230 12.768 14.813 14.165 14.340
19
Chine
I principali paesi importatori/esportatori nel Mondo Les principaux pays importateurs/exportateursdans le monde
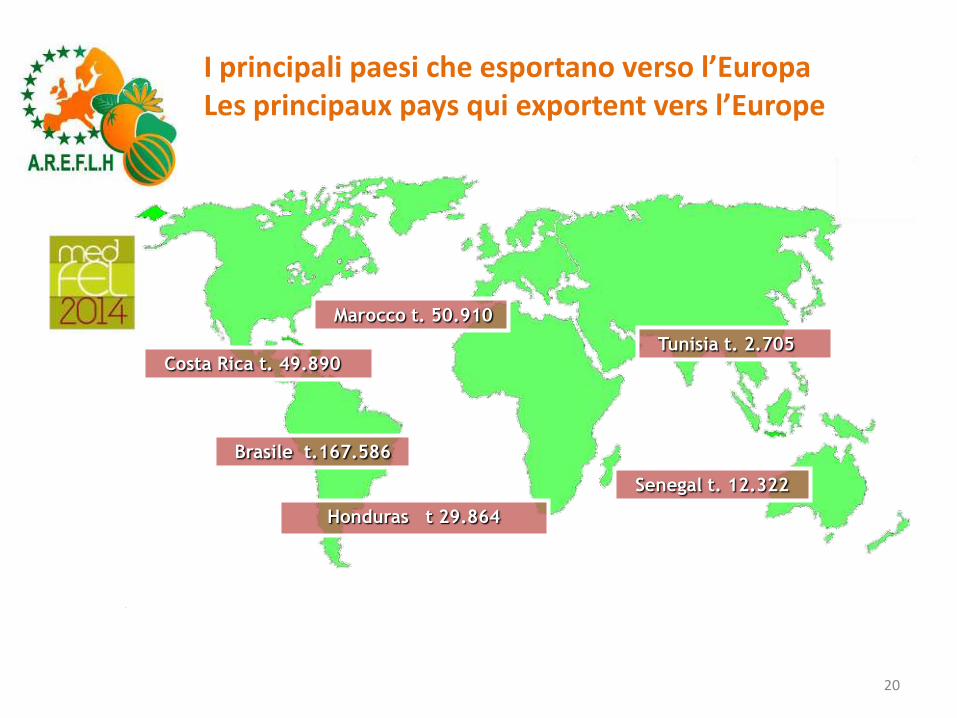
Brasile t.167.586
Costa Rica t. 49.890
Honduras t 29.864
Marocco t. 50.910
Senegal t. 12.322
Tunisia t. 2.705
20
I principali paesi che esportano verso l’Europa Les principaux pays qui exportent vers l’Europe
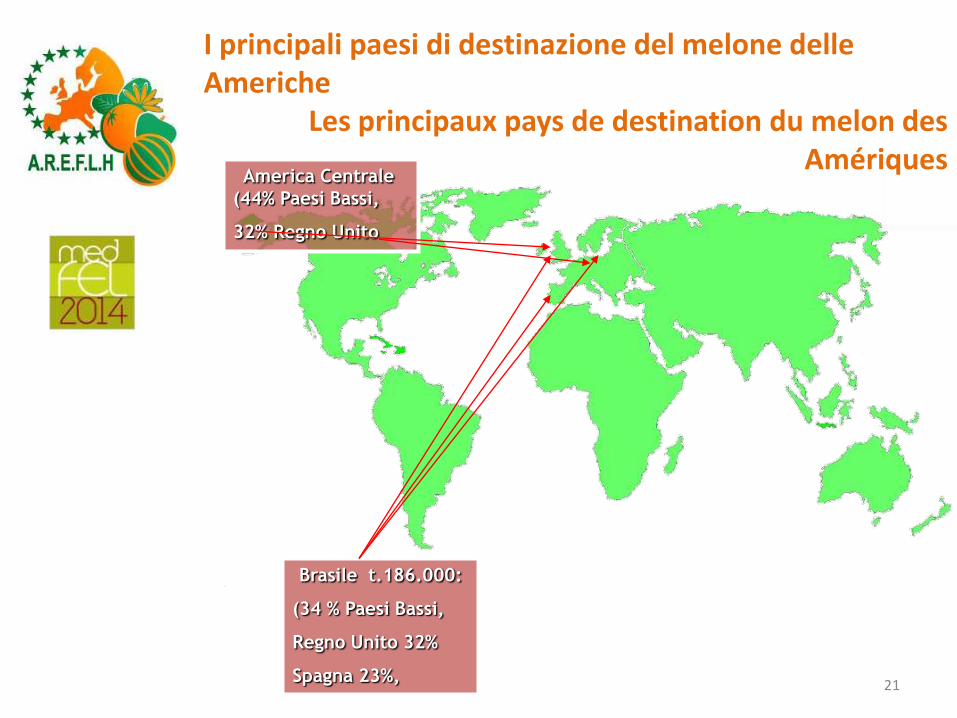
Brasile t.186.000:
(34 % Paesi Bassi,
Regno Unito 32%
Spagna 23%,
America Centrale
(44% Paesi Bassi,
32% Regno Unito
21
I principali paesi di destinazione del melone delle Americhe
Les principaux pays de destination du melon des Amériques
22
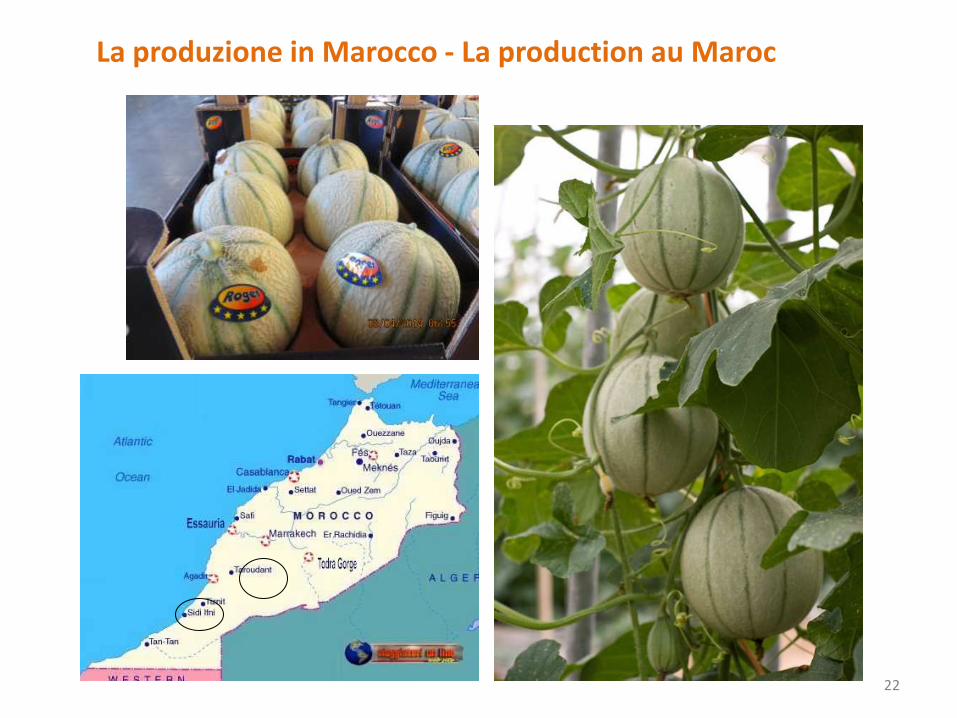
La produzione in Marocco - La production au Maroc
23
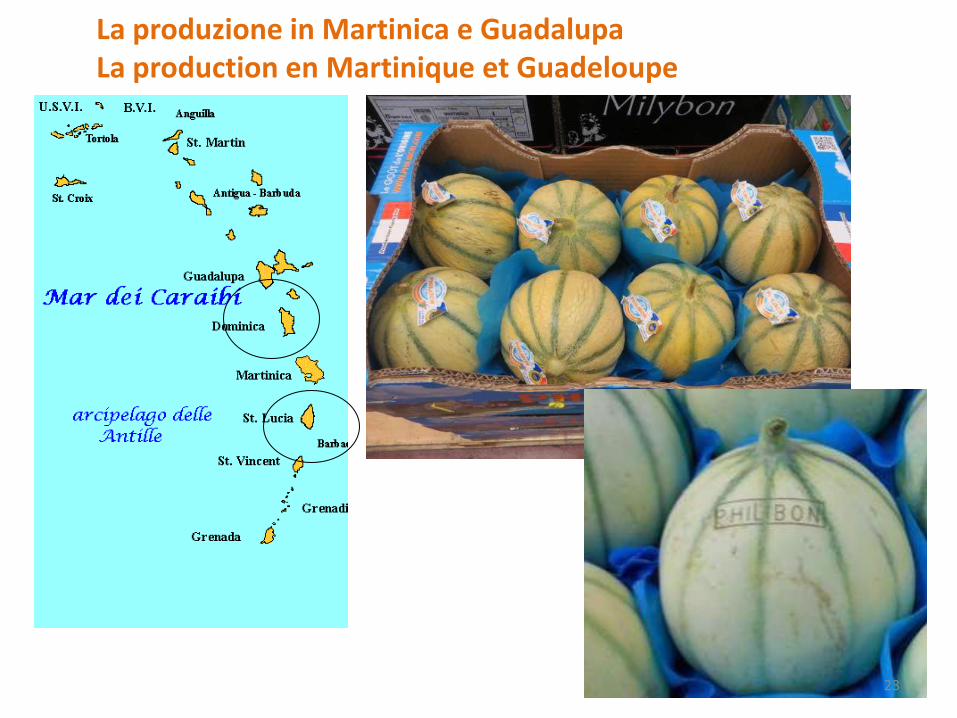
La produzione in Martinica e Guadalupa La production en Martinique et Guadeloupe
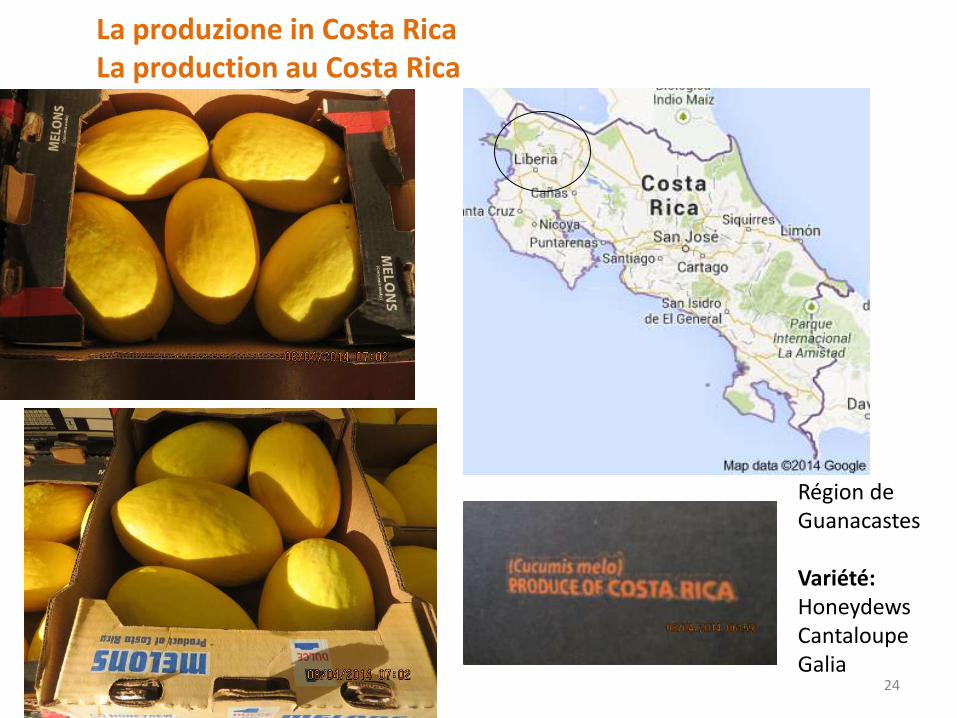
Région de Guanacastes Variété: Honeydews Cantaloupe Galia
24
La produzione in Costa Rica La production au Costa Rica
25
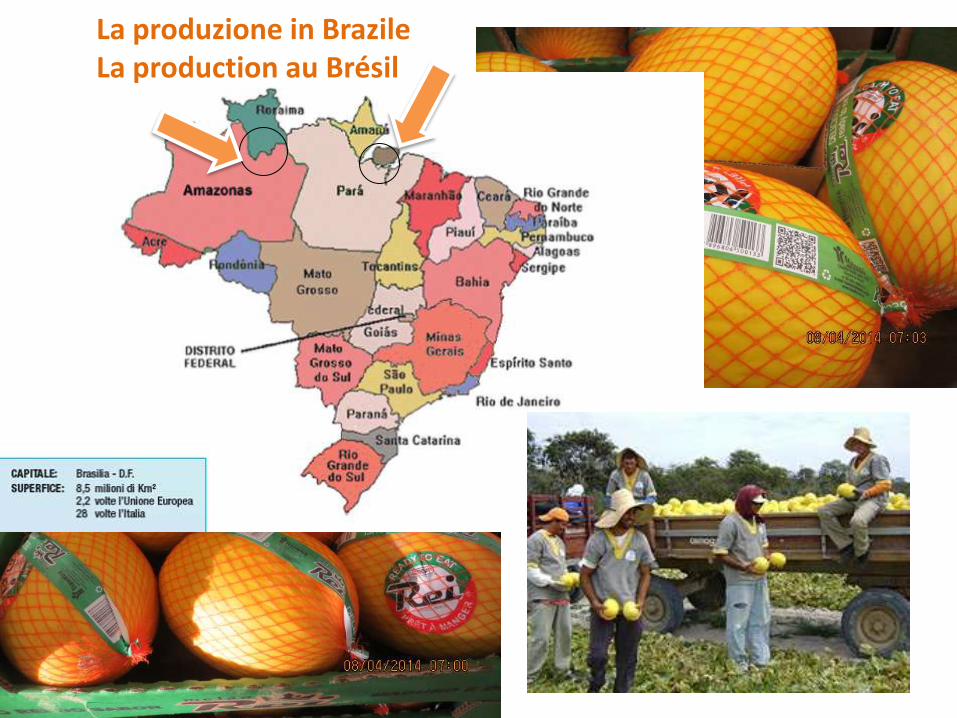
La produzione in Brazile La production au Brésil
40 m. di Euro di export cv Cantalupo, Galia, Honeydew, Piel de Sapo, Charenthais
Foto Fresh Plaza
Fonte: Fresh Plaza
Fonte: Fresh Plaza
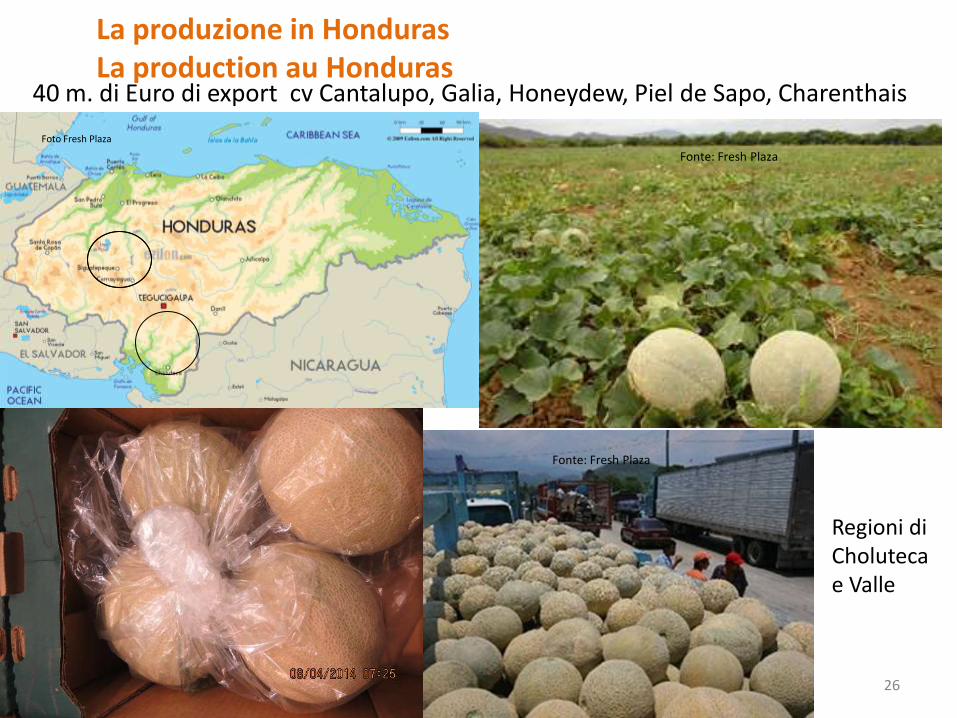
Regioni di Choluteca e Valle
26
La produzione in Honduras La production au Honduras
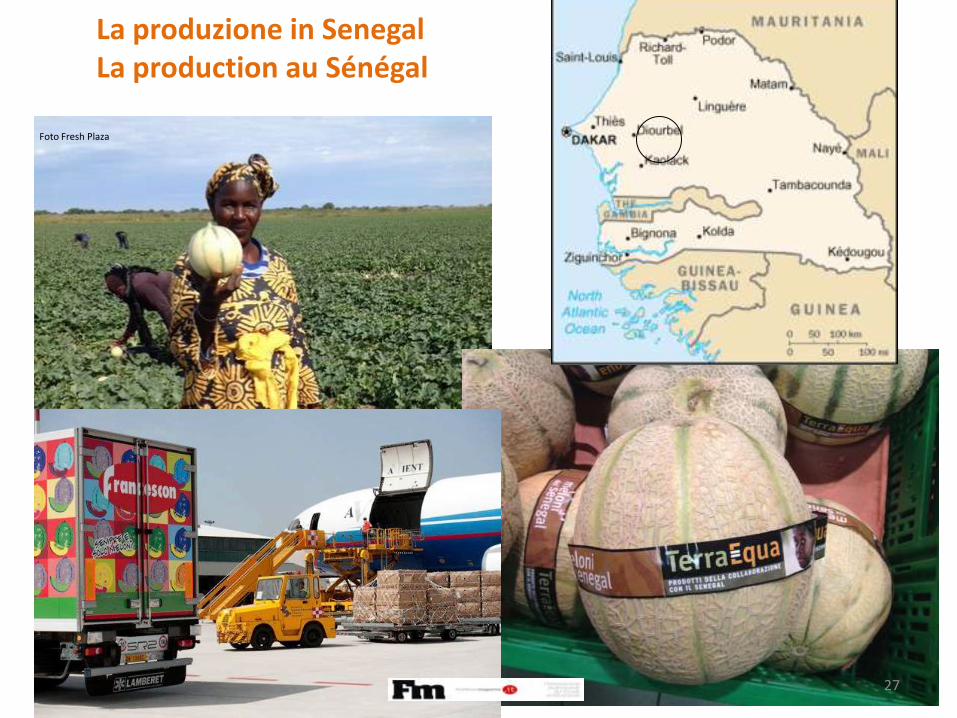
Foto Fresh Plaza
27
La produzione in Senegal La production au Sénégal
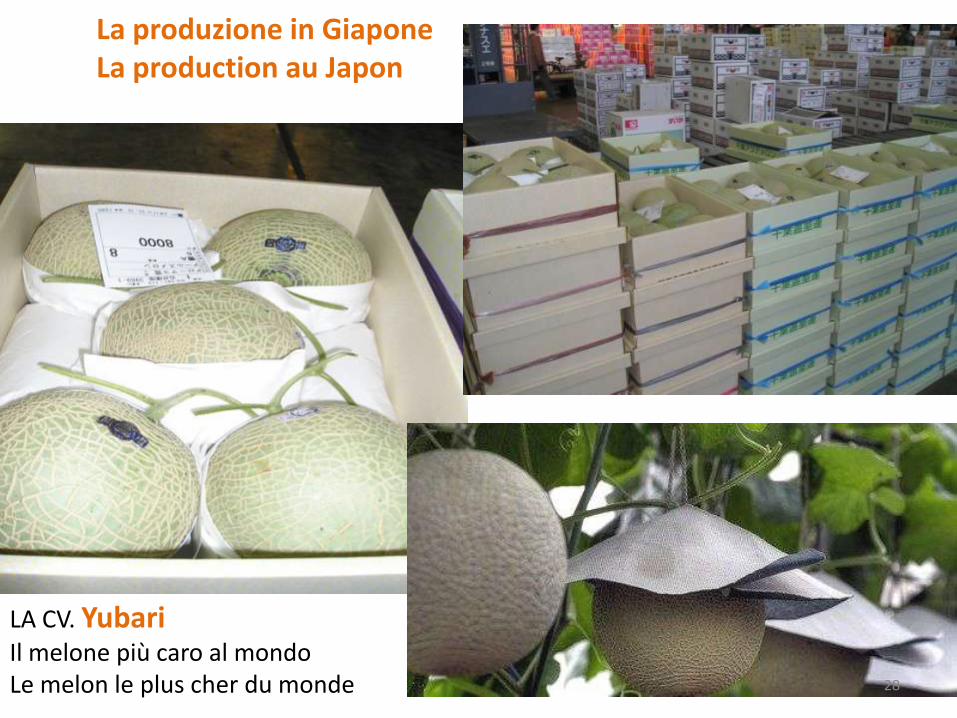
LA CV. Yubari Il melone più caro al mondo Le melon le plus cher du monde 28
La produzione in Giapone La production au Japon

Grazie per l’attenzione Merci de votre attention
www.areflh.org
[email protected] www.facebook.com/areflh
29
Assemblée des régions Européennes Fruitières, légumières et horticoles
Présenté lors du Congrès du Melon, Medfel * Perpignan 15 Mai 2014