Embed Size (px)
Citation preview
Low Energy Excitation Case Studies:
Formaldehyde absorption of the CMB HI 21 cm and OH 18 cm Line Surveys
Jeremy Darling (CASA, University of Colorado)
Lessons from Low-Frequency Spectral Line Observations
Collaborators: Alberto Bolatto (Maryland) Geoffrey Bower (UC Berkeley) Steve Curran (UNSW) Riccardo Giovanelli (Cornell) Kathryn Grasha (Colorado)* Martha Haynes (Cornell) Erin Macdonald (Glasgow) John Stocke (Colorado) Kyle Willett (Colorado)* Ting Yan (Colorado) Benjamin Zeiger (Colorado)
Jeremy Darling (CASA, University of Colorado)
Lessons from Low-Frequency Spectral Line Observations
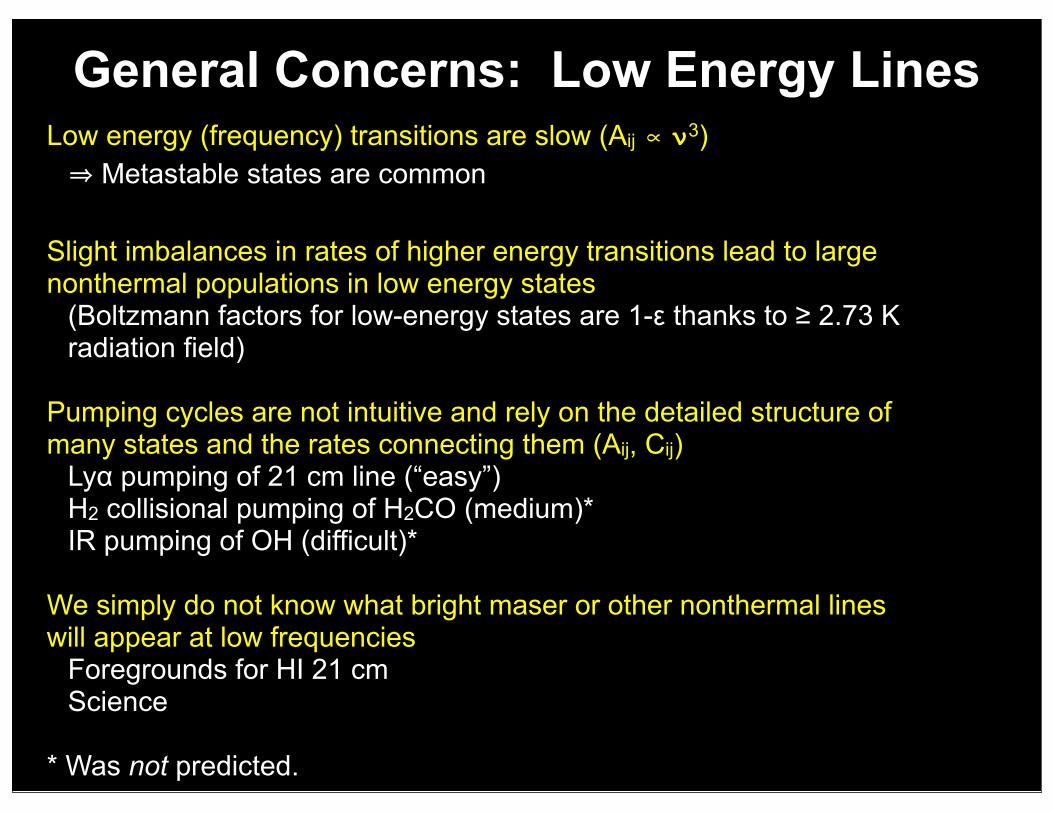
General Concerns: Low Energy LinesLow energy (frequency) transitions are slow (Aij ∝ ν3)⇒ Metastable states are common
Slight imbalances in rates of higher energy transitions lead to large nonthermal populations in low energy states
(Boltzmann factors for low-energy states are 1-ε thanks to ≥ 2.73 K radiation field)
Pumping cycles are not intuitive and rely on the detailed structure of many states and the rates connecting them (Aij, Cij)
Lyα pumping of 21 cm line (“easy”)H2 collisional pumping of H2CO (medium)*IR pumping of OH (difficult)*
We simply do not know what bright maser or other nonthermal lines will appear at low frequencies
Foregrounds for HI 21 cmScience
* Was not predicted.
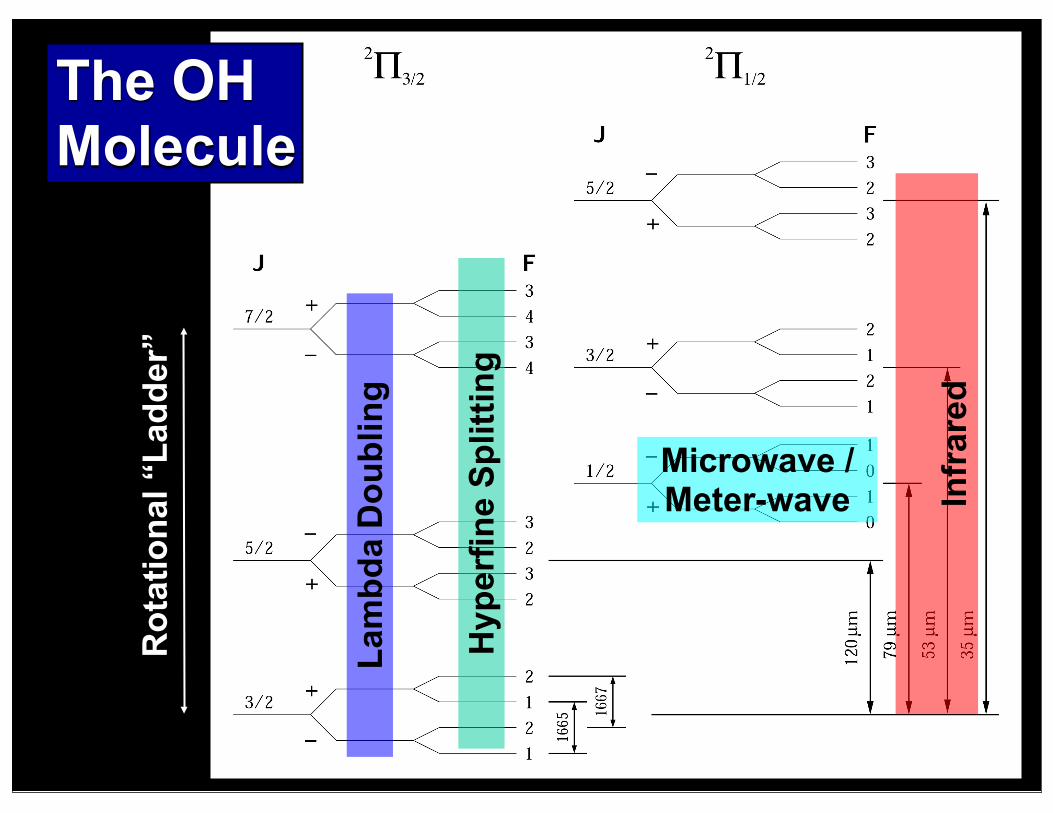
The OHMolecule
Rot
atio
nal “
Ladd
er”
Lam
bda
Dou
blin
g
Hyp
erfin
e Sp
littin
gMicrowave / Meter-wave In
frar
ed
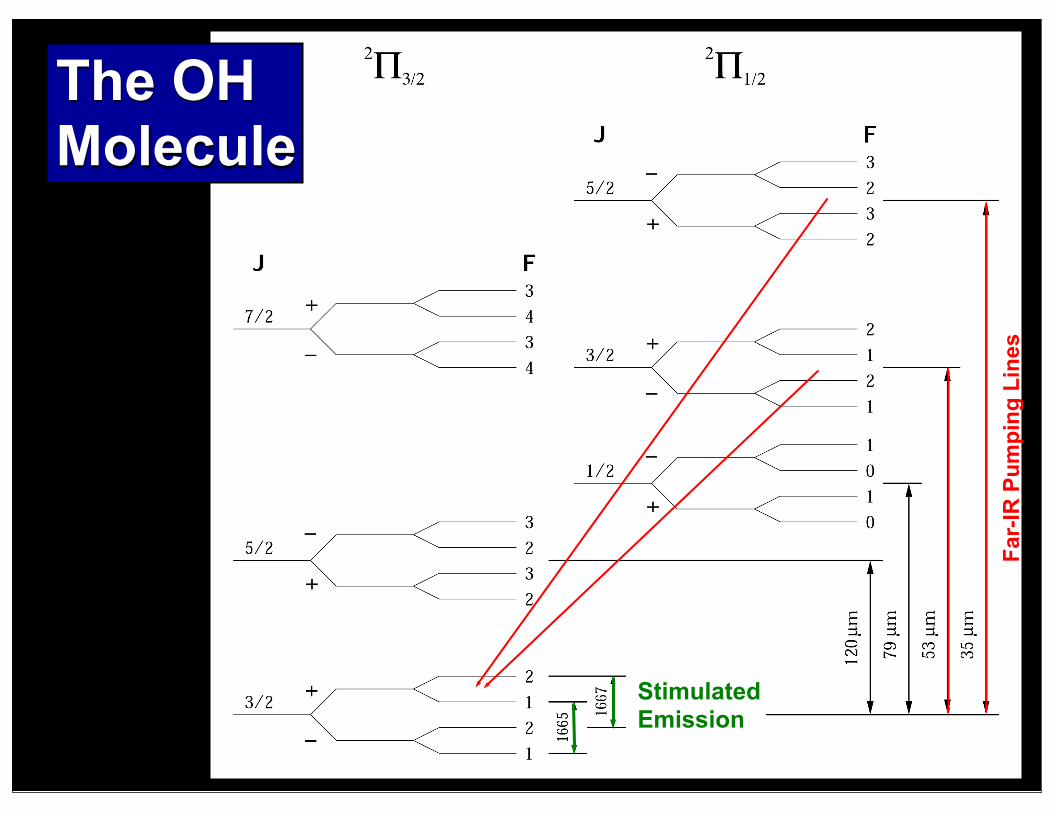
Far-
IR P
umpi
ng L
ines
StimulatedEmission
The OHMolecule
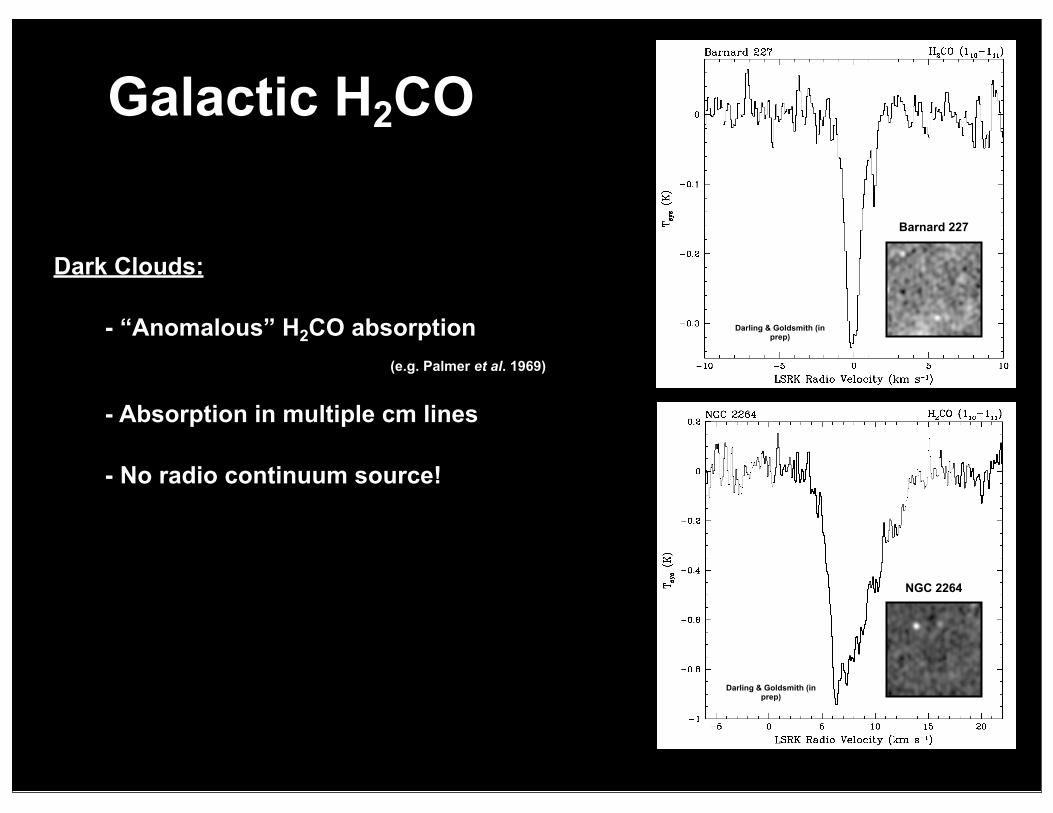
Galactic H2CO
Dark Clouds:
- “Anomalous” H2CO absorption (e.g. Palmer et al. 1969)
- Absorption in multiple cm lines
- No radio continuum source!
Darling & Goldsmith (in prep)
Darling & Goldsmith (in prep)
Barnard 227
NGC 2264
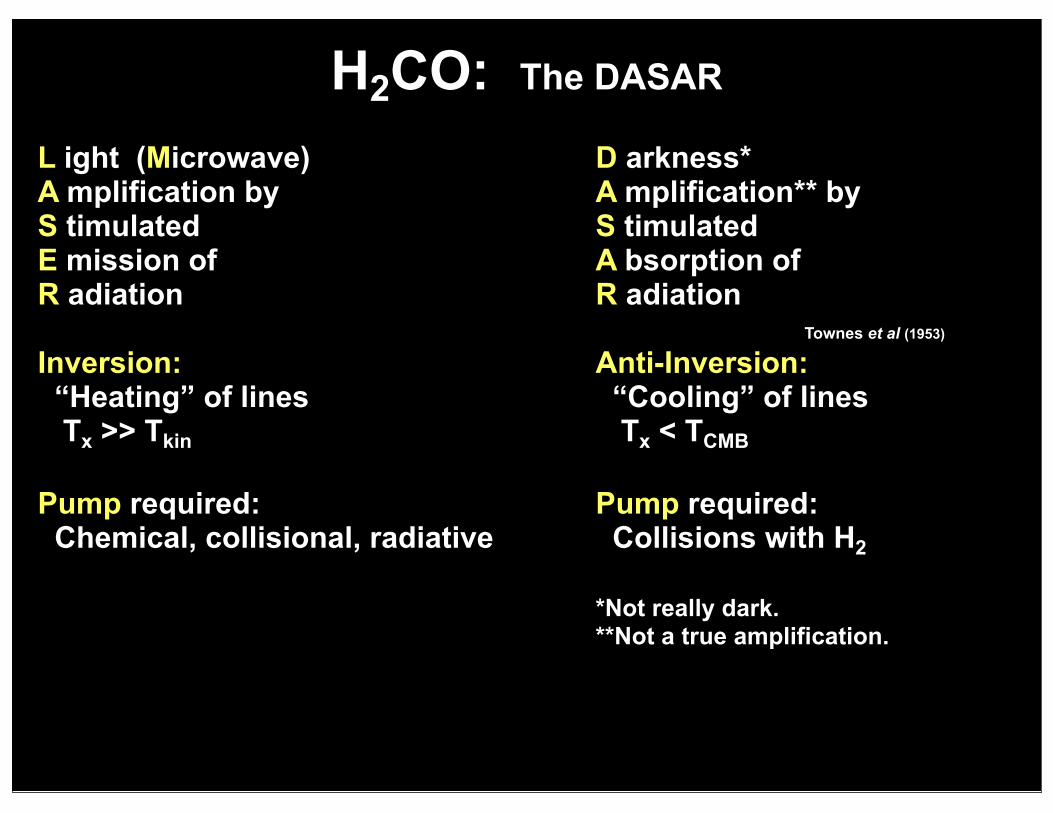
H2CO: The DASAR L ight (Microwave)A mplification byS timulated E mission ofR adiation
Inversion: “Heating” of lines Tx >> Tkin Pump required: Chemical, collisional, radiative
D arkness*A mplification** byS timulated A bsorption ofR adiation Townes et al (1953)
Anti-Inversion: “Cooling” of lines Tx < TCMB Pump required: Collisions with H2
*Not really dark.**Not a true amplification.
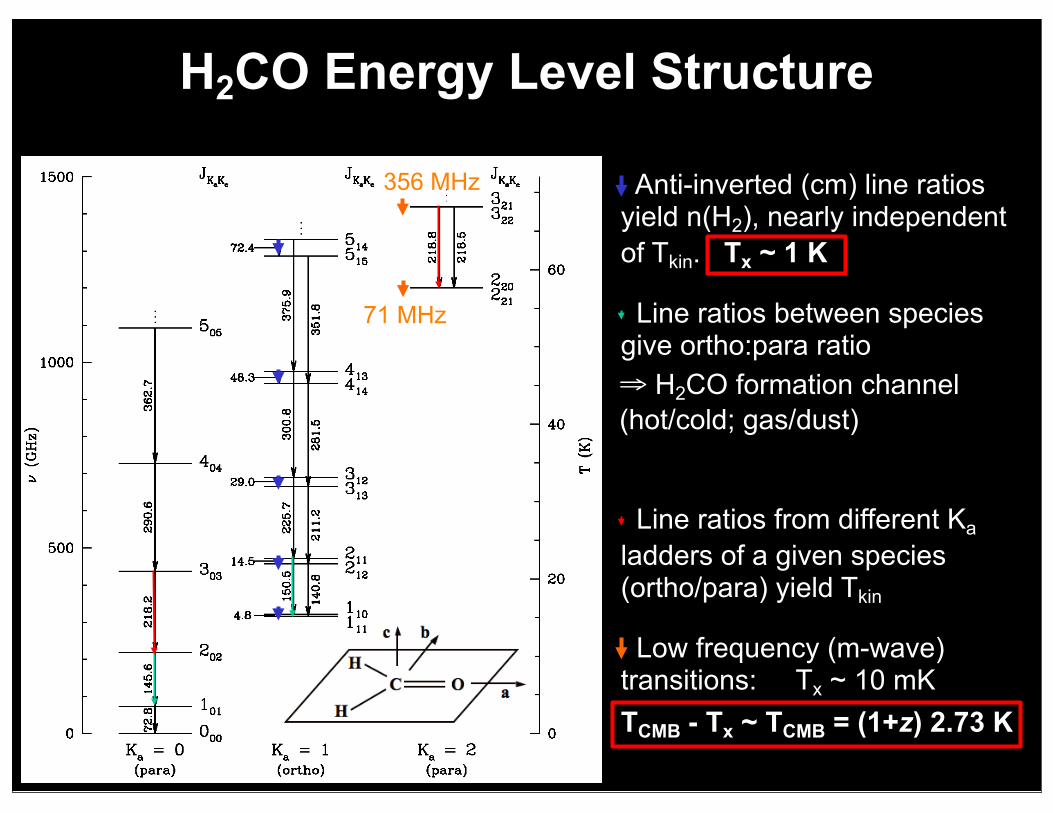
H2CO Energy Level Structure
Anti-inverted (cm) line ratios yield n(H2), nearly independent of Tkin. Tx ~ 1 K
Line ratios between species give ortho:para ratio⇒ H2CO formation channel (hot/cold; gas/dust)
Line ratios from different Ka ladders of a given species (ortho/para) yield Tkin
Low frequency (m-wave) transitions: Tx ~ 10 mKTCMB - Tx ~ TCMB = (1+z) 2.73 K
71 MHz
356 MHz
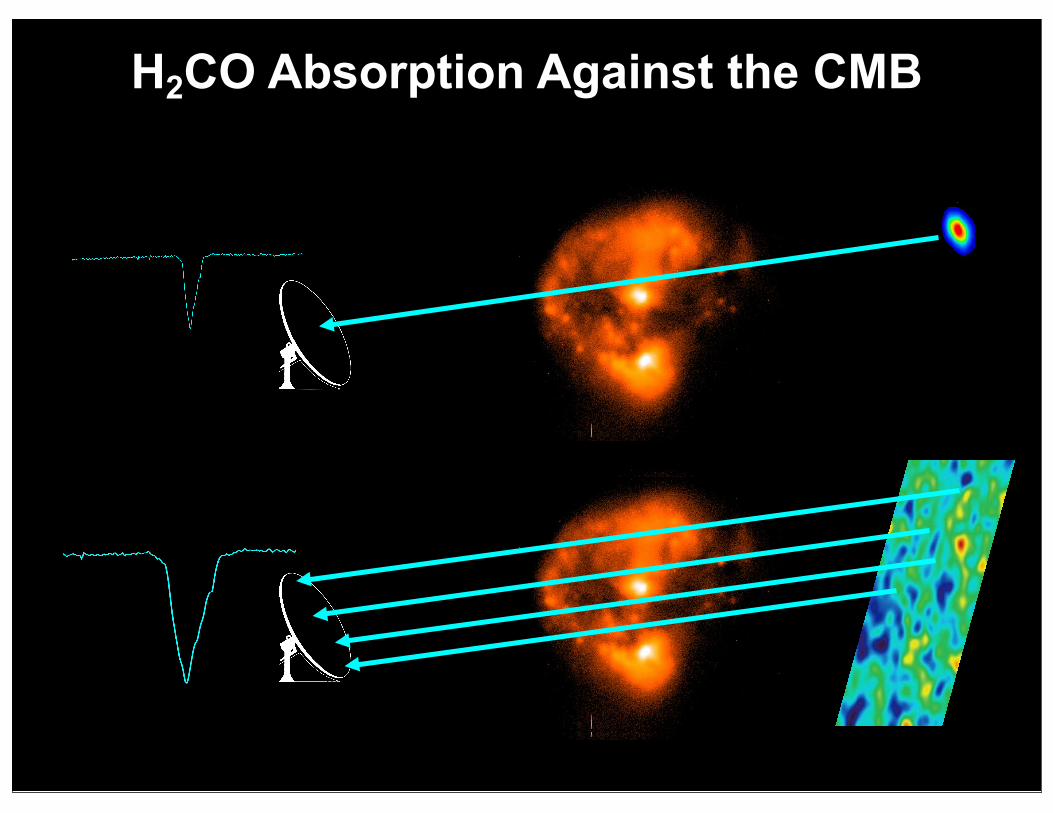
H2CO Absorption Against the CMB
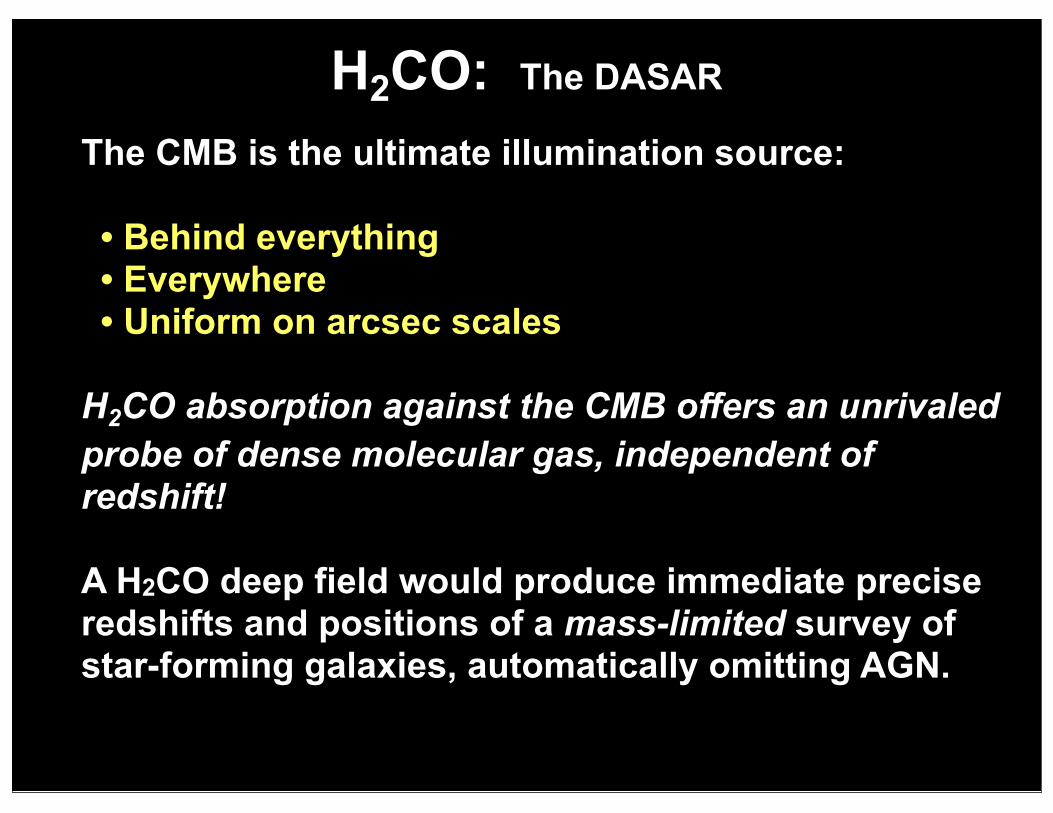
H2CO: The DASAR The CMB is the ultimate illumination source:
• Behind everything• Everywhere• Uniform on arcsec scales
H2CO absorption against the CMB offers an unrivaled probe of dense molecular gas, independent of redshift!
A H2CO deep field would produce immediate precise redshifts and positions of a mass-limited survey of star-forming galaxies, automatically omitting AGN.
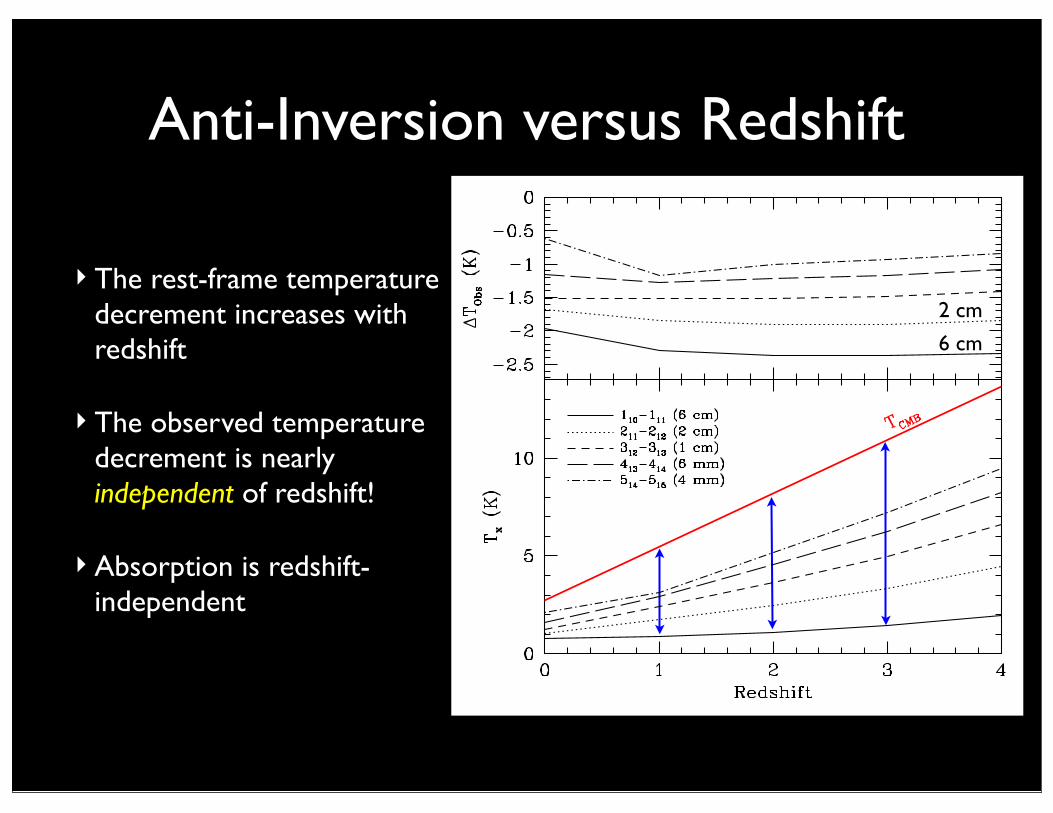
Anti-Inversion versus Redshift
‣ The rest-frame temperature decrement increases with redshift
‣ The observed temperature decrement is nearly independent of redshift!
‣Absorption is redshift-independent
6 cm
2 cm
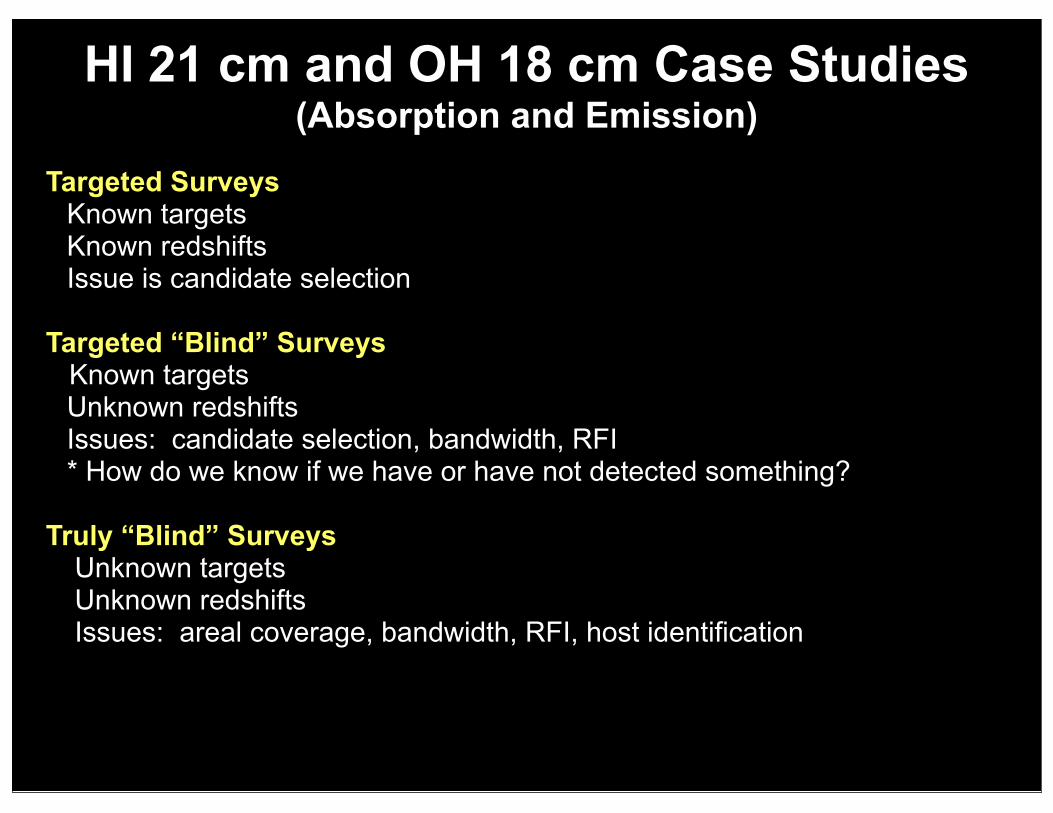
HI 21 cm and OH 18 cm Case Studies(Absorption and Emission)
Targeted SurveysKnown targetsKnown redshiftsIssue is candidate selection
Targeted “Blind” Surveys Known targets
Unknown redshiftsIssues: candidate selection, bandwidth, RFI* How do we know if we have or have not detected something?
Truly “Blind” Surveys Unknown targets Unknown redshifts Issues: areal coverage, bandwidth, RFI, host identification
Feed Resonance
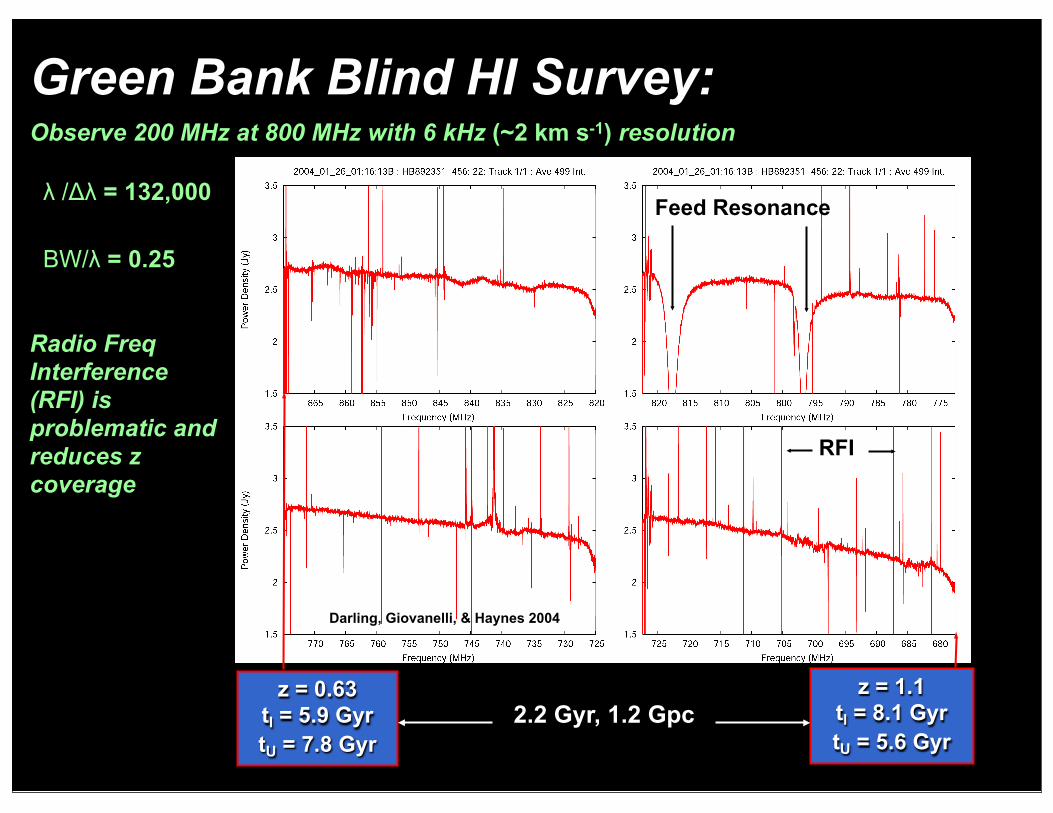
Green Bank Blind HI Survey:Observe 200 MHz at 800 MHz with 6 kHz (~2 km s-1) resolution
λ /Δλ = 132,000
BW/λ = 0.25
Radio Freq Interference (RFI) is problematic andreduces z coverage
RFI
z = 1.1tl = 8.1 GyrtU = 5.6 Gyr
z = 0.63tl = 5.9 GyrtU = 7.8 Gyr
2.2 Gyr, 1.2 Gpc
Darling, Giovanelli, & Haynes 2004
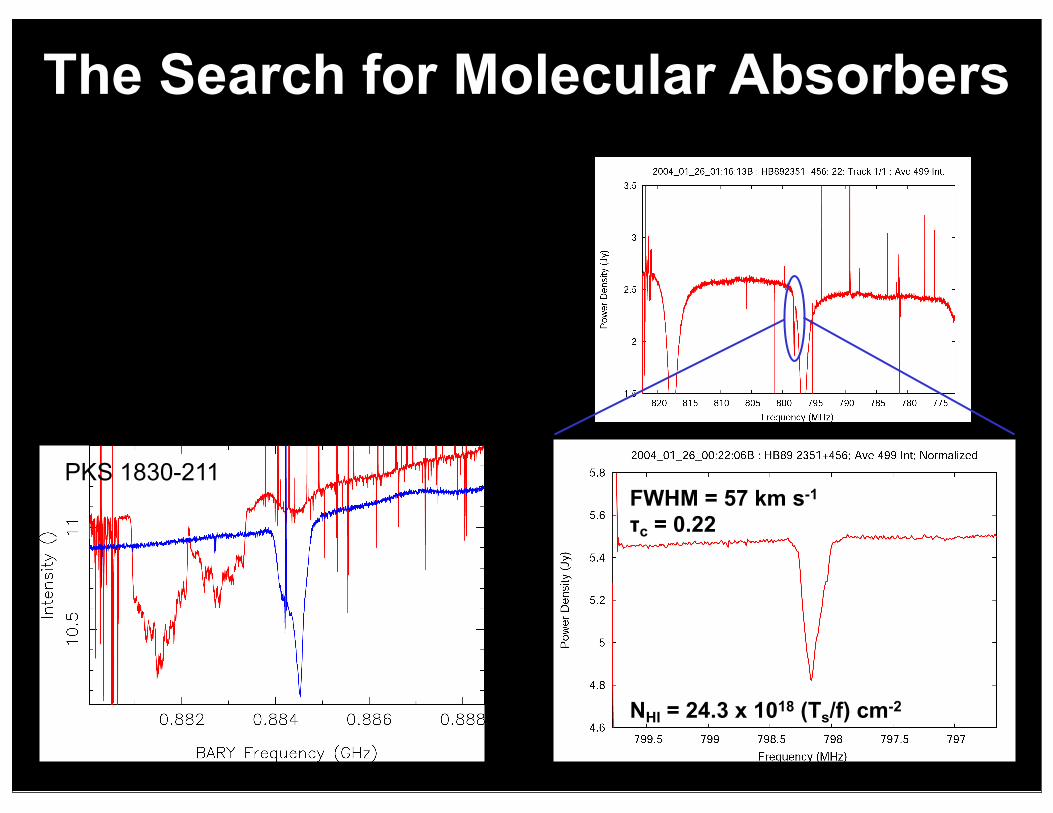
The Search for Molecular Absorbers
FWHM = 57 km s-1
τc = 0.22
NHI = 24.3 x 10¹⁸ (Ts/f) cm-2
PKS 1830-211
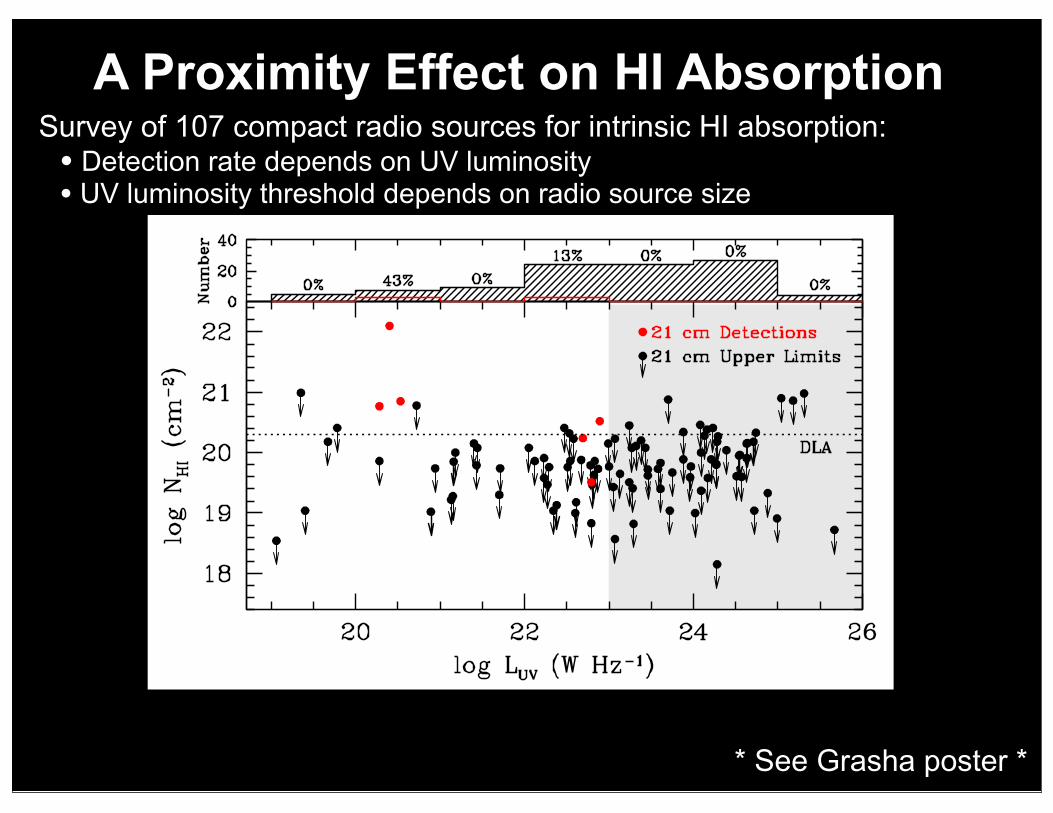
Survey of 107 compact radio sources for intrinsic HI absorption:• Detection rate depends on UV luminosity• UV luminosity threshold depends on radio source size
A Proximity Effect on HI Absorption
* See Grasha poster *
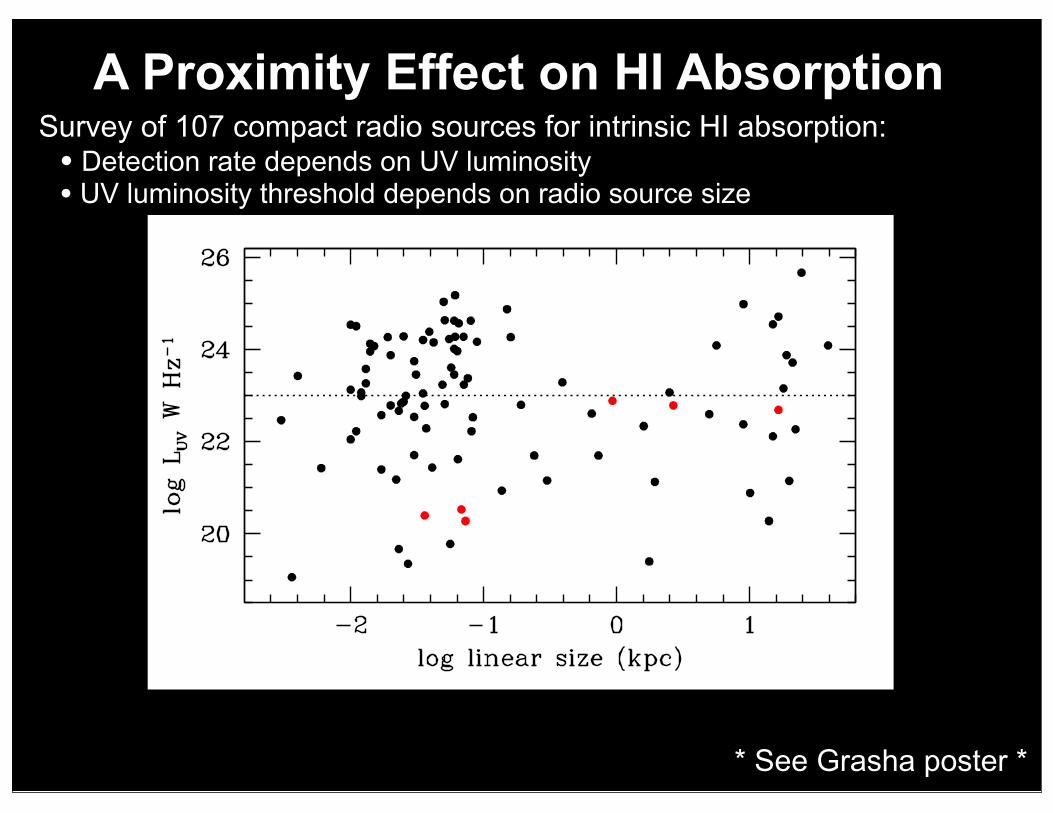
Survey of 107 compact radio sources for intrinsic HI absorption:• Detection rate depends on UV luminosity• UV luminosity threshold depends on radio source size
A Proximity Effect on HI Absorption
* See Grasha poster *
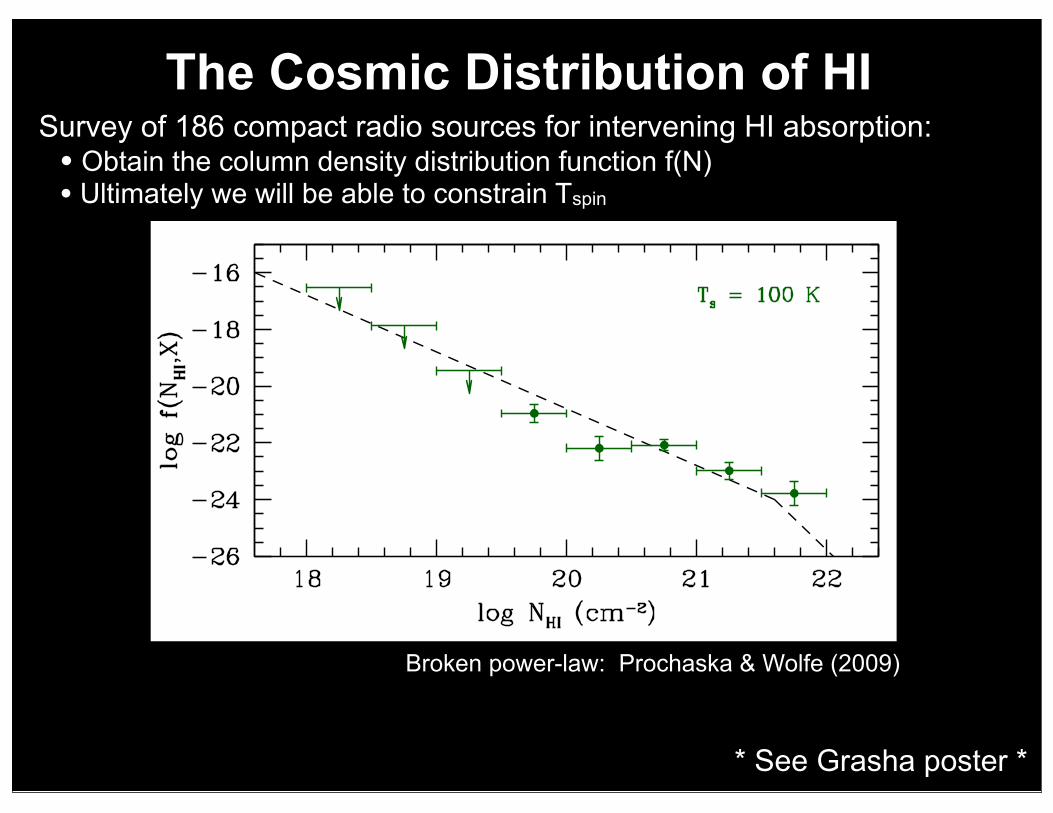
Survey of 186 compact radio sources for intervening HI absorption:• Obtain the column density distribution function f(N)• Ultimately we will be able to constrain Tspin
The Cosmic Distribution of HI
* See Grasha poster *
Broken power-law: Prochaska & Wolfe (2009)
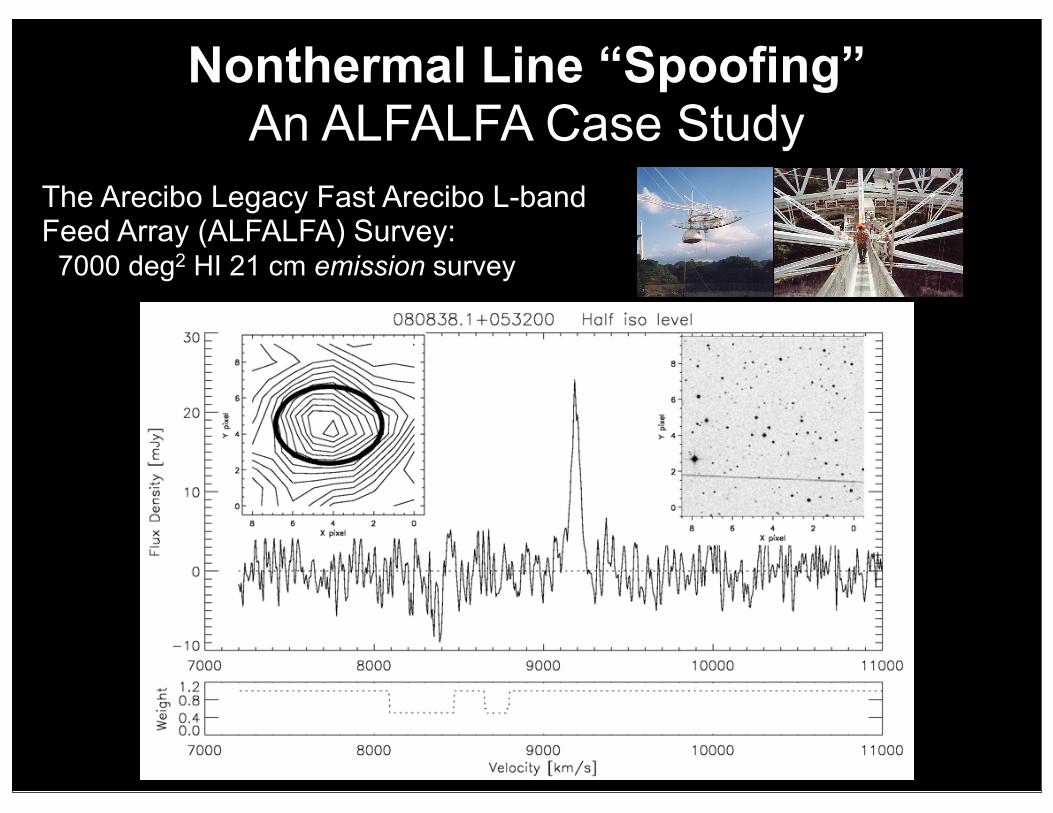
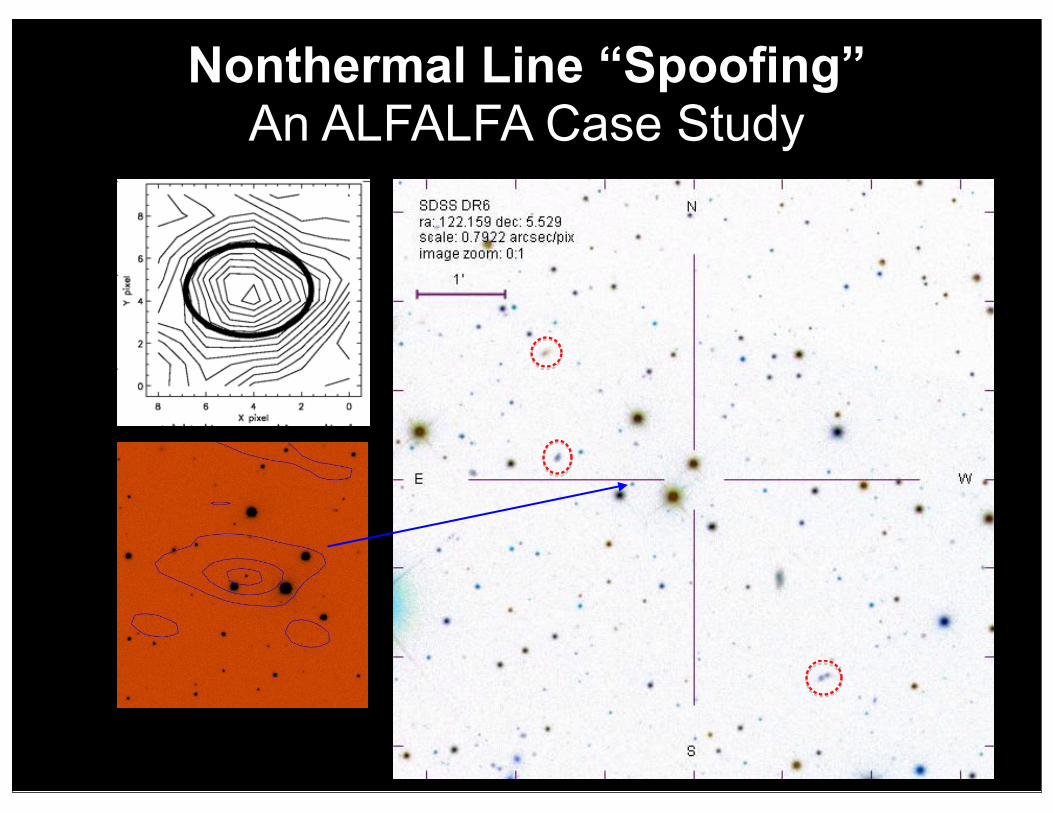
The Arecibo Legacy Fast Arecibo L-band Feed Array (ALFALFA) Survey: 7000 deg2 HI 21 cm emission survey
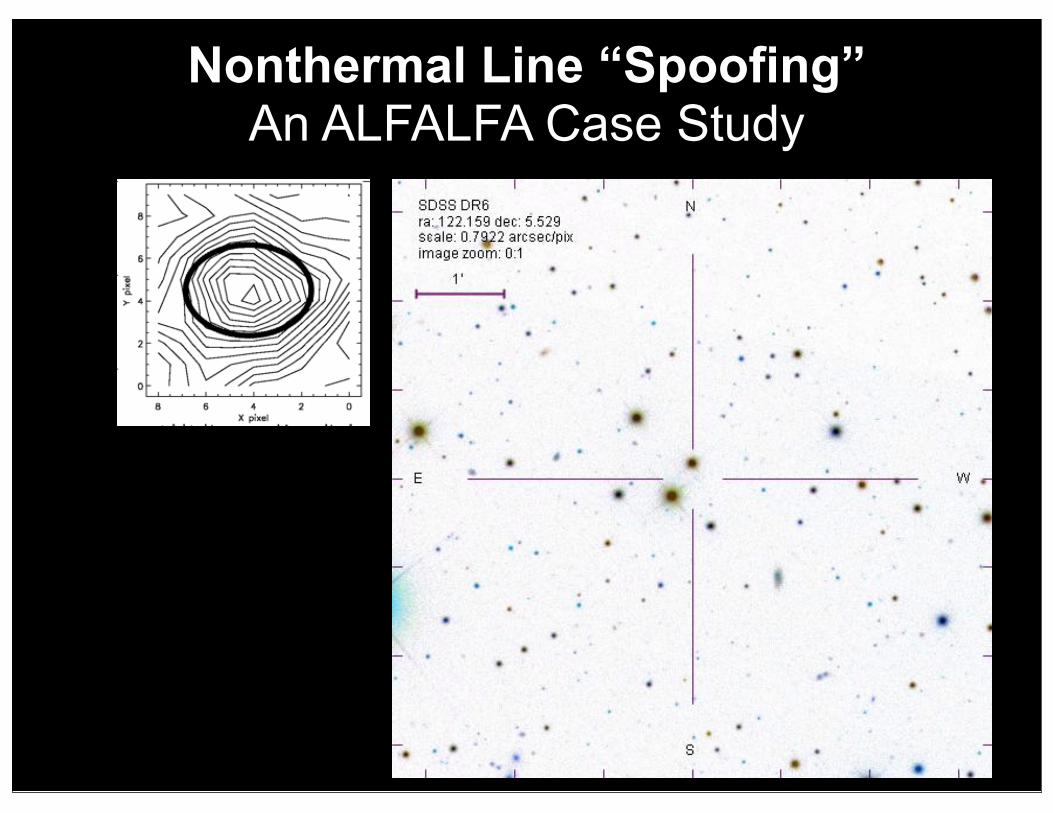
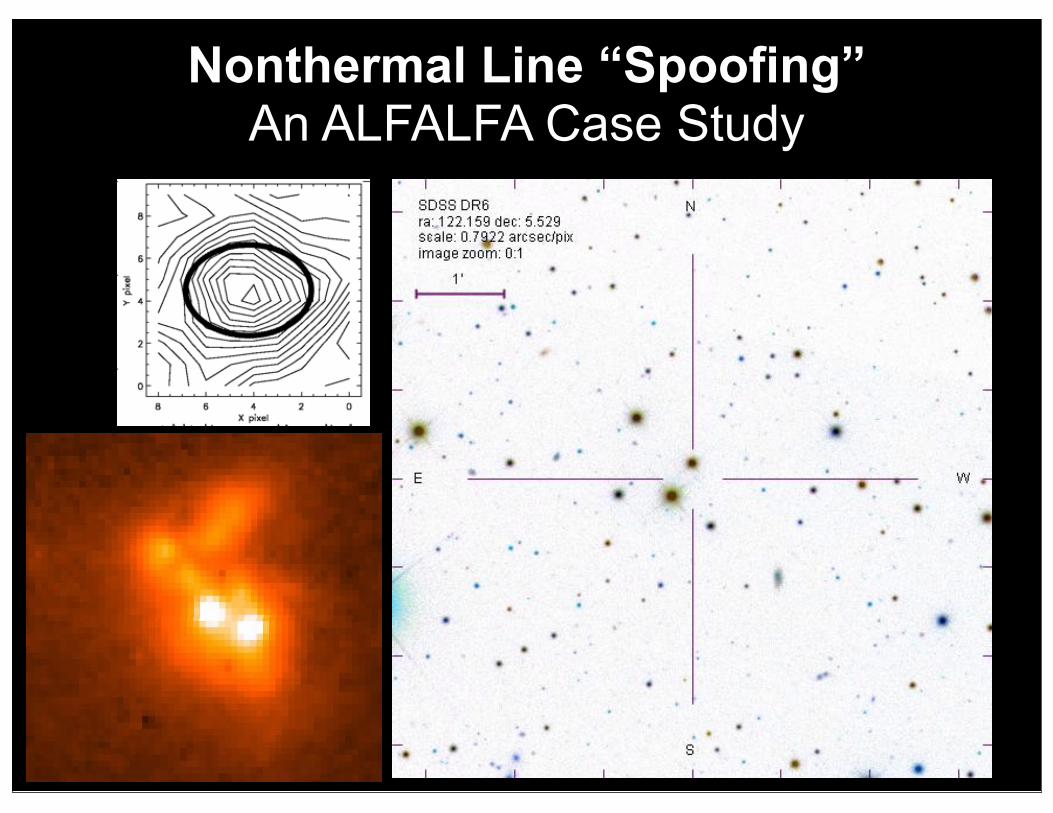
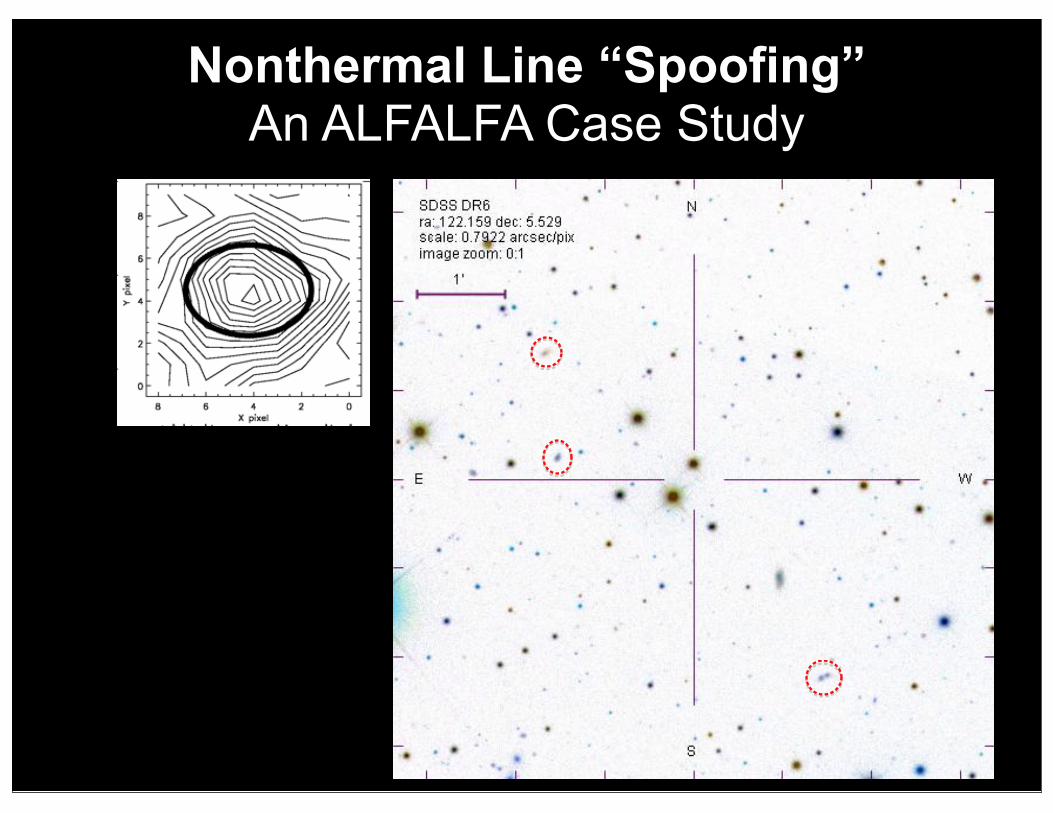
Nonthermal Line “Spoofing” An ALFALFA Case Study
Nonthermal Line “Spoofing” An ALFALFA Case Study
Nonthermal Line “Spoofing” An ALFALFA Case Study
Nonthermal Line “Spoofing” An ALFALFA Case Study
Nonthermal Line “Spoofing” An ALFALFA Case Study
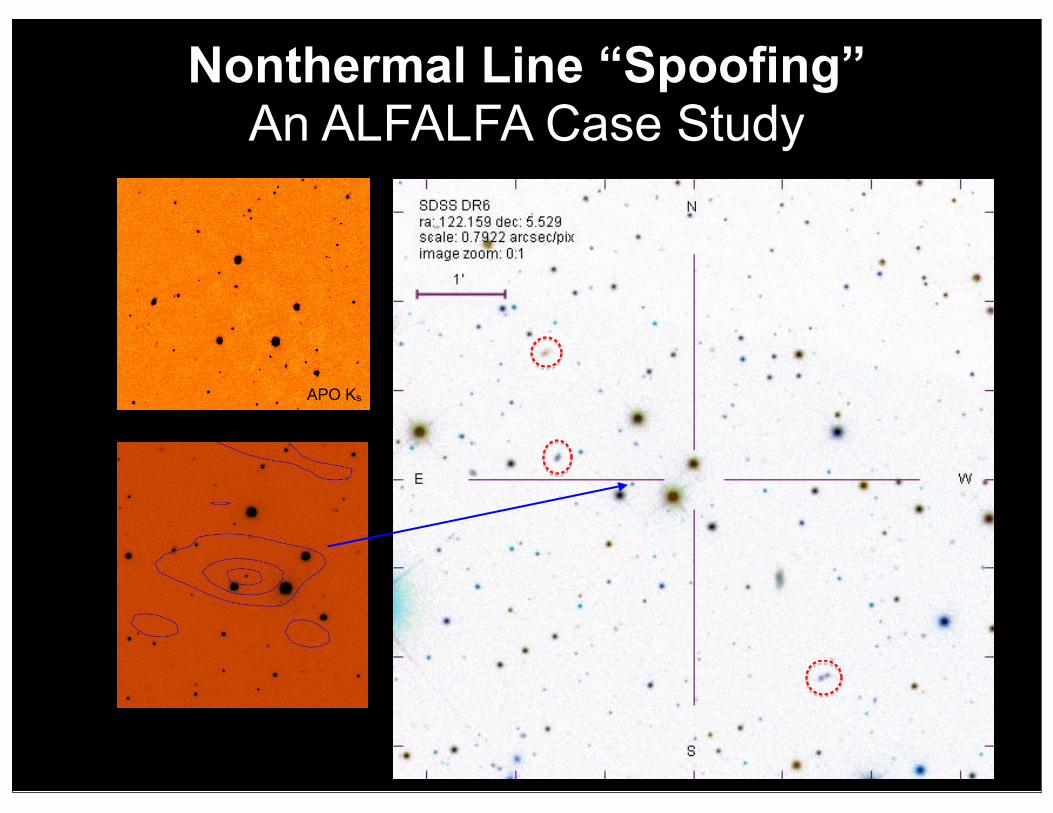
APO Ks
Nonthermal Line “Spoofing” An ALFALFA Case Study
818 F.H. Briggs: Cosmologically distant OH megamasers
Fig. 3.Minimum LOH detectable at redshift z in an observation withdetection threshold Sdet. Families of curves are drawn for Sdet = 0.2,
1, 5, and 20 mJy for cosmological models with Ωo = 0.01, 0.2 and
1. Models assume Ho = 100 km s−1 Mpc−1 and OH profiles having
width 100 km s−1.
tenna collecting area and the Boltzmann constant in mks units,
respectively. The noise level attained by observing a single po-
larization with a spectral resolution of ∆ν and an integrationtime τ is σJy = TsysKc/(Ka
√∆ν τ) where Kc is a factor
with values typically between 1 and 1.4 depending on the de-
tails of the digital correlation spectrometer used to obtain the
spectra.
As an example of sensitivities that can be attained at present
or in the near future, consider the specifications and noise levels
for typical observations with the Westerbork Synthesis Radio
Telescope. For this system, receivers at 600 and 1400 MHz will
have Tsys of 45 and 25 K respectively. The effective Ka of
combining fourteen 25 m telescopes is Ka ≈ 1.4 K Jy−1. For
velocity widths of 100 km s−1, these receiving systems will
reach the 1 mJy (5σ) level in roughly one to three 12 hour longintegrations. The WSRT telescope will soon have the further
benefit of a spectrometer capable of simultaneous observation
in the synthesis mapping mode of an 80 MHz bandwidth at
frequencies below 1200 MHz and 160 MHz above 1200 MHz
with adequate spectral resolution for the identification of 100
km s−1 width signals. The minimum detectable OH line lumi-
nosity as a function of redshift is plotted in Fig. 3 for a range of
cosmological models and observational sensitivity.
2.4. Density of megamasers per solid angle
Estimates for the number of detectable megamasers in a blind
survey of a large area of sky can be straightforwardly obtained
by computing the comoving volume at redshift z contained inthe solid angle dΩ and depth dz (Wieringa et al 1992),
dV = 4
(
c
Ho
)3 [Ωoz + (Ωo − 2)(√
1 + Ωoz − 1)]2
Ω4o(1 + z)3
√1 + Ωoz
dz dΩ,
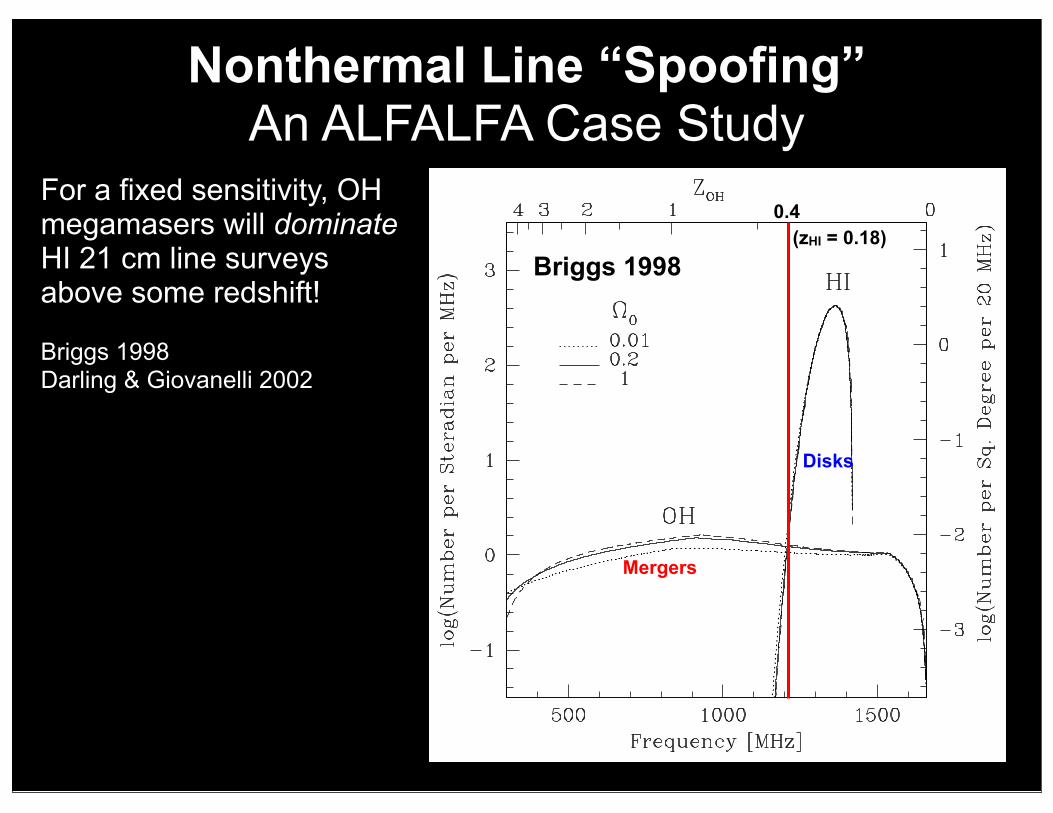
Fig. 4.Detection rate of signals fromOHmegamasers andHI in normal
galaxies as a function of frequency. Computed for line widths of 100
km s−1 and survey sensitivity of 1 mJy. The OH redshift for the OH
lines is indicated at the top of the figure. The relatively narrow peak in
detection rate for neutral hydrogen is labeled “HI,”while “OH” refers to
the broader, low-level function of redshift. Three cosmological models
are shown: Ωo = 0.01, 0.2 and 1.
and then filling the volume with OH emitters according to the
density prescribed by Fig. 1. A count of the number of objects
whose observed flux exceeds a detection threshold can be made
and plotted as shown for three cosmological models in Fig. 4.
The detection level was chosen to be 1mJy for 100 km s−1, con-
sistent with feasible integration times with existing radio tele-
scopes. In Fig. 4, the horizontal axis is chosen to be observed
frequency and the counts are binned according to expected de-
tection rate per bandwidth of radio spectrum. These are natural
units for use in planning surveys. In computing this diagram, the
assumption was made that there is no evolution in the comoving
number densities or luminosities of the OH megamasers with
redshift. Curves for showing the detection rate for the confusing
signals from normal galaxies emitting the 21cm hydrogen line
are shown for comparison. Computations of the detection rate
for a range of sensitivities is given in Fig. 5.
2.5. Confusion with 21cm line emission from normal galaxies
The expected number of detections of normal galaxies in the
21cm line of neutral hydrogen can be computed in a similar
manner to that for OHmegamasers. The HI luminosity function
φ(MHI) observed for nearby galaxies (Zwaan et al 1997) canbe represented as a function of HI mass,MHI
φ(MHI) dMHI = φ∗ (MHI/M∗HI)
−γ e−MHI/M∗
HI dMHI (7)
For a fixed sensitivity, OH megamasers will dominate HI 21 cm line surveys above some redshift!
Briggs 1998 Darling & Giovanelli 2002
Briggs 1998
0.4
Mergers
Disks
(zHI = 0.18)
Nonthermal Line “Spoofing” An ALFALFA Case Study
F.H. Briggs: Cosmologically distant OH megamasers 819
with φ∗ = 0.014 Mpc−3, γ = 1.2 and M∗HI = 109.55M#.
The luminosity in the 21cm line from an optically thin cloud
of neutral hydrogen with HI mass MHI is LHI/L# =6.2×10⁻⁹MHI/M#.
Curves for detection rates in the hydrogen line are plotted
in Figs. 4 and 5 for comparison with the OH line strengths. The
exponential cutoff to the HI luminosity function causes the HI
detection rate to cutoff very hard around z = 0.2 for 1 mJysensitivity. The power law function for the OH masers permits
the bright end of the OH maser population to dominate the
detection rate at frequencies below∼1200 MHz for reasonableintegration times with existing telescopes.
Not only are the typical velocity widths of the OH profiles
comparable to velocity spreads measured in the 21 cm line for
low mass and face-on galaxies, but also the pair of strong OH
lines at 1665.4 and 1667.4 MHz could produce a spectrum that,
at low signal to noise ratio, could imitate a double horned galaxy
profile with a splitting of ∼360 km s−1, although the horns are
likely to be asymmetric due to the usual weakness of the 1665
line relative to the 1667 line.
Sifting the OHmasers from the HI lines from normal galax-
ies of low redshift would be straightforward. High spatial reso-
lution radio observations would show OH masers to have high
brightness temperature and would identify the sources with
compact optical sources for which emission lineswould provide
an unambiguous redshift. OHmegamasers are strong emitters of
60µm infrared, but sources at z ≈ 0.17 (or greater), selected forOH line strength around 1 mJy, will have 60 µm flux densitiesapproximately equal or less than the 0.2 Jy sensitivity level of
the IRAS 60 µmFaint Source Survey (Moshir et al 1992). Sincethe infrared spectrum of the OH megamasers falls steeply from
60 µm to 25 µm, suitable megamaser host galaxies at moderateto high redshift may become increasingly difficult to detect at
infrared wavelengths as the 60 µm flux is redshifted toward stilllonger wavelengths.
3. Redshift dependent merging rate
The importance of merging small galaxies to build the large
galaxies that we observe at the present is a topic of considerable
controversy, since the question addresses the foundations for
theories of galaxy formation. In this section, it is demonstrated
that surveys sensitive to OH masers at z ≈ 2 may be able tomeasure the number density of interacting andmerging systems
at high redshift at a time when the merging rate is thought to
peak. Observations using radio telescopes with sufficient sensi-
tivity and sufficient spectral bandwidth can not only determine
the statistics of the evolving density of OHmasers with time, but
they will also select systems of interest at high redshift, which
can be further studied with a variety of techniques to determine
physical conditions, dynamics and effects of local environment.
For the purposes of estimating the effect of an increased
merging rate at early times, the model explored in Fig. 4 and the
top panel of Fig. 5 can be modified by increasing the number
density of OH megamasers in proportion to (1 + z)m, in keep-
ing with the idea that, locally, OH megamasers are associated
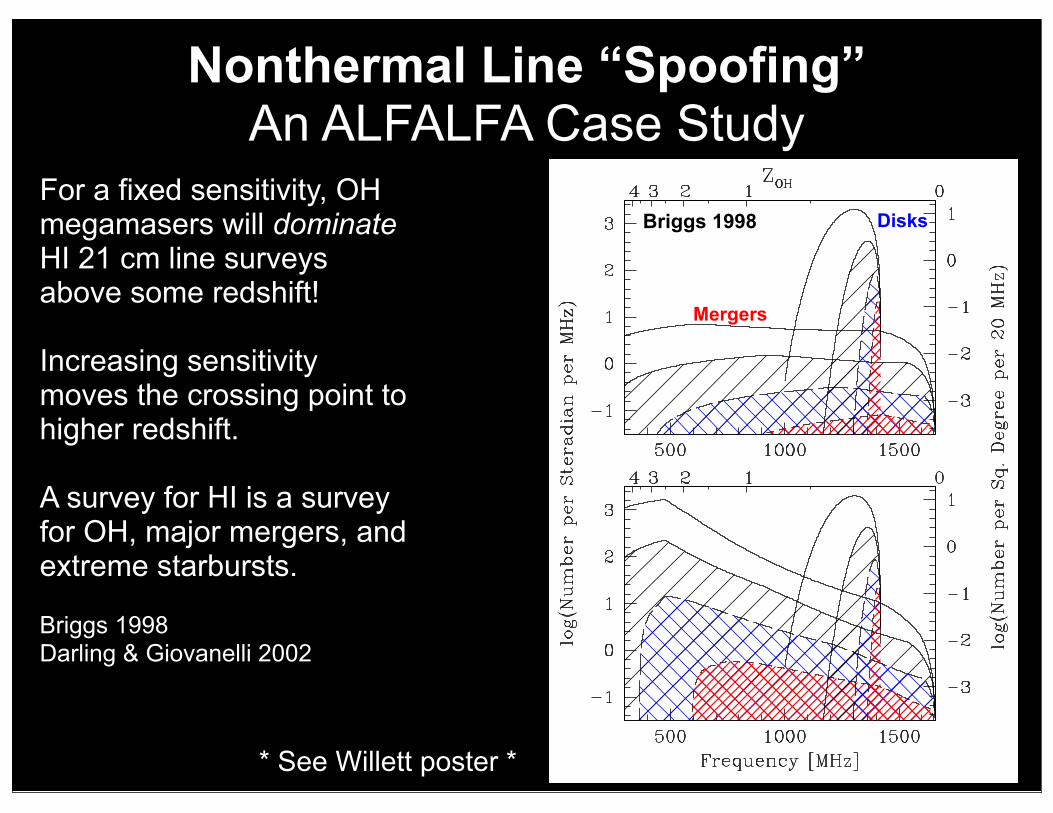
Fig. 5. Detection rate as a function of frequency for two different red-
shift dependences of the merging rate. Top Panel Constant merging
rate.Bottom Panel Merging rate proportional to (1+z)4.5 for z < 2.5but constant for z > 2.5. Detection rate is computed in a cosmologicalmodel withΩo = 0.2 for four sensitivity levels (0.2, 1, 5, and 20 mJy)for signals of velocity width 100 km s−1. The lowest sensitivity survey
(20 mJy) corresponds to the most heavily shaded area, and the highest
sensitivity (0.2 mJy) is unshaded.
with luminous FIR galaxies, which in turn are found to occur in
systems with merging and interacting morphologies (Clements
et al 1996). For comparison, an extreme example, m = 4.5(Lavery et al 1996) is shown in Fig. 5. The significance of this
detection rate is that an existing telescope, such as the Wester-
bork Synthesis Radio Telescope, which will reach a noise level
below 1 mJy level in a 12 hour synthesis observation and can
survey a field of one square degree per exposure at 600 MHz
(zoh ≈ 2), would be likely to detect a few objects per field,when it is equipped with a spectrometer capable of 80 MHz (or
more) bandwidth.
The luminous quasar population shows a still stronger evo-
lution than is typically suggested for normal galaxies. Since the
most luminous OH masers are associated with the most lumi-
nous galaxies in the nearby universe, it is reasonable to specu-
late about a possible relation between hosts for OH maser and
quasars and the possibility that both may be driven by mergers
and interactions. Fig. 6 shows recent observational constraints
on the comoving number density of bright QSOs (MB < −24.5
For a fixed sensitivity, OH megamasers will dominate HI 21 cm line surveys above some redshift!
Increasing sensitivity moves the crossing point to higher redshift.
A survey for HI is a survey for OH, major mergers, and extreme starbursts.
Briggs 1998 Darling & Giovanelli 2002
Briggs 1998
Mergers
Disks
Nonthermal Line “Spoofing” An ALFALFA Case Study
* See Willett poster *
SummaryLow Frequency Spectral Lines
Surprises are likely Foregrounds to EoR HI 21 cm studies New science
Case StudiesFormaldehyde absorption of CMB
ForegroundsDistance-independent probe of dense molecular gas
HI 21 cm absorption lines:RFI issuesProximity effectf(N) and Tspin
OH Megamasers HI survey contaminant Tracer of merging and star formation