Embed Size (px)
Citation preview
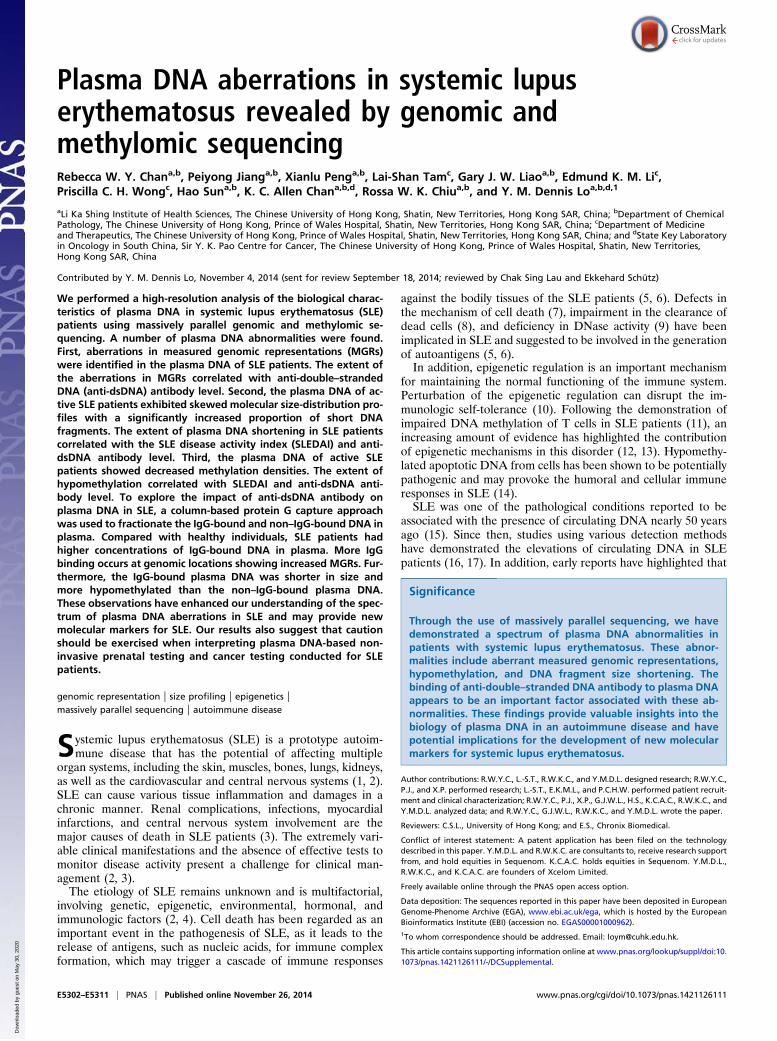
Plasma DNA aberrations in systemic lupuserythematosus revealed by genomic andmethylomic sequencingRebecca W. Y. Chana,b, Peiyong Jianga,b, Xianlu Penga,b, Lai-Shan Tamc, Gary J. W. Liaoa,b, Edmund K. M. Lic,Priscilla C. H. Wongc, Hao Suna,b, K. C. Allen Chana,b,d, Rossa W. K. Chiua,b, and Y. M. Dennis Loa,b,d,1
aLi Ka Shing Institute of Health Sciences, The Chinese University of Hong Kong, Shatin, New Territories, Hong Kong SAR, China; bDepartment of ChemicalPathology, The Chinese University of Hong Kong, Prince of Wales Hospital, Shatin, New Territories, Hong Kong SAR, China; cDepartment of Medicineand Therapeutics, The Chinese University of Hong Kong, Prince of Wales Hospital, Shatin, New Territories, Hong Kong SAR, China; and dState Key Laboratoryin Oncology in South China, Sir Y. K. Pao Centre for Cancer, The Chinese University of Hong Kong, Prince of Wales Hospital, Shatin, New Territories,Hong Kong SAR, China
Contributed by Y. M. Dennis Lo, November 4, 2014 (sent for review September 18, 2014; reviewed by Chak Sing Lau and Ekkehard Schütz)
We performed a high-resolution analysis of the biological charac-teristics of plasma DNA in systemic lupus erythematosus (SLE)patients using massively parallel genomic and methylomic se-quencing. A number of plasma DNA abnormalities were found.First, aberrations in measured genomic representations (MGRs)were identified in the plasma DNA of SLE patients. The extent ofthe aberrations in MGRs correlated with anti-double–strandedDNA (anti-dsDNA) antibody level. Second, the plasma DNA of ac-tive SLE patients exhibited skewed molecular size-distribution pro-files with a significantly increased proportion of short DNAfragments. The extent of plasma DNA shortening in SLE patientscorrelated with the SLE disease activity index (SLEDAI) and anti-dsDNA antibody level. Third, the plasma DNA of active SLEpatients showed decreased methylation densities. The extent ofhypomethylation correlated with SLEDAI and anti-dsDNA anti-body level. To explore the impact of anti-dsDNA antibody onplasma DNA in SLE, a column-based protein G capture approachwas used to fractionate the IgG-bound and non–IgG-bound DNA inplasma. Compared with healthy individuals, SLE patients hadhigher concentrations of IgG-bound DNA in plasma. More IgGbinding occurs at genomic locations showing increased MGRs. Fur-thermore, the IgG-bound plasma DNA was shorter in size andmore hypomethylated than the non–IgG-bound plasma DNA.These observations have enhanced our understanding of the spec-trum of plasma DNA aberrations in SLE and may provide newmolecular markers for SLE. Our results also suggest that cautionshould be exercised when interpreting plasma DNA-based non-invasive prenatal testing and cancer testing conducted for SLEpatients.
genomic representation | size profiling | epigenetics |massively parallel sequencing | autoimmune disease
Systemic lupus erythematosus (SLE) is a prototype autoim-mune disease that has the potential of affecting multiple
organ systems, including the skin, muscles, bones, lungs, kidneys,as well as the cardiovascular and central nervous systems (1, 2).SLE can cause various tissue inflammation and damages in achronic manner. Renal complications, infections, myocardialinfarctions, and central nervous system involvement are themajor causes of death in SLE patients (3). The extremely vari-able clinical manifestations and the absence of effective tests tomonitor disease activity present a challenge for clinical man-agement (2, 3).The etiology of SLE remains unknown and is multifactorial,
involving genetic, epigenetic, environmental, hormonal, andimmunologic factors (2, 4). Cell death has been regarded as animportant event in the pathogenesis of SLE, as it leads to therelease of antigens, such as nucleic acids, for immune complexformation, which may trigger a cascade of immune responses
against the bodily tissues of the SLE patients (5, 6). Defects inthe mechanism of cell death (7), impairment in the clearance ofdead cells (8), and deficiency in DNase activity (9) have beenimplicated in SLE and suggested to be involved in the generationof autoantigens (5, 6).In addition, epigenetic regulation is an important mechanism
for maintaining the normal functioning of the immune system.Perturbation of the epigenetic regulation can disrupt the im-munologic self-tolerance (10). Following the demonstration ofimpaired DNA methylation of T cells in SLE patients (11), anincreasing amount of evidence has highlighted the contributionof epigenetic mechanisms in this disorder (12, 13). Hypomethy-lated apoptotic DNA from cells has been shown to be potentiallypathogenic and may provoke the humoral and cellular immuneresponses in SLE (14).SLE was one of the pathological conditions reported to be
associated with the presence of circulating DNA nearly 50 yearsago (15). Since then, studies using various detection methodshave demonstrated the elevations of circulating DNA in SLEpatients (16, 17). In addition, early reports have highlighted that
Significance
Through the use of massively parallel sequencing, we havedemonstrated a spectrum of plasma DNA abnormalities inpatients with systemic lupus erythematosus. These abnor-malities include aberrant measured genomic representations,hypomethylation, and DNA fragment size shortening. Thebinding of anti-double–stranded DNA antibody to plasma DNAappears to be an important factor associated with these ab-normalities. These findings provide valuable insights into thebiology of plasma DNA in an autoimmune disease and havepotential implications for the development of new molecularmarkers for systemic lupus erythematosus.
Author contributions: R.W.Y.C., L.-S.T., R.W.K.C., and Y.M.D.L. designed research; R.W.Y.C.,P.J., and X.P. performed research; L.-S.T., E.K.M.L., and P.C.H.W. performed patient recruit-ment and clinical characterization; R.W.Y.C., P.J., X.P., G.J.W.L., H.S., K.C.A.C., R.W.K.C., andY.M.D.L. analyzed data; and R.W.Y.C., G.J.W.L., R.W.K.C., and Y.M.D.L. wrote the paper.
Reviewers: C.S.L., University of Hong Kong; and E.S., Chronix Biomedical.
Conflict of interest statement: A patent application has been filed on the technologydescribed in this paper. Y.M.D.L. and R.W.K.C. are consultants to, receive research supportfrom, and hold equities in Sequenom. K.C.A.C. holds equities in Sequenom. Y.M.D.L.,R.W.K.C., and K.C.A.C. are founders of Xcelom Limited.
Freely available online through the PNAS open access option.
Data deposition: The sequences reported in this paper have been deposited in EuropeanGenome-Phenome Archive (EGA), www.ebi.ac.uk/ega, which is hosted by the EuropeanBioinformatics Institute (EBI) (accession no. EGAS00001000962).1To whom correspondence should be addressed. Email: [email protected].
This article contains supporting information online at www.pnas.org/lookup/suppl/doi:10.1073/pnas.1421126111/-/DCSupplemental.
E5302–E5311 | PNAS | Published online November 26, 2014 www.pnas.org/cgi/doi/10.1073/pnas.1421126111
Dow
nloa
ded
by g
uest
on
May
30,
202
0
the circulating DNA that form immune complexes with auto-antibodies in SLE patients displays a characteristic fragmenta-tion pattern that resembles the DNA laddering pattern ofapoptosis by gel electrophoresis (18). These findings have sug-gested an interplay of apoptosis and circulating DNA in thepathogenesis of SLE. However, there have been very few studiesreporting the detailed biological characterization of circulatingDNA in SLE.The advent of massively parallel sequencing has enabled the
investigation of circulating DNA at single-base resolution on a
genome-wide scale in fields such as noninvasive prenatal testing(19–21) and cancer detection (22–25). It would be of great in-terest to use this technology to explore the genomic and meth-ylomic features of plasma DNA in SLE patients. In particular,the interplay of deregulated cell death, altered epigenetic regu-lation and production of autoimmune antibodies in SLE patientsmight cause abnormal patterns of circulating DNA. Hence, inthis study we delineated the biological characteristics of DNAin the plasma of SLE patients using genome-wide genomic andmethylomic sequencing.
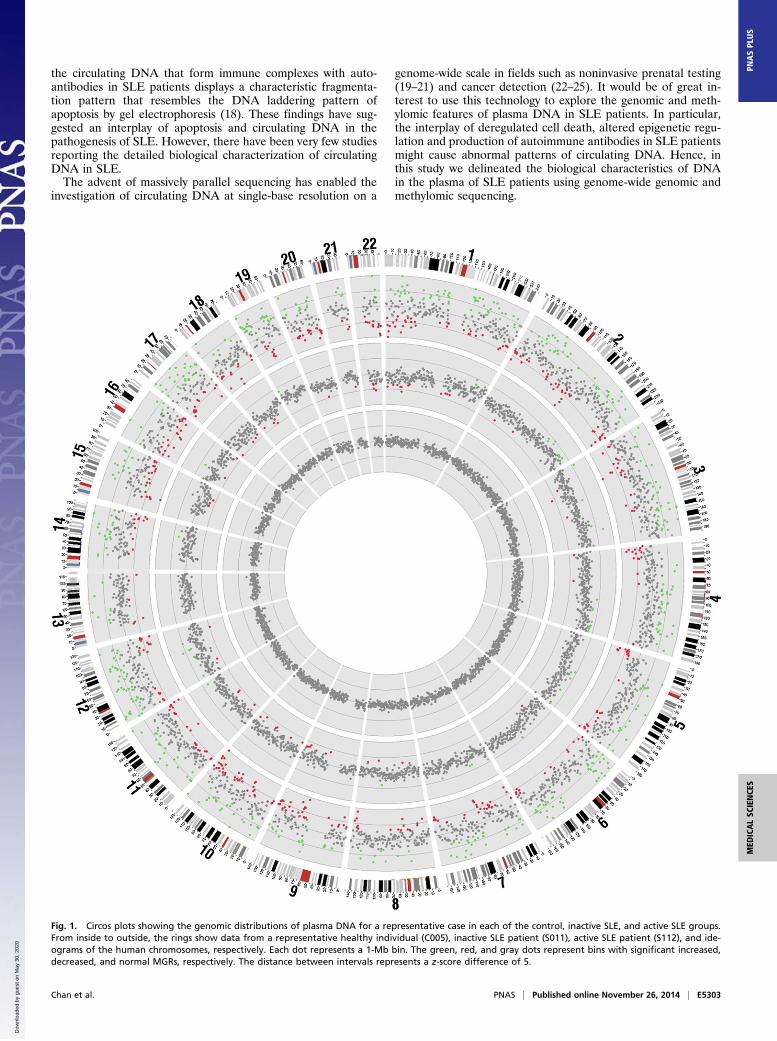
Fig. 1. Circos plots showing the genomic distributions of plasma DNA for a representative case in each of the control, inactive SLE, and active SLE groups.From inside to outside, the rings show data from a representative healthy individual (C005), inactive SLE patient (S011), active SLE patient (S112), and ide-ograms of the human chromosomes, respectively. Each dot represents a 1-Mb bin. The green, red, and gray dots represent bins with significant increased,decreased, and normal MGRs, respectively. The distance between intervals represents a z-score difference of 5.
Chan et al. PNAS | Published online November 26, 2014 | E5303
MED
ICALSC
IENCE
SPN
ASPL
US
Dow
nloa
ded
by g
uest
on
May
30,
202
0
ResultsGenomic Representations of Plasma DNA in SLE Patients. First, weassessed if the plasma DNA molecules in the circulation of SLEpatients were evenly distributed across the genome. PlasmaDNA from 24 SLE patients and 11 healthy individuals wereanalyzed by paired-end massively parallel sequencing. SLE patientswere divided into active and inactive groups according to their SLEdisease activity index (SLEDAI), which is a clinical index for themeasurement of disease activity (26). Fifteen patients with SLEDAIbelow or equal to 6 (median: 4, range: 0–6) were classified as theinactive group, and nine patients with SLEDAI over 6 (median: 8,range: 7–16) were classified as the active group. A median of120 million (range: 18–208 million) alignable and nonduplicatedpaired-end reads were obtained for the plasma DNA per case forsubsequent analyses (Dataset S1).We assessed the genomic distribution of plasma DNA across
segments (bins) of the human genome, each of 1 Mb in size. Thenumber of sequence reads in each bin was tallied and adjusted byGC-correction as previously described (25). The control groupconsisted of 11 healthy individuals and this group showed evengenomic distribution of the plasma DNA molecules as reportedpreviously [Fig. 1, the innermost ring of the circos plot (27)]. Todetermine if the plasma DNA profiles of SLE patients showeddifferences in genomic representation, we compared the numberof plasma DNA sequences aligned to a bin to the mean number
detected among the control group for the same bin. We ex-pressed the difference as a z-score, which was the number of SDsaway from the mean of the control group. Bins with z-scoresbelow −3 and above +3 were considered as showing significantunder- and over-representation, respectively. We termed thesechanges aberrant measured genomic representations (MGRs).The percentages of bins with aberrant MGRs among the
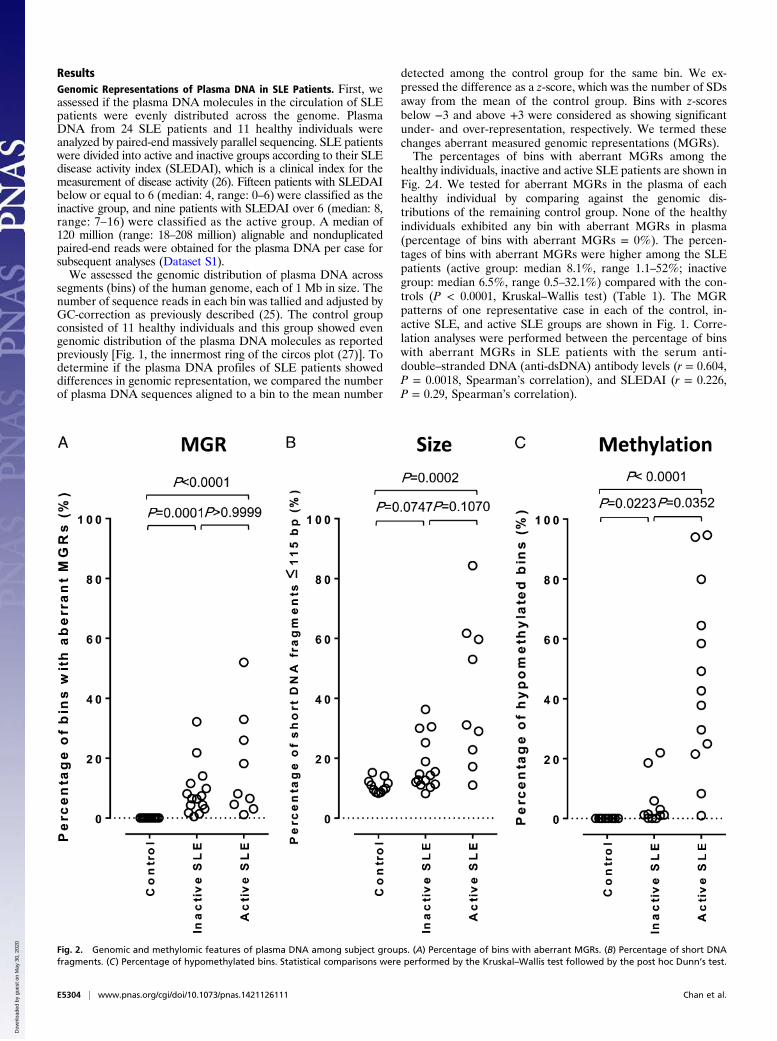
healthy individuals, inactive and active SLE patients are shown inFig. 2A. We tested for aberrant MGRs in the plasma of eachhealthy individual by comparing against the genomic dis-tributions of the remaining control group. None of the healthyindividuals exhibited any bin with aberrant MGRs in plasma(percentage of bins with aberrant MGRs = 0%). The percen-tages of bins with aberrant MGRs were higher among the SLEpatients (active group: median 8.1%, range 1.1–52%; inactivegroup: median 6.5%, range 0.5–32.1%) compared with the con-trols (P < 0.0001, Kruskal–Wallis test) (Table 1). The MGRpatterns of one representative case in each of the control, in-active SLE, and active SLE groups are shown in Fig. 1. Corre-lation analyses were performed between the percentage of binswith aberrant MGRs in SLE patients with the serum anti-double–stranded DNA (anti-dsDNA) antibody levels (r = 0.604,P = 0.0018, Spearman’s correlation), and SLEDAI (r = 0.226,P = 0.29, Spearman’s correlation).
Fig. 2. Genomic and methylomic features of plasma DNA among subject groups. (A) Percentage of bins with aberrant MGRs. (B) Percentage of short DNAfragments. (C) Percentage of hypomethylated bins. Statistical comparisons were performed by the Kruskal–Wallis test followed by the post hoc Dunn’s test.
E5304 | www.pnas.org/cgi/doi/10.1073/pnas.1421126111 Chan et al.
Dow
nloa
ded
by g
uest
on
May
30,
202
0
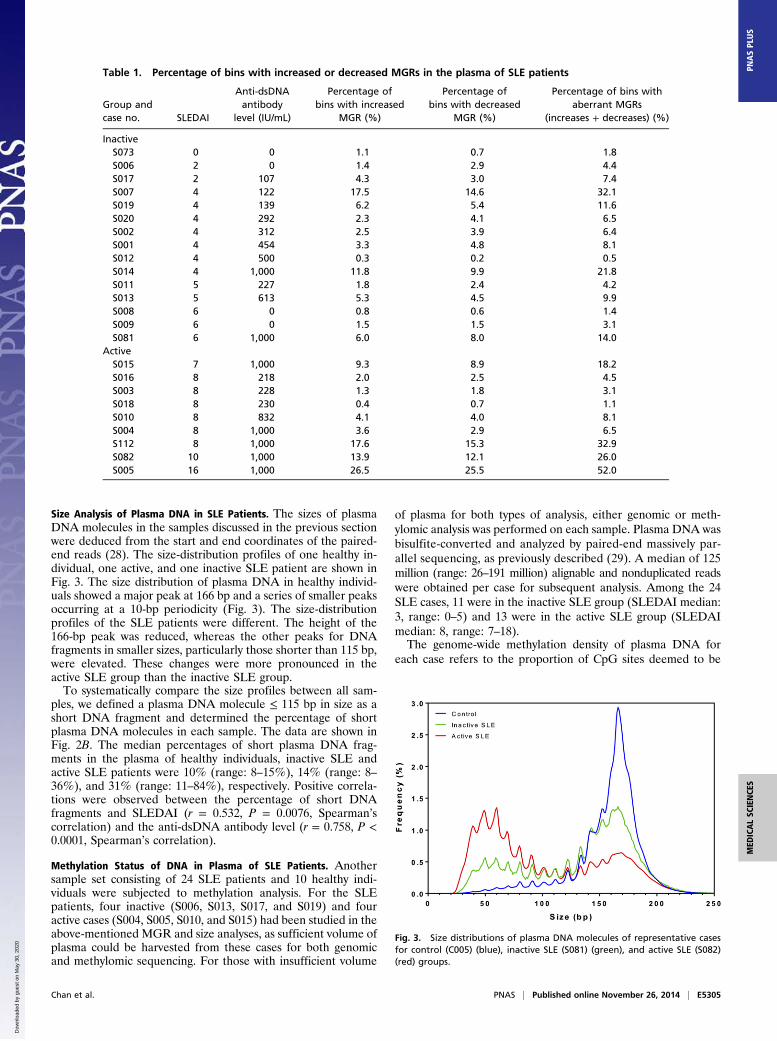
Size Analysis of Plasma DNA in SLE Patients. The sizes of plasmaDNA molecules in the samples discussed in the previous sectionwere deduced from the start and end coordinates of the paired-end reads (28). The size-distribution profiles of one healthy in-dividual, one active, and one inactive SLE patient are shown inFig. 3. The size distribution of plasma DNA in healthy individ-uals showed a major peak at 166 bp and a series of smaller peaksoccurring at a 10-bp periodicity (Fig. 3). The size-distributionprofiles of the SLE patients were different. The height of the166-bp peak was reduced, whereas the other peaks for DNAfragments in smaller sizes, particularly those shorter than 115 bp,were elevated. These changes were more pronounced in theactive SLE group than the inactive SLE group.To systematically compare the size profiles between all sam-
ples, we defined a plasma DNA molecule ≤ 115 bp in size as ashort DNA fragment and determined the percentage of shortplasma DNA molecules in each sample. The data are shown inFig. 2B. The median percentages of short plasma DNA frag-ments in the plasma of healthy individuals, inactive SLE andactive SLE patients were 10% (range: 8–15%), 14% (range: 8–36%), and 31% (range: 11–84%), respectively. Positive correla-tions were observed between the percentage of short DNAfragments and SLEDAI (r = 0.532, P = 0.0076, Spearman’scorrelation) and the anti-dsDNA antibody level (r = 0.758, P <0.0001, Spearman’s correlation).
Methylation Status of DNA in Plasma of SLE Patients. Anothersample set consisting of 24 SLE patients and 10 healthy indi-viduals were subjected to methylation analysis. For the SLEpatients, four inactive (S006, S013, S017, and S019) and fouractive cases (S004, S005, S010, and S015) had been studied in theabove-mentioned MGR and size analyses, as sufficient volume ofplasma could be harvested from these cases for both genomicand methylomic sequencing. For those with insufficient volume
of plasma for both types of analysis, either genomic or meth-ylomic analysis was performed on each sample. Plasma DNA wasbisulfite-converted and analyzed by paired-end massively par-allel sequencing, as previously described (29). A median of 125million (range: 26–191 million) alignable and nonduplicated readswere obtained per case for subsequent analysis. Among the 24SLE cases, 11 were in the inactive SLE group (SLEDAI median:3, range: 0–5) and 13 were in the active SLE group (SLEDAImedian: 8, range: 7–18).The genome-wide methylation density of plasma DNA for
each case refers to the proportion of CpG sites deemed to be
Table 1. Percentage of bins with increased or decreased MGRs in the plasma of SLE patients
Group andcase no. SLEDAI
Anti-dsDNAantibody
level (IU/mL)
Percentage ofbins with increased
MGR (%)
Percentage ofbins with decreased
MGR (%)
Percentage of bins withaberrant MGRs
(increases + decreases) (%)
InactiveS073 0 0 1.1 0.7 1.8S006 2 0 1.4 2.9 4.4S017 2 107 4.3 3.0 7.4S007 4 122 17.5 14.6 32.1S019 4 139 6.2 5.4 11.6S020 4 292 2.3 4.1 6.5S002 4 312 2.5 3.9 6.4S001 4 454 3.3 4.8 8.1S012 4 500 0.3 0.2 0.5S014 4 1,000 11.8 9.9 21.8S011 5 227 1.8 2.4 4.2S013 5 613 5.3 4.5 9.9S008 6 0 0.8 0.6 1.4S009 6 0 1.5 1.5 3.1S081 6 1,000 6.0 8.0 14.0
ActiveS015 7 1,000 9.3 8.9 18.2S016 8 218 2.0 2.5 4.5S003 8 228 1.3 1.8 3.1S018 8 230 0.4 0.7 1.1S010 8 832 4.1 4.0 8.1S004 8 1,000 3.6 2.9 6.5S112 8 1,000 17.6 15.3 32.9S082 10 1,000 13.9 12.1 26.0S005 16 1,000 26.5 25.5 52.0
Fig. 3. Size distributions of plasma DNA molecules of representative casesfor control (C005) (blue), inactive SLE (S081) (green), and active SLE (S082)(red) groups.
Chan et al. PNAS | Published online November 26, 2014 | E5305
MED
ICALSC
IENCE
SPN
ASPL
US
Dow
nloa
ded
by g
uest
on
May
30,
202
0
methylated among all of the CpG sites covered by sequencereads (29). The genome-wide methylation density of the activeSLE group (70.1% ± 4.5%) was significantly reduced comparedwith both the healthy individuals (74.3% ± 1.4%, P = 0.0367,Kruskal–Wallis test, post hoc Dunn’s test) and the inactive SLEgroup (74.4% ± 1.3%, P = 0.0118, Kruskal–Wallis test, post hocDunn’s test) (Fig. S1).Next we analyzed the methylation densities of each 1-Mb bin
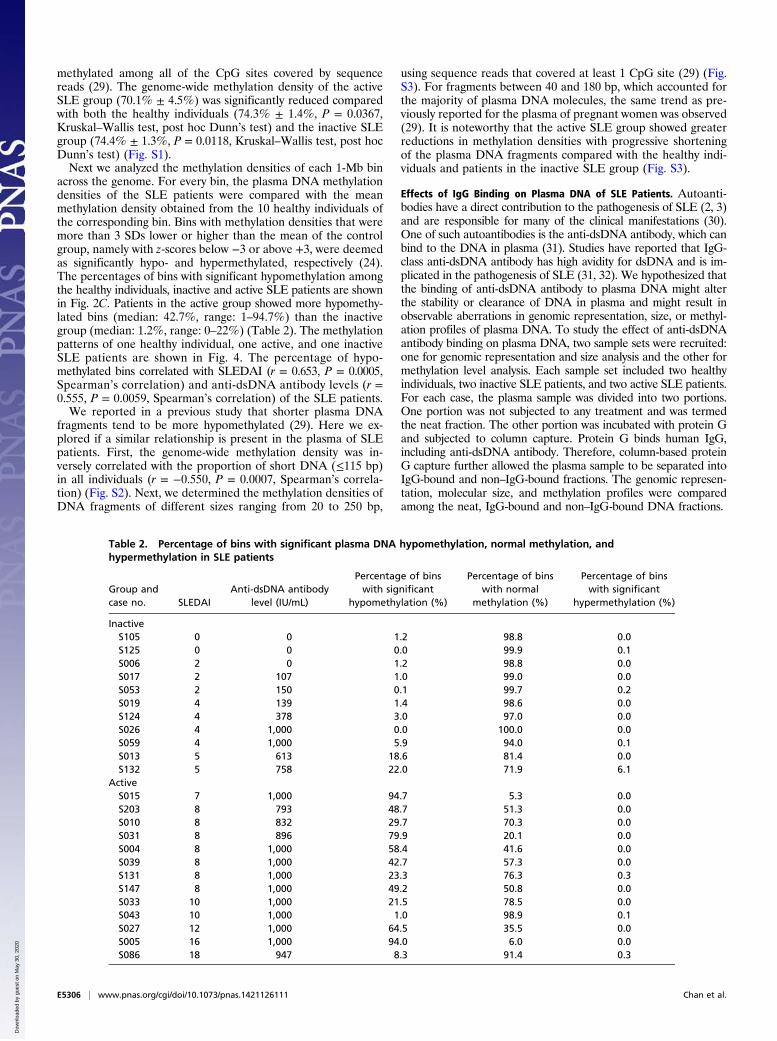
across the genome. For every bin, the plasma DNA methylationdensities of the SLE patients were compared with the meanmethylation density obtained from the 10 healthy individuals ofthe corresponding bin. Bins with methylation densities that weremore than 3 SDs lower or higher than the mean of the controlgroup, namely with z-scores below −3 or above +3, were deemedas significantly hypo- and hypermethylated, respectively (24).The percentages of bins with significant hypomethylation amongthe healthy individuals, inactive and active SLE patients are shownin Fig. 2C. Patients in the active group showed more hypomethy-lated bins (median: 42.7%, range: 1–94.7%) than the inactivegroup (median: 1.2%, range: 0–22%) (Table 2). The methylationpatterns of one healthy individual, one active, and one inactiveSLE patients are shown in Fig. 4. The percentage of hypo-methylated bins correlated with SLEDAI (r = 0.653, P = 0.0005,Spearman’s correlation) and anti-dsDNA antibody levels (r =0.555, P = 0.0059, Spearman’s correlation) of the SLE patients.We reported in a previous study that shorter plasma DNA
fragments tend to be more hypomethylated (29). Here we ex-plored if a similar relationship is present in the plasma of SLEpatients. First, the genome-wide methylation density was in-versely correlated with the proportion of short DNA (≤115 bp)in all individuals (r = −0.550, P = 0.0007, Spearman’s correla-tion) (Fig. S2). Next, we determined the methylation densities ofDNA fragments of different sizes ranging from 20 to 250 bp,
using sequence reads that covered at least 1 CpG site (29) (Fig.S3). For fragments between 40 and 180 bp, which accounted forthe majority of plasma DNA molecules, the same trend as pre-viously reported for the plasma of pregnant women was observed(29). It is noteworthy that the active SLE group showed greaterreductions in methylation densities with progressive shorteningof the plasma DNA fragments compared with the healthy indi-viduals and patients in the inactive SLE group (Fig. S3).
Effects of IgG Binding on Plasma DNA of SLE Patients. Autoanti-bodies have a direct contribution to the pathogenesis of SLE (2, 3)and are responsible for many of the clinical manifestations (30).One of such autoantibodies is the anti-dsDNA antibody, which canbind to the DNA in plasma (31). Studies have reported that IgG-class anti-dsDNA antibody has high avidity for dsDNA and is im-plicated in the pathogenesis of SLE (31, 32). We hypothesized thatthe binding of anti-dsDNA antibody to plasma DNA might alterthe stability or clearance of DNA in plasma and might result inobservable aberrations in genomic representation, size, or methyl-ation profiles of plasma DNA. To study the effect of anti-dsDNAantibody binding on plasma DNA, two sample sets were recruited:one for genomic representation and size analysis and the other formethylation level analysis. Each sample set included two healthyindividuals, two inactive SLE patients, and two active SLE patients.For each case, the plasma sample was divided into two portions.One portion was not subjected to any treatment and was termedthe neat fraction. The other portion was incubated with protein Gand subjected to column capture. Protein G binds human IgG,including anti-dsDNA antibody. Therefore, column-based proteinG capture further allowed the plasma sample to be separated intoIgG-bound and non–IgG-bound fractions. The genomic represen-tation, molecular size, and methylation profiles were comparedamong the neat, IgG-bound and non–IgG-bound DNA fractions.
Table 2. Percentage of bins with significant plasma DNA hypomethylation, normal methylation, andhypermethylation in SLE patients
Group andcase no. SLEDAI
Anti-dsDNA antibodylevel (IU/mL)
Percentage of binswith significant
hypomethylation (%)
Percentage of binswith normal
methylation (%)
Percentage of binswith significant
hypermethylation (%)
InactiveS105 0 0 1.2 98.8 0.0S125 0 0 0.0 99.9 0.1S006 2 0 1.2 98.8 0.0S017 2 107 1.0 99.0 0.0S053 2 150 0.1 99.7 0.2S019 4 139 1.4 98.6 0.0S124 4 378 3.0 97.0 0.0S026 4 1,000 0.0 100.0 0.0S059 4 1,000 5.9 94.0 0.1S013 5 613 18.6 81.4 0.0S132 5 758 22.0 71.9 6.1
ActiveS015 7 1,000 94.7 5.3 0.0S203 8 793 48.7 51.3 0.0S010 8 832 29.7 70.3 0.0S031 8 896 79.9 20.1 0.0S004 8 1,000 58.4 41.6 0.0S039 8 1,000 42.7 57.3 0.0S131 8 1,000 23.3 76.3 0.3S147 8 1,000 49.2 50.8 0.0S033 10 1,000 21.5 78.5 0.0S043 10 1,000 1.0 98.9 0.1S027 12 1,000 64.5 35.5 0.0S005 16 1,000 94.0 6.0 0.0S086 18 947 8.3 91.4 0.3
E5306 | www.pnas.org/cgi/doi/10.1073/pnas.1421126111 Chan et al.
Dow
nloa
ded
by g
uest
on
May
30,
202
0
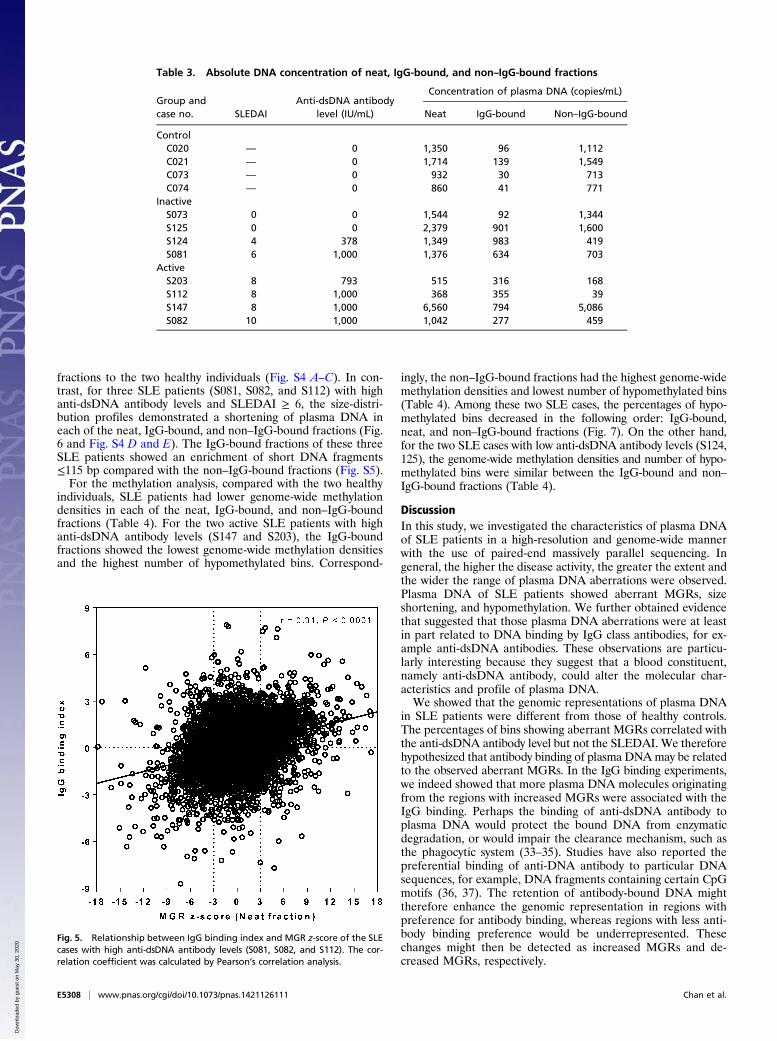
Higher concentrations of IgG-bound DNA were found in theplasma of SLE patients (median: 494.5 copies/mL, range: 92–983copies/mL), compared with the healthy individuals (median: 68.5copies/mL, range: 41–139 copies/mL) (Table 3).For genomic representation analysis, the z-score for each 1-Mb
bin was calculated in the neat, IgG-bound, and non–IgG-boundfractions. Next, we calculated the z-score difference between theIgG-bound and non–IgG-bound fractions for each bin, expressedas the “IgG binding index.” The IgG binding index of eachbin was then compared with the z-score of MGR in the neatfraction for the corresponding bin (Fig. 5). We hypothesized thata higher proportion of plasma DNA fragments originating from
regions showing increased MGRs were bound by anti-dsDNAantibody and would be found in the IgG-bound fraction. Hence,the IgG binding index for such locations should be higher. Forregions exhibiting decreased MGRs, the reverse would be trueand the IgG binding index should be more negative. Indeed, forSLE cases with high anti-dsDNA antibody levels (S081, S082,S112), the z-scores of bins with aberrant MGRs in the neat frac-tions showed a positive relationship with the corresponding IgGbinding index (r = 0.31, P < 0.0001, Pearson’s correlation) (Fig. 5).For the size analysis, the SLE case (S073) with SLEDAI 0 and
negative anti-dsDNA antibody showed similar plasma DNA size-distribution profiles in the neat, IgG-bound, and non–IgG-bound
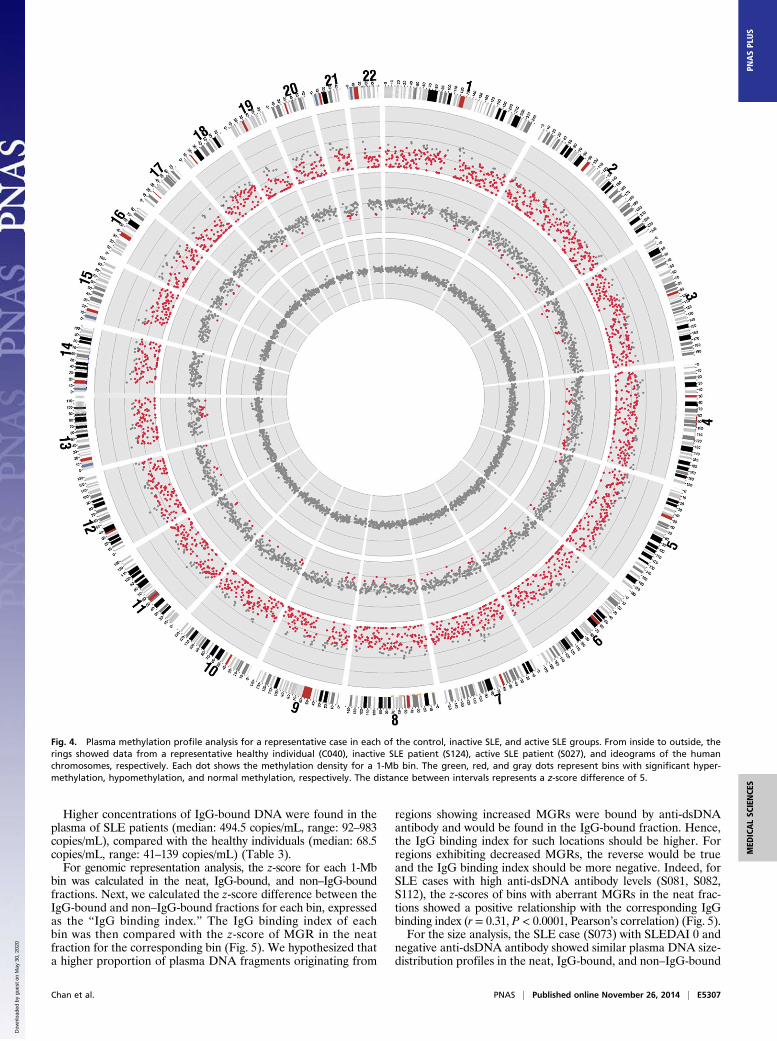
Fig. 4. Plasma methylation profile analysis for a representative case in each of the control, inactive SLE, and active SLE groups. From inside to outside, therings showed data from a representative healthy individual (C040), inactive SLE patient (S124), active SLE patient (S027), and ideograms of the humanchromosomes, respectively. Each dot shows the methylation density for a 1-Mb bin. The green, red, and gray dots represent bins with significant hyper-methylation, hypomethylation, and normal methylation, respectively. The distance between intervals represents a z-score difference of 5.
Chan et al. PNAS | Published online November 26, 2014 | E5307
MED
ICALSC
IENCE
SPN
ASPL
US
Dow
nloa
ded
by g
uest
on
May
30,
202
0
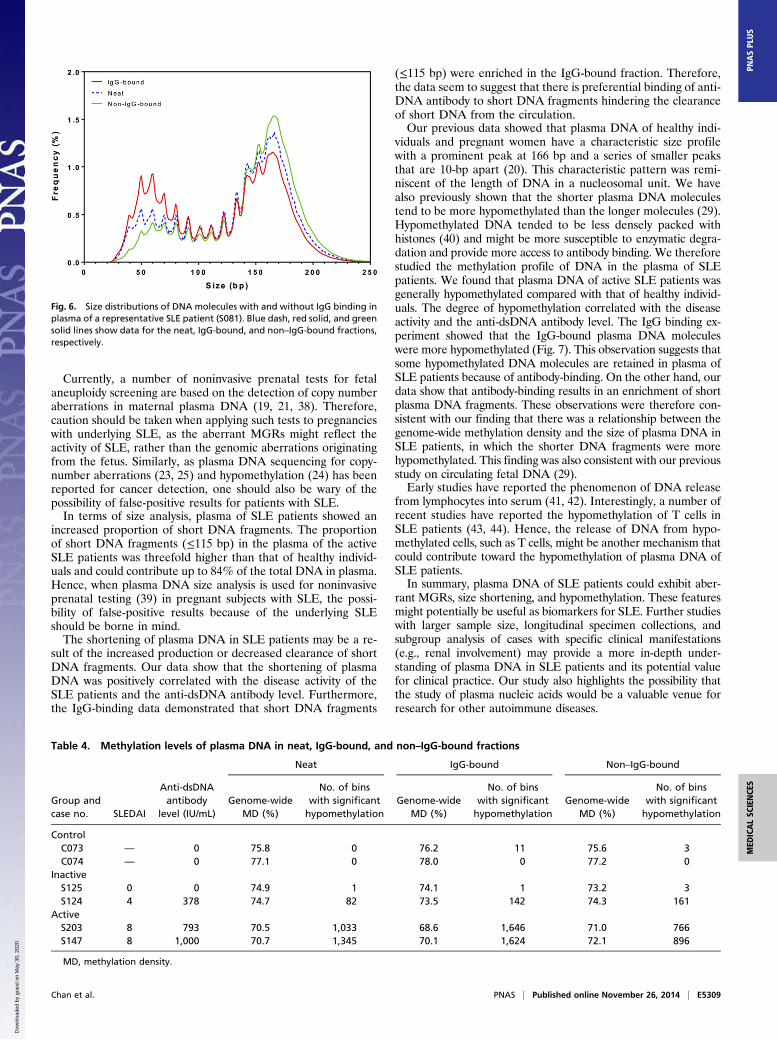
fractions to the two healthy individuals (Fig. S4 A–C). In con-trast, for three SLE patients (S081, S082, and S112) with highanti-dsDNA antibody levels and SLEDAI ≥ 6, the size-distri-bution profiles demonstrated a shortening of plasma DNA ineach of the neat, IgG-bound, and non–IgG-bound fractions (Fig.6 and Fig. S4 D and E). The IgG-bound fractions of these threeSLE patients showed an enrichment of short DNA fragments≤115 bp compared with the non–IgG-bound fractions (Fig. S5).For the methylation analysis, compared with the two healthy
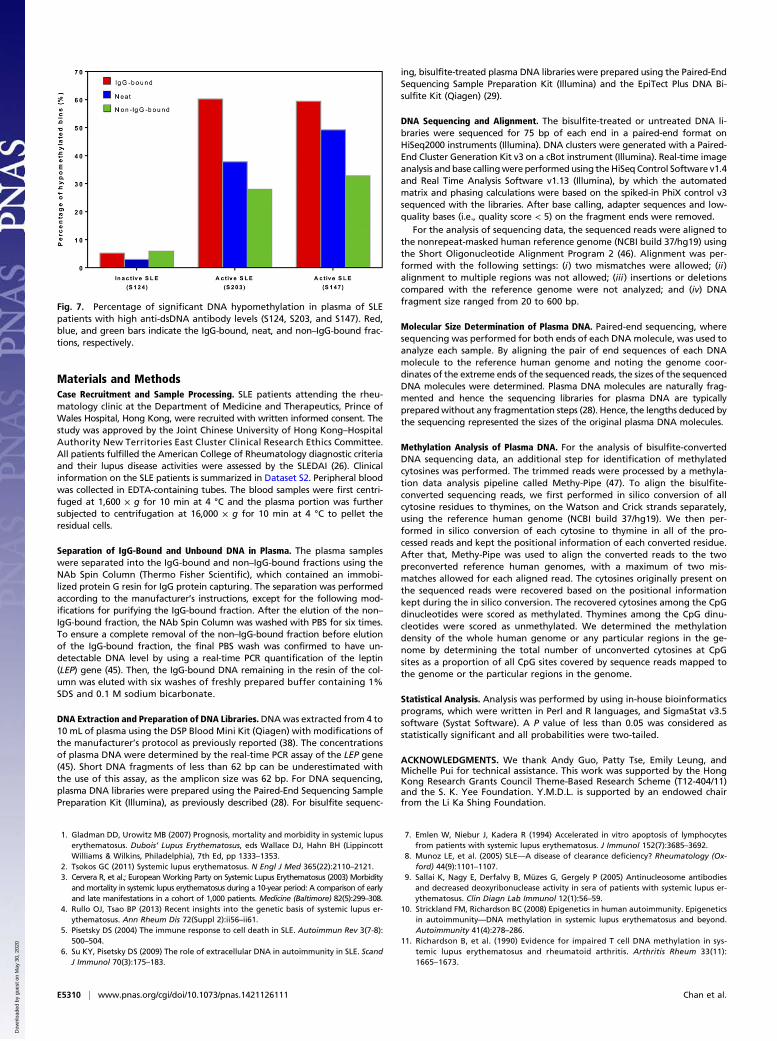
individuals, SLE patients had lower genome-wide methylationdensities in each of the neat, IgG-bound, and non–IgG-boundfractions (Table 4). For the two active SLE patients with highanti-dsDNA antibody levels (S147 and S203), the IgG-boundfractions showed the lowest genome-wide methylation densitiesand the highest number of hypomethylated bins. Correspond-
ingly, the non–IgG-bound fractions had the highest genome-widemethylation densities and lowest number of hypomethylated bins(Table 4). Among these two SLE cases, the percentages of hypo-methylated bins decreased in the following order: IgG-bound,neat, and non–IgG-bound fractions (Fig. 7). On the other hand,for the two SLE cases with low anti-dsDNA antibody levels (S124,125), the genome-wide methylation densities and number of hypo-methylated bins were similar between the IgG-bound and non–IgG-bound fractions (Table 4).
DiscussionIn this study, we investigated the characteristics of plasma DNAof SLE patients in a high-resolution and genome-wide mannerwith the use of paired-end massively parallel sequencing. Ingeneral, the higher the disease activity, the greater the extent andthe wider the range of plasma DNA aberrations were observed.Plasma DNA of SLE patients showed aberrant MGRs, sizeshortening, and hypomethylation. We further obtained evidencethat suggested that those plasma DNA aberrations were at leastin part related to DNA binding by IgG class antibodies, for ex-ample anti-dsDNA antibodies. These observations are particu-larly interesting because they suggest that a blood constituent,namely anti-dsDNA antibody, could alter the molecular char-acteristics and profile of plasma DNA.We showed that the genomic representations of plasma DNA
in SLE patients were different from those of healthy controls.The percentages of bins showing aberrant MGRs correlated withthe anti-dsDNA antibody level but not the SLEDAI. We thereforehypothesized that antibody binding of plasma DNAmay be relatedto the observed aberrant MGRs. In the IgG binding experiments,we indeed showed that more plasma DNA molecules originatingfrom the regions with increased MGRs were associated with theIgG binding. Perhaps the binding of anti-dsDNA antibody toplasma DNA would protect the bound DNA from enzymaticdegradation, or would impair the clearance mechanism, such asthe phagocytic system (33–35). Studies have also reported thepreferential binding of anti-DNA antibody to particular DNAsequences, for example, DNA fragments containing certain CpGmotifs (36, 37). The retention of antibody-bound DNA mighttherefore enhance the genomic representation in regions withpreference for antibody binding, whereas regions with less anti-body binding preference would be underrepresented. Thesechanges might then be detected as increased MGRs and de-creased MGRs, respectively.
Table 3. Absolute DNA concentration of neat, IgG-bound, and non–IgG-bound fractions
Group andcase no. SLEDAI
Anti-dsDNA antibodylevel (IU/mL)
Concentration of plasma DNA (copies/mL)
Neat IgG-bound Non–IgG-bound
ControlC020 — 0 1,350 96 1,112C021 — 0 1,714 139 1,549C073 — 0 932 30 713C074 — 0 860 41 771
InactiveS073 0 0 1,544 92 1,344S125 0 0 2,379 901 1,600S124 4 378 1,349 983 419S081 6 1,000 1,376 634 703
ActiveS203 8 793 515 316 168S112 8 1,000 368 355 39S147 8 1,000 6,560 794 5,086S082 10 1,000 1,042 277 459
Fig. 5. Relationship between IgG binding index and MGR z-score of the SLEcases with high anti-dsDNA antibody levels (S081, S082, and S112). The cor-relation coefficient was calculated by Pearson’s correlation analysis.
E5308 | www.pnas.org/cgi/doi/10.1073/pnas.1421126111 Chan et al.
Dow
nloa
ded
by g
uest
on
May
30,
202
0
Currently, a number of noninvasive prenatal tests for fetalaneuploidy screening are based on the detection of copy numberaberrations in maternal plasma DNA (19, 21, 38). Therefore,caution should be taken when applying such tests to pregnancieswith underlying SLE, as the aberrant MGRs might reflect theactivity of SLE, rather than the genomic aberrations originatingfrom the fetus. Similarly, as plasma DNA sequencing for copy-number aberrations (23, 25) and hypomethylation (24) has beenreported for cancer detection, one should also be wary of thepossibility of false-positive results for patients with SLE.In terms of size analysis, plasma of SLE patients showed an
increased proportion of short DNA fragments. The proportionof short DNA fragments (≤115 bp) in the plasma of the activeSLE patients was threefold higher than that of healthy individ-uals and could contribute up to 84% of the total DNA in plasma.Hence, when plasma DNA size analysis is used for noninvasiveprenatal testing (39) in pregnant subjects with SLE, the possi-bility of false-positive results because of the underlying SLEshould be borne in mind.The shortening of plasma DNA in SLE patients may be a re-
sult of the increased production or decreased clearance of shortDNA fragments. Our data show that the shortening of plasmaDNA was positively correlated with the disease activity of theSLE patients and the anti-dsDNA antibody level. Furthermore,the IgG-binding data demonstrated that short DNA fragments
(≤115 bp) were enriched in the IgG-bound fraction. Therefore,the data seem to suggest that there is preferential binding of anti-DNA antibody to short DNA fragments hindering the clearanceof short DNA from the circulation.Our previous data showed that plasma DNA of healthy indi-
viduals and pregnant women have a characteristic size profilewith a prominent peak at 166 bp and a series of smaller peaksthat are 10-bp apart (20). This characteristic pattern was remi-niscent of the length of DNA in a nucleosomal unit. We havealso previously shown that the shorter plasma DNA moleculestend to be more hypomethylated than the longer molecules (29).Hypomethylated DNA tended to be less densely packed withhistones (40) and might be more susceptible to enzymatic degra-dation and provide more access to antibody binding. We thereforestudied the methylation profile of DNA in the plasma of SLEpatients. We found that plasma DNA of active SLE patients wasgenerally hypomethylated compared with that of healthy individ-uals. The degree of hypomethylation correlated with the diseaseactivity and the anti-dsDNA antibody level. The IgG binding ex-periment showed that the IgG-bound plasma DNA moleculeswere more hypomethylated (Fig. 7). This observation suggests thatsome hypomethylated DNA molecules are retained in plasma ofSLE patients because of antibody-binding. On the other hand, ourdata show that antibody-binding results in an enrichment of shortplasma DNA fragments. These observations were therefore con-sistent with our finding that there was a relationship between thegenome-wide methylation density and the size of plasma DNA inSLE patients, in which the shorter DNA fragments were morehypomethylated. This finding was also consistent with our previousstudy on circulating fetal DNA (29).Early studies have reported the phenomenon of DNA release
from lymphocytes into serum (41, 42). Interestingly, a number ofrecent studies have reported the hypomethylation of T cells inSLE patients (43, 44). Hence, the release of DNA from hypo-methylated cells, such as T cells, might be another mechanism thatcould contribute toward the hypomethylation of plasma DNA ofSLE patients.In summary, plasma DNA of SLE patients could exhibit aber-
rant MGRs, size shortening, and hypomethylation. These featuresmight potentially be useful as biomarkers for SLE. Further studieswith larger sample size, longitudinal specimen collections, andsubgroup analysis of cases with specific clinical manifestations(e.g., renal involvement) may provide a more in-depth under-standing of plasma DNA in SLE patients and its potential valuefor clinical practice. Our study also highlights the possibility thatthe study of plasma nucleic acids would be a valuable venue forresearch for other autoimmune diseases.
Fig. 6. Size distributions of DNA molecules with and without IgG binding inplasma of a representative SLE patient (S081). Blue dash, red solid, and greensolid lines show data for the neat, IgG-bound, and non–IgG-bound fractions,respectively.
Table 4. Methylation levels of plasma DNA in neat, IgG-bound, and non–IgG-bound fractions
Group andcase no. SLEDAI
Anti-dsDNAantibody
level (IU/mL)
Neat IgG-bound Non–IgG-bound
Genome-wideMD (%)
No. of binswith significanthypomethylation
Genome-wideMD (%)
No. of binswith significanthypomethylation
Genome-wideMD (%)
No. of binswith significanthypomethylation
ControlC073 — 0 75.8 0 76.2 11 75.6 3C074 — 0 77.1 0 78.0 0 77.2 0
InactiveS125 0 0 74.9 1 74.1 1 73.2 3S124 4 378 74.7 82 73.5 142 74.3 161
ActiveS203 8 793 70.5 1,033 68.6 1,646 71.0 766S147 8 1,000 70.7 1,345 70.1 1,624 72.1 896
MD, methylation density.
Chan et al. PNAS | Published online November 26, 2014 | E5309
MED
ICALSC
IENCE
SPN
ASPL
US
Dow
nloa
ded
by g
uest
on
May
30,
202
0
Materials and MethodsCase Recruitment and Sample Processing. SLE patients attending the rheu-matology clinic at the Department of Medicine and Therapeutics, Prince ofWales Hospital, Hong Kong, were recruited with written informed consent. Thestudy was approved by the Joint Chinese University of Hong Kong–HospitalAuthority New Territories East Cluster Clinical Research Ethics Committee.All patients fulfilled the American College of Rheumatology diagnostic criteriaand their lupus disease activities were assessed by the SLEDAI (26). Clinicalinformation on the SLE patients is summarized in Dataset S2. Peripheral bloodwas collected in EDTA-containing tubes. The blood samples were first centri-fuged at 1,600 × g for 10 min at 4 °C and the plasma portion was furthersubjected to centrifugation at 16,000 × g for 10 min at 4 °C to pellet theresidual cells.
Separation of IgG-Bound and Unbound DNA in Plasma. The plasma sampleswere separated into the IgG-bound and non–IgG-bound fractions using theNAb Spin Column (Thermo Fisher Scientific), which contained an immobi-lized protein G resin for IgG protein capturing. The separation was performedaccording to the manufacturer’s instructions, except for the following mod-ifications for purifying the IgG-bound fraction. After the elution of the non–IgG-bound fraction, the NAb Spin Column was washed with PBS for six times.To ensure a complete removal of the non–IgG-bound fraction before elutionof the IgG-bound fraction, the final PBS wash was confirmed to have un-detectable DNA level by using a real-time PCR quantification of the leptin(LEP) gene (45). Then, the IgG-bound DNA remaining in the resin of the col-umn was eluted with six washes of freshly prepared buffer containing 1%SDS and 0.1 M sodium bicarbonate.
DNA Extraction and Preparation of DNA Libraries.DNAwas extracted from 4 to10 mL of plasma using the DSP Blood Mini Kit (Qiagen) with modifications ofthe manufacturer’s protocol as previously reported (38). The concentrationsof plasma DNA were determined by the real-time PCR assay of the LEP gene(45). Short DNA fragments of less than 62 bp can be underestimated withthe use of this assay, as the amplicon size was 62 bp. For DNA sequencing,plasma DNA libraries were prepared using the Paired-End Sequencing SamplePreparation Kit (Illumina), as previously described (28). For bisulfite sequenc-
ing, bisulfite-treated plasma DNA libraries were prepared using the Paired-EndSequencing Sample Preparation Kit (Illumina) and the EpiTect Plus DNA Bi-sulfite Kit (Qiagen) (29).
DNA Sequencing and Alignment. The bisulfite-treated or untreated DNA li-braries were sequenced for 75 bp of each end in a paired-end format onHiSeq2000 instruments (Illumina). DNA clusters were generated with a Paired-End Cluster Generation Kit v3 on a cBot instrument (Illumina). Real-time imageanalysis and base callingwere performed using theHiSeq Control Software v1.4and Real Time Analysis Software v1.13 (Illumina), by which the automatedmatrix and phasing calculations were based on the spiked-in PhiX control v3sequenced with the libraries. After base calling, adapter sequences and low-quality bases (i.e., quality score < 5) on the fragment ends were removed.
For the analysis of sequencing data, the sequenced reads were aligned tothe nonrepeat-masked human reference genome (NCBI build 37/hg19) usingthe Short Oligonucleotide Alignment Program 2 (46). Alignment was per-formed with the following settings: (i) two mismatches were allowed; (ii)alignment to multiple regions was not allowed; (iii) insertions or deletionscompared with the reference genome were not analyzed; and (iv) DNAfragment size ranged from 20 to 600 bp.
Molecular Size Determination of Plasma DNA. Paired-end sequencing, wheresequencing was performed for both ends of each DNA molecule, was used toanalyze each sample. By aligning the pair of end sequences of each DNAmolecule to the reference human genome and noting the genome coor-dinates of the extreme ends of the sequenced reads, the sizes of the sequencedDNA molecules were determined. Plasma DNA molecules are naturally frag-mented and hence the sequencing libraries for plasma DNA are typicallypreparedwithout any fragmentation steps (28). Hence, the lengths deduced bythe sequencing represented the sizes of the original plasma DNA molecules.
Methylation Analysis of Plasma DNA. For the analysis of bisulfite-convertedDNA sequencing data, an additional step for identification of methylatedcytosines was performed. The trimmed reads were processed by a methyla-tion data analysis pipeline called Methy-Pipe (47). To align the bisulfite-converted sequencing reads, we first performed in silico conversion of allcytosine residues to thymines, on the Watson and Crick strands separately,using the reference human genome (NCBI build 37/hg19). We then per-formed in silico conversion of each cytosine to thymine in all of the pro-cessed reads and kept the positional information of each converted residue.After that, Methy-Pipe was used to align the converted reads to the twopreconverted reference human genomes, with a maximum of two mis-matches allowed for each aligned read. The cytosines originally present onthe sequenced reads were recovered based on the positional informationkept during the in silico conversion. The recovered cytosines among the CpGdinucleotides were scored as methylated. Thymines among the CpG dinu-cleotides were scored as unmethylated. We determined the methylationdensity of the whole human genome or any particular regions in the ge-nome by determining the total number of unconverted cytosines at CpGsites as a proportion of all CpG sites covered by sequence reads mapped tothe genome or the particular regions in the genome.
Statistical Analysis. Analysis was performed by using in-house bioinformaticsprograms, which were written in Perl and R languages, and SigmaStat v3.5software (Systat Software). A P value of less than 0.05 was considered asstatistically significant and all probabilities were two-tailed.
ACKNOWLEDGMENTS. We thank Andy Guo, Patty Tse, Emily Leung, andMichelle Pui for technical assistance. This work was supported by the HongKong Research Grants Council Theme-Based Research Scheme (T12-404/11)and the S. K. Yee Foundation. Y.M.D.L. is supported by an endowed chairfrom the Li Ka Shing Foundation.
1. Gladman DD, Urowitz MB (2007) Prognosis, mortality and morbidity in systemic lupuserythematosus. Dubois’ Lupus Erythematosus, eds Wallace DJ, Hahn BH (LippincottWilliams & Wilkins, Philadelphia), 7th Ed, pp 1333–1353.
2. Tsokos GC (2011) Systemic lupus erythematosus. N Engl J Med 365(22):2110–2121.3. Cervera R, et al.; European Working Party on Systemic Lupus Erythematosus (2003) Morbidity
and mortality in systemic lupus erythematosus during a 10-year period: A comparison of earlyand late manifestations in a cohort of 1,000 patients. Medicine (Baltimore) 82(5):299–308.
4. Rullo OJ, Tsao BP (2013) Recent insights into the genetic basis of systemic lupus er-ythematosus. Ann Rheum Dis 72(Suppl 2):ii56–ii61.
5. Pisetsky DS (2004) The immune response to cell death in SLE. Autoimmun Rev 3(7-8):500–504.
6. Su KY, Pisetsky DS (2009) The role of extracellular DNA in autoimmunity in SLE. ScandJ Immunol 70(3):175–183.
7. Emlen W, Niebur J, Kadera R (1994) Accelerated in vitro apoptosis of lymphocytesfrom patients with systemic lupus erythematosus. J Immunol 152(7):3685–3692.
8. Munoz LE, et al. (2005) SLE—A disease of clearance deficiency? Rheumatology (Ox-ford) 44(9):1101–1107.
9. Sallai K, Nagy E, Derfalvy B, Müzes G, Gergely P (2005) Antinucleosome antibodiesand decreased deoxyribonuclease activity in sera of patients with systemic lupus er-ythematosus. Clin Diagn Lab Immunol 12(1):56–59.
10. Strickland FM, Richardson BC (2008) Epigenetics in human autoimmunity. Epigeneticsin autoimmunity—DNA methylation in systemic lupus erythematosus and beyond.Autoimmunity 41(4):278–286.
11. Richardson B, et al. (1990) Evidence for impaired T cell DNA methylation in sys-temic lupus erythematosus and rheumatoid arthritis. Arthritis Rheum 33(11):1665–1673.
Fig. 7. Percentage of significant DNA hypomethylation in plasma of SLEpatients with high anti-dsDNA antibody levels (S124, S203, and S147). Red,blue, and green bars indicate the IgG-bound, neat, and non–IgG-bound frac-tions, respectively.
E5310 | www.pnas.org/cgi/doi/10.1073/pnas.1421126111 Chan et al.
Dow
nloa
ded
by g
uest
on
May
30,
202
0
12. Ballestar E, Esteller M, Richardson BC (2006) The epigenetic face of systemic lupuserythematosus. J Immunol 176(12):7143–7147.
13. Yang ML, et al. (2013) Lupus autoimmunity altered by cellular methylation metabo-lism. Autoimmunity 46(1):21–31.
14. Wen ZK, et al. (2007) DNA hypomethylation is crucial for apoptotic DNA to inducesystemic lupus erythematosus-like autoimmune disease in SLE-non-susceptible mice.Rheumatology (Oxford) 46(12):1796–1803.
15. Tan EM, Schur PH, Carr RI, Kunkel HG (1966) Deoxybonucleic acid (DNA) and anti-bodies to DNA in the serum of patients with systemic lupus erythematosus. J ClinInvest 45(11):1732–1740.
16. Raptis L, Menard HA (1980) Quantitation and characterization of plasma DNA in nor-mals and patients with systemic lupus erythematosus. J Clin Invest 66(6):1391–1399.
17. Chen JA, et al. (2007) Sensitive detection of plasma/serum DNA in patients with sys-temic lupus erythematosus. Autoimmunity 40(4):307–310.
18. Rumore PM, Steinman CR (1990) Endogenous circulating DNA in systemic lupus er-ythematosus. Occurrence as multimeric complexes bound to histone. J Clin Invest86(1):69–74.
19. Chiu RWK, et al. (2008) Noninvasive prenatal diagnosis of fetal chromosomal aneu-ploidy by massively parallel genomic sequencing of DNA in maternal plasma. ProcNatl Acad Sci USA 105(51):20458–20463.
20. Lo YMD, et al. (2010) Maternal plasma DNA sequencing reveals the genome-widegenetic and mutational profile of the fetus. Sci Transl Med 2(61):61ra91.
21. Palomaki GE, et al. (2011) DNA sequencing of maternal plasma to detect Downsyndrome: An international clinical validation study. Genet Med 13(11):913–920.
22. Beck J, Urnovitz HB, Mitchell WM, Schütz E (2010) Next generation sequencing ofserum circulating nucleic acids from patients with invasive ductal breast cancer re-veals differences to healthy and nonmalignant controls.Mol Cancer Res 8(3):335–342.
23. Leary RJ, et al. (2012) Detection of chromosomal alterations in the circulation ofcancer patients with whole-genome sequencing. Sci Transl Med 4(162):162ra154.
24. Chan KCA, et al. (2013) Noninvasive detection of cancer-associated genome-widehypomethylation and copy number aberrations by plasma DNA bisulfite sequencing.Proc Natl Acad Sci USA 110(47):18761–18768.
25. Chan KCA, et al. (2013) Cancer genome scanning in plasma: Detection of tumor-associated copy number aberrations, single-nucleotide variants, and tumoral hetero-geneity by massively parallel sequencing. Clin Chem 59(1):211–224.
26. Bombardier C, Gladman DD, Urowitz MB, Caron D, Chang CH; The Committee onPrognosis Studies in SLE (1992) Derivation of the SLEDAI. A disease activity index forlupus patients. Arthritis Rheum 35(6):630–640.
27. Krzywinski M, et al. (2009) Circos: An information aesthetic for comparative ge-nomics. Genome Res 19(9):1639–1645.
28. Zheng YWL, et al. (2012) Nonhematopoietically derived DNA is shorter than hema-topoietically derived DNA in plasma: A transplantation model. Clin Chem 58(3):549–558.
29. Lun FMF, et al. (2013) Noninvasive prenatal methylomic analysis by genomewide bi-sulfite sequencing of maternal plasma DNA. Clin Chem 59(11):1583–1594.
30. Arbuckle MR, et al. (2003) Development of autoantibodies before the clinical onset ofsystemic lupus erythematosus. N Engl J Med 349(16):1526–1533.
31. Isenberg DA, Manson JJ, Ehrenstein MR, Rahman A (2007) Fifty years of anti-ds DNAantibodies: Are we approaching journey’s end? Rheumatology (Oxford) 46(7):1052–1056.
32. Winfield JB, Faiferman I, Koffler D (1977) Avidity of anti-DNA antibodies in serum andIgG glomerular eluates from patients with systemic lupus erythematosus. Associationof high avidity antinative DNA antibody with glomerulonephritis. J Clin Invest 59(1):90–96.
33. Haakenstad AO, Mannik M (1974) Saturation of the reticuloendothelial system withsoluble immune complexes. J Immunol 112(5):1939–1948.
34. Frank MM, Hamburger MI, Lawley TJ, Kimberly RP, Plotz PH (1979) Defective re-ticuloendothelial system Fc-receptor function in systemic lupus erythematosus. N EnglJ Med 300(10):518–523.
35. Mir A, Porteu F, Levy M, Lesavre P, Halbwachs-Mecarelli L (1988) C3b receptor (CR1)on phagocytic cells from SLE patients: Analysis of the defect and familial study. ClinExp Immunol 73(3):461–466.
36. Uccellini MB, et al. (2008) Autoreactive B cells discriminate CpG-rich and CpG-poorDNA and this response is modulated by IFN-alpha. J Immunol 181(9):5875–5884.
37. Uccellini MB, Busto P, Debatis M, Marshak-Rothstein A, Viglianti GA (2012) Selectivebinding of anti-DNA antibodies to native dsDNA fragments of differing sequence.Immunol Lett 143(1):85–91.
38. Chiu RWK, et al. (2011) Non-invasive prenatal assessment of trisomy 21 by multi-plexed maternal plasma DNA sequencing: Large scale validity study. BMJ 342:c7401.
39. Yu SCY, et al. (2014) Size-based molecular diagnostics using plasma DNA for non-invasive prenatal testing. Proc Natl Acad Sci USA 111(23):8583–8588.
40. Kelly TK, et al. (2012) Genome-wide mapping of nucleosome positioning and DNAmethylation within individual DNA molecules. Genome Res 22(12):2497–2506.
41. Anker P, Stroun M, Maurice PA (1976) Spontaneous extracellular synthesis of DNAreleased by human blood lymphocytes. Cancer Res 36(8):2832–2839.
42. Rogers JC, Boldt D, Kornfeld S, Skinner A, Valeri CR (1972) Excretion of deoxy-ribonucleic acid by lymphocytes stimulated with phytohemagglutinin or antigen. ProcNatl Acad Sci USA 69(7):1685–1689.
43. Lei W, et al. (2009) Abnormal DNA methylation in CD4+ T cells from patients withsystemic lupus erythematosus, systemic sclerosis, and dermatomyositis. Scand JRheumatol 38(5):369–374.
44. Zhang Y, Zhao M, Sawalha AH, Richardson B, Lu Q (2013) Impaired DNA methylationand its mechanisms in CD4(+)T cells of systemic lupus erythematosus. J Autoimmun41:92–99.
45. Tsui NBY, et al. (2012) High resolution size analysis of fetal DNA in the urine of pregnantwomen by paired-end massively parallel sequencing. PLoS ONE 7(10):e48319.
46. Li R, et al. (2009) SOAP2: An improved ultrafast tool for short read alignment. Bio-informatics 25(15):1966–1967.
47. Jiang P, et al. (2014) Methy-Pipe: An integrated bioinformatics pipeline for wholegenome bisulfite sequencing data analysis. PLoS ONE 9(6):e100360.
Chan et al. PNAS | Published online November 26, 2014 | E5311
MED
ICALSC
IENCE
SPN
ASPL
US
Dow
nloa
ded
by g
uest
on
May
30,
202
0