Embed Size (px)
Citation preview
9.0
Quelle est l'implication de la densité des ressources informatiques sur l'efficacité énergétique des Data Centers ?
HW+SW-KW
Jean-Michel Rodriguez [email protected] Brochard [email protected] Panda [email protected]çois Thomas [email protected] MontpellierIUT Alençon-Damigny, Universite de Caen Basse-Normandie
Green Days @ Toulouse | 16, 17 Mars 2015
1
© Copyright IBM Corporation 2014
9.0
Quelle est l'implication de la densité des ressources informatiques sur l'efficacité énergétique des Data Centers ?
HW+SW-KW
Jean-Michel Rodriguez [email protected] Brochard [email protected] Panda [email protected]çois Thomas [email protected] MontpellierIUT Alençon-Damigny, Universite de Caen Basse-Normandie
Green Days @ Toulouse | 16, 17 Mars 2015
2
© Copyright IBM Corporation 2014

Références“PUE in the Past; Towards TUE in the Future”
Henry Coles
Lawrence Berkeley National Laboratory
Environmental Energy Technologies Division (EETD)
https://www.brighttalk.com/webcast/540/96847
Références“TUE, a new energy-efficiency metric applied at ORNL's
Jaguar”, ISC 2013 Gauss Award Winner – Most Outstanding Paper
Michael K Patterson et al.
Intel, ORNL, LBNL, Sandia, Energy Efficient HPC Working Group
http://eetd.lbl.gov/sites/all/files/isc13_tuepaper.pdf

Agenda (revisité)Le PUE est injuste !
Mais on peut l'utiliser quand même
Et même le réutiliser (ITUE)
Pour aboutir à une métrique plus juste (TUE)
Même si...
PUE : trop injuste !
Moyen rapide d'avoir un bon PUE
Des serveurs avec des alimentations low cost
Des VRM qui fuient
Des ventilateurs gloutons
Mais si on l'étendait ?
ITUE : “un PUE au niveau du serveur”
On isole la partie vraiment utile du serveur : CPU, RAM, réseau, disque ? : “compute”
ITUE = IT energy / “compute”
Le TUE a moins de défauts
TUE : Total energy Utilization Efficiency
TUE = Total Data Center / “compute”
TUE = PUE * ITUE
TUE = (Total Data Center / IT) * ( IT / “compute”)
En conclusionLe TUE évite quelques inconvénients du PUE
Même s'il n'est pas parfait
Ne heurte pas la performance énergétique des data centers dans lesquels on met des serveurs à haute densité, souvent intrinsèquement moins dispendieux en électricité
Nécessite, pour être mesuré, que les serveurs soient équipés de dispositifs de mesure de consommation plus fins (*)
A few slides I extracted stole from :
HPC Total Cost of Ownership Study:
Comparing Air, Hybrid and Direct Water Cooling SolutionsASHRAE conference 2012
Dustin W. Demetriou, Roger Schmidt
Advanced Thermal Energy Efficiency Lab, IBM Poughkeepsie
TCO calculation methodology
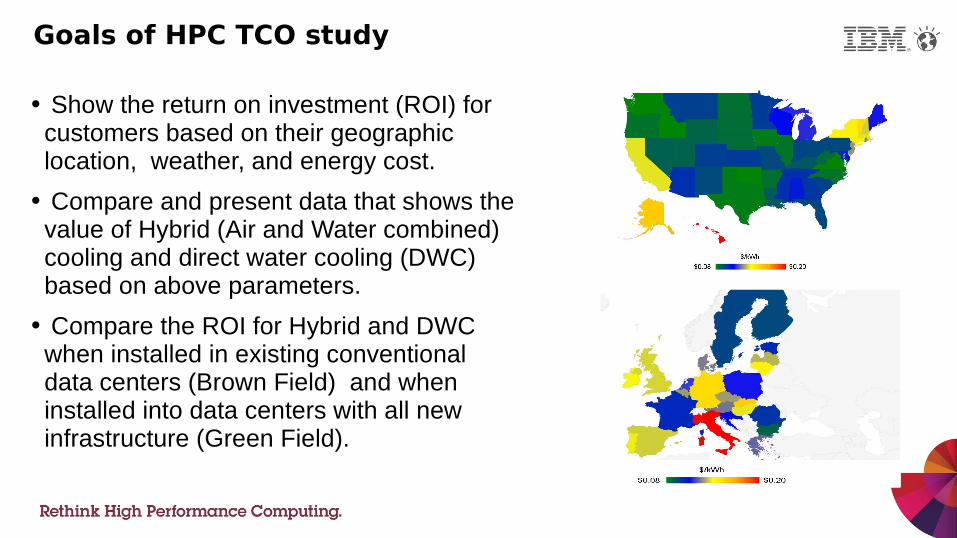
• Show the return on investment (ROI) for customers based on their geographic location, weather, and energy cost.
• Compare and present data that shows the value of Hybrid (Air and Water combined) cooling and direct water cooling (DWC) based on above parameters.
• Compare the ROI for Hybrid and DWC when installed in existing conventional data centers (Brown Field) and when installed into data centers with all new infrastructure (Green Field).
Goals of HPC TCO study
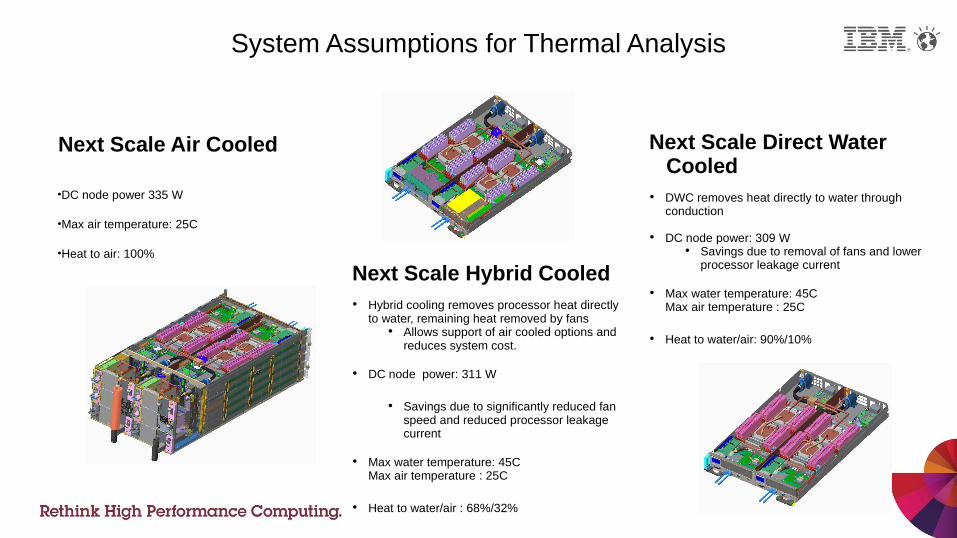
System Assumptions for Thermal Analysis
Next Scale Air Cooled
•DC node power 335 W
•Max air temperature: 25C
•Heat to air: 100%
Next Scale Direct Water Cooled
• DWC removes heat directly to water through conduction
• DC node power: 309 W• Savings due to removal of fans and lower
processor leakage current
• Max water temperature: 45CMax air temperature : 25C
• Heat to water/air: 90%/10%
Next Scale Hybrid Cooled• Hybrid cooling removes processor heat directly
to water, remaining heat removed by fans• Allows support of air cooled options and
reduces system cost.
• DC node power: 311 W
• Savings due to significantly reduced fan speed and reduced processor leakage current
• Max water temperature: 45CMax air temperature : 25C
• Heat to water/air : 68%/32%
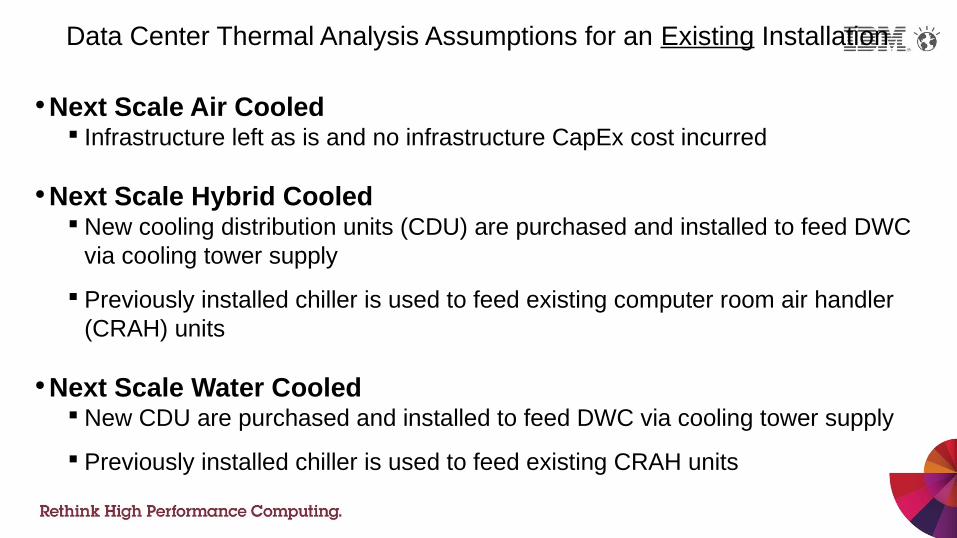
Data Center Thermal Analysis Assumptions for an Existing Installation
•Next Scale Air Cooled Infrastructure left as is and no infrastructure CapEx cost incurred
•Next Scale Hybrid Cooled New cooling distribution units (CDU) are purchased and installed to feed DWC
via cooling tower supply
Previously installed chiller is used to feed existing computer room air handler (CRAH) units
•Next Scale Water Cooled New CDU are purchased and installed to feed DWC via cooling tower supply
Previously installed chiller is used to feed existing CRAH units
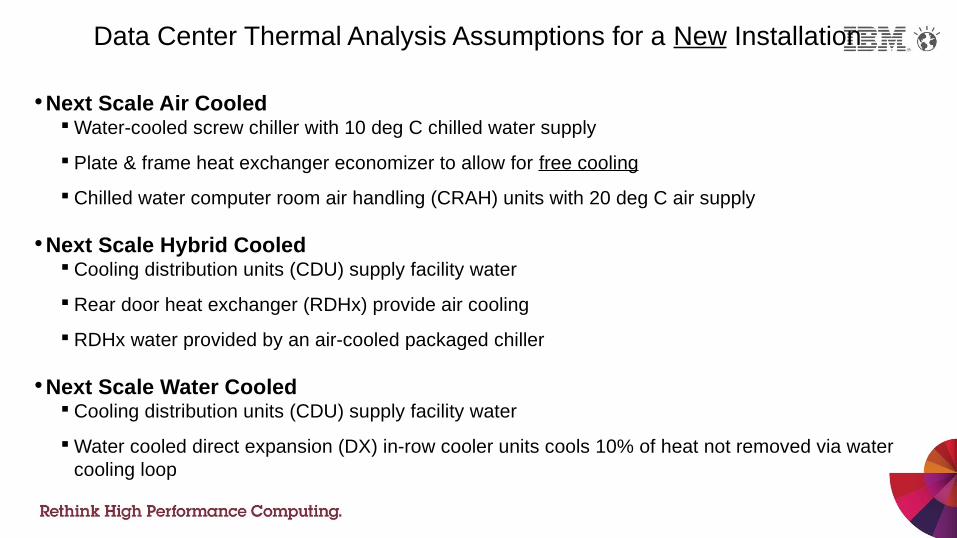
Data Center Thermal Analysis Assumptions for a New Installation
•Next Scale Air Cooled Water-cooled screw chiller with 10 deg C chilled water supply
Plate & frame heat exchanger economizer to allow for free cooling
Chilled water computer room air handling (CRAH) units with 20 deg C air supply
•Next Scale Hybrid Cooled Cooling distribution units (CDU) supply facility water
Rear door heat exchanger (RDHx) provide air cooling
RDHx water provided by an air-cooled packaged chiller
•Next Scale Water Cooled Cooling distribution units (CDU) supply facility water
Water cooled direct expansion (DX) in-row cooler units cools 10% of heat not removed via water cooling loop
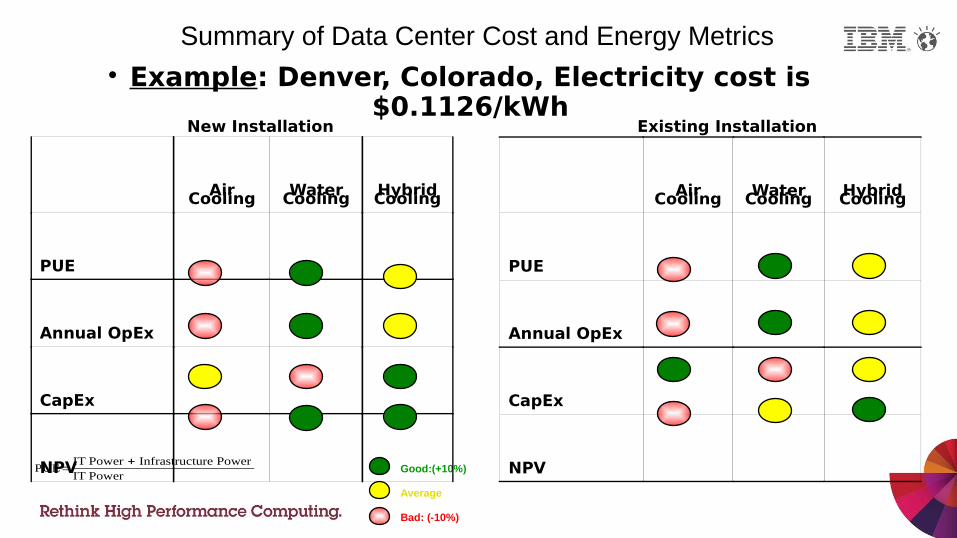
Summary of Data Center Cost and Energy Metrics
New Installation
Good:(+10%)
Average
Bad: (-10%)
Example: Denver, Colorado, Electricity cost is $0.1126/kWh
Existing Installation
Air Cooling Water Cooling Hybrid Cooling
PUE
Annual OpEx
CapEx
NPV
Air Cooling Water Cooling Hybrid Cooling
PUE
Annual OpEx
CapEx
NPVPUE=IT Power + Infrastructure PowerIT Power
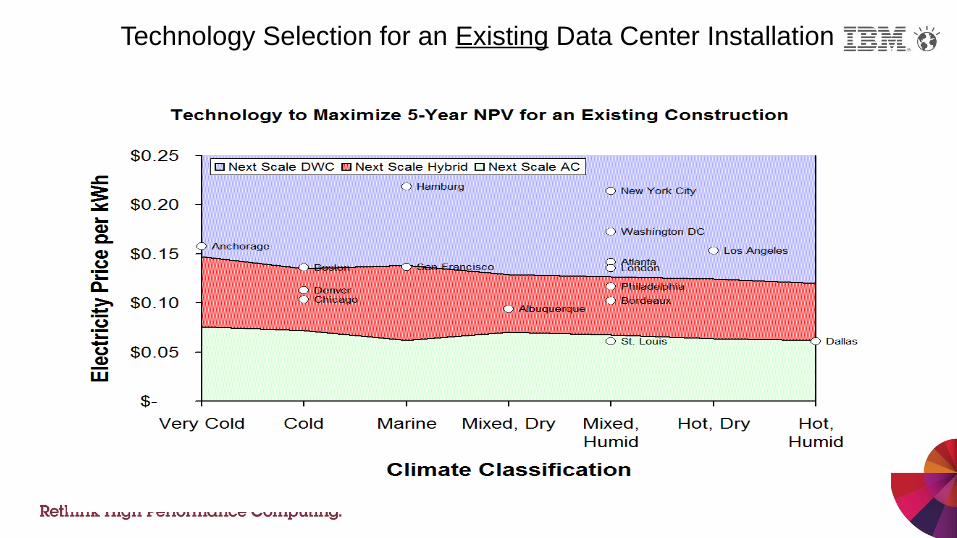
Technology Selection for an Existing Data Center Installation
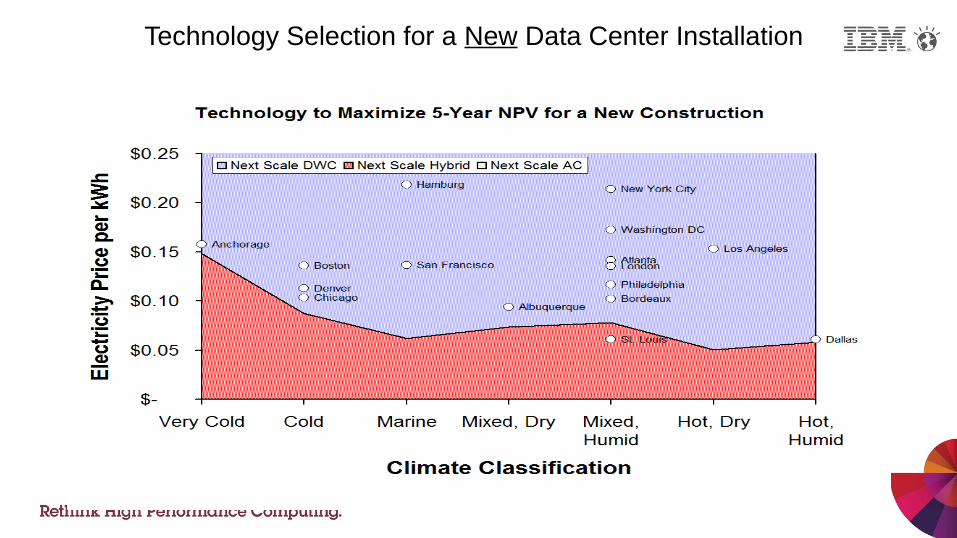
Technology Selection for a New Data Center Installation
9.0
Quelle est l'implication de la densité des ressources informatiques sur l'efficacité énergétique des Data Centers ?
HW+SW-KW
Jean-Michel Rodriguez [email protected] Brochard [email protected] Panda [email protected]çois Thomas [email protected] MontpellierIUT Alençon-Damigny, Universite de Caen Basse-Normandie
Green Days @ Toulouse | 16, 17 Mars 2015
20
© Copyright IBM Corporation 2014
explain how our customers save power with System x hardware and advanced job schedulers
explain how you can use EAS as a differentiation for your System x deals
give guidelines regarding TCO calculations
Session objectives
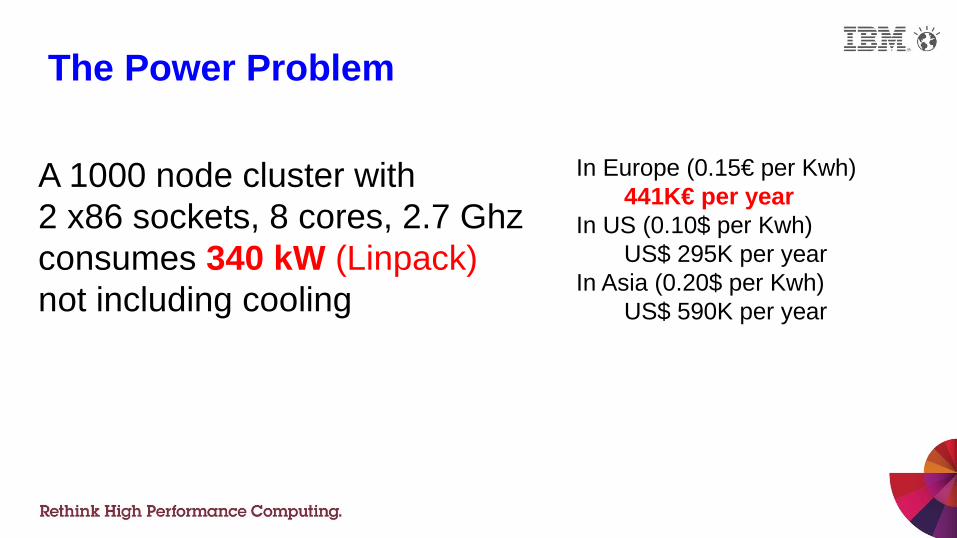
The Power Problem
A 1000 node cluster with2 x86 sockets, 8 cores, 2.7 Ghzconsumes 340 kW (Linpack)not including cooling
In Europe (0.15€ per Kwh)441K€ per year
In US (0.10$ per Kwh)US$ 295K per year
In Asia (0.20$ per Kwh)US$ 590K per year
Several ways to reduce power
Use better cooling (Direct Water Cooling)Reduce power distribution lossesChoose processors with high Flops/WattUse power and energy aware toolsTune the applications
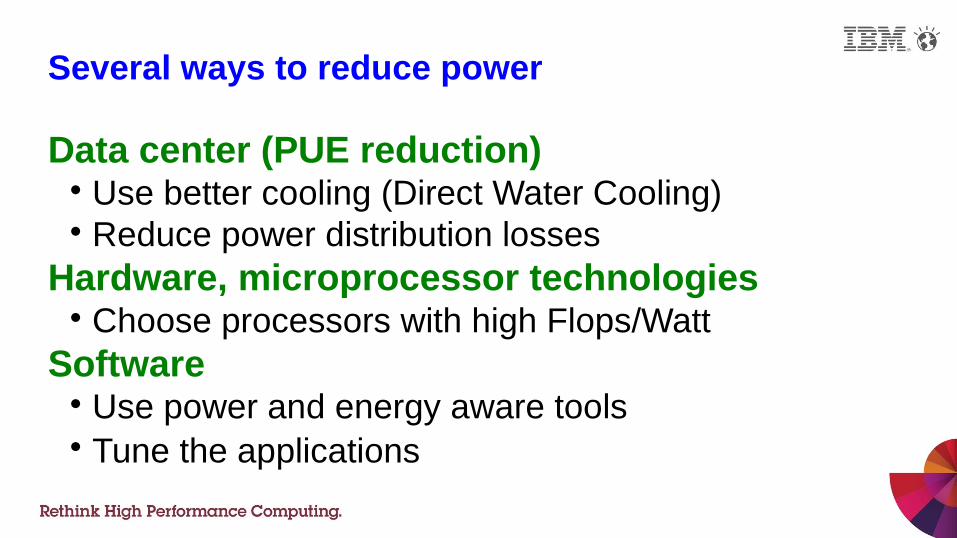
Several ways to reduce power
Data center (PUE reduction) Use better cooling (Direct Water Cooling) Reduce power distribution losses
Hardware, microprocessor technologies Choose processors with high Flops/Watt
Software Use power and energy aware tools Tune the applications
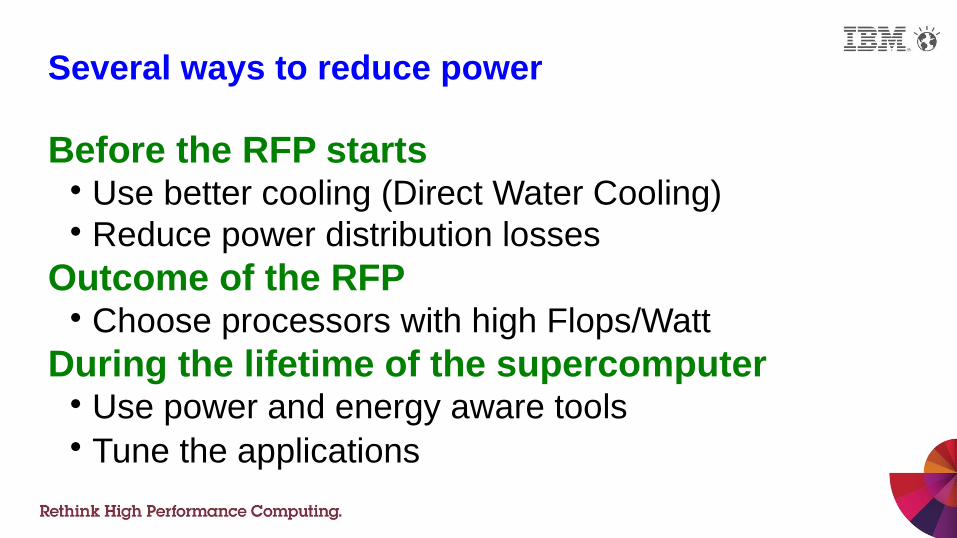
Several ways to reduce power
Before the RFP starts Use better cooling (Direct Water Cooling) Reduce power distribution losses
Outcome of the RFP Choose processors with high Flops/Watt
During the lifetime of the supercomputer Use power and energy aware tools Tune the applications
1950 1960 1970 1980 1990 2000 203002468
101214
BipolarCMOS
IntegratedCircuit
JunctionTransistor
2010 2020
3DI
Low-PowerMultic
ore
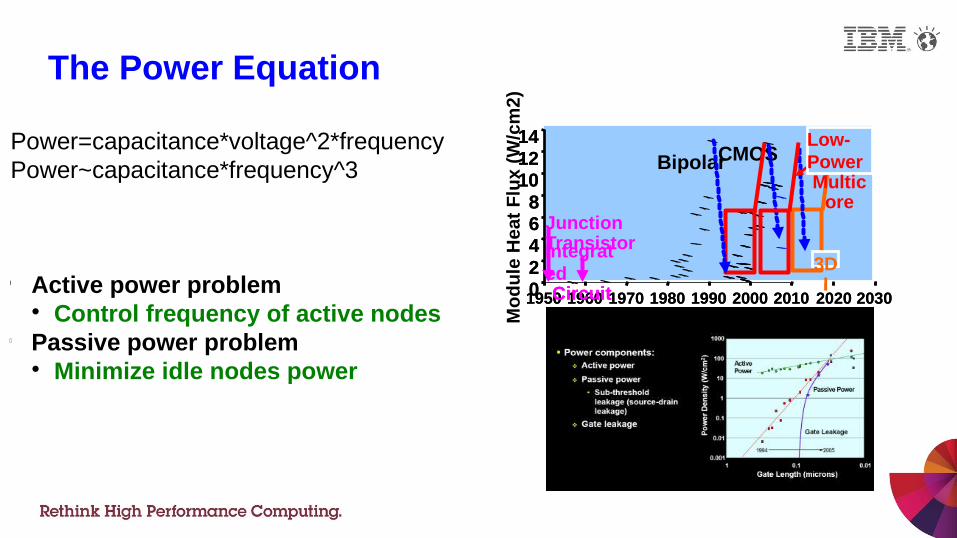
The Power Equation
Power=capacitance*voltage^2*frequencyPower~capacitance*frequency^3
l Active power problem Control frequency of active nodes
l Passive power problem Minimize idle nodes power
1950 1960 1970 1980 1990 2000 2030
Mo
du
le H
eat
Flu
x (W
/cm
2)
02468
101214
BipolarCMOS
IntegratedCircuit
JunctionTransistor
2010 2020
3DI
Low-PowerMultic
ore
•
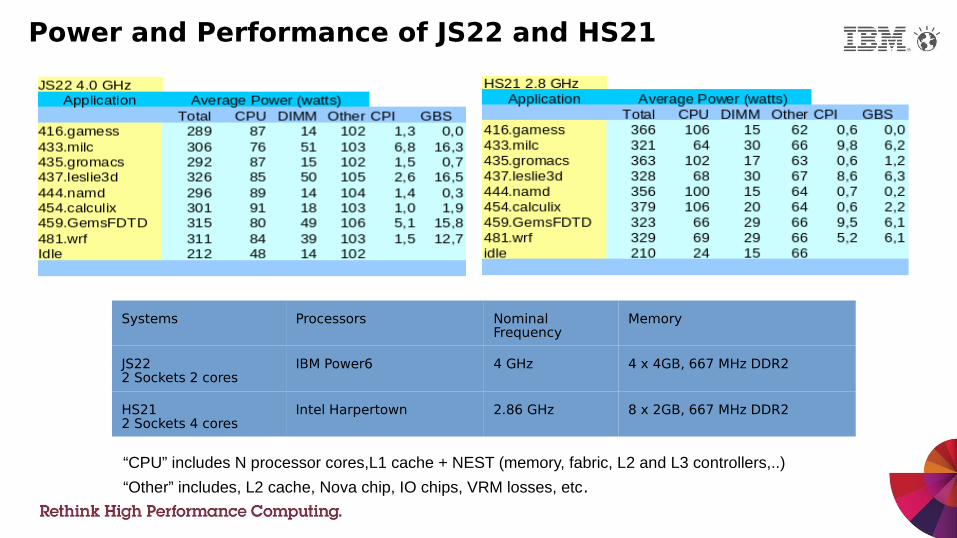
Power and Performance of JS22 and HS21
“CPU” includes N processor cores,L1 cache + NEST (memory, fabric, L2 and L3 controllers,..)
“Other” includes, L2 cache, Nova chip, IO chips, VRM losses, etc.
Systems Processors Nominal Frequency
Memory
JS22 2 Sockets 2 cores
IBM Power6 4 GHz 4 x 4GB, 667 MHz DDR2
HS21 2 Sockets 4 cores
Intel Harpertown 2.86 GHz 8 x 2GB, 667 MHz DDR2
•
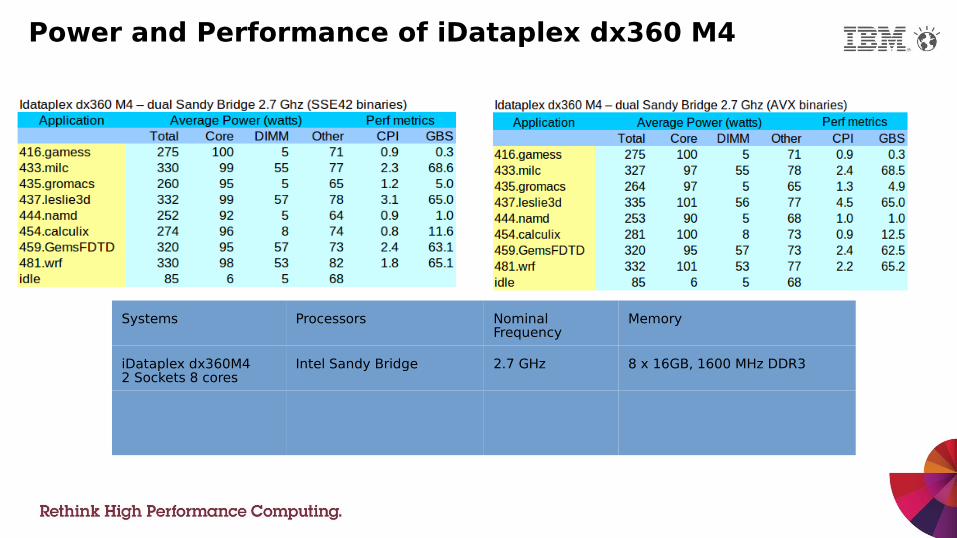
Power and Performance of iDataplex dx360 M4
Systems Processors Nominal Frequency
Memory
iDataplex dx360M4 2 Sockets 8 cores
Intel Sandy Bridge 2.7 GHz 8 x 16GB, 1600 MHz DDR3
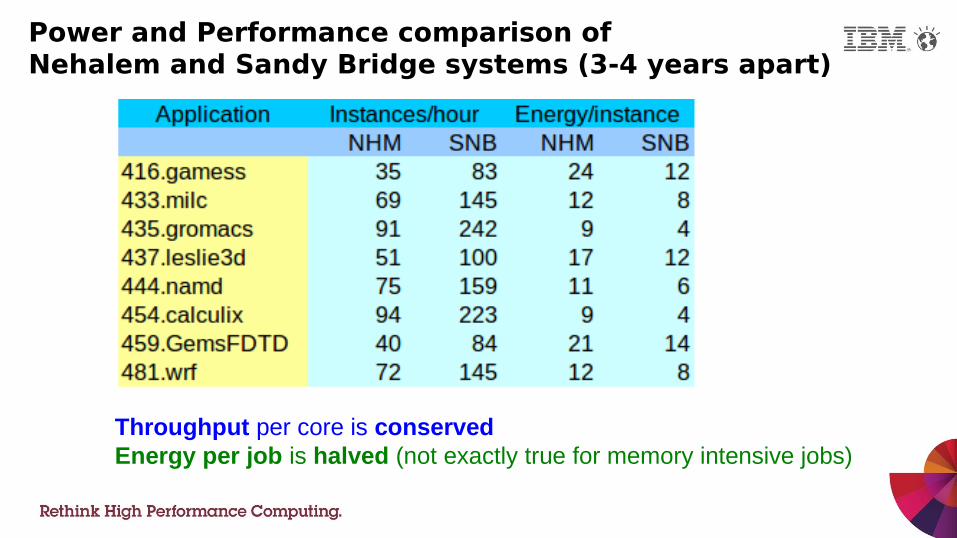
Power and Performance comparison ofNehalem and Sandy Bridge systems (3-4 years apart)
Throughput per core is conservedEnergy per job is halved (not exactly true for memory intensive jobs)
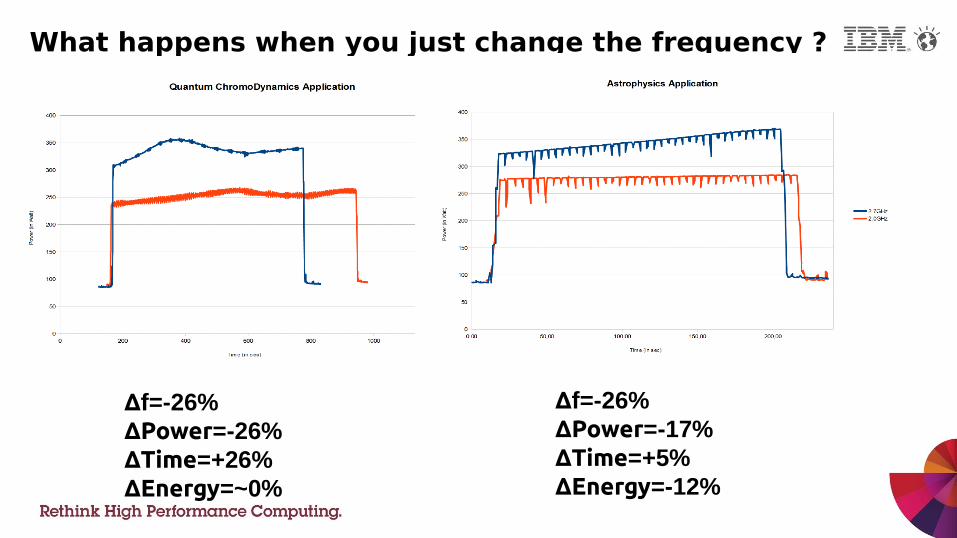
What happens when you just change the frequency ?
∆f=-26%∆Power=-17%∆Time=+5%∆Energy=-12%
∆f=-26%∆Power=-26%∆Time=+26%∆Energy=~0%
Monitor the application (hpm counters, power)
Build a performance and power model for prediction Which depends on the processor/node and the application
How do we find the performance/power trade-off ?
Is it worth tuning the applications ?
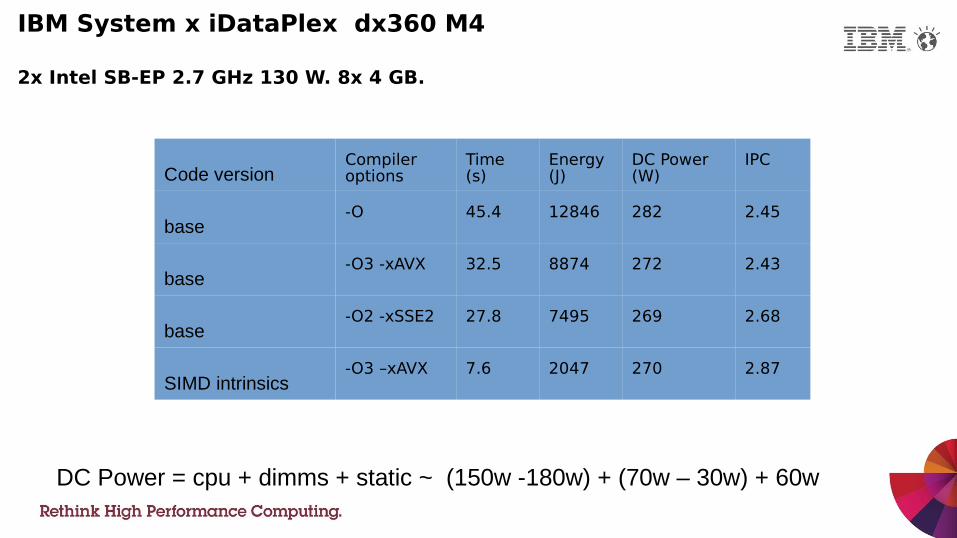
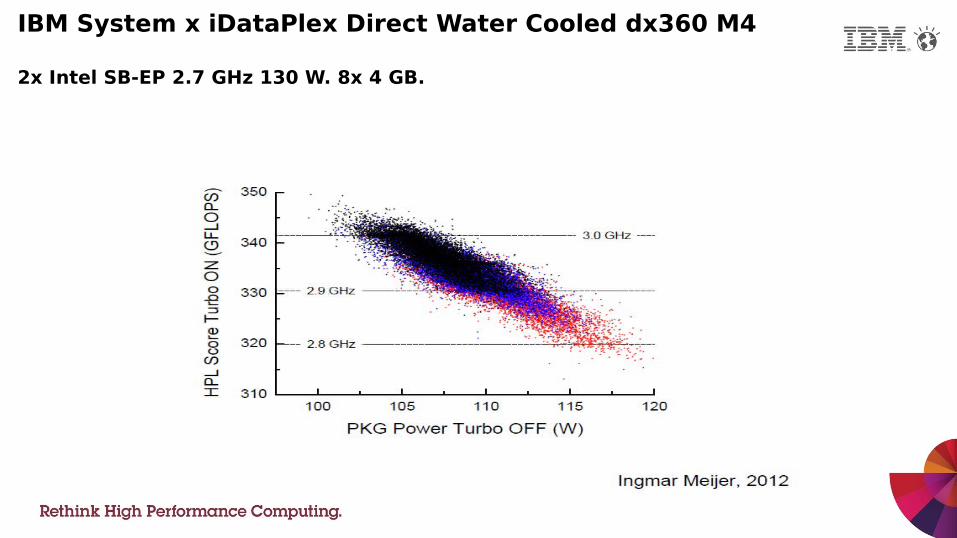
IBM System x iDataPlex dx360 M4
2x Intel SB-EP 2.7 GHz 130 W. 8x 4 GB.
Code versionCompiler options
Time (s)
Energy (J)
DC Power (W)
IPC
base-O 45.4 12846 282 2.45
base-O3 -xAVX 32.5 8874 272 2.43
base-O2 -xSSE2 27.8 7495 269 2.68
SIMD intrinsics-O3 –xAVX 7.6 2047 270 2.87
DC Power = cpu + dimms + static ~ (150w -180w) + (70w – 30w) + 60w

Is it worth using Turbo ?
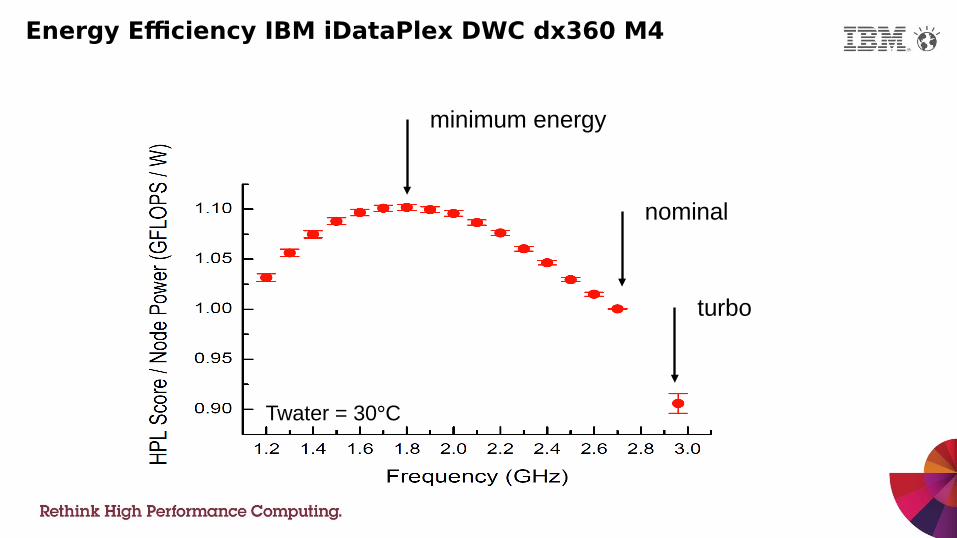
Energy Efficiency IBM iDataPlex DWC dx360 M4
Twater = 30C
nominal
turbo
minimum energy
Full Load Twater = 30°C
IBM System x iDataPlex Direct Water Cooled dx360 M4
2x Intel SB-EP 2.7 GHz 130 W. 8x 4 GB.
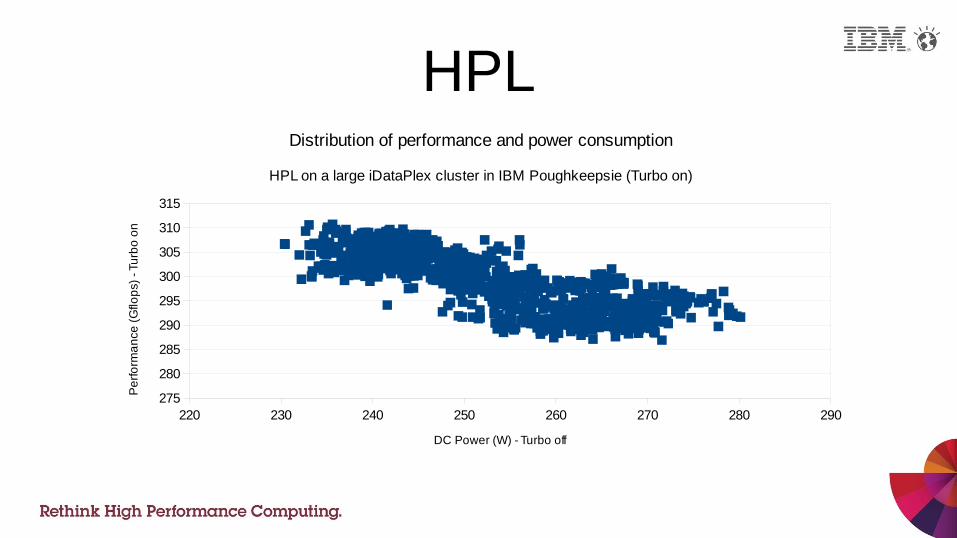
HPL
220 230 240 250 260 270 280 290275
280
285
290
295
300
305
310
315
Distribution of performance and power consumption
HPL on a large iDataPlex cluster in IBM Poughkeepsie (Turbo on)
DC Power (W) - Turbo off
Pe
rfo
rma
nce
(G
flop
s) -
Tu
rbo
on
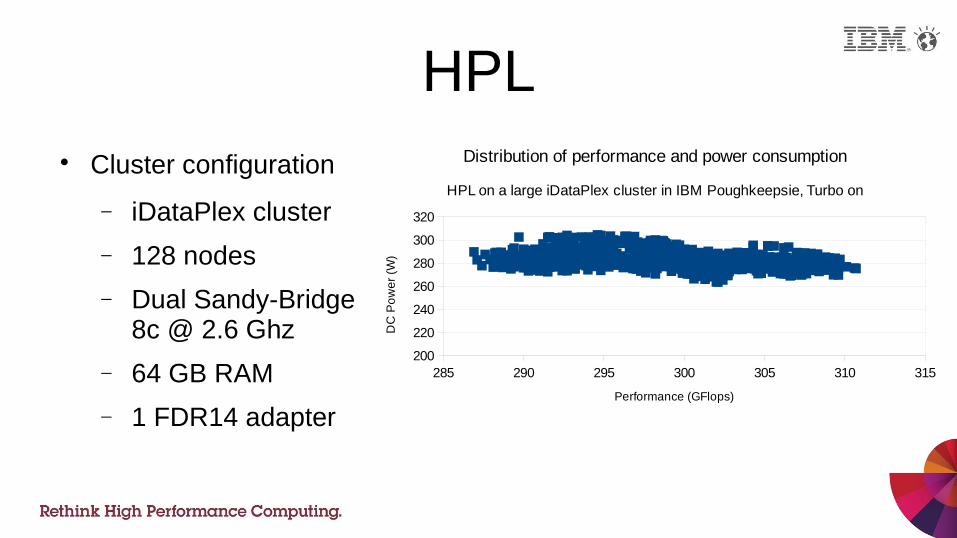
HPL Cluster configuration
iDataPlex cluster
128 nodes
Dual Sandy-Bridge 8c @ 2.6 Ghz
64 GB RAM
1 FDR14 adapter
285 290 295 300 305 310 315200
220
240
260
280
300
320
Distribution of performance and power consumption
HPL on a large iDataPlex cluster in IBM Poughkeepsie, Turbo on
Performance (GFlops)D
C P
ow
er
(W)
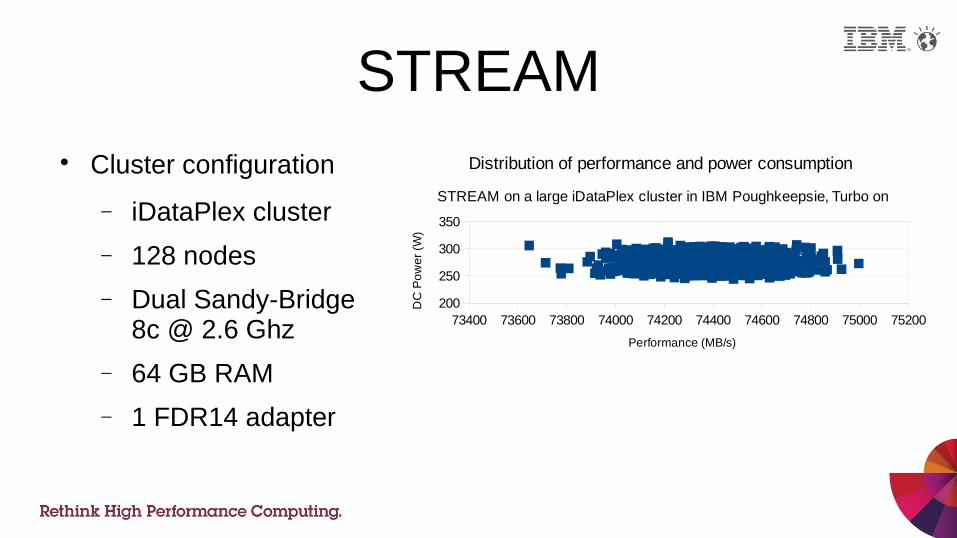
STREAM Cluster configuration
iDataPlex cluster
128 nodes
Dual Sandy-Bridge 8c @ 2.6 Ghz
64 GB RAM
1 FDR14 adapter
73400 73600 73800 74000 74200 74400 74600 74800 75000 75200200
250
300
350
Distribution of performance and power consumption
STREAM on a large iDataPlex cluster in IBM Poughkeepsie, Turbo on
Performance (MB/s)
DC
Po
we
r (W
)
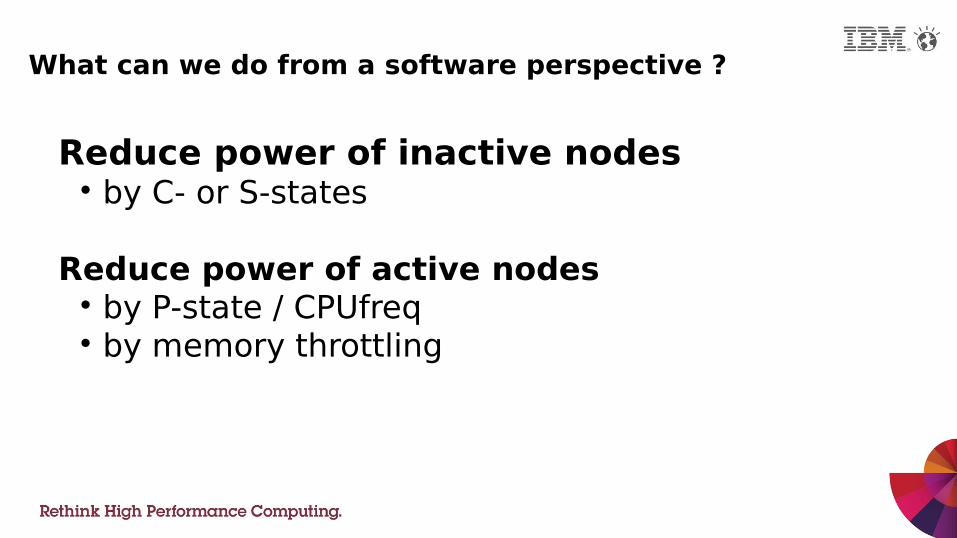
What can we do from a software perspective ?
Reduce power of inactive nodes by C- or S-states
Reduce power of active nodes by P-state / CPUfreq by memory throttling
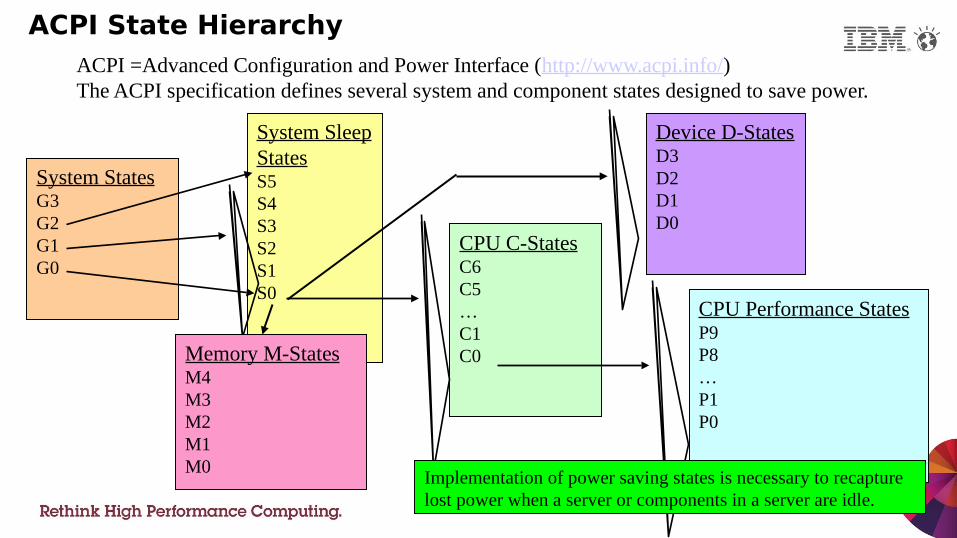
ACPI State Hierarchy
System StatesG3G2G1G0
System Sleep StatesS5S4S3S2S1S0
CPU C-StatesC6C5…C1C0
CPU Performance StatesP9P8…P1P0
ACPI =Advanced Configuration and Power Interface (http://www.acpi.info/)The ACPI specification defines several system and component states designed to save power.
Device D-StatesD3D2D1D0
Memory M-StatesM4M3M2M1M0
Implementation of power saving states is necessary to recapture lost power when a server or components in a server are idle.
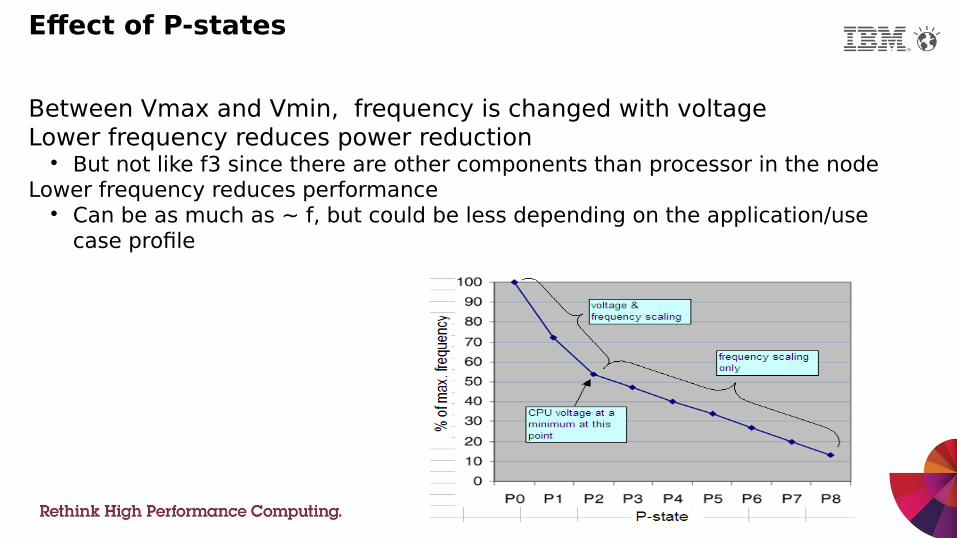
Effect of P-states
Between Vmax and Vmin, frequency is changed with voltageLower frequency reduces power reduction
But not like f3 since there are other components than processor in the node Lower frequency reduces performance
Can be as much as ~ f, but could be less depending on the application/use case profile
AC power measurements on Tian Den
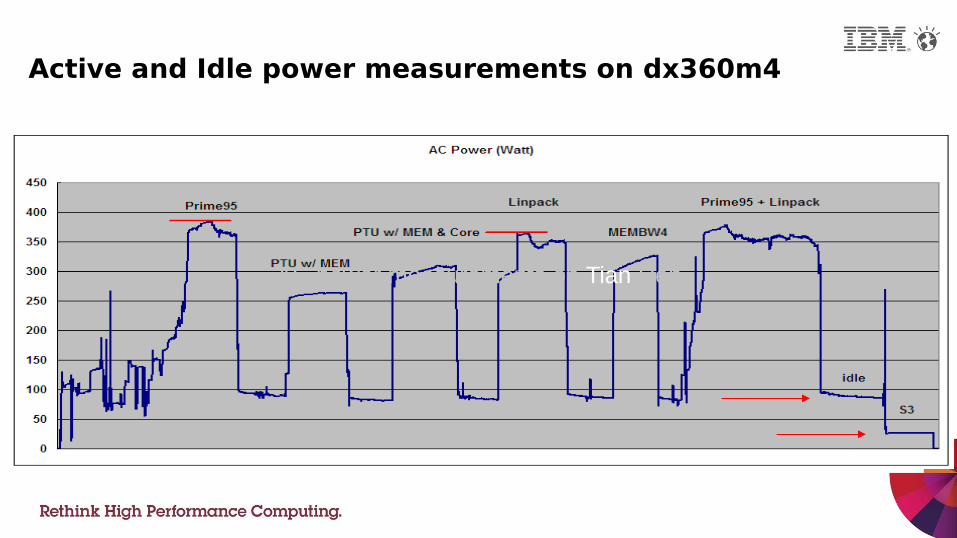
Active and Idle power measurements on dx360m4
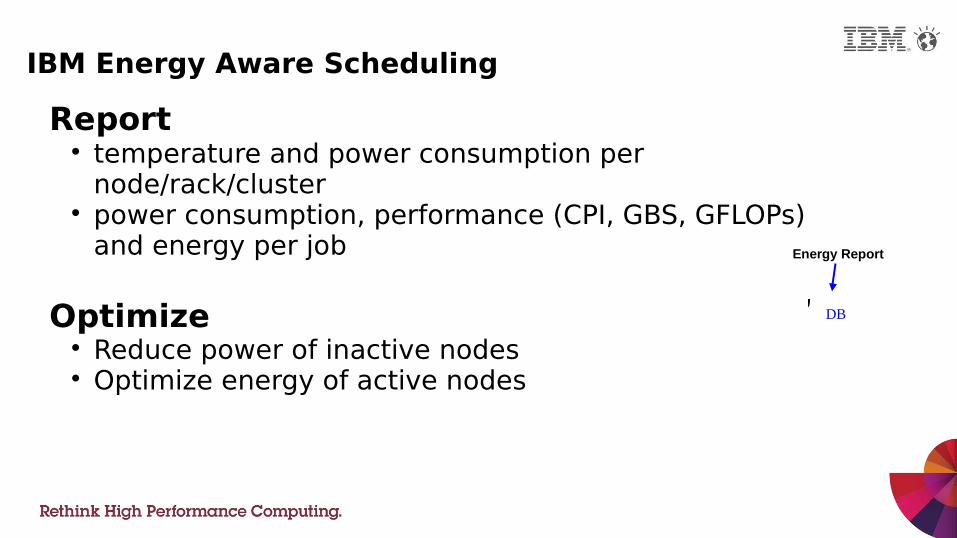
IBM Energy Aware Scheduling
Report temperature and power consumption per
node/rack/cluster power consumption, performance (CPI, GBS, GFLOPs)
and energy per job
Optimize Reduce power of inactive nodes Optimize energy of active nodes
Energy Report
DB
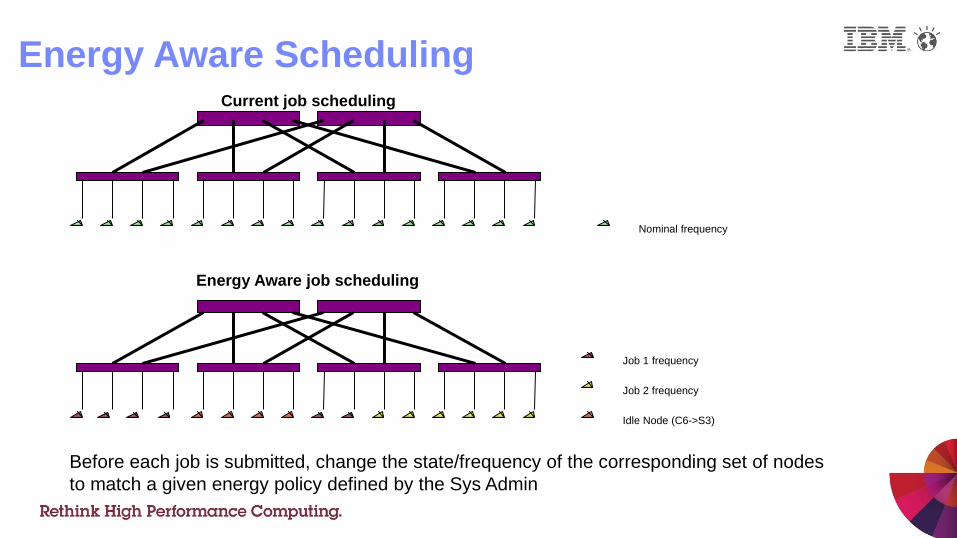
Energy Aware Scheduling
Before each job is submitted, change the state/frequency of the corresponding set of nodes to match a given energy policy defined by the Sys Admin
Job 1 frequency
Energy Aware job scheduling
Current job scheduling
Job 2 frequency
Idle Node (C6->S3)
Nominal frequency
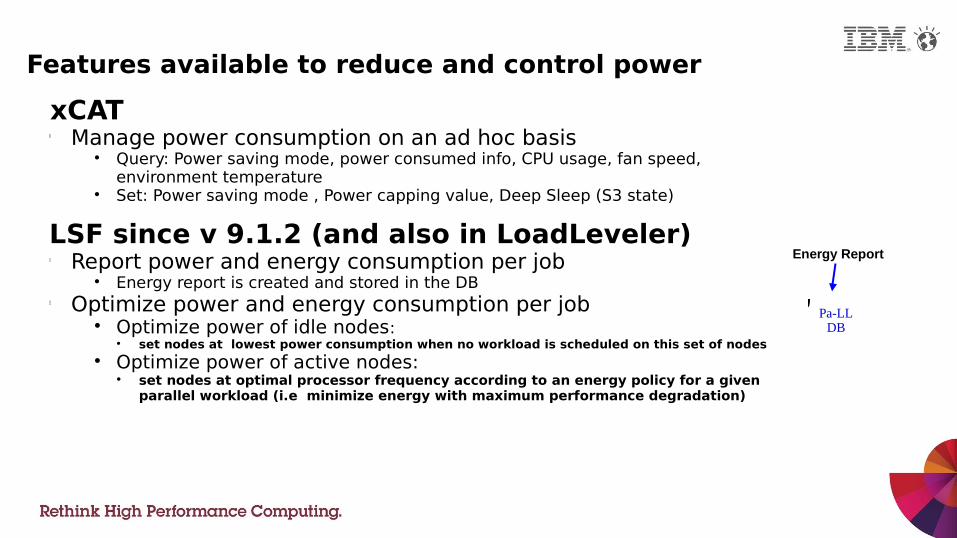
Features available to reduce and control power
xCATl Manage power consumption on an ad hoc basis
Query: Power saving mode, power consumed info, CPU usage, fan speed, environment temperature
Set: Power saving mode , Power capping value, Deep Sleep (S3 state)
LSF since v 9.1.2 (and also in LoadLeveler)l Report power and energy consumption per job
Energy report is created and stored in the DBl Optimize power and energy consumption per job
Optimize power of idle nodes: set nodes at lowest power consumption when no workload is scheduled on this set of nodes
Optimize power of active nodes: set nodes at optimal processor frequency according to an energy policy for a given
parallel workload (i.e minimize energy with maximum performance degradation)
Energy Report
Pa-LLDB
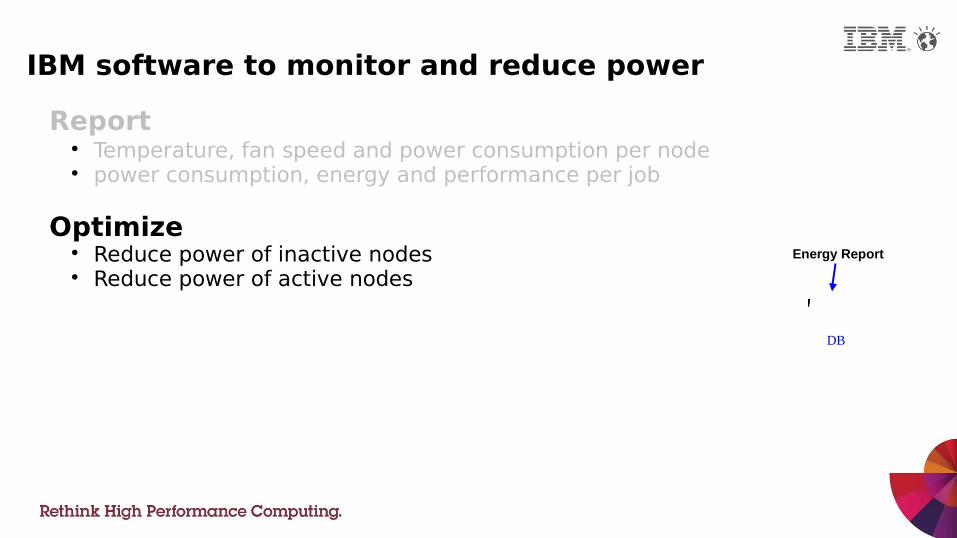
IBM software to monitor and reduce power
Report Temperature, fan speed and power consumption per node power consumption, energy and performance per job
Optimize Reduce power of inactive nodes Reduce power of active nodes
Energy Report
DB
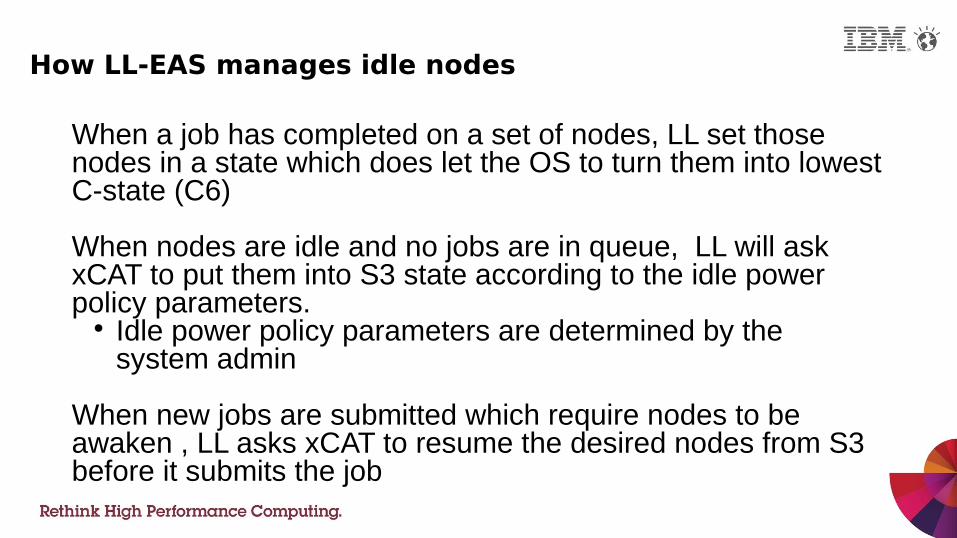
When a job has completed on a set of nodes, LL set those nodes in a state which does let the OS to turn them into lowest C-state (C6)
When nodes are idle and no jobs are in queue, LL will ask xCAT to put them into S3 state according to the idle power policy parameters.
Idle power policy parameters are determined by the system admin
When new jobs are submitted which require nodes to be awaken , LL asks xCAT to resume the desired nodes from S3 before it submits the job
How LL-EAS manages idle nodes
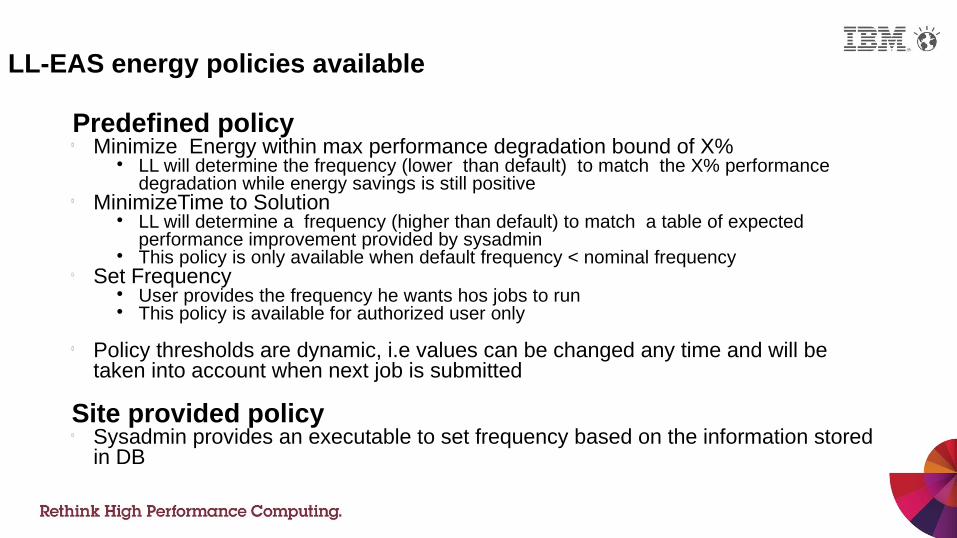
Predefined policyl Minimize Energy within max performance degradation bound of X%
LL will determine the frequency (lower than default) to match the X% performance degradation while energy savings is still positive
l MinimizeTime to Solution LL will determine a frequency (higher than default) to match a table of expected
performance improvement provided by sysadmin This policy is only available when default frequency < nominal frequency
l Set Frequency User provides the frequency he wants hos jobs to run This policy is available for authorized user only
l Policy thresholds are dynamic, i.e values can be changed any time and will be taken into account when next job is submitted
Site provided policy l Sysadmin provides an executable to set frequency based on the information stored
in DB
LL-EAS energy policies available
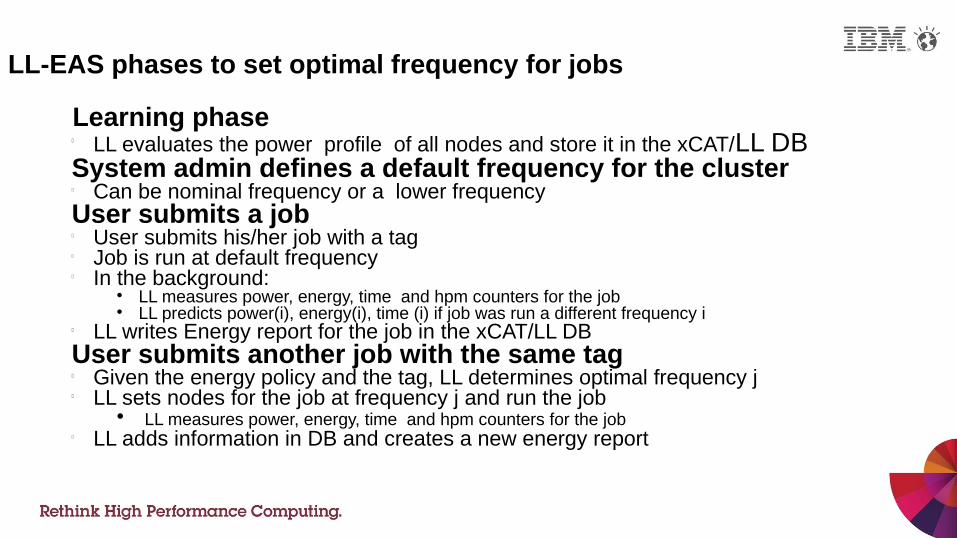
Learning phase l LL evaluates the power profile of all nodes and store it in the xCAT/LL DBSystem admin defines a default frequency for the clusterl Can be nominal frequency or a lower frequencyUser submits a job l User submits his/her job with a tagl Job is run at default frequency l In the background:
LL measures power, energy, time and hpm counters for the job LL predicts power(i), energy(i), time (i) if job was run a different frequency i
l LL writes Energy report for the job in the xCAT/LL DBUser submits another job with the same tagl Given the energy policy and the tag, LL determines optimal frequency jl LL sets nodes for the job at frequency j and run the job
LL measures power, energy, time and hpm counters for the jobl LL adds information in DB and creates a new energy report
LL-EAS phases to set optimal frequency for jobs

What happens when you just change the frequency ?
∆f=-26%∆Power=-17%∆Time=+5%∆Energy=-12%
∆f=-26%∆Power=-26%∆Time=+26%∆Energy=~0%
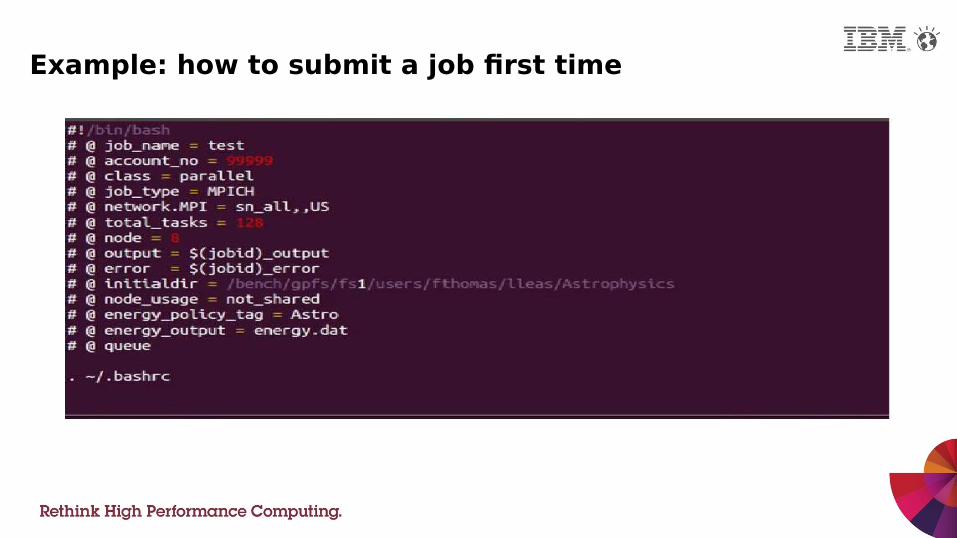
Example: how to submit a job first time
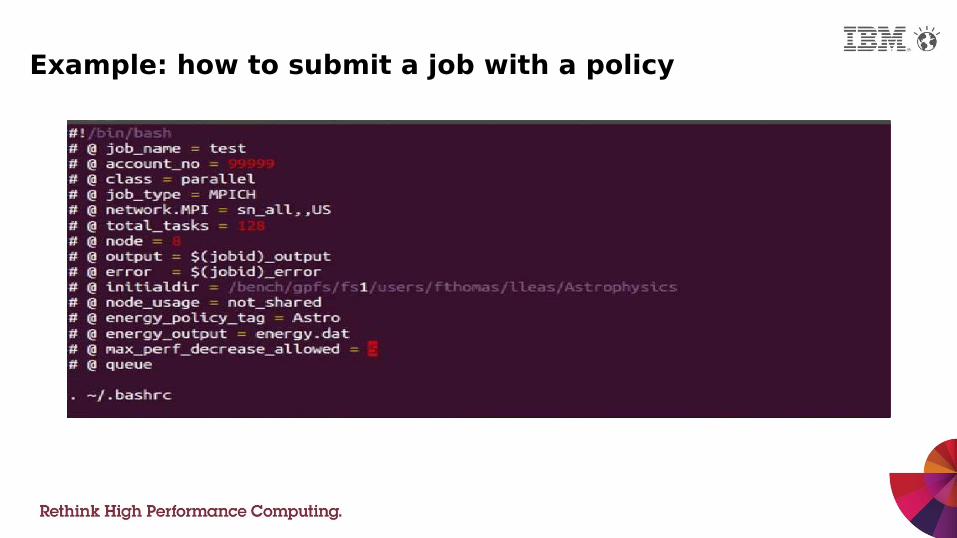
Example: how to submit a job with a policy
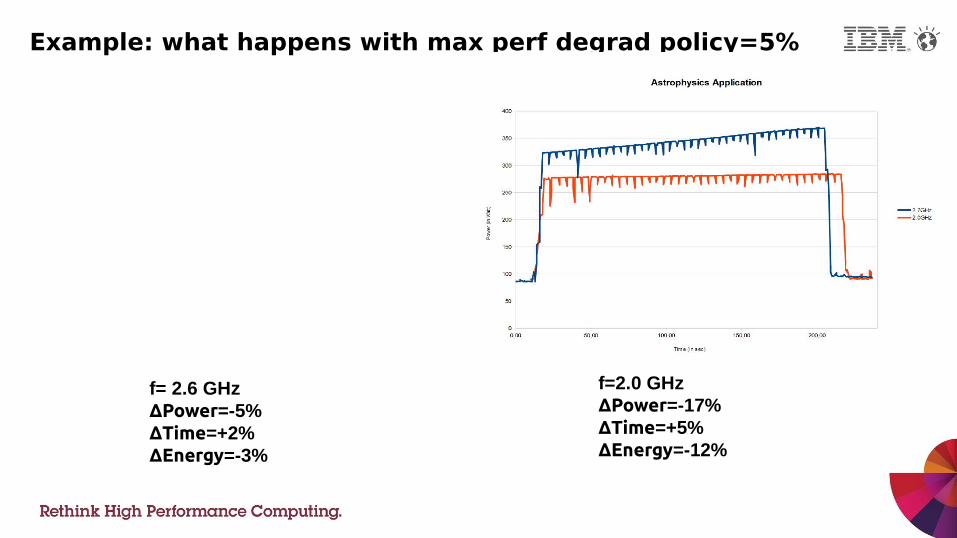
Example: what happens with max perf degrad policy=5%
f= 2.6 GHz∆Power=-5%∆Time=+2%∆Energy=-3%
f=2.0 GHz∆Power=-17%∆Time=+5%∆Energy=-12%
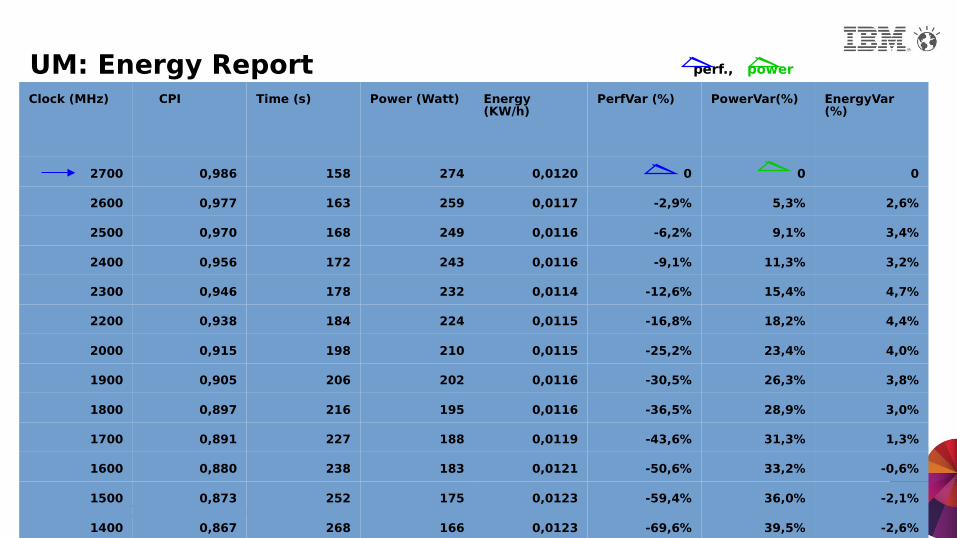
UM: Energy Report perf., power
Clock (MHz) CPI Time (s) Power (Watt) Energy (KW/h)
PerfVar (%) PowerVar(%) EnergyVar (%)
2700 0,986 158 274 0,0120 0 0 0
2600 0,977 163 259 0,0117 -2,9% 5,3% 2,6%
2500 0,970 168 249 0,0116 -6,2% 9,1% 3,4%
2400 0,956 172 243 0,0116 -9,1% 11,3% 3,2%
2300 0,946 178 232 0,0114 -12,6% 15,4% 4,7%
2200 0,938 184 224 0,0115 -16,8% 18,2% 4,4%
2000 0,915 198 210 0,0115 -25,2% 23,4% 4,0%
1900 0,905 206 202 0,0116 -30,5% 26,3% 3,8%
1800 0,897 216 195 0,0116 -36,5% 28,9% 3,0%
1700 0,891 227 188 0,0119 -43,6% 31,3% 1,3%
1600 0,880 238 183 0,0121 -50,6% 33,2% -0,6%
1500 0,873 252 175 0,0123 -59,4% 36,0% -2,1%
1400 0,867 268 166 0,0123 -69,6% 39,5% -2,6%
1300 0,861 287 158 0,0126 -81,4% 42,4% -4,5%
1200 0,854 308 149 0,0127 -94,9% 45,6% -6,0%
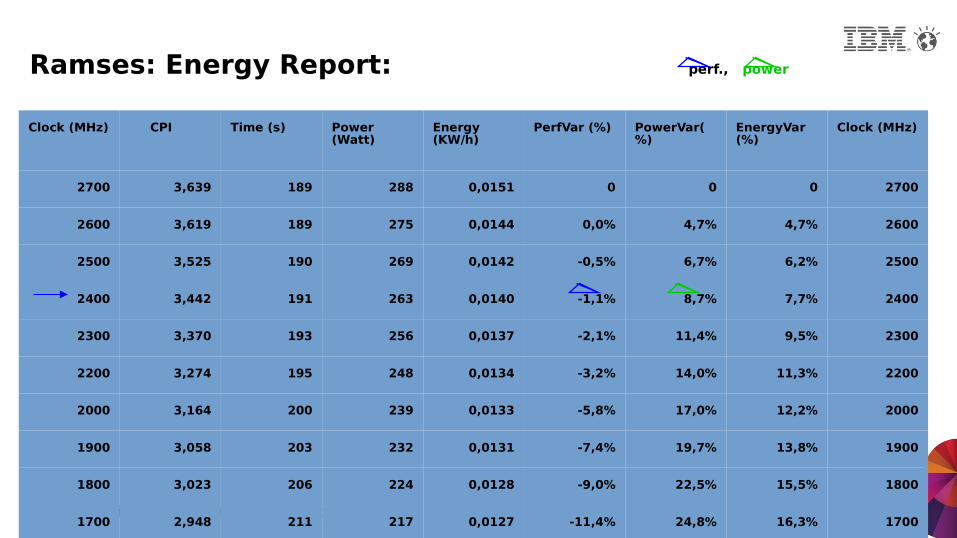
Ramses: Energy Report: perf., power
Clock (MHz) CPI Time (s) Power (Watt)
Energy (KW/h)
PerfVar (%) PowerVar(%)
EnergyVar (%)
Clock (MHz)
2700 3,639 189 288 0,0151 0 0 0 2700
2600 3,619 189 275 0,0144 0,0% 4,7% 4,7% 2600
2500 3,525 190 269 0,0142 -0,5% 6,7% 6,2% 2500
2400 3,442 191 263 0,0140 -1,1% 8,7% 7,7% 2400
2300 3,370 193 256 0,0137 -2,1% 11,4% 9,5% 2300
2200 3,274 195 248 0,0134 -3,2% 14,0% 11,3% 2200
2000 3,164 200 239 0,0133 -5,8% 17,0% 12,2% 2000
1900 3,058 203 232 0,0131 -7,4% 19,7% 13,8% 1900
1800 3,023 206 224 0,0128 -9,0% 22,5% 15,5% 1800
1700 2,948 211 217 0,0127 -11,4% 24,8% 16,3% 1700
1600 2,815 215 210 0,0125 -13,8% 27,2% 17,2% 1600
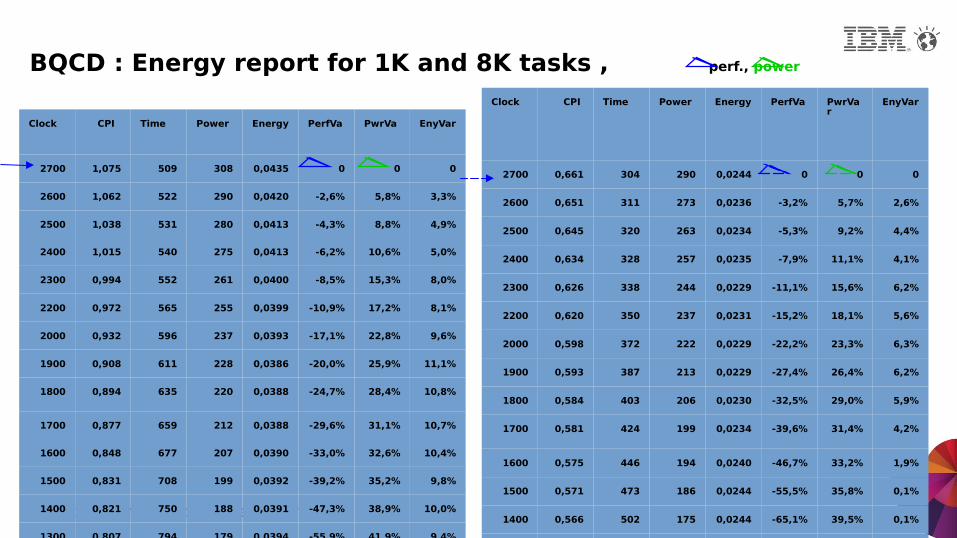
BQCD : Energy report for 1K and 8K tasks , perf., power
Clock CPI Time Power Energy PerfVa PwrVa EnyVar
2700 1,075 509 308 0,0435 0 0 0
2600 1,062 522 290 0,0420 -2,6% 5,8% 3,3%
2500 1,038 531 280 0,0413 -4,3% 8,8% 4,9%
2400 1,015 540 275 0,0413 -6,2% 10,6% 5,0%
2300 0,994 552 261 0,0400 -8,5% 15,3% 8,0%
2200 0,972 565 255 0,0399 -10,9% 17,2% 8,1%
2000 0,932 596 237 0,0393 -17,1% 22,8% 9,6%
1900 0,908 611 228 0,0386 -20,0% 25,9% 11,1%
1800 0,894 635 220 0,0388 -24,7% 28,4% 10,8%
1700 0,877 659 212 0,0388 -29,6% 31,1% 10,7%
1600 0,848 677 207 0,0390 -33,0% 32,6% 10,4%
1500 0,831 708 199 0,0392 -39,2% 35,2% 9,8%
1400 0,821 750 188 0,0391 -47,3% 38,9% 10,0%
1300 0,807 794 179 0,0394 -55,9% 41,9% 9,4%
1200 0,797 849 170 0,0400 -66,7% 44,8% 7,9%
Clock CPI Time Power Energy PerfVa PwrVar
EnyVar
2700 0,661 304 290 0,0244 0 0 0
2600 0,651 311 273 0,0236 -3,2% 5,7% 2,6%
2500 0,645 320 263 0,0234 -5,3% 9,2% 4,4%
2400 0,634 328 257 0,0235 -7,9% 11,1% 4,1%
2300 0,626 338 244 0,0229 -11,1% 15,6% 6,2%
2200 0,620 350 237 0,0231 -15,2% 18,1% 5,6%
2000 0,598 372 222 0,0229 -22,2% 23,3% 6,3%
1900 0,593 387 213 0,0229 -27,4% 26,4% 6,2%
1800 0,584 403 206 0,0230 -32,5% 29,0% 5,9%
1700 0,581 424 199 0,0234 -39,6% 31,4% 4,2%
1600 0,575 446 194 0,0240 -46,7% 33,2% 1,9%
1500 0,571 473 186 0,0244 -55,5% 35,8% 0,1%
1400 0,566 502 175 0,0244 -65,1% 39,5% 0,1%
1300 0,563 538 167 0,0249 -76,9% 42,3% -2,0%
1200 0,556 575 158 0,0252 -89,2% 45,4% -3,2%
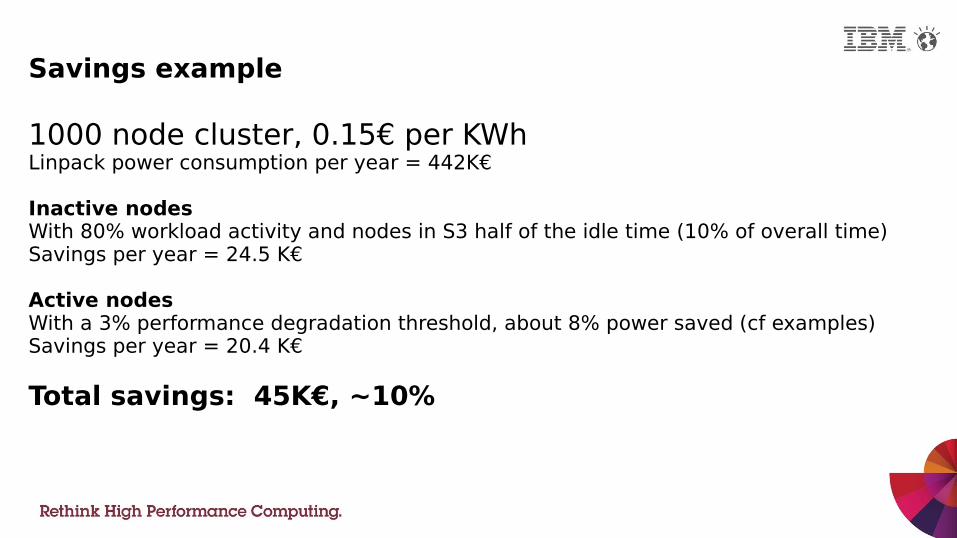
Savings example
1000 node cluster, 0.15€ per KWhLinpack power consumption per year = 442K€
Inactive nodes With 80% workload activity and nodes in S3 half of the idle time (10% of overall time)Savings per year = 24.5 K€
Active nodesWith a 3% performance degradation threshold, about 8% power saved (cf examples)Savings per year = 20.4 K€
Total savings: 45K€, ~10%
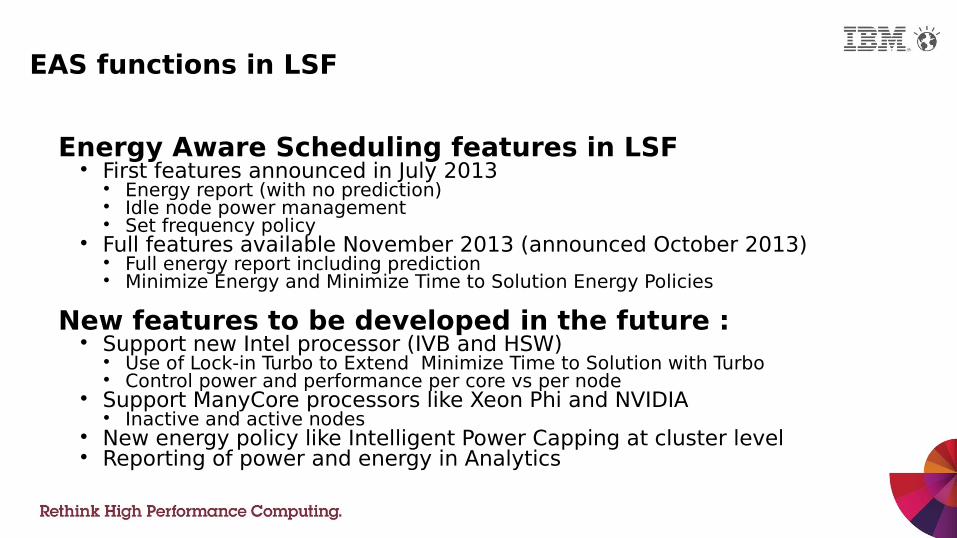
EAS functions in LSF
Energy Aware Scheduling features in LSF First features announced in July 2013
Energy report (with no prediction) Idle node power management Set frequency policy
Full features available November 2013 (announced October 2013) Full energy report including prediction Minimize Energy and Minimize Time to Solution Energy Policies
New features to be developed in the future : Support new Intel processor (IVB and HSW)
Use of Lock-in Turbo to Extend Minimize Time to Solution with Turbo Control power and performance per core vs per node
Support ManyCore processors like Xeon Phi and NVIDIA Inactive and active nodes
New energy policy like Intelligent Power Capping at cluster level Reporting of power and energy in Analytics
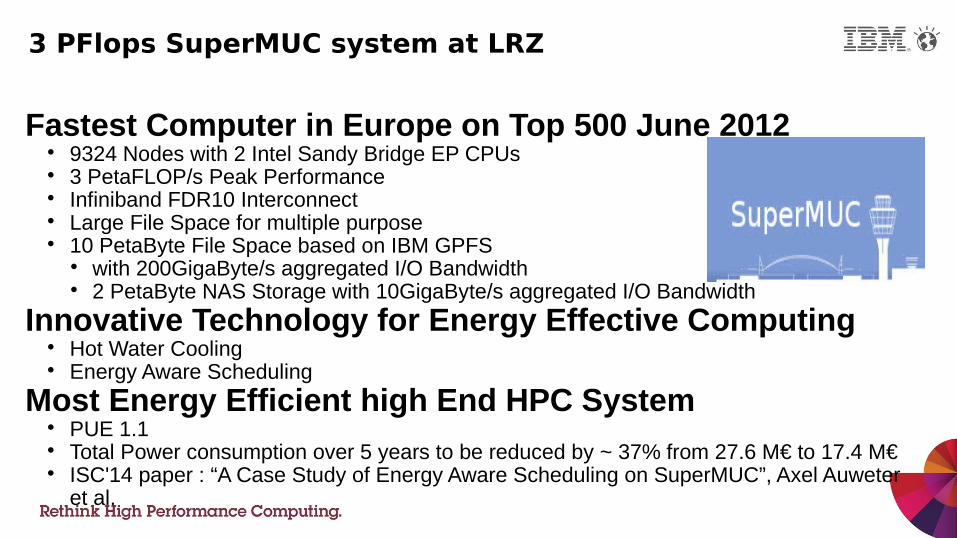
3 PFlops SuperMUC system at LRZ
Fastest Computer in Europe on Top 500 June 2012 9324 Nodes with 2 Intel Sandy Bridge EP CPUs 3 PetaFLOP/s Peak Performance Infiniband FDR10 Interconnect Large File Space for multiple purpose 10 PetaByte File Space based on IBM GPFS
with 200GigaByte/s aggregated I/O Bandwidth 2 PetaByte NAS Storage with 10GigaByte/s aggregated I/O Bandwidth
Innovative Technology for Energy Effective Computing Hot Water Cooling Energy Aware Scheduling
Most Energy Efficient high End HPC System PUE 1.1 Total Power consumption over 5 years to be reduced by ~ 37% from 27.6 M€ to 17.4 M€ ISC'14 paper : “A Case Study of Energy Aware Scheduling on SuperMUC”, Axel Auweter
et al.
explored several ways to save power explained EAS (Energy Aware Scheduling)
and the products that support it gave a methodology to help decide
between cooling options
Session summary
Thank you !
High Performance ComputingFor a Smarter Planet


![G od siques dans les surfaces browniennes - perso.ens …perso.ens-lyon.fr/gregory.miermont/Bettinelli.pdf · distance de graphe.] ... Toute surface brownienne a p.s. pour dimension](https://img.pdfslide.fr/doc/110x75/5b9d54e709d3f275078c2652/g-od-siques-dans-les-surfaces-browniennes-persoens-persoens-lyonfr-distance.jpg)