Embed Size (px)
DESCRIPTION
Qu’est-ce que l’IRM c érébrale A quoi sert-elle, Quelles sont ses limitations ?. Oury Monchi, Ph.D. Centre de Recherche, Institut Universitaire de Gériatrie de Montréal & Universit é de Montréal. Plan du cours. 12 conf érences de 3 heures 5 travaux pratiques de 3 heures devant ordinateurs - PowerPoint PPT Presentation
Citation preview
Qu’est-ce que l’IRM cQu’est-ce que l’IRM cérébraleérébraleA quoi sert-elle, Quelles sont ses limitationsA quoi sert-elle, Quelles sont ses limitations??
Oury Monchi, Ph.D.Oury Monchi, Ph.D.
Centre de Recherche, Institut Universitaire Centre de Recherche, Institut Universitaire de Gériatrie de Montréalde Gériatrie de Montréal & Universit & Université de é de
MontréalMontréal
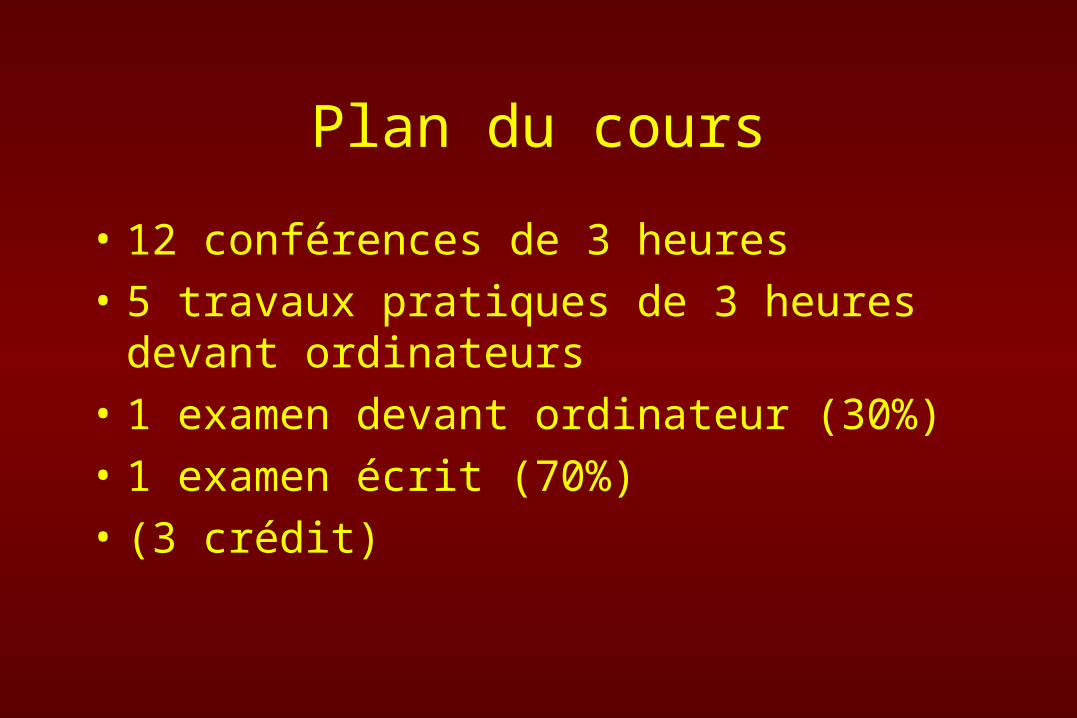
Plan du cours
• 12 conférences de 3 heures
• 5 travaux pratiques de 3 heures devant ordinateurs
• 1 examen devant ordinateur (30%)
• 1 examen écrit (70%)
• (3 crédit)
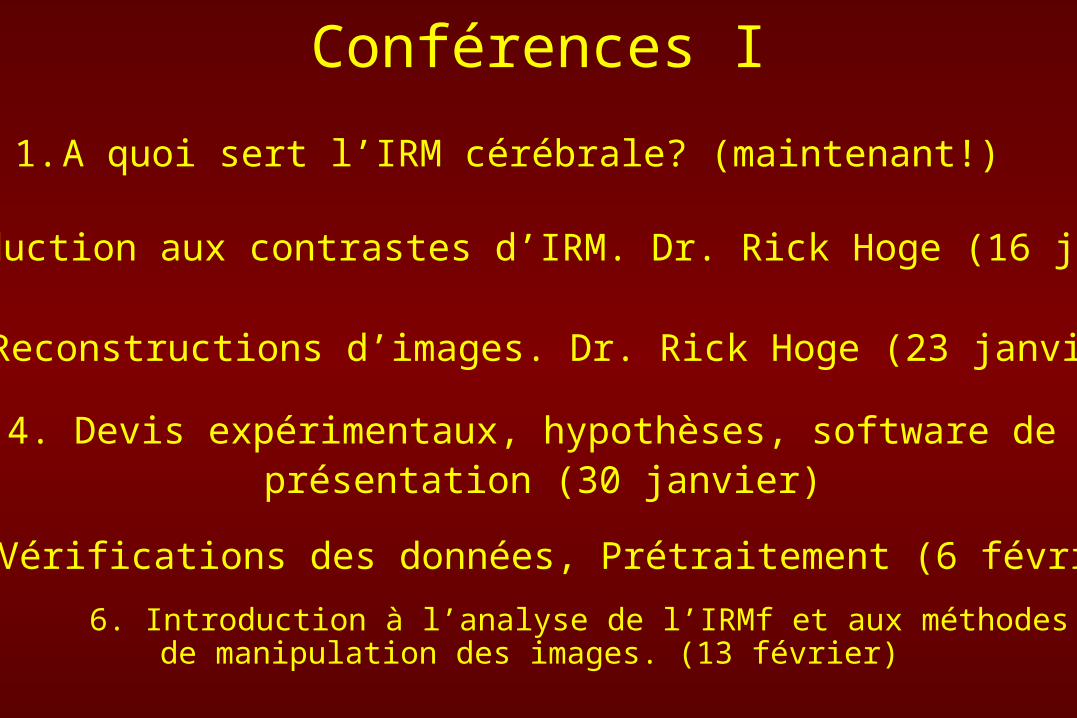
Conférences I
6. Introduction à l’analyse de l’IRMf et aux méthodes de manipulation des images. (13 février)
1. A quoi sert l’IRM cérébrale? (maintenant!)
2. Introduction aux contrastes d’IRM. Dr. Rick Hoge (16 janvier)
3. Reconstructions d’images. Dr. Rick Hoge (23 janvier)
4. Devis expérimentaux, hypothèses, software de présentation (30 janvier)
5. Vérifications des données, Prétraitement (6 février)
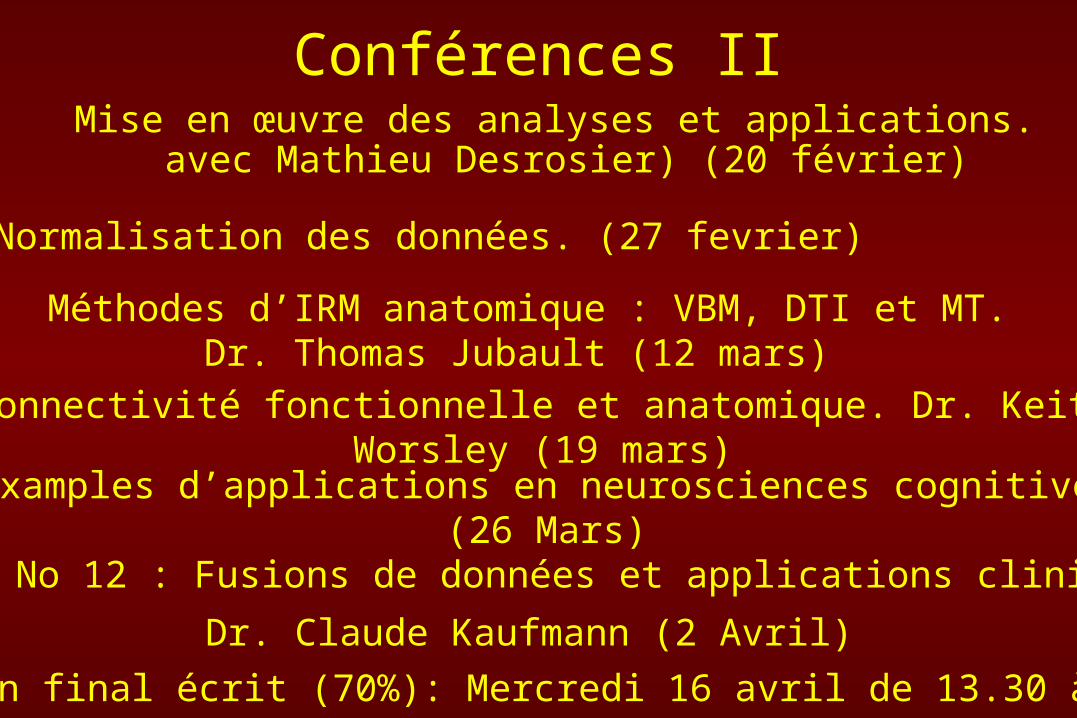
Conférences IIMise en œuvre des analyses et applications. avec Mathieu Desrosier)
(20 février)
Normalisation des données. (27 fevrier)
Méthodes d’IRM anatomique : VBM, DTI et MT. Dr. Thomas Jubault (12 mars)
Connectivité fonctionnelle et anatomique. Dr. Keith Worsley (19 mars)
Examples d’applications en neurosciences cognitives (26 Mars)
Session No 12 : Fusions de données et applications cliniques.
Dr. Claude Kaufmann (2 Avril)
Examen final écrit (70%): Mercredi 16 avril de 13.30 à 16.30
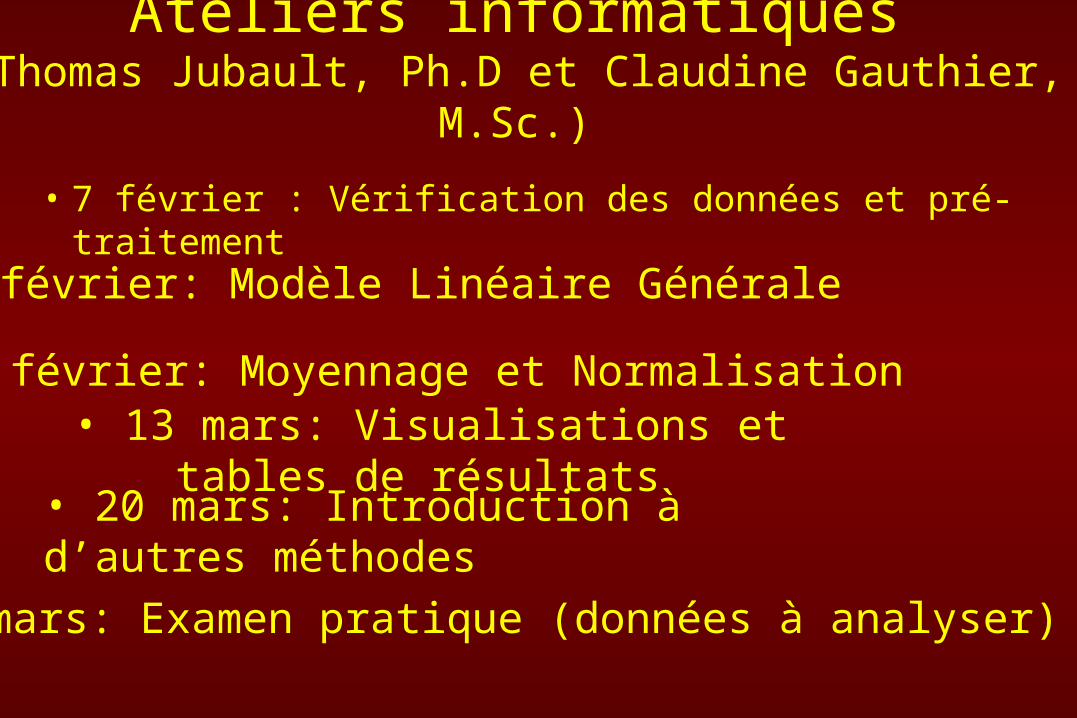
Ateliers informatiques(Thomas Jubault, Ph.D et Claudine Gauthier, M.Sc.)
• 7 février : Vérification des données et pré-traitement
• 14 février: Modèle Linéaire Générale
• 21 février: Moyennage et Normalisation
• 13 mars: Visualisations et tables de résultats
• 20 mars: Introduction à d’autres méthodes
• 27 mars: Examen pratique (données à analyser)
Techniques d’IRM
• I. Imagerie par Résonance Magnétique (IRM)I. Imagerie par Résonance Magnétique (IRM)
• A. Etudes anatomiques A. Etudes anatomiques
• B. Etudes FonctionnellesB. Etudes Fonctionnelles
• C. Etudes PhysiologiquesC. Etudes Physiologiques
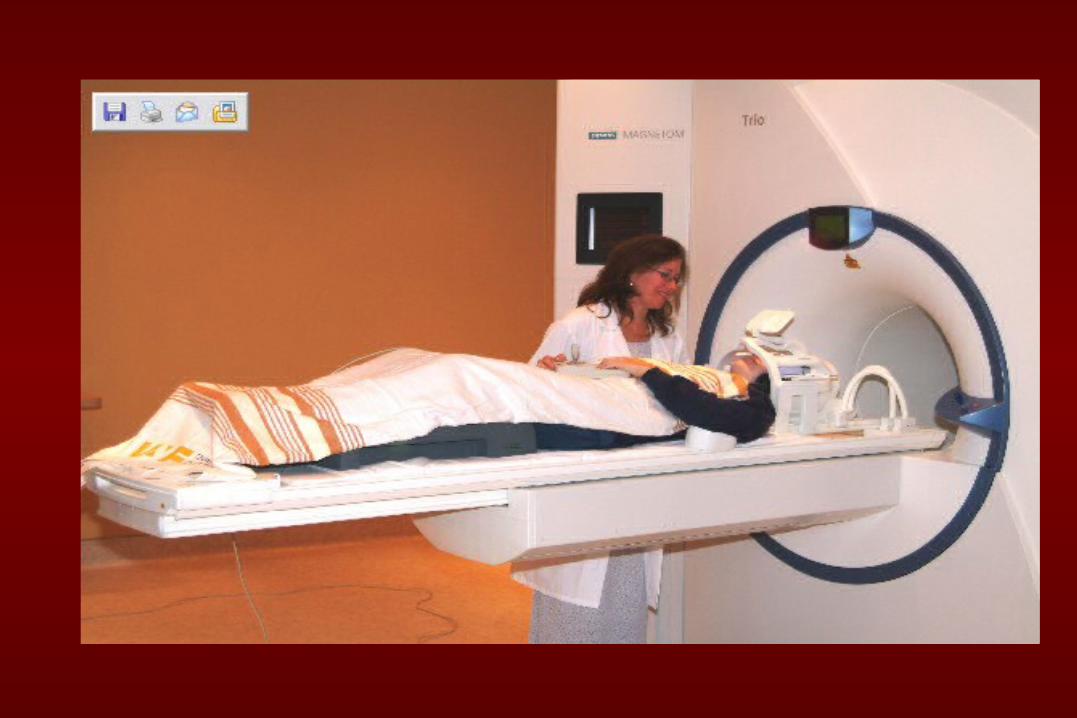
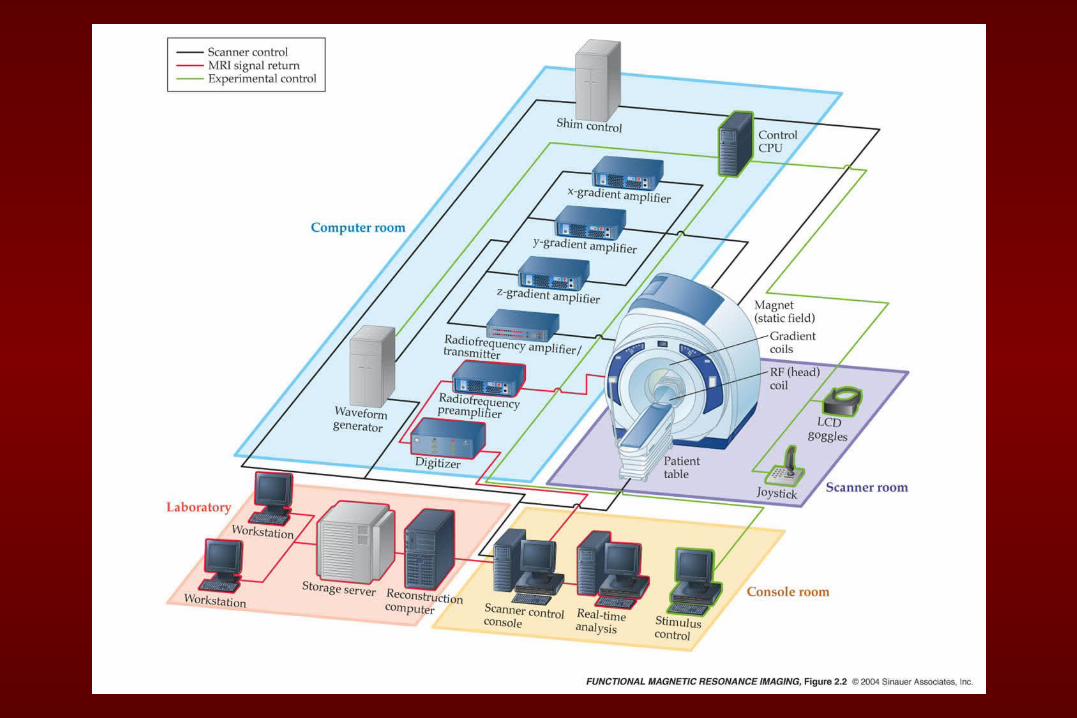
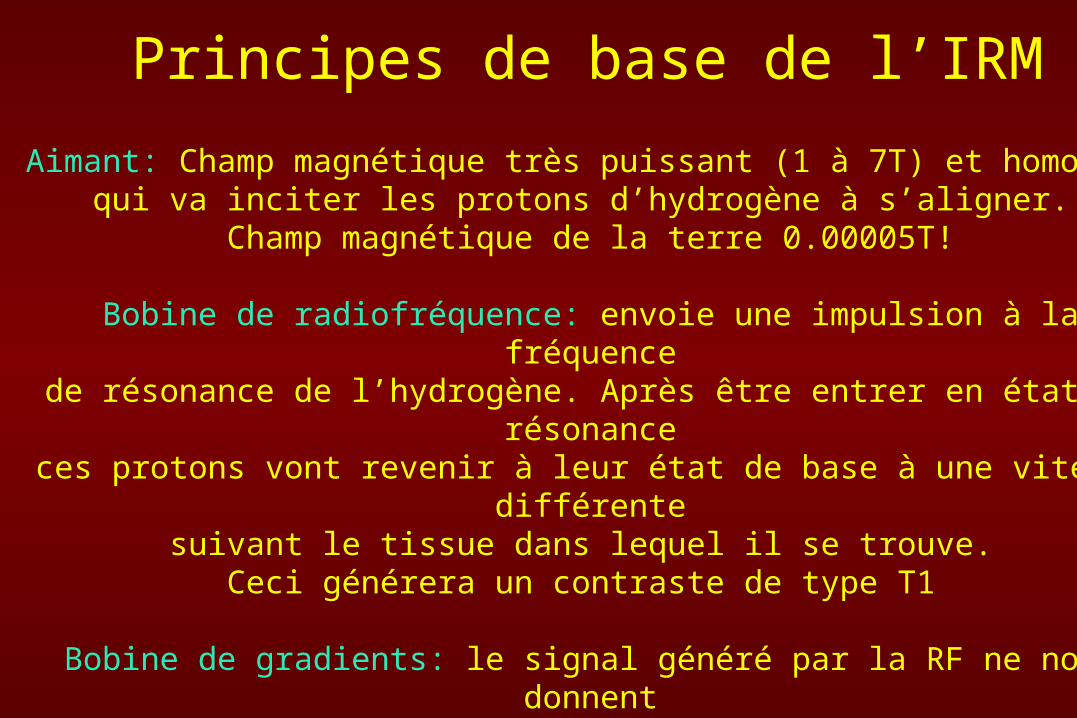
Principes de base de l’IRM
Aimant: Champ magnétique très puissant (1 à 7T) et homogènequi va inciter les protons d’hydrogène à s’aligner.
Champ magnétique de la terre 0.00005T!
Bobine de radiofréquence: envoie une impulsion à la fréquencede résonance de l’hydrogène. Après être entrer en état de résonanceces protons vont revenir à leur état de base à une vitesse différente
suivant le tissue dans lequel il se trouve. Ceci générera un contraste de type T1
Bobine de gradients: le signal généré par la RF ne nous donnentpas d’information spatiale en temps que tel, ce sont les bobines de
gradients alignées sur trois axes (x, y, z) qui nous permettent dele faire.
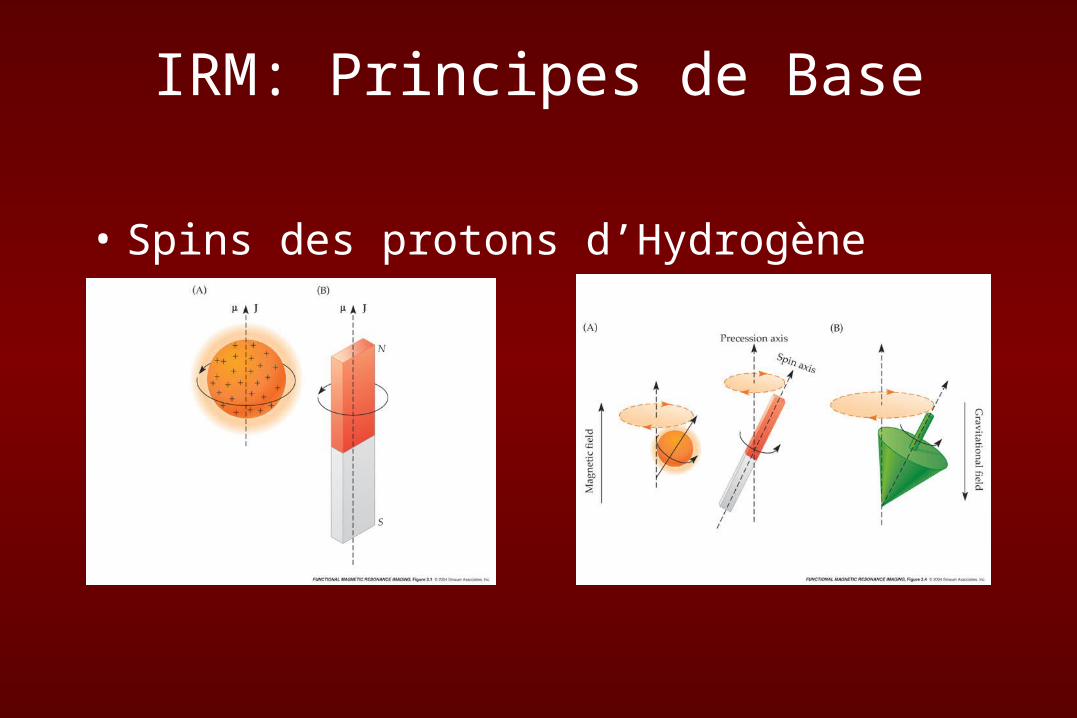
• Spins des protons d’Hydrogène
IRM: Principes de Base
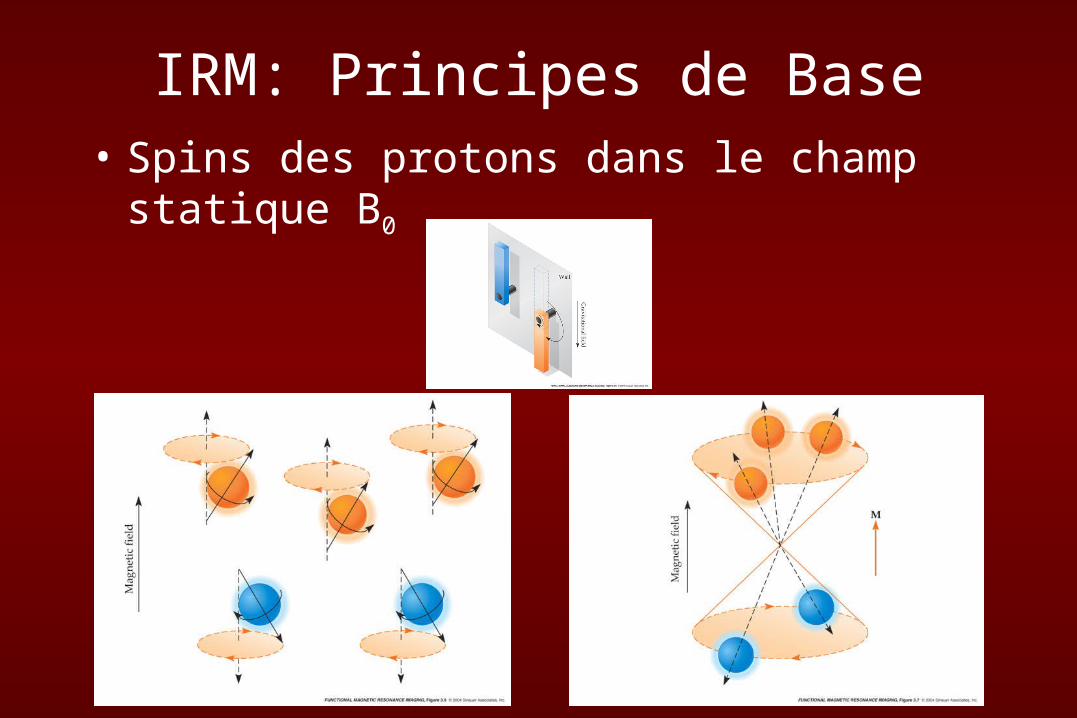
• Spins des protons dans le champ statique B0
IRM: Principes de Base
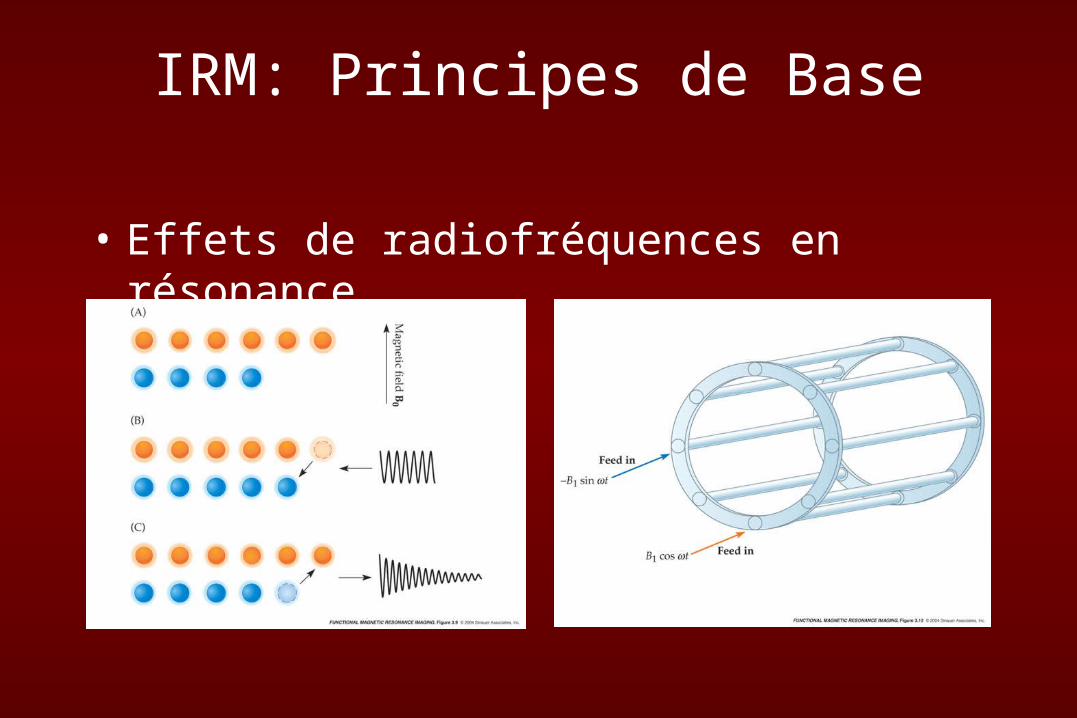
• Effets de radiofréquences en résonance
IRM: Principes de Base
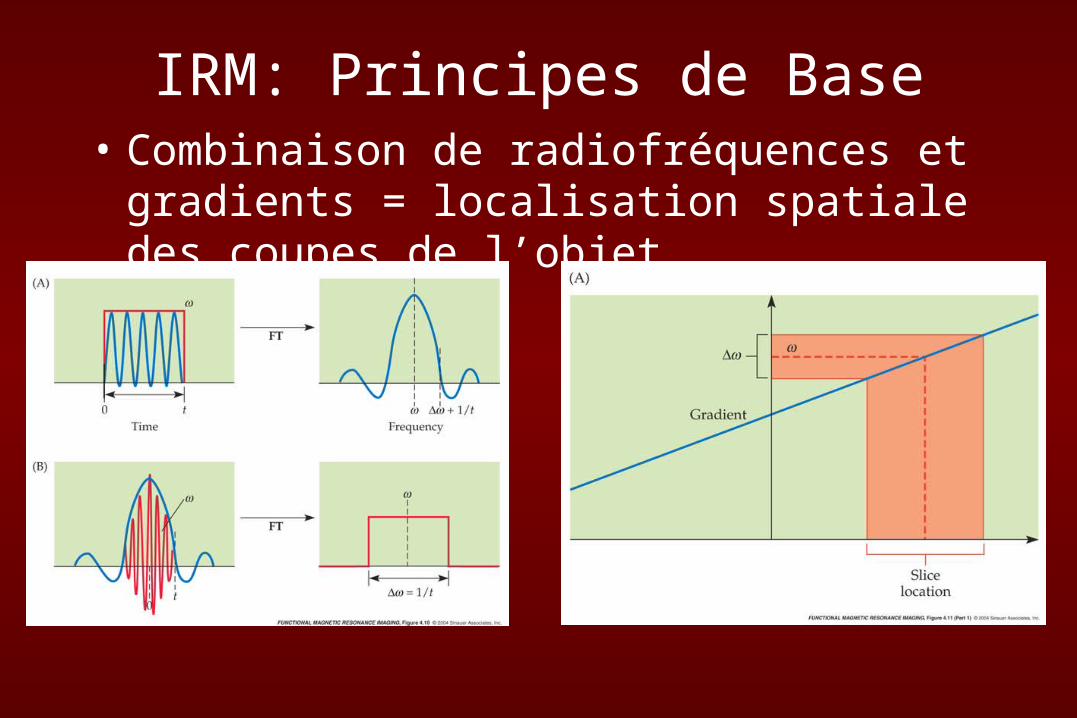
• Combinaison de radiofréquences et gradients = localisation spatiale des coupes de l’objet
IRM: Principes de Base
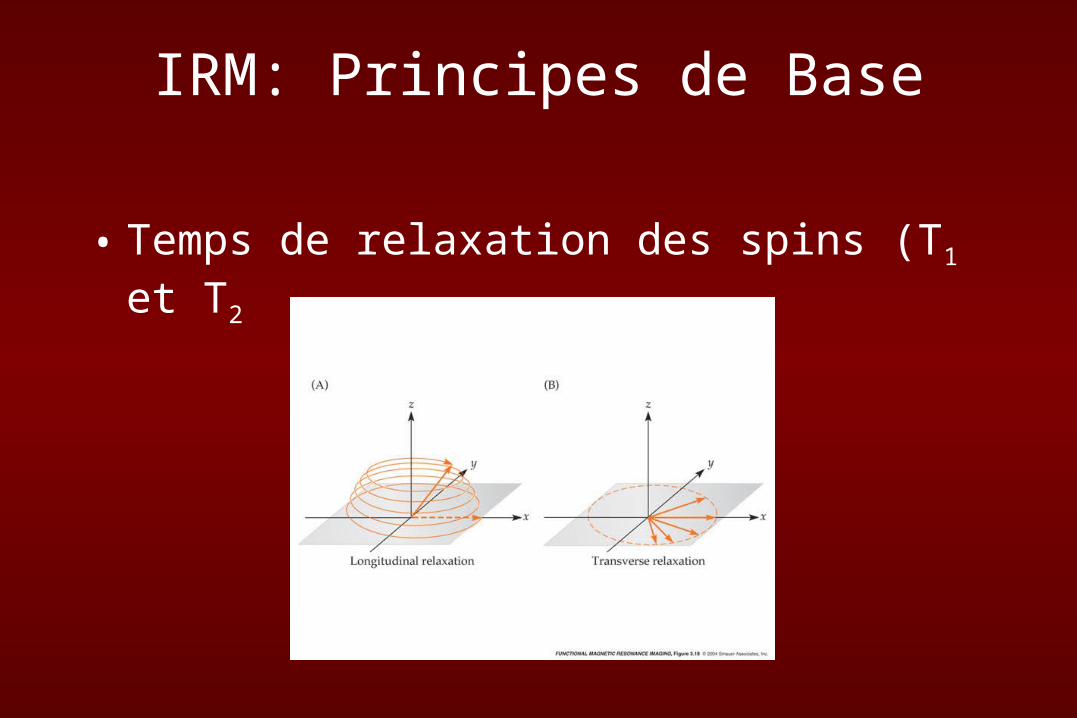
• Temps de relaxation des spins (T1 et T2
IRM: Principes de Base
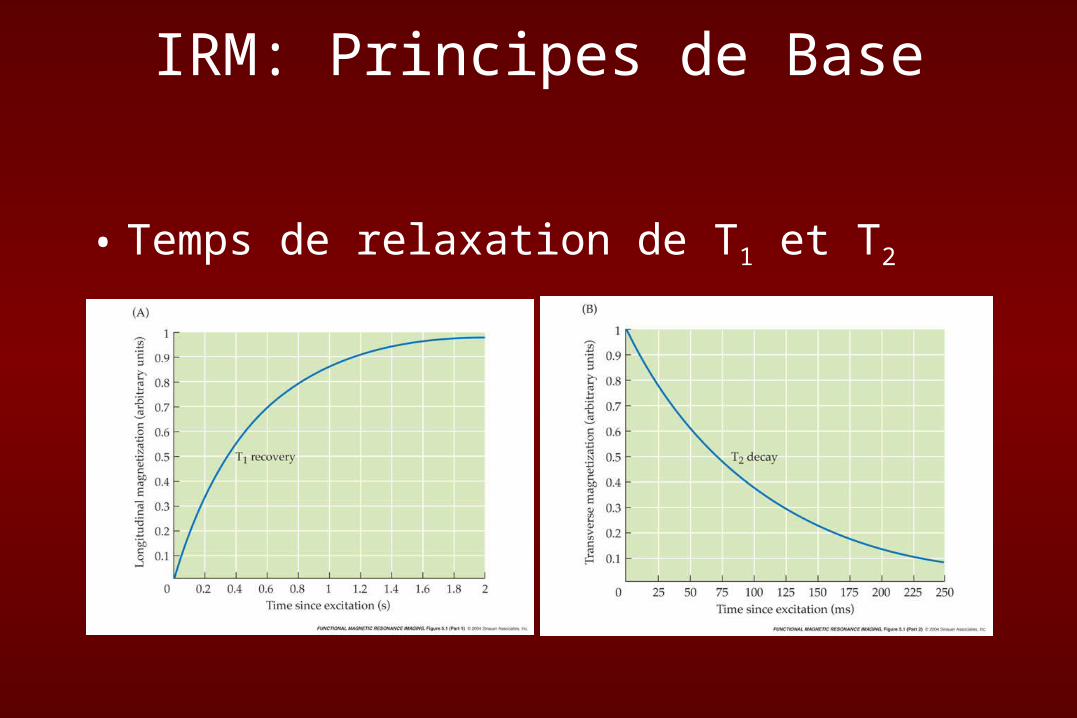
• Temps de relaxation de T1 et T2
IRM: Principes de Base
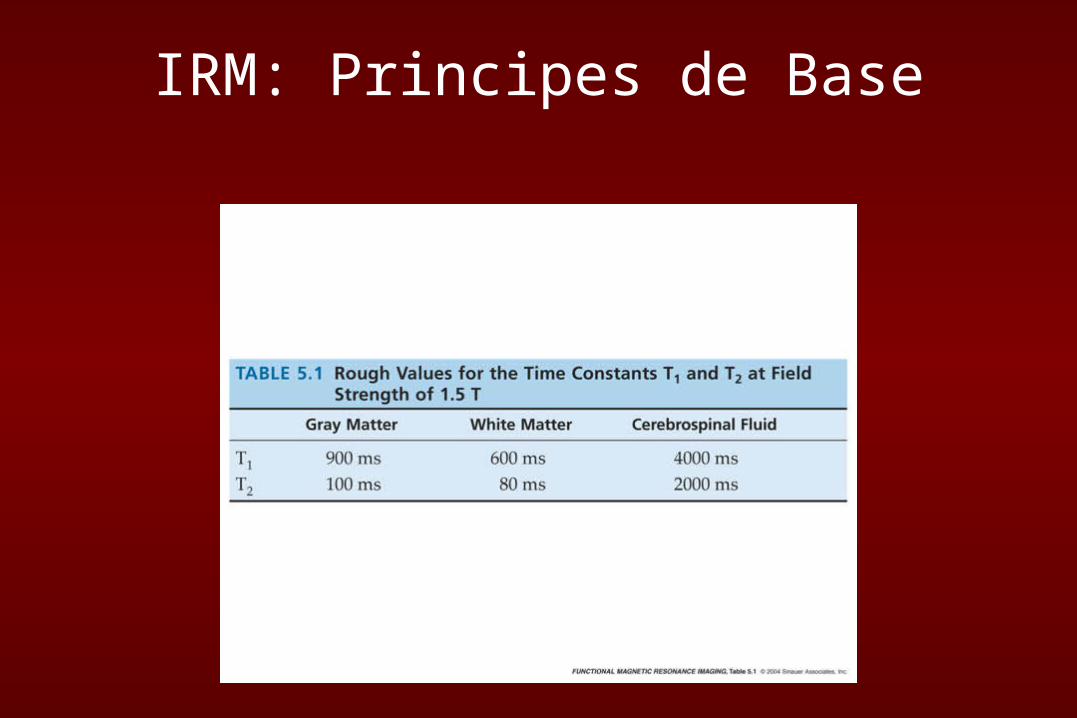
IRM: Principes de Base
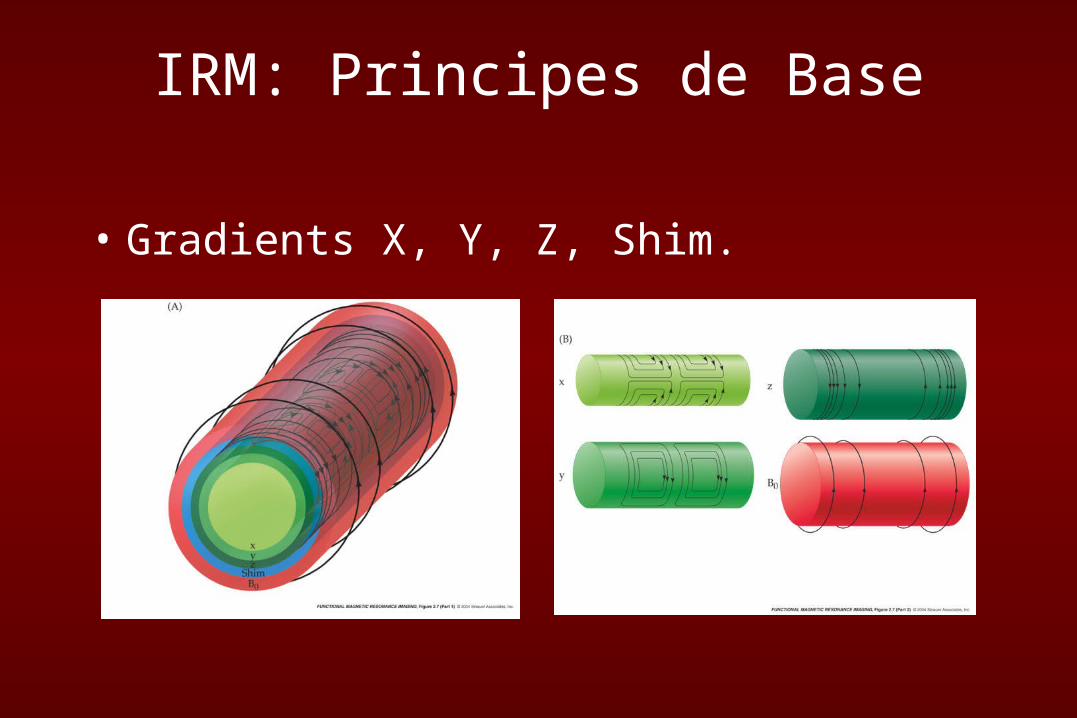
• Gradients X, Y, Z, Shim.
IRM: Principes de Base
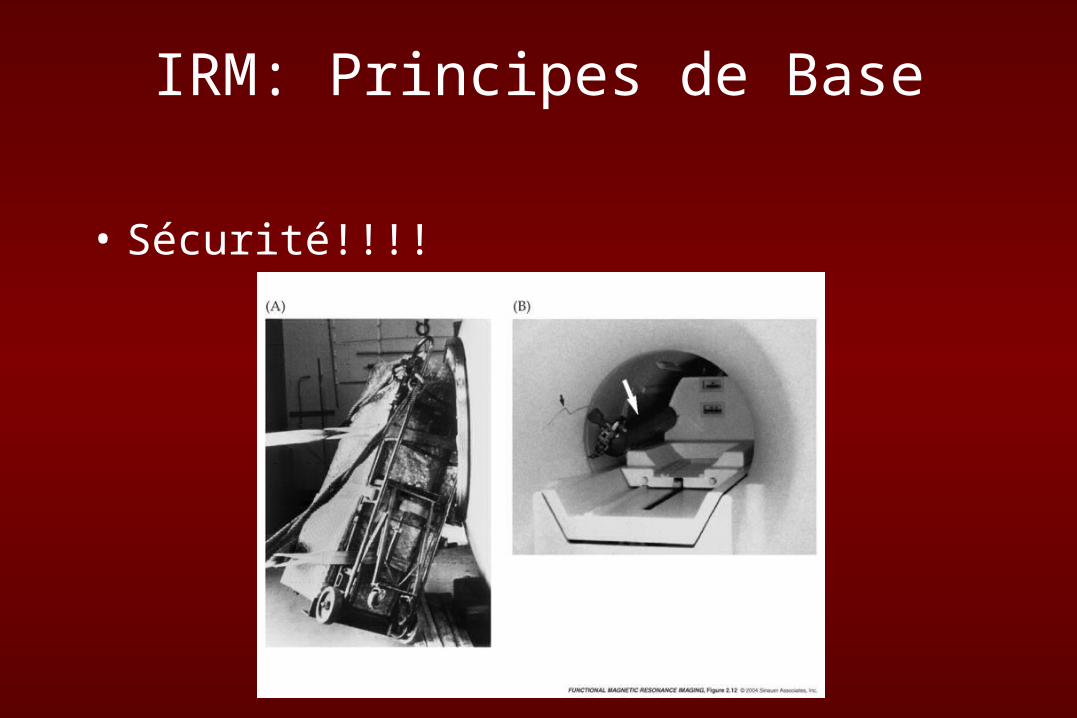
• Sécurité!!!!
IRM: Principes de Base
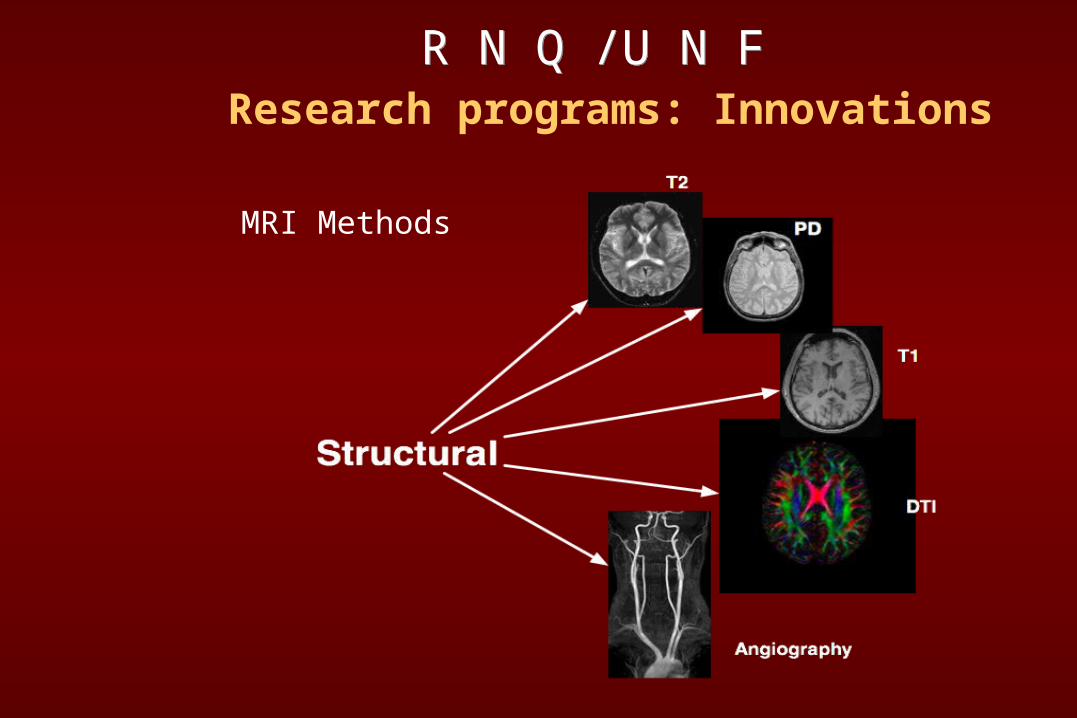
MRI Methods
R N Q /U N F R N Q /U N F Research programs: Innovations
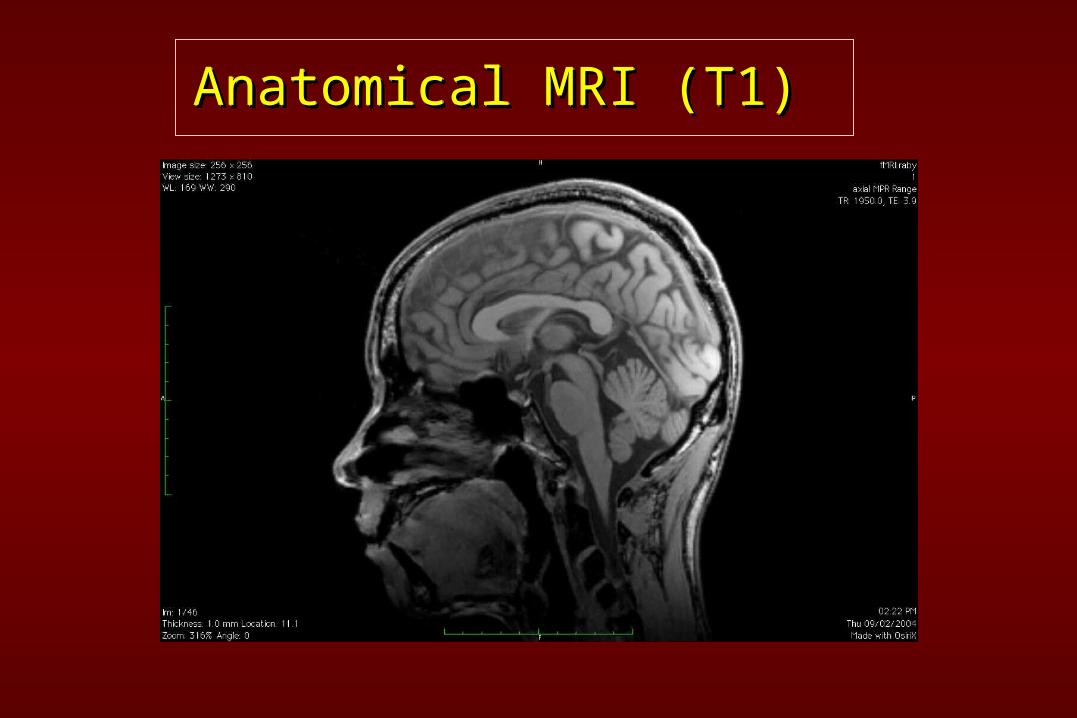
Anatomical MRI (T1)Anatomical MRI (T1)Anatomical MRI (T1)Anatomical MRI (T1)
Voxel Based Morphometry
Voxel based morphometry (VBM) is a neuroimaging analysis technique that allows investigation of focal
differences in brain volume.
Traditionally, brain volume is measured by drawing regions of interest (ROIs) and calculating the volume enclosed.
However, this is time consuming and can only provide measures of large areas. Smaller differences in volume may be
overlooked. VBM registers every brain to a template, which gets rid of most of the large differences in brain anatomy
among people. Then the brain images are smoothed so that each voxel represents the average of itself and its neighbors. Finally, volume is compared across brains at every voxel.
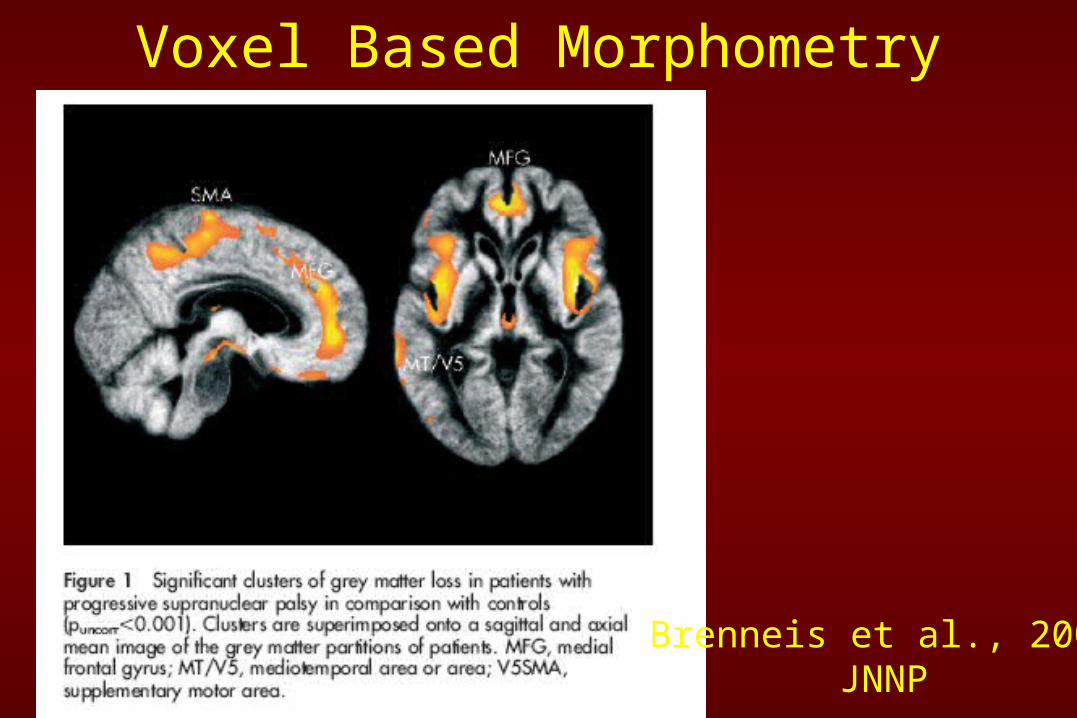
Voxel Based Morphometry
Brenneis et al., 2004JNNP
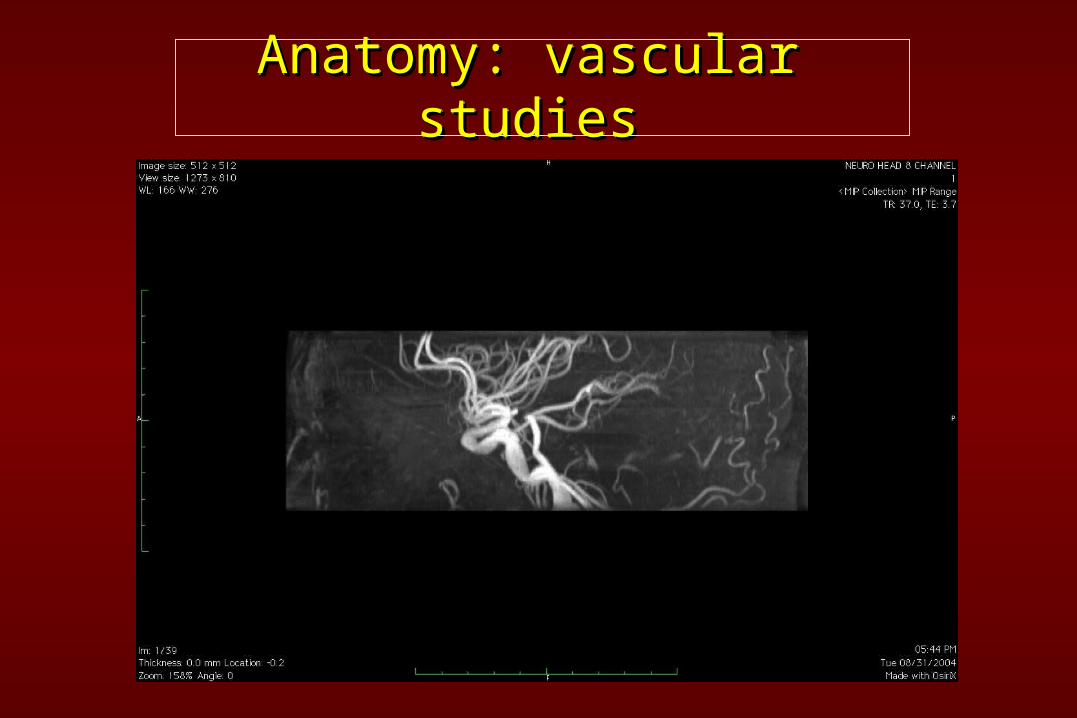
Anatomy: vascular studiesAnatomy: vascular studiesAnatomy: vascular studiesAnatomy: vascular studies
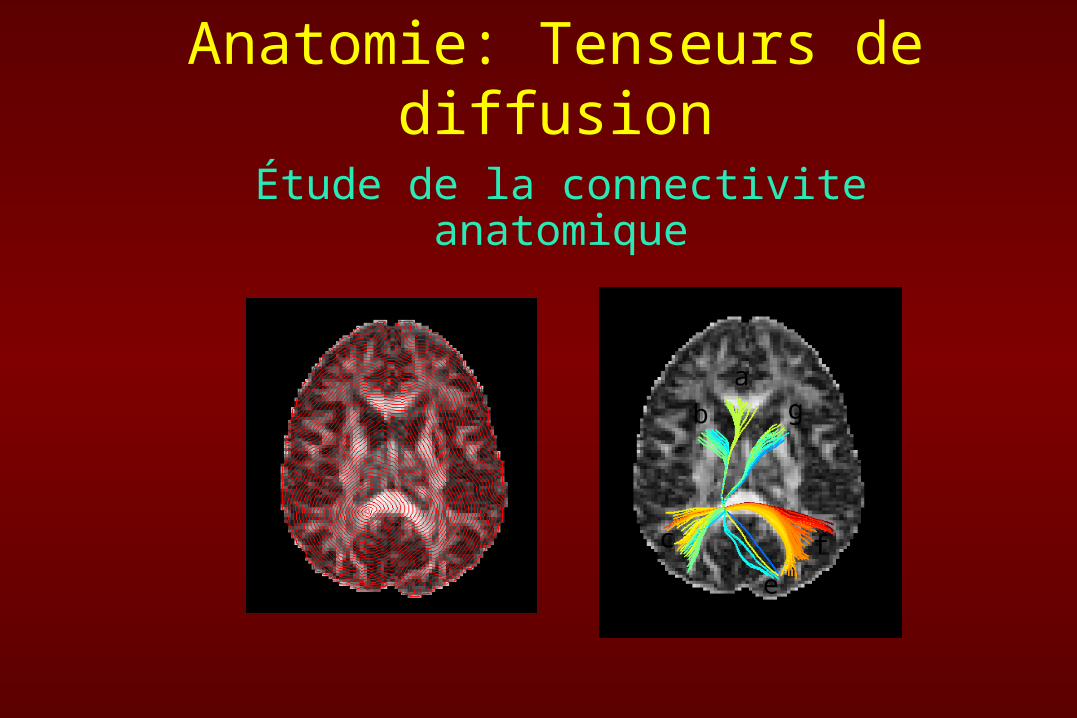
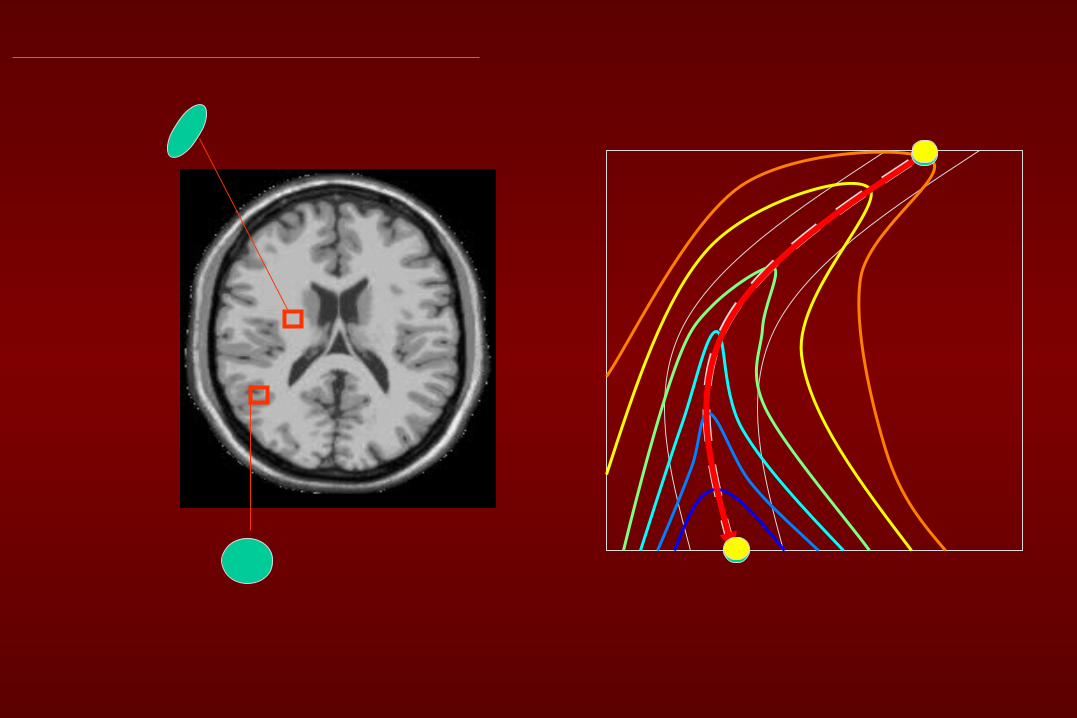
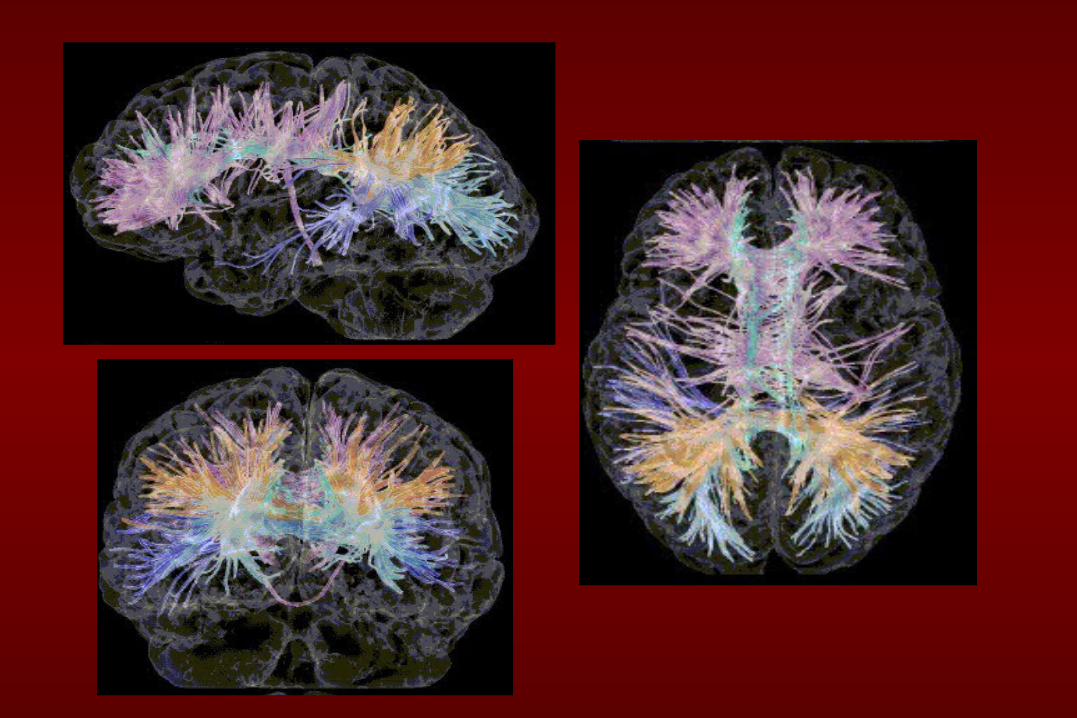
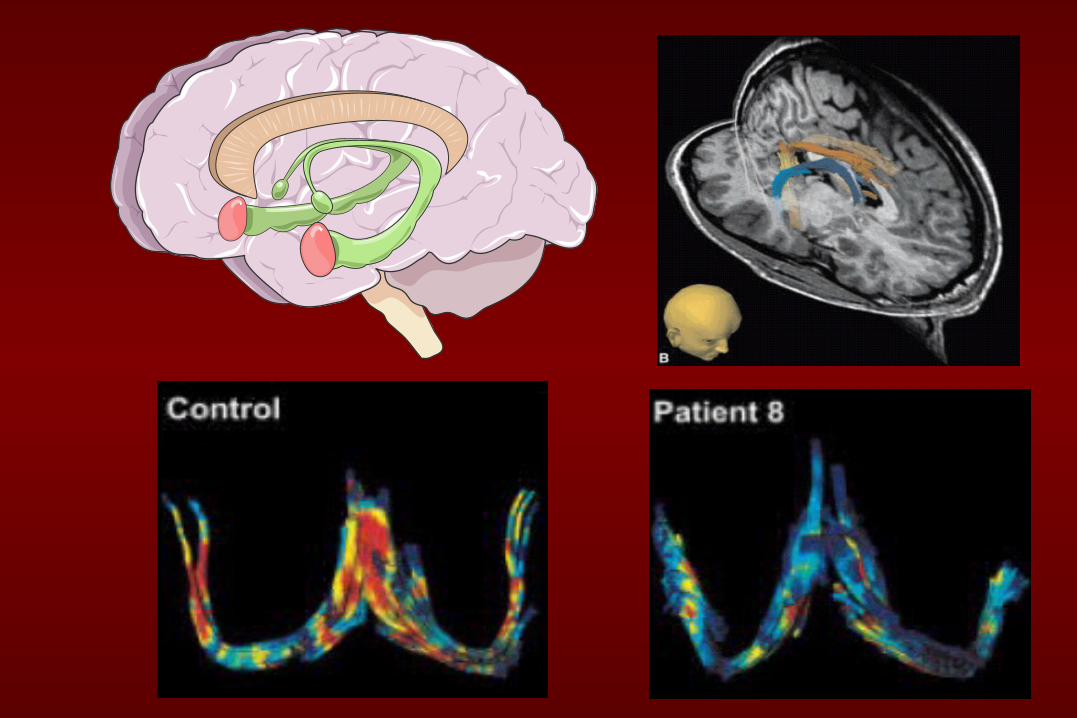
Anatomie: Tenseurs de diffusion
Étude de la connectivite anatomique
a
b
c f
e
g
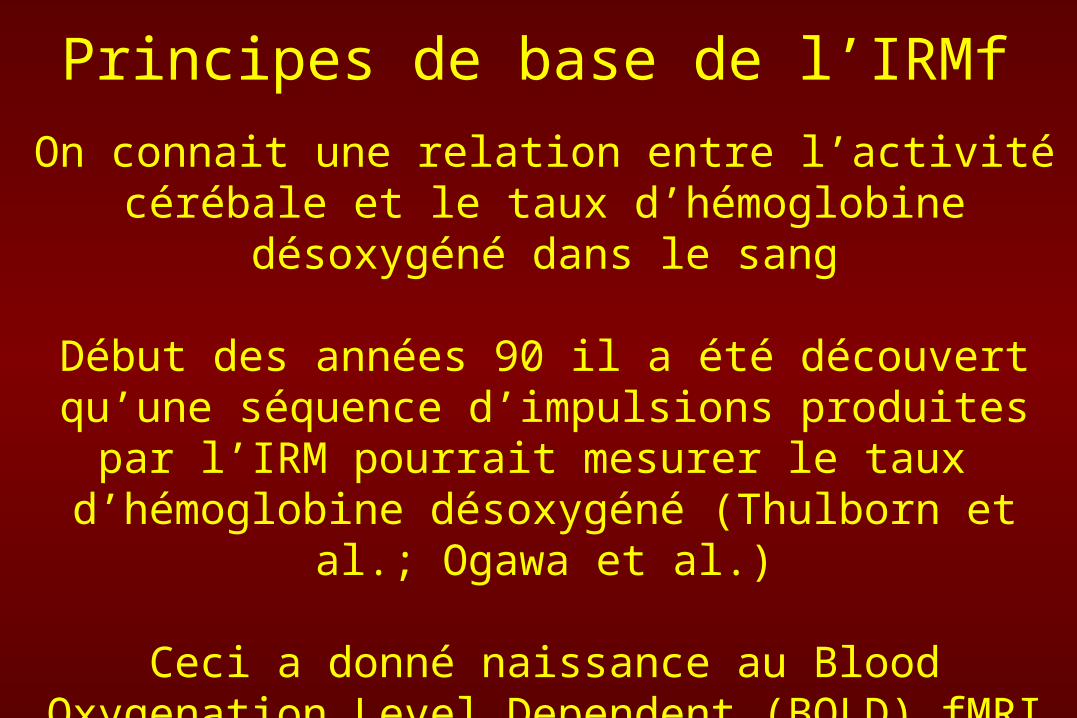
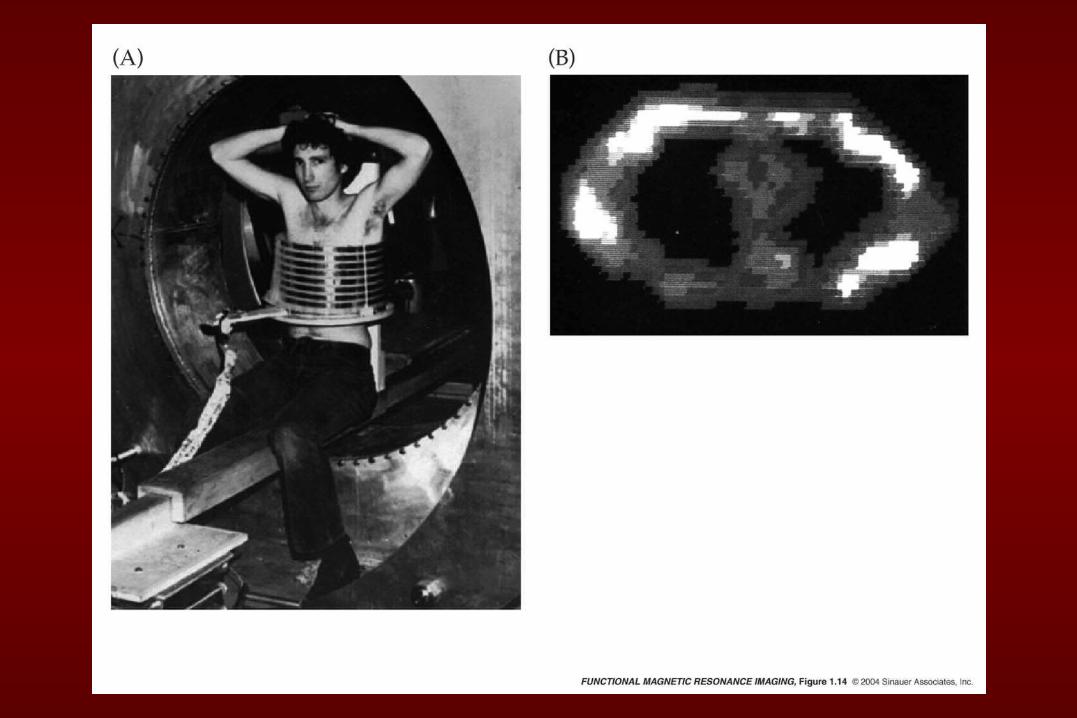
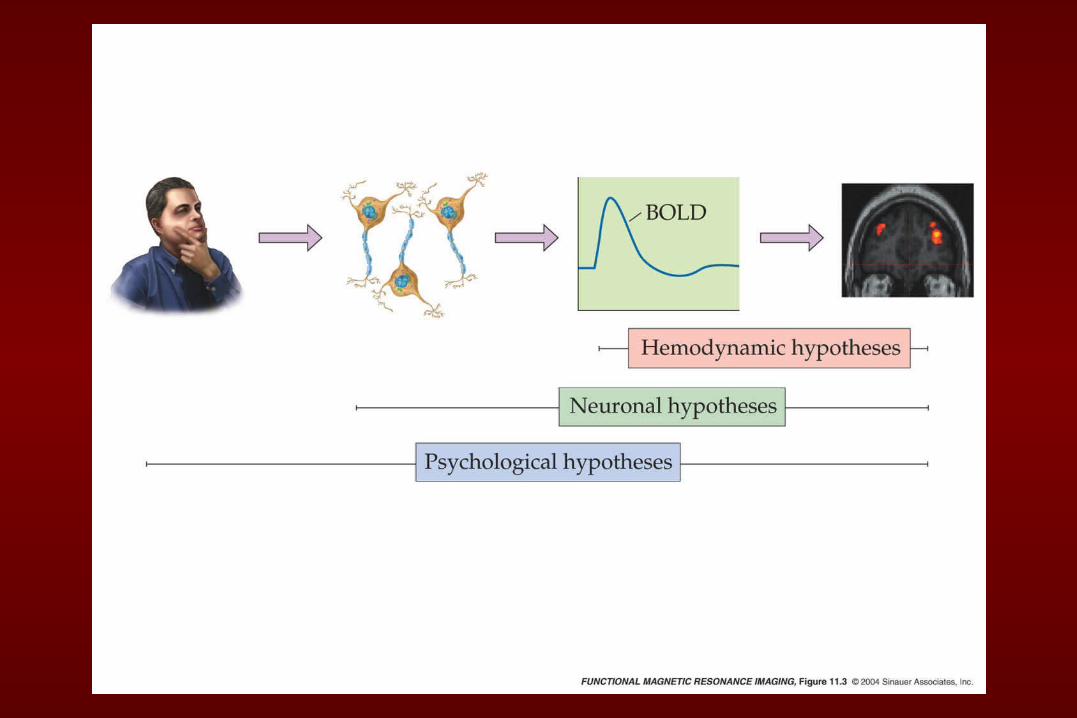
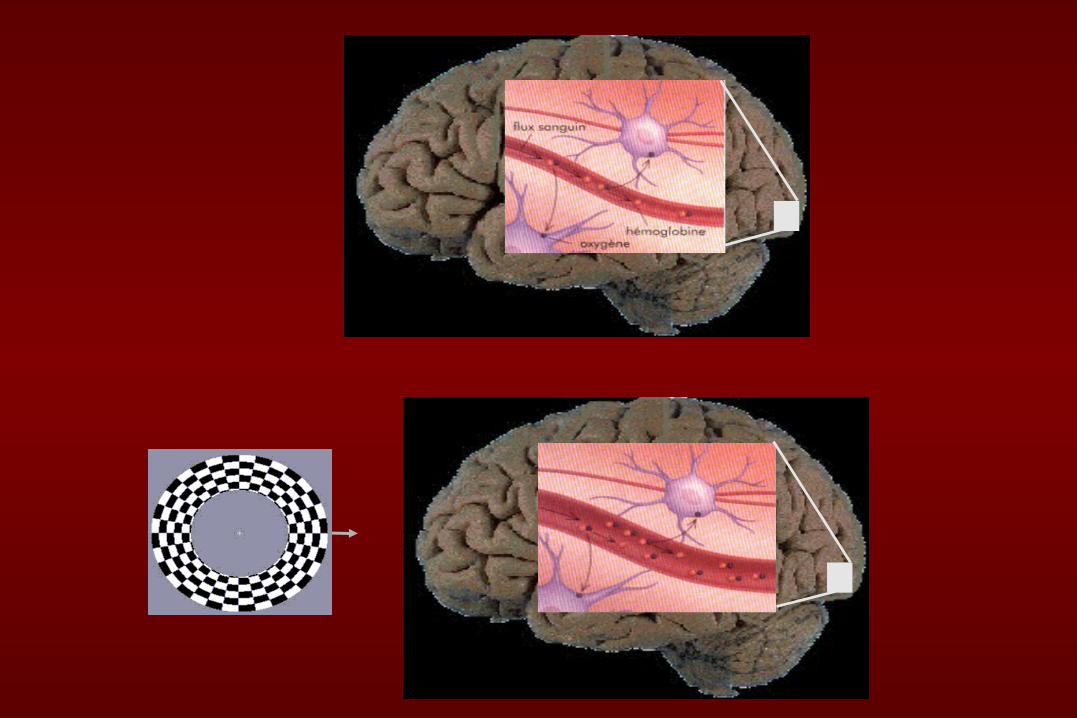
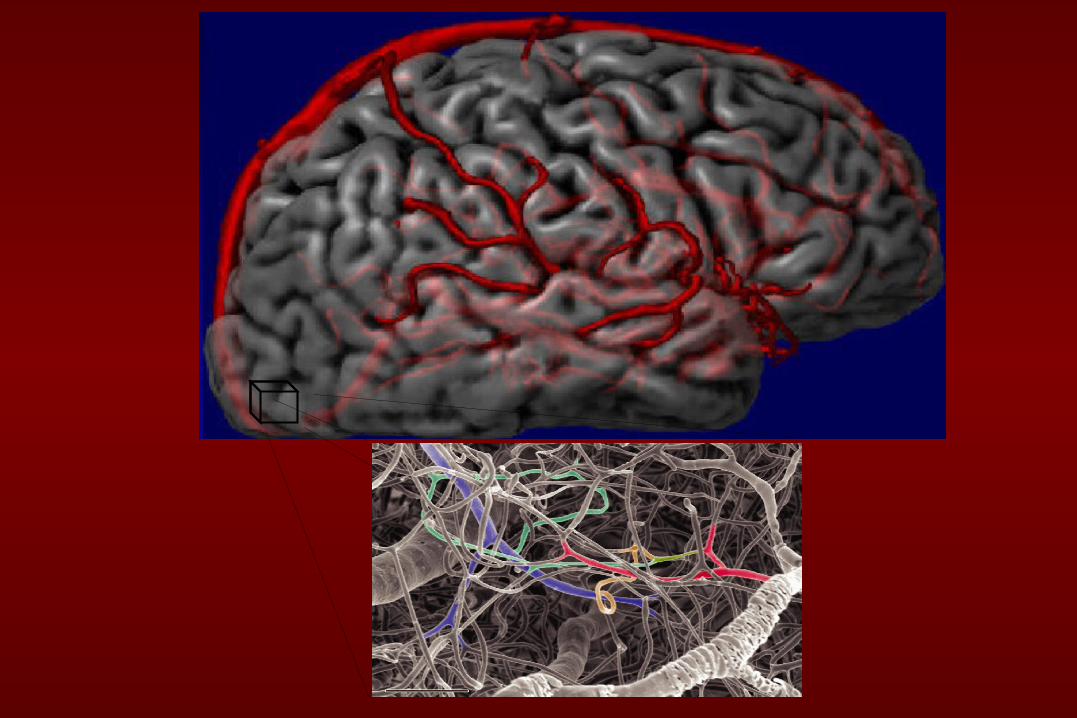
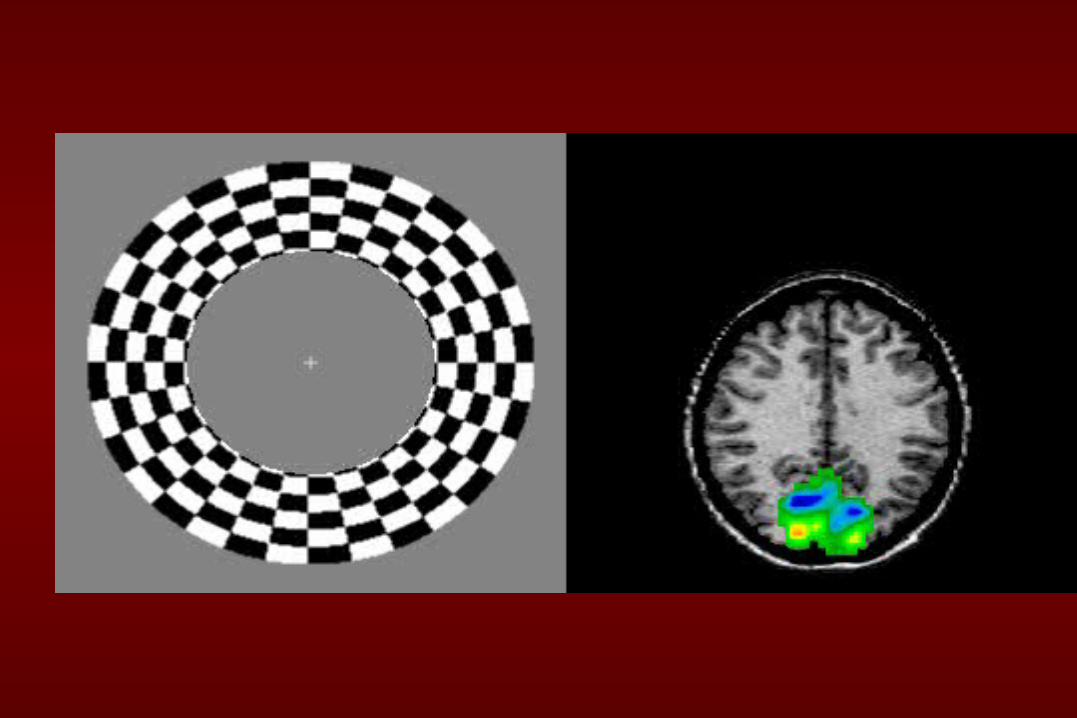
Principes de base de l’IRMf
On connait une relation entre l’activité cérébale et le taux d’hémoglobine désoxygéné dans le sang
Début des années 90 il a été découvert qu’une séquence d’impulsions produites par l’IRM pourrait mesurer le taux d’hémoglobine désoxygéné (Thulborn et al.; Ogawa et al.)
Ceci a donné naissance au Blood Oxygenation Level Dependent (BOLD) fMRI ou T2* qui nous donne une
mesure indirecte de l’activité cérébrale.
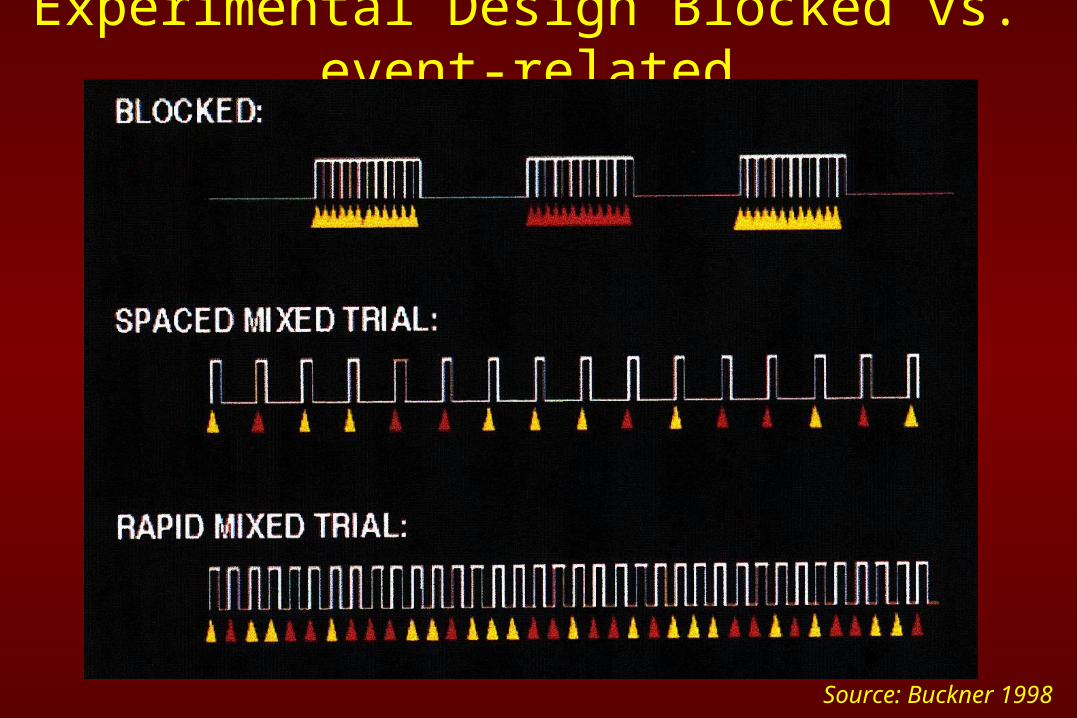
Experimental Design Blocked vs. event-related
Source: Buckner 1998
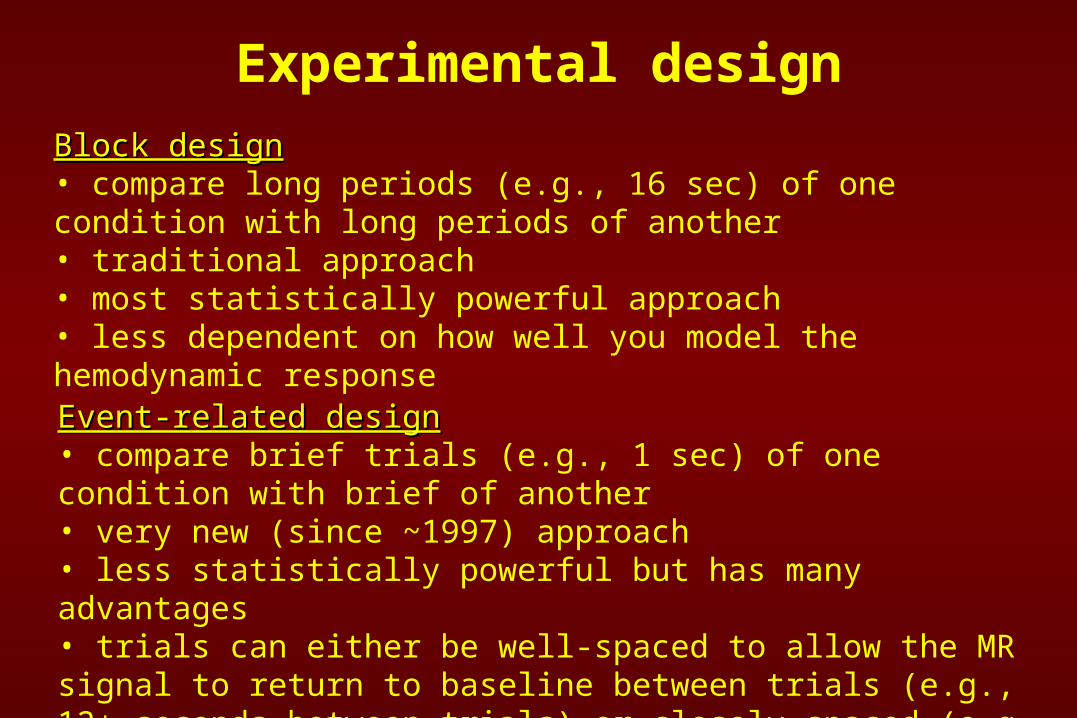
Experimental design
Block designBlock design• compare long periods (e.g., 16 sec) of one condition with long periods of another• traditional approach• most statistically powerful approach• less dependent on how well you model the hemodynamic response
Event-related designEvent-related design• compare brief trials (e.g., 1 sec) of one condition with brief of another• very new (since ~1997) approach• less statistically powerful but has many advantages• trials can either be well-spaced to allow the MR signal to return to baseline between trials (e.g., 12+ seconds between trials) or closely spaced (e.g., every 2 sec)
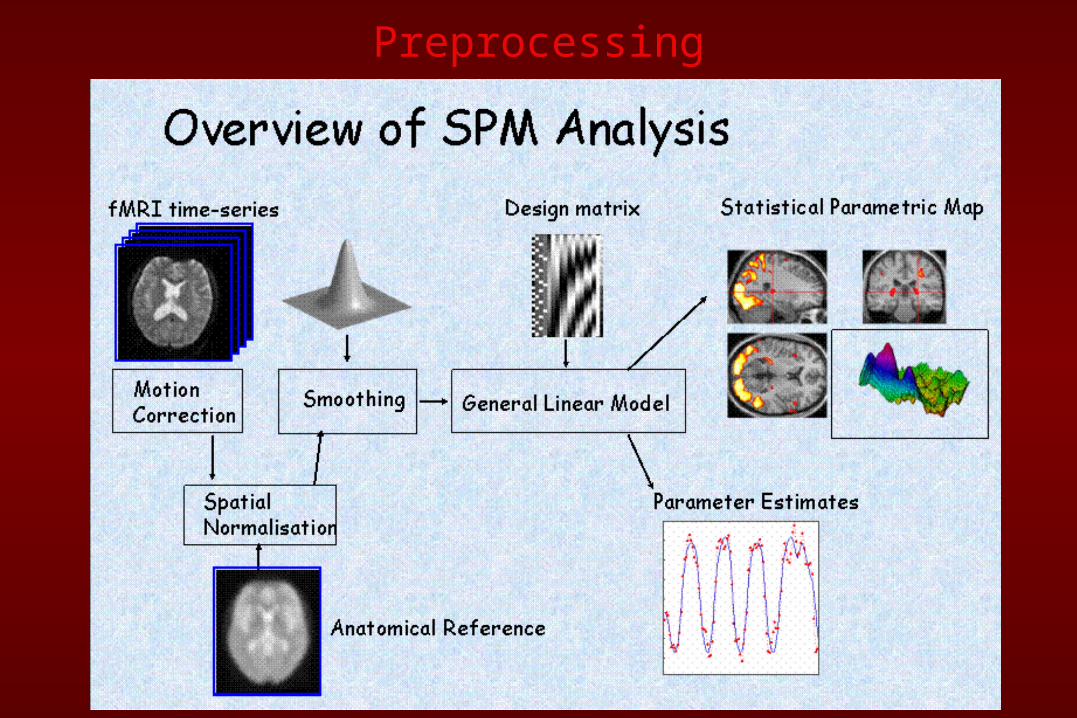
Preprocessing
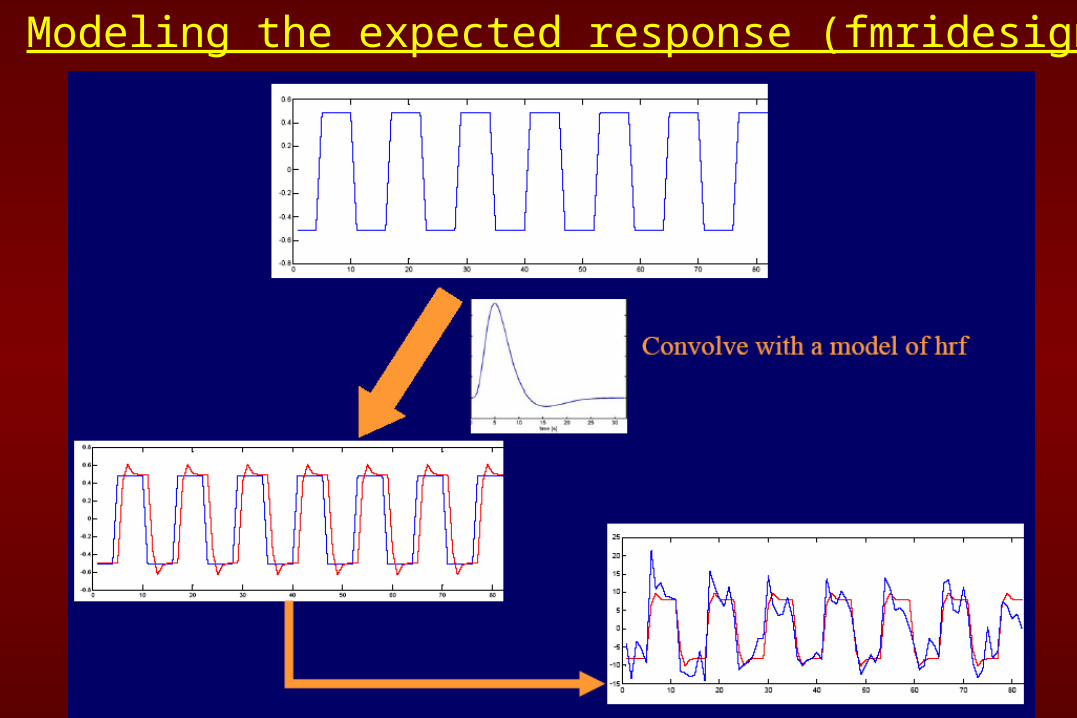
Modeling the expected response (fmridesign)
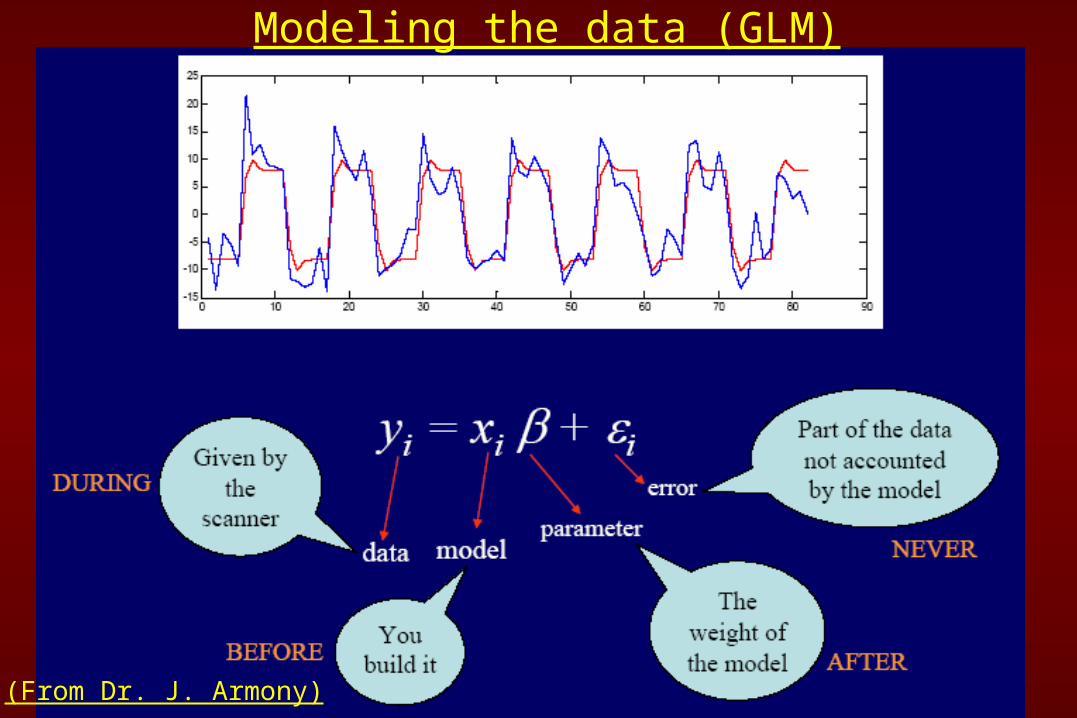
Modeling the data (GLM)
(From Dr. J. Armony)
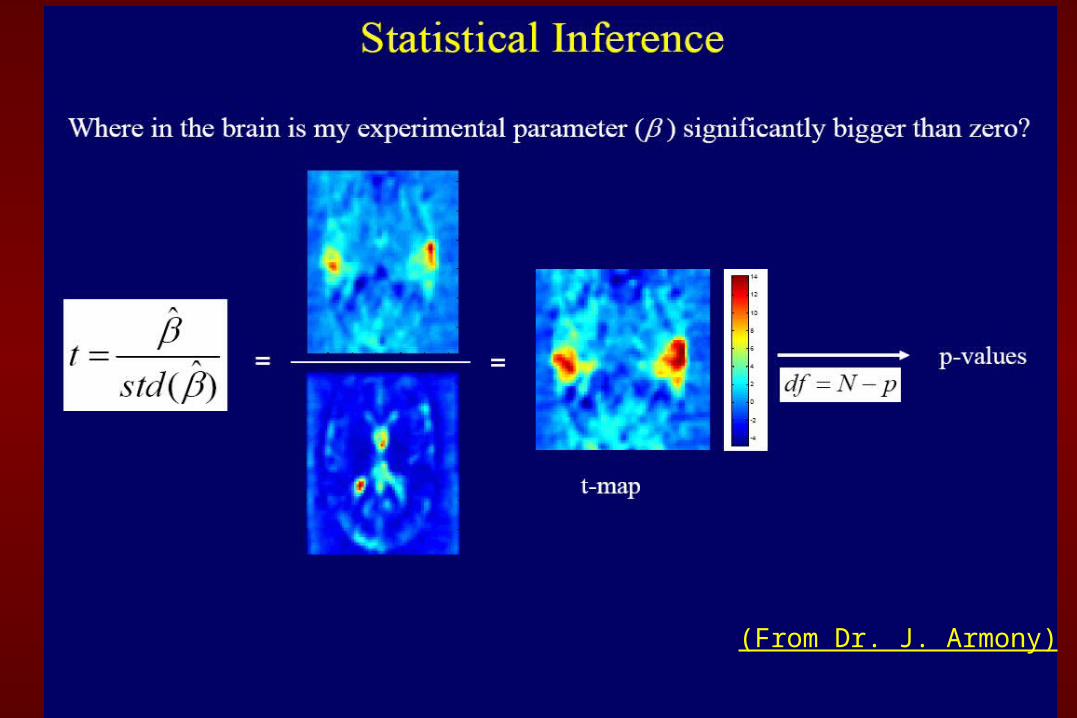
(From Dr. J. Armony)
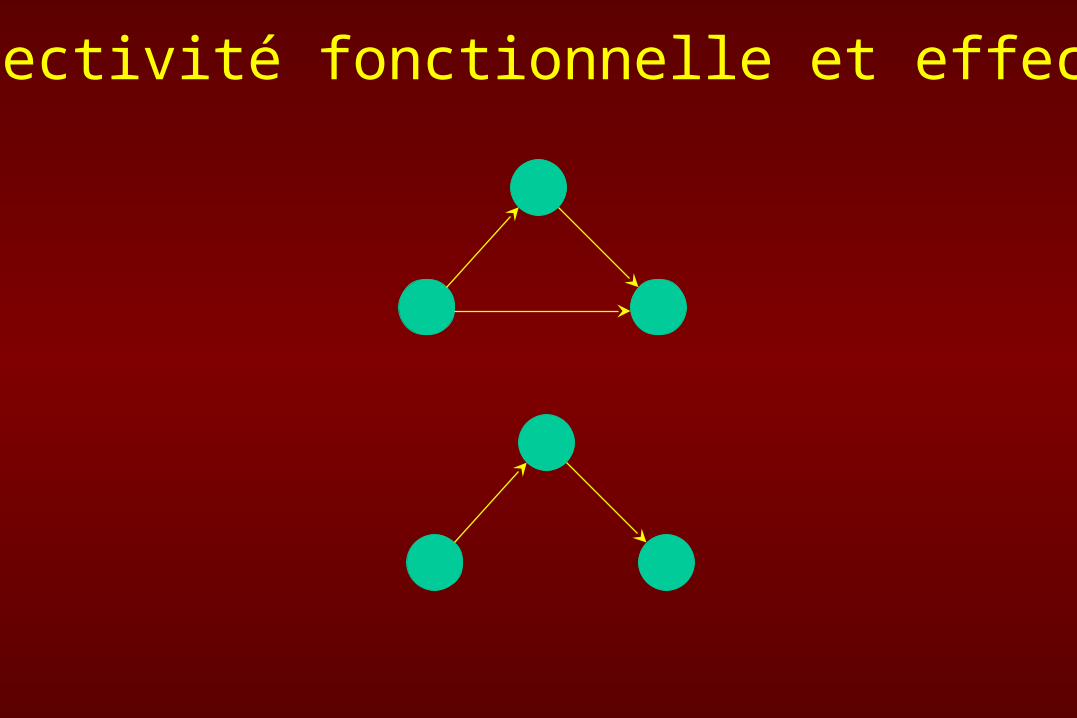
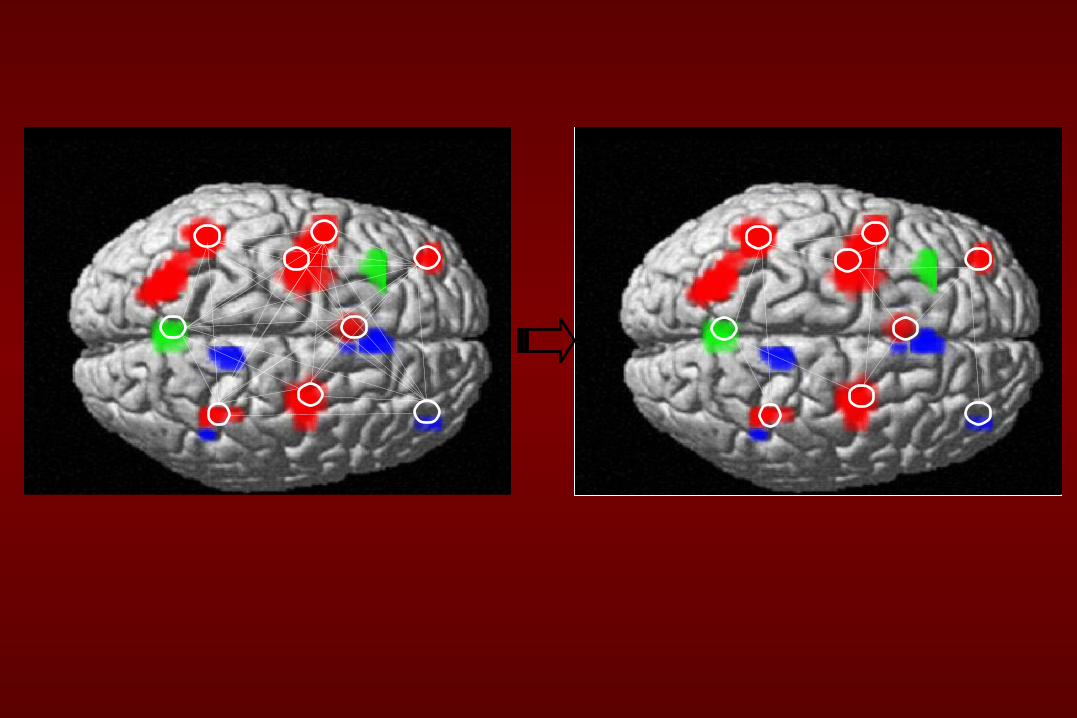
Connectivité fonctionnelle et effective
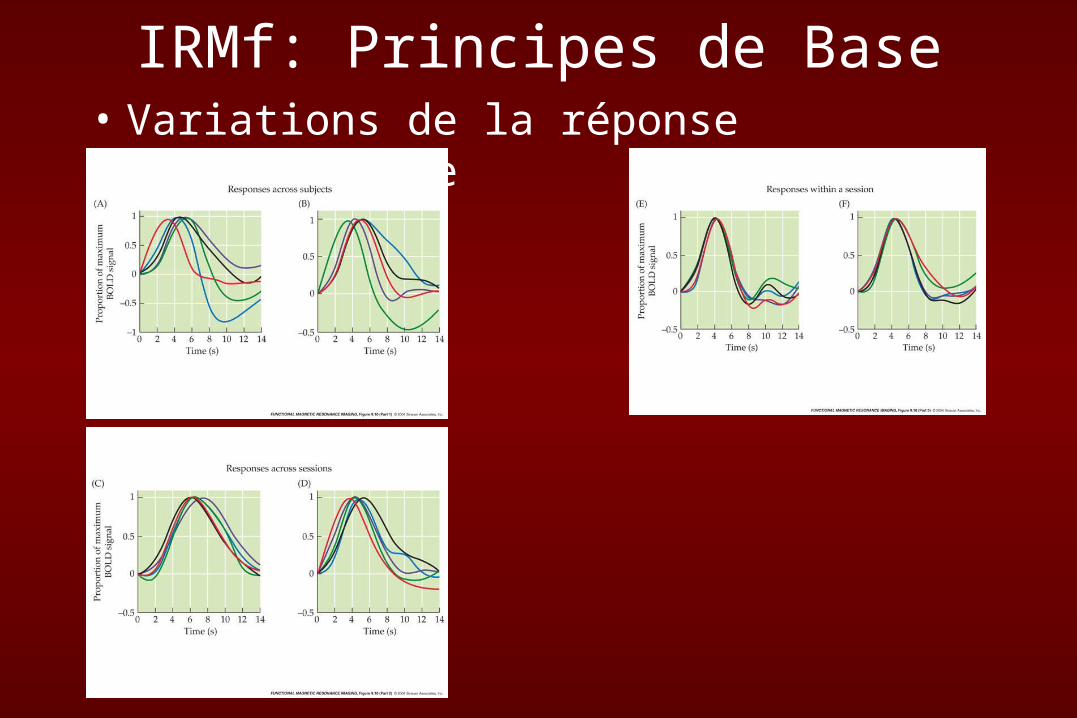
• Variations de la réponse hémodynamique
IRMf: Principes de Base
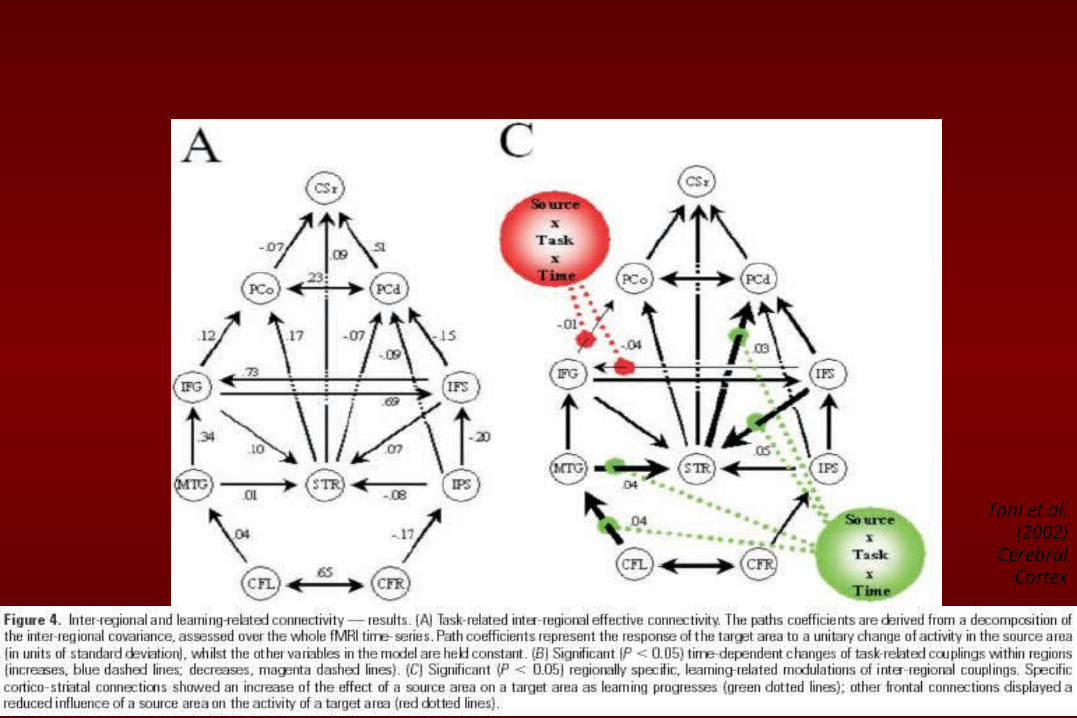
Toni et al. (2002)
Cerebral Cortex
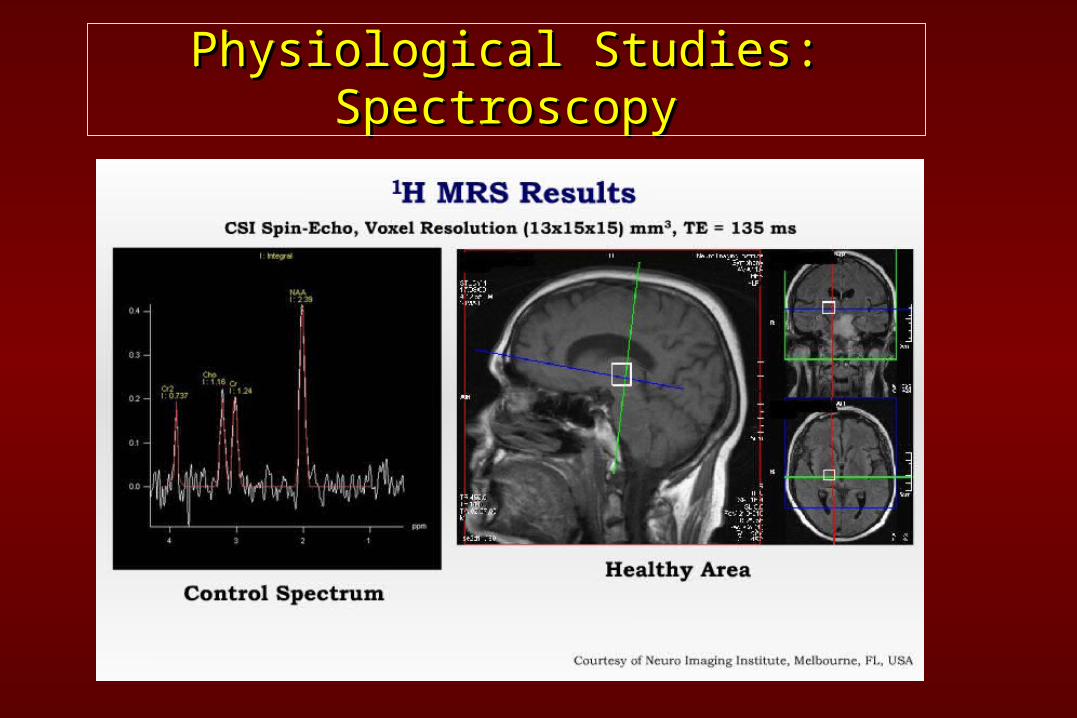
Physiological Studies: SpectroscopyPhysiological Studies: SpectroscopyPhysiological Studies: SpectroscopyPhysiological Studies: Spectroscopy

Physiological Studies: SpectroscopyPhysiological Studies: SpectroscopyPhysiological Studies: SpectroscopyPhysiological Studies: Spectroscopy
Imagerie Optique
La technique est basé sur l’émission d’un faisceau lumineux dans le cerveau à des fréquences proches de
l’infra-rouge
L’absorption de ce faisceau nous donne de l’informationsur l’oxygénation et la désoxygénation du sang
similairement à l’IRMf.
La diffusion de ce signal nous donnent de l’information spatiale
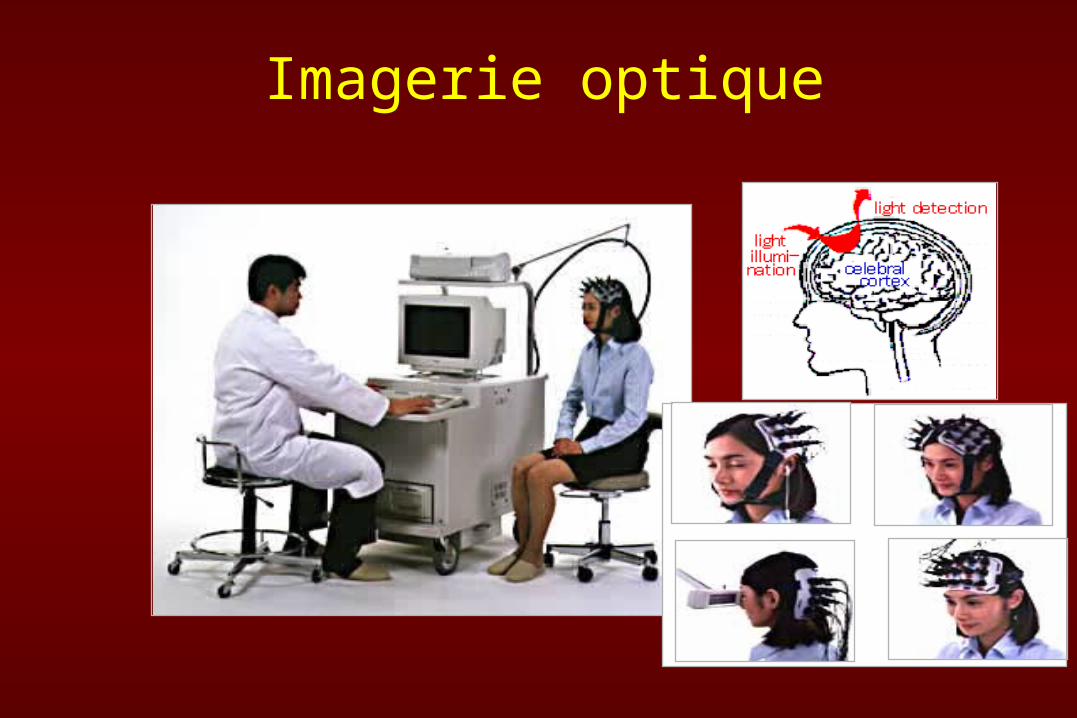
Imagerie optique
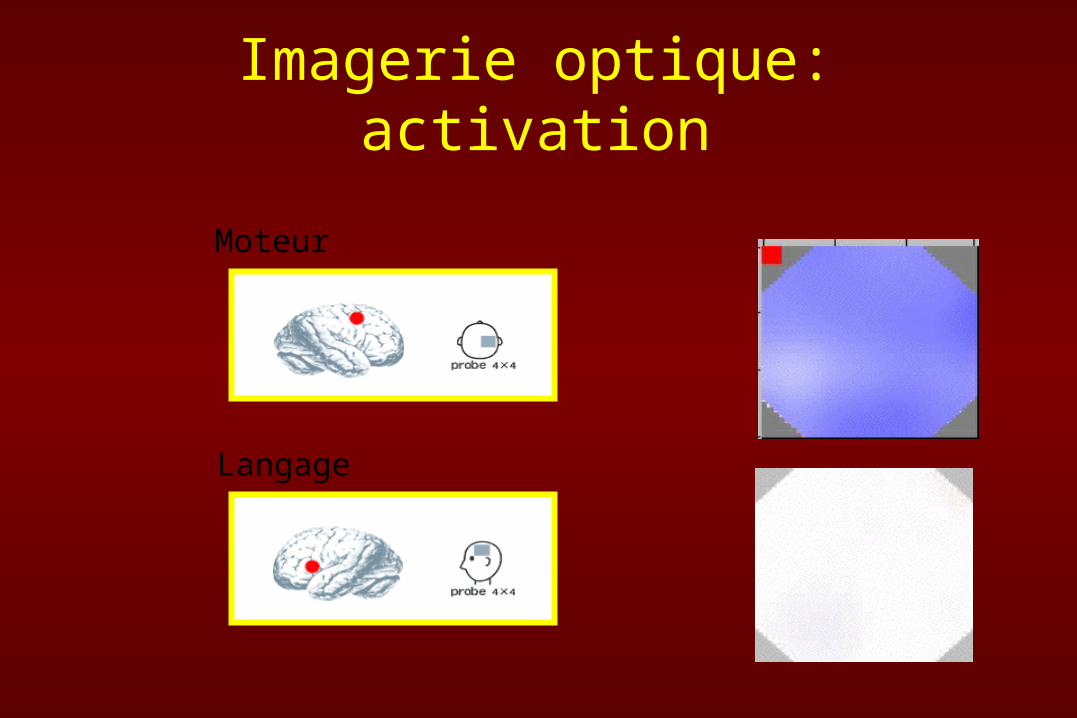
Imagerie optique: activation
Moteur
Langage
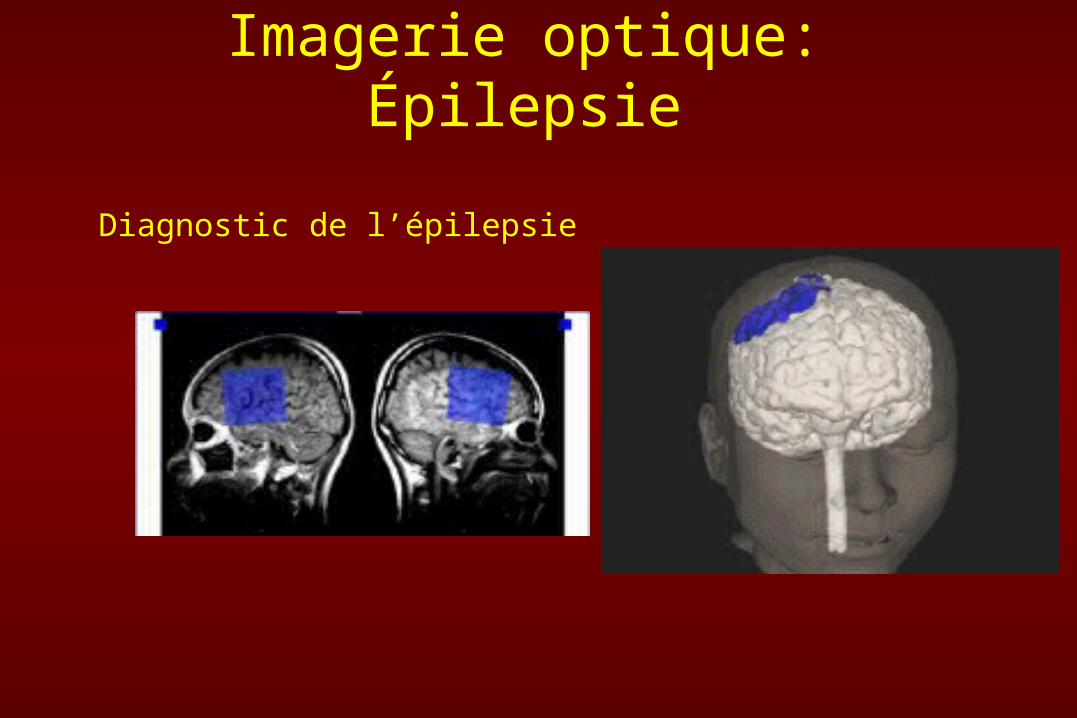
Imagerie optique: Épilepsie
Diagnostic de l’épilepsie
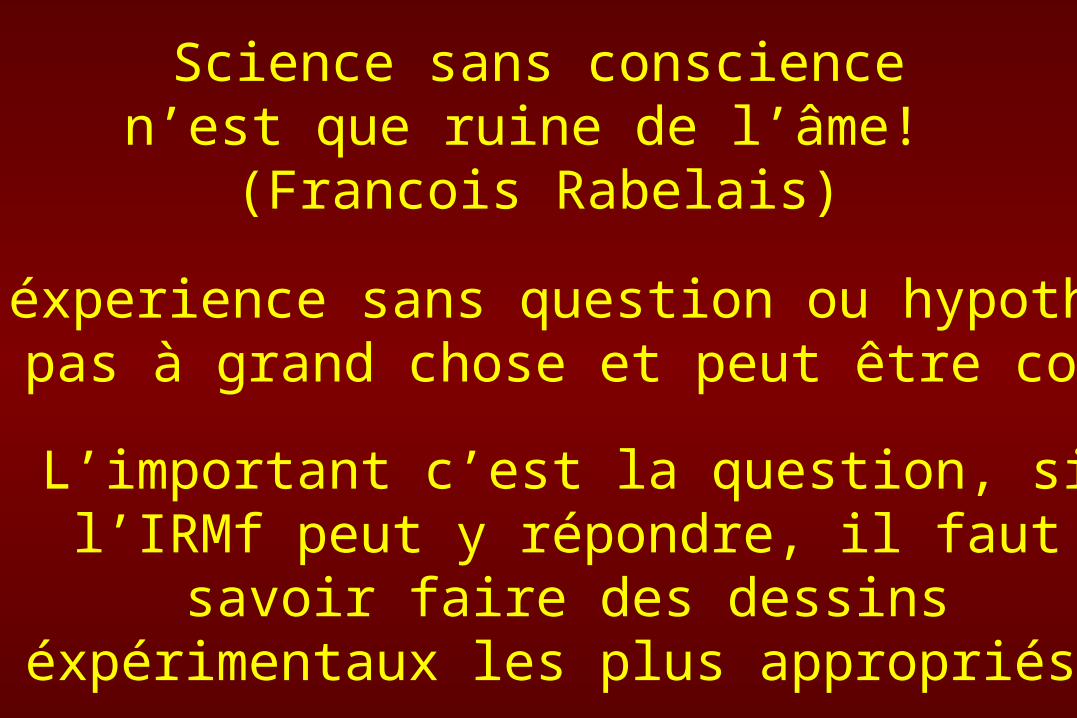
Science sans conscience n’est que ruine de l’âme! (Francois Rabelais)
Une éxperience sans question ou hypothèsene sert pas à grand chose et peut être couteuse!
L’important c’est la question, si l’IRMf peut y répondre, il faut savoir faire des dessins
éxpérimentaux les plus appropriés

Prof. Martha Farah, Interview in JOCN

Prof. Martha Farah, Interview in JOCN
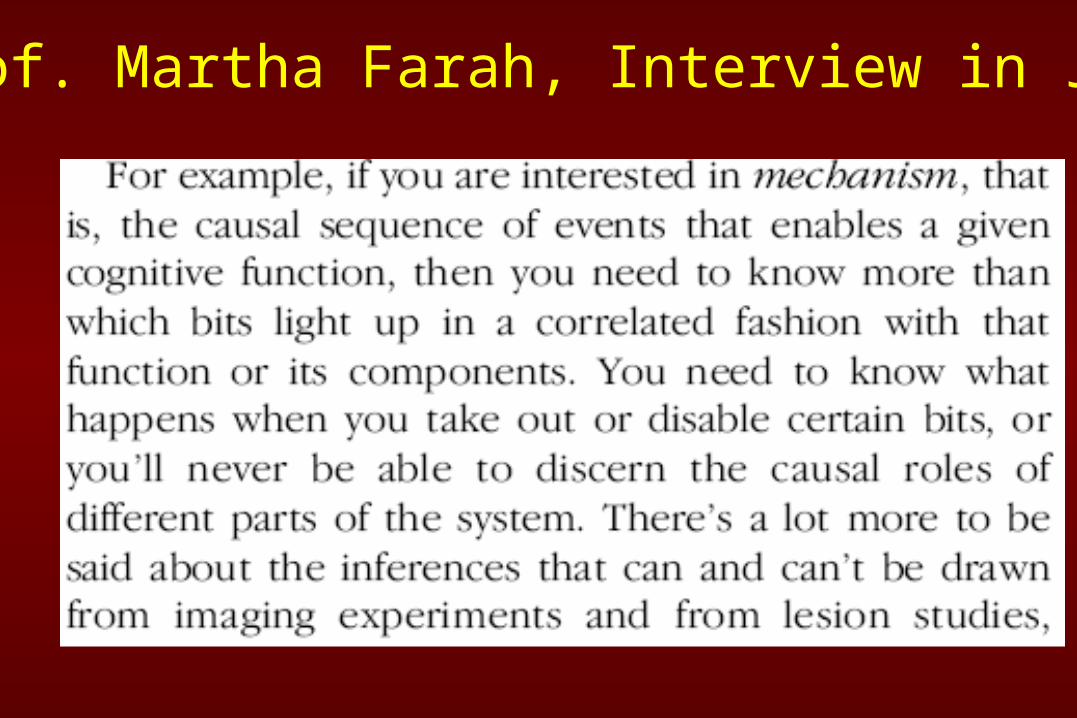
Prof. Martha Farah, Interview in JOCN
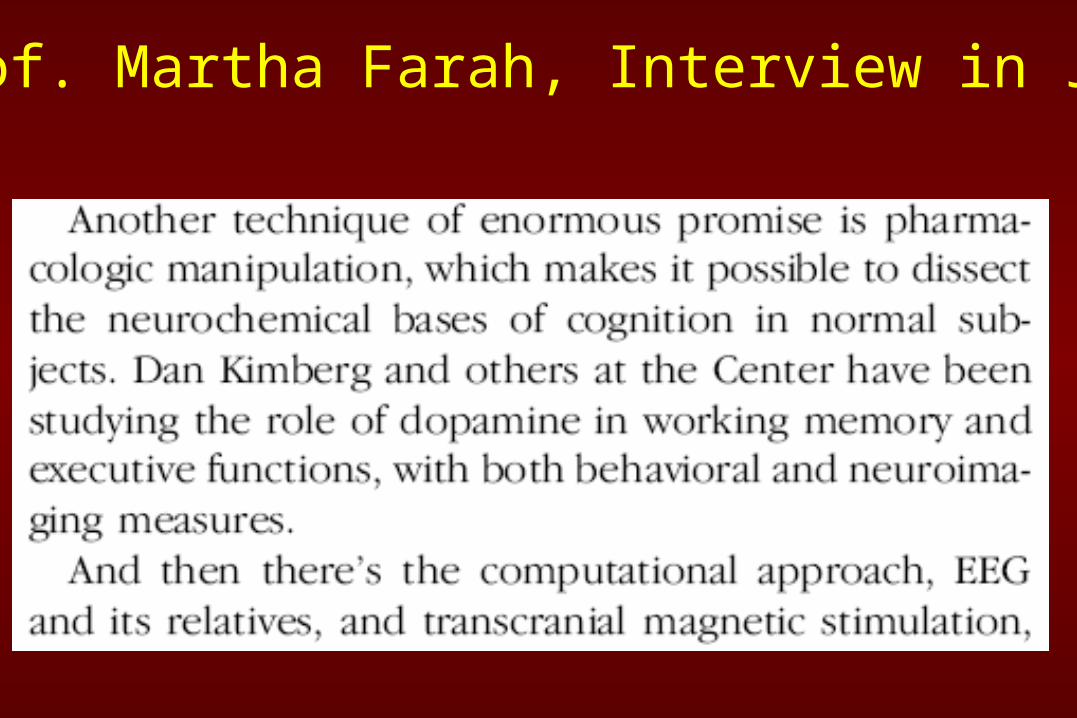
Prof. Martha Farah, Interview in JOCN

IRMf chez différentes populations
• Attention: Différences d’activité neuronal, ou différences dans le métabolisme de
désoxyhémoglobine
• Heureusement certains chercheurs essaient de répondre à cette question, p.ex. Dr. Rick Hoge au
CRIUGM
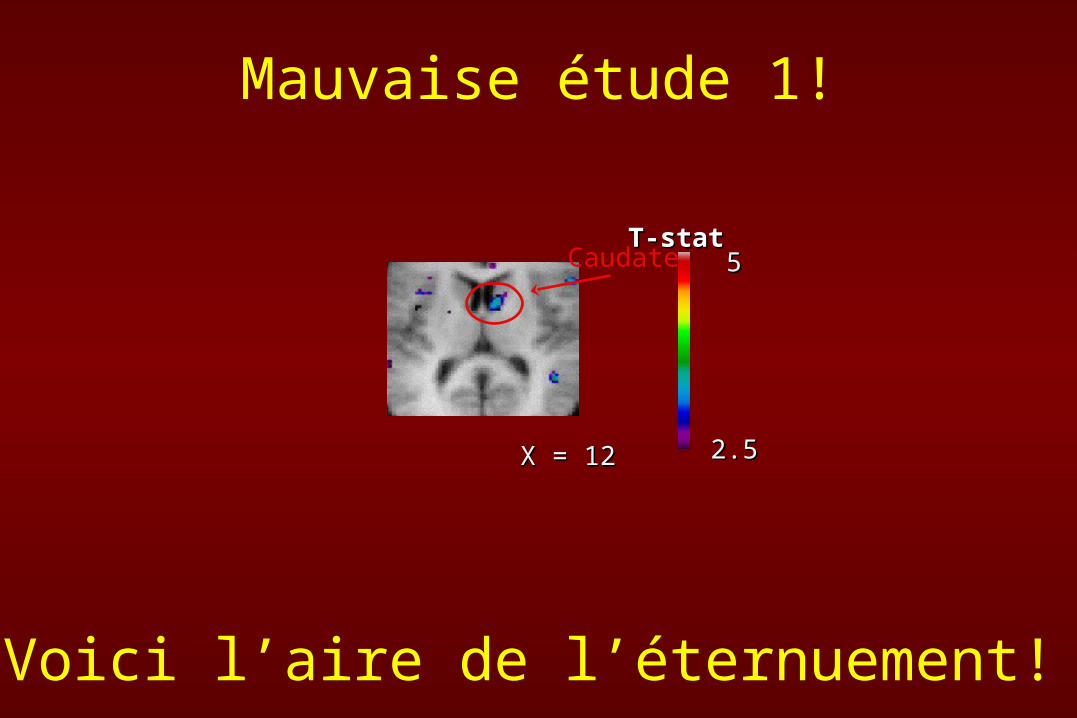
Mauvaise étude 1!
Voici l’aire de l’éternuement!
X = 12X = 12 2.52.5
55T-stat T-stat
Caudate
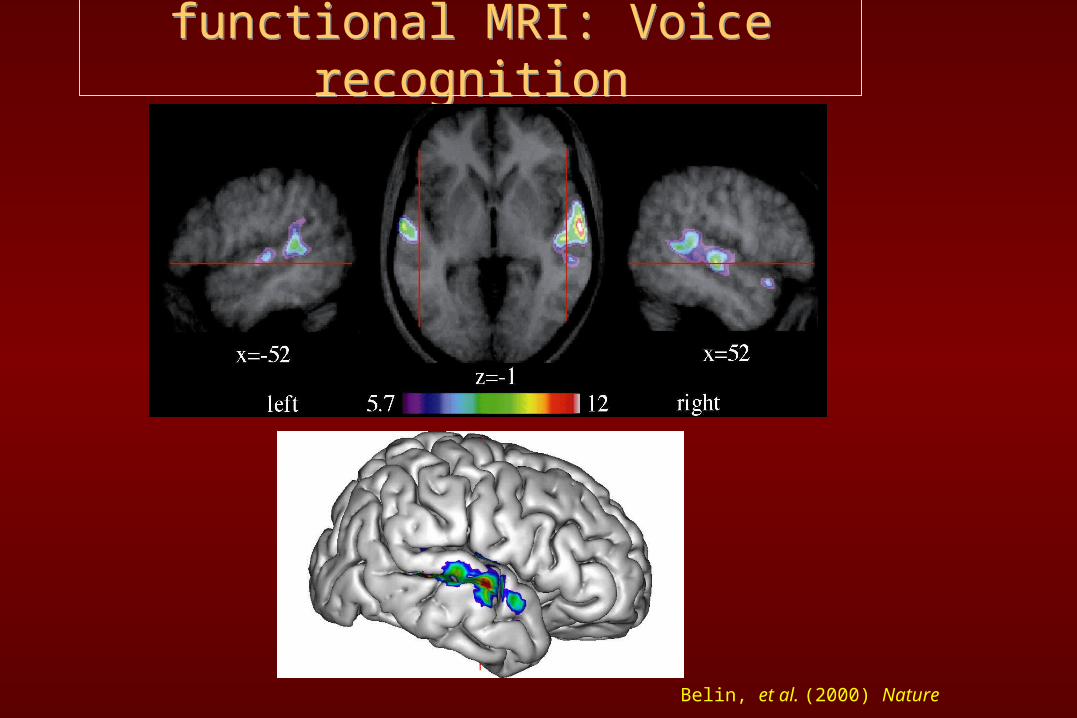
functional MRI: Voice recognitionfunctional MRI: Voice recognition
Belin, et al. (2000) Nature
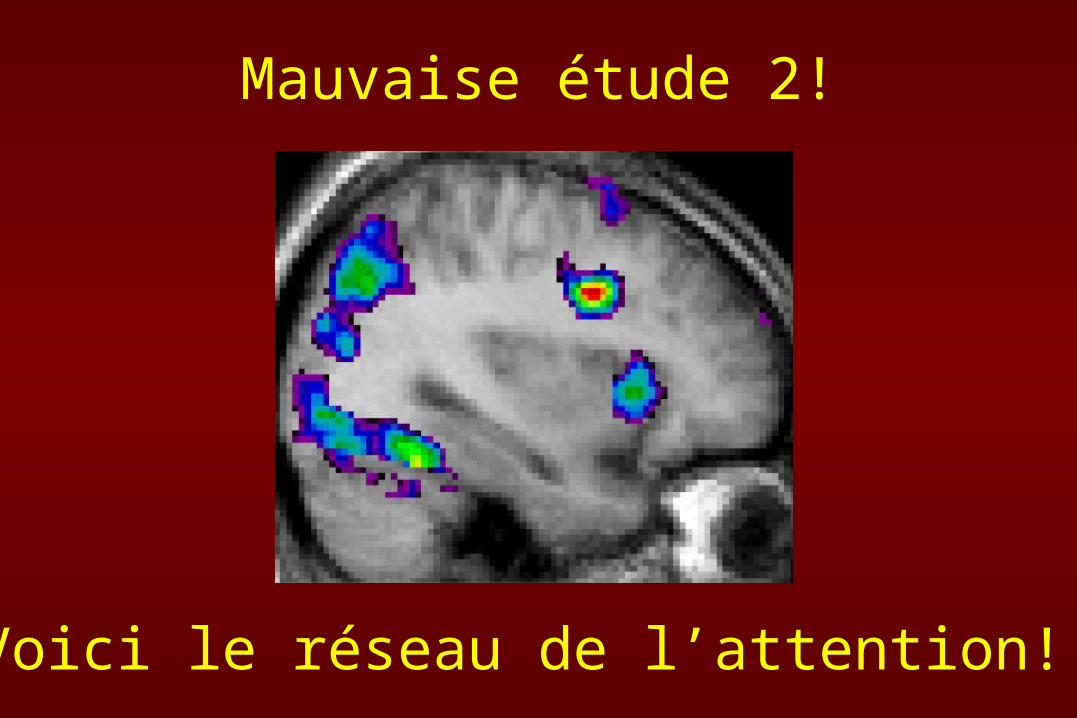
Mauvaise étude 2!
Voici le réseau de l’attention!
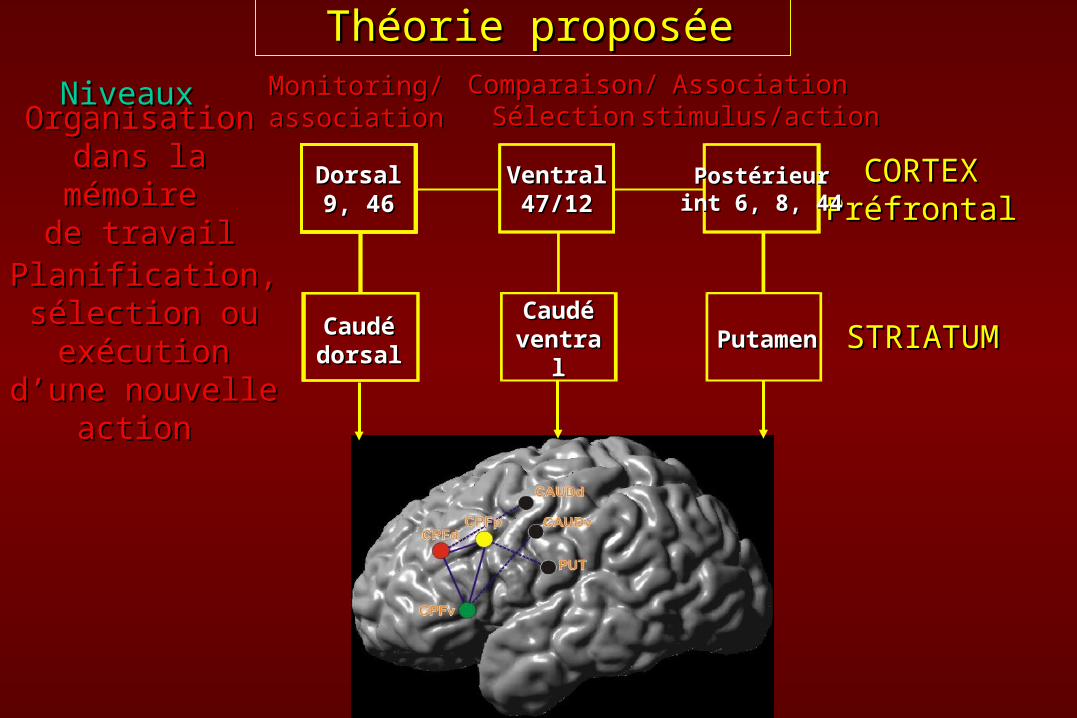
Théorie proposéeThéorie proposéeMonitoring/Monitoring/associationassociation
Comparaison/Comparaison/SélectionSélection
AssociationAssociationstimulus/actionstimulus/action
OrganisationOrganisationdans la mémoire dans la mémoire
de travailde travail
Planification,Planification,sélection ou sélection ou
exécution d’une exécution d’une nouvelle action nouvelle action
NiveauxNiveaux
PutamenPutamen
CORTEXCORTEXPréfrontalPréfrontal
Caudé Caudé ventralventral
Caudé Caudé dorsaldorsal
DorsalDorsal9, 469, 46
VentralVentral47/1247/12
PostérieurPostérieurint 6, 8, 44int 6, 8, 44
STRIATUMSTRIATUM
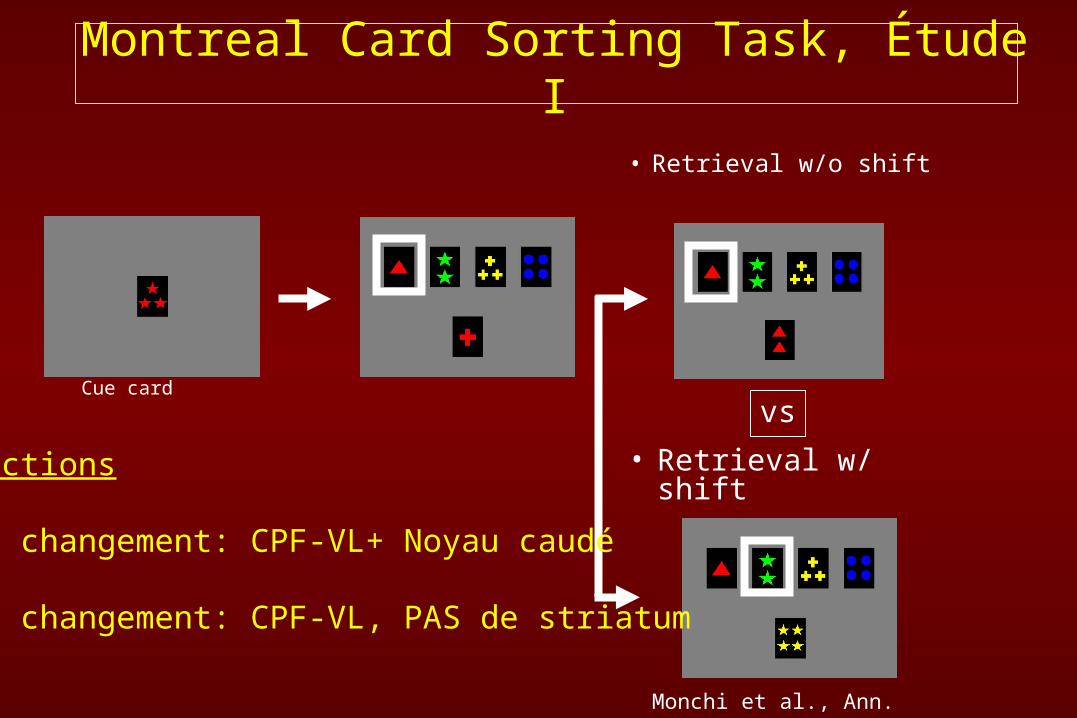
Montreal Card Sorting Task, Étude I
Cue card
• Retrieval w/o shift
• Retrieval w/ shiftvs
Monchi et al., Ann. Neurol., 2006
Prédictions
avec changement: CPF-VL+ Noyau caudé
sans changement: CPF-VL, PAS de striatum
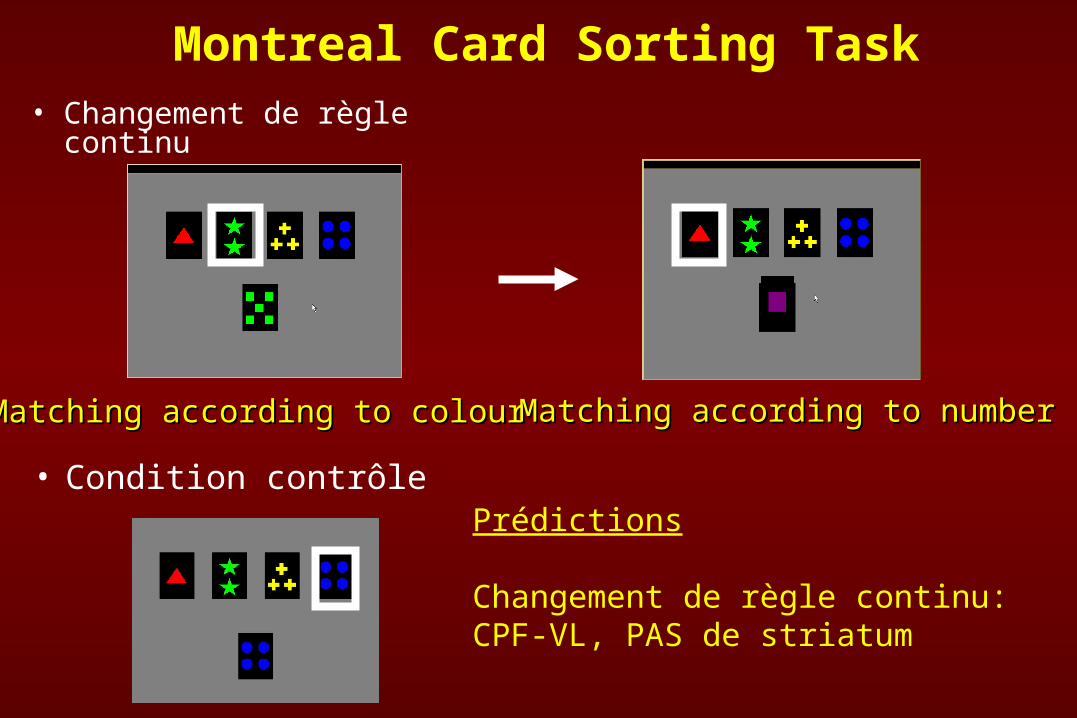
Montreal Card Sorting Task• Changement de règle continu
Matching according to colourMatching according to colour Matching according to numberMatching according to number
• Condition contrôle Prédictions
Changement de règle continu: CPF-VL, PAS de striatum
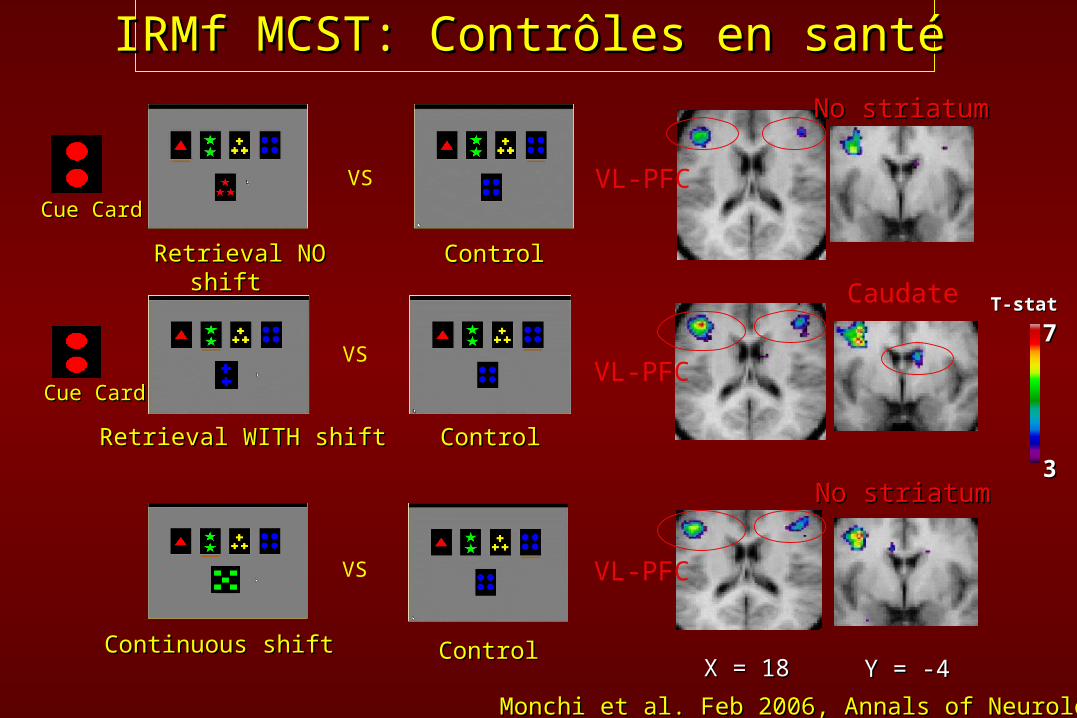
IRMf MCST: IRMf MCST: Contrôles en santéContrôles en santé
33
77T-stat T-stat
Cue CardCue Card
Retrieval NO shiftRetrieval NO shift
VS
ControlControl
Cue CardCue Card
Retrieval WITH shiftRetrieval WITH shift ControlControl
VS
X = 18X = 18Continuous shiftContinuous shift ControlControl
VS
Y = -4Y = -4
VL-PFC
Caudate
VL-PFC
No striatumNo striatum
VL-PFC
No striatumNo striatum
Monchi et al. Feb 2006, Annals of NeurologyMonchi et al. Feb 2006, Annals of Neurology
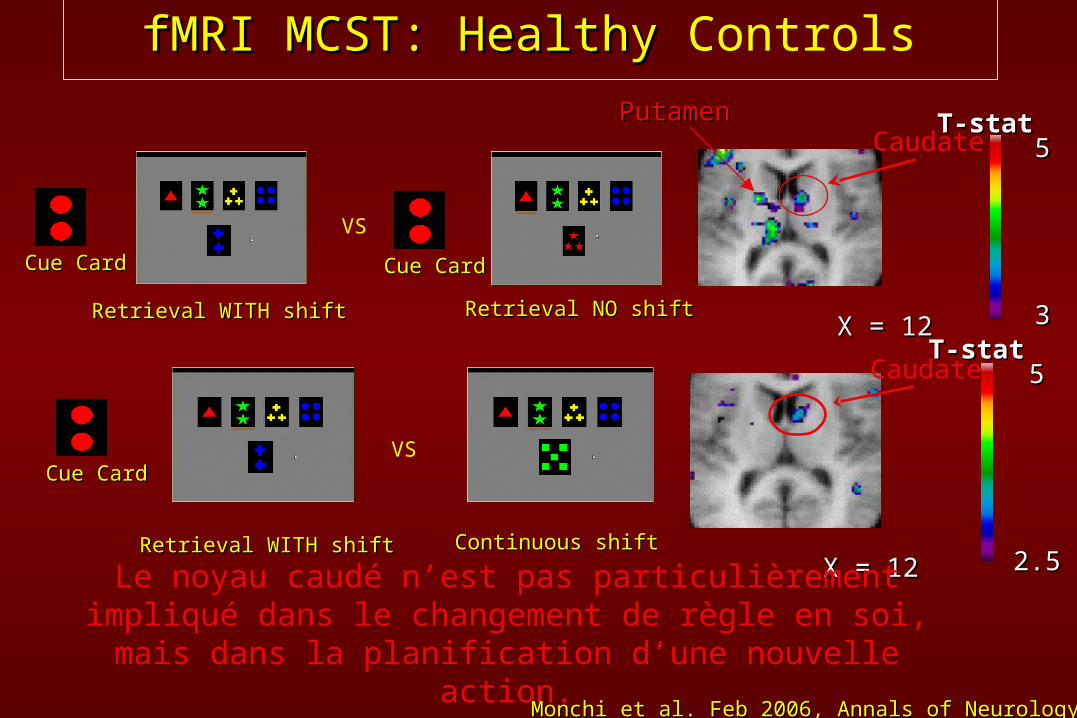
Continuous shiftContinuous shiftRetrieval WITH shiftRetrieval WITH shift
VS
Retrieval WITH shiftRetrieval WITH shift
VS
Retrieval NO shiftRetrieval NO shift
fMRI MCST: fMRI MCST: HealthyHealthy Controls
X = 12X = 12 2.52.5
55T-stat T-stat
Caudate
Le noyau caudé n’est pas particulièrement impliqué dans le changement de règle en soi, mais dans la planification d’une
nouvelle action.Monchi et al. Feb 2006, Annals of NeurologyMonchi et al. Feb 2006, Annals of Neurology
Cue CardCue Card Cue CardCue Card
Cue CardCue Card
33
55T-stat T-stat
X = 12X = 12
CaudatePutamenPutamen

Paramètres Nécessaires lors de la Paramètres Nécessaires lors de la Publication d’Articles en IRMfPublication d’Articles en IRMf
Paramètres Nécessaires lors de la Paramètres Nécessaires lors de la Publication d’Articles en IRMfPublication d’Articles en IRMf
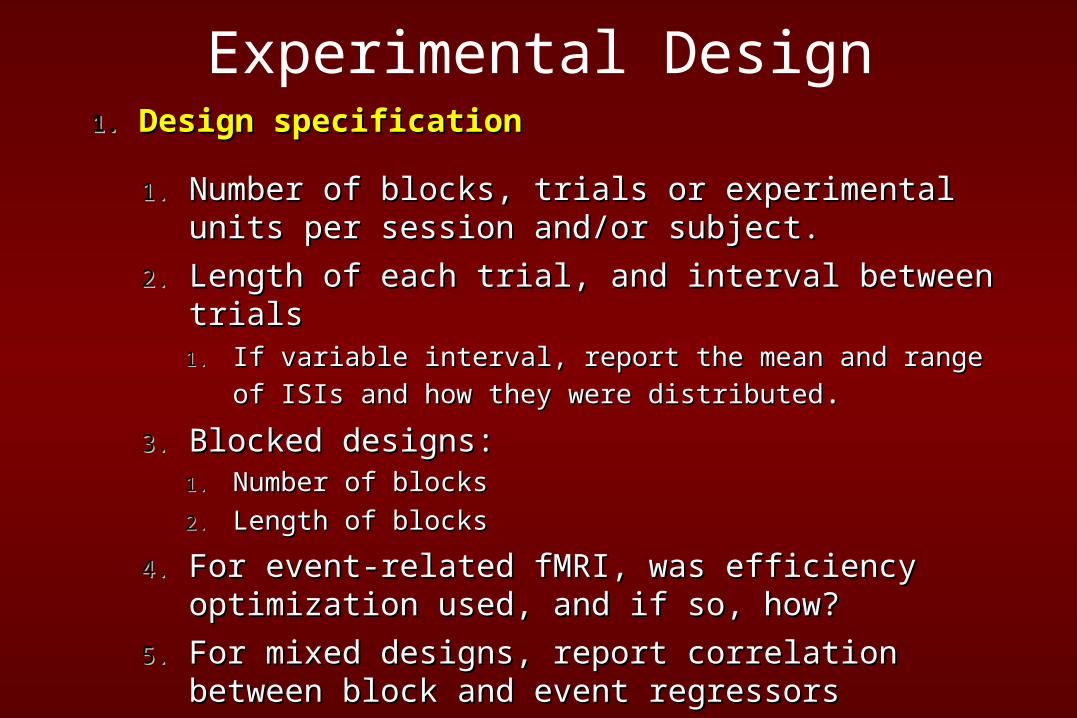
Experimental Design1.1. Design specificationDesign specification
1.1. Number of blocks, trials or experimental units per session Number of blocks, trials or experimental units per session and/or subject. and/or subject.
2.2. Length of each trial, and interval between trials Length of each trial, and interval between trials 1.1. If variable interval, report the mean and range of ISIs and how they If variable interval, report the mean and range of ISIs and how they
were distributedwere distributed. .
3.3. Blocked designs: Blocked designs: 1.1. Number of blocks Number of blocks
2.2. Length of blocksLength of blocks
4.4. For event-related fMRI, was efficiency optimization used, and For event-related fMRI, was efficiency optimization used, and if so, how? if so, how?
5.5. For mixed designs, report correlation between block and event For mixed designs, report correlation between block and event regressorsregressors
Experimental Design
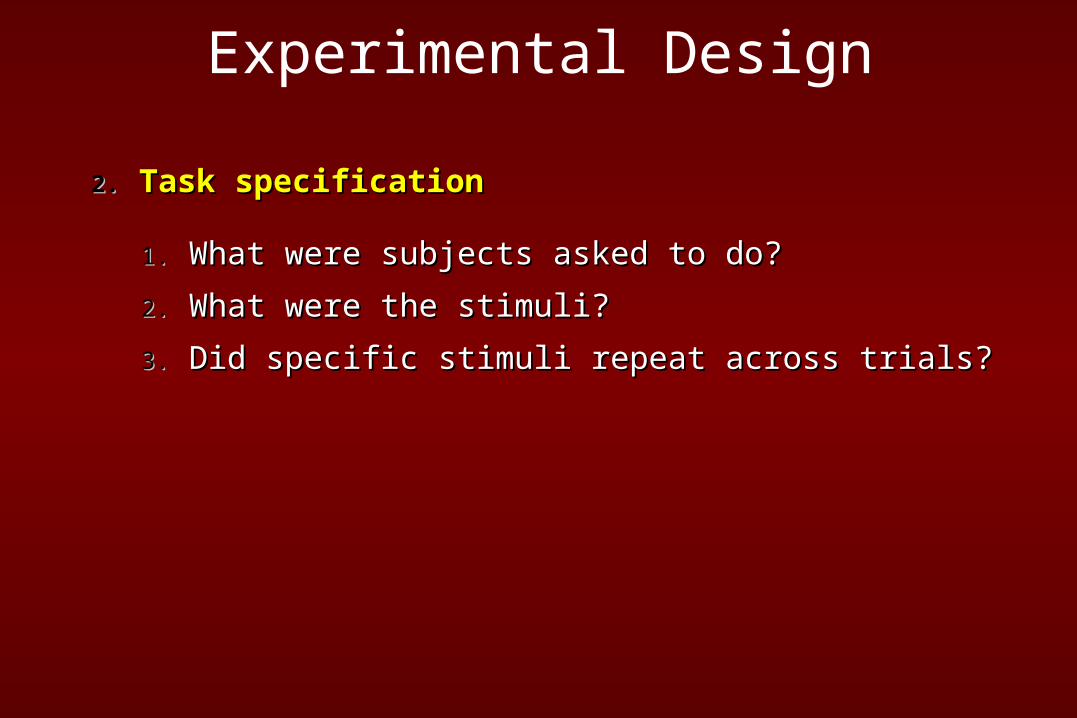
2.2. Task specification Task specification
1.1. What were subjects asked to do? What were subjects asked to do?
2.2. What were the stimuli? What were the stimuli?
3.3. Did specific stimuli repeat across trials? Did specific stimuli repeat across trials?
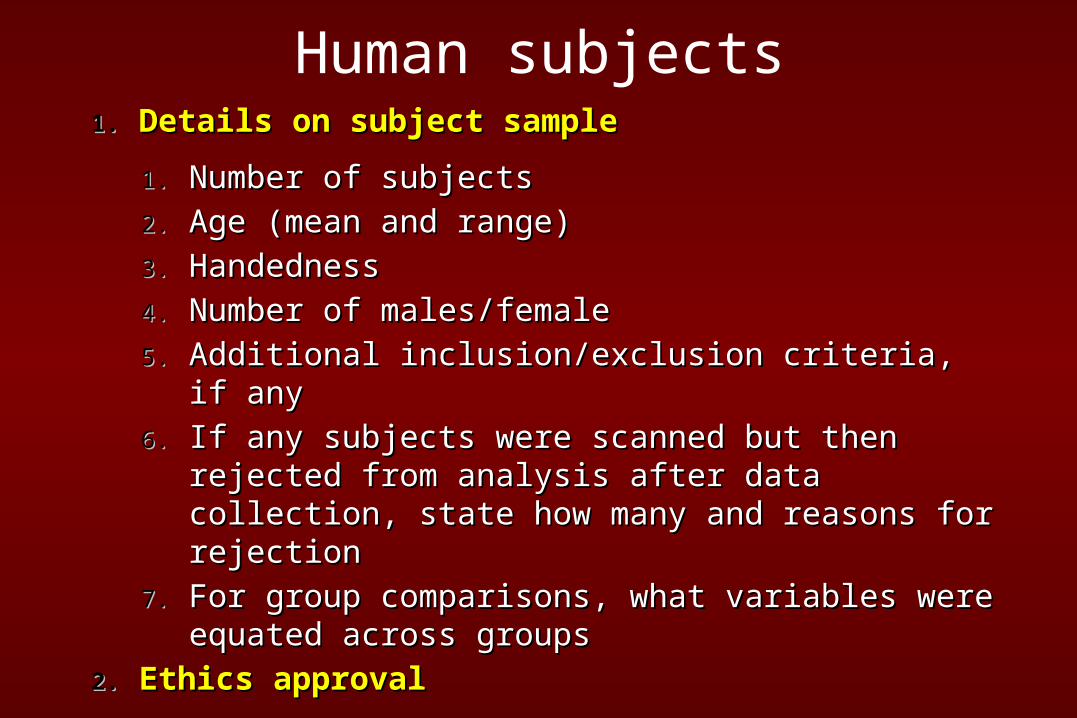
Human subjects1.1. Details on subject sample Details on subject sample
1.1. Number of subjectsNumber of subjects
2.2. Age (mean and range) Age (mean and range)
3.3. HandednessHandedness
4.4. Number of males/female Number of males/female
5.5. Additional inclusion/exclusion criteria, if anyAdditional inclusion/exclusion criteria, if any
6.6. If any subjects were scanned but then rejected from analysis If any subjects were scanned but then rejected from analysis after data collection, state how many and reasons for rejection after data collection, state how many and reasons for rejection
7.7. For group comparisons, what variables were equated across For group comparisons, what variables were equated across groupsgroups
2.2. Ethics approvalEthics approval
1.1. state which IRB approved the protocolstate which IRB approved the protocol
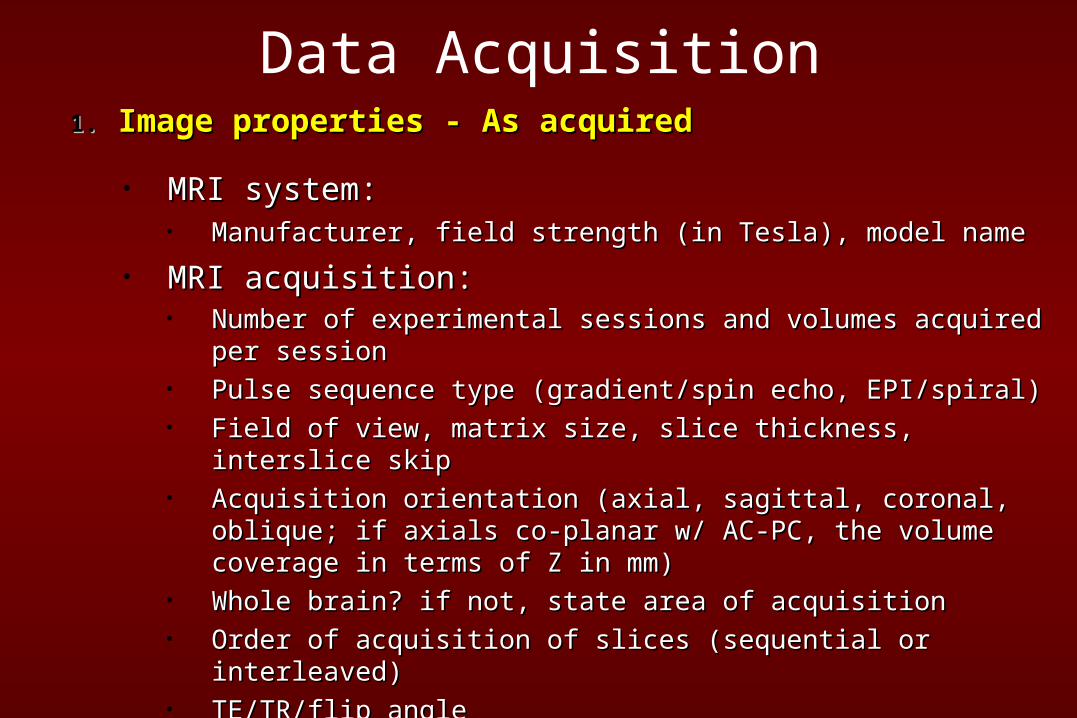
Data Acquisition1.1. Image properties - As acquiredImage properties - As acquired
• MRI system: MRI system: • Manufacturer, field strength (in Tesla), model nameManufacturer, field strength (in Tesla), model name
• MRI acquisition: MRI acquisition: • Number of experimental sessions and volumes acquired per session Number of experimental sessions and volumes acquired per session • Pulse sequence type (gradient/spin echo, EPI/spiral)Pulse sequence type (gradient/spin echo, EPI/spiral)• Field of view, matrix size, slice thickness, interslice skip Field of view, matrix size, slice thickness, interslice skip • Acquisition orientation (axial, sagittal, coronal, oblique; if axials co-planar w/ Acquisition orientation (axial, sagittal, coronal, oblique; if axials co-planar w/
AC-PC, the volume coverage in terms of Z in mm) AC-PC, the volume coverage in terms of Z in mm) • Whole brain? if not, state area of acquisitionWhole brain? if not, state area of acquisition• Order of acquisition of slices (sequential or interleaved) Order of acquisition of slices (sequential or interleaved) • TE/TR/flip angleTE/TR/flip angle

Data Acquisition2.2. Pre-processing: GeneralPre-processing: General
• Specify order of preprocessing operations Specify order of preprocessing operations
• Slice-timing correction Slice-timing correction • minimally, software version; ideally, order and type of interpolation used and minimally, software version; ideally, order and type of interpolation used and
reference slice reference slice
• Motion correction Motion correction • software version (major and minor version numbers) software version (major and minor version numbers) • Interpolation method (also ideally, image similarity metric and optimization Interpolation method (also ideally, image similarity metric and optimization
method) method)
• Motion-susceptibility correction?Motion-susceptibility correction?
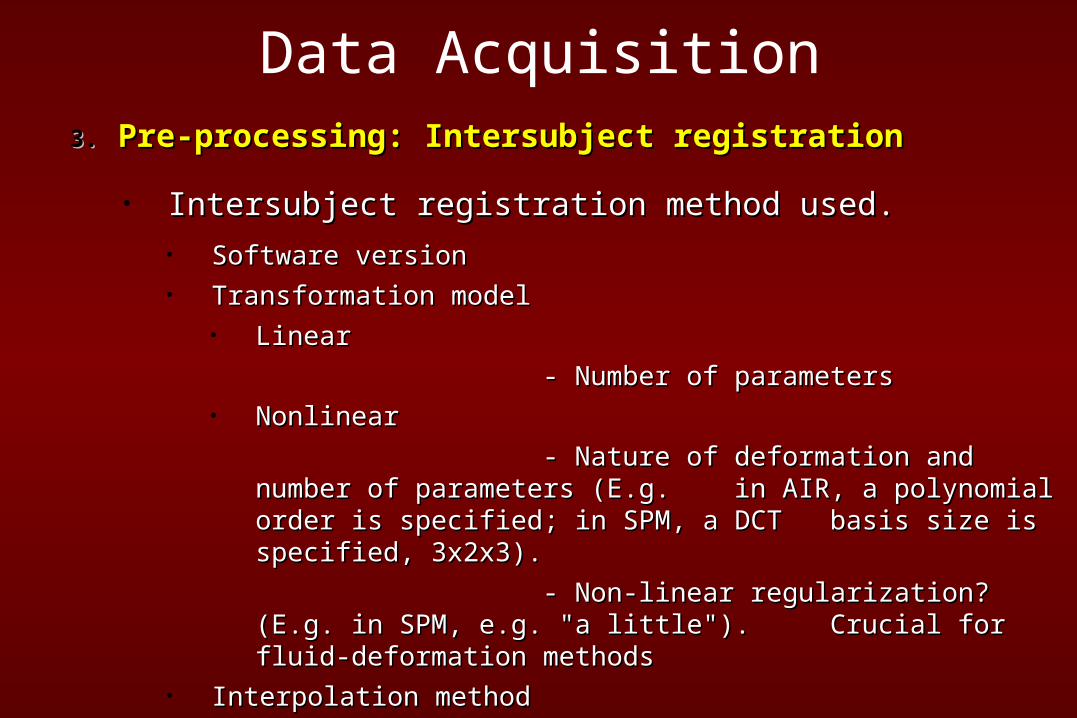
Data Acquisition3.3. Pre-processing: Intersubject registration Pre-processing: Intersubject registration
• Intersubject registration method used.Intersubject registration method used.
• Software version Software version • Transformation model Transformation model
• Linear Linear
- Number of parameters - Number of parameters • Nonlinear Nonlinear
- Nature of deformation and number of - Nature of deformation and number of parameters (E.g. parameters (E.g. in AIR, a polynomial order is specified; in SPM, in AIR, a polynomial order is specified; in SPM, a DCT a DCT basis size is specified, 3x2x3). basis size is specified, 3x2x3).
- Non-linear regularization? (E.g. in SPM, e.g. - Non-linear regularization? (E.g. in SPM, e.g. "a little"). "a little"). Crucial for fluid-deformation methods Crucial for fluid-deformation methods
• Interpolation method Interpolation method
Data Acquisition
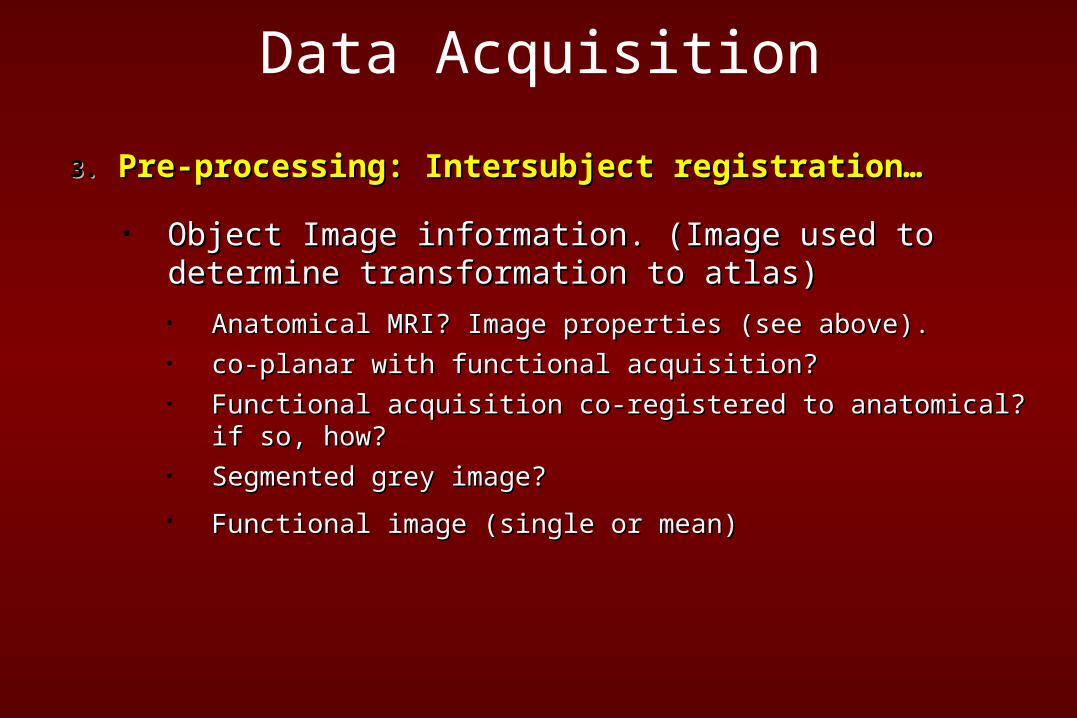
3.3. Pre-processing: Intersubject registration… Pre-processing: Intersubject registration…
• Object Image information. (Image used to determine transformation Object Image information. (Image used to determine transformation to atlas) to atlas)
• Anatomical MRI? Image properties (see above).Anatomical MRI? Image properties (see above).• co-planar with functional acquisition? co-planar with functional acquisition? • Functional acquisition co-registered to anatomical? if so, how?Functional acquisition co-registered to anatomical? if so, how?• Segmented grey image? Segmented grey image?
• Functional image (single or mean)Functional image (single or mean)
Data Acquisition
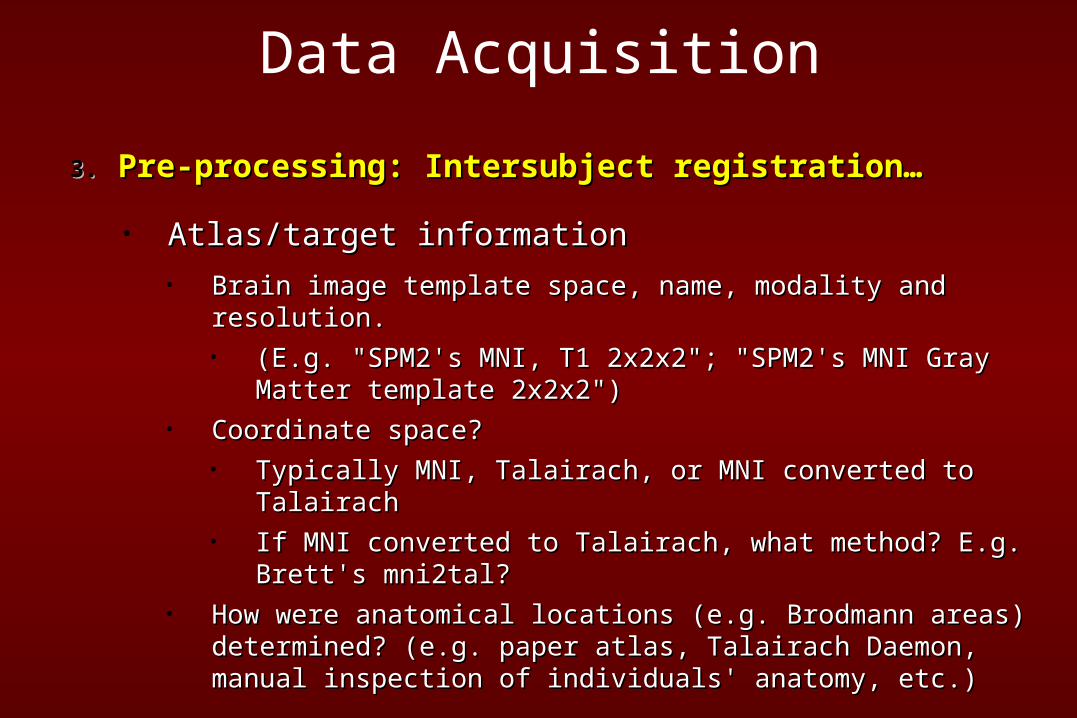
3.3. Pre-processing: Intersubject registration… Pre-processing: Intersubject registration…
• Atlas/target information Atlas/target information
• Brain image template space, name, modality and resolution. Brain image template space, name, modality and resolution. • (E.g. "SPM2's MNI, T1 2x2x2"; "SPM2's MNI Gray Matter template (E.g. "SPM2's MNI, T1 2x2x2"; "SPM2's MNI Gray Matter template
2x2x2") 2x2x2") • Coordinate space?Coordinate space?
• Typically MNI, Talairach, or MNI converted to Talairach Typically MNI, Talairach, or MNI converted to Talairach • If MNI converted to Talairach, what method? E.g. Brett's mni2tal? If MNI converted to Talairach, what method? E.g. Brett's mni2tal?
• How were anatomical locations (e.g. Brodmann areas) determined? (e.g. paper How were anatomical locations (e.g. Brodmann areas) determined? (e.g. paper atlas, Talairach Daemon, manual inspection of individuals' anatomy, etc.)atlas, Talairach Daemon, manual inspection of individuals' anatomy, etc.)

Data Acquisition
4.4. Pre-processing: Smoothing Pre-processing: Smoothing
• What size smoothing kernel? What size smoothing kernel?
• What type of kernel (especially if non-Gaussian, or adaptive). What type of kernel (especially if non-Gaussian, or adaptive).
• Is smoothing done separately at 1st and 2nd levels? Is smoothing done separately at 1st and 2nd levels?
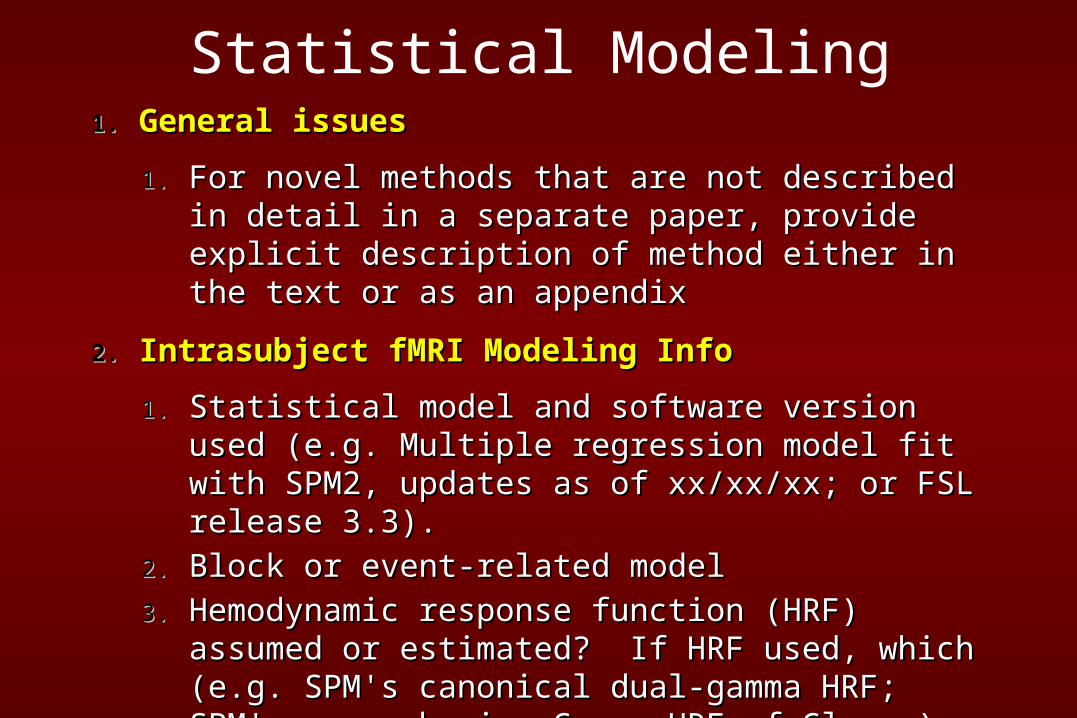
Statistical Modeling1.1. General issues General issues
1.1. For novel methods that are not described in detail in a separate For novel methods that are not described in detail in a separate paper, provide explicit description of method either in the text paper, provide explicit description of method either in the text or as an appendix or as an appendix
2.2. Intrasubject fMRI Modeling Info Intrasubject fMRI Modeling Info
1.1. Statistical model and software version used (e.g. Multiple Statistical model and software version used (e.g. Multiple regression model fit with SPM2, updates as of xx/xx/xx; or regression model fit with SPM2, updates as of xx/xx/xx; or FSL release 3.3). FSL release 3.3).
2.2. Block or event-related modelBlock or event-related model
3.3. Hemodynamic response function (HRF) assumed or estimated? Hemodynamic response function (HRF) assumed or estimated? If HRF used, which (e.g. SPM's canonical dual-gamma HRF; If HRF used, which (e.g. SPM's canonical dual-gamma HRF; SPM's gamma basis; Gamma HRF of Glover). SPM's gamma basis; Gamma HRF of Glover).
Statistical Modeling
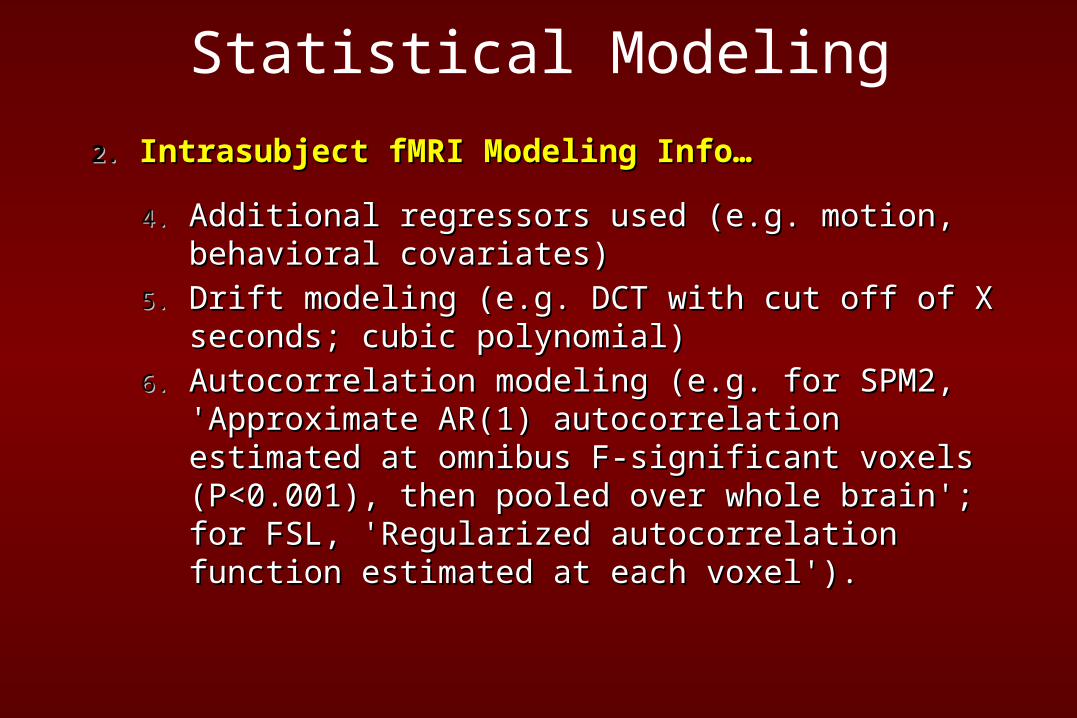
2.2. Intrasubject fMRI Modeling Info… Intrasubject fMRI Modeling Info…
4.4. Additional regressors used (e.g. motion, behavioral covariates) Additional regressors used (e.g. motion, behavioral covariates)
5.5. Drift modeling (e.g. DCT with cut off of X seconds; cubic Drift modeling (e.g. DCT with cut off of X seconds; cubic polynomial) polynomial)
6.6. Autocorrelation modeling (e.g. for SPM2, 'Approximate AR(1) Autocorrelation modeling (e.g. for SPM2, 'Approximate AR(1) autocorrelation estimated at omnibus F-significant voxels autocorrelation estimated at omnibus F-significant voxels (P<0.001), then pooled over whole brain'; for FSL, (P<0.001), then pooled over whole brain'; for FSL, 'Regularized autocorrelation function estimated at each voxel'). 'Regularized autocorrelation function estimated at each voxel').

Statistical Modeling
2.2. Intrasubject fMRI Modeling Info… Intrasubject fMRI Modeling Info…
7.7. Estimation method: OLS, OLS with variance-correction (G-G Estimation method: OLS, OLS with variance-correction (G-G correction or equivalent), or whitening. correction or equivalent), or whitening.
• Tom Nichols: Is this too hard core? It's what I want to know, but I Tom Nichols: Is this too hard core? It's what I want to know, but I guess you could argue that given enough detail about the software it guess you could argue that given enough detail about the software it
could be inferred.could be inferred.
8.8. Contrast construction. Exactly what terms are subtracted from Contrast construction. Exactly what terms are subtracted from what. It might be useful to always define abstract names (e.g. what. It might be useful to always define abstract names (e.g. AUDSTIM, VISSTIM) instead of underlying psychological AUDSTIM, VISSTIM) instead of underlying psychological concepts. concepts.
Statistical Modeling3.3. 2-level, modality-generic Modeling Info2-level, modality-generic Modeling Info
1.1. Statistical model and software version used (e.g. 1-sample t on Statistical model and software version used (e.g. 1-sample t on intrasubject contrast data, SPM2 with updates as of xx/xx/xx). intrasubject contrast data, SPM2 with updates as of xx/xx/xx).
2.2. Whether first level intersubject variances are assumed to be Whether first level intersubject variances are assumed to be homogeneous (SPM & simple summary stat methods: yes; FSL: homogeneous (SPM & simple summary stat methods: yes; FSL: no). no).
3.3. If multiple measurements per subject, method to account for within If multiple measurements per subject, method to account for within subject correlation. (e.g. SPM: 'Within-subject variance-covariance subject correlation. (e.g. SPM: 'Within-subject variance-covariance matrix estimated at F-significant voxels (P<0.001), then pooled over matrix estimated at F-significant voxels (P<0.001), then pooled over whole brain'). Jesper Andersson request: Variance correction whole brain'). Jesper Andersson request: Variance correction corresponding to within-subject variance-covariance matrix, so corresponding to within-subject variance-covariance matrix, so simply some measure of nonsphericitysimply some measure of nonsphericity..
Statistical Modeling
4.4. 3rd-level group difference modeling info 3rd-level group difference modeling info
1.1. Statistical model and software version used (if different from 1/2) Statistical model and software version used (if different from 1/2) (e.g. 2-sample unpaired t on contrast images). (e.g. 2-sample unpaired t on contrast images).
Statistical Inference1.1. Inference on Statistic Image (thresholding) Inference on Statistic Image (thresholding)
• Type of search region considered, and the volume in voxels or Type of search region considered, and the volume in voxels or CC. If not whole brain, how region was found; method for CC. If not whole brain, how region was found; method for constructing region should be independent of present statistic constructing region should be independent of present statistic image. image.
• If threshold used for inference and threshold used for If threshold used for inference and threshold used for visualization in figures is different, clearly state so and list visualization in figures is different, clearly state so and list each. each.
• All inferences must explicitly state if they are corrected for All inferences must explicitly state if they are corrected for multiple comparisons, and if so, what method and over what multiple comparisons, and if so, what method and over what region. region.
• If correction is limited to a small volume, the method for selecting the If correction is limited to a small volume, the method for selecting the region should be stated explicitly.region should be stated explicitly.
• If no formal multiple comparisons method is used, the inference must If no formal multiple comparisons method is used, the inference must
be explicitly labeled "uncorrected".be explicitly labeled "uncorrected".
Statistical Inference1.1. Inference on Statistic Image (thresholding)…Inference on Statistic Image (thresholding)…
• There was some disagreement over this topic in the discussion There was some disagreement over this topic in the discussion group. While most of the discussants felt that it should be group. While most of the discussants felt that it should be acceptable to report uncorrected statistics in some cases, there acceptable to report uncorrected statistics in some cases, there was also widespread feeling that current reporting standards was also widespread feeling that current reporting standards are too loose. The following comments provide a view of the are too loose. The following comments provide a view of the range of opinions: range of opinions:
Keith Worsley: Keith Worsley: • I've always advocated doing both i.e. labelling the 'confirmed' ones with I've always advocated doing both i.e. labelling the 'confirmed' ones with
a corrected P-value < 0.05, and reporting anything else as 'unconfirmed' a corrected P-value < 0.05, and reporting anything else as 'unconfirmed' or speculative or suggestive etc. (like PCA/ICA - but we're working on or speculative or suggestive etc. (like PCA/ICA - but we're working on this!) - as long as it's clear, I don't see that it matters too muchthis!) - as long as it's clear, I don't see that it matters too much
Statistical Inference1.1. Inference on Statistic Image (thresholding)…Inference on Statistic Image (thresholding)…
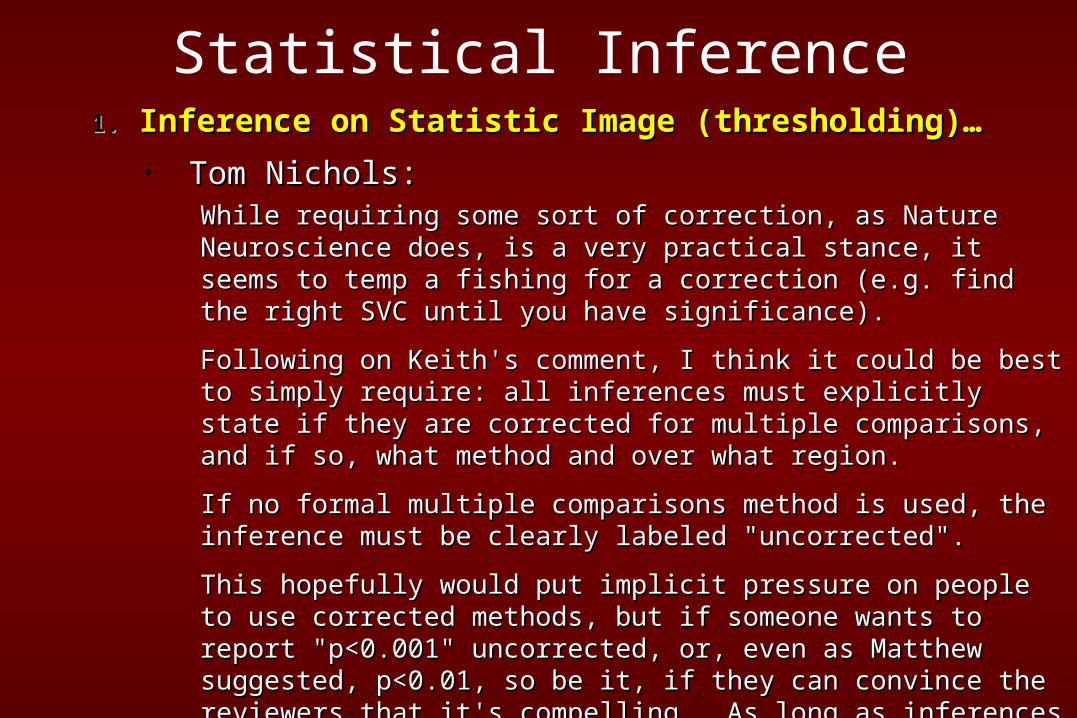
• Tom Nichols:Tom Nichols:While requiring some sort of correction, as Nature Neuroscience does, is a very While requiring some sort of correction, as Nature Neuroscience does, is a very practical stance, it seems to temp a fishing for a correction (e.g. find the right practical stance, it seems to temp a fishing for a correction (e.g. find the right SVC until you have significance).SVC until you have significance).
Following on Keith's comment, I think it could be best to simply require: all Following on Keith's comment, I think it could be best to simply require: all inferences must explicitly state if they are corrected for multiple comparisons, inferences must explicitly state if they are corrected for multiple comparisons, and if so, what method and over what region.and if so, what method and over what region.
If no formal multiple comparisons method is used, the inference must be clearly If no formal multiple comparisons method is used, the inference must be clearly labeled "uncorrected".labeled "uncorrected".
This hopefully would put implicit pressure on people to use corrected methods, This hopefully would put implicit pressure on people to use corrected methods, but if someone wants to report "p<0.001" uncorrected, or, even as Matthew but if someone wants to report "p<0.001" uncorrected, or, even as Matthew suggested, p<0.01, so be it, if they can convince the reviewers that it's suggested, p<0.01, so be it, if they can convince the reviewers that it's compelling. As long as inferences are clearly labeled, I think people can do compelling. As long as inferences are clearly labeled, I think people can do what they want. (Liberal inferences will be seen as weak evidence, and that's what they want. (Liberal inferences will be seen as weak evidence, and that's that.)that.)
Statistical Inference1.1. Inference on Statistic Image (thresholding)…Inference on Statistic Image (thresholding)…
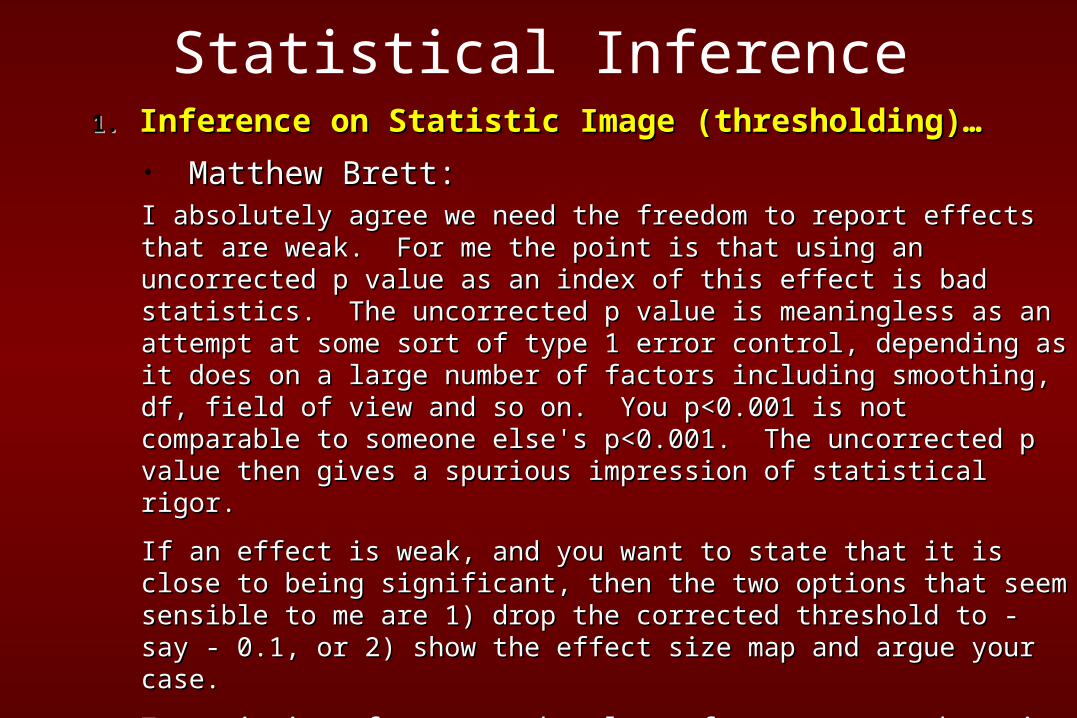
• Matthew Brett:Matthew Brett:I absolutely agree we need the freedom to report effects that are weak. For me the I absolutely agree we need the freedom to report effects that are weak. For me the point is that using an uncorrected p value as an index of this effect is bad statistics. point is that using an uncorrected p value as an index of this effect is bad statistics. The uncorrected p value is meaningless as an attempt at some sort of type 1 error The uncorrected p value is meaningless as an attempt at some sort of type 1 error control, depending as it does on a large number of factors including smoothing, df, control, depending as it does on a large number of factors including smoothing, df, field of view and so on. You p<0.001 is not comparable to someone else's p<0.001. field of view and so on. You p<0.001 is not comparable to someone else's p<0.001. The uncorrected p value then gives a spurious impression of statistical rigor.The uncorrected p value then gives a spurious impression of statistical rigor.
If an effect is weak, and you want to state that it is close to being significant, then the If an effect is weak, and you want to state that it is close to being significant, then the two options that seem sensible to me are 1) drop the corrected threshold to - say - 0.1, two options that seem sensible to me are 1) drop the corrected threshold to - say - 0.1, or 2) show the effect size map and argue your case.or 2) show the effect size map and argue your case.
To me it is unfortunate that lots of young researchers in FMRI seem to believe that To me it is unfortunate that lots of young researchers in FMRI seem to believe that uncorrected p<0.001 is in some magical sense 'sort of significant' - and it's such an uncorrected p<0.001 is in some magical sense 'sort of significant' - and it's such an unreliable rule of thumb, and so confusing for people entering the field, that we unreliable rule of thumb, and so confusing for people entering the field, that we should really try and move away from that.should really try and move away from that.

Statistical Inference
1.1. ROI AnalysisROI Analysis
• How were ROI's defined (e.g., functional versus anatomical How were ROI's defined (e.g., functional versus anatomical localizer)? localizer)?
• How was signal extracted within ROI?How was signal extracted within ROI?
Remerciements
• Jorge Armony, Ph.D.
• Claudine Gauthier, M.Sc.
• Rick Hoge, Ph.D.
• Julien Doyon, Ph.D.
Pour obtenir les diapos:http://unfweb.criugm.qc.ca/oury/downloads.html
Référence IRMf recommendée
Sinauer AssociatesPublisher