Embed Size (px)
Citation preview
NATIONAL PRICE AND SALARYSTATISTICS -EXPRESSED IN EUROSpecially produced for ESA, European Space Agency
STATISTIQUES NATIONALES DES PRIXET DES SALAIRES -EXPRIMÉES EN EUROProduites spécialement pour l’ASE, Agence Spatiale Européenne
ESA/IMT-C (97)
ANNUAL PUBLICATION: ALL SERIES FROM 2002 AND 2003
PUBLICATION ANNUELLE: TOUTES LES SERIES DE 2002 ET 2003
21 June 2004
2
Notice
Since 1996, this Bulletin has been published by EUROSTAT under contract from ESA.
In November 2003, EUROSTAT notified ESA that the European Commission haddecided to reorganise EUROSTAT and to re-focus its activities onto its core business,which is the production of Community Statistics within the framework of the EuropeanStatistical system. Furthermore, EUROSTAT stated that it would not be able to continueto produce this customised bulletin of price and salary data for ESA beyond theDecember 2003 issue.
The calculations and publication of the document have been contracted out byEUROSTAT and the Contractor since February 2003 has been the company Ariane 11,registered in Luxembourg.
ESA has concluded a contract directly with Ariane 11, to ensure the continuation of thepublication of this Bulletin using the same methodology and sources of data aspreviously, including data provided by EUROSTAT.
The validation of the publication will now be undertaken by ESA.
3
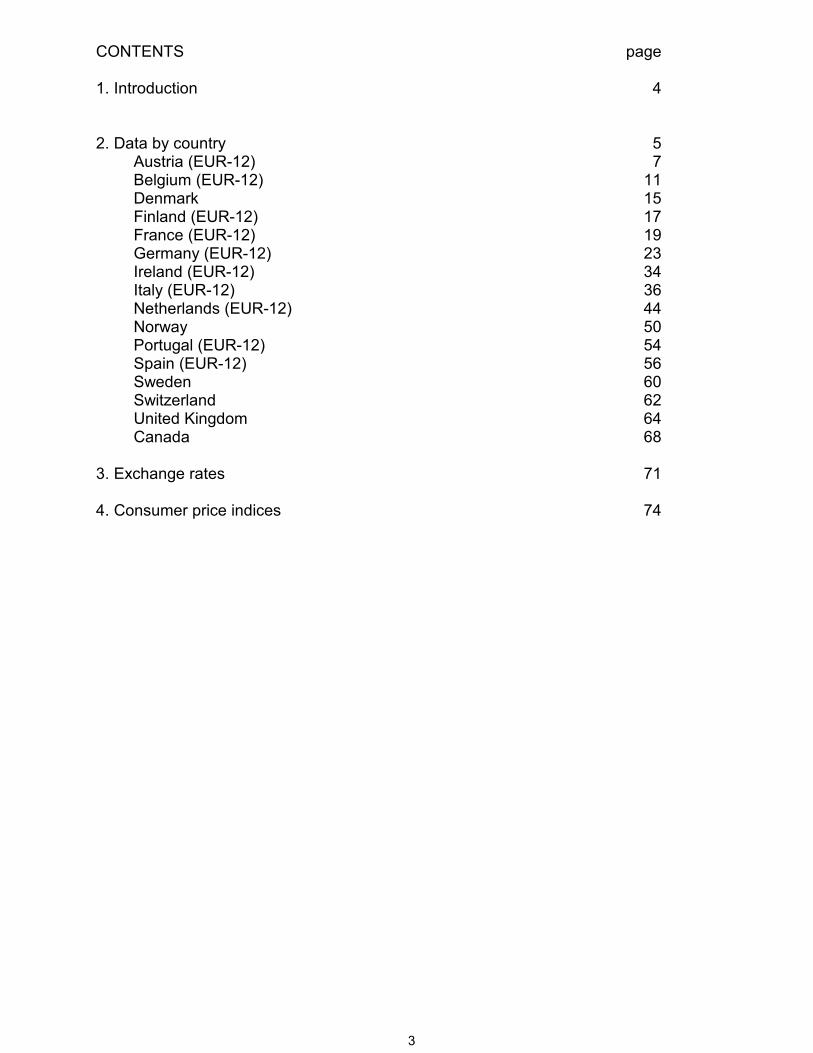
CONTENTS page
1. Introduction 4
2. Data by country 5Austria (EUR-12) 7Belgium (EUR-12) 11Denmark 15Finland (EUR-12) 17France (EUR-12) 19Germany (EUR-12) 23Ireland (EUR-12) 34Italy (EUR-12) 36Netherlands (EUR-12) 44Norway 50Portugal (EUR-12) 54Spain (EUR-12) 56Sweden 60Switzerland 62United Kingdom 64Canada 68
3. Exchange rates 71
4. Consumer price indices 74
4
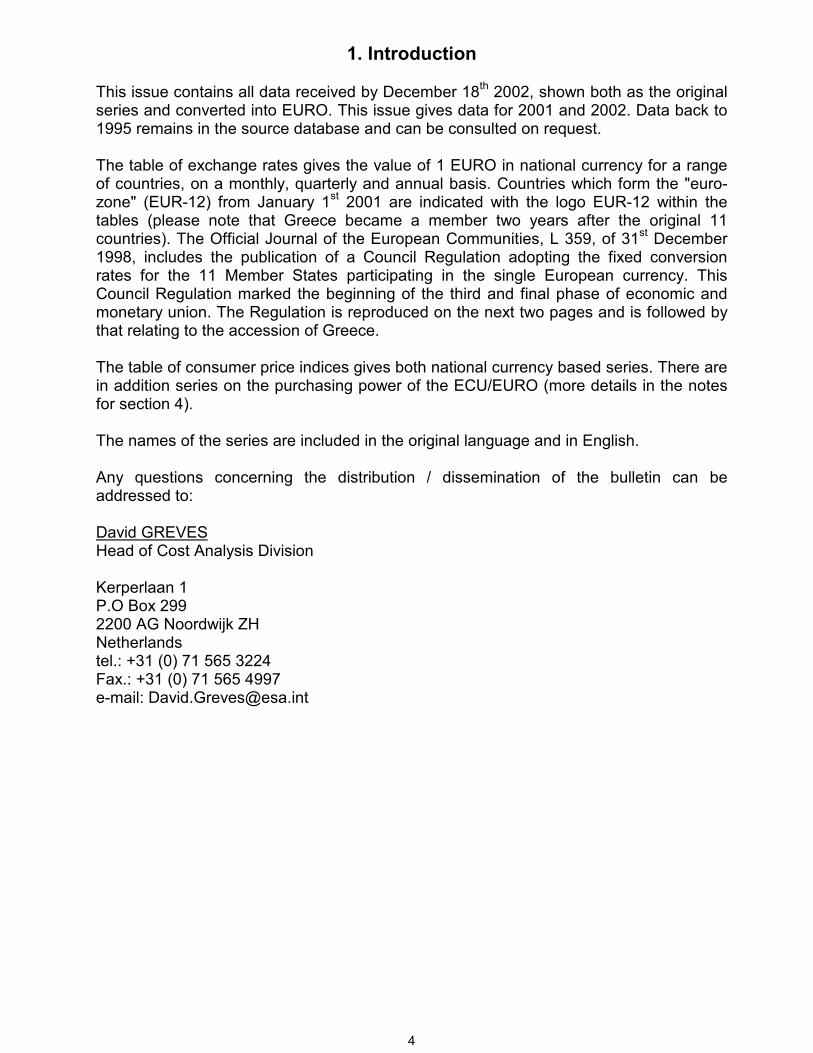
1. Introduction
This issue contains all data received by December 18th 2002, shown both as the originalseries and converted into EURO. This issue gives data for 2001 and 2002. Data back to1995 remains in the source database and can be consulted on request.
The table of exchange rates gives the value of 1 EURO in national currency for a rangeof countries, on a monthly, quarterly and annual basis. Countries which form the "euro-zone" (EUR-12) from January 1st 2001 are indicated with the logo EUR-12 within thetables (please note that Greece became a member two years after the original 11countries). The Official Journal of the European Communities, L 359, of 31st December1998, includes the publication of a Council Regulation adopting the fixed conversionrates for the 11 Member States participating in the single European currency. ThisCouncil Regulation marked the beginning of the third and final phase of economic andmonetary union. The Regulation is reproduced on the next two pages and is followed bythat relating to the accession of Greece.
The table of consumer price indices gives both national currency based series. There arein addition series on the purchasing power of the ECU/EURO (more details in the notesfor section 4).
The names of the series are included in the original language and in English.
Any questions concerning the distribution / dissemination of the bulletin can beaddressed to:
David GREVESHead of Cost Analysis Division
Kerperlaan 1P.O Box 2992200 AG Noordwijk ZHNetherlandstel.: +31 (0) 71 565 3224Fax.: +31 (0) 71 565 4997e-mail: [email protected]
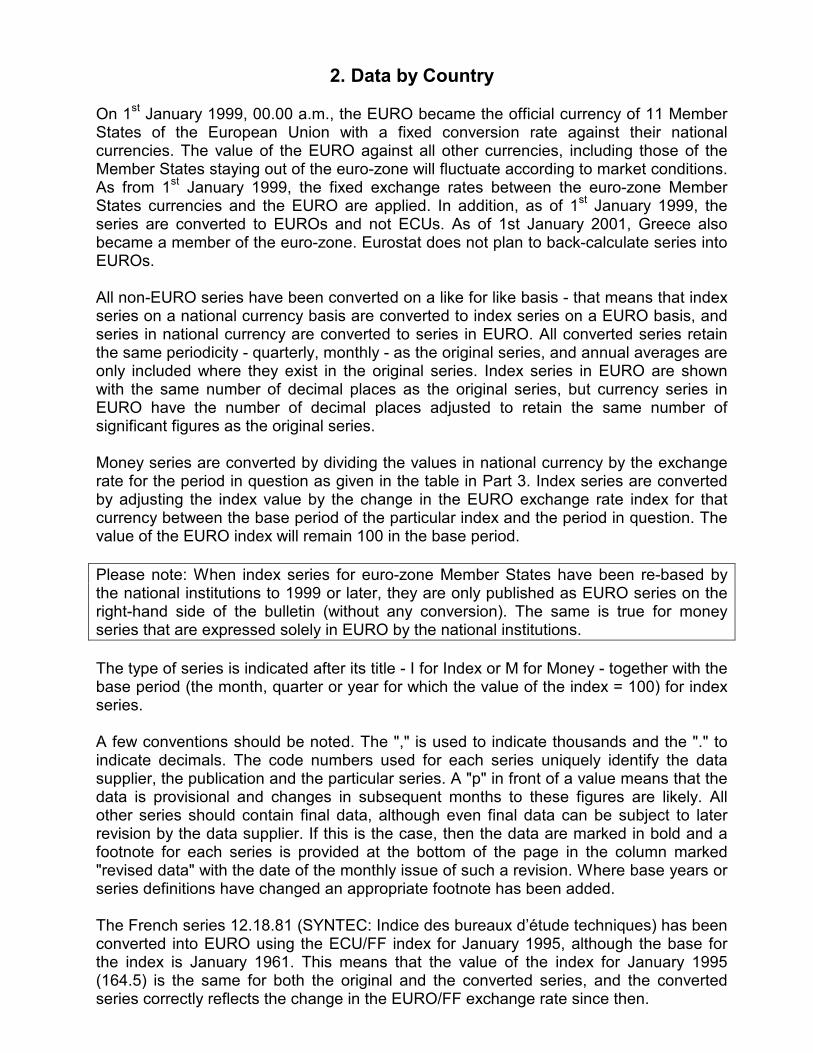
2. Data by Country
On 1st January 1999, 00.00 a.m., the EURO became the official currency of 11 MemberStates of the European Union with a fixed conversion rate against their nationalcurrencies. The value of the EURO against all other currencies, including those of theMember States staying out of the euro-zone will fluctuate according to market conditions.As from 1st January 1999, the fixed exchange rates between the euro-zone MemberStates currencies and the EURO are applied. In addition, as of 1st January 1999, theseries are converted to EUROs and not ECUs. As of 1st January 2001, Greece alsobecame a member of the euro-zone. Eurostat does not plan to back-calculate series intoEUROs.
All non-EURO series have been converted on a like for like basis - that means that indexseries on a national currency basis are converted to index series on a EURO basis, andseries in national currency are converted to series in EURO. All converted series retainthe same periodicity - quarterly, monthly - as the original series, and annual averages areonly included where they exist in the original series. Index series in EURO are shownwith the same number of decimal places as the original series, but currency series inEURO have the number of decimal places adjusted to retain the same number ofsignificant figures as the original series.
Money series are converted by dividing the values in national currency by the exchangerate for the period in question as given in the table in Part 3. Index series are convertedby adjusting the index value by the change in the EURO exchange rate index for thatcurrency between the base period of the particular index and the period in question. Thevalue of the EURO index will remain 100 in the base period.
Please note: When index series for euro-zone Member States have been re-based bythe national institutions to 1999 or later, they are only published as EURO series on theright-hand side of the bulletin (without any conversion). The same is true for moneyseries that are expressed solely in EURO by the national institutions.
The type of series is indicated after its title - I for Index or M for Money - together with thebase period (the month, quarter or year for which the value of the index = 100) for indexseries.
A few conventions should be noted. The "," is used to indicate thousands and the "." toindicate decimals. The code numbers used for each series uniquely identify the datasupplier, the publication and the particular series. A "p" in front of a value means that thedata is provisional and changes in subsequent months to these figures are likely. Allother series should contain final data, although even final data can be subject to laterrevision by the data supplier. If this is the case, then the data are marked in bold and afootnote for each series is provided at the bottom of the page in the column marked"revised data" with the date of the monthly issue of such a revision. Where base years orseries definitions have changed an appropriate footnote has been added.
The French series 12.18.81 (SYNTEC: Indice des bureaux d’étude techniques) has beenconverted into EURO using the ECU/FF index for January 1995, although the base forthe index is January 1961. This means that the value of the index for January 1995(164.5) is the same for both the original and the converted series, and the convertedseries correctly reflects the change in the EURO/FF exchange rate since then.
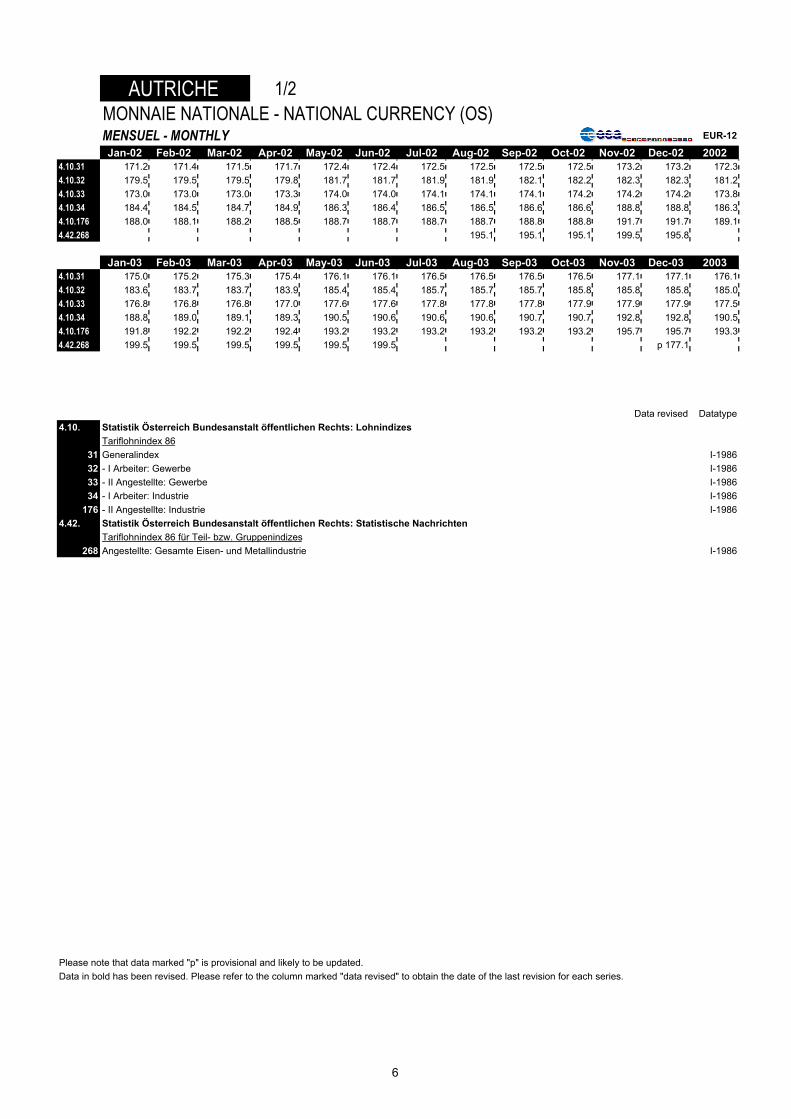
AUTRICHE 1/2MONNAIE NATIONALE - NATIONAL CURRENCY (OS) MENSUEL - MONTHLY EUR-12
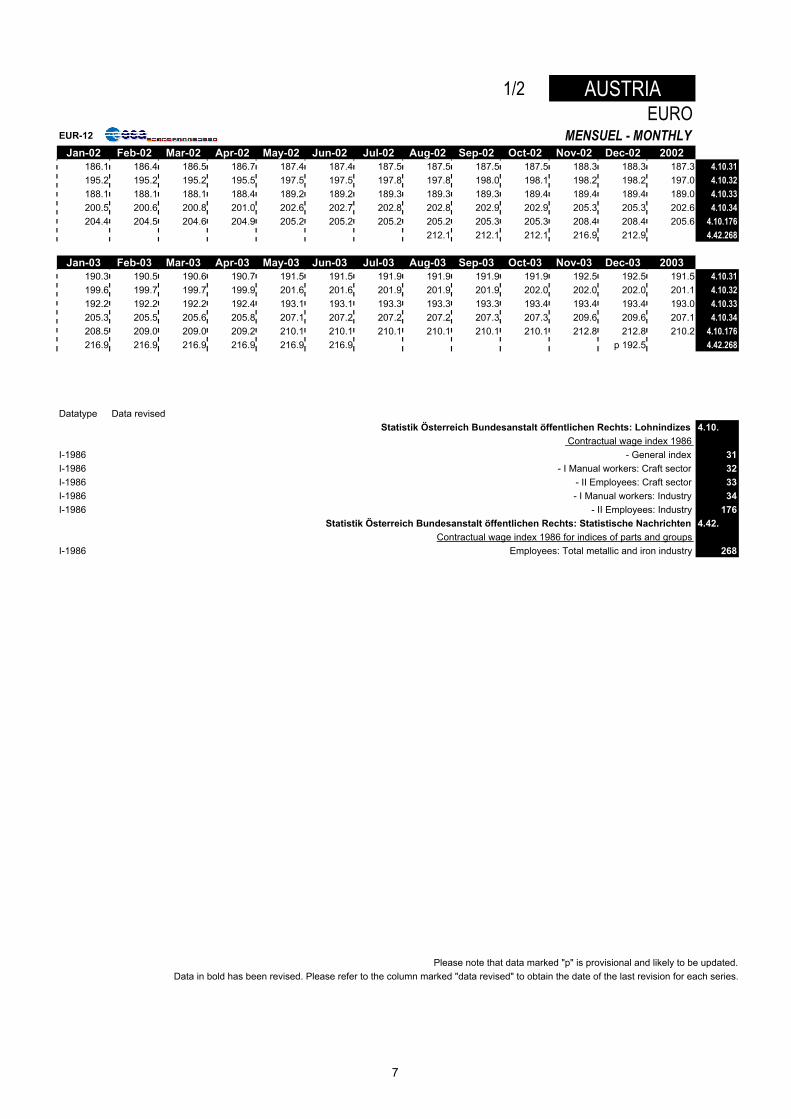
Jan-02 Feb-02 Mar-02 Apr-02 May-02 Jun-02 Jul-02 Aug-02 Sep-02 Oct-02 Nov-02 Dec-02 20024.10.31 171.2 171.4 171.5 171.7 172.4 172.4 172.5 172.5 172.5 172.5 173.2 173.2 172.34.10.32 179.5 179.5 179.5 179.8 181.7 181.7 181.9 181.9 182.1 182.2 182.3 182.3 181.24.10.33 173.0 173.0 173.0 173.3 174.0 174.0 174.1 174.1 174.1 174.2 174.2 174.2 173.84.10.34 184.4 184.5 184.7 184.9 186.3 186.4 186.5 186.5 186.6 186.6 188.8 188.8 186.34.10.176 188.0 188.1 188.2 188.5 188.7 188.7 188.7 188.7 188.8 188.8 191.7 191.7 189.14.42.268 195.1 195.1 195.1 199.5 195.8
Jan-03 Feb-03 Mar-03 Apr-03 May-03 Jun-03 Jul-03 Aug-03 Sep-03 Oct-03 Nov-03 Dec-03 20034.10.31 175.0 175.2 175.3 175.4 176.1 176.1 176.5 176.5 176.5 176.5 177.1 177.1 176.14.10.32 183.6 183.7 183.7 183.9 185.4 185.4 185.7 185.7 185.7 185.8 185.8 185.8 185.04.10.33 176.8 176.8 176.8 177.0 177.6 177.6 177.8 177.8 177.8 177.9 177.9 177.9 177.54.10.34 188.8 189.0 189.1 189.3 190.5 190.6 190.6 190.6 190.7 190.7 192.8 192.8 190.54.10.176 191.8 192.2 192.2 192.4 193.2 193.2 193.2 193.2 193.2 193.2 195.7 195.7 193.34.42.268 199.5 199.5 199.5 199.5 199.5 199.5 p 177.1
Data revised Datatype4.10. Statistik Österreich Bundesanstalt öffentlichen Rechts: Lohnindizes
Tariflohnindex 8631 Generalindex I-198632 - I Arbeiter: Gewerbe I-198633 - II Angestellte: Gewerbe I-198634 - I Arbeiter: Industrie I-1986
176 - II Angestellte: Industrie I-19864.42. Statistik Österreich Bundesanstalt öffentlichen Rechts: Statistische Nachrichten
Tariflohnindex 86 für Teil- bzw. Gruppenindizes268 Angestellte: Gesamte Eisen- und Metallindustrie I-1986
Please note that data marked "p" is provisional and likely to be updated.Data in bold has been revised. Please refer to the column marked "data revised" to obtain the date of the last revision for each series.
6
1/2 AUSTRIAEURO
EUR-12 MENSUEL - MONTHLYJan-02 Feb-02 Mar-02 Apr-02 May-02 Jun-02 Jul-02 Aug-02 Sep-02 Oct-02 Nov-02 Dec-02 2002
186.1 186.4 186.5 186.7 187.4 187.4 187.5 187.5 187.5 187.5 188.3 188.3 187.3 4.10.31195.2 195.2 195.2 195.5 197.5 197.5 197.8 197.8 198.0 198.1 198.2 198.2 197.0 4.10.32188.1 188.1 188.1 188.4 189.2 189.2 189.3 189.3 189.3 189.4 189.4 189.4 189.0 4.10.33200.5 200.6 200.8 201.0 202.6 202.7 202.8 202.8 202.9 202.9 205.3 205.3 202.6 4.10.34204.4 204.5 204.6 204.9 205.2 205.2 205.2 205.2 205.3 205.3 208.4 208.4 205.6 4.10.176
212.1 212.1 212.1 216.9 212.9 4.42.268
Jan-03 Feb-03 Mar-03 Apr-03 May-03 Jun-03 Jul-03 Aug-03 Sep-03 Oct-03 Nov-03 Dec-03 2003190.3 190.5 190.6 190.7 191.5 191.5 191.9 191.9 191.9 191.9 192.5 192.5 191.5 4.10.31199.6 199.7 199.7 199.9 201.6 201.6 201.9 201.9 201.9 202.0 202.0 202.0 201.1 4.10.32192.2 192.2 192.2 192.4 193.1 193.1 193.3 193.3 193.3 193.4 193.4 193.4 193.0 4.10.33205.3 205.5 205.6 205.8 207.1 207.2 207.2 207.2 207.3 207.3 209.6 209.6 207.1 4.10.34208.5 209.0 209.0 209.2 210.1 210.1 210.1 210.1 210.1 210.1 212.8 212.8 210.2 4.10.176216.9 216.9 216.9 216.9 216.9 216.9 p 192.5 4.42.268
Datatype Data revisedStatistik Österreich Bundesanstalt öffentlichen Rechts: Lohnindizes 4.10.
Contractual wage index 1986 I-1986 - General index 31I-1986 - I Manual workers: Craft sector 32I-1986 - II Employees: Craft sector 33I-1986 - I Manual workers: Industry 34I-1986 - II Employees: Industry 176
Statistik Österreich Bundesanstalt öffentlichen Rechts: Statistische Nachrichten 4.42.Contractual wage index 1986 for indices of parts and groups
I-1986 Employees: Total metallic and iron industry 268
Please note that data marked "p" is provisional and likely to be updated.Data in bold has been revised. Please refer to the column marked "data revised" to obtain the date of the last revision for each series.
7
AUTRICHE 2/2MONNAIE NATIONALE - NATIONAL CURRENCY (OS) MENSUEL - MONTHLY EUR-12
Jan-02 Feb-02 Mar-02 Apr-02 May-02 Jun-02 Jul-02 Aug-02 Sep-02 Oct-02 Nov-02 Dec-02 20024.9.3324.9.3334.9.3344.9.3354.9.3364.9.3374.9.3384.9.3394.9.340
Jan-03 Feb-03 Mar-03 Apr-03 May-03 Jun-03 Jul-03 Aug-03 Sep-03 Oct-03 Nov-03 Dec-03 20034.9.3324.9.3334.9.3344.9.3354.9.3364.9.3374.9.3384.9.3394.9.340
Data revised Datatype4.9. Statistik Österreich Bundesanstalt öffentlichen Rechts: Statistische Nachrichten - Statistische Übersichten
4.3 Großhandelpreisindex332 - 51.43.1 Elektrische Haushaltsgeräte und Leuchten (1) I-2000333 - 51.43.2 Rundfunk- und Fernsehgeräte, Bild- und Tonträger (1) I-2000334 - 51.47.12 Nichtelektrische Haushaltsgeräte (1) I-2000335 - 51.51.12 Motorenbenzin (inkl. Diesel) (1) I-2000336 - 51.51.13 Sonstige Mineralölerzeugnisse (1) I-2000337 - 51.52.21 Eisen und Stahl (1) I-2000338 - 51.52.22 NE-Metalle (1) I-2000339 - 51.53.21 Sanitäre Einrichtungen (1) I-2000340 - 51.54.1 Bauelemente aus Metall und Installationsbedarf (1) I-2000
(1) Series 4.9.332 to 4.9.340 are new series that replace 4.9.225 to 4.9.233 - change of base year.Please note that data marked "p" is provisional and likely to be updated.Data in bold has been revised. Please refer to the column marked "data revised" to obtain the date of the last revision for each series.
8
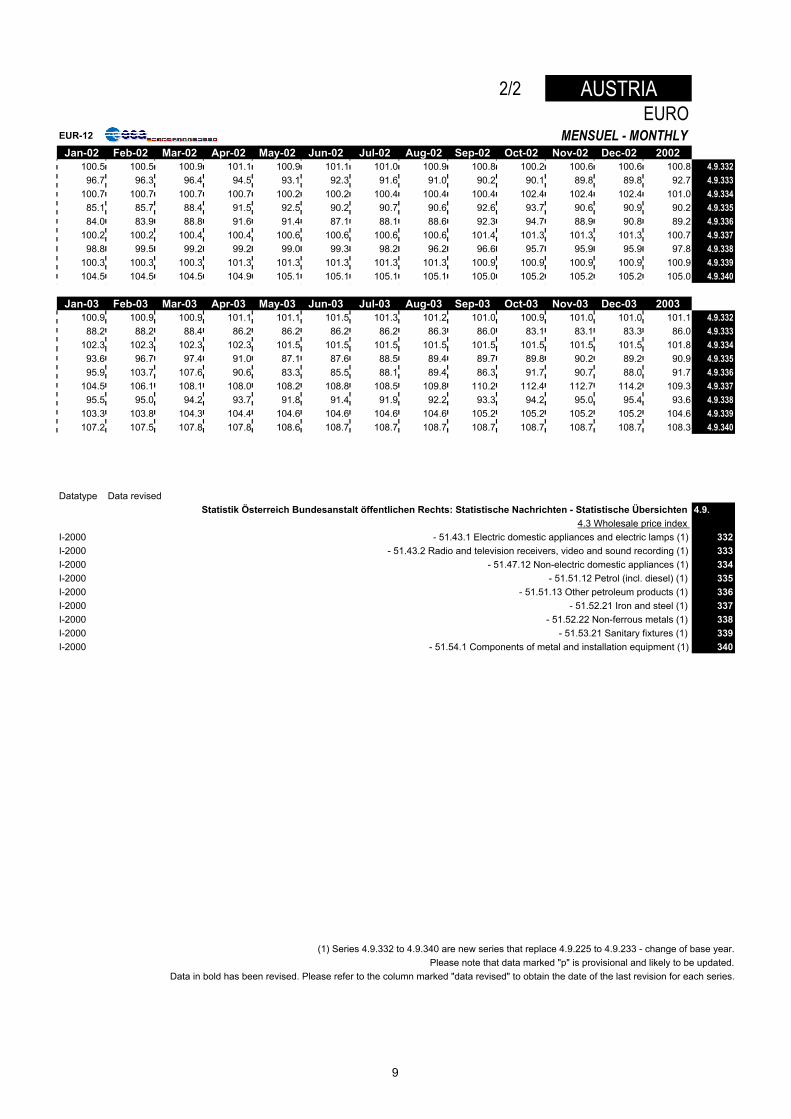
2/2 AUSTRIAEURO
EUR-12 MENSUEL - MONTHLYJan-02 Feb-02 Mar-02 Apr-02 May-02 Jun-02 Jul-02 Aug-02 Sep-02 Oct-02 Nov-02 Dec-02 2002
100.5 100.5 100.9 101.1 100.9 101.1 101.0 100.9 100.8 100.2 100.6 100.6 100.8 4.9.33296.7 96.3 96.4 94.5 93.1 92.3 91.6 91.0 90.2 90.1 89.8 89.8 92.7 4.9.333
100.7 100.7 100.7 100.7 100.2 100.2 100.4 100.4 100.4 102.4 102.4 102.4 101.0 4.9.33485.1 85.7 88.4 91.5 92.5 90.2 90.7 90.6 92.6 93.7 90.6 90.9 90.2 4.9.33584.0 83.9 88.8 91.6 91.4 87.1 88.1 88.6 92.3 94.7 88.9 90.8 89.2 4.9.336
100.2 100.2 100.4 100.4 100.6 100.6 100.6 100.6 101.4 101.3 101.3 101.3 100.7 4.9.33798.8 99.5 99.2 99.2 99.0 99.3 98.2 96.2 96.6 95.7 95.9 95.9 97.8 4.9.338
100.3 100.3 100.3 101.3 101.3 101.3 101.3 101.3 100.9 100.9 100.9 100.9 100.9 4.9.339104.5 104.5 104.5 104.9 105.1 105.1 105.1 105.1 105.0 105.2 105.2 105.2 105.0 4.9.340
Jan-03 Feb-03 Mar-03 Apr-03 May-03 Jun-03 Jul-03 Aug-03 Sep-03 Oct-03 Nov-03 Dec-03 2003100.9 100.9 100.9 101.1 101.1 101.5 101.3 101.2 101.0 100.9 101.0 101.0 101.1 4.9.33288.2 88.2 88.4 86.2 86.2 86.2 86.2 86.3 86.0 83.1 83.1 83.3 86.0 4.9.333
102.3 102.3 102.3 102.3 101.5 101.5 101.5 101.5 101.5 101.5 101.5 101.5 101.8 4.9.33493.6 96.7 97.4 91.0 87.1 87.6 88.5 89.4 89.7 89.8 90.2 89.2 90.9 4.9.33595.9 103.7 107.6 90.6 83.3 85.5 88.1 89.4 86.3 91.7 90.7 88.0 91.7 4.9.336
104.5 106.1 108.1 108.0 108.2 108.8 108.5 109.8 110.2 112.4 112.7 114.2 109.3 4.9.33795.5 95.0 94.2 93.7 91.8 91.4 91.9 92.2 93.3 94.2 95.0 95.4 93.6 4.9.338
103.3 103.8 104.3 104.4 104.6 104.6 104.6 104.6 105.2 105.2 105.2 105.2 104.6 4.9.339107.2 107.5 107.8 107.8 108.6 108.7 108.7 108.7 108.7 108.7 108.7 108.7 108.3 4.9.340
Datatype Data revisedStatistik Österreich Bundesanstalt öffentlichen Rechts: Statistische Nachrichten - Statistische Übersichten 4.9.
4.3 Wholesale price index I-2000 - 51.43.1 Electric domestic appliances and electric lamps (1) 332I-2000 - 51.43.2 Radio and television receivers, video and sound recording (1) 333I-2000 - 51.47.12 Non-electric domestic appliances (1) 334I-2000 - 51.51.12 Petrol (incl. diesel) (1) 335I-2000 - 51.51.13 Other petroleum products (1) 336I-2000 - 51.52.21 Iron and steel (1) 337I-2000 - 51.52.22 Non-ferrous metals (1) 338I-2000 - 51.53.21 Sanitary fixtures (1) 339I-2000 - 51.54.1 Components of metal and installation equipment (1) 340
(1) Series 4.9.332 to 4.9.340 are new series that replace 4.9.225 to 4.9.233 - change of base year.Please note that data marked "p" is provisional and likely to be updated.
Data in bold has been revised. Please refer to the column marked "data revised" to obtain the date of the last revision for each series.
9
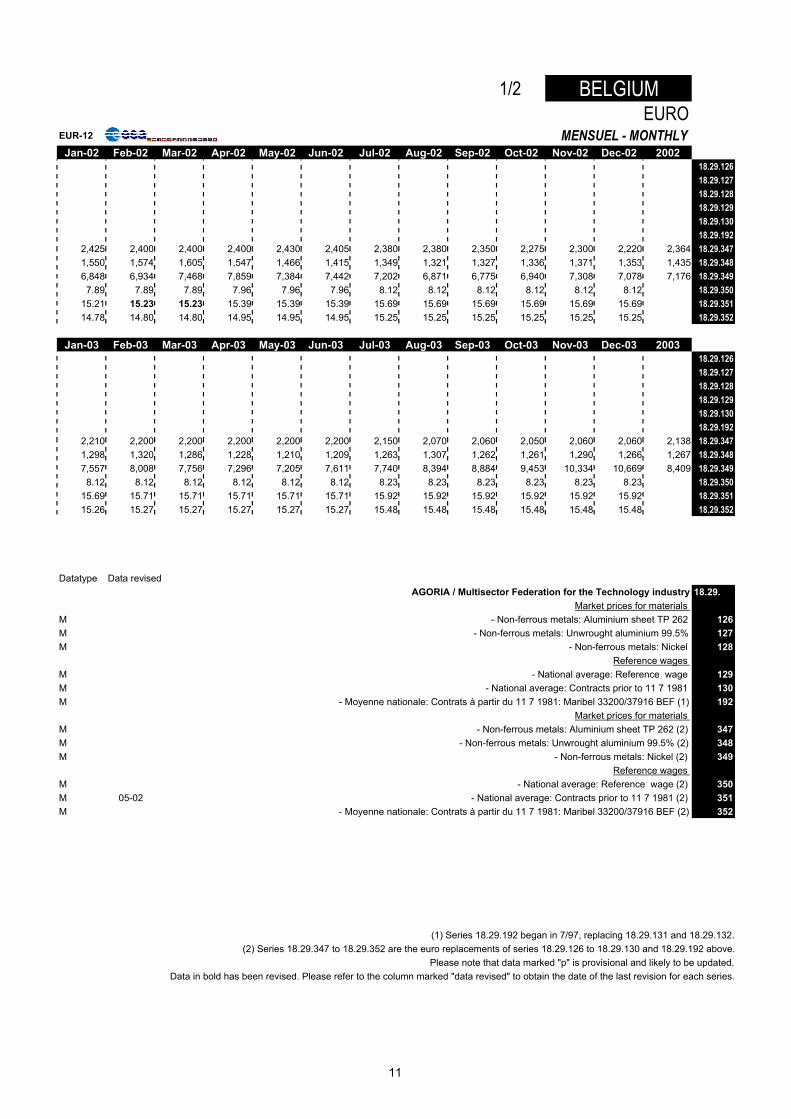
BELGIQUE 1/2MONNAIE NATIONALE - NATIONAL CURRENCY (BEF)MENSUEL - MONTHLY EUR-12
Jan-02 Feb-02 Mar-02 Apr-02 May-02 Jun-02 Jul-02 Aug-02 Sep-02 Oct-02 Nov-02 Dec-02 200218.29.12618.29.12718.29.12818.29.12918.29.13018.29.19218.29.34718.29.34818.29.34918.29.35018.29.35118.29.352
Jan-03 Feb-03 Mar-03 Apr-03 May-03 Jun-03 Jul-03 Aug-03 Sep-03 Oct-03 Nov-03 Dec-03 200318.29.12618.29.12718.29.12818.29.12918.29.13018.29.19218.29.34718.29.34818.29.34918.29.35018.29.35118.29.352
Data revised Datatype18.29. AGORIA / Multisector Federation for the Technology industry
Mercuriale des matériaux126 - Métaux non ferreux: Aluminium tôles TP 262 M127 - Métaux non ferreux: Aluminium brut 99.5% M128 - Métaux non ferreux: Nickel M
Salaires de référence129 - Moyenne nationale: Salaire de référence M130 - Moyenne nationale: Contrats avant le 11 7 1981 M192 - Moyenne nationale: Contrats à partir du 11 7 1981: Maribel 33200/37916 BEF (1) M
Mercuriale des matériaux347 - Métaux non ferreux: Aluminium tôles TP 262 (2) M348 - Métaux non ferreux: Aluminium brut 99.5% (2) M349 - Métaux non ferreux: Nickel (2) M
Salaires de référence350 - Moyenne nationale: Salaire de référence (2) M351 - Moyenne nationale: Contrats avant le 11 7 1981 (2) 05-02 M352 - Moyenne nationale: Contrats à partir du 11 7 1981: Maribel 33200/37916 BEF (2) M
(1) Series 18.29.192 began in 7/97, replacing 18.29.131 and 18.29.132.(2) Series 18.29.347 to 18.29.352 are the euro replacements of series 18.29.126 to 18.29.130 and 18.29.192 above.Please note that data marked "p" is provisional and likely to be updated.Data in bold has been revised. Please refer to the column marked "data revised" to obtain the date of the last revision for each series.
10
1/2 BELGIUMEURO
EUR-12 MENSUEL - MONTHLYJan-02 Feb-02 Mar-02 Apr-02 May-02 Jun-02 Jul-02 Aug-02 Sep-02 Oct-02 Nov-02 Dec-02 2002
18.29.12618.29.12718.29.12818.29.12918.29.13018.29.192
2,425 2,400 2,400 2,400 2,430 2,405 2,380 2,380 2,350 2,275 2,300 2,220 2,364 18.29.3471,550 1,574 1,605 1,547 1,466 1,415 1,349 1,321 1,327 1,336 1,371 1,353 1,435 18.29.3486,848 6,934 7,468 7,859 7,384 7,442 7,202 6,871 6,775 6,940 7,308 7,078 7,176 18.29.3497.89 7.89 7.89 7.96 7.96 7.96 8.12 8.12 8.12 8.12 8.12 8.12 18.29.350
15.21 15.23 15.23 15.39 15.39 15.39 15.69 15.69 15.69 15.69 15.69 15.69 18.29.35114.78 14.80 14.80 14.95 14.95 14.95 15.25 15.25 15.25 15.25 15.25 15.25 18.29.352
Jan-03 Feb-03 Mar-03 Apr-03 May-03 Jun-03 Jul-03 Aug-03 Sep-03 Oct-03 Nov-03 Dec-03 200318.29.12618.29.12718.29.12818.29.12918.29.13018.29.192
2,210 2,200 2,200 2,200 2,200 2,200 2,150 2,070 2,060 2,050 2,060 2,060 2,138 18.29.3471,298 1,320 1,286 1,228 1,210 1,209 1,263 1,307 1,262 1,261 1,290 1,266 1,267 18.29.3487,557 8,008 7,756 7,296 7,205 7,611 7,740 8,394 8,884 9,453 10,334 10,669 8,409 18.29.3498.12 8.12 8.12 8.12 8.12 8.12 8.23 8.23 8.23 8.23 8.23 8.23 18.29.350
15.69 15.71 15.71 15.71 15.71 15.71 15.92 15.92 15.92 15.92 15.92 15.92 18.29.35115.26 15.27 15.27 15.27 15.27 15.27 15.48 15.48 15.48 15.48 15.48 15.48 18.29.352
Datatype Data revisedAGORIA / Multisector Federation for the Technology industry 18.29.
Market prices for materials M - Non-ferrous metals: Aluminium sheet TP 262 126M - Non-ferrous metals: Unwrought aluminium 99.5% 127M - Non-ferrous metals: Nickel 128
Reference wages M - National average: Reference wage 129M - National average: Contracts prior to 11 7 1981 130M - Moyenne nationale: Contrats à partir du 11 7 1981: Maribel 33200/37916 BEF (1) 192
Market prices for materials M - Non-ferrous metals: Aluminium sheet TP 262 (2) 347M - Non-ferrous metals: Unwrought aluminium 99.5% (2) 348M - Non-ferrous metals: Nickel (2) 349
Reference wages M - National average: Reference wage (2) 350M 05-02 - National average: Contracts prior to 11 7 1981 (2) 351M - Moyenne nationale: Contrats à partir du 11 7 1981: Maribel 33200/37916 BEF (2) 352
(1) Series 18.29.192 began in 7/97, replacing 18.29.131 and 18.29.132.(2) Series 18.29.347 to 18.29.352 are the euro replacements of series 18.29.126 to 18.29.130 and 18.29.192 above.
Please note that data marked "p" is provisional and likely to be updated.Data in bold has been revised. Please refer to the column marked "data revised" to obtain the date of the last revision for each series.
11
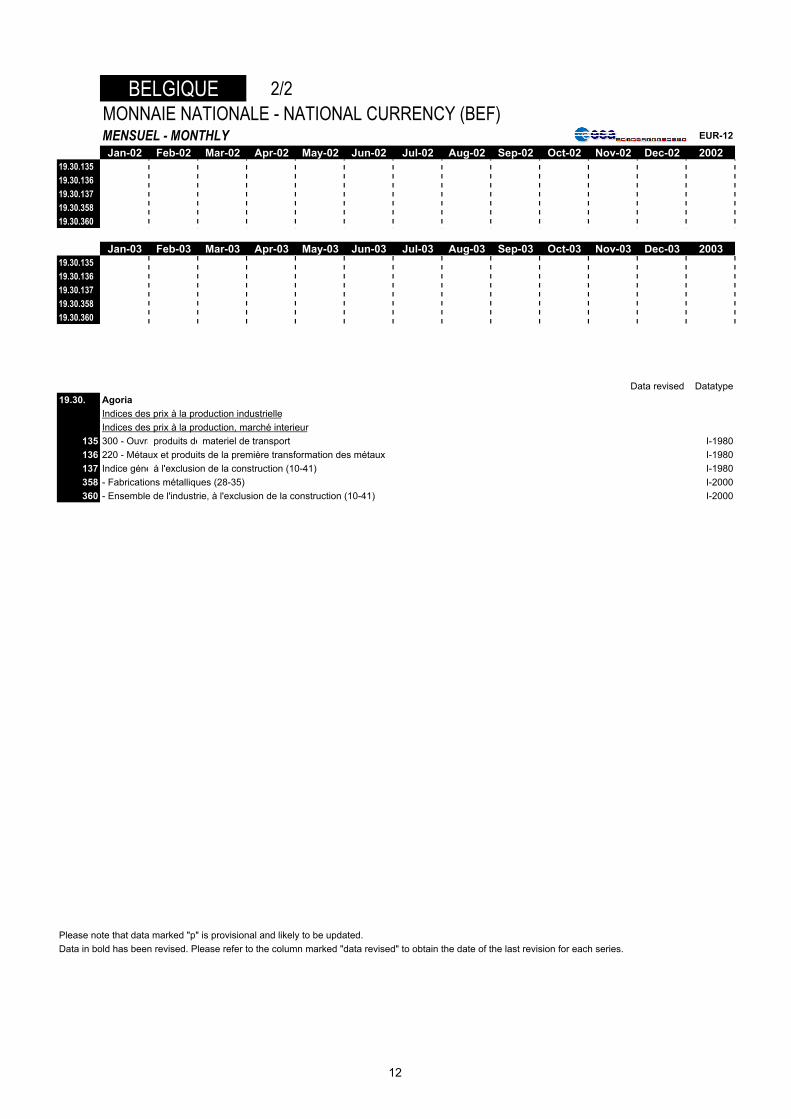
BELGIQUE 2/2MONNAIE NATIONALE - NATIONAL CURRENCY (BEF)MENSUEL - MONTHLY EUR-12
Jan-02 Feb-02 Mar-02 Apr-02 May-02 Jun-02 Jul-02 Aug-02 Sep-02 Oct-02 Nov-02 Dec-02 200219.30.13519.30.13619.30.13719.30.35819.30.360
Jan-03 Feb-03 Mar-03 Apr-03 May-03 Jun-03 Jul-03 Aug-03 Sep-03 Oct-03 Nov-03 Dec-03 200319.30.13519.30.13619.30.13719.30.35819.30.360
Data revised Datatype19.30. Agoria
Indices des prix à la production industrielleIndices des prix à la production, marché interieur
135 300 - Ouvra produits de materiel de transport I-1980136 220 - Métaux et produits de la première transformation des métaux I-1980137 Indice géné à l'exclusion de la construction (10-41) I-1980358 - Fabrications métalliques (28-35) I-2000360 - Ensemble de l'industrie, à l'exclusion de la construction (10-41) I-2000
Please note that data marked "p" is provisional and likely to be updated.Data in bold has been revised. Please refer to the column marked "data revised" to obtain the date of the last revision for each series.
12
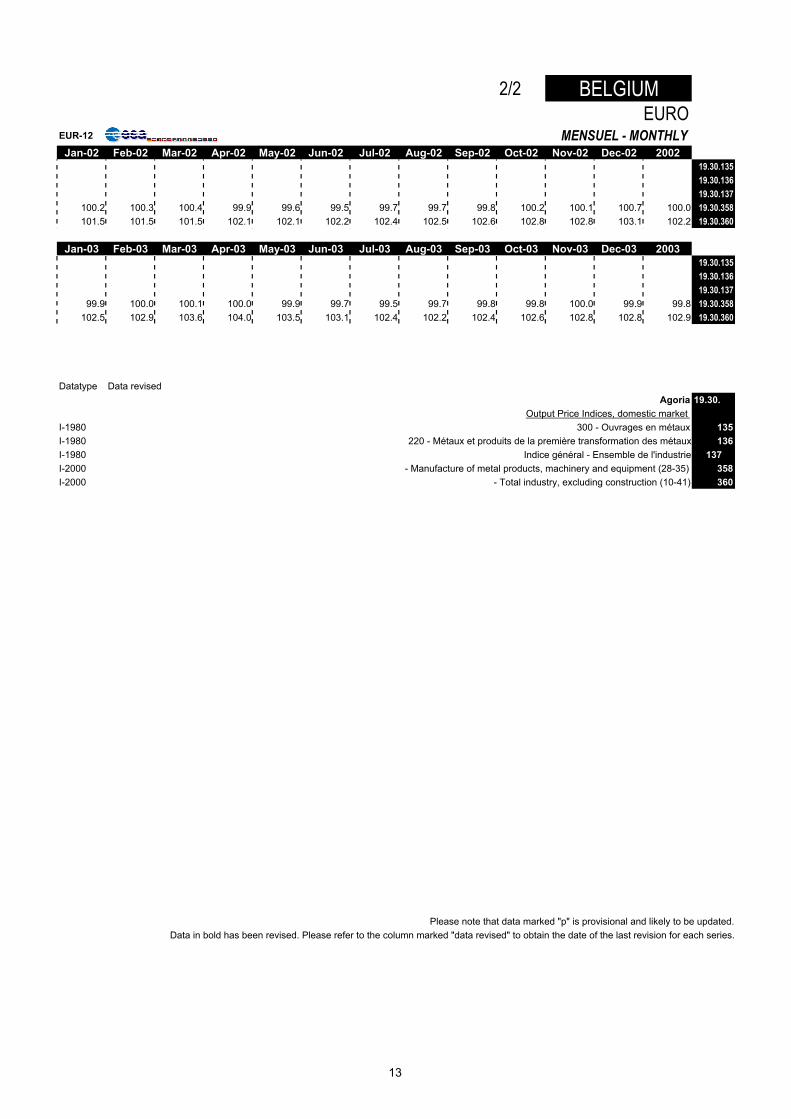
2/2 BELGIUMEURO
EUR-12 MENSUEL - MONTHLYJan-02 Feb-02 Mar-02 Apr-02 May-02 Jun-02 Jul-02 Aug-02 Sep-02 Oct-02 Nov-02 Dec-02 2002
19.30.13519.30.13619.30.137
100.2 100.3 100.4 99.9 99.6 99.5 99.7 99.7 99.8 100.2 100.1 100.7 100.0 19.30.358101.5 101.5 101.5 102.1 102.1 102.2 102.4 102.5 102.6 102.8 102.8 103.1 102.2 19.30.360
Jan-03 Feb-03 Mar-03 Apr-03 May-03 Jun-03 Jul-03 Aug-03 Sep-03 Oct-03 Nov-03 Dec-03 200319.30.13519.30.13619.30.137
99.9 100.0 100.1 100.0 99.9 99.7 99.5 99.7 99.8 99.8 100.0 99.9 99.8 19.30.358102.5 102.9 103.6 104.0 103.5 103.1 102.4 102.2 102.4 102.6 102.8 102.8 102.9 19.30.360
Datatype Data revisedAgoria 19.30.
Output Price Indices, domestic market I-1980 300 - Ouvrages en métaux 135I-1980 220 - Métaux et produits de la première transformation des métaux 136I-1980 Indice général - Ensemble de l'industrie 137I-2000 - Manufacture of metal products, machinery and equipment (28-35) 358I-2000 - Total industry, excluding construction (10-41) 360
Please note that data marked "p" is provisional and likely to be updated.Data in bold has been revised. Please refer to the column marked "data revised" to obtain the date of the last revision for each series.
13
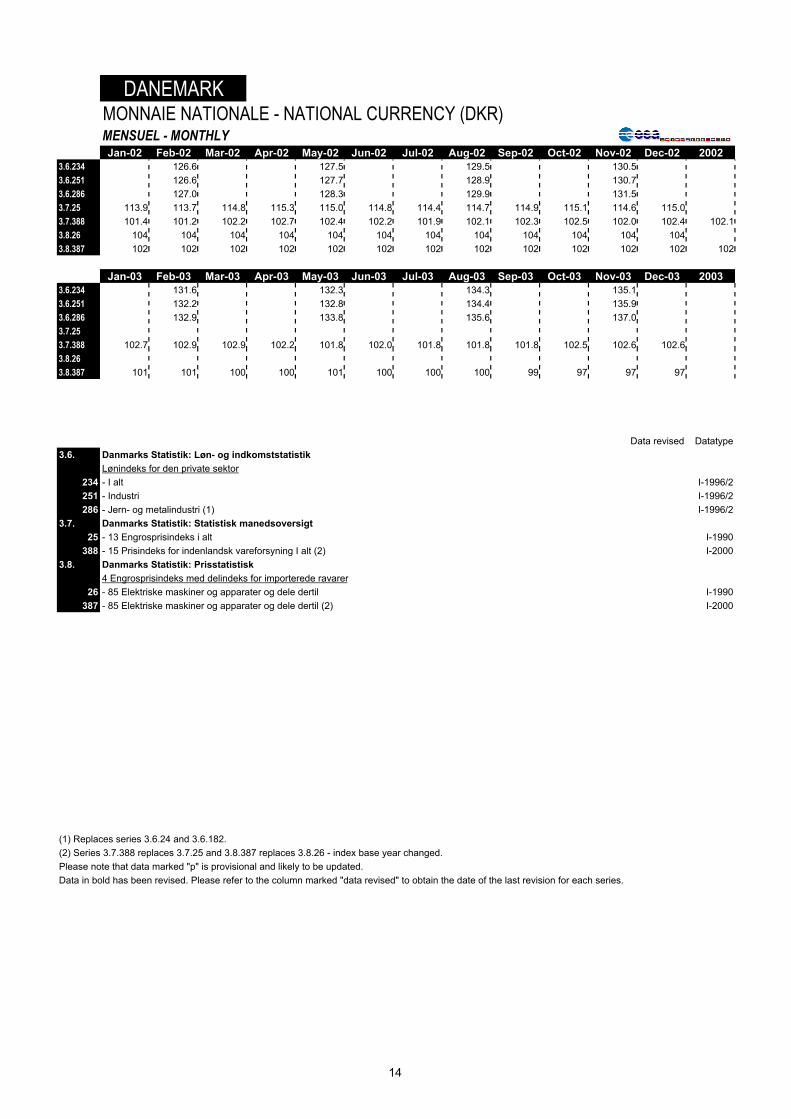
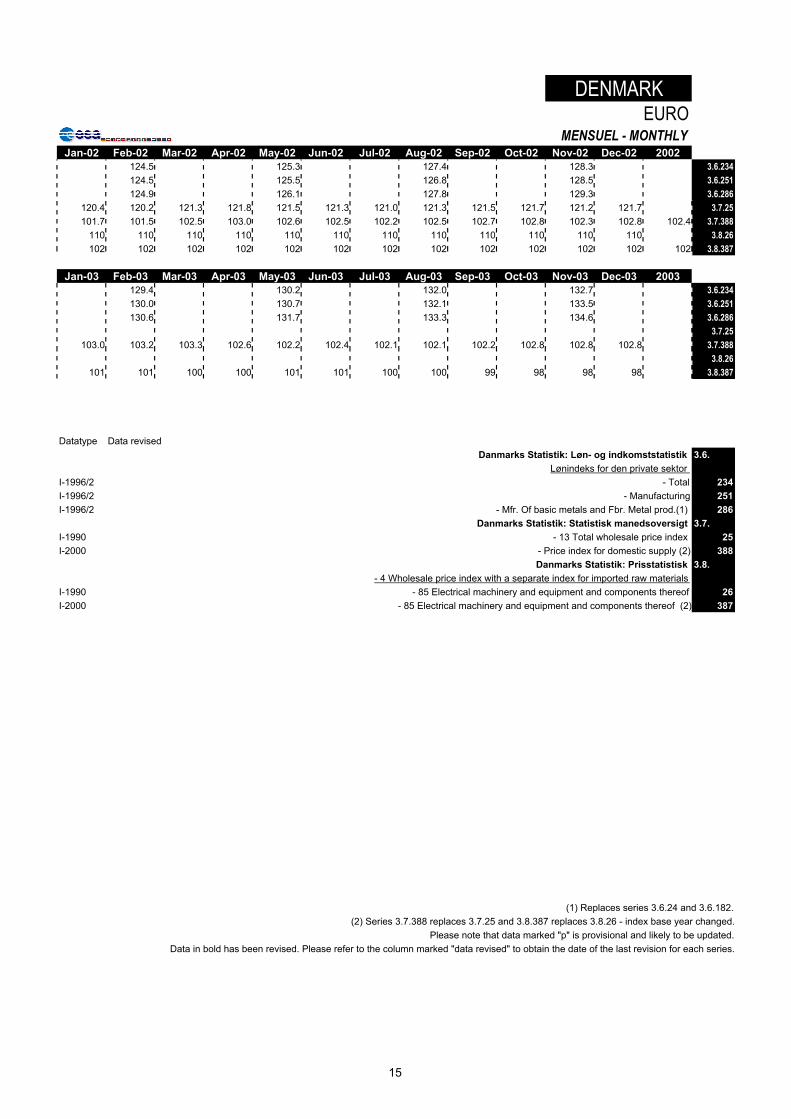
DANEMARKMONNAIE NATIONALE - NATIONAL CURRENCY (DKR)MENSUEL - MONTHLYJan-02 Feb-02 Mar-02 Apr-02 May-02 Jun-02 Jul-02 Aug-02 Sep-02 Oct-02 Nov-02 Dec-02 2002
3.6.234 126.6 127.5 129.5 130.53.6.251 126.6 127.7 128.9 130.73.6.286 127.0 128.3 129.9 131.53.7.25 113.9 113.7 114.8 115.3 115.0 114.8 114.4 114.7 114.9 115.1 114.6 115.03.7.388 101.4 101.2 102.2 102.7 102.4 102.2 101.9 102.1 102.3 102.5 102.0 102.4 102.13.8.26 104 104 104 104 104 104 104 104 104 104 104 1043.8.387 102 102 102 102 102 102 102 102 102 102 102 102 102
Jan-03 Feb-03 Mar-03 Apr-03 May-03 Jun-03 Jul-03 Aug-03 Sep-03 Oct-03 Nov-03 Dec-03 20033.6.234 131.6 132.3 134.3 135.13.6.251 132.2 132.8 134.4 135.93.6.286 132.9 133.8 135.6 137.03.7.253.7.388 102.7 102.9 102.9 102.2 101.8 102.0 101.8 101.8 101.8 102.5 102.6 102.63.8.263.8.387 101 101 100 100 101 100 100 100 99 97 97 97
Data revised Datatype3.6. Danmarks Statistik: Løn- og indkomststatistik
Lønindeks for den private sektor234 - I alt I-1996/2251 - Industri I-1996/2286 - Jern- og metalindustri (1) I-1996/2
3.7. Danmarks Statistik: Statistisk manedsoversigt25 - 13 Engrosprisindeks i alt I-1990
388 - 15 Prisindeks for indenlandsk vareforsyning I alt (2) I-20003.8. Danmarks Statistik: Prisstatistisk
4 Engrosprisindeks med delindeks for importerede ravarer26 - 85 Elektriske maskiner og apparater og dele dertil I-1990
387 - 85 Elektriske maskiner og apparater og dele dertil (2) I-2000
(1) Replaces series 3.6.24 and 3.6.182.(2) Series 3.7.388 replaces 3.7.25 and 3.8.387 replaces 3.8.26 - index base year changed.Please note that data marked "p" is provisional and likely to be updated.Data in bold has been revised. Please refer to the column marked "data revised" to obtain the date of the last revision for each series.
14
DENMARKEURO
MENSUEL - MONTHLYJan-02 Feb-02 Mar-02 Apr-02 May-02 Jun-02 Jul-02 Aug-02 Sep-02 Oct-02 Nov-02 Dec-02 2002
124.5 125.3 127.4 128.3 3.6.234124.5 125.5 126.8 128.5 3.6.251124.9 126.1 127.8 129.3 3.6.286
120.4 120.2 121.3 121.8 121.5 121.3 121.0 121.3 121.5 121.7 121.2 121.7 3.7.25101.7 101.5 102.5 103.0 102.6 102.5 102.2 102.5 102.7 102.8 102.3 102.8 102.4 3.7.388
110 110 110 110 110 110 110 110 110 110 110 110 3.8.26102 102 102 102 102 102 102 102 102 102 102 102 102 3.8.387
Jan-03 Feb-03 Mar-03 Apr-03 May-03 Jun-03 Jul-03 Aug-03 Sep-03 Oct-03 Nov-03 Dec-03 2003129.4 130.2 132.0 132.7 3.6.234130.0 130.7 132.1 133.5 3.6.251130.6 131.7 133.3 134.6 3.6.286
3.7.25103.0 103.2 103.3 102.6 102.2 102.4 102.1 102.1 102.2 102.8 102.8 102.8 3.7.388
3.8.26101 101 100 100 101 101 100 100 99 98 98 98 3.8.387
Datatype Data revisedDanmarks Statistik: Løn- og indkomststatistik 3.6.
Lønindeks for den private sektor I-1996/2 - Total 234I-1996/2 - Manufacturing 251I-1996/2 - Mfr. Of basic metals and Fbr. Metal prod.(1) 286
Danmarks Statistik: Statistisk manedsoversigt 3.7.I-1990 - 13 Total wholesale price index 25I-2000 - Price index for domestic supply (2) 388
Danmarks Statistik: Prisstatistisk 3.8.- 4 Wholesale price index with a separate index for imported raw materials
I-1990 - 85 Electrical machinery and equipment and components thereof 26I-2000 - 85 Electrical machinery and equipment and components thereof (2) 387
(1) Replaces series 3.6.24 and 3.6.182.(2) Series 3.7.388 replaces 3.7.25 and 3.8.387 replaces 3.8.26 - index base year changed.
Please note that data marked "p" is provisional and likely to be updated.Data in bold has been revised. Please refer to the column marked "data revised" to obtain the date of the last revision for each series.
15
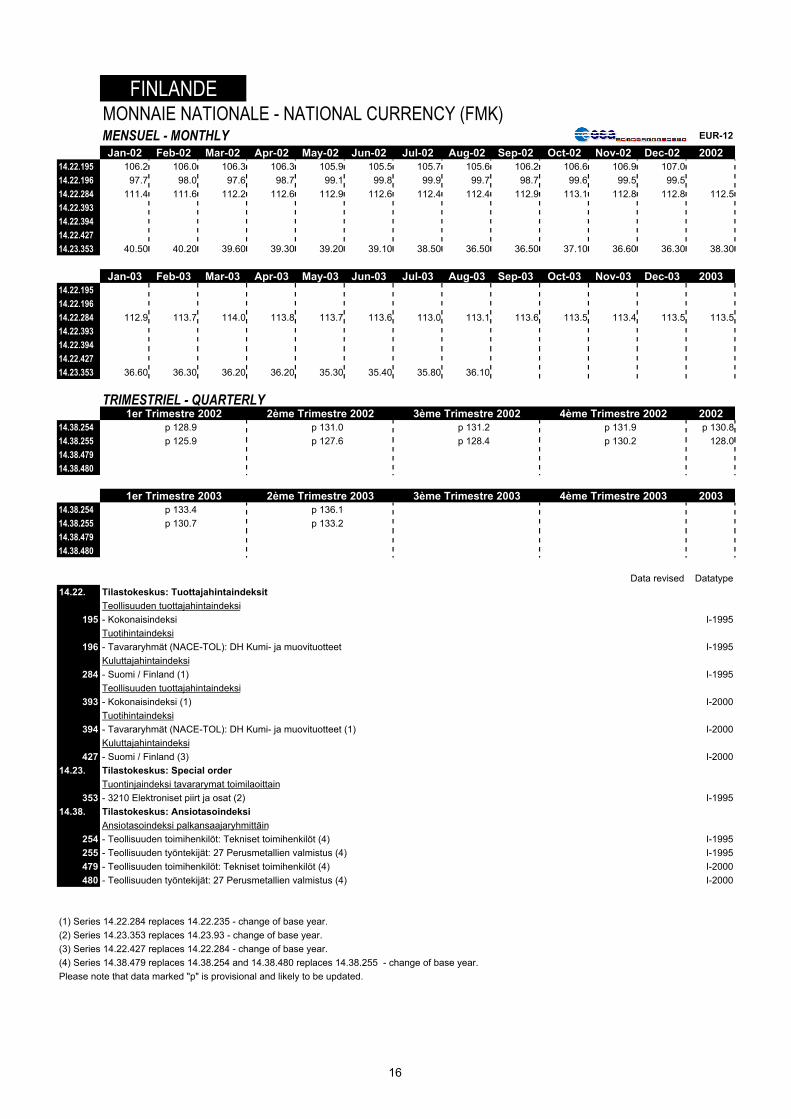
FINLANDEMONNAIE NATIONALE - NATIONAL CURRENCY (FMK)MENSUEL - MONTHLY EUR-12
Jan-02 Feb-02 Mar-02 Apr-02 May-02 Jun-02 Jul-02 Aug-02 Sep-02 Oct-02 Nov-02 Dec-02 200214.22.195 106.2 106.0 106.3 106.3 105.9 105.5 105.7 105.6 106.2 106.6 106.9 107.014.22.196 97.7 98.0 97.6 98.7 99.1 99.8 99.9 99.7 98.7 99.6 99.5 99.514.22.284 111.4 111.6 112.2 112.6 112.9 112.6 112.4 112.4 112.9 113.1 112.8 112.8 112.514.22.39314.22.39414.22.42714.23.353 40.50 40.20 39.60 39.30 39.20 39.10 38.50 36.50 36.50 37.10 36.60 36.30 38.30
Jan-03 Feb-03 Mar-03 Apr-03 May-03 Jun-03 Jul-03 Aug-03 Sep-03 Oct-03 Nov-03 Dec-03 200314.22.19514.22.19614.22.284 112.9 113.7 114.0 113.8 113.7 113.6 113.0 113.1 113.6 113.5 113.4 113.5 113.514.22.39314.22.39414.22.42714.23.353 36.60 36.30 36.20 36.20 35.30 35.40 35.80 36.10
TRIMESTRIEL - QUARTERLY1er Trimestre 2002 2ème Trimestre 2002 3ème Trimestre 2002 4ème Trimestre 2002 2002
14.38.254 p 128.9 p 131.0 p 131.2 p 131.9 p 130.814.38.255 p 125.9 p 127.6 p 128.4 p 130.2 128.014.38.47914.38.480
1er Trimestre 2003 2ème Trimestre 2003 3ème Trimestre 2003 4ème Trimestre 2003 200314.38.254 p 133.4 p 136.114.38.255 p 130.7 p 133.214.38.47914.38.480
Data revised Datatype14.22. Tilastokeskus: Tuottajahintaindeksit
Teollisuuden tuottajahintaindeksi195 - Kokonaisindeksi I-1995
Tuotihintaindeksi196 - Tavararyhmät (NACE-TOL): DH Kumi- ja muovituotteet I-1995
Kuluttajahintaindeksi284 - Suomi / Finland (1) I-1995
Teollisuuden tuottajahintaindeksi393 - Kokonaisindeksi (1) I-2000
Tuotihintaindeksi394 - Tavararyhmät (NACE-TOL): DH Kumi- ja muovituotteet (1) I-2000
Kuluttajahintaindeksi427 - Suomi / Finland (3) I-2000
14.23. Tilastokeskus: Special orderTuontinjaindeksi tavararymat toimilaoittain
353 - 3210 Elektroniset piirt ja osat (2) I-199514.38. Tilastokeskus: Ansiotasoindeksi
Ansiotasoindeksi palkansaajaryhmittäin254 - Teollisuuden toimihenkilöt: Tekniset toimihenkilöt (4) I-1995255 - Teollisuuden työntekijät: 27 Perusmetallien valmistus (4) I-1995479 - Teollisuuden toimihenkilöt: Tekniset toimihenkilöt (4) I-2000480 - Teollisuuden työntekijät: 27 Perusmetallien valmistus (4) I-2000
(1) Series 14.22.284 replaces 14.22.235 - change of base year.(2) Series 14.23.353 replaces 14.23.93 - change of base year.(3) Series 14.22.427 replaces 14.22.284 - change of base year.(4) Series 14.38.479 replaces 14.38.254 and 14.38.480 replaces 14.38.255 - change of base year.Please note that data marked "p" is provisional and likely to be updated.
16
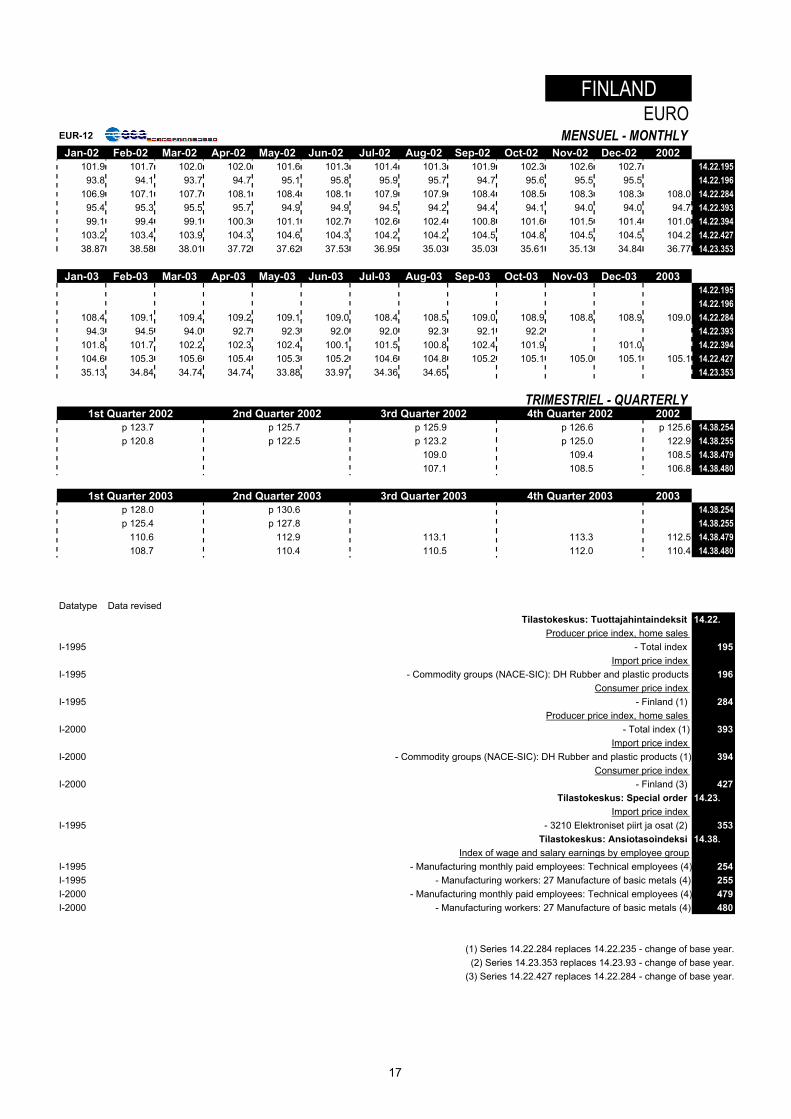
FINLANDEURO
EUR-12 MENSUEL - MONTHLYJan-02 Feb-02 Mar-02 Apr-02 May-02 Jun-02 Jul-02 Aug-02 Sep-02 Oct-02 Nov-02 Dec-02 2002
101.9 101.7 102.0 102.0 101.6 101.3 101.4 101.3 101.9 102.3 102.6 102.7 14.22.19593.8 94.1 93.7 94.7 95.1 95.8 95.9 95.7 94.7 95.6 95.5 95.5 14.22.196
106.9 107.1 107.7 108.1 108.4 108.1 107.9 107.9 108.4 108.5 108.3 108.3 108.0 14.22.28495.4 95.3 95.5 95.7 94.9 94.9 94.5 94.2 94.4 94.1 94.0 94.0 94.7 14.22.39399.1 99.4 99.1 100.3 101.1 102.7 102.6 102.4 100.8 101.6 101.5 101.4 101.0 14.22.394
103.2 103.4 103.9 104.3 104.6 104.3 104.2 104.2 104.5 104.8 104.5 104.5 104.2 14.22.42738.87 38.58 38.01 37.72 37.62 37.53 36.95 35.03 35.03 35.61 35.13 34.84 36.77 14.23.353
Jan-03 Feb-03 Mar-03 Apr-03 May-03 Jun-03 Jul-03 Aug-03 Sep-03 Oct-03 Nov-03 Dec-03 200314.22.19514.22.196
108.4 109.1 109.4 109.2 109.1 109.0 108.4 108.5 109.0 108.9 108.8 108.9 109.0 14.22.28494.3 94.5 94.0 92.7 92.3 92.0 92.0 92.3 92.1 92.2 14.22.393
101.8 101.7 102.2 102.3 102.4 100.1 101.5 100.8 102.4 101.9 101.0 14.22.394104.6 105.3 105.6 105.4 105.3 105.2 104.6 104.8 105.2 105.1 105.0 105.1 105.1 14.22.42735.13 34.84 34.74 34.74 33.88 33.97 34.36 34.65 14.23.353
TRIMESTRIEL - QUARTERLY1st Quarter 2002 2nd Quarter 2002 3rd Quarter 2002 4th Quarter 2002 2002
p 123.7 p 125.7 p 125.9 p 126.6 p 125.6 14.38.254p 120.8 p 122.5 p 123.2 p 125.0 122.9 14.38.255
109.0 109.4 108.5 14.38.479107.1 108.5 106.8 14.38.480
1st Quarter 2003 2nd Quarter 2003 3rd Quarter 2003 4th Quarter 2003 2003p 128.0 p 130.6 14.38.254p 125.4 p 127.8 14.38.255
110.6 112.9 113.1 113.3 112.5 14.38.479108.7 110.4 110.5 112.0 110.4 14.38.480
Datatype Data revisedTilastokeskus: Tuottajahintaindeksit 14.22.
Producer price index, home sales I-1995 - Total index 195
Import price index I-1995 - Commodity groups (NACE-SIC): DH Rubber and plastic products 196
Consumer price index I-1995 - Finland (1) 284
Producer price index, home sales I-2000 - Total index (1) 393
Import price index I-2000 - Commodity groups (NACE-SIC): DH Rubber and plastic products (1) 394
Consumer price index I-2000 - Finland (3) 427
Tilastokeskus: Special order 14.23.Import price index
I-1995 - 3210 Elektroniset piirt ja osat (2) 353Tilastokeskus: Ansiotasoindeksi 14.38.
Index of wage and salary earnings by employee group I-1995 - Manufacturing monthly paid employees: Technical employees (4) 254I-1995 - Manufacturing workers: 27 Manufacture of basic metals (4) 255I-2000 - Manufacturing monthly paid employees: Technical employees (4) 479I-2000 - Manufacturing workers: 27 Manufacture of basic metals (4) 480
(1) Series 14.22.284 replaces 14.22.235 - change of base year.(2) Series 14.23.353 replaces 14.23.93 - change of base year.
(3) Series 14.22.427 replaces 14.22.284 - change of base year.
17
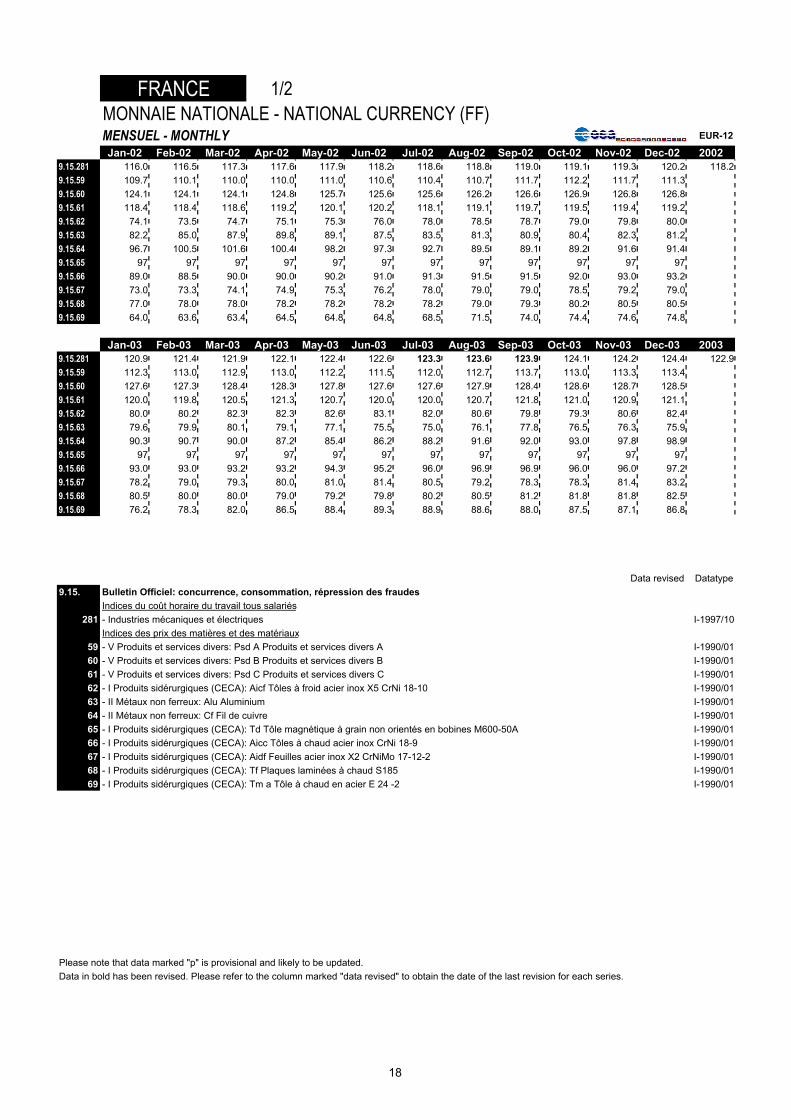
FRANCE 1/2MONNAIE NATIONALE - NATIONAL CURRENCY (FF)MENSUEL - MONTHLY EUR-12
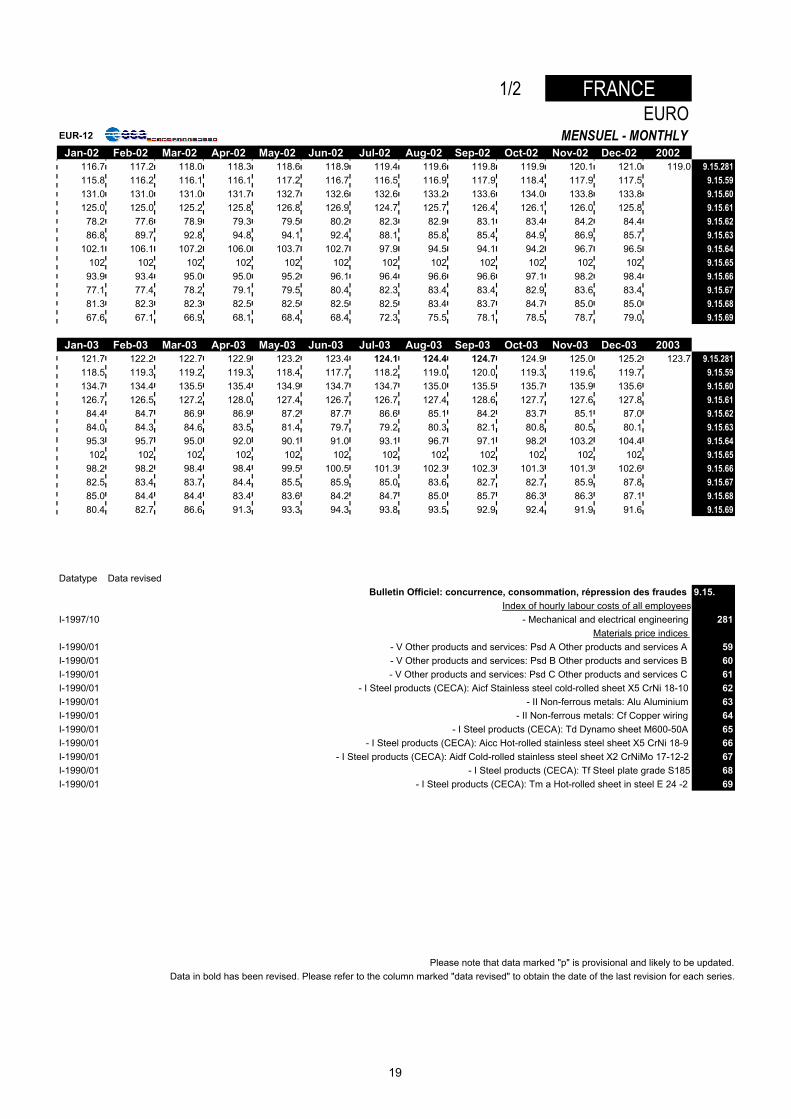
Jan-02 Feb-02 Mar-02 Apr-02 May-02 Jun-02 Jul-02 Aug-02 Sep-02 Oct-02 Nov-02 Dec-02 20029.15.281 116.0 116.5 117.3 117.6 117.9 118.2 118.6 118.8 119.0 119.1 119.3 120.2 118.29.15.59 109.7 110.1 110.0 110.0 111.0 110.6 110.4 110.7 111.7 112.2 111.7 111.39.15.60 124.1 124.1 124.1 124.8 125.7 125.6 125.6 126.2 126.6 126.9 126.8 126.89.15.61 118.4 118.4 118.6 119.2 120.1 120.2 118.1 119.1 119.7 119.5 119.4 119.29.15.62 74.1 73.5 74.7 75.1 75.3 76.0 78.0 78.5 78.7 79.0 79.8 80.09.15.63 82.2 85.0 87.9 89.8 89.1 87.5 83.5 81.3 80.9 80.4 82.3 81.29.15.64 96.7 100.5 101.6 100.4 98.2 97.3 92.7 89.5 89.1 89.2 91.6 91.49.15.65 97 97 97 97 97 97 97 97 97 97 97 979.15.66 89.0 88.5 90.0 90.0 90.2 91.0 91.3 91.5 91.5 92.0 93.0 93.29.15.67 73.0 73.3 74.1 74.9 75.3 76.2 78.0 79.0 79.0 78.5 79.2 79.09.15.68 77.0 78.0 78.0 78.2 78.2 78.2 78.2 79.0 79.3 80.2 80.5 80.59.15.69 64.0 63.6 63.4 64.5 64.8 64.8 68.5 71.5 74.0 74.4 74.6 74.8
Jan-03 Feb-03 Mar-03 Apr-03 May-03 Jun-03 Jul-03 Aug-03 Sep-03 Oct-03 Nov-03 Dec-03 20039.15.281 120.9 121.4 121.9 122.1 122.4 122.6 123.3 123.6 123.9 124.1 124.2 124.4 122.99.15.59 112.3 113.0 112.9 113.0 112.2 111.5 112.0 112.7 113.7 113.0 113.3 113.49.15.60 127.6 127.3 128.4 128.3 127.8 127.6 127.6 127.9 128.4 128.6 128.7 128.59.15.61 120.0 119.8 120.5 121.3 120.7 120.0 120.0 120.7 121.8 121.0 120.9 121.19.15.62 80.0 80.2 82.3 82.3 82.6 83.1 82.0 80.6 79.8 79.3 80.6 82.49.15.63 79.6 79.9 80.1 79.1 77.1 75.5 75.0 76.1 77.8 76.5 76.3 75.99.15.64 90.3 90.7 90.0 87.2 85.4 86.2 88.2 91.6 92.0 93.0 97.8 98.99.15.65 97 97 97 97 97 97 97 97 97 97 97 979.15.66 93.0 93.0 93.2 93.2 94.3 95.2 96.0 96.9 96.9 96.0 96.0 97.29.15.67 78.2 79.0 79.3 80.0 81.0 81.4 80.5 79.2 78.3 78.3 81.4 83.29.15.68 80.5 80.0 80.0 79.0 79.2 79.8 80.2 80.5 81.2 81.8 81.8 82.59.15.69 76.2 78.3 82.0 86.5 88.4 89.3 88.9 88.6 88.0 87.5 87.1 86.8
Data revised Datatype9.15. Bulletin Officiel: concurrence, consommation, répression des fraudes
Indices du coût horaire du travail tous salariés281 - Industries mécaniques et électriques I-1997/10
Indices des prix des matières et des matériaux59 - V Produits et services divers: Psd A Produits et services divers A I-1990/0160 - V Produits et services divers: Psd B Produits et services divers B I-1990/0161 - V Produits et services divers: Psd C Produits et services divers C I-1990/0162 - I Produits sidérurgiques (CECA): Aicf Tôles à froid acier inox X5 CrNi 18-10 I-1990/0163 - II Métaux non ferreux: Alu Aluminium I-1990/0164 - II Métaux non ferreux: Cf Fil de cuivre I-1990/0165 - I Produits sidérurgiques (CECA): Td Tôle magnétique à grain non orientés en bobines M600-50A I-1990/0166 - I Produits sidérurgiques (CECA): Aicc Tôles à chaud acier inox CrNi 18-9 I-1990/0167 - I Produits sidérurgiques (CECA): Aidf Feuilles acier inox X2 CrNiMo 17-12-2 I-1990/0168 - I Produits sidérurgiques (CECA): Tf Plaques laminées à chaud S185 I-1990/0169 - I Produits sidérurgiques (CECA): Tm a Tôle à chaud en acier E 24 -2 I-1990/01
Please note that data marked "p" is provisional and likely to be updated.Data in bold has been revised. Please refer to the column marked "data revised" to obtain the date of the last revision for each series.
18
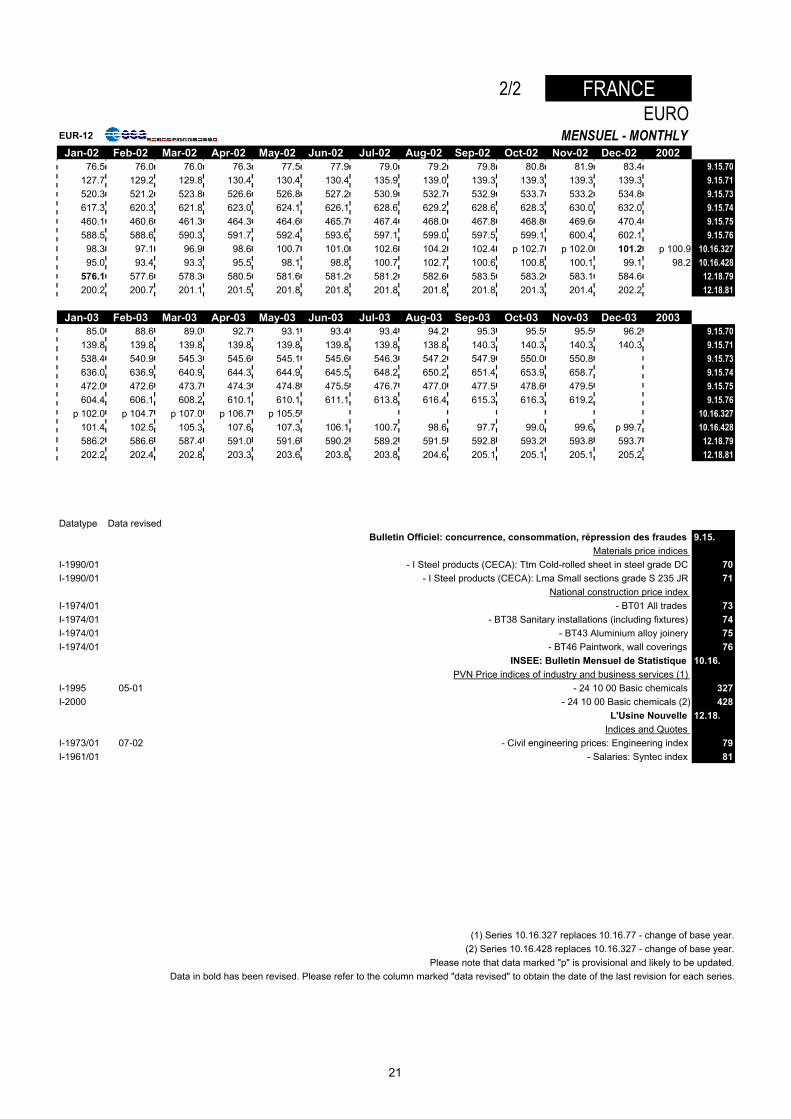
1/2 FRANCEEURO
EUR-12 MENSUEL - MONTHLYJan-02 Feb-02 Mar-02 Apr-02 May-02 Jun-02 Jul-02 Aug-02 Sep-02 Oct-02 Nov-02 Dec-02 2002
116.7 117.2 118.0 118.3 118.6 118.9 119.4 119.6 119.8 119.9 120.1 121.0 119.0 9.15.281115.8 116.2 116.1 116.1 117.2 116.7 116.5 116.9 117.9 118.4 117.9 117.5 9.15.59131.0 131.0 131.0 131.7 132.7 132.6 132.6 133.2 133.6 134.0 133.8 133.8 9.15.60125.0 125.0 125.2 125.8 126.8 126.9 124.7 125.7 126.4 126.1 126.0 125.8 9.15.6178.2 77.6 78.9 79.3 79.5 80.2 82.3 82.9 83.1 83.4 84.2 84.4 9.15.6286.8 89.7 92.8 94.8 94.1 92.4 88.1 85.8 85.4 84.9 86.9 85.7 9.15.63
102.1 106.1 107.2 106.0 103.7 102.7 97.9 94.5 94.1 94.2 96.7 96.5 9.15.64102 102 102 102 102 102 102 102 102 102 102 102 9.15.65
93.9 93.4 95.0 95.0 95.2 96.1 96.4 96.6 96.6 97.1 98.2 98.4 9.15.6677.1 77.4 78.2 79.1 79.5 80.4 82.3 83.4 83.4 82.9 83.6 83.4 9.15.6781.3 82.3 82.3 82.5 82.5 82.5 82.5 83.4 83.7 84.7 85.0 85.0 9.15.6867.6 67.1 66.9 68.1 68.4 68.4 72.3 75.5 78.1 78.5 78.7 79.0 9.15.69
Jan-03 Feb-03 Mar-03 Apr-03 May-03 Jun-03 Jul-03 Aug-03 Sep-03 Oct-03 Nov-03 Dec-03 2003121.7 122.2 122.7 122.9 123.2 123.4 124.1 124.4 124.7 124.9 125.0 125.2 123.7 9.15.281118.5 119.3 119.2 119.3 118.4 117.7 118.2 119.0 120.0 119.3 119.6 119.7 9.15.59134.7 134.4 135.5 135.4 134.9 134.7 134.7 135.0 135.5 135.7 135.9 135.6 9.15.60126.7 126.5 127.2 128.0 127.4 126.7 126.7 127.4 128.6 127.7 127.6 127.8 9.15.6184.4 84.7 86.9 86.9 87.2 87.7 86.6 85.1 84.2 83.7 85.1 87.0 9.15.6284.0 84.3 84.6 83.5 81.4 79.7 79.2 80.3 82.1 80.8 80.5 80.1 9.15.6395.3 95.7 95.0 92.0 90.1 91.0 93.1 96.7 97.1 98.2 103.2 104.4 9.15.64102 102 102 102 102 102 102 102 102 102 102 102 9.15.65
98.2 98.2 98.4 98.4 99.5 100.5 101.3 102.3 102.3 101.3 101.3 102.6 9.15.6682.5 83.4 83.7 84.4 85.5 85.9 85.0 83.6 82.7 82.7 85.9 87.8 9.15.6785.0 84.4 84.4 83.4 83.6 84.2 84.7 85.0 85.7 86.3 86.3 87.1 9.15.6880.4 82.7 86.6 91.3 93.3 94.3 93.8 93.5 92.9 92.4 91.9 91.6 9.15.69
Datatype Data revisedBulletin Officiel: concurrence, consommation, répression des fraudes 9.15.
Index of hourly labour costs of all employeesI-1997/10 - Mechanical and electrical engineering 281
Materials price indices I-1990/01 - V Other products and services: Psd A Other products and services A 59I-1990/01 - V Other products and services: Psd B Other products and services B 60I-1990/01 - V Other products and services: Psd C Other products and services C 61I-1990/01 - I Steel products (CECA): Aicf Stainless steel cold-rolled sheet X5 CrNi 18-10 62I-1990/01 - II Non-ferrous metals: Alu Aluminium 63I-1990/01 - II Non-ferrous metals: Cf Copper wiring 64I-1990/01 - I Steel products (CECA): Td Dynamo sheet M600-50A 65I-1990/01 - I Steel products (CECA): Aicc Hot-rolled stainless steel sheet X5 CrNi 18-9 66I-1990/01 - I Steel products (CECA): Aidf Cold-rolled stainless steel sheet X2 CrNiMo 17-12-2 67I-1990/01 - I Steel products (CECA): Tf Steel plate grade S185 68I-1990/01 - I Steel products (CECA): Tm a Hot-rolled sheet in steel E 24 -2 69
Please note that data marked "p" is provisional and likely to be updated.Data in bold has been revised. Please refer to the column marked "data revised" to obtain the date of the last revision for each series.
19
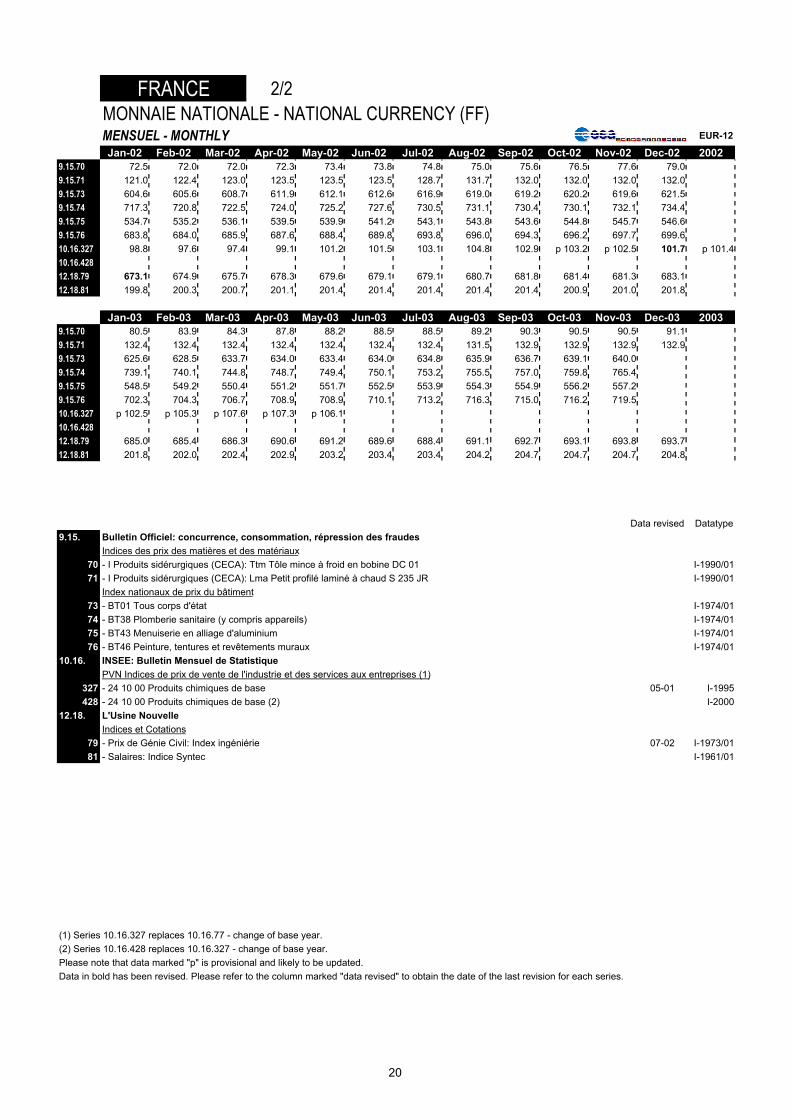
FRANCE 2/2MONNAIE NATIONALE - NATIONAL CURRENCY (FF)MENSUEL - MONTHLY EUR-12
Jan-02 Feb-02 Mar-02 Apr-02 May-02 Jun-02 Jul-02 Aug-02 Sep-02 Oct-02 Nov-02 Dec-02 20029.15.70 72.5 72.0 72.0 72.3 73.4 73.8 74.8 75.0 75.6 76.5 77.6 79.09.15.71 121.0 122.4 123.0 123.5 123.5 123.5 128.7 131.7 132.0 132.0 132.0 132.09.15.73 604.6 605.6 608.7 611.9 612.1 612.6 616.9 619.0 619.2 620.2 619.6 621.59.15.74 717.3 720.8 722.5 724.0 725.2 727.6 730.5 731.1 730.4 730.1 732.1 734.49.15.75 534.7 535.2 536.1 539.5 539.9 541.2 543.1 543.8 543.6 544.8 545.7 546.69.15.76 683.8 684.0 685.9 687.6 688.4 689.8 693.8 696.0 694.3 696.2 697.7 699.610.16.327 98.8 97.6 97.4 99.1 101.2 101.5 103.1 104.8 102.9 p 103.2 p 102.5 101.7 p 101.410.16.42812.18.79 673.1 674.9 675.7 678.3 679.6 679.1 679.1 680.7 681.8 681.4 681.3 683.112.18.81 199.8 200.3 200.7 201.1 201.4 201.4 201.4 201.4 201.4 200.9 201.0 201.8
Jan-03 Feb-03 Mar-03 Apr-03 May-03 Jun-03 Jul-03 Aug-03 Sep-03 Oct-03 Nov-03 Dec-03 20039.15.70 80.5 83.9 84.3 87.8 88.2 88.5 88.5 89.2 90.3 90.5 90.5 91.19.15.71 132.4 132.4 132.4 132.4 132.4 132.4 132.4 131.5 132.9 132.9 132.9 132.99.15.73 625.6 628.5 633.7 634.0 633.4 634.0 634.8 635.9 636.7 639.1 640.09.15.74 739.1 740.1 744.8 748.7 749.4 750.1 753.2 755.5 757.0 759.8 765.49.15.75 548.5 549.2 550.4 551.2 551.7 552.5 553.9 554.3 554.9 556.2 557.29.15.76 702.3 704.3 706.7 708.9 708.9 710.1 713.2 716.3 715.0 716.2 719.510.16.327 p 102.5 p 105.3 p 107.6 p 107.3 p 106.110.16.42812.18.79 685.0 685.4 686.3 690.6 691.2 689.6 688.4 691.1 692.7 693.1 693.8 693.712.18.81 201.8 202.0 202.4 202.9 203.2 203.4 203.4 204.2 204.7 204.7 204.7 204.8
Data revised Datatype9.15. Bulletin Officiel: concurrence, consommation, répression des fraudes
Indices des prix des matières et des matériaux70 - I Produits sidérurgiques (CECA): Ttm Tôle mince à froid en bobine DC 01 I-1990/0171 - I Produits sidérurgiques (CECA): Lma Petit profilé laminé à chaud S 235 JR I-1990/01
Index nationaux de prix du bâtiment73 - BT01 Tous corps d'état I-1974/0174 - BT38 Plomberie sanitaire (y compris appareils) I-1974/0175 - BT43 Menuiserie en alliage d'aluminium I-1974/0176 - BT46 Peinture, tentures et revêtements muraux I-1974/01
10.16. INSEE: Bulletin Mensuel de StatistiquePVN Indices de prix de vente de l'industrie et des services aux entreprises (1)
327 - 24 10 00 Produits chimiques de base 05-01 I-1995428 - 24 10 00 Produits chimiques de base (2) I-2000
12.18. L'Usine NouvelleIndices et Cotations
79 - Prix de Génie Civil: Index ingéniérie 07-02 I-1973/0181 - Salaires: Indice Syntec I-1961/01
(1) Series 10.16.327 replaces 10.16.77 - change of base year.(2) Series 10.16.428 replaces 10.16.327 - change of base year.Please note that data marked "p" is provisional and likely to be updated.Data in bold has been revised. Please refer to the column marked "data revised" to obtain the date of the last revision for each series.
20
2/2 FRANCEEURO
EUR-12 MENSUEL - MONTHLYJan-02 Feb-02 Mar-02 Apr-02 May-02 Jun-02 Jul-02 Aug-02 Sep-02 Oct-02 Nov-02 Dec-02 2002
76.5 76.0 76.0 76.3 77.5 77.9 79.0 79.2 79.8 80.8 81.9 83.4 9.15.70127.7 129.2 129.8 130.4 130.4 130.4 135.9 139.0 139.3 139.3 139.3 139.3 9.15.71520.3 521.2 523.8 526.6 526.8 527.2 530.9 532.7 532.9 533.7 533.2 534.8 9.15.73617.3 620.3 621.8 623.0 624.1 626.1 628.6 629.2 628.6 628.3 630.0 632.0 9.15.74460.1 460.6 461.3 464.3 464.6 465.7 467.4 468.0 467.8 468.8 469.6 470.4 9.15.75588.5 588.6 590.3 591.7 592.4 593.6 597.1 599.0 597.5 599.1 600.4 602.1 9.15.7698.3 97.1 96.9 98.6 100.7 101.0 102.6 104.2 102.4 p 102.7 p 102.0 101.2 p 100.9 10.16.32795.0 93.4 93.3 95.5 98.1 98.8 100.7 102.7 100.6 100.8 100.1 99.1 98.2 10.16.428
576.1 577.6 578.3 580.5 581.6 581.2 581.2 582.6 583.5 583.2 583.1 584.6 12.18.79200.2 200.7 201.1 201.5 201.8 201.8 201.8 201.8 201.8 201.3 201.4 202.2 12.18.81
Jan-03 Feb-03 Mar-03 Apr-03 May-03 Jun-03 Jul-03 Aug-03 Sep-03 Oct-03 Nov-03 Dec-03 200385.0 88.6 89.0 92.7 93.1 93.4 93.4 94.2 95.3 95.5 95.5 96.2 9.15.70
139.8 139.8 139.8 139.8 139.8 139.8 139.8 138.8 140.3 140.3 140.3 140.3 9.15.71538.4 540.9 545.3 545.6 545.1 545.6 546.3 547.2 547.9 550.0 550.8 9.15.73636.0 636.9 640.9 644.3 644.9 645.5 648.2 650.2 651.4 653.9 658.7 9.15.74472.0 472.6 473.7 474.3 474.8 475.5 476.7 477.0 477.5 478.6 479.5 9.15.75604.4 606.1 608.2 610.1 610.1 611.1 613.8 616.4 615.3 616.3 619.2 9.15.76
p 102.0 p 104.7 p 107.0 p 106.7 p 105.5 10.16.327101.4 102.5 105.3 107.6 107.3 106.1 100.7 98.6 97.7 99.0 99.6 p 99.7 10.16.428586.2 586.6 587.4 591.0 591.6 590.2 589.2 591.5 592.8 593.2 593.8 593.7 12.18.79202.2 202.4 202.8 203.3 203.6 203.8 203.8 204.6 205.1 205.1 205.1 205.2 12.18.81
Datatype Data revisedBulletin Officiel: concurrence, consommation, répression des fraudes 9.15.
Materials price indices I-1990/01 - I Steel products (CECA): Ttm Cold-rolled sheet in steel grade DC 70I-1990/01 - I Steel products (CECA): Lma Small sections grade S 235 JR 71
National construction price index I-1974/01 - BT01 All trades 73I-1974/01 - BT38 Sanitary installations (including fixtures) 74I-1974/01 - BT43 Aluminium alloy joinery 75I-1974/01 - BT46 Paintwork, wall coverings 76
INSEE: Bulletin Mensuel de Statistique 10.16.PVN Price indices of industry and business services (1)
I-1995 05-01 - 24 10 00 Basic chemicals 327I-2000 - 24 10 00 Basic chemicals (2) 428
L'Usine Nouvelle 12.18.Indices and Quotes
I-1973/01 07-02 - Civil engineering prices: Engineering index 79I-1961/01 - Salaries: Syntec index 81
(1) Series 10.16.327 replaces 10.16.77 - change of base year.(2) Series 10.16.428 replaces 10.16.327 - change of base year.
Please note that data marked "p" is provisional and likely to be updated.Data in bold has been revised. Please refer to the column marked "data revised" to obtain the date of the last revision for each series.
21
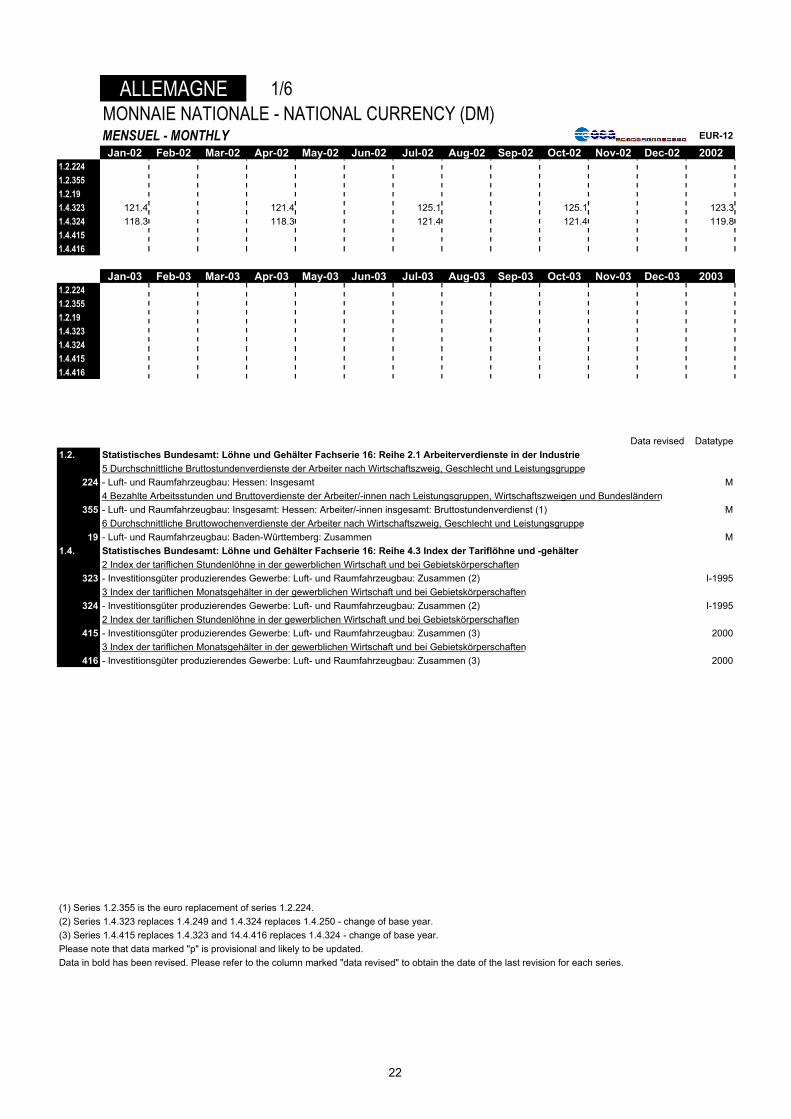
ALLEMAGNE 1/6MONNAIE NATIONALE - NATIONAL CURRENCY (DM)MENSUEL - MONTHLY EUR-12
Jan-02 Feb-02 Mar-02 Apr-02 May-02 Jun-02 Jul-02 Aug-02 Sep-02 Oct-02 Nov-02 Dec-02 20021.2.2241.2.3551.2.191.4.323 121.4 121.4 125.1 125.1 123.31.4.324 118.3 118.3 121.4 121.4 119.81.4.4151.4.416
Jan-03 Feb-03 Mar-03 Apr-03 May-03 Jun-03 Jul-03 Aug-03 Sep-03 Oct-03 Nov-03 Dec-03 20031.2.2241.2.3551.2.191.4.3231.4.3241.4.4151.4.416
Data revised Datatype1.2. Statistisches Bundesamt: Löhne und Gehälter Fachserie 16: Reihe 2.1 Arbeiterverdienste in der Industrie
5 Durchschnittliche Bruttostundenverdienste der Arbeiter nach Wirtschaftszweig, Geschlecht und Leistungsgruppe224 - Luft- und Raumfahrzeugbau: Hessen: Insgesamt M
4 Bezahlte Arbeitsstunden und Bruttoverdienste der Arbeiter/-innen nach Leistungsgruppen, Wirtschaftszweigen und Bundesländern355 - Luft- und Raumfahrzeugbau: Insgesamt: Hessen: Arbeiter/-innen insgesamt: Bruttostundenverdienst (1) M
6 Durchschnittliche Bruttowochenverdienste der Arbeiter nach Wirtschaftszweig, Geschlecht und Leistungsgruppe19 - Luft- und Raumfahrzeugbau: Baden-Württemberg: Zusammen M
1.4. Statistisches Bundesamt: Löhne und Gehälter Fachserie 16: Reihe 4.3 Index der Tariflöhne und -gehälter2 Index der tariflichen Stundenlöhne in der gewerblichen Wirtschaft und bei Gebietskörperschaften
323 - Investitionsgüter produzierendes Gewerbe: Luft- und Raumfahrzeugbau: Zusammen (2) I-19953 Index der tariflichen Monatsgehälter in der gewerblichen Wirtschaft und bei Gebietskörperschaften
324 - Investitionsgüter produzierendes Gewerbe: Luft- und Raumfahrzeugbau: Zusammen (2) I-19952 Index der tariflichen Stundenlöhne in der gewerblichen Wirtschaft und bei Gebietskörperschaften
415 - Investitionsgüter produzierendes Gewerbe: Luft- und Raumfahrzeugbau: Zusammen (3) 20003 Index der tariflichen Monatsgehälter in der gewerblichen Wirtschaft und bei Gebietskörperschaften
416 - Investitionsgüter produzierendes Gewerbe: Luft- und Raumfahrzeugbau: Zusammen (3) 2000
(1) Series 1.2.355 is the euro replacement of series 1.2.224.(2) Series 1.4.323 replaces 1.4.249 and 1.4.324 replaces 1.4.250 - change of base year.(3) Series 1.4.415 replaces 1.4.323 and 14.4.416 replaces 1.4.324 - change of base year.Please note that data marked "p" is provisional and likely to be updated.Data in bold has been revised. Please refer to the column marked "data revised" to obtain the date of the last revision for each series.
22
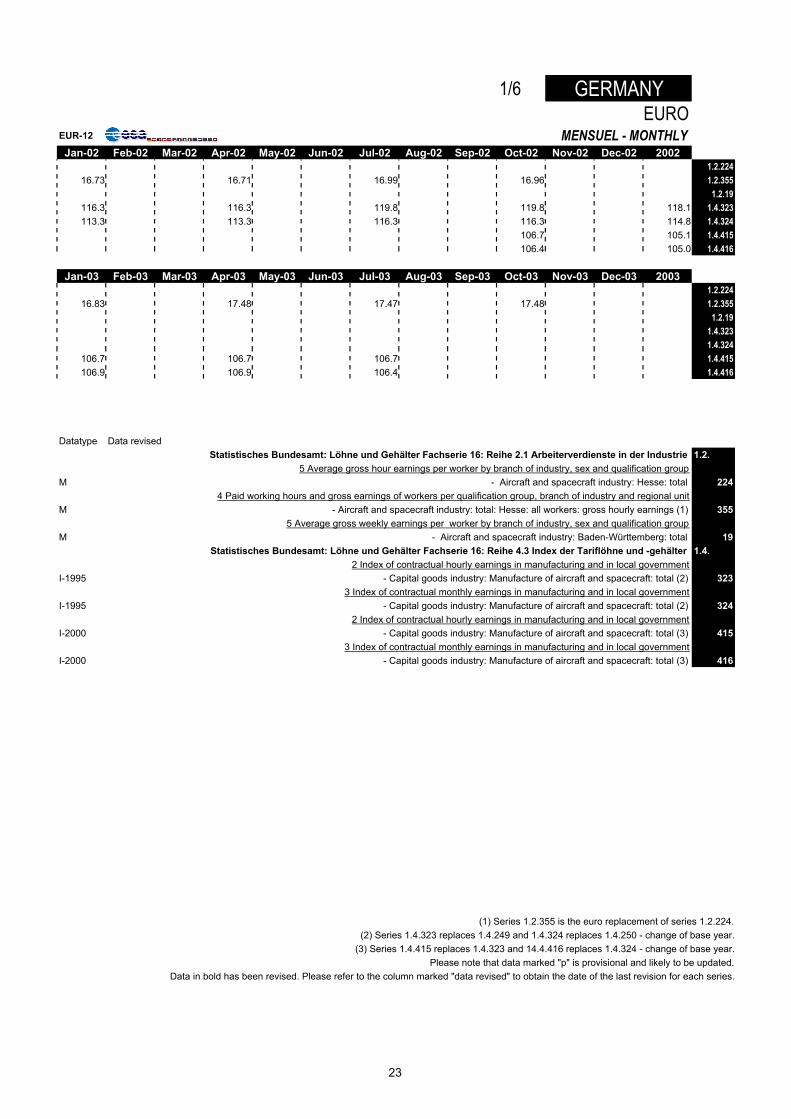
1/6 GERMANYEURO
EUR-12 MENSUEL - MONTHLYJan-02 Feb-02 Mar-02 Apr-02 May-02 Jun-02 Jul-02 Aug-02 Sep-02 Oct-02 Nov-02 Dec-02 2002
1.2.22416.73 16.71 16.99 16.96 1.2.355
1.2.19116.3 116.3 119.8 119.8 118.1 1.4.323113.3 113.3 116.3 116.3 114.8 1.4.324
106.7 105.1 1.4.415106.4 105.0 1.4.416
Jan-03 Feb-03 Mar-03 Apr-03 May-03 Jun-03 Jul-03 Aug-03 Sep-03 Oct-03 Nov-03 Dec-03 20031.2.224
16.83 17.48 17.47 17.48 1.2.3551.2.19
1.4.3231.4.324
106.7 106.7 106.7 1.4.415106.9 106.9 106.4 1.4.416
Datatype Data revisedStatistisches Bundesamt: Löhne und Gehälter Fachserie 16: Reihe 2.1 Arbeiterverdienste in der Industrie 1.2.
5 Average gross hour earnings per worker by branch of industry, sex and qualification group M - Aircraft and spacecraft industry: Hesse: total 224
4 Paid working hours and gross earnings of workers per qualification group, branch of industry and regional unit M - Aircraft and spacecraft industry: total: Hesse: all workers: gross hourly earnings (1) 355
5 Average gross weekly earnings per worker by branch of industry, sex and qualification group M - Aircraft and spacecraft industry: Baden-Württemberg: total 19
Statistisches Bundesamt: Löhne und Gehälter Fachserie 16: Reihe 4.3 Index der Tariflöhne und -gehälter 1.4.2 Index of contractual hourly earnings in manufacturing and in local government
I-1995 - Capital goods industry: Manufacture of aircraft and spacecraft: total (2) 3233 Index of contractual monthly earnings in manufacturing and in local government
I-1995 - Capital goods industry: Manufacture of aircraft and spacecraft: total (2) 3242 Index of contractual hourly earnings in manufacturing and in local government
I-2000 - Capital goods industry: Manufacture of aircraft and spacecraft: total (3) 4153 Index of contractual monthly earnings in manufacturing and in local government
I-2000 - Capital goods industry: Manufacture of aircraft and spacecraft: total (3) 416
(1) Series 1.2.355 is the euro replacement of series 1.2.224.(2) Series 1.4.323 replaces 1.4.249 and 1.4.324 replaces 1.4.250 - change of base year.
(3) Series 1.4.415 replaces 1.4.323 and 14.4.416 replaces 1.4.324 - change of base year.Please note that data marked "p" is provisional and likely to be updated.
Data in bold has been revised. Please refer to the column marked "data revised" to obtain the date of the last revision for each series.
23

ALLEMAGNE 2/6MONNAIE NATIONALE - NATIONAL CURRENCY (DM)MENSUEL - MONTHLY EUR-12
Jan-02 Feb-02 Mar-02 Apr-02 May-02 Jun-02 Jul-02 Aug-02 Sep-02 Oct-02 Nov-02 Dec-02 20021.40.2121.40.2131.40.2141.40.2151.40.2161.40.2171.40.2181.40.2191.40.2201.40.2211.40.222
Jan-03 Feb-03 Mar-03 Apr-03 May-03 Jun-03 Jul-03 Aug-03 Sep-03 Oct-03 Nov-03 Dec-03 20031.40.2121.40.2131.40.2141.40.2151.40.2161.40.2171.40.2181.40.2191.40.2201.40.2211.40.222
Data revised Datatype1.40. Statistisches Bundesamt: Schätzungen der Aufwendungen je geleisteter Stunde EUR (1) (2)
212 - Gehaltstarifvertrag für die Metallindustrie in Hamburg und Gebiete aus Schleswig- M Holstein und Niedersachsen Gehaltsgruppe G8a (2)
213 - Gehaltstarifvertrag für die Metallindustrie in Bremen M und Gebiete aus Niedersachsen (Unterwesergebiet) Gehaltsgruppe G8a (2)
214 - Gehaltsabkommen der Eisen-, Metall-, Elektro- und Zentralheizungsindustrie sowie in Verbindung damit M der kunststoffverarbeitenden Industrie in Nordrhien-Westfalen Gehaltsgruppe KT6a (2)
215 - Gehaltstarifvertrag für die Eisen- Metall-, Elektroindustrie in Hessen Gehaltsgruppe T6b (2) M216 - Gehaltstarifvertrag für die Metallindustrie in Nordwürttemberg-Nordbaden Gehaltsgruppe T6b (2) M217 - Gehaltstarifvertrag für die Metallindustrie in Bayern Gehaltsgruppe VII b (2) M218 - Gehaltstarifvertrag für die Metall- und Elektroindustrie in Berlin-Ost und Brandenburg Gehaltsgruppe 5b (2) M219 - Gehaltstarifvertrag für die Metall- und Elektroindustrie in Mecklenburg-Vorpommern Gehaltsgruppe 8a (2) M220 - Gehaltstarifvertrag für die Metallindustrie in Sachsen Gehaltsgruppe VI b (2) M221 - Gehaltstarifvertrag für die Metall- und Elektroindustrie in Thüringen Gehaltsgruppe T6b (2) M222 - Gehaltstarifvertrag für die Metallindustrie in Südwürttemberg-Hohenzollern Gehaltsgruppe T6b (2) M
(1) Series 1.40.361 to 1.40.371 have been derived from national sources, although they are not available in the Fachseries.(2) Series 1.40.361 to 1.40.371 are the euro replacements of series 1.40.212 to 1.40.222.Please note that data marked "p" is provisional and likely to be updated.Data in bold has been revised. Please refer to the column marked "data revised" to obtain the date of the last revision for each series.
24
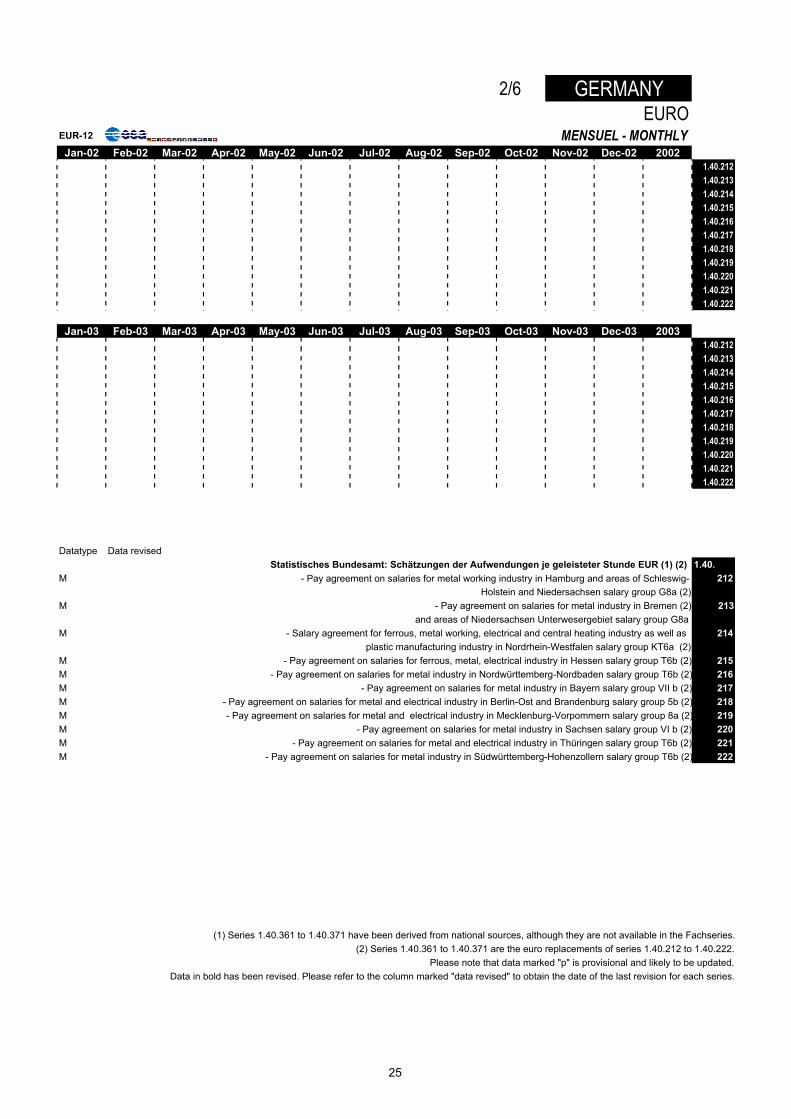
2/6 GERMANYEURO
EUR-12 MENSUEL - MONTHLYJan-02 Feb-02 Mar-02 Apr-02 May-02 Jun-02 Jul-02 Aug-02 Sep-02 Oct-02 Nov-02 Dec-02 2002
1.40.2121.40.2131.40.2141.40.2151.40.2161.40.2171.40.2181.40.2191.40.2201.40.2211.40.222
Jan-03 Feb-03 Mar-03 Apr-03 May-03 Jun-03 Jul-03 Aug-03 Sep-03 Oct-03 Nov-03 Dec-03 20031.40.2121.40.2131.40.2141.40.2151.40.2161.40.2171.40.2181.40.2191.40.2201.40.2211.40.222
Datatype Data revisedStatistisches Bundesamt: Schätzungen der Aufwendungen je geleisteter Stunde EUR (1) (2) 1.40.
M - Pay agreement on salaries for metal working industry in Hamburg and areas of Schleswig- 212Holstein and Niedersachsen salary group G8a (2)
M - Pay agreement on salaries for metal industry in Bremen (2) 213and areas of Niedersachsen Unterwesergebiet salary group G8a
M - Salary agreement for ferrous, metal working, electrical and central heating industry as well as 214plastic manufacturing industry in Nordrhein-Westfalen salary group KT6a (2)
M - Pay agreement on salaries for ferrous, metal, electrical industry in Hessen salary group T6b (2) 215M - Pay agreement on salaries for metal industry in Nordwürttemberg-Nordbaden salary group T6b (2) 216M - Pay agreement on salaries for metal industry in Bayern salary group VII b (2) 217M - Pay agreement on salaries for metal and electrical industry in Berlin-Ost and Brandenburg salary group 5b (2) 218M - Pay agreement on salaries for metal and electrical industry in Mecklenburg-Vorpommern salary group 8a (2) 219M - Pay agreement on salaries for metal industry in Sachsen salary group VI b (2) 220M - Pay agreement on salaries for metal and electrical industry in Thüringen salary group T6b (2) 221M - Pay agreement on salaries for metal industry in Südwürttemberg-Hohenzollern salary group T6b (2) 222
(1) Series 1.40.361 to 1.40.371 have been derived from national sources, although they are not available in the Fachseries.(2) Series 1.40.361 to 1.40.371 are the euro replacements of series 1.40.212 to 1.40.222.
Please note that data marked "p" is provisional and likely to be updated.Data in bold has been revised. Please refer to the column marked "data revised" to obtain the date of the last revision for each series.
25
ALLEMAGNE 3/6MONNAIE NATIONALE - NATIONAL CURRENCY (DM)MENSUEL - MONTHLY EUR-12
Jan-02 Feb-02 Mar-02 Apr-02 May-02 Jun-02 Jul-02 Aug-02 Sep-02 Oct-02 Nov-02 Dec-02 20021.40.3611.40.3621.40.3631.40.3641.40.3651.40.3661.40.3671.40.3681.40.3691.40.3701.40.371
Jan-03 Feb-03 Mar-03 Apr-03 May-03 Jun-03 Jul-03 Aug-03 Sep-03 Oct-03 Nov-03 Dec-03 20031.40.3611.40.3621.40.3631.40.3641.40.3651.40.3661.40.3671.40.3681.40.3691.40.3701.40.371
Data revised Datatype1.40. Statistisches Bundesamt: Schätzungen der Aufwendungen je geleisteter Stunde EUR (1) (2)
361 - Gehaltstarifvertrag für die Metallindustrie in Hamburg und Gebiete aus Schleswig- M Holstein und Niedersachsen Gehaltsgruppe G8a (2)
362 - Gehaltstarifvertrag für die Metallindustrie in Bremen M und Gebiete aus Niedersachsen (Unterwesergebiet) Gehaltsgruppe G8a (2)
363 - Gehaltsabkommen der Eisen-, Metall-, Elektro- und Zentralheizungsindustrie sowie in Verbindung damit M der kunststoffverarbeitenden Industrie in Nordrhien-Westfalen Gehaltsgruppe KT6a (2)
364 - Gehaltstarifvertrag für die Eisen- Metall-, Elektroindustrie in Hessen Gehaltsgruppe T6b (2) M365 - Gehaltstarifvertrag für die Metallindustrie in Nordwürttemberg-Nordbaden Gehaltsgruppe T6b (2) M366 - Gehaltstarifvertrag für die Metallindustrie in Bayern Gehaltsgruppe VII b (2) M367 - Gehaltstarifvertrag für die Metall- und Elektroindustrie in Berlin-Ost und Brandenburg Gehaltsgruppe 5b (2) M368 - Gehaltstarifvertrag für die Metall- und Elektroindustrie in Mecklenburg-Vorpommern Gehaltsgruppe 8a (2) M369 - Gehaltstarifvertrag für die Metallindustrie in Sachsen Gehaltsgruppe VI b (2) M370 - Gehaltstarifvertrag für die Metall- und Elektroindustrie in Thüringen Gehaltsgruppe T6b (2) M371 - Gehaltstarifvertrag für die Metallindustrie in Südwürttemberg-Hohenzollern Gehaltsgruppe T6b (2) M
(1) Series 1.40.361 to 1.40.371 have been derived from national sources, although they are not available in the Fachseries.(2) Series 1.40.361 to 1.40.371 are the euro replacements of series 1.40.212 to 1.40.222.Please note that data marked "p" is provisional and likely to be updated.Data in bold has been revised. Please refer to the column marked "data revised" to obtain the date of the last revision for each series.
26
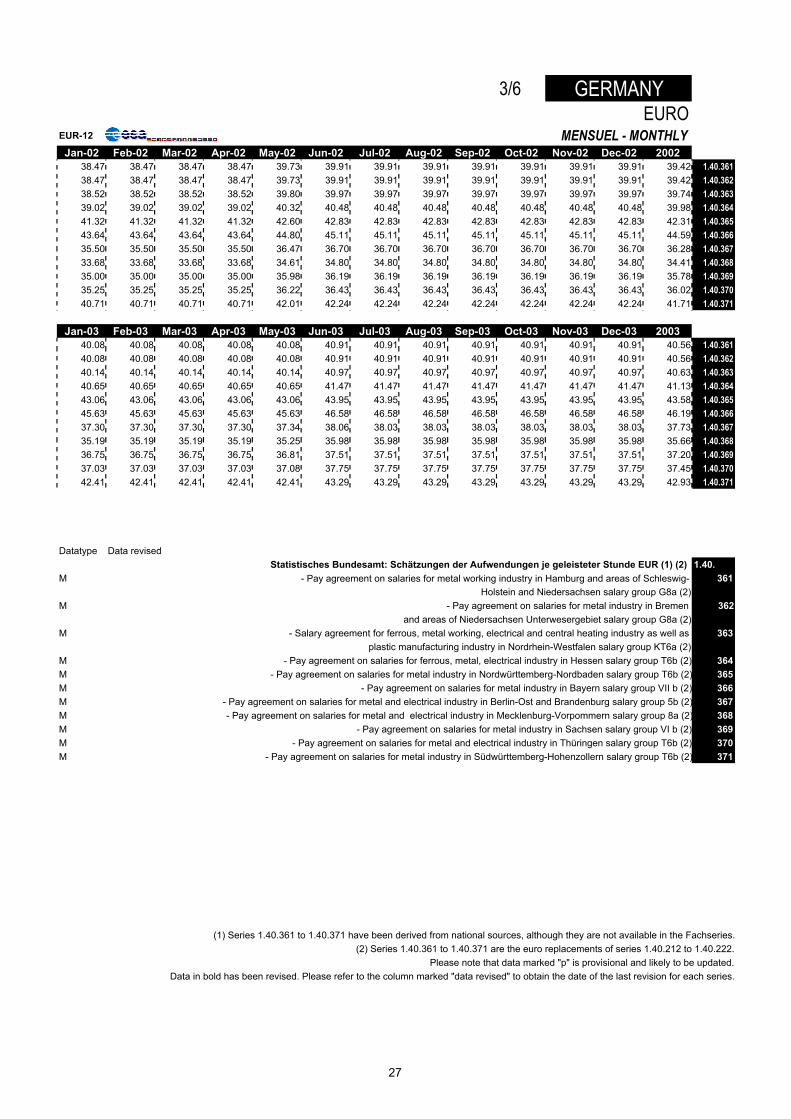
3/6 GERMANYEURO
EUR-12 MENSUEL - MONTHLYJan-02 Feb-02 Mar-02 Apr-02 May-02 Jun-02 Jul-02 Aug-02 Sep-02 Oct-02 Nov-02 Dec-02 2002
38.47 38.47 38.47 38.47 39.73 39.91 39.91 39.91 39.91 39.91 39.91 39.91 39.42 1.40.36138.47 38.47 38.47 38.47 39.73 39.91 39.91 39.91 39.91 39.91 39.91 39.91 39.42 1.40.36238.52 38.52 38.52 38.52 39.80 39.97 39.97 39.97 39.97 39.97 39.97 39.97 39.74 1.40.36339.02 39.02 39.02 39.02 40.32 40.48 40.48 40.48 40.48 40.48 40.48 40.48 39.98 1.40.36441.32 41.32 41.32 41.32 42.60 42.83 42.83 42.83 42.83 42.83 42.83 42.83 42.31 1.40.36543.64 43.64 43.64 43.64 44.80 45.11 45.11 45.11 45.11 45.11 45.11 45.11 44.59 1.40.36635.50 35.50 35.50 35.50 36.47 36.70 36.70 36.70 36.70 36.70 36.70 36.70 36.28 1.40.36733.68 33.68 33.68 33.68 34.61 34.80 34.80 34.80 34.80 34.80 34.80 34.80 34.41 1.40.36835.00 35.00 35.00 35.00 35.98 36.19 36.19 36.19 36.19 36.19 36.19 36.19 35.78 1.40.36935.25 35.25 35.25 35.25 36.22 36.43 36.43 36.43 36.43 36.43 36.43 36.43 36.02 1.40.37040.71 40.71 40.71 40.71 42.01 42.24 42.24 42.24 42.24 42.24 42.24 42.24 41.71 1.40.371
Jan-03 Feb-03 Mar-03 Apr-03 May-03 Jun-03 Jul-03 Aug-03 Sep-03 Oct-03 Nov-03 Dec-03 200340.08 40.08 40.08 40.08 40.08 40.91 40.91 40.91 40.91 40.91 40.91 40.91 40.56 1.40.36140.08 40.08 40.08 40.08 40.08 40.91 40.91 40.91 40.91 40.91 40.91 40.91 40.56 1.40.36240.14 40.14 40.14 40.14 40.14 40.97 40.97 40.97 40.97 40.97 40.97 40.97 40.63 1.40.36340.65 40.65 40.65 40.65 40.65 41.47 41.47 41.47 41.47 41.47 41.47 41.47 41.13 1.40.36443.06 43.06 43.06 43.06 43.06 43.95 43.95 43.95 43.95 43.95 43.95 43.95 43.58 1.40.36545.63 45.63 45.63 45.63 45.63 46.58 46.58 46.58 46.58 46.58 46.58 46.58 46.19 1.40.36637.30 37.30 37.30 37.30 37.34 38.06 38.03 38.03 38.03 38.03 38.03 38.03 37.73 1.40.36735.19 35.19 35.19 35.19 35.25 35.98 35.98 35.98 35.98 35.98 35.98 35.98 35.66 1.40.36836.75 36.75 36.75 36.75 36.81 37.51 37.51 37.51 37.51 37.51 37.51 37.51 37.20 1.40.36937.03 37.03 37.03 37.03 37.08 37.75 37.75 37.75 37.75 37.75 37.75 37.75 37.45 1.40.37042.41 42.41 42.41 42.41 42.41 43.29 43.29 43.29 43.29 43.29 43.29 43.29 42.93 1.40.371
Datatype Data revisedStatistisches Bundesamt: Schätzungen der Aufwendungen je geleisteter Stunde EUR (1) (2) 1.40.
M - Pay agreement on salaries for metal working industry in Hamburg and areas of Schleswig- 361Holstein and Niedersachsen salary group G8a (2)
M - Pay agreement on salaries for metal industry in Bremen 362and areas of Niedersachsen Unterwesergebiet salary group G8a (2)
M - Salary agreement for ferrous, metal working, electrical and central heating industry as well as 363plastic manufacturing industry in Nordrhein-Westfalen salary group KT6a (2)
M - Pay agreement on salaries for ferrous, metal, electrical industry in Hessen salary group T6b (2) 364M - Pay agreement on salaries for metal industry in Nordwürttemberg-Nordbaden salary group T6b (2) 365M - Pay agreement on salaries for metal industry in Bayern salary group VII b (2) 366M - Pay agreement on salaries for metal and electrical industry in Berlin-Ost and Brandenburg salary group 5b (2) 367M - Pay agreement on salaries for metal and electrical industry in Mecklenburg-Vorpommern salary group 8a (2) 368M - Pay agreement on salaries for metal industry in Sachsen salary group VI b (2) 369M - Pay agreement on salaries for metal and electrical industry in Thüringen salary group T6b (2) 370M - Pay agreement on salaries for metal industry in Südwürttemberg-Hohenzollern salary group T6b (2) 371
(1) Series 1.40.361 to 1.40.371 have been derived from national sources, although they are not available in the Fachseries.(2) Series 1.40.361 to 1.40.371 are the euro replacements of series 1.40.212 to 1.40.222.
Please note that data marked "p" is provisional and likely to be updated.Data in bold has been revised. Please refer to the column marked "data revised" to obtain the date of the last revision for each series.
27
ALLEMAGNE 4/6MONNAIE NATIONALE - NATIONAL CURRENCY (DM)MENSUEL - MONTHLY EUR-12
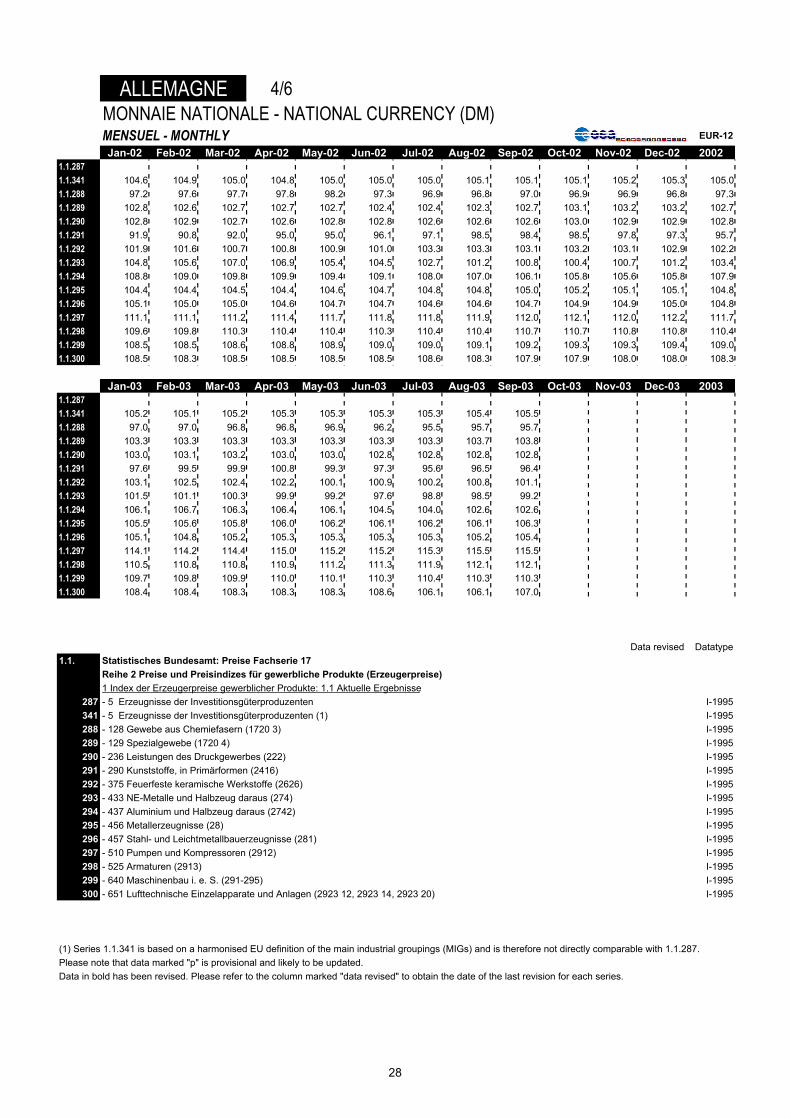
Jan-02 Feb-02 Mar-02 Apr-02 May-02 Jun-02 Jul-02 Aug-02 Sep-02 Oct-02 Nov-02 Dec-02 20021.1.2871.1.341 104.6 104.9 105.0 104.8 105.0 105.0 105.0 105.1 105.1 105.1 105.2 105.3 105.01.1.288 97.2 97.6 97.7 97.8 98.2 97.3 96.9 96.8 97.0 96.9 96.9 96.8 97.31.1.289 102.8 102.6 102.7 102.7 102.7 102.4 102.4 102.3 102.7 103.1 103.2 103.2 102.71.1.290 102.8 102.9 102.7 102.6 102.8 102.8 102.6 102.6 102.6 103.0 102.9 102.9 102.81.1.291 91.9 90.8 92.0 95.0 95.0 96.1 97.1 98.5 98.4 98.5 97.8 97.3 95.71.1.292 101.9 101.6 100.7 100.8 100.9 101.0 103.3 103.3 103.1 103.2 103.1 102.9 102.21.1.293 104.8 105.6 107.0 106.9 105.4 104.5 102.7 101.2 100.8 100.4 100.7 101.2 103.41.1.294 108.8 109.0 109.8 109.9 109.4 109.1 108.0 107.0 106.1 105.8 105.6 105.8 107.91.1.295 104.4 104.4 104.5 104.4 104.6 104.7 104.8 104.8 105.0 105.2 105.1 105.1 104.81.1.296 105.1 105.0 105.0 104.6 104.7 104.7 104.6 104.6 104.7 104.9 104.9 105.0 104.81.1.297 111.1 111.1 111.2 111.4 111.7 111.8 111.8 111.9 112.0 112.1 112.0 112.2 111.71.1.298 109.6 109.8 110.3 110.4 110.4 110.3 110.4 110.4 110.7 110.7 110.8 110.8 110.41.1.299 108.5 108.5 108.6 108.8 108.9 109.0 109.0 109.1 109.2 109.3 109.3 109.4 109.01.1.300 108.5 108.3 108.5 108.5 108.5 108.5 108.6 108.3 107.9 107.9 108.0 108.0 108.3
Jan-03 Feb-03 Mar-03 Apr-03 May-03 Jun-03 Jul-03 Aug-03 Sep-03 Oct-03 Nov-03 Dec-03 20031.1.2871.1.341 105.2 105.1 105.2 105.3 105.3 105.3 105.3 105.4 105.51.1.288 97.0 97.0 96.8 96.8 96.9 96.2 95.5 95.7 95.71.1.289 103.3 103.3 103.3 103.3 103.3 103.3 103.3 103.7 103.81.1.290 103.0 103.1 103.2 103.0 103.0 102.8 102.8 102.8 102.81.1.291 97.6 99.5 99.9 100.8 99.3 97.3 95.6 96.5 96.41.1.292 103.1 102.5 102.4 102.2 100.1 100.9 100.2 100.8 101.11.1.293 101.5 101.1 100.3 99.9 99.2 97.6 98.8 98.5 99.21.1.294 106.1 106.7 106.3 106.4 106.1 104.5 104.0 102.6 102.61.1.295 105.5 105.6 105.8 106.0 106.2 106.1 106.2 106.1 106.31.1.296 105.1 104.8 105.2 105.3 105.3 105.3 105.3 105.2 105.41.1.297 114.1 114.2 114.4 115.0 115.2 115.2 115.3 115.5 115.51.1.298 110.5 110.8 110.8 110.9 111.2 111.3 111.9 112.1 112.11.1.299 109.7 109.8 109.9 110.0 110.1 110.3 110.4 110.3 110.31.1.300 108.4 108.4 108.3 108.3 108.3 108.6 106.1 106.1 107.0
Data revised Datatype1.1. Statistisches Bundesamt: Preise Fachserie 17
Reihe 2 Preise und Preisindizes für gewerbliche Produkte (Erzeugerpreise)1 Index der Erzeugerpreise gewerblicher Produkte: 1.1 Aktuelle Ergebnisse
287 - 5 Erzeugnisse der Investitionsgüterproduzenten I-1995341 - 5 Erzeugnisse der Investitionsgüterproduzenten (1) I-1995288 - 128 Gewebe aus Chemiefasern (1720 3) I-1995289 - 129 Spezialgewebe (1720 4) I-1995290 - 236 Leistungen des Druckgewerbes (222) I-1995291 - 290 Kunststoffe, in Primärformen (2416) I-1995292 - 375 Feuerfeste keramische Werkstoffe (2626) I-1995293 - 433 NE-Metalle und Halbzeug daraus (274) I-1995294 - 437 Aluminium und Halbzeug daraus (2742) I-1995295 - 456 Metallerzeugnisse (28) I-1995296 - 457 Stahl- und Leichtmetallbauerzeugnisse (281) I-1995297 - 510 Pumpen und Kompressoren (2912) I-1995298 - 525 Armaturen (2913) I-1995299 - 640 Maschinenbau i. e. S. (291-295) I-1995300 - 651 Lufttechnische Einzelapparate und Anlagen (2923 12, 2923 14, 2923 20) I-1995
(1) Series 1.1.341 is based on a harmonised EU definition of the main industrial groupings (MIGs) and is therefore not directly comparable with 1.1.287.Please note that data marked "p" is provisional and likely to be updated.Data in bold has been revised. Please refer to the column marked "data revised" to obtain the date of the last revision for each series.
28
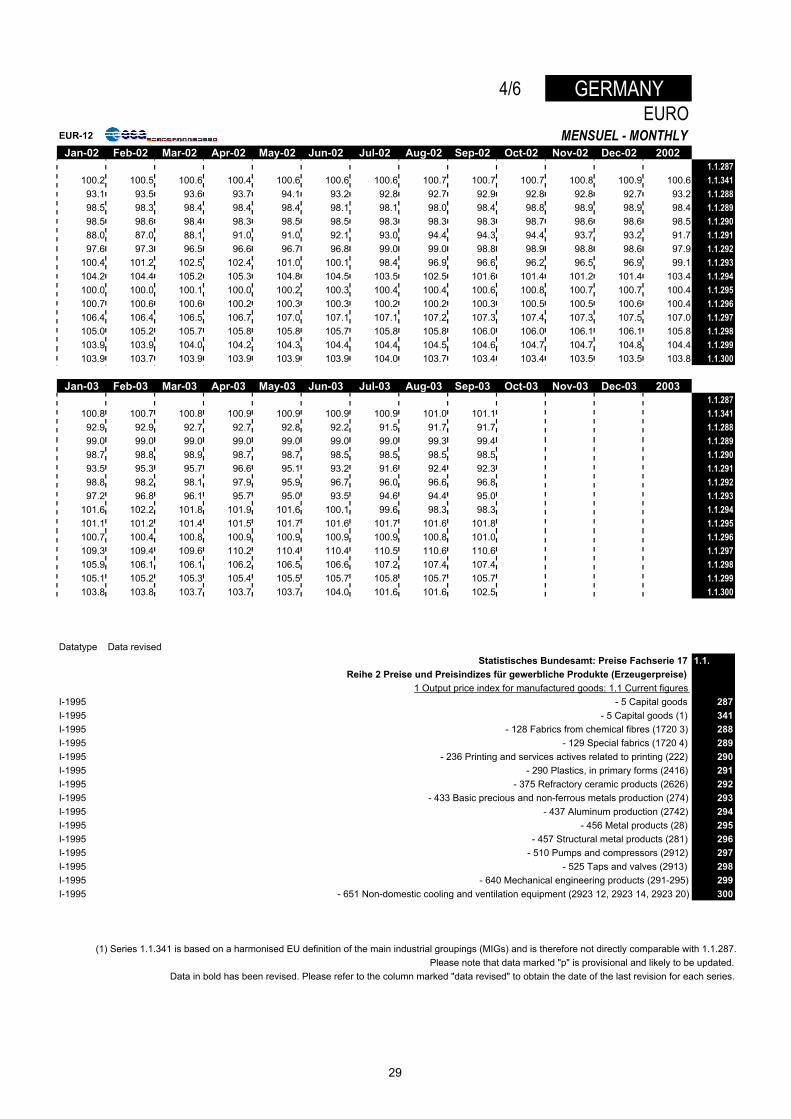
4/6 GERMANYEURO
EUR-12 MENSUEL - MONTHLYJan-02 Feb-02 Mar-02 Apr-02 May-02 Jun-02 Jul-02 Aug-02 Sep-02 Oct-02 Nov-02 Dec-02 2002
1.1.287100.2 100.5 100.6 100.4 100.6 100.6 100.6 100.7 100.7 100.7 100.8 100.9 100.6 1.1.34193.1 93.5 93.6 93.7 94.1 93.2 92.8 92.7 92.9 92.8 92.8 92.7 93.2 1.1.28898.5 98.3 98.4 98.4 98.4 98.1 98.1 98.0 98.4 98.8 98.9 98.9 98.4 1.1.28998.5 98.6 98.4 98.3 98.5 98.5 98.3 98.3 98.3 98.7 98.6 98.6 98.5 1.1.29088.0 87.0 88.1 91.0 91.0 92.1 93.0 94.4 94.3 94.4 93.7 93.2 91.7 1.1.29197.6 97.3 96.5 96.6 96.7 96.8 99.0 99.0 98.8 98.9 98.8 98.6 97.9 1.1.292
100.4 101.2 102.5 102.4 101.0 100.1 98.4 96.9 96.6 96.2 96.5 96.9 99.1 1.1.293104.2 104.4 105.2 105.3 104.8 104.5 103.5 102.5 101.6 101.4 101.2 101.4 103.4 1.1.294100.0 100.0 100.1 100.0 100.2 100.3 100.4 100.4 100.6 100.8 100.7 100.7 100.4 1.1.295100.7 100.6 100.6 100.2 100.3 100.3 100.2 100.2 100.3 100.5 100.5 100.6 100.4 1.1.296106.4 106.4 106.5 106.7 107.0 107.1 107.1 107.2 107.3 107.4 107.3 107.5 107.0 1.1.297105.0 105.2 105.7 105.8 105.8 105.7 105.8 105.8 106.0 106.0 106.1 106.1 105.8 1.1.298103.9 103.9 104.0 104.2 104.3 104.4 104.4 104.5 104.6 104.7 104.7 104.8 104.4 1.1.299103.9 103.7 103.9 103.9 103.9 103.9 104.0 103.7 103.4 103.4 103.5 103.5 103.8 1.1.300
Jan-03 Feb-03 Mar-03 Apr-03 May-03 Jun-03 Jul-03 Aug-03 Sep-03 Oct-03 Nov-03 Dec-03 20031.1.287
100.8 100.7 100.8 100.9 100.9 100.9 100.9 101.0 101.1 1.1.34192.9 92.9 92.7 92.7 92.8 92.2 91.5 91.7 91.7 1.1.28899.0 99.0 99.0 99.0 99.0 99.0 99.0 99.3 99.4 1.1.28998.7 98.8 98.9 98.7 98.7 98.5 98.5 98.5 98.5 1.1.29093.5 95.3 95.7 96.6 95.1 93.2 91.6 92.4 92.3 1.1.29198.8 98.2 98.1 97.9 95.9 96.7 96.0 96.6 96.8 1.1.29297.2 96.8 96.1 95.7 95.0 93.5 94.6 94.4 95.0 1.1.293
101.6 102.2 101.8 101.9 101.6 100.1 99.6 98.3 98.3 1.1.294101.1 101.2 101.4 101.5 101.7 101.6 101.7 101.6 101.8 1.1.295100.7 100.4 100.8 100.9 100.9 100.9 100.9 100.8 101.0 1.1.296109.3 109.4 109.6 110.2 110.4 110.4 110.5 110.6 110.6 1.1.297105.9 106.1 106.1 106.2 106.5 106.6 107.2 107.4 107.4 1.1.298105.1 105.2 105.3 105.4 105.5 105.7 105.8 105.7 105.7 1.1.299103.8 103.8 103.7 103.7 103.7 104.0 101.6 101.6 102.5 1.1.300
Datatype Data revisedStatistisches Bundesamt: Preise Fachserie 17 1.1.
Reihe 2 Preise und Preisindizes für gewerbliche Produkte (Erzeugerpreise) 1 Output price index for manufactured goods: 1.1 Current figures
I-1995 - 5 Capital goods 287I-1995 - 5 Capital goods (1) 341I-1995 - 128 Fabrics from chemical fibres (1720 3) 288I-1995 - 129 Special fabrics (1720 4) 289I-1995 - 236 Printing and services actives related to printing (222) 290I-1995 - 290 Plastics, in primary forms (2416) 291I-1995 - 375 Refractory ceramic products (2626) 292I-1995 - 433 Basic precious and non-ferrous metals production (274) 293I-1995 - 437 Aluminum production (2742) 294I-1995 - 456 Metal products (28) 295I-1995 - 457 Structural metal products (281) 296I-1995 - 510 Pumps and compressors (2912) 297I-1995 - 525 Taps and valves (2913) 298I-1995 - 640 Mechanical engineering products (291-295) 299I-1995 - 651 Non-domestic cooling and ventilation equipment (2923 12, 2923 14, 2923 20) 300
(1) Series 1.1.341 is based on a harmonised EU definition of the main industrial groupings (MIGs) and is therefore not directly comparable with 1.1.287.Please note that data marked "p" is provisional and likely to be updated.
Data in bold has been revised. Please refer to the column marked "data revised" to obtain the date of the last revision for each series.
29
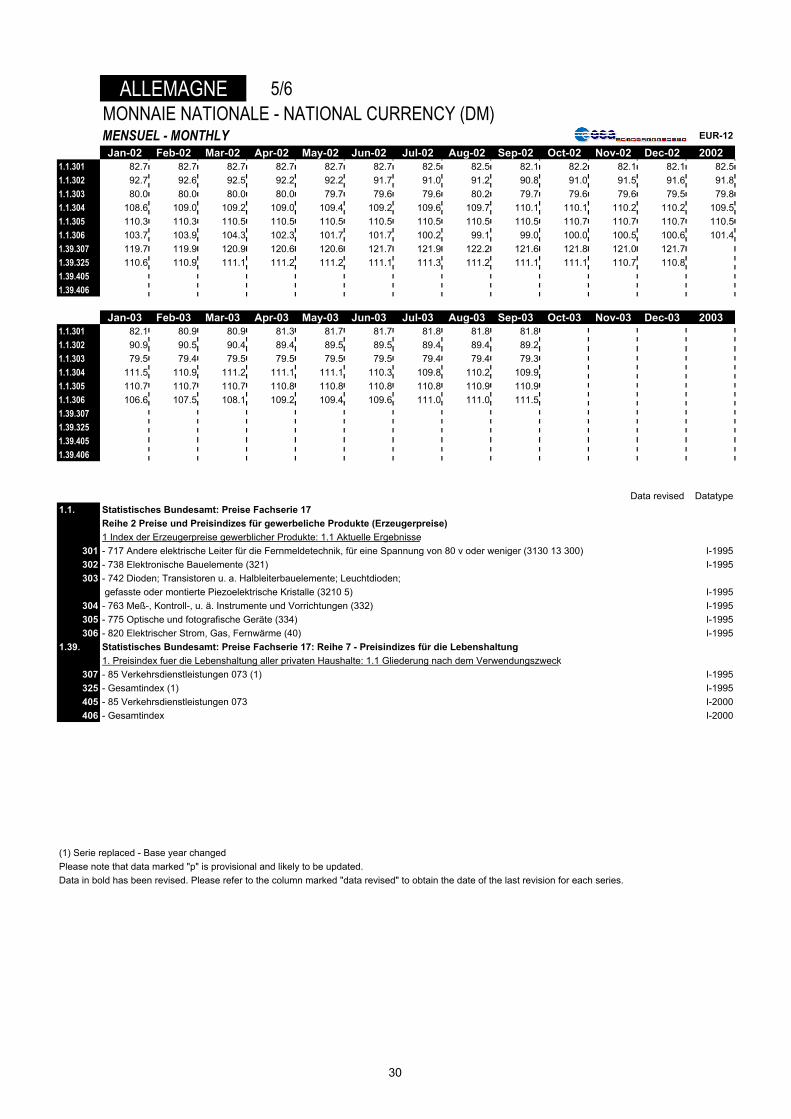
ALLEMAGNE 5/6MONNAIE NATIONALE - NATIONAL CURRENCY (DM)MENSUEL - MONTHLY EUR-12
Jan-02 Feb-02 Mar-02 Apr-02 May-02 Jun-02 Jul-02 Aug-02 Sep-02 Oct-02 Nov-02 Dec-02 20021.1.301 82.7 82.7 82.7 82.7 82.7 82.7 82.5 82.5 82.1 82.2 82.1 82.1 82.51.1.302 92.7 92.6 92.5 92.2 92.2 91.7 91.0 91.2 90.8 91.0 91.5 91.6 91.81.1.303 80.0 80.0 80.0 80.0 79.7 79.6 79.6 80.2 79.7 79.6 79.6 79.5 79.81.1.304 108.6 109.0 109.2 109.0 109.4 109.2 109.6 109.7 110.1 110.1 110.2 110.2 109.51.1.305 110.3 110.3 110.5 110.5 110.5 110.5 110.5 110.5 110.5 110.7 110.7 110.7 110.51.1.306 103.7 103.9 104.3 102.3 101.7 101.7 100.2 99.1 99.0 100.0 100.5 100.6 101.41.39.307 119.7 119.9 120.9 120.6 120.6 121.7 121.9 122.2 121.6 121.8 121.0 121.71.39.325 110.6 110.9 111.1 111.2 111.2 111.1 111.3 111.2 111.1 111.1 110.7 110.81.39.4051.39.406
Jan-03 Feb-03 Mar-03 Apr-03 May-03 Jun-03 Jul-03 Aug-03 Sep-03 Oct-03 Nov-03 Dec-03 20031.1.301 82.1 80.9 80.9 81.3 81.7 81.7 81.8 81.8 81.81.1.302 90.9 90.5 90.4 89.4 89.5 89.5 89.4 89.4 89.21.1.303 79.5 79.4 79.5 79.5 79.5 79.5 79.4 79.4 79.31.1.304 111.5 110.9 111.2 111.1 111.1 110.3 109.8 110.2 109.91.1.305 110.7 110.7 110.7 110.8 110.8 110.8 110.8 110.9 110.91.1.306 106.6 107.5 108.1 109.2 109.4 109.6 111.0 111.0 111.51.39.3071.39.3251.39.4051.39.406
Data revised Datatype1.1. Statistisches Bundesamt: Preise Fachserie 17
Reihe 2 Preise und Preisindizes für gewerbeliche Produkte (Erzeugerpreise)1 Index der Erzeugerpreise gewerblicher Produkte: 1.1 Aktuelle Ergebnisse
301 - 717 Andere elektrische Leiter für die Fernmeldetechnik, für eine Spannung von 80 v oder weniger (3130 13 300) I-1995302 - 738 Elektronische Bauelemente (321) I-1995303 - 742 Dioden; Transistoren u. a. Halbleiterbauelemente; Leuchtdioden;
gefasste oder montierte Piezoelektrische Kristalle (3210 5) I-1995304 - 763 Meß-, Kontroll-, u. ä. Instrumente und Vorrichtungen (332) I-1995305 - 775 Optische und fotografische Geräte (334) I-1995306 - 820 Elektrischer Strom, Gas, Fernwärme (40) I-1995
1.39. Statistisches Bundesamt: Preise Fachserie 17: Reihe 7 - Preisindizes für die Lebenshaltung1. Preisindex fuer die Lebenshaltung aller privaten Haushalte: 1.1 Gliederung nach dem Verwendungszweck
307 - 85 Verkehrsdienstleistungen 073 (1) I-1995325 - Gesamtindex (1) I-1995405 - 85 Verkehrsdienstleistungen 073 I-2000406 - Gesamtindex I-2000
(1) Serie replaced - Base year changedPlease note that data marked "p" is provisional and likely to be updated.Data in bold has been revised. Please refer to the column marked "data revised" to obtain the date of the last revision for each series.
30
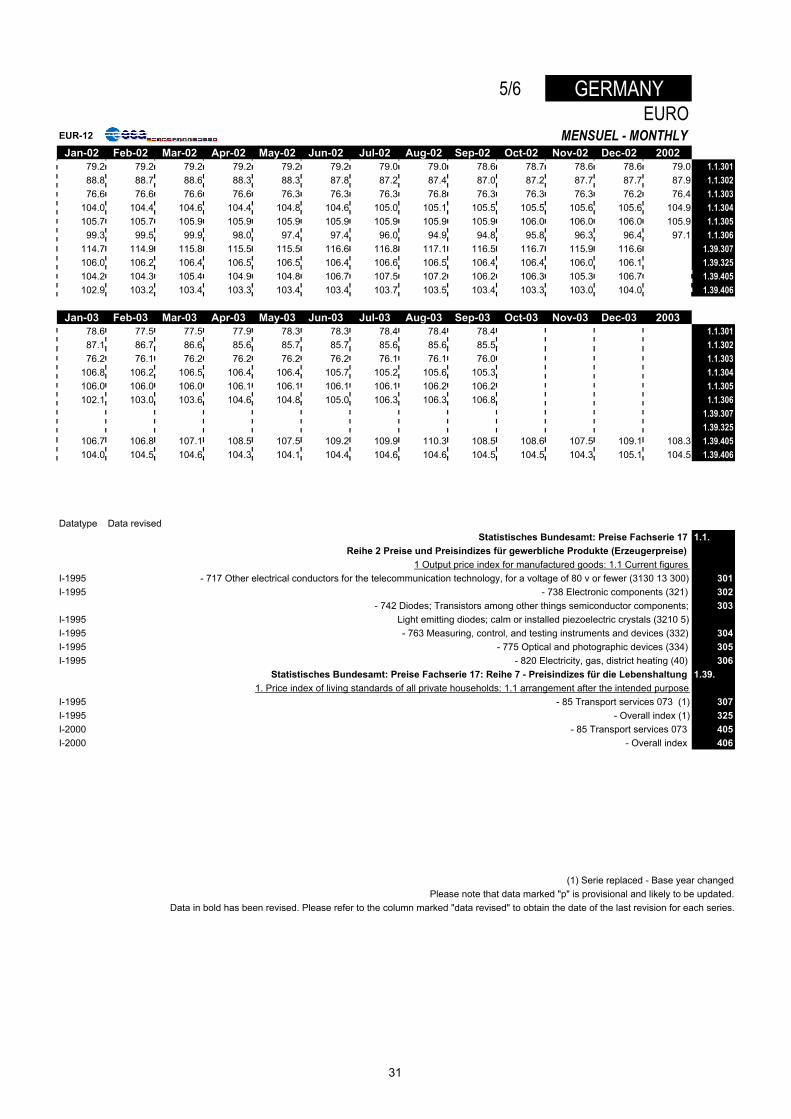
5/6 GERMANYEURO
EUR-12 MENSUEL - MONTHLYJan-02 Feb-02 Mar-02 Apr-02 May-02 Jun-02 Jul-02 Aug-02 Sep-02 Oct-02 Nov-02 Dec-02 2002
79.2 79.2 79.2 79.2 79.2 79.2 79.0 79.0 78.6 78.7 78.6 78.6 79.0 1.1.30188.8 88.7 88.6 88.3 88.3 87.8 87.2 87.4 87.0 87.2 87.7 87.7 87.9 1.1.30276.6 76.6 76.6 76.6 76.3 76.3 76.3 76.8 76.3 76.3 76.3 76.2 76.4 1.1.303
104.0 104.4 104.6 104.4 104.8 104.6 105.0 105.1 105.5 105.5 105.6 105.6 104.9 1.1.304105.7 105.7 105.9 105.9 105.9 105.9 105.9 105.9 105.9 106.0 106.0 106.0 105.9 1.1.30599.3 99.5 99.9 98.0 97.4 97.4 96.0 94.9 94.8 95.8 96.3 96.4 97.1 1.1.306
114.7 114.9 115.8 115.5 115.5 116.6 116.8 117.1 116.5 116.7 115.9 116.6 1.39.307106.0 106.2 106.4 106.5 106.5 106.4 106.6 106.5 106.4 106.4 106.0 106.1 1.39.325104.2 104.3 105.4 104.9 104.8 106.7 107.5 107.2 106.2 106.3 105.3 106.7 1.39.405102.9 103.2 103.4 103.3 103.4 103.4 103.7 103.5 103.4 103.3 103.0 104.0 1.39.406
Jan-03 Feb-03 Mar-03 Apr-03 May-03 Jun-03 Jul-03 Aug-03 Sep-03 Oct-03 Nov-03 Dec-03 200378.6 77.5 77.5 77.9 78.3 78.3 78.4 78.4 78.4 1.1.30187.1 86.7 86.6 85.6 85.7 85.7 85.6 85.6 85.5 1.1.30276.2 76.1 76.2 76.2 76.2 76.2 76.1 76.1 76.0 1.1.303
106.8 106.2 106.5 106.4 106.4 105.7 105.2 105.6 105.3 1.1.304106.0 106.0 106.0 106.1 106.1 106.1 106.1 106.2 106.2 1.1.305102.1 103.0 103.6 104.6 104.8 105.0 106.3 106.3 106.8 1.1.306
1.39.3071.39.325
106.7 106.8 107.1 108.5 107.5 109.2 109.9 110.3 108.5 108.6 107.5 109.1 108.3 1.39.405104.0 104.5 104.6 104.3 104.1 104.4 104.6 104.6 104.5 104.5 104.3 105.1 104.5 1.39.406
Datatype Data revisedStatistisches Bundesamt: Preise Fachserie 17 1.1.
Reihe 2 Preise und Preisindizes für gewerbliche Produkte (Erzeugerpreise) 1 Output price index for manufactured goods: 1.1 Current figures
I-1995 - 717 Other electrical conductors for the telecommunication technology, for a voltage of 80 v or fewer (3130 13 300) 301I-1995 - 738 Electronic components (321) 302
- 742 Diodes; Transistors among other things semiconductor components; 303I-1995 Light emitting diodes; calm or installed piezoelectric crystals (3210 5) I-1995 - 763 Measuring, control, and testing instruments and devices (332) 304I-1995 - 775 Optical and photographic devices (334) 305I-1995 - 820 Electricity, gas, district heating (40) 306
Statistisches Bundesamt: Preise Fachserie 17: Reihe 7 - Preisindizes für die Lebenshaltung 1.39.1. Price index of living standards of all private households: 1.1 arrangement after the intended purpose
I-1995 - 85 Transport services 073 (1) 307I-1995 - Overall index (1) 325I-2000 - 85 Transport services 073 405I-2000 - Overall index 406
(1) Serie replaced - Base year changedPlease note that data marked "p" is provisional and likely to be updated.
Data in bold has been revised. Please refer to the column marked "data revised" to obtain the date of the last revision for each series.
31
ALLEMAGNE 6/6MONNAIE NATIONALE - NATIONAL CURRENCY (DM)MENSUEL - MONTHLY EUR-12
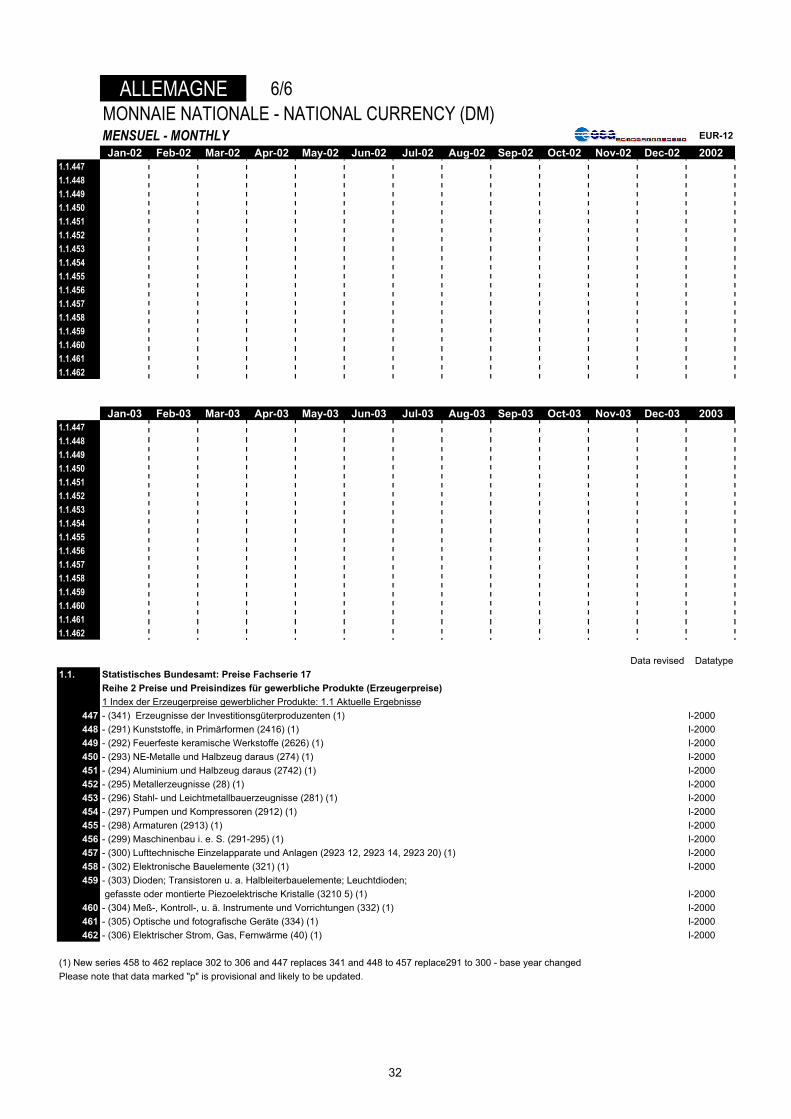
Jan-02 Feb-02 Mar-02 Apr-02 May-02 Jun-02 Jul-02 Aug-02 Sep-02 Oct-02 Nov-02 Dec-02 20021.1.4471.1.4481.1.4491.1.4501.1.4511.1.4521.1.4531.1.4541.1.4551.1.4561.1.4571.1.4581.1.4591.1.4601.1.4611.1.462
Jan-03 Feb-03 Mar-03 Apr-03 May-03 Jun-03 Jul-03 Aug-03 Sep-03 Oct-03 Nov-03 Dec-03 20031.1.4471.1.4481.1.4491.1.4501.1.4511.1.4521.1.4531.1.4541.1.4551.1.4561.1.4571.1.4581.1.4591.1.4601.1.4611.1.462
Data revised Datatype1.1. Statistisches Bundesamt: Preise Fachserie 17
Reihe 2 Preise und Preisindizes für gewerbliche Produkte (Erzeugerpreise) 1 Index der Erzeugerpreise gewerblicher Produkte: 1.1 Aktuelle Ergebnisse
447 - (341) Erzeugnisse der Investitionsgüterproduzenten (1) I-2000448 - (291) Kunststoffe, in Primärformen (2416) (1) I-2000449 - (292) Feuerfeste keramische Werkstoffe (2626) (1) I-2000450 - (293) NE-Metalle und Halbzeug daraus (274) (1) I-2000451 - (294) Aluminium und Halbzeug daraus (2742) (1) I-2000452 - (295) Metallerzeugnisse (28) (1) I-2000453 - (296) Stahl- und Leichtmetallbauerzeugnisse (281) (1) I-2000454 - (297) Pumpen und Kompressoren (2912) (1) I-2000455 - (298) Armaturen (2913) (1) I-2000456 - (299) Maschinenbau i. e. S. (291-295) (1) I-2000457 - (300) Lufttechnische Einzelapparate und Anlagen (2923 12, 2923 14, 2923 20) (1) I-2000458 - (302) Elektronische Bauelemente (321) (1) I-2000459 - (303) Dioden; Transistoren u. a. Halbleiterbauelemente; Leuchtdioden;
gefasste oder montierte Piezoelektrische Kristalle (3210 5) (1) I-2000460 - (304) Meß-, Kontroll-, u. ä. Instrumente und Vorrichtungen (332) (1) I-2000461 - (305) Optische und fotografische Geräte (334) (1) I-2000462 - (306) Elektrischer Strom, Gas, Fernwärme (40) (1) I-2000
(1) New series 458 to 462 replace 302 to 306 and 447 replaces 341 and 448 to 457 replace291 to 300 - base year changedPlease note that data marked "p" is provisional and likely to be updated.
32
6/6 GERMANYEURO
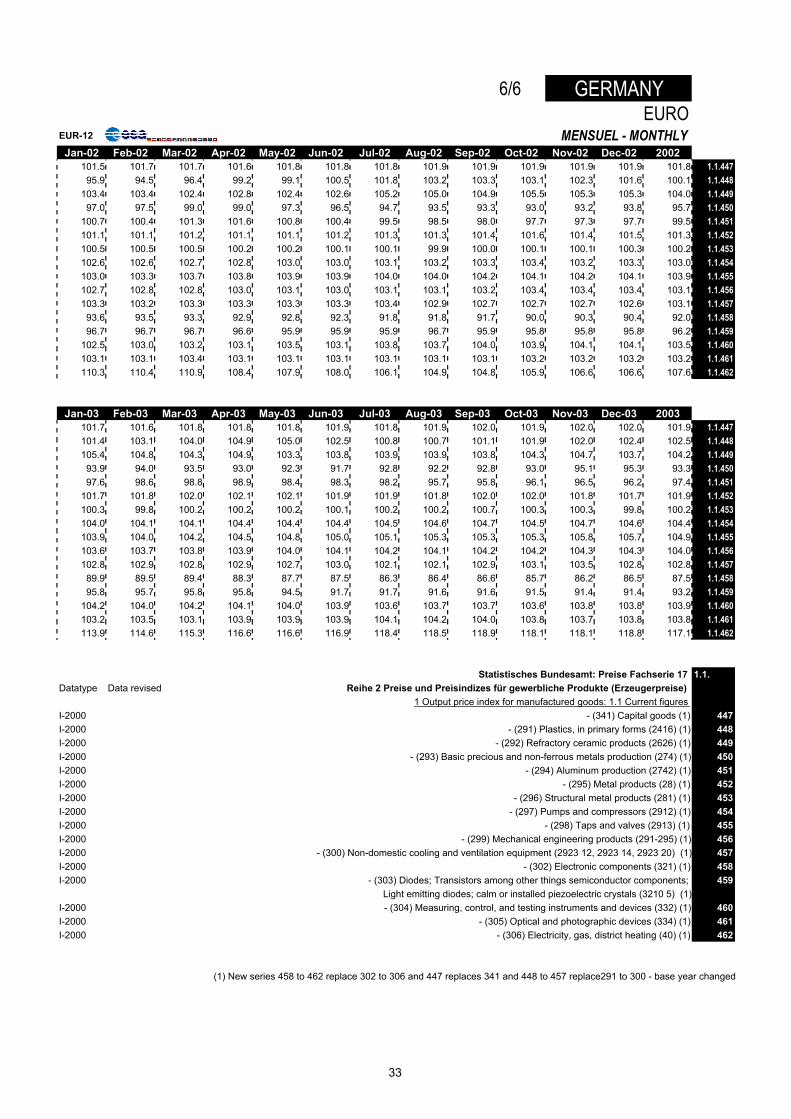
EUR-12 MENSUEL - MONTHLYJan-02 Feb-02 Mar-02 Apr-02 May-02 Jun-02 Jul-02 Aug-02 Sep-02 Oct-02 Nov-02 Dec-02 2002
101.5 101.7 101.7 101.6 101.8 101.8 101.8 101.9 101.9 101.9 101.9 101.9 101.8 1.1.44795.9 94.5 96.4 99.2 99.1 100.5 101.8 103.2 103.3 103.1 102.3 101.6 100.1 1.1.448
103.4 103.4 102.4 102.8 102.4 102.6 105.2 105.0 104.9 105.5 105.3 105.3 104.0 1.1.44997.0 97.5 99.0 99.0 97.3 96.5 94.7 93.5 93.3 93.0 93.2 93.8 95.7 1.1.450
100.7 100.4 101.3 101.6 100.8 100.4 99.5 98.5 98.0 97.7 97.3 97.7 99.5 1.1.451101.1 101.1 101.2 101.1 101.1 101.2 101.3 101.3 101.4 101.6 101.4 101.5 101.3 1.1.452100.5 100.5 100.5 100.2 100.2 100.1 100.1 99.9 100.0 100.1 100.1 100.3 100.2 1.1.453102.6 102.6 102.7 102.8 103.0 103.0 103.1 103.2 103.3 103.4 103.2 103.3 103.0 1.1.454103.0 103.3 103.7 103.8 103.9 103.9 104.0 104.0 104.2 104.1 104.2 104.1 103.9 1.1.455102.7 102.8 102.8 103.0 103.1 103.0 103.1 103.1 103.2 103.4 103.4 103.4 103.1 1.1.456103.3 103.2 103.3 103.3 103.3 103.3 103.4 102.9 102.7 102.7 102.7 102.6 103.1 1.1.45793.6 93.5 93.3 92.9 92.8 92.3 91.8 91.8 91.7 90.0 90.3 90.4 92.0 1.1.45896.7 96.7 96.7 96.6 95.9 95.9 95.9 96.7 95.9 95.8 95.8 95.8 96.2 1.1.459
102.5 103.0 103.2 103.1 103.5 103.1 103.8 103.7 104.0 103.9 104.1 104.1 103.5 1.1.460103.1 103.1 103.4 103.1 103.1 103.1 103.1 103.1 103.1 103.2 103.2 103.2 103.2 1.1.461110.3 110.4 110.9 108.4 107.9 108.0 106.1 104.9 104.8 105.9 106.6 106.6 107.6 1.1.462
Jan-03 Feb-03 Mar-03 Apr-03 May-03 Jun-03 Jul-03 Aug-03 Sep-03 Oct-03 Nov-03 Dec-03 2003101.7 101.6 101.8 101.8 101.8 101.9 101.8 101.9 102.0 101.9 102.0 102.0 101.9 1.1.447101.4 103.1 104.0 104.9 105.0 102.5 100.8 100.7 101.1 101.9 102.0 102.4 102.5 1.1.448105.4 104.8 104.3 104.9 103.3 103.8 103.9 103.9 103.8 104.3 104.7 103.7 104.2 1.1.44993.9 94.0 93.5 93.0 92.3 91.7 92.8 92.2 92.8 93.0 95.1 95.3 93.3 1.1.45097.6 98.6 98.8 98.9 98.4 98.3 98.2 95.7 95.8 96.1 96.5 96.2 97.4 1.1.451
101.7 101.8 102.0 102.1 102.1 101.9 101.9 101.8 102.0 102.0 101.8 101.7 101.9 1.1.452100.3 99.8 100.2 100.2 100.2 100.1 100.2 100.2 100.7 100.3 100.3 99.8 100.2 1.1.453104.0 104.1 104.1 104.4 104.4 104.4 104.5 104.6 104.7 104.5 104.7 104.6 104.4 1.1.454103.9 104.0 104.2 104.5 104.8 105.0 105.1 105.3 105.3 105.3 105.8 105.7 104.9 1.1.455103.6 103.7 103.8 103.9 104.0 104.1 104.2 104.1 104.2 104.2 104.3 104.3 104.0 1.1.456102.8 102.9 102.8 102.9 102.7 103.0 102.1 102.1 102.9 103.1 103.5 102.8 102.8 1.1.45789.9 89.5 89.4 88.3 87.7 87.5 86.3 86.4 86.6 85.7 86.2 86.5 87.5 1.1.45895.8 95.7 95.8 95.8 94.5 91.7 91.7 91.6 91.6 91.5 91.4 91.4 93.2 1.1.459
104.2 104.0 104.2 104.1 104.0 103.9 103.6 103.7 103.7 103.6 103.8 103.8 103.9 1.1.460103.2 103.5 103.1 103.9 103.9 103.9 104.1 104.2 104.0 103.8 103.7 103.8 103.8 1.1.461113.9 114.6 115.3 116.6 116.6 116.9 118.4 118.5 118.9 118.1 118.1 118.8 117.1 1.1.462
Statistisches Bundesamt: Preise Fachserie 17 1.1.Datatype Data revised Reihe 2 Preise und Preisindizes für gewerbliche Produkte (Erzeugerpreise)
1 Output price index for manufactured goods: 1.1 Current figures I-2000 - (341) Capital goods (1) 447I-2000 - (291) Plastics, in primary forms (2416) (1) 448I-2000 - (292) Refractory ceramic products (2626) (1) 449I-2000 - (293) Basic precious and non-ferrous metals production (274) (1) 450I-2000 - (294) Aluminum production (2742) (1) 451I-2000 - (295) Metal products (28) (1) 452I-2000 - (296) Structural metal products (281) (1) 453I-2000 - (297) Pumps and compressors (2912) (1) 454I-2000 - (298) Taps and valves (2913) (1) 455I-2000 - (299) Mechanical engineering products (291-295) (1) 456I-2000 - (300) Non-domestic cooling and ventilation equipment (2923 12, 2923 14, 2923 20) (1) 457I-2000 - (302) Electronic components (321) (1) 458I-2000 - (303) Diodes; Transistors among other things semiconductor components; 459
Light emitting diodes; calm or installed piezoelectric crystals (3210 5) (1)I-2000 - (304) Measuring, control, and testing instruments and devices (332) (1) 460I-2000 - (305) Optical and photographic devices (334) (1) 461I-2000 - (306) Electricity, gas, district heating (40) (1) 462
(1) New series 458 to 462 replace 302 to 306 and 447 replaces 341 and 448 to 457 replace291 to 300 - base year changed
33
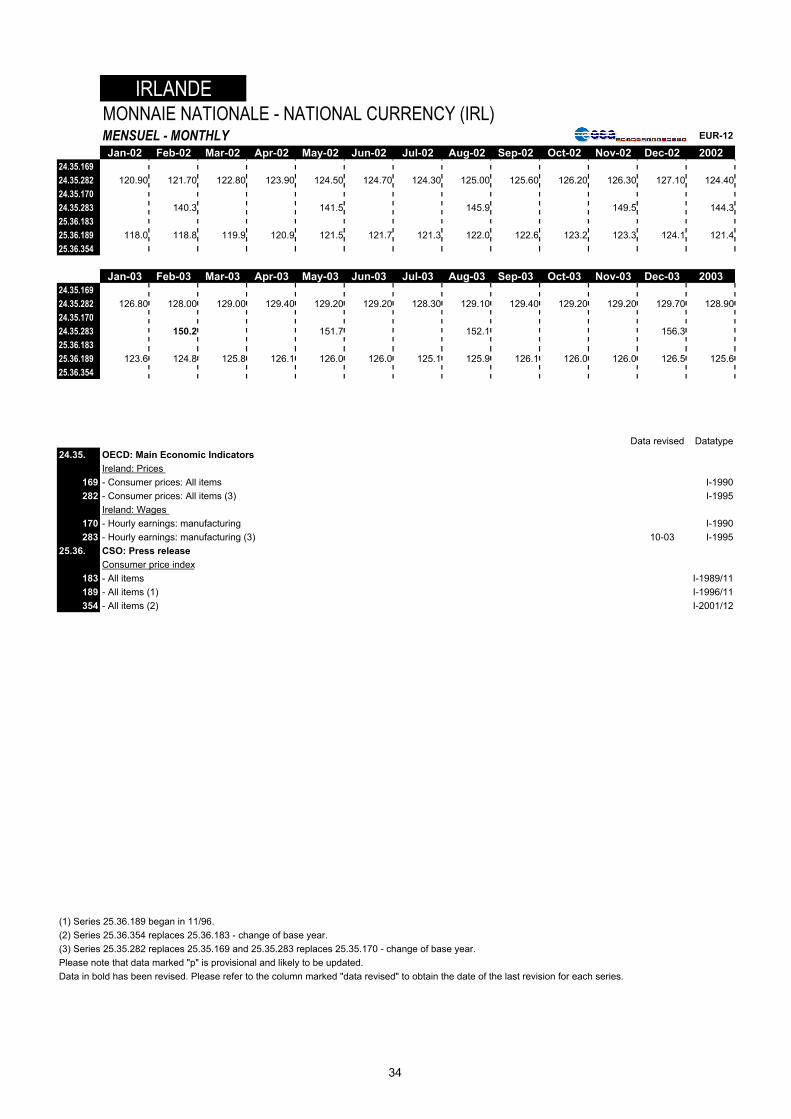
IRLANDEMONNAIE NATIONALE - NATIONAL CURRENCY (IRL)MENSUEL - MONTHLY EUR-12
Jan-02 Feb-02 Mar-02 Apr-02 May-02 Jun-02 Jul-02 Aug-02 Sep-02 Oct-02 Nov-02 Dec-02 200224.35.16924.35.282 120.90 121.70 122.80 123.90 124.50 124.70 124.30 125.00 125.60 126.20 126.30 127.10 124.4024.35.17024.35.283 140.3 141.5 145.9 149.5 144.325.36.18325.36.189 118.0 118.8 119.9 120.9 121.5 121.7 121.3 122.0 122.6 123.2 123.3 124.1 121.425.36.354
Jan-03 Feb-03 Mar-03 Apr-03 May-03 Jun-03 Jul-03 Aug-03 Sep-03 Oct-03 Nov-03 Dec-03 200324.35.16924.35.282 126.80 128.00 129.00 129.40 129.20 129.20 128.30 129.10 129.40 129.20 129.20 129.70 128.9024.35.17024.35.283 150.2 151.7 152.1 156.325.36.18325.36.189 123.6 124.8 125.8 126.1 126.0 126.0 125.1 125.9 126.1 126.0 126.0 126.5 125.625.36.354
Data revised Datatype24.35. OECD: Main Economic Indicators
Ireland: Prices 169 - Consumer prices: All items I-1990282 - Consumer prices: All items (3) I-1995
Ireland: Wages 170 - Hourly earnings: manufacturing I-1990283 - Hourly earnings: manufacturing (3) 10-03 I-1995
25.36. CSO: Press releaseConsumer price index
183 - All items I-1989/11189 - All items (1) I-1996/11354 - All items (2) I-2001/12
(1) Series 25.36.189 began in 11/96.(2) Series 25.36.354 replaces 25.36.183 - change of base year.(3) Series 25.35.282 replaces 25.35.169 and 25.35.283 replaces 25.35.170 - change of base year.Please note that data marked "p" is provisional and likely to be updated.Data in bold has been revised. Please refer to the column marked "data revised" to obtain the date of the last revision for each series.
34
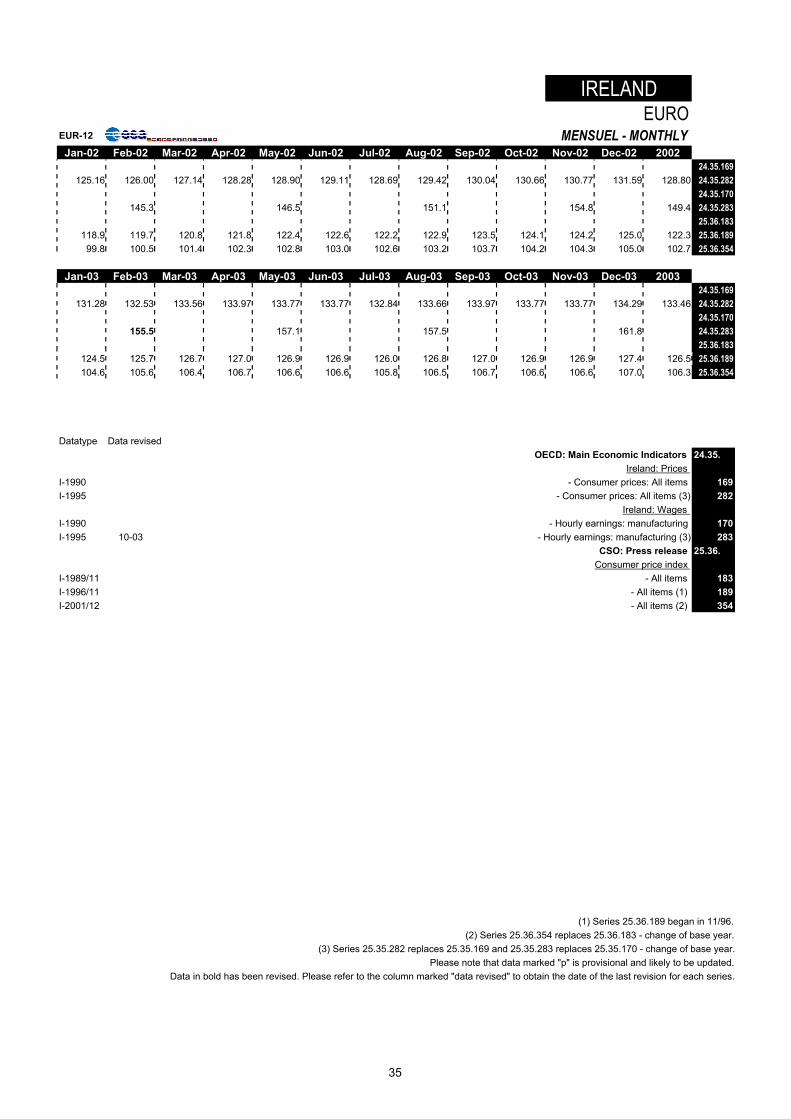
IRELANDEURO
EUR-12 MENSUEL - MONTHLYJan-02 Feb-02 Mar-02 Apr-02 May-02 Jun-02 Jul-02 Aug-02 Sep-02 Oct-02 Nov-02 Dec-02 2002
24.35.169125.16 126.00 127.14 128.28 128.90 129.11 128.69 129.42 130.04 130.66 130.77 131.59 128.80 24.35.282
24.35.170145.3 146.5 151.1 154.8 149.4 24.35.283
25.36.183118.9 119.7 120.8 121.8 122.4 122.6 122.2 122.9 123.5 124.1 124.2 125.0 122.3 25.36.18999.8 100.5 101.4 102.3 102.8 103.0 102.6 103.2 103.7 104.2 104.3 105.0 102.7 25.36.354
Jan-03 Feb-03 Mar-03 Apr-03 May-03 Jun-03 Jul-03 Aug-03 Sep-03 Oct-03 Nov-03 Dec-03 200324.35.169
131.28 132.53 133.56 133.97 133.77 133.77 132.84 133.66 133.97 133.77 133.77 134.29 133.46 24.35.28224.35.170
155.5 157.1 157.5 161.8 24.35.28325.36.183
124.5 125.7 126.7 127.0 126.9 126.9 126.0 126.8 127.0 126.9 126.9 127.4 126.5 25.36.189104.6 105.6 106.4 106.7 106.6 106.6 105.8 106.5 106.7 106.6 106.6 107.0 106.3 25.36.354
Datatype Data revisedOECD: Main Economic Indicators 24.35.
Ireland: Prices I-1990 - Consumer prices: All items 169I-1995 - Consumer prices: All items (3) 282
Ireland: Wages I-1990 - Hourly earnings: manufacturing 170I-1995 10-03 - Hourly earnings: manufacturing (3) 283
CSO: Press release 25.36.Consumer price index
I-1989/11 - All items 183I-1996/11 - All items (1) 189I-2001/12 - All items (2) 354
(1) Series 25.36.189 began in 11/96.(2) Series 25.36.354 replaces 25.36.183 - change of base year.
(3) Series 25.35.282 replaces 25.35.169 and 25.35.283 replaces 25.35.170 - change of base year.Please note that data marked "p" is provisional and likely to be updated.
Data in bold has been revised. Please refer to the column marked "data revised" to obtain the date of the last revision for each series.
35
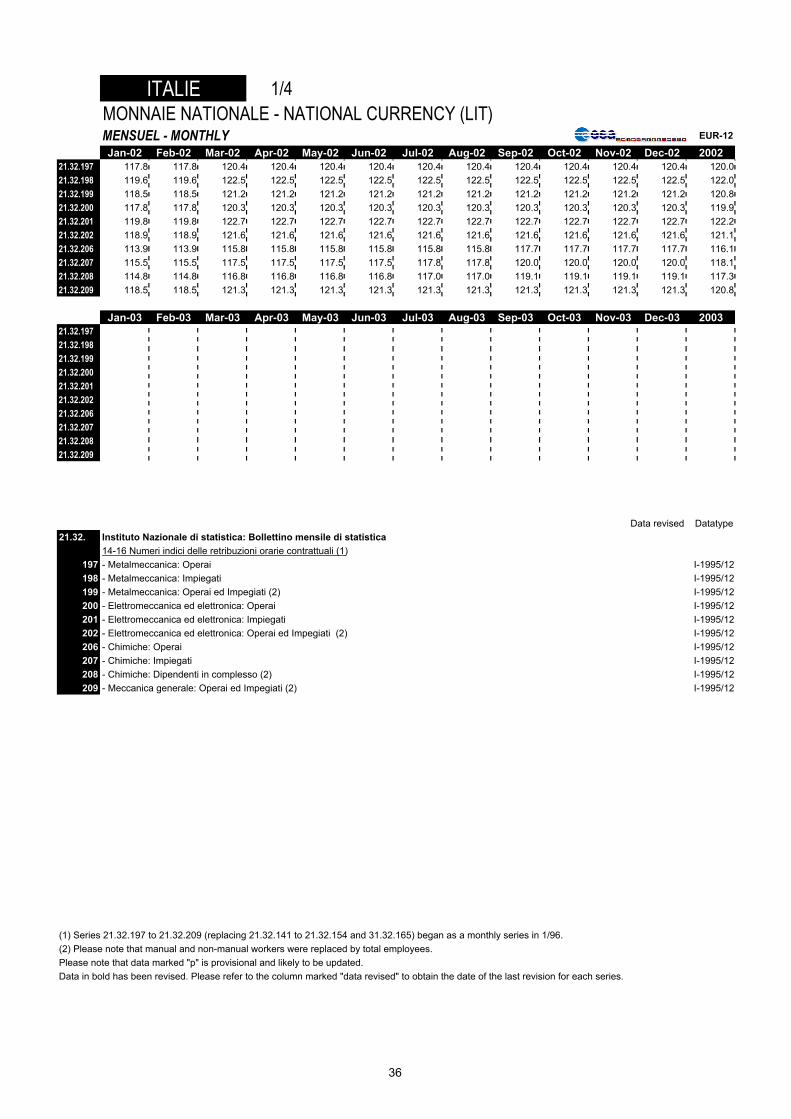
ITALIE 1/4MONNAIE NATIONALE - NATIONAL CURRENCY (LIT)MENSUEL - MONTHLY EUR-12
Jan-02 Feb-02 Mar-02 Apr-02 May-02 Jun-02 Jul-02 Aug-02 Sep-02 Oct-02 Nov-02 Dec-02 200221.32.197 117.8 117.8 120.4 120.4 120.4 120.4 120.4 120.4 120.4 120.4 120.4 120.4 120.021.32.198 119.6 119.6 122.5 122.5 122.5 122.5 122.5 122.5 122.5 122.5 122.5 122.5 122.021.32.199 118.5 118.5 121.2 121.2 121.2 121.2 121.2 121.2 121.2 121.2 121.2 121.2 120.821.32.200 117.8 117.8 120.3 120.3 120.3 120.3 120.3 120.3 120.3 120.3 120.3 120.3 119.921.32.201 119.8 119.8 122.7 122.7 122.7 122.7 122.7 122.7 122.7 122.7 122.7 122.7 122.221.32.202 118.9 118.9 121.6 121.6 121.6 121.6 121.6 121.6 121.6 121.6 121.6 121.6 121.121.32.206 113.9 113.9 115.8 115.8 115.8 115.8 115.8 115.8 117.7 117.7 117.7 117.7 116.121.32.207 115.5 115.5 117.5 117.5 117.5 117.5 117.8 117.8 120.0 120.0 120.0 120.0 118.121.32.208 114.8 114.8 116.8 116.8 116.8 116.8 117.0 117.0 119.1 119.1 119.1 119.1 117.321.32.209 118.5 118.5 121.3 121.3 121.3 121.3 121.3 121.3 121.3 121.3 121.3 121.3 120.8
Jan-03 Feb-03 Mar-03 Apr-03 May-03 Jun-03 Jul-03 Aug-03 Sep-03 Oct-03 Nov-03 Dec-03 200321.32.19721.32.19821.32.19921.32.20021.32.20121.32.20221.32.20621.32.20721.32.20821.32.209
Data revised Datatype21.32. Instituto Nazionale di statistica: Bollettino mensile di statistica
14-16 Numeri indici delle retribuzioni orarie contrattuali (1)197 - Metalmeccanica: Operai I-1995/12198 - Metalmeccanica: Impiegati I-1995/12199 - Metalmeccanica: Operai ed Impegiati (2) I-1995/12200 - Elettromeccanica ed elettronica: Operai I-1995/12201 - Elettromeccanica ed elettronica: Impiegati I-1995/12202 - Elettromeccanica ed elettronica: Operai ed Impegiati (2) I-1995/12206 - Chimiche: Operai I-1995/12207 - Chimiche: Impiegati I-1995/12208 - Chimiche: Dipendenti in complesso (2) I-1995/12209 - Meccanica generale: Operai ed Impegiati (2) I-1995/12
(1) Series 21.32.197 to 21.32.209 (replacing 21.32.141 to 21.32.154 and 31.32.165) began as a monthly series in 1/96. (2) Please note that manual and non-manual workers were replaced by total employees.Please note that data marked "p" is provisional and likely to be updated.Data in bold has been revised. Please refer to the column marked "data revised" to obtain the date of the last revision for each series.
36
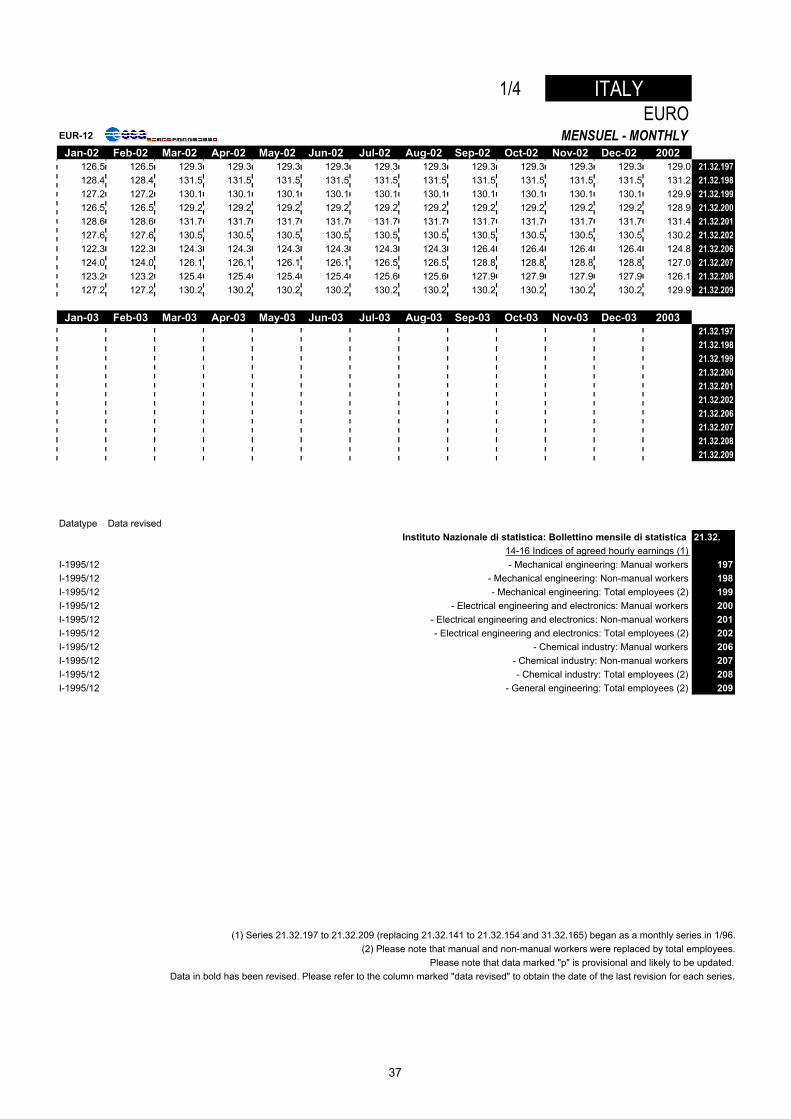
1/4 ITALYEURO
EUR-12 MENSUEL - MONTHLYJan-02 Feb-02 Mar-02 Apr-02 May-02 Jun-02 Jul-02 Aug-02 Sep-02 Oct-02 Nov-02 Dec-02 2002
126.5 126.5 129.3 129.3 129.3 129.3 129.3 129.3 129.3 129.3 129.3 129.3 129.0 21.32.197128.4 128.4 131.5 131.5 131.5 131.5 131.5 131.5 131.5 131.5 131.5 131.5 131.2 21.32.198127.2 127.2 130.1 130.1 130.1 130.1 130.1 130.1 130.1 130.1 130.1 130.1 129.9 21.32.199126.5 126.5 129.2 129.2 129.2 129.2 129.2 129.2 129.2 129.2 129.2 129.2 128.9 21.32.200128.6 128.6 131.7 131.7 131.7 131.7 131.7 131.7 131.7 131.7 131.7 131.7 131.4 21.32.201127.6 127.6 130.5 130.5 130.5 130.5 130.5 130.5 130.5 130.5 130.5 130.5 130.2 21.32.202122.3 122.3 124.3 124.3 124.3 124.3 124.3 124.3 126.4 126.4 126.4 126.4 124.8 21.32.206124.0 124.0 126.1 126.1 126.1 126.1 126.5 126.5 128.8 128.8 128.8 128.8 127.0 21.32.207123.2 123.2 125.4 125.4 125.4 125.4 125.6 125.6 127.9 127.9 127.9 127.9 126.1 21.32.208127.2 127.2 130.2 130.2 130.2 130.2 130.2 130.2 130.2 130.2 130.2 130.2 129.9 21.32.209
Jan-03 Feb-03 Mar-03 Apr-03 May-03 Jun-03 Jul-03 Aug-03 Sep-03 Oct-03 Nov-03 Dec-03 200321.32.19721.32.19821.32.19921.32.20021.32.20121.32.20221.32.20621.32.20721.32.20821.32.209
Datatype Data revisedInstituto Nazionale di statistica: Bollettino mensile di statistica 21.32.
14-16 Indices of agreed hourly earnings (1) I-1995/12 - Mechanical engineering: Manual workers 197I-1995/12 - Mechanical engineering: Non-manual workers 198I-1995/12 - Mechanical engineering: Total employees (2) 199I-1995/12 - Electrical engineering and electronics: Manual workers 200I-1995/12 - Electrical engineering and electronics: Non-manual workers 201I-1995/12 - Electrical engineering and electronics: Total employees (2) 202I-1995/12 - Chemical industry: Manual workers 206I-1995/12 - Chemical industry: Non-manual workers 207I-1995/12 - Chemical industry: Total employees (2) 208I-1995/12 - General engineering: Total employees (2) 209
(1) Series 21.32.197 to 21.32.209 (replacing 21.32.141 to 21.32.154 and 31.32.165) began as a monthly series in 1/96.(2) Please note that manual and non-manual workers were replaced by total employees.
Please note that data marked "p" is provisional and likely to be updated.Data in bold has been revised. Please refer to the column marked "data revised" to obtain the date of the last revision for each series.
37
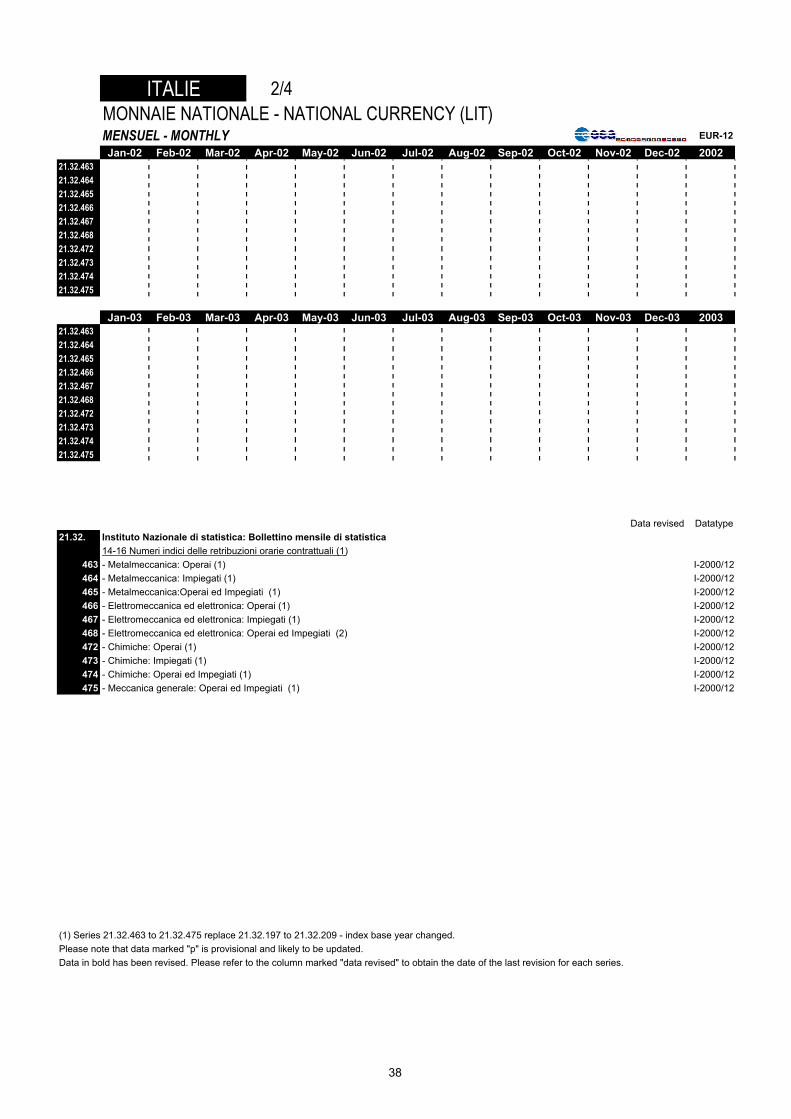
ITALIE 2/4MONNAIE NATIONALE - NATIONAL CURRENCY (LIT)MENSUEL - MONTHLY EUR-12
Jan-02 Feb-02 Mar-02 Apr-02 May-02 Jun-02 Jul-02 Aug-02 Sep-02 Oct-02 Nov-02 Dec-02 200221.32.46321.32.46421.32.46521.32.46621.32.46721.32.46821.32.47221.32.47321.32.47421.32.475
Jan-03 Feb-03 Mar-03 Apr-03 May-03 Jun-03 Jul-03 Aug-03 Sep-03 Oct-03 Nov-03 Dec-03 200321.32.46321.32.46421.32.46521.32.46621.32.46721.32.46821.32.47221.32.47321.32.47421.32.475
Data revised Datatype21.32. Instituto Nazionale di statistica: Bollettino mensile di statistica
14-16 Numeri indici delle retribuzioni orarie contrattuali (1)463 - Metalmeccanica: Operai (1) I-2000/12464 - Metalmeccanica: Impiegati (1) I-2000/12465 - Metalmeccanica:Operai ed Impegiati (1) I-2000/12466 - Elettromeccanica ed elettronica: Operai (1) I-2000/12467 - Elettromeccanica ed elettronica: Impiegati (1) I-2000/12468 - Elettromeccanica ed elettronica: Operai ed Impegiati (2) I-2000/12472 - Chimiche: Operai (1) I-2000/12473 - Chimiche: Impiegati (1) I-2000/12474 - Chimiche: Operai ed Impegiati (1) I-2000/12475 - Meccanica generale: Operai ed Impegiati (1) I-2000/12
(1) Series 21.32.463 to 21.32.475 replace 21.32.197 to 21.32.209 - index base year changed. Please note that data marked "p" is provisional and likely to be updated.Data in bold has been revised. Please refer to the column marked "data revised" to obtain the date of the last revision for each series.
38
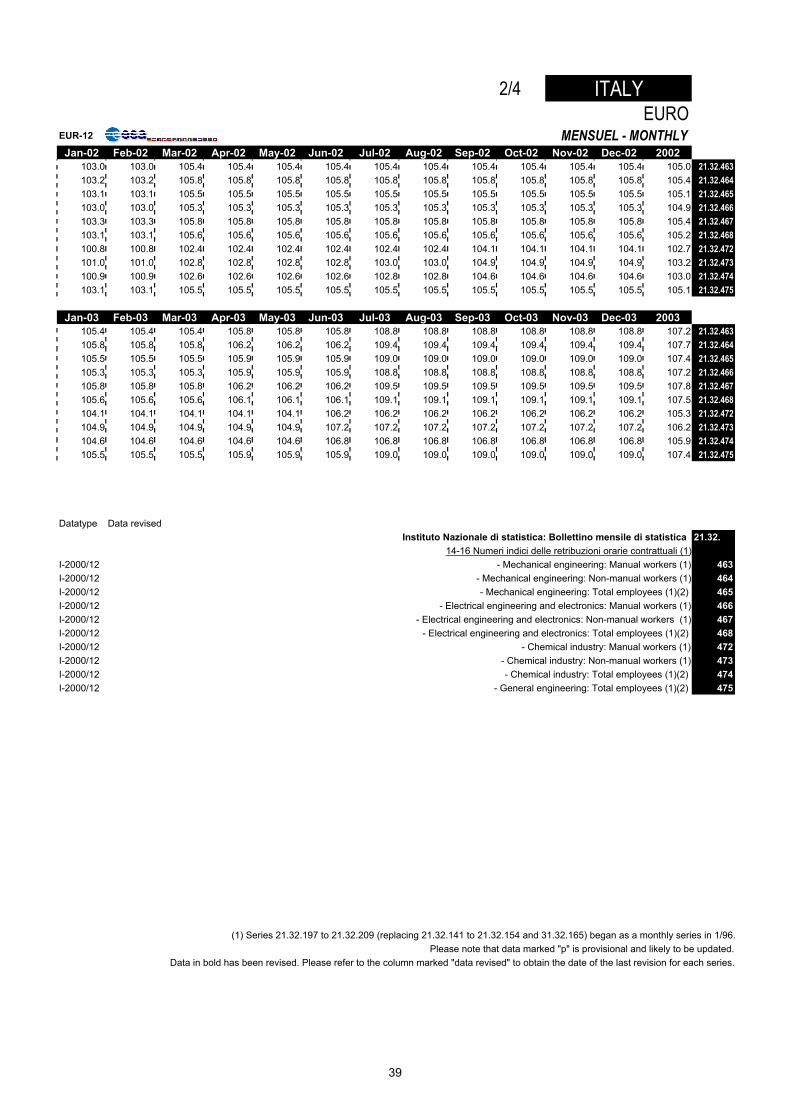
2/4 ITALYEURO
EUR-12 MENSUEL - MONTHLYJan-02 Feb-02 Mar-02 Apr-02 May-02 Jun-02 Jul-02 Aug-02 Sep-02 Oct-02 Nov-02 Dec-02 2002
103.0 103.0 105.4 105.4 105.4 105.4 105.4 105.4 105.4 105.4 105.4 105.4 105.0 21.32.463103.2 103.2 105.8 105.8 105.8 105.8 105.8 105.8 105.8 105.8 105.8 105.8 105.4 21.32.464103.1 103.1 105.5 105.5 105.5 105.5 105.5 105.5 105.5 105.5 105.5 105.5 105.1 21.32.465103.0 103.0 105.3 105.3 105.3 105.3 105.3 105.3 105.3 105.3 105.3 105.3 104.9 21.32.466103.3 103.3 105.8 105.8 105.8 105.8 105.8 105.8 105.8 105.8 105.8 105.8 105.4 21.32.467103.1 103.1 105.6 105.6 105.6 105.6 105.6 105.6 105.6 105.6 105.6 105.6 105.2 21.32.468100.8 100.8 102.4 102.4 102.4 102.4 102.4 102.4 104.1 104.1 104.1 104.1 102.7 21.32.472101.0 101.0 102.8 102.8 102.8 102.8 103.0 103.0 104.9 104.9 104.9 104.9 103.2 21.32.473100.9 100.9 102.6 102.6 102.6 102.6 102.8 102.8 104.6 104.6 104.6 104.6 103.0 21.32.474103.1 103.1 105.5 105.5 105.5 105.5 105.5 105.5 105.5 105.5 105.5 105.5 105.1 21.32.475
Jan-03 Feb-03 Mar-03 Apr-03 May-03 Jun-03 Jul-03 Aug-03 Sep-03 Oct-03 Nov-03 Dec-03 2003105.4 105.4 105.4 105.8 105.8 105.8 108.8 108.8 108.8 108.8 108.8 108.8 107.2 21.32.463105.8 105.8 105.8 106.2 106.2 106.2 109.4 109.4 109.4 109.4 109.4 109.4 107.7 21.32.464105.5 105.5 105.5 105.9 105.9 105.9 109.0 109.0 109.0 109.0 109.0 109.0 107.4 21.32.465105.3 105.3 105.3 105.9 105.9 105.9 108.8 108.8 108.8 108.8 108.8 108.8 107.2 21.32.466105.8 105.8 105.8 106.2 106.2 106.2 109.5 109.5 109.5 109.5 109.5 109.5 107.8 21.32.467105.6 105.6 105.6 106.1 106.1 106.1 109.1 109.1 109.1 109.1 109.1 109.1 107.5 21.32.468104.1 104.1 104.1 104.1 104.1 106.2 106.2 106.2 106.2 106.2 106.2 106.2 105.3 21.32.472104.9 104.9 104.9 104.9 104.9 107.2 107.2 107.2 107.2 107.2 107.2 107.2 106.2 21.32.473104.6 104.6 104.6 104.6 104.6 106.8 106.8 106.8 106.8 106.8 106.8 106.8 105.9 21.32.474105.5 105.5 105.5 105.9 105.9 105.9 109.0 109.0 109.0 109.0 109.0 109.0 107.4 21.32.475
Datatype Data revisedInstituto Nazionale di statistica: Bollettino mensile di statistica 21.32.
14-16 Numeri indici delle retribuzioni orarie contrattuali (1)I-2000/12 - Mechanical engineering: Manual workers (1) 463I-2000/12 - Mechanical engineering: Non-manual workers (1) 464I-2000/12 - Mechanical engineering: Total employees (1)(2) 465I-2000/12 - Electrical engineering and electronics: Manual workers (1) 466I-2000/12 - Electrical engineering and electronics: Non-manual workers (1) 467I-2000/12 - Electrical engineering and electronics: Total employees (1)(2) 468I-2000/12 - Chemical industry: Manual workers (1) 472I-2000/12 - Chemical industry: Non-manual workers (1) 473I-2000/12 - Chemical industry: Total employees (1)(2) 474I-2000/12 - General engineering: Total employees (1)(2) 475
(1) Series 21.32.197 to 21.32.209 (replacing 21.32.141 to 21.32.154 and 31.32.165) began as a monthly series in 1/96.Please note that data marked "p" is provisional and likely to be updated.
Data in bold has been revised. Please refer to the column marked "data revised" to obtain the date of the last revision for each series.
39
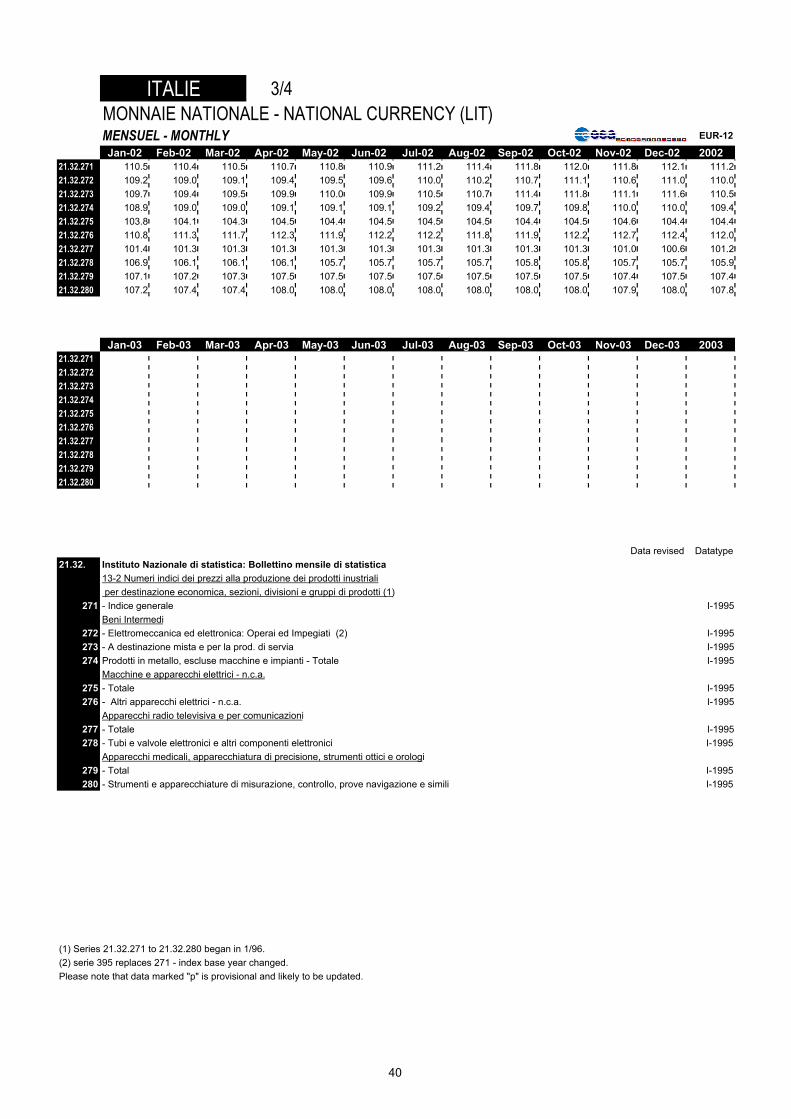
ITALIE 3/4MONNAIE NATIONALE - NATIONAL CURRENCY (LIT)MENSUEL - MONTHLY EUR-12
Jan-02 Feb-02 Mar-02 Apr-02 May-02 Jun-02 Jul-02 Aug-02 Sep-02 Oct-02 Nov-02 Dec-02 200221.32.271 110.5 110.4 110.5 110.7 110.8 110.9 111.2 111.4 111.8 112.0 111.8 112.1 111.221.32.272 109.2 109.0 109.1 109.4 109.5 109.6 110.0 110.2 110.7 111.1 110.6 111.0 110.021.32.273 109.7 109.4 109.5 109.9 110.0 109.9 110.5 110.7 111.4 111.8 111.1 111.6 110.521.32.274 108.9 109.0 109.0 109.1 109.1 109.1 109.2 109.4 109.7 109.8 110.0 110.0 109.421.32.275 103.8 104.1 104.3 104.5 104.4 104.5 104.5 104.5 104.4 104.5 104.6 104.4 104.421.32.276 110.8 111.3 111.7 112.3 111.9 112.2 112.2 111.8 111.9 112.2 112.7 112.4 112.021.32.277 101.4 101.3 101.3 101.3 101.3 101.3 101.3 101.3 101.3 101.3 101.0 100.6 101.221.32.278 106.9 106.1 106.1 106.1 105.7 105.7 105.7 105.7 105.8 105.8 105.7 105.7 105.921.32.279 107.1 107.2 107.3 107.5 107.5 107.5 107.5 107.5 107.5 107.5 107.4 107.5 107.421.32.280 107.2 107.4 107.4 108.0 108.0 108.0 108.0 108.0 108.0 108.0 107.9 108.0 107.8
Jan-03 Feb-03 Mar-03 Apr-03 May-03 Jun-03 Jul-03 Aug-03 Sep-03 Oct-03 Nov-03 Dec-03 200321.32.27121.32.27221.32.27321.32.27421.32.27521.32.27621.32.27721.32.27821.32.27921.32.280
Data revised Datatype21.32. Instituto Nazionale di statistica: Bollettino mensile di statistica
13-2 Numeri indici dei prezzi alla produzione dei prodotti inustriali per destinazione economica, sezioni, divisioni e gruppi di prodotti (1)
271 - Indice generale I-1995Beni Intermedi
272 - Elettromeccanica ed elettronica: Operai ed Impegiati (2) I-1995273 - A destinazione mista e per la prod. di servia I-1995274 Prodotti in metallo, escluse macchine e impianti - Totale I-1995
Macchine e apparecchi elettrici - n.c.a.275 - Totale I-1995276 - Altri apparecchi elettrici - n.c.a. I-1995
Apparecchi radio televisiva e per comunicazioni277 - Totale I-1995278 - Tubi e valvole elettronici e altri componenti elettronici I-1995
Apparecchi medicali, apparecchiatura di precisione, strumenti ottici e orologi279 - Total I-1995280 - Strumenti e apparecchiature di misurazione, controllo, prove navigazione e simili I-1995
(1) Series 21.32.271 to 21.32.280 began in 1/96.(2) serie 395 replaces 271 - index base year changed.Please note that data marked "p" is provisional and likely to be updated.
40
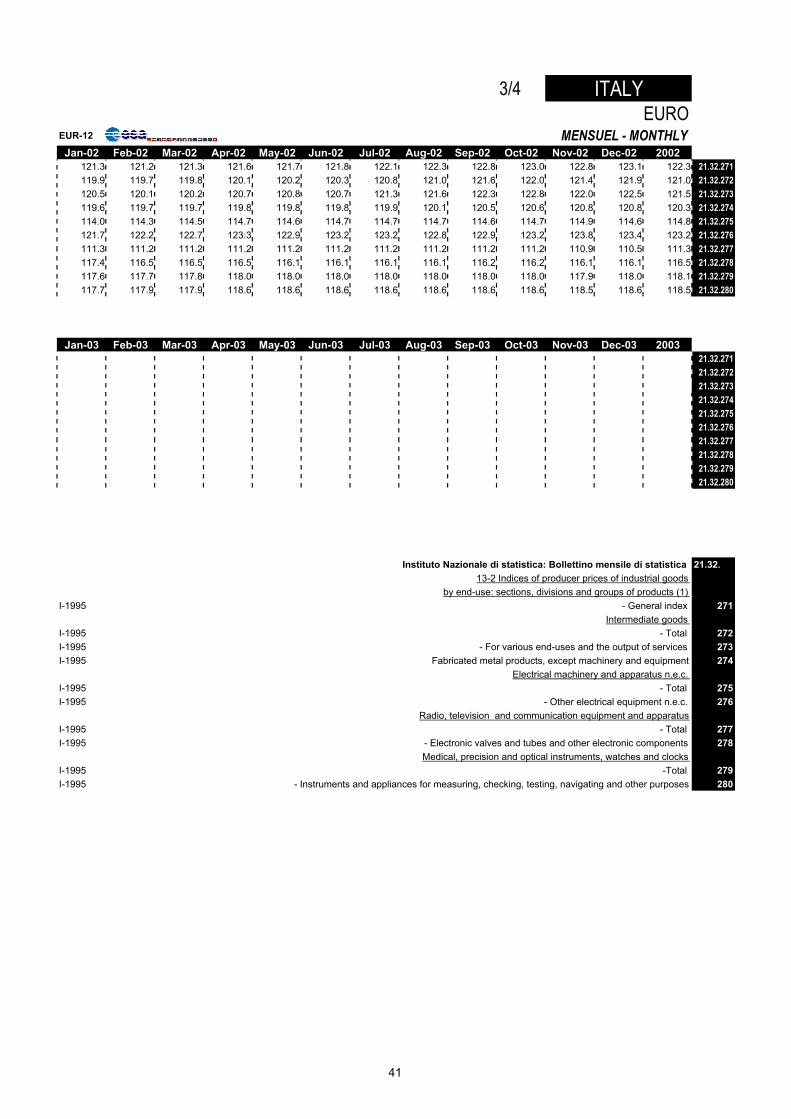
3/4 ITALYEURO
EUR-12 MENSUEL - MONTHLYJan-02 Feb-02 Mar-02 Apr-02 May-02 Jun-02 Jul-02 Aug-02 Sep-02 Oct-02 Nov-02 Dec-02 2002
121.3 121.2 121.3 121.6 121.7 121.8 122.1 122.3 122.8 123.0 122.8 123.1 122.3 21.32.271119.9 119.7 119.8 120.1 120.2 120.3 120.8 121.0 121.6 122.0 121.4 121.9 121.0 21.32.272120.5 120.1 120.2 120.7 120.8 120.7 121.3 121.6 122.3 122.8 122.0 122.5 121.5 21.32.273119.6 119.7 119.7 119.8 119.8 119.8 119.9 120.1 120.5 120.6 120.8 120.8 120.3 21.32.274114.0 114.3 114.5 114.7 114.6 114.7 114.7 114.7 114.6 114.7 114.9 114.6 114.8 21.32.275121.7 122.2 122.7 123.3 122.9 123.2 123.2 122.8 122.9 123.2 123.8 123.4 123.2 21.32.276111.3 111.2 111.2 111.2 111.2 111.2 111.2 111.2 111.2 111.2 110.9 110.5 111.3 21.32.277117.4 116.5 116.5 116.5 116.1 116.1 116.1 116.1 116.2 116.2 116.1 116.1 116.5 21.32.278117.6 117.7 117.8 118.0 118.0 118.0 118.0 118.0 118.0 118.0 117.9 118.0 118.1 21.32.279117.7 117.9 117.9 118.6 118.6 118.6 118.6 118.6 118.6 118.6 118.5 118.6 118.5 21.32.280
Jan-03 Feb-03 Mar-03 Apr-03 May-03 Jun-03 Jul-03 Aug-03 Sep-03 Oct-03 Nov-03 Dec-03 200321.32.27121.32.27221.32.27321.32.27421.32.27521.32.27621.32.27721.32.27821.32.27921.32.280
Instituto Nazionale di statistica: Bollettino mensile di statistica 21.32.13-2 Indices of producer prices of industrial goods
by end-use: sections, divisions and groups of products (1) I-1995 - General index 271
Intermediate goods I-1995 - Total 272I-1995 - For various end-uses and the output of services 273I-1995 Fabricated metal products, except machinery and equipment 274
Electrical machinery and apparatus n.e.c. I-1995 - Total 275I-1995 - Other electrical equipment n.e.c. 276
Radio, television and communication equipment and apparatus I-1995 - Total 277I-1995 - Electronic valves and tubes and other electronic components 278
Medical, precision and optical instruments, watches and clocks I-1995 -Total 279I-1995 - Instruments and appliances for measuring, checking, testing, navigating and other purposes 280
41
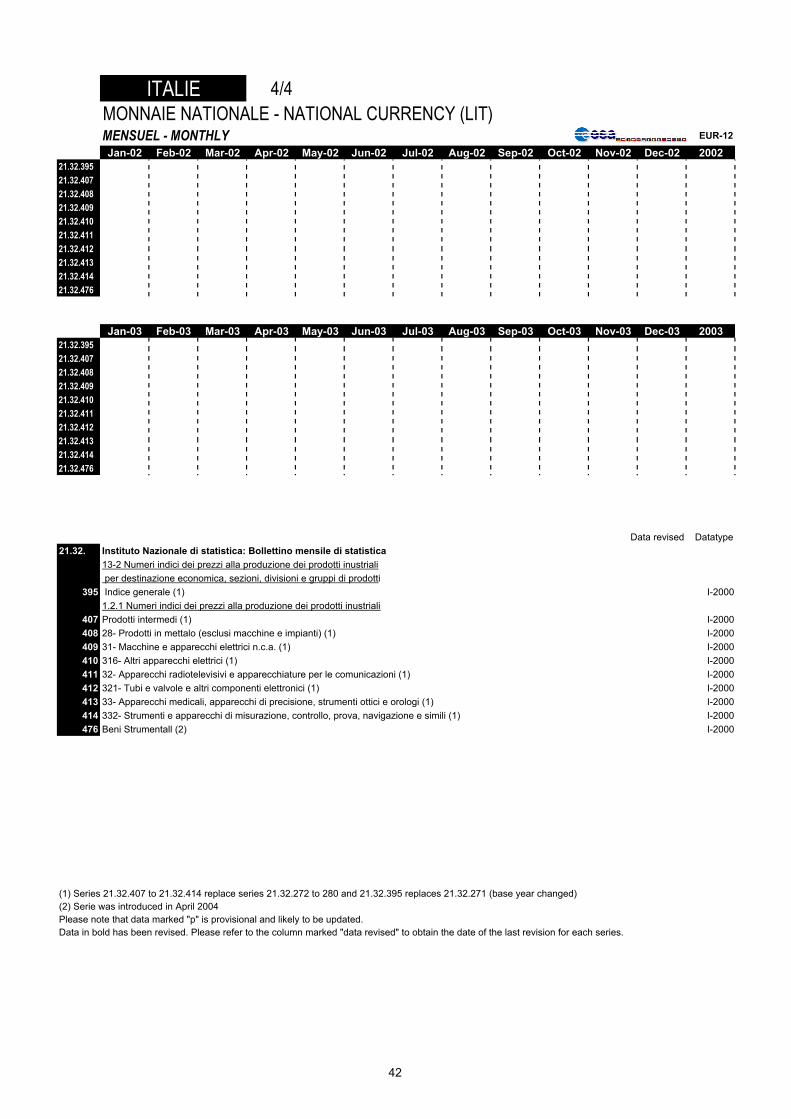
ITALIE 4/4MONNAIE NATIONALE - NATIONAL CURRENCY (LIT)MENSUEL - MONTHLY EUR-12
Jan-02 Feb-02 Mar-02 Apr-02 May-02 Jun-02 Jul-02 Aug-02 Sep-02 Oct-02 Nov-02 Dec-02 200221.32.39521.32.40721.32.40821.32.40921.32.41021.32.41121.32.41221.32.41321.32.41421.32.476
Jan-03 Feb-03 Mar-03 Apr-03 May-03 Jun-03 Jul-03 Aug-03 Sep-03 Oct-03 Nov-03 Dec-03 200321.32.39521.32.40721.32.40821.32.40921.32.41021.32.41121.32.41221.32.41321.32.41421.32.476
Data revised Datatype21.32. Instituto Nazionale di statistica: Bollettino mensile di statistica
13-2 Numeri indici dei prezzi alla produzione dei prodotti inustriali per destinazione economica, sezioni, divisioni e gruppi di prodotti
395 Indice generale (1) I-20001.2.1 Numeri indici dei prezzi alla produzione dei prodotti inustriali
407 Prodotti intermedi (1) I-2000408 28- Prodotti in mettalo (esclusi macchine e impianti) (1) I-2000409 31- Macchine e apparecchi elettrici n.c.a. (1) I-2000410 316- Altri apparecchi elettrici (1) I-2000411 32- Apparecchi radiotelevisivi e apparecchiature per le comunicazioni (1) I-2000412 321- Tubi e valvole e altri componenti elettronici (1) I-2000413 33- Apparecchi medicali, apparecchi di precisione, strumenti ottici e orologi (1) I-2000414 332- Strumenti e apparecchi di misurazione, controllo, prova, navigazione e simili (1) I-2000476 Beni Strumentall (2) I-2000
(1) Series 21.32.407 to 21.32.414 replace series 21.32.272 to 280 and 21.32.395 replaces 21.32.271 (base year changed) (2) Serie was introduced in April 2004Please note that data marked "p" is provisional and likely to be updated.Data in bold has been revised. Please refer to the column marked "data revised" to obtain the date of the last revision for each series.
42
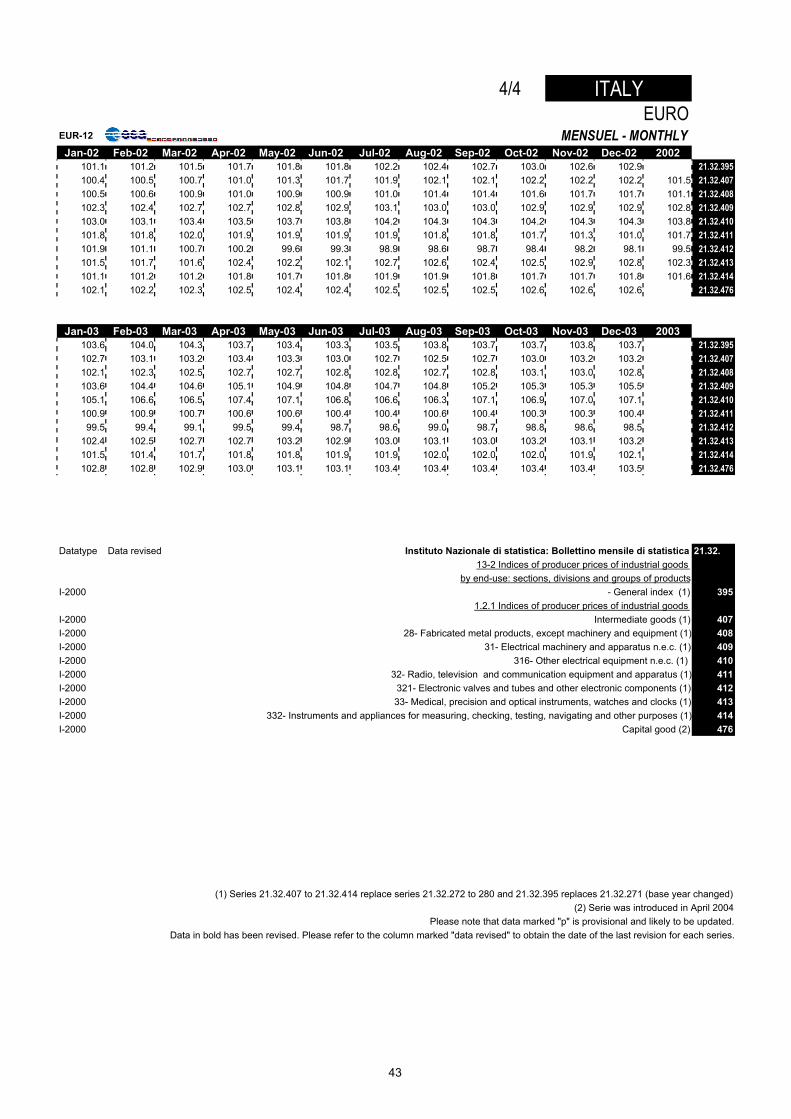
4/4 ITALYEURO
EUR-12 MENSUEL - MONTHLYJan-02 Feb-02 Mar-02 Apr-02 May-02 Jun-02 Jul-02 Aug-02 Sep-02 Oct-02 Nov-02 Dec-02 2002
101.1 101.2 101.5 101.7 101.8 101.8 102.2 102.4 102.7 103.0 102.6 102.9 21.32.395100.4 100.5 100.7 101.0 101.3 101.7 101.9 102.1 102.1 102.2 102.2 102.2 101.5 21.32.407100.5 100.6 100.9 101.0 100.9 100.9 101.0 101.4 101.4 101.6 101.7 101.7 101.1 21.32.408102.3 102.4 102.7 102.7 102.8 102.9 103.1 103.0 103.0 102.9 102.9 102.9 102.8 21.32.409103.0 103.1 103.4 103.5 103.7 103.8 104.2 104.3 104.3 104.2 104.3 104.3 103.8 21.32.410101.8 101.8 102.0 101.9 101.9 101.9 101.9 101.8 101.8 101.7 101.3 101.0 101.7 21.32.411101.9 101.1 100.7 100.2 99.6 99.3 98.9 98.6 98.7 98.4 98.2 98.1 99.5 21.32.412101.5 101.7 101.6 102.4 102.2 102.1 102.7 102.6 102.4 102.5 102.9 102.8 102.3 21.32.413101.1 101.2 101.2 101.8 101.7 101.8 101.9 101.9 101.8 101.7 101.7 101.8 101.6 21.32.414102.1 102.2 102.3 102.5 102.4 102.4 102.5 102.5 102.5 102.6 102.6 102.6 21.32.476
Jan-03 Feb-03 Mar-03 Apr-03 May-03 Jun-03 Jul-03 Aug-03 Sep-03 Oct-03 Nov-03 Dec-03 2003103.6 104.0 104.3 103.7 103.4 103.3 103.5 103.8 103.7 103.7 103.8 103.7 21.32.395102.7 103.1 103.2 103.4 103.3 103.0 102.7 102.5 102.7 103.0 103.2 103.2 21.32.407102.1 102.3 102.5 102.7 102.7 102.8 102.8 102.7 102.8 103.1 103.0 102.8 21.32.408103.6 104.4 104.6 105.1 104.9 104.8 104.7 104.8 105.2 105.3 105.3 105.5 21.32.409105.1 106.6 106.5 107.4 107.1 106.8 106.6 106.3 107.1 106.9 107.0 107.1 21.32.410100.9 100.9 100.7 100.6 100.6 100.4 100.4 100.6 100.4 100.3 100.3 100.4 21.32.41199.5 99.4 99.1 99.5 99.4 98.7 98.6 99.0 98.7 98.8 98.6 98.5 21.32.412
102.4 102.5 102.7 102.7 103.2 102.9 103.0 103.1 103.0 103.2 103.1 103.2 21.32.413101.5 101.4 101.7 101.8 101.8 101.9 101.9 102.0 102.0 102.0 101.9 102.1 21.32.414102.8 102.8 102.9 103.0 103.1 103.1 103.4 103.4 103.4 103.4 103.4 103.5 21.32.476
Datatype Data revised Instituto Nazionale di statistica: Bollettino mensile di statistica 21.32.13-2 Indices of producer prices of industrial goods
by end-use: sections, divisions and groups of productsI-2000 - General index (1) 395
1.2.1 Indices of producer prices of industrial goods I-2000 Intermediate goods (1) 407I-2000 28- Fabricated metal products, except machinery and equipment (1) 408I-2000 31- Electrical machinery and apparatus n.e.c. (1) 409I-2000 316- Other electrical equipment n.e.c. (1) 410I-2000 32- Radio, television and communication equipment and apparatus (1) 411I-2000 321- Electronic valves and tubes and other electronic components (1) 412I-2000 33- Medical, precision and optical instruments, watches and clocks (1) 413I-2000 332- Instruments and appliances for measuring, checking, testing, navigating and other purposes (1) 414I-2000 Capital good (2) 476
(1) Series 21.32.407 to 21.32.414 replace series 21.32.272 to 280 and 21.32.395 replaces 21.32.271 (base year changed) (2) Serie was introduced in April 2004
Please note that data marked "p" is provisional and likely to be updated.Data in bold has been revised. Please refer to the column marked "data revised" to obtain the date of the last revision for each series.
43
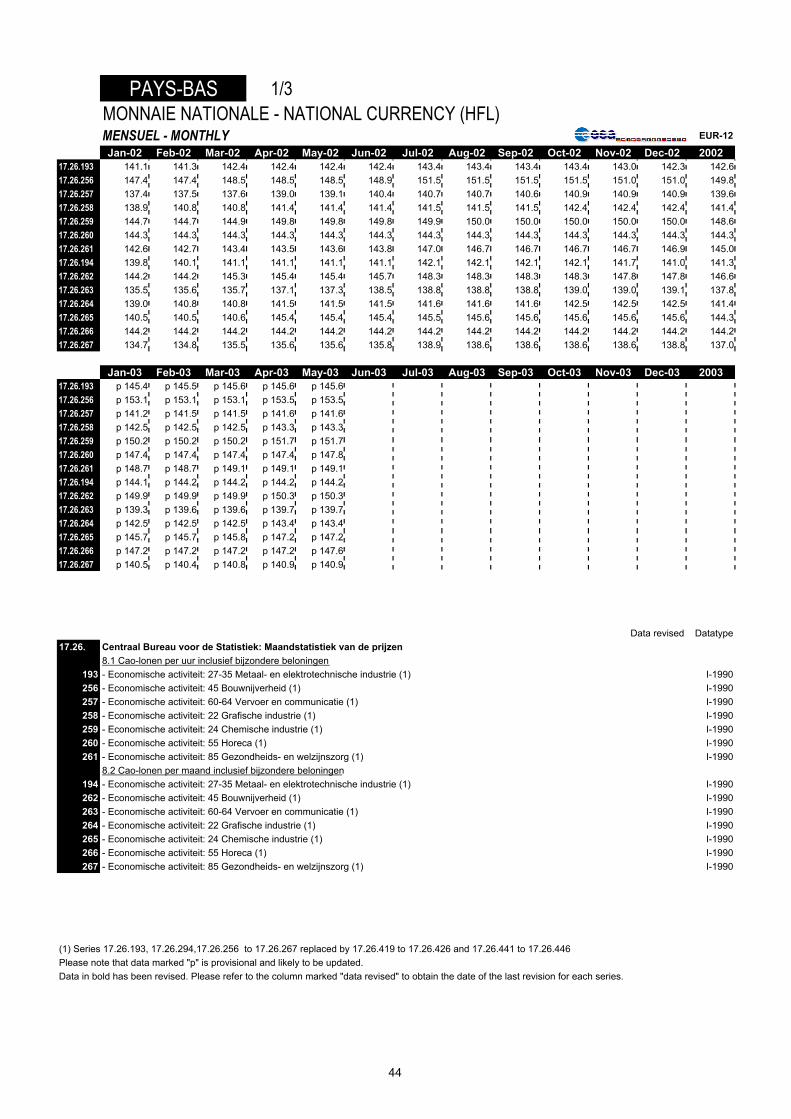
PAYS-BAS 1/3MONNAIE NATIONALE - NATIONAL CURRENCY (HFL)MENSUEL - MONTHLY EUR-12
Jan-02 Feb-02 Mar-02 Apr-02 May-02 Jun-02 Jul-02 Aug-02 Sep-02 Oct-02 Nov-02 Dec-02 200217.26.193 141.1 141.3 142.4 142.4 142.4 142.4 143.4 143.4 143.4 143.4 143.0 142.3 142.617.26.256 147.4 147.4 148.5 148.5 148.5 148.9 151.5 151.5 151.5 151.5 151.0 151.0 149.817.26.257 137.4 137.5 137.6 139.0 139.1 140.4 140.7 140.7 140.6 140.9 140.9 140.9 139.617.26.258 138.9 140.8 140.8 141.4 141.4 141.4 141.5 141.5 141.5 142.4 142.4 142.4 141.417.26.259 144.7 144.7 144.9 149.8 149.8 149.8 149.9 150.0 150.0 150.0 150.0 150.0 148.617.26.260 144.3 144.3 144.3 144.3 144.3 144.3 144.3 144.3 144.3 144.3 144.3 144.3 144.317.26.261 142.6 142.7 143.4 143.5 143.6 143.8 147.0 146.7 146.7 146.7 146.7 146.9 145.017.26.194 139.8 140.1 141.1 141.1 141.1 141.1 142.1 142.1 142.1 142.1 141.7 141.0 141.317.26.262 144.2 144.2 145.3 145.4 145.4 145.7 148.3 148.3 148.3 148.3 147.8 147.8 146.617.26.263 135.5 135.6 135.7 137.1 137.3 138.5 138.8 138.8 138.8 139.0 139.0 139.1 137.817.26.264 139.0 140.8 140.8 141.5 141.5 141.5 141.6 141.6 141.6 142.5 142.5 142.5 141.417.26.265 140.5 140.5 140.6 145.4 145.4 145.4 145.5 145.6 145.6 145.6 145.6 145.6 144.317.26.266 144.2 144.2 144.2 144.2 144.2 144.2 144.2 144.2 144.2 144.2 144.2 144.2 144.217.26.267 134.7 134.8 135.5 135.6 135.6 135.8 138.9 138.6 138.6 138.6 138.6 138.8 137.0
Jan-03 Feb-03 Mar-03 Apr-03 May-03 Jun-03 Jul-03 Aug-03 Sep-03 Oct-03 Nov-03 Dec-03 200317.26.193 p 145.4 p 145.5 p 145.6 p 145.6 p 145.617.26.256 p 153.1 p 153.1 p 153.1 p 153.5 p 153.517.26.257 p 141.2 p 141.5 p 141.5 p 141.6 p 141.617.26.258 p 142.5 p 142.5 p 142.5 p 143.3 p 143.317.26.259 p 150.2 p 150.2 p 150.2 p 151.7 p 151.717.26.260 p 147.4 p 147.4 p 147.4 p 147.4 p 147.817.26.261 p 148.7 p 148.7 p 149.1 p 149.1 p 149.117.26.194 p 144.1 p 144.2 p 144.2 p 144.2 p 144.217.26.262 p 149.9 p 149.9 p 149.9 p 150.3 p 150.317.26.263 p 139.3 p 139.6 p 139.6 p 139.7 p 139.717.26.264 p 142.5 p 142.5 p 142.5 p 143.4 p 143.417.26.265 p 145.7 p 145.7 p 145.8 p 147.2 p 147.217.26.266 p 147.2 p 147.2 p 147.2 p 147.2 p 147.617.26.267 p 140.5 p 140.4 p 140.8 p 140.9 p 140.9
Data revised Datatype17.26. Centraal Bureau voor de Statistiek: Maandstatistiek van de prijzen
8.1 Cao-lonen per uur inclusief bijzondere beloningen 193 - Economische activiteit: 27-35 Metaal- en elektrotechnische industrie (1) I-1990256 - Economische activiteit: 45 Bouwnijverheid (1) I-1990257 - Economische activiteit: 60-64 Vervoer en communicatie (1) I-1990258 - Economische activiteit: 22 Grafische industrie (1) I-1990259 - Economische activiteit: 24 Chemische industrie (1) I-1990260 - Economische activiteit: 55 Horeca (1) I-1990261 - Economische activiteit: 85 Gezondheids- en welzijnszorg (1) I-1990
8.2 Cao-lonen per maand inclusief bijzondere beloningen194 - Economische activiteit: 27-35 Metaal- en elektrotechnische industrie (1) I-1990262 - Economische activiteit: 45 Bouwnijverheid (1) I-1990263 - Economische activiteit: 60-64 Vervoer en communicatie (1) I-1990264 - Economische activiteit: 22 Grafische industrie (1) I-1990265 - Economische activiteit: 24 Chemische industrie (1) I-1990266 - Economische activiteit: 55 Horeca (1) I-1990267 - Economische activiteit: 85 Gezondheids- en welzijnszorg (1) I-1990
(1) Series 17.26.193, 17.26.294,17.26.256 to 17.26.267 replaced by 17.26.419 to 17.26.426 and 17.26.441 to 17.26.446Please note that data marked "p" is provisional and likely to be updated.Data in bold has been revised. Please refer to the column marked "data revised" to obtain the date of the last revision for each series.
44
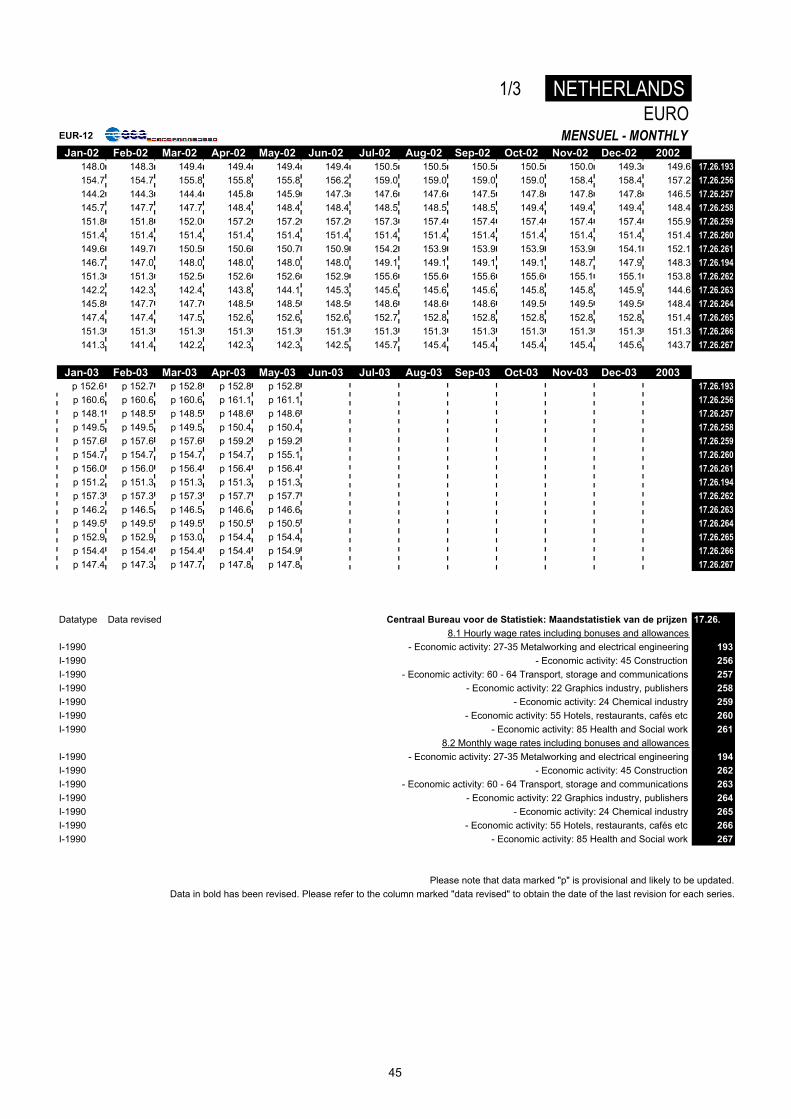
1/3 NETHERLANDSEURO
EUR-12 MENSUEL - MONTHLYJan-02 Feb-02 Mar-02 Apr-02 May-02 Jun-02 Jul-02 Aug-02 Sep-02 Oct-02 Nov-02 Dec-02 2002
148.0 148.3 149.4 149.4 149.4 149.4 150.5 150.5 150.5 150.5 150.0 149.3 149.6 17.26.193154.7 154.7 155.8 155.8 155.8 156.2 159.0 159.0 159.0 159.0 158.4 158.4 157.2 17.26.256144.2 144.3 144.4 145.8 145.9 147.3 147.6 147.6 147.5 147.8 147.8 147.8 146.5 17.26.257145.7 147.7 147.7 148.4 148.4 148.4 148.5 148.5 148.5 149.4 149.4 149.4 148.4 17.26.258151.8 151.8 152.0 157.2 157.2 157.2 157.3 157.4 157.4 157.4 157.4 157.4 155.9 17.26.259151.4 151.4 151.4 151.4 151.4 151.4 151.4 151.4 151.4 151.4 151.4 151.4 151.4 17.26.260149.6 149.7 150.5 150.6 150.7 150.9 154.2 153.9 153.9 153.9 153.9 154.1 152.1 17.26.261146.7 147.0 148.0 148.0 148.0 148.0 149.1 149.1 149.1 149.1 148.7 147.9 148.3 17.26.194151.3 151.3 152.5 152.6 152.6 152.9 155.6 155.6 155.6 155.6 155.1 155.1 153.8 17.26.262142.2 142.3 142.4 143.8 144.1 145.3 145.6 145.6 145.6 145.8 145.8 145.9 144.6 17.26.263145.8 147.7 147.7 148.5 148.5 148.5 148.6 148.6 148.6 149.5 149.5 149.5 148.4 17.26.264147.4 147.4 147.5 152.6 152.6 152.6 152.7 152.8 152.8 152.8 152.8 152.8 151.4 17.26.265151.3 151.3 151.3 151.3 151.3 151.3 151.3 151.3 151.3 151.3 151.3 151.3 151.3 17.26.266141.3 141.4 142.2 142.3 142.3 142.5 145.7 145.4 145.4 145.4 145.4 145.6 143.7 17.26.267
Jan-03 Feb-03 Mar-03 Apr-03 May-03 Jun-03 Jul-03 Aug-03 Sep-03 Oct-03 Nov-03 Dec-03 2003p 152.6 p 152.7 p 152.8 p 152.8 p 152.8 17.26.193p 160.6 p 160.6 p 160.6 p 161.1 p 161.1 17.26.256p 148.1 p 148.5 p 148.5 p 148.6 p 148.6 17.26.257p 149.5 p 149.5 p 149.5 p 150.4 p 150.4 17.26.258p 157.6 p 157.6 p 157.6 p 159.2 p 159.2 17.26.259p 154.7 p 154.7 p 154.7 p 154.7 p 155.1 17.26.260p 156.0 p 156.0 p 156.4 p 156.4 p 156.4 17.26.261p 151.2 p 151.3 p 151.3 p 151.3 p 151.3 17.26.194p 157.3 p 157.3 p 157.3 p 157.7 p 157.7 17.26.262p 146.2 p 146.5 p 146.5 p 146.6 p 146.6 17.26.263p 149.5 p 149.5 p 149.5 p 150.5 p 150.5 17.26.264p 152.9 p 152.9 p 153.0 p 154.4 p 154.4 17.26.265p 154.4 p 154.4 p 154.4 p 154.4 p 154.9 17.26.266p 147.4 p 147.3 p 147.7 p 147.8 p 147.8 17.26.267
Datatype Data revised Centraal Bureau voor de Statistiek: Maandstatistiek van de prijzen 17.26.8.1 Hourly wage rates including bonuses and allowances
I-1990 - Economic activity: 27-35 Metalworking and electrical engineering 193I-1990 - Economic activity: 45 Construction 256I-1990 - Economic activity: 60 - 64 Transport, storage and communications 257I-1990 - Economic activity: 22 Graphics industry, publishers 258I-1990 - Economic activity: 24 Chemical industry 259I-1990 - Economic activity: 55 Hotels, restaurants, cafés etc 260I-1990 - Economic activity: 85 Health and Social work 261
8.2 Monthly wage rates including bonuses and allowances I-1990 - Economic activity: 27-35 Metalworking and electrical engineering 194I-1990 - Economic activity: 45 Construction 262I-1990 - Economic activity: 60 - 64 Transport, storage and communications 263I-1990 - Economic activity: 22 Graphics industry, publishers 264I-1990 - Economic activity: 24 Chemical industry 265I-1990 - Economic activity: 55 Hotels, restaurants, cafés etc 266I-1990 - Economic activity: 85 Health and Social work 267
Please note that data marked "p" is provisional and likely to be updated.Data in bold has been revised. Please refer to the column marked "data revised" to obtain the date of the last revision for each series.
45
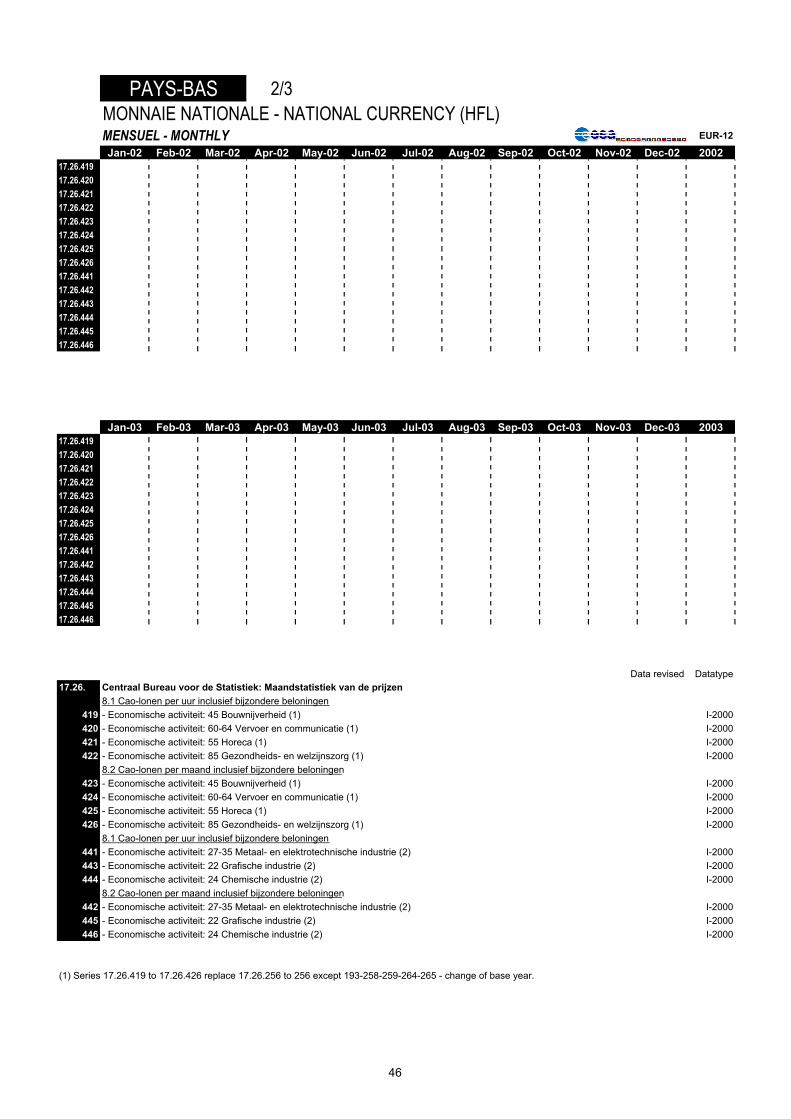
PAYS-BAS 2/3MONNAIE NATIONALE - NATIONAL CURRENCY (HFL)MENSUEL - MONTHLY EUR-12
Jan-02 Feb-02 Mar-02 Apr-02 May-02 Jun-02 Jul-02 Aug-02 Sep-02 Oct-02 Nov-02 Dec-02 200217.26.41917.26.42017.26.42117.26.42217.26.42317.26.42417.26.42517.26.42617.26.44117.26.44217.26.44317.26.44417.26.44517.26.446
Jan-03 Feb-03 Mar-03 Apr-03 May-03 Jun-03 Jul-03 Aug-03 Sep-03 Oct-03 Nov-03 Dec-03 200317.26.41917.26.42017.26.42117.26.42217.26.42317.26.42417.26.42517.26.42617.26.44117.26.44217.26.44317.26.44417.26.44517.26.446
Data revised Datatype17.26. Centraal Bureau voor de Statistiek: Maandstatistiek van de prijzen
8.1 Cao-lonen per uur inclusief bijzondere beloningen 419 - Economische activiteit: 45 Bouwnijverheid (1) I-2000420 - Economische activiteit: 60-64 Vervoer en communicatie (1) I-2000421 - Economische activiteit: 55 Horeca (1) I-2000422 - Economische activiteit: 85 Gezondheids- en welzijnszorg (1) I-2000
8.2 Cao-lonen per maand inclusief bijzondere beloningen423 - Economische activiteit: 45 Bouwnijverheid (1) I-2000424 - Economische activiteit: 60-64 Vervoer en communicatie (1) I-2000425 - Economische activiteit: 55 Horeca (1) I-2000426 - Economische activiteit: 85 Gezondheids- en welzijnszorg (1) I-2000
8.1 Cao-lonen per uur inclusief bijzondere beloningen 441 - Economische activiteit: 27-35 Metaal- en elektrotechnische industrie (2) I-2000443 - Economische activiteit: 22 Grafische industrie (2) I-2000444 - Economische activiteit: 24 Chemische industrie (2) I-2000
8.2 Cao-lonen per maand inclusief bijzondere beloningen442 - Economische activiteit: 27-35 Metaal- en elektrotechnische industrie (2) I-2000445 - Economische activiteit: 22 Grafische industrie (2) I-2000446 - Economische activiteit: 24 Chemische industrie (2) I-2000
(1) Series 17.26.419 to 17.26.426 replace 17.26.256 to 256 except 193-258-259-264-265 - change of base year.
46
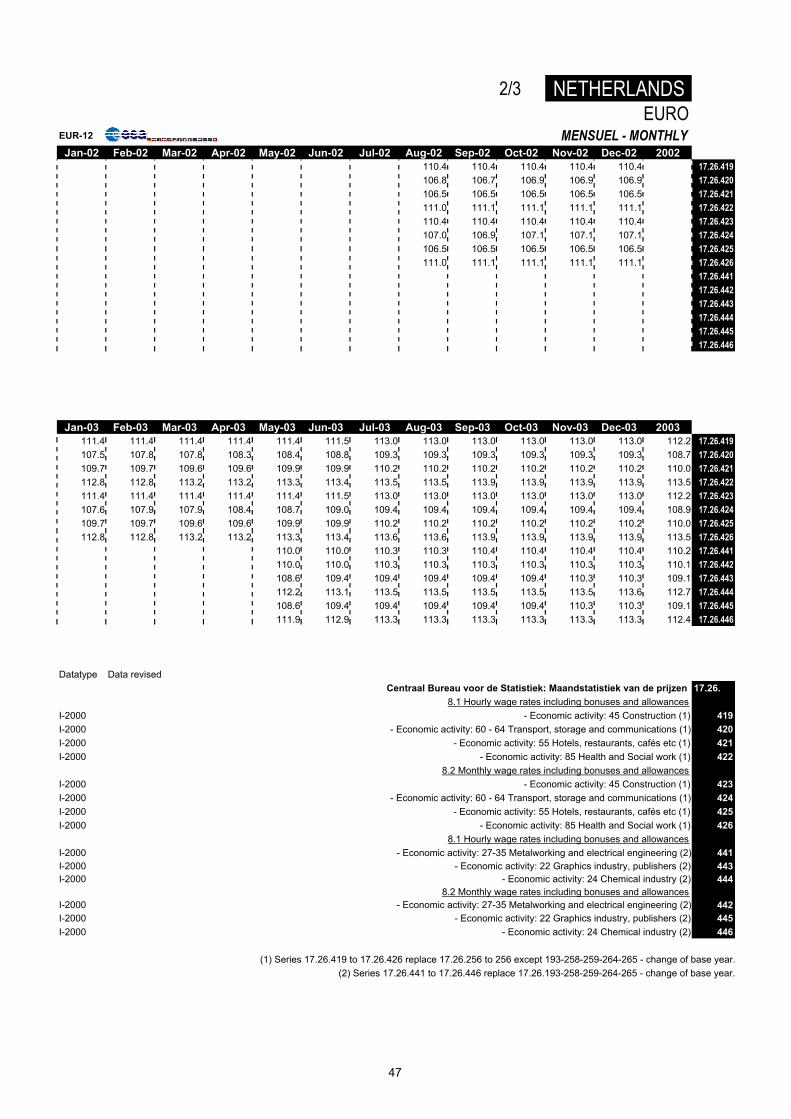
2/3 NETHERLANDSEURO
EUR-12 MENSUEL - MONTHLYJan-02 Feb-02 Mar-02 Apr-02 May-02 Jun-02 Jul-02 Aug-02 Sep-02 Oct-02 Nov-02 Dec-02 2002
110.4 110.4 110.4 110.4 110.4 17.26.419106.8 106.7 106.9 106.9 106.9 17.26.420106.5 106.5 106.5 106.5 106.5 17.26.421111.0 111.1 111.1 111.1 111.1 17.26.422110.4 110.4 110.4 110.4 110.4 17.26.423107.0 106.9 107.1 107.1 107.1 17.26.424106.5 106.5 106.5 106.5 106.5 17.26.425111.0 111.1 111.1 111.1 111.1 17.26.426
17.26.44117.26.44217.26.44317.26.44417.26.44517.26.446
Jan-03 Feb-03 Mar-03 Apr-03 May-03 Jun-03 Jul-03 Aug-03 Sep-03 Oct-03 Nov-03 Dec-03 2003111.4 111.4 111.4 111.4 111.4 111.5 113.0 113.0 113.0 113.0 113.0 113.0 112.2 17.26.419107.5 107.8 107.8 108.3 108.4 108.8 109.3 109.3 109.3 109.3 109.3 109.3 108.7 17.26.420109.7 109.7 109.6 109.6 109.9 109.9 110.2 110.2 110.2 110.2 110.2 110.2 110.0 17.26.421112.8 112.8 113.2 113.2 113.3 113.4 113.5 113.5 113.9 113.9 113.9 113.9 113.5 17.26.422111.4 111.4 111.4 111.4 111.4 111.5 113.0 113.0 113.0 113.0 113.0 113.0 112.2 17.26.423107.6 107.9 107.9 108.4 108.7 109.0 109.4 109.4 109.4 109.4 109.4 109.4 108.9 17.26.424109.7 109.7 109.6 109.6 109.9 109.9 110.2 110.2 110.2 110.2 110.2 110.2 110.0 17.26.425112.8 112.8 113.2 113.2 113.3 113.4 113.6 113.6 113.9 113.9 113.9 113.9 113.5 17.26.426
110.0 110.0 110.3 110.3 110.4 110.4 110.4 110.4 110.2 17.26.441110.0 110.0 110.3 110.3 110.3 110.3 110.3 110.3 110.1 17.26.442108.6 109.4 109.4 109.4 109.4 109.4 110.3 110.3 109.1 17.26.443112.2 113.1 113.5 113.5 113.5 113.5 113.5 113.6 112.7 17.26.444108.6 109.4 109.4 109.4 109.4 109.4 110.3 110.3 109.1 17.26.445111.9 112.9 113.3 113.3 113.3 113.3 113.3 113.3 112.4 17.26.446
Datatype Data revisedCentraal Bureau voor de Statistiek: Maandstatistiek van de prijzen 17.26.
8.1 Hourly wage rates including bonuses and allowances I-2000 - Economic activity: 45 Construction (1) 419I-2000 - Economic activity: 60 - 64 Transport, storage and communications (1) 420I-2000 - Economic activity: 55 Hotels, restaurants, cafés etc (1) 421I-2000 - Economic activity: 85 Health and Social work (1) 422
8.2 Monthly wage rates including bonuses and allowances I-2000 - Economic activity: 45 Construction (1) 423I-2000 - Economic activity: 60 - 64 Transport, storage and communications (1) 424I-2000 - Economic activity: 55 Hotels, restaurants, cafés etc (1) 425I-2000 - Economic activity: 85 Health and Social work (1) 426
8.1 Hourly wage rates including bonuses and allowances I-2000 - Economic activity: 27-35 Metalworking and electrical engineering (2) 441I-2000 - Economic activity: 22 Graphics industry, publishers (2) 443I-2000 - Economic activity: 24 Chemical industry (2) 444
8.2 Monthly wage rates including bonuses and allowances I-2000 - Economic activity: 27-35 Metalworking and electrical engineering (2) 442I-2000 - Economic activity: 22 Graphics industry, publishers (2) 445I-2000 - Economic activity: 24 Chemical industry (2) 446
(1) Series 17.26.419 to 17.26.426 replace 17.26.256 to 256 except 193-258-259-264-265 - change of base year.(2) Series 17.26.441 to 17.26.446 replace 17.26.193-258-259-264-265 - change of base year.
47

PAYS-BAS 3/3MONNAIE NATIONALE - NATIONAL CURRENCY (HFL)MENSUEL - MONTHLY EUR-12
Jan-02 Feb-02 Mar-02 Apr-02 May-02 Jun-02 Jul-02 Aug-02 Sep-02 Oct-02 Nov-02 Dec-02 200217.26.11917.26.12117.26.326 107 107 107 108 108 108 108 108 108 108 108 108 10817.26.404 105 105 106 10417.27.120 p 138.5 p 139.9 p 141.0 p 141.1 p 140.1
Jan-03 Feb-03 Mar-03 Apr-03 May-03 Jun-03 Jul-03 Aug-03 Sep-03 Oct-03 Nov-03 Dec-03 200317.26.11917.26.12117.26.326 109 109 109 109 109 108 109 109 109 109 109 108 10817.26.404 107 107 108 108 108 108 p 107 p 108 p 108 p 108 p 10817.27.120 p 143.6 p 145.4 p 145.6 p 146.3 p 145.2
Data revised Datatype17.26. Centraal bureau voor de Statistiek: Statistisch Bulletin
3.2.2 Producentenprijsindexcijfers van het verbruik van grondstoffen en halffabrikaten door de nijverheid, per bedrijfsklasse
119 - 27-35 Vervaardiging van metaal- en elektrotechnische produkten: 7 Totaal I-1990121 - 28 Vervaardiging van produkten van metaal (excl. machines en transportmiddelen): 7 Totaal (2) (3) I-1990326 - DJA Metaal en elektrotechnische producenten industrie; Totaal verbruik (1) I-1995404 - 28 Vervaardiging van produkten van metaal (excl. machines en transportmiddelen): 7 Totaal (2) I-1995
17.27. Centraal bureau voor de Statistiek: Statistisch BulletinGeactualiseerde loonkosten per gewerkt uur
120 - Metaalnijverheid en electrotechniek I-1992
(1) Series 17.26.326 replaces 17.26.119 - change of nomenclature and base year.(2) Series 17.26.121 has ended.(3) Series 17.26.404 replaces 17.26.121 - base year changed.Please note that data marked "p" is provisional and likely to be updated.Data in bold has been revised. Please refer to the column marked "data revised" to obtain the date of the last revision for each series.
48
3/3 NETHERLANDSEURO
EUR-12 MENSUEL - MONTHLYJan-02 Feb-02 Mar-02 Apr-02 May-02 Jun-02 Jul-02 Aug-02 Sep-02 Oct-02 Nov-02 Dec-02 2002
17.26.11917.26.121
102 102 102 103 103 103 103 103 103 103 103 103 103 17.26.326100 100 101 99 17.26.404
p 142.9 p 144.4 p 145.5 p 145.6 p 144.6 17.27.120
Jan-03 Feb-03 Mar-03 Apr-03 May-03 Jun-03 Jul-03 Aug-03 Sep-03 Oct-03 Nov-03 Dec-03 200317.26.11917.26.121
104 104 104 104 104 103 104 104 104 104 104 103 103 17.26.326102 102 103 103 103 103 p 102 p 103 p 103 p 103 p 103 17.26.404
p 148.2 p 150.0 p 150.3 p 151.0 p 149.8 17.27.120
Datatype Data revisedCentraal bureau voor de Statistiek: Statistisch Bulletin 17.26.
3.2.2 Producer price indices for consumption by industry of raw materials and semi-finished products, by class of company
I-1990 - 27-35 Manufacture of metal and electrical products: 7 Total 119I-1990 - 28 Manufacture of metal products (excluding machinery and means of transport): 7 Total (2) 121I-1995 DJA Metal and electrotechnical producers' industry; Total consumption (1) 326I-1995 - 28 Manufacture of metal products (excluding machinery and means of transport): 7 Total (2) (3) 404
Centraal bureau voor de Statistiek: Statistisch Bulletin 17.27.Updated wage costs per hour worked
I-1992 - Metal industry and electrical engineering 120
(1) Series 17.26.326 replaces 17.26.119 - change of nomenclature and base year.(2) Series 17.26.121 has ended.
(3) Series 17.26.404 replaces 17.26.121 - base year changed.Please note that data marked "p" is provisional and likely to be updated.
Data in bold has been revised. Please refer to the column marked "data revised" to obtain the date of the last revision for each series.
49
NORVEGE 1/2MONNAIE NATIONALE - NATIONAL CURRENCY (NKR)MENSUEL - MONTHLYJan-02 Feb-02 Mar-02 Apr-02 May-02 Jun-02 Jul-02 Aug-02 Sep-02 Oct-02 Nov-02 Dec-02 2002
15.45.31915.45.32015.45.32115.45.32215.45.328 96.93 97.48 98.56 98.89 98.07 96.64 95.85 96.77 98.56 99.20 99.28 105.4915.45.329 98.79 98.89 99.13 98.75 98.68 98.60 98.81 98.71 98.80 98.70 98.51 98.3615.45.330 95.63 95.72 94.35 93.14 92.87 93.52 93.93 92.86 93.72 92.87 93.75 91.9115.45.331 97.36 96.99 98.18 98.66 98.21 97.04 96.50 96.47 97.48 97.04 96.34 96.97
Jan-03 Feb-03 Mar-03 Apr-03 May-03 Jun-03 Jul-03 Aug-03 Sep-03 Oct-03 Nov-03 Dec-03 200315.45.31915.45.32015.45.32115.45.32215.45.328 107.72 107.25 106.55 103.87 102.83 102.62 104.56 105.57 104.78 105.42 105.54 104.8915.45.329 98.72 98.59 98.86 99.13 98.66 98.97 98.97 99.52 99.19 99.26 99.20 99.2415.45.330 92.02 92.46 93.84 95.92 95.59 95.90 96.96 97.15 97.85 97.70 98.11 98.2915.45.331 97.58 99.18 99.96 98.23 97.41 98.21 99.18 99.39 99.05 99.49 100.16 100.14
Data revised Datatype15.45. Statistisk sentralbyrå: Statistisk Manedshefte
Prisindeks for førstegangsomsetning innenlands319 Varer i alt I-1981
Bearbeidde varer gruppert etter materiale320 I alt I-1981321 Jern og stål I-1981
Produsentprisindeks for olje- og gassutvinning, industri, bergverksdrift og kraftforsyning322 Industri; I alt I-1981
Prisindeks for førstegangsomsetning innenlands328 Varer i alt (1) I-2000
Bearbeidde varer gruppert etter materiale329 I alt (1) I-2000330 Jern og stål (1) I-2000
Produsentprisindeks for olje- og gassutvinning, industri, bergverksdrift og kraftforsyning331 Industri; I alt (1) I-2000
(1) Series 15.45.328 to 15.45.331 are new series that replace 15.45.319 to 15.45.322 - change of base year.Please note that data marked "p" is provisional and likely to be updated.Data in bold has been revised. Please refer to the column marked "data revised" to obtain the date of the last revision for each series.
50
1/2 NORWAYEURO
MENSUEL - MONTHLYJan-02 Feb-02 Mar-02 Apr-02 May-02 Jun-02 Jul-02 Aug-02 Sep-02 Oct-02 Nov-02 Dec-02 2002
15.45.31915.45.32015.45.32115.45.322
99.25 101.55 103.57 105.23 105.76 105.86 104.98 105.66 108.58 109.61 110.02 117.29 15.45.328101.16 103.02 104.17 105.08 106.42 108.00 108.22 107.77 108.85 109.05 109.16 109.36 15.45.32997.92 99.72 99.14 99.11 100.15 102.44 102.88 101.39 103.25 102.61 103.89 102.19 15.45.33099.69 101.04 103.17 104.98 105.91 106.29 105.69 105.33 107.39 107.22 106.76 107.81 15.45.331
Jan-03 Feb-03 Mar-03 Apr-03 May-03 Jun-03 Jul-03 Aug-03 Sep-03 Oct-03 Nov-03 Dec-03 200315.45.31915.45.32015.45.32115.45.322
119.14 115.30 110.16 107.57 105.95 101.97 102.30 103.71 103.70 103.92 104.43 103.21 15.45.328109.19 105.99 102.21 102.66 101.66 98.35 96.83 97.77 98.16 97.85 98.15 97.65 15.45.329101.78 99.40 97.02 99.33 98.49 95.30 94.87 95.44 96.84 96.31 97.08 96.72 15.45.330107.93 106.63 103.34 101.73 100.37 97.59 97.04 97.64 98.03 98.08 99.10 98.54 15.45.331
Datatype Data revisedStatistisk sentralbyrå: Statistisk Manedshefte 15.45.
Price index of first-hand domestic transactions I-1981 Commodities total (1) 319
Manufactured goods classified by material I-1981 Total (1) 320I-1981 Iron and steel (1) 321
Producer price index for goods from oil extraction, mining and quarrying, manufacturing and electricity supply I-1981 Manufacturing; Total (1) 322
Price index of first-hand domestic transactions I-2000 All sitc groups (1) 328
Manufactured goods classified by material I-2000 Total (1) 329I-2000 Iron and steel (1) 330
Producer price index for goods from oil extraction, mining and quarrying, manufacturing and electricity supply I-2000 Manufacturing; Total (1) 331
(1) Series 15.45.328 to 15.45.331 are new series that replace 15.45.319 to 15.45.322 - change of base year.Please note that data marked "p" is provisional and likely to be updated.
Data in bold has been revised. Please refer to the column marked "data revised" to obtain the date of the last revision for each series.
51
NORVEGE 2/2MONNAIE NATIONALE - NATIONAL CURRENCY (NKR)TRIMESTRIEL - QUARTERLY
1er Trimestre 2002 2ème Trimestre 2002 3ème Trimestre 2002 4ème Trimestre 2002 200215.45.315 120.9 122.2 124.115.45.316 122.7 124.3 126.215.45.317 121.7 123.3 126.015.45.318 125.2 128.5 128.1 127.8 127.415.45.389 107.5 108.6 111.7 112.215.45.390 108.6 110.0 111.1 112.715.45.391 107.6 108.9 110.2 111.6
1er Trimestre 2003 2ème Trimestre 2003 3ème Trimestre 2003 4ème Trimestre 2003 200315.45.31515.45.31615.45.31715.45.318 134.5 130.2 127.4 133.115.45.389 113.2 114.5 116.4 116.615.45.390 113.8 114.8 115.4 115.915.45.391 112.0 112.8 115.4 115.8
Data revised Datatype15.45. Statistisk sentralbyrå: Statistisk Manedshefte
06 Arbeidsliv, yrkesdeltakingIndeks for gjennomsnittlig månedsfortjeneste i alt i industri, olje- og gassutvinning og bergverksdrift,bygge- og anleggsvirksomhet, samferdsel, varehandel, forretningsmessig tjenesteyting og eiendomsdrift
315 - Industri (1) I-1998/Q1316 - Samferdsel (1) I-1998/Q1317 - Forretningsmessig tjenesteyting og eiendomsdrift (1) I-1998/Q1
08 Priser, prisindekser og konjunkturindikatorerEngroshandel. Prisindeks
318 Innsats- varer, unntatt jordbruks- varer, avfall og skrap; I alt I-199506 Arbeidsliv, yrkesdeltakingIndeks for gjennomsnittlig månedsfortjeneste i alt i industri, olje- og gassutvinning og bergverksdrift,bygge- og anleggsvirksomhet, samferdsel, varehandel, forretningsmessig tjenesteyting og eiendomsdrift
389 - Industri (1) I-2000390 - Samferdsel (1) I-2000391 - Forretningsmessig tjenesteyting og eiendomsdrift (1) I-2000
(1) Series 15.45.389 to 15.45.391 replace 15.45.315 to 15.45.317 - index base year changedPlease note that data marked "p" is provisional and likely to be updated.Data in bold has been revised. Please refer to the column marked "data revised" to obtain the date of the last revision for each series.
52
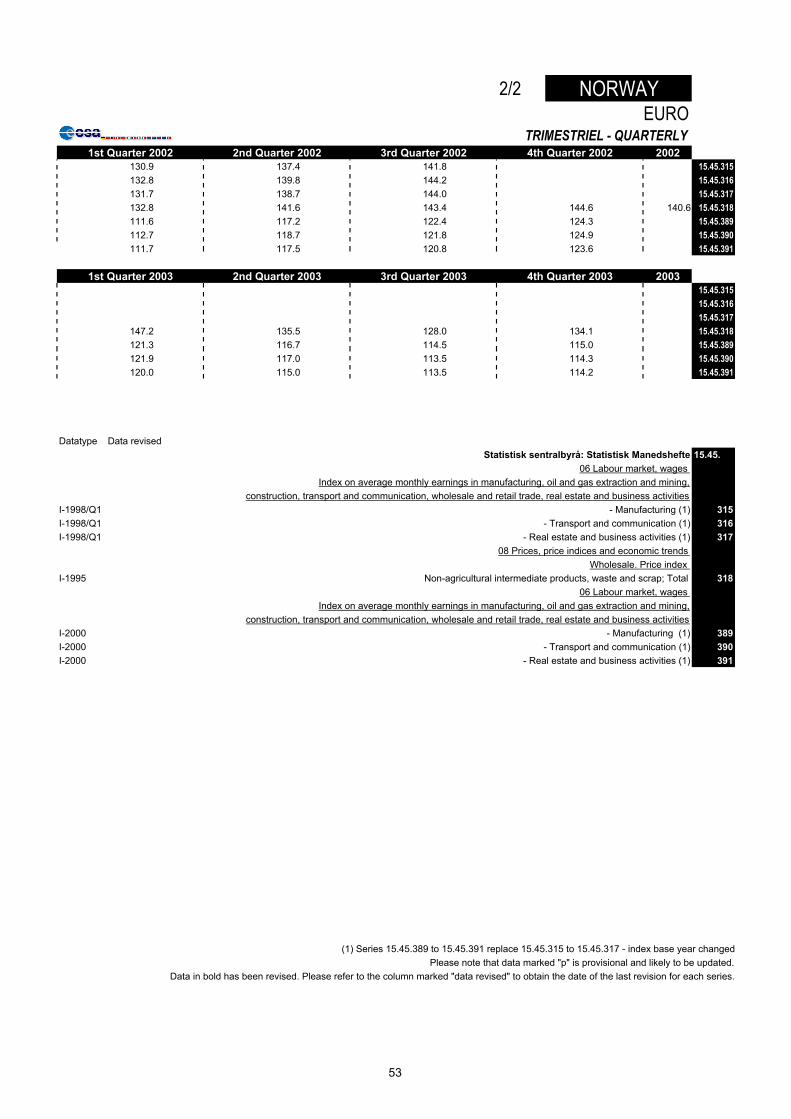
2/2 NORWAYEURO
TRIMESTRIEL - QUARTERLY1st Quarter 2002 2nd Quarter 2002 3rd Quarter 2002 4th Quarter 2002 2002
130.9 137.4 141.8 15.45.315132.8 139.8 144.2 15.45.316131.7 138.7 144.0 15.45.317132.8 141.6 143.4 144.6 140.6 15.45.318111.6 117.2 122.4 124.3 15.45.389112.7 118.7 121.8 124.9 15.45.390111.7 117.5 120.8 123.6 15.45.391
1st Quarter 2003 2nd Quarter 2003 3rd Quarter 2003 4th Quarter 2003 200315.45.31515.45.31615.45.317
147.2 135.5 128.0 134.1 15.45.318121.3 116.7 114.5 115.0 15.45.389121.9 117.0 113.5 114.3 15.45.390120.0 115.0 113.5 114.2 15.45.391
Datatype Data revisedStatistisk sentralbyrå: Statistisk Manedshefte 15.45.
06 Labour market, wages Index on average monthly earnings in manufacturing, oil and gas extraction and mining,
construction, transport and communication, wholesale and retail trade, real estate and business activities I-1998/Q1 - Manufacturing (1) 315I-1998/Q1 - Transport and communication (1) 316I-1998/Q1 - Real estate and business activities (1) 317
08 Prices, price indices and economic trends Wholesale. Price index
I-1995 Non-agricultural intermediate products, waste and scrap; Total 31806 Labour market, wages
Index on average monthly earnings in manufacturing, oil and gas extraction and mining, construction, transport and communication, wholesale and retail trade, real estate and business activities
I-2000 - Manufacturing (1) 389I-2000 - Transport and communication (1) 390I-2000 - Real estate and business activities (1) 391
(1) Series 15.45.389 to 15.45.391 replace 15.45.315 to 15.45.317 - index base year changedPlease note that data marked "p" is provisional and likely to be updated.
Data in bold has been revised. Please refer to the column marked "data revised" to obtain the date of the last revision for each series.
53
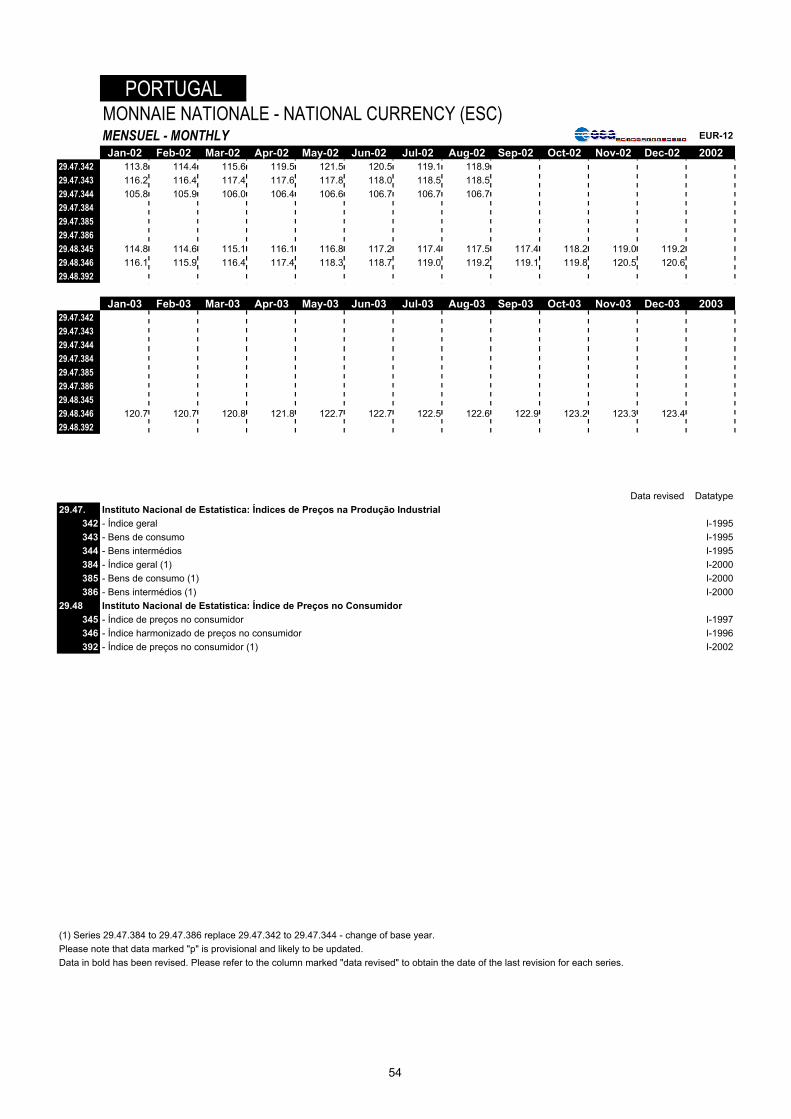
PORTUGALMONNAIE NATIONALE - NATIONAL CURRENCY (ESC)MENSUEL - MONTHLY EUR-12
Jan-02 Feb-02 Mar-02 Apr-02 May-02 Jun-02 Jul-02 Aug-02 Sep-02 Oct-02 Nov-02 Dec-02 200229.47.342 113.8 114.4 115.6 119.5 121.5 120.5 119.1 118.929.47.343 116.2 116.4 117.4 117.6 117.8 118.0 118.5 118.529.47.344 105.8 105.9 106.0 106.4 106.6 106.7 106.7 106.729.47.38429.47.38529.47.38629.48.345 114.8 114.6 115.1 116.1 116.8 117.2 117.4 117.5 117.4 118.2 119.0 119.229.48.346 116.1 115.9 116.4 117.4 118.3 118.7 119.0 119.2 119.1 119.8 120.5 120.629.48.392
Jan-03 Feb-03 Mar-03 Apr-03 May-03 Jun-03 Jul-03 Aug-03 Sep-03 Oct-03 Nov-03 Dec-03 200329.47.34229.47.34329.47.34429.47.38429.47.38529.47.38629.48.34529.48.346 120.7 120.7 120.8 121.8 122.7 122.7 122.5 122.6 122.9 123.2 123.3 123.429.48.392
Data revised Datatype29.47. Instituto Nacional de Estatística: Índices de Preços na Produção Industrial
342 - Índice geral I-1995343 - Bens de consumo I-1995344 - Bens intermédios I-1995384 - Índice geral (1) I-2000385 - Bens de consumo (1) I-2000386 - Bens intermédios (1) I-2000
29.48 Instituto Nacional de Estatística: Índice de Preços no Consumidor345 - Índice de preços no consumidor I-1997346 - Índice harmonizado de preços no consumidor I-1996392 - Índice de preços no consumidor (1) I-2002
(1) Series 29.47.384 to 29.47.386 replace 29.47.342 to 29.47.344 - change of base year.Please note that data marked "p" is provisional and likely to be updated.Data in bold has been revised. Please refer to the column marked "data revised" to obtain the date of the last revision for each series.
54
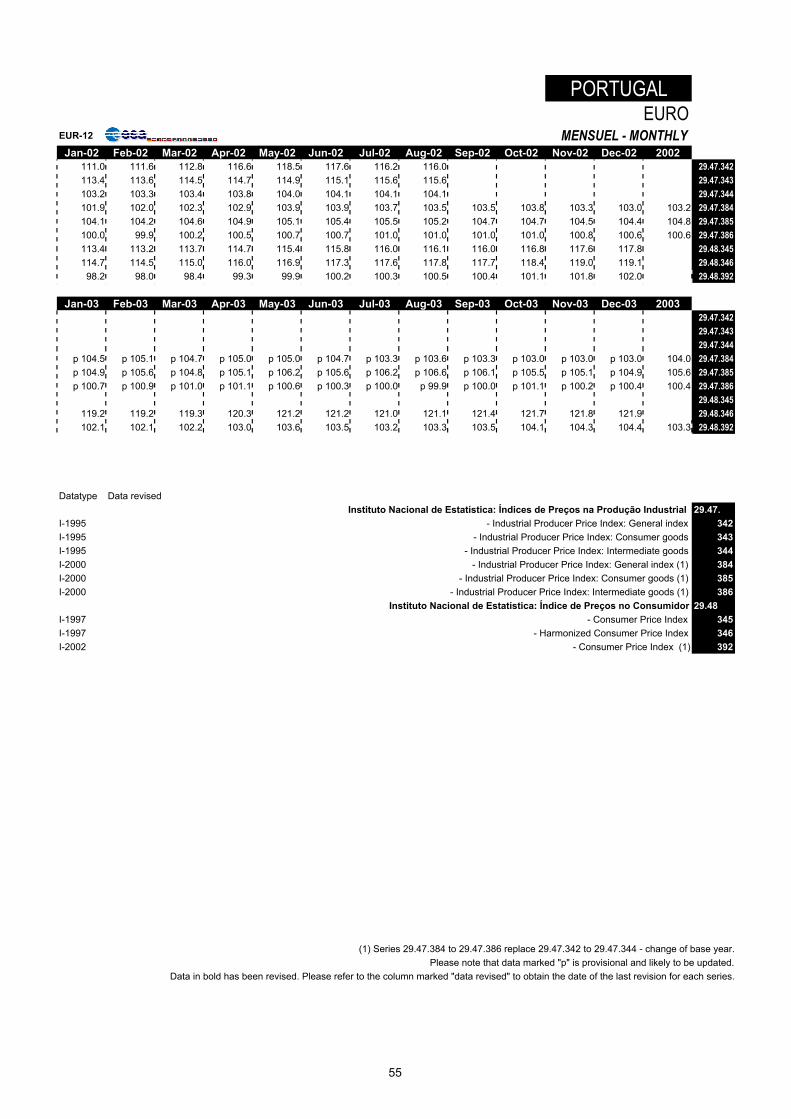
PORTUGALEURO
EUR-12 MENSUEL - MONTHLYJan-02 Feb-02 Mar-02 Apr-02 May-02 Jun-02 Jul-02 Aug-02 Sep-02 Oct-02 Nov-02 Dec-02 2002
111.0 111.6 112.8 116.6 118.5 117.6 116.2 116.0 29.47.342113.4 113.6 114.5 114.7 114.9 115.1 115.6 115.6 29.47.343103.2 103.3 103.4 103.8 104.0 104.1 104.1 104.1 29.47.344101.9 102.0 102.3 102.9 103.9 103.9 103.7 103.5 103.5 103.8 103.3 103.0 103.2 29.47.384104.1 104.2 104.6 104.9 105.1 105.4 105.5 105.2 104.7 104.7 104.5 104.4 104.8 29.47.385100.0 99.9 100.2 100.5 100.7 100.7 101.0 101.0 101.0 101.0 100.8 100.6 100.6 29.47.386113.4 113.2 113.7 114.7 115.4 115.8 116.0 116.1 116.0 116.8 117.6 117.8 29.48.345114.7 114.5 115.0 116.0 116.9 117.3 117.6 117.8 117.7 118.4 119.0 119.1 29.48.34698.2 98.0 98.4 99.3 99.9 100.2 100.3 100.5 100.4 101.1 101.8 102.0 29.48.392
Jan-03 Feb-03 Mar-03 Apr-03 May-03 Jun-03 Jul-03 Aug-03 Sep-03 Oct-03 Nov-03 Dec-03 200329.47.34229.47.34329.47.344
p 104.5 p 105.1 p 104.7 p 105.0 p 105.0 p 104.7 p 103.3 p 103.6 p 103.3 p 103.0 p 103.0 p 103.0 104.0 29.47.384p 104.9 p 105.6 p 104.8 p 105.1 p 106.2 p 105.6 p 106.2 p 106.6 p 106.1 p 105.5 p 105.1 p 104.9 105.6 29.47.385p 100.7 p 100.9 p 101.0 p 101.1 p 100.6 p 100.3 p 100.0 p 99.9 p 100.0 p 101.1 p 100.2 p 100.4 100.4 29.47.386
29.48.345119.2 119.2 119.3 120.3 121.2 121.2 121.0 121.1 121.4 121.7 121.8 121.9 29.48.346102.1 102.1 102.2 103.0 103.6 103.5 103.2 103.3 103.5 104.1 104.3 104.4 103.3 29.48.392
Datatype Data revisedInstituto Nacional de Estatística: Índices de Preços na Produção Industrial 29.47.
I-1995 - Industrial Producer Price Index: General index 342I-1995 - Industrial Producer Price Index: Consumer goods 343I-1995 - Industrial Producer Price Index: Intermediate goods 344I-2000 - Industrial Producer Price Index: General index (1) 384I-2000 - Industrial Producer Price Index: Consumer goods (1) 385I-2000 - Industrial Producer Price Index: Intermediate goods (1) 386
Instituto Nacional de Estatística: Índice de Preços no Consumidor 29.48I-1997 - Consumer Price Index 345I-1997 - Harmonized Consumer Price Index 346I-2002 - Consumer Price Index (1) 392
(1) Series 29.47.384 to 29.47.386 replace 29.47.342 to 29.47.344 - change of base year.Please note that data marked "p" is provisional and likely to be updated.
Data in bold has been revised. Please refer to the column marked "data revised" to obtain the date of the last revision for each series.
55
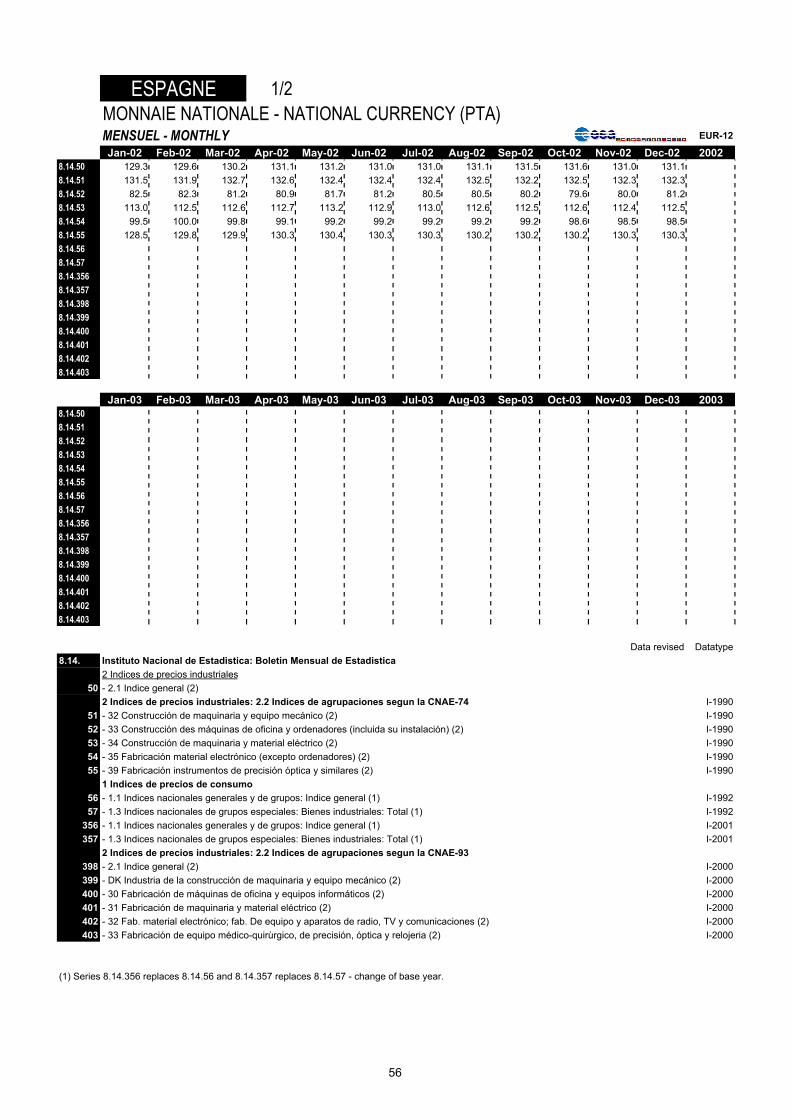
ESPAGNE 1/2MONNAIE NATIONALE - NATIONAL CURRENCY (PTA)MENSUEL - MONTHLY EUR-12
Jan-02 Feb-02 Mar-02 Apr-02 May-02 Jun-02 Jul-02 Aug-02 Sep-02 Oct-02 Nov-02 Dec-02 20028.14.50 129.3 129.6 130.2 131.1 131.2 131.0 131.0 131.1 131.5 131.6 131.0 131.18.14.51 131.5 131.9 132.7 132.6 132.4 132.4 132.4 132.5 132.2 132.5 132.3 132.38.14.52 82.5 82.3 81.2 80.9 81.7 81.2 80.5 80.5 80.2 79.6 80.0 81.28.14.53 113.0 112.5 112.6 112.7 113.2 112.9 113.0 112.6 112.5 112.6 112.4 112.58.14.54 99.5 100.0 99.8 99.1 99.2 99.2 99.2 99.2 99.2 98.6 98.5 98.58.14.55 128.5 129.8 129.9 130.3 130.4 130.3 130.3 130.2 130.2 130.2 130.3 130.38.14.568.14.578.14.3568.14.3578.14.3988.14.3998.14.4008.14.4018.14.4028.14.403
Jan-03 Feb-03 Mar-03 Apr-03 May-03 Jun-03 Jul-03 Aug-03 Sep-03 Oct-03 Nov-03 Dec-03 20038.14.508.14.518.14.528.14.538.14.548.14.558.14.568.14.578.14.3568.14.3578.14.3988.14.3998.14.4008.14.4018.14.4028.14.403
Data revised Datatype8.14. Instituto Nacional de Estadistica: Boletín Mensual de Estadistica
2 Indices de precios industriales50 - 2.1 Indice general (2)
2 Indices de precios industriales: 2.2 Indices de agrupaciones segun la CNAE-74 I-199051 - 32 Construcción de maquinaria y equipo mecánico (2) I-199052 - 33 Construcción des máquinas de oficina y ordenadores (incluida su instalación) (2) I-199053 - 34 Construcción de maquinaria y material eléctrico (2) I-199054 - 35 Fabricación material electrónico (excepto ordenadores) (2) I-199055 - 39 Fabricación instrumentos de precisión óptica y similares (2) I-1990
1 Indices de precios de consumo56 - 1.1 Indices nacionales generales y de grupos: Indice general (1) I-199257 - 1.3 Indices nacionales de grupos especiales: Bienes industriales: Total (1) I-1992
356 - 1.1 Indices nacionales generales y de grupos: Indice general (1) I-2001357 - 1.3 Indices nacionales de grupos especiales: Bienes industriales: Total (1) I-2001
2 Indices de precios industriales: 2.2 Indices de agrupaciones segun la CNAE-93398 - 2.1 Indice general (2) I-2000399 - DK Industria de la construcción de maquinaria y equipo mecánico (2) I-2000400 - 30 Fabricación de máquinas de oficina y equipos informáticos (2) I-2000401 - 31 Fabricación de maquinaria y material eléctrico (2) I-2000402 - 32 Fab. material electrónico; fab. De equipo y aparatos de radio, TV y comunicaciones (2) I-2000403 - 33 Fabricación de equipo médico-quirùrgico, de precisión, óptica y relojeria (2) I-2000
(1) Series 8.14.356 replaces 8.14.56 and 8.14.357 replaces 8.14.57 - change of base year.
56
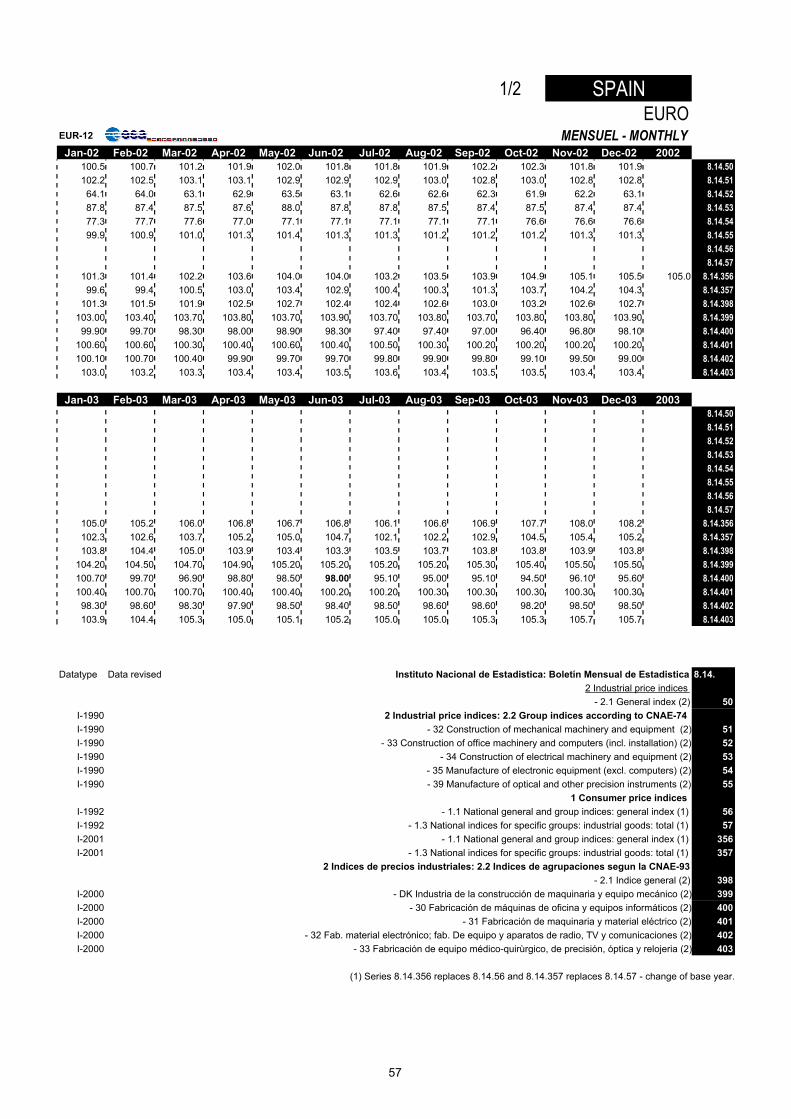
1/2 SPAINEURO
EUR-12 MENSUEL - MONTHLYJan-02 Feb-02 Mar-02 Apr-02 May-02 Jun-02 Jul-02 Aug-02 Sep-02 Oct-02 Nov-02 Dec-02 2002
100.5 100.7 101.2 101.9 102.0 101.8 101.8 101.9 102.2 102.3 101.8 101.9 8.14.50102.2 102.5 103.1 103.1 102.9 102.9 102.9 103.0 102.8 103.0 102.8 102.8 8.14.5164.1 64.0 63.1 62.9 63.5 63.1 62.6 62.6 62.3 61.9 62.2 63.1 8.14.5287.8 87.4 87.5 87.6 88.0 87.8 87.8 87.5 87.4 87.5 87.4 87.4 8.14.5377.3 77.7 77.6 77.0 77.1 77.1 77.1 77.1 77.1 76.6 76.6 76.6 8.14.5499.9 100.9 101.0 101.3 101.4 101.3 101.3 101.2 101.2 101.2 101.3 101.3 8.14.55
8.14.568.14.57
101.3 101.4 102.2 103.6 104.0 104.0 103.2 103.5 103.9 104.9 105.1 105.5 105.0 8.14.35699.6 99.4 100.5 103.0 103.4 102.9 100.4 100.3 101.3 103.7 104.2 104.3 8.14.357
101.3 101.5 101.9 102.5 102.7 102.4 102.4 102.6 103.0 103.2 102.6 102.7 8.14.398103.00 103.40 103.70 103.80 103.70 103.90 103.70 103.80 103.70 103.80 103.80 103.90 8.14.39999.90 99.70 98.30 98.00 98.90 98.30 97.40 97.40 97.00 96.40 96.80 98.10 8.14.400
100.60 100.60 100.30 100.40 100.60 100.40 100.50 100.30 100.20 100.20 100.20 100.20 8.14.401100.10 100.70 100.40 99.90 99.70 99.70 99.80 99.90 99.80 99.10 99.50 99.00 8.14.402103.0 103.2 103.3 103.4 103.4 103.5 103.6 103.4 103.5 103.5 103.4 103.4 8.14.403
Jan-03 Feb-03 Mar-03 Apr-03 May-03 Jun-03 Jul-03 Aug-03 Sep-03 Oct-03 Nov-03 Dec-03 20038.14.508.14.518.14.528.14.538.14.548.14.558.14.568.14.57
105.0 105.2 106.0 106.8 106.7 106.8 106.1 106.6 106.9 107.7 108.0 108.2 8.14.356102.3 102.6 103.7 105.2 105.0 104.7 102.1 102.2 102.9 104.5 105.4 105.2 8.14.357103.8 104.4 105.0 103.9 103.4 103.3 103.5 103.7 103.8 103.8 103.9 103.8 8.14.398
104.20 104.50 104.70 104.90 105.20 105.20 105.20 105.20 105.30 105.40 105.50 105.50 8.14.399100.70 99.70 96.90 98.80 98.50 98.00 95.10 95.00 95.10 94.50 96.10 95.60 8.14.400100.40 100.70 100.70 100.40 100.40 100.20 100.20 100.30 100.30 100.30 100.30 100.30 8.14.40198.30 98.60 98.30 97.90 98.50 98.40 98.50 98.60 98.60 98.20 98.50 98.50 8.14.402103.9 104.4 105.3 105.0 105.1 105.2 105.0 105.0 105.3 105.3 105.7 105.7 8.14.403
Datatype Data revised Instituto Nacional de Estadistica: Boletín Mensual de Estadistica 8.14.2 Industrial price indices
- 2.1 General index (2) 50I-1990 2 Industrial price indices: 2.2 Group indices according to CNAE-74 I-1990 - 32 Construction of mechanical machinery and equipment (2) 51I-1990 - 33 Construction of office machinery and computers (incl. installation) (2) 52I-1990 - 34 Construction of electrical machinery and equipment (2) 53I-1990 - 35 Manufacture of electronic equipment (excl. computers) (2) 54I-1990 - 39 Manufacture of optical and other precision instruments (2) 55
1 Consumer price indices I-1992 - 1.1 National general and group indices: general index (1) 56I-1992 - 1.3 National indices for specific groups: industrial goods: total (1) 57I-2001 - 1.1 National general and group indices: general index (1) 356I-2001 - 1.3 National indices for specific groups: industrial goods: total (1) 357
2 Indices de precios industriales: 2.2 Indices de agrupaciones segun la CNAE-93- 2.1 Indice general (2) 398
I-2000 - DK Industria de la construcción de maquinaria y equipo mecánico (2) 399I-2000 - 30 Fabricación de máquinas de oficina y equipos informáticos (2) 400I-2000 - 31 Fabricación de maquinaria y material eléctrico (2) 401I-2000 - 32 Fab. material electrónico; fab. De equipo y aparatos de radio, TV y comunicaciones (2) 402I-2000 - 33 Fabricación de equipo médico-quirùrgico, de precisión, óptica y relojeria (2) 403
(1) Series 8.14.356 replaces 8.14.56 and 8.14.357 replaces 8.14.57 - change of base year.
57
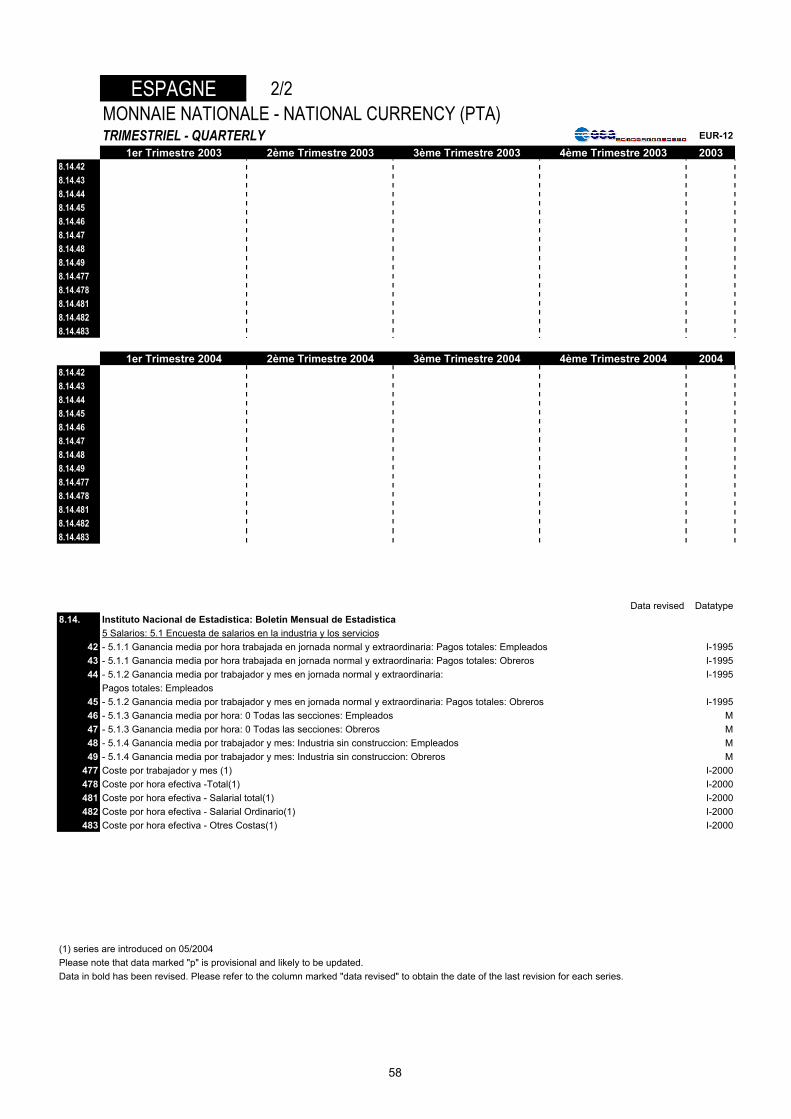
ESPAGNE 2/2MONNAIE NATIONALE - NATIONAL CURRENCY (PTA)TRIMESTRIEL - QUARTERLY EUR-12
1er Trimestre 2003 2ème Trimestre 2003 3ème Trimestre 2003 4ème Trimestre 2003 20038.14.428.14.438.14.448.14.458.14.468.14.478.14.488.14.498.14.4778.14.4788.14.4818.14.4828.14.483
1er Trimestre 2004 2ème Trimestre 2004 3ème Trimestre 2004 4ème Trimestre 2004 20048.14.428.14.438.14.448.14.458.14.468.14.478.14.488.14.498.14.4778.14.4788.14.4818.14.4828.14.483
Data revised Datatype8.14. Instituto Nacional de Estadistica: Boletín Mensual de Estadistica
5 Salarios: 5.1 Encuesta de salarios en la industria y los servicios42 - 5.1.1 Ganancia media por hora trabajada en jornada normal y extraordinaria: Pagos totales: Empleados I-199543 - 5.1.1 Ganancia media por hora trabajada en jornada normal y extraordinaria: Pagos totales: Obreros I-199544 - 5.1.2 Ganancia media por trabajador y mes en jornada normal y extraordinaria: I-1995
Pagos totales: Empleados45 - 5.1.2 Ganancia media por trabajador y mes en jornada normal y extraordinaria: Pagos totales: Obreros I-199546 - 5.1.3 Ganancia media por hora: 0 Todas las secciones: Empleados M47 - 5.1.3 Ganancia media por hora: 0 Todas las secciones: Obreros M48 - 5.1.4 Ganancia media por trabajador y mes: Industria sin construccion: Empleados M49 - 5.1.4 Ganancia media por trabajador y mes: Industria sin construccion: Obreros M
477 Coste por trabajador y mes (1) I-2000478 Coste por hora efectiva -Total(1) I-2000481 Coste por hora efectiva - Salarial total(1) I-2000482 Coste por hora efectiva - Salarial Ordinario(1) I-2000483 Coste por hora efectiva - Otres Costas(1) I-2000
(1) series are introduced on 05/2004Please note that data marked "p" is provisional and likely to be updated.Data in bold has been revised. Please refer to the column marked "data revised" to obtain the date of the last revision for each series.
58
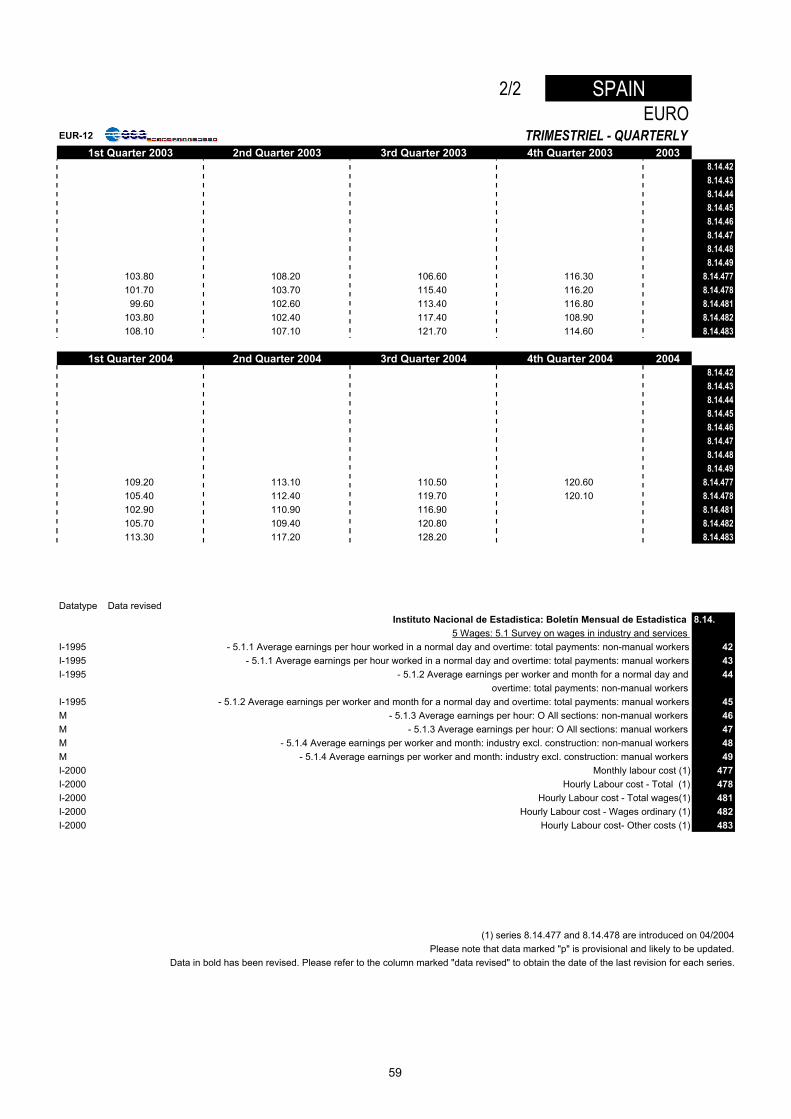
2/2 SPAINEURO
EUR-12 TRIMESTRIEL - QUARTERLY1st Quarter 2003 2nd Quarter 2003 3rd Quarter 2003 4th Quarter 2003 2003
8.14.428.14.438.14.448.14.458.14.468.14.478.14.488.14.49
103.80 108.20 106.60 116.30 8.14.477101.70 103.70 115.40 116.20 8.14.47899.60 102.60 113.40 116.80 8.14.481
103.80 102.40 117.40 108.90 8.14.482108.10 107.10 121.70 114.60 8.14.483
1st Quarter 2004 2nd Quarter 2004 3rd Quarter 2004 4th Quarter 2004 20048.14.428.14.438.14.448.14.458.14.468.14.478.14.488.14.49
109.20 113.10 110.50 120.60 8.14.477105.40 112.40 119.70 120.10 8.14.478102.90 110.90 116.90 8.14.481105.70 109.40 120.80 8.14.482113.30 117.20 128.20 8.14.483
Datatype Data revisedInstituto Nacional de Estadistica: Boletín Mensual de Estadistica 8.14.
5 Wages: 5.1 Survey on wages in industry and services I-1995 - 5.1.1 Average earnings per hour worked in a normal day and overtime: total payments: non-manual workers 42I-1995 - 5.1.1 Average earnings per hour worked in a normal day and overtime: total payments: manual workers 43I-1995 - 5.1.2 Average earnings per worker and month for a normal day and 44
overtime: total payments: non-manual workers I-1995 - 5.1.2 Average earnings per worker and month for a normal day and overtime: total payments: manual workers 45M - 5.1.3 Average earnings per hour: O All sections: non-manual workers 46M - 5.1.3 Average earnings per hour: O All sections: manual workers 47M - 5.1.4 Average earnings per worker and month: industry excl. construction: non-manual workers 48M - 5.1.4 Average earnings per worker and month: industry excl. construction: manual workers 49I-2000 Monthly labour cost (1) 477I-2000 Hourly Labour cost - Total (1) 478I-2000 Hourly Labour cost - Total wages(1) 481I-2000 Hourly Labour cost - Wages ordinary (1) 482I-2000 Hourly Labour cost- Other costs (1) 483
(1) series 8.14.477 and 8.14.478 are introduced on 04/2004Please note that data marked "p" is provisional and likely to be updated.
Data in bold has been revised. Please refer to the column marked "data revised" to obtain the date of the last revision for each series.
59
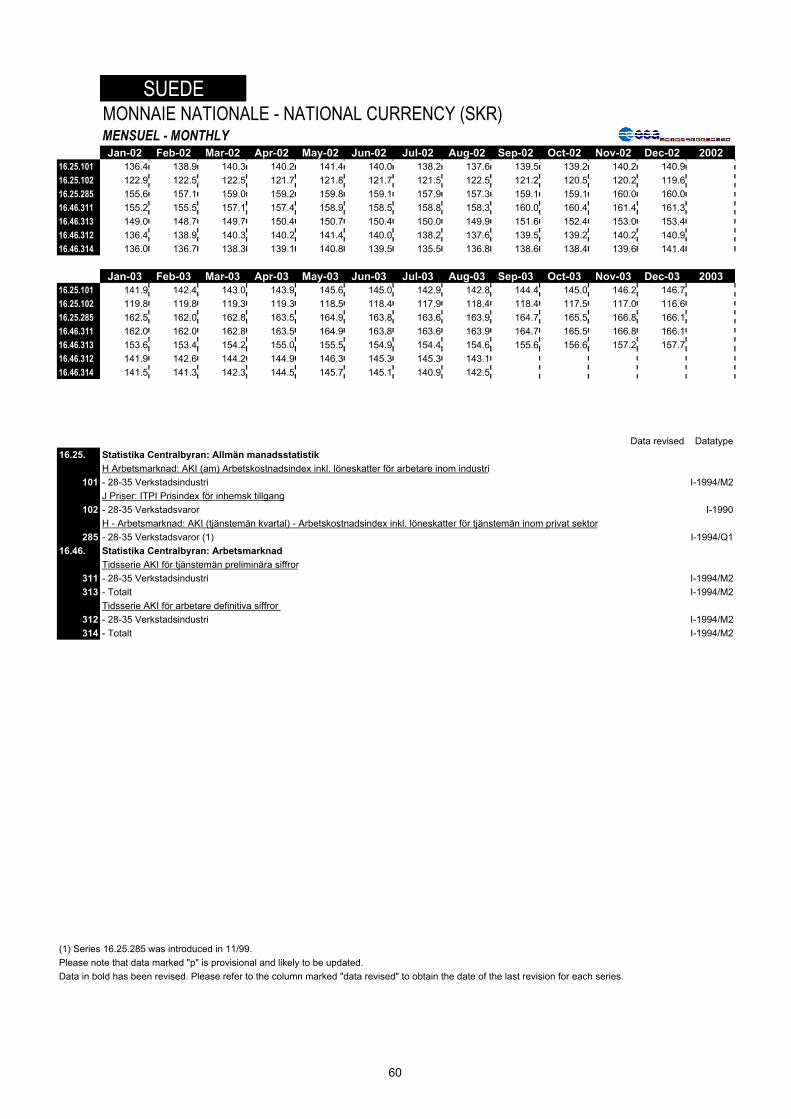
SUEDEMONNAIE NATIONALE - NATIONAL CURRENCY (SKR)MENSUEL - MONTHLYJan-02 Feb-02 Mar-02 Apr-02 May-02 Jun-02 Jul-02 Aug-02 Sep-02 Oct-02 Nov-02 Dec-02 2002
16.25.101 136.4 138.9 140.3 140.2 141.4 140.0 138.2 137.6 139.5 139.2 140.2 140.916.25.102 122.9 122.5 122.5 121.7 121.8 121.7 121.5 122.5 121.2 120.5 120.2 119.616.25.285 155.6 157.1 159.0 159.2 159.8 159.1 157.9 157.3 159.1 159.1 160.0 160.016.46.311 155.2 155.5 157.1 157.4 158.9 158.5 158.8 158.3 160.0 160.4 161.4 161.316.46.313 149.0 148.7 149.7 150.4 150.7 150.4 150.0 149.9 151.6 152.4 153.0 153.416.46.312 136.4 138.9 140.3 140.2 141.4 140.0 138.2 137.6 139.5 139.2 140.2 140.916.46.314 136.0 136.7 138.3 139.1 140.8 139.5 135.5 136.8 138.6 138.4 139.6 141.4
Jan-03 Feb-03 Mar-03 Apr-03 May-03 Jun-03 Jul-03 Aug-03 Sep-03 Oct-03 Nov-03 Dec-03 200316.25.101 141.9 142.4 143.0 143.9 145.6 145.0 142.9 142.8 144.4 145.0 146.2 146.716.25.102 119.8 119.8 119.3 119.3 118.5 118.4 117.9 118.4 118.4 117.5 117.0 116.616.25.285 162.5 162.0 162.8 163.5 164.9 163.8 163.6 163.9 164.7 165.5 166.8 166.116.46.311 162.0 162.0 162.8 163.5 164.9 163.8 163.6 163.9 164.7 165.5 166.8 166.116.46.313 153.6 153.4 154.2 155.0 155.5 154.9 154.4 154.6 155.6 156.6 157.2 157.716.46.312 141.9 142.6 144.2 144.9 146.3 145.3 145.3 143.116.46.314 141.5 141.3 142.3 144.5 145.7 145.1 140.9 142.5
Data revised Datatype16.25. Statistika Centralbyran: Allmän manadsstatistik
H Arbetsmarknad: AKI (am) Arbetskostnadsindex inkl. löneskatter för arbetare inom industri101 - 28-35 Verkstadsindustri I-1994/M2
J Priser: ITPI Prisindex för inhemsk tillgang102 - 28-35 Verkstadsvaror I-1990
H - Arbetsmarknad: AKI (tjänstemän kvartal) - Arbetskostnadsindex inkl. löneskatter för tjänstemän inom privat sektor285 - 28-35 Verkstadsvaror (1) I-1994/Q1
16.46. Statistika Centralbyran: ArbetsmarknadTidsserie AKI för tjänstemän preliminära siffror
311 - 28-35 Verkstadsindustri I-1994/M2313 - Totalt I-1994/M2
Tidsserie AKI för arbetare definitiva siffror 312 - 28-35 Verkstadsindustri I-1994/M2314 - Totalt I-1994/M2
(1) Series 16.25.285 was introduced in 11/99.Please note that data marked "p" is provisional and likely to be updated.Data in bold has been revised. Please refer to the column marked "data revised" to obtain the date of the last revision for each series.
60
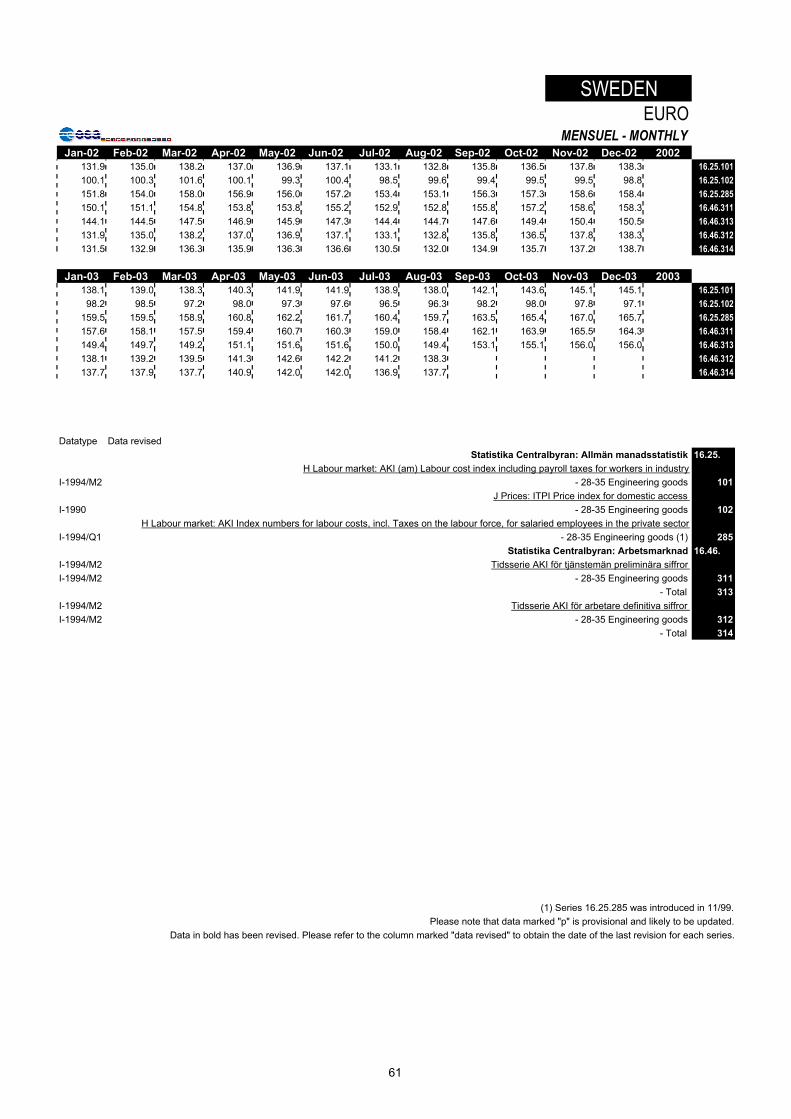
SWEDENEURO
MENSUEL - MONTHLYJan-02 Feb-02 Mar-02 Apr-02 May-02 Jun-02 Jul-02 Aug-02 Sep-02 Oct-02 Nov-02 Dec-02 2002
131.9 135.0 138.2 137.0 136.9 137.1 133.1 132.8 135.8 136.5 137.8 138.3 16.25.101100.1 100.3 101.6 100.1 99.3 100.4 98.5 99.6 99.4 99.5 99.5 98.8 16.25.102151.8 154.0 158.0 156.9 156.0 157.2 153.4 153.1 156.3 157.3 158.6 158.4 16.25.285150.1 151.1 154.8 153.8 153.8 155.2 152.9 152.8 155.8 157.2 158.6 158.3 16.46.311144.1 144.5 147.5 146.9 145.9 147.3 144.4 144.7 147.6 149.4 150.4 150.5 16.46.313131.9 135.0 138.2 137.0 136.9 137.1 133.1 132.8 135.8 136.5 137.8 138.3 16.46.312131.5 132.9 136.3 135.9 136.3 136.6 130.5 132.0 134.9 135.7 137.2 138.7 16.46.314
Jan-03 Feb-03 Mar-03 Apr-03 May-03 Jun-03 Jul-03 Aug-03 Sep-03 Oct-03 Nov-03 Dec-03 2003138.1 139.0 138.3 140.3 141.9 141.9 138.9 138.0 142.1 143.6 145.1 145.1 16.25.10198.2 98.5 97.2 98.0 97.3 97.6 96.5 96.3 98.2 98.0 97.8 97.1 16.25.102
159.5 159.5 158.9 160.8 162.2 161.7 160.4 159.7 163.5 165.4 167.0 165.7 16.25.285157.6 158.1 157.5 159.4 160.7 160.3 159.0 158.4 162.1 163.9 165.5 164.3 16.46.311149.4 149.7 149.2 151.1 151.6 151.6 150.0 149.4 153.1 155.1 156.0 156.0 16.46.313138.1 139.2 139.5 141.3 142.6 142.2 141.2 138.3 16.46.312137.7 137.9 137.7 140.9 142.0 142.0 136.9 137.7 16.46.314
Datatype Data revisedStatistika Centralbyran: Allmän manadsstatistik 16.25.
H Labour market: AKI (am) Labour cost index including payroll taxes for workers in industry I-1994/M2 - 28-35 Engineering goods 101
J Prices: ITPI Price index for domestic access I-1990 - 28-35 Engineering goods 102
H Labour market: AKI Index numbers for labour costs, incl. Taxes on the labour force, for salaried employees in the private sector I-1994/Q1 - 28-35 Engineering goods (1) 285
Statistika Centralbyran: Arbetsmarknad 16.46.I-1994/M2 Tidsserie AKI för tjänstemän preliminära siffror I-1994/M2 - 28-35 Engineering goods 311
- Total 313I-1994/M2 Tidsserie AKI för arbetare definitiva siffror I-1994/M2 - 28-35 Engineering goods 312
- Total 314
(1) Series 16.25.285 was introduced in 11/99.Please note that data marked "p" is provisional and likely to be updated.
Data in bold has been revised. Please refer to the column marked "data revised" to obtain the date of the last revision for each series.
61
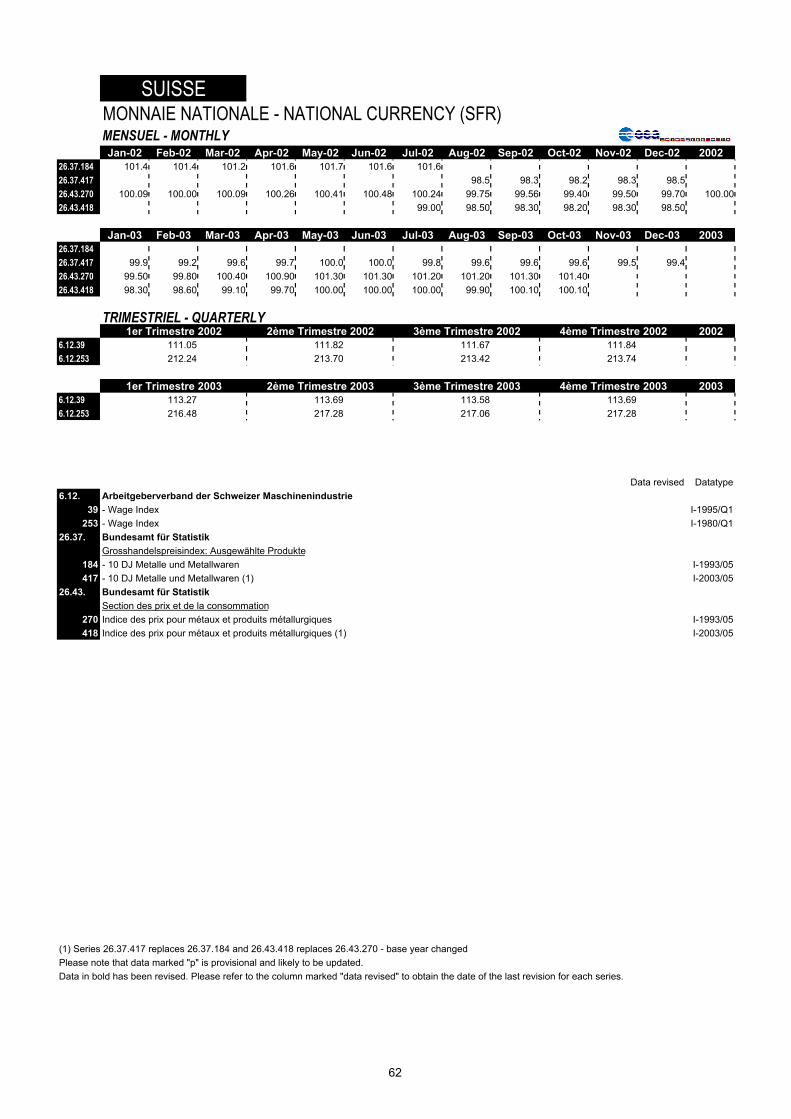
SUISSEMONNAIE NATIONALE - NATIONAL CURRENCY (SFR)MENSUEL - MONTHLYJan-02 Feb-02 Mar-02 Apr-02 May-02 Jun-02 Jul-02 Aug-02 Sep-02 Oct-02 Nov-02 Dec-02 2002
26.37.184 101.4 101.4 101.2 101.6 101.7 101.6 101.626.37.417 98.5 98.3 98.2 98.3 98.526.43.270 100.09 100.00 100.09 100.26 100.41 100.48 100.24 99.75 99.56 99.40 99.50 99.70 100.0026.43.418 99.00 98.50 98.30 98.20 98.30 98.50
Jan-03 Feb-03 Mar-03 Apr-03 May-03 Jun-03 Jul-03 Aug-03 Sep-03 Oct-03 Nov-03 Dec-03 200326.37.18426.37.417 99.9 99.2 99.6 99.7 100.0 100.0 99.8 99.6 99.6 99.6 99.5 99.426.43.270 99.50 99.80 100.40 100.90 101.30 101.30 101.20 101.20 101.30 101.4026.43.418 98.30 98.60 99.10 99.70 100.00 100.00 100.00 99.90 100.10 100.10
TRIMESTRIEL - QUARTERLY1er Trimestre 2002 2ème Trimestre 2002 3ème Trimestre 2002 4ème Trimestre 2002 2002
6.12.39 111.05 111.82 111.67 111.846.12.253 212.24 213.70 213.42 213.74
1er Trimestre 2003 2ème Trimestre 2003 3ème Trimestre 2003 4ème Trimestre 2003 20036.12.39 113.27 113.69 113.58 113.696.12.253 216.48 217.28 217.06 217.28
Data revised Datatype6.12. Arbeitgeberverband der Schweizer Maschinenindustrie
39 - Wage Index I-1995/Q1253 - Wage Index I-1980/Q1
26.37. Bundesamt für StatistikGrosshandelspreisindex: Ausgewählte Produkte
184 - 10 DJ Metalle und Metallwaren I-1993/05417 - 10 DJ Metalle und Metallwaren (1) I-2003/05
26.43. Bundesamt für StatistikSection des prix et de la consommation
270 Indice des prix pour métaux et produits métallurgiques I-1993/05418 Indice des prix pour métaux et produits métallurgiques (1) I-2003/05
(1) Series 26.37.417 replaces 26.37.184 and 26.43.418 replaces 26.43.270 - base year changedPlease note that data marked "p" is provisional and likely to be updated.Data in bold has been revised. Please refer to the column marked "data revised" to obtain the date of the last revision for each series.
62
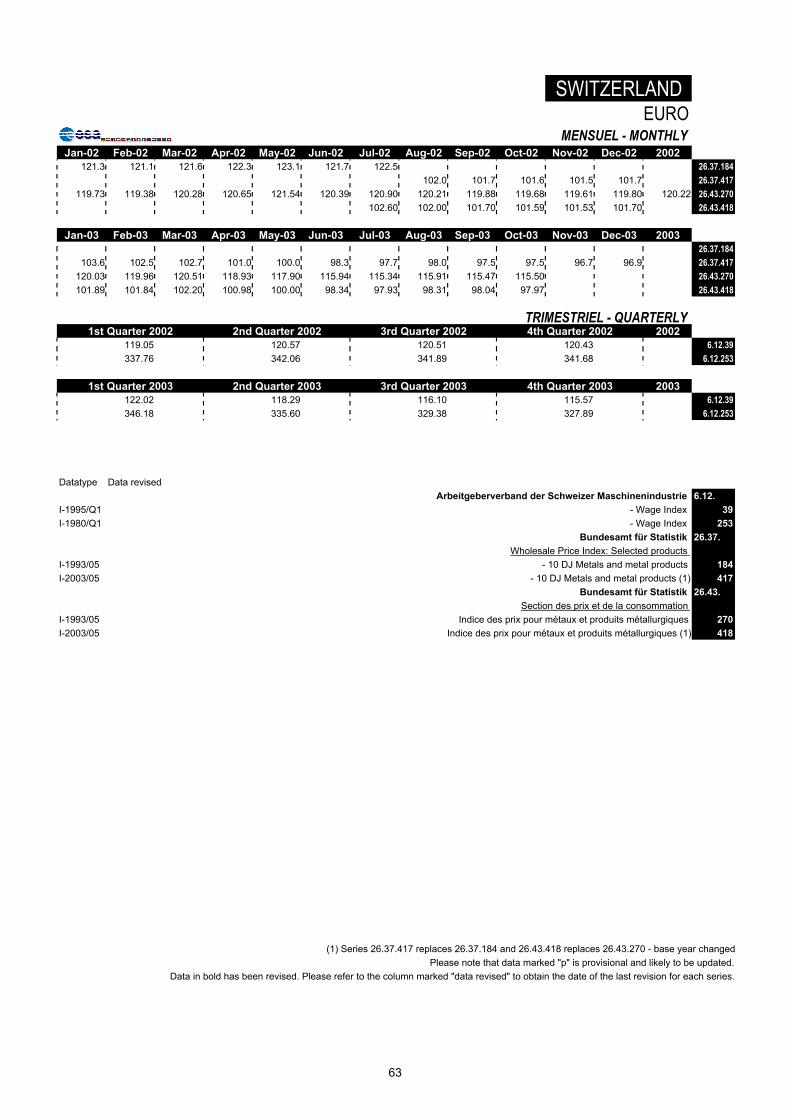
SWITZERLANDEURO
MENSUEL - MONTHLYJan-02 Feb-02 Mar-02 Apr-02 May-02 Jun-02 Jul-02 Aug-02 Sep-02 Oct-02 Nov-02 Dec-02 2002
121.3 121.1 121.6 122.3 123.1 121.7 122.5 26.37.184102.0 101.7 101.6 101.5 101.7 26.37.417
119.73 119.38 120.28 120.65 121.54 120.39 120.90 120.21 119.88 119.68 119.61 119.80 120.22 26.43.270102.60 102.00 101.70 101.59 101.53 101.70 26.43.418
Jan-03 Feb-03 Mar-03 Apr-03 May-03 Jun-03 Jul-03 Aug-03 Sep-03 Oct-03 Nov-03 Dec-03 200326.37.184
103.6 102.5 102.7 101.0 100.0 98.3 97.7 98.0 97.5 97.5 96.7 96.9 26.37.417120.03 119.96 120.51 118.93 117.90 115.94 115.34 115.91 115.47 115.50 26.43.270101.89 101.84 102.20 100.98 100.00 98.34 97.93 98.31 98.04 97.97 26.43.418
TRIMESTRIEL - QUARTERLY1st Quarter 2002 2nd Quarter 2002 3rd Quarter 2002 4th Quarter 2002 2002
119.05 120.57 120.51 120.43 6.12.39337.76 342.06 341.89 341.68 6.12.253
1st Quarter 2003 2nd Quarter 2003 3rd Quarter 2003 4th Quarter 2003 2003122.02 118.29 116.10 115.57 6.12.39346.18 335.60 329.38 327.89 6.12.253
Datatype Data revisedArbeitgeberverband der Schweizer Maschinenindustrie 6.12.
I-1995/Q1 - Wage Index 39I-1980/Q1 - Wage Index 253
Bundesamt für Statistik 26.37.Wholesale Price Index: Selected products
I-1993/05 - 10 DJ Metals and metal products 184I-2003/05 - 10 DJ Metals and metal products (1) 417
Bundesamt für Statistik 26.43.Section des prix et de la consommation
I-1993/05 Indice des prix pour métaux et produits métallurgiques 270I-2003/05 Indice des prix pour métaux et produits métallurgiques (1) 418
(1) Series 26.37.417 replaces 26.37.184 and 26.43.418 replaces 26.43.270 - base year changedPlease note that data marked "p" is provisional and likely to be updated.
Data in bold has been revised. Please refer to the column marked "data revised" to obtain the date of the last revision for each series.
63
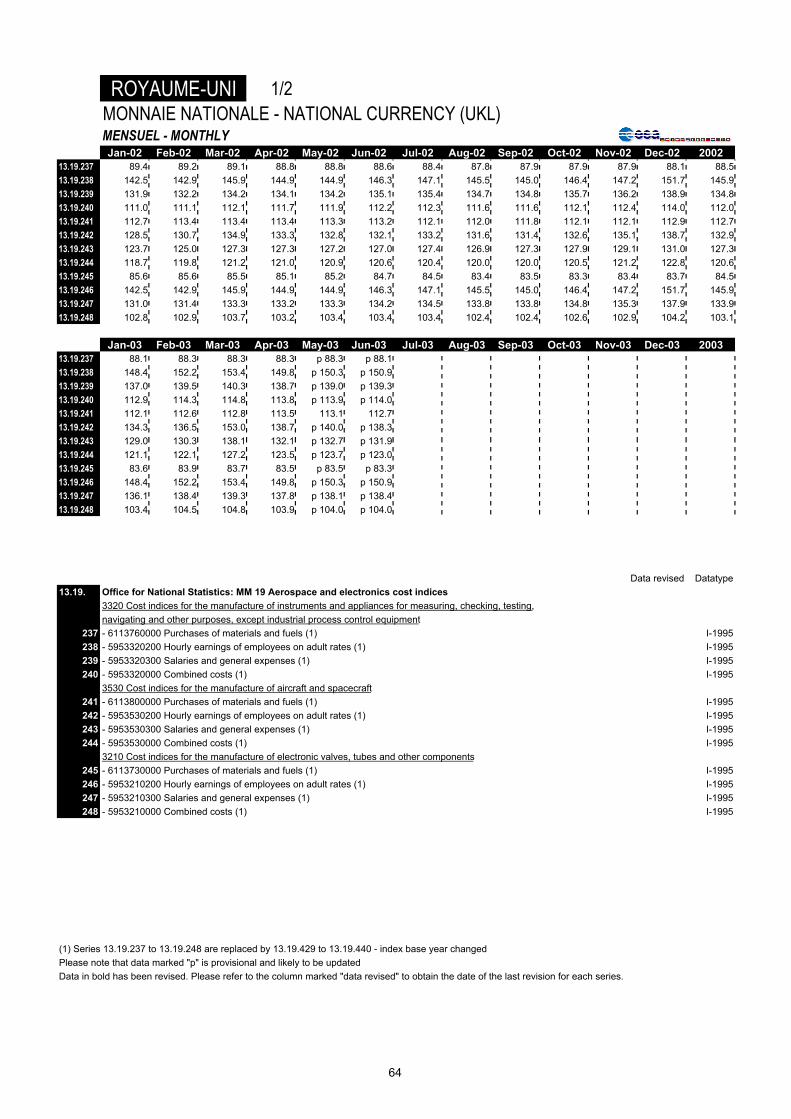
ROYAUME-UNI 1/2MONNAIE NATIONALE - NATIONAL CURRENCY (UKL)MENSUEL - MONTHLYJan-02 Feb-02 Mar-02 Apr-02 May-02 Jun-02 Jul-02 Aug-02 Sep-02 Oct-02 Nov-02 Dec-02 2002
13.19.237 89.4 89.2 89.1 88.8 88.8 88.6 88.4 87.8 87.9 87.9 87.9 88.1 88.513.19.238 142.5 142.9 145.9 144.9 144.9 146.3 147.1 145.5 145.0 146.4 147.2 151.7 145.913.19.239 131.9 132.2 134.2 134.1 134.2 135.1 135.4 134.7 134.8 135.7 136.2 138.9 134.813.19.240 111.0 111.1 112.1 111.7 111.9 112.2 112.3 111.6 111.6 112.1 112.4 114.0 112.013.19.241 112.7 113.4 113.4 113.4 113.3 113.2 112.1 112.0 111.8 112.1 112.1 112.9 112.713.19.242 128.5 130.7 134.9 133.3 132.8 132.1 133.2 131.6 131.4 132.6 135.1 138.7 132.913.19.243 123.7 125.0 127.3 127.3 127.2 127.0 127.4 126.9 127.3 127.9 129.1 131.0 127.313.19.244 118.7 119.8 121.2 121.0 120.9 120.6 120.4 120.0 120.0 120.5 121.2 122.8 120.613.19.245 85.6 85.6 85.5 85.1 85.2 84.7 84.5 83.4 83.5 83.3 83.4 83.7 84.513.19.246 142.5 142.9 145.9 144.9 144.9 146.3 147.1 145.5 145.0 146.4 147.2 151.7 145.913.19.247 131.0 131.4 133.3 133.2 133.3 134.2 134.5 133.8 133.8 134.8 135.3 137.9 133.913.19.248 102.8 102.9 103.7 103.2 103.4 103.4 103.4 102.4 102.4 102.6 102.9 104.2 103.1
Jan-03 Feb-03 Mar-03 Apr-03 May-03 Jun-03 Jul-03 Aug-03 Sep-03 Oct-03 Nov-03 Dec-03 200313.19.237 88.1 88.3 88.3 88.3 p 88.3 p 88.113.19.238 148.4 152.2 153.4 149.8 p 150.3 p 150.913.19.239 137.0 139.5 140.3 138.7 p 139.0 p 139.313.19.240 112.9 114.3 114.8 113.8 p 113.9 p 114.013.19.241 112.1 112.6 112.8 113.5 113.1 112.713.19.242 134.3 136.5 153.0 138.7 p 140.0 p 138.313.19.243 129.0 130.3 138.1 132.1 p 132.7 p 131.913.19.244 121.1 122.1 127.2 123.5 p 123.7 p 123.013.19.245 83.6 83.9 83.7 83.5 p 83.5 p 83.313.19.246 148.4 152.2 153.4 149.8 p 150.3 p 150.913.19.247 136.1 138.4 139.3 137.8 p 138.1 p 138.413.19.248 103.4 104.5 104.8 103.9 p 104.0 p 104.0
Data revised Datatype13.19. Office for National Statistics: MM 19 Aerospace and electronics cost indices
3320 Cost indices for the manufacture of instruments and appliances for measuring, checking, testing,navigating and other purposes, except industrial process control equipment
237 - 6113760000 Purchases of materials and fuels (1) I-1995238 - 5953320200 Hourly earnings of employees on adult rates (1) I-1995239 - 5953320300 Salaries and general expenses (1) I-1995240 - 5953320000 Combined costs (1) I-1995
3530 Cost indices for the manufacture of aircraft and spacecraft241 - 6113800000 Purchases of materials and fuels (1) I-1995242 - 5953530200 Hourly earnings of employees on adult rates (1) I-1995243 - 5953530300 Salaries and general expenses (1) I-1995244 - 5953530000 Combined costs (1) I-1995
3210 Cost indices for the manufacture of electronic valves, tubes and other components245 - 6113730000 Purchases of materials and fuels (1) I-1995246 - 5953210200 Hourly earnings of employees on adult rates (1) I-1995247 - 5953210300 Salaries and general expenses (1) I-1995248 - 5953210000 Combined costs (1) I-1995
(1) Series 13.19.237 to 13.19.248 are replaced by 13.19.429 to 13.19.440 - index base year changedPlease note that data marked "p" is provisional and likely to be updatedData in bold has been revised. Please refer to the column marked "data revised" to obtain the date of the last revision for each series.
64
1/2 UNITED KINGDOMEURO
MENSUEL - MONTHLYJan-02 Feb-02 Mar-02 Apr-02 May-02 Jun-02 Jul-02 Aug-02 Sep-02 Oct-02 Nov-02 Dec-02 2002
120.2 120.9 119.9 119.8 117.1 114.0 114.7 114.3 115.5 115.6 114.3 113.7 116.7 13.19.237191.5 193.6 196.4 195.6 191.1 188.3 190.9 189.5 190.6 192.6 191.5 195.8 192.4 13.19.238177.3 179.1 180.6 181.0 177.0 173.8 175.7 175.4 177.2 178.5 177.2 179.3 177.8 13.19.239149.2 150.5 150.9 150.7 147.6 144.4 145.7 145.3 146.7 147.5 146.2 147.1 147.7 13.19.240151.5 153.7 152.6 153.0 149.5 145.7 145.5 145.9 146.9 147.5 145.8 145.7 148.6 13.19.241172.7 177.1 181.6 179.9 175.2 170.0 172.8 171.4 172.7 174.4 175.7 179.0 175.3 13.19.242166.3 169.4 171.3 171.8 167.8 163.4 165.3 165.3 167.3 168.3 167.9 169.1 167.9 13.19.243159.5 162.3 163.1 163.3 159.5 155.2 156.2 156.3 157.7 158.5 157.7 158.5 159.0 13.19.244115.1 116.0 115.1 114.8 112.4 109.0 109.6 108.6 109.7 109.6 108.5 108.0 111.4 13.19.245191.5 193.6 196.4 195.6 191.1 188.3 190.9 189.5 190.6 192.6 191.5 195.8 192.4 13.19.246176.1 178.1 179.4 179.8 175.8 172.7 174.5 174.3 175.8 177.3 176.0 178.0 176.6 13.19.247138.2 139.4 139.6 139.3 136.4 133.1 134.2 133.4 134.6 135.0 133.9 134.5 136.0 13.19.248
Jan-03 Feb-03 Mar-03 Apr-03 May-03 Jun-03 Jul-03 Aug-03 Sep-03 Oct-03 Nov-03 Dec-03 2003111.1 109.3 107.2 106.2 p 102.6 p 104.0 13.19.237187.2 188.3 186.3 180.2 p 174.6 p 178.1 13.19.238172.8 172.6 170.3 166.8 p 161.5 p 164.4 13.19.239142.4 141.4 139.4 136.9 p 132.3 p 134.5 13.19.240141.4 139.3 137.0 136.5 131.4 133.0 13.19.241169.4 168.9 185.8 166.8 p 162.7 p 163.2 13.19.242162.7 161.2 167.7 158.9 p 154.2 p 155.7 13.19.243152.7 151.1 154.4 148.5 p 143.7 p 145.2 13.19.244105.4 103.8 101.6 100.4 p 97.0 p 98.3 13.19.245187.2 188.3 186.3 180.2 p 174.6 p 178.1 13.19.246171.6 171.2 169.1 165.7 p 160.5 p 163.3 13.19.247130.4 129.3 127.2 125.0 p 120.8 p 122.7 13.19.248
Datatype Data revisedOffice for National Statistics: MM 19 Aerospace and electronics cost indices 13.19.
3320 Cost indices for the manufacture of instruments and appliances for measuring, checking, testing, navigating and other purposes, except industrial process control equipment
I-1995 - 6113760000 Purchases of materials and fuels (1) 237I-1995 - 5953320200 Hourly earnings of employees on adult rates (1) 238I-1995 - 5953320300 Salaries and general expenses (1) 239I-1995 - 5953320000 Combined costs (1) 240
3530 Cost indices for the manufacture of aircraft and spacecraft I-1995 - 6113800000 Purchases of materials and fuels (1) 241I-1995 - 5953530200 Hourly earnings of employees on adult rates (1) 242I-1995 - 5953530300 Salaries and general expenses (1) 243I-1995 - 5953530000 Combined costs (1) 244
3210 Cost indices for the manufacture of electronic valves, tubes and other components I-1995 - 6113730000 Purchases of materials and fuels (1) 245I-1995 - 5953210200 Hourly earnings of employees on adult rates (1) 246I-1995 - 5953210300 Salaries and general expenses (1) 247I-1995 - 5953210000 Combined costs (1) 248
(1) Series 13.19.237 to 13.19.248 are replaced by 13.19.429 to 13.19.440 - index base year changedPlease note that data marked "p" is provisional and likely to be updated
Data in bold has been revised. Please refer to the column marked "data revised" to obtain the date of the last revision for each series.
65
ROYAUME-UNI 2/2MONNAIE NATIONALE - NATIONAL CURRENCY (UKL)MENSUEL - MONTHLYJan-02 Feb-02 Mar-02 Apr-02 May-02 Jun-02 Jul-02 Aug-02 Sep-02 Oct-02 Nov-02 Dec-02 2002
13.19.429 96.6 96.8 96.9 96.1 96.0 95.7 94.7 94.5 94.2 93.7 93.6 93.8 95.213.19.430 108.1 108.4 110.7 109.9 109.8 110.9 111.5 110.3 109.9 110.9 111.6 115.1 110.613.19.431 101.4 101.7 102.2 103.0 103.4 103.5 103.3 103.6 104.4 104.6 104.8 105.0 103.413.19.432 101.2 101.5 102.4 101.8 101.8 102.0 101.7 101.2 101.1 101.2 101.4 102.7 101.713.19.433 94.5 94.6 95.1 94.8 94.2 94.2 93.4 93.5 92.9 92.8 92.7 93.1 93.813.19.434 102.5 104.6 108.2 107.0 106.5 106.0 106.9 105.6 105.4 106.4 108.4 111.4 106.613.19.435 101.4 101.7 102.2 103.0 103.4 103.5 103.3 103.6 104.4 104.6 104.8 105.0 103.413.19.436 98.0 98.7 100.0 99.7 99.3 99.2 98.9 98.7 98.5 98.7 99.3 100.3 99.113.19.437 95.2 95.4 95.3 94.3 93.9 93.6 92.6 92.4 92.0 91.4 91.2 91.3 93.213.19.438 108.1 108.4 110.7 109.9 109.8 110.9 111.5 110.3 109.9 110.9 111.6 115.1 110.613.19.439 101.4 101.7 102.2 103.0 103.4 103.5 103.3 103.6 104.4 104.6 104.8 105.0 103.413.19.440 99.8 100.0 100.6 100.0 99.8 100.0 99.5 99.1 98.9 98.9 99.0 100.0 99.6
Jan-03 Feb-03 Mar-03 Apr-03 May-03 Jun-03 Jul-03 Aug-03 Sep-03 Oct-03 Nov-03 Dec-03 200313.19.429 93.2 93.4 93.8 93.0 92.6 91.8 92.2 91.9 91.9 91.2 91.5 90.913.19.430 112.6 115.5 116.4 114.5 114.9 115.4 114.9 114.1 113.7 114.9 119.9 118.713.19.431 105.0 105.4 105.8 106.6 106.7 106.7 106.6 106.8 107.4 107.4 107.4 107.913.19.432 101.6 102.7 103.3 102.4 102.3 102.1 102.1 101.7 101.7 101.7 103.5 102.913.19.433 92.8 92.7 93.3 93.7 93.8 93.2 93.3 93.7 94.1 93.9 94.1 94.013.19.434 107.8 109.6 123.1 112.2 113.3 111.9 113.3 109.8 111.2 112.4 113.9 117.713.19.435 105.0 105.4 105.8 106.6 106.7 106.7 106.6 106.8 107.4 107.4 107.4 107.913.19.436 99.2 99.7 103.7 101.2 101.5 100.8 101.3 100.6 101.2 101.5 102.0 103.113.19.437 90.5 90.5 90.8 90.0 89.5 88.7 88.8 88.5 89.5 88.6 88.7 88.113.19.438 112.6 115.5 116.4 114.5 114.9 115.4 114.9 114.1 113.7 114.9 119.9 118.713.19.439 105.0 105.4 105.8 106.6 106.7 106.7 106.6 106.8 107.4 107.4 107.4 107.913.19.440 98.9 99.8 100.3 99.5 99.3 99.0 98.9 98.6 99.1 98.9 100.3 99.3
Data revised Datatype13.19. Office for National Statistics: MM 19 Aerospace and electronics cost indices
3320 Cost indices for the manufacture of instruments and appliances for measuring, checking, testing,navigating and other purposes, except industrial process control equipment
429 - 6113760000 Purchases of materials and fuels (1) I-2000430 - 5003320200 Earnings and National Insurance (1) I-2000431 - 5000000300 General Expenses (1) I-2000432 - 5003320000 Combined costs (1) I-2000
3530 Cost indices for the manufacture of aircraft and spacecraft433 - 6113800000 Purchases of materials and fuels (1) I-2000434 - 5003530200 Earnings and National Insurance (1) I-2000435 - 5000000300 General Expenses (1) I-2000436 - 5003530000 Combined costs (1) I-2000
3210 Cost indices for the manufacture of electronic valves, tubes and other components437 - 6113730000 Purchases of materials and fuels (1) I-2000438 - 5003210200 Earnings and National Insurance (1) I-2000439 - 5000000300 General Expenses (1) I-2000440 - 5003210000 Combined costs (1) I-2000
(1) Series 13.19.429 to 13.19.440 are new series that replace 13.19.237 to 13.19.248 - change of base year.Please note that data marked "p" is provisional and likely to be updatedData in bold has been revised. Please refer to the column marked "data revised" to obtain the date of the last revision for each series.
66
2/2 UNITED KINGDOMEURO
MENSUEL - MONTHLYJan-02 Feb-02 Mar-02 Apr-02 May-02 Jun-02 Jul-02 Aug-02 Sep-02 Oct-02 Nov-02 Dec-02 2002
95.4 96.4 95.9 95.3 93.1 90.5 90.3 90.5 91.0 90.6 89.5 89.0 92.3 13.19.429106.8 108.0 109.5 109.0 106.5 104.9 106.3 105.6 106.2 107.2 106.7 109.2 107.2 13.19.430100.2 101.3 101.1 102.2 100.3 97.9 98.5 99.2 100.8 101.1 100.2 99.6 100.2 13.19.431100.0 101.1 101.3 101.0 98.7 96.5 97.0 96.9 97.7 97.9 96.9 97.4 98.6 13.19.43293.4 94.2 94.1 94.0 91.3 89.1 89.1 89.5 89.7 89.7 88.6 88.3 90.9 13.19.433
101.3 104.2 107.0 106.1 103.3 100.3 101.9 101.1 101.8 102.9 103.6 105.7 103.3 13.19.434100.2 101.3 101.1 102.2 100.3 97.9 98.5 99.2 100.8 101.1 100.2 99.6 100.2 13.19.43596.8 98.3 98.9 98.9 96.3 93.8 94.3 94.5 95.1 95.4 94.9 95.1 96.1 13.19.43694.0 95.0 94.3 93.5 91.0 88.5 88.3 88.4 88.9 88.4 87.2 86.6 90.3 13.19.437
106.8 108.0 109.5 109.0 106.5 104.9 106.3 105.6 106.2 107.2 106.7 109.2 107.2 13.19.438100.2 101.3 101.1 102.2 100.3 97.9 98.5 99.2 100.8 101.1 100.2 99.6 100.2 13.19.43998.6 99.6 99.5 99.2 96.8 94.6 94.9 94.9 95.5 95.6 94.7 94.9 96.5 13.19.440
Jan-03 Feb-03 Mar-03 Apr-03 May-03 Jun-03 Jul-03 Aug-03 Sep-03 Oct-03 Nov-03 Dec-03 200386.4 84.9 83.7 82.2 79.1 79.6 80.2 80.1 80.3 79.6 80.5 78.9 13.19.429
104.4 105.0 103.9 101.2 98.1 100.1 99.9 99.4 99.4 100.3 105.4 103.0 13.19.43097.3 95.9 94.4 94.2 91.1 92.6 92.7 93.0 93.9 93.8 94.4 93.6 13.19.43194.2 93.4 92.2 90.5 87.4 88.6 88.8 88.6 88.9 88.8 91.0 89.3 13.19.43286.0 84.3 83.3 82.8 80.1 80.8 81.1 81.6 82.2 82.0 82.7 81.6 13.19.43399.9 99.7 109.9 99.2 96.8 97.1 98.5 95.7 97.2 98.1 100.1 102.1 13.19.43497.3 95.9 94.4 94.2 91.1 92.6 92.7 93.0 93.9 93.8 94.4 93.6 13.19.43592.0 90.7 92.5 89.5 86.7 87.4 88.1 87.6 88.4 88.6 89.7 89.5 13.19.43683.9 82.3 81.0 79.6 76.4 76.9 77.2 77.1 78.2 77.4 78.0 76.4 13.19.437
104.4 105.0 103.9 101.2 98.1 100.1 99.9 99.4 99.4 100.3 105.4 103.0 13.19.43897.3 95.9 94.4 94.2 91.1 92.6 92.7 93.0 93.9 93.8 94.4 93.6 13.19.43991.7 90.8 89.5 88.0 84.8 85.9 86.0 85.9 86.6 86.4 88.2 86.2 13.19.440
Datatype Data revisedOffice for National Statistics: MM 19 Aerospace and electronics cost indices 13.19.
3320 Cost indices for the manufacture of instruments and appliances for measuring, checking, testing, navigating and other purposes, except industrial process control equipment
I-2000 - 6113760000 Purchases of materials and fuels (1) 429I-2000 - 5003320200 Earnings and National Insurance (1) 430I-2000 - 5000000300 General Expenses (1) 431I-2000 - 5003320000 Combined costs (1) 432
3530 Cost indices for the manufacture of aircraft and spacecraftI-2000 - 6113800000 Purchases of materials and fuels (1) 433I-2000 - 5003530200 Earnings and National Insurance (1) 434I-2000 - 5000000300 General Expenses (1) 435I-2000 - 5003530000 Combined costs (1) 436
3210 Cost indices for the manufacture of electronic valves, tubes and other componentsI-2000 - 6113730000 Purchases of materials and fuels (1) 437I-2000 - 5003210200 Earnings and National Insurance (1) 438I-2000 - 5000000300 General Expenses (1) 439I-2000 - 5003210000 Combined costs (1) 440
(1) Series 13.19.429 to 13.19.440 are new series that replace 13.19.237 to 13.19.248 - change of base year.Please note that data marked "p" is provisional and likely to be updated
Data in bold has been revised. Please refer to the column marked "data revised" to obtain the date of the last revision for each series.
67
CANADAMONNAIE NATIONALE - NATIONAL CURRENCY (CAD)MENSUEL - MONTHLYJan-02 Feb-02 Mar-02 Apr-02 May-02 Jun-02 Jul-02 Aug-02 Sep-02 Oct-02 Nov-02 Dec-02 2002
28.44.30828.44.30928.44.373 861.94 863.47 863.75 869.33 874.01 878.77 885.29 887.78 883.42 882.96 882.43 887.0728.44.374 514.95 515.06 514.63 516.27 512.63 514.07 514.85 513.32 511.69 511.00 512.66 513.0428.44.375 1,028.09 1,028.75 1,025.58 1,037.98 1,032.33 1,035.75 1,029.20 1,029.10 1,013.60 1,008.79 1,011.17 1,025.7728.44.376 933.72 937.62 944.57 947.92 949.10 948.05 949.01 951.67 954.39 959.67 962.19 965.9128.44.377 876.98 888.47 884.87 888.97 894.62 891.54 890.34 885.38 890.80 893.67 881.12 881.1028.44.378 1,129.44 1,140.55 1,137.30 1,144.71 1,148.28 1,151.39 1,151.76 1,153.79 1,153.34 1,154.71 1,155.01 1,155.4528.44.379 1,176.78 1,180.31 1,184.38 1,184.75 1,189.18 1,196.91 1,197.23 1,197.82 1,197.71 1,199.41 1,199.88 1,202.5828.44.380 843.75 871.42 831.90 861.56 872.22 870.91 872.50 861.44 873.05 879.70 881.65 893.8128.44.381 439.61 438.47 437.57 437.80 434.52 433.14 434.51 432.07 431.75 433.17 433.45 432.9228.49.372 116.2 116.9 117.7 118.4 118.6 119.0 119.6 120.1 120.1 120.5 120.8 120.428.50.382 114.2 114.4 114.4 114.3 114.2 114.5 114.5 114.5 114.6 114.6 114.1 114.928.50.383 109.7 109.8 110.2 110.9 110.3 110.1 110.2 111.3 112.5 112.8 112.3 111.7
Jan-03 Feb-03 Mar-03 Apr-03 May-03 Jun-03 Jul-03 Aug-03 Sep-03 Oct-03 Nov-03 Dec-03 200328.44.30828.44.30928.44.373 886.51 885.04 883.86 891.75 885.62 886.93 890.14 884.92 887.2628.44.374 510.41 510.13 509.61 510.82 521.32 528.45 528.23 520.36 526.0628.44.375 1,035.38 1,069.50 1,078.75 1,094.61 1,035.97 1,015.70 1,037.53 1,021.28 1,043.8728.44.376 967.37 961.76 966.89 962.22 954.00 970.21 988.57 965.08 984.1228.44.377 892.58 906.68 880.09 858.10 854.68 859.80 858.73 831.73 853.9228.44.378 1,160.05 1,167.75 1,152.81 1,097.22 1,076.42 1,085.82 1,110.36 1,075.36 1,030.8728.44.379 1,227.21 1,226.27 1,217.73 1,198.98 1,170.62 1,198.20 1,190.97 1,135.16 1,114.7028.44.380 868.73 877.39 866.44 900.69 923.38 920.68 958.72 933.09 918.9228.44.381 432.65 431.21 431.06 431.89 441.27 447.62 451.61 442.09 445.9028.49.372 121.4 122.3 122.8 121.9 122.0 122.1 122.2 122.5 122.7 122.4 122.728.50.382 115.6 117.4 117.4 117.4 117.4 117.4 117.3 115.9 115.9 115.828.50.383 112.5 113.6 113.3 110.7 107.8 106.6 108.2 108.7 108.1 106.9
Data revised Datatype28.44 Statistics Canada: Employment, Earnings and Hours
Average weekly earnings (incl. overtime), of salaried employees, firms of all sizes, by industry308 1.5.1.1.3.2.7, matrix number 4289, electrical & electronic products M
Industrial product price indexes 1992=100 monthly309 1.24.59.3, matrix number 1876, industrial electrical equipment I-1992
Average weekly earnings (SEPH), unadjusted for seasonal variation373 Salaried employees paid a fixed salary; Excluding overtime; Industrial aggregate excluding unclassified 06-03 M374 Employees paid by the hour; Excluding overtime; Industrial aggregate excluding unclassified 07-03 M375 Salaried employees paid a fixed salary; Excluding overtime; Professional, scientific and technical services [54] 07-03 M376 All employees; Including overtime; Computer and electronic product manufacturing [334] 07-03 M377 All employees; Excluding overtime; Management, scientific and technical consulting services [5416] 07-03 M378 Salaried employees paid a fixed salary; Including overtime; Electrical equipment manufacturing [3353] 07-03 M379 Salaried employees paid a fixed salary; Including overtime; Other electrical equipment and component manufacturing [3359] 07-03 M380 Employees paid by the hour; Excluding overtime; Aerospace product and parts manufacturing [3364] 07-03 M381 Employees paid by the hour; Excluding overtime; Service producing industries 07-03 M
28.49 Statistics Canada: Consumer Price Index372 All items I-1992
28.50 Statistics Canada: Industry Price IndexesIPI, electrical/communication/non-metallic mineral/petroleum/coal products
382 Industrial electrical equipment 05-03 I-1997Industry price indexes, by NAICS
383 Non-food manufacturing (excluding basic manufacturing industries) 07-03 I-1997
Please note that data marked "p" is provisional and likely to be updated.Data in bold has been revised. Please refer to the column marked "data revised" to obtain the date of the last revision for each series.
68
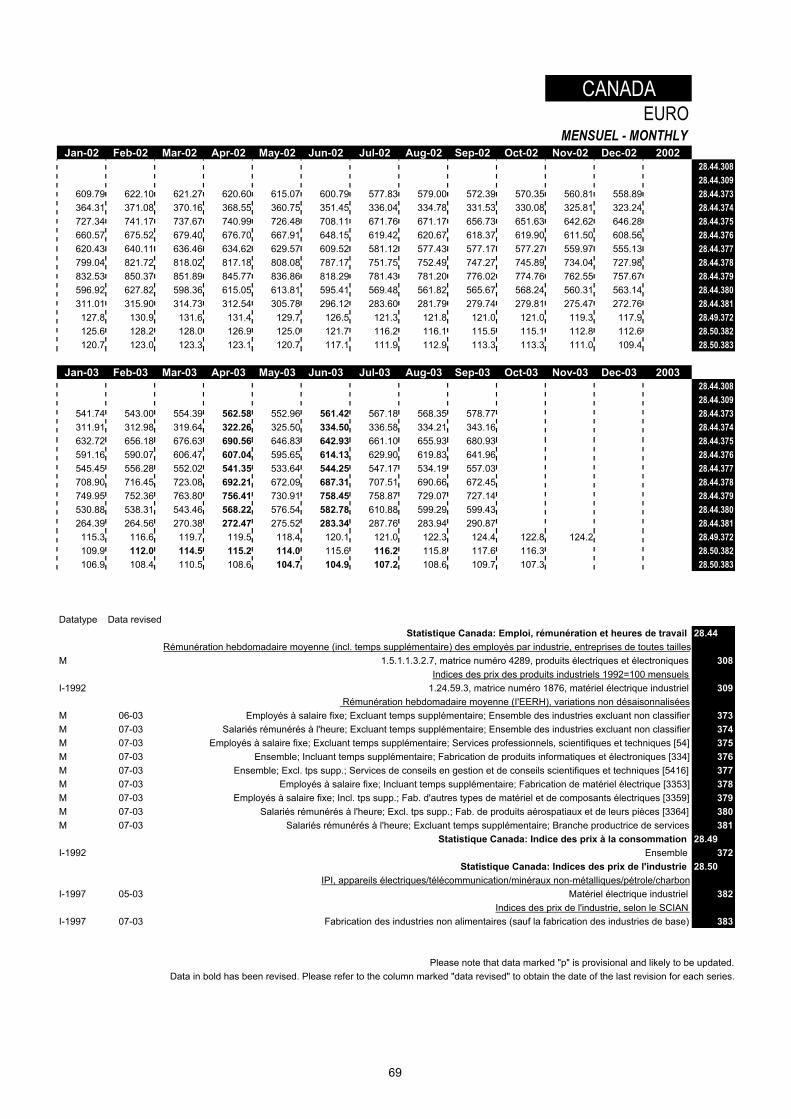
CANADAEURO
MENSUEL - MONTHLYJan-02 Feb-02 Mar-02 Apr-02 May-02 Jun-02 Jul-02 Aug-02 Sep-02 Oct-02 Nov-02 Dec-02 2002
28.44.30828.44.309
609.79 622.10 621.27 620.60 615.07 600.79 577.83 579.00 572.39 570.35 560.81 558.89 28.44.373364.31 371.08 370.16 368.55 360.75 351.45 336.04 334.78 331.53 330.08 325.81 323.24 28.44.374727.34 741.17 737.67 740.99 726.48 708.11 671.76 671.17 656.73 651.63 642.62 646.28 28.44.375660.57 675.52 679.40 676.70 667.91 648.15 619.42 620.67 618.37 619.90 611.50 608.56 28.44.376620.43 640.11 636.46 634.62 629.57 609.52 581.12 577.43 577.17 577.27 559.97 555.13 28.44.377799.04 821.72 818.02 817.18 808.08 787.17 751.75 752.49 747.27 745.89 734.04 727.98 28.44.378832.53 850.37 851.89 845.77 836.86 818.29 781.43 781.20 776.02 774.76 762.55 757.67 28.44.379596.92 627.82 598.36 615.05 613.81 595.41 569.48 561.82 565.67 568.24 560.31 563.14 28.44.380311.01 315.90 314.73 312.54 305.78 296.12 283.60 281.79 279.74 279.81 275.47 272.76 28.44.381127.8 130.9 131.6 131.4 129.7 126.5 121.3 121.8 121.0 121.0 119.3 117.9 28.49.372125.6 128.2 128.0 126.9 125.0 121.7 116.2 116.1 115.5 115.1 112.8 112.6 28.50.382120.7 123.0 123.3 123.1 120.7 117.1 111.9 112.9 113.3 113.3 111.0 109.4 28.50.383
Jan-03 Feb-03 Mar-03 Apr-03 May-03 Jun-03 Jul-03 Aug-03 Sep-03 Oct-03 Nov-03 Dec-03 200328.44.30828.44.309
541.74 543.00 554.39 562.58 552.96 561.42 567.18 568.35 578.77 28.44.373311.91 312.98 319.64 322.26 325.50 334.50 336.58 334.21 343.16 28.44.374632.72 656.18 676.63 690.56 646.83 642.93 661.10 655.93 680.93 28.44.375591.16 590.07 606.47 607.04 595.65 614.13 629.90 619.83 641.96 28.44.376545.45 556.28 552.02 541.35 533.64 544.25 547.17 534.19 557.03 28.44.377708.90 716.45 723.08 692.21 672.09 687.31 707.51 690.66 672.45 28.44.378749.95 752.36 763.80 756.41 730.91 758.45 758.87 729.07 727.14 28.44.379530.88 538.31 543.46 568.22 576.54 582.78 610.88 599.29 599.43 28.44.380264.39 264.56 270.38 272.47 275.52 283.34 287.76 283.94 290.87 28.44.381115.3 116.6 119.7 119.5 118.4 120.1 121.0 122.3 124.4 122.8 124.2 28.49.372109.9 112.0 114.5 115.2 114.0 115.6 116.2 115.8 117.6 116.3 28.50.382106.9 108.4 110.5 108.6 104.7 104.9 107.2 108.6 109.7 107.3 28.50.383
Datatype Data revisedStatistique Canada: Emploi, rémunération et heures de travail 28.44
Rémunération hebdomadaire moyenne (incl. temps supplémentaire) des employés par industrie, entreprises de toutes tailles M 1.5.1.1.3.2.7, matrice numéro 4289, produits électriques et électroniques 308
Indices des prix des produits industriels 1992=100 mensuels I-1992 1.24.59.3, matrice numéro 1876, matériel électrique industriel 309
Rémunération hebdomadaire moyenne (I'EERH), variations non désaisonnalisées M 06-03 Employés à salaire fixe; Excluant temps supplémentaire; Ensemble des industries excluant non classifier 373M 07-03 Salariés rémunérés à l'heure; Excluant temps supplémentaire; Ensemble des industries excluant non classifier 374M 07-03 Employés à salaire fixe; Excluant temps supplémentaire; Services professionnels, scientifiques et techniques [54] 375M 07-03 Ensemble; Incluant temps supplémentaire; Fabrication de produits informatiques et électroniques [334] 376M 07-03 Ensemble; Excl. tps supp.; Services de conseils en gestion et de conseils scientifiques et techniques [5416] 377M 07-03 Employés à salaire fixe; Incluant temps supplémentaire; Fabrication de matériel électrique [3353] 378M 07-03 Employés à salaire fixe; Incl. tps supp.; Fab. d'autres types de matériel et de composants électriques [3359] 379M 07-03 Salariés rémunérés à l'heure; Excl. tps supp.; Fab. de produits aérospatiaux et de leurs pièces [3364] 380M 07-03 Salariés rémunérés à l'heure; Excluant temps supplémentaire; Branche productrice de services 381
Statistique Canada: Indice des prix à la consommation 28.49I-1992 Ensemble 372
Statistique Canada: Indices des prix de l'industrie 28.50IPI, appareils électriques/télécommunication/minéraux non-métalliques/pétrole/charbon
I-1997 05-03 Matériel électrique industriel 382Indices des prix de l'industrie, selon le SCIAN
I-1997 07-03 Fabrication des industries non alimentaires (sauf la fabrication des industries de base) 383
Please note that data marked "p" is provisional and likely to be updated.Data in bold has been revised. Please refer to the column marked "data revised" to obtain the date of the last revision for each series.
69

71
3. Exchange rates
The exchange rates for the EURO against the national currencies of theMember States of the European Community and other major currencies areshown as annual, quarterly and monthly averages. These are based ontheoretical daily exchange rates calculated by the European Commission fromthe market rates of the individual currencies that make up the EURO, andmay not be the same as market rates quoted for the EURO.
For further explanation concerning the introduction of the EURO please referto the notes in the introduction and the extract of the Council Regulation from31st December 1998 and from 19th June 2000 (provided on pages 5 to 7).
3. Taux de change
Les taux de change de l’EURO dans les monnaies nationales des Étatsmembres de la Communauté Européenne et dans les autres monnaiesimportantes sont présentés en moyennes annuelles, trimestrielles etmensuelles. Ceux-ci sont fondés sur les taux de change théoriques au jour lejour calculés par la Commission européenne à partir des taux sur les marchésdes monnaies nationales qui constituaient l'EURO; il se peut qu'ils différentdes taux du marché établit pour l'EURO.
Pour de plus amples informations concernant l'introduction de l'EURO veuillezvous référer aux notes dans l'introduction et aux extraits du règlement duConseil du 31 décembre 1998 et du 19 juin 2000 se trouvant aux pages 5 au7.
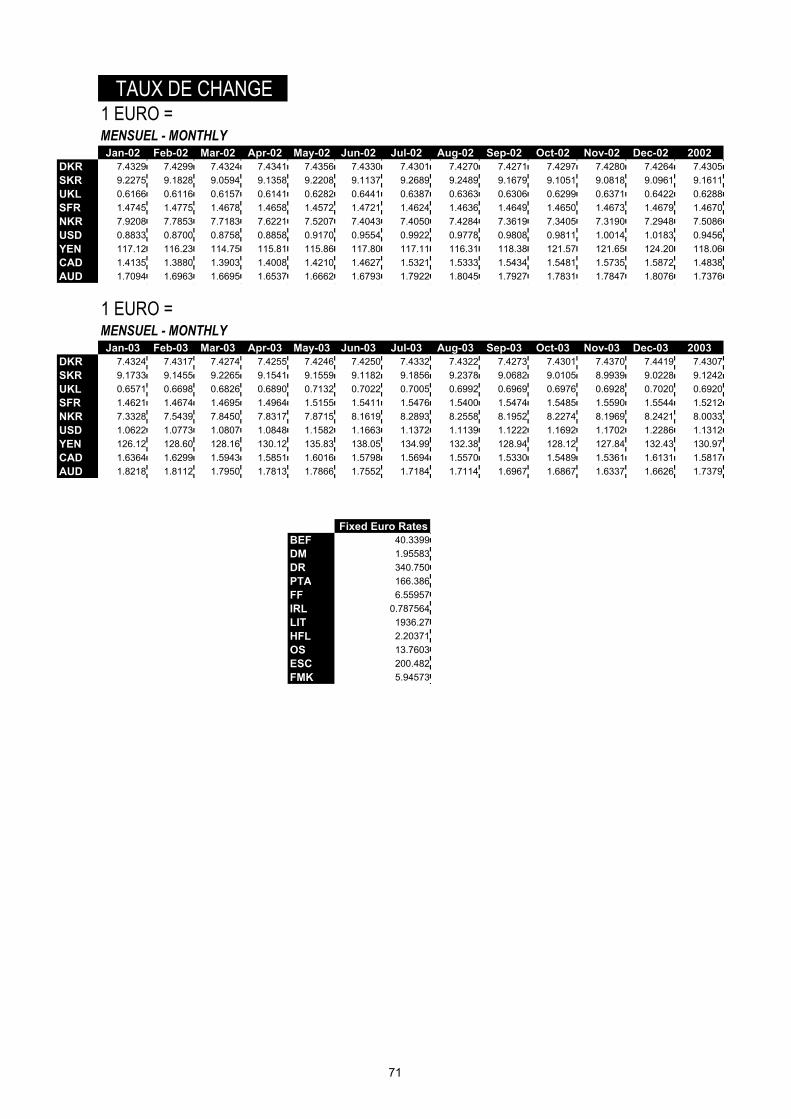
TAUX DE CHANGE1 EURO =MENSUEL - MONTHLYJan-02 Feb-02 Mar-02 Apr-02 May-02 Jun-02 Jul-02 Aug-02 Sep-02 Oct-02 Nov-02 Dec-02 2002
DKR 7.4329 7.4299 7.4324 7.4341 7.4356 7.4330 7.4301 7.4270 7.4271 7.4297 7.4280 7.4264 7.4305SKR 9.2275 9.1828 9.0594 9.1358 9.2208 9.1137 9.2689 9.2489 9.1679 9.1051 9.0818 9.0961 9.1611UKL 0.6166 0.6116 0.6157 0.6141 0.6282 0.6441 0.6387 0.6363 0.6306 0.6299 0.6371 0.6422 0.6288SFR 1.4745 1.4775 1.4678 1.4658 1.4572 1.4721 1.4624 1.4636 1.4649 1.4650 1.4673 1.4679 1.4670NKR 7.9208 7.7853 7.7183 7.6221 7.5207 7.4043 7.4050 7.4284 7.3619 7.3405 7.3190 7.2948 7.5086USD 0.8833 0.8700 0.8758 0.8858 0.9170 0.9554 0.9922 0.9778 0.9808 0.9811 1.0014 1.0183 0.9456YEN 117.12 116.23 114.75 115.81 115.86 117.80 117.11 116.31 118.38 121.57 121.65 124.20 118.06CAD 1.4135 1.3880 1.3903 1.4008 1.4210 1.4627 1.5321 1.5333 1.5434 1.5481 1.5735 1.5872 1.4838AUD 1.7094 1.6963 1.6695 1.6537 1.6662 1.6793 1.7922 1.8045 1.7927 1.7831 1.7847 1.8076 1.7376
1 EURO =MENSUEL - MONTHLYJan-03 Feb-03 Mar-03 Apr-03 May-03 Jun-03 Jul-03 Aug-03 Sep-03 Oct-03 Nov-03 Dec-03 2003
DKR 7.4324 7.4317 7.4274 7.4255 7.4246 7.4250 7.4332 7.4322 7.4273 7.4301 7.4370 7.4419 7.4307SKR 9.1733 9.1455 9.2265 9.1541 9.1559 9.1182 9.1856 9.2378 9.0682 9.0105 8.9939 9.0228 9.1242UKL 0.6571 0.6698 0.6826 0.6890 0.7132 0.7022 0.7005 0.6992 0.6969 0.6976 0.6928 0.7020 0.6920SFR 1.4621 1.4674 1.4695 1.4964 1.5155 1.5411 1.5476 1.5400 1.5474 1.5485 1.5590 1.5544 1.5212NKR 7.3328 7.5439 7.8450 7.8317 7.8715 8.1619 8.2893 8.2558 8.1952 8.2274 8.1969 8.2421 8.0033USD 1.0622 1.0773 1.0807 1.0848 1.1582 1.1663 1.1372 1.1139 1.1222 1.1692 1.1702 1.2286 1.1312YEN 126.12 128.60 128.16 130.12 135.83 138.05 134.99 132.38 128.94 128.12 127.84 132.43 130.97CAD 1.6364 1.6299 1.5943 1.5851 1.6016 1.5798 1.5694 1.5570 1.5330 1.5489 1.5361 1.6131 1.5817AUD 1.8218 1.8112 1.7950 1.7813 1.7866 1.7552 1.7184 1.7114 1.6967 1.6867 1.6337 1.6626 1.7379
Fixed Euro RatesBEF 40.3399DM 1.95583DR 340.750PTA 166.386FF 6.55957IRL 0.787564LIT 1936.27HFL 2.20371OS 13.7603ESC 200.482FMK 5.94573
71
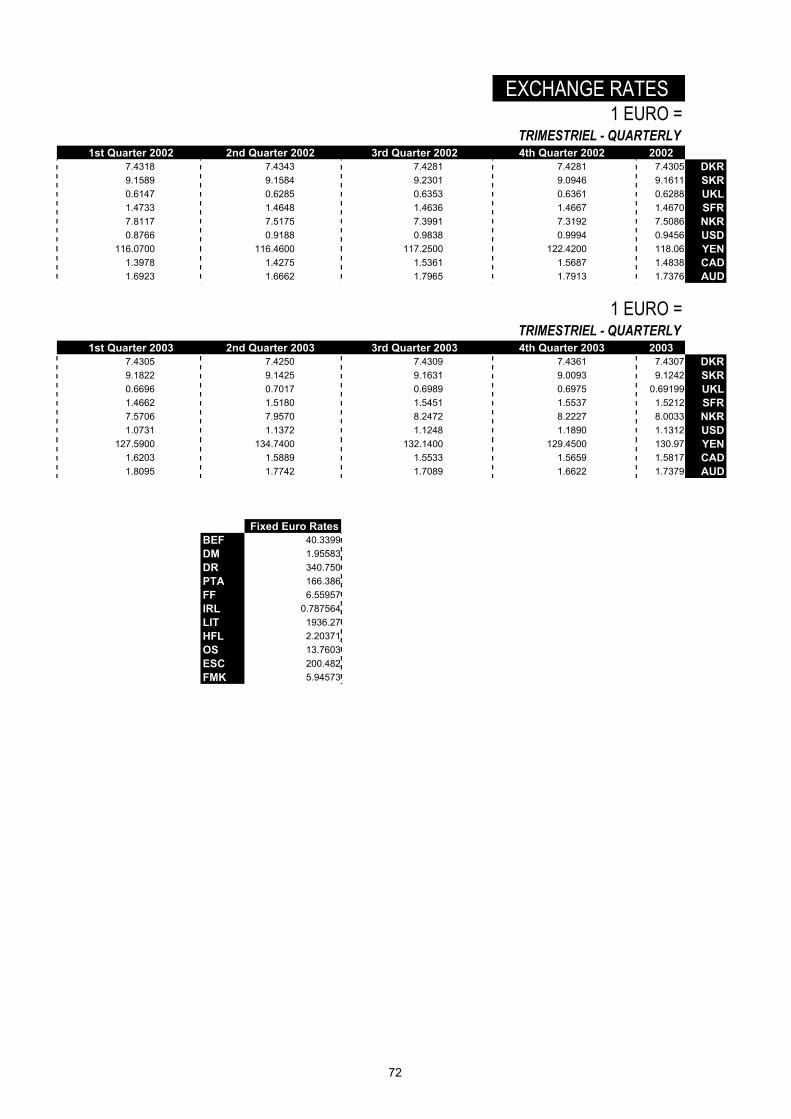
EXCHANGE RATES1 EURO =
TRIMESTRIEL - QUARTERLY1st Quarter 2002 2nd Quarter 2002 3rd Quarter 2002 4th Quarter 2002 2002
7.4318 7.4343 7.4281 7.4281 7.4305 DKR9.1589 9.1584 9.2301 9.0946 9.1611 SKR0.6147 0.6285 0.6353 0.6361 0.6288 UKL1.4733 1.4648 1.4636 1.4667 1.4670 SFR7.8117 7.5175 7.3991 7.3192 7.5086 NKR0.8766 0.9188 0.9838 0.9994 0.9456 USD
116.0700 116.4600 117.2500 122.4200 118.06 YEN1.3978 1.4275 1.5361 1.5687 1.4838 CAD1.6923 1.6662 1.7965 1.7913 1.7376 AUD
1 EURO =TRIMESTRIEL - QUARTERLY
1st Quarter 2003 2nd Quarter 2003 3rd Quarter 2003 4th Quarter 2003 20037.4305 7.4250 7.4309 7.4361 7.4307 DKR9.1822 9.1425 9.1631 9.0093 9.1242 SKR0.6696 0.7017 0.6989 0.6975 0.69199 UKL1.4662 1.5180 1.5451 1.5537 1.5212 SFR7.5706 7.9570 8.2472 8.2227 8.0033 NKR1.0731 1.1372 1.1248 1.1890 1.1312 USD
127.5900 134.7400 132.1400 129.4500 130.97 YEN1.6203 1.5889 1.5533 1.5659 1.5817 CAD1.8095 1.7742 1.7089 1.6622 1.7379 AUD
Fixed Euro RatesBEF 40.3399DM 1.95583DR 340.750PTA 166.386FF 6.55957IRL 0.787564LIT 1936.27HFL 2.20371OS 13.7603ESC 200.482FMK 5.94573
72
74
4. Consumer price indices
Consumer price indices in national currencyThe consumer price indices in the national currency of each country measure changes inthe purchasing power of one unit of national currency spent in the country concerned.Two composite indices are calculated, covering all the Member States of the Community(EU-15) and the Member States with currencies participating in monetary union (EURO).These indices are calculated as weighted arithmetic means (chain indices) of thenational indices, the weight for each Member State being its relative share in the finalconsumption of households of the group of countries in question (EU-15 or EURO),expressed in purchasing power standards, at current prices and purchasing powerparities.
Purchasing power of the ECU/EURO (PPs)These harmonised inflation figures are used for the assessment of inflation convergence.They are not intended to replace existing national Consumer Price Indices (CPIs) whichmay still be published according to national need and definitions.PPs are designed for international comparisons of consumer price inflation. They wereused in particular by the European Commission and European Monetary Institute in theirEMU convergence reports under Article 109j of the Treaty on European Union.The Monetary Union Index of Consumer Prices (MUICP) is a key instrument formonitoring price stability in the euro-zone. The MUICP is based on the PPs of thecountries participating in Stage III of Economic and Monetary Union (EMU). The MUICPis calculated as a weighted average of PPs of the members of the euro-zone. Countryweights are computed every year reflecting the country's share of private final domesticconsumption expenditure in the euro-zone.
75
4. Indices de prix à la consommation
Indices de prix à la consommation exprimés en monnaie nationalePour chaque pays, les indices des prix à la consommation calculés sur la base dedonnées en monnaie nationale mesurent la variation de pouvoir d’achat d’une unité demonnaie nationale dépensée dans le pays considéré. Deux indices synthétiques sontcalculés couvrant respectivement l’ensemble des États membres de la Communauté(EU-15) et les États membres dont les monnaies participent dans l'union monétaire(EURO). Ces indices sont calculés comme moyennes arithmétiques des indicesnationaux, pondérées (indices-chaînes) par la part de chaque État membre dans laconsommation finale des ménages de l’ensemble considéré (EU-15 ou EURO). Pour cescalculs, les données de consommation finale des ménages sont exprimées en standardsde pouvoir d’achat, aux prix et parités de pouvoir d’achat courants.
Pouvoir d'achat de l'ECU/EURO (PA)Ces chiffres harmonisés sont utilisés pour évaluer la convergence entre les tauxd'inflation. Ils ne sont pas destinés à remplacer les indices nationaux des prix à laconsommation (IPC) qui pourront toujours être calculés et publiés sur la base desdéfinitions et besoins spécifiques de chaque État membre.Le PA doit permettre les comparaisons internationales de l'évolution des prix à laconsommation. Il a été utilisé en particulier à la Commission européenne et à l'Institutmonétaire européen (IME) pour établir son rapport sur la convergence dans le cadre dela réalisation de l'UEM conformément à l'article 109 J du traité sur l'Union européenne.L'indice des prix à la consommation de l'Union monétaire (IPCUM) est le principalinstrument de suivi de l'évolution des prix dans la zone euro. L'IPCUM est basé sur le PAdes pays participant à la phase III de l'union économique et monétaire (UEM). L'IPCUMest une moyenne pondérée du PA des États membres. La pondération de chaque paysest proportionnelle à la part de sa consommation privée intérieure finale dans le total dela zone euro.
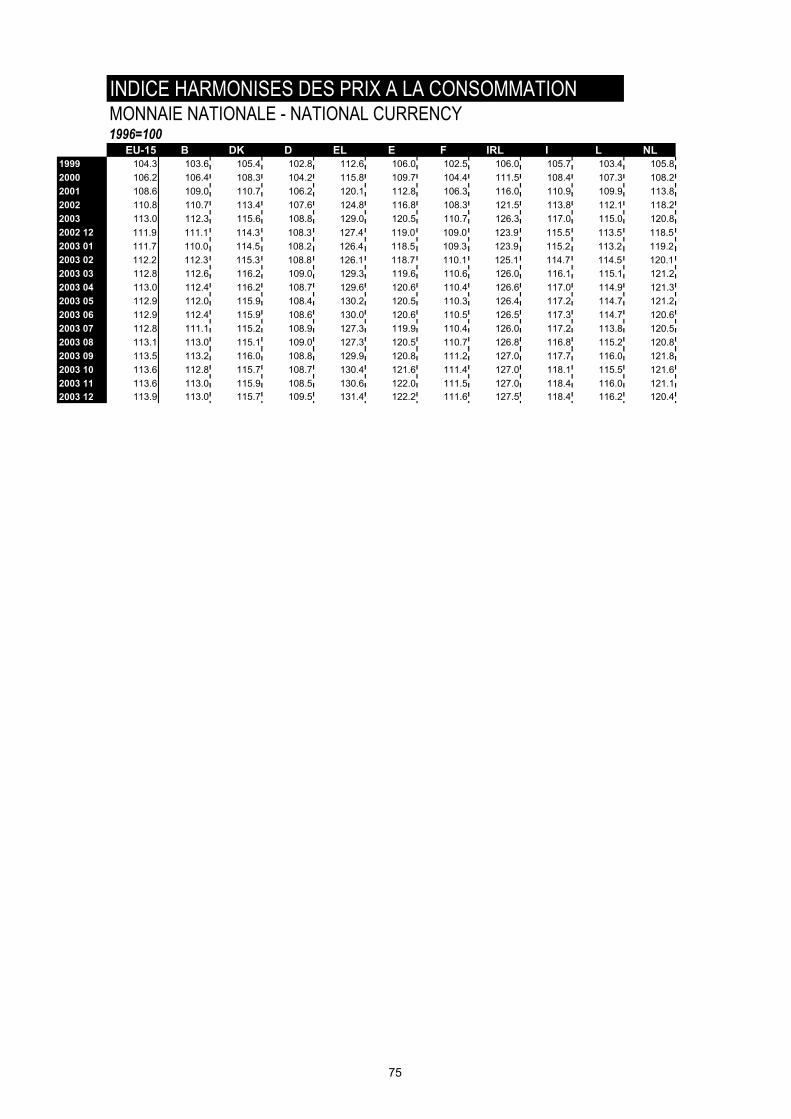
INDICE HARMONISES DES PRIX A LA CONSOMMATIONMONNAIE NATIONALE - NATIONAL CURRENCY1996=100
EU-15 B DK D EL E F IRL I L NL1999 104.3 103.6 105.4 102.8 112.6 106.0 102.5 106.0 105.7 103.4 105.8 2000 106.2 106.4 108.3 104.2 115.8 109.7 104.4 111.5 108.4 107.3 108.2 2001 108.6 109.0 110.7 106.2 120.1 112.8 106.3 116.0 110.9 109.9 113.8 2002 110.8 110.7 113.4 107.6 124.8 116.8 108.3 121.5 113.8 112.1 118.2 2003 113.0 112.3 115.6 108.8 129.0 120.5 110.7 126.3 117.0 115.0 120.8 2002 12 111.9 111.1 114.3 108.3 127.4 119.0 109.0 123.9 115.5 113.5 118.52003 01 111.7 110.0 114.5 108.2 126.4 118.5 109.3 123.9 115.2 113.2 119.22003 02 112.2 112.3 115.3 108.8 126.1 118.7 110.1 125.1 114.7 114.5 120.12003 03 112.8 112.6 116.2 109.0 129.3 119.6 110.6 126.0 116.1 115.1 121.2 2003 04 113.0 112.4 116.2 108.7 129.6 120.6 110.4 126.6 117.0 114.9 121.3 2003 05 112.9 112.0 115.9 108.4 130.2 120.5 110.3 126.4 117.2 114.7 121.2 2003 06 112.9 112.4 115.9 108.6 130.0 120.6 110.5 126.5 117.3 114.7 120.6 2003 07 112.8 111.1 115.2 108.9 127.3 119.9 110.4 126.0 117.2 113.8 120.5 2003 08 113.1 113.0 115.1 109.0 127.3 120.5 110.7 126.8 116.8 115.2 120.8 2003 09 113.5 113.2 116.0 108.8 129.9 120.8 111.2 127.0 117.7 116.0 121.8 2003 10 113.6 112.8 115.7 108.7 130.4 121.6 111.4 127.0 118.1 115.5 121.6 2003 11 113.6 113.0 115.9 108.5 130.6 122.0 111.5 127.0 118.4 116.0 121.1 2003 12 113.9 113.0 115.7 109.5 131.4 122.2 111.6 127.5 118.4 116.2 120.4
75
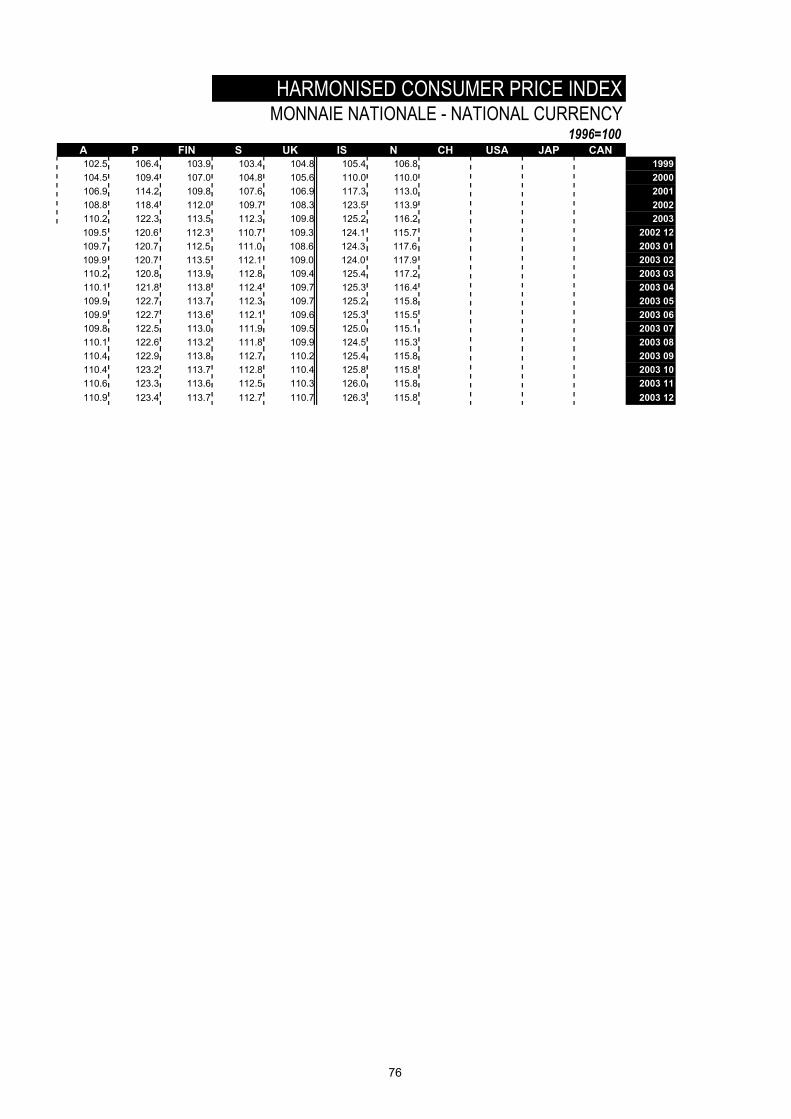
HARMONISED CONSUMER PRICE INDEXMONNAIE NATIONALE - NATIONAL CURRENCY
1996=100A P FIN S UK IS N CH USA JAP CAN
102.5 106.4 103.9 103.4 104.8 105.4 106.8 1999 104.5 109.4 107.0 104.8 105.6 110.0 110.0 2000 106.9 114.2 109.8 107.6 106.9 117.3 113.0 2001 108.8 118.4 112.0 109.7 108.3 123.5 113.9 2002 110.2 122.3 113.5 112.3 109.8 125.2 116.2 2003
109.5 120.6 112.3 110.7 109.3 124.1 115.7 2002 12109.7 120.7 112.5 111.0 108.6 124.3 117.6 2003 01109.9 120.7 113.5 112.1 109.0 124.0 117.9 2003 02
110.2 120.8 113.9 112.8 109.4 125.4 117.2 2003 03 110.1 121.8 113.8 112.4 109.7 125.3 116.4 2003 04 109.9 122.7 113.7 112.3 109.7 125.2 115.8 2003 05 109.9 122.7 113.6 112.1 109.6 125.3 115.5 2003 06 109.8 122.5 113.0 111.9 109.5 125.0 115.1 2003 07 110.1 122.6 113.2 111.8 109.9 124.5 115.3 2003 08 110.4 122.9 113.8 112.7 110.2 125.4 115.8 2003 09 110.4 123.2 113.7 112.8 110.4 125.8 115.8 2003 10 110.6 123.3 113.6 112.5 110.3 126.0 115.8 2003 11 110.9 123.4 113.7 112.7 110.7 126.3 115.8 2003 12
76
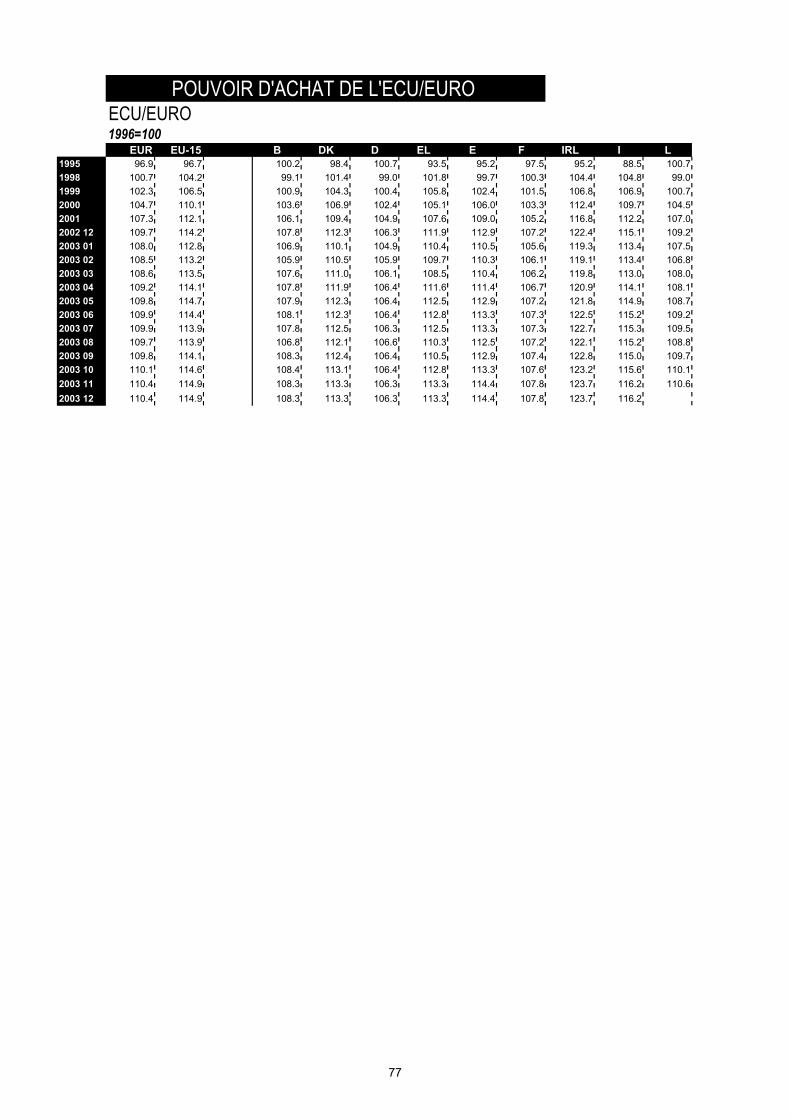
POUVOIR D'ACHAT DE L'ECU/EURO ECU/EURO1996=100
EUR EU-15 B DK D EL E F IRL I L1995 96.9 96.7 100.2 98.4 100.7 93.5 95.2 97.5 95.2 88.5 100.7 1998 100.7 104.2 99.1 101.4 99.0 101.8 99.7 100.3 104.4 104.8 99.0 1999 102.3 106.5 100.9 104.3 100.4 105.8 102.4 101.5 106.8 106.9 100.7 2000 104.7 110.1 103.6 106.9 102.4 105.1 106.0 103.3 112.4 109.7 104.5 2001 107.3 112.1 106.1 109.4 104.9 107.6 109.0 105.2 116.8 112.2 107.0 2002 12 109.7 114.2 107.8 112.3 106.3 111.9 112.9 107.2 122.4 115.1 109.2 2003 01 108.0 112.8 106.9 110.1 104.9 110.4 110.5 105.6 119.3 113.4 107.5 2003 02 108.5 113.2 105.9 110.5 105.9 109.7 110.3 106.1 119.1 113.4 106.8 2003 03 108.6 113.5 107.6 111.0 106.1 108.5 110.4 106.2 119.8 113.0 108.0 2003 04 109.2 114.1 107.8 111.9 106.4 111.6 111.4 106.7 120.9 114.1 108.1 2003 05 109.8 114.7 107.9 112.3 106.4 112.5 112.9 107.2 121.8 114.9 108.7 2003 06 109.9 114.4 108.1 112.3 106.4 112.8 113.3 107.3 122.5 115.2 109.2 2003 07 109.9 113.9 107.8 112.5 106.3 112.5 113.3 107.3 122.7 115.3 109.5 2003 08 109.7 113.9 106.8 112.1 106.6 110.3 112.5 107.2 122.1 115.2 108.8 2003 09 109.8 114.1 108.3 112.4 106.4 110.5 112.9 107.4 122.8 115.0 109.7 2003 10 110.1 114.6 108.4 113.1 106.4 112.8 113.3 107.6 123.2 115.6 110.1 2003 11 110.4 114.9 108.3 113.3 106.3 113.3 114.4 107.8 123.7 116.2 110.6 2003 12 110.4 114.9 108.3 113.3 106.3 113.3 114.4 107.8 123.7 116.2
77
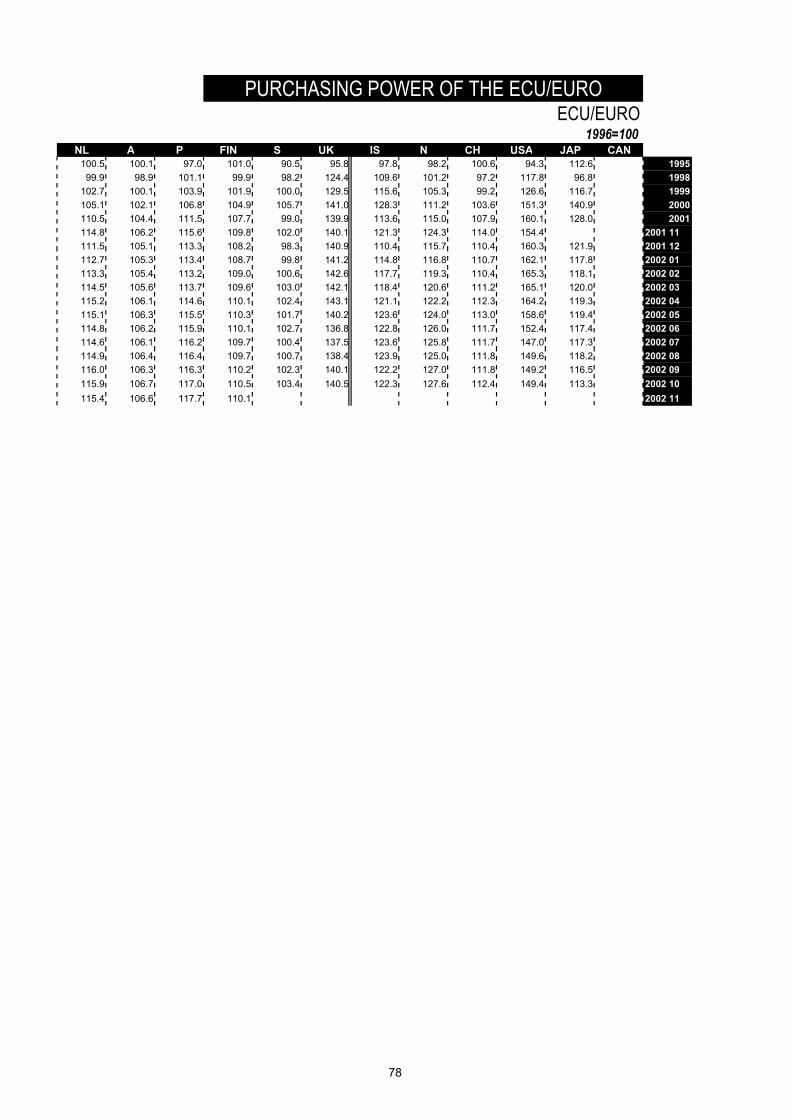
PURCHASING POWER OF THE ECU/EUROECU/EURO
1996=100NL A P FIN S UK IS N CH USA JAP CAN
100.5 100.1 97.0 101.0 90.5 95.8 97.8 98.2 100.6 94.3 112.6 1995 99.9 98.9 101.1 99.9 98.2 124.4 109.6 101.2 97.2 117.8 96.8 1998 102.7 100.1 103.9 101.9 100.0 129.5 115.6 105.3 99.2 126.6 116.7 1999 105.1 102.1 106.8 104.9 105.7 141.0 128.3 111.2 103.6 151.3 140.9 2000 110.5 104.4 111.5 107.7 99.0 139.9 113.6 115.0 107.9 160.1 128.0 2001 114.8 106.2 115.6 109.8 102.0 140.1 121.3 124.3 114.0 154.4 2001 11 111.5 105.1 113.3 108.2 98.3 140.9 110.4 115.7 110.4 160.3 121.9 2001 12 112.7 105.3 113.4 108.7 99.8 141.2 114.8 116.8 110.7 162.1 117.8 2002 01 113.3 105.4 113.2 109.0 100.6 142.6 117.7 119.3 110.4 165.3 118.1 2002 02 114.5 105.6 113.7 109.6 103.0 142.1 118.4 120.6 111.2 165.1 120.0 2002 03 115.2 106.1 114.6 110.1 102.4 143.1 121.1 122.2 112.3 164.2 119.3 2002 04 115.1 106.3 115.5 110.3 101.7 140.2 123.6 124.0 113.0 158.6 119.4 2002 05 114.8 106.2 115.9 110.1 102.7 136.8 122.8 126.0 111.7 152.4 117.4 2002 06 114.6 106.1 116.2 109.7 100.4 137.5 123.6 125.8 111.7 147.0 117.3 2002 07 114.9 106.4 116.4 109.7 100.7 138.4 123.9 125.0 111.8 149.6 118.2 2002 08 116.0 106.3 116.3 110.2 102.3 140.1 122.2 127.0 111.8 149.2 116.5 2002 09 115.9 106.7 117.0 110.5 103.4 140.5 122.3 127.6 112.4 149.4 113.3 2002 10 115.4 106.6 117.7 110.1 2002 11
78