Embed Size (px)
Citation preview
Office of the New York City Comptroller
Scott M. Stringer Bureau of Fiscal and Budget Studies
www.comptroller.nyc.gov (212) 669-2507
The State of the City’s Economy and Finances December 15, 2014
SCOTT M. STRINGER Comptroller
Deputy Comptroller for Budget Tim Mulligan
Assistant Director for Budget Suri Grussgott
Bureau Chief Eng-Kai Tan
Chief Economist Frank Braconi
Project Coordinator Principal Economist Manny Kwan Farid Heydarpour Staff Kettly Bastien Robyn Liverpool Amitabha Basu Irina Livshits Rosa Charles Andrew McWilliam Stephen Corson Marcia Murphy Peter E. Flynn Jane Pyon Michele Griffin Andrew Rosenthal Michael Hecht Orlando Vasquez Dahong Huang

TABLE OF CONTENTS
I. EXECUTIVE SUMMARY ...................................................................................................... iii
II. STATE OF THE CITY’S ECONOMY ...........................................................................4
A. NEW YORK CITY’S ECONOMIC PERFORMANCE IN 2014 ........................................... 4
B. ECONOMIC OUTLOOK ...................................................................................................... 8
III. THE CITY’S FISCAL OUTLOOK ............................................................................. 14 Risks and Offsets ................................................................................................................... 17
IV. REVENUE ASSUMPTIONS ....................................................................................... 19 Tax Revenues ........................................................................................................................ 19 Miscellaneous Revenues ....................................................................................................... 23 Federal and State Aid ........................................................................................................... 24
V. EXPENDITURE ANALYSIS ........................................................................................ 27 Labor .................................................................................................................................... 28 Pensions ................................................................................................................................ 31 Headcount ............................................................................................................................. 32 Overtime ............................................................................................................................... 34 Health Insurance .................................................................................................................. 35 Public Assistance .................................................................................................................. 37 Department of Education ...................................................................................................... 37 Debt Service .......................................................................................................................... 38 Capital Plan .......................................................................................................................... 42
VI. APPENDIX – REVENUE AND EXPENDITURE DETAILS .......................... 45
GLOSSARY OF ACRONYMS .............................................................................................. 49

LIST OF TABLES TABLE 1. FY 2015–FY 2018 NOVEMBER 2014 FINANCIAL PLAN.............................................................................. 1 TABLE 2. PLAN-TO-PLAN CHANGES NOVEMBER 2014 PLAN VS. JUNE 2014 PLAN .................................................... 2 TABLE 3. RISKS AND OFFSETS TO THE NOVEMBER 2014 FINANCIAL PLAN ............................................................... 3 TABLE 4. SELECTED NYC AND THE U.S. ECONOMIC INDICATORS, ANNUAL AVERAGES, COMPTROLLER
AND MAYOR’S FORECASTS, 2014-2018 .................................................................................................... 12 TABLE 5. CHANGES TO THE JULY PLAN CITY-FUNDS ESTIMATES ........................................................................... 14 TABLE 6. RISKS AND OFFSETS TO THE FY 2015 ADOPTED BUDGET AND THE FYS 2015-2018 FINANCIAL PLAN .... 17 TABLE 7. REVISIONS TO THE CITY’S TAX REVENUE ASSUMPTIONS NOVEMBER 2014 VS. JUNE 2014 ..................... 20 TABLE 8. CITY’S TAX REVENUE FORECAST, GROWTH RATE, FYS 2015 – 2018...................................................... 21 TABLE 9. RISKS AND OFFSETS TO THE CITY’S TAX REVENUE PROJECTIONS ............................................................ 22 TABLE 10. CHANGES IN FY 2015 ESTIMATES NOVEMBER 2014 VS. JUNE 2014 ......................................................... 23 TABLE 11. FY 2015 – FY 2018 EXPENDITURE GROWTH ADJUSTED FOR PREPAYMENTS ........................................... 27 TABLE 12. FY 2014 – FY 2018 CITY PENSION EXPENDIURES .................................................................................... 31 TABLE 13. CHANGES TO FYS 2015 – 2018 CITY-FUNDED FULL-TIME HEADCOUNT NOVEMBER 2014 FINANCIAL
PLAN VS. JUNE 2014 ADOPTED FINANCIAL PLAN ..................................................................................... 33 TABLE 14. CITY-FUNDED FULL-TIME YEAR-END HEADCOUNT PROJECTIONS FYS 2015-2018 ................................. 34 TABLE 15. PROJECTED OVERTIME SPENDING, FY 2015 ............................................................................................. 35 TABLE 16. CITY’S HEALTH INSURANCE EXPENDITURES ............................................................................................ 36 TABLE 17. NOVEMBER 2014 FINANCIAL PLAN DEBT SERVICE ESTIMATES ............................................................... 39 TABLE 18. FY 2014 NOVEMBER PLAN, FYS 2015-2018 ............................................................................................ 42 TABLE 19. FYS 2015 – 2018 FOUR-YEAR CAPITAL COMMITMENTS, ALL-FUNDS ..................................................... 43 TABLE 20. FYS 2015 – 2018 FOUR-YEAR CAPITAL COMMITMENTS, CITY-FUNDS .................................................... 44
TABLE A1. NOVEMBER 2014 FINANCIAL PLAN REVENUE DETAIL ............................................................................. 45 TABLE A2. NOVEMBER 2014 FINANCIAL PLAN EXPENDITURE DETAIL ...................................................................... 47
LIST OF CHARTS CHART 1. ANNUALIZED CHANGE IN NYC AND U.S. PAYROLL JOBS, FIRST 10 MONTHS OF 2014 ................................ 5 CHART 2. AVERAGE ANNUAL WAGE GROWTH BY INDUSTRY, NYC AND U.S., 2010-2013 ......................................... 7 CHART 3. NEW YORK CITY’S EMPLOYMENT SHARE IN MAJOR EXPORT INDUSTRIES, 3Q2010 VS. 3Q2014 ................ 8 CHART 4. EMPLOYEE COMPENSATION AS A SHARE OF GDP, 1929-2013 .................................................................... 10 CHART 5. DEBT SERVICE AS A PERCENT OF TAX REVENUES, FYS 1992 – 2018 ......................................................... 41 CHART 6. DEBT SERVICE AS PERCENT OF CITY-FUNDED EXPENDITURES ................................................................... 41
ii
I. Executive Summary
The City’s fiscal position is strong. The current Financial Plan benefits from low outyear budget gaps, thanks to stronger revenue projections in the November 2014 Financial Plan. Until there is a significant downturn in the growth of revenues, the City is on a stable budget path and should achieve balance through FY 2018 with relative ease. The Comptroller’s Office’s projections of higher than anticipated revenues over the duration of the Plan period offsets the identified budget risks and further bolsters the outlook.
Economy
The growth to New York City’s economy in FY 2014 helped the City’s financial position. The rate of growth in the City’s economy outpaced the national rate over the first three quarters of the year. New York City’s real gross city product (GCP) grew at an average annualized rate of three percent over the first three quarters of the year, almost one percentage point more than the U.S. during the same period.
The city’s strong job creation over the last several years continued in 2014 with gains in private sector jobs of 24,100 in the first quarter, 38,400 in the second quarter, and 21,500 in the third quarter (seasonally adjusted). Despite strong job growth, wage gains have remained tepid as growth skewed towards relative low wage industries. Another contributing factor to slow wage growth is that, with a few exceptions overall, wage growth for existing jobs has been sluggish. Strong personal income tax withholding growth in the third quarter of 2014 and a sharp increase in measured private-sector wages in October provide some hope that growth in New York City wages is starting to pick up.
Assessment of the November Financial Plan
The FY 2015 Budget totals $76.94 billion after a $1.9 billion increase in all-funds made in the November Modification. Federal aid accounts for more than three quarters of the increase. Tax revenues in FY 2015 are $766 million higher, mainly as a result of revisions to property tax, personal income tax (PIT), and tax audit revenue estimates. The additional tax revenues are largely offset by a reduction in non-tax revenues due to stretching out the taxi medallion sales, with some of the revenues that were anticipated in FYs 2015 through 2017, now shifted to FY 2018 and beyond.
FY 2015 City-funds expenditures in the November Modification are $179 million more than the Adopted Budget. This leaves the City with available resources of $105 million to prepay FY 2016 debt service. The expenditure increase stems primarily from higher agency spending, offset by $95 million in debt service savings. The November Modification and Financial Plan includes health insurance savings of $55 million in FY 2015, growing to $454 million in FY 2018, from lower than expected premium rate increases. The City is allocating these savings to the healthcare reform savings targets negotiated in the labor settlement. Since those savings were already embedded in the Financial Plan, no new savings are recognized in this Plan.
Since budget adoption, higher outyear City-funds revenue projections along with lower City-funds expenditure estimates reduced the outyear budget gaps by a combined $2.8 billion to
iii
gaps of $1.84 billion, $1.19 billion, and $1.77 billion in FYs 2016 through 2018, respectively. The Comptroller’s Office’s review of the November Plan finds that the outyear gaps could be even lower than projected in the Plan.
The Comptroller’s Office projects tax revenues to be higher than in the November Plan by $522 million in FY 2015, $668 million in FY 2016, $966 million in FY 2017, and $1.29 billion in FY 2018. Partially offsetting the higher tax revenue forecasts is this report’s identification of higher City-funds expenditures — risks of $462 million in FY 2015, $307 million in FY 2016, $299 million in FY 2017 and $296 million in FY 2018. The higher expenditures come primarily from the recent labor agreements with the Council of School Supervisors and Administrators (CSA) as well as the Uniformed Superior Officers Coalition (USOC), which were announced after the City released its November Plan. Part of the labor cost of these agreements is above the pay pattern already budgeted — established by the initial agreements earlier this year. In addition, this report’s labor expenditure risk includes the cost of applying the pattern of the USOC agreement to all remaining unsettled uniformed groups, which include all rank-and-file members who do not yet have a settled contract. The Comptroller’ Office estimates the additional labor costs for uniformed workers to total approximately $600 million in FYs 2015 through 2018. The other risks identified in this report include the assumption of higher overtime spending and lower Federal Medicaid reimbursements for special education services in the Department of Education which will result in an increase to City-fund expenditures.
Overall, this report identifies net additional resources of $70 million in FY 2015, growing to $991 million in FY 2018. After accounting for the Comptroller’s Office’s budget risks and offsets, the Comptroller’s Office’s restated budget gaps are $1.46 billion in FY 2016, $516 million in FY 2017 and $780 million in FY 2018. This report estimates a modest budget surplus of $70 million in FY 2015 (which, if added to the Budget Stabilization Account, would increase it to $175 million and reduce the FY 2016 restated gap to $1.39 billion).
Last Year’s Actual Expenditures as Shown in the CAFR
The FY 2014 Comprehensive Annual Financial Report (CAFR) shows how the City’s budget closed last year. To get a clear picture of the City’s position at the close of the fiscal year, it is essential to examine which resources the City rolled forward to future years and which prior-year resources the City utilized in FY 2014. Adjusting for those resources yields the operating surplus or deficit of the City. When looking at spending actions and netting out the reductions from changes to prior-year receivables and payables, FY 2014 shows an operating deficit of $632 million. In essence, the City’s FY 2014 expenses were higher than the revenues it generated in FY 2014 despite realizing $3.5 billion in higher than anticipated revenues. FY 2014 had an operating deficit $34 million higher than in FY 2013 and is the sixth straight year, since the Great Recession that the City ended its fiscal year with an operating deficit.
Hopefully, the City will reverse that pattern and add to its vital fiscal cushion in FY 2015. Since we do not know when the next financial downturn will occur, the Administration’s November announcement that it will seek agency efficiencies will be an essential tool for the City to build up resources for the future. More details on those cost savings actions are expected in the Mayor’s FY 2016 Preliminary Budget.
iv
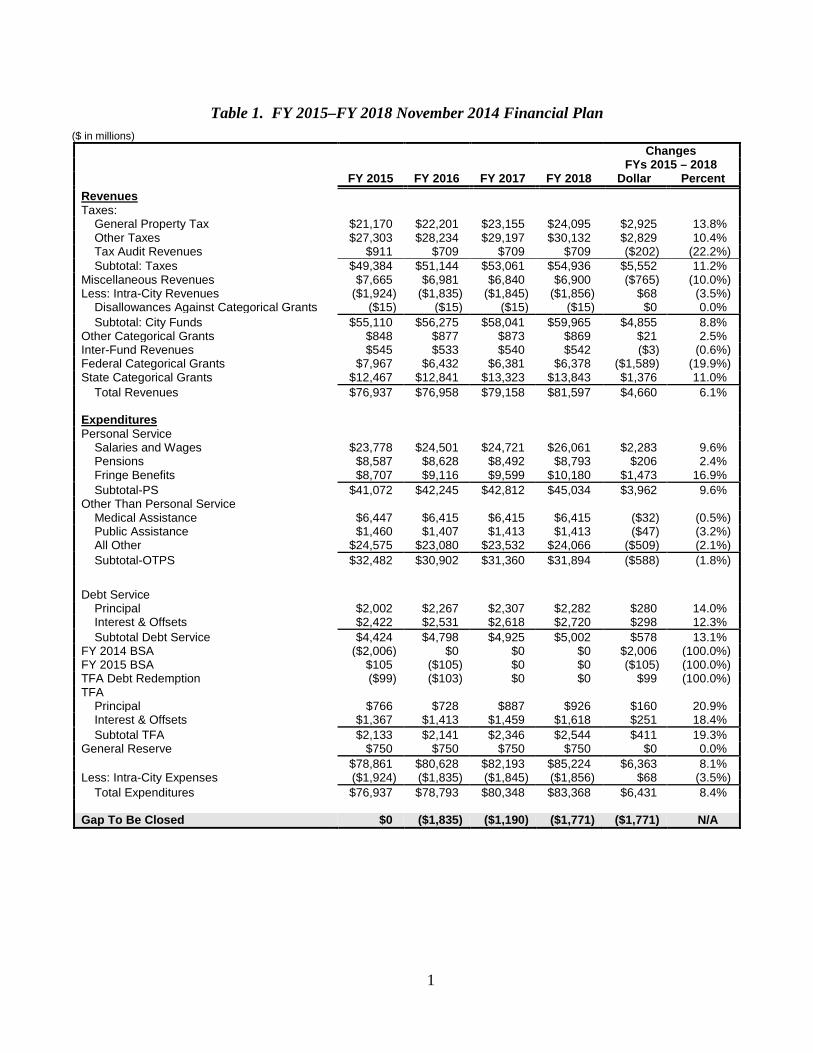
Table 1. FY 2015–FY 2018 November 2014 Financial Plan ($ in millions)
Changes FYs 2015 – 2018 FY 2015 FY 2016 FY 2017 FY 2018 Dollar Percent Revenues Taxes:
General Property Tax $21,170 $22,201 $23,155 $24,095 $2,925 13.8% Other Taxes $27,303 $28,234 $29,197 $30,132 $2,829 10.4% Tax Audit Revenues $911 $709 $709 $709 ($202) (22.2%) Subtotal: Taxes $49,384 $51,144 $53,061 $54,936 $5,552 11.2%
Miscellaneous Revenues $7,665 $6,981 $6,840 $6,900 ($765) (10.0%) Less: Intra-City Revenues ($1,924) ($1,835) ($1,845) ($1,856) $68 (3.5%)
Disallowances Against Categorical Grants ($15) ($15) ($15) ($15) $0 0.0% Subtotal: City Funds $55,110 $56,275 $58,041 $59,965 $4,855 8.8%
Other Categorical Grants $848 $877 $873 $869 $21 2.5% Inter-Fund Revenues $545 $533 $540 $542 ($3) (0.6%) Federal Categorical Grants $7,967 $6,432 $6,381 $6,378 ($1,589) (19.9%) State Categorical Grants $12,467 $12,841 $13,323 $13,843 $1,376 11.0%
Total Revenues $76,937 $76,958 $79,158 $81,597 $4,660 6.1% Expenditures Personal Service
Salaries and Wages $23,778 $24,501 $24,721 $26,061 $2,283 9.6% Pensions $8,587 $8,628 $8,492 $8,793 $206 2.4% Fringe Benefits $8,707 $9,116 $9,599 $10,180 $1,473 16.9% Subtotal-PS $41,072 $42,245 $42,812 $45,034 $3,962 9.6%
Other Than Personal Service Medical Assistance $6,447 $6,415 $6,415 $6,415 ($32) (0.5%) Public Assistance $1,460 $1,407 $1,413 $1,413 ($47) (3.2%) All Other $24,575 $23,080 $23,532 $24,066 ($509) (2.1%) Subtotal-OTPS $32,482 $30,902 $31,360 $31,894 ($588) (1.8%)
Debt Service
Principal $2,002 $2,267 $2,307 $2,282 $280 14.0% Interest & Offsets $2,422 $2,531 $2,618 $2,720 $298 12.3% Subtotal Debt Service $4,424 $4,798 $4,925 $5,002 $578 13.1%
FY 2014 BSA ($2,006) $0 $0 $0 $2,006 (100.0%) FY 2015 BSA $105 ($105) $0 $0 ($105) (100.0%) TFA Debt Redemption ($99) ($103) $0 $0 $99 (100.0%) TFA
Principal $766 $728 $887 $926 $160 20.9% Interest & Offsets $1,367 $1,413 $1,459 $1,618 $251 18.4% Subtotal TFA $2,133 $2,141 $2,346 $2,544 $411 19.3%
General Reserve $750 $750 $750 $750 $0 0.0% $78,861 $80,628 $82,193 $85,224 $6,363 8.1% Less: Intra-City Expenses ($1,924) ($1,835) ($1,845) ($1,856) $68 (3.5%)
Total Expenditures $76,937 $78,793 $80,348 $83,368 $6,431 8.4% Gap To Be Closed $0 ($1,835) ($1,190) ($1,771) ($1,771) N/A
1
Table 2. Plan-to-Plan Changes November 2014 Plan vs. June 2014 Plan
($ in millions) FY 2015 FY 2016 FY 2017 FY 2018 Revenues Taxes:
General Property Tax $189 $115 $120 $125 Other Taxes $375 $137 $142 $148 Tax Audit Revenues $202 $0 $0 $0 Subtotal: Taxes $766 $252 $262 $273
Miscellaneous Revenues ($355) ($15) ($148) $276 Less: Intra-City Revenues ($127) ($13) ($20) ($26)
Disallowances Against Categorical Grants $0 $0 $0 $0 Subtotal: City Funds $284 $224 $94 $523
Other Categorical Grants $39 $1 $1 $2 Inter-Fund Revenues $12 $14 $22 $24 Federal Categorical Grants $1,509 $103 $75 $85 State Categorical Grants $66 $21 $29 $30
Total Revenues $1,910 $363 $221 $664 Expenditures Personal Service
Salaries and Wages $31 ($167) ($254) ($327) Pensions ($8) ($205) ($408) ($615) Fringe Benefits $37 $77 $139 $208 Subtotal-PS $60 ($295) ($523) ($734)
Other Than Personal Service Medical Assistance $0 $0 $0 $0 Public Assistance $32 $0 $0 $0 All Other $1,935 $392 $394 $395 Subtotal-OTPS $1,967 $392 $394 $395
Debt Service Principal ($145) ($98) $1 $0 Interest & Offsets $99 ($14) ($11) $0 Subtotal Debt Service ($46) ($112) ($10) $0
FY 2014 BSA ($23) $0 $0 $0 FY 2015 BSA $105 ($105) $0 $0 TFA Debt Defeasance $0 $0 $0 $0 TFA Debt Service
Principal $1 ($187) ($164) ($157) Interest & Offsets ($27) ($107) ($137) ($136) Subtotal TFA ($26) ($294) ($301) ($293)
General Reserve $0 $0 $0 $0 $2,037 ($414) ($440) ($632) Less: Intra-City Expenses ($127) ($13) ($20) ($26)
Total Expenditures $1,910 ($427) ($460) ($658) Change To The Gap To Be Closed $0 $790 $681 $1,322
2
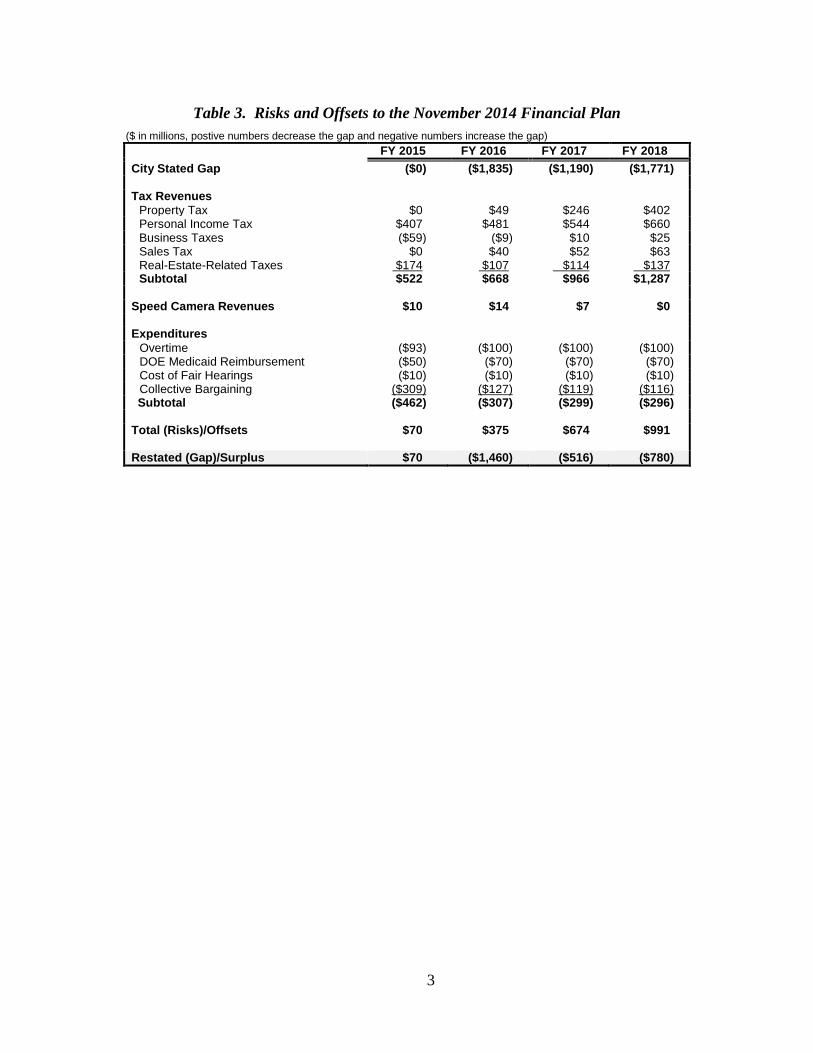
Table 3. Risks and Offsets to the November 2014 Financial Plan ($ in millions, postive numbers decrease the gap and negative numbers increase the gap)
FY 2015 FY 2016 FY 2017 FY 2018 City Stated Gap ($0) ($1,835) ($1,190) ($1,771) Tax Revenues
Property Tax $0 $49 $246 $402 Personal Income Tax $407 $481 $544 $660 Business Taxes ($59) ($9) $10 $25 Sales Tax $0 $40 $52 $63 Real-Estate-Related Taxes $174 $107 $114 $137 Subtotal $522 $668 $966 $1,287
Speed Camera Revenues $10 $14 $7 $0 Expenditures
Overtime ($93) ($100) ($100) ($100) DOE Medicaid Reimbursement ($50) ($70) ($70) ($70) Cost of Fair Hearings ($10) ($10) ($10) ($10) Collective Bargaining ($309) ($127) ($119) ($116) Subtotal ($462) ($307) ($299) ($296)
Total (Risks)/Offsets $70 $375 $674 $991 Restated (Gap)/Surplus $70 ($1,460) ($516) ($780)
3
II. State of the City’s Economy
While overall economic growth for calendar year 2014 was only moderate, there was a clear strengthening beginning in the second quarter of the year. After a harsh winter contributed to a first-quarter contraction in GDP, the U.S. economy rebounded with vigor in the second quarter and remained on an even keel for the rest of the year. The 2.3 percent growth expected for the full year will be below par by historical standards, but nevertheless provides some momentum for the coming year. Moderate economic growth should continue into 2015, providing for a further improvement in the jobless rate and perhaps for a long-awaited pick-up in wage growth.
New York City’s economy also continued to grow in 2014, with another year of strong job creation finally translating into a significant decrease in the local unemployment rate. Wage growth, however, has remained tepid as job creation skewed toward low-wage services industries.
A. NEW YORK CITY’S ECONOMIC PERFORMANCE IN 2014
The city’s economic growth rate slightly outpaced the national rate over the first three quarters of 2014 and it is expected to do so in the final quarter as well. The real gross city product (GCP) grew at an average annualized rate of 3.0 percent during the first three quarters of the year, compared to the 2.1 percent average for the U.S. during the same period.
The nation’s economic performance in 2014 was marred by a first-quarter drop in real GDP of 2.1 percent, an unexpected decline generally attributed to unusually harsh winter weather in much of the country. Spring brought a sharp economic rebound, however, with GDP posting annualized growth rates of 4.6 percent and 3.9 percent in the second and third quarters, respectively. The most encouraging aspect of recent economic performance has been the improvement in job creation: 233,000 jobs per month on average during the first ten months of 2014, the fastest pace since 1999. The national unemployment rate has consequently dropped about one percentage point since the year began to 5.8 percent.
New York City’s economy proved more resistant to weather disruptions and grew in every quarter of the year. The strong job creation of the previous several years was sustained. The city gained 24,100 private jobs in the first quarter, 38,400 in the second quarter, and 21,500 in the third quarter (seasonally adjusted). Through October, the city had gained 81,800 private jobs in total. On a year-over-year basis (October-over-October) private jobs were up by 2.5 percent, compared to a 2.3 percent increase for the nation as a whole.
All but two major industries posted job gains on a year-over-year basis. The biggest gainer was health care, which added nearly 23,000 jobs in the year ending October. Once again, home health care services led the way, accounting for almost half of the health care job gain. Over the past 10 years, home health care employment has grown at an annual rate in excess of 9 percent.
Other industries that have added substantially to their employment rolls are retail trade (+12,500), food service (+11,600) and arts and entertainment (+8,700). The two sectors that lost
4
jobs in the year ending October were manufacturing and information. The city has been losing manufacturing jobs for over half a century and the 400 jobs lost in the twelve months ending October did not represent an unusually steep decrease. Job losses in the information sector totaled 3,300 over the same period of time, and reflect the technological and structural changes that continue to disrupt the publishing, broadcasting and telecommunications industries. One bright spot within the information sector is employment in motion pictures and sound recording, employment in which increased by 1,900 in the past year and has grown at a 4.3 percent annual rate over the past decade.
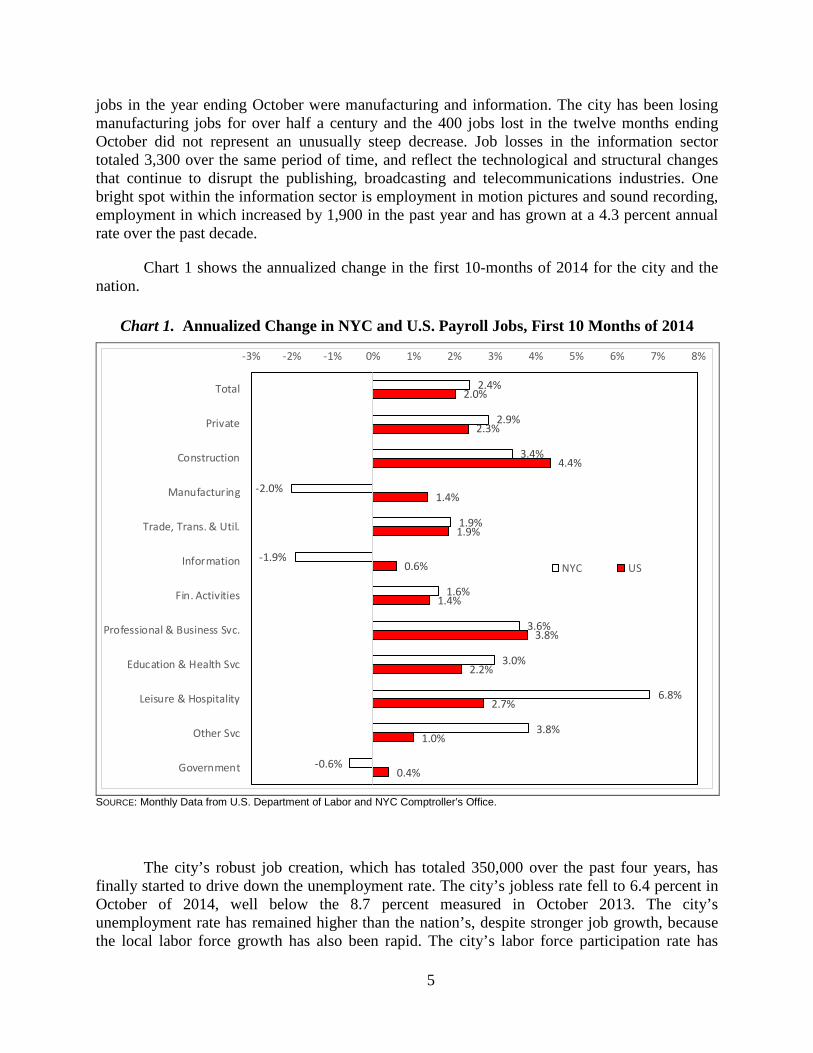
Chart 1 shows the annualized change in the first 10-months of 2014 for the city and the nation.
Chart 1. Annualized Change in NYC and U.S. Payroll Jobs, First 10 Months of 2014
2.4%
2.9%
3.4%
-2.0%
1.9%
-1.9%
1.6%
3.6%
3.0%
6.8%
3.8%
-0.6%
2.0%
2.3%
4.4%
1.4%
1.9%
0.6%
1.4%
3.8%
2.2%
2.7%
1.0%
0.4%
-3% -2% -1% 0% 1% 2% 3% 4% 5% 6% 7% 8%
Total
Private
Construction
Manufacturing
Trade, Trans. & Util.
Information
Fin. Activities
Professional & Business Svc.
Education & Health Svc
Leisure & Hospitality
Other Svc
Government
NYC US
SOURCE: Monthly Data from U.S. Department of Labor and NYC Comptroller’s Office.
The city’s robust job creation, which has totaled 350,000 over the past four years, has finally started to drive down the unemployment rate. The city’s jobless rate fell to 6.4 percent in October of 2014, well below the 8.7 percent measured in October 2013. The city’s unemployment rate has remained higher than the nation’s, despite stronger job growth, because the local labor force growth has also been rapid. The city’s labor force participation rate has
5
remained steady throughout the recession and recovery, while the national rate has plummeted by almost four percentage points.
Although there remain significant disparities in the unemployment rate among demographic groups, the decrease in the city’s overall rate has helped to alleviate joblessness across the board. By the third quarter of 2014, the unemployment rate among Black New Yorkers had dropped to 10.7 percent, compared to 13.5 percent in the same quarter of 2013. Among Hispanics, the unemployment rate dropped to 6.9 percent in the third quarter of 2014, compared to 11.1 percent a year earlier.
The decrease in the unemployment rate was particularly sharp for certain categories of workers in the third quarter of 2014, when the overall unemployment rate averaged 6.1 percent. Prior to the 2008-2009 recession, the male unemployment rate in New York City was somewhat below the female rate. During the recession, however, the male jobless rate rose to a level well above the female rate and stayed comparatively high throughout the recovery. In the third quarter of 2014, however, it fell to 5.8 percent, the first time it dipped significantly below the female rate in over six years. The unemployment rate for young people (aged 16-24) and among the highly-educated (BA degree or more) also showed big drops in the third quarter of 2014.
The unemployment rate for less-educated New Yorkers has not decreased as rapidly as it has for other groups. In the third quarter of 2014, the jobless rate for New Yorkers who do not have a high school diploma was still 13.2 percent. During this prolonged period of elevated unemployment, more highly educated workers may have pushed less educated workers out of their traditional employment niches. For example, in 2008, 29 percent of workers in the city’s food service industry lacked a high school diploma; by 2014, that percentage had fallen to 20 percent. Conversely, the share of food service workers who held at least a bachelor’s degree increased from 20 percent to 28 percent.
One concern about the city’s economic performance is that most of the new jobs created have been in relatively low wage industries. Since the beginning of 2011, nearly 40 percent of the job creation has occurred in the low-wage sectors of home health care, retail trade, and food service, although at the start of the period only about 16 percent of all jobs in the city were in those sectors. The disproportionate number of new jobs created in those sectors has contributed to an annual rate of growth in private-sector average weekly earnings of only 1.6 percent over the past four years.
The distribution of job growth among industries is not the sole reason for slow wage growth, however. Another contributing factor to slow wage growth is that overall, wage growth for existing jobs has been sluggish, with some exceptions such as information, wholesale trade, and educational services. Strong personal income tax withholding growth in the third quarter of 2014 and a sharp increase in measured private-sector wages in October provide some hope that New York City workers are finally starting to see their paychecks rise faster than the inflation rate.
Chart 2 shows the average annual increase in wages for the city’s major industry sectors compared with the nation from 2010 through 2013.
6
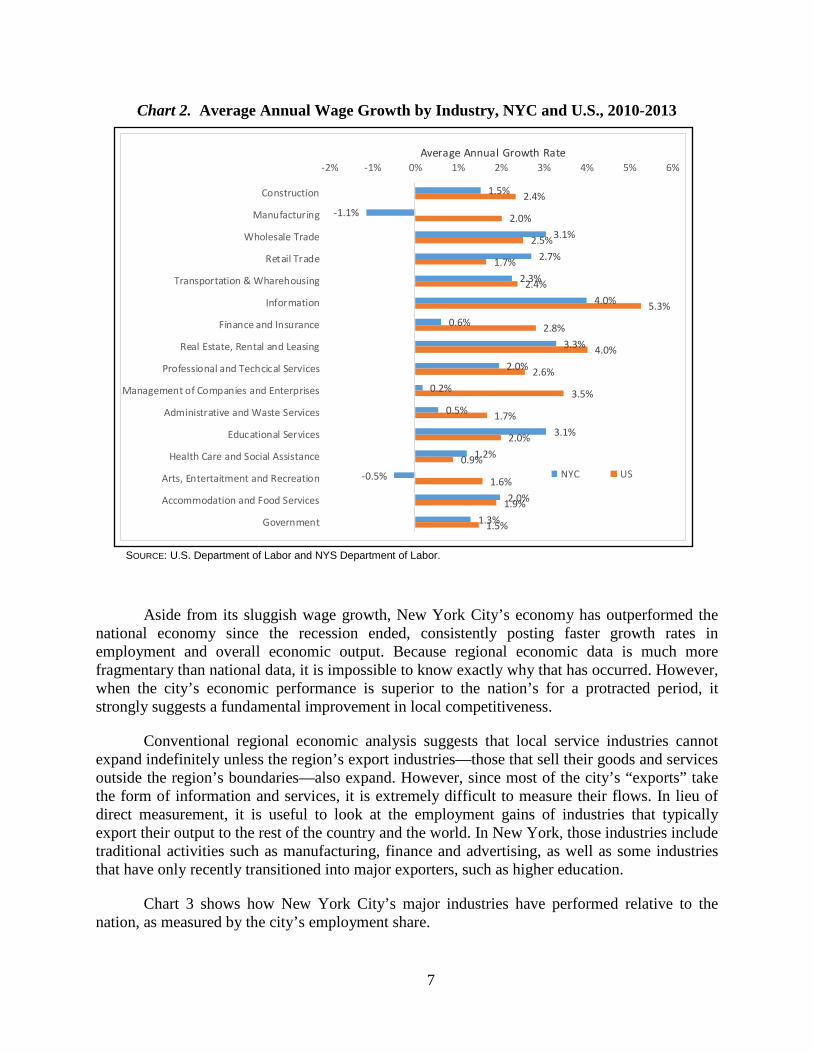
Chart 2. Average Annual Wage Growth by Industry, NYC and U.S., 2010-2013
SOURCE: U.S. Department of Labor and NYS Department of Labor.
Aside from its sluggish wage growth, New York City’s economy has outperformed the national economy since the recession ended, consistently posting faster growth rates in employment and overall economic output. Because regional economic data is much more fragmentary than national data, it is impossible to know exactly why that has occurred. However, when the city’s economic performance is superior to the nation’s for a protracted period, it strongly suggests a fundamental improvement in local competitiveness.
Conventional regional economic analysis suggests that local service industries cannot expand indefinitely unless the region’s export industries—those that sell their goods and services outside the region’s boundaries—also expand. However, since most of the city’s “exports” take the form of information and services, it is extremely difficult to measure their flows. In lieu of direct measurement, it is useful to look at the employment gains of industries that typically export their output to the rest of the country and the world. In New York, those industries include traditional activities such as manufacturing, finance and advertising, as well as some industries that have only recently transitioned into major exporters, such as higher education.
Chart 3 shows how New York City’s major industries have performed relative to the nation, as measured by the city’s employment share.
1.5%
-1.1%
3.1%
2.7%
2.3%
4.0%
0.6%
3.3%
2.0%
0.2%
0.5%
3.1%
1.2%
-0.5%
2.0%
1.3%
2.4%
2.0%
2.5%
1.7%
2.4%
5.3%
2.8%
4.0%
2.6%
3.5%
1.7%
2.0%
0.9%
1.6%
1.9%
1.5%
-2% -1% 0% 1% 2% 3% 4% 5% 6%
Construction
Manufacturing
Wholesale Trade
Retail Trade
Transportation & Wharehousing
Information
Finance and Insurance
Real Estate, Rental and Leasing
Professional and Techcical Services
Management of Companies and Enterprises
Administrative and Waste Services
Educational Services
Health Care and Social Assistance
Arts, Entertaitment and Recreation
Accommodation and Food Services
Government
Average Annual Growth Rate
NYC US
7
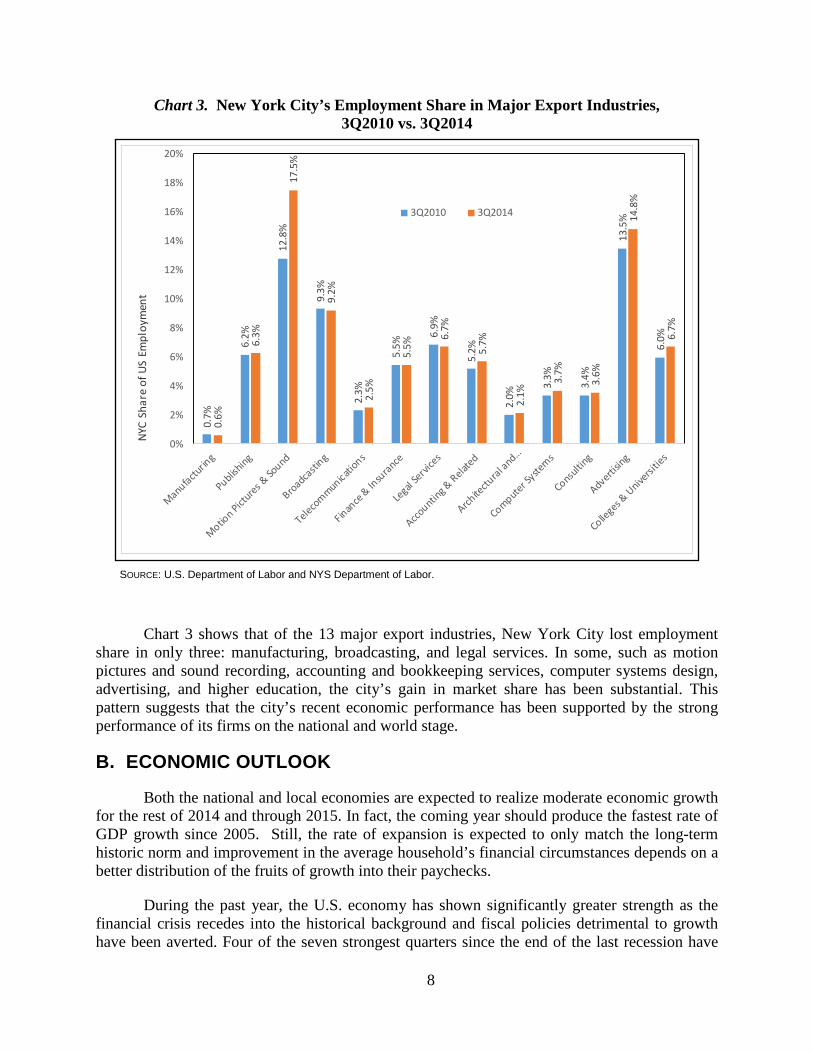
Chart 3. New York City’s Employment Share in Major Export Industries, 3Q2010 vs. 3Q2014
SOURCE: U.S. Department of Labor and NYS Department of Labor.
Chart 3 shows that of the 13 major export industries, New York City lost employment share in only three: manufacturing, broadcasting, and legal services. In some, such as motion pictures and sound recording, accounting and bookkeeping services, computer systems design, advertising, and higher education, the city’s gain in market share has been substantial. This pattern suggests that the city’s recent economic performance has been supported by the strong performance of its firms on the national and world stage.
B. ECONOMIC OUTLOOK
Both the national and local economies are expected to realize moderate economic growth for the rest of 2014 and through 2015. In fact, the coming year should produce the fastest rate of GDP growth since 2005. Still, the rate of expansion is expected to only match the long-term historic norm and improvement in the average household’s financial circumstances depends on a better distribution of the fruits of growth into their paychecks.
During the past year, the U.S. economy has shown significantly greater strength as the financial crisis recedes into the historical background and fiscal policies detrimental to growth have been averted. Four of the seven strongest quarters since the end of the last recession have
0.7%
6.2%
12.8
%
9.3%
2.3%
5.5%
6.9%
5.2%
2.0%
3.3%
3.4%
13.5
%
6.0%
0.6%
6.3%
17.5
%
9.2%
2.5%
5.5%
6.7%
5.7%
2.1%
3.7%
3.6%
14.8
%
6.7%
0%
2%
4%
6%
8%
10%
12%
14%
16%
18%
20%NY
C Sh
are
of U
S Em
ploy
men
t
3Q2010 3Q2014
8
been recorded since mid-2013 and the recent pickup in job creation lays a foundation for sustainable growth in consumer demand. Moreover, even though the Fed is expected to normalize monetary policy during 2015, it has demonstrated a determination to encourage maximum economic growth.
One recent development that has strengthened the economic outlook for 2015 is the precipitous decline in crude oil and gasoline prices since mid-2014. If retail gasoline prices during 2015 remain roughly at the levels reached by December, U.S. households will realize an effective gain to their disposable income of approximately $75 billion in 2015 which, assuming a reasonable consumption multiplier, will add approximately 0.5 percent points to GDP growth.
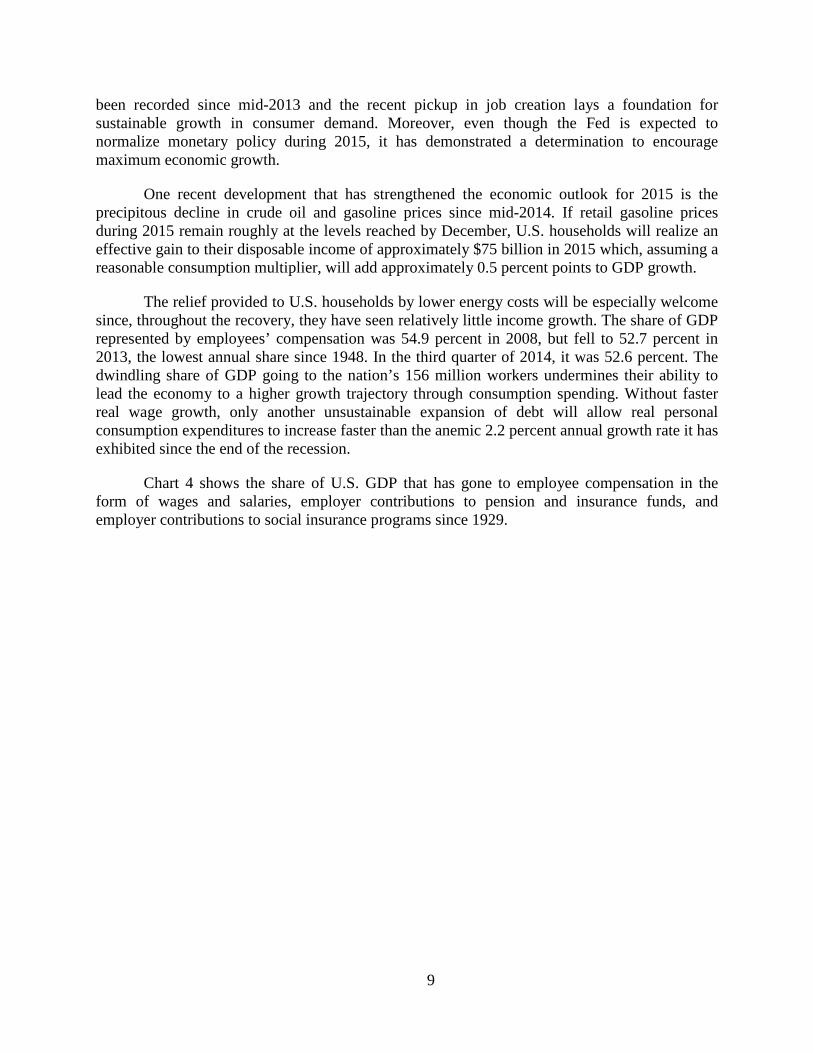
The relief provided to U.S. households by lower energy costs will be especially welcome since, throughout the recovery, they have seen relatively little income growth. The share of GDP represented by employees’ compensation was 54.9 percent in 2008, but fell to 52.7 percent in 2013, the lowest annual share since 1948. In the third quarter of 2014, it was 52.6 percent. The dwindling share of GDP going to the nation’s 156 million workers undermines their ability to lead the economy to a higher growth trajectory through consumption spending. Without faster real wage growth, only another unsustainable expansion of debt will allow real personal consumption expenditures to increase faster than the anemic 2.2 percent annual growth rate it has exhibited since the end of the recession.
Chart 4 shows the share of U.S. GDP that has gone to employee compensation in the form of wages and salaries, employer contributions to pension and insurance funds, and employer contributions to social insurance programs since 1929.
9
Chart 4. Employee Compensation as a Share of GDP, 1929-2013
SOURCE: U.S. Bureau of Economic Analysis.
Faster GDP growth could also be supported by a surge in private investment spending, but thus far in the recovery, investment spending has been inconsistent. Business spending on structures and equipment has recently strengthened after a disappointing 2013, but the housing recovery has faltered. The increase in new housing starts has slowed stranding housing construction well below its historic levels. New single-family home sales in 2014 were up only one percent through October, on a year-to-year basis. The market for existing homes has also softened. Despite mortgage rates that remain near their historic lows, seven years of high unemployment and stagnant wages seem to have left many potential homebuyers unable to meet the more stringent credit requirements that have been adopted since the financial crisis.
There are also several international risks on the horizon. On the Atlantic side, the European Union, which remains by far America’s largest export market, continues to flirt with recession and a potentially disastrous deflation. In November, prices in the 18-country euro zone were a bare 0.3 percentage points above those of the previous year. In a twist on the usual oil price worry, declining energy prices could help tip the euro zone into outright deflation, which could result in unprecedented financial stresses. Across the Pacific, Japan continues to struggle with chronically slow growth and “lowflation.” Even China’s economy has slowed as its real estate bubble and building boom show signs of deflating. All of these international risks seem
10
manageable as 2014 draws to a close, but it is unlikely that the U.S. economy can truly prosper while the other global economic engines sputter.
The return of a deflationary threat after an abeyance of nearly 80 years will continue to afford the Federal Reserve and other central banks the opportunity to pursue stimulatory monetary policies and, in fact, it compels them to do so. The monthly U.S. inflation rate, as measured by the year-over-year change in consumer price index, averaged just 1.7 percent during the first nine months of 2014, while the inflation-protected Treasury securities market is pricing five-year inflation at around 1.9 percent. With inflation running below the Fed’s 2-percent target, the Comptroller’s Office expects the central bank to maintain its zero interest rate policy at least until October 2015 and, even when it begins to normalize short-term interest rates, that there will be relatively little effect on long-term rates.
The immediate risk to the economy is more likely to come from Congress than from the Federal Reserve. The results of the U.S. midterm election have widened the political gap between the executive and the legislative branches. However, the Comptroller’s Office expects no dramatic change in federal fiscal policies since Republicans lack the 60-vote majority required to avoid a Senate filibuster and the President retains veto power. Moreover, positioning for the 2016 presidential election has started and both parties’ leadership seem motivated to avoid government showdowns, but many deadlines and expiration dates loom on the calendar in 2015.
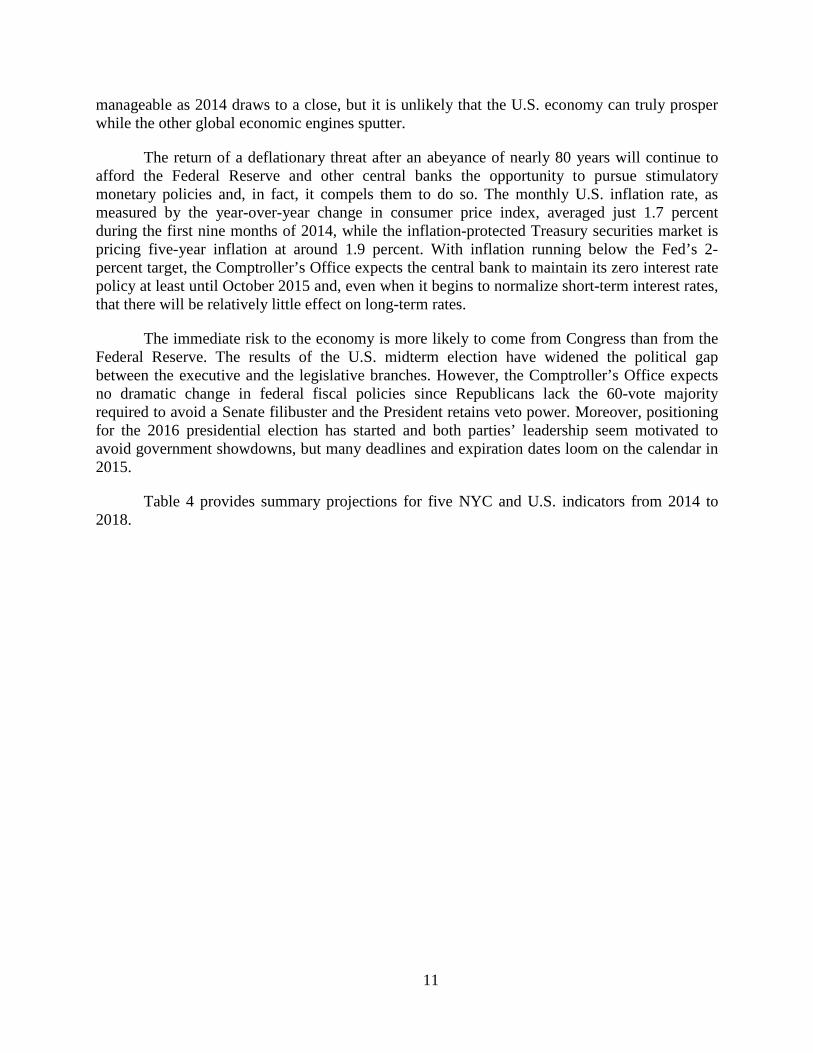
Table 4 provides summary projections for five NYC and U.S. indicators from 2014 to 2018.
11
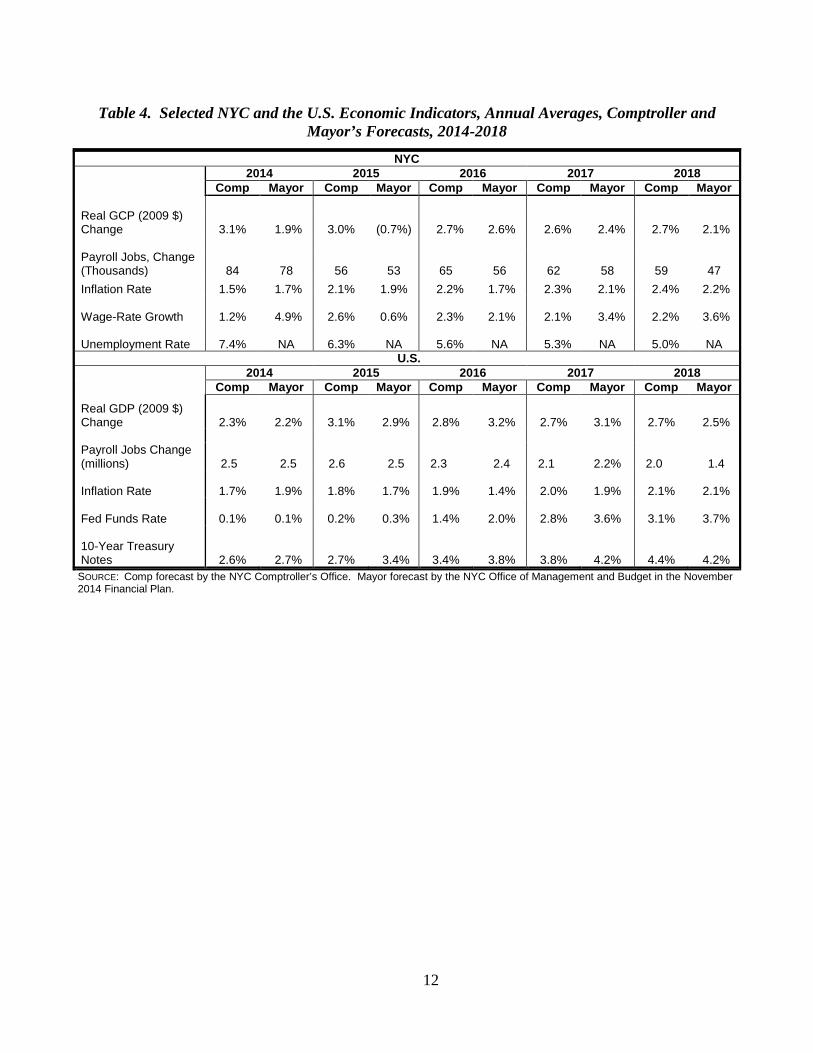
Table 4. Selected NYC and the U.S. Economic Indicators, Annual Averages, Comptroller and Mayor’s Forecasts, 2014-2018
NYC 2014 2015 2016 2017 2018 Comp Mayor Comp Mayor Comp Mayor Comp Mayor Comp Mayor
Real GCP (2009 $) Change
3.1% 1.9% 3.0% (0.7%) 2.7% 2.6% 2.6% 2.4% 2.7% 2.1% Payroll Jobs, Change (Thousands) 84 78 56 53 65 56 62 58 59 47 Inflation Rate 1.5% 1.7% 2.1% 1.9% 2.2% 1.7% 2.3% 2.1% 2.4% 2.2% Wage-Rate Growth 1.2% 4.9% 2.6% 0.6% 2.3% 2.1% 2.1% 3.4% 2.2% 3.6% Unemployment Rate 7.4% NA 6.3% NA 5.6% NA 5.3% NA 5.0% NA
U.S. 2014 2015 2016 2017 2018 Comp Mayor Comp Mayor Comp Mayor Comp Mayor Comp Mayor Real GDP (2009 $) Change 2.3% 2.2% 3.1% 2.9% 2.8% 3.2% 2.7% 3.1% 2.7% 2.5% Payroll Jobs Change (millions) 2.5 2.5 2.6 2.5 2.3 2.4 2.1 2.2% 2.0 1.4 Inflation Rate 1.7% 1.9% 1.8% 1.7% 1.9% 1.4% 2.0% 1.9% 2.1% 2.1% Fed Funds Rate 0.1% 0.1% 0.2% 0.3% 1.4% 2.0% 2.8% 3.6% 3.1% 3.7% 10-Year Treasury Notes 2.6% 2.7% 2.7% 3.4% 3.4% 3.8% 3.8% 4.2% 4.4% 4.2%
SOURCE: Comp forecast by the NYC Comptroller’s Office. Mayor forecast by the NYC Office of Management and Budget in the November 2014 Financial Plan.
12

13
III. The City’s Fiscal Outlook
The November 2014 Financial Plan increases the FY 2015 Budget by $1.9 billion from the June 2014 Plan to $76.97 billion. In the outyears of the Plan, revenue forecasts are increased by $363 million in FY 2016, $221 million in FY 2017 and $664 million in FY 2018, while expenditure projections are reduced by $427 million in FY 2016, $460 million in FY 2017, and $658 million in FY 2018. As a result, the outyear gaps are reduced by $790 million, $681 million, and $1.32 billion in FYs 2016, 2017, and 2018, respectively.
The FY 2015 change is due mainly to an increase in the Federal funds portion of the Budget, which is now estimated at $7.97 billion, an increase of $1.5 billion from the Adopted Budget. The majority of this increase is due to the rolling over of unrealized FY 2014 Community Development Block Grants (CDBG), earmarked for disaster recovery, into FY 2015.
In June, the City adopted a balanced budget for FY 2015. The November Plan increased FY 2015 City-funds revenue and expenditure estimates by $284 million and $179 million, respectively, resulting in $105 million of additional resources. These additional resources are used to fund the FY 2015 Budget Stabilization Account (BSA) to prepay $105 million of FY 2016 New York City Transitional Finance Authority (TFA) debt service, as shown in Table 5 below.
Table 5. Changes to the July Plan City-Funds Estimates ($ in millions, negative numbers increase the gap)
FY 2015 FY 2016 FY 2017 FY 2018 June 2014 Financial Plan Gap $0 ($2,625) ($1,871) ($3,093) Revenues
Property Tax $189 $115 $120 $125 Personal Income Tax 215 137 142 148 Audit 202 0 0 0 Other 160 0 0 0 Subtotal Tax Revenues $766 $252 $262 $273 Taxi Medallions (506) (48) (161) 256 Other non-Tax Revenues 24 20 (7) (6) Total Revenues $284 $224 $94 $523
Expenditures
Debt Service $95 $405 $311 $293 Pensions 8 205 408 615 Health Insurance (11) (62) (102) (143) Agency Expenses (271) (87) (30) 34 Total Expenditures ($179) $461 $587 $799
Additional Resources/Obligations $105 $685 $681 $1,322 FY 2015 BSA ($105) $105 $0 $0 November 2014 Financial Plan Gap $0 ($1,835) ($1,190) ($1,771)
14
Most of the increase in FY 2015 City-funds revenues is due to upward revisions of $189 million to property tax, $215 million to personal income tax (PIT), and $202 million to tax audit revenues. An increase of $160 million in the estimate of all other tax revenues brings the total FY 2015 tax revenues to $49.38 billion, an increase of $766 million from the Adopted Budget. This increase is offset by a net decrease in $482 million in non-tax revenues due primarily to the stretch-out of the sales of taxi medallions into FYs 2018 and 2019. The revenues from the sale of taxi medallions in the June 2014 Financial Plan was based on a schedule that assumed all 2,000 medallions, authorized by the State legislation permitting street hail livery service, would be sold by FY 2017. The stretch-out of the sales reduces the projected taxi medallion sales revenues by $506 million in FY 2015, $48 million in FY 2016, and $161 million in FY 2017 and shifts $256 million of the projected revenues to FY 2018. The November 2014 Financial Plan does not extend beyond FY 2018. However, the City has indicated that as of now the remaining $459 million is scheduled to be realized after the current financial plan period in FY 2019. The total expected revenues from the sale of the 2,000 taxi medallions remain unchanged at $1.65 billion.
FY 2015 City-funds expenditure estimates are $179 million higher than the June 2014 Financial Plan, due primarily to an increase of $271 million in agency expenses, offset by $95 million in debt service savings. In the outyears, projected City-funds expenditures are below the June 2014 Financial Plan by $461 million, $587 million, and $799 million in FYs 2016, 2017, and 2018, respectively. The reductions in the outyears stem primarily from debt service savings and reduction in pension contributions resulting from FY 2014 pension investment earnings that were significantly above the Actuarial Interest Rate Assumption (AIRA) of 7 percent as discussed in more detail in “Pensions” beginning on page 33.
The FY 2014 Close
Prior to the release of the November Plan, the Office of the Comptroller released the FY 2014 Comprehensive Annual Financial Report (CAFR). The CAFR shows actual revenues and expenditures for the fiscal year and brings to a close the FY 2014 budget cycle that began January 29, 2013 with the release of the Preliminary Budget.
The City is legally required to end the fiscal year with its actual results being in balance according to Generally Accepted Accounting Principles (GAAP). The City meets this requirement by reporting a small surplus, typically $5 million, at the end of the fiscal year. Any additional resources above the $5 million reported surplus is normally used to prepay certain expenditures of the subsequent year.1 Thus, budget balance alone is a limited metric for analyzing the financial health of the City, especially when comparing the City’s financial position across fiscal years. A more meaningful metric is a measure that adjusts for both the current year costs that were supported with prior-year resources, as well as for the use of current year resources to pay for costs of subsequent fiscal years. Essentially, operating surplus or deficit does just that. It compares the revenues collected in a given fiscal year with the funds expended in that year, adjusting out the funds that flowed into the year or out of the year. The operating surplus or deficit illustrates whether the City is increasing its financial cushion through the BSA
1 There were a few fiscal years when the additional resources were used to prepay expenses for more than one ensuing fiscal year.
15
and other funds, or is decreasing its cushion by reducing the amount of resources pushed into the future.
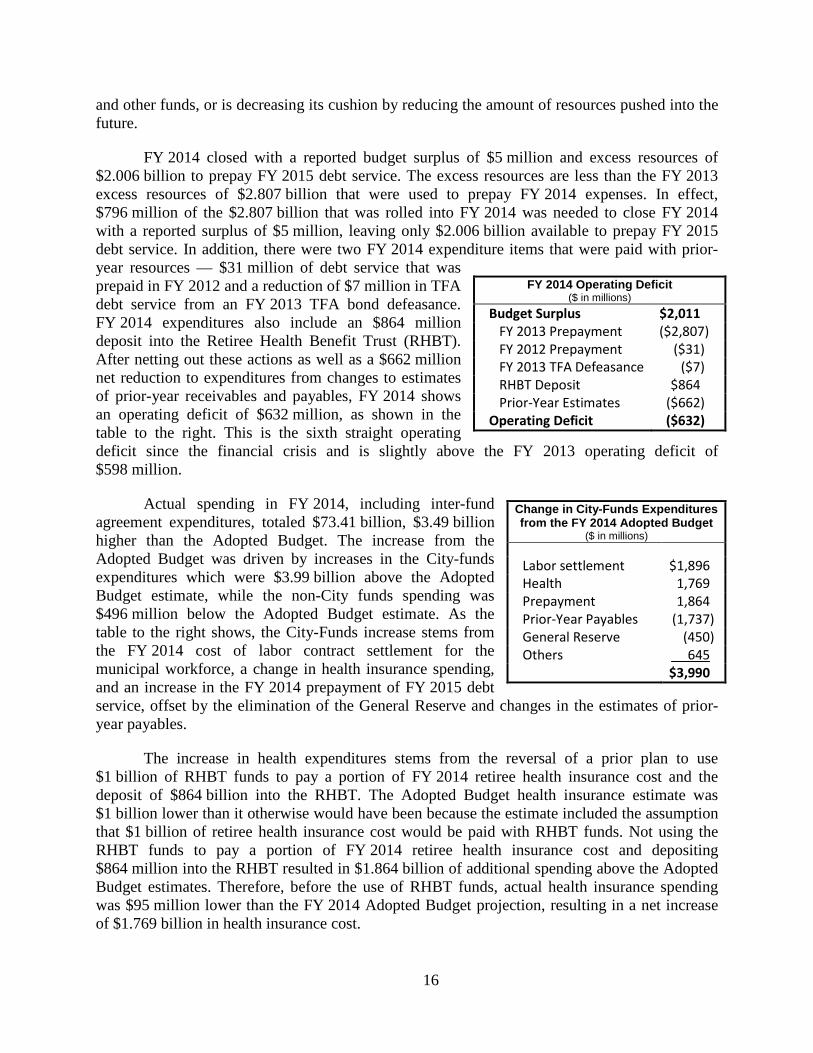
FY 2014 closed with a reported budget surplus of $5 million and excess resources of $2.006 billion to prepay FY 2015 debt service. The excess resources are less than the FY 2013 excess resources of $2.807 billion that were used to prepay FY 2014 expenses. In effect, $796 million of the $2.807 billion that was rolled into FY 2014 was needed to close FY 2014 with a reported surplus of $5 million, leaving only $2.006 billion available to prepay FY 2015 debt service. In addition, there were two FY 2014 expenditure items that were paid with prior-year resources — $31 million of debt service that was prepaid in FY 2012 and a reduction of $7 million in TFA debt service from an FY 2013 TFA bond defeasance. FY 2014 expenditures also include an $864 million deposit into the Retiree Health Benefit Trust (RHBT). After netting out these actions as well as a $662 million net reduction to expenditures from changes to estimates of prior-year receivables and payables, FY 2014 shows an operating deficit of $632 million, as shown in the table to the right. This is the sixth straight operating deficit since the financial crisis and is slightly above the FY 2013 operating deficit of $598 million.
Actual spending in FY 2014, including inter-fund agreement expenditures, totaled $73.41 billion, $3.49 billion higher than the Adopted Budget. The increase from the Adopted Budget was driven by increases in the City-funds expenditures which were $3.99 billion above the Adopted Budget estimate, while the non-City funds spending was $496 million below the Adopted Budget estimate. As the table to the right shows, the City-Funds increase stems from the FY 2014 cost of labor contract settlement for the municipal workforce, a change in health insurance spending, and an increase in the FY 2014 prepayment of FY 2015 debt service, offset by the elimination of the General Reserve and changes in the estimates of prior-year payables.
The increase in health expenditures stems from the reversal of a prior plan to use $1 billion of RHBT funds to pay a portion of FY 2014 retiree health insurance cost and the deposit of $864 billion into the RHBT. The Adopted Budget health insurance estimate was $1 billion lower than it otherwise would have been because the estimate included the assumption that $1 billion of retiree health insurance cost would be paid with RHBT funds. Not using the RHBT funds to pay a portion of FY 2014 retiree health insurance cost and depositing $864 million into the RHBT resulted in $1.864 billion of additional spending above the Adopted Budget estimates. Therefore, before the use of RHBT funds, actual health insurance spending was $95 million lower than the FY 2014 Adopted Budget projection, resulting in a net increase of $1.769 billion in health insurance cost.
FY 2014 Operating Deficit ($ in millions)
Budget Surplus $2,011 FY 2013 Prepayment ($2,807) FY 2012 Prepayment ($31) FY 2013 TFA Defeasance ($7) RHBT Deposit $864 Prior-Year Estimates ($662)
Operating Deficit ($632)
Change in City-Funds Expenditures from the FY 2014 Adopted Budget
($ in millions)
Labor settlement $1,896 Health 1,769 Prepayment 1,864 Prior-Year Payables (1,737) General Reserve (450) Others 645 $3,990
16
Risks and Offsets
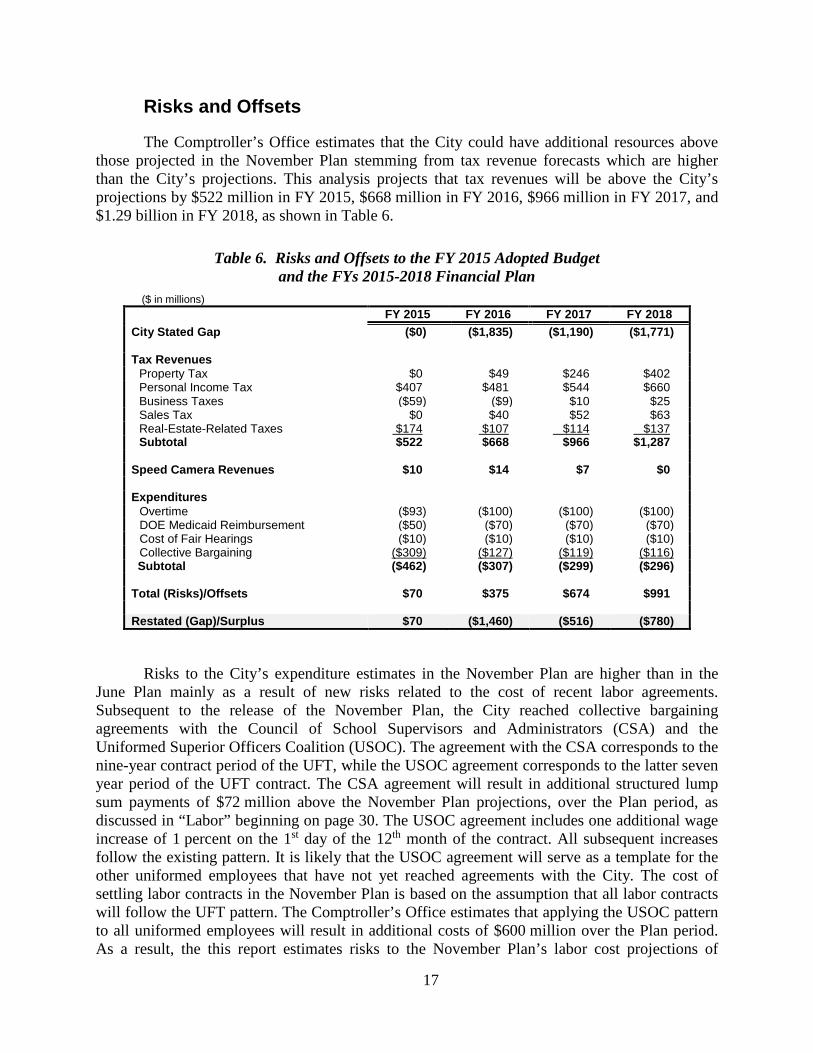
The Comptroller’s Office estimates that the City could have additional resources above those projected in the November Plan stemming from tax revenue forecasts which are higher than the City’s projections. This analysis projects that tax revenues will be above the City’s projections by $522 million in FY 2015, $668 million in FY 2016, $966 million in FY 2017, and $1.29 billion in FY 2018, as shown in Table 6.
Table 6. Risks and Offsets to the FY 2015 Adopted Budget and the FYs 2015-2018 Financial Plan
($ in millions) FY 2015 FY 2016 FY 2017 FY 2018
City Stated Gap ($0) ($1,835) ($1,190) ($1,771) Tax Revenues
Property Tax $0 $49 $246 $402 Personal Income Tax $407 $481 $544 $660 Business Taxes ($59) ($9) $10 $25 Sales Tax $0 $40 $52 $63 Real-Estate-Related Taxes $174 $107 $114 $137 Subtotal $522 $668 $966 $1,287
Speed Camera Revenues $10 $14 $7 $0 Expenditures
Overtime ($93) ($100) ($100) ($100) DOE Medicaid Reimbursement ($50) ($70) ($70) ($70) Cost of Fair Hearings ($10) ($10) ($10) ($10) Collective Bargaining ($309) ($127) ($119) ($116) Subtotal ($462) ($307) ($299) ($296)
Total (Risks)/Offsets $70 $375 $674 $991 Restated (Gap)/Surplus $70 ($1,460) ($516) ($780)
Risks to the City’s expenditure estimates in the November Plan are higher than in the June Plan mainly as a result of new risks related to the cost of recent labor agreements. Subsequent to the release of the November Plan, the City reached collective bargaining agreements with the Council of School Supervisors and Administrators (CSA) and the Uniformed Superior Officers Coalition (USOC). The agreement with the CSA corresponds to the nine-year contract period of the UFT, while the USOC agreement corresponds to the latter seven year period of the UFT contract. The CSA agreement will result in additional structured lump sum payments of $72 million above the November Plan projections, over the Plan period, as discussed in “Labor” beginning on page 30. The USOC agreement includes one additional wage increase of 1 percent on the 1st day of the 12th month of the contract. All subsequent increases follow the existing pattern. It is likely that the USOC agreement will serve as a template for the other uniformed employees that have not yet reached agreements with the City. The cost of settling labor contracts in the November Plan is based on the assumption that all labor contracts will follow the UFT pattern. The Comptroller’s Office estimates that applying the USOC pattern to all uniformed employees will result in additional costs of $600 million over the Plan period. As a result, the this report estimates risks to the November Plan’s labor cost projections of
17
$309 million in FY 2015, $127 million in FY 2016, $119 million in FY 2017, and $116 million in FY 2018.
Overall, the Comptroller’s Office estimates that there could be net additional resources of $70 million in FY 2015, $375 million in FY 2016, $674 million in FY 2017, and $991 million in FY 2018. Compared to the City’s projections, our latest net resources estimate is lower than our June estimate, mainly due to the City increasing its tax revenue forecasts and speed camera revenue estimates, which narrowed the gaps between the Comptroller’s Office’s revenue forecast and the City’s forecast.
18
IV. Revenue Assumptions
The November 2014 Financial Plan projects that total revenues will grow by $4.67 billion, from $76.94 billion in FY 2015 to $81.60 billion in FY 2018. Those projections are based on the City’s assumption of moderate growth in the local and national economies. The November Plan reflects a net increase of $766 million in projected tax revenues in FY 2015. Tax revenues are expected to comprise 64 percent of total revenues in FY 2015, and are projected to increase to nearly 67 percent of total revenues in FY 2018. Property tax revenues are projected to grow from $21.17 billion in FY 2015 to $24.09 billion in FY 2018, while non-property tax revenues are expected to grow from $28.21 billion in FY 2015 to $30.84 billion in FY 2018.2
Miscellaneous revenue, excluding intra-City revenue, is expected to reach $5.74 billion in FY 2015. This projection includes a $1 billion transfer from the Health Stabilization Fund to help cover costs associated with labor settlements and a projected $47 million in proceeds from taxi medallion sales. The City lowered its revenue projections from taxi medallion sales for FYs 2015-2018 from $1.65 billion in the June 2014 Plan to $1.19 billion in the current plan. Total miscellaneous revenue is expected to decline 10.4 percent, to $5.15 billion in FY 2016, and to stabilize at $5 billion annually in FYs 2017 and 2018.
The November 2014 Financial Plan projects total Federal and State aid at $20.43 billion in FY 2015, reflecting an increase of $1.58 billion in that year. The increase is due primarily to the roll of unspent Federal grants from FY 2014 into FY 2015. In the outyears, Federal and State aid are expected to grow to a combined $19.27 billion in FY 2016, $19.70 billion in FY 2017 and $20.22 billion in FY 2018. This trend mainly reflects the City’s expectation of education aid increases from the State.
Tax Revenues
The City has raised its FY 2015 tax revenue forecast by a net $766 million, from $48.62 billion in the June 2014 Plan to $49.38 billion in the November 2014 Plan. The revision includes increases in all major tax revenue projections. Re-estimates for the personal income tax (PIT), property tax and tax audit revenue account for most of the increase. Tax revenues are expected to grow from $49.38 billion in FY 2015 to $54.94 billion in FY 2018. The current Plan reflects the City’s improved outlook for employment and wages.
Changes to the City’s Tax Revenue Forecasts
As Table 7 shows, the largest tax revenue forecast increases are the PIT and the property tax. The FY 2015 forecast for property tax revenue increased $189 million from the June Plan forecast, to $21.17 billion. This increase is due to a decline in current year reserves, primarily reserves for cancellations and delinquencies.
2 If not indicated specifically, throughout this section, personal income tax (PIT) and property tax revenues include School Tax Relief (STAR) reimbursement.
19
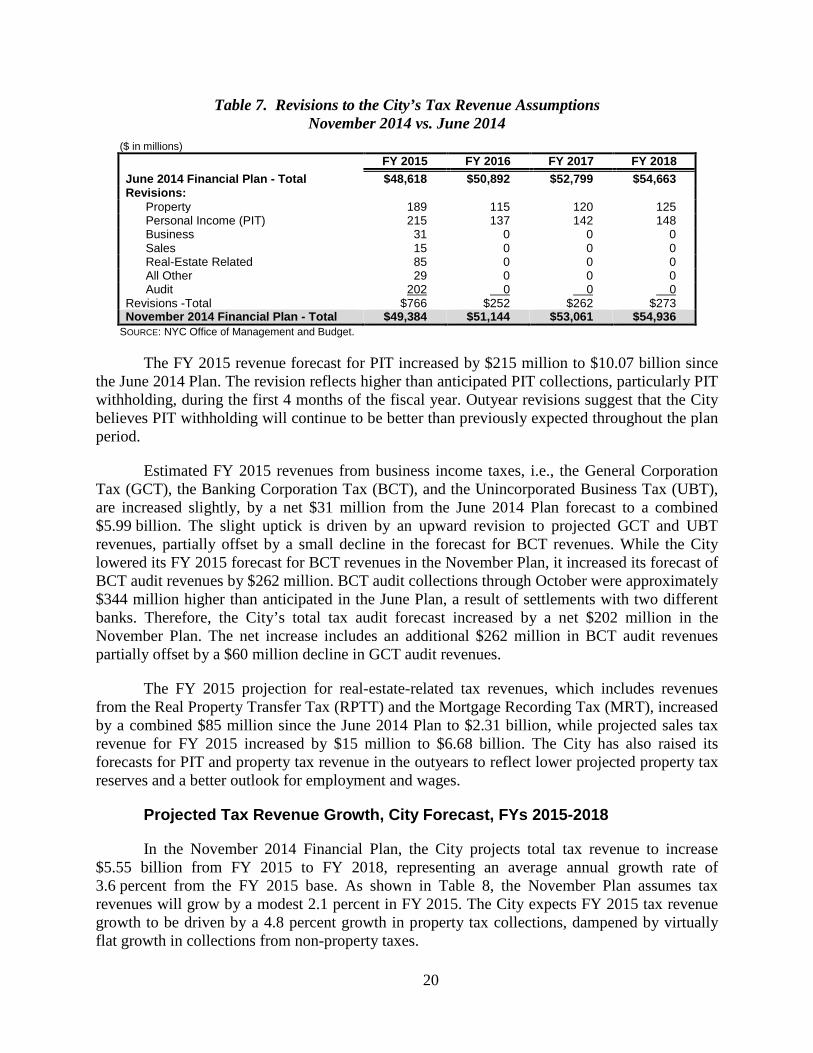
Table 7. Revisions to the City’s Tax Revenue Assumptions November 2014 vs. June 2014
($ in millions) FY 2015 FY 2016 FY 2017 FY 2018 June 2014 Financial Plan - Total $48,618 $50,892 $52,799 $54,663 Revisions: Property 189 115 120 125 Personal Income (PIT) 215 137 142 148 Business 31 0 0 0 Sales 15 0 0 0 Real-Estate Related 85 0 0 0 All Other 29 0 0 0 Audit 202 0 0 0 Revisions -Total $766 $252 $262 $273 November 2014 Financial Plan - Total $49,384 $51,144 $53,061 $54,936
SOURCE: NYC Office of Management and Budget.
The FY 2015 revenue forecast for PIT increased by $215 million to $10.07 billion since the June 2014 Plan. The revision reflects higher than anticipated PIT collections, particularly PIT withholding, during the first 4 months of the fiscal year. Outyear revisions suggest that the City believes PIT withholding will continue to be better than previously expected throughout the plan period.
Estimated FY 2015 revenues from business income taxes, i.e., the General Corporation Tax (GCT), the Banking Corporation Tax (BCT), and the Unincorporated Business Tax (UBT), are increased slightly, by a net $31 million from the June 2014 Plan forecast to a combined $5.99 billion. The slight uptick is driven by an upward revision to projected GCT and UBT revenues, partially offset by a small decline in the forecast for BCT revenues. While the City lowered its FY 2015 forecast for BCT revenues in the November Plan, it increased its forecast of BCT audit revenues by $262 million. BCT audit collections through October were approximately $344 million higher than anticipated in the June Plan, a result of settlements with two different banks. Therefore, the City’s total tax audit forecast increased by a net $202 million in the November Plan. The net increase includes an additional $262 million in BCT audit revenues partially offset by a $60 million decline in GCT audit revenues.
The FY 2015 projection for real-estate-related tax revenues, which includes revenues from the Real Property Transfer Tax (RPTT) and the Mortgage Recording Tax (MRT), increased by a combined $85 million since the June 2014 Plan to $2.31 billion, while projected sales tax revenue for FY 2015 increased by $15 million to $6.68 billion. The City has also raised its forecasts for PIT and property tax revenue in the outyears to reflect lower projected property tax reserves and a better outlook for employment and wages.
Projected Tax Revenue Growth, City Forecast, FYs 2015-2018
In the November 2014 Financial Plan, the City projects total tax revenue to increase $5.55 billion from FY 2015 to FY 2018, representing an average annual growth rate of 3.6 percent from the FY 2015 base. As shown in Table 8, the November Plan assumes tax revenues will grow by a modest 2.1 percent in FY 2015. The City expects FY 2015 tax revenue growth to be driven by a 4.8 percent growth in property tax collections, dampened by virtually flat growth in collections from non-property taxes.
20
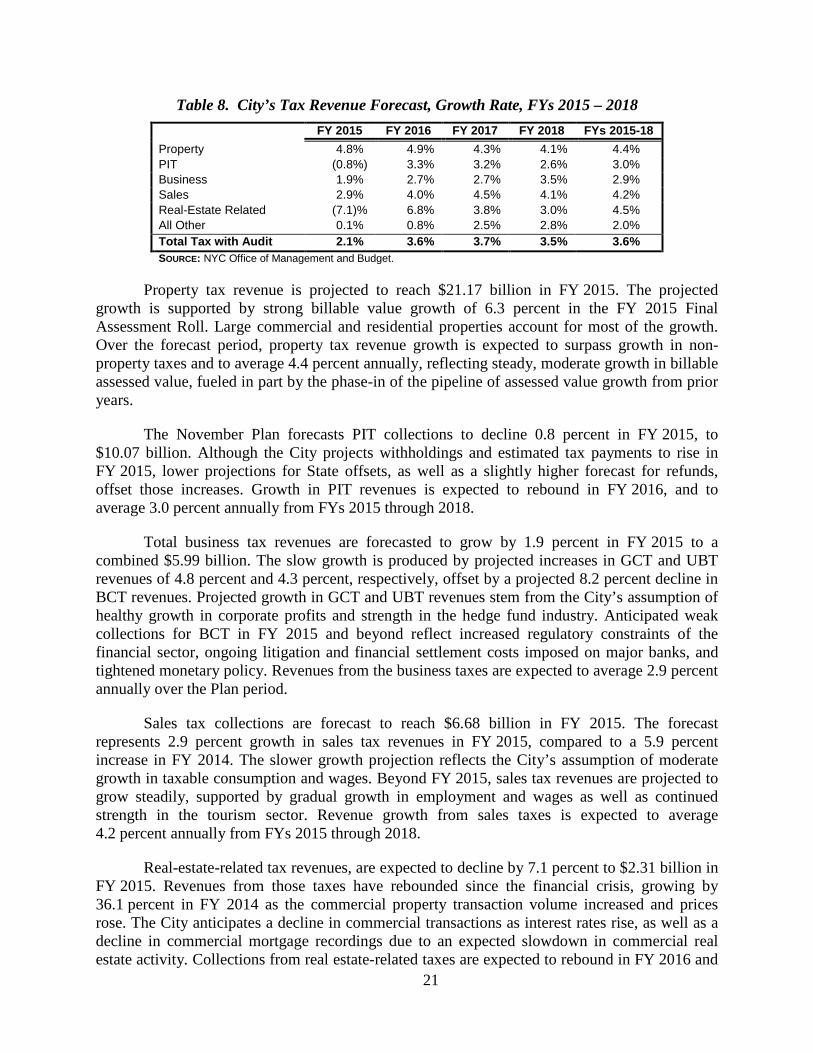
Table 8. City’s Tax Revenue Forecast, Growth Rate, FYs 2015 – 2018 FY 2015 FY 2016 FY 2017 FY 2018 FYs 2015-18 Property 4.8% 4.9% 4.3% 4.1% 4.4% PIT (0.8%) 3.3% 3.2% 2.6% 3.0% Business 1.9% 2.7% 2.7% 3.5% 2.9% Sales 2.9% 4.0% 4.5% 4.1% 4.2% Real-Estate Related (7.1)% 6.8% 3.8% 3.0% 4.5% All Other 0.1% 0.8% 2.5% 2.8% 2.0% Total Tax with Audit 2.1% 3.6% 3.7% 3.5% 3.6% SOURCE: NYC Office of Management and Budget.
Property tax revenue is projected to reach $21.17 billion in FY 2015. The projected growth is supported by strong billable value growth of 6.3 percent in the FY 2015 Final Assessment Roll. Large commercial and residential properties account for most of the growth. Over the forecast period, property tax revenue growth is expected to surpass growth in non-property taxes and to average 4.4 percent annually, reflecting steady, moderate growth in billable assessed value, fueled in part by the phase-in of the pipeline of assessed value growth from prior years.
The November Plan forecasts PIT collections to decline 0.8 percent in FY 2015, to $10.07 billion. Although the City projects withholdings and estimated tax payments to rise in FY 2015, lower projections for State offsets, as well as a slightly higher forecast for refunds, offset those increases. Growth in PIT revenues is expected to rebound in FY 2016, and to average 3.0 percent annually from FYs 2015 through 2018.
Total business tax revenues are forecasted to grow by 1.9 percent in FY 2015 to a combined $5.99 billion. The slow growth is produced by projected increases in GCT and UBT revenues of 4.8 percent and 4.3 percent, respectively, offset by a projected 8.2 percent decline in BCT revenues. Projected growth in GCT and UBT revenues stem from the City’s assumption of healthy growth in corporate profits and strength in the hedge fund industry. Anticipated weak collections for BCT in FY 2015 and beyond reflect increased regulatory constraints of the financial sector, ongoing litigation and financial settlement costs imposed on major banks, and tightened monetary policy. Revenues from the business taxes are expected to average 2.9 percent annually over the Plan period.
Sales tax collections are forecast to reach $6.68 billion in FY 2015. The forecast represents 2.9 percent growth in sales tax revenues in FY 2015, compared to a 5.9 percent increase in FY 2014. The slower growth projection reflects the City’s assumption of moderate growth in taxable consumption and wages. Beyond FY 2015, sales tax revenues are projected to grow steadily, supported by gradual growth in employment and wages as well as continued strength in the tourism sector. Revenue growth from sales taxes is expected to average 4.2 percent annually from FYs 2015 through 2018.
Real-estate-related tax revenues, are expected to decline by 7.1 percent to $2.31 billion in FY 2015. Revenues from those taxes have rebounded since the financial crisis, growing by 36.1 percent in FY 2014 as the commercial property transaction volume increased and prices rose. The City anticipates a decline in commercial transactions as interest rates rise, as well as a decline in commercial mortgage recordings due to an expected slowdown in commercial real estate activity. Collections from real estate-related taxes are expected to rebound in FY 2016 and
21
to grow at a moderate pace in the last two years of the Plan period. Real estate-related tax revenues are projected to grow at an average annual rate of 4.5 percent over the Financial Plan period.
Risks and Offsets to the City’s Tax Revenue Assumptions
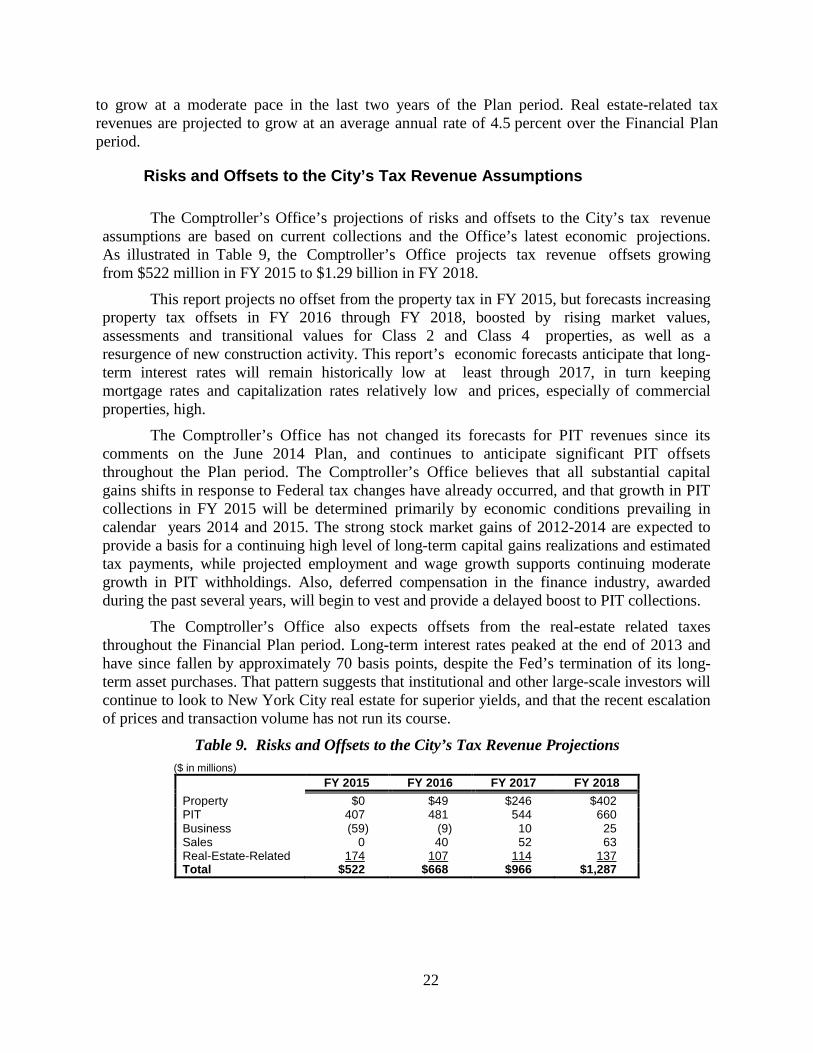
The Comptroller’s Office’s projections of risks and offsets to the City’s tax revenue assumptions are based on current collections and the Office’s latest economic projections. As illustrated in Table 9, the Comptroller’s Office projects tax revenue offsets growing from $522 million in FY 2015 to $1.29 billion in FY 2018.
This report projects no offset from the property tax in FY 2015, but forecasts increasing property tax offsets in FY 2016 through FY 2018, boosted by rising market values, assessments and transitional values for Class 2 and Class 4 properties, as well as a resurgence of new construction activity. This report’s economic forecasts anticipate that long-term interest rates will remain historically low at least through 2017, in turn keeping mortgage rates and capitalization rates relatively low and prices, especially of commercial properties, high.
The Comptroller’s Office has not changed its forecasts for PIT revenues since its comments on the June 2014 Plan, and continues to anticipate significant PIT offsets throughout the Plan period. The Comptroller’s Office believes that all substantial capital gains shifts in response to Federal tax changes have already occurred, and that growth in PIT collections in FY 2015 will be determined primarily by economic conditions prevailing in calendar years 2014 and 2015. The strong stock market gains of 2012-2014 are expected to provide a basis for a continuing high level of long-term capital gains realizations and estimated tax payments, while projected employment and wage growth supports continuing moderate growth in PIT withholdings. Also, deferred compensation in the finance industry, awarded during the past several years, will begin to vest and provide a delayed boost to PIT collections.
The Comptroller’s Office also expects offsets from the real-estate related taxes throughout the Financial Plan period. Long-term interest rates peaked at the end of 2013 and have since fallen by approximately 70 basis points, despite the Fed’s termination of its long-term asset purchases. That pattern suggests that institutional and other large-scale investors will continue to look to New York City real estate for superior yields, and that the recent escalation of prices and transaction volume has not run its course.
Table 9. Risks and Offsets to the City’s Tax Revenue Projections ($ in millions)
FY 2015 FY 2016 FY 2017 FY 2018 Property $0 $49 $246 $402 PIT 407 481 544 660 Business (59) (9) 10 25 Sales 0 40 52 63 Real-Estate-Related 174 107 114 137 Total $522 $668 $966 $1,287
22
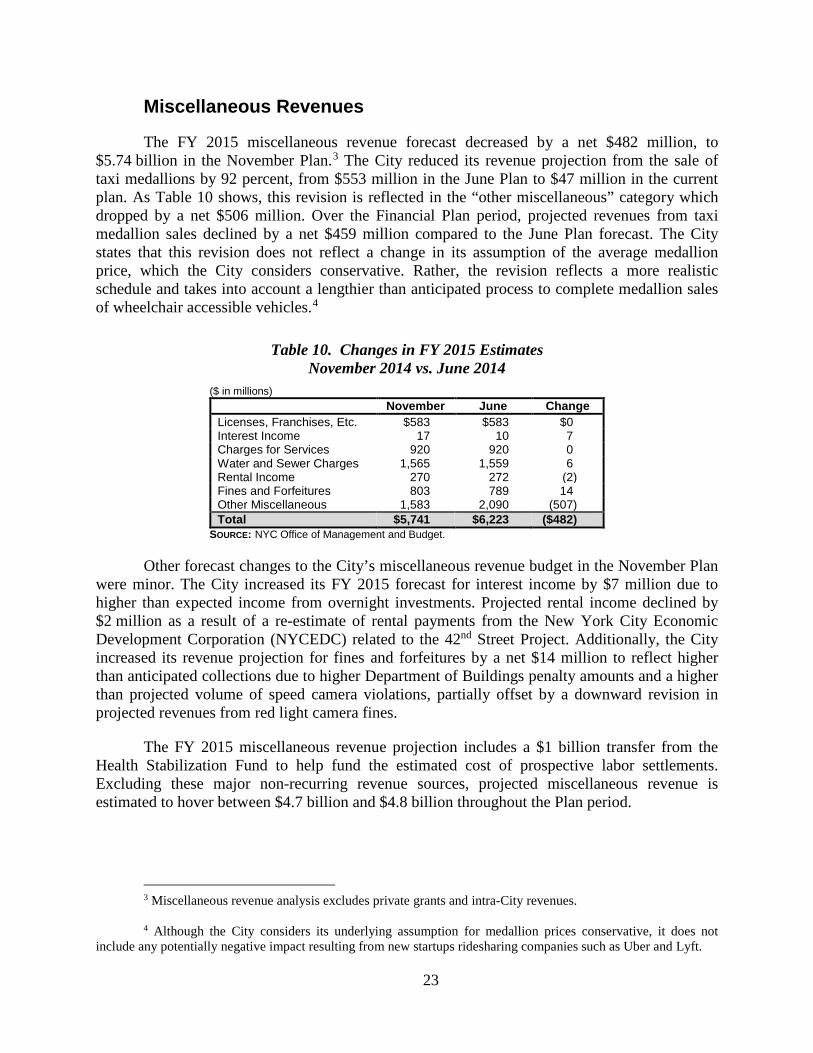
Miscellaneous Revenues
The FY 2015 miscellaneous revenue forecast decreased by a net $482 million, to $5.74 billion in the November Plan.3 The City reduced its revenue projection from the sale of taxi medallions by 92 percent, from $553 million in the June Plan to $47 million in the current plan. As Table 10 shows, this revision is reflected in the “other miscellaneous” category which dropped by a net $506 million. Over the Financial Plan period, projected revenues from taxi medallion sales declined by a net $459 million compared to the June Plan forecast. The City states that this revision does not reflect a change in its assumption of the average medallion price, which the City considers conservative. Rather, the revision reflects a more realistic schedule and takes into account a lengthier than anticipated process to complete medallion sales of wheelchair accessible vehicles.4
Table 10. Changes in FY 2015 Estimates November 2014 vs. June 2014
($ in millions) November June Change Licenses, Franchises, Etc. $583 $583 $0 Interest Income 17 10 7 Charges for Services 920 920 0 Water and Sewer Charges 1,565 1,559 6 Rental Income 270 272 (2) Fines and Forfeitures 803 789 14 Other Miscellaneous 1,583 2,090 (507) Total $5,741 $6,223 ($482)
SOURCE: NYC Office of Management and Budget.
Other forecast changes to the City’s miscellaneous revenue budget in the November Plan were minor. The City increased its FY 2015 forecast for interest income by $7 million due to higher than expected income from overnight investments. Projected rental income declined by $2 million as a result of a re-estimate of rental payments from the New York City Economic Development Corporation (NYCEDC) related to the 42nd Street Project. Additionally, the City increased its revenue projection for fines and forfeitures by a net $14 million to reflect higher than anticipated collections due to higher Department of Buildings penalty amounts and a higher than projected volume of speed camera violations, partially offset by a downward revision in projected revenues from red light camera fines.
The FY 2015 miscellaneous revenue projection includes a $1 billion transfer from the Health Stabilization Fund to help fund the estimated cost of prospective labor settlements. Excluding these major non-recurring revenue sources, projected miscellaneous revenue is estimated to hover between $4.7 billion and $4.8 billion throughout the Plan period.
3 Miscellaneous revenue analysis excludes private grants and intra-City revenues. 4 Although the City considers its underlying assumption for medallion prices conservative, it does not
include any potentially negative impact resulting from new startups ridesharing companies such as Uber and Lyft.
23
Federal and State Aid
The November Plan projects Federal and State aid of $20.43 billion for FY 2015, an increase of $1.58 billion over the Adopted Budget. The bulk of this increase, about $1.51 billion, is recognized under Federal aid. More than half of the additional Federal funding is attributable to a $786 million increase in Community Development Block Grants (CDBG) earmarked for disaster recovery. The increase is primarily due to a change in the timing of Hurricane Sandy-related reimbursement. The City has shifted a large portion of the CDBG funding for disaster recovery previously anticipated in FY 2014 into FY 2015. The November Plan also shows an increase of $126 million in Federal funding for Section 8 housing vouchers to support programmatic spending at the Department of Housing Preservation and Development.
In social services, the November Modification assumes an additional $81 million of Federal support in FY 2015, with the Department of Homeless Services capturing the bulk of the increase for shelter and family services. In contrast, Federal education support is reduced by $52 million to reflect the City’s latest Title I funding allocation. The budget also anticipates new Federal reimbursement of $32 million for the cost of Ebola preparedness and response efforts stemming from a recent Ebola patient recovery case in the City. The remainder of the Federal aid increase results mainly from the rollover of unspent grants from prior years, a technical procedure that typically occurs in the first quarter budget modification of each fiscal year. A major component within this category is the cumulative $292 million from a prior series of Homeland Security grants.
The November Modification shows an increase of $66 million in State aid. About $25 million of this total represents additional social services support and the remainder is scattered across various functions, with the majority reflected in Police, Transportation and the District Attorneys’ offices. It is worth noting that the budget outlook at the State level is much improved from previous years. As the State prepares to release its SFY 2015-16 Executive Budget in January, its Mid-Year Financial Plan Update shows a budget surplus of nearly $6.8 billion in the current year, an increase of $4.8 billion since the Enacted Budget. The State generated the additional surplus primarily from $5.1 billion in settlements with major financial institutions for banking law violations. Although the State indicates it will still adhere to an imposed benchmark of two percent growth in annual spending in future years, it expects to submit a formal proposal for the use of the settlement funds in the Executive Budget.
Over the outyears of the Plan, the City has reflected increases between $104 million and $124 million annually to Federal and State aid assumptions. The November Plan projects Federal and State grants to fall to $19.27 billion in FY 2016. The decline is due to a significant drop in Hurricane Sandy-related reimbursement and the aforementioned roll of unspent Federal funds in FY 2015. Federal and State support of the expense budget correspondingly falls from 26.6 percent in FY 2015 to 24.5 percent in FY 2016. While the November Plan projects Federal and State grants to increase to $19.70 billion in FY 2017 and $20.22 billion in FY 2018, their support of the City’s expense budget would remain at 24.5 percent in FY 2017 before edging down to 24.3 percent in FY 2018. However, given that the City historically underestimates its Federal aid receipts in the outyears of its plans, it is likely that these measures are understated. The City, for the most part, holds its Federal aid projections flat in the outyears for major areas such as education, social services and CDBG funds. In some of the smaller categories, the City
24

actually does not reflect future aid amounts at all or significantly underestimates grant levels until Federal aid award amounts are known. The key components in this latter group are housing, homeland security, and certain transportation and health grants.
25

26
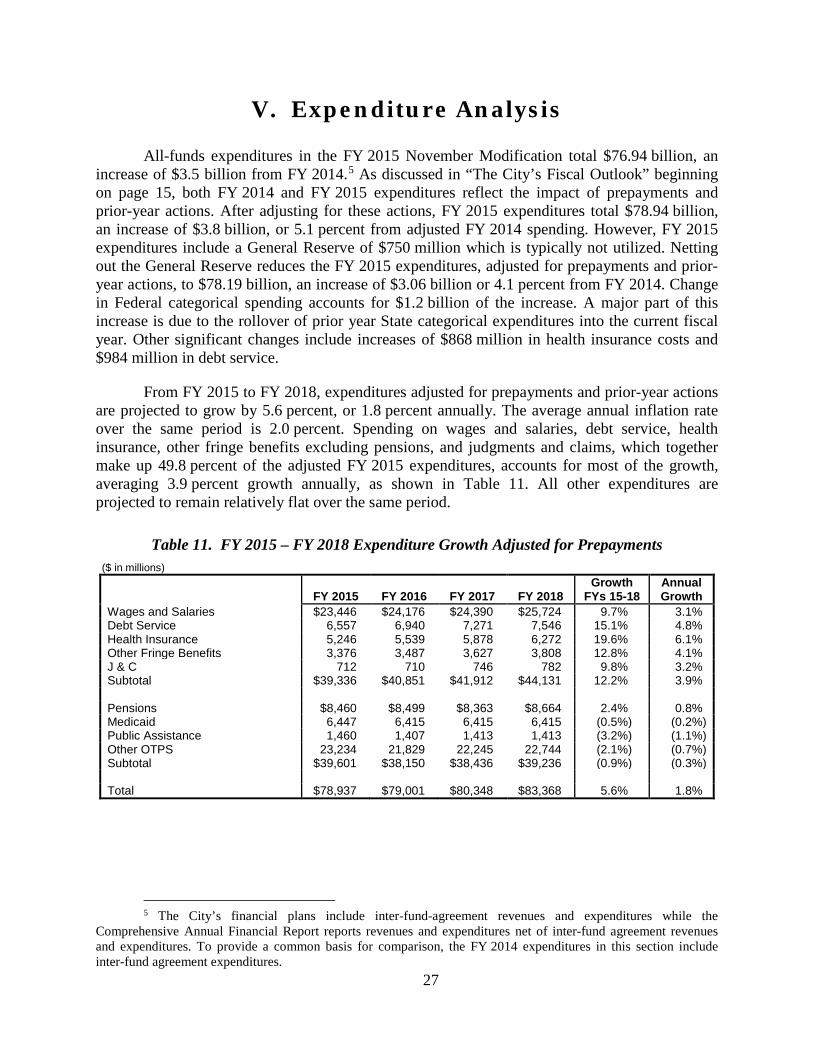
V. Expenditure Analysis
All-funds expenditures in the FY 2015 November Modification total $76.94 billion, an increase of $3.5 billion from FY 2014.5 As discussed in “The City’s Fiscal Outlook” beginning on page 15, both FY 2014 and FY 2015 expenditures reflect the impact of prepayments and prior-year actions. After adjusting for these actions, FY 2015 expenditures total $78.94 billion, an increase of $3.8 billion, or 5.1 percent from adjusted FY 2014 spending. However, FY 2015 expenditures include a General Reserve of $750 million which is typically not utilized. Netting out the General Reserve reduces the FY 2015 expenditures, adjusted for prepayments and prior-year actions, to $78.19 billion, an increase of $3.06 billion or 4.1 percent from FY 2014. Change in Federal categorical spending accounts for $1.2 billion of the increase. A major part of this increase is due to the rollover of prior year State categorical expenditures into the current fiscal year. Other significant changes include increases of $868 million in health insurance costs and $984 million in debt service.
From FY 2015 to FY 2018, expenditures adjusted for prepayments and prior-year actions are projected to grow by 5.6 percent, or 1.8 percent annually. The average annual inflation rate over the same period is 2.0 percent. Spending on wages and salaries, debt service, health insurance, other fringe benefits excluding pensions, and judgments and claims, which together make up 49.8 percent of the adjusted FY 2015 expenditures, accounts for most of the growth, averaging 3.9 percent growth annually, as shown in Table 11. All other expenditures are projected to remain relatively flat over the same period.
Table 11. FY 2015 – FY 2018 Expenditure Growth Adjusted for Prepayments ($ in millions)
FY 2015 FY 2016 FY 2017 FY 2018 Growth
FYs 15-18 Annual Growth
Wages and Salaries $23,446 $24,176 $24,390 $25,724 9.7% 3.1% Debt Service 6,557 6,940 7,271 7,546 15.1% 4.8% Health Insurance 5,246 5,539 5,878 6,272 19.6% 6.1% Other Fringe Benefits 3,376 3,487 3,627 3,808 12.8% 4.1% J & C 712 710 746 782 9.8% 3.2% Subtotal $39,336 $40,851 $41,912 $44,131 12.2% 3.9% Pensions $8,460 $8,499 $8,363 $8,664 2.4% 0.8% Medicaid 6,447 6,415 6,415 6,415 (0.5%) (0.2%) Public Assistance 1,460 1,407 1,413 1,413 (3.2%) (1.1%) Other OTPS 23,234 21,829 22,245 22,744 (2.1%) (0.7%) Subtotal $39,601 $38,150 $38,436 $39,236 (0.9%) (0.3%) Total $78,937 $79,001 $80,348 $83,368 5.6% 1.8%
5 The City’s financial plans include inter-fund-agreement revenues and expenditures while the Comprehensive Annual Financial Report reports revenues and expenditures net of inter-fund agreement revenues and expenditures. To provide a common basis for comparison, the FY 2014 expenditures in this section include inter-fund agreement expenditures.
27
Labor
Since the FY 2015 Adopted Budget, the City has settled contracts with SEIU Local 300, the United Probation Officers Association (UPOA), and the Teamsters Local 237. Subsequent to the release of the November plan, the City also reached tentative agreements with the Council of School Supervisors and Administrators (CSA) and the Uniformed Superior Officers Coalition (USOC), making the total 71 percent of the City’s workforce that have either settled labor contracts or have reached tentative agreements with the City.6
The CSA’s tentative agreement proposes a nine-year, one month and fifteen-day contract patterned after the United Federation of Teachers (UFT). 7 The first two years of the agreement correspond to the 2008 – 2010 round of collective bargaining, a period for which most of the City’s other municipal labor unions had reached a two year agreement wherein members received two annual wage increases of four percent. The latter seven years of the agreement cover the current round of collective bargaining.
For the 2008 – 2010 round of collective bargaining, the agreement will compensate CSA members for the two 4 percent wage increases that were given in the 2008 – 2010 round. However, under the terms of the agreement, the value of these increases will be converted into a series of base salary increases and structured lump sum payments. First, the two 4 percent wage increases will be integrated into the salary base over four installments of approximately two percent annual increases beginning on September 6, 2015. Therefore, by September 6, 2018, the 2008-2010 round raises will be fully incorporated into the members’ salaries. Second, the cumulative lump sum that will accrue between March 6, 2010 and September 6, 2018 will be paid to active members and members who retire after June 30, 2014 in installments, as follows: 12.5 percent in FY 2016, 12.5 percent in FY 2018, 25 percent in FY 2019, 25 percent in FY 2020 and the remainder in FY 2021. Members who retired on or before June 30, 2015 will receive one lump sum payment for the accrued amounts resulting from the two 4 percent wage increases on March 6, 2010 and March 6, 2011.
Members who were promoted into CSA leadership positions from the classroom subsequent to the 4 percent increases and those who will be promoted into CSA positions in the future, will also receive the structured lump sum payments. Members who will be promoted into superintendent or management positions out of CSA before ratification will also be eligible for the structured lump sum payments. The City estimates that it will cost an additional $120 million to fund the structured lump sum payments to these members. This cost will be borne by the City and CSA. The City’s share is estimated to be $72 million.
The tentative agreement reached with the USOC corresponds to the latter seven years of the UFT contract. It modifies the pattern of the UFT agreement by providing an additional one percent increase over the UFT pattern. This additional one percent increase will be effective
6 The USOC represents the Detectives Endowment Association, the Uniformed Fire Officers Association, the Lieutenants Benevolent Association, the Sanitation Officers Association, the Correction Captains Association, the Captains Endowment Association, the Assistant Deputy Wardens/Deputy Warden Association, and the Uniformed Sanitation Chiefs Association.
7 The UFT contract is discussed in detail in the Comptroller’s report, “Comments on New York City’s
Modified Fiscal Year 2015 Executive Budget”, June 4, 2014. 28
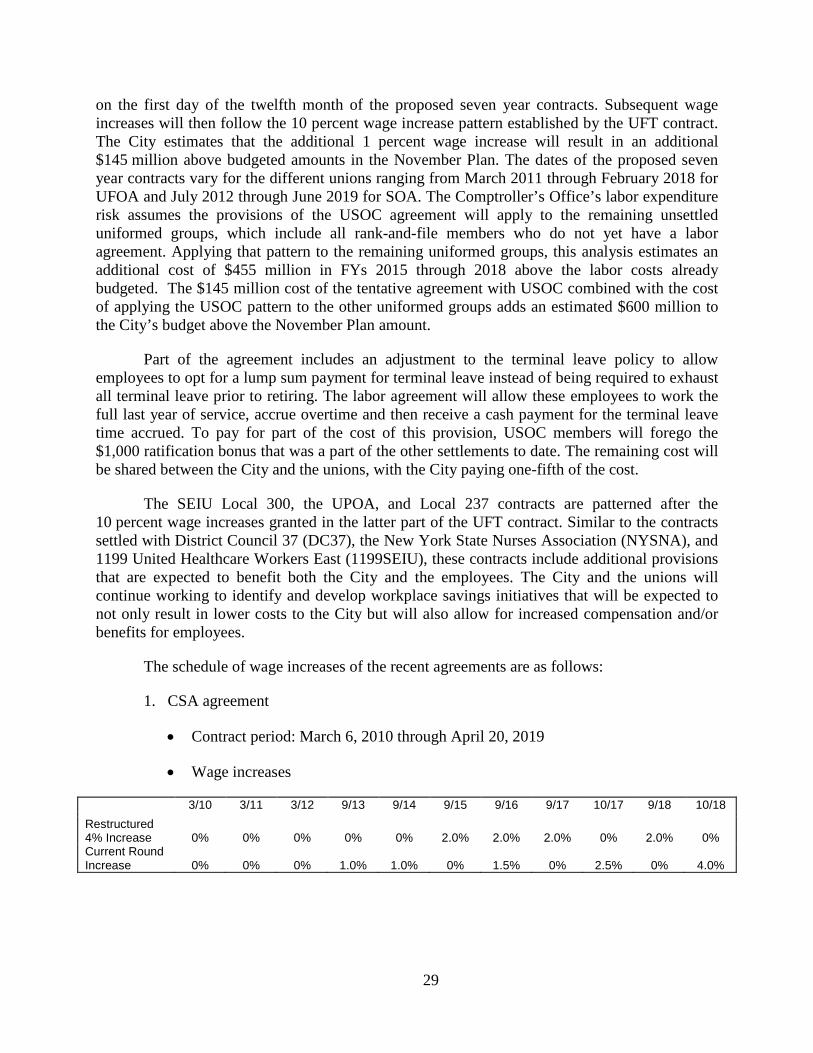
on the first day of the twelfth month of the proposed seven year contracts. Subsequent wage increases will then follow the 10 percent wage increase pattern established by the UFT contract. The City estimates that the additional 1 percent wage increase will result in an additional $145 million above budgeted amounts in the November Plan. The dates of the proposed seven year contracts vary for the different unions ranging from March 2011 through February 2018 for UFOA and July 2012 through June 2019 for SOA. The Comptroller’s Office’s labor expenditure risk assumes the provisions of the USOC agreement will apply to the remaining unsettled uniformed groups, which include all rank-and-file members who do not yet have a labor agreement. Applying that pattern to the remaining uniformed groups, this analysis estimates an additional cost of $455 million in FYs 2015 through 2018 above the labor costs already budgeted. The $145 million cost of the tentative agreement with USOC combined with the cost of applying the USOC pattern to the other uniformed groups adds an estimated $600 million to the City’s budget above the November Plan amount.
Part of the agreement includes an adjustment to the terminal leave policy to allow employees to opt for a lump sum payment for terminal leave instead of being required to exhaust all terminal leave prior to retiring. The labor agreement will allow these employees to work the full last year of service, accrue overtime and then receive a cash payment for the terminal leave time accrued. To pay for part of the cost of this provision, USOC members will forego the $1,000 ratification bonus that was a part of the other settlements to date. The remaining cost will be shared between the City and the unions, with the City paying one-fifth of the cost.
The SEIU Local 300, the UPOA, and Local 237 contracts are patterned after the 10 percent wage increases granted in the latter part of the UFT contract. Similar to the contracts settled with District Council 37 (DC37), the New York State Nurses Association (NYSNA), and 1199 United Healthcare Workers East (1199SEIU), these contracts include additional provisions that are expected to benefit both the City and the employees. The City and the unions will continue working to identify and develop workplace savings initiatives that will be expected to not only result in lower costs to the City but will also allow for increased compensation and/or benefits for employees.
The schedule of wage increases of the recent agreements are as follows:
1. CSA agreement
• Contract period: March 6, 2010 through April 20, 2019
• Wage increases
3/10 3/11 3/12 9/13 9/14 9/15 9/16 9/17 10/17 9/18 10/18 Restructured
4% Increase 0% 0% 0% 0% 0% 2.0% 2.0% 2.0% 0% 2.0% 0% Current Round Increase 0% 0% 0% 1.0% 1.0% 0% 1.5% 0% 2.5% 0% 4.0%
29
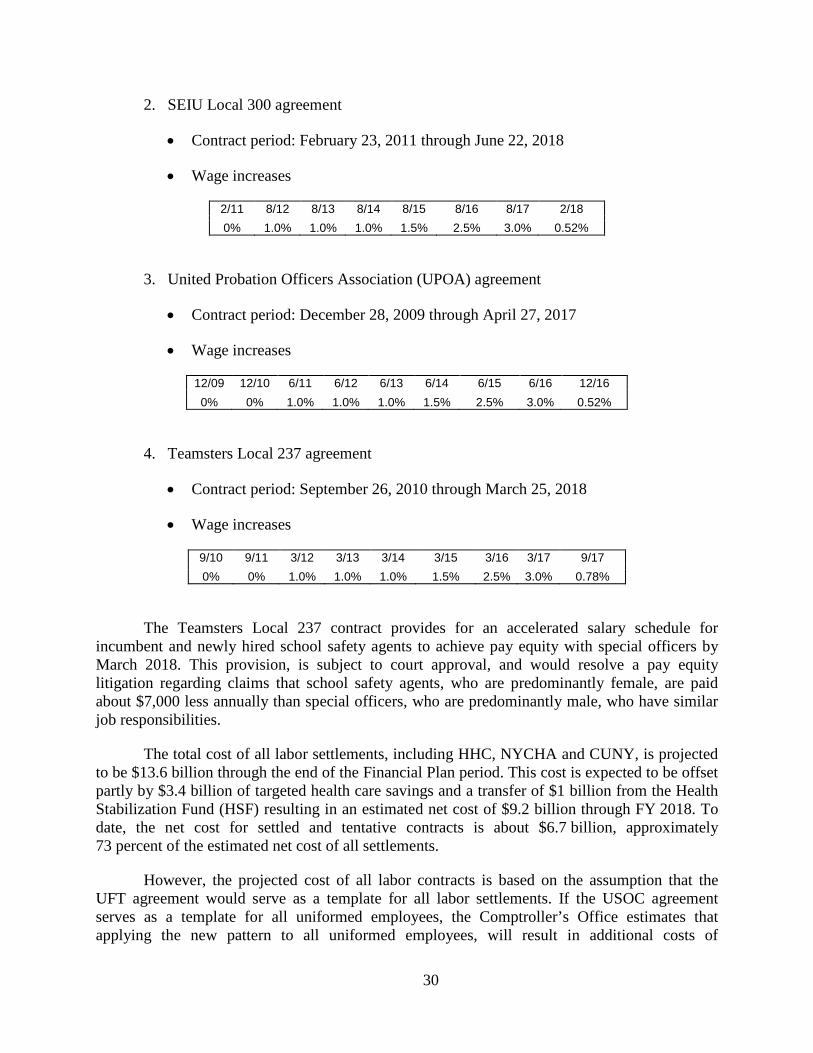
2. SEIU Local 300 agreement
• Contract period: February 23, 2011 through June 22, 2018
• Wage increases
2/11 8/12 8/13 8/14 8/15 8/16 8/17 2/18 0% 1.0% 1.0% 1.0% 1.5% 2.5% 3.0% 0.52%
3. United Probation Officers Association (UPOA) agreement
• Contract period: December 28, 2009 through April 27, 2017
• Wage increases
12/09 12/10 6/11 6/12 6/13 6/14 6/15 6/16 12/16 0% 0% 1.0% 1.0% 1.0% 1.5% 2.5% 3.0% 0.52%
4. Teamsters Local 237 agreement
• Contract period: September 26, 2010 through March 25, 2018
• Wage increases
9/10 9/11 3/12 3/13 3/14 3/15 3/16 3/17 9/17 0% 0% 1.0% 1.0% 1.0% 1.5% 2.5% 3.0% 0.78%
The Teamsters Local 237 contract provides for an accelerated salary schedule for incumbent and newly hired school safety agents to achieve pay equity with special officers by March 2018. This provision, is subject to court approval, and would resolve a pay equity litigation regarding claims that school safety agents, who are predominantly female, are paid about $7,000 less annually than special officers, who are predominantly male, who have similar job responsibilities.
The total cost of all labor settlements, including HHC, NYCHA and CUNY, is projected to be $13.6 billion through the end of the Financial Plan period. This cost is expected to be offset partly by $3.4 billion of targeted health care savings and a transfer of $1 billion from the Health Stabilization Fund (HSF) resulting in an estimated net cost of $9.2 billion through FY 2018. To date, the net cost for settled and tentative contracts is about $6.7 billion, approximately 73 percent of the estimated net cost of all settlements.
However, the projected cost of all labor contracts is based on the assumption that the UFT agreement would serve as a template for all labor settlements. If the USOC agreement serves as a template for all uniformed employees, the Comptroller’s Office estimates that applying the new pattern to all uniformed employees, will result in additional costs of
30
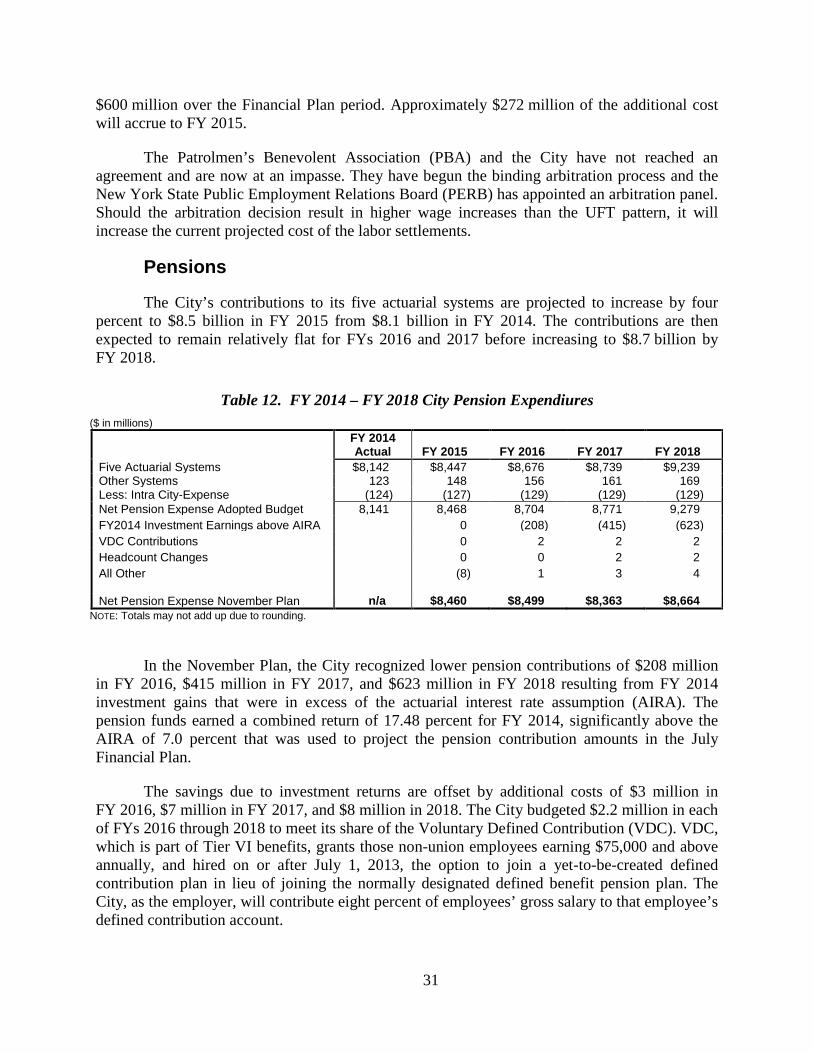
$600 million over the Financial Plan period. Approximately $272 million of the additional cost will accrue to FY 2015.
The Patrolmen’s Benevolent Association (PBA) and the City have not reached an agreement and are now at an impasse. They have begun the binding arbitration process and the New York State Public Employment Relations Board (PERB) has appointed an arbitration panel. Should the arbitration decision result in higher wage increases than the UFT pattern, it will increase the current projected cost of the labor settlements.
Pensions
The City’s contributions to its five actuarial systems are projected to increase by four percent to $8.5 billion in FY 2015 from $8.1 billion in FY 2014. The contributions are then expected to remain relatively flat for FYs 2016 and 2017 before increasing to $8.7 billion by FY 2018.
Table 12. FY 2014 – FY 2018 City Pension Expendiures ($ in millions)
FY 2014 Actual FY 2015 FY 2016 FY 2017 FY 2018
Five Actuarial Systems $8,142 $8,447 $8,676 $8,739 $9,239 Other Systems 123 148 156 161 169 Less: Intra City-Expense (124) (127) (129) (129) (129) Net Pension Expense Adopted Budget 8,141 8,468 8,704 8,771 9,279 FY2014 Investment Earnings above AIRA 0 (208) (415) (623) VDC Contributions 0 2 2 2 Headcount Changes 0 0 2 2 All Other (8) 1 3 4 Net Pension Expense November Plan n/a $8,460 $8,499 $8,363 $8,664
NOTE: Totals may not add up due to rounding.
In the November Plan, the City recognized lower pension contributions of $208 million in FY 2016, $415 million in FY 2017, and $623 million in FY 2018 resulting from FY 2014 investment gains that were in excess of the actuarial interest rate assumption (AIRA). The pension funds earned a combined return of 17.48 percent for FY 2014, significantly above the AIRA of 7.0 percent that was used to project the pension contribution amounts in the July Financial Plan.
The savings due to investment returns are offset by additional costs of $3 million in FY 2016, $7 million in FY 2017, and $8 million in 2018. The City budgeted $2.2 million in each of FYs 2016 through 2018 to meet its share of the Voluntary Defined Contribution (VDC). VDC, which is part of Tier VI benefits, grants those non-union employees earning $75,000 and above annually, and hired on or after July 1, 2013, the option to join a yet-to-be-created defined contribution plan in lieu of joining the normally designated defined benefit pension plan. The City, as the employer, will contribute eight percent of employees’ gross salary to that employee’s defined contribution account.
31
Headcount
The November 2014 Financial Plan reflects increases in full-time City-funded headcount, totaling 1,009 positions as shown in Table 13. These include:
• 184 positions for the Department of Education, including 145 pedagogical positions
• 146 positions for the Department of Correction, including 99 for Adolescent Management and 35 for Discharge Planning Expansion
• 82 positions for the Department of Social Services, with 48 for expanding rent arrears services for clients
• 81 positions for the Department of Citywide Administrative Services, including 18 for the City’s “One City, Built to Last” and 12 for Civil Service compliance
• 53 positions for the Department of Health and Mental Hygiene, including 28 for Discharge Planning and 13 for Ebola Rapid Response
• 53 positions for the Department of Information Technology and Telecommunications, including 40 for 311 services
• 46 positions for the Fire Department for EMS Service Level Maintenance • 36 positions for the Department of Finance, including 18 for the Department’s
Business Tax System • 28 positions for the Department of Homeless Services to provide increased
security in homeless shelters.
The November 2014 Financial Plan, as compared to the June Adopted Plan, includes City-funds for the hiring of more than 80 civilian full-time equivalent (FTE) employees in the Police Department. Civilian employees in the Police Department allow uniformed police officers currently performing functions other than patrol and enforcement to be redeployed to perform these duties.
32
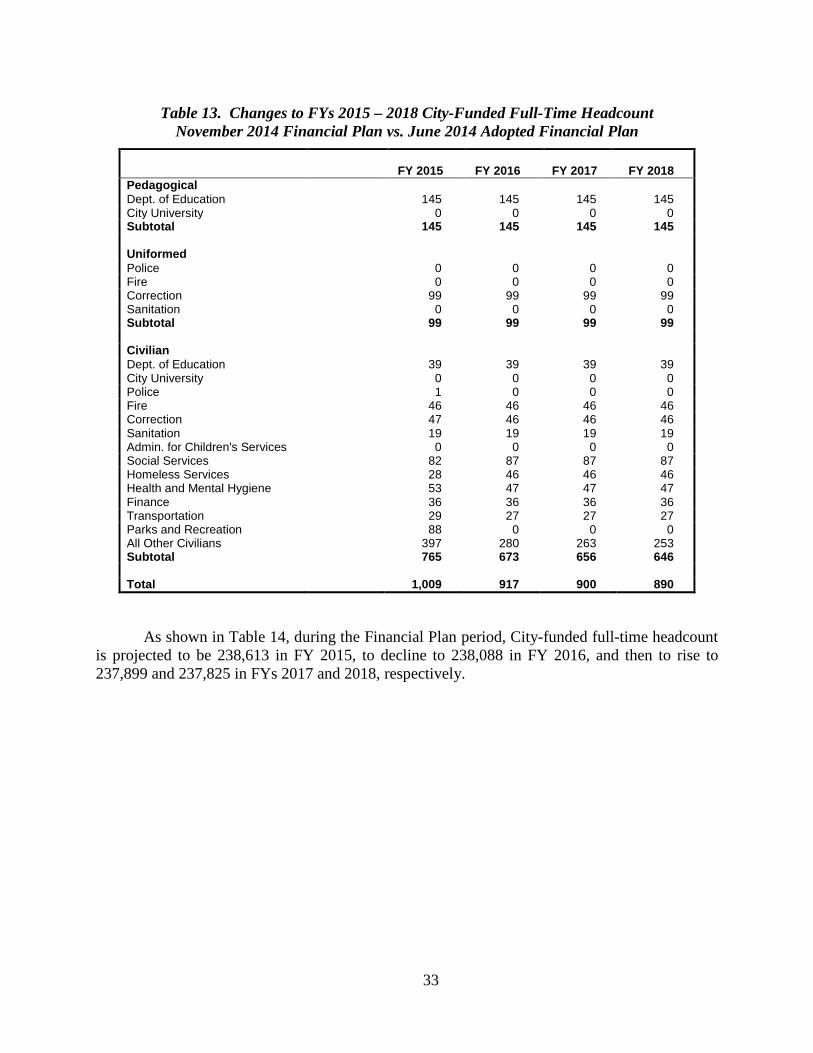
Table 13. Changes to FYs 2015 – 2018 City-Funded Full-Time Headcount November 2014 Financial Plan vs. June 2014 Adopted Financial Plan
FY 2015 FY 2016
FY 2017 FY 2018
Pedagogical Dept. of Education 145 145 145 145 City University 0 0 0 0 Subtotal 145 145 145 145 Uniformed Police 0 0 0 0 Fire 0 0 0 0 Correction 99 99 99 99 Sanitation 0 0 0 0 Subtotal 99 99 99 99 Civilian Dept. of Education 39 39 39 39 City University 0 0 0 0 Police 1 0 0 0 Fire 46 46 46 46 Correction 47 46 46 46 Sanitation 19 19 19 19 Admin. for Children's Services 0 0 0 0 Social Services 82 87 87 87 Homeless Services 28 46 46 46 Health and Mental Hygiene 53 47 47 47 Finance 36 36 36 36 Transportation 29 27 27 27 Parks and Recreation 88 0 0 0 All Other Civilians 397 280 263 253 Subtotal 765 673 656 646 Total 1,009 917 900 890
As shown in Table 14, during the Financial Plan period, City-funded full-time headcount is projected to be 238,613 in FY 2015, to decline to 238,088 in FY 2016, and then to rise to 237,899 and 237,825 in FYs 2017 and 2018, respectively.
33
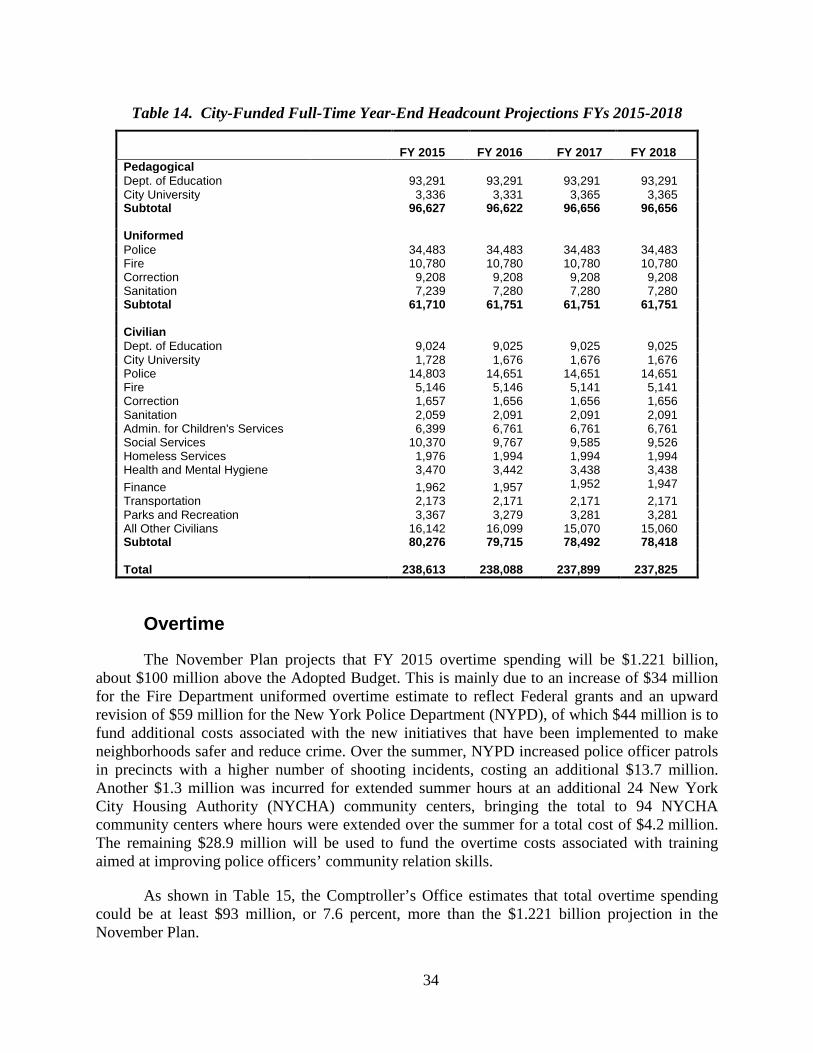
Table 14. City-Funded Full-Time Year-End Headcount Projections FYs 2015-2018
FY 2015 FY 2016
FY 2017
FY 2018 Pedagogical Dept. of Education 93,291 93,291 93,291 93,291 City University 3,336 3,331 3,365 3,365 Subtotal 96,627 96,622 96,656 96,656 Uniformed Police 34,483 34,483 34,483 34,483 Fire 10,780 10,780 10,780 10,780 Correction 9,208 9,208 9,208 9,208 Sanitation 7,239 7,280 7,280 7,280 Subtotal 61,710 61,751 61,751 61,751 Civilian Dept. of Education 9,024 9,025 9,025 9,025 City University 1,728 1,676 1,676 1,676 Police 14,803 14,651 14,651 14,651 Fire 5,146 5,146 5,141 5,141 Correction 1,657 1,656 1,656 1,656 Sanitation 2,059 2,091 2,091 2,091 Admin. for Children's Services 6,399 6,761 6,761 6,761 Social Services 10,370 9,767 9,585 9,526 Homeless Services 1,976 1,994 1,994 1,994 Health and Mental Hygiene 3,470 3,442 3,438 3,438 Finance 1,962 1,957 1,952 1,947 Transportation 2,173 2,171 2,171 2,171 Parks and Recreation 3,367 3,279 3,281 3,281 All Other Civilians 16,142 16,099 15,070 15,060 Subtotal 80,276 79,715 78,492 78,418 Total 238,613 238,088 237,899 237,825
Overtime
The November Plan projects that FY 2015 overtime spending will be $1.221 billion, about $100 million above the Adopted Budget. This is mainly due to an increase of $34 million for the Fire Department uniformed overtime estimate to reflect Federal grants and an upward revision of $59 million for the New York Police Department (NYPD), of which $44 million is to fund additional costs associated with the new initiatives that have been implemented to make neighborhoods safer and reduce crime. Over the summer, NYPD increased police officer patrols in precincts with a higher number of shooting incidents, costing an additional $13.7 million. Another $1.3 million was incurred for extended summer hours at an additional 24 New York City Housing Authority (NYCHA) community centers, bringing the total to 94 NYCHA community centers where hours were extended over the summer for a total cost of $4.2 million. The remaining $28.9 million will be used to fund the overtime costs associated with training aimed at improving police officers’ community relation skills.
As shown in Table 15, the Comptroller’s Office estimates that total overtime spending could be at least $93 million, or 7.6 percent, more than the $1.221 billion projection in the November Plan.
34
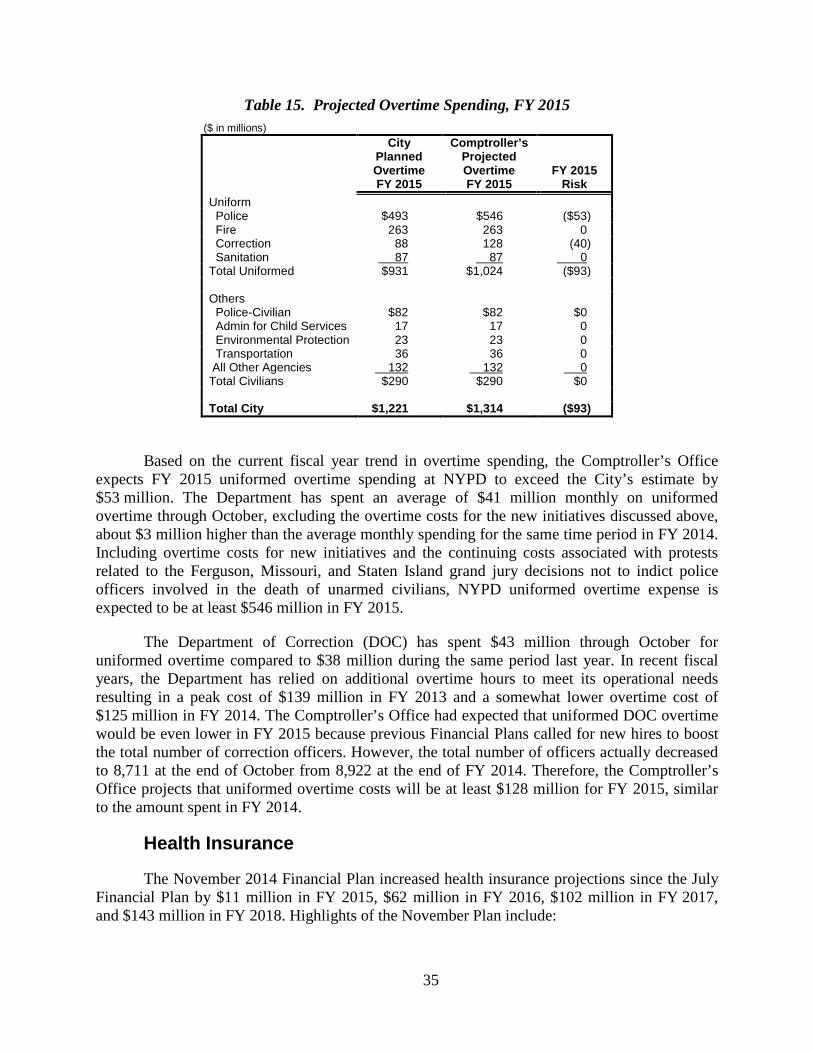
Table 15. Projected Overtime Spending, FY 2015 ($ in millions)
City
Planned Overtime FY 2015
Comptroller’s Projected Overtime FY 2015
FY 2015 Risk
Uniform Police $493 $546 ($53) Fire 263 263 0 Correction 88 128 (40) Sanitation 87 87 0 Total Uniformed $931 $1,024 ($93) Others Police-Civilian $82 $82 $0 Admin for Child Services 17 17 0 Environmental Protection 23 23 0 Transportation 36 36 0 All Other Agencies 132 132 0 Total Civilians $290 $290 $0 Total City $1,221 $1,314 ($93)
Based on the current fiscal year trend in overtime spending, the Comptroller’s Office expects FY 2015 uniformed overtime spending at NYPD to exceed the City’s estimate by $53 million. The Department has spent an average of $41 million monthly on uniformed overtime through October, excluding the overtime costs for the new initiatives discussed above, about $3 million higher than the average monthly spending for the same time period in FY 2014. Including overtime costs for new initiatives and the continuing costs associated with protests related to the Ferguson, Missouri, and Staten Island grand jury decisions not to indict police officers involved in the death of unarmed civilians, NYPD uniformed overtime expense is expected to be at least $546 million in FY 2015.
The Department of Correction (DOC) has spent $43 million through October for uniformed overtime compared to $38 million during the same period last year. In recent fiscal years, the Department has relied on additional overtime hours to meet its operational needs resulting in a peak cost of $139 million in FY 2013 and a somewhat lower overtime cost of $125 million in FY 2014. The Comptroller’s Office had expected that uniformed DOC overtime would be even lower in FY 2015 because previous Financial Plans called for new hires to boost the total number of correction officers. However, the total number of officers actually decreased to 8,711 at the end of October from 8,922 at the end of FY 2014. Therefore, the Comptroller’s Office projects that uniformed overtime costs will be at least $128 million for FY 2015, similar to the amount spent in FY 2014.
Health Insurance
The November 2014 Financial Plan increased health insurance projections since the July Financial Plan by $11 million in FY 2015, $62 million in FY 2016, $102 million in FY 2017, and $143 million in FY 2018. Highlights of the November Plan include:
35
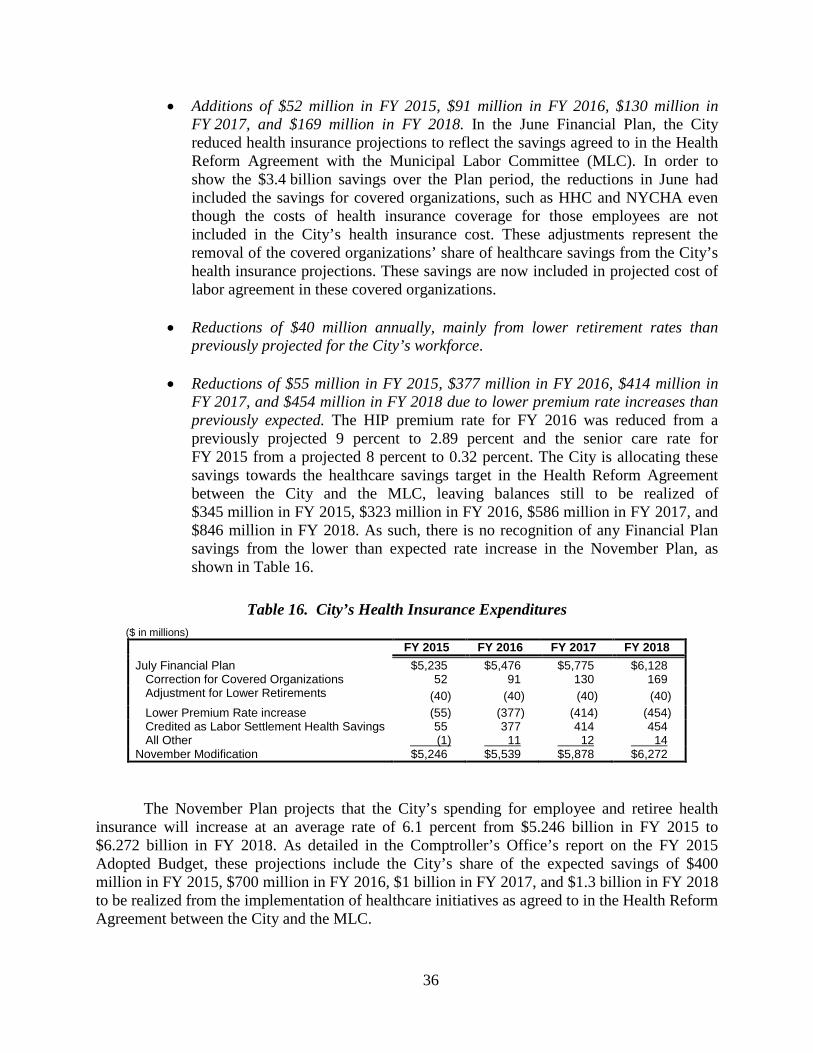
• Additions of $52 million in FY 2015, $91 million in FY 2016, $130 million in FY 2017, and $169 million in FY 2018. In the June Financial Plan, the City reduced health insurance projections to reflect the savings agreed to in the Health Reform Agreement with the Municipal Labor Committee (MLC). In order to show the $3.4 billion savings over the Plan period, the reductions in June had included the savings for covered organizations, such as HHC and NYCHA even though the costs of health insurance coverage for those employees are not included in the City’s health insurance cost. These adjustments represent the removal of the covered organizations’ share of healthcare savings from the City’s health insurance projections. These savings are now included in projected cost of labor agreement in these covered organizations.
• Reductions of $40 million annually, mainly from lower retirement rates than previously projected for the City’s workforce.
• Reductions of $55 million in FY 2015, $377 million in FY 2016, $414 million in FY 2017, and $454 million in FY 2018 due to lower premium rate increases than previously expected. The HIP premium rate for FY 2016 was reduced from a previously projected 9 percent to 2.89 percent and the senior care rate for FY 2015 from a projected 8 percent to 0.32 percent. The City is allocating these savings towards the healthcare savings target in the Health Reform Agreement between the City and the MLC, leaving balances still to be realized of $345 million in FY 2015, $323 million in FY 2016, $586 million in FY 2017, and $846 million in FY 2018. As such, there is no recognition of any Financial Plan savings from the lower than expected rate increase in the November Plan, as shown in Table 16.
Table 16. City’s Health Insurance Expenditures ($ in millions)
FY 2015 FY 2016 FY 2017 FY 2018 July Financial Plan $5,235 $5,476 $5,775 $6,128 Correction for Covered Organizations 52 91 130 169 Adjustment for Lower Retirements (40) (40) (40) (40) Lower Premium Rate increase (55) (377) (414) (454) Credited as Labor Settlement Health Savings 55 377 414 454 All Other (1) 11 12 14 November Modification $5,246 $5,539 $5,878 $6,272
The November Plan projects that the City’s spending for employee and retiree health
insurance will increase at an average rate of 6.1 percent from $5.246 billion in FY 2015 to $6.272 billion in FY 2018. As detailed in the Comptroller’s Office’s report on the FY 2015 Adopted Budget, these projections include the City’s share of the expected savings of $400 million in FY 2015, $700 million in FY 2016, $1 billion in FY 2017, and $1.3 billion in FY 2018 to be realized from the implementation of healthcare initiatives as agreed to in the Health Reform Agreement between the City and the MLC.
36
The City’s FY 2015 health insurance expense in the November Plan is projected to be
1.3 percent lower than the amount spent in FY 2014, net of the FY 2014 transfer of $864 million to the Retiree Health Benefits Trust (RHBT). The decline reflects mainly the assumed $400 million Labor Settlement healthcare savings. The health insurance premium rates for FY 2015 remain relatively unchanged from FY 2014.
Public Assistance
Through November, the City’s FY 2015 public assistance caseload has averaged 345,575 recipients per month. The average monthly caseload has increased by less than one percent, or 1,830 recipients compared to the average monthly caseload in FY 2014. While the City’s public assistance caseload still remains about 70 percent below the historical peak, it has rebounded sharply over the past six months after falling to an interim low of 336,403 in May. The November 2014 public assistance caseload of 349,568 represents an increase of almost 4 percent from the May caseload. Thus far in FY 2014, public assistance spending has averaged more than $110 million per month, representing a 4 percent increase from the FY 2014 monthly average of approximately $106 million.
The City’s FY 2015 public assistance caseload projections remain unchanged in the November Plan, at an average of 350,297 over the plan period. Total baseline grants expenditures are projected at approximately $1.38 billion in FY 2015 and $1.35 billion in each of FYs 2016-2018. The higher grant level for the current year is due to an increase of $34 million in the November Plan to support expansion of the rent arrears program for public assistance clients.8 The City’s budget projections for public assistance appear in line with actual spending thus far in FY 2015. However, if the increase in the City’s public assistance spending continues for an extended period, it may pose a risk to the City’s outyear plan assumptions.
Department of Education
The November Modification reflects an increase of $7 million to the Department of Education (DOE) budget in the current year, raising it to $20.75 billion in FY 2015. This total is an increase of 3.5 percent or $697 million compared to the FY 2014 DOE spending of $20.05 billion.
The November Plan increased City funds by $64 million and reduced Federal and State support by $57 million. The changes to City funds include a host of new needs totaling $18 million in the current year, including funding for facilities costs of new schools ($4 million), peer validators for teacher evaluations ($3 million), card reader systems for school food services ($3 million), installation of school door alarms required under the 2014 enacted Avonte’s Law ($2 million) and additional costs from continued non-participation in the E-Rate program
8 The November Plan also provides additional rental assistance funding of $14 million in FY 2015 under the new Living in Communities (LINC) program that helps families relocate from homeless and domestic violence shelters into more permanent housing situations. Funding for the LINC program is budgeted both in the Departments of Social Services and Homeless Services, totaling nearly $40 million annually in FY 2016 and FY 2017 and $25 million in FY 2018.
37
($2 million).9 The November Plan also reflects a number of collective bargaining transfers from the labor reserve that increase City funds by another $46 million in the Department’s budget. The decline in Federal and State aid is attributable to a $52 million reduction in Title I funding and $5 million less in State Full-Day Universal Pre-kindergarten revenue. The DOE’s FY 2016 budget is projected to rise to $21.46 billion, increasing by $716 million or 3.5 percent from the FY 2015 projection. Compared to the June Plan, the FY 2016 budget has increased by only $26 million. Over the remainder of the Plan, the City projects the DOE budget to rise to $22.27 billion in FY 2017 and $23.15 billion in FY 2018, reflecting annual increases of $804 million and $878 million, respectively. State aid would comprise about $1.09 billion or 46 percent of the cumulative growth of $2.4 billion in FYs 2016-2018, with City and other categorical funds making up the remainder of the increase.
The Department’s budget will likely continue to face risks due to its assumptions of Federal Medicaid reimbursement in the November Plan. The DOE estimates it will realize $67 million in Medicaid revenue in the current year for reimbursement of special education costs for occupational and physical therapies. Over the outyears, Medicaid revenues are budgeted to rise to $97 million annually. While the Department continues to expand its effort to improve Medicaid collections, including the issuance of Google Chromebooks to therapists for more efficient documentation of session data, the revenue targets in the November Plan remain well above actual collections. The Department only managed to collect Medicaid revenues of $15 million each year in both FY 2013 and FY 2014. Therefore, the Comptroller’s Office projects DOE Medicaid revenue risks of $50 million in FY 2015 and $70 million in each of FYs 2016-2018.
Debt Service
As shown in Table 17, the November Financial Plan for debt service, after netting out for the impact of prepayments, totals $6.63 billion in FY 2015, $7.01 billion in FY 2016, $7.35 billion in FY 2017 and $7.63 billion in FY 2018.10 These amounts represent decreases from the June 2014 Financial Plan of $95 million in FY 2015, $405 million in FY 2016, $311 million in FY 2017, and $293 million in FY 2018. Between FY 2015 and FY 2018, total debt service is projected to increase by $997 million, or 15.0 percent. These figures do not include debt of the New York City Municipal Water Finance Authority (NYW), which is backed by water and sewer user charges, nor that of the New York City Transitional Finance Authority Building Aid Revenue Bonds (TFA BARB) debt, which is repaid from State building aid.
9 The Federal E-Rate program subsidizes school expenses for internet and other telecommunications services based on poverty and eligible costs. E-Rate has suspended payments for City expenses dating back to 2011 due to an investigation into DOE’s compliance with the rules of the program. As the City seeks to restore its E-Rate subsidy, it had to set aside more than $80 million at the close of FY 2014 for prior year expenses covering the period between FY 2011 and FY 2013. In addition, the City spent $40 million to cover the E-Rate costs in FY 2014 bringing the total to more than $120 million through FY 2014. The additional funding reflected in the November Plan raises annual provisions to $42 million in the DOE budget to address potential needs from this ongoing issue.
10 Includes GO, TFA PIT bonds, TSASC, as well as interest on short-term notes.
38
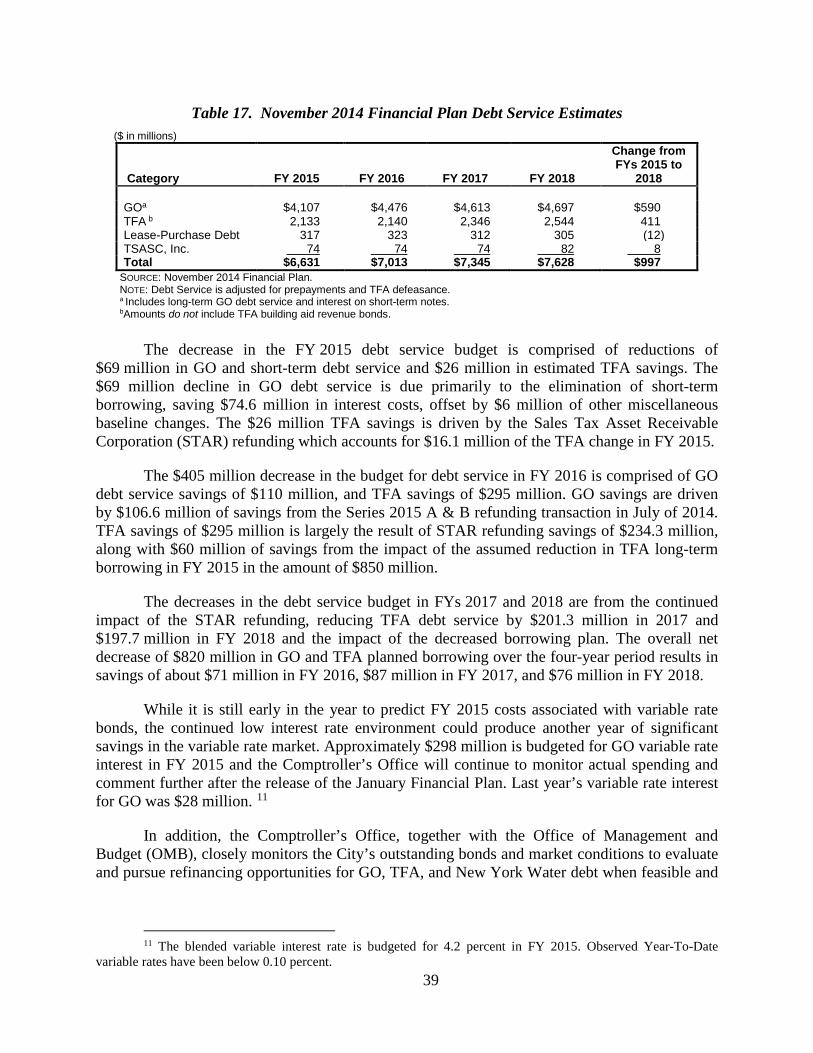
Table 17. November 2014 Financial Plan Debt Service Estimates ($ in millions)
Category FY 2015 FY 2016 FY 2017 FY 2018
Change from FYs 2015 to
2018 GOa $4,107 $4,476 $4,613 $4,697 $590 TFA b 2,133 2,140 2,346 2,544 411 Lease-Purchase Debt 317 323 312 305 (12) TSASC, Inc. 74 74 74 82 8 Total $6,631 $7,013 $7,345 $7,628 $997
SOURCE: November 2014 Financial Plan. NOTE: Debt Service is adjusted for prepayments and TFA defeasance. a Includes long-term GO debt service and interest on short-term notes. bAmounts do not include TFA building aid revenue bonds.
The decrease in the FY 2015 debt service budget is comprised of reductions of $69 million in GO and short-term debt service and $26 million in estimated TFA savings. The $69 million decline in GO debt service is due primarily to the elimination of short-term borrowing, saving $74.6 million in interest costs, offset by $6 million of other miscellaneous baseline changes. The $26 million TFA savings is driven by the Sales Tax Asset Receivable Corporation (STAR) refunding which accounts for $16.1 million of the TFA change in FY 2015.
The $405 million decrease in the budget for debt service in FY 2016 is comprised of GO debt service savings of $110 million, and TFA savings of $295 million. GO savings are driven by $106.6 million of savings from the Series 2015 A & B refunding transaction in July of 2014. TFA savings of $295 million is largely the result of STAR refunding savings of $234.3 million, along with $60 million of savings from the impact of the assumed reduction in TFA long-term borrowing in FY 2015 in the amount of $850 million.
The decreases in the debt service budget in FYs 2017 and 2018 are from the continued impact of the STAR refunding, reducing TFA debt service by $201.3 million in 2017 and $197.7 million in FY 2018 and the impact of the decreased borrowing plan. The overall net decrease of $820 million in GO and TFA planned borrowing over the four-year period results in savings of about $71 million in FY 2016, $87 million in FY 2017, and $76 million in FY 2018.
While it is still early in the year to predict FY 2015 costs associated with variable rate bonds, the continued low interest rate environment could produce another year of significant savings in the variable rate market. Approximately $298 million is budgeted for GO variable rate interest in FY 2015 and the Comptroller’s Office will continue to monitor actual spending and comment further after the release of the January Financial Plan. Last year’s variable rate interest for GO was $28 million. 11
In addition, the Comptroller’s Office, together with the Office of Management and Budget (OMB), closely monitors the City’s outstanding bonds and market conditions to evaluate and pursue refinancing opportunities for GO, TFA, and New York Water debt when feasible and
11 The blended variable interest rate is budgeted for 4.2 percent in FY 2015. Observed Year-To-Date variable rates have been below 0.10 percent.
39
cost-effective. Since January 1, 2010, refundings have saved City taxpayers and water and sewer rate payers over $3.3 billion in budgetary savings.12
Comparison with FY 2014 CAFR Actual
Debt service in the FY 2014 CAFR totals $4.798 billion.13 In order for the 2014 figure to be comparable to FYs 2015-2018, it is necessary to adjust for prepayments. In June of 2013, the City prepaid FY 2014 GO debt service in the amount of $2.727 billion.14 In June of 2014, the City prepaid $1.983 billion of FY 2015 debt service ($1.362 billion of TFA and $621 million of GO debt service). Because the FY 2013 prepayment of $2.727 billion reduces debt service in FY 2014 with resources in FY 2013, it is added back to the FY 2014 debt service total. Conversely, the FY 2014 prepayment is subtracted from the FY 2014 total, because the payment is for FY 2015 debt service and should not be counted against FY 2014. The adjustments bring the FY 2014 actual to $5.572 billion. FY 2015 debt service in the November Plan, adjusted for prior-year actions, is projected to be $985 million higher than FY 2014. The major factors explaining the increase are approximately $400 million of principal and interest costs on existing and projected debt service, about $390 million in higher estimated GO and TFA VRDB costs, $99 million for the FY 2012 TFA defeasance action impacting FY 2015, $57 million in higher projected lease-purchase debt service costs, along with $41 million of higher estimated interest exchange and index bond interest costs.
Debt Affordability
Debt service as a percent of local tax revenues and as a percent of City-funds expenditures are commonly used measures of debt affordability.15 In FY 2014, the City’s debt service was 11.7 percent of local tax revenues. The November Plan projects debt service will consume 13.4 percent of local tax revenues in FY 2015, 13.7 percent in FY 2016, and 13.8 percent in both FYs 2017 and 2018, as shown in Chart 5. The increase in the debt service to tax revenue ratio reflects the disparity between debt service and tax revenue growth over the Plan period. Debt service is projected to grow at an average annual rate of 4.8 percent from FYs 2015 to 2018 while tax revenue during this period is projected to grow 3.6 percent annually.
12 Refunding savings number includes STAR savings of $649.4 million. 13 This total excludes TSASC debt service. 14 $31 million prepayment for lease-purchase is also added back to FY 2014. 15 Debt service in this discussion is adjusted for prepayments.
40
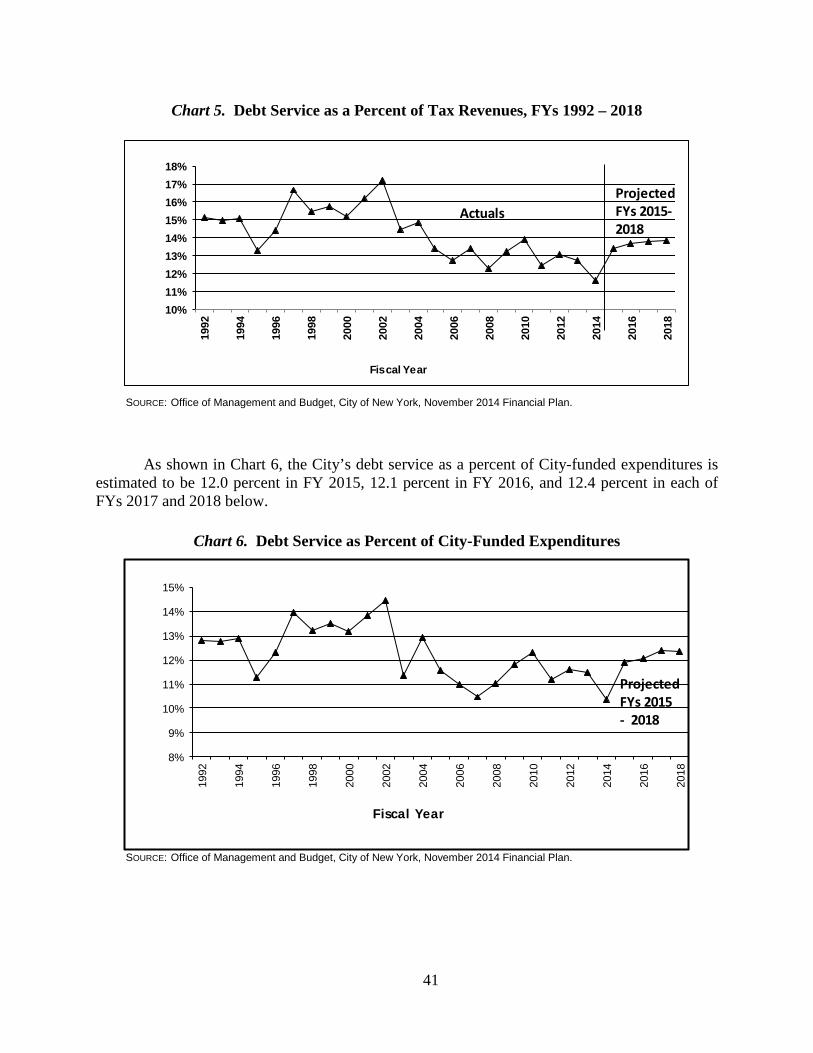
Chart 5. Debt Service as a Percent of Tax Revenues, FYs 1992 – 2018
SOURCE: Office of Management and Budget, City of New York, November 2014 Financial Plan.
As shown in Chart 6, the City’s debt service as a percent of City-funded expenditures is estimated to be 12.0 percent in FY 2015, 12.1 percent in FY 2016, and 12.4 percent in each of FYs 2017 and 2018 below.
Chart 6. Debt Service as Percent of City-Funded Expenditures
SOURCE: Office of Management and Budget, City of New York, November 2014 Financial Plan.
8%
9%
10%
11%
12%
13%
14%
15%
1992
1994
1996
1998
2000
2002
2004
2006
2008
2010
2012
2014
2016
2018
Fiscal Year
Projected FYs 2015 - 2018
10%11%12%13%14%15%16%17%18%
1992
1994
1996
1998
2000
2002
2004
2006
2008
2010
2012
2014
2016
2018
Fiscal Year
ActualsProjected FYs 2015-2018
41
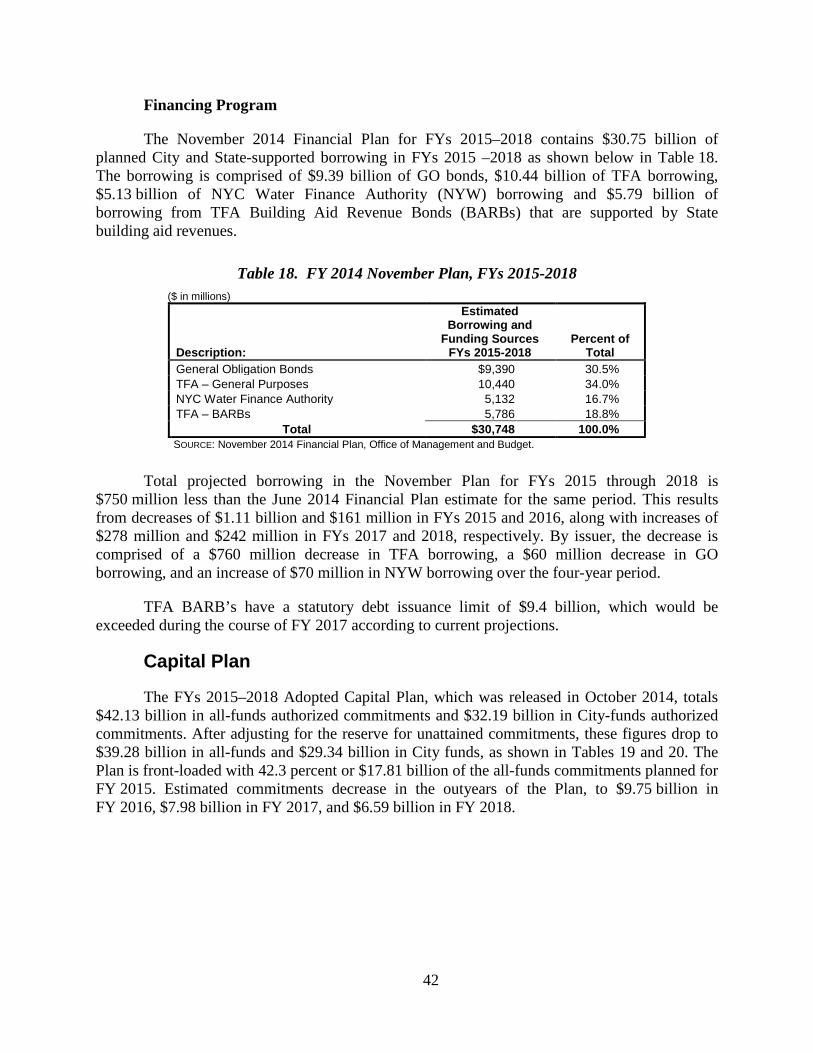
Financing Program
The November 2014 Financial Plan for FYs 2015–2018 contains $30.75 billion of planned City and State-supported borrowing in FYs 2015 –2018 as shown below in Table 18. The borrowing is comprised of $9.39 billion of GO bonds, $10.44 billion of TFA borrowing, $5.13 billion of NYC Water Finance Authority (NYW) borrowing and $5.79 billion of borrowing from TFA Building Aid Revenue Bonds (BARBs) that are supported by State building aid revenues.
Table 18. FY 2014 November Plan, FYs 2015-2018 ($ in millions)
Description:
Estimated Borrowing and
Funding Sources FYs 2015-2018
Percent of Total
General Obligation Bonds $9,390 30.5% TFA – General Purposes 10,440 34.0% NYC Water Finance Authority 5,132 16.7% TFA – BARBs 5,786 18.8%
Total $30,748 100.0% SOURCE: November 2014 Financial Plan, Office of Management and Budget.
Total projected borrowing in the November Plan for FYs 2015 through 2018 is $750 million less than the June 2014 Financial Plan estimate for the same period. This results from decreases of $1.11 billion and $161 million in FYs 2015 and 2016, along with increases of $278 million and $242 million in FYs 2017 and 2018, respectively. By issuer, the decrease is comprised of a $760 million decrease in TFA borrowing, a $60 million decrease in GO borrowing, and an increase of $70 million in NYW borrowing over the four-year period.
TFA BARB’s have a statutory debt issuance limit of $9.4 billion, which would be exceeded during the course of FY 2017 according to current projections.
Capital Plan
The FYs 2015–2018 Adopted Capital Plan, which was released in October 2014, totals $42.13 billion in all-funds authorized commitments and $32.19 billion in City-funds authorized commitments. After adjusting for the reserve for unattained commitments, these figures drop to $39.28 billion in all-funds and $29.34 billion in City funds, as shown in Tables 19 and 20. The Plan is front-loaded with 42.3 percent or $17.81 billion of the all-funds commitments planned for FY 2015. Estimated commitments decrease in the outyears of the Plan, to $9.75 billion in FY 2016, $7.98 billion in FY 2017, and $6.59 billion in FY 2018.
42
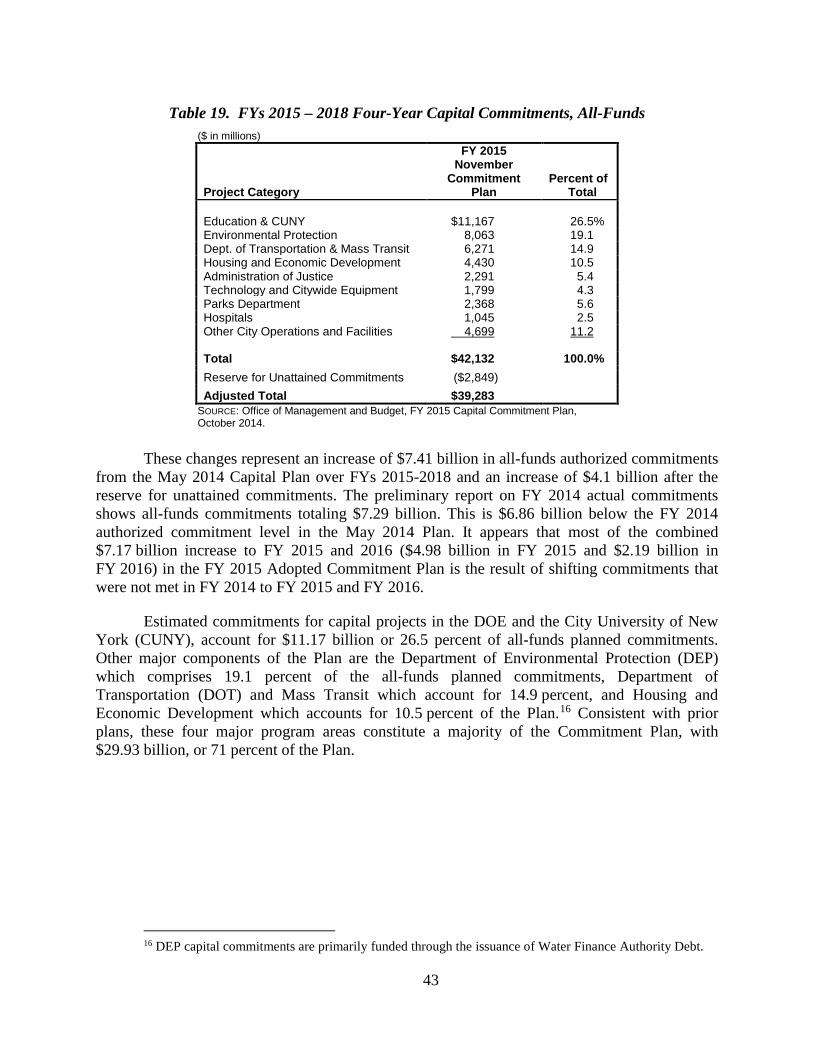
Table 19. FYs 2015 – 2018 Four-Year Capital Commitments, All-Funds ($ in millions)
Project Category
FY 2015 November
Commitment Plan
Percent of Total
Education & CUNY $11,167 26.5% Environmental Protection 8,063 19.1 Dept. of Transportation & Mass Transit 6,271 14.9 Housing and Economic Development 4,430 10.5 Administration of Justice 2,291 5.4 Technology and Citywide Equipment 1,799 4.3 Parks Department 2,368 5.6 Hospitals 1,045 2.5 Other City Operations and Facilities 4,699
11.2
Total $42,132 100.0% Reserve for Unattained Commitments ($2,849) Adjusted Total $39,283
SOURCE: Office of Management and Budget, FY 2015 Capital Commitment Plan, October 2014.
These changes represent an increase of $7.41 billion in all-funds authorized commitments from the May 2014 Capital Plan over FYs 2015-2018 and an increase of $4.1 billion after the reserve for unattained commitments. The preliminary report on FY 2014 actual commitments shows all-funds commitments totaling $7.29 billion. This is $6.86 billion below the FY 2014 authorized commitment level in the May 2014 Plan. It appears that most of the combined $7.17 billion increase to FY 2015 and 2016 ($4.98 billion in FY 2015 and $2.19 billion in FY 2016) in the FY 2015 Adopted Commitment Plan is the result of shifting commitments that were not met in FY 2014 to FY 2015 and FY 2016.
Estimated commitments for capital projects in the DOE and the City University of New York (CUNY), account for $11.17 billion or 26.5 percent of all-funds planned commitments. Other major components of the Plan are the Department of Environmental Protection (DEP) which comprises 19.1 percent of the all-funds planned commitments, Department of Transportation (DOT) and Mass Transit which account for 14.9 percent, and Housing and Economic Development which accounts for 10.5 percent of the Plan.16 Consistent with prior plans, these four major program areas constitute a majority of the Commitment Plan, with $29.93 billion, or 71 percent of the Plan.
16 DEP capital commitments are primarily funded through the issuance of Water Finance Authority Debt.
43
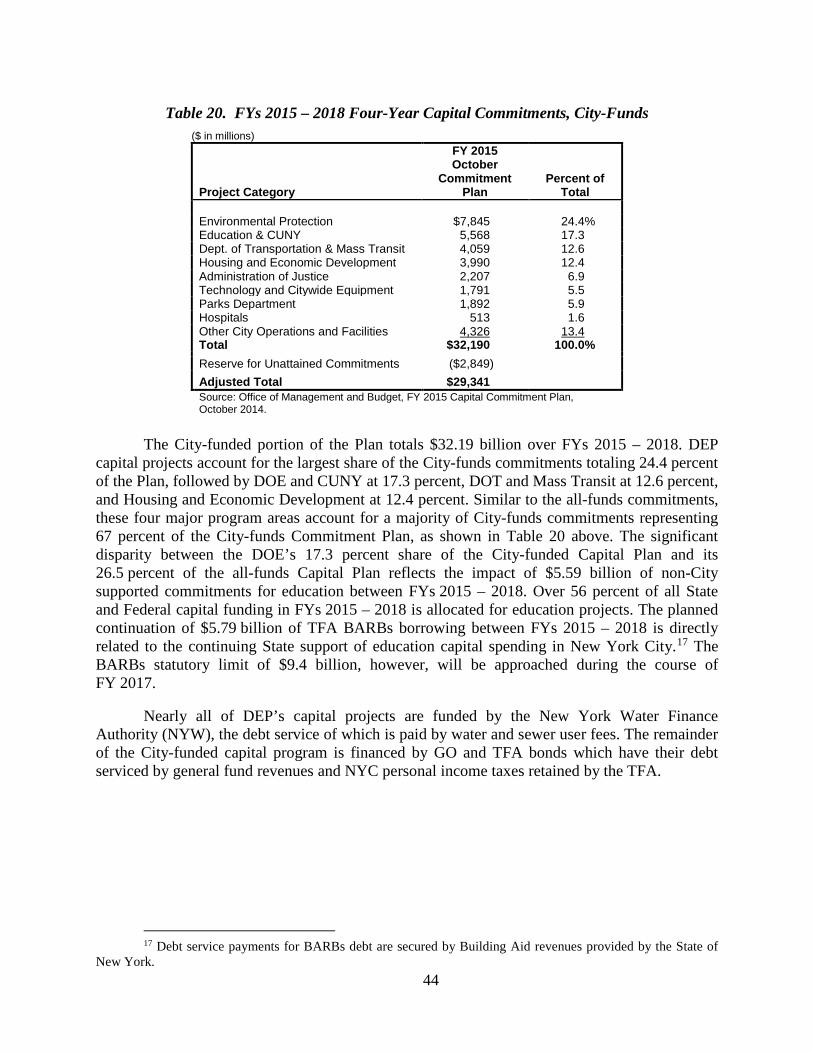
Table 20. FYs 2015 – 2018 Four-Year Capital Commitments, City-Funds ($ in millions)
Project Category
FY 2015 October
Commitment Plan
Percent of Total
Environmental Protection $7,845 24.4% Education & CUNY 5,568 17.3 Dept. of Transportation & Mass Transit 4,059 12.6 Housing and Economic Development 3,990 12.4 Administration of Justice 2,207 6.9 Technology and Citywide Equipment 1,791 5.5 Parks Department 1,892 5.9 Hospitals 513 1.6 Other City Operations and Facilities 4,326 13.4 Total $32,190 100.0% Reserve for Unattained Commitments ($2,849) Adjusted Total $29,341 Source: Office of Management and Budget, FY 2015 Capital Commitment Plan, October 2014.
The City-funded portion of the Plan totals $32.19 billion over FYs 2015 – 2018. DEP capital projects account for the largest share of the City-funds commitments totaling 24.4 percent of the Plan, followed by DOE and CUNY at 17.3 percent, DOT and Mass Transit at 12.6 percent, and Housing and Economic Development at 12.4 percent. Similar to the all-funds commitments, these four major program areas account for a majority of City-funds commitments representing 67 percent of the City-funds Commitment Plan, as shown in Table 20 above. The significant disparity between the DOE’s 17.3 percent share of the City-funded Capital Plan and its 26.5 percent of the all-funds Capital Plan reflects the impact of $5.59 billion of non-City supported commitments for education between FYs 2015 – 2018. Over 56 percent of all State and Federal capital funding in FYs 2015 – 2018 is allocated for education projects. The planned continuation of $5.79 billion of TFA BARBs borrowing between FYs 2015 – 2018 is directly related to the continuing State support of education capital spending in New York City.17 The BARBs statutory limit of $9.4 billion, however, will be approached during the course of FY 2017.
Nearly all of DEP’s capital projects are funded by the New York Water Finance Authority (NYW), the debt service of which is paid by water and sewer user fees. The remainder of the City-funded capital program is financed by GO and TFA bonds which have their debt serviced by general fund revenues and NYC personal income taxes retained by the TFA.
17 Debt service payments for BARBs debt are secured by Building Aid revenues provided by the State of New York.
44
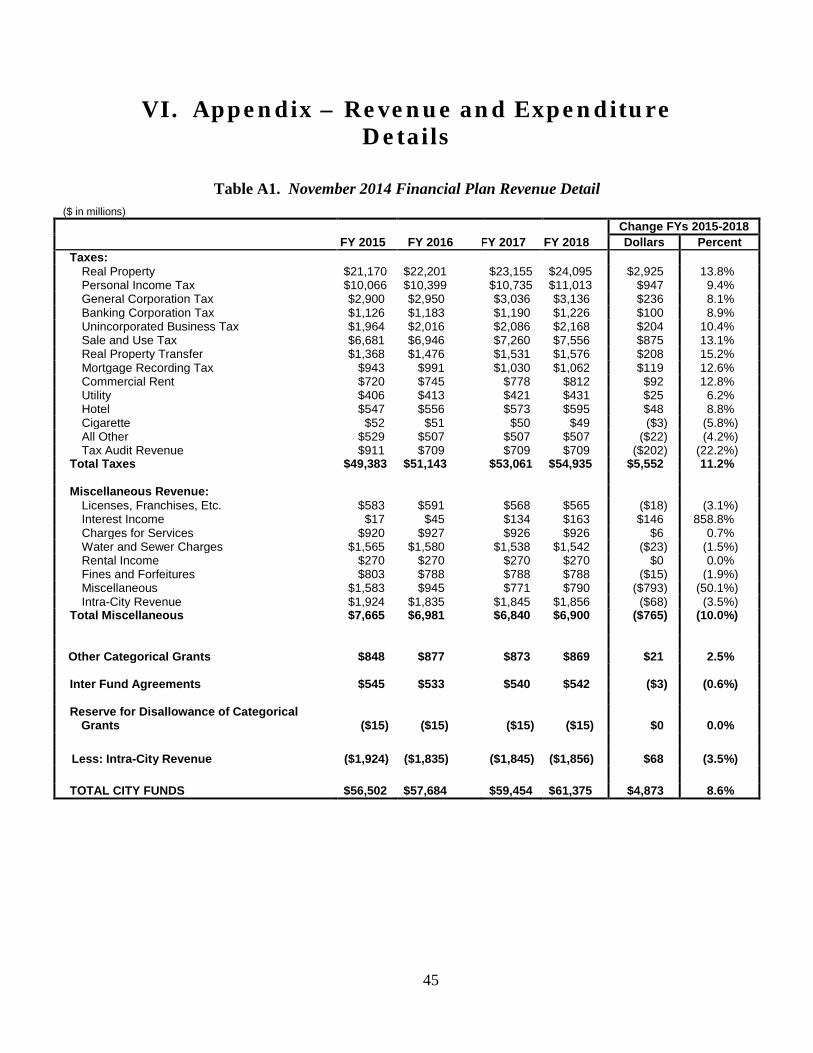
VI. Appendix – Revenue and Expenditure Details
Table A1. November 2014 Financial Plan Revenue Detail ($ in millions)
Change FYs 2015-2018
FY 2015 FY 2016 FY 2017 FY 2018 Dollars Percent
Taxes:
Real Property $21,170 $22,201 $23,155 $24,095 $2,925 13.8% Personal Income Tax $10,066 $10,399 $10,735 $11,013 $947 9.4% General Corporation Tax $2,900 $2,950 $3,036 $3,136 $236 8.1% Banking Corporation Tax $1,126 $1,183 $1,190 $1,226 $100 8.9% Unincorporated Business Tax $1,964 $2,016 $2,086 $2,168 $204 10.4% Sale and Use Tax $6,681 $6,946 $7,260 $7,556 $875 13.1% Real Property Transfer $1,368 $1,476 $1,531 $1,576 $208 15.2% Mortgage Recording Tax $943 $991 $1,030 $1,062 $119 12.6% Commercial Rent $720 $745 $778 $812 $92 12.8% Utility $406 $413 $421 $431 $25 6.2% Hotel $547 $556 $573 $595 $48 8.8% Cigarette $52 $51 $50 $49 ($3) (5.8%) All Other $529 $507 $507 $507 ($22) (4.2%) Tax Audit Revenue $911 $709 $709 $709 ($202) (22.2%)
Total Taxes $49,383 $51,143 $53,061 $54,935 $5,552 11.2%
Miscellaneous Revenue:
Licenses, Franchises, Etc. $583 $591 $568 $565 ($18) (3.1%) Interest Income $17 $45 $134 $163 $146 858.8% Charges for Services $920 $927 $926 $926 $6 0.7% Water and Sewer Charges $1,565 $1,580 $1,538 $1,542 ($23) (1.5%) Rental Income $270 $270 $270 $270 $0 0.0% Fines and Forfeitures $803 $788 $788 $788 ($15) (1.9%) Miscellaneous $1,583 $945 $771 $790 ($793) (50.1%) Intra-City Revenue $1,924 $1,835 $1,845 $1,856 ($68) (3.5%)
Total Miscellaneous $7,665 $6,981 $6,840 $6,900 ($765) (10.0%)
Other Categorical Grants $848 $877 $873 $869 $21 2.5%
Inter Fund Agreements $545 $533 $540 $542 ($3) (0.6%) Reserve for Disallowance of Categorical
Grants ($15) ($15) ($15) ($15) $0 0.0%
Less: Intra-City Revenue ($1,924) ($1,835) ($1,845) ($1,856) $68 (3.5%) TOTAL CITY FUNDS $56,502 $57,684 $59,454 $61,375 $4,873 8.6%
45
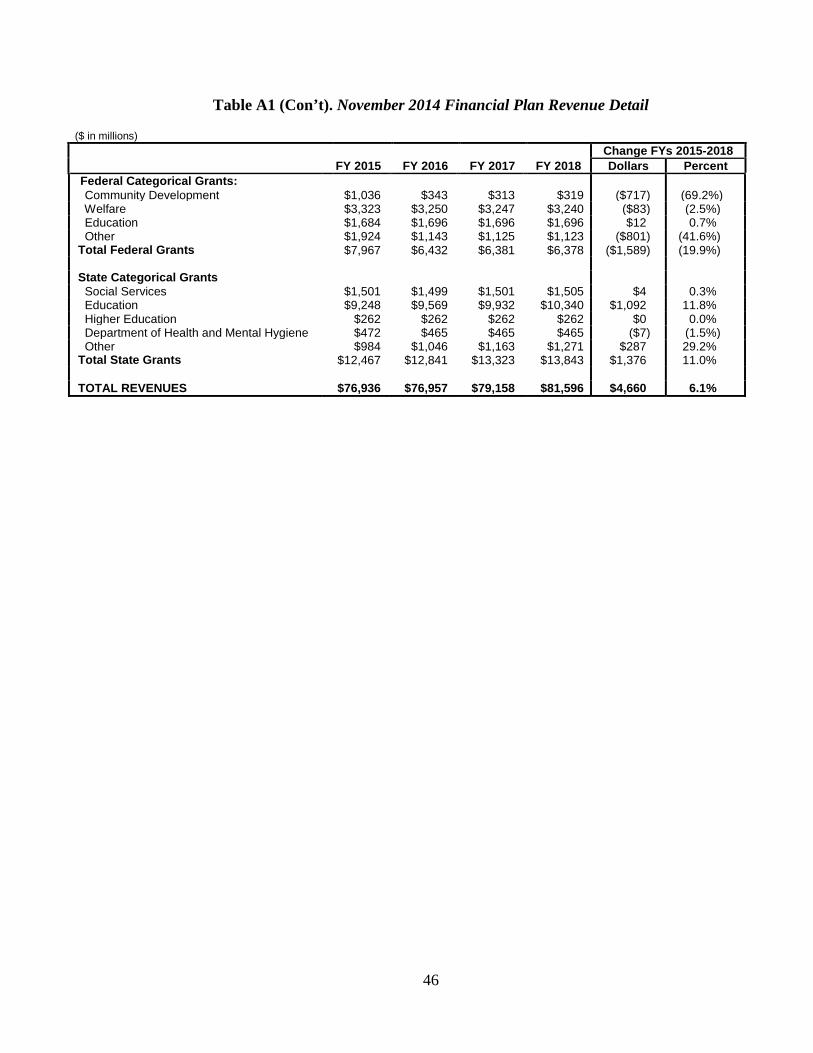
Table A1 (Con’t). November 2014 Financial Plan Revenue Detail
($ in millions)
Change FYs 2015-2018
FY 2015 FY 2016 FY 2017 FY 2018 Dollars Percent
Federal Categorical Grants: Community Development $1,036 $343 $313 $319 ($717) (69.2%)
Welfare $3,323 $3,250 $3,247 $3,240 ($83) (2.5%) Education $1,684 $1,696 $1,696 $1,696 $12 0.7% Other $1,924 $1,143 $1,125 $1,123 ($801) (41.6%) Total Federal Grants $7,967 $6,432 $6,381 $6,378 ($1,589) (19.9%)
State Categorical Grants Social Services $1,501 $1,499 $1,501 $1,505 $4 0.3%
Education $9,248 $9,569 $9,932 $10,340 $1,092 11.8% Higher Education $262 $262 $262 $262 $0 0.0% Department of Health and Mental Hygiene $472 $465 $465 $465 ($7) (1.5%) Other $984 $1,046 $1,163 $1,271 $287 29.2% Total State Grants $12,467 $12,841 $13,323 $13,843 $1,376 11.0%
TOTAL REVENUES $76,936 $76,957 $79,158 $81,596 $4,660 6.1%
46
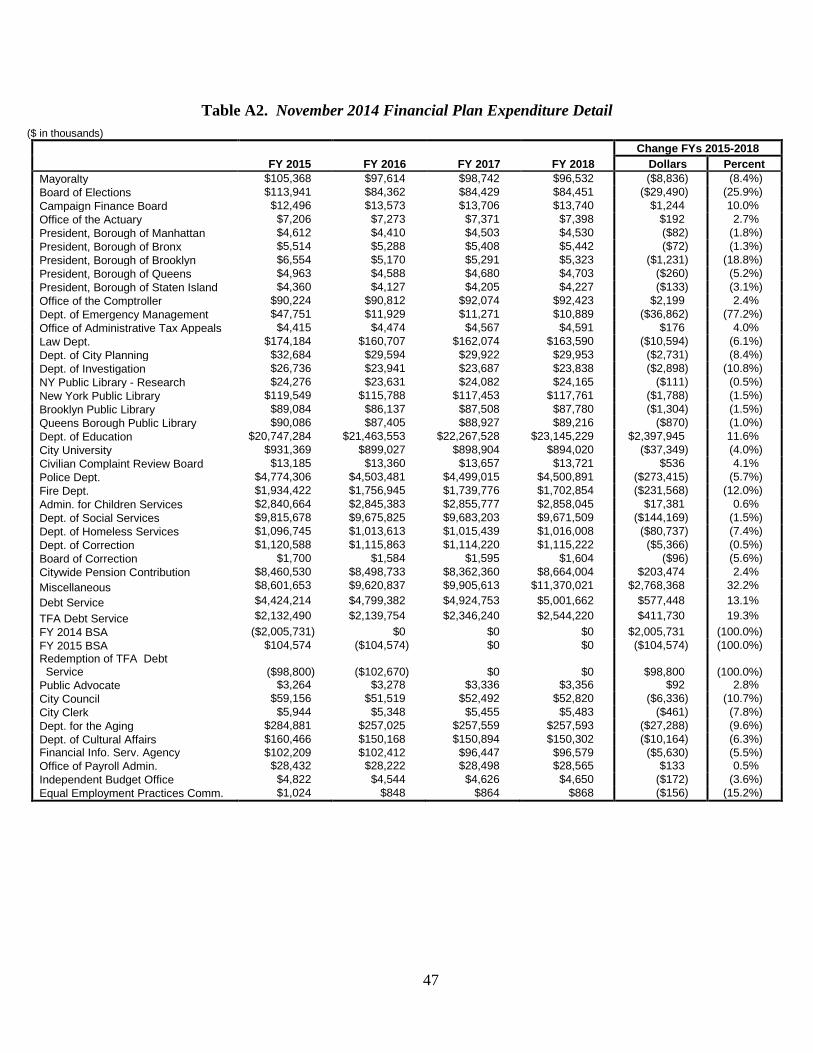
Table A2. November 2014 Financial Plan Expenditure Detail ($ in thousands)
Change FYs 2015-2018
FY 2015 FY 2016 FY 2017 FY 2018 Dollars Percent
Mayoralty $105,368 $97,614 $98,742 $96,532 ($8,836) (8.4%) Board of Elections $113,941 $84,362 $84,429 $84,451 ($29,490) (25.9%) Campaign Finance Board $12,496 $13,573 $13,706 $13,740 $1,244 10.0% Office of the Actuary $7,206 $7,273 $7,371 $7,398 $192 2.7% President, Borough of Manhattan $4,612 $4,410 $4,503 $4,530 ($82) (1.8%) President, Borough of Bronx $5,514 $5,288 $5,408 $5,442 ($72) (1.3%) President, Borough of Brooklyn $6,554 $5,170 $5,291 $5,323 ($1,231) (18.8%) President, Borough of Queens $4,963 $4,588 $4,680 $4,703 ($260) (5.2%) President, Borough of Staten Island $4,360 $4,127 $4,205 $4,227 ($133) (3.1%) Office of the Comptroller $90,224 $90,812 $92,074 $92,423 $2,199 2.4% Dept. of Emergency Management $47,751 $11,929 $11,271 $10,889 ($36,862) (77.2%) Office of Administrative Tax Appeals $4,415 $4,474 $4,567 $4,591 $176 4.0% Law Dept. $174,184 $160,707 $162,074 $163,590 ($10,594) (6.1%) Dept. of City Planning $32,684 $29,594 $29,922 $29,953 ($2,731) (8.4%) Dept. of Investigation $26,736 $23,941 $23,687 $23,838 ($2,898) (10.8%) NY Public Library - Research $24,276 $23,631 $24,082 $24,165 ($111) (0.5%) New York Public Library $119,549 $115,788 $117,453 $117,761 ($1,788) (1.5%) Brooklyn Public Library $89,084 $86,137 $87,508 $87,780 ($1,304) (1.5%) Queens Borough Public Library $90,086 $87,405 $88,927 $89,216 ($870) (1.0%) Dept. of Education $20,747,284 $21,463,553 $22,267,528 $23,145,229 $2,397,945 11.6% City University $931,369 $899,027 $898,904 $894,020 ($37,349) (4.0%) Civilian Complaint Review Board $13,185 $13,360 $13,657 $13,721 $536 4.1% Police Dept. $4,774,306 $4,503,481 $4,499,015 $4,500,891 ($273,415) (5.7%) Fire Dept. $1,934,422 $1,756,945 $1,739,776 $1,702,854 ($231,568) (12.0%) Admin. for Children Services $2,840,664 $2,845,383 $2,855,777 $2,858,045 $17,381 0.6% Dept. of Social Services $9,815,678 $9,675,825 $9,683,203 $9,671,509 ($144,169) (1.5%) Dept. of Homeless Services $1,096,745 $1,013,613 $1,015,439 $1,016,008 ($80,737) (7.4%) Dept. of Correction $1,120,588 $1,115,863 $1,114,220 $1,115,222 ($5,366) (0.5%) Board of Correction $1,700 $1,584 $1,595 $1,604 ($96) (5.6%) Citywide Pension Contribution $8,460,530 $8,498,733 $8,362,360 $8,664,004 $203,474 2.4% Miscellaneous $8,601,653 $9,620,837 $9,905,613 $11,370,021 $2,768,368 32.2% Debt Service $4,424,214 $4,799,382 $4,924,753 $5,001,662 $577,448 13.1% TFA Debt Service $2,132,490 $2,139,754 $2,346,240 $2,544,220 $411,730 19.3% FY 2014 BSA ($2,005,731) $0 $0 $0 $2,005,731 (100.0%) FY 2015 BSA $104,574 ($104,574) $0 $0 ($104,574) (100.0%) Redemption of TFA Debt Service ($98,800) ($102,670) $0 $0 $98,800 (100.0%) Public Advocate $3,264 $3,278 $3,336 $3,356 $92 2.8% City Council $59,156 $51,519 $52,492 $52,820 ($6,336) (10.7%) City Clerk $5,944 $5,348 $5,455 $5,483 ($461) (7.8%) Dept. for the Aging $284,881 $257,025 $257,559 $257,593 ($27,288) (9.6%) Dept. of Cultural Affairs $160,466 $150,168 $150,894 $150,302 ($10,164) (6.3%) Financial Info. Serv. Agency $102,209 $102,412 $96,447 $96,579 ($5,630) (5.5%) Office of Payroll Admin. $28,432 $28,222 $28,498 $28,565 $133 0.5% Independent Budget Office $4,822 $4,544 $4,626 $4,650 ($172) (3.6%) Equal Employment Practices Comm. $1,024 $848 $864 $868 ($156) (15.2%)
47
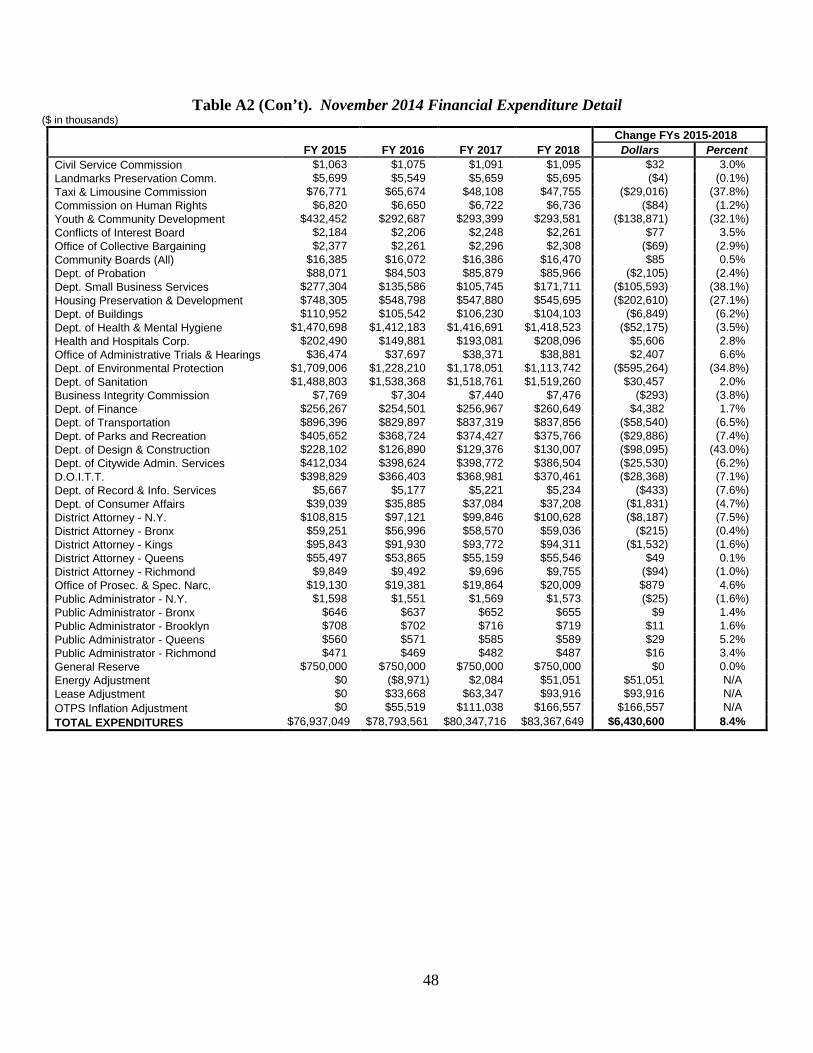
Table A2 (Con’t). November 2014 Financial Expenditure Detail ($ in thousands)
Change FYs 2015-2018
FY 2015 FY 2016 FY 2017 FY 2018 Dollars Percent
Civil Service Commission $1,063 $1,075 $1,091 $1,095 $32 3.0% Landmarks Preservation Comm. $5,699 $5,549 $5,659 $5,695 ($4) (0.1%) Taxi & Limousine Commission $76,771 $65,674 $48,108 $47,755 ($29,016) (37.8%) Commission on Human Rights $6,820 $6,650 $6,722 $6,736 ($84) (1.2%) Youth & Community Development $432,452 $292,687 $293,399 $293,581 ($138,871) (32.1%) Conflicts of Interest Board $2,184 $2,206 $2,248 $2,261 $77 3.5% Office of Collective Bargaining $2,377 $2,261 $2,296 $2,308 ($69) (2.9%) Community Boards (All) $16,385 $16,072 $16,386 $16,470 $85 0.5% Dept. of Probation $88,071 $84,503 $85,879 $85,966 ($2,105) (2.4%) Dept. Small Business Services $277,304 $135,586 $105,745 $171,711 ($105,593) (38.1%) Housing Preservation & Development $748,305 $548,798 $547,880 $545,695 ($202,610) (27.1%) Dept. of Buildings $110,952 $105,542 $106,230 $104,103 ($6,849) (6.2%) Dept. of Health & Mental Hygiene $1,470,698 $1,412,183 $1,416,691 $1,418,523 ($52,175) (3.5%) Health and Hospitals Corp. $202,490 $149,881 $193,081 $208,096 $5,606 2.8% Office of Administrative Trials & Hearings $36,474 $37,697 $38,371 $38,881 $2,407 6.6% Dept. of Environmental Protection $1,709,006 $1,228,210 $1,178,051 $1,113,742 ($595,264) (34.8%) Dept. of Sanitation $1,488,803 $1,538,368 $1,518,761 $1,519,260 $30,457 2.0% Business Integrity Commission $7,769 $7,304 $7,440 $7,476 ($293) (3.8%) Dept. of Finance $256,267 $254,501 $256,967 $260,649 $4,382 1.7% Dept. of Transportation $896,396 $829,897 $837,319 $837,856 ($58,540) (6.5%) Dept. of Parks and Recreation $405,652 $368,724 $374,427 $375,766 ($29,886) (7.4%) Dept. of Design & Construction $228,102 $126,890 $129,376 $130,007 ($98,095) (43.0%) Dept. of Citywide Admin. Services $412,034 $398,624 $398,772 $386,504 ($25,530) (6.2%) D.O.I.T.T. $398,829 $366,403 $368,981 $370,461 ($28,368) (7.1%) Dept. of Record & Info. Services $5,667 $5,177 $5,221 $5,234 ($433) (7.6%) Dept. of Consumer Affairs $39,039 $35,885 $37,084 $37,208 ($1,831) (4.7%) District Attorney - N.Y. $108,815 $97,121 $99,846 $100,628 ($8,187) (7.5%) District Attorney - Bronx $59,251 $56,996 $58,570 $59,036 ($215) (0.4%) District Attorney - Kings $95,843 $91,930 $93,772 $94,311 ($1,532) (1.6%) District Attorney - Queens $55,497 $53,865 $55,159 $55,546 $49 0.1% District Attorney - Richmond $9,849 $9,492 $9,696 $9,755 ($94) (1.0%) Office of Prosec. & Spec. Narc. $19,130 $19,381 $19,864 $20,009 $879 4.6% Public Administrator - N.Y. $1,598 $1,551 $1,569 $1,573 ($25) (1.6%) Public Administrator - Bronx $646 $637 $652 $655 $9 1.4% Public Administrator - Brooklyn $708 $702 $716 $719 $11 1.6% Public Administrator - Queens $560 $571 $585 $589 $29 5.2% Public Administrator - Richmond $471 $469 $482 $487 $16 3.4% General Reserve $750,000 $750,000 $750,000 $750,000 $0 0.0% Energy Adjustment $0 ($8,971) $2,084 $51,051 $51,051 N/A Lease Adjustment $0 $33,668 $63,347 $93,916 $93,916 N/A OTPS Inflation Adjustment $0 $55,519 $111,038 $166,557 $166,557 N/A TOTAL EXPENDITURES $76,937,049 $78,793,561 $80,347,716 $83,367,649 $6,430,600 8.4%
48
Glossary of Acronyms
AIRA Actuarial Interest Rate Assumption
BCT Banking Corporation Tax
BSA Budget Stabilization Account
BARB Building Aid Revenue Bonds
CAFR Comprehensive Annual Financial Report
CDBG Community Development Block Grants
CSA Council of School Supervisors and Administrators
CUNY City University of New York
DC37 District Council 37
DOC Department of Correction
DOE Department of Education
FY Fiscal Year
GAAP Generally Accepted Accounting Principles
GCP Gross City Product
GCT General Corporation Tax
GDP Gross Domestic Product
GO Debt General Obligation Debt
HHC Health and Hospitals Corporation
HSF Health Stabilization Fund
J&C Judgments and Claims
MLC Municipal Labor Committee
MRT Mortgage Recording Tax
NYC New York City
NYCEDC New York City Economic Development Corporation
49
NYCHA New York City Housing Authority
NYPD New York Police Department
NYS New York State
NYSNA New York State Nurses Association
NYW New York City Municipal Water Finance Authority
OMB Office of Management and Budget
OTPS Other Than Personal Services
PERB New York State Public Employment Relations Board
PIT Personal Income Tax
PS Personal Services
RHBT Retiree Health Benefits Trust
RPTT Real Property Transfer Tax
SFY State Fiscal Year
STAR School Tax Relief
STAR Corp. Sales Tax Asset Receivable Corporation
TFA New York City Transitional Finance Authority
TSASC Tobacco Settlement Asset Securitization Corporation, Inc.
UBT Unincorporated Business Tax
UFT United Federation of Teachers
UPOA United Probation Officers Association
U.S. United States
VDC Voluntary Defined Contribution
VRDB Variable Rate Demand Bonds
50