Embed Size (px)
Citation preview
Organizing the tsunami of videos and making them searchable and
useful
About Us
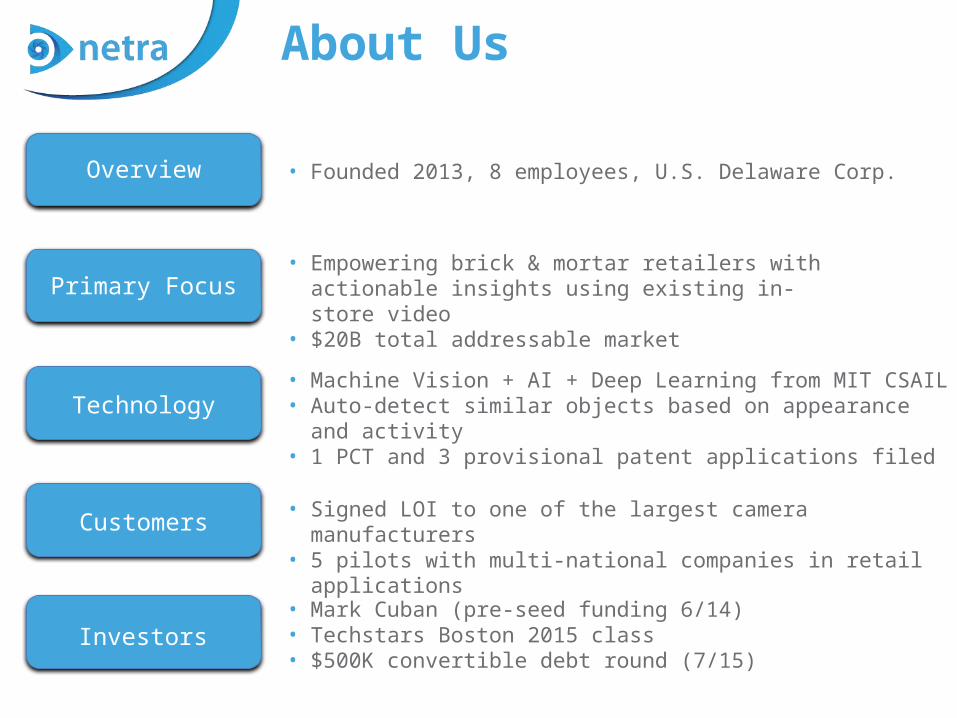
• Empowering brick & mortar retailers with actionable insights using existing in-store video
• $20B total addressable market
• Machine Vision + AI + Deep Learning from MIT CSAIL• Auto-detect similar objects based on appearance and
activity• 1 PCT and 3 provisional patent applications filed
• Signed LOI to one of the largest camera manufacturers• 5 pilots with multi-national companies in retail applications
• Mark Cuban (pre-seed funding 6/14)• Techstars Boston 2015 class• $500K convertible debt round (7/15)
Overview
Primary Focus
Technology
Customers
Investors
• Founded 2013, 8 employees, U.S. Delaware Corp.
Senior Team
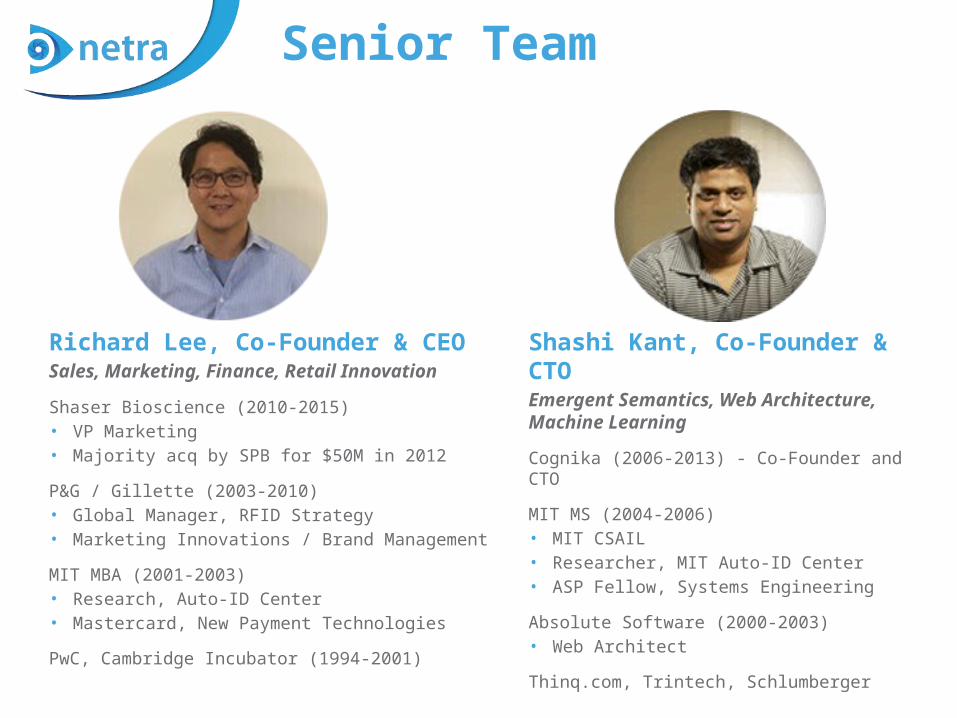
Richard Lee, Co-Founder & CEOSales, Marketing, Finance, Retail Innovation
Shaser Bioscience (2010-2015)• VP Marketing • Majority acq by SPB for $50M in 2012P&G / Gillette (2003-2010)• Global Manager, RFID Strategy• Marketing Innovations / Brand ManagementMIT MBA (2001-2003)• Research, Auto-ID Center• Mastercard, New Payment TechnologiesPwC, Cambridge Incubator (1994-2001)
Shashi Kant, Co-Founder & CTOEmergent Semantics, Web Architecture, Machine Learning
Cognika (2006-2013) - Co-Founder and CTOMIT MS (2004-2006)• MIT CSAIL• Researcher, MIT Auto-ID Center• ASP Fellow, Systems EngineeringAbsolute Software (2000-2003)• Web ArchitectThinq.com, Trintech, Schlumberger
Why Video Analytics (now)?
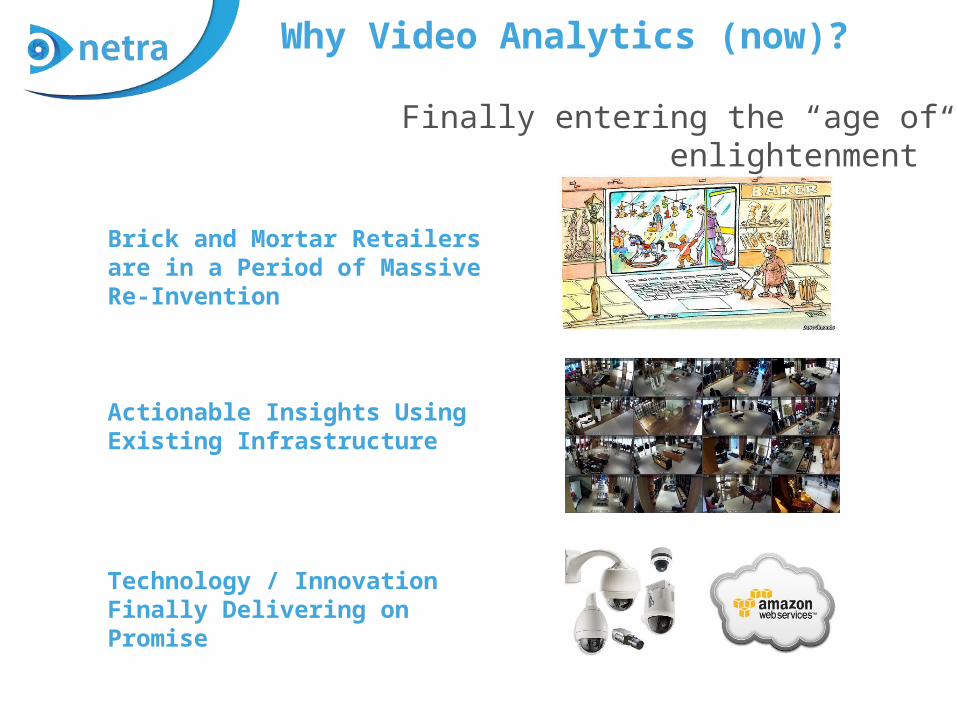
Brick and Mortar Retailers are in a Period of Massive Re-Invention
Finally entering the “age of enlightenment”
Actionable Insights Using Existing Infrastructure
Technology / Innovation Finally Delivering on Promise
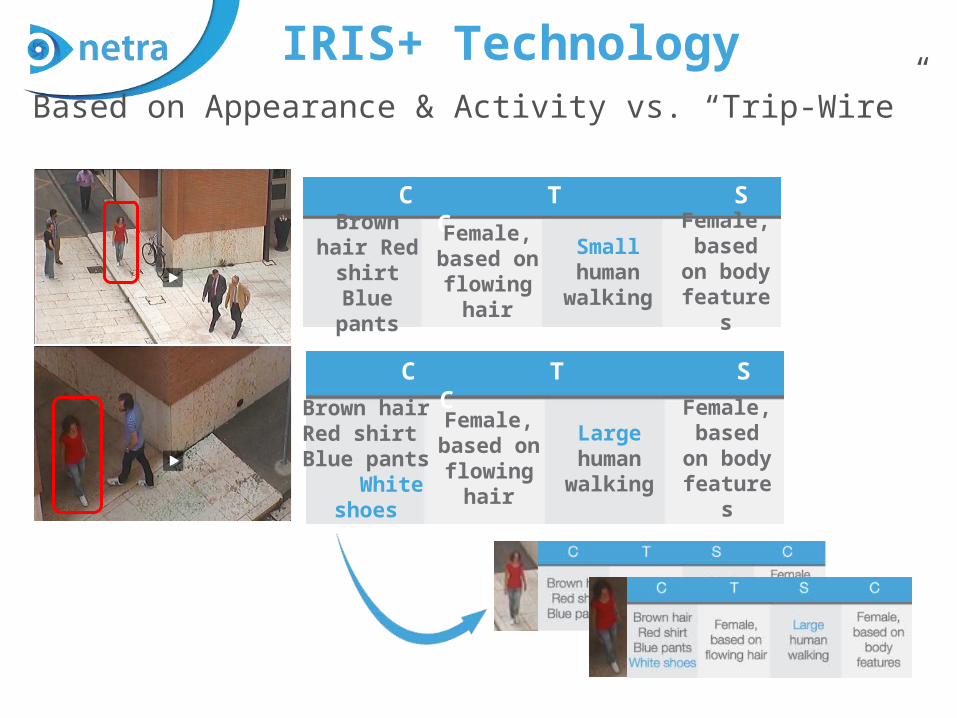
IRIS+ TechnologyBased on Appearance & Activity vs. “Trip-Wire”
Female, based
on flowing
hair
Large human walking
Female, based
on body feature
s
Brown hair Red
shirt Blue pants White shoes
C T S C
C T S CFemale,
based on
flowing hair
Small human walking
Female, based
on body feature
s
Brown hair Red
shirt Blue pants
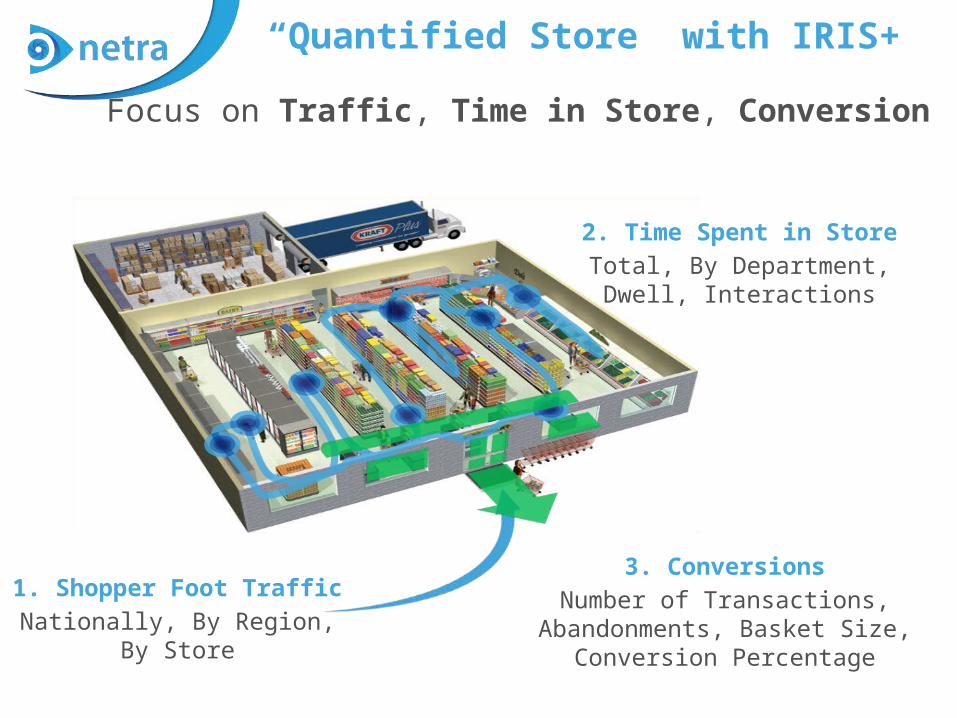
“Quantified Store” with IRIS+
1. Shopper Foot TrafficNationally, By Region, By
Store
Focus on Traffic, Time in Store, Conversion
2. Time Spent in StoreTotal, By Department, Dwell,
Interactions
3. ConversionsNumber of Transactions,
Abandonments, Basket Size, Conversion Percentage
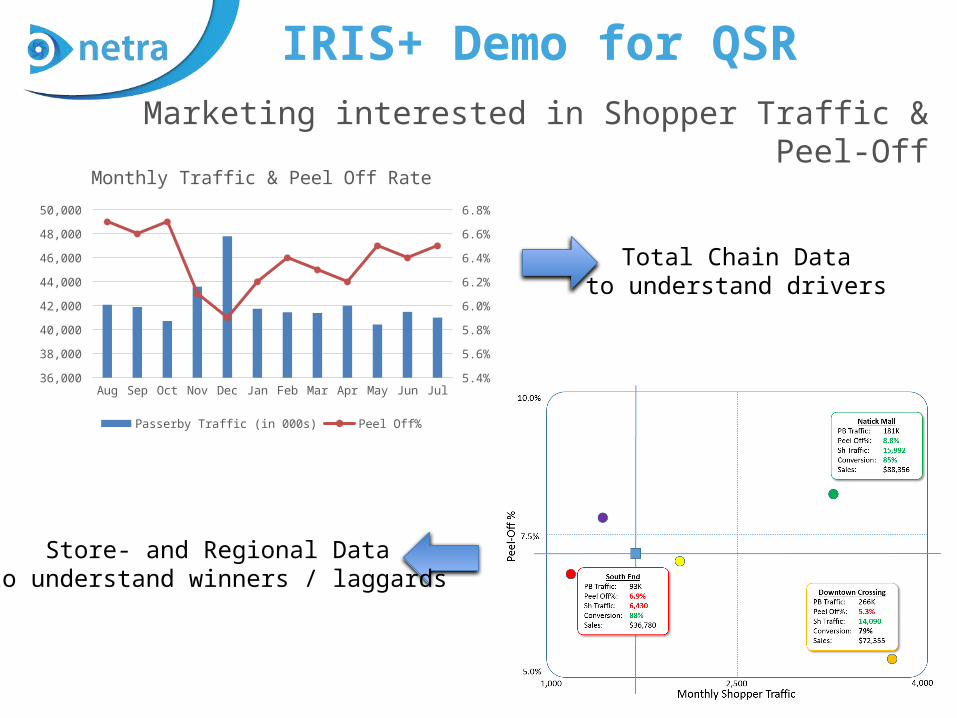
IRIS+ Demo for QSRMarketing interested in Shopper Traffic & Peel-Off
Aug Sep Oct Nov Dec Jan Feb Mar Apr May Jun Jul 36,000
38,000
40,000
42,000
44,000
46,000
48,000
50,000
5.4%
5.6%
5.8%
6.0%
6.2%
6.4%
6.6%
6.8%
Monthly Traffic & Peel Off Rate
Passerby Traffic (in 000s) Peel Off%
Total Chain Datato understand drivers
Store- and Regional Datato understand winners / laggards
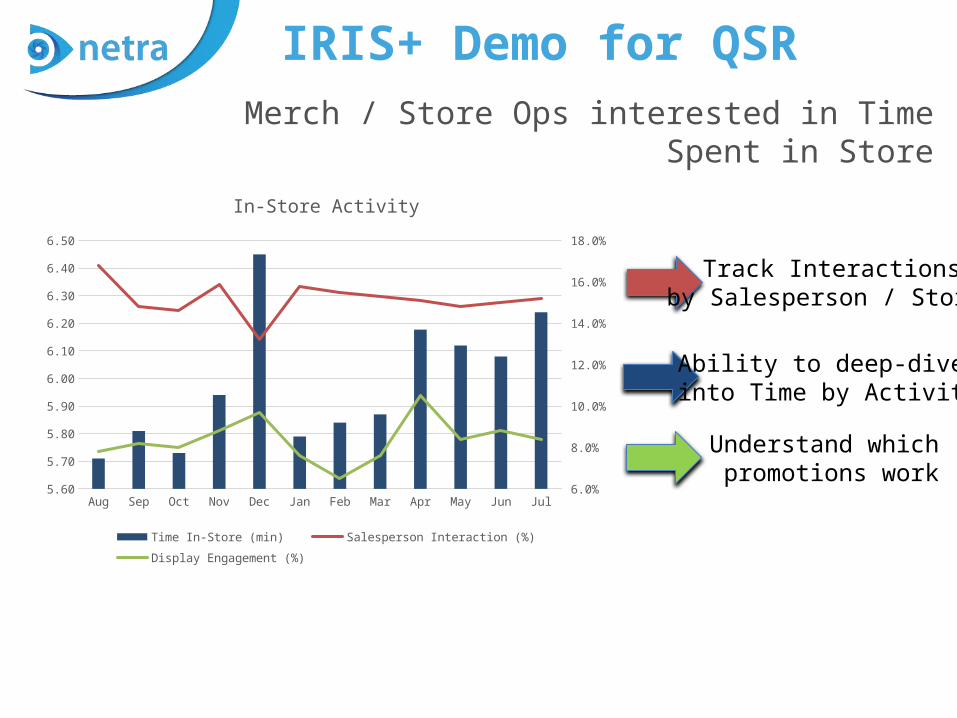
IRIS+ Demo for QSRMerch / Store Ops interested in Time Spent in
Store
Aug Sep Oct Nov Dec Jan Feb Mar Apr May Jun Jul5.60
5.70
5.80
5.90
6.00
6.10
6.20
6.30
6.40
6.50
6.0%
8.0%
10.0%
12.0%
14.0%
16.0%
18.0%
In-Store Activity
Time In-Store (min) Salesperson Interaction (%) Display Engagement (%)
Ability to deep-dive into Time by Activity
Understand which promotions work
Track Interactionsby Salesperson / Stores
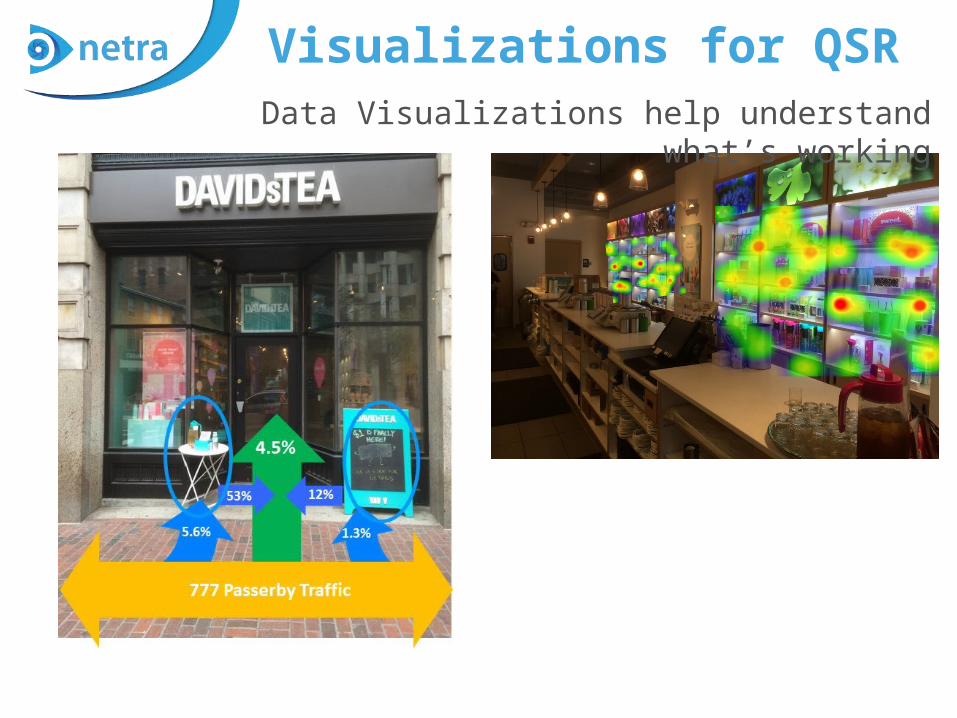
Visualizations for QSRData Visualizations help understand what’s
working
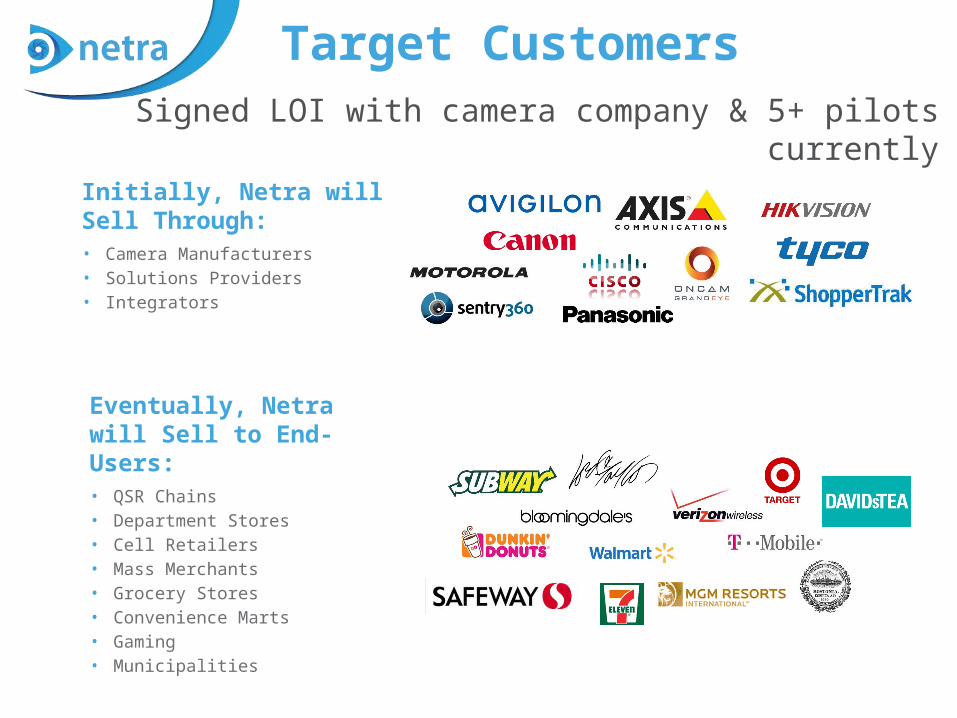
Target Customers
Initially, Netra will Sell Through:• Camera Manufacturers• Solutions Providers• Integrators
Signed LOI with camera company & 5+ pilots currently
Eventually, Netra will Sell to End-Users:• QSR Chains• Department Stores• Cell Retailers• Mass Merchants• Grocery Stores• Convenience Marts• Gaming• Municipalities
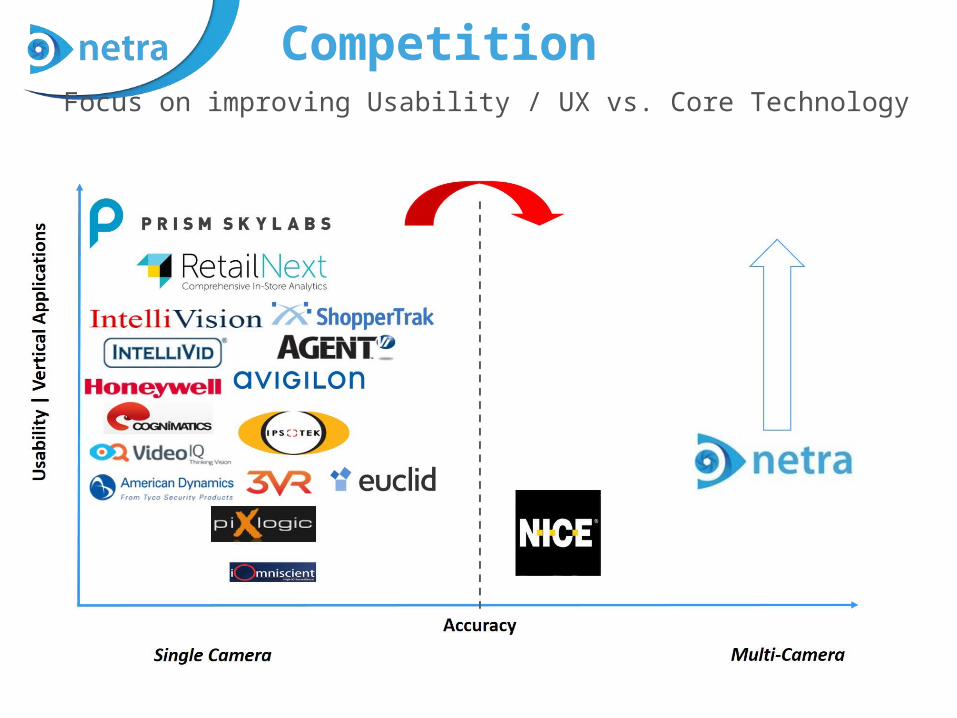
CompetitionFocus on improving Usability / UX vs. Core Technology
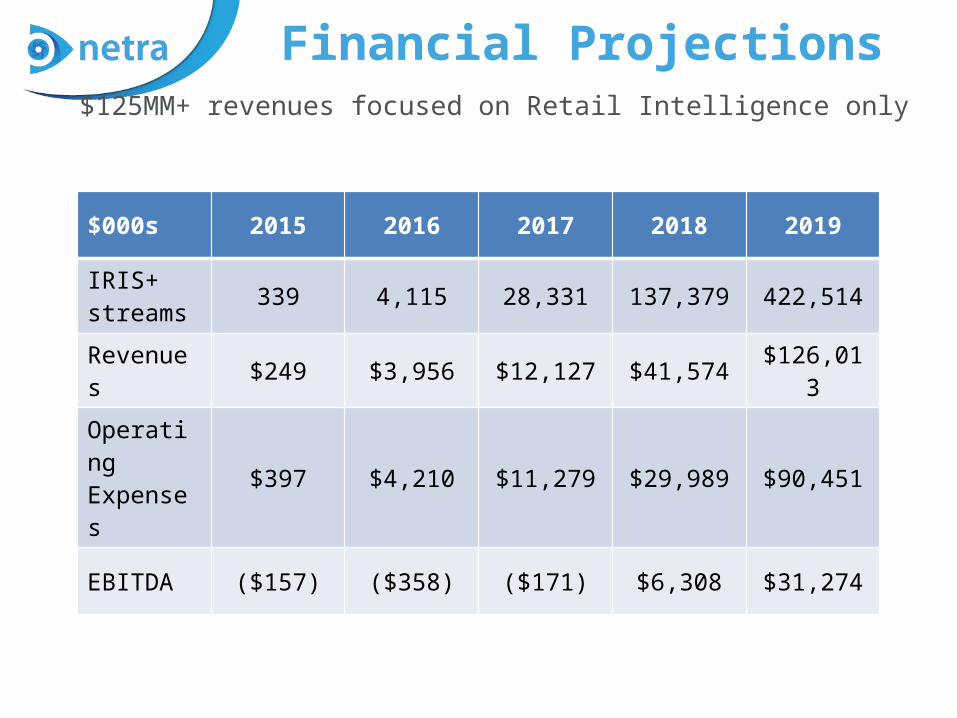
Financial Projections$125MM+ revenues focused on Retail Intelligence only
$000s 2015 2016 2017 2018 2019
IRIS+ streams 339 4,115 28,331 137,379 422,514
Revenues $249 $3,956 $12,127 $41,574 $126,013
Operating Expenses $397 $4,210 $11,279 $29,989 $90,451
EBITDA ($157) ($358) ($171) $6,308 $31,274