Embed Size (px)
Citation preview
Carbon Control and Competitiveness Post 2020: The Cement Report
FINAL REPORT February 2014
Authors
Karsten Neuhoff
Bruno Vanderborght
Andrzej Ancygier
Ayse Tugba Atasoy
Manuel Haussner
Roland Ismer
Benedikt Mack
Ralf Martin
Jean-Pierre Ponssard
Philippe Quirion
Arjan van Rooij
Nagore Sabio
Oliver Sartor
Misato Sato
Anne Schopp
About the Authors
Karsten Neuhoff,
German Institute for Economic Research, DIW Berlin
Bruno Vanderborght,
Independent Researcher
Andrzej Ancygier
Hertie School of Governance
Ayse Tugba Atasoy
German Institute for Economic Research, DIW Berlin
Manuel Haussner
University Erlangen-Nürnberg
Roland Ismer
University Erlangen-Nürnberg
Benedikt Mack
German Institute for Economic Research, DIW Berlin
Ralf Martin
Imperial College London
Jean-Pierre Ponssard
CNRS-Ecole Polytechnique
Philippe Quirion
Centre International de Recherche sur l’Environnement et le Développement (CIRED), CNRS
Arjan van Rooij
Radboud University Nijmegen
Nagore Sabio
University College London
Oliver Sartor
The Institute for Sustainable Development and International Relations (IDDRI)
Misato Sato
The Grantham Research Institute on Climate Change and the Environment, London School of Economics and
Political Sciences
Anne Schopp
German Institute for Economic Research, DIW Berlin
This report is an output from the Energy Intensive Industries project funded by Ministries in Germany, Netherlands,
France, UK and by Tata Steel and Heidelberg Cement. The views expressed and information contained in it are not
necessarily those of or endorsed by the funders which can accept no responsibility or liability for such views,
completeness or accuracy of the information or for any reliance placed on them.
The authors are gratefull for detailed comments and other input to Samuela Bassi, Christopher Beauman, Simone
Cooper, Michael Flach, Daniel Gauthier, David Grover, Guillaume Habert, Detlef Heinz, David Leal, Niall Mackenzie,
Kerstin Ringelhan, Martin Schneider, Matthew Tisdale, Heleen de Coninck and Stephan Schleicher.
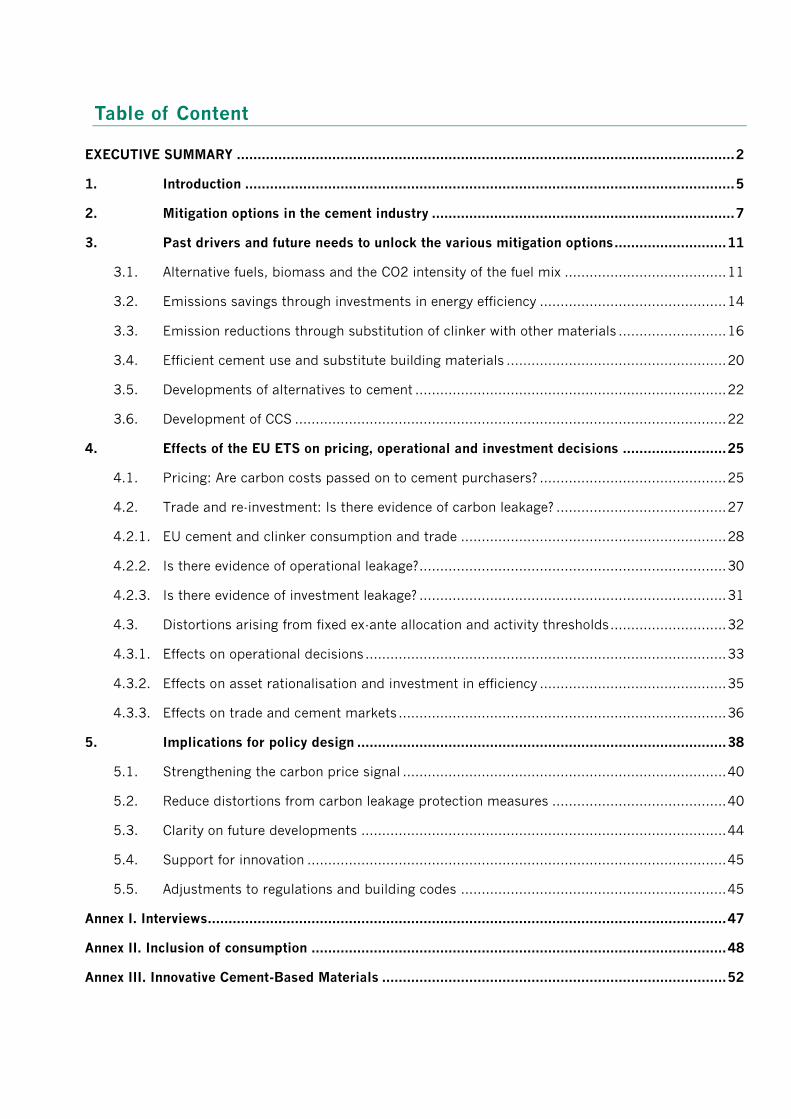
Table of Content
EXECUTIVE SUMMARY ........................................................................................................................ 2
1. Introduction ...................................................................................................................... 5
2. Mitigation options in the cement industry ......................................................................... 7
3. Past drivers and future needs to unlock the various mitigation options ........................... 11
3.1. Alternative fuels, biomass and the CO2 intensity of the fuel mix ....................................... 11
3.2. Emissions savings through investments in energy efficiency ............................................. 14
3.3. Emission reductions through substitution of clinker with other materials .......................... 16
3.4. Efficient cement use and substitute building materials ..................................................... 20
3.5. Developments of alternatives to cement ........................................................................... 22
3.6. Development of CCS ........................................................................................................ 22
4. Effects of the EU ETS on pricing, operational and investment decisions ......................... 25
4.1. Pricing: Are carbon costs passed on to cement purchasers? ............................................. 25
4.2. Trade and re-investment: Is there evidence of carbon leakage? ......................................... 27
4.2.1. EU cement and clinker consumption and trade ................................................................ 28
4.2.2. Is there evidence of operational leakage? .......................................................................... 30
4.2.3. Is there evidence of investment leakage? .......................................................................... 31
4.3. Distortions arising from fixed ex-ante allocation and activity thresholds ............................ 32
4.3.1. Effects on operational decisions ....................................................................................... 33
4.3.2. Effects on asset rationalisation and investment in efficiency ............................................. 35
4.3.3. Effects on trade and cement markets ............................................................................... 36
5. Implications for policy design ......................................................................................... 38
5.1. Strengthening the carbon price signal .............................................................................. 40
5.2. Reduce distortions from carbon leakage protection measures .......................................... 40
5.3. Clarity on future developments ........................................................................................ 44
5.4. Support for innovation ..................................................................................................... 45
5.5. Adjustments to regulations and building codes ................................................................ 45
Annex I. Interviews............................................................................................................................. 47
Annex II. Inclusion of consumption .................................................................................................... 48
Annex III. Innovative Cement-Based Materials ................................................................................... 52
2
EXECUTIVE SUMMARY
This report assesses how production and emission volumes, energy and CO2
efficiency and competitiveness of companies in the Energy Intensive Industries have
evolved prior and during the European Union Emissions Trading System (EU ETS).
Furthermore the report assesses how the EU ETS and other policy instruments may
have influenced investment and operational choices at the company level. In doing so,
this work combines detailed analysis and comparison of available data with
comprehensive interviews of industry executives.
Building on the experience gathered to date, the project then explored what is needed
to unlock the mitigation potentials identified in the low-carbon roadmaps for the
sector – with respect to potential reforms of the EU ETS as much as with respect to
complementary policy instruments.
Top management’s confidence in the EU ETS policy needs to be restored
Our research findings reveal that during its early years the EU ETS attracted top
management attention to reducing CO2 emissions. Cement companies firmly included
CO2 reduction targets and carbon costs into their planning and decision-making.
However, with a carbon price declining from 30 to 5 €/ton CO2, with the limited
effectiveness of the system to date, and with the system’s complexities and
uncertainties, and against the economic background of a global financial crisis, the
EU ETS has slipped from the top to the bottom of management’s priorities. This is
not helped by the prolonged discussions on changes to the system, such as on
backloading of allowances, structural reforms of the EU ETS and limitations on the
eligibility of emission reduction credits. As a result, even the most knowledgeable top
executives are no longer able to explain to their board the relevance of the policy
framework for corporate decisions.
In addition to the carbon price being low, it is also as volatile as energy prices. The
volatility increases the perception of complexity and thus limits the effectiveness of
the EU ETS. The effect might be particularly strong for the cement sector, as it has
typically limited involvement with commodity trading. This is reflected in references
to price forecasts that have been repeatedly wrong and a lack of trust of cement
executives in the influence of market intermediaries.
By early 2014, backloading had finally been approved and the European Commission
has published its vision of a 2030 package on January 22, 2014. The discussion and
ultimate implementation of the package including setting of new targets for 2030,
structural reform of the EU ETS and formulation of other policy objectives, for
example on innovation, provides the opportunity to recover the confidence and
initiative of cement companies.
More effective economic incentives are needed to unlock mitigation
To date, most of the emission reductions in the cement sector are caused by drivers
other than the EU ETS. The share of emissions from the cement sector in total EU
2
ETS emissions decreased from 7% in 2008 to 5.6% in 2012 but this was largely due
to a decrease of clinker and cement production as a consequence of the state of the
economy, with only a few percent due to CO2 efficiency gains. The influence of the EU
ETS on the CO2 intensity improvement has been only marginal.
The combination of the free allocation and low carbon price for most of the period
under Phase I and II provided an insufficient economic incentive to further leverage
emission reduction options in this sector. However, to unlock significant additional
emission reductions, a robust carbon price is necessary but not sufficient.
The EU ETS emission cap declines by 1.74% per year. Industry executives raised
doubts whether given uncertainties about the scale and costs of different mitigation
options this is a technological and economical optimal for the cement sector. The
industry interpretation of an emission trajectory at sector level contrasts with the
motivation of using an emission trading mechanism to provide flexibility through
trading between sectors. The apparent need for sector specific trajectories points to
the importance of guidance and coordination through sector specific road maps. The
road maps need to obtain broader visibility, including through the incorporation of
customer side mitigation options.
Free allocation may explain absence of carbon leakage, but creates
distortions
No operational leakage 1 has taken place so far and provisions concerning free
allocation may be credited for that. There is also currently no evidence that
investments in Europe have been cancelled and moved abroad because of the EU
ETS. However, free allowance allocation provisions also create severe distortions. The
shift from historic levels of emissions towards benchmark-based allocation has
eliminated perverse subsidization of inefficient plants, but major distortions remain.
Activity level requirements imply that half of the historic production level must be
maintained for installations to obtain maximum free allocation. This discourages
asset rationalization and negatively affects energy efficiency improvement. It also
causes excess clinker production, reducing clinker substitution with lower-carbon
substitutes and distorting trade flows. The profits resulting from the excess allocation
further distort competition. Apart from their direct consequences, these deficiencies
fundamentally undermine the level of confidence in the policy by the top
management, further lowering it in their priorities.
As most mitigation options are linked to efficiency, innovation and lead market
investment, early clarity on the free allocation procedures post-2020 is essential to
ensure early investment choices. The uncertainty associated with sunset clauses for
carbon leakage protection measures post-2020 and the revision of the list of the
carbon leakage exposed sector is regarded by the industry to be extremely high.
1 Carbon leakage is a transfer of production to other countries triggered by climate policy instruments. This would
lead to reduced emissions in the EU, but less of an overall reduction of global GHGs emissions. In our Report we
differentiate between operational leakage, the replacement of domestic with foreign production, and investment
leakage, the replacement of investment in domestic production capacity with investment in foreign production
capacity.
3
Hence, it is important to develop and communicate early a clear strategy on carbon
leakage protection post-2020.
Refining EU ETS carbon leakage protection to provide carbon price for
consumers
The combination of free allowance allocation – in place to address carbon leakage
concerns – and the competition with imports from countries where producers do not
pay for carbon, results in a low and very uncertain carbon price pass through to
cement prices. Without an increase of cement prices major mitigation options cannot
be pursued as: (i) customers are unlikely to select other cement types with lower
clinker content in the absence of economic incentives; (ii) firms will not develop new
low-carbon cement types without prospects of future market demand; and (iii) the
building industry has limited incentive to use cement more efficiently. Reflecting the
full carbon price in cement prices in Europe could be realized through two
mechanisms, in the absence of a global carbon price.
First, a shift to full auctioning could be combined with the inclusion of importers in
the EU ETS as envisaged in Article 10b of the 2009 ETS directive. Imported clinker
and cement would be liable to surrender allowances based for example on the current
best available technology benchmark. This would ensure non-discrimination between
domestic and foreign producers and contributes to World Trade Organization
compatibility. International coordination would be required to avoid political
repercussions.
Second, output based allowances allocation could be combined with an inclusion of
consumption in the EU ETS. Allocating allowances proportional to clinker production
volume (output based) instead of the current use of activity level requirements
eliminates distortions for efficient production of clinker, but eliminates incentives for
clinker substitution and efficient customer choices. Hence it is combined with a
consumption charge on the clinker content in cement linked to the EU ETS. Firms
producing or trading cement would have to levy the charge as the product is prepared
for final domestic sale, irrespective of the country or production process of the
clinker.
Both of these approaches would not impact the basic structure of EU ETS or the ETS
directive, but merely implement one of the options already outlined in the directive for
carbon leakage protection of individual sectors of the carbon leakage (inclusion of
imports) list and add one additional option (output based allocation combined with
inclusion of consumption). However, the options are politically (inclusion of imports)
and administratively (both options) more challenging – and hence their application
would likely be limited to products with very high shares of embedded carbon.
EU ETS not sufficient: enabling environment and innovation policy essential
Empirical evidence reveals that emissions trading on its own will be an insufficient
policy to incentivise further CO2 mitigation. Coordination with and adaptation of other
4
existing and new policies will be required to enable the realisation of low-carbon
options.
Enabling mitigation options by addressing regulatory and institutional constraints: Much of
the emission reductions in the cement sector to date have been initiated or facilitated
by regulatory changes. For example, the co-firing of waste products required new
permits, which together with the supply of suitable waste was required by the waste
framework, incineration and landfill directive or the reduction of clinker content in
cement and concrete achieved to date required adjustments to codes and standards.
What precise requirements are needed for the exploration and diffusion of further
mitigation options needs early analysis to avoid potential regulatory barriers.
Engaging decision makers to consider lower-carbon options in cement production and use:
On the cement user side, adaptations of building practices, standards, and
information systems will be needed to stimulate low carbon procurement in the
construction industry. This can require provision of information, e.g. with labelling
approaches and reporting requirements, as much as training and certification of
different actors.
Support investment in innovation for longer-term mitigation options: Major mitigation
options, such as material substitution and carbon dioxide capture and storage (CCS),
will require significant investment in demonstration plants and large-scale adoption of
new building practices and materials will require significant upfront demonstration of
the viability of new practices and materials. Experience from the EU ETS and other
sectors suggest that the necessary scale of funding is unlikely to materialize through
private initiative alone. Further work is required to understand the precise
requirements for funding and suitable mechanisms.
5
1. Introduction
The objective of this research is to provide objective, evidence-based analysis and
explanation of the past and current effectiveness of the EU ETS for Energy Intensive
Industries (EII). In doing so, we identify potential areas of improvement for the EU
ETS and complementing policy instruments. The insights gained enable us to evaluate
possible options to improve the effectiveness of policy to foster energy efficiency and
greenhouse gas mitigation, whilst maintaining the international competitiveness of
European EII.
The research focuses on three of the most energy and carbon intensive industrial
activities, namely cement, steel, and chemicals. This first study explores the situation
in the cement sector based on data analysis of sources such as the WBCSD – CSI
Getting the Numbers Right database, the EUTL, Eurostat, the UN Comtrade trade flow
data and company annual financial reports. The researchers then conducted a series
of interviews with executives from cement companies with the purpose of discussing
and understanding the business decision processes and the role of the EU ETS and
other policy instruments. Annex 1 includes the list of interviewed executives and a
short description of the methodology. Wherever throughout this report there is a
reference to the interviews, the conclusion is based on a representative majority of the
interviews and thus likely scalable to the industry.
We found that the EU ETS attracted top management attention on the need to reduce
CO2 emissions. During the years with higher EUA prices and strong political support
for consistent long-term targets, emission reductions formed part of the company
strategy of most European cement firms.
However, the interviews with the cement executives revealed that over the last two
years (2012-2013), the EU ETS drastically slipped to the bottom of company’s
management priorities. This was due not only to the overall economic situation with
significant surplus capacity, but also to the ETS itself. Interest in measures that would
lead to the reduction of CO2 emissions at the management-level diminished as the EU
ETS came to be considered ineffective and deficient in several ways. The lack of CO2
market price predictability, the uncertainties about future structural reform of the ETS
and about future measures for carbon leakage protection, as well as the uncertainty
on the political support for consistent long-term CO2 emissions reduction targets all
added to a lack of confidence in the EU ETS.
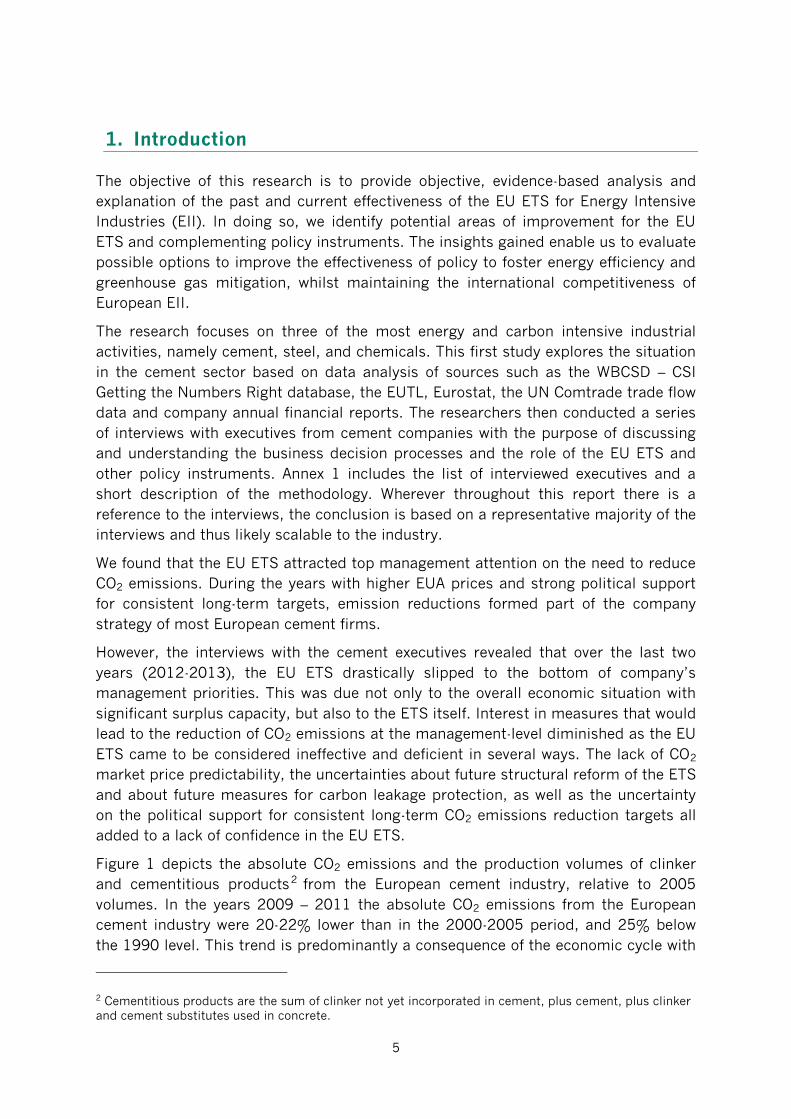
Figure 1 depicts the absolute CO2 emissions and the production volumes of clinker
and cementitious products2 from the European cement industry, relative to 2005
volumes. In the years 2009 – 2011 the absolute CO2 emissions from the European
cement industry were 20-22% lower than in the 2000-2005 period, and 25% below
the 1990 level. This trend is predominantly a consequence of the economic cycle with
2 Cementitious products are the sum of clinker not yet incorporated in cement, plus cement, plus clinker
and cement substitutes used in concrete.
6
emissions and output peaking in 2007 and decreasing by 30% over the following two
years.
Figure 1. Absolute CO2 emissions and the production volumes of clinker and cementitious
products from the European cement industry, relative to the 2005 volumes
Source: CSI GNR Source
The cement sector received 8% of the total volume of allowances for the years 2008-
2012 ranking second of the industrial sectors after steel and before refineries. At the
same time the share of emissions from the cement sector in total EU ETS emissions
decreased from 7% in 2008 to 5.6% in 2012, ranking as the third industrial sector
after steel and refineries3.
There is limited evidence that the EU ETS has accelerated the pace of improvement in
the CO2 intensity of clinker and cement production. The same pace of improvement
has been observed during the 5-10 year period prior to the EU ETS and the 7 years of
the ETS. During the EU ETS the average CO2 emissions per ton of clinker decreased
by 1.2% to 2% over the entire 7 years period from 2005 to 2011. Over the same
period CO2 emissions per ton of cement decreased by about 3% to 5%. There is a
strong argument to consider the significant decrease of the cement production and
the CO2 emissions in the EU since the beginning of the EU-ETS in 2005 as a
consequence of the economic crisis and not of the investment and operational
leakage caused by the EU ETS.4
3 European Environmental Agency and EU ETS registry (EUTL). 4 Similar conclusions were made in the ecorys study prepared for the European Commission: Closure of
plants and reduced cement production was caused by economic crisis and has not by the carbon price.
Ecorys (2013) "Carbon Leakage Evidence Project",
http://ec.europa.eu/clima/policies/ets/cap/leakage/docs/cl_evidence_factsheets_en.pdf (pp. 133-134).
0,7
0,75
0,8
0,85
0,9
0,95
1
1,05
1,1
1,15
1990 2000 2005 2006 2007 2008 2009 2010 2011
CO2 Clinker Cement
7
To understand this we present the main options for a reduction of the CO2 emissions
in the cement sector in the following section. Subsequently, in Section 3 the current
progress to date of the different levers to reduce CO2 emissions and the contribution
of the ETS and other regulatory and economic drivers towards this progress are
analyzed. The section does not provide a comprehensive coverage of all instruments
in place, but merely discusses instruments where they were reported to be relevant
for past decisions with mitigation impact. Section 4 discusses the effectiveness and
other implications of the carbon leakage protection measures. Based on the empirical
evidence gathered, we then discuss improvements to the policy framework that could
unlock the portfolio of the mitigation options in Section 5.
2. Mitigation options in the cement industry
The purpose of this section is to briefly summarize the sources of CO2 emission in the
cement industry and the possibilities to reduce them.5 Cement is the mineral glue
that is responsible for the strength of the widely used construction materials concrete
and mortar. The main ingredient of cement is clinker, which is activated by gypsum.
The properties of cement can be changed by adding other mineral components, which
are partially substituting clinker, such as ground granulated slag from the steel
industry, fly ash from coal combustion, ground limestone and burnt oil shale.
Clinker is produced by decarbonizing and mineralization of limestone in a high
temperature process. Consequently it is the production of clinker that causes the
majority of the CO2 emissions of the cement industry. Overall the CO2 originates from
two main sources: The decomposition of limestone (so called process CO2) and the
combustion of fuels burnt to reach the high temperatures (fuel CO2). The process CO2
emissions amount to typically around 530 kg CO2 per ton of clinker6, 7. Depending on
the thermal energy efficiency of the clinker kiln and the fuel type, fuel emissions range
between 220 kg and 500 kg fuel CO2 per ton of clinker.
5 Ba-Shammakh, et al., Analysis and Optimization of Carbon Dioxide Emission Mitigation Options in the
Cement Industry, American Journal of Environmental Sciences, 4 (5): 482-490, 2008; Moya et al., Energy
Efficiency and CO2 Emissions: Prospective Scenarios for the Cement Industry, JRC Scientific and
Technical Reports, 2010.
6 Source: CSI Getting the Numbers Right database. <www.wbcsdcement.org>.
7 IPCC and EU ETS Phase III benchmarks assume 525 kg CO2 per ton of clinker.
8
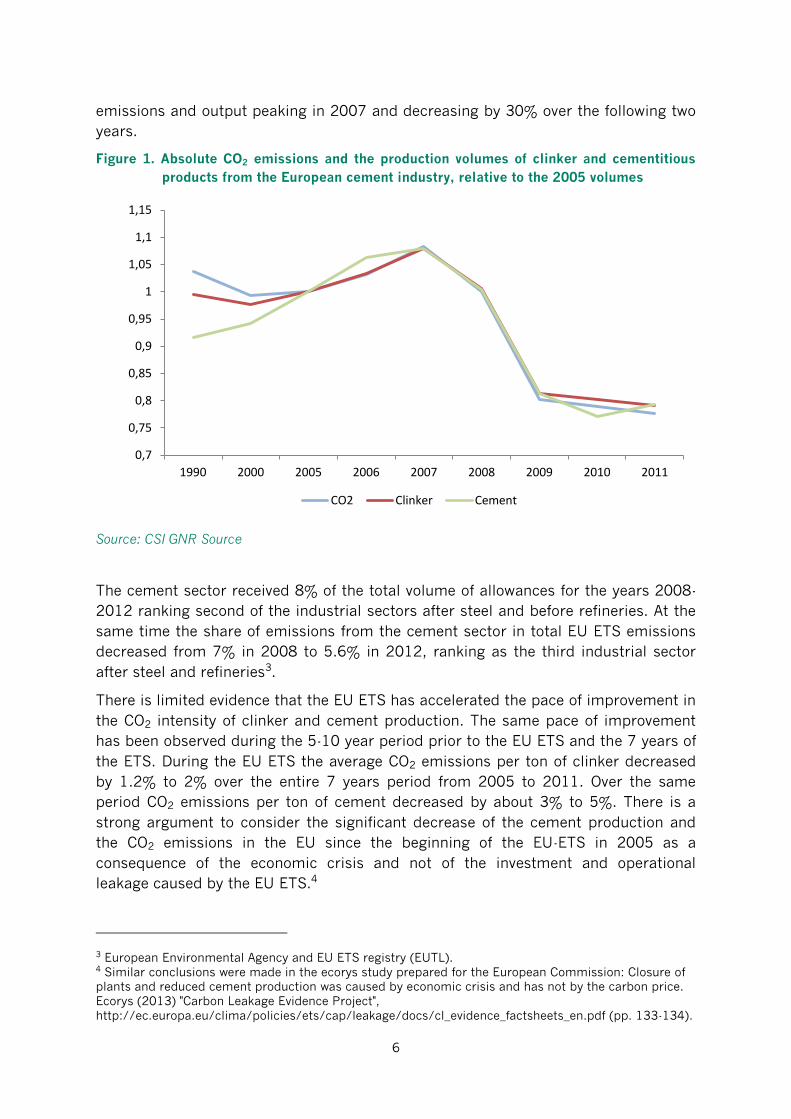
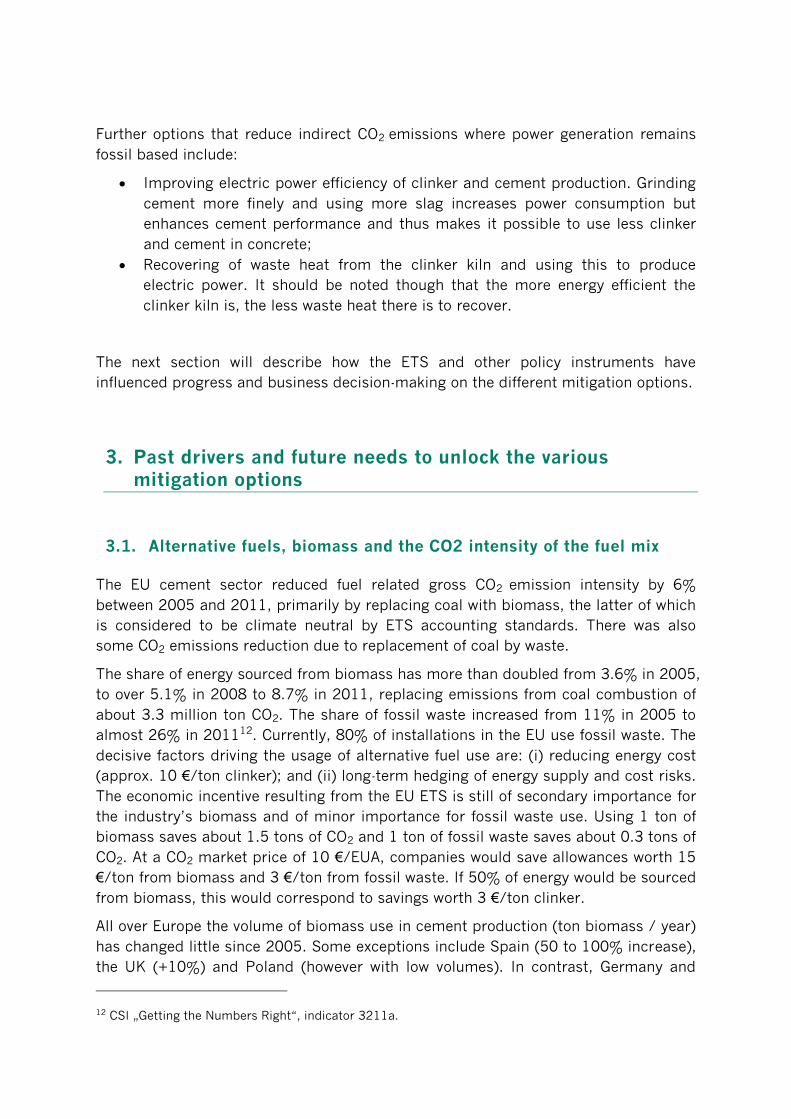
Figure 2. Fuel and process related emissions of cement sector and mitigation options to
reduce the emissions.
In addition to the process and fuel related emissions, there are also indirect
emissions that originate from the consumption of electric power (around 110
kWh/ton cement) 8 and emissions resulting from transport. Transport emissions
obviously vary depending on transport distance and mode, but generally contribute a
maximum of 5% to the production emissions. 9
The main options to reduce emissions from the cement industry are discussed in the
points that follow.
Reduction of fuel-related emissions:
Substituting the traditional fossil fuels such as coal, lignite and petcoke, which
emit around 100 kg CO2/MJ, by alternative fossil fuels, mainly waste derived
fuels emitting around 70 to 80 kg CO2/MJ or biomass that is considered
climate neutral if it is waste biomass or sustainably grown; and
Improving the thermal energy efficiency of the clinker kilns by using Best
Available Technology (i.e. pre-heater pre-calciner kiln technology) and Best
Operating Practices (i.e. concentrating production in the most efficient
installations and operating those close to their nominal capacity).
8 CSI „Getting the Numbers Right“, indicator 3212. 9 The role of CEMENT in the 2050 LOW CARBON ECONOMY, The European Cement Association, 2013.
Cem
ent
dem
and
(EU
27
)
Emissions / t cement
Fuel related emissions (35%)
Process related emissions (65%)
Substitution/efficient cement use
Carbon Capture & Storage
New cement types
Lower clinker content
Ener
gy E
ffic
ien
cy
Pre
-tre
ated
was
te
Bio
mas
s w
aste
Total cement emissions (demand times emissions/t)
Emission reduction options (illustration)
9
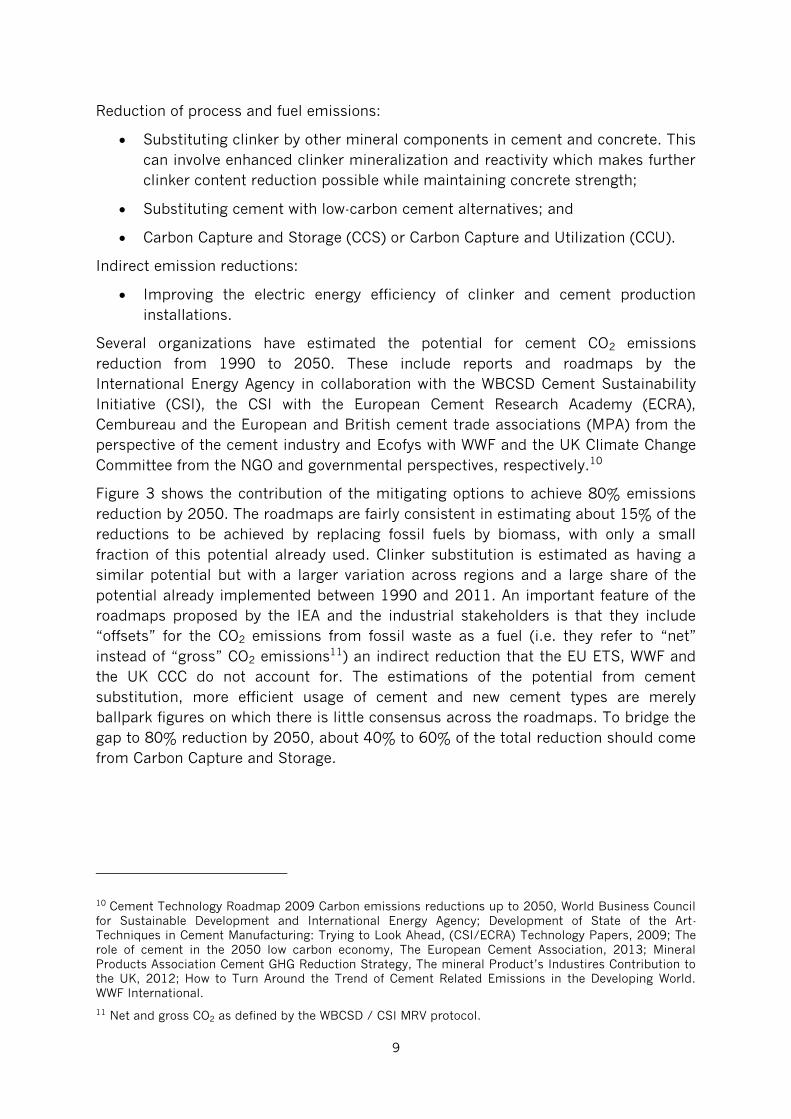
Reduction of process and fuel emissions:
Substituting clinker by other mineral components in cement and concrete. This
can involve enhanced clinker mineralization and reactivity which makes further
clinker content reduction possible while maintaining concrete strength;
Substituting cement with low-carbon cement alternatives; and
Carbon Capture and Storage (CCS) or Carbon Capture and Utilization (CCU).
Indirect emission reductions:
Improving the electric energy efficiency of clinker and cement production
installations.
Several organizations have estimated the potential for cement CO2 emissions
reduction from 1990 to 2050. These include reports and roadmaps by the
International Energy Agency in collaboration with the WBCSD Cement Sustainability
Initiative (CSI), the CSI with the European Cement Research Academy (ECRA),
Cembureau and the European and British cement trade associations (MPA) from the
perspective of the cement industry and Ecofys with WWF and the UK Climate Change
Committee from the NGO and governmental perspectives, respectively.10
Figure 3 shows the contribution of the mitigating options to achieve 80% emissions
reduction by 2050. The roadmaps are fairly consistent in estimating about 15% of the
reductions to be achieved by replacing fossil fuels by biomass, with only a small
fraction of this potential already used. Clinker substitution is estimated as having a
similar potential but with a larger variation across regions and a large share of the
potential already implemented between 1990 and 2011. An important feature of the
roadmaps proposed by the IEA and the industrial stakeholders is that they include
“offsets” for the CO2 emissions from fossil waste as a fuel (i.e. they refer to “net”
instead of “gross” CO2 emissions11) an indirect reduction that the EU ETS, WWF and
the UK CCC do not account for. The estimations of the potential from cement
substitution, more efficient usage of cement and new cement types are merely
ballpark figures on which there is little consensus across the roadmaps. To bridge the
gap to 80% reduction by 2050, about 40% to 60% of the total reduction should come
from Carbon Capture and Storage.
10 Cement Technology Roadmap 2009 Carbon emissions reductions up to 2050, World Business Council
for Sustainable Development and International Energy Agency; Development of State of the Art-
Techniques in Cement Manufacturing: Trying to Look Ahead, (CSI/ECRA) Technology Papers, 2009; The
role of cement in the 2050 low carbon economy, The European Cement Association, 2013; Mineral
Products Association Cement GHG Reduction Strategy, The mineral Product’s Industires Contribution to
the UK, 2012; How to Turn Around the Trend of Cement Related Emissions in the Developing World.
WWF International.
11 Net and gross CO2 as defined by the WBCSD / CSI MRV protocol.
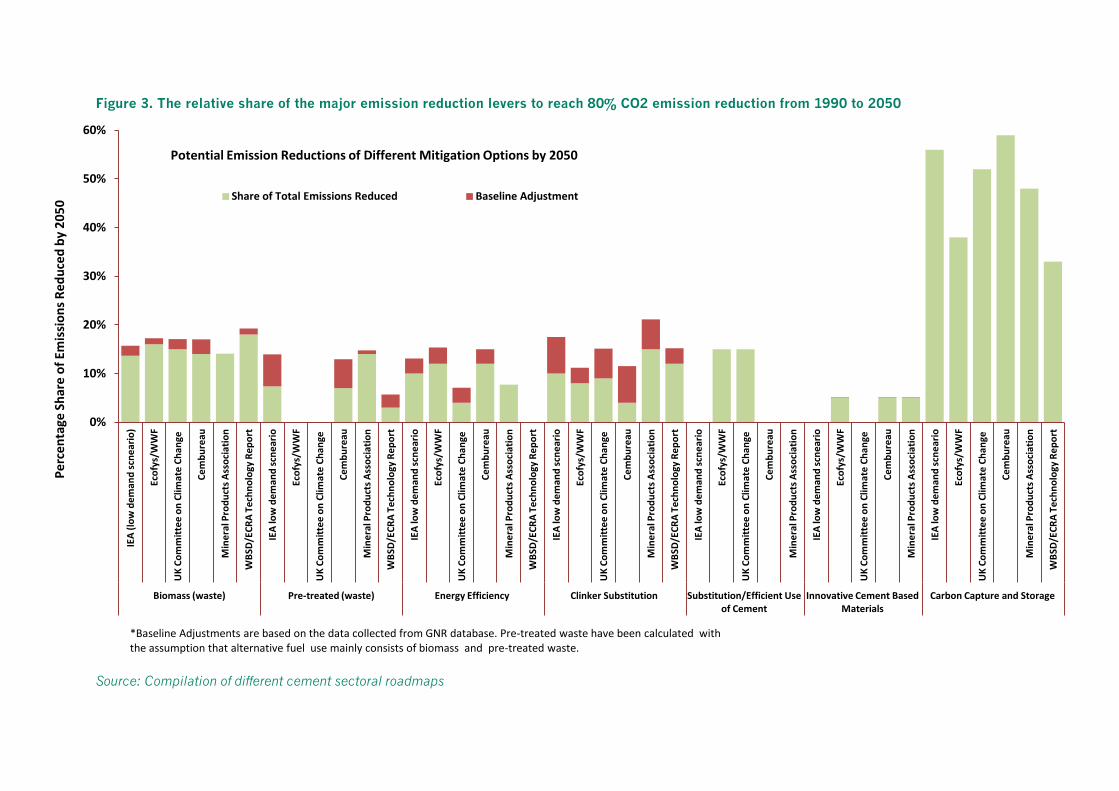
Figure 3. The relative share of the major emission reduction levers to reach 80% CO2 emission reduction from 1990 to 2050
Source: Compilation of different cement sectoral roadmaps
0%
10%
20%
30%
40%
50%
60% IE
A (
low
de
man
d s
cne
ario
)
Eco
fys/
WW
F
UK
Co
mm
itte
e o
n C
limat
e C
han
ge
Ce
mb
ure
au
Min
era
l Pro
du
cts
Ass
oci
atio
n
WB
SD/E
CR
A T
ech
no
logy
Re
po
rt
IEA
low
de
man
d s
cne
ario
Eco
fys/
WW
F
UK
Co
mm
itte
e o
n C
limat
e C
han
ge
Ce
mb
ure
au
Min
era
l Pro
du
cts
Ass
oci
atio
n
WB
SD/E
CR
A T
ech
no
logy
Re
po
rt
IEA
low
de
man
d s
cne
ario
Eco
fys/
WW
F
UK
Co
mm
itte
e o
n C
limat
e C
han
ge
Ce
mb
ure
au
Min
era
l Pro
du
cts
Ass
oci
atio
n
WB
SD/E
CR
A T
ech
no
logy
Re
po
rt
IEA
low
de
man
d s
cne
ario
Eco
fys/
WW
F
UK
Co
mm
itte
e o
n C
limat
e C
han
ge
Ce
mb
ure
au
Min
era
l Pro
du
cts
Ass
oci
atio
n
WB
SD/E
CR
A T
ech
no
logy
Re
po
rt
IEA
low
de
man
d s
cne
ario
Eco
fys/
WW
F
UK
Co
mm
itte
e o
n C
limat
e C
han
ge
Ce
mb
ure
au
Min
era
l Pro
du
cts
Ass
oci
atio
n
IEA
low
de
man
d s
cne
ario
Eco
fys/
WW
F
UK
Co
mm
itte
e o
n C
limat
e C
han
ge
Ce
mb
ure
au
Min
era
l Pro
du
cts
Ass
oci
atio
n
IEA
low
de
man
d s
cne
ario
Eco
fys/
WW
F
UK
Co
mm
itte
e o
n C
limat
e C
han
ge
Ce
mb
ure
au
Min
era
l Pro
du
cts
Ass
oci
atio
n
WB
SD/E
CR
A T
ech
no
logy
Re
po
rt
Biomass (waste) Pre-treated (waste) Energy Efficiency Clinker Substitution Substitution/Efficient Use of Cement
Innovative Cement Based Materials
Carbon Capture and Storage
Pe
rce
nta
ge S
har
e o
f Em
issi
on
s R
edu
ced
by
20
50
Potential Emission Reductions of Different Mitigation Options by 2050
Share of Total Emissions Reduced Baseline Adjustment
*Baseline Adjustments are based on the data collected from GNR database. Pre-treated waste have been calculated with the assumption that alternative fuel use mainly consists of biomass and pre-treated waste.
Further options that reduce indirect CO2 emissions where power generation remains
fossil based include:
Improving electric power efficiency of clinker and cement production. Grinding
cement more finely and using more slag increases power consumption but
enhances cement performance and thus makes it possible to use less clinker
and cement in concrete;
Recovering of waste heat from the clinker kiln and using this to produce
electric power. It should be noted though that the more energy efficient the
clinker kiln is, the less waste heat there is to recover.
The next section will describe how the ETS and other policy instruments have
influenced progress and business decision-making on the different mitigation options.
3. Past drivers and future needs to unlock the various mitigation options
3.1. Alternative fuels, biomass and the CO2 intensity of the fuel mix
The EU cement sector reduced fuel related gross CO2 emission intensity by 6%
between 2005 and 2011, primarily by replacing coal with biomass, the latter of which
is considered to be climate neutral by ETS accounting standards. There was also
some CO2 emissions reduction due to replacement of coal by waste.
The share of energy sourced from biomass has more than doubled from 3.6% in 2005,
to over 5.1% in 2008 to 8.7% in 2011, replacing emissions from coal combustion of
about 3.3 million ton CO2. The share of fossil waste increased from 11% in 2005 to
almost 26% in 201112. Currently, 80% of installations in the EU use fossil waste. The
decisive factors driving the usage of alternative fuel use are: (i) reducing energy cost
(approx. 10 €/ton clinker); and (ii) long-term hedging of energy supply and cost risks.
The economic incentive resulting from the EU ETS is still of secondary importance for
the industry’s biomass and of minor importance for fossil waste use. Using 1 ton of
biomass saves about 1.5 tons of CO2 and 1 ton of fossil waste saves about 0.3 tons of
CO2. At a CO2 market price of 10 €/EUA, companies would save allowances worth 15
€/ton from biomass and 3 €/ton from fossil waste. If 50% of energy would be sourced
from biomass, this would correspond to savings worth 3 €/ton clinker.
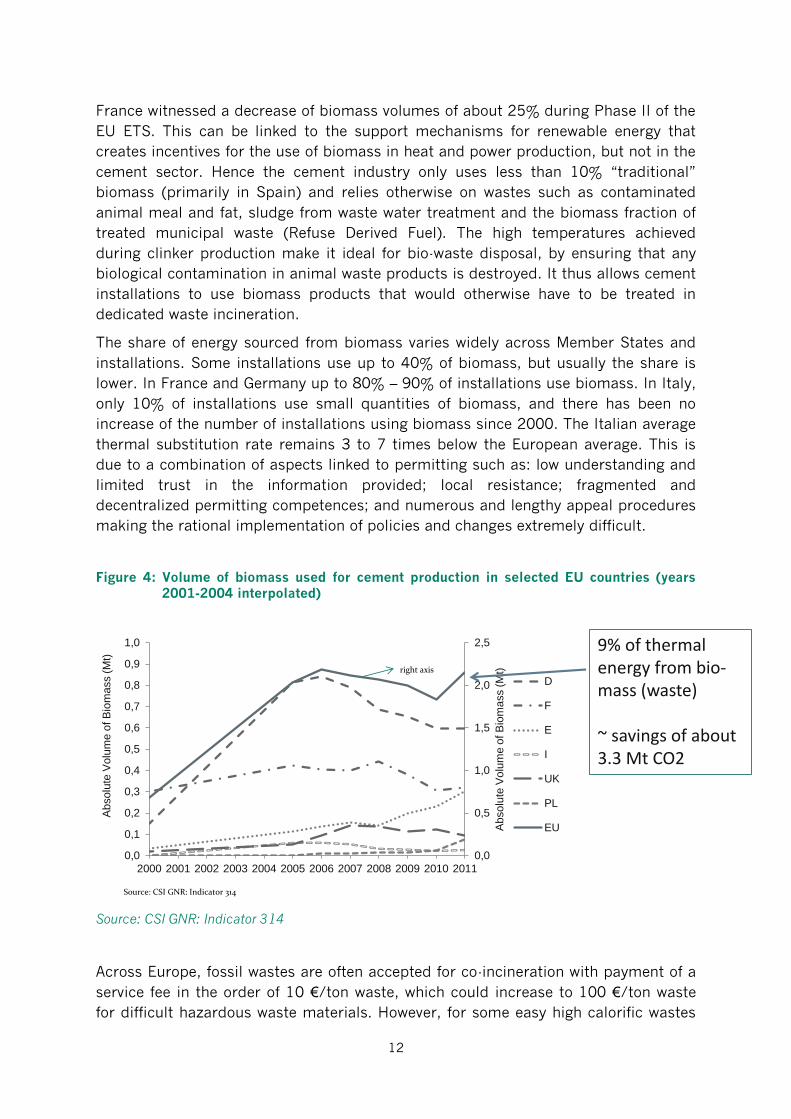
All over Europe the volume of biomass use in cement production (ton biomass / year)
has changed little since 2005. Some exceptions include Spain (50 to 100% increase),
the UK (+10%) and Poland (however with low volumes). In contrast, Germany and
12 CSI „Getting the Numbers Right“, indicator 3211a.
12
France witnessed a decrease of biomass volumes of about 25% during Phase II of the
EU ETS. This can be linked to the support mechanisms for renewable energy that
creates incentives for the use of biomass in heat and power production, but not in the
cement sector. Hence the cement industry only uses less than 10% “traditional”
biomass (primarily in Spain) and relies otherwise on wastes such as contaminated
animal meal and fat, sludge from waste water treatment and the biomass fraction of
treated municipal waste (Refuse Derived Fuel). The high temperatures achieved
during clinker production make it ideal for bio-waste disposal, by ensuring that any
biological contamination in animal waste products is destroyed. It thus allows cement
installations to use biomass products that would otherwise have to be treated in
dedicated waste incineration.
The share of energy sourced from biomass varies widely across Member States and
installations. Some installations use up to 40% of biomass, but usually the share is
lower. In France and Germany up to 80% – 90% of installations use biomass. In Italy,
only 10% of installations use small quantities of biomass, and there has been no
increase of the number of installations using biomass since 2000. The Italian average
thermal substitution rate remains 3 to 7 times below the European average. This is
due to a combination of aspects linked to permitting such as: low understanding and
limited trust in the information provided; local resistance; fragmented and
decentralized permitting competences; and numerous and lengthy appeal procedures
making the rational implementation of policies and changes extremely difficult.
Figure 4: Volume of biomass used for cement production in selected EU countries (years 2001-2004 interpolated)
Source: CSI GNR: Indicator 314
Across Europe, fossil wastes are often accepted for co-incineration with payment of a
service fee in the order of 10 €/ton waste, which could increase to 100 €/ton waste
for difficult hazardous waste materials. However, for some easy high calorific wastes
0,0
0,5
1,0
1,5
2,0
2,5
0,0
0,1
0,2
0,3
0,4
0,5
0,6
0,7
0,8
0,9
1,0
2000 2001 2002 2003 2004 2005 2006 2007 2008 2009 2010 2011
Ab
so
lute
Vo
lum
e o
f B
iom
ass (
Mt)
Absolu
te V
olu
me o
f B
iom
ass (
Mt)
D
F
E
I
UK
PL
EU
Source: CSI GNR: Indicator 314
right axis
9% of thermal energy from bio-mass (waste)
~ savings of about 3.3 Mt CO2
13
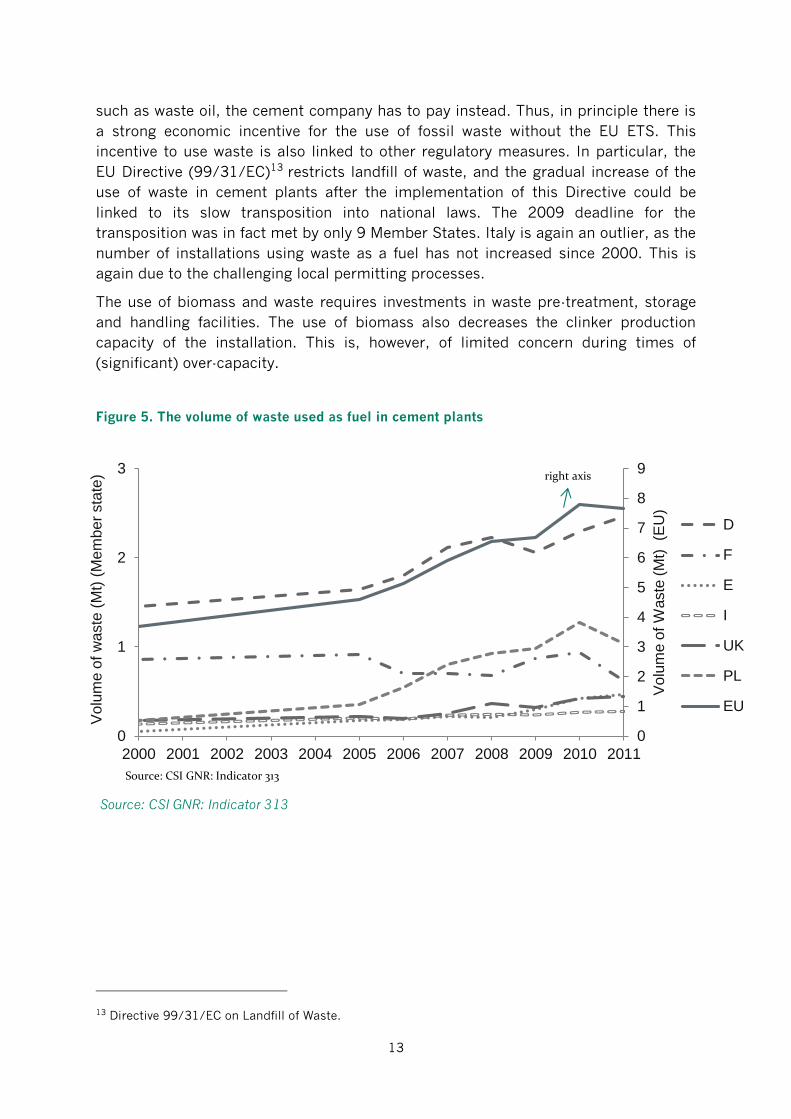
such as waste oil, the cement company has to pay instead. Thus, in principle there is
a strong economic incentive for the use of fossil waste without the EU ETS. This
incentive to use waste is also linked to other regulatory measures. In particular, the
EU Directive (99/31/EC)13 restricts landfill of waste, and the gradual increase of the
use of waste in cement plants after the implementation of this Directive could be
linked to its slow transposition into national laws. The 2009 deadline for the
transposition was in fact met by only 9 Member States. Italy is again an outlier, as the
number of installations using waste as a fuel has not increased since 2000. This is
again due to the challenging local permitting processes.
The use of biomass and waste requires investments in waste pre-treatment, storage
and handling facilities. The use of biomass also decreases the clinker production
capacity of the installation. This is, however, of limited concern during times of
(significant) over-capacity.
Figure 5. The volume of waste used as fuel in cement plants
Source: CSI GNR: Indicator 313
13 Directive 99/31/EC on Landfill of Waste.
0
1
2
3
4
5
6
7
8
9
0
1
2
3
2000 2001 2002 2003 2004 2005 2006 2007 2008 2009 2010 2011
Volu
me o
f W
aste
(M
t) (E
U)
Volu
me o
f w
aste
(M
t) (
Mem
ber
sta
te)
D
F
E
I
UK
PL
EU
Source: CSI GNR: Indicator 313
right axis
14
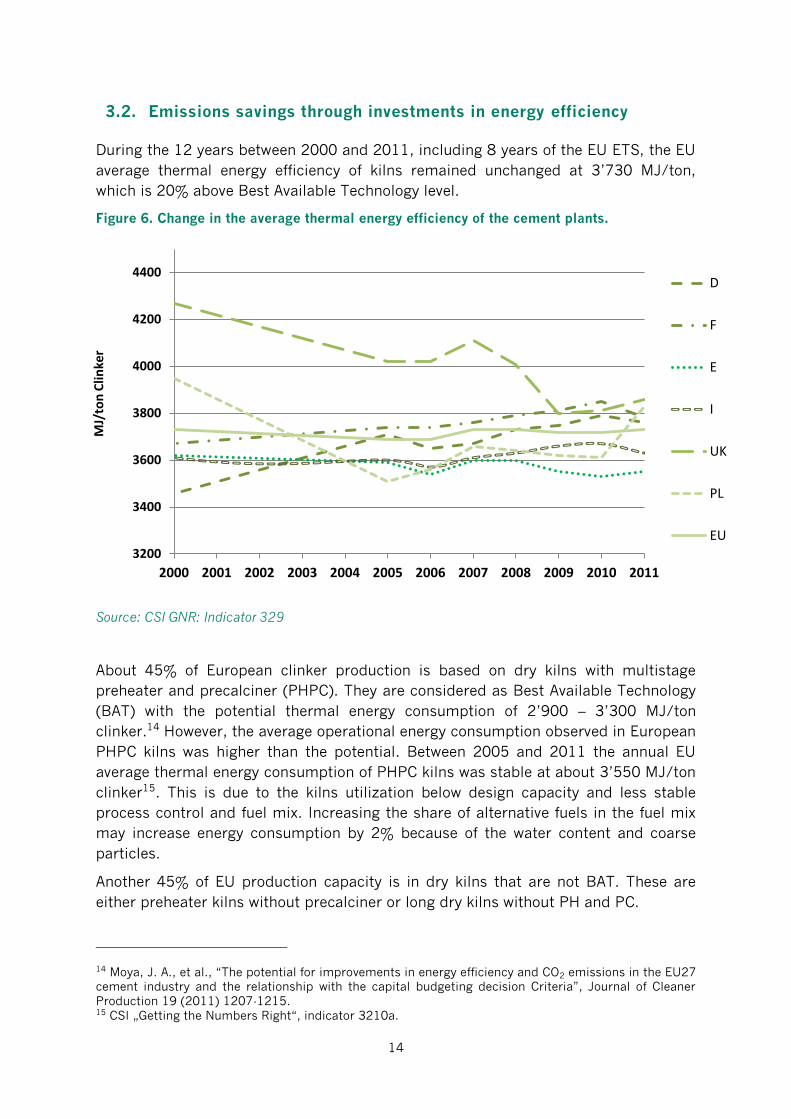
3.2. Emissions savings through investments in energy efficiency
During the 12 years between 2000 and 2011, including 8 years of the EU ETS, the EU
average thermal energy efficiency of kilns remained unchanged at 3’730 MJ/ton,
which is 20% above Best Available Technology level.
Figure 6. Change in the average thermal energy efficiency of the cement plants.
Source: CSI GNR: Indicator 329
About 45% of European clinker production is based on dry kilns with multistage
preheater and precalciner (PHPC). They are considered as Best Available Technology
(BAT) with the potential thermal energy consumption of 2’900 – 3’300 MJ/ton
clinker.14 However, the average operational energy consumption observed in European
PHPC kilns was higher than the potential. Between 2005 and 2011 the annual EU
average thermal energy consumption of PHPC kilns was stable at about 3’550 MJ/ton
clinker15. This is due to the kilns utilization below design capacity and less stable
process control and fuel mix. Increasing the share of alternative fuels in the fuel mix
may increase energy consumption by 2% because of the water content and coarse
particles.
Another 45% of EU production capacity is in dry kilns that are not BAT. These are
either preheater kilns without precalciner or long dry kilns without PH and PC.
14 Moya, J. A., et al., “The potential for improvements in energy efficiency and CO2 emissions in the EU27
cement industry and the relationship with the capital budgeting decision Criteria”, Journal of Cleaner
Production 19 (2011) 1207-1215. 15 CSI „Getting the Numbers Right“, indicator 3210a.
3200
3400
3600
3800
4000
4200
4400
2000 2001 2002 2003 2004 2005 2006 2007 2008 2009 2010 2011
MJ/
ton
Clin
ker
D
F
E
I
UK
PL
EU
15
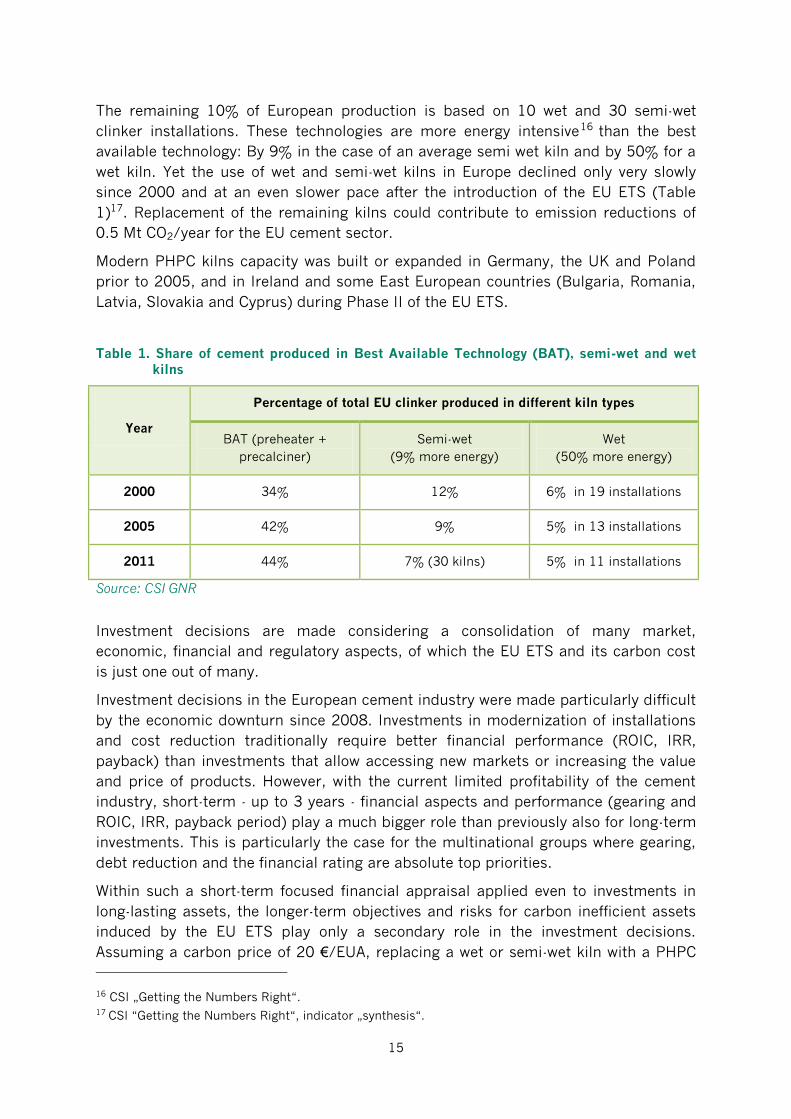
The remaining 10% of European production is based on 10 wet and 30 semi-wet
clinker installations. These technologies are more energy intensive16 than the best
available technology: By 9% in the case of an average semi wet kiln and by 50% for a
wet kiln. Yet the use of wet and semi-wet kilns in Europe declined only very slowly
since 2000 and at an even slower pace after the introduction of the EU ETS (Table
1)17. Replacement of the remaining kilns could contribute to emission reductions of
0.5 Mt CO2/year for the EU cement sector.
Modern PHPC kilns capacity was built or expanded in Germany, the UK and Poland
prior to 2005, and in Ireland and some East European countries (Bulgaria, Romania,
Latvia, Slovakia and Cyprus) during Phase II of the EU ETS.
Table 1. Share of cement produced in Best Available Technology (BAT), semi-wet and wet kilns
Year
Percentage of total EU clinker produced in different kiln types
BAT (preheater +
precalciner)
Semi-wet
(9% more energy)
Wet
(50% more energy)
2000 34% 12% 6% in 19 installations
2005 42% 9% 5% in 13 installations
2011 44% 7% (30 kilns) 5% in 11 installations
Source: CSI GNR
Investment decisions are made considering a consolidation of many market,
economic, financial and regulatory aspects, of which the EU ETS and its carbon cost
is just one out of many.
Investment decisions in the European cement industry were made particularly difficult
by the economic downturn since 2008. Investments in modernization of installations
and cost reduction traditionally require better financial performance (ROIC, IRR,
payback) than investments that allow accessing new markets or increasing the value
and price of products. However, with the current limited profitability of the cement
industry, short-term - up to 3 years - financial aspects and performance (gearing and
ROIC, IRR, payback period) play a much bigger role than previously also for long-term
investments. This is particularly the case for the multinational groups where gearing,
debt reduction and the financial rating are absolute top priorities.
Within such a short-term focused financial appraisal applied even to investments in
long-lasting assets, the longer-term objectives and risks for carbon inefficient assets
induced by the EU ETS play only a secondary role in the investment decisions.
Assuming a carbon price of 20 €/EUA, replacing a wet or semi-wet kiln with a PHPC
16 CSI „Getting the Numbers Right“. 17 CSI “Getting the Numbers Right“, indicator „synthesis“.
16
kilns leads to cost savings of 4.6 €/ton and 1.4 €/ton clinker respectively. While this
is not a negligible cost, it is insufficient for justifying a wet to dry kiln conversion. The
refurbishment of existing installations to bring them to BAT level is expensive,
especially because many of the less efficient installations in Europe are of relatively
small size (less than 1 Mton/year).
Based on the interviews with company executives, wet kilns can still reach a financial
contribution (i.e. sales price minus production cost) of about 20 to 30 €/ton product,
despite the higher thermal energy consumption and CO2 emissions. Apart from the
investment costs having been amortized, (semi) wet installations in Europe reduce
their energy cost through sourcing high to very high (up to 70%) energy contributions
from waste, often industrial wastes that are obtained including a service fee.
The CO2 cost is thus insufficient to trigger a wet to dry kiln conversion at carbon
prices in the range of 10 to 20 €/EUA. The effect of carbon prices is weakened
through the allowance allocation provisions within the EU ETS. As installations receive
the full allowance allocation as long as annual production volume is not bellow 50% of
historic production volume, old installations can operate at a lower capacity factor (as
they are already depreciated) and still benefit from full allowance allocation, thus
obtaining surplus allowance allocation that contributes to net revenue. 18
A set of the EU ETS provisions and implementing measures contribute to a perception
of reduced regulatory predictability and investment uncertainty that may have
contributed to a delay of investment decisions. These include the revision of the list of
carbon leakage-exposed sectors which takes place every 5 years, uncertainties about
carbon leakage protection measures after 2020 and the complexity of historically
based allocation rules. It also relates to ongoing discussions on backloading,
structural reforms of the EU ETS, 2030 targets and international agreements
concerning the reduction of CO2 emissions. However, according to several executives
interviewed, the risks induced by the EU ETS are also used as a welcome excuse for
the deferral of difficult decisions.
3.3. Emission reductions through substitution of clinker with other materials
Since it is the production of clinker that causes CO2 emissions, the substitution of it
by other hydraulic minerals is the most effective way to reduce CO2 emissions in
cement. The European cement norm19 allows six clinker substituting minerals, from
which the most important are ground granulated blast furnace slag from the steel
industry, fly ash from coal fired power stations, limestone and burnt oil shale.
Reducing the clinker content in cement is currently the most effective mitigation
18 Demailly, D., et al., “How to design a border adjustment for the European Union Emissions Trading
System?”, Energy Policy 38 (2010) 5199–5207. 19 European Standard EN197-1 Cement - Part 1: Composition, specifications and conformity criteria for
common cements.
17
option because it not only prevents fuel CO2 but also the process CO2 emissions from
the chemical transformation of limestone in clinker.
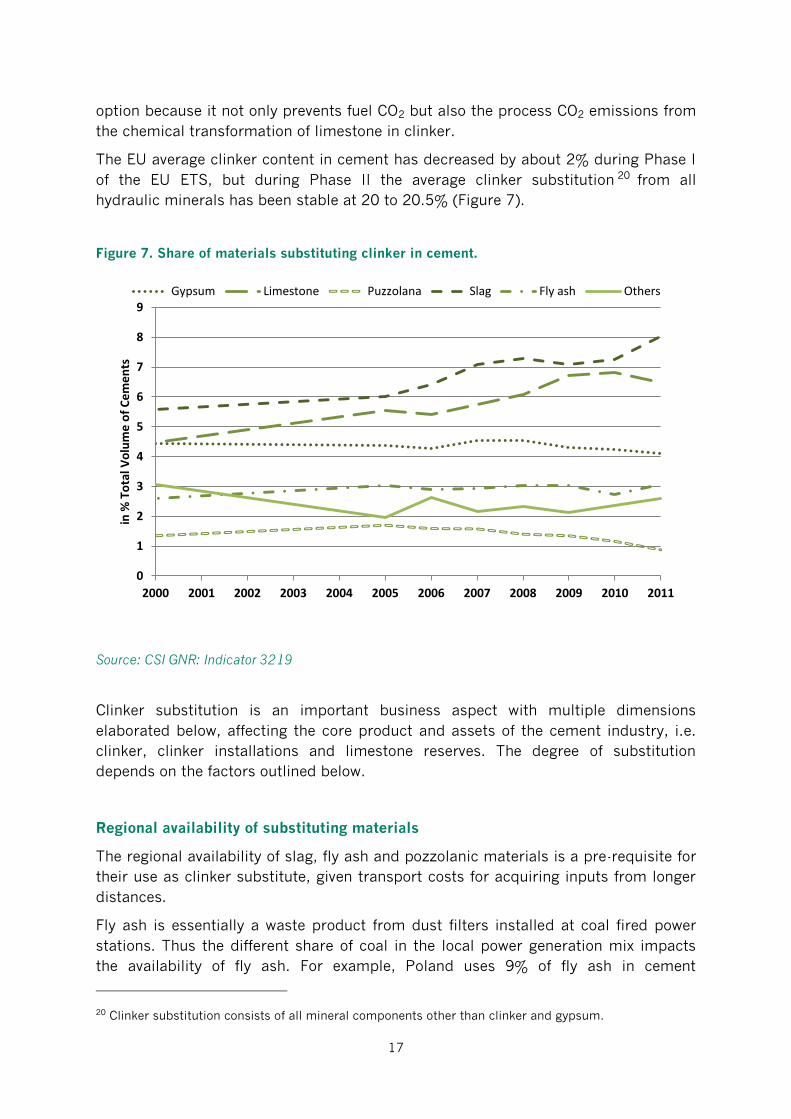
The EU average clinker content in cement has decreased by about 2% during Phase I
of the EU ETS, but during Phase II the average clinker substitution 20 from all
hydraulic minerals has been stable at 20 to 20.5% (Figure 7).
Figure 7. Share of materials substituting clinker in cement.
Source: CSI GNR: Indicator 3219
Clinker substitution is an important business aspect with multiple dimensions
elaborated below, affecting the core product and assets of the cement industry, i.e.
clinker, clinker installations and limestone reserves. The degree of substitution
depends on the factors outlined below.
Regional availability of substituting materials
The regional availability of slag, fly ash and pozzolanic materials is a pre-requisite for
their use as clinker substitute, given transport costs for acquiring inputs from longer
distances.
Fly ash is essentially a waste product from dust filters installed at coal fired power
stations. Thus the different share of coal in the local power generation mix impacts
the availability of fly ash. For example, Poland uses 9% of fly ash in cement
20 Clinker substitution consists of all mineral components other than clinker and gypsum.
0
1
2
3
4
5
6
7
8
9
2000 2001 2002 2003 2004 2005 2006 2007 2008 2009 2010 2011
in %
To
tal V
olu
me
of
Ce
me
nts
Gypsum Limestone Puzzolana Slag Fly ash Others
18
production, significantly above the European average of 3%. The potential for further
increases of the use of fly ash is limited and will decline if climate policy triggers a
shift away from coal power generation.
Most slag from steel plants is utilized across Europe for cement production.
Significant up-front investment costs are required for processing facilities prior to
inclusion of slag into cement. In the UK and Ireland, clinker is also substituted with
slag at the concrete mixer instead of during cement production. Total clinker
substitution for these countries, in cement and in concrete combined, is similar to the
rest of Europe.
Geology limits the availability of pozzolanic minerals to a few southern European
countries with volcanic activity such as Italy to Greece. 21 Also, burnt oil shale is an
excellent cementitious product. It is produced in a fluidized bed combustion
installation and co-generates electric power. CO2 emission per ton of cement is low
because there is no limestone decomposition, it requires a low combustion
temperature (half that of a clinker kiln) and it co-generates power. However, geology
limits the availability of open-air mining of useful shale to a few regions in Europe.
Cost of substituting materials
Fly ash and slag are by-products of power and steel production. Their use requires
some up-front investments in treatment plants. Cement producers compete for the
limited available fly ash and slag, resulting in significant prices that however usually
remain below the total cost of providing clinker. In addition, there is a trend that with
contract renewals the value of the CO2 savings from clinker substitution by slag is
shared between the cement and steel companies. Typically supply contracts secure
cement companies a stable access to fly ash and slag at a fixed price.
Dependence on other companies
The economic cycles of cement and steel do not always coincide. This may lead to
temporary imbalances in the supply and demand of slag as a clinker substitute. Since
2009 slag has been (temporarily) stockpiled in limestone quarries of cement
companies rather than being used in cement. There are no accurate data available on
the volume and time of slag stockpiled. A reasonable estimate could be around 3
million ton or about 15% of the slag volume used annually across Europe.
Meeting consumer needs
Clinker substitution may impact the technical qualities and requirements of the
concrete, such as early and late strength, sulphate resistance, colour and workability.
This requires overcoming demand-side resistance to new products.
21 “A blue print for a climate friendly cement industry. How to Turn Around the Trend of Cement Related
Emissions in the Developing World”, Ecofys, 2008.
19
Some companies have started with Product Carbon Footprinting, labelling and
advertising reduction of embedded CO2 in marketing and sales of different cement
types. Market acceptance has been mixed but generally rather muted. Product quality
and price remain the two most important aspects for the customer. This shows the
importance of economic incentives for emission reductions from the EU ETS into
consumer choices. The cost of embedded CO2 should be reflected in the cement price
to more effectively stimulate consumer choices to low carbon cement types.
The EU ETS
Substituting for example 25% to 30% of clinker, i.e. selling CEM II instead of CEM I
cement, saves about 0.2 ton CO2/ton of cement. At a carbon price of €10 this would
offer savings of 2 €/ton of cement. This raises the question as to why the EU ETS has
not induced further clinker substitution.
Most cement executives interviewed stated that, while recognizing that clinker
substitution is an effective option to reduce CO2 emissions, the influence of the EU
ETS is not (yet) weighted as much as other factors that drive decisions about clinker
substitution. This can be broken down to two factors:
First, cement companies only add a limited and uncertain share of opportunity costs
for CO2 allowances to cement prices (see section 4.2). Thus there is currently a very
limited economic incentive for cement consumers to shift towards cement with lower
clinker content. A (full) CO2 cost pass-through in the cement pricing may be necessary
to effectively influence consumer choices towards lower CO2 cement types and
producers.
Secondly, cement companies discount the value of potential emission savings from
clinker substitution if allowances are allocated for free. This repeated observation in
industry reality contradicts simplified economic models of companies maximizing
profits. In theory, companies should pursue equal levels of abatement if they can save
costs from buying fewer allowances or if they can increase revenue from selling
additional surplus allowances. Why the reality diverges from this theory can be linked
to: (i) the uncertainty whether lower clinker production will be reflected in the base-
line for allowance allocation in future periods; and (ii) the norms in corporate
accounting procedures that report costs, but ignore forgone opportunity costs savings
(see also section 4.3 on use of profits from over-allocation by cement companies).
As a result, some companies have invested in production with reduced clinker content,
mainly in view of a long-term corporate CO2 reduction strategy. Yet the effective
incentive from the EU ETS was limited across Europe and the average share of clinker
substitution remained stable. Regional differences did however occur. Germany and
the UK have further increased clinker substitution during both EU ETS phases, in the
UK mainly with fly ash. Poland increased clinker substitution during Phase I but not
Phase II. In Italy and the Czech Republic clinker substitution remained remarkably
unchanged since the beginning of the EU ETS. Slag use at the concrete mixer in the
UK has also not changed since 2005. Spain on the other hand has decreased clinker
20
substitution during EU ETS Phase II, going back to the year 2000 level (see further in
section 4.3). Also Austria increased the clinker content of cement, reaching
substitution levels only slightly above the EU average.
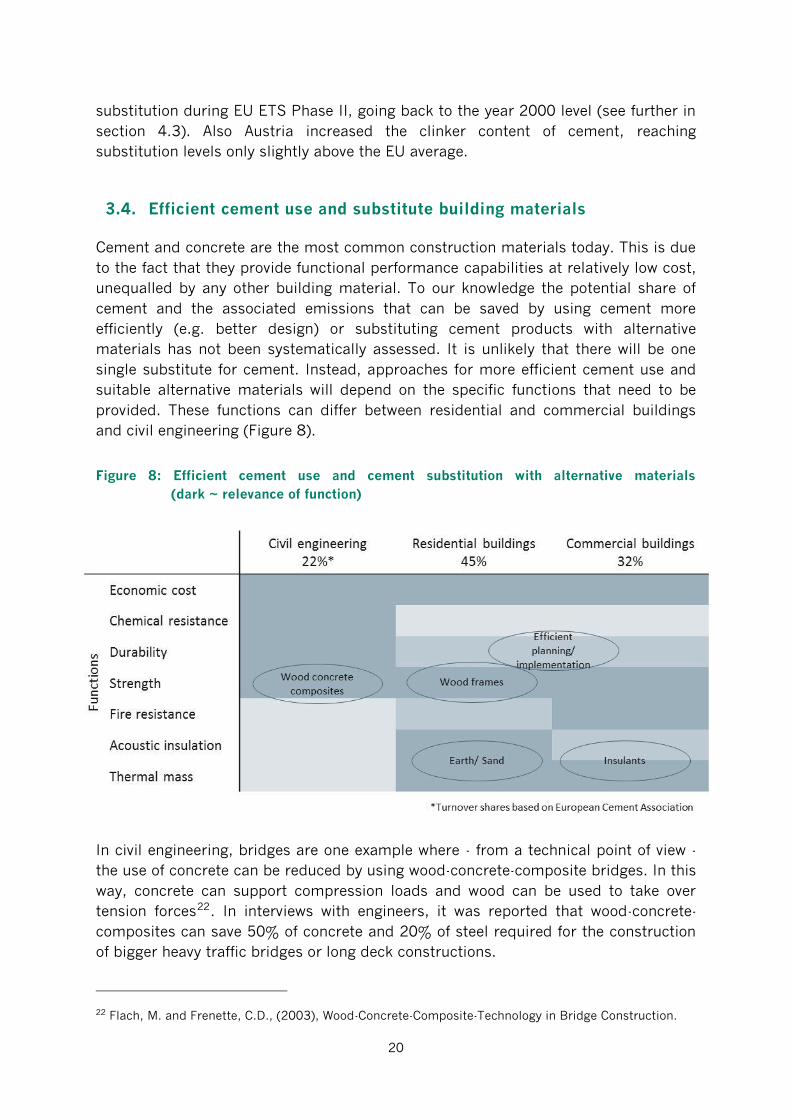
3.4. Efficient cement use and substitute building materials
Cement and concrete are the most common construction materials today. This is due
to the fact that they provide functional performance capabilities at relatively low cost,
unequalled by any other building material. To our knowledge the potential share of
cement and the associated emissions that can be saved by using cement more
efficiently (e.g. better design) or substituting cement products with alternative
materials has not been systematically assessed. It is unlikely that there will be one
single substitute for cement. Instead, approaches for more efficient cement use and
suitable alternative materials will depend on the specific functions that need to be
provided. These functions can differ between residential and commercial buildings
and civil engineering (Figure 8).
Figure 8: Efficient cement use and cement substitution with alternative materials
(dark ~ relevance of function)
In civil engineering, bridges are one example where - from a technical point of view -
the use of concrete can be reduced by using wood-concrete-composite bridges. In this
way, concrete can support compression loads and wood can be used to take over
tension forces22. In interviews with engineers, it was reported that wood-concrete-
composites can save 50% of concrete and 20% of steel required for the construction
of bigger heavy traffic bridges or long deck constructions.
22 Flach, M. and Frenette, C.D., (2003), Wood-Concrete-Composite-Technology in Bridge Construction.
21
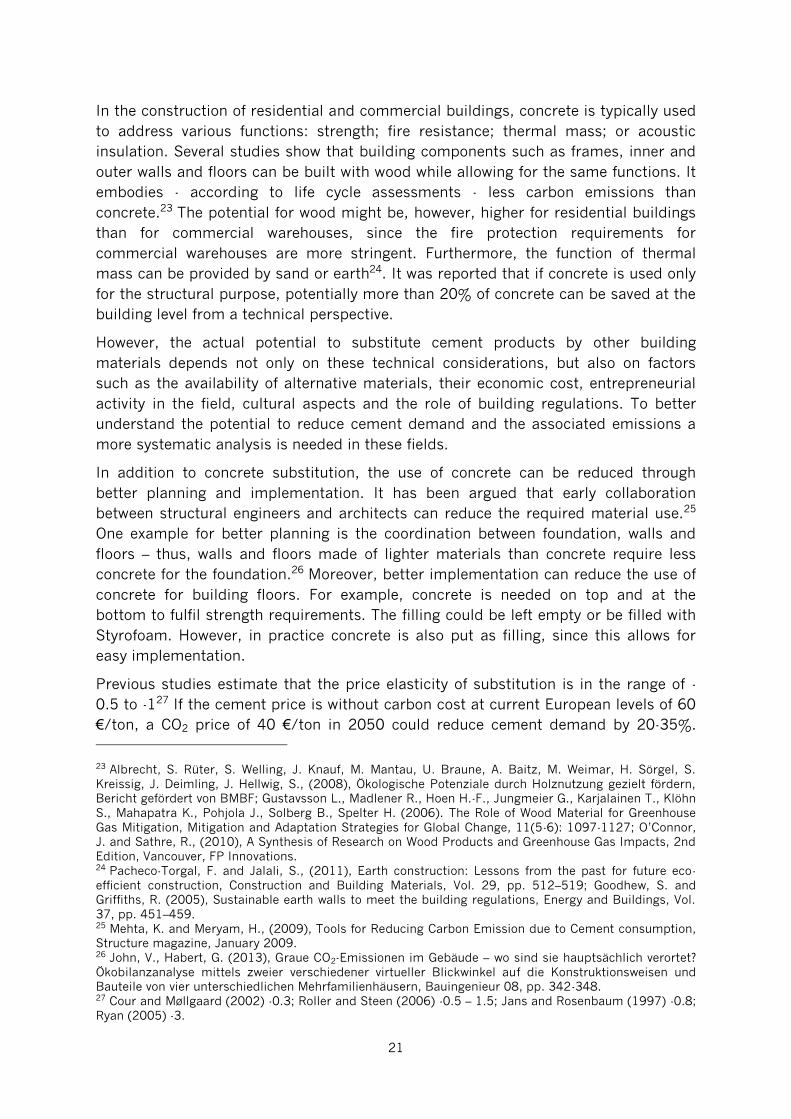
In the construction of residential and commercial buildings, concrete is typically used
to address various functions: strength; fire resistance; thermal mass; or acoustic
insulation. Several studies show that building components such as frames, inner and
outer walls and floors can be built with wood while allowing for the same functions. It
embodies - according to life cycle assessments - less carbon emissions than
concrete.23 The potential for wood might be, however, higher for residential buildings
than for commercial warehouses, since the fire protection requirements for
commercial warehouses are more stringent. Furthermore, the function of thermal
mass can be provided by sand or earth24. It was reported that if concrete is used only
for the structural purpose, potentially more than 20% of concrete can be saved at the
building level from a technical perspective.
However, the actual potential to substitute cement products by other building
materials depends not only on these technical considerations, but also on factors
such as the availability of alternative materials, their economic cost, entrepreneurial
activity in the field, cultural aspects and the role of building regulations. To better
understand the potential to reduce cement demand and the associated emissions a
more systematic analysis is needed in these fields.
In addition to concrete substitution, the use of concrete can be reduced through
better planning and implementation. It has been argued that early collaboration
between structural engineers and architects can reduce the required material use.25
One example for better planning is the coordination between foundation, walls and
floors – thus, walls and floors made of lighter materials than concrete require less
concrete for the foundation.26 Moreover, better implementation can reduce the use of
concrete for building floors. For example, concrete is needed on top and at the
bottom to fulfil strength requirements. The filling could be left empty or be filled with
Styrofoam. However, in practice concrete is also put as filling, since this allows for
easy implementation.
Previous studies estimate that the price elasticity of substitution is in the range of -
0.5 to -127 If the cement price is without carbon cost at current European levels of 60
€/ton, a CO2 price of 40 €/ton in 2050 could reduce cement demand by 20-35%.
23 Albrecht, S. Rüter, S. Welling, J. Knauf, M. Mantau, U. Braune, A. Baitz, M. Weimar, H. Sörgel, S.
Kreissig, J. Deimling, J. Hellwig, S., (2008), Ökologische Potenziale durch Holznutzung gezielt fördern,
Bericht gefördert von BMBF; Gustavsson L., Madlener R., Hoen H.-F., Jungmeier G., Karjalainen T., Klöhn
S., Mahapatra K., Pohjola J., Solberg B., Spelter H. (2006). The Role of Wood Material for Greenhouse
Gas Mitigation, Mitigation and Adaptation Strategies for Global Change, 11(5-6): 1097-1127; O’Connor,
J. and Sathre, R., (2010), A Synthesis of Research on Wood Products and Greenhouse Gas Impacts, 2nd
Edition, Vancouver, FP Innovations. 24 Pacheco-Torgal, F. and Jalali, S., (2011), Earth construction: Lessons from the past for future eco-
efficient construction, Construction and Building Materials, Vol. 29, pp. 512–519; Goodhew, S. and
Griffiths, R. (2005), Sustainable earth walls to meet the building regulations, Energy and Buildings, Vol.
37, pp. 451–459. 25 Mehta, K. and Meryam, H., (2009), Tools for Reducing Carbon Emission due to Cement consumption,
Structure magazine, January 2009. 26 John, V., Habert, G. (2013), Graue CO2-Emissionen im Gebäude – wo sind sie hauptsächlich verortet?
Ökobilanzanalyse mittels zweier verschiedener virtueller Blickwinkel auf die Konstruktionsweisen und
Bauteile von vier unterschiedlichen Mehrfamilienhäusern, Bauingenieur 08, pp. 342-348. 27 Cour and Møllgaard (2002) -0.3; Roller and Steen (2006) -0.5 – 1.5; Jans and Rosenbaum (1997) -0.8;
Ryan (2005) -3.
22
However, as there was to date no significant carbon cost pass through to the cement
price, the EU ETS with free allowance allocation provisions has not contributed to the
substitution of cement by other building materials.
At the same time one needs to be careful not to increase the CO2 emissions by
replacing concrete with other materials that lead to higher emissions. Therefore
passing the costs of carbon to final customers must not be limited only to cement-
based products but also to its possible substitutes, i.e. steel. In sum, this brief review
points to various opportunities to reduce demand for cement and to the need for
more systematic analysis on the reduction potential of concrete.
3.5. Developments of alternatives to cement
Low-carbon cement options include “new” cements based on “old” ideas, such as
calcium sulfo-aluminate cement, clinker mineralization and alkali-activated cement,
as well as new processes and products such as Celitement (Schwenk) and Novacem.
Cement sector executives argue that developing and demonstrating such new
products will take 10 to 15 years.
Probably the most important barrier for product innovation is absence of market
demand for products with lower embedded carbon, especially as long as carbon
prices are low and not reflected in cement prices. Even with carbon prices included in
cement costs it will be difficult to encourage users to shift to new cement types: The
application of cement and concrete for infrastructure with a very long life-time,
foundations, buildings and housing makes proven durability of the product an
absolutely essential requirement of the customer.
As discussed for the case of cement substitutes, also low-carbon cement alternatives
are unlikely to provide the very same functions of cement. Instead a specific low
carbon cement type might be used – and possibly preferred – according to the
specific application. A further rational for a more differentiated set of low-carbon
cement types might emerge from potentially limited availability of individual
resources.
3.6. Development of CCS
CO2 capture and storage (CCS) is a mitigation option that captures CO2 from the flue
gases of stationary installations, compresses the purified CO2 and transports it to a
geological storage location, injecting it deep underground for permanent isolation
from the atmosphere.28
Since 2007 the European Cement Research Academy (ECRA) has been conducting
research projects on carbon capture technologies for the cement industry and makes
28 IPCC, 2005: Special Report on Carbon Dioxide Capture and Storage. Cambridge University Press:
Cambridge, United Kingdom.
23
the extensive technical reports publicly available.29 Cement companies as well as
cement equipment and gas technology companies participate in this joint research
effort.
After initial assessment ECRA focused on two capture technologies. With the “post
combustion” technology a flue gas treatment installation at the end of a traditional
clinker production installation absorbs the CO2 out of the flue gases into a chemical
liquid, to be followed by a regeneration of the liquid and separation of pure CO2. With
the “oxyfuel technology” ambient air is separated in oxygen and nitrogen and the fuels
in the clinker kiln are burnt with an oxygen/CO2 mixture instead of with air. The main
components of the resulting flue gases are CO2 and water which are separated prior
to compression of the CO2.
ECRA’s research has revealed that both technologies could be used for retrofitting
existing clinker installations. The energy required to separate 1 ton of CO2 with the
post combustion technology is almost the same as the clinker BAT thermal energy
demand. The energy penalty of the oxyfuel technology is lower: the thermal energy
demand per ton clinker would be roughly the same as with traditional BAT but electric
energy consumption will double.
Norcem, the Norwegian subsidiary of Heidelberg cement, hosts a test rig enabling the
testing of different CO2 capture technologies since mid-2013.
Still a lot of research and development, including pilot plants, remains to be done.
While the economic analysis is only preliminary in this research, it indicates
investment costs around 100M Euro and abatement cost around 30 to 40€ per ton
CO2 captured, excluding compression, transport and storage.
CCS in general has several barriers, which also apply to CCS in cement. Capture leads
to higher energy consumption. Specifically the cost of CCS technologies in the cement
sector will likely exceed 40 euro/tCO230 and societal acceptance of CO2 storage is
uncertain31. R&D on CO2-storage is generally done by companies specialised in the
underground, such as oil and gas companies, requiring a new type of cooperation
between cement and underground companies, which some see as another barrier.
European environmental organisations are generally opposed to CCS in the power
sector as it displaces renewables, but more supportive of CCS in industry where few
other options for deep emission reductions exist.32
29 European Cement Research Academy – ECRA CCS technical reports parts 1 to 3 <www.ecra-
online.de>. 30 IEA/UNIDO, 2011. Technology Roadmap: Carbon Capture and Storage in Industrial Applications. IEA:
Paris, France. 31 Global Energy Assessment, 2012: Chapter 13: Carbon capture and storage. Available on
www.iiasa.at/gea. 32 “Climate Action Network Europe Position Paper CO2 Capture and Storage” Climate Action Network
Europe 2006, <http://www.climnet.org/resources/doc_download/1119-caneurope-ccs-position-paper-
11-2006>.
24
No EU Member State has a specific policy on CCS in the cement industry, although
several documents have been recommending specific activities.33 The EU Economic
Recovery Package of 2008 has made available funds for CCS demonstrations, but all
six proposed projects involved coal-fired power. The NER300 call was open to CCS on
cement-plants, but no applications were submitted from the cement sector.
An interesting new ECRA R&D initiative, though still at a very early stage, aims at
finding other solutions than permanent storage of the captured CO2. It focuses on
conversion of the captured CO2 into hydrocarbons such as methanol, using solar and
renewable energy. In this form the captured CO2 could be reconverted into a fossil
fuel or resource for industry.
ECRA’s decision to engage in this long-term R&D is inspired by the European Union’s
long term CO2 reduction ambition. It is however not financially supported through nor
are there economic incentives from the EU ETS yet. According to McKinsey & Co, CCS
retrofitting of existing cement plants is at the highest cost end of the Carbon
Abatement Cost Curves.34 Since the purpose of an ETS is precisely to incentivize the
least costly abatement options, economic theory suggests that CCS will not be
stimulated by the ETS unless the other reduction levers are insufficient to meet
reduction targets and the ETS price rises accordingly. Prior to this, other support
mechanisms are needed for large scale demonstration of CCS in the cement industry.
33 IEA/UNIDO, 2011. Technology Roadmap: Carbon Capture and Storage in Industrial Applications. IEA:
Paris, France. 34 McKinsey & Company, 2009, Pathways to a Low-Carbon Economy; Version 2 of the Global
Greenhouse Gas Abatement Cost Curve.
25
4. Effects of the EU ETS on pricing, operational and investment decisions
4.1. Pricing: Are carbon costs passed on to cement purchasers?
One of the ways that the carbon market is intended to drive emission reductions is by
incentivizing substitution and a more efficient utilization of products with high CO2
emissions. If producers of carbon-intensive products pass the cost of CO2 incurred in
the production of their goods through to final product prices, consumers will have an
incentive to either switch to less carbon-intensive alternatives or use these products
more efficiently. The CO2 cost pass-through may also be important for producers of
less carbon-intensive alternatives, such as low-carbon cements, to be confident that
their products can be commercially competitive.
Historically, European cement companies adopted a “cost-plus” approach to product
pricing, whereby prices were based on costs plus a desired margin. More recently,
some companies began debating a shift towards an approach to pricing based on the
“value-added”, which the consumers gain from using the product in a given
application.
During the expert interviews cement executives, who were asked about price pass-
through, stated that they did not pass on carbon prices to consumers in the cement
sale price. This statement was subsequently checked against the available data on
cement prices, which also suggest that cement prices do not include CO2 opportunity
costs.
Data on cement prices were obtained by dividing Eurostat’s quarterly intra EU trade
value data for grey Portland cement by the corresponding trade flow quantities within
the EU-15 since 2000. This was done because EU-wide data on cement prices are not
publicly available. While trade volumes within the EU-15 only represent a small
portion of total sales in the sector, a check of the implied trade values against
Eurostat’s annual production value and volume data, reported by Prodcom, reveal
that the implied prices from trade closely follow prices for all production.
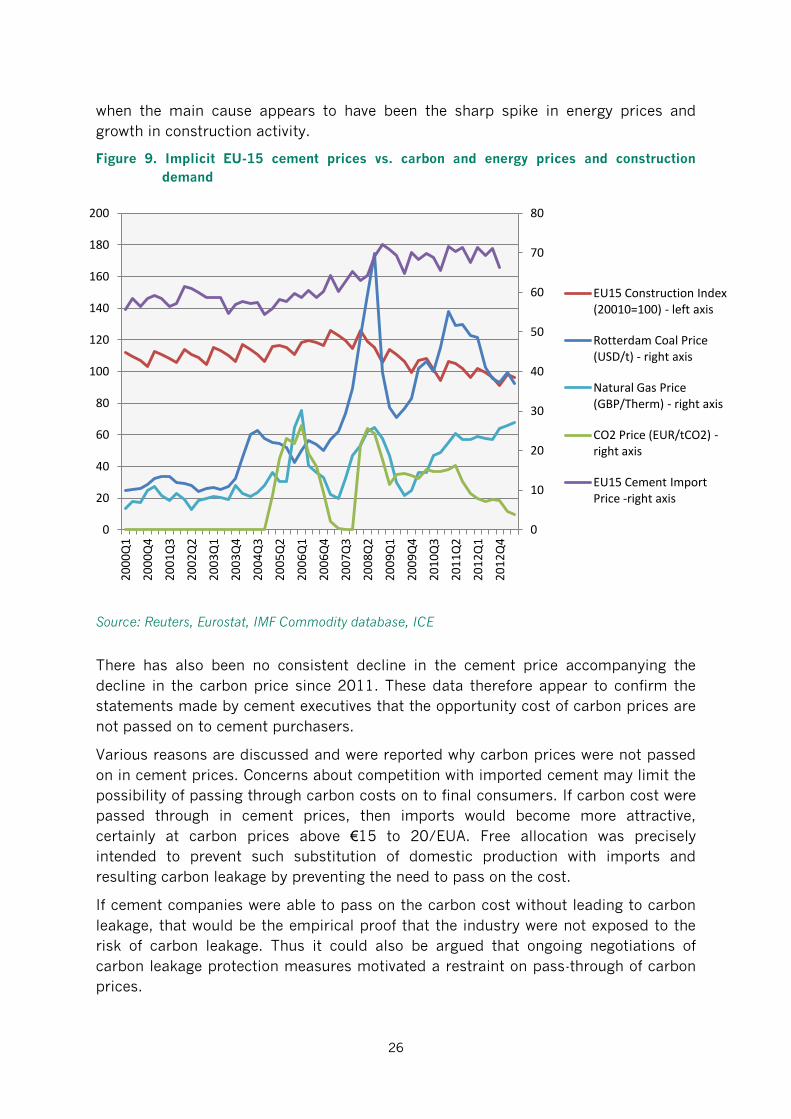
Figure 9 shows the quarterly average grey Portland cement price as implied by EU-15
import prices. The figure also shows the evolution of construction activity in the EU-15,
steam coal prices, natural gas prices, and carbon prices in the EU ETS since 2000.
Assuming an average CO2 intensity of 0.6 ton/CO2 per ton of cement, a carbon price
of €10 would add up to €6 to the price of cement if fully passed on to consumers.
However, no such relationship between cement and carbon prices can be observed
since the introduction of the EU ETS in January 2005. It can be seen that the cement
prices rose gradually from around 60 to 70 €/ton between the third quarter of 2004
and the final quarter of 2008. However, the periods in which the sharpest rise in
prices occurred do not correspond closely to the introduction of the EU ETS in
January 2005. On the contrary, cement prices only began to rise significantly in mid-
to-late 2006, after the sharp decline of the carbon price, and in late 2007- early 2008,
26
when the main cause appears to have been the sharp spike in energy prices and
growth in construction activity.
Figure 9. Implicit EU-15 cement prices vs. carbon and energy prices and construction
demand
Source: Reuters, Eurostat, IMF Commodity database, ICE
There has also been no consistent decline in the cement price accompanying the
decline in the carbon price since 2011. These data therefore appear to confirm the
statements made by cement executives that the opportunity cost of carbon prices are
not passed on to cement purchasers.
Various reasons are discussed and were reported why carbon prices were not passed
on in cement prices. Concerns about competition with imported cement may limit the
possibility of passing through carbon costs on to final consumers. If carbon cost were
passed through in cement prices, then imports would become more attractive,
certainly at carbon prices above €15 to 20/EUA. Free allocation was precisely
intended to prevent such substitution of domestic production with imports and
resulting carbon leakage by preventing the need to pass on the cost.
If cement companies were able to pass on the carbon cost without leading to carbon
leakage, that would be the empirical proof that the industry were not exposed to the
risk of carbon leakage. Thus it could also be argued that ongoing negotiations of
carbon leakage protection measures motivated a restraint on pass-through of carbon
prices.
0
10
20
30
40
50
60
70
80
0
20
40
60
80
100
120
140
160
180
200
20
00
Q1
20
00
Q4
20
01
Q3
20
02
Q2
20
03
Q1
20
03
Q4
20
04
Q3
20
05
Q2
20
06
Q1
20
06
Q4
20
07
Q3
20
08
Q2
20
09
Q1
20
09
Q4
20
10
Q3
20
11
Q2
20
12
Q1
20
12
Q4
EU15 Construction Index (20010=100) - left axis
Rotterdam Coal Price (USD/t) - right axis
Natural Gas Price (GBP/Therm) - right axis
CO2 Price (EUR/tCO2) - right axis
EU15 Cement Import Price -right axis
27
Longer-term strategic considerations – such as maintaining market share and good
client relationships – could partially balance the incentive to pass on opportunity
carbon prices to the product prices.
Another concern is that raising prices to reflect opportunity costs of carbon would, in
the presence of free allowances, lead to a large rise in profit margins. Some
interviewees expressed concerns that this might raise suspicions of competition
authorities, which pay close attention to pricing practices in the cement sector.
The substantial unbalance between production capacity and market demand during
recent years has also eroded the industry’s capability to include other cost increases,
such as increased energy costs, into product prices.
Finally, several interviewed executives confirmed that their companies do not yet use
the carbon content embedded in cement for marketing and pricing of different
cement types. Cement companies do not use carbon cost pass through to promote
the sales of low carbon cement, quite the opposite, some try charging a premium for
“green” low carbon products. This notion of “value added” unfortunately goes against
the concept of internalization of the environmental cost.
The limited or absent carbon prices pass-through to the cement price is closely linked
to the fact that cement firms have so far received their required emission allowances
for free under the EU ETS. This may be subject to change during the EU ETS Phase III
if installations face a real carbon cost if capacity utilization is similar to or above the
production volume during the reference period and emissions of the installations are
above the benchmark rate.
4.2. Trade and re-investment: Is there evidence of carbon leakage?
There are a number of definitions of the term ’carbon leakage’.35 This report focuses
on the question as to whether the EU ETS had direct effects on trade and investment
patterns, which resulted in EU production and emissions ’escaping’ to regions not
covered by the EU ETS. The main concern is that by increasing production costs for
EU cement companies, the EU ETS directly leads to an increase in the share of EU
demand met by imports.
In discussing this question, we differentiate between operational leakage, in which
imports gain market share from domestic production because of different carbon
costs between producing regions, i.e. operational leakage that occurs in the short
term; and investment leakage, i.e. leakage which occurs via the impacts of the EU ETS
on the cement sector investment policy and which could occur over a longer time
horizon. It is also possible that, under certain circumstances, the EU ETS causes
35 It is most commonly perceived as the marginal emission changes in country B that is induced by
climate policy in country A. Many channels of potential leakage (both positive and negative) have been
identified including impacts on international trade, investments, international energy prices and
technology spill-overs (see Dröge, S. 2011). Using border measures to address carbon flows. Climate
Policy, 11(5), 1191– 1201.
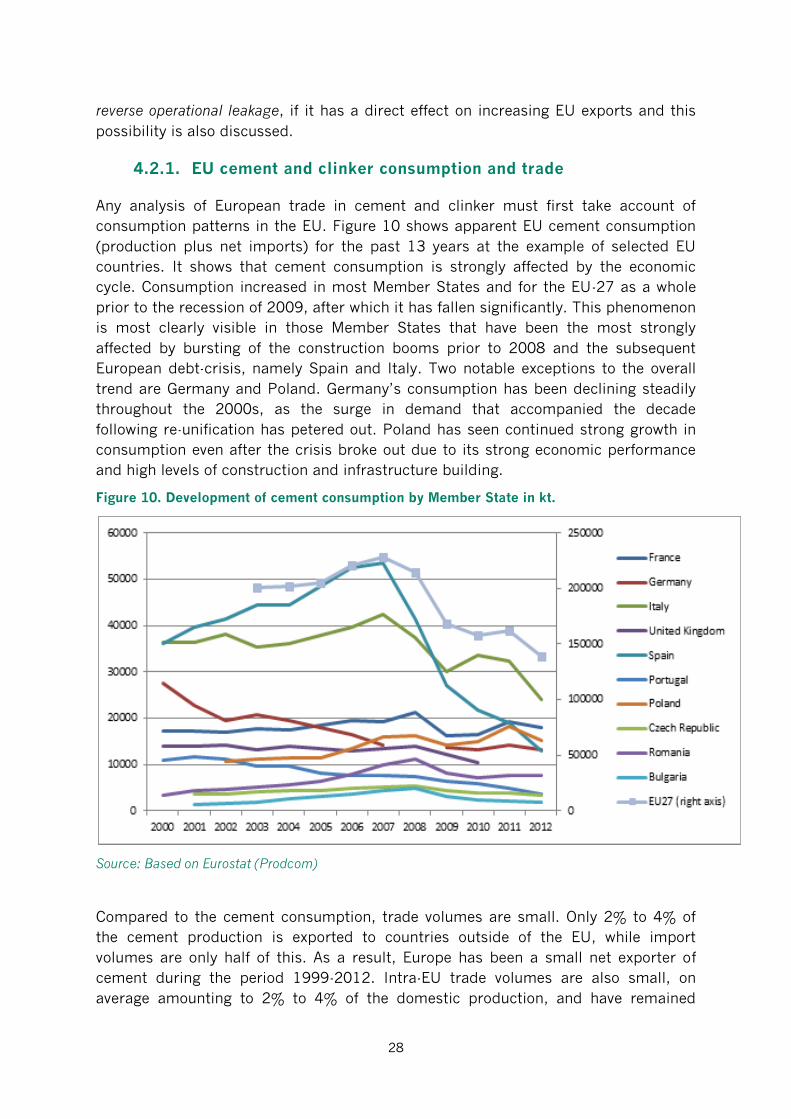
28
reverse operational leakage, if it has a direct effect on increasing EU exports and this
possibility is also discussed.
4.2.1. EU cement and clinker consumption and trade
Any analysis of European trade in cement and clinker must first take account of
consumption patterns in the EU. Figure 10 shows apparent EU cement consumption
(production plus net imports) for the past 13 years at the example of selected EU
countries. It shows that cement consumption is strongly affected by the economic
cycle. Consumption increased in most Member States and for the EU-27 as a whole
prior to the recession of 2009, after which it has fallen significantly. This phenomenon
is most clearly visible in those Member States that have been the most strongly
affected by bursting of the construction booms prior to 2008 and the subsequent
European debt-crisis, namely Spain and Italy. Two notable exceptions to the overall
trend are Germany and Poland. Germany’s consumption has been declining steadily
throughout the 2000s, as the surge in demand that accompanied the decade
following re-unification has petered out. Poland has seen continued strong growth in
consumption even after the crisis broke out due to its strong economic performance
and high levels of construction and infrastructure building.
Figure 10. Development of cement consumption by Member State in kt.
Source: Based on Eurostat (Prodcom)
Compared to the cement consumption, trade volumes are small. Only 2% to 4% of
the cement production is exported to countries outside of the EU, while import
volumes are only half of this. As a result, Europe has been a small net exporter of
cement during the period 1999-2012. Intra-EU trade volumes are also small, on
average amounting to 2% to 4% of the domestic production, and have remained
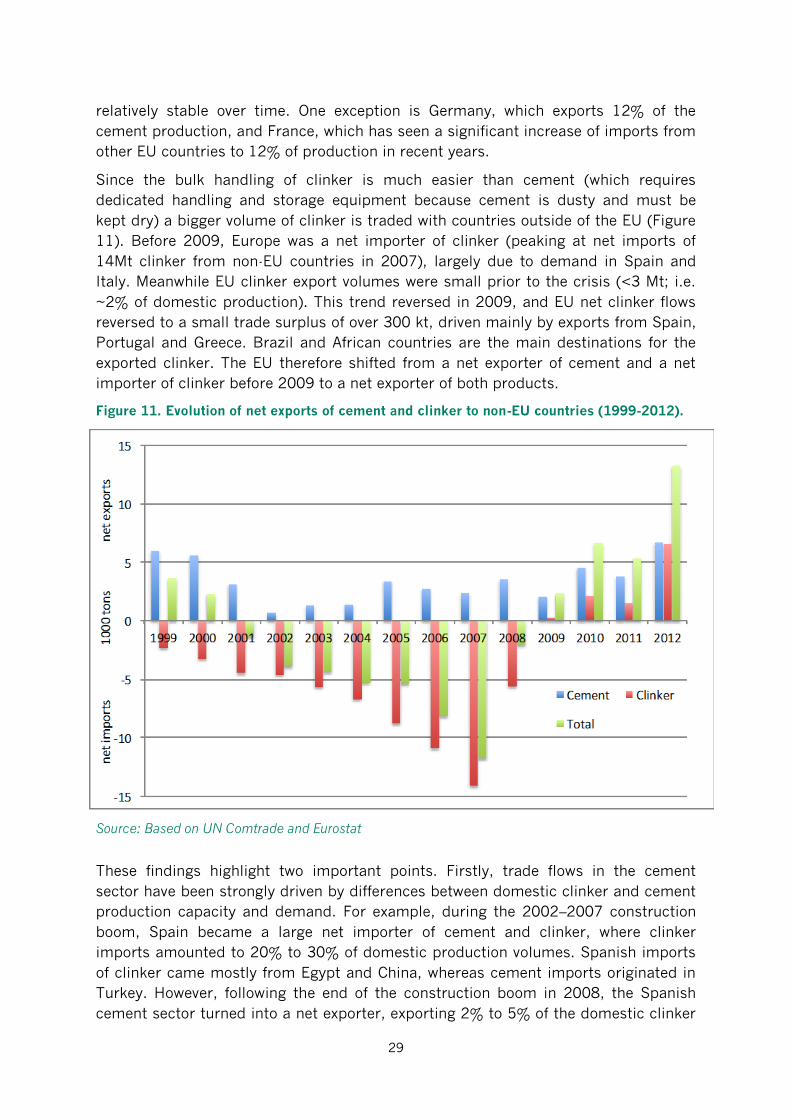
29
relatively stable over time. One exception is Germany, which exports 12% of the
cement production, and France, which has seen a significant increase of imports from
other EU countries to 12% of production in recent years.
Since the bulk handling of clinker is much easier than cement (which requires
dedicated handling and storage equipment because cement is dusty and must be
kept dry) a bigger volume of clinker is traded with countries outside of the EU (Figure
11). Before 2009, Europe was a net importer of clinker (peaking at net imports of
14Mt clinker from non-EU countries in 2007), largely due to demand in Spain and
Italy. Meanwhile EU clinker export volumes were small prior to the crisis (<3 Mt; i.e.
~2% of domestic production). This trend reversed in 2009, and EU net clinker flows
reversed to a small trade surplus of over 300 kt, driven mainly by exports from Spain,
Portugal and Greece. Brazil and African countries are the main destinations for the
exported clinker. The EU therefore shifted from a net exporter of cement and a net
importer of clinker before 2009 to a net exporter of both products.
Figure 11. Evolution of net exports of cement and clinker to non-EU countries (1999-2012).
Source: Based on UN Comtrade and Eurostat
These findings highlight two important points. Firstly, trade flows in the cement
sector have been strongly driven by differences between domestic clinker and cement
production capacity and demand. For example, during the 2002–2007 construction
boom, Spain became a large net importer of cement and clinker, where clinker
imports amounted to 20% to 30% of domestic production volumes. Spanish imports
of clinker came mostly from Egypt and China, whereas cement imports originated in
Turkey. However, following the end of the construction boom in 2008, the Spanish
cement sector turned into a net exporter, exporting 2% to 5% of the domestic clinker
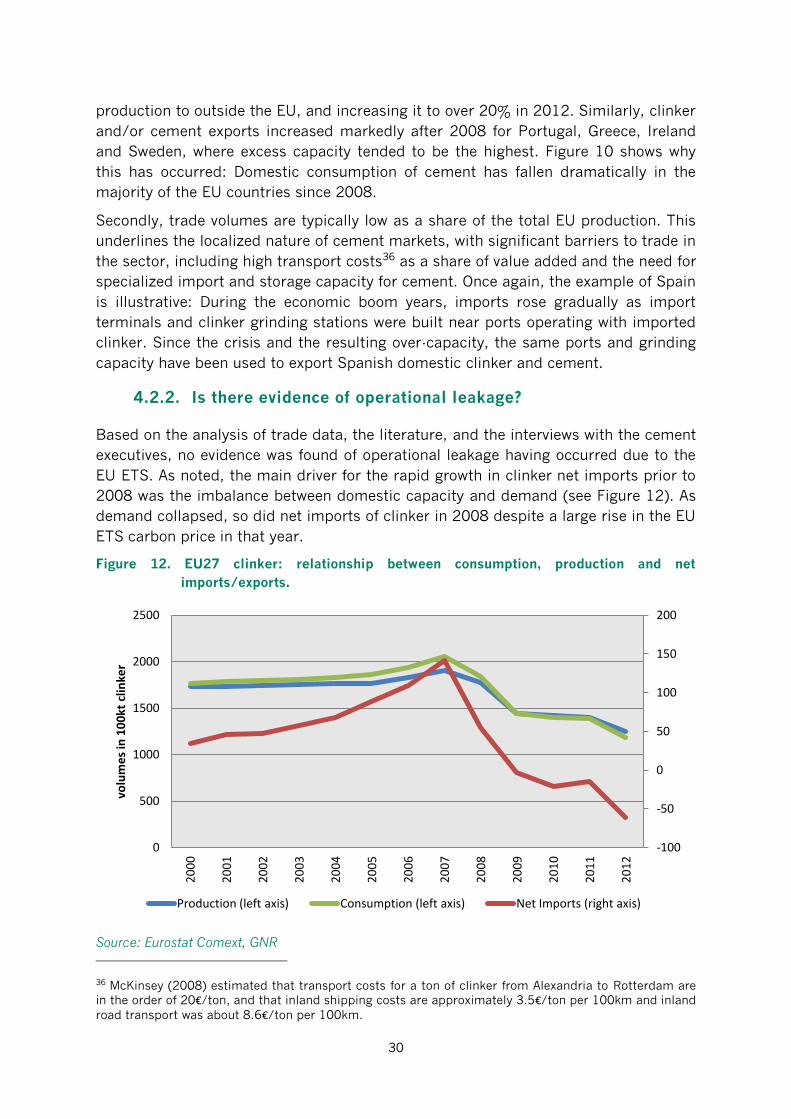
30
production to outside the EU, and increasing it to over 20% in 2012. Similarly, clinker
and/or cement exports increased markedly after 2008 for Portugal, Greece, Ireland
and Sweden, where excess capacity tended to be the highest. Figure 10 shows why
this has occurred: Domestic consumption of cement has fallen dramatically in the
majority of the EU countries since 2008.
Secondly, trade volumes are typically low as a share of the total EU production. This
underlines the localized nature of cement markets, with significant barriers to trade in
the sector, including high transport costs36 as a share of value added and the need for
specialized import and storage capacity for cement. Once again, the example of Spain
is illustrative: During the economic boom years, imports rose gradually as import
terminals and clinker grinding stations were built near ports operating with imported
clinker. Since the crisis and the resulting over-capacity, the same ports and grinding
capacity have been used to export Spanish domestic clinker and cement.
4.2.2. Is there evidence of operational leakage?
Based on the analysis of trade data, the literature, and the interviews with the cement
executives, no evidence was found of operational leakage having occurred due to the
EU ETS. As noted, the main driver for the rapid growth in clinker net imports prior to
2008 was the imbalance between domestic capacity and demand (see Figure 12). As
demand collapsed, so did net imports of clinker in 2008 despite a large rise in the EU
ETS carbon price in that year.
Figure 12. EU27 clinker: relationship between consumption, production and net
imports/exports.
Source: Eurostat Comext, GNR
36 McKinsey (2008) estimated that transport costs for a ton of clinker from Alexandria to Rotterdam are
in the order of 20€/ton, and that inland shipping costs are approximately 3.5€/ton per 100km and inland
road transport was about 8.6€/ton per 100km.
-100
-50
0
50
100
150
200
0
500
1000
1500
2000
2500
20
00
20
01
20
02
20
03
20
04
20
05
20
06
20
07
20
08
20
09
20
10
20
11
20
12
volu
me
s in
10
0kt
clin
ker
Production (left axis) Consumption (left axis) Net Imports (right axis)
31
Discussions with cement company executives confirmed the hypothesis made from
the observed data, that import flows have so far not been driven by carbon prices. For
example, one executive noted that unless future EUA prices are “significantly higher”
than those observed in Phase II, justifying the logistics and cost of offshoring
production for import into the EU based purely on carbon price differences would be
“too difficult”. However, the possibility that significantly higher carbon price
differences in the future may result in operational leakage (in the absence of a level
playing field with producers) in third countries was consistently maintained.
This evidence is consistent with existing econometric studies on this question which
include the EU ETS Phase II.37 They found that the carbon price was not statistically
significant in explaining short-run changes in the level of net imports of cement and
clinker by the EU27. This is also consistent with the evidence given in Section 4.1 on
the fact that European cement producers do not appear to pass-through carbon costs
into their prices.38
4.2.3. Is there evidence of investment leakage?
Empirical evidence of investment leakage is more difficult to establish, since a longer
time-frame is required to observe impacts on investments and this is not necessarily
correlated with short-term carbon prices. Nevertheless, anecdotal evidence from the
expert interviews suggests that the likelihood of investment leakage having occurred
due to the EU ETS is thus far very small.
Some of the cement executives who we interviewed were of the opinion that it is not a
good long-term strategy to build installations outside the EU dedicated to serve the
European cement market. Several of them expressed the view that “BAT production
close to the market” is the best business and environmental option for a heavy
commodity, with low added value and high energy and transport costs.
While the majority of emission allowances required for EU cement production were
distributed for free in Phases I and II, under the benchmarking system introduced
under Phase III, installations will receive free allocation equivalent to 88.4% of their
historical production39, multiplied by the clinker benchmarks. There was considerable
uncertainty about these free allocation levels before they were finally determined in
September 2013. While the long-term path of 1,74% per year decreasing ETS cap is
embedded in the Emission Trading Directive, there is a number of aspects of the
directive that are considered to provide uncertainty for investments. These include: (i)
the 5-yearly revision of the list of carbon leakage-exposed sectors; (ii) the uncertainty
on carbon leakage prevention measures after 2020; (iii) the complexity and
37 Ellerman et al (2010), who looked at data from 2005 to 2008 and by Frédéric Branger, Philippe
Quirion, Julien Chevallier (2013). Carbon leakage and competitiveness of cement and steel industries
under the EU ETS: much ado about nothing, CIRED Working Paper No 2013-53 who analyse data up to
2012. 38 Price pass through is however not a necessary condition for operational leakage to occur.
Theoretically, leakage could also occur via international arbitrage of production costs by European
companies if capacity constraints are not binding and carbon costs are sufficiently high to render such
activities attractive. 39 This reflects the average allocation rate after accounting for the cross-sectoral correction factor.
32
deficiencies of the historically based allocation rules; and (iv) the perception of the
lack of legislative predictability caused by on-going discussions on back-loading,
structural reforms and 2030 targets and international agreements.
While this renders planning and investment decision-making in Europe more difficult,
there is no evidence that investments in Europe have been cancelled and moved
abroad because of the EU ETS. It was not possible to establish to what extent such
uncertainty leads to investment leakage as opposed to simply slowing investment
decision-making on European operations.
4.3. Distortions arising from fixed ex-ante allocation and activity
thresholds
Up to now, free allocation is based on the principle of fixed ex-ante historic allocation
(HA). When allocation is not adapted to the changes of actual production volumes,
this can lead to significant excess initial free allocation in times of low cement
demand.
During Phase II, the criteria to continue receiving full free allocation despite a partial
cessation of production varied across Member States. In most countries there was no
minimum activity level specified, thus enabling up to 95% excess allocation.
The fixed ex-ante allocation followed by the substantial decrease of production caused
by the economic downturn therefore led to a significant excess of freely allocated
allowances. Across the EU this excess of the cement industry increased from 27% of
the total cement sectoral allocation in 2009 to 37% excess in 2012. Since emissions
intensity per ton clinker improved by just about 1%, this excess is essentially due to
production decrease. Most cement companies sold this excess. The financial revenue
as reported by the five largest cement companies in Europe aggregate to well over
one billion Euro from 2009 to 201240. The companies did not earmark these profits
from over-allocation for energy efficiency or emission reduction projects but included
them in the overall corporate budget.
Phase III includes EU harmonized allocation rules dealing with partial cessation of
production, requiring 50% utilization of the Historic Activity Level (HAL) to receive full
free allocation the next year, and requiring 25% operation to receive 50% of the
allocation. 41 This rule was intended to avoid over-allocation accruing to installations
which produce at only a small fraction of their capacity.
However, analysis of the EUTL emissions data and discussions with cement executives
revealed that it continues to create perverse incentives which, especially in a context
of low demand for clinker, lead to various distortions.
40 Reference: Finacial reports from Lafarge, Cemex, HeidelbergCement, Italcementi and Holcim. 41 Cf. Art. 23 Commisson Decision 2011/278/EU.
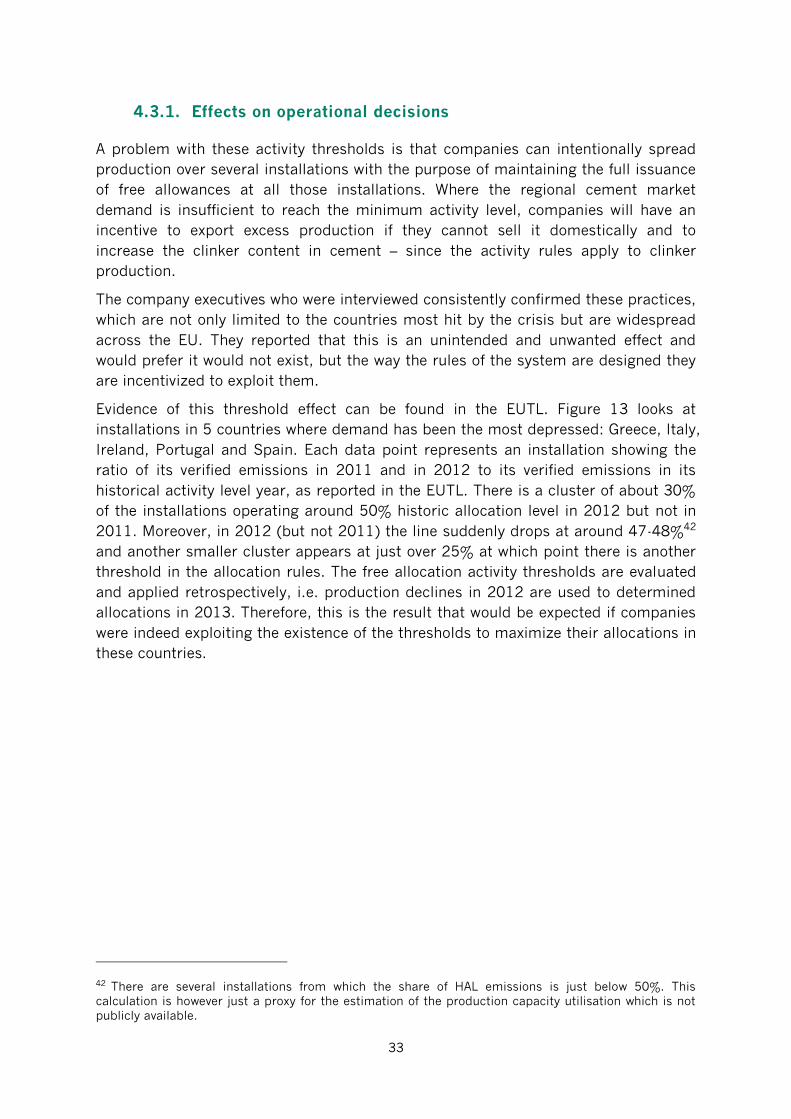
33
4.3.1. Effects on operational decisions
A problem with these activity thresholds is that companies can intentionally spread
production over several installations with the purpose of maintaining the full issuance
of free allowances at all those installations. Where the regional cement market
demand is insufficient to reach the minimum activity level, companies will have an
incentive to export excess production if they cannot sell it domestically and to
increase the clinker content in cement – since the activity rules apply to clinker
production.
The company executives who were interviewed consistently confirmed these practices,
which are not only limited to the countries most hit by the crisis but are widespread
across the EU. They reported that this is an unintended and unwanted effect and
would prefer it would not exist, but the way the rules of the system are designed they
are incentivized to exploit them.
Evidence of this threshold effect can be found in the EUTL. Figure 13 looks at
installations in 5 countries where demand has been the most depressed: Greece, Italy,
Ireland, Portugal and Spain. Each data point represents an installation showing the
ratio of its verified emissions in 2011 and in 2012 to its verified emissions in its
historical activity level year, as reported in the EUTL. There is a cluster of about 30%
of the installations operating around 50% historic allocation level in 2012 but not in
2011. Moreover, in 2012 (but not 2011) the line suddenly drops at around 47-48%42
and another smaller cluster appears at just over 25% at which point there is another
threshold in the allocation rules. The free allocation activity thresholds are evaluated
and applied retrospectively, i.e. production declines in 2012 are used to determined
allocations in 2013. Therefore, this is the result that would be expected if companies
were indeed exploiting the existence of the thresholds to maximize their allocations in
these countries.
42 There are several installations from which the share of HAL emissions is just below 50%. This
calculation is however just a proxy for the estimation of the production capacity utilisation which is not
publicly available.
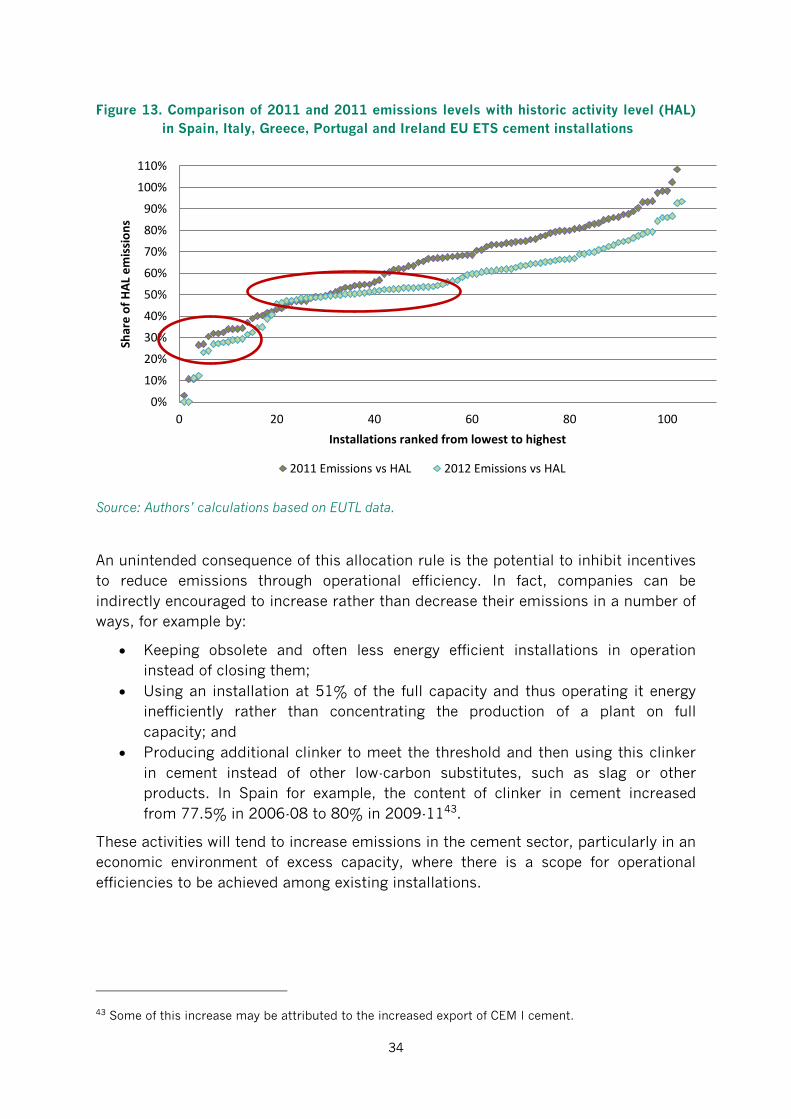
34
Figure 13. Comparison of 2011 and 2011 emissions levels with historic activity level (HAL)
in Spain, Italy, Greece, Portugal and Ireland EU ETS cement installations
Source: Authors’ calculations based on EUTL data.
An unintended consequence of this allocation rule is the potential to inhibit incentives
to reduce emissions through operational efficiency. In fact, companies can be
indirectly encouraged to increase rather than decrease their emissions in a number of
ways, for example by:
Keeping obsolete and often less energy efficient installations in operation
instead of closing them;
Using an installation at 51% of the full capacity and thus operating it energy
inefficiently rather than concentrating the production of a plant on full
capacity; and
Producing additional clinker to meet the threshold and then using this clinker
in cement instead of other low-carbon substitutes, such as slag or other
products. In Spain for example, the content of clinker in cement increased
from 77.5% in 2006-08 to 80% in 2009-1143.
These activities will tend to increase emissions in the cement sector, particularly in an
economic environment of excess capacity, where there is a scope for operational
efficiencies to be achieved among existing installations.
43 Some of this increase may be attributed to the increased export of CEM I cement.
0%
10%
20%
30%
40%
50%
60%
70%
80%
90%
100%
110%
0 20 40 60 80 100
Shar
e o
f H
AL
em
issi
on
s
Installations ranked from lowest to highest
2011 Emissions vs HAL 2012 Emissions vs HAL
35
4.3.2. Effects on asset rationalisation and investment in efficiency
It was also suggested by some interviewees that the partial cessation rules may create
distortions at the level of longer-term decision-making, such as asset rationalization.
This relates to incentives for new investments in energy and carbon efficiency
improvements. Asset rationalization, including closure of structural excess capacity,
is a difficult business decision that is not taken lightly. Such decisions must take into
account a range of factors, including:
Prospect of the future evolution of the economy;
The value of the operating permits, the limestone reserves and quarrying
permits;
Access to cement markets and market share;
Social costs of closures;
Costs of site clean-up; and
Impact on company’s balance sheet.
Asset rationalization is related to investments in energy and emissions efficiency
because for these investments to be profitable, as with all capital expenditures, it is
desirable that the new investment will be fully exploited. This is because the greater
the rate of capacity utilization of the newly built capital or retrofit is, the shorter is the
investment payback period. If the partial closure rules incentivize running plants at
below full capacity in order to spread production across existing installations, or if
they also contribute to excess capacity, production and lower cement prices, then
they will tend to reduce the payback of new investments that improve energy and
emissions efficiency.
Box. 1 How transport costs influence asset rationalization decisions?
An objection to asset rationalization (and thus concentration of production) can be linked to
potential increases of transport volumes involved in serving cement demand with fewer plants.
Also increased use of clinker substitutes may require the sourcing of slag or fly ash from
longer distances. To quantify the relevance of this argument we put the CO2 emissions from
transport in perspective to the CO2 emissions from cement production. These emissions may
be compared to the difference in production emissions of the average plants and the 10%
plants with the lowest emissions in Europe. This difference is 52 kg CO2 per ton clinker and
86 kg CO2 per ton cement.
The next table gives typical CO2 emissions per ton kilometer for different transport modes44
and the distance that clinker and cement may be hauled so that the transport emissions
equate the difference between the average and 10% best production emissions. This
illustrates that heavy products like clinker, cement and slag can be transported over relatively
long distances, even by truck, before CO2 transport emissions offset the CO2 savings from
production emission improvements.
44 Guidelines for Measuring and Managing CO2 emissions from freight transport operations, CEFIC,
March 2011.
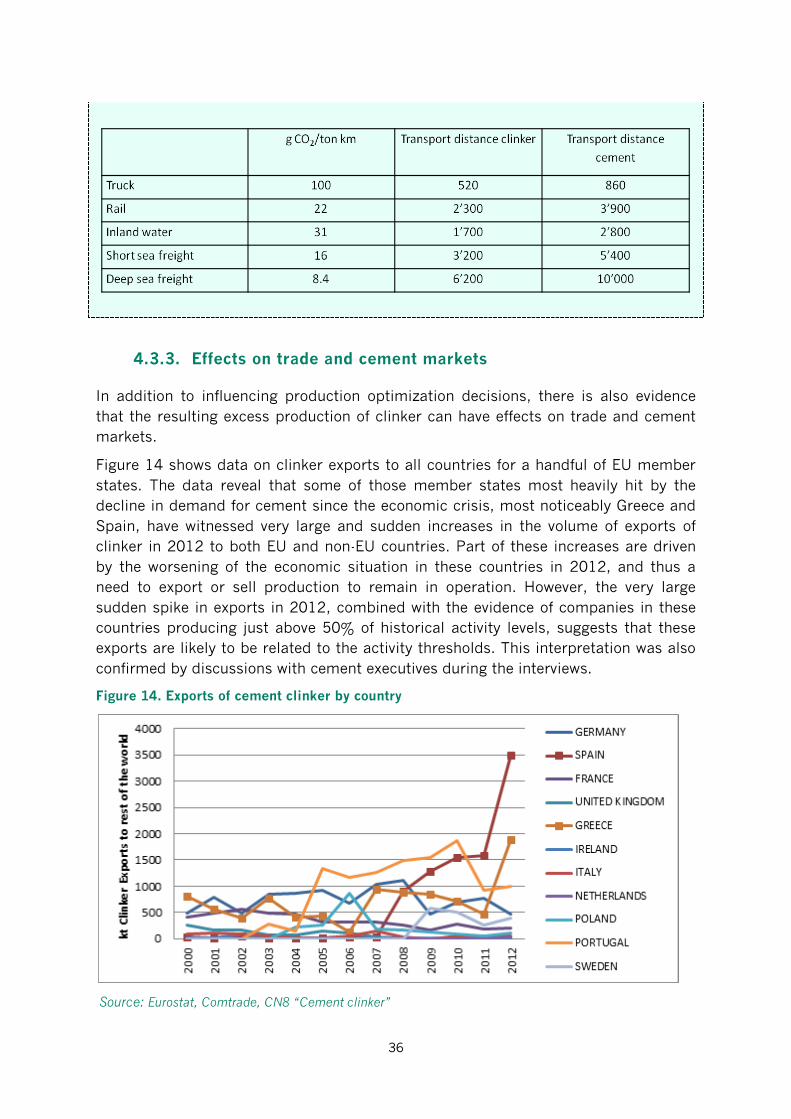
36
4.3.3. Effects on trade and cement markets
In addition to influencing production optimization decisions, there is also evidence
that the resulting excess production of clinker can have effects on trade and cement
markets.
Figure 14 shows data on clinker exports to all countries for a handful of EU member
states. The data reveal that some of those member states most heavily hit by the
decline in demand for cement since the economic crisis, most noticeably Greece and
Spain, have witnessed very large and sudden increases in the volume of exports of
clinker in 2012 to both EU and non-EU countries. Part of these increases are driven
by the worsening of the economic situation in these countries in 2012, and thus a
need to export or sell production to remain in operation. However, the very large
sudden spike in exports in 2012, combined with the evidence of companies in these
countries producing just above 50% of historical activity levels, suggests that these
exports are likely to be related to the activity thresholds. This interpretation was also
confirmed by discussions with cement executives during the interviews.
Figure 14. Exports of cement clinker by country
Source: Eurostat, Comtrade, CN8 “Cement clinker”
37
The evidence thus suggests that the fixed historic allocation and specific closure
thresholds contained in the current EU ETS free allocation rules have distortionary
effects on production and export levels, especially under conditions of extremely
depressed local demand, as in Spain and Greece. While it was not possible for us to
differentiate between the incentives created by the EU ETS and other drivers for
continued operation of plant, the activity level requirements are likely to have
contributed to the increase in export volumes to EU and non EU countries.
The effect is likely to decline during 2013 due to lower allowance prices reducing the
incentive to retain production volumes above threshold levels. However, when the EUA
market price would increase again, the unintended negative effects of the phase III
allocation rules will be amplified again.
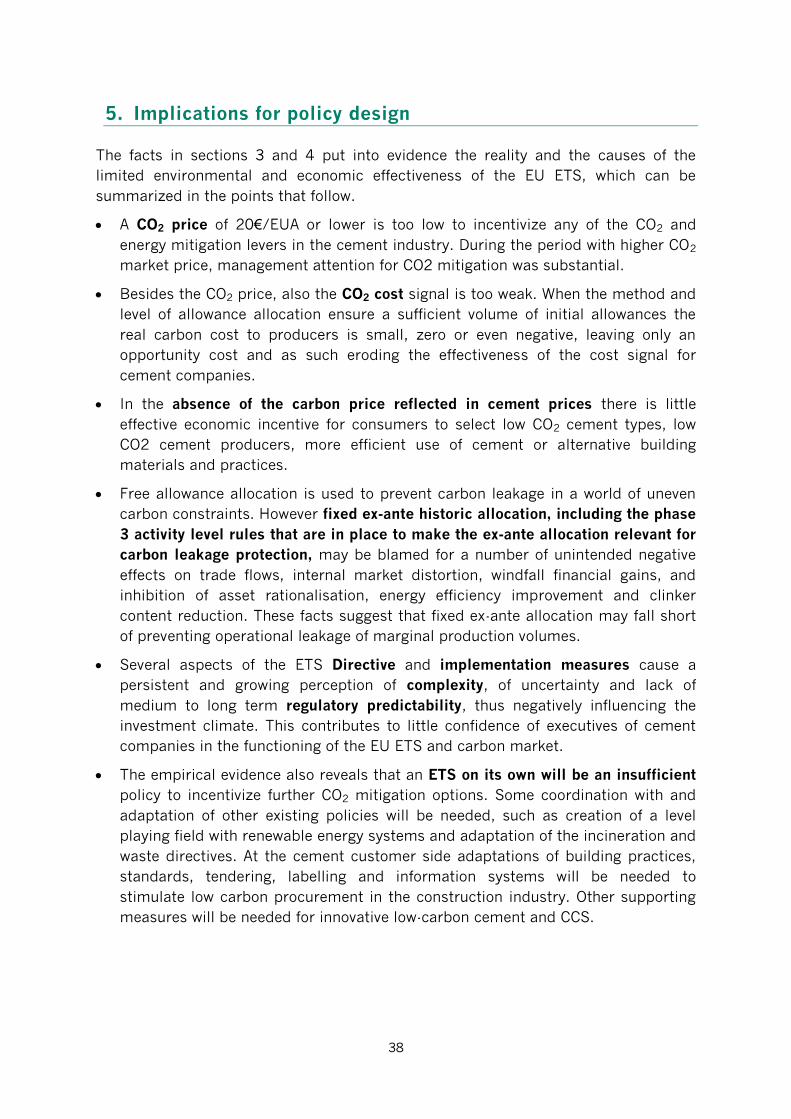
38
5. Implications for policy design
The facts in sections 3 and 4 put into evidence the reality and the causes of the
limited environmental and economic effectiveness of the EU ETS, which can be
summarized in the points that follow.
A CO2 price of 20€/EUA or lower is too low to incentivize any of the CO2 and
energy mitigation levers in the cement industry. During the period with higher CO2
market price, management attention for CO2 mitigation was substantial.
Besides the CO2 price, also the CO2 cost signal is too weak. When the method and
level of allowance allocation ensure a sufficient volume of initial allowances the
real carbon cost to producers is small, zero or even negative, leaving only an
opportunity cost and as such eroding the effectiveness of the cost signal for
cement companies.
In the absence of the carbon price reflected in cement prices there is little
effective economic incentive for consumers to select low CO2 cement types, low
CO2 cement producers, more efficient use of cement or alternative building
materials and practices.
Free allowance allocation is used to prevent carbon leakage in a world of uneven
carbon constraints. However fixed ex-ante historic allocation, including the phase
3 activity level rules that are in place to make the ex-ante allocation relevant for
carbon leakage protection, may be blamed for a number of unintended negative
effects on trade flows, internal market distortion, windfall financial gains, and
inhibition of asset rationalisation, energy efficiency improvement and clinker
content reduction. These facts suggest that fixed ex-ante allocation may fall short
of preventing operational leakage of marginal production volumes.
Several aspects of the ETS Directive and implementation measures cause a
persistent and growing perception of complexity, of uncertainty and lack of
medium to long term regulatory predictability, thus negatively influencing the
investment climate. This contributes to little confidence of executives of cement
companies in the functioning of the EU ETS and carbon market.
The empirical evidence also reveals that an ETS on its own will be an insufficient
policy to incentivize further CO2 mitigation options. Some coordination with and
adaptation of other existing policies will be needed, such as creation of a level
playing field with renewable energy systems and adaptation of the incineration and
waste directives. At the cement customer side adaptations of building practices,
standards, tendering, labelling and information systems will be needed to
stimulate low carbon procurement in the construction industry. Other supporting
measures will be needed for innovative low-carbon cement and CCS.
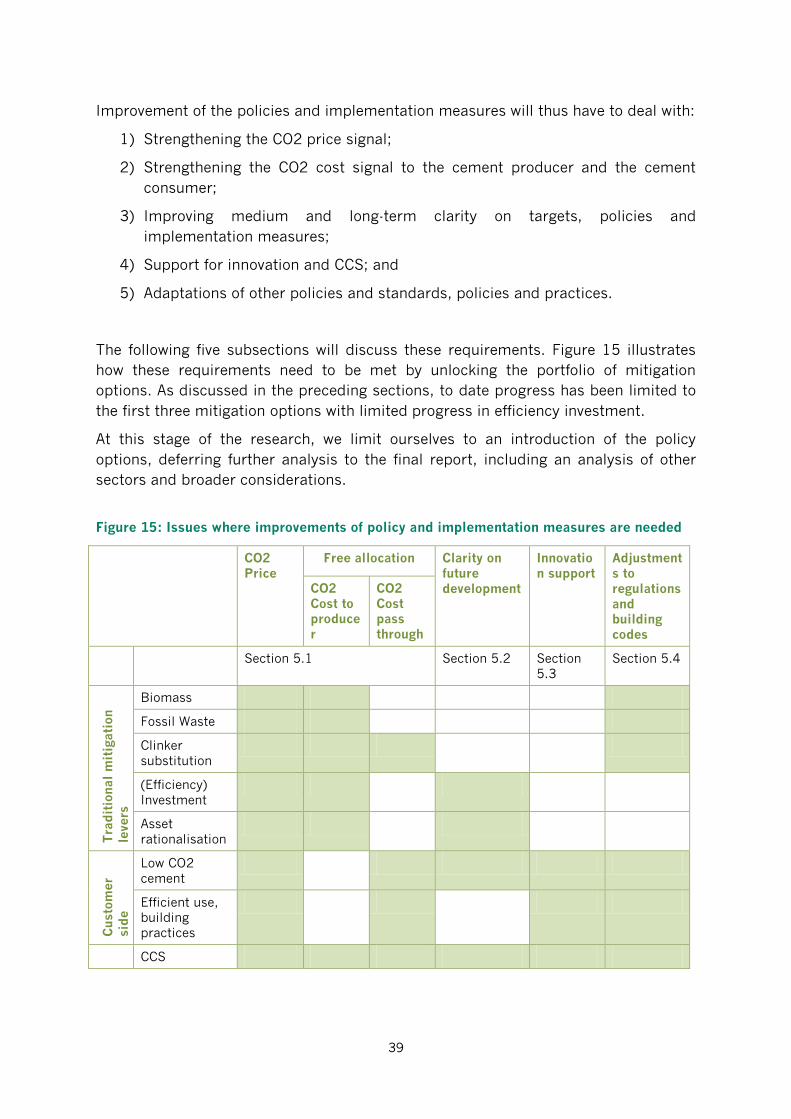
39
Improvement of the policies and implementation measures will thus have to deal with:
1) Strengthening the CO2 price signal;
2) Strengthening the CO2 cost signal to the cement producer and the cement
consumer;
3) Improving medium and long-term clarity on targets, policies and
implementation measures;
4) Support for innovation and CCS; and
5) Adaptations of other policies and standards, policies and practices.
The following five subsections will discuss these requirements. Figure 15 illustrates
how these requirements need to be met by unlocking the portfolio of mitigation
options. As discussed in the preceding sections, to date progress has been limited to
the first three mitigation options with limited progress in efficiency investment.
At this stage of the research, we limit ourselves to an introduction of the policy
options, deferring further analysis to the final report, including an analysis of other
sectors and broader considerations.
Figure 15: Issues where improvements of policy and implementation measures are needed
CO2
Price
Free allocation Clarity on
future
development
Innovatio
n support
Adjustment
s to
regulations
and building
codes
CO2
Cost to produce
r
CO2
Cost pass
through
Section 5.1 Section 5.2 Section
5.3
Section 5.4
Tra
dit
ional
mit
igati
on
levers
Biomass
Fossil Waste
Clinker
substitution
(Efficiency)
Investment
Asset
rationalisation
Custo
mer
sid
e
Low CO2
cement
Efficient use,
building
practices
CCS
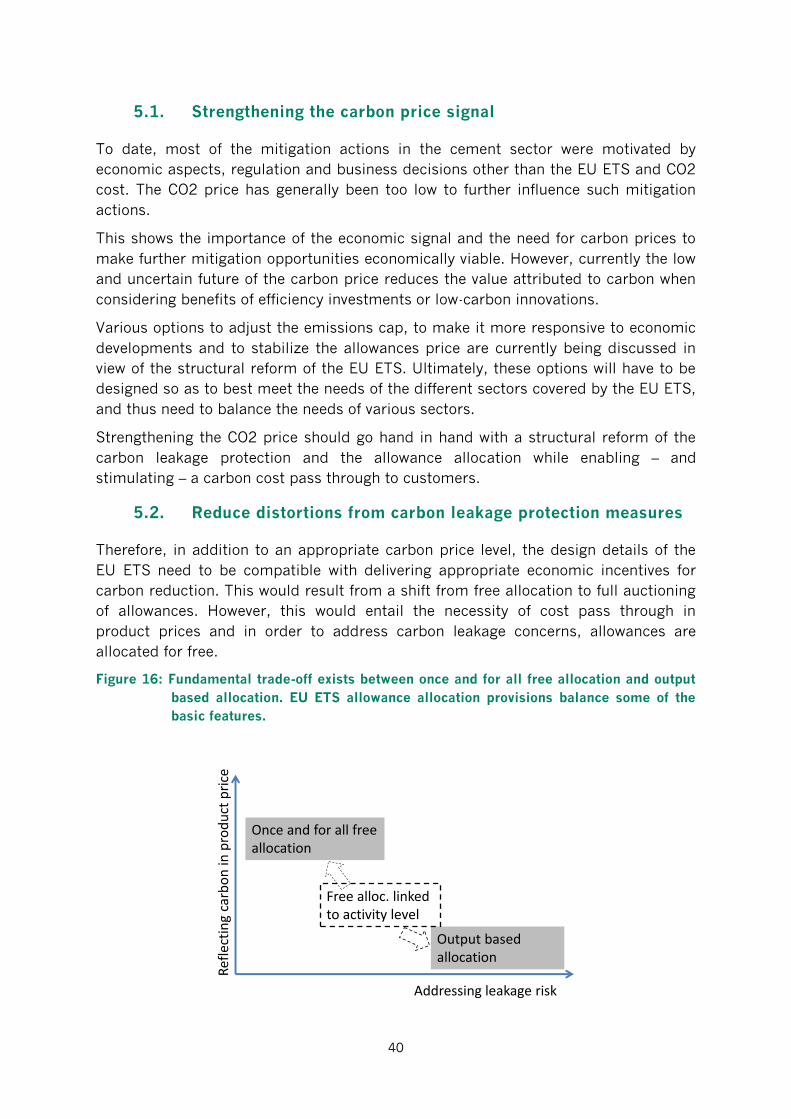
40
5.1. Strengthening the carbon price signal
To date, most of the mitigation actions in the cement sector were motivated by
economic aspects, regulation and business decisions other than the EU ETS and CO2
cost. The CO2 price has generally been too low to further influence such mitigation
actions.
This shows the importance of the economic signal and the need for carbon prices to
make further mitigation opportunities economically viable. However, currently the low
and uncertain future of the carbon price reduces the value attributed to carbon when
considering benefits of efficiency investments or low-carbon innovations.
Various options to adjust the emissions cap, to make it more responsive to economic
developments and to stabilize the allowances price are currently being discussed in
view of the structural reform of the EU ETS. Ultimately, these options will have to be
designed so as to best meet the needs of the different sectors covered by the EU ETS,
and thus need to balance the needs of various sectors.
Strengthening the CO2 price should go hand in hand with a structural reform of the
carbon leakage protection and the allowance allocation while enabling – and
stimulating – a carbon cost pass through to customers.
5.2. Reduce distortions from carbon leakage protection measures
Therefore, in addition to an appropriate carbon price level, the design details of the
EU ETS need to be compatible with delivering appropriate economic incentives for
carbon reduction. This would result from a shift from free allocation to full auctioning
of allowances. However, this would entail the necessity of cost pass through in
product prices and in order to address carbon leakage concerns, allowances are
allocated for free.
Figure 16: Fundamental trade-off exists between once and for all free allocation and output
based allocation. EU ETS allowance allocation provisions balance some of the
basic features.
Ref
lect
ing
carb
on
in p
rod
uct
pri
ce
Output basedallocation
Addressing leakage risk
Once and for all freeallocation
Free alloc. linkedto activity level
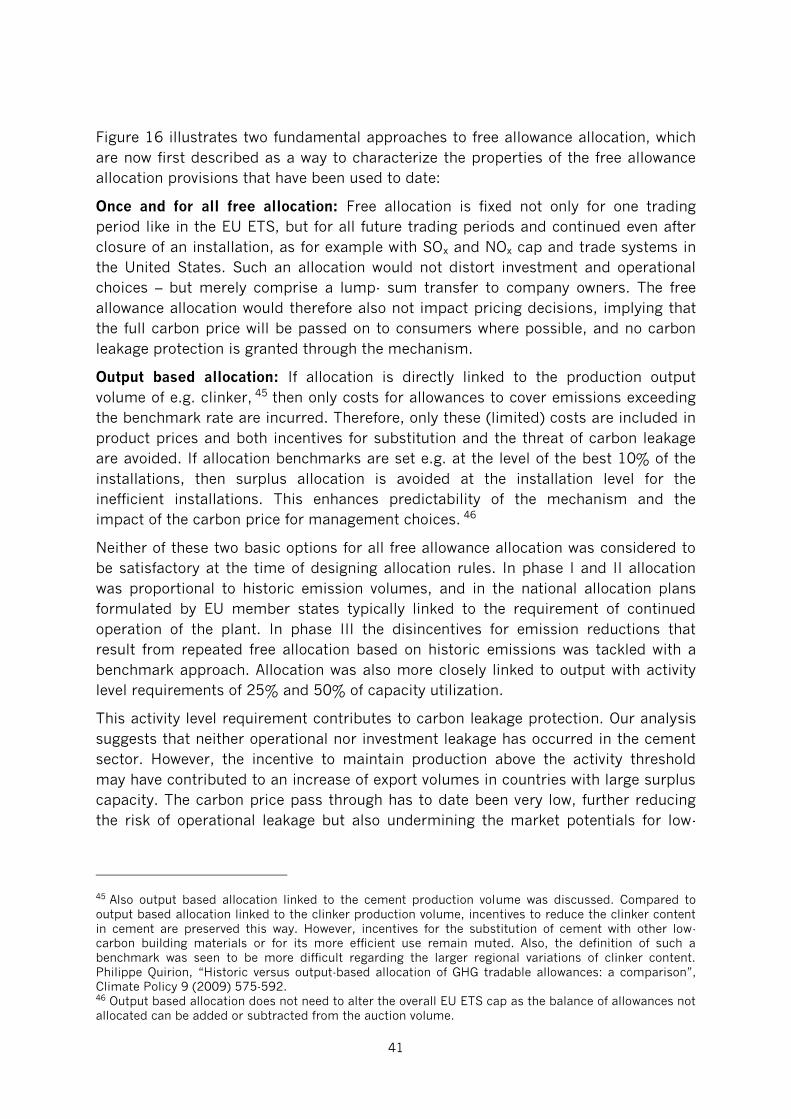
41
Figure 16 illustrates two fundamental approaches to free allowance allocation, which
are now first described as a way to characterize the properties of the free allowance
allocation provisions that have been used to date:
Once and for all free allocation: Free allocation is fixed not only for one trading
period like in the EU ETS, but for all future trading periods and continued even after
closure of an installation, as for example with SOx and NOx cap and trade systems in
the United States. Such an allocation would not distort investment and operational
choices – but merely comprise a lump- sum transfer to company owners. The free
allowance allocation would therefore also not impact pricing decisions, implying that
the full carbon price will be passed on to consumers where possible, and no carbon
leakage protection is granted through the mechanism.
Output based allocation: If allocation is directly linked to the production output
volume of e.g. clinker, 45 then only costs for allowances to cover emissions exceeding
the benchmark rate are incurred. Therefore, only these (limited) costs are included in
product prices and both incentives for substitution and the threat of carbon leakage
are avoided. If allocation benchmarks are set e.g. at the level of the best 10% of the
installations, then surplus allocation is avoided at the installation level for the
inefficient installations. This enhances predictability of the mechanism and the
impact of the carbon price for management choices. 46
Neither of these two basic options for all free allowance allocation was considered to
be satisfactory at the time of designing allocation rules. In phase I and II allocation
was proportional to historic emission volumes, and in the national allocation plans
formulated by EU member states typically linked to the requirement of continued
operation of the plant. In phase III the disincentives for emission reductions that
result from repeated free allocation based on historic emissions was tackled with a
benchmark approach. Allocation was also more closely linked to output with activity
level requirements of 25% and 50% of capacity utilization.
This activity level requirement contributes to carbon leakage protection. Our analysis
suggests that neither operational nor investment leakage has occurred in the cement
sector. However, the incentive to maintain production above the activity threshold
may have contributed to an increase of export volumes in countries with large surplus
capacity. The carbon price pass through has to date been very low, further reducing
the risk of operational leakage but also undermining the market potentials for low-
45 Also output based allocation linked to the cement production volume was discussed. Compared to
output based allocation linked to the clinker production volume, incentives to reduce the clinker content
in cement are preserved this way. However, incentives for the substitution of cement with other low-
carbon building materials or for its more efficient use remain muted. Also, the definition of such a
benchmark was seen to be more difficult regarding the larger regional variations of clinker content.
Philippe Quirion, “Historic versus output-based allocation of GHG tradable allowances: a comparison”,
Climate Policy 9 (2009) 575-592. 46 Output based allocation does not need to alter the overall EU ETS cap as the balance of allowances not
allocated can be added or subtracted from the auction volume.
42
carbon cement, efficient use, and cement substitutes which hinge on carbon prices
being reflected in the cement price.
It is difficult to envisage how a further refinement of the activity level requirement can
avoid this inherent trade-off in the design of free allowance allocation provisions
between addressing carbon leakage protection and reflecting the carbon price in the
product price to encourage down-stream mitigation options: if the activity level
requirements are further refined, then this will ultimately turn the approach towards
an output based allocation, with the drawback of eliminating incentives for
substitution and efficient use of clinker and cement. If activity level requirements are
removed, then carbon leakage protection features are eliminated.
Hence, Figure 17 includes two additional options for a further development of the
carbon leakage protection measures.
Figure 17: In a very carbon intensive sector like cement additional provisions are required to
ensure carbon leakage protection and carbon price in product price: Border
Levelling or Inclusion of consumption
Output based free allowance allocation combined with inclusion of consumption under the EU ETS47
Output Based Allocation (OBA) avoids the over- or under-allocation as a consequence
of the state of the economy. Output based allocation ensures direct costs for
allowances to meet the gap between emission performance and benchmark, which
creates an incentive for business to improve performance. Output based allocation
also avoids the risk of windfall profit or incentives that inhibit asset rationalization. 48
47 Approach economically comparable with BTA: Thus recourse should be taken to BTA literature: Cf.
Frédéric Branger and Philippe Quirion, Would Border Carbon Adjustments prevent carbon leakage and
heavy industry competitiveness losses?, CIRED Working Paper Series; Stéphanie Monjon and Philippe
Quirion, Addressing leakage in the EU ETS: Border adjustment or output-based allocation. 48 Philippe Quirion, “Historic versus output-based allocation of GHG tradable allowances: a comparison”,
Climate Policy 9 (2009) 575-592.
Ref
lect
ing
carb
on
in p
rod
uct
pri
ce
Output based alloc. & Inclusion of Consump.
Output basedallocation
Addressing leakage risk
Once and for all freeallocation
Free alloc. linkedto activity level
Full auctioning & border levelling
43
However, only the marginal carbon cost, i.e. the cost of the CO2 emission above the
benchmark, will be included in product cost and price calculations. Thus, incentives
for clinker substitution, consumer choices for composite cement and product
substitutes are not incentivized.49
To re-establish the full incentives, OBA would need to be complemented with the
inclusion of clinker consumption in the EU ETS. This may, for example, involve
making firms liable for a charge on the clinker content of their product, as a proxy for
the carbon content, because the product is prepared for final sale. Thus, products
could be freely traded nationally and internationally and would, like tobacco and
liquor, only bear the EU ETS price related charge and therefore include the carbon
costs only once they are moved towards consumption.
As a result, the consumption of the European cement would bear the carbon cost. At
the same time, lower-carbon clinker substitutes, alternative cements or low-carbon
building materials would thus compete on a level playing field with cement. This
would be implemented at the domestic level and, as it does not differentiate between
domestically produced and imported cement, it would not distort trade. The approach
would thus have the economically desired properties.
OBA in combination with inclusion of consumption could be anchored in the EU ETS
directive as alternative approach to provide protection for the sectors on the carbon
leakage list, thus also ensuring that output based allocation is implemented jointly
with the inclusion of consumption.
Since this option relates to a charge on domestic consumption of a product,
irrespective of its origin, it is likely to avoid free trade concerns of border related
options. However, at this early stage of the proposal many domestic as well as
international political and implementation issues remain to be investigated. Of
particular concern to the cement sector is whether carbon prices are also reflected in
competing products so as to avoid distortions in cross-sector competition.
Moving to full auctioning in combination with border levelling
Another option would be to include the operators and installations for import and
possibly export of clinker and cement in the scope of the EU ETS and moving to zero
free allocation i.e. full auctioning of allowances.50
While this would be the most effective in internalizing the full carbon cost in the
production and consumption of clinker, cement and concrete, and would thus
maximize the incentive for all emission reduction levers, there remain many aspects
and consequences to be thoroughly investigated before coming to conclusions. These
49 Cement benchmarking could avoid some of these disincentives, but faces in practice various
administrative barriers. 50 Ismer, R. and Neuhoff, K., 2007, Border Tax Adjustments: A feasible way to support stringent emission
trading, European Journal of Law and Economics 24, p. 137–164; Monjon, S. and P. Quirion, 2010. How
to design a border adjustment for the European Union Emissions Trading System?, Energy Policy, 38(9):
5199-5207,
44
include the legal, practical and political aspects of the inclusion of importers and
exporters in the scope of the Directive, especially the aspects of the implicit or explicit
inclusion of the emissions of the clinker and cement producers outside the European
territory in the system. It would also be necessary to investigate the ramifications for
the competitiveness of those building materials versus other building materials that
would not be subject to full auctioning.
5.3. Clarity on future developments
As most mitigation options are linked to efficiency, innovation and investment, early
clarity on the procedures post-2020 will be essential to ensure early investment
choices. The sunset clauses for carbon leakage protection measures post-2020 and
the revision of the list of the carbon leakage exposed sector create a high level of
uncertainty for industry. Ironically, no one other than the industry believes that
carbon leakage protection measures will not be in place when needed – hence it is
important to develop and communicate a clear strategy on carbon leakage protection
post-2020.
Improving the medium- and long-term predictability of the EU ETS for the cement
industry is an essential requirement to improve the effective inclusion of the carbon
price in business decisions. For strategic choices not only the carbon price, but also
clarity on the carbon constraint is important. This requires primarily a sector specific
outlook as it starts to emerge from sector specific low-carbon roadmaps. However, it
is still unclear how mitigation costs variations across energy and carbon intensive
sectors will evolve and therefore what contributions different sectors will make to
mitigation. The EU ETS has the potential to provide credibility to the overall
mitigation target and thus also the low-carbon roadmaps while allowing for flexibility
and a clear mechanism for the adjustment of the sector specific low-carbon roadmaps.
Some interview partners suggested that the complexity of the mechanism and
associated trading requirements could be reduced if the cement industry were to
leave the EU ETS and would instead be covered by a carbon tax. Such a change –
apart from the extensive period of uncertainty during the transition and the previously
challenges of implementing a tax at European scale – would also eliminate one of the
key benefits the EU ETS can offer to coordinate a low-carbon development: credibility
of emission reduction targets through a price mechanism that adjusted with target
achievement.
Furthermore, most of the complexity of the EU ETS is linked to implementation
measures that aim at protecting competitiveness. Also with a carbon tax, protecting
competitiveness and preventing carbon leakage would be a legitimate concern.
Similar to free allowance allocation, there would be a high political and lobbying
pressure from the side of the industry to get exemptions and rebates from the carbon
tax with the purpose of preventing carbon leakage. But this would at the same time
create complexity in the tax structure and erode the economic incentive and thus
emission reductions.
Hence we consider such shift in the European context not to be a viable option.
45
5.4. Support for innovation
New low-carbon cement types and carbon capture and storage require significant
investment in research, development and demonstration. A subsequent large scale
adoption of new building practices and materials furthermore requires significant up-
front investment to demonstrate viability of new practices and materials. In addition,
issues around societal acceptance of such practices will have to be resolved. It is
unlikely that this will be unlocked by the ETS alone. Supplementary policies,
mechanisms and initiatives will be needed.
Currently, there is only limited engagement of cement companies in such activities
which can be explained by three factors. First of all, the low carbon price and
uncertainty about its development in the future leads to the lack of confidence that
carbon prices will contribute to an increase in cement price. This implies that there is
very limited market demand for alternative materials that may lead to lower CO2
emissions, but are – at least initially – more expensive than traditional cement.
Secondly, for substitutions for cement, the cement sector (as well as any other
commodity sector) will be reluctant to invest in innovative alternatives that compete
with their existing products and thus create competition for their existing production
facilities. Finally, successful low-carbon cements will require several years to
gradually capture market share. It is unclear to what extent the initial investor will be
able to capture the future benefits of the product.
However, beyond the market demand, some interview partners also voiced concern
about the existence of suitable low-carbon cement options. It is unclear to what extent
this reflects concerns that there will be not one single substitute for all the functions
provided by cement or that, in the absence of effective carbon prices, low-carbon
cement alternatives are not competitive. A number of low-carbon alternatives to
cement are listed in Annex 2.
In addition to marketable innovation, mechanisms like labelling could also contribute
to closer consumer engagement and thus create niche-markets for low-carbon cement
options. But this would depend on the credibility of labelling approaches and
transparent and robust information on the alternative products.
5.5. Adjustments to regulations and building codes
Much of the emissions reduction in the cement sector to date was linked with
adjustments to regulation. Co-firing of waste products required new permits, which,
together with the supply of suitable waste, resulted from the EU Waste Framework
Directive. Also, the reduction of clinker content in cement required adjustments of
codes and standards for concrete and buildings in several jurisdictions. Additional use
of these options could require for example symmetric rules for the treatment under
renewable energy support mechanisms for co-firing of biomass in power and clinker
installations and symmetric rules for the inclusion of installations for the incineration
of waste (currently excluded from Annex 1 of the Directive).
46
In addition, further reduction of clinker content in concrete, the use of low-carbon
concrete and substitute building materials may require adjustments of codes and
standards for concrete and buildings in member states. Investment in innovative
techniques and products depends on confidence that such adjustment will be pursued
in a timely manner. Hence, an early analysis is necessary to assess whether and what
precise adjustments are needed for the exploration and diffusion of further mitigation
options.
Beyond the adjustment of regulation to prevent barriers for the use of economically
attractive mitigation options, regulation can also help to support the diffusion of
economically viable options that are currently not selected due to inertia and other
priorities in decision-making processes. Therefore, regulatory approaches would
complement effective carbon pricing mechanisms. This has been the prominent
motivation for fuel efficiency standards in the automotive sector or codes on thermal
efficiency in buildings. Standards and regulation thus helped to facilitate the
innovation and deployment of lower-carbon technologies. Equally, regulation on the
thermal performance of buildings limits the operational energy use in buildings – and
could be complemented with standards to limit the volume of carbon to be embedded
in the materials of the building.
Potentially, norms and standards could be even more ambitious and prescribe
activities that might not be economically viable – e.g. due to continued challenges for
the implementation of an effective carbon price. This could involve requiring a certain
thermal performance of a clinker installation or limiting the clinker share that can be
used for certain cement applications. This could address the concerns about a limited
investment of the industry in efficiency improvement measures due to more attractive
investment opportunities in other activities. With regulatory requirements, the
investment option would be judged against the future net-revenue streams of an
installation that can only be accessed through the “license to operate” obtained with
efficiency investments.
47
Annex I. Interviews
The research team first collected and analysed data from a number of sources such as the
WBCSD – CSI Getting the Numbers Right database, the EUTL, Eurostat, UN Comtrade trade
flow data and company annual financial reports. The researchers then conducted a series of
interviews with executives from cement companies with the purpose to discuss the business
decisions processes and the influence of the EU ETS and other policy instruments on the
different aspects that influence energy and CO2 intensity, trade flows, competitiveness,
investments and innovation on the short, medium and long term.
The interviewers had knowledge of the facts and figures of each subject of the sections 3 and 4
and focused the discussions on the related business considerations of each of those.
The following executives were interviewed in the period July to September 2013:
Heidelberg Cement: Daniel Gauthier, Chief Executive Officer Heidelberg Cement
(Europe and Africa);
Cemex: Ignacio Madridejos, Madrid, President of Cemex (Northern
Europe);
Schwenk: Gerhard Hirth, Managing Director of Schwenk (Germany);
Holcim: Lukas Epple, CEO of Holcim (Belgium);
Lafarge: Christophe Bouf, Director of Strategy;
CRH: Mossy O’Connor, CEO of CRH (Poland); and
ECRA: Martin Schneider, CEO of the European Cement Research
Academy.
In addition, CO2 policy and public affairs experts were interviewed:
CO2 policy experts: Rob Vander Meer, Heidelberg Cement and Vincent Mages,
Lafarge.
Public affairs: Alain Guillen, Lafarge
Wherever this report draws conclusions from the interviews, they are based on a
representative majority of the interviews and cannot be attributed to a single interviewee.
Annex II. Inclusion of consumption
Purpose
Emission trading mechanisms have the objective of imposing a liability and thus cost for CO2
emission reductions at the site of emissions, which is then passed through the value chain so
as to create economic incentives for emission reduction along the value chain. To address
leakage concerns, allowances are allocated for free to emitting installations. The design of free
allowance allocation faces a trade-off between providing effective leakage protection and
muting the carbon price signal by linkages to output or activity levels. As a result free
allowance allocation both distorts the incentive effect of EU ETS for clinker production and
reduces or mutes the carbon price signal necessary to encourage mitigation through
substitution and effective use of cement. It is therefore argued that free allowance allocation
should be more closely linked to production volumes of installations (output based allocation)
so as to increase the incentive properties (and clarity) for upstream produces. This would
however – on its own - also mute the carbon price signal for down-stream producers. This
situation triggered the discussion on whether it would be possible to re-instate the carbon
price signal downstream through inclusion of consumption in EU ETS.
The approach ‘inclusion of consumption’ is based on the idea that consumers should be
charged for the carbon embedded in the consumed goods based on a benchmark applied to
the clinker content. Thus it complements output based allocation of allowances (based on the
same benchmark) and reinstates the full carbon price signal for consumption choices and all
the up-stream decisions that are lead by consumer preferences.
Approach
The inclusion of consumption into the EU ETS would extend the application of the EU ETS to
carbon embedded in the consumed goods. As the participation of each consumer in the
trading scheme would not be feasible, an indirect consumption charge should be levied, which
reflects the carbon embedded in the consumed goods. The charge would be payable to
national trust funds51 at the time of the release of the product for consumption within the
territory of the European community, irrespective of the origin of the product. A product not
released for consumption within the territory of the community but destined for export thus
would not bear the levy. The consumption based design as well as the levying of the charge,
irrespective of the origin of the product, would assure accordance with world trade rules, as
there would be no discrimination52.
A direct link to the EU ETS would be established by basing the levy on the EU ETS allowance
price, applying the same emission benchmark used in EU ETS for free allowance allocation for
clinker producers and by using part of the money raised through the levy for the acquisition of
allowances. The number of allowances acquired and retired would reflect the carbon
embedded in the European Union consumption which is not already covered by allowances
51 A tax can be defined as compulsory, unrequited payment to general government. Taxes are subject to
the principle of universality and flow to the national budget. No earmarking is involved. In contrast, the
envisaged charge levied is not given to a national budget but to a body governed by public law (“national
trust funds”). Additionally, the charge is earmarked and introduced to make the inclusion of consumption
into EU ETS feasible. 52 Cf. in particular Art. III (1), (2) GATT.
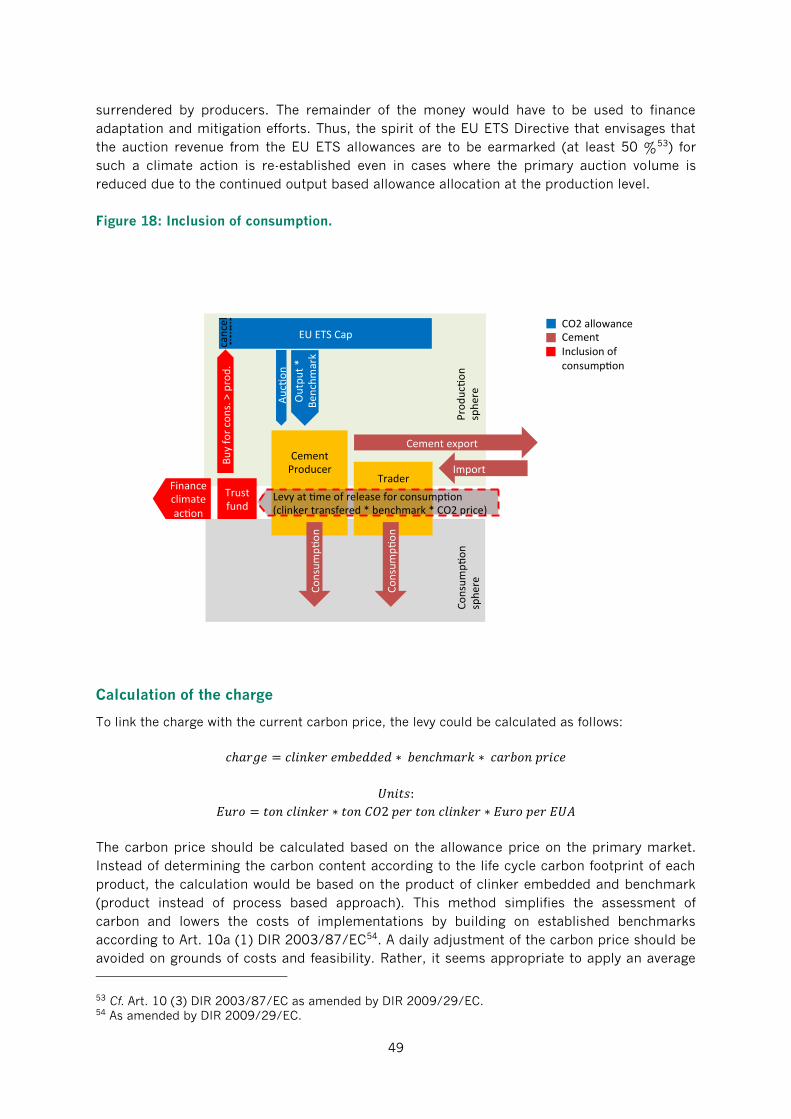
49
surrendered by producers. The remainder of the money would have to be used to finance
adaptation and mitigation efforts. Thus, the spirit of the EU ETS Directive that envisages that
the auction revenue from the EU ETS allowances are to be earmarked (at least 50 %53) for
such a climate action is re-established even in cases where the primary auction volume is
reduced due to the continued output based allowance allocation at the production level.
Figure 18: Inclusion of consumption.
Calculation of the charge
To link the charge with the current carbon price, the levy could be calculated as follows:
The carbon price should be calculated based on the allowance price on the primary market.
Instead of determining the carbon content according to the life cycle carbon footprint of each
product, the calculation would be based on the product of clinker embedded and benchmark
(product instead of process based approach). This method simplifies the assessment of
carbon and lowers the costs of implementations by building on established benchmarks
according to Art. 10a (1) DIR 2003/87/EC54. A daily adjustment of the carbon price should be
avoided on grounds of costs and feasibility. Rather, it seems appropriate to apply an average
53 Cf. Art. 10 (3) DIR 2003/87/EC as amended by DIR 2009/29/EC. 54 As amended by DIR 2009/29/EC.
Trader
InclusionofconsumptioninEUETS(onenewapproach)3
Producon
sphere
Consump
on
sphere
CementProducer
Cementexport
Import
EUETSCap
Output*
Ben
chmark
Consump
on
Consump
on
Aucon
Financeclimateac on
Buyforcons.>prod.
Trustfund
Levyat meofreleaseforconsump on(clinkertransfered*benchmark*CO2price)
cancel
CO2allowanceCementInclusionofconsump on
22
50
carbon price. To reflect the market price at the time of consumption and thus the real value of
carbon emissions, it might be a reasonable compromise to use a monthly or quarterly carbon
price average.
Consumption sphere
One major challenge is to determine when a product leaves the production sphere and enters
the consumption sphere. The more production processes are involved in producing a
consumable good, the more difficult the implementation and the more extensive the
administration become. However, this problem does not arise in the cement sector, since
cement can already be regarded as consumable product and the end consumer can be
determined easily. Accordingly, the charge should be levied when cement is sold. If further
trade levels were to follow, the last level being exempted from the charge should be the
wholesale. This minimizes administrative costs and experiences from the administration of
excise duties can be applied, which is based on a similar system. Thus, the charge will be due
when cement is i.e. used for construction.
Administration and monitoring
To ensure effective monitoring, a European based record for cement trade flows could be
implemented which records trade flows of producers, traders, imports and exports via
electronic procedure. A database should be included, providing information to producers and
traders about the eligibility of trading partners to dispatch and receive goods without
triggering the charge. On the basis of recorded imports and exports, the amount of carbon
embedded in international trade can easily be calculated, which is necessary for the
readjustment of emission allowances. Necessary electronic administration systems can be
based on already established software and experiences in regards to the implementation and
administration of excise duties.
On the national level, the mechanism can be built on established administration processes.
Thus, the trust funds should be under the control of the national authority, which is
responsible for the implementation of the EU ETS according to Art. 18 DIR 2003/87/EC. At
this level, it is possible to control the payment of the levy charge and to monitor the respective
transactions.
Legal background
A European based implementation requires a legal base established in the Treaties of the
European Union 55 . Art. 192 TFEU 56 opens the door for environmental policy measures.
Depending on the nature of the measure in question, different legislative procedures are
applicable. Whereas Art. 192 (1) TFEU refers to the ordinary legislative procedure, Art. 192 (2)
lit. a TFEU demands a unanimous decision by the Council for provisions primarily of fiscal
nature, which might not be obtainable. The scope of Art. 192 (2) lit. a TFEU comprises taxes
in the narrow sense and charges which are fiscally usable, meaning that the amount payable
can easily be adjusted by governments and can be used to cover general expenditures. In
contrast, parafiscal charges are covered by Art. 192 (1) TFEU.
55 Art. 4 (1), 5 (1) TEU. 56 Treaty on the Functioning of the European Union.
51
This raises the question whether the proposed scheme would be primarily fiscal in nature. In
its ATA decision57, the European Court of Justice ruled that the inclusion of aviation into the
EU ETS “is not intended to generate revenue for the public authorities, does not in any way
enable the establishment, applying a basis of assessment and a rate defined in advance, of an
amount that must be payable [...]“ and thus does not give rise to a tax, fee, charge or duty.
These findings of the Courts can be generalized and applied to the EU ETS as a whole. Hence,
the inclusion of consumption into the EU ETS by itself would be qualified as not being fiscal in
nature. Accordingly, it could be based on Art. 192 (1) TFEU.
In our view, this result does not change if consumers, retailers or wholesalers are on grounds
of feasibility, not directly included in the EU ETS . This is because the charge payable to the
trust funds should not be considered as fiscal in nature. According to settled case-law, the
European Court of Justice qualifies a charge as a parafiscal charge which comprises the
following features: Earmarking, assigned to a body governed by public law, no inflow to the
national budget. This means that the proposed scheme could be based on Art. 192 (1) TFEU
instead of Art. 192 (2) lit. a TFEU, the charge would not go to the member states budgets and
the charge would only constitute a mechanism to make the scheme ‘inclusion of consumption’
feasible.
57 Case C-366/10 ATA v Secretary of State for Energy and Climate Change (ECJ, 21 December 2011), para
142ff.
52
Annex III. Innovative Cement-Based Materials
Although there are some examples of using cement alternatives for certain applications, the
existing innovative cement-based products are currently nearly all at either a demonstration or
early commercialization stage or at a research and development phase. Each product has its
specific benefits, mostly for the pre-targeted application areas, as well as its challenges,
mainly caused by the limited availability of the different materials necessary for its production.
Accordingly, the replacement and CO2 emissions saving potentials vary across different
innovative cement materials.
In most cases, the purpose is to reduce the CaO content in the product, because it is
essentially the calcination of CaCO3 that causes process and fuel CO2 emissions. Another
innovative stream works with MgCO3 based products, in which the reaction producing
magnesium oxide (MgO) also releases CO2 emissions with the additional benefit of the product
capturing CO2 emissions during the stabilization phase after being constructed. In the
categorization mentioned below, the different types of cements and concretes were clustered
in 5 categories, including products that are worked on by different cement companies. It must
be noted that although some of these products have already been developed over a decade
ago, they still have not grown out of the demonstration phase and are not used commercially
on a wider scale. Some of the products are not worked on anymore.
The standards classify cements by their uses because their chemical composition is usually
very complex and in some cases not perfectly known. In a more generic classification,
conventional cements can lie into the category of hydraulic (e.g. Portland cement), which are
based on a mixture of alumina, silicate and calcium oxides, such as belite, alite and celite, and
which react with water to settle and harden. Non-hydraulic cements harden due to the reaction
of carbonation in presence of the carbon dioxide present in the air. The objective of innovative
cement materials lies in reducing the clinker content.
Limestone based cements
Calcium sulfoaluminate cement
This class of cement can be made at a lower temperature and contains less lime than Portland
cement. It could offer CO2 emissions reductions of 25 to 50% compared to the Ordinary
Portland Cement (OPC). However, it is more expensive than OPC and belite-based cements are
slower to set.
Aether
AetherTM cement is an alternative production method being developed by Lafarge also based
on a raw material recalculation, where calcium oxide content is reduced and substituted by
more aluminium and silicon oxides. The composition of the resulting product is a mixture
based on belite as a major phase and calcium sulphoaluminate and calcium alumino-ferrite as
the two other principal phases. The produced cements are adapted for specific applications
rather than general concrete use. Lafarge has tried the AetherTM production in a semi-
industrial facility in Poland, in its UK-based BRE semi-dry installation with Lepol kiln and in a
dry kiln facility in France. Emissions savings of 25-30% can be achieved, through lower fuel
consumption due to the lower temperature, lower process emissions given the lower calcium
oxide content and, finally, high savings in the grinding and mixing operations can be
potentially obtained due to the excellent AetherTM clinker grinding properties.
53
Calcium aluminate and calcium alumina silicate cements
These cements are made in a rotary kiln using bauxite instead of the typical calcium silicates.
Although these cements reduce CO2 emissions, they are more expensive and less available as
OPC. They are often blended with high concentrations of ground granulated blast furnace slag
(GGBFS).
Artifical Pozzolans
The use of artificial pozzolans, produced i.e. by thermal activation of kaolin-clays to obtain
metakaolin, allows reducing CO2 emissions by up to 20% compared to OPC clinker. Its
challenge lies in its availability. It could be very expensive due to the extreme shortage of
kaolin rich clays.
Celitement
Celitement is calciumhydrosilicate, a material that is produced using the same raw materials
as OPC, based on calcium and silicon oxides, but requiring a much lower calcium to silicon
ratio. The difference is that instead of a mixture, Celitement contains only one product that
adds mechanical strength to concrete, while reducing the amount of energy, emissions and
limestone requirements. It includes a third of the lime when compared with OPC and could
save up to 50% of the CO2 emissions in production. Additionally, the unit operations are well
known, it has a homogenous composition and is compatible with conventional cement use,
and therefore can be mixed with it. The product is developed in the Karlsruhe Institute for
Technology (KIT), Germany, and the Celitement GmBH was founded to develop the product
and process for commercial use.
Natural Pozzolans
Natural pozzolans have a similar composition to artificial pozzolans but occur naturally.
Historically, the volcanoes that Romans and Greeks used to construct the strong buildings that
are still erect today were the Vesuvius and volcanoes in the famous island Santorini. Natural
pozzolans can replace clinker up to 35%. Nevertheless, its cost depends widely on the region
and the availability.
Supersulfated cements
Supersulfated cements contain 80-85% of GGBFS, 10-15% of calcium sulfate and 5% of
clinker, and are produced for high sulphate and chemical resistance, but they are expensive
given the availability of materials.
Non-limestone based cement
Magnesium-Based Cement
Magnesium cement follows a similar reaction as OPC, with the exception that here calcium
carbonate and oxides are substituted by the corresponding magnesium carbonate and oxides.
It requires around 30% less energy given the fact that the reaction occurs at a much lower
temperature. During the carbonation process it captures atmospheric CO2 emissions even
faster than concrete made from OPC. These sorts of cement develop considerably greater
compressive and tension strengths compared to OPC.
54
CeramiCrete
These materials are 2 to 3 times stronger than the regular concretes. Conversely their costs
are 2 to 3 times of cement based concretes. These are created from acid-based reactions and
more resistant to the environment
Novacem
Novacem has the properties of CO2 capture during the stabilization phase in addition to
maintaining comparable to cement structural properties. The capture process is a well-known
natural procedure called mineral carbonation or mineral sequestration. The process in itself
involves the inverse reaction to calcination as the mineral oxide is turned into stable
carbonates by the addition of CO2. The most innovative fact comes in the use of magnesium
silicate, which decarbonizes at a much lower temperature, namely 650 °C, than conventional
clinker. In the process itself, more than 50% emission reductions can be obtained, while
during the construction phase, the process is claimed to capture up to 1 tonne of CO2 per
tonne of cement constructed. The development took place in Imperial College Laboratories, for
which an Australian firm has acquired the intellectual property rights.
TecEco
These cements contain magnesia and have the ability to sequester carbon-dioxide from the
atmosphere. Additionally, it can also immobilize toxic substances within its structure. However,
as they are magnesia based cements, their potential worldwide use is limited due to the
insufficient availability of raw material.
Alkali activated cements or geopolymers
Geopolymers are a different class of cements based on pozzolans. Conventional pozzolanic
cements require lime to activate the pozzolan, whereas geopolymers make use of sodium
hydroxide or sodium silicates. They offer up to 80% lower CO2 emissions than OPC. An
additional beneficial function of the material is that it allows to reach very high strengths for
corrosive and very high temperature environments. Nevertheless, geopolymers require high
alkalinity to complete its chemical reaction for formation. To maintain high alkalinity, water is
not added to its mixture. As a result, the viscosity could be very high which makes it less
workable. Availability of pozzolans may be challenging in some regions. World supply of
sodium hydroxides or silicates required for this is lacking to meet the demand of this
technology. They suffer from the nanoporosity durability flaw.
E-crete
E-crete is an alternative cement based on geopolymeric, well known waste materials, such as
pulverized fly ash (PFA) and GGBFS. The properties of the product and availability of the raw
materials are under discussion, but the product has already been commercialised in road
construction in Australia. Therefore, it might be that only further regulations would need to be
developed according to different uses.
Sialite cement
This silica alumina based cement can be produced using the industrial waste, similar to E-
crete, but also from waste bricks or tailing. Sialites could reduce CO2 emission by 30% to 90%.
Its raw materials are based in more than 60% on industrial solid wastes.
55
Calera
The Calera Corporation had a process that emulates marine cement by initially taking calcium
and magnesium ion from sea water which, combined with captured CO2 and SO2 via a
precipitation reaction, produced the desired calcium and magnesium carbonates. The process
had clean flue gas as emission, recovers waste materials and the waste water stream from the
precipitation is recovered by reverse osmosis and through a specific technology to give back
the sodium hydroxide solution to the raw stream. However, the idea of using sea water was
abandoned because of resulting acidification of the ocean and the need of enormous volumes
of water and thus energy. Subsequently, Calera moved to natural brine solutions, but these are
rather (to very) rare. Calera now looks at artificial brine solutions, but they are very costly and
energy intensive to produce.
Innovations on concrete-based materials
The most important application of cement is to produce concrete, which is the combination of
cement with an aggregate to produce a strong building material. Besides the innovation with
regards to cement, there is the innovation with regards to concrete, with the purpose of either
using less clinker in concrete (and thus reduce CO2) or reducing the mass of concrete while
achieving similar strength.
Fiber reinforced concretes
The basis of fiber reinforced concretes is that for a similar application they require less
material than conventional concretes due to adding specific fibers that help strengthening the
final material for the specific use.
Ductal
Ductal is an example of materials that offer enhanced tensile strength based on the addition of
different types of fibers, such as steel, glass, synthetic and natural type of fibers to the
concrete mix. This solution reduces the consumption of clinker in the concrete mix for
targeted applications. Bridges are the potential application area of the material, especially for
substituting the use of steel for bridge applications. Consequently, the CO2 emissions are
reduced by nearly 60%.
Carbon Concrete
This sort of concrete is based on adding carbon fiber to the concrete structure already in place
or to the mix to improve the mechanical strength. It offers strength close to that of traditional
concrete and additionally requires less material compared to similar applications where
concrete is used. It may be suitable for heavy industrial roads and saltwater applications.
Carbon Cure
This technology aims at accelerating and strengthening concrete curing (i.e. hardening) by re-
carbonating parts of the CaO in the cement or concrete under a CO2 enriched atmosphere in
autoclaves, thus "sequestering" CO2 in concrete. This technology is thought to be only
applicable for concrete products (that can be made in autoclaves, thus not for structures) that
contain no steel reinforcement as the CO2 absorption decreases the alkalinity (pH).
Many of these products have been on the market for more than 15 years (such as
Geopolymers and Ductal) but have had difficulties in penetrating the market. Currently,
research on cement and concrete materials is carried out both by independent and public
organizations and within the companies themselves.

Climate Strategies is a charitable company limited by
guarantee that provides world-class, independent policy
and economic research input to European and
international climate policy.
Climate Strategies works with a wide network of experts
to bridge the gap between research and policy, provide
unrivalled analysis for international decision-makers in
the fields of climate change and energy policy.
Climate Strategies is supported by range of national
governments, businesses and foundations, it is entirely
international in its design and remit.
All our research is published in the public domain.
Companies House Number 05796323
www.climaestrategies.org